1 Contribution of Coastal Retrogressive Thaw Slumps to the Nearshore Organic Carbon budget along the Yukon Coast Justine L. Ramage 1,2 , Anna M. Irrgang 1,2 , Anne Morgenstern 1 , Hugues Lantuit 1,2 5 1 Department of Periglacial Research, Alfred Wegener Institute Helmholtz Centre for Polar and Marine Research, Potsdam, Germany 2 University of Potsdam, Institute of Earth and Environmental Science, Potsdam, Germany Correspondence to: Justine L. Ramage ([email protected]) Abstract. We describe the evolution of coastal retrogressive thaw slumps (RTSs) between 1952 and 2011 along the Yukon 10 Coast, Canada, and provide the first estimate of the contribution of RTSs to the nearshore organic carbon budget in this area. We 1) monitor the evolution of RTSs during the periods 1952-1972 and 1972-2011; 2) calculate the volume of material eroded and stocks of organic carbon (OC) mobilized through slumping – including soil organic carbon (SOC) and dissolved organic carbon (DOC) – and 3) measure the OC fluxes mobilized through slumping between 1972 and 2011. We identified RTSs using high-resolution satellite imagery from 2011 and geocoded aerial photographs from 1952 and 1972. To estimate 15 the volume of eroded material, we applied a spline interpolation on an airborne LiDAR dataset acquired in July 2013. We inferred the stocks of mobilized SOC and DOC from existing related literature. Our results show a 73% increase in the number of RTSs between 1952 and 2011. In the study area, RTSs displaced at least 8600*10 3 m 3 of material, with 53% of ice. We estimated that slumping mobilized 81900*10 3 kg of SOC and 156*10 3 kg of DOC. Since 1972, 17% of the RTSs have displaced 8.6*10 3 m 3 /yr of material, with an average OC flux of 82.5*10 3 kg/yr. This flux represents 0.3% of the OC 20 flux released from coastal retreat; however RTSs have a strong impact on the transformation of OC in the coastal fringe. 1 Introduction Soil organic carbon (SOC) stocks in the Arctic are estimated to 1307 Pg; 76.4% (999 Pg) of them are stored in permafrost 25 terrains (Hugelius et al., 2014). These stocks resulted from slow decomposition of soil organic matter in permanently frozen soils, caused by low soil temperatures and impeded drainage. During the last decades, air temperatures in the Arctic increased by a factor of 3-4, at twice the rate of the global temperature increase (Hansen et al., 2010). As the active layer thickens due to warmer air, increased microbial activity in the soil mobilizes more organic carbon (OC) that is eventually released to the atmosphere (Mackelprang et al., 2011; Schuur et al., 2008). Organic carbon and nutrients are also released to 30 streams, rivers and to the Arctic Ocean by coastal and riverbank erosion, thermokarst erosion, and thermal erosion (Vonk et al., 2012; Ping et al., 2011; Lamoureux and Lafrenière, 2009). Mass wasting processes along the Arctic coast, such as coastal retrogressive thaw slumps (RTSs), contribute to the transport of terrestrial OC to the nearshore zone (Obu et al., 2016). RTSs are among the most active thermokarst landforms in the Arctic and have increased both in number and size over the past decades (Segal et al., 2016; Brooker et al., 2014; Lacelle et al., 2010). Active RTS headwalls retreat faster than the coast, 35 Biogeosciences Discuss., https://doi.org/10.5194/bg-2017-437 Manuscript under review for journal Biogeosciences Discussion started: 26 October 2017 c Author(s) 2017. CC BY 4.0 License.

Welcome message from author
This document is posted to help you gain knowledge. Please leave a comment to let me know what you think about it! Share it to your friends and learn new things together.
Transcript
1
Contribution of Coastal Retrogressive Thaw Slumps to the Nearshore Organic Carbon budget along the Yukon Coast Justine L. Ramage1,2, Anna M. Irrgang1,2, Anne Morgenstern1, Hugues Lantuit1,2 5 1Department of Periglacial Research, Alfred Wegener Institute Helmholtz Centre for Polar and Marine Research, Potsdam,
Germany 2University of Potsdam, Institute of Earth and Environmental Science, Potsdam, Germany
Correspondence to: Justine L. Ramage ([email protected])
Abstract. We describe the evolution of coastal retrogressive thaw slumps (RTSs) between 1952 and 2011 along the Yukon 10 Coast, Canada, and provide the first estimate of the contribution of RTSs to the nearshore organic carbon budget in this area. We 1) monitor the evolution of RTSs during the periods 1952-1972 and 1972-2011; 2) calculate the volume of material eroded and stocks of organic carbon (OC) mobilized through slumping – including soil organic carbon (SOC) and dissolved organic carbon (DOC) – and 3) measure the OC fluxes mobilized through slumping between 1972 and 2011. We identified RTSs using high-resolution satellite imagery from 2011 and geocoded aerial photographs from 1952 and 1972. To estimate 15 the volume of eroded material, we applied a spline interpolation on an airborne LiDAR dataset acquired in July 2013. We inferred the stocks of mobilized SOC and DOC from existing related literature. Our results show a 73% increase in the number of RTSs between 1952 and 2011. In the study area, RTSs displaced at least 8600*103 m3 of material, with 53% of ice. We estimated that slumping mobilized 81900*103 kg of SOC and 156*103 kg of DOC. Since 1972, 17% of the RTSs have displaced 8.6*103 m3/yr of material, with an average OC flux of 82.5*103 kg/yr. This flux represents 0.3% of the OC 20 flux released from coastal retreat; however RTSs have a strong impact on the transformation of OC in the coastal fringe.
1 Introduction
Soil organic carbon (SOC) stocks in the Arctic are estimated to 1307 Pg; 76.4% (999 Pg) of them are stored in permafrost 25
terrains (Hugelius et al., 2014). These stocks resulted from slow decomposition of soil organic matter in permanently frozen
soils, caused by low soil temperatures and impeded drainage. During the last decades, air temperatures in the Arctic
increased by a factor of 3-4, at twice the rate of the global temperature increase (Hansen et al., 2010). As the active layer
thickens due to warmer air, increased microbial activity in the soil mobilizes more organic carbon (OC) that is eventually
released to the atmosphere (Mackelprang et al., 2011; Schuur et al., 2008). Organic carbon and nutrients are also released to 30
streams, rivers and to the Arctic Ocean by coastal and riverbank erosion, thermokarst erosion, and thermal erosion (Vonk et
al., 2012; Ping et al., 2011; Lamoureux and Lafrenière, 2009). Mass wasting processes along the Arctic coast, such as coastal
retrogressive thaw slumps (RTSs), contribute to the transport of terrestrial OC to the nearshore zone (Obu et al., 2016). RTSs
are among the most active thermokarst landforms in the Arctic and have increased both in number and size over the past
decades (Segal et al., 2016; Brooker et al., 2014; Lacelle et al., 2010). Active RTS headwalls retreat faster than the coast, 35
Biogeosciences Discuss., https://doi.org/10.5194/bg-2017-437Manuscript under review for journal BiogeosciencesDiscussion started: 26 October 2017c© Author(s) 2017. CC BY 4.0 License.
2
displace a large volume of sediments, and considerably impact the surrounding ecosystems (Schuur et al., 2015; Abbott et
al., 2015). RTSs rework sediments and mobilize carbon, nitrogen, and nutrients; as a result RTSs affect terrestrial (Cassidy
and Henry, 2016; Tanski et al., 2016; Cray and Pollard 2015; Cannone et al., 2010) and aquatic ecosystems (Malone et al.,
2013; Kokelj et al., 2013, 2009a).
Permafrost carbon stocks were recently included in calibrating global carbon models (MacDougall et al., 2012; Burke et al., 5
2012; von Deimling et al., 2012; Koven et al., 2011; Schaefer et al., 2011). Schaefer et al. (2014) predicted 120 ± 85 Gt
carbon emissions from thawing permafrost by 2100, which represents 5.7 ± 4.0% of the total anthropogenic emissions.
Nevertheless, global carbon models do not account either for the spatial heterogeneity of permafrost terrains or for abrupt
thaw processes (such as thermokarst), post-fire dynamics, or coastal erosion (Hugelius et al., 2014; MacDougall et al., 2012;
Vonk et al., 2012). This gap can be addressed by quantifying the impact of the above processes on the carbon budget (Kuhry 10
et al., 2010).
Our study estimates the impact of thermokarst disturbances on the OC budget in coastal permafrost environments. We
calculate the volume of sediments and OC mobilized by the RTSs along the Yukon Coast, Canada. We 1) analyse the
evolution of RTSs in the area between 1952 and 2011; 2) calculate the volume of material eroded and stocks of organic
carbon (OC) mobilized through slumping – including soil organic carbon (SOC) and dissolved organic carbon (DOC) – and 15
3) measure the OC fluxes mobilized through slumping between 1972 and 2011.
2 Study area
The study area is located in the Canadian Arctic, along the westernmost coast of the Yukon Territory (Fig. 1). The study area
comprises a 238-km portion of the Yukon Coastal Plain, including Herschel Island (Fig. 1). The area is in the continuous 20
permafrost zone (Rampton, 1982) and tundra vegetation zone dominated by mosses, graminoids, and shrubs (CAVM Team,
2003). The area is characterized by a subarctic climate with mean summer air temperature of 6°C on the East end and 8.7°C
on the West end; the mean summer precipitations (June, July and August, 1971-2000) are 79.8 mm on the East end, and
112.9 mm on the West end (Environment Canada, 2017). The Mackenzie River influences seawater temperature and sea ice
extent and is the main forcing on the local precipitation patterns (Burn and Zhang, 2009). The western margin of the 25
Laurentide ice sheet, which reached its maximum ice extent around Herschel Island at ca. 16 200 years BP (Fritz et al.,
2012), shaped the topography of the Yukon Coastal Plain. Long and high moraine ridges characterize most of the previously
glaciated area. Herschel Island is a moraine thrust at the margin of the formerly glaciated area, and is one of the largest
moraine deposits in the region (Mackay, 1959). Stream valleys, fluvial deltas, alluvial fans, and thermokarst basins
characterize the unglaciated area. Due to widespread moraine deposits, 35% of the Yukon Coast is composed of ice-rich 30
cliffs (Harper, 1990). Volumetric ground ice contents (massive ice, pore ice and wedge ice) vary along the coast and range
from 0% to 74% (Couture and Pollard, 2017). Previous studies divided the study area into 36 coastal segments (Fig. 1),
Biogeosciences Discuss., https://doi.org/10.5194/bg-2017-437Manuscript under review for journal BiogeosciencesDiscussion started: 26 October 2017c© Author(s) 2017. CC BY 4.0 License.

3
based on ground ice contents, surficial geology and geomorphology (Lantuit et al., 2012b; Couture, 2010; Lantuit and
Pollard, 2005). Most segments fall into three surficial geologic unit: ice-thrust moraines (30%); lacustrine plains (23%) and
rolling moraines (16%). Alluvial fans, stream terraces, floodplains, and outwash plains underlay the remaining segments
(Rampton, 1982). The coast is rapidly retreating (Harper, 1990): during the period 1951-2011, the average rate of coastal
change was –0.7 m/yr and was characterized by decreasing erosion rates from West to East (Irrgang et al., 2017). RTSs are 5
common along the coast and mostly develop on segments with massive ground ice thicker than 1.5 m and coastal slope
greater than 3.9° (Ramage et al., 2017).
Figure 1: Study area. The coastal subset defined as the LiDAR scan is represented in red. The limit of the glaciation was
reproduced after Dyke and Prest (1987) and the surficial sediments after Rampton (1982). The numbers stand for the coastal 10
segments stretching along the coast from west to east: 1) Clarence Lagoon West; 2) Clarence Lagoon East; 3) Komakuk
Beach West 2; 4) Komakuk Beach West 1; 5) Komakuk Beach; 6) Malcom River Fan; 7) Malcom River Fan with barrier
Islands; 8) Workboat Passage West; 9) Workboat Passage East; 10) Herschel Island South; 11) Herschel Island West; 12)
Herschel Island North; 13) Herschel Island East; 14) Whale Cove West; 15) Whale Cove; 16) Whale Cove East; 17) Roland
Bay northwest; 18) Roland Bay West; 19) Roland Bay East; 20) Stokes Point West; 21) Stokes Point; 22) Stokes Point 15
Southeast; 23) Phillips Bay northwest; 24) Phillips Bay West; 25) Phillips Bay; 26) Babbage River Delta; 27) Kay Point
Spit; 28) Kay Point South East; 29) King Point Northwest; 30) King Point Lagoon; 31) King Point; 32) King Point
Southeast; 33) Sabine Point West; 34) Sabine Point; 35) Sabine Point East; 36) Shingle Point West.
±
0 10 205 km
Geologic unitsFf Alluvial fanFp FloodplainL Lacustrine plainFt Stream terraceGf Outwash fanGp Outwash plainMm Rolling moraineMr Ice-thrust moraine ridge
LiDAR scan
Glaciation margin
Beaufort Sea
Beaufort SeaHerschel Island
Shingle Point
Komakuk Beach
13
24 5
6 7
8
9
10
11 12
13
1415 16
17 1819
2021
2223
262425
27
28
2930
31
3233 3435
36
Biogeosciences Discuss., https://doi.org/10.5194/bg-2017-437Manuscript under review for journal BiogeosciencesDiscussion started: 26 October 2017c© Author(s) 2017. CC BY 4.0 License.
4
3 Methods
3.1 Evolution of RTSs
We used two data inputs to measure the evolution of RTSs between 1952 and 2011: a dataset with RTSs present in 1972 and
2011 (dataset A) and a dataset with RTSs present in 1952 (dataset B). All RTSs were mapped using ArcMap 10.3 (ESRI) on 5
a scale of 1:2000 and classified as active or stable.
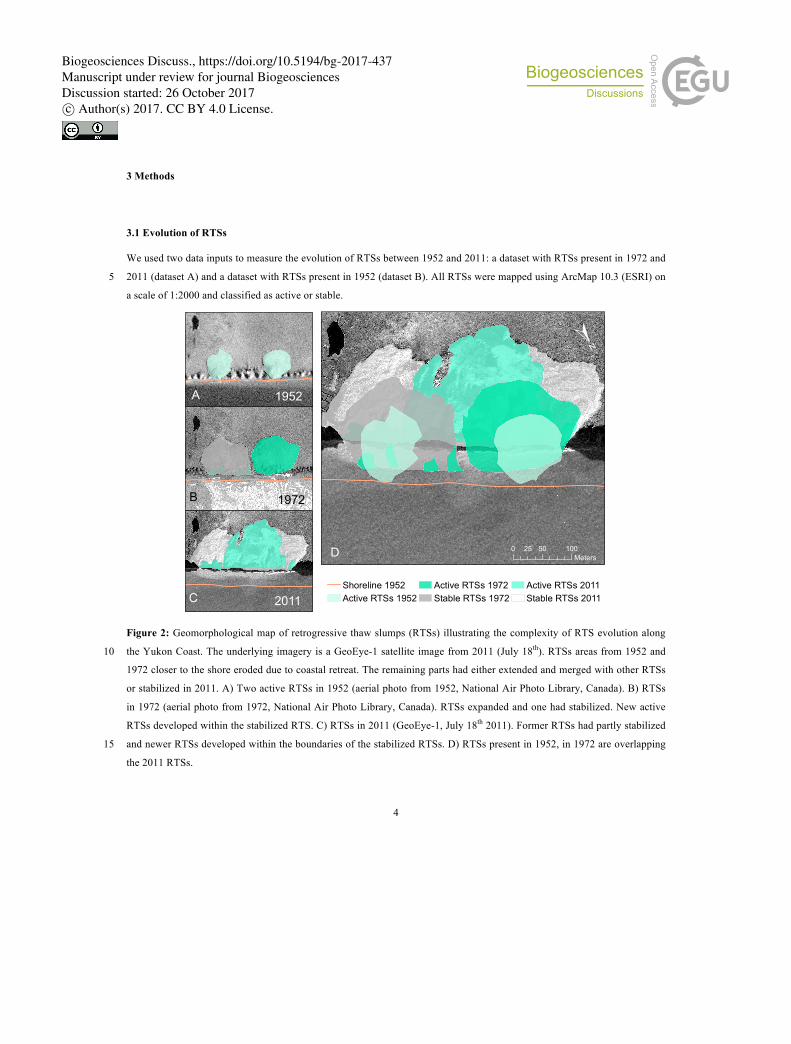
Figure 2: Geomorphological map of retrogressive thaw slumps (RTSs) illustrating the complexity of RTS evolution along
the Yukon Coast. The underlying imagery is a GeoEye-1 satellite image from 2011 (July 18th). RTSs areas from 1952 and 10
1972 closer to the shore eroded due to coastal retreat. The remaining parts had either extended and merged with other RTSs
or stabilized in 2011. A) Two active RTSs in 1952 (aerial photo from 1952, National Air Photo Library, Canada). B) RTSs
in 1972 (aerial photo from 1972, National Air Photo Library, Canada). RTSs expanded and one had stabilized. New active
RTSs developed within the stabilized RTS. C) RTSs in 2011 (GeoEye-1, July 18th 2011). Former RTSs had partly stabilized
and newer RTSs developed within the boundaries of the stabilized RTSs. D) RTSs present in 1952, in 1972 are overlapping 15
the 2011 RTSs.
±
Shoreline 1952Active RTSs 1952
Active RTSs 1972Stable RTSs 1972
Active RTSs 2011Stable RTSs 2011
0 50 10025Meters
1952
1972
2011
A
B
C
D
Biogeosciences Discuss., https://doi.org/10.5194/bg-2017-437Manuscript under review for journal BiogeosciencesDiscussion started: 26 October 2017c© Author(s) 2017. CC BY 4.0 License.

5
Ramage et al. (2016) provided dataset A. RTSs present in 2011 were mapped based on multispectral GeoEye-1 and
WorldView-2 satellite images acquired in July, August and September 2011. RTSs present in 1972 were mapped using a
series of geocoded aerial photographs from the 1970s obtained from the National Air Photo Library in Canada (Irrgang et al.,
2017). The mapping methodology is explained in detail in Ramage et al. (2017).
Dataset B comprises RTSs present in 1952 that we mapped using a series of geocoded aerial photographs from 1952, 5
obtained from the National Air Photo Library in Canada (Irrgang et al., 2017).
We compared the number and size of RTSs present in 1952, in 1972 and in 2011. RTSs are polycyclic and can occur on
surfaces previously affected by RTS. As a result, several active RTSs can be located within the boundary of a stable RTS
(Fig. 2). In this case, stable polycyclic RTSs include the areal surfaces of active RTSs located within their boundaries.
10
3.2 Volume estimations
3.2.1 LiDAR dataset
For each RTS identified in 2011 we extracted morphological information – size and mean surface elevation – from an
airborne LiDAR dataset acquired in July 2013 (Kohnert et al., 2014). The LiDAR dataset has a scan width of 500 m; the
LiDAR point data was interpolated with inverse distance weighting to obtain digital elevation models with a horizontal 15
resolution of 1 m (Obu et al., 2016). The LiDAR dataset has a final georeferenced point cloud data vertical accuracy of 0.15
± 0.1 m and covers 80% of the coastline in our study area.
We selected a subset of the 2011 RTSs dataset comprising RTSs that occurred within the boundary of the LiDAR dataset in
order to measure the volume of eroded material from RTSs, (Fig. 1). We discarded all RTSs outside of the LiDAR scan from
the volume and flux analyses (n = 125). 20
Additionally to the RTSs present in 2011 within the LiDAR area, we defined a subgroup with RTSs present in 2011 on
surfaces not affected by slumping before 1972; we defined this subgroup as RTSs initiated after 1972.
3.2.2 Interpolation method
We applied a regularized spline interpolation technique to model pre-slump topographies used for calculating the volume of
material eroded through slumping. The spline method allows to estimate elevation points outside the range of input sample 25
points and to minimize the total curvature of the surface. We therefore selected spline among other interpolation methods.
We based our interpolation on the extensive point elevation data available for the study area from the LiDAR dataset (Fig.
3).
Biogeosciences Discuss., https://doi.org/10.5194/bg-2017-437Manuscript under review for journal BiogeosciencesDiscussion started: 26 October 2017c© Author(s) 2017. CC BY 4.0 License.

6
Figure 3: Map illustrating the different datasets used to model pre-slump topographies. Retrogressive thaw slumps (RTSs)
are outlined in green for the active RTSs and orange for the stable RTSs. The background satellite imagery is a GeoEye-1
image taken on July 18th 2011. The background elevation and the random elevation points outside the RTS areas are derived
from the LiDAR dataset. Elevation surface within the RTS borders represent the elevation before RTS occurred and is 5
interpolated using a Spline.
3.2.3 Volume of eroded material
In order to calculate the volume of eroded material from the RTS identified in 2011, we subtracted the mean surface
elevation values obtained from the LiDAR dataset from the mean interpolated surface elevation values (Fig. 3). Due to 10
ground ice melting, a part of the sediments subside and remain compacted in the RTS floor (Obu et al., 2016). Moreover,
coastal retreat erodes the base of RTSs. We did not account for these processes in our analyses.
We derived the volume of eroded ice (VI) and sediments (VS) for each RTS using the volumetric ice content provided in
Couture and Pollard (2017). We derived the mass of sediments eroded per RTS using the values provided in Couture (2010).
! ! !!!!! ! !!! ! !! ! !! !!!! !! !! !!! ! ! !! ! !!! !!!! !!!!! ! !!! ! !! ! !!!!! !!!! !!! ! ! !! !! !! !!! !! ! !!! ! !! !!!!! !! !!!!! ! ! !! ! !! ! !! !!!
!
!! !!! ! ! !! ! !! ! ! ! !! ! ! ! !!! !! ! !!!! ! !! ! !! ! !! ! !! !! ! ! !! ! ! ! ! !! !! ! ! !! ! !! !
!
! ! !!!!! ! ! !!!! !! !!
!
! ! !!! ! ! !! ! !! !! !! !! ! !! !! ! !! ! !
!!
! ! !!
! !! ! !! !!
!! ! !!! !!! !!
! ! !!! ! !!! ! ! !! ! !! ! !! ! ! !
!
! !
!
!! !!! ! !! !!! !! !! ! ! !
!
!!! !
!
! ! ! ! !!! ! ! ! ! !! ! !!!! ! ! !! ! ! !!! ! !! ! !! !
!!
! !! ! !! !!! ! ! !! !! !
!
!!
!
!! ! ! !! ! !! !!! !! !! !! ! ! ! ! ! !! !! ! !! ! ! !!
!
!! ! !
!
! !! !! !
!
!! !! ! !! !! !!! ! ! !!
!
! !! ! !!! ! ! !!! !!! !! ! !! ! !! ! ! !!!! !! ! !!
!
!! !! !!
! ! !!! !! ! !! ! ! !! ! !! ! ! !! ! ! ! !!!!
!
!
!
!! !! !
!
!
!
! !! !
!
! !! !! !! !
!
!! ! !! !! !! ! !! !! ! !! !!!
!
! !
!
! !! !! ! !! !! !!!
!
! ! ! !! ! !! !! ! !!!! !! ! !!
!! !! ! ! !!
!
! !!! !! ! !!! !! ! ! !! ! ! !! !! ! !
!
!
! !
!
! !!!!! ! ! ! ! !! ! !! ! !!! ! !! !! ! !!! ! !! !!! !
!
! !! ! !
!
!
!
! !!
!
! !! !! !
!
!
!
! !!
!
! !! ! !
!
!
!
! !
!
!! ! !
!
!
!
! ! !!!
!
!! ! !! !
!
!! !! !! ! ! ! !
!
!
!
!! !!
!
!!! ! !
!
!
!
! ! !
!
!
!
! !
!
!! !!
!
!!
!! !
!
! !!! !! ! !
!
!
!
!
!
!! ! ! !
!
! !! !! !!
!
!
!
!! ! !!
!
! !
!
! !!! !!!
! ! !!
!
!! !!
!
! !
!
!! ! !! !!!
!
!!
!! !! !!
!
!
!!
!
! ! !! !
!
!
!
!
! ! !! ! ! !!! ! !
!
!! !
!!
!! !
!!!!
! !
!
!!!
!! ! !! !!
!
!
!
!! !!
!! !
!
!
!
!!
! !! ! !! !
!!
!!! !
!
!
!
!
!
!! !! !!! !
!
!
!
! !! !
!
! ! ! !
!
!
!
! !!! !
!
!
!! !! !! ! ! !
!
!
!
! !
!
!
! !
!!
!
!
! ! ! !! !!
!
! !
!
!
!
! !! ! !
!
!
!
!
!
!!
!!
!
!
!
! ! ! !
!
!
!
!!
!!
!
!
! !
!
!
!!
!
! ! !
!
! !!
! !! ! !! ! ! !! !
!
! !!! ! !!!!! ! ! !! ! ! ! !
!
!
!
! ! ! !!! ! !!
! ! !
!
!
!
!
!! !
!
! !
!
! !!
!
!
!
!
!!
!
! !! ! ! !! !
!
!
!
!
!!!!!! ! !
!
!! !!
!
!!
! ! !! !
!
!
!
!
!! !
!
! !!!
!
!!!
!!!!
!
! !!
!!!
!!
!
! ! !!!! !
!
! !
!
!
!
!
! !!! !
!
!
!
! ! !! !!
!
! !!!
!!
! !
!
! !
!
!!! !!
!
!
!
! ! !!! ! ! !
!
! !!!! !
!
!!! !!! ! ! !!!! !
!
!!! !!
!
!
!! !! !! !!! ! ! !! ! !
!
! !
!
!! !! !
!
!
!
! ! ! ! !! !! ! !
!
!!!!!!!! !
!
!
! ! !!! !!!!!!! !
!!
! ! !!! !
!
!
!! !! ! !!! !! ! !!! ! !
!
! !!! ! !!!!!! ! !
!
! !! ! !! !
!
! !! ! ! !!!!!
!
! ! ! ! ! !!! !! ! ! ! ! !!
!
!! !
!
! !
!
! !! ! ! !
!
!! !!! !
!
!! !! !! ! !!
!
!
! !! !!
!
! !
!
!
!
! !!
! !
!
!!
!
!
!!
!!
!!!! ! ! !! ! !! ! !! ! !
!
!
!! !
!
!! !!! ! !
!
! ! ! !! !!
!
! !
!
! ! ! !
!
!! ! ! !! !
!
!
!! ! !!
!
!
!!!!!!! !!! !!!!! !
!
! !!! ! !!!
!
! !! !!!!!!!!
!
! !!
!
!
! ! !
!
!!!!!! !! !
!
!!
!
!
!
! !
!
!
!
!
!!
!
!!!!!!
! !
!!!
!
!
!
!
!
!
!!
!
!! ! ! !!! !! !!! ! !! ! ! !!!!
!
!
!
!
!
! !! !
!
!!!
!
!
!!
!
!
! !
!
!!
!! !!!
!! ! !!! !! !! !! ! ! !! ! ! !! !!! !!!! !! !!! !
!
! !! !!! !!!!!!!!!!!
!
!! !!! !!! ! !!!
!
!!
! !!
!
!
!!!
! !!!
!
!
!!
!!!! !!
!
!!!
!
!
!
!!
!
!
!
!
!
!!!!!
!
!!!
!
!!!!
!
!
!
!
!!
!
! !!!
!!
!
!!!!
!!!!! !!! ! !! !
!
!!!! ! !!!
!
!
!
!!
!
!
!
!! ! !!!! !!! !!!
!
! !!! !!!! !!
!
!
!!
!!!!! !!! !! !!! ! ! !! !! ! !! !!! ! ! !!! !!!!
!!!
!!!
!!
!!! !!
!!!!!! !!
!
!!!!!! !! !! ! !!! !!! ! !! ! ! ! !!!!
!!!!!!!!!! !
!
!
!!!!!!! !
!
!
!
! !
!
! !
!
!! !! ! !!!!!!!
!
!
!
!
!
!
!! !
!!!!!!! !!
!
! !!
!
!!!!
!!!!! !!!!!!!
!
!!!!!
! ! ! ! ! ! ! ! !!!! !!
!
!
!!!!!!!!!!
! !!!!!
!!
!!!!! !!!!!
!!!
!!
!!! !!
!!!!!
!!!!!
!
!!! !!! !!!!!!
±
active RTS
stable RTS
! Elevation points
LiDAR
High : 100
Low : -3
SPLINE
High : 62
Low : 0
0 250 500125 Meters
Biogeosciences Discuss., https://doi.org/10.5194/bg-2017-437Manuscript under review for journal BiogeosciencesDiscussion started: 26 October 2017c© Author(s) 2017. CC BY 4.0 License.
7
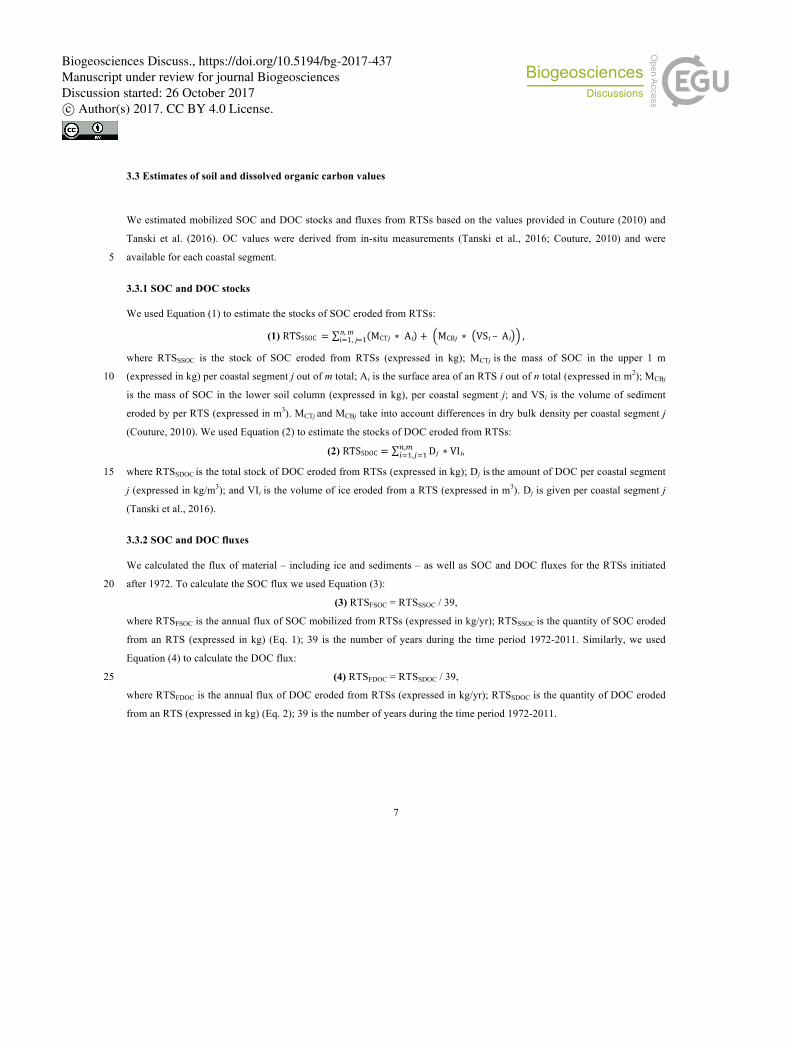
3.3 Estimates of soil and dissolved organic carbon values
We estimated mobilized SOC and DOC stocks and fluxes from RTSs based on the values provided in Couture (2010) and
Tanski et al. (2016). OC values were derived from in-situ measurements (Tanski et al., 2016; Couture, 2010) and were
available for each coastal segment. 5
3.3.1 SOC and DOC stocks
We used Equation (1) to estimate the stocks of SOC eroded from RTSs:
(1) RTSSSOC = MCTj ∗ Ai + MCBj ∗ VSi – Ai ,n, mi=1, j=1
where RTSSSOC is the stock of SOC eroded from RTSs (expressed in kg); MCTj is the mass of SOC in the upper 1 m
(expressed in kg) per coastal segment j out of m total; Ai is the surface area of an RTS i out of n total (expressed in m2); MCBj 10
is the mass of SOC in the lower soil column (expressed in kg), per coastal segment j; and VSi is the volume of sediment
eroded by per RTS (expressed in m3). MCTj and MCBj take into account differences in dry bulk density per coastal segment j
(Couture, 2010). We used Equation (2) to estimate the stocks of DOC eroded from RTSs:
(2) RTSSDOC = Dj ∗ VIi!,!!!!,!!! ,
where RTSSDOC is the total stock of DOC eroded from RTSs (expressed in kg); Dj is the amount of DOC per coastal segment 15
j (expressed in kg/m3); and VIi is the volume of ice eroded from a RTS (expressed in m3). Dj is given per coastal segment j
(Tanski et al., 2016).
3.3.2 SOC and DOC fluxes
We calculated the flux of material – including ice and sediments – as well as SOC and DOC fluxes for the RTSs initiated
after 1972. To calculate the SOC flux we used Equation (3): 20
(3) RTSFSOC = RTSSSOC / 39,
where RTSFSOC is the annual flux of SOC mobilized from RTSs (expressed in kg/yr); RTSSSOC is the quantity of SOC eroded
from an RTS (expressed in kg) (Eq. 1); 39 is the number of years during the time period 1972-2011. Similarly, we used
Equation (4) to calculate the DOC flux:
(4) RTSFDOC = RTSSDOC / 39, 25
where RTSFDOC is the annual flux of DOC eroded from RTSs (expressed in kg/yr); RTSSDOC is the quantity of DOC eroded
from an RTS (expressed in kg) (Eq. 2); 39 is the number of years during the time period 1972-2011.
Biogeosciences Discuss., https://doi.org/10.5194/bg-2017-437Manuscript under review for journal BiogeosciencesDiscussion started: 26 October 2017c© Author(s) 2017. CC BY 4.0 License.
8
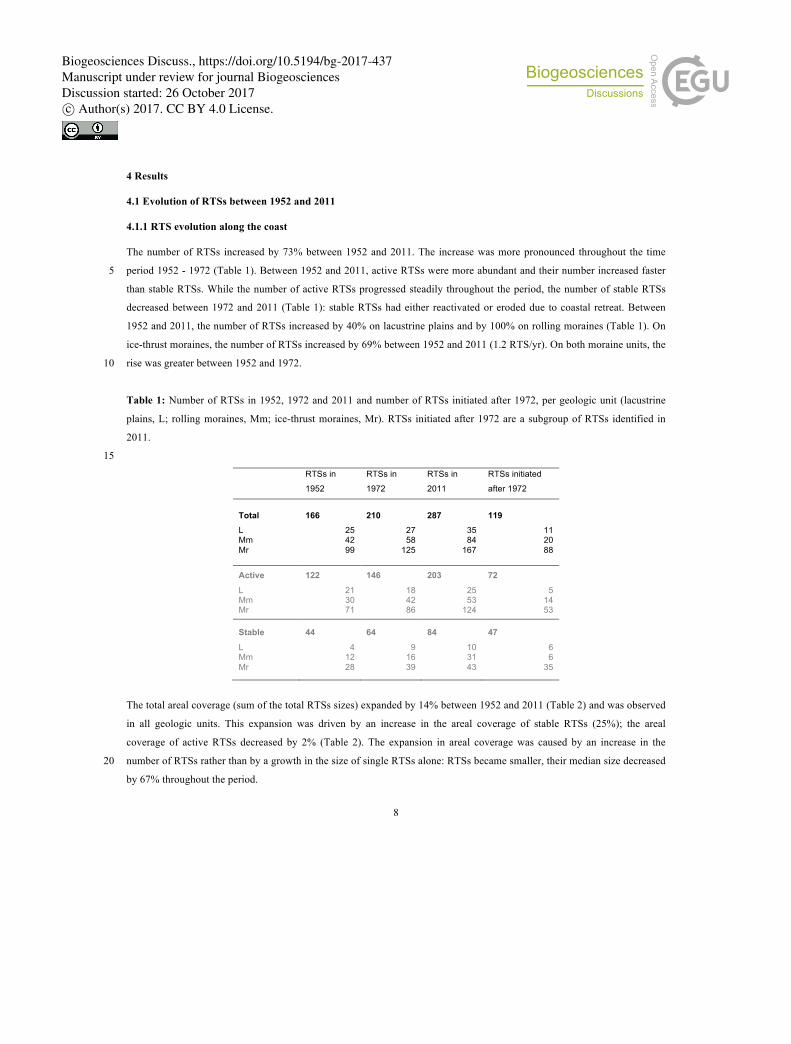
4 Results
4.1 Evolution of RTSs between 1952 and 2011
4.1.1 RTS evolution along the coast
The number of RTSs increased by 73% between 1952 and 2011. The increase was more pronounced throughout the time
period 1952 - 1972 (Table 1). Between 1952 and 2011, active RTSs were more abundant and their number increased faster 5
than stable RTSs. While the number of active RTSs progressed steadily throughout the period, the number of stable RTSs
decreased between 1972 and 2011 (Table 1): stable RTSs had either reactivated or eroded due to coastal retreat. Between
1952 and 2011, the number of RTSs increased by 40% on lacustrine plains and by 100% on rolling moraines (Table 1). On
ice-thrust moraines, the number of RTSs increased by 69% between 1952 and 2011 (1.2 RTS/yr). On both moraine units, the
rise was greater between 1952 and 1972. 10
Table 1: Number of RTSs in 1952, 1972 and 2011 and number of RTSs initiated after 1972, per geologic unit (lacustrine
plains, L; rolling moraines, Mm; ice-thrust moraines, Mr). RTSs initiated after 1972 are a subgroup of RTSs identified in
2011.
15
RTSs in
1952
RTSs in
1972
RTSs in
2011
RTSs initiated
after 1972
Total L Mm Mr
166 25 42 99
210 27 58
125
287 35 84
167
119 11 20 88
Active
L Mm Mr
122
21 30 71
146
18 42 86
203
25 53
124
72
5 14 53
Stable
L Mm Mr
44
4 12 28
64
9 16 39
84
10 31 43
47
6 6
35
The total areal coverage (sum of the total RTSs sizes) expanded by 14% between 1952 and 2011 (Table 2) and was observed
in all geologic units. This expansion was driven by an increase in the areal coverage of stable RTSs (25%); the areal
coverage of active RTSs decreased by 2% (Table 2). The expansion in areal coverage was caused by an increase in the
number of RTSs rather than by a growth in the size of single RTSs alone: RTSs became smaller, their median size decreased 20
by 67% throughout the period.
Biogeosciences Discuss., https://doi.org/10.5194/bg-2017-437Manuscript under review for journal BiogeosciencesDiscussion started: 26 October 2017c© Author(s) 2017. CC BY 4.0 License.
9
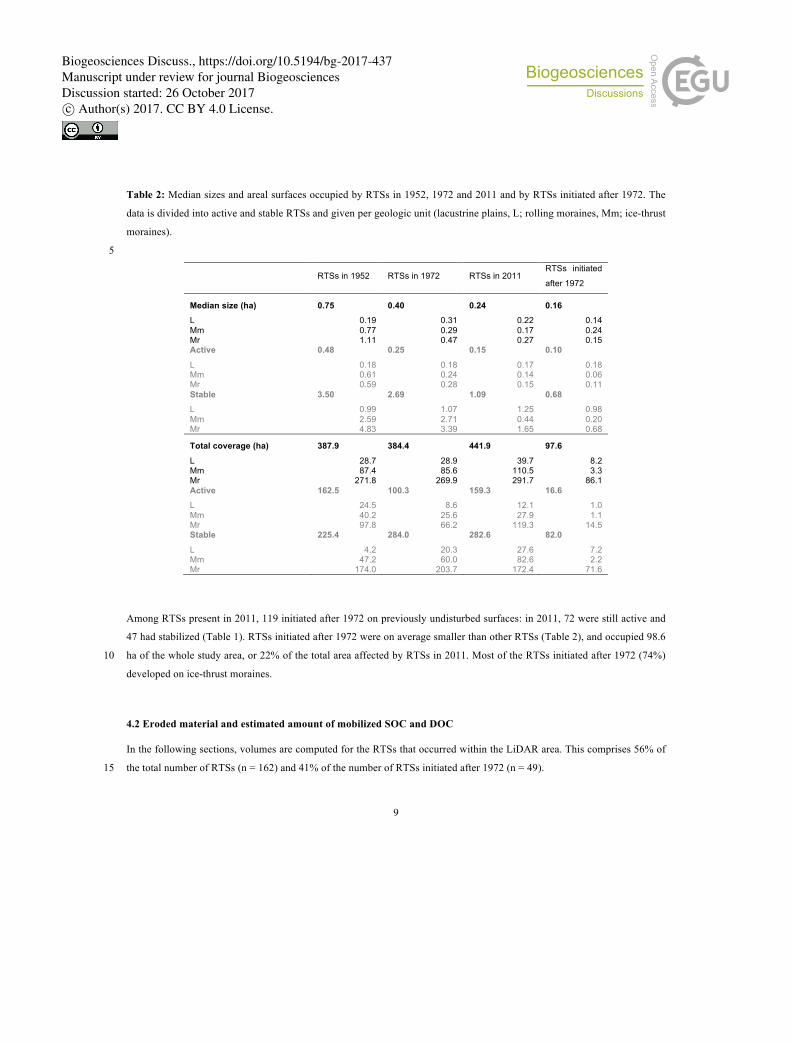
Table 2: Median sizes and areal surfaces occupied by RTSs in 1952, 1972 and 2011 and by RTSs initiated after 1972. The
data is divided into active and stable RTSs and given per geologic unit (lacustrine plains, L; rolling moraines, Mm; ice-thrust
moraines).
5
RTSs in 1952 RTSs in 1972 RTSs in 2011 RTSs initiated
after 1972
Median size (ha) L Mm Mr
0.75 0.19 0.77 1.11
0.40 0.31 0.29 0.47
0.24 0.22 0.17 0.27
0.16 0.14 0.24 0.15
Active
L Mm Mr
0.48
0.18 0.61 0.59
0.25
0.18 0.24 0.28
0.15
0.17 0.14 0.15
0.10
0.18 0.06 0.11
Stable L Mm Mr
3.50 0.99 2.59 4.83
2.69 1.07 2.71 3.39
1.09 1.25 0.44 1.65
0.68 0.98 0.20 0.68
Total coverage (ha)
L Mm Mr
387.9
28.7 87.4
271.8
384.4
28.9 85.6
269.9
441.9
39.7 110.5 291.7
97.6
8.2 3.3
86.1 Active L Mm Mr
162.5 24.5 40.2 97.8
100.3 8.6
25.6 66.2
159.3 12.1 27.9
119.3
16.6 1.0 1.1
14.5 Stable
L Mm Mr
225.4
4.2 47.2
174.0
284.0
20.3 60.0
203.7
282.6
27.6 82.6
172.4
82.0
7.2 2.2
71.6
Among RTSs present in 2011, 119 initiated after 1972 on previously undisturbed surfaces: in 2011, 72 were still active and
47 had stabilized (Table 1). RTSs initiated after 1972 were on average smaller than other RTSs (Table 2), and occupied 98.6
ha of the whole study area, or 22% of the total area affected by RTSs in 2011. Most of the RTSs initiated after 1972 (74%) 10
developed on ice-thrust moraines.
4.2 Eroded material and estimated amount of mobilized SOC and DOC
In the following sections, volumes are computed for the RTSs that occurred within the LiDAR area. This comprises 56% of
the total number of RTSs (n = 162) and 41% of the number of RTSs initiated after 1972 (n = 49). 15
Biogeosciences Discuss., https://doi.org/10.5194/bg-2017-437Manuscript under review for journal BiogeosciencesDiscussion started: 26 October 2017c© Author(s) 2017. CC BY 4.0 License.
10
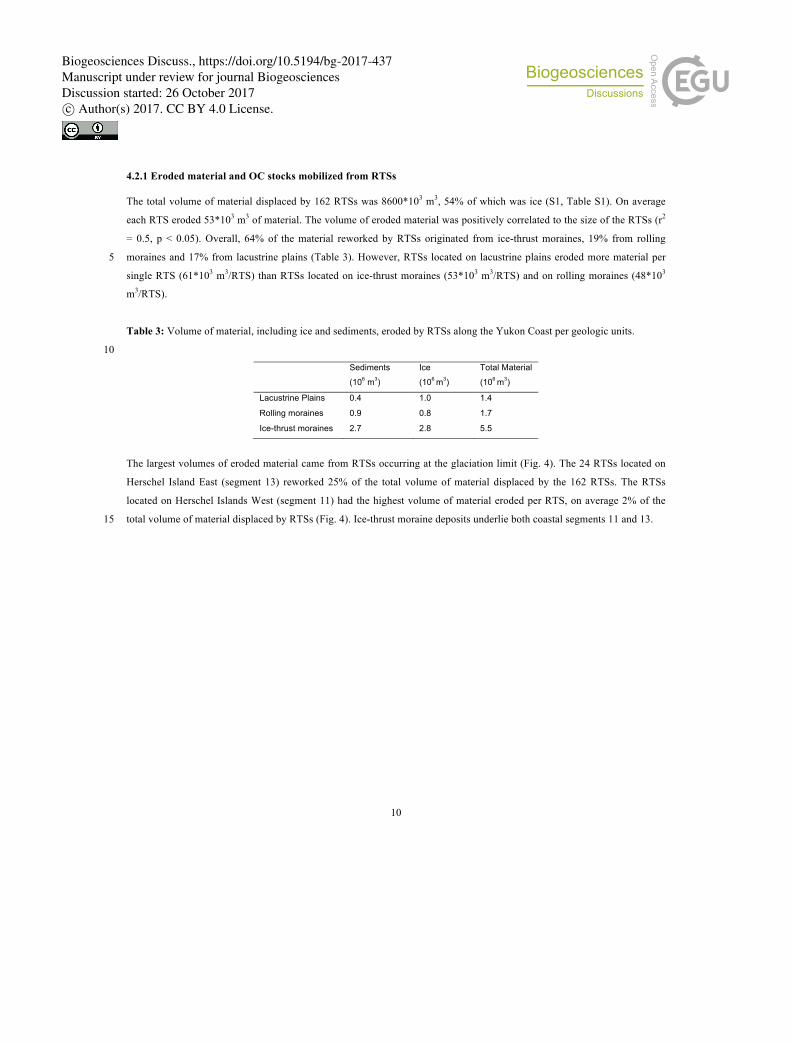
4.2.1 Eroded material and OC stocks mobilized from RTSs
The total volume of material displaced by 162 RTSs was 8600*103 m3, 54% of which was ice (S1, Table S1). On average
each RTS eroded 53*103 m3 of material. The volume of eroded material was positively correlated to the size of the RTSs (r2
= 0.5, p < 0.05). Overall, 64% of the material reworked by RTSs originated from ice-thrust moraines, 19% from rolling
moraines and 17% from lacustrine plains (Table 3). However, RTSs located on lacustrine plains eroded more material per 5
single RTS (61*103 m3/RTS) than RTSs located on ice-thrust moraines (53*103 m3/RTS) and on rolling moraines (48*103
m3/RTS).
Table 3: Volume of material, including ice and sediments, eroded by RTSs along the Yukon Coast per geologic units.
10
Sediments
(106 m3)
Ice
(106 m3)
Total Material
(106 m3)
Lacustrine Plains 0.4 1.0 1.4
Rolling moraines 0.9 0.8 1.7
Ice-thrust moraines 2.7 2.8 5.5
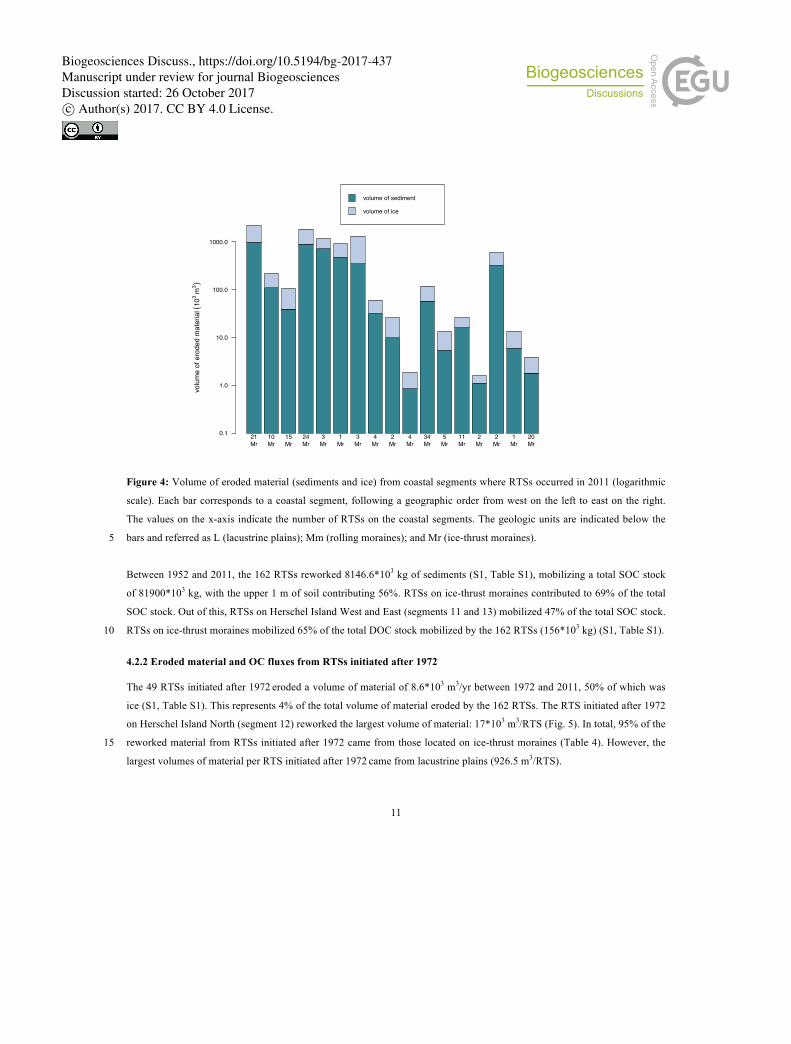
The largest volumes of eroded material came from RTSs occurring at the glaciation limit (Fig. 4). The 24 RTSs located on
Herschel Island East (segment 13) reworked 25% of the total volume of material displaced by the 162 RTSs. The RTSs
located on Herschel Islands West (segment 11) had the highest volume of material eroded per RTS, on average 2% of the
total volume of material displaced by RTSs (Fig. 4). Ice-thrust moraine deposits underlie both coastal segments 11 and 13. 15
Biogeosciences Discuss., https://doi.org/10.5194/bg-2017-437Manuscript under review for journal BiogeosciencesDiscussion started: 26 October 2017c© Author(s) 2017. CC BY 4.0 License.
11
Figure 4: Volume of eroded material (sediments and ice) from coastal segments where RTSs occurred in 2011 (logarithmic
scale). Each bar corresponds to a coastal segment, following a geographic order from west on the left to east on the right.
The values on the x-axis indicate the number of RTSs on the coastal segments. The geologic units are indicated below the
bars and referred as L (lacustrine plains); Mm (rolling moraines); and Mr (ice-thrust moraines). 5
Between 1952 and 2011, the 162 RTSs reworked 8146.6*103 kg of sediments (S1, Table S1), mobilizing a total SOC stock
of 81900*103 kg, with the upper 1 m of soil contributing 56%. RTSs on ice-thrust moraines contributed to 69% of the total
SOC stock. Out of this, RTSs on Herschel Island West and East (segments 11 and 13) mobilized 47% of the total SOC stock.
RTSs on ice-thrust moraines mobilized 65% of the total DOC stock mobilized by the 162 RTSs (156*103 kg) (S1, Table S1). 10
4.2.2 Eroded material and OC fluxes from RTSs initiated after 1972
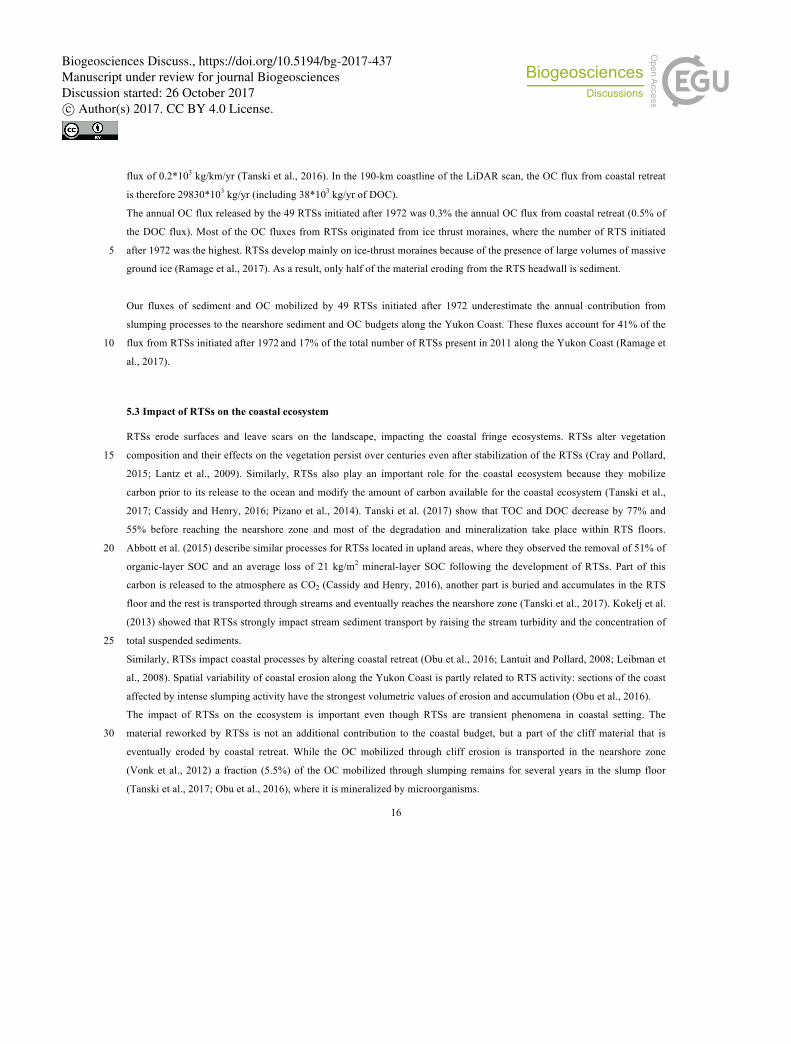
The 49 RTSs initiated after 1972 eroded a volume of material of 8.6*103 m3/yr between 1972 and 2011, 50% of which was
ice (S1, Table S1). This represents 4% of the total volume of material eroded by the 162 RTSs. The RTS initiated after 1972
on Herschel Island North (segment 12) reworked the largest volume of material: 17*103 m3/RTS (Fig. 5). In total, 95% of the
reworked material from RTSs initiated after 1972 came from those located on ice-thrust moraines (Table 4). However, the 15
largest volumes of material per RTS initiated after 1972 came from lacustrine plains (926.5 m3/RTS).
21Mr
10Mr
15Mr
24Mr
3Mr
1Mr
3Mr
4Mr
2Mr
4Mr
34Mr
5Mr
11Mr
2Mr
2Mr
1Mr
20Mr
0.1
1.0
10.0
100.0
1000.0
volu
me
of e
rode
d m
ater
ial (
103 m
3 )volume of sediment
volume of ice
Biogeosciences Discuss., https://doi.org/10.5194/bg-2017-437Manuscript under review for journal BiogeosciencesDiscussion started: 26 October 2017c© Author(s) 2017. CC BY 4.0 License.

12
Figure 5: Volume of eroded material (sediments and ice) from coastal segments where RTSs initiated after 1972 occurred in
2011 (logarithmic scale). Each bar corresponds to a coastal segment, following a geographic order from West on the left to
East on the right. The values on the x-axis indicate the number of RTSs on the coastal segments. The geologic units are
indicated below the bars and referred as L (lacustrine plains): Mm (rolling moraines): and Mr (ice-thrust moraines). 5
Table 4: Volume of material, including ice and sediments, eroded by RTSs initiated after 1972 along the Yukon Coast per
geologic unit.
Sediments
(103 m3)
Ice
(103 m3)
Total Material
(103 m3)
Lacustrine Plains 4.4 5.7 10.1
Rolling moraines 3.1 3.0 6.1
Ice-thrust moraines 160.4 158.3 318.7
10
The 49 RTSs initiated after 1972 reworked 341.2*103 kg/yr of material and therefore mobilized an SOC flux of 82.3*103
kg/yr (Table 5), representing an average of 10.4 kg/m3/yr. Most of the SOC fluxes originated from the RTSs initiated after
1972 on Herschel Island North (segment 12, 43.2*103 kg/yr) and on Kay Point South East (segment 28, 18.9*103 kg/yr) (S1,
Table S1). On ice-thrust moraines, RTSs initiated after 1972 mobilized 92% of the total SOC flux (Table 5). The total DOC
flux from RTSs initiated after 1972 was 182.6 kg/yr, with high variability between the coastal segments: from 0.6 kg/yr to 15
9Mr
2Mr
12Mr
7Mr
0Mm
0L
1Mm
0L
0Mm
1L
12Mr
0Mm
1L
0L
1L
1L
2Mm
0.5
1.0
2.0
5.0
10.0
20.0
50.0
100.0
200.0
volu
me
of e
rode
d m
ater
ial (
103 m
3 )
volume of sediment
volume of ice
Biogeosciences Discuss., https://doi.org/10.5194/bg-2017-437Manuscript under review for journal BiogeosciencesDiscussion started: 26 October 2017c© Author(s) 2017. CC BY 4.0 License.
13
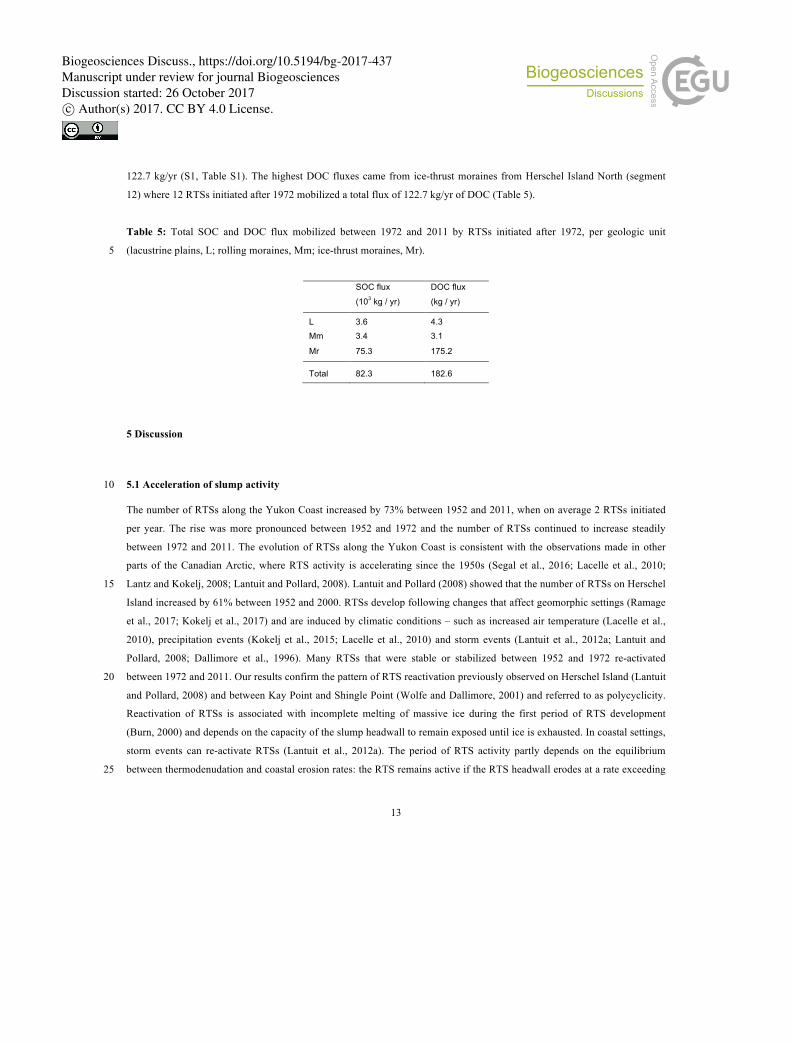
122.7 kg/yr (S1, Table S1). The highest DOC fluxes came from ice-thrust moraines from Herschel Island North (segment
12) where 12 RTSs initiated after 1972 mobilized a total flux of 122.7 kg/yr of DOC (Table 5).
Table 5: Total SOC and DOC flux mobilized between 1972 and 2011 by RTSs initiated after 1972, per geologic unit
(lacustrine plains, L; rolling moraines, Mm; ice-thrust moraines, Mr). 5
SOC flux
(103 kg / yr)
DOC flux
(kg / yr)
L 3.6 4.3
Mm 3.4 3.1
Mr 75.3 175.2
Total 82.3 182.6
5 Discussion
5.1 Acceleration of slump activity 10
The number of RTSs along the Yukon Coast increased by 73% between 1952 and 2011, when on average 2 RTSs initiated
per year. The rise was more pronounced between 1952 and 1972 and the number of RTSs continued to increase steadily
between 1972 and 2011. The evolution of RTSs along the Yukon Coast is consistent with the observations made in other
parts of the Canadian Arctic, where RTS activity is accelerating since the 1950s (Segal et al., 2016; Lacelle et al., 2010;
Lantz and Kokelj, 2008; Lantuit and Pollard, 2008). Lantuit and Pollard (2008) showed that the number of RTSs on Herschel 15
Island increased by 61% between 1952 and 2000. RTSs develop following changes that affect geomorphic settings (Ramage
et al., 2017; Kokelj et al., 2017) and are induced by climatic conditions – such as increased air temperature (Lacelle et al.,
2010), precipitation events (Kokelj et al., 2015; Lacelle et al., 2010) and storm events (Lantuit et al., 2012a; Lantuit and
Pollard, 2008; Dallimore et al., 1996). Many RTSs that were stable or stabilized between 1952 and 1972 re-activated
between 1972 and 2011. Our results confirm the pattern of RTS reactivation previously observed on Herschel Island (Lantuit 20
and Pollard, 2008) and between Kay Point and Shingle Point (Wolfe and Dallimore, 2001) and referred to as polycyclicity.
Reactivation of RTSs is associated with incomplete melting of massive ice during the first period of RTS development
(Burn, 2000) and depends on the capacity of the slump headwall to remain exposed until ice is exhausted. In coastal settings,
storm events can re-activate RTSs (Lantuit et al., 2012a). The period of RTS activity partly depends on the equilibrium
between thermodenudation and coastal erosion rates: the RTS remains active if the RTS headwall erodes at a rate exceeding 25
Biogeosciences Discuss., https://doi.org/10.5194/bg-2017-437Manuscript under review for journal BiogeosciencesDiscussion started: 26 October 2017c© Author(s) 2017. CC BY 4.0 License.

14
coastal retreat (Lantuit et al., 2012a; Are, 1999). This equilibrium is strongly linked to the changing climatic and sea
conditions that act on coastal retreat, such as storm events and sea ice duration.
Along the Yukon Coast, RTSs developed mainly on ice-thrust moraines, where their number increased by 1.1 RTS/yr
throughout the whole period. Differences in ice content and coastal geomorphology explain the disparities in the evolution of 5
RTSs observed among geologic units (Ramage et al., 2017; Lewkowicz, 1987). Our results confirm the results of Kokelj et
al. (2017), who showed evidence of a spatial link between RTS occurrence in North America and the maximum extent of the
Laurentide Ice Sheet. Similar to our observations along the Yukon Coast, most of the RTSs in North America are found
along the marginal moraines of the Laurentide Ice Sheet.
Along with the increase in number of RTSs along the Yukon Coast, the total areal coverage of RTSs increased by 14% 10
between 1952 and 2011. However, RTSs along the Yukon Coast were on average smaller in 2011 compared to 1952 and
1972. This differs from RTSs observed in other parts of the Canadian Arctic (Segal et al., 2016; Kokelj et al., 2017). Our
results support those reported by Ramage et al. (2017); coastal RTSs are on average smaller compared to inland RTSs, and
coastal RTSs along the Yukon Coast are smaller than the ones found in other coastal areas of the Arctic. The large number of
RTSs initiated after 1972 along the Yukon Coast partly explains this: RTSs initiated after 1972 represented 41% of the total 15
amount of RTSs in 2011; these RTSs were still developing in 2011 and thus did not reach their maximal expansion size.
5.2 Eroded material from RTSs
According to our estimates, RTSs have reworked at least 8600*103 m3 of material along the Yukon Coast, among which
335*103 m3 of material was reworked by 49 RTSs initiated after 1972. These estimates are low compared to material
removal from other RTSs in the Arctic. Lantuit and Pollard (2005) calculated a sediment volume loss of 105*103 m3 between 20
1970 and 2004 for a single RTS located on Herschel Island; Kokelj et al. (2015) and Jensen et al. (2014) measured material
displacements up to 106 m3 per RTS located in NW Canada and Alaska; the Batagay mega-slump located in Siberia eroded
more than 24*106 m3 of ice rich permafrost in 2014 (Günther et al., 2015). The size of the observed RTSs is one reason
behind such differences: most of the RTSs examined in the above studies are classified as mega slumps (> 0.5 ha). RTSs
along the Yukon coast are small, with an average size of 0.2 ha (Ramage et al., 2017). Furthermore, our estimates do not 25
include all of the material eroded by the RTSs; they only represent the amount of material released to the nearshore zone
through slumping. We did not include the material eroded from the RTS headwalls that settles within the RTS floors and the
material eroded and transported alongshore by coastal erosion (Fig. 6).
Biogeosciences Discuss., https://doi.org/10.5194/bg-2017-437Manuscript under review for journal BiogeosciencesDiscussion started: 26 October 2017c© Author(s) 2017. CC BY 4.0 License.
15
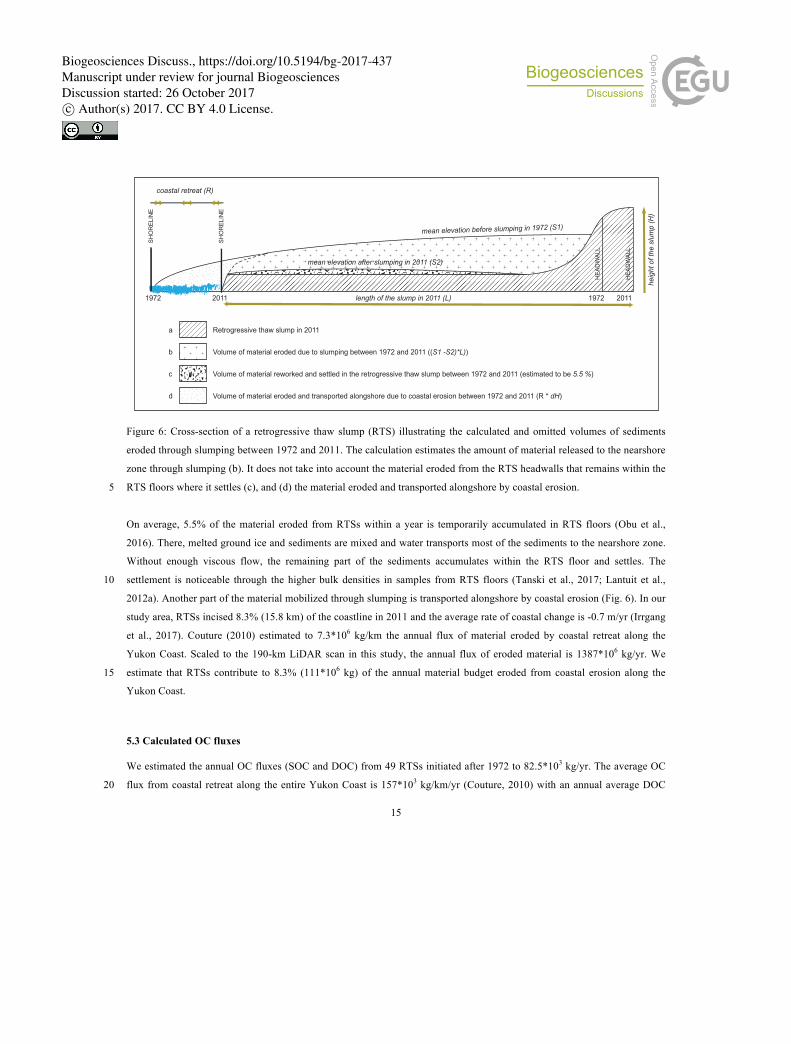
Figure 6: Cross-section of a retrogressive thaw slump (RTS) illustrating the calculated and omitted volumes of sediments
eroded through slumping between 1972 and 2011. The calculation estimates the amount of material released to the nearshore
zone through slumping (b). It does not take into account the material eroded from the RTS headwalls that remains within the
RTS floors where it settles (c), and (d) the material eroded and transported alongshore by coastal erosion. 5
On average, 5.5% of the material eroded from RTSs within a year is temporarily accumulated in RTS floors (Obu et al.,
2016). There, melted ground ice and sediments are mixed and water transports most of the sediments to the nearshore zone.
Without enough viscous flow, the remaining part of the sediments accumulates within the RTS floor and settles. The
settlement is noticeable through the higher bulk densities in samples from RTS floors (Tanski et al., 2017; Lantuit et al., 10
2012a). Another part of the material mobilized through slumping is transported alongshore by coastal erosion (Fig. 6). In our
study area, RTSs incised 8.3% (15.8 km) of the coastline in 2011 and the average rate of coastal change is -0.7 m/yr (Irrgang
et al., 2017). Couture (2010) estimated to 7.3*106 kg/km the annual flux of material eroded by coastal retreat along the
Yukon Coast. Scaled to the 190-km LiDAR scan in this study, the annual flux of eroded material is 1387*106 kg/yr. We
estimate that RTSs contribute to 8.3% (111*106 kg) of the annual material budget eroded from coastal erosion along the 15
Yukon Coast.
5.3 Calculated OC fluxes
We estimated the annual OC fluxes (SOC and DOC) from 49 RTSs initiated after 1972 to 82.5*103 kg/yr. The average OC
flux from coastal retreat along the entire Yukon Coast is 157*103 kg/km/yr (Couture, 2010) with an annual average DOC 20
20111972 1972 2011
Volume of material eroded due to slumping between 1972 and 2011 ((S1 -S2)*L))
Retrogressive thaw slump in 2011
Volume of material eroded and transported alongshore due to coastal erosion between 1972 and 2011 (R * dH)
HEA
DW
ALL
HEA
DW
ALL
SHO
REL
INE
SHO
REL
INE
Volume of material reworked and settled in the retrogressive thaw slump between 1972 and 2011 (estimated to be 5.5 %)
coastal retreat (R)
length of the slump in 2011 (L)
heig
ht of th
e s
lum
p (
H)
mean elevation before slumping in 1972 (S1)
mean elevation after slumping in 2011 (S2)
a
b
c
d
Biogeosciences Discuss., https://doi.org/10.5194/bg-2017-437Manuscript under review for journal BiogeosciencesDiscussion started: 26 October 2017c© Author(s) 2017. CC BY 4.0 License.
16
flux of 0.2*103 kg/km/yr (Tanski et al., 2016). In the 190-km coastline of the LiDAR scan, the OC flux from coastal retreat
is therefore 29830*103 kg/yr (including 38*103 kg/yr of DOC).
The annual OC flux released by the 49 RTSs initiated after 1972 was 0.3% the annual OC flux from coastal retreat (0.5% of
the DOC flux). Most of the OC fluxes from RTSs originated from ice thrust moraines, where the number of RTS initiated
after 1972 was the highest. RTSs develop mainly on ice-thrust moraines because of the presence of large volumes of massive 5
ground ice (Ramage et al., 2017). As a result, only half of the material eroding from the RTS headwall is sediment.
Our fluxes of sediment and OC mobilized by 49 RTSs initiated after 1972 underestimate the annual contribution from
slumping processes to the nearshore sediment and OC budgets along the Yukon Coast. These fluxes account for 41% of the
flux from RTSs initiated after 1972 and 17% of the total number of RTSs present in 2011 along the Yukon Coast (Ramage et 10
al., 2017).
5.3 Impact of RTSs on the coastal ecosystem
RTSs erode surfaces and leave scars on the landscape, impacting the coastal fringe ecosystems. RTSs alter vegetation
composition and their effects on the vegetation persist over centuries even after stabilization of the RTSs (Cray and Pollard, 15
2015; Lantz et al., 2009). Similarly, RTSs also play an important role for the coastal ecosystem because they mobilize
carbon prior to its release to the ocean and modify the amount of carbon available for the coastal ecosystem (Tanski et al.,
2017; Cassidy and Henry, 2016; Pizano et al., 2014). Tanski et al. (2017) show that TOC and DOC decrease by 77% and
55% before reaching the nearshore zone and most of the degradation and mineralization take place within RTS floors.
Abbott et al. (2015) describe similar processes for RTSs located in upland areas, where they observed the removal of 51% of 20
organic-layer SOC and an average loss of 21 kg/m2 mineral-layer SOC following the development of RTSs. Part of this
carbon is released to the atmosphere as CO2 (Cassidy and Henry, 2016), another part is buried and accumulates in the RTS
floor and the rest is transported through streams and eventually reaches the nearshore zone (Tanski et al., 2017). Kokelj et al.
(2013) showed that RTSs strongly impact stream sediment transport by raising the stream turbidity and the concentration of
total suspended sediments. 25
Similarly, RTSs impact coastal processes by altering coastal retreat (Obu et al., 2016; Lantuit and Pollard, 2008; Leibman et
al., 2008). Spatial variability of coastal erosion along the Yukon Coast is partly related to RTS activity: sections of the coast
affected by intense slumping activity have the strongest volumetric values of erosion and accumulation (Obu et al., 2016).
The impact of RTSs on the ecosystem is important even though RTSs are transient phenomena in coastal setting. The
material reworked by RTSs is not an additional contribution to the coastal budget, but a part of the cliff material that is 30
eventually eroded by coastal retreat. While the OC mobilized through cliff erosion is transported in the nearshore zone
(Vonk et al., 2012) a fraction (5.5%) of the OC mobilized through slumping remains for several years in the slump floor
(Tanski et al., 2017; Obu et al., 2016), where it is mineralized by microorganisms.
Biogeosciences Discuss., https://doi.org/10.5194/bg-2017-437Manuscript under review for journal BiogeosciencesDiscussion started: 26 October 2017c© Author(s) 2017. CC BY 4.0 License.
17
Conclusions
The number of RTSs along the Yukon Coast increased by 73% between 1952 and 2011. We observed disparities between
geomorphic units: the largest increase was on ice-thrust moraines, where the number of RTSs increased at an annual rate of
1.2 RTSs/yr. Many RTSs are polycyclic and reactivated between 1972 and 2011. RTSs reworked at least 8600*103 m3 of
material within a 190-km portion of the coastal fringe. The OC flux from 49 RTS initiated after 1972 and present in 2011 5
was 82.5*103 kg/yr and represented 0.3% of the annual OC fluxes from coastal erosion. This number accounts for 17% of
the RTSs present along the Yukon Coast in 2011. Our results do not include the volume of material eroded from the RTS
headwalls (that remained within the RTS floors where it subsided) and material eroded from the RTS bluff by coastal retreat
and transported alongshore. However, we provide a first estimate on the contribution of RTSs to the nearshore carbon budget
along the Yukon Coast. 10
Author contribution: JLR and HL designed the study. AMI geocoded the historical photographs used for mapping. JLR
created the spline interpolation and calculated the eroded volumes of material from retrogressive thaw slumps. JLR prepared
the manuscript with contributions from all co-authors.
Aknowledgments: This study was supported by the Helmholtz Association through the COPER Young Investigators Group
(VH-NG-801) and by the Alfred Wegener Institute in Potsdam. J. L. Ramage was financially supported by a PhD stipend by 15
the University of Potsdam. A.M. Irrgang was financially supported by a PhD stipend from the German Federal
Environmental Foundation. We thank J. Obu and G. Hugelius who provided insight and expertise at the early stage of the
study.
Competing interests: The authors declare that they have no conflict of interest. 20
Biogeosciences Discuss., https://doi.org/10.5194/bg-2017-437Manuscript under review for journal BiogeosciencesDiscussion started: 26 October 2017c© Author(s) 2017. CC BY 4.0 License.

18
References
Abbott, B.W., Jones, J.B., Godsey, S.E., Larouche, J.R. and Bowden, W.B.: Patterns and persistence of hydrologic carbon
and nutrient export from collapsing upland permafrost. Biogeosciences, 12(12), pp.3725-3740, 2015.
Are, F.E.: The role of coastal retreat for sedimentation in the Laptev Sea. In Land-Ocean Systems in the Siberian Arctic (pp. 5
288-295). Springer Berlin Heidelberg, 1999.
Brooker, A., Fraser, R.H., Olthof, I., Kokelj, S.V. and Lacelle, D.: Mapping the activity and evolution of retrogressive thaw
slumps by tasselled cap trend analysis of a Landsat satellite image stack. Permafrost and Periglacial Processes, 25(4),
pp.243-256, 2014.
Burke, E.J., Hartley, I.P. and Jones, C.D.: Uncertainties in the global temperature change caused by carbon release from 10
permafrost thawing. The Cryosphere, 6(5), pp.1063-1076, 2012.
Burn, C.R.: The thermal regime of a retrogressive thaw slump near Mayo, Yukon Territory. Canadian Journal of Earth
Sciences 37: 967–981, 2000.
Burn, C.R. and Zhang, Y.: Permafrost and climate change at Herschel Island (Qikiqtaruq), Yukon Territory, Canada. Journal
of Geophysical Research: Earth Surface, 114(F2), 2009. 15
Cannone, N., Lewkowicz, A.G. and Guglielmin, M.: Vegetation colonization of permafrost‐related landslides, Ellesmere
Island, Canadian High Arctic. Journal of Geophysical Research: Biogeosciences, 115(G4), 2010.
Cassidy, A.E. and Henry, G.H.: The effect of a permafrost disturbance on growing-season carbon-dioxide fluxes in a high
Arctic tundra ecosystem. Biogeosciences, 13(8), p.2291, 2016.
CAVM Team: Circumpolar Arctic Vegetation Map. (1:7,500,000 scale), Conservation of Arctic Flora and Fauna (CAFF) 20
Map No. 1. U.S. Fish and Wildlife Service, Anchorage, Alaska. ISBN: 0-9767525-0-6, ISBN-13: 978-0-9767525-0-9, 2003.
Couture, N.: Fluxes of Soil Organic Carbon from Eroding Permafrost Coasts, Canadian Beaufort Sea, 155 pp, McGill
University, Montreal, Canada, 2010.
Couture, N.J. and Pollard, W.H.: A Model for Quantifying Ground‐Ice Volume, Yukon Coast, Western Arctic Canada.
Permafrost and Periglacial Processes, 2017. 25
Cray, H.A. and Pollard, W.H.: Vegetation recovery patterns following permafrost disturbance in a Low Arctic setting: case
study of Herschel Island, Yukon, Canada. Arctic, Antarctic, and Alpine Research, 47(1), pp.99-113, 2015.
Dallimore, S. R., Wolfe, S. A., & Solomon, S. M.: Influence of ground ice and permafrost on coastal evolution, Richards
Island, Beaufort Sea coast, NWT. Canadian Journal of Earth Sciences, 33(5), 664-675, 1996.
von Deimling, T.S., Meinshausen, M., Levermann, A., Huber, V., Frieler, K., Lawrence, D.M. and Brovkin, V.: Estimating 30
the near-surface permafrost-carbon feedback on global warming. Biogeosciences, 9(2), p.649, 2012.
Dyke, A. and V. Prest (1987). Late Wisconsinan and Holocene history of the Laurentide ice sheet. Géographie physique et
Quaternaire, 41(2), pp.237-263.
Biogeosciences Discuss., https://doi.org/10.5194/bg-2017-437Manuscript under review for journal BiogeosciencesDiscussion started: 26 October 2017c© Author(s) 2017. CC BY 4.0 License.

19
Environment Canada: Canadian Climate Normals 1971-2000 Station Data, Available from:
http://climate.weather.gc.ca/climate_normals, 2017.
Fritz, M., Wetterich, S., Schirrmeister, L., Meyer, H., Lantuit, H., Preusser, F. and Pollard, W.H.: Eastern Beringia and
beyond: late Wisconsinan and Holocene landscape dynamics along the Yukon Coastal Plain, Canada. Palaeogeography,
Palaeoclimatology, Palaeoecology, 319, pp.28-45, 2012. 5
Günther, F., Grosse, G., Wetterich, S., Jones, B. M., Kunitsky, V. V., Kienast, F., & Schirrmeister, L.: The Batagay mega
thaw slump, Yana Uplands, Yakutia, Russia: permafrost thaw dynamics on decadal time scale. TERRA NOSTRA-Schriften
der GeoUnion Alfred-Wegener-Stiftung, 2015.
Hansen, J., Ruedy, R., Sato, M. and Lo, K.: Global surface temperature change. Reviews of Geophysics, 48(4), 2010.
Harper, J.R.: Morphology of the Canadian Beaufort Sea coast. Marine Geology, 91(1-2), pp.75-91, 1990. 10
Hugelius, G., Strauss, J., Zubrzycki, S., Harden, J.W., Schuur, E., Ping, C.L., Schirrmeister, L., Grosse, G., Michaelson, G.J.,
Irrgang, A.M., Lantuit, H., Manson, G.K., Günther, F., Grosse, G., Overduin, P.P.: Variability in rates of coastal change
along the Yukon coast, 1951-2015. Journal of Geophysical Research: Earth Surface, under review, 2017.
Jensen, A. E., Lohse, K. A., Crosby, B. T., and Mora, C. I.: Variations in soil carbon dioxide efflux across a thaw slump
chronosequence in northwestern Alaska. Environmental Research Letters, 9(2), 025001, 2014. 15
Kohnert, K., Serafimovich A., Hartmann J., and Sachs T.: Airborne measurements of methane fluxes in Alaskan and
Canadian tundra with the research aircraft Polar 5, Berichte zur Polar-und Meeresforschung= Reports on polar and marine
research, 673, 2014.
Kokelj, S.V., Zajdlik, B. and Thompson, M.S.:The impacts of thawing permafrost on the chemistry of lakes across the
subarctic boreal‐tundra transition, Mackenzie Delta region, Canada. Permafrost and Periglacial Processes, 20(2), pp.185-20
199, 2009a.
Kokelj, S.V., Lantz, T.C., Kanigan, J., Smith, S.L. and Coutts, R.: Origin and polycyclic behaviour of tundra thaw slumps,
Mackenzie Delta region, Northwest Territories, Canada. Permafrost and Periglacial Processes, 20(2), pp.173-184, 2009b.
Kokelj, S.V., Lacelle, D., Lantz, T.C., Tunnicliffe, J., Malone, L., Clark, I.D. and Chin, K.S.: Thawing of massive ground ice
in mega slumps drives increases in stream sediment and solute flux across a range of watershed scales. Journal of 25
Geophysical Research: Earth Surface, 118(2), pp.681-692, 2013.
Kokelj, S. V., Tunnicliffe, J., Lacelle, D., Lantz, T. C., Chin, K. S., & Fraser, R.: Increased precipitation drives mega slump
development and destabilization of ice-rich permafrost terrain, northwestern Canada. Global and Planetary Change, 129, 56-
68, 2015.
Kokelj, S. V., Lantz, T. C., Tunnicliffe, J., Segal, R., & Lacelle, D.: Climate-driven thaw of permafrost preserved glacial 30
landscapes, northwestern Canada. Geology, 45(4), 371-374, 2017.
Biogeosciences Discuss., https://doi.org/10.5194/bg-2017-437Manuscript under review for journal BiogeosciencesDiscussion started: 26 October 2017c© Author(s) 2017. CC BY 4.0 License.

20
Koven, C.D., Ringeval, B., Friedlingstein, P., Ciais, P., Cadule, P., Khvorostyanov, D., Krinner, G. and Tarnocai, C.:
Permafrost carbon-climate feedbacks accelerate global warming. Proceedings of the National Academy of Sciences, 108(36),
pp.14769-14774, 2011.
Kuhry, P., Dorrepaal, E., Hugelius, G., Schuur, E. A. G. and Tarnocai, C.: Potential remobilization of belowground
permafrost carbon under future global warming. Permafrost Periglac. Process., 21: 208–214. doi:10.1002/ppp.684, 2010. 5
Lacelle, D., Bjornson, J. and Lauriol, B.: Climatic and geomorphic factors affecting contemporary (1950–2004) activity of
retrogressive thaw slumps on the Aklavik Plateau, Richardson Mountains, NWT, Canada. Permafrost and Periglacial
Processes, 21(1), pp.1-15, 2010.
Lantz, T.C. and Kokelj, S.V.: Increasing rates of retrogressive thaw slump activity in the Mackenzie Delta region, NWT,
Canada. Geophysical Research Letters, 35(6), 2008. 10
Lantz, T.C., Kokelj, S.V., Gergel, S.E. and Henry, G.H.: Relative impacts of disturbance and temperature: persistent changes
in microenvironment and vegetation in retrogressive thaw slumps. Global Change Biology, 15(7), pp.1664-1675, 2009.
Lamoureux, S.F. and Lafrenière, M.J.: Fluvial impact of extensive active layer detachments, Cape Bounty, Melville Island,
Canada. Arctic, Antarctic, and Alpine Research, 41(1), pp.59-68, 2009.
Lantuit, H. and Pollard, W.H.,: Temporal stereophotogrammetric analysis of retrogressive thaw slumps on Herschel Island, 15
Yukon Territory. Natural Hazards and Earth System Science, 5(3), pp.413-423, 2005.
Lantuit, H. and Pollard, W.H.: Fifty years of coastal erosion and retrogressive thaw slump activity on Herschel Island,
southern Beaufort Sea, Yukon Territory, Canada. Geomorphology, 95(1), pp.84-102, 2008.
Lantuit, H., Pollard, W.H., Couture, N., Fritz, M., Schirrmeister, L., Meyer, H. and Hubberten, H.W.: Modern and late
Holocene retrogressive thaw slump activity on the Yukon coastal plain and Herschel Island, Yukon Territory, Canada. 20
Permafrost and Periglacial Processes, 23(1), pp.39-51, 2012a.
Lantuit, H., Overduin, P.P., Couture, N., Wetterich, S., Aré, F., Atkinson, D., Brown, J., Cherkashov, G., Drozdov, D.,
Forbes, D.L. and Graves-Gaylord, A.: The Arctic coastal dynamics database: a new classification scheme and statistics on
Arctic permafrost coastlines. Estuaries and Coasts, 35(2), pp.383-400, 2012b.
Leibman, M., Gubarkov, A., Khomutov, A., Kizyaakov, A., Vanshtein, B.: Coastal Processes at the Tabular-Ground-Ice-25
Bearing Area, Yugorsky Peninsula, Russia. Proceedings of the 9th International Conference on Permafrost, Fairbanks,
Alaska, pp. 1037–1042, 2008.
Lewkowicz, A. G.: Headwall retreat of ground-ice slumps, Banks Island, Northwest Territories, Canadian Journal of Earth
Sciences, 24(6), 1077-1085, 1987.
MacDougall, A.H., Avis, C.A. and Weaver, A.J.: Significant contribution to climate warming from the permafrost carbon 30
feedback. Nature Geoscience, 5(10), pp.719-721, 2012.
Mackay, J. R.: Glacier ice thrust features of the Yukon coast. Geographical Bulletin, 13 5-21, 1959.
Mackelprang, R., Waldrop, M. P., DeAngelis, K. M., David, M. M., Chavarria, K. L., Blazewicz, S. J., ... & Jansson, J. K.:
Metagenomic analysis of a permafrost microbial community reveals a rapid response to thaw. Nature, 480(7377), 368, 2011.
Biogeosciences Discuss., https://doi.org/10.5194/bg-2017-437Manuscript under review for journal BiogeosciencesDiscussion started: 26 October 2017c© Author(s) 2017. CC BY 4.0 License.
21
Malone, L., Lacelle, D., Kokelj, S. and Clark, I.D.: Impacts of hillslope thaw slumps on the geochemistry of permafrost
catchments (Stony Creek watershed, NWT, Canada). Chemical Geology, 356, pp.38-49, 2013.
Obu, J., Lantuit, H., Grosse, G., Günther, F., Sachs, T., Helm, V. and Fritz, M.: Coastal erosion and mass wasting along the
Canadian Beaufort Sea based on annual airborne LiDAR elevation data. Geomorphology, 2016.
Ping, C.-L., Michaelson G. J., Guo L., Jorgenson M. T.,Kanevskiy M.,Shur Y.,Dou F., and Liang J.: Soil carbon and material 5
fluxes across the eroding Alaska Beaufort Sea coastline, J. Geophys. Res., 116, G02004, doi:10.1029/2010JG001588, 2011.
Pizano, C., Barón, A. F., Schuur, E. A., Crummer, K. G., & Mack, M. C.: Effects of thermo-erosional disturbance on surface
soil carbon and nitrogen dynamics in upland arctic tundra. Environmental Research Letters, 9(7), 075006, 2014.
Ramage, J. L., Konopczak A. M.; Herzschuh U.; Morgenstern A.; Couture, N.; Lantuit, H.: Coastal retrogressive thaw
slumps along the Yukon Coast (Canada), link to shapefile. PANGAEA, doi:10.1594/PANGAEA.869573, 2016. 10
Ramage, J.L., Irrgang A.M, Herzschuh U., Morgenstern A., Couture N., Lantuit H.: Terrain Controls on the Occurrence of
Coastal Retrogressive Thaw Slumps along the Yukon Coast, Canada. Journal of Geophysical Research: Earth Surface,
2017.
Rampton, V. N.: Quaternary Geology of the Yukon Coastal Plain, Geological Survey of Canada, Canada, 1982.
Schaefer, K., Zhang, T., Bruhwiler, L. and Barrett, A.P.: Amount and timing of permafrost carbon release in response to 15
climate warming. Tellus B, 63(2), pp.165-180, 2011.
Schaefer, K., Lantuit, H., Romanovsky, V.E., Schuur, E.A. and Witt, R.: The impact of the permafrost carbon feedback on
global climate. Environmental Research Letters, 9(8), p.085003, 2014.
Schuur, E.A., Bockheim, J., Canadell, J.G., Euskirchen, E., Field, C.B., Goryachkin, S.V., Hagemann, S., Kuhry, P., Lafleur,
P.M., Lee, H. and Mazhitova, G.: Vulnerability of permafrost carbon to climate change: Implications for the global carbon 20
cycle. AIBS Bulletin, 58(8), pp.701-714, 2008.
Schuur, E.A.G., McGuire, A.D., Schädel, C., Grosse, G., Harden, J.W., Hayes, D.J., Hugelius, G., Koven, C.D., Kuhry, P.,
Lawrence, D.M. and Natali, S.M.: Climate change and the permafrost carbon feedback. Nature, 520(7546), pp.171-179,
2015.
Segal, R.A., Lantz, T.C. and Kokelj, S.V.: Acceleration of thaw slump activity in glaciated landscapes of the Western 25
Canadian Arctic. Environmental Research Letters, 11(3), p.034025, 2016.
Tanski, G., Couture, N., Lantuit, H., Eulenburg, A. and Fritz, M.: Eroding permafrost coasts release low amounts of
dissolved organic carbon (DOC) from ground ice into the nearshore zone of the Arctic Ocean. Global Biogeochemical
Cycles, 30(7), pp.1054-1068, 2016.
Tanski, G., Lantuit, H., Ruttor, S., Knoblauch, C., Radosavljevic, B., Strauss, J., Wolter, J., Irrgang, A.M., Ramage, J. and 30
Fritz, M.: Transformation of terrestrial organic matter along thermokarst-affected permafrost coasts in the Arctic. Science of
The Total Environment, 581, pp.434-447, 2017.
Biogeosciences Discuss., https://doi.org/10.5194/bg-2017-437Manuscript under review for journal BiogeosciencesDiscussion started: 26 October 2017c© Author(s) 2017. CC BY 4.0 License.
22
Vonk, J.E., Sánchez-García, L., Van Dongen, B.E., Alling, V., Kosmach, D., Charkin, A., Semiletov, I.P., Dudarev, O.V.,
Shakhova, N., Roos, P. and Eglinton, T.I.: Activation of old carbon by erosion of coastal and subsea permafrost in Arctic
Siberia. Nature, 489(7414), pp.137-140, 2012.
Wolfe, S., E. Kotler, and S. Dallimore (2001), Surficial characteristics and the distribution of thaw landforms (1970-1999),
Shingle Point to Kay Point, Yukon Territory, Rep., Geological Survey of Canada 5
Biogeosciences Discuss., https://doi.org/10.5194/bg-2017-437Manuscript under review for journal BiogeosciencesDiscussion started: 26 October 2017c© Author(s) 2017. CC BY 4.0 License.
Related Documents