Ultrasound in Med. & Biol., Vol. 22, No. 3, pp. 319-328, 1996 Copyright 0 1996 World Federation for Ultrasound in Medicine & Biology Printed in the USA. All rights reserved 03014629196 $15.00 + .OO SSDI 0301-5629(95)02048-9 @Original Contribution NEARLY REAL-TIME VISUALIZATION OF ARBITRARY TWO-DIMENSIONAL SECTIONS FROM THREE-DIMENSIONAL ACQUISITION L. CAPINERI, + L. MASOTTI,’ S. ROCCHI,* F. ANDREUCCETTI, * M. CEROFOLINI* and A. TONDINI* ‘Dipartimento di Ingegneria Elettronica, Universit& degli Studi di Firenze, Firenze, Italy; $FacoltB di Ingegneria, UniversitB degli Studi di Siena, Siena, Italy; and *ESAOTE S.p.A, Firenze, Italy (Received 16 March 1995; in$nal form 18 September 1995) Abstract-This work presents a system for the reconstruction of cross-sections with arbitrary orientations derived from three-dimensional (3D) echographic scanners. The interest for this powerful diagnostic tool has prompted us to develop a low-cost processing board that inserts easily into a stand-alone echograph. The proposed system is able to reconstruct high-resolution cross-sections at one frame per second with a time lag of about 60 s due the 3D acquisition process. The board, based on three pipelined DSP devices, has been designed to process volumetric data collected with a commercial echograph by means a rotating probe synchronized with the ECG signal. The resolution of the reconstruction algorithm implemented on the processing unit has been evaluated both with synthetic 3D data and with experimental data from a phantom. Key Words: Two-dimensional section reconstruction, Three-dimensional acquisition, Echocardiography, Real-time processing board. INTRODUCTION The development of 3D echographic scanners supported by processing hardware and software devices opens new perspectivesfor powerful diagnostic tools by: l the assessment of the actual morphology of the in- vestigated organ or pathological zone; l providing accurate volume measurements;and l the reconstruction of organ arbitrary sections. These characteristics become very interesting when 3D echography is used for the assessment of patholo- gies related to the heart motion. Thus, two main solutions have been proposed (Beach 1992; Harris and Wells 1992; Stickels and Wann 1984): the first is 3D real-time scanning; the second is a combina- tion of real-time 2D scanning synchronized with the cardiac cycle or the respiratory motion and, at pres- ent, is more technically feasible (Brinkley et al. 1978). In general, the 3D real-time scanning of the heart motion is a difficult problem because ,a frame race up to 30 Hz is required for dynamic presentation. In fact, by assuming an average ultrasound speed of Address correspondence to: Prof. Leonardo Masotti, Depart- ment of Electrical Engineering, University of Florence, Via di S. Marta 3, 50139 Firenze, Italy. 1540 m/s and maximum investigation depth of 15 cm corresponding to a time of flight (TOF) of 194 ps, the pulse repetition frequency (PRF) cannot exceed 5.1 kHz. Consequently, the system should have a limited number of scanning lines, i.e.: NLwEs = 1 /frame rate * TOF = $ X 194 X 10m6 - 154. This should lead to a resolution without any clini- cal meaning for echocardiology purposes.For instance, if we suppose that a ?r/3sr sector is investigated with 154 lines, each line relates to a surface area of 1.2 cm2 at a depth of 15 cm. Nevertheless, this approach is still suitable for shallow organs such as the carotid vessel. In this case, because of the limited depth up to 3 cm, the investigated surface is about 0.75 mm’, retaining a frame rate of about 15 Hz, which is good enough for the carotid investigation. In principle, the use of a matrix of transducers should solve this problem by parallel ultrasonic data acquisition techniques. The frame rate of such systems is increased by a factor equal to the number of parallel receiving channels. However, at present, the technological problems of the fabrication of matrix transducers and front-end elec- tronics are still topics of research (Masotti and Pini 1992; von Ramm et al. 1991). 319

Welcome message from author
This document is posted to help you gain knowledge. Please leave a comment to let me know what you think about it! Share it to your friends and learn new things together.
Transcript
Ultrasound in Med. & Biol., Vol. 22, No. 3, pp. 319-328, 1996 Copyright 0 1996 World Federation for Ultrasound in Medicine & Biology
Printed in the USA. All rights reserved 03014629196 $15.00 + .OO
SSDI 0301-5629(95)02048-9
@Original Contribution
NEARLY REAL-TIME VISUALIZATION OF ARBITRARY TWO-DIMENSIONAL SECTIONS FROM THREE-DIMENSIONAL ACQUISITION
L. CAPINERI, + L. MASOTTI,’ S. ROCCHI,* F. ANDREUCCETTI, * M. CEROFOLINI* and A. TONDINI*
‘Dipartimento di Ingegneria Elettronica, Universit& degli Studi di Firenze, Firenze, Italy; $FacoltB di Ingegneria, UniversitB degli Studi di Siena, Siena, Italy; and *ESAOTE S.p.A, Firenze, Italy
(Received 16 March 1995; in$nal form 18 September 1995)
Abstract-This work presents a system for the reconstruction of cross-sections with arbitrary orientations derived from three-dimensional (3D) echographic scanners. The interest for this powerful diagnostic tool has prompted us to develop a low-cost processing board that inserts easily into a stand-alone echograph. The proposed system is able to reconstruct high-resolution cross-sections at one frame per second with a time lag of about 60 s due the 3D acquisition process. The board, based on three pipelined DSP devices, has been designed to process volumetric data collected with a commercial echograph by means a rotating probe synchronized with the ECG signal. The resolution of the reconstruction algorithm implemented on the processing unit has been evaluated both with synthetic 3D data and with experimental data from a phantom.
Key Words: Two-dimensional section reconstruction, Three-dimensional acquisition, Echocardiography, Real-time processing board.
INTRODUCTION
The development of 3D echographic scanners supported by processing hardware and software devices opens new perspectives for powerful diagnostic tools by: l the assessment of the actual morphology of the in-
vestigated organ or pathological zone; l providing accurate volume measurements; and l the reconstruction of organ arbitrary sections. These characteristics become very interesting when 3D echography is used for the assessment of patholo- gies related to the heart motion. Thus, two main solutions have been proposed (Beach 1992; Harris and Wells 1992; Stickels and Wann 1984): the first is 3D real-time scanning; the second is a combina- tion of real-time 2D scanning synchronized with the cardiac cycle or the respiratory motion and, at pres- ent, is more technically feasible (Brinkley et al. 1978). In general, the 3D real-time scanning of the heart motion is a difficult problem because ,a frame race up to 30 Hz is required for dynamic presentation. In fact, by assuming an average ultrasound speed of
Address correspondence to: Prof. Leonardo Masotti, Depart- ment of Electrical Engineering, University of Florence, Via di S. Marta 3, 50139 Firenze, Italy.
1540 m/s and maximum investigation depth of 15 cm corresponding to a time of flight (TOF) of 194 ps, the pulse repetition frequency (PRF) cannot exceed 5.1 kHz. Consequently, the system should have a limited number of scanning lines, i.e.: NLwEs = 1 /frame rate * TOF = $ X 194 X 10m6 - 154.
This should lead to a resolution without any clini- cal meaning for echocardiology purposes. For instance, if we suppose that a ?r/3sr sector is investigated with 154 lines, each line relates to a surface area of 1.2 cm2 at a depth of 15 cm. Nevertheless, this approach is still suitable for shallow organs such as the carotid vessel. In this case, because of the limited depth up to 3 cm, the investigated surface is about 0.75 mm’, retaining a frame rate of about 15 Hz, which is good enough for the carotid investigation. In principle, the use of a matrix of transducers should solve this problem by parallel ultrasonic data acquisition techniques. The frame rate of such systems is increased by a factor equal to the number of parallel receiving channels. However, at present, the technological problems of the fabrication of matrix transducers and front-end elec- tronics are still topics of research (Masotti and Pini 1992; von Ramm et al. 1991).
319
320 Ultrasound in Medicine and Biology Volume 22, Number 3, 1996
Cycle # 1 Cycle # 2 Cycle #N
Section # 1 Section # 2 Section #N
000000 1-- ECG SIGNAL
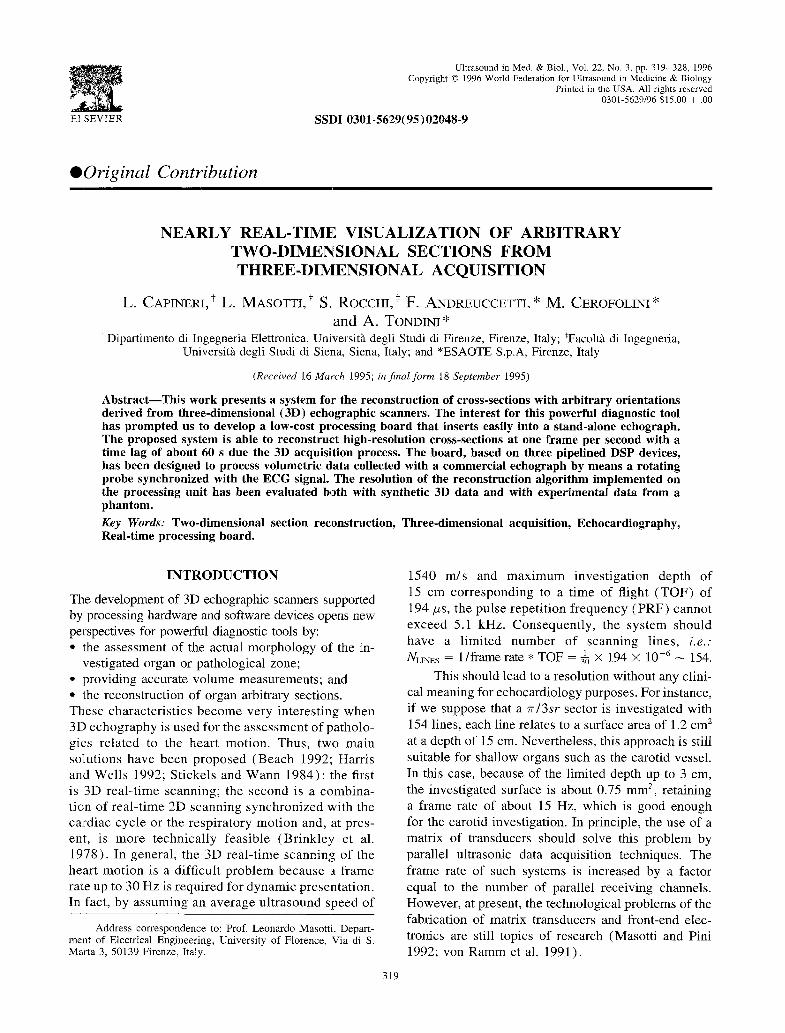
Fig. 1. Data volume acquisition synchronized with the cardiac cycle.
An alternative is the 3D acquisition formed by a series of 2D scans synchronized with the cardiac cycle. In these cases, the scanner must be swept across the
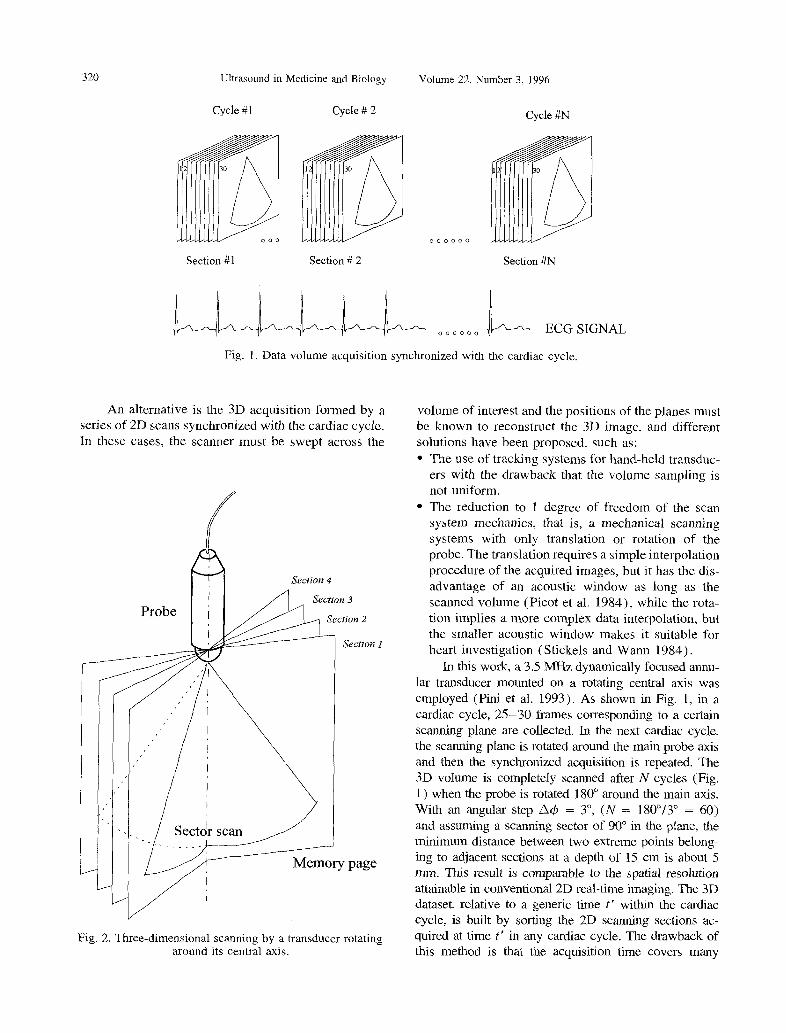
Fig. 2. Three-dimensional scanning by a transducer rotating around its central axis.
volume of interest and the positions of the planes must be known to reconstruct the 3D image, and different solutions have been proposed, such as: l The use of tracking systems for hand-held transduc-
ers with the drawback that the volume sampling is not uniform.
l The reduction to 1 degree of freedom of the scan system mechanics, that is, a mechanical scanning systems with only translation or rotation of the probe. The translation requires a simple interpolation procedure of the acquired images, but it has the dis- advantage of an acoustic window as long as the scanned volume (Picot et al. 1984)) while the rota- tion implies a more complex data interpolation, but the smaller acoustic window makes it suitable for heart investigation (Stickels and Wann 1984).
In this work, a 3.5 MHz dynamically focused annu- lar transducer mounted on a rotating central axis was employed (Pini et al. 1993). As shown in Fig. I, in a cardiac cycle, 25-30 frames corresponding to a certain scanning plane are collected. In the next cardiac cycle, the scanning plane is rotated around the main probe axis and then the synchronized acquisition is repeated. The 3D volume is completely scanned after N cycles (Fig. 1) when the probe is rotated 180” around the main axis. With an angular step n4 = 3”, (N = 180”/3” = 60) and assuming a scanning sector of 90” in the plane, the minimum distance between two extreme points belong- ing to adjacent sections at a depth of 15 cm is about 5 mm. This result is comparable to the spatial resolution attainable in conventional 2D real-time imaging. The 3D dataset. relative to a generic time t’ within the cardiac cycle, is built by sorting the 2D scanning sections ac- quired at time t’ in any cardiac cycle. The drawback of this method is that the acquisition time covers many
Nearly real-time visualization * L. CAPINERI er al. 321
- Reference system of acquired memory page
4 Arbitrary section plane
m Reconstructed section Acquisition sector with the rotating probe
m Generic memory page
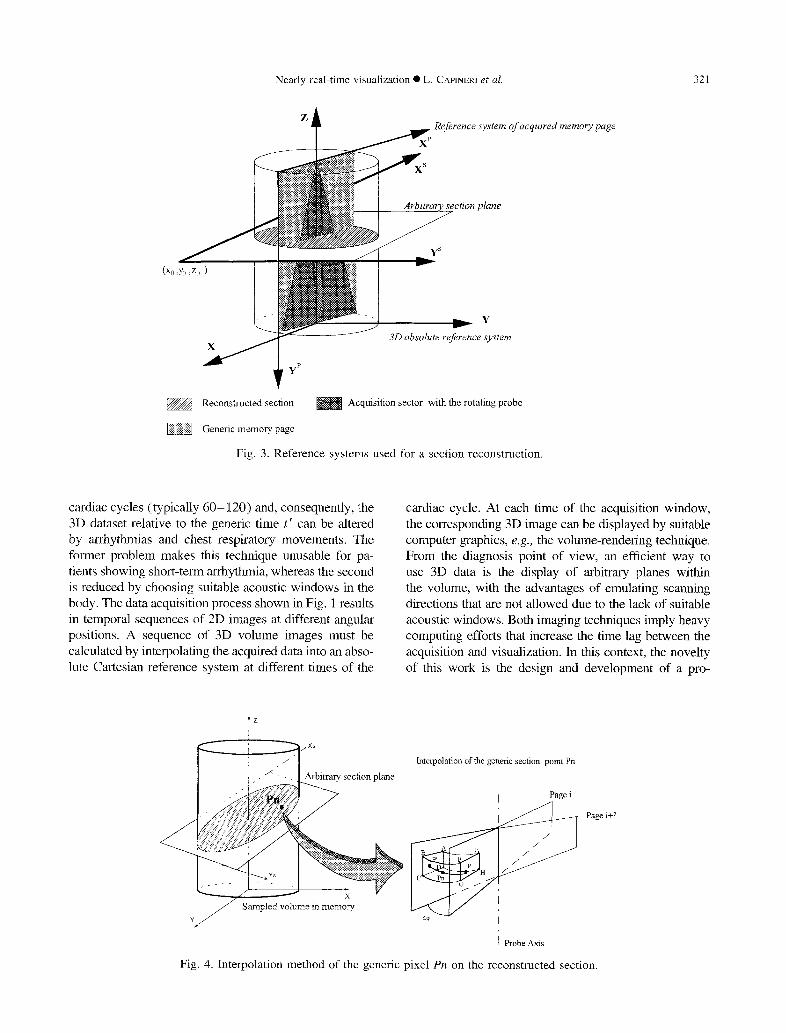
Fig. 3. Reference systems used for a section reconstruction.
cardiac cycles (typically 60- 120) and, consequently, the 3D dataset relative to the generic time t’ can be altered by arrhythmias and chest respiratory movements. The former problem makes this technique unusable for pa- tients showing short-term arrhythmia, whereas the second is reduced by choosing suitable acoustic windows in the body. The data acquisition process shown in Fig. 1 results in temporal sequences of 2D images at different. angular positions. A sequence of 3D volume images must be calculated by interpolating the acquired data into an abso- lute Cartesian reference system at different times of the
Arbitrary section plane
cardiac cycle. At each time of the acquisition window, the corresponding 3D image can be displayed by suitable computer graphics, e.g., the volume-rendering technique. From the diagnosis point of view, an efficient way to use 3D data is the display of arbitrary planes within the volume, with the advantages of emulating scanning directions that are not allowed due to the lack of suitable acoustic windows. Both imaging techniques imply heavy computing efforts that increase the time lag between the acquisition and visualization. In this context, the novelty of this work is the design and development of a pro-
Interpolation of the generic section point Pn
I Page i
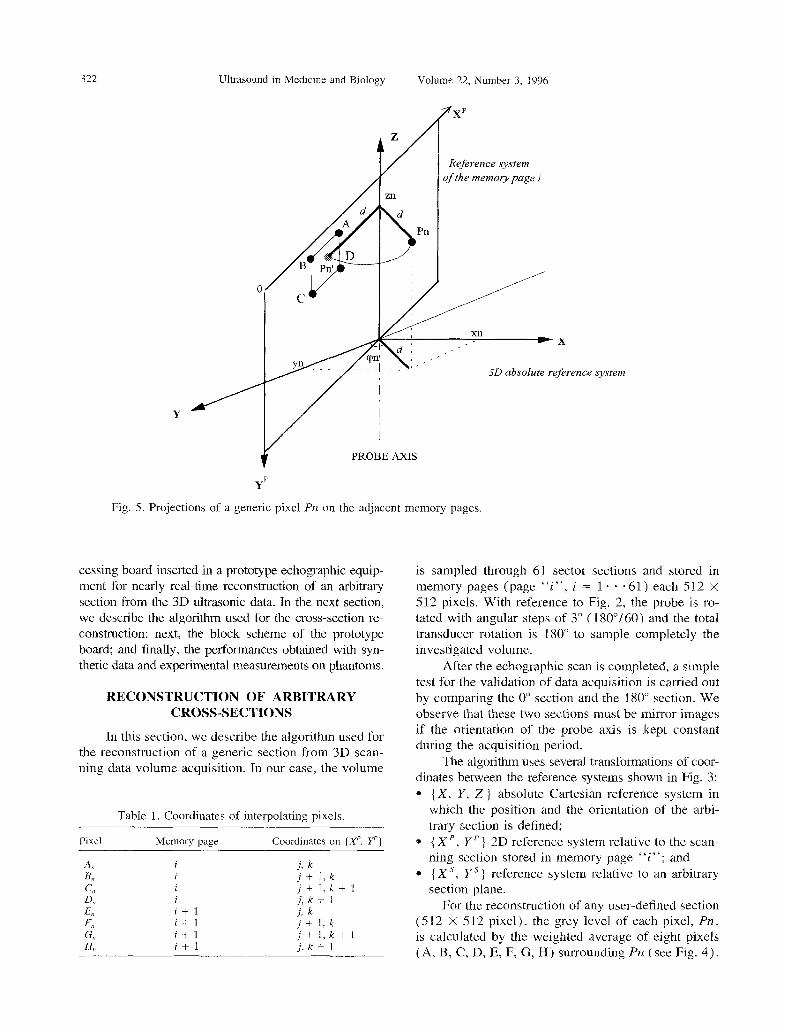
Fig. 4. Interpolation method of the generic pixel Pn on the reconstructed section.
322 Ultrasound in Medicine and Biology Volume 22, Number 3, 1996
Reference system ofthe memorypage i
Fig. 5. Projections of a generic pixel Prl on the adjacent memory pages.
cessing board inserted in a prototype echographic equip- ment for nearly real-time reconstruction of an arbitrary section from the 3D ultrasonic data. In the next section, we describe the algorithm used for the cross-section re- construction; next, the block scheme of the prototype board; and finally, the performances obtained with syn- thetic data and experimental measurements on phantoms.
RECONSTRUCTION OF ARBITRARY CROSS-SECTIONS
In this section, we describe the algorithm used for the reconstruction of a generic section from 3D scan- ning data volume acquisition. In our case, the volume
Table 1. Coordinates of interpolating pixels.
Pixel Memory page Coordinates on (X’. Yp)
A” 8, Cl, D,, ES, F,, G,, H,
i
i i i i+l i+ 1 i+1 i+ 1
j. k j+ 1,k j+ 1,X-+ 1 j, k + 1 j, k j+ 1:k j+ I,k+ 1 j. k + 1
system
is sampled through 61 sector sections and stored in memory pages (page “i”, i = 1 * * *61) each 512 x 512 pixels. With reference to Fig. 2, the probe is ro- tated with angular steps of 3” (180”/60) and the total transducer rotation is 180” to sample completely the investigated volume.
After the echographic scan is completed, a simple test for the validation of data acquisition is carried out by comparing the 0” section and the 180” section. We observe that these two sections must be mirror images if the orientation of the probe axis is kept constant during the acquisition period.
The algorithm uses several transformations of coor- dinates between the reference systems shown in Fig. 3: * {X, Y, Z} absolute Cartesian reference system in
which the position and the orientation of the arbi- trary section is defined;
0 { XP, Yp} 2D reference system relative to the scan- ning section stored in memory page “i”; and
l { X ‘, Ys ) reference system relative to an arbitrary section plane.
For the reconstruction of any user-defined section (5 12 X 5 I2 pixel), the grey level of each pixel, Pn , is calculated by the weighted average of eight pixels (A, B, C, D, E, F, G, H) surrounding PIZ (see Fig. 4).

Nearly real--time visualization 0 L. CAPINERI ~?f al. 323
Fig. 6. Data flow diagram between the host echograph and the reconstruction board with three DSPs.
For each of the eight pixels, the weight (IV’“) is in- versely proportional to its pseudodistance from Pn .
By means of the grey levels (G;, G;2R, . . , G’;,
The coordinates of Pn in the absolute reference system, & > yn, z,, are obtained by the following transformation:
G$) and the relative weights (Wi, Wg, . W$, W >). the unknown grey level Gi of Pn is evaluated by the following relationship:
G,* = G;W; + G;W; + G”,W; + G;;W; + G;W; + G;W; + G;Wi;: + G;Wr;l /’ wg+w;+w’2+w’;,+w~+w;+w’;+ww”, (1)
The two memory pages, indexed “i” and “i + 1,” to where x0, yo, z0 is the origin and A, are the director cosines which the eight pixels belong, are the adjacent pages of the user-defined section plane. The pixels coordinates embedding Pn, as shown on right of Fig. 4.. The index of A, B, C, D. E, F, G, H are determined by finding the “i” is given by: position on the memory pages “i” and “i + 1” of two
points P’ and Plr, respectively, having the same distance
(2) d of Pn from the probe axis 2 (see Fig. 5). The coordi- nates of P’ in { Xp, Y’} of 512 X 512 pixels coincide with P” ones and they are given by:
where
A, x y,v,, 23 0 xc =
4% = d(xrJ)’ + (Y,~)~ + 256 (51
t3) Finally, the algorithm finds the pixel A coordinates by:
324 Ultrasound in Medicine and Biology
A: = ZNT(x:) = j
A; = ZNT(y:) = k (6)
Volume 22, Number 3, 1996
HARDWARE ARCHITECTURE
The rest of the coordinates of B, C, D, E, F, G, H are simply derived from j and k as shown in Table 1.
Concerning calculation of the weights W” and referring to the pixel A belonging to memory page “i” in Fig. 5, the pseudodistance has been defined to be computation- ally efficient for the DSP hardware processing unit; that is:
As explained previously, the interpolation and analysis of the 3D dataset must have a time lag due to the 3D acquisition time and, until now, an off-line presentation has been imposed by the computing bur- den. Among the different displaying techniques pro- posed in the literature, the most important are static representations of surface-shaded images and the dis- playing of reconstructed cross-sections obtained by slicing the data volume along user-defined planes. The latter type of presentation can be a dynamic sequence of cross-sections representing the motion of the investi- gated organ through the cardiac or respiratory cycle: it appears as an off-line cinematic display.
and similarly for the B, C, D, E, F, G, H pixels. Finally, Previous work reported in the literature used an the gray level 6; of Pn is determined by the relationship experimental set-up to obtain experimental 3D ultra- in eqn ( 1) . These operations are then repeated for each sonic images consisting of an assembly of equipment pixel of the cross-section (5 12 x 5 12) to reconstruct the such as a framegrabber, a computer and a commercial final gray-level image. When Pn falls out, the scanned echograph. The novelty of this work is the design and volume, a gray level equal to 0 (black) is assigned to development of a processing board prototype inserted Cl, saving computing time. inside the echograph frame. In particular, the commer-
=I
DC(
3
DATA IN
INTROL BUS
DATA OUT
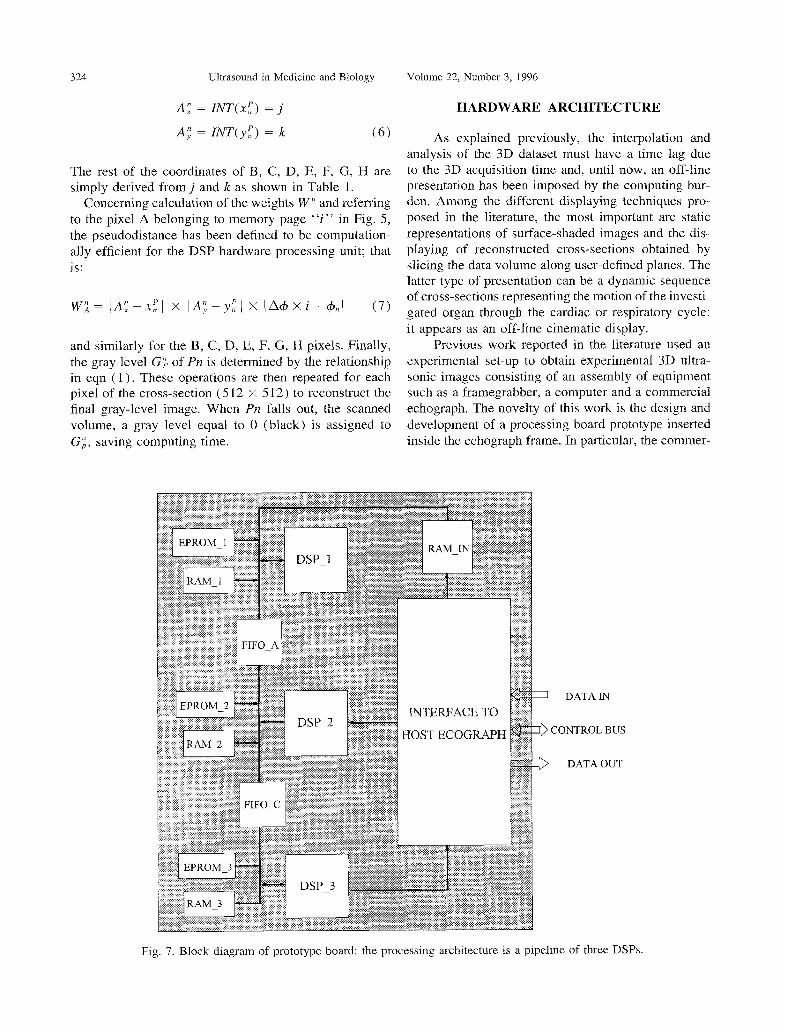
Fig. 7. Block diagram of prototype board: the processing architecture is a pipeline of three DSPs.

Nearly real-time visualization l L. CAPINERI et nl 325
Start/Stop (l/O)
H1GH 7 11 m 7
4 w 262144 writing pulses
--+
262144x8 reading pulses
Fig. 8. Timing diagrams of start/stop signal ( Sl ) and read/write control signal (S2). S2 is schematically shown in black for time-scale reasons.
cial echographic equipment (ESAOTE S.p.A, Model SM.5000, Firenze, Italy) has been modified to control the probe rotation and to acquire the relative echo- graphic sections. Additionally, it has been enhanced with a powerful processing board able to reconstruct in nearly real-time (about 1 frame/s) volume cross- sections along user-defined planes with the physical time lag of 60- 120 s due to the ultrasonic data acquisi- tion time.
Fig. 9. Synthetic image used for testing reconstruction accu- racy. The picture shows the grey levels of pixels (512 x
5 12 pixels, 256 grey levels).
It is a processing board compatible with the electri- cal and mechanical bus specifications of the host echo- graph that can read, process and write the data from and into the echograph memory (see Fig. 6). The memory is organized in 64 pages of 512 x 5 12 bytes and the processing board implements the previously described algorithm to reconstruct a desired volume cross-section from the acquired sections stored in the echograph. The memory access timing allows readout of the eight inter- polating pixels in 3.2 ps, which determines the lower limit for the processing time of the proposed hardware solution. The use of the multiprocessing pipelined strnc-
Plane section oriented at oi = 60
Phe section oriented at a = 30” /
Plane section parallel to plane z=o
Fig. 10. Inclined sections from the cylindrical synthetic data volume.
Ultrasound in Medicine and Biology Volume 22, Number 3. 1996
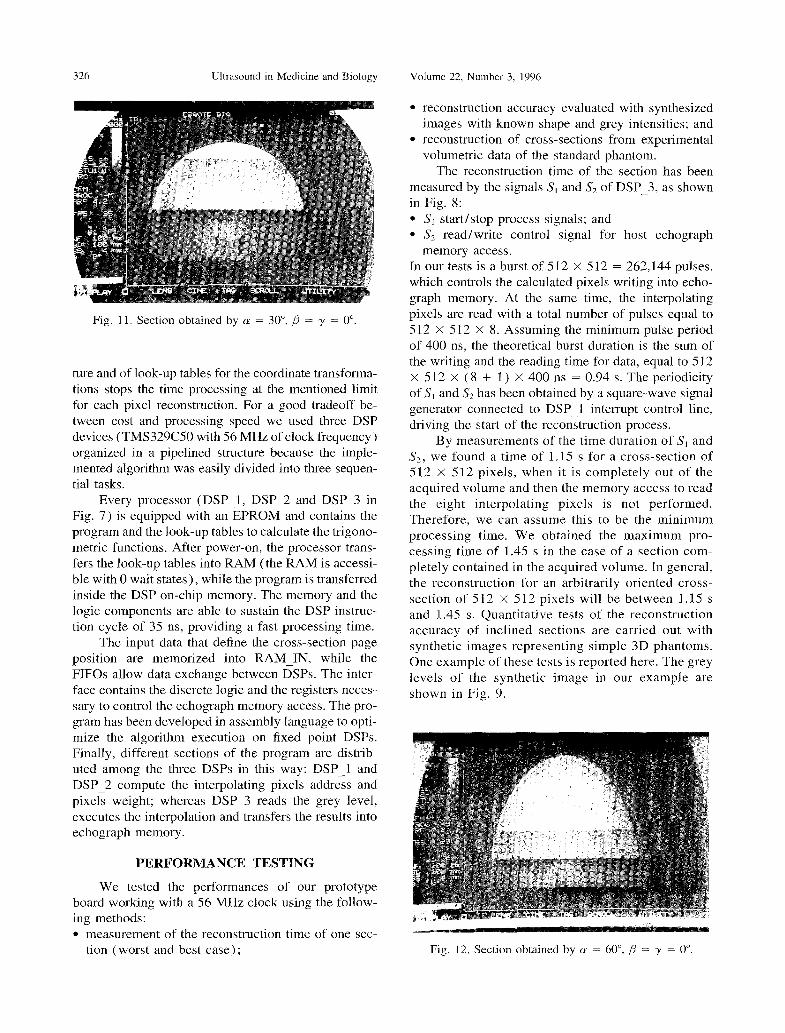
Fig. 11. Section obtained by (Y = 30”, p = y = 0”.
ture and of look-up tables for the coordinate transforma- tions stops the time processing at the mentioned limit for each pixel reconstruction. For a good tradeoff be- tween cost and processing speed we used three DSP devices (TMS329C50 with 56 MHz of clock frequency) organized in a pipelined structure because the imple- mented algorithm was easily divided into three sequen- tial tasks.
Every processor (DSP-1, DSP 2 and DSP-3 in Fig. 7) is equipped with an EPROM and contains the program and the look-up tables to calculate the trigono- metric functions. After power-on, the processor trans- fers the look-up tables into RAM (the RAM is accessi- ble with 0 wait states), while the program is transferred inside the DSP on-chip memory. The memory and the logic components are able to sustain the DSP instruc- tion cycle of 35 ns, providing a fast processing time.
The input data that define the cross-section page position are memorized into RAM-IN, while the FIFOs allow data exchange between DSPs. The inter- face contains the discrete logic and the registers neces- sary to control the echograph memory access. The pro- gram has been developed in assembly language to opti- mize the algorithm execution on fixed point DSPs. Finally, different sections of the program are distrib- uted among the three DSPs in this way: DSP-1 and DSP-2 compute the interpolating pixels address and pixels weight; whereas DSP 3 reads the grey level, executes the interpolation and transfers the results into echograph memory.
PERFORMANCE TESTING
We tested the performances of our prototype board working with a 56 MHz clock using the follow- ing methods: l measurement of the reconstruction time of one sec-
tion (worst and best case) ;
0 reconstruction accuracy evaluated with synthesized images with known shape and grey intensities: and
* reconstruction of cross-sections from experimental volumetric data of the standard phantom.
The reconstruction time of the section has been measured by the signals Si and S2 of DSP-3, as shown in Fig. 8: l Sr start/stop process signals; and * S2 read/write control signal for host echograph
memory access. In our tests is a burst of 512 X 5 12 = 262,144 pulses. which controls the calculated pixels writing into echo- graph memory. At the same time, the interpolating pixels are read with a total number of pulses equal to 512 X 512 X 8. Assuming the minimum pulse period of 400 ns, the theoretical burst duration is the sum of the writing and the reading time for data, equal to 5 12 X 512 X (8 + 1) X 400 ns = 0.94 s. The periodicity of S, and Sz has been obtained by a square-wave signal generator connected to DSP-1 interrupt control line, driving the start of the reconstruction process.
By measurements of the time duration of S1 and S?, we found a time of 1.15 s for a cross-section of 512 X 512 pixels, when it is completely out of the acquired volume and then the memory access to read the eight interpolating pixels is not performed. Therefore, we can assume this to be the minimum processing time. We obtained the maximum pro- cessing time of 1.45 s in the case of a section com- pletely contained in the acquired volume. In general, the reconstruction for an arbitrarily oriented cross- section of 512 x 512 pixels will be between 1 .I 5 s and 1.45 s. Quantitative tests of the reconstruction accuracy of inclined sections are carried out with synthetic images representing simple 3D phantoms. One example of these tests is reported here. The grey levels of the synthetic image in our example are shown in Fig. 9.
Fig. 12. Section obtained by (Y = 60”, 0 = y = 0”.
Nearly real-time visualization 0 L. CAPINERI er al. 321
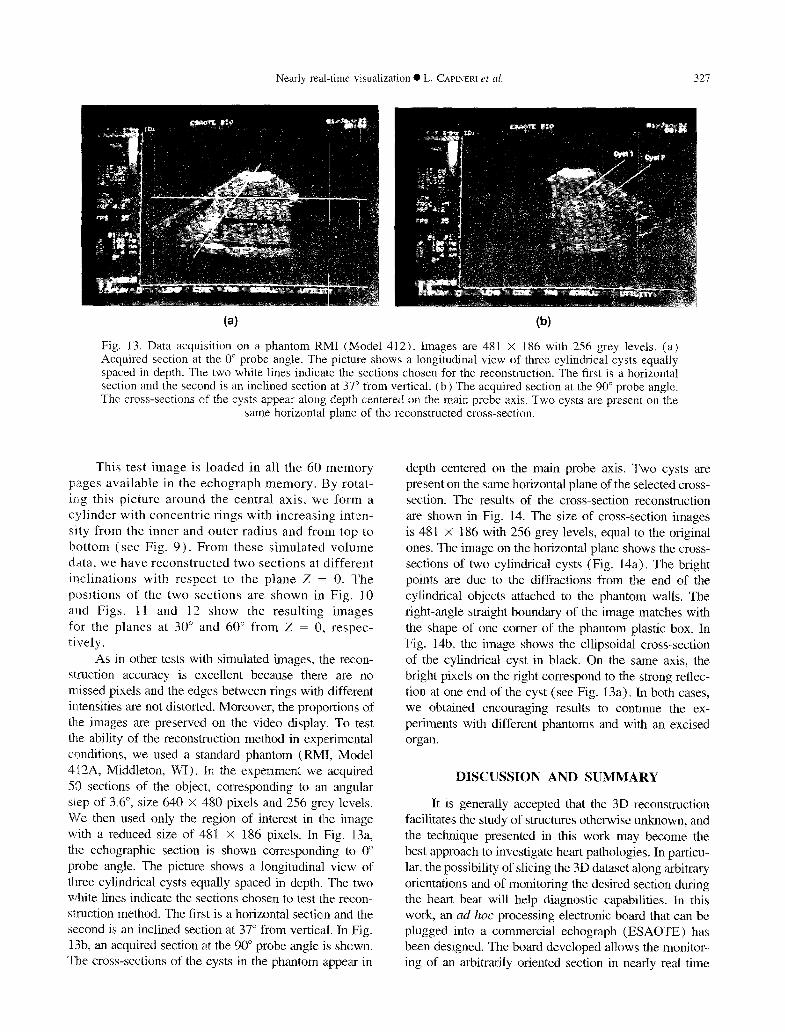
Fig. 13. Data acquisition on a phantom RIvII (Model 412). Images are 481 X 186 with 256 grey levels. (a) Acquired section at the 0” probe angle. The picture shows a longitudinal view of three cylindrical cysts equally spaced in depth. The two white lines indicate the sections chosen for the reconstruction. The first is a horizontal section and the second is an inclined section at 37” from vertical. (b) The acquired section at the 90” probe angle. The cross-sections of the cysts appear along depth centered on the main probe axis. Two cysts are present on the
same horizontal plane of the reconstructed cross-section.
This test image is loaded in all the 60 memory pages available in the echograph memory. By rotat- irg this picture around the central axis, we form a cylinder with concentric rings with increasing inten- sity from the inner and outer radius and from top to bottom (see Fig. 9). From these simulated volume data, we have reconstructed two sections at different inclinations with respect to the plane 2 = 0. The positions of the two sections are shown in Fig. IO and Figs. 11 and 12 show the resulting images for the planes at 30” and 60” from Z = 0, respec- tively.
As in other tests with simulated images, the recon- struction accuracy is excellent because there are no missed pixels and the edges between rings with different intensities are not distorted. Moreover, the proportions of th,e images are preserved on the video display. To test the ability of the reconstruction method in experimental conditions, we used a standard phantom (RMI, Model 412A, Middleton, WI). In the experiment we acquired SO sections of the object, corresponding to an angular slep of 3.6”, size 640 X 480 pixels and 256 grey levels. We then used only the region of interest in the image with a reduced size of 481 X 186 pixels. In Fig. 13a, the echographic section is shown corresponding to 0” probe angle. The picture shows a longitudinal view of three cylindrical cysts equally spaced in depth. The two white lines indicate the sections chosen to test the recon- s8uction method. The first is a horizontal section and the second is an inclined section at 37” from vertical In Fig. 13b, an acquired section at the 90” probe angle is shown. The cross-sections of the cysts in the phantom appear in
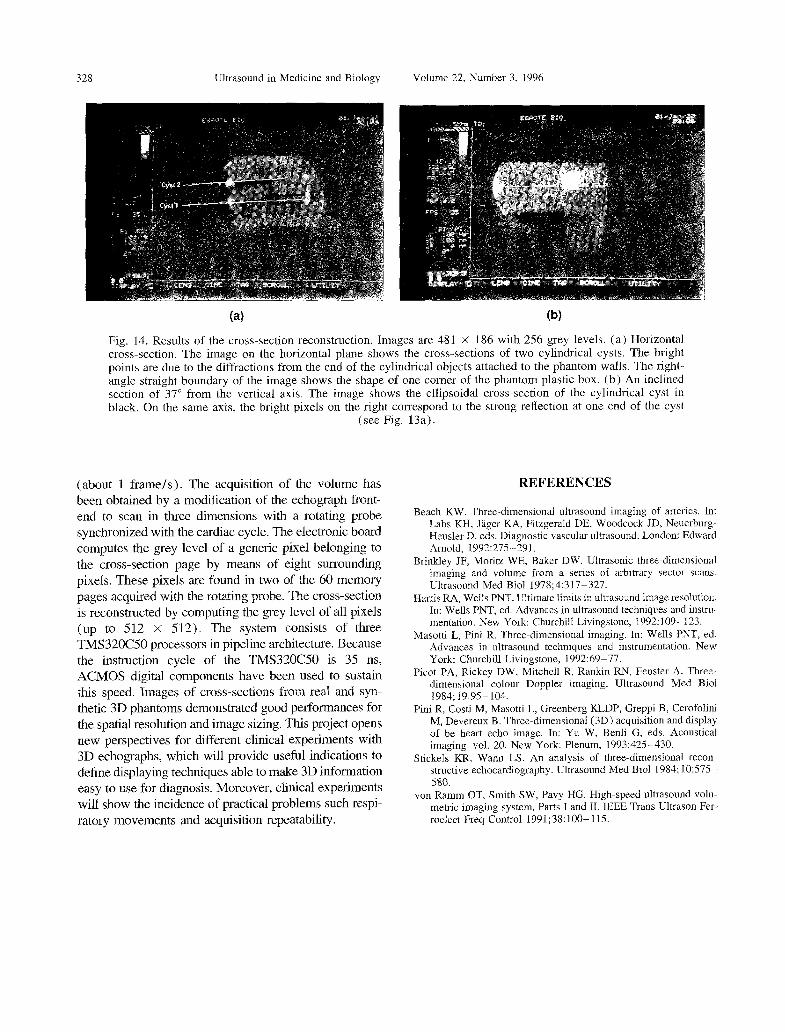
depth centered on the main probe axis. Two cysts are present on the same horizontal plane of the selected cross- section. The results of the cross-section reconstruction are shown in Fig. 14. The size of cross-section images is 481 X 186 with 256 grey levels, equal to the original ones. The image on the horizontal plane shows the cross- sections of two cylindrical cysts (Fig. 14a). The bright points are due to the diffractions from the end of the cylindrical objects attached to the phantom walls. The right-angle straight boundary of the image matches with the shape of one comer of the phantom plastic box. In Fig. 14b, the image shows the ellipsoidal cross-section of the cylindrical cyst in black. On the same axis, the bright pixels on the right correspond to the strong reflec- tion at one end of the cyst (see Fig. 13a). In both cases, we obtained encouraging results to continue the ex- periments with different phantoms and with an excised organ.
DISCUSSION AND SUMMARY
It is generally accepted that the 3D reconstruction facilitates the study of structures otherwise unknown, and the technique presented in this work may become the best approach to investigate heart pathologies. In particu- lar, the possibility of slicing the 3D dataset along arbitrary orientations and of monitoring the desired section during the heart beat will help diagnostic capabilities. In this work, an an hoc processing electronic board that can be plugged into a commercial echograph (ESAOTE) has been designed. The board developed allows the monitor- ing of an arbitrarily oriented section in nearly real time
328 Ultrasound in Medicine and Biology Volume 22. Number 3, 1996
Fig. 14. Results of the cross-section reconstruction. Images are 481 X 186 with 256 grey levels. (a) Horizontal cross-section. The image on the horizontal plane shows the cross-sections of two cylindrical cysts. The bright points are due to the diffractions from the end of the cylindrical objects attached to the phantom walls. The right- angle straight boundary of the image shows the shape of one comer of the phantom plastic box. (b) An inclined section of 37” from the vertical axis. The image shows the ellipsoidal cross-section of the cylindrical cyst in black. On the same axis, the bright pixels on the right correspond to the strong reflection at one end of the cyst
(see Fig. 13a).
(about 1 frame/s). The acquisition of the volume has been obtained by a modification of the echograph front- end to scan in three dimensions with a rotating probe synchronized with the cardiac cycle. The electronic board computes the grey level of a generic pixel belonging to the cross-section page by means of eight surrounding pixels. These pixels are found in two of the 60 memory pages acquired with the rotating probe. The cross-section is reconstructed by computing the grey level of all pixels (up to 512 x 512). The system consists of three TMS32OC.50 processors in pipeline architecture. Because the instruction cycle of the TMS32OC50 is 35 ns, ACMOS digital components have been used to sustain this speed. Images of cross-sections from real and syn- thetic 3D phantoms demonstrated good performances for the spatial resolution and image sizing. This project opens new perspectives for different clinical experiments with 3D echographs, which will provide useful indications to define displaying techniques able to make 3D information easy to use for diagnosis. Moreover, clinical experiments will show the incidence of practical problems such respi- ratory movements and acquisition repeatability.
REFERENCES
Beach KW. Three-dimensional ultrasound imaging of arteries. In: Labs KH. Jlger KA, Fitzgerald DE, Woodcock JD, Neuerburg- Heusler D, eds. Diagnostic vascular ultrasound. London: Edward Arnold, 1992275-291.
Brinkley JF, Moritz WE, Baker DW. Ultrasonic three-dimensional imaging and volume from a series of arbitrary sector scans. Ultrasound Med Biol 1978;4:317-327.
Harris RA, Wells PNT. Ultimate limits in ultrasound image resolution. In: Wells PNT, ed. Advances in ultrasound techniques and instru- mentation. New York: Churchill Livingstone, 1992: 109- 123.
Masotti L, Pini R. Three-dimensional imaging. In: Wells PNT, ed. Advances in ultrasound techniques and instrumentation. New York: Churchill Livingstone, 1992:69-77.
Picot PA, Rickey DW, Mitchell R, Rankin RN, Fenster A. Three- dimensional colour Doppler imaging. Ultrasound Med Biol 1984; 19~95-104.
Pini R, Costi M, Masotti L, Greenberg KLDP, Greppi B, Cerofolini M. Devereux B. Three-dimensional ( 3D) acquisition and display of be heart echo image. In: Yu W, Benli-G, eds. Acou&cal imaging. vol. 20. New York: Plenum, 1993:425-430.
Stickels KR, Wann LS. An analysis of three-dimensional recon- structive echocardiography. Ultrasound Med Biol 1984; 10:575- 580.
von Ramm OT, Smith SW, Pavy HG. High-speed ultrasound volu- metric imaging system. Parts I and II. IEEE Trans Ultrason Fer- reelect Freq Control 1991;38:100-115.
Related Documents