Near-Field Ground Motion of the 2002 Denali Fault, Alaska, Earthquake Recorded at Pump Station 10 W. L. Ellsworth, a) M. Celebi, a) M.EERI, J. R. Evans, a) E. G. Jensen, a) R. Kayen, a) M. C. Metz, b) D. J. Nyman, c) M.EERI, J. W. Roddick, d) P. Spudich, a) M.EERI, and C. D. Stephens a) A free-field recording of the Denali fault earthquake was obtained by the Alyeska Pipeline Service Company 3 km from the surface rupture of the De- nali fault. The instrument, part of the monitoring and control system for the trans-Alaska pipeline, was located at Pump Station 10, approximately 85 km east of the epicenter. After correction for the measured instrument response, we recover a seismogram that includes a permanent displacement of 3.0 m. The recorded ground motion has relatively low peak acceleration (0.36 g) and very high peak velocity (180 cm/s). Nonlinear soil response may have re- duced the peak acceleration to this 0.36 g value. Accelerations in excess of 0.1 g lasted for 10 s, with the most intense motion occurring during a 1.5-s interval when the rupture passed the site. The low acceleration and high ve- locity observed near the fault in this earthquake agree with observations from other recent large-magnitude earthquakes. [DOI: 10.1193/1.1778172] INTRODUCTION The M7.9* earthquake of 3 November 2002 ruptured 340 km of the Denali and re- lated faults in the largest strike-slip earthquake in North America in almost 150 years (Eberhart-Phillips et al. 2003). The earthquake occurred beneath the spine of the Alaska Range, a rugged and remote mountain belt in central Alaska (Figure 1). The main shock initiated as a bilateral rupture on the 40-km-long Susitna Glacier fault before beginning its long, west-to-east strike-slip rupture on the Denali and Totschunda faults (Figure 1). The principal seismic energy release occurred on the 218-km-long ruptured segment of the Denali fault, where the right-lateral fault displacement averaged 5.0-5.3 m. The nature of ground motion in large-magnitude earthquakes near the causative faults continues to be of critical interest to engineers and earth scientists alike because there are few observations with which to constrain either empirical or theoretical models (Somerville 2003, Campbell and Bozorgnia 2003, Lee et al. 2001). We are fortunate that such a record was obtained by the Alyeska Pipeline Service Company (hereinafter, Aly- a) U.S. Geological Survey, 345 Middlefield Road, Menlo Park, CA94025 b) M. C. Metz & Associates, 1049 W 5th Avenue, Anchorage, AK 99501 c) D. J. Nyman & Associates, 12337 Jones Rd # 232, Houston, TX 77070 d) Alyeska Pipeline Service Company, P.O. Box 60469, Fairbanks, AK99706 * All magnitudes in this issue, unless otherwise indicated, are moment magnitudes, M. 597 Earthquake Spectra, Volume 20, No. 3, pages 597–615, August 2004; © 2004, Earthquake Engineering Research Institute

Welcome message from author
This document is posted to help you gain knowledge. Please leave a comment to let me know what you think about it! Share it to your friends and learn new things together.
Transcript
Near-Field Ground Motion of the 2002Denali Fault, Alaska, Earthquake Recordedat Pump Station 10
W. L. Ellsworth,a) M. Celebi,a) M.EERI, J. R. Evans,a) E. G. Jensen,a)
R. Kayen,a) M. C. Metz,b) D. J. Nyman,c)M.EERI, J. W. Roddick,d)
P. Spudich,a)M.EERI, and C. D. Stephensa)
A free-field recording of the Denali fault earthquake was obtained by theAlyeska Pipeline Service Company 3 km from the surface rupture of the De-nali fault. The instrument, part of the monitoring and control system for thetrans-Alaska pipeline, was located at Pump Station 10, approximately 85 kmeast of the epicenter. After correction for the measured instrument response,we recover a seismogram that includes a permanent displacement of 3.0 m.The recorded ground motion has relatively low peak acceleration (0.36 g) andvery high peak velocity (180 cm/s). Nonlinear soil response may have re-duced the peak acceleration to this 0.36 g value. Accelerations in excess of0.1 g lasted for 10 s, with the most intense motion occurring during a 1.5-sinterval when the rupture passed the site. The low acceleration and high ve-locity observed near the fault in this earthquake agree with observations fromother recent large-magnitude earthquakes. [DOI: 10.1193/1.1778172]
INTRODUCTION
The M7.9* earthquake of 3 November 2002 ruptured 340 km of the Denali and re-lated faults in the largest strike-slip earthquake in North America in almost 150 years(Eberhart-Phillips et al. 2003). The earthquake occurred beneath the spine of the AlaskaRange, a rugged and remote mountain belt in central Alaska (Figure 1). The main shockinitiated as a bilateral rupture on the 40-km-long Susitna Glacier fault before beginningits long, west-to-east strike-slip rupture on the Denali and Totschunda faults (Figure 1).The principal seismic energy release occurred on the 218-km-long ruptured segment ofthe Denali fault, where the right-lateral fault displacement averaged 5.0-5.3 m.
The nature of ground motion in large-magnitude earthquakes near the causativefaults continues to be of critical interest to engineers and earth scientists alike becausethere are few observations with which to constrain either empirical or theoretical models(Somerville 2003, Campbell and Bozorgnia 2003, Lee et al. 2001). We are fortunate thatsuch a record was obtained by the Alyeska Pipeline Service Company (hereinafter, Aly-
a) U.S. Geological Survey, 345 Middlefield Road, Menlo Park, CA 94025b) M. C. Metz & Associates, 1049 W 5th Avenue, Anchorage, AK 99501c) D. J. Nyman & Associates, 12337 Jones Rd # 232, Houston, TX 77070d) Alyeska Pipeline Service Company, P.O. Box 60469, Fairbanks, AK 99706
* All magnitudes in this issue, unless otherwise indicated, are moment magnitudes, M.
597Earthquake Spectra, Volume 20, No. 3, pages 597–615, August 2004; © 2004, Earthquake Engineering Research Institute
598 ELLSWORTH ET AL.
eska) 3 km from where the Denali fault slipped 5-6 m horizontally and 0.5 m verticallyin the earthquake. The combination of the close proximity to the fault and the large mag-nitude of the event make this an extremely rare and potentially important recording.
In this paper, we describe the calibration of the instrumentation and recording sys-tem, and the recovery of long-period (greater than 10 s) ground motions, compare themotion with building code response spectra, and discuss the ground motion implicationsfor the faulting process. This paper supersedes the earlier report of Ellsworth et al.(2004) in which theoretical values were used for the recording system response insteadof the measured values reported here.
INSTRUMENTATION AT PUMP STATION 10
A free-field strong-motion recording of the earthquake was obtained by Alyeska atPump Station 10 (instrument station PS10) some 85 km east of the epicenter (Figure 1).Pump Station 10 had been ‘‘mothballed’’ six years before the earthquake, and piping,vessels and storage tanks were empty when the earthquake struck. The facility did notsustain any structural damage in the earthquake (Hall et al. 2003).
The instrument at PS10 is part of the accelerograph network operated by Alyeska toprovide seismic alarms and response data for pipeline operations control. The instrumentenclosure sits on Holocene gravels on level ground, approximately 50 m from the near-est buildings and pipeline infrastructure, on the eastern side of the 1.5-km-wide valleyincised across the Alaska Range by the Delta River (Figure 2). The accelerometers aremounted on a grade-level concrete slab measuring 5 ft35 ft32 ft (1.52 m31.52 m30.61 m). Boreholes to a depth of 30 m (National Soil Service 1971) show the depositsto be coarse-grained, mostly sand to silty gravel and gravelly sand up to boulder size,with an average blow count of about 50. The average shear-wave velocity in the upper 30m is 316 m/s, and the shear-wave velocity exceeds 600 m/s at a depth of about 115 m(Kayen et al. 2004). Thus the site would be classified in IBC2003 (International CodeCouncil 2002) as site class D or soil type 3 in the 1994 Uniform Building Code(UBC94), (International Conference of Building Officials 1994), (or soil profile type SD
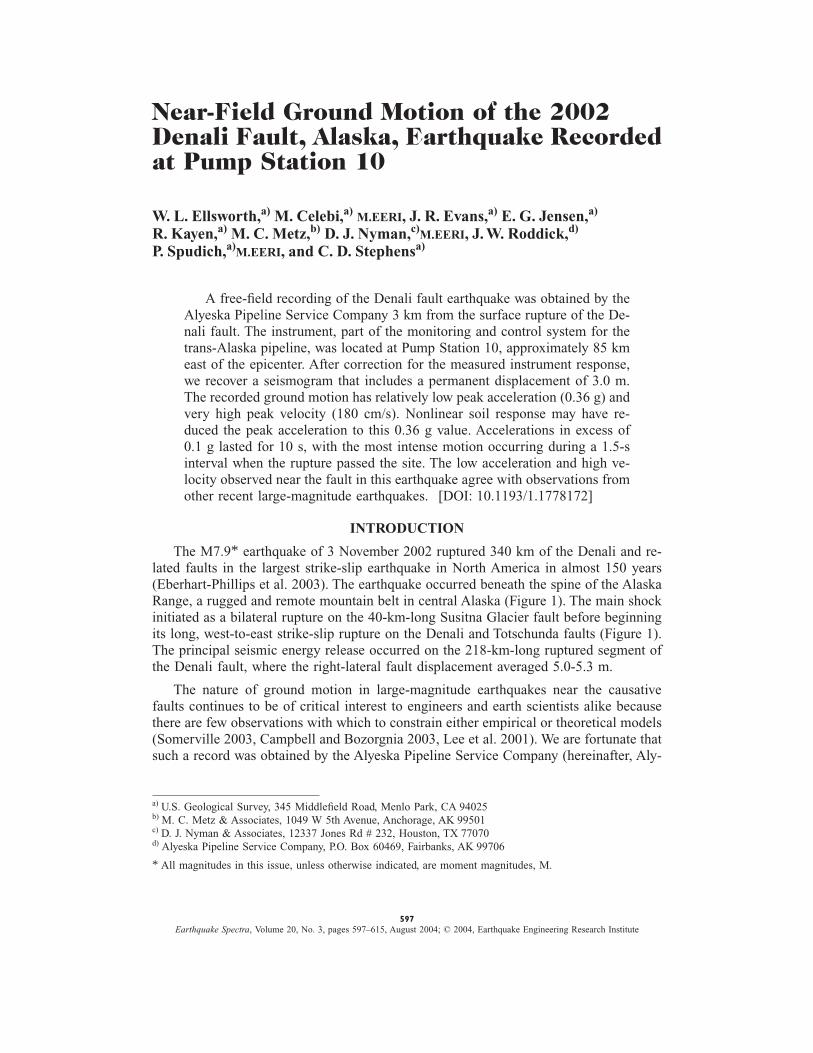
Figure 1. Location of the Denali Fault earthquake rupture (bold line) through the AlaskaRange. Epicenter (star) of initial thrust rupture of the Susitna Glacier fault is located at thewestern end of this 340-km-long unilateral rupture. PS10 of the Alyeska Pipeline Service Com-pany (triangle) is located 3 km ENE of the nearest point on the Denali fault. The pipeline routegenerally parallels the Richardson Highway (dashed).
NEAR-FIELD GROUND MOTION OF THE DENALI FAULT EQ RECORDED AT PUMP STATION 10 599
in UBC97), and it would have a Geomatrix code of IHC (Electric Power Research In-stitute 1993).
The sensors are navigation-grade, Honeywell Sundstrand Q-Flex™ force-balance ac-celerometers, which are constructed by laser etching both the mass and a simple canti-lever from a single piece of quartz and equipping this mechanical system with capacitivedisplacement sensing and electromagnetic force feedback. This is a robust sensor (250-gshock tolerance) with high natural frequency (higher than 800 Hz), small displacements,and excellent low cross-axis sensitivity (about 0.3%). The current in the force-feedbackloop is the output signal, converted to a voltage in this application by passing it througha 1.91-Kq resistor, and conditioned through a Honeywell Sundstrand amplifier. Com-pensation for individual sensor sensitivity factors is performed in software subsequent toband-pass filtering and 16-bit digitization. The signals are band-pass filtered between0.086 Hz and 40 Hz by a pair of cascaded 2-pole analog Butterworth filters in the con-trol room. The analog signals are digitized at 200 samples/s by a PC-based recordingsystem in the control room. The dynamic range of the system is about 61.6 g.
INSTRUMENT CALIBRATION
In September 2003, Alyeska and the U.S. Geological Survey (USGS) embarked on ajoint effort to test and calibrate the accelerometers, amplifiers, and bandpass filters fromthe accelerometer systems at Pump Stations 9, 10, and 11, these being the three closestinstruments in the Alyeska monitoring system to the Denali fault. Here, only the resultsfor PS10 are reported.
Table 1 gives the coordinates of site PS10 and the orientation of the accelerometers.The nominal north and east azimuths are in quotes. To establish the sensor azimuth, weused differential-GPS points along a 149-m-long laser bore-sight line pointed along thedirection of a stiff plastic and aluminum jig. This jig was in turn held firmly to the sideof the 6.1-cm-wide aluminum mounting block upon which the accelerometers were
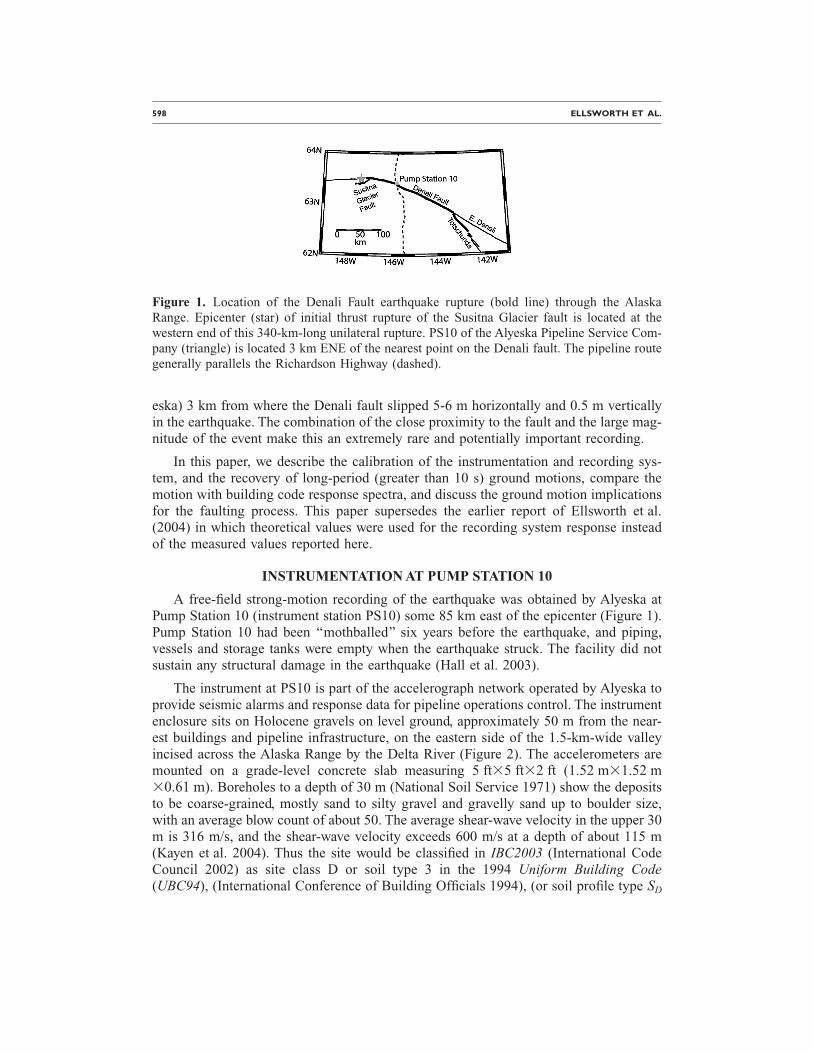
Figure 2. View of Alyeska Pipeline Service Company Pump Station 10 looking to northwest.Nearest point on the Denali fault is 3 km to the left (south). Strong-motion sensors are locatedin the small enclosure in the foreground. The Delta River lies between the pump station and themountain in the distance.
600 ELLSWORTH ET AL.
mounted. We noted a 4.47 counterclockwise rotation of the measured orientation fromthe nominal orientation (321.067) reported in the header of the field recordings andprobably based on the local ‘‘plant coordinates’’ and the assumption that the contractorbuilding the 58358328-thick pad for the instrument (1.52 m31.52 m30.61 m) orientedthe pad precisely.
Static calibration of the three individual sensors was performed on a portable tilttable on site. No nonlinearities above the 0.3% resolution of the method were observed.Sensor gains were found to be within 0.2% of the stated values. We used a vertical stepjig to test the ability of an accelerometer to measure a permanent displacement. The jigis a parallelogram of thick acrylic that partially folds and unfolds to rigid stops. The stepjig held the accelerometer aligned rigidly vertical and moved it through a six-inch (15.24cm) vertical step, either up or down. The jig and accelerometer remained in the up ordown position for three minutes before and after each step motion. The duration of thestep motion was about 5 s, approximating the strong-motion duration in the 2002 earth-quake. Displacements were derived from a 60-s window centered on the step. The testaccelerogram was first integrated to velocity and a 3rd-order polynomial (a cubic) wasfitted to the start and end of the interval to establish a baseline correction used to inte-grate the record to displacement (see RECORD PROCESSING below). Test displace-ments recovered from the horizontal accelerometers were stable to within 1 cm over 60s and recovered the step to within 2%, measured from just before to just after the stepinterval. The vertical sensor performed less well, producing a 4-cm baseline instabilityover the 60 s integration window for upward (but not downward) displacement, possiblybecause of minor hysteresis in the accelerometer.
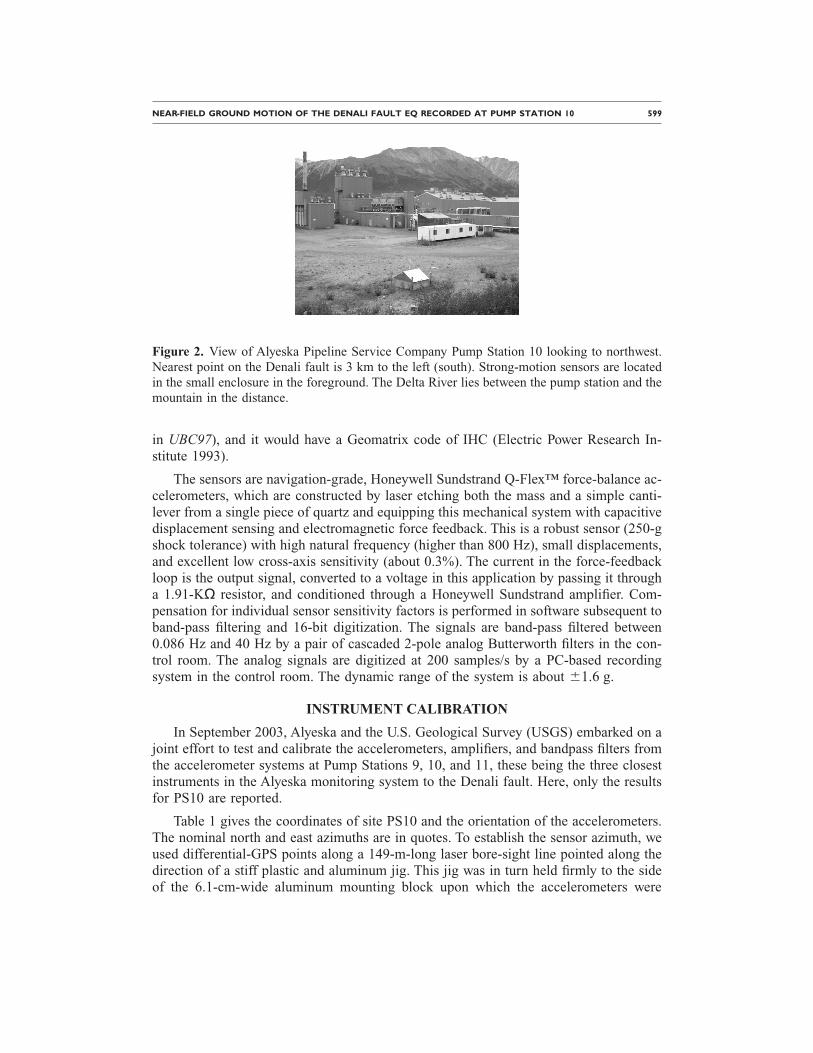
Table 1. Location and orientation of the accelerometers at Pump Station10
PS10 Value Est. Error Datums
Latitude 63.4244944 0.00000095 ITRF001
Longitude 2145.762664 0.00000205 ITRF001
Elevation (m) 726.1 0.4 NGVD29
‘‘North’’ azimuth2,3 316.7 1.1
‘‘East’’ azimuth2,3 46.7 1.1
‘‘North’’ dip (deg)4 0.2 0.2
‘‘East’’ dip (deg)4 0.2 0.2
1 WGS84(G1150);ITRF00;IGS00 (Geographic coordinate reference frames)2 2GPS positioning of points along laser bore-sight line from jig held to face of accel-
erometer mounting block.3 Weighted average of azimuths from station to points along bore-sight line; in degrees
clockwise from true north.4 Dip is relative to instrument coordinates, using machinist’s bubble level and large pro-
tractor; positive dip is down.5 Sensor location determined with GPS has 10 cm accuracy
NEAR-FIELD GROUND MOTION OF THE DENALI FAULT EQ RECORDED AT PUMP STATION 10 601
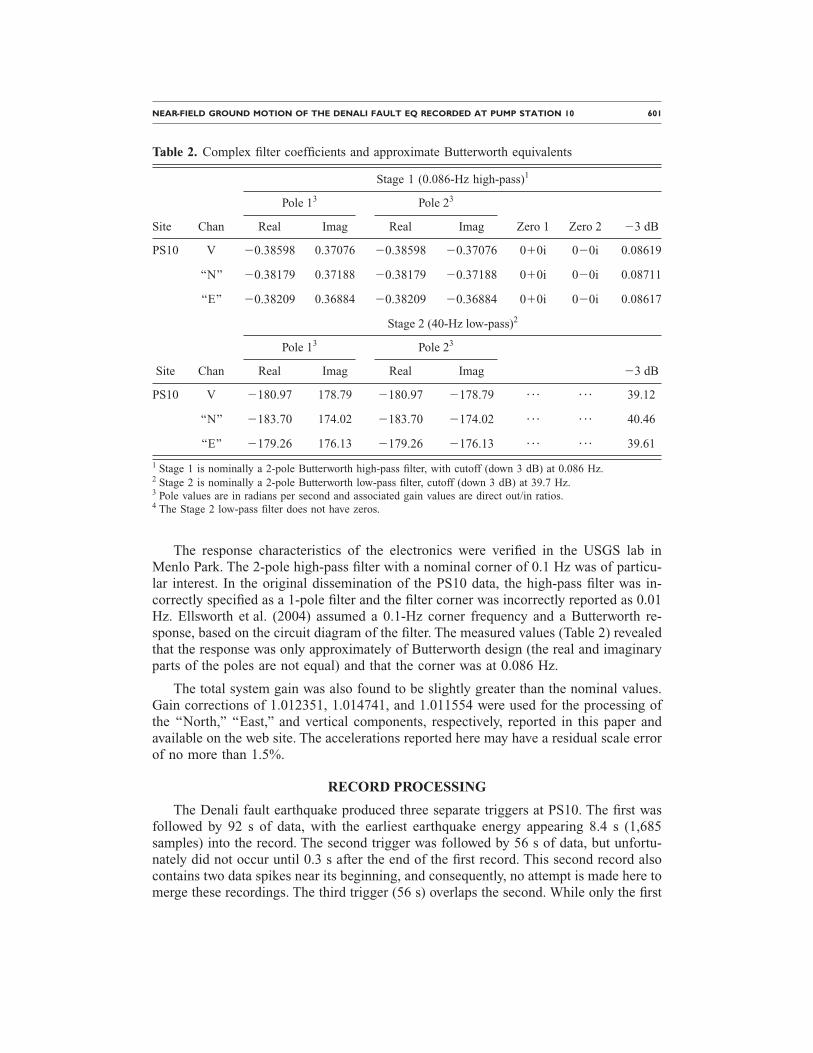
The response characteristics of the electronics were verified in the USGS lab inMenlo Park. The 2-pole high-pass filter with a nominal corner of 0.1 Hz was of particu-lar interest. In the original dissemination of the PS10 data, the high-pass filter was in-correctly specified as a 1-pole filter and the filter corner was incorrectly reported as 0.01Hz. Ellsworth et al. (2004) assumed a 0.1-Hz corner frequency and a Butterworth re-sponse, based on the circuit diagram of the filter. The measured values (Table 2) revealedthat the response was only approximately of Butterworth design (the real and imaginaryparts of the poles are not equal) and that the corner was at 0.086 Hz.
The total system gain was also found to be slightly greater than the nominal values.Gain corrections of 1.012351, 1.014741, and 1.011554 were used for the processing ofthe ‘‘North,’’ ‘‘East,’’ and vertical components, respectively, reported in this paper andavailable on the web site. The accelerations reported here may have a residual scale errorof no more than 1.5%.
RECORD PROCESSING
The Denali fault earthquake produced three separate triggers at PS10. The first wasfollowed by 92 s of data, with the earliest earthquake energy appearing 8.4 s (1,685samples) into the record. The second trigger was followed by 56 s of data, but unfortu-nately did not occur until 0.3 s after the end of the first record. This second record alsocontains two data spikes near its beginning, and consequently, no attempt is made here tomerge these recordings. The third trigger (56 s) overlaps the second. While only the first
Table 2. Complex filter coefficients and approximate Butterworth equivalents
Site Chan
Stage 1 (0.086-Hz high-pass)1
Pole 13 Pole 23
Zero 1 Zero 2 23 dBReal Imag Real Imag
PS10 V 20.38598 0.37076 20.38598 20.37076 010i 020i 0.08619
‘‘N’’ 20.38179 0.37188 20.38179 20.37188 010i 020i 0.08711
‘‘E’’ 20.38209 0.36884 20.38209 20.36884 010i 020i 0.08617
Site Chan
Stage 2 (40-Hz low-pass)2
Pole 13 Pole 23
23 dBReal Imag Real Imag
PS10 V 2180.97 178.79 2180.97 2178.79 ¯ ¯ 39.12
‘‘N’’ 2183.70 174.02 2183.70 2174.02 ¯ ¯ 40.46
‘‘E’’ 2179.26 176.13 2179.26 2176.13 ¯ ¯ 39.61
1 Stage 1 is nominally a 2-pole Butterworth high-pass filter, with cutoff (down 3 dB) at 0.086 Hz.2 Stage 2 is nominally a 2-pole Butterworth low-pass filter, cutoff (down 3 dB) at 39.7 Hz.3 Pole values are in radians per second and associated gain values are direct out/in ratios.4 The Stage 2 low-pass filter does not have zeros.
602 ELLSWORTH ET AL.
record is considered in this paper, we believe that it would be possible to merge the threerecords, albeit with some effort.
The first step in the processing of the PS10 records was to restore the low-frequencyenergy removed by the high-pass filters applied to the accelerograms. This deconvolutionwas accomplished in the frequency domain by dividing each accelerogram by the im-pulse response of the high-pass filter. At the four lowest frequencies the modulii of thehigh-pass filter’s Fourier transform were: 0.00023 (D.C.), 0.01646, (0.01085 Hz),0.06491 (0.02170 Hz), and 0.14408 (0.03255 Hz). We found that the spectral divisionoperation was stable and that it was unnecessary to set artificially a minimum size (a‘‘water level’’) for the filter impulse response spectrum. (The accelerograms were notexamined for content above 40 Hz, as the power at frequencies greater than 40 Hz wasmore than 60 dB below the peak power in the record.)
The second step in the processing addresses the problem of the selection and place-ment of an acceleration baseline. Before the earthquake begins and long after it is overthe sensor can be assumed to be stationary so that the expected values of both the ac-celeration and velocity are zero. After correction for the high-pass filter, however, nei-ther of these conditions is met, principally because of the amplification of long-periodnoise (with the long-period signal) during the filter removal process. A change in the tiltof the sensor would also produce an apparent acceleration (a 1-degree tilt of a horizontalaccelerometer is equivalent to an acceleration of 17 cm/sec2). To satisfy the constraintson the velocity and acceleration, we adjust the baseline of the velocity record. A smoothcubic polynomial is best fit to the data preceding the P-wave arrival and the last 30 s ofthe record. These time intervals avoid the high-amplitude middle section of the record,and we can be reasonably certain that both constraints apply. The coefficients of the cu-bic polynomial are determined using a robust L1 (least absolute value) regression. Sub-tracting the polynomial from the velocity trace defines the baseline-adjusted velocityrecord. We further set the velocity to zero immediately preceding the P-wave arrival toobtain the corrected velocity. Integration of this record yields the corrected displacementtime series, and differentiation yields the corrected acceleration time series.
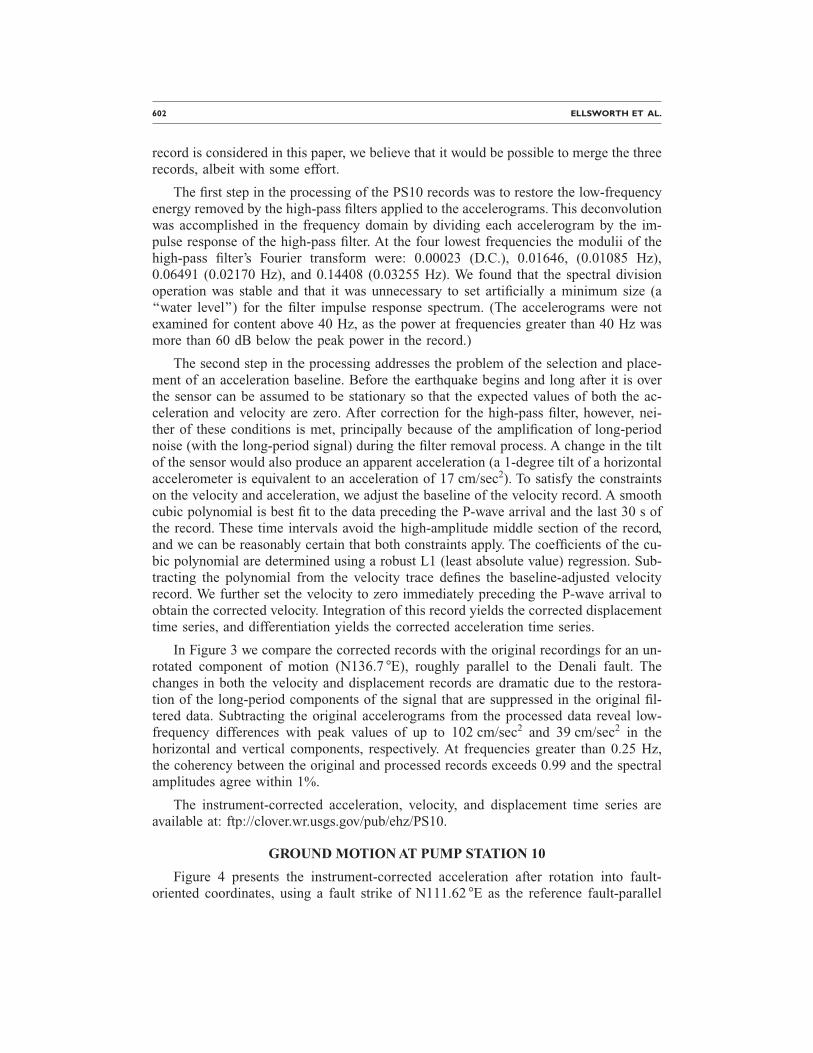
In Figure 3 we compare the corrected records with the original recordings for an un-rotated component of motion (N136.7 7E), roughly parallel to the Denali fault. Thechanges in both the velocity and displacement records are dramatic due to the restora-tion of the long-period components of the signal that are suppressed in the original fil-tered data. Subtracting the original accelerograms from the processed data reveal low-frequency differences with peak values of up to 102 cm/sec2 and 39 cm/sec2 in thehorizontal and vertical components, respectively. At frequencies greater than 0.25 Hz,the coherency between the original and processed records exceeds 0.99 and the spectralamplitudes agree within 1%.
The instrument-corrected acceleration, velocity, and displacement time series areavailable at: ftp://clover.wr.usgs.gov/pub/ehz/PS10.
GROUND MOTION AT PUMP STATION 10
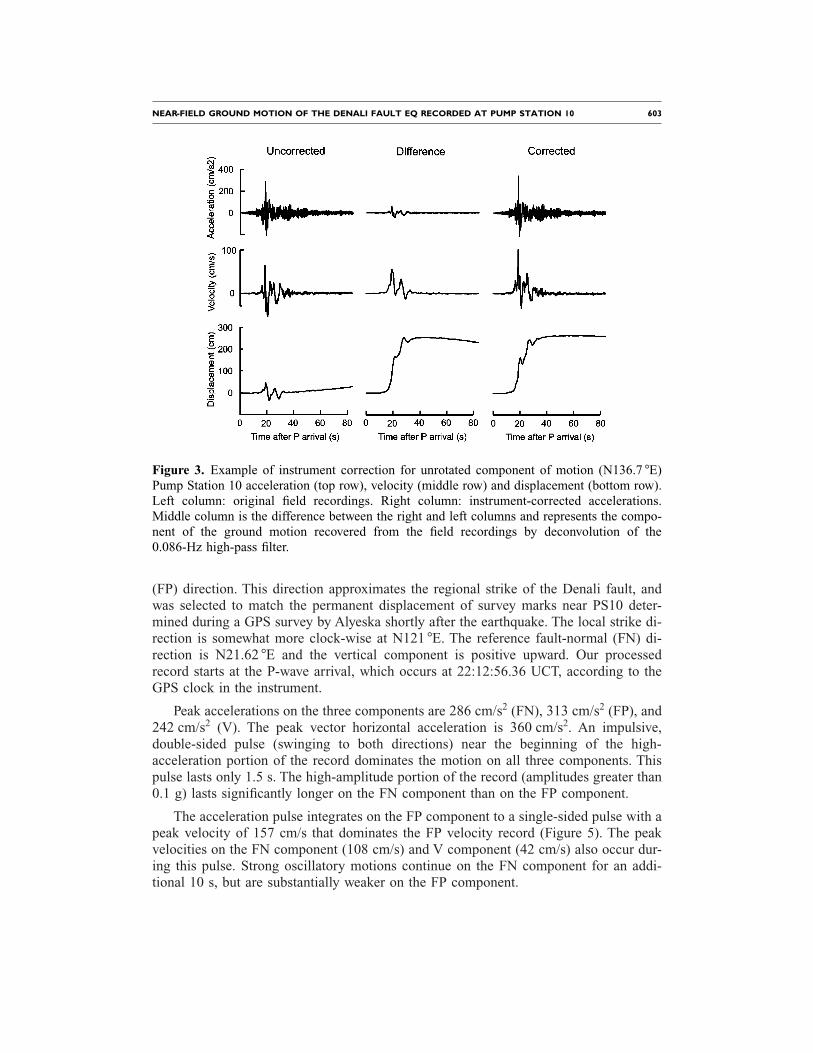
Figure 4 presents the instrument-corrected acceleration after rotation into fault-oriented coordinates, using a fault strike of N111.62 7E as the reference fault-parallel
NEAR-FIELD GROUND MOTION OF THE DENALI FAULT EQ RECORDED AT PUMP STATION 10 603
(FP) direction. This direction approximates the regional strike of the Denali fault, andwas selected to match the permanent displacement of survey marks near PS10 deter-mined during a GPS survey by Alyeska shortly after the earthquake. The local strike di-rection is somewhat more clock-wise at N121 7E. The reference fault-normal (FN) di-rection is N21.62 7E and the vertical component is positive upward. Our processedrecord starts at the P-wave arrival, which occurs at 22:12:56.36 UCT, according to theGPS clock in the instrument.
Peak accelerations on the three components are 286 cm/s2 (FN), 313 cm/s2 (FP), and242 cm/s2 (V). The peak vector horizontal acceleration is 360 cm/s2. An impulsive,double-sided pulse (swinging to both directions) near the beginning of the high-acceleration portion of the record dominates the motion on all three components. Thispulse lasts only 1.5 s. The high-amplitude portion of the record (amplitudes greater than0.1 g) lasts significantly longer on the FN component than on the FP component.
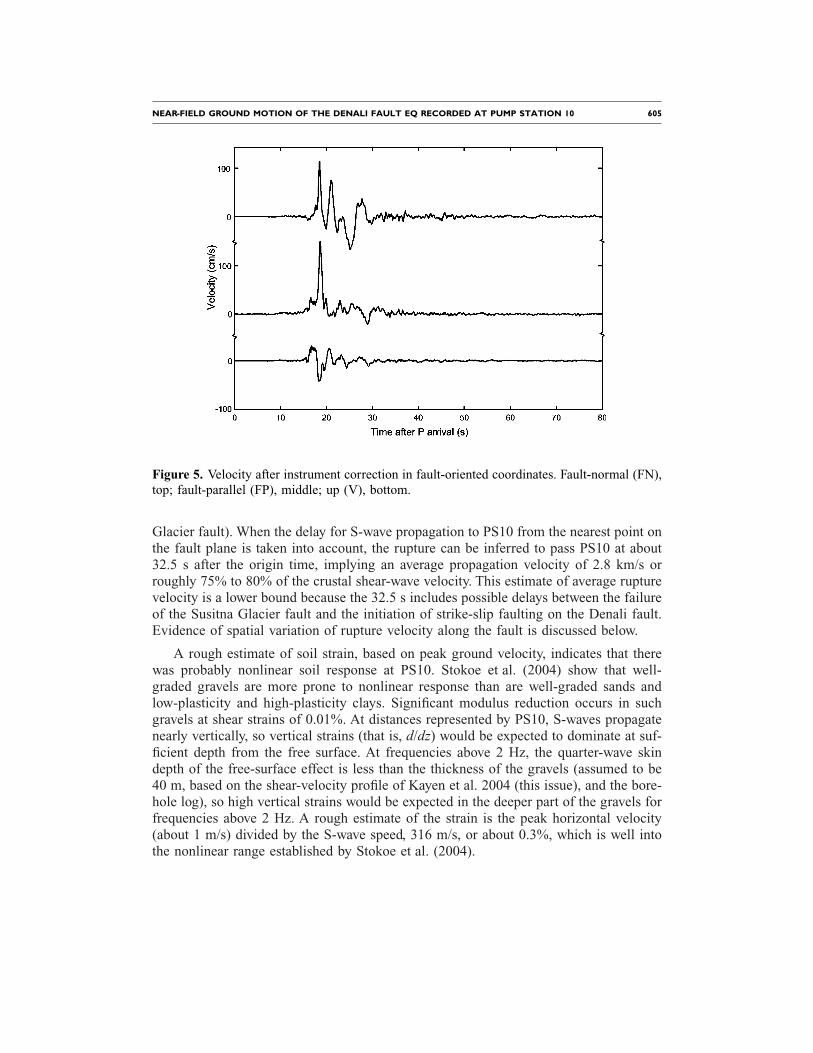
The acceleration pulse integrates on the FP component to a single-sided pulse with apeak velocity of 157 cm/s that dominates the FP velocity record (Figure 5). The peakvelocities on the FN component (108 cm/s) and V component (42 cm/s) also occur dur-ing this pulse. Strong oscillatory motions continue on the FN component for an addi-tional 10 s, but are substantially weaker on the FP component.
Figure 3. Example of instrument correction for unrotated component of motion (N136.7 7E)Pump Station 10 acceleration (top row), velocity (middle row) and displacement (bottom row).Left column: original field recordings. Right column: instrument-corrected accelerations.Middle column is the difference between the right and left columns and represents the compo-nent of the ground motion recovered from the field recordings by deconvolution of the0.086-Hz high-pass filter.
604 ELLSWORTH ET AL.
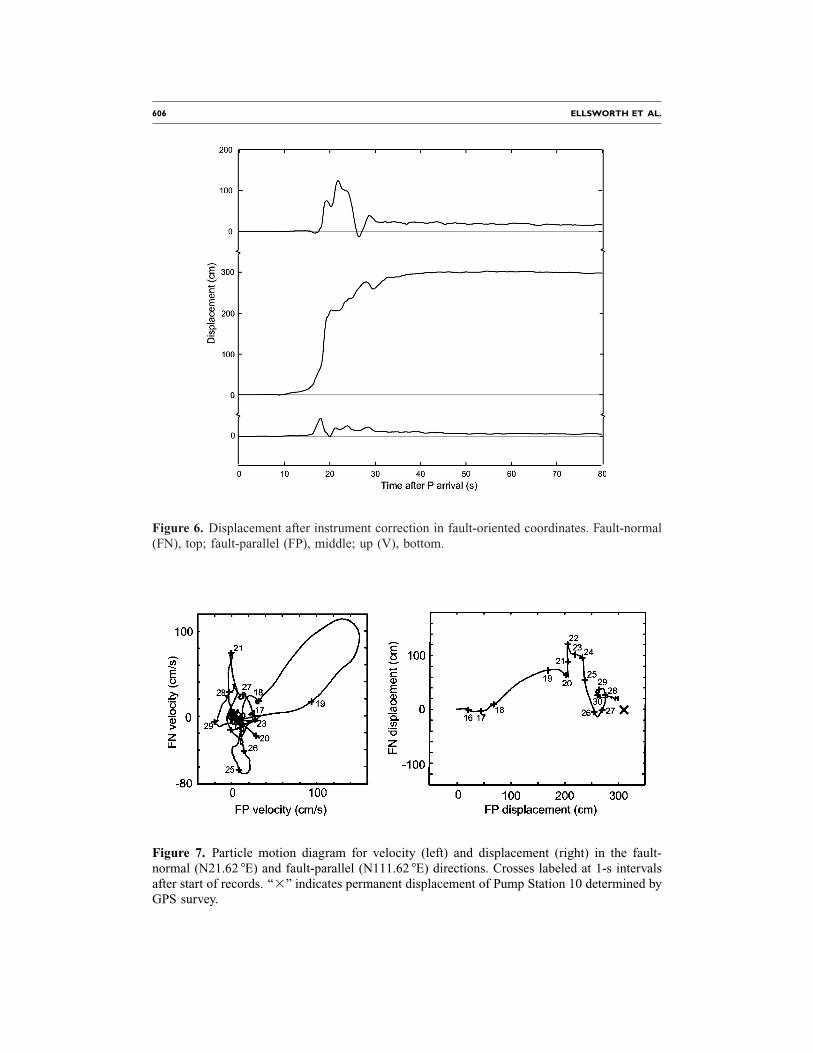
The FP displacement time series is a smoothed-step-like pulse that grows almostmonotonically to its permanent displacement of 2.98 m (Figure 6). This step-like dis-placement pulse has been called the ‘‘fling step’’ (Bolt and Abrahamson 2003). Abouthalf of its total displacement occurs during the high-velocity FP pulse. The FN displace-ment is a single-sided pulse of 8-s duration with a peak displacement of 1.08 m corre-sponding to the ‘‘directivity pulse’’ of Bolt and Abrahamson (2003). The permanenthorizontal displacement of PS10 recovered from the instrument-corrected accelerogramsagrees well with the displacement of 3 m determined by the GPS survey made by Aly-eska (Figure 7).
Particle-motion diagrams of the velocity and displacement reveal several importantfeatures of the ground motion (Figure 7). These diagrams portray the movement of PS10in the horizontal plane. The high-velocity portion of the record begins 18 s after theP-wave arrival with a large clockwise loop comprised initially of almost equal parts ofFN and FP motion that attains a peak velocity (combined FN and FP) of 181 cm/s. Fol-lowing this first large velocity pulse, the strongest motion occurs principally on the FNcomponent, with major velocity peaks at 21, 25 and 28 s.
Both the timing and direction of motion during the first large-velocity pulse and dis-placement surge (between 18 s and 19.5 s) strongly suggest that the pulse originates asthe rupture is passing PS10, and that the short duration of the pulse is caused by direc-tivity. (A station in line with an approaching rupture sees a Doppler-effect compressionof data.) The pulse arrives 33.5 s after the origin time of the earthquake (on the Susitna
Figure 4. Accelerations after instrument correction in fault-oriented coordinates. Fault-normal(FN), top; fault-parallel (FP), middle; up (V), bottom.
NEAR-FIELD GROUND MOTION OF THE DENALI FAULT EQ RECORDED AT PUMP STATION 10 605
Glacier fault). When the delay for S-wave propagation to PS10 from the nearest point onthe fault plane is taken into account, the rupture can be inferred to pass PS10 at about32.5 s after the origin time, implying an average propagation velocity of 2.8 km/s orroughly 75% to 80% of the crustal shear-wave velocity. This estimate of average rupturevelocity is a lower bound because the 32.5 s includes possible delays between the failureof the Susitna Glacier fault and the initiation of strike-slip faulting on the Denali fault.Evidence of spatial variation of rupture velocity along the fault is discussed below.
A rough estimate of soil strain, based on peak ground velocity, indicates that therewas probably nonlinear soil response at PS10. Stokoe et al. (2004) show that well-graded gravels are more prone to nonlinear response than are well-graded sands andlow-plasticity and high-plasticity clays. Significant modulus reduction occurs in suchgravels at shear strains of 0.01%. At distances represented by PS10, S-waves propagatenearly vertically, so vertical strains (that is, d/dz) would be expected to dominate at suf-ficient depth from the free surface. At frequencies above 2 Hz, the quarter-wave skindepth of the free-surface effect is less than the thickness of the gravels (assumed to be40 m, based on the shear-velocity profile of Kayen et al. 2004 (this issue), and the bore-hole log), so high vertical strains would be expected in the deeper part of the gravels forfrequencies above 2 Hz. A rough estimate of the strain is the peak horizontal velocity(about 1 m/s) divided by the S-wave speed, 316 m/s, or about 0.3%, which is well intothe nonlinear range established by Stokoe et al. (2004).
Figure 5. Velocity after instrument correction in fault-oriented coordinates. Fault-normal (FN),top; fault-parallel (FP), middle; up (V), bottom.
606 ELLSWORTH ET AL.
Figure 6. Displacement after instrument correction in fault-oriented coordinates. Fault-normal(FN), top; fault-parallel (FP), middle; up (V), bottom.
Figure 7. Particle motion diagram for velocity (left) and displacement (right) in the fault-normal (N21.62 7E) and fault-parallel (N111.62 7E) directions. Crosses labeled at 1-s intervalsafter start of records. ‘‘3’’ indicates permanent displacement of Pump Station 10 determined byGPS survey.
NEAR-FIELD GROUND MOTION OF THE DENALI FAULT EQ RECORDED AT PUMP STATION 10 607
IMPLICATIONS FOR THE FAULTING PROCESS
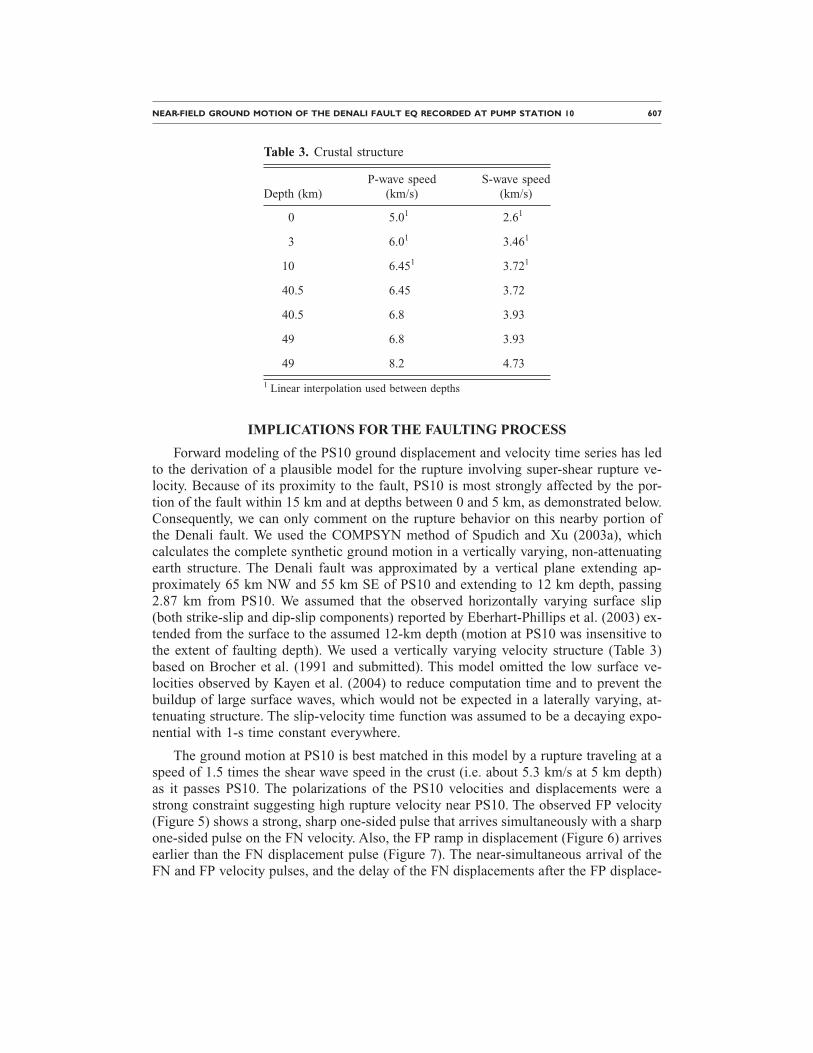
Forward modeling of the PS10 ground displacement and velocity time series has ledto the derivation of a plausible model for the rupture involving super-shear rupture ve-locity. Because of its proximity to the fault, PS10 is most strongly affected by the por-tion of the fault within 15 km and at depths between 0 and 5 km, as demonstrated below.Consequently, we can only comment on the rupture behavior on this nearby portion ofthe Denali fault. We used the COMPSYN method of Spudich and Xu (2003a), whichcalculates the complete synthetic ground motion in a vertically varying, non-attenuatingearth structure. The Denali fault was approximated by a vertical plane extending ap-proximately 65 km NW and 55 km SE of PS10 and extending to 12 km depth, passing2.87 km from PS10. We assumed that the observed horizontally varying surface slip(both strike-slip and dip-slip components) reported by Eberhart-Phillips et al. (2003) ex-tended from the surface to the assumed 12-km depth (motion at PS10 was insensitive tothe extent of faulting depth). We used a vertically varying velocity structure (Table 3)based on Brocher et al. (1991 and submitted). This model omitted the low surface ve-locities observed by Kayen et al. (2004) to reduce computation time and to prevent thebuildup of large surface waves, which would not be expected in a laterally varying, at-tenuating structure. The slip-velocity time function was assumed to be a decaying expo-nential with 1-s time constant everywhere.
The ground motion at PS10 is best matched in this model by a rupture traveling at aspeed of 1.5 times the shear wave speed in the crust (i.e. about 5.3 km/s at 5 km depth)as it passes PS10. The polarizations of the PS10 velocities and displacements were astrong constraint suggesting high rupture velocity near PS10. The observed FP velocity(Figure 5) shows a strong, sharp one-sided pulse that arrives simultaneously with a sharpone-sided pulse on the FN velocity. Also, the FP ramp in displacement (Figure 6) arrivesearlier than the FN displacement pulse (Figure 7). The near-simultaneous arrival of theFN and FP velocity pulses, and the delay of the FN displacements after the FP displace-
Table 3. Crustal structure
Depth (km)P-wave speed
(km/s)S-wave speed
(km/s)
0 5.01 2.61
3 6.01 3.461
10 6.451 3.721
40.5 6.45 3.72
40.5 6.8 3.93
49 6.8 3.93
49 8.2 4.73
1 Linear interpolation used between depths
608 ELLSWORTH ET AL.
ments are characteristics of the data that we found difficult to produce using sub-shearrupture velocities. This is in accord with the synthetic modeling of Aagaard and Heaton(submitted).
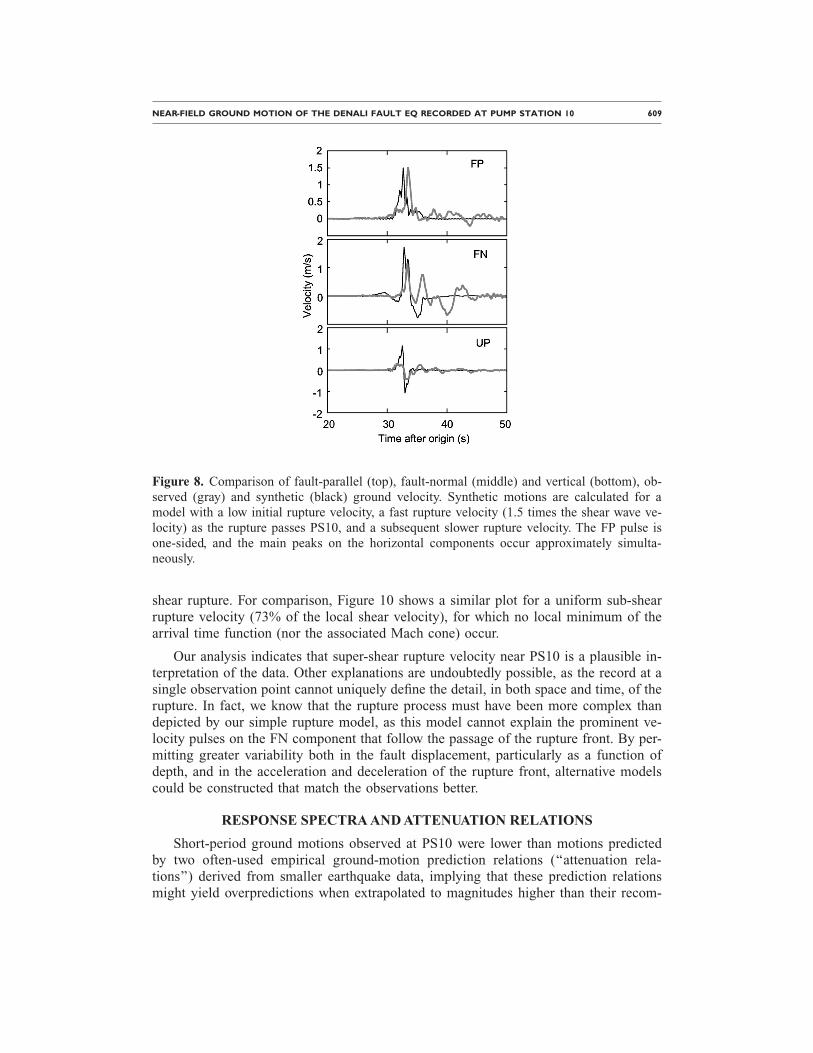
Our rupture model has a ratio Vr /Vs of rupture velocity Vr to shear velocity Vs of0.65 on the portion of the fault farther west than 18 km from PS10, 1.5 from 18 km westto 20 km east of PS10, and 0.85 farther than 20 km east of PS10. The primary control onthe high rupture velocity segment near PS10 is polarization, as discussed above. The lowrupture velocity (Vr /Vs50.65) is poorly resolved; given the high rupture velocity closeto PS10, the rupture must be delayed by a slower rupture before reaching the high rup-ture velocity segment. The 0.65 ratio is a lower bound for this segment because it as-sumes a straight fault, rather than a longer arc-like fault connecting the hypocenter andPS10. Ground motion amplitudes at PS10 are insensitive to rupture velocity on this seg-ment, and the actual rupture velocity on this segment could be higher if the rupture isdelayed in jumping from the Susitna Glacier fault to the Denali fault. Our rupture ve-locity of 0.85Vs east of PS10 is a nominal value; we have no resolution of rupture ve-locity in this region, and we did not test other possible velocities. Figure 8 shows thesynthetic velocities from our preferred rupture model. Peak horizontal ground velocity ispredicted very well from this simple source model, considering that there are only fourfree parameters in our rupture model, namely the rupture velocities on the fault seg-ments west of, and adjacent to, PS10, the location of the rupture velocity jump, and therise time. Our model overpredicts peak vertical ground velocity by a factor of 3. Thesynthetic FP velocity pulse is one-sided, a characteristic difficult to produce with a rup-ture traveling at a sub-shear velocity. The synthetic horizontal pulses in Figure 8 arriveabout 1 s earlier than the data, but this is a negligible problem that could easily be rem-edied by allowing a 1-s delay in the jumping of the rupture from the Susitna Glacierfault to the Denali fault.
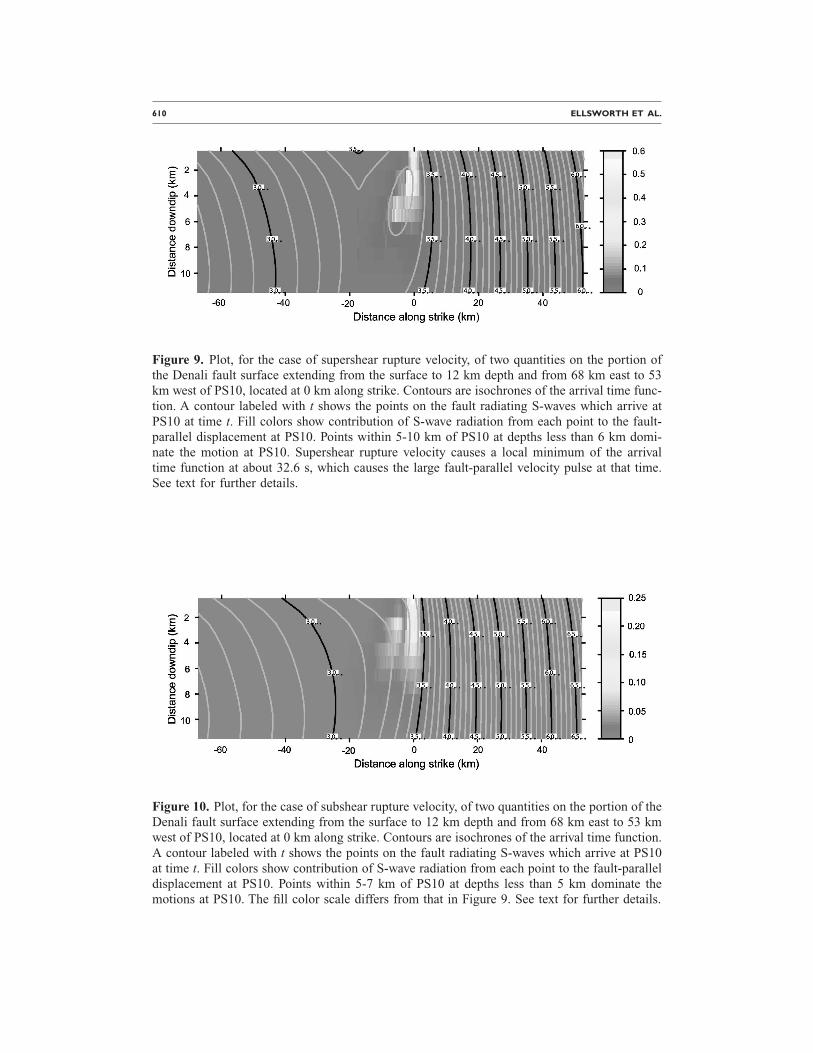
The large horizontal velocity pulse in our rupture model is caused by a local mini-mum of the arrival time function, a consequence of the super-shear rupture velocity. Fig-ure 9 shows contours (isochrones) of the arrival time function superimposed on a plot ofthe amplitude of the fault-parallel S-wave radiation emitted from each point on the faultand received at PS10. Contours labeled t show the points on the fault that radiate Swaves which arrive at PS10 at time t. (Actually, owing to the finite rise time of slip oneach point of the fault, the contours show the leading edge of a narrow advancing bandon the fault contributing S waves.) The plotted color function is uCx
su (Spudich and Xu2003b, Equation 27.2), which is the product of the slip, geometric spreading factor, ra-diation pattern, directivity factor (isochrone velocity), and impedance factors which con-tribute to the S-wave amplitude at PS10. This function is large only near PS10, demon-strating that PS10 is only affected by the nearby portion of the Denali fault. Figure 9shows that at about time 32.6 s, S waves are arriving from a region about 30 km east ofPS10 (along-strike coordinate: 230 km) and also from about 5 km east of PS10, whichis the location of a local minimum in the arrival time function. Super-shear rupture ve-locity causes this local minimum, which physically signifies the formation of a Machcone, which causes the high-velocity pulse as it sweeps by PS10. Numerical simulationsby Aagaard and Heaton (submitted) show the development of this Mach cone in super-
NEAR-FIELD GROUND MOTION OF THE DENALI FAULT EQ RECORDED AT PUMP STATION 10 609
shear rupture. For comparison, Figure 10 shows a similar plot for a uniform sub-shearrupture velocity (73% of the local shear velocity), for which no local minimum of thearrival time function (nor the associated Mach cone) occur.
Our analysis indicates that super-shear rupture velocity near PS10 is a plausible in-terpretation of the data. Other explanations are undoubtedly possible, as the record at asingle observation point cannot uniquely define the detail, in both space and time, of therupture. In fact, we know that the rupture process must have been more complex thandepicted by our simple rupture model, as this model cannot explain the prominent ve-locity pulses on the FN component that follow the passage of the rupture front. By per-mitting greater variability both in the fault displacement, particularly as a function ofdepth, and in the acceleration and deceleration of the rupture front, alternative modelscould be constructed that match the observations better.
RESPONSE SPECTRA AND ATTENUATION RELATIONS
Short-period ground motions observed at PS10 were lower than motions predictedby two often-used empirical ground-motion prediction relations (‘‘attenuation rela-tions’’) derived from smaller earthquake data, implying that these prediction relationsmight yield overpredictions when extrapolated to magnitudes higher than their recom-
Figure 8. Comparison of fault-parallel (top), fault-normal (middle) and vertical (bottom), ob-served (gray) and synthetic (black) ground velocity. Synthetic motions are calculated for amodel with a low initial rupture velocity, a fast rupture velocity (1.5 times the shear wave ve-locity) as the rupture passes PS10, and a subsequent slower rupture velocity. The FP pulse isone-sided, and the main peaks on the horizontal components occur approximately simulta-neously.
610 ELLSWORTH ET AL.
Figure 9. Plot, for the case of supershear rupture velocity, of two quantities on the portion ofthe Denali fault surface extending from the surface to 12 km depth and from 68 km east to 53km west of PS10, located at 0 km along strike. Contours are isochrones of the arrival time func-tion. A contour labeled with t shows the points on the fault radiating S-waves which arrive atPS10 at time t. Fill colors show contribution of S-wave radiation from each point to the fault-parallel displacement at PS10. Points within 5-10 km of PS10 at depths less than 6 km domi-nate the motion at PS10. Supershear rupture velocity causes a local minimum of the arrivaltime function at about 32.6 s, which causes the large fault-parallel velocity pulse at that time.See text for further details.
Figure 10. Plot, for the case of subshear rupture velocity, of two quantities on the portion of theDenali fault surface extending from the surface to 12 km depth and from 68 km east to 53 kmwest of PS10, located at 0 km along strike. Contours are isochrones of the arrival time function.A contour labeled with t shows the points on the fault radiating S-waves which arrive at PS10at time t. Fill colors show contribution of S-wave radiation from each point to the fault-paralleldisplacement at PS10. Points within 5-7 km of PS10 at depths less than 5 km dominate themotions at PS10. The fill color scale differs from that in Figure 9. See text for further details.
NEAR-FIELD GROUND MOTION OF THE DENALI FAULT EQ RECORDED AT PUMP STATION 10 611
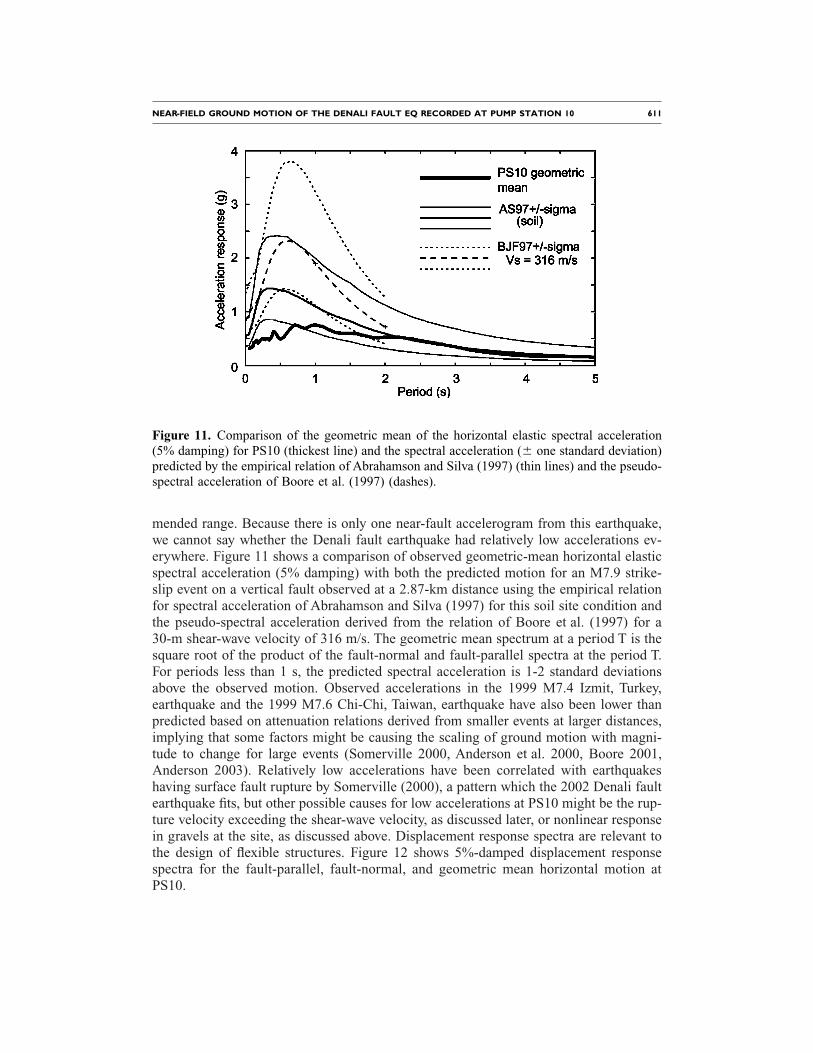
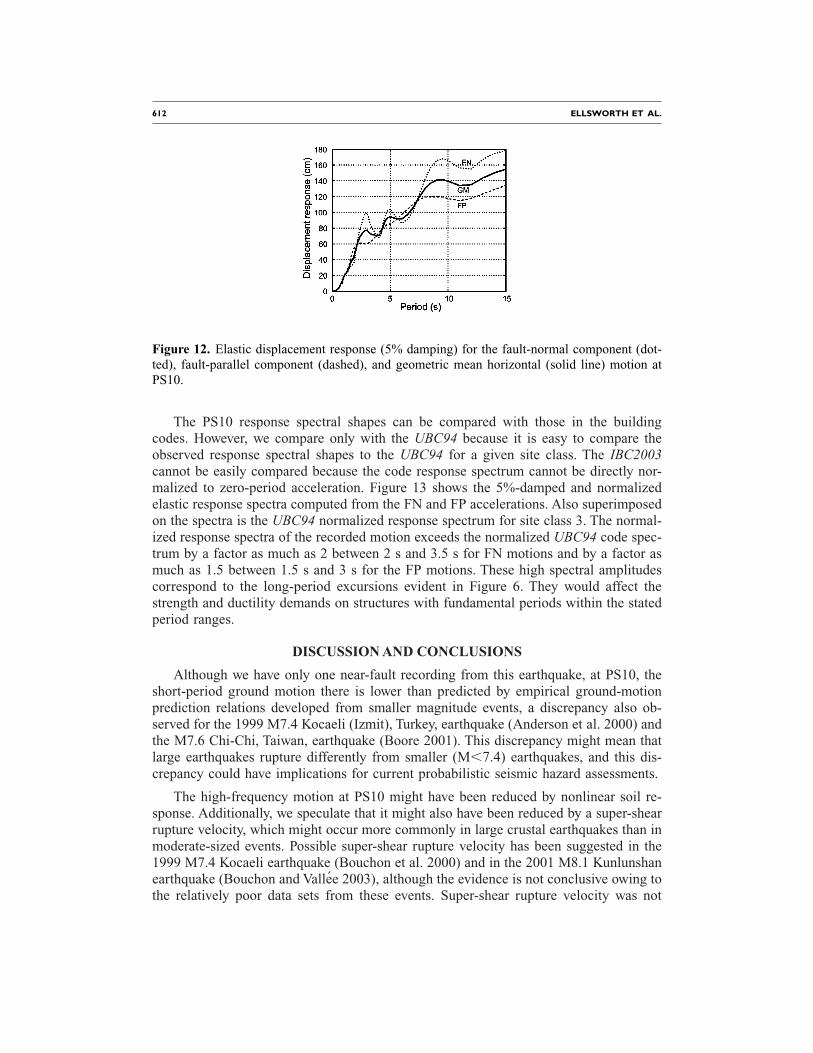
mended range. Because there is only one near-fault accelerogram from this earthquake,we cannot say whether the Denali fault earthquake had relatively low accelerations ev-erywhere. Figure 11 shows a comparison of observed geometric-mean horizontal elasticspectral acceleration (5% damping) with both the predicted motion for an M7.9 strike-slip event on a vertical fault observed at a 2.87-km distance using the empirical relationfor spectral acceleration of Abrahamson and Silva (1997) for this soil site condition andthe pseudo-spectral acceleration derived from the relation of Boore et al. (1997) for a30-m shear-wave velocity of 316 m/s. The geometric mean spectrum at a period T is thesquare root of the product of the fault-normal and fault-parallel spectra at the period T.For periods less than 1 s, the predicted spectral acceleration is 1-2 standard deviationsabove the observed motion. Observed accelerations in the 1999 M7.4 Izmit, Turkey,earthquake and the 1999 M7.6 Chi-Chi, Taiwan, earthquake have also been lower thanpredicted based on attenuation relations derived from smaller events at larger distances,implying that some factors might be causing the scaling of ground motion with magni-tude to change for large events (Somerville 2000, Anderson et al. 2000, Boore 2001,Anderson 2003). Relatively low accelerations have been correlated with earthquakeshaving surface fault rupture by Somerville (2000), a pattern which the 2002 Denali faultearthquake fits, but other possible causes for low accelerations at PS10 might be the rup-ture velocity exceeding the shear-wave velocity, as discussed later, or nonlinear responsein gravels at the site, as discussed above. Displacement response spectra are relevant tothe design of flexible structures. Figure 12 shows 5%-damped displacement responsespectra for the fault-parallel, fault-normal, and geometric mean horizontal motion atPS10.
Figure 11. Comparison of the geometric mean of the horizontal elastic spectral acceleration(5% damping) for PS10 (thickest line) and the spectral acceleration (6 one standard deviation)predicted by the empirical relation of Abrahamson and Silva (1997) (thin lines) and the pseudo-spectral acceleration of Boore et al. (1997) (dashes).
612 ELLSWORTH ET AL.
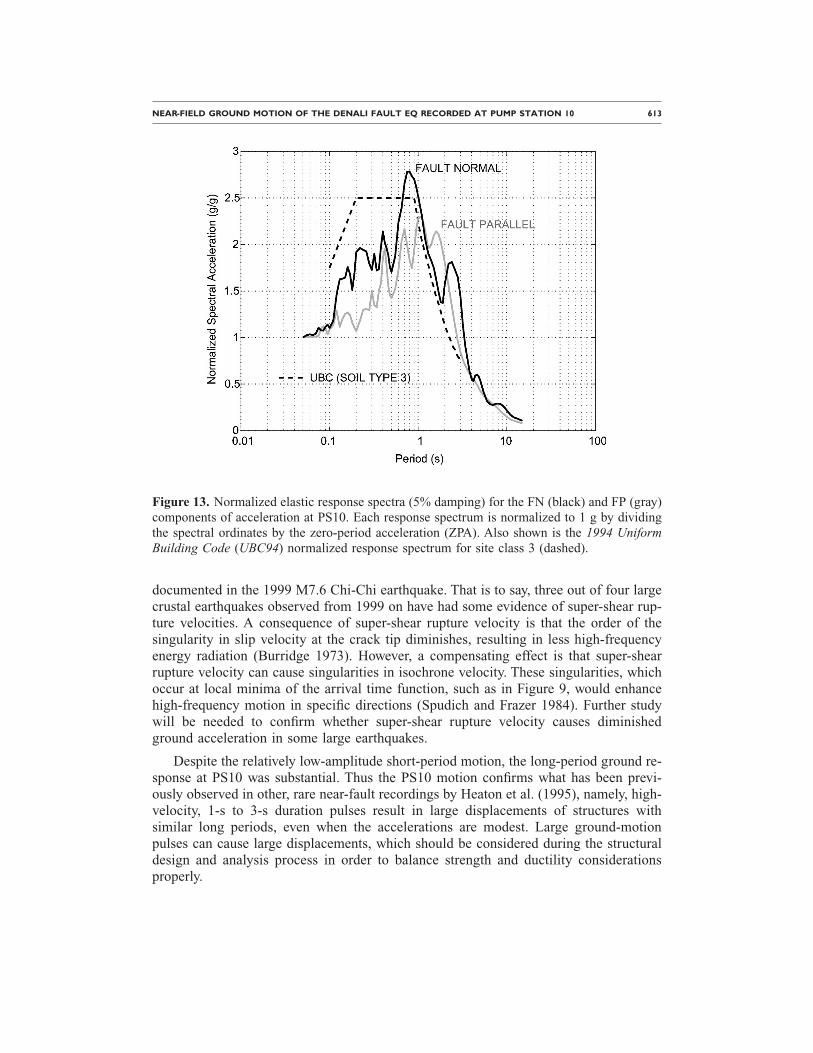
The PS10 response spectral shapes can be compared with those in the buildingcodes. However, we compare only with the UBC94 because it is easy to compare theobserved response spectral shapes to the UBC94 for a given site class. The IBC2003cannot be easily compared because the code response spectrum cannot be directly nor-malized to zero-period acceleration. Figure 13 shows the 5%-damped and normalizedelastic response spectra computed from the FN and FP accelerations. Also superimposedon the spectra is the UBC94 normalized response spectrum for site class 3. The normal-ized response spectra of the recorded motion exceeds the normalized UBC94 code spec-trum by a factor as much as 2 between 2 s and 3.5 s for FN motions and by a factor asmuch as 1.5 between 1.5 s and 3 s for the FP motions. These high spectral amplitudescorrespond to the long-period excursions evident in Figure 6. They would affect thestrength and ductility demands on structures with fundamental periods within the statedperiod ranges.
DISCUSSION AND CONCLUSIONS
Although we have only one near-fault recording from this earthquake, at PS10, theshort-period ground motion there is lower than predicted by empirical ground-motionprediction relations developed from smaller magnitude events, a discrepancy also ob-served for the 1999 M7.4 Kocaeli (Izmit), Turkey, earthquake (Anderson et al. 2000) andthe M7.6 Chi-Chi, Taiwan, earthquake (Boore 2001). This discrepancy might mean thatlarge earthquakes rupture differently from smaller (M,7.4) earthquakes, and this dis-crepancy could have implications for current probabilistic seismic hazard assessments.
The high-frequency motion at PS10 might have been reduced by nonlinear soil re-sponse. Additionally, we speculate that it might also have been reduced by a super-shearrupture velocity, which might occur more commonly in large crustal earthquakes than inmoderate-sized events. Possible super-shear rupture velocity has been suggested in the1999 M7.4 Kocaeli earthquake (Bouchon et al. 2000) and in the 2001 M8.1 Kunlunshanearthquake (Bouchon and Vallee 2003), although the evidence is not conclusive owing tothe relatively poor data sets from these events. Super-shear rupture velocity was not
Figure 12. Elastic displacement response (5% damping) for the fault-normal component (dot-ted), fault-parallel component (dashed), and geometric mean horizontal (solid line) motion atPS10.
NEAR-FIELD GROUND MOTION OF THE DENALI FAULT EQ RECORDED AT PUMP STATION 10 613
documented in the 1999 M7.6 Chi-Chi earthquake. That is to say, three out of four largecrustal earthquakes observed from 1999 on have had some evidence of super-shear rup-ture velocities. A consequence of super-shear rupture velocity is that the order of thesingularity in slip velocity at the crack tip diminishes, resulting in less high-frequencyenergy radiation (Burridge 1973). However, a compensating effect is that super-shearrupture velocity can cause singularities in isochrone velocity. These singularities, whichoccur at local minima of the arrival time function, such as in Figure 9, would enhancehigh-frequency motion in specific directions (Spudich and Frazer 1984). Further studywill be needed to confirm whether super-shear rupture velocity causes diminishedground acceleration in some large earthquakes.
Despite the relatively low-amplitude short-period motion, the long-period ground re-sponse at PS10 was substantial. Thus the PS10 motion confirms what has been previ-ously observed in other, rare near-fault recordings by Heaton et al. (1995), namely, high-velocity, 1-s to 3-s duration pulses result in large displacements of structures withsimilar long periods, even when the accelerations are modest. Large ground-motionpulses can cause large displacements, which should be considered during the structuraldesign and analysis process in order to balance strength and ductility considerationsproperly.
Figure 13. Normalized elastic response spectra (5% damping) for the FN (black) and FP (gray)components of acceleration at PS10. Each response spectrum is normalized to 1 g by dividingthe spectral ordinates by the zero-period acceleration (ZPA). Also shown is the 1994 UniformBuilding Code (UBC94) normalized response spectrum for site class 3 (dashed).
614 ELLSWORTH ET AL.
ACKNOWLEDGMENTS
We thank Russell Sell, who participated in the field calibration of the PS10 instru-mentation, Janise Rodgers, and Arthur Frankel, who reviewed the manuscript, and ArtakMartirosyan and Sharon Wood for additional helpful input.
REFERENCES
Aagaard, B. T., and Heaton, T. H., Near-source ground motions from simulations of sustainedintersonic and supersonic fault ruptures, submitted to Bull. Seismol. Soc. Am.
Abrahamson, N. A., and Silva, W. J., 1997. Empirical response spectral attenuation relations forshallow crustal earthquakes, Seismol. Res. Lett. 68, 94–127.
Anderson, J. G., 2003. Strong-motion seismology, in International Handbook of Earthquakeand Engineering Seismology, W. H. K. Lee, H. Kanamori, P. C. Jennings, and C. Kisslinger(editors), Academic Press, New York, Part B, ch. 57, pp. 937–966.
Anderson, J. G., Brune, J. N., Anooshehpoor, R., and Ni, S. D., 2000. New ground-motion dataand concepts in seismic hazard analysis, Curr. Sci. 79, 1278–1290.
Bolt, B. A., and Abrahamson, N. A., 2003. Estimation of strong seismic ground motions, inInternational Handbook of Earthquake and Engineering Seismology, W. H. K. Lee, H. Kan-amori, P. C. Jennings, and C. Kisslinger (editors), Academic Press, New York, Part B, ch. 59,pp. 983–1001.
Boore, D. M., 2001. Comparisons of ground motions from the 1999 Chi-Chi earthquake withempirical predictions largely based on data from California, Bull. Seismol. Soc. Am. 91,1212–1217.
Boore, D. M., Joyner, W. B., and Fumal, T. E., 1997. Equations for estimating horizontal re-sponse spectra and peak acceleration from western North American earthquakes: A sum-mary of recent work, Seismol. Res. Lett. 68, 128–153.
Bouchon, M., Toksoz, N., Karabulut, H., Bouin, M. P., Dietrich, M., Aktar, M., and Edie, M.,2000. Seismic imaging of the 1999 Izmit (Turkey) rupture inferred from the near-fault re-cordings, Geophys. Res. Lett. 27, 3013–3016.
Bouchon, M., and Vallee, M., 2003. Observation of long supershear rupture during the magni-tude 8.1 Kunlunshan earthquake, Science 301, 824–826.
Brocher, T. M., Fuis, G. S., Lutter, W. J., and Christensen, N. I., Seismic velocity models for theDenali fault zone along the Richardson Highway, Alaska, submitted to Bull. Seismol. Soc.Am.
Brocher, T. M., Nokleberg, W. J., Christensen, N. I., Lutter, W. J., Geist, E. L., and Fisher, M. A.,1991. Seismic reflection/refraction mapping of faulting and regional dips in the easternAlaska Range, J. Geophys. Res. 96, 10233–10249.
Burridge, R., 1973. Admissible speeds for plane-strain self-similar shear cracks with frictionbut lacking cohesion, Geophys. J. Roy. Astron. Soc. 35, 439–455.
Campbell, K. W., and Bozorgnia, Y., 2003. Updated near-source ground-motion (attenuation)relations for the horizontal and vertical components of peak ground acceleration and accel-eration response spectra, Bull. Seismol. Soc. Am. 93, 314–331.
Eberhart-Phillips, D., and 28 coauthors, 2003. The 2002 Denali fault earthquake, Alaska: Alarge-magnitude, slip-partitioned event, Science 300, 1113–1118.
Electric Power Research Institute, 1993. Guidelines for Site-Specific Ground Motions, Appendix2A, EPRI TR-102293, 2, Palo Alto, CA.
NEAR-FIELD GROUND MOTION OF THE DENALI FAULT EQ RECORDED AT PUMP STATION 10 615
Ellsworth, W. L., Celebi, M., Evans, J. R., Jensen, E. G., Nyman, D. J., and Spudich, P., 2004.Processing and modeling of the Pump Station 10 record from the November 3, 2003, Denalifault, Alaska, earthquake, Proceedings, 11th International Conference on Soil Dynamics andEarthquake Engineering, vol. 1, Berkeley, California, pp. 471–477.
Hall, W. J., Nyman, D. J., Johnson, E. R., and Norton, J. D., 2003. Performance of the trans-Alaska pipeline in the November 3, 2003 Denali fault earthquake, Proceedings of the SixthU.S. Conference and Workshop on Lifeline Earthquake Engineering, ASCE Technical Coun-cil on Lifeline Engineering, Long Beach, CA.
Heaton, T. H., Hall, J. F., Wald, D. J., and Halling, M. W., 1995. Response of high-rise and base-isolated buildings to a hypothetical Mw 7.0 blind thrust earthquake, Science 267, 206–211.
International Code Council, 2002. 2003 International Building Code, Falls Church, VA.International Conference of Building Officials, 1994. Uniform Building Code, Whittier, CA.Kayen, R., Thompson, E., Minasian, D., Collins, B., Moss, E. R. S., Sitar, N., and Carver, G.,
2004. Geotechnical reconnaissance of the 2002 Denali fault, Alaska, earthquake, EarthquakeSpectra 20 (3), 639–667 (this issue).
Lee, W. H. K., Shin, T. C., Kuo, K. W., Chen, K. C., and Wu, C. F., 2001. CWB free-fieldstrong-motion data from the 21 September Chi-Chi, Taiwan, earthquake, Bull. Seismol. Soc.Am. 91, 1370–1376.
National Soil Services, 1971. Log of boring no. 10-6 & P-6, Pump Station No. 10, unpublished,dated April 18, 1971. Available: http://nsmp.wr.usgs.gov/borehole/taps–logs.html
Somerville, P. G., 2000. Magnitude scaling of near fault ground motions, American Geophys-ical Union, Fall Meeting Supplement, vol. 81, p. F822, Available at http://www.agu.org.
Somerville, P. G., 2003. Magnitude scaling of the near fault rupture directivity pulse, Physics ofthe Earth and Planetary Interiors 137, 201–212.
Spudich, P., and Frazer, L. N., 1984. Use of ray theory to calculate high-frequency radiationfrom earthquake sources having spatially variable rupture velocity and stress drop, Bull.Seismol. Soc. Am. 74, 2061–2082.
Spudich, P., and Xu, L., 2003a. Software for calculating earthquake ground motions from finitefaults in vertically varying media, in International Handbook of Earthquake and Engineer-ing Seismology, W. H. K. Lee, H. Kanamori, P. C. Jennings, and C. Kisslinger (editors), Aca-demic Press, New York, Part B, ch. 85-14, pp. 1633–1634.
Spudich, P., and Xu, L., 2003b. Documentation of software package ISOSYN v3.11: isochroneintegration programs for earthquake ground motion calculation, in CD#3 accompanying In-ternational Handbook of Earthquake and Engineering Seismology, Part B, W. H. K. Lee, H.Kanamori, P. C. Jennings, and C. Kisslinger (editors), Academic Press, New York, Part B.
Stokoe, K. H., Darendeli, M. B., Menq, F.-Y., and Choi, W. K., 2004. Comparison of the linearand nonlinear dynamic properties of gravels, sands, silts, and clays, Proceedings, 11th In-ternational Conference on Soil Dynamics and Earthquake Engineering, vol. 1, Berkeley,California, pp. 1–4.
(Received 25 November 2003; accepted 13 January 2004)
Related Documents


![Indian Ocean earthquake - tetney.lincs.sch.uk424710]Tsunami_in_the... · • On 26th December 2004, an earthquake of magnitude 9.1 on the Richter scale was recorded in the Indian](https://static.cupdf.com/doc/110x72/5f549f870e90c97ff95d84a8/indian-ocean-earthquake-424710tsunamiinthe-a-on-26th-december-2004.jpg)

