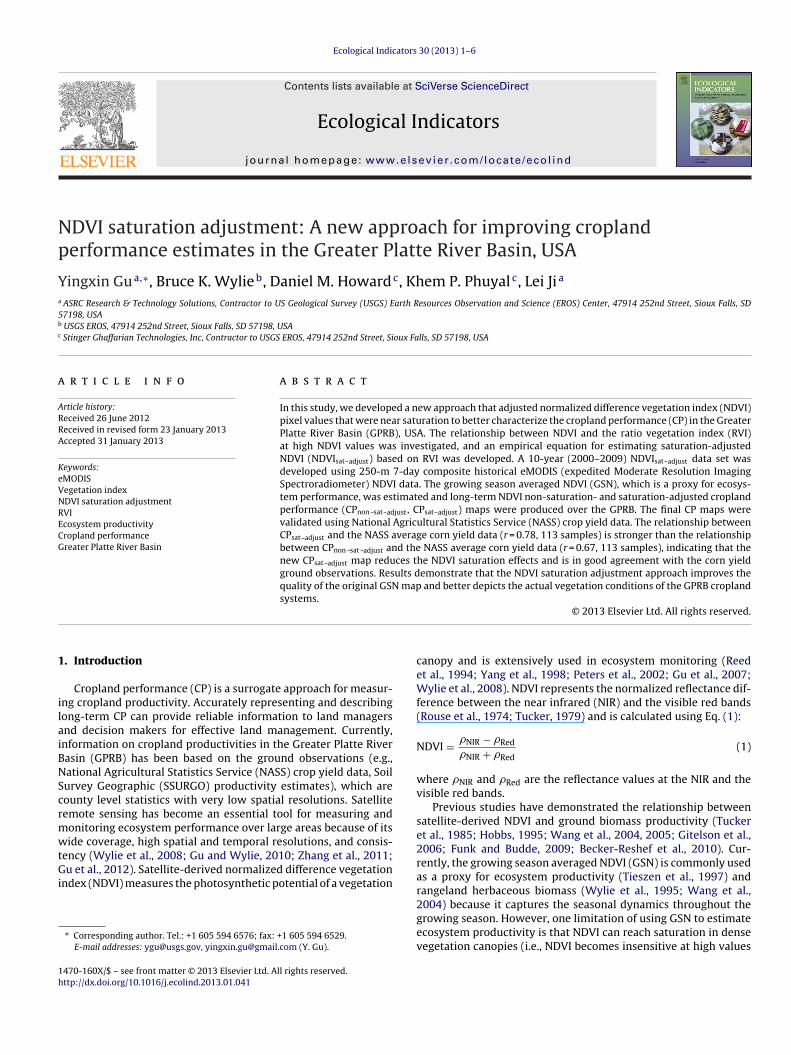
Ecological Indicators 30 (2013) 1–6 Contents lists available at SciVerse ScienceDirect Ecological Indicators jo ur nal homep age: www.elsevier.com/locate/ecolind NDVI saturation adjustment: A new approach for improving cropland performance estimates in the Greater Platte River Basin, USA Yingxin Gu a,∗ , Bruce K. Wylie b , Daniel M. Howard c , Khem P. Phuyal c , Lei Ji a a ASRC Research & Technology Solutions, Contractor to US Geological Survey (USGS) Earth Resources Observation and Science (EROS) Center, 47914 252nd Street, Sioux Falls, SD 57198, USA b USGS EROS, 47914 252nd Street, Sioux Falls, SD 57198, USA c Stinger Ghaffarian Technologies, Inc, Contractor to USGS EROS, 47914 252nd Street, Sioux Falls, SD 57198, USA a r t i c l e i n f o Article history: Received 26 June 2012 Received in revised form 23 January 2013 Accepted 31 January 2013 Keywords: eMODIS Vegetation index NDVI saturation adjustment RVI Ecosystem productivity Cropland performance Greater Platte River Basin a b s t r a c t In this study, we developed a new approach that adjusted normalized difference vegetation index (NDVI) pixel values that were near saturation to better characterize the cropland performance (CP) in the Greater Platte River Basin (GPRB), USA. The relationship between NDVI and the ratio vegetation index (RVI) at high NDVI values was investigated, and an empirical equation for estimating saturation-adjusted NDVI (NDVI sat adjust ) based on RVI was developed. A 10-year (2000–2009) NDVI sat adjust data set was developed using 250-m 7-day composite historical eMODIS (expedited Moderate Resolution Imaging Spectroradiometer) NDVI data. The growing season averaged NDVI (GSN), which is a proxy for ecosys- tem performance, was estimated and long-term NDVI non-saturation- and saturation-adjusted cropland performance (CP non sat adjust , CP sat adjust ) maps were produced over the GPRB. The final CP maps were validated using National Agricultural Statistics Service (NASS) crop yield data. The relationship between CP sat adjust and the NASS average corn yield data (r = 0.78, 113 samples) is stronger than the relationship between CP non sat adjust and the NASS average corn yield data (r = 0.67, 113 samples), indicating that the new CP sat adjust map reduces the NDVI saturation effects and is in good agreement with the corn yield ground observations. Results demonstrate that the NDVI saturation adjustment approach improves the quality of the original GSN map and better depicts the actual vegetation conditions of the GPRB cropland systems. © 2013 Elsevier Ltd. All rights reserved. 1. Introduction Cropland performance (CP) is a surrogate approach for measur- ing cropland productivity. Accurately representing and describing long-term CP can provide reliable information to land managers and decision makers for effective land management. Currently, information on cropland productivities in the Greater Platte River Basin (GPRB) has been based on the ground observations (e.g., National Agricultural Statistics Service (NASS) crop yield data, Soil Survey Geographic (SSURGO) productivity estimates), which are county level statistics with very low spatial resolutions. Satellite remote sensing has become an essential tool for measuring and monitoring ecosystem performance over large areas because of its wide coverage, high spatial and temporal resolutions, and consis- tency (Wylie et al., 2008; Gu and Wylie, 2010; Zhang et al., 2011; Gu et al., 2012). Satellite-derived normalized difference vegetation index (NDVI) measures the photosynthetic potential of a vegetation ∗ Corresponding author. Tel.: +1 605 594 6576; fax: +1 605 594 6529. E-mail addresses: [email protected], [email protected] (Y. Gu). canopy and is extensively used in ecosystem monitoring (Reed et al., 1994; Yang et al., 1998; Peters et al., 2002; Gu et al., 2007; Wylie et al., 2008). NDVI represents the normalized reflectance dif- ference between the near infrared (NIR) and the visible red bands (Rouse et al., 1974; Tucker, 1979) and is calculated using Eq. (1): NDVI = NIR − Red NIR + Red (1) where NIR and Red are the reflectance values at the NIR and the visible red bands. Previous studies have demonstrated the relationship between satellite-derived NDVI and ground biomass productivity (Tucker et al., 1985; Hobbs, 1995; Wang et al., 2004, 2005; Gitelson et al., 2006; Funk and Budde, 2009; Becker-Reshef et al., 2010). Cur- rently, the growing season averaged NDVI (GSN) is commonly used as a proxy for ecosystem productivity (Tieszen et al., 1997) and rangeland herbaceous biomass (Wylie et al., 1995; Wang et al., 2004) because it captures the seasonal dynamics throughout the growing season. However, one limitation of using GSN to estimate ecosystem productivity is that NDVI can reach saturation in dense vegetation canopies (i.e., NDVI becomes insensitive at high values 1470-160X/$ – see front matter © 2013 Elsevier Ltd. All rights reserved. http://dx.doi.org/10.1016/j.ecolind.2013.01.041

Welcome message from author
This document is posted to help you gain knowledge. Please leave a comment to let me know what you think about it! Share it to your friends and learn new things together.
Transcript
Np
Ya
5b
c
a
ARRA
KeVNRECG
1
ilaiBNScrmwtGi
1h
Ecological Indicators 30 (2013) 1–6
Contents lists available at SciVerse ScienceDirect
Ecological Indicators
jo ur nal homep age: www.elsev ier .com/ locate /eco l ind
DVI saturation adjustment: A new approach for improving croplanderformance estimates in the Greater Platte River Basin, USA
ingxin Gua,∗, Bruce K. Wylieb, Daniel M. Howardc, Khem P. Phuyalc, Lei Ji a
ASRC Research & Technology Solutions, Contractor to US Geological Survey (USGS) Earth Resources Observation and Science (EROS) Center, 47914 252nd Street, Sioux Falls, SD7198, USAUSGS EROS, 47914 252nd Street, Sioux Falls, SD 57198, USAStinger Ghaffarian Technologies, Inc, Contractor to USGS EROS, 47914 252nd Street, Sioux Falls, SD 57198, USA
r t i c l e i n f o
rticle history:eceived 26 June 2012eceived in revised form 23 January 2013ccepted 31 January 2013
eywords:MODISegetation indexDVI saturation adjustmentVIcosystem productivity
a b s t r a c t
In this study, we developed a new approach that adjusted normalized difference vegetation index (NDVI)pixel values that were near saturation to better characterize the cropland performance (CP) in the GreaterPlatte River Basin (GPRB), USA. The relationship between NDVI and the ratio vegetation index (RVI)at high NDVI values was investigated, and an empirical equation for estimating saturation-adjustedNDVI (NDVIsat adjust) based on RVI was developed. A 10-year (2000–2009) NDVIsat adjust data set wasdeveloped using 250-m 7-day composite historical eMODIS (expedited Moderate Resolution ImagingSpectroradiometer) NDVI data. The growing season averaged NDVI (GSN), which is a proxy for ecosys-tem performance, was estimated and long-term NDVI non-saturation- and saturation-adjusted croplandperformance (CPnon sat adjust, CPsat adjust) maps were produced over the GPRB. The final CP maps werevalidated using National Agricultural Statistics Service (NASS) crop yield data. The relationship between
ropland performancereater Platte River Basin
CPsat adjust and the NASS average corn yield data (r = 0.78, 113 samples) is stronger than the relationshipbetween CPnon sat adjust and the NASS average corn yield data (r = 0.67, 113 samples), indicating that thenew CPsat adjust map reduces the NDVI saturation effects and is in good agreement with the corn yieldground observations. Results demonstrate that the NDVI saturation adjustment approach improves thequality of the original GSN map and better depicts the actual vegetation conditions of the GPRB croplandsystems.
. Introduction
Cropland performance (CP) is a surrogate approach for measur-ng cropland productivity. Accurately representing and describingong-term CP can provide reliable information to land managersnd decision makers for effective land management. Currently,nformation on cropland productivities in the Greater Platte Riverasin (GPRB) has been based on the ground observations (e.g.,ational Agricultural Statistics Service (NASS) crop yield data, Soilurvey Geographic (SSURGO) productivity estimates), which areounty level statistics with very low spatial resolutions. Satelliteemote sensing has become an essential tool for measuring andonitoring ecosystem performance over large areas because of itside coverage, high spatial and temporal resolutions, and consis-
ency (Wylie et al., 2008; Gu and Wylie, 2010; Zhang et al., 2011;u et al., 2012). Satellite-derived normalized difference vegetation
ndex (NDVI) measures the photosynthetic potential of a vegetation
∗ Corresponding author. Tel.: +1 605 594 6576; fax: +1 605 594 6529.E-mail addresses: [email protected], [email protected] (Y. Gu).
470-160X/$ – see front matter © 2013 Elsevier Ltd. All rights reserved.ttp://dx.doi.org/10.1016/j.ecolind.2013.01.041
© 2013 Elsevier Ltd. All rights reserved.
canopy and is extensively used in ecosystem monitoring (Reedet al., 1994; Yang et al., 1998; Peters et al., 2002; Gu et al., 2007;Wylie et al., 2008). NDVI represents the normalized reflectance dif-ference between the near infrared (NIR) and the visible red bands(Rouse et al., 1974; Tucker, 1979) and is calculated using Eq. (1):
NDVI = �NIR − �Red
�NIR + �Red(1)
where �NIR and �Red are the reflectance values at the NIR and thevisible red bands.
Previous studies have demonstrated the relationship betweensatellite-derived NDVI and ground biomass productivity (Tuckeret al., 1985; Hobbs, 1995; Wang et al., 2004, 2005; Gitelson et al.,2006; Funk and Budde, 2009; Becker-Reshef et al., 2010). Cur-rently, the growing season averaged NDVI (GSN) is commonly usedas a proxy for ecosystem productivity (Tieszen et al., 1997) andrangeland herbaceous biomass (Wylie et al., 1995; Wang et al.,
2004) because it captures the seasonal dynamics throughout thegrowing season. However, one limitation of using GSN to estimateecosystem productivity is that NDVI can reach saturation in densevegetation canopies (i.e., NDVI becomes insensitive at high values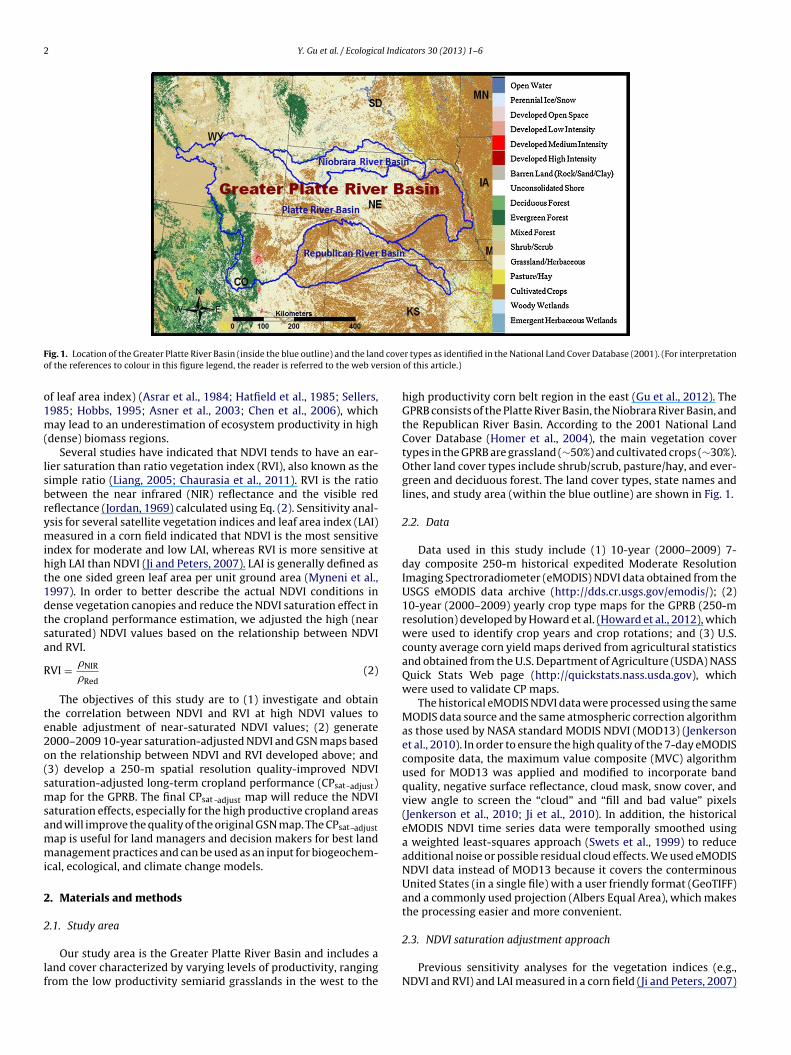
2 Y. Gu et al. / Ecological Indicators 30 (2013) 1–6
F d coveo rsion
o1m(
lsbrymiht1dtsa
R
te2o(smsammi
2
2
lf
ig. 1. Location of the Greater Platte River Basin (inside the blue outline) and the lanf the references to colour in this figure legend, the reader is referred to the web ve
f leaf area index) (Asrar et al., 1984; Hatfield et al., 1985; Sellers,985; Hobbs, 1995; Asner et al., 2003; Chen et al., 2006), whichay lead to an underestimation of ecosystem productivity in high
dense) biomass regions.Several studies have indicated that NDVI tends to have an ear-
ier saturation than ratio vegetation index (RVI), also known as theimple ratio (Liang, 2005; Chaurasia et al., 2011). RVI is the ratioetween the near infrared (NIR) reflectance and the visible redeflectance (Jordan, 1969) calculated using Eq. (2). Sensitivity anal-sis for several satellite vegetation indices and leaf area index (LAI)easured in a corn field indicated that NDVI is the most sensitive
ndex for moderate and low LAI, whereas RVI is more sensitive atigh LAI than NDVI (Ji and Peters, 2007). LAI is generally defined ashe one sided green leaf area per unit ground area (Myneni et al.,997). In order to better describe the actual NDVI conditions inense vegetation canopies and reduce the NDVI saturation effect inhe cropland performance estimation, we adjusted the high (nearaturated) NDVI values based on the relationship between NDVInd RVI.
VI = �NIR
�Red(2)
The objectives of this study are to (1) investigate and obtainhe correlation between NDVI and RVI at high NDVI values tonable adjustment of near-saturated NDVI values; (2) generate000–2009 10-year saturation-adjusted NDVI and GSN maps basedn the relationship between NDVI and RVI developed above; and3) develop a 250-m spatial resolution quality-improved NDVIaturation-adjusted long-term cropland performance (CPsat adjust)ap for the GPRB. The final CPsat adjust map will reduce the NDVI
aturation effects, especially for the high productive cropland areasnd will improve the quality of the original GSN map. The CPsat adjustap is useful for land managers and decision makers for best landanagement practices and can be used as an input for biogeochem-
cal, ecological, and climate change models.
. Materials and methods
.1. Study area
Our study area is the Greater Platte River Basin and includes aand cover characterized by varying levels of productivity, rangingrom the low productivity semiarid grasslands in the west to the
r types as identified in the National Land Cover Database (2001). (For interpretationof this article.)
high productivity corn belt region in the east (Gu et al., 2012). TheGPRB consists of the Platte River Basin, the Niobrara River Basin, andthe Republican River Basin. According to the 2001 National LandCover Database (Homer et al., 2004), the main vegetation covertypes in the GPRB are grassland (∼50%) and cultivated crops (∼30%).Other land cover types include shrub/scrub, pasture/hay, and ever-green and deciduous forest. The land cover types, state names andlines, and study area (within the blue outline) are shown in Fig. 1.
2.2. Data
Data used in this study include (1) 10-year (2000–2009) 7-day composite 250-m historical expedited Moderate ResolutionImaging Spectroradiometer (eMODIS) NDVI data obtained from theUSGS eMODIS data archive (http://dds.cr.usgs.gov/emodis/); (2)10-year (2000–2009) yearly crop type maps for the GPRB (250-mresolution) developed by Howard et al. (Howard et al., 2012), whichwere used to identify crop years and crop rotations; and (3) U.S.county average corn yield maps derived from agricultural statisticsand obtained from the U.S. Department of Agriculture (USDA) NASSQuick Stats Web page (http://quickstats.nass.usda.gov), whichwere used to validate CP maps.
The historical eMODIS NDVI data were processed using the sameMODIS data source and the same atmospheric correction algorithmas those used by NASA standard MODIS NDVI (MOD13) (Jenkersonet al., 2010). In order to ensure the high quality of the 7-day eMODIScomposite data, the maximum value composite (MVC) algorithmused for MOD13 was applied and modified to incorporate bandquality, negative surface reflectance, cloud mask, snow cover, andview angle to screen the “cloud” and “fill and bad value” pixels(Jenkerson et al., 2010; Ji et al., 2010). In addition, the historicaleMODIS NDVI time series data were temporally smoothed usinga weighted least-squares approach (Swets et al., 1999) to reduceadditional noise or possible residual cloud effects. We used eMODISNDVI data instead of MOD13 because it covers the conterminousUnited States (in a single file) with a user friendly format (GeoTIFF)and a commonly used projection (Albers Equal Area), which makesthe processing easier and more convenient.
2.3. NDVI saturation adjustment approach
Previous sensitivity analyses for the vegetation indices (e.g.,NDVI and RVI) and LAI measured in a corn field (Ji and Peters, 2007)

Y. Gu et al. / Ecological Indicators 30 (2013) 1–6 3
NDVI = 0.03 x RVI + 0.5363R² = 0.9872
0
0.2
0.4
0.6
0.8
1
1.2
0 2 4 6 8 10 12 14 16 18
ND
VI
RVI
NDVI < 0.78
NDVI >= 0.78
NDVI 0.7 to 0.8
NDVI predicte d from RVI
Line ar (NDVI 0. 7 to 0.8)
Fig. 2. RVI versus NDVI plots, RVI–NDVI regression analysis was performed for theNto
i(hsb
R
Foafrtttgc
N
w
2
fpsta4(tldcC
2
nnt
0
0.2
0.4
0.6
0.8
1
1.2
5 10 15 20 25 30 35 40 45
NDV
I
Time (weeks)
high corn: sat_adjust ndvi
high corn
med corn
low corn
Fig. 3. 2008 growing season NDVI time series plots for the low, medium, high,and saturation-adjusted “high” cropland production pixels in the GPRB regions.Locations of the three selected pixels are shown in Fig. 4a with red triangles. (For
DVI range 0.7–0.8. The RVI–NDVIsat adjust plot is in magenta. (For interpretation ofhe references to color in this figure legend, the reader is referred to the web versionf this article.)
ndicated that NDVI is more sensitive to the moderate and low LAIwhen NDVI < 0.78) than RVI. Conversely, RVI is more sensitive toigh LAI (when NDVI >0.78) than NDVI. RVI and NDVI show similarensitivities to LAI in the NDVI range of 0.7–0.8. The relationshipetween NDVI and RVI is formulized as the following equation:
VI = 1 + NDVI1 − NDVI
(3)
Our NDVI saturation adjustment approach is illustrated in Fig. 2.irst, we generated a RVI-NDVI data set based on a wide rangef NDVI values (NDVI from 0.20 to 0.85) and Eq. (3) (RVIs werelgebraically calculated from NDVIs based on Eq. (3)). We then per-ormed linear regression analysis for RVI and NDVI for the NDVIange of 0.7–0.8 (where RVI and NDVI show similar sensitivitieso LAI) and derived an empirical Eq. (4) to predict NDVI based onhe RVI (Fig. 2, in magenta). Finally, we applied Eq. (4) to calculatehe 2000–2009 saturation-adjusted NDVI (NDVIsat adjust) for NDVIreater than 0.78 (the threshold where NDVI is less sensitive to theorn field LAI).
DVIsat adjust = 0.03 × RVI + 0.5363 (4)
here RVI can be calculated from NDVI using Eq. (3).
.4. Generation of a long-term CP map for the GPRB
In this study, we first calculated the 2000–2009 NDVIsat adjustor the GPRB cropland areas using historical 7-day com-osite eMODIS NDVI data. We then calculated 2000–2009aturation-adjusted GSN (GSN sat adjust) using NDVIsat adjust withhe start of season time as mid-March (week 10 or 11)nd the end of season time as late October (week 43 or4) determined by the long-term averaged phenological datahttp://phenology.cr.usgs.gov/get data.php). Finally, we calculatedhe 10-year mean GSN sat adjust (MGSN sat adjust) for the GPRB crop-ands and used 2000–2009 corn maps to exclude the non-corn yearsuring the MGSN sat adjust calculation. The MGSN sat adjust map (fororn pixels only, i.e., corn year ≥5 years) is used as a proxy for thePsat adjust map.
.5. Evaluation and validation of the long-term CP map
In order to validate and demonstrate the improvement of theew CPsat adjust map developed from this study, we calculated theon-saturation adjusted CP (CPnon sat adjust) using the same calcula-ion procedure as the CPsat adjust described in Section 2.4. The NASS
interpretation of the references to color in this figure legend, the reader is referredto the web version of this article.)
average corn yield county statistics data were used to compare andvalidate the CPnon sat adjust and CPsat adjust maps. Regression analy-ses were performed between the CPnon sat adjust map and the NASSaverage corn yield data, and between the CPsat adjust map and theNASS average corn yield data. Additionally, the spatial patterns andtrends of the maps were assessed and compared.
3. Results and discussion
3.1. Comparison of the original GSN with the saturation-adjustedGSN
We selected the growing season weekly NDVI time series plotsfrom one of the 10 years (2008) as an example for illustration anddiscussion purposes. Fig. 3 shows the 2008 growing season NDVI(weeks 10 through 43) time series plots for the three representa-tive cropland pixels from the GPRB which represent low, medium,and high cropland productivities. The locations of the three pix-els are shown in Fig. 4 with red triangles. No NDVI saturations arefound during the entire growing season for both the low and themedium production pixels (Fig. 3). On the other hand, there is anapparent NDVI saturation trend starting from week 28 (early July)and continuing until week 37 (early September) for the high pro-duction pixel (Fig. 3, blue line). The saturation adjustment methodwas applied to this high production pixel and the NDVIsat adjust timeseries plot is shown in Fig. 3 (thick orange line). The NDVIsat adjustincreases until week 31 during the NDVI near-saturation period,after which it starts decreasing. Our NDVI saturation adjustmentapproach reduces NDVI saturation effects and thus can be utilizedto refine productivity estimates in high biomass areas.
Fig. 4a and b are the MGSN maps calculated from the non-saturation-adjusted NDVI (noted as MGSNnon sat adjust) and thesaturation-adjusted NDVI (noted as MGSNsat adjust) over the GPRB.Cropland performances show an increasing trend from the westernto the eastern GPRB in both MGSN maps because of more favorablevegetation growing conditions (e.g., good climate and soil condi-tions) in the eastern part of the GPRB (Gu et al., 2012). MGSNsat adjustis higher than MGSNnon sat adjust in most of the eastern GPRB (i.e.,
areas with very high biomass production and NDVI is approachingor at saturation), suggesting that our NDVI saturation adjustmentapproach improves NDVI sensitivity in high biomass regions.
4 Y. Gu et al. / Ecological Indicators 30 (2013) 1–6
Fig. 4. Cropland productivity maps for the GPRB. (a) MGSN . (b) MGSN t adjust. (c) County average corn yield derived from NASS. The black star in Fig. 3c showst is figu
3c
fpwitw(
non sat adjust sa
he location of Platte County, NE. (For interpretation of the references to color in th
.2. Evaluating and validating the CP maps using NASS averageorn yield data
Fig. 4c shows the U.S. county average corn yield map derivedrom the NASS database for the GPRB region. The general spatialatterns for the satellite-derived MGSN maps (Fig. 4a and b) agreeith the ground-observed average corn yield map (i.e., productivity
ncreases from west to east in the GPRB). In the eastern part ofhe GPRB, the MGSNsat adjust (Fig. 4b) shows a better agreementith the NASS average corn yield data than the MGSNnon sat adjust
Fig. 4a).
re legend, the reader is referred to the web version of this article.)
In order to illustrate the improvement of our new MGSNsat adjustmap more clearly (i.e., provide a more detailed view of the perfor-mance maps), we zoomed in on Platte County, Nebraska (noted asa black star in Fig. 4c) in the GPRB as an illustration example. In thezoomed maps, the average corn yield for Platte County is very high(10,632 kg/ha, Fig. 4 zoom (c)). The corresponding MGSNsat adjustmap (Fig. 4 zoom (b)) shows higher productivity (more green areas)
than the corresponding MGSNnon sat adjust data set (Fig. 4 zoom (a)),which has lower productivity values (fewer green and more yellowareas). The new MGSNsat adjust map is in better agreement thanMGSNnon sat adjust regarding average corn yield data. In addition,
Y. Gu et al. / Ecological Indic
Corn Yield = 307 X MGSN non_sat_adjust - 5871R² = 0.45
Corn Yield = 273 X MGSN sat_adjust - 4560R² = 0.60
4000
5000
6000
7000
8000
9000
10000
11000
12000
30 35 40 45 50 55 60
non_sat_adjust MGSN
sat_adjust MGSN
Linear (non_sat_adjust MGSN)
Linear (sat_adjust MGSN)
MGSN x 100
Co
rn Y
ield
(kg
/ha)
Fcr
tmC
tao1eubctNseiNMot
4
t(s0yMtc
st((scb1aae
ig. 5. Relationships between county averaged MGSNnon sat adjust/MGSNsat adjust (fororn pixels only) and NASS average corn yield data. 113 counties from the GPRBegion were used in the analysis.
he MGSNsat adjust map has higher spatial variations in the zoomap, reflecting higher sensitivity to vegetation conditions in Platte
ounty.Finally, we performed regression analyses to further validate
he new CPsat adjust map. Fig. 5 shows scatterplots for the county-veraged MGSNnon sat adjust and MGSNsat adjust (for corn pixelsnly) versus the NASS county average corn yield data. A total of13 counties from the southeastern part of Wyoming, northeast-rn part of Colorado, Nebraska, and the western part of Iowa weresed in the regression analysis. Results show a stronger relationshipetween the MGSNsat adjust (squares in Fig. 5) and the NASS averageorn yield data (r = 0.78, P-value = 4.5 × 10⁻²³) and a weaker rela-ionship between the MGSNnon sat adjust (triangles in Fig. 5) and theASS average corn yield data (r = 0.67, P-values = 4.6 × 10⁻¹⁵). NDVI
aturation effects are reduced for the MGSNsat adjust (MGSN valuesxtend to 0.56) compared to the MGSNnon sat adjust (MGSN stopsncreasing at about 0.52). These results demonstrate again that ourDVI saturation adjustment approach improves the quality of theGSN map and can better depict the actual vegetation conditions
f the dense vegetation canopy in the GPRB. The results also verifyhat using GSN as a proxy for ecosystem performance is reliable.
. Conclusions
This study introduces a new approach for adjusting NDVI valueshat are near saturation based on the relationship between NDVImore sensitive to the moderate and low LAI) and RVI (more sen-itive to high LAI) in dense vegetation canopies (NDVI from 0.7 to.8, where NDVI and RVI have similar sensitivity to the LAI). A 10-ear (2000–2009) NDVIsat adjust data set was generated, and theGSNsat adjust and MGSNnon sat adjust maps were developed. The
wo CP maps were evaluated and validated using NASS averageorn yield data.
NDVI time series plots show that NDVIsat adjust retained highensitivity to vegetation dynamics when NDVI is near satura-ion. NDVI saturation effects are reduced for the MGSNsat adjustMGSN values extend to 0.56) compared to the MGSNnon sat adjustMGSN stops increasing at ∼0.52). Correlation analyses exhibit atronger relationship between MGSNsat adjust and the NASS averageorn yield data (r = 0.78, 113 samples) and a weaker relationshipetween MGSNnon sat adjust and average corn yield data (r = 0.67,
13 samples). These results demonstrate that our NDVI saturationdjustment approach improves the quality of the original GSN mapnd better describes the actual cropland conditions when the veg-tation canopy is especially dense in the GPRB. Results also verifyators 30 (2013) 1–6 5
that using GSN as a proxy for ecosystem performance is a reliableapproach in the GPRB cropland systems. We plan to test and vali-date the wide applications of this approach (e.g., other land covertypes and other geographic regions) in the future.
Acknowledgments
This work was performed under USGS contracts G08PC91508and G10PC00044, and funded by the USGS Geographic Analysisand Monitoring Program in support of Renewable Energy-Biofuels.The authors thank James Vogelmann, Thomas Adamson, and twoanonymous reviewers for their valuable suggestions and com-ments. Any use of trade, product, or firm names is for descriptivepurposes only and does not imply endorsement by the U.S. Gov-ernment.
References
Asner, G.P., Scurlock, J.M.O., Hicke, J.A., 2003. Global synthesis of leaf area indexobservations: implications for ecological and remote sensing studies. GlobalEcol. Biogeogr. 12, 191–205.
Asrar, G., Fuchs, M., Kanemasu, E.T., Hatfield, J.L., 1984. Estimating absorbed photo-synthetic radiation and leaf area index from spectral reflectance in wheat. Agron.J. 76, 300–306.
Becker-Reshef, I., Vermote, E., Lindeman, M., Justice, C., 2010. A generalizedregression-based model for forecasting winter wheat yields in Kansas andUkraine using MODIS data. Remote Sens. Environ. 114, 1312–1323.
Chaurasia, S., Nigam, R., Bhattacharya, B.K., Sridhar, V.N., Mallick, K., Vyas, S.P., Patel,N.K., Mukherjee, J., Shekhar, C., Kumar, D., Singh, K.R.P., Bairagi, G.D., Purohit,N.L., Parihar, J.S., 2011. Development of regional wheat VI-LAI models usingResourcesat-1 AWiFS data. J. Earth Sci. 120, 1113–1125.
Chen, P.Y., Fedosejevs, G., Tiscareno-López, M., Arnold, J.G., 2006. Assessment ofMODIS-EVI, MODIS-NDVI and VEGETATION-NDVI composite data using agri-cultural measurements: an example at corn fields in western Mexico. Environ.Monit. Assess. 119, 69–82.
Funk, C., Budde, M.E., 2009. Phenologically-tuned MODIS NDVI-based productionanomaly estimates for Zimbabwe. Remote Sens. Environ. 113, 115–125.
Gitelson, A.A., Vina, A., Verma, S.B., Rundquist, D.C., Arkebauer, T.J., Keydan, G., Leav-itt, B., Ciganda, V., Burba, G.G., Suyker, A.E., 2006. Relationship between grossprimary production and chlorophyll content in crops: implications for the syn-optic monitoring of vegetation productivity. J. Geophys. Res. D: Atmos., 111.
Gu, Y., Boyte, S.P., Wylie, B.K., Tieszen, L.L., 2012. Identifying grasslands suitable forcellulosic feedstock crops in the Greater Platte River Basin: dynamic modelingof ecosystem performance with 250 m eMODIS. Global Change Biol. Bioenergy4, 96–106.
Gu, Y., Brown, J.F., Verdin, J.P., Wardlow, B., 2007. A five-year analysis ofMODIS NDVI and NDWI for grassland drought assessment over the cen-tral Great Plains of the United States. Geophys. Res. Lett. 34, L06407,http://dx.doi.org/10.1029/2006GL029127.
Gu, Y., Wylie, B.K., 2010. Detecting ecosystem performance anomalies for land man-agement in the Upper Colorado River Basin using satellite observations, climatedata, and ecosystem models. Remote Sens. 2 (8), 1880–1891.
Hatfield, J.L., Kanemasu, E.T., Asrar, G., Jackson, R.D., Pinter, P.J., Reginato, R.J., Idso,S.B., 1985. Leaf-area estimates from spectral measurements over various plant-ing dates of wheat. Int. J. Remote Sens. 6, 167–175.
Hobbs, T.J., 1995. The use of NOAA-AVHRR NDVI data to assess herbage productionin the arid rangelands of central Australia. Int. J. Remote Sens. 16, 1289–1302.
Homer, C., Huang, C., Yang, L., Wylie, B., Coan, M., 2004. development of a 2001national land-cover database for the United States. Photogramm. Eng. RemoteSens. 70, 829–840.
Howard, D.M., Wylie, B.K., Tieszen, L.L., 2012. Crop classification modelling usingremote sensing and environmental data in the Greater Platte River Basin, USA.Int. J. Remote Sens. 33, 6094–6108.
Ji, L., Peters, A.J., 2007. Performance evaluation of spectral vegetation indices usinga statistical sensitivity function. Remote Sens. Environ. 106, 59–65.
Ji, L., Wylie, B.K., Ramachandran, B., Jenkerson, C.K., 2010. A comparative analysisof three different MODIS NDVI datasets for Alaska and adjacent Canada. Can. J.Remote Sens. 36, S149–S167.
Jenkerson, C.B., Maiersperger, T.K., Schmidt, G.L., 2010. eMODIS—An User-FriendlyData Source. U.S. Geological Survey Open-File Report, Reston, VA, USA,2010–1055.
Jordan, C.F., 1969. Derivation of leaf-area index from quality of light on the forestfloor. Ecology 50, 663–666.
Liang, S., 2005. Quantitative Remote Sensing of Land Surfaces. John Wiley & Sons,Inc.
Myneni, R.B., Ramakrishna, R., Nemani, R., Running, S.W., 1997. Estimation of globalleaf area index and absorbed par using radiative transfer models. IEEE Transac-tions on Geoscience and Remote Sensing 35, 1380–1393.
6 l Indi
P
R
R
S
S
T
T
Y. Gu et al. / Ecologica
eters, A.J., Walter-Shea, E.A., Ji, L., Vina, A., Hayes, M., Svoboda, M.D., 2002. Droughtmonitoring with NDVI-based standardized vegetation index. Photogramm. Eng.Remote Sens. 68, 71–75.
eed, B.C., Brown, J.F., Vanderzee, D., Loveland, T.R., Merchant, J.R., Ohlen, D.O.,1994. Measuring phenological variability from satellite imagery. J. Veg. Sci. 5,703–714.
ouse, J.W., Haas, H.R., Deering, D.W., Schell, J.A., Harlan, J.C., 1974. Monitoringthe Vernal Advancement and Retrogradation (Green Wave Effect) of NaturalVegetation. NASA/GSFC Type III Final Report. Greenbelt, MD, 371 pp.
ellers, P.J., 1985. Canopy reflectance, photosynthesis and transpiration. Int. J.Remote Sens. 6, 1335–1372.
wets, D.L., Reed, B.C., Rowland, J.R., Marko, S.E., 1999. A weighted least-squaresapproach to temporal smoothing of NDVI. In: ASPRS Annual Conference, FromImage to Information, Portland, OR, USA.
ieszen, L.L., Reed, B.C., Bliss, N.B., Wylie, B.K., DeJong, D.D., 1997. NDVI, C3 AND C4production, and distributions in Great Plains grassland land cover classes. Ecol.Appl. 7, 59–78.
ucker, C.J., 1979. Red and photographic infrared linear combinations for monitoringvegetation. Remote Sens. Environ. 8, 127–150.
cators 30 (2013) 1–6
Tucker, C.J., Vanpraet, C.L., Sharman, M.J., Van Ittersum, G., 1985. Satellite remotesensing of total herbaceous biomass production in the Senegalese sahel:1980–1984. Remote Sens. Environ. 17, 233–249.
Wang, J., Rich, P.M., Price, K.P., Kettle, W.D., 2004. Relations between NDVI and treeproductivity in the central Great Plains. Int. J. Remote Sens. 25, 3127–3138.
Wang, Q., Adiku, S., Tenhunen, J., Granier, A., 2005. On the relationship of NDVI withleaf area index in a deciduous forest site. Remote Sens. Environ. 94, 244–255.
Wylie, B.K., Denda, I., Pieper, R.D., Harrington, J.A., Reed, B.C., Southward, G.M., 1995.Satellite-based herbaceous biomass estimates in the pastoral zone of Niger. J.Range Manag. 48, 159–164.
Wylie, B.K., Zhang, L., Bliss, N.B., Ji, L., Tieszen, L.L., Jolly, W.M., 2008. Integratingmodelling and remote sensing to identify ecosystem performance anomalies inthe boreal forest, Yukon River Basin, Alaska. Int. J. Dig. Earth 1, 196–220.
Yang, L., Wylie, B.K., Tieszen, L.L., Reed, B.C., 1998. An analysis of relationships among
climate forcing and time-integrated NDVI of grasslands over the U.S. northernand central Great Plains. Remote Sens. Environ. 65, 25–37.Zhang, L., Wylie, B.K., Ji, L., Gilmanov, T.G., Tieszen, L.L., Howard, D.M., 2011. Upscal-ing carbon fluxes over the Great Plains grasslands: sinks and sources. J. Geophys.Res. G: Biogeosciences 116, G00J03.
Related Documents