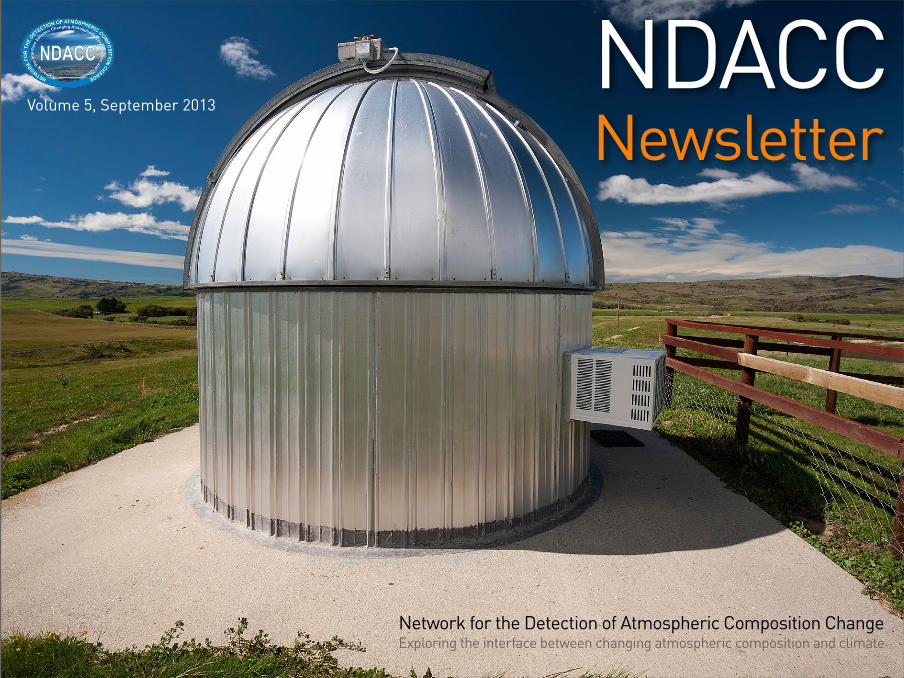
NDACC Newsletter Network for the Detection of Atmospheric Composition Change Exploring the interface between changing atmospheric composition and climate Volume 5, September 2013

Welcome message from author
This document is posted to help you gain knowledge. Please leave a comment to let me know what you think about it! Share it to your friends and learn new things together.
Transcript
NDACC Newsletter
Network for the Detection of Atmospheric Composition ChangeExploring the interface between changing atmospheric composition and climate
Volume 5, September 2013
2
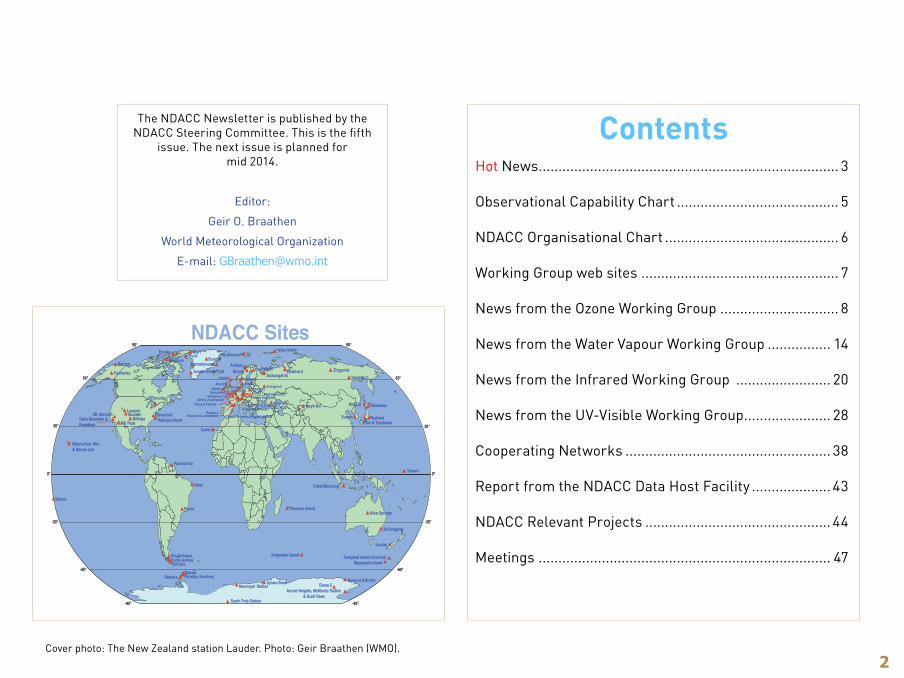
NDACC Sites90°
60°
30°
0°
-30°
-60°
-90°
90°
60°
30°
0°
-30°
-60°
-90°
Bern & Jungfraujoch
BordeauxHaute Provence &Plateau de Bure
Garmisch & Zugspitze
LegionowoPrahaHoher Sonnblick
Aberystwyth
AberdeenValentia Uccle
Hohenpeissenberg
DeBiltBremen
Villeneuve d'Ascq
Briançon & Lannemezan
Arosa & Payerne
Onsala
Izaña
HarestuaLerwick
RotheraSyowa Base
South Pole Station
Mauna Kea, Hilo,& Mauna Loa
Faraday (Inactive)Palmer
Natal
Bauru
Kerguelen Island
Neumayer Station
Paramaribo
Samoa
Punta ArenasUshuaia
Rio Gallegos
Tarawa
Lauder
Ciater/Bandung
Wollongong
Alice Springs
Groß-Enzersdorf
Rikubetsu
TsukubaKiso & Toyokawa
Reunion Island
Suwon
Arrival Heights, McMurdo Station
Dumont d'UrvilleDome C
Campbell Island (Inactive)Macquarie Island
Kitt Peak
Toronto
Table Mountain &Pasadena
Mt. Barcroft GreenbeltBillings Wallops Island
LaramieBoulder
Fairbanks
BarrowKiruna
Ny-Ålesund
Søndre StrømfjordScoresbysund
Zvenigorod
Zhygansk
Moshiri
AndøyaSalekhard
Kislovodsk Issyk-Kul
Arckangel'sk
Heiss Island
Yakutsk
Summit
& Scott Base
Thule
Sodankylä
Alert
Resolute
Eureka
The NDACC Newsletter is published by the NDACC Steering Committee. This is the fifth
issue. The next issue is planned for mid 2014.
Editor:
Geir O. Braathen
World Meteorological Organization
E-mail: [email protected]
Cover photo: The New Zealand station Lauder. Photo: Geir Braathen (WMO).
ContentsHot News ............................................................................ 3
Observational Capability Chart ......................................... 5
NDACC Organisational Chart ............................................ 6
Working Group web sites .................................................. 7
News from the Ozone Working Group .............................. 8
News from the Water Vapour Working Group ................ 14
News from the Infrared Working Group ........................ 20
News from the UV-Visible Working Group ...................... 28
Cooperating Networks .................................................... 38
Report from the NDACC Data Host Facility .................... 43
NDACC Relevant Projects ............................................... 44
Meetings .......................................................................... 47
3
Hot NewsNORS and rapid data delivery to the NDACC database
The Demonstration Network Of ground-based Remote Sensing observations (NORS) is a new EU Framework 7 R&D project in support of the GMES Atmospheric Service (GAS) that began on November 1, 2011 and will run for 33 months.
The project is built around 4 NDACC pilot stations: Ny-Ålesund, the Alps (Bern, Jungfraujoch, and Observatoire de Haute Provence), Izaña, and Île de La Réunion and 4 NDACC remote sensing techniques for studying atmospheric composition (microwave, differential lidar, and infrared, and UV/Visible differential optical absorption spectrometry). NORS focuses on a limited number of target species in the troposphere and the stratosphere: Ozone, CO, CH4, NO2, HCHO and aerosol extinction. The general objective of the project is to perform the required research and development necessary to optimise NDACC data products to support quality assessments of the future GAS.
One of the more specific objectives is to achieve data submission to the NDACC database with a maximum delay of 1 month from data acquisition, in the GEOMS HDF file format, one of the stand-ard data file formats in the NDACC database.
If these rapid delivery data are of less quality than the standard verified NDACC data or if the data file is less complete (e.g. missing uncertainty estimates), then the data must be identified as NRT in the DATA_QUALITY attribute of the data file; the data provider will submit a standard verified version of the same data later on.
The NRT-data will show up in the newly created NRT directory on the NDACC ftp public data server and will be removed by the data
provider as soon as the standard verified data become available. The latter will appear on the NDACC public database ftp server as usual in the corresponding station directories.
The existence of the NRT directory is a new feature of the NDACC database that has been implemented for the purpose of NORS but that is available to all NDACC PIs who want to use this option. The purposes of the NRT directory are (1) to enable the data providers to rapidly submit data that are suitable for first-look purposes but that may require a further quality-control before being submitted to the regular station data, and (2), to make the quality distinction clearly visible to the users of the data. Further inquiries on the use of this option should be directed to the NDACC Database Administrator.
TCCON
The NDACC welcomes as a Cooperating Network the Total Column Carbon Observing Network (TCCON). Though the primary data product is high precision total column CO2 several other gases are retrieved and archived as well. Sites for the network span the globe to provide diverse and targeted data for use as validation sites for the GOSAT and OCO-2 CO2 observing satellites as well as monitoring the seasonal cycle and long-term evolution of CO2. The network shares common methodologies, technical issues and membership with the NDACC/IRWG. The instruments are solar viewing Fourier transform spectrometers providing near-infrared spectra. Employing a network wide common retrieval technique and site specific aircraft calibrated retrievals the network aims to provide a temporally dense, globally consist-ent data coverage. Details and data can be found at http://www.tccon.caltech.edu/.
4
New web sites
IR WG
The Infrared Working Group has established a dedicated web site to describe their activities. It can be found here:
http://www.acd.ucar.edu/irwg/
Lidar WG
Also the Lidar Working Group has established a dedicated web site to describe their activities. It can be found here:
http://ndacc-lidar.org/
UV-Vis WG
The UV-Visible Working Group has established a dedicated web site:
http://ndacc-uvvis-wg.aeronomie.be/
NDACC Symposium, Île de la Réunion, 7-10 November 2011
The second NDACC symposium was arranged in order to celebrate the first twenty years of NDSC/NDACC operation. The Symposium was held in Île de la Réunion on 7-10 November 2011. A short report from the symposium can be found on page 49.
The Quadrennial Ozone Symposium, Toronto, August 2012
The 2012 Quadrennial Ozone Symposium (QOS) was held under the auspices of the International Ozone Commission (IO3C) of the International Association of Meteorology and Atmospheric Sciences (IAMAS) during the last week of August, 2012 in the Sheraton Centre in downtown Toronto, Canada. The meeting
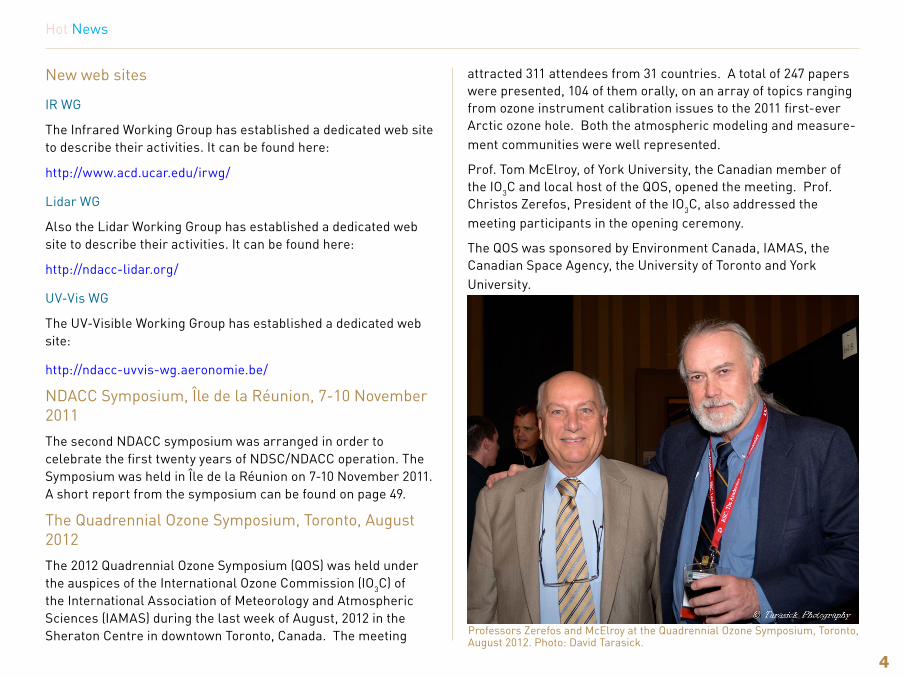
attracted 311 attendees from 31 countries. A total of 247 papers were presented, 104 of them orally, on an array of topics ranging from ozone instrument calibration issues to the 2011 first-ever Arctic ozone hole. Both the atmospheric modeling and measure-ment communities were well represented.
Prof. Tom McElroy, of York University, the Canadian member of the IO3C and local host of the QOS, opened the meeting. Prof. Christos Zerefos, President of the IO3C, also addressed the meeting participants in the opening ceremony.
The QOS was sponsored by Environment Canada, IAMAS, the Canadian Space Agency, the University of Toronto and York University.
Hot News
Professors Zerefos and McElroy at the Quadrennial Ozone Symposium, Toronto, August 2012. Photo: David Tarasick.
5
Observational Capability Chart
Observational Capabilities of the Network for the Detection of Atmospheric Composition Change
O3
H2O
Altit
ude
Ripples indicate approximate vertical resolution.
NO
y
Aero
sols
Tem
pera
ture
GH
Gs
Hal
ocar
bons
UV
radi
atio
n
Rea
ctiv
e ga
ses
F y/Cl y
/Br y
NO
y
F y/Cl y
/Br y
H2OO3
Dob
son,
Bre
wer
, UV-
Vis
DO
AS
UV-
Vis
DO
AS (O
ClO
, BrO
)
10-15 km
45-50 km
0 km
UV-
Vis
DO
AS (N
O2)
FTIR
(CFC
11, C
FC12
, HC
FC22
, SF 6)
Surfa
ce s
pect
ral U
V ra
dian
ce a
nd ir
radi
ance
Mic
row
ave
radi
omet
er
Total Column Vertical Profiles
FTIR
Lida
r
Ozo
neso
ndes
Mic
row
ave
spec
trom
eter
FTIR
Mic
row
ave
spec
trom
eter
Lida
r
Fros
t poi
nt h
ygro
met
er s
onde
s
Mic
row
ave
(ClO
)
FTIR
(HF,
HC
l, C
lON
O2 )
Back
scat
ter s
onde
s
FTIR
(CO
2 , C
H4 , N
2O)
Lida
r
FTIR
(CO
, hyd
roca
rbon
s)
Lida
r
FTIR
(NO
, NO
2 , H
NO
3)
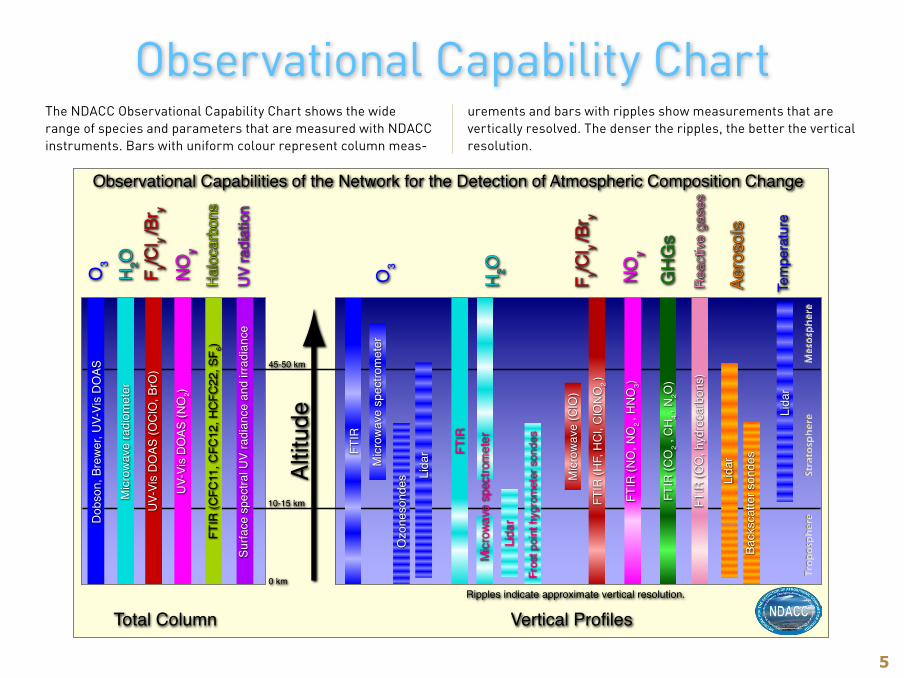
The NDACC Observational Capability Chart shows the wide range of species and parameters that are measured with NDACC instruments. Bars with uniform colour represent column meas-
urements and bars with ripples show measurements that are vertically resolved. The denser the ripples, the better the vertical resolution.
6
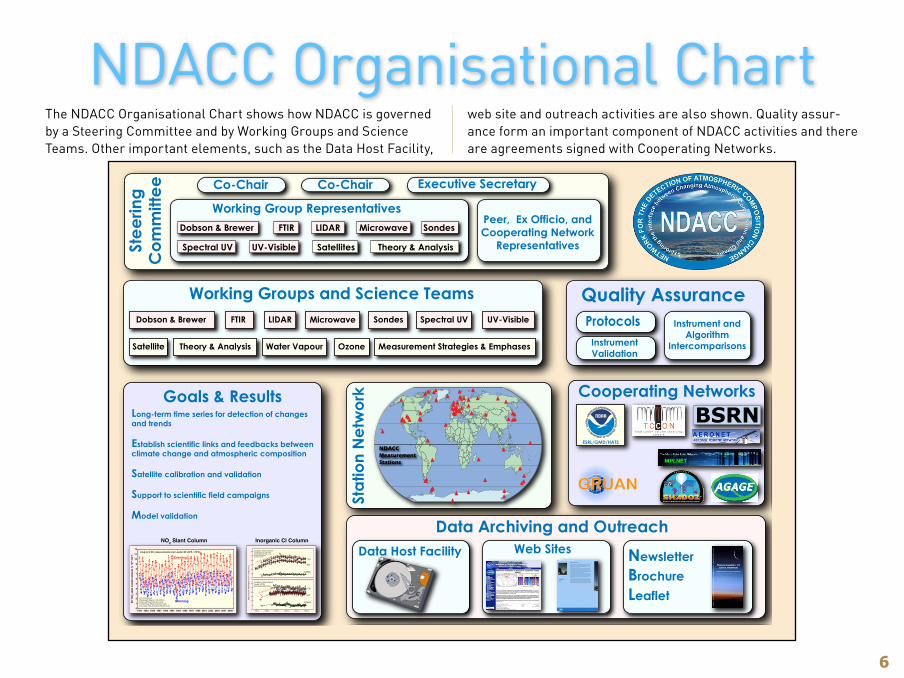
NDACC Organisational ChartThe NDACC Organisational Chart shows how NDACC is governed by a Steering Committee and by Working Groups and Science Teams. Other important elements, such as the Data Host Facility,
web site and outreach activities are also shown. Quality assur-ance form an important component of NDACC activities and there are agreements signed with Cooperating Networks.
0
1
2
3
4
5
6
1984.0 1989.00
1
2
3
4
5
6
Inorganic chlorine aboveJungfraujoch (46.5°N)
Inorganic chlorine aboveLauder (45°S)
June-to-November monthly means
Year-round monthly means
2
Cly
HCl
ClONO2
ClONO2
HCl
Cly
1994.0 1999.0 2004.0 2009.0
Tota
l Col
umn
Abu
ndan
ce (x
10
mol
ec./c
m )
152
Data Archiving and Outreach
Quality Assurance
Working Group RepresentativesPeer, Ex Officio, andCooperating Network
Representatives
NDACCMeasurement Stations
Protocols Instrument andAlgorithm
Intercomparisons
Goals & Results
Co-Chair Co-Chair Executive Secretary
Long-term time series for detection of changes and trends
Establish scientific links and feedbacks between climate change and atmospheric composition
Satellite calibration and validation
Support to scientific field campaigns
Model validation
1981 1983 1985 1987 1989 1991 1993 1995 1997 1999 2001 2003 2005 2007 20090
1
2
3
4
5
6
7
8
9
10
11
12
v0.5 Processing:Wavelength Region: 435-450nmObserved Ring X-Section usedControl Ring Offset correction madeLow Temp. NO2 X-section (Harder et al.)
Evening
Morning
Long term NO2 measurements over Lauder, NZ (45°S, 170°E)
90° N
O2 s
lant
col
umn
amou
nt (x
1016
cm
-2)
NO2 Slant Column Inorganic Cl Column
InstrumentValidation
Theory & Analysis
UV-VisibleFTIR Microwave Spectral UVDobson & Brewer Sondes
Satellite
LIDAR
Ozone Measurement Strategies & EmphasesWater Vapour
UV-Visible
FTIR LIDAR Microwave
Spectral UV
Dobson & Brewer
Theory & AnalysisSatellites
Sondes
ESRL/GMD/HATS
U.S. DEPARTMENT OF COMMERCE
NAT
ION
ALO
CEANIC
AND ATMOSPHERIC ADMINISTR
ATION
Working Groups and Science Teams
Stee
ring
Com
mitt
ee
Cooperating Networks
Stat
ion
Net
wor
k
Data Host Facility Web Sites NewsletterBrochureLeaflet
BSRN
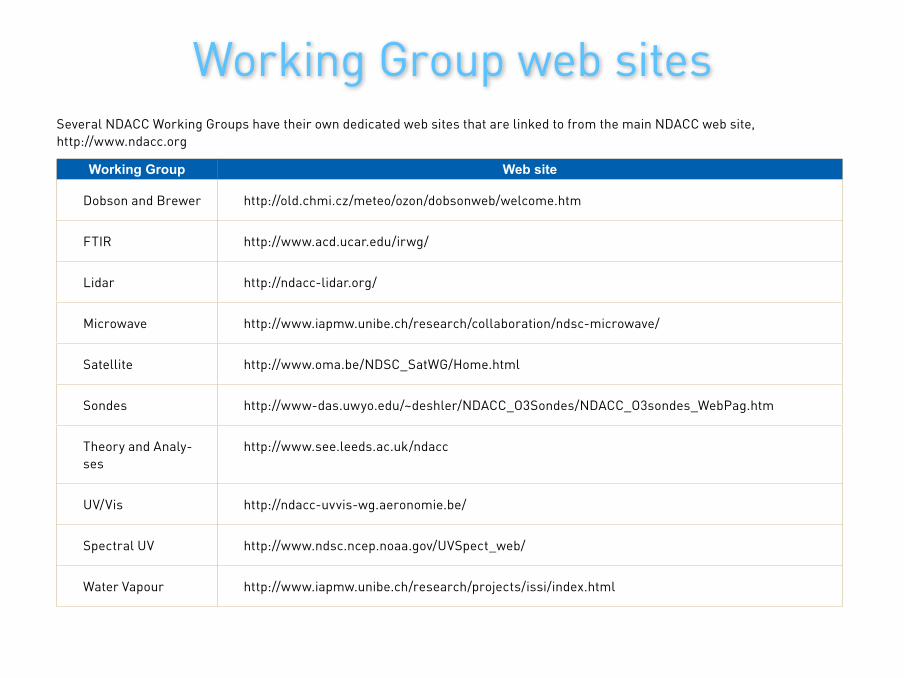
Working Group web sitesSeveral NDACC Working Groups have their own dedicated web sites that are linked to from the main NDACC web site, http://www.ndacc.org
Working Group Web site
Dobson and Brewer http://old.chmi.cz/meteo/ozon/dobsonweb/welcome.htm
FTIR http://www.acd.ucar.edu/irwg/
Lidar http://ndacc-lidar.org/
Microwave http://www.iapmw.unibe.ch/research/collaboration/ndsc-microwave/
Satellite http://www.oma.be/NDSC_SatWG/Home.html
Sondes http://www-das.uwyo.edu/~deshler/NDACC_O3Sondes/NDACC_O3sondes_WebPag.htm
Theory and Analy-ses
http://www.see.leeds.ac.uk/ndacc
UV/Vis http://ndacc-uvvis-wg.aeronomie.be/
Spectral UV http://www.ndsc.ncep.noaa.gov/UVSpect_web/
Water Vapour http://www.iapmw.unibe.ch/research/projects/issi/index.html
8
NDACC Measurement and Analysis Contributions to the SPARC/IO3C/IGACO/NDACC (SI2N) Initiative on Past Changes in the Vertical Distribution of Ozoneby Michael Kurylo,Universities Space Research Association, NASA Goddard
Space Flight Center, Greenbelt, MD, USA
Historical Perspective
For more than three decades the international atmospheric science community has conducted comprehensive assessments of the state of our understanding of the response of the Earth’s stratospheric ozone layer to various natural and anthropogenic forcings (WMO, 2011 and references contained therein). Since such forcings leave signatures on the ozone abundances at dif-ferent altitudes, an integral component of these assessments has been the determination of ozone profile trends (and their uncer-tainties). Throughout the 1990’s, however, trends derived from different ozone profile data sets have not been entirely consist-ent. For example, the 1994 Ozone Assessment (WMO, 1995) cited an inconsistency between ozone profile trends obtained from satellite vs. ground-based measurements.
Thus, in an attempt to resolve this discrepancy the Stratospheric Processes and their Role in Climate (SPARC) project of the World Climate Research Programme (WCRP) initiated in 1996 a collabo-ration with the International Ozone Commission (IO3C) under the
auspices of the WCRP and the World Meteorological Organization to carefully re-evaluate the ground-based and satellite ozone data. This study, headed by the SPARC Panel on Understanding Ozone Trends, did not simply review the published literature but conducted a critical re-analysis and interpretation of ozone vertical profiles. Consequently, a significant focus of the study included validation of the data quality and quantification of the errors to determine if such aspects limited trend determinations as a function of altitude or latitude.
The SPARC/IO3C/GAW Assessment of Trends in the Vertical Distribution of Ozone was published in 1998 (SPARC Report No. 1) and was used extensively in the 1998 Ozone Assessment (WMO, 1999). This complete report can be downloaded from the SPARC web site at http://www.sparc-climate.org/publications/sparc-reports/sparc-report-no1/
The SI2N Initiative
Since the 1998 trends assessment, the end of certain satellite records (the SAGE instruments in particular) has limited our observations of global changes in the vertical distribution of ozone. More specifically, while a number of new satellite instru-ments have been launched since 2000, no thorough assessment of how well these new measurements agree with each other or with the SAGE record has been conducted. In addition, ozone profile measurements from various ground-based networks have matured through an additional 15 years of operations and through improved geographical coverage. Thus, these additional meas-urement assets have the potential for use in providing a global view of ozone changes (Steinbrecht et al., 2009).
However, due to the aforementioned lack of a rigorous evalua-
News from the Ozone Working Group
9
News from the Ozone Working Group
tion of the new satellite instruments, few trend analyses using satellite ozone profile data have been performed since the WMO (2007) report. In fact, the satellite records did not provide significant updates of the long-term ozone changes for the WMO (2011) assessment. Thus, in an effort to improve our knowledge and understanding of the past changes in the vertical distribu-tion of ozone, a new SPARC/IO3C/IGACO/NDACC (SI2N) initiative has been organized. Details on the scope of this initiative and about its specific components can be found on the initiative web site http://igaco-o3.fmi.fi/VDO/index.html and in recent SPARC Newsletter articles (Harris et al., 2011; Harris et al., 2012).
Briefly, under this initiative satellite, ground-based, and sonde measurements of ozone are being critically analysed, as are methods of preparing combined data sets in an effort to provide input to the next WMO Scientific Assessment of Ozone Depletion planned for 2014. As might be anticipated from the above discus-sion, this initiative entails far more than the simple analysis of multiple data records for trends. Within the SI2N initiative, an essential aim is to better understand all instrumental records and to improve the methods for combining them. Validation of each measurement record by other measurements is integral to this approach.
Finally the SI2N initiative highlights the need for, and challenges associated with, keeping high quality atmospheric profiling operational for at least the next two decades or so. From both a space-based and non-space-based perspective, such continuity is in jeopardy. In particular, in the post SAGE satellite time frame the “golden age” of satellite limb and solar occultation measure-ments appears to be over. While the SI2N initiative will hopefully make broad gains in our abilities to utilize and combine data from diverse measurement suites for ozone profiles, temperature profiles, and even trace gas abundances and profiles, it cannot fill
all the gaps created by measurement cessation.
NDACC Activities
Such a focus on the quality assurance of long-term data records, verification of instrument performance, and intercomparisons of data sets from a broad spectrum of instruments has been a corner stone of the NDACC (formerly the NDSC) since its incep-tion. The expanded role of ground-based profile measurements within the SI2N initiative charts a clear path for NDACC leadership in
• comparing ground-based measurements with those from current satellite instruments to examine bias, drift, and trends,
• intercomparing ground-based data records from the same and different instrument types operating in similar geographic regimes, and
• exploring the capabilities of ground-based measurements for filling future gaps in satellite data.
Three NDACC instrument working groups (led by S. Godin-Beekmann, T. Leblanc, and W. Steinbrecht; N. Kämpfer and G. Nedoluha; and J. Hannigan and M. De Mazière) for lidar, micro-wave and FTIR respectively are ensuring that the contributions by these instruments to the initiative occur in a timely manner. NDACC scientists are also contributing to the efforts of two ad-ditional SI2N working groups (Ozonesondes led by S. Oltmans and H. Smit, and Umkehr led by T. McElroy and I. Petropavlovskikh).
Exemplary of the type of SI2N-related activities being pursued by NDACC investigators is the study by Nair et al., 2012 on the long-term evolution of stratospheric ozone at different lidar stations in the low and mid-latitudes. As summarized in the manuscript, this study established the degree of bias and drift of short- and long-term data for a number of ground-based stations and evalu-ated drifts of the combined data sets. Thus, It demonstrated that

10
News from the Ozone Working Group
Figure 1. Anomaly of the ozone partial column (35-45 km) at five ozone lidar sta-tions from Hohenpeissenberg in the north to Lauder in the south for the time period 1979-2012. Updated from Steinbrecht et al. (2009).
the long-term NDACC ozone lidar measurements are, indeed, suitable for the evaluation of the stability of satellite observations and for the estimation of ozone trends.
A broad range of SI2N-focused activities is now underway within the NDACC and the associated publications are in preparation. These include studies dealing specifically with lidar, microwave, or FTIR measurements as well as those that combine data from multiple instrument types including both ozonesondes and Umkehr. A representative sampling is highlighted below.
Lidar-specific activities include an extension of the Nair et al, 2012 work using data from several NDACC stations (led by inves-tigators at the Observatoire de Haute-Provence) to other satel-lites, new data versions, and merged ozone products. Trends in total ozone and in its vertical distribution at OHP will then be determined. Steinbrecht et al. have updated their 2009 study of ozone and temperature trends from multiple lidar stations and compare the results with those from other data sets. The ozone anomalies updated from the Steinbrecht et al. (2009) paper are presented in Figure 1. Lidar investigators from the Jet Propulsion Laboratory are preparing for publication the results from an International Space Science Institute (ISSI) team study yielding a new NDACC lidar-standardized expression of vertical resolution and a new NDACC lidar-standardized expression of uncertainty, and the technical implementation of both. This same group is finalizing a study on long-term trends in ozone determined from JPL lidar data at the Mauna Loa Observatory and the JPL Table Mountain Facility together with coincident satellite data (SAGE II, HALOE, Aura-MLS). This study will be extended to include more
1980 1985 1990 1995 2000 2005 2010 2015
-505
-505
-505
35 to
45
km o
zone
ano
mal
y [%
]
-505
-20-15-10-505
F 10.7cm
Lidar, µWave , SAGE, HALOE, SBUV, GOMOS, SCIA, allMIPAS
Hohenpeissenberg/Bern(48°N)
Haute Provence(44°N,6°E)
Table Mountain(35°N,118°W)
Hawaii (20°N,156°W)
Lauder (45°S,170°E)
-ESC(4 yr, 2wd, 0Br)
11
News from the Ozone Working Group
NDACC sites and data sets (lidar as well as microwave) in an attempt to examine longitudinal asymmetries.
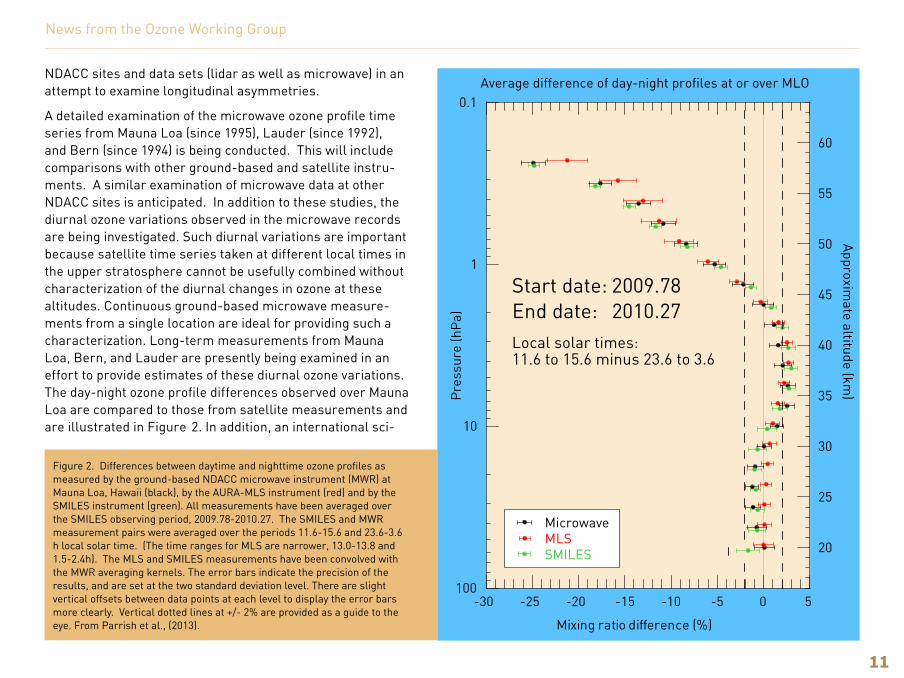
A detailed examination of the microwave ozone profile time series from Mauna Loa (since 1995), Lauder (since 1992), and Bern (since 1994) is being conducted. This will include comparisons with other ground-based and satellite instru-ments. A similar examination of microwave data at other NDACC sites is anticipated. In addition to these studies, the diurnal ozone variations observed in the microwave records are being investigated. Such diurnal variations are important because satellite time series taken at different local times in the upper stratosphere cannot be usefully combined without characterization of the diurnal changes in ozone at these altitudes. Continuous ground-based microwave measure-ments from a single location are ideal for providing such a characterization. Long-term measurements from Mauna Loa, Bern, and Lauder are presently being examined in an effort to provide estimates of these diurnal ozone variations. The day-night ozone profile differences observed over Mauna Loa are compared to those from satellite measurements and are illustrated in Figure 2. In addition, an international sci-
-30 -25 -20 -15 -10 -5 0 5
Mixing ratio difference (%)
100
10
1
0.1
Pre
ssur
e (h
Pa)
20
25
30
35
40
45
50
55
60
Approxim
ate altitude (km)
Average difference of day-night profiles at or over MLO
Start date: 2009.78
Local solar times: 11.6 to 15.6 minus 23.6 to 3.6
End date: 2010.27
MicrowaveMLSSMILES
Figure 2. Differences between daytime and nighttime ozone profiles as measured by the ground-based NDACC microwave instrument (MWR) at Mauna Loa, Hawaii (black), by the AURA-MLS instrument (red) and by the SMILES instrument (green). All measurements have been averaged over the SMILES observing period, 2009.78-2010.27. The SMILES and MWR measurement pairs were averaged over the periods 11.6-15.6 and 23.6-3.6 h local solar time. (The time ranges for MLS are narrower, 13.0-13.8 and 1.5-2.4h). The MLS and SMILES measurements have been convolved with the MWR averaging kernels. The error bars indicate the precision of the results, and are set at the two standard deviation level. There are slight vertical offsets between data points at each level to display the error bars more clearly. Vertical dotted lines at +/- 2% are provided as a guide to the eye. From Parrish et al., (2013).
12
News from the Ozone Working Group
ence team has been organized at ISSI on the topic “Characterizing Diurnal Variations of Ozone for Improving Ozone Trend Estimates” (see http://www.issibern.ch/teams/ozonetrend/) and a number of publications are expected to result from team activities.
NDACC FTIR investigators are updating to October 2012 the earlier work by Vigouroux et al., 2008, which used a bootstrap method to determine stratospheric and tropospheric ozone trends from FTIR data at six European NDACC stations. A multi-regression model will now be applied to the updated European time-series, and to additional FTIR stations in both hemispheres, including Lauder NZ, Arrival Heights Antarctica, Thule Green-land, and Toronto Canada.
Numerous additional studies involve the use of lidar, microwave, and FTIR data with those from ozonesondes and Umkehr. For example, the SI2N Umkehr and Ozonesonde Working Groups (in collaboration with NDACC investigators) are utilizing the new Umkehr multiple wavelength algorithm to compare ozone profiles at Mauna Loa obtained from Umkehr, microwave, FTIR, lidar, and ozonesonde measurements. A multiple regression analyses of the Umkehr, ozonesonde and MERRA data records at Boulder, Colorado will also be conducted as will a detailed data analysis of the OHP Umkehr, lidar and sonde records. Finally, an ozone trend analysis using data from several Umkehr and ozonesonde stations together with overpass SBUV V8.6 data is in progress.
The importance of the intercomparisons with satellite data is highlighted in many of the above activities and is particularly emphasized in an ozonesonde and lidar network-based evalu-ation of fourteen satellite limb/occultation profilers being con-ducted under a collaborative effort between the NDACC Satellite Working Group and the aforementioned Lidar and Sonde Working Groups (Hubert et al., 2013). Other NDACC –affiliated investiga-tors are using NDACC measurements to evaluate the results
of combined satellite ozone profile data sets (Wild et al., 2012). Publications resulting from many of the above-listed studies will appear in an SI2N special journal issue as discussed on the SI2N web site and in the referenced SPARC Newsletter articles.
ReferencesHarris, N.R.P., J.S. Staehelin & R.S. Stolarski, 2011: The New Initiative on
Past Changes in the Vertical Distribution of Ozone, SPARC Newsletter 37, 23-26.
Harris, N.R.P., J.S. Staehelin & R.S. Stolarski, 2012: Progress Report on the SI2N Initiative on Past Changes in the Vertical Distribution of Ozone, SPARC Newsletter 39, 21-24.
Hubert, D., T. Verhoelst, A. Keppens, J. Granville, J.-C. Lambert, Ozonesonde and lidar network-based evaluation of fourteen satellite limb/occultation profilers for the next SPARC and WMO ozone trend assessments, 2013 (in preparation).
Nair, P.J., S. Godin-Beekmann, L. Froidevaux, L. E. Flynn, J. M. Zawodny, J. M. Russell III, A. Pazmiño, G. Ancellet, W. Steinbrecht, H. Claude, T. Leb-lanc, S. McDermid, J. A. E. van Gijsel, B. Johnson, A. Thomas, D. Hubert, J.-C. Lambert, and H. Nakane, Relative drifts and stability of satellite and ground-based stratospheric ozone profiles at NDACC lidar stations, Atmos. Meas. Tech. Discuss., 5, 471-516, doi:10.5194/amtd-5-471-2012, 2012.
Parrish, A., I. S. Boyd, G. E. Nedoluha, P. K. Bhartia, S. M. Frith, N. A. Kramarova, B. J. Connor, G. E. Bodeker, and L. Froidevaux,, Diurnal variations of stratospheric ozone measured by ground-based microwave remote sensing at the Mauna Loa NDACC site: Measurement validation and GEOSCCM model comparison, Atmospheric Chemistry and Physics, 2013 (in preparation).
SPARC Report No.1; WMO Ozone Research and Monitoring Project Report No. 43, 1998.
Steinbrecht, W., H. Claude, F. Schönenborn, I. S. McDermid, T. Leblanc, S. Godin-Beekmann, P. Keckhut, A. Hauchecorne, J. A. E. Van Gijsel, D. P. J. Swart, G. E. Bodeker, A. Parrish, I. S. Boyd, N. Kämpfer, K. Hocke, R. S. Stolarski, S. M. Frith, L. W. Thomason, E. E. Remsberg, C. Von Savigny, A. Rozanov, and J. P. Burrows, 2009: Ozone and temperature trends in the upper stratosphere at five stations of the Network for the Detection of Atmospheric Composition Change, Int. J. Remote Sens., 30, 3875-3886, doi: 10.1080/01431160902821841.
13
News from the Ozone Working Group
Absorption Cross Sections of Ozone (ACSO)by Geir Braathen, World Meteorological Organization
The committee “ACSO” (“Absorption Cross Sections of Ozone”) established in spring 2009 is a joint ad hoc commission of the Scientific Advisory Group (SAG) of the Global Atmosphere Watch (GAW) of the World Meteorological Organization (WMO) and the International Ozone Commission (IO3C) of the International Association of Meteorology and Atmospheric Sciences (IAMAS).
The mandate of ACSO includes:
• Review the presently available ozone absorption cross sections. Priority will be on the Huggins band in the first instance.
• Determine the impact of changing the reference ozone absorption cross sections for all of the commonly used (both ground-based and satellite) atmospheric ozone monitoring instruments.
• Recommend whether a change needs to be made to the presently used WMO/IO3C standard ozone absorption cross section data (by Bass and Paur, 1985).
The recommendations are being discussed with the community of the involved experts. The first discussion on ozone cross sections took place at the IGACO-Ozone/UV meeting in Geneva in April 2008. The first meeting entirely dedicated to ozone absorption cross sections took place in May 2009. New meetings on ozone cross sections were arranged in March 2010 and January 2011. The final meeting of ACSO, as far as the Huggins band is con-cerned, took place in early June 2013. There might be meetings a later stage dealing with ozone absorption cross sections in other spectral regions. Information about the ACSO process with presentations given at the meetings can be found here: http://igaco-o3.fmi.fi/ACSO/
Vigouroux, C., De Mazière, M., Demoulin, P., Servais, C., Hase, F., Blumen-stock, T., Kramer, I., Schneider, M., Mellqvist, J., Strandberg, A., Velazco, V., Notholt, J., Sussmann, R., Stremme, W., Rockmann, A., Gardiner, T., Coleman, M., and Woods, P.: Evaluation of tropospheric and stratospheric ozone trends over Western Europe from ground-based FTIR network observations, Atmos. Chem. Phys., 8, 6865-6886, doi:10.5194/acp-8-6865-2008, 2008.
Wild, J. D., C. S. Long, and L. E. Flynn; A Coherent Ozone Profile Dataset from SBUV, SBUV/2: 1979 to 2011; Atmos. Chem. And Phys.; submitted, 2012.
WMO (World Meteorological Organization, Scientific Assessment of Ozone Depletion: 1994, Global Ozone Research and Monitoring Project – Report No. 37, Geneva, Switzerland, 1995.
WMO (World Meteorological Organization, Scientific Assessment of Ozone Depletion: 1998, Global Ozone Research and Monitoring Project – Report No. 44, Geneva, Switzerland, 1999.
WMO (World Meteorological Organization, Scientific Assessment of Ozone Depletion: 2006, Global Ozone Research and Monitoring Project – Report No. 50, Geneva, Switzerland, 2007.
WMO (World Meteorological Organization, Scientific Assessment of Ozone Depletion: 2010, Global Ozone Research and Monitoring Project – Report No. 52, Geneva, Switzerland, 2011.
14
News from the Water Vapour Working Group
Springer book on water vapour monitoringby Geir Braathen, World Meteorological Organization
Water vapour and its role in weather and climate
Water vapour in the atmosphere is the key trace gas controlling weather and climate. It also plays a central role in atmospheric chemistry, influencing the heterogeneous chemical reactions that destroy stratospheric ozone. The effects of water vapour are large in the upper troposphere and lower stratosphere, but there are few measurements of water vapour concentrations and its long-term variation in this altitude region.
The importance of measurements on a continuous basis of water vapour has been recognized and data from a number of well vali-dated instruments worldwide are made available to the scientific
community through NDACC, the Network for the Detection of Atmospheric Composition Change.
Members of NDACC have recognized the need to carefully ana-lyse the different measuring and retrieval techniques for water vapour and established a working group on water vapour that met in 2006 for the first time. With help from the International Space Science Institute (ISSI) the working group has found the support to continue with an activity that has started successfully. Three workshops were held during the 2008-2009 time period with support from ISSI and the outcome of these workshops material-ised in a book published by Springer in the ISSI Scientific Report Series (Kämpfer, 2013).
Reference
N. Kämpfer (ed.), Monitoring Atmospheric Water Vapour, ISSI Scientific Report Series 10, ISBN 978-1-4614-3908-0. © Springer Science +Busi-ness Media, LLC 2013
15
News from the Sonde Working Group
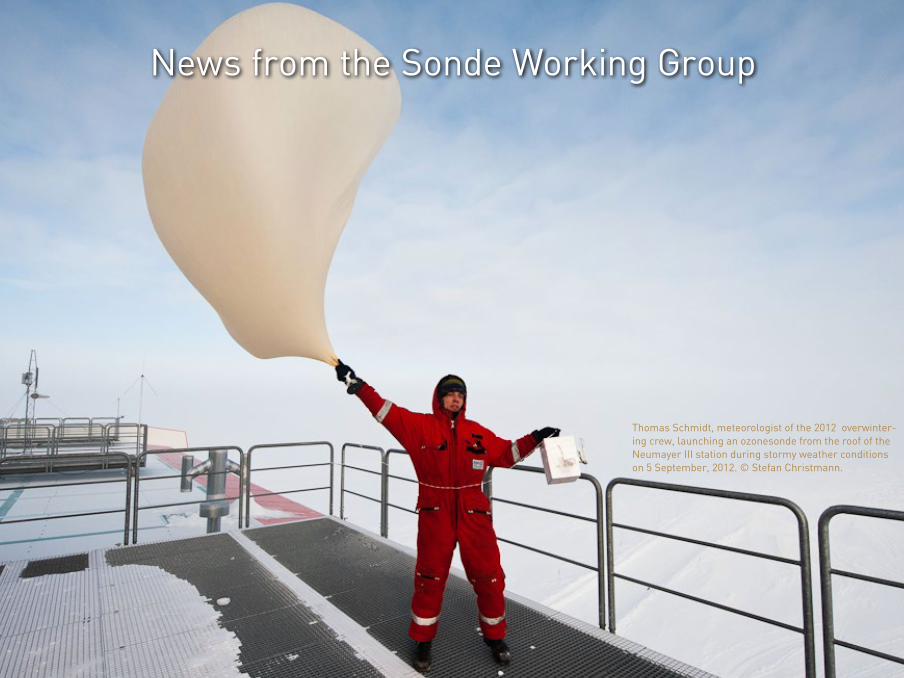
Thomas Schmidt, meteorologist of the 2012 overwinter-ing crew, launching an ozonesonde from the roof of the Neumayer III station during stormy weather conditions on 5 September, 2012. © Stefan Christmann.
16
News from the Sonde Working Group
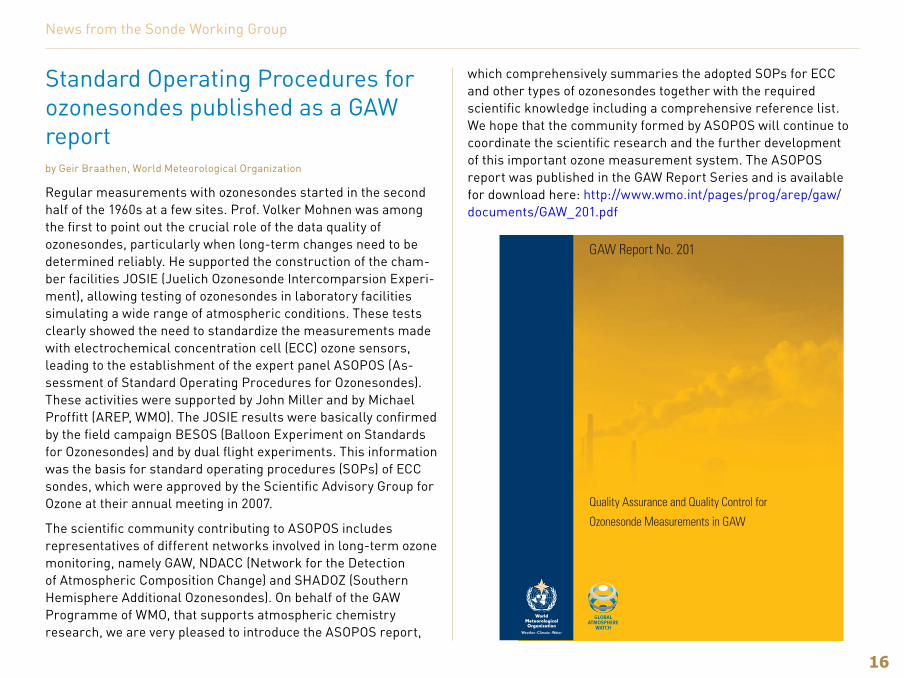
Standard Operating Procedures for ozonesondes published as a GAW reportby Geir Braathen, World Meteorological Organization
Regular measurements with ozonesondes started in the second half of the 1960s at a few sites. Prof. Volker Mohnen was among the first to point out the crucial role of the data quality of ozonesondes, particularly when long-term changes need to be determined reliably. He supported the construction of the cham-ber facilities JOSIE (Juelich Ozonesonde Intercomparsion Experi-ment), allowing testing of ozonesondes in laboratory facilities simulating a wide range of atmospheric conditions. These tests clearly showed the need to standardize the measurements made with electrochemical concentration cell (ECC) ozone sensors, leading to the establishment of the expert panel ASOPOS (As-sessment of Standard Operating Procedures for Ozonesondes). These activities were supported by John Miller and by Michael Proffitt (AREP, WMO). The JOSIE results were basically confirmed by the field campaign BESOS (Balloon Experiment on Standards for Ozonesondes) and by dual flight experiments. This information was the basis for standard operating procedures (SOPs) of ECC sondes, which were approved by the Scientific Advisory Group for Ozone at their annual meeting in 2007.
The scientific community contributing to ASOPOS includes representatives of different networks involved in long-term ozone monitoring, namely GAW, NDACC (Network for the Detection of Atmospheric Composition Change) and SHADOZ (Southern Hemisphere Additional Ozonesondes). On behalf of the GAW Programme of WMO, that supports atmospheric chemistry research, we are very pleased to introduce the ASOPOS report,
which comprehensively summaries the adopted SOPs for ECC and other types of ozonesondes together with the required scientific knowledge including a comprehensive reference list. We hope that the community formed by ASOPOS will continue to coordinate the scientific research and the further development of this important ozone measurement system. The ASOPOS report was published in the GAW Report Series and is available for download here: http://www.wmo.int/pages/prog/arep/gaw/documents/GAW_201.pdf
For more information, please contact:
World Meteorological Organization
Research Department
Atmospheric Research and Environment Branch
7 bis, avenue de la Paix – P.O. Box 2300 – CH 1211 Geneva 2 – Switzerland
Tel.: +41 (0) 22 730 81 11 – Fax: +41 (0) 22 730 81 81
E-mail: [email protected]
Website: http://www.wmo.int/pages/prog/arep/gaw/gaw_home_en.html
GAW Report No. 201
Quality Assurance and Quality Control for
Ozonesonde Measurements in GAW
17
News from the Sonde Working Group
Ozonesonde Data Series Homogenization Project Status as of 7 May, 2013
by Bryan Johnson, Global Monitoring Division, NOAA/ESRL, Boulder
The electrochemical concentration cell (ECC) ozonesonde was developed over 40 years ago to interface with a balloon-borne weather radiosonde providing a high resolution measurement of the vertical distribution of ozone from surface to 30-35 km altitude. ECC ozonesondes have gone through various design improvements and standard operating procedure adjustments since they were first manufactured. Approximately every 3-4 years, intercomparison projects have been planned and carried out in the field with multi-sonde balloon platforms and in the environmental simulation facility at Forschungszentrum Jülich, Germany to assess performance of various sonde types and pro-cedures. From the JOSIE (Smit et al., 2007) and BESOS (Deshler et al., 2008) intercomparison activities it was found that several significant events over the course of an ozonesonde measure-ment program may contribute to an inhomogeneous ozone data record. Two prominent ones were a switch from one ozonesonde type or manufacturer to another and a change in sensing solution composition used in ECC sondes. Other changes that may be important include: processing software, measurement of the pump flow rate, measure of the background current, total ozone normalization factors, and the pump temperature (actual pump temperature or box temperature). The recent WMO/GAW Report No. 201 (WMO, 2011) provides details of ozonesonde experiments and an assessment of standard operating procedures.
These Intercomparison reports and independent studies (dual
flights from several ozonesonde sites) have provided a strong scientific background to begin addressing the goal of homogeniz-ing data and to produce a consistent time series of ozonesonde profiles that will be available for data users, including satellite ozone profiling and trend analysis groups.
The steps to preparing for data homogenization were addressed at three meetings (listed in Table 1) through discussions and presentations on strategies and methods for carrying out an activity for producing ozonesonde data sets that had been scrutinized and, where necessary, reprocessed, selecting long term sites for homogenization, and setting forth guidelines and designating coaches to assist in the reprocessing effort. Under the new SPARC-IGACO-IO3C-NDACC Initiative on “Past Changes in the Vertical Distribution of Ozone“ (SI2N) an “Ozone Sonde Data Quality Assessment (O3S-DQA)” provided a guideline and motiva-tion for project completion dates.
Table 1. Ozonesonde Homogenization Workshops and Meet-ings
Dates Location Meeting in conjunction with
18-19 October 2011 Boulder, Colorado, NOAA/ESRL
WMO/GAW SAG-Ozone meeting
12-13 April 2012 Greenbelt, Maryland NASA-GSFC
SI2N Workshop (Columbia, MD)
24-25 August 2012 Toronto, Ontario Quad. Ozone Symposium
Strategy
The strategy for the ozonesonde data homogenization process that evolved from the final meeting in Toronto is outlined in four steps:

18
1. Each station begins preparatory work:
• Review and collection of metadata and identify when changes are made at site
• Document reprocessing methods and applications of:
a. Total ozone normalization
b. Total ozone column by Dobson or Brewer
c. Residual ozone column above burst altitude
d. Background currents
e. Pump flow rate
f. Pump temperature in flight
2. Each station will reprocess ozonesonde records:
• Following guidelines prescribed by O3S-DQA
• Using transfer functions based on dual soundings
• Coached by an O3S-DQA-expert
• Adding an uncertainty estimation
3. Validation of ozonesonde data sets involves:
• Testing for consistency
• Comparisons with other ozone profiling instruments at the ozone-sonde site
• Checking homogenized data against satellite data sets
4. Storage of data on the ftp-site at the WCCOS-Data Server.
The transfer function was derived from an analysis of scatter plots and best fit statistics when comparing ozonesonde meas-urements using the two sensing solutions (1% KI versus 0.5% KI) from the BESOS multi-sonde photometer intercomparison flight (Deshler et al., 2008) and dual sonde flights from Kivi et al, 2007; Stuebi et al., 2008; and Mercer et al., 2008.
An essential aspect of this homogenization will be the estimation of expected uncertainties. The basic idea of the ozonesonde homogenization process is to remove all known bias effects from the measured instrumental parameters in order to determine the partial pressure of ozone during a vertical balloon sounding. It is assumed that after removal of all the measured parameter biases (inhomogeneities), the remaining uncertainties of the corrected values are random and follow Gaussian statistics in error propagation.
After the ozonesonde data have been reprocessed, quality checks have to be performed for both internal and external consistency through comparisons with other ozone profiling platforms, which will involve collaborations with other investigators.
Details on homogenization guidelines (WMO, 2011), transfer func-tions, uncertainty analysis, and list of participating ozonesonde stations can be found at the NDACC Ozone and Aerosol Sonde Working Group web site at:
http://www-das.uwyo.edu/~deshler/NDACC_O3Sondes/
NDACC_O3sondes_WebPag.htm
Time Table
The original time table for completion was set up to meet the deadlines for the 2014 WMO-UNEP Scientific Assessment of Ozone Depletion, allowing time for preparing publications, and for presentations at the SI2N Workshop in Helsinki on 18-20 Sep-tember, 2013. The homogenization project is behind schedule with the time-limiting steps to completion primarily related to finding methods to correct or adjust background sensor currents in older data files, calculating and adding an uncertainty column for ozone, and in many cases the sheer number of ozonesonde profiles to review and reprocess - for some networks it involves
News from the Sonde Working Group
19
thousands of data files. The new deadline for having data submit-ted to the WCCOS-Data Server is 3 June 2013. Though it remains a large task and with the deadline looming the motivation to complete the project is of great benefit to the ozonesonde com-munity and data users.
Original Schedule
1. September 2012 - February 2013: Reprocessing Data
2. January-March 2013: Consistency checks with other profiling instru-ments
3. April-June 2013: Validations with satellites
References
Deshler, T., Mercer, J. M., Smit, H.G.J., Stübi, R., Levrat, G., Johnson, B.J., Oltmans, S.J., Kivi, R., Thompson, A.M., Witte, J., Davies, J., Schmidlin, F.J., Brothers, G., Sasaki, T., Atmospheric comparison of electrochemical cell ozonesondes from different manufacturers, and with different cathode so-lution strengths: The Balloon Experiment on Standards for Ozonesondes, J. Geophys. Res., 113, D04307, doi:10.1029/2007JD008975, 2008.
Kivi, R., Kyrö, E., Turunen, T., Harris, N.R.P., von der Gathen, P., Rex, M.,
Andersen, S.B., and Wohltmann, I., Ozonesonde observations in the Arctic during 1989–2003: Ozone variability and trends in the lower stratosphere and free troposphere, J. Geophys. Res., 112, D08306, doi:10.1029/2006JD007271, 2007.
Mercer J., et al., Atmospheric comparisons of electrochemical cell ozone-sondes with different cathode solution strengths and from different manufacturers: A method to homogenize 0.5% and 1.0% KI measure-ments, European Geophysical Union, Vienna, Austria, April, 2008.
Smit, H.G.J., W. Straeter, W., Johnson, B., Oltmans, S., Davies, J., Tarasick, D.W., Hoegger, B., Stübi, R., Schmidlin, F., Northam, T., Thompson, A., Witte, J., Boyd, I., Posny, F., Assessment of the performance of ECC ozonesondes under quasi-flight conditions in the environ-mental simulation chamber: Insights from the Jülich Ozone Sonde Intercomparison Experiment (JOSIE), J. Geophys. Res., 112, D19306, doi:10.1029/2006JD007308, 2007.
Stübi, R., Levrat G., Mercer J., Deshler T., Davis J., Johnson B., Oltmans S., Kivi R., Kyrö E., Schmidlin F., Analysis of ECC dual flights at various sites: transfer functions for correcting KI concentrations and sonde manufactur-ers influences, Quadrennial Ozone Symposium, Tromsø, Norway, July 2008.
World Meteorological Organization (2011), Global Atmosphere Watch Guide, GAW Report No. 201, Quality Assurance and Quality Control for Ozonesonde Measurements in GAW, Geneva 2011. http://www.wmo.int/pages/prog/arep/gaw/documents/GAW_201.pdf
News from the Sonde Working Group
20The annual infrared working group meeting in May 2007 assembled more than 40 scientists.
News from the Infrared Working Group
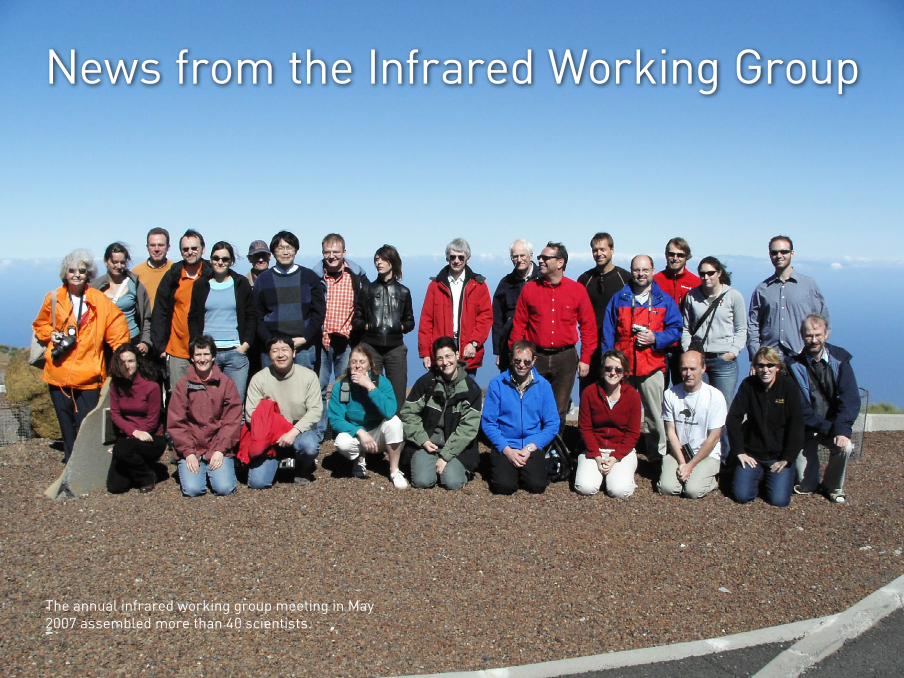
The annual infrared working group meeting in May 2007 assembled more than 40 scientists.
21
FTIR measurements indicate global impacts of air quality measuresO. Morgenstern, G. Zeng, S. W. Wood*, J. Robinson, and D. Smale, National Insti-tute of Water and Atmospheric Research, Lauder, New Zealand
N. B. Jones, School of Chemistry, University of Wollongong, Wollongong, NSW, Australia
*now at 1981 Omakau – Chatto Creek Road, RD3, Alexandra, New Zealand
Fourier-Transform Infra-Red (FTIR) spectrometers form part of the Network for the Detection of Atmospheric Composition Change (NDACC). Historically, a lot of attention has been paid to compounds associated with ozone depletion in the stratosphere. However, the FTIR network is also extremely relevant for studies of tropospheric air pollution. Two such pollutants are ethane (C2H6) and carbon monoxide (CO); both are important ozone precursors in the troposphere. In the Southern Hemisphere, they are predominantly produced by biomass burning (Watson et al., 1990), but in the Northern Hemisphere human activities add considerably to their emissions, e.g. associated with fossil fuel usage. At several Northern-Hemisphere locations, downward trends have recently been reported for both compounds (Angel-bratt et al., 2011; Aydin et al., 2011), reflecting the implementation of measures to improve regional air quality. By contrast, hydro-gen cyanide (HCN) is thought to be nearly exclusively produced by biomass burning (Li et al., 2000). All three compounds are represented in the mid-infrared spectrum.
The National Institute of Water and Atmospheric Research (NIWA) operates the two southernmost FTIR instruments in the NDACC network. Unlike their Northern-Hemisphere counterparts, the NIWA FTIR instruments sample background air representative of the relatively clean southern mid- and high latitudes (Morgen-
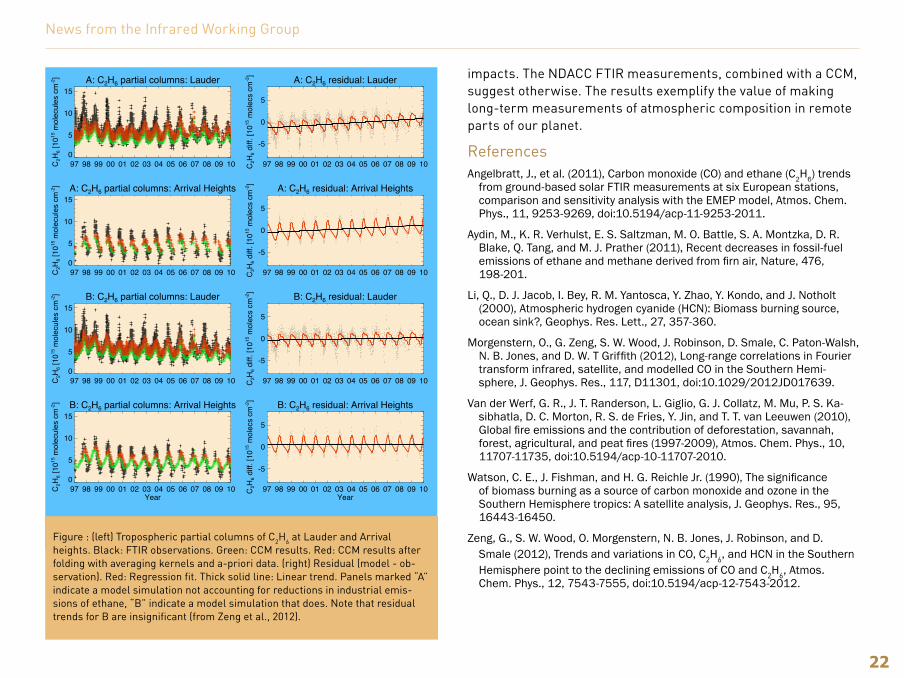
stern et al., 2012). In a recent study, Zeng et al. (2012) analysed 13 years of FTIR measurements made at the Lauder, New Zea-land, and Arrival Heights, Antarctica, sites. Tropospheric partial columns of all three species (CO, C2H6 , and HCN) were found to decline between 1997 and 2009, with ethane exhibiting the largest relative decrease of around 2.5%/year . Partly, the negative trends were associated with 1997-1998, the start of the records, dominated by an anomalously strong El Niño event causing major wildfires in Indonesia. However, even if only a shorter period ex-cluding this El Niño event is analysed, significant negative trends ensue. Zeng et al. (2012) compare the measurements to results from chemistry-climate model (CCM) simulations (Figure 1). In one set of simulations, emissions of anthropogenic pollutants are assumed to be annually periodic and only the biomass burning emissions are interannually varying according to observations (van der Werf et al., 2010). In this simulation, generally realistic amounts of the three pollutants are found, and the interannual variability is mostly captured at both locations, but the model does not correctly reproduce the observed trends in C2H6 and CO. Only when negative linear trends are imposed on the anthro-pogenic part of the emissions of CO and C2H6 (of -35% for C2H6 and -26% for CO over 1997-2009), do the modelled and measured trends for these species agree. There is no such disagreement for HCN which does not have a major anthropogenic component. In further sensitivity experiments, the authors establish that reductions in the Northern Hemisphere cause this effect because anthropogenic emissions in the Southern Hemisphere are relatively minor. The assumed emission trends for C2H6 and CO are in agreement with the recent literature.
The results are interesting in that the timescale of mixing between the two hemispheres is considerably longer than the atmospheric lifetimes of CO and ethane. One could have expected this to preclude these reductions in emissions to have global
News from the Infrared Working Group
22
A: C2H6 partial columns: Lauder
97 98 99 00 01 02 03 04 05 06 07 08 09 100
5
10
15
C2H
6 [10
15 m
olec
ules
cm
-2] A: C2H6 residual: Lauder
97 98 99 00 01 02 03 04 05 06 07 08 09 10
-5
0
5
C2H
6 diff
. [10
15 m
olec
s cm
-2]
A: C2H6 partial columns: Arrival Heights
97 98 99 00 01 02 03 04 05 06 07 08 09 100
5
10
15
C2H
6 [10
15 m
olec
ules
cm
-2] A: C2H6 residual: Arrival Heights
97 98 99 00 01 02 03 04 05 06 07 08 09 10
-5
0
5
C2H
6 diff
. [10
15 m
olec
s cm
-2]
B: C2H6 partial columns: Lauder
97 98 99 00 01 02 03 04 05 06 07 08 09 100
5
10
15
C2H
6 [10
15 m
olec
ules
cm
-2] B: C2H6 residual: Lauder
97 98 99 00 01 02 03 04 05 06 07 08 09 10
-5
0
5
C2H
6 diff
. [10
15 m
olec
s cm
-2]
B: C2H6 partial columns: Arrival Heights
97 98 99 00 01 02 03 04 05 06 07 08 09 10Year
0
5
10
15
C2H
6 [10
15 m
olec
ules
cm
-2] B: C2H6 residual: Arrival Heights
97 98 99 00 01 02 03 04 05 06 07 08 09 10Year
-5
0
5
C2H
6 diff
. [10
15 m
olec
s cm
-2]
impacts. The NDACC FTIR measurements, combined with a CCM, suggest otherwise. The results exemplify the value of making long-term measurements of atmospheric composition in remote parts of our planet.
ReferencesAngelbratt, J., et al. (2011), Carbon monoxide (CO) and ethane (C2H6) trends
from ground-based solar FTIR measurements at six European stations, comparison and sensitivity analysis with the EMEP model, Atmos. Chem. Phys., 11, 9253-9269, doi:10.5194/acp-11-9253-2011.
Aydin, M., K. R. Verhulst, E. S. Saltzman, M. O. Battle, S. A. Montzka, D. R. Blake, Q. Tang, and M. J. Prather (2011), Recent decreases in fossil-fuel emissions of ethane and methane derived from firn air, Nature, 476, 198-201.
Li, Q., D. J. Jacob, I. Bey, R. M. Yantosca, Y. Zhao, Y. Kondo, and J. Notholt (2000), Atmospheric hydrogen cyanide (HCN): Biomass burning source, ocean sink?, Geophys. Res. Lett., 27, 357-360.
Morgenstern, O., G. Zeng, S. W. Wood, J. Robinson, D. Smale, C. Paton-Walsh, N. B. Jones, and D. W. T Griffith (2012), Long-range correlations in Fourier transform infrared, satellite, and modelled CO in the Southern Hemi-sphere, J. Geophys. Res., 117, D11301, doi:10.1029/2012JD017639.
Van der Werf, G. R., J. T. Randerson, L. Giglio, G. J. Collatz, M. Mu, P. S. Ka-sibhatla, D. C. Morton, R. S. de Fries, Y. Jin, and T. T. van Leeuwen (2010), Global fire emissions and the contribution of deforestation, savannah, forest, agricultural, and peat fires (1997-2009), Atmos. Chem. Phys., 10, 11707-11735, doi:10.5194/acp-10-11707-2010.
Watson, C. E., J. Fishman, and H. G. Reichle Jr. (1990), The significance of biomass burning as a source of carbon monoxide and ozone in the Southern Hemisphere tropics: A satellite analysis, J. Geophys. Res., 95, 16443-16450.
Zeng, G., S. W. Wood, O. Morgenstern, N. B. Jones, J. Robinson, and D. Smale (2012), Trends and variations in CO, C2H6, and HCN in the Southern Hemisphere point to the declining emissions of CO and C2H6, Atmos. Chem. Phys., 12, 7543-7555, doi:10.5194/acp-12-7543-2012.
News from the Infrared Working Group
Figure : (left) Tropospheric partial columns of C2H6 at Lauder and Arrival heights. Black: FTIR observations. Green: CCM results. Red: CCM results after folding with averaging kernels and a-priori data. (right) Residual (model - ob-servation). Red: Regression fit. Thick solid line: Linear trend. Panels marked “A” indicate a model simulation not accounting for reductions in industrial emis-sions of ethane, “B” indicate a model simulation that does. Note that residual trends for B are insignificant (from Zeng et al., 2012).
23
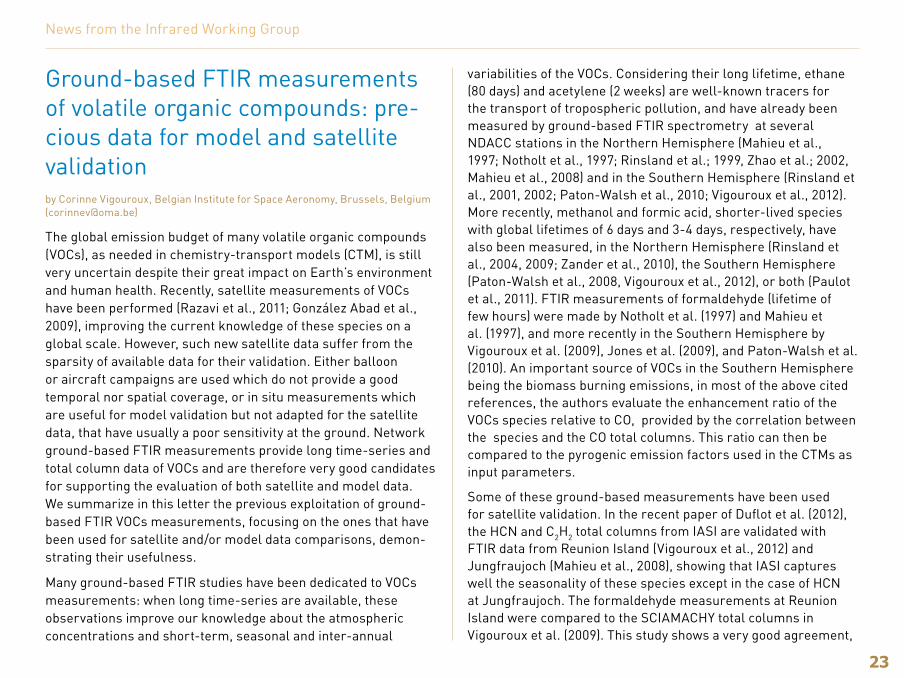
Ground-based FTIR measurements of volatile organic compounds: pre-cious data for model and satellite validationby Corinne Vigouroux, Belgian Institute for Space Aeronomy, Brussels, Belgium ([email protected])
The global emission budget of many volatile organic compounds (VOCs), as needed in chemistry-transport models (CTM), is still very uncertain despite their great impact on Earth’s environment and human health. Recently, satellite measurements of VOCs have been performed (Razavi et al., 2011; González Abad et al., 2009), improving the current knowledge of these species on a global scale. However, such new satellite data suffer from the sparsity of available data for their validation. Either balloon or aircraft campaigns are used which do not provide a good temporal nor spatial coverage, or in situ measurements which are useful for model validation but not adapted for the satellite data, that have usually a poor sensitivity at the ground. Network ground-based FTIR measurements provide long time-series and total column data of VOCs and are therefore very good candidates for supporting the evaluation of both satellite and model data. We summarize in this letter the previous exploitation of ground-based FTIR VOCs measurements, focusing on the ones that have been used for satellite and/or model data comparisons, demon-strating their usefulness.
Many ground-based FTIR studies have been dedicated to VOCs measurements: when long time-series are available, these observations improve our knowledge about the atmospheric concentrations and short-term, seasonal and inter-annual
variabilities of the VOCs. Considering their long lifetime, ethane (80 days) and acetylene (2 weeks) are well-known tracers for the transport of tropospheric pollution, and have already been measured by ground-based FTIR spectrometry at several NDACC stations in the Northern Hemisphere (Mahieu et al., 1997; Notholt et al., 1997; Rinsland et al.; 1999, Zhao et al.; 2002, Mahieu et al., 2008) and in the Southern Hemisphere (Rinsland et al., 2001, 2002; Paton-Walsh et al., 2010; Vigouroux et al., 2012). More recently, methanol and formic acid, shorter-lived species with global lifetimes of 6 days and 3-4 days, respectively, have also been measured, in the Northern Hemisphere (Rinsland et al., 2004, 2009; Zander et al., 2010), the Southern Hemisphere (Paton-Walsh et al., 2008, Vigouroux et al., 2012), or both (Paulot et al., 2011). FTIR measurements of formaldehyde (lifetime of few hours) were made by Notholt et al. (1997) and Mahieu et al. (1997), and more recently in the Southern Hemisphere by Vigouroux et al. (2009), Jones et al. (2009), and Paton-Walsh et al. (2010). An important source of VOCs in the Southern Hemisphere being the biomass burning emissions, in most of the above cited references, the authors evaluate the enhancement ratio of the VOCs species relative to CO, provided by the correlation between the species and the CO total columns. This ratio can then be compared to the pyrogenic emission factors used in the CTMs as input parameters.
Some of these ground-based measurements have been used for satellite validation. In the recent paper of Duflot et al. (2012), the HCN and C2H2 total columns from IASI are validated with FTIR data from Reunion Island (Vigouroux et al., 2012) and Jungfraujoch (Mahieu et al., 2008), showing that IASI captures well the seasonality of these species except in the case of HCN at Jungfraujoch. The formaldehyde measurements at Reunion Island were compared to the SCIAMACHY total columns in Vigouroux et al. (2009). This study shows a very good agreement,
News from the Infrared Working Group
24
especially in 2004, with a day-to-day variability well reproduced by both data sets. Both instruments show the same seasonal cycle with a minimum in local winter, due to the lower OH concen-trations during this period. The formaldehyde measurements at Wollongong also compared well to GOME columns (Jones et al., 2009). Considering the large amount of available VOCs measure-ments from FTIR stations, and the success of these few studies for satellite validation, we believe that there is room for this kind of collaboration with the satellite community.
Comparisons between ground-based measurements and models are needed to evaluate the chemical and transport processes in the models and the input parameters (emission factors, fire and anthropogenic emission databases). In the papers by Vigouroux et al. (2009) and Jones et al. (2009), the formaldehyde time-series are compared to model simulations: in the former paper the CTM IMAGESv2 is used, while the latter uses a simple box model of methane oxidation by OH, which is the largest source of formaldehyde. Both comparisons show an underestimation by the models. Such comparisons help to question the CTM models, such as IMAGEsv2. First, the OH concentrations can be under-estimated in the model. Second, the fire injection heights and the convective updraft fluxes which are uncertain in IMAGESv2, could explain why the high day to day variability observed in the data are not reproduced by the model. Lastly, the pyrogenic and biogenic emissions at Madagascar could be underestimated. The underestimation of pyrogenic emissions, in the Global Fire Emission Database v2 (GFED2, van der Werf et al., 2006) used in the IMAGESv2, seems to be confirmed in Vigouroux et al. (2012), which concludes that also GFED3 (van der Werf et al., 2010) underestimates the pyrogenic emissions, especially in the late September-October period in south-eastern Africa - Madagascar region. Another interesting finding of the comparisons between model and FTIR data at Reunion Island concerns the budget
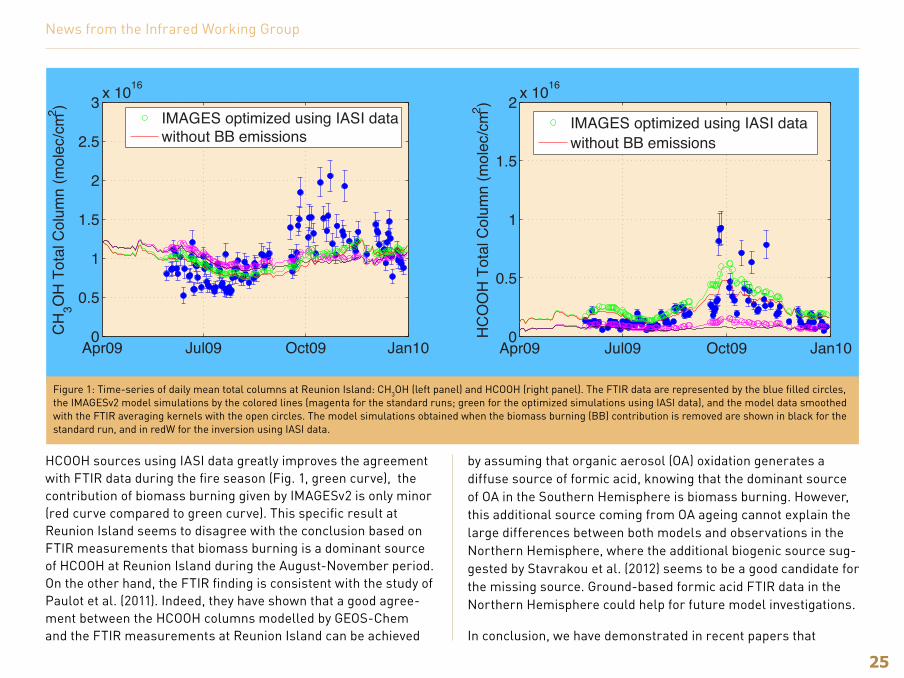
of methanol and acid formic. Indeed, the excellent correlation of CH3OH and HCOOH with CO between August and November suggests that, despite the dominance of the biogenic source of these compounds on the global scale, biomass burning is their major source at Reunion Island during this period. This was expected for other species such as HCN, C2H6 and C2H2, but less so for methanol and formic acid given the low contribution of fires to their global budget (2% and 14%, respectively). This conclusion demonstrates the need for models to use, in addition to satellite data, some independent ground-based measurements. Indeed, while satellite data are very useful for source inversion studies, as made in Stavrakou et al. (2011) for methanol and Stavrakou et al. (2012) for formic acid, in which IMAGEsv2 emission budgets were constrained by IASI data, the comparisons with ground-based data can validate or temperate the inversion study. As an example, we show in Fig. 1, the FTIR and IMAGESv2 simulations of methanol and formic acid. The optimised IMAGESv2 simula-tions, using IASI data, are shown in green in Fig. 1. We observe that the CH3OH IASI derived emissions remain too low during the fire season, suggesting that IASI may underestimate CH3OH in this period in the Southeastern Africa-Madagascar region.
Formic acid (HCOOH) provides another good example of what can be learned from ground-based FTIR observations. It is well-known that the CTMs strongly underestimate formic acid observations: it is a hot topic today to find the missing source(s), and this has been the subject of two recent studies, that have used FTIR ground-based data from several stations: Paulot et al. (2011) in ACP, and Stavrakou et al. (2012) in Nature Geosci-ence. As already mentioned, the latter paper is based on source inversion using IASI data, and leads to an increase of the global source of HCOOH from 36 to 102 Tg yr-1, obtained mainly by the introduction of a large source due to the photochemical degrada-tion of biogenic NMVOCs. Although the IMAGESv2 optimization of
News from the Infrared Working Group
25
HCOOH sources using IASI data greatly improves the agreement with FTIR data during the fire season (Fig. 1, green curve), the contribution of biomass burning given by IMAGESv2 is only minor (red curve compared to green curve). This specific result at Reunion Island seems to disagree with the conclusion based on FTIR measurements that biomass burning is a dominant source of HCOOH at Reunion Island during the August-November period. On the other hand, the FTIR finding is consistent with the study of Paulot et al. (2011). Indeed, they have shown that a good agree-ment between the HCOOH columns modelled by GEOS-Chem and the FTIR measurements at Reunion Island can be achieved
by assuming that organic aerosol (OA) oxidation generates a diffuse source of formic acid, knowing that the dominant source of OA in the Southern Hemisphere is biomass burning. However, this additional source coming from OA ageing cannot explain the large differences between both models and observations in the Northern Hemisphere, where the additional biogenic source sug-gested by Stavrakou et al. (2012) seems to be a good candidate for the missing source. Ground-based formic acid FTIR data in the Northern Hemisphere could help for future model investigations.
In conclusion, we have demonstrated in recent papers that
News from the Infrared Working Group
Apr09 Jul09 Oct09 Jan100
0.5
1
1.5
2 x 10¹⁶
HC
OO
H T
otal
Col
umn
(mol
ec/c
m2 )
IMAGES optimized using IASI datawithout BB emissions
Apr09 Jul09 Oct09 Jan100
0.5
1
1.5
2
2.5
3 x 10¹⁶
CH
3OH
Tot
al C
olum
n (m
olec
/cm2 )
IMAGES optimized using IASI datawithout BB emissions
Figure 1: Time-series of daily mean total columns at Reunion Island: CH3OH (left panel) and HCOOH (right panel). The FTIR data are represented by the blue filled circles, the IMAGESv2 model simulations by the colored lines (magenta for the standard runs; green for the optimized simulations using IASI data), and the model data smoothed with the FTIR averaging kernels with the open circles. The model simulations obtained when the biomass burning (BB) contribution is removed are shown in black for the standard run, and in redW for the inversion using IASI data.
26
ground-based FTIR measurements of VOCs are very useful for satellite validation and to evaluate the CTMs (missing sources or sinks, dynamical processes) and their input parameters such as emission factors and biomass burning emission inventories. Other parameters such as the fire injection heights or the con-vective updraft fluxes should also be investigated in future model evaluations. The infrared working group within NDACC offers long time-series measurements of VOCS with a good spatial coverage, to be further exploited by both satellite and model communities.
ReferencesDuflot, V., Hurtmans, D., Clarisse, L., R’honi, Y., Vigouroux, C., De Mazière,
M., Mahieu, E., Servais, C., Clerbaux, C., and Coheur, P.-F.: Measurements of hydrogen cyanide (HCN) and acetylene (C2H2) from the Infrared Atmos-pheric Sounding Interferometer (IASI), Atmos. Meas. Tech. Discuss., 5, 7567-7586, 2012.
González Abad, G., Bernath, P. F., Boone, C. D., McLeod, S. D., Manney, G. L., and Toon, G. C.: Global distribution of upper tropospheric formic acid from the ACE-FTS, Atmos. Chem. Phys., 9, 8039-8047, 2009.
Jones, N. B., Riedel, K., Allan, W., Wood, S., Palmer, P. I., Chance, K., and Notholt, J.: Long-term tropospheric formaldehyde concentrations deduced from ground-based fourier transform solar infrared measurements, Atmos. Chem. Phys., 9, 7131-7142, 2009.
Mahieu, E., Zander, R., Delbouille, L., Demoulin, P., Roland, G., and Servais, C.: Observed trends in total vertical column abundances of atmospheric gases from IR solar spectra recorded at the Jungfraujoch, J. Atmos. Chem., 28, 227-243, 1997.
Mahieu, E., Duchatelet, P., Bernath, P. F., Boone, C. D., De Mazière, M., Demoulin, P., Rinsland, C. P., Servais, C., and Walker, K. A.: Retrievals of C2H2 from high-resolution FTIR solar spectra recorded at the Jungfraujoch station (46.5°N) and comparison with ACE-FTS observations, Geophys. Res. Abstr., 10, EGU2008-A-00000, 2008.
Notholt, J., Toon, G. C., Lehmann, R., Sen, B., and Blavier, J.-F.: Comparison of Arctic and Antarctic trace gas column abundances from ground-based Fourier transform infrared spectrometry, J. Geophys. Res., 102, 12863-12869, 1997.
Paton-Walsh, C., Wilson, S. R., Jones, N. B., and Griffith, D. W. T.: Measure-ment of methanol emissions from Australian wildfires by ground-based solar Fourier transform spectroscopy, Geophys. Res. Lett., 35, L08810, 2008.
Paton-Walsh, C., Deutscher, N. M., Griffith, D. W. T., Forgan, B. W., Wilson, S. R., Jones, N. B., and Edwards, D. P.: Trace gas emissions from savanna fires in Northern Australia, J. Geophys. Res., 115, D16314, 2010.
Paulot, F., Wunch, D., Crounse, J. D., Toon, G. C., Millet, D. B., DeCarlo, P. F., Vigouroux, C., Deutscher, N. M., González Abad, G., Notholt, J., Warneke, T., Hannigan, J. W., Warneke, C., de Gouw, J. A., Dunlea, E. J., De Mazière, M., Griffith, D. W. T., Bernath, P., Jimenez, J. L., and Wennberg, P. O.: Importance of secondary sources in the atmospheric budgets of formic and acetic acids, Atmos. Chem. Phys., 11, 1989-2013, 2011.
Razavi, A., Karagulian, F., Clarisse, L., Hurtmans, D., Coheur, P. F., Clerbaux, C., Müller, J. F., and Stavrakou, T.: Global distributions of methanol and formic acid retrieved for the first time from the IASI/MetOp thermal infrared sounder, Atmos. Chem. Phys., 11, 857-872, 2011.
Rinsland, C. P., Goldman, A., Murcray, F. J., Stephen, T. M., Pougatchev, N. S., Fishman, J., David, S. J., Blatherwick, R. D., Novelli, P. C., Jones, N. B., and Connor, B. J.: Infrared solar spectroscopic measurements of free tropo-spheric CO, C2H6, and HCN above Mauna Loa, Hawaii: seasonal variations and evidence for enhanced emissions from the Southeast Asian tropical fires of 1997-1998, J. Geophys. Res., 104(D15), 18667-18680, 1999.
Rinsland, C. P., Meier, A., Griffith, D. W. T., and Chiou, L. S.: Ground-based measurements of tropospheric CO, C2H6, and HCN from Australia at 34°S latitude during 1997-1998, J. Geophys. Res., 106, 20913-20924, 2001.
Rinsland, C. P., Jones, N. B., Connor, B. J., Wood, S. W., Goldman, A., Stephen, T. M., Murcray, F. J., Chiou, L. S., Zander, R., and Mahieu, E.: Multiyear infrared solar spectroscopic measurements of HCN, CO, C2H6, and C2H2 tropospheric columns above Lauder, New Zealand (45°S latitude), J. Geophys. Res., 107(D14), 4185, 2002.
Rinsland, C. P., Mahieu, E., Zander, R., Goldman, A., Wood, S., and Chiou, L.: Free tropospheric measurements of formic acid (HCOOH) from infrared ground-based solar absorption spectra: retrieval approach, evidence for a seasonal cycle, and comparison with model calculations, J. Geophys. Res., 109, 2004.
Rinsland, C. P., Mahieu, E., Chiou, L., and Herbin, H.: First ground-based infra-red solar absorption measurements of free tropospheric methanol CH3OH):
News from the Infrared Working Group
27
multidecade infrared time series from Kitt Peak (31.9°N, 111.6°W): trend, seasonal cycle, and comparison with previous measurements, J. Geophys. Res., 114, D04309, 2009.
Stavrakou, T., Guenther, A., Razavi, A., Clarisse, L., Clerbaux, C., Coheur, P.-F., Hurtmans, D., Karagulian, F., De Mazière, M., Vigouroux, C., Amelynck, C., Schoon, N., Laffineur, Q., Heinesch, B., Aubinet, M., Rinsland, C., and Mül-ler, J.-F.: First space-based derivation of the global atmospheric methanol emission fluxes, Atmos. Chem. Phys., 11, 4873-4898, 2011.
Stavrakou, T., Müller, J.-F., Peeters, J., Razavi, A., Clarisse, L., Clerbaux, C., Coheur, P.-F., Hurtmans, D., De Mazière, M., Vigouroux, C., Deutscher, N. M., Griffith, D. W. T. , Jones N., and Paton-Walsh, C.: Satellite evidence for a large source of formic acid from boreal and tropical forests, Nature Geosci., 5, 26-30, 2012.
van der Werf, G. R., Randerson, J. T., Giglio, L., Collatz, G. J., Kasibhatla, P. S., and Arellano Jr., A. F.: Interannual variability in global biomass burning emissions from 1997 to 2004, Atmos. Chem. Phys., 6, 3423-3441, 2006.
van der Werf, G. R., Randerson, J. T. , Giglio, L., Collatz, G. J., Mu, M., Kasibhatla, P. S., Morton, D. C., DeFries, R. S., Jin, Y., and van Leeuwen, T. T.: Global fire emissions and the contribution of deforestation, savanna, forest, agricultural, and peat fires (1997--2009), Atmos. Chem. Phys., 10, 2010.
Vigouroux, C., Hendrick, F., Stavrakou, T., Dils, B., De Smedt, I., Hermans, C., Merlaud, A., Scolas, F., Senten, C., Vanhaelewyn, G., Fally, S., Carleer, M., Metzger, J.-M., Müller, J.-F., Van Roozendael, M., and De Mazière; M.: Ground-based FTIR and MAX-DOAS observations of formaldehyde at Reunion Island and comparisons with satellite and model data, Atmos. Chem. Phys., 9, 9523-9544, 2009.
Vigouroux, C., Stavrakou, T., Whaley, C., Dils, B., Duflot, V., Hermans, C., Kumps, N., Metzger, J.-M., Scolas, F., Vanhaelewyn, G., Müller, J.-F., Jones, D. B. A., Li, Q., and De Mazière, M.: FTIR time-series of biomass burning products (HCN, C2H6, C2H2, CH3OH, and HCOOH) at Reunion Island (21°S, 55°E) and comparisons with model data, Atmos. Chem. Phys., 12, 10367-10385, 2012.
Zander, R., Duchatelet, P., Mahieu, E., Demoulin, P., Roland, G., Servais, C., Auwera, J. V., Perrin, A., Rinsland, C. P., and Crutzen, P.J.: Formic acid above the Jungfraujoch during 1985--2007: observed variability, seasonal-ity, but no long-term background evolution, Atmos. Chem. Phys., 10, 10047-10065, 2010.
Zhao, Y., Strong, K., Kondo, Y., Koike, M., Matsumi, Y., Irie, H., Rinsland, C. P., Jones, N. B., Suzuki, K., Nakajima, H., Nakane, H., and Murata, I: Spectro-scopic measurements of tropospheric CO, C2H6, C2H2, and HCN in Northern Japan, J. Geophys. Res., 107, 4343, 2002.
News from the Infrared Working Group

28
NORS/NDACC UV-Vis workshop
by Michel van Roozendael, Belgian Institute for Space Aeronomy (BIRA-IASB)
The 2012 edition of the UV-Vis working group annual meeting took place in Brussels on 3-4 July 2012. The meeting was organized in the form of a joint workshop addressing regular NDACC station reports and more specific MAXDOAS activities being developed as part of the EU FP7 NORS project. In a first part of the work-shop, the status of the different UV-Vis stations and instruments was reviewed. Several sites were upgraded or started in 2012. In particular a new mini-DOAS system was installed by BAS in Halley for halogen oxides monitoring, and a new MAXDOAS system was set up by the University of Bremen in Athens. Also BIRA-IASB installed a MAXDOAS instrument at the University of Burundi in Central Africa. Besides these successes, the difficul-ties to maintain existing long-term monitoring sites were also highlighted. The situation is particularly critical at the Canadian PEARL site where year-round operations had to be stopped in April 2012 due to funding issues. Likewise NIWA has been suf-fering from recurrent and severe funding cuts with major impact on UV-Vis activities. Currently the Lauder and Arrival-Height stations are still in operation but Kiruna has been stopped and the future of the other NIWA sites is very uncertain.
The second part of the meeting was devoted to science talks, mainly dealing with new MAXDOAS developments for tropospher-ic gases and aerosols. Most of these studies were carried out in the context of the Demonstration Network Of ground-based Re-mote Sensing observations in support of the GMES Atmospheric Service (NORS) project. The overall objective of this EU project
is to develop methods and tools aiming at the operationalization of NDACC in support of the quality assessment of the future European GMES Atmospheric Service (see http://nors.aeronomie.be/). UV-Vis data products under focus are tropospheric columns and profiles of NO2, HCHO and aerosols as well as stratospheric NO2 and O3 columns. Activities concentrate on harmonization of data reporting according to the HDF GEOMS metadata guidelines, harmonization of retrieval methods, including data and error characterization, quality control and documentation for traceabil-ity purpose. A NORS demonstration system based on four pilot stations is being developed for evaluation by the EU FP7 MACC-2 GMES Atmosphere precursor project.
The last part of the meeting consisted in a discussion of the future activities of the NDACC UV-Vis working group. In particular the next large UV-Vis intercomparison exercise planned to take place in summer-autumn 2015 was discussed. The focus of this campaign will be on the study of the small scale variability in tropospheric trace gas measurements (in particular of NO2) and its impact on the usability of MAXDOAS observations for the validation of tropospheric chemistry sensors, such as the future ESA GMES Sentinels. In addition to a traditional intercomparison of NDACC spectrometers, a suite of ground-based instruments will be deployed and complemented with balloon soundings, mobile observations and aircraft measurements. The aim will be to characterize the three-dimensional distribution of tropo-spheric NO2 at the sub-kilometer scale, i.e. an order of magnitude smaller than the resolution of tropospheric chemistry satellite sensors.
News from the UV-Visible Working Group

29
News from the UV-Visible Working Group
SAOZ data archived in WOUDC
Geir Braathen, World Meteorological Organization
SAOZ data from eleven NDACC stations are now regularly being submitted to the WMO World Ozone and UV radiation Data Centre (WOUDC) in Toronto, Canada (http://www.woudc.org) . Most of the stations are up to date as of late 2012 and some have also submitted data well into 2013. The data stored in the WOUDC are
consolidated and can be considered of the best possible quality. In addition, one can find data in near-real time at the SAOZ web page at CNRS (http://saoz.obs.uvsq.fr/SAOZ-RT.html). These data are preliminary and should be used with caution. SAOZ data from four Antarctic stations are now being reported in the WMO Antarctic Ozone Bulletins. These stations are: Dôme Concordia, Dumont d’Urville, Halley and Rothera. The figure shows data from Dumont d’Urville for the first few weeks of the 2013 ozone hole season in comparison to earlier years.
Dumont d'UrvilleTotal ozone with SAOZ
Jul Aug Sep Oct Nov Dec
200 250 300 350
0
100
200
300
400
Tota
l ozo
ne [D
U]
0
100
200
300
400
2007 2008 2009 2010 2011 2012 2013
Time-series of daily mean total ozone columns measured with a SAOZ spectrometer at Dumont d’Urville in Antarctica. SAOZ measurements have been carried out here since February 1988. Since the SAOZ measured light scattered from zenith at around 90° solar zenith angle it can measure all year around at these latitudes, close to the polar circle. The most striking feature of the plot is the large day-to-day variability, due to the movements of the vortex edge above the station.
30
News from the Microwave Working Group
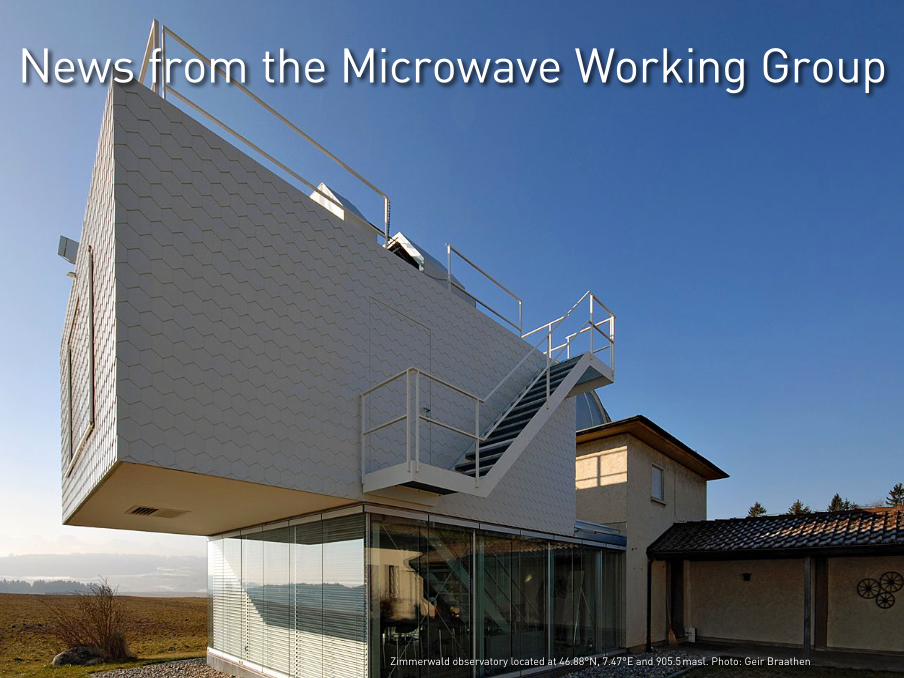
Zimmerwald observatory located at 46.88°N, 7.47°E and 905.5 masl. Photo: Geir Braathen
31
News from the Microwave Working Group
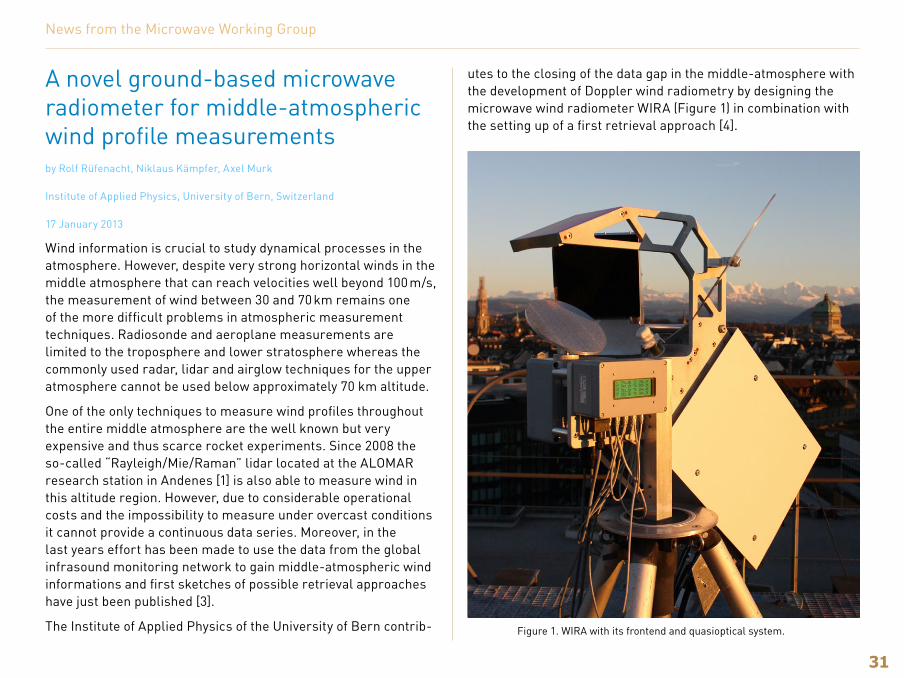
A novel ground-based microwave radiometer for middle-atmospheric wind profile measurementsby Rolf Rüfenacht, Niklaus Kämpfer, Axel Murk
Institute of Applied Physics, University of Bern, Switzerland
17 January 2013
Wind information is crucial to study dynamical processes in the atmosphere. However, despite very strong horizontal winds in the middle atmosphere that can reach velocities well beyond 100 m/s, the measurement of wind between 30 and 70 km remains one of the more difficult problems in atmospheric measurement techniques. Radiosonde and aeroplane measurements are limited to the troposphere and lower stratosphere whereas the commonly used radar, lidar and airglow techniques for the upper atmosphere cannot be used below approximately 70 km altitude.
One of the only techniques to measure wind profiles throughout the entire middle atmosphere are the well known but very expensive and thus scarce rocket experiments. Since 2008 the so-called “Rayleigh/Mie/Raman” lidar located at the ALOMAR research station in Andenes [1] is also able to measure wind in this altitude region. However, due to considerable operational costs and the impossibility to measure under overcast conditions it cannot provide a continuous data series. Moreover, in the last years effort has been made to use the data from the global infrasound monitoring network to gain middle-atmospheric wind informations and first sketches of possible retrieval approaches have just been published [3].
The Institute of Applied Physics of the University of Bern contrib-
utes to the closing of the data gap in the middle-atmosphere with the development of Doppler wind radiometry by designing the microwave wind radiometer WIRA (Figure 1) in combination with the setting up of a first retrieval approach [4].
Figure 1. WIRA with its frontend and quasioptical system.
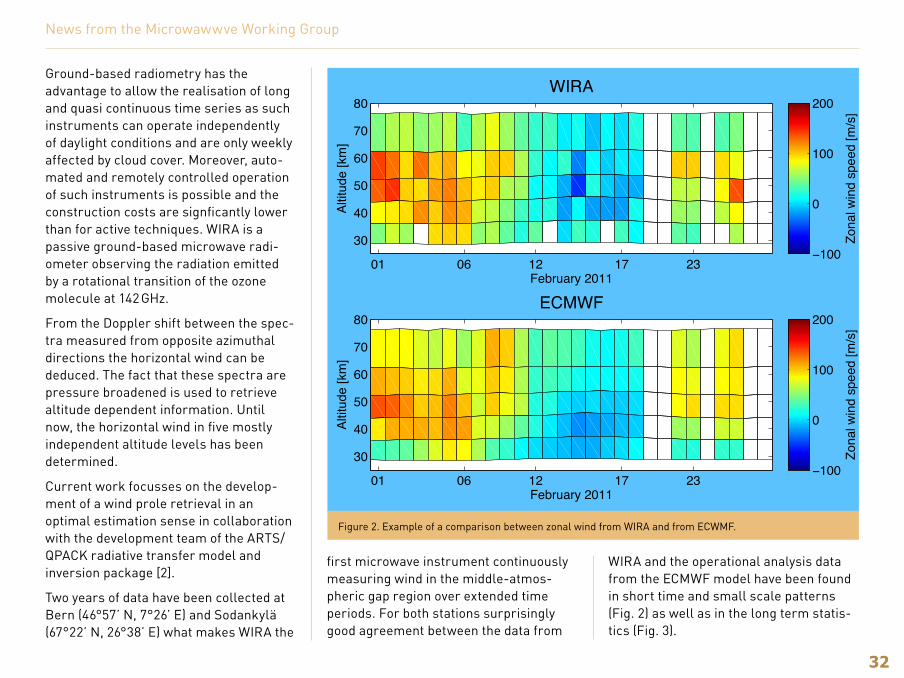
32
Ground-based radiometry has the advantage to allow the realisation of long and quasi continuous time series as such instruments can operate independently of daylight conditions and are only weekly affected by cloud cover. Moreover, auto-mated and remotely controlled operation of such instruments is possible and the construction costs are signficantly lower than for active techniques. WIRA is a passive ground-based microwave radi-ometer observing the radiation emitted by a rotational transition of the ozone molecule at 142 GHz.
From the Doppler shift between the spec-tra measured from opposite azimuthal directions the horizontal wind can be deduced. The fact that these spectra are pressure broadened is used to retrieve altitude dependent information. Until now, the horizontal wind in five mostly independent altitude levels has been determined.
Current work focusses on the develop-ment of a wind prole retrieval in an optimal estimation sense in collaboration with the development team of the ARTS/QPACK radiative transfer model and inversion package [2].
Two years of data have been collected at Bern (46°57’ N, 7°26’ E) and Sodankylä (67°22’ N, 26°38’ E) what makes WIRA the
first microwave instrument continuously measuring wind in the middle-atmos-pheric gap region over extended time periods. For both stations surprisingly good agreement between the data from
News from the Microwawwve Working Group
WIRA and the operational analysis data from the ECMWF model have been found in short time and small scale patterns (Fig. 2) as well as in the long term statis-tics (Fig. 3).
01 06 12 17 23
30
40
50
60
70
80
February 2011
Altit
ude
[km
]
WIRA
Zona
l win
d sp
eed
[m/s
]
−100
0
100
200
01 06 12 17 23
30
40
50
60
70
80
February 2011
Altit
ude
[km
]
ECMWF
Zona
l win
d sp
eed
[m/s
]
−100
0
100
200
Figure 2. Example of a comparison between zonal wind from WIRA and from ECWMF.
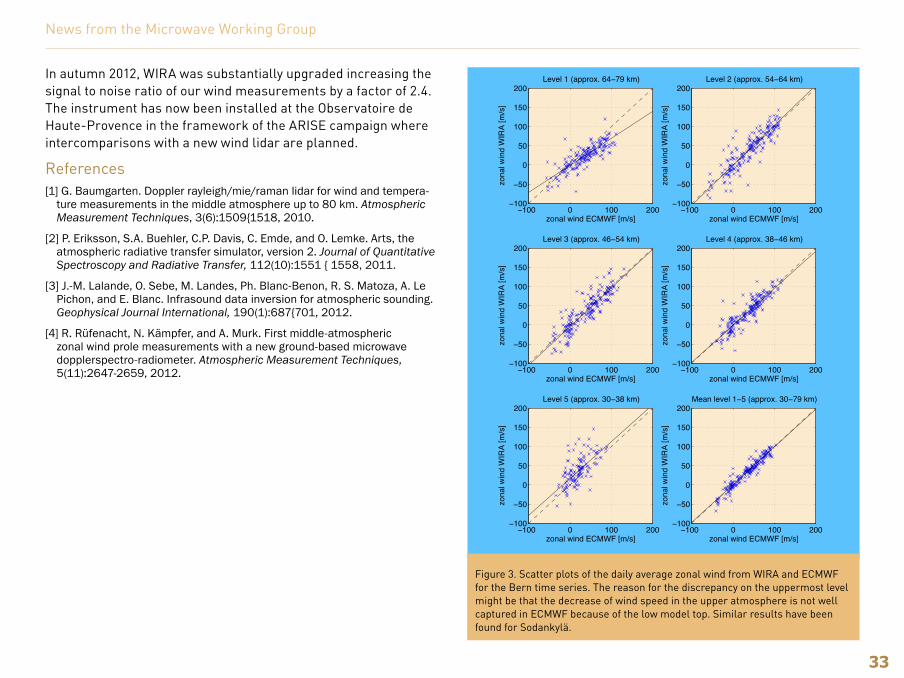
33
In autumn 2012, WIRA was substantially upgraded increasing the signal to noise ratio of our wind measurements by a factor of 2.4. The instrument has now been installed at the Observatoire de Haute-Provence in the framework of the ARISE campaign where intercomparisons with a new wind lidar are planned.
References[1] G. Baumgarten. Doppler rayleigh/mie/raman lidar for wind and tempera-
ture measurements in the middle atmosphere up to 80 km. Atmospheric Measurement Techniques, 3(6):1509{1518, 2010.
[2] P. Eriksson, S.A. Buehler, C.P. Davis, C. Emde, and O. Lemke. Arts, the atmospheric radiative transfer simulator, version 2. Journal of Quantitative Spectroscopy and Radiative Transfer, 112(10):1551 { 1558, 2011.
[3] J.-M. Lalande, O. Sebe, M. Landes, Ph. Blanc-Benon, R. S. Matoza, A. Le Pichon, and E. Blanc. Infrasound data inversion for atmospheric sounding. Geophysical Journal International, 190(1):687{701, 2012.
[4] R. Rüfenacht, N. Kämpfer, and A. Murk. First middle-atmospheric zonal wind prole measurements with a new ground-based microwave dopplerspectro-radiometer. Atmospheric Measurement Techniques, 5(11):2647-2659, 2012.
−100 0 100 200−100
−50
0
50
100
150
200
zonal wind ECMWF [m/s]
zona
l win
d W
IRA
[m/s
]
Level 1 (approx. 64−79 km)
−100 0 100 200−100
−50
0
50
100
150
200
zonal wind ECMWF [m/s]
zona
l win
d W
IRA
[m/s
]
Level 2 (approx. 54−64 km)
−100 0 100 200−100
−50
0
50
100
150
200
zonal wind ECMWF [m/s]
zona
l win
d W
IRA
[m/s
]
Level 3 (approx. 46−54 km)
−100 0 100 200−100
−50
0
50
100
150
200
zonal wind ECMWF [m/s]
zona
l win
d W
IRA
[m/s
]
Level 4 (approx. 38−46 km)
−100 0 100 200−100
−50
0
50
100
150
200
zonal wind ECMWF [m/s]
zona
l win
d W
IRA
[m/s
]
Level 5 (approx. 30−38 km)
−100 0 100 200−100
−50
0
50
100
150
200
zonal wind ECMWF [m/s]
zona
l win
d W
IRA
[m/s
]
Mean level 1−5 (approx. 30−79 km)
News from the Microwave Working Group
Figure 3. Scatter plots of the daily average zonal wind from WIRA and ECMWF for the Bern time series. The reason for the discrepancy on the uppermost level might be that the decrease of wind speed in the upper atmosphere is not well captured in ECMWF because of the low model top. Similar results have been found for Sodankylä.

34
News from the Satellite Working Group
Artist’s impression of Metop-B in orbit.

35
News from the Satellite Working Group
Update on Atmospheric Satellite Missionsby Jean-Christopher Lambert, Belgian Institute for Space Aeronomy, Brussels, Belgium and Hideaki Nakane, Kochi University of Technology, Tosayamada, Kami, Kochi, Japan
Long-term ozone monitoring by nadir satellites
Pioneered by the US SBUV(-2)/TOMS series and the European GOME/SCIAMACHY/OMI instruments, global monitoring of the ozone column and profile continues now with three series of nadir-viewing polar orbiting missions: three EUMETSAT Polar System (EPS) MetOp satellites (MetOp-A launched 19 October 2006, MetOp-B launched 17 September 2012, MetOp-C planned for 2017, see below) equipped with the GOME-2 and IASI instru-ments, three Chinese CMA/NSMC FengYun-3 satellites (FY-3A launched on 27 May 2008, FY-3B on 5 November 2010, FY-3C planned for 2013) with aboard the SBUS/TOU ozone instruments, and OMPS aboard NOAA/NASA JPSS (NPP-Suomi launched on 28 October 2011, JPSS-1 planned for 2016, JPSS-2 for 2022). While multi-spectral UV instruments like OMPS and SBUS focus on ozone, hyper-spectral UV-visible and IR instruments like GOME-2 and IASI measure a list of trace gases and aerosols as well. Similar nadir-viewing facilities are envisaged in the post-EPS era with the ESA/EUMETSAT Copernicus Sentinel-5 (launch around 2020) and NASA’s GACM (project for 2025), and with Sentinel-5 Precursor TROPOMI to be launched by ESA in 2015 as a gap-filler between Envisat SCIAMACHY and Copernicus Sentinel-5.
MetOp-B reaches operational status
MetOp-B, the second of three EUMETSAT polar orbiting satellites, was successfully launched on 17 September 2012 from Baikonur
in Kazakhstan. MetOp platforms carry a host of instruments to provide key information on many weather forecasting and climate variables such as temperature and humidity, wind speed and direction over oceans, ozone and other atmospheric gases. They are part of the Initial Joint Polar-Orbiting Operational Satellite System (IJPS) constellation, along with the NOAA-N and -N’ satellites. From the hyper-spectral measurements of GOME-2 and IASI, the EUMETSAT Satellite Application Facility on Ozone and Atmospheric Composition Monitoring (O3M-SAF) generates near-real-time data on O3, NO2, SO2 and UV index, and in off-line mode data on BrO, HCHO, OClO, water vapour and aerosols. Data on additional trace gases are in development. MetOp-B GOME-2 data generated by the O3M-SAF have been granted operational status following a recent review. Their near-real time dissemina-tion via EUMETCast started on 15 July 2013, together with tandem operations with MetOp-A: while GOME-2/MetOp-B operates on the nominal wide swath at 1920 km (resolution of 80x40 km²), the swath width of GOME-2/MetOp-A has been reduced to 960 km to increase spatial resolution (40x40 km²).
Fig. 1 – The MetOp satellite and its payload (image courtesy EUMETSAT).
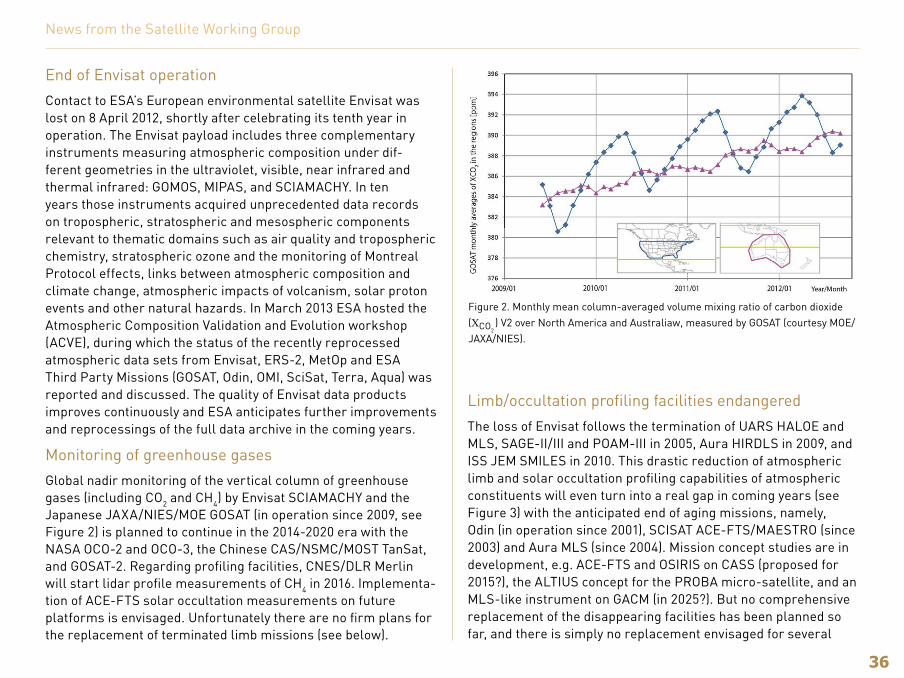
36
News from the Satellite Working Group
End of Envisat operation
Contact to ESA’s European environmental satellite Envisat was lost on 8 April 2012, shortly after celebrating its tenth year in operation. The Envisat payload includes three complementary instruments measuring atmospheric composition under dif-ferent geometries in the ultraviolet, visible, near infrared and thermal infrared: GOMOS, MIPAS, and SCIAMACHY. In ten years those instruments acquired unprecedented data records on tropospheric, stratospheric and mesospheric components relevant to thematic domains such as air quality and tropospheric chemistry, stratospheric ozone and the monitoring of Montreal Protocol effects, links between atmospheric composition and climate change, atmospheric impacts of volcanism, solar proton events and other natural hazards. In March 2013 ESA hosted the Atmospheric Composition Validation and Evolution workshop (ACVE), during which the status of the recently reprocessed atmospheric data sets from Envisat, ERS-2, MetOp and ESA Third Party Missions (GOSAT, Odin, OMI, SciSat, Terra, Aqua) was reported and discussed. The quality of Envisat data products improves continuously and ESA anticipates further improvements and reprocessings of the full data archive in the coming years.
Monitoring of greenhouse gases
Global nadir monitoring of the vertical column of greenhouse gases (including CO2 and CH4) by Envisat SCIAMACHY and the Japanese JAXA/NIES/MOE GOSAT (in operation since 2009, see Figure 2) is planned to continue in the 2014-2020 era with the NASA OCO-2 and OCO-3, the Chinese CAS/NSMC/MOST TanSat, and GOSAT-2. Regarding profiling facilities, CNES/DLR Merlin will start lidar profile measurements of CH4 in 2016. Implementa-tion of ACE-FTS solar occultation measurements on future platforms is envisaged. Unfortunately there are no firm plans for the replacement of terminated limb missions (see below).
Limb/occultation profiling facilities endangered
The loss of Envisat follows the termination of UARS HALOE and MLS, SAGE-II/III and POAM-III in 2005, Aura HIRDLS in 2009, and ISS JEM SMILES in 2010. This drastic reduction of atmospheric limb and solar occultation profiling capabilities of atmospheric constituents will even turn into a real gap in coming years (see Figure 3) with the anticipated end of aging missions, namely, Odin (in operation since 2001), SCISAT ACE-FTS/MAESTRO (since 2003) and Aura MLS (since 2004). Mission concept studies are in development, e.g. ACE-FTS and OSIRIS on CASS (proposed for 2015?), the ALTIUS concept for the PROBA micro-satellite, and an MLS-like instrument on GACM (in 2025?). But no comprehensive replacement of the disappearing facilities has been planned so far, and there is simply no replacement envisaged for several
Figure 2. Monthly mean column-averaged volume mixing ratio of carbon dioxide (C ) V2 over North America and Australiaw, measured by GOSAT (courtesy MOE/JAXA/NIES).
CO2
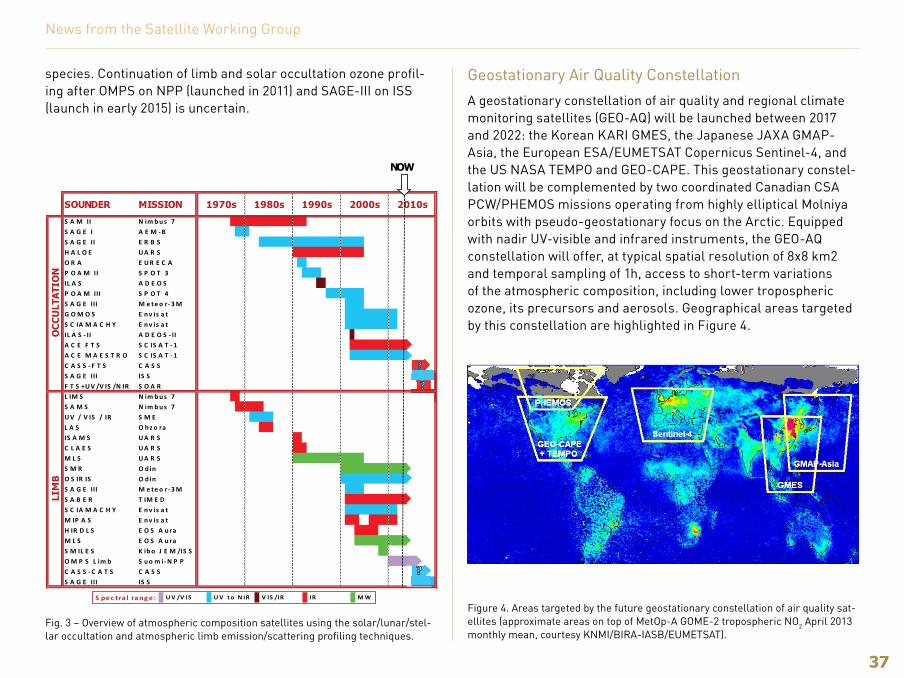
37
News from the Satellite Working Group
species. Continuation of limb and solar occultation ozone profil-ing after OMPS on NPP (launched in 2011) and SAGE-III on ISS (launch in early 2015) is uncertain.
Geostationary Air Quality Constellation
A geostationary constellation of air quality and regional climate monitoring satellites (GEO-AQ) will be launched between 2017 and 2022: the Korean KARI GMES, the Japanese JAXA GMAP-Asia, the European ESA/EUMETSAT Copernicus Sentinel-4, and the US NASA TEMPO and GEO-CAPE. This geostationary constel-lation will be complemented by two coordinated Canadian CSA PCW/PHEMOS missions operating from highly elliptical Molniya orbits with pseudo-geostationary focus on the Arctic. Equipped with nadir UV-visible and infrared instruments, the GEO-AQ constellation will offer, at typical spatial resolution of 8x8 km2 and temporal sampling of 1h, access to short-term variations of the atmospheric composition, including lower tropospheric ozone, its precursors and aerosols. Geographical areas targeted by this constellation are highlighted in Figure 4.
Figure 4. Areas targeted by the future geostationary constellation of air quality sat-ellites (approximate areas on top of MetOp-A GOME-2 tropospheric NO2 April 2013 monthly mean, courtesy KNMI/BIRA-IASB/EUMETSAT).
Fig. 3 – Overview of atmospheric composition satellites using the solar/lunar/stel-lar occultation and atmospheric limb emission/scattering profiling techniques.
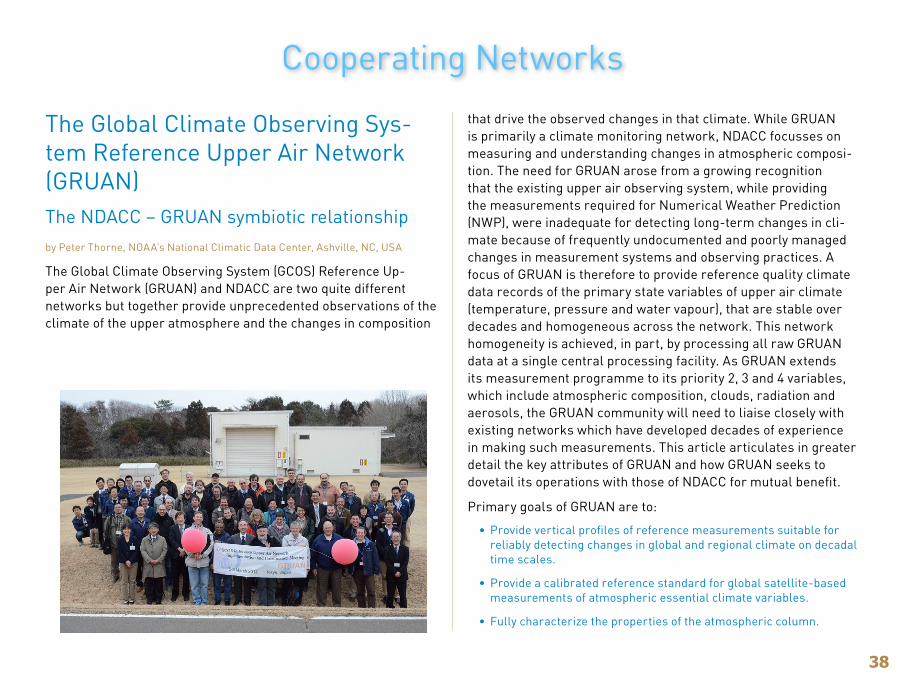
38
Cooperating Networks
The Global Climate Observing Sys-tem Reference Upper Air Network (GRUAN)The NDACC – GRUAN symbiotic relationshipby Peter Thorne, NOAA’s National Climatic Data Center, Ashville, NC, USA
The Global Climate Observing System (GCOS) Reference Up-per Air Network (GRUAN) and NDACC are two quite different networks but together provide unprecedented observations of the climate of the upper atmosphere and the changes in composition
that drive the observed changes in that climate. While GRUAN is primarily a climate monitoring network, NDACC focusses on measuring and understanding changes in atmospheric composi-tion. The need for GRUAN arose from a growing recognition that the existing upper air observing system, while providing the measurements required for Numerical Weather Prediction (NWP), were inadequate for detecting long-term changes in cli-mate because of frequently undocumented and poorly managed changes in measurement systems and observing practices. A focus of GRUAN is therefore to provide reference quality climate data records of the primary state variables of upper air climate (temperature, pressure and water vapour), that are stable over decades and homogeneous across the network. This network homogeneity is achieved, in part, by processing all raw GRUAN data at a single central processing facility. As GRUAN extends its measurement programme to its priority 2, 3 and 4 variables, which include atmospheric composition, clouds, radiation and aerosols, the GRUAN community will need to liaise closely with existing networks which have developed decades of experience in making such measurements. This article articulates in greater detail the key attributes of GRUAN and how GRUAN seeks to dovetail its operations with those of NDACC for mutual benefit.
Primary goals of GRUAN are to:
• Provide vertical profiles of reference measurements suitable for reliably detecting changes in global and regional climate on decadal time scales.
• Provide a calibrated reference standard for global satellite-based measurements of atmospheric essential climate variables.
• Fully characterize the properties of the atmospheric column.
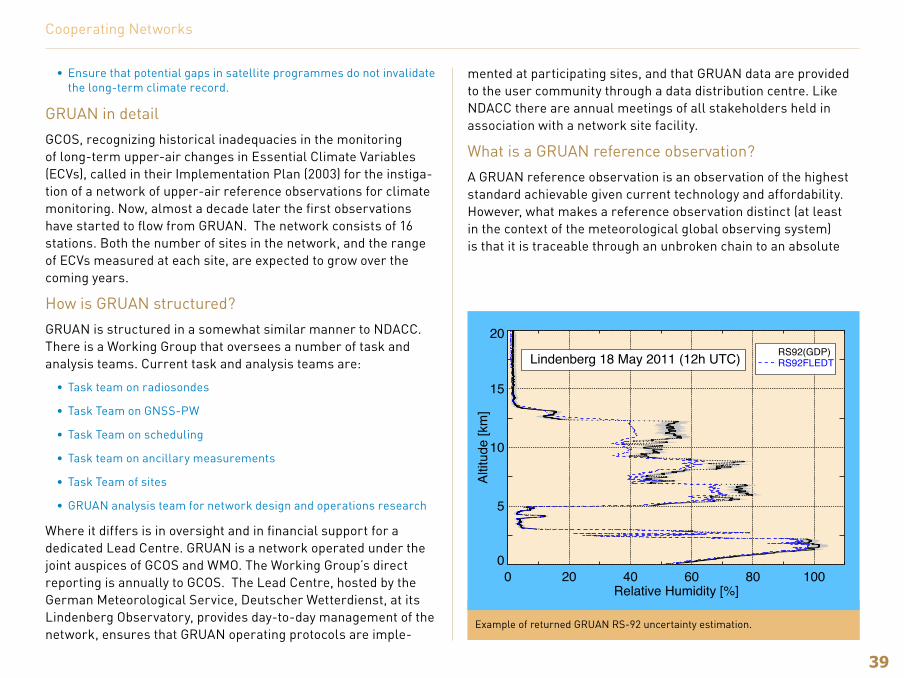
39
• Ensure that potential gaps in satellite programmes do not invalidate the long-term climate record.
GRUAN in detail
GCOS, recognizing historical inadequacies in the monitoring of long-term upper-air changes in Essential Climate Variables (ECVs), called in their Implementation Plan (2003) for the instiga-tion of a network of upper-air reference observations for climate monitoring. Now, almost a decade later the first observations have started to flow from GRUAN. The network consists of 16 stations. Both the number of sites in the network, and the range of ECVs measured at each site, are expected to grow over the coming years.
How is GRUAN structured?
GRUAN is structured in a somewhat similar manner to NDACC. There is a Working Group that oversees a number of task and analysis teams. Current task and analysis teams are:
• Task team on radiosondes
• Task Team on GNSS-PW
• Task Team on scheduling
• Task team on ancillary measurements
• Task Team of sites
• GRUAN analysis team for network design and operations research
Where it differs is in oversight and in financial support for a dedicated Lead Centre. GRUAN is a network operated under the joint auspices of GCOS and WMO. The Working Group’s direct reporting is annually to GCOS. The Lead Centre, hosted by the German Meteorological Service, Deutscher Wetterdienst, at its Lindenberg Observatory, provides day-to-day management of the network, ensures that GRUAN operating protocols are imple-
mented at participating sites, and that GRUAN data are provided to the user community through a data distribution centre. Like NDACC there are annual meetings of all stakeholders held in association with a network site facility.
What is a GRUAN reference observation?
A GRUAN reference observation is an observation of the highest standard achievable given current technology and affordability. However, what makes a reference observation distinct (at least in the context of the meteorological global observing system) is that it is traceable through an unbroken chain to an absolute
Cooperating Networks
0 20 40 60 80 100Relative Humidity [%]
0
5
10
15
20
Altit
ude
[km
]
Lindenberg 18 May 2011 (12h UTC) RS92(GDP)RS92FLEDT
Example of returned GRUAN RS-92 uncertainty estimation.
40
or accepted standard. Each step in the processing chain is well understood and an uncertainty is quantified for each and every recognized source of uncertainty.
The first GRUAN data stream, flowing since mid- 2011, is the Vaisala RS-92 data product. This product makes use of the commercially available Vaisala RS-92 production radiosonde. Raw data are collected from GRUAN sites, and are processed centrally using a common algorithm at the GRUAN Lead Centre before being served through the GRUAN central data centre. Additional ground checks prior to launch are also required. The processing applies systematic bias corrections where they are known and then parameterizes remaining sources of uncertainty. These uncertainties are independent and so are combined in quadrature.
What are future plans?
By 2017, GRUAN shall consist of:
• A network of approximately 30 sites (towards the stated long-term aspiration of 30-40 sites) all of which shall have been subject to regular certification and will be more globally equitably located. The new sites’ locations will be chosen pro-actively to meet documented stakeholder requirements.
• A network serving reference quality measurements with verified uncertainty estimates of vertical profiles from the surface through the lower stratosphere (and higher where feasible) of temperature, pressure, water vapour, wind speed and direction, and ozone. To the
extent possible these measurements will be made using redundant measurement systems including radiosonde and in-situ remote sensing equipment. Measurements will be made to stated stand-ards with each data stream processed centrally, and backed up by substantive metadata.
• A set of sustainable long-term measurements being used by recognized target stakeholders (climate change monitoring and detection, satellites, NWP, process studies), as demonstrated in the peer-reviewed literature, to improve our collective scientific understanding.
• A network with operational and research functions, embedded within the overarching WMO Integrated Global Observing System (WIGOS) framework and leading to improved capabilities and practices in other broader components of the Global Observing System and its applications.
How can you get involved?
There are very many opportunities to be involved in GRUAN activities ranging from simply using and providing feedback upon the data streams to helping in task teams and defining technical measurement, data and metadata requirements. There is much that GRUAN can learn from NDACC experiences and expertise and a need to ensure inter-compatibility / interoperability in particular as some sites will almost inevitably be affiliated to both networks.
You can contact the GRUAN Chairs at [email protected]
More detail on GRUAN can be found at www.gruan.org
Cooperating Networks

41
Update from SHADOZby Anne Thompson, Penn State University, USA
The SHADOZ (Southern Hemisphere Additional Ozonesondes) project began in 1998 as an international effort to augment ozone profiles in undersampled regions of the tropics and sub-tropics. The goals were validation of satellite ozone and elucidation of ozone variability on weekly to seasonal time scales. The data were quickly adopted for a range of studies, including the tropospheric wave-one in ozone, and signatures of the QBO and ENSO in both temperature and ozone profiles. From a start with 9 stations in the southern hemisphere the SHADOZ network expanded to northern tropical and subtropical stations in recog-nition that ozone characteristics north of the ITCZ (Intertropical Convergence Zone) are frequently distinct from the southern hemisphere. Since 2005, a total of 15 SHADOZ stations operated
(Figure 1). In 2013, the complement is 12 sites. Seasonal varia-tions at two contrasting SHADOZ stations, based on 2005-2009 data, appear in Figure 2.
SHADOZ affiliated with NDACC in 2009. The 20th Anniversary
Cooperating Networks
Nairobi, Kenya: Annual Cycle of Ozone (ppbv) [1998-2011]
Jan Mar May Jul Sep Nov JanMonth
0
5
10
15
20
Alti
tude
(km
)
1010 20203030
4040
50
50
50
60
60
60
70
70
70
9090120120 150150
10 20 30 40 50 60 70 75 90 120 150 ppbv
Natal, Brazil: Annual Cycle of Ozone (ppbv) [1998-2011]
Jan Mar May Jul Sep Nov JanMonth
0
5
10
15
20A
ltitu
de (k
m)
20 2030
3040
40
40
50
50
50
50
50
60
60
60
7070
70
9090 120
120 150150
10 20 30 40 50 60 70 75 90 120 150 ppbv
SHADOZ Sites
Suva, FijiWatukosek, JavaPago Pago, Am. Samoa
Hilo, HI
Natal, Brazil
La Reunion Is., France
Nairobi, Kenya Kuala Lumpur, MalaysiaParamaribo, SurinamCosta Rica (various sites)
Ha Noi, Vietnam
San Cristobal, Ecuador
Ascension Is., UK
Irene, South Africa
Cotonou, Benin
Figure 1. SHADOZ stations that operated within the 2005-2011 period. Data are at the website http://croc.gsfc.nasa.gov/shadoz.
Figure 2. The sea-sonal cycle of tropo-spheric and lower stratospheric ozone based on monthly av-eraged SHADOZ data at representative stations: (a) Nairobi; (b) Natal, Brazil.
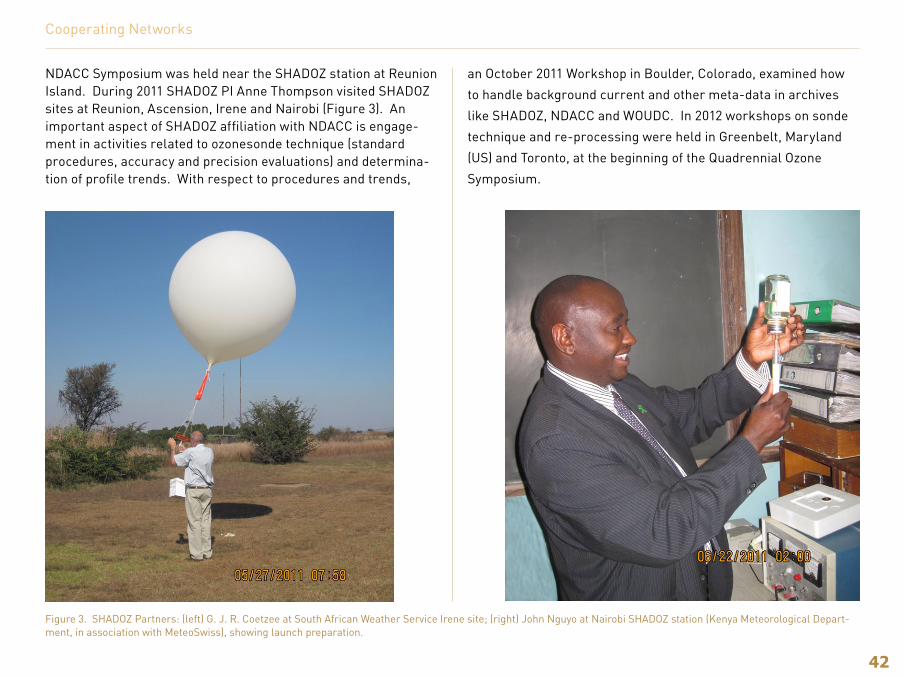
42
Cooperating Networks
Figure 3. SHADOZ Partners: (left) G. J. R. Coetzee at South African Weather Service Irene site; (right) John Nguyo at Nairobi SHADOZ station (Kenya Meteorological Depart-ment, in association with MeteoSwiss), showing launch preparation.
NDACC Symposium was held near the SHADOZ station at Reunion Island. During 2011 SHADOZ PI Anne Thompson visited SHADOZ sites at Reunion, Ascension, Irene and Nairobi (Figure 3). An important aspect of SHADOZ affiliation with NDACC is engage-ment in activities related to ozonesonde technique (standard procedures, accuracy and precision evaluations) and determina-tion of profile trends. With respect to procedures and trends,
an October 2011 Workshop in Boulder, Colorado, examined how
to handle background current and other meta-data in archives
like SHADOZ, NDACC and WOUDC. In 2012 workshops on sonde
technique and re-processing were held in Greenbelt, Maryland
(US) and Toronto, at the beginning of the Quadrennial Ozone
Symposium.

43
Report from the NDACC Data Host FacilityJeannette Wild and Roger Lin, National Oceanic and Atmospheric Administration National Center for Environmental Prediction (NOAA/NCEP), Camp Springs, Maryland, USA
Data AvailabilityThe NDACC web page http://www.ndacc.org has several visu-alizations of the contents of the NDACC database: The NDACC Observational Capabilities Chart (available on the home page) depicts a high level overview of NDACC’s core measurements; the Measurements and Analyses Directory (click NDACC Data, Measurements and Analyses Directory) gives a listing and short description of the instruments; the Data Table (Click NDACC Data, listing of data) gives a range of dates of data in the database with a direct link to the public data sets; and the Instrument Measure-
ment Charts (click Instruments, then species of interest) provide an in depth review of site/species and measurement availability per month. The number of files transferred from the NDACC Data Host Facility is on the tens of thousands of files per month. The statistics for the last 14 years is shown in Figure.
Rapid Delivery DataSeveral groups (especially in the context of NORS, see separate article in news Newsletter) have begun to submit rapid delivery data to the NDACC database. These are available within a month or two of measurement, and may be revised before submission into the standard, fully verified NDACC catalogue. These data are available in the public FTP area at ftp://ftp.cpc.ncep.noaa.gov/ndacc/RD.
Figure 1: Number of files transferred per month from the NDACC Data Host Facility. The counting is done from one Steering Committee to the next, so the period might not always be exactly one year.
0
20
40
60
80
100
# o
f File
Tra
nsfe
r (t
hous
ands
)
Time Period
NDACC Transfer Count Monthly Average
44
NDACC Relevant Projects
NORS: a contribution to the quality assessment and improvement of the Copernicus1 Atmosphere ServiceMartine de Mazière, Belgian Institute for Space Aeronomy
NORS (http://nors.aeronomie.be) stands for “Demonstration Network Of ground-based Remote Sensing Observations in support of the Copernicus Atmosphere Service (CAS)”. It is an EU FP7 project (grant agreement 284421) that started in November 2011 and will last until mid-2014. It aims at demonstrating the value of ground – based remote sensing data from the Network for the Detection of Atmospheric Composition Change (NDACC, http://www.ndacc.org) for quality assessment and improve-ment of the Copernicus1 Atmosphere Service (CAS) products. The CAS should become operational by the end of 2014. Today, it is embodied by the prototype project MACC-II (http://www.copernicus-atmosphere.eu/) and therefore NORS is cooperating closely with the MACC-II community, and in particular with the MACC-II Validation subproject.
NORS is a demonstration project: it relies on 4 European NDACC stations that are Ny-Ålesund, the Alpine station, Izaña and île
1Formerly known as GMES, Global Monitoring for Environment and Security
de La Réunion, and it involves the 4 major NDACC measurement techniques: Ozone DIAL, microwave radiometry, UV-Visible spectrometry (DOAS and MAXDOAS instruments) and infrared spectrometry (the Fourier-transform infrared spectrometers). Several research and developments activities are carried out in order to optimise the quality, the characterization and the rapid availability of the NDACC data products, using these stations datasets as typical representatives for the global NDACC.
The research and development activities are described hereinaf-ter.
First, the data submission to the NDACC Data Host Facility will be accelerated: data will be available in the database at latest one month after acquisition, in the GEOMS HDF format. It has been decided to separate the ‘rapid delivery’ data from the fully con-solidated NDACC data in the database, by submitting them in two distinct sections of the database, and by having a DATA_QUALITY indicator in the data file. This will avoid misuse of the data. The GEOMS HDF templates are being optimised for each technique in order to contain all the necessary information for a data user like MACC-II, and to be compliant with ISO and INSPIRE guidelines, e.g. for uncertainty reporting.
Next, major efforts will concern the better harmonization of the data, especially in the MAXDOAS and FTIR communities, and a better characterization.
A data documentation and a user guide will be delivered in order to clarify for a data user the information content and the repre-sentativeness of the data, and their uncertainties.
Since many techniques deliver O3 data, NORS will also develop an integrated ozone product, that covers the whole altitude range from the ground to the upper atmosphere, integrating the infor-
NORSNetwork of Remote SensingGround-Based Observations in supportof the Copernicus Atmospheric Service
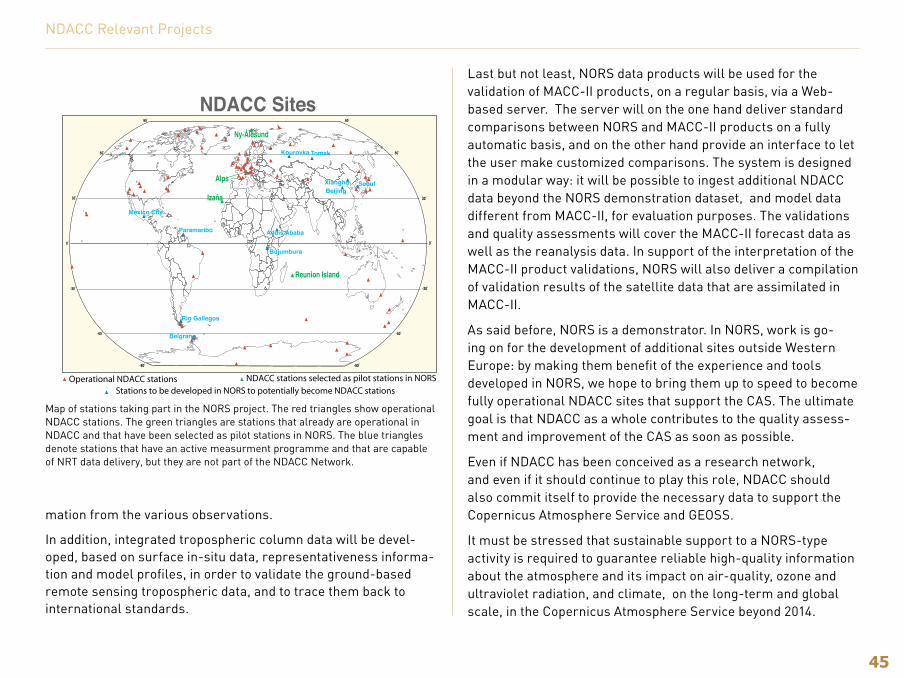
45
mation from the various observations.
In addition, integrated tropospheric column data will be devel-oped, based on surface in-situ data, representativeness informa-tion and model profiles, in order to validate the ground-based remote sensing tropospheric data, and to trace them back to international standards.
Last but not least, NORS data products will be used for the validation of MACC-II products, on a regular basis, via a Web-based server. The server will on the one hand deliver standard comparisons between NORS and MACC-II products on a fully automatic basis, and on the other hand provide an interface to let the user make customized comparisons. The system is designed in a modular way: it will be possible to ingest additional NDACC data beyond the NORS demonstration dataset, and model data different from MACC-II, for evaluation purposes. The validations and quality assessments will cover the MACC-II forecast data as well as the reanalysis data. In support of the interpretation of the MACC-II product validations, NORS will also deliver a compilation of validation results of the satellite data that are assimilated in MACC-II.
As said before, NORS is a demonstrator. In NORS, work is go-ing on for the development of additional sites outside Western Europe: by making them benefit of the experience and tools developed in NORS, we hope to bring them up to speed to become fully operational NDACC sites that support the CAS. The ultimate goal is that NDACC as a whole contributes to the quality assess-ment and improvement of the CAS as soon as possible.
Even if NDACC has been conceived as a research network, and even if it should continue to play this role, NDACC should also commit itself to provide the necessary data to support the Copernicus Atmosphere Service and GEOSS.
It must be stressed that sustainable support to a NORS-type activity is required to guarantee reliable high-quality information about the atmosphere and its impact on air-quality, ozone and ultraviolet radiation, and climate, on the long-term and global scale, in the Copernicus Atmosphere Service beyond 2014.
NDACC Sites
Alps
Ny-Ålesund
Reunion Island
Izaña
XiangheBeijing
Kourovka Tomsk
Paramaribo
Rio Gallegos
Bujumbura
Addis Ababa
Belgrano
Seoul
NDACC stations selected as pilot stations in NORSOperational NDACC stationsStations to be developed in NORS to potentially become NDACC stations
Mexico City
-90˚
-60˚
-30˚
0˚
30˚
60˚
90˚
-90˚
-60˚
-30˚
0˚
30˚
60˚
90˚
Map of stations taking part in the NORS project. The red triangles show operational NDACC stations. The green triangles are stations that already are operational in NDACC and that have been selected as pilot stations in NORS. The blue triangles denote stations that have an active measurment programme and that are capable of NRT data delivery, but they are not part of the NDACC Network.
NDACC Relevant Projects
46
ARISEGeir Braathen, World Meteorological Organization
NDACC stations and NDACC scientists participate in a new European Commission funded design study, ARISE (Atmospheric Dynamics Research Infrastructure in Europe) that aims at inte-grating different atmospheric observation networks to provide a new 3D image of the atmosphere in each atmospheric layer from the ground to the mesosphere with unprecedented spatio-temporal resolution. The project will cover Europe and outlying areas, including polar and equatorial regions. The project started in January 2012 and it will have a duration of three years.
The infrastructure will include the infrasound networks devel-oped for verification of the Comprehensive Nuclear Test Ban Treaty, the Network for the Detection of Atmospheric Composi-tion Change – using LIDAR (LIght Detection And Ranging) – and the Network for the Detection of Mesopause Change, dedicated to airglow layer measurements in the mesosphere. It will also include the complementary infrasound stations of various countries, specific infrasound stations located near volcanoes for volcanic source studies and ionospheric arrays to determine coupling with near Earth space.
Data collected by these multiple networks will be analysed to extract an optimised estimation of the evolving state of different atmospheric layers, which would help to constrain the param-eterisation of gravity waves and to better initialize forecasts of
the middle and upper atmosphere.
The expected benefits would be a better description of the atmosphere and an improved accuracy in short- and medium-range weather forecasts. ARISE measurements will also be used to improve the representation of gravity waves in stratosphere-resolving climate models, crucial to estimating the impact of a range of stratospheric climate forcing on the troposphere. Some recent phenomena have been observed by ARISE partners which demonstrate the relevance of its measurements. The fist relates to a major sudden stratospheric warming event that took place in the period from December 2012 to January 2013: three ARISE instruments installed at the Haute Provence Observatory revealed that there can be a temperature difference of 20°C between models and observations.
The other relates to the increased activity of the Etna volcano in January 2013, observations of which are now being thoroughly analysed in order to improve infrasound monitoring of remote volcanic regions. Results emanating from the analysis of ARISE observations will help to describe the global dynamics of such complex large scale events, and this will increase the use of ARISE data and results for modelling the mechanisms of such events and their impact on weather.
The expansion of ARISE into Africa also provides exceptional coverage from equatorial to Polar Regions.
More information on the ARISE project can be found on the project web site: http://arise-project.eu/
An article on the ARISE project appeared in the March 2013 Issue of the WMO Bulletin. The article can be found here: http://www.wmo.int/pages/publications/bulletin_en/documents/bulletin_en.pdf
NDACC Relevant Projects
47
The 2011 NDACC Symposium
The second NDACC symposium was arranged in order to celebrate the first twenty years of NDSC/NDACC operation. The Symposium was held in Île de la Réunion on 7-10 November 2011. It can be seen as a follow-up to the first NDSC Symposium, which was held in Arcachon, France on 24-27 September 2001 to celebrate the first ten years of NDSC operation. The 2011 NDACC Symposium demonstrated the remarkable accomplishments of the first two decades of this global network.
Background
The stratosphere plays a critical role in the Earth system. Its composition, chemistry, and circulation are affected by, and at the same time significantly influence, processes in the troposphere below and mesosphere above. Its susceptibility to human-in-duced change, exemplified by chlorofluorocarbon-induced ozone depletion, makes it imperative that we measure and understand the ongoing changes and their effects on Earth’s climate and biosphere. Toward this end, the international Network for the Detection of Stratospheric Change (NDSC) was initiated in 1991.
In the mid 2000s it became clear that the priorities and measure-ment capabilities of the Network had have broadened consider-ably to encompass:
• detecting trends in overall atmospheric composition and under-standing their impacts on the stratosphere and troposphere,
• establishing links between climate change and atmospheric composition,
• calibrating and validating space-based measurements of the atmosphere,
Meetings• supporting process-focused scientific field campaigns, and
• testing and improving theoretical models of the atmosphere.
Many members of the atmospheric science community had noted that this expanded emphasis was not adequately reflected in the original name of the Network and, in fact, that the word “Stratospheric” had led to a mistaken impression that the focus of activities was that of a “solved problem” (i.e., stratospheric ozone depletion). Hence, to better reflect the free tropospheric and stratospheric coverage of Network measurement, analysis, and modeling activities, as well as to convey the linkage to climate change, the Steering Committee voted in 2005 to change the name of the network to the Network for the Detection of Atmospheric Composition Change (NDACC).
At the NDACC Steering Committee meeting in October 2010 it was decided to arrange a scientific symposium to mark the first twenty years of network operation. CNRS volunteered to arrange and host the symposium in collaboration with the Université de la Réunion and other French sponsors. The Symposium was held in Saint Paul de la Réunion from 7 to 10 November 2011.
The Symposium was organized into nine complementary ses-sions:
1. Satellite Calibration, Validation, and Intercomparisons (8 talks, 9 posters)
2. Polar Chemistry and Ozone Loss (7 talks, 9 posters)
3. Tropical and Subtropical Observations and Analyses (5 talks, 7 posters)
4. Water Vapour (4 talks, 5 posters)
5. Tropospheric Observations and Analyses (5 talks, 5 posters)
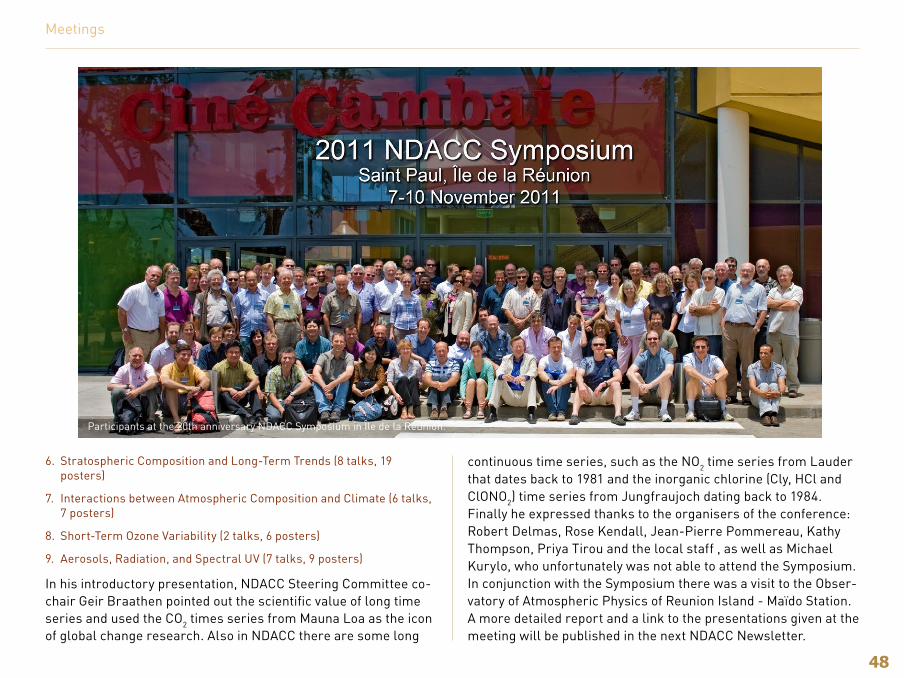
48
Meetings
Participants at the 20th anniversary NDACC Symposium in Île de la Réunion.
6. Stratospheric Composition and Long-Term Trends (8 talks, 19 posters)
7. Interactions between Atmospheric Composition and Climate (6 talks, 7 posters)
8. Short-Term Ozone Variability (2 talks, 6 posters)
9. Aerosols, Radiation, and Spectral UV (7 talks, 9 posters)
In his introductory presentation, NDACC Steering Committee co-chair Geir Braathen pointed out the scientific value of long time series and used the CO2 times series from Mauna Loa as the icon of global change research. Also in NDACC there are some long
continuous time series, such as the NO2 time series from Lauder that dates back to 1981 and the inorganic chlorine (Cly, HCl and ClONO2) time series from Jungfraujoch dating back to 1984. Finally he expressed thanks to the organisers of the conference: Robert Delmas, Rose Kendall, Jean-Pierre Pommereau, Kathy Thompson, Priya Tirou and the local staff , as well as Michael Kurylo, who unfortunately was not able to attend the Symposium. In conjunction with the Symposium there was a visit to the Obser-vatory of Atmospheric Physics of Reunion Island - Maïdo Station. A more detailed report and a link to the presentations given at the meeting will be published in the next NDACC Newsletter.
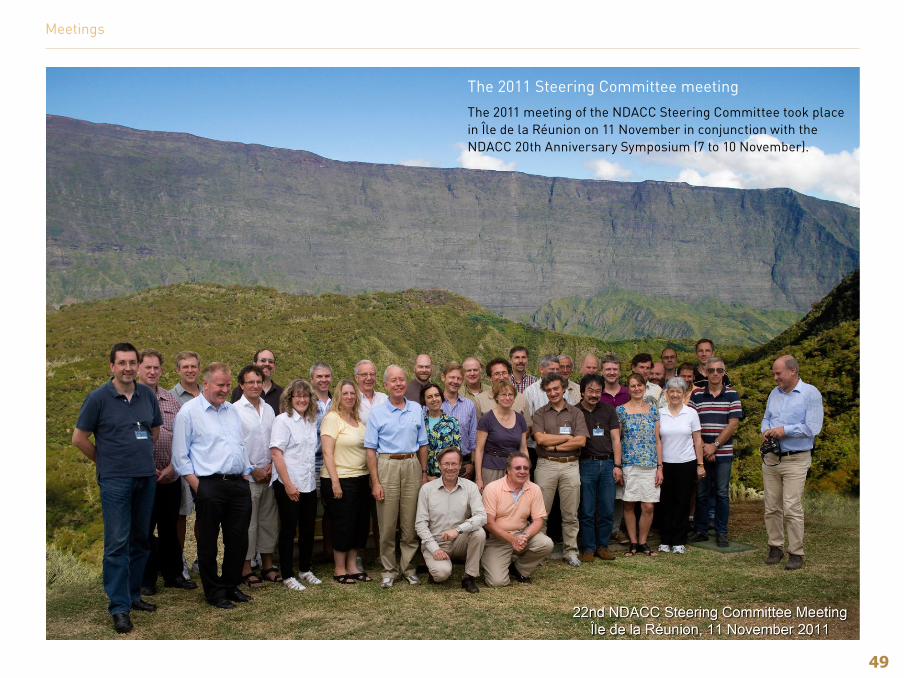
49
Meetings
The 2011 Steering Committee meeting
The 2011 meeting of the NDACC Steering Committee took place in Île de la Réunion on 11 November in conjunction with the NDACC 20th Anniversary Symposium (7 to 10 November).
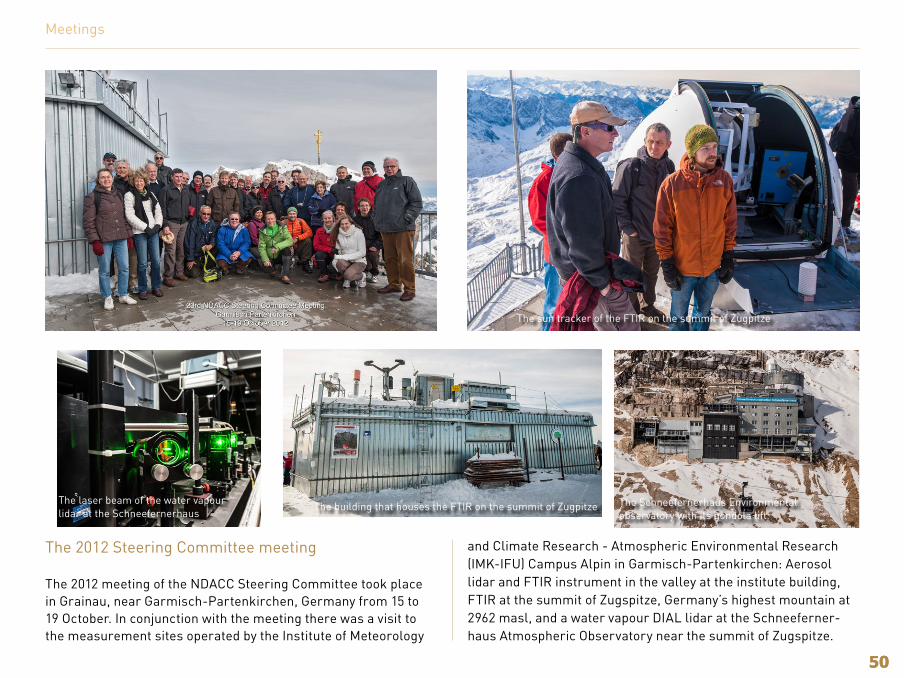
5050
The 2012 Steering Committee meeting
The 2012 meeting of the NDACC Steering Committee took place in Grainau, near Garmisch-Partenkirchen, Germany from 15 to 19 October. In conjunction with the meeting there was a visit to the measurement sites operated by the Institute of Meteorology
and Climate Research - Atmospheric Environmental Research (IMK-IFU) Campus Alpin in Garmisch-Partenkirchen: Aerosol lidar and FTIR instrument in the valley at the institute building, FTIR at the summit of Zugspitze, Germany’s highest mountain at 2962 masl, and a water vapour DIAL lidar at the Schneeferner-haus Atmospheric Observatory near the summit of Zugspitze.
Meetings
The Schneefernerhaus Environmental observatory with its gondola lift.
The sun tracker of the FTIR on the summit of Zugpitze
The building that houses the FTIR on the summit of ZugpitzeThe laser beam of the water vapour lidar at the Schneefernerhaus
The international Network for the Detection of Atmospheric Composition Change (NDACC) was formed to provide a consist-ent, standardised set of long-term measurements of atmos-pheric trace gases, particles, and physical parameters via a
suite of globally distributed sites.
The principal goals of the network are: • To study the temporal and spatial variability of atmospheric composition
and structure in order to provide early detection and subsequent long-term monitoring of changes in the physical and chemical state of the stratosphere and upper troposphere; in particular to provide the means to discern and understand the causes of such changes.
• To establish the links between changes in stratospheric ozone, UV radiation at the ground, tropospheric chemistry, and climate.
• To provide independent calibration and validation of space-based sen-sors of the atmosphere and to make complementary measurements.
• To support field campaigns focusing on specific processes occurring at various latitudes and seasons.
• To produce verified data sets for testing and improving multidimensional models of both the stratosphere and the troposphere.
The primary instruments and measurements of NDACC are:• Ozone lidar (vertical profiles of ozone from the tropopause to at least 40
km altitude; in some cases tropospheric ozone will also be measured)
• Temperature lidar (vertical profiles of temperature from about 30 to 80 km)
• Aerosol lidar (vertical profiles of aerosol optical depth in the lower stratosphere)
• Water vapour lidar (vertical profiles of water vapour in the lower stratosphere)
• Ozone microwave (vertical profiles of stratospheric ozone from 20 to 70 km)
• H2O microwave (vertical profiles water vapour from about 20 to 80 km)
• ClO microwave (vertical profiles of ClO from about 25 to 45 km, depend-ing on latitude)
• Ultraviolet/Visible spectrograph (column abundance of ozone, NO, and, at some latitudes, OClO and BrO)
• Fourier Transform Infrared spectrometer (column abundances of a broad range of species including ozone, HCl, NO, NO2, ClONO2, and HNO3)
• Ozone and aerosol sondes (vertical profiles of ozone concentration and aerosol backscatter ratio)
• UV spectroradiometers (absolutely calibrated measurements of UV radiance and irradiance)
ContactsFor more information, please go to the NDACC web site (http://www.ndacc.org) or contact the co-chairs:
Dr. Stuart McDermidJet Propulsion LaboratoryTable Mountain FacilityP.O. Box 367Wrightwood, CA 92397USAE-mail: [email protected]
Dr. Geir O. BraathenAtmospheric Environment Research Division (AER)Research Department (RES)World Meteorological Organization (WMO)Case postale 2300CH-1211 Geneva 2, SwitzerlandE-mail: [email protected]
Related Documents