NCWE-2007, Oct 30 - Nov 1, SERC Chennai, India Experimental Investigation of Wind Loads on Canopy-Roofs A. K. Roy 1 , A. K. Ahuja 2 and V. K. Gupta 3 Department of Civil Engineering, I. I. T. Roorkee., Roorkee – 247667, India, amrit_ju200, ahuja_ak & vkgfce @rediffmail.com Abstract Low-rise buildings are designed against wind using pressure coefficients on wall and roof surfaces as available in relevant code of practices. In case of canopy-roofs, very limited information is available in code of practices. The present paper describes the efforts taken to collect more information in this area. Models of gable type canopy- roof with varying slope (0, 10, 20 and 30) are made of Perspex sheet (Fig. 1) and tested in the closed-circuit wind tunnel to measure wind pressure distribution on upper as well as lower surfaces. Models with and without side cladding are tested to see the influence of storage material on wind pressure distribution on canopy-roofs. Mean, R.M.S, maximum and minimum values of wind pressures are measured on the surfaces of the models for 7 wind directions (0 to 90 @ 15) in order to study the influence of wind incidence angle. INTRODUCTION Calculation of occasional loads like wind loads on structures require information on design wind speed and pressure or force coefficients, which can be obtained from the relevant codes of practice or literature to the extent it is available (AS/NZS: 1170.2, 2002, ASCE: 7- 02, 2002, IS: 875 (part-3), 1987, NBC (Part-4), 1995). According to Indian code of practices for design wind loads for building and structures IS: 875 (Part-3), 1987, the pressure coefficients (C p ) for gable type 1 Research Scholar, 2 Associate Professor, 3 Professor

NCWE 007_Full Length Paper_A K Roy_IITR-final
Dec 12, 2015
Experimental Investigation of Wind Loads on
Canopy-Roofs
Canopy-Roofs
Welcome message from author
This document is posted to help you gain knowledge. Please leave a comment to let me know what you think about it! Share it to your friends and learn new things together.
Transcript
NCWE-2007, Oct 30 - Nov 1, SERC Chennai, India
Experimental Investigation of Wind Loads on Canopy-Roofs
A. K. Roy1, A. K. Ahuja2 and V. K. Gupta3
Department of Civil Engineering, I. I. T. Roorkee., Roorkee – 247667, India, amrit_ju200, ahuja_ak & vkgfce @rediffmail.com
Abstract
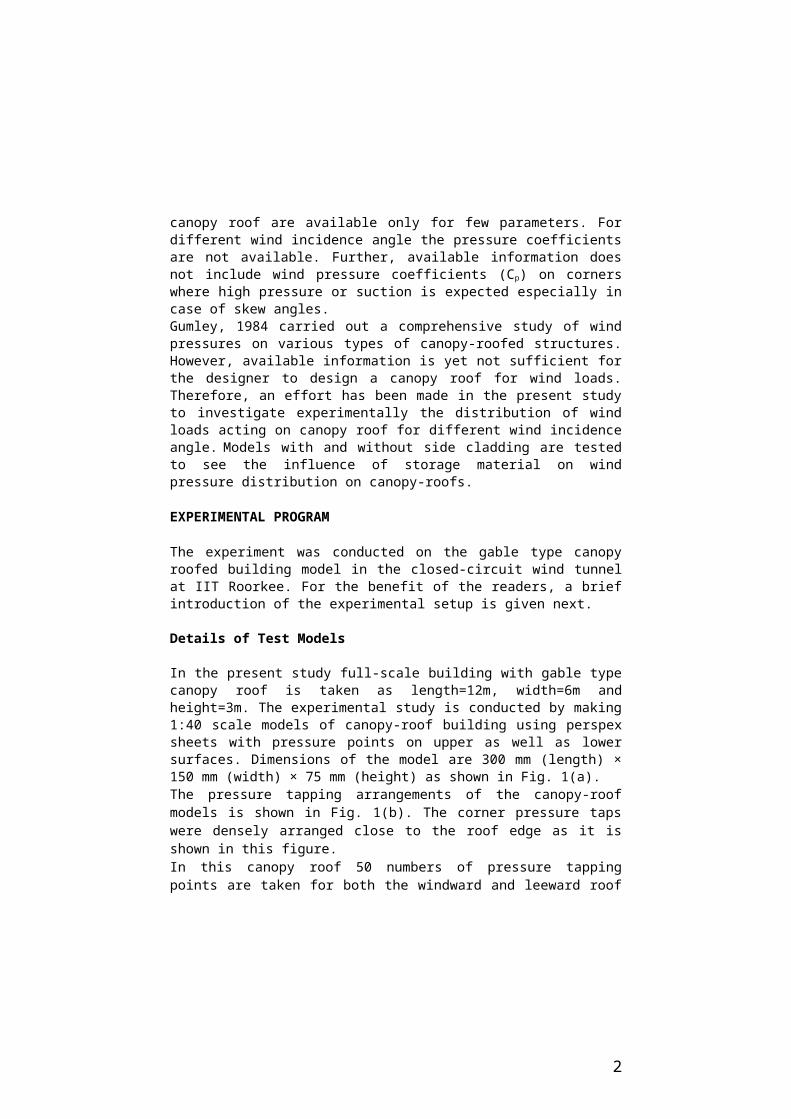
Low-rise buildings are designed against wind using pressure coefficients on wall and roof surfaces as available in relevant code of practices. In case of canopy-roofs, very limited information is available in code of practices. The present paper describes the efforts taken to collect more information in this area. Models of gable type canopy-roof with varying slope (0, 10, 20 and 30) are made of Perspex sheet (Fig. 1) and tested in the closed-circuit wind tunnel to measure wind pressure distribution on upper as well as lower surfaces. Models with and without side cladding are tested to see the influence of storage material on wind pressure distribution on canopy-roofs. Mean, R.M.S, maximum and minimum values of wind pressures are measured on the surfaces of the models for 7 wind directions (0 to 90 @ 15) in order to study the influence of wind incidence angle.
INTRODUCTION
Calculation of occasional loads like wind loads on structures require information on design wind speed and pressure or force coefficients, which can be obtained from the relevant codes of practice or literature to the extent it is available (AS/NZS: 1170.2, 2002, ASCE: 7-02, 2002, IS: 875 (part-3), 1987, NBC (Part-4), 1995). According to Indian code of practices for design wind loads for building and structures IS: 875 (Part-3), 1987, the pressure coefficients (Cp) for gable type canopy roof are available only for few parameters. For different wind incidence angle the pressure coefficients are not available. Further, available information does not include wind pressure coefficients (Cp) on corners where high pressure or suction is expected especially in case of skew angles.Gumley, 1984 carried out a comprehensive study of wind pressures on various types of canopy-roofed structures. However, available information is yet not sufficient for the designer to design a canopy roof for wind loads. Therefore, an effort has been made in the present study to investigate experimentally the distribution of wind loads acting on canopy roof for different wind incidence angle. Models with and
1 Research Scholar, 2 Associate Professor, 3 Professor
without side cladding are tested to see the influence of storage material on wind pressure distribution on canopy-roofs.
EXPERIMENTAL PROGRAM
The experiment was conducted on the gable type canopy roofed building model in the closed-circuit wind tunnel at IIT Roorkee. For the benefit of the readers, a brief introduction of the experimental setup is given next.
Details of Test Models
In the present study full-scale building with gable type canopy roof is taken as length=12m, width=6m and height=3m. The experimental study is conducted by making 1:40 scale models of canopy-roof building using perspex sheets with pressure points on upper as well as lower surfaces. Dimensions of the model are 300 mm (length) × 150 mm (width) × 75 mm (height) as shown in Fig. 1(a).The pressure tapping arrangements of the canopy-roof models is shown in Fig. 1(b). The corner pressure taps were densely arranged close to the roof edge as it is shown in this figure. In this canopy roof 50 numbers of pressure tapping points are taken for both the windward and leeward roof surface and in case of both the above and below the roof surface. For all the cases the distance between pressures tapping points are arranged according to the position of the roof surface.Schematic Diagram of different blockage provided in the experimental models are shown in the Fig. 2(a) to Fig. 2(d). In the experimental models cladding provided are 25%, 50%, 75% and 100% cladding.
Flow Characteristics
The model is tested in boundary layer flow corresponding to terrain category 2 as per IS: 875 (part-3)-(1987) in the closed-circuit wind tunnel having cross section 1.3 m (width) x 0.85 m (height) as shown in Fig. 3.Mean, R.M.S, Maximum and Minimum pressures has been measured on both the upper and lower surfaces of the models for 7 wind directions namely 00, 150, 300, 450, 600, 750 and 900 in order to study the influence of wind incidence angle.The pressure taping installation of the experimental gable type roof model is shown in Fig. 4. In this figure P1, P2 and P3 are the pressure tapping point on the upper surface of the roof model and P4, P5 and P6 are the pressure taping points on the lower surface of the model.A photograph of 1:40 scale model of 10° slope canopy roof placed on a turn-table is shown in Fig. 5. The turn table is used to rotate the model to the desired angle to face the wind flow and made the model to face wind at different angle.RESULTS AND DISCUSSION
2
Systematic measurements of wind pressure are conducted at the experimental model. More than 50 data of 5 second interval each are collected out of 46 data are analyzed. These 46 recorded wind pressure data at each tap location are used to calculate Mean, R.M.S., Maximum and Minimum pressure values. Then these pressure values (p) are presented in the form of pressure coefficients (Cp) using the mean wind speed Uh at the roof height as the reference velocity, e.g.,
. (1)
Variation of pressure with respect to different parameters
The convention for positive roof pressure, wind force and the corresponding pressure and force coefficients, on either the upper or lower surface is always from the air side onto the roof surface. The net wind-induced pressure and force on the roof due to the combined effect of the upper and lower roof surfaces are defined as positive in the vertically downward direction. The relationship is like the following expression: . (2)
The wind incident angle θ are measured as θ = 90º when wind coming directly perpendicular to ridgeline of the canopy roof.With the lower and upper surface pressure coefficients we can calculate the net acting pressure on the roof surface. The distinguishing relationship between the pressure coefficients at four pressure taping points on the edge of the roofs (A1, A2, A3 and A4) with different wind incident angle for different roof slope is shown in Fig. 6.
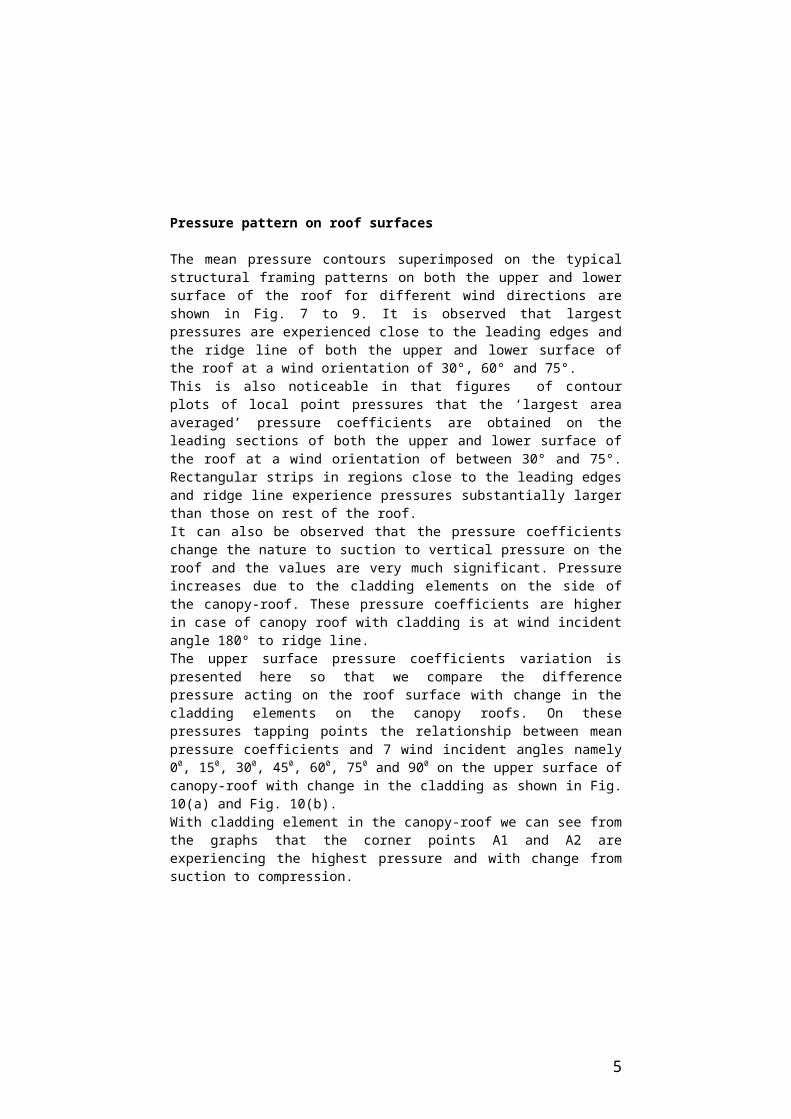
Pressure pattern on roof surfaces
The mean pressure contours superimposed on the typical structural framing patterns on both the upper and lower surface of the roof for different wind directions are shown in Fig. 7 to 9. It is observed that largest pressures are experienced close to the leading edges and the ridge line of both the upper and lower surface of the roof at a wind orientation of 30°, 60° and 75°.This is also noticeable in that figures of contour plots of local point pressures that the ‘largest area averaged’ pressure coefficients are obtained on the leading sections of both the upper and lower surface of the roof at a wind orientation of between 30° and 75°. Rectangular strips in regions close to the leading edges and ridge line experience pressures substantially larger than those on rest of the roof.It can also be observed that the pressure coefficients change the nature to suction to vertical pressure on the roof and the values are very much significant. Pressure increases due to the cladding elements on the side of the canopy-roof. These
3

pressure coefficients are higher in case of canopy roof with cladding is at wind incident angle 180º to ridge line.The upper surface pressure coefficients variation is presented here so that we compare the difference pressure acting on the roof surface with change in the cladding elements on the canopy roofs. On these pressures tapping points the relationship between mean pressure coefficients and 7 wind incident angles namely 00, 150, 300, 450, 600, 750 and 900 on the upper surface of canopy-roof with change in the cladding as shown in Fig. 10(a) and Fig. 10(b). With cladding element in the canopy-roof we can see from the graphs that the corner points A1 and A2 are experiencing the highest pressure and with change from suction to compression.
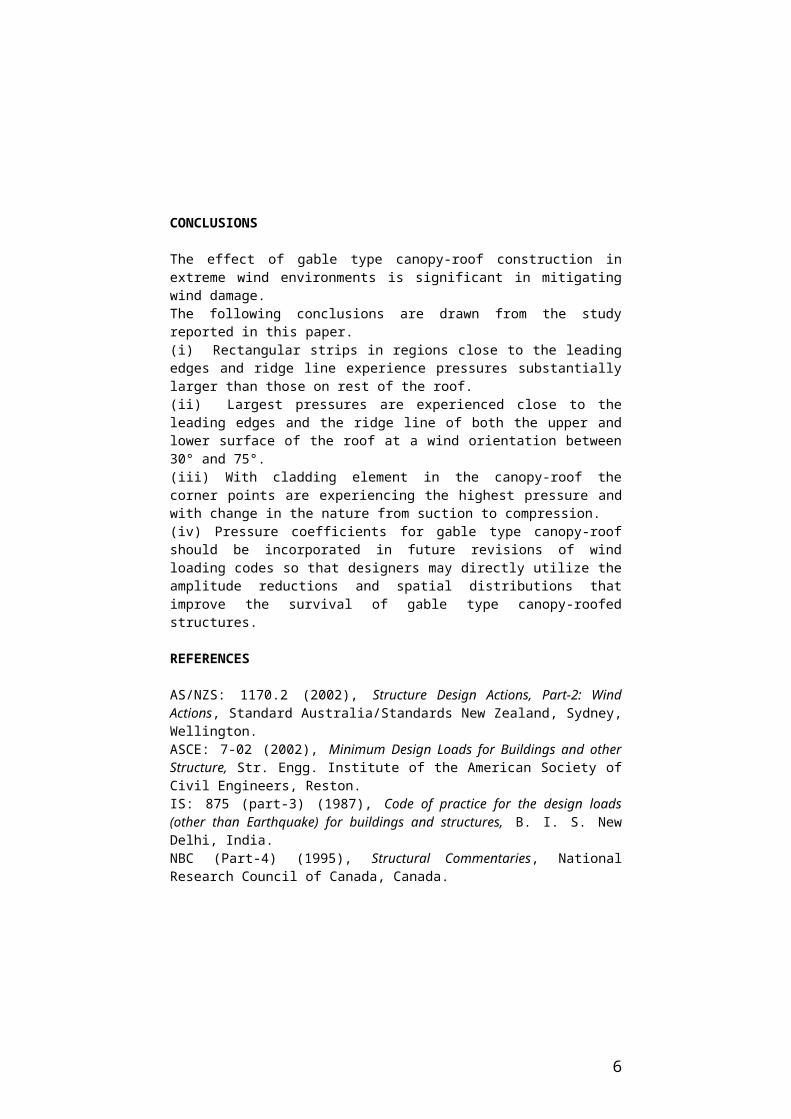
CONCLUSIONS
The effect of gable type canopy-roof construction in extreme wind environments is significant in mitigating wind damage.The following conclusions are drawn from the study reported in this paper.(i) Rectangular strips in regions close to the leading edges and ridge line experience pressures substantially larger than those on rest of the roof.(ii) Largest pressures are experienced close to the leading edges and the ridge line of both the upper and lower surface of the roof at a wind orientation between 30° and 75°.(iii) With cladding element in the canopy-roof the corner points are experiencing the highest pressure and with change in the nature from suction to compression.(iv) Pressure coefficients for gable type canopy-roof should be incorporated in future revisions of wind loading codes so that designers may directly utilize the amplitude reductions and spatial distributions that improve the survival of gable type canopy-roofed structures.
REFERENCES
AS/NZS: 1170.2 (2002), Structure Design Actions, Part-2: Wind Actions, Standard Australia/Standards New Zealand, Sydney, Wellington.ASCE: 7-02 (2002), Minimum Design Loads for Buildings and other Structure, Str. Engg. Institute of the American Society of Civil Engineers, Reston.IS: 875 (part-3) (1987), Code of practice for the design loads (other than Earthquake) for buildings and structures, B. I. S. New Delhi, India. NBC (Part-4) (1995), Structural Commentaries, National Research Council of Canada, Canada.Gumley S. J. (1984), “A parametric study of extreme pressure for the static design of canopy structures”, J. of Wind Engg. and Ind. Aerodyn., 16, 43-56.
4
(a) (b)Fig. 1 Schematic Diagram of (a) Typical Experimental Model and (b) Pressure
Tap Layout.
5
5
5
P1 P2 P3
P4 P5 P6
Fig. 2 Schematic Diagram of blockage provided in the experimental models (a) 25%, (b) 50%, (c) 75% and (b) 100% cladding.
Fig. 3 Schematic Diagram Showing Model Placed at Test Section in Wind Tunnel.
Fig. 4 Pressure Tubes Arrangements in Roof Section.
6
Model
Ref. Pitot Tube
Flow
Grid
3.5 m 2.6 m500
6.1 m
Flow
Fig. 5 Photograph of canopy-roof model of 10° slope placed in the
wind tunnel.
Fig. 6 Four corner pressure tapping points on the upper surface of the canopy-roof.
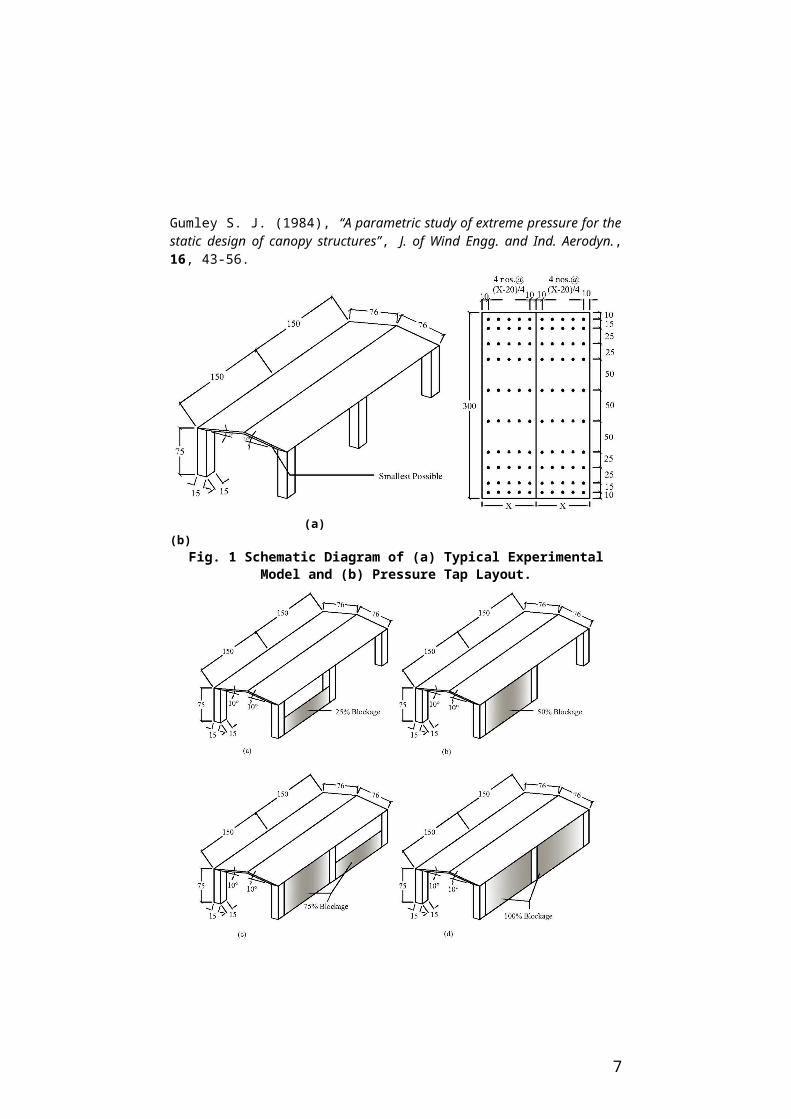
Fig. 7 Mean Pressure Coefficient Contours (Cp, mean) on the Upper Surface of the Canopy Roof of 10° Slope for Wind Incident Angle 0° to Ridge (a) Without
Cladding and (b) With Cladding.
7
1 0 2 5 4 0 5 5
W Id th (m m )
1 0
3 0
5 0
7 0
9 0
11 0
1 3 0
1 5 0
1 7 0
1 9 0
2 1 0
2 3 0
2 5 0
2 7 0
2 9 0
Len
gth
(mm
)
F a ce A
(a )
F a ce B
7 0 8 5 1 0 0 11 5 1 0 2 5 4 0 5 5
W Id th (m m )
1 0
3 0
5 0
7 0
9 0
11 0
1 3 0
1 5 0
1 7 0
1 9 0
2 1 0
2 3 0
2 5 0
2 7 0
2 9 0
Len
gth
(m
m)
(b )
F a ce A
7 0 8 5 1 0 0 11 5
F a ce B
1 0 2 5 4 0 5 5
W id th (m m )
1 0
3 0
5 0
7 0
9 0
11 0
1 3 0
1 5 0
1 7 0
1 9 0
2 1 0
2 3 0
2 5 0
2 7 0
2 9 0
Len
gth
(m
m)
F a ce A
(a )
7 0 8 5 1 0 0 11 5
F a ce B
1 0 2 5 4 0 5 5
W id th (m m )
1 0
3 0
5 0
7 0
9 0
11 0
1 3 0
1 5 0
1 7 0
1 9 0
2 1 0
2 3 0
2 5 0
2 7 0
2 9 0
Len
gth
(m
m)
F a ce A
(b )
7 0 8 5 1 0 0 11 5
F a ce B

Fig. 8 Mean Pressure Coefficient Contours (Cp, mean) on the Upper Surface of the Canopy Roof of 10° Slope for Wind Incident Angle 90° to Ridge (a) Without
Cladding and (b) With Cladding.
Fig. 9 Mean Pressure Coefficient Contours (Cp, mean) on the Upper Surface of the Canopy Roof of 10° Slope for Wind Incident Angle 180° to Ridge Without
Cladding.
(a) (b)
8
1 0 2 5 4 0 5 5
W id th (m m )
1 0
3 0
5 0
7 0
9 0
11 0
1 3 0
1 5 0
1 7 0
1 9 0
2 1 0
2 3 0
2 5 0
2 7 0
2 9 0
Len
gth
(m
m) F a ce A
7 0 8 5 1 0 0 11 5
F a ce B

Fig. 10 Variation of pressure coefficients (Cp, rms) at four corner pressure taping points with different wind incident angle for Canopy-Roof (a) without and (b)
with Cladding.
9
Related Documents