LatestLaws.com

Welcome message from author
This document is posted to help you gain knowledge. Please leave a comment to let me know what you think about it! Share it to your friends and learn new things together.
Transcript
LatestLaws.com

LatestLaws.com
Crime in India
2012
Compendium
: 26172324, 26105353, 26177442
Fax : 26197984
E-Mail : [email protected] / [email protected]
Web Site : http://ncrb.gov.in
National Crime Records Bureau Ministry of Home Affairs
Government of India East Block - 7, R.K. Puram,
New Delhi - 110 066.
LatestLaws.com

LatestLaws.com
R. K. SINGH
MESSAGE
~~ HOME SECRETARY
l'IT'{\1 ~
GOVERNMENT OF INDIA
North Block,
New Delhi.
4th June, 2013.
I am pleased to learn that the arumal publication of the National Crime
Records Bureau "Crime in India 2012" was released in the first week of June 2013,
well ahead of the target date 30th June, 2013. It is an important achievement for us
and I take this opportunity to congratulate the Director General, NCRB and his
team of officers for this achievement. Crime in India publication is an important
report which provides exh·emely useful statistics on crime in the country.
NCRB has taken lot of initiatives to revise the format of "Crime in India" to
include more number of crimes from IPC and other special laws to fulfil the
requirements of various stake holders. Consultations with States and UTs have
been completed at MHA level on this issue and the new format for collection of
crime data will be circulated to all States and UTs shortly.
The h·ends of crime keep changing with the growing population and rapid
development of towns and cities. Rise in crime in any place is a worrying factor for
everyone and especially crime against women, children and weaker sections of the
society is a great concern to ,all of us. Crime leaves deep scars in the society;
therefore we need to study the causes, patterns and nature of crimes affecting the
human body and property to find out the reasons for incidence of such crimes.
Such a study will help us to identify remedial measures and policy interventions to
contain such heinous crimes. Crime in India publication is a vital tool in the hands
of such researchers, criminologists and officers of criminal justice system in the
counh-y as it provides ample statistical data to conduct such studies.
I convey my gratitude to all the States and UT Police Departments for
supplying the crime data to NCRB within the time schedule. Without their active
support and cooperation it would not have been possible for us to bring out the
publication "Crime in India 2012" within a record time. I urge the heads of law
enforcement agencies to keep up this good work and send the crime data of current
calendar year by March 2014.
(R. ~
"Please visit our website at.http://mha.nic.in"
LatestLaws.com

LatestLaws.com
~ 3ll(>fl1, llf."g.~ .
~t:?IPI~~I¢
Shafi Alam, IPS
Director General
FOREWORD
~ fl\!¢ 1\!
7[6 ~?II C'tll
~31lmt:l ~~
~ ~-7 , 3TR . cfi . ~. ~ ~ - 66
Government of India
Ministry of Home Affairs
National Crime Records Bureau
East Block- 7, R. K. Puram, New Delhi- 66
I am privileged to release Crime in India 2012 edition. Officers and staff of NCRB and
MHA have put in lot of efforts in collection and compilation of data for publishing this edition in
record time. I take this opportunity to congratulate them for their efforts. For the first time in
the history of NCRB this publication is released in the first week of June 2013, well ahead of our
target. We could have released this publication in the month of May 2013 itself but owing to
the delay caused by some of the States in sending the crime data to NCRB we could not release
it by May 2013. Nevertheless for all of us this is an important achievement as we have bettered
our own record set in 2011 by further reducing the time lag of "Crime in India" publication.
For any information to be useful or relevant to any stake holder such information has to
be current and in this respect I hope the information of crime statistics of the country for the
calendar year 2012 would be of great importance and relevance to all the stake holders.
NCRB has completed the process of revising the data collection proforma for future
Crime in India publication to accommodate various requirements of stake holders. The future
publication of Crime in India will contain more details on crimes against women, children,
weaker sections of the society and senior citizens, cases under IT Act and other special Acts.
Once the new format is approved, NCRB will develop web based data collection software for
Crime in India publication.
Like previous years, this publication is also available in digital form and it can be freely
downloaded by all the stakeholders by accessing our website http ://ncrb.gov.in.
I sincerely acknowledge the cooperation extended by all States/UTs and thank all the
officers and men of State Crime Records Bureau and Anti Corruption Bureau/Vigilance
Departments in all the States and UTs for their untiring efforts in extending all support to NCRB
bring out this publicat ion in time.
4thJune, 2013
New Delhi
~ ~~
LatestLaws.com
Disclaimer
The information given in this report has been obtained from State/U.T. Police.
All precautions have been taken to ensure that the data is statistically
consistent. NCRB has only compiled and collated the data and presented it in
the form of this report. NCRB shall not be responsible for authenticity of this
information. However, any discrepancy observed in this report may be
brought to the notice of the Bureau.
In this report, the calculated values of crime rate, percentage, etc are rounded
up to only one decimal; hence an approximate value is used for analysis.
In our earlier editions, Crime Rate for Crime against Women, Schedule
Castes, Schedule Tribes and Children for the States/UTs was calculated on
the basis of total population of that State/UT and similar method was used
for all India level calculation.
However, in the present edition, in order to make the statistical analysis more
meaningful, we have calculated ‘Crime Rate’ on the basis of population of that
segment only e.g. the crime rate of crime against women has been calculated
using only female population. Further, crime rate in respect of Schedule
Castes, Schedule Tribes and Children has been calculated and presented in
this report using population of the concerned segment. Hence, there may be
variation in respect of crime rate calculated and presented in previous reports
in respect of these segments of population.
In present edition the crime head ‘Molestation’, ‘Sexual Harassment (Eve-
teasing)’, ‘Importation of Girls’ and ‘Cruelty by Husband & Relatives’ are changed as ‘Assault on Women with intent to outrage her modesty’, ‘Insult to the modesty of Women’, ‘Importation of Girls from foreign country’ and ‘Cruelty by Husband or his Relatives’ in consonance with IPC sections 354,
509, 366-B and 498-A respectively.
LatestLaws.com

Limitation
Mid-Year Estimated Population of Children (upto 18 years of age) based on
Projected Total Mid-Year Population has been used for calculating crime rate
in respect of Crime against Children for the year 2012.
Provisional population of census 2011 has been used for calculating crime
rate of Mega Cities, Crime against SC and ST for the year 2012 due to non-
availability of projected census figures.
There may be some inconsistencies in tables in respect of data on
Prevention of Corruption Act and related sections of IPC due to clarifications
pending from Police units. This data is sent by Vigilance Departments of
States/UTs separately.
Projected mid-year population for the year 2012 based on population Census
of India 2001, as supplied by Demographic Division, RGI, MHA was used for
calculating crime rate in this report. Hence the projected population for the
year 2012 in respect of some States/UTs may be less than the provisional
population of Census of India 2011.
LatestLaws.com
Guidance
Shri Shafi Alam, IPS Director General
Editorial Board
Shri Nasir Kamal, IPS Joint Director
Sh. R. Rajasekaran, IPS Deputy Director
Shri Akhilesh Kumar, ISS Chief Statistical Officer
Shri R.B. Singh, ISS Statistical Officer
Smt. Surekha Soni Statistical Investigator
Other Officers and Technical Personnel
Other Officers and Technical Personnel (Contd….)
Shri Pawan Kumar Bhardwaj, JAD Shri Rajesh Kumar, DEO-A Shri M.P. Sharma, JAD Ms. Tajender Kaur, DEO-B Shri K.P. Uday Shankar, DPA-B Sh. Jitender Rawat, DEO-A
Shri D.C. Pandey, DPA-B Ms. Usha Rawat, DEO-A
Shri M. Rajakumar, DPA-B
Ms. Seema Rani, DPA-A Graphics, Maps & Cover Page
Ms. Jyoti, Statistical Investigator
Ms. Komal, DPA-A Shri D.C. Pandey, DPA-B
Shri Devki Nandan, DEO-D Shri C. Sivakumar, DPA-A
Shri Ashok Kumar, DEO-B Shri Suresh Bohra, DPA-B
OFFICERS & OFFICIALS ASSOCIATED WITH THE PUBLICATION
LatestLaws.com
i
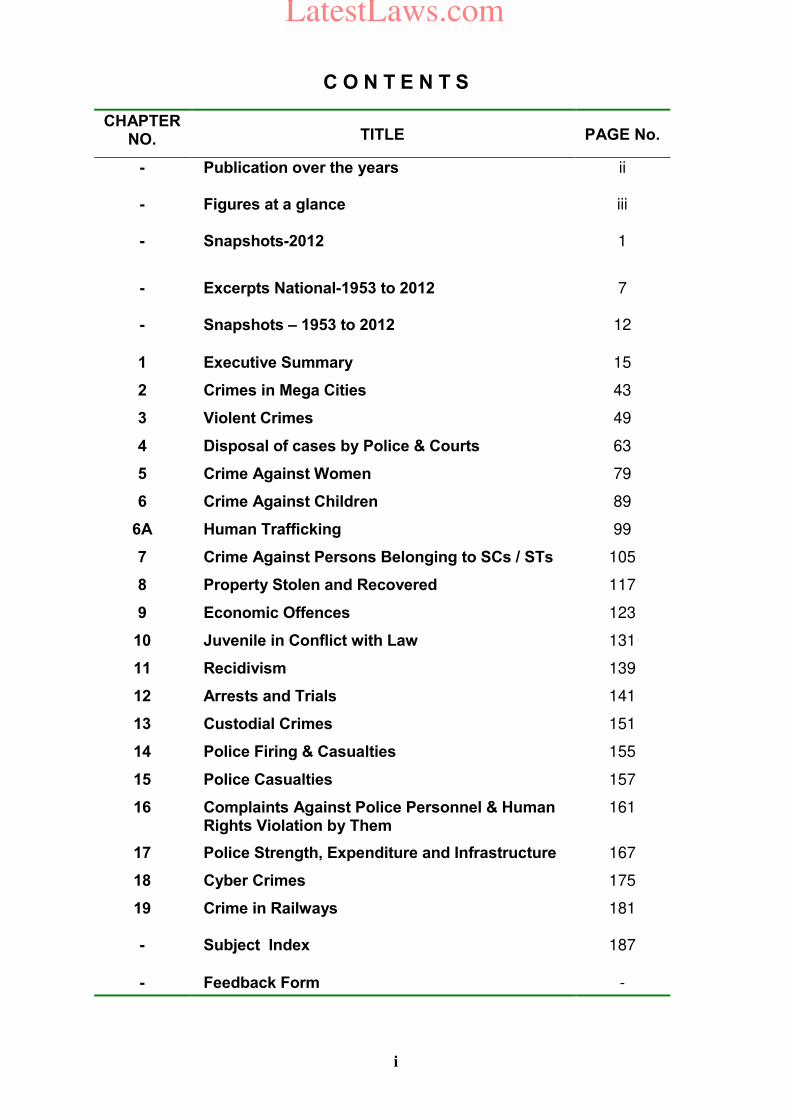
C O N T E N T S
CHAPTER NO.
TITLE PAGE No.
- - -
Publication over the years Figures at a glance Snapshots-2012
ii
iii
1
- -
Excerpts National-1953 to 2012 Snapshots – 1953 to 2012
7
12
1 Executive Summary 15
2 Crimes in Mega Cities 43
3 Violent Crimes 49
4 Disposal of cases by Police & Courts 63
5 Crime Against Women 79
6 Crime Against Children 89
6A Human Trafficking 99
7 Crime Against Persons Belonging to SCs / STs 105
8 Property Stolen and Recovered 117
9 Economic Offences 123
10 Juvenile in Conflict with Law 131
11 Recidivism 139
12 Arrests and Trials 141
13 Custodial Crimes 151
14 Police Firing & Casualties 155
15 Police Casualties 157
16 Complaints Against Police Personnel & Human Rights Violation by Them
161
17 Police Strength, Expenditure and Infrastructure 167
18 Cyber Crimes 175
19 -
Crime in Railways Subject Index
181
187
- Feedback Form -
LatestLaws.com
ii
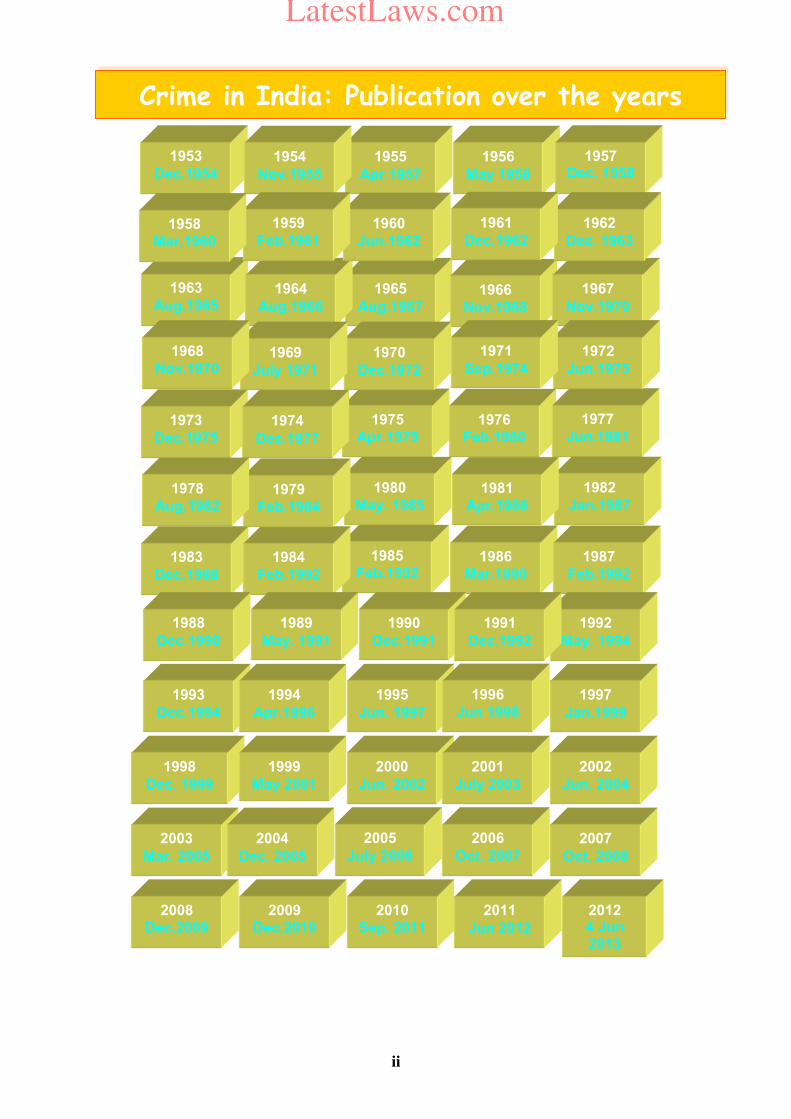
Crime in India: Publication over the years
1953
Dec.1954
1955
Apr.1957
1956
May 1958
1957 Dec. 1958
1954
Nov.1955
1963
Aug.1965 1965
Aug.1967 1966
Nov.1968
1967
Nov.1970
1964
Aug.1966
1960
Jun.1962
1962 Dec. 1963
1959 Feb.1961
1958 Mar.1960
1961 Dec.1962
1973
Dec.1975
1975 Apr.1979
1976 Feb.1980
1977 Jun.1981
1974
Dec.1977
1983
Dec.1988
1985 Feb.1992
1986 Mar.1990
1987 Feb.1992
1984 Feb.1992
1993
Dec.1994
1995
Jun. 1997
1996 Jun 1998
1997
Jan.1999
1994
Apr.1996
1970 Dec.1972
1972 Jun.1975
1969 July 1971
1968 Nov.1970
1971
Sep.1974
1980 May. 1985
1982
Jan.1987 1979
Feb.1984
1978 Aug.1982
1981 Apr.1986
2000
Jun. 2002
2002
Jun. 2004
1998
Dec. 1999
2001
July 2003
1990
Dec.1991
1992
May. 1994
1989
May. 1991
1988
Dec.1990
1991
Dec.1992
2003
Mar. 2005
2004
Dec. 2005
2005
July 2006
2006
Oct. 2007
2007
Oct. 2008
2008 Dec.2009
2009 Dec.2010
2010 Sep. 2011
2011
Jun 2012
1999 May 2001
2012 4 Jun 2013
LatestLaws.com
SL.
No.
CRIME HEADS CASES
REPORTED
% TO
TOTAL
IPC
CRIMES
RATE OF
CRIME
CHARGE-
SHEETING
RATE
CONVI-
CTION
RATE
A) VIOLENT CRIMES
1 MURDER 34434 1 3 86 36
2 ATTEMPT TO COMMIT MURDER 35138 1 3 92 26
3 C.H. NOT AMOUNTING MURDER 3620 0 0 88 33
4 RAPE 24923 1 4 96 24
5 KIDNAPPING & ABDUCTION 47592 2 4 72 21
6 DACOITY 4314 0 0 78 21
7 PREPARATION & ASSEMBLY FOR 3099 0 0 95 19
8 ROBBERY 27343 1 2 71 29
9 RIOTS 74633 3 6 92 18
10 ARSON 11836 0 1 68 16
11 DOWRY DEATHS 8233 0 1 94 32
TOTAL VIOLENT CRIMES 275165 12 23 86 25
B) CRIME AGAINST WOMEN (IPC+SLL)
1KIDNAPPING & ABDUCTION OF WOMEN &
GIRLS 38262 1.6 6.5 72.9 21.2
2ASSAULT ON WOMEN WITH INTENT TO
OUTRAGE HER MODESTY 45351 1.9 7.7 96.0 24.0
3 INSULT TO THE MODESTY OF WOMEN 9173 0.4 1.6 96.1 36.9
4 CRUELTY BY HUSBAND OR HIS RELATIVES 106527 4.5 18.2 93.6 15.0
5IMPORTATION OF GIRLS FROM FOREIGN
COUNTRIES 59 0.0 0.0 90.0 16.1
TOTAL CRIME AGAINST WOMEN (IPC+SLL) 244270 10.2 41.7 91.7 21.3
C) ECONOMIC CRIMES
1 CRIMINAL BREACH OF TRUST 17901 0.7 1.5 73.7 24.8
2 CHEATING 94203 3.9 7.8 72.6 24.3
3 COUNTERFEITING 2351 0.1 0.2 51.1 36.2
TOTAL ECONOMIC CRIMES 114455 4.8 9.4 72.2 24.6
D) PROPERTY CRIMES
1 BURGLARY 92892 3.9 7.7 42.1 29.7
2 THEFT 337407 14.1 27.8 34.0 33.3
TOTAL PROPERTY CRIMES 430299 18.0 35.5 35.7 32.4
E) CRIMES AGAINST SCs
TOTAL CRIME AGAINST SCs 33655 1.4 16.7 91.8 23.9
F) CRIMES AGAINST STs
TOTAL CRIME AGAINST STs 5922 0.2 5.7 95.8 22.5
G) TOTAL CRIME AGAINST CHILDREN
TOTAL CRIME AGAINST CHILDREN 38172 1.6 8.9 84.7 29.0
H) COGNIZABLE CRIMES UNDER IPC
TOTAL COGNIZABLE CRIMES UNDER IPC 2387188 78.8 38.5
I) COGNIZABLE CRIMES UNDER SLL
TOTAL COGNIZABLE CRIMES UNDER SLL 3654371 93.4 88.6
J) COGNIZABLE CRIMES UNDER IPC + SLL
TOTAL COGNIZABLE CRIMES UNDER IPC + SLL 6041559 87.8 73.6
FIGURES AT A GLANCE-2012
NOTE: 1. A4,A11 ARE PART OF CRIME AGAINST WOMEN ALSO; A6,A7 & A8 ARE PART OF PROPERTY
CRIMES ALSO
2. For calculation of Crime Rate of Crime Against Women, Crime Againsst SCs, Crime Against STs and
Crime against Children, respective population has been used instead of overall total persons population
of India.
LatestLaws.com

LatestLaws.com
1
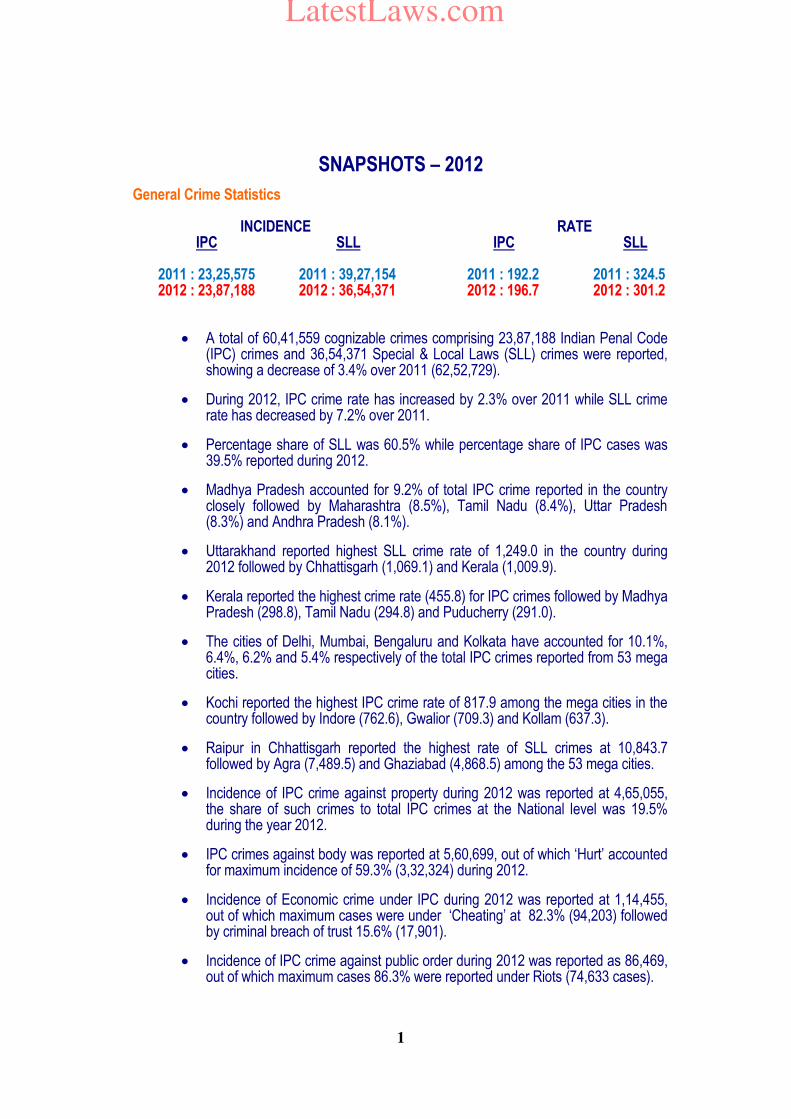
SNAPSHOTS – 2012
General Crime Statistics
INCIDENCE RATE IPC SLL IPC SLL 2011 : 23,25,575 2011 : 39,27,154 2011 : 192.2 2011 : 324.5 2012 : 23,87,188 2012 : 36,54,371 2012 : 196.7 2012 : 301.2
A total of 60,41,559 cognizable crimes comprising 23,87,188 Indian Penal Code (IPC) crimes and 36,54,371 Special & Local Laws (SLL) crimes were reported, showing a decrease of 3.4% over 2011 (62,52,729).
During 2012, IPC crime rate has increased by 2.3% over 2011 while SLL crime rate has decreased by 7.2% over 2011.
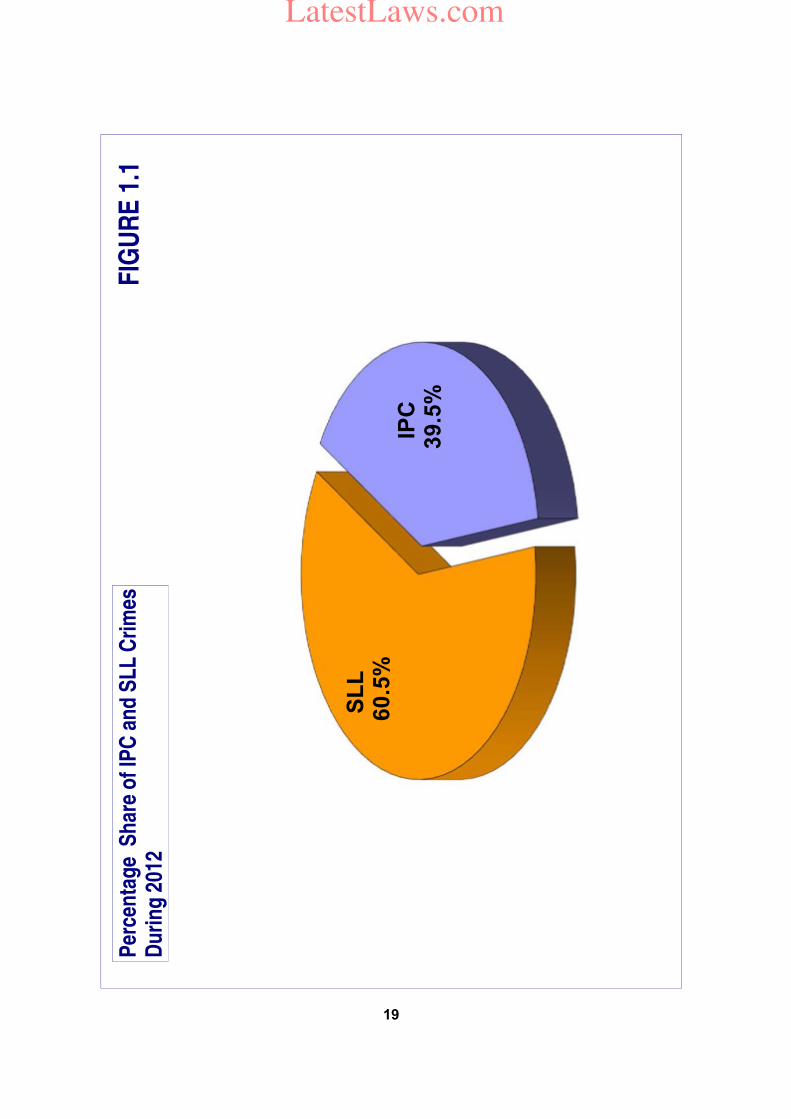
Percentage share of SLL was 60.5% while percentage share of IPC cases was 39.5% reported during 2012.
Madhya Pradesh accounted for 9.2% of total IPC crime reported in the country closely followed by Maharashtra (8.5%), Tamil Nadu (8.4%), Uttar Pradesh (8.3%) and Andhra Pradesh (8.1%).
Uttarakhand reported highest SLL crime rate of 1,249.0 in the country during 2012 followed by Chhattisgarh (1,069.1) and Kerala (1,009.9).
Kerala reported the highest crime rate (455.8) for IPC crimes followed by Madhya Pradesh (298.8), Tamil Nadu (294.8) and Puducherry (291.0).
The cities of Delhi, Mumbai, Bengaluru and Kolkata have accounted for 10.1%, 6.4%, 6.2% and 5.4% respectively of the total IPC crimes reported from 53 mega cities.
Kochi reported the highest IPC crime rate of 817.9 among the mega cities in the country followed by Indore (762.6), Gwalior (709.3) and Kollam (637.3).
Raipur in Chhattisgarh reported the highest rate of SLL crimes at 10,843.7 followed by Agra (7,489.5) and Ghaziabad (4,868.5) among the 53 mega cities.
Incidence of IPC crime against property during 2012 was reported at 4,65,055, the share of such crimes to total IPC crimes at the National level was 19.5% during the year 2012.
IPC crimes against body was reported at 5,60,699, out of which ‘Hurt’ accounted for maximum incidence of 59.3% (3,32,324) during 2012.
Incidence of Economic crime under IPC during 2012 was reported at 1,14,455, out of which maximum cases were under ‘Cheating’ at 82.3% (94,203) followed by criminal breach of trust 15.6% (17,901).
Incidence of IPC crime against public order during 2012 was reported as 86,469, out of which maximum cases 86.3% were reported under Riots (74,633 cases).
LatestLaws.com
2
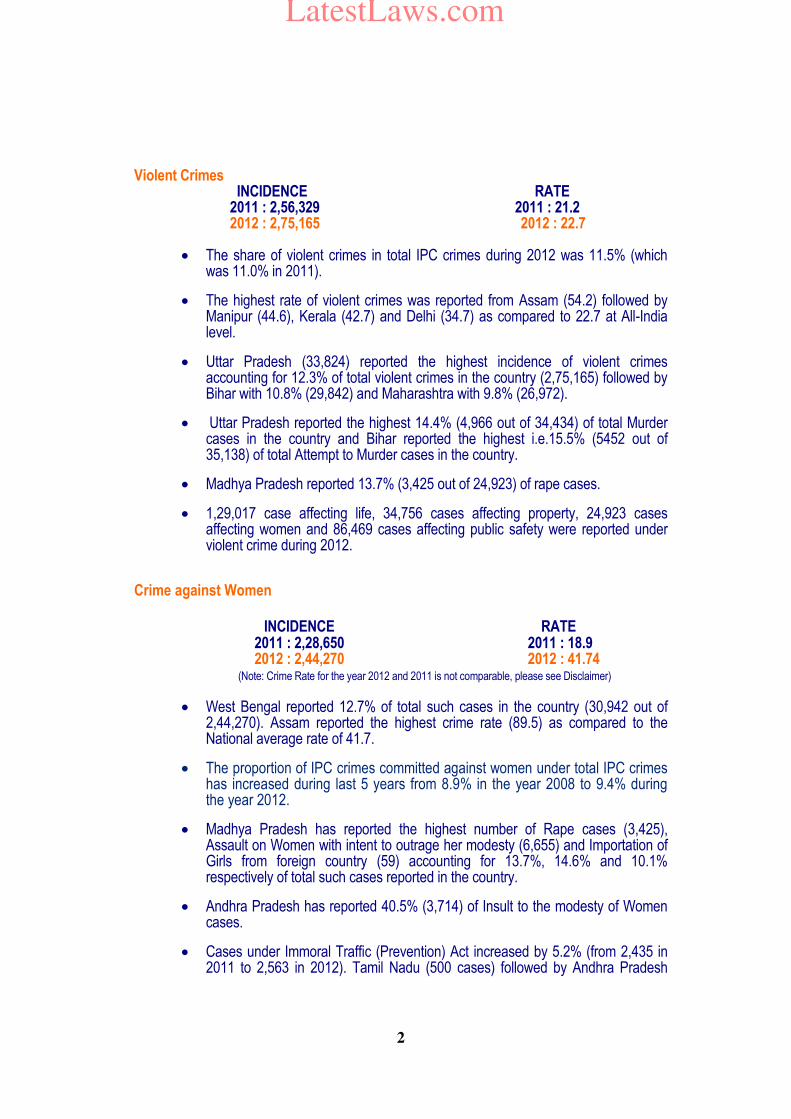
Violent Crimes
INCIDENCE RATE 2011 : 2,56,329 2011 : 21.2 2012 : 2,75,165 2012 : 22.7
The share of violent crimes in total IPC crimes during 2012 was 11.5% (which was 11.0% in 2011).
The highest rate of violent crimes was reported from Assam (54.2) followed by Manipur (44.6), Kerala (42.7) and Delhi (34.7) as compared to 22.7 at All-India level.
Uttar Pradesh (33,824) reported the highest incidence of violent crimes accounting for 12.3% of total violent crimes in the country (2,75,165) followed by Bihar with 10.8% (29,842) and Maharashtra with 9.8% (26,972).
Uttar Pradesh reported the highest 14.4% (4,966 out of 34,434) of total Murder cases in the country and Bihar reported the highest i.e.15.5% (5452 out of 35,138) of total Attempt to Murder cases in the country.
Madhya Pradesh reported 13.7% (3,425 out of 24,923) of rape cases.
1,29,017 case affecting life, 34,756 cases affecting property, 24,923 cases affecting women and 86,469 cases affecting public safety were reported under violent crime during 2012.
Crime against Women INCIDENCE RATE
2011 : 2,28,650 2011 : 18.9 2012 : 2,44,270 2012 : 41.74
(Note: Crime Rate for the year 2012 and 2011 is not comparable, please see Disclaimer)
West Bengal reported 12.7% of total such cases in the country (30,942 out of
2,44,270). Assam reported the highest crime rate (89.5) as compared to the National average rate of 41.7.
The proportion of IPC crimes committed against women under total IPC crimes has increased during last 5 years from 8.9% in the year 2008 to 9.4% during the year 2012.
Madhya Pradesh has reported the highest number of Rape cases (3,425), Assault on Women with intent to outrage her modesty (6,655) and Importation of Girls from foreign country (59) accounting for 13.7%, 14.6% and 10.1% respectively of total such cases reported in the country.
Andhra Pradesh has reported 40.5% (3,714) of Insult to the modesty of Women cases.
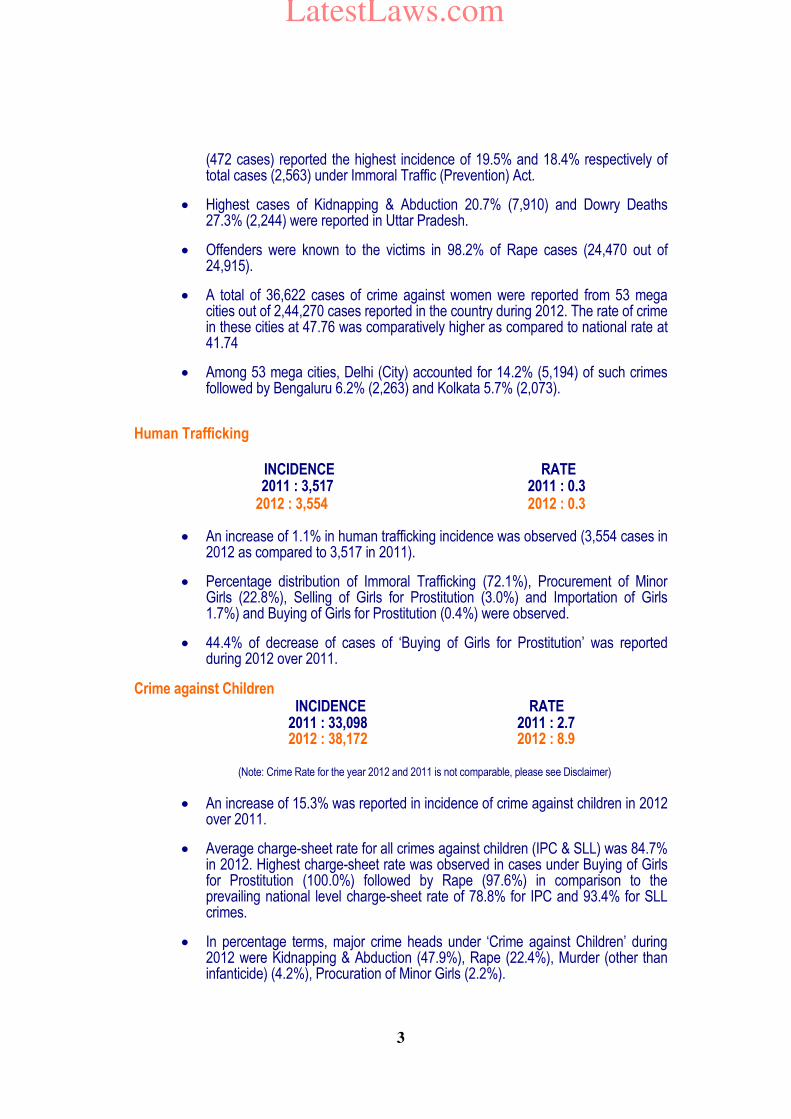
Cases under Immoral Traffic (Prevention) Act increased by 5.2% (from 2,435 in 2011 to 2,563 in 2012). Tamil Nadu (500 cases) followed by Andhra Pradesh
LatestLaws.com
3
(472 cases) reported the highest incidence of 19.5% and 18.4% respectively of total cases (2,563) under Immoral Traffic (Prevention) Act.
Highest cases of Kidnapping & Abduction 20.7% (7,910) and Dowry Deaths 27.3% (2,244) were reported in Uttar Pradesh.
Offenders were known to the victims in 98.2% of Rape cases (24,470 out of 24,915).
A total of 36,622 cases of crime against women were reported from 53 mega cities out of 2,44,270 cases reported in the country during 2012. The rate of crime in these cities at 47.76 was comparatively higher as compared to national rate at 41.74
Among 53 mega cities, Delhi (City) accounted for 14.2% (5,194) of such crimes followed by Bengaluru 6.2% (2,263) and Kolkata 5.7% (2,073).
Human Trafficking INCIDENCE RATE
2011 : 3,517 2011 : 0.3 2012 : 3,554 2012 : 0.3
An increase of 1.1% in human trafficking incidence was observed (3,554 cases in
2012 as compared to 3,517 in 2011).
Percentage distribution of Immoral Trafficking (72.1%), Procurement of Minor Girls (22.8%), Selling of Girls for Prostitution (3.0%) and Importation of Girls 1.7%) and Buying of Girls for Prostitution (0.4%) were observed.
44.4% of decrease of cases of ‘Buying of Girls for Prostitution’ was reported during 2012 over 2011.
Crime against Children INCIDENCE RATE
2011 : 33,098 2011 : 2.7 2012 : 38,172 2012 : 8.9
(Note: Crime Rate for the year 2012 and 2011 is not comparable, please see Disclaimer)
An increase of 15.3% was reported in incidence of crime against children in 2012
over 2011.
Average charge-sheet rate for all crimes against children (IPC & SLL) was 84.7% in 2012. Highest charge-sheet rate was observed in cases under Buying of Girls for Prostitution (100.0%) followed by Rape (97.6%) in comparison to the prevailing national level charge-sheet rate of 78.8% for IPC and 93.4% for SLL crimes.
In percentage terms, major crime heads under ‘Crime against Children’ during 2012 were Kidnapping & Abduction (47.9%), Rape (22.4%), Murder (other than infanticide) (4.2%), Procuration of Minor Girls (2.2%).
LatestLaws.com
4
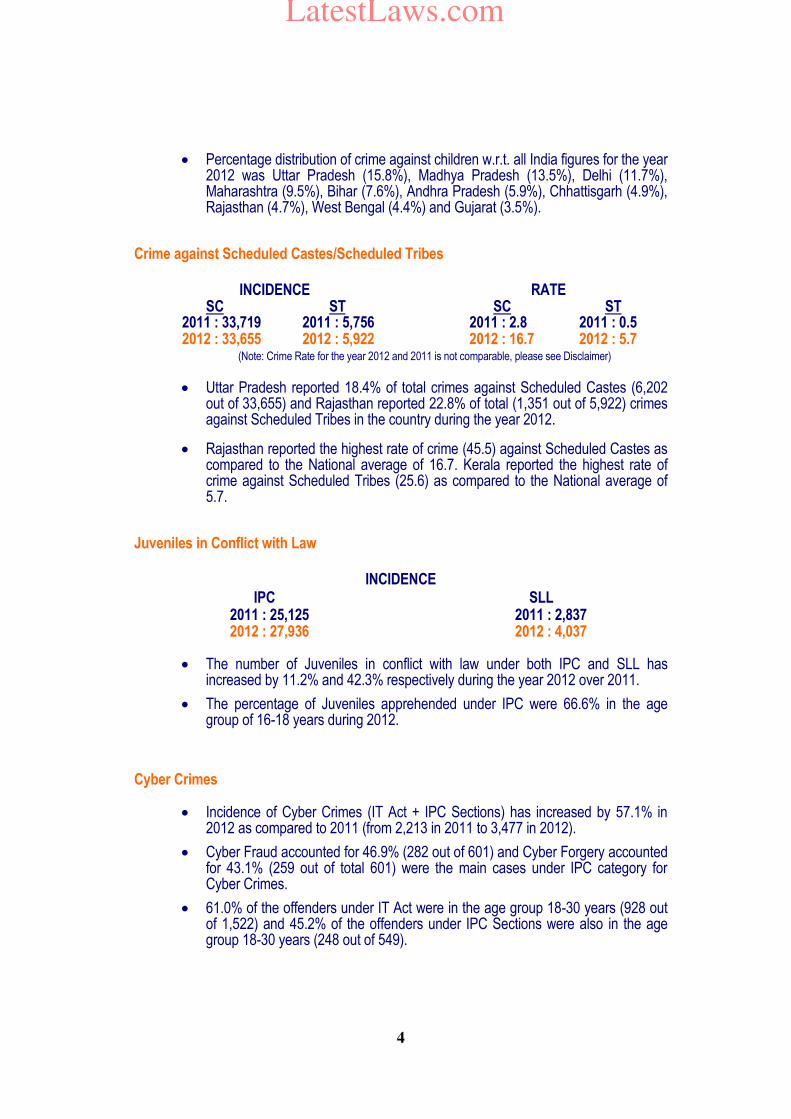
Percentage distribution of crime against children w.r.t. all India figures for the year 2012 was Uttar Pradesh (15.8%), Madhya Pradesh (13.5%), Delhi (11.7%), Maharashtra (9.5%), Bihar (7.6%), Andhra Pradesh (5.9%), Chhattisgarh (4.9%), Rajasthan (4.7%), West Bengal (4.4%) and Gujarat (3.5%).
Crime against Scheduled Castes/Scheduled Tribes INCIDENCE RATE SC ST SC ST 2011 : 33,719 2011 : 5,756 2011 : 2.8 2011 : 0.5 2012 : 33,655 2012 : 5,922 2012 : 16.7 2012 : 5.7
(Note: Crime Rate for the year 2012 and 2011 is not comparable, please see Disclaimer)
Uttar Pradesh reported 18.4% of total crimes against Scheduled Castes (6,202
out of 33,655) and Rajasthan reported 22.8% of total (1,351 out of 5,922) crimes against Scheduled Tribes in the country during the year 2012.
Rajasthan reported the highest rate of crime (45.5) against Scheduled Castes as compared to the National average of 16.7. Kerala reported the highest rate of crime against Scheduled Tribes (25.6) as compared to the National average of 5.7.
Juveniles in Conflict with Law
INCIDENCE
IPC SLL 2011 : 25,125 2011 : 2,837 2012 : 27,936 2012 : 4,037
The number of Juveniles in conflict with law under both IPC and SLL has increased by 11.2% and 42.3% respectively during the year 2012 over 2011.
The percentage of Juveniles apprehended under IPC were 66.6% in the age group of 16-18 years during 2012.
Cyber Crimes
Incidence of Cyber Crimes (IT Act + IPC Sections) has increased by 57.1% in 2012 as compared to 2011 (from 2,213 in 2011 to 3,477 in 2012).
Cyber Fraud accounted for 46.9% (282 out of 601) and Cyber Forgery accounted for 43.1% (259 out of total 601) were the main cases under IPC category for Cyber Crimes.
61.0% of the offenders under IT Act were in the age group 18-30 years (928 out of 1,522) and 45.2% of the offenders under IPC Sections were also in the age group 18-30 years (248 out of 549).
LatestLaws.com
5
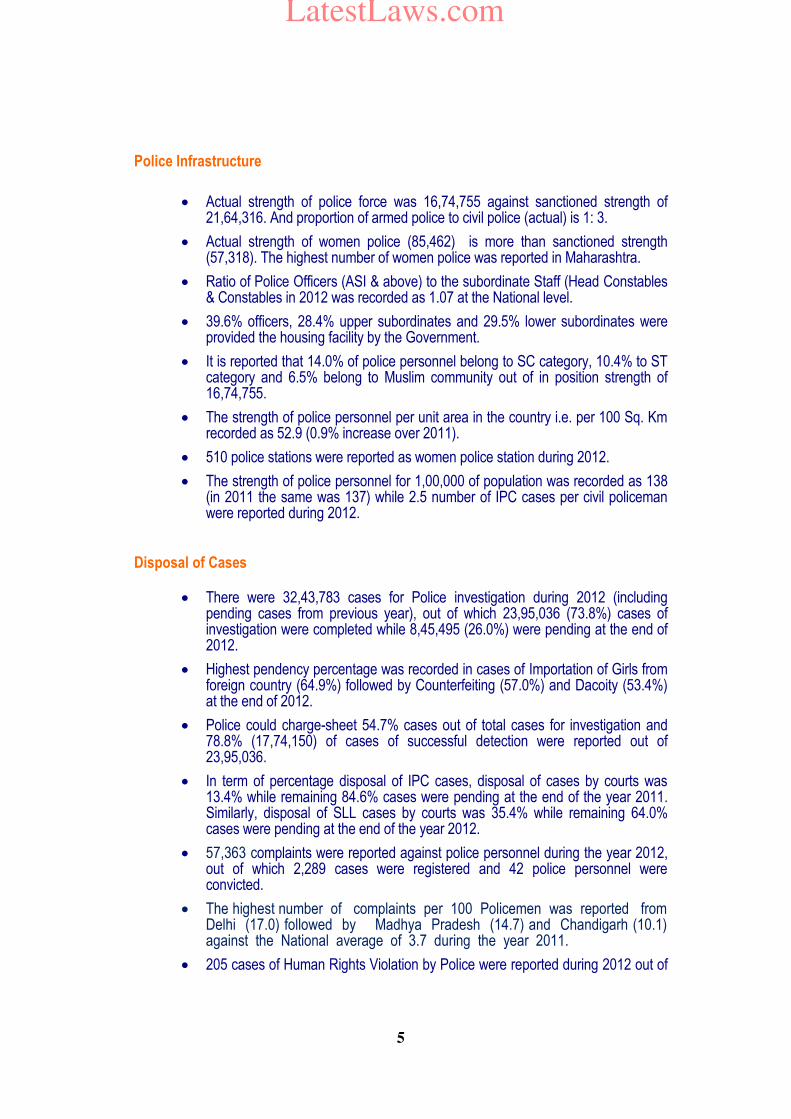
Police Infrastructure
Actual strength of police force was 16,74,755 against sanctioned strength of 21,64,316. And proportion of armed police to civil police (actual) is 1: 3.
Actual strength of women police (85,462) is more than sanctioned strength (57,318). The highest number of women police was reported in Maharashtra.
Ratio of Police Officers (ASI & above) to the subordinate Staff (Head Constables & Constables in 2012 was recorded as 1.07 at the National level.
39.6% officers, 28.4% upper subordinates and 29.5% lower subordinates were provided the housing facility by the Government.
It is reported that 14.0% of police personnel belong to SC category, 10.4% to ST category and 6.5% belong to Muslim community out of in position strength of 16,74,755.
The strength of police personnel per unit area in the country i.e. per 100 Sq. Km recorded as 52.9 (0.9% increase over 2011).
510 police stations were reported as women police station during 2012.
The strength of police personnel for 1,00,000 of population was recorded as 138 (in 2011 the same was 137) while 2.5 number of IPC cases per civil policeman were reported during 2012.
Disposal of Cases
There were 32,43,783 cases for Police investigation during 2012 (including pending cases from previous year), out of which 23,95,036 (73.8%) cases of investigation were completed while 8,45,495 (26.0%) were pending at the end of 2012.
Highest pendency percentage was recorded in cases of Importation of Girls from foreign country (64.9%) followed by Counterfeiting (57.0%) and Dacoity (53.4%) at the end of 2012.
Police could charge-sheet 54.7% cases out of total cases for investigation and 78.8% (17,74,150) of cases of successful detection were reported out of 23,95,036.
In term of percentage disposal of IPC cases, disposal of cases by courts was 13.4% while remaining 84.6% cases were pending at the end of the year 2011. Similarly, disposal of SLL cases by courts was 35.4% while remaining 64.0% cases were pending at the end of the year 2012.
57,363 complaints were reported against police personnel during the year 2012, out of which 2,289 cases were registered and 42 police personnel were convicted.
The highest number of complaints per 100 Policemen was reported from Delhi (17.0) followed by Madhya Pradesh (14.7) and Chandigarh (10.1) against the National average of 3.7 during the year 2011.
205 cases of Human Rights Violation by Police were reported during 2012 out of
LatestLaws.com
6
which 19 were charge-sheeted. The highest number of Human Rights Violation by Police was reported in Assam (102 cases)
3,270,016 persons were arrested out of 23,87,188 IPC cases, showing arrest rate of 269.5 and 1.4 arrests per case.
Custodial Crimes
109 Custodial Deaths were reported in the country. 7 policemen were charge sheeted and no policeman was convicted during the year. 1 case of Custodial Rape was reported in the country. 24 cases of custodial deaths were on account of suicide
Police Firing & Casualties
Total number of police firing was reported on 548 occasions during 2012.
Maximum casualties of civilians were observed in unspecified (other) events (31) and maximum casualties of policemen were observed in Anti Extremists & Terrorist Operations (37).
Maximum injuries of civilians (214) and policemen (567) were reported during ‘Riot Control’.
42.3% of police firing was reported under Anti-Extremists Operation followed by 28.3% in ‘Riot Control’.
During the year 2012, 821 police personnel were killed on duty and maximum casualties were reported in age group of 45 to 55 years (273 out of 821).
A total of 214 police personnel committed suicide while in service and among them maximum occurrence was reported in the age group of 45-55 years (75) followed by age group 35-45 years (61).
Miscellaneous Persons Arrested
IPC SLL 2011 : 31,45,845 2011 : 43,12,413 2012 : 32,70,016 2012 : 41,50,075
For every one hour, 273 cases were reported in country and 373 persons were arrested different IPC sections in the year 2012.
For every one hour, 2.84 cases of rape were reported in country in which, on an average, 3.55 persons were arrested during the year 2012
---------
LatestLaws.com
In
cid
ence
Of
Co
gn
izab
le C
rim
es (
IPC
) U
nd
er D
iffe
ren
t C
rim
e H
ead
s D
uri
ng
195
3 T
o 2
012
Sl.
No.
Y
ear
Mur
der
Atte
mpt
to
com
mit
Mur
der
C.H
. not
am
ount
ing
to m
urde
r
Rap
e K
idna
ppin
g &
A
bduc
tion
Dac
oity
Pre
para
tion
& A
ssem
bly
for
daco
ity
Rob
bery
B
urgl
ary
(Hou
se-
Bre
akin
g)
The
ft R
iots
(1)
(2)
(3)
(4)
(5)
(6)
(7)
(8)
(9)
(10)
(1
1)
(12)
(1
3)
1 2 3 4 5 6 7 8 9 10
11
12
13
14
15
16
17
18
19
20
21
22
23
24
25
26
27
28
29
30
31
1953
1954
1955
1956
1957
1958
1959
1960
1961
1962
1963
1964
1965
1966
1967
1968
1969
1970
1971
1972
1973
1974
1975
1976
1977
1978
1979
1980
1981
1982
1983
9802
9765
9700
1002
5
1041
9
1066
1
1071
2
1091
0
1118
8
1158
6
1075
4
1174
8
1231
0
1263
1
1339
8
1384
9
1473
2
1570
8
1618
0
1547
5
1707
2
1864
9
1756
3
1667
3
1837
6
1931
4
2034
9
2214
9
2272
7
2333
9
2511
2
* * * * * * * * * * * * * * * * * * * * * * * * * * * * * * *
* * * * * * * * * * * * * * * * * *
2357
2196
2408
2514
2502
2584
2615
2728
3008
3032
3272
3427
3793
* * * * * * * * * * * * * * * * * *
2487
2605
2919
2962
3376
3893
4058
4558
4300
5023
5409
5427
6019
5261
5514
5529
5905
5821
6043
6549
6024
6698
7119
6924
8050
7927
7854
8192
8830
8464
1011
1
9647
9402
1022
3
1054
3
1113
9
1125
0
1224
0
1361
6
1312
5
1359
5
1383
3
1334
1
1384
2
5579
5395
4779
5397
5560
4658
3774
3981
4213
4890
4997
5287
4955
4817
6300
6384
6049
9837
1119
3
1041
1
1062
7
1369
7
1250
6
1091
0
1259
9
1319
5
1402
8
1519
4
1462
6
1270
0
1238
2
* * * * * * * * * * * * * * * * * * * * * * * * * * * * * * *
8407
7600
6710
7618
7408
7120
6267
6263
6428
7551
7694
8336
8067
8585
1025
2
1019
4
9922
1695
8
1840
2
1705
4
1885
7
2228
6
2165
6
1797
4
2272
5
2292
3
2286
0
2349
3
2299
6
2193
8
2131
0
1473
79
1324
57
1217
44
1345
56
1296
32
1246
95
1182
05
1145
40
1226
05
1343
24
1370
25
1538
62
1420
15
1501
80
1735
75
1562
06
1454
29
1663
39
1658
07
1670
62
1814
33
1998
78
1928
54
1686
55
1936
22
1839
91
1685
74
1666
95
1575
40
1427
26
1391
03
2565
67
2238
66
2120
28
2362
14
2332
39
2361
03
2330
52
2288
42
2328
68
2524
53
2424
87
2736
76
2737
02
2987
01
3398
61
3155
46
3001
40
3372
11
3352
04
3463
82
3794
12
4369
18
4218
91
3651
38
4320
46
4371
87
4304
83
4310
36
4220
59
3752
40
3535
36
2052
9
2277
7
2360
9
2470
0
2375
0
2494
2
2698
7
2689
0
2719
9
2909
6
2811
4
3269
3
3294
0
3469
6
4244
7
4580
1
5579
6
6833
1
6411
4
6578
1
7338
8
8054
7
6724
1
6367
5
8044
9
9648
8
9889
6
1069
57
1103
61
1065
11
1081
01
7
Sl.
No.
Y
ear
Mur
der
Atte
mpt
to
com
mit
Mur
der
C.H
. not
am
ount
ing
to m
urde
r
Rap
e K
idna
ppin
g &
A
bduc
tion
Dac
oity
Pre
para
tion
& A
ssem
bly
for
daco
ity
Rob
bery
B
urgl
ary
(Hou
se-
Bre
akin
g)
The
ft R
iots
(1)
(2)
(3)
(4)
(5)
(6)
(7)
(8)
(9)
(10)
(1
1)
(12)
(1
3)
32
33
34
35
36
37
38
39
40
41
42
43
44
45
46
47
48
49
50
51
52
53
54
55
56
57
58
59
60
1984
1985
1986
1987
1988
1989
1990
1991
1992
1993
1994
1995
1996
1997
1998
1999
2000
2001
2002
2003
2004
2005
2006
2007
2008
2009
2010
2011
2012
2578
6
2597
0
2726
9
2851
3
2877
1
3122
2
3504
5
3917
4
4010
5
3824
0
3857
7
3746
4
3767
1
3754
3
3858
4
3717
0
3739
9
3620
2
3529
0
3271
6
3360
8
3271
9
3248
1
3231
8
3276
6
3236
9
3333
5
3430
5
3443
4
* * * *
2068
9
2374
8
2709
5
2977
8
3120
2
2972
5
3002
0
2957
1
2959
7
2932
2
3057
7
2962
8
3074
3
3152
3
3038
0
2594
2
2789
0
2803
1
2723
0
2740
1
2859
8
2903
8
2942
1
3138
5
3513
8
4093
3995
4195
3721
3755
4100
4281
4243
4621
3890
3946
3830
3728
3869
3681
3912
3773
3367
3624
4029
3935
3578
3535
3644
3863
3930
3782
3707
3620
6740
7289
7952
8559
9099
9752
1006
8
1041
0
1170
8
1221
8
1320
8
1375
4
1484
6
1533
0
1515
1
1546
8
1649
6
1607
5
1637
3
1584
7
1823
3
1835
9
1934
8
2073
7
2146
7
2139
7
2217
2
2420
6
2492
3
1514
1
1605
1
1566
7
1525
1
1577
1
1731
8
1847
4
2007
9
2051
8
1983
0
2098
3
2042
6
2084
8
2189
8
2352
0
2323
6
2287
1
2248
7
2185
0
1999
2
2332
7
1575
0
2399
1
2756
1
3026
1
3386
0
3844
0
4466
4
4759
2
1230
1
1125
4
1044
4
1003
6
9306
9896
1108
9
1083
1
1130
8
9357
9271
8335
8035
7867
8091
7079
6825
6154
6101
5303
5311
5141
4747
4579
4530
4586
4358
4285
4314
* * * *
931
1015
1286
1393
1297
1102
946
961
888
1049
1266
1501
1505
1614
1841
2302
2340
2834
3129
3205
3217
2850
2615
2895
3099
2320
4
2250
1
2239
5
2291
7
2161
1
2248
0
2544
0
2642
8
2644
4
2435
4
2393
3
2244
3
2270
5
2214
1
2360
3
2133
2
2092
6
1990
1
1876
4
1751
2
1845
8
1767
3
1845
6
1913
6
2052
2
2240
9
2339
3
2470
0
2734
3
1362
72
1303
54
1289
46
1254
66
1243
04
1290
20
1313
31
1320
87
1272
81
1230
20
1215
36
1165
07
1150
97
1133
19
1192
60
1112
96
1053
91
1011
82
9646
1
9282
7
9249
0
9010
8
9166
6
9121
8
9374
2
9207
0
9017
9
9250
4
9289
2
3306
69
3305
54
3235
33
3105
75
3198
48
3412
40
3531
91
3629
28
3505
82
3204
34
3035
64
2943
06
2849
85
2770
77
2879
67
2719
07
2585
88
2528
03
2474
62
2452
37
2730
45
2731
11
2743
54
2850
43
3167
61
3241
95
3303
12
3408
00
3374
07
1014
60
9975
7
9419
7
9078
9
9458
7
9894
3
1028
46
1053
09
1047
49
9383
8
9434
4
9652
0
9283
1
9181
2
9076
7
8083
8
8045
6
7622
2
6894
5
5733
4
5997
1
5623
5
5664
1
5991
5
6601
8
6294
2
6757
1
6850
0
7463
3
8
Inci
den
ce O
f C
og
niz
able
Cri
mes
(IP
C)
Un
der
Dif
fere
nt
Cri
me
Hea
ds
Du
rin
g 1
953
To
201
2
(C
on
clu
ded
) S
l. N
o.
Yea
r C
rimin
al
Bre
ach
of
Tru
st
Che
atin
g C
ount
er-
feiti
ng
Ars
on
Hur
t D
owry
D
eath
s A
ssau
lt on
W
omen
with
In
tent
to
Out
rage
her
M
odes
ty
Insu
lt to
the
Mod
esty
of
Wom
en
Cru
elty
by
Hus
band
or h
is
Rel
ativ
es
Impo
rta-
tion
of G
irls
from
fo
reig
n co
untri
es
Cau
sing
D
eath
by
Neg
ligen
ce
Oth
er
IPC
crim
es
Tot
al
Cog
niza
ble
Crim
es
unde
r IP
C
(1)
(2)
(14)
(1
5)
(16)
(1
7)
(18)
(1
9)
(20)
(2
1)
(22)
(2
3)
(24)
(2
5)
(26)
1 2 3 4 5 6 7 8 9 10
11
12
13
14
15
16
17
18
19
20
21
22
23
24
25
26
27
28
29
1953
1954
1955
1956
1957
1958
1959
1960
1961
1962
1963
1964
1965
1966
1967
1968
1969
1970
1971
1972
1973
1974
1975
1976
1977
1978
1979
1980
1981
*
1586
0
1464
4
1546
6
1536
2
1601
7
1587
8
1586
2
1689
5
1809
2
1843
8
2118
0
2135
4
2235
3
2395
0
2240
8
2111
8
2267
9
2027
0
2100
4
2183
7
2227
4
2328
7
2365
6
2286
8
2325
5
2201
6
2068
4
2057
9
*
9934
9461
9519
9388
9503
9677
9207
9511
9738
8854
1167
0
1193
5
1160
6
1270
1
1252
4
1200
1
1233
1
1141
2
1264
6
1439
2
1538
0
1777
2
1958
8
1962
3
1982
1
1837
0
1741
6
1776
4
*
815
597
596
629
555
443
554
485
423
289
317
436
655
1413
1425
739
650
641
670
582
718
951
887
784
636
525
830
1004
* * * * * * * * * * * * * * * * * * * * * * * * * * * * *
* * * * * * * * * * * * * * * * * * * * * * * * * * * * *
* * * * * * * * * * * * * * * * * * * * * * * * * * * * *
* * * * * * * * * * * * * * * * * * * * * * * * * * * * *
* * * * * * * * * * * * * * * * * * * * * * * * * * * * *
* * * * * * * * * * * * * * * * * * * * * * * * * * * * *
* * * * * * * * * * * * * * * * * * * * * * * * * * * * *
* * * * * * * * * * * * * * * * * * * * * * * * * * * * *
1484
40
1229
29
1264
35
1352
21
1401
63
1738
87
1887
72
1832
94
1875
61
1991
94
1932
54
2321
94
2359
74
2426
55
2498
92
2687
95
2707
77
2952
67
2997
11
3188
86
3493
58
3713
87
3736
60
3954
91
4516
72
5145
42
5269
42
5504
80
5822
65
6019
64
5569
12
5352
36
5852
17
5813
71
6141
84
6203
26
6063
67
6256
51
6744
66
6588
30
7590
13
7516
15
7947
33
8819
81
8619
62
8451
67
9554
22
9525
81
9847
73
1077
181
1192
277
1160
520
1093
897
1267
004
1344
968
1336
168
1368
529
1385
757
9
Sl.
No.
Y
ear
Crim
inal
B
reac
h of
T
rust
Che
atin
g C
ount
er-
feiti
ng
Ars
on
Hur
t D
owry
D
eath
s A
ssau
lt on
W
omen
with
In
tent
to
Out
rage
her
M
odes
ty
Insu
lt to
the
Mod
esty
of
Wom
en
Cru
elty
by
Hus
band
or h
is
Rel
ativ
es
Impo
rta-
tion
of G
irls
from
fo
reig
n co
untri
es
Cau
sing
D
eath
by
Neg
ligen
ce
Oth
er
IPC
crim
es
Tot
al
Cog
niza
ble
Crim
es
unde
r IP
C
(1)
(2)
(14)
(1
5)
(16)
(1
7)
(18)
(1
9)
(20)
(2
1)
(22)
(2
3)
(24)
(2
5)
(26)
30
31
32
33
34
35
36
37
38
39
40
41
42
43
44
45
46
47
48
49
50
51
52
53
54
55
56
57
58
59
60
1982
1983
1984
1985
1986
1987
1988
1989
1990
1991
1992
1993
1994
1995
1996
1997
1998
1999
2000
2001
2002
2003
2004
2005
2006
2007
2008
2009
2010
2011
2012
1825
9
1851
4
1842
8
1841
7
1902
1
1784
7
1735
2
1754
1
1655
2
1749
5
1792
5
1703
9
1652
3
1550
3
1536
8
1507
7
1615
7
1545
4
1458
1
1479
8
1402
7
1343
2
1417
6
1357
2
1363
6
1553
1
1648
7
1632
6
1667
8
1745
7
1790
1
1747
1
1976
7
1907
7
2101
6
2257
9
2211
5
2270
5
2369
1
2446
6
2746
6
2939
7
3007
9
3120
7
3067
8
3382
3
3522
8
3827
1
4140
3
4170
1
4472
7
4627
1
4747
8
5193
9
5362
5
5807
6
6532
6
6657
9
7271
8
7899
9
8765
6
9420
3
939
809
1118
1504
1687
1653
1537
2075
2576
4467
5133
3728
2851
2203
2796
2228
1353
1347
2299
1683
1522
2055
1529
2383
2169
2204
2991
2935
2589
2307
2351
* * * * * * * * * * * * *
1202
8
1242
5
1236
3
1291
3
1121
8
1039
2
1053
4
1182
0
9365
8637
8451
8480
9024
9249
8736
8508
9064
1183
6
* * * * * * * * * * * * *
2038
12
2239
77
2284
97
2358
70
2363
13
2405
80
2714
87
2650
25
2614
44
2768
68
2708
61
2647
48
2730
67
2849
69
2792
14
2890
22
3028
47
3323
24
* * * * * * * * * * * * *
4648
5513
6006
6975
6699
6995
6851
6822
6208
7026
6787
7618
8093
8172
8383
8391
8618
8233
* * * * * * * * * * * * *
2685
6
2893
9
3076
4
3095
9
3231
1
3294
0
3412
4
3394
3
3293
9
3456
7
3417
5
3661
7
3873
4
4041
3
3871
1
4061
3
4296
8
4535
1
* * * * * * * * * * * * *
4689
5671
5796
8053
8858
1102
4
9746
1015
5
1232
5
1000
1
9984
9966
1095
0
1221
4
1100
9
9961
8570
9173
* * * * * * * * * * * * *
2857
9
3524
6
3659
2
4137
5
4382
3
4577
8
4917
0
4923
7
5070
3
5812
1
5831
9
6312
8
7593
0
8134
4
8954
6
9404
1
9913
5
1065
27
* * * * * * * * * * * * * * * * * 1 64
114 76
46
89
149 67
61
67
48
36
80
59
* * * * * * * * * * * * * * * * * * *
5718
2
6404
4
6067
2
6942
3
7169
8
7851
3
8679
0
9218
6
9853
2
1063
43
1088
90
1075
91
6125
86
6275
78
6643
71
6960
69
7279
50
7495
50
7500
90
7978
03
8407
09
8862
87
9070
71
9030
82
9243
42
7225
83
7145
87
7260
42
7444
22
7638
35
7797
57
7013
62
7302
97
7004
12
7410
31
7419
77
7796
97
8292
06
8569
63
8655
41
9240
72
9660
32
9662
44
1353
904
1349
866
1358
660
1384
731
1405
835
1406
992
1440
356
1529
844
1604
449
1678
375
1689
341
1629
936
1635
251
1695
696
1709
576
1719
820
1778
815
1764
629
1771
084
1769
308
1780
330
1716
120
1832
015
1822
602
1878
293
1989
673
2093
379
21
2134
5
2224
831
2325
575
2387
188
10
“*”
Info
rmat
ion
no
t c
oco
coco
llect
ed
0
500
000
100
0000
150
0000
200
0000
250
0000
300
0000
195319541955195619571958195919601961196219631964196519661967196819691970197119721973197419751976197719781979198019811982198319841985198619871988198919901991199219931994199519961997199819992000200120022003200420052006200720082009201020112012
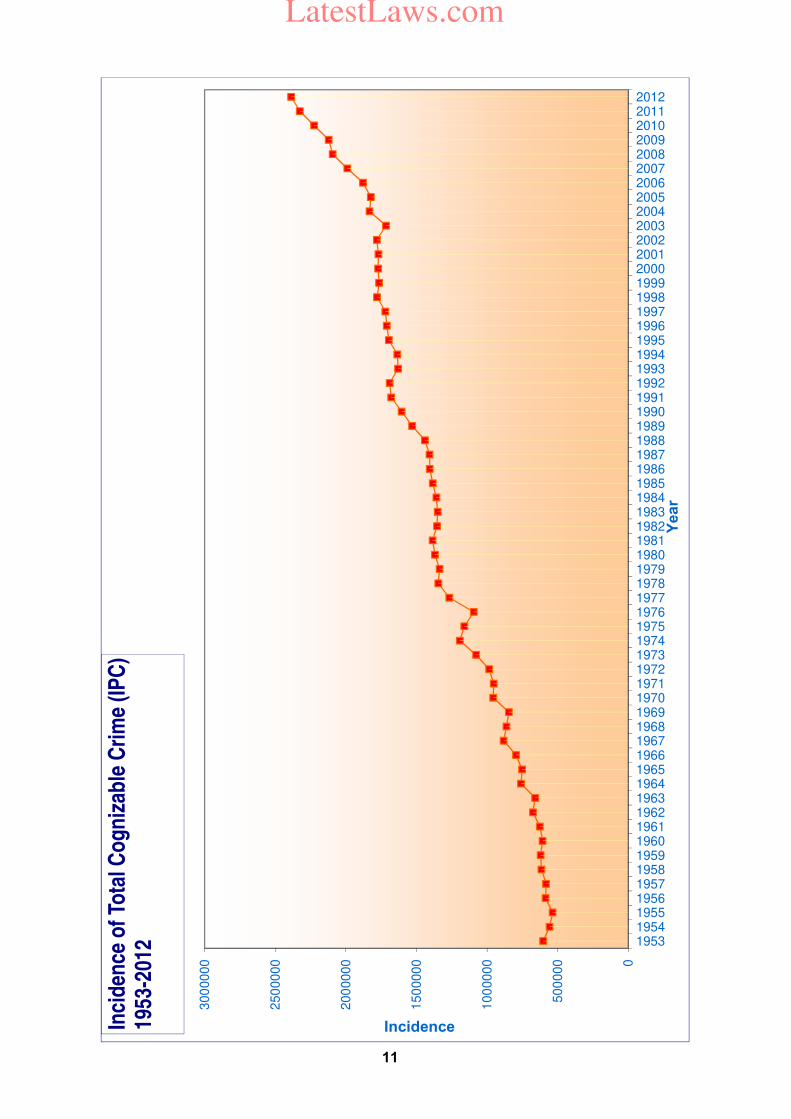
Incidence
Year
Inci
den
ce o
f To
tal C
og
niz
able
Cri
me
(IP
C)
1953
-201
2
11
LatestLaws.com
12
SN
AP
SH
OT
S (
1953—
2012
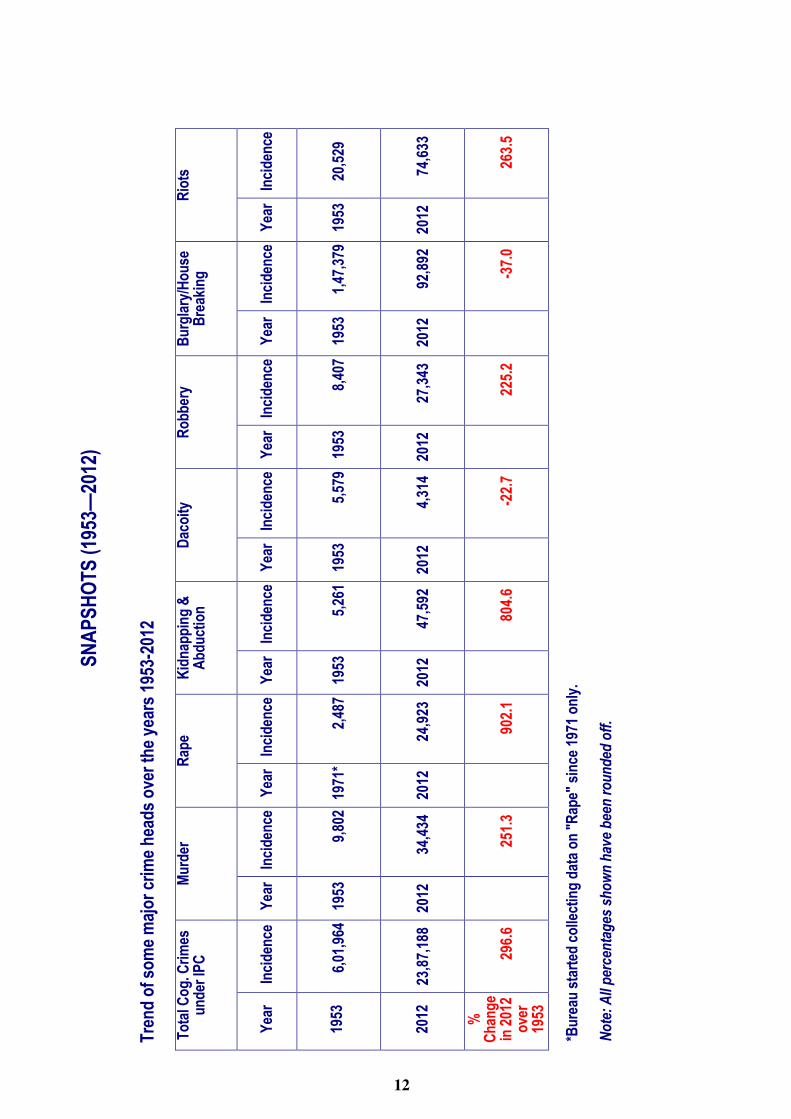
) Tre
nd
of
som
e m
ajo
r cr
ime
hea
ds
ove
r th
e ye
ars
1953
-201
2 T
ota
l Co
g. C
rim
es
un
der
IPC
M
urd
er
Rap
e K
idn
app
ing
&
Ab
du
ctio
n
Dac
oit
y R
ob
ber
y B
urg
lary
/Ho
use
B
reak
ing
Rio
ts
Yea
r In
cid
ence
Y
ear
Inci
den
ce
Yea
r In
cid
ence
Y
ear
Inci
den
ce
Yea
r In
cid
ence
Y
ear
Inci
den
ce
Yea
r In
cid
ence
Y
ear
Inci
den
ce
19
53
6,01
,964
19
53
9,80
2 19
71*
2,48
7 19
53
5,26
1 19
53
5,57
9 19
53
8,40
7 19
53
1,47
,379
19
53
20,5
29
2012
23
,87,
188
2012
34
,434
20
12
24,9
23
2012
47
,592
20
12
4,31
4 20
12
27,3
43
2012
92
,892
20
12
74,6
33
%
Ch
ang
e in
201
2 o
ver
1953
296.
6
251.
3
902.
1
804.
6
-22.
7
225.
2
-37.
0
263.
5
*Bu
reau
sta
rted
co
llect
ing
dat
a o
n "
Rap
e" s
ince
197
1 o
nly
.
No
te:
All
per
cen
tag
es s
ho
wn
hav
e b
een
ro
un
ded
off
.
12
13
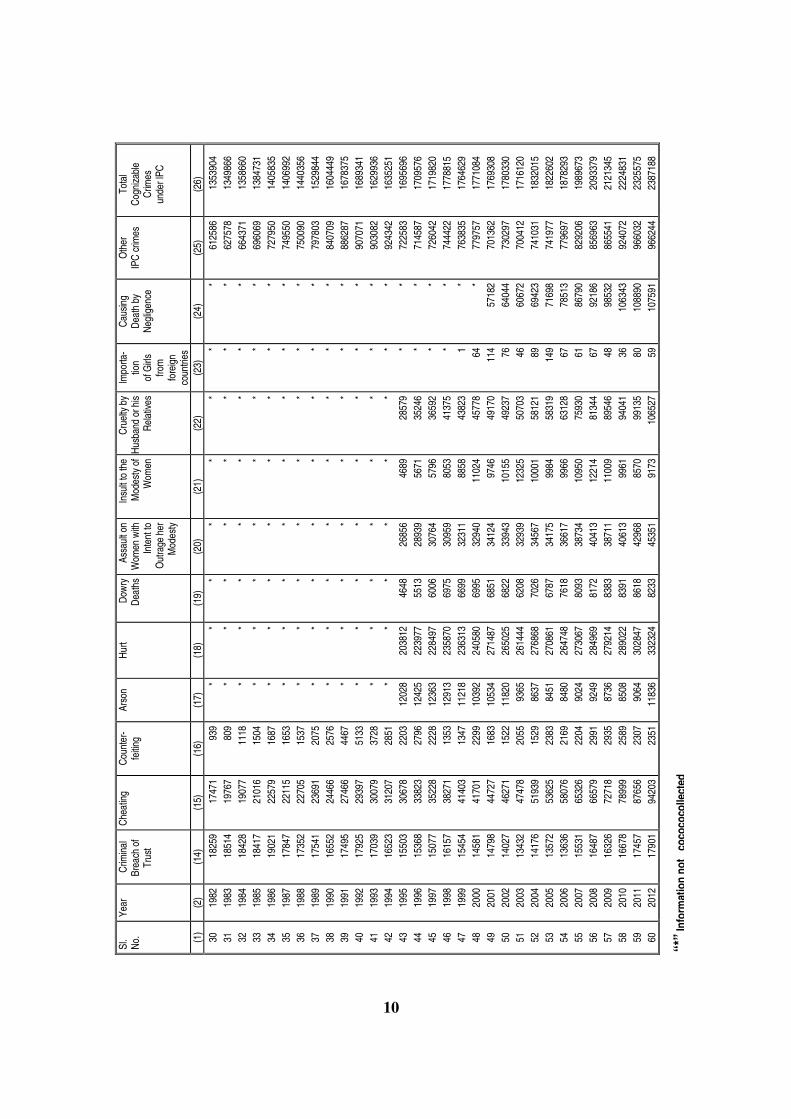
The total cognizable crime under IPC in general has been showing a rising trend except for the
years 1954, 1955, 1963, 1968, 1969, 1975, 1976, 1979, 1982, 1993 and 2003, in which the
declining trend was observed.
It can be observed from the above table showing crime trends of major heads, Dacoity and
Burglary / House breaking have being showing a declining trend over a period of 60 years.
Burglary / House breaking has declined by 37.0% (from 1,47,379 in 1953 to 92,892 in 2012) and
Dacoity has declined by 22.7% (from 5,579 in 1953 to 4,314 in 2012), whereas Murder has
increased by 251.3% (from 9,802 in 1953 to 34,434 in 2012); Rape by 902.1% (from 2,487 in 1971
to 24,923 in 2012); Kidnapping & Abduction by 804.6% (from 5,261 in 1953 to 47,592 in 2012);
Robbery by 225.2% (from 8,407 in 1953 to 27,343 in 2012) and Riots by 263.5% (from 20,529 in
1953 to 74,633 in 2012).
LatestLaws.com
0
100
00
0
200
00
0
300
00
0
400
00
0
500
00
0
600
00
0
200
82
00
92
01
02
01
12
01
2
Incidence
Ye
ar
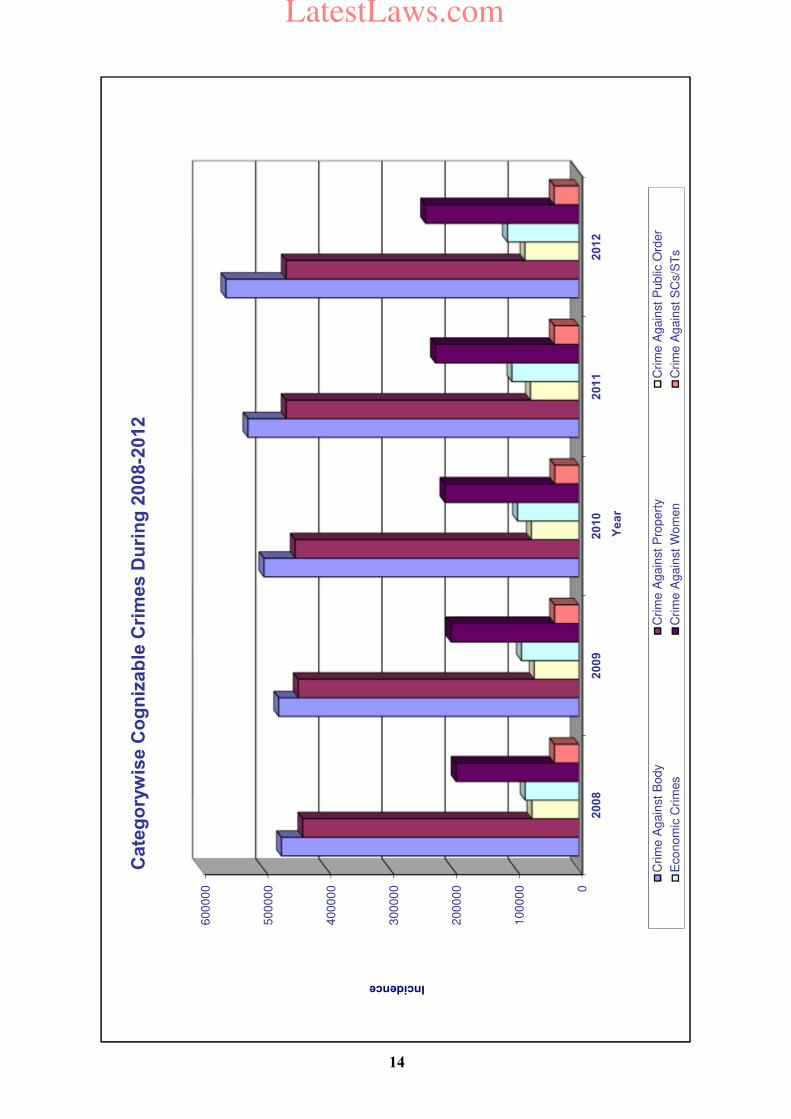
Cate
go
ryw
ise C
og
niz
ab
le C
rim
es D
uri
ng
2008-2
012
Cri
me A
gain
st
Bod
yC
rim
e A
gain
st
Pro
pert
yC
rim
e A
gain
st
Public
Ord
er
Eco
nom
ic C
rim
es
Cri
me A
gain
st
Wo
men
Crim
e A
gain
st
SC
s/S
Ts
14
LatestLaws.com
15
Chapter - 1
Executive Summary
Introduction
The Criminal Procedure Code (Cr.P.C.) classifies all the crimes into two categories:
(i) Cognizable - Sec.2(c) Cr.PC
(ii) Non-cognizable - Sec.2(l) Cr.PC
Cognizable Crimes
A cognizable offence or case is defined as the one which an officer in-charge of a police station may investigate without the order of a magistrate and effect arrest without warrant. The police have a direct responsibility to take immediate action on the receipt of a complaint or of credible information in such crimes, visit the scene of the crime, investigate the facts, apprehend the offender and arraign him before a court of law having jurisdiction over the matter. Cognizable crimes are broadly categorised as those falling either under the `Indian Penal Code (IPC)' or under the `Special and Local Laws (SLL)'. Non-Cognizable Offence
Non-Cognizable crimes are defined as those which can not be investigated by police without the order of a competent magistrate. Police do not initiate investigation in non-cognizable crimes except with magisterial permission. First schedule of the Cr.P.C. gives the classification of the offences of the
IPC into cognizable & non-cognizable categories. Various crimes that are being registered and investigated by different law enforcement agencies are broadly grouped under the following categories for Statistical Information System. Broad classification of crimes under the Indian penal code (IPC)
i) Crimes against body: Murder, Attempt to commit murder, Culpable homicide not amounting to murder, Kidnapping & Abduction, Hurt, Causing death by negligence;
ii) Crimes against property: Dacoity, Preparation and assembly to commit Dacoity, Robbery, Burglary and Theft;
iii) Crimes against public
order: Riots and Arson; iv) Economic crimes: Criminal
breach of trust, Cheating & Counterfeiting;
v) Crimes against women: Rape, Dowry death, Cruelty by husband or his relatives, Assault on women with intent to outrage her modesty, Insult to the modesty of women and Importation of girl from foreign country;
vi) Crimes against children: Child rape, Kidnapping & abduction of children, Procuration of minor girls, Selling and buying of girls for prostitution, Abetment of
LatestLaws.com
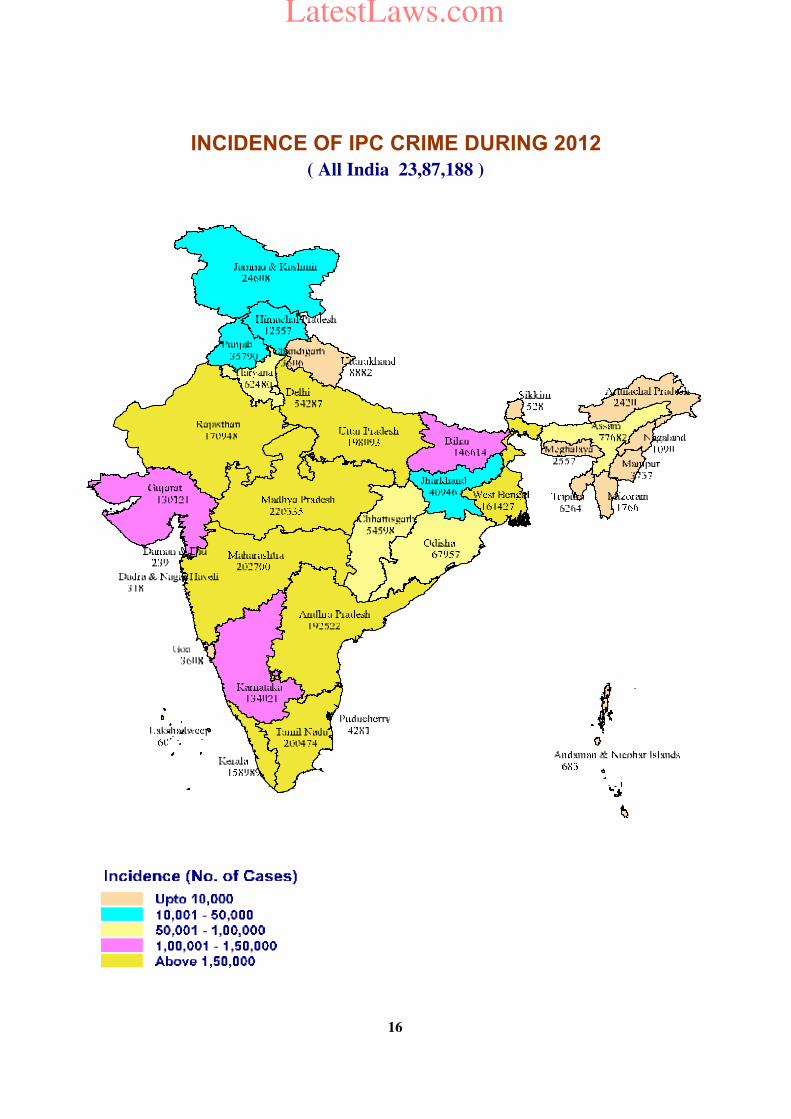
INCIDENCE OF IPC CRIME DURING 2012
( All India 23,87,188 )
16
LatestLaws.com
17
suicide, Exposure and Abandonment, Infanticide and foeticide;
vii) Other IPC crimes.
Crimes under the Special and Local Laws (SLL) i) Arms Act, 1959; ii) Narcotic Drugs & Psychotropic
Substances Act, 1985; iii) Gambling Act, 1867; iv) Excise Act, 1944; v) Prohibition Act; vi) Explosives & Explosive
Substances Act, 1884 & 1908; vii) Immoral Traffic (Prevention)
Act, 1956; viii) Indian Railways Act, 1989; ix) The Foreigners Act, 1946; x) Protection of Civil Rights Act,
1955; xi) Passport Act, 1967; xii) Essential Commodities Act,
1955; xiii) Antiquities & Art Treasures
Act, 1972; xiv) Dowry Prohibition Act, 1961; xv) Prohibition of Child Marriage
Act 2006; xvi) Indecent Representation of
Women (Prohibition) Act, 1986;
xvii) Copyright Act, 1957; xiii) Commission of Sati
Prevention Act, 1987; xix) SC/ST (Prevention of
Atrocities) Act, 1989; xx) Forest Act, 1927; xxi) Other crimes (not specified
above) under Special and Local Laws including Cyber Laws under Information Technology Act (IT), 2000.
Complaints received by police The total number of complaints received by police including oral, written, distress call or the ones initiated suo-moto by police is being collected since 1999 in order to assess the quantum of work load of police. The year-wise number of such complaints vis-à-vis actual number of cognizable crimes registered by Police are presented in Table-1.1. A total of 1,07,82,638 complaints were received by police in the country during the year 2012 as compared to 2,27,59,714 complaints received during the year 2011 representing a decrease of 52.6% over 2011. 33.6% of these were written complaints, 11.2% were oral complaints, 32.0% complaints were initiated by Police and 23.3% were distress calls reported over phones (No.100). Nearly, 56.0% of these complaints were registered as cognizable offences (60,41,559 out of 1,07,82,638 ).
Cognizable crimes
The incidences of cognizable crimes in the country during the decade 2002 to 2012 are presented in Table-1.2. As many as 60,41,559 cognizable crimes were reported in the country during 2012 comprising 23.9 lakh cases under the IPC and 36.5 lakh cases under the SLL. The ratio of IPC
to SLL crimes varied from 1:2.1 in 2002 to 1:1.5 in 2012. In terms of percentage, 60.5% of total cases (IPC + SLL) during 2012 were reported under special & local laws and rest of the cases (39.5%) under
LatestLaws.com
Note:
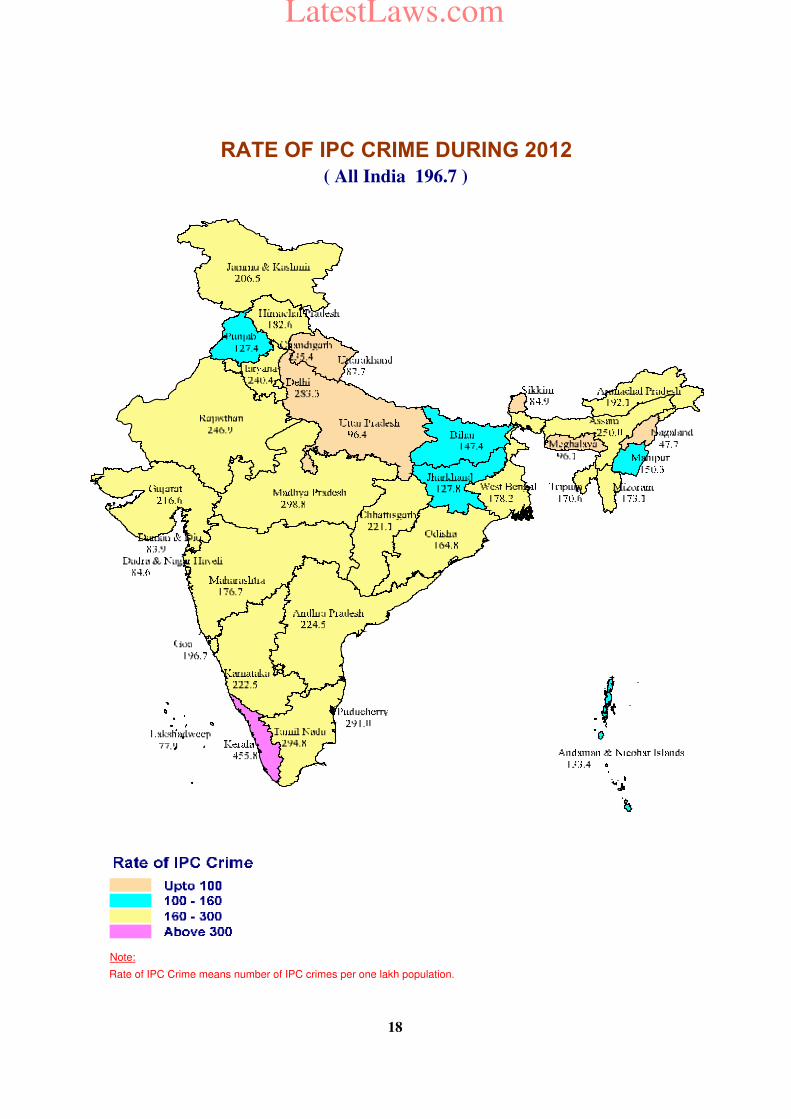
Rate of IPC Crime means number of IPC crimes per one lakh population.
RATE OF IPC CRIME DURING 2012
( All India 196.7 )
18
LatestLaws.com
IPC
39
.5%
SL
L6
0.5
%
Per
cen
tag
e S
har
e o
f IP
C a
nd
SL
L C
rim
es
Du
rin
g 2
012
FIG
UR
E 1
.1
19
LatestLaws.com
-10
.0
-5.0
0.0
5.0
10
.0
15
.0
20
.0
25
.0
30
.0
35
.0
20
02
20
03
20
04
20
05
20
06
20
07
20
08
20
09
20
10
20
11
20
12
-3.6
2.9
2.4
5.5
11
.8
17
.61
9.2
25
.0
30
.63
4.1
-5.2
-0.4
-2.5
-1.0
3.3
7.1
7.0
10
.71
3.4
16
.1
Percentage
Ye
ar
Inci
den
ce &
Rat
e o
f IP
C C
rim
e P
erce
nta
ge
Ch
ang
e fr
om
200
2
Inci
denc
eR
ate
FIG
UR
E 1
.2
20
LatestLaws.com
Cri
me
A
gain
st
Bo
dy
23.5
%
Pro
pert
y
Cri
me
19.5
%
Cri
me
A
gain
st
Pu
blic
Safe
ty3.6
%
Eco
no
mic
C
rim
es
4.8
%
Oth
er
Cri
me
s48.6
%0
%
10%
20%
30%
40%
50%
60%
70%
80%
90%
100
%
Econ
om
icC
rim
es
Pro
pe
rty
Cri
me
sC
rim
eA
ga
inst
Pub
lic S
afe
ty
Cri
me
Aga
inst B
ody
Criminal Breachof Trust
Cheating
Counte
r-fe
itin
g
Dacoity
PA
FD
Robbery
BurglaryTheft
RiotsArson
Murd
er
Attempt to commitMurder
Kidnapping & Abduction
Hurt
Causing deathby negligence
C.H. not amounting to murder
Per
cen
tag
e D
istr
ibu
tio
n o
f IP
C C
rim
es
du
rin
g 2
012
FIG
UR
E 1
.3
PA
FD
=P
repara
tion &
Assem
bly
for
Dacoity
21
LatestLaws.com
Oth
er IP
C C
rim
es
48.7
%
Hu
rt
13.9
%
Th
eft
14.1
% Bu
rgla
ry
3.9%
Cau
sin
g D
eath
By
Neg
ligen
ce
4.5%
Rio
ts
3.1%
Cru
elty
By
Hu
sban
d
or
his
Rel
ativ
es
4.5%
Ch
eati
ng
3.
9%
Ass
ault
on
Wo
men
wit
h
Inte
nt
to O
utr
age
her
m
od
esty
1.9%
Mu
rder
1.
4%
Per
cen
tag
e D
istr
ibu
tio
n o
f IP
C C
rim
es
du
rin
g 2
012
FIG
UR
E 1
.4
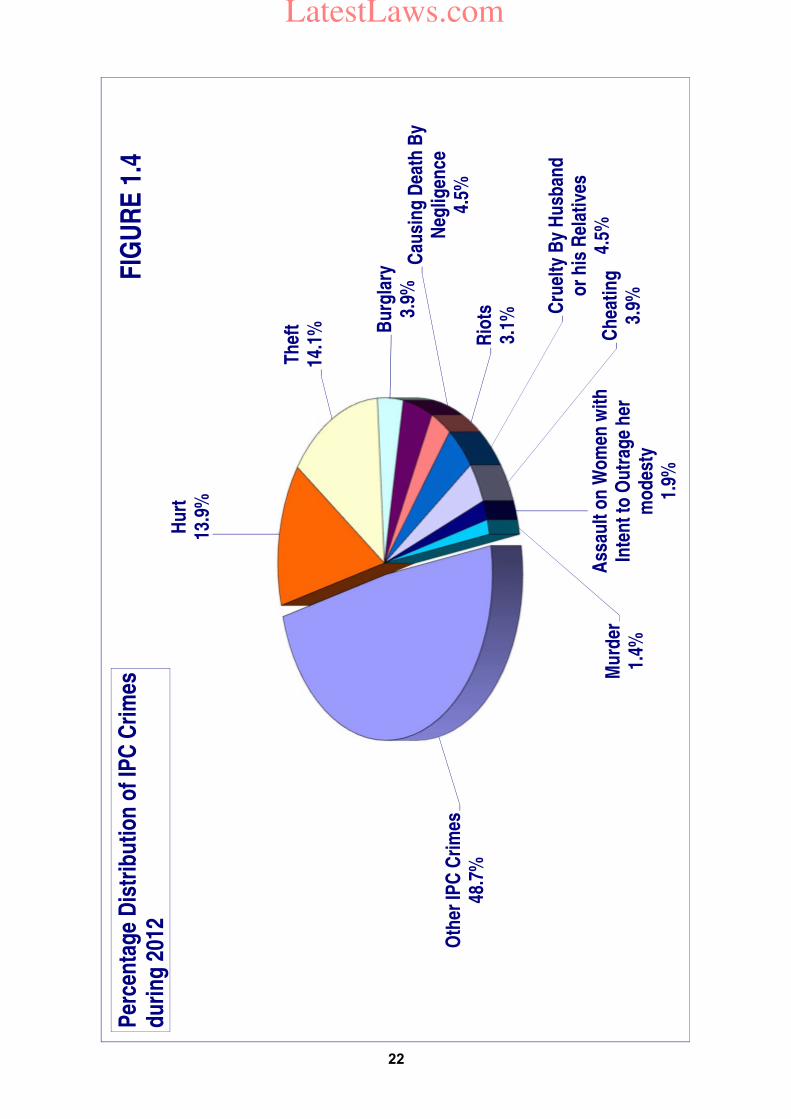
22
LatestLaws.com
23
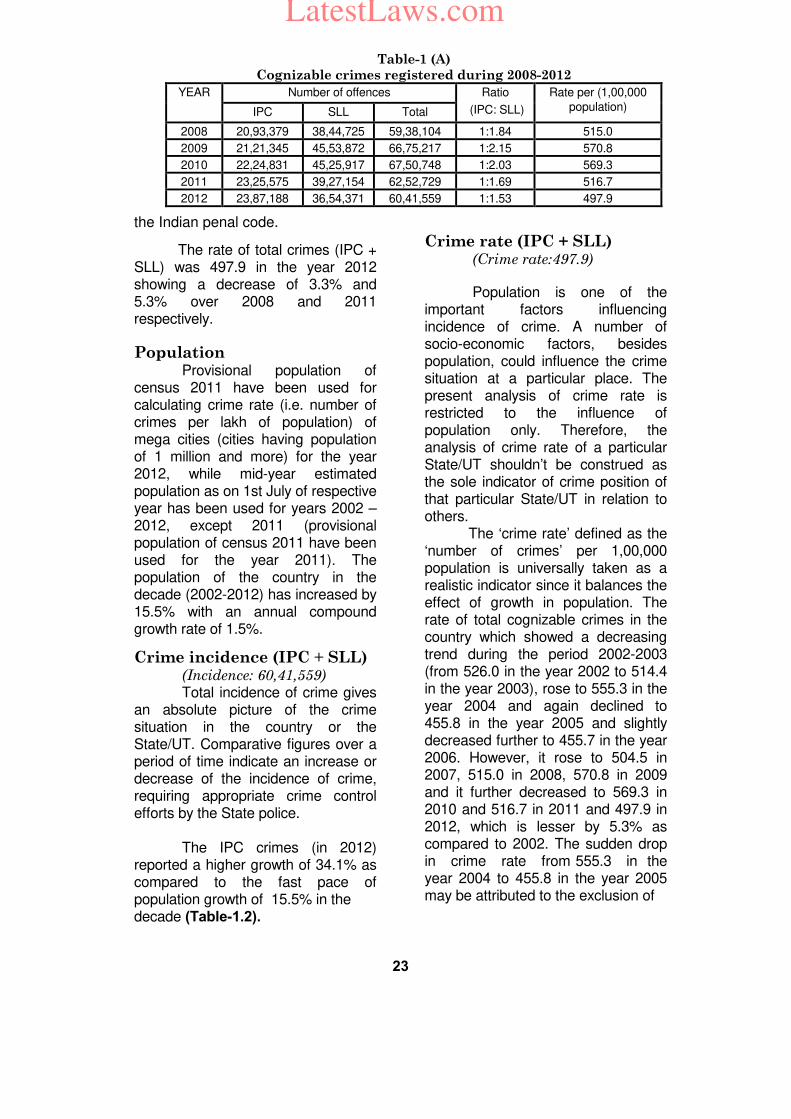
Table-1 (A)
Cognizable crimes registered during 2008-2012
YEAR Number of offences Ratio
(IPC: SLL)
Rate per (1,00,000
population) IPC SLL Total
2008 20,93,379 38,44,725 59,38,104 1:1.84 515.0
2009 21,21,345 45,53,872 66,75,217 1:2.15 570.8
2010 22,24,831 45,25,917 67,50,748 1:2.03 569.3
2011 23,25,575 39,27,154 62,52,729 1:1.69 516.7
2012 23,87,188 36,54,371 60,41,559 1:1.53 497.9
the Indian penal code.
The rate of total crimes (IPC + SLL) was 497.9 in the year 2012 showing a decrease of 3.3% and 5.3% over 2008 and 2011 respectively.
Population Provisional population of census 2011 have been used for calculating crime rate (i.e. number of crimes per lakh of population) of mega cities (cities having population of 1 million and more) for the year 2012, while mid-year estimated population as on 1st July of respective year has been used for years 2002 – 2012, except 2011 (provisional population of census 2011 have been used for the year 2011). The population of the country in the decade (2002-2012) has increased by 15.5% with an annual compound growth rate of 1.5%.
Crime incidence (IPC + SLL) (Incidence: 60,41,559)
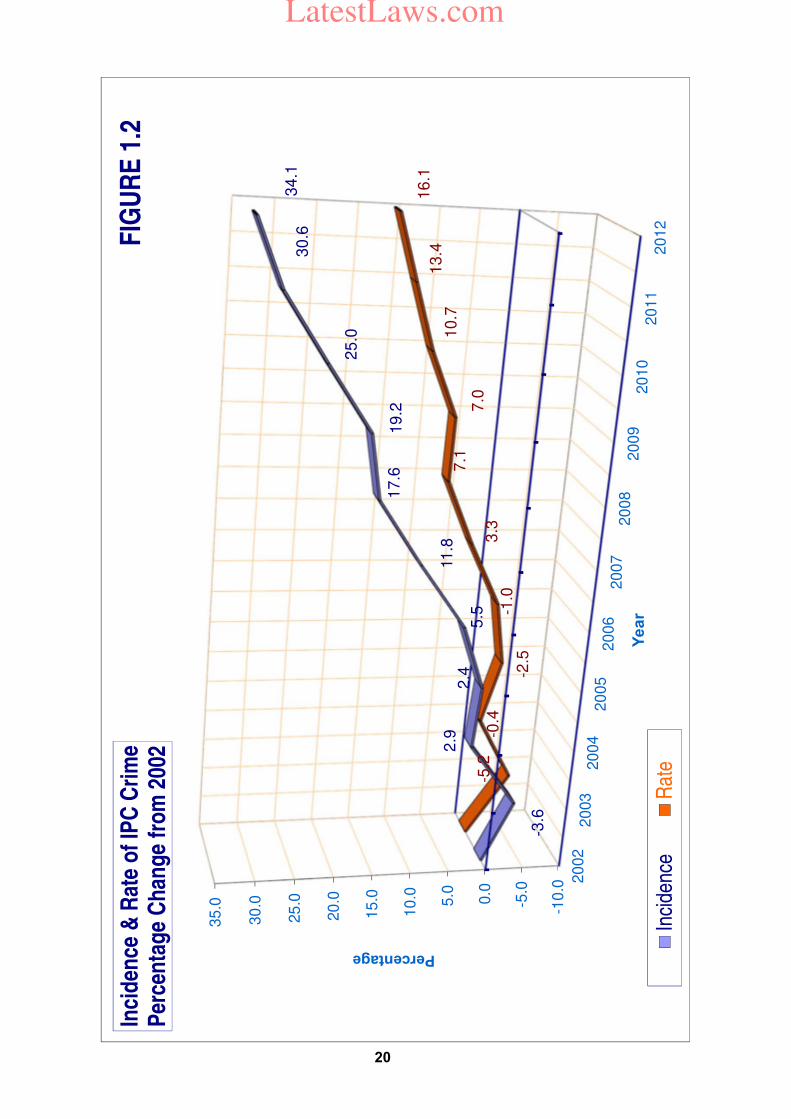
Total incidence of crime gives an absolute picture of the crime situation in the country or the State/UT. Comparative figures over a period of time indicate an increase or decrease of the incidence of crime, requiring appropriate crime control efforts by the State police. The IPC crimes (in 2012) reported a higher growth of 34.1% as compared to the fast pace of population growth of 15.5% in the decade (Table-1.2).
Crime rate (IPC + SLL) (Crime rate:497.9)
Population is one of the important factors influencing incidence of crime. A number of socio-economic factors, besides population, could influence the crime situation at a particular place. The present analysis of crime rate is restricted to the influence of population only. Therefore, the analysis of crime rate of a particular State/UT shouldn’t be construed as the sole indicator of crime position of that particular State/UT in relation to others. The ‘crime rate’ defined as the ‘number of crimes’ per 1,00,000 population is universally taken as a realistic indicator since it balances the effect of growth in population. The rate of total cognizable crimes in the country which showed a decreasing trend during the period 2002-2003 (from 526.0 in the year 2002 to 514.4 in the year 2003), rose to 555.3 in the year 2004 and again declined to 455.8 in the year 2005 and slightly decreased further to 455.7 in the year 2006. However, it rose to 504.5 in 2007, 515.0 in 2008, 570.8 in 2009 and it further decreased to 569.3 in 2010 and 516.7 in 2011 and 497.9 in 2012, which is lesser by 5.3% as compared to 2002. The sudden drop in crime rate from 555.3 in the year 2004 to 455.8 in the year 2005 may be attributed to the exclusion of
LatestLaws.com
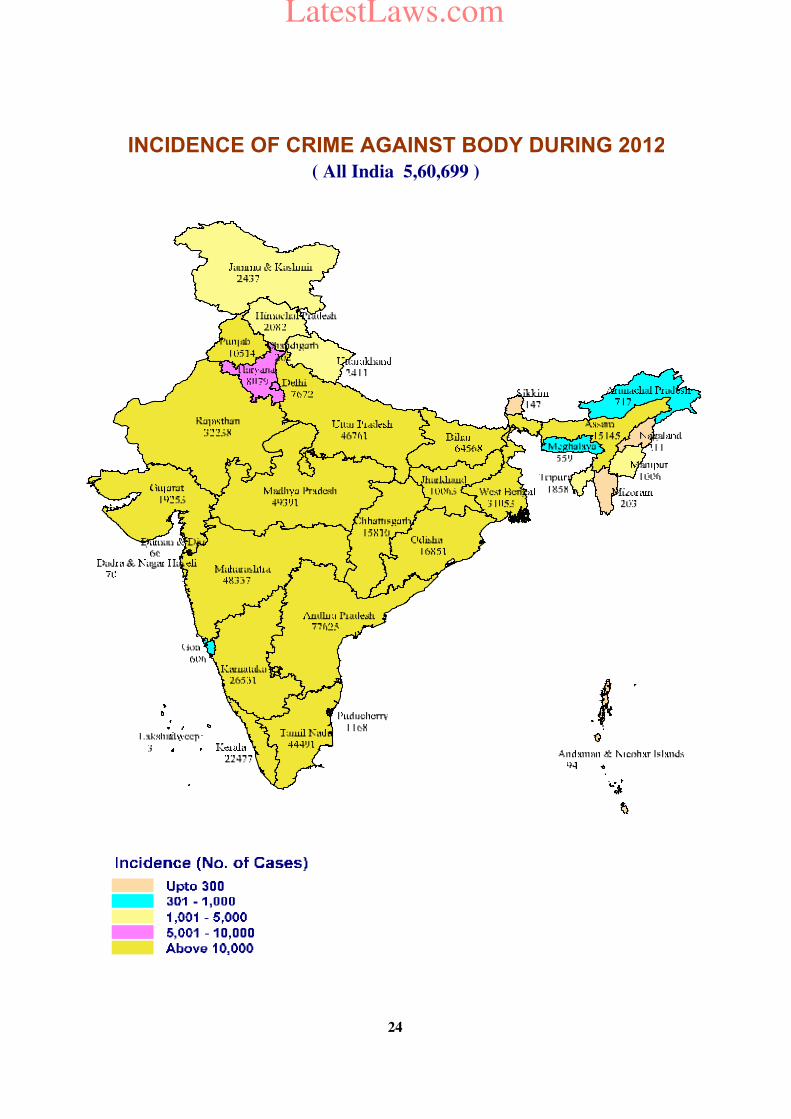
( All India 5,60,699 )
INCIDENCE OF CRIME AGAINST BODY DURING 2012
24
LatestLaws.com
25
certain non-cognizable crimes by Kolkata Police in 2005 data, which were being included inadvertently under the crime-head 'Other SLL crimes' prior to the year 2005. The crime rate in respect of IPC crimes has increased by 2.3% from 192.2 in the year 2011 to 196.7 in the year 2012 whereas for SLL crimes it has decreased by 7.2% from 324.5 in the year 2011 to 301.2 in the year 2012.
Crime incidence- IPC (Incidence: 23,87,188)
A total of 23,87,188 IPC crimes were reported in the country during the year 2012 against 23,25,575 in the year 2011 recording an increase of 2.3% in the year 2012 over 2011. The share of IPC crimes to total cognizable crimes in percentage terms, slightly decreased from 35.3% in the year 2008 to 31.8% in 2009, and further increased to 33.0% in the year 2010, 37.2% in 2011 and 39.5% in 2012, thus showing a mixed trend during the five-year period 2008 – 2012. Madhya Pradesh, Maharashtra, Tamil Nadu, Uttar Pradesh and Andhra Pradesh have contributed about 9.2%, 8.5%, 8.4%, 8.3% and 8.1% respectively of total crimes reported in the country during the year 2012.
Crime rate – IPC (Crime rate: 196.7) The IPC crime rate has increased by 16.1% during the decade 2002-2012 from 169.5 in the year 2002 to 196.7 in the year 2012. It has increased by 7.1% during the year 2012 as compared with quinquennial average (during the period 2008-2012). Kerala (455.8),
Madhya Pradesh (298.8), Tamil Nadu (294.8), Puducherry (291.0), Delhi (283.3) and 10 other States/UTs have reported much higher crime rates as compared to the national average of 196.7, which is higher than national average of 192.2 in the year 2011.
Trend analysis
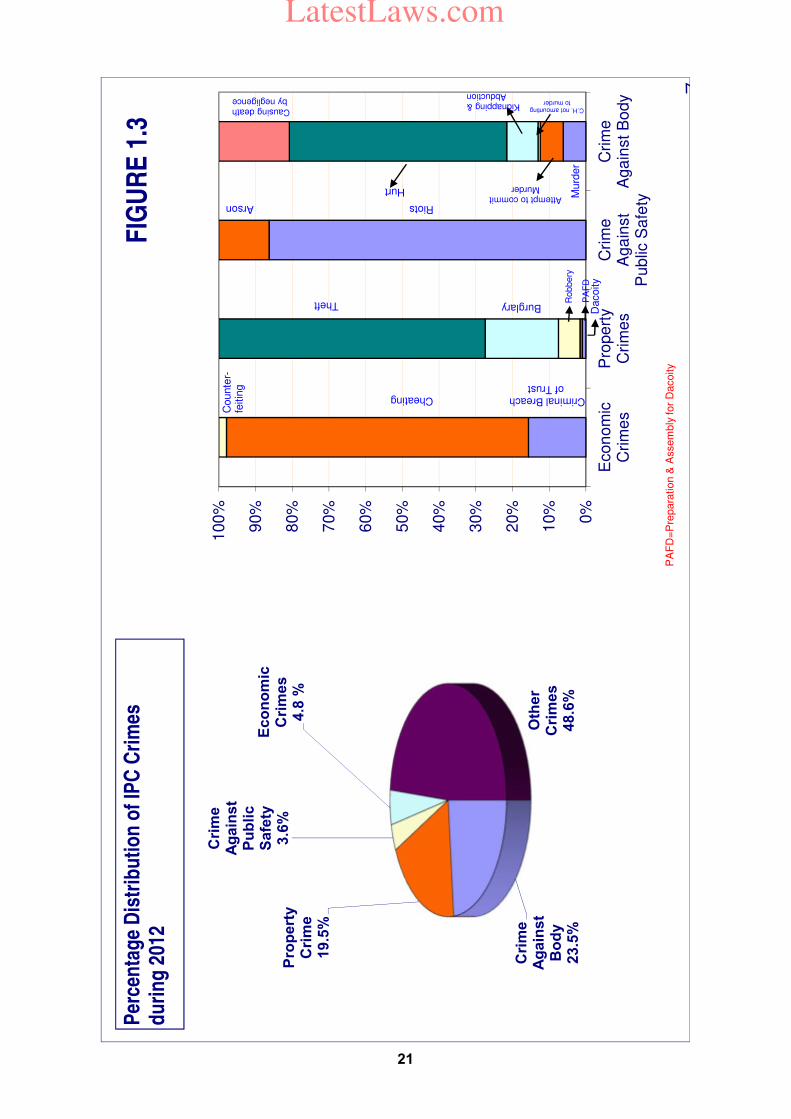
Crimes against body
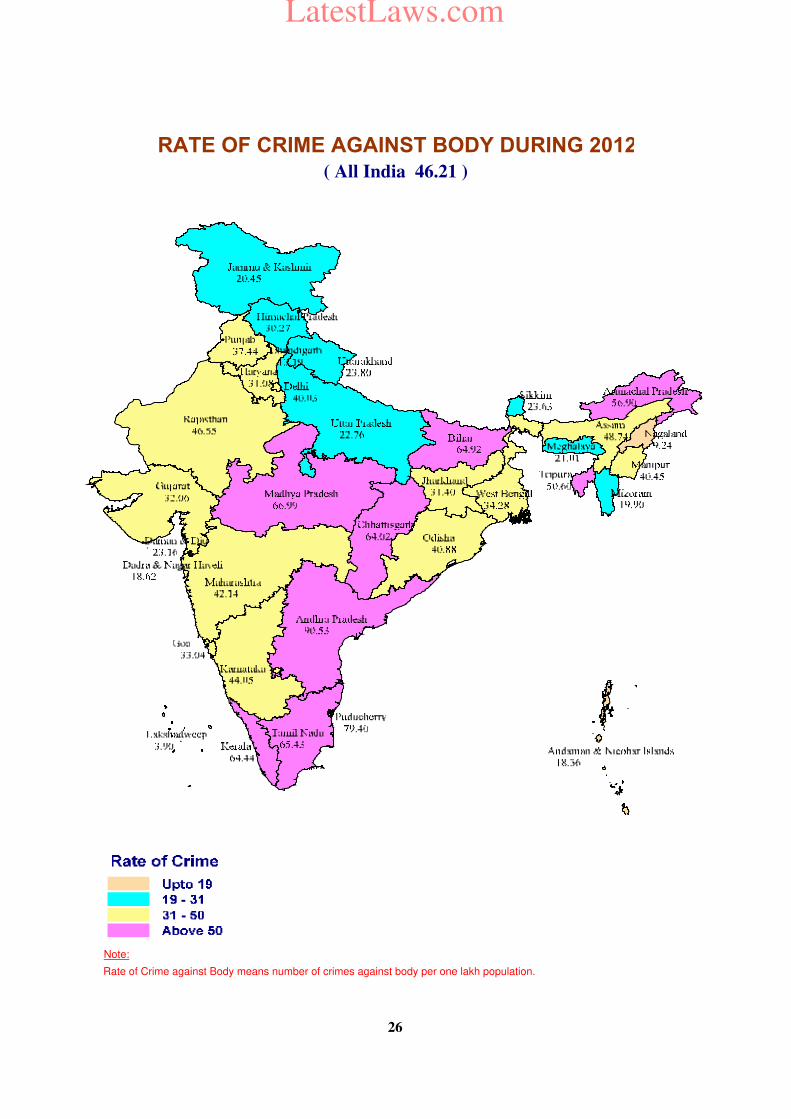
(Incidence: 5,60,699
Rate: 46.2)
These comprise murder and attempt to murder, culpable homicide not amounting to murder, kidnapping & abduction, hurt and causing death by negligence as defined in the beginning of the chapter. A total of 5,60,699 such crime were reported during 2012. The share of these crimes to total IPC crimes at the national level was 23.5% during the year 2012. Crimes against body showed an increase of 6.6% during the year 2012 over 2011 (5,25,798). The share of these crimes (44.0%) to total IPC crimes was highest in Bihar followed by Andhra Pradesh (40.3%) as compared to national average of 23.5% of total IPC crimes. Details are presented in Table-1.9. The rate of crimes against body was highest in Andhra Pradesh (90.5 per lakh population) followed by UT of Puducherry (79.4) as compared to national rate of 46.2.
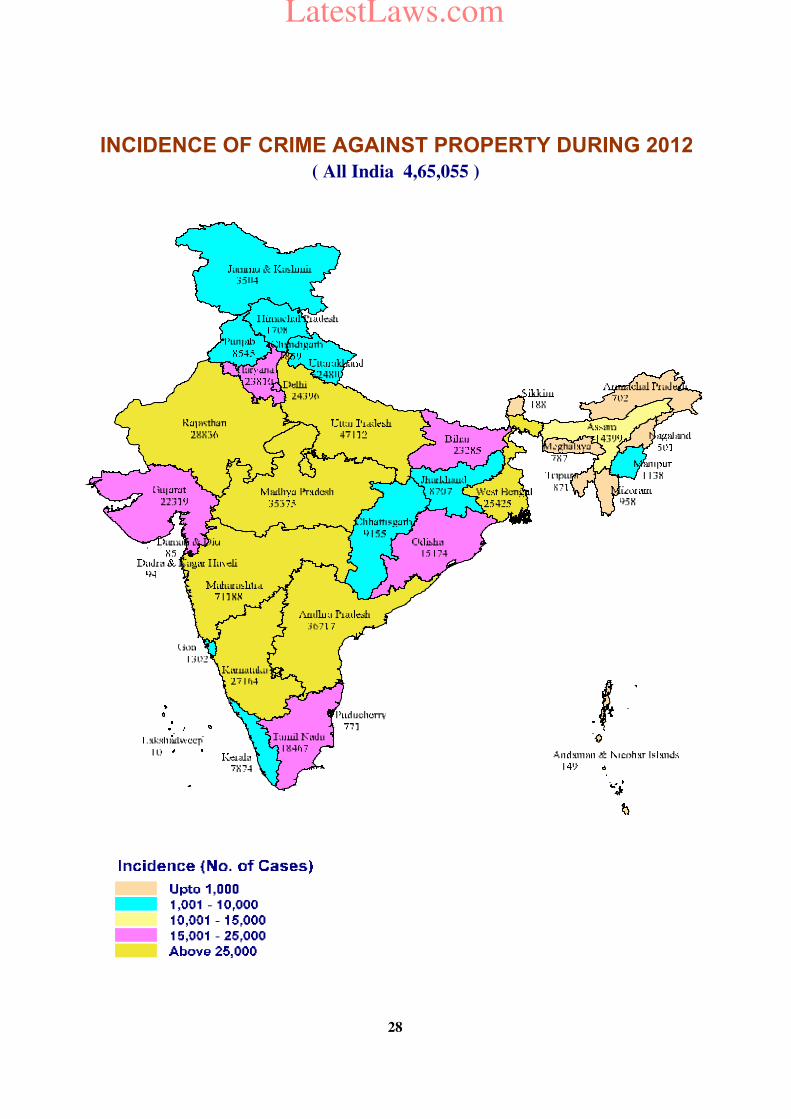
Crimes against property
(Incidence:4,65,055 Rate: 38.3)
These comprise dacoity, its preparation & assembly to commit dacoity, robbery, burglary and theft. A total of 4,65,055 such crimes were reported during the year 2012 as compared to 4,65,184 crimes during
LatestLaws.com
Note:
Rate of Crime against Body means number of crimes against body per one lakh population.
RATE OF CRIME AGAINST BODY DURING 2012
( All India 46.21 )
26
LatestLaws.com
27
the year 2011 showing a marginal decrease of 0.03%. The share of these crimes to total IPC crimes at the national level was 19.5% during the year 2012. The share of these crimes to total IPC crimes was reported highest in Mizoram (54.3%) followed by Delhi (45.0%) as compared to national average of 19.5%. The share of such crimes in the country has decreased from 20.0% (in the year 2011) to 19.5%(in 2012).
The average rate of crime under this head in the country during the year 2012 was 38.3. Table-1.10 may be seen for details.
Crimes against public order
(Incidence: 86,469
Rates: 7.13)
Riots and arson are the major components of this category of crimes against public order which constitute 3.6% of total IPC crimes. Incidence of crimes under this head has increased by 11.5% from 77,564 cases in the year 2011 to 86,469 cases in the year 2012. The rate of such crimes has marginally increased from 6.4 in the year 2011 to 7.1 in the year 2012. The rate of such crime was reported highest in Kerala at 33.0 as compared to National average of 7.1. Table-1.11 may be seen for details.
Economic crimes
(Incidence: 1,14,455
Rate: 9.4)
These crimes comprising criminal breach of trust, cheating and counterfeiting, showed an increase of 6.5% in the year 2012 as there were 1,14,455 reported crimes as compared to 1,07,420 in the year
2011. The rate of such crimes has increased from 8.9 in the year 2011 to 9.4 in the year 2012. These crimes have accounted for 4.8% of the total IPC crimes. Rajasthan (17.8) followed by Uttar Pradesh (12.7%) have reported the highest share of these crimes to its IPC component. Rajasthan and Chandigarh have highest crime rates of 29.4 and 17.6 respectively compared to national average of 9.4. Table 1.12 may be seen for details.
Trend analysis - major IPC crimes
The components of violent crimes such as murder, attempt to commit murder, culpable homicide not amounting to murder, rape, kidnapping & abduction, dacoity, its preparation & assembly, robbery, riots, arson and dowry death have been separately analysed in the chapter on violent crimes. The crime head-wise analysis indicating 5 and 10 year trends for remaining crimes are discussed below.
Burglary (Sec. 449 to 452, 454,
455, 457 to 460 IPC)
(Incidence: 92,892
Rate: 7.7)
Burglary offences with 92,892 cases in 2012 showed a marginal rise of 0.4% as compared to 92,504 cases in 2011. The trend analysis of burglary cases reported at the national level revealed that there was a decline in such cases by 3.7% during 2012 as compared to the 2002 level and a rise of 1.0% as compared
LatestLaws.com
INCIDENCE OF CRIME AGAINST PROPERTY DURING 2012
( All India 4,65,055 )
28
LatestLaws.com
29
to the average of last 5 years (2007 - 2012) (See Table-1.3).
Maharashtra has reported the maximum number of burglary cases (15,648 cases) among States/UTs accounting for 16.8% of such incidences at the national level. Delhi has reported the highest increase of 20.9% in incidence of burglary during the year 2012(1,715 cases) as compared to the year 2011(1,419 cases), followed by Arunachal Pradesh (17.5%) (from 183 in 2011 to 215 in 2012) and Uttarakhand (14.3%) (from 342 in 2011 to 464 in 2012. Among UTs, A & N Islands (28.3%) has reported the highest decrease over the year 2011.
Every one lakh population in the country experienced nearly 8 burglaries on an average in the year 2012. The population in urban agglomerations experienced nearly 13 of such crimes per lakh population. The highest rate of about 34.0 burglaries per lakh population was reported from Mizoram during the year 2012.
Theft (Sec. 379 to 382 IPC)
(Incidence: 3,37,407
Rate: 27.8)
Theft cases reported an increase of 36.3% during the year 2012 as compared to the year 2002. There was 5.6% increase in the year 2012 as compared to average of such cases during last 5 years. The incidence of theft showed a decrease of 1.0% in the year 2012 as compared to the year 2011. Maharashtra has reported highest number of cases (47,476) under theft during the year 2012 which amounts to 14.1% of the total
thefts in the country. There were about nearly 28 thefts for every 1,00,000 population in the country. The urban agglomerations have reported more than triple rate with 70.0 thefts (per one lakh population) compared to the all India rate of incidence of thefts. Delhi, Chandigarh and Haryana have reported a rate of 75.1, 58.4 and 49.9 thefts respectively during the year 2012. ‘Auto theft’ has accounted for 45.7% (1,54,351 cases) of the total theft cases, which accounted for an increase of 2.1% in the year 2012 as compared to the year 2011 (1,51,200 cases). Theft other than automobile has shown a decline of 3.5% from 1,89,600 (in the year 2011) to 1,83,056 (in the year 2012). The maximum auto thefts were reported in U.P. (14.8%) followed by Maharashtra (11.6%) and Delhi (9.3%). Delhi has reported much higher rate at 75.1 as compared to the national rate of 12.7 of auto thefts per 1,00,000 population.
Riot (Sec. 143-145, 147-151, 153,
153-A, 153-B, 157, 158, 160 IPC)
(Incidence: 74,633
Rate: 6.2)
A total of 74,633 riot cases were reported in the country during the year 2012. The overall riot cases have increased by 9.0% in the year 2012 over those of the year 2011(68,500 cases). As per 10-year and 5-year trend analysis, a rise of 8.3% in comparison to the year 2002 and an increase of 14.8% as compared to average of last 5 years (2007 – 2012) were observed. Kerala (10,938 cases) followed by Bihar (10,871 cases) has reported the
LatestLaws.com
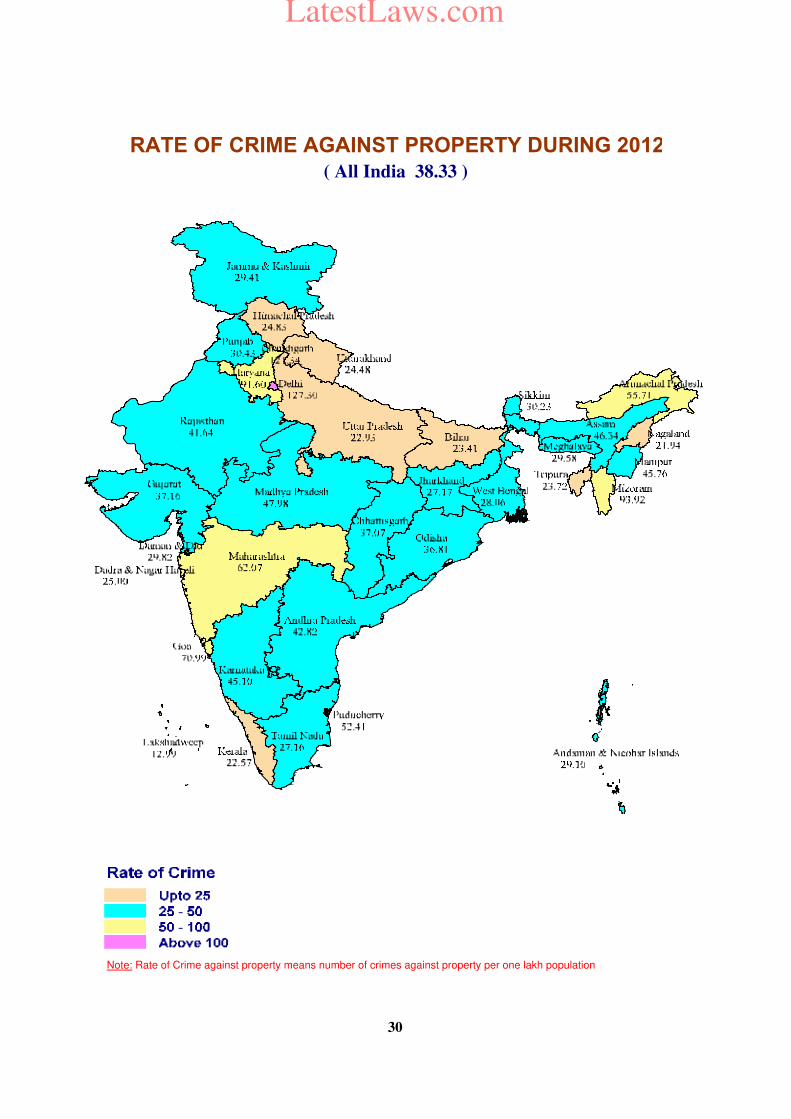
Note: Rate of Crime against property means number of crimes against property per one lakh population
RATE OF CRIME AGAINST PROPERTY DURING 2012
( All India 38.33 )
30
LatestLaws.com
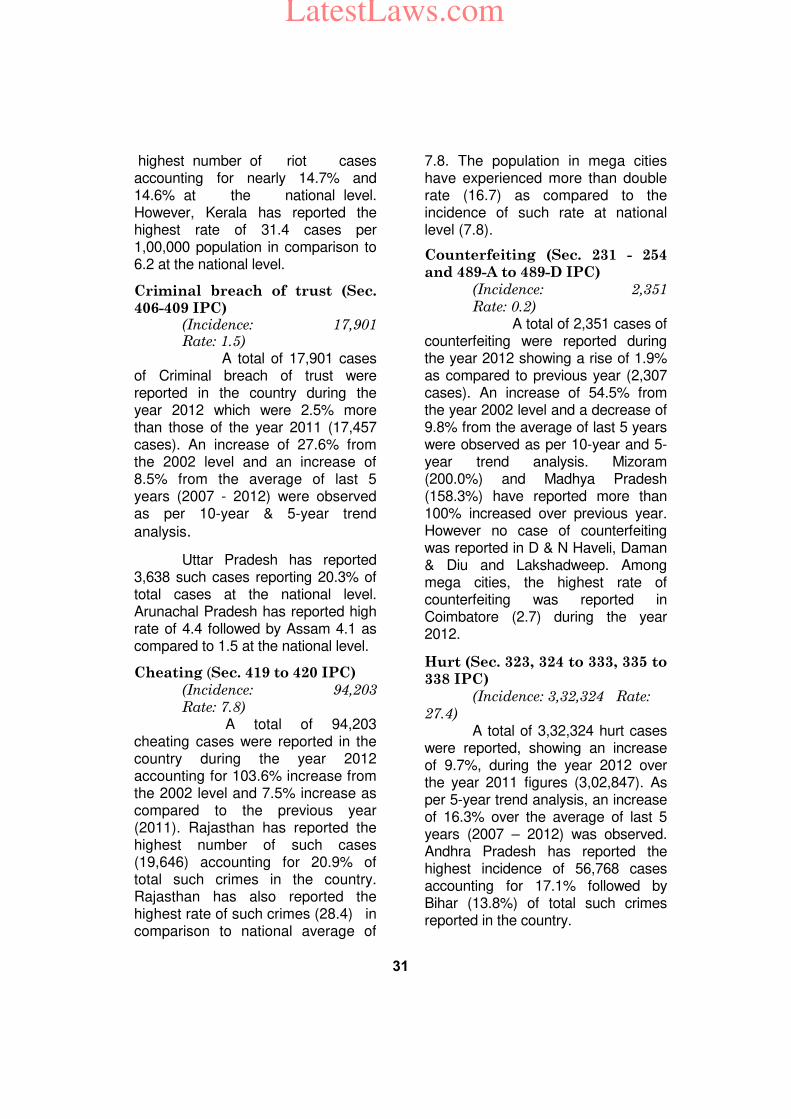
31
highest number of riot cases accounting for nearly 14.7% and 14.6% at the national level. However, Kerala has reported the highest rate of 31.4 cases per 1,00,000 population in comparison to 6.2 at the national level.
Criminal breach of trust (Sec.
406-409 IPC) (Incidence: 17,901 Rate: 1.5)
A total of 17,901 cases of Criminal breach of trust were reported in the country during the year 2012 which were 2.5% more than those of the year 2011 (17,457 cases). An increase of 27.6% from the 2002 level and an increase of 8.5% from the average of last 5 years (2007 - 2012) were observed as per 10-year & 5-year trend
analysis.
Uttar Pradesh has reported 3,638 such cases reporting 20.3% of total cases at the national level. Arunachal Pradesh has reported high rate of 4.4 followed by Assam 4.1 as compared to 1.5 at the national level.
Cheating (Sec. 419 to 420 IPC)
(Incidence: 94,203
Rate: 7.8)
A total of 94,203 cheating cases were reported in the country during the year 2012 accounting for 103.6% increase from the 2002 level and 7.5% increase as compared to the previous year (2011). Rajasthan has reported the highest number of such cases (19,646) accounting for 20.9% of total such crimes in the country. Rajasthan has also reported the highest rate of such crimes (28.4) in comparison to national average of
7.8. The population in mega cities have experienced more than double rate (16.7) as compared to the incidence of such rate at national level (7.8).
Counterfeiting (Sec. 231 - 254
and 489-A to 489-D IPC)
(Incidence: 2,351
Rate: 0.2)
A total of 2,351 cases of counterfeiting were reported during the year 2012 showing a rise of 1.9% as compared to previous year (2,307 cases). An increase of 54.5% from the year 2002 level and a decrease of 9.8% from the average of last 5 years were observed as per 10-year and 5-year trend analysis. Mizoram (200.0%) and Madhya Pradesh (158.3%) have reported more than 100% increased over previous year. However no case of counterfeiting was reported in D & N Haveli, Daman & Diu and Lakshadweep. Among mega cities, the highest rate of counterfeiting was reported in Coimbatore (2.7) during the year 2012.
Hurt (Sec. 323, 324 to 333, 335 to
338 IPC) (Incidence: 3,32,324 Rate:
27.4)
A total of 3,32,324 hurt cases were reported, showing an increase of 9.7%, during the year 2012 over the year 2011 figures (3,02,847). As per 5-year trend analysis, an increase of 16.3% over the average of last 5 years (2007 – 2012) was observed. Andhra Pradesh has reported the highest incidence of 56,768 cases accounting for 17.1% followed by Bihar (13.8%) of total such crimes reported in the country.
LatestLaws.com
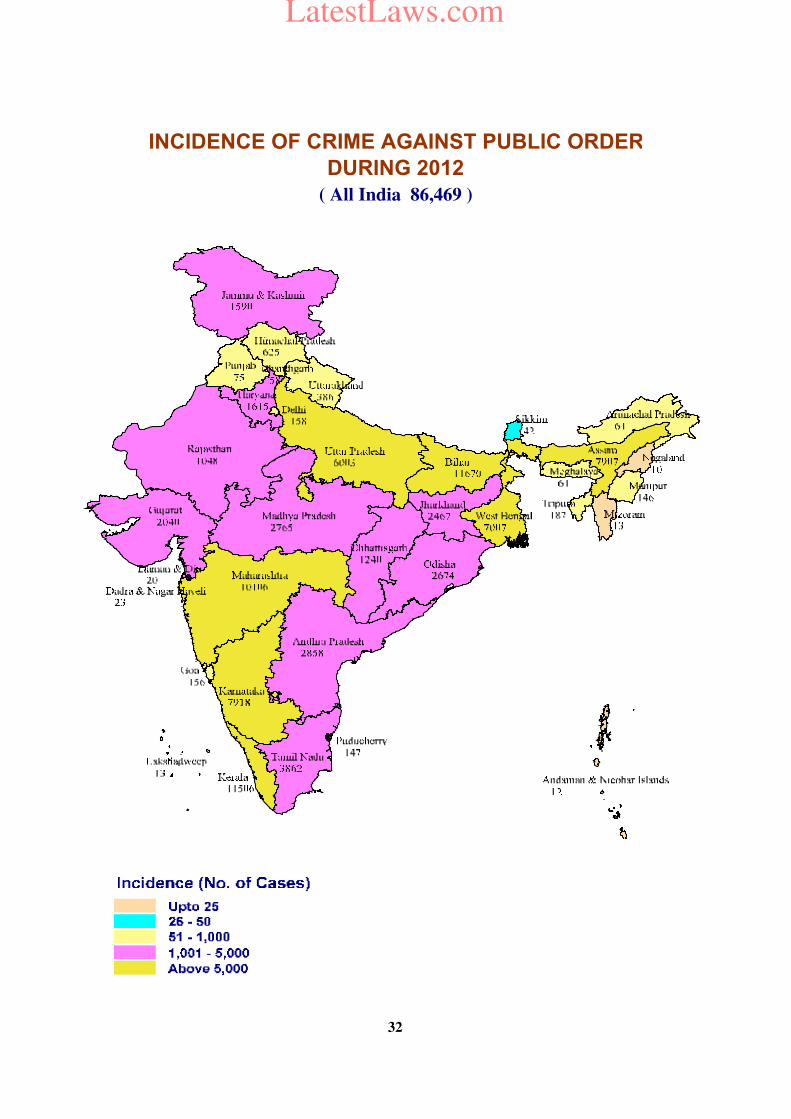
INCIDENCE OF CRIME AGAINST PUBLIC ORDER
DURING 2012
( All India 86,469 )
32
LatestLaws.com
33
Assault on women with intent to
outrage her modesty (Sec. 354
IPC)
(Incidence:45,351 Rate: 3.7)
A total of 45,351 cases of Assault on women with intent to outrage her modesty were reported in the country during the year 2012, showing an increase of 5.5% over the year 2011 (42,968 cases). Madhya Pradesh has reported 6,655 cases accounting for 14.7% of total cases reported in the country. Jammu & Kashmir has reported the highest rate of 11.1 in comparison to the national average of 3.7.
Dowry deaths (Sec. 304B IPC)
(Incidence: 8,233 Rate: 0.7)
A total of 8,233 Dowry deaths were reported in the country during the year 2012. Uttar Pradesh has reported the highest incidence (2,244) accounting for 27.3% of dowry death followed by Bihar with 1,275 incidences (15.5%). Insult to the modesty of women
(Sec. 509 IPC)
(Incidence: 9,173 Rate: 0.8)
A total of 9,173 cases of Insult to the modesty of women were reported in the country during the year 2012 showing an increase of 7.0% as compared to the previous year (8,570 cases). 5-year trend analysis showed a decrease of 13.0% over the average of 2007 – 2012. Andhra Pradesh reported 40.5% of total cases reported in the country during the year 2012.
Cruelty by husband or his
relatives (Sec.498-A IPC)
(Incidence: 1,06,527 Rate: 8.8)
A total of 1,06,527 cases were reported in the country during the year 2012 showing an increase of 7.5% over 2011 and an increase of 21.1% over the average of last 5 years (2007 - 2012). In terms of percentage, 43.7% of such crimes in the country were reported from three states only namely West Bengal (19,865 cases), Andhra Pradesh (13,389 cases) and Rajasthan (13,312 cases). Tripura has reported the highest crime rate of 23.4 followed by West Bengal (21.9) and Assam (20.6) as compared to National average of 8.8. Importation of girls from
foreign country (Sec. 366-B IPC)
(Incidence:59 Rate:negligible)
A total of 59 cases of such crimes were reported in the country during the year 2012 as compared to 80 cases in the year 2011 accounting for a decrease of 26.3% over 2011.
Causing death by negligence
(Sec. 304-A IPC)
(Incidence:1,07,591 Rate: 8.9)
A total of 1,07,591 cases were reported in the country during the year 2012 showing a decrease of 1.2% over the year 2011 (1,08,890 cases). Tamil Nadu has reported the highest number of 15,499 cases followed by Uttar Pradesh (14,406 cases), Andhra Pradesh (13,929 cases) and Maharashtra (13,311 cases). These four States together accounted for 53.1% of total cases reported in the country.
LatestLaws.com
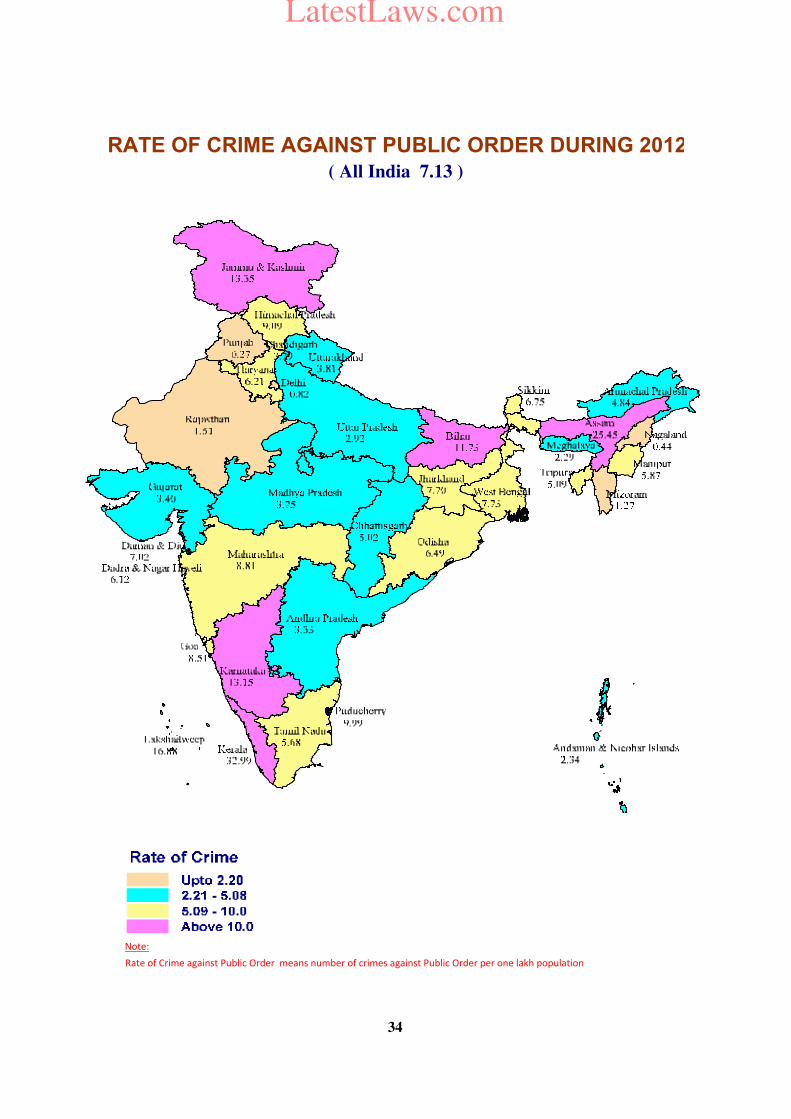
Note: Rate of Crime against Public Order means number of crimes against Public Order per one lakh population
RATE OF CRIME AGAINST PUBLIC ORDER DURING 2012
( All India 7.13 )
34
LatestLaws.com
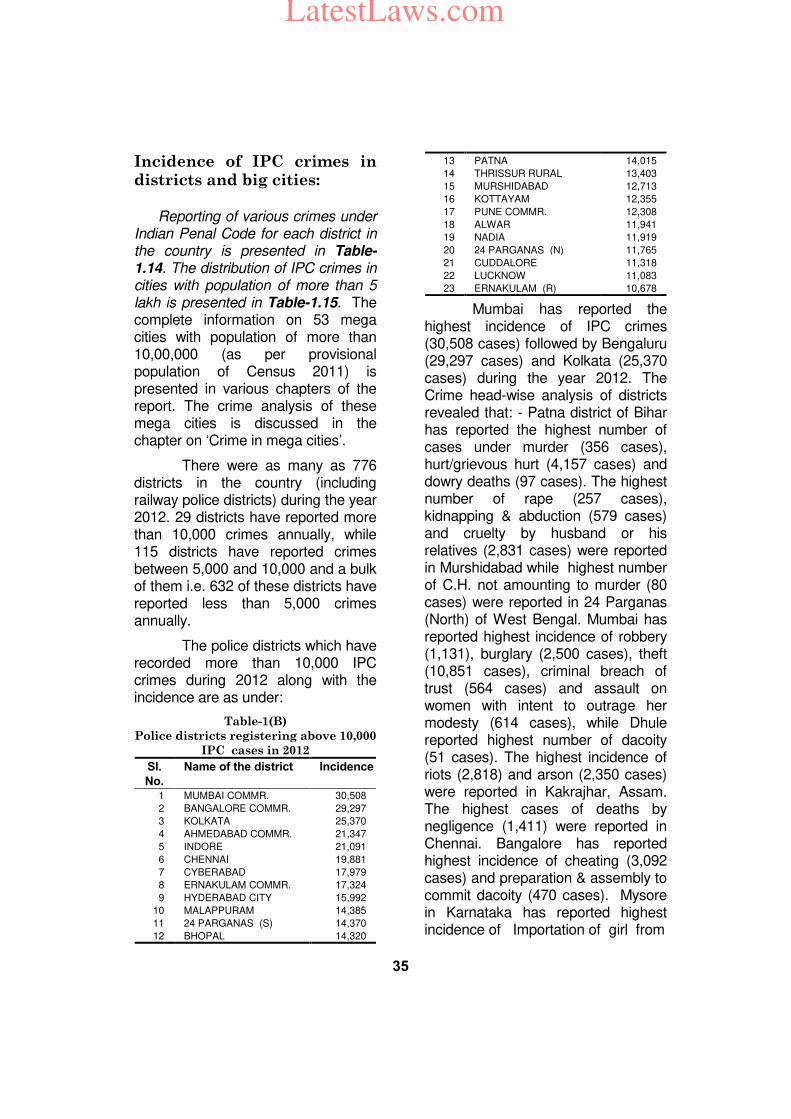
35
Incidence of IPC crimes in districts and big cities: Reporting of various crimes under Indian Penal Code for each district in the country is presented in Table-1.14. The distribution of IPC crimes in cities with population of more than 5 lakh is presented in Table-1.15. The complete information on 53 mega cities with population of more than 10,00,000 (as per provisional population of Census 2011) is presented in various chapters of the report. The crime analysis of these mega cities is discussed in the chapter on ‘Crime in mega cities’.
There were as many as 776 districts in the country (including railway police districts) during the year 2012. 29 districts have reported more than 10,000 crimes annually, while 115 districts have reported crimes between 5,000 and 10,000 and a bulk of them i.e. 632 of these districts have reported less than 5,000 crimes annually.
The police districts which have recorded more than 10,000 IPC crimes during 2012 along with the incidence are as under:
Table-1(B)
Police districts registering above 10,000
IPC cases in 2012
Sl.
No.
Name of the district Incidence
1 MUMBAI COMMR. 30,508
2 BANGALORE COMMR. 29,297
3 KOLKATA 25,370
4 AHMEDABAD COMMR. 21,347
5 INDORE 21,091
6 CHENNAI 19,881
7 CYBERABAD 17,979
8 ERNAKULAM COMMR. 17,324
9 HYDERABAD CITY 15,992
10 MALAPPURAM 14,385
11 24 PARGANAS (S) 14,370
12 BHOPAL 14,320
13 PATNA 14,015
14 THRISSUR RURAL 13,403
15 MURSHIDABAD 12,713
16 KOTTAYAM 12,355
17 PUNE COMMR. 12,308
18 ALWAR 11,941
19 NADIA 11,919
20 24 PARGANAS (N) 11,765
21 CUDDALORE 11,318
22 LUCKNOW 11,083
23 ERNAKULAM (R) 10,678
Mumbai has reported the highest incidence of IPC crimes (30,508 cases) followed by Bengaluru (29,297 cases) and Kolkata (25,370 cases) during the year 2012. The Crime head-wise analysis of districts revealed that: - Patna district of Bihar has reported the highest number of cases under murder (356 cases), hurt/grievous hurt (4,157 cases) and dowry deaths (97 cases). The highest number of rape (257 cases), kidnapping & abduction (579 cases) and cruelty by husband or his relatives (2,831 cases) were reported in Murshidabad while highest number of C.H. not amounting to murder (80 cases) were reported in 24 Parganas (North) of West Bengal. Mumbai has reported highest incidence of robbery (1,131), burglary (2,500 cases), theft (10,851 cases), criminal breach of trust (564 cases) and assault on women with intent to outrage her modesty (614 cases), while Dhule reported highest number of dacoity (51 cases). The highest incidence of riots (2,818) and arson (2,350 cases) were reported in Kakrajhar, Assam. The highest cases of deaths by negligence (1,411) were reported in Chennai. Bangalore has reported highest incidence of cheating (3,092 cases) and preparation & assembly to commit dacoity (470 cases). Mysore in Karnataka has reported highest incidence of Importation of girl from
LatestLaws.com
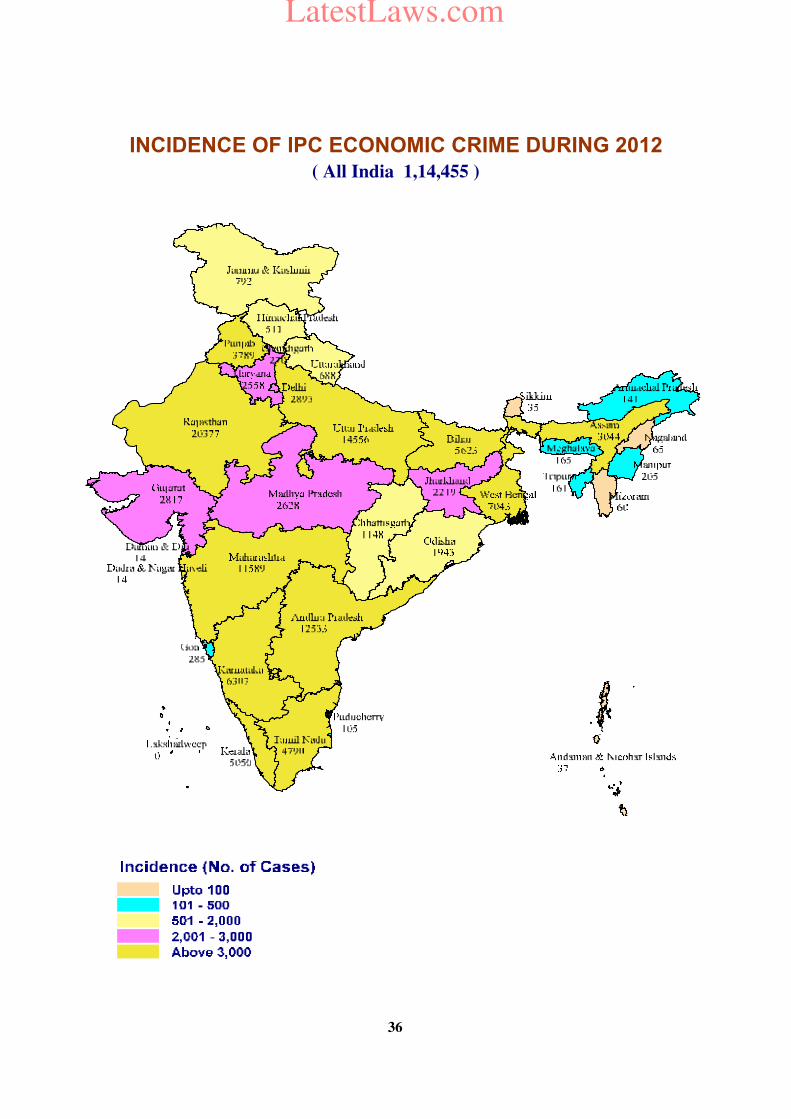
INCIDENCE OF IPC ECONOMIC CRIME DURING 2012
( All India 1,14,455 )
36
LatestLaws.com
37
foreign country (12 cases). Vijayawada of Andhra Pradesh has reported the highest incidence of insult to the modesty of women (418 cases).
Crimes under the special & local laws (SLL) (Incidence:36,54,371 Rate:301.2)
Cases under these “Acts” generally represent preventive policing i.e. reporting of crimes generally indicates better policing efforts. Mostly the central Acts on special subjects which are applicable in the whole country are considered for the purpose of crimes reported under SLL. Local Acts are clubbed together in ‘Other SLL’ crimes.
A total of 36,54,371 SLL crimes were reported in the country during the year 2012 accounting for decrease of 6.9% over the year 2011 (39,27,154 cases). 10-year and 5-year trend analysis shows, 2.5% decrease from the 2002 level and 11.3% decrease over the average of last 5 years (2007 – 2012). The rate of crime has also shown a decrease of 14.5% as compared to the year 2011 (351.7). 10-year and 5-year trends for each crime are presented in Table-1.16.
The crime head-wise percentage distribution of various cognizable crimes under SLL is presented in Table-1.17. It is observed that the 21 specified crime heads of SLL have accounted for 23.4% of the total SLL crimes, while the remaining 76.6% were clubbed as ‘Other SLL crimes’. The ‘Prohibition Act’, though enforced only in few States, accounted for 11.4% of the total SLL crimes during the year 2012.
The next in order were the ‘Excise Act’ (4.4%), `Gambling Act’ (3.8%) and `Arms Act’ (1.5%). The trend of major SLL crimes is discussed as under:
Arms Act, 1959
(Incidence:55,376 Rate: 4.6)
A total of 55,376 cases under Arms Act were reported in the country during the year 2012 showing a decrease of 11.2% over the previous year (62,329 cases). Uttar Pradesh has reported the highest incidence of 26,396 cases and accounted for 47.7% of the total such cases reported in the country. Madhya Pradesh has reported the highest crime rate at 14.7 as compared to 4.6 at the national level.
Narcotic Drugs & Psychotropic
Substances Act, 1985
(Incidence:29,247 Rate: 2.4)
A total of 29,247 cases under this Act were registered in the year 2012 showing an increase of 13.4% over previous year (29,048 cases). 10-year and 5-year trend analysis showed 15.7% increase from the year 2002 level and 0.7% marginal increase from the average of last 5 years (2007 – 2012). Punjab has reported 34.9% (10,220 cases) of the total such cases reported in the country. Punjab has also reported the highest crime rate of 36.4 as compared to the national average of 2.4.
Gambling Act, 1867
(Incidence:1,40,302 Rate:11.6)
The incidence under this Act showed a decrease of 9.1% over the previous year (1,63,146 cases).
LatestLaws.com
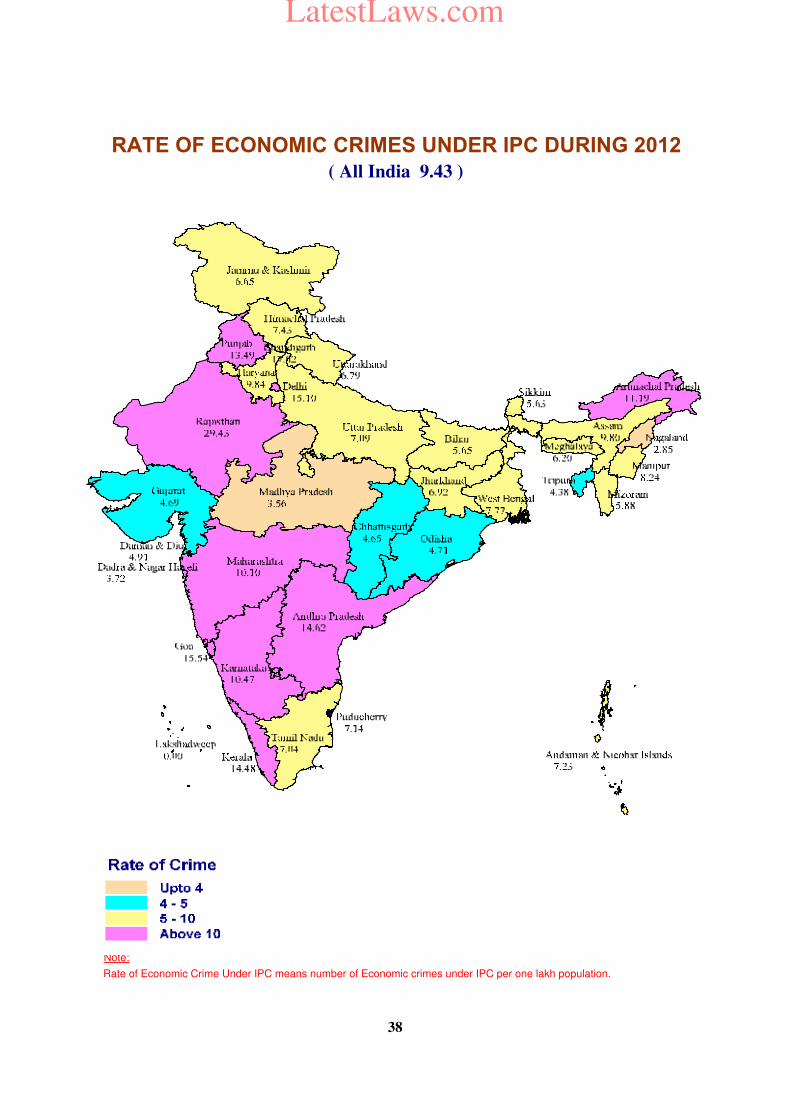
Note:
Rate of Economic Crime Under IPC means number of Economic crimes under IPC per one lakh population.
RATE OF ECONOMIC CRIMES UNDER IPC DURING 2012
( All India 9.43 )
38
LatestLaws.com
39
10-year and 5-year trend analysis shows, 19.8%decrease from the 2002 level and 14.0% decrease over the average of last 5 years (2007 – 2012). In percentage terms, 21.9% of the total cases registered in the country were reported from Andhra Pradesh (30,664 cases). The crime rate was also reported highest in Andhra Pradesh (35.8) as compared to 11.6 at the National level.
Excise Act, 1944
(Incidence:1,60,528 Rate:13.2)
The incidence under the Excise Act showed an increase of 28.4% over the year 2002 and 11.0% over the previous year. Madhya Pradesh has reported the highest incidents (42,693) accounting for 26.6% of the total cases reported under this Act. Among the States, highest crime rate was reported from Haryana (67.8) followed by Madhya Pradesh (57.9). Among the UTs, A&N Islands (403.1) has reported highest crime rate among UTs as compared to national average of 13.2.
Prohibition Act
(Incidence:4,16,749 Rate: 34.3)
The cases reported under this Act have accounted for 11.4% of total SLL crimes in the country and shows an increase of 4.4% over the previous year (3,99,257 cases). The incidences under this Act have declined by 14.6% over the year 2002 and increased by 10.9% over the average of 5 years (2007 - 2012). The highest number of cases under this Act (1,98,297 cases) were reported from Gujarat followed by Tamil Nadu (90,272 cases) and Maharashtra (72,442 cases). These three States together accounted for 86.6% of the
total cases registered in the country. The rate was highest at 330.2 in Gujarat as against the National average of 34.3.
Explosives & Explosive
Substances Act, 1884 & 1908
(Incidence:4,027 Rate:0.3)
The incidence under the Explosives & Explosive Substances Act showed a decrease of 13.1% from the year 2002 level and marginal decrease 0.3% over the average of last 5 years (2007 - 2012). However, an increase of 9.8% in incidence was observed over the year 2011. The highest number of cases (610) accounting for 15.1% of the total cases was reported from Rajasthan followed by Tamil Nadu (15.0%) (605 cases). The crime rate of 1.3 was observed in Kerala and Lakshadweep each against the national average of 0.3.
Immoral Traffic (Prevention)
Act, 1956
(Incidence:2,563 Rate: 0.2)
The incidence under the Immoral Traffic (Prevention) Act has declined by 61.2% over the year 2002 level and 6.0% over average of last 5 years (2007 - 2012). A rise of 5.2% was observed as compared to 2011. Tamil Nadu reported 19.5% of total such cases followed by Andhra Pradesh (18.4%). Goa reported the highest crime rate at 2.2 against the national average of 0.2.
Indian Railways Act, 1989
(Incidence: 144 Rate: Negligible)
The cases registered under this Act declined from 186 cases in 2007 to 145 in the year 2008 but
LatestLaws.com
40
rose to 175 in 2009 and again declined to 148 in 2010 and again rose to 156 in the year 2011 but again declined to 144 in 2012 thereby showing a mixed trend during the years 2002 – 2012. A decline of 7.7% was observed during the year 2012 as compared to 2011. Andhra Pradesh (27 cases) has reported 18.8% of total such cases (144 cases).
The Registration of Foreigners
Act, 1930
(Incidence:1,519 Rate: 0.1)
Cases registered under this Act have shown a decrease of 13.4% over the year 2002 and an increase of 18.3% over previous year (1,284 cases). West Bengal alone has reported 71.0% (1,079 cases) of the total cases reported at the national level while A & N Island has reported the highest crime rate of 2.9 against the national crime rate of 0.1.
Passport Act, 1967
(Incidence: 953 Rate: 0.1)
The cases registered under the Indian Passport Act have increased by 37.5% over the year 2002, decreased by 6.3% over the quinquennial average of 2007 - 2012, and further decreased by 9.7% over the previous year (869 cases). The highest incidence (357) of such crime accounting for 37.5% of the total cases in the country was reported from Kerala during the year 2012 while the highest crime rate of 1.8 was reported in Tripura against the national average of 0.1.
Essential Commodities Act, 1955
(Incidence:6,755 Rate: 0.6)
The cases registered under the Essential Commodities Act have
increased by 88.02% over the year 2002. It decreased by 18.2% over the quinquennial average during the years 2007 - 2012 and 21.9% over previous year (8,654 cases). The highest incidence (1,493) accounting for 22.1% of the total cases were reported from Uttar Pradesh followed by Maharashtra (1,447 cases) representing 21.4% of the total cases. However, the crime rate was highest in Puducherry (3.7) as compared to the National average of 0.6 during the year 2012.
Antiquities & Art Treasures Act,
1972
(Incidence:59 Rate:negligible)
The cases registered under this Act during the year 2012 have shown a decrease of 23.4% over the year 2002 and an increase of 19.4% over the quinquennial average of the years 2007 - 2012 and decrease of 16.9% over the previous year. Maximum number of cases were reported from Andhra Pradesh (35) out of total 59 such cases reported at national level.
Dowry Prohibition Act, 1961
(Incidence:9,038 Rate:0.7)
The cases registered under the Dowry Prohibition Act have shown an increase of 221.0% over 2002, an increase of 57.8% over the quinquennial average of 2007 - 2012 and 3 an increase of 6.5% over the year 2011 (6,619 cases). Andhra Pradesh (2,511) followed by Odisha (1,487), Bihar (1,353), Karnataka (1,328) and Jharkhand (1,066) have together accounted for 85.7% of the total cases reported in the country. Odisha reported the highest crime rate (3.6) against the national average of 0.7.
LatestLaws.com
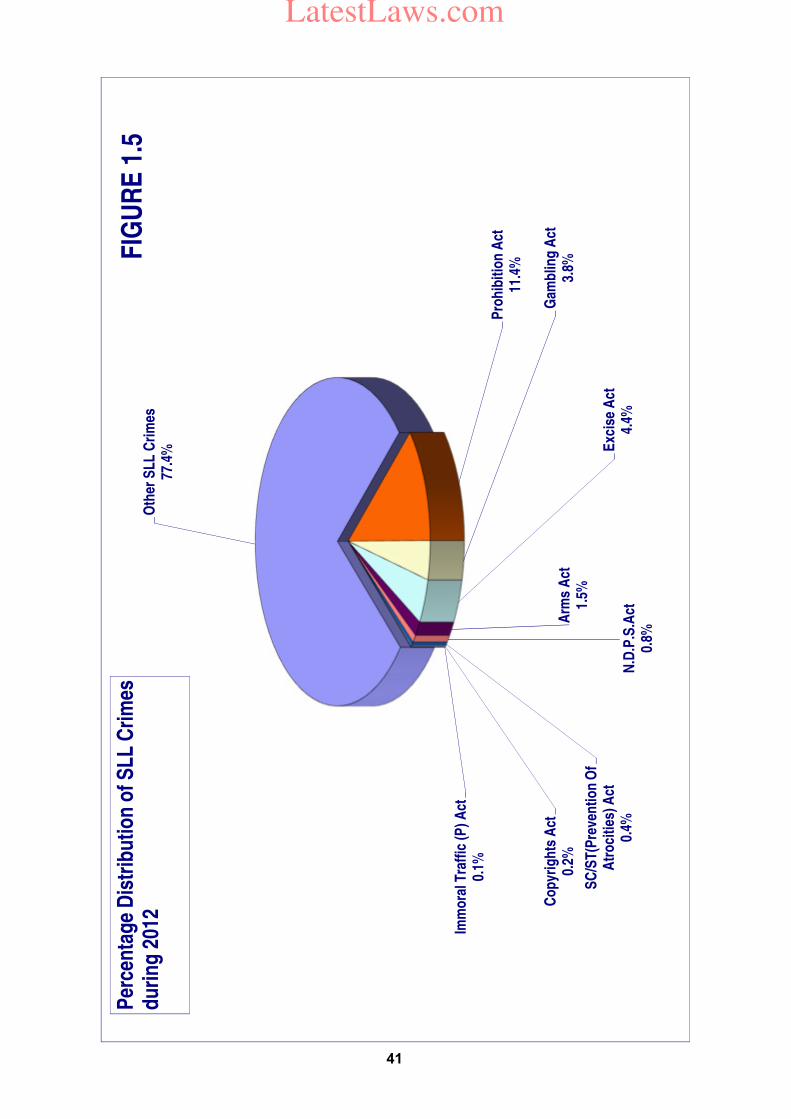
Oth
er S
LL
Cri
mes
77
.4%
Pro
hib
itio
n A
ct
11.4
%
Gam
blin
g A
ct
3.8%
Exc
ise
Act
4.
4%
Arm
s A
ct
1.5%
N.D
.P.S
.Act
0.
8%
SC
/ST
(Pre
ven
tio
n O
f A
tro
citi
es)
Act
0.
4%
Co
pyr
igh
ts A
ct
0.2%
Imm
ora
l Tra
ffic
(P
) A
ct
0.1%
Per
cen
tag
e D
istr
ibu
tio
n o
f S
LL
Cri
mes
d
uri
ng
201
2F
IGU
RE
1.5
41
LatestLaws.com
42
Indecent Representation of
Women (Prohibition) Act, 1986
(Incidence:141 Rate: negligible)
The number of cases registered under Indecent Representation of Women (Prohibition) Act has shown a decline of 94.4% over 2002 and a decline of 84.0% over the average of 5 years (2007 - 2012) and a decline of 68.9% over the year 2011. Rajasthan (62 cases) has reported 44.0% of the total cases registered in the country.
Copyright Act, 1957
(Incidence:6,151 Rate:0.5)
The cases registered under the Copyright Act have shown a mixed trend during 2002-2012. An increase of 52.4% in 2012 over the 2002 level, a decrease of 8.4% in 2012 over the 5 year average (2007 - 2012) and a decrease of 11.8% in 2012 over the 5 year average (2007 - 2012) were observed. Tamil Nadu (with 2,708 cases) has registered 44.0% of the total cases reported in the country. SC/ST (Prevention of Atrocities)
Act, 1989
(Incidence:13,887 Rate:1.1)
The cases reported under the SC/ST (Prevention of Atrocities) Act have shown a rise of 10.5% in 2012 over the 2002 level, an increase of 17.5% in 2012 over the average of last five years (2007 – 2012) and an increase 11.1% in 2012 over the previous year (12,496). 12,576 cases accounting for 90.6% of total 13,887 cases registered in the country were reported for crimes against the Scheduled Castes and 1,311 cases
accounting for 9.4% were reported for crimes against Scheduled Tribes.
Protection of Civil Rights Act,
1955
(Incidence:64 Rate:negligible)
The cases registered under the Protection of Civil Rights Act have shown a decline of 94.0% over the 2002 level, 64.0% decrease over the average of 5 years (2007 - 2012) and 13.5% decrease over the year 2011 (74). 96.9% (62 cases) out of 64 cases under this Act were reported for crimes against the Scheduled Castes while the rest 3.1% cases (2 out of 64 cases) were reported for crimes against the Scheduled Tribes.
Forest Act, 1927
(Incidence:6,467 Rates:0.5)
The cases registered under this Act have shown a decrease of 13.2% over the previous year (7,448 cases).Two States viz. Rajasthan (3,682 cases) and Uttar Pradesh (1,795 cases) have accounted for 84.7% of the total such cases reported in the country during the year 2012. Rajasthan has reported highest crime rate of 5.3 followed by Himachal Pradesh (2.4) as against the national crime rate of 0.5.
*****
LatestLaws.com
43
Chapter-2
Crimes in Mega Cities
Introduction The term `Mega City’ in context of this chapter refers to city having population of over 10 lakh (1 million). The number of such cities has increased from 35 in the year 2001 to 53 in the year 2011. Mega cities are facing increased criminal activities on account of a number of socio-economic factors. This chapter deals with crime analysis relating to these cities. The provisional population of census 2011 is used for calculating the crime rates for these cities. The population of these 53 mega cities (see Table-1.6) constitutes nearly 13.3% of the country’s total population. The present analysis does not aim at complete urban crime pattern in the country but restricts to only 53 mega cities having urban population of only 1611.07 lakh as per 2011 census).
Various forms of crime The present analysis on mega cities is restricted to 22 major specified crimes under IPC and 21 specified crimes under SLL. The city-wise details of these crimes for 53 mega cities are furnished in Chapter-I. Other related details on property stolen & recovered, crime against
women, crime against children and cyber crimes are also furnished in the respective chapters of the reports. The major crime pattern of IPC crimes & SLL crimes in 53 mega cities are discussed below.
Crimes under the Indian
Penal Code (IPC) Incidence (All India- 23,87,188
Mega Cities- 4,73,922 )
A total of 4,73,922 cognizable crimes under the IPC were reported in 53 mega cities during the year 2012 as compared to 4,75,369 crimes in these cities during the year 2011.
These 53 cities have accounted for 41.9% (64,682 out of 1,54,351 cases) of the total auto theft cases in the country followed by 28.6% cheating cases (26,935 out of 94,203 cases) and 27.8% counterfeiting cases (654 out of 2,351 cases). The cities of Delhi, Mumbai, Bengaluru and Kolkata have accounted for 10.1%, 6.4%, 6.2% and 5.4% respectively of the total crimes reported from 53 mega cities. Coimbatore (Tamil Nadu) has reported significant increase of 157.0% of IPC crimes during the year 2012 as compared to previous year (2011) while in 21 cities, decline under IPC crimes has been observed.
LatestLaws.com
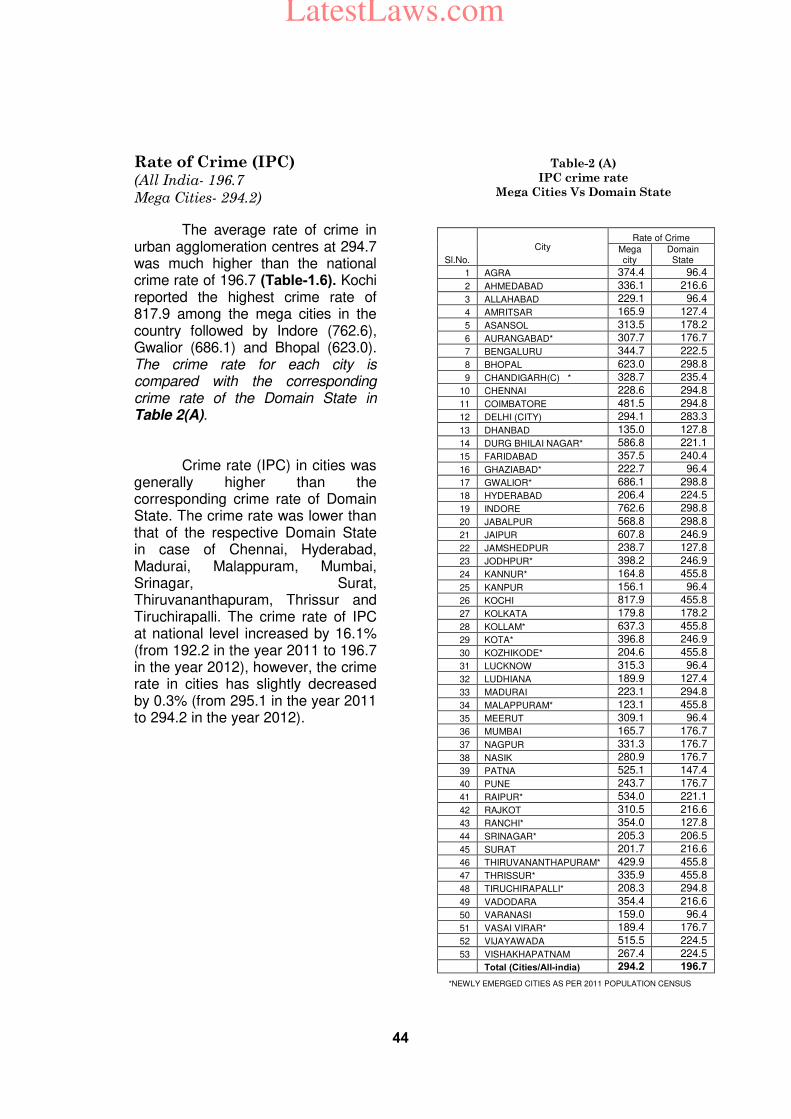
44
Rate of Crime (IPC) (All India- 196.7
Mega Cities- 294.2)
The average rate of crime in urban agglomeration centres at 294.7 was much higher than the national crime rate of 196.7 (Table-1.6). Kochi reported the highest crime rate of 817.9 among the mega cities in the country followed by Indore (762.6), Gwalior (686.1) and Bhopal (623.0). The crime rate for each city is compared with the corresponding crime rate of the Domain State in Table 2(A). Crime rate (IPC) in cities was generally higher than the corresponding crime rate of Domain State. The crime rate was lower than that of the respective Domain State in case of Chennai, Hyderabad, Madurai, Malappuram, Mumbai, Srinagar, Surat, Thiruvananthapuram, Thrissur and Tiruchirapalli. The crime rate of IPC at national level increased by 16.1% (from 192.2 in the year 2011 to 196.7 in the year 2012), however, the crime rate in cities has slightly decreased by 0.3% (from 295.1 in the year 2011 to 294.2 in the year 2012).
Sl.No.
City Rate of Crime
Mega city
Domain State
1 AGRA 374.4 96.4
2 AHMEDABAD 336.1 216.6
3 ALLAHABAD 229.1 96.4
4 AMRITSAR 165.9 127.4
5 ASANSOL 313.5 178.2
6 AURANGABAD* 307.7 176.7
7 BENGALURU 344.7 222.5
8 BHOPAL 623.0 298.8
9 CHANDIGARH(C) * 328.7 235.4
10 CHENNAI 228.6 294.8
11 COIMBATORE 481.5 294.8
12 DELHI (CITY) 294.1 283.3
13 DHANBAD 135.0 127.8
14 DURG BHILAI NAGAR* 586.8 221.1
15 FARIDABAD 357.5 240.4
16 GHAZIABAD* 222.7 96.4
17 GWALIOR* 686.1 298.8
18 HYDERABAD 206.4 224.5
19 INDORE 762.6 298.8
20 JABALPUR 568.8 298.8
21 JAIPUR 607.8 246.9
22 JAMSHEDPUR 238.7 127.8
23 JODHPUR* 398.2 246.9
24 KANNUR* 164.8 455.8
25 KANPUR 156.1 96.4
26 KOCHI 817.9 455.8
27 KOLKATA 179.8 178.2
28 KOLLAM* 637.3 455.8
29 KOTA* 396.8 246.9
30 KOZHIKODE* 204.6 455.8
31 LUCKNOW 315.3 96.4
32 LUDHIANA 189.9 127.4
33 MADURAI 223.1 294.8
34 MALAPPURAM* 123.1 455.8
35 MEERUT 309.1 96.4
36 MUMBAI 165.7 176.7
37 NAGPUR 331.3 176.7
38 NASIK 280.9 176.7
39 PATNA 525.1 147.4
40 PUNE 243.7 176.7
41 RAIPUR* 534.0 221.1
42 RAJKOT 310.5 216.6
43 RANCHI* 354.0 127.8
44 SRINAGAR* 205.3 206.5
45 SURAT 201.7 216.6
46 THIRUVANANTHAPURAM* 429.9 455.8
47 THRISSUR* 335.9 455.8
48 TIRUCHIRAPALLI* 208.3 294.8
49 VADODARA 354.4 216.6
50 VARANASI 159.0 96.4
51 VASAI VIRAR* 189.4 176.7
52 VIJAYAWADA 515.5 224.5
53 VISHAKHAPATNAM 267.4 224.5
Total (Cities/All-india) 294.2 196.7
*NEWLY EMERGED CITIES AS PER 2011 POPULATION CENSUS
Table-2 (A)
IPC crime rate
Mega Cities Vs Domain State
LatestLaws.com
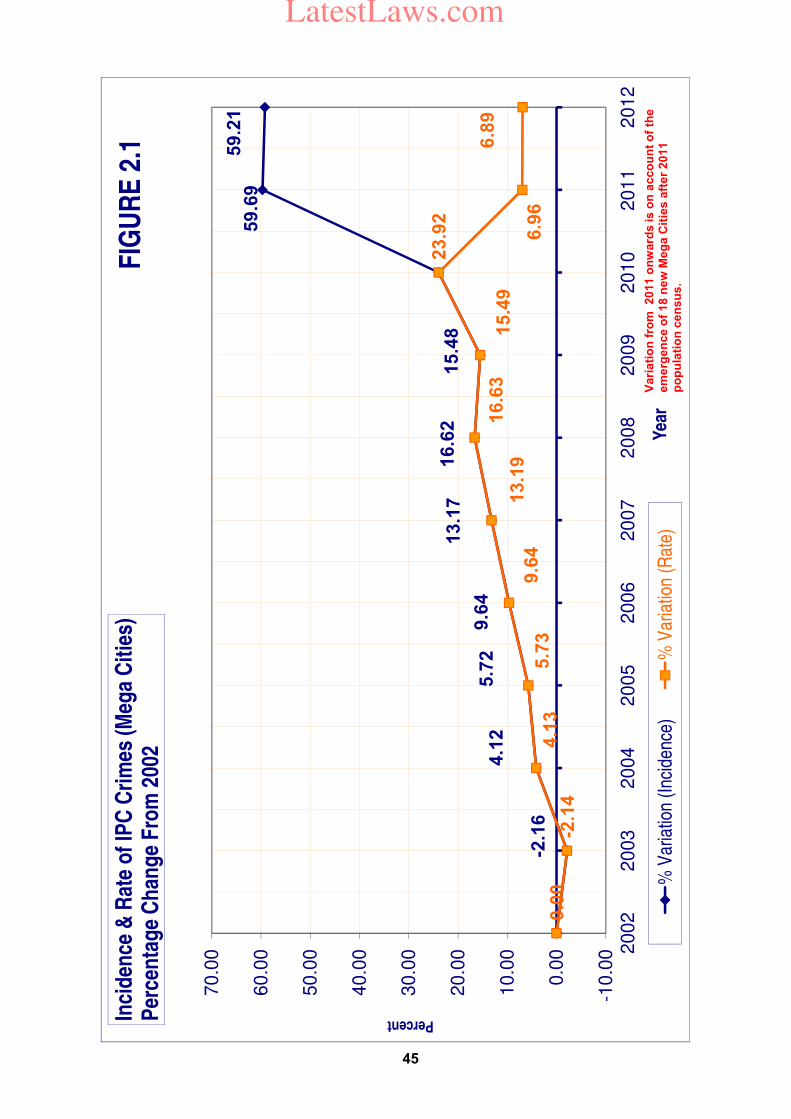
-2.1
6
4.1
25
.72
9.6
4
13
.17
16
.62
15
.48
59
.69
59
.21
0.0
0-2
.14
4.1
35
.73
9.6
41
3.1
91
6.6
31
5.4
9
23
.92
6.9
6
6.8
9
-10.0
0
0.0
0
10.0
0
20.0
0
30.0
0
40.0
0
50.0
0
60.0
0
70.0
0 2002
2003
2004
2005
2006
2007
2008
2009
2010
2011
2012
Percent
Yea
r
Inci
den
ce &
Rat
e o
f IP
C C
rim
es (
Meg
a C
itie
s)
Per
cen
tag
e C
han
ge
Fro
m 2
002
% V
aria
tion
(Inc
iden
ce)
% V
aria
tion
(Rat
e)
FIG
UR
E 2
.1
Va
ria
tio
n f
rom
2
01
1 o
nw
ard
s is
on
ac
co
un
t o
f th
e
em
erg
en
ce
of
18
ne
w M
eg
a C
itie
s a
fte
r 2
01
1
po
pu
lati
on
ce
ns
us
.
45
LatestLaws.com
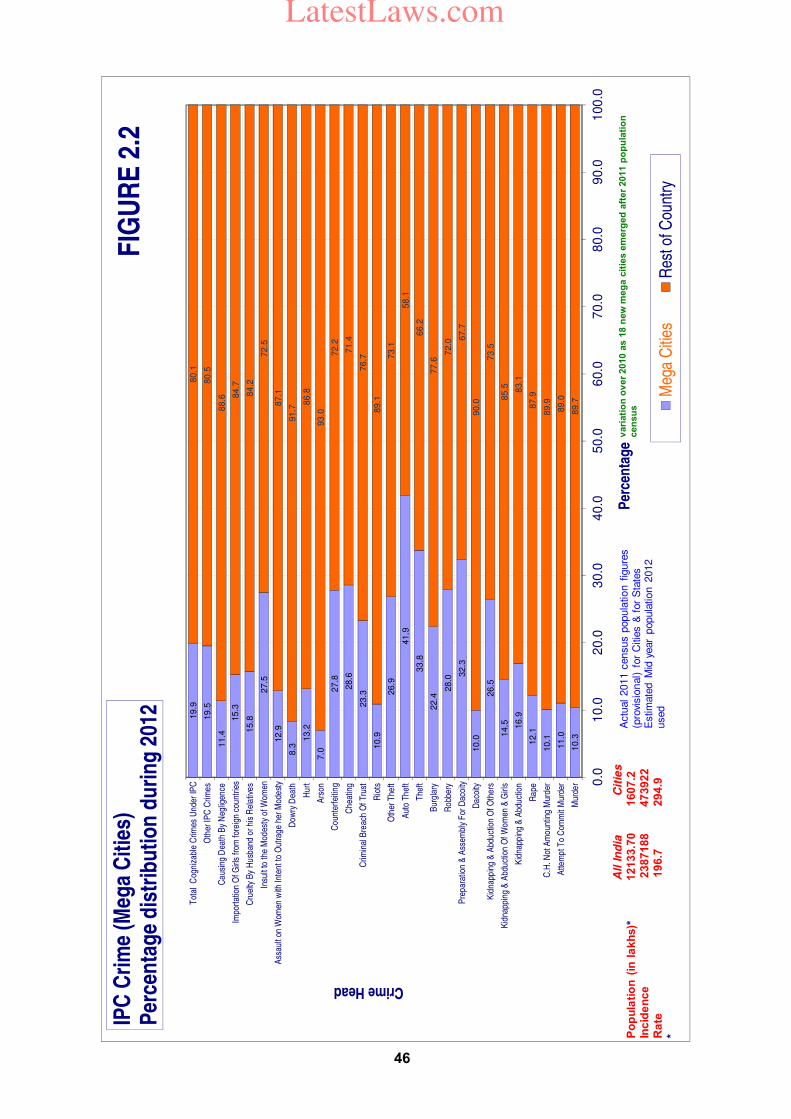
10.3
11.0
10.112.1
16.9
14.5
26.5
10.0
32.3
28.0
22.4
33.8
41.9
26.9
10.9
23.3
28.6
27.8
7.0
13.2
8.3
12.9
27.5
15.81
5.3
11.4
19.5
19.9
89.7
89.0
89.987.9
83.1
85.5
73.5
90.0
67.7
72.0
77.6
66.2
58.1
73.1
89.1
76.7
71.4
72.2
93.0
86.8
91.7
87.1
72.5
84.2
84.7
88.6
80.5
80.1
0.0
10.0
20.0
30.0
40.0
50.0
60.0
70.0
80.0
90.0
100
.0
Mur
der
Atte
mp
t To
Com
mit
Mur
der
C.H
. Not
Am
oun
ting
Mur
der
Ra
pe
Kid
napp
ing
& A
bdu
ctio
n
Kid
napp
ing
& A
bdu
ctio
n O
f W
om
en &
Girl
s
Kid
napp
ing
& A
bdu
ctio
n O
f O
the
rs
Da
coity
Pre
par
atio
n &
Ass
embl
y F
or D
acoi
ty
Ro
bber
y
Bur
gla
ry
The
ft
Aut
o T
hef
t
Oth
er T
heft
Rio
ts
Cri
min
al B
reac
h O
f T
rust
Ch
eatin
g
Co
unte
rfei
ting
Ars
on
Hu
rt
Do
wry
Dea
th
Ass
ault
on W
omen
with
Inte
nt t
o O
utra
ge
her
Mod
est
y
Insu
lt to
the
Mod
esty
of W
om
en
Cru
elty
By
Hu
sban
d o
r hi
s R
ela
tive
s
Impo
rtat
ion
Of G
irls
from
fore
ign
cou
ntrie
s
Ca
usin
g D
eath
By
Neg
ligen
ce
Oth
er IP
C C
rim
es
Tot
al C
ogn
izab
le C
rimes
Un
der
IPC
Per
cen
tag
e
Crime HeadIP
C C
rim
e (M
ega
Cit
ies)
P
erce
nta
ge
dis
trib
uti
on
du
rin
g 2
012
Meg
a C
ities
Res
t of C
ount
ry
All In
dia
C
itie
sP
op
ula
tio
n (
in l
ak
hs)*
12133.7
0
1607.2
Incid
en
ce
2
387188
473922
Ra
te
196.7
2
94.9
*
FIG
UR
E 2
.2
vari
ati
on
ov
er
2010 a
s 1
8 n
ew
meg
a c
itie
s e
merg
ed
aft
er
2011 p
op
ula
tio
n
cen
su
sA
ctu
al
2011 c
ensus p
opula
tion f
igure
s
(pro
visio
nal)
for
Citie
s &
for
Sta
tes
Estim
ate
d M
id y
ear
popula
tion 2
012
used
46
LatestLaws.com
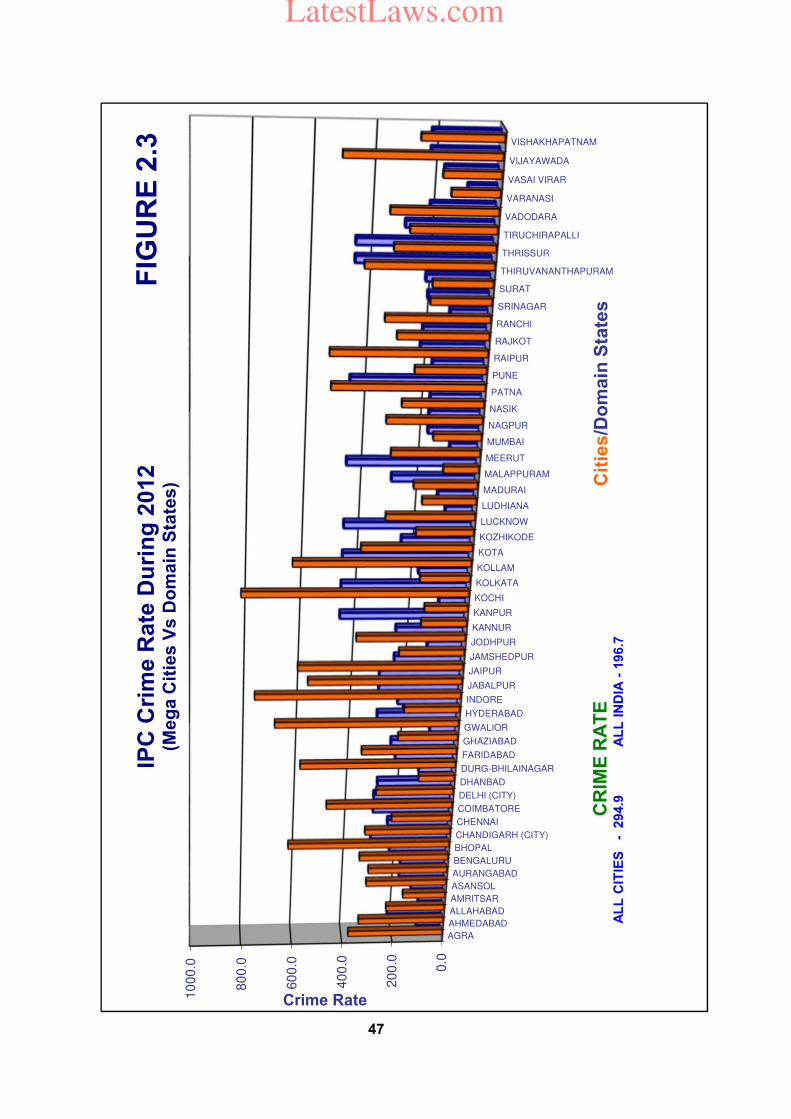
0.0
20
0.0
40
0.0
60
0.0
80
0.0
10
00.0
AGRA
AHMEDABAD
ALLAHABAD
AMRITSAR
ASANSOL
AURANGABAD
BENGALURU
BHOPAL
CHANDIGARH (CITY)
CHENNAI
COIMBATORE
DELHI (CITY)
DHANBAD
DURG-BHILAINAGAR
FARIDABAD
GHAZIABAD
GWALIOR
HYDERABAD
INDORE
JABALPUR
JAIPUR
JAMSHEDPUR
JODHPUR
KANNUR
KANPUR
KOCHI
KOLKATA
KOLLAM
KOTA
KOZHIKODE
LUCKNOW
LUDHIANA
MADURAI
MALAPPURAM
MEERUT
MUMBAI
NAGPUR
NASIK
PATNA
PUNE
RAIPUR
RAJKOT
RANCHI
SRINAGAR
SURAT
THIRUVANANTHAPURAM
THRISSUR
TIRUCHIRAPALLI
VADODARA
VARANASI
VASAI VIRAR
VIJAYAWADA
VISHAKHAPATNAM
Crime Rate
Cit
ies/D
om
ain
Sta
tes
FIG
UR
E 2
.3IP
C C
rim
e R
ate
Du
rin
g 2
012
(Me
ga
Cit
ies
Vs
Do
ma
in S
tate
s)
CR
IME
RA
TE
A
LL
CIT
IES
-
294.9
A
LL
IN
DIA
-196.7
47
LatestLaws.com
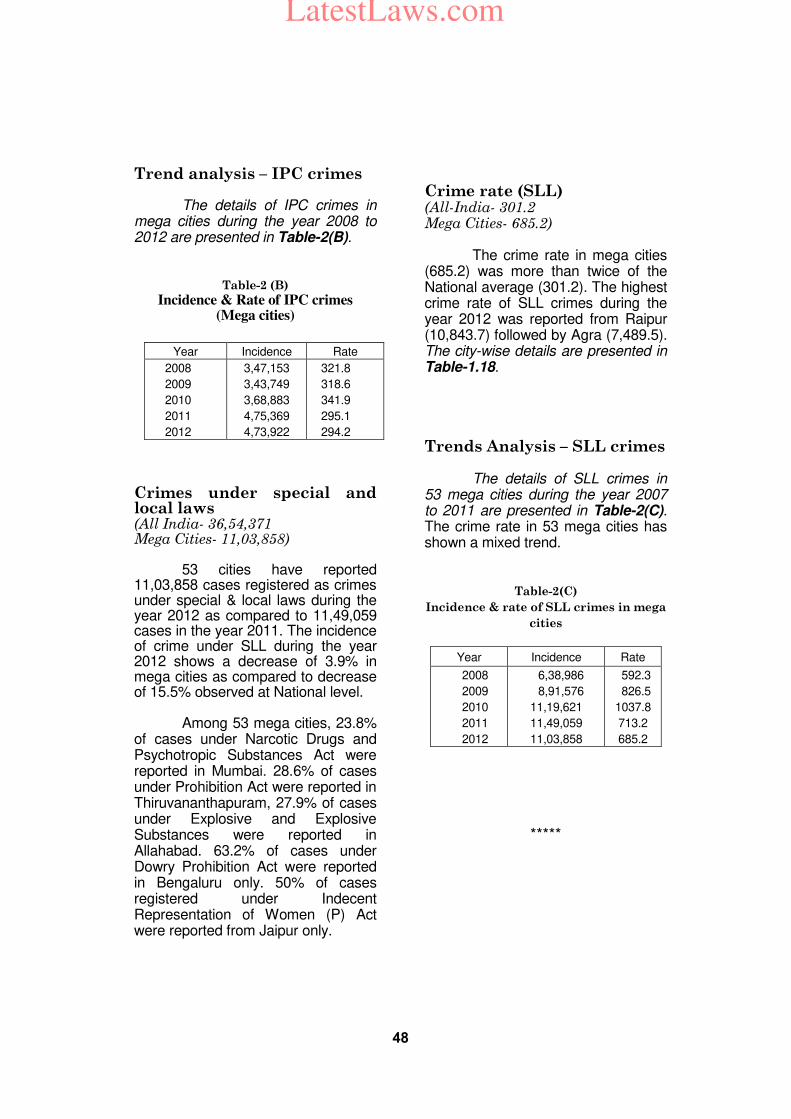
48
Trend analysis – IPC crimes The details of IPC crimes in mega cities during the year 2008 to 2012 are presented in Table-2(B).
Table-2 (B)
Incidence & Rate of IPC crimes (Mega cities)
Year Incidence Rate
2008
2009
2010
2011
2012
3,47,153
3,43,749
3,68,883
4,75,369
4,73,922
321.8
318.6
341.9
295.1
294.2
Crimes under special and local laws (All India- 36,54,371 Mega Cities- 11,03,858) 53 cities have reported 11,03,858 cases registered as crimes under special & local laws during the year 2012 as compared to 11,49,059 cases in the year 2011. The incidence of crime under SLL during the year 2012 shows a decrease of 3.9% in mega cities as compared to decrease of 15.5% observed at National level. Among 53 mega cities, 23.8% of cases under Narcotic Drugs and Psychotropic Substances Act were reported in Mumbai. 28.6% of cases under Prohibition Act were reported in Thiruvananthapuram, 27.9% of cases under Explosive and Explosive Substances were reported in Allahabad. 63.2% of cases under Dowry Prohibition Act were reported in Bengaluru only. 50% of cases registered under Indecent Representation of Women (P) Act were reported from Jaipur only.
Crime rate (SLL) (All-India- 301.2 Mega Cities- 685.2)
The crime rate in mega cities (685.2) was more than twice of the National average (301.2). The highest crime rate of SLL crimes during the year 2012 was reported from Raipur (10,843.7) followed by Agra (7,489.5). The city-wise details are presented in Table-1.18.
Trends Analysis – SLL crimes
The details of SLL crimes in 53 mega cities during the year 2007 to 2011 are presented in Table-2(C). The crime rate in 53 mega cities has shown a mixed trend.
Table-2(C)
Incidence & rate of SLL crimes in mega
cities
Year Incidence Rate
2008
2009
2010
2011
2012
6,38,986
8,91,576
11,19,621
11,49,059
11,03,858
592.3
826.5
1037.8
713.2
685.2
*****
LatestLaws.com
49
Chapter-3
Violent Crimes
Violent crimes affect the life and safety of the people. Such crimes induce a sense of insecurity and fear in the community. The frequency and the magnitude of such crimes also affect the public peace. The following IPC crimes reported to the Police authorities have been grouped as ‘Violent Crimes’ for the purpose of crime analysis in this chapter.
I. Violent crimes affecting life
Murder, attempt to commit murder, culpable homicide not amounting to murder, dowry deaths and kidnapping & abduction;
II. Violent crimes affecting property
Dacoity, preparation & assembly to commit dacoity and robbery;
III. Violent crimes affecting public safety
Riots and arson;
IV. Violent crimes affecting women
Rape.
Percentage distribution of violent crimes during 2008 -2012. The percentage share of violent crimes increased from 11.1% in 2011 to 11.5% in 2012. Out of the total 2,75,165 violent crimes reported in the country during the year 2012,
46.9% crimes were violent crimes affecting life (1,29,017 cases). Violent crimes which affected the property during the year 2012 were 12.6% (34,756 cases); those affecting the public safety were 31.4% (86,469 cases) and violent crimes against women (Rape) were 9.1% (24,206 cases) of the total violent crimes.
Trend of violent crimes (2008 – 2012)
The quantum of total violent crimes is continuously increasing from 2008 to 2012. However, the share of violent crimes in total IPC crimes has remained almost static over this period (2008 - 2012). The share of violent crimes affecting life showed a rising trend during 2008-2011 and declined in 2012. The share of violent crimes affecting women has decreased continually from 9.4 in 2008 to 9.2 in 2010 and increased slightly to 9.4 in 2011 and decreased to 9.1 in 2012. The pattern of violent crimes affecting public safety and affecting property has shown a mixed trend during this period.
Incidence of violent crimes (Incidence- 2,75,165
Crime rate- 22.7)
A total of 2,75,165 incidents of violent crimes were reported in the country during the year 2012 compared to 2,56,329 incidents in 2011, recording an increase of 7.3%. The share of violent crimes to the total IPC crimes during the year 2012 was 11.5%.
LatestLaws.com
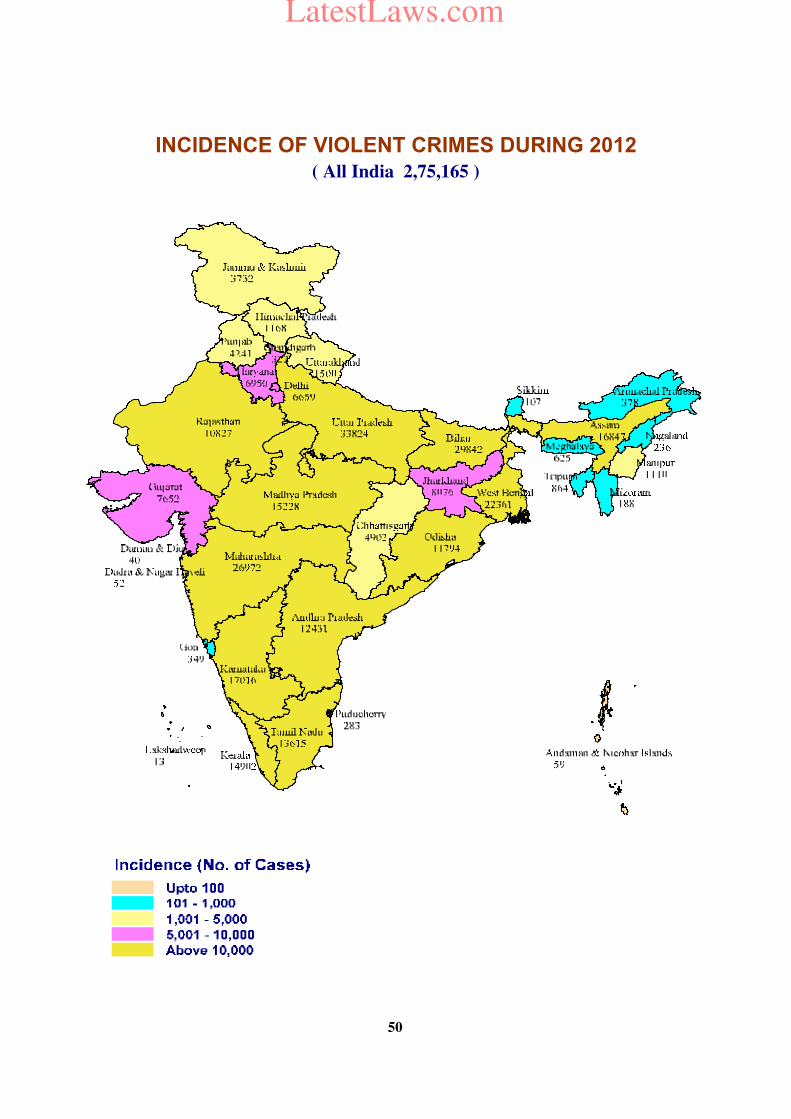
INCIDENCE OF VIOLENT CRIMES DURING 2012
( All India 2,75,165 )
50
LatestLaws.com
51
Table-3(A)
Violent crimes reported during 2008 - 2012
Sl.
No.
Crimes Years
2008 2009 2010 2011 2012
(1) (2) (3) (4) (5) (6) (7)
1.
1.1
1.2
1.3
1.4
Total Violent crimes
Affecting life
Affecting property
Affecting public safety
Affecting women
2,28,663
[10.9]
1,03,660
(45.3)
28,269
(12.4)
75,267
(32.9)
21,467
(9.4)
2,41,986
[10.9]
1,07,580
(46.7)
29,845
(12.9)
71,678
(31.1)
21,397
(9.3)
24,19,86
[10.9]
11,33,69
(46.8)
30,366
(12.5)
76,079
(31.4)
22,172
(9.2)
2,56,329
[11.0]
12,26,79
(47.9)
31,880
(12.4)
77,564
(30.3)
24,206
(9.4)
2,75,165
[11.5]
1,29,017
(46.9)
34,756
(12.6)
86,469
(31.4)
24,206
(9.1)
Note: 1. [ ] Bracketed figures represent the percentage share of crimes to total IPC crimes
2. ( ) Bracketed figures represent the percentage share of crimes to total violent crimes
Trend of violent crimes The State and UT-wise incidents of violent crimes and their rate during 2012 are presented in Table-3.1. Uttar Pradesh, Bihar and Maharashtra have reported high number of incidence with 33,824, 29,842 and 26,972 cases representing 12.3%, 10.8% and 9.8% respectively of the total violent crimes reported in the country during the year 2012.
The crime rate (22.7) of total violent crimes in the country has shown an increase of 7.1% during the year 2012 over the year 2011. The crime rates recorded for various categories of violent crimes for the years 2008 - 2012 at the All-India level are given in Table-3 (B). The
rate of total violent crimes has shown an increasing trend from 2009 to 2012. Details can be seen in table 3(B). The highest crime rate of violent crimes was reported in Assam (54.2) followed by Manipur (44.6), Kerala (42.7) and Delhi (34.7). The lowest crime rate was observed in Nagaland (10.3), A & N Island (11.5) and Gujarat (12.7).
Share of violent crimes to total IPC crimes The violent crimes constituted 10.9% of total IPC crimes reported in the country during 2008 and remained same in 2009 and 2010. The share of violent crime marginally increased to 11.0% in 2011. In 2012 it again increased to 11.5%
Table-3 (B)
Crime rate of violent crimes during 2008 - 2012
Sl. No. Crime rate for violent crimes (IPC) 2008 2009 2010 2011 2012
1.
2.
3.
4.
Affecting life
Affecting property
Affecting public safety
Affecting women
8.9
2.5
6.5
1.9
9.2
2.6
6.1
1.8
9.6
2.6
6.4
1.9
10.1
2.6
6.4
2.0
10.6
2.9
7.1
2.1
Total crimes 19.8 19.7 20.4 21.2 22.7
LatestLaws.com
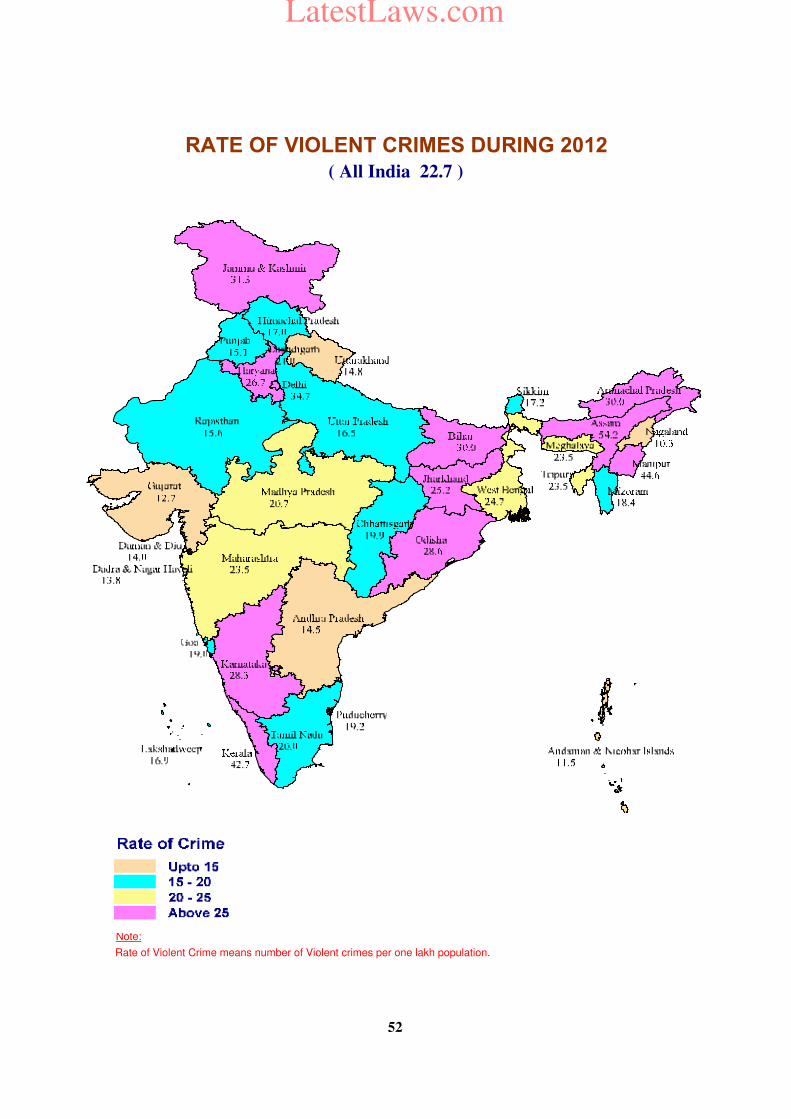
Note:
Rate of Violent Crime means number of Violent crimes per one lakh population.
RATE OF VIOLENT CRIMES DURING 2012
( All India 22.7 )
52
LatestLaws.com
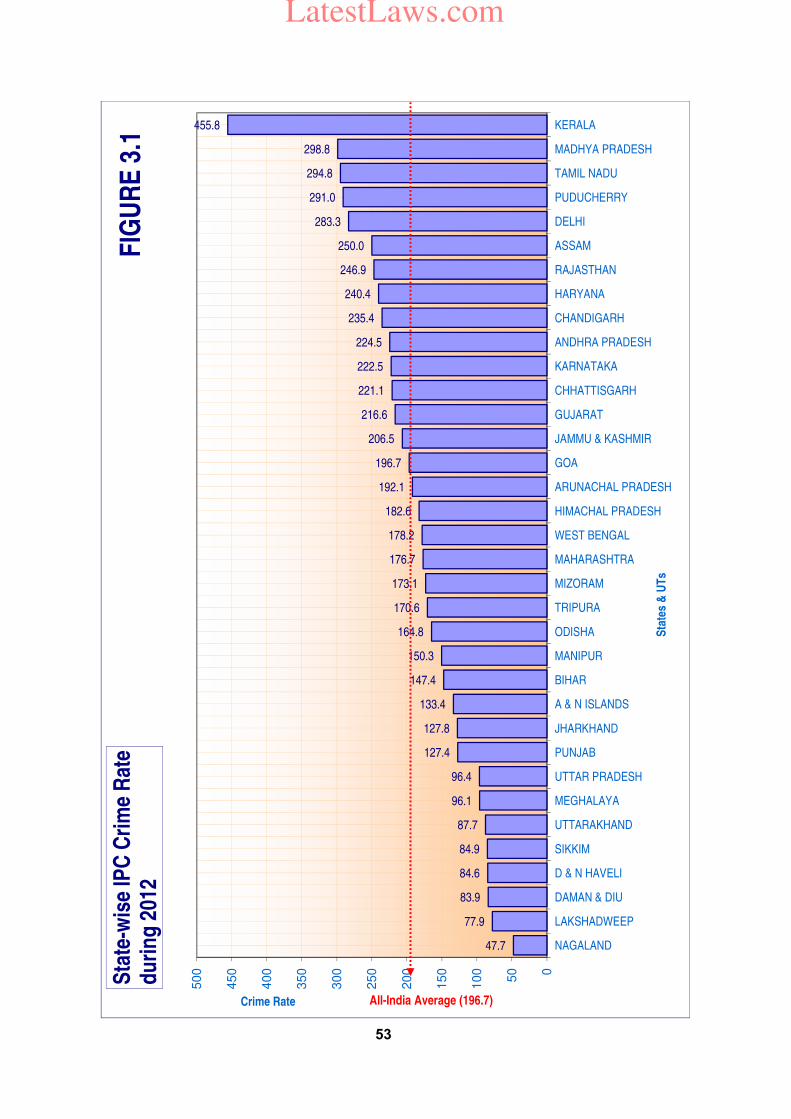
47.7
77.9
83.9
84.6
84.9
87.7
96.1
96.4
127.4
127.8
133.4
147.4
150.3
164.8
170.6
173.1
176.7
178.2
182.6
192.1
196.7
206.5
216.6
221.1
222.5
224.5
235.4
240.4
246.9
250.0
283.3
291.0
294.8
298.8
455.8
0
50
10
0
15
0
20
0
25
0
30
0
35
0
40
0
45
0
50
0
NAGALAND
LAKSHADWEEP
DAMAN & DIU
D & N HAVELI
SIKKIM
UTTARAKHAND
MEGHALAYA
UTTAR PRADESH
PUNJAB
JHARKHAND
A & N ISLANDS
BIHAR
MANIPUR
ODISHA
TRIPURA
MIZORAM
MAHARASHTRA
WEST BENGAL
HIMACHAL PRADESH
ARUNACHAL PRADESH
GOA
JAMMU & KASHMIR
GUJARAT
CHHATTISGARH
KARNATAKA
ANDHRA PRADESH
CHANDIGARH
HARYANA
RAJASTHAN
ASSAM
DELHI
PUDUCHERRY
TAMIL NADU
MADHYA PRADESH
KERALA
Crime Rate
Sta
tes
& U
Ts
Sta
te-w
ise
IPC
Cri
me
Rat
ed
uri
ng
201
2
All-India Average (196.7)
FIG
UR
E 3
.1
53
LatestLaws.com
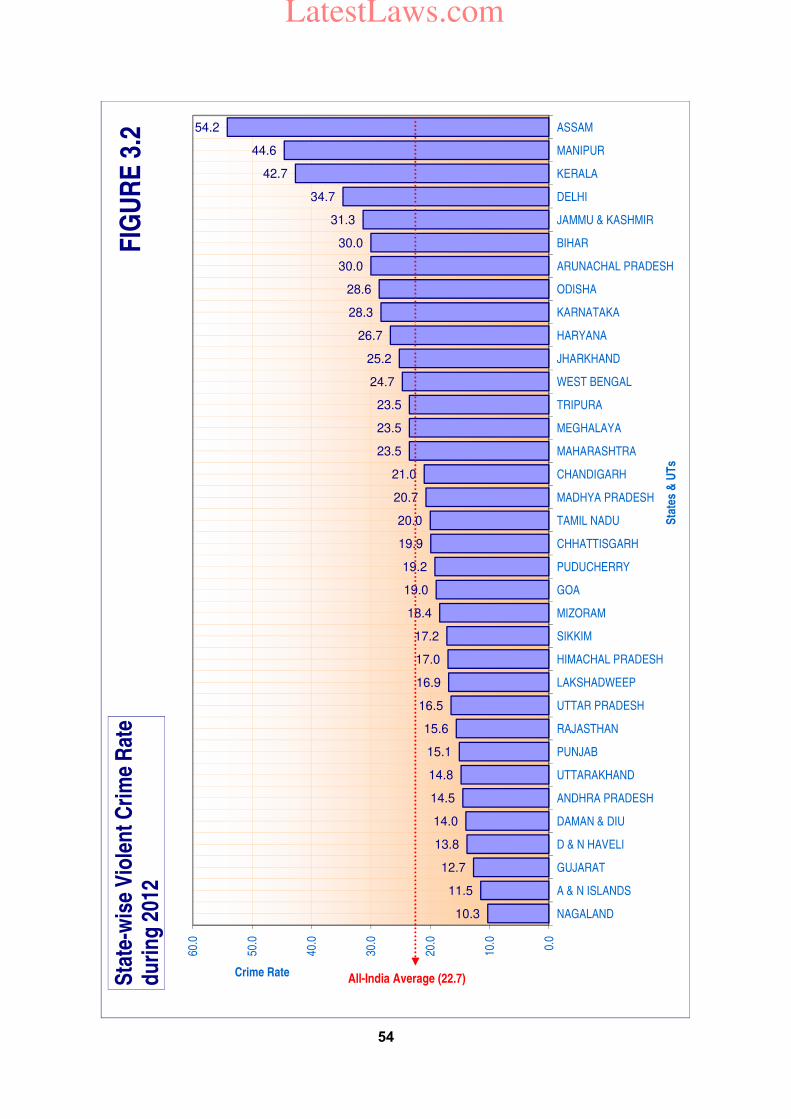
10.3
11.5
12.7
13.8
14.0
14.5
14.8
15.1
15.6
16.5
16.9
17.0
17.2
18.4
19.0
19.2
19.9
20.0
20.7
21.0
23.5
23.5
23.5
24.7
25.2
26.7
28.3
28.6
30.0
30.0
31.3
34.7
42.7
44.6
54.2
0.0
10.0
20.0
30.0
40.0
50.0
60.0
NAGALAND
A & N ISLANDS
GUJARAT
D & N HAVELI
DAMAN & DIU
ANDHRA PRADESH
UTTARAKHAND
PUNJAB
RAJASTHAN
UTTAR PRADESH
LAKSHADWEEP
HIMACHAL PRADESH
SIKKIM
MIZORAM
GOA
PUDUCHERRY
CHHATTISGARH
TAMIL NADU
MADHYA PRADESH
CHANDIGARH
MAHARASHTRA
MEGHALAYA
TRIPURA
WEST BENGAL
JHARKHAND
HARYANA
KARNATAKA
ODISHA
ARUNACHAL PRADESH
BIHAR
JAMMU & KASHMIR
DELHI
KERALA
MANIPUR
ASSAM
Crime Rate
Sta
tes
& U
Ts
Sta
te-w
ise
Vio
len
t C
rim
e R
ate
du
rin
g 2
012
All-India Average (22.7)
FIG
UR
E 3
.2
54
LatestLaws.com
55
The comparative national level details are presented in Table-3 (A). The share of violent crimes to total IPC crimes was highest in Manipur (29.7%) followed by Meghalaya (24.4%), Assam, Nagaland & Lakshadweep (21.7% each) and Bihar (20.4%) against the national average of 11.5%.
Trend analysis of various violent crimes
Murder
(Incidence… 34,434
Crime rate…2.8)
The incidence of murder (34,434) has increased by 0.4% in 2012 as compared to the previous year (34,305 cases). The highest incidence (4,966) of murder, accounting for 14.4% of total cases was reported from Uttar Pradesh. Bihar has reported 3,566 cases accounting for 10.4% of total murder cases. The rate of crime was highest in Arunachal Pradesh (5.8) followed by Meghalaya (5.1) and Assam (4.4) as compared to the national average rate of 2.8 (See Table 1.8).
Motives of murder
The prominent motives behind murders were 'personal vendetta or enmity' and 'property dispute', which accounted for 11.3% and 9.2% of cases of murder respectively. The other significant causes were: ‘love affairs / sexual causes’ (7.4%), ‘gain’ (4.9%) and ‘dowry’ (4.2%). Bihar has accounted for 18.9% murders (319 out of 1,688)
for ‘gain’, 36.6% (1,159 out of 3,169) murders due to ‘property dispute’ and 14.7% (570 out of 3,877) murder due to 'personal vendetta or enmity'. Andhra Pradesh has reported 17.5% of murders due to ‘love affairs / sexual causes'. 26.7% of murders due to 'political reasons’ were reported from Bihar. 28.5% of murders due to ‘dowry' were reported from Odisha. Odisha accounted for 26.9% of murders due to ‘witchcraft'. Chhattisgarh has accounted for 29.0% murders by ‘terrorist / extremist violence’ followed by Jharkhand (22.0%). Attempt to commit murder
(Incidence… 35,138
Crime rate… 2.9)
The incidence of attempt to commit murder (35,138) during the year 2012 has increased by 12.0% over the previous year (31,385). As in the case of murder, Bihar has registered the highest (5,452) incidence of attempt to commit murder followed by Uttar Pradesh with 4,811 cases. The crime rate was the highest in Manipur (16.4) against the national average of 2.9. Culpable homicide not
amounting to murder
(Incidence......3,620
Crime rate… 0.3)
The incidence (3,620) of culpable homicide not amounting to murder has declined by 2.3% over previous year (3,707). Uttar Pradesh has reported the highest number of 1,410 cases of culpable homicide not
LatestLaws.com
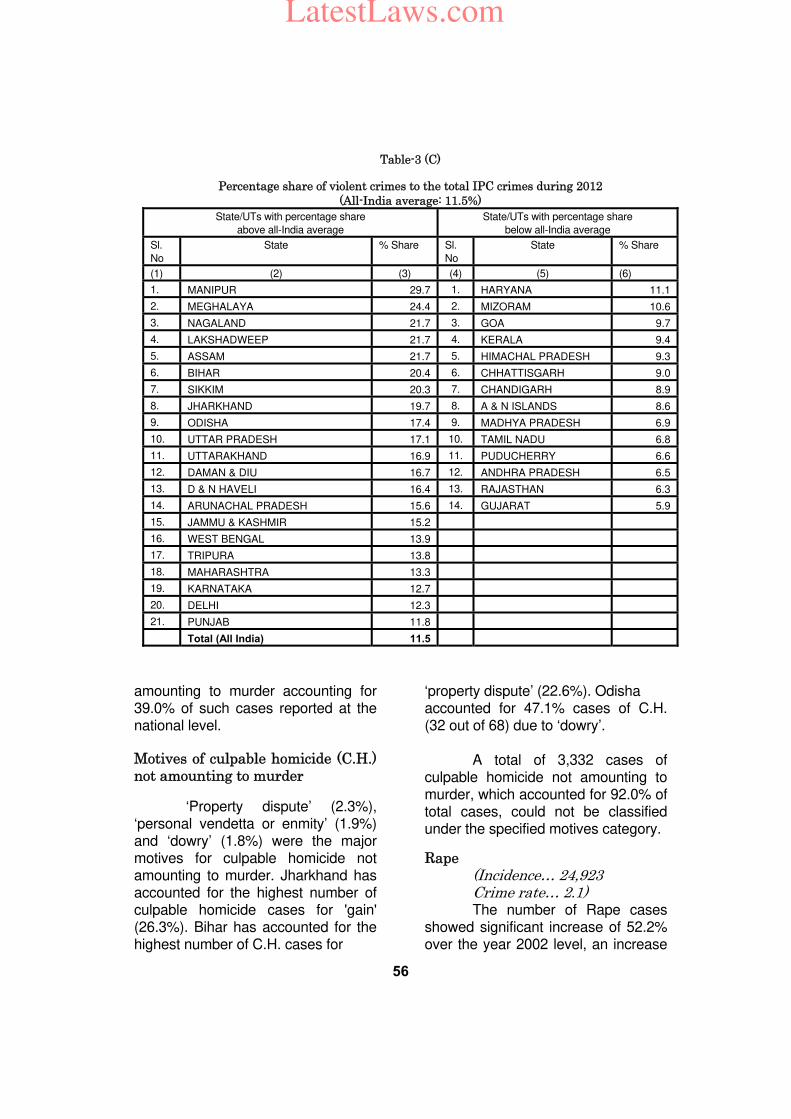
56
amounting to murder accounting for 39.0% of such cases reported at the national level.
Motives of culpable homicide (C.H.) not amounting to murder
‘Property dispute’ (2.3%), ‘personal vendetta or enmity’ (1.9%) and ‘dowry’ (1.8%) were the major motives for culpable homicide not amounting to murder. Jharkhand has accounted for the highest number of culpable homicide cases for 'gain' (26.3%). Bihar has accounted for the highest number of C.H. cases for
‘property dispute’ (22.6%). Odisha accounted for 47.1% cases of C.H. (32 out of 68) due to ‘dowry’. A total of 3,332 cases of culpable homicide not amounting to murder, which accounted for 92.0% of total cases, could not be classified under the specified motives category.
Rape (Incidence… 24,923 Crime rate… 2.1) The number of Rape cases showed significant increase of 52.2% over the year 2002 level, an increase
Table-3 (C)
Percentage share of violent crimes to the total IPC crimes during 2012 (All-India average: 11.5%)
State/UTs with percentage share
above all-India average
State/UTs with percentage share
below all-India average
Sl.
No
State % Share Sl.
No
State % Share
(1) (2) (3) (4) (5) (6)
1. MANIPUR 29.7 1. HARYANA 11.1
2. MEGHALAYA 24.4 2. MIZORAM 10.6
3. NAGALAND 21.7 3. GOA 9.7
4. LAKSHADWEEP 21.7 4. KERALA 9.4
5. ASSAM 21.7 5. HIMACHAL PRADESH 9.3
6. BIHAR 20.4 6. CHHATTISGARH 9.0
7. SIKKIM 20.3 7. CHANDIGARH 8.9
8. JHARKHAND 19.7 8. A & N ISLANDS 8.6
9. ODISHA 17.4 9. MADHYA PRADESH 6.9
10. UTTAR PRADESH 17.1 10. TAMIL NADU 6.8
11. UTTARAKHAND 16.9 11. PUDUCHERRY 6.6
12. DAMAN & DIU 16.7 12. ANDHRA PRADESH 6.5
13. D & N HAVELI 16.4 13. RAJASTHAN 6.3
14. ARUNACHAL PRADESH 15.6 14. GUJARAT 5.9
15. JAMMU & KASHMIR 15.2
16. WEST BENGAL 13.9
17. TRIPURA 13.8
18. MAHARASHTRA 13.3
19. KARNATAKA 12.7
20. DELHI 12.3
21. PUNJAB 11.8
Total (All India) 11.5
LatestLaws.com
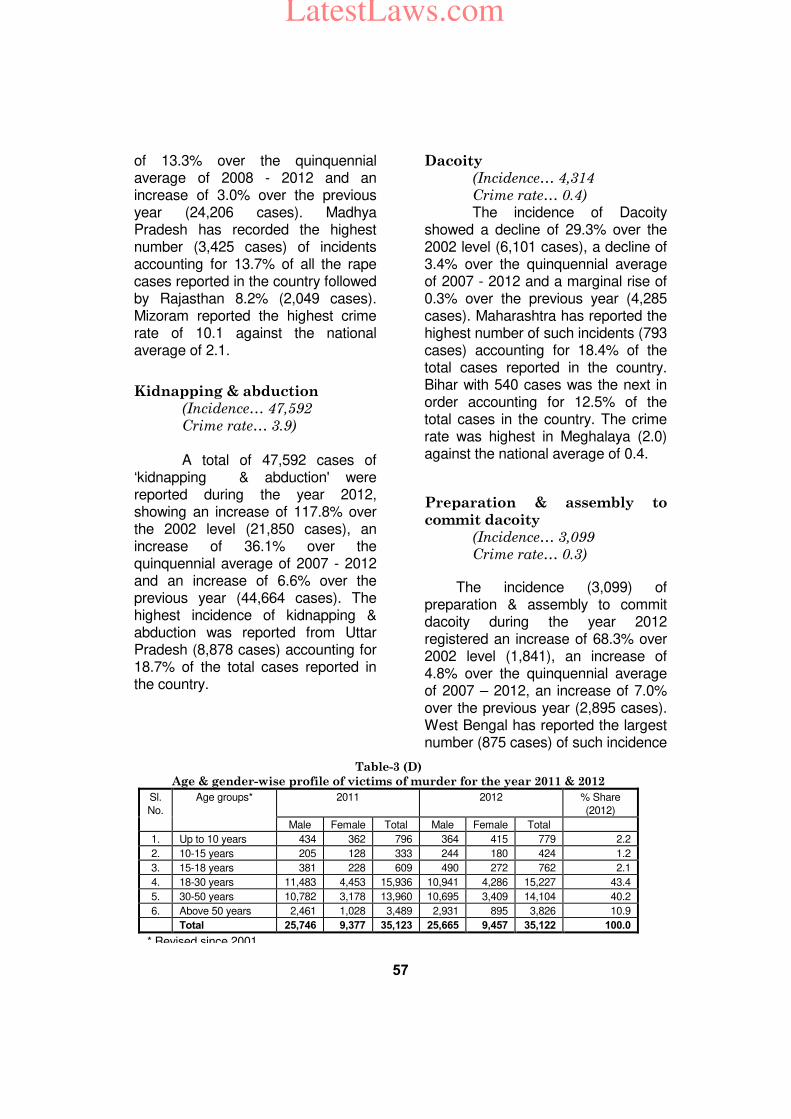
57
of 13.3% over the quinquennial average of 2008 - 2012 and an increase of 3.0% over the previous year (24,206 cases). Madhya Pradesh has recorded the highest number (3,425 cases) of incidents accounting for 13.7% of all the rape cases reported in the country followed by Rajasthan 8.2% (2,049 cases). Mizoram reported the highest crime rate of 10.1 against the national average of 2.1.
Kidnapping & abduction
(Incidence… 47,592
Crime rate… 3.9)
A total of 47,592 cases of ‘kidnapping & abduction' were reported during the year 2012, showing an increase of 117.8% over the 2002 level (21,850 cases), an increase of 36.1% over the quinquennial average of 2007 - 2012 and an increase of 6.6% over the previous year (44,664 cases). The highest incidence of kidnapping & abduction was reported from Uttar Pradesh (8,878 cases) accounting for 18.7% of the total cases reported in the country.
Dacoity
(Incidence… 4,314
Crime rate… 0.4)
The incidence of Dacoity showed a decline of 29.3% over the 2002 level (6,101 cases), a decline of 3.4% over the quinquennial average of 2007 - 2012 and a marginal rise of 0.3% over the previous year (4,285 cases). Maharashtra has reported the highest number of such incidents (793 cases) accounting for 18.4% of the total cases reported in the country. Bihar with 540 cases was the next in order accounting for 12.5% of the total cases in the country. The crime rate was highest in Meghalaya (2.0) against the national average of 0.4.
Preparation & assembly to
commit dacoity
(Incidence… 3,099
Crime rate… 0.3)
The incidence (3,099) of preparation & assembly to commit dacoity during the year 2012 registered an increase of 68.3% over 2002 level (1,841), an increase of 4.8% over the quinquennial average of 2007 – 2012, an increase of 7.0% over the previous year (2,895 cases). West Bengal has reported the largest number (875 cases) of such incidence
Table-3 (D)
Age & gender-wise profile of victims of murder for the year 2011 & 2012
Sl.
No.
Age groups* 2011 2012 % Share
(2012)
Male Female Total Male Female Total
1. Up to 10 years 434 362 796 364 415 779 2.2
2. 10-15 years 205 128 333 244 180 424 1.2
3. 15-18 years 381 228 609 490 272 762 2.1
4. 18-30 years 11,483 4,453 15,936 10,941 4,286 15,227 43.4
5. 30-50 years 10,782 3,178 13,960 10,695 3,409 14,104 40.2
6. Above 50 years 2,461 1,028 3,489 2,931 895 3,826 10.9
Total 25,746 9,377 35,123 25,665 9,457 35,122 100.0
* Revised since 2001
LatestLaws.com
58
accounting for 28.2% of total such cases at the national level. The crime rate of 6.9 was highest in Manipur against the national average of 0.2. Robbery
(Incidence… 27,343
Crime rate… 2.3)
The incidence of robbery (27,343) showed an increase of 45.7% during 2012 over the 2002 level (18,764 cases), an increase of 24.1% over the quinquennial average of 2007 - 2012 and 10.7% increase over the previous year (24,700 cases). The highest number of incidents (6,949 cases) accounting for 25.4% were reported from Maharashtra. Maharashtra reported the highest crime rate of 6.1 against the national average of 2.3. Riots
(Incidence…74,633
Crime rate… 6.2)
The incidence of riots (74,633) registered during the year 2012 has increased by 8.3% over the year 2002 level, increased by 14.8% over the quinquennial average of 2007 - 2012 and an increase of 9.0% is observed over the previous year (68,500). The highest numbers of incidents (10,938) were reported from Kerala accounting for 14.7% followed by Bihar 14.6% (10,871 cases) of total such incidents in the country. The crime rate was also the highest in Kerala (31.4) against the national average of 6.2.
Arson
(Incidence… 11,836
Crime rate… 1.0)
The incidence of arson during the year 2012 has increased by 0.1% over the 2002 level; an increase of 32.7% over the quinquennial average of 2007 - 2012 and 30.6% over the year 2011 (9,064 cases) is also observed. Assam (2,830 cases) has reported the highest number of incidents accounting for 23.9% followed by Maharashtra at 10.5% (1,246 cases) of the total cases at the national level. The highest crime rate was reported in Assam (9.1) against the national average of 1.0.
Dowry death
(Incidence… 8,233
Crime rate… 0.7)
The incidence of Dowry deaths during the year 2012 (8,233) increased by 20.7% over the 2002 level, decreased by 1.2% over quinquennial average of 2007 - 2012 and decreased by 4.5% over previous year (8,618). Uttar Pradesh, like previous year, has reported the highest number of such incidents (2,244) followed by Bihar (1,275). The crime rate for dowry deaths was highest in Bihar and Odisha at (1.3 each) against the national rate of 0.7.
Victims of violent crimes
The age-wise details of victims of various crimes viz. murder, C.H. not amounting to murder, kidnapping & abduction and rape are compiled annually, besides the
LatestLaws.com
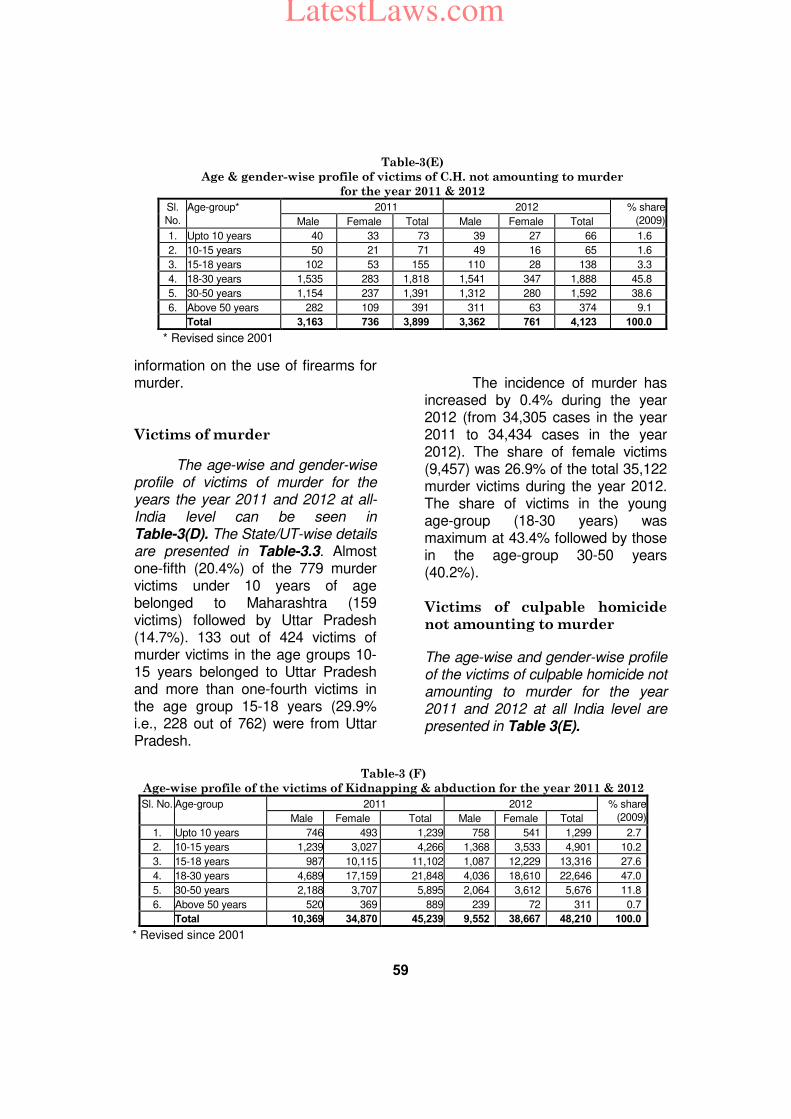
59
information on the use of firearms for murder.
Victims of murder
The age-wise and gender-wise profile of victims of murder for the years the year 2011 and 2012 at all-India level can be seen in Table-3(D). The State/UT-wise details are presented in Table-3.3. Almost one-fifth (20.4%) of the 779 murder victims under 10 years of age belonged to Maharashtra (159 victims) followed by Uttar Pradesh (14.7%). 133 out of 424 victims of murder victims in the age groups 10-15 years belonged to Uttar Pradesh and more than one-fourth victims in the age group 15-18 years (29.9% i.e., 228 out of 762) were from Uttar Pradesh.
The incidence of murder has increased by 0.4% during the year 2012 (from 34,305 cases in the year 2011 to 34,434 cases in the year 2012). The share of female victims (9,457) was 26.9% of the total 35,122 murder victims during the year 2012. The share of victims in the young age-group (18-30 years) was maximum at 43.4% followed by those in the age-group 30-50 years (40.2%). Victims of culpable homicide
not amounting to murder
The age-wise and gender-wise profile of the victims of culpable homicide not amounting to murder for the year 2011 and 2012 at all India level are presented in Table 3(E).
Table-3(E)
Age & gender-wise profile of victims of C.H. not amounting to murder
for the year 2011 & 2012
Sl.
No.
Age-group* 2011 2012 % share
(2009) Male Female Total Male Female Total
1. Upto 10 years 40 33 73 39 27 66 1.6
2. 10-15 years 50 21 71 49 16 65 1.6
3. 15-18 years 102 53 155 110 28 138 3.3
4. 18-30 years 1,535 283 1,818 1,541 347 1,888 45.8
5. 30-50 years 1,154 237 1,391 1,312 280 1,592 38.6
6. Above 50 years 282 109 391 311 63 374 9.1
Total 3,163 736 3,899 3,362 761 4,123 100.0
* Revised since 2001
Table-3 (F)
Age-wise profile of the victims of Kidnapping & abduction for the year 2011 & 2012
Sl. No. Age-group 2011 2012 % share
(2009) Male Female Total Male Female Total
1. Upto 10 years 746 493 1,239 758 541 1,299 2.7
2. 10-15 years 1,239 3,027 4,266 1,368 3,533 4,901 10.2
3. 15-18 years 987 10,115 11,102 1,087 12,229 13,316 27.6
4. 18-30 years 4,689 17,159 21,848 4,036 18,610 22,646 47.0
5. 30-50 years 2,188 3,707 5,895 2,064 3,612 5,676 11.8
6. Above 50 years 520 369 889 239 72 311 0.7
Total 10,369 34,870 45,239 9,552 38,667 48,210 100.0
* Revised since 2001
LatestLaws.com
60
The share of female victims (761) of culpable homicide not amounting to murder was 18.5% of the total 4,123 victims during the year 2012. The victims in the age group 18-30 years and 30-50 years accounted for 45.8% and 38.6% respectively of total victims under culpable homicide not amounting to murder. The State/UT wise details are presented in Table 3.4.
Victims of kidnapping & abduction
Information on motive-wise, gender-wise, State-UT wise details on the kidnapping & abduction cases and their victims are collected since 1999.
Victims of kidnapping & abduction have undergone ordeal at the hands of the criminals for various causes, viz. for adoption, begging, camel racing, marriage, prostitution, ransom, revenge, sale, slavery, etc. The State/UT wise details of the victims of kidnapping & abduction are presented in Table 3.5. The motive wise break-up of kidnapping & abduction at all India level is presented in Table-3.6.
A total of 48,219 persons were kidnapped & abducted during the year 2012 as compared to 45,239 in the previous year (2011), registering an increase of 6.6% over the year 2011. More than four times number of females (38,667) were kidnapped compared to the numbers of males
(9,552) accounting for 80.2% during the year 2012. ‘Marriage’ was the main cause of kidnapping & abduction of females accounting for 63.2% (24,456 out of 38,667 persons) of the total females kidnapped & abducted. ‘Ransom’ (534 out of 9,552) and ‘revenge’ (519 out of 9,552) were the main causes of kidnapping & abduction of males representing 5.6% and 5.4% respectively of the kidnapped & abducted males.
The number of victims of kidnapping & abduction was higher in the age group of 18 - 30 years (22,646). The number of victims in this age group accounted for 47.0% of the total such victims reported during the year 2012.
N.C.T. of Delhi, which accounted for only 8.9% victims of kidnapping & abduction, reported 45.8% (595 out of 1,299) of child victims (Up-to 10 years of age) and 34.9% victims for the age-group 10 - 15 years (1,710 out of 4,901 victims). Uttar Pradesh has reported the highest number of victims under age group 18 - 30 years (3,893 out of 22,646 i.e., 17.2%) followed by West Bengal (16.6%). Assam reported the highest number of victims in 30 – 50 years age group (1,184 out of 5,676 i.e., 20.9%) and Andhra Pradesh reported the highest number of victims of age 50 & above years (46 out of 311 i.e., 14.8%).
Table-3 (G)
Victims of murder by fire-arms during 2008 to 2012
Year
Number of victims murdered Proportion of
victims by fire-
arms Total victims By licensed fire
arms
By un-licensed fire
arms
Total fire arms
victims
2008 33,727 574 3,527 4,101 12.2
2009 33,159 371 2,722 3,093 9.3
2010 33,908 340 2,723 3,064 9.0
2011 35,123 404 2,964 3,368 9.6
2012 35,122 323 3,458 3,781 10.8
LatestLaws.com
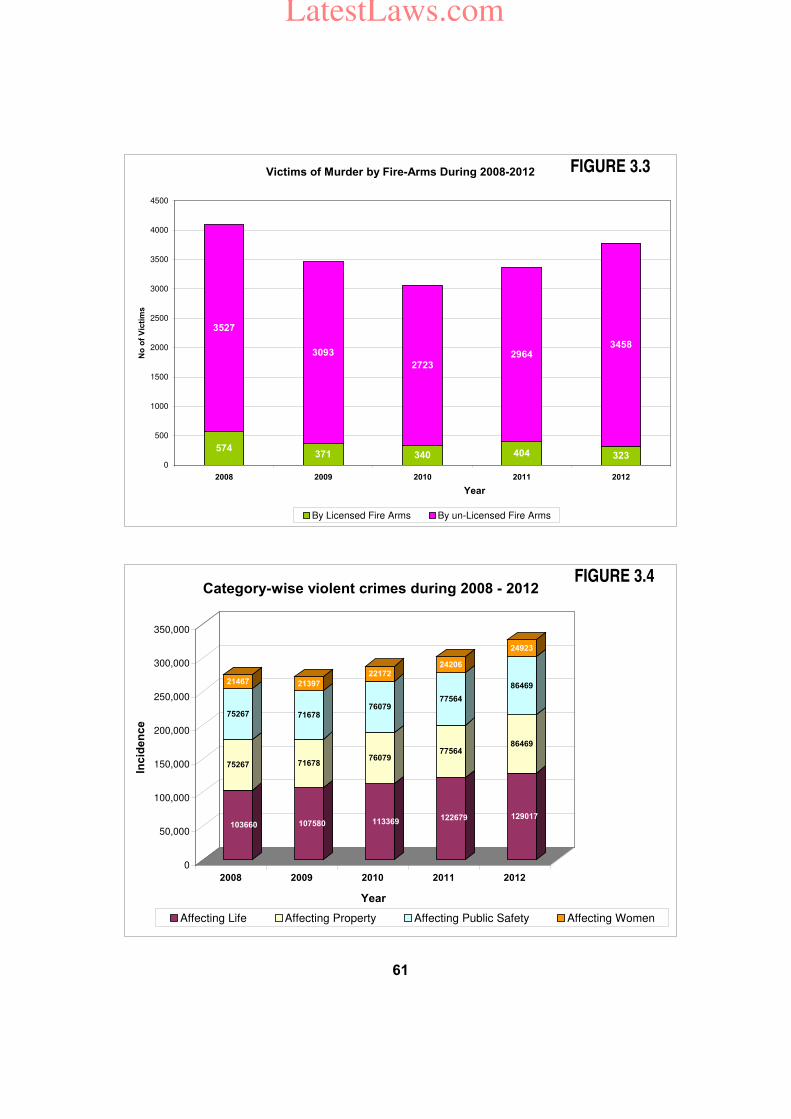
61
Victims of Murder by Fire-Arms During 2008-2012
574371 340 404 323
3527
3093
27232964
3458
0
500
1000
1500
2000
2500
3000
3500
4000
4500
2008 2009 2010 2011 2012
Year
No
of
Vic
tim
s
By Licensed Fire Arms By un-Licensed Fire Arms
FIGURE 3.3
103660
75267
75267
21467
107580
71678
71678
21397
113369
76079
76079
22172
122679
77564
77564
24206
129017
86469
86469
24923
0
50,000
100,000
150,000
200,000
250,000
300,000
350,000
Inc
iden
ce
2008 2009 2010 2011 2012
Year
Category-wise violent crimes during 2008 - 2012
Affecting Life Affecting Property Affecting Public Safety Affecting Women
FIGURE 3.4
LatestLaws.com
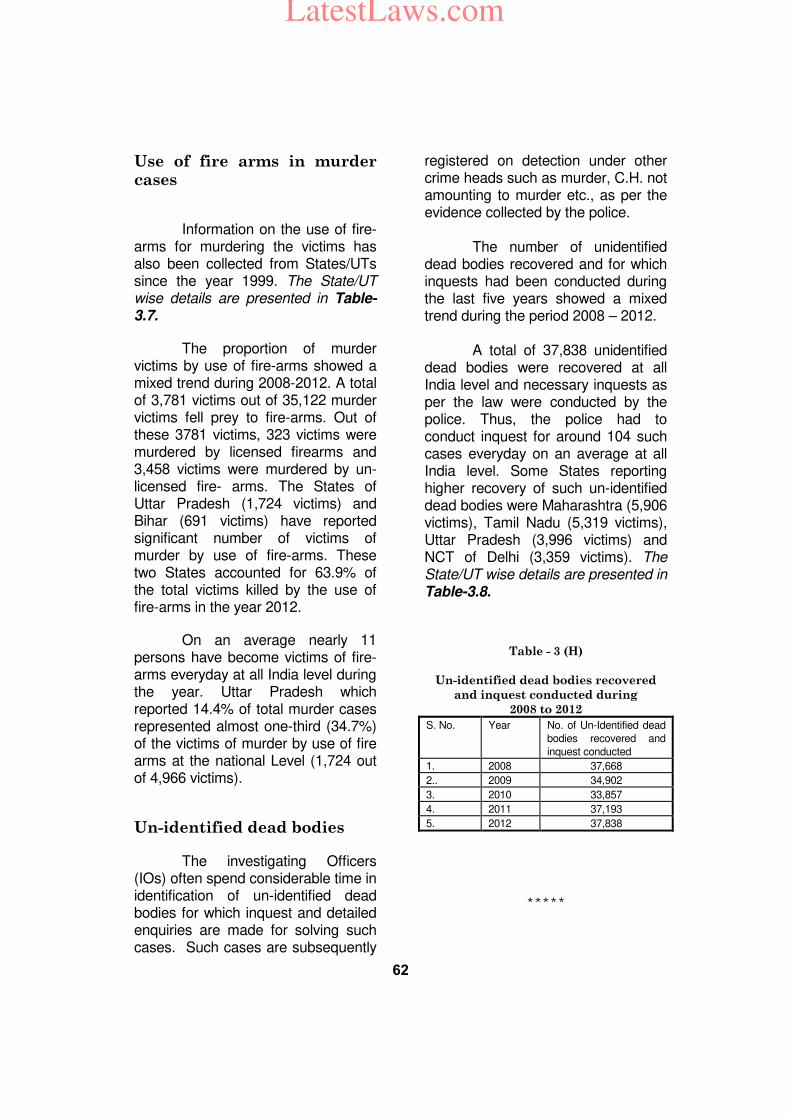
62
Use of fire arms in murder cases
Information on the use of fire-arms for murdering the victims has also been collected from States/UTs since the year 1999. The State/UT wise details are presented in Table-3.7.
The proportion of murder victims by use of fire-arms showed a mixed trend during 2008-2012. A total of 3,781 victims out of 35,122 murder victims fell prey to fire-arms. Out of these 3781 victims, 323 victims were murdered by licensed firearms and 3,458 victims were murdered by un-licensed fire- arms. The States of Uttar Pradesh (1,724 victims) and Bihar (691 victims) have reported significant number of victims of murder by use of fire-arms. These two States accounted for 63.9% of the total victims killed by the use of fire-arms in the year 2012.
On an average nearly 11 persons have become victims of fire-arms everyday at all India level during the year. Uttar Pradesh which reported 14.4% of total murder cases represented almost one-third (34.7%) of the victims of murder by use of fire arms at the national Level (1,724 out of 4,966 victims).
Un-identified dead bodies
The investigating Officers (IOs) often spend considerable time in identification of un-identified dead bodies for which inquest and detailed enquiries are made for solving such cases. Such cases are subsequently
registered on detection under other crime heads such as murder, C.H. not amounting to murder etc., as per the evidence collected by the police. The number of unidentified dead bodies recovered and for which inquests had been conducted during the last five years showed a mixed trend during the period 2008 – 2012. A total of 37,838 unidentified dead bodies were recovered at all India level and necessary inquests as per the law were conducted by the police. Thus, the police had to conduct inquest for around 104 such cases everyday on an average at all India level. Some States reporting higher recovery of such un-identified dead bodies were Maharashtra (5,906 victims), Tamil Nadu (5,319 victims), Uttar Pradesh (3,996 victims) and NCT of Delhi (3,359 victims). The State/UT wise details are presented in Table-3.8.
Table - 3 (H)
Un-identified dead bodies recovered
and inquest conducted during
2008 to 2012
S. No. Year No. of Un-Identified dead
bodies recovered and
inquest conducted
1. 2008 37,668
2.. 2009 34,902
3. 2010 33,857
4. 2011 37,193
5. 2012 37,838
*****
LatestLaws.com
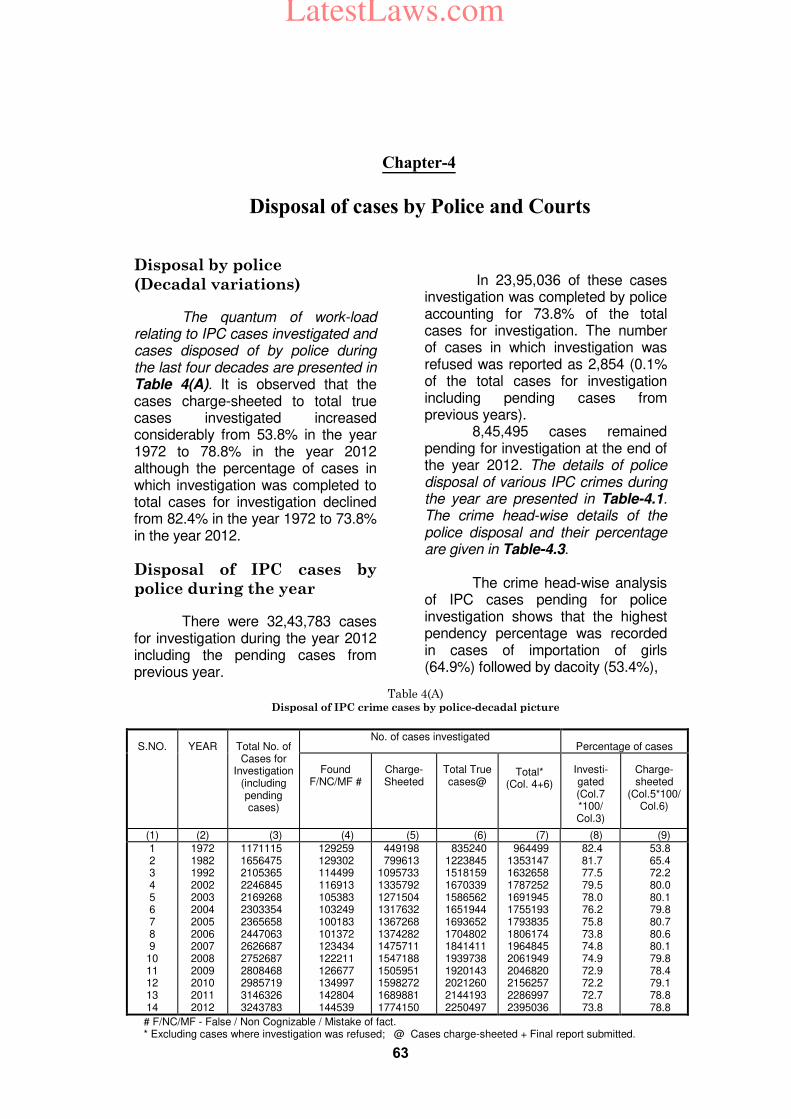
63
Chapter-4
Disposal of cases by Police and Courts
Disposal by police
(Decadal variations)
The quantum of work-load relating to IPC cases investigated and cases disposed of by police during the last four decades are presented in Table 4(A). It is observed that the cases charge-sheeted to total true cases investigated increased considerably from 53.8% in the year 1972 to 78.8% in the year 2012 although the percentage of cases in which investigation was completed to total cases for investigation declined from 82.4% in the year 1972 to 73.8% in the year 2012.
Disposal of IPC cases by
police during the year
There were 32,43,783 cases for investigation during the year 2012 including the pending cases from previous year.
In 23,95,036 of these cases investigation was completed by police accounting for 73.8% of the total cases for investigation. The number of cases in which investigation was refused was reported as 2,854 (0.1% of the total cases for investigation including pending cases from previous years). 8,45,495 cases remained pending for investigation at the end of the year 2012. The details of police disposal of various IPC crimes during the year are presented in Table-4.1. The crime head-wise details of the police disposal and their percentage are given in Table-4.3. The crime head-wise analysis of IPC cases pending for police investigation shows that the highest pendency percentage was recorded in cases of importation of girls (64.9%) followed by dacoity (53.4%),
Table 4(A) Disposal of IPC crime cases by police-decadal picture
S.NO. YEAR Total No. of Cases for
Investigation (including pending cases)
No. of cases investigated Percentage of cases
Found F/NC/MF #
Charge- Sheeted
Total True cases@
Total*
(Col. 4+6)
Investi- gated (Col.7 *100/ Col.3)
Charge- sheeted
(Col.5*100/ Col.6)
(1) (2) (3) (4) (5) (6) (7) (8) (9)
1 2 3 4 5 6 7 8 9
10 11 12 13 14
1972 1982 1992 2002 2003 2004 2005 2006 2007 2008 2009 2010 2011 2012
1171115 1656475 2105365 2246845 2169268 2303354 2365658 2447063 2626687 2752687 2808468 2985719 3146326 3243783
129259 129302 114499 116913 105383 103249 100183 101372 123434 122211 126677 134997 142804 144539
449198 799613
1095733 1335792 1271504 1317632 1367268 1374282 1475711 1547188 1505951 1598272 1689881 1774150
835240 1223845 1518159 1670339 1586562 1651944 1693652 1704802 1841411 1939738 1920143 2021260 2144193 2250497
964499 1353147 1632658 1787252 1691945 1755193 1793835 1806174 1964845 2061949 2046820 2156257 2286997 2395036
82.4 81.7 77.5 79.5 78.0 76.2 75.8 73.8 74.8 74.9 72.9 72.2 72.7 73.8
53.8 65.4 72.2 80.0 80.1 79.8 80.7 80.6 80.1 79.8 78.4 79.1 78.8 78.8
# F/NC/MF - False / Non Cognizable / Mistake of fact. * Excluding cases where investigation was refused; @ Cases charge-sheeted + Final report submitted.
LatestLaws.com
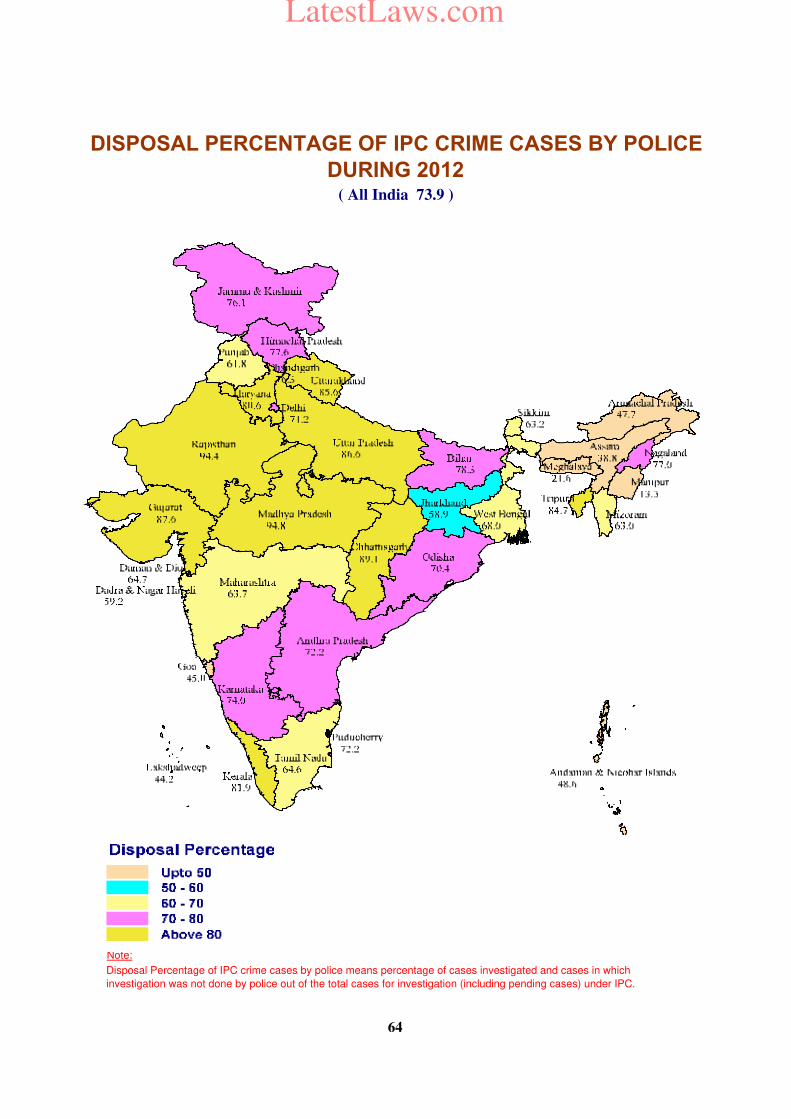
Note:
Disposal Percentage of IPC crime cases by police means percentage of cases investigated and cases in which
investigation was not done by police out of the total cases for investigation (including pending cases) under IPC.
DISPOSAL PERCENTAGE OF IPC CRIME CASES BY POLICE
DURING 2012( All India 73.9 )
64
LatestLaws.com
65
cheating (45.9%), preparation & assembly for committing dacoity (45.8%) and arson (45.7%). The rate of investigation of cases relating to crimes against women was better than that of other offences. The percentage of cases investigated to total cases for investigation was reported as 81.9% for hurt followed by insult to the modesty of women (76.8%), assault on the women to outrage her modesty (76.2%), causing death by negligence (73.8%) and theft (71.7%).
Police could charge-sheet 54.7% cases out of the total cases under investigation. The cases for which ‘final report submitted’, ‘charges found false/mistake of law etc’ and `investigation refused' accounted for 14.7%, 4.5% and 0.1% respectively. 398 cases were withdrawn by the government at the investigation stage. The police investigation of 73.8% in the year 2012 was higher than that of the previous year (72.7% investigation).
17,74,150 cases were charge-sheeted by police of the total true cases (charge-sheeted + final report submitted i.e. 22,50,497 cases) investigated amounting to 78.8% of successful detection. 14.6% cases of cheating, 12.6% cases of kidnapping & abduction and 6.9% cases of cruelty by husband and relatives were found false or related to mistake of law, as a result, no charge-sheet could be filed in such cases as compared to 4.5% cases found false or those relating to mistake of law in all the IPC cases at national level. The States which have reported a higher percentage of
pendency of cases at the end of the year for investigation by police are - Manipur (86.7%), Meghalaya (78.4%) and Assam (61.2%). Highest such percentage among UTs has been found in Lakshadweep (55.8%).
Charge-sheeting rate of IPC
crimes
State/UT-wise rate of charge-sheet (percentage of cases charge-sheeted to total true cases investigated) of all the IPC crimes is presented in Table-4.4. It was observed that overall rate of charge-sheet was the highest at 95.4% in Kerala followed by Mizoram (92.6%), Tamil Nadu (89.0%), Andhra Pradesh (88.5%), Odisha (86.9%), Jammu & Kashmir (86.6%), Madhya Pradesh (86.0%), Puducherry (85.0%), Gujarat (84.3%), Himanchal Pradesh (84.1%), Chhattisgarh (83.2%) and Tripura (81.6) as compared to the all-India average at 78.8%.
The rate of charge-sheet in respect of total IPC cases in Manipur was the lowest at 4.2%.
Disposal of SLL Cases by
Police
The disposal of SLL cases by police under different crime-heads are presented in Table - 4.5. Police completed investigation in 93.4% cases (33,49,875) and in negligible percentage of cases in which investigation was refused out of the total 39,06,719 cases (including the pending cases from previous
LatestLaws.com
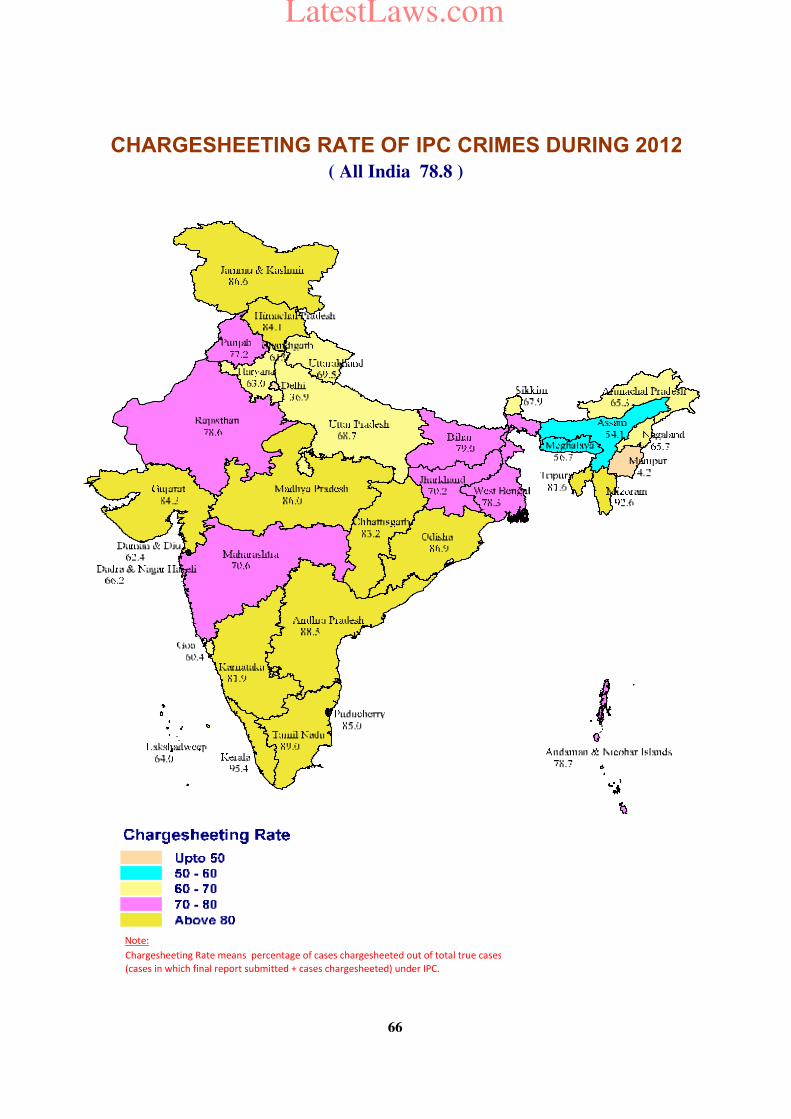
Note: Chargesheeting Rate means percentage of cases chargesheeted out of total true cases (cases in which final report submitted + cases chargesheeted) under IPC.
CHARGESHEETING RATE OF IPC CRIMES DURING 2012
( All India 78.8 )
66
LatestLaws.com
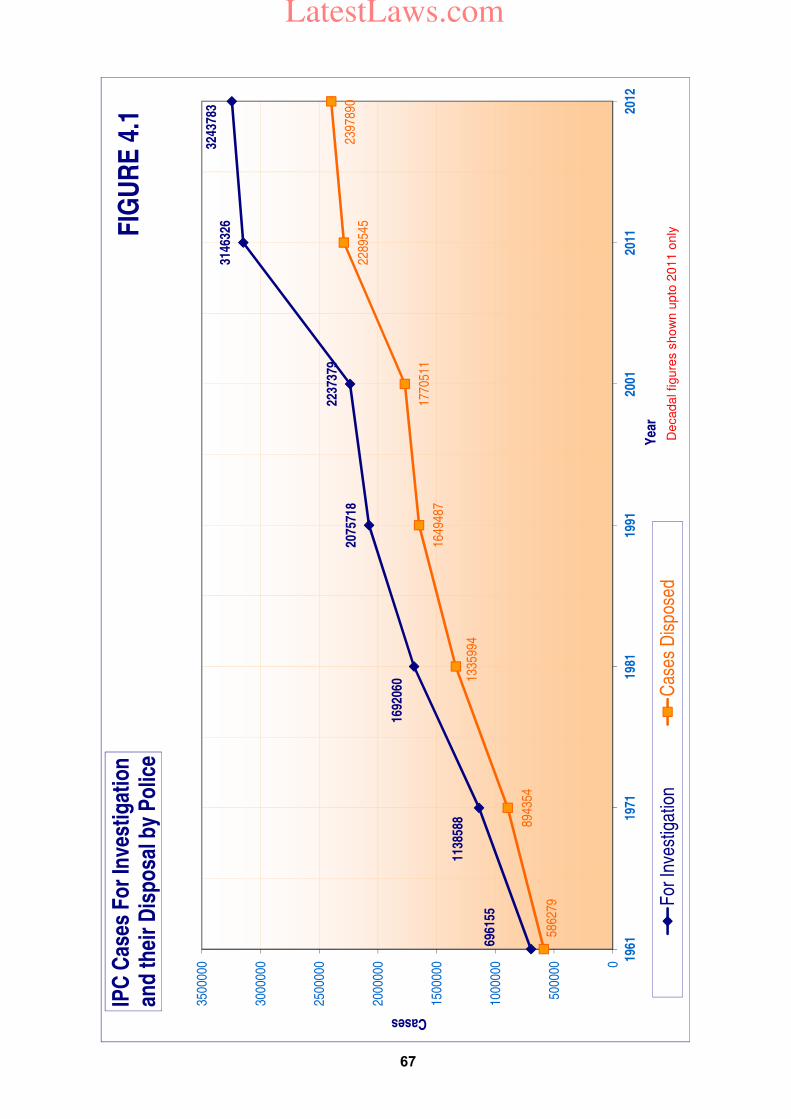
6961
55
1138
588
1692
060
2075
718
2237
379
3146
326
3243
783
5862
79
8943
54
1335
994
1649
487
1770
511
2289
545
2397
890
0
5000
00
1000
000
1500
000
2000
000
2500
000
3000
000
3500
000 19
6119
7119
8119
9120
0120
1120
12
Cases
Yea
r
IPC
Cas
es F
or
Inve
stig
atio
nan
d t
hei
r D
isp
osa
l by
Po
lice
For
Inve
stig
atio
nC
ases
Dis
pose
d
FIG
UR
E 4
.1
De
ca
da
l fig
ure
s s
ho
wn
up
to 2
01
1 o
nly
67
LatestLaws.com
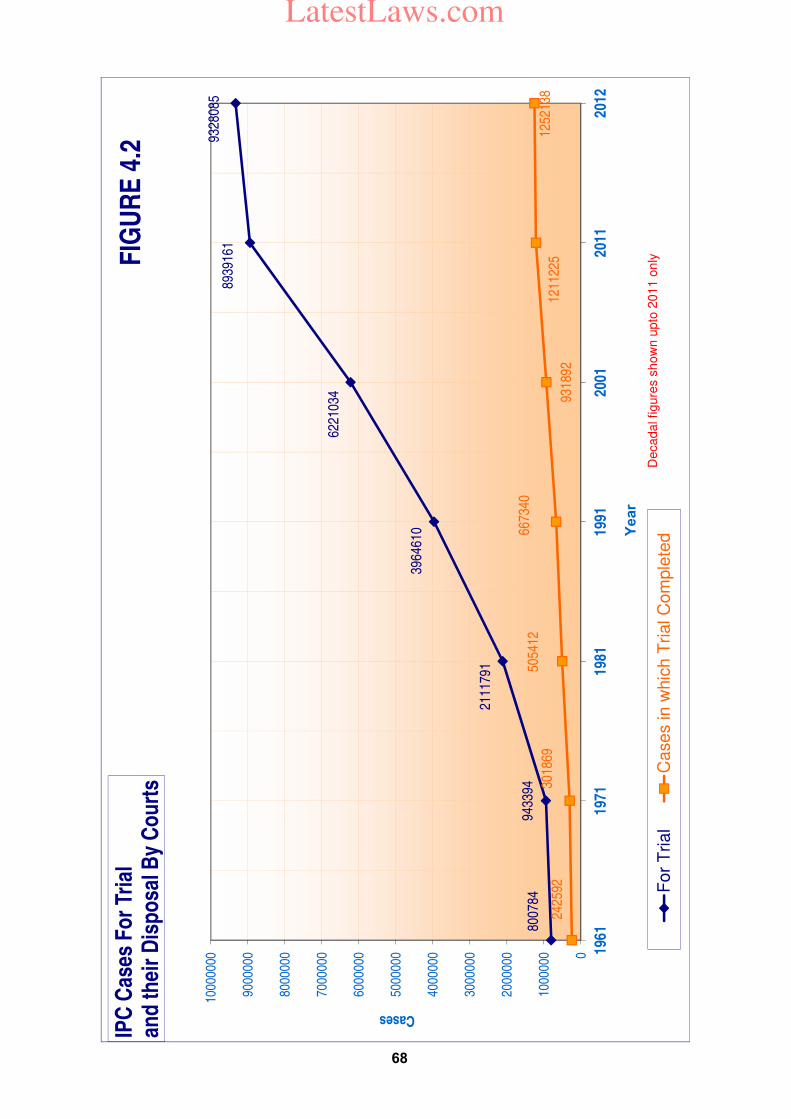
8007
8494
3394
2111
791
3964
610
6221
034
8939
161
9328
085
2425
9230
1869
5054
1266
7340
9318
9212
1122
512
5213
8
0
1000
000
2000
000
3000
000
4000
000
5000
000
6000
000
7000
000
8000
000
9000
000
1000
0000
1961
1971
1981
1991
2001
2011
2012
Cases
Year
IPC
Cas
es F
or
Tria
l an
d t
hei
r D
isp
osa
l By
Co
urt
s
Fo
r T
ria
lC
ase
s in
whic
h T
rial C
om
ple
ted
FIG
UR
E 4
.2
De
ca
da
l fig
ure
s s
ho
wn
up
to 2
01
1 o
nly
68
LatestLaws.com
69
years) meant for investigation. The percentage of SLL cases (93.4%) in which investigation was completed was better as compared to percentage of IPC cases (73.8%). Only 6.6% SLL cases were pending for police disposal at the end of the year 2012 against 26.1% under IPC. State / UT wise pendency of SLL cases for investigation by police (Table - 4.6) reveals that 91.0% cases were pending investigation at the end of the year 2012 in Manipur, followed by Assam (81.8%), Meghalaya (79.8%) and Delhi (63.2%). The States / UTs which had appreciable police disposal percentage (99.9%) for SLL cases were Chhattisgarh and Sikkim (100.0%). The details of disposal of SLL crimes by police under various crime-heads are presented in Table - 4.7. A high pendency was observed in TADA cases (90.8%) followed by Indian Passport Act (70.0%), Indian Railways Act (55.7%) and Explosive & Explosive Substance Act (46.1%) in the year 2012. Charge sheeting rate of SLL crimes
State / UT-wise details of charge sheeting rate of SLL crimes during the year 2012 are presented in Table - 4.8. The charge-sheeting rate of SLL crimes was also fairly high (93.4%) compared to 78.8% of IPC crimes. Eight States / UTs have reported charge-sheeting rate of
99.0% or more for SLL crimes. These States/UTs were Chhattisgarh, Dadra & Nagar Haveli and Daman & Diu (100.0% each), Puducherry (99.9%), Madhya Pradesh and Andaman & Nicobar Islands (99.8% each) and Gujarat & Mizoram (99.7% each). Manipur had a low charge-sheeting rate, which stood at 53.7% during the year 2012.
Disposal by courts (decadal variations)
The quantum of IPC cases to be tried by courts and the actual number of cases tried by courts resulting in conviction etc. during last four decades are presented in Table 4(B).
It was observed that the
percentage of cases tried to total cases for trial and percentage of cases convicted to total cases tried showed a declining trend. These percentages were 30.9% and 62.7% respectively in the year 1972 which went down in 2012 to 13.4% and 38.5% respectively.
LatestLaws.com
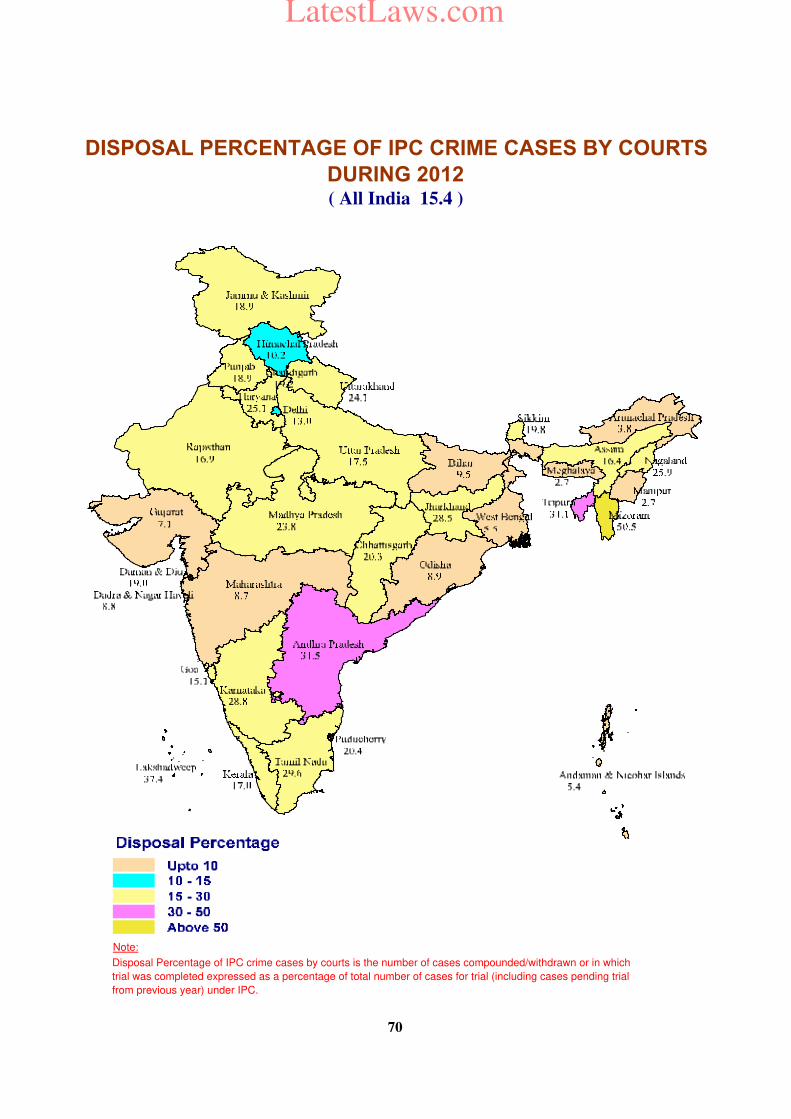
Note:
Disposal Percentage of IPC crime cases by courts is the number of cases compounded/withdrawn or in which
trial was completed expressed as a percentage of total number of cases for trial (including cases pending trial
from previous year) under IPC.
DISPOSAL PERCENTAGE OF IPC CRIME CASES BY COURTS
DURING 2012( All India 15.4 )
70
LatestLaws.com
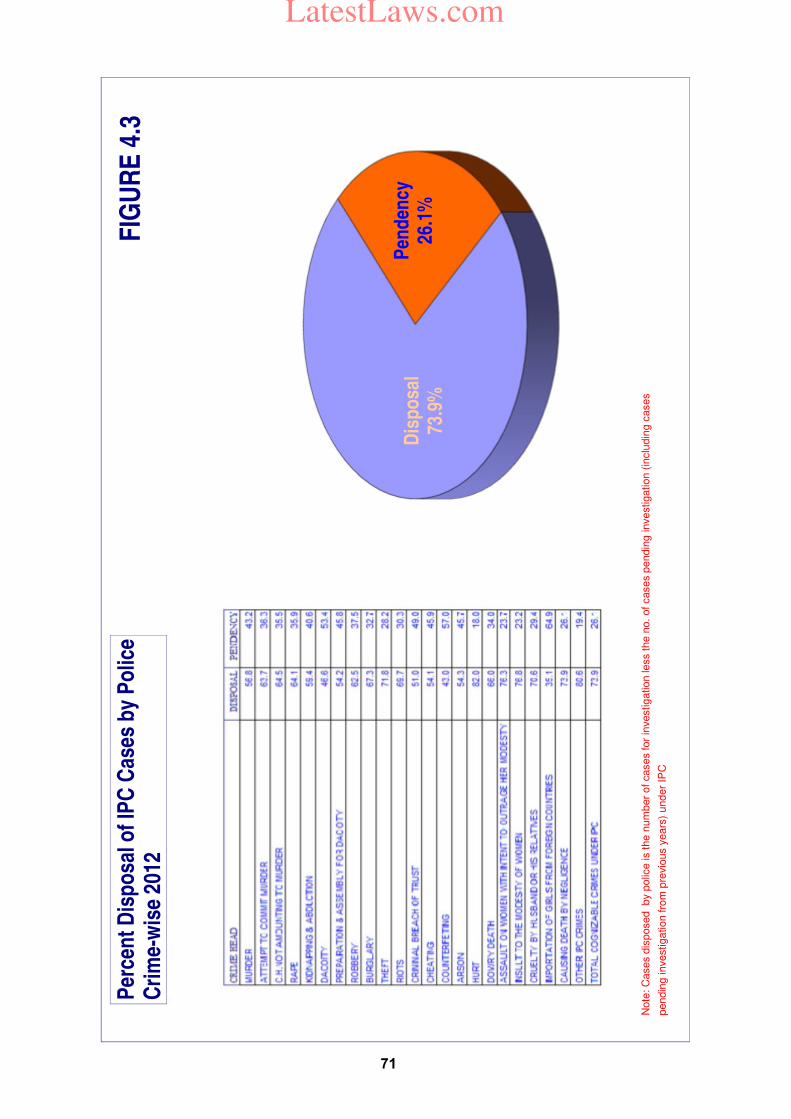
Dis
po
sal
73.9
%
Pen
den
cy26
.1%
Per
cen
t D
isp
osa
l of
IPC
Cas
es b
y P
olic
e C
rim
e-w
ise
2012
FIG
UR
E 4
.3
Note
: C
ases d
isposed by p
olic
e is the n
um
ber
of cases for
investigation le
ss the n
o.
of cases p
endin
g investigation (
inclu
din
g c
ases
pendin
g investigation fro
m p
revio
us y
ears
) under
IPC
71
LatestLaws.com
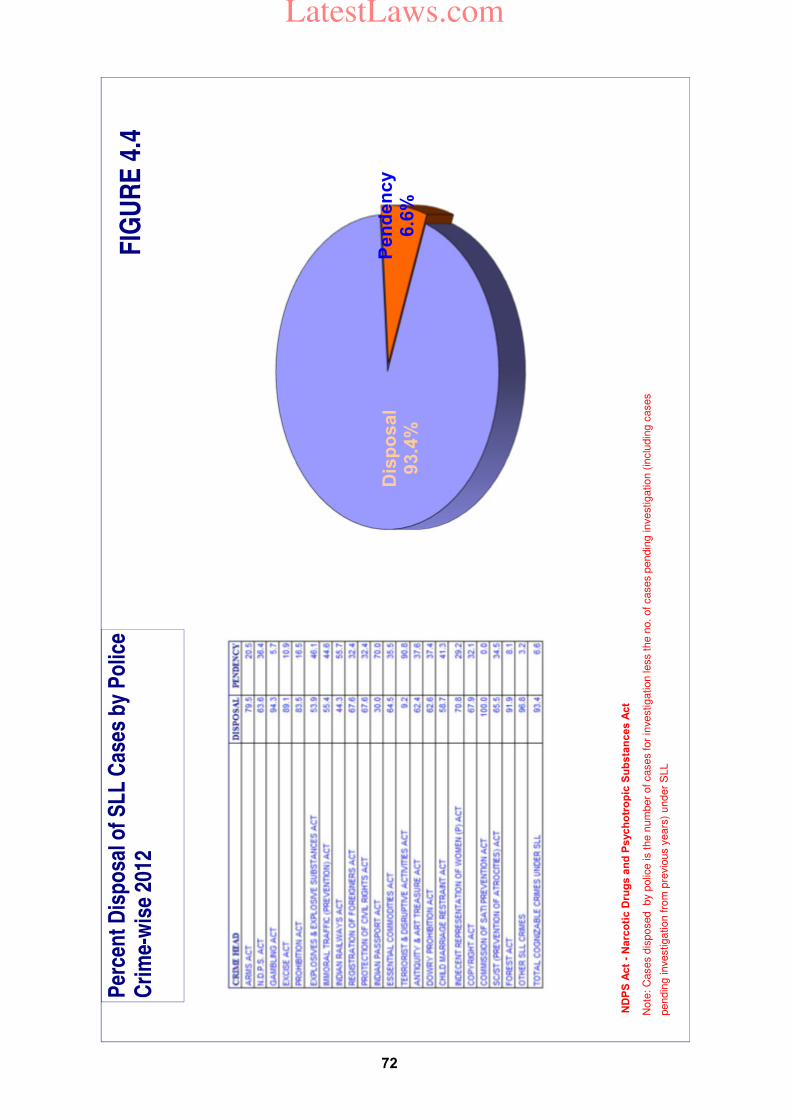
Dis
po
sal
93
.4%
Pen
den
cy
6.6
%
Per
cen
t D
isp
osa
l of
SL
L C
ases
by
Po
lice
Cri
me-
wis
e 20
12F
IGU
RE
4.4
Note
: C
ases d
isposed by p
olic
e is the n
um
ber
of cases for
investigation le
ss the n
o.
of cases p
endin
g investigation (
inclu
din
g c
ases
pendin
g investigation fro
m p
revio
us y
ears
) under
SLL
ND
PS
Act
-N
arc
oti
c D
rug
s a
nd
Psych
otr
op
ic S
ub
sta
nces A
ct
72
LatestLaws.com
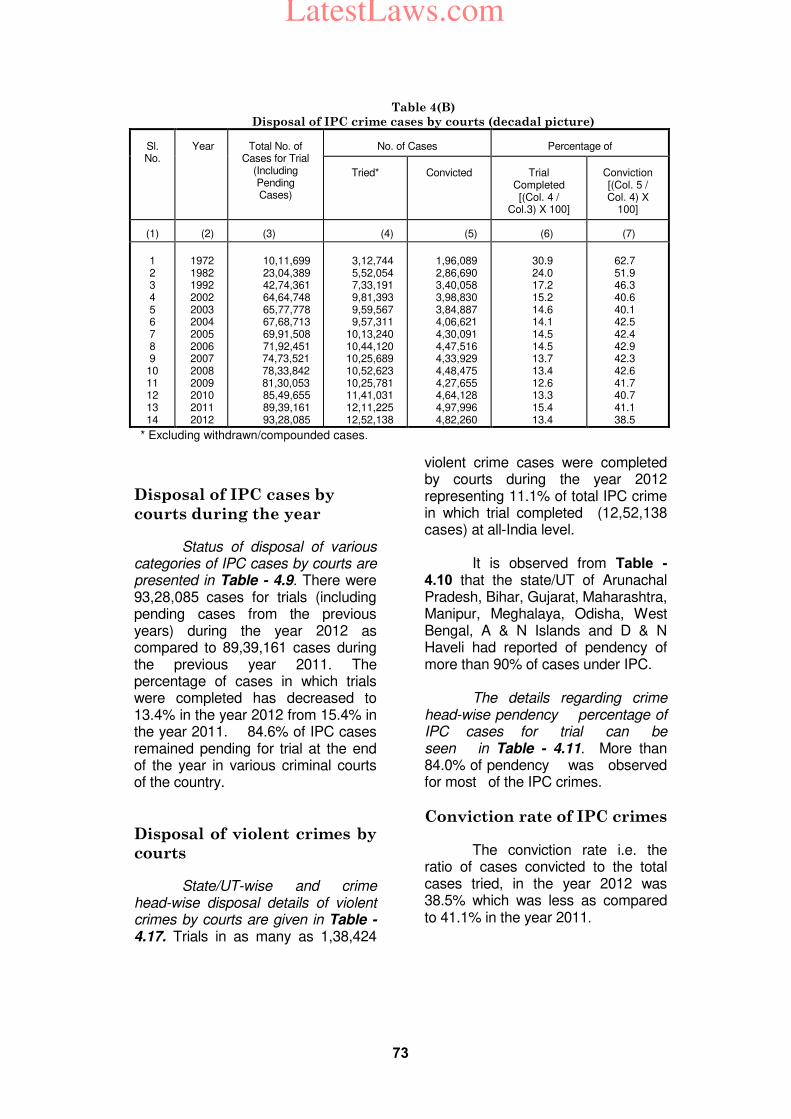
73
Table 4(B)
Disposal of IPC crime cases by courts (decadal picture)
Sl. No.
Year Total No. of Cases for Trial
(Including Pending Cases)
No. of Cases Percentage of
Tried* Convicted Trial Completed [(Col. 4 /
Col.3) X 100]
Conviction [(Col. 5 / Col. 4) X
100]
(1) (2) (3) (4) (5) (6) (7)
1 2 3 4 5 6 7 8 9
10 11 12 13 14
1972 1982 1992 2002 2003 2004 2005 2006 2007 2008 2009 2010 2011 2012
10,11,699 23,04,389 42,74,361 64,64,748 65,77,778 67,68,713 69,91,508 71,92,451 74,73,521 78,33,842 81,30,053 85,49,655 89,39,161 93,28,085
3,12,744 5,52,054 7,33,191 9,81,393 9,59,567 9,57,311
10,13,240 10,44,120 10,25,689 10,52,623 10,25,781 11,41,031 12,11,225 12,52,138
1,96,089 2,86,690 3,40,058 3,98,830 3,84,887 4,06,621 4,30,091 4,47,516 4,33,929 4,48,475 4,27,655 4,64,128 4,97,996 4,82,260
30.9 24.0 17.2 15.2 14.6 14.1 14.5 14.5 13.7 13.4 12.6 13.3 15.4 13.4
62.7 51.9 46.3 40.6 40.1 42.5 42.4 42.9 42.3 42.6 41.7 40.7 41.1 38.5
* Excluding withdrawn/compounded cases.
Disposal of IPC cases by
courts during the year
Status of disposal of various categories of IPC cases by courts are presented in Table - 4.9. There were 93,28,085 cases for trials (including pending cases from the previous years) during the year 2012 as compared to 89,39,161 cases during the previous year 2011. The percentage of cases in which trials were completed has decreased to 13.4% in the year 2012 from 15.4% in the year 2011. 84.6% of IPC cases remained pending for trial at the end of the year in various criminal courts of the country.
Disposal of violent crimes by
courts
State/UT-wise and crime head-wise disposal details of violent crimes by courts are given in Table - 4.17. Trials in as many as 1,38,424
violent crime cases were completed by courts during the year 2012 representing 11.1% of total IPC crime in which trial completed (12,52,138 cases) at all-India level.
It is observed from Table - 4.10 that the state/UT of Arunachal Pradesh, Bihar, Gujarat, Maharashtra, Manipur, Meghalaya, Odisha, West Bengal, A & N Islands and D & N Haveli had reported of pendency of more than 90% of cases under IPC. The details regarding crime head-wise pendency percentage of IPC cases for trial can be seen in Table - 4.11. More than 84.0% of pendency was observed for most of the IPC crimes.
Conviction rate of IPC crimes
The conviction rate i.e. the ratio of cases convicted to the total cases tried, in the year 2012 was 38.5% which was less as compared to 41.1% in the year 2011.
LatestLaws.com
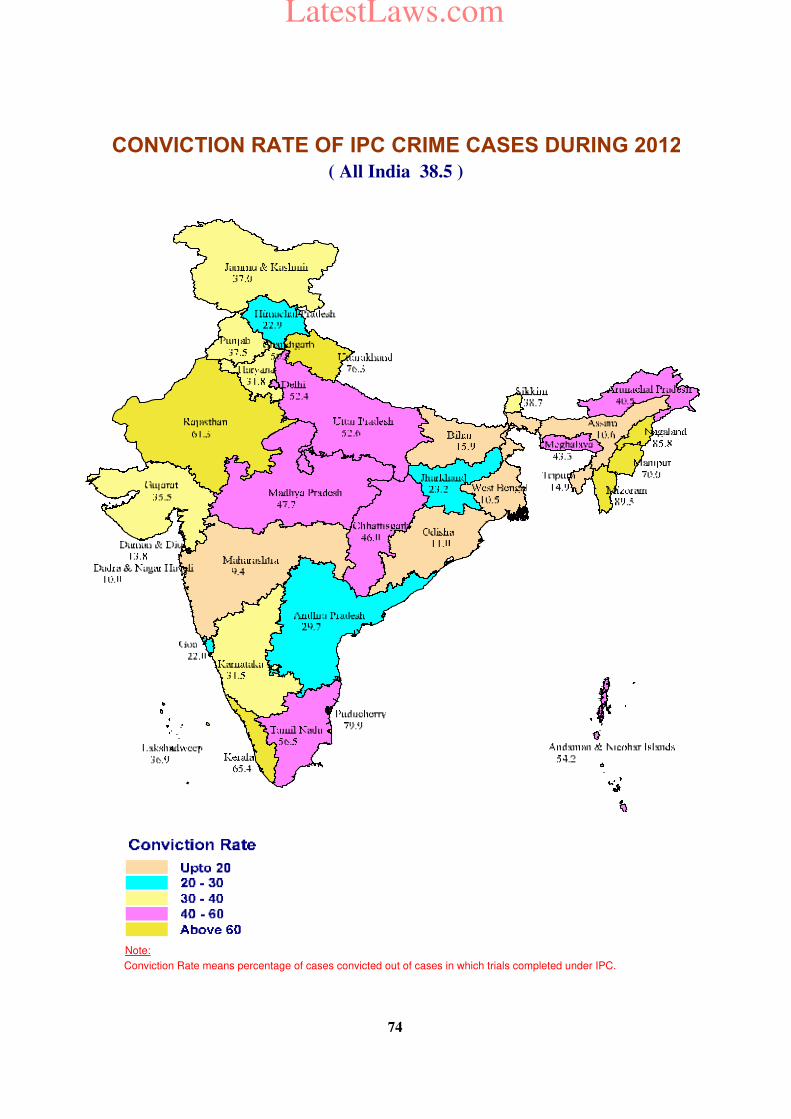
Note:
Conviction Rate means percentage of cases convicted out of cases in which trials completed under IPC.
CONVICTION RATE OF IPC CRIME CASES DURING 2012
( All India 38.5 )
74
LatestLaws.com
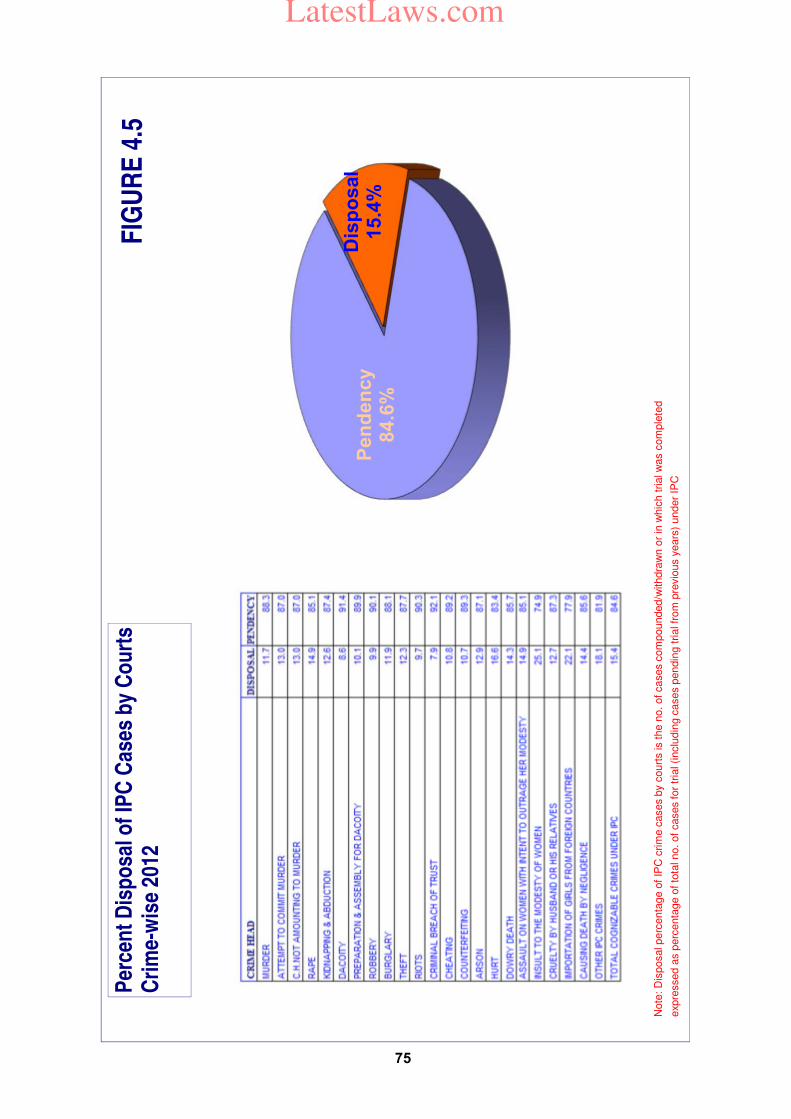
Dis
po
sal
15.4
%P
en
den
cy
84.6
%
Per
cen
t D
isp
osa
l of
IPC
Cas
es b
y C
ou
rts
Cri
me-
wis
e 20
12F
IGU
RE
4.5
Note
: D
isposal p
erc
enta
ge o
f IP
C c
rim
e c
ases b
y c
ourt
s is
the n
o.
of cases c
om
pounded/w
ithdra
wn o
r in
whic
h t
rial w
as c
om
ple
ted
exp
ressed a
s p
erc
enta
ge o
f to
tal no. of
cases for
tria
l (inclu
din
g c
ases p
endin
g t
rial fr
om
pre
vio
us y
ears
) under
IPC
75
LatestLaws.com
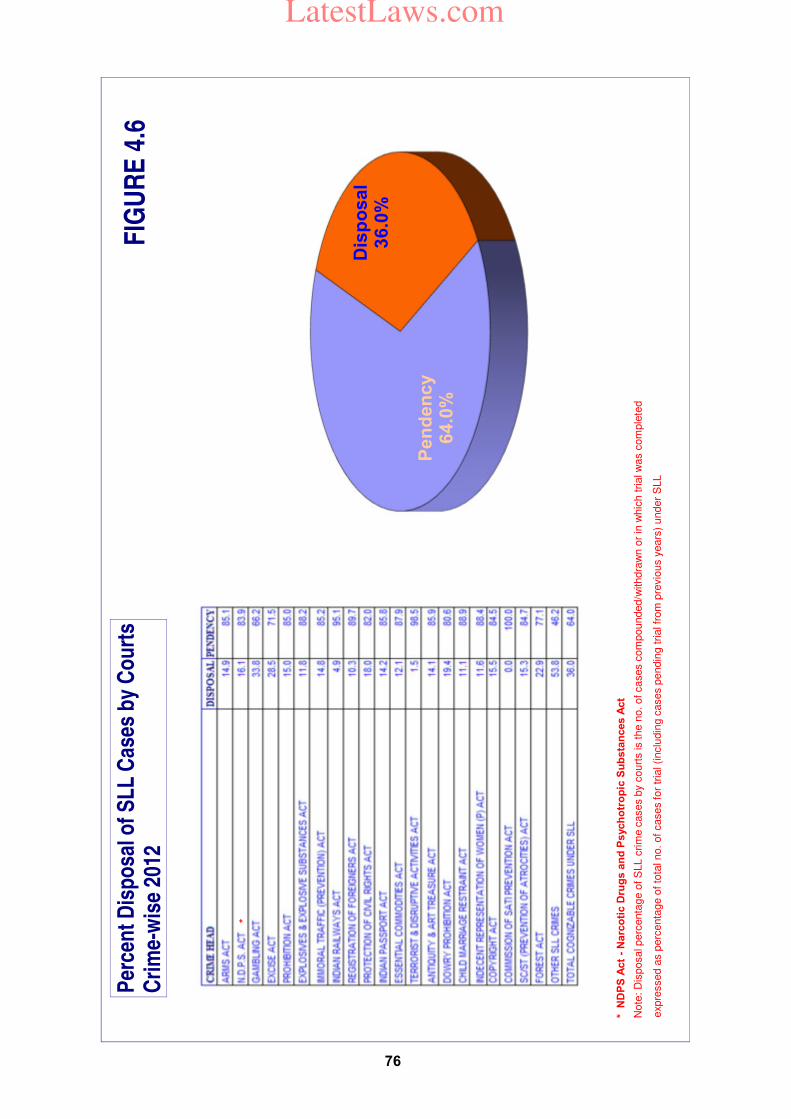
Dis
po
sal
36
.0%
Pen
den
cy
64
.0%
Per
cen
t D
isp
osa
l of
SL
L C
ases
by
Co
urt
s C
rim
e-w
ise
2012
FIG
UR
E 4
.6
Note
: D
isposal p
erc
enta
ge o
f S
LL c
rim
e c
ases b
y c
ourt
s is
the n
o. of cases c
om
pounded/w
ithdra
wn o
r in
whic
h t
rial w
as c
om
ple
ted
exp
ressed a
s p
erc
enta
ge o
f to
tal no. of
cases for
tria
l (inclu
din
g c
ases p
endin
g t
rial fr
om
pre
vio
us y
ears
) under
SLL
* N
DP
S A
ct
-N
arc
oti
c D
rug
s a
nd
Psych
otr
op
ic S
ub
sta
nces A
ct
*
76
LatestLaws.com
77
The crime head - wise analysis revealed that the conviction rate was highest in cases relating to insult to the modesty of women (36.9%) followed by counterfeiting (36.2%), murder (35.6%) and culpable homicide not amounting to murder (33.3%). The highest percentage of cases which were either compounded or withdrawn was reported under ‘Insult to the modesty of women’ (4.0%) cases followed by ‘hurt’ (3.6%). State / UT-wise details of conviction rates are presented for various IPC crimes in Table - 4.12. It is observed that three north eastern States namely Manipur, Mizoram and Nagaland have reported higher conviction rates for various crimes under IPC as compared to other States during 2012.
Disposal of SLL cases by
courts
The details of SLL crimes disposed by the courts are presented in Table - 4.13. There were as many as 82,51,289 SLL cases, including those pending from the previous years, for disposal by criminal courts in the country during the year 2012. There was a decrease of 2.4% in SLL cases pending trial in the year 2012 as compared to the year 2011 (84,51,289 cases). The pendency of SLL cases in courts during the year 2012 was higher at 64.0% as compared to 57.9% in the year 2011. The State/UT-wise disposal of SLL crimes by various courts are given in Table - 4.14. The pendency for SLL cases was reported to be high from Arunachal Pradesh (97.6%). The
next in the order was Manipur (96.4%) followed by West Bengal (94.6%), Meghalaya (93.6%), Bihar (90.6%), Odisha (90.3%), Assam (89.0%) and Maharashtra (88.4%). The highest pendency among UTs was reported from Delhi (92.5%) followed by Andaman & Nicobar Islands (88.8%). The percentage disposals of various SLL crimes by courts during the year 2012 are presented in Table - 4.15. The percentage of cases convicted to total cases tried was highest in cases of Gambling Act (85.4%), Registration of Foreigner Act (82.8%), Excise Act (82.2%) and Forest Act (80.1%)
Conviction rate of SLL crimes
State / UT-wise details of conviction rate of various SLL crimes are presented in Table - 4.16. The conviction rate for SLL crimes was much higher (88.6%) than that of IPC crimes (38.5%) at the national level. The conviction rate for SLL crimes was much higher than that of IPC crimes except 5 States/UTs showing the reverse trend. The conviction rate for SLL crimes and IPC crimes in respect of these States/UTs were Arunachal Pradesh (35.0 SLL crimes, 40.5 IPC crimes), Manipur (46.2 SLL crimes, 70.0 IPC crimes), Mizoram (86.0 SLL crimes, 89.5 IPC crimes) D & N Haveli (8.0 SLL crimes, 10.0 IPC crimes) and Puducherry (57.7 SLL crimes, 79.9 IPC crimes).
LatestLaws.com
78
Duration of trials for IPC
crimes by various courts
The duration of trials (for completed trials) compiled for the IPC crimes at various levels of courts from all the States / UTs are presented in Table - 4.18. It was observed that 36,757 trials (2.9%) were completed after 10 years of trial, 1,55,585 (12.4%) trials took between 5 to 10 years, 2,85,778 (22.8%) trials took between 3 to 5 years, 4,00,965 (32.0%) trials took between 1 to 3 years, 2,15,924 (17.2%) trials took between 6 months to a year and 1,56,856 (12.5%) trials completed within 6 months. It may be seen that maximum disposal of cases by various courts (32.0%) took place between 1 to 3 years followed by 3 - 5 years (22.8%).
Salient features
1) Charge-sheeting rate for IPC crimes was low in Manipur (4.2%) against the national average of
78.8%. 2) The Conviction rate for IPC cases was low in Maharashtra (9.4%), D&N Haveli (10.0%), West Bengal (10.5%), Assam (10.6%), Odisha (11.0%), Daman & Diu (13.8%), Tripura (14.9%) and Bihar (15.9%) as compared to national average of 38.5%. 3) The percentage pendency of cases (IPC and SLL both) for trials was found to be on higher side in north eastern States except Mizoram and Nagaland. 4) The conviction rates for SLL crimes in respect of Daman & Diu (nil), Odisha (12.1%), Assam (11.4%) and Maharashtra (16.3%) were very low against the national average of 88.6%. 5) 98.5% cases were reported as pending for trial under ‘TADA’ at the end of the year 2012.
*****
LatestLaws.com
79
Chapter-5
Crime against Women
Although women may be victims of any of the general crimes such as ‘murder’, ‘robbery’, ‘cheating’, etc, only the crimes which are directed specifically against women are characterised as ‘crimes against women’. Various new legislations have been brought and amendments have been made in existing laws with a view to handle these crimes effectively. These are broadly classified under two categories.
(1) The crimes under the Indian Penal Code (IPC)
(i) Rape (Sec. 376 IPC) (ii) Kidnapping & abduction for
specified purposes (Sec. 363 - 373 IPC)
(iii) Homicide for dowry, dowry deaths or their attempts (Sec. 302/304-B IPC)
(iv) Torture - both mental and physical (Sec. 498-A IPC)
(v) Assault on women with intent to outrage her modesty (Sec. 354 IPC)
(vi) Insult to the modesty of women (Sec. 509 IPC)
(vii) Importation of girl from foreign country (upto 21 years of age) (Sec. 366-B IPC)
(2) The crimes under the special & local laws (SLL)
Although all laws are not gender specific, the provisions of law affecting women significantly have been reviewed periodically and amendments carried out to keep pace
with the emerging requirements. The gender specific laws for which crime statistics are recorded throughout the country are - (i) Immoral Traffic (Prevention) Act,
1956 (ii) Dowry Prohibition Act, 1961 (iii) Indecent Representation of
Women (Prohibition) Act, 1986 (iv) Commission of Sati Prevention
Act, 1987
This year the crime rate for crimes committed against women has been calculated using only female population based on RGI`s Mid-year projected female population. Therefore ‘crime rate’ of year 2012 is not comparable to previous years’ ‘crime rate’.
Reported incidents of crime
(Incidence- 2,44,270)
A total of 2,44,270 incidents of crime against women (both under IPC and SLL) were reported in the country during the year 2012 as compared to 2,28,650 in the year 2011 recording an increase of 6.4% during the year 2012. These crimes have continuously increased during 2008 - 2012 with 1,95,856 cases in the year 2008, 2,03,804 cases in 2009 and 2,13,585 cases in 2010 and 2,28,650 cases in 2011 and 2,44,270 cases in the year 2012. West Bengal with 7.5% share of country’s female population has accounted for nearly 12.7% of total crime against women by reporting 30,942 cases during the year 2012. Andhra Pradesh,
LatestLaws.com
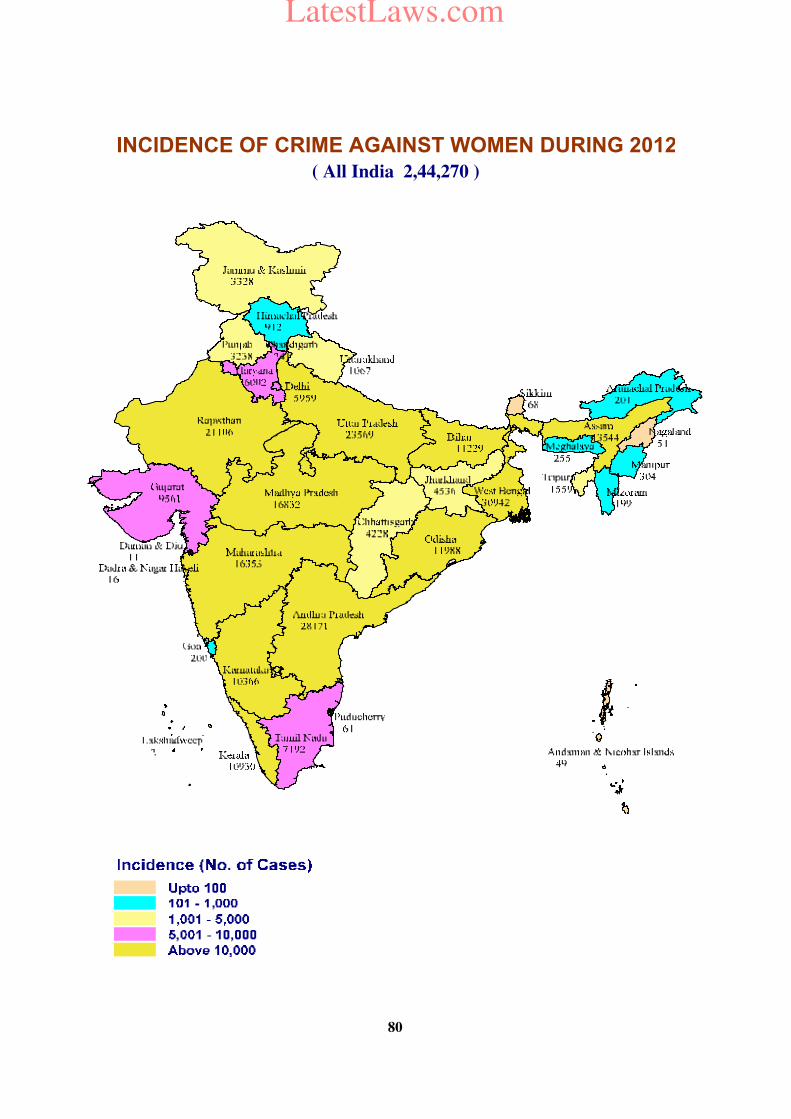
INCIDENCE OF CRIME AGAINST WOMEN DURING 2012
( All India 2,44,270 )
80
LatestLaws.com
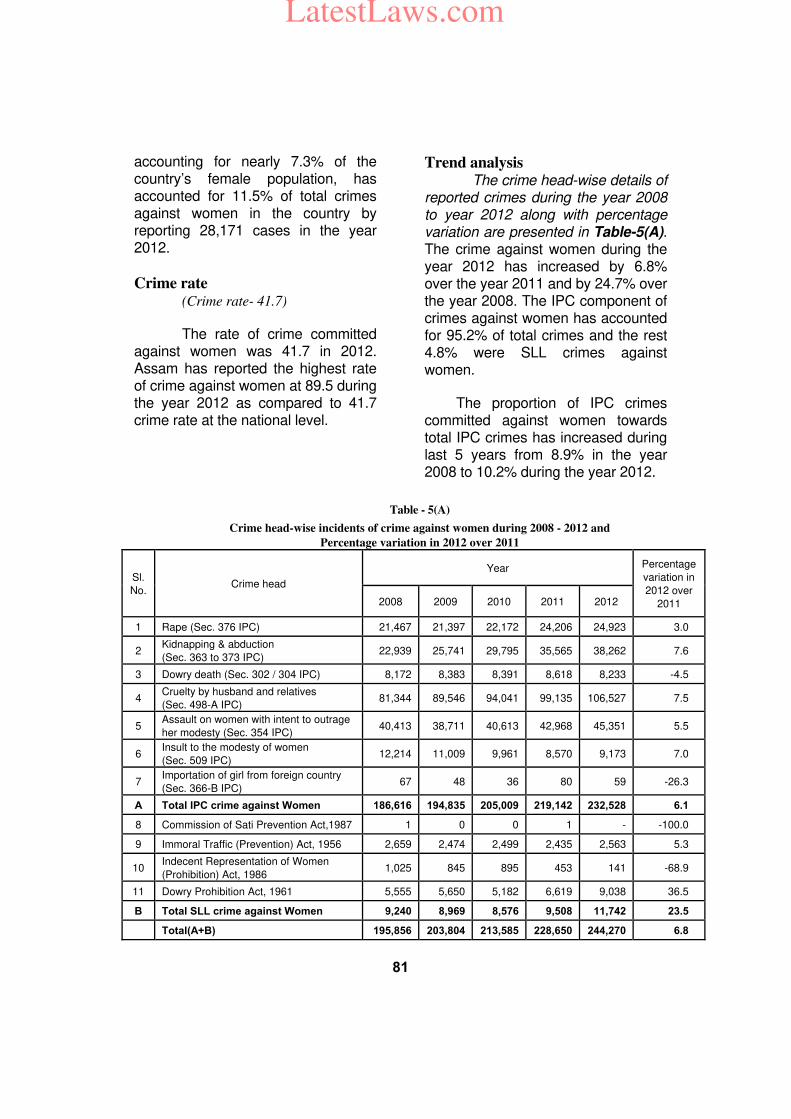
81
accounting for nearly 7.3% of the country’s female population, has accounted for 11.5% of total crimes against women in the country by reporting 28,171 cases in the year 2012.
Crime rate (Crime rate- 41.7)
The rate of crime committed against women was 41.7 in 2012. Assam has reported the highest rate of crime against women at 89.5 during the year 2012 as compared to 41.7 crime rate at the national level.
Trend analysis The crime head-wise details of reported crimes during the year 2008 to year 2012 along with percentage variation are presented in Table-5(A). The crime against women during the year 2012 has increased by 6.8% over the year 2011 and by 24.7% over the year 2008. The IPC component of crimes against women has accounted for 95.2% of total crimes and the rest 4.8% were SLL crimes against women.
The proportion of IPC crimes committed against women towards total IPC crimes has increased during last 5 years from 8.9% in the year 2008 to 10.2% during the year 2012.
Table - 5(A)
Crime head-wise incidents of crime against women during 2008 - 2012 and
Percentage variation in 2012 over 2011
Sl.
No. Crime head
Year Percentage
variation in
2012 over
2011 2008 2009 2010 2011 2012
1 Rape (Sec. 376 IPC) 21,467 21,397 22,172 24,206 24,923 3.0
2 Kidnapping & abduction
(Sec. 363 to 373 IPC) 22,939 25,741 29,795 35,565 38,262 7.6
3 Dowry death (Sec. 302 / 304 IPC) 8,172 8,383 8,391 8,618 8,233 -4.5
4 Cruelty by husband and relatives
(Sec. 498-A IPC) 81,344 89,546 94,041 99,135 106,527 7.5
5 Assault on women with intent to outrage
her modesty (Sec. 354 IPC) 40,413 38,711 40,613 42,968 45,351 5.5
6 Insult to the modesty of women
(Sec. 509 IPC) 12,214 11,009 9,961 8,570 9,173 7.0
7 Importation of girl from foreign country
(Sec. 366-B IPC) 67 48 36 80 59 -26.3
A Total IPC crime against Women 186,616 194,835 205,009 219,142 232,528 6.1
8 Commission of Sati Prevention Act,1987 1 0 0 1 - -100.0
9 Immoral Traffic (Prevention) Act, 1956 2,659 2,474 2,499 2,435 2,563 5.3
10 Indecent Representation of Women
(Prohibition) Act, 1986 1,025 845 895 453 141 -68.9
11 Dowry Prohibition Act, 1961 5,555 5,650 5,182 6,619 9,038 36.5
B Total SLL crime against Women 9,240 8,969 8,576 9,508 11,742 23.5
Total(A+B) 195,856 203,804 213,585 228,650 244,270 6.8
LatestLaws.com
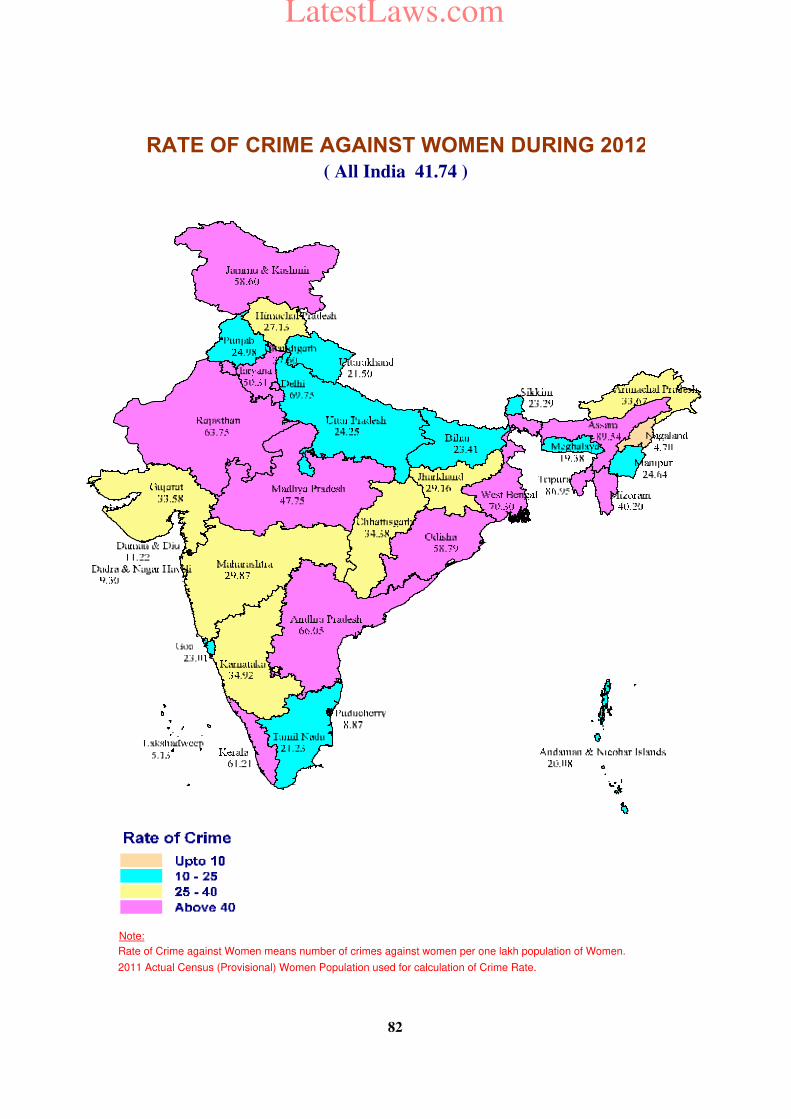
Note:
Rate of Crime against Women means number of crimes against women per one lakh population of Women.
2011 Actual Census (Provisional) Women Population used for calculation of Crime Rate.
RATE OF CRIME AGAINST WOMEN DURING 2012
( All India 41.74 )
82
LatestLaws.com
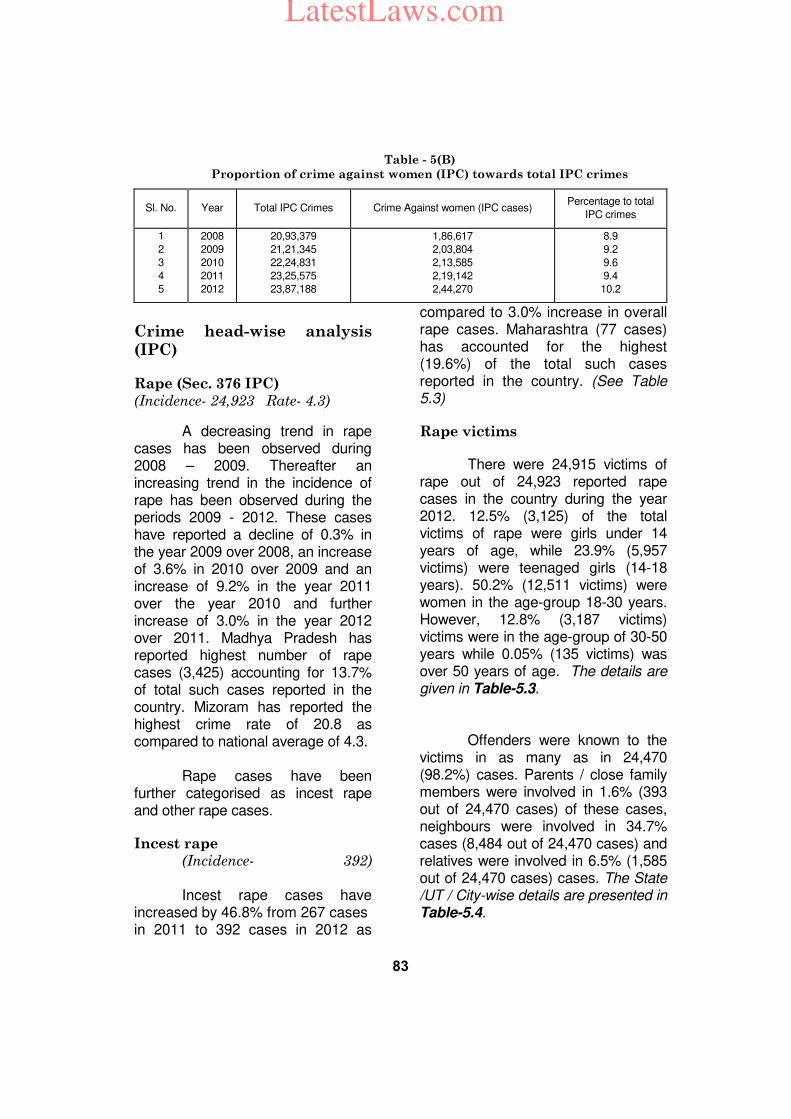
83
Table - 5(B)
Proportion of crime against women (IPC) towards total IPC crimes
Sl. No. Year Total IPC Crimes Crime Against women (IPC cases) Percentage to total
IPC crimes
1
2
3
4
5
2008
2009
2010
2011
2012
20,93,379
21,21,345
22,24,831
23,25,575
23,87,188
1,86,617
2,03,804
2,13,585
2,19,142
2,44,270
8.9
9.2
9.6
9.4
10.2
Crime head-wise analysis (IPC)
Rape (Sec. 376 IPC)
(Incidence- 24,923 Rate- 4.3)
A decreasing trend in rape cases has been observed during 2008 – 2009. Thereafter an increasing trend in the incidence of rape has been observed during the periods 2009 - 2012. These cases have reported a decline of 0.3% in the year 2009 over 2008, an increase of 3.6% in 2010 over 2009 and an increase of 9.2% in the year 2011 over the year 2010 and further increase of 3.0% in the year 2012 over 2011. Madhya Pradesh has reported highest number of rape cases (3,425) accounting for 13.7% of total such cases reported in the country. Mizoram has reported the highest crime rate of 20.8 as compared to national average of 4.3. Rape cases have been further categorised as incest rape and other rape cases.
Incest rape
(Incidence- 392)
Incest rape cases have increased by 46.8% from 267 cases in 2011 to 392 cases in 2012 as
compared to 3.0% increase in overall rape cases. Maharashtra (77 cases) has accounted for the highest (19.6%) of the total such cases reported in the country. (See Table 5.3)
Rape victims
There were 24,915 victims of rape out of 24,923 reported rape cases in the country during the year 2012. 12.5% (3,125) of the total victims of rape were girls under 14 years of age, while 23.9% (5,957 victims) were teenaged girls (14-18 years). 50.2% (12,511 victims) were women in the age-group 18-30 years. However, 12.8% (3,187 victims) victims were in the age-group of 30-50 years while 0.05% (135 victims) was over 50 years of age. The details are given in Table-5.3. Offenders were known to the victims in as many as in 24,470 (98.2%) cases. Parents / close family members were involved in 1.6% (393 out of 24,470 cases) of these cases, neighbours were involved in 34.7% cases (8,484 out of 24,470 cases) and relatives were involved in 6.5% (1,585 out of 24,470 cases) cases. The State /UT / City-wise details are presented in Table-5.4.
LatestLaws.com
84
Kidnapping & abduction
(Sec. 363-373 IPC)
(Incidence- 38,262 Rate- 6.5)
These cases have reported an increase of 7.6% during the year as compared to previous year (35,565 cases). Uttar Pradesh with 7,910 cases has accounted for 22.2% of the total cases at the national level. Delhi UT has reported the highest crime rate at 25.3 as compared to the national average of 6.5.
Dowry Deaths
(Sec. 302, 304B IPC)
(Incidence- 8,233 Rate- 1.4)
The cases of dowry deaths have decreased by 4.5% during the year 2012 over the previous year (8,618 cases). 27.3% of the total such cases reported in the country were reported from Uttar Pradesh (2,244 cases) alone followed by Bihar (1,275 cases) (15.5%). The highest rate of crime (2.7) was reported from Bihar as compared to the national average of 1.4.
Torture (cruelty by husband or
his relatives) (Sec. 498-A IPC)
(Incidence-1,06,527 Rate-18.2)
‘Torture’ cases in the country have increased by 7.5% over the previous year (99,135 cases). 18.7% of these were reported from West Bengal (19,865 cases) followed by Andhra Pradesh 12.6% (13,389 cases) and Rajasthan 12.5% (13,312). The highest crime rate of 47.8 was reported from Tripura as compared to the national rate at 18.2.
Assault on women with intent to
outrage her modesty
(Sec. 354 IPC)
(Incidence-45,351 Rate- 7.7)
Incidents of Assault on Women with Intent to outrage her Modesty in the country have increased by 5.5% over the previous year (42,968 cases). Madhya Pradesh has reported the highest incidence (6,655) amounting to 14.7% of total such incidences. Kerala has reported the highest crime rate (20.9) as compared to the National average of 7.7.
Insult to the modesty of women
(Sec. 509 IPC)
(Incidence- 9,173 Rate- 1.6)
The number of such cases has increased by 7% during the year over the previous year (8,570 cases). Andhra Pradesh has reported 40.5% (3,714 cases) followed by Maharashtra 14.1% (1,294 cases) of total incidences during the year 2012. Andhra Pradesh has reported the highest crime rate (8.7) as compared to the national average of 1.6.
Importation of girl from foreign
country (Sec. 366-B IPC)
(Incidence- 59)
A decrease of 26.2% has been observed in crime head as 59 cases were reported during the year 2012 as compared to 80 cases in the previous year (2011). Karnataka (32 cases) and West Bengal (12 cases) have together contributed 93.2% of total such cases at the national level.
LatestLaws.com
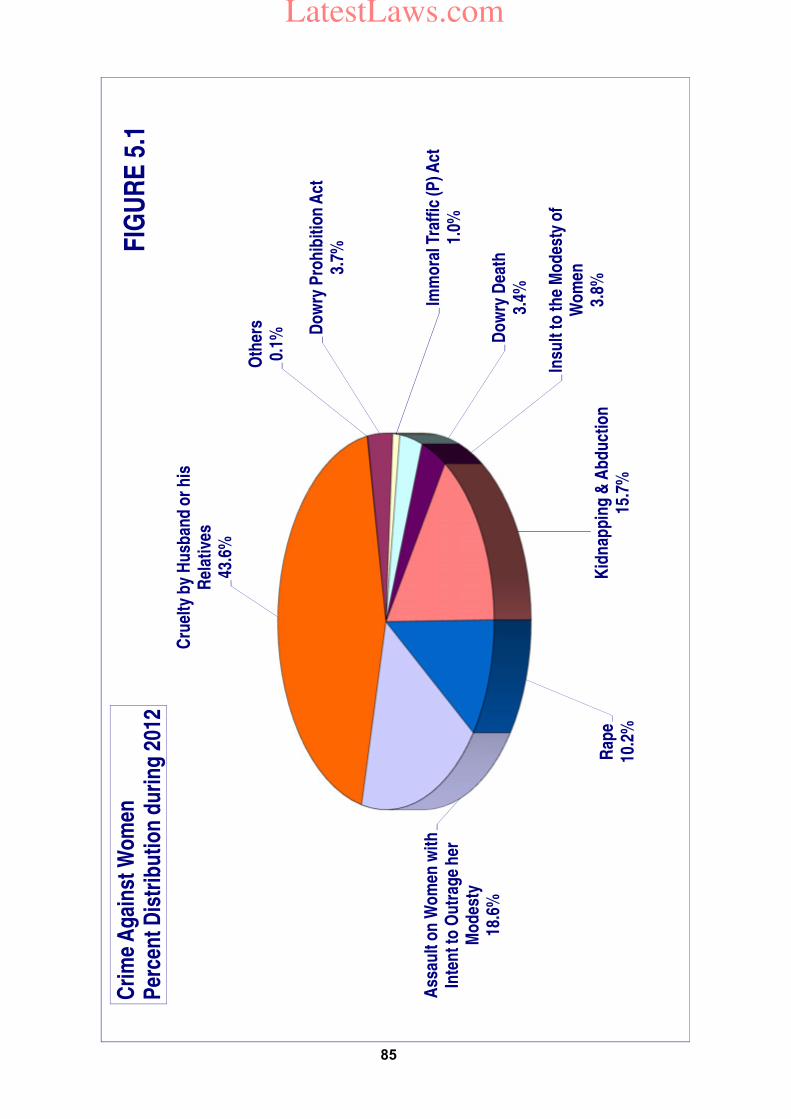
Oth
ers
0.1%
Do
wry
Pro
hib
itio
n A
ct3.
7%
Imm
ora
l Tra
ffic
(P
) Act
1.0%
Do
wry
Dea
th3.
4%
Insu
lt t
o t
he
Mo
des
ty o
f W
om
en3.
8%K
idn
app
ing
& A
bd
uct
ion
15.7
%R
ape
10.2
%
Ass
ault
on
Wo
men
wit
h
Inte
nt
to O
utr
age
her
M
od
esty
18.6
%
Cru
elty
by
Hu
sban
d o
r h
is
Rel
ativ
es43
.6%
Cri
me
Ag
ain
st W
om
en
Per
cen
t D
istr
ibu
tio
n d
uri
ng
201
2F
IGU
RE
5.1
85
LatestLaws.com
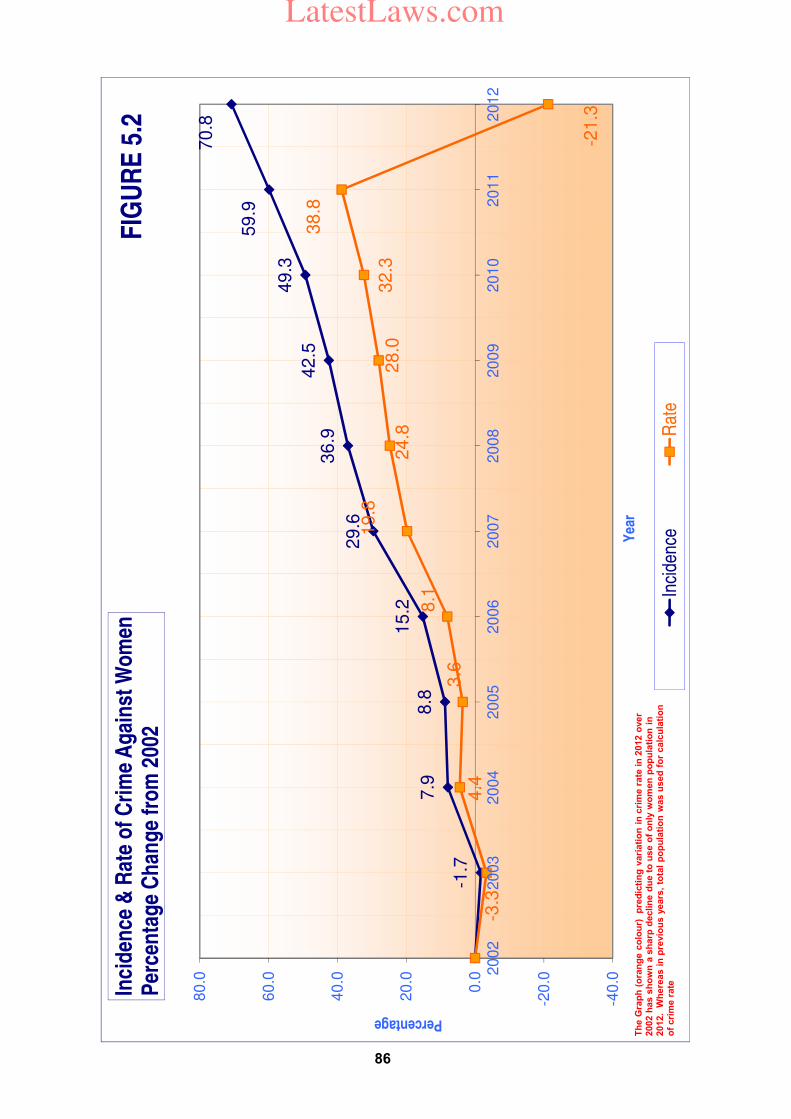
-1.7
7.9
8.8
15.2
29.6
36.9
42.5
49.3
59.9
70.8
-3.3
4.4
3.6
8.1
19.8
24.8
28.0
32.3
38.8
-21
.3-4
0.0
-20
.0
0.0
20
.0
40
.0
60
.0
80
.0
20
02
20
03
20
04
20
05
20
06
20
07
20
08
20
09
20
10
20
11
20
12
Percentage
Yea
r
Inci
den
ce &
Rat
e o
f C
rim
e A
gai
nst
Wo
men
P
erce
nta
ge
Ch
ang
e fr
om
200
2
Inci
denc
eR
ate
FIG
UR
E 5
.2
Th
e G
rap
h (
ora
ng
e c
olo
ur)
p
red
icti
ng
vari
ati
on
in
cri
me r
ate
in
2012 o
ver
2002 h
as s
ho
wn
a s
harp
declin
e d
ue t
o u
se o
f o
nly
wo
men
po
pu
lati
on
in
2012.
Wh
ere
as i
n p
revio
us y
ears
, to
tal
po
pu
lati
on
was u
sed
fo
r calc
ula
tio
n
of
cri
me r
ate
86
LatestLaws.com
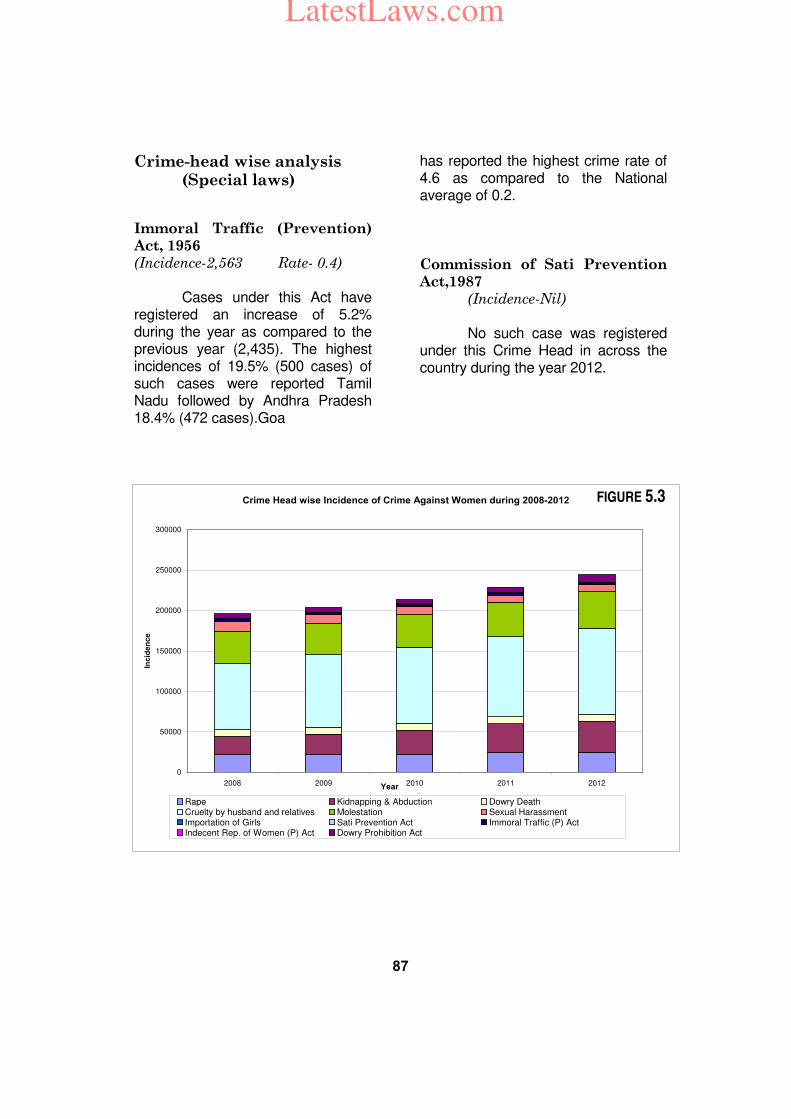
87
Crime-head wise analysis (Special laws)
Immoral Traffic (Prevention)
Act, 1956
(Incidence-2,563 Rate- 0.4)
Cases under this Act have registered an increase of 5.2% during the year as compared to the previous year (2,435). The highest incidences of 19.5% (500 cases) of such cases were reported Tamil Nadu followed by Andhra Pradesh 18.4% (472 cases).Goa
has reported the highest crime rate of 4.6 as compared to the National average of 0.2.
Commission of Sati Prevention
Act,1987
(Incidence-Nil)
No such case was registered under this Crime Head in across the country during the year 2012.
Crime Head wise Incidence of Crime Against Women during 2008-2012
0
50000
100000
150000
200000
250000
300000
2008 2009 2010 2011 2012Year
Inc
ide
nc
e
Rape Kidnapping & Abduction Dowry Death Cruelty by husband and relatives Molestation Sexual Harassment Importation of Girls Sati Prevention Act Immoral Traffic (P) ActIndecent Rep. of Women (P) Act Dowry Prohibition Act
FIGURE 5.3
LatestLaws.com
88
Indecent Representation of
Women (Prohibition) Act, 1986
(Incidence- 141 Rate-Negligible)
A decrease of 68.9% was noticed in this crime head during the year 2012 as compared to the previous year (453 cases). Rajasthan with 62 cases has accounted for 44% of total such cases at the national level which has also reported the highest crime rate of 0.2.
Dowry Prohibition Act
(Incidence-9,038 Rate-1.5)
The cases under this Act have increased by 36.5% during the year 2012 as compared to the previous year (6,619 cases). 27.8% of cases were reported from Andhra Pradesh (2,511) followed by Odisha (1,487 cases) accounting for 16.5% of total cases at the national level. The highest crime rate of 7.3 was reported from Odisha as compared to 1.5 at the national level.
Crime against women in cities (All-India- 2,44,270
Cities- 36,622)
53 cities having population over 10 lakh (See Chapter-2) have been identified as mega cities as per population census 2011. A total of 36,622 cases of crimes against women were reported from these 53 cities during the year 2012 as compared to 33,789 cases in the year 2011. The rate of crime in cities at 47.8 was comparatively higher as compared to the national rate of 41.7. Among 53 cities, Delhi (5,194
cases) has accounted for 14.2% of total such crimes followed by Bengaluru (6.2%) (2,263 cases), Kolkata (5.7%) (2,073 cases), Hyderabad (5.2%) (1,899 cases) and Vijayawada (5.2%) (1,898 cases). The crime rate was significantly higher in Vijayawada, Kota, Kollam, Jaipur and Indore at 256.4, 130.2, 106.3, 98.1 and 88.8 respectively as compared to average (47.8) of mega cities.
Delhi city has accounted for 19.3% of rape cases, 23.1% of kidnapping & abduction cases, 14.6% of dowry deaths and 10.9% of assault on women with intent to outrage her modesty cases among 53 cities. Delhi has reported 11.1% (1,870 cases) of incidences of cruelty by husband or his relatives. Vijayawada has reported 16.6% incidences of insult to the modesty of women. Only 9 cases of ‘importation of girl from foreign country’ at all India level have been reported from Kolkata.
It is worthwhile to mention that Chennai, Bengaluru, Hyderabad and Mumbai have booked more cases under special & local laws among the mega cities. 16.5% (193 out of 1,170) of cases under Immoral Traffic (Prevention) Act and 11.0% (639 out of 5,836) of cases under assault on women with intent to outrage her modesty was reported in Delhi alone. Similarly, 50% (10 out of 20 cases) and 40% (8 out of 20 cases) of cases of Indecent Representation of Women Act were reported in Jaipur and Jodhpur respectively. 63.2% (633 out of 1,001) of cases under Dowry Prohibition Act during the year 2012 were registered in Bengaluru city alone.
LatestLaws.com
89
Chapter-6
Crime against Children
There is no separate classification of offences against children. Generally, the offences committed against children or the crimes in which children are the victims are considered as crime against children. Indian penal code and the various protective and preventive special and local laws specifically mention the offences wherein children are victims. The age of child varies as per the definition given in the concerned Acts and sections but age of child has been defined to be below 18 years as per Juvenile Justice Act, 2000. Therefore an offence committed on a victim under the age of 18 years is construed as crime against children for the purpose of analysis in this chapter. It is also to be borne in mind that the offences that are analysed in this chapter do not form an exclusive block of offences that are reported in the country. They are included in the IPC/SLL cases already discussed in other relevant chapters. The offences mentioned in this chapter have been culled out from various reported crimes in the country wherein the victims of the offences were children. The data on crimes against children is compiled through the revised annual returns w.e.f. year 2001. Cumulative totals of crime statistics available on monthly basis were used for this analysis till 2000. The revised annual returns have
additional heads like `murder of children’ and `other crimes’, therefore, incidents of crimes against children during 2001 and later years may not be comparable with the figures of year 2000 and before. The crime rate for crimes committed against children has been calculated using only children population (upto 18 years of age) based on Ministry of health & family welfare’s mid-year estimated children population, therefore the crime rate of reference year may not be comparable with the crime rate of previous years. The cases in which the children are victimised and abused can be categorised under two broad sections: 1) Crimes committed against
children which are punishable under Indian penal code (IPC).
2) Crimes committed against
children which are punishable under special and local laws (SLL).
Specific sections/Acts under above two categories are as follows:
1. Crime against children punishable under the Indian penal code (IPC) are:
a) Murder (302 IPC) b) Foeticides (Crime against a
foetus) IPC Section 315 & 316
LatestLaws.com
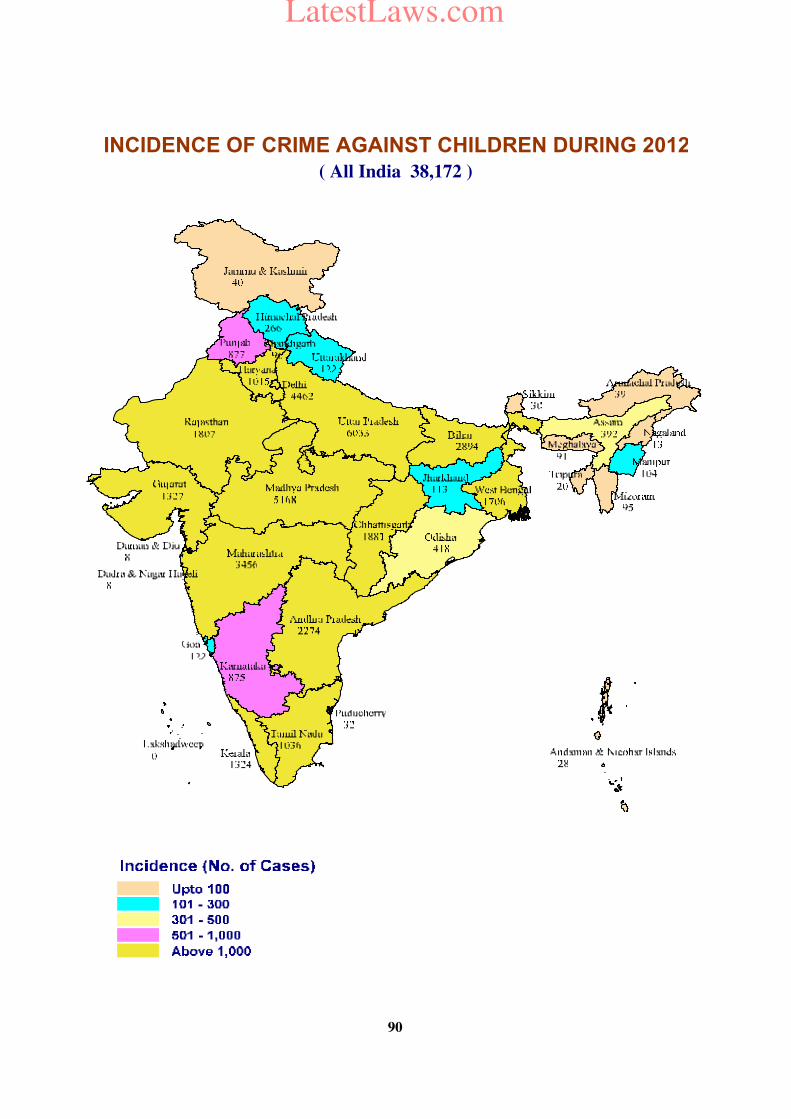
( All India 38,172 )
INCIDENCE OF CRIME AGAINST CHILDREN DURING 2012
90
LatestLaws.com
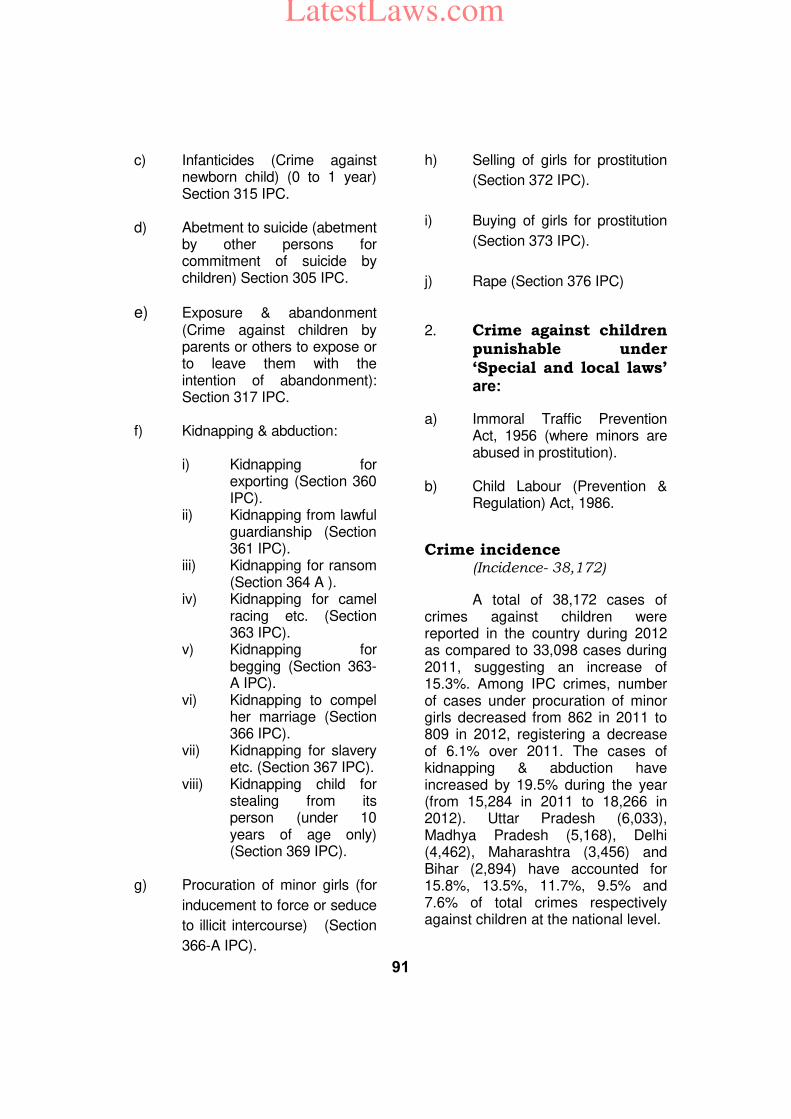
91
c) Infanticides (Crime against newborn child) (0 to 1 year) Section 315 IPC.
d) Abetment to suicide (abetment
by other persons for commitment of suicide by children) Section 305 IPC.
e) Exposure & abandonment (Crime against children by parents or others to expose or to leave them with the intention of abandonment): Section 317 IPC.
f) Kidnapping & abduction: i) Kidnapping for
exporting (Section 360 IPC).
ii) Kidnapping from lawful guardianship (Section 361 IPC).
iii) Kidnapping for ransom (Section 364 A ).
iv) Kidnapping for camel racing etc. (Section 363 IPC).
v) Kidnapping for begging (Section 363-A IPC).
vi) Kidnapping to compel her marriage (Section 366 IPC).
vii) Kidnapping for slavery etc. (Section 367 IPC).
viii) Kidnapping child for stealing from its person (under 10 years of age only) (Section 369 IPC).
g) Procuration of minor girls (for
inducement to force or seduce
to illicit intercourse) (Section
366-A IPC).
h) Selling of girls for prostitution
(Section 372 IPC).
i) Buying of girls for prostitution
(Section 373 IPC).
j) Rape (Section 376 IPC)
2. Crime against children punishable under ‘Special and local laws’ are:
a) Immoral Traffic Prevention Act, 1956 (where minors are abused in prostitution).
b) Child Labour (Prevention &
Regulation) Act, 1986.
Crime incidence (Incidence- 38,172)
A total of 38,172 cases of crimes against children were reported in the country during 2012 as compared to 33,098 cases during 2011, suggesting an increase of 15.3%. Among IPC crimes, number of cases under procuration of minor girls decreased from 862 in 2011 to 809 in 2012, registering a decrease of 6.1% over 2011. The cases of kidnapping & abduction have increased by 19.5% during the year (from 15,284 in 2011 to 18,266 in 2012). Uttar Pradesh (6,033), Madhya Pradesh (5,168), Delhi (4,462), Maharashtra (3,456) and Bihar (2,894) have accounted for 15.8%, 13.5%, 11.7%, 9.5% and 7.6% of total crimes respectively against children at the national level.
LatestLaws.com
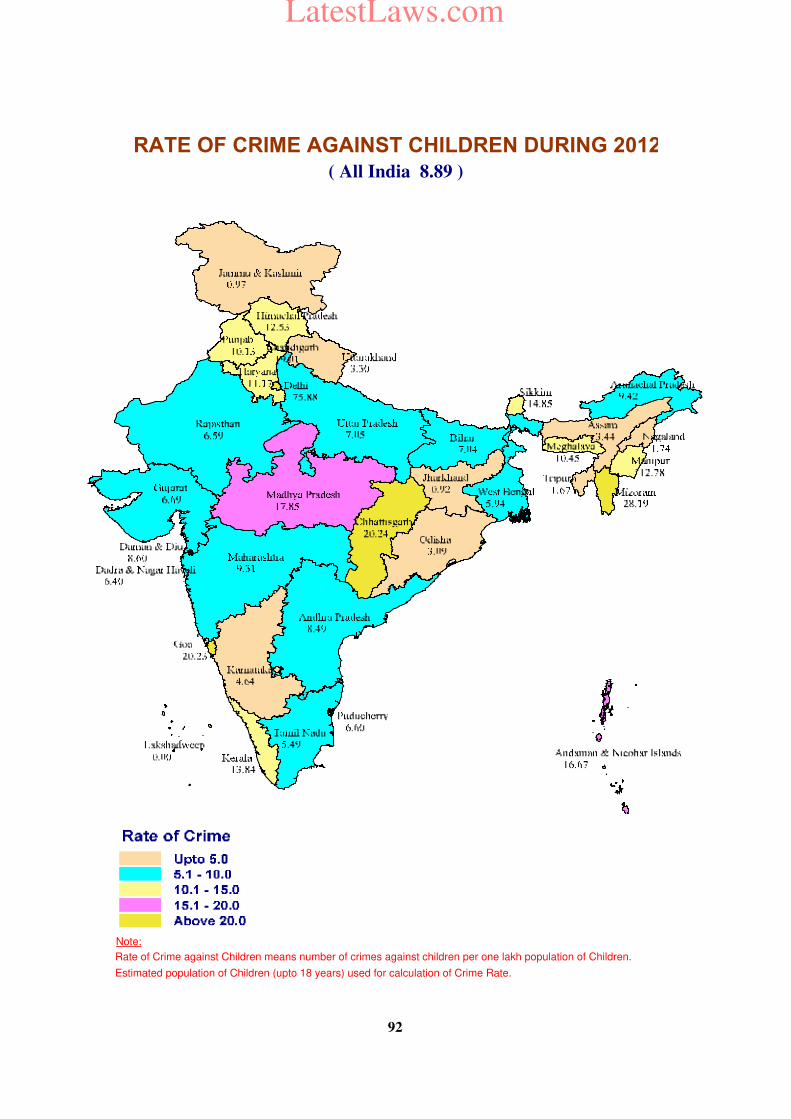
Note:
Rate of Crime against Children means number of crimes against children per one lakh population of Children.
Estimated population of Children (upto 18 years) used for calculation of Crime Rate.
RATE OF CRIME AGAINST CHILDREN DURING 2012
( All India 8.89 )
92
LatestLaws.com
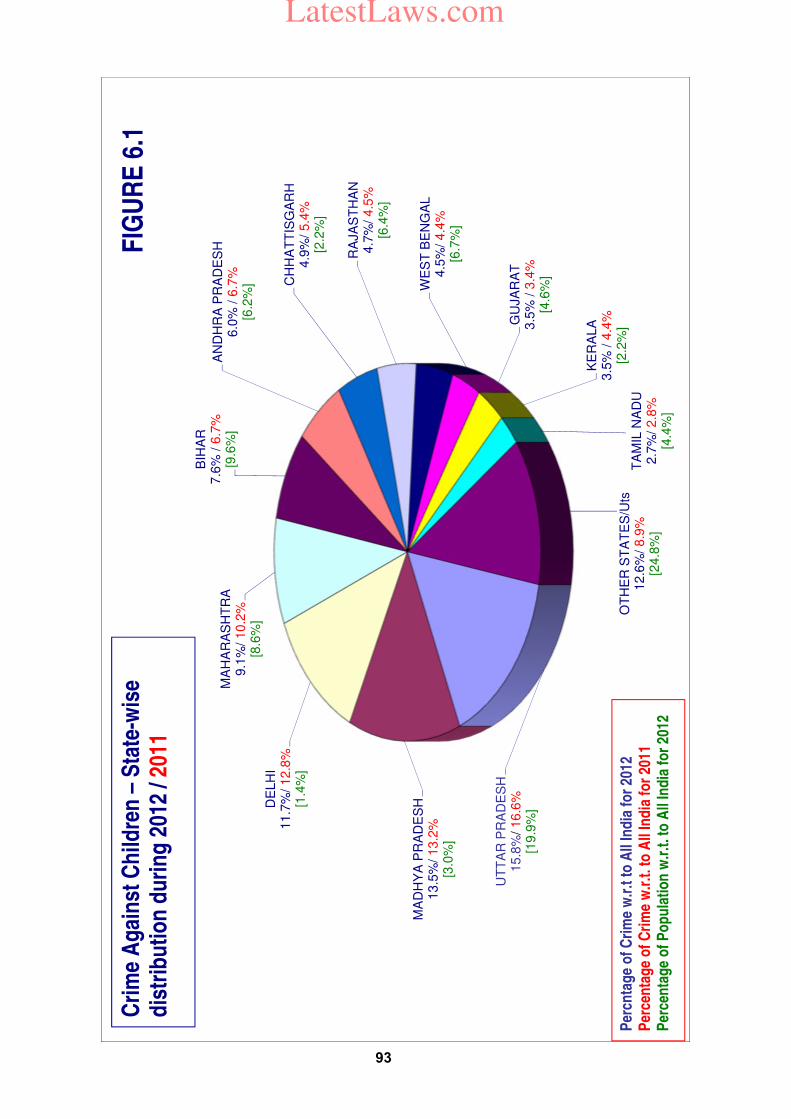
UT
TA
R P
RA
DE
SH
1
5.8
%/ 1
6.6
%[1
9.9
%]
MA
DH
YA
PR
AD
ES
H1
3.5
%/ 1
3.2
%[3
.0%
]
DE
LH
I 1
1.7
%/ 1
2.8
%[1
.4%
]
MA
HA
RA
SH
TR
A
9.1
%/ 1
0.2
%[8
.6%
]
BIH
AR
7.6
% / 6
.7%
[9.6
%]
AN
DH
RA
PR
AD
ES
H6.0
% / 6
.7%
[6.2
%] C
HH
AT
TIS
GA
RH
4.9
%/ 5
.4%
[2.2
%]
RA
JA
ST
HA
N4.7
%/ 4
.5%
[6.4
%]
WE
ST
BE
NG
AL
4.5
%/ 4
.4%
[6.7
%]
GU
JA
RA
T3.5
% / 3
.4%
[4.6
%]
KE
RA
LA
3.5
% / 4
.4%
[2.2
%]
TA
MIL
NA
DU
2.7
%/ 2
.8%
[4.4
%]
OT
HE
R S
TA
TE
S/U
ts1
2.6
%/ 8
.9%
[24
.8%
]
Cri
me
Ag
ain
st C
hild
ren
–S
tate
-wis
e d
istr
ibu
tio
n d
uri
ng
201
2 / 2
011
Per
cnta
ge
of
Cri
me
w.r
.t t
o A
ll In
dia
fo
r 20
12P
erce
nta
ge
of
Cri
me
w.r
.t. t
o A
ll In
dia
fo
r 20
11
Per
cen
tag
e o
f P
op
ula
tio
n w
.r.t
. to
All
Ind
ia f
or
2012
FIG
UR
E 6
.1
93
LatestLaws.com
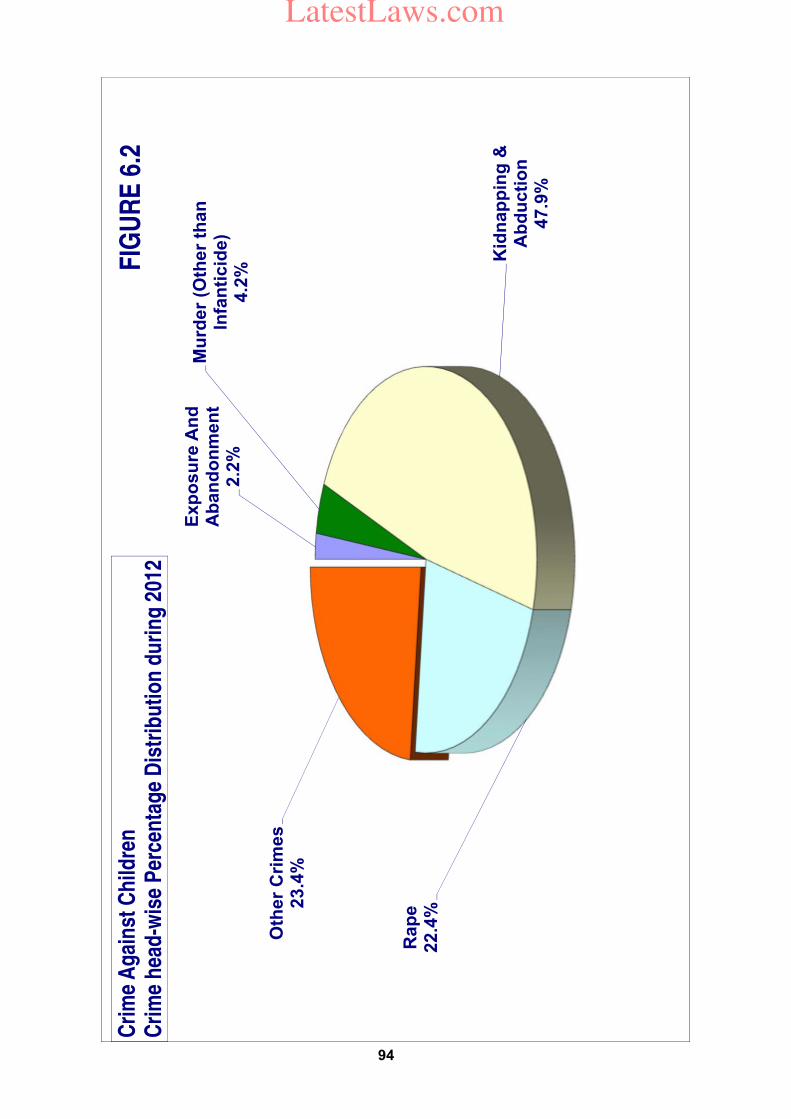
Exp
osu
re A
nd
A
ban
do
nm
en
t2
.2%
Mu
rder
(Oth
er
than
In
fan
ticid
e)
4.2
%
Kid
nap
pin
g &
A
bd
ucti
on
47.9
%
Rap
e2
2.4
%
Oth
er
Cri
me
s23.4
%
Cri
me
Ag
ain
st C
hild
ren
C
rim
e h
ead
-wis
e P
erce
nta
ge
Dis
trib
uti
on
du
rin
g 2
012
FIG
UR
E 6
.2
94
LatestLaws.com
95
Crime rate (Rate- 8.9)
The crime rate was observed as 8.9 during 2012. The rate was highest in Delhi (75.9) followed by Mizoram (28.2) Chhattisgarh (20.24), Goa (20.23), Chandigarh(19.0), Madhya Pradesh (17.8) and A&N Islands(16.7) as compared to the national average of 8.9.
Crime head-wise analysis
The State/UT-wise and crime head-wise incidents of crimes are presented in Table-6.2.
Murder (Including Infanticide) (Sec. 302 IPC and 315 IPC) (Incidence- 1,678 Rate- 0.4)
A total of 1,678 cases of murder of children (including infanticides) were reported in the country against 1,514 cases in 2011 resulting in an increase of 10.8% in 2012 over 2011. Uttar Pradesh has reported the highest number of such cases (463) accounting for 27.6% of the total cases reported in the country. Arunachal Pradesh, Jammu & Kashmir, Meghalaya, Daman & Diu, Lakshadweep and Puducherry did not report any case of child murder during the year 2012.
Infanticide (Sec. 315 IPC) (Incidence- 81 Rate-Negligible) A total of 81 Infanticide cases were reported in the country during the 2012. The incidents increased in the year 2012 (81 cases) from 63 cases in the year 2011. The increase amounted to 28.6% over 2011. 17
cases were reported from Madhya Pradesh and 14 cases reported from Uttar Pradesh of the 81 cases reported at national level. Rape (Sec. 376 IPC) (Incidence- 8,541 Rate- 2.0)
A total of 8,541 cases of child rape were reported in the country during 2012 as compared to 7,112 in 2011 accounting for an increase of 20.1% during the year 2012. Madhya Pradesh has reported the highest number of cases (1,632) followed by Uttar Pradesh (1,040) and Maharashtra (917). These three States together accounted for 42.0% of the total child rape cases reported in the country.
Kidnapping & abduction (Sec. 363 to 373 IPC) (Incidence-18,266 Rate-4.2)
A total of 18,266 cases of kidnapping & abduction of children were reported during the year 2012 as compared to 15,284 cases in the previous year accounting for a increase of 19.5%. Uttar Pradesh (4,239) followed by Delhi (3,686) has accounted for 23.2% and 20.2% respectively of the total cases reported in the country. The rate of crime was highest in Delhi (62.7) followed by Chandigarh (11.7) as compared to the national average of 4.2
Foeticide (Sec. 315 & 316 IPC) (Incidence-210 Rate-Negligible)
A total of 210 cases of
LatestLaws.com
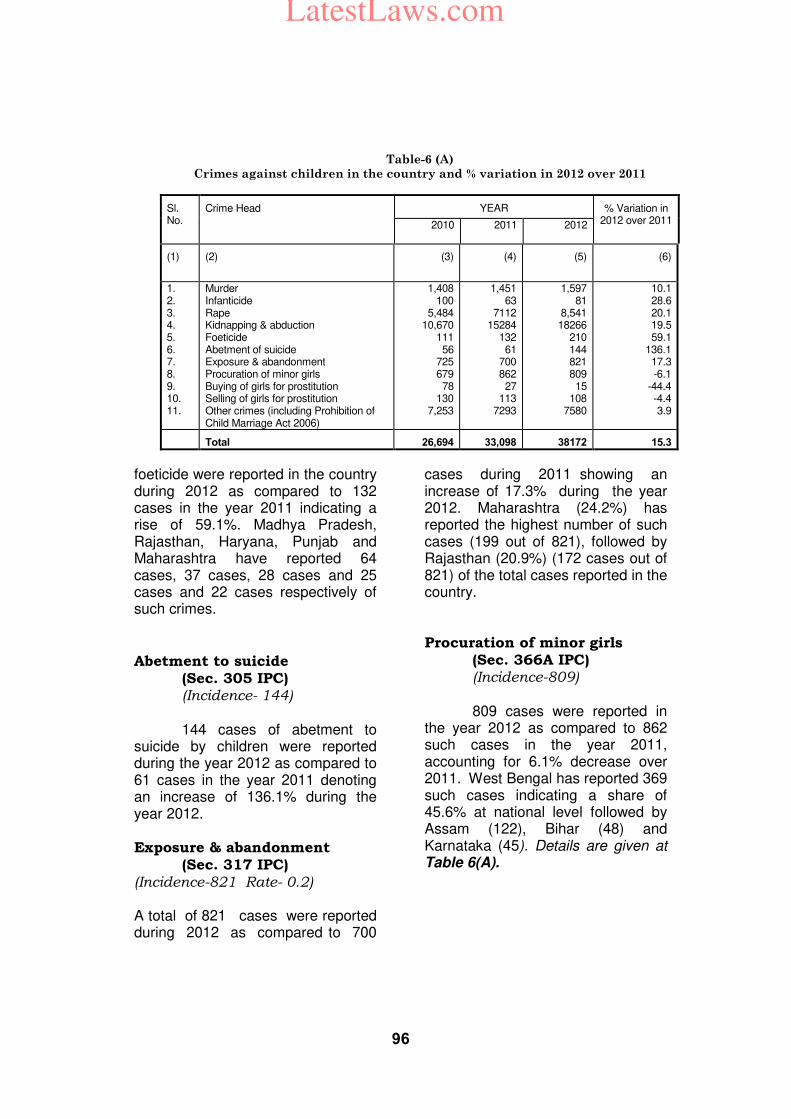
96
Table-6 (A)
Crimes against children in the country and % variation in 2012 over 2011
Sl. No.
Crime Head YEAR % Variation in 2012 over 2011 2010 2011 2012
(1) (2) (3) (4) (5) (6)
1. 2. 3. 4. 5. 6. 7. 8. 9. 10. 11.
Murder Infanticide Rape Kidnapping & abduction Foeticide Abetment of suicide Exposure & abandonment Procuration of minor girls Buying of girls for prostitution Selling of girls for prostitution Other crimes (including Prohibition of Child Marriage Act 2006)
1,408 100
5,484 10,670
111 56
725 679 78
130 7,253
1,451 63
7112 15284
132 61
700 862 27
113 7293
1,597 81
8,541 18266
210 144 821 809 15
108 7580
10.1 28.6 20.1 19.5 59.1
136.1 17.3 -6.1
-44.4 -4.4 3.9
Total 26,694 33,098 38172 15.3
foeticide were reported in the country during 2012 as compared to 132 cases in the year 2011 indicating a rise of 59.1%. Madhya Pradesh, Rajasthan, Haryana, Punjab and Maharashtra have reported 64 cases, 37 cases, 28 cases and 25 cases and 22 cases respectively of such crimes.
Abetment to suicide (Sec. 305 IPC) (Incidence- 144)
144 cases of abetment to suicide by children were reported during the year 2012 as compared to 61 cases in the year 2011 denoting an increase of 136.1% during the year 2012. Exposure & abandonment (Sec. 317 IPC) (Incidence-821 Rate- 0.2) A total of 821 cases were reported during 2012 as compared to 700
cases during 2011 showing an increase of 17.3% during the year 2012. Maharashtra (24.2%) has reported the highest number of such cases (199 out of 821), followed by Rajasthan (20.9%) (172 cases out of 821) of the total cases reported in the country. Procuration of minor girls (Sec. 366A IPC) (Incidence-809)
809 cases were reported in the year 2012 as compared to 862 such cases in the year 2011, accounting for 6.1% decrease over 2011. West Bengal has reported 369 such cases indicating a share of 45.6% at national level followed by Assam (122), Bihar (48) and Karnataka (45). Details are given at Table 6(A).
LatestLaws.com
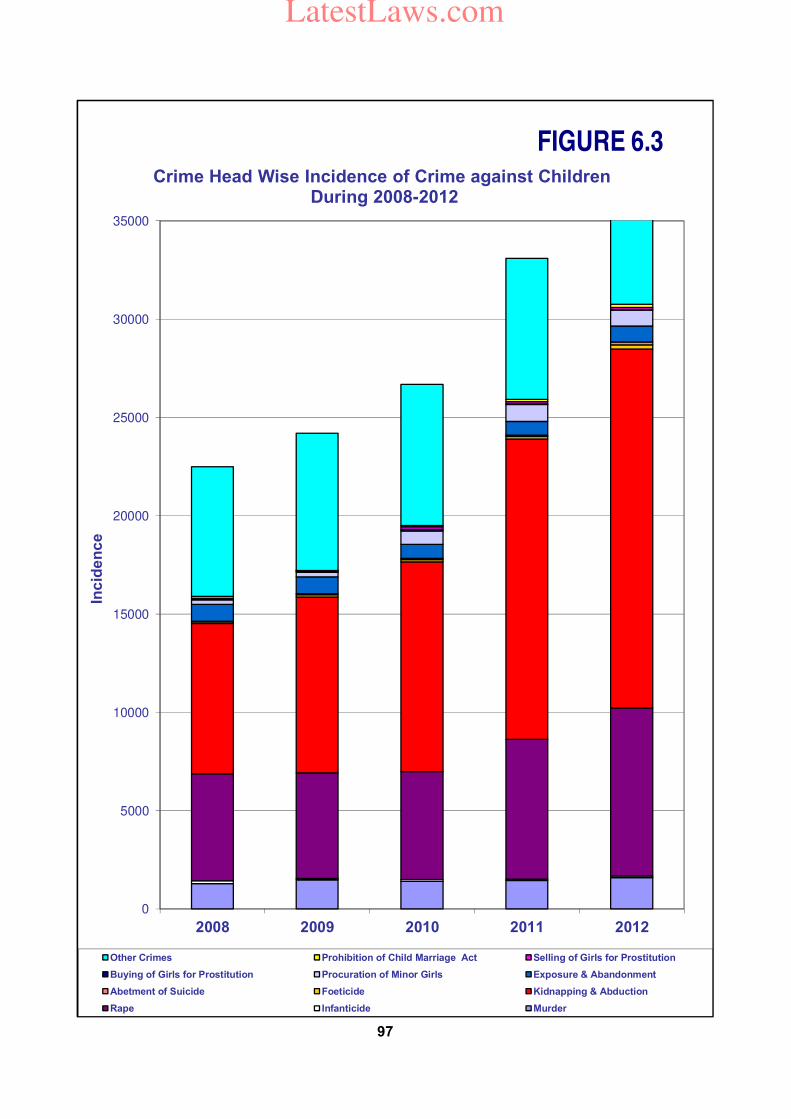
0
5000
10000
15000
20000
25000
30000
35000
2008 2009 2010 2011 2012
Inc
ide
nc
e
Year
Crime Head Wise Incidence of Crime against ChildrenDuring 2008-2012
Other Crimes Prohibition of Child Marriage Act Selling of Girls for Prostitution
Buying of Girls for Prostitution Procuration of Minor Girls Exposure & Abandonment
Abetment of Suicide Foeticide Kidnapping & Abduction
Rape Infanticide Murder
FIGURE 6.3
97
LatestLaws.com
98
Buying/selling of girls for prostitution (Sec. 373/372 IPC) (Incidence…15/108)
15 cases of ‘buying of girls’ and 108 cases of ‘selling of girls’ for prostitution were reported in the country during the year 2012 against 27 and 113 such cases respectively in the year 2011. Jharkhand(5 cases) has accounted for 33.3% of total 15 cases of ‘buying of girls for prostitution' and West Bengal has accounted for 51.9% (56 cases out of 108 cases) of the total cases of ‘selling of girls for prostitution' reported in the country.
Disposal of crimes by police & courts
The general trend of disposal of IPC and SLL crimes by police & courts has already been discussed in detail in Chapter-4. The average charge-sheeting rate for all the crimes against children (IPC & SLL) was 84.7% in 2012, which is marginally higher than charge-sheeting rate of 2011(82.5%). The highest charge sheet rate was observed in cases under ‘buying of girls for prostitution’ (100%) followed by ‘rape’ (97.6%) in comparison to the prevailing national level charge-sheeting rate of 78.8% for the IPC crimes and 93.4% for SLL crimes. The lowest charge sheet rate was found in cases of ‘exposure & abandonment’ (14.9%). The details are presented in Table-6.5.
The conviction rate at the national level for these crimes stood at 29.0%. The conviction rate under crime head ‘murder’ (40.2%) was highest followed by ‘Infanticide’ (other than murder)(38.9%) during the year 2012. State/UT-wise and crime head-wise details are presented in Table-6.3 to Table-6.8.
Disposal of persons arrested by police & courts
The details of disposal of arrested persons for committing crimes against children are presented in Table-6.9 to Table-6.12. 37,541 (71.9%) arrested persons out of 52,243 arrested persons for these crimes were charge-sheeted by the police and correspondingly, only 5,710 persons were convicted representing 29.0% conviction rate of persons arrested, which is almost same as conviction rate (case-wise) for crimes committed against children (29.0%).
*****
LatestLaws.com
99
Chapter-6A
Human Trafficking
Human trafficking is a group of crimes involving the exploitation of men, women and children for financial gains which is violation of fundamental human rights. Victims are lured or abducted from their homes and subsequently forced to work against their wish through various means in various establishments, indulge in prostitution or subjected to various types of indignities and even killed or incapacitated for the purposes of begging and trade in human organs. This Bureau is collecting data under the following heads of crime which are related to human trafficking.
IPC Crimes (i) Procuration of minor girls
(section 366-A IPC) (ii) Importation of girls from
foreign country ((Sec. 366-B IPC)
(iii) Selling of girls for prostitution (Section-372 IPC)
(iv) Buying of girls for prostitution (Section -373 IPC)
SLL Crimes (i) Immoral Trafficking
(Prevention) Act 1956 (ii) Prohibition of Child Marriage
Act, 2006. Cases under following legislations also form part of offences under human trafficking but NCRB is not collecting data specifically relating to these acts.
(i) Bonded Labour System (Abolition) Act 1976
(ii) Juvenile Justice (Care and Protection of Children) Act 2000
(iii) Child Labour (Prohibition and Regulation) Act 1986
(iv) Transplantation of Human Organs Act 1994.
Reported Incidents of crime
(Incidence: 3,554)
A total of 3,554 incidents of crimes under various provisions of laws (for which data is being collected for this report) relating to human trafficking were reported in the country during the year 2012 as compared to 3,517 during the year 2011 recording an increase of 1.1% during the year 2012. 3,029 cases relating to human trafficking were reported during 2008 as compared to 2,848, 3,422, 3,517 and 3,554 cases reported in 2009, 2010, 2011 and 2012 respectively.
Crime Rate (Crime rate: 0.3)
No change in crime rate was observed during the year 2012 as compare to the year 2011.
Trend Analysis
The crime head-wise details of reported crimes during 2008 to 2012 along with percentage variation in the year 2012 over 2011 are presented in Table-6A(A). The crime under
LatestLaws.com
100
human trafficking during the year 2012 has increased by 17.3% over 2008.
Importation of Girls from
foreign country (Sec. 366-B IPC)
(Incidence: 59)
Decline of 26.3% has been observed in such cases as 59 cases were reported during the year 2012 as compared to 80 cases in the previous year (2011). Karnataka (32 cases) and West Bengal (12 cases) altogether accounting for nearly two-third (74.6%) of total such cases at the National level.
Procuration of minor Girls
(Sec. 366A IPC)
(Incidence: 809)
809 cases were reported in the year 2012 as compared to 862 such cases in 2011, accounting for 6.1% decline over 2011. West Bengal has reported 369 such cases indicating a share of 45.6% at National level followed by Assam (122 cases) (15.1%) and Bihar (48 cases) (5.9%). Decreasing trend was observed in these cases during the last four years. Details are given in Table 6A(C).
Selling of Girls for Prostitution
(Sec. 372 IPC)
(Incidence: 108)
108 cases of ‘Selling of Girls for Prostitution’ were reported in the country during 2012 against 108
such cases in 2011, thereby indicating a decrease of 44.2% over 2011. West Bengal has accounted for 51.9% (56 cases out of 108 cases) of the total cases of ‘Selling of Girls for Prostitution' reported in the country.
Buying of Girls for Prostitution
(Sec. 373 IPC)
(Incidence:15)
15 cases of ‘Buying of Girls for Prostitution’ were reported in the country during the year 2012. This indicates a 44.4% decrease in the incidence over 2011 when 27 cases were reported in the country. 74.1% cases were reported in Maharashtra alone (4 out of 15 cases).
Immoral Traffic (Prevention)
Act, 1956
(Incidence: 2,563 Rate: 0.2)
Cases under this Act have registered an increase of 5.3% during the year 2012 as compared to the previous year (2,435 cases). 19.5% (500 cases out of 2,563 cases) of such cases were reported from Tamil Nadu while Andhra Pradesh has accounted for 18.4% (472 out of 2,563) of such cases. Among UTs, Delhi has reported the highest number of such cases (24 out of 2,563).
LatestLaws.com
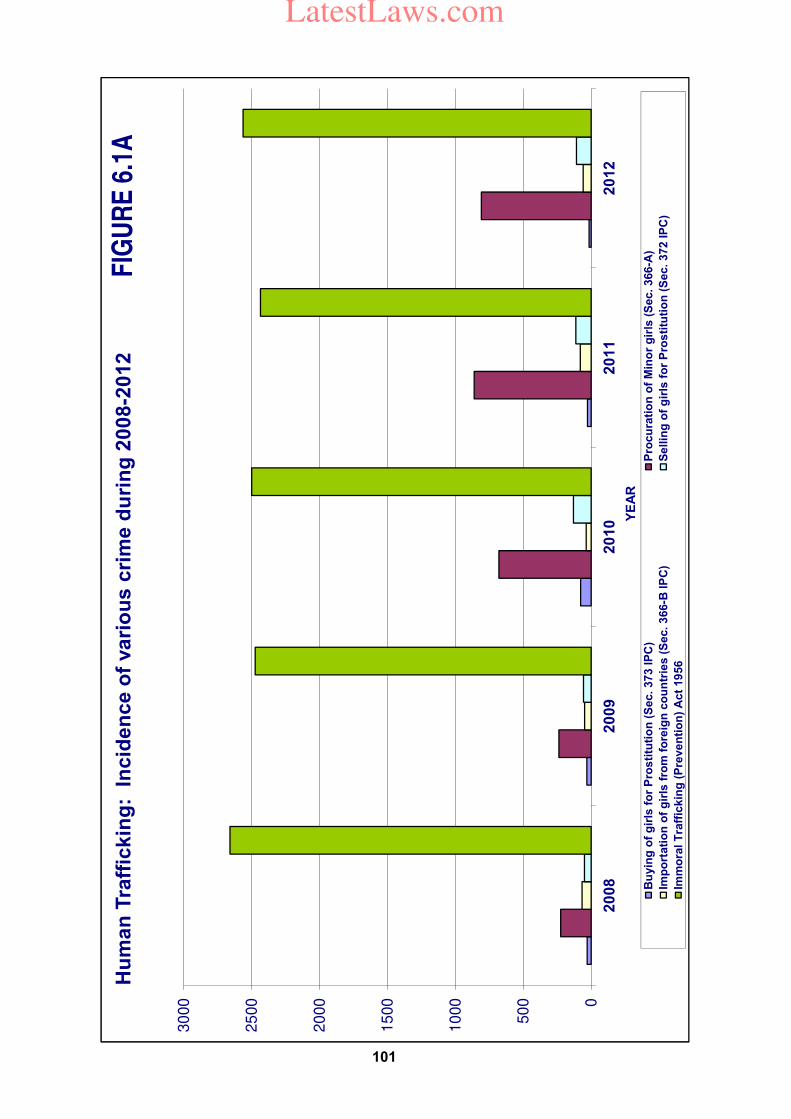
0
50
0
10
00
15
00
20
00
25
00
30
00
20
08
20
09
20
10
20
11
20
12
Hu
ma
n T
raff
ick
ing
: I
nc
ide
nc
e o
f va
rio
us
cri
me
du
rin
g 2
00
8-2
01
2
Bu
yin
g o
f g
irls
fo
r P
ros
titu
tio
n (
Sec.
373
IP
C)
Pro
cu
rati
on
of
Min
or
gir
ls (
Sec.
366
-A)
Imp
ort
ati
on
of
gir
ls f
rom
fo
reig
n c
ou
ntr
ies (
Sec. 3
66-B
IP
C)
Se
llin
g o
f g
irls
fo
r P
ros
titu
tio
n (
Sec.
372
IP
C)
Imm
ora
l T
raff
ickin
g (
Pre
ve
nti
on
) A
ct
19
56
FIG
UR
E 6
.1A
YE
AR
101
LatestLaws.com
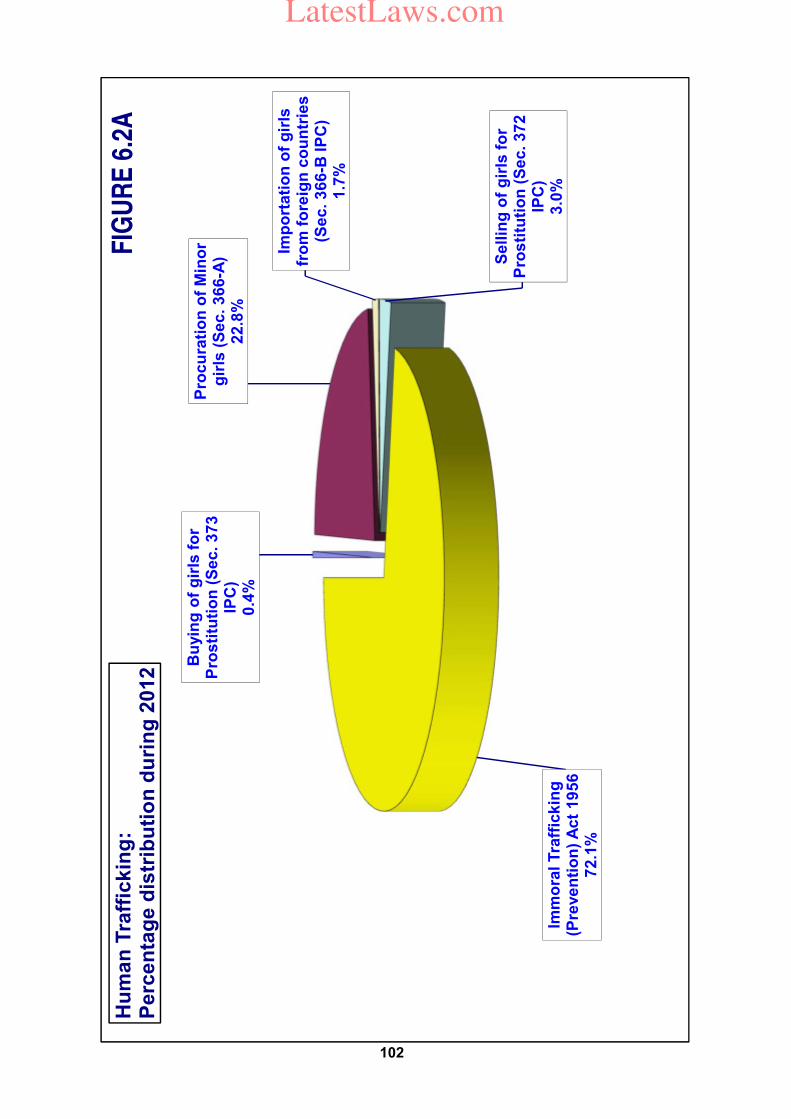
Bu
yin
g o
f g
irls
fo
r P
ros
titu
tio
n (
Se
c. 3
73
IP
C)
0.4
%
Pro
cu
rati
on
of
Min
or
gir
ls (
Se
c. 3
66
-A)
22
.8%
Imp
ort
ati
on
of
gir
ls
fro
m f
ore
ign
co
un
trie
s
(Se
c. 3
66
-B IP
C)
1.7
%
Se
llin
g o
f g
irls
fo
r P
ros
titu
tio
n (
Se
c. 3
72
IP
C)
3.0
%Im
mo
ral T
raff
ick
ing
(P
reve
nti
on
) A
ct
19
56
72
.1%
Hu
ma
n T
raff
ick
ing
: P
erc
en
tag
e d
istr
ibu
tio
n d
uri
ng
20
12
FIG
UR
E 6
.2A
102
LatestLaws.com
103
Table-6A(A)
Crime head-wise incidence of various crimes under human trafficking during 2008 - 2012
and percentage variation in 2012 over 2011
Sl.
No.
Crime head Year Percentage
variation in
2012 over
2011
2008 2009 2010 2011 2012
1. Procuration of minor girls (Sec. 366-A
IPC) 224 237 679 862 809 -6.1
2. Importation of girls from foreign country
(Sec. 366-B IPC) 67 48 36 80 59 -26.3
3. Selling of girls for prostitution (Sec. 372
IPC) 49 57 130 113 108 -4.4
4. Buying of girls for prostitution (Sec. 373
IPC) 30 32 78 27 15 -44.4
5. Immoral Trafficking (Prevention) Act
1956 2,659 2,474 2,499 2,435 2563 5.3
Total 3,029 2,848 3,422 3,517 3,554 1.1
The total number of cases registered under these heads of human trafficking has shown a mixed trend during the last 5 years. Details may be seen at Table-6A(B).
States/UTs wise cases registered during 2012 are given at Table 6A(C).
Table-6A(B)
IPC crimes, SLL crimes and crimes under human trafficking during 2008 - 2012
Sl.
No.
Year Total IPC
crimes
Total SLL
crimes
Cases under
human trafficking
Rate of crime under
human trafficking
1. 2008 20,93,379 38,44,725 3,029 0.3
2. 2009 21,21,345 45,53,872 2,848 0.2
3. 2010 22,24,831 45,25,917 3,422 0.3
4. 2011 23,25,575 39,27,154 3,517 0.3
5. 2012 23,87,188 36,54,371 3,554 0.3
LatestLaws.com
104
Table 6A(C)
Cases registered under human trafficking during 2012
Sl.
No.
State / UT Buying of
girls for
prostitution
Selling of
girls for
prostitution
Procuration
of minor
girls
Importation
of girls
Immoral
Trafficking
(Prevention)
Act, 1956
Total
1 Andhra Pradesh 0 4 30 0 472 506
2 Arunachal Pradesh 0 0 0 0 1 1
3 Assam 0 0 122 2 30 154
4 Bihar 2 10 48 4 35 99
5 Chhattisgarh 0 0 13 0 5 18
6 Goa 0 0 0 0 40 40
7 Gujarat 0 0 19 0 44 63
8 Haryana 0 0 0 0 69 69
9 Himachal Pradesh 0 0 3 0 6 9
10 Jammu & Kashmir 0 0 0 0 3 3
11 Jharkhand 5 7 16 3 12 43
12 Karnataka 0 0 45 32 335 412
13 Kerala 0 0 10 0 210 220
14 Madhya Pradesh 0 5 21 6 13 45
15 Maharashtra 4 2 31 0 366 403
16 Manipur 0 0 17 0 15 32
17 Meghalaya 0 0 0 0 7 7
18 Mizoram 0 1 0 0 0 1
19 Nagaland 0 0 0 0 4 4
20 Odisha 0 0 5 0 24 29
21 Punjab 0 0 0 0 86 86
22 Rajasthan 0 1 20 0 99 120
23 Sikkim 0 0 0 0 0 0
24 Tamil Nadu 0 0 28 0 500 528
25 Tripura 0 0 0 0 0 0
26 Uttar Pradesh 0 18 2 0 31 51
27 Uttarakhand 0 0 7 0 12 19
28 West Bengal 3 56 369 12 109 549
Total (States) 14 104 806 59 2528 3511
29 A & N Islands 0 0 0 0 2 2
30 Chandigarh 0 0 0 0 0 0
31 D & N Haveli 0 0 0 0 2 2
32 Daman & Diu 0 0 0 0 3 3
33 Delhi 1 4 3 0 24 32
34 Lakshadweep 0 0 0 0 0 0
35 Puducherry 0 0 0 0 4 4
Total (UTs) 1 4 3 0 35 43
Total (All-India) 15 108 809 59 2563 3554
*****
LatestLaws.com
105
Chapter-7
Crime against Scheduled Castes & Scheduled Tribes
India is committed to the welfare and development of its people in general and of vulnerable sections of society in particular. Equality of status and opportunity to all citizens of the country is guaranteed by the constitution of India, which also provides that no individual shall be discriminated against on the grounds of religion, caste or sex, etc. Fundamental rights and other specific provisions, namely, Articles 38, 39 and 46 in the constitution of India stand testimony to the commitment of the State towards its people. The strategy of the State is to secure distributive justice and allocation of resources to support programmes for social, economic and educational advancement of the weaker sections in general and those of Scheduled castes and Scheduled tribes in particular.
Constitutional rights
The Indian Constitution vide Article 15 lays down that no citizen shall be subjected to any disability or restriction on the grounds of religion, race, caste, sex or place of birth. It also guarantees that every citizen shall have equality of status and opportunity. The problems of social inequality and class divide in a country like India with heterogeneous groups and sub-groups needs to be
recognised and resolved by all available democratic measures including special legislations to deal with particular acts constituting offences against such weaker sections of the society. `Scheduled Castes' and `Scheduled Tribes' are two such identified social groups. Article 46 of the constitution of India expressly provides that the State shall promote the educational and economic upliftment of the weaker sections of the society, in particular of SCs & STs with special care and shall protect them from injustice and all forms of exploitation.
Legal rights
Special social enactments have come into force from time to time for SCs and STs in order to uphold the constitutional mandate and safeguard the interests of this section of the society. The major legal enactments at the national level are: (i) Protection of Civil Rights Act,
1955; (ii) Scheduled Caste/Scheduled
Tribe (Prevention of Atrocities) Act, 1989
The Protection of Civil Rights Act, 1955 was enacted in furtherance of Article 17 of the constitution to abolish untouchability and its practice in any form.
LatestLaws.com
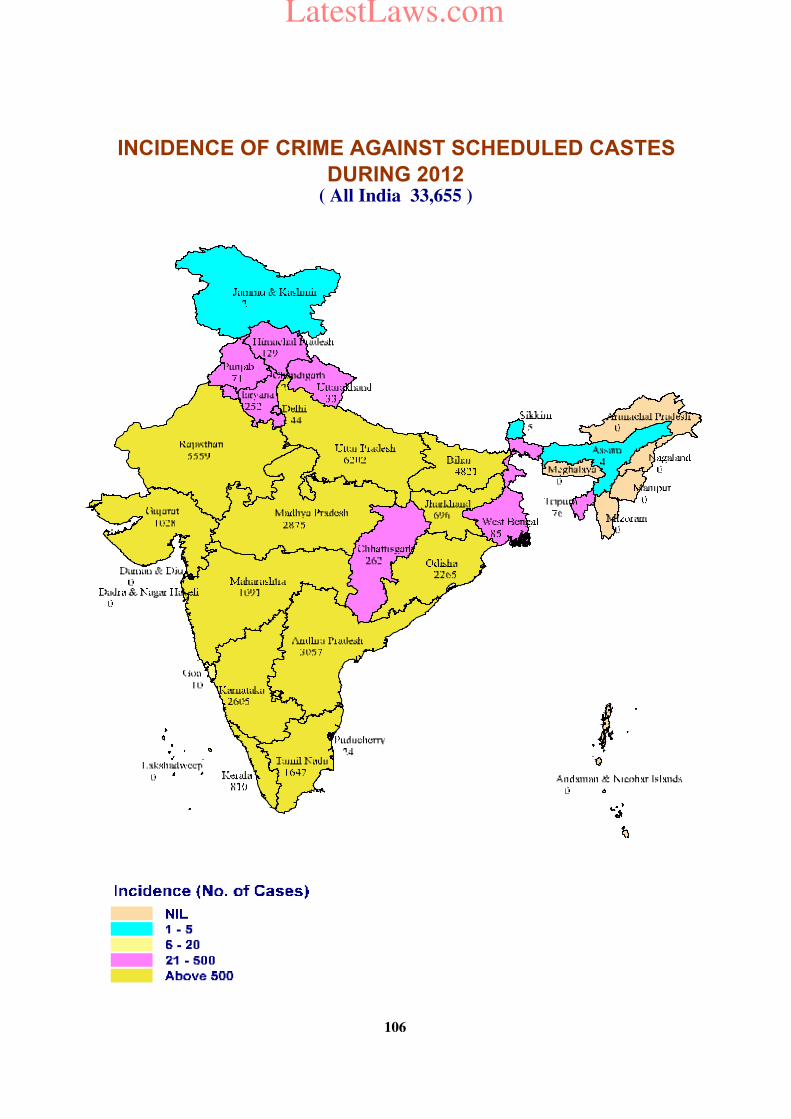
INCIDENCE OF CRIME AGAINST SCHEDULED CASTES
DURING 2012( All India 33,655 )
106
LatestLaws.com
107
The Scheduled Castes and Scheduled Tribes (Prevention of Atrocities) Act, 1989 was brought into force from 30
th January 1990 in order
to check and deter crimes against SCs/STs by persons belonging to other communities. These enactments have extended the positive discrimination in favour of SCs and STs to the field of criminal law in as much as they prescribe penalties that are more stringent than the corresponding offences under Indian penal code (IPC) and other laws. Special courts have been established in major states for speedy trial of cases registered exclusively under these Acts.
Classification of crimes
The crimes against Scheduled castes/Scheduled tribes are broadly categorised under two major heads:
(1) Under the Indian Penal Code (IPC)
(i) Murder (ii) Hurt (iii) Rape (iv) Kidnapping & abduction (v) Dacoity (vi) Robbery (vii) Arson
(viii) Others (other classified IPC crimes)
(2) Under Special Laws (SL)
(i) Protection of Civil Rights Acts, 1955
(ii) The Scheduled Castes
and the Scheduled
Tribes (Prevention of Atrocities) Act, 1989.
The crimes under IPC such as `murder', `hurt', `rape', etc. or under special Acts such as Protection of Civil Rights Act & Scheduled Castes and Scheduled Tribes (Prevention of Atrocities) Act are already included in overall crimes reported under IPC and SLLs respectively and have been discussed in detail in the preceding chapters. The specific crimes against SCs/STs discussed in the following paragraphs are part and parcel of total crimes but analysed separately for better comprehension of crimes committed against SCs & STs. The data on crimes against SCs/STs are being compiled with provision for district-wise reporting of these crimes with effect from the year 2001. Cases under the Protection of Civil Rights Act and the Scheduled Castes and the Scheduled Tribes (Prevention of Atrocities) Act have been segregated for SCs and STs to have clear picture of all the crimes against each category. Cumulative totals of crime statistics available on monthly basis were used for analysis till 2000 which did not distinguish true or false cases, therefore, the incidence of crime reported in the year 2001 and later years may not be comparable with figures of earlier years. The ‘Crime rate’ for crimes committed against SCs and STs has been calculated using only population of SC and ST respectively based on Population Census 2011(Provisional). Therefore ‘Crime rate’ of reference year with previous years is not comparable.
LatestLaws.com
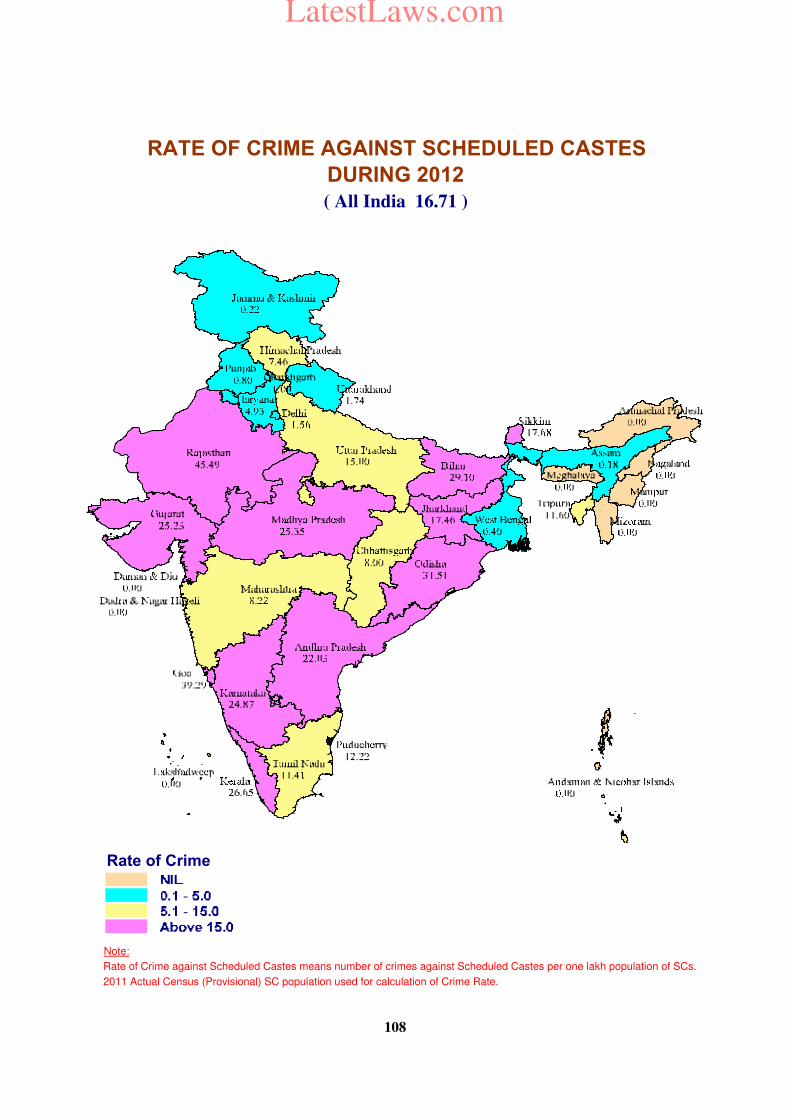
Rate of Crime
Note:
Rate of Crime against Scheduled Castes means number of crimes against Scheduled Castes per one lakh population of SCs.
2011 Actual Census (Provisional) SC population used for calculation of Crime Rate.
RATE OF CRIME AGAINST SCHEDULED CASTES
DURING 2012
( All India 16.71 )
108
LatestLaws.com
109
Crime against Scheduled Castes Incidence of Crime - National (Incidence (IPC+SLL): 33,655)
The year 2012 has witnessed a decrease in crime against Scheduled Castes as 33,719 cases reported in the year 2011 have decreased to 33,655 cases in the year 2012. This decrease was observed in all heads except rape, arson and POA Act. The cases of rape, arson and SC/ST (Prevention of Atrocities) Act in the year 2012 have increased by 1.2%, 26.6% and 10.9% respectively over the year 2011. On the other hand murder, kidnapping & abduction, dacoity, robbery, hurt and Protection of Civil Rights Act have shown a decrease of 3.3%, 20.5%, 25.0%, 25.9%, 9.2% and 7.5% respectively during the year 2012 over the year 2011. Uttar Pradesh has accounted for 18.4% (6,202 cases) of the total 33,655 cases reported in the country followed by Rajasthan (16.5%) (5,559 Cases), Bihar (14.3%) (4821 Cases) and Andhra Pradesh (9.1%) (3,057 Cases).
Crime rate (Crime rate: 16.7)
The rate of crime against Scheduled Castes was observed as 16.7 during the years 2012. Rajasthan has reported the highest crime rate of 45.5 in the year 2012 followed by Goa (39.3), Odisha (31.5), Bihar (29.1) and Kerala (26.7) against the national average of 16.7.
Crime head-wise Analysis of crimes against Scheduled Castes
Murder
(Incidence: 651)
A total of 651 cases of murder were reported in the country during the year 2012 compared to 673 cases in the year 2011 thereby reporting a decrease of 3.3%. Uttar Pradesh has accounted for 35.9% of the total murder cases reported in the country (234 out of 651 cases) followed by Madhya Pradesh 13.5% (88 out of 651 cases).
Hurt
(Incidence: 3,855 Rate:1.9)
A total of 3,855 cases of hurt were reported during the year 2012 as compared to 4,247 cases in the year 2011 in the country thereby reporting a decrease of 9.2% during the year 2012 as compared to the year 2011. Madhya Pradesh (704 cases), Andhra Pradesh (626 cases) and Rajasthan (568 cases) together accounted for 49.2% of the 3,855 such cases during the year 2012.
Rape
(Incidence: 1,576 Rate: 1.6)
A total of 1,576 cases of rape of women belonging to Scheduled castes were reported in the country during the year 2012 as compared to 1,557 cases in the year 2011, thereby reporting a marginal increase of 1.2%. Madhya Pradesh has reported 367 cases accounting for 23.3% of the total 1,576 cases reported in the country followed by Uttar Pradesh 18.1% (285 out of 1,576 cases).
LatestLaws.com
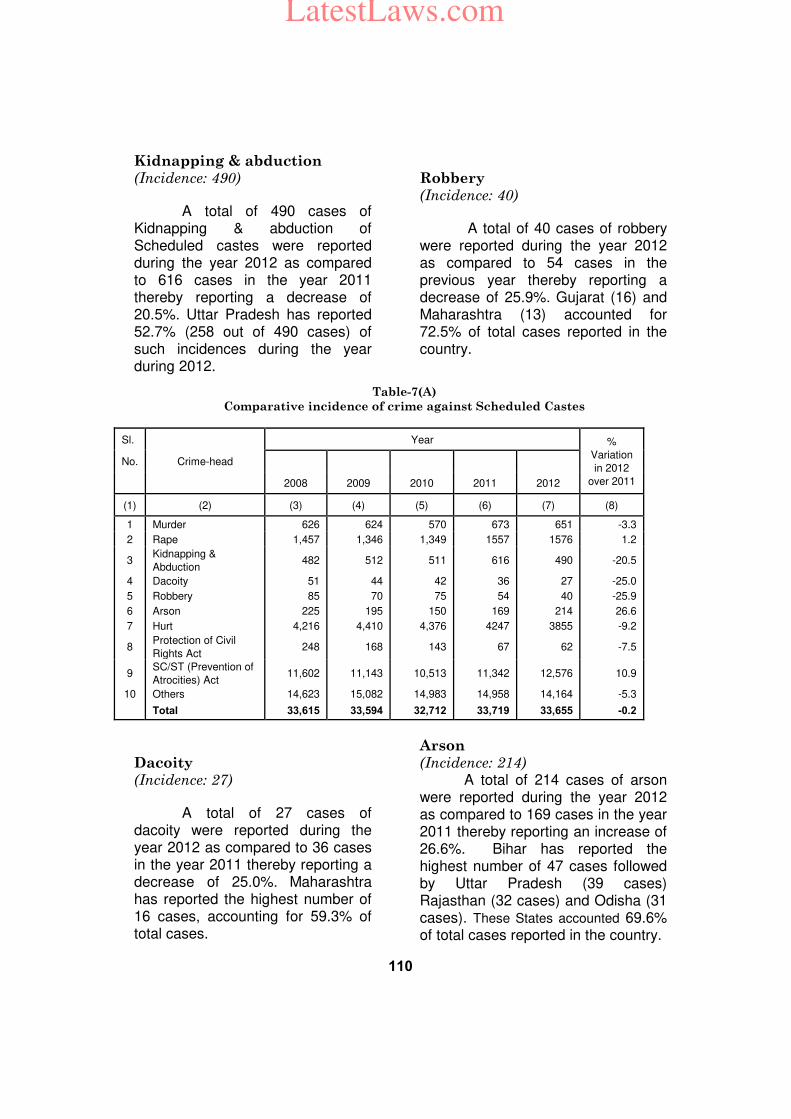
110
Kidnapping & abduction
(Incidence: 490)
A total of 490 cases of Kidnapping & abduction of Scheduled castes were reported during the year 2012 as compared to 616 cases in the year 2011 thereby reporting a decrease of 20.5%. Uttar Pradesh has reported 52.7% (258 out of 490 cases) of such incidences during the year during 2012.
Dacoity
(Incidence: 27) A total of 27 cases of dacoity were reported during the year 2012 as compared to 36 cases in the year 2011 thereby reporting a decrease of 25.0%. Maharashtra has reported the highest number of 16 cases, accounting for 59.3% of total cases.
Robbery
(Incidence: 40)
A total of 40 cases of robbery were reported during the year 2012 as compared to 54 cases in the previous year thereby reporting a decrease of 25.9%. Gujarat (16) and Maharashtra (13) accounted for 72.5% of total cases reported in the country.
Arson
(Incidence: 214)
A total of 214 cases of arson were reported during the year 2012 as compared to 169 cases in the year 2011 thereby reporting an increase of 26.6%. Bihar has reported the highest number of 47 cases followed by Uttar Pradesh (39 cases) Rajasthan (32 cases) and Odisha (31 cases). These States accounted 69.6% of total cases reported in the country.
Table-7(A)
Comparative incidence of crime against Scheduled Castes
Sl.
Crime-head
Year %
Variation
in 2012
over 2011
No.
2008 2009 2010 2011 2012
(1) (2) (3) (4) (5) (6) (7) (8)
1 Murder 626 624 570 673 651 -3.3
2 Rape 1,457 1,346 1,349 1557 1576 1.2
3 Kidnapping &
Abduction 482 512 511 616 490 -20.5
4 Dacoity 51 44 42 36 27 -25.0
5 Robbery 85 70 75 54 40 -25.9
6 Arson 225 195 150 169 214 26.6
7 Hurt 4,216 4,410 4,376 4247 3855 -9.2
8 Protection of Civil
Rights Act 248 168 143 67 62 -7.5
9 SC/ST (Prevention of
Atrocities) Act 11,602 11,143 10,513 11,342 12,576 10.9
10 Others 14,623 15,082 14,983 14,958 14,164 -5.3
Total 33,615 33,594 32,712 33,719 33,655 -0.2
LatestLaws.com
111
Protection of Civil Rights Act, 1955 (Incidence: 62) A total of 62 cases were reported during the year 2012 as compared to 67 cases in the year 2011 thereby reporting a decrease of 7.5% in 2012 over 2011. Puducherry has reported the 20 cases of such crimes followed by Karnataka (11 cases), Andhra Pradesh and Tamil Nadu (9 cases each) during the year 2012. These four States have accounted for 79% of total cases reported in the country.
SC/ST (Prevention of Atrocities) Act (Incidence: 12,576 Rate: 6.24) A total of 12,576 cases were reported under this Act during the year 2012 as compared to 11,342 in the year 2011 thereby reporting an increase of 10.9%. Bihar has reported 4,436 cases accounting for 35.3% of the total cases reported in the country followed by Odisha (15.5%) (1,943 cases), Uttar Pradesh (13.8%) (1,740 cases), and Karnataka (10.6%)(1,334 cases). At 27.0, the highest rate of crime was reported in Odisha as compared to national rate of 6.2. Crimes against Scheduled Tribes (Incidence (IPC+SLL): 5,922 Rate: 5.7) A total of 5,922 cases against Scheduled Tribes were reported in the country during the year 2012 as compared to 5,756 cases in the year 2011 showing an increase of 2.9% in 2012 over 2011. This increase was observed under heads ’murder’, ‘robbery’ ‘arson’, ‘hurt’ and ‘POA, Act’. The details are
presented in Table-7 (B). Rajasthan has reported 22.8% (1,351 cases) followed by Madhya Pradesh 20.6% (1218 cases) of the total 5,922 cases reported in the country during the year 2012. However the crime rate was highest in Kerala at 25.6 as compared to only 5.7 at national level. Crime head-wise analysis of Crimes against Scheduled Tribes Murder (Incidence: 156) A total of 156 cases of murder of Scheduled tribes were reported in the year 2012 as compared to 143 cases in the year 2011, showing an increase of 9.1%. Madhya Pradesh has reported the highest number of cases (62 cases) accounting for 39.7% cases followed by Chhattisgarh (19 cases) of the total 156 cases reported in the country during the year 2012.
Rape (Incidence: 729) A total of 729 cases were reported in the year 2012 as compared to 772 cases in the year 2011, thereby, showing a decrease of 5.6%. Madhya Pradesh has reported 288 cases accounting for 39.5% of the total cases in the country during the year 2012. Kidnapping & abduction (Incidence: 103) The incidents of Kidnapping & abduction have decreased by 24.8% in the year 2012 over the year 2011 (137 cases). Madhya Pradesh has reported 45 cases followed by Gujarat 13 cases. These two States together accounted for 56.3% of the total 103 cases reported in the country.
LatestLaws.com
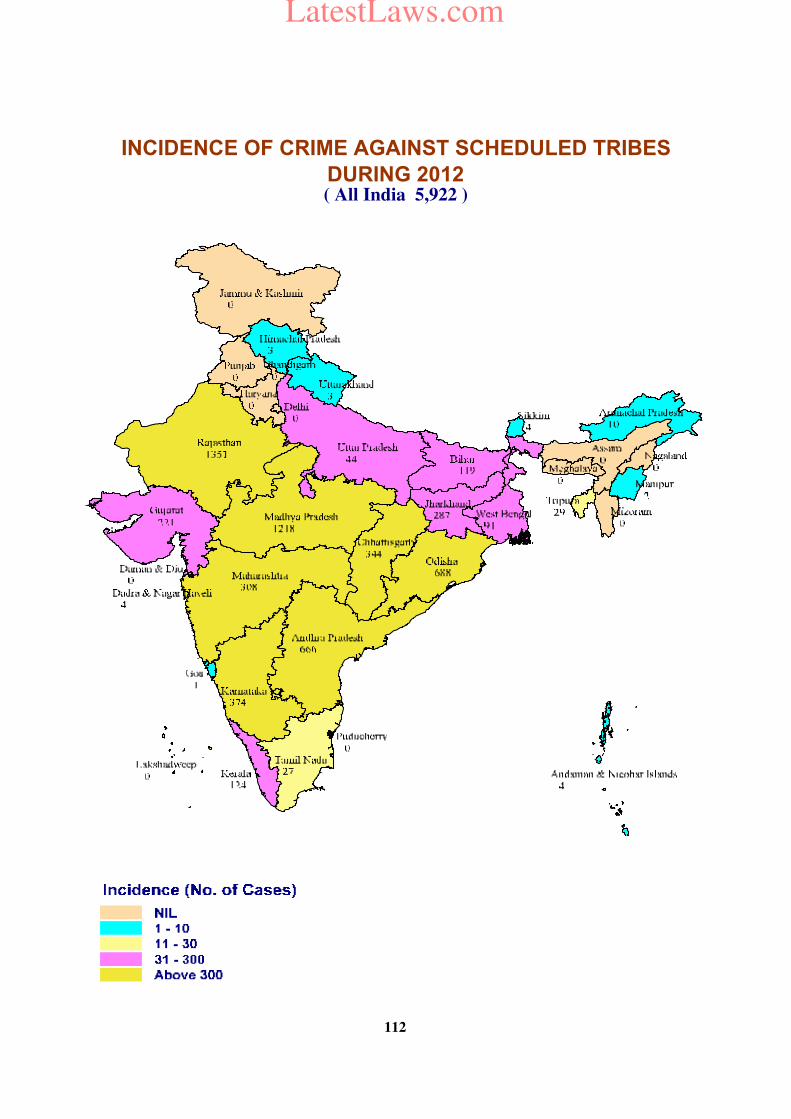
INCIDENCE OF CRIME AGAINST SCHEDULED TRIBES
DURING 2012( All India 5,922 )
112
LatestLaws.com
113
Dacoity (Incidence: 5) A total of 5 cases were reported in the country during the year 2012. Maharashtra (4 cases) and Odisha (3 cases) together accounted for 100% of such cases during the year 2012.
Robbery (Incidence: 15) A total of 15 cases were reported during the year 2012 as compared to 9 cases in the year 2011, indicating an increase of 66.7%. Jharkhand (5 cases) and Maharashtra (3 cases) together accounted for 53.3% of such crime during the year 2012.
Hurt (Incidence: 816 Rate: 0.78) A total of 816 cases were reported during the year 2012 as compared to 803 cases in the year 2011 showing an increase of 1.6%. Madhya Pradesh has accounted for 30.3% (247cases) of total 816 cases reported in the country followed by Andhra Pradesh (132 cases) and Rajasthan (123 cases). The highest crime rate of 5.6 was reported in Kerala as compared to national average of 0.8. Arson (Incidence: 26) A total of 26 cases were reported in the year 2012 as compared to 24 cases in the year 2011 showing an increase of 8.3%. Madhya Pradesh has accounted for 30.8% (8 cases) of total 26 such cases reported in the country
followed by Odisha and Rajasthan have reported 19.2% (5 cases) each such crime during the year 2011. Protection of Civil Rights Act (Incidence: 2) A total of 2 cases were reported during the year 2012 as compared to 7 cases in the year 2011, thereby showing decrease of 71.4% over 2011. Karnataka and Maharashtra have reported 1 case each accounted for 100% of such cases during the year 2012. SC/ST (Prevention of Atrocities) Act (Incidence: 1311 Rate:1.26) A total of 1,311 cases were reported during the year 2012 as compared to 1,154 cases in the year 2011 showing an increase of 13.6%. Odisha has accounted for 44.2% (579 cases) of the total 1,311 cases reported in the country followed by Karnataka (164 cases). Jharkhand (133 cases), Andhra Pradesh (127 cases) and Bihar (118 cases) accounted for 85.5% of such crime during the year 2012. Disposal of Crimes by Police Courts
The general trend of disposal of IPC and SLL crimes by police and courts has already been discussed in detail in Chapter-4. The average charge-sheeting rate for the crimes against Scheduled castes and Scheduled tribes stood at 91.8% and 95.8% respectively in comparison to national level general charge-sheeting rate of 78.8% for IPC crimes and 93.4% for SLL crimes.
LatestLaws.com
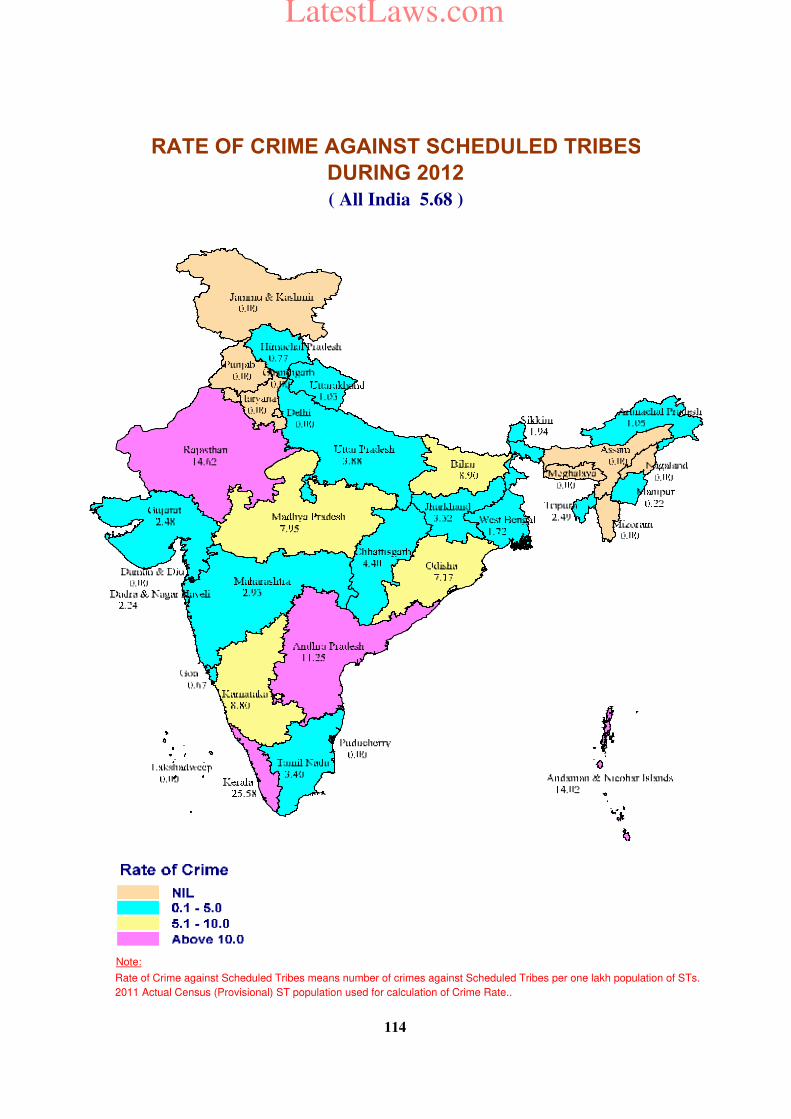
Note:
Rate of Crime against Scheduled Tribes means number of crimes against Scheduled Tribes per one lakh population of STs.
2011 Actual Census (Provisional) ST population used for calculation of Crime Rate..
RATE OF CRIME AGAINST SCHEDULED TRIBES
DURING 2012
( All India 5.68 )
114
LatestLaws.com
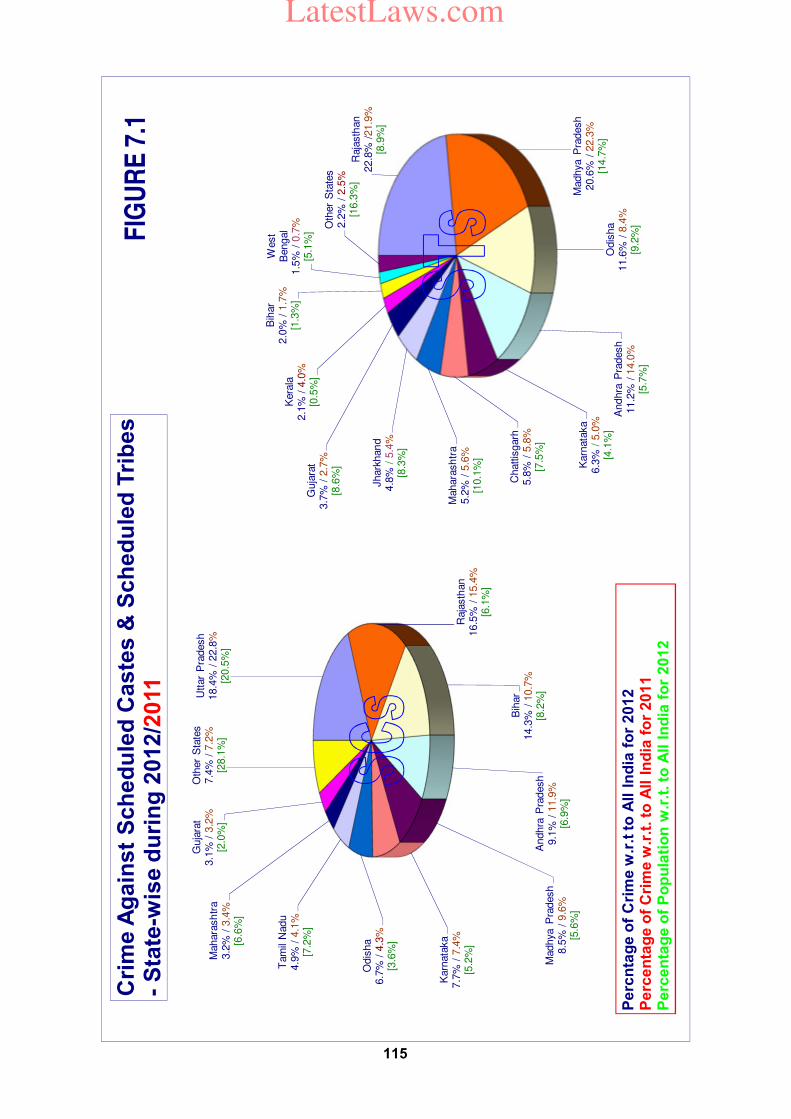
Uttar
Pra
desh
18.4
% /
22.8
%[2
0.5
%]
Raja
sth
an
16.5
% /
15.4
%[6
.1%
]
Bih
ar
14.3
% /
10.7
%[8
.2%
]A
ndhra
Pra
desh
9.1
% /
11.9
%[6
.9%
]
Madhya P
radesh
8.5
% /
9.6
%[5
.6%
]
Karn
ata
ka
7.7
% /
7.4
%[5
.2%
]
Odis
ha
6.7
% /
4.3
%[3
.6%
]
Tam
il N
adu
4.9
% /
4.1
%[7
.2%
]
Mahara
sh
tra
3.2
% /
3.4
%[6
.6%
]
Guja
rat
3.1
% /
3.2
%[2
.0%
]
Oth
er
Sta
tes
7.4
% /
7.2
%[2
8.1
%]
Cri
me A
gain
st
Sch
ed
ule
d C
aste
s &
Sch
ed
ule
d T
rib
es
-S
tate
-wis
e d
uri
ng
2012/2
011
Raja
sth
an
22.8
% /
21.9
%[8
.9%
]
Madhya P
radesh
20.6
% /
22.3
%[1
4.7
%]
Odis
ha
11.6
% /
8.4
%[9
.2%
]
Andhra
Pra
desh
11.2
% /
14.0
%[5
.7%
]
Karn
ata
ka
6.3
% /
5.0
%[4
.1%
]
Chattis
garh
5.8
% /
5.8
%[7
.5%
]
Mahara
sh
tra
5.2
% /
5.6
%[1
0.1
%]
Jhark
han
d4.8
%/
5.4
%[8
.3%
]
Guja
rat
3.7
% /
2.7
%[8
.6%
]
Kera
la2.1
% /
4.0
%[0
.5%
]
Bih
ar
2.0
% /
1.7
%[1
.3%
]
West
Bengal
1.5
% /
0.7
%[5
.1%
]
Oth
er
Sta
tes
2.2
% /
2.5
%[1
6.3
%]
Pe
rcn
tag
e o
f C
rim
e w
.r.t
to
All I
nd
ia f
or
20
12
Pe
rce
nta
ge
of
Cri
me
w.r
.t. to
All I
nd
ia f
or
20
11
Pe
rce
nta
ge
of
Po
pu
lati
on
w.r
.t. to
All I
nd
ia f
or
20
12
FIG
UR
E 7
.1
115
LatestLaws.com
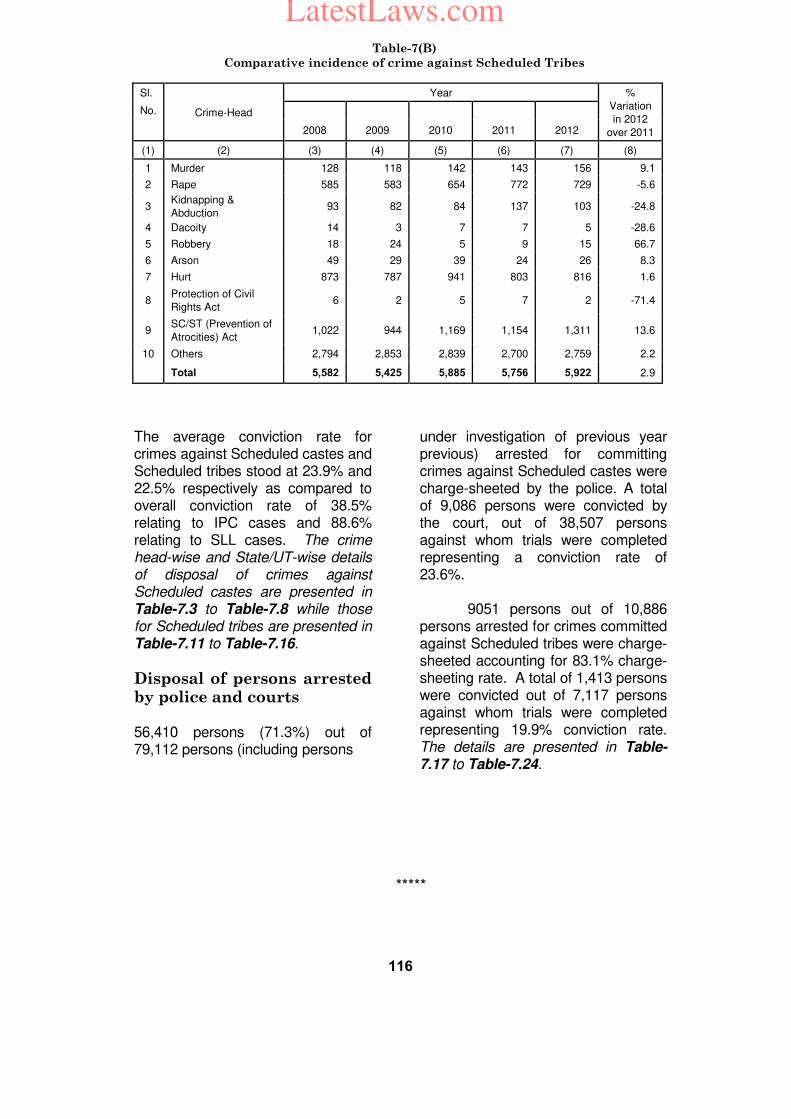
116
The average conviction rate for crimes against Scheduled castes and Scheduled tribes stood at 23.9% and 22.5% respectively as compared to overall conviction rate of 38.5% relating to IPC cases and 88.6% relating to SLL cases. The crime head-wise and State/UT-wise details of disposal of crimes against Scheduled castes are presented in Table-7.3 to Table-7.8 while those for Scheduled tribes are presented in Table-7.11 to Table-7.16.
Disposal of persons arrested by police and courts 56,410 persons (71.3%) out of 79,112 persons (including persons
under investigation of previous year previous) arrested for committing crimes against Scheduled castes were charge-sheeted by the police. A total of 9,086 persons were convicted by the court, out of 38,507 persons against whom trials were completed representing a conviction rate of 23.6%. 9051 persons out of 10,886 persons arrested for crimes committed against Scheduled tribes were charge-sheeted accounting for 83.1% charge-sheeting rate. A total of 1,413 persons were convicted out of 7,117 persons against whom trials were completed representing 19.9% conviction rate. The details are presented in Table-7.17 to Table-7.24.
*****
Table-7(B)
Comparative incidence of crime against Scheduled Tribes
Sl.
Crime-Head
Year %
Variation
in 2012
over 2011
No.
2008 2009 2010 2011 2012
(1) (2) (3) (4) (5) (6) (7) (8)
1 Murder 128 118 142 143 156 9.1
2 Rape 585 583 654 772 729 -5.6
3 Kidnapping &
Abduction 93 82 84 137 103 -24.8
4 Dacoity 14 3 7 7 5 -28.6
5 Robbery 18 24 5 9 15 66.7
6 Arson 49 29 39 24 26 8.3
7 Hurt 873 787 941 803 816 1.6
8 Protection of Civil
Rights Act 6 2 5 7 2 -71.4
9 SC/ST (Prevention of
Atrocities) Act 1,022 944 1,169 1,154 1,311 13.6
10 Others 2,794 2,853 2,839 2,700 2,759 2.2
Total 5,582 5,425 5,885 5,756 5,922 2.9
LatestLaws.com
117
Chapter-8
Property Stolen and Recovered
Value of property Stolen &
Recovered - National level The details of property stolen and recovered, percentage of recovery (year-wise) and percentage changes over the decade (2002 - 2012) have been presented in Table-8.1. During 2002 - 2003 there were variations in the value of lost properties. But since the year 2003-2011, increasing trend of value of property was observed. Property worth `21, 07,194 lakh was stolen during the year 2012 and against this loss, property worth `1,41,793 lakh was recovered. The net value of property lost increased by 220.0% over 2011 (from ` 6, 58,525 lakh in 2011 to ` 21, 07,194 lakh in 2012). The value of property recovered has shown an increase of 15.7% (from ` 1, 22,538 lakh in 2011 to ` 1, 41,793 lakh in 2012) during the year 2012. The percentage of recovery of stolen property during the year 2012 was 6.7% which is lower than the previous year recovery percentage (18.6%).
Value of property Stolen &
Recovered - States, UTs and
Mega Cities
The State, UT and City-wise details regarding value of property stolen and recovered as also the percentage of recovery are
presented in Table-8.2. In terms of numerical value, Maharashtra has reported the highest loss of property at ` 14,45,448.8 lakh followed by Gujarat at ` 1,50,461.2 lakh. The highest worth of property recovered at ` 23,430.3 lakh was reported in Maharashtra, accounting for 1.6% worth property recovered in the country. Sikkim had made 67.5% recovery (`74.1 lakh worth property recovered out of `109.8 lakh worth property stolen) as against 6.7% at national level. Tamil Nadu also reported good percentage of recovery at 60.1%. Among 53 mega cities, Mumbai and Delhi cities have recorded a significant loss of property worth ` 8,34,483.1 lakh and ` 1,43,936.1 lakh respectively. The highest percentage recovery was reported from Ludhiana (108.2%) followed by Madurai (92.5%) and Chennai (78.6%).
Category of Offences -
Incidence and Value
The crime head-wise details on the incidence and value of property stolen and recovered as also the percentage of recovery during 2012 have been shown in Table-8.3. The maximum incidences of property loss (3,29,840) were reported for theft out of five different types of specified property crimes. The value of property lost was the highest for criminal breach of trust cases (` 6,38,219.5 lakh). However, the highest percentage of cases (54.3%) in which property was recovered to cases in
LatestLaws.com
118
which property was stolen was for dacoity cases (2,256 out of 4,155 cases) and the highest recovery percentage in terms of value recovered was also for dacoity cases (53.3%) (` 7,639.5 lakh out of ` 14,338.2 lakh).
Nature of property Stolen and Recovered - Incidence and Value
The nature of property stolen and recovered has been classified into different categories viz. ‘Communication and electricity wire’, ‘Cattle’, ‘Cycle’, ‘Motor vehicles’, ‘Fire arms’, ‘Explosives’, ‘Electronic components’ and ‘Cultural property including antiques’. Properties other than the above 8 specified categories are clubbed as ‘Other kinds of property’. The details of incidence and value of property stolen & recovered along with percentage of recovery have been shown in Table-8.4. The highest loss and recovery worth ` 97,209.8 lakh and ` 34,753.6 lakh respectively was reported for motor vehicles among the specified types of properties. It is worth mentioning that explosives/explosive substances, fire arms and worth ` 142.1 lakh and ` 27.1 lakh were stolen respectively during the year 2012.
Vehicles Stolen, Recovered and Co-ordinated
The highest amount of property recovered and lost related to motor vehicles. Hence, additional information on number of motor vehicles lost, recovered and co-ordinated has been compiled
separately. The State/UT/City-wise information on motor vehicles is given in Table-8.5. The highest number of vehicles lost was reported from Uttar Pradesh (21,600) followed by Maharashtra (17,857) and Delhi (14,446). 25.5% (39,760) vehicles could be recovered out of 1,55,749 stolen vehicles at the national level.
Cultural property Stolen & Recovered - Incidence and Value The State/UT-wise information on cultural property (including antiques) stolen and recovered is shown in Table-8.6. The maximum incidents of loss were reported from Andhra Pradesh (202) followed by Bihar (129) and Jharkhand (83). The highest value of loss (` 1,411.9 lakh) was reported from Rajasthan. The recovery cases of stolen properties were highest in Kerala (1 out of 1 cases) (100%) followed by Tamil Nadu (7 out of 10 cases) and Mizoram (12 out of 18 cases). The highest recovery in terms of value (` 1306.7 lakh) was reported from Rajasthan. No case of theft or recovery of cultural property has been reported from 7 States i.e. Chhattisgarh, Gujarat, Jammu & Kashmir, Manipur, Nagaland, Punjab and Uttarakhand and 6 UTs i.e. A & N Islands, Chandigarh, D & N Haveli, Daman & Diu,, Lakshadweep and Puducherry.
Premises Incidence and Value of property lost as per place of occurrence The information relating to the number of cases and value of property stolen under ‘Dacoity’, ‘Robbery’, ‘Burglary’ and ‘Theft’ at
LatestLaws.com
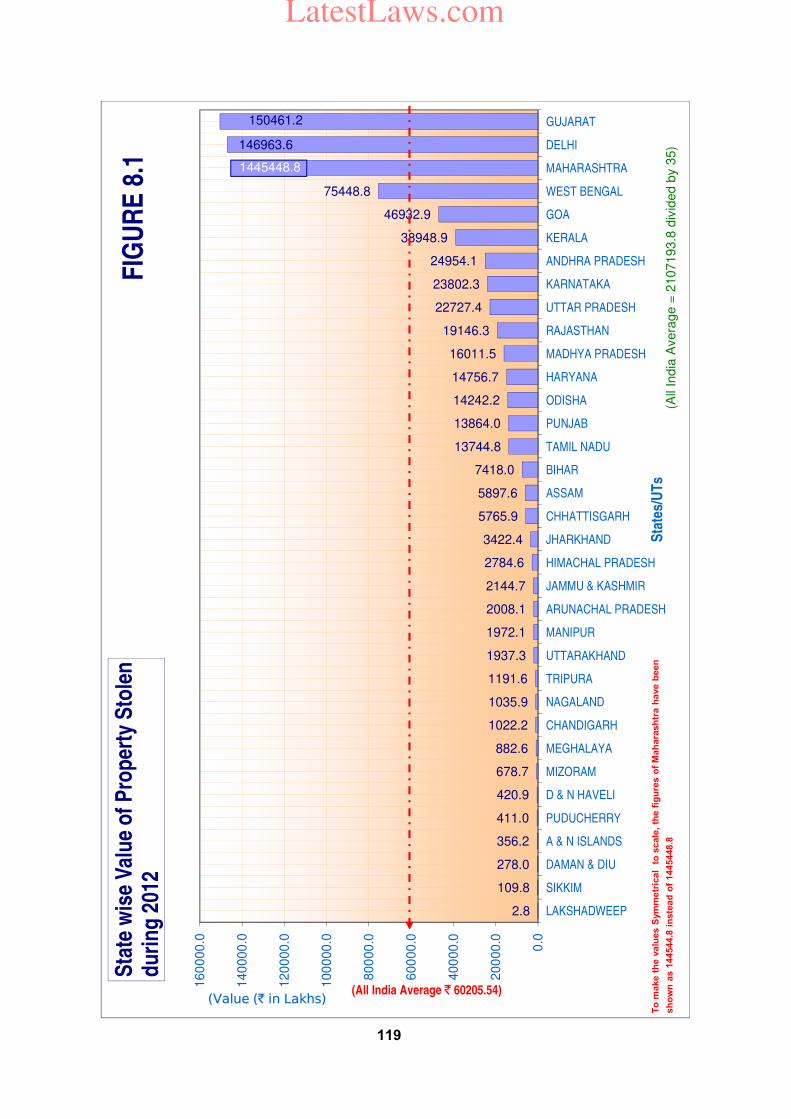
2.8
109.8
278.0
356.2
411.0
420.9
678.7
882.6
1022.2
1035.9
1191.6
1937.3
1972.1
2008.1
2144.7
2784.6
3422.4
5765.9
5897.6
7418.0
13744.8
13864.0
14242.2
14756.7
16011.5
19146.3
22727.4
23802.3
24954.1
38948.9
46932.9
75448.8
146963.6
150461.2
0.0
200
00.0
400
00.0
600
00.0
800
00.0
100
000.0
120
000.0
140
000.0
160
000.0
LAKSHADWEEP
SIKKIM
DAMAN & DIU
A & N ISLANDS
PUDUCHERRY
D & N HAVELI
MIZORAM
MEGHALAYA
CHANDIGARH
NAGALAND
TRIPURA
UTTARAKHAND
MANIPUR
ARUNACHAL PRADESH
JAMMU & KASHMIR
HIMACHAL PRADESH
JHARKHAND
CHHATTISGARH
ASSAM
BIHAR
TAMIL NADU
PUNJAB
ODISHA
HARYANA
MADHYA PRADESH
RAJASTHAN
UTTAR PRADESH
KARNATAKA
ANDHRA PRADESH
KERALA
GOA
WEST BENGAL
MAHARASHTRA
DELHI
GUJARAT
(Value (` in Lakhs)
Sta
tes/
UT
s
Sta
te w
ise
Val
ue
of
Pro
per
ty S
tole
n
du
rin
g 2
012
FIG
UR
E 8
.1
(All India Average ` 60205.54)
1445448.8
To
make t
he v
alu
es S
ym
metr
ical
to
scale
, th
e f
igu
res o
f M
ah
ara
sh
tra h
ave b
een
sh
ow
n a
s 1
44544.8
in
ste
ad
of
1445448.8
(All
India
Avera
ge =
2107193.8
div
ided b
y 3
5)
119
LatestLaws.com
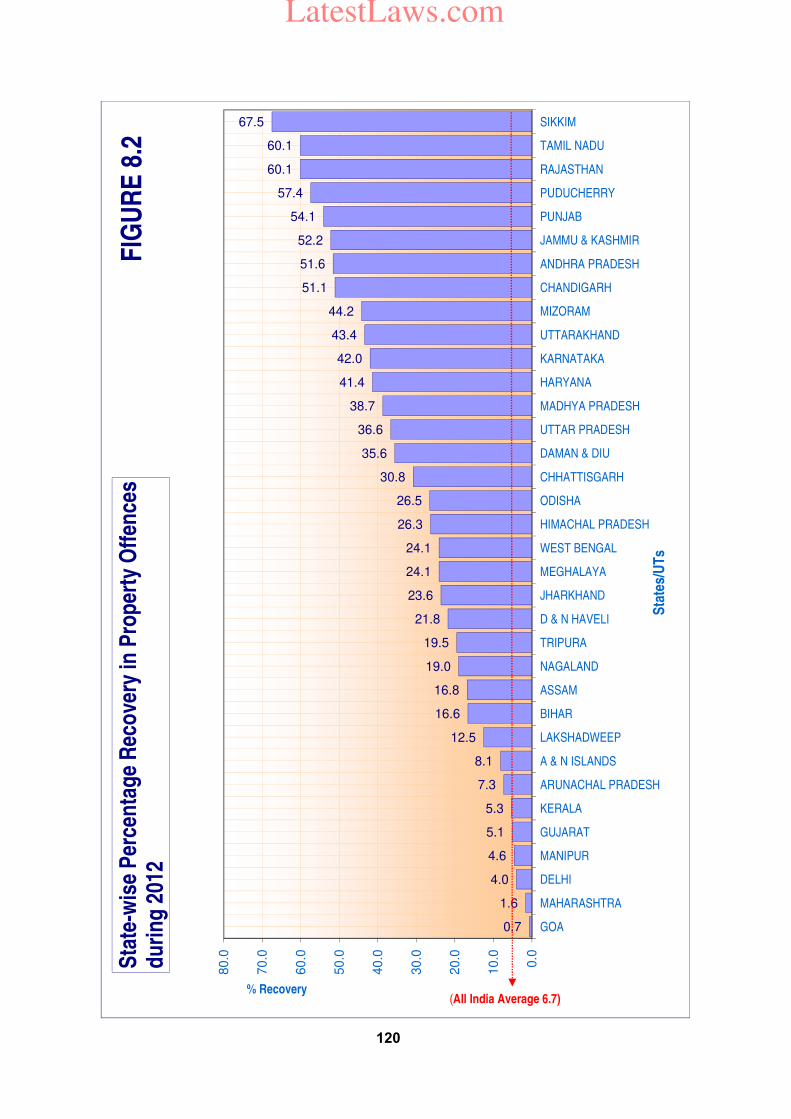
0.7
1.6
4.0
4.6
5.1
5.3
7.3
8.1
12.5
16.6
16.8
19.0
19.5
21.8
23.6
24.1
24.1
26.3
26.5
30.8
35.6
36.6
38.7
41.4
42.0
43.4
44.2
51.1
51.6
52.2
54.1
57.4
60.1
60.1
67.5
0.0
10.0
20.0
30.0
40.0
50.0
60.0
70.0
80.0
GOA
MAHARASHTRA
DELHI
MANIPUR
GUJARAT
KERALA
ARUNACHAL PRADESH
A & N ISLANDS
LAKSHADWEEP
BIHAR
ASSAM
NAGALAND
TRIPURA
D & N HAVELI
JHARKHAND
MEGHALAYA
WEST BENGAL
HIMACHAL PRADESH
ODISHA
CHHATTISGARH
DAMAN & DIU
UTTAR PRADESH
MADHYA PRADESH
HARYANA
KARNATAKA
UTTARAKHAND
MIZORAM
CHANDIGARH
ANDHRA PRADESH
JAMMU & KASHMIR
PUNJAB
PUDUCHERRY
RAJASTHAN
TAMIL NADU
SIKKIM
% Recovery
Sta
tes/
UT
s
Sta
te-w
ise
Per
cen
tag
e R
eco
very
in P
rop
erty
Off
ence
sd
uri
ng
201
2
(All India Average 6.7)
FIG
UR
E 8
.2
120
LatestLaws.com
121
various premises or various places of occurrence of these crimes have been shown in Table-8.7. Dacoity State, UT and city-wise information on the number of cases of dacoity reported and the value of property taken away in these cases at various ‘Places of occurrence’ in the country is presented in Table-8.8. The highest incidence of dacoity at ‘residential premises’ (260) was reported from Bihar followed by Jharkhand (125) and Assam (123). These three states together have accounted for 39.4% of total 1,288 dacoity (wherein the property was lost) at ‘residential premises’ in the country. Uttar Pradesh, with 110 cases of dacoity at ‘residential premises’ has reported the highest loss of property worth ` 318.7 lakh followed by Madhya Pradesh (` 314.7 lakh) and Gujarat (` 299.6 lakh). The highest incidence of dacoity on ‘highways’ was reported from Bihar (191) followed by Jharkhand (116). The maximum number of such cases at ‘commercial establishment’ was reported from Maharashtra (55) followed by Odisha (51) and Gujarat and West Bengal (31 each). The highest incidence of dacoity at ‘railways’ (running trains and ‘others’ in railways) was reported from Bihar (15 cases) followed by Maharashtra (13 cases) and Uttar Pradesh (8 cases). Amongst mega cities, highest incidence of dacoity at residential premises was reported from Bengaluru (16 cases) followed by Delhi-City (9 cases). A total of 4,314 incidents of dacoity at various premises were reported with property lost worth ` 14,338.2 lakh at the national level.
Robbery State, UT and city-wise information on the number of cases of robbery reported and the value of property taken away in these cases at various ‘places of occurrence’ in the country is presented in Table-8.9. The place of occurrence could not be categorized in more than half (63.9%) of the robbery cases in specified category. Tamil Nadu has reported 401 out of 2,821 cases of robbery at ‘residential premises’ and Odisha has reported 151 cases of robbery at ‘commercial establishments’. As many as 1,480 cases of robbery on ‘highways’ were reported from Uttar Pradesh followed by Bihar (1,081 cases) out of total 5,000 cases reported in the country.
Amongst the mega cities, the highest incidence of robbery at various premises together was reported from Mumbai (1,131) followed by Bengaluru (670) and Ahmedabad (603) with property loss of ` 1,143.3 lakh, ` 771.0 lakh and ` 285.1 lakh respectively. Highest incidence of robbery at ‘residential premises' was reported from Indore (178) followed by Delhi-city (86). The highest incidence of robbery at ‘commercial establishments' was reported from Mumbai (32) followed by Delhi-city (27) and Indore (22).
Burglary State, UT & city-wise information on burglary cases and the value of property stolen at various places of occurrence during the year 2012 is presented in Table-8.10. The ‘residential premises’, continued to be the prime target for this type of crime, reporting 60,698 (i.e. 65.3%) incidents with a loss of property worth ` 43,815.0 lakh. Maharashtra (10,508), Madhya Pradesh (7,671) and Andhra
LatestLaws.com
122
Pradesh (6,028) have reported significantly large number of burglary cases at ‘residential premises’. These three States together have accounted for 39.9% (24,207 out of 60,698) of the total incidents and 39.0% (` 17,069.7 lakh out of ` 43,815 lakh) of the total value of property lost in Burglary at ‘residential premises’. 22.6% (93 out of 411 cases) of burglaries at ‘banks’ reported in the country were from Maharashtra. More than a thousand cases of burglaries at ‘commercial establishments’ were reported from Maharashtra (1,943 cases - loss ` 3,347.3 lakh), Madhya Pradesh (1,080 cases - loss ` 584.1 lakh) and Haryana (1,078 cases - loss ` 465.8 lakh). Among the mega cities, Mumbai has reported the highest number of burglaries at ‘residential premises’ (1,519). The highest loss of property worth ` 3,038.4 lakh in burglary cases at residential premises was also reported from Mumbai. Theft The State, UT & city-wise information on ‘theft’ cases reported and the value of property stolen at various places of occurrence in the country are shown in Table- 8.11. The place of occurrence could not be categorised in 53.7% of theft cases in specified category. 24.3% of theft cases (81,861 out of 3,37,407) with property loss of ` 51,234.9 lakh were reported at ‘residential premises'. A significant number of cases were also reported at ‘commercial establishments’ (29,661), ‘highways’ (27,802) and ‘railways’ (16,015). Andhra Pradesh has reported the highest number of theft cases at ‘residential premises’
(9,085) followed by Maharashtra (8,293) and Madhya Pradesh (7,450). Among UTs Delhi reported the highest no. of theft cases (7,076). Uttar Pradesh has reported 77.9% (21,662 out of 27,802) cases of theft at ‘highways’. Maharashtra has reported the highest number of theft cases in ‘Railways’ (running trains and others in Railways) (3,081) followed by Madhya Pradesh (2,089). The highest number of thefts at ‘commercial establishments’ was reported from Haryana (3,295) followed by Maharashtra (2,589). The total value of property stolen for all theft cases was the highest (` 44,473.4 lakh) in Maharashtra, followed by West Bengal (` 41,845.6 lakh) and Delhi (` 15,805 lakh). Among the mega cities, Delhi City has reported the highest number of theft cases (20,218) with a property loss of ` 14,413.3 lakh followed by Mumbai with 10,851 cases with a property loss worth ` 13,707.2 lakh. While highest loss in term of value was reported in Kolkata (` 37527.7 lakh with 4,960 cases). Agra city was very prone to theft at 'highways' reporting 2,485 such incidents during the year 2012. The highest number of Theft cases at ‘residential premises’ (6,267) was reported from Delhi city. A substantial number of Theft cases at ‘commercial establishments’ were reported from Delhi (1,224) followed by Kolkata (1,163). Delhi reported 637 cases of theft cases at ‘Railways’ followed by Hyderabad(33). Value of property stolen and percentage recovery in each State/UT during 2012 are presented in Figure 8.1 and Figure 8.2 respectively.
LatestLaws.com
123
Chapter-9
Economic Offences
Economic offences form a separate category of crimes under criminal offences. These are often referred to as white/blue collar crimes. Economic offences not only inflict pecuniary losses on individuals
but also damage the national economy and have security implications as well. The offences of smuggling of narcotic substances, counterfeiting of currency and valuable securities, financial scams, frauds, money laundering and
Sl.
No. Economic crimes Acts / Legislation
Enforcement
authorities
1 Tax evasion Income Tax Act Central Board of Direct
Taxes
2 Illicit trafficking in contraband goods
(smuggling)
Customs Act 1962
COFEPOSA, 1974
Collectors of Customs
3 Evasion of Excise Duty Central Excise Act, 1944 Collectors of Central
Excise
4 Cultural object’s theft Antiquity and Art Treasures Act, 1972 Police/State CB-CID/CBI
5 Money laundering Foreign Exchange Regulations Act, 1973;
Money Laundering Act, 2002
Directorate of
Enforcement
6 Foreign contribution manipulations Foreign Contribution (Regulation) Act,
1976;
Police/CBI
7 Land grabbing/Real estate frauds IPC Police/State CB-CID/CBI
8 Trade in human body parts Transplantation of Human Organs Act,
1994
Police/State CB-CID/CBI
9 Illicit drug trafficking Narcotic Drugs and Psychotropic
Substances Act 1985 & NDPS Act, 1988
NCB/ Police/State CB-
CID/CBI
10 Fraudulent bankruptcy Banking Regulation Act, 1949 Police, CBI
11 Corruption and bribery of public
servants
Prevention of Corruption Act, 1988 State/Anti Corruption
Bureaux/ Vigilance
Bureaux/CBI
12 Bank frauds IPC Police/State
Vigilance/CB-CID/CBI
13 Insurance rrauds IPC Police/State
Vigilance/CB-CID/CBI
14 Racketeering in employment IPC Police/State CB-CID/CBI
15 Illegal foreign trade Import & Export (Control) Act,1947 Directorate General of
Foreign Trade/CBI
16 Racketeering in false travel
documents
Passport Act, 1920/IPC Police/State CB-CID/CBI
17 Credit cards fraud IPC Police/State CB-CID/CBI
18 Terrorist activities IPC & related Acts Police/State CB-CID/CBI
19 Illicit trafficking in arms Arms Act,1959 Police/State CB-CID/CBI
20 Illicit trafficking in explosives Explosives Act, 1884 & Explosive
Substances Act, 1908
Police/State CB-CID/CBI
21 Theft of intellectual property Copyright Act, 1957 (Amendments 1984 &
1994)
Police/State CB-CID/CBI
22 Computer crime/software piracy Copyright Act, 1957/I.T.Act, 2000 Police/State CB-CID/CBI
23 Stock market manipulations IPC Police/State CB-CID/CBI
24 Company frauds Companies Act, 1956/IPC
MRTP Act, 1968
Police/CBI/SFIO
LatestLaws.com
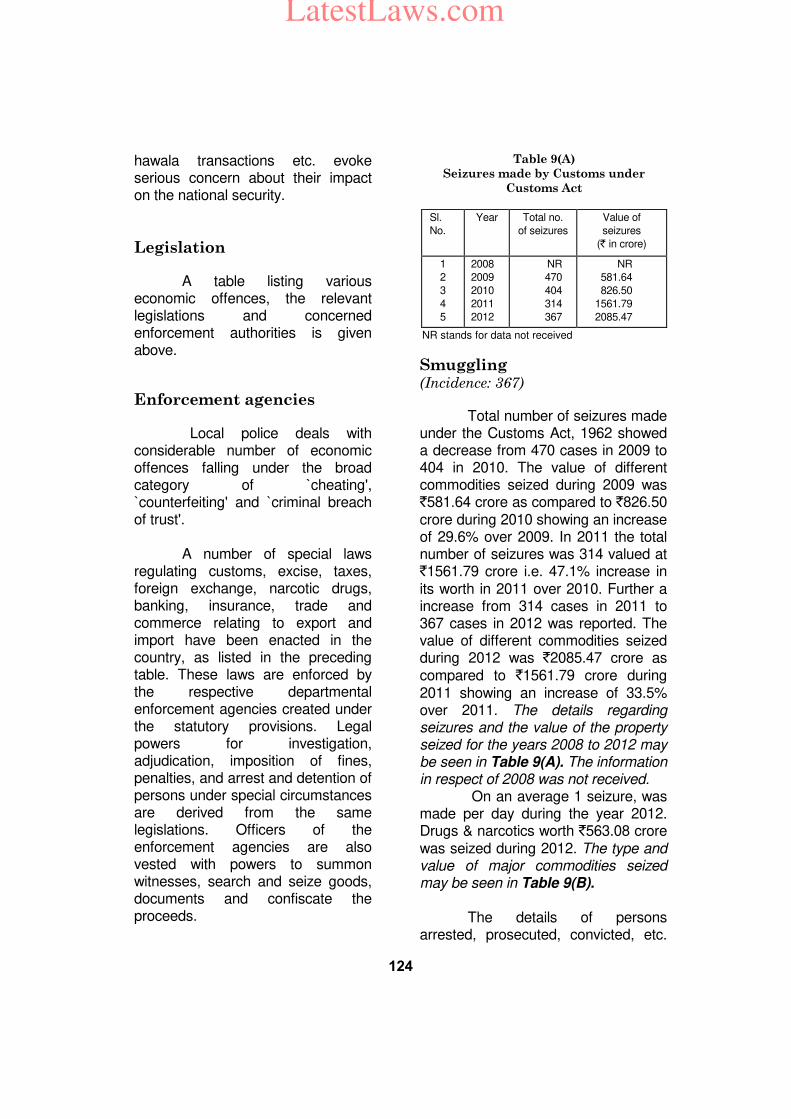
124
hawala transactions etc. evoke serious concern about their impact on the national security.
Legislation
A table listing various economic offences, the relevant legislations and concerned enforcement authorities is given above.
Enforcement agencies
Local police deals with considerable number of economic offences falling under the broad category of `cheating', `counterfeiting' and `criminal breach of trust'. A number of special laws regulating customs, excise, taxes, foreign exchange, narcotic drugs, banking, insurance, trade and commerce relating to export and import have been enacted in the country, as listed in the preceding table. These laws are enforced by the respective departmental enforcement agencies created under the statutory provisions. Legal powers for investigation, adjudication, imposition of fines, penalties, and arrest and detention of persons under special circumstances are derived from the same legislations. Officers of the enforcement agencies are also vested with powers to summon witnesses, search and seize goods, documents and confiscate the proceeds.
Smuggling (Incidence: 367)
Total number of seizures made under the Customs Act, 1962 showed a decrease from 470 cases in 2009 to 404 in 2010. The value of different commodities seized during 2009 was `581.64 crore as compared to `826.50 crore during 2010 showing an increase of 29.6% over 2009. In 2011 the total number of seizures was 314 valued at `1561.79 crore i.e. 47.1% increase in its worth in 2011 over 2010. Further a increase from 314 cases in 2011 to 367 cases in 2012 was reported. The value of different commodities seized during 2012 was `2085.47 crore as compared to `1561.79 crore during 2011 showing an increase of 33.5% over 2011. The details regarding seizures and the value of the property seized for the years 2008 to 2012 may be seen in Table 9(A). The information in respect of 2008 was not received. On an average 1 seizure, was made per day during the year 2012. Drugs & narcotics worth `563.08 crore was seized during 2012. The type and value of major commodities seized may be seen in Table 9(B). The details of persons arrested, prosecuted, convicted, etc.
Table 9(A)
Seizures made by Customs under
Customs Act
Sl.
No.
Year Total no.
of seizures
Value of
seizures
(` in crore)
1
2
3
4
5
2008
2009
2010
2011
2012
NR
470
404
314
367
NR
581.64
826.50
1561.79
2085.47
NR stands for data not received
LatestLaws.com
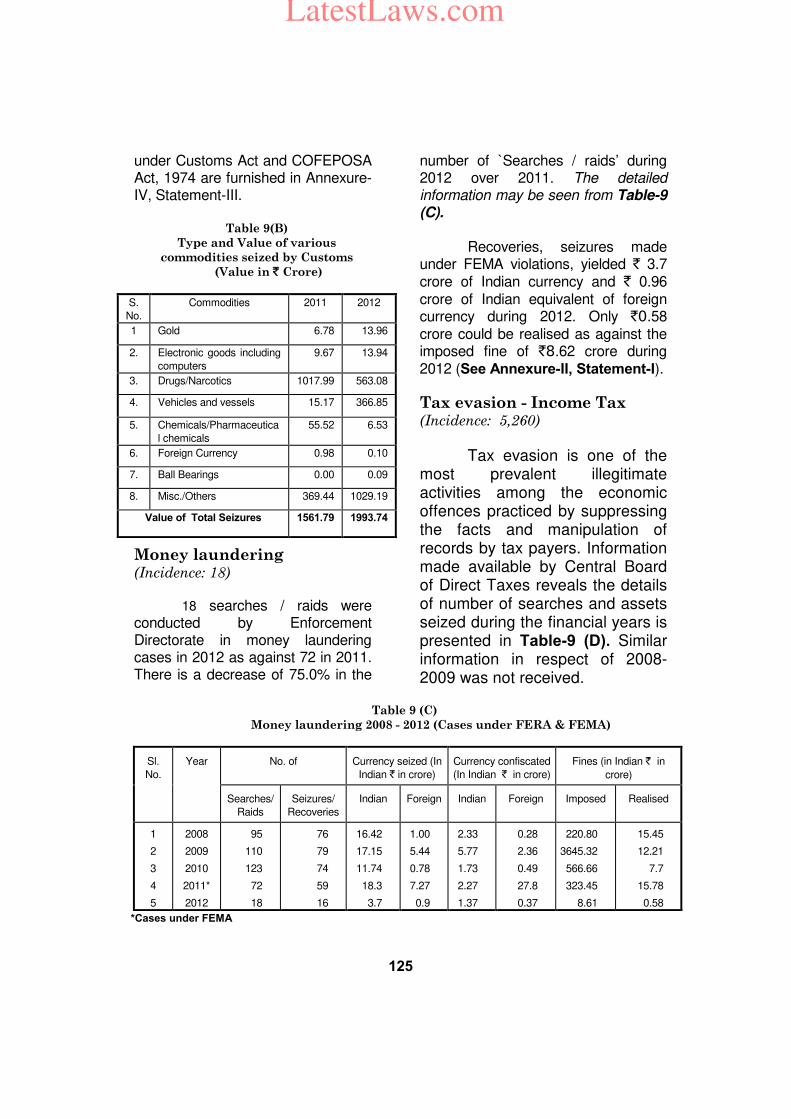
125
Table 9 (C)
Money laundering 2008 - 2012 (Cases under FERA & FEMA)
Sl.
No.
Year No. of Currency seized (In
Indian ` in crore)
Currency confiscated
(In Indian ` in crore)
Fines (in Indian ` in
crore)
Searches/
Raids
Seizures/
Recoveries
Indian Foreign Indian Foreign Imposed Realised
1
2
3
4
5
2008
2009
2010
2011*
2012
95
110
123
72
18
76
79
74
59
16
16.42
17.15
11.74
18.3
3.7
1.00
5.44
0.78
7.27
0.9
2.33
5.77
1.73
2.27
1.37
0.28
2.36
0.49
27.8
0.37
220.80
3645.32
566.66
323.45
8.61
15.45
12.21
7.7
15.78
0.58
*Cases under FEMA
under Customs Act and COFEPOSA Act, 1974 are furnished in Annexure-IV, Statement-III.
Money laundering (Incidence: 18)
18 searches / raids were conducted by Enforcement Directorate in money laundering cases in 2012 as against 72 in 2011. There is a decrease of 75.0% in the
number of `Searches / raids’ during 2012 over 2011. The detailed information may be seen from Table-9 (C).
Recoveries, seizures made under FEMA violations, yielded ` 3.7 crore of Indian currency and ` 0.96 crore of Indian equivalent of foreign currency during 2012. Only `0.58 crore could be realised as against the imposed fine of `8.62 crore during 2012 (See Annexure-II, Statement-I).
Tax evasion - Income Tax (Incidence: 5,260)
Tax evasion is one of the most prevalent illegitimate activities among the economic offences practiced by suppressing the facts and manipulation of records by tax payers. Information made available by Central Board of Direct Taxes reveals the details of number of searches and assets seized during the financial years is presented in Table-9 (D). Similar information in respect of 2008-2009 was not received.
Table 9(B)
Type and Value of various
commodities seized by Customs
(Value in ` Crore)
S.
No.
Commodities 2011 2012
1 Gold 6.78 13.96
2. Electronic goods including
computers
9.67 13.94
3. Drugs/Narcotics 1017.99 563.08
4. Vehicles and vessels 15.17 366.85
5. Chemicals/Pharmaceutica
l chemicals
55.52 6.53
6. Foreign Currency 0.98 0.10
7. Ball Bearings 0.00 0.09
8. Misc./Others 369.44 1029.19
Value of Total Seizures 1561.79 1993.74
LatestLaws.com
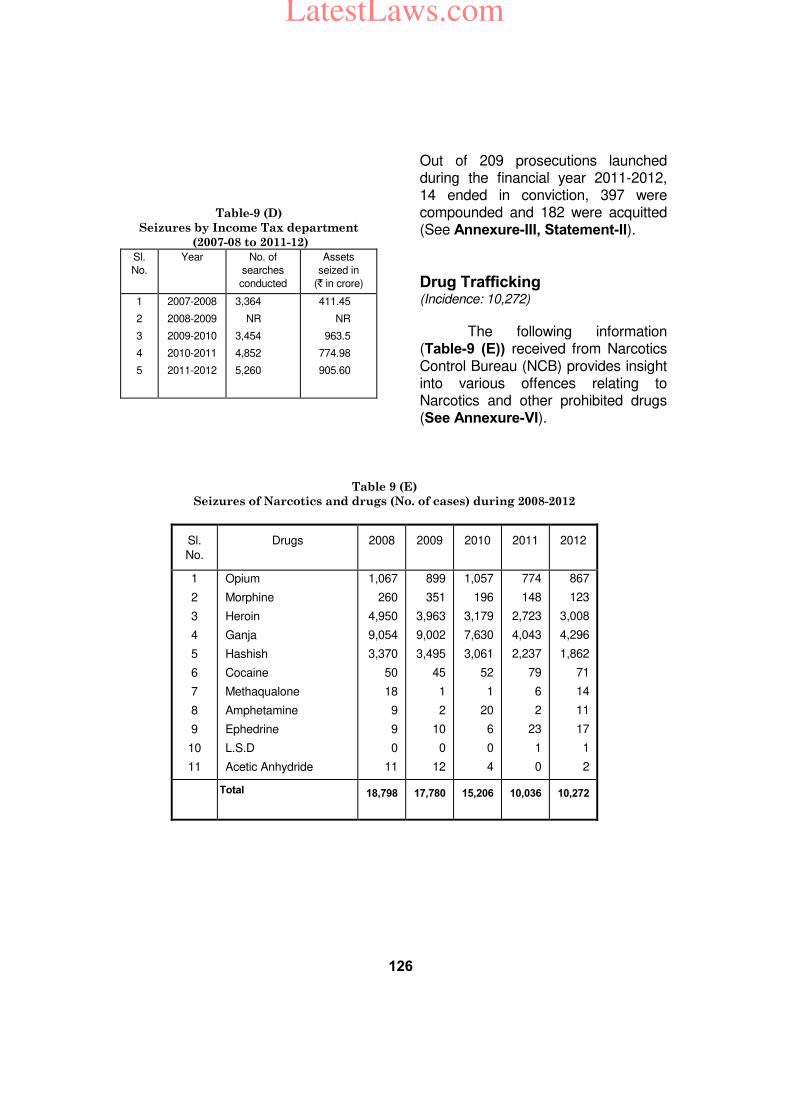
126
Table 9 (E)
Seizures of Narcotics and drugs (No. of cases) during 2008-2012
Sl.
No.
Drugs 2008 2009 2010 2011 2012
1
2
3
4
5
6
7
8
9
10
11
Opium
Morphine
Heroin
Ganja
Hashish
Cocaine
Methaqualone
Amphetamine
Ephedrine
L.S.D
Acetic Anhydride
1,067
260
4,950
9,054
3,370
50
18
9
9
0
11
899
351
3,963
9,002
3,495
45
1
2
10
0
12
1,057
196
3,179
7,630
3,061
52
1
20
6
0
4
774
148
2,723
4,043
2,237
79
6
2
23
1
0
867
123
3,008
4,296
1,862
71
14
11
17
1
2
Total 18,798 17,780 15,206 10,036
10,272
Out of 209 prosecutions launched during the financial year 2011-2012, 14 ended in conviction, 397 were compounded and 182 were acquitted (See Annexure-III, Statement-II).
Drug Trafficking (Incidence: 10,272)
The following information (Table-9 (E)) received from Narcotics Control Bureau (NCB) provides insight into various offences relating to Narcotics and other prohibited drugs (See Annexure-VI).
Table-9 (D)
Seizures by Income Tax department
(2007-08 to 2011-12)
Sl.
No.
Year No. of
searches
conducted
Assets
seized in
(` in crore)
1
2
3
4
5
2007-2008
2008-2009
2009-2010
2010-2011
2011-2012
3,364
NR
3,454
4,852
5,260
411.45
NR
963.5
774.98
905.60
LatestLaws.com
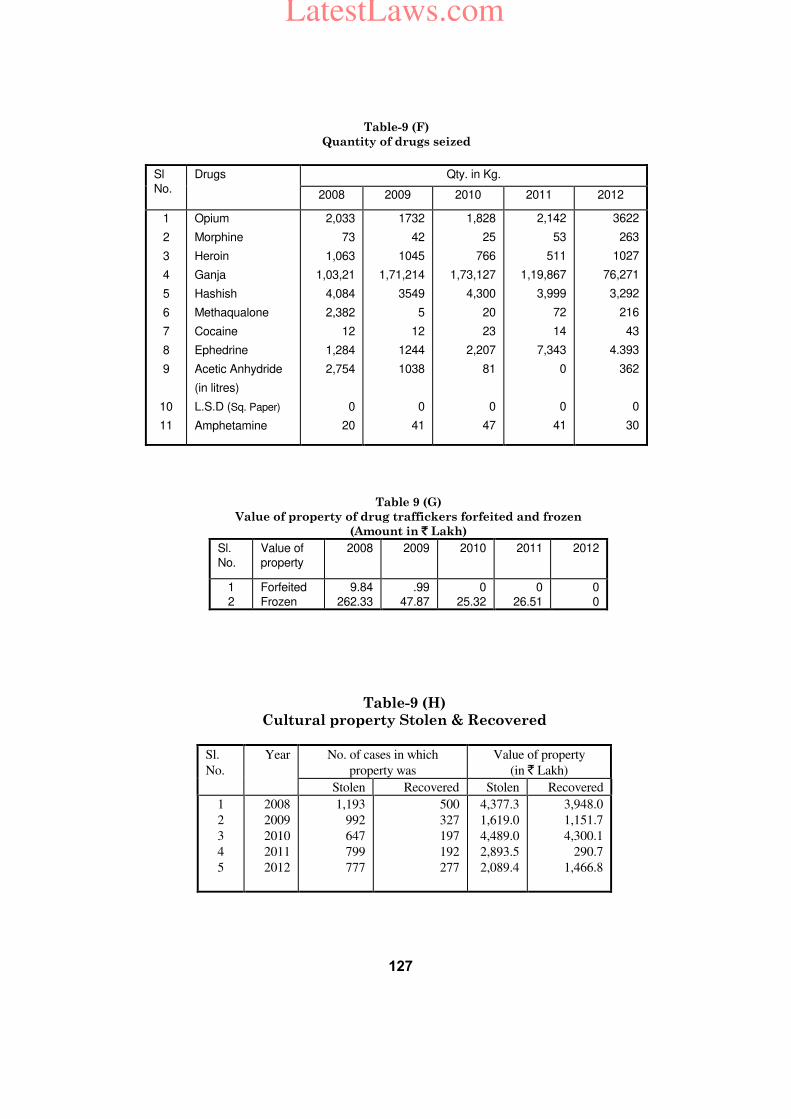
127
Table-9 (F)
Quantity of drugs seized
Sl
No.
Drugs Qty. in Kg.
2008 2009 2010 2011 2012
1
2
3
4
5
6
7
8
9
10
11
Opium
Morphine
Heroin
Ganja
Hashish
Methaqualone
Cocaine
Ephedrine
Acetic Anhydride
(in litres)
L.S.D (Sq. Paper)
Amphetamine
2,033
73
1,063
1,03,21
4,084
2,382
12
1,284
2,754
0
20
1732
42
1045
1,71,214
3549
5
12
1244
1038
0
41
1,828
25
766
1,73,127
4,300
20
23
2,207
81
0
47
2,142
53
511
1,19,867
3,999
72
14
7,343
0
0
41
3622
263
1027
76,271
3,292
216
43
4.393
362
0
30
Table 9 (G)
Value of property of drug traffickers forfeited and frozen
(Amount in ` Lakh)
Sl.
No.
Value of
property
2008 2009 2010 2011 2012
1
2
Forfeited
Frozen
9.84
262.33
.99
47.87
0
25.32
0
26.51
0
0
Table-9 (H)
Cultural property Stolen & Recovered
Sl.
No.
Year No. of cases in which
property was
Value of property
(in ` Lakh)
Stolen Recovered Stolen Recovered
1
2
3
4
5
2008
2009
2010
2011
2012
1,193
992
647
799
777
500
327
197
192
277
4,377.3
1,619.0
4,489.0
2,893.5
2,089.4
3,948.0
1,151.7
4,300.1
290.7
1,466.8
LatestLaws.com
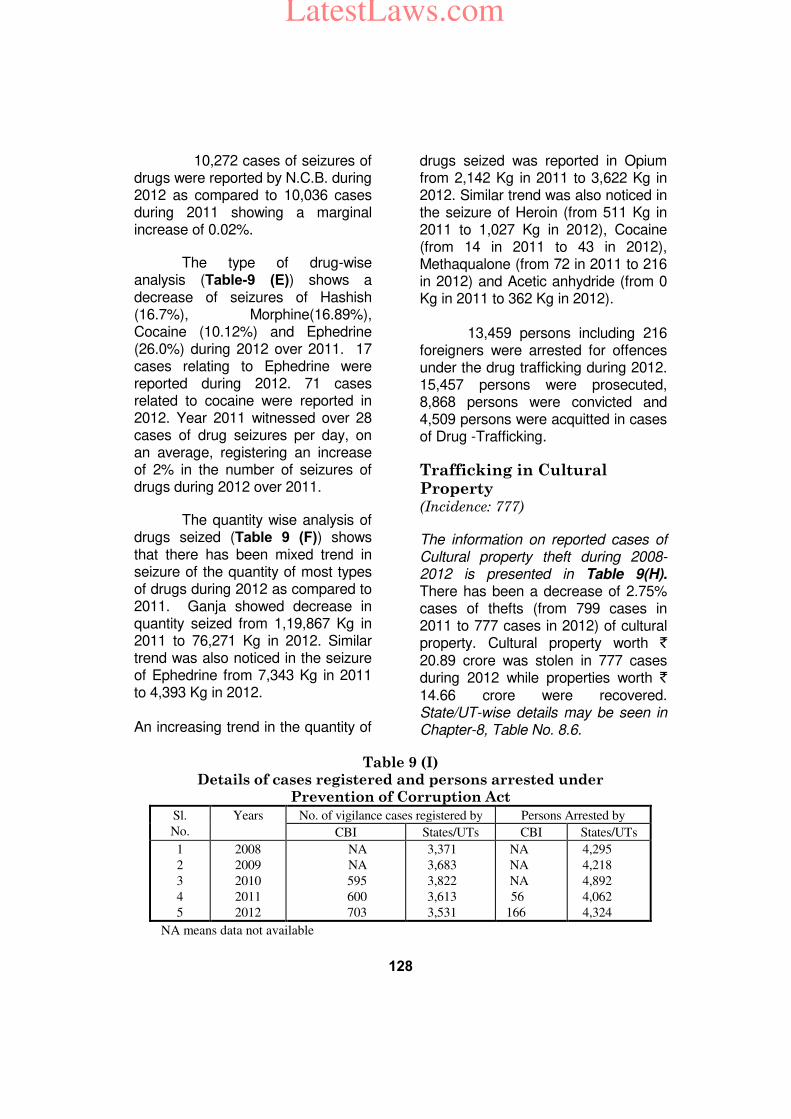
128
Table 9 (I)
Details of cases registered and persons arrested under
Prevention of Corruption Act
Sl.
No.
Years No. of vigilance cases registered by Persons Arrested by
CBI States/UTs CBI States/UTs
1
2
3
4
5
2008
2009
2010
2011
2012
NA
NA
595
600
703
3,371
3,683
3,822
3,613
3,531
NA
NA
NA
56
166
4,295
4,218
4,892
4,062
4,324
NA means data not available
10,272 cases of seizures of drugs were reported by N.C.B. during 2012 as compared to 10,036 cases during 2011 showing a marginal increase of 0.02%.
The type of drug-wise analysis (Table-9 (E)) shows a decrease of seizures of Hashish (16.7%), Morphine(16.89%), Cocaine (10.12%) and Ephedrine (26.0%) during 2012 over 2011. 17 cases relating to Ephedrine were reported during 2012. 71 cases related to cocaine were reported in 2012. Year 2011 witnessed over 28 cases of drug seizures per day, on an average, registering an increase of 2% in the number of seizures of drugs during 2012 over 2011.
The quantity wise analysis of drugs seized (Table 9 (F)) shows that there has been mixed trend in seizure of the quantity of most types of drugs during 2012 as compared to 2011. Ganja showed decrease in quantity seized from 1,19,867 Kg in 2011 to 76,271 Kg in 2012. Similar trend was also noticed in the seizure of Ephedrine from 7,343 Kg in 2011 to 4,393 Kg in 2012. An increasing trend in the quantity of
drugs seized was reported in Opium from 2,142 Kg in 2011 to 3,622 Kg in 2012. Similar trend was also noticed in the seizure of Heroin (from 511 Kg in 2011 to 1,027 Kg in 2012), Cocaine (from 14 in 2011 to 43 in 2012), Methaqualone (from 72 in 2011 to 216 in 2012) and Acetic anhydride (from 0 Kg in 2011 to 362 Kg in 2012). 13,459 persons including 216 foreigners were arrested for offences under the drug trafficking during 2012. 15,457 persons were prosecuted, 8,868 persons were convicted and 4,509 persons were acquitted in cases of Drug -Trafficking.
Trafficking in Cultural Property (Incidence: 777)
The information on reported cases of Cultural property theft during 2008-2012 is presented in Table 9(H). There has been a decrease of 2.75% cases of thefts (from 799 cases in 2011 to 777 cases in 2012) of cultural property. Cultural property worth ` 20.89 crore was stolen in 777 cases during 2012 while properties worth ` 14.66 crore were recovered. State/UT-wise details may be seen in Chapter-8, Table No. 8.6.
LatestLaws.com
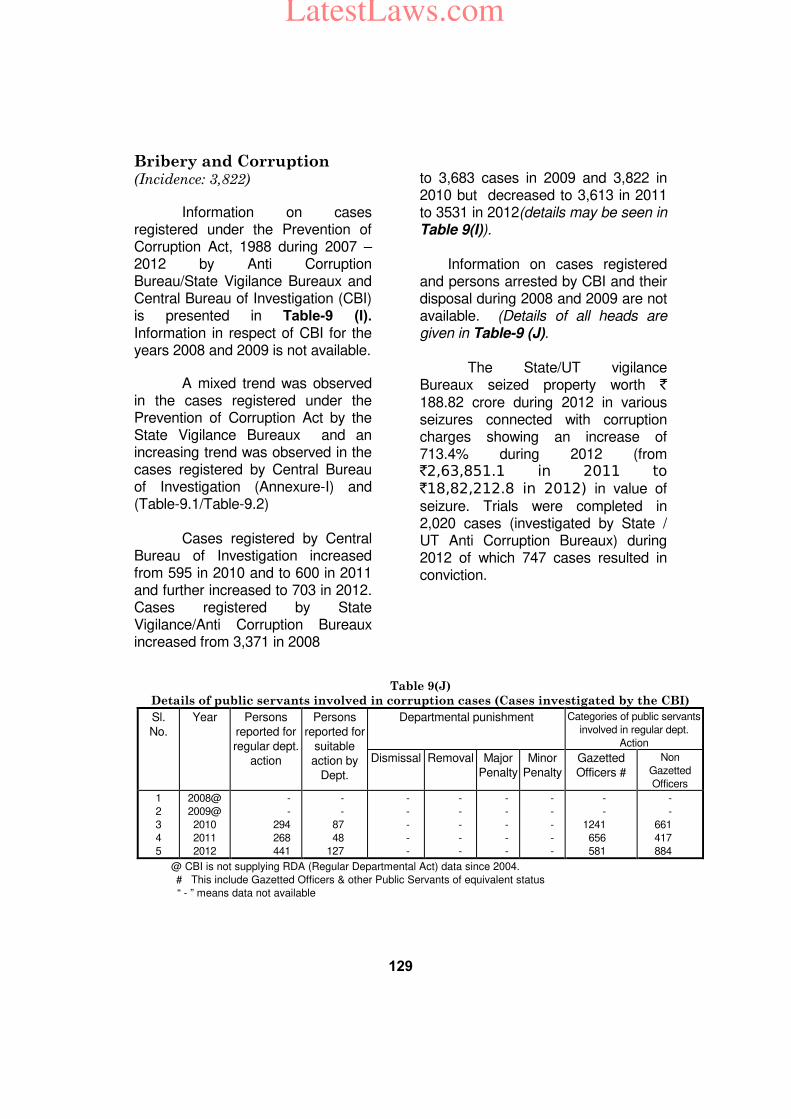
129
Table 9(J)
Details of public servants involved in corruption cases (Cases investigated by the CBI)
Sl.
No.
Year Persons
reported for
regular dept.
action
Persons
reported for
suitable
action by
Dept.
Departmental punishment Categories of public servants
involved in regular dept.
Action
Dismissal Removal Major
Penalty
Minor
Penalty
Gazetted
Officers #
Non
Gazetted
Officers
1
2
3
4
5
2008@
2009@
2010
2011
2012
-
-
294
268
441
-
-
87
48
127
-
-
-
-
-
-
-
-
-
-
-
-
-
-
-
-
-
-
-
-
-
-
1241
656
581
-
-
661
417
884
@ CBI is not supplying RDA (Regular Departmental Act) data since 2004.
# This include Gazetted Officers & other Public Servants of equivalent status
“ - ” means data not available
Bribery and Corruption (Incidence: 3,822)
Information on cases registered under the Prevention of Corruption Act, 1988 during 2007 – 2012 by Anti Corruption Bureau/State Vigilance Bureaux and Central Bureau of Investigation (CBI) is presented in Table-9 (I). Information in respect of CBI for the years 2008 and 2009 is not available.
A mixed trend was observed in the cases registered under the Prevention of Corruption Act by the State Vigilance Bureaux and an increasing trend was observed in the cases registered by Central Bureau of Investigation (Annexure-I) and (Table-9.1/Table-9.2)
Cases registered by Central Bureau of Investigation increased from 595 in 2010 and to 600 in 2011 and further increased to 703 in 2012. Cases registered by State Vigilance/Anti Corruption Bureaux increased from 3,371 in 2008
to 3,683 cases in 2009 and 3,822 in 2010 but decreased to 3,613 in 2011 to 3531 in 2012(details may be seen in Table 9(I)). Information on cases registered and persons arrested by CBI and their disposal during 2008 and 2009 are not available. (Details of all heads are given in Table-9 (J). The State/UT vigilance Bureaux seized property worth `
188.82 crore during 2012 in various seizures connected with corruption charges showing an increase of 713.4% during 2012 (from `2,63,851.1 in 2011 to
`18,82,212.8 in 2012) in value of seizure. Trials were completed in 2,020 cases (investigated by State / UT Anti Corruption Bureaux) during 2012 of which 747 cases resulted in conviction.
LatestLaws.com
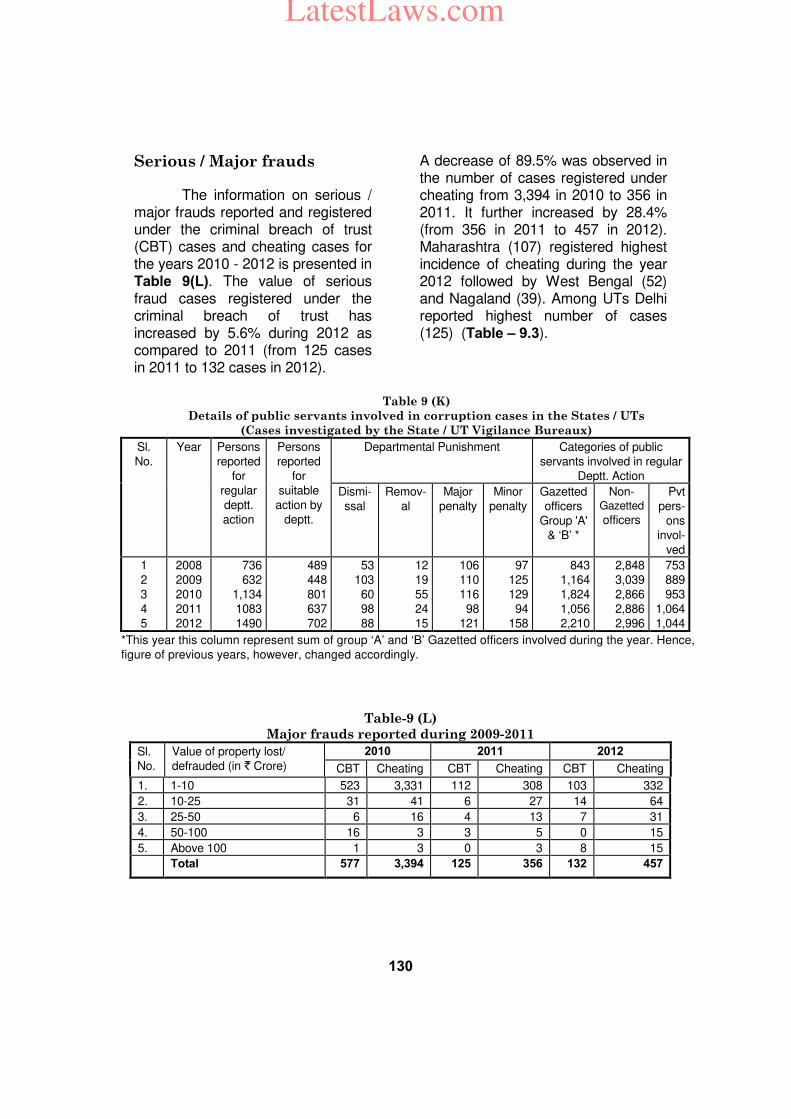
130
Table 9 (K)
Details of public servants involved in corruption cases in the States / UTs
(Cases investigated by the State / UT Vigilance Bureaux)
Sl.
No.
Year Persons
reported
for
regular
deptt.
action
Persons
reported
for
suitable
action by
deptt.
Departmental Punishment Categories of public
servants involved in regular
Deptt. Action
Dismi-
ssal
Remov-
al
Major
penalty
Minor
penalty
Gazetted
officers
Group 'A'
& ‘B’ *
Non-Gazetted
officers
Pvt
pers-
ons
invol-
ved
1
2
3
4
5
2008
2009
2010
2011
2012
736
632
1,134
1083
1490
489
448
801
637
702
53
103
60
98
88
12
19
55
24
15
106
110
116
98
121
97
125
129
94
158
843
1,164
1,824
1,056
2,210
2,848
3,039
2,866
2,886
2,996
753
889
953
1,064
1,044
*This year this column represent sum of group ‘A’ and ‘B’ Gazetted officers involved during the year. Hence,
figure of previous years, however, changed accordingly.
Table-9 (L)
Major frauds reported during 2009-2011
Sl.
No.
Value of property lost/
defrauded (in ` Crore)
2010 2011 2012
CBT Cheating CBT Cheating CBT Cheating
1. 1-10 523 3,331 112 308 103 332
2. 10-25 31 41 6 27 14 64
3. 25-50 6 16 4 13 7 31
4. 50-100 16 3 3 5 0 15
5. Above 100 1 3 0 3 8 15
Total 577 3,394 125 356 132 457
Serious / Major frauds
The information on serious / major frauds reported and registered under the criminal breach of trust (CBT) cases and cheating cases for the years 2010 - 2012 is presented in Table 9(L). The value of serious fraud cases registered under the criminal breach of trust has increased by 5.6% during 2012 as compared to 2011 (from 125 cases in 2011 to 132 cases in 2012).
A decrease of 89.5% was observed in the number of cases registered under cheating from 3,394 in 2010 to 356 in 2011. It further increased by 28.4% (from 356 in 2011 to 457 in 2012). Maharashtra (107) registered highest incidence of cheating during the year 2012 followed by West Bengal (52) and Nagaland (39). Among UTs Delhi reported highest number of cases (125) (Table – 9.3).
LatestLaws.com
131
Chapter – 10
Juvenile in conflict with law
Introduction
The figures for Juvenile apprehended till 2000 were collected as per the definition of Juveniles in the Juvenile Justice Act, 1986. Male below the age of 16 years and female below the age of 18 years were considered as juveniles in this Act. The Act was amended in 2000 according to which, the age of juvenile males and females was brought at par as below the age of 18 years.
Share of Juvenile Crimes
The share of IPC crimes committed by juveniles to total IPC crimes reported in the country during 2002-2005 remained static at 1.0% which marginally increased to 1.1% in 2006 and remained static in 2007. This share increased marginally to 1.2% in 2008 and decreased to 1.1% in 2009.This share further decreased to 1.0% in 2010 and thereafter marginally increased to 1.1 in 2011 and 1.2% in 2012. However, juvenile crime rate has shown a mixed trend during 2002-2012. The details may be seen in Table 10.1.
IPC Crimes
(Incidence: 27,936)
The juveniles in conflict with law (IPC crimes) in 2012 have increased by 11.2% over 2011 as 25,125 IPC crimes by juveniles were
registered during 2011 which increased to 27,936 cases in 2012. The highest decrease in Juvenile in conflict with law was observed under the crime head ‘dowry deaths’ (29.0%), followed by 'cruelty by husband or his relatives’ (18.9%) and ‘kidnapping & abduction of others’ (17.5%) in 2012 over 2011. The highest increase in the incidence of crimes committed by juvenile was observed under the heads 'preparation & assembly for committing dacoity’ (178.8%), death due to negligence (65.6%), ‘attempt to commit murder’ (36.4%), ‘dacoity’ (29.9%) and 'riots' (25.5%). The details may be seen in Table 10.2.
SLL Crimes (Incidence: 4,037)
Juveniles in conflict with law under SLL crimes have increased by 42.3% in 2012 as compared to 2011 as 2,837 cases of Juveniles in conflict with law under SLL reported in 2011 which increased to 4,037 in 2012. There was substantial decrease of 47.4% cases under 'Essential commodities Act’ followed by ‘The Registration of Foreigners act” (45.7%), and ‘Copy Rights Act’ ( 28.6%) during 2012 as compared to 2011 while cases under Prevention of Atrocities Act for STs’ increased from 2 cases in 2011 to 11 cases in 2012 (450%), ‘Prohibition of Child Marriage Act’ from 3 cases in 2011 to 9 cases in 2012 and ‘Indian Railways Act’
LatestLaws.com
132
from 2 cases in 2011 to 6 cases in 2012 (200% each).
State-wise distribution of Juveniles in conflict with law (IPC)
Madhya Pradesh (5,446), Maharashtra (4,570), Assam (2,345) Chhattisgarh (2,180), Rajasthan (1,880) and Andhra Pradesh (1,593), have reported high incidence of juvenile crimes under IPC. These six States taken together have accounted for 64.5% of total juveniles in conflict with law cases under IPC reported in the country. Maharashtra and Madhya Pradesh reported 117 and 161 respectively cases of murder during 2012. The highest incidence of the rape cases committed by juveniles in the country was reported from Madhya Pradesh (249) followed by Uttar Pradesh (110) and Rajasthan (110) which was 21.2%, 9.4% and 8.7% of total rape cases committed by juveniles respectively in the country. The highest incidence of the juvenile theft in the country was reported from Maharashtra (1,095, 19.8%). Details are given in Table
10.4.
State-wise distribution of Juveniles in conflict with law (SLL)
The highest number of Juveniles in conflict with law cases under special and local laws was reported from Tamil Nadu (1,888) which accounted for 46.8% of total juvenile crimes under SLL followed
by Gujarat (462 cases, 11.4%), Chhattisgarh (322 cases, 7.7%), Maharashtra (316 cases, 7.8%) and Madhya Pradesh (231 cases, 5.7%). These five States taken together have accounted for 79.7% of total Juveniles in conflict with law cases under SLL crimes reported in the country.
Out of 326 cases reported in the country under ‘Gambling Act’ against juveniles, 23.0% cases were reported from Madhya Pradesh (75) followed by Gujarat 58 cases (17.8%). Gujarat reported 204 cases ( 63.9%) under 'Prohibition Act' followed by Maharashtra 105 cases (32.9%) and both states accounted for 96.9%. 37 cases out of 177 under 'Arms Act' were reported from Madhya Pradesh whereas 16 out of 25 cases reported under the 'The Foreigners Act' were reported from West Bengal and 12 out of 17 cases registered under Dowry Prohibition Act' were reported from Bihar. 44 out of 95 cases under 'Scheduled Castes / Scheduled Tribes (Prevention of Atrocities) Act' were registered in Tamil Nadu. Madhya Pradesh reported 82 cases out of 278 under 'Excise Act'. Details are given in Table 10.5.
Juveniles apprehended
The details of juveniles apprehended under IPC and SLL crimes by sex are presented in Table
10.6. A total of 35,123 juveniles were apprehended during 2012 out of which 33,205 were boys and 2,058 were girls. The percentage of girls
LatestLaws.com
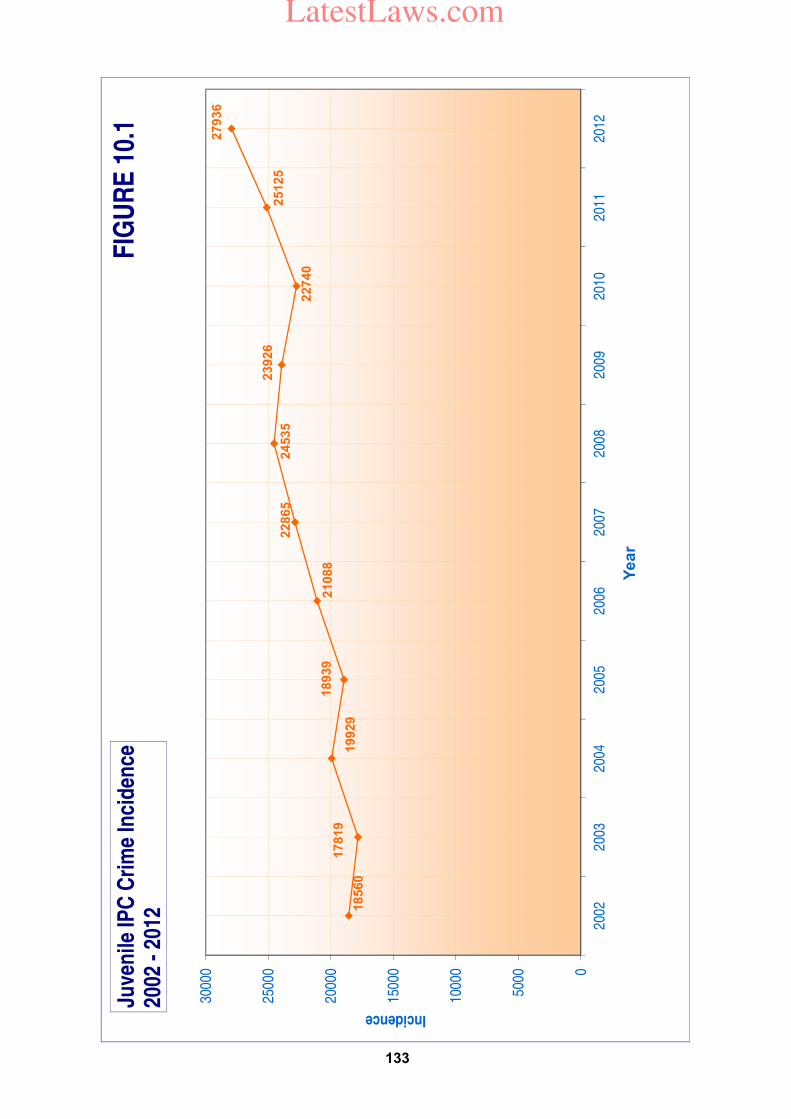
18560
17819
19929
18939
21088
22865
24535
23926
22740
25125
27936
0
5000
1000
0
1500
0
2000
0
2500
0
3000
0
2002
2003
2004
2005
2006
2007
2008
2009
2010
2011
2012
Incidence
Ye
ar
Juve
nile
IPC
Cri
me
Inci
den
ce20
02 -
2012
FIG
UR
E 1
0.1
133
LatestLaws.com
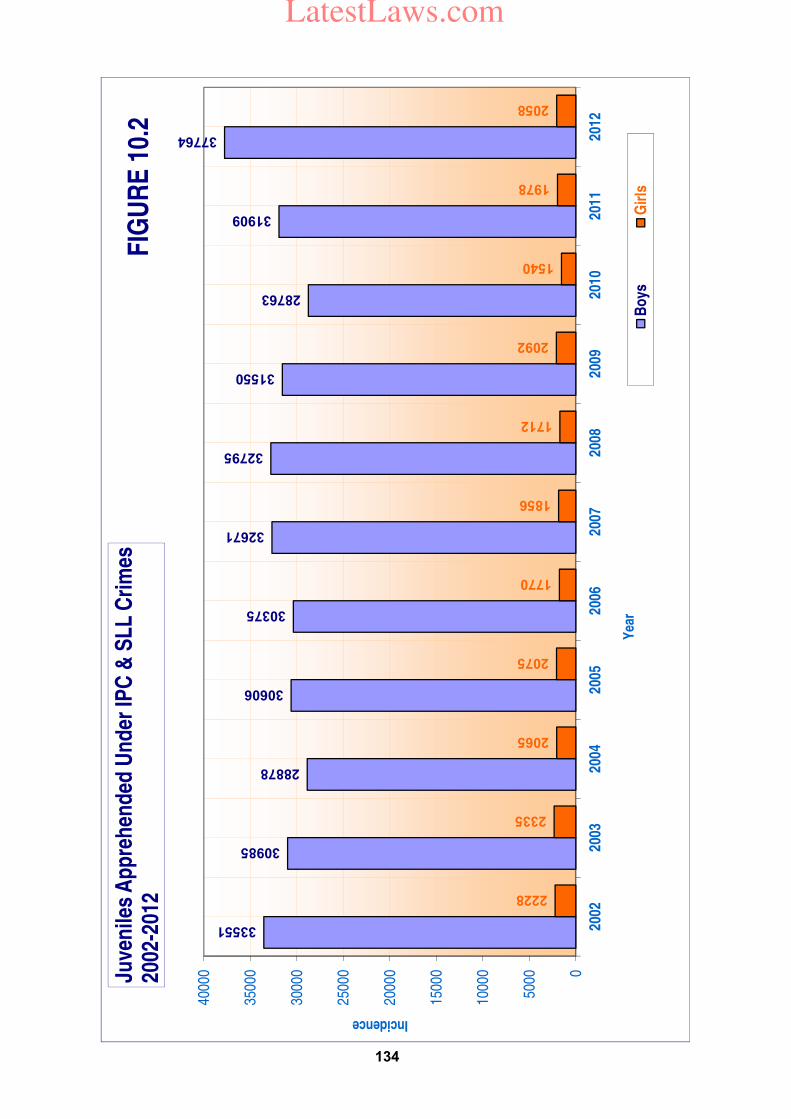
33551
30985
28878
30606
30375
32671
32795
31550
28763
31909
37764
2228
2335
2065
2075
1770
1856
1712
2092
1540
1978
2058
0
5000
1000
0
1500
0
2000
0
2500
0
3000
0
3500
0
4000
0
2002
2003
2004
2005
2006
2007
2008
2009
2010
2011
2012
Incidence
Yea
r
Juve
nile
s A
pp
reh
end
ed U
nd
er IP
C &
SL
L C
rim
es20
02-2
012
Bo
ysG
irls
FIG
UR
E 1
0.2
134
LatestLaws.com
135
to total juveniles was 5.9% i.e. 0.1 percentage point more than share relating to 2011 (5.8%). Details of juveniles apprehended under IPC and SLL crimes by age-group are presented in Table 10.7. 1,286 juveniles were apprehended in the age-group of 7-12 years, 12,063 juveniles were apprehended in the age-group of 12-16 years during 2012 whereas bulk of juveniles apprehended (26,473) were under the age-group of 16-18 years. The percentage shares of Juveniles apprehended under these age-groups were 3.2%, 30.3% and 66.5% respectively. The number of juveniles apprehended was 1,211 under the age-group of 7-12 years, 11,019 under the age-group of 12-16 years and 21,657 under the age-group of 16-18 years. The increase in the number of juveniles apprehended was 6.2% in 7-12 age group, 9.5% in 12-16 year age group and 22.2% in 16-18 age group in 2012 over 2011. The overall increase in juveniles apprehended at the national level was 17.5% in 2012 as compared to 2011.
Out of total 39,822 juveniles apprehended, 35,465 (89.1%) were apprehended under IPC crimes while 4,357 (10.9%) were apprehended for committing SLL crimes. The highest number of juveniles were apprehended for theft (7,205) followed by hurt (5,934) and burglary (3,520). These heads taken together accounted for 41.8% of total juveniles apprehended under IPC crimes. Out of total 4,357 juveniles apprehended under SLL crimes in the country during 2012, the highest number of juveniles
were apprehended under the 'Gambling Act' (409) followed by 'Prohibition Act' (337) and 'Excise Act' (294). These three heads under SLL crimes taken together accounted for 23.9% of total juveniles apprehended under SLL.
Juveniles apprehended by type of crimes State/UT-wise distribution of juveniles apprehended under various IPC crimes is presented in Table
10.9. Madhya Pradesh has reported the highest number of juveniles apprehended (6,247) under IPC crimes followed by Maharashtra (6,218), Bihar (3,088), Rajasthan (2,445) and Andhra Pradesh (2,331). Maharashtra has reported the highest number of juveniles apprehended for murder (183), Attempt to murder (188), Dacoity (100), Preparation and assembly for committing dacoity (40), Robbery (312), Burglary (727), Theft (1,491), Riots (742), Cheating (44), Counterfeiting (10), Hurt (1,380), Cruelty by husband or his relatives (84) and Causing death by negligence (59). Maximum of juveniles apprehended for rape (281), dowry deaths (25), and assault on women with intent to outrage her modesty (223) were reported in Madhya Pradesh. Among UTs, Delhi UT alone has reported 85.8% of juveniles (1,541) apprehended under different crime heads during the year.
State / UT-wise distribution of
juveniles apprehended under special and local laws (SLL) is presented in Table 10.10. The highest number of juveniles under SLL were apprehended in Tamil Nadu (1,922) followed by Gujarat (500),
LatestLaws.com
136
Maharashtra (412) and Chhattisgarh (322). These four states have accounted for 72.4% of total juveniles apprehended under SLL crimes. Profile of Juveniles apprehended
The ratio of girls to boys arrested for committing IPC crimes during 2012 was 1:19, whereas this ratio during 2011 was nearly 1:20. Madhya Pradesh (164) and Maharashtra (138) have reported significant number of juveniles apprehended in the age group of 7-12 years in the country under IPC during 2012. The highest juveniles apprehended in the age group of 12-16 years were from Madhya Pradesh (2,061) followed by Maharashtra (1,859). A substantial number of juveniles apprehended in the age group 16-18 years were from Maharashtra (4,221) and Madhya Pradesh (4,022). The details are presented in Table
10.11.
The ratio of girls to boys apprehended for committing SLL crimes during 2011 was about 1:10.3, whereas it was 1:6 in 2011. Tamil Nadu (1,922), Gujarat (500), Maharashtra (412) Chhattisgarh (322) and Madhya Pradesh (241) have reported higher juvenile offenders (boys + girls) in SLL crimes. Tamil Nadu had the highest juveniles in conflict with law (boys + girls) in the age group of 7-12 years (372) and 12-16 years (631). The details are presented in Table
10.12.
Disposal of juveniles apprehended
The details of disposal of juveniles arrested are presented in Table 10.13. A total of 39,822 juveniles were apprehended and produced before various courts during 2012. The percentage of juveniles awaiting trial at the end of 2012 was 26.9% (10,721 out of 39,822). Arunachal Pradesh and Puducherry have reported 100% disposal of juveniles apprehended. 14.9% (5,927) out of the total juveniles apprehended in the country (39,822) were disposed of after advice or admonition, 18.3% (7,290) were placed under care of parents / guardians, 5.5% (2,183) were sent to institutions, 24.3% (9,677) were sent to special homes, 3.6% (1,452) were dealt with fine and 6.5% (2,572) were either acquitted or their cases were otherwise disposed off.
LatestLaws.com
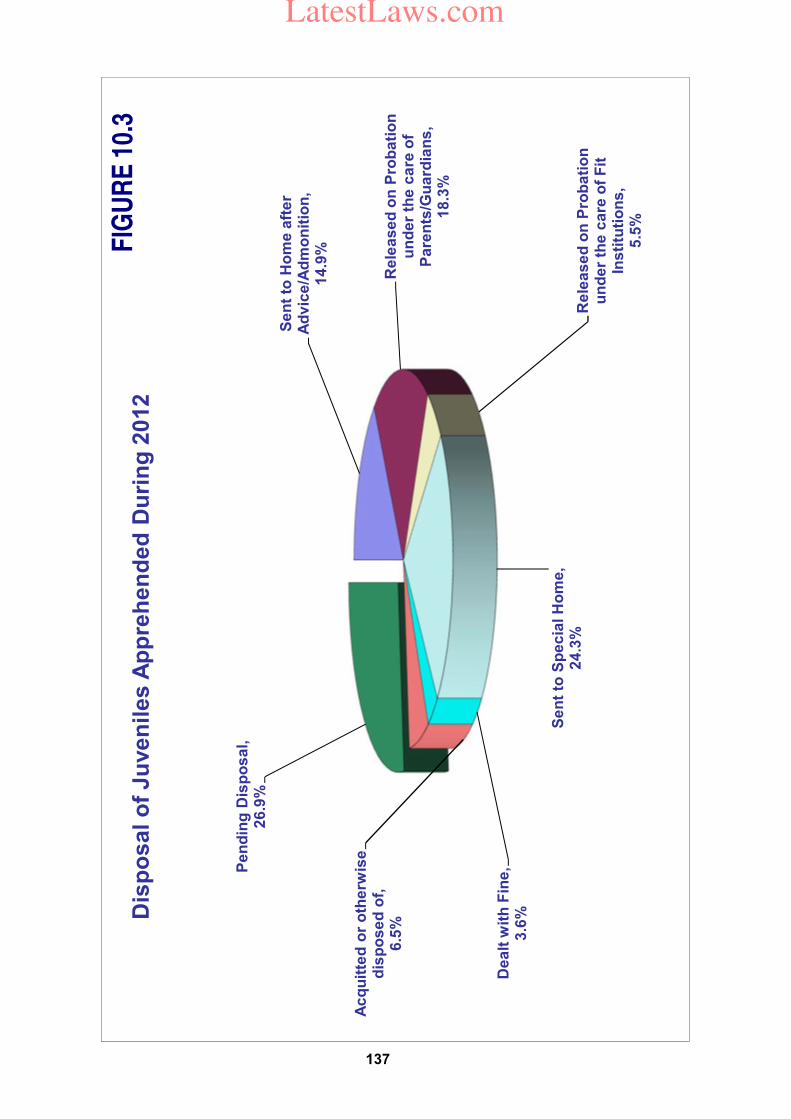
Se
nt
to H
om
e a
fte
r A
dv
ice
/Ad
mo
nit
ion
, 1
4.9
%
Re
lea
se
d o
n P
rob
ati
on
u
nd
er
the
ca
re o
f P
are
nts
/Gu
ard
ian
s,
18
.3%
Re
lea
se
d o
n P
rob
ati
on
u
nd
er
the
ca
re o
f F
it
Ins
titu
tio
ns
, 5
.5%
Se
nt
to S
pe
cia
l H
om
e,
24
.3%
De
alt
wit
h F
ine
, 3
.6%
Ac
qu
itte
d o
r o
the
rwis
e
dis
po
se
d o
f,
6.5
%
Pe
nd
ing
Dis
po
sa
l,
26
.9%
Dis
po
sal o
f Ju
ven
iles A
pp
reh
en
ded
Du
rin
g 2
012
FIG
UR
E 1
0.3
137
LatestLaws.com
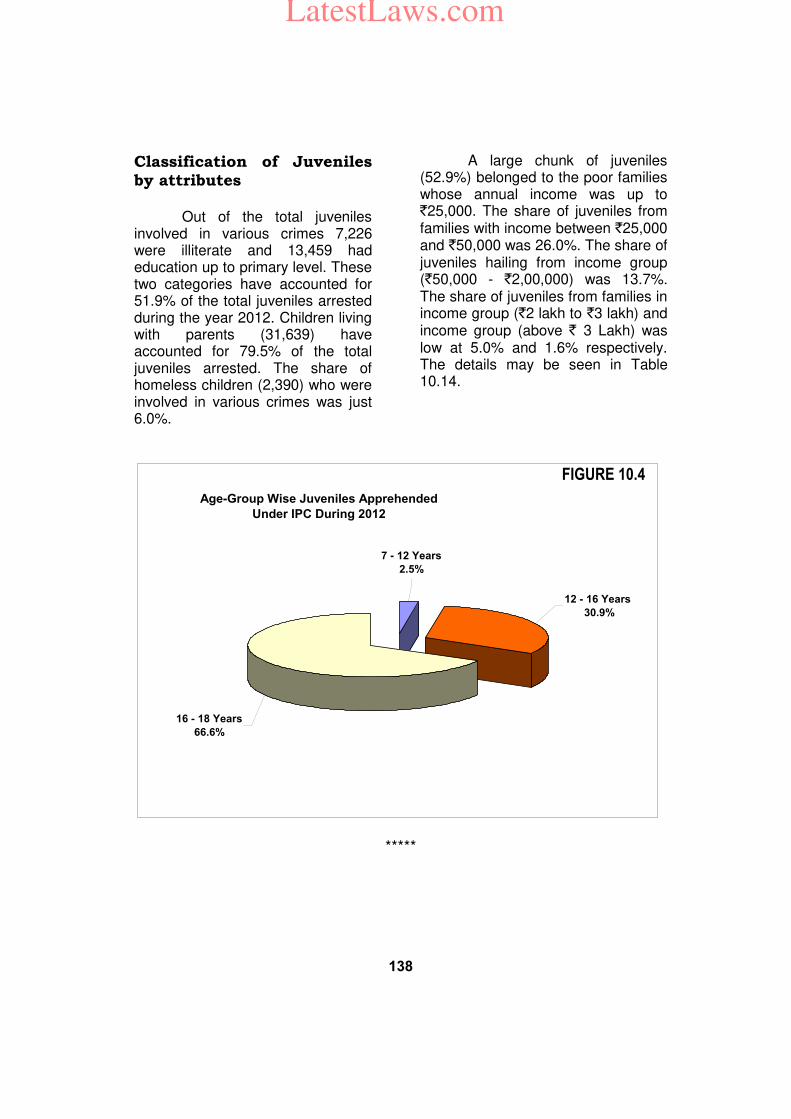
138
Classification of Juveniles by attributes
Out of the total juveniles involved in various crimes 7,226 were illiterate and 13,459 had education up to primary level. These two categories have accounted for 51.9% of the total juveniles arrested during the year 2012. Children living with parents (31,639) have accounted for 79.5% of the total juveniles arrested. The share of homeless children (2,390) who were involved in various crimes was just 6.0%.
A large chunk of juveniles (52.9%) belonged to the poor families whose annual income was up to `25,000. The share of juveniles from families with income between `25,000 and `50,000 was 26.0%. The share of juveniles hailing from income group (`50,000 - `2,00,000) was 13.7%. The share of juveniles from families in income group (`2 lakh to `3 lakh) and income group (above ` 3 Lakh) was low at 5.0% and 1.6% respectively. The details may be seen in Table 10.14.
Age-Group Wise Juveniles Apprehended
Under IPC During 2012
12 - 16 Years
30.9%
7 - 12 Years
2.5%
16 - 18 Years
66.6%
FIGURE 10.4
*****
LatestLaws.com
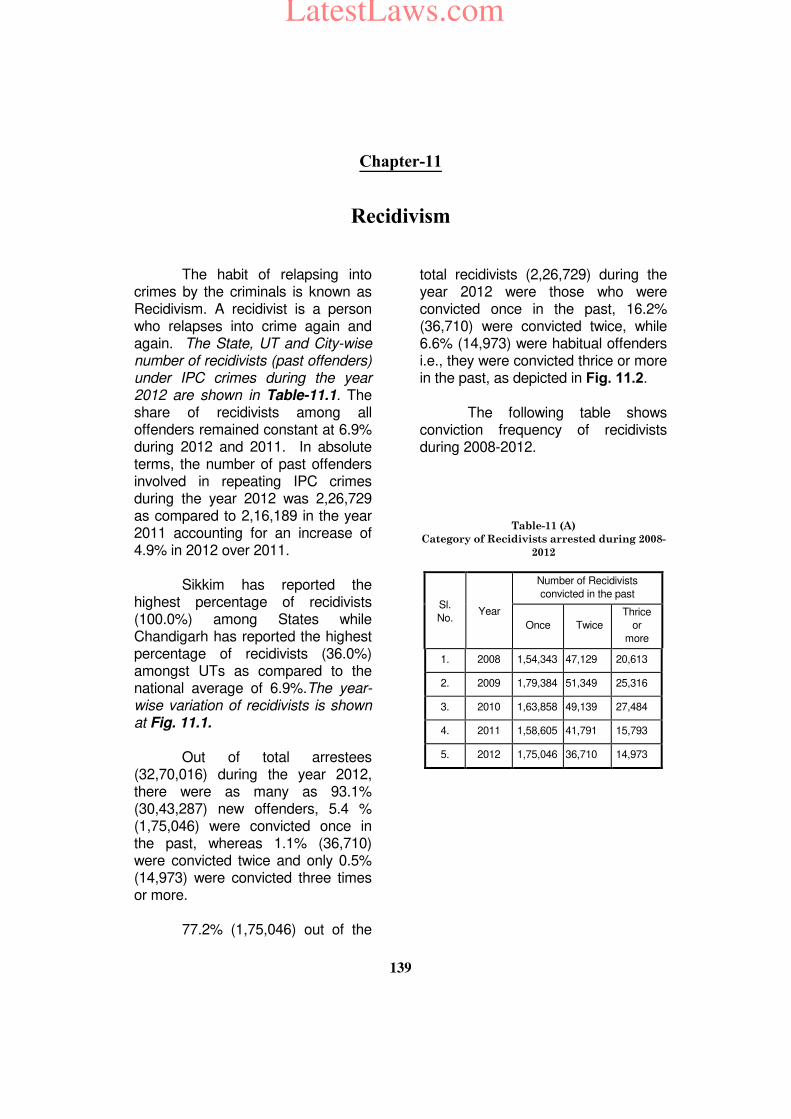
139
Chapter-11
Recidivism
The habit of relapsing into crimes by the criminals is known as Recidivism. A recidivist is a person who relapses into crime again and again. The State, UT and City-wise number of recidivists (past offenders) under IPC crimes during the year 2012 are shown in Table-11.1. The share of recidivists among all offenders remained constant at 6.9% during 2012 and 2011. In absolute terms, the number of past offenders involved in repeating IPC crimes during the year 2012 was 2,26,729 as compared to 2,16,189 in the year 2011 accounting for an increase of 4.9% in 2012 over 2011. Sikkim has reported the highest percentage of recidivists (100.0%) among States while Chandigarh has reported the highest percentage of recidivists (36.0%) amongst UTs as compared to the national average of 6.9%.The year-wise variation of recidivists is shown at Fig. 11.1. Out of total arrestees (32,70,016) during the year 2012, there were as many as 93.1% (30,43,287) new offenders, 5.4 % (1,75,046) were convicted once in the past, whereas 1.1% (36,710) were convicted twice and only 0.5% (14,973) were convicted three times or more. 77.2% (1,75,046) out of the
total recidivists (2,26,729) during the year 2012 were those who were convicted once in the past, 16.2% (36,710) were convicted twice, while 6.6% (14,973) were habitual offenders i.e., they were convicted thrice or more in the past, as depicted in Fig. 11.2. The following table shows conviction frequency of recidivists during 2008-2012.
Table-11 (A)
Category of Recidivists arrested during 2008-
2012
Sl.
No. Year
Number of Recidivists
convicted in the past
Once Twice
Thrice
or
more
1. 2008 1,54,343 47,129 20,613
2. 2009 1,79,384 51,349 25,316
3. 2010 1,63,858 49,139 27,484
4. 2011 1,58,605 41,791 15,793
5. 2012 1,75,046 36,710 14,973
LatestLaws.com
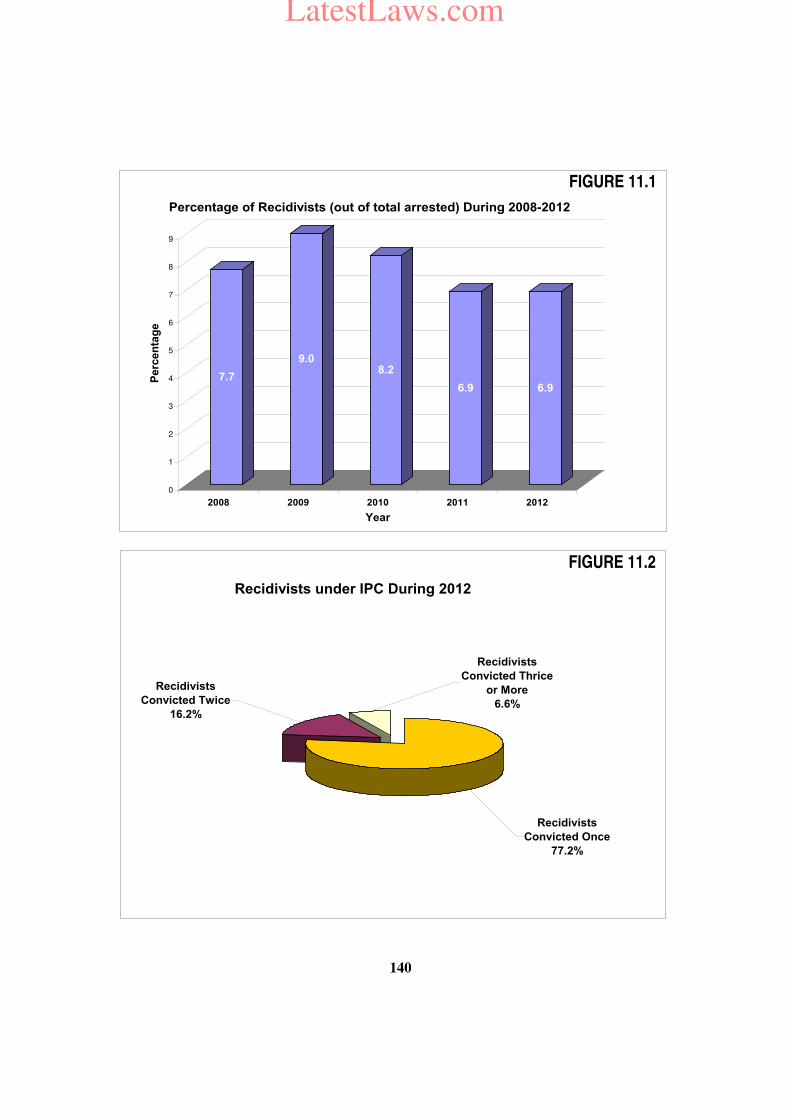
140
7.7
9.08.2
6.9 6.9
0
1
2
3
4
5
6
7
8
9
Perc
en
tag
e
2008 2009 2010 2011 2012
Year
Percentage of Recidivists (out of total arrested) During 2008-2012
FIGURE 11.1
Recidivists under IPC During 2012
Recidivists
Convicted Once
77.2%
Recidivists
Convicted Twice
16.2%
Recidivists
Convicted Thrice
or More
6.6%
FIGURE 11.2
LatestLaws.com
141
Chapter-12
Arrests and Trials
Persons arrested under the IPC cases
A total of 32,70,016 persons were arrested by the police under various IPC crimes during 2012 as against 31,45,845 persons in 2011 showing an increase of 3.9%. Crime head-wise information on the persons arrested under IPC crimes during 2011 and 2012 along with percentage variation in 2012 over 2011 is presented in Table-12.1. As many as 12,45,073 persons accounting for 38.1% were arrested for committing crimes other than the specified ones termed as ‘Other IPC crimes’. Among the specified crimes, the highest arrest was made in cases of ‘hurt’ (17.5%) (5,72,599 persons) followed by ‘riots’ (10.6%) (3,48,232 persons), ‘theft’ and ‘cruelty by husband or his relatives’ (6.0% each). The highest increase in the arrests was observed for cases of counterfeiting (32.1%) (from 2,130 in 2011 to 2,814 in the year 2012). Highest decline was observed in importation of girls from foreign country (79.2%) (From 221 in 2011 to 46 in 2012).
Comparison of crime rate vis-à-vis arrest rate (number of arrests per one lakh population) and number of arrests per case for the crimes reported under IPC during 2012 are presented in Table-12 (A). Arrest rate for burglary, theft, importation of girls from foreign country and causing death by negligence were reported
to be comparatively lower than their respective crime rates to the extent that not even one person per case was arrested for these crimes.
The arrest rate at all-India level increased by 2.2% in 2008 over 2007 (from 244.6 in 2007 to 250.0 in 2008). A decline of 2.6% was observed in 2009 over 2008 (from 250.0 in 2008 to 243.6 in 2009). However, it increased by 2.0% in 2010 over 2009 (from 243.5 in 2009 to 248.5 in 2010), 4.6% in the year 2011 over 2010 (from 248.5 in 2010 to 259.9 in 2011) and 1.4% in 2012 over 2011 (from 259.9 in 2011 to 269.5 in 2012). The number of arrests per case was the highest for riots (4.7) followed by dacoity (4.3) and preparation & assembly for committing dacoity (4.2) compared to national average of 1.4 arrests per case under IPC.
The crime head-wise and sex-wise break-up of persons arrested for IPC crimes during 2012 is presented in Table-12.2.
The female arrested under various sections of IPC crimes accounted for 6.5% only. However, the percentage share of female arrestees was higher for those crimes which are perpetrated on women such as cruelty by husband or his relatives (24.2%) followed by dowry deaths (20.6%) and importation of girls from foreign country (15.2%).
The details on the number of
persons arrested during the year 2011 and 2012 along with percentage variations and the percentage share of each State and UT to all-India total for arrests during 2012 are presented in Table-12.3.
LatestLaws.com
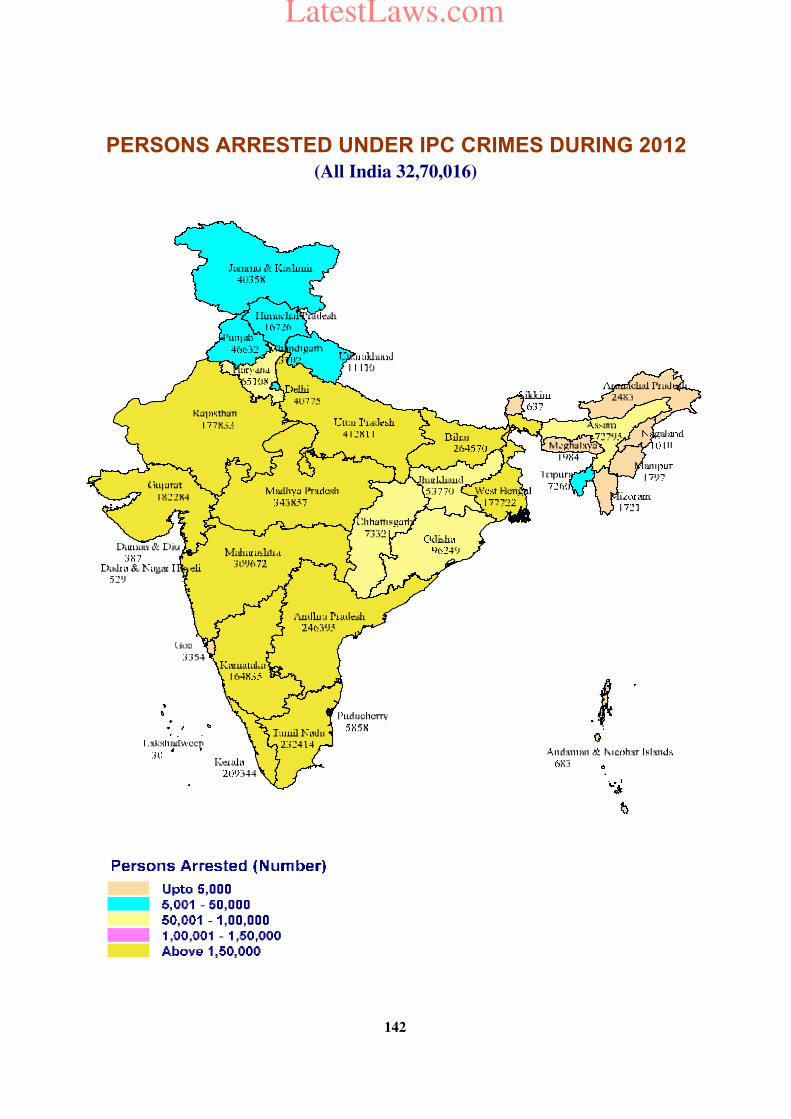
PERSONS ARRESTED UNDER IPC CRIMES DURING 2012
(All India 32,70,016)
142
LatestLaws.com
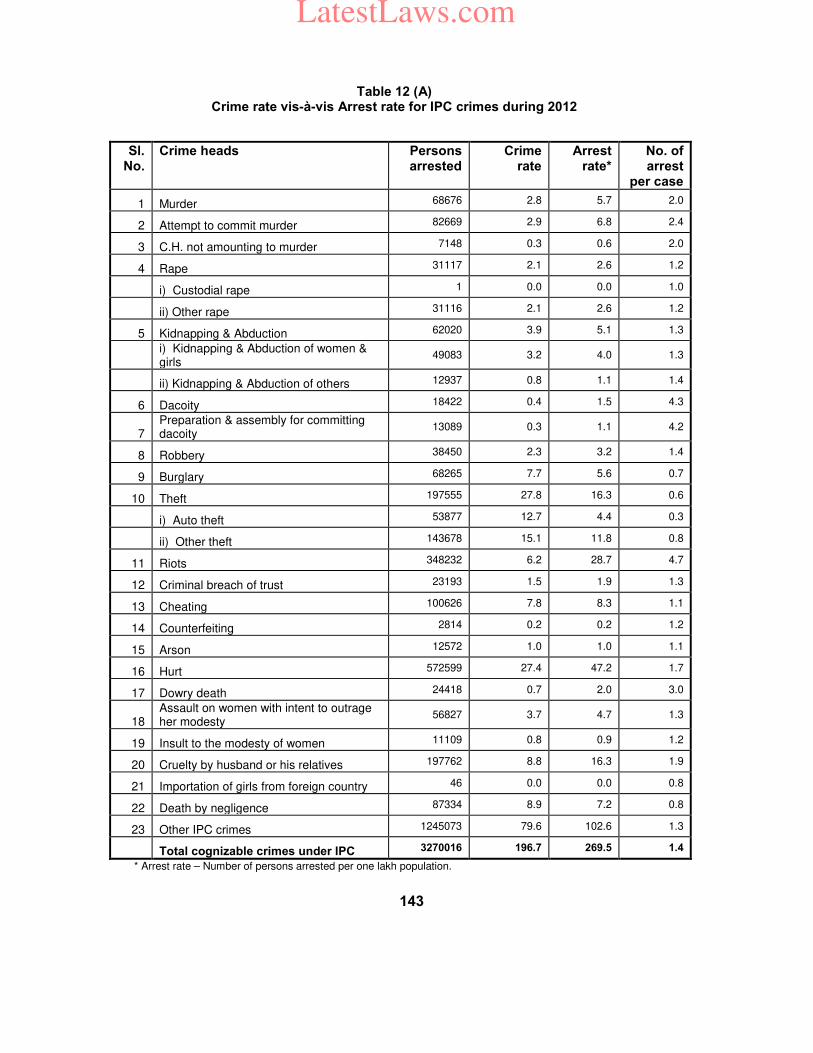
143
Sl.
No. Crime heads Persons
arrested Crime
rate Arrest
rate* No. of arrest
per case
1 Murder 68676 2.8 5.7 2.0
2 Attempt to commit murder 82669 2.9 6.8 2.4
3 C.H. not amounting to murder 7148 0.3 0.6 2.0
4 Rape 31117 2.1 2.6 1.2
i) Custodial rape 1 0.0 0.0 1.0
ii) Other rape 31116 2.1 2.6 1.2
5 Kidnapping & Abduction 62020 3.9 5.1 1.3
i) Kidnapping & Abduction of women & girls
49083 3.2 4.0 1.3
ii) Kidnapping & Abduction of others 12937 0.8 1.1 1.4
6 Dacoity 18422 0.4 1.5 4.3
7 Preparation & assembly for committing dacoity
13089 0.3 1.1 4.2
8 Robbery 38450 2.3 3.2 1.4
9 Burglary 68265 7.7 5.6 0.7
10 Theft 197555 27.8 16.3 0.6
i) Auto theft 53877 12.7 4.4 0.3
ii) Other theft 143678 15.1 11.8 0.8
11 Riots 348232 6.2 28.7 4.7
12 Criminal breach of trust 23193 1.5 1.9 1.3
13 Cheating 100626 7.8 8.3 1.1
14 Counterfeiting 2814 0.2 0.2 1.2
15 Arson 12572 1.0 1.0 1.1
16 Hurt 572599 27.4 47.2 1.7
17 Dowry death 24418 0.7 2.0 3.0
18 Assault on women with intent to outrage her modesty
56827 3.7 4.7 1.3
19 Insult to the modesty of women 11109 0.8 0.9 1.2
20 Cruelty by husband or his relatives 197762 8.8 16.3 1.9
21 Importation of girls from foreign country 46 0.0 0.0 0.8
22 Death by negligence 87334 8.9 7.2 0.8
23 Other IPC crimes 1245073 79.6 102.6 1.3
Total cognizable crimes under IPC 3270016 196.7 269.5 1.4
* Arrest rate – Number of persons arrested per one lakh population.
Table 12 (A) Crime rate vis-à-vis Arrest rate for IPC crimes during 2012
LatestLaws.com
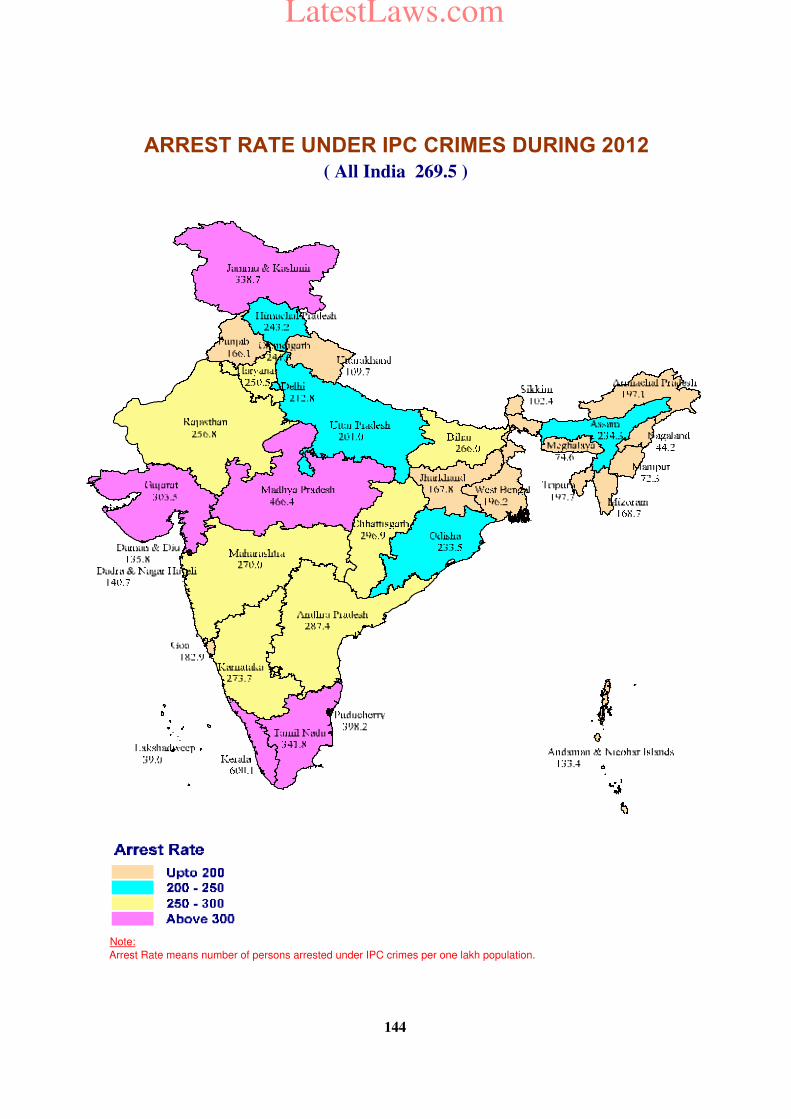
Note:
Arrest Rate means number of persons arrested under IPC crimes per one lakh population.
ARREST RATE UNDER IPC CRIMES DURING 2012
( All India 269.5 )
144
LatestLaws.com
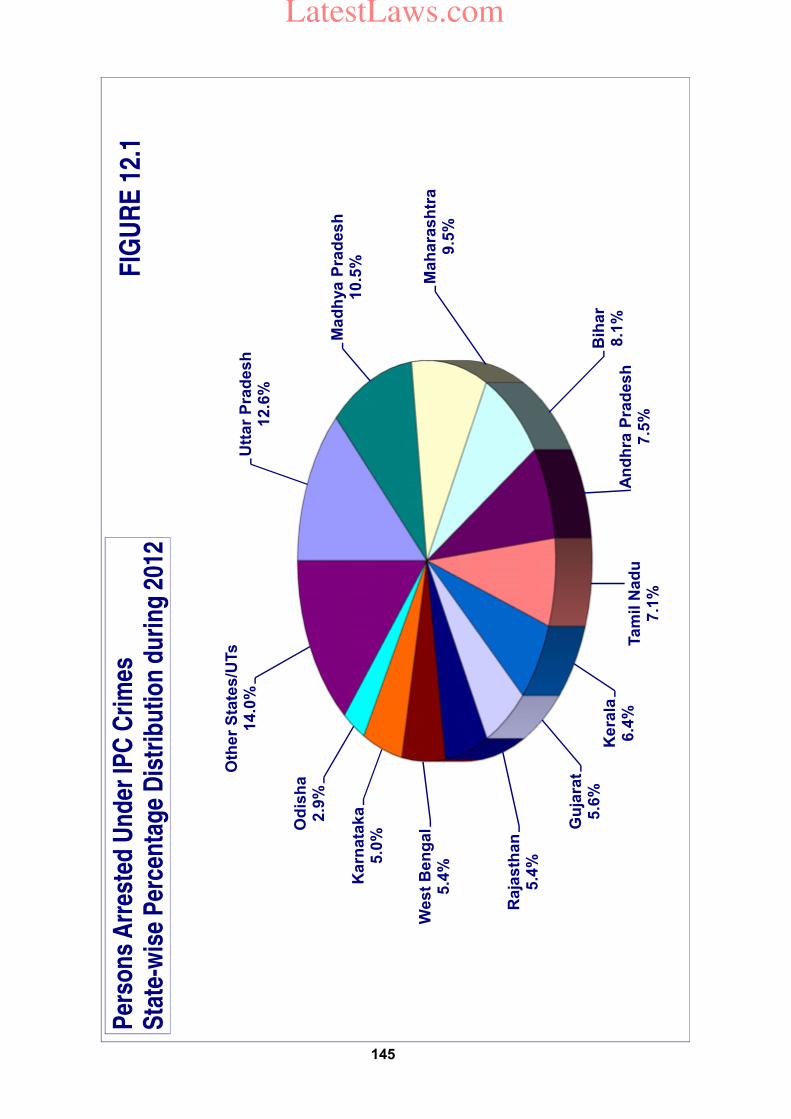
Utt
ar
Pra
de
sh
12
.6%
Ma
dh
ya
Pra
de
sh
10
.5%
Ma
ha
ras
htr
a9
.5%
Bih
ar
8.1
%A
nd
hra
Pra
de
sh
7.5
%Ta
mil
Na
du
7.1
%
Ke
rala
6.4
%
Gu
jara
t5
.6%
Ra
jas
tha
n5
.4%
We
st
Be
ng
al
5.4
%
Ka
rna
tak
a5
.0%
Od
ish
a2
.9%
Oth
er
Sta
tes
/UTs
14
.0%
Per
son
s A
rres
ted
Un
der
IPC
Cri
mes
S
tate
-wis
e P
erce
nta
ge
Dis
trib
uti
on
du
rin
g 2
012
FIG
UR
E 1
2.1
145
LatestLaws.com
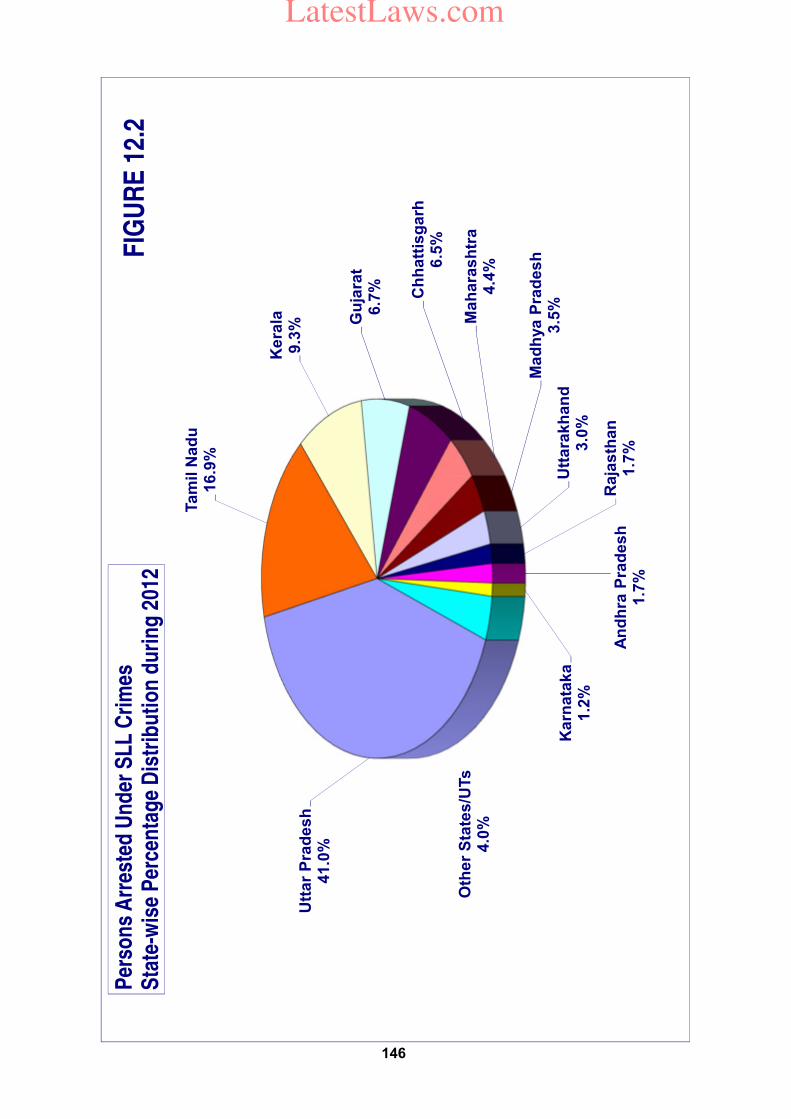
Utt
ar
Pra
de
sh
41
.0%
Ta
mil
Na
du
16
.9%
Ke
rala
9.3
% Gu
jara
t6
.7% Ch
ha
ttis
ga
rh6
.5%
Ma
ha
ras
htr
a4
.4%
Ma
dh
ya
Pra
de
sh
3.5
%U
tta
rak
ha
nd
3.0
%
Ra
jas
tha
n1
.7%
An
dh
ra P
rad
es
h1
.7%
Ka
rna
tak
a1
.2%
Oth
er
Sta
tes
/UTs
4.0
%
Per
son
s A
rres
ted
Un
der
SL
L C
rim
es
Sta
te-w
ise
Per
cen
tag
e D
istr
ibu
tio
n d
uri
ng
201
2F
IGU
RE
12.
2
146
LatestLaws.com
147
Uttar Pradesh and Madhya Pradesh have accounted for high share of 12.6% (4,12,811) and 10.5%(3,43,857) respectively of the persons arrested during the year 2012 in IPC crimes. The increase in the arrested persons during 2012 over 2011 in terms of percentage was highest in Chandigarh (37.6%) followed by West Bengal (23.8%) and Daman & Diu (17.3%).
The sex-wise details of number of persons arrested under IPC crimes in States and UTs are presented in Table-12.4. The percentage of females arrested under IPC crimes at all-India level was at 6.5%. Himachal Pradesh (12.7%), Tripura (10.3%), A & N Islands (10.1%) and Maharashtra (9.9%) have reported comparatively higher share of females in total arrests as compared to national average of 6.5%.
Persons arrested under SLL crimes
A total of 41,50,075 persons were arrested under the SLL crimes during 2012 as compared to 43,12,413 persons during 2011 accounting for a decrease of 3.8% during 2012 over 2011. The details on crime-head wise arrests for SLL crimes during the year 2011 and 2012, percentage variation and share of arrestees for each crime are presented in Table-12.5. Crime head-wise percentage share of arrestees in SLL cases indicates that the uncategorised
‘Other SLL cases' accounted for 71.8% (29,79,096) of the total arrestees in the country during 2012. The highest share of arrestees among the specified crimes was under 'Prohibition Act' (10.6%) (4,38,191) and 'Gambling Act' (9.1%) (3,78,689) followed by 'Excise Act' (4.1%) (1,68,197). The highest increase was found under Indian Passport Act (36.9%) followed by Prevention of Atrocities Act for STs (31.6%) (2305) and Dowry Prohibition Act (27.6%), while significant decrease of 68.3% was reported under Protection of Civil Rights Act (62.0%). Sex-wise and crime head-wise information on persons arrested and percentage of arrestees during 2012 are presented in Table-12.6. The percentage of females arrested under SLL crimes at all-India level was 3.6% (1,50,076 out of 41,50,075) against 6.5% for IPC crimes. The share of female arrestees was highest for cases under ‘Immoral Traffic (Prevention) Act’ (38.4%) (3,088 out of 8,052) followed by ‘Dowry Prohibition Act’ (21.5%) (3400 out of 15786) and ‘Prohibition Act’ (20.3%) (88,778 out of 4,38,191). The State/UT-wise and sex-wise details of number of persons arrested in various SLL crimes are given in Table-12.7. Mizoram (31.1%), Gujarat (26.9%) and Manipur (13.2%) have reported higher percentage of female arrestees of total arrested persons as compared to the National average of 3.6%. Age-group wise and sex-wise distribution of persons arrested under various IPC and SLL cases are given in Table-12.8. Among the total (IPC+SLL) arrested persons (74,20,091) those falling
LatestLaws.com
148
under the age-group 18 – 30 years accounted for (45.6%) (33,86,785 persons) followed by age-group 30 – 45 years accounting for 37.3% (27,66,340 persons). This confirms the age-group profile of arrestees observed during the previous year reflecting drift of more young people (18 – 30 years) in crimes. The Juveniles apprehended accounted for just 0.5% in the total arrests (IPC + SLL) made in 2012. Girls' share was 5.2% among juveniles apprehended.
Information on persons arrested on an average per case under IPC and SLL for the years 2008 to 2012 is presented in Table-12.9. It is seen that the trend of arrests made per case in 2012 is almost the same as the previous year (2011) for various IPC & SLL cases. In violent crimes such as murder (2.0), attempt to commit murder(2.4), dacoity (4.3), preparation & assembly for committing dacoity (4.2), dowry deaths (3.0) and riots (4.7) about 2 or more persons per case were arrested on an average, signifying involvement of accomplice(s) in such cases. Similarly, 2 persons, on an average, were taken into custody by police in SLL crime under Gambling Act, Immoral Traffic (Prevention) Act, and Prohibition of Child Marriage Act. The higher arrests per case in cases of riots (4.7), dacoity (4.3) and preparation & assembly for committing dacoity (4.2), Immoral Traffic (Prevention) Act(3.1) and Gambling Act (2.7) were reported during the year 2012.
Disposal of persons arrested under IPC crimes by police
The crime head-wise details on the disposal of persons arrested are presented in Table-12.10. A total of 40,77,442 persons were either under custody or on bail during the year 2012 for 32,43,783 total IPC offences under investigation by police (Table-4.1). Police could file charge-sheets against 30,65,654 persons (75.2%) out of the total persons who were under arrest, 4.4% of persons (1,80,497) arrested were either released or freed by police before trial; 20.4% persons (8,31,291) remained under custody or on bail at the end of the year as police investigation could not be completed in their cases. The highest pendency percentage in the disposal of arrested persons was recorded in cases of counterfeiting (47.2%) (2,210 out of 4,679 persons), dacoity (40.8%) (12,111 out of 29,665 persons) and preparation & assembly for committing dacoity (36.0%)(7,103 out of 19,747 persons) and the lowest pendency percentage was observed in assault on women with intent to outrage her modesty (14.9%) (9,896 out of 66,243 persons). Police could establish the charges with as high as 83.3% (5,57,848 out of 6,69,829) persons in chargesheeting of arrested persons in cases of hurt followed by assault on women with intent to outrage her modesty (54,402 out of 66,243). The lowest level of charge-sheeting in disposal of arrested persons was witnessed in cases of counterfeiting (50.5%) (2,362 out of 4,679) as compared to the national average of 75.2% (30,65,654 out of 40,77,442) for all IPC crimes. The State/UT-wise disposal of arrested persons under IPC crimes by
LatestLaws.com
149
police is presented in Table-12.11. Tamil Nadu reported 13.2% (1,09,597 out of 8,31,291) of total pendency of disposal of arrested persons in the country followed by Maharashtra (12.8%) (1,06,369) and Bihar (12.7%) (1,05,221).
Disposal of persons arrested under IPC crimes by courts
As many as 1,69,23,430 persons (including those from previous years) were awaiting trials in various criminal courts in the country during 2012 (an increase of 3.4% over the last year(1,63,63,000)) as per information presented in Table-12.12. The disposal of such arrested persons was pending to an extent of 85.2% (1,44,15,203 persons out of 1,69,23,430) at the end of the year. The highest pendency was noticed in persons arrested under dacoity (92.3%) (1,53,341 out of 1,66,178) followed by criminal breach of trust (91.5%) (1,34,879 out of 1,47,469). The lowest pendency was observed in insult to the modesty of women (76.6%) (33,587 out of 43,875) against all-India average of 85.2%. The overall conviction percentage at all-India level for the persons arrested in IPC cases was 33.1% (7,17,781 out of 21,67,652 trials completed). Crime-wise, persons arrested in Insult to the modesty of women cases, who were on trial, got the highest conviction (35.4%) (3,136 out of 8,867) followed by murder (33.4%) (16,438 out of 49,169). Cases of large number of persons involved in `Other IPC' cases (1,50,632), hurt cases
(92,663) and riots cases (37,720) were compounded or withdrawn. The State/UT-wise details on the disposal of persons charged in IPC cases by courts are presented in Table-12.13. Out of total 1,69,23,430 under trials (18.7%) 31,61,253 persons, were from the State of Maharashtra followed by Bihar accounting for 10.8% (18,26,360) and Gujarat(17,90,050) accounting for 10.6%. When compared with share of persons awaiting trials at the end of the year at national level, these States stood at 20.1%, 11.5% and 11.6% respectively.
Disposal of persons arrested
under SLL crimes by police
The crime head-wise details of the disposal of persons arrested under SLL crimes by police during the year are presented in Table-12.14. A total of 44,78,074 persons including those from the previous years were either in custody or on bail at the beginning of the year and their cases were under disposal with police during the year 2012. Police could chargesheet 39,02,911 persons of the total arrested persons, which accounted for 87.2% of the total arrestees and whose cases were under investigation during this period. The percentage of persons released before trial and persons under investigation at the end of year 2012 were observed as 6.0% and 6.9% respectively. Higher number of pre-trial release was noticed in the cases of persons involved in `Other SLL' cases (2,60,126) and cases under ‘SC/ST (Prevention of Atrocities) Act’ (2,190) during the year 2012. The State / UT-wise details of disposal of persons arrested under SLL crimes are presented in Table-12.15.
LatestLaws.com
150
A majority of total 3,07,523 persons in whose cases investigation was pending at the end of the year were from Tamil Nadu (29.5%) (90,601), Maharashtra (21.6%) (66,371) and Gujarat (7.6%) (23,372) accounting for a pendency of more than half i.e. 58.7%. Assam followed by Arunachal Pradesh and Manipur have reported the highest percentage of pendency 76.1%, 57.6% and 56.9% respectively for disposal of persons arrested under SLL crime. Among Union Territories, Lakshadweep had the highest pendency (78.6%)
Disposal of persons arrested under SLL crimes by courts
Information relating to disposal of persons arrested under SLL cases by courts is presented in Table-12.16. A total of 1,01,66,413 persons (as against 1,01,57,546 in the year 2011) were facing trial in various criminal courts for the offences committed under SLL cases registering a marginal increase of 0.1% over the previous year 2011. Trials were completed against 33,03,648 persons of the total arrested persons, out of which 28,30,036 persons were convicted for these offences. The conviction percentage in SLL cases was 85.7% (lower than 88.4% in 2011). The pendency for trial was higher at 66.8% during 2012 as compared to 2011 (61.6%). An analysis of crime head-wise disposal of arrested persons showed that the highest percentage of persons pending disposal was under the
Commission of Sati Prevention Act (100%) (18 out of 18) and ‘Prohibition of Child Marriage Act’ (90.6%) (1,669 out of 1,843) closely followed by 'Immoral Traffic (P) Act' (90.5%) (42,831 out of 47,343 and Terrorist & Disruptive Activities Act (90.1%) (4,775 out of 5,299). Information in respect of conviction for the categorized SLL crimes showed that conviction percentage was highest for persons arrested under ‘Foreigners Act’(82.7%)(1,463 out of 1,769) followed by ‘Gambling Act’ (82.4%)(2,77,287 out of 3,36,574), ‘Excise Act’ (80.4%)(1,38,240 out of 1,71,842) and ‘Forest Act’(72.1%)(4,998 out of 6,936). No person was convicted under Terrorist and Disruptive Activities Act during the year 2012, out of 524 persons whose trials were completed under this Act during 2012. The State & UT-wise information on disposal of persons arrested under SLL cases by courts is presented in Table-12.17. Gujarat has accounted for the highest share of pendency (27.7%) (18,78,562 out of 67,91,866) for trials in the case of persons arrested under SLL cases at All-India level followed by Maharashtra (23.6%) (16,01,288) and Uttar Pradesh (21.3%) (14,45,026). The States & UTs which recorded higher pendency (State/UT having more than 90% of pendency in disposal of the persons arrested in SLL cases) were Arunachal Pradesh (97.9%) (961 out of 982), Manipur (96.1%) (2,094 out of 2,180), West Bengal (94.0%) (80,338 out of 85,477), Delhi (90.9%) (1,23,211 out of 1,35,603), Gujarat (90.6%) (18,78,562 out of 20,74,341) and Odisha (90.4%) (1,15,409 out of 1,27,602).
LatestLaws.com
151
Chapter-13
Custodial Crimes
The cases registered for deaths and rapes in police custody have been discussed in this chapter. The details on escapees from police custody and trials for such violations have also been discussed.
The information on deaths in police custody is recorded under the following categories: (i) Death in police custody /
lock up (of persons remanded to police custody
by court) (Table-13.1) (ii) Death in police custody/lock
up (of persons not remanded to police custody by court) (Table-13.2)
(iii) Death in police custody during production/process in courts/journey connected with investigation. (Table-
13.3) (iv) Death in police custody
during hospitalisation/treatment (Table13.4)
(v) Other deaths in police custody
• In accidents • By mob attack/riots
• By other criminals • By suicide • While escaping from
custody
Deaths in police custody A: Remanded to police custody
by court
There were 38 deaths in police custody of persons who were remanded to such custody by the court during the year 2012. It increased by 31.0% in 2012 as
compared to previous year and by 16.0% in 2011 as compared to 2010. Such deaths remain same for 2010 as compared to 2009 while it decreased by 37.5% in 2009 over 2008 (from 40 in 2008 to 25 in 2009) at all-India level. Magisterial enquiry was ordered / conducted in 25 of the reported incidents in 2012. Judicial enquiry was ordered conducted in 6 deaths during the year 2012. 26 cases were registered against police personnel; no policeman was convicted for custodial deaths during the year while 1 policeman was charge sheeted.
Table-13 (A)
Number of deaths in police custody/lockup 2010-2012
Death in police custody/lockup Years
2010 2011 2012
(i) Of persons remanded to police
custody by court
25 29 38
(ii)
Of persons not remanded to
police custody by court
45 75 71
LatestLaws.com
152
B: Not remanded to police
custody by court
There were 61 incidents of deaths in police custody of persons who were taken in custody by police themselves during 2008. In 2009, 59 deaths were reported, thereby showing a decrease of 3.3% was observed over 2008. While in 2010, 45 deaths were reported, thereby showing a decrease of 23.7% was observed over 2009. In 2011, 75 deaths were reported thereby showing an increase of 66.7% over 2010. In 2012, 71 custodial deaths were reported thereby showing a decline of 5.3% over 2011.
Magisterial enquiry was ordered in 31 incidents of the 71 such deaths reported and judicial enquiry was ordered in 21 incidents. Cases were registered against police personnel in 30 incidents. 6
police personnel were charge-sheeted and no police personnel were convicted during the year 2012.
Deaths in police custody by causes The highest number of
deaths in Police custody took place due to illness / natural deaths (36) closely followed by suicides (24), During production, process in courts, journey connected with Investigation (20) and during hospitalisation/ treatment (13) during the year 2012. A mixed trend in custodial deaths due to suicides has been observed during 2010 - 2012, as 18, 33 and 24 such deaths respectively have been reported during these years. Custodial deaths due to illness/ natural death during 2010- 2012 were reported at 19, 35 and 36 respectively.
Custodial rape The incidents of Custodial rape in police custody are presented in the following table.
Table-13(C)
Incidents of custodial rape in police
custody
Sl.
No. Year No. of reported custodial
rape cases
1.
2.
3.
2010
2011
2012
6
1
1
1 case of custodial rape was reported during 2012. 1 case was charge-sheeted during 2012. (See Table 13.5)
Table-13 (B)
Details on the custodial deaths in police custody during 2010-2012
Sl.
No.
Death during / due to Years
2010 2011 2012
1.
2.
3.
4.
5.
6.
7.
During production, process in courts,
journey connected with investigation
During hospitalisation/ treatment
Due to accidents
In mob attacks / riots
By other criminals
By suicides
During escape from custody
Illness / natural deaths
12
16
5
0
0
18
7
19
19
21
3
0
2
33
7
35
20
13
7
0
3
24
7
36
LatestLaws.com
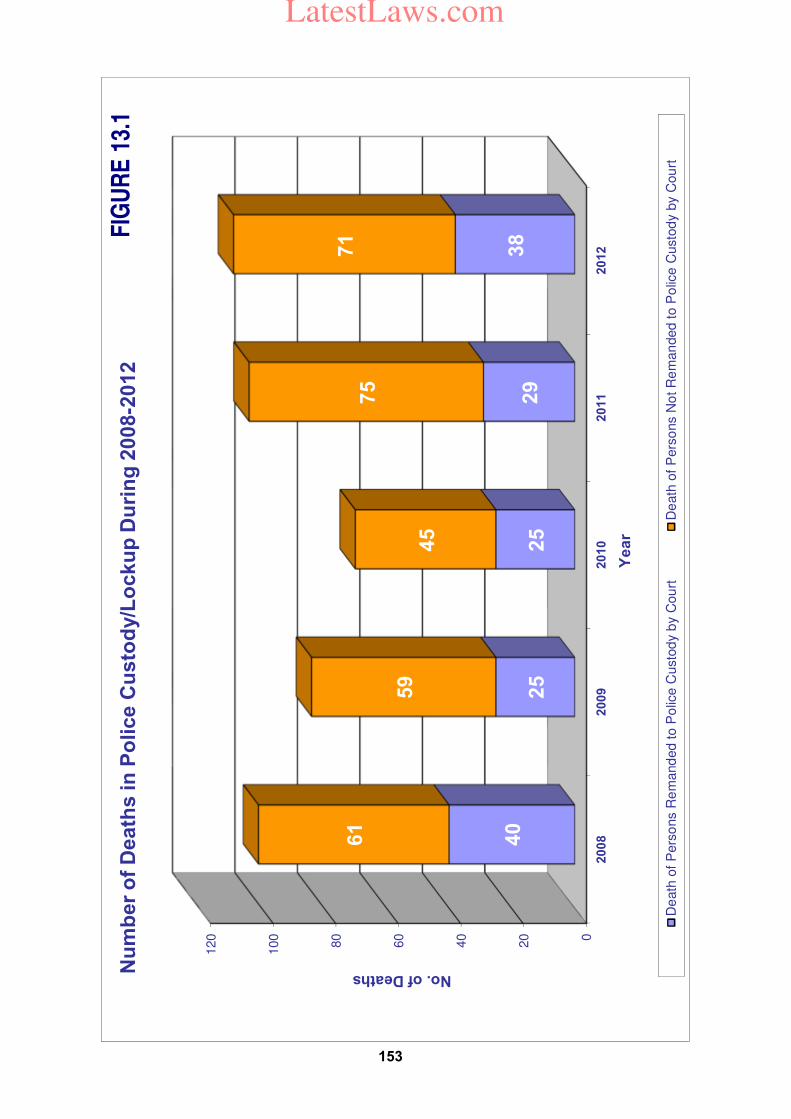
0
20
40
60
80
100
120
2008
2009
2010
2011
2012
40
25
25
29
38
61
59
45
75
71
No. of Deaths
Ye
ar
Nu
mb
er
of
Death
s in
Po
lice C
usto
dy/L
ocku
p D
uri
ng
2008-2
012
De
ath
of
Pers
ons R
em
and
ed
to P
olic
e C
usto
dy b
y C
ou
rtD
eath
of
Pers
ons N
ot R
em
an
ded
to
Po
lice
Custo
dy b
y C
ou
rt
FIG
UR
E 1
3.1
153
LatestLaws.com
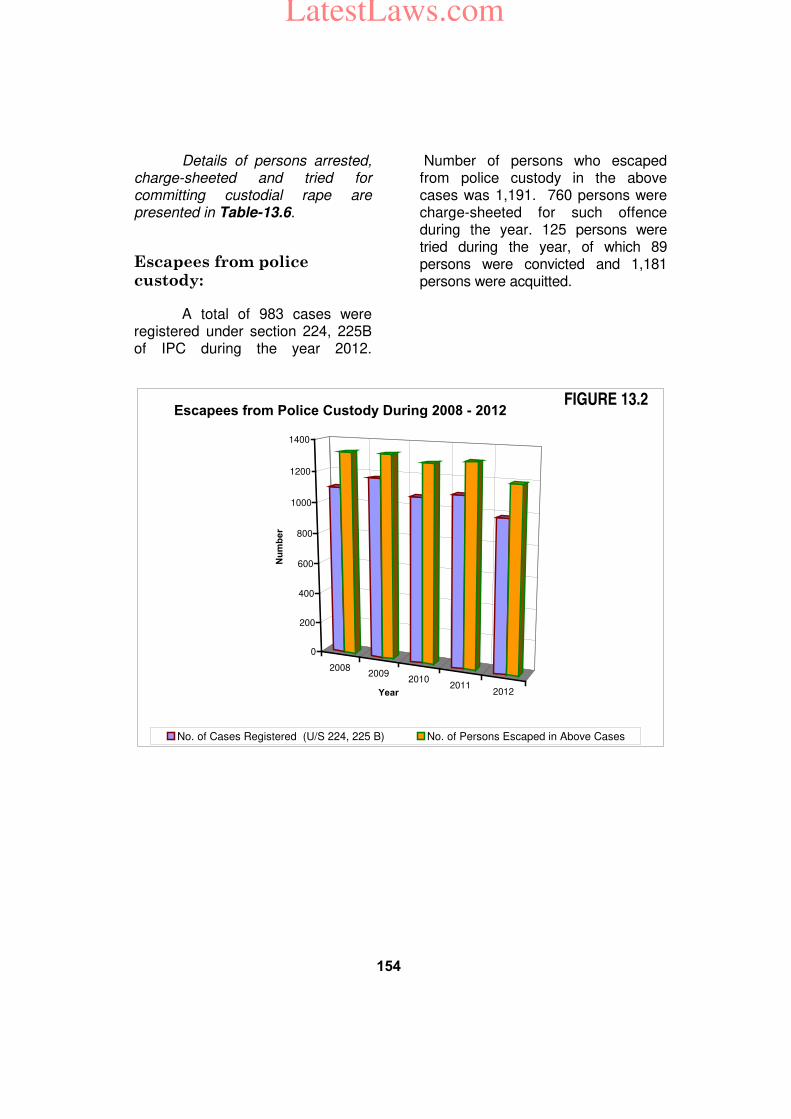
154
Details of persons arrested, charge-sheeted and tried for committing custodial rape are presented in Table-13.6.
Escapees from police custody:
A total of 983 cases were registered under section 224, 225B of IPC during the year 2012.
Number of persons who escaped from police custody in the above cases was 1,191. 760 persons were charge-sheeted for such offence during the year. 125 persons were tried during the year, of which 89 persons were convicted and 1,181 persons were acquitted.
20082009
20102011
2012
0
200
400
600
800
1000
1200
1400
Nu
mb
er
Year
Escapees from Police Custody During 2008 - 2012
No. of Cases Registered (U/S 224, 225 B) No. of Persons Escaped in Above Cases
FIGURE 13.2
LatestLaws.com
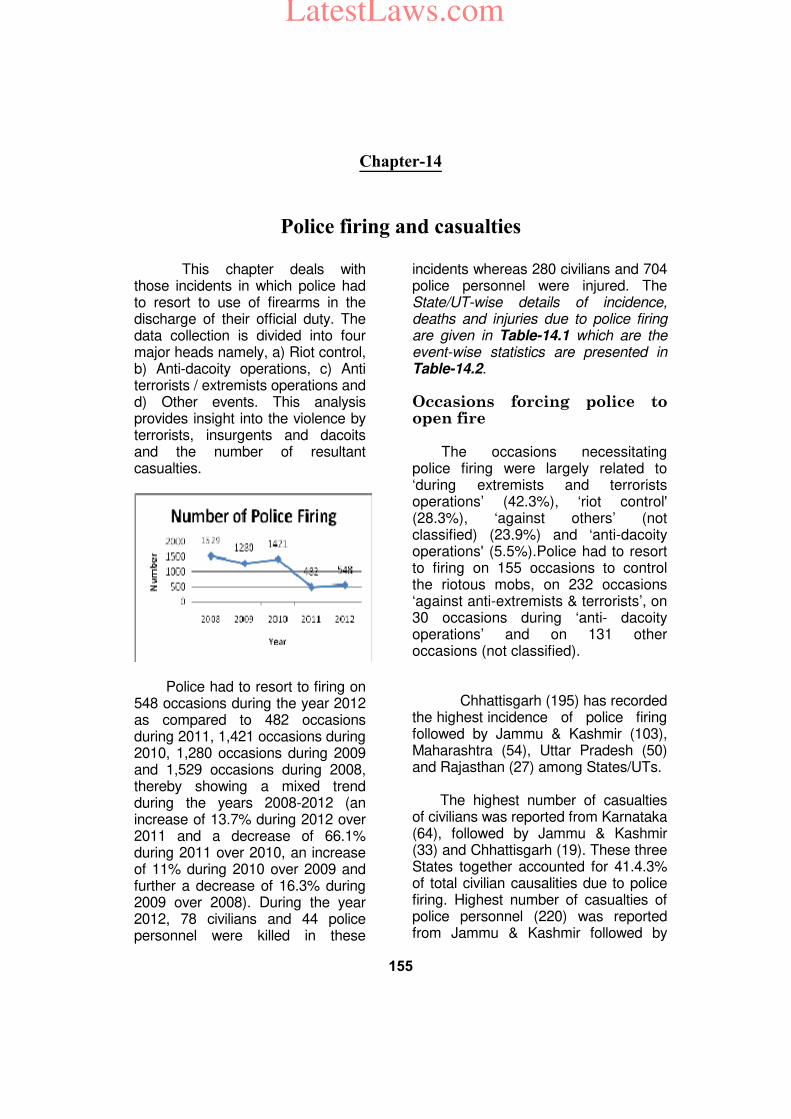
155
Chapter-14
Police firing and casualties
This chapter deals with those incidents in which police had to resort to use of firearms in the discharge of their official duty. The data collection is divided into four major heads namely, a) Riot control, b) Anti-dacoity operations, c) Anti terrorists / extremists operations and d) Other events. This analysis provides insight into the violence by terrorists, insurgents and dacoits and the number of resultant casualties.
Police had to resort to firing on 548 occasions during the year 2012 as compared to 482 occasions during 2011, 1,421 occasions during 2010, 1,280 occasions during 2009 and 1,529 occasions during 2008, thereby showing a mixed trend during the years 2008-2012 (an increase of 13.7% during 2012 over 2011 and a decrease of 66.1% during 2011 over 2010, an increase of 11% during 2010 over 2009 and further a decrease of 16.3% during 2009 over 2008). During the year 2012, 78 civilians and 44 police personnel were killed in these
incidents whereas 280 civilians and 704 police personnel were injured. The State/UT-wise details of incidence, deaths and injuries due to police firing are given in Table-14.1 which are the event-wise statistics are presented in Table-14.2. Occasions forcing police to open fire The occasions necessitating police firing were largely related to ‘during extremists and terrorists operations’ (42.3%), ‘riot control' (28.3%), ‘against others’ (not classified) (23.9%) and ‘anti-dacoity operations' (5.5%).Police had to resort to firing on 155 occasions to control the riotous mobs, on 232 occasions ‘against anti-extremists & terrorists’, on 30 occasions during ‘anti- dacoity operations’ and on 131 other occasions (not classified). Chhattisgarh (195) has recorded the highest incidence of police firing followed by Jammu & Kashmir (103), Maharashtra (54), Uttar Pradesh (50) and Rajasthan (27) among States/UTs. The highest number of casualties of civilians was reported from Karnataka (64), followed by Jammu & Kashmir (33) and Chhattisgarh (19). These three States together accounted for 41.4.3% of total civilian causalities due to police firing. Highest number of casualties of police personnel (220) was reported from Jammu & Kashmir followed by
LatestLaws.com
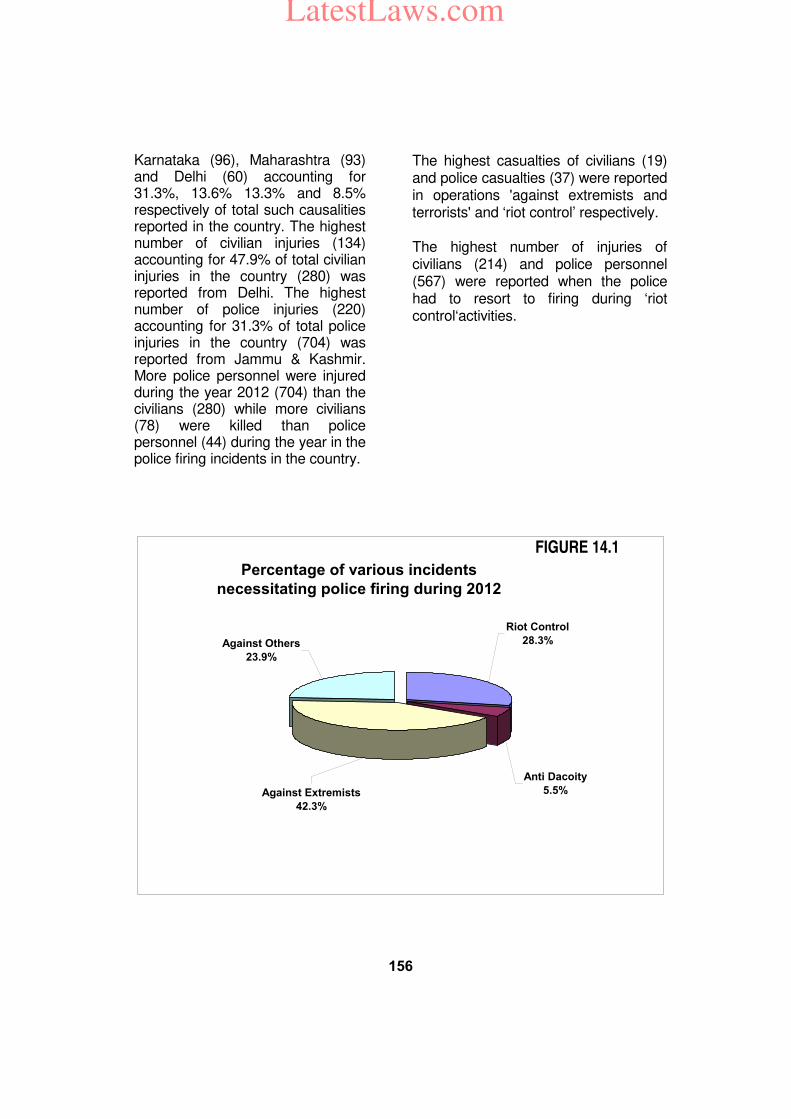
156
Karnataka (96), Maharashtra (93) and Delhi (60) accounting for 31.3%, 13.6% 13.3% and 8.5% respectively of total such causalities reported in the country. The highest number of civilian injuries (134) accounting for 47.9% of total civilian injuries in the country (280) was reported from Delhi. The highest number of police injuries (220) accounting for 31.3% of total police injuries in the country (704) was reported from Jammu & Kashmir. More police personnel were injured during the year 2012 (704) than the civilians (280) while more civilians (78) were killed than police personnel (44) during the year in the police firing incidents in the country.
The highest casualties of civilians (19) and police casualties (37) were reported in operations 'against extremists and terrorists' and ‘riot control’ respectively. The highest number of injuries of civilians (214) and police personnel (567) were reported when the police had to resort to firing during ‘riot control‘activities.
Against Others
23.9%
Riot Control
28.3%
Anti Dacoity
5.5%Against Extremists
42.3%
Percentage of various incidents
necessitating police firing during 2012
FIGURE 14.1
LatestLaws.com
157
Chapter-15
Police Casualties
A large number of policemen lose their lives or limbs while performing duty every year - fighting insurgents, militants, and criminals or during controlling the mobs in a law and order situation. The State/UT and City-wise information relating to police personnel killed or injured on duty during 2012 is presented in Table-15.1, while the information on the rank-wise casualties or injuries sustained by these personnel is given in Table-15.4.
A total number of 3,759 police personnel (comprising 2,724 natural deaths, 821 deaths on duty and 214 suicidal deaths) died during the year 2011 as compared to 3,881 deaths in the year 2012 showing a decrease of 3.1% over the previous year.
Police personnel killed on
duty
The casualties include civil as well as the armed police personnel of various States / UTs who sacrificed their lives while performing their duty. The police casualties (821) while on duty decreased marginally during 2012 by 5.3% as compared to previous year (867). Out of the total 821 casualties, 795 personnel belonged to 24 States and 26 personnel belonged to UT. 80.0% of
the police casualties (657 out of 821) were due to ‘accidents’ followed by ‘anti-terrorist / extremists operations’ and ‘anti-riotous mob duty’ which accounted for 10.1% (83 out of 821) and 1.5% (13 out of 821) respectively of such deaths. 7.4% (61 out of 821) of personnel were killed by ‘other criminal elements’. It was observed that the highest number of casualties was in Uttar Pradesh (110) followed by Maharashtra (83), Chhattisgarh, Gujarat & Punjab (72 each) and Tamil Nadu (63). Highest casualties were reported in Chhattisgarh in terrorist/extremist operations (37). In case of accident, the highest casualties were reported in Uttar Pradesh (99) followed by Gujarat and Punjab (71 each). Among 821 police personnel killed on duty, 8 were Dy. SPs and above, 66 were upper subordinates (Inspectors - 13 and Sub-Inspectors - 52) and 747 were lower subordinates (Assistant Sub- Inspectors - 88, Head Constables -191 and Constables - 468). The details are given in Table-15.4. 29.1% police personnel (239) were in younger age group (18-35 years), 27.9% (229) were middle aged (35-45 years) while 40.3% (353) were in upper age group (45 years and above) out of 821 police personnel
LatestLaws.com
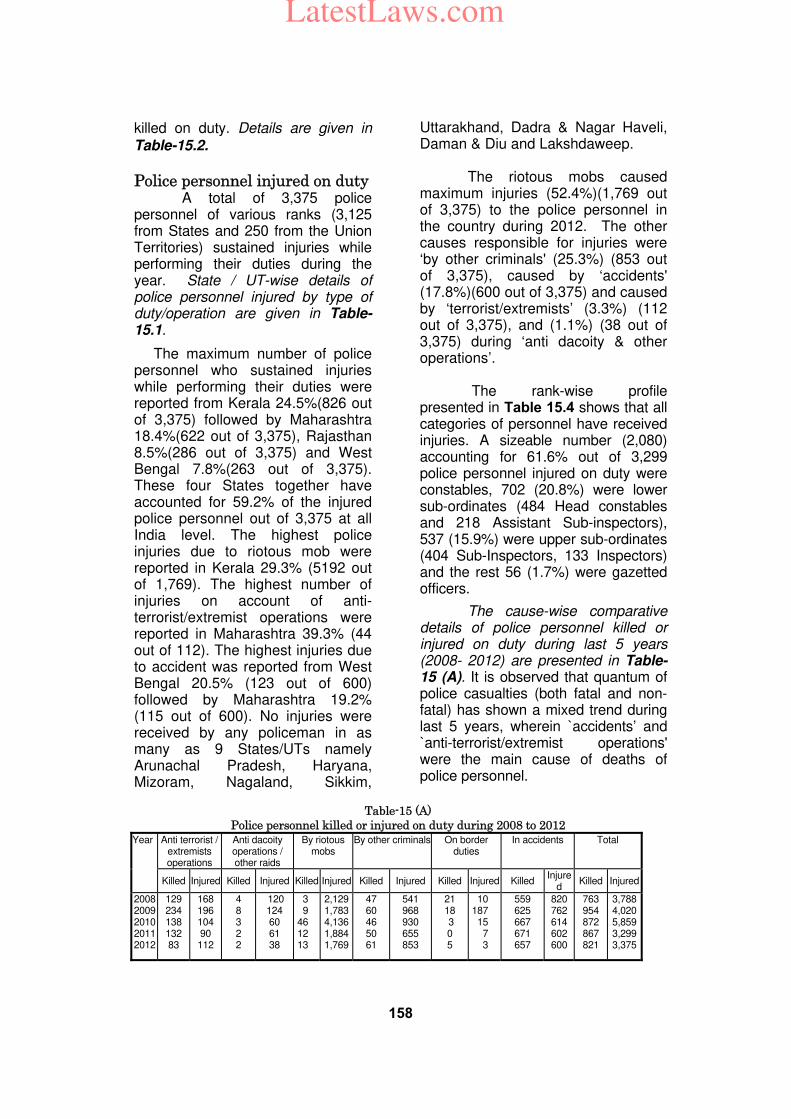
158
Table-15 (A) Police personnel killed or injured on duty during 2008 to 2012
Year Anti terrorist / extremists operations
Anti dacoity operations / other raids
By riotous mobs
By other criminals On border duties
In accidents Total
Killed Injured Killed Injured Killed Injured Killed Injured Killed Injured Killed Injure
d Killed Injured
2008 2009 2010 2011 2012
129 234 138 132 83
168 196 104 90 112
4 8 3 2 2
120 124 60 61 38
3 9
46 12 13
2,1291,7834,1361,8841,769
47 60 46 50 61
541 968 930 655 853
21 18 3 0 5
10 187 15 7 3
559 625 667 671 657
820 762 614 602 600
763 954 872 867 821
3,788 4,020 5,859 3,299 3,375
killed on duty. Details are given in Table-15.2.
Police personnel injured on duty A total of 3,375 police personnel of various ranks (3,125 from States and 250 from the Union Territories) sustained injuries while performing their duties during the year. State / UT-wise details of police personnel injured by type of duty/operation are given in Table-15.1.
The maximum number of police personnel who sustained injuries while performing their duties were reported from Kerala 24.5%(826 out of 3,375) followed by Maharashtra 18.4%(622 out of 3,375), Rajasthan 8.5%(286 out of 3,375) and West Bengal 7.8%(263 out of 3,375). These four States together have accounted for 59.2% of the injured police personnel out of 3,375 at all India level. The highest police injuries due to riotous mob were reported in Kerala 29.3% (5192 out of 1,769). The highest number of injuries on account of anti-terrorist/extremist operations were reported in Maharashtra 39.3% (44 out of 112). The highest injuries due to accident was reported from West Bengal 20.5% (123 out of 600) followed by Maharashtra 19.2% (115 out of 600). No injuries were received by any policeman in as many as 9 States/UTs namely Arunachal Pradesh, Haryana, Mizoram, Nagaland, Sikkim,
Uttarakhand, Dadra & Nagar Haveli, Daman & Diu and Lakshdaweep. The riotous mobs caused maximum injuries (52.4%)(1,769 out of 3,375) to the police personnel in the country during 2012. The other causes responsible for injuries were ‘by other criminals' (25.3%) (853 out of 3,375), caused by ‘accidents' (17.8%)(600 out of 3,375) and caused by ‘terrorist/extremists’ (3.3%) (112 out of 3,375), and (1.1%) (38 out of 3,375) during ‘anti dacoity & other operations’. The rank-wise profile presented in Table 15.4 shows that all categories of personnel have received injuries. A sizeable number (2,080) accounting for 61.6% out of 3,299 police personnel injured on duty were constables, 702 (20.8%) were lower sub-ordinates (484 Head constables and 218 Assistant Sub-inspectors), 537 (15.9%) were upper sub-ordinates (404 Sub-Inspectors, 133 Inspectors) and the rest 56 (1.7%) were gazetted officers.
The cause-wise comparative details of police personnel killed or injured on duty during last 5 years (2008- 2012) are presented in Table-15 (A). It is observed that quantum of police casualties (both fatal and non-fatal) has shown a mixed trend during last 5 years, wherein `accidents’ and `anti-terrorist/extremist operations' were the main cause of deaths of police personnel.
LatestLaws.com
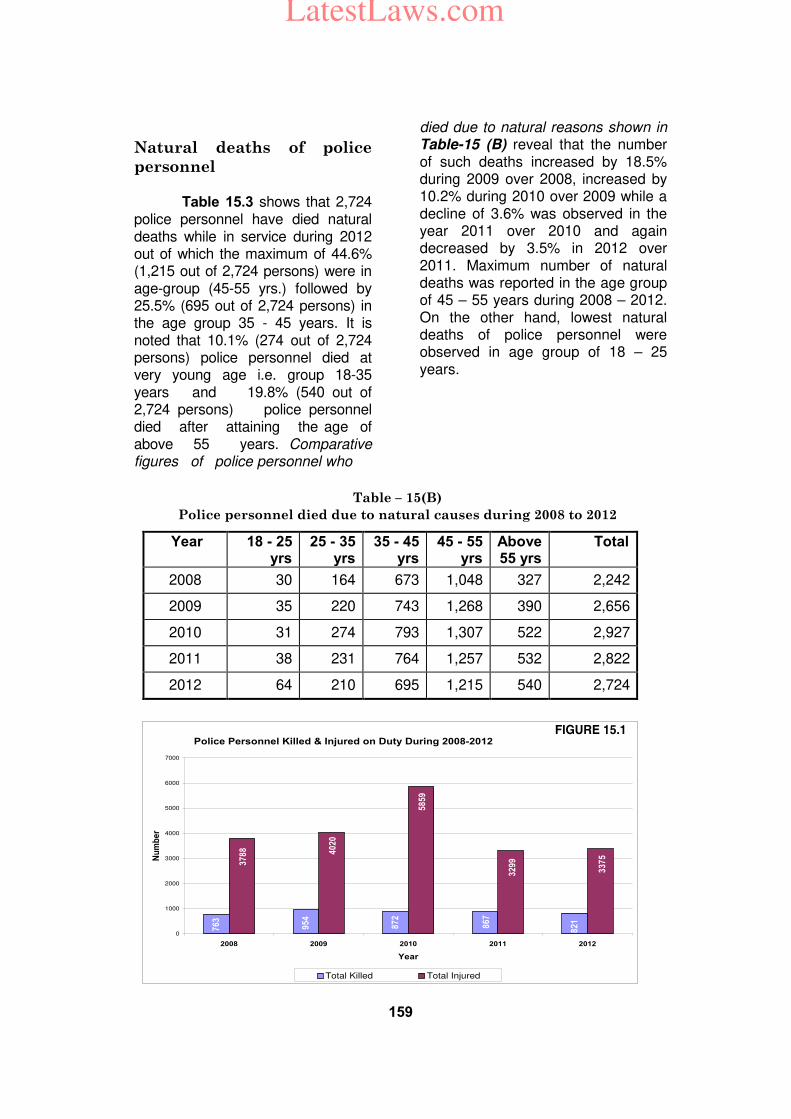
159
Natural deaths of police
personnel
Table 15.3 shows that 2,724 police personnel have died natural deaths while in service during 2012 out of which the maximum of 44.6% (1,215 out of 2,724 persons) were in age-group (45-55 yrs.) followed by 25.5% (695 out of 2,724 persons) in the age group 35 - 45 years. It is noted that 10.1% (274 out of 2,724 persons) police personnel died at very young age i.e. group 18-35 years and 19.8% (540 out of 2,724 persons) police personnel died after attaining the age of above 55 years. Comparative figures of police personnel who
died due to natural reasons shown in Table-15 (B) reveal that the number of such deaths increased by 18.5% during 2009 over 2008, increased by 10.2% during 2010 over 2009 while a decline of 3.6% was observed in the year 2011 over 2010 and again decreased by 3.5% in 2012 over 2011. Maximum number of natural deaths was reported in the age group of 45 – 55 years during 2008 – 2012. On the other hand, lowest natural deaths of police personnel were observed in age group of 18 – 25 years.
Year 18 - 25 yrs
25 - 35 yrs
35 - 45 yrs
45 - 55 yrs
Above 55 yrs
Total
2008 30 164 673 1,048 327 2,242
2009 35 220 743 1,268 390 2,656
2010 31 274 793 1,307 522 2,927
2011 38 231 764 1,257 532 2,822
2012 64 210 695 1,215 540 2,724
Table – 15(B)
Police personnel died due to natural causes during 2008 to 2012
Police Personnel Killed & Injured on Duty During 2008-2012
82
1
86
7
95
4
76
3
87
2
33
75
32
99
58
59
40
20
37
88
0
1000
2000
3000
4000
5000
6000
7000
2008 2009 2010 2011 2012
Year
Nu
mb
er
Total Killed Total Injured
FIGURE 15.1
LatestLaws.com
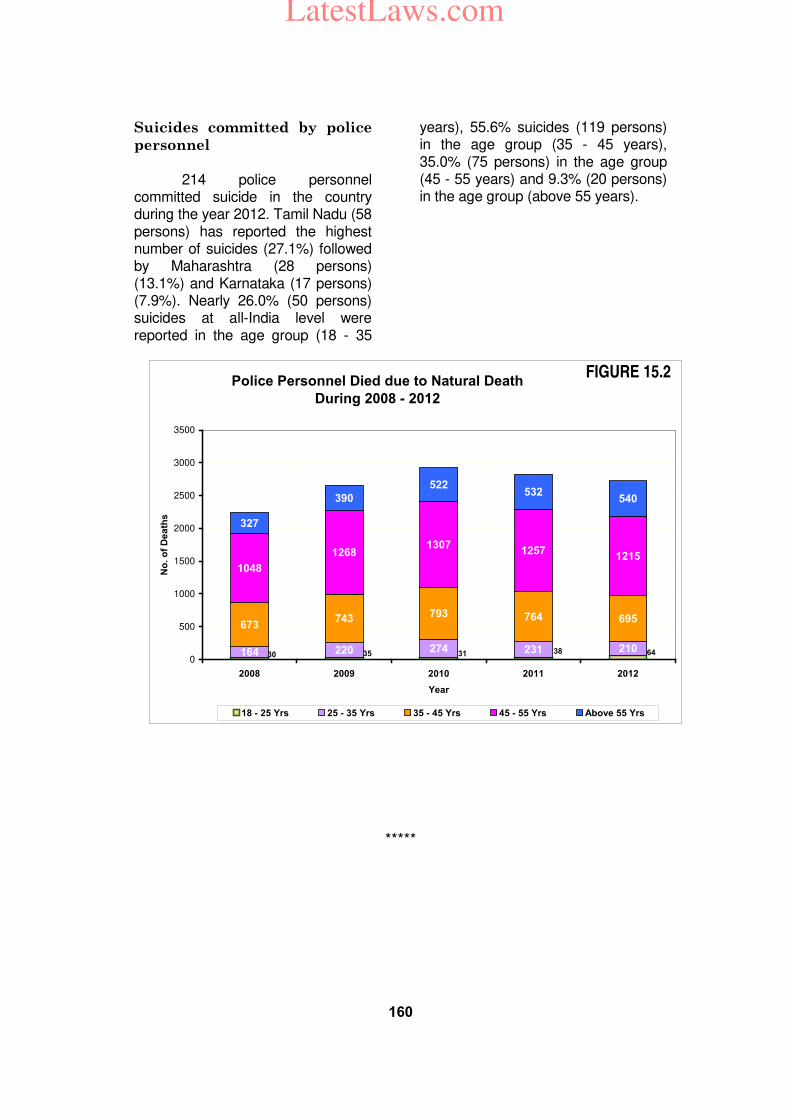
160
Suicides committed by police
personnel
214 police personnel committed suicide in the country during the year 2012. Tamil Nadu (58 persons) has reported the highest number of suicides (27.1%) followed by Maharashtra (28 persons) (13.1%) and Karnataka (17 persons) (7.9%). Nearly 26.0% (50 persons) suicides at all-India level were reported in the age group (18 - 35
years), 55.6% suicides (119 persons) in the age group (35 - 45 years), 35.0% (75 persons) in the age group (45 - 55 years) and 9.3% (20 persons) in the age group (above 55 years).
*****
Police Personnel Died due to Natural Death
During 2008 - 2012
164 220 274 231 210
673743 793 764 695
1048
12681307
12571215
327
390
522532
540
30 35 31 38 640
500
1000
1500
2000
2500
3000
3500
2008 2009 2010 2011 2012
Year
No
. o
f D
ea
ths
18 - 25 Yrs 25 - 35 Yrs 35 - 45 Yrs 45 - 55 Yrs Above 55 Yrs
FIGURE 15.2
LatestLaws.com
161
Chapter-16
Complaints against police personnel
and
Human rights violations by them
Complaints received and reported against police personnel
Total numbers of complaints, both non-cognizable and cognizable, reported to the police authorities against police personnel from States/UTs are presented in Table-
16.1. Information on the number of complaints / allegations received against police personnel; number of inquiries instituted such as departmental, magisterial and judicial; number of complaints/cases found false/unsubstantiated; number of cases registered during the year; and number of cases either reported for
regular departmental action or sent for trials/charge-sheeted is presented in Table-16 (A).
A total of 57,363 complaints were reported in the country against police personnel during the year 2012. Inquiries were instituted in as many as 20,094 cases. Out of these, departmental inquiries were initiated in 19,490 cases, magisterial inquiries in 352 cases and judicial inquiries in 252 cases. Thus, inquiries were instituted in 35.0% complaints. The total number of cases that were either not substantiated or not found true was 30,875 which amounted to 53.8% of the total complaints reported. A decline of 7.1% was noticed in reported complaints against police personnel as compared to the
previous year (from 61,765 in the year 2011 to 57,363 in 2012). Madhya Pradesh accounted for 21.6% (12,412 cases out of 57,363 cases) of such complaints followed by Delhi 21.5%
Table-16 (A)
Complaints, Inquiries and cases registered against police personnel during 2008-2012
Year No. of
complaints
received/
alleged
during the
year
No. of Inquiry Instituted
Complaints /
Cases
declared false
/ unsub-
stantiated
No. of cases
registered
during the
year
No. of cases
Depart-
mental Magisterial Judicial
Reported for
regular
departmental
action
Sent for trials /
charge sheeted
2008
2009
2010
2011
2012
48,939
54,873
58,438
61,765
57,363
17,215
24,302
21,563
21,144
19,490
99
611
326
282
352
204
481
268
246
252
29,577
28,120
31,115
28,789
30,875
5,445
14,975
10,470
11,171
2,289
4,596
9,759
9,665
10,020
7,283
1,132
1,618
861
913
839
LatestLaws.com
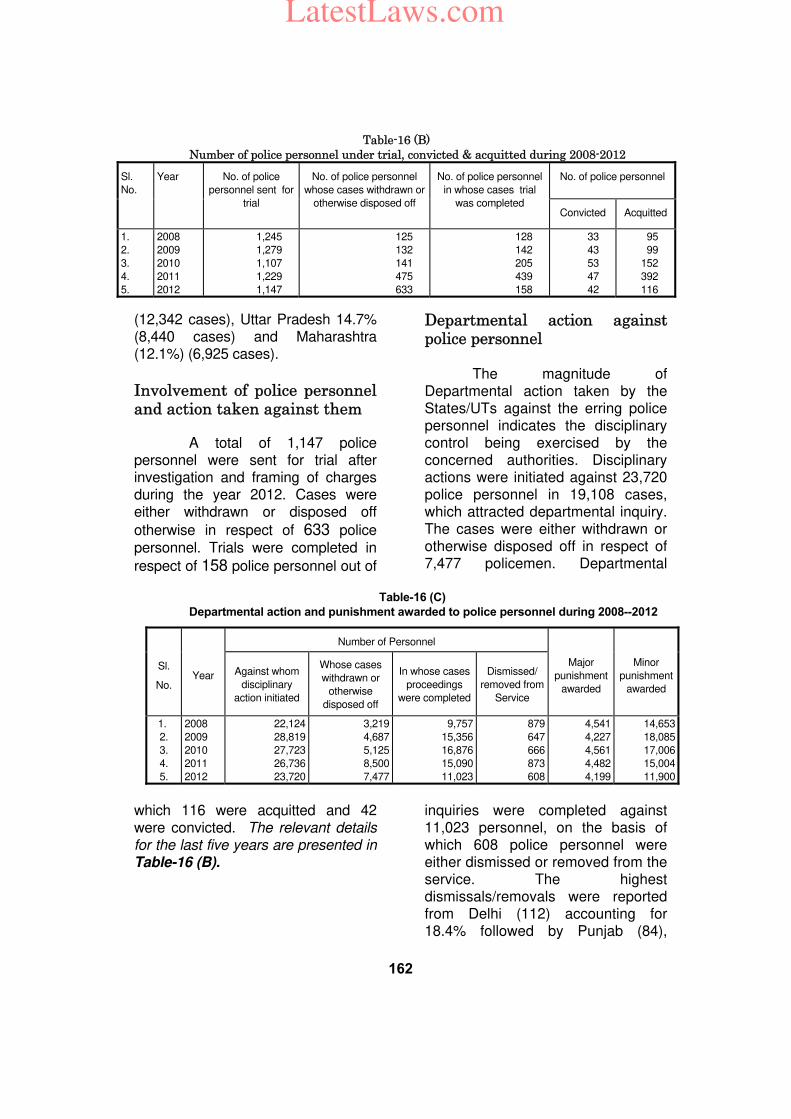
162
(12,342 cases), Uttar Pradesh 14.7% (8,440 cases) and Maharashtra (12.1%) (6,925 cases).
Involvement of police personnel and action taken against them
A total of 1,147 police personnel were sent for trial after investigation and framing of charges during the year 2012. Cases were either withdrawn or disposed off
otherwise in respect of 633 police
personnel. Trials were completed in
respect of 158 police personnel out of
which 116 were acquitted and 42
were convicted. The relevant details for the last five years are presented in Table-16 (B).
Departmental action against police personnel
The magnitude of Departmental action taken by the States/UTs against the erring police personnel indicates the disciplinary control being exercised by the concerned authorities. Disciplinary actions were initiated against 23,720 police personnel in 19,108 cases, which attracted departmental inquiry. The cases were either withdrawn or otherwise disposed off in respect of 7,477 policemen. Departmental
inquiries were completed against 11,023 personnel, on the basis of which 608 police personnel were either dismissed or removed from the service. The highest dismissals/removals were reported from Delhi (112) accounting for 18.4% followed by Punjab (84),
Table-16 (B) Number of police personnel under trial, convicted & acquitted during 2008-2012
Sl.
No.
Year No. of police
personnel sent for
trial
No. of police personnel
whose cases withdrawn or
otherwise disposed off
No. of police personnel
in whose cases trial
was completed
No. of police personnel
Convicted Acquitted
1.
2.
3.
4.
5.
2008
2009
2010
2011
2012
1,245
1,279
1,107
1,229
1,147
125
132
141
475
633
128
142
205
439
158
33
43
53
47
42
95
99
152
392
116
Table-16 (C)
Departmental action and punishment awarded to police personnel during 2008--2012
Sl.
No. Year
Number of Personnel
Major
punishment
awarded
Minor
punishment
awarded
Against whom
disciplinary
action initiated
Whose cases
withdrawn or
otherwise
disposed off
In whose cases
proceedings
were completed
Dismissed/
removed from
Service
1.
2.
3.
4.
5.
2008
2009
2010
2011
2012
22,124
28,819
27,723
26,736
23,720
3,219
4,687
5,125
8,500
7,477
9,757
15,356
16,876
15,090
11,023
879
647
666
873
608
4,541
4,227
4,561
4,482
4,199
14,653
18,085
17,006
15,004
11,900
LatestLaws.com
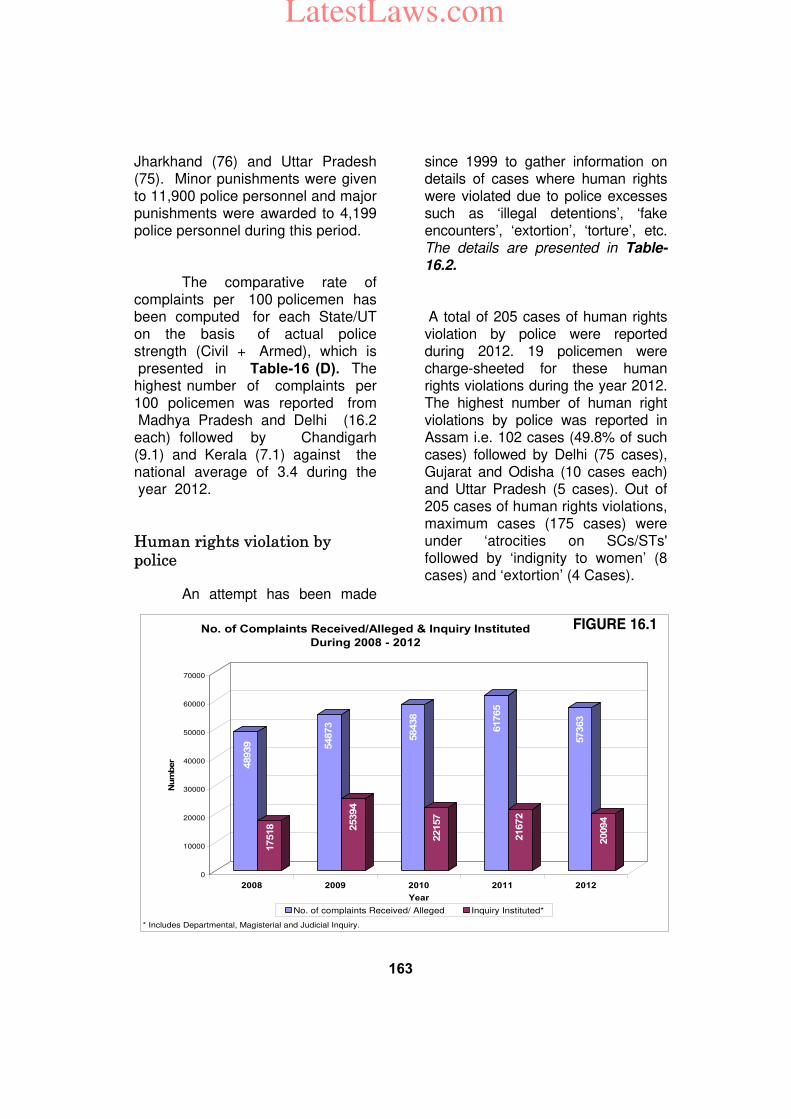
163
Jharkhand (76) and Uttar Pradesh (75). Minor punishments were given to 11,900 police personnel and major punishments were awarded to 4,199 police personnel during this period.
The comparative rate of complaints per 100 policemen has been computed for each State/UT on the basis of actual police strength (Civil + Armed), which is presented in Table-16 (D). The highest number of complaints per 100 policemen was reported from Madhya Pradesh and Delhi (16.2 each) followed by Chandigarh (9.1) and Kerala (7.1) against the national average of 3.4 during the year 2012.
Human rights violation by police
An attempt has been made
since 1999 to gather information on details of cases where human rights were violated due to police excesses such as ‘illegal detentions’, ‘fake encounters’, ‘extortion’, ‘torture’, etc. The details are presented in Table-16.2. A total of 205 cases of human rights violation by police were reported during 2012. 19 policemen were charge-sheeted for these human rights violations during the year 2012. The highest number of human right violations by police was reported in Assam i.e. 102 cases (49.8% of such cases) followed by Delhi (75 cases), Gujarat and Odisha (10 cases each) and Uttar Pradesh (5 cases). Out of 205 cases of human rights violations, maximum cases (175 cases) were under ‘atrocities on SCs/STs' followed by ‘indignity to women’ (8 cases) and ‘extortion’ (4 Cases).
48939
17518
54873
25394
58438
22157
61765
21672
57363
20094
0
10000
20000
30000
40000
50000
60000
70000
Num
ber
2008 2009 2010 2011 2012
Year
No. of Complaints Received/Alleged & Inquiry Instituted
During 2008 - 2012
No. of complaints Received/ Alleged Inquiry Instituted*
* Includes Departmental, Magisterial and Judicial Inquiry.
FIGURE 16.1
LatestLaws.com
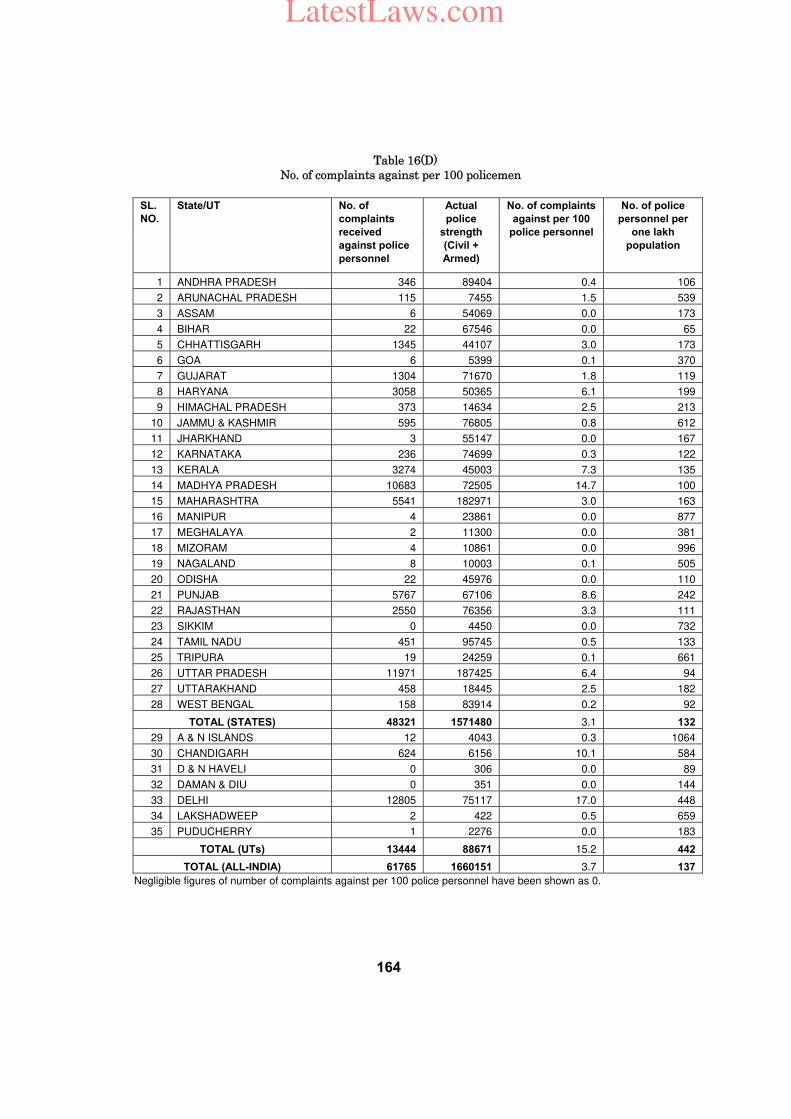
164
Table 16(D) No. of complaints against per 100 policemen
SL.
NO.
State/UT No. of
complaints
received
against police
personnel
Actual
police
strength
(Civil +
Armed)
No. of complaints
against per 100
police personnel
No. of police
personnel per
one lakh
population
1 ANDHRA PRADESH 346 89404 0.4 106
2 ARUNACHAL PRADESH 115 7455 1.5 539
3 ASSAM 6 54069 0.0 173
4 BIHAR 22 67546 0.0 65
5 CHHATTISGARH 1345 44107 3.0 173
6 GOA 6 5399 0.1 370
7 GUJARAT 1304 71670 1.8 119
8 HARYANA 3058 50365 6.1 199
9 HIMACHAL PRADESH 373 14634 2.5 213
10 JAMMU & KASHMIR 595 76805 0.8 612
11 JHARKHAND 3 55147 0.0 167
12 KARNATAKA 236 74699 0.3 122
13 KERALA 3274 45003 7.3 135
14 MADHYA PRADESH 10683 72505 14.7 100
15 MAHARASHTRA 5541 182971 3.0 163
16 MANIPUR 4 23861 0.0 877
17 MEGHALAYA 2 11300 0.0 381
18 MIZORAM 4 10861 0.0 996
19 NAGALAND 8 10003 0.1 505
20 ODISHA 22 45976 0.0 110
21 PUNJAB 5767 67106 8.6 242
22 RAJASTHAN 2550 76356 3.3 111
23 SIKKIM 0 4450 0.0 732
24 TAMIL NADU 451 95745 0.5 133
25 TRIPURA 19 24259 0.1 661
26 UTTAR PRADESH 11971 187425 6.4 94
27 UTTARAKHAND 458 18445 2.5 182
28 WEST BENGAL 158 83914 0.2 92
TOTAL (STATES) 48321 1571480 3.1 132
29 A & N ISLANDS 12 4043 0.3 1064
30 CHANDIGARH 624 6156 10.1 584
31 D & N HAVELI 0 306 0.0 89
32 DAMAN & DIU 0 351 0.0 144
33 DELHI 12805 75117 17.0 448
34 LAKSHADWEEP 2 422 0.5 659
35 PUDUCHERRY 1 2276 0.0 183
TOTAL (UTs) 13444 88671 15.2 442
TOTAL (ALL-INDIA) 61765 1660151 3.7 137
Negligible figures of number of complaints against per 100 police personnel have been shown as 0.
LatestLaws.com
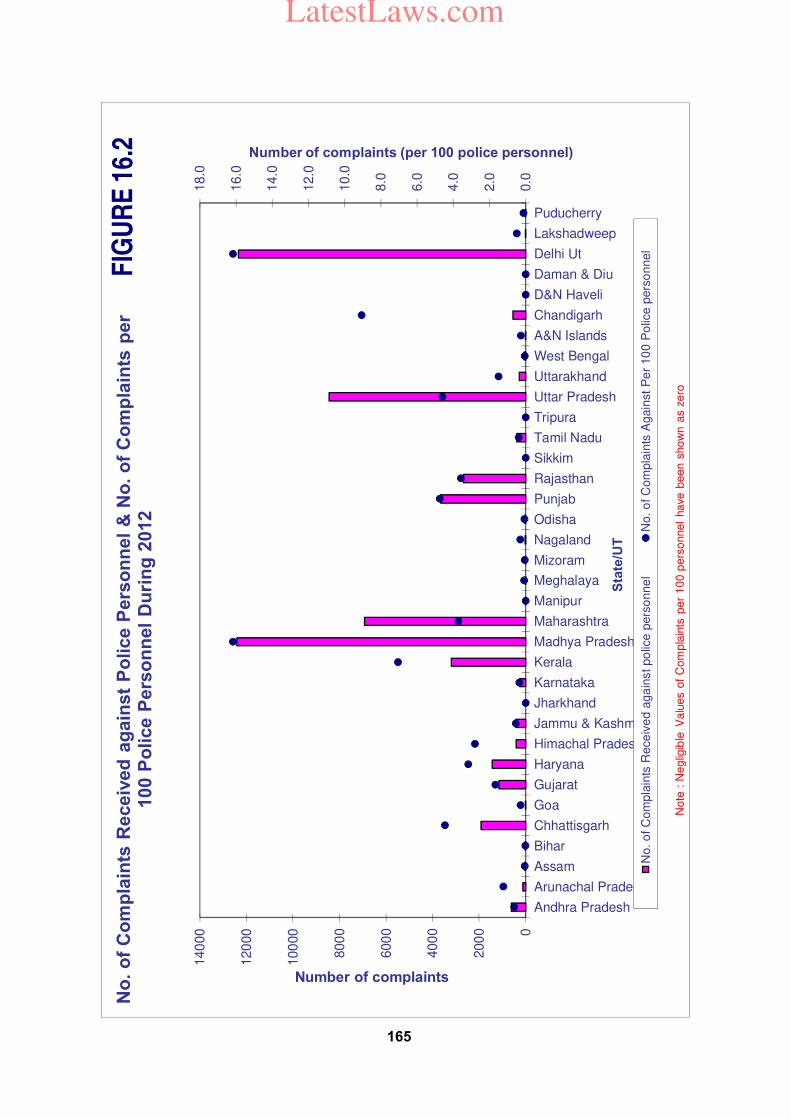
0.0
2.0
4.0
6.0
8.0
10.0
12.0
14.0
16.0
18.0
0
200
0
400
0
600
0
800
0
100
00
120
00
140
00
Andhra Pradesh
Arunachal Pradesh
Assam
Bihar
Chhattisgarh
Goa
Gujarat
Haryana
Himachal Pradesh
Jammu & Kashmir
Jharkhand
Karnataka
Kerala
Madhya Pradesh
Maharashtra
Manipur
Meghalaya
Mizoram
Nagaland
Odisha
Punjab
Rajasthan
Sikkim
Tamil Nadu
Tripura
Uttar Pradesh
Uttarakhand
West Bengal
A&N Islands
Chandigarh
D&N Haveli
Daman & Diu
Delhi Ut
Lakshadweep
Puducherry
Number of complaints (per 100 police personnel)
Number of complaints
Sta
te/U
T
No
. o
f C
om
pla
ints
Receiv
ed
ag
ain
st
Po
lice P
ers
on
nel
& N
o.
of
Co
mp
lain
ts p
er
100 P
olice P
ers
on
nel
Du
rin
g 2
012
No. o
f C
om
pla
ints
Rece
ive
d a
ga
inst po
lice p
ers
onne
lN
o. o
f C
om
pla
ints
Again
st
Pe
r 10
0 P
olic
e p
ers
onnel
Note
: N
eglig
ible
Valu
es o
f C
om
pla
ints
per
100 p
ers
onnel
have
been s
how
n a
s z
ero
FIG
UR
E 1
6.2
165
LatestLaws.com
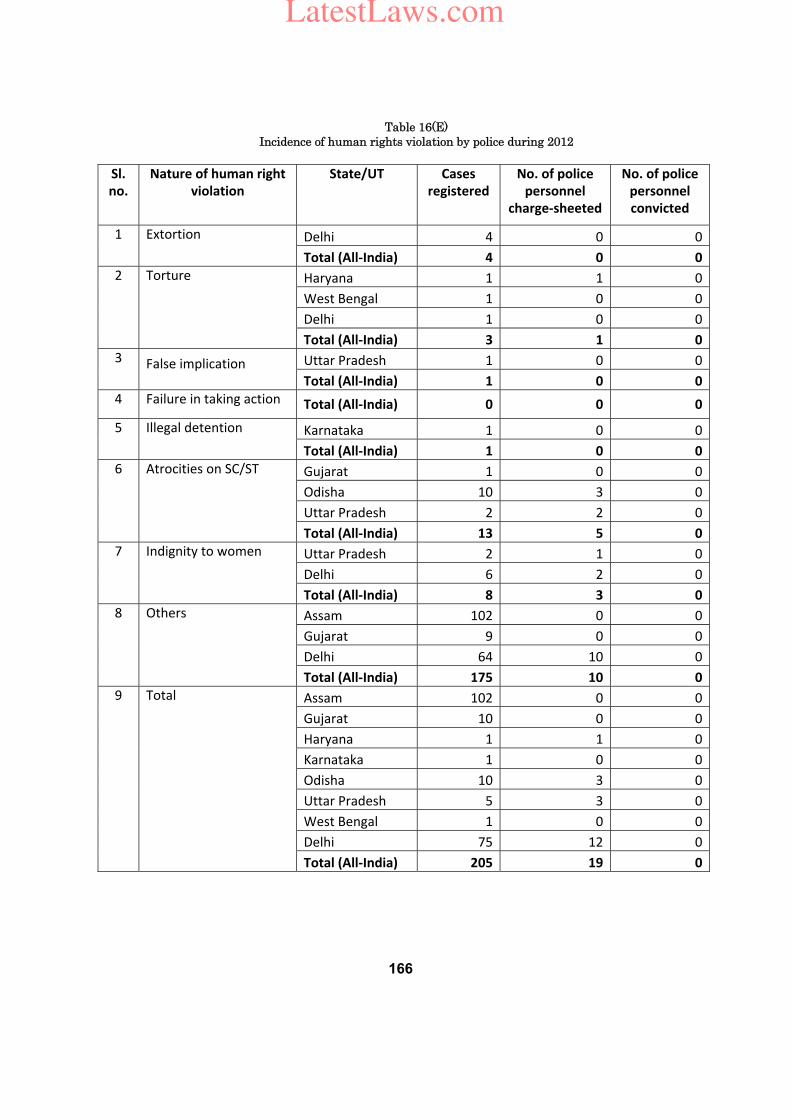
166
Table 16(E) Incidence of human rights violation by police during 2012
Sl. no.
Nature of human right violation
State/UT Cases registered
No. of police personnel
charge‐sheeted
No. of police personnel convicted
1 Extortion Delhi 4 0 0
Total (All‐India) 4 0 0
2 Torture Haryana 1 1 0
West Bengal 1 0 0
Delhi 1 0 0
Total (All‐India) 3 1 0
3 False implication
Uttar Pradesh 1 0 0
Total (All‐India) 1 0 0
4 Failure in taking action Total (All‐India) 0 0 0
5 Illegal detention Karnataka 1 0 0
Total (All‐India) 1 0 0
6 Atrocities on SC/ST Gujarat 1 0 0
Odisha 10 3 0
Uttar Pradesh 2 2 0
Total (All‐India) 13 5 0
7 Indignity to women Uttar Pradesh 2 1 0
Delhi 6 2 0
Total (All‐India) 8 3 0
8 Others Assam 102 0 0
Gujarat 9 0 0
Delhi 64 10 0
Total (All‐India) 175 10 0
9 Total Assam 102 0 0
Gujarat 10 0 0
Haryana 1 1 0
Karnataka 1 0 0
Odisha 10 3 0
Uttar Pradesh 5 3 0
West Bengal 1 0 0
Delhi 75 12 0
Total (All‐India) 205 19 0
LatestLaws.com
167
Chapter-17
Police strength, expenditure and infrastructure
The State/UT wise, sex-wise and rank-wise details on ‘sanctioned’ as well as ‘actual’ police strength in the country as on 31.12.2012 are presented in Table 17.1 to Table
17.4. It is seen from Table-17.1 and Table-17.2 that the existing (actual) police strength was 16.7 lakhs against the sanctioned strength of 21.6 lakhs of total police force (civil and armed combined), rendering 22.7% of the posts vacant.
Civil Police
The ‘actual’ strength of civil police, including district armed police in the country during 2012 stood at 1,29,8944 against the ‘sanctioned’ strength of 1,70,2290 (Table-17.1). Thus, the civil police strength in position was 76.3% of the sanctioned strength and 23.7% of the posts were vacant. Maharashtra (1,70,990) has the highest actual strength of civil police accounting for 13.2% of the total civil police in the country followed by Uttar Pradesh 1,51,912 (11.7%). Delhi has the largest contingent of 68,024 (85.4%) of the total police strength of 79,654 in the seven Union Territories.
Armed Police
The ‘actual’ strength of armed police in the country during 2012 was 3,75,811 showing a decline of 0.8% over 2011 (from 3,78,834 in 2011)
whereas the ‘sanctioned’ strength was 4,62,026 (Table-17.2). The percentage of vacant posts in case of armed police was less (18.7%) as compared to that of civil police (23.7%). The proportion of actual armed police to actual civil police was 1:3.5. Assam had the highest contingent of armed police (36,112) followed by Uttar Pradesh (31,243), Jammu & Kashmir (28,086) and West Bengal (22,872). There was no sanctioned post of armed police for the UTs of Dadra & Nagar Haveli, Daman & Diu and Lakshadweep. The strength of armed police was more than that of civil police only in six North-Eastern States of Arunachal Pradesh, Manipur, Mizoram, Sikkim and Tripura.
Women Police
The ‘sanctioned’ and the ‘actual’ strength of women civil police (including district armed police) and women armed police are presented separately in Tables-17.3 and Table 17.4 respectively. The actual strength of women civil police including district armed police at the national level was 85,462 against the sanctioned strength of 57,318. The proportion of actual ‘women civil police' to the total ‘civil police' was 1:15.2. The maximum strength of women civil police among the States existed in Maharashtra (17,134)
LatestLaws.com
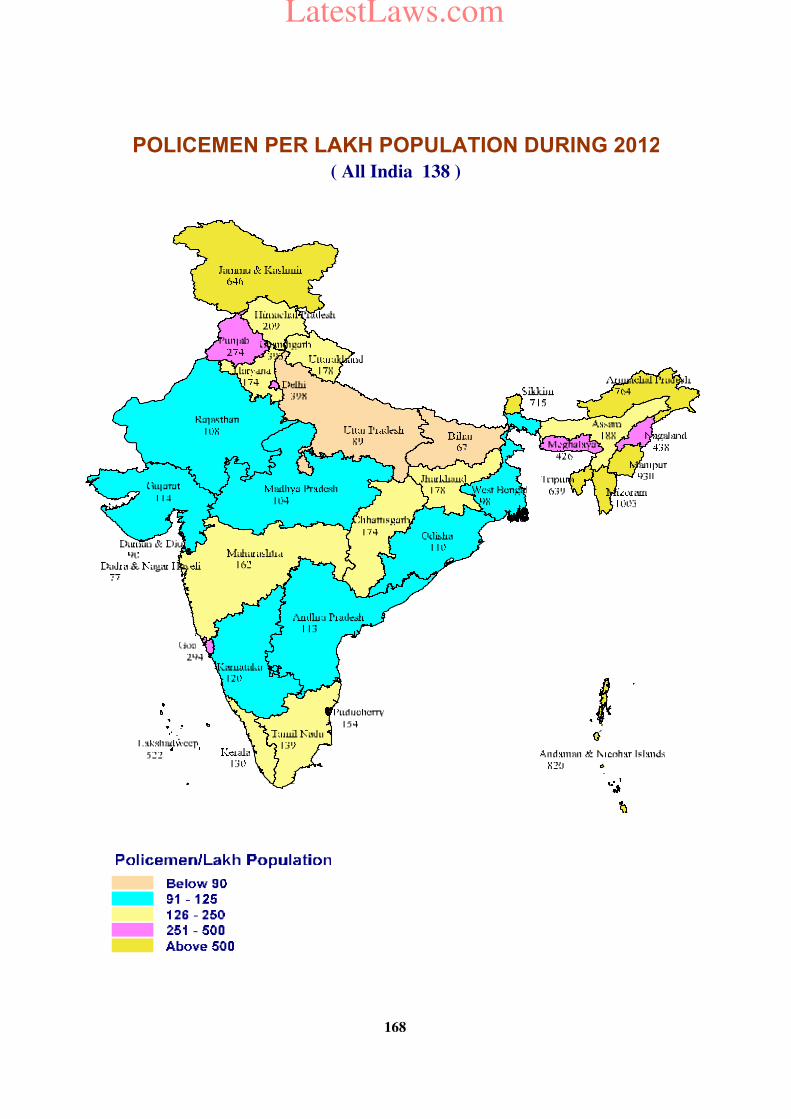
POLICEMEN PER LAKH POPULATION DURING 2012
( All India 138 )
168
LatestLaws.com
169
followed by Tamil Nadu (12,085), Uttar Pradesh (6,488), Rajasthan (4,941) and Delhi (4,674). Nine States and five UTs had strength of less than one thousand. Delhi had the largest contingent of women civil police among UTs with strength of 4,674. 16 States and 5 UTs had more number of women civil police than their sanctioned strength. Women armed police is in existence in only 21 States / UTs namely Andhra Pradesh, Assam, Bihar, Chhattisgarh, Goa, Gujarat, Haryana, Himachal Pradesh, Kerala, Madhya Pradesh, Manipur, Meghalaya, Nagaland, Odisha, Rajasthan, Tamil Nadu, Tripura, Uttar Pradesh, Uttarakhand, West Bengal, A&N Island, Daman & Diu, and Puducherry. The ratio of women armed police to the women civil police was 1:7.7. Ratio of police to area and population
Just as the crime incidence in an area is not a representative pointer to the crime situation, the absolute strength of police personnel is also not a true indicator of the magnitude of crime and its combating machinery as well as performance of other assigned tasks by police. The number of policemen per 100 Sq. Kms and per 1,00,000 of population is considered to be important indicator in planning for their deployment. The State/UT-wise availability of police strength by various parameters is presented in Table 17.5.
Police strength per unit area /population
The strength of police personnel per unit area in the country i.e., per 100 Sq. Kms. was 52.9. However, it should be noted that the area coverage being a constant, the density of population is expected to progressively increase with times. The UTs of Chandigarh and Delhi have recorded significantly higher density values at 5,278.1 and 5,146.7 policemen per 100 Sq. Km. respectively as in the past which is much higher than the national average of 52.9 in 2012. The highest number of police men per one lakh population was reported in Mizoram (1,003) followed by Manipur (930) and A&N Islands (820) while Bihar occupied the lowest number (67) followed by D&N Haveli (77) Uttar Pradesh (89) and Daman & Diu (90) against 138 at the national level.
Teeth to tail ratio
The teeth to tail ratio (the ratio of police officers, from the rank of A.S.I. and above to lower subordinates i.e., Head Constables &
LatestLaws.com
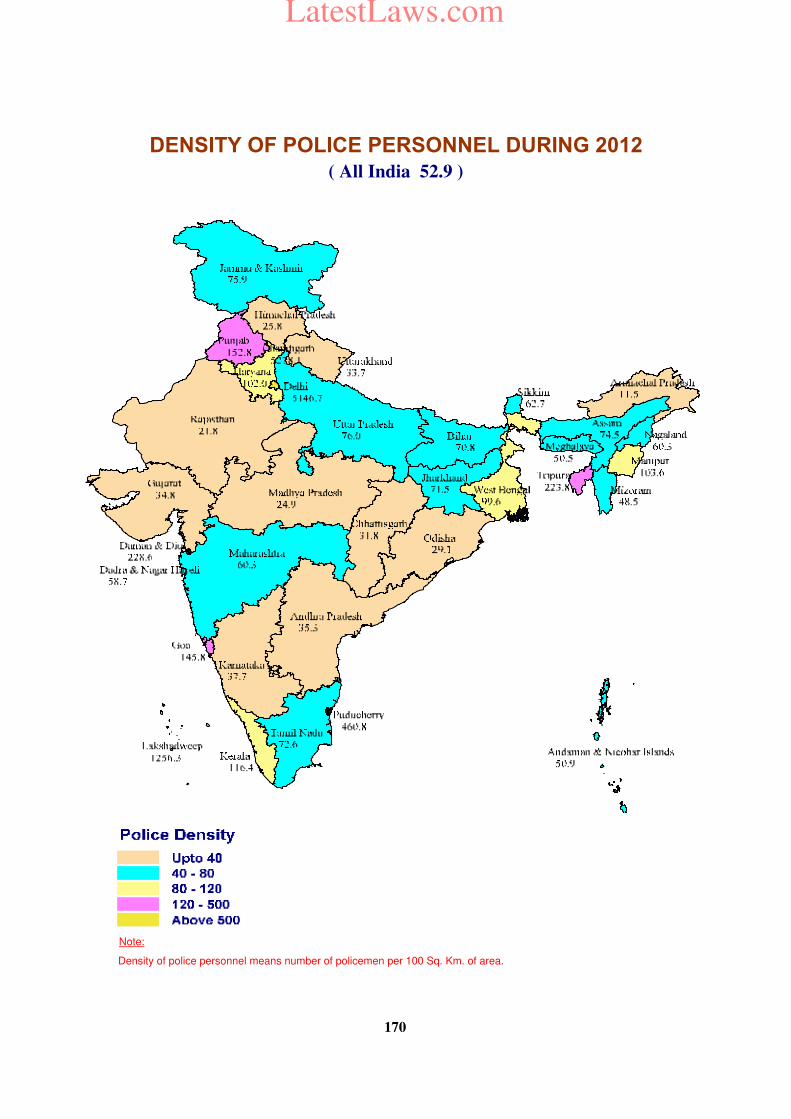
Note:
Density of police personnel means number of policemen per 100 Sq. Km. of area.
DENSITY OF POLICE PERSONNEL DURING 2012
( All India 52.9 )
170
LatestLaws.com
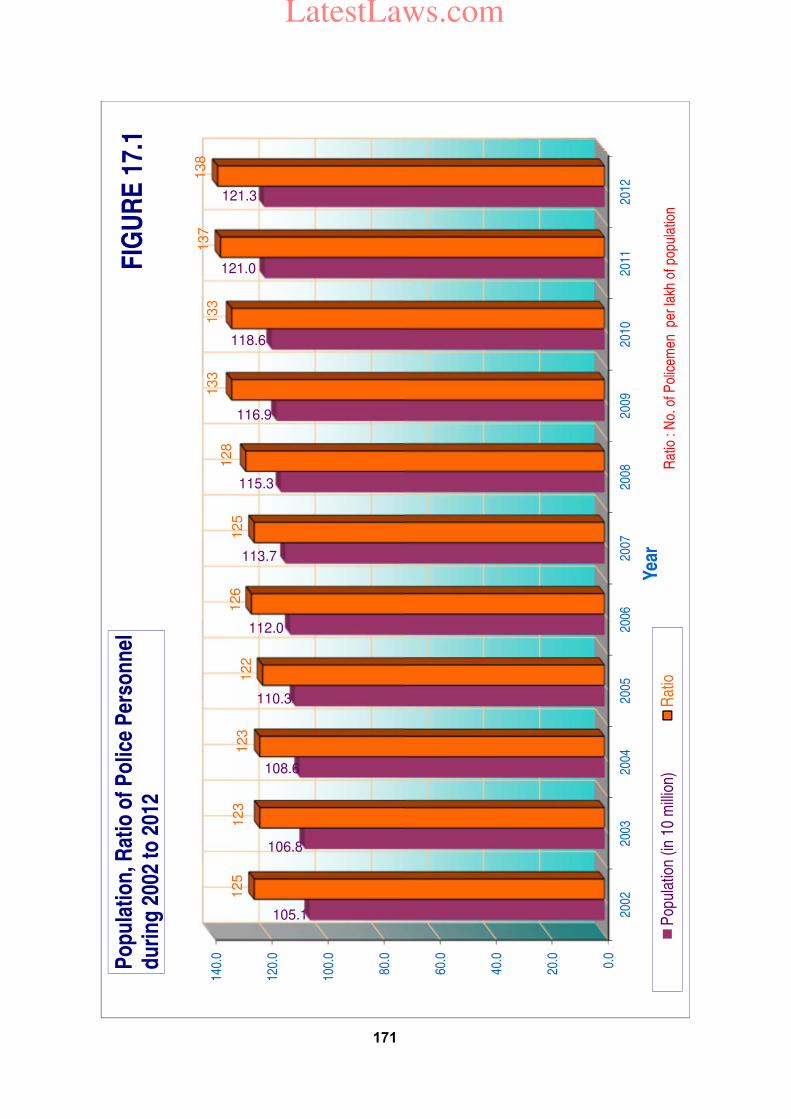
0.0
20.0
40.0
60.0
80.0
100.
0
120.
0
140.
0
2002
2003
2004
2005
2006
2007
2008
2009
2010
2011
2012
105.1
106.8
108.6
110.3
112.0
113.7
115.3
116.9
118.6
121.0
121.3
12
51
23
12
31
22
12
61
25
12
81
33
13
31
37
13
8
Yea
r
Po
pu
lati
on
, Rat
io o
f P
olic
e P
erso
nn
el
du
rin
g 2
002
to 2
012
Pop
ulat
ion
(in 1
0 m
illio
n)R
atio
Rat
io :
No.
of P
olic
emen
per
lakh
of p
opul
atio
n
FIG
UR
E 1
7.1
171
LatestLaws.com
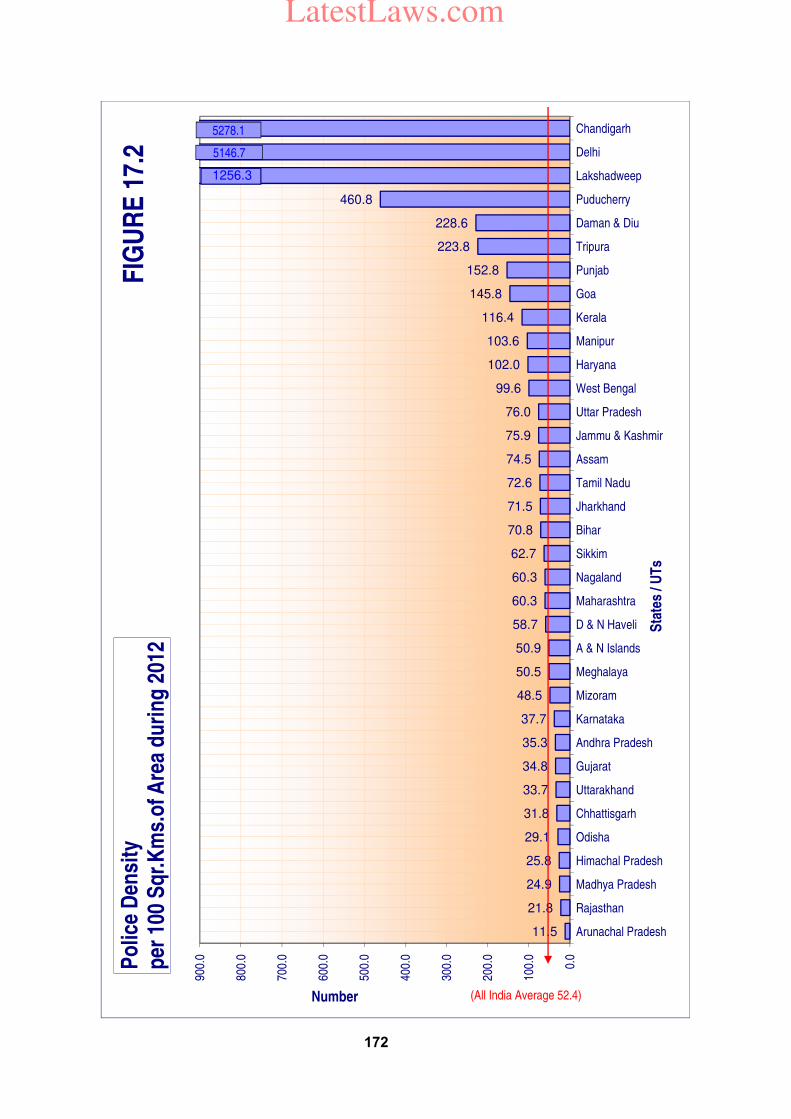
11.5
21.8
24.9
25.8
29.1
31.8
33.7
34.8
35.3
37.7
48.5
50.5
50.9
58.7
60.3
60.3
62.7
70.8
71.5
72.6
74.5
75.9
76.0
99.6
102.0
103.6
116.4
145.8
152.8
223.8
228.6
460.8
0.0
100.
0
200.
0
300.
0
400.
0
500.
0
600.
0
700.
0
800.
0
900.
0
Arunachal Pradesh
Rajasthan
Madhya Pradesh
Himachal Pradesh
Odisha
Chhattisgarh
Uttarakhand
Gujarat
Andhra Pradesh
Karnataka
Mizoram
Meghalaya
A & N Islands
D & N Haveli
Maharashtra
Nagaland
Sikkim
Bihar
Jharkhand
Tamil Nadu
Assam
Jammu & Kashmir
Uttar Pradesh
West Bengal
Haryana
Manipur
Kerala
Goa
Punjab
Tripura
Daman & Diu
Puducherry
Lakshadweep
Delhi
Chandigarh
Number
Sta
tes
/ UT
s
Po
lice
Den
sity
p
er 1
00 S
qr.
Km
s.o
f Are
a d
uri
ng
201
2
(All India Average 52.4)
5146.7F
IGU
RE
17.
25278.1
1256.3
172
LatestLaws.com
173
Constables) was highest in D&N Haveli (1.18) followed by Uttar Pradesh (1.15), Arunachal Pradesh and Nagaland (1.13 each) and Goa (1.11). This ratio at the national level was same i.e. 1:07 in 2012 as in 2011.
Police expenditure
The State Governments and UT administrations incurred an expenditure of ` 55,747.00 crore on the police, averaging an expenditure of ` 3,32,867 per policeman per annum. The highest per capita expenditure on policeman during the year was in Nagaland (` 7,89,441), followed by Meghalaya (`
6,43,084) and Sikkim (` 4,99,438). Assam has reported the lowest expenditure of ` 2,25,678 per policeman.
Home guards and auxiliary forces
Frequent deployment of home guards and auxiliary forces is required to maintain law and order in the country due to increasing work-load of the police. Table-17.6 provides information on sanctioned and actual strength of home guards and other forces in the country. The ratio between actual strength of officer: upper subordinate; lower subordinate supporting staffs are in 1:5.0:45.7 during 2012. Total number of actual strength of home guards and auxiliary forces during 2012 was 1,83,899 (82.4%) against sanctioned strength of 2,23,169.
Information on police housing
Police manpower alone is not sufficient to curb the crime unless the personnel are motivated and facilitated with basic necessities such as equipment, transport, housing, medical insurance, etc. Therefore, an attempt has been made to compile auxiliary information such as availability of housing facility to various categories of police officials, availability of vehicles and sophisticated gadgets with the police, etc. Information on the availability of police housing facility against the sanctioned police force for different categories is presented in Table-17.7. The information on police housing has been furnished by the State police. Out of 21.6 lakhs sanctioned strength, 4.6 lakhs housing facility were provided residential accommodation by govt., while 1.8 lakhs were provided on lease, rent/ general pool by govt. It is observed that 39.7% (6,976) officers have got the housing facility against 28.4% (81,366) of upper subordinates and 29.5% (5,48,085) of lower subordinates out of total sanctioned strength.
LatestLaws.com
174
The State / UT-wise information on equipment & transport facility available with the police, number of police stations by the quantum of crimes, number of police stations by strength of police personnel, number of rural/urban/women police stations, representation of SCs / STs and muslims in police force is also compiled and presented in Table
17.8 to Table 17.12 (This information is being compiled in this report since 1999.) It is observed that, 1,62,402 motor vehicles are available with police all over India to enable them to perform their duties efficiently. 69,575 (42.8%) out of these are motor cycles, 10,260(6.3%) are cars, 45,656 (28.1%) are jeeps, 10,787(6.6%) one tonners trucks and 9,676(6.0%) are three tonners trucks. Remaining 16,448 are other types of vehicles. Maharashtra has the highest number of motor vehicles (17,606) followed by Karnataka (16,782), Tamil Nadu (14,485) and Uttar Pradesh (12,791). Police have 3,87,052 different types of wireless equipments. Out of these 1,67,940 are H.F. / V.H.F., 1,51,405 are walkie-talkie and remaining 67,707 are other types of wireless equipments. Delhi is equipped with highest number of wireless equipments (20,008) amongst UTs. States of Karnataka (52,741) and Uttar Pradesh (37,894) were among the best equipped with wireless equipments. Details may be seen in Table 17.8.
There are 14,155 police stations in the country, as per information furnished by various States and UTs, out of which 26.3% deal with 101-200 cases annually on an average and 15.5% deal with 201-300 cases per year. Only 3.9% police stations (557) in the country deal with more than 1,000 cases in a year. Details may be seen in Table 17.9.
Police stations by strength of police personnel may be seen in Table 17.10. 21.8% out of total 14,155 police stations had strength of 11 - 20 personnel, 18.0% police stations had strength of 21 - 30 personnel and 5.6% police stations had strength of police personnel less than 10. 28.2% of police stations had staff strength of more than 50 persons and nearly 26.4% had 31 - 50 personnel. There are 755 police districts, 2,439 sub-divisions and 2,390 circles.
64.6% police stations are in rural areas and 36.2% are in urban areas. There are 510 women police stations all over India amounting to 3.6% of all police stations (14,155). Details may be seen in Table 17.11.
Information on representation of SCs / STs and muslims in police forces show that 14.0% police personnel belong to scheduled castes, 10.4% belong to scheduled tribes and 6.5% are muslims out of total actual strength of 16,74,755 about which this information is available. Remaining police personnel belong to other categories. Details may be seen in Table-17.12.
LatestLaws.com
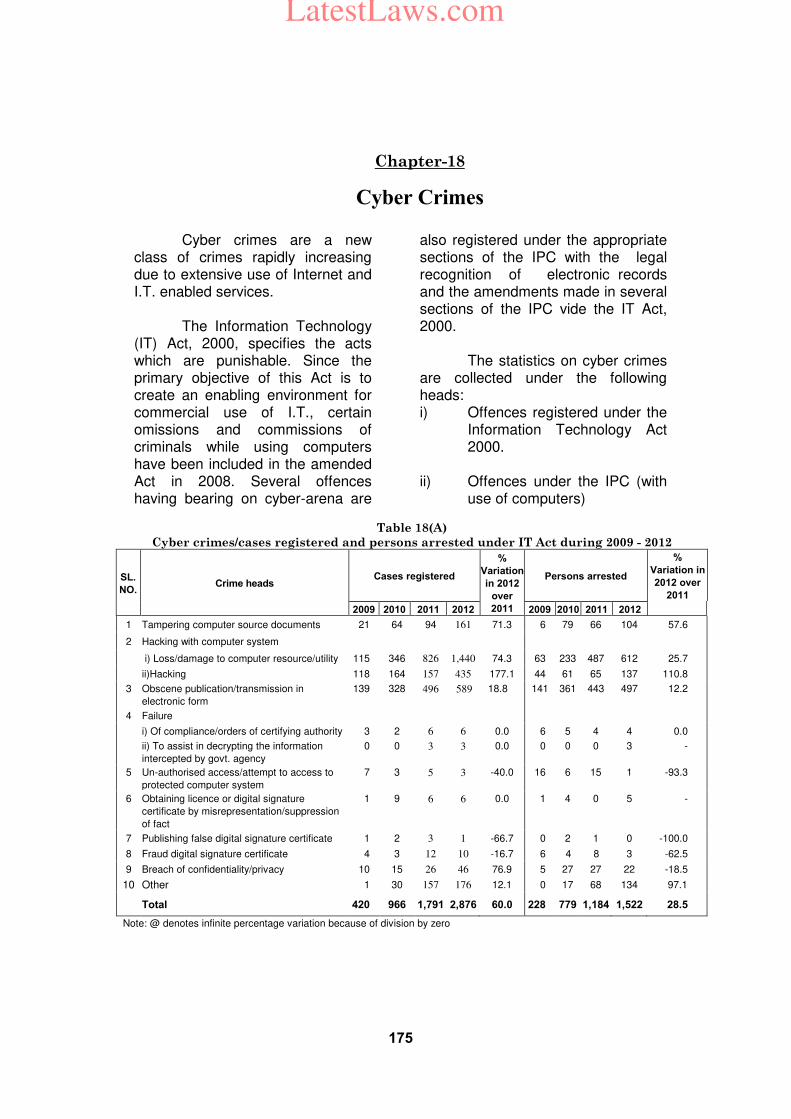
175
Chapter-18
Cyber Crimes
Cyber crimes are a new class of crimes rapidly increasing due to extensive use of Internet and I.T. enabled services. The Information Technology (IT) Act, 2000, specifies the acts which are punishable. Since the primary objective of this Act is to create an enabling environment for commercial use of I.T., certain omissions and commissions of criminals while using computers have been included in the amended Act in 2008. Several offences having bearing on cyber-arena are
also registered under the appropriate sections of the IPC with the legal recognition of electronic records and the amendments made in several sections of the IPC vide the IT Act, 2000. The statistics on cyber crimes are collected under the following heads: i) Offences registered under the
Information Technology Act 2000.
ii) Offences under the IPC (with
use of computers)
Table 18(A)
Cyber crimes/cases registered and persons arrested under IT Act during 2009 - 2012
SL.
NO. Crime heads
Cases registered
%
Variation
in 2012
over
2011
Persons arrested
%
Variation in
2012 over
2011
2009 2010 2011 2012 2009 2010 2011 2012
1 Tampering computer source documents 21 64 94 161 71.3 6 79 66 104 57.6
2 Hacking with computer system
i) Loss/damage to computer resource/utility 115 346 826 1,440 74.3 63 233 487 612 25.7
ii)Hacking 118 164 157 435 177.1 44 61 65 137 110.8
3 Obscene publication/transmission in
electronic form
139 328 496 589 18.8 141 361 443 497 12.2
4 Failure
i) Of compliance/orders of certifying authority 3 2 6 6 0.0 6 5 4 4 0.0
ii) To assist in decrypting the information
intercepted by govt. agency
0 0 3 3 0.0 0 0 0 3 -
5 Un-authorised access/attempt to access to
protected computer system
7 3 5 3 -40.0 16 6 15 1 -93.3
6 Obtaining licence or digital signature
certificate by misrepresentation/suppression
of fact
1 9 6 6 0.0 1 4 0 5 -
7 Publishing false digital signature certificate 1 2 3 1 -66.7 0 2 1 0 -100.0
8 Fraud digital signature certificate 4 3 12 10 -16.7 6 4 8 3 -62.5
9 Breach of confidentiality/privacy 10 15 26 46 76.9 5 27 27 22 -18.5
10 Other 1 30 157 176 12.1 0 17 68 134 97.1
Total 420 966 1,791 2,876 60.0 228 779 1,184 1,522 28.5
Note: @ denotes infinite percentage variation because of division by zero
LatestLaws.com
176
Cyber crimes – cases of various categories under IT Act, 2000 2,876 cases were registered under IT Act during the year 2012 as compared to 1,791 cases during the previous year (2011), thereby reporting an increase of 60.6% in 2012 over 2011. 16.4% cases (471 out of 2,876 cases) were reported from Maharashtra followed by Andhra Pradesh (429), Karnataka (412), Kerala (269) and Uttar Pradesh (205). 50.1% (1,440 cases) of the total 2,876 cases registered under IT Act 2000 were related to Loss/damage to computer resource/utility reported under hacking with computer systems. 612 persons were arrested for committing such offences during 2012. There were 589 cases of obscene publications/transmission in electronic form during the year 2012 wherein 497 persons were arrested. Out of the total (1,875) hacking cases, the cases relating to loss / damage of computer resource/utility under Sec 66(1) of the IT Act were 76.8% (1,440 cases) whereas the cases related to hacking under Section 66(2) of IT Act were 23.2% (435 cases). Andhra Pradesh (292) Karnataka (219), Maharashtra (192) and West Bengal (101) registered maximum cases under Sec 66(1) of the IT Act out of total 1,440 such cases at the national level. Out of the total 435 cases relating to hacking under Sec. 66(2), most of the cases (148 cases) were reported from Karnataka followed by Andhra
Pradesh (94) and Kerala (39 cases). 21.3% of the 1,522 persons arrested in cases relating to IT Act, 2000 were from Maharashtra (324) followed by Andhra Pradesh (170). The age-wise profile of persons arrested in Cyber Crime cases under IT Act, 2000 showed that 61.0% of the offenders were in the age group 18 – 30 years (928 out of 1,522) and 28.6% of the offenders were in the age group 30 - 45 years (436 out of 1522). Kerala, Madhya Pradesh, Rajasthan and Maharashtra reported 15, 13, 13 and 9 offenders respectively whose age was below 18 years. Further details on the State/UT-wise and age-group wise profiles may be seen in Table -18.2. Crime head-wise and age-group wise profile of the offenders arrested under IT Act, 2000 (Table
18.5) reveals that 40.2% (612 out of 1,522) of the offenders arrested for ‘Loss/damage to computer resource/utility under hacking with computer systems’ of which 62.3% (381 out of 612 were in the age-group 18 –30 years. 55.9% (278 out of 497) of the total persons arrested for 'obscene publication/transmission in electronic form' were in the age-group of 18 - 30 years.
Incidences of cyber crimes registered under IPC
Information on the cases registered under various sections of IPC which were considered as cyber crimes at all-India level is presented in Table – 18(B).
LatestLaws.com
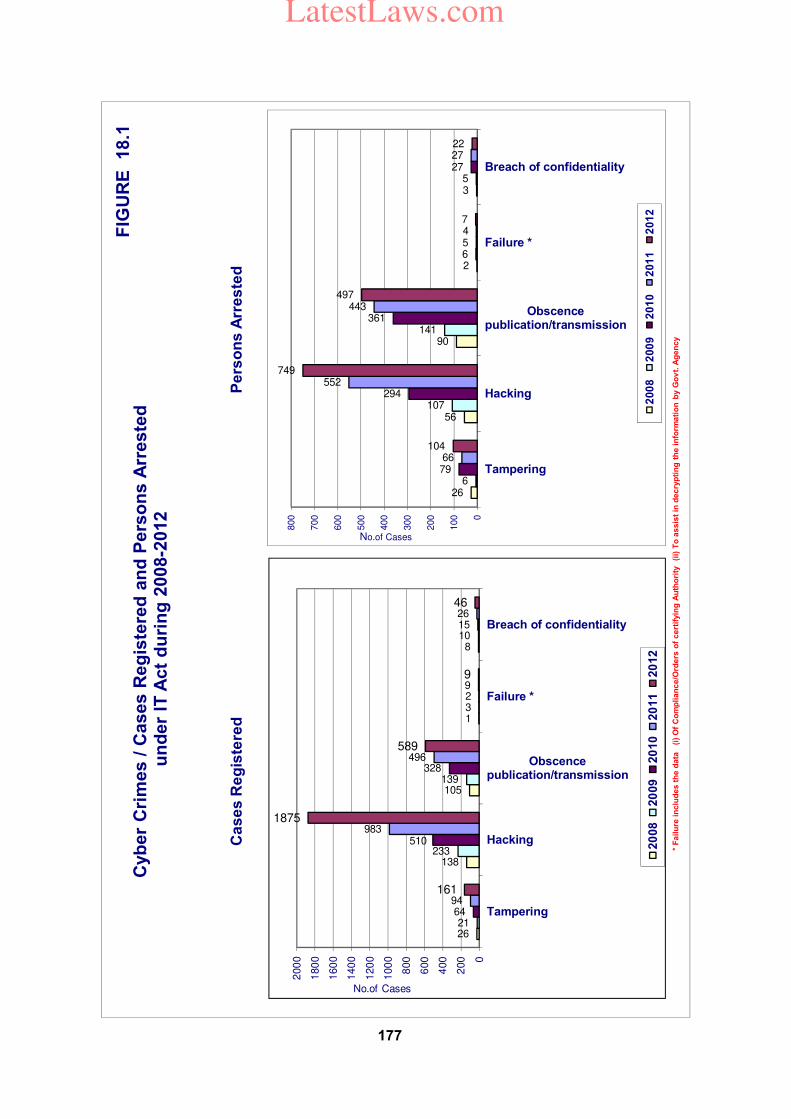
26
138
105
1
8
21
233
139
3
10
64
510
328
2
15
94
983
496
9
26
161
1875
589
9
46
0
200
400
600
800
100
0
120
0
140
0
160
0
180
0
200
0
Tampering
Hacking
Obscencepublication/transmission
Failure *
Breach of confidentiality
No.of Cases
Cyb
er
Cri
mes /
Cases R
eg
iste
red
an
d P
ers
on
s A
rreste
du
nd
er
IT A
ct
du
rin
g 2
008-2
012
20
08
20
09
20
10
20
11
20
12
26
56
90
2
3
6
107
141
6
5
79
294
361
5
27
66
552
443
4
27
104
749
497
7
22
0
100
200
300
400
500
600
700
800
Tampering
Hacking
Obscencepublication/transmission
Failure *
Breach of confidentiality
No.of Cases
200
82
00
92
01
02
01
12
01
2
Ca
se
s R
eg
iste
red
Pe
rso
ns
Arr
es
ted
FIG
UR
E
18.1
* F
ail
ure
in
clu
de
s t
he
da
ta
(i)
Of
Co
mp
lia
nc
e/O
rde
rs o
f c
ert
ifyin
g A
uth
ori
ty
(ii)
To
as
sis
t in
de
cry
pti
ng
th
e i
nfo
rma
tio
n b
y G
ov
t. A
ge
nc
y
177
LatestLaws.com
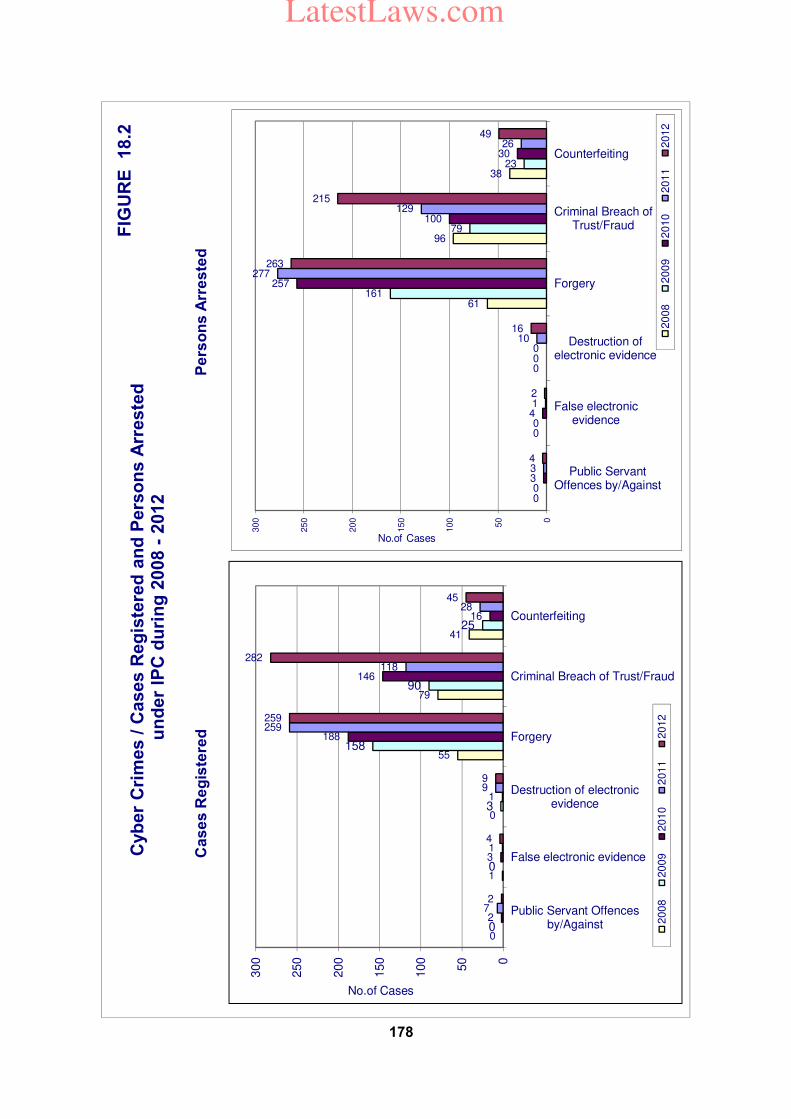
0
1
0
55
79
41
0
0
3
158
90
25
2
3
1
188
146
16
7
1
9
259
118
28
2
4
9
259
282
45
0
50
100
150
200
250
300
Public Servant Offencesby/Against
False electronic evidence
Destruction of electronicevidence
Forgery
Criminal Breach of Trust/Fraud
Counterfeiting
No.of Cases
Cyb
er
Cri
mes /
Cases R
eg
iste
red
an
d P
ers
on
s A
rreste
du
nd
er
IPC
du
rin
g 2
008 -
2012
20
08
20
09
20
10
20
11
20
12
0
0
0
61
96
38
0
0
0
161
79
23
3
4
0
257
100
30
3
1
10
277
129
26
4
2
16
263
215
49
0
50
100
150
200
250
300
Public ServantOffences by/Against
False electronicevidence
Destruction ofelectronic evidence
Forgery
Criminal Breach ofTrust/Fraud
Counterfeiting
No.of Cases
20
08
20
09
20
10
20
11
20
12
Ca
se
s R
eg
iste
red
Pe
rso
ns
Arr
es
ted
FIG
UR
E
18.2
178
LatestLaws.com
179
Cyber crimes – cases of various categories under IPC Section
A total of 601 cases were registered under IPC Sections during the year 2012 as compared to 422 such cases during 2011, thereby reporting an increase of 42.4%. Haryana reported maximum number of such cases (116 out of 601 cases i.e. 19.3%) followed by West Bengal 18.8% (113 cases) and Maharashtra 15.0% (90 Cases). Majority of the crimes out of total 601 cases registered under IPC fall under 2 categories viz. criminal breach of trust or fraud (282) and forgery (259). Although such offences fall under the traditional IPC crimes, these cases had the cyber overtones wherein computer, Internet or its enabled services were present in the crime and hence they were categorised as Cyber crimes under IPC. Cyber forgery (259 cases) accounted for 0.27% out of the 94,203 cases reported under
cheating. Cyber frauds (118) accounted for 0.66% of the total criminal breach of trust cases under IPC (17,201). The crime head and State / UT-wise analysis of cyber crimes under IPC are presented in Table 18.7. Cyber forgery cases were the highest in Maharashtra (76) followed by Kerala & West Bengal (31 each), Uttar Pradesh (30) and Haryana (23). The cases of cyber fraud were highest in Haryana (89), West Bengal (76), Madhya Pradesh (37) and Jharkhand (21). A total of 549 persons were arrested in the country for cyber crimes under IPC during 2012. 47.9% (263) of these offenders were arrested for offences under 'cyber forgery’, 39.2% (215) for 'criminal breach of trust/fraud' and 2.9% (16) for 'distribution of electronic evidence'.
Table-18 (B)
Cyber crimes/cases registered and persons arrested under IPC during 2009-2012
SL.
NO. Crime heads Cases registered
%
Variation
in 2012
over 2011
Persons arrested
%
Variation
in 2012
over 2011
2009 2010 2011 2012 2009 2010 2011 2012
1 Offences by/against public servant 0 2 7 2 -71.4 0 3 3 4 33.3
2 False electronic evidence 0 3 1 4 300.0 0 4 1 2 100.0
3 Destruction of electronic evidence 3 1 9 9 0.0 0 0 10 16 60.0
4 Forgery 158 188 259 259 0.0 161 257 277 263 -5.1
5 Criminal breach of trust/fraud 90 146 118 282 139.0 79 100 129 215 66.7
6 Counterfeiting
i) Property Mark 1 1 6 21 250.0 3 2 8 13 62.5
ii) Tampering 3 8 5 19 280.0 0 12 7 26 271.4
iii)Currency/stamps 21 7 17 5 -70.6 20 16 11 10 -9.1
7 Total 276 356 422 601 42.4 263 394 446 549 23.1
Note: @ zero value in previous year
LatestLaws.com
180
The States such as Haryana with 137 arrests followed by Maharashtra (83), Uttar Pradesh (73), Andhra Pradesh (69) and Madhya Pradesh (45) have reported higher arrests for cyber crimes registered under IPC. The age group-wise profile of the arrested persons under this category showed that 45.2% (248 out of 549) were in the age-group of 18 - 30 years and 40.3% (221 out of 549) of the offenders were in the age-group of 30-45 years. Further details on the State/UT-wise and age group-wise profile of the Offenders are presented in Table-18.3. Crime head-wise and age-wise profile of the offenders arrested under cyber crimes (IPC) (Table 18.5) for the year 2012 reveals that offenders involved in forgery cases were more in the age-group of 18-30 (49.4%) (130 out of 263). 40.0% of the persons arrested under criminal breach of trust / cyber fraud offences were in the age group 30-45 years (86 out of 215).
Incidence of cyber crimes in cities
31 out of 53 mega cities did not report any case of cyber crime under IPC Sections during the year 2012. Bengaluru, Durg-Bhilai Nagar, Jamshedpur and Srinagar cities did not report any case under IT Act in 2012. 53 mega cities have reported 1396 cases under IT Act and 186 cases under various sections of IPC. There was an increase of 62.7% (from 858 cases in 2011 to 1,396 cases in 2012) in cases under IT Act as compared to previous year 2011, and decline of 7.0% (from 200 cases in 2011 to 186 cases in 2012) of cases registered under various sections of IPC (Table 18.1)
Aurangabad (342), Vishakhapatnam (153), Pune (76), Delhi (City) (73) & Jaipur (69) have reported high incidence of cases (713 out of 1,396 cases) registered under IT Act, accounting for more than half of the cases (51.1%) reported under the IT Act. Mumbai has reported the highest incidence (72 out of 186) of cases reported under IPC sections accounting for 38.7% casesfollowed by Pune (32 cases i.e. 17.2%).
LatestLaws.com
181
Chapter-19
Crime in Railways
Introduction Whereas the maintenance of law & order in railways and railway premises is the responsibility of concerned State police, the security of passengers and their belongings in the running trains and railway premises is the joint responsibility of the Railway Protection Force and the concerned State police. The responsibility of security of railway passengers, passenger area and property has been vested with the Railway Protection Force by RPF Amendment Act, 2003. The cases of crime in railways are reported to, registered and investigated by the Government Railway Police (GRP). The investigation and prosecution of crime under the Indian Penal Code as well as sabotage related cases under the Railways Act (Sec. 150 to 152) are the responsibility of the State police. The enforcement of Railways Property (Unlawful Possession) Act, 1966 and the Railways Act, 1989 excluding sec. 150 to 152 has been entrusted to Railway Protection Force whereas the Indian Penal Code, all other special and local laws and maintenance of law and order remain with Government Railway Police and State governments concerned. The responsibility for arrest and prosecution of minor offences under the Indian Railways Act
(which affect the passengers and the train operations) have been vested with the Railway Protection Force by amending the Railway Protection Force Act, 1957 and the Indian Railways Act, 1989, with a view to supplement the efforts of the Government Railway Police and State governments in maintaining law & order and help them concentrate better on serious crimes. The amendments in these Acts came into force from 1st July 2004. Though the incidents of specific crimes on railways discussed below are part and parcel of the general crimes discussed in Chapter-I of the report, efforts were made in 2005 for the first time to separately analyze the extent of these crimes both as reported under Indian Penal Code and Indian Railways Act, 1989.
Trend of crimes in
Railways
20 out of 28 States namely, Andhra Pradesh, Assam, Bihar, Chhattisgarh, Gujarat, Haryana, Himachal Pradesh, Jammu & Kashmir, Jharkhand, Karnataka, Kerala, Madhya Pradesh, Maharashtra, Odisha, Punjab, Rajasthan, Tamil Nadu, Tripura, Uttar Pradesh and West Bengal and only Delhi among UTs have notified Government Railway
LatestLaws.com
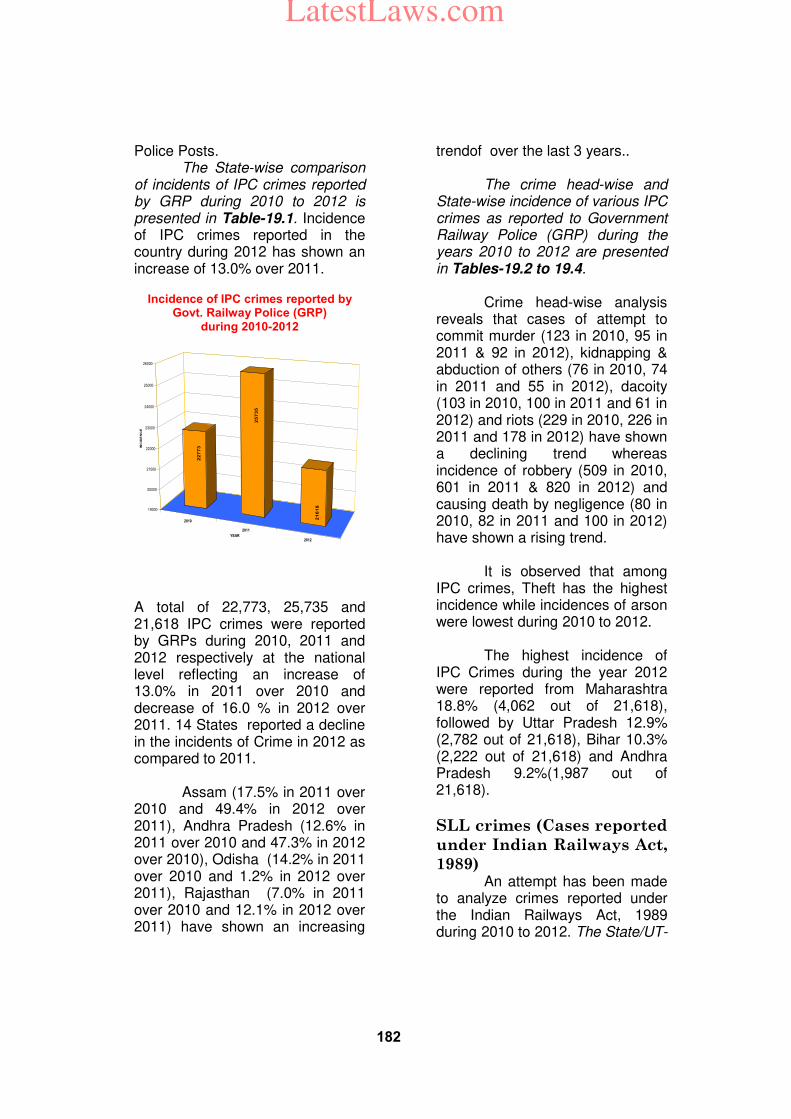
182
Police Posts. The State-wise comparison of incidents of IPC crimes reported by GRP during 2010 to 2012 is presented in Table-19.1. Incidence of IPC crimes reported in the country during 2012 has shown an increase of 13.0% over 2011.
Incidence of IPC crimes reported by Govt. Railway Police (GRP)
during 2010-2012
A total of 22,773, 25,735 and 21,618 IPC crimes were reported by GRPs during 2010, 2011 and 2012 respectively at the national level reflecting an increase of 13.0% in 2011 over 2010 and decrease of 16.0 % in 2012 over 2011. 14 States reported a decline in the incidents of Crime in 2012 as compared to 2011. Assam (17.5% in 2011 over 2010 and 49.4% in 2012 over 2011), Andhra Pradesh (12.6% in 2011 over 2010 and 47.3% in 2012 over 2010), Odisha (14.2% in 2011 over 2010 and 1.2% in 2012 over 2011), Rajasthan (7.0% in 2011 over 2010 and 12.1% in 2012 over 2011) have shown an increasing
trendof over the last 3 years..
The crime head-wise and State-wise incidence of various IPC crimes as reported to Government Railway Police (GRP) during the years 2010 to 2012 are presented in Tables-19.2 to 19.4.
Crime head-wise analysis
reveals that cases of attempt to commit murder (123 in 2010, 95 in 2011 & 92 in 2012), kidnapping & abduction of others (76 in 2010, 74 in 2011 and 55 in 2012), dacoity (103 in 2010, 100 in 2011 and 61 in 2012) and riots (229 in 2010, 226 in 2011 and 178 in 2012) have shown a declining trend whereas incidence of robbery (509 in 2010, 601 in 2011 & 820 in 2012) and causing death by negligence (80 in 2010, 82 in 2011 and 100 in 2012) have shown a rising trend.
It is observed that among
IPC crimes, Theft has the highest incidence while incidences of arson were lowest during 2010 to 2012. The highest incidence of IPC Crimes during the year 2012 were reported from Maharashtra 18.8% (4,062 out of 21,618), followed by Uttar Pradesh 12.9% (2,782 out of 21,618), Bihar 10.3% (2,222 out of 21,618) and Andhra Pradesh 9.2%(1,987 out of 21,618).
SLL crimes (Cases reported
under Indian Railways Act,
1989) An attempt has been made to analyze crimes reported under the Indian Railways Act, 1989 during 2010 to 2012. The State/UT-
2010
2011
2012
22
77
3
25
73
5
21
61
8
19000
20000
21000
22000
23000
24000
25000
26000
INC
IDE
NC
E
YEAR
LatestLaws.com
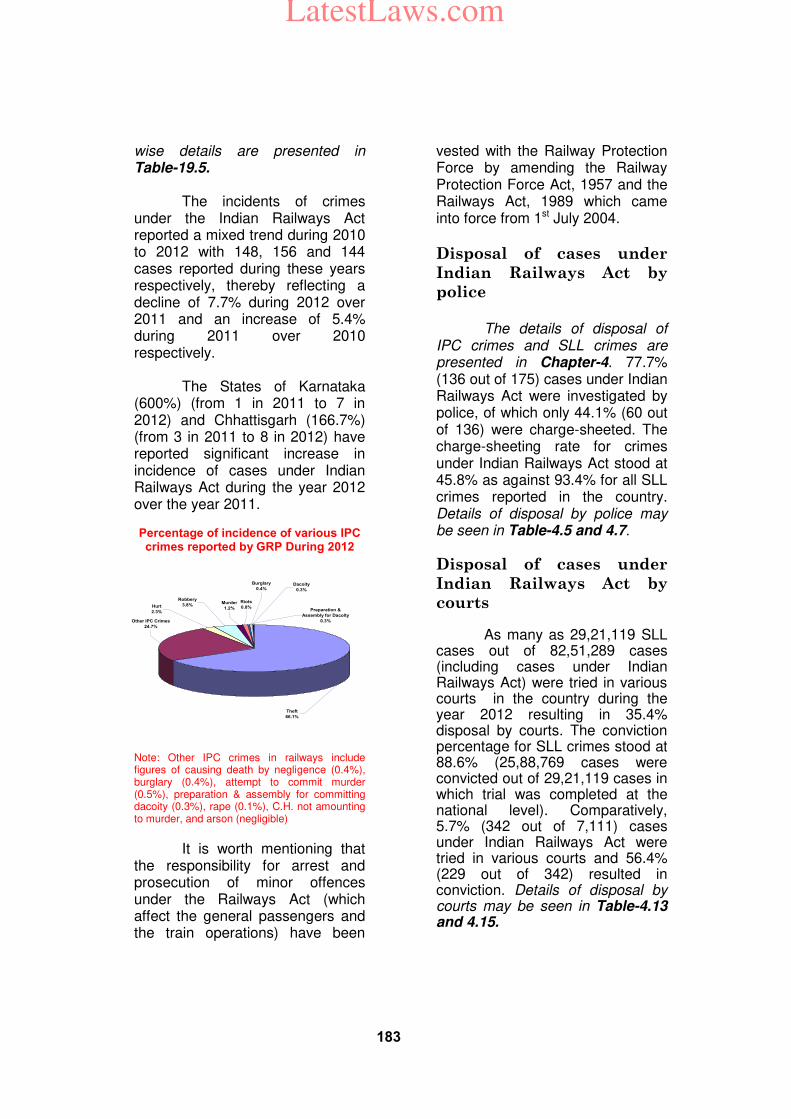
183
wise details are presented in Table-19.5. The incidents of crimes under the Indian Railways Act reported a mixed trend during 2010 to 2012 with 148, 156 and 144 cases reported during these years respectively, thereby reflecting a decline of 7.7% during 2012 over 2011 and an increase of 5.4% during 2011 over 2010 respectively.
The States of Karnataka (600%) (from 1 in 2011 to 7 in 2012) and Chhattisgarh (166.7%) (from 3 in 2011 to 8 in 2012) have reported significant increase in incidence of cases under Indian Railways Act during the year 2012 over the year 2011.
Percentage of incidence of various IPC crimes reported by GRP During 2012
Note: Other IPC crimes in railways include figures of causing death by negligence (0.4%), burglary (0.4%), attempt to commit murder (0.5%), preparation & assembly for committing dacoity (0.3%), rape (0.1%), C.H. not amounting to murder, and arson (negligible)
It is worth mentioning that the responsibility for arrest and prosecution of minor offences under the Railways Act (which affect the general passengers and the train operations) have been
vested with the Railway Protection Force by amending the Railway Protection Force Act, 1957 and the Railways Act, 1989 which came into force from 1st July 2004.
Disposal of cases under
Indian Railways Act by
police
The details of disposal of IPC crimes and SLL crimes are presented in Chapter-4. 77.7% (136 out of 175) cases under Indian Railways Act were investigated by police, of which only 44.1% (60 out of 136) were charge-sheeted. The charge-sheeting rate for crimes under Indian Railways Act stood at 45.8% as against 93.4% for all SLL crimes reported in the country. Details of disposal by police may be seen in Table-4.5 and 4.7.
Disposal of cases under
Indian Railways Act by
courts As many as 29,21,119 SLL cases out of 82,51,289 cases (including cases under Indian Railways Act) were tried in various courts in the country during the year 2012 resulting in 35.4% disposal by courts. The conviction percentage for SLL crimes stood at 88.6% (25,88,769 cases were convicted out of 29,21,119 cases in which trial was completed at the national level). Comparatively, 5.7% (342 out of 7,111) cases under Indian Railways Act were tried in various courts and 56.4% (229 out of 342) resulted in conviction. Details of disposal by courts may be seen in Table-4.13 and 4.15.
Preparation &
Assembly for Dacoity
0.3%
Hurt
2.3%
Dacoity
0.3%
Robbery
3.8%
Burglary
0.4%
Riots
0.8%Murder
1.2%
Other IPC Crimes
24.7%
Theft
66.1%
LatestLaws.com
184
Property stolen/taken away from Railways The details of property stolen/taken away by place of occurrence including railways have been discussed at length in Chapter-8 (Property stolen and recovered). Dacoity in Railways
A total of 62 cases of dacoity in railways were reported (45 in running trains and 17 in others) accounting for 1.4% of total 4,314 cases of dacoity reported in the country during 2012 in which property of value ` 75.3 lakh ( ` 48.2 lakh in running trains and ` 27.1 lakh in others) was taken away out of total ` 14,338.2 lakh of property stolen / taken away in all dacoities reported in the country during 2012. Bihar has reported the highest 15 cases of dacoity in railways followed by Maharashtra (13). State /UT-wise details may be seen in Table - 8.8. Robbery in Railways
848 cases of robbery in railways were reported (364 cases in running trains and 484 cases in others) accounting for 3.1% of total 27,343 cases of robbery reported in the country during 2012 in which property of ` 364.0 lakh (` 165.0 lakh in running trains and ` 199.0 lakh in others) was taken away out of total ` 29,095.8 lakh of property stolen / taken away in all Robbery cases in the country during 2012. The percentage share of property taken away in robberies in railways to total robberies reported in the country during 2012 comes to 1.3%. Maharashtra (515) has reported the highest cases of
robbery in railways followed by Madhya Pradesh (67). State / UT-wise details may be seen in Table - 8.9. Burglary in Railways
A total of 53 cases of burglary in railways were reported (10 in running trains and 43 in others) accounting for 0.6% of total 92,892 cases of burglary reported in the country during 2012 in which property of ` 15.4 lakh ( ` 3.0 lakh in running trains and ` 12.4 lakh in others) was stolen / taken away out of total ` 68,861.8 lakh of property stolen / taken away in burglary cases reported in the country during 2012. The percentage share of property taken away in burglaries in railways to total burglaries reported in the country during 2012 comes to just 0.2%. Chhattisgarh has reported highest number of cases (10 cases) of burglary followed by Jharkhand (8 cases) and Jammu & Kashmir (7 cases). State / UT-wise details may be seen in Table - 8.10.
Theft in Railways
A total of 16,015 cases of theft in railways were reported (9,355 in running trains and 6,600 in others) accounting for 4.8% of total 3,37,407 cases of theft reported in the country during 2012. Property worth ` 9,355 lakh (` 3,865.1 lakh in running trains and ` 1,884.7 lakh in others) was stolen / taken away out of total ` 2,20,583.1 lakh of property stolen/taken away in all Thefts reported in the country during 2012.
LatestLaws.com
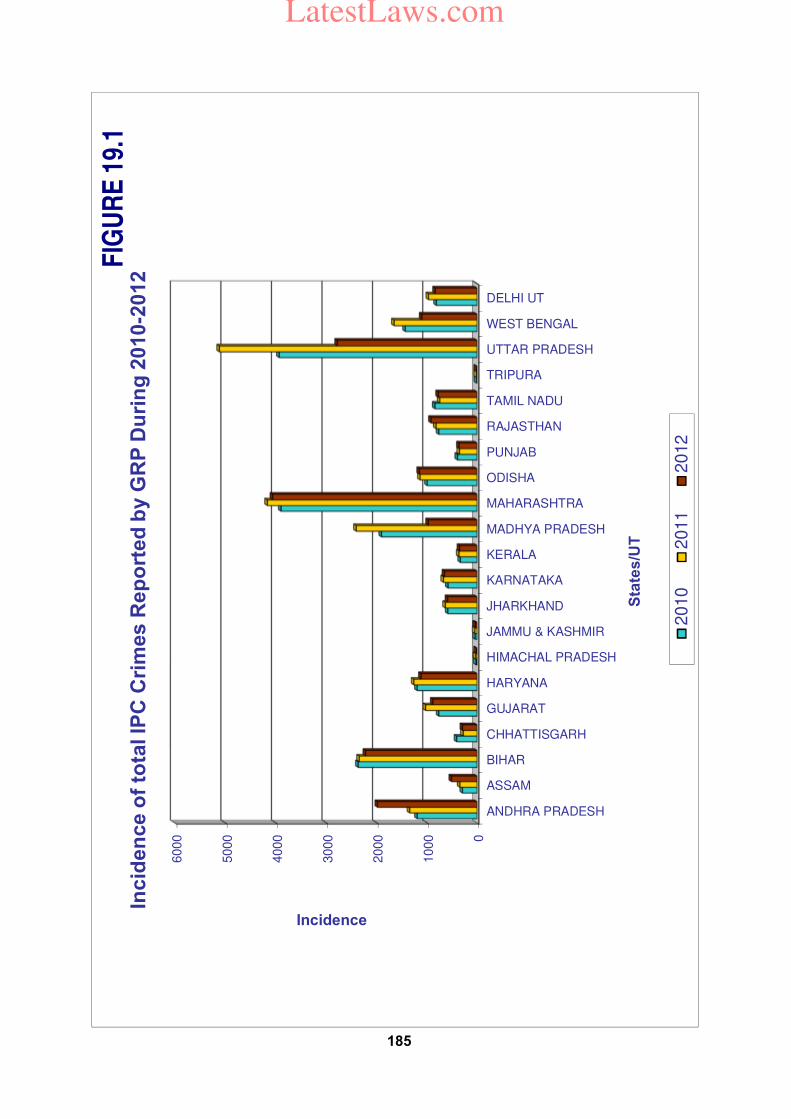
0
1000
2000
3000
4000
5000
6000
ANDHRA PRADESH
ASSAM
BIHAR
CHHATTISGARH
GUJARAT
HARYANA
HIMACHAL PRADESH
JAMMU & KASHMIR
JHARKHAND
KARNATAKA
KERALA
MADHYA PRADESH
MAHARASHTRA
ODISHA
PUNJAB
RAJASTHAN
TAMIL NADU
TRIPURA
UTTAR PRADESH
WEST BENGAL
DELHI UT
Incidence
Sta
tes
/UT
Incid
en
ce o
f to
tal IP
C C
rim
es R
ep
ort
ed
by G
RP
Du
rin
g 2
010-2
012
2010
2011
2012
FIG
UR
E 1
9.1
185
LatestLaws.com
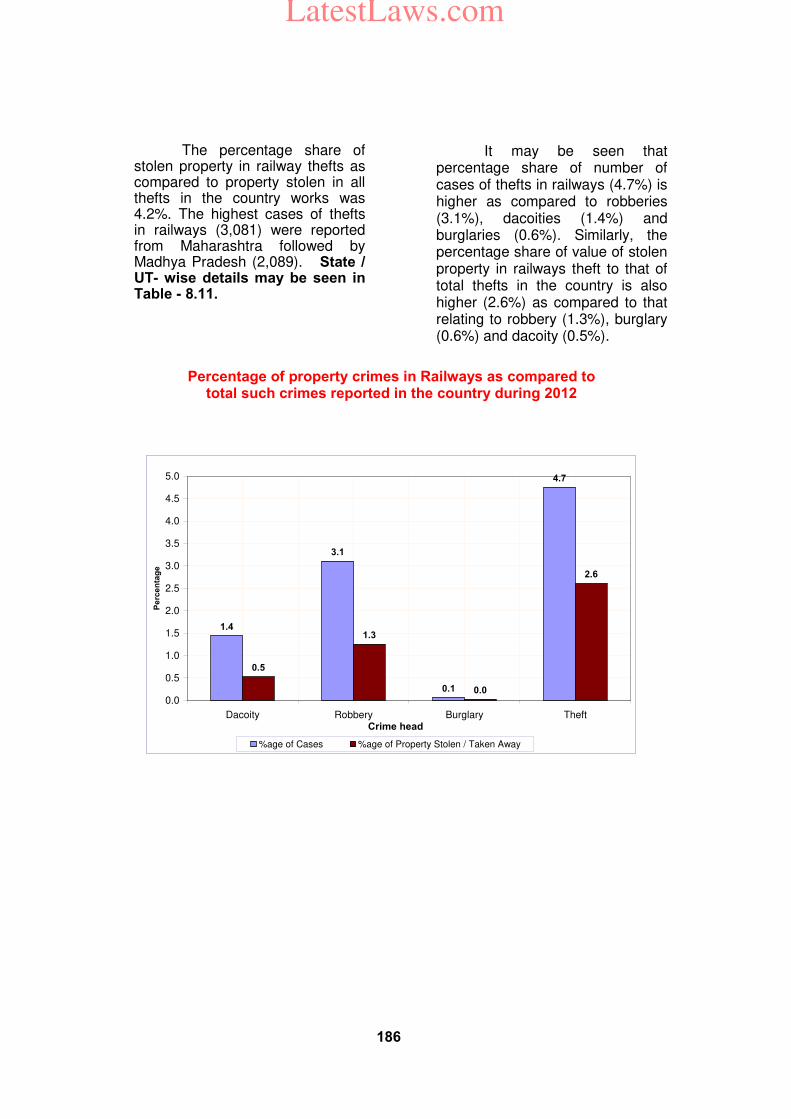
186
The percentage share of stolen property in railway thefts as compared to property stolen in all thefts in the country works was 4.2%. The highest cases of thefts in railways (3,081) were reported from Maharashtra followed by Madhya Pradesh (2,089). State / UT- wise details may be seen in Table - 8.11.
It may be seen that percentage share of number of cases of thefts in railways (4.7%) is higher as compared to robberies (3.1%), dacoities (1.4%) and burglaries (0.6%). Similarly, the percentage share of value of stolen property in railways theft to that of total thefts in the country is also higher (2.6%) as compared to that relating to robbery (1.3%), burglary (0.6%) and dacoity (0.5%).
Percentage of property crimes in Railways as compared to total such crimes reported in the country during 2012
1.4
3.1
0.1
4.7
0.5
1.3
0.0
2.6
0.0
0.5
1.0
1.5
2.0
2.5
3.0
3.5
4.0
4.5
5.0
Dacoity Robbery Burglary TheftCrime head
Pe
rce
nta
ge
%age of Cases %age of Property Stolen / Taken Away
LatestLaws.com
187
SUBJECT INDEX
A
Abetment of Suicide, 96
Armed Police, 157, 167, 169
Arms Act, 17, 37, 135
Arson, 15, 27, 49, 58, 107, 110, 111, 113, 131, 135, 183
Assault on Women with Intent to Outrage her Modesty, 15, 31, 65, 77, 79, 81, 84,
88, 131, 148
Attempt to Commit Murder, 27, 49, 55, 135, 183
Auto Theft, 29
B
Bribery, 129
Burglary, 15, 25, 27, 29, 35, 118, 121, 122, 131, 132, 135, 141, 182, 183, 184
Buying of girls, 15, 91, 96, 99
C
C.H. not amounting to Murder, 58
charge-sheeting rate, 69, 98, 113, 116, 183
Cheating, 15, 27, 31, 35, 43, 65, 79, 124, 130, 135, 141, 149, 179
Child Marriage Restraint Act, 17, 40, 79, 91, 96, 98, 99, 100, 103, 104, 147, 148
Civil Police, 167, 169
COFEPOSA, 125
Commercial Establishment, 121, 122
Commission of Sati Prevention Act, 17, 81, 87, 150
Conviction Rate, 77
Copyright Act, 17, 42, 48, 131
Corruption, 129
Counterfeiting, 15, 27, 31, 65, 124, 131, 179
Crimes Against Body, 15, 25
Crimes Against Property, 15, 25
Crimes Against Public Order, 15, 27
Criminal Breach of Trust, 15, 27, 31, 35, 65, 124, 130, 131, 141, 149, 179, 180
Cruelty by Husband or his relatives, 15, 33, 35, 65, 84, 88, 135, 141, 148
Cultural Property, 118, 128
custodial deaths, 151, 152
Customs Act, 124, 125
Cyber Crime, 43, 175, 176, 179, 180
LatestLaws.com
188
D
Dacoity, 15, 25, 27, 35, 43, 49, 57, 63, 107, 109, 110, 113, 118, 121, 131, 135, 141,
148, 149, 155, 156, 157, 158, 182, 183, 184, 186
Death, 15, 25, 27, 33, 58, 81, 131, 135, 141, 151, 152, 183
Disposal by Courts, 69, 184
Disposal by Police, 63, 183
E
Economic Crimes, 15, 27
Equipment & Transport facility, 174
Essential Commodities Act, 17, 40, 131
Excise Act, 17, 37, 132, 135, 147
Explosives & Explosive Substances Act, 17, 39
Extremists, 55, 56, 155, 157, 158
F
false cases, 107
Foeticide, 17, 95, 96
Forest Act, 17, 42
G
Gambling Act, 17, 37, 132, 135, 147, 148
H
Hacking, 176
Highways, 121, 122
Hurt, 15, 25, 31, 35, 77, 107, 109, 111, 113, 132, 135, 141, 148, 149
I
Immoral Traffic (Prevention) Act, 17, 39, 48, 79, 87, 88, 131, 147
Importation of Girls, 15, 35, 65, 81, 84, 100, 103, 104, 141
Indian Passport Act, 17, 39, 48, 69, 148
Indian Railways Act, 181, 182, 183
Infanticide, 17, 95, 96, 98
Insult to the Modesty of Women, 15, 33, 35, 65, 77, 79, 81, 84, 131, 135, 148, 149
IT Act, 175, 176, 180
LatestLaws.com
189
J
Juvenile in conflict with law, 131, 132
Juveniles Apprehended, 132, 135, 136
K
Kidnapping & Abduction, 15, 25, 27, 35, 49, 57, 58, 60, 65, 79, 81, 84, 88, 91, 95,
96, 107, 109, 110, 111, 135, 141, 183
M
Motives of Murder, 55
Murder, 15, 25, 27, 35, 49, 55, 56, 58, 59, 62, 77, 79, 89, 95, 96, 98, 107, 109, 111,
135, 148, 183
Muslims in Police, 174
N
Narcotic Drugs & Psychotropic Substances Act, 17, 37
Natural Deaths of Police Personnel, 159
P
PCR Act, 109
Police Expenditure, 173
Police Firing, 155
Police Housing, 173
Police Personnel Injured, 157
Police Personnel killed, 157, 158
Premises, 118, 121, 122
Prevention of Corruption Act, 129
Procuration of minor girls, 15, 91, 99
Prohibition Act, 17, 37, 39, 40, 69, 79, 81, 88, 132, 135, 147, 149
Prostitution, 15, 91, 96, 98, 100, 103, 104
Protection of Civil Rights Act, 17, 42, 105, 107, 109, 111, 113, 147
R
Rape, 15, 27, 35, 49, 56, 57, 58, 65, 79, 81, 83, 88, 91, 95, 96, 98, 107, 109, 111,
135, 152, 183
Recidivism, 139
Recovered, 43, 62, 117, 118, 184
LatestLaws.com
190
Registration of Foreigners Act, 17, 39, 77, 148, 150
Riots, 15, 27, 29, 35, 49, 58, 131, 132, 135, 141, 148, 149, 151
Robbery, 15, 25, 27, 35, 49, 57, 79, 107, 109, 110, 113, 117, 118, 121, 135, 184, 186
S
SC/ST (Prevention of Atrocities) Act, 17, 42, 105, 111, 113
Selling of girls, 91, 96, 99
T
Terrorist & Disruptive Activities Act, 17, 150
Terrorists, 55, 56, 155
Theft, 15, 25, 29, 35, 77, 117, 118, 122, 132, 135, 141, 149, 182, 184, 186
true cases, 63, 65
V
Vehicles Stolen, 118
victims of Murder, 58, 59, 62
Violent Crime, 27, 49, 51, 55, 58, 73
LatestLaws.com
FEEDBACK FORM (Crime in India – 2012)
Sender(s) Name & Full Address (Optional)
For improvement in the Report we solicit your views. PLEASE TICK () IN THE APPROPRIATE BOX
Quantity of InformationVery Large Large Limited Scanty
Quality of Data Very High High Good Poor
Usefulness of Data Very relevant Relevant Little use No use
Quality of Publication Impressive Good Ordinary Poor
Obtainability of Book Timely Late Very Late
Suggestion(s), if any, for further improvement(s) in :
(i) Quality of Data (usefulness of statistics to police in controlling law and order):
(ii) Additional information needed to be added/incorporated:
(iii) Quality of Publication:
Any other comment(s) / suggestion(s):
Date : Place : Signature in Full
(Optional) Reply to :The Director General,National Crime Records Bureau,East Block – 7, R.K. Puram, New Delhi – 110066. INDIA, e-mail : [email protected] Fax : +91-11- 26197984
LatestLaws.com

LatestLaws.com
Related Documents