NCR CORPORATION > 2004 ANNUAL REPORT ANNUAL REPORT 04

Welcome message from author
This document is posted to help you gain knowledge. Please leave a comment to let me know what you think about it! Share it to your friends and learn new things together.
Transcript
NCR CORPORATION \ 1700 S. PATTERSON BLVD. \ DAYTON, OH 45479 \ WWW.NCR.COM
NCR
CORPORATION>
2004AN
NUAL
REPORT
ANN
UALREPORT
04
MC4237
4
NCR04
BUILDING MOMENTUM
> DELIVERING TOP-LINE REVENUE GROWTH
> IMPROVING PROFITABILITY IN EACH CORE BUSINESS SEGMENT
> GENERATING CASH FLOW FOR FUTURE INVESTMENT
“IN 2004, ALONG WITH DRIVINGMEANINGFUL REVENUE GROWTH FOR THE FIRST TIME IN SEVERALYEARS, NCR MADE GOOD PROGRESSIN STREAMLINING THE COMPANY’SCOST STRUCTURE AND INVESTINGFOR FUTURE EARNINGS EXPANSION.”
MARK V. HURDPresident and Chief Executive Officer
ANNUAL STOCKHOLDER MEETINGStockholders are invited to attend NCR’s Annual Meetingof Stockholders at 9:30 a.m. on April 27, 2005, to beheld at:
NCR Auditorium, World Headquarters Building1700 S. Patterson Blvd.Dayton, OH 45479
STOCKHOLDER ACCOUNT INQUIRIESInquiries concerning stockholder accounts or NCR’sDirect Stock Purchase/Sell Program should be directed to:
NCR Corporationc/o Mellon Investor Services LLC85 Challenger RoadOverpeck CentreRidgefield Park, NJ 07660Ph. 800-NCR-2303 (800-627-2303)Ph. 201-329-8660 (Outside the U.S.)
Account information can also be obtained via e-mail at [email protected],or by visiting NCR’s stock transfer agent’s website at www.melloninvestor.com/isd.
NCR ANNUAL REPORT ON FORM 10-KThe company’s annual report filed with the U.S. Securitiesand Exchange Commission (SEC) on Form 10-K for current and prior years can be accessed via the “Investor”page of NCR’s website at www.ncr.com.
COMPANY INFORMATIONInformation requests for NCR’s SEC filings, annual report on Form 10-K, quarterly reports and other financialinformation can be obtained without charge by writing or calling:
NCR Investor Relations1700 S. Patterson Blvd.Dayton, OH 45479Ph. [email protected]://investor.ncr.com
Stockholders can help NCR reduce printing and mailingcosts by electing to view NCR’s annual reports and proxystatements online rather than receiving paper copies. Ifyou would like to participate, please indicate your consenton your proxy card or log on to Mellon Investor Servicesat www.melloninvestor.com/isd.
CEO AND CFO CERTIFICATIONSIn 2004, the company’s CEO provided the New YorkStock Exchange (NYSE) with the annual CEO certificationregarding NCR’s compliance with the NYSE’s corporategovernance listing standards. In addition, the company’sCEO and CFO filed with the SEC all required certifications regarding the quality of NCR’s public disclosures in its fiscal 2004 periodic reports.
NCR’S EXECUTIVE OFFICERSMark V. HurdPresident and Chief Executive Officer
Eric A. BergSenior Vice President and Chief Administrative Officer
Peter J. BocianSenior Vice President of Finance and Chief Financial Officer
Gerald A. GagliardiSenior Vice President, Worldwide Customer Services Division
Jonathan S. HoakSenior Vice President, General Counsel and Secretary
Michael KoehlerSenior Vice President, Teradata Division
Mark D. QuinlanVice President, Systemedia Division
Lee SchramSenior Vice President, Retail Solutions Division
Keith A. TaylorSenior Vice President, Financial Solutions Division
Christine W. WallaceSenior Vice President, Human Resources
NCR’S BOARD OF DIRECTORSLars NybergChairman of the Board and former CEO, NCR Corporation
Edward P. BoykinFormer President and COO, Computer Sciences Corporation
Mark P. FrissoraChairman and CEO, Tenneco Automotive Inc.
Mark V. HurdPresident and CEO, NCR Corporation
Linda Fayne LevinsonFormer Partner, GRP Partners
Victor L. LundFormer Chairman, Mariner Health Care, Inc.
C.K. PrahaladProfessor of Business Administration, The University of Michigan
James M. RinglerRetired Vice Chairman, Illinois Tool Works Inc.
William S. StavropoulosChairman and former CEO, The Dow Chemical Co.
DESI
GNM
IZRA
HIDE
SIGN
ASSO
CIAT
ES,
INC.
(WW
W.M
IZRA
HIDE
SIGN
.COM
)PR
INTI
NG
ADP
GRAP
HIC
COM
MUN
ICAT
ION
S
CORPORATE INFORMATION
NCR04 > LETTER TO SHAREHOLDERS > 1
LETTER TO SHAREHOLDERS
NCR is at the midpoint of executing a multiyear plan to deliver greater value to our customers and investors.The company is fundamentally changing its operatingmodel, aggressively realigning cost and, just as important,investing in revenue-producing activities. Although wehave more to do, our progress to date has put us in a muchstronger position to increase shareholder value in 2005and beyond.
Since 2003, the company has removed $200 million of cost inefficiency, with $50 million more to be eliminated in 2005. Through our continued benchmarking efforts,we’ve identified further opportunities to streamline thecompany’s cost structure. As a result, in December 2004,we announced our intention to remove an additional $100 million of cost through 2006, for a total of $350 million.
For the future success of the company, we are removingincremental corporate infrastructure cost and reinvestingthose dollars to drive innovation for our customers andprofitable growth for NCR, particularly in the areas ofenterprise analytics and self-service technologies.
The first important investment area is fueling our ability to develop new products and services. Last year, we improved the efficiency of our R&D expenditures byadding engineers and optimizing R&D spending throughout NCR. We further strengthened our self-servicecapabilities through the acquisition of Kinetics, Inc., theleading provider of self-check-in solutions to the traveland hospitality industries.
Additionally, we are increasing investment in sales and consulting personnel. NCR is adding talented, knowledgeable professionals that will help capturethe growing demand for enterprise analytics and self-service technologies.
We witnessed the positive results of these investmentsand cost-reduction actions as revenues and profitsgrew in each of our key product segments in 2004.
• Teradata® Data Warehousing revenues grew 12 percent, and operating income, excluding pensionexpense, improved more than 50 percent from 2003,reflecting the increased demand for enterprise analyticsand our market-leading Teradata technology.
• Revenue growth of 19 percent leveraged an improved operating model in the Financial Self Service (ATMs)business to drive strong results in 2004. With severalregionally based demand drivers fueling our growth, it is a good time to be in the ATM business.
• Retail Store Automation increased revenues 8 percentand improved profitability by $26 million from 2003 asretailers began replacing aging point-of-sale systems.
We also made progress in our Customer ServicesDivision to increase the efficiency of our service deliveryand sharpen our service focus on NCR-brandedproducts. The positive impact of theses initiatives shouldbecome visible in our 2005 financial results.
The outcome of these and other revenue-enhancing and cost-management initiatives was evident in the company’s 2004 results, as we improved operating performance, excluding pension expense, by more than $130 million from 2003. Additionally, the company generated $436 million of cash from operations.
Although we are proud of our improvements to date,NCR’s goal is to achieve a 10 percent operating margin,before pension expense, by 2007. And we continue tobenchmark ourselves against industry cost and expensemeasures, finding even more opportunity for improvement.
As you evaluate NCR’s current and potential earnings performance, I encourage you to consider these drivers:
• NCR is committed to driving further cost reductions, architecting a healthy operating model in all of our businesses, including Customer Services, which willposition us to profitably grow the company. We knowfirst-hand how difficult it is to compete and grow whenburdened with inefficiency and high cost.
• Longer term, the opportunities in the enterprise analytics and self-service markets should remain healthy. NCR is well-positioned in these markets withindustry-leading technology and sales professionals to create increased demand for our products and services.We will continue to invest to create greater value for ourcustomers, investors and employees.
My sincere thanks to the people of NCR – it is throughtheir ideas and hard work that we made good progress in2004. It will be through their continued determination andpassion that we can accomplish even more.
On behalf of NCR’s employees, many thanks to ourinvestors for your continued interest and support.
Mark V. HurdPresident and Chief Executive Officer
2 > NCR AT A GLANCE > NCR04
NCR AT A GLANCE
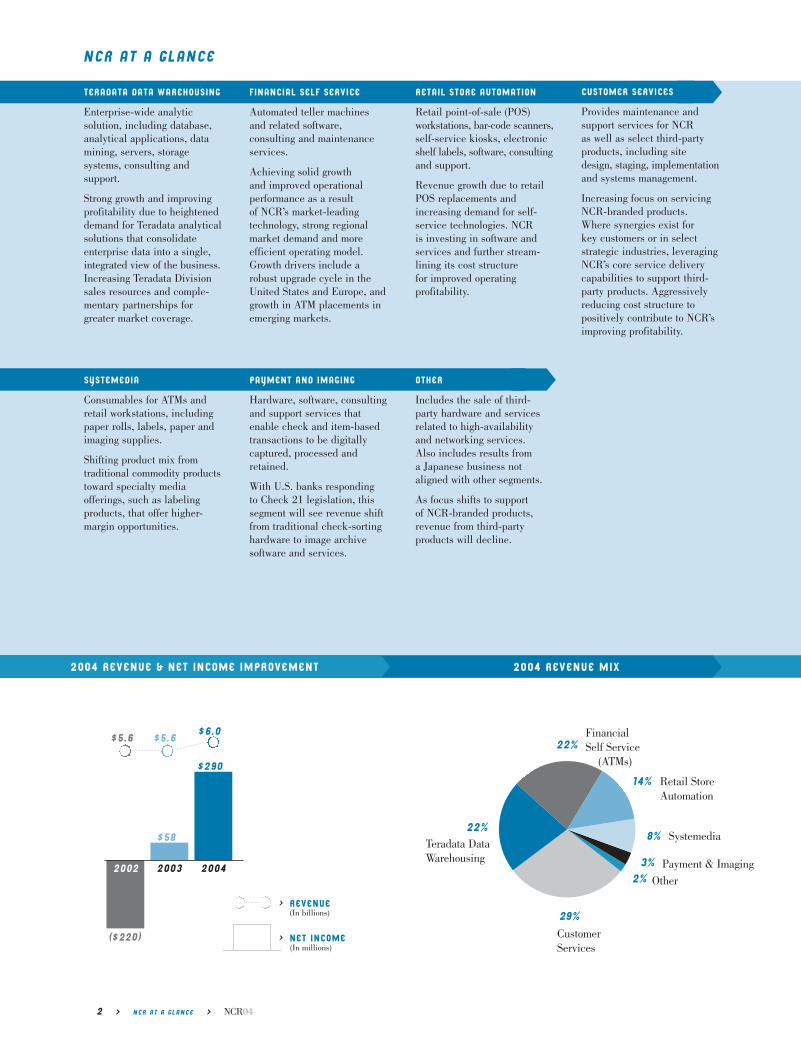
22%
14%
8%
3%2%
22%
Financial Self Service
(ATMs)
CustomerServices
Retail StoreAutomation
Systemedia
Payment & Imaging
Other
Teradata Data Warehousing
> REVENUE
> NET INCOME
$5.6 B $5.6 B $6.0 B
$290 M
$58 M
($220)
2002 2003 2004
TERADATA DATA WAREHOUSING
Enterprise-wide analytic solution, including database,analytical applications, datamining, servers, storage systems, consulting and support.
Strong growth and improvingprofitability due to heighteneddemand for Teradata analyticalsolutions that consolidateenterprise data into a single,integrated view of the business.Increasing Teradata Divisionsales resources and comple-mentary partnerships forgreater market coverage.
FINANCIAL SELF SERVICE
Automated teller machinesand related software, consulting and maintenanceservices.
Achieving solid growth and improved operational performance as a result of NCR’s market-leading technology, strong regionalmarket demand and more efficient operating model.Growth drivers include arobust upgrade cycle in theUnited States and Europe, andgrowth in ATM placements in emerging markets.
RETAIL STORE AUTOMATION
Retail point-of-sale (POS)workstations, bar-code scanners,self-service kiosks, electronicshelf labels, software, consultingand support.
Revenue growth due to retailPOS replacements andincreasing demand for self-service technologies. NCR is investing in software andservices and further stream-lining its cost structure for improved operating profitability.
CUSTOMER SERVICES
Provides maintenance andsupport services for NCR as well as select third-partyproducts, including sitedesign, staging, implementationand systems management.
Increasing focus on servicingNCR-branded products.Where synergies exist for key customers or in selectstrategic industries, leveragingNCR’s core service deliverycapabilities to support third-party products. Aggressivelyreducing cost structure to positively contribute to NCR’simproving profitability.
OTHER
Includes the sale of third-party hardware and servicesrelated to high-availability and networking services. Also includes results from a Japanese business notaligned with other segments.
As focus shifts to support of NCR-branded products, revenue from third-party products will decline.
PAYMENT AND IMAGING
Hardware, software, consultingand support services thatenable check and item-basedtransactions to be digitallycaptured, processed andretained.
With U.S. banks responding to Check 21 legislation, thissegment will see revenue shiftfrom traditional check-sortinghardware to image archivesoftware and services.
SYSTEMEDIA
Consumables for ATMs andretail workstations, includingpaper rolls, labels, paper andimaging supplies.
Shifting product mix from traditional commodity productstoward specialty media offerings, such as labelingproducts, that offer higher-margin opportunities.
29%
2004 REVENUE & NET INCOME IMPROVEMENT 2004 REVENUE MIX
(In millions)
(In billions)
Management’s Discussion and Analysis 4
Report of Management 26
Report of Independent Registered Public Accounting Firm 27
Consolidated Statements of Operations 28
Consolidated Balance Sheets 29
Consolidated Statements of Cash Flows 30
Consolidated Statements of Changes in Stockholders’ Equity 31
Notes to Consolidated Financial Statements 32
Selected Financial Data 58
Corporate Information IBC
FINANCIAL REPORT2004
NCR04 > TABLE OF CONTENTS > 3
4 > MANAGEMENT’S DISCUSSION AND ANALYSIS > NCR04
MANAGEMENT’S DISCUSSION AND ANALYSIS (MD&A)
BUSINESS OVERVIEWNCR Corporation is a leading global technology company that provides innovative products and services to help businessesbuild stronger relationships with their customers. Our market-leading Teradata Data Warehousing solutions transform data into an integrated view of a company’s business, which permits it to develop programs designed to improve customer acquisition, retention and profitability, as well as streamline the supply chain and business operations. Through our presence at customer interaction points, such as automated teller machines (ATMs), retail point-of-sale (POS) workstations,and self-check-in/out systems, our Financial Self Service and Retail Store Automation solutions enable companies to addressconsumer demand for convenience, value and individual service. Our Customer Services Division provides support servicesfor NCR’s solutions as well as third-party products.
We provide solutions for the retail and financial industries through our Financial Self Service (ATMs) and Retail StoreAutomation businesses. Additionally, our Teradata Data Warehousing and Customer Services businesses provide solutionsfor industries including telecommunications, transportation, insurance and consumer goods manufacturers, as well as governmental entities. We deliver our solutions to customers on a global basis and categorize our results into four regions:the Americas, Europe/Middle East/Africa (EMEA), Japan and Asia/Pacific. Our solutions are based on a foundation of long-established industry knowledge and consulting expertise, hardware technology, value-adding software, global customer support services and a complete line of business consumables and specialty media products.
NCR’s reputation has been built upon 120 years of providing quality products, services and solutions to our customers. Atthe heart of our customer and other business relationships are years of acting responsibly, with the highest level of integrity,a commitment based on trust and a will to act responsibly and ethically in all of our business dealings. Using NCR’s Code ofConduct (available on the corporate governance page of our website) as our guide, the Company remains firmly committed tocontinuing this tradition.
STRATEGY OVERVIEWOur current strategic initiatives to increase operating income and return maximum value to our stockholders include:
1) Delivering superior value propositions – The majority of our product revenue is generated from our DataWarehousing, Financial Self Service and Retail Store Automation businesses, and leveraging our market leadership andvalue propositions in these businesses is important to NCR’s future success. These businesses are strategically focused ongaining market share and reallocating spending to value-added activities within our product offerings to generate revenueand operating income growth. We are also making investments in research and development activities to generate newproducts that will further improve the value of our product offerings. Please refer to the sections in this MD&A discussingeach of NCR’s businesses for more information on these strategies.
2) Enhancing demand creation – We are investing in our sales force by hiring additional sales people and industry professionals, along with increasing our training offerings. We expect these investments to provide meaningful benefits in 2005 and beyond.
3) Improving profitability in Customer Services – In our Customer Services Division, we are driving operational and financial improvement by lowering our service delivery costs, improving the percentage of NCR ATMs and POSequipment that is serviced by NCR and increasing our focus on the linkage between product engineering and productserviceability. Please refer to the “Customer Services” section in this MD&A for further details on these initiatives.
4) Optimizing our cost structure – In 2004, we made significant progress on reducing our cost structure to bring it inline with industry benchmark standards. Through 2003 and 2004, we have delivered $200 million of our $250 millioncommitment to reduce cost and expense. We expect to deliver the remaining $50 million in 2005, as well as an additional$100 million of cost reductions in 2005 and 2006. Please refer to the “Re-engineering” section in this MD&A for furtherdetails on our cost reductions efforts.
NCR04 > MANAGEMENT’S DISCUSSION AND ANALYSIS > 5
FINANCIAL OVERVIEW2004 was a positive year for NCR as we showed significant progress and made several key strategic decisions in order togenerate future revenue growth and operating income. As more fully discussed in later sections of the MD&A, the followingwere the significant themes and events for 2004:
• We continued to strengthen the value of our products and services provided to customers around the world andincreased our revenue 7% in 2004, including 4 percentage points of benefit from foreign currency translation.
• Cost and expense reductions in 2004 helped improve our operating income despite $46 million of incremental pension and severance expense compared to 2003 and the negative effect of foreign exchange.
• We produced $436 million of cash from operations, $182 million after $254 million of capital expenditures.
In 2004, we established five key value drivers in order to improve and measure our overall success. These drivers and ourresults against them were as follows:
• Data Warehousing revenue growth – Data Warehousing experienced 12% growth as companies continued toinvest in the strong value proposition our Teradata data warehouses provide. Foreign currency fluctuations provided a 4 percentage point benefit to 2004 revenue.
• Financial Self Service revenue growth – Financial Self Service revenue grew 19% due to strong ATM sales inboth the Americas and EMEA regions and to a lesser extent in the Asia/Pacific region. The impact of foreign currencyfluctuations provided a benefit of 5 percentage points to 2004 revenue.
• Retail Store Automation profitability – Retail Store Automation improved profitability from breakeven in 2003 to $26 million of operating income in 2004 due to 8% revenue growth and meaningful expense reductions. Foreigncurrency fluctuations provided a 3 percentage point benefit to 2004 revenue.
• Customer Services performance – Although we are continuing our actions to improve the financial results of thissegment, the improvement in 2004 was offset by continued price erosion and a less favorable mix of high-marginmaintenance revenue from businesses we previously exited.
• Cost and expense reductions – As mentioned above, we made significant progress on this value driver, reducingcost and expense by more than $100 million in 2004.
The 2004 key drivers are discussed in greater detail later in this MD&A. Our key drivers for 2005 will be similar to those for2004, and will include:
• Improving the profitability of our Customer Services operating segment,• Continuing to reduce spending to achieve optimum operating performance, and• Driving revenue growth in our key product sets.
We are projecting that the capital spending environment in 2005 will be about the same as what was experienced in 2004,resulting in a slight increase in 2005 revenue. We expect our 2005 operating income to increase due to higher revenues, thecontinued reduction of infrastructure cost, and the restructuring of our Customer Services business.
We see the following as the most significant risks to the execution of our initiatives:
• Capital/competitive environment – If the overall IT capital spending environment declines, or if we cannot overcome the negative effect of pricing pressure or adverse foreign exchange movement with cost reductions, we maynot be able to profitably grow our business and meet our financial objectives.
• Executing our Customer Services transformation process – It is critical for NCR to structure this business sothat it can substantially improve profitability. This improvement could be at risk if we cannot successfully meet ourplan objectives, described in the Customer Services segment discussion of this MD&A; if we cannot overcome thenegative effect of anticipated pricing pressures; or if an unforeseen event occurs that would increase the number ofservice incidents and therefore increase cost.
• Impact of pension expense – Changes in actuarial assumptions and declines in the capital markets for both NCR’sU.S. and international pension plans may result in more pension expense in future periods than anticipated, whichcould decrease our overall profitability. While changes in actuarial assumptions may have a more immediate effect onour pension expense, changes in the capital markets may affect our net income in following years. We are continuingto analyze all costs and employee benefits related to our current pension plans.
• Reduce cost – If we cannot continue to remove costs and expenses from our infrastructure and business units, wemay not be competitive in our pricing and may not be able to create the capacity to invest in new solutions.
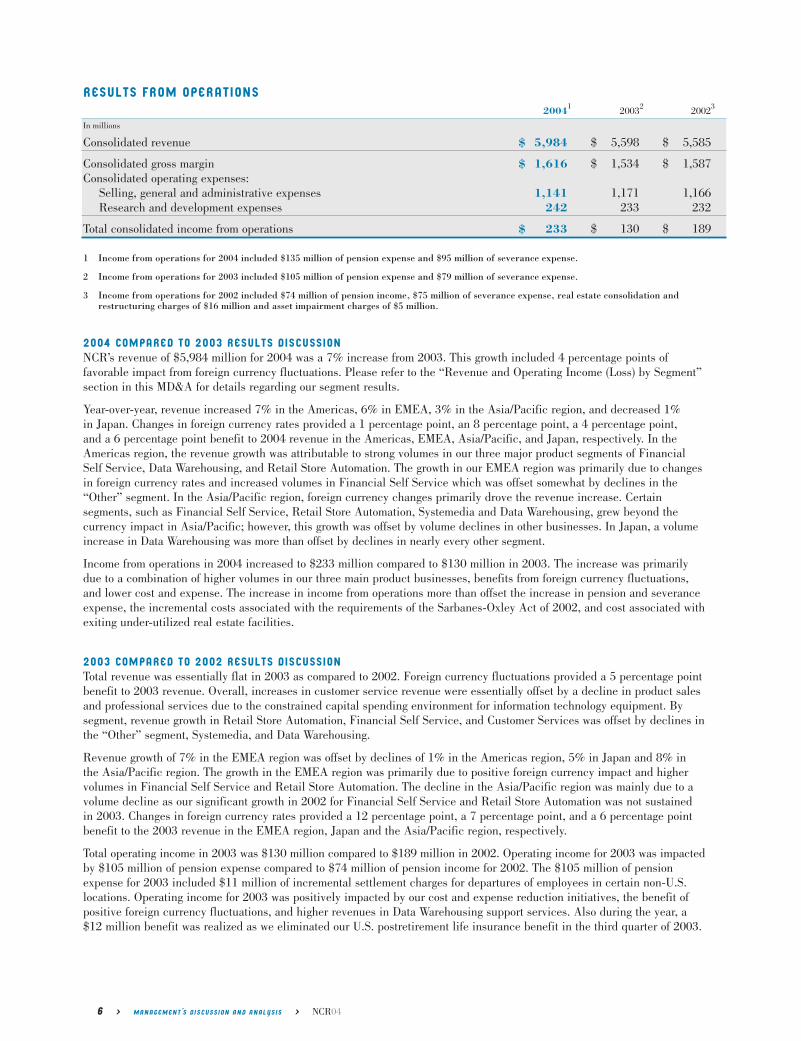
RESULTS FROM OPERATIONS 20041 20032 20023
In millions
Consolidated revenue $ 5,984 $ 5,598 $ 5,585
Consolidated gross margin $ 1,616 $ 1,534 $ 1,587Consolidated operating expenses:
Selling, general and administrative expenses 1,141 1,171 1,166Research and development expenses 242 233 232
Total consolidated income from operations $ 233 $ 130 $ 189
1 Income from operations for 2004 included $135 million of pension expense and $95 million of severance expense.
2 Income from operations for 2003 included $105 million of pension expense and $79 million of severance expense.
3 Income from operations for 2002 included $74 million of pension income, $75 million of severance expense, real estate consolidation andrestructuring charges of $16 million and asset impairment charges of $5 million.
2004 COMPARED TO 2003 RESULTS DISCUSSIONNCR’s revenue of $5,984 million for 2004 was a 7% increase from 2003. This growth included 4 percentage points of favorable impact from foreign currency fluctuations. Please refer to the “Revenue and Operating Income (Loss) by Segment”section in this MD&A for details regarding our segment results.
Year-over-year, revenue increased 7% in the Americas, 6% in EMEA, 3% in the Asia/Pacific region, and decreased 1% in Japan. Changes in foreign currency rates provided a 1 percentage point, an 8 percentage point, a 4 percentage point, and a 6 percentage point benefit to 2004 revenue in the Americas, EMEA, Asia/Pacific, and Japan, respectively. In theAmericas region, the revenue growth was attributable to strong volumes in our three major product segments of FinancialSelf Service, Data Warehousing, and Retail Store Automation. The growth in our EMEA region was primarily due to changesin foreign currency rates and increased volumes in Financial Self Service which was offset somewhat by declines in the“Other” segment. In the Asia/Pacific region, foreign currency changes primarily drove the revenue increase. Certain segments, such as Financial Self Service, Retail Store Automation, Systemedia and Data Warehousing, grew beyond the currency impact in Asia/Pacific; however, this growth was offset by volume declines in other businesses. In Japan, a volumeincrease in Data Warehousing was more than offset by declines in nearly every other segment.
Income from operations in 2004 increased to $233 million compared to $130 million in 2003. The increase was primarilydue to a combination of higher volumes in our three main product businesses, benefits from foreign currency fluctuations,and lower cost and expense. The increase in income from operations more than offset the increase in pension and severanceexpense, the incremental costs associated with the requirements of the Sarbanes-Oxley Act of 2002, and cost associated withexiting under-utilized real estate facilities.
2003 COMPARED TO 2002 RESULTS DISCUSSIONTotal revenue was essentially flat in 2003 as compared to 2002. Foreign currency fluctuations provided a 5 percentage pointbenefit to 2003 revenue. Overall, increases in customer service revenue were essentially offset by a decline in product salesand professional services due to the constrained capital spending environment for information technology equipment. Bysegment, revenue growth in Retail Store Automation, Financial Self Service, and Customer Services was offset by declines inthe “Other” segment, Systemedia, and Data Warehousing.
Revenue growth of 7% in the EMEA region was offset by declines of 1% in the Americas region, 5% in Japan and 8% in the Asia/Pacific region. The growth in the EMEA region was primarily due to positive foreign currency impact and highervolumes in Financial Self Service and Retail Store Automation. The decline in the Asia/Pacific region was mainly due to avolume decline as our significant growth in 2002 for Financial Self Service and Retail Store Automation was not sustained in 2003. Changes in foreign currency rates provided a 12 percentage point, a 7 percentage point, and a 6 percentage pointbenefit to the 2003 revenue in the EMEA region, Japan and the Asia/Pacific region, respectively.
Total operating income in 2003 was $130 million compared to $189 million in 2002. Operating income for 2003 was impactedby $105 million of pension expense compared to $74 million of pension income for 2002. The $105 million of pensionexpense for 2003 included $11 million of incremental settlement charges for departures of employees in certain non-U.S.locations. Operating income for 2003 was positively impacted by our cost and expense reduction initiatives, the benefit ofpositive foreign currency fluctuations, and higher revenues in Data Warehousing support services. Also during the year, a$12 million benefit was realized as we eliminated our U.S. postretirement life insurance benefit in the third quarter of 2003.
6 > MANAGEMENT’S DISCUSSION AND ANALYSIS > NCR04
REVENUE AND OPERATING INCOME (LOSS) BY SEGMENTOur key solutions are categorized as Data Warehousing, Financial Self Service, Retail Store Automation and CustomerServices, each of which is a reportable operating segment. In addition, our Systemedia and Payment and Imaging solutionsare reportable segments. A seventh segment, “Other,” primarily relates to the Company’s resale of third-party computerhardware and related professional and installation services, and to a business in Japan that is not aligned with our other segments. Our segments are comprised of hardware, software, and professional and installation-related services.
For purposes of discussing our operating results by segment, we exclude the impact of certain items, such as pensionexpense, from operating income or loss, consistent with the manner by which management views each segment and reportsour operating segment results under Statement of Financial Accounting Standards No. 131 (SFAS 131), “Disclosures aboutSegments of an Enterprise and Related Information.” This format is useful to investors because it allows analysis and comparability of operating trends for each business. It also includes the same information that is used by NCR managementto make decisions regarding the segments and to assess our financial performance. Restructuring items in the fourth quarterof 2002 were also excluded from the discussion of operating results. Our segment results are reconciled to total Companyresults reported under accounting principles generally accepted in the United States of America (otherwise known as GAAP)in Note 12 of Notes to Consolidated Financial Statements.
In the segment discussions, we have disclosed the impact of foreign currency fluctuations on revenue growth. As a result of the weaker U.S. Dollar, the Company benefited from currency fluctuations in 2004, mainly in our EMEA, Japan andAsia/Pacific regions.
Data Warehousing provides the market-leading Teradata data warehousing database software, hardware platform and related services that enable companies to gain a competitive advantage by more quickly and efficiently analyzing a singleintegrated view of customer behavior and other business information and then delivering that business intelligence to thecompany’s decision-makers. This segment’s revenues are primarily generated in the enterprise data warehousing market,which is part of the larger database market.
The current business and financial model for Data Warehousing allows for a significant portion of revenue growth to enhanceprofitability. Our main strategic direction for the future is to increase our market share in the enterprise data warehouse market and to increase our penetration in the overall data warehousing market. We plan to meet these goals by providing thetechnology, support and consulting services that companies need to capitalize on enterprise-wide analytics and maximize theusefulness of their existing data. We focus on adding companies that have massive amounts of data to leverage, which willgenerate a continued need for technology and consulting and lead to future upgrades and expansion.
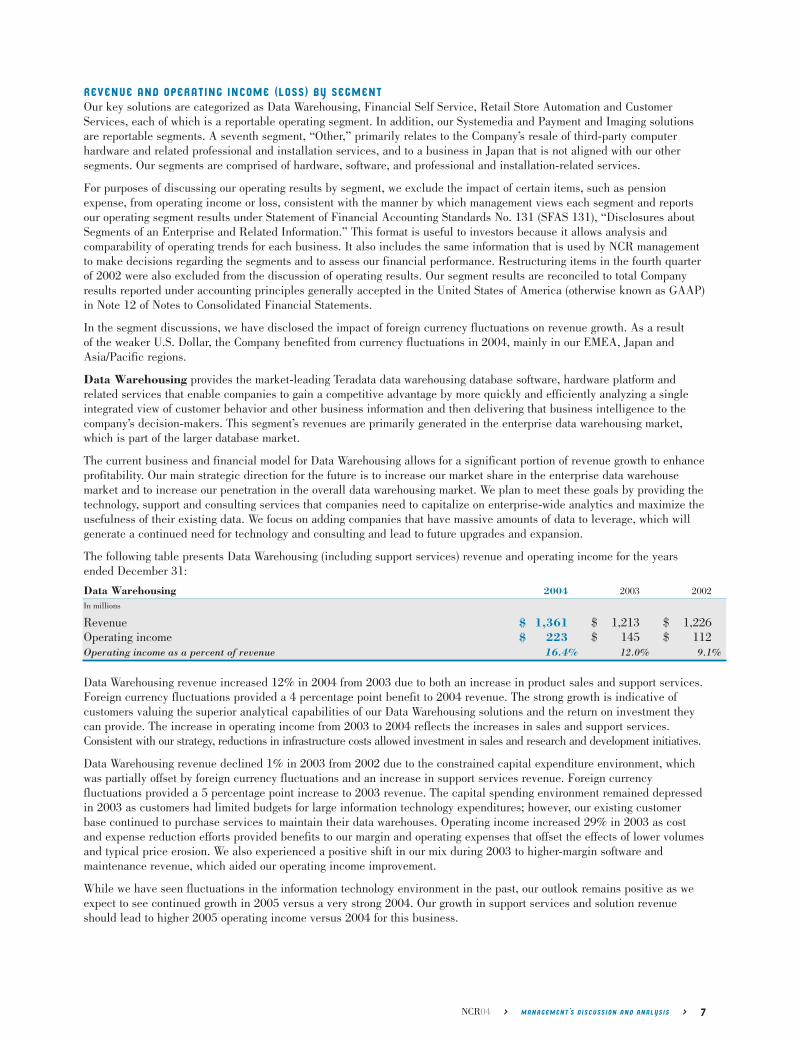
The following table presents Data Warehousing (including support services) revenue and operating income for the yearsended December 31:
Data Warehousing 2004 2003 2002
In millions
Revenue $ 1,361 $ 1,213 $ 1,226Operating income $ 223 $ 145 $ 112Operating income as a percent of revenue 16.4% 12.0% 9.1%
Data Warehousing revenue increased 12% in 2004 from 2003 due to both an increase in product sales and support services.Foreign currency fluctuations provided a 4 percentage point benefit to 2004 revenue. The strong growth is indicative of customers valuing the superior analytical capabilities of our Data Warehousing solutions and the return on investment theycan provide. The increase in operating income from 2003 to 2004 reflects the increases in sales and support services.Consistent with our strategy, reductions in infrastructure costs allowed investment in sales and research and development initiatives.
Data Warehousing revenue declined 1% in 2003 from 2002 due to the constrained capital expenditure environment, whichwas partially offset by foreign currency fluctuations and an increase in support services revenue. Foreign currency fluctuations provided a 5 percentage point increase to 2003 revenue. The capital spending environment remained depressedin 2003 as customers had limited budgets for large information technology expenditures; however, our existing customerbase continued to purchase services to maintain their data warehouses. Operating income increased 29% in 2003 as costand expense reduction efforts provided benefits to our margin and operating expenses that offset the effects of lower volumesand typical price erosion. We also experienced a positive shift in our mix during 2003 to higher-margin software and maintenance revenue, which aided our operating income improvement.
While we have seen fluctuations in the information technology environment in the past, our outlook remains positive as weexpect to see continued growth in 2005 versus a very strong 2004. Our growth in support services and solution revenueshould lead to higher 2005 operating income versus 2004 for this business.
NCR04 > MANAGEMENT’S DISCUSSION AND ANALYSIS > 7

Financial Self Service provides ATM-related technologies including cash dispensers, services, and software solutions to financial institutions, retailers and independent deployers. Our Financial Self Service solutions are designed to quicklyand reliably process consumer transactions and incorporate advanced features such as web-enablement, automated checkcashing/deposit, automated cash deposit, bill payment and the dispensing of non-cash items.
The market demand for financial self-service products and services is expected to grow moderately over the next few yearsdue to an anticipated ATM upgrade cycle in the Americas and EMEA regions, expanding demand in emerging markets, andfrom banks moving to advanced-function ATMs to increase their revenue and lower their operating costs. Our strategy is tofully distribute our sales force and invest in markets such as China, India and Russia. Also, we believe we are well-positionedto take advantage of our market-leading deposit automation technology and software which provide higher-value solutions.Additionally, we are making progress to create a competitive cost advantage for this business, optimizing our human andasset capital deployment in order to become a lower-cost supplier. This includes streamlining our supply chain and producingATMs in the region generating the demand.
A significant event in the financial services marketplace is The Check Clearing for the 21st Century Act, or “Check 21,”which took effect in October 2004. The act is intended to improve the efficiency of the U.S. Federal Reserve’s current paper-based clearing and settlement system through expedited funds availability and reduced risk associated with papermovement. The Financial Self Service business should realize benefits from this legislative change over the next severalyears. Financial institutions in the United States have begun to upgrade their ATMs in order to allow checks to be digitallyscanned upon deposit at the ATM so that they can eliminate the costly and slow process of clearing the paper form of the check.
The following table presents Financial Self Service revenue and operating income for the years ended December 31:
Financial Self Service (ATMs) 2004 2003 2002
In millions
Revenue $ 1,370 $ 1,149 $ 1,095Operating income $ 222 $ 165 $ 115Operating income as a percent of revenue 16.2% 14.4% 10.5%
Revenue for Financial Self Service grew 19% in 2004 from 2003. The increase was the result of growth in all regions. In theAmericas region, we continue to benefit from financial institutions in the United States upgrading their ATM networks forrecent regulatory changes. Growth in the EMEA region was reflective of banks upgrading their ATMs for the automation ofcash deposits, as well as expansion of ATM networks in Eastern Europe. Growth in the Asia/Pacific region was broad-basedwith meaningful growth in several countries. The impact of foreign currency fluctuations provided a benefit of 5 percentagepoints to 2004 revenue. Operating income improved due to increased volume, the favorable impact of foreign currency translation, and expense reductions, which offset the effects of anticipated price erosion.
Revenues in Financial Self Service increased 5% in 2003 as compared to 2002 primarily due to foreign currency fluctuations.Foreign currency provided a 7 percentage point benefit in 2003 for this business. Services revenue included in this segmentwas higher in 2003, but we experienced typical levels of product price erosion due to competitive pressures. We experiencedstrong growth in the Americas region as financial institutions increased spending for our advanced function ATM solutions.However, the Asia/Pacific region’s revenue declined relative to a difficult compare in 2002. Operating income improved43% from 2002 due to cost and expense reduction programs and positive foreign currency fluctuations. We have been successful in lowering our supply chain costs with the actions we took in 2003, such as reducing the number of staging centers that customize ATMs and leveraging our regional manufacturing capabilities.
In 2005, we expect revenue for Financial Self Service to increase, at least in line with growth in the overall ATM market. To remain competitive in the market, it is imperative that we continue to reduce our costs by leveraging the synergies of ourglobal manufacturing locations. We expect operating income to increase at a rate greater than the growth in revenue as aresult of our initiatives to reduce our cost and expense structure.
Retail Store Automation provides retail-oriented technologies such as POS terminals, bar-code scanners and software, aswell as innovative products such as our self-checkout systems and self-service kiosks, to companies worldwide. Combiningour retail industry expertise, software and hardware technologies, and implementation and store performance consultingservices, our Retail Store Automation solutions are designed to enable cost reductions and improve operational efficiency forcompanies while increasing satisfaction of their customers. NCR provides a highly competitive product offering for retailersin an increasingly commoditized market. Revenue in this segment will more than likely increase as retailers continue toupgrade and replace aging POS systems and install new self-checkout and self-service technologies.
In 2004, the Retail Store Automation business made significant improvement in lowering its cost structure and will continue tofocus on additional improvements in its operating model in 2005, reducing infrastructure costs as it shifts investments intosales and research and development. This includes making investments in new technologies that are projected to increase efficiencies for retailers, such as radio frequency identification (RFID) systems and self-service technologies.
8 > MANAGEMENT’S DISCUSSION AND ANALYSIS > NCR04

The following table presents Retail Store Automation revenue and operating income (loss) for the years ended December 31:
Retail Store Automation 2004 2003 2002
In millions
Revenue $ 864 $ 797 $ 714Operating income (loss) $ 26 $ – $ (57)Operating income (loss) as a percent of revenue 3.0% 0.0% (8.0)%
Retail Store Automation revenue grew 8% compared to 2003. The revenue growth was attributable to higher POS terminaland bar-code scanner volumes, software, and professional services, as well as 3 percentage points of benefit from foreigncurrency rate changes. The operating income improvement of $26 million was the result of cost and expense reductions, highervolumes mentioned above, and favorable foreign currency fluctuations.
Revenue increased 12% for Retail Store Automation in 2003 compared to 2002 as increased demand and positive foreigncurrency fluctuations more than offset the price erosion we experienced during the year. Foreign currency provided a 5 percentage point benefit for 2003 revenue. The higher volumes were mainly driven by sales of self-checkout systems,which were characterized by large, single purchases in the Americas region. The EMEA and Japan regions also contributedto the growth, led by sales of POS terminals and self-checkout systems in these regions. The improvement in operatingincome was driven mainly by our cost reduction efforts, volume increases, and positive foreign currency impact. These costreductions included progress on our configure-to-order initiative and moving a portion of our product development activitiesto lower-cost locations outside of the United States.
We expect higher 2005 revenue for Retail Store Automation solutions due to increasing demand for self-service technologiesalong with expansion of software and services. Due to higher revenue and our continuing actions to reduce cost and expensein this business, we expect operating income to improve in 2005.
Systemedia provides printer consumables and products including paper rolls for ATMs and POS workstations, inkjet and laser printer supplies, thermal transfer ribbons, labels, ink ribbons, laser documents, business forms and retail officeproducts. Systemedia products are designed to reduce paper-related failures in our ATMs and POS terminals and enablebusinesses to improve transaction accuracy while reducing overall costs.
The printer consumables market is highly fragmented, and market consolidation continues due to lower levels of demand intraditional media products such as paper rolls, fax paper, ink ribbons and forms. Excess capacity and lack of fixed cost coverageresults in price competition that often uses only variable cost as its base. The use of internet auctions and the willingness ofcustomers to set lower paper grade specifications for the products they use also results in price and margin erosion.
To compete effectively in this market, we are shifting our market and application focus to consumable offerings that offergrowth opportunities. These include RFID products, laser documents, labels, ink jet supplies, laser cartridges, and specialtymedia. Increased revenue in these products is expected to offset declines experienced in mature products due to the changesin printer technologies. In addition to a shift to higher-growth products, we are also working to increase our use of servicesand industry expertise. Increased focus on defining value drivers and refining our demand generation capabilities throughadditional direct sales resources is important to our strategy. We will continue to review our cost structure and manufacturingefficiency in 2005 in order to drive improved profitability.
The following table presents Systemedia revenue and operating income for the years ended December 31:
Systemedia 2004 2003 2002
In millions
Revenue $ 512 $ 494 $ 518Operating income $ 8 $ 14 $ 6Operating income as a percent of revenue 1.6% 2.8% 1.2%
Revenue for Systemedia increased 4% in 2004 from 2003. Excluding the impact of foreign exchange fluctuations, revenuewas unchanged. Growth in the Americas and Asia/Pacific regions was offset by declines in the EMEA region and Japan. Thedecrease in operating income from 2003 was due to competition for traditional media products which affects both pricingand volumes. Cost and expense reductions were somewhat offset by significant increases in paper prices, which representsthe largest percentage of product cost for this business.
Revenue for the Systemedia business declined 5% from 2002 to 2003 due to softness in the market from a pricing and volume perspective as customers reduced their expenditures for printer consumables. The Americas region was impacted themost from the volume decline as customers we lost in late 2002 and early 2003 could not be replaced during the remainderof the year. Foreign currency provided a 5 percentage point benefit to 2003 revenue. Operating income for Systemediaincreased in 2003 from 2002 due to cost reductions in both our material costs and manufacturing process, which more thanoutpaced the volume and price erosion impacts.
NCR04 > MANAGEMENT’S DISCUSSION AND ANALYSIS > 9
We expect similar revenue levels in 2005 versus 2004, as gains in growth products are expected to be offset by competitionin mature products. We believe that operating income will increase slightly in 2005 due to our cost reduction efforts.
Payment and Imaging provides end-to-end solutions for both traditional paper-based and image-based check and itemprocessing. Our imaging solutions utilize advanced image recognition and workflow technologies to automate item processing, helping financial institutions increase efficiency and reduce operating costs. Consisting of hardware, software,consulting and support services, our comprehensive Payment and Imaging solutions enable check and item-based transactions to be digitally scanned, processed and retained within a flexible, scalable environment.
The most significant event that has occurred in the check payment and imaging marketplace in recent years was the CheckClearing for the 21st Century Act, also known as “Check 21,” which took effect in October of 2004. The act is intended toimprove the efficiency of the U.S. Federal Reserve’s current paper-based clearing and settlement system through expedited fundsavailability and reduced risk associated with paper movement. NCR is well-positioned for this change with our current image-based solutions and services. However, as the need for digital imaging increases, the reliance on products that were designed forpaper-based processing will decrease. Revenue growth in this segment will be challenging given these market dynamics.
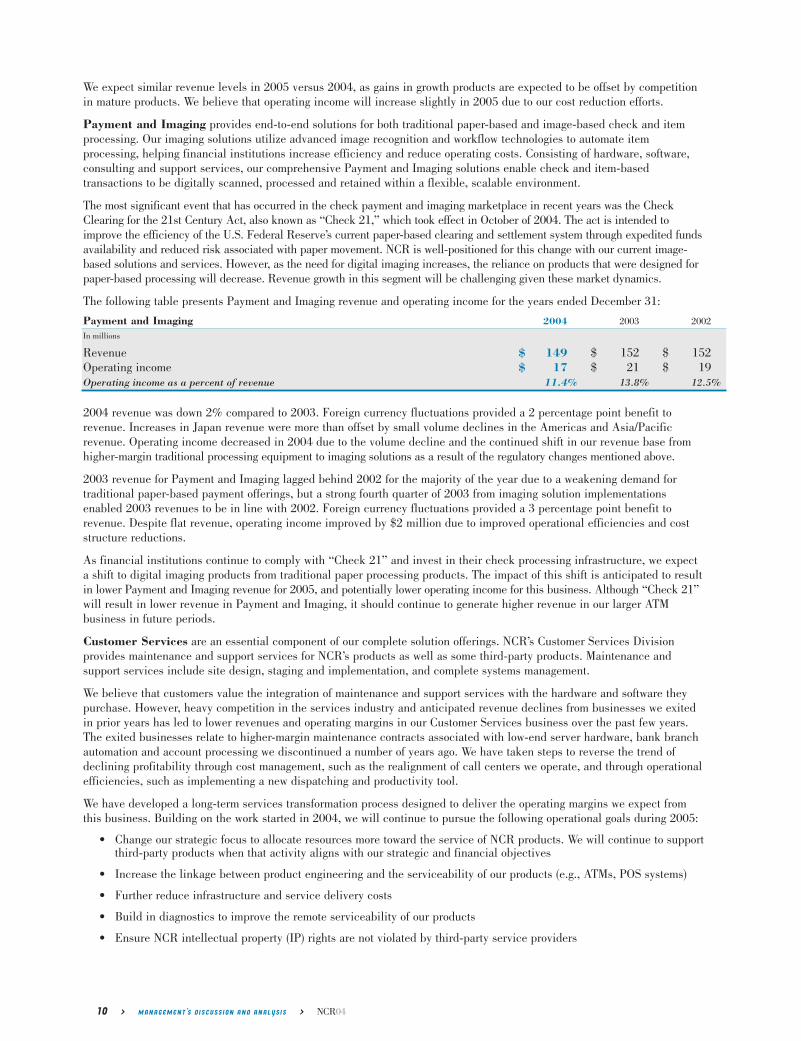
The following table presents Payment and Imaging revenue and operating income for the years ended December 31:
Payment and Imaging 2004 2003 2002
In millions
Revenue $ 149 $ 152 $ 152Operating income $ 17 $ 21 $ 19Operating income as a percent of revenue 11.4% 13.8% 12.5%
2004 revenue was down 2% compared to 2003. Foreign currency fluctuations provided a 2 percentage point benefit to revenue. Increases in Japan revenue were more than offset by small volume declines in the Americas and Asia/Pacific revenue. Operating income decreased in 2004 due to the volume decline and the continued shift in our revenue base fromhigher-margin traditional processing equipment to imaging solutions as a result of the regulatory changes mentioned above.
2003 revenue for Payment and Imaging lagged behind 2002 for the majority of the year due to a weakening demand for traditional paper-based payment offerings, but a strong fourth quarter of 2003 from imaging solution implementationsenabled 2003 revenues to be in line with 2002. Foreign currency fluctuations provided a 3 percentage point benefit to revenue. Despite flat revenue, operating income improved by $2 million due to improved operational efficiencies and coststructure reductions.
As financial institutions continue to comply with “Check 21” and invest in their check processing infrastructure, we expecta shift to digital imaging products from traditional paper processing products. The impact of this shift is anticipated to resultin lower Payment and Imaging revenue for 2005, and potentially lower operating income for this business. Although “Check 21”will result in lower revenue in Payment and Imaging, it should continue to generate higher revenue in our larger ATM business in future periods.
Customer Services are an essential component of our complete solution offerings. NCR’s Customer Services Division provides maintenance and support services for NCR’s products as well as some third-party products. Maintenance and support services include site design, staging and implementation, and complete systems management.
We believe that customers value the integration of maintenance and support services with the hardware and software theypurchase. However, heavy competition in the services industry and anticipated revenue declines from businesses we exitedin prior years has led to lower revenues and operating margins in our Customer Services business over the past few years.The exited businesses relate to higher-margin maintenance contracts associated with low-end server hardware, bank branchautomation and account processing we discontinued a number of years ago. We have taken steps to reverse the trend ofdeclining profitability through cost management, such as the realignment of call centers we operate, and through operationalefficiencies, such as implementing a new dispatching and productivity tool.
We have developed a long-term services transformation process designed to deliver the operating margins we expect fromthis business. Building on the work started in 2004, we will continue to pursue the following operational goals during 2005:
• Change our strategic focus to allocate resources more toward the service of NCR products. We will continue to supportthird-party products when that activity aligns with our strategic and financial objectives
• Increase the linkage between product engineering and the serviceability of our products (e.g., ATMs, POS systems)
• Further reduce infrastructure and service delivery costs
• Build in diagnostics to improve the remote serviceability of our products
• Ensure NCR intellectual property (IP) rights are not violated by third-party service providers
10 > MANAGEMENT’S DISCUSSION AND ANALYSIS > NCR04

We have realized some benefit from each of these items to date. However, as anticipated, this progress has not been sufficientto overcome the adverse impact of price erosion from heavy competition in the marketplace and the reduction of higher-marginrevenue associated with exited businesses. We believe we can be more competitive in the marketplace by concentrating onservicing NCR products rather than on incremental services from third-party products. By proactively designing products formore efficient serviceability, time spent on service incidents will be reduced. This will help us achieve a lower cost structureby shifting our service model to diagnose incidents remotely and dispatch personnel through a global operating model thattakes advantage of personnel and incident location synergies. Also, we will continue to evaluate the number of customer callcenters we maintain and modify their operations to enhance our remote diagnostic capabilities. We believe these changes willlead to increased customer satisfaction through faster service, while reducing our service delivery costs.
Unauthorized use of NCR intellectual property allows third-party service providers a “free ride” on NCR’s investment inresearch and development, giving them an unfair price advantage. NCR’s actions to enforce its IP rights and require thatthird parties properly license diagnostic software are intended to eliminate this free ride. Additionally, NCR continues tomonitor and enforce its parts sales agreements to ensure that purchasers comply with program requirements and use parts fortheir intended purpose. Together, these activities help eliminate unfair cost advantages to third-party service providers andgenerate an appropriate return on NCR’s investment for development of its intellectual property.
The following table presents Customer Services revenue and operating income for the years ended December 31:
Customer Services 2004 2003 2002
In millions
Revenue $ 1,833 $ 1,849 $ 1,791Operating (loss) income $ (3) $ 27 $ 37Operating (loss) income as a percent of revenue (0.2)% 1.5% 2.1%
As anticipated, revenue for Customer Services decreased 1% in 2004 compared to 2003. Foreign currency fluctuations provided a 4 percentage point benefit to revenue during the year. Customer Services revenue was impacted by lower revenue from maintenance of third-party products and continued price erosion as competition for services remains strong.Also affecting the year-over-year comparison is the declining base of high-margin revenue associated with businesses we previously exited. Operating income declined due to price erosion and the effect of exited businesses, as well as from actionswe are taking to correct the operating costs for this business. One of these actions, planned headcount reductions, resulted inhigher severance-related postemployment benefits expense in 2004. However, these actions are expected to have a positiveimpact on operating income starting in 2005.
Revenues for Customer Services increased 3% in 2003 versus 2002, mainly driven by foreign currency fluctuations that provided a 5 percentage point benefit. We experienced declining revenue from higher-margin maintenance contracts associated with businesses the Company exited in prior years and continued price erosion due to competition. Operatingincome in 2003 declined from 2002 as cost and expense reductions were not able to offset declines in volume from exitedbusinesses and price erosion factors.
Customer Services segment revenue in 2005 is expected to be slightly down compared to 2004 as planned declines in third-party maintenance contracts and price erosion continue to limit our ability to generate growth. We expect revenues fromour exited businesses to continue to decline in 2005, but not as materially as in prior years. However, due to an improvingmix of revenue and the cost actions mentioned above, operating income in 2005 is expected to improve compared to 2004.
NCR’s “Other” operating segment primarily relates to the resale of third-party computer hardware and related professionaland installation services in our high-availability and networking services businesses. Also included in this segment are thefinancial results from a business in Japan that is not aligned with any of our other segments.
The following table presents “Other” segment revenue and operating losses for the years ended December 31:
“Other” segment 2004 2003 2002
In millions
Revenue $ 196 $ 242 $ 287Operating (loss) $ (35) $ (48) $ (46)Operating (loss) as a percent of revenue (17.9)% (19.8)% (16.0)%
Revenue is expected to decline in this segment as we concentrate on reducing our third-party product sales in order to focuson sales and services of NCR’s products. However, we also anticipate a lower loss in this segment as we reduce costs associatedwith this activity.
NCR04 > MANAGEMENT’S DISCUSSION AND ANALYSIS > 11
RE-ENGINEERINGIn the third quarter of 2002, we announced re-engineering plans to improve operational efficiency throughout NCR. We are targeting process improvements to drive simplification, standardization, globalization and consistency across the organization.During 2004, despite the unfavorable movement of foreign exchange, our success in reducing costs and expenses put usfirmly on track to deliver $250 million of annualized cost savings by 2005 and an additional $100 million through 2006,using 2002 results as a starting point. In addition to the activities described above in our businesses, we are making changesin our infrastructure to bring our costs in line with industry benchmarks. Regarding NCR’s internal information technology, wecontinue to replace all major company applications, migrating from country-centric applications to new enterprise applicationssuch as our Enterprise Resource Planning (ERP) system, our global human resources system, and our Teradata EnterpriseData Warehouse. Our ERP implementation is on schedule and we expect to have 91% of all revenue-generating countriesaround the world on ERP by mid-2005. In our human resources organization, we have improved efficiencies and reducedcosts by centralizing our staffing organization and controlling our external recruitment expenses. In our finance and administration area, we are reorganizing and reducing our workforce to a lower cost structure. In 2003, NCR entered into aservice agreement with Accenture LLP (Accenture), a global outsourcing services provider, under which many of NCR’s keytransaction processing activities, including overall and day-to-day responsibility for order and revenue processing, accountsreceivable, accounts payable, and the Company’s general ledger function, will be performed by Accenture. The transition ofresponsibility for these activities, which is 85% complete, began in the fourth quarter of 2003, and will continue into 2005.As part of this transition, NCR’s transaction processing activities will be streamlined and standardized for improved efficiencyand consistency of practices globally. As a result, we expect to significantly reduce our overall finance and administrationcosts and optimize the use of global and regional centers for transaction processing.
Another element of the re-engineering is our real estate consolidation and restructuring plan. During 2004, we reduced ournumber of properties by 97, representing a 22% reduction in total properties from 2003. Although the reduction in numberof properties may be lower in future periods as compared to 2004, we will continue to reduce excess square footage throughbetter utilization of current space, increasing the use of virtual offices and the sale of underutilized facilities.
In connection with our 2002 restructuring plan, a pre-tax restructuring charge of $8 million was recorded in the fourth quarter of 2002 under EITF Issue No. 94-3, “Liability Recognition for Certain Employee Termination Benefits and OtherCosts to Exit an Activity,” to provide for contractual lease termination costs. The balance of this recorded liability atDecember 31, 2004 was $3 million. During 2004, the Company utilized $4 million of the reserve. The majority of the leaseobligations will continue through 2005, with one obligation continuing to 2009.
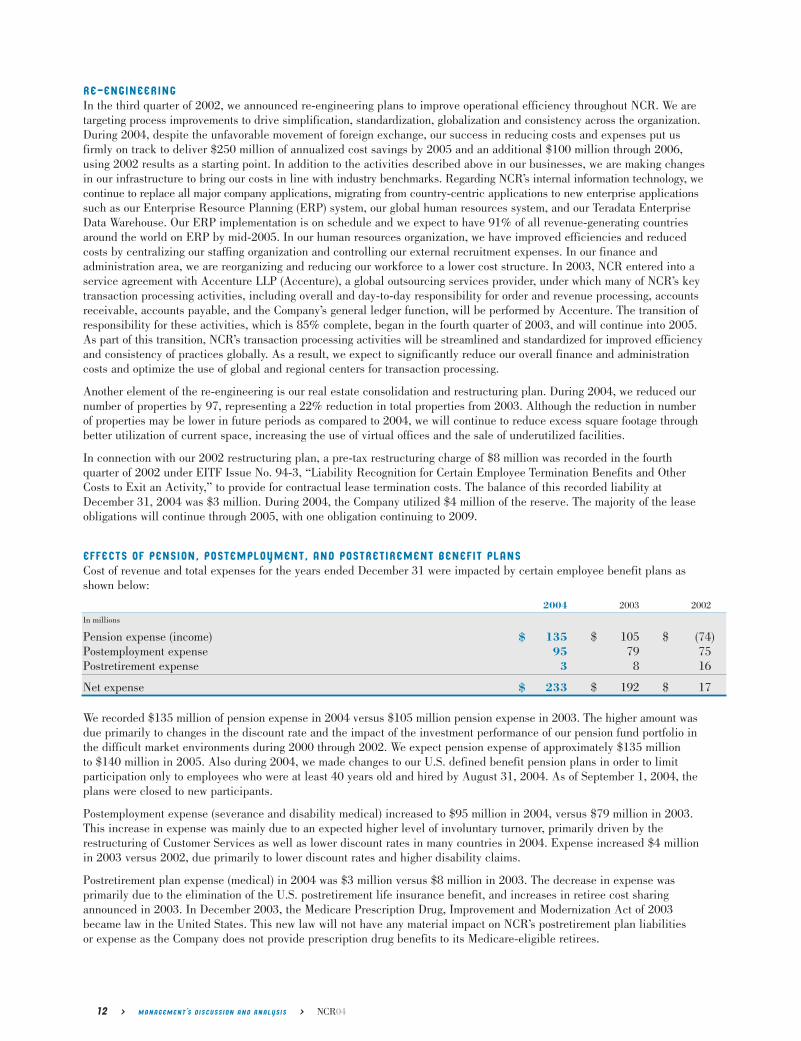
EFFECTS OF PENSION, POSTEMPLOYMENT, AND POSTRETIREMENT BENEFIT PLANSCost of revenue and total expenses for the years ended December 31 were impacted by certain employee benefit plans asshown below:
2004 2003 2002
In millions
Pension expense (income) $ 135 $ 105 $ (74)Postemployment expense 95 79 75Postretirement expense 3 8 16
Net expense $ 233 $ 192 $ 17
We recorded $135 million of pension expense in 2004 versus $105 million pension expense in 2003. The higher amount wasdue primarily to changes in the discount rate and the impact of the investment performance of our pension fund portfolio inthe difficult market environments during 2000 through 2002. We expect pension expense of approximately $135 million to $140 million in 2005. Also during 2004, we made changes to our U.S. defined benefit pension plans in order to limit participation only to employees who were at least 40 years old and hired by August 31, 2004. As of September 1, 2004, theplans were closed to new participants.
Postemployment expense (severance and disability medical) increased to $95 million in 2004, versus $79 million in 2003.This increase in expense was mainly due to an expected higher level of involuntary turnover, primarily driven by the restructuring of Customer Services as well as lower discount rates in many countries in 2004. Expense increased $4 millionin 2003 versus 2002, due primarily to lower discount rates and higher disability claims.
Postretirement plan expense (medical) in 2004 was $3 million versus $8 million in 2003. The decrease in expense was primarily due to the elimination of the U.S. postretirement life insurance benefit, and increases in retiree cost sharingannounced in 2003. In December 2003, the Medicare Prescription Drug, Improvement and Modernization Act of 2003became law in the United States. This new law will not have any material impact on NCR’s postretirement plan liabilities or expense as the Company does not provide prescription drug benefits to its Medicare-eligible retirees.
12 > MANAGEMENT’S DISCUSSION AND ANALYSIS > NCR04
GROSS MARGINIn 2004, gross margin as a percentage of total revenue declined to 27.0% from 27.4% in 2003. Both product and servicesgross margins were down versus the prior year. Most of the decline was due to $20 million higher pension cost recorded incost of sales in 2004 compared to 2003. Additionally, pricing pressure had an adverse effect on gross margin rate.
In 2003, gross margin as a percentage of total revenue declined to 27.4% from 28.4% in 2002. While our product grossmargin showed a 1.8 percentage point improvement, services margin decreased 3.6 percentage points. Product gross marginincreased due to higher margins in Retail Store Automation from higher revenues and cost reductions, improved margins inData Warehousing from a favorable mix shift to higher-margin software, and volume increases and cost reduction measuresin Financial Self Service. The decline in services margin is primarily due to the inclusion of $51 million of pension expensein 2003 versus $49 million of pension income in 2002.
OPERATING EXPENSESOur 2004 operating expenses, characterized as “selling, general, and administrative expenses” along with “research anddevelopment expenses” in the Consolidated Statements of Operations, decreased to $1,383 million in 2004 versus $1,404 millionin 2003. Lower expenses were directly related to the continued actions to reduce our infrastructure and back-office expenditures. The reduction in these areas was partially offset by the increased investment in sales and demand creation inour Data Warehouse and Financial Self Service segments, research and development, and $10 million more of pension expense.
Operating expenses for 2003 were $1,404 million compared to $1,398 million for 2002. The negative impact of pensionexpense and foreign currency fluctuations was greater than the expense reductions we achieved during 2003. For 2003,operating expenses included $47 million of pension expense compared to $15 million of pension income in 2002.
In 2005, we plan to continue reducing our infrastructure costs; however, as was the case in 2004, a portion of our cost savings will be reinvested to improve demand generation capabilities. We are committed to new product development andwill focus on achieving maximum yield from our research and development spending and resources.
INTEREST AND OTHER EXPENSE AND INCOME ITEMSInterest expense was $23 million in 2004, $26 million in 2003 and $19 million in 2002. The decrease in interest expense in2004 from 2003 was driven by lower interest rates from an interest rate swap and by the elimination of certain borrowingsagainst company-owned life insurance policies. The increase in interest expense in 2003 from 2002 was due to the issuancein June 2002 of $300 million of senior unsecured notes, which are due in 2009. The notes carry an interest rate of 7.125%;however, the rate increased to 7.375% in November 2002 because certain registration requirements under the Securities Actof 1933 were not met. These registration requirements were met in May 2003, and the interest rate was adjusted to its originalfixed rate. In November 2003, the Company entered into an interest rate swap agreement that converted $50 million of thedebt to a variable rate. Although this variable rate was lower than the fixed rate as of December 31, 2004, changes in theinterest rate markets could raise the variable rate of the swap above the fixed rate of the debt, which would lead to higherexpenses and cash outflows.
Other income and expense, net, was $41 million of income, $32 million of expense, and $39 million of expense in 2004,2003, and 2002, respectively. 2004 included $17 million of real estate gains, $3 million related to receipt of an acquisitionbreak-up fee, $4 million for recovery of a non-trade receivable that was previously fully reserved, and a $9 million release ofa reserve for exit of certain countries in the Middle East and Africa region. The reserve was previously made to account foran expected loss on sale when the Company anticipated exiting certain countries. However, due to a realignment in strategyin late 2004, the Company now believes it can profitably market an attractive range of products to these countries by utilizinga shared resource infrastructure.
In 2003, due to the reassessment of the accrual for the potential future liability related to the Fox River environmental matter,we recorded $37 million in net other expense. The risks and uncertainties associated with this matter are discussed in theEnvironmental and Legal Contingencies section of the Critical Accounting Policies and Estimates section of this MD&A andin Note 11 of Notes to Consolidated Financial Statements. The 2002 other expense consisted primarily of a $14 millioninvestment basis write-down of marketable securities in Japan for losses that were considered to be other than temporary, a$9 million charge relating to an indemnification claim made by Lucent Technologies, Inc. (Lucent), $8 million of real estateconsolidation impairment charges and $6 million of costs relating to the disposition of a small non-strategic business. Wereversed $6 million of the 2002 Lucent indemnification charge in the first quarter of 2003, which resulted in recognition ofother income due to updated information received from Lucent as to the actual extent of the claim.
NCR04 > MANAGEMENT’S DISCUSSION AND ANALYSIS > 13
INCOME TAX Income tax benefit was $39 million in 2004 compared to income tax expense of $14 million in 2003 and income tax expenseof $3 million in 2002. The income tax benefit in 2004 included an $85 million benefit resulting from a favorable settlementof audit items relating to the period when NCR was a subsidiary of AT&T. The income tax expense in 2003 included $24 millionfor an increase to the valuation allowance established against deferred tax assets of NCR’s Japanese subsidiaries. Theincome tax expense in 2002 was reduced by a $15 million benefit relating to the resolution of outstanding issues on refundclaims from the U.S. and French governments.
Our effective tax benefit rate was approximately 16% for 2004, including the $85 million tax benefit. Excluding the $85 million,our effective tax rate was 18%. The 2004 effective tax rate was also favorably impacted by profit generated in several foreigncountries which have lower effective tax rates due to prior-year losses. Our effective tax rate was approximately 19% for2003, and included the impact of the reserve taken for the Fox River environmental matter and income related to the Lucentindemnification claim. These items provided a 5 percentage point benefit to the effective tax rate for 2003. Each year, oureffective tax rate includes a certain amount of benefit related to the use of foreign tax credits. For 2003 and 2002, theamount of such benefits as compared to the amount of income before tax was larger than prior years. Our effective tax ratewas approximately 2% for 2002 including the tax impacts relating to the adoption of Statement of Financial AccountingStandard No. 142 (SFAS 142), “Goodwill and Other Intangible Assets,” and the benefit from the resolution of outstandingissues on refund claims. These items provided a 12 percentage point benefit to the effective tax rate for 2002. We anticipateour effective tax rate will be approximately 25% in 2005. However, changes in profit mix or one-time events, such as auditsettlements, could change this rate.
CUMULATIVE EFFECT OF ACCOUNTING CHANGEThe cumulative effect of accounting change in 2002 was a non-cash, net-of-tax goodwill impairment charge of $348 millionwhich relates to the adoption of SFAS 142.
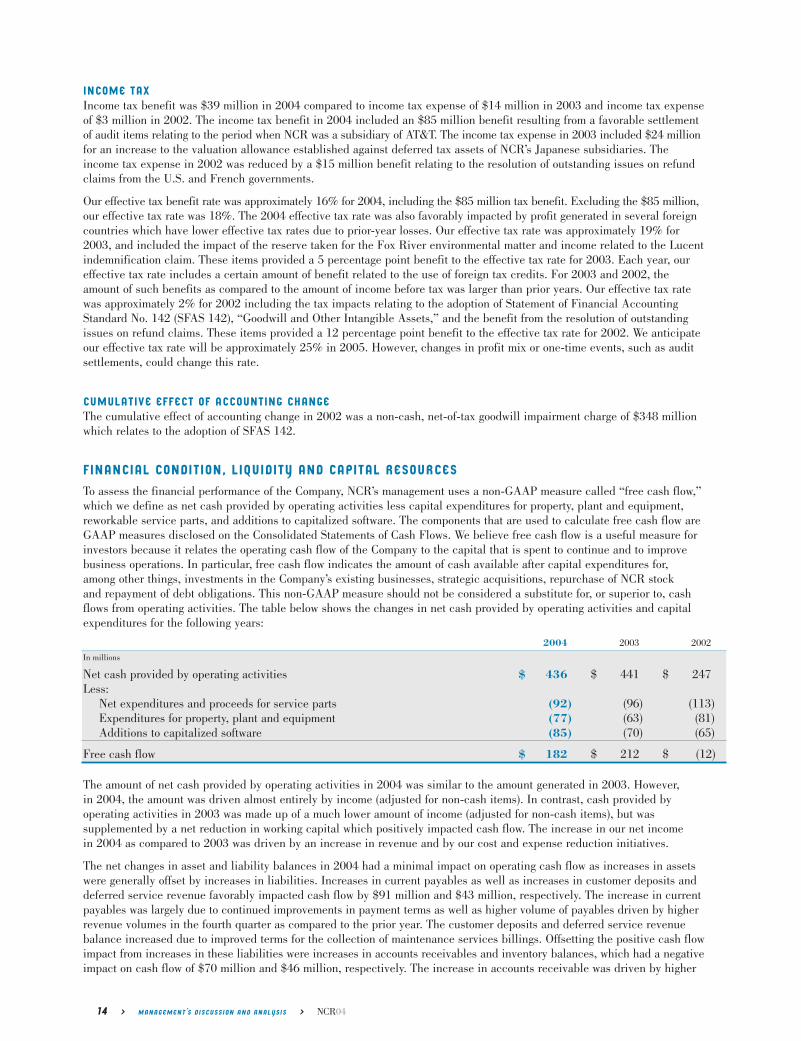
FINANCIAL CONDITION, LIQUIDITY AND CAPITAL RESOURCESTo assess the financial performance of the Company, NCR’s management uses a non-GAAP measure called “free cash flow,”which we define as net cash provided by operating activities less capital expenditures for property, plant and equipment,reworkable service parts, and additions to capitalized software. The components that are used to calculate free cash flow areGAAP measures disclosed on the Consolidated Statements of Cash Flows. We believe free cash flow is a useful measure forinvestors because it relates the operating cash flow of the Company to the capital that is spent to continue and to improve business operations. In particular, free cash flow indicates the amount of cash available after capital expenditures for, among other things, investments in the Company’s existing businesses, strategic acquisitions, repurchase of NCR stock and repayment of debt obligations. This non-GAAP measure should not be considered a substitute for, or superior to, cash flows from operating activities. The table below shows the changes in net cash provided by operating activities and capitalexpenditures for the following years:
2004 2003 2002
In millions
Net cash provided by operating activities $ 436 $ 441 $ 247Less:
Net expenditures and proceeds for service parts (92) (96) (113)Expenditures for property, plant and equipment (77) (63) (81)Additions to capitalized software (85) (70) (65)
Free cash flow $ 182 $ 212 $ (12)
The amount of net cash provided by operating activities in 2004 was similar to the amount generated in 2003. However,in 2004, the amount was driven almost entirely by income (adjusted for non-cash items). In contrast, cash provided by operating activities in 2003 was made up of a much lower amount of income (adjusted for non-cash items), but was supplemented by a net reduction in working capital which positively impacted cash flow. The increase in our net income in 2004 as compared to 2003 was driven by an increase in revenue and by our cost and expense reduction initiatives.
The net changes in asset and liability balances in 2004 had a minimal impact on operating cash flow as increases in assetswere generally offset by increases in liabilities. Increases in current payables as well as increases in customer deposits anddeferred service revenue favorably impacted cash flow by $91 million and $43 million, respectively. The increase in currentpayables was largely due to continued improvements in payment terms as well as higher volume of payables driven by higherrevenue volumes in the fourth quarter as compared to the prior year. The customer deposits and deferred service revenuebalance increased due to improved terms for the collection of maintenance services billings. Offsetting the positive cash flowimpact from increases in these liabilities were increases in accounts receivables and inventory balances, which had a negativeimpact on cash flow of $70 million and $46 million, respectively. The increase in accounts receivable was driven by higher
14 > MANAGEMENT’S DISCUSSION AND ANALYSIS > NCR04
fourth quarter sales, which were $145 million more than in the same period of the prior year. The impact of this increase infourth quarter sales was somewhat mitigated by improved collection times as compared to the prior year period. Inventorybalances continued to increase in 2004 mostly due to Retail Store Automation’s continued conversion to a configure-to-ordermodel, which drives shorter lead times but increases inventory on hand.
In 2004, our capital expenditures increased to $254 million from $229 million in 2003. We expect capital expenditures for2005 to be approximately $250 million, which is about equal to our expected 2005 depreciation and amortization expense.We expect net cash provided by operating activities less capital expenditures, otherwise defined as free cash flow, to bemore than $200 million in 2005.
Financing activities and certain other investing activities are not included in our calculations of free cash flow. These otherinvesting actvities included net proceeds of $50 million from the purchases and sales of short-term investments, proceeds of$68 million from the sales of real estate, and cash outflows of $36 million for activities largely consisting of our purchase ofKinetics, Inc. for $26 million.
Our financing activities in 2004 mainly consisted of cash outflows from our share repurchase activities and cash inflowsfrom the issuance of shares through our employee stock plans. During 2004, we purchased 17.2 million shares of NCR common stock for $428 million as compared to 8.2 million shares purchased for $90 million in 2003. Shares for 2004 and2003 reflect the impact of a two-for-one stock split effective January 21, 2005. Cash inflows from stock plans were $260 millionin 2004 compared to $35 million in 2003. The increase in cash inflows was driven by an increase in the number of optionsexercised by employees. The overall impact of our share purchases and issuances in 2004 was a reduction of 2.8 millionshares outstanding as compared to 2003. The share purchases are part of a systematic purchase program authorized byNCR’s Board of Directors. We will continue this program in 2005; however, the amount of stock purchases may vary frompast years depending on the amount of exercises of stock compensation awards and employee stock purchase plan activity.
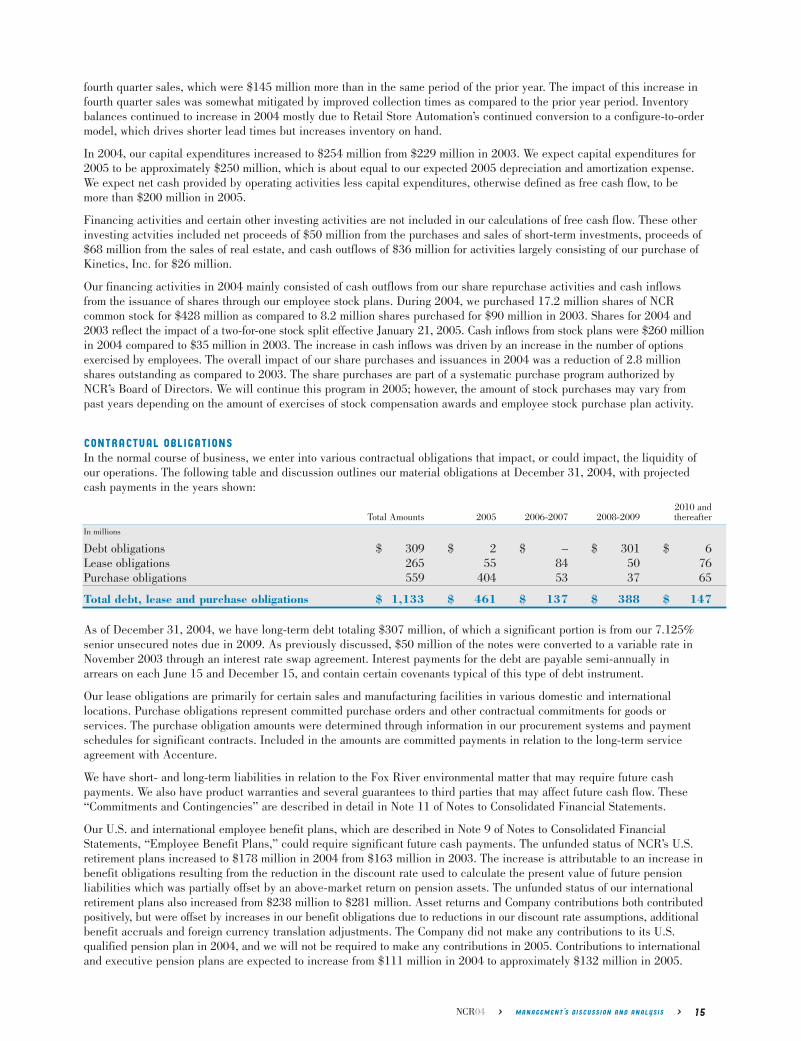
CONTRACTUAL OBLIGATIONSIn the normal course of business, we enter into various contractual obligations that impact, or could impact, the liquidity ofour operations. The following table and discussion outlines our material obligations at December 31, 2004, with projectedcash payments in the years shown:
2010 andTotal Amounts 2005 2006-2007 2008-2009 thereafter
In millions
Debt obligations $ 309 $ 2 $ – $ 301 $ 6Lease obligations 265 55 84 50 76Purchase obligations 559 404 53 37 65
Total debt, lease and purchase obligations $ 1,133 $ 461 $ 137 $ 388 $ 147
As of December 31, 2004, we have long-term debt totaling $307 million, of which a significant portion is from our 7.125% senior unsecured notes due in 2009. As previously discussed, $50 million of the notes were converted to a variable rate inNovember 2003 through an interest rate swap agreement. Interest payments for the debt are payable semi-annually inarrears on each June 15 and December 15, and contain certain covenants typical of this type of debt instrument.
Our lease obligations are primarily for certain sales and manufacturing facilities in various domestic and international locations. Purchase obligations represent committed purchase orders and other contractual commitments for goods or services. The purchase obligation amounts were determined through information in our procurement systems and paymentschedules for significant contracts. Included in the amounts are committed payments in relation to the long-term serviceagreement with Accenture.
We have short- and long-term liabilities in relation to the Fox River environmental matter that may require future cash payments. We also have product warranties and several guarantees to third parties that may affect future cash flow. These“Commitments and Contingencies” are described in detail in Note 11 of Notes to Consolidated Financial Statements.
Our U.S. and international employee benefit plans, which are described in Note 9 of Notes to Consolidated FinancialStatements, “Employee Benefit Plans,” could require significant future cash payments. The unfunded status of NCR’s U.S.retirement plans increased to $178 million in 2004 from $163 million in 2003. The increase is attributable to an increase inbenefit obligations resulting from the reduction in the discount rate used to calculate the present value of future pension liabilities which was partially offset by an above-market return on pension assets. The unfunded status of our internationalretirement plans also increased from $238 million to $281 million. Asset returns and Company contributions both contributedpositively, but were offset by increases in our benefit obligations due to reductions in our discount rate assumptions, additionalbenefit accruals and foreign currency translation adjustments. The Company did not make any contributions to its U.S. qualified pension plan in 2004, and we will not be required to make any contributions in 2005. Contributions to internationaland executive pension plans are expected to increase from $111 million in 2004 to approximately $132 million in 2005.
NCR04 > MANAGEMENT’S DISCUSSION AND ANALYSIS > 15

In October 2004, the Company replaced a $200 million 364-day unsecured credit facility with a $200 million five-yearunsecured credit facility with a syndicate of financial institutions. In addition to the $200 million facility, the Company has a $400 million, five-year unsecured revolving credit facility which the Company entered into in October 2001. The creditfacilities contain certain representations and warranties; conditions; affirmative, negative and financial covenants; andevents of default customary for such facilities. Interest rates charged on borrowings outstanding under the credit facilitiesare based on prevailing market rates. No amounts were outstanding under the facilities at December 31, 2004 and 2003.
Our cash, cash equivalents and short-term investments totaled $750 million as of December 31, 2004. We believe our cashflows from operations, the credit facilities (existing or future arrangements), the 7.125% senior notes, and other short- andlong-term debt financing, will be sufficient to satisfy our future working capital, research and development activities, capitalexpenditures, pension contributions and other financing requirements for the foreseeable future. Our ability to generate positive cash flows from operations is dependent on general economic conditions, competitive pressures, and other businessand risk factors described below in “Factors That May Affect Future Results.” If we are unable to generate sufficient cashflows from operations, or otherwise comply with the terms of our credit facilities and the 7.125% senior notes, we may berequired to refinance all or a portion of our existing debt or seek additional financing alternatives.
FACTORS THAT MAY AFFECT FUTURE RESULTSThis report and other documents that we file with the U.S. Securities and Exchange Commission (SEC), as well as other oral or written statements we may make from time to time, contain information based on management’s beliefs and includeforward-looking statements (within the meaning of the Private Securities Litigation Reform Act of 1995) that involve a number of known and unknown risks, uncertainties and assumptions. These forward-looking statements are not guarantees of future performance, and there are a number of factors including, but not limited to, those listed below, which could causeactual outcomes and results to differ materially from the results contemplated by such forward-looking statements. We do notundertake any obligation to publicly update or revise any forward-looking statements, whether as a result of new information,future events or otherwise.
ECONOMIC PRESSURESOur business is affected by the global economies in which we operate. The current economic climate, whichincludes decreased and/or more closely scrutinized capital spending by many industries, could impact our ability to meetour commitments to customers, the ability of our suppliers to meet their commitments to us, the timing of purchases by ourcurrent and potential customers, or the ability of our customers to fulfill their obligations to us on a timely basis. The extentof this impact, if any, is dependent on a number of factors, including the duration of the current economic climate, its effecton the markets and other general economic and business conditions.
COMPETITIONOur ability to compete effectively within the technology industry is critical to our future success. We operate in the intensely competitive information technology industry. This industry is characterized by rapidly changing technology,evolving industry standards, frequent new product introductions, price and cost reductions, and increasingly greater commoditization of products, making differentiation difficult. Our competitors include other large companies in the technologyindustry such as: International Business Machines, Inc. (IBM), Oracle Corporation, Diebold, Inc., Wincor Nixdorf GmbH & Co.,Getronics NV, and Unisys Corporation, some of which have widespread distribution and penetration of their platforms and service offerings. In addition, we compete with companies in specific markets such as self-checkout, entry-level ATMs,payment and imaging, and business consumables and media products.
Our future competitive performance and market position depend on a number of factors, including our ability to: react tocompetitive product and pricing pressures and meet the changing competitive requirements and deliverables in developingand emerging markets, such as India and China in the ATM business; rapidly and continually design, develop and market,or otherwise maintain and introduce solutions and related products and services for our customers that are competitive in the marketplace; react on a timely basis to shifts in market demands; compete in reverse auctions for new and continuingbusiness; take advantage of data warehousing market demands; reduce costs without creating operating inefficiencies; maintain competitive operating margins; improve product and service delivery quality; and effectively market and sell all of our diverse solutions. Our business and operating performance could be impacted by external competitive pressures, suchas increasing price erosion and the addition of new competitors.
Our customers sometimes finance our product sales through third-party financing companies. In case of customer default,these financing companies may be forced to resell this equipment at discounted prices impacting our ability to sell incremental units. The impact of these product and pricing pressures could include lower customer satisfaction, decreaseddemand for our solutions, loss of market share and reduction of operating profits.
16 > MANAGEMENT’S DISCUSSION AND ANALYSIS > NCR04
OPERATING RESULT FLUCTUATIONSOur revenue and operating results could fluctuate for a number of reasons including:
Seasonality Our sales are historically seasonal, with lower revenue in the first quarter and higher revenue in the fourthquarter of each year. Such seasonality also causes our working capital cash flow requirements to vary from quarter to quarterdepending on the variability in the volume, timing and mix of product sales. In addition, revenue in the third month of eachquarter is typically higher than in the first and second months. These factors, among other things, make forecasting moredifficult and may adversely affect our ability to predict financial results accurately.
Foreign Currency Our revenue and operating income are subject to variability due to the effects of foreign currency fluctuations against the U.S. Dollar. We have exposure to approximately 50 functional currencies, in which our primary exposure is from fluctuations in the Euro, British Pound, and Japanese Yen. Due to our global operations, weaknesses insome of these currencies are sometimes offset by strengths in others. Although the foreign currency environment is difficultto predict, the effects of currency fluctuations are partially mitigated by our hedging strategy.
Cost/Expense Reductions We are actively working to reduce our costs and expenses to improve operating profitability without jeopardizing the quality of our products or the efficiencies of our operations. Our success in achieving targeted cost andexpense reductions depends on a number of factors, including our ability to achieve infrastructure rationalizations, drive lowercomponent costs, improve supply chain efficiencies, and reduce inventory levels, among other things. If we do not successfullycomplete our cost reduction initiatives, our operating results or financial condition could be adversely affected.
Contractual Obligations of Consulting Services We maintain a professional services consulting workforce to fulfillcontracts that we enter into with our customers that may extend to multiple periods. Our profitability is largely a function of performing to customer contractual arrangements within the estimated costs to perform these obligations. If we exceedthese estimated costs, our profitability related to these contracts may be negatively impacted. In addition, if we are not ableto maintain appropriate utilization rates for our consultants, we may not be able to sustain profitability on these contracts.
Acquisitions and Divestitures As part of our solutions strategy, we intend to selectively acquire and divest technologies,products and businesses. As these acquisitions and divestures take place and we begin to include, or exclude as the casemay be, the financial results related to these transactions, it could cause our operating results to fluctuate.
Pension Funds Consistent with local competitive practice and regulations, we sponsor pension plans in many of the countries where we do business. A number of these pension plans are supported by pension fund investments which aresubject to financial market risk. The liabilities and assets of these plans are reported in our financial statements in accordancewith Statement of Financial Accounting Standards SFAS No. 87 (SFAS 87), “Employer’s Accounting for Pensions.” In conforming to the requirements of SFAS 87, we are required to make a number of actuarial assumptions for each plan,including expected long-term return on plan assets and discount rate. Our future financial results could be materiallyimpacted by volatility in financial market performance and changes in the actuarial assumptions, including those describedin our “Critical Accounting Policies and Estimates” disclosed below. Consistent with the requirements of paragraphs 44-45of SFAS 87, we estimate our discount rate and long-term expected rate of return on assets assumptions on a country-by-countrybasis after consultation with independent actuarial consultants. We examine interest rate trends within each country, particularly yields on high-quality long-term corporate bonds, to determine our discount rate assumptions. Our long-termexpected rate of return on asset assumptions are developed by considering the asset allocation and implementation strategiesemployed by each pension fund relative to capital market expectations.
Stock Option Accounting Similar to other companies, we use stock options as a form of compensation for certainemployees. Currently, the expense of these stock options is not reflected in the operating results under accounting guidancefrom Accounting Principles Board Opinion No. 25, “Accounting for Stock Issued to Employees.” In December 2004, theFinancial Accounting Standards Board (FASB) issued Statement of Financial Accounting Standards No. 123 (revised 2004)(SFAS 123(R)), “Share-Based Payment.” SFAS 123(R) requires all share-based payments to employees, including grants ofemployee stock options, to be recognized in the financial statements based on their fair values. The amount recognized for stock compensation could vary depending on a number of assumptions or changes. For example, assumptions such asrisk-free rate and expected volatility that drive our valuation model could change. Other examples that could have an impactinclude changes in our compensation plans, tax rate, or an unusually high amount of expirations of stock options. Furtherdisclosure is reported in Note 1 of Notes to Consolidated Financial Statements, “Stock Compensation,” and “RecentlyIssued Accounting Pronouncements.”
Income Taxes We account for income taxes in accordance with Statement of Financial Accounting Standards No. 109(SFAS 109), “Accounting for Income Taxes,” which recognizes deferred tax assets and liabilities based on the differencesbetween the financial statement carrying amounts and the tax basis of assets and liabilities. We regularly review our deferred tax assets for recoverability and establish a valuation allowance if it is more likely than not that some portion or allof a deferred tax asset will not be realized. If we are unable to generate sufficient future taxable income, or if there is amaterial change in the actual effective tax rates or the time period within which the underlying temporary differencesbecome taxable or deductible, or if the tax laws change unfavorably, then we could be required to increase our valuationallowance against our deferred tax assets, resulting in an increase in our effective tax rate.
NCR04 > MANAGEMENT’S DISCUSSION AND ANALYSIS > 17

Real Estate Our strategy over the past several years with respect to real estate has been to reduce our holdings of excessreal estate. In line with this strategy, we anticipate the exit of certain facilities, which may affect net income. Adverse realestate markets could impede our ability to reduce the size of our real estate portfolio.
MULTINATIONAL OPERATIONSGenerating substantial revenues from our multinational operations helps to balance our risks and meet ourstrategic goals. In 2004, the percentage of revenues from outside of the United States was 57%. We believe that our geographic diversity may help to mitigate some risks associated with geographic concentrations of operations (e.g., adversechanges in foreign currency exchange rates and deteriorating economic environments or business disruptions due to economic or political uncertainties). However, our ability to sell our solutions domestically in the United States and internationally is subject to the following risks, among others: general economic and political conditions in each countrywhich could adversely affect demand for our solutions in these markets; currency exchange rate fluctuations which couldresult in lower demand for our products as well as generate currency translation losses; changes to and compliance with a variety of local laws and regulations which may increase our cost of doing business in these markets or otherwise preventus from effectively competing in these markets; changing competitive requirements and deliverables in developing andemerging markets; and the impact of civil unrest relating to war and terrorist activity on the economy or markets in general,or on our ability, or that of our suppliers, to meet commitments.
INTRODUCTION OF NEW SOLUTIONSThe solutions we sell are very complex, and we need to rapidly and successfully develop and introduce newsolutions in a competitive, rapidly changing environment. The development process for our solutions, including our software application development programs and the migration of our Teradata Data Warehousing solution to the latesthardware and software platforms, requires high levels of innovation from both our developers and our suppliers of the components embedded in our solutions. In addition, the development process can be lengthy and costly, and requires us tocommit a significant amount of resources to bring our business solutions to market.
If we are unable to anticipate our customers’ needs and technological trends accurately, or are otherwise unable to completedevelopment efficiently, we would be unable to introduce new solutions into the market on a timely basis, if at all, and ourbusiness and operating results could be impacted. Likewise, we sometimes make assurances to customers regarding newtechnologies, and our results could be impacted if we are unable to deliver such technologies as planned. Also, if we cannotsuccessfully market and sell both existing and newly developed solutions, our business and operating results could be impacted.
Our hardware and software-based solutions may contain known, as well as undetected errors, which may be found after theproducts’ introduction and shipment. While we attempt to remedy errors that we believe would be considered critical by ourcustomers prior to shipment, we may not be able to detect or remedy all such errors, and this could result in lost revenues,delays in customer acceptance, and incremental costs, which would all impact our business and operating results.
RELIANCE ON THIRD PARTIESThird-party suppliers provide important elements to our solutions. In most cases, there are a number of vendorsproducing the parts and components that we utilize. However, there are some components that are purchased from single sources due to price, quality, technology or other reasons. For example, we depend on silicon computer chips andmicroprocessors from Intel Corporation and operating systems from Microsoft Corporation. Certain parts and components usedin the manufacture of our ATMs and the delivery of many of our Retail Store Automation solutions are also supplied by single sources. In addition, there are a number of key suppliers for our businesses who provide us with critical products forour solutions. If we were unable to purchase the necessary parts, components or products from a particular vendor and wehad to find an alternative supplier, our new and existing product shipments and solutions deliveries could be delayed,impacting our business and operating results.
We have, from time to time, formed alliances with third parties that have complementary products, software, services and skills. Many different relationships are formed by these alliances, such as outsourcing arrangements to manufacturehardware and subcontract agreements with third parties to perform services and provide products and software to our customers in connection with our solutions. For example, we rely on third parties for cash replenishment services for ourATM products. Also, some of these third parties have access to confidential NCR and customer data, the integrity and security of which we need to ensure. These alliances introduce risks that we cannot control, such as nonperformance bythird parties and difficulties with or delays in integrating elements provided by third parties into our solutions.
Lack of information technology infrastructure, shortages in business capitalization, manual processes and data integrityissues of smaller suppliers can also create product time delays, inventory and invoicing problems and staging delays, as wellas other operating issues. The failure of third parties to provide high-quality products or services that conform to requiredspecifications or contractual arrangements could impair the delivery of our solutions on a timely basis, create exposure fornon-compliance with our contractual commitments to our customers and impact our business and operating results.
18 > MANAGEMENT’S DISCUSSION AND ANALYSIS > NCR04

INTELLECTUAL PROPERTYAs a technology company, our intellectual property portfolio is key to our future ability to be a leading technology and services solutions provider. To that end, it is critical that we continue to develop leading technologiesand protect and enhance our proprietary rights in our intellectual property through patent, copyright, trademark and tradesecret laws. These efforts include protection of the products and application, diagnostic and other software we develop. To theextent we are not successful, our business could be adversely impacted. Also, many of our offerings rely on technologiesdeveloped by others, and if we are not able to continue to obtain licenses for such technologies, our business would be impacted.
There has been a recent increase in the issuance of software and business method patents, and more companies are aggressively enforcing their intellectual property rights. This trend could impact NCR because from time to time we receivenotices from third parties regarding patent and other intellectual property claims. Whether such claims are with or withoutmerit, they may require significant resources to defend. If an infringement claim is successful, in the event we are unable tolicense the infringed technology or to substitute similar non-infringing technology, our business could be adversely affected.
WORK ENVIRONMENT Restructuring and Re-engineering As we discussed above, we are implementing a re-engineering plan to drive operational efficiency throughout our Company. In order to drive cost and expense out of our businesses, we are rationalizingour infrastructure through real estate and support cost reductions including consolidating a portion of our product developmentfunctions to locations outside of the United States; simplifying our front- and back-office processes by, for example, standardizing global IT applications and finance and administration processes; reducing our product costs through designand procurement initiatives; and working to lower our cost of services through completion of a global model for such services.In addition, as part of our ongoing efforts to optimize our cost structure, from time to time, we shift and realign our employeeresources, which could temporarily result in substandard productivity levels. Also, as we move our transaction supportprocesses to Accenture, we have mutually agreed to schedules for the transition of work. An inability to meet the associatedtimelines or commitments on the part of either NCR or Accenture could have a material adverse impact on the Company’sresults from operations, financial condition and cash flows. In addition to reducing costs and expenses, our plan includesinitiatives to grow revenue, such as improving sales training, addressing sales territory requirements, maintaining and monitoring customer satisfaction with our solutions, and focusing on our strong value propositions. We currently have manyinitiatives underway. If we are not successful in managing these initiatives and minimizing any resulting loss in productivity,our business and operating results could be impacted.
Employees Our employees are vital to our success. Our ability to attract and retain highly skilled technical, sales, consulting and other key personnel is critical, as these key employees are difficult to replace. Our current re-engineeringefforts may adversely impact our workforce. If we are not able to attract or retain highly qualified employees by offeringcompetitive compensation, secure work environments and leadership opportunities, our business could be impacted.
Internal Controls/Accounting Policies and Practices Our internal controls, accounting policies and practices, andinternal information systems enable us to capture and process transactions in a timely and accurate manner in compliancewith accounting principles generally accepted in the United States of America, laws and regulations, taxation requirementsand federal securities laws and regulations. Our internal controls and policies are being closely monitored by managementas we implement a worldwide ERP system and transition our transaction support functions to Accenture. While we believethese controls, policies, practices and systems are adequate to ensure data integrity, unanticipated and unauthorized actionsof employees (both domestic and international), temporary lapses in internal controls due to shortfalls in transition planningand oversight, or resource constraints could lead to improprieties and undetected errors that could impact our financial condition or results of operations. Moreover, while management has concluded that the Company’s internal control overfinancial reporting was effective as of December 31, 2004 (as set forth in “Report of Management” included later in thisannual report), due to its inherent limitations, such controls may not prevent or detect misstatements in our reported financial statements. Such limitations include, among other things, the potential for human error or circumvention of controls. Further, the Company’s internal control over financial reporting is subject to the risk that controls may becomeinadequate because of a failure to remediate control deficiencies, changes in conditions, or a deterioration of the degree of compliance with established policies and procedures.
Information Systems It is periodically necessary to replace, upgrade, or modify our internal information systems. If weare unable to replace, upgrade or modify such systems in a timely and cost-effective manner, especially in light of demandson our information technology resources, our ability to capture and process financial transactions and therefore our financialcondition or results of operation may be impacted.
ACQUISITIONS AND ALLIANCESOur ability to successfully integrate acquisitions or effectively manage alliance activities will help drivefuture growth. As part of our overall solutions strategy, we intend to make investments in companies, products, servicesand technologies, either through acquisitions, joint ventures or strategic alliances. Acquisitions and alliance activitiesinherently involve risks. The risks we may encounter include those associated with assimilating and integrating different
NCR04 > MANAGEMENT’S DISCUSSION AND ANALYSIS > 19
business operations, corporate cultures, personnel, infrastructures and technologies or products acquired or licensed, and thepotential for unknown liabilities within the acquired or combined business. The investment or alliance may also disrupt ourongoing business, or we may not be able to successfully incorporate acquired products, services or technologies into oursolutions and maintain quality. Further, we may not achieve the projected synergies once we have integrated the businessinto our operations. This may lead to additional costs not anticipated at the time of acquisition.
It is our policy not to discuss or comment upon negotiations regarding such business combinations or divestitures unlessthey are material and a definitive agreement is signed or circumstances indicate a high degree of probability that a materialtransaction will be consummated, unless the law requires otherwise.
ENVIRONMENTALOur historical and ongoing manufacturing activities subject us to environmental exposures. Our facilities andoperations are subject to a wide range of environmental protection laws, and we have investigatory and remedial activitiesunderway at a number of facilities that we currently own or operate, or formerly owned or operated, to comply, or to determine compliance, with such laws. Given the uncertainties inherent in such activities, there can be no assurances that the costs required to comply with applicable environmental laws will not impact future operating results.
We have also been identified as a potentially responsible party in connection with certain environmental matters, includingthe Fox River matter, as further described in “Environmental Matters” under Note 11 of Notes to Consolidated FinancialStatements, “Commitments and Contingencies,” and in the “Critical Accounting Policies and Estimates” section of thisMD&A, and we incorporate such disclosures by reference and make them a part of this risk factor. As described in moredetail in such disclosures, we maintain an accrual for our potential liability relating to the Fox River matter which representscertain critical estimates and judgments made by us regarding our potential liability; however, both the ultimate costs associated with the Fox River matter and our share of those costs are subject to a wide range of potential outcomes.
CONTINGENCIESLike other technology companies, we face uncertainties with regard to regulations, lawsuits and other relatedmatters. In the normal course of business, we are subject to proceedings, lawsuits, claims and other matters, includingthose that relate to the environment, health and safety, employee benefits, export compliance, intellectual property and otherregulatory compliance and general matters. Because such matters are subject to many uncertainties, their outcomes are notpredictable. While we believe that amounts provided in our consolidated financial statements are currently adequate in lightof the probable and estimable liabilities, there can be no assurances that the amounts required to satisfy alleged liabilitiesfrom such matters will not impact future operating results. Additionally, we are subject to diverse and complex laws and regulations, including those relating to corporate governance, public disclosure and reporting, which are rapidly changingand subject to many possible changes in the future. Although we do not believe that recent regulatory and legal initiativeswill result in significant changes to our internal practices or our operations, rapid changes in accounting standards, taxationrequirements, and federal securities laws and regulations, among others, may substantially increase costs to our organizationand could have an impact on our future operating results.
CRITICAL ACCOUNTING POLICIES AND ESTIMATESOur consolidated financial statements are prepared in accordance with GAAP. In connection with the preparation of thesefinancial statements, we are required to make assumptions, estimates and judgments that affect the reported amounts ofassets, liabilities, revenues, expenses and the related disclosure of contingent liabilities. These assumptions, estimates andjudgments are based on historical experience and assumptions that are believed to be reasonable at the time. However,because future events and their effects cannot be determined with certainty, the determination of estimates requires theexercise of judgment. Our critical accounting policies are those which require assumptions to be made about matters that are highly uncertain. Different estimates could have a material impact on our financial results. Judgments and uncertaintiesaffecting the application of these policies and estimates may result in materially different amounts being reported under different conditions or circumstances. Our management continually reviews these estimates and assumptions to ensure thatour financial statements are presented fairly and are materially correct.
In many cases, the accounting treatment of a particular transaction is specifically dictated by GAAP and does not requiresignificant management judgment in its application. There are also areas in which management’s judgment in selectingamong available alternatives would not produce a materially different result. The significant accounting policies and estimates that we believe are the most critical to aid in fully understanding and evaluating our reported financial results arediscussed in the paragraphs below. Our senior management has reviewed these critical accounting policies and related disclosures with our independent auditors and the Audit Committee of our Board of Directors (see Note 1 of Notes toConsolidated Financial Statements, which contains additional information regarding our accounting policies and other disclosures required by GAAP).
20 > MANAGEMENT’S DISCUSSION AND ANALYSIS > NCR04

REVENUE RECOGNITIONConsistent with other companies that provide similar solution offerings that include hardware, software, professional, consulting and support services, revenue recognition is often complex and subject to multiple accounting pronouncements.These include Statement of Position 97-2, “Software Revenue Recognition,” Staff Accounting Bulletin No. 104 (SAB 104),“Revenue Recognition,” Emerging Issues Task Force No. 00-21 (Issue 00-21), “Revenue Arrangements with MultipleDeliverables,” and other applicable revenue recognition guidance and interpretations.
We consider revenue realized, or realizable, and earned when persuasive evidence of an arrangement exists, the products or services have been provided to the customer, the sales price is fixed or determinable, and collectibility is reasonably assured.Please refer to Note 1 of Notes to Consolidated Financial Statements for a description of our revenue recognition policies.
Revenue recognition for complex contractual arrangements requires a greater degree of judgment, including a review of specific contracts, past experience, creditworthiness of customers, international laws and other factors. Changes in judgments about these factors could impact the timing and amount of revenue recognized between periods.
ALLOWANCE FOR DOUBTFUL ACCOUNTSWe evaluate the collectibility of our accounts receivable based on a number of factors. We establish provisions for doubtfulaccounts using percentages of our accounts receivable balances as an overall proxy to reflect historical average credit lossesand provision for known issues. These percentages are applied to aged accounts receivable balances. Aged accounts aredetermined based on the number of days the receivable is outstanding, measured from the date of the invoice, or from thedate on which payment is due. As the age of the receivable increases, the provision percentage also increases. This policy isapplied to all of our operating segments.
Based on the factors below, we periodically review customer account activity in order to assess the adequacy of theallowances provided for potential losses. Factors include economic conditions and judgments regarding collectibility ofaccount balances, each customer’s payment history and creditworthiness.
The allowance for doubtful accounts as of December 31 was $24 million in 2004, $27 million in 2003, and $25 million in2002. These allowances represent 1.8%, 2.1% and 2.0% of gross receivables for 2004, 2003 and 2002, respectively.Although no near-term changes are expected, unforeseen changes to future allowance percentages could materially impactoverall financial results.
Given our experience, we believe that the reserves for potential losses are adequate, but if one or more of our larger customers were to default on its obligations, we could be exposed to potentially significant losses in excess of the provisionsestablished. If economic conditions deteriorate, we may increase our reserves for doubtful accounts.
INVENTORY VALUATIONInventories are stated at lower of cost or market. Each quarter, our business segments reassess raw materials, work-in-process,parts and finished equipment inventory average costs for purchase or usage variances from standards, and valuation adjustments are made. Additionally, to properly provide for potential exposure due to slow-moving, excess, obsolete or unusable inventory, a reserve against inventory is established. This reserve is established based on forecasted usage, orders,technological obsolescence and inventory aging. These factors are impacted by market conditions, technology changes, andchanges in strategic direction, and require estimates and management judgment that may include elements that are uncertain.On a quarterly basis, we review the current market value of inventory and require each business segment to ensure thatinventory balances are adjusted for any inventory exposure due to age or excess of cost over market value.
We have inventory in more than 40 countries around the world. We transfer inventory from our plants to our distribution andsales organizations. This inventory is transferred at cost plus mark-up. This mark-up is referred to as inter-company profit.Each quarter we review our inventory levels and analyze our inter-company profit for each of our segments to determine theamount of inter-company profit to eliminate. Key assumptions are made to estimate product gross margins, the product mixof existing inventory balances and current period shipments. Over time, we refine these estimates as facts and circumstanceschange. If our estimates require refinement, our results could be impacted.
Our excess and obsolete reserves for inventory were $56 million, $50 million and $51 million as of December 31, 2004,2003 and 2002, respectively, and represent 13.5%, 13.9% and 16.2% of our gross inventory balances for each period.Although we strive to achieve a balance between market demands and risk of inventory obsolescence or excess quantitiescaused by these factors, it is possible that, should conditions change, additional reserves may be needed. Any changes inreserves will impact operating income during a given period. This policy is consistently applied to all of our operating segments and we do not anticipate any changes to our policy in the near term.
NCR04 > MANAGEMENT’S DISCUSSION AND ANALYSIS > 21
WARRANTY RESERVESOne of our key objectives is to provide superior quality products and services. To that end, we provide a standard manufacturer’s warranty extending up to 12 months such that, should products under warranty require repair, no additionalcost of that repair will be charged to our customers. A corresponding estimated liability for potential warranty costs is alsorecorded at the time of the sale. We sometimes offer extended warranties to our customers for purchase. We defer the fairvalue of these revenues and recognize revenue over the life of the warranty. This impacts all segments of our business exceptfor the “Other” segment where minimal warranty, if any, is offered.
Future warranty obligation costs are based upon historic factors such as labor rates, average repair time, travel time, numberof service calls per machine and cost of replacement parts. Each segment consummating a sale recognizes the total customerrevenue and records the associated warranty liability based upon the pre-established warranty percentages for that product class.
Total warranty costs were $44 million, $43 million and $41 million, representing 1.4%, 1.5% and 1.4% of total product revenues for the years ended December 31, 2004, 2003 and 2002, respectively. Historically, the principal factor used to estimate our warranty costs has been service calls per machine. Significant changes in this factor could result in actual warranty costs differing from accrued estimates. Although no near-term changes in our estimated warranty reserves are currently anticipated, in the unlikely event of a significant increase in warranty claims by one or more of our larger customers, costs to fulfill warranty obligations would be higher than provisioned, thereby impacting results.
PENSION, POSTRETIREMENT AND POSTEMPLOYMENT BENEFITSWe account for defined benefit pension plans in accordance with SFAS 87, which requires that amounts recognized in financial statements be determined on an actuarial basis. Our postretirement plans are accounted for in accordance withStatement of Financial Accounting Standards No. 106 (SFAS 106), “Employers’ Accounting for Postretirement BenefitsOther Than Pensions,” and our postemployment plans are accounted for in accordance with Statement of FinancialAccounting Standards No. 112 (SFAS 112), “Employers’ Accounting for Postemployment Benefits.” We have significant pension, postretirement and postemployment benefit costs and credits, which are developed from actuarial valuations.Actuarial assumptions attempt to anticipate future events and are used in calculating the expense and liability relating tothese plans. These factors include assumptions we make about interest rates, expected investment return on plan assets, rateof increase in health care costs, total and involuntary turnover rates, and rates of future compensation increases. In addition,our actuarial consultants use subjective factors such as withdrawal rates and mortality rates to develop our valuations. Wegenerally review and update these assumptions on an annual basis at the beginning of each fiscal year. We are required to consider current market conditions, including changes in interest rates, in making these assumptions. The actuarialassumptions that we use may differ materially from actual results due to changing market and economic conditions, higheror lower withdrawal rates or longer or shorter life spans of participants. These differences may result in a significant impactto the amount of pension, postretirement or postemployment benefits expense we have recorded or may record. Postretirementand postemployment expenses impact all of our segments, while pension expense is reported at the corporate level.
The key assumptions used in developing our 2004 pension and postretirement plan expense were the discount rate of 6.25%and expected return on assets assumption of 8.5% for our U.S. plans, which represent 62% and 100% of pension and postretirement plan obligations, respectively. Holding all other assumptions constant, a 0.25% change in the discount rateused for the U.S. plans would have increased or decreased pre-tax 2004 income by approximately $9 million ($9 million inpension expense and $0.1 million in postretirement expense). Likewise, a 0.25% change in the expected rate of return onplan assets assumption for the U.S. pension plan would have increased or decreased pre-tax 2004 income by approximately$6 million. Our expected return on plan assets has historically been and will likely continue to be material to net income.While it is required that we review our actuarial assumptions each year at the measurement date, we generally do notchange them between measurement dates. We use a measurement date of December 31 for all of our plans. In determining2005 pension and postretirement expense for the U.S. plans, we intend to use a discount rate of 5.75% and 5.25%, respectively, and an expected rate of return on assets assumption of 8.5%. The most significant assumption used in developing our 2004 postemployment plan expense was the assumed rate of involuntary turnover of 5%. The involuntaryturnover rate is based on historical trends and projections of involuntary turnover in the future. A 0.25% change in the rate of involuntary turnover would have increased or decreased pre-tax 2004 expense by approximately $5 million. The sensitivity of the assumptions described above is specific to each individual plan and not to our pension, postretirement, and postemployment plans in the aggregate.
ENVIRONMENTAL AND LEGAL CONTINGENCIESEach quarter, we review the status of each claim and legal proceeding and assess our potential financial exposure. If thepotential loss from any claim or legal proceeding is considered probable and the amount can be reasonably estimated, weaccrue a liability for the estimated loss, in accordance with Statement of Financial Accounting Standards No. 5 (SFAS 5),“Accounting for Contingencies.” To the extent the amount of a probable loss is estimable only by reference to a range ofequally probable outcomes, and no amount within the range appears to be a better estimate than any other amount, weaccrue for the low end of the range. Because of uncertainties related to these matters, the use of estimates, assumptions and
22 > MANAGEMENT’S DISCUSSION AND ANALYSIS > NCR04
judgments, and external factors beyond our control, accruals are based on the best information available at the time. As additional information becomes available, we reassess the potential liability related to our pending claims and litigation andmay revise our estimates. Such revisions in the estimates of the potential liabilities could have a material impact on ourresults of operations and financial position. Except for the sharing agreement with Appleton Papers Inc. (API) described inNote 11 of Notes to Consolidated Financial Statements, “Commitments and Contigencies,” (Note 11) with respect to the Fox River matter, when insurance carriers or third parties have agreed to pay any amounts related to costs, and we believethat it is probable that we can collect such amounts, those amounts would be reflected as receivables in our consolidatedfinancial statements.
The most significant legal contingency impacting our Company relates to the Fox River matter, which is further described in detail in Note 11. This matter impacts our Company overall and does not affect the financial results of any one of its segments. As described in Note 11, NCR was identified as a potentially responsible party (PRP) at the Fox River site inWisconsin because of polychlorinated biphenyl (PCB) discharges from two carbonless paper manufacturing facilities previously owned by NCR located along the Fox River.
Our reserve for the Fox River matter was approximately $67 million as of December 31, 2004 (after taking into considerationamounts expected to be recovered under an indemnity agreement discussed in Note 11). The Company regularly re-evaluatesthe assumptions used in determining the appropriate reserve for the Fox River matter as additional information becomesavailable and, when warranted, makes appropriate adjustments.
As described below and in Note 11, the extent of our potential liability in connection with the Fox River matter is subject tomany uncertainties at this time, including the amount of dredging that will be required by the U.S. Environmental ProtectionAgency and the Wisconsin Department of Natural Resources (the Governments); how contaminated sediments will be managed; the accuracy of existing cost estimates (actual costs could be substantially higher than estimated in the Governments’clean-up plans or Records of Decision (RODs) that were issued in 2003); and the extent of NCR’s eventual liability.
In setting our reserve, we attempt to estimate a range of reasonably possible outcomes for relevant factors, although eachrange is itself highly uncertain. We use our best estimate within the range if that is possible. Where there is a range of equallyprobable outcomes, and there is no amount within that range that appears to be a better estimate than any other amount, we use the low end of the range. Our eventual liability, which we expect will be paid out over a period of at least ten years,and likely as long as twenty to forty or more years, will depend on a number of factors, the most significant of which include:
• The total clean-up costs for the site (we use the low end of the range – $480 million – which is derived from theGovernments’ estimates in the RODs, increased by 20% to account for what we determined were underestimates inthe Governments’ figures);
• The total natural resource damages for the site (we use the low end of the range – $176 million – which is derivedfrom Government estimates in a 2000 report);
• The share NCR and API will jointly bear of the total clean-up costs and natural resource damages (we use the low end of the range, which is based primarily on an estimate of the joint NCR/API percentage of direct discharges of PCBs to the Fox River);
• The share NCR will bear of the joint NCR/API payments for clean-up costs and natural resource damages (we estimate we would pay approximately half of the total costs jointly attributable to NCR/API); and
• Our transaction costs to defend NCR in this matter (we have estimated the costs we are likely to incur over the nextten years, the time period the Governments project it will take to design and implement the remedy for the Fox River).
AT&T and Lucent Technologies, Inc. (Lucent) are jointly responsible for indemnifying NCR for a portion of amounts for theFox River incurred by NCR over a certain threshold. NCR’s estimate of what AT&T and Lucent will pay under the indemnityis recorded as a long-term receivable of $15 million and is deducted in determining the net amount discussed above.
While it remains difficult to predict, we do not expect there to be any significant near-term changes to any of the above-described assumptions that are likely to have a material effect on the amount of our accrual. However, there are otherestimates for each of these factors which are significantly higher than the estimates described above. We believe there issuch uncertainty surrounding these estimates that we cannot quantify the high end of the range of such estimates. In anyevent, assuming, for example, that the assumptions described above are each doubled (except where that would be inconsistentwith an existing agreement), and taking into account our payments under the interim settlement with the Governments (discussed in Note 11), our payments for the potential liabilities for the Fox River matter would be approximately $320 million(to be paid out over at least the ten-year period ending in 2013, and likely as long as twenty to forty or more years). AT&Tand Lucent are jointly responsible for indemnifying us for a portion of amounts incurred by our Company over a certainthreshold, and the $320 million estimate assumes they will make such payments. If we were in fact required to pay anamount such as $320 million for NCR’s share of the Fox River liabilities, it would have a moderate but manageable impact on our liquidity and capital resources, assuming that such amount was required to be paid over the time frame currently contemplated. However, if such an amount were required to be paid in a shorter time period, it could have a material impact on our liquidity or capital resources.
NCR04 > MANAGEMENT’S DISCUSSION AND ANALYSIS > 23
INCOME TAXESWe account for income taxes in accordance with Statement of Financial Accounting Standards No. 109 (SFAS 109),“Accounting for Income Taxes,” which recognizes deferred tax assets and liabilities based on the differences between thefinancial statement carrying amounts and the tax basis of assets and liabilities. The deferred tax assets and liabilities aredetermined based on the enacted tax rates expected to apply in the periods in which the deferred tax assets or liabilities areexpected to be settled or realized.
We regularly review our deferred tax assets for recoverability and establish a valuation allowance if it is more likely than notthat some portion or all of a deferred tax asset will not be realized. The determination as to whether a deferred tax asset willbe realized is made on a jurisdictional basis and is based on the evaluation of positive and negative evidence. This evidenceincludes historical taxable income, projected future taxable income, the expected timing of the reversal of existing temporarydifferences and the implementation of tax planning strategies. Projected future taxable income is based on our expectedresults and assumptions as to the jurisdiction in which the income will be earned. The expected timing of the reversals ofexisting temporary differences is based on current tax law and our tax methods of accounting. We also review our liabilitiesunder SFAS No. 5, which requires an accrual for estimated losses when it is probable that a liability has been incurred andthe amount can be reasonably estimated. These projections and estimates may change in the future as actual results become known.
If we are unable to generate sufficient future taxable income, or if there is a material change in the actual effective tax ratesor the time period within which the underlying temporary differences become taxable or deductible, or if the tax laws changeunfavorably, then we could be required to increase our valuation allowance against our deferred tax assets, resulting in anincrease in our effective tax rate. The impact to our effective tax rate would be an increase of one percentage point for eachincrease of $2.5 million to the valuation allowance as of December 31, 2004.
We had a valuation allowance of $585 million as of December 31, 2004, related to certain deferred income tax assets, primarily tax loss carryforwards, in jurisdictions where there is uncertainty as to ultimate realization of a benefit from thosetax assets. As of December 31, 2003, the valuation allowance was $546 million.
IMPAIRMENT OF LONG-LIVED ASSETSIn accordance with Statement of Financial Accounting Standards No. 144 (SFAS 144), “Accounting for the Impairment or Disposal of Long-Lived Assets,” long-lived assets to be held and used are reviewed for impairment whenever events or circumstances indicate that the carrying amount may not be recoverable. When required, impairment losses on assets to beheld and used are recognized based on the fair value of the asset. We determine the fair value of these assets based uponestimates of future cash flows, market value of similar assets, if available, or independent appraisals, if required. In analyzingthe fair value and recoverability using future cash flows, we make projections based on a number of assumptions and estimates of growth rates, future economic conditions, assignment of discount rates and estimates of terminal values. Animpairment loss is recognized if the carrying amount of the long-lived asset is not recoverable from its undiscounted cashflows. The measurement of impairment loss is the difference between the carrying amount and fair value of the asset. Thispolicy is applied to all of our operating segments. Long-lived assets to be disposed of and/or held for sale are reported at thelower of carrying amount or fair value less cost to sell. We determine the fair value of these assets in the same manner asdescribed for assets held and used.
The FASB issued the Statement of Financial Accounting Standards No. 141 (SFAS 141), “Business Combinations,” and SFAS 142 in June 2001. SFAS 141 specifies criteria that intangible assets acquired in a purchase method businesscombination must be recognized and reported apart from goodwill. SFAS 142 requires that goodwill no longer be amortized,but instead be tested for impairment at least annually. SFAS 142 also requires intangible assets with definite useful lives tocontinue to be amortized over their respective useful lives and be tested for impairment whenever events and circumstancesindicate that the carrying amount may not be recoverable. Indefinite life intangible assets must be tested annually to determinewhether events or circumstances continue to support the indefinite useful life. If the intangible asset is subsequently determined to have a finite useful life, the asset shall be tested for impairment in accordance with SFAS 144. Similar togoodwill, the assessment of impairment for intangible assets requires estimates of future cash flows. To the extent the carryingvalue of the assets exceed their fair value, an impairment loss would be recorded. See Note 5 of Notes to ConsolidatedFinancial Statements, “Long-lived Assets,” for our disclosure regarding goodwill and intangible assets.
RECENTLY ISSUED ACCOUNTING PRONOUNCEMENTSA discussion of recently issued accounting pronouncements is described in Note 1 of Notes to Consolidated FinancialStatements, and we incorporate such discussion in this MD&A by reference and make it a part hereof.
24 > MANAGEMENT’S DISCUSSION AND ANALYSIS > NCR04
QUANTITATIVE AND QUALITATIVE DISCLOSURES ABOUT MARKET RISKWe are exposed to market risk, including changes in foreign currency exchange rates and interest rates. We use a variety of measures to monitor and manage these risks, including derivative financial instruments. Since a substantial portion of ouroperations and revenue occur outside the United States, and in currencies other than the U.S. Dollar, our results can be significantly impacted by changes in foreign currency exchange rates. To manage our exposures and mitigate the impact ofcurrency fluctuations on the operations of our foreign subsidiaries, we hedge our main transactional exposures through the useof foreign exchange forward contracts. This is primarily done through the hedging of foreign currency denominated inter-companyinventory purchases by the marketing units and of foreign currency denominated inventory sales by the manufacturing units.All of these transactions are firmly committed or forecasted. These foreign exchange contracts are designated as highlyeffective cash flow hedges. The gains or losses are deferred in other comprehensive income and recognized in the determinationof income when the underlying hedged transaction impacts earnings. As we hedge inventory purchases, the ultimate gain orloss from the derivative contract is recorded in cost of revenue when the inventory is sold to an unrelated third party.
We have exposure to approximately 50 functional currencies, in which our primary exposure is from fluctuations in the Euro,British Pound, and Japanese Yen. Due to our global operations, weaknesses in some of these currencies are sometimes offsetby strengths in others. The U.S. Dollar was weaker in 2004 as compared to 2003 based on comparable weighted averages forour functional currencies. This had a favorable impact of 4% on 2004 revenue versus 2003 revenue. This does not includethe effects of our hedging activities and, therefore, does not reflect the actual impact of fluctuations in exchange rates on ouroperating income.
Our strategy is to hedge, on behalf of each subsidiary, a portion of our non-functional currency denominated cash flows for aperiod of up to 15 months. In this way, some of the impact of currency fluctuations on non-functional currency denominatedtransactions (and hence on subsidiary operating income, as stated in the functional currency) is mitigated in the near term.The amount we hedge and the length of time hedge contracts are entered into may vary significantly. In the longer term(longer than the hedging period of up to 15 months), the subsidiaries are still subject to the impacts of foreign currency fluctuations. In addition, the subsidiary results are still subject to any impact of translating the functional currency results to U.S. Dollars. When hedging certain foreign currency transactions of a long-term investment nature (net investments in foreign operations), the gains and losses are recorded in the currency translation adjustment component of stockholders’equity. Gains and losses on other foreign exchange contracts are recognized in other income or expense as exchange rates change.
For purposes of potential risk analysis, we use sensitivity analysis to quantify potential impacts that market rate changesmay have on the fair values of our hedge portfolio related to firmly committed or forecasted transactions. The sensitivityanalysis represents the hypothetical changes in value of the hedge position and does not reflect the related gain or loss onthe forecasted underlying transaction. As of December 31, 2004 and 2003, a 10% appreciation in the value of the U.S. Dollaragainst foreign currencies from the prevailing market rates would result in increases of $20 million and $14 million in thefair value of the hedge portfolio, respectively. Conversely, a 10% depreciation of the U.S. Dollar against foreign currenciesfrom the prevailing market rates would result in decreases of $20 million and $14 million in the fair value of the hedge portfolio as of December 31, 2004 and 2003, respectively.
The interest rate risk associated with our borrowing and investing activities at December 31, 2004, was not material in relation to our consolidated financial position, results of operations or cash flows. In 2003, we swapped a portion of our7.125% senior unsecured notes from the fixed rate to a variable rate. The swap is described in more detail in Note 10 ofNotes to Consolidated Financial Statements.
We utilize non-exchange traded financial instruments, such as foreign exchange forward contracts that we purchase exclusively from highly-rated financial institutions. We record these contracts on our balance sheet at fair market valuebased upon market price quotations from the financial institutions. We do not enter into non-exchange traded contracts thatrequire the use of fair value estimation techniques, but if we did, they could have a material impact on our financial results.Also, we do not enter into hedges for speculative purposes.
We are potentially subject to concentrations of credit risk on accounts receivable and financial instruments, such as hedginginstruments, short-term investments, and cash and cash equivalents. Credit risk includes the risk of nonperformance bycounterparties. The maximum potential loss may exceed the amount recognized on the balance sheet. Exposure to credit riskis managed through credit approvals, credit limits, selecting major international financial institutions (as counterparties tohedging transactions) and monitoring procedures. Our business often involves large transactions with customers for whichwe do not require collateral. If one or more of those customers were to default in its obligations under applicable contractualarrangements, we could be exposed to potentially significant losses. Moreover, a downturn in the global economy could havean adverse impact on the ability of our customers to pay their obligations on a timely basis. We believe that the reserves forpotential losses are adequate. At December 31, 2004 and 2003, we did not have any major concentration of credit risk related to financial instruments.
NCR04 > MANAGEMENT’S DISCUSSION AND ANALYSIS > 25

FINANCIAL STATEMENTSWe are responsible for the preparation, integrity, and objectivity of our consolidated financial statements and other financialinformation presented in our annual report. The accompanying consolidated financial statements were prepared in accordance with accounting principles generally accepted in the United States of America and include certain amountsbased on currently available information and our judgment of current conditions and circumstances.
PricewaterhouseCoopers LLP, our independent registered public accounting firm, is engaged to perform audits of our consolidated financial statements. These audits are performed in accordance with the standards of the Public CompanyAccounting Oversight Board (United States). Our independent auditors were given unrestricted access to all financialrecords and related data, including minutes of all meetings of shareholders, the Board of Directors, and committees of theBoard. The Company believes that all representations made to the independent accountants during their audits were validand appropriate.
The Audit Committee of the Board of Directors, consisting entirely of independent directors who are not employees of NCR,monitors our accounting, reporting, and internal control structure. Our independent auditors, internal auditors, and managementhave complete and free access to the Audit Committee, which periodically meets directly with each group to ensure thattheir respective duties are being properly discharged.
INTERNAL CONTROL OVER FINANCIAL REPORTINGManagement is responsible for establishing and maintaining adequate internal control over financial reporting as defined in Rules 13a-15(f) and 15d-15(f) under the Securities Exchange Act of 1934. The Company’s internal control over financialreporting is a process designed to provide reasonable assurance regarding the reliability of financial reporting and the preparation of financial statements for external purposes in accordance with generally accepted accounting principles. Acompany’s internal control over financial reporting includes those policies and procedures that (i) pertain to the maintenanceof records that, in reasonable detail, accurately and fairly reflect the transactions and dispositions of the assets of the company; (ii) provide reasonable assurance that transactions are recorded as necessary to permit preparation of financialstatements in accordance with generally accepted accounting principles, and that receipts and expenditures of the companyare being made only in accordance with authorizations of management and directors of the company; and (iii) provide reasonable assurance regarding prevention or timely detection of unauthorized acquisition, use, or disposition of the company’s assets that could have a material effect on the financial statements.
Because of its inherent limitations due to, for example, the potential for human error or circumvention of controls, internalcontrol over financial reporting may not prevent or detect misstatements. Also, projections of any evaluation of effectivenessto future periods are subject to the risk that controls may become inadequate because of changes in conditions, or that thedegree of compliance with the policies or procedures may deteriorate.
Our management assessed the effectiveness of the Company’s internal control over financial reporting as of December 31,2004. In making this assessment, we used the criteria set forth by the Committee of Sponsoring Organizations of theTreadway Commission (COSO) in Internal Control – Integrated Framework. Based on our assessment, we determined that, as of December 31, 2004, the Company’s internal control over financial reporting was effective based on those criteria.Management’s assessment of the effectiveness of NCR’s internal control over financial reporting as of December 31, 2004has been audited by PricewaterhouseCoopers LLP, our independent registered public accounting firm, as stated in theirreport which appears on page 27 of this Annual Report.
Mark V. Hurd Peter J. BocianDirector, President and Senior Vice President, andChief Executive Officer Chief Financial Officer
REPORT OF MANAGEMENT
26 > REPORT OF MANAGEMENT > NCR04

NCR04 > REPORT OF INDEPENDENT REGISTERED PUBLIC ACCOUNTING FIRM > 27
REPORT OF INDEPENDENT REGISTERED PUBLIC ACCOUNTING FIRM
To the Board of Directors and Stockholders of NCR Corporation:
We have completed an integrated audit of NCR Corporation’s 2004 consolidated financial statements and of its internal control over financial reporting as of December 31, 2004 and audits of its 2003 and 2002 consolidated financial statementsin accordance with the standards of the Public Company Accounting Oversight Board (United States). Our opinions, basedon our audits, are presented below.
CONSOLIDATED FINANCIAL STATEMENTSIn our opinion, the accompanying consolidated balance sheets and the related consolidated statements of operations, ofchanges in stockholders’ equity and of cash flows present fairly, in all material respects, the financial position of NCRCorporation and its subsidiaries at December 31, 2004 and 2003, and the results of their operations and their cash flows foreach of the three years in the period ended December 31, 2004 in conformity with accounting principles generally acceptedin the United States of America. These financial statements are the responsibility of the Company’s management. Ourresponsibility is to express an opinion on these financial statements based on our audits. We conducted our audits of thesestatements in accordance with the standards of the Public Company Accounting Oversight Board (United States). Thosestandards require that we plan and perform the audit to obtain reasonable assurance about whether the financial statementsare free of material misstatement. An audit of financial statements includes examining, on a test basis, evidence supportingthe amounts and disclosures in the financial statements, assessing the accounting principles used and significant estimatesmade by management, and evaluating the overall financial statement presentation. We believe that our audits provide a reasonable basis for our opinion.
As discussed in Note 1 of the Notes to Consolidated Financial Statements, on January 1, 2002, NCR Corporation adoptedStatement of Financial Accounting Standards No. 142, “Goodwill and Other Intangible Assets.”
INTERNAL CONTROL OVER FINANCIAL REPORTINGAlso, in our opinion, management’s assessment, included in the accompanying Management’s Report on Internal Control Over Financial Reporting, that the Company maintained effective internal control over financial reporting as ofDecember 31, 2004 based on criteria established in Internal Control – Integrated Framework issued by the Committee ofSponsoring Organizations of the Treadway Commission (COSO), is fairly stated, in all material respects, based on those criteria.Furthermore, in our opinion, the Company maintained, in all material respects, effective internal control over financialreporting as of December 31, 2004, based on criteria established in Internal Control – Integrated Framework issued by theCOSO. The Company’s management is responsible for maintaining effective internal control over financial reporting and forits assessment of the effectiveness of internal control over financial reporting. Our responsibility is to express opinions onmanagement’s assessment and on the effectiveness of the Company’s internal control over financial reporting based on ouraudit. We conducted our audit of internal control over financial reporting in accordance with the standards of the PublicCompany Accounting Oversight Board (United States). Those standards require that we plan and perform the audit to obtainreasonable assurance about whether effective internal control over financial reporting was maintained in all materialrespects. An audit of internal control over financial reporting includes obtaining an understanding of internal control overfinancial reporting, evaluating management’s assessment, testing and evaluating the design and operating effectiveness ofinternal control, and performing such other procedures as we consider necessary in the circumstances. We believe that ouraudit provides a reasonable basis for our opinions.
A company’s internal control over financial reporting is a process designed to provide reasonable assurance regarding thereliability of financial reporting and the preparation of financial statements for external purposes in accordance with generallyaccepted accounting principles. A company’s internal control over financial reporting includes those policies and proceduresthat (i) pertain to the maintenance of records that, in reasonable detail, accurately and fairly reflect the transactions and dispositions of the assets of the company; (ii) provide reasonable assurance that transactions are recorded as necessary topermit preparation of financial statements in accordance with generally accepted accounting principles, and that receiptsand expenditures of the company are being made only in accordance with authorizations of management and directors of thecompany; and (iii) provide reasonable assurance regarding prevention or timely detection of unauthorized acquisition, use, ordisposition of the company’s assets that could have a material effect on the financial statements.
Because of its inherent limitations, internal control over financial reporting may not prevent or detect misstatements. Also,projections of any evaluation of effectiveness to future periods are subject to the risk that controls may become inadequatebecause of changes in conditions, or that the degree of compliance with the policies or procedures may deteriorate.
Dayton, OhioMarch 2, 2005
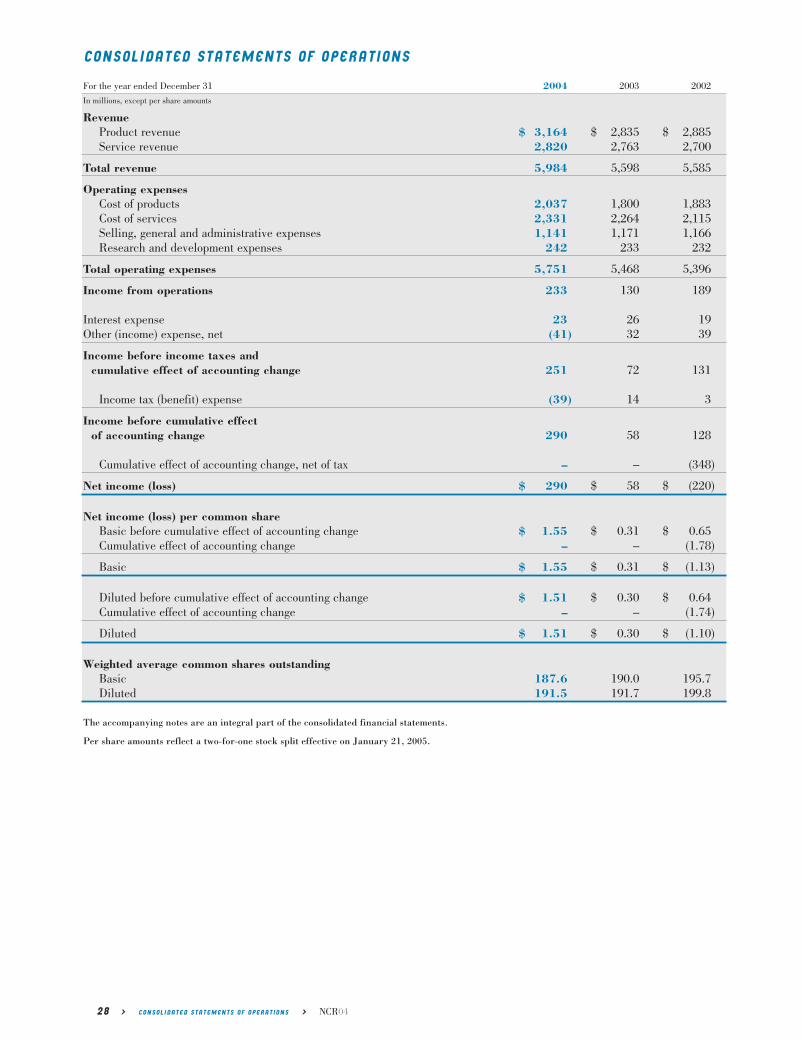
28 > CONSOLIDATED STATEMENTS OF OPERATIONS > NCR04
For the year ended December 31 2004 2003 2002
In millions, except per share amounts
RevenueProduct revenue $ 3,164 $ 2,835 $ 2,885Service revenue 2,820 2,763 2,700
Total revenue 5,984 5,598 5,585
Operating expensesCost of products 2,037 1,800 1,883Cost of services 2,331 2,264 2,115Selling, general and administrative expenses 1,141 1,171 1,166Research and development expenses 242 233 232
Total operating expenses 5,751 5,468 5,396
Income from operations 233 130 189
Interest expense 23 26 19Other (income) expense, net (41) 32 39
Income before income taxes andcumulative effect of accounting change 251 72 131
Income tax (benefit) expense (39) 14 3
Income before cumulative effect of accounting change 290 58 128
Cumulative effect of accounting change, net of tax – – (348)
Net income (loss) $ 290 $ 58 $ (220)
Net income (loss) per common shareBasic before cumulative effect of accounting change $ 1.55 $ 0.31 $ 0.65Cumulative effect of accounting change – – (1.78)
Basic $ 1.55 $ 0.31 $ (1.13)
Diluted before cumulative effect of accounting change $ 1.51 $ 0.30 $ 0.64Cumulative effect of accounting change – – (1.74)
Diluted $ 1.51 $ 0.30 $ (1.10)
Weighted average common shares outstandingBasic 187.6 190.0 195.7Diluted 191.5 191.7 199.8
The accompanying notes are an integral part of the consolidated financial statements.
Per share amounts reflect a two-for-one stock split effective on January 21, 2005.
CONSOLIDATED STATEMENTS OF OPERATIONS
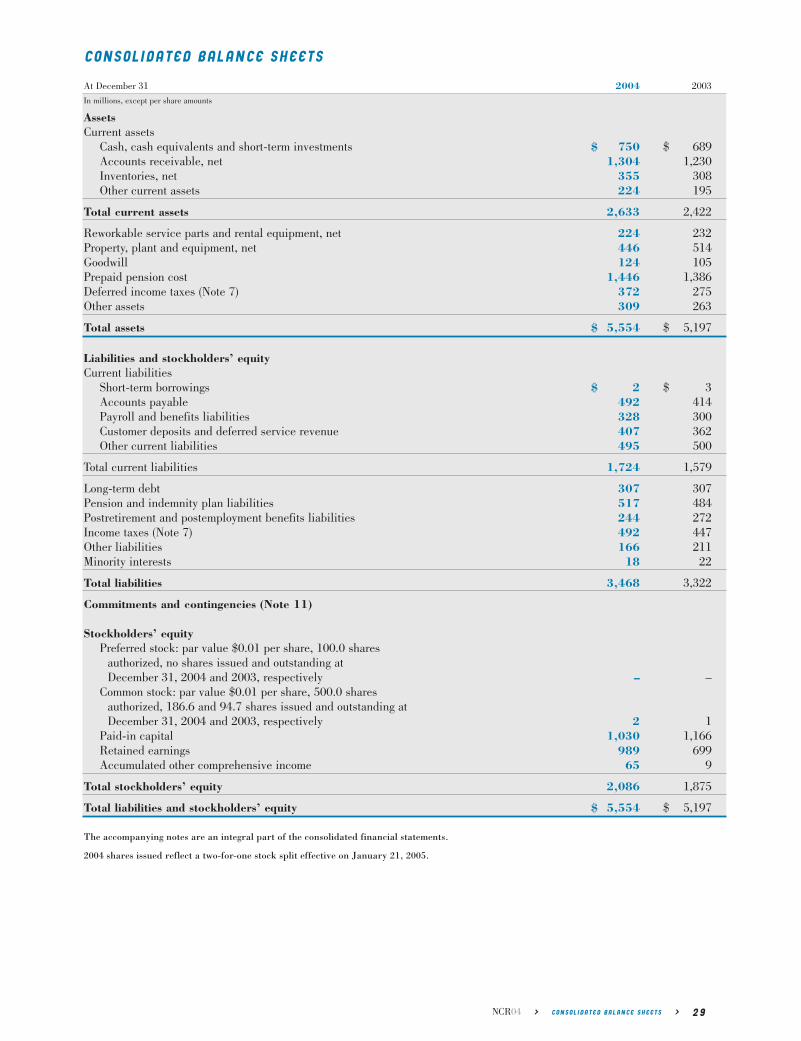
NCR04 > CONSOLIDATED BALANCE SHEETS > 29
At December 31 2004 2003
In millions, except per share amounts
AssetsCurrent assets
Cash, cash equivalents and short-term investments $ 750 $ 689Accounts receivable, net 1,304 1,230Inventories, net 355 308Other current assets 224 195
Total current assets 2,633 2,422
Reworkable service parts and rental equipment, net 224 232Property, plant and equipment, net 446 514Goodwill 124 105Prepaid pension cost 1,446 1,386Deferred income taxes (Note 7) 372 275Other assets 309 263
Total assets $ 5,554 $ 5,197
Liabilities and stockholders’ equityCurrent liabilities
Short-term borrowings $ 2 $ 3Accounts payable 492 414Payroll and benefits liabilities 328 300Customer deposits and deferred service revenue 407 362Other current liabilities 495 500
Total current liabilities 1,724 1,579
Long-term debt 307 307Pension and indemnity plan liabilities 517 484Postretirement and postemployment benefits liabilities 244 272Income taxes (Note 7) 492 447Other liabilities 166 211Minority interests 18 22
Total liabilities 3,468 3,322
Commitments and contingencies (Note 11)
Stockholders’ equityPreferred stock: par value $0.01 per share, 100.0 shares
authorized, no shares issued and outstanding at December 31, 2004 and 2003, respectively – –
Common stock: par value $0.01 per share, 500.0 sharesauthorized, 186.6 and 94.7 shares issued and outstanding atDecember 31, 2004 and 2003, respectively 2 1
Paid-in capital 1,030 1,166Retained earnings 989 699Accumulated other comprehensive income 65 9
Total stockholders’ equity 2,086 1,875
Total liabilities and stockholders’ equity $ 5,554 $ 5,197
The accompanying notes are an integral part of the consolidated financial statements.
2004 shares issued reflect a two-for-one stock split effective on January 21, 2005.
CONSOLIDATED BALANCE SHEETS
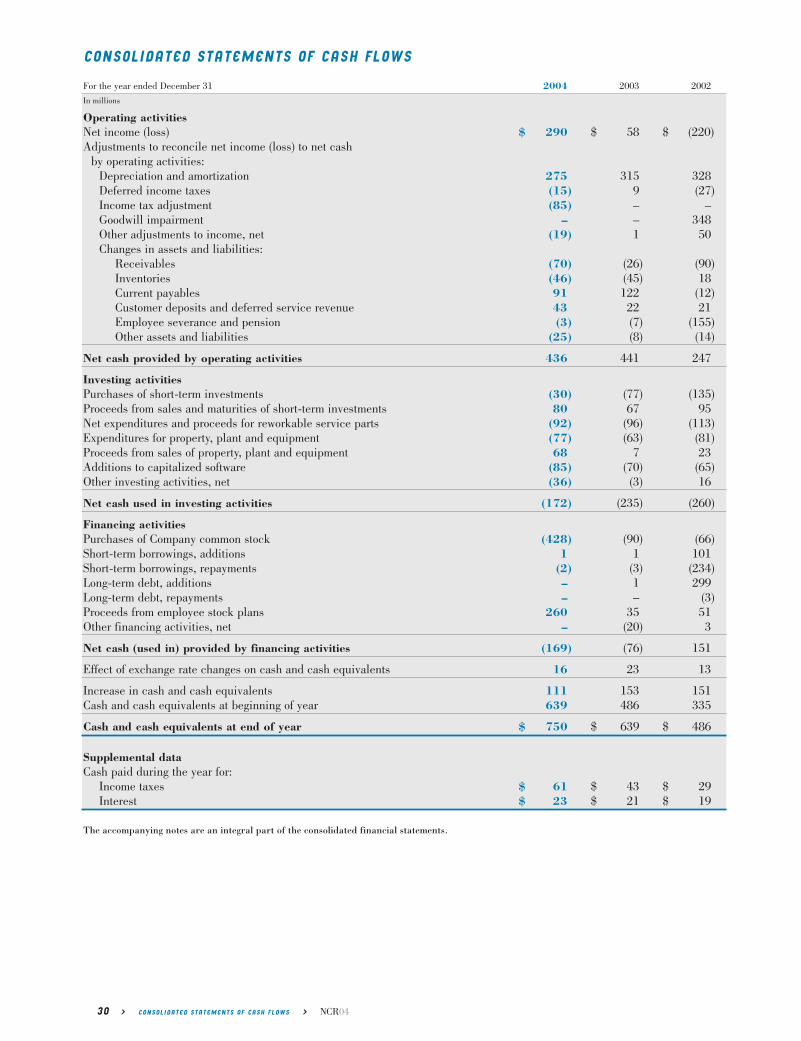
For the year ended December 31 2004 2003 2002
In millions
Operating activitiesNet income (loss) $ 290 $ 58 $ (220)Adjustments to reconcile net income (loss) to net cash
by operating activities:Depreciation and amortization 275 315 328Deferred income taxes (15) 9 (27)Income tax adjustment (85) – –Goodwill impairment – – 348Other adjustments to income, net (19) 1 50Changes in assets and liabilities:
Receivables (70) (26) (90)Inventories (46) (45) 18Current payables 91 122 (12)Customer deposits and deferred service revenue 43 22 21Employee severance and pension (3) (7) (155)Other assets and liabilities (25) (8) (14)
Net cash provided by operating activities 436 441 247
Investing activitiesPurchases of short-term investments (30) (77) (135)Proceeds from sales and maturities of short-term investments 80 67 95Net expenditures and proceeds for reworkable service parts (92) (96) (113)Expenditures for property, plant and equipment (77) (63) (81)Proceeds from sales of property, plant and equipment 68 7 23Additions to capitalized software (85) (70) (65)Other investing activities, net (36) (3) 16
Net cash used in investing activities (172) (235) (260)
Financing activitiesPurchases of Company common stock (428) (90) (66)Short-term borrowings, additions 1 1 101Short-term borrowings, repayments (2) (3) (234)Long-term debt, additions – 1 299Long-term debt, repayments – – (3)Proceeds from employee stock plans 260 35 51Other financing activities, net – (20) 3
Net cash (used in) provided by financing activities (169) (76) 151
Effect of exchange rate changes on cash and cash equivalents 16 23 13
Increase in cash and cash equivalents 111 153 151Cash and cash equivalents at beginning of year 639 486 335
Cash and cash equivalents at end of year $ 750 $ 639 $ 486
Supplemental dataCash paid during the year for:
Income taxes $ 61 $ 43 $ 29Interest $ 23 $ 21 $ 19
The accompanying notes are an integral part of the consolidated financial statements.
30 > CONSOLIDATED STATEMENTS OF CASH FLOWS > NCR04
CONSOLIDATED STATEMENTS OF CASH FLOWS

NCR04 > CONSOLIDATED STATEMENTS OF CHANGES IN STOCKHOLDERS’ EQUITY > 31
CONSOLIDATED STATEMENTS OF CHANGES IN STOCKHOLDERS’ EQUITY
AccumulatedOther
Common Stock Paid-in Retained ComprehensiveShares Amount Capital Earnings Income (Loss) Total
In millions
December 31, 2001 97 $ 1 $ 1,235 $ 861 $ (70) $ 2,027Employee stock purchase
and stock compensation plans 2 – 48 – – 48Purchase of Company common stock (2) – (66) – – (66)
Subtotal 97 1 1,217 861 (70) 2,009
Net loss – – – (220) – (220)Other comprehensive (loss), net of tax:
Currency translation adjustments – – – – 101 101Unrealized losses on securities:
Unrealized holding losses arisingduring the period – – – – (7) (7)
Less: reclassification adjustment forlosses included in net income – – – – 6 6
Changes in additional minimum pension liability – – – – (551) (551)
Unrealized losses on derivatives – – – – (13) (13)
Comprehensive (loss) – – – (220) (464) (684)
December 31, 2002 97 $ 1 $ 1,217 $ 641 $ (534) $ 1,325Employee stock purchase
and stock compensation plans 2 – 39 – – 39Purchase of Company common stock (4) – (90) – – (90)
Subtotal 95 1 1,166 641 (534) 1,274
Net income – – – 58 – 58Other comprehensive income, net of tax:
Currency translation adjustments – – – – 48 48Unrealized gains on securities:
Unrealized holding gains arisingduring the period – – – – 5 5
Changes in additional minimum pension liability – – – – 490 490
Unrealized gains on derivatives – – – – – –
Comprehensive income – – – 58 543 601
December 31, 2003 95 $ 1 $ 1,166 $ 699 $ 9 $ 1,875Employee stock purchase
and stock compensation plans 7 – 293 – – 293Purchase of Company common stock (9) – (428) – – (428)Stock split in the form of a stock dividend 94 1 (1) – – –
Subtotal 187 2 1,030 699 9 1,740
Net income – – – 290 – 290Other comprehensive income (loss), net of tax:
Currency translation adjustments – – – – 58 58Unrealized gains on securities:
Urealized holding gains arisingduring the period – – – – 4 4
Changes in additional minimum pension liability – – – – – –
Unrealized losses on derivatives – – – – (6) (6)
Comprehensive income – – 290 56 346
December 31, 2004 187 $ 2 $ 1,030 $ 989 $ 65 $ 2,086
The accompanying notes are an integral part of the consolidated financial statements.
NOTE 1 DESCRIPTION OF BUSINESS AND SIGNIFICANT ACCOUNTING POLICIES
DESCRIPTION OF BUSINESSNCR Corporation (NCR or the Company) and its subsidiaries provide solutions worldwide that are designed specifically toenable NCR’s customers to build, expand and enhance their relationships with their customers by facilitating transactionsand transforming data from transactions into useful business information.
NCR offers specific solutions for the retail and financial industries, and through its Data Warehousing and CustomerServices segments, NCR provides solutions for industries including telecommunications, transportation, insurance, utilitiesand electronic commerce, as well as consumer goods manufacturers and government entities. These solutions are built on afoundation of long-established industry knowledge and consulting expertise, a range of hardware technology, value-addingsoftware, global customer support services, and a complete line of business consumables.
BASIS OF CONSOLIDATIONThe consolidated financial statements include the accounts of NCR and its majority-owned subsidiaries. Long-term investments in affiliated companies in which NCR owns between 20% and 50%, and therefore exercises significant influence, but which it does not control, are accounted for using the equity method. Investments in which NCR does notexercise significant influence (generally, when NCR has an investment of less than 20% and no representation on the company’s board of directors) are accounted for using the cost method. All significant inter-company transactions andaccounts have been eliminated.
In January 2003, the Financial Accounting Standards Board (FASB) issued Interpretation No. 46 (FIN 46), “Consolidation of Variable Interest Entities,” which significantly changes the criteria used in determining whether entities are consolidatedwithin the financial statements. Under the new interpretation, the Company is required to determine whether it is the primarybeneficiary of economic income or losses that may be generated by variable interest entities (VIEs) in which the Company hassuch an interest. In circumstances where the Company has determined it is the primary beneficiary, consolidation of that entityis required. For the year ended December 31, 2003, FIN 46 is effective for variable interests created after January 31, 2003.See the FIN 46 discussion below for the treatment of variable interests created on or before January 31, 2003.
USE OF ESTIMATESThe preparation of financial statements in conformity with accounting principles generally accepted in the United States ofAmerica (otherwise referred to as GAAP) requires management to make estimates and judgments that affect the reportedamounts of assets and liabilities, the disclosure of contingent assets and liabilities at the date of the financial statements,and revenues and expenses during the period reported. Actual results could differ from those estimates.
REVENUE RECOGNITIONNCR’s revenue recognition policy is consistent with the requirements of Statement of Position 97-2 (SOP 97-2), “SoftwareRevenue Recognition,” Staff Accounting Bulletin No. 104 (SAB 104), “Revenue Recognition,” Emerging Issues Task Force Issue No. 00-21 (Issue 00-21), “Revenue Arrangements with Multiple Deliverables,” and other applicable revenue recognition guidance and interpretations. The Company records revenue when it is realized, or realizable, and earned. The Company considers these requirements met when persuasive evidence of an arrangement exists, the products or services have been provided to the customer, the sales price is fixed or determinable and collectibility is reasonably assured.
Typically, NCR does not sell its software products without the related hardware. The majority of the Company’s solutionscontain software that is more than incidental to the hardware and services included in the arrangement. The Company’s typical solution requires no significant production, modification or customization of the software or hardware after it isshipped. For these arrangements, revenue is recognized upon shipment, delivery, installation or customer acceptance of theproduct, as defined in the customer contract. Revenue for services-only contracts is typically recognized when the servicesare complete or ratably over the period services are provided.
32 > NOTES TO CONSOLIDATED FINANCIAL STATEMENTS > NCR04
NOTES TO CONSOLIDATED FINANCIAL STATEMENTS

As a solutions provider, the Company’s sales arrangements often include support services in addition to hardware and software. These services could include hardware and software maintenance, customer support and professional consultingservices. Revenue for the Company’s arrangements that include multiple elements is allocated to each element based onvendor specific objective evidence of the fair value of each element as defined in SOP 97-2. Allocated revenue for each element is recognized when revenue recognition criteria have been met for each element. Vendor specific objective evidenceof fair value is determined based on the price charged when each element is sold separately. A portion of the revenue contained in the “Other” segment (see Note 12 of Notes to Consolidated Financial Statements for segment details) containshardware, embedded software and services elements only. For these transactions, the guidance in Issue 00-21 on multipledeliverables is followed to determine if separate units of accounting exist and, if so, how the contractual considerationshould be allocated to the individual elements. The allocation of the arrangement fee to the various deliverables is basedupon the relative fair value of each of the deliverables.
NCR’s customers may request that certain transactions be on a bill and hold basis. For these transactions, the Company recognizes revenue in accordance with SAB 104. Typically, the amount from bill and hold transactions makes up less than1% of the total consolidated revenue.
CASH, CASH EQUIVALENTS AND SHORT-TERM INVESTMENTSAll short-term, highly liquid investments having original maturities of three months or less are considered to be cashequivalents. Short-term investments include securities generally having maturities of 90 days to one year. The Company had no short-term investments as of December 31, 2004. As of December 31, 2003, the Company held approximately $50 million of short-term investments which consisted primarily of auction rate securities classified as available-for-salesecurities. The Company’s investment in these securities was recorded at cost, which approximates fair market value due to their variable interest rates, which typically reset every 7 to 28 days, and despite the long-term nature of their stated contractual maturities, the Company had the ability to quickly liquidate these securities. As a result, there were no cumulativegross unrealized holding gains (losses) or gross realized gains (losses) from these short-term investments, and all incomegenerated from these short-term investments was recorded as interest income.
Revision in the Classification of Certain Securities In connection with the preparation of this report, the Companyconcluded that it was appropriate to classify auction rate securities as short-term investments. Previously, such investmentshad been classified as cash and cash equivalents. Accordingly, the Company has revised the classification to report thesesecurities as short-term investments as of December 31, 2003. The Company has revised the presentation of theConsolidated Statements of Cash Flows for the years ended December 31, 2003 and 2002, to reflect the gross purchases andsales of these securities as investing activities rather than as a component of cash and cash equivalents, which is consistentwith the presentation for the year ended December 31, 2004. This change in classification does not affect previously reportedcash flows from operations or from financing activities in the Company’s previously reported Consolidated Statements ofCash Flows, or previously reported results of operations for any period. The Company had no investments in auction ratesecurities as of December 31, 2004. In the previously reported Consolidated Statements of Cash Flows for the years endedDecember 31, 2003 and 2002, net cash used in investing activities related to these short-term investments of $10 millionand $40 million, respectively, were included in cash and cash equivalents.
TRANSFER OF FINANCIAL ASSETSNCR offers its customers the option to acquire its products and services through payment plans, financing or leasing contracts. From time to time, the Company has factored certain receivables, or transfers future payments under these contracts, to financing institutions on a non-recourse basis. NCR may act as servicing agent for the purchaser and retain collection and administrative responsibilities. These transfers are recorded as sales of the related accounts receivable whenNCR is considered to have surrendered control of such receivables. The Company had factored receivables of $3 million atDecember 31, 2004, $11 million at December 31, 2003 and less than $1 million at December 31, 2002. The 2004 activity isrelated to the factoring of promissory notes from customers in Japan. The related cost of the factoring was immaterial to theCompany’s consolidated financial results.
ALLOWANCE FOR DOUBTFUL ACCOUNTSNCR establishes provisions for doubtful accounts using both percentages of accounts receivable balance to reflect historicalaverage credit losses and specific provisions for known issues. Given this experience, NCR believes that the reserves forpotential losses are adequate, but if one or more of the Company’s larger customers were to default on its obligations underapplicable contractual arrangements, NCR could be exposed to potentially significant losses in excess of the provisions established.
INVENTORIESInventories are stated at the lower of average cost or market value. Excess and obsolete reserves are established based onforecasted usage, orders, technological obsolescence and inventory aging.
NCR04 > NOTES TO CONSOLIDATED FINANCIAL STATEMENTS > 33
INVESTMENTS IN MARKETABLE SECURITIESTypically, marketable securities, which are included in other assets, are deemed by management to be available-for-sale andare reported at fair value with net unrealized gains or losses reported, net-of-tax, within stockholders’ equity. If a decline inthe fair value of a marketable security is deemed by management to be other than temporary, the cost basis of the investmentis written down to fair value, and the amount of the write-down is included in the determination of income. Realized gainsand losses are recorded based on the specific identification method and average cost method, as appropriate, based upon theinvestment type.
LONG-LIVED ASSETS Capitalized Software Certain direct development costs associated with internal-use software are capitalized within otherassets and are amortized over the estimated useful lives of the resulting software. NCR typically amortizes capitalized internal-use software over three years beginning when the asset is substantially ready for use.
Costs incurred for the development of computer software that will be sold, leased or otherwise marketed are capitalized when technological feasibility has been established. These costs are included within other assets and are amortized over theestimated useful lives of the resulting software. The Company typically amortizes capitalized software over three years beginning when the product is available for general release. Costs capitalized include direct labor and related overheadcosts. Costs incurred prior to technological feasibility and after general release are expensed as incurred.
Total capitalized software development costs, net of accumulated amortization, were $112 million, $103 million and $103 million as of December 31, 2004, 2003 and 2002, respectively. Amortization of capitalized software development costswas $72 million, $70 million and $70 million for the years ended December 31, 2004, 2003 and 2002, respectively.
Goodwill NCR adopted Statement of Financial Accounting Standards No. 142 (SFAS 142), “Goodwill and Other IntangibleAssets,” on January 1, 2002. SFAS 142 requires the identification of reporting units, which NCR has deemed to be the operating segments described in Note 12 of Notes to Consolidated Financial Statements. Goodwill is allocated to the reportingunits for the purposes of goodwill impairment testing, which is performed at least annually. The impairment test is also performed if an event occurs or when circumstances change between annual tests that would more likely than not reduce the fair value of a reporting unit below its carrying value.
Upon adoption of SFAS 142, NCR discontinued the amortization of goodwill assets and recorded a non-cash, net-of-tax goodwill impairment charge of $348 million as a cumulative effect of accounting change for the year ended December 31, 2002.See Note 5 of Notes to Consolidated Financial Statements for further information.
Property, Plant and Equipment Property, plant and equipment, reworkable service parts and rental equipment are statedat cost less accumulated depreciation. Depreciation is computed over the estimated useful lives of the related assets primarilyon a straight-line basis. Buildings are depreciated over 25 to 45 years, machinery and other equipment over three to ten yearsand reworkable service parts over three to six years. Reworkable service parts are those parts that can be reconditioned and used in installation and ongoing maintenance services and integrated service solutions for NCR’s customers.
Property, Plant and Equipment Held for Sale Long-lived assets to be sold are classified as held for sale in the periodfor which they meet the criteria outlined in Statement of Financial Accounting Standards No. 144, “Accounting for theImpairment or Disposal of Long-Lived Assets.” Assets classified as held for sale are carried at the lower of their carryingamount or fair value, and are not depreciated while classified as held for sale.
Valuation of Long-Lived Assets Long-lived assets such as property, plant and equipment, software and investments arereviewed for impairment when events or changes in circumstances indicate that the carrying amount of the assets may not be recoverable. An impairment loss would be recognized when estimated future undiscounted cash flows expected to resultfrom the use of the asset and its eventual disposition are less than the carrying amount.
WARRANTY, POST-SALES SUPPORT AND SALES RETURNSProvisions for product warranties, post-sales support and sales returns and allowances are recorded in the period in whichthe related revenue is recognized. The Company accrues warranty reserves and sales return and allowances using percentagesof revenue to reflect the Company’s historical average warranty and sales return claims.
In addition to the standard product warranty, the Company offers extended warranties to its customers. NCR considersextended warranties to be no different than a normal service contract and therefore accounts for the extended warranty bydeferring revenue equal to the fair value of the warranty and recognizes the deferred revenue over the extended warranty term.
34 > NOTES TO CONSOLIDATED FINANCIAL STATEMENTS > NCR04
PENSION, POSTRETIREMENT AND POSTEMPLOYMENT BENEFITSNCR has significant pension, postretirement and postemployment benefit costs, which are developed from actuarial valuations.Actuarial assumptions are established to anticipate future events and are used in calculating the expense and liability relatingto these plans. These factors include assumptions the Company makes about interest rates, expected investment return onplan assets, rate of increase in health care costs, total and involuntary turnover rates, and rates of future compensationincreases. In addition, NCR’s actuarial consultants also use subjective factors such as withdrawal rates and mortality rates to develop the Company’s valuations. NCR generally reviews and updates these assumptions on an annual basis. NCR isrequired to consider current market conditions, including changes in interest rates, in making these assumptions. The actuarial assumptions that NCR uses may differ materially from actual results due to changing market and economic conditions, higher or lower withdrawal rates or longer or shorter life spans of participants. These differences may result in a significant impact to the amount of pension, postretirement or postemployment benefits expense the Company hasrecorded or may record.
FOREIGN CURRENCYFor many NCR international operations, the local currency is designated as the functional currency. Accordingly, assets andliabilities are translated into U.S. Dollars at year-end exchange rates, and revenues and expenses are translated at averageexchange rates prevailing during the year. Currency translation adjustments from local functional currency countries resultingfrom fluctuations in exchange rates are recorded in other comprehensive income.
DERIVATIVE INSTRUMENTSIn the normal course of business, NCR enters into various financial instruments, including derivative financial instruments.The Company accounts for derivative instruments in accordance with Statement of Financial Accounting Standards No. 133(SFAS 133), “Accounting for Derivatives and Hedging Activities,” as amended. The standard requires the recognition of allderivative instruments as either assets or liabilities in the balance sheet at fair value and recognition of the resulting gains or losses as adjustments to earnings or other comprehensive income. The Company formally documents all relationshipsbetween hedging instruments and hedged items, as well as the risk management objective and strategy for undertaking various hedge transactions. Hedging activities are transacted only with highly-rated institutions, reducing the exposure tocredit risk in the event of nonperformance.
The accounting for changes in fair value of a derivative instrument depends on whether it has been designated and qualifiesas part of a hedging relationship, and further, on the type of hedging relationship. For those derivative instruments that aredesignated and qualify as hedging instruments, the Company has designated the hedging instrument, based on the exposurebeing hedged, as either a fair value hedge, cash flow hedge, or a hedge of a net investment in a foreign operation. For derivativeinstruments designated as fair value hedges, the effective portion of the hedge is recorded as an offset to the change in thefair value of the hedged item and the ineffective portion of the hedge, if any, is recorded in the income statement. For derivativeinstruments designated as cash flow hedges and determined to be highly effective, the gains or losses are deferred in othercomprehensive income and recognized in the determination of income as adjustments of carrying amounts when the underlyinghedged transaction is realized, canceled or otherwise terminated. When hedging certain foreign currency transactions of along-term investment nature (net investments in foreign operations), gains and losses are recorded in the currency translationadjustment component of stockholders’ equity. Gains and losses on foreign exchange contracts that are not used to hedgecurrency transactions of a long-term investment nature, or that are not designated as cash flow or fair value hedges, are recognized in other income or expense as exchange rates change.
ENVIRONMENTAL AND LEGAL CONTINGENCIESIn the normal course of business, NCR is subject to various regulations, proceedings, lawsuits, claims and other matters,including actions under laws and regulations related to the environment and health and safety, among others. NCR believesthe amounts provided in its consolidated financial statements, as prescribed by GAAP, are adequate in light of the probableand estimable liabilities. However, there can be no assurances that the actual amounts required to satisfy alleged liabilitiesfrom various lawsuits, claims, legal proceedings and other matters, including the Fox River environmental matter discussedbelow in Note 11 of Notes to Consolidated Financial Statements, and to comply with applicable laws and regulations, willnot exceed the amounts reflected in NCR’s consolidated financial statements or will not have a material adverse effect on theconsolidated results of operations, financial condition or cash flows. Any costs that may be incurred in excess of thoseamounts provided as of December 31, 2004, cannot currently be reasonably determined.
NCR04 > NOTES TO CONSOLIDATED FINANCIAL STATEMENTS > 35
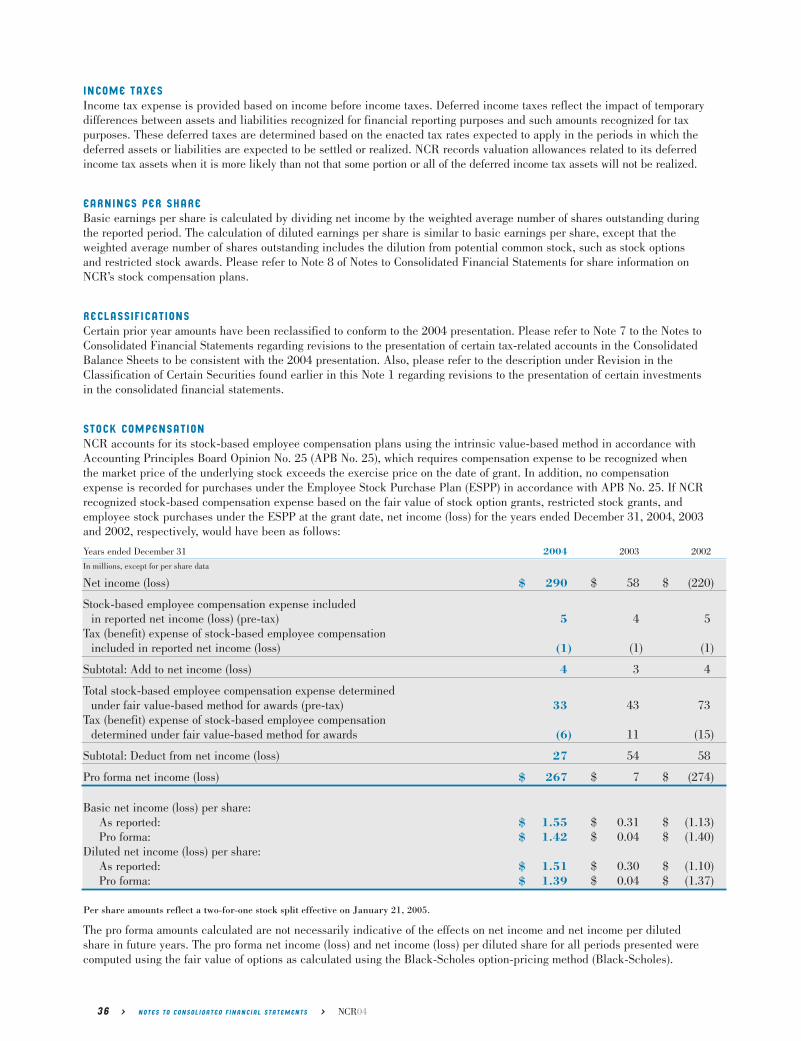
INCOME TAXESIncome tax expense is provided based on income before income taxes. Deferred income taxes reflect the impact of temporarydifferences between assets and liabilities recognized for financial reporting purposes and such amounts recognized for taxpurposes. These deferred taxes are determined based on the enacted tax rates expected to apply in the periods in which thedeferred assets or liabilities are expected to be settled or realized. NCR records valuation allowances related to its deferredincome tax assets when it is more likely than not that some portion or all of the deferred income tax assets will not be realized.
EARNINGS PER SHAREBasic earnings per share is calculated by dividing net income by the weighted average number of shares outstanding duringthe reported period. The calculation of diluted earnings per share is similar to basic earnings per share, except that theweighted average number of shares outstanding includes the dilution from potential common stock, such as stock optionsand restricted stock awards. Please refer to Note 8 of Notes to Consolidated Financial Statements for share information onNCR’s stock compensation plans.
RECLASSIFICATIONSCertain prior year amounts have been reclassified to conform to the 2004 presentation. Please refer to Note 7 to the Notes toConsolidated Financial Statements regarding revisions to the presentation of certain tax-related accounts in the ConsolidatedBalance Sheets to be consistent with the 2004 presentation. Also, please refer to the description under Revision in theClassification of Certain Securities found earlier in this Note 1 regarding revisions to the presentation of certain investmentsin the consolidated financial statements.
STOCK COMPENSATIONNCR accounts for its stock-based employee compensation plans using the intrinsic value-based method in accordance withAccounting Principles Board Opinion No. 25 (APB No. 25), which requires compensation expense to be recognized whenthe market price of the underlying stock exceeds the exercise price on the date of grant. In addition, no compensationexpense is recorded for purchases under the Employee Stock Purchase Plan (ESPP) in accordance with APB No. 25. If NCRrecognized stock-based compensation expense based on the fair value of stock option grants, restricted stock grants, andemployee stock purchases under the ESPP at the grant date, net income (loss) for the years ended December 31, 2004, 2003and 2002, respectively, would have been as follows:
Years ended December 31 2004 2003 2002
In millions, except for per share data
Net income (loss) $ 290 $ 58 $ (220)
Stock-based employee compensation expense includedin reported net income (loss) (pre-tax) 5 4 5
Tax (benefit) expense of stock-based employee compensationincluded in reported net income (loss) (1) (1) (1)
Subtotal: Add to net income (loss) 4 3 4
Total stock-based employee compensation expense determinedunder fair value-based method for awards (pre-tax) 33 43 73
Tax (benefit) expense of stock-based employee compensationdetermined under fair value-based method for awards (6) 11 (15)
Subtotal: Deduct from net income (loss) 27 54 58
Pro forma net income (loss) $ 267 $ 7 $ (274)
Basic net income (loss) per share:As reported: $ 1.55 $ 0.31 $ (1.13)Pro forma: $ 1.42 $ 0.04 $ (1.40)
Diluted net income (loss) per share:As reported: $ 1.51 $ 0.30 $ (1.10)Pro forma: $ 1.39 $ 0.04 $ (1.37)
Per share amounts reflect a two-for-one stock split effective on January 21, 2005.
The pro forma amounts calculated are not necessarily indicative of the effects on net income and net income per dilutedshare in future years. The pro forma net income (loss) and net income (loss) per diluted share for all periods presented werecomputed using the fair value of options as calculated using the Black-Scholes option-pricing method (Black-Scholes).
36 > NOTES TO CONSOLIDATED FINANCIAL STATEMENTS > NCR04
Departures of certain senior executives in 2003 caused an unusually high amount of expirations of stock options. The effectof these events on the pro forma expense for the year ended December 31, 2003 was the recognition of a significant amountof pro forma tax expense from the write-off of pro forma deferred tax assets. These deferred tax assets would have beenrecorded as the options were vesting if NCR accounted for stock compensation in accordance with Statement of FinancialAccounting Standards No. 123 (SFAS 123), “Accounting for Stock-Based Compensation.” The pro forma tax expense for theyear ended December 31, 2003 is unusually higher than other periods because of these events.
When computing the pro forma SFAS 123 expense, NCR uses Black-Scholes to determine the fair value of employee stockoptions. Black-Scholes requires the use of judgmental assumptions in which the Company uses historical amounts as thebasis for the assumptions. These historical amounts may not be reflective of actual amounts in the future.
The following weighted average assumptions were used to calculate the fair value of stock option grants using Black-Scholesfor the periods shown in the above table:
2004 2003 2002
Dividend yield – – –Risk-free interest rate 2.99% 3.08% 3.92%Expected volatility 45.00% 45.00% 45.00%Expected holding period (years) 5.0 5.0 5.0
The weighted average fair value of NCR stock options calculated using Black-Scholes for options granted during the yearsended December 31, 2004, 2003 and 2002, was $9.76, $5.11 and $7.42 per share, respectively, on a post stock-split basis.
On April 23, 2003, NCR’s stockholders approved a non-binding measure for the Company to establish a policy to expensestock options issued by the Company in its annual consolidated statements of operations. The Company has been evaluatingthe implementation alternatives under the newly revised Statement of Accounting Standards No. 123 (revised 2004). TheCompany expects to adopt the new standard starting on July 1, 2005. Please refer to the Recently Issued AccountingPronouncements below under this Note 1 for more information.
Please refer to Note 8 of Notes to Consolidated Financial Statements for more information on NCR’s stock compensation plans.
RECENTLY ISSUED ACCOUNTING PRONOUNCEMENTSFASB Interpretation No. 46 In January 2003, the FASB issued Interpretation No. 46 (FIN 46), “Consolidation ofVariable Interest Entities,” an Interpretation of Accounting Research Bulletin (ARB) No. 51, “Consolidated FinancialStatements.” FIN 46 requires certain variable interest entities to be consolidated by the primary beneficiary of the entity ifthe equity investors in the entity do not have the characteristics of a controlling financial interest or the entity does not havesufficient equity at risk. Also, FIN 46 requires disclosure of significant variable interests in variable interest entities inwhich a company is not required to consolidate. In December 2003, the FASB revised FIN 46 for certain implementationprovisions and extended the effective date of the pronouncement to the first quarter of 2004. As a result, the Company adoptedthe revised guidance on January 1, 2004. Management evaluated the revised provisions of FIN 46 and determined that theadoption of this pronouncement did not have a material impact on the Company’s results of operations, financial position orcash flows.
Emerging Issues Task Force (EITF) Issue 03-6 In March 2004, the EITF ratified the consensus on EITF Issue 03-6,“Participating Securities and the Two-Class Method under FASB Statement No. 128.” The consensus requires the use of atwo-class method of calculating earnings per share under FASB Statement No. 128, “Earnings Per Share,” when a companyhas participating securities. A participating security is defined as a security that may participate in undistributed earningswith common stock, whether that participation is conditioned upon the occurrence of a specified event or not. NCR does notcurrently have any participating securities, and although this guidance was adopted in the second quarter of 2004, it did nothave any impact on the Company’s results of operations.
NCR04 > NOTES TO CONSOLIDATED FINANCIAL STATEMENTS > 37

Statement of Financial Accounting Standards No. 123 (revised 2004) In December 2004, the FASB issuedStatement of Financial Accounting Standards No. 123 (revised 2004) (SFAS 123(R)), “Share-Based Payment.” SFAS 123(R)requires all share-based payments to employees, including grants of employee stock options, to be recognized in the financialstatements based on their fair values. SFAS 123(R) eliminates the ability to account for share-based compensation using theintrinsic value-based method under APB Opinion No. 25, “Accounting for Stock Issued to Employees.” Currently, theCompany discloses the pro forma net income (loss) and related pro forma income (loss) per share information in accordancewith SFAS No 123, “Accounting for Stock-Based Compensation.” SFAS 123(R) must be adopted no later than July 1, 2005.The Company expects to adopt, effective on July 1, 2005, the Modified Prospective Method with no restatement of interimperiods prior to the effective date. The adoption of SFAS 123(R) fair value method will have a significant impact on ourresults of operations, although it will not impact our overall financial position. While the expense impact cannot be preciselyestimated at this time, based on the guidelines for the 2005 long-term incentive compensation plan recently approved by theCompensation Committee, the Company believes its stock compensation expense for 2005 to be in the range of 5 to 6 centsper share. This estimate is subject to change and is based on the following assumptions: (1) continued use of the Black-Scholesvaluation model, (2) the Company’s Employee Stock Purchase Plan will be considered non-compensatory under applicabletax laws and regulations, (3) the Company’s effective tax rate is 25%, and (4) the Company implements SFAS 123(R) mid-year as currently planned. On an annualized basis, the Company expects its expense to be 9 to 10 cents per share in2006 and 10 to 12 cents per share in outer years utilizing the same assumptions previously mentioned. The Company isevaluating the use of a binomial valuation model at this time and is unable to predict the impact on the Company’s stockcompensation expenses, either positive or negative, created by a change in valuation model. The Company is also unable to predict the impact of deferred tax assets on the tax rate applied to our pre-tax stock compensation expense. SFAS 123(R)also requires the benefits of tax deductions in excess of recognized compensation cost to be reported as a financing cashflow, rather than as an operating cash flow as required under current accounting literature. This requirement will reduce net operating cash flows and increase net financing cash flows in periods after adoption. The Company cannot estimate whatthose amounts will be in the future because they depend on, among other things, favorable tax versus book differences inoption expense.
Statement of Financial Accounting Standards No. 151 In November 2004, the FASB issued Statement of FinancialAccounting Standards No. 151 (SFAS 151), “Inventory Costs – an amendment of ARB No. 43.” SFAS 151 requires idlefacility expenses, freight, handling costs, and wasted material spoilage costs to be recognized as current-period charges. It also requires that allocation of fixed production overheads to the costs of conversion be based on normal capacity of theproduction facilities. SFAS 151 will be effective for inventory costs incurred during fiscal years beginning after June 15, 2005.The Company does not expect that this standard will have a material impact on our results of operations.
FASB Staff Position No. FAS 109-1 and No. FAS 109-2 The American Jobs Creation Act of 2004, enacted onOctober 22, 2004, provides a temporary 85% dividends received deduction for certain repatriated earnings, subject to certainlimitations. The Company has evaluated the effects of the repatriation provision and determined that the potential benefitsoffset by the limitations and associated costs are immaterial. The Company has determined not to repatriate foreign earningsunder the new law’s dividends received deduction. Additionally, this Act has other issues, including the establishment of adeduction for certain qualified domestic production activities. The Company evaluated this deduction and determined theeffects to be negligible.
38 > NOTES TO CONSOLIDATED FINANCIAL STATEMENTS > NCR04

NOTE 2 SUPPLEMENTAL FINANCIAL INFORMATIONFor the year ended December 31 2004 2003 2002
In millions
Other (income) expenseInterest income $ (10) $ (9) $ (10)Other (gain) loss on assets, net (17) – 50Fox River provision (see Note 11) – 37 –Other, net (14) 4 (1)
Other (income) expense, net (41) 32 39Interest expense 23 26 19
Total interest and other (income) expense, net $ (18) $ 58 $ 58
At December 31 2004 2003
In millions
Accounts receivableTrade $ 1,291 $ 1,225Other 37 32
Accounts receivable, gross 1,328 1,257Less: allowance for doubtful accounts 24 27
Total accounts receivable, net $ 1,304 $ 1,230
InventoriesFinished goods, net $ 258 $ 233Work in process and raw materials, net 97 75
Total inventories, net $ 355 $ 308
Other current assetsCurrent deferred tax assets $ 96 $ 86Other 128 109
Total other current assets $ 224 $ 195
Reworkable service parts and rental equipmentReworkable service parts and rental equipment, gross $ 464 $ 490Less: accumulated depreciation 240 258
Total reworkable service parts and rental equipment, net $ 224 $ 232
Property, plant and equipmentLand and improvements $ 80 $ 92Buildings and improvements 434 516Machinery and other equipment 1,008 1,002
Property, plant and equipment, gross 1,522 1,610Less: accumulated depreciation 1,092 1,114
430 496Property, plant and equipment held for sale, net 16 18
Total property, plant and equipment, net $ 446 $ 514
Accumulated other comprehensive income, net of taxCurrency translation adjustments $ 156 $ 98Unrealized gain on securities 11 7Unrealized loss on derivatives (15) (9)Additional minimum pension liability1 (87) (87)
Total accumulated other comprehensive income $ 65 $ 9
1 See Note 9 of Notes to Consolidated Financial Statements for details on the change in additional minimum pension liability.
NCR04 > NOTES TO CONSOLIDATED FINANCIAL STATEMENTS > 39

40 > NOTES TO CONSOLIDATED FINANCIAL STATEMENTS > NCR04
NOTE 3 RESTRUCTURING AND REAL ESTATE TRANSACTIONSIn the third quarter of 2002, NCR announced re-engineering plans to improve operational efficiency throughout theCompany. The Company is targeting process improvements to drive simplification, standardization, globalization and consistency across the organization. Key business processes and supporting functions are being re-engineered to improveefficiency and lower costs and expenses. Management is taking action to shorten the Company’s product and service offerdevelopment cycles and to improve its sales and order management processes. To improve accounts receivables collectionsand cash flow, management implemented plans to drive efficiencies for the Company’s invoicing and collection activities.
During the fourth quarter of 2002, in connection with announced restructuring efforts, NCR’s management approved a real estate consolidation and restructuring plan designed to accelerate the Company’s re-engineering strategies. A pre-taxrestructuring charge of $8 million was recorded in the fourth quarter of 2002 under EITF Issue No. 94-3, “LiabilityRecognition for Certain Employee Termination Benefits and Other Costs to Exit an Activity,” to provide for contractual leasetermination costs. The balance of this recorded liability at December 31, 2004 was $3 million. During 2004, the Companyutilized $4 million of the reserve. The majority of the lease obligations will continue through 2005, with one remaining obligation continuing to 2009.
During 2004, the Company recognized $14 million (after-tax) in net income from the sale of real estate that was previouslyclassified as held for sale. The net book value of the properties was $48 million. One of these properties has a note receivablebearing interest at 5% with nominal principal payments before a balloon payment of $5 million in 2007.
The Company also recognized $8 million (after-tax) of other income for the release of a reserve for exit of certain countries in the Middle East and Africa region. The reserve was previously made to account for an expected loss on sale when theCompany anticipated exiting certain countries. However, due to a strategy realignment, the Company now believes it canprofitably market an attractive range of products to these countries by utilizing a shared resource infrastructure.
NOTE 4 BUSINESS COMBINATIONS, DIVESTITURES AND EQUITY INVESTMENTSThe Company acquired Kinetics, Inc. (Kinetics) on September 30, 2004. Kinetics, headquartered in Lake Mary, Florida, is a leading provider of self-service solutions for the travel industry. This acquisition further strengthens NCR’s portfolio ofself-service technologies enabling the Company to extend its market reach and leadership to additional market segments likeairline and hotel check-in, quick-service food ordering and event ticketing. This cash transaction was accounted for as apurchase. Approximately $8 million of the $26 million purchase price was allocated to software development costs, and theCompany recorded goodwill of approximately $18 million, which was allocated to the Retail Store Automation operating segment. The $26 million cash payment made to complete this acquisition is reported in Other investing activities in theCompany’s Consolidated Statements of Cash Flows as of December 31, 2004. The operating results of Kinetics were includedin the Company’s consolidated financial statements from September 30, 2004 forward. The pro forma disclosures required underFASB Statement No. 141, “Business Combinations,” are not being provided because the impact of the transaction is not material.
During 2003 and 2002, NCR had no significant acquisition or divestiture activity that materially impacted the consolidatedstatement of income, balance sheet or cash flows. Also, in 2004, 2003 and 2002, NCR completed other investments and soldassets related to portions of its businesses to third parties, all of which were insignificant.
NOTE 5 LONG-LIVED ASSETS
PROPERTY, PLANT AND EQUIPMENT HELD FOR SALEProperty, plant and equipment held for sale, net of accumulated depreciation and impairment charges, consists of the followingcategories as of December 31 for the periods shown in the table below:
2004 2003
In millions
Land and improvements, net $ 2 $ 6Buildings and improvements, net 14 12
Property, plant and equipment held for sale, net $ 16 $ 18
GOODWILLAs a result of the adoption of SFAS 142 on January 1, 2002, NCR discontinued the amortization of goodwill and it wasdetermined that the goodwill of the Retail Store Automation, Systemedia, and “Other” segments was impaired. The Companyrecorded a non-cash, net-of-tax goodwill impairment charge of $348 million as a cumulative effect of a change in accountingprinciple as of January 1, 2002. The impairment charge was reflected as a cumulative effect of accounting change, net oftax, in the consolidated statements of operations for the year ended December 31, 2002.

The carrying amounts of goodwill by operating segment for the year ended December 31, 2004 were as follows:
Ending BalanceBeginning Balance Other December 31,
January 1, 2004 Additions Adjustments 2004In millions
GoodwillData Warehousing $ 79 $ – $ 1 $ 80Financial Self Service 15 – – 15Retail Store Automation – 18 – 18Systemedia – – – –Payment and Imaging 3 – – 3Customer Services 8 – – 8Other – – – –
Total goodwill $ 105 $ 18 $ 1 $ 124
The increase in goodwill since December 31, 2003, is due to foreign currency fluctuations and the acquisition of Kinetics.In the fourth quarter of 2004, in accordance with SFAS 142, NCR performed its annual impairment test using the samemethodology used for the transitional test performed in 2002 and no further goodwill impairment losses were realized.
OTHER INTANGIBLE ASSETSNCR’s other intangible assets, which were specifically identified when acquired, are deemed to have finite lives and are being amortized over original periods ranging from three to ten years. The gross carrying amount and accumulated amortization for NCR’s other intangible assets were as follows:
December 31, 2004 December 31, 2003
Gross Carrying Accumulated Gross Carrying AccumulatedAmount Amortization Amount Amortization
In millions
Other intangible assetsPatents $ 14 $ (12) $ 19 $ (15)Intellectual property 28 (7) 13 (5)
Total other intangible assets $ 42 $ (19) $ 32 $ (20)
The decrease in patents since December 31, 2003 is due to a patent becoming fully amortized in the first quarter of 2004;therefore, it is no longer listed in the table above. The increase in the intellectual property since December 31, 2003 is primarily due to the purchase of intellectual property licenses from Accenture as part of our long-term service agreement andintellectual property associated with the acquisition of Kinetics.
The aggregate amortization expense (actual and estimated, in millions) for other intangible assets for the following periods is:
For the year ended For the year (estimated)
December 31, December 31, December 31, December 31, December 31, December 31,2004 2005 2006 2007 2008 2009
Amortization expense $ 5 $ 6 $ 5 $ 4 $ 4 $ 2
NOTE 6 DEBT OBLIGATIONSIn June 2002, the Company issued $300 million of senior unsecured notes with an interest rate of 7.125% due in 2009. The net proceeds from the issuance totaled $296 million, after discount and expenses, and were used to repay short-termdebt with the remainder available for general corporate purposes. In the fourth quarter of 2003, the Company entered into an interest rate swap which effectively converted $50 million of the notes to floating rate debt. See Note 10 of Notes toConsolidated Financial Statements for further details of the interest rate swap.
The most significant portion of the Company’s other long-term debt consists of notes payable originating in the United Stateswith maturities of $0.6 million in 2010 and $5 million in 2020 with rates of 9.4% and 9.49%, respectively.
In October 2004, the Company replaced a $200 million 364-day unsecured credit facility with a $200 million five-yearunsecured credit facility with a syndicate of financial institutions. In addition to the $200 million facility, the Company has a $400 million, five-year unsecured revolving credit facility which the Company entered into in October 2001. The creditfacilities contain certain representations and warranties; conditions; affirmative, negative and financial covenants; andevents of default customary for such facilities. Interest rates charged on borrowings outstanding under the credit facilitiesare based on prevailing market rates. No amounts were outstanding under the facilities at December 31, 2004 and 2003.
NCR04 > NOTES TO CONSOLIDATED FINANCIAL STATEMENTS > 41

NOTE 7 INCOME TAXESFor the years ended December 31, income before income taxes consisted of the following: 2004 2003 2002
In millions
Income (loss) before income taxes andcumulative effect of accounting change
United States $ 101 $ 98 $ 284Foreign 150 (26) (153)
Total income before income taxes and cumulative effect of accounting change $ 251 $ 72 $ 131
For the years ended December 31, income tax (benefit) expense consisted of the following: 2004 2003 2002
In millions
Income tax (benefit) expenseCurrent
Federal $ 3 $ (39) $ (2)State and local (1) 3 4Foreign 58 37 28
DeferredFederal (80) (55) (13)State and local – 5 (1)Foreign (19) 63 (13)
Total income tax (benefit) expense $ (39) $ 14 $ 3
The following table presents the principal components of the difference between the effective tax rate and the U.S. federal statutory income tax rate for the years ended December 31: 2004 2003 2002
In millions
Income tax expense at the U.S. federal tax rate of 35% $ 88 $ 25 $ 46Foreign income tax differential (56) (10) (30)U.S. permanent book/tax differences (3) 3 1Tax contingencies (66) (6) (15)Other, net (2) 2 1
Total income tax (benefit) expense $ (39) $ 14 $ 3
NCR’s tax provisions include a provision for income taxes in those tax jurisdictions where its subsidiaries are profitable, but reflect only a portion of the tax benefits related to certain foreign subsidiaries’ tax losses due to the uncertainty of theultimate realization of future benefits from these losses. In 2004, the Company realized an $85 million income tax benefitresulting from the favorable settlement of audit issues relating to the period when NCR was a subsidiary of AT&T.
Included in the balance sheets at December 31 were as follows: 2004 2003
In millions
Deferred income tax assetsEmployee pensions and other benefits $ 28 $ 51Other balance sheet reserves and allowances 136 115Tax loss and credit carryforwards 856 655Capitalized research and development 224 191Property, plant and equipment 15 52Other 41 65
Total deferred income tax assets 1,300 1,129Valuation allowance (585) (546)
Net deferred income tax assets 715 583
Deferred income tax liabilitiesProperty, plant and equipment 25 25Employee pensions and other benefits 353 302Other 31 7
Total deferred income tax liabilities 409 334
Total net deferred income tax assets $ 306 $ 249
42 > NOTES TO CONSOLIDATED FINANCIAL STATEMENTS > NCR04
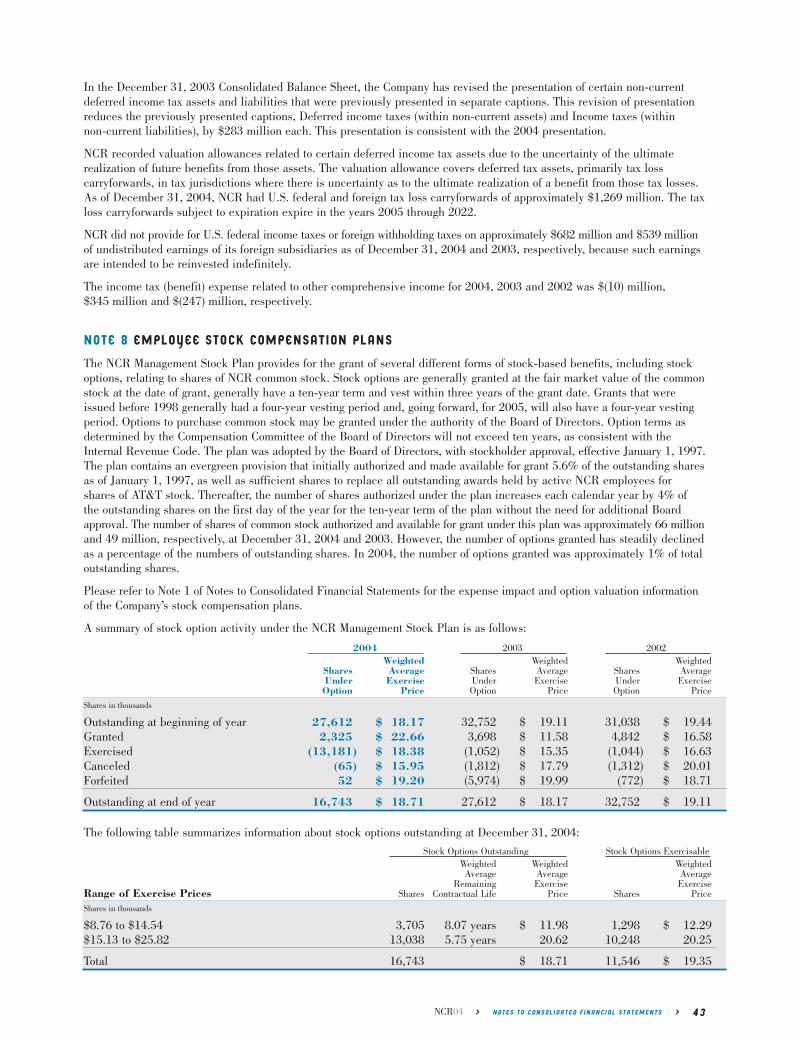
In the December 31, 2003 Consolidated Balance Sheet, the Company has revised the presentation of certain non-currentdeferred income tax assets and liabilities that were previously presented in separate captions. This revision of presentationreduces the previously presented captions, Deferred income taxes (within non-current assets) and Income taxes (within non-current liabilities), by $283 million each. This presentation is consistent with the 2004 presentation.
NCR recorded valuation allowances related to certain deferred income tax assets due to the uncertainty of the ultimate realization of future benefits from those assets. The valuation allowance covers deferred tax assets, primarily tax loss carryforwards, in tax jurisdictions where there is uncertainty as to the ultimate realization of a benefit from those tax losses.As of December 31, 2004, NCR had U.S. federal and foreign tax loss carryforwards of approximately $1,269 million. The taxloss carryforwards subject to expiration expire in the years 2005 through 2022.
NCR did not provide for U.S. federal income taxes or foreign withholding taxes on approximately $682 million and $539 millionof undistributed earnings of its foreign subsidiaries as of December 31, 2004 and 2003, respectively, because such earningsare intended to be reinvested indefinitely.
The income tax (benefit) expense related to other comprehensive income for 2004, 2003 and 2002 was $(10) million, $345 million and $(247) million, respectively.
NOTE 8 EMPLOYEE STOCK COMPENSATION PLANSThe NCR Management Stock Plan provides for the grant of several different forms of stock-based benefits, including stockoptions, relating to shares of NCR common stock. Stock options are generally granted at the fair market value of the commonstock at the date of grant, generally have a ten-year term and vest within three years of the grant date. Grants that wereissued before 1998 generally had a four-year vesting period and, going forward, for 2005, will also have a four-year vestingperiod. Options to purchase common stock may be granted under the authority of the Board of Directors. Option terms asdetermined by the Compensation Committee of the Board of Directors will not exceed ten years, as consistent with theInternal Revenue Code. The plan was adopted by the Board of Directors, with stockholder approval, effective January 1, 1997.The plan contains an evergreen provision that initially authorized and made available for grant 5.6% of the outstanding sharesas of January 1, 1997, as well as sufficient shares to replace all outstanding awards held by active NCR employees forshares of AT&T stock. Thereafter, the number of shares authorized under the plan increases each calendar year by 4% of the outstanding shares on the first day of the year for the ten-year term of the plan without the need for additional Boardapproval. The number of shares of common stock authorized and available for grant under this plan was approximately 66 millionand 49 million, respectively, at December 31, 2004 and 2003. However, the number of options granted has steadily declinedas a percentage of the numbers of outstanding shares. In 2004, the number of options granted was approximately 1% of totaloutstanding shares.
Please refer to Note 1 of Notes to Consolidated Financial Statements for the expense impact and option valuation informationof the Company’s stock compensation plans.
A summary of stock option activity under the NCR Management Stock Plan is as follows:
2004 2003 2002Weighted Weighted Weighted
Shares Average Shares Average Shares AverageUnder Exercise Under Exercise Under ExerciseOption Price Option Price Option Price
Shares in thousands
Outstanding at beginning of year 27,612 $ 18.17 32,752 $ 19.11 31,038 $ 19.44Granted 2,325 $ 22.66 3,698 $ 11.58 4,842 $ 16.58Exercised (13,181) $ 18.38 (1,052) $ 15.35 (1,044) $ 16.63Canceled (65) $ 15.95 (1,812) $ 17.79 (1,312) $ 20.01Forfeited 52 $ 19.20 (5,974) $ 19.99 (772) $ 18.71
Outstanding at end of year 16,743 $ 18.71 27,612 $ 18.17 32,752 $ 19.11
The following table summarizes information about stock options outstanding at December 31, 2004:
Stock Options Outstanding Stock Options ExercisableWeighted Weighted WeightedAverage Average Average
Remaining Exercise ExerciseRange of Exercise Prices Shares Contractual Life Price Shares Price
Shares in thousands
$8.76 to $14.54 3,705 8.07 years $ 11.98 1,298 $ 12.29$15.13 to $25.82 13,038 5.75 years 20.62 10,248 20.25
Total 16,743 $ 18.71 11,546 $ 19.35
NCR04 > NOTES TO CONSOLIDATED FINANCIAL STATEMENTS > 43

There were approximately 20.6 million stock options exercisable with a weighted average exercise price of $19.08 atDecember 31, 2003. At December 31, 2002, there were approximately 22.2 million stock options exercisable with a weightedaverage exercise price of $19.10.
The NCR Employee Stock Purchase Plan (ESPP) enables eligible employees to purchase NCR’s common stock at 85% of theaverage market price at the end of the last trading day of each month. Employees may authorize payroll deductions up to10% of eligible compensation for common stock purchases. During 2004, 2003 and 2002, employees purchased approximately1.0 million, 1.8 million and 1.6 million shares, respectively, of NCR common stock for approximately $19 million, $19 millionand $22 million, respectively. As of December 31, 2004, the number of shares authorized and the number of shares availablefor grant under this plan were approximately 16 million and 2.8 million, respectively.
NOTE 9 EMPLOYEE BENEFIT PLANS
PENSION AND POSTRETIREMENT PLANSNCR sponsors defined benefit plans for the majority of its U.S. employees and international employees. For salaried employees,the defined benefit plans are based primarily upon compensation and years of service. For certain hourly employees in theUnited States, the benefits are based on a fixed dollar amount per year of service. During 2004, NCR made changes to itsU.S. defined benefit pension plans in order to limit participation in the plans to U.S. based employees who were at least 40 yearsold and hired by August 31, 2004. The plans are closed to new participants as of September 1, 2004. NCR’s funding policyis to contribute annually not less than the minimum required by applicable laws and regulations. Assets of NCR’s definedbenefit plans are primarily invested in publicly traded common stocks, corporate and government debt securities, real estateinvestments and cash or cash equivalents.
Prior to September 1998, substantially all U.S. employees who reached retirement age while working for NCR were eligibleto participate in a postretirement benefit plan. The plan provides medical care and life insurance benefits to retirees andtheir eligible dependents. In September 1998, the plan was amended whereby U.S. participants who had not reached a certainage and years of service with NCR were no longer eligible for such benefits. In September 2003, the plan was amended toeliminate the postretirement life insurance benefit for both active and non-active employees. In December 2003, theMedicare Prescription Drug, Improvement and Modernization Act of 2003 became law in the United States. This new lawwill not have any material impact on NCR’s postretirement plan liabilities or expense as the Company does not provide prescription drug benefits to its Medicare-eligible retirees. Non-U.S. employees are typically covered under government-sponsored programs, and NCR generally does not provide postretirement benefits other than pensions to non-U.S. retirees.NCR generally funds these benefits on a pay-as-you-go basis.
NCR uses a December 31 measurement date for all of its plans.
PENSION PLANSReconciliation of the beginning and ending balances of the benefit obligations for NCR’s pension plans were:
U.S. Pension Benefits International Pension Benefits Total Pension Benefits2004 2003 2004 2003 2004 2003
In millions
Change in benefit obligationBenefit obligation at January 1 $ 2,960 $ 2,700 $ 1,635 $ 1,380 $ 4,595 $ 4,080Gross service cost 47 48 45 43 92 91Interest cost 180 179 85 77 265 256Amendments – – 1 4 1 4Actuarial loss 181 194 142 26 323 220Benefits paid (166) (161) (106) (93) (272) (254)Curtailment (8) – (1) – (9) –Currency translation adjustments – – 138 198 138 198
Benefit obligation at December 31 $ 3,194 $ 2,960 $ 1,939 $ 1,635 $ 5,133 $ 4,595
Accumulated benefit obligationas of December 31 $ 3,088 $ 2,841 $ 1,819 $ 1,534 $ 4,907 $ 4,375
44 > NOTES TO CONSOLIDATED FINANCIAL STATEMENTS > NCR04
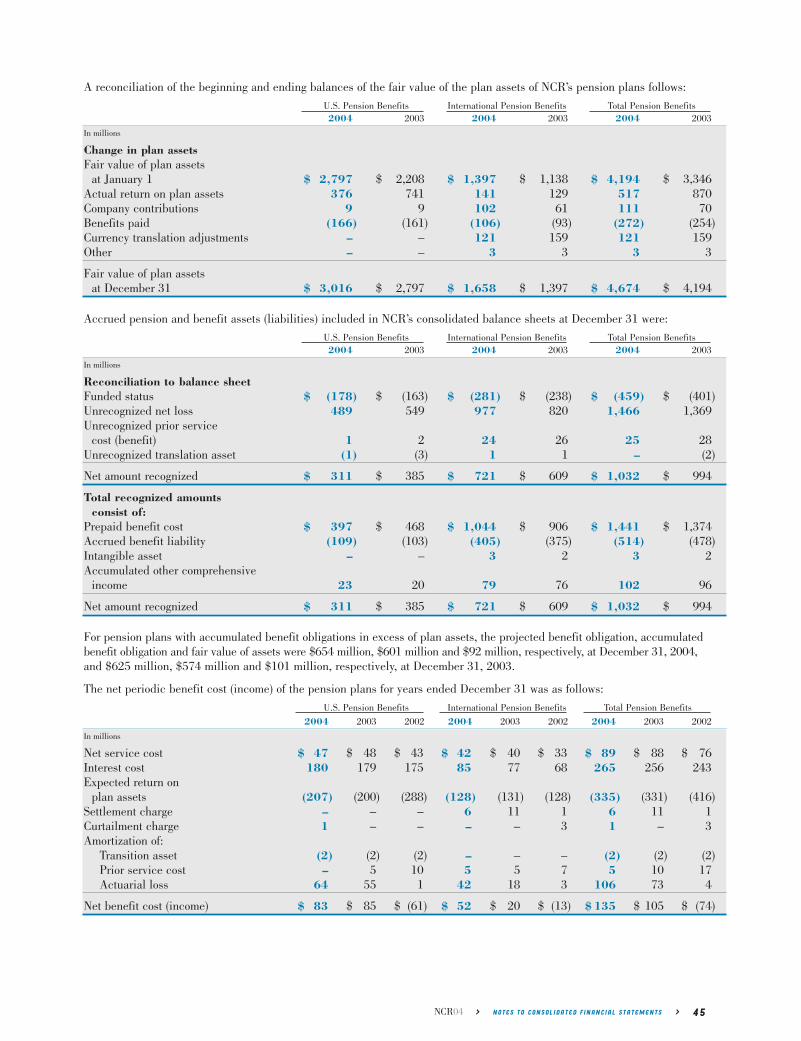
A reconciliation of the beginning and ending balances of the fair value of the plan assets of NCR’s pension plans follows:
U.S. Pension Benefits International Pension Benefits Total Pension Benefits2004 2003 2004 2003 2004 2003
In millions
Change in plan assetsFair value of plan assets
at January 1 $ 2,797 $ 2,208 $ 1,397 $ 1,138 $ 4,194 $ 3,346Actual return on plan assets 376 741 141 129 517 870Company contributions 9 9 102 61 111 70Benefits paid (166) (161) (106) (93) (272) (254)Currency translation adjustments – – 121 159 121 159Other – – 3 3 3 3
Fair value of plan assetsat December 31 $ 3,016 $ 2,797 $ 1,658 $ 1,397 $ 4,674 $ 4,194
Accrued pension and benefit assets (liabilities) included in NCR’s consolidated balance sheets at December 31 were:
U.S. Pension Benefits International Pension Benefits Total Pension Benefits2004 2003 2004 2003 2004 2003
In millions
Reconciliation to balance sheetFunded status $ (178) $ (163) $ (281) $ (238) $ (459) $ (401)Unrecognized net loss 489 549 977 820 1,466 1,369Unrecognized prior service
cost (benefit) 1 2 24 26 25 28Unrecognized translation asset (1) (3) 1 1 – (2)
Net amount recognized $ 311 $ 385 $ 721 $ 609 $ 1,032 $ 994
Total recognized amountsconsist of:
Prepaid benefit cost $ 397 $ 468 $ 1,044 $ 906 $ 1,441 $ 1,374Accrued benefit liability (109) (103) (405) (375) (514) (478)Intangible asset – – 3 2 3 2Accumulated other comprehensive
income 23 20 79 76 102 96
Net amount recognized $ 311 $ 385 $ 721 $ 609 $ 1,032 $ 994
For pension plans with accumulated benefit obligations in excess of plan assets, the projected benefit obligation, accumulatedbenefit obligation and fair value of assets were $654 million, $601 million and $92 million, respectively, at December 31, 2004,and $625 million, $574 million and $101 million, respectively, at December 31, 2003.
The net periodic benefit cost (income) of the pension plans for years ended December 31 was as follows:
U.S. Pension Benefits International Pension Benefits Total Pension Benefits
2004 2003 2002 2004 2003 2002 2004 2003 2002
In millions
Net service cost $ 47 $ 48 $ 43 $ 42 $ 40 $ 33 $ 89 $ 88 $ 76Interest cost 180 179 175 85 77 68 265 256 243Expected return on
plan assets (207) (200) (288) (128) (131) (128) (335) (331) (416)Settlement charge – – – 6 11 1 6 11 1Curtailment charge 1 – – – – 3 1 – 3Amortization of:
Transition asset (2) (2) (2) – – – (2) (2) (2)Prior service cost – 5 10 5 5 7 5 10 17Actuarial loss 64 55 1 42 18 3 106 73 4
Net benefit cost (income) $ 83 $ 85 $ (61) $ 52 $ 20 $ (13) $ 135 $ 105 $ (74)
NCR04 > NOTES TO CONSOLIDATED FINANCIAL STATEMENTS > 45

46 > NOTES TO CONSOLIDATED FINANCIAL STATEMENTS > NCR04
The weighted average rates and assumptions used to determine benefit obligations at December 31 were as follows:
U.S. Pension Benefits International Pension Benefits Total Pension Benefits
2004 2003 2004 2003 2004 2003
Discount rate 5.8% 6.3% 4.7% 5.2% 5.4% 5.9%Rate of compensation increase 4.2% 4.2% 3.3% 3.4% 3.9% 3.9%
The weighted average rates and assumptions used to determine net periodic benefit cost for years ended December 31 wereas follows:
U.S. Pension Benefits International Pension Benefits Total Pension Benefits
2004 2003 2002 2004 2003 2002 2004 2003 2002
Discount rate 6.3% 6.8% 7.3% 5.2% 5.6% 6.0% 5.9% 6.4% 6.9%Expected return on plan assets 8.5% 8.5% 10.0% 7.3% 8.1% 8.9% 8.1% 8.4% 9.7%Rate of compensation increase 4.2% 4.4% 4.4% 3.4% 3.7% 3.6% 3.9% 4.2% 4.2%
NCR employs a building block approach as its primary approach in determining the long-term expected rate of returnassumption for plan assets. Historical market returns are studied and long-term relationships between equities and fixedincome are preserved consistent with the widely accepted capital market principle that assets with higher volatility generatea higher return over the long run. Current market factors such as inflation and interest rates are evaluated before long-termcapital market assumptions are determined. The expected long-term portfolio return is established for each plan via a buildingblock approach with proper rebalancing consideration. The result is then adjusted to reflect additional expected return fromactive management net of plan expenses. Historical plan returns, the expectations of other capital market participants, andpeer data are all used to review and check the results for reasonableness and appropriateness.
PLAN ASSETSThe weighted average asset allocations at December 31, 2004 and 2003 by asset category are as follows:
U.S. Pension Fund International Pension FundsActual Allocation Actual Allocation
of Plan Assets Target of Plan Assets Targetat December 31 Asset at December 31 Asset
2004 2003 Allocation 2004 2003 Allocation
Equity securities 73% 73% 68-75% 64% 64% 60-71%Debt securities 19% 19% 18-22% 29% 28% 23-35%Real estate 8% 8% 7-9% 6% 7% 4-7%Other 0% 0% 0-1% 1% 1% 0-1%
Total 100% 100% 100% 100%
INVESTMENT STRATEGYNCR employs a total return investment approach whereby a mix of equities, fixed-income, and real estate investments areused to maximize the long-term return of plan assets subject to a prudent level of risk. The risk tolerance is established foreach plan through a careful consideration of plan liabilities, plan funded status, and corporate financial condition. Theinvestment portfolios contain a diversified blend of equity and fixed-income investments. Furthermore, equity investmentsare diversified across U.S. and non-U.S. stocks, small and large capitalization stocks, and growth and value stocks. Fixed-incomeassets are also diversified across U.S. and non-U.S. issuers, type of fixed-income security (i.e., government bond, corporatebonds, mortgage-backed securities), and credit quality. Where applicable, real estate investments are made through realestate securities, partnership interests, or direct investment and are diversified by property type and location. Other assetssuch as cash or private equity are used judiciously to improve portfolio diversification and enhance risk adjusted portfolioreturns. Derivatives may be used to adjust market exposures in an efficient and timely manner. Cash held by fund managersdue to the timing of security purchases and sales is classified in the same asset category as the related investment. Rebalancingalgorithms are applied to keep the asset mix of the plans from deviating excessively from their targets. Investment risk ismeasured and monitored on an ongoing basis through regular performance reporting, investment manager reviews, actuarialliability measurements, and periodic investment strategy reviews.
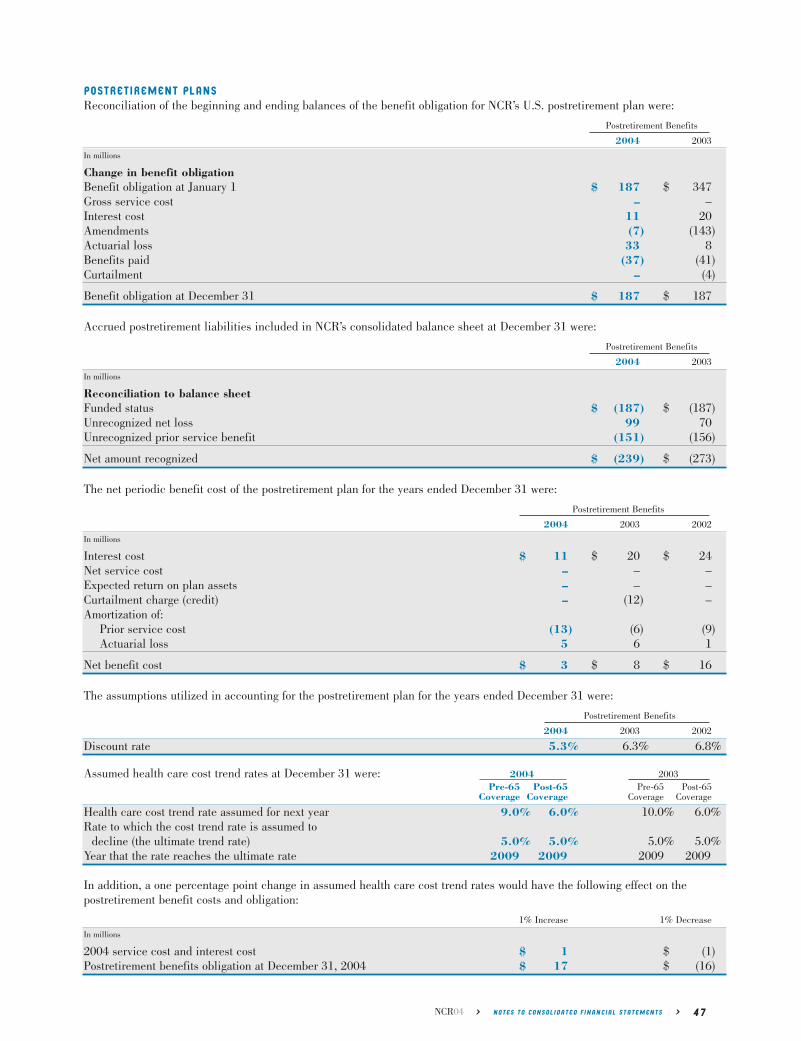
POSTRETIREMENT PLANSReconciliation of the beginning and ending balances of the benefit obligation for NCR’s U.S. postretirement plan were:
Postretirement Benefits
2004 2003
In millions
Change in benefit obligationBenefit obligation at January 1 $ 187 $ 347Gross service cost – –Interest cost 11 20Amendments (7) (143)Actuarial loss 33 8Benefits paid (37) (41)Curtailment – (4)
Benefit obligation at December 31 $ 187 $ 187
Accrued postretirement liabilities included in NCR’s consolidated balance sheet at December 31 were:
Postretirement Benefits
2004 2003
In millions
Reconciliation to balance sheetFunded status $ (187) $ (187)Unrecognized net loss 99 70Unrecognized prior service benefit (151) (156)
Net amount recognized $ (239) $ (273)
The net periodic benefit cost of the postretirement plan for the years ended December 31 were:
Postretirement Benefits
2004 2003 2002
In millions
Interest cost $ 11 $ 20 $ 24Net service cost – – –Expected return on plan assets – – –Curtailment charge (credit) – (12) –Amortization of:
Prior service cost (13) (6) (9)Actuarial loss 5 6 1
Net benefit cost $ 3 $ 8 $ 16
The assumptions utilized in accounting for the postretirement plan for the years ended December 31 were:
Postretirement Benefits
2004 2003 2002
Discount rate 5.3% 6.3% 6.8%
Assumed health care cost trend rates at December 31 were: 2004 2003Pre-65 Post-65 Pre-65 Post-65
Coverage Coverage Coverage Coverage
Health care cost trend rate assumed for next year 9.0% 6.0% 10.0% 6.0%Rate to which the cost trend rate is assumed to
decline (the ultimate trend rate) 5.0% 5.0% 5.0% 5.0%Year that the rate reaches the ultimate rate 2009 2009 2009 2009
In addition, a one percentage point change in assumed health care cost trend rates would have the following effect on thepostretirement benefit costs and obligation:
1% Increase 1% Decrease
In millions
2004 service cost and interest cost $ 1 $ (1)Postretirement benefits obligation at December 31, 2004 $ 17 $ (16)
NCR04 > NOTES TO CONSOLIDATED FINANCIAL STATEMENTS > 47

48 > NOTES TO CONSOLIDATED FINANCIAL STATEMENTS > NCR04
CASH FLOWS RELATED TO EMPLOYEE BENEFIT PLANSContributions NCR does not expect to contribute to its U.S. qualified pension plan in 2005; however, the Company plansto contribute approximately $124 million and $8 million to its international pension plan and executive pension plans,respectively, in 2005. It also expects contributions of $25 million to its U.S. postretirement plan in 2005.
Estimated Future Benefit Payment NCR expects to make the following benefit payments reflecting past and futureservice from its pension and postretirement plans:
U.S. International TotalPension Pension Pension PostretirementBenefits Benefits Benefits Benefits
In millions
2005 $ 178 $ 102 $ 280 $ 252006 $ 183 $ 99 $ 282 $ 252007 $ 188 $ 103 $ 291 $ 242008 $ 194 $ 113 $ 307 $ 212009 $ 200 $ 113 $ 313 $ 192010-2014 $ 1,084 $ 549 $ 1,633 $ 71
Savings Plans U.S. employees and many international employees participate in defined contribution savings plans. Theseplans generally provide either a specified percent of pay or a matching contribution on participating employees’ voluntaryelections. NCR’s matching contributions typically are subject to a maximum percentage or level of compensation. Employeecontributions can be made pre-tax, after-tax or a combination thereof. The expense under the U.S. plan was approximately$24 million in 2004, $23 million in 2003 and $24 million in 2002. The expense under international and subsidiary savingsplans was $16 million, $13 million and $10 million in 2004, 2003 and 2002, respectively.
Other Postemployment Benefits NCR offers various postemployment benefits to involuntarily terminated and certaininactive employees after employment but before retirement. These benefits are paid in accordance with NCR’s establishedpostemployment benefit practices and policies. Postemployment benefits may include disability benefits, supplemental unemployment benefits, severance, workers’ compensation benefits, and continuation of health care benefits and life insurancecoverage. NCR provides appropriate accruals for these postemployment benefits. These postemployment benefits are fundedon a pay-as-you-go basis. The expense under these plans was approximately $95 million, $79 million and $75 million for2004, 2003 and 2002, respectively. The accrued postemployment liability at December 31, 2004 and 2003 was $101 millionand $95 million, respectively.
NOTE 10 FINANCIAL INSTRUMENTSIn the normal course of business, NCR enters into various financial instruments, including derivative financial instruments.A description of these derivative instruments is as follows.
CASH FLOW HEDGESNCR primarily uses foreign exchange forward contracts to reduce the Company’s exposure to changes in currency exchangerates, primarily as it relates to inventory purchases by marketing units and inventory sales by manufacturing units. Themajority of the contracts were to exchange Euros, British Pounds and Japanese Yen, and generally mature within 15 months.Foreign exchange contracts used as a part of NCR’s risk management strategy, which are designated at inception as highlyeffective cash flow hedges, are measured for effectiveness both at inception and on an ongoing basis. For foreign exchangecontracts designated as highly effective cash flow hedges, the gains or losses are deferred in other comprehensive incomeand recognized in the determination of income as adjustments of carrying amounts when the underlying hedged transactionis realized, canceled or otherwise terminated. NCR reclassified an immaterial amount of net losses for the years endedDecember 31, 2004 and 2003, and $1 million for 2002. These losses are reclassified to other income and are the result ofdiscontinuance of cash flow hedges. The net impact related to the ineffectiveness of all cash flow hedges was not materialduring 2004, 2003 and 2002. At December 31, 2004, before-tax deferred net losses recorded in other comprehensiveincome related to cash flow hedges were $18 million, and are expected to be reclassified to earnings during the next 12 months.
FAIR VALUE HEDGESNCR entered into an interest rate swap agreement (swap) in 2003 as part of its risk management strategy. The swap utilizedby the Company effectively modifies a portion of the Company’s exposure to interest rate risk by converting a portion of theCompany’s fixed-rate debt to a floating rate. This agreement involves the receipt of fixed rate amounts in exchange for floatingrate interest payments over the life of the agreement without an exchange of the underlying principal amount. This swap wasdesignated as a highly effective fair value hedge of $50 million of the $300 million senior unsecured notes due in 2009
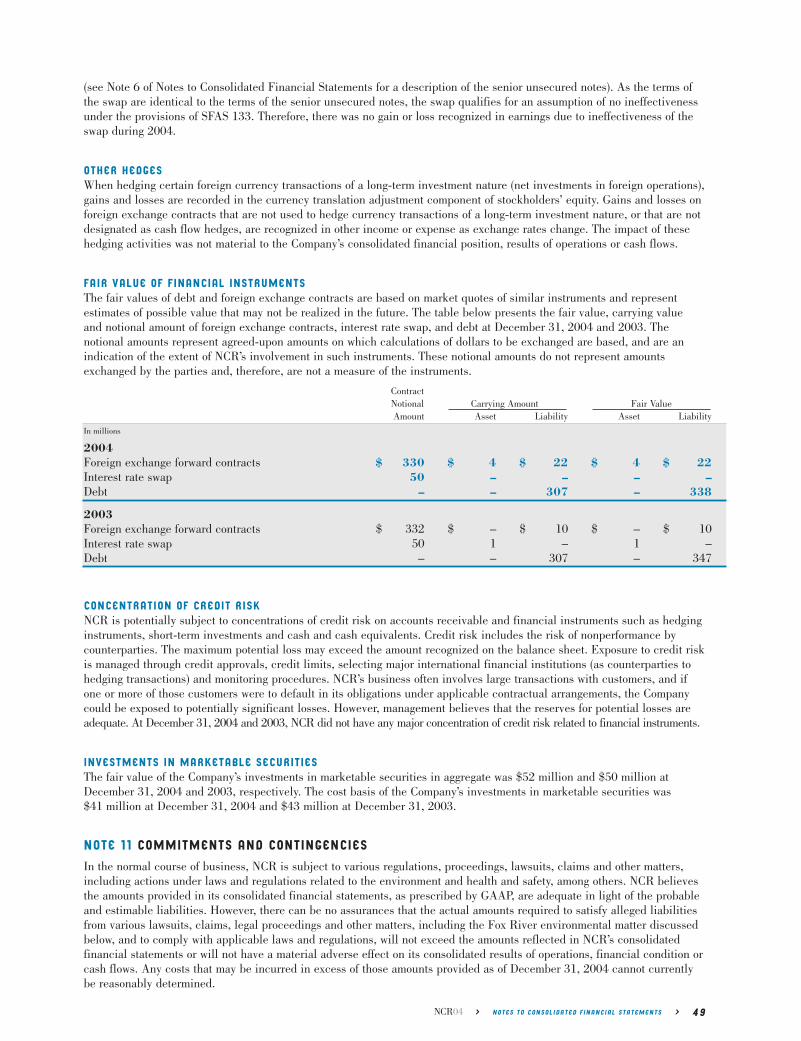
(see Note 6 of Notes to Consolidated Financial Statements for a description of the senior unsecured notes). As the terms ofthe swap are identical to the terms of the senior unsecured notes, the swap qualifies for an assumption of no ineffectivenessunder the provisions of SFAS 133. Therefore, there was no gain or loss recognized in earnings due to ineffectiveness of theswap during 2004.
OTHER HEDGESWhen hedging certain foreign currency transactions of a long-term investment nature (net investments in foreign operations),gains and losses are recorded in the currency translation adjustment component of stockholders’ equity. Gains and losses onforeign exchange contracts that are not used to hedge currency transactions of a long-term investment nature, or that are notdesignated as cash flow hedges, are recognized in other income or expense as exchange rates change. The impact of thesehedging activities was not material to the Company’s consolidated financial position, results of operations or cash flows.
FAIR VALUE OF FINANCIAL INSTRUMENTSThe fair values of debt and foreign exchange contracts are based on market quotes of similar instruments and represent estimates of possible value that may not be realized in the future. The table below presents the fair value, carrying value and notional amount of foreign exchange contracts, interest rate swap, and debt at December 31, 2004 and 2003. Thenotional amounts represent agreed-upon amounts on which calculations of dollars to be exchanged are based, and are anindication of the extent of NCR’s involvement in such instruments. These notional amounts do not represent amountsexchanged by the parties and, therefore, are not a measure of the instruments.
ContractNotional Carrying Amount Fair ValueAmount Asset Liability Asset Liability
In millions
2004Foreign exchange forward contracts $ 330 $ 4 $ 22 $ 4 $ 22Interest rate swap 50 – – – –Debt – – 307 – 338
2003Foreign exchange forward contracts $ 332 $ – $ 10 $ – $ 10Interest rate swap 50 1 – 1 –Debt – – 307 – 347
CONCENTRATION OF CREDIT RISKNCR is potentially subject to concentrations of credit risk on accounts receivable and financial instruments such as hedginginstruments, short-term investments and cash and cash equivalents. Credit risk includes the risk of nonperformance bycounterparties. The maximum potential loss may exceed the amount recognized on the balance sheet. Exposure to credit riskis managed through credit approvals, credit limits, selecting major international financial institutions (as counterparties tohedging transactions) and monitoring procedures. NCR’s business often involves large transactions with customers, and ifone or more of those customers were to default in its obligations under applicable contractual arrangements, the Companycould be exposed to potentially significant losses. However, management believes that the reserves for potential losses areadequate. At December 31, 2004 and 2003, NCR did not have any major concentration of credit risk related to financial instruments.
INVESTMENTS IN MARKETABLE SECURITIESThe fair value of the Company’s investments in marketable securities in aggregate was $52 million and $50 million atDecember 31, 2004 and 2003, respectively. The cost basis of the Company’s investments in marketable securities was $41 million at December 31, 2004 and $43 million at December 31, 2003.
NOTE 11 COMMITMENTS AND CONTINGENCIESIn the normal course of business, NCR is subject to various regulations, proceedings, lawsuits, claims and other matters,including actions under laws and regulations related to the environment and health and safety, among others. NCR believesthe amounts provided in its consolidated financial statements, as prescribed by GAAP, are adequate in light of the probableand estimable liabilities. However, there can be no assurances that the actual amounts required to satisfy alleged liabilitiesfrom various lawsuits, claims, legal proceedings and other matters, including the Fox River environmental matter discussedbelow, and to comply with applicable laws and regulations, will not exceed the amounts reflected in NCR’s consolidatedfinancial statements or will not have a material adverse effect on its consolidated results of operations, financial condition orcash flows. Any costs that may be incurred in excess of those amounts provided as of December 31, 2004 cannot currentlybe reasonably determined.
NCR04 > NOTES TO CONSOLIDATED FINANCIAL STATEMENTS > 49
ENVIRONMENTAL MATTERSNCR’s facilities and operations are subject to a wide range of environmental protection laws, and NCR has investigatory andremedial activities underway at a number of facilities that it currently owns or operates, or formerly owned or operated, tocomply, or to determine compliance, with such laws. Also, NCR has been identified, either by a government agency or by aprivate party seeking contribution to site clean-up costs, as a potentially responsible party (PRP) at a number of sites pursuantto various state and federal laws, including the Federal Water Pollution Control Act (FWPCA) and comparable state statutes,and the Comprehensive Environmental Response, Compensation and Liability Act of 1980 (CERCLA), as amended, and comparable state statutes.
NCR is one of eight entities that have been formally notified by governmental and other entities (such as local NativeAmerican tribes) that they are PRPs for environmental claims under CERCLA and other statutes arising out of the presenceof polychlorinated biphenyls (PCBs) in sediments in the lower Fox River and in the Bay of Green Bay, in Wisconsin. NCRwas identified as a PRP because of alleged PCB discharges from two carbonless copy paper manufacturing facilities it previouslyowned, which are located along the Fox River. Some parties contend that NCR is also responsible for PCB discharges frompaper mills owned by other companies because carbonless paper manufactured by NCR was purchased by those mills as araw material for their paper making processes. NCR sold the facilities in 1978 to Appleton Papers Inc. (API), which has alsobeen identified as a PRP. The other Fox River PRPs include P.H. Glatfelter Company, Georgia-Pacific Corp. (formerly FortJames), WTM I Co. (formerly Wisconsin Tissue Mills, now owned by Chesapeake Corporation), Riverside Paper Corporation,Sonoco U.S. Mills, Inc. (owned by Sonoco Products Company), and Menasha Corporation.
The governmental and other entities making such claims against NCR and the other PRPs have been coordinating theiractions, including the assertion of claims against the PRPs. Additionally, certain claimants have notified NCR and the otherPRPs of their intent to commence a natural resource damage (NRD) lawsuit, but have not as yet instituted litigation; and oneof the claimants, the U.S. Environmental Protection Agency (USEPA), formally proposed the Fox River site for inclusion onthe CERCLA National Priorities List, but no action has yet been taken on this proposal.
NCR’s reserve for the Fox River matter has decreased from the end of the third quarter of 2004 to reflect the incurrence of ongoing Fox River-related expenses (which are charged against and reduce the reserve). The reserve was approximately$67 million as of December 31, 2004 (after taking into consideration amounts expected to be recovered under an indemnity agreement discussed below). The Company regularly re-evaluates the assumptions used in determining the appropriate reserve for the Fox River matter as additional information becomes available and, when warranted, makes appropriate adjustments.
In July 2003, USEPA and Wisconsin Department of Natural Resources (WDNR) issued their final clean-up plan (known as a Record of Decision, or ROD) for the largest portion of the Fox River. The ROD addresses the lower part of the Fox Riverand portions of Green Bay, where USEPA and WDNR (the Governments) estimate the bulk of the sediments that need to beremediated are located. In the two portions of the lower part of the Fox River covered by the ROD – Operable Units (OUs) 3 and 4 – the Governments selected large-scale dredging as the remedial approach. The Governments estimate that approximately 6.5 million cubic yards of sediment will be removed from these portions at an estimated cost of approximately$284 million. The Governments also identify “capping” the river bed with appropriate materials as a “contingent remedy” to be evaluated during the remedial design process. For Green Bay, or OU-5, the Governments selected monitored naturalattenuation as the remedial approach at an estimated cost of approximately $40 million. The Governments also indicate thatsome limited dredging near the mouth of the river might be required, but this will be determined during the design stage ofthe project. Earlier, in January 2003, the Governments issued their ROD for the upper portions of the Fox River – OUs 1and 2. Combining the cost estimates from both RODs, it appears the Governments expect the selected remedies for all fiveOUs to cost approximately $400 million exclusive of contingencies.
NCR believes the Governments’ cost estimates omit some categories of cost, use unit costs that are lower than what mightreasonably be expected, and underestimate the cost of some portions of the selected remedy. As a result, the total clean-upcosts could be substantially higher, and the cost estimates are subject to many uncertainties. The Governments and certainPRPs have initiated the engineering design of the remedy, a process that could take three to four years. Actual dredging inthe lower portions will not begin until the design work is complete. The Governments have indicated they expect the designand dredging work to take at least ten years.
By letter dated September 30, 2003, the Governments notified NCR and seven other PRPs of their potential liability forremediation of the lower portions of the Fox River and requested that one or more of the PRPs enter into an agreement withthe Governments to perform the design work for OUs 2-5. In response, NCR and Georgia-Pacific (G-P) in March 2004entered into an Administrative Order on Consent (AOC) with the Governments to perform the remedial design work for OUs 2-5.
NCR, in conjunction with the other PRPs, has developed a substantial body of evidence that may demonstrate that the eventual implementation of alternatives involving river-wide restoration/remediation, particularly massive dredging, wouldbe inappropriate and unnecessary. There is ongoing debate within the scientific, regulatory, legal, public policy and legislativecommunities over how to properly manage large areas of contaminated sediments, and NCR believes there is a high degreeof uncertainty about the appropriate scope of alternatives that may ultimately be required by the Governments.
50 > NOTES TO CONSOLIDATED FINANCIAL STATEMENTS > NCR04

Notwithstanding the issuance of the RODs, the extent of NCR’s potential liability is subject to many uncertainties at thistime. NCR’s eventual liability – which is expected to be paid out over a period of at least ten years, and likely as long astwenty to forty or more years – will depend on a number of factors. In general, the most significant factors include: (1) thetotal clean-up costs for the site; (2) the total natural resource damages for the site; (3) the share NCR and API will jointlybear of the total clean-up costs and natural resource damages as former and current owners of paper manufacturing facilitieslocated along the Fox River; (4) the share NCR will bear of the joint NCR/API payments for clean-up costs and naturalresource damages; and (5) NCR’s transaction costs to defend itself in this matter. In setting the reserve, NCR attempts toestimate a range of reasonably possible outcomes for each of these factors, although each range is itself highly uncertain.NCR uses its best estimate within the range if that is possible. Where there is a range of equally probable outcomes, andthere is no amount within that range that appears to be a better estimate than any other amount, NCR uses the low end ofthe range. These factors are discussed below:
• For the first factor described above, total clean-up costs for the site, NCR has determined that there is a range ofequally probable outcomes, and that no estimate within that range is better than the other estimates. Accordingly,NCR uses the low end of that range, which is now $480 million. This amount is derived by taking the Governments’estimate for total clean-up costs – $400 million – and increasing it by 20% to reflect NCR’s analysis that indicates the Governments’ own cost estimates are understated. For example, NCR’s review indicates that the Governments’ $400 million cost number omits some categories of cost, uses unit costs that are lower than what might reasonably beexpected, and underestimates the cost of some elements of the selected remedy. However, there can be no assurancesthat this amount will not be significantly higher. For example, one consultant has expressed an opinion that totalclean-up costs for the site could be approximately $1.1 billion.
• Second, for total natural resource damages, NCR has determined that there is a range of equally probable outcomes,and that no estimate within that range is better than the other estimates. Accordingly, NCR uses the low end of thatrange, which is the lowest estimate in the Governments’ 2000 report on natural resource damages. This amount is$176 million.
• Third, for the NCR/API share of clean-up costs and natural resource damages, NCR examined figures developed byseveral independent, nationally-recognized engineering and paper-industry experts, along with those set forth in draftgovernment reports. Again, the Company determined that there is a range of equally probable outcomes, and that noestimate within that range is better than the other estimates. Accordingly, NCR uses the low end of that range, whichis based primarily on an estimate of the joint NCR/API percentage of direct discharges of PCBs to the river.
• Fourth, for the NCR share of the joint NCR/API payments, the Company estimates that it would pay approximatelyhalf of the total costs jointly attributable to NCR/API. This is based on a sharing agreement between NCR and API,the terms of which are confidential. This factor assumes that API is able to pay its share of the NCR/API joint share.
• Finally, for NCR’s transaction costs to defend this matter, the Company has estimated the costs that are likely to be incurred over the ten years ending in 2013, the time period the Governments project it will take to design andimplement the remedy for the river. This estimate is based on an analysis of NCR’s costs since this matter first arosein 1995 and estimates of what the Company’s defense and transaction costs will be in the future. NCR expects that the bulk of these transaction costs will be incurred over the first four to five years of this time period, when the remedywill be designed and the initial dredging will begin. Once dredging is underway, NCR believes that its transactioncosts may decrease significantly on an annual basis.
While it remains difficult to predict, NCR does not expect there to be any significant near-term changes to any of the above-described estimates that are likely to have a material effect on the amount of our accrual. However, there are otherestimates for each of these factors which are significantly higher than the estimates described above. NCR believes there is such uncertainty surrounding these estimates that it cannot quantify the high end of the range of such estimates.
NCR has discussed above the Company’s overall, long-term exposure to the Fox River liability. However, NCR’s short-termliability for this matter is limited. In December 2001, NCR and API entered into an interim settlement with the Governmentsthat limits NCR/API’s joint cash payouts to $10 million per year over a four-year period beginning at the time of such interimsettlement. Any portion of an annual $10 million installment not paid out in a given year will be rolled over and made availablefor payment during subsequent years up until December 10, 2005. In exchange for these payments, the Governments haveagreed not to take any enforcement actions against NCR and API during the term of the settlement. These payments arebeing shared by NCR and API under the terms of the confidential settlement agreement discussed above and will be creditedagainst NCR’s long-term exposure for this matter. NCR’s share of these payments was taken into account in determining itsreserve. Six and a half million of the amounts paid under the interim settlement will be used to fund part of the design workNCR and G-P are performing under the AOC discussed above.
AT&T and Lucent Technologies, Inc. (Lucent) are jointly responsible for indemnifying NCR for a portion of amounts for theFox River incurred by NCR over a certain threshold. NCR’s estimate of what AT&T and Lucent will pay under the indemnityis recorded as a long-term receivable of $15 million and is deducted in determining the net amount discussed above.
NCR04 > NOTES TO CONSOLIDATED FINANCIAL STATEMENTS > 51
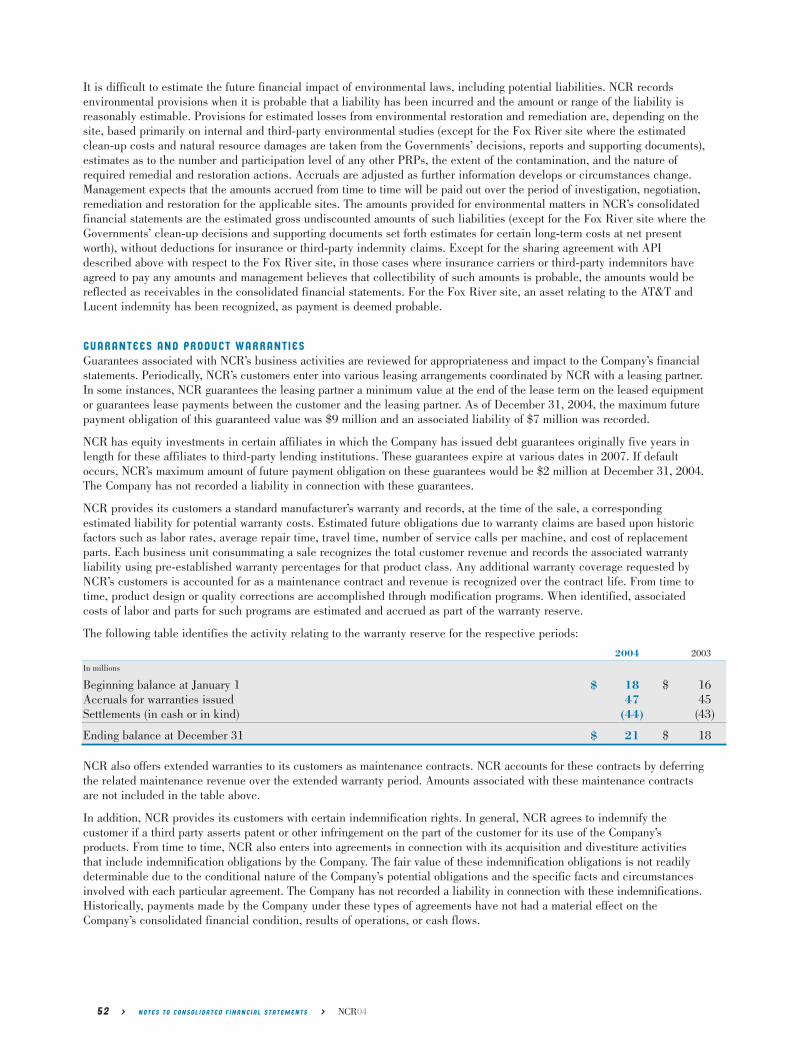
It is difficult to estimate the future financial impact of environmental laws, including potential liabilities. NCR records environmental provisions when it is probable that a liability has been incurred and the amount or range of the liability isreasonably estimable. Provisions for estimated losses from environmental restoration and remediation are, depending on thesite, based primarily on internal and third-party environmental studies (except for the Fox River site where the estimatedclean-up costs and natural resource damages are taken from the Governments’ decisions, reports and supporting documents),estimates as to the number and participation level of any other PRPs, the extent of the contamination, and the nature ofrequired remedial and restoration actions. Accruals are adjusted as further information develops or circumstances change.Management expects that the amounts accrued from time to time will be paid out over the period of investigation, negotiation,remediation and restoration for the applicable sites. The amounts provided for environmental matters in NCR’s consolidatedfinancial statements are the estimated gross undiscounted amounts of such liabilities (except for the Fox River site where theGovernments’ clean-up decisions and supporting documents set forth estimates for certain long-term costs at net presentworth), without deductions for insurance or third-party indemnity claims. Except for the sharing agreement with APIdescribed above with respect to the Fox River site, in those cases where insurance carriers or third-party indemnitors haveagreed to pay any amounts and management believes that collectibility of such amounts is probable, the amounts would bereflected as receivables in the consolidated financial statements. For the Fox River site, an asset relating to the AT&T andLucent indemnity has been recognized, as payment is deemed probable.
GUARANTEES AND PRODUCT WARRANTIESGuarantees associated with NCR’s business activities are reviewed for appropriateness and impact to the Company’s financialstatements. Periodically, NCR’s customers enter into various leasing arrangements coordinated by NCR with a leasing partner.In some instances, NCR guarantees the leasing partner a minimum value at the end of the lease term on the leased equipmentor guarantees lease payments between the customer and the leasing partner. As of December 31, 2004, the maximum futurepayment obligation of this guaranteed value was $9 million and an associated liability of $7 million was recorded.
NCR has equity investments in certain affiliates in which the Company has issued debt guarantees originally five years inlength for these affiliates to third-party lending institutions. These guarantees expire at various dates in 2007. If defaultoccurs, NCR’s maximum amount of future payment obligation on these guarantees would be $2 million at December 31, 2004.The Company has not recorded a liability in connection with these guarantees.
NCR provides its customers a standard manufacturer’s warranty and records, at the time of the sale, a corresponding estimated liability for potential warranty costs. Estimated future obligations due to warranty claims are based upon historicfactors such as labor rates, average repair time, travel time, number of service calls per machine, and cost of replacementparts. Each business unit consummating a sale recognizes the total customer revenue and records the associated warrantyliability using pre-established warranty percentages for that product class. Any additional warranty coverage requested byNCR’s customers is accounted for as a maintenance contract and revenue is recognized over the contract life. From time totime, product design or quality corrections are accomplished through modification programs. When identified, associatedcosts of labor and parts for such programs are estimated and accrued as part of the warranty reserve.
The following table identifies the activity relating to the warranty reserve for the respective periods:
2004 2003
In millions
Beginning balance at January 1 $ 18 $ 16Accruals for warranties issued 47 45Settlements (in cash or in kind) (44) (43)
Ending balance at December 31 $ 21 $ 18
NCR also offers extended warranties to its customers as maintenance contracts. NCR accounts for these contracts by deferringthe related maintenance revenue over the extended warranty period. Amounts associated with these maintenance contractsare not included in the table above.
In addition, NCR provides its customers with certain indemnification rights. In general, NCR agrees to indemnify the customer if a third party asserts patent or other infringement on the part of the customer for its use of the Company’s products. From time to time, NCR also enters into agreements in connection with its acquisition and divestiture activitiesthat include indemnification obligations by the Company. The fair value of these indemnification obligations is not readilydeterminable due to the conditional nature of the Company’s potential obligations and the specific facts and circumstancesinvolved with each particular agreement. The Company has not recorded a liability in connection with these indemnifications.Historically, payments made by the Company under these types of agreements have not had a material effect on theCompany’s consolidated financial condition, results of operations, or cash flows.
52 > NOTES TO CONSOLIDATED FINANCIAL STATEMENTS > NCR04
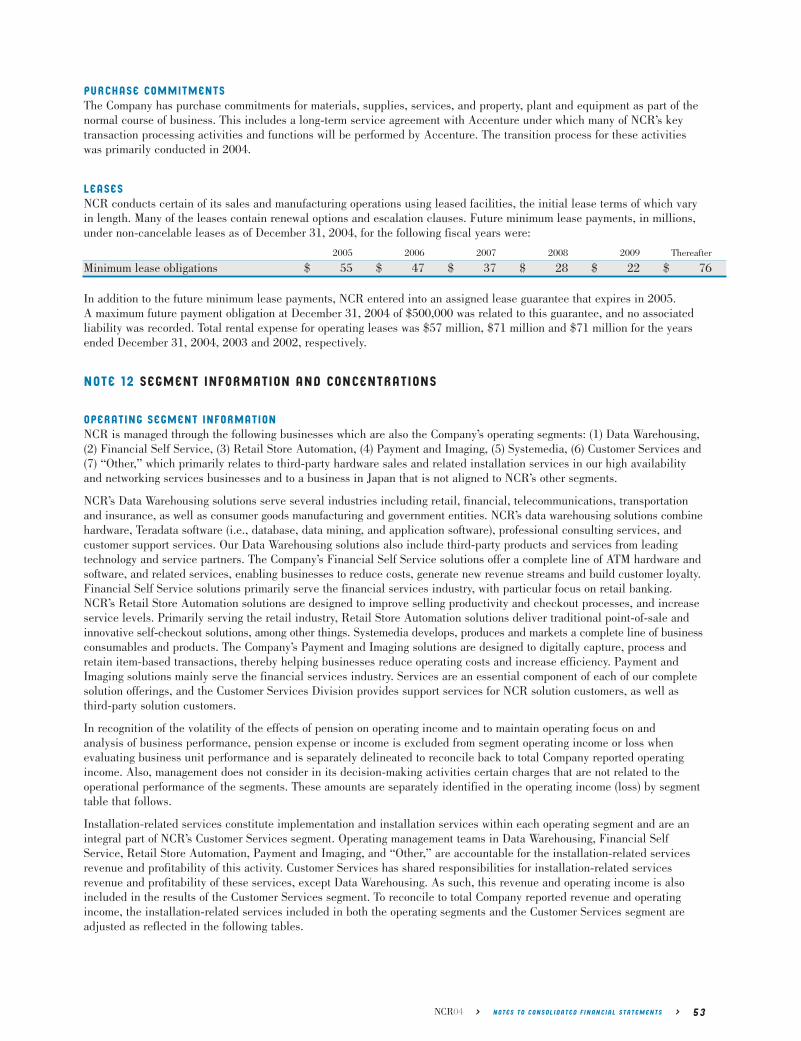
PURCHASE COMMITMENTSThe Company has purchase commitments for materials, supplies, services, and property, plant and equipment as part of thenormal course of business. This includes a long-term service agreement with Accenture under which many of NCR’s keytransaction processing activities and functions will be performed by Accenture. The transition process for these activitieswas primarily conducted in 2004.
LEASESNCR conducts certain of its sales and manufacturing operations using leased facilities, the initial lease terms of which varyin length. Many of the leases contain renewal options and escalation clauses. Future minimum lease payments, in millions,under non-cancelable leases as of December 31, 2004, for the following fiscal years were:
2005 2006 2007 2008 2009 Thereafter
Minimum lease obligations $ 55 $ 47 $ 37 $ 28 $ 22 $ 76
In addition to the future minimum lease payments, NCR entered into an assigned lease guarantee that expires in 2005. A maximum future payment obligation at December 31, 2004 of $500,000 was related to this guarantee, and no associatedliability was recorded. Total rental expense for operating leases was $57 million, $71 million and $71 million for the yearsended December 31, 2004, 2003 and 2002, respectively.
NOTE 12 SEGMENT INFORMATION AND CONCENTRATIONS
OPERATING SEGMENT INFORMATIONNCR is managed through the following businesses which are also the Company’s operating segments: (1) Data Warehousing,(2) Financial Self Service, (3) Retail Store Automation, (4) Payment and Imaging, (5) Systemedia, (6) Customer Services and(7) “Other,” which primarily relates to third-party hardware sales and related installation services in our high availabilityand networking services businesses and to a business in Japan that is not aligned to NCR’s other segments.
NCR’s Data Warehousing solutions serve several industries including retail, financial, telecommunications, transportationand insurance, as well as consumer goods manufacturing and government entities. NCR’s data warehousing solutions combinehardware, Teradata software (i.e., database, data mining, and application software), professional consulting services, andcustomer support services. Our Data Warehousing solutions also include third-party products and services from leadingtechnology and service partners. The Company’s Financial Self Service solutions offer a complete line of ATM hardware andsoftware, and related services, enabling businesses to reduce costs, generate new revenue streams and build customer loyalty.Financial Self Service solutions primarily serve the financial services industry, with particular focus on retail banking.NCR’s Retail Store Automation solutions are designed to improve selling productivity and checkout processes, and increaseservice levels. Primarily serving the retail industry, Retail Store Automation solutions deliver traditional point-of-sale andinnovative self-checkout solutions, among other things. Systemedia develops, produces and markets a complete line of businessconsumables and products. The Company’s Payment and Imaging solutions are designed to digitally capture, process andretain item-based transactions, thereby helping businesses reduce operating costs and increase efficiency. Payment andImaging solutions mainly serve the financial services industry. Services are an essential component of each of our completesolution offerings, and the Customer Services Division provides support services for NCR solution customers, as well asthird-party solution customers.
In recognition of the volatility of the effects of pension on operating income and to maintain operating focus on and analysis of business performance, pension expense or income is excluded from segment operating income or loss when evaluating business unit performance and is separately delineated to reconcile back to total Company reported operatingincome. Also, management does not consider in its decision-making activities certain charges that are not related to theoperational performance of the segments. These amounts are separately identified in the operating income (loss) by segmenttable that follows.
Installation-related services constitute implementation and installation services within each operating segment and are anintegral part of NCR’s Customer Services segment. Operating management teams in Data Warehousing, Financial SelfService, Retail Store Automation, Payment and Imaging, and “Other,” are accountable for the installation-related servicesrevenue and profitability of this activity. Customer Services has shared responsibilities for installation-related services revenue and profitability of these services, except Data Warehousing. As such, this revenue and operating income is alsoincluded in the results of the Customer Services segment. To reconcile to total Company reported revenue and operatingincome, the installation-related services included in both the operating segments and the Customer Services segment areadjusted as reflected in the following tables.
NCR04 > NOTES TO CONSOLIDATED FINANCIAL STATEMENTS > 53

54 > NOTES TO CONSOLIDATED FINANCIAL STATEMENTS > NCR04
The following table presents revenue by operating segment for the years ended December 31:
2004 2003 2002
In millions
RevenueData Warehousing
Products $ 728 $ 624 $ 668Professional and installation-related services 341 325 334
Total Data Warehousing Solution 1,069 949 1,002Data Warehousing support services 292 264 224
Total Data Warehousing revenue 1,361 1,213 1,226
Financial Self ServiceProducts 1,102 913 912Professional and installation-related services 268 236 183
Total Financial Self Service revenue 1,370 1,149 1,095
Retail Store AutomationProducts 627 558 504Professional and installation-related services 237 239 210
Total Retail Store Automation revenue 864 797 714
Systemedia 512 494 518
Payment and ImagingProducts 109 116 115Professional and installation-related services 40 36 37
Total Payment and Imaging revenue 149 152 152
Customer ServicesProducts – – 2Professional and installation-related services 326 320 218Customer Service Maintenance:
Financial Self Service 576 546 516Retail Store Automation 462 467 462Payment and Imaging 108 107 107Other 361 409 486
Total Customer Services revenue 1,833 1,849 1,791
OtherProducts 86 130 166Professional and installation-related services 110 112 121
Total Other revenue 196 242 287
Elimination of installation-related services revenueincluded in both the Customer Services segmentand the other segments (301) (298) (198)
Total Revenue $ 5,984 $ 5,598 $ 5,585
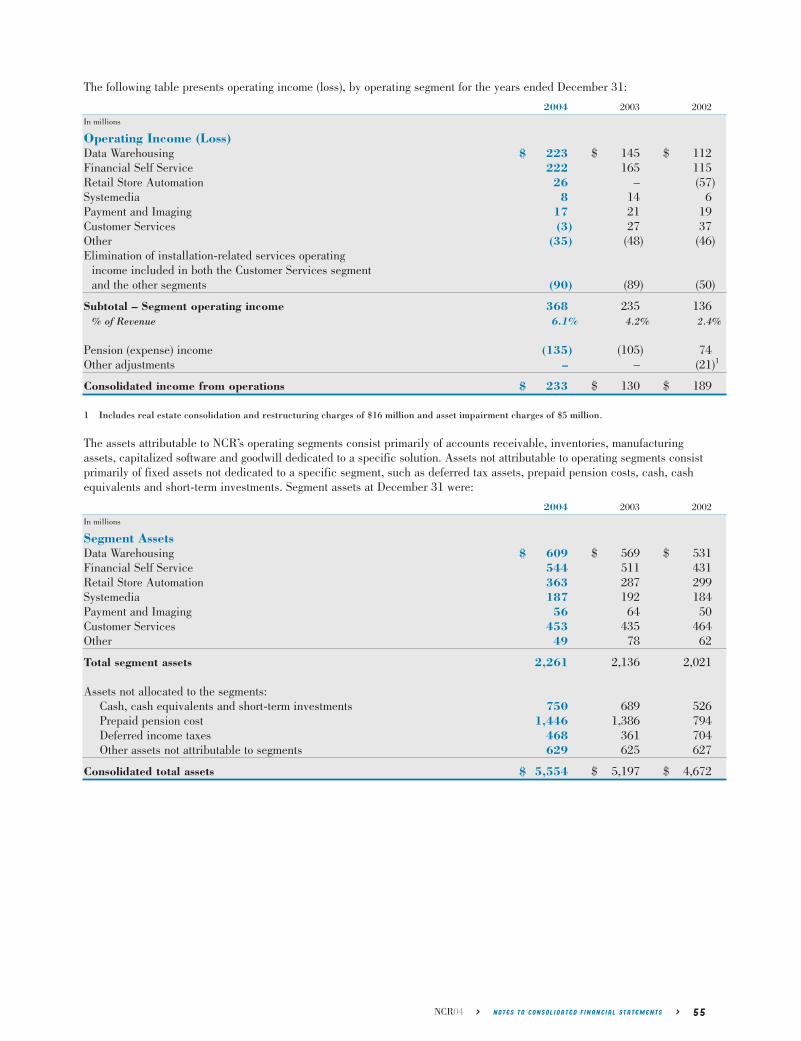
The following table presents operating income (loss), by operating segment for the years ended December 31:
2004 2003 2002
In millions
Operating Income (Loss)Data Warehousing $ 223 $ 145 $ 112Financial Self Service 222 165 115Retail Store Automation 26 – (57)Systemedia 8 14 6Payment and Imaging 17 21 19Customer Services (3) 27 37Other (35) (48) (46)Elimination of installation-related services operating
income included in both the Customer Services segmentand the other segments (90) (89) (50)
Subtotal – Segment operating income 368 235 136% of Revenue 6.1% 4.2% 2.4%
Pension (expense) income (135) (105) 74Other adjustments – – (21)1
Consolidated income from operations $ 233 $ 130 $ 189
1 Includes real estate consolidation and restructuring charges of $16 million and asset impairment charges of $5 million.
The assets attributable to NCR’s operating segments consist primarily of accounts receivable, inventories, manufacturingassets, capitalized software and goodwill dedicated to a specific solution. Assets not attributable to operating segments consistprimarily of fixed assets not dedicated to a specific segment, such as deferred tax assets, prepaid pension costs, cash, cashequivalents and short-term investments. Segment assets at December 31 were:
2004 2003 2002
In millions
Segment AssetsData Warehousing $ 609 $ 569 $ 531Financial Self Service 544 511 431Retail Store Automation 363 287 299Systemedia 187 192 184Payment and Imaging 56 64 50Customer Services 453 435 464Other 49 78 62
Total segment assets 2,261 2,136 2,021
Assets not allocated to the segments:Cash, cash equivalents and short-term investments 750 689 526Prepaid pension cost 1,446 1,386 794Deferred income taxes 468 361 704Other assets not attributable to segments 629 625 627
Consolidated total assets $ 5,554 $ 5,197 $ 4,672
NCR04 > NOTES TO CONSOLIDATED FINANCIAL STATEMENTS > 55

Revenues are attributed to the geographic area/country to which the product is delivered or in which the service is provided.The following table presents revenue by geographic area for NCR for the years ended December 31:
2004 % 2003 % 2002 %
In millions
Revenue by geographic areaUnited States $ 2,570 43% $ 2,405 43% $ 2,396 43%Americas (excluding United States) 386 6% 343 6% 383 7%Europe/Middle East/Africa 1,933 32% 1,793 32% 1,671 30%Japan 457 8% 460 8% 483 9%Asia/Pacific (excluding Japan) 638 11% 597 11% 652 11%
Consolidated revenue $ 5,984 100% $ 5,598 100% $ 5,585 100%
The following table presents certain long-lived assets, primarily composed of property, plant and equipment, prepaid pension,capitalized software and goodwill by country at December 31:
2004 2003 2002
In millions
Long-lived assetsUnited States $ 1,023 $ 1,060 $ 610United Kingdom 808 740 643Japan 145 180 154All other countries 529 482 439
Consolidated long-lived assets $ 2,505 $ 2,462 $ 1,846
CONCENTRATIONSNo single customer accounts for more than 10% of NCR’s consolidated revenue. As of December 31, 2004, NCR is notaware of any significant concentration of business transacted with a particular customer that could, if suddenly eliminated,have a material adverse effect on NCR’s operations. NCR also does not have a concentration of available sources of labor, services, licenses or other rights that could, if suddenly eliminated, have a material adverse effect on its operations.
A number of NCR’s products, systems and solutions rely primarily on specific suppliers for microprocessors and other component products, manufactured assemblies, operating systems, commercial databases and other central components.There can be no assurances that any sudden impact to the availability or cost of these technologies would not have a materialadverse effect on NCR’s operations.
NOTE 13 SUBSEQUENT EVENTSAt December 31, 2004, NCR had a reserve in anticipation of non-payment of a non-trade receivable with one of ourJapanese-affiliated companies due to a long history of non-payment and unprofitable operations. In February 2005, the equityposition of this company improved as the result of its improving profitability, an additional investment of capital from one ofthe other equity holders and the acquisition of an external loan (not guaranteed by NCR). Due to these events, this companywas able to pay NCR $4 million in February 2005. As this event provided additional evidence, with respect to conditionsthat existed at the date of the balance sheet as to the estimates of realization of receivables, NCR adjusted the financialstatements accordingly.
At December 31, 2004, the Company had a $1 million reserve for an environmental liability related to a former manufacturingfacility owned and operated from 1965 to 1994. The property was sold in 1994. In February 2005, additional developmentscaused us to increase our reserve by $2 million. The adjustment was made to NCR’s 2004 financial statements to reflect this change.
56 > NOTES TO CONSOLIDATED FINANCIAL STATEMENTS > NCR04
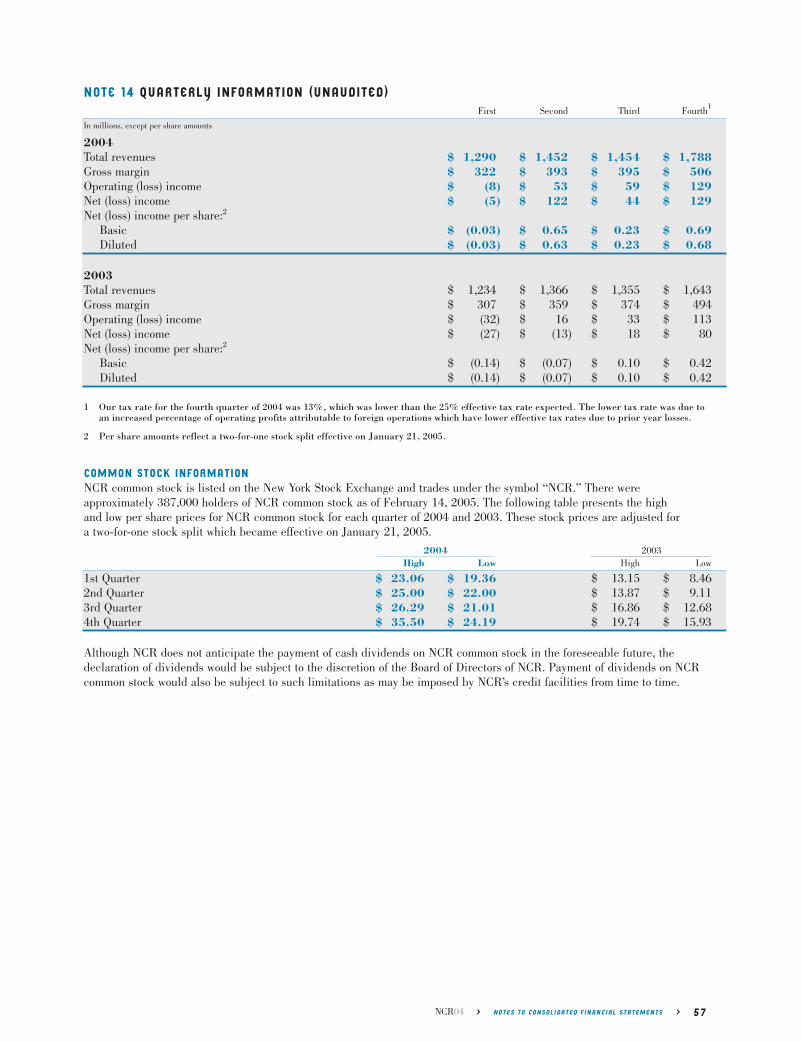
NOTE 14 QUARTERLY INFORMATION (UNAUDITED)First Second Third Fourth1
In millions, except per share amounts
2004Total revenues $ 1,290 $ 1,452 $ 1,454 $ 1,788Gross margin $ 322 $ 393 $ 395 $ 506Operating (loss) income $ (8) $ 53 $ 59 $ 129Net (loss) income $ (5) $ 122 $ 44 $ 129Net (loss) income per share:2
Basic $ (0.03) $ 0.65 $ 0.23 $ 0.69Diluted $ (0.03) $ 0.63 $ 0.23 $ 0.68
2003Total revenues $ 1,234 $ 1,366 $ 1,355 $ 1,643Gross margin $ 307 $ 359 $ 374 $ 494Operating (loss) income $ (32) $ 16 $ 33 $ 113Net (loss) income $ (27) $ (13) $ 18 $ 80Net (loss) income per share:2
Basic $ (0.14) $ (0.07) $ 0.10 $ 0.42Diluted $ (0.14) $ (0.07) $ 0.10 $ 0.42
1 Our tax rate for the fourth quarter of 2004 was 13%, which was lower than the 25% effective tax rate expected. The lower tax rate was due toan increased percentage of operating profits attributable to foreign operations which have lower effective tax rates due to prior year losses.
2 Per share amounts reflect a two-for-one stock split effective on January 21, 2005.
COMMON STOCK INFORMATIONNCR common stock is listed on the New York Stock Exchange and trades under the symbol “NCR.” There were approximately 387,000 holders of NCR common stock as of February 14, 2005. The following table presents the high and low per share prices for NCR common stock for each quarter of 2004 and 2003. These stock prices are adjusted for a two-for-one stock split which became effective on January 21, 2005.
2004 2003High Low High Low
1st Quarter $ 23.06 $ 19.36 $ 13.15 $ 8.462nd Quarter $ 25.00 $ 22.00 $ 13.87 $ 9.113rd Quarter $ 26.29 $ 21.01 $ 16.86 $ 12.684th Quarter $ 35.50 $ 24.19 $ 19.74 $ 15.93
Although NCR does not anticipate the payment of cash dividends on NCR common stock in the foreseeable future, the declaration of dividends would be subject to the discretion of the Board of Directors of NCR. Payment of dividends on NCRcommon stock would also be subject to such limitations as may be imposed by NCR’s credit facilities from time to time.
NCR04 > NOTES TO CONSOLIDATED FINANCIAL STATEMENTS > 57
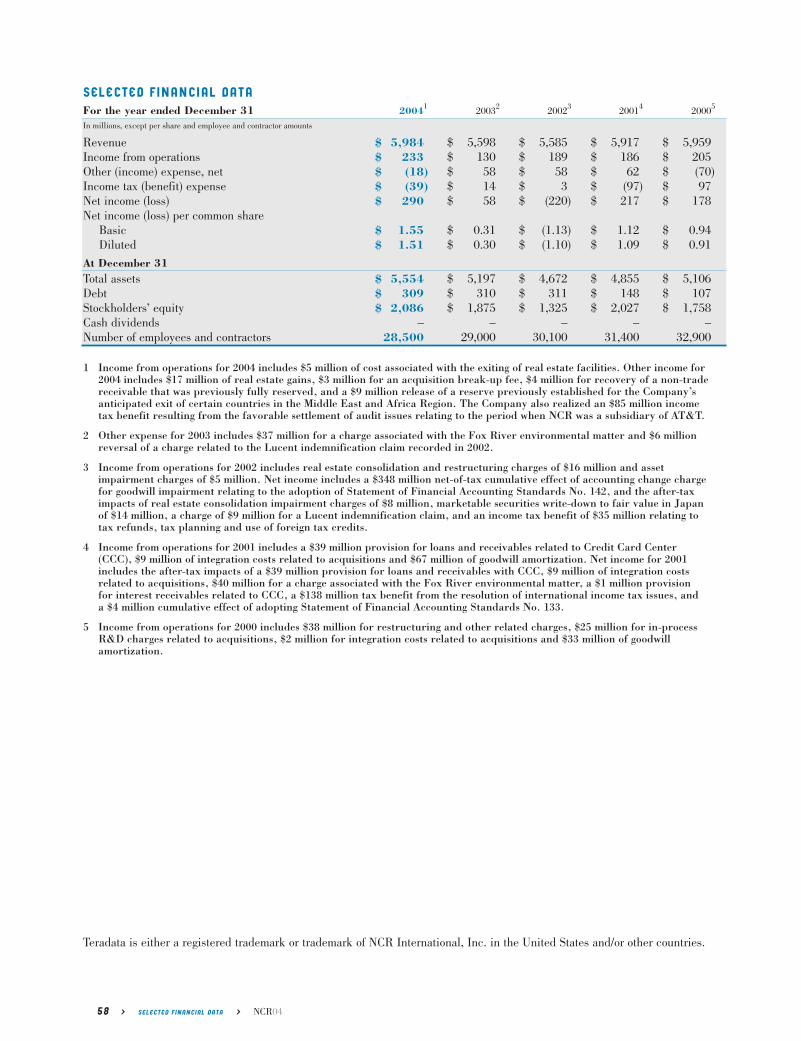
SELECTED FINANCIAL DATAFor the year ended December 31 20041 20032 20023 20014 20005
In millions, except per share and employee and contractor amounts
Revenue $ 5,984 $ 5,598 $ 5,585 $ 5,917 $ 5,959Income from operations $ 233 $ 130 $ 189 $ 186 $ 205Other (income) expense, net $ (18) $ 58 $ 58 $ 62 $ (70)Income tax (benefit) expense $ (39) $ 14 $ 3 $ (97) $ 97Net income (loss) $ 290 $ 58 $ (220) $ 217 $ 178Net income (loss) per common share
Basic $ 1.55 $ 0.31 $ (1.13) $ 1.12 $ 0.94Diluted $ 1.51 $ 0.30 $ (1.10) $ 1.09 $ 0.91
At December 31Total assets $ 5,554 $ 5,197 $ 4,672 $ 4,855 $ 5,106Debt $ 309 $ 310 $ 311 $ 148 $ 107Stockholders’ equity $ 2,086 $ 1,875 $ 1,325 $ 2,027 $ 1,758Cash dividends – – – – –Number of employees and contractors 28,500 29,000 30,100 31,400 32,900
1 Income from operations for 2004 includes $5 million of cost associated with the exiting of real estate facilities. Other income for2004 includes $17 million of real estate gains, $3 million for an acquisition break-up fee, $4 million for recovery of a non-tradereceivable that was previously fully reserved, and a $9 million release of a reserve previously established for the Company’santicipated exit of certain countries in the Middle East and Africa Region. The Company also realized an $85 million incometax benefit resulting from the favorable settlement of audit issues relating to the period when NCR was a subsidiary of AT&T.
2 Other expense for 2003 includes $37 million for a charge associated with the Fox River environmental matter and $6 millionreversal of a charge related to the Lucent indemnification claim recorded in 2002.
3 Income from operations for 2002 includes real estate consolidation and restructuring charges of $16 million and asset impairment charges of $5 million. Net income includes a $348 million net-of-tax cumulative effect of accounting change chargefor goodwill impairment relating to the adoption of Statement of Financial Accounting Standards No. 142, and the after-taximpacts of real estate consolidation impairment charges of $8 million, marketable securities write-down to fair value in Japanof $14 million, a charge of $9 million for a Lucent indemnification claim, and an income tax benefit of $35 million relating totax refunds, tax planning and use of foreign tax credits.
4 Income from operations for 2001 includes a $39 million provision for loans and receivables related to Credit Card Center(CCC), $9 million of integration costs related to acquisitions and $67 million of goodwill amortization. Net income for 2001includes the after-tax impacts of a $39 million provision for loans and receivables with CCC, $9 million of integration costsrelated to acquisitions, $40 million for a charge associated with the Fox River environmental matter, a $1 million provision for interest receivables related to CCC, a $138 million tax benefit from the resolution of international income tax issues, and a $4 million cumulative effect of adopting Statement of Financial Accounting Standards No. 133.
5 Income from operations for 2000 includes $38 million for restructuring and other related charges, $25 million for in-processR&D charges related to acquisitions, $2 million for integration costs related to acquisitions and $33 million of goodwill amortization.
Teradata is either a registered trademark or trademark of NCR International, Inc. in the United States and/or other countries.
58 > SELECTED FINANCIAL DATA > NCR04

4
NCR04
BUILDING MOMENTUM
> DELIVERING TOP-LINE REVENUE GROWTH
> IMPROVING PROFITABILITY IN EACH CORE BUSINESS SEGMENT
> GENERATING CASH FLOW FOR FUTURE INVESTMENT
“IN 2004, ALONG WITH DRIVINGMEANINGFUL REVENUE GROWTH FOR THE FIRST TIME IN SEVERALYEARS, NCR MADE GOOD PROGRESSIN STREAMLINING THE COMPANY’SCOST STRUCTURE AND INVESTINGFOR FUTURE EARNINGS EXPANSION.”
MARK V. HURDPresident and Chief Executive Officer
ANNUAL STOCKHOLDER MEETINGStockholders are invited to attend NCR’s Annual Meetingof Stockholders at 9:30 a.m. on April 27, 2005, to beheld at:
NCR Auditorium, World Headquarters Building1700 S. Patterson Blvd.Dayton, OH 45479
STOCKHOLDER ACCOUNT INQUIRIESInquiries concerning stockholder accounts or NCR’sDirect Stock Purchase/Sell Program should be directed to:
NCR Corporationc/o Mellon Investor Services LLC85 Challenger RoadOverpeck CentreRidgefield Park, NJ 07660Ph. 800-NCR-2303 (800-627-2303)Ph. 201-329-8660 (Outside the U.S.)
Account information can also be obtained via e-mail at [email protected],or by visiting NCR’s stock transfer agent’s website at www.melloninvestor.com/isd.
NCR ANNUAL REPORT ON FORM 10-KThe company’s annual report filed with the U.S. Securitiesand Exchange Commission (SEC) on Form 10-K for current and prior years can be accessed via the “Investor”page of NCR’s website at www.ncr.com.
COMPANY INFORMATIONInformation requests for NCR’s SEC filings, annual report on Form 10-K, quarterly reports and other financialinformation can be obtained without charge by writing or calling:
NCR Investor Relations1700 S. Patterson Blvd.Dayton, OH 45479Ph. [email protected]://investor.ncr.com
Stockholders can help NCR reduce printing and mailingcosts by electing to view NCR’s annual reports and proxystatements online rather than receiving paper copies. Ifyou would like to participate, please indicate your consenton your proxy card or log on to Mellon Investor Servicesat www.melloninvestor.com/isd.
CEO AND CFO CERTIFICATIONSIn 2004, the company’s CEO provided the New YorkStock Exchange (NYSE) with the annual CEO certificationregarding NCR’s compliance with the NYSE’s corporategovernance listing standards. In addition, the company’sCEO and CFO filed with the SEC all required certifications regarding the quality of NCR’s public disclosures in its fiscal 2004 periodic reports.
NCR’S EXECUTIVE OFFICERSMark V. HurdPresident and Chief Executive Officer
Eric A. BergSenior Vice President and Chief Administrative Officer
Peter J. BocianSenior Vice President of Finance and Chief Financial Officer
Gerald A. GagliardiSenior Vice President, Worldwide Customer Services Division
Jonathan S. HoakSenior Vice President, General Counsel and Secretary
Michael KoehlerSenior Vice President, Teradata Division
Mark D. QuinlanVice President, Systemedia Division
Lee SchramSenior Vice President, Retail Solutions Division
Keith A. TaylorSenior Vice President, Financial Solutions Division
Christine W. WallaceSenior Vice President, Human Resources
NCR’S BOARD OF DIRECTORSLars NybergChairman of the Board and former CEO, NCR Corporation
Edward P. BoykinFormer President and COO, Computer Sciences Corporation
Mark P. FrissoraChairman and CEO, Tenneco Automotive Inc.
Mark V. HurdPresident and CEO, NCR Corporation
Linda Fayne LevinsonFormer Partner, GRP Partners
Victor L. LundFormer Chairman, Mariner Health Care, Inc.
C.K. PrahaladProfessor of Business Administration, The University of Michigan
James M. RinglerRetired Vice Chairman, Illinois Tool Works Inc.
William S. StavropoulosChairman and former CEO, The Dow Chemical Co.
DESI
GNM
IZRA
HIDE
SIGN
ASSO
CIAT
ES,
INC.
(WW
W.M
IZRA
HIDE
SIGN
.COM
)PR
INTI
NG
ADP
GRAP
HIC
COM
MUN
ICAT
ION
S
CORPORATE INFORMATION

NCR CORPORATION \ 1700 S. PATTERSON BLVD. \ DAYTON, OH 45479 \ WWW.NCR.COM
NCR
CORPORATION>
2004AN
NUAL
REPORT
ANN
UALREPORT
04
MC4237
Related Documents