1 NCH 2015 Community Health Needs Assessment Appendix A: Data Reviewed General Population Data Population Numbers and Percentage of Total OC OC as % of State EC EC as % of State VT Population -- 625,741 27,231 4.3% 6,306 1.0% Source: www.healthvermont.gov, 2010 Vital Statistics, Aug. 2014. NOTE: NCH service area includes only the northern part of EC, with a population of approximately 2,720. Demographics: Socioeconomic Status / Education Level Indicator US VT OC EC % Under Federal Poverty Level (2013) 15.4 11.8 15.4 15.9 % Adults age 25+ Without High School Education (2009-2013) 14.0 8.6 13.8 16.7 % Adults age 25+ With Bachelor’s Degree or Higher (2009-2013) 28.8 34.8 21.3 14.7 Median Household Income ($) (2009-2013) 53,046 54,267 41,953 35,916 Per Capita Income in Past 12 Months ($) (2013) 28,155 29,167 22,303 20,887 % Unemployment December 2013 / December 2014 3.8 / 3.9 5.5 / 5.5 5.4 / 5.8 Ruralness: Persons per Square Miles (2010) 87.4 67.9 39.3 9.5 Source: www.healthvermont.gov; www.census.gov, Last Revised Feb. 5, 2015; www.labor.vermont.gov The North Country Hospital (NCH) service area (HSA) includes most of Orleans County (OC) and the northern section of Essex County (EC) in Vermont’s Northeast Kingdom. This encompasses 22 communities with a total population of approximately 29,000. These communities are scattered over a large geographic area, separated by numerous hills or mountains and many lakes. Derby (OC), with a population of 4621 is the largest community. Averill and Norton (EC) are the smallest, with populations of 24 and 169, respectively. (Source: www.healthvermont.gov, 2010 Vital Statistics, Aug. 2014.)

Welcome message from author
This document is posted to help you gain knowledge. Please leave a comment to let me know what you think about it! Share it to your friends and learn new things together.
Transcript

1
NCH 2015 Community Health Needs Assessment Appendix A: Data Reviewed
General Population Data
Population Numbers and Percentage of Total OC OC as %
of State
EC EC as %
of State
VT Population -- 625,741 27,231 4.3% 6,306 1.0%
Source: www.healthvermont.gov, 2010 Vital Statistics, Aug. 2014.
NOTE: NCH service area includes only the northern part of EC, with a population of approximately 2,720.
Demographics: Socioeconomic Status / Education Level
Indicator
US
VT
OC
EC
% Under Federal Poverty Level (2013) 15.4 11.8 15.4 15.9
% Adults age 25+ Without High School Education (2009-2013) 14.0 8.6 13.8 16.7
% Adults age 25+ With Bachelor’s Degree or Higher (2009-2013) 28.8 34.8 21.3 14.7
Median Household Income ($) (2009-2013) 53,046 54,267 41,953 35,916
Per Capita Income in Past 12 Months ($) (2013) 28,155 29,167 22,303 20,887
% Unemployment December 2013 / December 2014 3.8 / 3.9 5.5 / 5.5 5.4 / 5.8
Ruralness: Persons per Square Miles (2010) 87.4 67.9 39.3 9.5
Source: www.healthvermont.gov; www.census.gov, Last Revised Feb. 5, 2015; www.labor.vermont.gov
The North Country Hospital (NCH) service area (HSA) includes most of Orleans County (OC) and the northern section of Essex
County (EC) in Vermont’s Northeast Kingdom. This encompasses 22 communities with a total population of approximately 29,000.
These communities are scattered over a large geographic area, separated by numerous hills or mountains and many lakes. Derby (OC),
with a population of 4621 is the largest community. Averill and Norton (EC) are the smallest, with populations of 24 and 169,
respectively. (Source: www.healthvermont.gov, 2010 Vital Statistics, Aug. 2014.)

2
Insurance Status
Indicator VT OC EC
% Adults age 18+ With Health Insurance (2009 -2013) (VT 2020 Goal = 100%)
93% 90% 89%
Source: www.healthvermont.gov
NOTE: Not updated since onset of VHC and the work of NCH Navigators
Insurance Status of Patients Recently Served at NCH (Includes Outpatients and Inpatients)
% of Patients under Medicare 40%
% of Patients under Medicaid 27%
% of Patients with Commercial Insurance 32%
% of Patients – Self-Pay 1%
Source: North Country Hospital, Patient Financial Services, Feb. 2015
NOTE: There is still a certain percentage of underinsured as those with commercial insurance often have a high deductible.
Health Care Access
Was there a time in the past 12 months when you needed to see a doctor, but could not
because of the cost?
VT
9%
NCH Service Area
10%
Source: www.healthvermont.gov Newport Health District 2012-2013 Behavioral Risk Factor Surveillance System (BRFSS) Data

3
Socioeconomic Status & Education Level
(Source: www.census.gov, Last Revised Feb. 5, 2015)
(NOTE: “Previous” refers to data in previous NCH 2012 Community Health Assessment; data was for 2005-2009)
14.3
11.5
13.5
16.915.4
11.8
15.4 15.9
0
2
4
6
8
10
12
14
16
18
US VT OC EC
Percent Under Federal Poverty Level
Previous Most Recent-2013
50,221 51,219
39,914
34,407
53,046 54,267
41,953
35,916
-
10,000
20,000
30,000
40,000
50,000
60,000
US VT OC EC
Median Household Income
Previous Most Recent -'09 -'13
15.4
9.9
15.9
17.6
14.0
8.6
13.8
16.7
0
2
4
6
8
10
12
14
16
18
20
US VT OC EC
Percent Adults Age 25+ without High School Eucation
Previous Most Recent -'09-'13
27.5
32.9
20.0
16.1
28.8
34.8
21.3
14.7
0
5
10
15
20
25
30
35
40
US VT OC EC
Percent Adults Age 25+ with Bachelor's Degree or Higher
Previous Most Recent-'09-'13
4
Age Distribution
(Source: www.healthvermont.gov; 2010 VT Vital Statistics, August 2014)
Summary: Orleans and Essex Counties have a slightly smaller population of youth <25 yrs.
and a slightly greater aging population than VT as a whole.
25%
56%19%
Orleans Co. Age Distribution
<25 25-64 yrs. 65+ yrs.
23%
57%20%
Essex Co. Age Distribution
<25 yrs. 25 - 64 yrs. 65+ yrs.
28%
57%15%
VT - Age Distribution
< 25 yrs. 25 - 64 yrs. 65+ yrs.
5
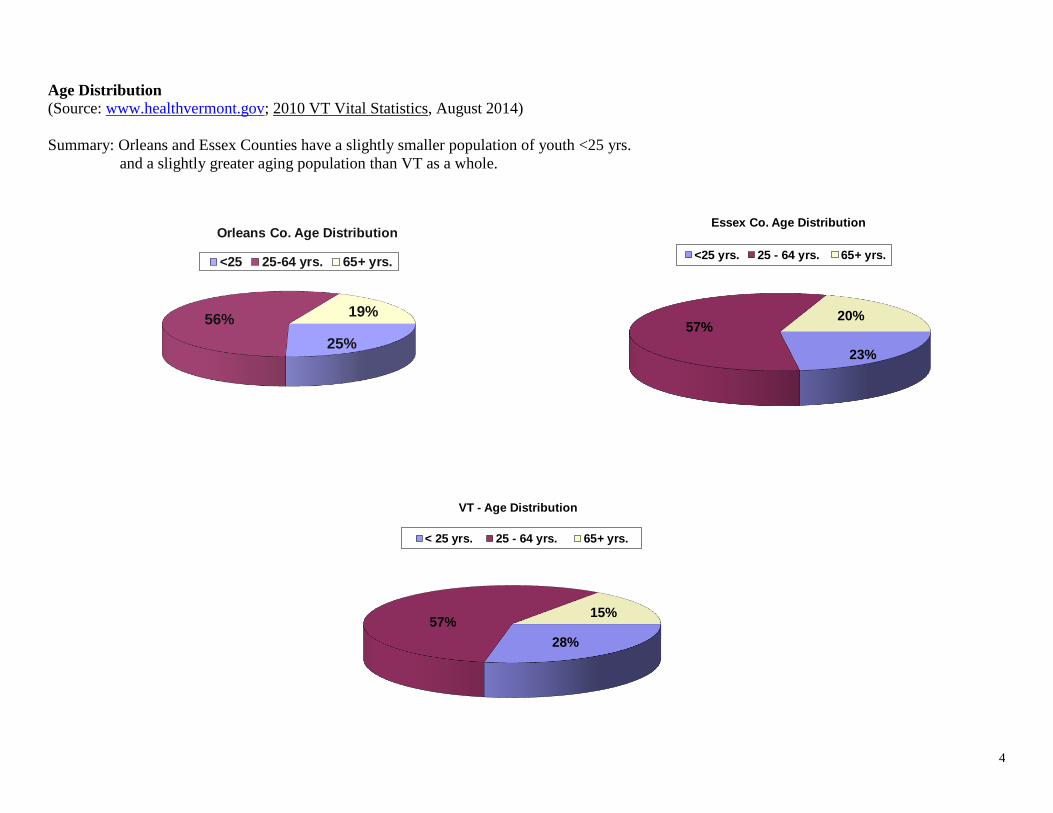
Race / Ethnicity of Orleans and Essex Counties as compared to Vermont
(Source: www.census.gov Last Revised Feb. 5, 2015)
97.0%
0.8%
0.5% 0.4%1.3%
Ethnicity / Race - Orleans County
White Black Native American Asian Hispanic / Latino
97.3%
0.4%
0.6% 0.4%1.3%
Ethnicity / Race - Essex County
White Black Native American Asian Hispanic / Latino
95.3%
1.2%
0.4% 1.4%
1.7%
Ethnicity /Race - Vermont
White Black Native American Asian Hispanic /Latino

6
Health Status Indicators Statistically better than statewide; Statistically worse than statewide
Maternal / Child Health (Data is by Hospital Service Area -HSA) (N/A=Not available)
Indicator VT 2020
Goal
VT NCH Births
% of low birth weight births ( < 5.5 lbs; 2500 grams) 5.0 6.8 5.7
% pregnant women who received first trimester prenatal care
(NCH ranks 1st in the state for this time period, of 12 facilities.)
90 83.9 93.3
% of pregnant women who receive early & adequate prenatal care
(Based on the Adequacy of Prenatal Care Utilization Index Developed by Milton
Kotelchuck, PhD, MPH)
(NCH ranks 2nd in the state for this time period.)
90
88.0
92.8
% women using tobacco during pregnancy
(Individual hospital rates range from 13% to 32% for this time period.)
(NCH ranks 6th
in the state for this time period.)
N/A
16.8
20.5
% of mothers who smoked but quit before 4th
month
(Range statewide is 0 to 32% fort his time period.
NCH ranks 4th
for this time period, of 12 facilities.)
N/A
27.3
29.0
% of women who are overweight before pregnancy (BMI > 25)
(Range statewide is 42% to 60%. NCH ranked 12th
for this time period.)
N/A
48.2
58.4
% mothers who are breastfeeding infant
(Range statewide is 67% to 98% and NCH ranks 12th
for this time period.)
N/A
86.7
74.0
Source: VT Dept. of Health, Div. of Health Surveillance, Public Health Statistics, Dec. 2014.
NOTE: Data is for year ending 9/30/2014. For any 12 month period, NCH averages just over 200 births.

7
Immunization and Infectious Disease
NOTE: Indicators for this topic area have been renamed and are no longer comparable to previous data.
For most of these indicators, only statewide data is available.
Unless otherwise noted, data represents 2010.
N/A = Not available
Indicator VT 2020
Goal
US
VT
OC EC
% of children age 19 to 35 months receiving universally recommended vaccines:
Series of 4 doses to prevent: Diphtheria, Tetanus, Pertussis (DTaP)
80%
84%
86%
N/A
N/A
Series of 3 doses to prevent Polio 80% 93% 94% N/A N/A
Vaccine (1 does) to prevent Measles, Mumps, Rubella (MMR) 80% 93% 92% N/A N/A
Series of 4 does to prevent Influenza (Hib) 80% 67% 52% N/A N/A
Series of 3 doses to prevent Hepatitis B (Hep B) 80% 92% 92% N/A N/A
% of children in kindergarten who are vaccinated with 2 or more doses of MMR
95%
Not
comparable
91%
N/A
N/A
% of youth age 13- 15 who are vaccinated with 1 dose of DTaP vaccine
90%
Not
comparable
83%
N/A
N/A
% of adults age 65+ who receive annual influenza immunizations
(NOTE: US rate is for 2008; VT, OC, EC rates are for 2012-13)
90%
66%
65%
62%
71%
% of adults age 65+ who have ever been vaccinated against pneumonia
(NOTE: US rate is for 2008; VT, OC, EC rates are for 2012-13)
90%
68%
73%
68%
75%
Source: www.healthvermont.gov, Healthy Vermonters 2020, Dec. 2012.
www.healthvermont.gov, 2012-2013 Adult Behavioral Risk Factor Surveillance System, May 2014
8
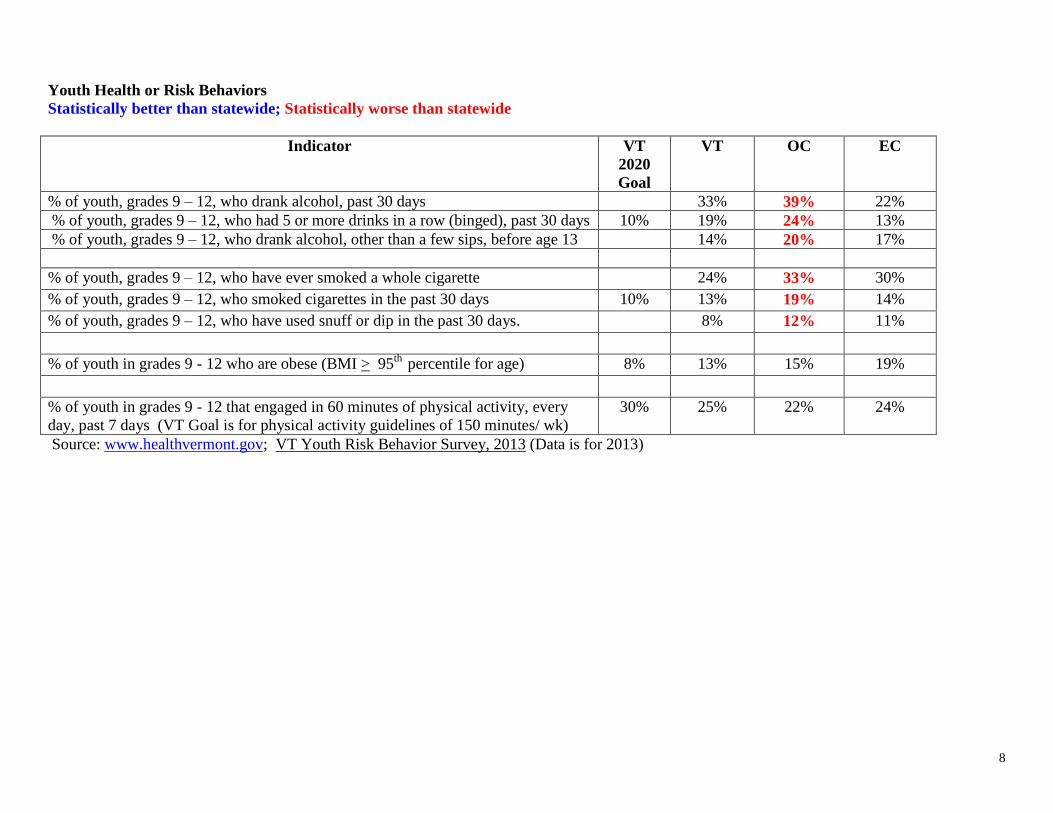
Youth Health or Risk Behaviors
Statistically better than statewide; Statistically worse than statewide
Indicator VT
2020
Goal
VT OC EC
% of youth, grades 9 – 12, who drank alcohol, past 30 days 33% 39% 22%
% of youth, grades 9 – 12, who had 5 or more drinks in a row (binged), past 30 days 10% 19% 24% 13%
% of youth, grades 9 – 12, who drank alcohol, other than a few sips, before age 13 14% 20% 17%
% of youth, grades 9 – 12, who have ever smoked a whole cigarette 24% 33% 30%
% of youth, grades 9 – 12, who smoked cigarettes in the past 30 days 10% 13% 19% 14%
% of youth, grades 9 – 12, who have used snuff or dip in the past 30 days. 8% 12% 11%
% of youth in grades 9 - 12 who are obese (BMI > 95th
percentile for age) 8% 13% 15% 19%
% of youth in grades 9 - 12 that engaged in 60 minutes of physical activity, every
day, past 7 days (VT Goal is for physical activity guidelines of 150 minutes/ wk)
30% 25% 22% 24%
Source: www.healthvermont.gov; VT Youth Risk Behavior Survey, 2013 (Data is for 2013)
9
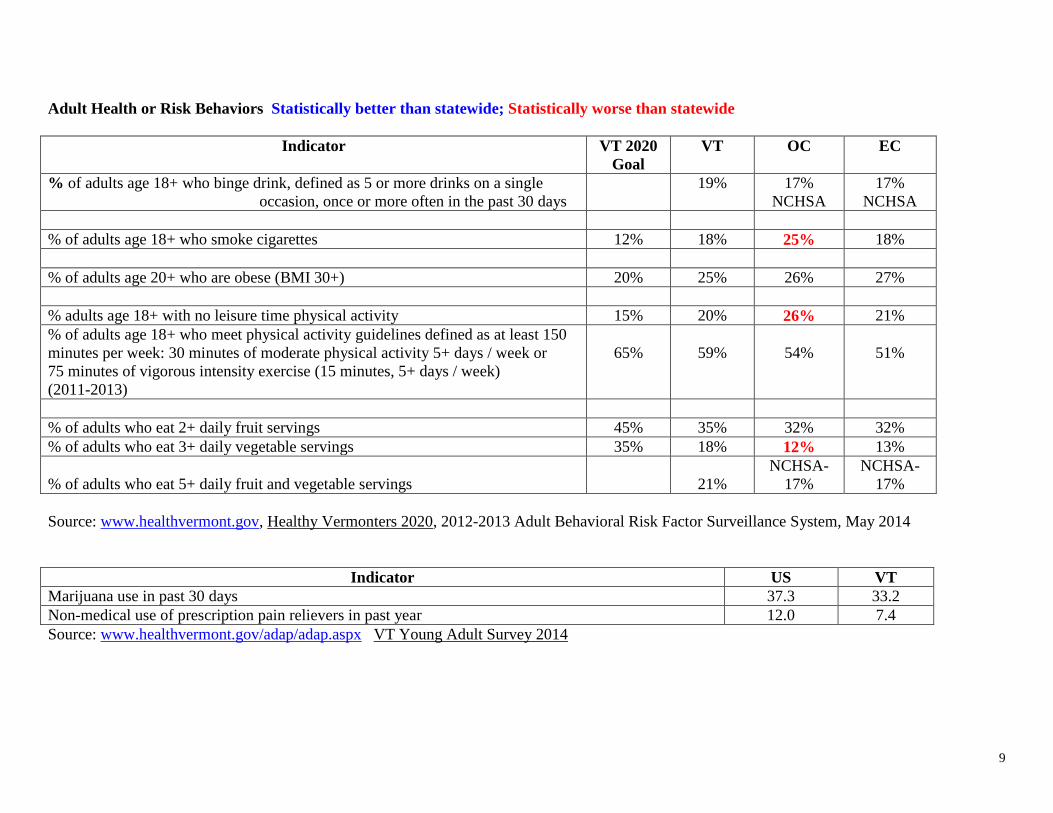
Adult Health or Risk Behaviors Statistically better than statewide; Statistically worse than statewide
Indicator VT 2020
Goal
VT OC EC
% of adults age 18+ who binge drink, defined as 5 or more drinks on a single
occasion, once or more often in the past 30 days 19% 17%
NCHSA
17%
NCHSA
% of adults age 18+ who smoke cigarettes 12% 18% 25% 18%
% of adults age 20+ who are obese (BMI 30+) 20% 25% 26% 27%
% adults age 18+ with no leisure time physical activity 15% 20% 26% 21%
% of adults age 18+ who meet physical activity guidelines defined as at least 150
minutes per week: 30 minutes of moderate physical activity 5+ days / week or
75 minutes of vigorous intensity exercise (15 minutes, 5+ days / week)
(2011-2013)
65%
59%
54%
51%
% of adults who eat 2+ daily fruit servings 45% 35% 32% 32%
% of adults who eat 3+ daily vegetable servings 35% 18% 12% 13%
% of adults who eat 5+ daily fruit and vegetable servings
21%
NCHSA-
17%
NCHSA-
17%
Source: www.healthvermont.gov, Healthy Vermonters 2020, 2012-2013 Adult Behavioral Risk Factor Surveillance System, May 2014
Indicator US VT
Marijuana use in past 30 days 37.3 33.2
Non-medical use of prescription pain relievers in past year 12.0 7.4
Source: www.healthvermont.gov/adap/adap.aspx VT Young Adult Survey 2014
10
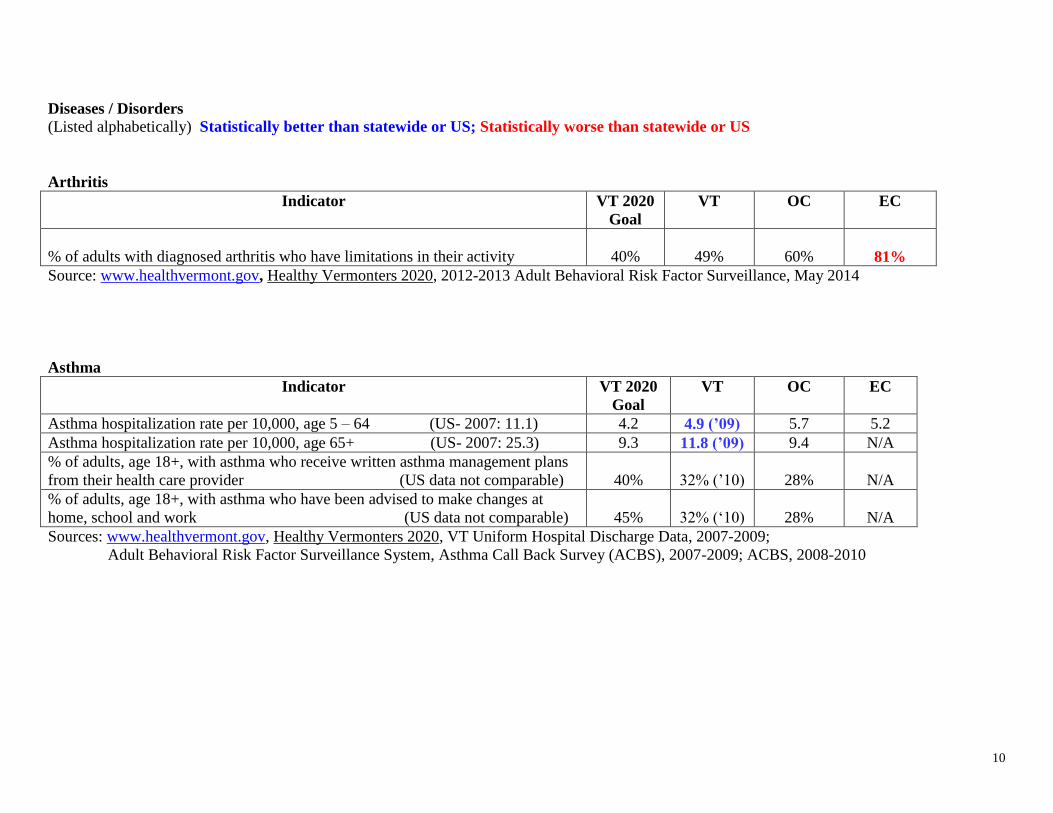
Diseases / Disorders
(Listed alphabetically) Statistically better than statewide or US; Statistically worse than statewide or US
Arthritis
Indicator VT 2020
Goal
VT OC EC
% of adults with diagnosed arthritis who have limitations in their activity
40%
49%
60%
81%
Source: www.healthvermont.gov, Healthy Vermonters 2020, 2012-2013 Adult Behavioral Risk Factor Surveillance, May 2014
Asthma
Indicator VT 2020
Goal
VT OC EC
Asthma hospitalization rate per 10,000, age 5 – 64 (US- 2007: 11.1) 4.2 4.9 (’09) 5.7 5.2
Asthma hospitalization rate per 10,000, age 65+ (US- 2007: 25.3) 9.3 11.8 (’09) 9.4 N/A
% of adults, age 18+, with asthma who receive written asthma management plans
from their health care provider (US data not comparable)
40%
32% (’10)
28%
N/A
% of adults, age 18+, with asthma who have been advised to make changes at
home, school and work (US data not comparable)
45%
32% (‘10)
28%
N/A
Sources: www.healthvermont.gov, Healthy Vermonters 2020, VT Uniform Hospital Discharge Data, 2007-2009;
Adult Behavioral Risk Factor Surveillance System, Asthma Call Back Survey (ACBS), 2007-2009; ACBS, 2008-2010
11
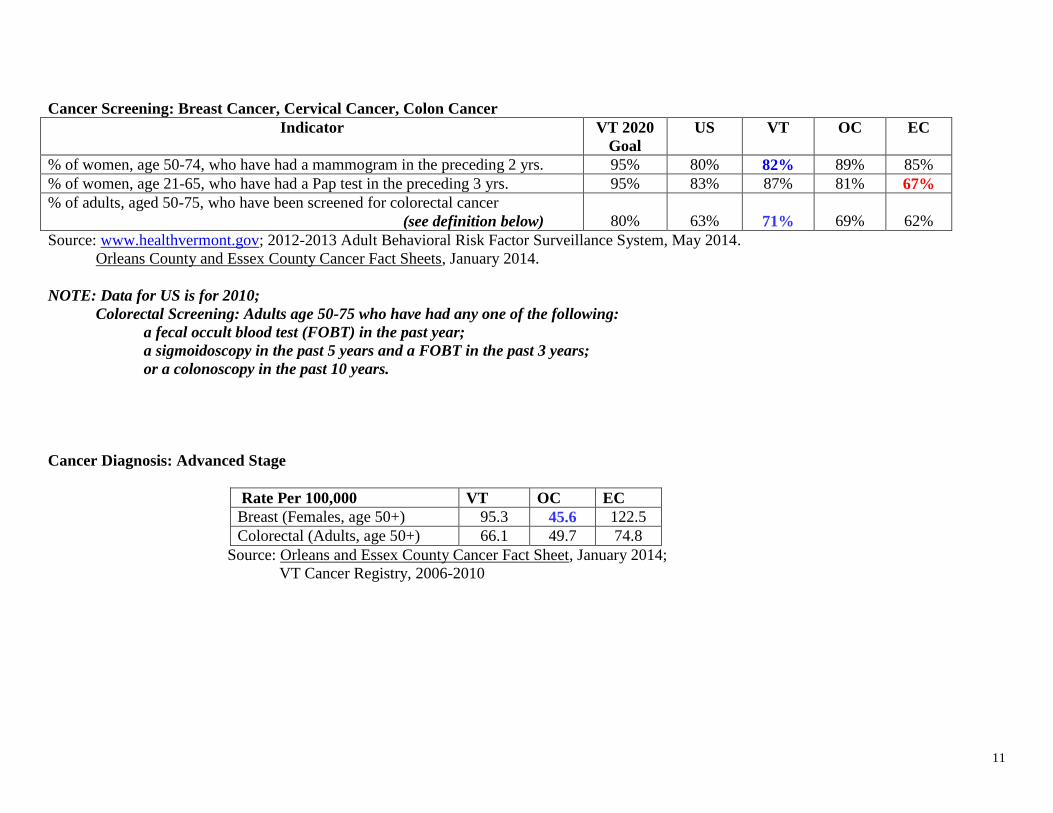
Cancer Screening: Breast Cancer, Cervical Cancer, Colon Cancer
Indicator VT 2020
Goal
US VT OC EC
% of women, age 50-74, who have had a mammogram in the preceding 2 yrs. 95% 80% 82% 89% 85%
% of women, age 21-65, who have had a Pap test in the preceding 3 yrs. 95% 83% 87% 81% 67%
% of adults, aged 50-75, who have been screened for colorectal cancer
(see definition below)
80%
63%
71%
69%
62%
Source: www.healthvermont.gov; 2012-2013 Adult Behavioral Risk Factor Surveillance System, May 2014.
Orleans County and Essex County Cancer Fact Sheets, January 2014.
NOTE: Data for US is for 2010;
Colorectal Screening: Adults age 50-75 who have had any one of the following:
a fecal occult blood test (FOBT) in the past year;
a sigmoidoscopy in the past 5 years and a FOBT in the past 3 years;
or a colonoscopy in the past 10 years.
Cancer Diagnosis: Advanced Stage
Rate Per 100,000 VT OC EC
Breast (Females, age 50+) 95.3 45.6 122.5
Colorectal (Adults, age 50+) 66.1 49.7 74.8
Source: Orleans and Essex County Cancer Fact Sheet, January 2014;
VT Cancer Registry, 2006-2010
12
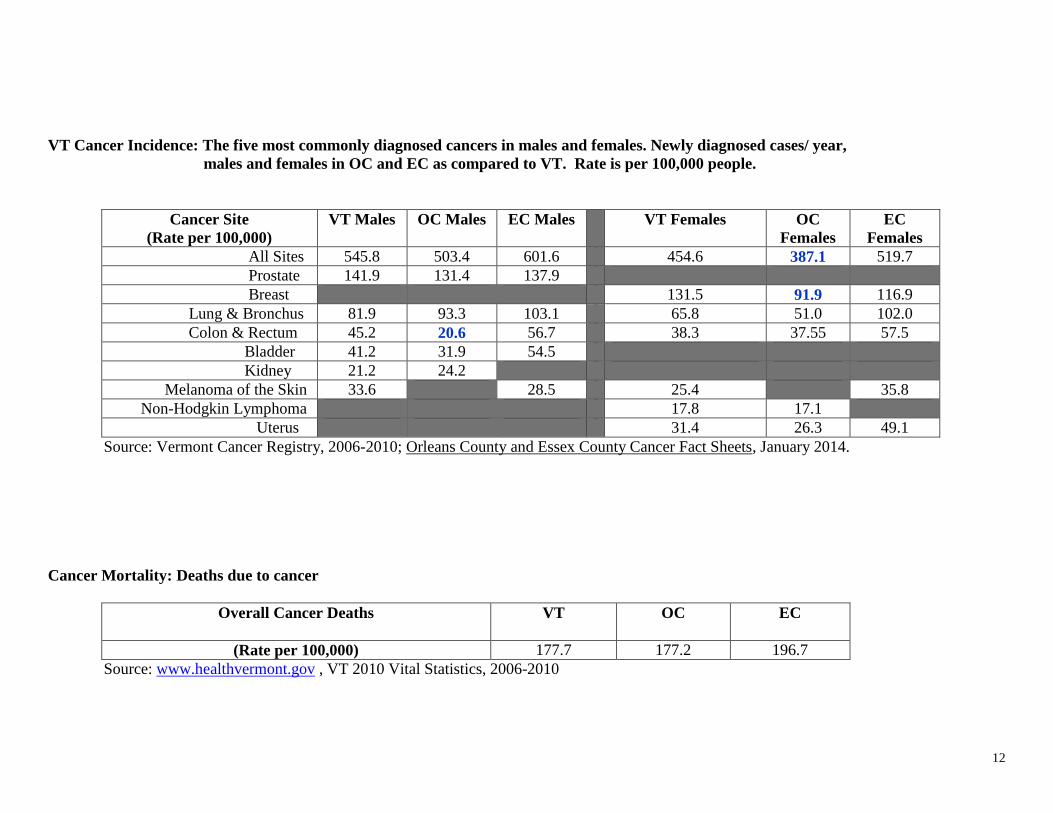
VT Cancer Incidence: The five most commonly diagnosed cancers in males and females. Newly diagnosed cases/ year,
males and females in OC and EC as compared to VT. Rate is per 100,000 people.
Cancer Site
(Rate per 100,000)
VT Males OC Males EC Males VT Females OC
Females
EC
Females
All Sites 545.8 503.4 601.6 454.6 387.1 519.7
Prostate 141.9 131.4 137.9
Breast 131.5 91.9 116.9
Lung & Bronchus 81.9 93.3 103.1 65.8 51.0 102.0
Colon & Rectum 45.2 20.6 56.7 38.3 37.55 57.5
Bladder 41.2 31.9 54.5
Kidney 21.2 24.2
Melanoma of the Skin 33.6 28.5 25.4 35.8
Non-Hodgkin Lymphoma 17.8 17.1
Uterus 31.4 26.3 49.1
Source: Vermont Cancer Registry, 2006-2010; Orleans County and Essex County Cancer Fact Sheets, January 2014.
Cancer Mortality: Deaths due to cancer
Overall Cancer Deaths
VT OC EC
(Rate per 100,000) 177.7 177.2 196.7
Source: www.healthvermont.gov , VT 2010 Vital Statistics, 2006-2010

13
Diabetes
Indicator VT 2020
Goal
VT OC EC
Diabetes Prevalence - % of VT adults ever told they have diabetes (US - 10%) N/A 7% 8% 8%
% of adults with diabetes who had diabetes education (BRFSS 2008-2010) 60% 51% 59% N/A
% of adults with diabetes who have an annual dilated eye exam (BRFSS-2008-‘10) 60% 51% 54% N/A
% of VT women who develop diabetes during pregnancy
Gestational Diabetes (VT Birth Certificate Data, 2007 – 2009)
N/A 5% 2% 5%
Source: www.healthvermont.gov, 2012 Diabetes Data Pages, September 2013; Healthy Vermonters 2020, Dec. 2012;
Adult Behavioral Risk Factor Surveillance System, 2011-2012;
NOTE: VT BRFSS for 2011 and 2012 are not comparable to previous years due to methodological changes in data collection.
Heart Disease and Stroke
Indicator VT 2020
Goal
VT OC EC
Coronary heart disease deaths (per 100,000 ) (US – 2009: 126.0) 89.4 111.7 123.6 121.6
Stroke deaths (per 100,000) (US- 2009: 38.9) 23.4 29.3 31.2 32.9
% of adults, age 18+, with high blood pressure (US 2009: 28%) 20% 27% 33% 23%
% of adults who have had their cholesterol checked within the preceding 5 yrs.
(US 2009: 76%)
85%
75%
69%
73%
Source: www.healthvermont.gov, Healthy Vermonters 2020, December 2012,
Adult Behavioral Risk Factor Surveillance System, 2009, 2011, 2013.
NOTE: Data in the previous CHNA showed that coronary heart disease death rate was significantly worse than VT at that time.
Stroke death rate cannot be compared to previous as previous measurement was per 10,000.
14
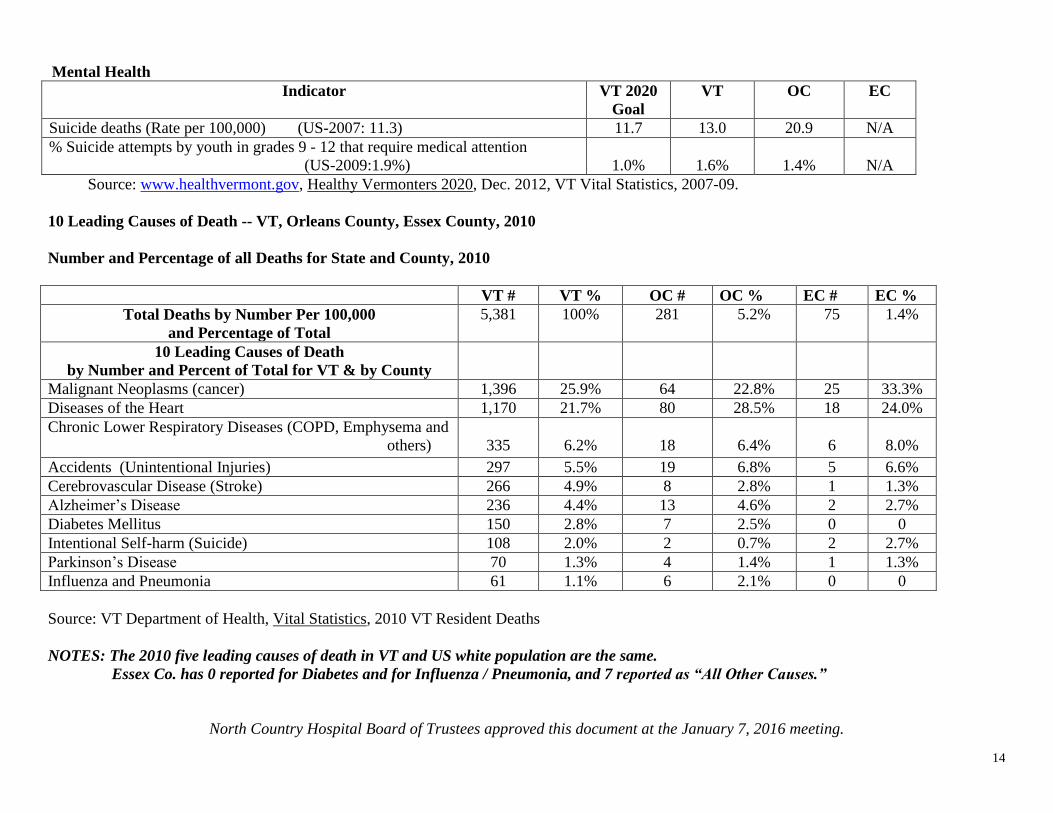
Mental Health
Indicator VT 2020
Goal
VT OC EC
Suicide deaths (Rate per 100,000) (US-2007: 11.3) 11.7 13.0 20.9 N/A
% Suicide attempts by youth in grades 9 - 12 that require medical attention
(US-2009:1.9%)
1.0%
1.6%
1.4%
N/A
Source: www.healthvermont.gov, Healthy Vermonters 2020, Dec. 2012, VT Vital Statistics, 2007-09.
10 Leading Causes of Death -- VT, Orleans County, Essex County, 2010
Number and Percentage of all Deaths for State and County, 2010
VT # VT % OC # OC % EC # EC %
Total Deaths by Number Per 100,000
and Percentage of Total
5,381 100% 281 5.2% 75 1.4%
10 Leading Causes of Death
by Number and Percent of Total for VT & by County
Malignant Neoplasms (cancer) 1,396 25.9% 64 22.8% 25 33.3%
Diseases of the Heart 1,170 21.7% 80 28.5% 18 24.0%
Chronic Lower Respiratory Diseases (COPD, Emphysema and
others)
335
6.2%
18
6.4%
6
8.0%
Accidents (Unintentional Injuries) 297 5.5% 19 6.8% 5 6.6%
Cerebrovascular Disease (Stroke) 266 4.9% 8 2.8% 1 1.3%
Alzheimer’s Disease 236 4.4% 13 4.6% 2 2.7%
Diabetes Mellitus 150 2.8% 7 2.5% 0 0
Intentional Self-harm (Suicide) 108 2.0% 2 0.7% 2 2.7%
Parkinson’s Disease 70 1.3% 4 1.4% 1 1.3%
Influenza and Pneumonia 61 1.1% 6 2.1% 0 0
Source: VT Department of Health, Vital Statistics, 2010 VT Resident Deaths
NOTES: The 2010 five leading causes of death in VT and US white population are the same.
Essex Co. has 0 reported for Diabetes and for Influenza / Pneumonia, and 7 reported as “All Other Causes.”
North Country Hospital Board of Trustees approved this document at the January 7, 2016 meeting.
Related Documents