NCAP Publications Committee P.K. Joshi S. Selvarajan Ramesh Chand B.C. Barah P. Adhiguru NCAP has been established by the Indian Council of Agricultural Research (ICAR) with a view to upgrading agricultural economics research through integration of economics input in planning, designing, and evaluation of agricultural research programmes and strengthening the competence in agricultural policy analysis within the Council. The Centre is assigned a leadership role in this area not only for various ICAR Institutes but also for the State Agricultural Universities. With a view to making agricultural research a more effective instrument for agricultural and rural change and strengthening the policy making and planning machinery, the Centre undertakes and sponsors research in agricultural economics relating to the problems of regional and national importance.

Welcome message from author
This document is posted to help you gain knowledge. Please leave a comment to let me know what you think about it! Share it to your friends and learn new things together.
Transcript
NCAP Publications Committee P.K. Joshi S. Selvarajan Ramesh Chand B.C. Barah P. Adhiguru
NCAP has been established by the Indian Council of AgriculturalResearch (ICAR) with a view to upgrading agricultural economicsresearch through integration of economics input in planning, designing,and evaluation of agricultural research programmes and strengtheningthe competence in agricultural policy analysis within the Council. TheCentre is assigned a leadership role in this area not only for variousICAR Institutes but also for the State Agricultural Universities. With aview to making agricultural research a more effective instrument foragricultural and rural change and strengthening the policy making andplanning machinery, the Centre undertakes and sponsors research inagricultural economics relating to the problems of regional and nationalimportance.
iv
Irrigation Development and Equity
Impacts in India
S. Selvarajan A. Ravishankar P.A. Lakshmi Prasanna
Policy Paper 14
NATIONAL CENTRE FOR AGRICULTURAL ECONOMICS AND POLICY RESEARCH (ICAR)
NEW DELHI-110 012, INDIA
ii
NCAP Policy Paper 14
Irrigation Development and Equity Impacts in India First Published March, 2001 Published by Dr. Mruthyunjaya Director, NCAP Printed at Chandu Press D-97, Shakarpur New Delhi-110 092 About the authors: Dr. S. Selvarajan is Principal Scientist and Mr. A. Ravishankar and Ms. P.A. Lakshmi Prasanna are Scientists at National Centre for Agricultural Economics and Policy Research, New Delhi.
iii
Contents Acronyms and Abbreviations v Tables and figures viii Foreword x Acknowledgements xi Executive Summary xii 1. Introduction 1
1.1 Emerging scenario in Indian agriculture 1 1.2 The setting and objectives 2 1.3 Outline of the report 3
2. Existing Status of Irrigation Development 4
2.1 India’s irrigation development: trends and shifts 4 2.2 Sources of irrigation development in India:
trends and shifts 8 2.3 Sources of irrigation development in states:
trends and shifts 9 2.3.1 Canal irrigated area 12 2.3.2 Tank irrigated area 12 2.3.3 Well irrigated area 13 2.3.4 Total irrigated area 13 2.4 Shifts in irrigation sources 13 2.5 Farm level irrigation distribution in India:
trends and shifts 15 2.5.1 Distribution of total farm households and area 15 2.5.2 Distribution of irrigated farm households 17 2.5.3 Distribution of irrigated area 20 2.5.4 Distribution of surface irrigation facilities 21 2.5.5 Distribution of groundwater irrigated area 24 2.5.6 Percent distribution of irrigated area 25 2.5.7 Distribution of cereals crop area 28 2.5.8 Distribution of food and non-food
crop area 30 2.5.9 Per cent distribution of crop area 32 2.5.10 Per cent distribution of irrigated crop 35

iv
3. Equity Impacts of Irrigation Development 40 3.1 Approach for equity impact analysis 40 3.2 Methodology for equity impact analysis 40 3.3 Data base 42 3.4 Inequity impacts: current & Rawlsian
distribution, all India 43 3.5 Inequity impacts: current & Rawlsian
distribution, states 45 3.6 Inequity impacts: Rawlsian & proportional
distribution, states 47 3.7 Theil’s inequity index for irrigation attributes,
all India 48 3.7.1 All farm households 48 3.7.2 Irrigated farm households 50 3.8 Theil’s inequity index for irrigation attributes
by states 52 3.9 Source-wise inequality index 58
4. Future Irrigation water development strategies 60 4.1 Equitable irrigation water development 60 4.2 Watershed development: experiences and
Strategies 64 4.2.1 Watershed management approach 65 4.2.2 Watershed development: a multi-agency
approach 68 4.3 Alternative institutional models for watershed
development 73 4.3.1 People’s initiative 73 4.3.2 Bilateral partnership 76 4.3.3 Multilateral mode 77 4.3.4 ICAR-research mode 79 4.3.5 The NGO’s experience 81 4.4 Summing-up 83 4.4.1 watershed experience 83 4.4.2 Irrigation sector: surface water 83 4.4.3 Irrigation sector: ground water 85
5. Conclusions and Recommendations 88 Select Bibliography 92
v
Acronyms and Abbreviations
AICRIP All India Co-ordinated Research Project AKRSP Aga Khan Rural Support Program ALLFLOW All Flow Irrigated Area ALLFT All lift irrigated area AVARD Association of Voluntary Organization for Rural Development BAIF Bharatiya Agro-Industries Foundation BCR Benefit Cost Ratio BETSTS Between the states CADA Command Area Development Authority CERI Irrigated Cereals Area CGIAR Consultative Group on International Agricultural Research CIA Canal Irrigated Area CPR Common Property Resources CRIDA Central Research Institute for Dryland Agriculture CSWCRTI Central Soil and Water Conservation Research and Training
Institute DANIDA DDP Desert Development Program DPAP Drought Prone Area Programme EEC European Economic Community EAP Externally Aided Projects FG Food grain FGI Irrigated foodgrains area FHH Farm Households FLOW Flow irrigated Area FOODI Irrigated food crop area FPR Food Prone Areas FYP Five Year Plan GCA Gross cropped Area GCAI Gross cropped area irrigated GPF GWD Ground Water Development HRD Human Resource Development ICAR Indian Council of Agricultural Research ITK Indigenous Technical Knowledge IWDP Integrated watershed Development Programme MDCIDFPD Magnitude of deviation of current canal irrigation distribution
from proportional distribution MDCIDFRD Magnitude of deviation of current canal irrigation distribution
from Rawlsian distribution MOA Ministry of Agriculture MRAE Ministry of Rural Areas and Employment MYRADA NA Not available
vi
NAS Net area sown NBSS&LUP National Bureau of Soil Survey and Land Use Planning NCIA Non-canal irrigated area NFOODI Irrigated non-food crop area NGOs Non-Governmental Organizations NIA Net Irrigated Area NIACAN Net irrigated area by canals NIATNK Net irrigated area by Tanks NIATOT Total Net irrigated area NIATW Net irrigated area by Tubewells NIAWELLS Net irrigated area by Wells NSS National Sample Survey NWDPRA National Watershed Development Programs ORP Operational Research Project OSIA Other sources irrigated Area POP Post operative Phase PPP Pre Project Phase PRA Participatory Rural Appraisal PRIYA Society for Participatory Research in Asia PWMTA Participatory Watershed Management Training PWSM Participatory watershed Management RCEI Irrigated rice Area RRA Rapid Rural Appraisal RVP River Valley Project SCNI Irrigated Sugarcane area SPEECH SSUT Small States and Union Territories SWC Soil and Water Conservation SWD Surface Water Development TA Total Area TBS Tarun Bharat Sangh THH Total Households TIA Total Irrigated Area TMI-FLIA Theil’s measure of inequality in flow and lift irrigated areas TMIR-FLIA Theil’s measure of inequality under Rawlsian approach to
canal irrigation water distribution TWIA Tube Well Irrigated Area UAS University of Agricultural Sciences WALMI Water and Land Management Institutes WDPSCA Watershed Development Projects for Control of Shifting
Cultivation Area WHTI Wheat irrigated area WIA Well irrigated Area WITHSTS Within the states WSD Watershed Development WUA Water Users Associations
vii
Tables and Figures 1. Progress of irrigation development in India, 1950-96 2. Sources of irrigation in India, 1950-93 (Mha) 3. State-wise sources of irrigation, 1972-93 4. State-wise shifts in sources of irrigated area, 1972-93 5. Distribution of FHHs and area across farm sizes, 1971-91 6. Distribution of irrigated FHHs across farm sizes, 1971-91 7. Percent of irrigated FHHs across farm sizes, 1971-91 8. Per cent distribution of wholly and partially irrigated FHHs, 1971-91 9. Irrigated FHHs as a percent of total FHHs across farm sizes, 1971-91
10. Distribution of irrigated area by farm size, 1970/71 to 1990/91 11. Distribution of surface irrigation facilities by farm size, 1971-91 12. Declining performance of minor irrigation system in AP, 1956-98 13. Distribution of ground water irrigation by farm size 14. Irrigation distribution by farm size over time (%) 15. Distribution of cropped area by farm size, 1976/77 to 1990/91 16. Distribution of irrigated area by crop and farm size, 1971-91 17. Distribution of cropped area by food and non-food crop groups 18. Distribution of irrigated area by food and non-food crops 19. Crop area distribution by farm size (%) 20. Irrigated crop area distribution by farm size (%) 21. Irrigated crop as a percent of total crop area by farm size, 1977-91 22. Crop area distribution by farm size (%) 23. Irrigated crop area distribution by farm size over time (%) 24. Levels of inequality under current and Rawlsian distribution of
irrigation, all India 25. Temporal distribution of levels of inequality under current and
Rawlsian distribution of irrigation by states 26. Temporal distribution of levels of inequality under Rawlsian and
Proportional distribution of irrigation 27. Theil’s inequality index among farm households 28. Theil's inequality among irrigated farm households 29. State-wise inequity in NCIA, NAS, NIACAN distribution, 1971-91 30. State-wise inequity in NIATNK and NIAWELL distribution, 1971-91 31. State-wise inequity in NIATW, NIATOT, GCAI among FHHs 32. State-wise inequity in GCA, ALLFLOW, ALLLFT among FHHs 33. Inequality decomposition by sources, 1971-91 34. Index of NCIA and NIACAN inequalities 35. Changes in inequity in 1991 36. Changing inequality levels in irrigation distribution 37. Investment in (crore Rs) watershed development under different
programs
viii
38. Area treated (lakh ha) under different watershed development programs
39. State-wise problem area treated and the balance yet to be treated on a watershed basis (lakh ha)
40. Area proposed to be treated and unit cost for next 25 years 41. Performance evaluation of selected watershed programmes in India 42. Spread of selected water management related institutions in India 43. Revised agricultural water rates in India as on 1997 44. Spatial and temporal status of groundwater exploitation in selected
states 45. Average tariff for agriculture, 1997/98
Figures 1. India’s irrigation development: trends and shifts, 1950-96 2. India’s minor irrigation outlay: trends and shifts, 1950-96 3. Growth in source wise irrigated area in India, 1951-93 4. Deteriorating MI tank infrastructure in Andhra Pradesh, 1990s
Box 1. Performance details of selected watersheds
Appendix 1. Indian agriculture and shrinking resource base 2. Methodology for equity impact analysis
ix
Foreword Water resource, as an input to agriculture, has become vital for economic growth and sustainable development. Its catalytic role in enhancing the productivity growth to meet the food and income needs of the Indian economy is well established. With looming crisis in water sector, water policies and water plans will have to be vision oriented for ensuring equity and efficiency in multiple uses and sources of water. Equitable distribution of irrigation benefits while promoting efficiency in its use will be a win-win situation matching with the poverty alleviation and income growth goals of India’s agricultural development. Stiff competition is developing between different uses and users of water, which is likely to sharpen as India’s annual per capita water availability goes below the water scarce threshold level of 1700 cubic meter within next two decades. For instance, in India, inter-state conflicts over sharing the common river basin are not uncommon in the past. But now, intra-basin conflicts within the state percolating down to village level conflicts are seen frequently as a manifestation of equity issues with multiple users ascertaining their rights over the sharing of this scarce resource. Equity impacts of water, in its major use, namely, irrigated agriculture has been the central theme of this policy paper. The authors have attempted to quantify the equity impacts of irrigation development in India during 1970 through 1990, using the Agricultural Census database covering major states and small states and union territories. Better understanding of spatial and temporal equity implications of the irrigation development policies pursued in the past shall be useful in evolving future strategies. We hope that this analytical study, assessing equity dimensions of irrigation development, shall further strengthen the informed decision making process while deliberating future direction for policies and planning in the India’s water sector. March, 2001 Dr. Mruthyunjaya New Delhi Director
x
Acknowledgements This study has been undertaken to provide a comprehensive assessment of equity status of irrigation development impacts in India covering various time periods and states during the past few decades. The idea for this came from the review of seminal works done by Prof. R.K. Sampath earlier in this area of research. We have updated and consolidated with wider temporal and spatial coverage while addressing the equity issues besides integrating the watershed approach for promoting equitable distribution of irrigation benefits in the future. The continued cooperation, help and instantaneous support received from Prof. R.K. Sampath in understanding the methodologies enunciated in his several write-ups and publications in the past is gratefully acknowledged. Dr. K. Palanisami, Director, Water Technology Centre, contributed much in the shaping of this paper as an external referee offering several critical comments and valuable suggestions some of which could not be addressed due to various limitations. The authors record their deep sense of gratitude for several rounds of professional interactions with him while finalizing this paper. Dr. Dayanatha Jha, Former Director, NCAP is the spirit behind this effort who not only motivated us to do this but encouraged us throughout with lot of patience and counseling. Dr. Mruthyunjaya, Director, NCAP has gone through the entire report in one week end, offered valuable comments and remained instrumental in completing this task. We thank both of them for all the institutional support in conducting this study. This study when presented to the faculty received several comments during the discussions, which helped in its refinement. Notably, critical interventions by Dr. Ramesh Chand and Dr. P.K. Joshi during the seminar helped in unraveling the inferences on some of the results particularly for northwestern states. We are highly thankful to them. Help and support received from Heads, Library Services of Krishi Bhavan, Directorate of Economic and Statistics, Central Water Commission, Indian Agricultural Research Institute and Indian Agricultural Statistics Research Institute are thankfully acknowledged. The usual disclaimer namely for any errors and omissions the authors remain responsible applies here also. March. 2001 Authors
1
1 INTRODUCTION India’s agricultural growth per se during the 50-year period of independence remains impressive at 2.7 per cent per annum. Around two-third of this production growth was aided by gains in crop productivity. With the unrelenting population growth at 2.1 per cent per annum, per capita availability of food grains during this period has grown at around 0.5 per cent per annum (GOI, 1997). The need based strategies followed during this period mainly focused on intensive input based productivity led agricultural growth for feeding the growing population and making the country self sufficient in food production. As a result India’s agricultural sector has made rapid strides in making India not only self sufficient in meeting food needs but also marginally surplus in food (Paroda, 1996). Total annual food grain production has already exceeded 200 MT at the beginning of the new millennium. The first major concern of providing food security during the post independence era is, thus, achieved by matching the supply with demand. 1.1 Emerging scenario in Indian agriculture Future scenario emerging in Indian agriculture is different from what is hitherto experienced. Firstly, with continuous growth in population, agricultural growth has to still balance between the need to provide food and nutrition security to the country, the need to accelerate income growth to alleviate poverty and the need to quicken the pace of economic growth. For instance, latest estimations on foodgrains demand in India to 2020 reveal that with an anticipated rise in the growth rate of per capita income in India from the current trend of 3.5 to 5.5 per cent, total cereals demand will increase by around 140 per cent over 1990 (Bhalla and Hazell, 1998). Secondly, in tune with economic liberalization, impending agricultural policy resolution and GATT agreements, agricultural technology management has to become highly efficient in order to exploit the expanding production and marketing opportunities. Thirdly, with shrinking resource base for supporting future production growth (Appendix.1), the challenges are unprecedented as compared to the pre-green revolution era. For instance, in the past four decades ending with 1990's, the resource base consisting of land and water for an average farm holding to support eight persons has considerably declined. Reduced farm land for producing food, continuous decline in land area for meeting fuel and fodder needs, slowing of net irrigation expansion due to maintenance, investment, physical and environment related constraints, falling growth in total factor productivity and falling public investments in agricultural research in real terms make the future
2
resource, production and technology management scenario quantitatively different from what was experienced during the later half of this century. Finally, improving the use efficiency of existing resources like land, water, fertilizer, infrastructure etc. will be crucial to relax the supply side constraints on future agricultural growth (Rao and Gulati, 1994). The role of Irrigation water will remain crucial in the whole process of agricultural growth planning primarily in view of its complementarity with other yield enhancing and/or cost saving inputs. 1.2 The setting and objectives Demands on irrigation systems, both surface and ground water based, are accelerating with population growth and development, and with competition with domestic and industrial uses. Per capita water availability has continuously fallen from 6000 Cubic metre in 1947 to 2300 Cubic metre in 1997 which is projected to further fall to 1600 Cubic metre per annum in 2017. The total annual renewable fresh water available in India is assessed at 2085 BCM (Billion cubic metre). Annual requirement of fresh water is projected to increase from 552 BCM in 1990 to 870 BCM in 2000 and 1330 BCM in 2025. The share of irrigation water in absolute terms is expected to increase by two-third in 2025 over that of 1990 level but will decline as a percent of total water needs from 83 to 58 percent during this period due to the increasing competition from other uses. In addition to temporal variability in water needs and supply, spatial variability also adds another dimension towards the status and sustainable use of water. For instance, Brahmaputra basin accounting for only six per cent of the country’s area holds 29 per cent of the country’s water resources. In some parts of the western and southern regions, water availability is as low as one-fourth of the national average. In Punjab and Haryana states, more than 50 per cent of the blocks are categorised as over exploited and dark areas in ground water use. Permanent depletion of ground water acquifer as in the case of Mehsana district in Gujarat and Coimbatore district in Tamil nadu and increase in the number of stressed ground water blocks from 253 in 1985 to 422 in 1993 signals the disturbing trends emerging in India’s water sector. As competition for limited water supply increases, responding effectively to these demands is a continuous process requiring careful and critical understanding of existing status, impacts and emerging prospects in irrigation water management. Paradoxically, water scarcity and inefficiency in its use co-exits in India's water resource management system. Irrigation retains its crucial role in productivity-led future agricultural production, in alleviating poverty and reducing inequality in income distribution in rural areas. In the past, agricultural development in general and irrigation development in particular has evolved around productivity and food security related concerns. Research scholars have adequately documented productivity impacts of irrigation in India. Equity impacts in irrigation management is
3
commonly adopted and now recognized by irrigation professionals across different disciplines as one of the most important objectives in India. Empirical analyses of equity impacts by and large concentrated at micro level within the irrigation system and that too capturing the farm location related inequity aspects within the watercourses (Bromley et al., 1980 and Palanisami, 1989). Empirical analyses of macro level equity impacts of irrigation development and use are scanty. Available evidences on the equity impact of irrigation distribution are restricted in its temporal coverage (Sampath, 1990). While irrigation development in the past was not specifically designed to target desired multiple impacts, equity implications as influenced during the course of irrigation development initiatives in the past four decades can no longer be ignored while formulating future water resource development strategies. A shift in water resource development and management paradigm is contingent upon the existing status and diverse impacts and experiences gained so far in this sector. This paper sets to address the following issues in the context of India's irrigation water management. Objectives
1. To comprehensively review the existing status of irrigation water development in India,
2. To highlight the equity impacts of irrigation water development in
India and
3. To suggest future irrigation water development strategies 1.3 Outline of the report Following the introductory part, in the second chapter, existing status of India’s irrigation development is outlined. Trends and shifts in the sources of irrigation at national and state level are discussed. Irrigation distribution in India at farm level covering sources and crop shares is also attempted in this chapter. In third chapter, equity impacts of irrigation development at all India and state levels are quantified and presented covering different irrigation attributes. Different irrigation distribution policies are considered while assessing the equity impacts at farm households (FHHs) level. In fourth chapter, irrigation water development strategies are presented. Integrated approach involves the efficient and equitable utilization of surface water, ground water and rainwater. Covering surface water, ground water and watershed approach, the past experiences are outlined for evolving future strategies. Conclusions of the study are outlined in the fifth and last chapter of the report.
4
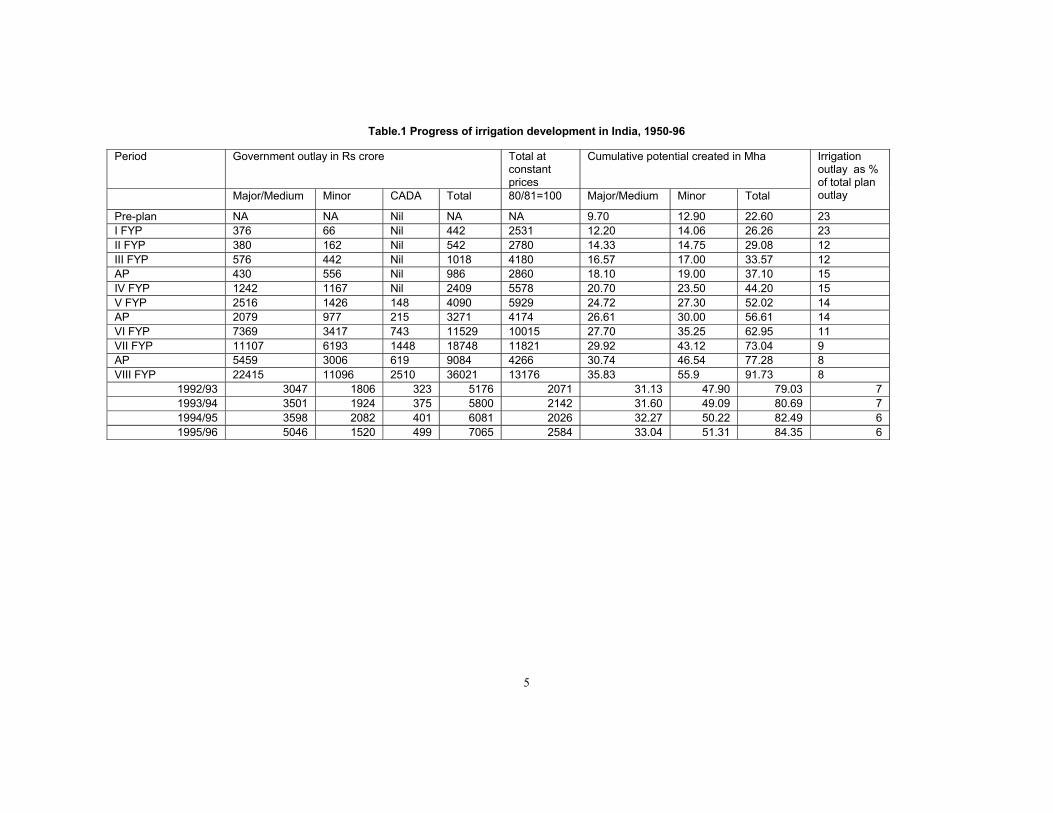
2 EXISTING STATUS OF IRRIGATION DEVELOPMENT 2.1 India’s irrigation development: trends and shifts Recognising the importance of irrigation as a crucial input in India's agricultural development, harnessing of water resources for irrigation has been given an important place in our successive five-year Plans (FYP). The ultimate irrigation potential of the country from major and medium projects is assessed at 58.5 million hectare (Mha). The irrigation potential from minor projects is estimated at 55 Mha, which is undergoing reassessment in view of the possible improvements in water management practices. As against this, the irrigation potential created during the pre-plan period was 22.6 Mha. Further, an estimated 62 Mha of additional irrigation potential has been created during 1951-96 (Table.1). Consequently, up to 1996, 74.5 per cent of the total irrigation potential has been harnessed for expanding irrigation facilities. Major and medium irrigation programmes accounted for 38 per cent of the additional irrigation potential created while the remaining 62 per cent of the added irrigation potential came through minor irrigation programmes. Initially, starting from I FYP, major and medium irrigation programmes contributed around two-third of the additional irrigation potential created (Fig.1). Minor irrigation programmes contributed the remaining one-third. This emphasis was gradually changing and completely reversed from IV FYP onwards extending upto VIII FYP. As a result of this, both surface and ground water resources were harnessed at varying levels across space and time with resultant variations in their multiple impacts, which are highlighted later. Irrigation development in India accounted for a financial outlay of Rs. 690 billion during I FYP to VIII FYP. The outlay on irrigation includes major, medium and minor irrigation projects and CADA but excludes the flood control programmes. The CADA was initiated in 1974/75 as a Centrally sponsored programme to ensure efficient utilisation of created irrigation potential for optimising agricultural production from irrigated lands. The outlay on minor irrigation projects includes both state and institutional sources but exclude private sources. Within minor irrigation projects, institutional sources accounted for nearly half of the outlay during VIII FYP as compared to negligible level during I FYP. This shift in the funding source (Fig.2) from state to institutional source for supporting minor irrigation programmes started almost from II FYP onwards and stabilised at around 50 per cent from IV FYP onwards with only marginal variations. Such a shift in the funding source for minor irrigation development also provided the fillip for increased share of minor irrigation in the additional irrigation potential created from IV FYP onwards.
5
Table.1 Progress of irrigation development in India, 1950-96
Period Government outlay in Rs crore Total at constant prices
Cumulative potential created in Mha
Major/Medium Minor CADA Total 80/81=100 Major/Medium Minor Total
Irrigation outlay as % of total plan outlay
Pre-plan NA NA Nil NA NA 9.70 12.90 22.60 23 I FYP 376 66 Nil 442 2531 12.20 14.06 26.26 23 II FYP 380 162 Nil 542 2780 14.33 14.75 29.08 12 III FYP 576 442 Nil 1018 4180 16.57 17.00 33.57 12 AP 430 556 Nil 986 2860 18.10 19.00 37.10 15 IV FYP 1242 1167 Nil 2409 5578 20.70 23.50 44.20 15 V FYP 2516 1426 148 4090 5929 24.72 27.30 52.02 14 AP 2079 977 215 3271 4174 26.61 30.00 56.61 14 VI FYP 7369 3417 743 11529 10015 27.70 35.25 62.95 11 VII FYP 11107 6193 1448 18748 11821 29.92 43.12 73.04 9 AP 5459 3006 619 9084 4266 30.74 46.54 77.28 8 VIII FYP 22415 11096 2510 36021 13176 35.83 55.9 91.73 8
1992/93 3047 1806 323 5176 2071 31.13 47.90 79.03 7 1993/94 3501 1924 375 5800 2142 31.60 49.09 80.69 7 1994/95 3598 2082 401 6081 2026 32.27 50.22 82.49 6 1995/96 5046 1520 499 7065 2584 33.04 51.31 84.35 6
8
As percentage of total plan expenditure, outlay on irrigation constituted 23 per cent in I FYP, which came down by almost half in subsequent two plan periods before marginally improving during annual plans and IV and V FYPs. Starting from VI FYP, the share of irrigation outlay has been coming down continuously and has reached six per cent during 1995/96. 2.2 Sources of irrigation development in India: trends and
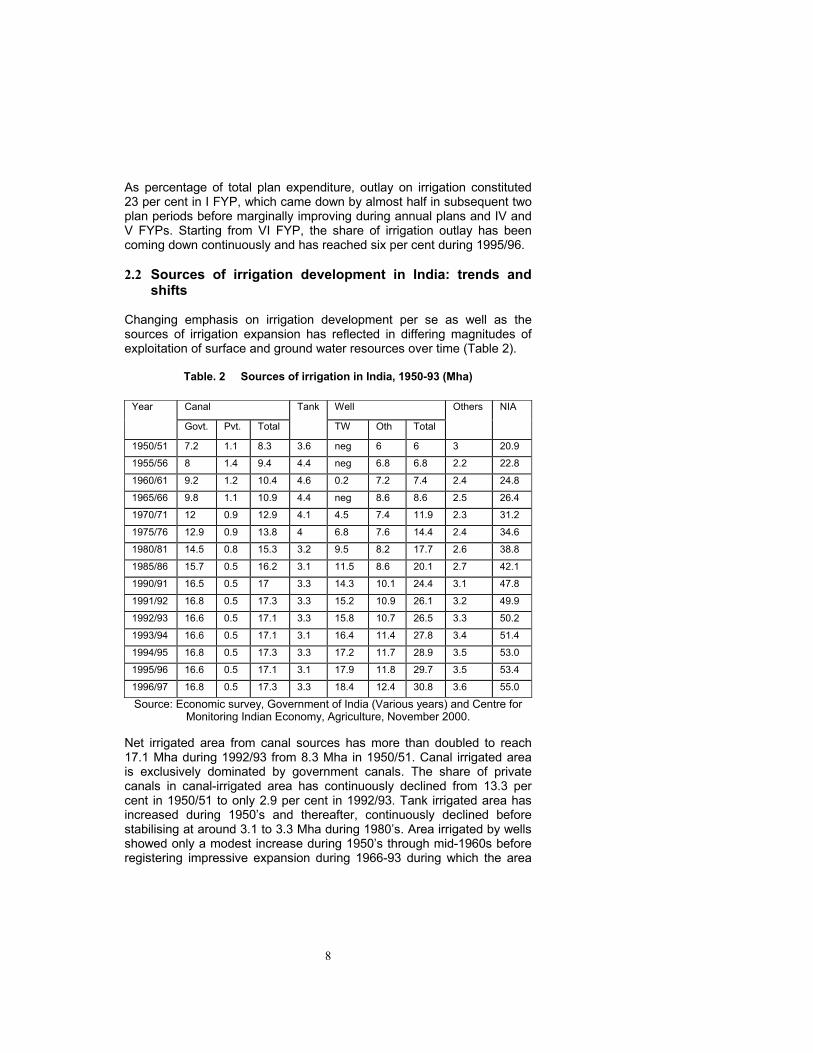
shifts Changing emphasis on irrigation development per se as well as the sources of irrigation expansion has reflected in differing magnitudes of exploitation of surface and ground water resources over time (Table 2).
Table. 2 Sources of irrigation in India, 1950-93 (Mha)
Canal Well Year
Govt. Pvt. Total
Tank
TW Oth Total
Others NIA
1950/51 7.2 1.1 8.3 3.6 neg 6 6 3 20.9
1955/56 8 1.4 9.4 4.4 neg 6.8 6.8 2.2 22.8
1960/61 9.2 1.2 10.4 4.6 0.2 7.2 7.4 2.4 24.8
1965/66 9.8 1.1 10.9 4.4 neg 8.6 8.6 2.5 26.4
1970/71 12 0.9 12.9 4.1 4.5 7.4 11.9 2.3 31.2
1975/76 12.9 0.9 13.8 4 6.8 7.6 14.4 2.4 34.6
1980/81 14.5 0.8 15.3 3.2 9.5 8.2 17.7 2.6 38.8
1985/86 15.7 0.5 16.2 3.1 11.5 8.6 20.1 2.7 42.1
1990/91 16.5 0.5 17 3.3 14.3 10.1 24.4 3.1 47.8
1991/92 16.8 0.5 17.3 3.3 15.2 10.9 26.1 3.2 49.9
1992/93 16.6 0.5 17.1 3.3 15.8 10.7 26.5 3.3 50.2
1993/94 16.6 0.5 17.1 3.1 16.4 11.4 27.8 3.4 51.4
1994/95 16.8 0.5 17.3 3.3 17.2 11.7 28.9 3.5 53.0
1995/96 16.6 0.5 17.1 3.1 17.9 11.8 29.7 3.5 53.4
1996/97 16.8 0.5 17.3 3.3 18.4 12.4 30.8 3.6 55.0
Source: Economic survey, Government of India (Various years) and Centre for Monitoring Indian Economy, Agriculture, November 2000.
Net irrigated area from canal sources has more than doubled to reach 17.1 Mha during 1992/93 from 8.3 Mha in 1950/51. Canal irrigated area is exclusively dominated by government canals. The share of private canals in canal-irrigated area has continuously declined from 13.3 per cent in 1950/51 to only 2.9 per cent in 1992/93. Tank irrigated area has increased during 1950’s and thereafter, continuously declined before stabilising at around 3.1 to 3.3 Mha during 1980’s. Area irrigated by wells showed only a modest increase during 1950’s through mid-1960s before registering impressive expansion during 1966-93 during which the area
9
has more than tripled. There was also a perceptible shift in the sources of area irrigated by wells. During 1951-66, contribution of tube wells remained almost negligible. Starting from 1966 onwards, area irrigated by tubewells increased substantially to reach 15.8 Mha in 1993, contributing 59.6 per cent of the area irrigated by the wells. As on 1993, the total net irrigated area of 50.2 Mha is accounted for by canals (34.1 per cent), by wells (52.9 per cent), by tanks (6.5 per cent) and by others (6.5 per cent). In 1951, the respective share of canals, wells and tanks remained at 39.7, 28.7 and 17.2 per cent of the net irrigated area. The intensive installation of tubewells since 1970s has resulted in wells emerging as the dominating source of irrigation in Indian agriculture. Other sources of irrigation fluctuated around 2.2 to 3.3 Mha accounting for 6 to 14 per cent of the net irrigated area over time. The growth in source-wise irrigated area exhibited different trends over different time periods in accordance with the shifts in irrigation development policies pursued from time to time. The preceding discussions indicated a perceptible shift in the irrigation development strategies based on which two periods; namely 1951-66 (Period I) and 1971-93 (Period 2) can be broadly grouped for growth analysis (Fig. 3). The annual compound growth rate for canal-irrigated area came down from 1.8 in Period I to 1.3 in Period 2. Within the Period 2, the growth rate for canal-irrigated area has fallen from 1.7 per cent in 1970s to 0.9 percent in 1980s extending upto early 1990s. While the pace of expansion of canal-irrigated area is almost maintained in 1970s, it has considerably slowed down during 1981-93. The area commanded by tanks has grown at an annual rate of 1.3 per cent during Period 1. But, during the Period 2, the growth rate for tank-irrigated area has become negative at 1.1 per cent. Almost the entire fall in growth rate for tank irrigated area has happened during 1970s with no change in 1980s and beyond. Area irrigated by wells grew at 2.4 per cent during Period 1, which was accelerated to 3.7 per cent during Period 2. Within Period 2, the growth rate of area irrigated by wells was the highest at 4.1 per cent during 1970s, which came down to 3.4 per cent during the later period ending early 1990s. 2.3 Sources of irrigation development in states: trends and
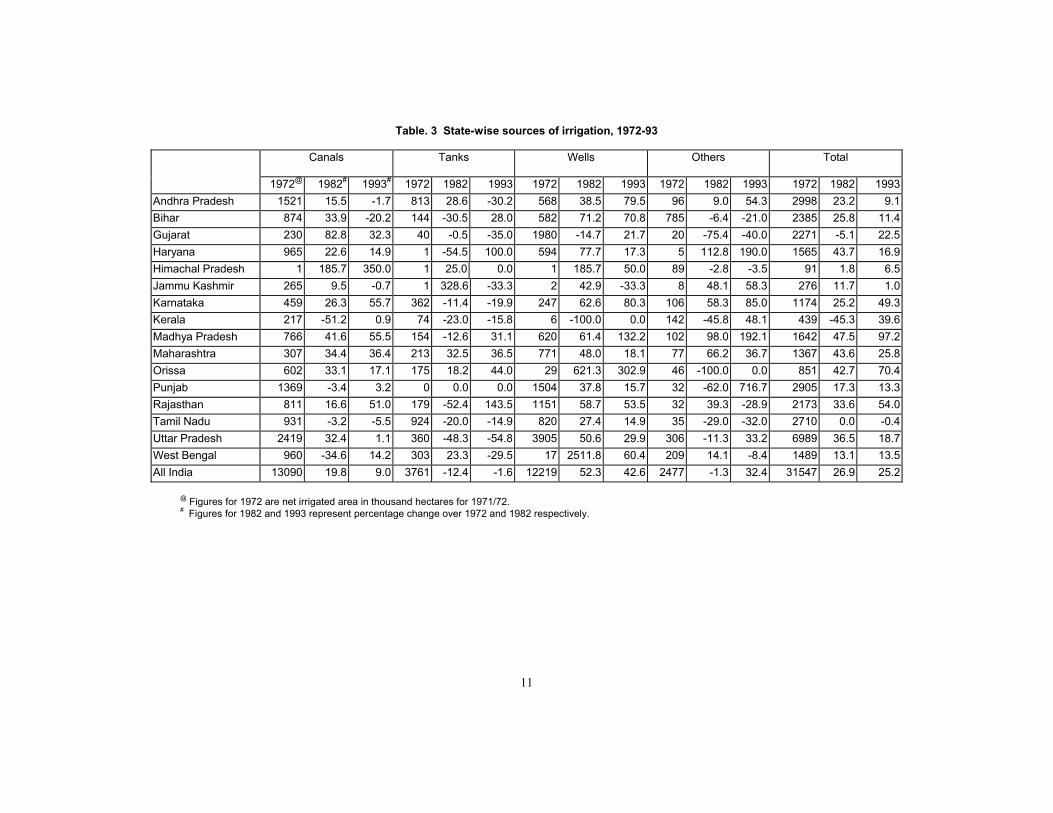
shifts The growth in source-wise net irrigated area also exhibited different temporal and spatial trends as a consequence of shifts in irrigation development policies pursued in the past (Table. 3). As on 1972, excluding the states of minor importance in terms of individual sources of irrigation, the expansion in source-wise irrigated area was analyzed.
11
Table. 3 State-wise sources of irrigation, 1972-93
Canals Tanks Wells Others Total
1972@ 1982# 1993# 1972 1982 1993 1972 1982 1993 1972 1982 1993 1972 1982 1993Andhra Pradesh 1521 15.5 -1.7 813 28.6 -30.2 568 38.5 79.5 96 9.0 54.3 2998 23.2 9.1Bihar 874 33.9 -20.2 144 -30.5 28.0 582 71.2 70.8 785 -6.4 -21.0 2385 25.8 11.4Gujarat 230 82.8 32.3 40 -0.5 -35.0 1980 -14.7 21.7 20 -75.4 -40.0 2271 -5.1 22.5Haryana 965 22.6 14.9 1 -54.5 100.0 594 77.7 17.3 5 112.8 190.0 1565 43.7 16.9Himachal Pradesh 1 185.7 350.0 1 25.0 0.0 1 185.7 50.0 89 -2.8 -3.5 91 1.8 6.5Jammu Kashmir 265 9.5 -0.7 1 328.6 -33.3 2 42.9 -33.3 8 48.1 58.3 276 11.7 1.0Karnataka 459 26.3 55.7 362 -11.4 -19.9 247 62.6 80.3 106 58.3 85.0 1174 25.2 49.3Kerala 217 -51.2 0.9 74 -23.0 -15.8 6 -100.0 0.0 142 -45.8 48.1 439 -45.3 39.6Madhya Pradesh 766 41.6 55.5 154 -12.6 31.1 620 61.4 132.2 102 98.0 192.1 1642 47.5 97.2Maharashtra 307 34.4 36.4 213 32.5 36.5 771 48.0 18.1 77 66.2 36.7 1367 43.6 25.8Orissa 602 33.1 17.1 175 18.2 44.0 29 621.3 302.9 46 -100.0 0.0 851 42.7 70.4Punjab 1369 -3.4 3.2 0 0.0 0.0 1504 37.8 15.7 32 -62.0 716.7 2905 17.3 13.3Rajasthan 811 16.6 51.0 179 -52.4 143.5 1151 58.7 53.5 32 39.3 -28.9 2173 33.6 54.0Tamil Nadu 931 -3.2 -5.5 924 -20.0 -14.9 820 27.4 14.9 35 -29.0 -32.0 2710 0.0 -0.4Uttar Pradesh 2419 32.4 1.1 360 -48.3 -54.8 3905 50.6 29.9 306 -11.3 33.2 6989 36.5 18.7West Bengal 960 -34.6 14.2 303 23.3 -29.5 17 2511.8 60.4 209 14.1 -8.4 1489 13.1 13.5All India 13090 19.8 9.0 3761 -12.4 -1.6 12219 52.3 42.6 2477 -1.3 32.4 31547 26.9 25.2
@ Figures for 1972 are net irrigated area in thousand hectares for 1971/72. # Figures for 1982 and 1993 represent percentage change over 1972 and 1982 respectively.
12
2.3.1 Canal irrigated area Among the major states, in case of canal-irrigated area, during 1972-82, the percentage increase was the highest in case of Gujarat (82.8 per cent) followed by Madhya Pradesh (41.6 per cent), Maharashtra (34.4 per cent), Bihar (33.9 per cent) and Orissa (33.1 per cent). Remaining states registered less than one-third increase in canal irrigated area over the 1972 level. Kerala and West Bengal registered decline in canal irrigated area during this period. Marginal decline in canal-irrigated area was also observed in case of Punjab and Tamil Nadu. During 1982-93, canal irrigated area registered impressive expansion in states like Karnataka, Madhya Pradesh, Rajasthan, Maharashtra and Gujarat. All these states registered more than one-third increase in canal-irrigated area in 1993 over the 1982 level. Orissa, West Bengal and Haryana states have recorded 14 to 17 per cent increase in canal-irrigated area during 1982-93 period. Bihar, Tamil Nadu, A.P and Jammu & Kashmir registered decline in canal irrigated area during this period. Considering both the time periods together, it was observed that states like Gujarat, Haryana, Karnataka, Madhya Pradesh, Maharashtra, Orissa and Rajasthan have consistently increased the area under canal irrigation during 1972-93. In case of Tamil Nadu, the decline in canal irrigated area is consistent although only marginally (3.2 and 5.5 per cent during 1972-82 and 1982-93 respectively). For other states both expansion and contraction in canal-irrigated area was observed during this time period 1972-93. 2.3.2 Tank irrigated area Among the major states, maximum expansion in tank irrigated area was observed during 1972-82 in case of Maharashtra (32.5 per cent), followed by Andhra Pradesh (28.6 per cent), West Bengal (23.3 per cent) and Orissa (18.2 per cent). Among the states with declining tank-irrigated area during the same period, Haryana and Rajasthan were leading with 52.4 to 54.5 per cent fall, followed by Uttar Pradesh (48.3 per cent), Bihar (30.5 per cent), Kerala (23 per cent) and Tamil Nadu (20 per cent). During 1982-93, Rajasthan registered maximum expansion in tank-irrigated area with 143.5 per cent followed by Haryana (100 per cent), Orissa (44 per cent), Maharashtra (36.5 per cent), Madhya Pradesh (31.1 per cent) and Bihar (28 per cent). Maximum decline in tank irrigated area during 1982-93 was observed in case of Uttar Pradesh (54.8 per cent), followed by Gujarat (35 per cent), Andhra Pradesh (30.2 per cent) and West Bengal (29 .5 per cent). Across two time periods covering 1972-93, only Maharashtra and Orissa have consistently expanded the area under tank irrigation. On the other hand, Uttar Pradesh, Tamil Nadu, Karnataka and Kerala have registered continuous decline in tank-irrigated area during the same periods. For
13
other states both expansion and contraction in tank-irrigated area was observed during 1972-93. 2.3.3 Well irrigated area Well-irrigated area includes the area irrigated by both wells and tubewells. During 1972-82, except Kerala and Gujarat, all other states registered increase in the area irrigated by wells by over 25 per cent. Expansion in well-irrigated area was the highest in West Bengal and Orissa. This was followed by states like Haryana, Bihar, Karnataka, Madhya Pradesh, Rajasthan and Uttar Pradesh accounting for more than 50 per cent expansion in well-irrigated area during this period. Well-irrigated area declined only in case of Kerala and Gujarat during 1972-82. During 1982-93, Orissa and Madhya Pradesh recorded maximum expansion in well-irrigated area. Bihar, Himachal Pradesh, Karnataka, Rajasthan and West Bengal sustained the growth in well-irrigated area during 1982-93 also by registering above 50 per cent growth during this period. While Andhra Pradesh accelerated the well irrigation growth during this period, Tamil Nadu, Haryana, Maharashtra, Punjab and Uttar Pradesh slowed down as compared to the earlier period of 1972-82. Considering both the periods together, impressive and consistent growth of more than 50 per cent in each period is observed in case of several states like; Bihar, Himachal Pradesh, Karnataka, Madhya Pradesh, Orissa, Rajasthan and West Bengal. Barring Jammu and Kashmir with decline in well-irrigated area and Kerala with no change in well-irrigated area, all other states have expanded the area under well irrigation during the later period of 1982-93. Consequently, at all India level also, well-irrigated area has gone up continuously by 52.3 and 42.6 per cent respectively in 1972-82 and 1982-93. 2.3.4 Total irrigated area Total irrigated area across the sources has gone up consistently by over 25 per cent during each of the period namely 1972-82 and 1982-93. Only Tamil Nadu has stagnated in providing additional irrigation facilities. Both consistency and improvement in irrigation expansion was observed in case of Karnataka, Madhya Pradesh, Orissa, Rajasthan, and West Bengal. In case of Gujarat and Kerala, total irrigated area declined during 1972-82 but expanded subsequently in 1982-93. In all the remaining states, total irrigated area continued to expand in both the periods but with a declined rate of growth in the later period. 2.4 Shifts in irrigation sources Varying magnitudes of growth in source-wise irrigated area over time has also resulted in perceptible shifts in the importance of different sources of irrigation over space and time. The state-wise shifts in the sources of net irrigated area during the period 1972-93 are given in Table. 4.
14
Table. 4 State-wise shifts in sources of irrigated area, 1972-93
Canals Tanks Wells Others
1972 1982 1993 1972 1982 1993 1972 1982 1993 1972 1982 1993Andhra Pradesh 50.7 47.6 42.9 27.1 28.3 18.1 18.9 21.3 35.0 3.2 2.8 4.0Bihar 36.7 39.0 27.9 6.0 3.3 3.8 24.4 33.2 50.9 32.9 24.5 17.4Gujarat 10.1 19.5 21.1 1.8 1.9 1.0 87.2 78.4 77.8 0.9 0.2 0.1Haryana 61.7 52.6 51.7 0.1 0.0 0.0 38.0 47.0 47.1 0.3 0.4 1.1Himachal Pradesh 0.8 2.2 9.1 0.9 1.1 1.0 1.5 4.3 6.1 96.8 92.5 83.8Jammu Kashmir 96.0 94.2 92.6 0.3 1.0 0.6 0.8 1.0 0.6 2.9 3.9 6.1Karnataka 39.1 39.5 41.2 30.8 21.8 11.7 21.1 27.3 33.0 9.0 11.4 14.1Kerala 49.5 44.2 31.9 16.9 23.8 14.3 1.3 0.0 19.7 32.4 32.1 34.0Madhya Pradesh 46.6 44.8 35.3 9.4 5.6 3.7 37.7 41.3 48.6 6.2 8.3 12.4Maharashtra 22.4 21.0 22.8 15.6 14.4 15.6 56.4 58.1 54.6 5.6 6.5 7.1Orissa 70.7 65.9 45.3 20.6 17.0 14.4 3.4 17.0 40.3 5.4 0.0 0.0Punjab 47.1 38.8 35.4 0.0 0.0 0.0 51.8 60.8 62.1 1.1 0.4 2.5Rajasthan 37.3 32.6 31.9 8.2 2.9 4.6 53.0 62.9 62.7 1.5 1.6 0.7Tamil Nadu 34.3 33.2 31.5 34.1 27.3 23.3 30.3 38.6 44.5 1.3 0.9 0.6Uttar Pradesh 34.6 33.6 28.6 5.1 1.9 0.7 55.9 61.6 67.5 4.4 2.8 3.2West Bengal 64.5 37.3 37.5 20.3 22.1 13.8 1.1 26.4 37.3 14.1 14.2 11.5All India 41.5 39.2 34.1 11.9 8.2 6.5 38.7 46.5 53.0 7.9 6.1 6.5
Figures refer to state-wise percentage of net irrigated area under each source in respective years.
15
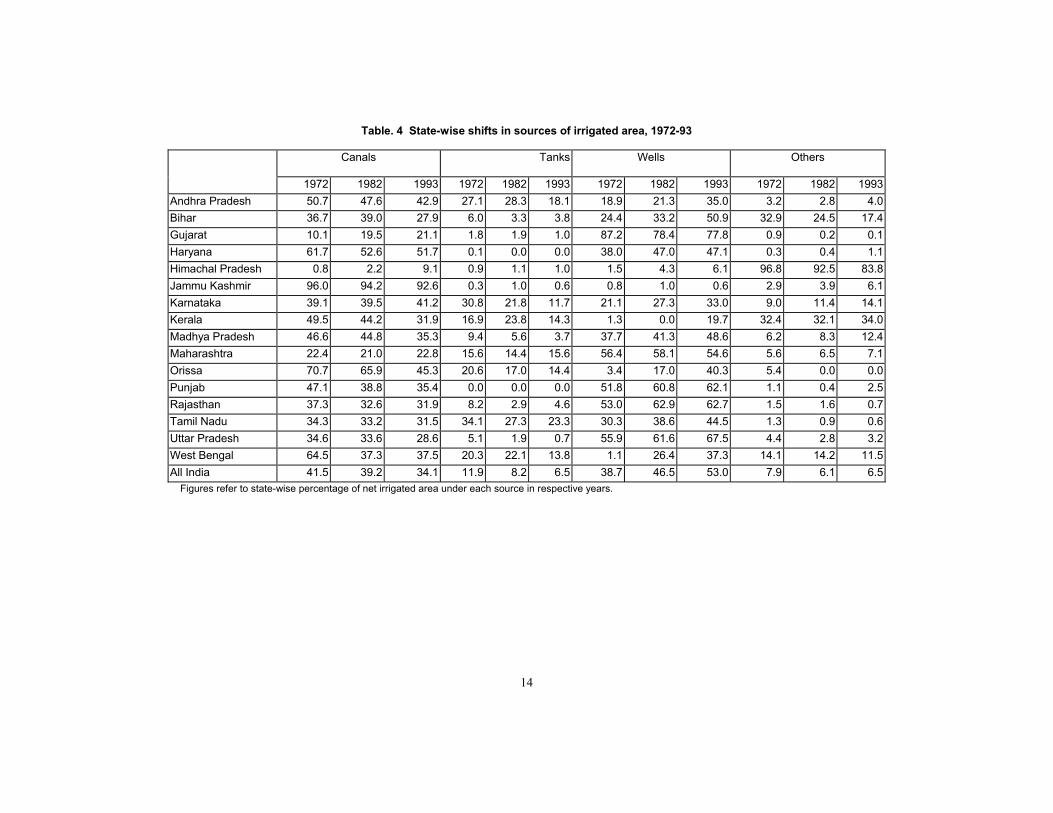
At all India level, canals dominated the source of irrigation with 41.5 per cent in 1972, closely followed by wells with 38.7 per cent. However in 1982, wells became the dominating source of irrigation with a share of 46.5 per cent, which further increased to 53 per cent in 1993. Consequently, the share of canals in the irrigated area has come down to 34.1 per cent in 1993. Tanks as a source of irrigation also came down from 11.9 to 6.5 percent during the period 1972-93. Among the states, despite continuous decline in the share of canal irrigated area in the total net irrigated area during this period, canals continued its domination as the major source of irrigation in case of Andhra Pradesh, Haryana, Jammu and Kashmir, Karnataka, Orissa and West Bengal. The share of canal irrigation in the net irrigated area has consistently declined in every state during this period, 1972-93 excepting Gujarat, Himachal Pradesh, Karnataka and Maharashtra. In case of tanks as a source of irrigation, only Maharashtra has retained its share at around 15 per cent during this period. Every other state has recorded decline in the share of tanks in the net irrigated area during 1972-93. Drastic decline in the tanks' share in irrigated area is observed in Karnataka, Andhra Pradesh and West Bengal. Orissa and West Bengal registered maximum increase in the share of wells as a source of irrigation during 1972-93. The share in irrigated area by wells has more than doubled in Andhra Pradesh and Bihar. Except in Gujarat and Maharashtra where the wells' share in irrigated area has marginally declined, in most of the other states, this share has continuously increased during this period. 2.5 Farm level irrigation distribution in India: trends and
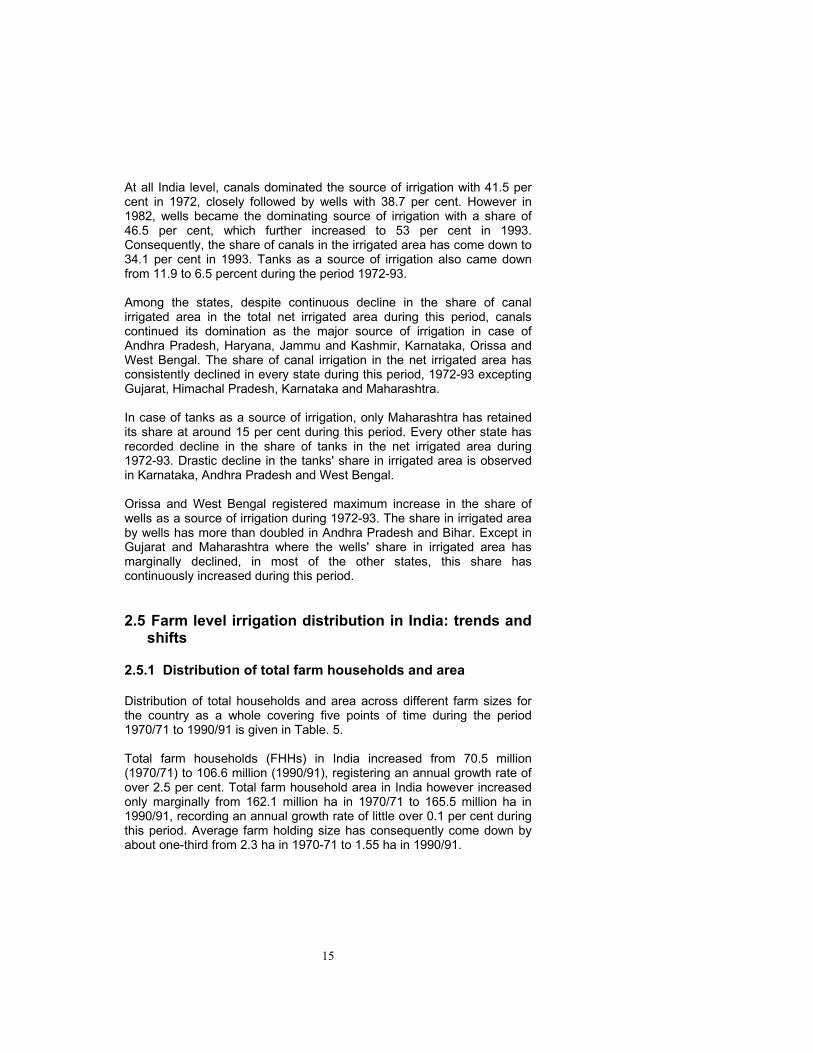
shifts 2.5.1 Distribution of total farm households and area Distribution of total households and area across different farm sizes for the country as a whole covering five points of time during the period 1970/71 to 1990/91 is given in Table. 5. Total farm households (FHHs) in India increased from 70.5 million (1970/71) to 106.6 million (1990/91), registering an annual growth rate of over 2.5 per cent. Total farm household area in India however increased only marginally from 162.1 million ha in 1970/71 to 165.5 million ha in 1990/91, recording an annual growth rate of little over 0.1 per cent during this period. Average farm holding size has consequently come down by about one-third from 2.3 ha in 1970-71 to 1.55 ha in 1990/91.
16
Table 5. Distribution of FHHs and area across farm sizes, 1971-91
Farm size (ha) Year 0-1 1-2 2-4 4-10 >10 All
Total house holds ('000 No.) 1970/71 35682 13432 10681 7932 2766 704931976/77 43636 14438 11373 7946 2361 797541980/81 49763 16072 12455 8068 2166 885241985/86 53899 17922 13252 7917 1918 949081990/91 63389 20092 13923 7580 1654 106638Total area ('000 ha) 1970/71 14545 19282 29999 48234 50064 1621241976/77 17223 20484 31569 47972 40307 1575551980/81 19730 23169 34645 48543 37705 1637921985/86 22009 25708 36666 47144 33002 1645291990/91 24894 28827 38375 44752 28659 165507
Change in 1990/91 over 1970/71 (%) Total households 77.6 49.6 30.4 -4.4 -40.2 51.3Total area 71.2 49.5 27.9 -7.2 -42.8 2.1Farm holding size -3.7 -0.1 -1.9 -2.9 -4.3 -32.5
Among different farm sizes, maximum growth in farm households is observed in less than 1 ha size. Number of farm households in this size group has increased by 77.6 per cent during 1970/71 to 1990/91. This was closely followed by 1-2 ha size group whose size has increased by 49.6 per cent. Least expansion was recorded by 2-4 ha size group farms with 30.4 per cent growth during the same period. In case of farm sizes exceeding 4 ha, number of farm households has declined marginally by 4.4 per cent in case of 4-10 ha category and substantially by 40.2 per cent in case of above 10 ha farm size group. Rate of expansion in number of households has consistently exhibited inverse relationship with the farm size across all the time periods considered here. In fact over 3/4th of the increase in the farm households in 1990/91 over 1970/71 has occurred within the 0-1 ha size group. If 1-2 ha size group is also included, then over 95 per cent of the increase in the number of farm households is registered with less than 2 ha size group. Right to land ownership is a necessary condition to acquire right to irrigation water facilities. Therefore, observed shift in the growth of farm households over time, mostly in the range of less than 2 ha size will have different implications on distribution of water and hence income depending on the irrigation water development policies adopted in the past.
17
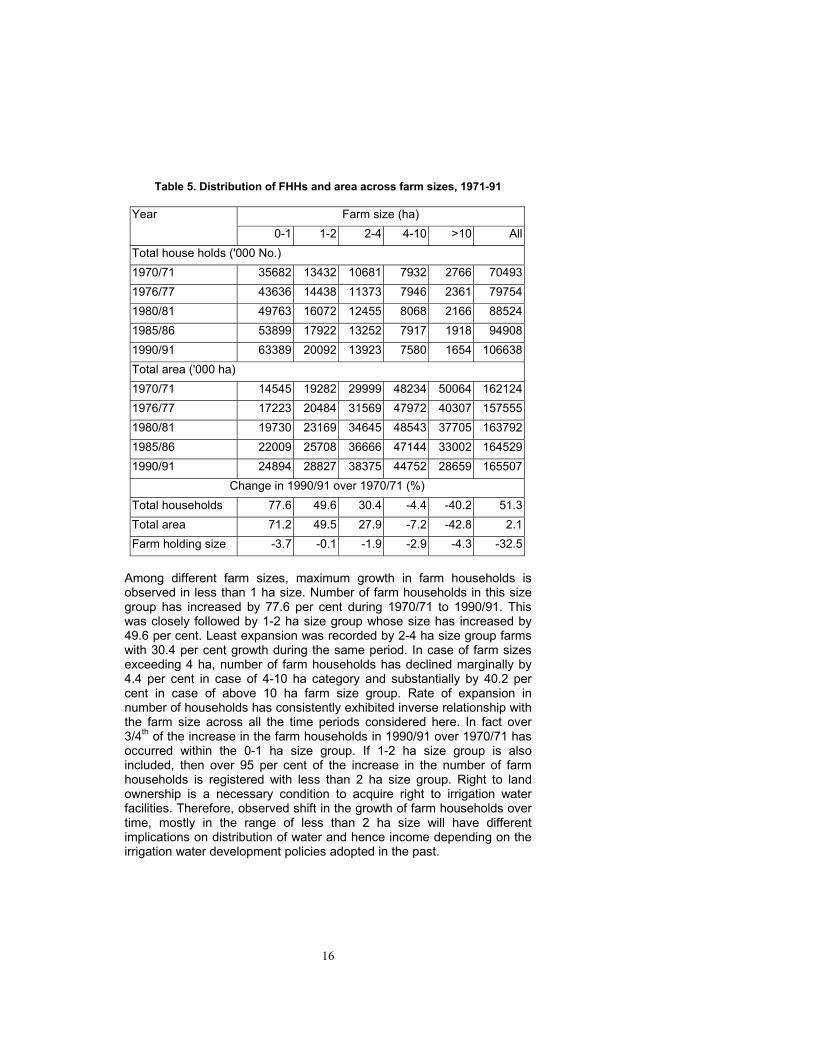
2.5.2 Distribution of Irrigated farm households Distribution of irrigated farm households across different farm sizes for the country as a whole covering five points of time during the period 1970/71 to 1990/91 is given in Table. 6.
Table 6. Distribution of irrigated FHHs across farm sizes, 1971-91
Farm size (ha) Year 0-1 1-2 2-4 4-10 >10 All
Wholly irrigated farms ('000 No.) 1970/71 8770 1919 1117 538 91 124351976/77 11471 2494 1419 613 97 160941980/81 14254 3154 1897 897 145 203471985/86 17344 4152 2480 1140 176 252921990/91 19707 4672 2727 1194 177 28477 Partially irrigated farms ('000 No.) 1970/71 5807 3719 3472 2900 1052 169501976/77 6837 3714 3455 2772 830 176081980/81 8882 3947 3499 2585 698 196111985/86 7104 3532 3114 2254 585 165891990/91 10245 4475 3550 2342 518 21130 Change in 1990/91 over 1970/71 Wholly irrigated farms
124.7 143.5 144.1 121.9 94.5 129.0
Partially irrigated farms
76.4 20.3 2.2 -19.2 -50.8 24.7
Irrigated farms 105.5 62.2 36.8 2.9 -39.2 68.8 Currently, as on 1990/91, 49.6 million FHH are having wholly or partially irrigated holdings. Irrigated FHH in India has increased by more than two-third during the period 1970/71 to 1990/91. Maximum increase of over 100 per cent is recorded in marginal FHH category and the magnitude of growth in irrigated FHH is inversely related to the farm size. Only in case of more than 10 ha farm size, there is a decline in the number of irrigated FHH by 39.2 per cent during this period. Similar trend is also observed while considering wholly and partially irrigated FHH separately. The magnitude of growth is more in case of wholly irrigated farms than in partially irrigated farms, which is also desirable from improving the efficiency of use of resources in a wholly irrigated farm environment. However, from equity point of view it remains to be seen whether such an irrigation development path pursued in the past has resulted in more equitable distribution of the irrigation facilities across different farm sizes.
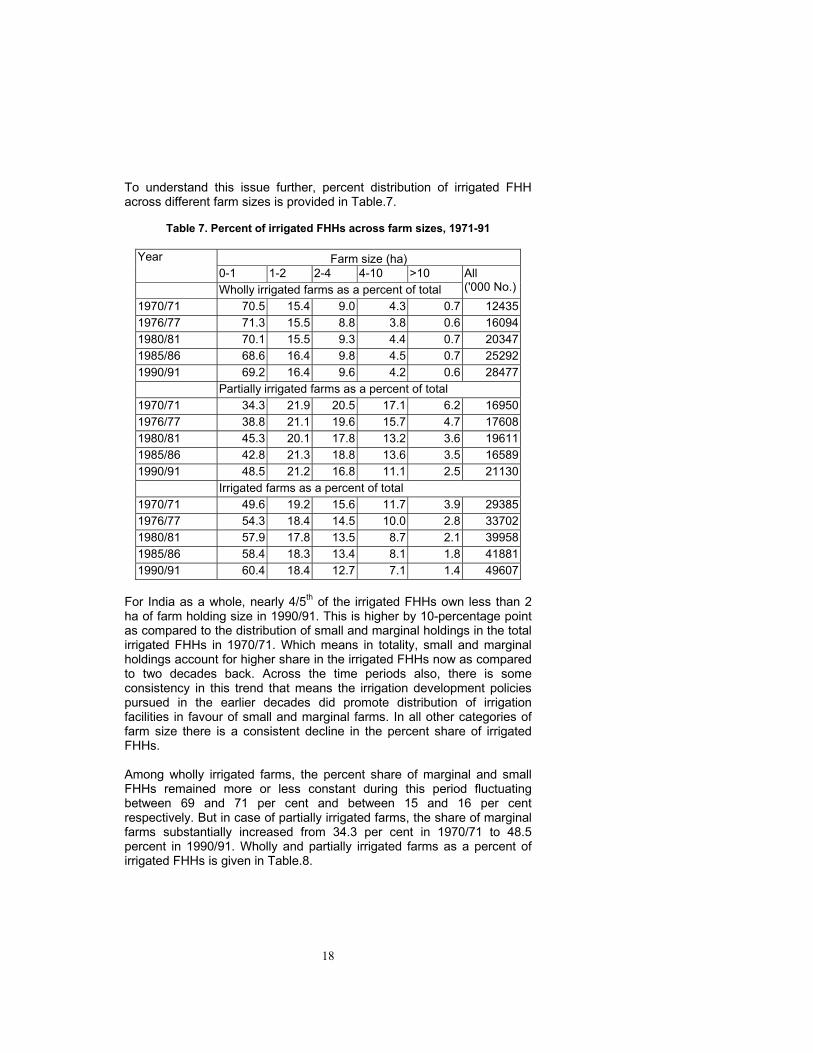
18
To understand this issue further, percent distribution of irrigated FHH across different farm sizes is provided in Table.7.
Table 7. Percent of irrigated FHHs across farm sizes, 1971-91
Farm size (ha) Year
0-1 1-2 2-4 4-10 >10 Wholly irrigated farms as a percent of total
All ('000 No.)
1970/71 70.5 15.4 9.0 4.3 0.7 124351976/77 71.3 15.5 8.8 3.8 0.6 160941980/81 70.1 15.5 9.3 4.4 0.7 203471985/86 68.6 16.4 9.8 4.5 0.7 252921990/91 69.2 16.4 9.6 4.2 0.6 28477
Partially irrigated farms as a percent of total 1970/71 34.3 21.9 20.5 17.1 6.2 169501976/77 38.8 21.1 19.6 15.7 4.7 176081980/81 45.3 20.1 17.8 13.2 3.6 196111985/86 42.8 21.3 18.8 13.6 3.5 165891990/91 48.5 21.2 16.8 11.1 2.5 21130
Irrigated farms as a percent of total 1970/71 49.6 19.2 15.6 11.7 3.9 293851976/77 54.3 18.4 14.5 10.0 2.8 337021980/81 57.9 17.8 13.5 8.7 2.1 399581985/86 58.4 18.3 13.4 8.1 1.8 418811990/91 60.4 18.4 12.7 7.1 1.4 49607
For India as a whole, nearly 4/5th of the irrigated FHHs own less than 2 ha of farm holding size in 1990/91. This is higher by 10-percentage point as compared to the distribution of small and marginal holdings in the total irrigated FHHs in 1970/71. Which means in totality, small and marginal holdings account for higher share in the irrigated FHHs now as compared to two decades back. Across the time periods also, there is some consistency in this trend that means the irrigation development policies pursued in the earlier decades did promote distribution of irrigation facilities in favour of small and marginal farms. In all other categories of farm size there is a consistent decline in the percent share of irrigated FHHs. Among wholly irrigated farms, the percent share of marginal and small FHHs remained more or less constant during this period fluctuating between 69 and 71 per cent and between 15 and 16 per cent respectively. But in case of partially irrigated farms, the share of marginal farms substantially increased from 34.3 per cent in 1970/71 to 48.5 percent in 1990/91. Wholly and partially irrigated farms as a percent of irrigated FHHs is given in Table.8.
19
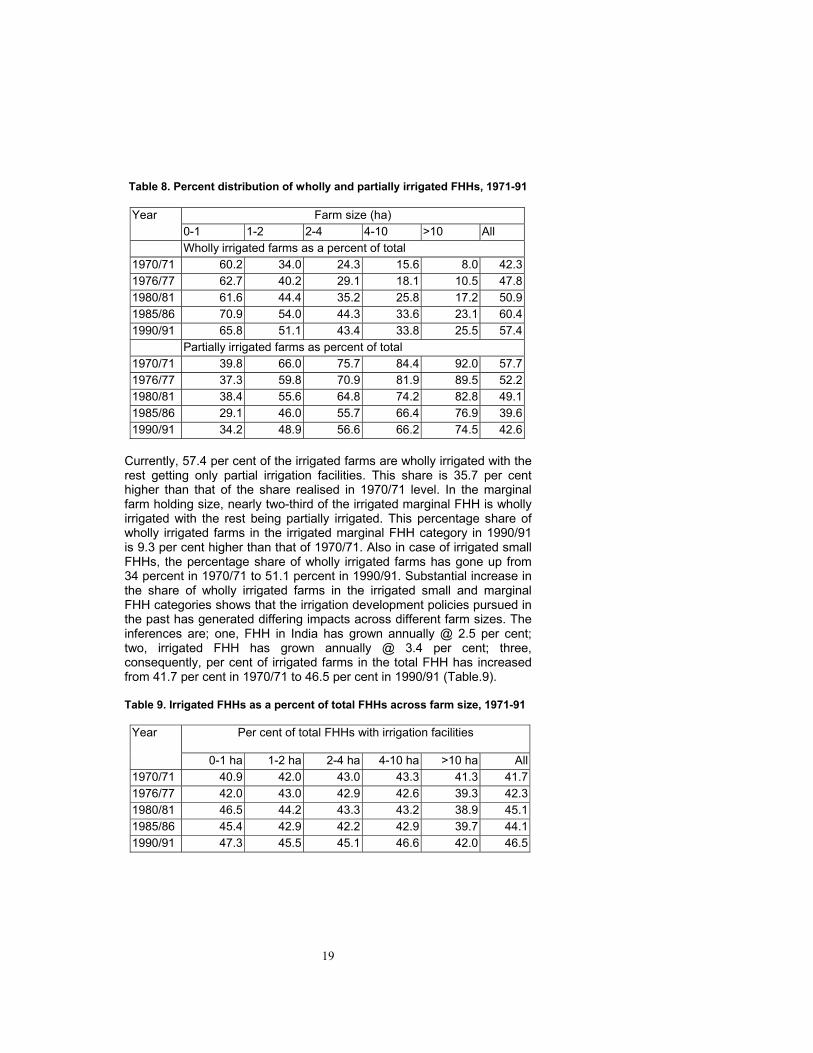
Table 8. Percent distribution of wholly and partially irrigated FHHs, 1971-91
Farm size (ha) Year 0-1 1-2 2-4 4-10 >10 All
Wholly irrigated farms as a percent of total 1970/71 60.2 34.0 24.3 15.6 8.0 42.31976/77 62.7 40.2 29.1 18.1 10.5 47.81980/81 61.6 44.4 35.2 25.8 17.2 50.91985/86 70.9 54.0 44.3 33.6 23.1 60.41990/91 65.8 51.1 43.4 33.8 25.5 57.4
Partially irrigated farms as percent of total 1970/71 39.8 66.0 75.7 84.4 92.0 57.71976/77 37.3 59.8 70.9 81.9 89.5 52.21980/81 38.4 55.6 64.8 74.2 82.8 49.11985/86 29.1 46.0 55.7 66.4 76.9 39.61990/91 34.2 48.9 56.6 66.2 74.5 42.6
Currently, 57.4 per cent of the irrigated farms are wholly irrigated with the rest getting only partial irrigation facilities. This share is 35.7 per cent higher than that of the share realised in 1970/71 level. In the marginal farm holding size, nearly two-third of the irrigated marginal FHH is wholly irrigated with the rest being partially irrigated. This percentage share of wholly irrigated farms in the irrigated marginal FHH category in 1990/91 is 9.3 per cent higher than that of 1970/71. Also in case of irrigated small FHHs, the percentage share of wholly irrigated farms has gone up from 34 percent in 1970/71 to 51.1 percent in 1990/91. Substantial increase in the share of wholly irrigated farms in the irrigated small and marginal FHH categories shows that the irrigation development policies pursued in the past has generated differing impacts across different farm sizes. The inferences are; one, FHH in India has grown annually @ 2.5 per cent; two, irrigated FHH has grown annually @ 3.4 per cent; three, consequently, per cent of irrigated farms in the total FHH has increased from 41.7 per cent in 1970/71 to 46.5 per cent in 1990/91 (Table.9). Table 9. Irrigated FHHs as a percent of total FHHs across farm size, 1971-91
Per cent of total FHHs with irrigation facilities
Year
0-1 ha 1-2 ha 2-4 ha 4-10 ha >10 ha All1970/71 40.9 42.0 43.0 43.3 41.3 41.71976/77 42.0 43.0 42.9 42.6 39.3 42.31980/81 46.5 44.2 43.3 43.2 38.9 45.11985/86 45.4 42.9 42.2 42.9 39.7 44.11990/91 47.3 45.5 45.1 46.6 42.0 46.5
20
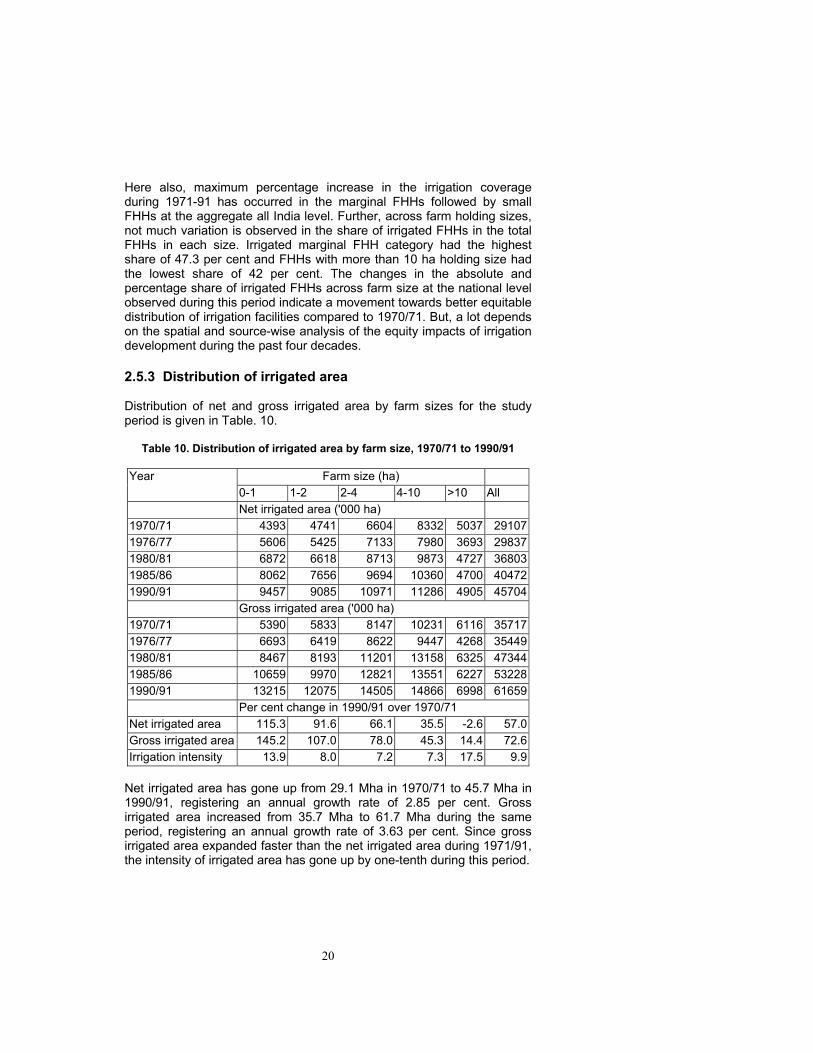
Here also, maximum percentage increase in the irrigation coverage during 1971-91 has occurred in the marginal FHHs followed by small FHHs at the aggregate all India level. Further, across farm holding sizes, not much variation is observed in the share of irrigated FHHs in the total FHHs in each size. Irrigated marginal FHH category had the highest share of 47.3 per cent and FHHs with more than 10 ha holding size had the lowest share of 42 per cent. The changes in the absolute and percentage share of irrigated FHHs across farm size at the national level observed during this period indicate a movement towards better equitable distribution of irrigation facilities compared to 1970/71. But, a lot depends on the spatial and source-wise analysis of the equity impacts of irrigation development during the past four decades. 2.5.3 Distribution of irrigated area Distribution of net and gross irrigated area by farm sizes for the study period is given in Table. 10.
Table 10. Distribution of irrigated area by farm size, 1970/71 to 1990/91
Farm size (ha) Year 0-1 1-2 2-4 4-10 >10 All
Net irrigated area ('000 ha) 1970/71 4393 4741 6604 8332 5037 291071976/77 5606 5425 7133 7980 3693 298371980/81 6872 6618 8713 9873 4727 368031985/86 8062 7656 9694 10360 4700 404721990/91 9457 9085 10971 11286 4905 45704
Gross irrigated area ('000 ha) 1970/71 5390 5833 8147 10231 6116 357171976/77 6693 6419 8622 9447 4268 354491980/81 8467 8193 11201 13158 6325 473441985/86 10659 9970 12821 13551 6227 532281990/91 13215 12075 14505 14866 6998 61659
Per cent change in 1990/91 over 1970/71 Net irrigated area 115.3 91.6 66.1 35.5 -2.6 57.0Gross irrigated area 145.2 107.0 78.0 45.3 14.4 72.6Irrigation intensity 13.9 8.0 7.2 7.3 17.5 9.9
Net irrigated area has gone up from 29.1 Mha in 1970/71 to 45.7 Mha in 1990/91, registering an annual growth rate of 2.85 per cent. Gross irrigated area increased from 35.7 Mha to 61.7 Mha during the same period, registering an annual growth rate of 3.63 per cent. Since gross irrigated area expanded faster than the net irrigated area during 1971/91, the intensity of irrigated area has gone up by one-tenth during this period.
21
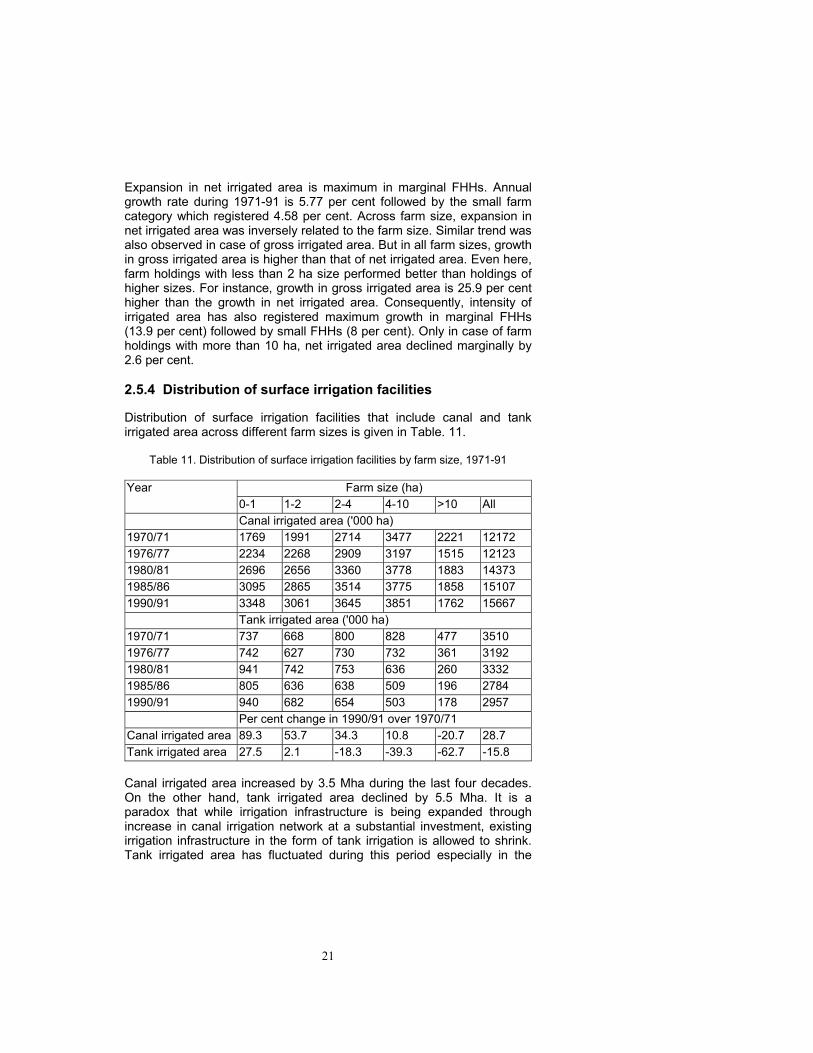
Expansion in net irrigated area is maximum in marginal FHHs. Annual growth rate during 1971-91 is 5.77 per cent followed by the small farm category which registered 4.58 per cent. Across farm size, expansion in net irrigated area was inversely related to the farm size. Similar trend was also observed in case of gross irrigated area. But in all farm sizes, growth in gross irrigated area is higher than that of net irrigated area. Even here, farm holdings with less than 2 ha size performed better than holdings of higher sizes. For instance, growth in gross irrigated area is 25.9 per cent higher than the growth in net irrigated area. Consequently, intensity of irrigated area has also registered maximum growth in marginal FHHs (13.9 per cent) followed by small FHHs (8 per cent). Only in case of farm holdings with more than 10 ha, net irrigated area declined marginally by 2.6 per cent. 2.5.4 Distribution of surface irrigation facilities Distribution of surface irrigation facilities that include canal and tank irrigated area across different farm sizes is given in Table. 11.
Table 11. Distribution of surface irrigation facilities by farm size, 1971-91
Farm size (ha) Year 0-1 1-2 2-4 4-10 >10 All
Canal irrigated area ('000 ha) 1970/71 1769 1991 2714 3477 2221 12172 1976/77 2234 2268 2909 3197 1515 12123 1980/81 2696 2656 3360 3778 1883 14373 1985/86 3095 2865 3514 3775 1858 15107 1990/91 3348 3061 3645 3851 1762 15667
Tank irrigated area ('000 ha) 1970/71 737 668 800 828 477 3510 1976/77 742 627 730 732 361 3192 1980/81 941 742 753 636 260 3332 1985/86 805 636 638 509 196 2784 1990/91 940 682 654 503 178 2957
Per cent change in 1990/91 over 1970/71 Canal irrigated area 89.3 53.7 34.3 10.8 -20.7 28.7 Tank irrigated area 27.5 2.1 -18.3 -39.3 -62.7 -15.8 Canal irrigated area increased by 3.5 Mha during the last four decades. On the other hand, tank irrigated area declined by 5.5 Mha. It is a paradox that while irrigation infrastructure is being expanded through increase in canal irrigation network at a substantial investment, existing irrigation infrastructure in the form of tank irrigation is allowed to shrink. Tank irrigated area has fluctuated during this period especially in the
22
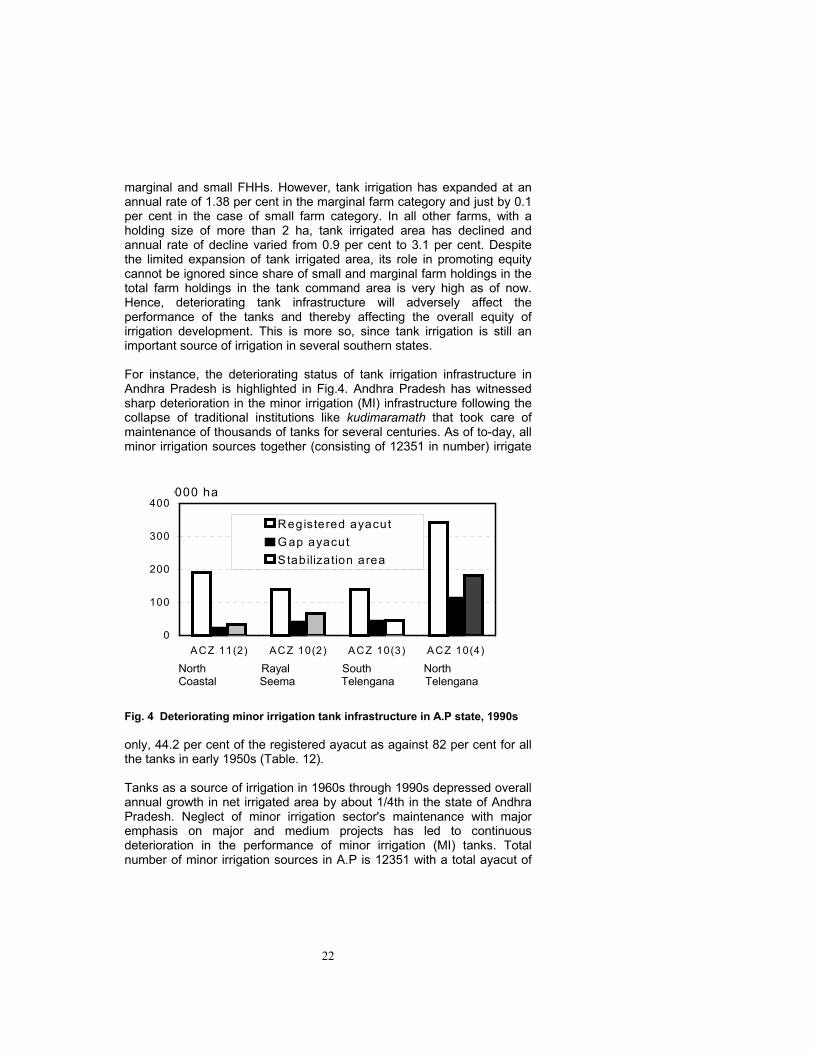
marginal and small FHHs. However, tank irrigation has expanded at an annual rate of 1.38 per cent in the marginal farm category and just by 0.1 per cent in the case of small farm category. In all other farms, with a holding size of more than 2 ha, tank irrigated area has declined and annual rate of decline varied from 0.9 per cent to 3.1 per cent. Despite the limited expansion of tank irrigated area, its role in promoting equity cannot be ignored since share of small and marginal farm holdings in the total farm holdings in the tank command area is very high as of now. Hence, deteriorating tank infrastructure will adversely affect the performance of the tanks and thereby affecting the overall equity of irrigation development. This is more so, since tank irrigation is still an important source of irrigation in several southern states. For instance, the deteriorating status of tank irrigation infrastructure in Andhra Pradesh is highlighted in Fig.4. Andhra Pradesh has witnessed sharp deterioration in the minor irrigation (MI) infrastructure following the collapse of traditional institutions like kudimaramath that took care of maintenance of thousands of tanks for several centuries. As of to-day, all minor irrigation sources together (consisting of 12351 in number) irrigate
Fig. 4 Deteriorating minor irrigation tank infrastructure in A.P state, 1990s only, 44.2 per cent of the registered ayacut as against 82 per cent for all the tanks in early 1950s (Table. 12). Tanks as a source of irrigation in 1960s through 1990s depressed overall annual growth in net irrigated area by about 1/4th in the state of Andhra Pradesh. Neglect of minor irrigation sector's maintenance with major emphasis on major and medium projects has led to continuous deterioration in the performance of minor irrigation (MI) tanks. Total number of minor irrigation sources in A.P is 12351 with a total ayacut of
0
100
200
300
400
ACZ 11(2) ACZ 10(2) ACZ 10(3) ACZ 10(4)
'000 ha
Registered ayacutG ap ayacutS tabilization area
North Rayal South North Coastal Seema Telengana Telengana
23
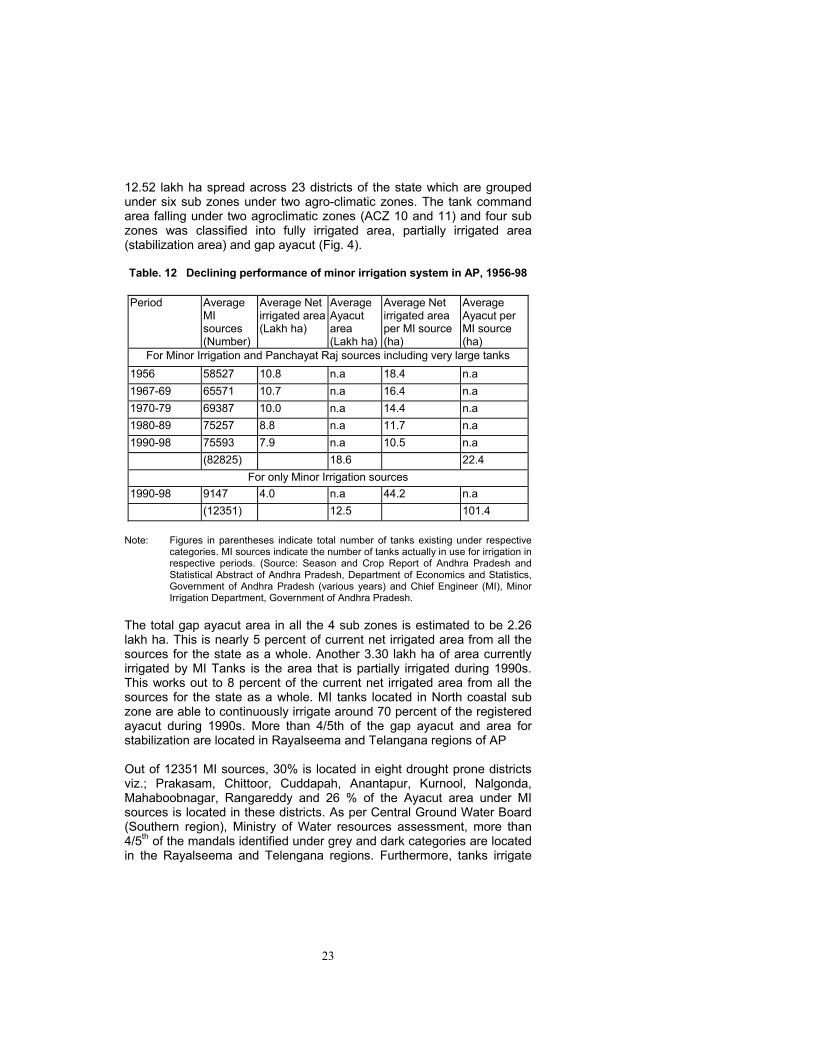
12.52 lakh ha spread across 23 districts of the state which are grouped under six sub zones under two agro-climatic zones. The tank command area falling under two agroclimatic zones (ACZ 10 and 11) and four sub zones was classified into fully irrigated area, partially irrigated area (stabilization area) and gap ayacut (Fig. 4). Table. 12 Declining performance of minor irrigation system in AP, 1956-98
Period Average
MI sources (Number)
Average Net irrigated area (Lakh ha)
Average Ayacut area (Lakh ha)
Average Net irrigated area per MI source (ha)
Average Ayacut per MI source (ha)
For Minor Irrigation and Panchayat Raj sources including very large tanks 1956 58527 10.8 n.a 18.4 n.a 1967-69 65571 10.7 n.a 16.4 n.a 1970-79 69387 10.0 n.a 14.4 n.a 1980-89 75257 8.8 n.a 11.7 n.a 1990-98 75593 7.9 n.a 10.5 n.a (82825) 18.6 22.4
For only Minor Irrigation sources 1990-98 9147 4.0 n.a 44.2 n.a (12351) 12.5 101.4
Note: Figures in parentheses indicate total number of tanks existing under respective
categories. MI sources indicate the number of tanks actually in use for irrigation in respective periods. (Source: Season and Crop Report of Andhra Pradesh and Statistical Abstract of Andhra Pradesh, Department of Economics and Statistics, Government of Andhra Pradesh (various years) and Chief Engineer (MI), Minor Irrigation Department, Government of Andhra Pradesh.
The total gap ayacut area in all the 4 sub zones is estimated to be 2.26 lakh ha. This is nearly 5 percent of current net irrigated area from all the sources for the state as a whole. Another 3.30 lakh ha of area currently irrigated by MI Tanks is the area that is partially irrigated during 1990s. This works out to 8 percent of the current net irrigated area from all the sources for the state as a whole. MI tanks located in North coastal sub zone are able to continuously irrigate around 70 percent of the registered ayacut during 1990s. More than 4/5th of the gap ayacut and area for stabilization are located in Rayalseema and Telangana regions of AP Out of 12351 MI sources, 30% is located in eight drought prone districts viz.; Prakasam, Chittoor, Cuddapah, Anantapur, Kurnool, Nalgonda, Mahaboobnagar, Rangareddy and 26 % of the Ayacut area under MI sources is located in these districts. As per Central Ground Water Board (Southern region), Ministry of Water resources assessment, more than 4/5th of the mandals identified under grey and dark categories are located in the Rayalseema and Telengana regions. Furthermore, tanks irrigate
24
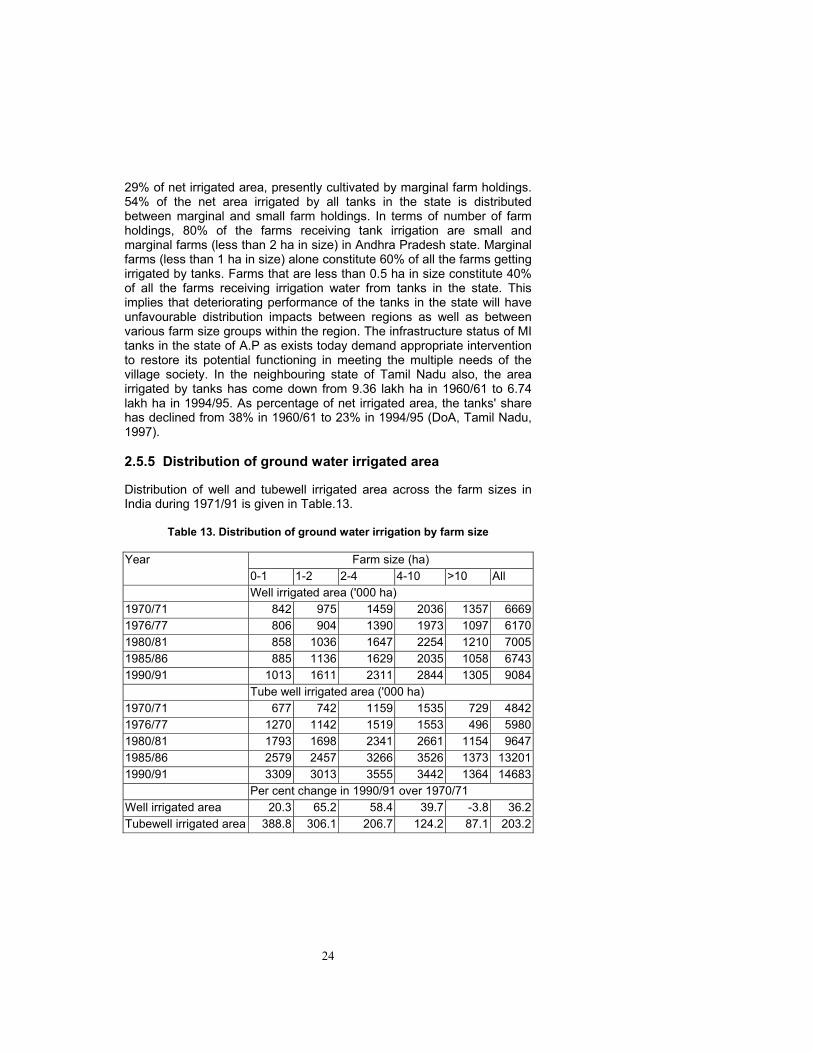
29% of net irrigated area, presently cultivated by marginal farm holdings. 54% of the net area irrigated by all tanks in the state is distributed between marginal and small farm holdings. In terms of number of farm holdings, 80% of the farms receiving tank irrigation are small and marginal farms (less than 2 ha in size) in Andhra Pradesh state. Marginal farms (less than 1 ha in size) alone constitute 60% of all the farms getting irrigated by tanks. Farms that are less than 0.5 ha in size constitute 40% of all the farms receiving irrigation water from tanks in the state. This implies that deteriorating performance of the tanks in the state will have unfavourable distribution impacts between regions as well as between various farm size groups within the region. The infrastructure status of MI tanks in the state of A.P as exists today demand appropriate intervention to restore its potential functioning in meeting the multiple needs of the village society. In the neighbouring state of Tamil Nadu also, the area irrigated by tanks has come down from 9.36 lakh ha in 1960/61 to 6.74 lakh ha in 1994/95. As percentage of net irrigated area, the tanks' share has declined from 38% in 1960/61 to 23% in 1994/95 (DoA, Tamil Nadu, 1997). 2.5.5 Distribution of ground water irrigated area Distribution of well and tubewell irrigated area across the farm sizes in India during 1971/91 is given in Table.13.
Table 13. Distribution of ground water irrigation by farm size
Farm size (ha) Year 0-1 1-2 2-4 4-10 >10 All
Well irrigated area ('000 ha) 1970/71 842 975 1459 2036 1357 66691976/77 806 904 1390 1973 1097 61701980/81 858 1036 1647 2254 1210 70051985/86 885 1136 1629 2035 1058 67431990/91 1013 1611 2311 2844 1305 9084
Tube well irrigated area ('000 ha) 1970/71 677 742 1159 1535 729 48421976/77 1270 1142 1519 1553 496 59801980/81 1793 1698 2341 2661 1154 96471985/86 2579 2457 3266 3526 1373 132011990/91 3309 3013 3555 3442 1364 14683
Per cent change in 1990/91 over 1970/71 Well irrigated area 20.3 65.2 58.4 39.7 -3.8 36.2Tubewell irrigated area 388.8 306.1 206.7 124.2 87.1 203.2
25
Well-irrigated area has gone up from 6.7 Mha to 9.1 Mha during this period registering an annual growth rate of 1.81 per cent. Tubewell irrigated area recorded an increase of around 10 Mha with an annual average growth rate of over 10 per cent. Relative to tubewell irrigated area expansion, well irrigated area remained more or less stagnant during this period. Among all farm holdings, least annual growth of around one per cent was observed in the marginal farm holdings obviously because of unviable farm size to make capital investment in wells. Large holdings of more than 10 ha registered marginal decline in the area irrigated by wells during the same period. Over time, informal institutional sharing of wells by more number of marginal farm holdings also came under social stress resulting in limited growth in well-irrigated area under this category. Declining ground water table also contributed to the failure of wells totally or partially restricting the per well command area in states like Karnataka. Initial failure and falling life of irrigation wells has become a common feature in hard rock regions. For example, in eastern dry zone of Karnataka, the (negative binomial) probability of well failure is estimated to be 40 per cent (Nagaraj et al.,1994). Maximum growth in well-irrigated area has been recorded in the farm holding sizes ranging from 1 to 4 ha in which annual average growth rate varied from 2.92 to 3.26 per cent during 1971/91. In case of tubewell-irrigated area, expansion is phenomenal in the marginal FHHs followed by small FHHs. The magnitude of expansion in tube well-irrigated area is inversely related to the farm holding size. With a skewed distribution of farms in favour of marginal and small holdings, faster expansion in tubewell irrigation in the marginal and small holding categories tend to promote overall equity in the distribution irrigation facilities. Annual average growth in tubewell-irrigated area is maximum at 19.4 per cent in marginal FHH followed by 15.3 per cent in small FHH. In both categories, recorded growth is much higher than the over all growth of 10.16 per cent observed across farm sizes during the period 1971/91. In other words, growth in farm holdings less than 2 ha was the driving force behind the over all expansion in the tubewell irrigated area during the past four decades. Innovative pumping technology matched by electricity expansion and coverage in the farm sector made ground water pumping scale neutral providing assured irrigation coverage and thereby, complementing the adoption of seed cum fertilizer led modern technology. 2.5.6 Percent distribution of irrigated area The percentage distribution of farm households, total area, irrigated area and source-wise irrigated area during 1970/71 to 1990/91 by different farm sizes is given in Table.14. The share of marginal FHH in the total

26
FHH has increased from 51 per cent to 59 per cent during the past four decades. Both marginal and small FHHs alone account for 78 per cent of the total FHHs in the country as of 1990/91 cultivating nearly one-third of the total area. This has implications for the equitable distribution of irrigation impacts from the past irrigation water development strategies.
Table 14. Irrigation distribution by farm size over time (%) Farm size(Ha)
Year THH Total area
CIA TIA WIA TWIA NIA GIA
0-1 1970/71 51 9 15 21 13 14 15 15 1976/77 55 11 18 23 13 21 19 19 1980/81 56 12 19 28 12 19 19 18 1985/86 57 13 20 29 13 20 20 20 1990/91 59 15 21 32 11 23 21 211-2 1970/71 19 12 16 19 15 15 16 16 1976/77 18 13 19 20 15 19 18 18 1980/81 18 14 18 22 15 18 18 17 1985/86 19 16 19 23 17 19 19 19 1990/91 19 17 20 23 18 21 20 202-4 1970/71 15 19 22 23 22 24 23 23 1976/77 14 20 24 23 23 25 24 24 1980/81 14 21 23 23 24 24 24 24 1985/86 14 22 23 23 24 25 24 24 1990/91 13 23 23 22 25 24 24 244-10 1970/71 11 30 29 24 31 32 29 29 1976/77 10 30 26 23 32 26 27 27 1980/81 9 30 26 19 32 28 27 28 1985/86 8 29 25 18 30 27 26 25 1990/91 7 27 25 17 31 23 25 24>10 1970/71 4 31 18 14 20 15 17 17 1976/77 3 26 12 11 18 8 12 12 1980/81 2 23 13 8 17 12 13 13 1985/86 2 20 12 7 16 10 12 12 1990/91 2 17 11 6 14 9 11 11All 1970/71 100 100 100 100 100 100 100 100 1976/77 100 100 100 100 100 100 100 100 1980/81 100 100 100 100 100 100 100 100 1985/86 100 100 100 100 100 100 100 100 1990/91 100 100 100 100 100 100 100 100
27
Collectively, small and marginal farmers are now operating 32 per cent of the total area as against 21 per cent of the total area operated by them four decades back. But the share of small and marginal FHH in the total FHH has gone up from 70 percent in 1971 to 78 percent in 1991. Since providing irrigation water is expected to have a catalytic impact on farm income and hence alleviation of rural poverty, spreading irrigation coverage in proportion to the share of FHHs in different size groups is useful to promote the equity impacts of irrigation development in India. In terms of the distribution of net and gross irrigated area among the farm sizes, it is seen that the share of farm holdings with less than 2 ha has improved from 31per cent in 1970/71 to 41 percent in 1990/91. In 1970/71, the share of small and marginal holdings together in the canal irrigation source is 31 per cent. By 1990/91, this share of canal irrigation source in holdings with less than 2 ha went up to 41 per cent. Similarly, small and marginal holdings accounted for 40 per cent of tank irrigated area in 1970/71, which went up to 55 per cent in 1990/91. While tank irrigated area itself is declining due to the neglect of this important traditional infrastructure, its increased importance for the small and marginal holdings underlines its continued importance in improving the equitable distribution of irrigation benefits in favour of farm households with less than 2 ha. Distribution of well-irrigated area highlights its dominance in the holdings with 1 to 10 ha size and stagnancy in its expansion or even decline in its percentage share in case of other farm sizes. In 1970/71, the share of FHH with less than 2 ha size accounted for 29 per cent of total tubewell irrigated area. But in 1990/91, this share of small and marginal FHH in total tubewell irrigated area has increased to 44 per cent underlying the scale neutrality of this technology, the adoption of which was necessitated by the spread of modern varieties during the green revolution period. Analysis of percentage distribution of FHHs and area across different farm sizes revealed the following: One, FHHs are predominantly distributed in the smallest holding size category of less than 1 ha and this trend will continue. Two, such a distribution will tend to sharpen more the equity related issues particularly in irrigation water, which are invariably, linked with the ownership rights of the land. Three, distribution of canal, tank and tubewell irrigated area has changed following the irrigation development strategies pursued in the past four decades. Four, the observed change in the source-wise distribution of irrigation benefits indicate a shift towards small and marginal FHHs whose share in canal, tank and tubewell irrigated area at aggregate national level has improved during the period 1971-91. However, only empirical analysis of the equity impacts of irrigation development by sources and regions over different time periods will help in the assessment of current status and needed future strategies.
28
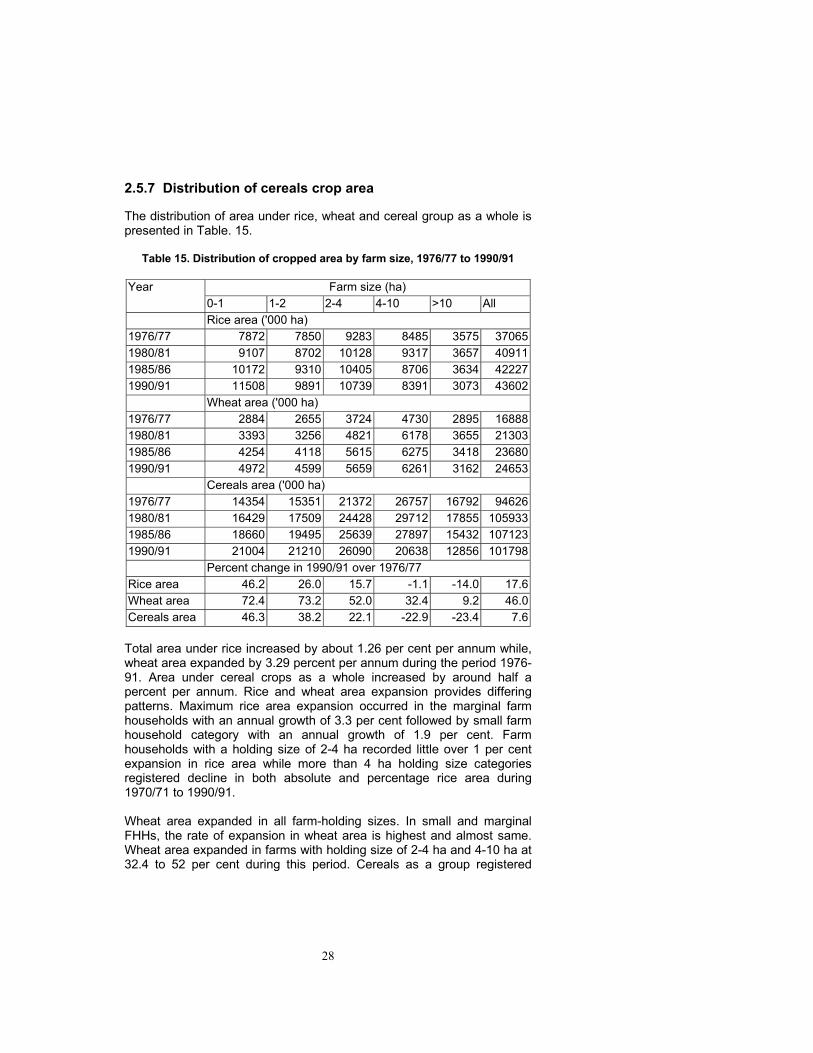
2.5.7 Distribution of cereals crop area The distribution of area under rice, wheat and cereal group as a whole is presented in Table. 15.
Table 15. Distribution of cropped area by farm size, 1976/77 to 1990/91
Farm size (ha) Year 0-1 1-2 2-4 4-10 >10 All
Rice area ('000 ha) 1976/77 7872 7850 9283 8485 3575 370651980/81 9107 8702 10128 9317 3657 409111985/86 10172 9310 10405 8706 3634 422271990/91 11508 9891 10739 8391 3073 43602
Wheat area ('000 ha) 1976/77 2884 2655 3724 4730 2895 168881980/81 3393 3256 4821 6178 3655 213031985/86 4254 4118 5615 6275 3418 236801990/91 4972 4599 5659 6261 3162 24653
Cereals area ('000 ha) 1976/77 14354 15351 21372 26757 16792 946261980/81 16429 17509 24428 29712 17855 1059331985/86 18660 19495 25639 27897 15432 1071231990/91 21004 21210 26090 20638 12856 101798
Percent change in 1990/91 over 1976/77 Rice area 46.2 26.0 15.7 -1.1 -14.0 17.6Wheat area 72.4 73.2 52.0 32.4 9.2 46.0Cereals area 46.3 38.2 22.1 -22.9 -23.4 7.6
Total area under rice increased by about 1.26 per cent per annum while, wheat area expanded by 3.29 percent per annum during the period 1976-91. Area under cereal crops as a whole increased by around half a percent per annum. Rice and wheat area expansion provides differing patterns. Maximum rice area expansion occurred in the marginal farm households with an annual growth of 3.3 per cent followed by small farm household category with an annual growth of 1.9 per cent. Farm households with a holding size of 2-4 ha recorded little over 1 per cent expansion in rice area while more than 4 ha holding size categories registered decline in both absolute and percentage rice area during 1970/71 to 1990/91. Wheat area expanded in all farm-holding sizes. In small and marginal FHHs, the rate of expansion in wheat area is highest and almost same. Wheat area expanded in farms with holding size of 2-4 ha and 4-10 ha at 32.4 to 52 per cent during this period. Cereals as a group registered

29
expansion in area in case of farms with holding size up to 4 ha but declined by over 1.6 per cent annually in farms with holding size more than 4 ha during the period 1977-91. The distribution of irrigated area under rice, wheat and cereals by farm size is given in Table. 16.
Table 16. Distribution of irrigated area by crop and farm size, 1971- 91
Farm size (ha) Year 0-1 1-2 2-4 4-10 >10 All
Rice irrigated area ('000 ha) 1970/71 2486 2489 3128 3170 1609 128821976/77 2954 2766 3329 2992 1169 132101980/81 3773 3457 3944 3681 1371 162261985/86 4359 3726 4169 3652 1496 174021990/91 5436 4446 4729 3856 1433 19900
Wheat irrigated area ('000 ha) 1970/71 1428 1572 2334 3100 1812 102461976/77 2130 1892 2518 2820 1240 106001980/81 2621 2403 3459 4324 2142 149491985/86 3327 3142 4221 4520 2168 173781990/91 4190 3748 4496 4847 2276 19557
Cereals irrigated area ('000 ha) 1970/71 4391 4591 6247 7357 4070 266561976/77 5594 5179 6659 6755 2857 270441980/81 6922 6436 8310 9114 4089 348711985/86 8339 7522 9332 9205 4123 385211990/91 10345 8981 10253 9718 4094 43391
Percent change in 1990/91 over 1970/71 Rice irrigated area 118.7 78.6 51.2 21.6 -10.9 54.5Wheat irrigated area 193.4 138.4 92.6 56.4 25.6 90.9Cereals irrigated area 135.6 95.6 64.1 32.1 0.6 62.8
Total rice irrigated area registered an average annual growth rate of 2.73 per cent during 1971/91. Expansion in wheat-irrigated area during the same period was at an annual average rate of 4.55 per cent. Irrigated area under cereals as a group itself has expanded at an impressive rate of 3.14 per cent per annum during the past four decades ending 1990/91. Among different farm sizes, the rate of expansion in the irrigated area under rice, wheat and cereals showed inverse relationship with the farm size. Marginal farm holdings recorded 5.94 per cent growth in the irrigated rice area per annum followed by small farm holdings with an annual average growth rate of 3.93 per cent. The irrigated area under rice registered a decline of about half a percent, only in case of holdings with more than 10 ha.
30
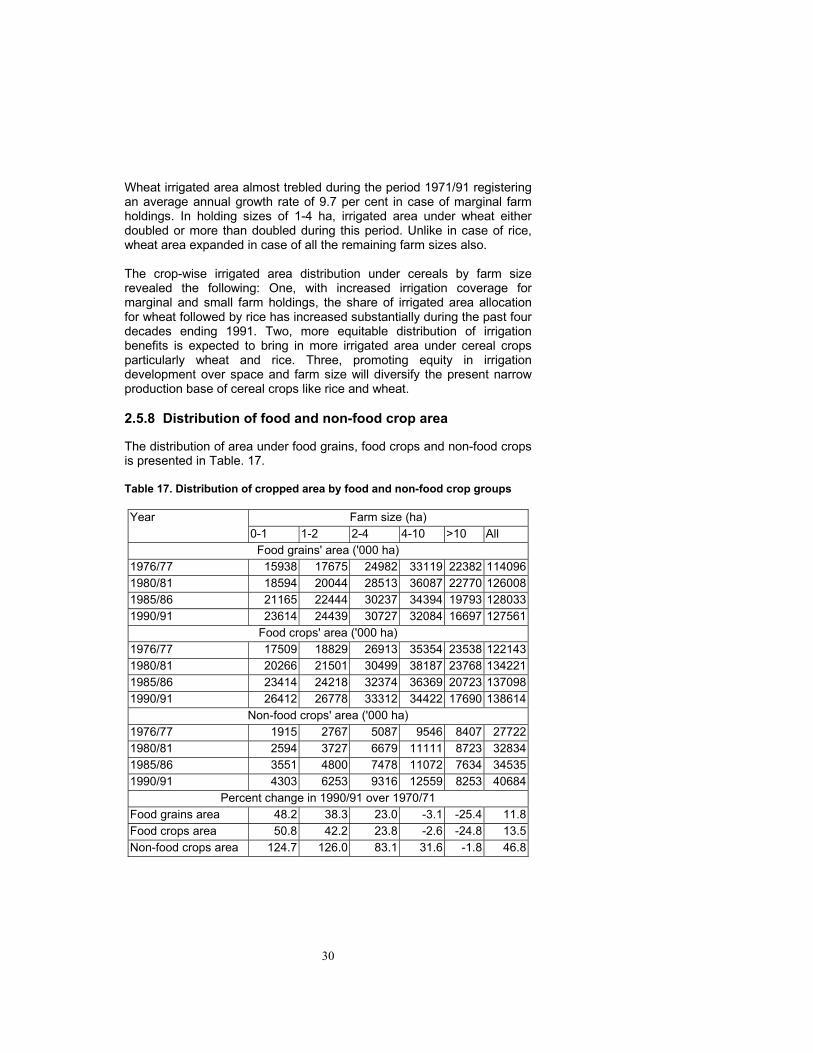
Wheat irrigated area almost trebled during the period 1971/91 registering an average annual growth rate of 9.7 per cent in case of marginal farm holdings. In holding sizes of 1-4 ha, irrigated area under wheat either doubled or more than doubled during this period. Unlike in case of rice, wheat area expanded in case of all the remaining farm sizes also. The crop-wise irrigated area distribution under cereals by farm size revealed the following: One, with increased irrigation coverage for marginal and small farm holdings, the share of irrigated area allocation for wheat followed by rice has increased substantially during the past four decades ending 1991. Two, more equitable distribution of irrigation benefits is expected to bring in more irrigated area under cereal crops particularly wheat and rice. Three, promoting equity in irrigation development over space and farm size will diversify the present narrow production base of cereal crops like rice and wheat. 2.5.8 Distribution of food and non-food crop area The distribution of area under food grains, food crops and non-food crops is presented in Table. 17. Table 17. Distribution of cropped area by food and non-food crop groups
Farm size (ha) Year 0-1 1-2 2-4 4-10 >10 All
Food grains' area ('000 ha) 1976/77 15938 17675 24982 33119 22382 1140961980/81 18594 20044 28513 36087 22770 1260081985/86 21165 22444 30237 34394 19793 1280331990/91 23614 24439 30727 32084 16697 127561
Food crops' area ('000 ha) 1976/77 17509 18829 26913 35354 23538 1221431980/81 20266 21501 30499 38187 23768 1342211985/86 23414 24218 32374 36369 20723 1370981990/91 26412 26778 33312 34422 17690 138614
Non-food crops' area ('000 ha) 1976/77 1915 2767 5087 9546 8407 277221980/81 2594 3727 6679 11111 8723 328341985/86 3551 4800 7478 11072 7634 345351990/91 4303 6253 9316 12559 8253 40684
Percent change in 1990/91 over 1970/71 Food grains area 48.2 38.3 23.0 -3.1 -25.4 11.8Food crops area 50.8 42.2 23.8 -2.6 -24.8 13.5Non-food crops area 124.7 126.0 83.1 31.6 -1.8 46.8
31
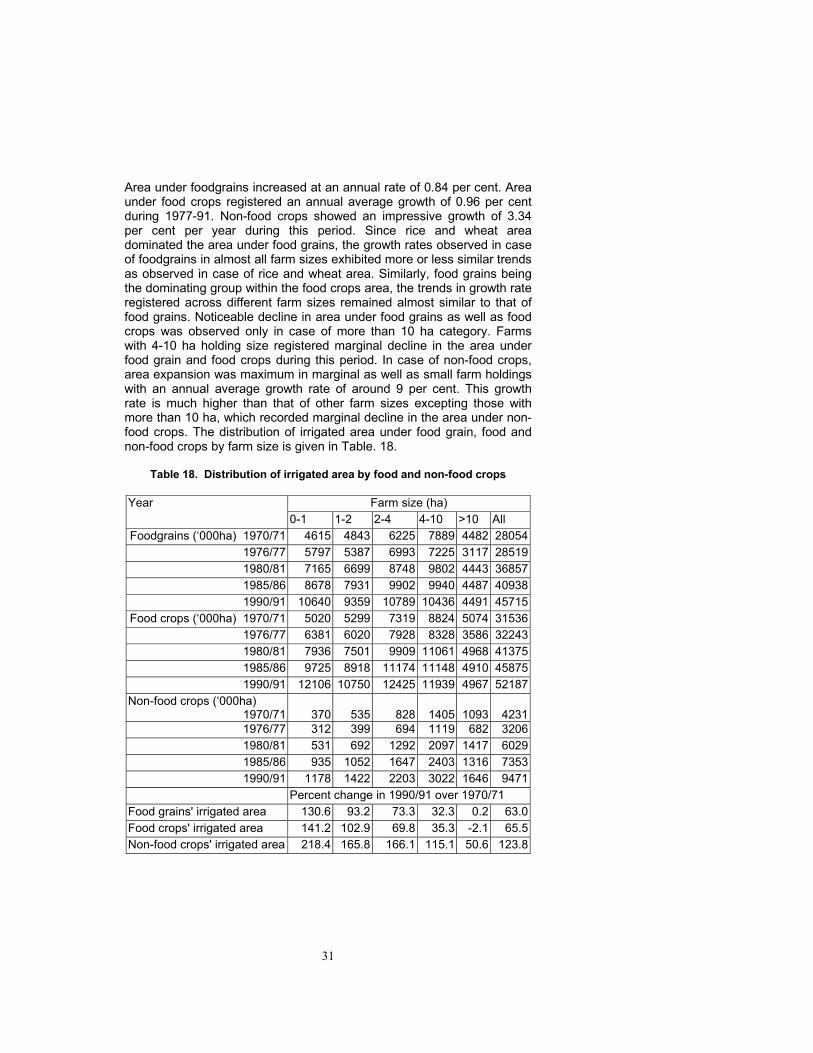
Area under foodgrains increased at an annual rate of 0.84 per cent. Area under food crops registered an annual average growth of 0.96 per cent during 1977-91. Non-food crops showed an impressive growth of 3.34 per cent per year during this period. Since rice and wheat area dominated the area under food grains, the growth rates observed in case of foodgrains in almost all farm sizes exhibited more or less similar trends as observed in case of rice and wheat area. Similarly, food grains being the dominating group within the food crops area, the trends in growth rate registered across different farm sizes remained almost similar to that of food grains. Noticeable decline in area under food grains as well as food crops was observed only in case of more than 10 ha category. Farms with 4-10 ha holding size registered marginal decline in the area under food grain and food crops during this period. In case of non-food crops, area expansion was maximum in marginal as well as small farm holdings with an annual average growth rate of around 9 per cent. This growth rate is much higher than that of other farm sizes excepting those with more than 10 ha, which recorded marginal decline in the area under non-food crops. The distribution of irrigated area under food grain, food and non-food crops by farm size is given in Table. 18.
Table 18. Distribution of irrigated area by food and non-food crops
Farm size (ha) Year 0-1 1-2 2-4 4-10 >10 All
Foodgrains (‘000ha) 1970/71 4615 4843 6225 7889 4482 280541976/77 5797 5387 6993 7225 3117 285191980/81 7165 6699 8748 9802 4443 368571985/86 8678 7931 9902 9940 4487 409381990/91 10640 9359 10789 10436 4491 45715
Food crops (‘000ha) 1970/71 5020 5299 7319 8824 5074 315361976/77 6381 6020 7928 8328 3586 322431980/81 7936 7501 9909 11061 4968 413751985/86 9725 8918 11174 11148 4910 458751990/91 12106 10750 12425 11939 4967 52187
Non-food crops (‘000ha) 1970/71 370 535 828 1405 1093 4231
1976/77 312 399 694 1119 682 32061980/81 531 692 1292 2097 1417 60291985/86 935 1052 1647 2403 1316 73531990/91 1178 1422 2203 3022 1646 9471
Percent change in 1990/91 over 1970/71 Food grains' irrigated area 130.6 93.2 73.3 32.3 0.2 63.0Food crops' irrigated area 141.2 102.9 69.8 35.3 -2.1 65.5Non-food crops' irrigated area 218.4 165.8 166.1 115.1 50.6 123.8
32
The area under food grain and food crops expanded, individually, by almost same magnitude of around 3.2 per cent per annum during 1971/91. However, the rate of expansion in non-food crops is almost double than that of food grain and food crops during the same period. Irrigated area under food grains as well as food crops more than doubled in the marginal FHHs, registering an annual average growth rate of around 6.5 to 7 per cent. The irrigated area expansion in other farm sizes up to 10 ha is less than that of marginal farms but still impressive. The irrigated area expansion under food grain and food crops in case of farms with holding size more than 10 ha is either negligible or marginally negative. In case of non-food crops, the irrigated area expansion is impressive at an annual average rate of 8.3 to 10.92 per cent in farms with holding size up to 4 ha. Analysis of area under food and non-food crops across farm holdings and different time periods revealed the following: One, rate of expansion in area under food grain and food crops is inversely related to the farm size. Two, this expansion is limited to farms with holdings less than 4 ha. Three, despite the small share of non-food crops in the total area, the area under non-food crops has expanded in all size groups impressively except in more than 10 ha farms. Four, almost similar trends but larger in magnitude are observed in the expansion of irrigated area under food grain, food and non-food crops across all farm sizes. Finally, distribution of irrigation benefits exhibited differing impacts on the distribution of crop and crop group wise irrigated area under cereals, food grain, and food and non-food crops. 2.5.9 Per cent distribution of crop area The distribution of crop area by farm size expressed as a percent of total crop wise area under each farm size is given in Table 19. In 1976/77, 27 per cent of the gross cropped area was operated by farm holdings with less than 2 ha size. This share went up to 35 per cent in 1990/91. In case of rice, 42 per cent of the total rice area in 1976/77 is cultivated by farm holdings with less than 2 ha which increased further to 49 per cent in 1990/91. Similarly, share of wheat area in small and marginal holdings increased from 33 to 39 per cent in this period. Cereals as a group in these holdings of less than 2 ha also increased their share from 31 to 42 per cent during 1977-91. Share of food as well as non-food crops also increased by 31 to 53 per cent in 1990/91 over that of 1976/77. It is thus observed that, with increase in gross cropped area, increased share of area under rice, wheat, food and non-food crops are recorded in small and marginal farm households.

33
Table 19. Crop area distribution by farm size (%) Farm size (Ha)
Year Total area (GCA)
Rice Wheat Cereal FG Food Non-Food
0-1 1976/77 13 21 17 15 14 14 7 1980/81 14 22 16 16 15 15 8 1985/86 16 24 18 17 17 17 10 1990/91 17 26 20 21 19 19 111-2 1976/77 14 21 16 16 15 15 10 1980/81 15 21 15 17 16 16 11 1985/86 17 22 17 18 18 18 14 1990/91 18 23 19 21 19 19 152-4 1976/77 21 25 22 23 22 22 18 1980/81 22 25 23 23 23 23 20 1985/86 23 25 24 24 24 24 22 1990/91 24 25 23 26 24 24 234-10 1976/77 30 23 28 28 29 29 34 1980/81 30 23 29 28 29 28 34 1985/86 28 21 26 26 27 27 32 1990/91 26 19 25 20 25 25 31>10 1976/77 21 10 17 18 20 19 30 1980/81 19 9 17 17 18 18 27 1985/86 17 9 14 14 15 15 22 1990/91 14 7 13 13 13 13 20All 1976/77 100 100 100 100 100 100 100 1980/81 100 100 100 100 100 100 100 1985/86 100 100 100 100 100 100 100 1990/91 100 100 100 100 100 100 100
The distribution of irrigated crop area by farm size is given in Table 20. Overall share of total irrigated area (GIA) increased by 35.5 per cent during the period 1971-91 in case of holdings less than 2 ha. This share, in case of bigger holdings with more than 2 ha, declined by 14.5 per cent during the same period. Percentage of irrigated area under rice and wheat respectively operated under less than 2 ha holding size improved by 29 and 38 per cent during the past four decades. Share of wheat and rice irrigated area remained same in the 2-4 ha holding size group but declined by 22.9 to 29.7 per cent respectively during the past covering 1971-91. Irrigated area under cereal crops in farm holdings with less than 2 ha occupied 45 per cent of the irrigated area under cereals in 1990/91, which is 36.4 per cent higher than that of 1970/71.
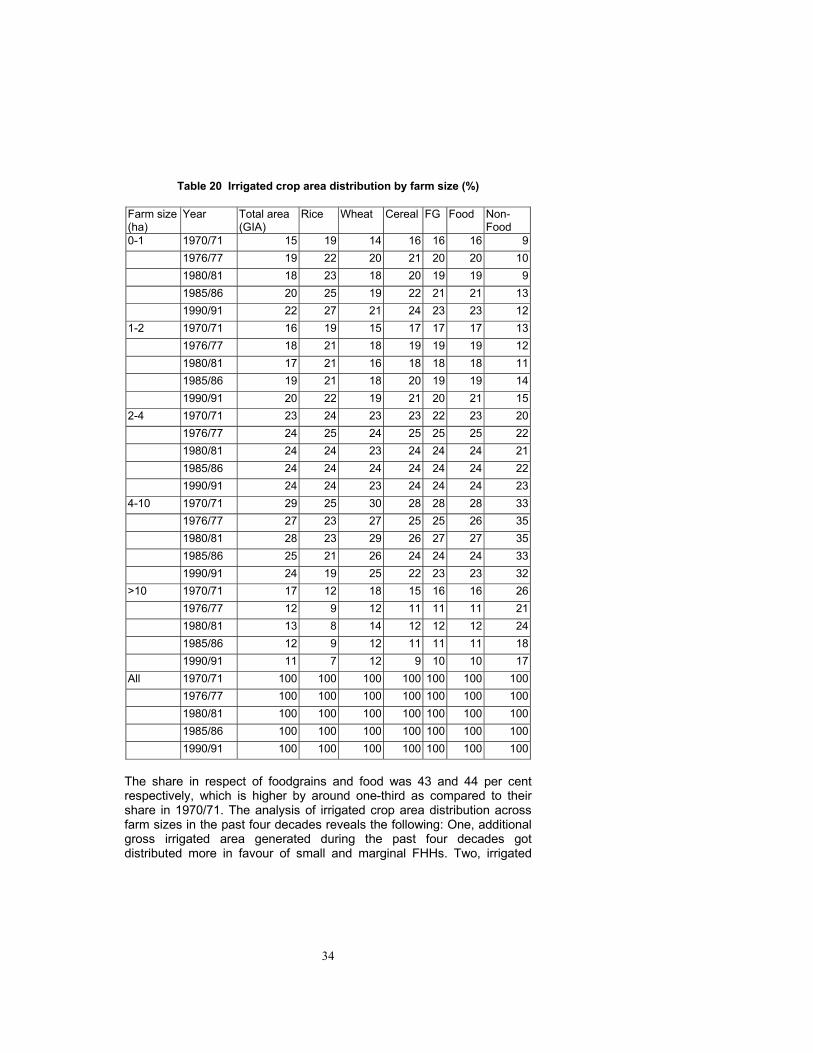
34
Table 20 Irrigated crop area distribution by farm size (%) Farm size (ha)
Year Total area (GIA)
Rice Wheat Cereal FG Food Non-Food
0-1 1970/71 15 19 14 16 16 16 9 1976/77 19 22 20 21 20 20 10 1980/81 18 23 18 20 19 19 9 1985/86 20 25 19 22 21 21 13 1990/91 22 27 21 24 23 23 121-2 1970/71 16 19 15 17 17 17 13 1976/77 18 21 18 19 19 19 12 1980/81 17 21 16 18 18 18 11 1985/86 19 21 18 20 19 19 14 1990/91 20 22 19 21 20 21 152-4 1970/71 23 24 23 23 22 23 20 1976/77 24 25 24 25 25 25 22 1980/81 24 24 23 24 24 24 21 1985/86 24 24 24 24 24 24 22 1990/91 24 24 23 24 24 24 234-10 1970/71 29 25 30 28 28 28 33 1976/77 27 23 27 25 25 26 35 1980/81 28 23 29 26 27 27 35 1985/86 25 21 26 24 24 24 33 1990/91 24 19 25 22 23 23 32>10 1970/71 17 12 18 15 16 16 26 1976/77 12 9 12 11 11 11 21 1980/81 13 8 14 12 12 12 24 1985/86 12 9 12 11 11 11 18 1990/91 11 7 12 9 10 10 17All 1970/71 100 100 100 100 100 100 100 1976/77 100 100 100 100 100 100 100 1980/81 100 100 100 100 100 100 100 1985/86 100 100 100 100 100 100 100 1990/91 100 100 100 100 100 100 100 The share in respect of foodgrains and food was 43 and 44 per cent respectively, which is higher by around one-third as compared to their share in 1970/71. The analysis of irrigated crop area distribution across farm sizes in the past four decades reveals the following: One, additional gross irrigated area generated during the past four decades got distributed more in favour of small and marginal FHHs. Two, irrigated

35
area share of rice and wheat in the small and marginal holdings has increased but declined in case of holdings with more than 4 ha. Three, since rice and wheat are the dominant crops in cereals, food grain and food crop groups, similar trend was observed in the share of irrigated area allocation under cereals, food grain and food crop groups. 2.5.10 Per cent distribution of irrigated crop area share The distribution of irrigated crop area expressed as a percent share of total crop area by farm size is given in Table 21. Table 21 Irrigated crop as a percent of total crop area by farm size, 1977-91
Year Farm
size (Ha) Area (GCA)
Rice Wheat Cereals FG Food Non-Food
1976/77 0-1 34 38 74 39 36 36 16 1-2 30 35 71 34 30 32 14 2-4 27 36 68 31 28 29 14 4-10 21 35 60 25 22 24 12 >10 13 33 43 17 14 15 8 All 24 36 63 29 25 26 12
1980/81 0-1 37 41 77 42 39 39 20 1-2 32 40 74 37 33 35 19 2-4 30 39 72 34 31 32 19 4-10 27 40 70 31 27 29 19 >10 20 37 59 23 20 21 16 All 28 40 70 33 29 31 18
1985/86 0-1 40 43 78 45 41 42 26 1-2 34 40 76 39 35 37 22 2-4 32 40 75 36 33 35 22 4-10 29 42 72 33 29 31 22 >10 22 41 63 27 23 24 17 All 31 41 73 36 32 33 21
1990/91 0-1 43 47 84 49 45 46 27 1-2 37 45 81 42 38 40 23 2-4 34 44 79 39 35 37 24 4-10 32 46 77 47 33 35 24 >10 25 47 72 32 27 28 20 All 34 46 79 43 36 38 23
Irrigated area share in the gross cropped area has increased from 34 per cent to 43 per cent in case of marginal farm holdings and 30 to 37 per
36
cent in case of small farm holdings during this period namely 1976/77 to 1990/91. Percent of gross cropped area irrigated in different farm sizes varied inversely with the farm size and this inverse relationship was maintained in all the decades ending 1990/91. The impact of irrigation development on the percentage share of gross cropped area irrigated varied with farm size even though the inverse relationship as observed above remained intact during the period covered in this study. Across farm sizes, percentage share of irrigated area in the gross cropped area has expanded at an annual growth rate of around 3 per cent during 1977-91. Irrigated area under rice grown under irrigation increased its share from 36 percent in 1977 to 46 percent in 1991. Share of irrigated area under wheat improved substantially from 63 per cent to 79 per cent during this period. The percentage share of cereals, FG, food and non-food crops cultivated under irrigated situation got more than doubled during the same period. Among different farm sizes, increasing trend in the share of irrigated area in each of the major crop and crop group considered here is observed in all the FHH categories. Notably, share of wheat irrigated area increased substantially in the farms with holding size above 10 ha. Share of irrigated area under non-food crops also nearly doubled for all the farm sizes with impressive increase in the share observed in all the FHH categories. Distribution of crop area expressed as a percent of gross cropped area for each farm size is given in Table 22. Share of rice area in the total GCA remained almost same during the period 1977-91 but wheat area share improved from 11 to 14 per cent during this period. Area share of cereals, foodgrains and food crops declined but non-food crop area share in the gross cropped area increased by 27.8 per cent during the same period. Between farm sizes, rice area share in 1990/91 accounted for 37 per cent of gross cropped area in marginal farms, which recorded marginal fluctuations during 1977-91. Share of wheat area in gross cropped area increased by one-third to reach 16 per cent in 1990/91 from 12 per cent in 1970/71. Both wheat and rice occupied little over half of the gross cropped area in the marginal FHH category. Percentage share of rice and wheat in the gross cropped area of respective farm size groups exhibited inverse relationship with farm size. Largest farms with more than 10 ha holding size allocated 24 per cent of gross cropped area for rice and wheat. Share of non-food crop in the gross cropped area improved marginally in the holding sizes of less than 2 ha and substantially in holding sizes with more than 2 ha. Share of cereals, foodgrains and food declined with differing magnitudes in different farm sizes during the period 1977-91.
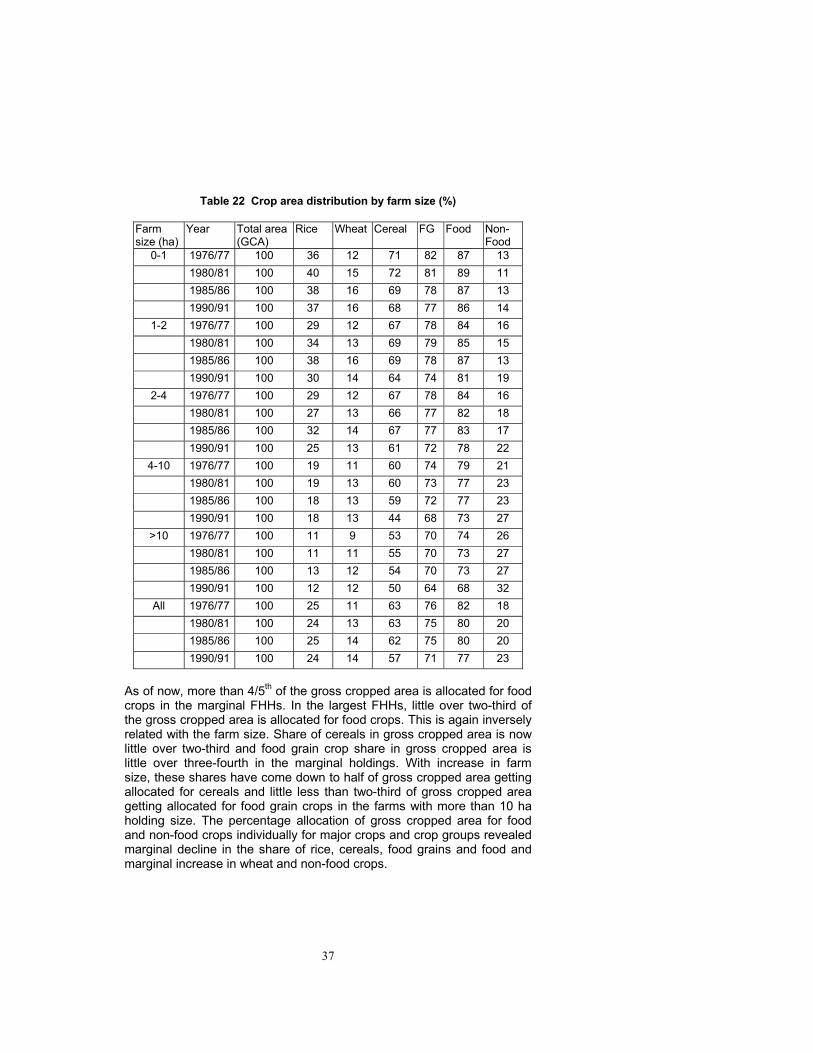
37
Table 22 Crop area distribution by farm size (%)
Farm size (ha)
Year Total area (GCA)
Rice Wheat Cereal FG Food Non-Food
0-1 1976/77 100 36 12 71 82 87 13 1980/81 100 40 15 72 81 89 11 1985/86 100 38 16 69 78 87 13 1990/91 100 37 16 68 77 86 14
1-2 1976/77 100 29 12 67 78 84 16 1980/81 100 34 13 69 79 85 15 1985/86 100 38 16 69 78 87 13 1990/91 100 30 14 64 74 81 19
2-4 1976/77 100 29 12 67 78 84 16 1980/81 100 27 13 66 77 82 18 1985/86 100 32 14 67 77 83 17 1990/91 100 25 13 61 72 78 22
4-10 1976/77 100 19 11 60 74 79 21 1980/81 100 19 13 60 73 77 23 1985/86 100 18 13 59 72 77 23 1990/91 100 18 13 44 68 73 27
>10 1976/77 100 11 9 53 70 74 26 1980/81 100 11 11 55 70 73 27 1985/86 100 13 12 54 70 73 27 1990/91 100 12 12 50 64 68 32
All 1976/77 100 25 11 63 76 82 18 1980/81 100 24 13 63 75 80 20 1985/86 100 25 14 62 75 80 20 1990/91 100 24 14 57 71 77 23
As of now, more than 4/5th of the gross cropped area is allocated for food crops in the marginal FHHs. In the largest FHHs, little over two-third of the gross cropped area is allocated for food crops. This is again inversely related with the farm size. Share of cereals in gross cropped area is now little over two-third and food grain crop share in gross cropped area is little over three-fourth in the marginal holdings. With increase in farm size, these shares have come down to half of gross cropped area getting allocated for cereals and little less than two-third of gross cropped area getting allocated for food grain crops in the farms with more than 10 ha holding size. The percentage allocation of gross cropped area for food and non-food crops individually for major crops and crop groups revealed marginal decline in the share of rice, cereals, food grains and food and marginal increase in wheat and non-food crops.
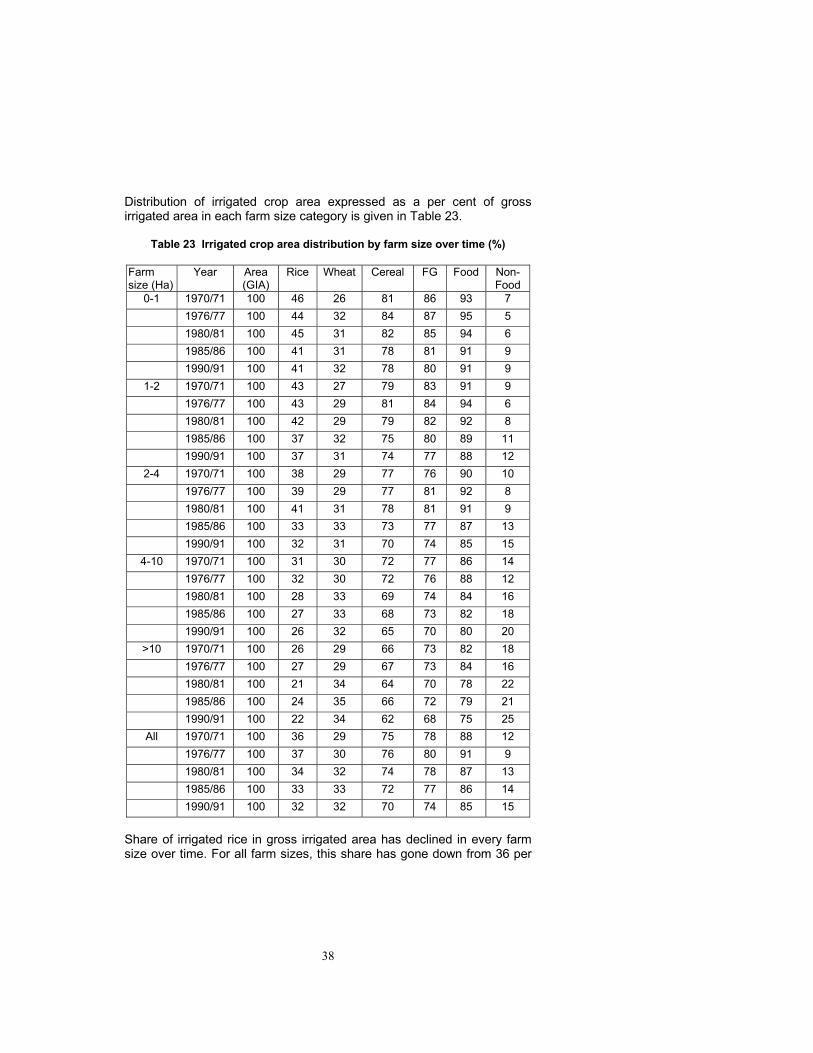
38
Distribution of irrigated crop area expressed as a per cent of gross irrigated area in each farm size category is given in Table 23.
Table 23 Irrigated crop area distribution by farm size over time (%) Farm size (Ha)
Year Area (GIA)
Rice Wheat Cereal FG Food Non-Food
0-1 1970/71 100 46 26 81 86 93 7 1976/77 100 44 32 84 87 95 5 1980/81 100 45 31 82 85 94 6 1985/86 100 41 31 78 81 91 9 1990/91 100 41 32 78 80 91 9
1-2 1970/71 100 43 27 79 83 91 9 1976/77 100 43 29 81 84 94 6 1980/81 100 42 29 79 82 92 8 1985/86 100 37 32 75 80 89 11 1990/91 100 37 31 74 77 88 12
2-4 1970/71 100 38 29 77 76 90 10 1976/77 100 39 29 77 81 92 8 1980/81 100 41 31 78 81 91 9 1985/86 100 33 33 73 77 87 13 1990/91 100 32 31 70 74 85 15
4-10 1970/71 100 31 30 72 77 86 14 1976/77 100 32 30 72 76 88 12 1980/81 100 28 33 69 74 84 16 1985/86 100 27 33 68 73 82 18 1990/91 100 26 32 65 70 80 20
>10 1970/71 100 26 29 66 73 82 18 1976/77 100 27 29 67 73 84 16 1980/81 100 21 34 64 70 78 22 1985/86 100 24 35 66 72 79 21 1990/91 100 22 34 62 68 75 25
All 1970/71 100 36 29 75 78 88 12 1976/77 100 37 30 76 80 91 9 1980/81 100 34 32 74 78 87 13 1985/86 100 33 33 72 77 86 14 1990/91 100 32 32 70 74 85 15
Share of irrigated rice in gross irrigated area has declined in every farm size over time. For all farm sizes, this share has gone down from 36 per
39
cent in 1970/71 to 32 percent in 1990/91. The magnitude of this decline in irrigated rice area share is directly related to the farm size increasing from little over 10 to 15 per cent during the period 1971-91. On the contrary, share of wheat in gross irrigated area has increased in every farm size with differing magnitudes during this period. Across all farm sizes, around two-third of the gross irrigated area is getting allocated for rice and wheat which remained more or less stable during this period. This share showed inverse relationship with the farm size. Marginal decline in the share of gross irrigated area getting allocated for cereals, foodgrains and food crops is also observed in all the farm size categories during the study period. Marginal increase in the share of non-food crops in the gross irrigated area is registered in the small and marginal FHHs but with increase in farm size beyond 2 ha, this share has gone up substantially by 39 to 50 per cent during the past four decades ending 1991.
40
3 EQUITY IMPACTS OF IRRIGATION DEVELOPMENT Irrigation development policies pursued in the past five decades have targeted to bring more and more area under irrigation facilities through harnessing surface water and developing ground water. The distribution of land in association with the availability and accessibility to irrigation facilities will determine the equity impacts over space and time. While resultant equity impacts is neither designed explicitly nor targeted specifically while evolving irrigation development policies in the past, it would be useful to understand these impacts to plan for corrective future management strategies if and so needed. 3.1 Approach for equity impact analysis Availability of land and accessibility to irrigation water play crucial role in the determination of the level and distribution of agricultural production and therefore income in many developing countries and India is no exception to this. Equitable distribution of land and water is therefore an essential pre-requisite for ensuring equitable distribution of income while alleviating poverty through irrigation-led agricultural development strategies. Conversely, quantitative assessment of inequality in irrigation water distribution is considered extremely important for strengthening irrigation policy decision making to achieve desired development objectives. With increasing dimensions of development goals in every sector, a balanced irrigation development can no longer rest only on regional equity but will have to factor in farm level equity implication as well. With the economic literature on income distribution providing the background, equity in irrigation distribution can be considered in terms of positive or objective and normative or subjective approaches. Given the nature of the problem of equity, Sampath (1988) argued that any useful measure of equity must integrate both objective and normative measures. Deriving from the income distribution analysis, seven axioms namely irrigation scale independence, equal additions, principle of population, weak principle of transfers, strong principle of transfers, symmetry and normalized values are used for evaluating the robustness of different positive measures of equity. Seven equity measures are considered such as range, relative mean deviation, variance, coefficient of variation, standard deviation of algorithms, Gini coefficient and Theil's information measure. Among these, Theil's entropy measure is observed
41
to be more versatile than the remaining measures analyzed. Theil's information measure fulfills many of the important axioms besides being amenable for decomposition analysis. While detailed studies have been conducted in understanding the problems of efficiency in the use of irrigation, distributional aspects of irrigation development have started receiving attention only since 1980s (Bromley et al., 1980, Lenton, 1984, Palanisami, 1980, Malhotra et al., 1984, Aberrantly, 1986) but the focus of such studies getting limited to the inequity problems in irrigation distribution in terms of farm location on the water course and farm size in particular project contexts (Bromley et al. 1980). Up to 1980s, no analysis of inequity in irrigation distribution even at a macro level was ever attempted in India. Farm-size wise distribution of irrigation and irrigation assets has started receiving attention only in 1990s. Sampath (1990) using National Sample Survey (NSS) analyzed the level of inequity in irrigation distribution across farm size-groups in India with the agricultural year 1976/77 as the reference year. Using the same set of data, Sampath (1992) analyzed and described the relationship between the size of operational holding on the one hand and various irrigation-related variables. The study representing pre-1975 period concluded that, both over all irrigation development in India as well as predominantly government controlled development and distribution of flow-sources of irrigation, especially of canal irrigation does not seem to have promoted equity in the distribution of irrigation across farm size groups. With the same set of data, Sampath (1992) evaluated the nature of irrigation distribution in India using Rawlsian criterion of equity in distribution and estimated the performance of different states according to the Rawlsian notion of fairness in distribution. Considerable inequality across farm size groups in the distribution of irrigated areas in general and canal irrigated areas in particular with wide interstate differences in the levels of inequality is observed in the pre-1975 period. Switching over to a Rawlsian based distribution of canal irrigation tend to reduce the levels of inequality in overall irrigation development in all states. Sampath (1992) also analyzed the levels of inequality in irrigation distribution over time utilizing agricultural census aggregate data. The distribution analysis was done for different sources of irrigation and for different farm sizes over a period of time covering 1970/71, 1976/77 and 1980/81 for India as a whole. The results showed mixed trends with the inequality in the distribution of irrigated area (both net and gross) declining in the period 1970/71 to 1976/77 and increasing in the period 1976/77 to1980/81 indicating the lack of consistency in the irrigation development policies pursued during pre-1980 period. Since then, however, substantial investments have been made especially in medium and minor irrigation besides other private sources of ground water development. A shift in the paradigm of irrigation development from
42
regionally balanced development in 1950s through 1970s towards balanced development within the region since 1980s assumes significance in view of its possible implications on equity related issues. Only a detailed empirical analysis of the equity impacts of such irrigation development strategies over space and time can capture the improvement or otherwise of equity impacts which is extremely important for improved irrigation policy decision-making. 3.2 Methodology for equity impact analysis Among various measures of inequality evaluated and discussed in the context of irrigation development in India, only Theil's information theoretic measure fulfills all the relevant equity axioms in addition to being easily amenable for decomposition analysis (Theil, 1967). A detailed discussion on the reasons for the choice of Theil's measure of inequality among all others is elucidated in Sampath, 1990. Theil's entropy measure has attractive cardinal properties when one considers the decomposition of overall inequality in the country as a whole in terms of its constituent parts and hence more frequently used in the literature. Some of its applications in the analysis of inequality in irrigation distribution can be found in India, Pakistan, Sri Lanka and Bangladesh. For quantifying the extent of inequity in irrigation distribution across agricultural farm households, Theil’s entropy measure has been used in this study. Using Theil's entropy measure, inter-farm size inequality in irrigation distribution in India was analyzed at all-India level as well as at the state level. Furthermore, the inequality at the all India level was also decomposed into its constituent parts namely 'between states' inequality and 'within states' inequality. Such an analysis will help in quantifying the sources of inequality for better irrigation policy decisions. This analysis was further extended as follows. More irrigation attributes were covered to understand the inequality status in irrigation distribution with respect to different sources of irrigation. More time periods covering 1970s through 1990s were taken up to provide reasonable insight into the distribution impacts of past irrigation development strategies for better irrigation policy decision making in the future. For comparison, several irrigation distribution policies like proportional distribution of water and Rawlsian based distribution were considered in the analysis. Methodological approach followed for equity impact analysis is given in the Appendix 2. 3.3 Data base Cross-sectional database for this study was drawn from All India Report on Agricultural Census for the years 1970/71, 1976/77, 1980/81, 1985/86
43
and 1990/91 published by the agricultural census division of the Ministry of Agriculture, Government of India. This census is done once in five years and latest available report is for 1990/91. The coverage of this census is not uniform across periods. For instance, Agricultural census, 1970/71 provides data by farm size and state-wise for 12 farm size classifications. Agricultural census, 1976/77 provides data by farm size and state-wise for 13 farm size classifications. Agricultural census, 1980/81 and 1985/86 provides data by farm size but not for state-wise for 13 farm size classifications. Finally, the latest available Agricultural census, 1990/91 provides data by farm size and state-wise for five farm size classifications. In this paper, for percentage analysis of irrigation distribution impact, all the census data for the period 1970/71 to 1990/91 are used. For applying the Theil's entropy measure and Theil's forecast error measure to estimate the levels of unfairness in distribution using Rawlsian notion of fairness in distribution, selected census period data as permitted by uniformity in their coverage are used. For providing common base for inter-temporal comparison of inequity impacts of irrigation distribution, farm sizes are also standardized into five size groups. They are 0 to 1 ha, 1 to 2 ha, 2 to 4 ha, 4 to 10 ha and more than 10 ha for the purpose of quantifying the inequity in irrigation distribution. For quantifying the between states and within states contribution to irrigation inequity and estimating the state level inequity in irrigation distribution, the analysis was restricted to only two census periods namely agricultural census, 1970/71 and agricultural census, 1990/91. No state-wise coverage was provided for the agricultural census reports available during 1980/81 and 1985/86. The data collection methodology for the agricultural census was complete enumeration by retabulation of data already available in the land records. In a few states where land records are not maintained, the data was collected through sample surveys. For this study, 16 states are covered that include Andhra Pradesh, Bihar, Karnataka, Madhya Pradesh, Maharashtra, Orissa, West Bengal, Gujarat, Haryana, Himachal Pradesh, Jammu & Kashmir, Kerala, Punjab, Rajasthan, Tamil Nadu and Uttar Pradesh. Small states like Arunachal Pradesh, Assam, Goa, Manipur, Mizoram, Meghalaya, Nagaland, Sikkim and Tripura and all Union Territories are combined into small states and union territories (SSUT) for the purpose of this analysis making the total number of constituents to 17 including SSUT. 3.4 Inequity impacts: current & Rawlsian distribution, all
India The temporal distribution of levels of inequality under current and Rawlsian distribution are given in Table 24.
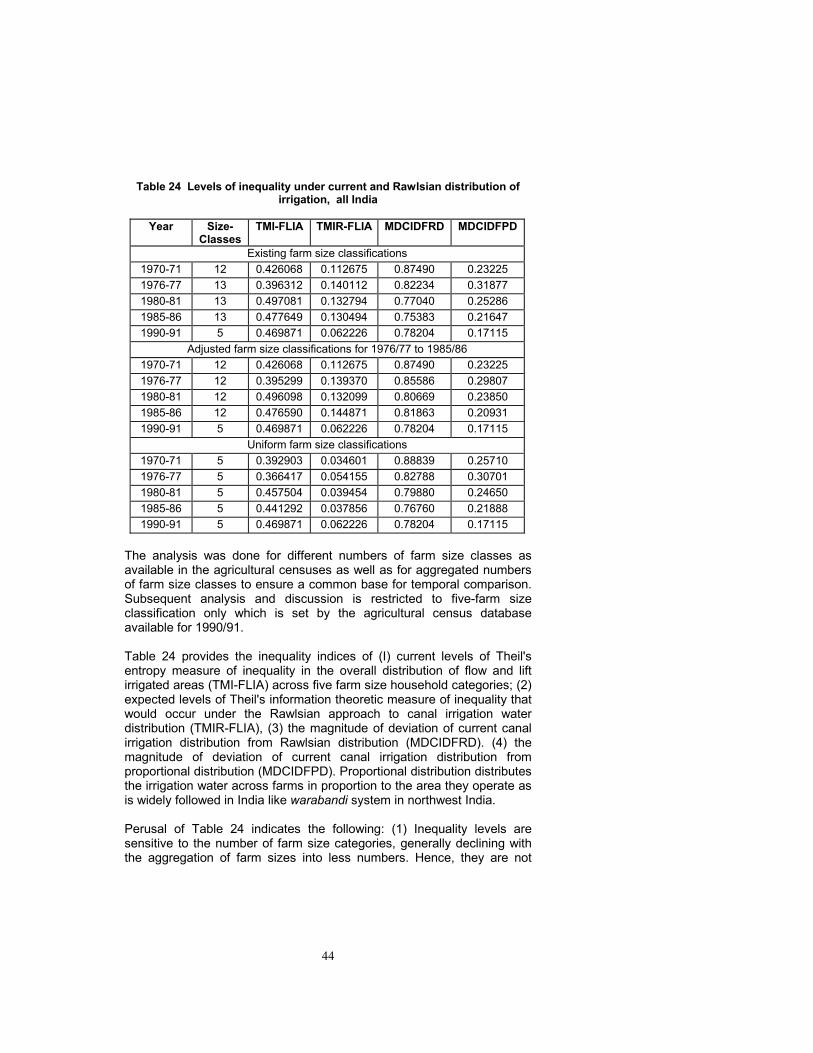
44
Table 24 Levels of inequality under current and Rawlsian distribution of irrigation, all India
Year
Size-
Classes TMI-FLIA TMIR-FLIA MDCIDFRD MDCIDFPD
Existing farm size classifications 1970-71 12 0.426068 0.112675 0.87490 0.23225 1976-77 13 0.396312 0.140112 0.82234 0.31877 1980-81 13 0.497081 0.132794 0.77040 0.25286 1985-86 13 0.477649 0.130494 0.75383 0.21647 1990-91 5 0.469871 0.062226 0.78204 0.17115
Adjusted farm size classifications for 1976/77 to 1985/86 1970-71 12 0.426068 0.112675 0.87490 0.23225 1976-77 12 0.395299 0.139370 0.85586 0.29807 1980-81 12 0.496098 0.132099 0.80669 0.23850 1985-86 12 0.476590 0.144871 0.81863 0.20931 1990-91 5 0.469871 0.062226 0.78204 0.17115
Uniform farm size classifications 1970-71 5 0.392903 0.034601 0.88839 0.25710 1976-77 5 0.366417 0.054155 0.82788 0.30701 1980-81 5 0.457504 0.039454 0.79880 0.24650 1985-86 5 0.441292 0.037856 0.76760 0.21888 1990-91 5 0.469871 0.062226 0.78204 0.17115
The analysis was done for different numbers of farm size classes as available in the agricultural censuses as well as for aggregated numbers of farm size classes to ensure a common base for temporal comparison. Subsequent analysis and discussion is restricted to five-farm size classification only which is set by the agricultural census database available for 1990/91. Table 24 provides the inequality indices of (I) current levels of Theil's entropy measure of inequality in the overall distribution of flow and lift irrigated areas (TMI-FLIA) across five farm size household categories; (2) expected levels of Theil's information theoretic measure of inequality that would occur under the Rawlsian approach to canal irrigation water distribution (TMIR-FLIA), (3) the magnitude of deviation of current canal irrigation distribution from Rawlsian distribution (MDCIDFRD). (4) the magnitude of deviation of current canal irrigation distribution from proportional distribution (MDCIDFPD). Proportional distribution distributes the irrigation water across farms in proportion to the area they operate as is widely followed in India like warabandi system in northwest India. Perusal of Table 24 indicates the following: (1) Inequality levels are sensitive to the number of farm size categories, generally declining with the aggregation of farm sizes into less numbers. Hence, they are not
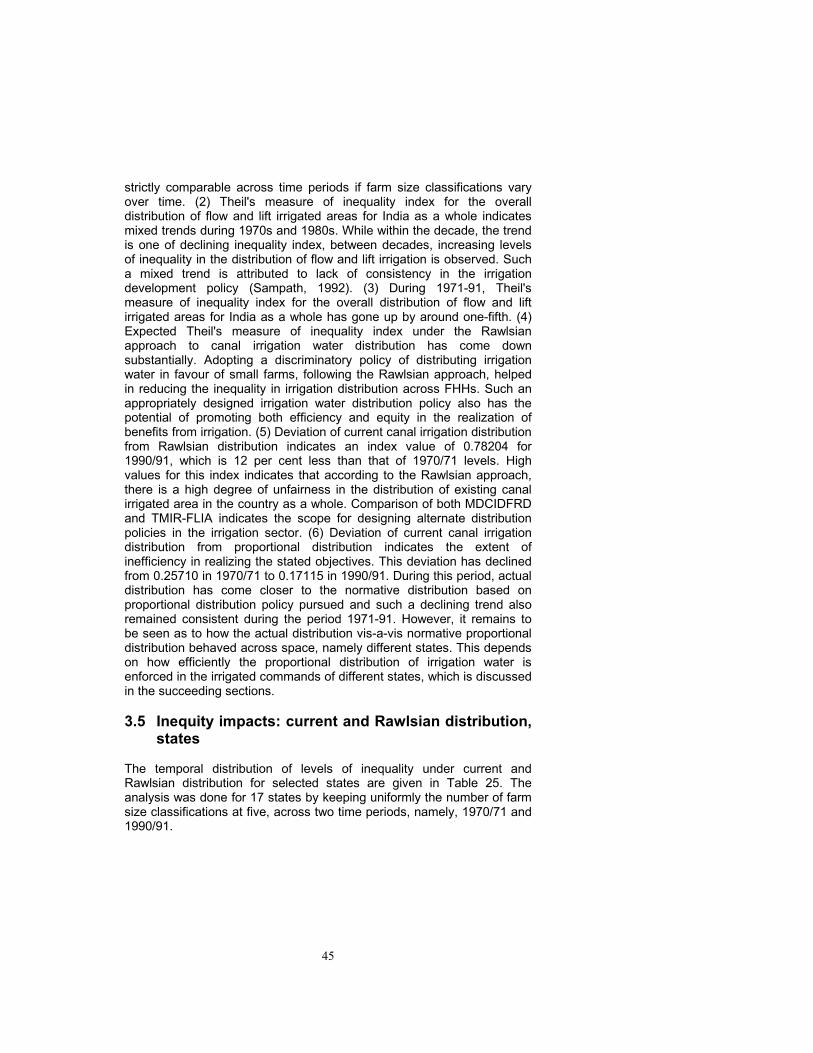
45
strictly comparable across time periods if farm size classifications vary over time. (2) Theil's measure of inequality index for the overall distribution of flow and lift irrigated areas for India as a whole indicates mixed trends during 1970s and 1980s. While within the decade, the trend is one of declining inequality index, between decades, increasing levels of inequality in the distribution of flow and lift irrigation is observed. Such a mixed trend is attributed to lack of consistency in the irrigation development policy (Sampath, 1992). (3) During 1971-91, Theil's measure of inequality index for the overall distribution of flow and lift irrigated areas for India as a whole has gone up by around one-fifth. (4) Expected Theil's measure of inequality index under the Rawlsian approach to canal irrigation water distribution has come down substantially. Adopting a discriminatory policy of distributing irrigation water in favour of small farms, following the Rawlsian approach, helped in reducing the inequality in irrigation distribution across FHHs. Such an appropriately designed irrigation water distribution policy also has the potential of promoting both efficiency and equity in the realization of benefits from irrigation. (5) Deviation of current canal irrigation distribution from Rawlsian distribution indicates an index value of 0.78204 for 1990/91, which is 12 per cent less than that of 1970/71 levels. High values for this index indicates that according to the Rawlsian approach, there is a high degree of unfairness in the distribution of existing canal irrigated area in the country as a whole. Comparison of both MDCIDFRD and TMIR-FLIA indicates the scope for designing alternate distribution policies in the irrigation sector. (6) Deviation of current canal irrigation distribution from proportional distribution indicates the extent of inefficiency in realizing the stated objectives. This deviation has declined from 0.25710 in 1970/71 to 0.17115 in 1990/91. During this period, actual distribution has come closer to the normative distribution based on proportional distribution policy pursued and such a declining trend also remained consistent during the period 1971-91. However, it remains to be seen as to how the actual distribution vis-a-vis normative proportional distribution behaved across space, namely different states. This depends on how efficiently the proportional distribution of irrigation water is enforced in the irrigated commands of different states, which is discussed in the succeeding sections. 3.5 Inequity impacts: current and Rawlsian distribution,
states The temporal distribution of levels of inequality under current and Rawlsian distribution for selected states are given in Table 25. The analysis was done for 17 states by keeping uniformly the number of farm size classifications at five, across two time periods, namely, 1970/71 and 1990/91.
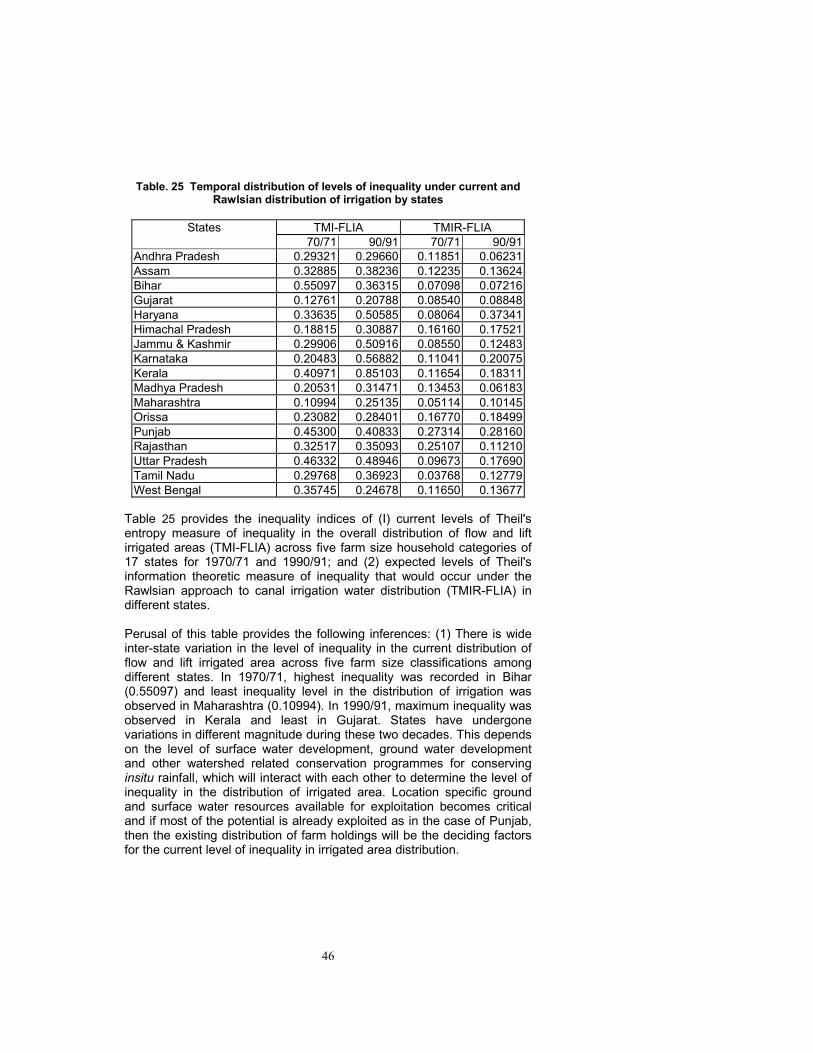
46
Table. 25 Temporal distribution of levels of inequality under current and Rawlsian distribution of irrigation by states
TMI-FLIA TMIR-FLIA States
70/71 90/91 70/71 90/91Andhra Pradesh 0.29321 0.29660 0.11851 0.06231Assam 0.32885 0.38236 0.12235 0.13624Bihar 0.55097 0.36315 0.07098 0.07216Gujarat 0.12761 0.20788 0.08540 0.08848Haryana 0.33635 0.50585 0.08064 0.37341Himachal Pradesh 0.18815 0.30887 0.16160 0.17521Jammu & Kashmir 0.29906 0.50916 0.08550 0.12483Karnataka 0.20483 0.56882 0.11041 0.20075Kerala 0.40971 0.85103 0.11654 0.18311Madhya Pradesh 0.20531 0.31471 0.13453 0.06183Maharashtra 0.10994 0.25135 0.05114 0.10145Orissa 0.23082 0.28401 0.16770 0.18499Punjab 0.45300 0.40833 0.27314 0.28160Rajasthan 0.32517 0.35093 0.25107 0.11210Uttar Pradesh 0.46332 0.48946 0.09673 0.17690Tamil Nadu 0.29768 0.36923 0.03768 0.12779West Bengal 0.35745 0.24678 0.11650 0.13677
Table 25 provides the inequality indices of (I) current levels of Theil's entropy measure of inequality in the overall distribution of flow and lift irrigated areas (TMI-FLIA) across five farm size household categories of 17 states for 1970/71 and 1990/91; and (2) expected levels of Theil's information theoretic measure of inequality that would occur under the Rawlsian approach to canal irrigation water distribution (TMIR-FLIA) in different states. Perusal of this table provides the following inferences: (1) There is wide inter-state variation in the level of inequality in the current distribution of flow and lift irrigated area across five farm size classifications among different states. In 1970/71, highest inequality was recorded in Bihar (0.55097) and least inequality level in the distribution of irrigation was observed in Maharashtra (0.10994). In 1990/91, maximum inequality was observed in Kerala and least in Gujarat. States have undergone variations in different magnitude during these two decades. This depends on the level of surface water development, ground water development and other watershed related conservation programmes for conserving insitu rainfall, which will interact with each other to determine the level of inequality in the distribution of irrigated area. Location specific ground and surface water resources available for exploitation becomes critical and if most of the potential is already exploited as in the case of Punjab, then the existing distribution of farm holdings will be the deciding factors for the current level of inequality in irrigated area distribution.
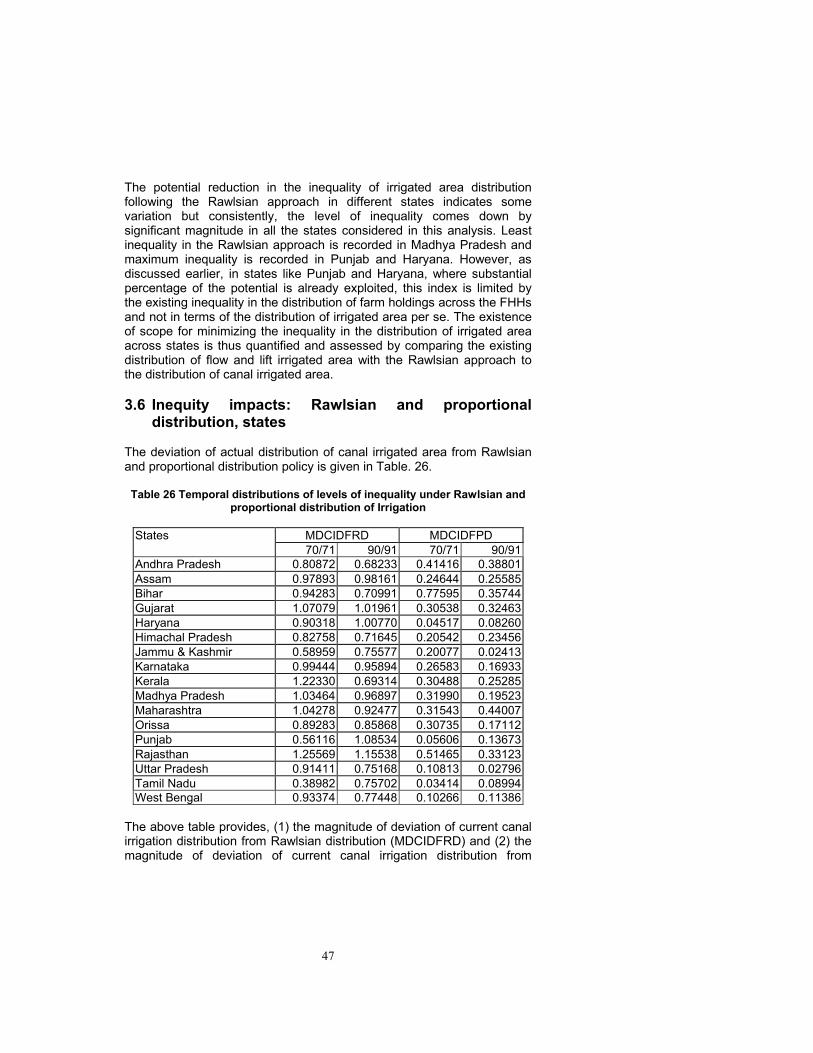
47
The potential reduction in the inequality of irrigated area distribution following the Rawlsian approach in different states indicates some variation but consistently, the level of inequality comes down by significant magnitude in all the states considered in this analysis. Least inequality in the Rawlsian approach is recorded in Madhya Pradesh and maximum inequality is recorded in Punjab and Haryana. However, as discussed earlier, in states like Punjab and Haryana, where substantial percentage of the potential is already exploited, this index is limited by the existing inequality in the distribution of farm holdings across the FHHs and not in terms of the distribution of irrigated area per se. The existence of scope for minimizing the inequality in the distribution of irrigated area across states is thus quantified and assessed by comparing the existing distribution of flow and lift irrigated area with the Rawlsian approach to the distribution of canal irrigated area. 3.6 Inequity impacts: Rawlsian and proportional
distribution, states The deviation of actual distribution of canal irrigated area from Rawlsian and proportional distribution policy is given in Table. 26. Table 26 Temporal distributions of levels of inequality under Rawlsian and
proportional distribution of Irrigation
MDCIDFRD MDCIDFPD States 70/71 90/91 70/71 90/91
Andhra Pradesh 0.80872 0.68233 0.41416 0.38801Assam 0.97893 0.98161 0.24644 0.25585Bihar 0.94283 0.70991 0.77595 0.35744Gujarat 1.07079 1.01961 0.30538 0.32463Haryana 0.90318 1.00770 0.04517 0.08260Himachal Pradesh 0.82758 0.71645 0.20542 0.23456Jammu & Kashmir 0.58959 0.75577 0.20077 0.02413Karnataka 0.99444 0.95894 0.26583 0.16933Kerala 1.22330 0.69314 0.30488 0.25285Madhya Pradesh 1.03464 0.96897 0.31990 0.19523Maharashtra 1.04278 0.92477 0.31543 0.44007Orissa 0.89283 0.85868 0.30735 0.17112Punjab 0.56116 1.08534 0.05606 0.13673Rajasthan 1.25569 1.15538 0.51465 0.33123Uttar Pradesh 0.91411 0.75168 0.10813 0.02796Tamil Nadu 0.38982 0.75702 0.03414 0.08994West Bengal 0.93374 0.77448 0.10266 0.11386
The above table provides, (1) the magnitude of deviation of current canal irrigation distribution from Rawlsian distribution (MDCIDFRD) and (2) the magnitude of deviation of current canal irrigation distribution from
48
proportional distribution (MDCIDFPD) for 17 states by keeping uniformly the number of farm size classifications at five, across two time periods, namely, 1970/71 and 1990/91. Perusal of Table 26 provides the following inferences: One, The measure of deviation of existing canal irrigated area distribution from the Rawlsian approach indicates very high values for the estimated index. In many states, based on Rawlsian approach, existence of unfairness in the distribution of canal-irrigated area exists. This offers scope to evaluate alternate distribution policies to minimize the inequality in the distribution of canal-irrigated area that is predominantly controlled by the government. Two, As of 1990/91, the magnitude of unfairness in the existing distribution is high in states like Punjab, Gujarat, Rajasthan and Haryana. But again, states like Punjab and Haryana only exhibit the existing inequality in the distribution of land area across holdings rather than the distribution of irrigated area as such since these states have exploited most of their water resource potentials as of now. Three, the deviation of actual distribution of canal irrigated area across farm sizes from the proposed proportional distribution shows wide inter-state variation during both the periods namely 1970/71 and 1990/91. This deviation has come down in many states during the period 1971-91 but still the inequality levels across states in 1990/91 highlights differing realization of the targeted irrigated area distribution under proportional distribution policy. The physical condition of the irrigation system and enforcement of proportional distribution policies play an important role in these inter-state differences in the observed deviations. Such deviations also contribute to the inefficient performance of the systems as well as negatively impacting the equitable distribution of irrigation water. 3.7 Theil's inequity index for irrigation attributes, all
India The inequality indices for several irrigation related attributes such as; total area (TA), net area sown (NAS), net irrigated area (NIA), canal irrigated area (CIA), tank irrigated area (TIA), well irrigated area (WIA), tubewell irrigated area (TWIA), other sources irrigated area (OSIA), gross irrigated area (GIA), gross unirrigated area (GUIA) and gross cropped area (GCA) are estimated using the Theil's entropy measure. The analysis was done for five farm size classifications covering five different time periods, namely, 1970/71, 1976/77, 1980/81, 1985/86 and 1990/91. 3.7.1 All farm house holds The estimated inequality index for all farm households and time period is given in Table 27.
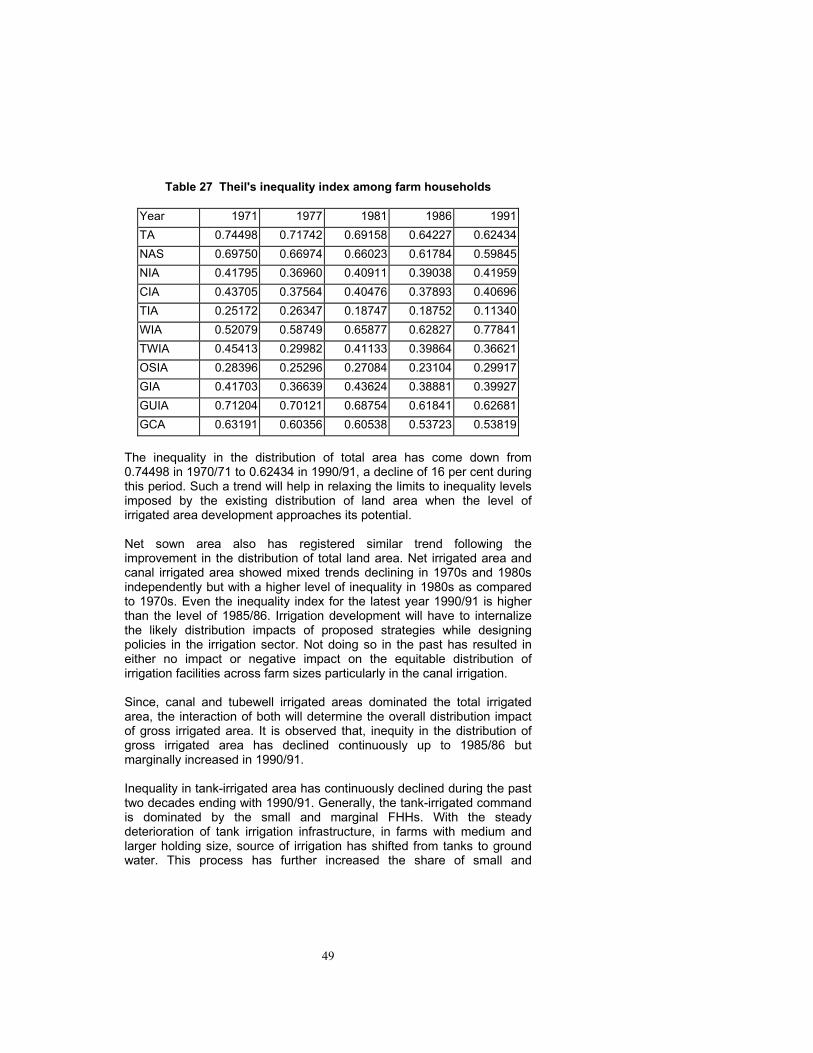
49
Table 27 Theil's inequality index among farm households
Year 1971 1977 1981 1986 1991 TA 0.74498 0.71742 0.69158 0.64227 0.62434NAS 0.69750 0.66974 0.66023 0.61784 0.59845NIA 0.41795 0.36960 0.40911 0.39038 0.41959CIA 0.43705 0.37564 0.40476 0.37893 0.40696TIA 0.25172 0.26347 0.18747 0.18752 0.11340WIA 0.52079 0.58749 0.65877 0.62827 0.77841TWIA 0.45413 0.29982 0.41133 0.39864 0.36621OSIA 0.28396 0.25296 0.27084 0.23104 0.29917GIA 0.41703 0.36639 0.43624 0.38881 0.39927GUIA 0.71204 0.70121 0.68754 0.61841 0.62681GCA 0.63191 0.60356 0.60538 0.53723 0.53819
The inequality in the distribution of total area has come down from 0.74498 in 1970/71 to 0.62434 in 1990/91, a decline of 16 per cent during this period. Such a trend will help in relaxing the limits to inequality levels imposed by the existing distribution of land area when the level of irrigated area development approaches its potential. Net sown area also has registered similar trend following the improvement in the distribution of total land area. Net irrigated area and canal irrigated area showed mixed trends declining in 1970s and 1980s independently but with a higher level of inequality in 1980s as compared to 1970s. Even the inequality index for the latest year 1990/91 is higher than the level of 1985/86. Irrigation development will have to internalize the likely distribution impacts of proposed strategies while designing policies in the irrigation sector. Not doing so in the past has resulted in either no impact or negative impact on the equitable distribution of irrigation facilities across farm sizes particularly in the canal irrigation. Since, canal and tubewell irrigated areas dominated the total irrigated area, the interaction of both will determine the overall distribution impact of gross irrigated area. It is observed that, inequity in the distribution of gross irrigated area has declined continuously up to 1985/86 but marginally increased in 1990/91. Inequality in tank-irrigated area has continuously declined during the past two decades ending with 1990/91. Generally, the tank-irrigated command is dominated by the small and marginal FHHs. With the steady deterioration of tank irrigation infrastructure, in farms with medium and larger holding size, source of irrigation has shifted from tanks to ground water. This process has further increased the share of small and
50
marginal farm households in the tank irrigated area and thereby minimizing the inequity in the distribution of tank irrigated area over time. But the real concern here is the quality of tank irrigation which affects both the frequency of tank failure as well as level of its performance even in normal years with their shrinking capacity to receive, store and distribute water during the past as outlined in the earlier sections. Tank's failure will affect the small and marginal farm households severely contributing to the inequitable distribution of irrigation benefits in future if they are not rehabilitated and restored to normal functioning with physical and financial sustainability. Promoting equity in the distribution of irrigation benefits has to, therefore, encompass the integrated approach of involving every source of harnessing the rainwater and developing it for irrigation. Inequality in well-irrigated area has generally increased over time except for a decline in 1985/86. Tube well-irrigated area registered impressive decline in 1970s and marginal decline in 1980s. But, like that of canal irrigation distribution, the level of inequality in tubewell irrigation also exhibited mixed trends between the two decades of 1970s and 1980s. Between 1971 and 1991, inequality in the distribution of gross unirrigated area and gross cropped area has declined. In 1990/91, distribution of well-irrigated area had the highest inequality (0.77841) followed by gross unirrigated area, total area, net sown area and gross cropped area. It is also observed that inequality index for most of the irrigation attributes except well-irrigated area and that too only in 1990/91 is lesser than that of total area. This indicates that irrigation distribution alongwith net sown area and gross cropped area distributions are relatively more equitable than that warranted by the total area distribution. 3.7.2 Irrigated farm households The inequality indices for irrigated area related attributes such as; total area (TA), net irrigated area (NIA), canal irrigated area (CIA), tank irrigated area (TIA), well irrigated area (WIA), tubewell irrigated area (TWIA), other sources irrigated area (OSIA), Gross irrigated area (GIA), Flow irrigated area (FLOW), Lift irrigated area (LIFT), irrigated rice area (RCEI), wheat irrigated area (WHTI), irrigated cereals area (CERI), irrigated foodgrains area (FGI), irrigated sugarcane area (SCNI), irrigated food crop area (FOODI) and irrigated non-food crop area (NFOODI) are estimated using the Theil's entropy measure. The analysis was done for five farms size classifications for five different time periods namely 1970/71, 1976/77, 1980/81, 1985/86 and 1990/91. Since most of the households do not have irrigation facilities, inequality index was now estimated only for irrigated households and shown in Table. 28.
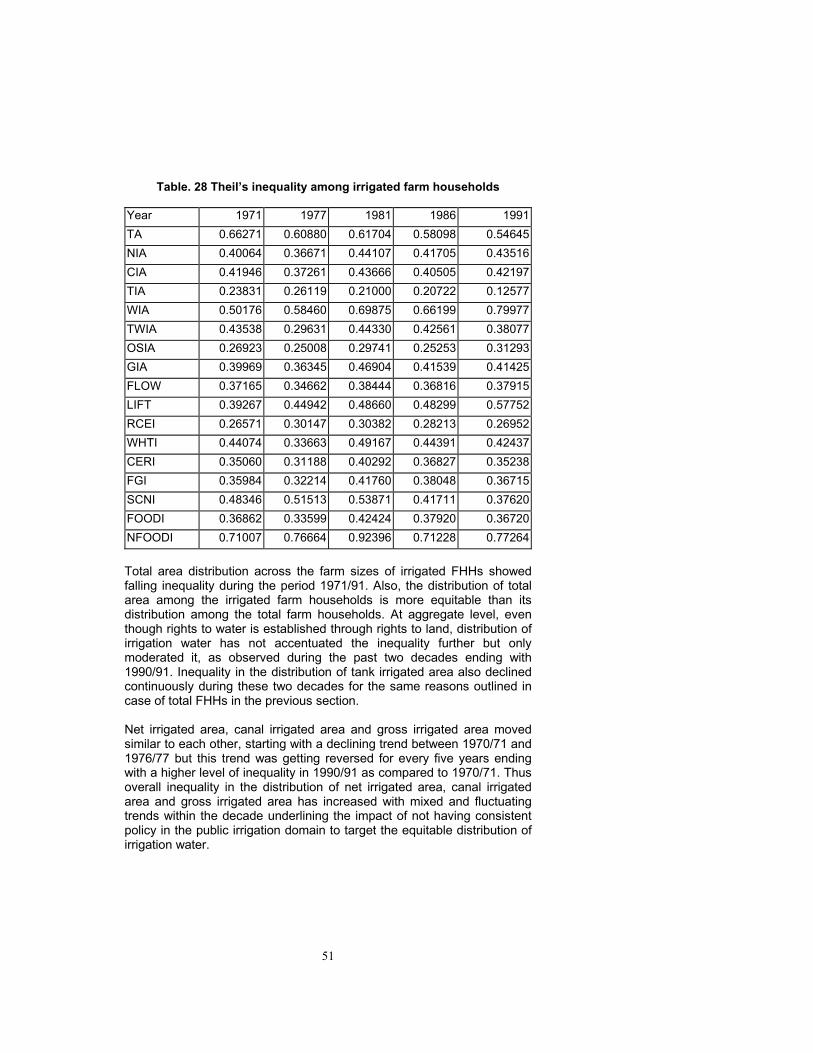
51
Table. 28 Theil’s inequality among irrigated farm households Year 1971 1977 1981 1986 1991 TA 0.66271 0.60880 0.61704 0.58098 0.54645NIA 0.40064 0.36671 0.44107 0.41705 0.43516CIA 0.41946 0.37261 0.43666 0.40505 0.42197TIA 0.23831 0.26119 0.21000 0.20722 0.12577WIA 0.50176 0.58460 0.69875 0.66199 0.79977TWIA 0.43538 0.29631 0.44330 0.42561 0.38077OSIA 0.26923 0.25008 0.29741 0.25253 0.31293GIA 0.39969 0.36345 0.46904 0.41539 0.41425FLOW 0.37165 0.34662 0.38444 0.36816 0.37915LIFT 0.39267 0.44942 0.48660 0.48299 0.57752RCEI 0.26571 0.30147 0.30382 0.28213 0.26952WHTI 0.44074 0.33663 0.49167 0.44391 0.42437CERI 0.35060 0.31188 0.40292 0.36827 0.35238FGI 0.35984 0.32214 0.41760 0.38048 0.36715SCNI 0.48346 0.51513 0.53871 0.41711 0.37620FOODI 0.36862 0.33599 0.42424 0.37920 0.36720NFOODI 0.71007 0.76664 0.92396 0.71228 0.77264 Total area distribution across the farm sizes of irrigated FHHs showed falling inequality during the period 1971/91. Also, the distribution of total area among the irrigated farm households is more equitable than its distribution among the total farm households. At aggregate level, even though rights to water is established through rights to land, distribution of irrigation water has not accentuated the inequality further but only moderated it, as observed during the past two decades ending with 1990/91. Inequality in the distribution of tank irrigated area also declined continuously during these two decades for the same reasons outlined in case of total FHHs in the previous section. Net irrigated area, canal irrigated area and gross irrigated area moved similar to each other, starting with a declining trend between 1970/71 and 1976/77 but this trend was getting reversed for every five years ending with a higher level of inequality in 1990/91 as compared to 1970/71. Thus overall inequality in the distribution of net irrigated area, canal irrigated area and gross irrigated area has increased with mixed and fluctuating trends within the decade underlining the impact of not having consistent policy in the public irrigation domain to target the equitable distribution of irrigation water.
52
The inequality index declined initially in 1970s but increased in 1980/81 before again declining in 1980s in case of tubewell irrigated area. Ultimately, the inequality index in respect of tubewell-irrigated area in 1990/91 is less in magnitude than in 1970/71. On the contrary well-irrigated area registered continuous increase in its distributional inequality across the irrigated farm households during 1971-91. Flow and lift irrigated area distribution across the farm sizes registered increase in inequality in 1990/91 compared to that of 1970/71 but with a fluctuating trend during every five year time period underlining the inconsistency in the over all policy of irrigation development in the past. Inequality in the distribution of irrigated area across the irrigated farm households exhibited mixed trends between the decades as well as within the decade. Among the individual irrigated crop area distribution considered, rice exhibited least inequality followed by wheat in 1970/71 and sugar cane in 1991. In fact, reduction in the inequality is more emphatic in sugar cane in 1980s indicating adjustment in the cropping pattern in favour of cash crops as a result of the existing distribution impacts of irrigation even without a clear cut and consistent trend. This reinforces the view that a targeted policy for promoting equitable irrigation development will ensure both equity and efficiency in the irrigation water use. Here also, as in the case of all farm house holds, inequality in the distribution of key irrigation attributes like NIA, CIA, TIA, TWIA, GIA, FLOW, and LIFT is considerably less in magnitude as compared to the inequality in the distribution of total area across the irrigated farm households. While inequality in the distribution of most of these irrigation attributes per se has not consistently declined during the past decades, certainly, the distribution impacts has moderated the inequality arising from the distribution of total area across farm holding sizes over time and this has remained consistent too. 3.8 Theil's inequity index for irrigation attributes by
states The inequality in distribution of selected irrigation and area attributes like non-canal irrigated area (NCIA), net area sown (NAS), net irrigated area by canal (NIACAN), net irrigated area by tanks (NIATNK), net irrigated area by wells (NIAWELL), net irrigated area by tubewell (NIATW), total net irrigated area (NIATOT), gross cropped area irrigated (GCAI), gross cropped area (GCA), all flow irrigated area (ALLFLOW), and all lift irrigated area (ALLFT) are considered for different states. The analysis covered 17 states including SSUT for two time periods namely 1970/71 and 1990/91. The spatial and temporal distribution of inequality in NCIA, NAS and NIATOT are given in Table 29.
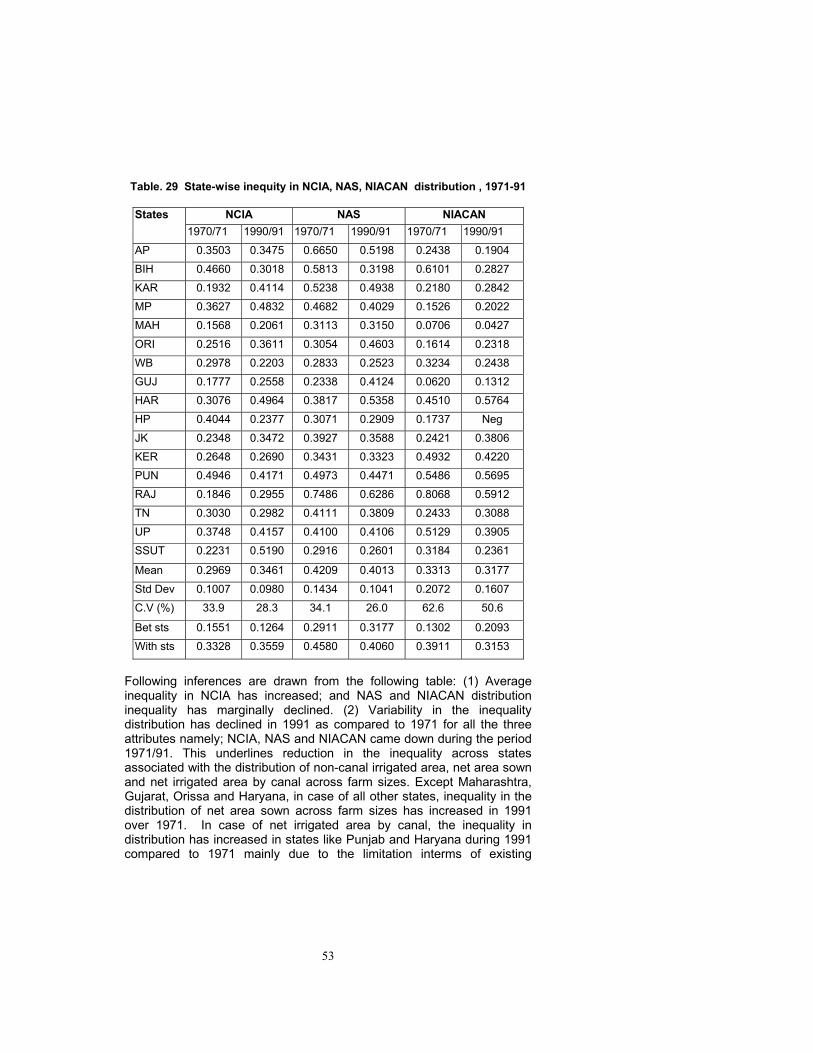
53
Table. 29 State-wise inequity in NCIA, NAS, NIACAN distribution , 1971-91
NCIA NAS NIACAN States 1970/71 1990/91 1970/71 1990/91 1970/71 1990/91
AP 0.3503 0.3475 0.6650 0.5198 0.2438 0.1904 BIH 0.4660 0.3018 0.5813 0.3198 0.6101 0.2827 KAR 0.1932 0.4114 0.5238 0.4938 0.2180 0.2842 MP 0.3627 0.4832 0.4682 0.4029 0.1526 0.2022 MAH 0.1568 0.2061 0.3113 0.3150 0.0706 0.0427 ORI 0.2516 0.3611 0.3054 0.4603 0.1614 0.2318 WB 0.2978 0.2203 0.2833 0.2523 0.3234 0.2438 GUJ 0.1777 0.2558 0.2338 0.4124 0.0620 0.1312 HAR 0.3076 0.4964 0.3817 0.5358 0.4510 0.5764 HP 0.4044 0.2377 0.3071 0.2909 0.1737 Neg JK 0.2348 0.3472 0.3927 0.3588 0.2421 0.3806 KER 0.2648 0.2690 0.3431 0.3323 0.4932 0.4220 PUN 0.4946 0.4171 0.4973 0.4471 0.5486 0.5695 RAJ 0.1846 0.2955 0.7486 0.6286 0.8068 0.5912 TN 0.3030 0.2982 0.4111 0.3809 0.2433 0.3088 UP 0.3748 0.4157 0.4100 0.4106 0.5129 0.3905 SSUT 0.2231 0.5190 0.2916 0.2601 0.3184 0.2361
Mean 0.2969 0.3461 0.4209 0.4013 0.3313 0.3177 Std Dev 0.1007 0.0980 0.1434 0.1041 0.2072 0.1607 C.V (%) 33.9 28.3 34.1 26.0 62.6 50.6
Bet sts 0.1551 0.1264 0.2911 0.3177 0.1302 0.2093 With sts 0.3328 0.3559 0.4580 0.4060 0.3911 0.3153
Following inferences are drawn from the following table: (1) Average inequality in NCIA has increased; and NAS and NIACAN distribution inequality has marginally declined. (2) Variability in the inequality distribution has declined in 1991 as compared to 1971 for all the three attributes namely; NCIA, NAS and NIACAN came down during the period 1971/91. This underlines reduction in the inequality across states associated with the distribution of non-canal irrigated area, net area sown and net irrigated area by canal across farm sizes. Except Maharashtra, Gujarat, Orissa and Haryana, in case of all other states, inequality in the distribution of net area sown across farm sizes has increased in 1991 over 1971. In case of net irrigated area by canal, the inequality in distribution has increased in states like Punjab and Haryana during 1991 compared to 1971 mainly due to the limitation interms of existing
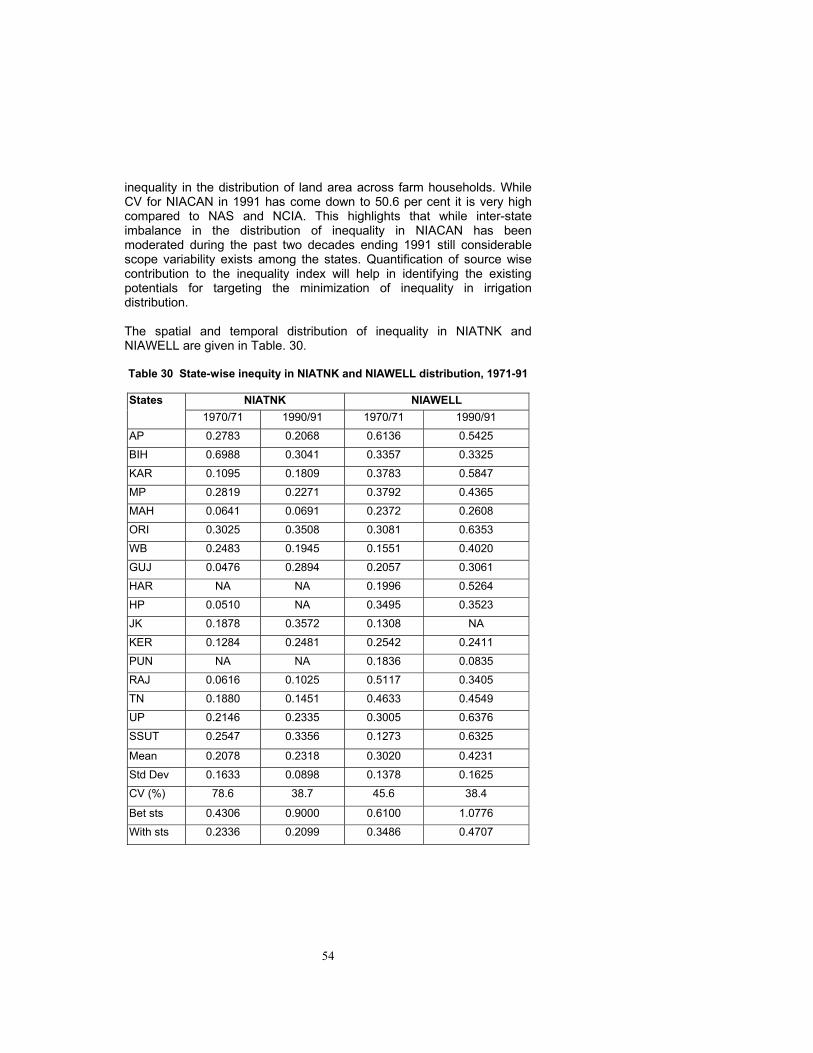
54
inequality in the distribution of land area across farm households. While CV for NIACAN in 1991 has come down to 50.6 per cent it is very high compared to NAS and NCIA. This highlights that while inter-state imbalance in the distribution of inequality in NIACAN has been moderated during the past two decades ending 1991 still considerable scope variability exists among the states. Quantification of source wise contribution to the inequality index will help in identifying the existing potentials for targeting the minimization of inequality in irrigation distribution. The spatial and temporal distribution of inequality in NIATNK and NIAWELL are given in Table. 30. Table 30 State-wise inequity in NIATNK and NIAWELL distribution, 1971-91
NIATNK NIAWELL States
1970/71 1990/91 1970/71 1990/91 AP 0.2783 0.2068 0.6136 0.5425 BIH 0.6988 0.3041 0.3357 0.3325 KAR 0.1095 0.1809 0.3783 0.5847 MP 0.2819 0.2271 0.3792 0.4365 MAH 0.0641 0.0691 0.2372 0.2608 ORI 0.3025 0.3508 0.3081 0.6353 WB 0.2483 0.1945 0.1551 0.4020 GUJ 0.0476 0.2894 0.2057 0.3061 HAR NA NA 0.1996 0.5264 HP 0.0510 NA 0.3495 0.3523 JK 0.1878 0.3572 0.1308 NA KER 0.1284 0.2481 0.2542 0.2411 PUN NA NA 0.1836 0.0835 RAJ 0.0616 0.1025 0.5117 0.3405 TN 0.1880 0.1451 0.4633 0.4549 UP 0.2146 0.2335 0.3005 0.6376 SSUT 0.2547 0.3356 0.1273 0.6325
Mean 0.2078 0.2318 0.3020 0.4231 Std Dev 0.1633 0.0898 0.1378 0.1625 CV (%) 78.6 38.7 45.6 38.4
Bet sts 0.4306 0.9000 0.6100 1.0776 With sts 0.2336 0.2099 0.3486 0.4707
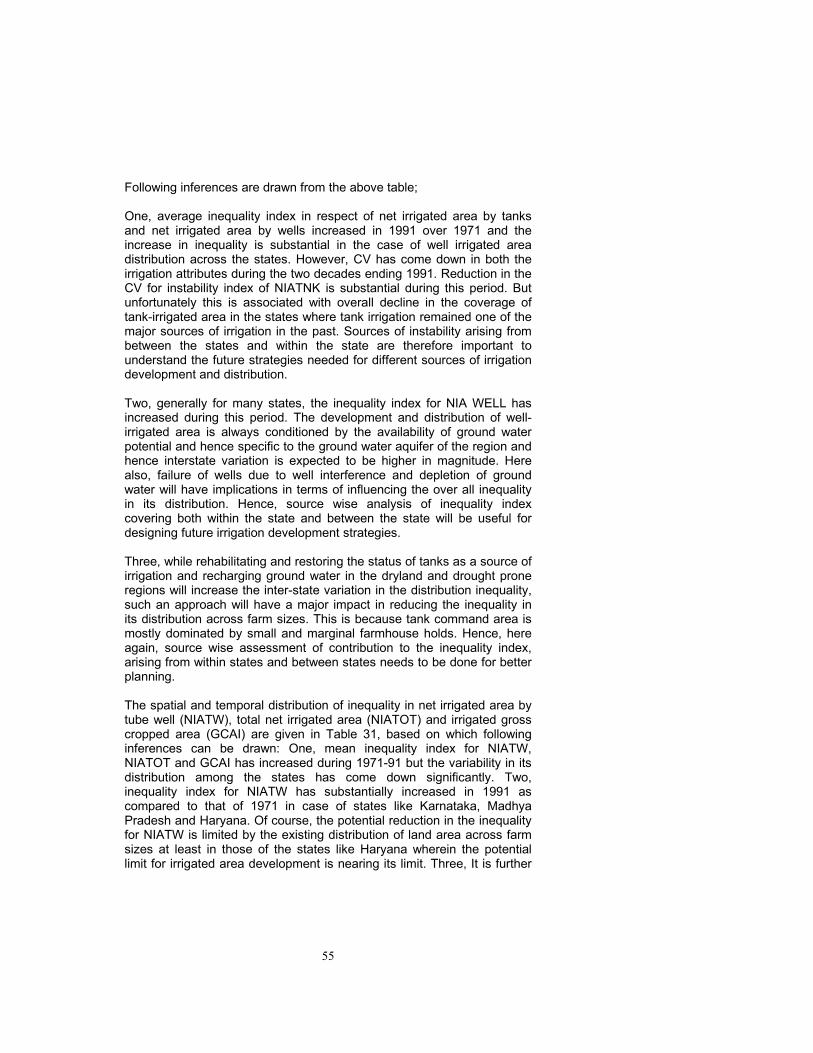
55
Following inferences are drawn from the above table; One, average inequality index in respect of net irrigated area by tanks and net irrigated area by wells increased in 1991 over 1971 and the increase in inequality is substantial in the case of well irrigated area distribution across the states. However, CV has come down in both the irrigation attributes during the two decades ending 1991. Reduction in the CV for instability index of NIATNK is substantial during this period. But unfortunately this is associated with overall decline in the coverage of tank-irrigated area in the states where tank irrigation remained one of the major sources of irrigation in the past. Sources of instability arising from between the states and within the state are therefore important to understand the future strategies needed for different sources of irrigation development and distribution. Two, generally for many states, the inequality index for NIA WELL has increased during this period. The development and distribution of well- irrigated area is always conditioned by the availability of ground water potential and hence specific to the ground water aquifer of the region and hence interstate variation is expected to be higher in magnitude. Here also, failure of wells due to well interference and depletion of ground water will have implications in terms of influencing the over all inequality in its distribution. Hence, source wise analysis of inequality index covering both within the state and between the state will be useful for designing future irrigation development strategies. Three, while rehabilitating and restoring the status of tanks as a source of irrigation and recharging ground water in the dryland and drought prone regions will increase the inter-state variation in the distribution inequality, such an approach will have a major impact in reducing the inequality in its distribution across farm sizes. This is because tank command area is mostly dominated by small and marginal farmhouse holds. Hence, here again, source wise assessment of contribution to the inequality index, arising from within states and between states needs to be done for better planning. The spatial and temporal distribution of inequality in net irrigated area by tube well (NIATW), total net irrigated area (NIATOT) and irrigated gross cropped area (GCAI) are given in Table 31, based on which following inferences can be drawn: One, mean inequality index for NIATW, NIATOT and GCAI has increased during 1971-91 but the variability in its distribution among the states has come down significantly. Two, inequality index for NIATW has substantially increased in 1991 as compared to that of 1971 in case of states like Karnataka, Madhya Pradesh and Haryana. Of course, the potential reduction in the inequality for NIATW is limited by the existing distribution of land area across farm sizes at least in those of the states like Haryana wherein the potential limit for irrigated area development is nearing its limit. Three, It is further
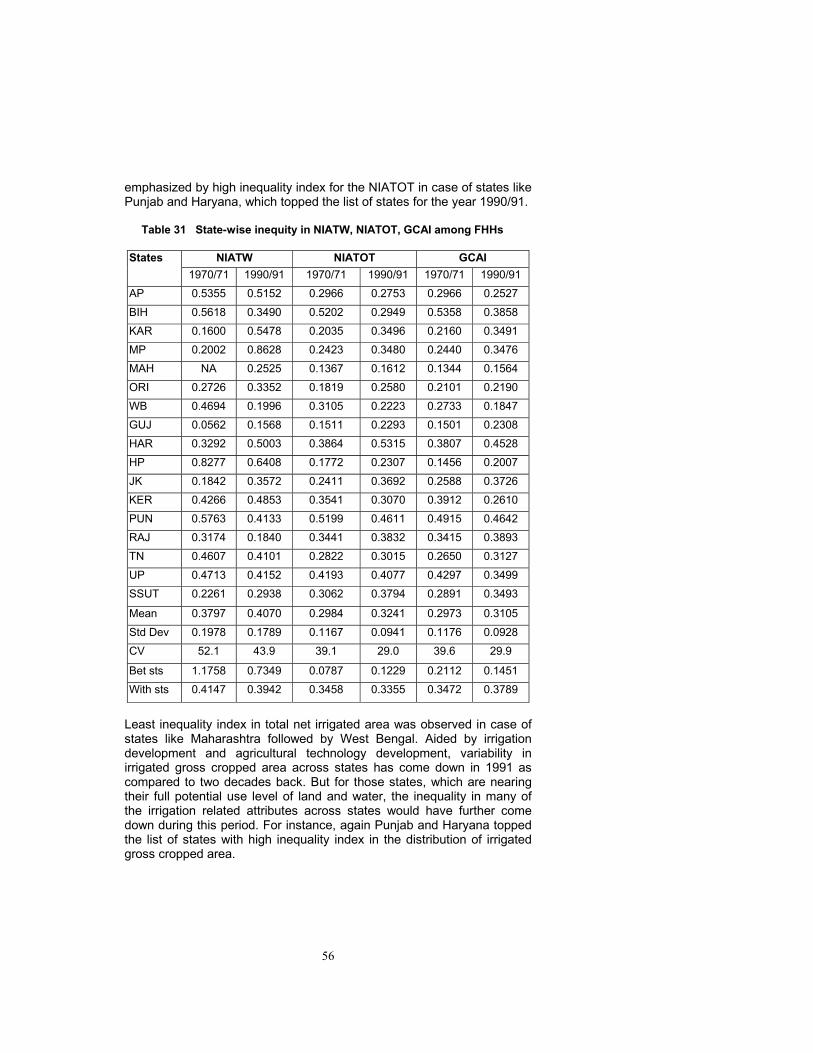
56
emphasized by high inequality index for the NIATOT in case of states like Punjab and Haryana, which topped the list of states for the year 1990/91.
Table 31 State-wise inequity in NIATW, NIATOT, GCAI among FHHs
NIATW NIATOT GCAI States 1970/71 1990/91 1970/71 1990/91 1970/71 1990/91
AP 0.5355 0.5152 0.2966 0.2753 0.2966 0.2527 BIH 0.5618 0.3490 0.5202 0.2949 0.5358 0.3858 KAR 0.1600 0.5478 0.2035 0.3496 0.2160 0.3491 MP 0.2002 0.8628 0.2423 0.3480 0.2440 0.3476 MAH NA 0.2525 0.1367 0.1612 0.1344 0.1564 ORI 0.2726 0.3352 0.1819 0.2580 0.2101 0.2190 WB 0.4694 0.1996 0.3105 0.2223 0.2733 0.1847 GUJ 0.0562 0.1568 0.1511 0.2293 0.1501 0.2308 HAR 0.3292 0.5003 0.3864 0.5315 0.3807 0.4528 HP 0.8277 0.6408 0.1772 0.2307 0.1456 0.2007 JK 0.1842 0.3572 0.2411 0.3692 0.2588 0.3726 KER 0.4266 0.4853 0.3541 0.3070 0.3912 0.2610 PUN 0.5763 0.4133 0.5199 0.4611 0.4915 0.4642 RAJ 0.3174 0.1840 0.3441 0.3832 0.3415 0.3893 TN 0.4607 0.4101 0.2822 0.3015 0.2650 0.3127 UP 0.4713 0.4152 0.4193 0.4077 0.4297 0.3499 SSUT 0.2261 0.2938 0.3062 0.3794 0.2891 0.3493
Mean 0.3797 0.4070 0.2984 0.3241 0.2973 0.3105 Std Dev 0.1978 0.1789 0.1167 0.0941 0.1176 0.0928 CV 52.1 43.9 39.1 29.0 39.6 29.9
Bet sts 1.1758 0.7349 0.0787 0.1229 0.2112 0.1451 With sts 0.4147 0.3942 0.3458 0.3355 0.3472 0.3789
Least inequality index in total net irrigated area was observed in case of states like Maharashtra followed by West Bengal. Aided by irrigation development and agricultural technology development, variability in irrigated gross cropped area across states has come down in 1991 as compared to two decades back. But for those states, which are nearing their full potential use level of land and water, the inequality in many of the irrigation related attributes across states would have further come down during this period. For instance, again Punjab and Haryana topped the list of states with high inequality index in the distribution of irrigated gross cropped area.
57
The spatial and temporal distribution of inequality in gross cropped area (GCA), all flow-irrigated area (ALLFLOW) and all lift-irrigated area (ALLLFT) are given in Table 32.
Table 32 State-wise inequity in GCA, ALL FLOW, ALLLFT among FHHs
GCA ALLFLOW ALLLFT States 1970/71 1990/91 1970/71 1990/91 1970/71 1990/91
AP 0.6287 0.4578 0.2568 0.1966 0.6050 0.5336 BIH 0.5634 0.4022 0.6186 0.2849 0.4536 0.3449 KAR 0.5067 0.4856 0.1675 0.2561 0.3782 0.5755 MP 0.4335 0.3970 0.1685 0.2037 0.3740 0.4890 MAH 0.2830 0.2962 0.0673 0.0467 0.2372 0.2611 ORI 0.2478 0.3487 0.1803 0.2454 0.2660 0.4934 WB 0.2696 0.1774 0.2979 0.2231 0.3648 0.2170 GUJ 0.2248 0.3981 0.0590 0.1351 0.1892 0.2567 HAR 0.3532 0.4444 0.4510 0.5802 0.3042 0.4999 HP 0.2869 0.2667 0.1734 NA 0.4635 0.4219 JK 0.4047 0.3590 0.2418 0.3717 0.1611 NA KER 0.3317 0.2657 0.3626 0.3467 0.2650 0.2437 PUN 0.4615 0.4572 0.5486 0.5695 0.4949 0.4127 RAJ 0.5692 0.5369 0.5714 0.5367 0.5046 0.3104 TN 0.3830 0.3888 0.2153 0.2254 0.4630 0.4463 UP 0.4174 0.3680 0.4737 0.3875 0.3996 0.4209 SSUT 0.2717 0.2823 0.3180 0.2354 0.1965 0.5558
Mean 0.3904 0.3725 0.3042 0.3028 0.3600 0.4052 Std. Dev 0.1234 0.0926 0.1739 0.1536 0.1282 0.1186 CV 31.6 24.9 57.2 50.7 35.6 29.3
Bet sts 0.3722 0.2514 0.1109 0.1895 0.4781 0.3187 With sts 0.4348 0.3787 0.3631 0.3032 0.4136 0.3959
From this table, following inferences are drawn: (1) Mean inequality index has come down for GCA and ALLFLOW but increased for ALLLFT during the two decades ending 1991. (2) The variability in the distribution of inequality among the states has come down in respect of all the irrigation attributes considered here namely, GCA, ALLFLOW and ALLFT. (3) Least inequality index for GCA is recorded in case of West Bengal. Maharashtra, Gujarat and Andhra Pradesh registered less inequality in ALLFLOW among all the states considered in this analysis. For ALLLFT, West Bengal led the states with least inequality index followed by Kerala
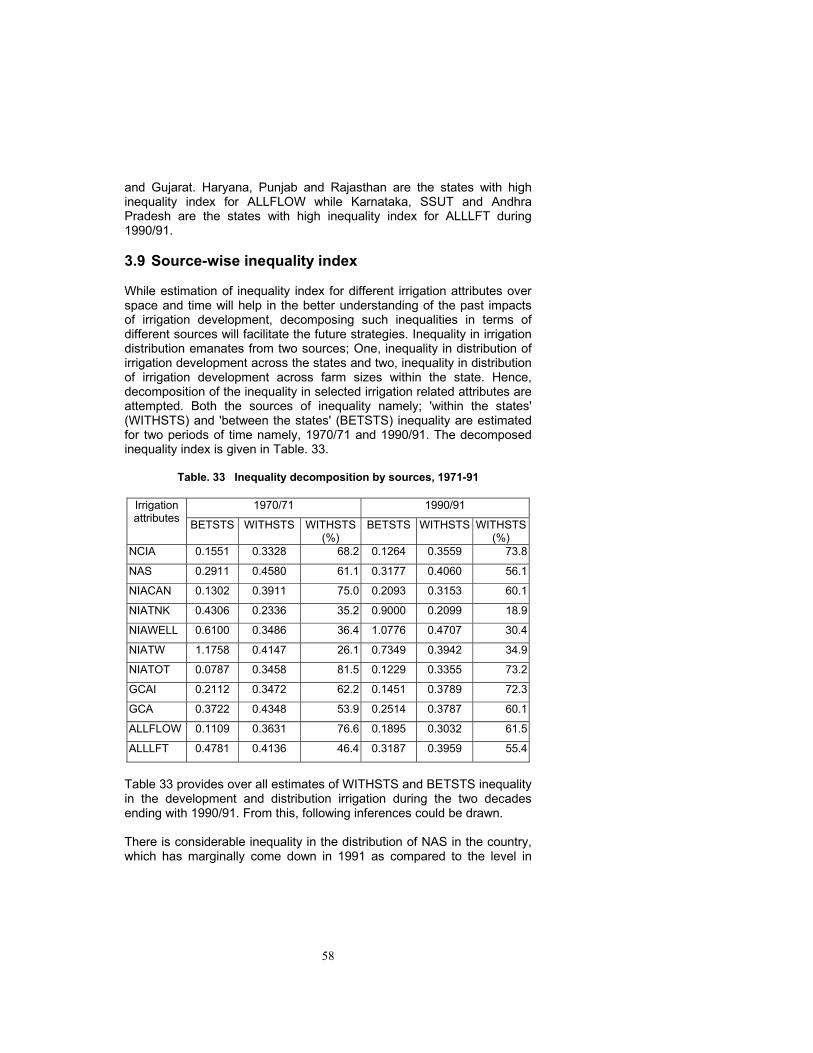
58
and Gujarat. Haryana, Punjab and Rajasthan are the states with high inequality index for ALLFLOW while Karnataka, SSUT and Andhra Pradesh are the states with high inequality index for ALLLFT during 1990/91. 3.9 Source-wise inequality index While estimation of inequality index for different irrigation attributes over space and time will help in the better understanding of the past impacts of irrigation development, decomposing such inequalities in terms of different sources will facilitate the future strategies. Inequality in irrigation distribution emanates from two sources; One, inequality in distribution of irrigation development across the states and two, inequality in distribution of irrigation development across farm sizes within the state. Hence, decomposition of the inequality in selected irrigation related attributes are attempted. Both the sources of inequality namely; 'within the states' (WITHSTS) and 'between the states' (BETSTS) inequality are estimated for two periods of time namely, 1970/71 and 1990/91. The decomposed inequality index is given in Table. 33.
Table. 33 Inequality decomposition by sources, 1971-91
1970/71 1990/91 Irrigation attributes BETSTS WITHSTS WITHSTS
(%) BETSTS WITHSTS WITHSTS
(%) NCIA 0.1551 0.3328 68.2 0.1264 0.3559 73.8
NAS 0.2911 0.4580 61.1 0.3177 0.4060 56.1
NIACAN 0.1302 0.3911 75.0 0.2093 0.3153 60.1
NIATNK 0.4306 0.2336 35.2 0.9000 0.2099 18.9
NIAWELL 0.6100 0.3486 36.4 1.0776 0.4707 30.4
NIATW 1.1758 0.4147 26.1 0.7349 0.3942 34.9
NIATOT 0.0787 0.3458 81.5 0.1229 0.3355 73.2
GCAI 0.2112 0.3472 62.2 0.1451 0.3789 72.3
GCA 0.3722 0.4348 53.9 0.2514 0.3787 60.1
ALLFLOW 0.1109 0.3631 76.6 0.1895 0.3032 61.5
ALLLFT 0.4781 0.4136 46.4 0.3187 0.3959 55.4
Table 33 provides over all estimates of WITHSTS and BETSTS inequality in the development and distribution irrigation during the two decades ending with 1990/91. From this, following inferences could be drawn. There is considerable inequality in the distribution of NAS in the country, which has marginally come down in 1991 as compared to the level in
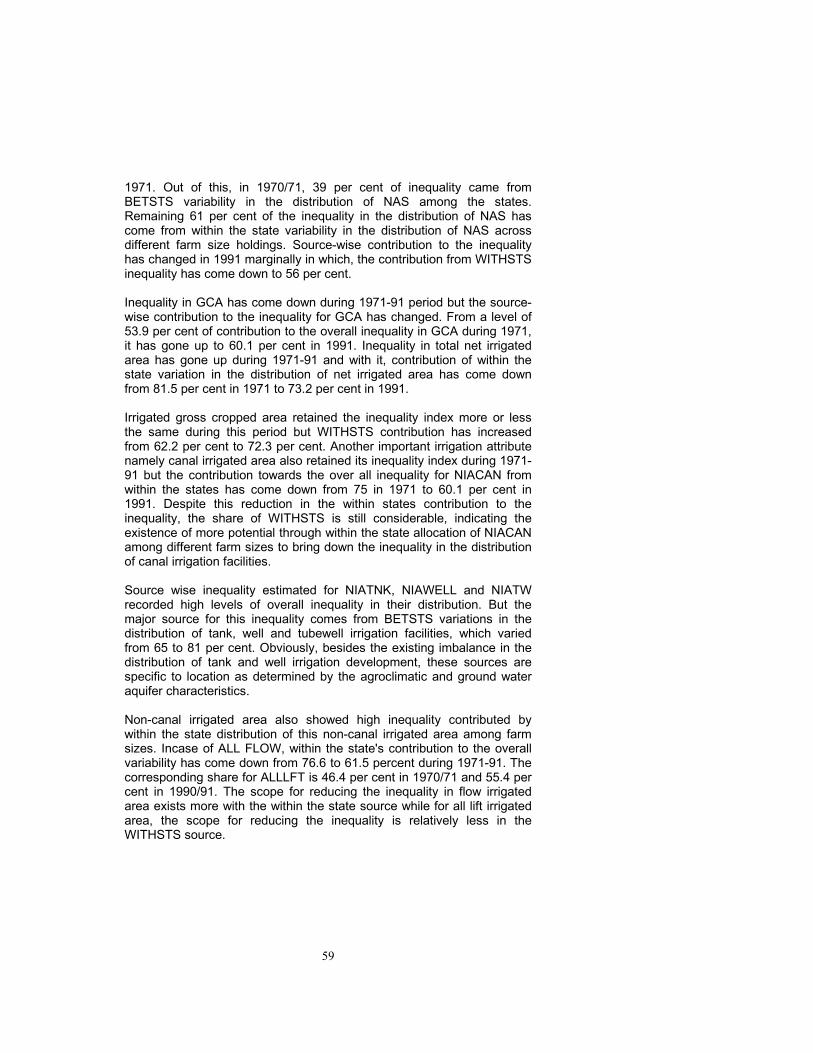
59
1971. Out of this, in 1970/71, 39 per cent of inequality came from BETSTS variability in the distribution of NAS among the states. Remaining 61 per cent of the inequality in the distribution of NAS has come from within the state variability in the distribution of NAS across different farm size holdings. Source-wise contribution to the inequality has changed in 1991 marginally in which, the contribution from WITHSTS inequality has come down to 56 per cent. Inequality in GCA has come down during 1971-91 period but the source-wise contribution to the inequality for GCA has changed. From a level of 53.9 per cent of contribution to the overall inequality in GCA during 1971, it has gone up to 60.1 per cent in 1991. Inequality in total net irrigated area has gone up during 1971-91 and with it, contribution of within the state variation in the distribution of net irrigated area has come down from 81.5 per cent in 1971 to 73.2 per cent in 1991. Irrigated gross cropped area retained the inequality index more or less the same during this period but WITHSTS contribution has increased from 62.2 per cent to 72.3 per cent. Another important irrigation attribute namely canal irrigated area also retained its inequality index during 1971-91 but the contribution towards the over all inequality for NIACAN from within the states has come down from 75 in 1971 to 60.1 per cent in 1991. Despite this reduction in the within states contribution to the inequality, the share of WITHSTS is still considerable, indicating the existence of more potential through within the state allocation of NIACAN among different farm sizes to bring down the inequality in the distribution of canal irrigation facilities. Source wise inequality estimated for NIATNK, NIAWELL and NIATW recorded high levels of overall inequality in their distribution. But the major source for this inequality comes from BETSTS variations in the distribution of tank, well and tubewell irrigation facilities, which varied from 65 to 81 per cent. Obviously, besides the existing imbalance in the distribution of tank and well irrigation development, these sources are specific to location as determined by the agroclimatic and ground water aquifer characteristics. Non-canal irrigated area also showed high inequality contributed by within the state distribution of this non-canal irrigated area among farm sizes. Incase of ALL FLOW, within the state's contribution to the overall variability has come down from 76.6 to 61.5 percent during 1971-91. The corresponding share for ALLLFT is 46.4 per cent in 1970/71 and 55.4 per cent in 1990/91. The scope for reducing the inequality in flow irrigated area exists more with the within the state source while for all lift irrigated area, the scope for reducing the inequality is relatively less in the WITHSTS source.
60
4 FUTURE IRRIGATION WATER DEVELOPMENT STRATEGIES 4.1 Equitable irrigation development
Relative equity performance of different sources of irrigation is compared for assessing the future strategies. For this comparison, index of NCIA and NIACAN inequalities over two periods of time is estimated. The states are arranged in the descending order of the index for 1970/71 and 1990/91. An index value of less than unity indicates the superior performance of NCIA in promoting equitable distribution of irrigation benefits across the farm sizes. An index value of more than one indicate the better performance of NIACAN in promoting equitable distribution of irrigation benefits across the selected five FHH categories (Table 34).
Table 34 Index of NCIA and NIACAN inequalities States 1971 States 1991 Gujarat 2.87 Maharashtra 4.83 Madhya Pradesh 2.38 Madhya Pradesh 2.39 Himachal Pradesh 2.33 Small States & Union
Territories 2.20
Maharashtra 2.22 Gujarat 1.95 Orissa 1.56 Andhra Pradesh 1.83 Andhra Pradesh 1.44 Orissa 1.56 Tamil Nadu 1.25 Karnataka 1.45 Jammu & Kashmir 0.97 Bihar 1.07 West Bengal 0.92 Uttar Pradesh 1.06 Punjab 0.90 Tamil Nadu 0.97 Karnataka 0.89 Jammu & Kashmir 0.91 Bihar 0.76 West Bengal 0.90 Uttar Pradesh 0.73 Haryana 0.86 Small States & Union Territories
0.70 Punjab 0.73
Haryana 0.68 Kerala 0.64 Kerala 0.54 Rajasthan 0.50 Rajasthan 0.23 Himachal Pradesh NA
States like Gujarat, MP, Maharashtra, Orissa and AP exhibited consistent trend in both the time periods. The NCIA/NIACAN index being more than
61
unity in these states, canal irrigated area proved to be superior in promoting equity in the distribution of irrigation benefits. Inequality values for NIACAN remained less than NCIA inequality in both the periods for these states and the magnitude of difference is also high with 1.44 as the lowest and 4.83 as the highest index value among these states. Canal irrigated area provides better option for improving the overall equity in irrigation distribution in these states. Therefore, equitable distribution of canal-irrigated area assumes greater significance in these states. With 2/3rd of the current inequality in canal irrigation distribution coming from within the state source, equitable distribution of irrigation water among the FHH categories within the state assumes greater significance in these states to reduce overall inequality in irrigation distribution. States like Rajasthan, Kerala, Punjab, Haryana, West Bengal and Jammu and Kashmir consistently registered less than unity value for the index during 1971 and 1991. Relatively, distribution of NCIA has contributed more for improving the equity in irrigation distribution as compared to that of NIACAN in these states. Around 3/4th of the inequality in NCIA distribution has come from within the states source, once again highlighting the necessity of targeting the equitable distribution of irrigation among the different FHH categories within the state. In 1971, in seven out of 17 states, canal irrigated area distribution had a better equity performance than NCIA and this number increased to nine states in 1991. This calls for spatially differentiated strategies by states and irrigation sources to specifically target for equitable distribution of irrigation coverage. Changes in the inequity levels of 11 irrigation related attributes during the period 1971 and 1991 are given in Table 35. Only in case of AP and Bihar, inequality in the distribution of all irrigation-related attributes has decreased during the two periods of time namely 1971 and 1991. But in case of Orissa, Gujarat and Haryana, inequality in the distribution of all irrigation attributes has increased during this period. States with most of the irrigation attributes recording increase in the levels of inequality during 1971-91 are Karnataka, MP, Maharashtra, Orissa, Jammu & Kashmir and SSUT. States with most of the attributes registering decrease in the levels of inequality during 1971-91 are WB, HP, Kerala, Punjab and Rajasthan. Such a wide variation in the levels of different irrigation attributes observed both over space and time underlines the absence of any definite trend which could be attributed to the past irrigation development policies. Mixed trends can at the best be indicative of not having any policies in the past, primarily focusing on equitable distribution of irrigation. In other words, equitable distribution of irrigation in future will have to be explicitly targeted in the irrigation development strategies. List of states with inequality levels higher than the mean levels of inequality is given in Table 36.
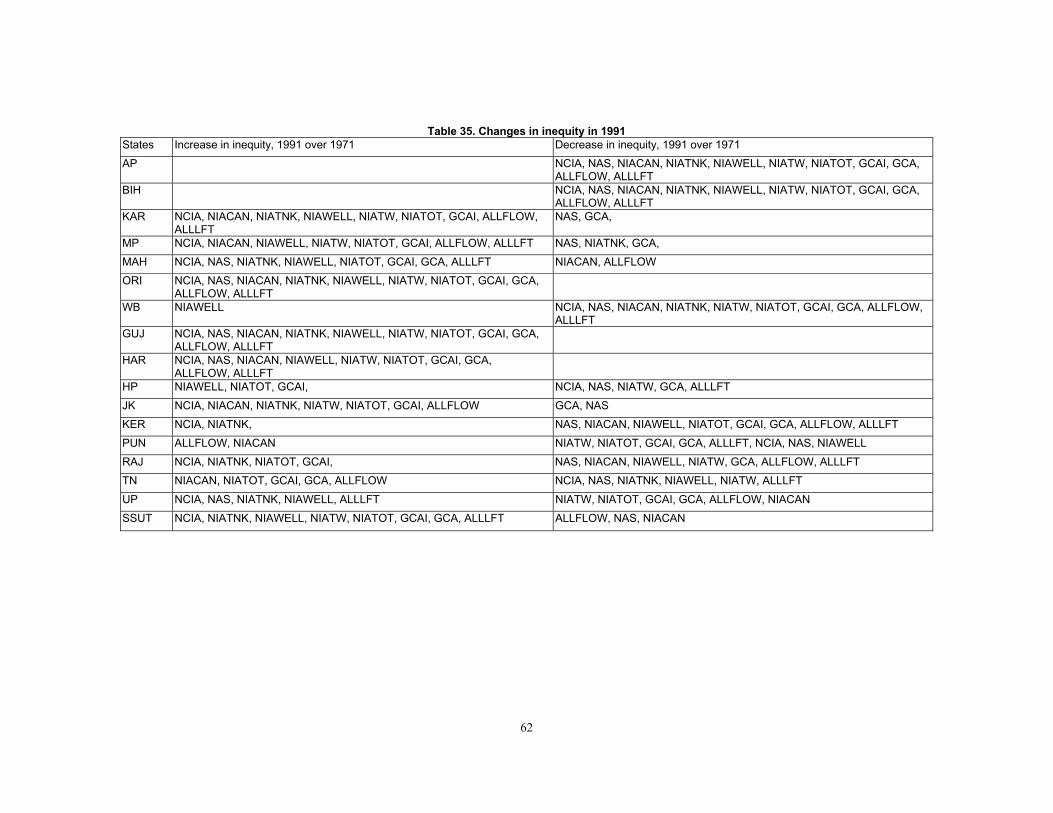
62
Table 35. Changes in inequity in 1991 States Increase in inequity, 1991 over 1971 Decrease in inequity, 1991 over 1971 AP NCIA, NAS, NIACAN, NIATNK, NIAWELL, NIATW, NIATOT, GCAI, GCA,
ALLFLOW, ALLLFT BIH NCIA, NAS, NIACAN, NIATNK, NIAWELL, NIATW, NIATOT, GCAI, GCA,
ALLFLOW, ALLLFT KAR NCIA, NIACAN, NIATNK, NIAWELL, NIATW, NIATOT, GCAI, ALLFLOW,
ALLLFT NAS, GCA,
MP NCIA, NIACAN, NIAWELL, NIATW, NIATOT, GCAI, ALLFLOW, ALLLFT NAS, NIATNK, GCA, MAH NCIA, NAS, NIATNK, NIAWELL, NIATOT, GCAI, GCA, ALLLFT NIACAN, ALLFLOW ORI NCIA, NAS, NIACAN, NIATNK, NIAWELL, NIATW, NIATOT, GCAI, GCA,
ALLFLOW, ALLLFT
WB NIAWELL NCIA, NAS, NIACAN, NIATNK, NIATW, NIATOT, GCAI, GCA, ALLFLOW, ALLLFT
GUJ NCIA, NAS, NIACAN, NIATNK, NIAWELL, NIATW, NIATOT, GCAI, GCA, ALLFLOW, ALLLFT
HAR NCIA, NAS, NIACAN, NIAWELL, NIATW, NIATOT, GCAI, GCA, ALLFLOW, ALLLFT
HP NIAWELL, NIATOT, GCAI, NCIA, NAS, NIATW, GCA, ALLLFT JK NCIA, NIACAN, NIATNK, NIATW, NIATOT, GCAI, ALLFLOW GCA, NAS KER NCIA, NIATNK, NAS, NIACAN, NIAWELL, NIATOT, GCAI, GCA, ALLFLOW, ALLLFT PUN ALLFLOW, NIACAN NIATW, NIATOT, GCAI, GCA, ALLLFT, NCIA, NAS, NIAWELL RAJ NCIA, NIATNK, NIATOT, GCAI, NAS, NIACAN, NIAWELL, NIATW, GCA, ALLFLOW, ALLLFT TN NIACAN, NIATOT, GCAI, GCA, ALLFLOW NCIA, NAS, NIATNK, NIAWELL, NIATW, ALLLFT UP NCIA, NAS, NIATNK, NIAWELL, ALLLFT NIATW, NIATOT, GCAI, GCA, ALLFLOW, NIACAN SSUT NCIA, NIATNK, NIAWELL, NIATW, NIATOT, GCAI, GCA, ALLLFT ALLFLOW, NAS, NIACAN
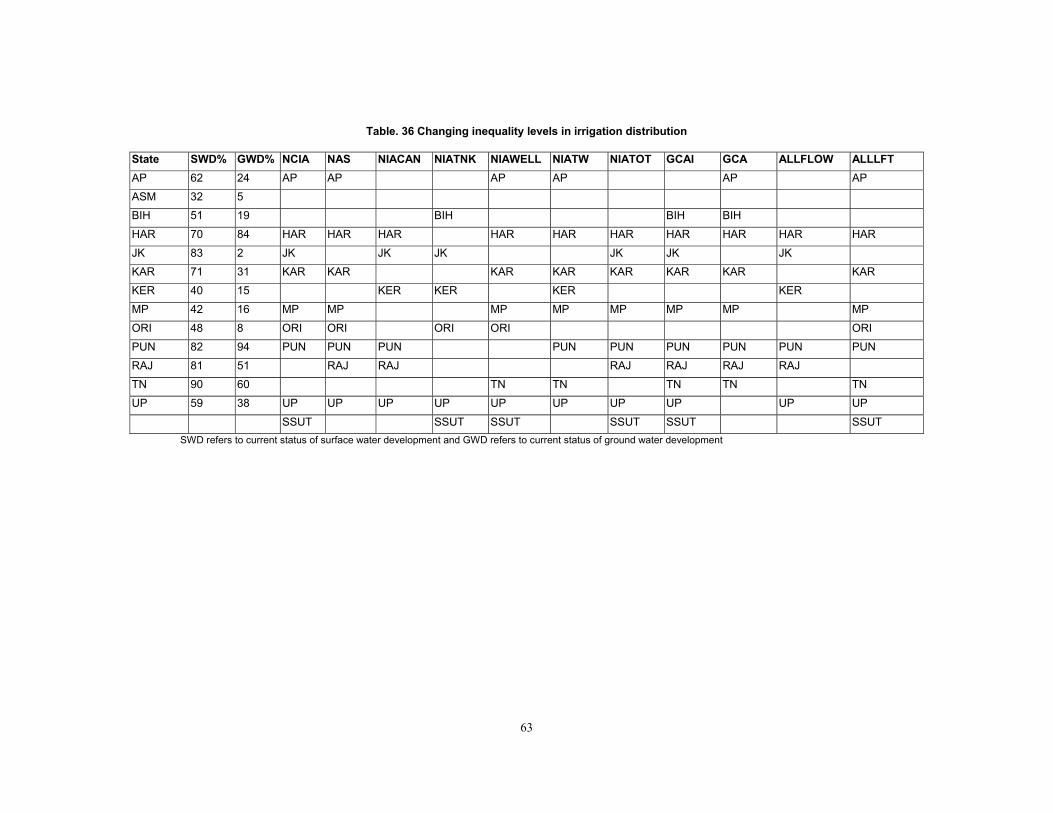
63
Table. 36 Changing inequality levels in irrigation distribution
State SWD% GWD% NCIA NAS NIACAN NIATNK NIAWELL NIATW NIATOT GCAI GCA ALLFLOW ALLLFT AP 62 24 AP AP AP AP AP AP ASM 32 5 BIH 51 19 BIH BIH BIH HAR 70 84 HAR HAR HAR HAR HAR HAR HAR HAR HAR HAR JK 83 2 JK JK JK JK JK JK KAR 71 31 KAR KAR KAR KAR KAR KAR KAR KAR KER 40 15 KER KER KER KER MP 42 16 MP MP MP MP MP MP MP MP ORI 48 8 ORI ORI ORI ORI ORI PUN 82 94 PUN PUN PUN PUN PUN PUN PUN PUN PUN RAJ 81 51 RAJ RAJ RAJ RAJ RAJ RAJ TN 90 60 TN TN TN TN TN UP 59 38 UP UP UP UP UP UP UP UP UP UP SSUT SSUT SSUT SSUT SSUT SSUT
SWD refers to current status of surface water development and GWD refers to current status of ground water development
64
Eleven irrigation-related attributes are considered for this. Punjab, Haryana and Uttar Pradesh are the states to have registered inequality levels higher than the mean levels in respect of most of the irrigation related attributes. Karnataka and Madhya Pradesh are the other states to closely follow similar trends exhibiting high inequality levels in many of the irrigation attributes. In southern states like, Andhra Pradesh, Tamil Nadu and Karnataka, non-canal related irrigation attributes recorded higher inequality levels than the mean values. In case of Kerala, both flow and lift irrigation attributes have shown higher inequality than their mean values. In most of these states, wherein, higher inequality levels are observed in both flow as well as lift irrigation related attributes, surface water development are nearer to two-third or even higher levels and similarly, ground water development is also much higher than other states. Such a tightening situation sharpens the equity goals in the context of future irrigation development, which has to encompass all the sources of water. Watershed based resource development strategies can no longer be viewed in isolation and will have to be integrated in to the irrigation development planning with equity goals coming to the forefront. In most of these states, watershed approach will have to be the major driving force in the coming years for improving the equity in irrigation distribution through direct augmentation of surface flows and improved ground water recharge. Despite having adequate technology backup in watershed development over years, the pace of progress in saturating the priority areas is far from satisfactory. The current status of diverse experience in watershed development in the country is briefly outlined in the following sections. 4.2 Watershed development: experiences and strategies Water is a vital input in agriculture. In order to sustain the food security goal realized, rainfed agriculture must contribute to food production growth in future. Currently, rainfed area contributes only 44 per cent to the total foodgrain production. If food production growth in future is to be rainfed-led, then water inter alia other inputs holds the key. Keeping in view the financial and other geo-physical constraints, judicious harvesting and utilization of rainwater should be given pre-eminence in every stage of water use planning and development. Only then, overall efficiency as well as equity in the use of irrigation water within the water sector can be ensured. The watershed concept is not something new in India. Water harvesting practices in the country date back to 300-400 BC. Peoples’ participation in impounding and utilizing rainwater was inherent up to the beginning of 20th century. Thereafter, due to a host of reasons, community involvement in water resource management started to decline.
65
4.2.1 Watershed management approach Watershed development in India is essentially multi-organizational based both in terms of implementation and participation. Broadly, they are implemented by organizations like central ministries, state departments, external agencies (like World Bank, EEC, DANIDA and individual governments like Germany and Sweden) and the NGO’s. Obviously, extent of participation and level of performance varies across the groups. Watershed concept in a technology development and generation mode was initiated during 1970’s. The ICAR under All India Coordinated Research Projects on Dry Land Farming took up 23 integrated watershed development models. Thereafter, 15 pilot projects for disseminating water conservation/harvesting technology were launched by the ICAR. In the early eighties, through the combined efforts of ICAR and Department of Agriculture & Cooperation, 42 model watershed development projects were developed. This combined effort was the launching pad for the National Watershed Development Programme for Rainfed Areas (NWDPRA) in the VII FYP. This ambitious plan targeted 99 select watersheds spread across the nation. In the VIII FYP, a number of projects for the integrated development of rainfed areas, based on watershed management approach are initiated. Under the Agricultural Ministry, four projects viz., the National Watershed Development Project for Rainfed Areas (NWDPRA), Soil Conservation in the Catchments of River Valley Projects, Integrated Watershed Management in the Catchments of Flood-Prone Rivers (FPR) and Watershed Development Projects for Control of Shifting Cultivation Area (WDPSCA) in North Eastern India are operational. There are 14 other internationally aided projects in which the Ministry is involved. The Ministry of Rural Areas and Employment is also involved in watershed development through programs such as DPAP, DDP and IWDP. The magnitude of investment and area treated by the central agencies are provided in the Tables 37 and 38 respectively. From Table 37, it is clear that NWDPRA and RVP are the dominant schemes in the watershed sector. This is followed by FPR and externally aided projects (EAP). Put together, total expenditure incurred by different schemes for watershed development stands at Rs.1368 crores. Area treated by RVP scheme accounts for 30 per cent of total area treated by all schemes. In all, around 80 lakh hectares have been treated. Distribution of problem area by states that requires watershed based treatment, current status of development and balance area to be treated with estimated financial requirements are outlined in Table 39. For the country as a whole, out of 1690 lakh ha of problem area identified, 29.8 per cent has been so far treated. For providing watershed based resource conservation treatment in the remaining 1187.15 lakh ha area, Rs 29736.65 crore is required at current prices. This estimate is based on per hectare cost requirement of
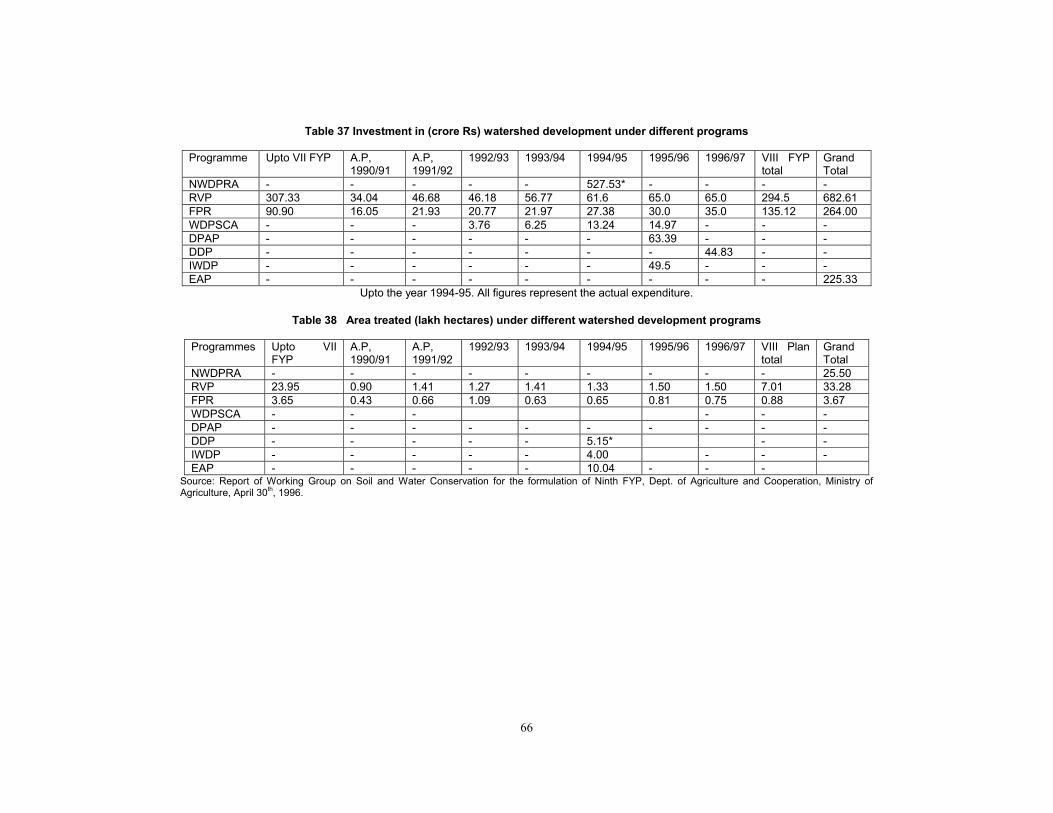
66
Table 37 Investment in (crore Rs) watershed development under different programs
Programme Upto VII FYP A.P, 1990/91
A.P, 1991/92
1992/93 1993/94 1994/95 1995/96 1996/97 VIII FYP total
Grand Total
NWDPRA - - - - - 527.53* - - - - RVP 307.33 34.04 46.68 46.18 56.77 61.6 65.0 65.0 294.5 682.61 FPR 90.90 16.05 21.93 20.77 21.97 27.38 30.0 35.0 135.12 264.00 WDPSCA - - - 3.76 6.25 13.24 14.97 - - - DPAP - - - - - - 63.39 - - - DDP - - - - - - - 44.83 - - IWDP - - - - - - 49.5 - - - EAP - - - - - - - - - 225.33
Upto the year 1994-95. All figures represent the actual expenditure.
Table 38 Area treated (lakh hectares) under different watershed development programs
Programmes Upto VII FYP
A.P, 1990/91
A.P, 1991/92
1992/93 1993/94 1994/95 1995/96 1996/97 VIII Plan total
Grand Total
NWDPRA - - - - - - - - - 25.50 RVP 23.95 0.90 1.41 1.27 1.41 1.33 1.50 1.50 7.01 33.28 FPR 3.65 0.43 0.66 1.09 0.63 0.65 0.81 0.75 0.88 3.67 WDPSCA - - - - - - DPAP - - - - - - - - - - DDP - - - - - 5.15* - - IWDP - - - - - 4.00 - - - EAP - - - - - 10.04 - - -
Source: Report of Working Group on Soil and Water Conservation for the formulation of Ninth FYP, Dept. of Agriculture and Cooperation, Ministry of Agriculture, April 30th, 1996.
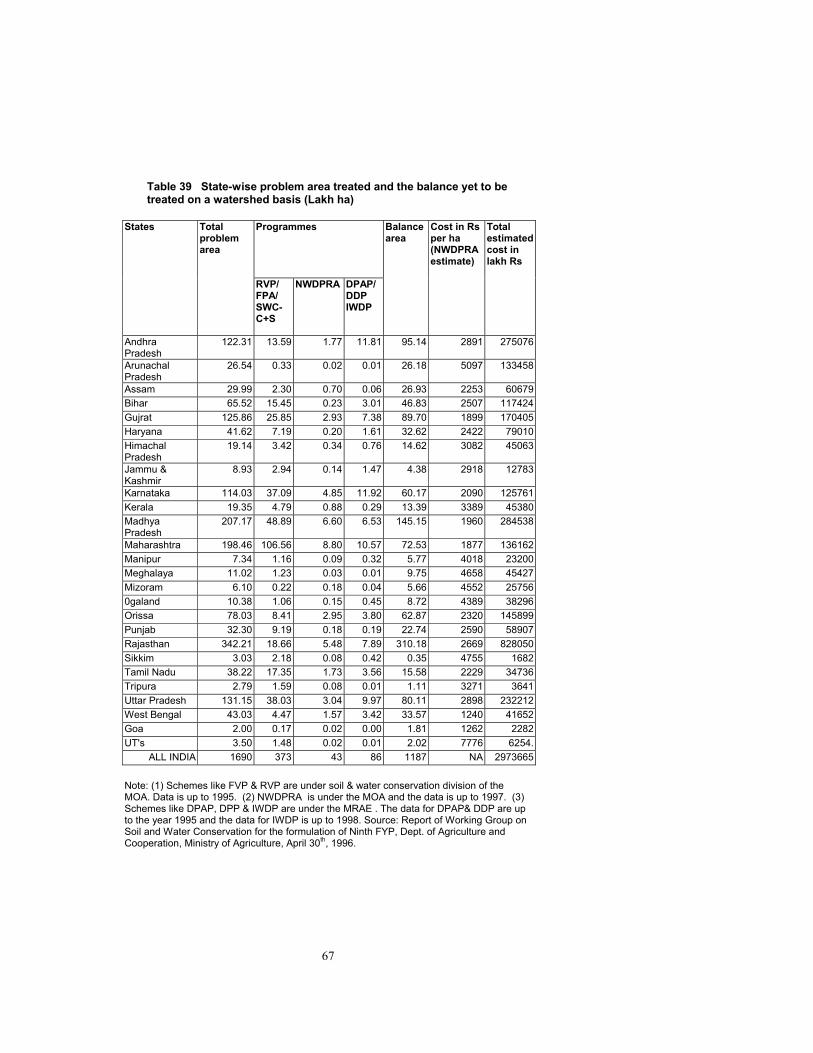
67
Table 39 State-wise problem area treated and the balance yet to be treated on a watershed basis (Lakh ha)
Programmes States Total
problem area
RVP/ FPA/ SWC- C+S
NWDPRA DPAP/ DDP IWDP
Balance area
Cost in Rs per ha (NWDPRA estimate)
Total estimated cost in lakh Rs
Andhra Pradesh
122.31 13.59 1.77 11.81 95.14 2891 275076
Arunachal Pradesh
26.54 0.33 0.02 0.01 26.18 5097 133458
Assam 29.99 2.30 0.70 0.06 26.93 2253 60679Bihar 65.52 15.45 0.23 3.01 46.83 2507 117424Gujrat 125.86 25.85 2.93 7.38 89.70 1899 170405Haryana 41.62 7.19 0.20 1.61 32.62 2422 79010Himachal Pradesh
19.14 3.42 0.34 0.76 14.62 3082 45063
Jammu & Kashmir
8.93 2.94 0.14 1.47 4.38 2918 12783
Karnataka 114.03 37.09 4.85 11.92 60.17 2090 125761Kerala 19.35 4.79 0.88 0.29 13.39 3389 45380Madhya Pradesh
207.17 48.89 6.60 6.53 145.15 1960 284538
Maharashtra 198.46 106.56 8.80 10.57 72.53 1877 136162Manipur 7.34 1.16 0.09 0.32 5.77 4018 23200Meghalaya 11.02 1.23 0.03 0.01 9.75 4658 45427Mizoram 6.10 0.22 0.18 0.04 5.66 4552 257560galand 10.38 1.06 0.15 0.45 8.72 4389 38296Orissa 78.03 8.41 2.95 3.80 62.87 2320 145899Punjab 32.30 9.19 0.18 0.19 22.74 2590 58907Rajasthan 342.21 18.66 5.48 7.89 310.18 2669 828050Sikkim 3.03 2.18 0.08 0.42 0.35 4755 1682Tamil Nadu 38.22 17.35 1.73 3.56 15.58 2229 34736Tripura 2.79 1.59 0.08 0.01 1.11 3271 3641Uttar Pradesh 131.15 38.03 3.04 9.97 80.11 2898 232212West Bengal 43.03 4.47 1.57 3.42 33.57 1240 41652Goa 2.00 0.17 0.02 0.00 1.81 1262 2282UT's 3.50 1.48 0.02 0.01 2.02 7776 6254.
ALL INDIA 1690 373 43 86 1187 NA 2973665 Note: (1) Schemes like FVP & RVP are under soil & water conservation division of the MOA. Data is up to 1995. (2) NWDPRA is under the MOA and the data is up to 1997. (3) Schemes like DPAP, DPP & IWDP are under the MRAE . The data for DPAP& DDP are up to the year 1995 and the data for IWDP is up to 1998. Source: Report of Working Group on Soil and Water Conservation for the formulation of Ninth FYP, Dept. of Agriculture and Cooperation, Ministry of Agriculture, April 30th, 1996.
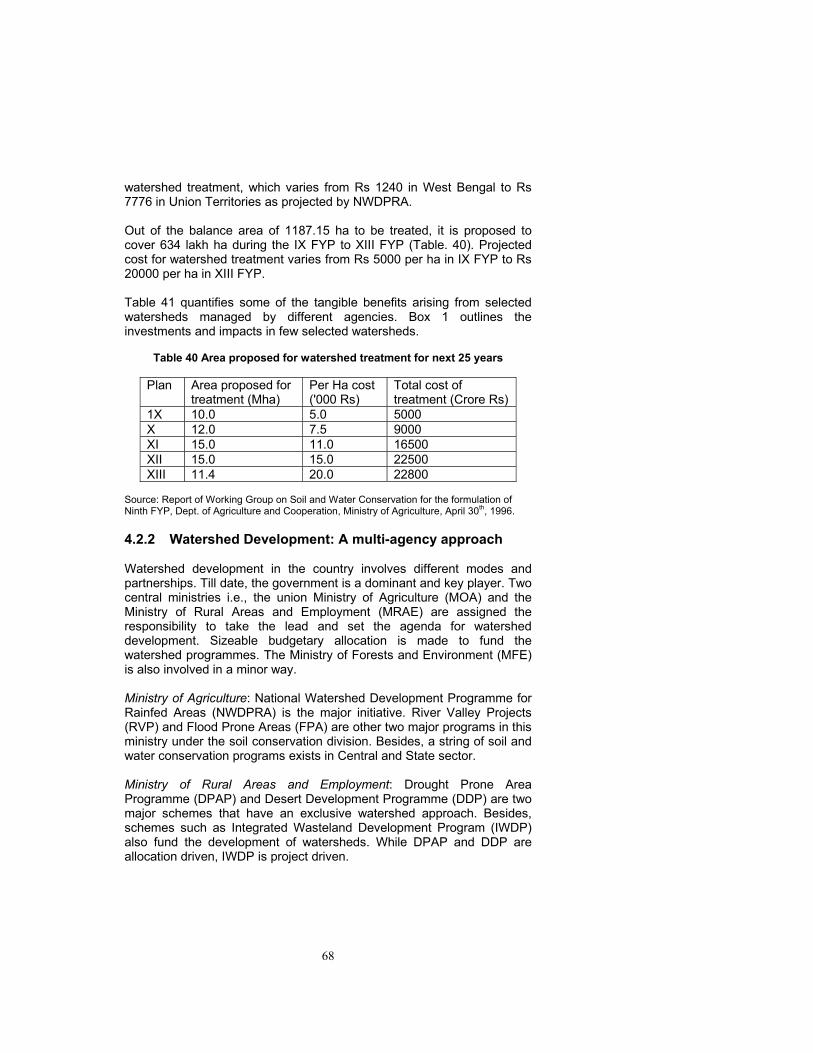
68
watershed treatment, which varies from Rs 1240 in West Bengal to Rs 7776 in Union Territories as projected by NWDPRA. Out of the balance area of 1187.15 ha to be treated, it is proposed to cover 634 lakh ha during the IX FYP to XIII FYP (Table. 40). Projected cost for watershed treatment varies from Rs 5000 per ha in IX FYP to Rs 20000 per ha in XIII FYP. Table 41 quantifies some of the tangible benefits arising from selected watersheds managed by different agencies. Box 1 outlines the investments and impacts in few selected watersheds.
Table 40 Area proposed for watershed treatment for next 25 years
Plan Area proposed for
treatment (Mha) Per Ha cost ('000 Rs)
Total cost of treatment (Crore Rs)
1X 10.0 5.0 5000 X 12.0 7.5 9000 XI 15.0 11.0 16500 XII 15.0 15.0 22500 XIII 11.4 20.0 22800
Source: Report of Working Group on Soil and Water Conservation for the formulation of Ninth FYP, Dept. of Agriculture and Cooperation, Ministry of Agriculture, April 30th, 1996. 4.2.2 Watershed Development: A multi-agency approach Watershed development in the country involves different modes and partnerships. Till date, the government is a dominant and key player. Two central ministries i.e., the union Ministry of Agriculture (MOA) and the Ministry of Rural Areas and Employment (MRAE) are assigned the responsibility to take the lead and set the agenda for watershed development. Sizeable budgetary allocation is made to fund the watershed programmes. The Ministry of Forests and Environment (MFE) is also involved in a minor way. Ministry of Agriculture: National Watershed Development Programme for Rainfed Areas (NWDPRA) is the major initiative. River Valley Projects (RVP) and Flood Prone Areas (FPA) are other two major programs in this ministry under the soil conservation division. Besides, a string of soil and water conservation programs exists in Central and State sector. Ministry of Rural Areas and Employment: Drought Prone Area Programme (DPAP) and Desert Development Programme (DDP) are two major schemes that have an exclusive watershed approach. Besides, schemes such as Integrated Wasteland Development Program (IWDP) also fund the development of watersheds. While DPAP and DDP are allocation driven, IWDP is project driven.

69
Table. 41 Performance evaluation of selected watershed programmes in India No Project Location and
Agro-Climatic Zone Source Nature of
Project Increase in Cropping Intensity (%)
Increase in productivity per hectare in percent in watershed areas
Returns per hectare ( Rs./ Ha)
Rate of return
1. Maharashtra : Western Plateau & Hill region
Saksena et al (1989)
Water Reservoir
NA NA Rs 3900-5000 BCR: 1.28 IRR :12.33
2. Maharashtra: Western Plateau & Hill region
Nawadkar & Shaikh (1989)
Land shaping, contour bunding, moisture conservation
NA NA Rs 2455 (103 % increase)
Net sown area increased by 14%
3. Karnataka: Southern Plateau & Hill region
Kulkarni et al. (1989)
Soil & run-off conservation
7.45 Kharif Sorghum: 3.6 Groundnut: 3.3, Chilli: 12.4, Cotton : 16.14, Rabi Sorghum: 1.44
NA NA
4. Karnataka: Southern Plateau & Hill region
Singh, Katar (1989)
Bunds, graded contours, farm ponds
NA Groundnut local : 1.68, Groundnut (HYV): 1.19, Pigeon pea, ragi: 5.23, ragi (HYV): 4.42
Incremental net returns: Rs.9,170
NA
5. Punjab; Himalayan foot hills
Singh et al (1991)
Livestock development & soil conservation
NA NA NA Overall Rate of return: 12.5% on forestry: 15.27%
6. Haryana: Himalayan foot hills
Chopra et al. (1990)
Water reservoir afforestation, creation of new institutions
NA NA NA Rate of return: 19%
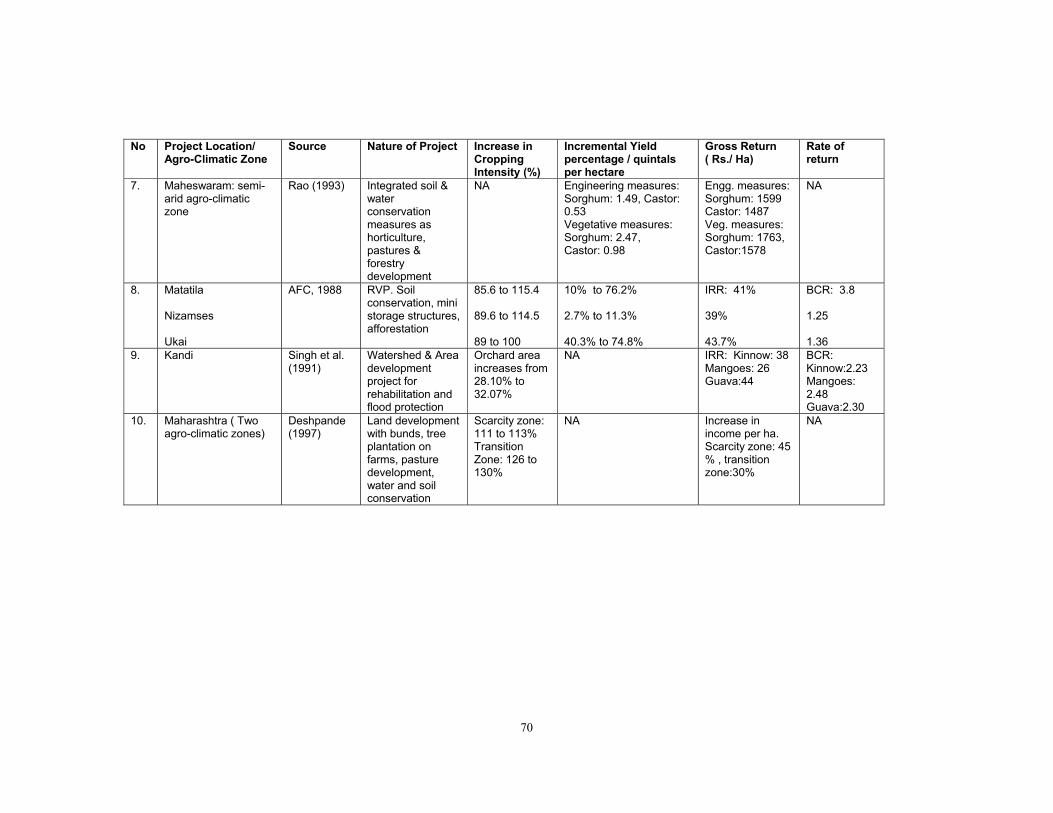
70
No Project Location/
Agro-Climatic Zone Source Nature of Project Increase in
Cropping Intensity (%)
Incremental Yield percentage / quintals per hectare
Gross Return ( Rs./ Ha)
Rate of return
7. Maheswaram: semi-arid agro-climatic zone
Rao (1993) Integrated soil & water conservation measures as horticulture, pastures & forestry development
NA Engineering measures: Sorghum: 1.49, Castor: 0.53 Vegetative measures: Sorghum: 2.47, Castor: 0.98
Engg. measures: Sorghum: 1599 Castor: 1487 Veg. measures: Sorghum: 1763, Castor:1578
NA
8. Matatila Nizamses Ukai
AFC, 1988 RVP. Soil conservation, mini storage structures, afforestation
85.6 to 115.4 89.6 to 114.5 89 to 100
10% to 76.2% 2.7% to 11.3% 40.3% to 74.8%
IRR: 41% 39% 43.7%
BCR: 3.8 1.25 1.36
9. Kandi Singh et al. (1991)
Watershed & Area development project for rehabilitation and flood protection
Orchard area increases from 28.10% to 32.07%
NA IRR: Kinnow: 38 Mangoes: 26 Guava:44
BCR: Kinnow:2.23 Mangoes: 2.48 Guava:2.30
10. Maharashtra ( Two agro-climatic zones)
Deshpande (1997)
Land development with bunds, tree plantation on farms, pasture development, water and soil conservation
Scarcity zone: 111 to 113% Transition Zone: 126 to 130%
NA Increase in income per ha. Scarcity zone: 45 % , transition zone:30%
NA
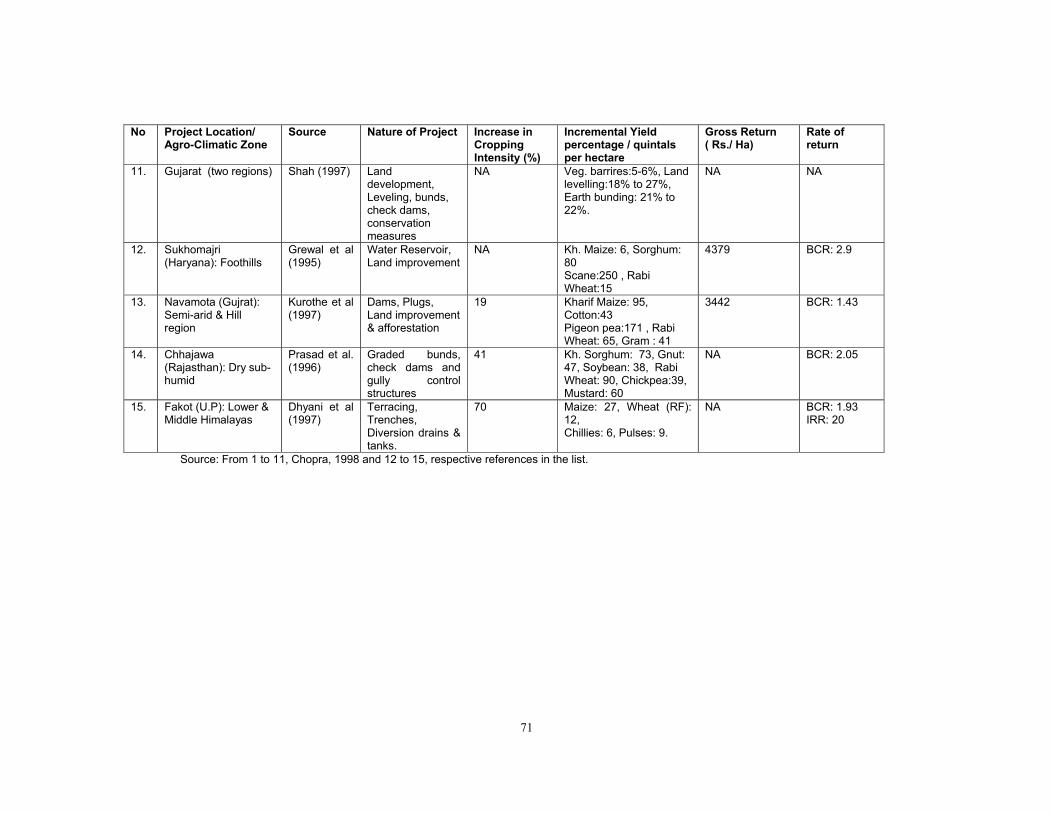
71
No Project Location/ Agro-Climatic Zone
Source Nature of Project Increase in Cropping Intensity (%)
Incremental Yield percentage / quintals per hectare
Gross Return ( Rs./ Ha)
Rate of return
11. Gujarat (two regions) Shah (1997) Land development, Leveling, bunds, check dams, conservation measures
NA Veg. barrires:5-6%, Land levelling:18% to 27%, Earth bunding: 21% to 22%.
NA NA
12. Sukhomajri (Haryana): Foothills
Grewal et al (1995)
Water Reservoir, Land improvement
NA Kh. Maize: 6, Sorghum: 80 Scane:250 , Rabi Wheat:15
4379 BCR: 2.9
13. Navamota (Gujrat): Semi-arid & Hill region
Kurothe et al (1997)
Dams, Plugs, Land improvement & afforestation
19 Kharif Maize: 95, Cotton:43 Pigeon pea:171 , Rabi Wheat: 65, Gram : 41
3442 BCR: 1.43
14. Chhajawa (Rajasthan): Dry sub-humid
Prasad et al. (1996)
Graded bunds, check dams and gully control structures
41 Kh. Sorghum: 73, Gnut: 47, Soybean: 38, Rabi Wheat: 90, Chickpea:39, Mustard: 60
NA BCR: 2.05
15. Fakot (U.P): Lower & Middle Himalayas
Dhyani et al (1997)
Terracing, Trenches, Diversion drains & tanks.
70 Maize: 27, Wheat (RF): 12, Chillies: 6, Pulses: 9.
NA BCR: 1.93 IRR: 20
Source: From 1 to 11, Chopra, 1998 and 12 to 15, respective references in the list.
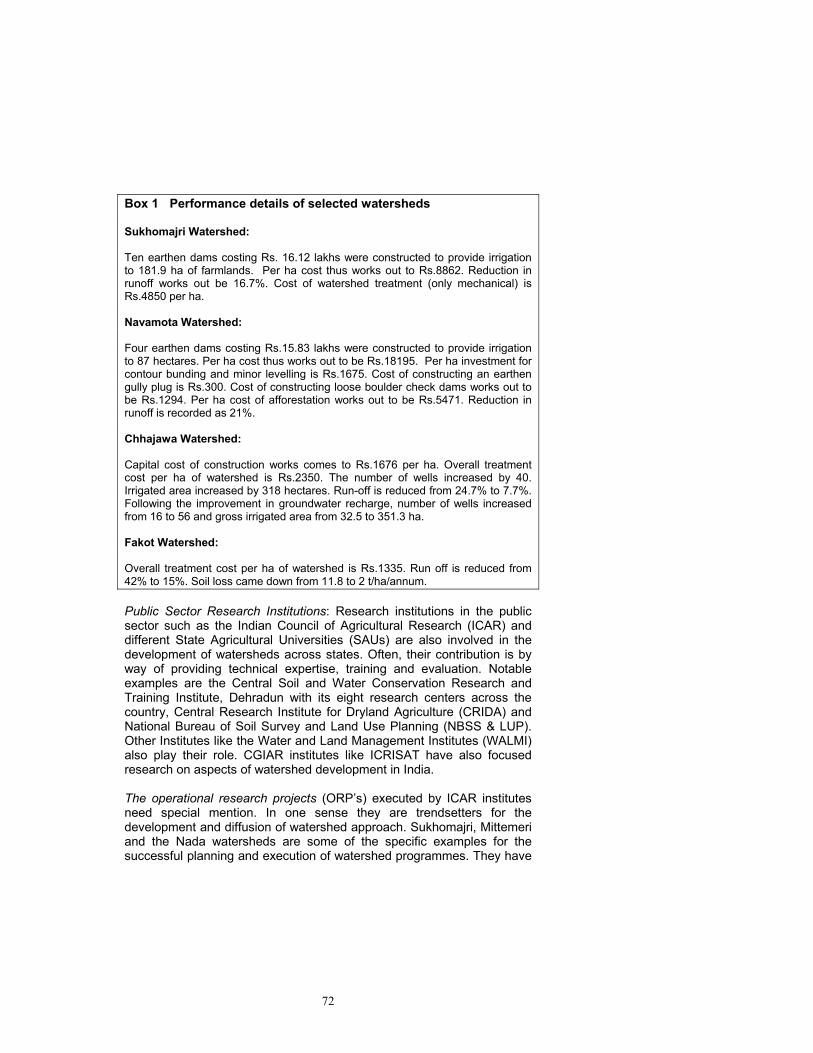
72
Box 1 Performance details of selected watersheds Sukhomajri Watershed: Ten earthen dams costing Rs. 16.12 lakhs were constructed to provide irrigation to 181.9 ha of farmlands. Per ha cost thus works out to Rs.8862. Reduction in runoff works out be 16.7%. Cost of watershed treatment (only mechanical) is Rs.4850 per ha. Navamota Watershed: Four earthen dams costing Rs.15.83 lakhs were constructed to provide irrigation to 87 hectares. Per ha cost thus works out to be Rs.18195. Per ha investment for contour bunding and minor levelling is Rs.1675. Cost of constructing an earthen gully plug is Rs.300. Cost of constructing loose boulder check dams works out to be Rs.1294. Per ha cost of afforestation works out to be Rs.5471. Reduction in runoff is recorded as 21%. Chhajawa Watershed: Capital cost of construction works comes to Rs.1676 per ha. Overall treatment cost per ha of watershed is Rs.2350. The number of wells increased by 40. Irrigated area increased by 318 hectares. Run-off is reduced from 24.7% to 7.7%. Following the improvement in groundwater recharge, number of wells increased from 16 to 56 and gross irrigated area from 32.5 to 351.3 ha. Fakot Watershed: Overall treatment cost per ha of watershed is Rs.1335. Run off is reduced from 42% to 15%. Soil loss came down from 11.8 to 2 t/ha/annum. Public Sector Research Institutions: Research institutions in the public sector such as the Indian Council of Agricultural Research (ICAR) and different State Agricultural Universities (SAUs) are also involved in the development of watersheds across states. Often, their contribution is by way of providing technical expertise, training and evaluation. Notable examples are the Central Soil and Water Conservation Research and Training Institute, Dehradun with its eight research centers across the country, Central Research Institute for Dryland Agriculture (CRIDA) and National Bureau of Soil Survey and Land Use Planning (NBSS & LUP). Other Institutes like the Water and Land Management Institutes (WALMI) also play their role. CGIAR institutes like ICRISAT have also focused research on aspects of watershed development in India. The operational research projects (ORP’s) executed by ICAR institutes need special mention. In one sense they are trendsetters for the development and diffusion of watershed approach. Sukhomajri, Mittemeri and the Nada watersheds are some of the specific examples for the successful planning and execution of watershed programmes. They have

73
had tremendous demonstration-effect. Many watersheds were subsequently developed on these models. Bilateral Mode: In the bilateral mode, examples are Indo-Dutch, Indo-Sweden, Indo-UK and Indo-German partnerships. The Danish government has been active in funding watersheds in the states of Karnataka, Orissa, Tamil Nadu and Madhya Pradesh. While SIDA supports watersheds in the state of Rajasthan, the German government lends its support to Maharashtra and Karnataka. The agencies involved in watershed development can be broadly classified as: 1. Government Centre and the state. 2. Public sector research institutions like the ICAR & SAU’s 3. Bilateral Indo-Dutch and Indo-German 4. Multilateral the World Bank, FAO 5. NGO’s TBS, GPF, MYRADA, AVRD, PRIYA and DA’s 6. Donor/ Philanthropic organizations DFID & Ford Foundation 7. Peoples' initiatives: Ralegaon Siddhi, Lapodia, Gopalpura,
Doodatholi 4.3 Alternate institutional models for Watershed
Development 4.3.1 People's Initiative The Backdrop There are instances, few and far in between though, of people-led efforts in Watershed development (WSD) in India. This mode of WSD is economically, ecologically and institutionally sustainable. People-led initiatives in WSD in the country are not something new. Historically, India has had a rich experience of this mode. This mode of WSD assumes greater importance in the present socio-economic and biophysical setting. For a host of reasons, ranging from the process of colonization to the gradual erosion of moral, social and cultural fabric, informal institutions and the governmental ownership of common property resources led to the degradation of these resources. In short, the people lost confidence in the regime and also in themselves. The people became helpless with this process of confidence loss and helplessness accelerated with time. Now, one fact that of people’s participation is not only clearly established but also widely acknowledged. Any program, irrespective of the source of funding or execution, depends critically on the degree of people’s involvement for its success. In the past two decades, there has been sporadic but encouraging instances of the resurgence of the process of people- led initiatives in the management of

74
natural resources. Correspondingly, the regime, both Centre and State have attempted to decentralize, empower and promote participation of people by a host of policy instruments. The Paradigm People’s involvement is sine-qua-non for any program to succeed. Participatory Watershed Management (PWSM) is the cliché used to describe the people-driven WSD. For a variety of reasons, WSD in the people-led mode is not only ideal but also the most effective. Following are the major reasons for the inherent success of this paradigm. First, such programs internalize the native culture. Second, a sense of ownership and belonging is in-built the members of the community become the stakeholders and shareholders in one stroke. Third, the institution evolving through such a process is voluntary, vibrant democratic and guarantees ‘common interest’. Fourth, more often than not such a paradigm is self-sustaining from different perspectives. The foremost being the financial angle. In programs wherein people’s participation is inherent and assured, projects are often self-financed. Such projects sustain in the literal sense of the word. Continuum of the project is guaranteed in the different phases of the project planning, implementation and maintenance. It is the last phase i.e. maintenance that is crucial and vulnerable in the other modes of WSD. Due to the factors listed above (and many other unlisted), this paradigm is not only ideal, sustainable, fitting (to our peculiarities) but comes with an element of intrinsic success as a bonus. Pre-requisite for the success and large-scale replication of such a process is only one non-interference. If this critical necessity along with other sufficient conditions is ensured, success is inevitable. Case Study No literature on people-led efforts in WSD can be complete without mentioning two successful examples; Ralegan Siddhi in Maharashtra and Lapodia in Rajasthan. These are worth quoting as they fall in the chronic dry-belt of our nation. Apart from these two excellent WSD models, there are at least a dozen examples scattered across different agro-ecological regions of the country. Located in the Parner thesil of Ahmednagar district of Maharashtra state, the Ralegan Siddhi village typifies the vast tracts of rainfed agriculture in the country. With an annual rainfall range of 50 to 700mm, it represents the archetypal drought-prone area. The PWSM experiment though involves the entire community of the village, the precursor of this process was one individual Sri. Kishan Baburao Hazare. In other words, he catalyzed the entire process of PWSM in the village. The baseline situation (prior to 1975) of both natural resources and the social fabric
75
was rather dismal. Groundwater table was below 20 m, only 20 ha of irrigated area, around 70 per cent of the households were living below poverty line. In the scheme of things, utmost priority was given to the renovation, resurrection and management of four watersheds in the village. This process was initiated with a judicious mix of mechanical and vegetative structures; drainage system, trenches, check dams, drainage plugs, percolation tank and reforestation by planting 500000 saplings. Voluntary labor stands out as the major factor in this process of harvesting rain water. As a (cumulative and interactive) result of all this, the groundwater was recharged to a substantial extent and is available throughout the year at 6.5 m depth. Irrigation potential in the village has increased manifold to 2800 ha. The PWSM centered experience in Ralegan Siddhi is holistic in its approach. There has been complete socio-economic transformation. Though, enhancement of agricultural productivity through rain-water harvesting was the driving force; the process achieved much more. Gandhian approach is the basis of the experiment. Cooperative management of natural resources, focus on women, evolution of democratic institutions, selfless leadership are unique features of this experiment. The PWSM exercise has had a string of spin-off effects such as total prohibition of alcohol and dowry, ban on open grazing and felling of tress, family planning and access to primary education. Lapodia village is located in the Alwar district of Rajasthan state. Situated in the arid-zone, without assured irrigation source; natural resources in the village had degraded beyond recognition. The agro-pastoral economy was characterized by human and livestock migration out of compulsion to make ends meet. Water-fodder scarcity coupled with dilapidated water storage structures were the major bottlenecks faced by the villagers. In order to arrest and rejuvenate their resources, the villagers started a PWSM process in the early 90’s. The process was again initialized and catalyzed by one individual Sri. Laxman Singh. A council of village elders, Gram Sabha was conceived to formulate and enforce a strict code of conduct and regulation in the CPR’s of the village. To harvest the rain water, mechanical and vegetative measures were undertaken. De-silting and strengthening the earthen embankment of the dilapidated village tank was the first effort. The percolation tank was also subject to similar activity later. An earthen wall was constructed around the pasture land for demarcation. Reforestation was initiated on the common lands. Subsequently, a culvert was constructed on the existing percolation tank. Another percolation tank in the proximity of the existing tank was constructed. All such activities are through the contribution from the people themselves. A deep drainage channel was also constructed to divert the surface run-off of rain water. Earthen bunds (‘Chaukas’) and
76
trenches (‘Santra’) were constructed in the pasture land. Irrigation canals were also fabricated. In sum, the soil and water conservation measures undertaken in the village have been self-financed and completely indigenous in technology. The result of these S&W conservation measures has been reflected in the substantial rise in both production and productivity of agriculture. A 100 percent increase in Kharif production was realized. For the first time, maize and pulses were cultivated in the Rabi season also. 300 out of the total 500 ha of agricultural land started receiving assured irrigation. As in the case of Ralegan Siddhi, here too there have been tremendous spin-off effect self-sufficiency and even surpluses in food-grains, fodder and livestock products, access to primary education and health care, empowerment of women and the democratization of political institutions at the grassroots. Such PWSM models need large-scale replication. The necessary and sufficient condition for successful replication obviously is “peoples participation”. 4.3.2 Bilateral Partnership
The Backdrop Recognizing the potential of WSD in ensuring all round rural development in a sustainable manner and alleviating poverty, few developed counties have chipped in with funds. Notable among these are the governments of Denmark, Germany, Sweden and United Kingdom. In the bilateral mode of WSD, the funding countries opt to have partnerships with select state governments. Often, these partnerships are based on well defined principles. Usually, these principles differ at various stages of WSD. In this WSD approach, the state governments and/or their departments play a major role. Non-governmental organizations (NGO’s) also have an important role in the overall scheme of things. Budgetary allocations to WSD programs are drying up particularly at the state level. Funding from developed countries are therefore, welcome considering the current context of financial crunch. The Paradigm Bilateral mode of WSD brings with it certain advantages. First, the participating country from abroad contributes valuable financial resources. Second, monitoring at various stages of WSD is relatively superior. Third, more often than not the element of PWSM is ensured. Generally, the departments of respective state governments are the implementing agencies. NGO’s are roped in to organize, train and motivate the farmers. Beneficiaries (farmers) are also expected to contribute 10 to 25 percent of the total cost of the project ( as in the Indo-
77
Swedish partnership) or through labor. In the Indo-German program for example, there is an explicit emphasis on the involvement of NGOs. An Illustration Here we illustrate in detail the WSD experience in the bilateral mode by taking the case of Indo-Denmark partnership. Popularly known as DANIDA projects, the Danish government is implementing WSD programs in the states of Karnataka, Orissa, T.N and M.P. Specifically, the Bommasandra watershed in the Dharwad district of Karnataka state and the Canaan watershed in Brougham block of Corrupt district of Orissa state are illustrated. In Dharwad, the implementing agency is the state Department of Agriculture. Organization of the farmers is the responsibility of the junior program officers of the department. This process was initially achieved by involving youth groups in the villages. Later this process was facilitated by “link couples” in each of the villages. Hence, several watershed associations were established. Though the farmers are consulted at stage of project design, the extent of incorporation of their suggestions is rather limited. The degree of farmers’ contribution varies according to the component of the WSD project. For the saplings in horticulture and forestry components, farmers have to pay for 50 percent of the total costs. Both mechanical and vegetative measures are employed. S & W conservation structures along drainage lines and extensive planting of vetiver grass on field boundaries are the major treatments. In Corrupt, the implementing agency is the state Department of Soil Conservation. Social organization is achieved by roping in NGO’s. Two link workers from each village establish self-help groups (SHG’s) and village level organizations. Here also the inclusion of farmers’ inputs is rather limited. Farmers contribute only 10 percent of the total project cost by way of their labor. Total project area is 4052 ha. out of which 1215 ha. have been treated. The cost per hectare comes to Rs.3,500 per hectare. Treatments both mechanical and vegetative are on similar lines as in Dharwad. Bilateral approach to WSD is important from the view-point of funding. There are certain advantages as well as shortcomings. Mutually beneficial partnerships can be made more productive if the shortcomings are overcome by learning lessons from the experiences in other countries and the people’s initiative mode. 4.3.3 Multilateral Mode The Backdrop Multilateral institutions too lend support to WSD efforts in the country. The World Bank is a fine example of this approach. In 1990/91, an
78
integrated WSD project (IWDP) was launched in seven states. Gujarat, Rajasthan and Orissa came under IWDP (plains) and J&K, H.P., Punjab and Haryana (Hills). The time frame for the entire project was seven years, the first three years being the pilot phase and the next four years expansion phase. As on December 1995, the world bank has treated 2.59 and 1.46 lakh hectares by spending Rs. 182.48 and Rs.187.58 lakhs in the plain and the hills respectively. The European Economic Community (EEC) is another example for the multi-lateral approach. Three projects in the state of Uttar Pradesh are being funded ranging from 65 to 95 percent of the total cost by the EEC. The balance is borne by the state government. This project was launched in 1993 for a period of nine years with an outlay of Rs.766 million. The target area for treatment was 1.72 lakh hectares. The Paradigm Like the bilateral approach, the multilateral mode of WSD is welcome as they come with much needed funds. Here too the implementing agencies are the relevant state departments. PWSM is one of the major institutional objectives. NGO’s cater to the need of organizing farmers. While the treatments are selected from a list of eligible treatments, beneficiaries have no choice regarding the kind of treatment. Panchayats contribute 10 percent of the costs and private land owners contribute 15 per cent of the labor cost and planting material. An Illustration By looking into the details of WSD programs one each in the states of Orissa and Rajasthan, insights into the multilateral approach of WSD can be gained. The Jatni watershed is located in the Khorda district of Orissa state. The state department of soil conservation is the implementing agency. The total watershed area of 26,273 ha has 53 mini-watersheds. Loose rock check dam, bunds around the village tank and drainage lines treatment were some of the major mechanical interventions. Contour hedges, protection of pasture land and plantations are the vegetative measures. The cost per hectare works out to be Rs.3700. The village association had equitable representation in terms of the caste-composition and gender representation. In this particular watershed no costs are shared by the farmers. In Rajasthan, Bilwara district is the choice of illustration. The entire district is divided into many macro and micro watersheds. The state watershed development and soil conservation departments are the implementing agencies. As in the other example, the treatments are based on donor-standards with little or no input from farmers. Both mechanical and vegetative treatments are undertaken. Check dams, masonry structures and dugout ponds constitute the mechanical
79
measures. The vegetative intervention is by way of contour barriers, alley cropping and horti-silviculture plantations. The beneficiaries contribute by way of labor. Up to 10 percent of the wages are withheld as contribution. The cost per hectare works out to around Rs.7000. Village level committees take care of the CPRs and other interventions. 4.3.4 ICAR-Research Mode The Backdrop WSD experiences of the Indian Council of Agricultural Research (ICAR) a research organization in the public domain dates back to the decade of the 70’s. Initially, under the All India Coordinated Projects on Dry land Farming (AICRIPs) the ICAR took up 23 integrated watershed development models on an experimental basis. Thereafter, 15 pilot projects were launched to disseminate water harvesting technologies. Subsequently, 42 model WSD projects were jointly developed by the ICAR and the Department of Agriculture and Cooperation in the early 80’s. This was the basis for the launching of the National Watershed Development Programs (NWDPRA) in the seventh five year plan. CGIAR institutes like the ICRISAT has also undertaken substantial research work in WSD in the semi arid tropics. Few state agricultural Universities (SAUs) are involved in watershed R&D. The Paradigm Treatments are based on strong technical foundation and people’s involvement, with an emphasis on crop production in particular and overall development of the natural resources in general. The Union Ministry of Agriculture funds WSD efforts through budgetary allocations to the ICAR. The Central Soil and Water Conservation Research and Training Institute, head-quartered at Dehradun have nine regional centres. Research staff of the centres is multi-disciplinary in character. After a thorough review of the ground situation, project staff zero-in on the kind of treatment required. Both mechanical and vegetative interventions are undertaken. Apart from rehabilitating the CPRs, the major objective is the integrated development of the farms in the watershed. Organizing the farmers is again done by the scientists themselves. In order to take stock of the initial situation and sensitize the beneficiaries, Rapid Rural Appraisal (RRA) and Participatory Rural Appraisal (PRA) techniques are employed. Ex-ante, ex-post and concurrent evaluation are often ingrained in the scheme of things. Case Study The ICAR-Research approach is characterized by two operational research projects (ORPs). In more ways than one the Sukhomajri example is a celebrated one. The ORP Sukhomajri was initiated by the
80
Chandigarh centre of the Central Soil and Water Conservation Research Training Institute (CSWTRI) in 1975. Being located in the ecologically fragile Shiwalik foothill region, Sukhomajri was no exception to the processes of deforestation, denudation of hills, overgrazing, sedimentation of water sources and associated problems relating to soil erosion. The technological package consisted of vegetative and mechanical treatment of the catchment area, construction of earthen dams, pipe outlets, irrigation pipelines, land improvements and appropriate cropping sequences. In all, ten earthen dams were constructed in the hills in and around Sukhomajri. These dams not only stored the rainwater but also provided supplemental irrigation to farm lands. The cost per hectare (Sukhomajri II project) works out to be Rs. 4850 per hectare. Water users association (WUA) has become a reality in the watershed. The Sukhomajri WSD model went to achieve all round development. The villagers became secure from different viewpoints viz., food, fodder, fuel, drought, flood, ecology and social. Cumulative and interactive benefits from the WSD process were immense. Runoff was reduced by 16.7%. Total food grain production in the village grew exponentially by about 300 percent from 45 tons per year in 1975 to 185 tons per year in 1988. Similarly, fodder output increased by 330 percent from 73 tons per year in 1975 to 317 tons in 1988. Forest area increased by 150 percent. Crop productivity registered impressive performance. The BCR estimated at 2.9 is a reflection of the success of the project. In sum, there was a perceptible improvement in the standard of living. The Navamota watershed is located in the Khedbrahmma Tehsil of Sabarkantha district in the state of Gujrat. The regional centre of CSWTRI in Vasad was instrumental in developing the watershed. While the comprehensive action plan was prepared by the researchers in the centre, the State Land Development Corporation was the executing authority. In 1987, a technological package combining vegetative and mechanical measures was initiated. The mechanical treatments consisted of two masonry dams, four earthen dams, 37 earthen gully plugs, 17 loose boulder check dams, contour bunding and leveling on 197 hectares. Reforestation and silvi-pasture on CPRs constituted the vegetative interventions. An integrated development of farms via enhancing crop productivity and soil health was also an important component of the overall package. Benefits from the WSD process are manifold. Runoff was reduced by 21 percent. Irrigated area increased by 124 percent. Crop productivity recorded significant improvements ranging from 44 to 197 percent. With a BCR of 1.8, this WSD experience is hugely successful.
81
The University of Agricultural Sciences (UAS) Bangalore, has undertaken and successfully demonstrated WS R & D. The Mittimeri and Kabbalanala watershed ORPs are models for replication in similar agro-climatic zones.
4.3.5 The NGO’s experience The Backdrop Non Governmental Organizations (NGOs) do play a critical role in WSD in the country. The NGOs contribute in whole or in part at different stages of WSD. The role of NGOs in WSD in general and PWSM in particular has become important in the context of shortcomings of other approaches. The problem lies either in the pre-project-phase (PPP) or at the post-operative-phase (POP). In the PPP, the involvement or rather the lack of it is a major concern and often detrimental to the success of the entire project. Maintenance of the treatments and assets created is the vital issue in the PPP. NGOs contribute substantially, especially in the PPP. Inter alia, insensitivity, lack of expertise, people’s perception of the regime, lack of an unified command, target-orientation, and low priority on training and organizational components in the alternative modes has created a vacuum. It is this vacuum that the NGOs attempt to fill in. The Paradigm Generally, the NGOs organize and sensitize beneficiaries prior to the actual initiation and subsequent implementation of the WSD process. Perception has gained ground that this particular function is the core-competency of the NGOs. The NGOs may be funded by the government, bilateral & multilateral agencies, people-funded and /or self-financed. Inter alia, the NGOs are involved in training of trainers, networking of different organizations, arranging technical expertise and finance for WSD. Sometimes the NGOs bring in innovative approaches to WSD. The inherent advantages of the NGOs are their grass-root level contacts, network and dedication. Recognizing and appreciating their role and potential, the government (MOA) has entered into a memorandum of understanding (MOU) with some prominent NGOs. Some state governments have also accepted the MOU. The NGOs are expected to create awareness, provide TOT, impact evaluation and monitoring from the beneficiaries perspective and enhance women’s’ participation. Some Examples There are sufficient examples of different NGOs involved in various activities of WSD in the country. Some of them include Tarun Bharat Sangh (TBS), Yug Nirman Mission, Shri.Aurobindo Mission, Institute of
82
Rural Development, Dr.Swaminathan Foundation of Sustainable Agriculture, Association of Voluntary Organization for Rural Development (AVARD), Youth for Action, MYRADA, Ramakrishna Kendra, Himalayan Action Research Centre, Vanavasi Sewa Ashram, Ramakrishna Mission Vidyapeeth, Bhartiya Agro-Industries Foundation (BAIF), Social Centre, SPEECH, Aga Khan Rural Support Program (AKRSP), Development Alternatives, Society for Participatory Research in Asia (PRIYA), CAPART, Peoples Science Institute, Indian Social Institute, etc. Here, we take up few NGOs and explain their role in WSD in the nation. The Tarun Bharat Sangh, an NGO based in Rajasthan is an example of holistic PWSM. Gopalpura village in the Alwar district of Rajasthan, today is vastly different than what it used to be in the early and mid eighties. The famine of 1986/87 had devastated the village and the inhabitants had lost their source of livelihood. Against this dismal backdrop, the TBS team started to gain confidence of the villagers. The rapport and trust gained was complete and total. To augment water resources of the area by resurrecting and rejuvenating the existing water harvesting structures and techniques was the main objective. Desilting and deepening of the earthen tank bed was the first step. Labor was voluntary and spontaneous. The second step was to repair the masonry overflow and sluice system of a dilapidated dam. The cost and labor came forth. Reforestation of barren land was undertaken by the Gram Sabha. A code of conduct to manage the CPRs was also evolved. As a cumulative cum interactive effect, the groundwater level in the wells jumped from a mere 15 feet to 55 feet. Irrigated land expanded by 227 and 90 percent in the Kharif and Rabi season respectively. More than 10,000 trees are a standing testimony to the PWSM efforts. The entire process was triggered off by one individual Shri.Rajendra Singh. Though the TBS is a dedicated team, the soul behind the success of this organization is Shri. Rajendra Singh. The overwhelming success of this effort had tremendous spin-off and demonstration effects. Villages far and near began to replicate this PWSM model. There are certain NGOs who contribute implicitly to the WSD processes. AVRD is one such organization. It performs functions of networking the relevant actors and agencies, provides technical expertise and arranges funding for the NGOs involved in WSD. Few other NGOs provide TOT. PRIA and Indian Social Institute fall under this category. By preparing trainers’ manual on integrated WS management, PRIA caters to reviving traditional and local institutions. Yet, some other NGOs like the Development Alternatives (DA) adopt a particular area and aim to develop it on a watershed basis. This organization undertook wasteland development on a watershed basis in the Datia district of M.P. from 1986 to 1990. Trenching, gully plugging and other mechanical and vegetative interventions were made. These simple but effective measures have led to the regeneration of deciduous forest in and around the area. Future
83
plans include agro-forestry and horticultural activities within the watershed to augment the income of the farmers. NGOs like MYRADA, adopt a holistic approach to rural development. This they attempt to attain by considering a micro-watershed as an unit of development. All their efforts planning and implementation are centered around this unit. Certain other organizations that are not NGOs in the strictest sense but are playing a pro-active role in the WSD and PWSM processes do exist. The Participatory Watershed Management Training in Asia Program (PWMTA) is a noteworthy example. Funded by the FAO and the Netherlands government, the major objective of this program is to develop the HRD in PWSM. By preparing manuals’ relating to PWSM and its numerous facets (like gender issues, ITK, experiences of other nations in WSD, resource books and packs for the trainers, policy issues, exchange of ideas between different actors), publishing a host of literature and periodicals and networking the PWMTA is playing a crucial role to develop HRD in WSD in the member countries. 4.4 Summing-up 4.4.1 Watershed experience We have several innovative models of watershed development tried out in the past. Institutional alternatives are available matching with specific resource and socio-economic situations. Technology back-up for different magnitudes of resource conservation related problems specific to the agroclimatic situation is available and continuously refined. Scattered programmes in the past have not yielded desired results covering only 30 per cent of the problem area so far. For the balance area of 119 Mha to be treated on a watershed basis, proposed plan for the next 25 years would cover 64 Mha of problem area, still leaving 46 per cent of the problem area uncovered. In the meantime degradation of the resources would continue depleting the surface flows as well as groundwater recharge with attendant implications on overall irrigation distribution. Integrating all the watershed programmes and dovetailing with irrigation water development strategies to plan for all sources and uses of water is the need of the hour. 4.4.2 Irrigation Sector: Surface water Simultaneous existence of scarcity of water and inefficiency in its use remains a paradox. Improving efficiency in the use of irrigation water will also complement the equitable distribution of irrigation water. The national agricultural system has a strong network of institutions under both Central and State governments (Table 42) to generate water management related technologies, to impart human resource development in water management extension and to train farmers in

84
water management activities. These institutions are regionally located with specific mandate and coverage to meet the location specific and region specific water management related requirements in agriculture sector with an annual budget outlay of Rs 6 to 31 million (1998-2000) for each of the institutions. Thus the supply side in terms of evolving appropriate water management technologies has been addressed and given a thrust since 1980s. Table.42 Spread of selected water management related institutions in India
States/Regions Water Management related Institutions Southern, Eastern and Northern Regions
Water Technology Centres
UP, Punjab, Karnataka, TN, MP, Meghalaya, Haryana, Kerala, Orissa, Maharashtra, WB, J&K, HP, Assam, Rajasthan, Gujarat, Bihar,
All India Coordinated Research Project-Water Management: Directorate of Water Management Research, Patna
UP, WB, Kerala, Gujarat, Maharashtra, Orissa, MP, Bihar, AP
Water Resources Development and Training/ Management Centres; Water and Land Management/ Training & Research Institutes
Punjab, Rajasthan, TN, Haryana Irrigation and Management Training Institutes/ Irrigation Research and Management Institute
But the demand side continues to be neglected for want of matching policy thrusts in rationalizing the water rates to reflect its physical scarcity or its economic value in its use. Pricing regime in agricultural use of water neither facilitated the demand for and adoption of water management technologies nor promoted the concept of efficiency in water use. This is true in several other uses of water also. A comparison of water rates in surface water irrigation projects across states is given in Table 43. Despite the necessity to generate adequate revenue from irrigation users to cover the O&M expenses and also meet a part of the interest charges, revision of water rates has been infrequent, hesitant and very much less than the increase in costs (Planning Commission, 19921). Water rates remained static for more than three decades in Tamil Nadu; totally abolished in Punjab since 1997; no revisions since mid 1970s in Kerala, Haryana, Jammu&Kashmir and Himachal Pradesh; revisions announced but withheld subsequently in the states of Gujarat and Karnataka. Irrigation commission's recommendation for reviewing and adjusting water rates every five years to at least cover the O&M expenses has not been accepted, much less implemented by any state in the past as observed in the Planning Commission's report 1 Report of the Committee on Pricing of Irrigation Water, Planning Commission, Government of India, New Delhi, 1992.
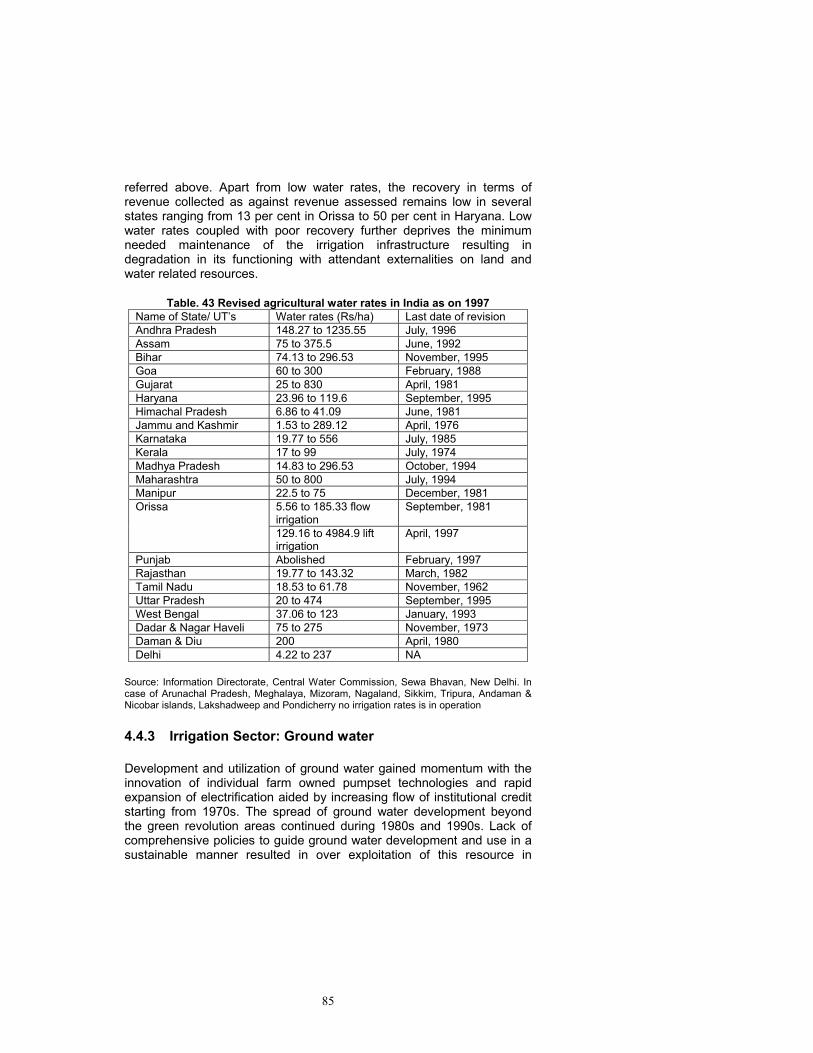
85
referred above. Apart from low water rates, the recovery in terms of revenue collected as against revenue assessed remains low in several states ranging from 13 per cent in Orissa to 50 per cent in Haryana. Low water rates coupled with poor recovery further deprives the minimum needed maintenance of the irrigation infrastructure resulting in degradation in its functioning with attendant externalities on land and water related resources.
Table. 43 Revised agricultural water rates in India as on 1997 Name of State/ UT’s Water rates (Rs/ha) Last date of revision Andhra Pradesh 148.27 to 1235.55 July, 1996 Assam 75 to 375.5 June, 1992 Bihar 74.13 to 296.53 November, 1995 Goa 60 to 300 February, 1988 Gujarat 25 to 830 April, 1981 Haryana 23.96 to 119.6 September, 1995 Himachal Pradesh 6.86 to 41.09 June, 1981 Jammu and Kashmir 1.53 to 289.12 April, 1976 Karnataka 19.77 to 556 July, 1985 Kerala 17 to 99 July, 1974 Madhya Pradesh 14.83 to 296.53 October, 1994 Maharashtra 50 to 800 July, 1994 Manipur 22.5 to 75 December, 1981
5.56 to 185.33 flow irrigation
September, 1981 Orissa
129.16 to 4984.9 lift irrigation
April, 1997
Punjab Abolished February, 1997 Rajasthan 19.77 to 143.32 March, 1982 Tamil Nadu 18.53 to 61.78 November, 1962 Uttar Pradesh 20 to 474 September, 1995 West Bengal 37.06 to 123 January, 1993 Dadar & Nagar Haveli 75 to 275 November, 1973 Daman & Diu 200 April, 1980 Delhi 4.22 to 237 NA
Source: Information Directorate, Central Water Commission, Sewa Bhavan, New Delhi. In case of Arunachal Pradesh, Meghalaya, Mizoram, Nagaland, Sikkim, Tripura, Andaman & Nicobar islands, Lakshadweep and Pondicherry no irrigation rates is in operation 4.4.3 Irrigation Sector: Ground water Development and utilization of ground water gained momentum with the innovation of individual farm owned pumpset technologies and rapid expansion of electrification aided by increasing flow of institutional credit starting from 1970s. The spread of ground water development beyond the green revolution areas continued during 1980s and 1990s. Lack of comprehensive policies to guide ground water development and use in a sustainable manner resulted in over exploitation of this resource in
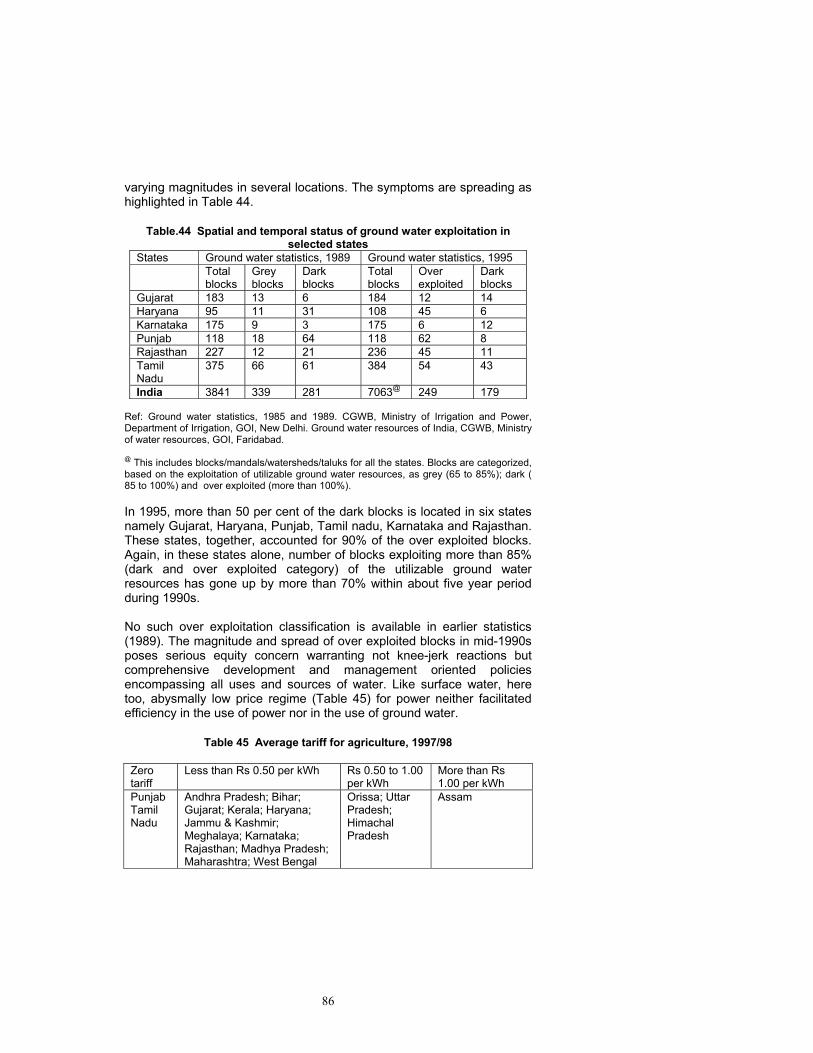
86
varying magnitudes in several locations. The symptoms are spreading as highlighted in Table 44.
Table.44 Spatial and temporal status of ground water exploitation in selected states
States Ground water statistics, 1989 Ground water statistics, 1995 Total
blocks Grey blocks
Dark blocks
Total blocks
Over exploited
Dark blocks
Gujarat 183 13 6 184 12 14 Haryana 95 11 31 108 45 6 Karnataka 175 9 3 175 6 12 Punjab 118 18 64 118 62 8 Rajasthan 227 12 21 236 45 11 Tamil Nadu
375 66 61 384 54 43
India 3841 339 281 7063@ 249 179 Ref: Ground water statistics, 1985 and 1989. CGWB, Ministry of Irrigation and Power, Department of Irrigation, GOI, New Delhi. Ground water resources of India, CGWB, Ministry of water resources, GOI, Faridabad.
@ This includes blocks/mandals/watersheds/taluks for all the states. Blocks are categorized, based on the exploitation of utilizable ground water resources, as grey (65 to 85%); dark ( 85 to 100%) and over exploited (more than 100%). In 1995, more than 50 per cent of the dark blocks is located in six states namely Gujarat, Haryana, Punjab, Tamil nadu, Karnataka and Rajasthan. These states, together, accounted for 90% of the over exploited blocks. Again, in these states alone, number of blocks exploiting more than 85% (dark and over exploited category) of the utilizable ground water resources has gone up by more than 70% within about five year period during 1990s. No such over exploitation classification is available in earlier statistics (1989). The magnitude and spread of over exploited blocks in mid-1990s poses serious equity concern warranting not knee-jerk reactions but comprehensive development and management oriented policies encompassing all uses and sources of water. Like surface water, here too, abysmally low price regime (Table 45) for power neither facilitated efficiency in the use of power nor in the use of ground water.
Table 45 Average tariff for agriculture, 1997/98
Zero tariff
Less than Rs 0.50 per kWh Rs 0.50 to 1.00 per kWh
More than Rs 1.00 per kWh
Punjab Tamil Nadu
Andhra Pradesh; Bihar; Gujarat; Kerala; Haryana; Jammu & Kashmir; Meghalaya; Karnataka; Rajasthan; Madhya Pradesh; Maharashtra; West Bengal
Orissa; Uttar Pradesh; Himachal Pradesh
Assam
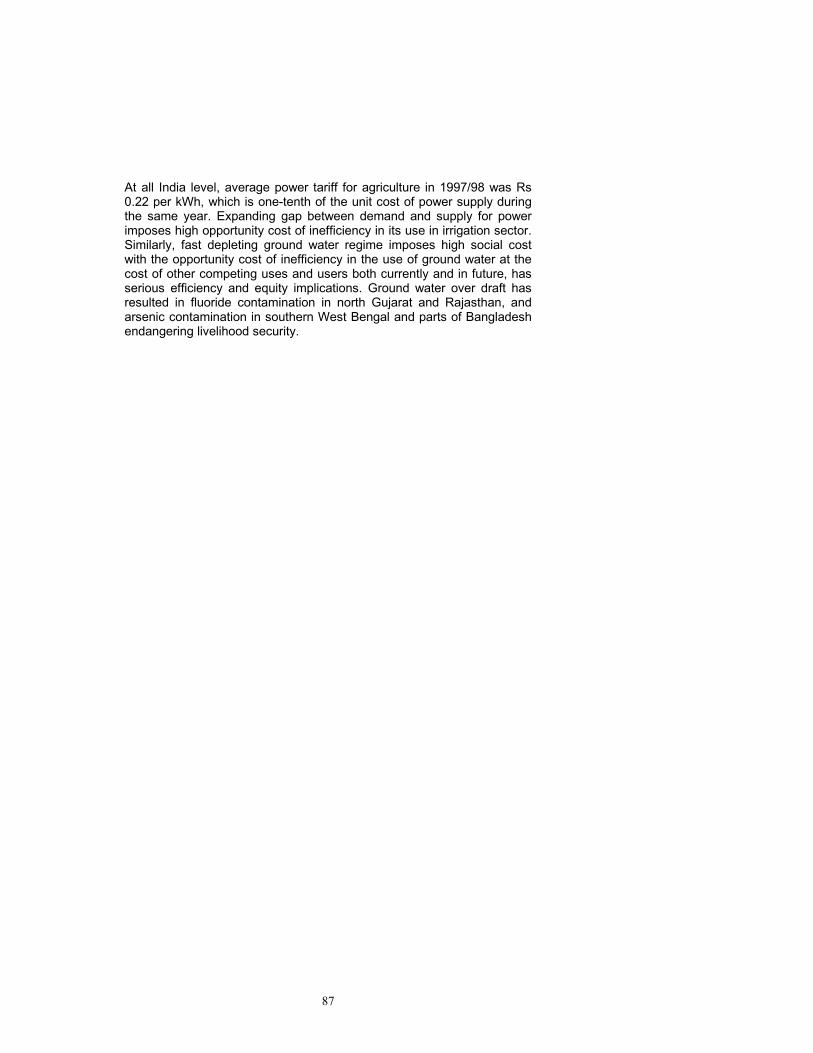
87
At all India level, average power tariff for agriculture in 1997/98 was Rs 0.22 per kWh, which is one-tenth of the unit cost of power supply during the same year. Expanding gap between demand and supply for power imposes high opportunity cost of inefficiency in its use in irrigation sector. Similarly, fast depleting ground water regime imposes high social cost with the opportunity cost of inefficiency in the use of ground water at the cost of other competing uses and users both currently and in future, has serious efficiency and equity implications. Ground water over draft has resulted in fluoride contamination in north Gujarat and Rajasthan, and arsenic contamination in southern West Bengal and parts of Bangladesh endangering livelihood security.

88
5 CONCLUSIONS AND RECOMMENDATIONS Irrigation retains its crucial role in productivity-led agricultural production growth, in alleviating poverty and in reducing inequality in income distribution in rural areas. Irrigation development in the past was not specifically targeted towards desired multiple impacts. Equity implications as influenced during the course of irrigation development initiatives therefore, assumes significance while formulating future water resource development strategies. Equity impacts of irrigation water distribution in India is empirically analysed at national and state level between sources covering different decades. For the country as a whole, number of small and marginal FHHs increased from 49.1 million in 1971 to 83.5 million in 1991 of which partially and wholly irrigated small and marginal FHHs accounted for 41.2 and 46.8 per cent respectively. In terms of irrigated area, irrigated small and marginal FHHs accounted for 23 per cent of the total household area of small and marginal FHHs in 1971, which increased, to 34.5 per cent in 1991. Inter-farm inequality in irrigation distribution is measured by applying Theil’s information theoretic measure based on five farm holding sizes namely; less than 1 ha; 1-2 ha; 2-4 ha; 4-10 ha; and above 10 ha. Eleven irrigation related attributes covering non-canal irrigated area (NCIA), net area sown (NAS), net irrigated area by canal (NIACAN), net irrigated area by tanks (NIATNK), net irrigated area by wells (NIAWELL), net irrigated area by tubewell (NIATW), total net irrigated area (NIATOT), gross cropped area irrigated (GCAI), gross cropped area (GCA), All flow irrigated area (ALLFLOW), and all lift irrigated area (ALLFT) are considered for different states. The analysis covered 17 states including SSUT for two time periods namely 1970/71 and 1990/91. For the absolute and relative distribution analysis of irrigation related attributes, five time periods at five year interval during the period 1970/71 to 1990/91 were covered. Following conclusions emerged from this study: 1. There exists considerable inequality in the distribution of irrigated
areas across farm size holdings over time and the levels of inequality vary widely across different states.
2. Both in absolute terms and in terms of household distribution of
irrigation, large farms have captured disproportionately larger share of irrigation benefits as compared to the small and marginal farms. For instance, marginal farms, accounting for 59 per cent of the total FHHs had only 21 per cent of net irrigated area and same per cent of canal irrigated area. On the contrary, large farms with more than 4 ha
89
holding size, accounting for 8.7 per cent of the total FHHs had 35 per cent of the net irrigated area and 36 per cent of canal irrigated area.
3. Changing towards Rawlsian distribution policy will significantly bring
down the levels of inequality in the current irrigation distribution in general and canal irrigation distribution in particular.
4. Level of inequality in the distribution of most of the irrigation related
attributes is less than the overall inequality in the current distribution of cultivated area.
5. Trends in the inequality with respect to most of the irrigation related
attributes are mixed; declining within the decades namely 1970s and 1980s ending with 1990/91 but increasing between the decades. Such mixed trends reflect the absence of consistent policies in the past specifically designed for using irrigation distribution as a means of bringing down inequality in agricultural income and wealth.
6. Performance of existing proportional distribution policy varied widely
across states but the deviation from the targeted objectives has narrowed down during the past two decades ending with 1990/91.
7. Existing distribution of farms is highly skewed in favour of small and
marginal farms. They, together account for 78 per cent total FHHs in 1990/91, commanding 32 per cent of the total area operated. In such a situation, proportional distribution policy, with variable performance across states, by linking the distribution of irrigation to the proportional holding of land area, neither promotes efficiency as of now nor promotes equity as has been observed in this analysis.
8. Never in the past, integrated approach was adopted in the water
sector by internalising all the sources and uses of water while designing policies. Consequently, sourcewise analysis of irrigated area exhibits mixed inequality trends in the distribution of irrigation related attributes. Mutual interdependent linkages among different uses and sources of water require designing of policies for development, management and utilization of water for the sector as a whole encompassing all uses and sources of water in a holistic manner.
9. Adhocism in the irrigation development policy also failed to consider
the inter sectoral linkages and their interactions and thereby resulting in different magnitudes of positive and negative externalities which are neither quantified nor anticipated. Efficiency and equity implications get totally distorted depending upon the inter sectoral linkages. The approach, therefore, has to be holistic and not sector or sub-sector specific as has been in the past and even now, more as a rule than as an exception.
90
10. Shrinking resource base both in terms of quantity and quality of
natural resources like soil and water available for sustaining agriculture growth and livelihood security underlines the effective targeting of socioeconomic policies in a holistic manner encompassing all uses. In the process, the impact of policies pursued in other related sectors can no longer be ignored since competition for natural resources both by present and future generation is getting increasingly complex to ignore such interactions among policies designed exogenously in other sectors as of now.
11. For instance, significant increase in the paddy area and better crop
yields in the north-western region (Punjab, Haryana and eastern UP) are at the cost of over exploitation of ground water (Sharma, 19972). The cycle of more and more area getting into early planting of paddy followed by the advancement of paddy procurement season by GOI by 15 days to one month (from October.1 to September.1) and consequent over drafting of ground water goes unabated with least consideration to the ground water sustainability. Advancement of paddy procurement season cannot be decided in isolation without factoring in the possible impact on ground water use related issues. It is estimated that advancing paddy planting by one month from June 16 to May 16 entails 25 to 30% more irrigation requirement (Sandhu, 19943) in western region. In most of the districts falling in this region, the stage of ground water development has already crossed 100% reaching as high as 259%. With zero tariff for agricultural power and abolition of water rates for surface water or freezing it at a low level for several decades, virtually socio-economic policies are non-existent in the water sector in such of the states like Punjab and Tamil Nadu and even in many other states also.
12. Source-wise inequality analysis revealed that contribution from ‘within
states’ is more in flow irrigated area distribution than in lift irrigated area distribution. For instance, 60.1 per cent of the inequality in NIACAN distribution comes from ‘within states’ source as compared to only 34.9 per cent of the inequality in NIATW distribution coming from ‘within states’ source. Thus to improve equity in irrigation development and distribution, improved distribution across farm size groups need to be targeted than in terms of balanced regional
2 B.R. Sharma, Policy Issues for Farm-Level Irrigation Water Management. National Water Policy: Agricultural Scientists' Perception, Eds. N.S. Randhawa and P.B.S.Sarma, National Academy of Agricultural Sciences, 1997. 3 Sandhu, B.S. Optimising irrigation scheduling to field crops in natural resource management for Sustainable Agriculture and Development (eds. D.L.Deb), Angkor Publishers (P) Ltd., New Delhi, 1994.
91
irrigation development in case of canal irrigation source. But in case of tube well irrigation as a source, balanced regional irrigation development provides more opportunities for reducing the inequality in its distribution since ‘between states’ accounted for nearly 2/3rd of the inequality in the distribution of NIATW.
13. Highly skewed distribution of land across rural households and the
proportional distribution policy of canal irrigation contribute to the high ‘within the states inequality’. This problem is further accentuated by allowing the irrigation system infrastructure to deteriorate with meager allocation of resources for operation and maintenance resulting in inefficiency in its performance and inequity in the distribution of irrigation water.
14. The irrigation systems; both major and medium, should be restored
to a minimum acceptable level of performance to be agreed upon by the water user associations before effecting the transfer of operational and maintenance responsibilities. Policies shifting the management and utilization responsibilities of the irrigation system to the user groups should evolve simultaneously for ensuring physical as well as financial sustainability of the irrigation system that would promote both efficiency and equity in the long run.
15. Efficient water management at the farm level holds the key to the
equitable distribution and efficient utilization of irrigated areas. This implies a paradigm shift in the policy focus from utilization gap and irrigation gap orientation towards an incentive gap orientation which addresses the gap between scarcity value of water and the value underlying the current pattern of water utilization (Saleth, 19914). Reforms in the existing water laws and institutions are urgently needed to correct this incentive gap and promote ecological security, economic efficiency and social equity in every use of water.
4 R.M.Saleth. Water Resources as Private Property: I&II, The Economic Times, June 13-14, 1991.
92
SELECT BIBLIOGRAPHY Amita Shah 1998. Watershed Development Programmes: Emerging Environment Perspectives. Economic and Political Weekly, Vol XXXIII, No.26: A66-80. Bhalla, G. S and Peter Hazell. “Foodgrains Demand in India to 2020”, Economic and Political Weekly, Vol XXXII No 52, Dec. 27, 1997-Jan 2, 1998. pp. A-150 to A-154. Deshpande R.S. and N.Rajasekaran. 1997. Impact of Watershed Development Programme: Experiences and Issues. Artha Vijnana, Vol.XXXIX, No.3: 374-390, September. Dhyani, B.L., J.S.Samra, G.P.Juyal, Ram Babu and V.S. Katiyar. 1997. Socio-Economic Analysis of a Participatory Integrated Watershed Management in Garhwal Himalaya (Fakot Watershed). Central Soil and Water Conservation Research and Training Institute, ICAR, Dehradun. Government of India (GOI). All-India Report on Agricultural Census, 1970/71, 1980/81, 1985/86, 1990/91. Department of Agriculture and Cooperation, Ministry of Agriculture, New Delhi. Government of India (GOI).1992. Report of the committee on pricing of irrigation water. Planning commission, New Delhi. Government of India (GOI). 1994. Guidelines for Watershed Development. Department of Wastelands Development. Ministry of Rural Areas and Employment, New Delhi. Government of India (GOI). 1994. Report of the Technical Committee on Drought Prone Areas Program and Desert Development Program. Ministry of Rural Development, New Delhi. Government of India (GOI). 1996. Report of the Working Group on Rainfed Agriculture. Planning Commission, New Delhi. Government of India (GOI). 1996. Report of the Working Group on Soil and Water Conservation for the formulation of the Ninth Five Year Plan. Department of Agriculture and Cooperation, Ministry of Agriculture, New Delhi. Government of India, 1997. Agricultural Statistics at a Glance. Directorate of Economics and Statistics, Department of Agriculture and Cooperation, Ministry of Agriculture, New Delhi. Grewal, S.S., J.S.Samra, S.P.Mittal and Y. Agnihotri. 1997. Sukhomajri Concept of Integrated Watershed Management. Central Soil and Water Conservation Research and Training Institute, Chandigarh Centre, ICAR, Chandigarh. Hanumantha Rao, C.H. and Ashok Gulati. 1994. Indian Agriculture: Emerging Perspectives and Policy Issues. Research paper under USAID Grant No. 386-
93
0282-G-IN-8334, Indian Council of Agricultural Research, New Delhi and International Food Policy Research Institute, Washington, D.C. J.S.Samra, V.N.Sharda and A.K.Sikka. 1996. Water Harvesting and Recycling: Indian Experiences. Central Soil and Water Conservation Research and Training Institute, ICAR, Dehradun. Joshi, P.K. and M.C.S.Bantilan. 1997. Vertisol Watershed Research in the Semi-Arid Tropics: Directions for Impact Assessment. Artha Vijnana, Vol.XXXIX, No.3: 326-373, September. Kanchan Chopra .1998. Watershed Management Programmes: An Evaluation of Alternative Institutional and Technological Options. IEG Working Paper No.E/197/98, Delhi. Kerr, J., Pangare, G., and Lokur-Pangare, P.J.George and Shashi Kollavalli. 1998. The Role of Watershed Projects in Developing Rainfed Agriculture in India. A Report submitted to the ICAR and the World Bank. Kolavalli, Shashi . 1998. A Review of Approaches to Watershed Development in India. A Report submitted to the National Centre for Agricultural Economics and Policy Research, ICAR, New Delhi. Kurothe, R.S., B.B.Singh, K.T.N. Nambiar, V.C.Pande, R.M.Samarth and Virendra Kumar. 1997. Watershed Management for Sustained Production in Aravali Hills of North Gujrat (Navamota Watershed). Central Soil and Water Conservation Research and Training Institute, Vasad Centre, ICAR, Dehradun. Lenton, R. 1984. A Note on Monitoring Productivity and Equity in Irrigation Systems. In Niranjan Pant (Eds.) Productivity and Equity in Irrigation Systems, Asish Publishing House, New Delhi. Mishra, B. 1997. A Successful Case of Participatory Watershed Management at Ralegan Siddhi Village in District Ahmednagar, Maharashtra, India. In: Prem N. Sharma and Mohan P. Wagley, (eds). Case Studies of Peoples’ Participation in Watershed Management in Asia, Part-I: Nepal, China and India. PWMTA-FAO, Nepal. Paroda, R. 1996. “Sustaining the Green Revolution: New Paradigms”, Lecture delivered at the 2nd International Crop Science Congress, New Delhi. Per Pinstrup-Andersen, Rajul Pandya-Lorch and Mark W. Rosegrant. The World Food Situation: Recent Developments, Emerging Issues and long-term Prospects. Paper presented at the Consultative Group on International Agricultural Research’s International Centers Week, October 27, 1997. International Food Policy Research Institute, Washington, D.C. Prasad, S.N., Ratan Singh, C.Prakash, V.S.Katiyar, J.S.Samra and K.D.Singh. 1996. Watershed Management for Sustained Production in South-Eastern Rajasthan (Chhajawa Watershed). Central Soil and Water Conservation Research and Training Institute, ICAR, Dehradun.
94
Ram Babu, B.L.Dhyani, M.C.Agarwal and J.S.Samra. 1997. Economic Evaluation of Watershed Management Projects Concepts, Methodologies and Case Studies. Central Soil and Water Conservation Research and Training Institute, ICAR, Dehradun. Rosegrant, M.W., C. Ringler and R.V.Gerpacio. 1997. Water and land resources and global food supply. Paper presented for the 23rd International Conference of Agricultural Economists on “Food Security, Diversification and Resource Management: Refocusing the Role of Agriculture”, Sacramento, California, August 10-16, 1997. International Food Policy Research Institute, Washington, D.C. Rosegrant, M.W., M. Agcaoili-Sombilla and N.D.Perez. 1995. Global Food Projections to 2020: Implications for Investment. Food, Agriculture and the Environment Discussion Paper 5. International Food Policy Research Institute, Washington, D.C. Saleth R.M,1991. Water Resources as private property: I&II, The Economic Times, June 13-14. Sampath, R.K. 1984. Income Distribution Impacts of Water Distribution Policy. Water Resources Research, Vol.20 (6): 647-654. Sampath, R.K. 1984. On the Estimation of Direct Irrigation Benefits. Water Resources Bulletin, Vol.19 (3): 469-476. Sampath, R.K. 1990. Measures of Inequity for Distribution Analysis of Large Public Surface Irrigation Systems: A Welfare Theoretic Approach. In R.K.Sampath and R.A.Young (Eds) Social, economic and institutional issues in Third world irrigation management, Westview Press, U.K Sampath, R.K. 1990. On some aspects of Irrigation Distribution in India. Land Economics, Vol.66 (4): 448-463. Sampath, R.K. 1992. A Farm-Sizewise Analysis of Irrigation Distribution in India. The Journal of Development Studies, Vol. 29 (1): 121-147. Sampath, R.K. 1992. Issues in Irrigation Pricing In Developing Countries. World Development, Vol.20 (7): 967-977. Sampath, R.K. and C. Gopinath 1979. Land Distribution in India: Its Nature and Economic Implications. Margin, Vol.2 (3): 43-70. Sampath, R.K. and Kenneth C. Nobe. 1984. Optimum Investment for Irrigation Development in India. Margin Vol.16 (4): 30-47. Sandhu,B.S.1994.Optimising irrigation Scheduling to field crops in natural resource management for Sustainable Agriculture and Development (Eds.D.L.Deb), Angkor Publishers(P) Ltd, New Delhi. Science Academies Summit. 1996. Uncommon Opportunities for Achieving Sustainable Food and Nutrition Security. An Agenda for Science and Public
95
Policy. Conference Proceedings of the Science Academies Summit, July 8-11, 1996. M.S.Swaminathan Research Foundation, Madras, India. Sharma.B.R,1997. Policy issues for farm-level irrigation water Management. National Water Policy: Agricultural Scientists' perception, Eds. N.S. Randhawa and P.B.S.Sarma, National Academy of Agricultural Sciences. Sheena and Anupam Mishra .1998.Ripples of the Society: People's Movement in Watershed Development in India. Gandhi Peace Foundation and FAO, New Delhi. Sinha, Basawan and Ramesh Bhatia.1982. Economic Appraisal of irrigation projects in India. Agricole Publishing Academy, New Delhi. Strategic Change in Indian Agriculture,1994. IFRI-ICAR Collaborative Research Program. Eds. Mark Svendsen and Ashok Gulati, Washington DC. Verma ,L.R.1998.A Glimpse of Indigenous Technology Knowledge for watershed Management in Upper North-West Himalayas of India. PWMTA-FAO, Nepal. World Bank.1997.India: Sustaining Rapid Economic Growth, A World Bank Country Study, and The World Bank, Washington, D.C. Yogesh Kumar Bhatt, Rajesh Tandon and Prem N.Sharma.1998. Building Farmers' organisation for Integrated watershed Management in India-A Trainers' Manual . PWMTA-FAO, Nepal.
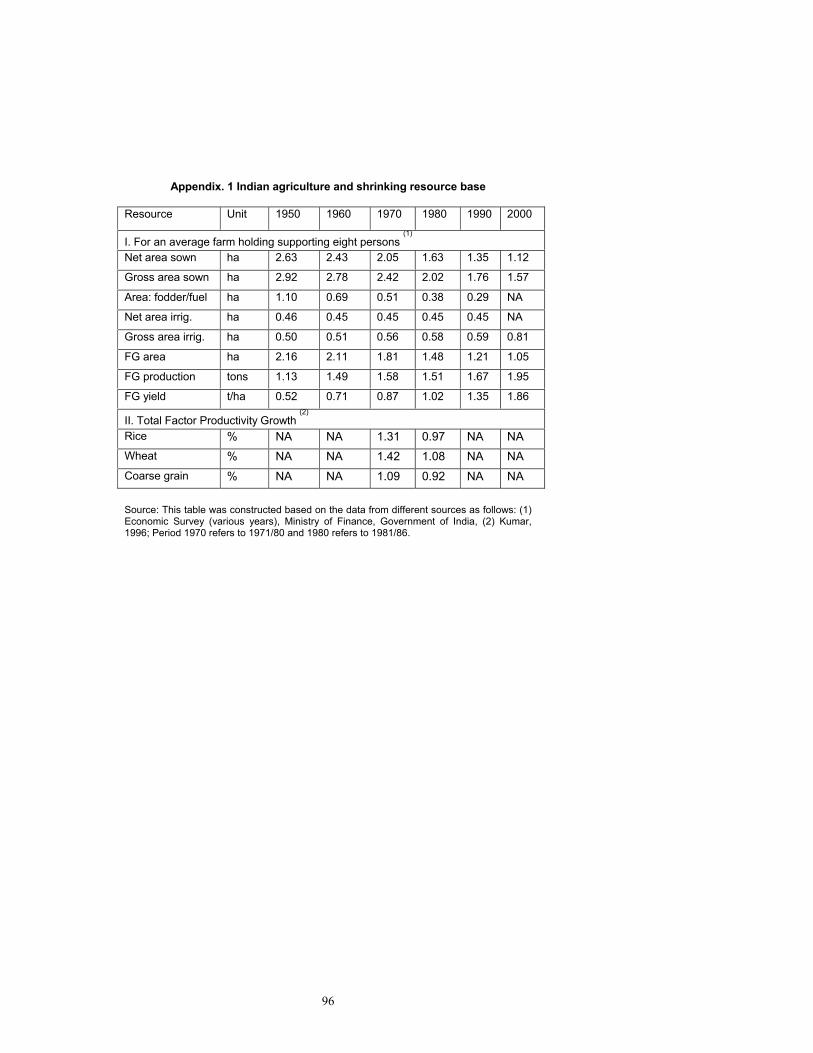
96
Appendix. 1 Indian agriculture and shrinking resource base
Resource Unit 1950 1960 1970 1980 1990 2000
I. For an average farm holding supporting eight persons (1)
Net area sown ha 2.63 2.43 2.05 1.63 1.35 1.12
Gross area sown ha 2.92 2.78 2.42 2.02 1.76 1.57
Area: fodder/fuel ha 1.10 0.69 0.51 0.38 0.29 NA
Net area irrig. ha 0.46 0.45 0.45 0.45 0.45 NA
Gross area irrig. ha 0.50 0.51 0.56 0.58 0.59 0.81
FG area ha 2.16 2.11 1.81 1.48 1.21 1.05
FG production tons 1.13 1.49 1.58 1.51 1.67 1.95
FG yield t/ha 0.52 0.71 0.87 1.02 1.35 1.86
II. Total Factor Productivity Growth (2)
Rice % NA NA 1.31 0.97 NA NA Wheat % NA NA 1.42 1.08 NA NA Coarse grain % NA NA 1.09 0.92 NA NA
Source: This table was constructed based on the data from different sources as follows: (1) Economic Survey (various years), Ministry of Finance, Government of India, (2) Kumar, 1996; Period 1970 refers to 1971/80 and 1980 refers to 1981/86.
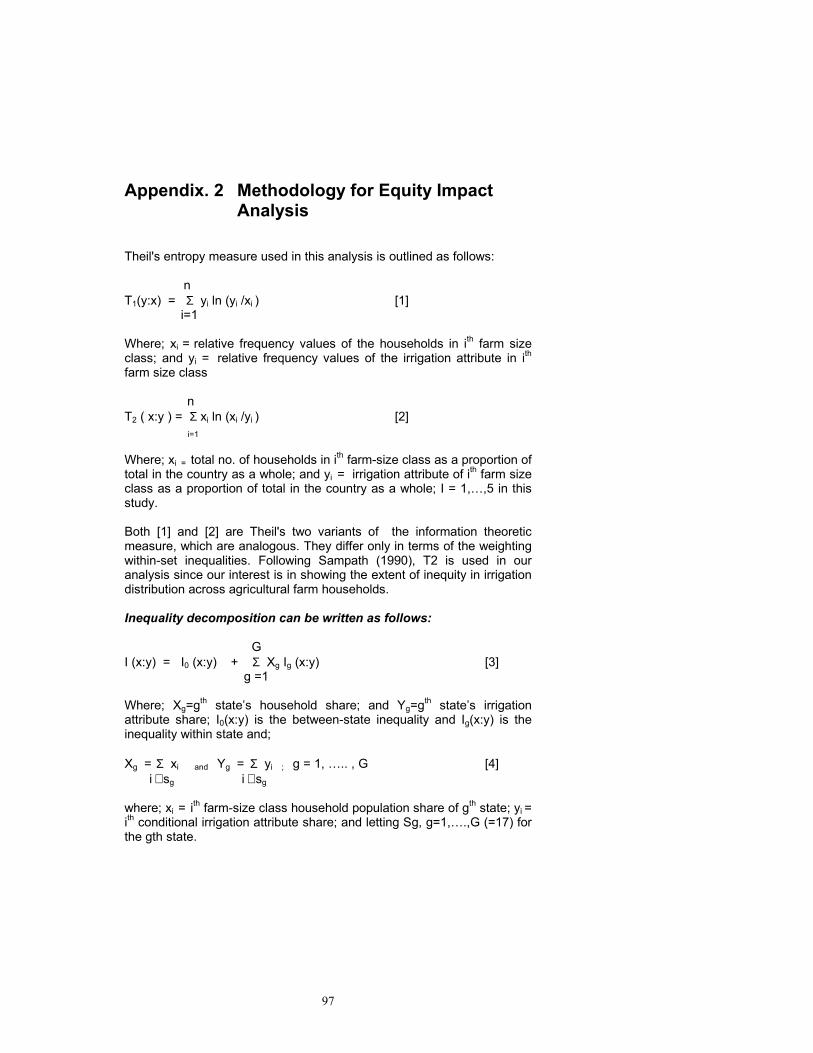
97
Appendix. 2 Methodology for Equity Impact Analysis
Theil's entropy measure used in this analysis is outlined as follows: n T1(y:x) = Σ yi ln (yi /xi ) [1] i=1 Where; xi = relative frequency values of the households in ith farm size class; and yi = relative frequency values of the irrigation attribute in ith
farm size class
n T2 ( x:y ) = Σ xi ln (xi /yi ) [2] i=1
Where; xi = total no. of households in ith farm-size class as a proportion of total in the country as a whole; and yi = irrigation attribute of ith farm size class as a proportion of total in the country as a whole; I = 1,…,5 in this study. Both [1] and [2] are Theil's two variants of the information theoretic measure, which are analogous. They differ only in terms of the weighting within-set inequalities. Following Sampath (1990), T2 is used in our analysis since our interest is in showing the extent of inequity in irrigation distribution across agricultural farm households. Inequality decomposition can be written as follows: G I (x:y) = I0 (x:y) + Σ Xg Ig (x:y) [3] g =1 Where; Xg=gth state’s household share; and Yg=gth state’s irrigation attribute share; I0(x:y) is the between-state inequality and Ig(x:y) is the inequality within state and; Xg = Σ xi and Yg = Σ yi ; g = 1, ….. , G [4] i ∈ sg i ∈ sg
where; xi = ith farm-size class household population share of gth state; yi = ith conditional irrigation attribute share; and letting Sg, g=1,….,G (=17) for the gth state.
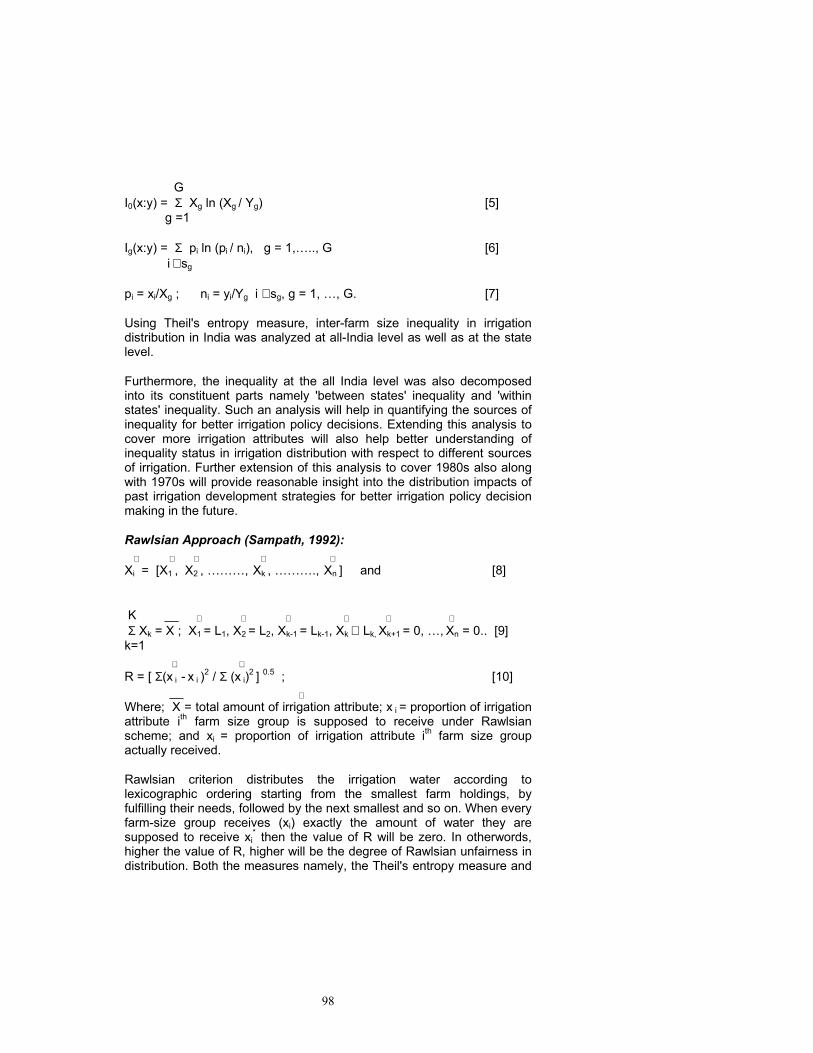
98
G I0(x:y) = Σ Xg ln (Xg / Yg) [5] g =1 Ig(x:y) = Σ pi ln (pi / ni), g = 1,….., G [6] i ∈ sg
pi = xi/Xg ; ni = yi/Yg i ∈ sg, g = 1, …, G. [7] Using Theil's entropy measure, inter-farm size inequality in irrigation distribution in India was analyzed at all-India level as well as at the state level. Furthermore, the inequality at the all India level was also decomposed into its constituent parts namely 'between states' inequality and 'within states' inequality. Such an analysis will help in quantifying the sources of inequality for better irrigation policy decisions. Extending this analysis to cover more irrigation attributes will also help better understanding of inequality status in irrigation distribution with respect to different sources of irrigation. Further extension of this analysis to cover 1980s also along with 1970s will provide reasonable insight into the distribution impacts of past irrigation development strategies for better irrigation policy decision making in the future. Rawlsian Approach (Sampath, 1992): ∗ ∗ ∗ ∗ ∗ Xi = [X1 , X2 , ………, Xk , ………., Xn ] and [8] K __ ∗ ∗ ∗ ∗ ∗ ∗ Σ Xk = X ; X1 = L1, X2 = L2, Xk-1 = Lk-1, Xk ⊆ Lk, Xk+1 = 0, …, Xn = 0.. [9] k=1 ∗ ∗ R = [ Σ(x i - x i )2 / Σ (x i)2 ] 0.5 ; [10]
__ ∗ Where; X = total amount of irrigation attribute; x i = proportion of irrigation attribute ith farm size group is supposed to receive under Rawlsian scheme; and xi = proportion of irrigation attribute ith farm size group actually received. Rawlsian criterion distributes the irrigation water according to lexicographic ordering starting from the smallest farm holdings, by fulfilling their needs, followed by the next smallest and so on. When every farm-size group receives (xi) exactly the amount of water they are supposed to receive xi
* then the value of R will be zero. In otherwords, higher the value of R, higher will be the degree of Rawlsian unfairness in distribution. Both the measures namely, the Theil's entropy measure and

99
Theil's forecast error measure to estimate the levels of unfairness in distribution using Rawlsian notion of fairness in distribution are used in this study.
Related Documents