Source: Bloomberg, Company filings and Broker Report Shriram Transport FY 2013A FY 2014E FY 2015E Share price (INR) 574.1 Number of shares 226.9 Market Cap. (INRmm) 130,253.4 Total Debt (INRmm) 246,391.8 Cash & Cash eq. (INRmm) 63,517.3 Net debt (INRmm) 182,874.5 Enterprise Value (INRmm) 313,127.9 EV/Sales (x) 4.46 4.10 3.43 EV/EBITDA (x) 5.98 10.90 10.77 P/E (x) 8.90 9.16 14.98 P/BV (x) 1.78 12.58 11.94 As of 30 Sep 2013

Welcome message from author
This document is posted to help you gain knowledge. Please leave a comment to let me know what you think about it! Share it to your friends and learn new things together.
Transcript

Source: Bloomberg, Company filings and Broker ReportShriram Transport M&M Financial
FY 2013A FY 2014E FY 2015E
Share price (INR) 574.1 Share price (INR)
Number of shares 226.9 Number of shares
Market Cap. (INRmm) 130,253.4 Market Cap. (INRmm)
Total Debt (INRmm) 246,391.8 Total Debt (INRmm)
Cash & Cash eq. (INRmm) 63,517.3 Cash & Cash eq. (INRmm)
Net debt (INRmm) 182,874.5 Net debt (INRmm)
Enterprise Value (INRmm) 313,127.9 Enterprise Value (INRmm)
EV/Sales (x) 4.46 4.10 3.43 EV/Sales (x)
EV/EBITDA (x) 5.98 10.90 10.77 EV/EBITDA (x)
P/E (x) 8.90 9.16 14.98 P/E (x)
P/BV (x) 1.78 12.58 11.94 P/BV (x)
As of 30 Sep 2013 As of 30 Sep 2013
B4
Author: Bloomberg
B5
Author: http://www.stfc.in/pdf/financial-results/qr-sep-13-consolidated.pdf
B7
Author: http://www.stfc.in/pdf/financial-results/qr-sep-13-consolidated.pdf
B8
Author: http://www.stfc.in/pdf/financial-results/qr-sep-13-consolidated.pdf
C11
Author: http://www.stfc.in/pdf/financial-results/qr-sep-13-consolidated.pdf
D11
Author: Bloomberg
E11
Author: Bloomberg

Sundaram FinanceFY 2013A FY 2014E FY 2015E FY 2013A
257.4 Share price (INR) 503.8
568.8 Number of shares 111.1
146,371.7 Market Cap. (INRmm) 55,974.1
191,011.6 Total Debt (INRmm) 91,889.8
3,362.3 Cash & Cash eq. (INRmm) 4,708.6
187,649.3 Net debt (INRmm) 87,181.1
334,325.4 Enterprise Value (INRmm) 145,935.7
8.16 1.97 1.97 EV/Sales (x) 7.07
11.15 10.90 10.77 EV/EBITDA (x) 8.65
14.94 15.50 14.98 P/E (x) 13.65
3.20 12.58 11.94 P/BV (x) 2.68
As of 30 Sep 2013
H4
Author: Bloomberg
N4
Author: Bloomberg
H5
Author: Q2 Sep 2013 p2
N5
Author: Q2 Sep 2013 p1
H7
Author: Q2 Sep 2013 p2
N7
Author: Q2 Sep 2013 p2
H8
Author: Q2 Sep 2013 p2
N8
Author: Q2 Sep 2013 p2
H10
Author: Add minority interest
N10
Author: Add minority interest
I11
Author: Q2 Sep 2013 p1
J11
Author: Bloomberg
K11
Author: Bloomberg
O11
Author: Q2 Sep 2013 p1

CholamandalamFY 2014E FY 2015E FY 2013A FY 2014E FY 2015E
Share price (INR) 219.1
Number of shares 143.2
Market Cap. (INRmm) 31,365.3
Total Debt (INRmm) 184,257.1
Cash & Cash eq. (INRmm) 10,023.5
Net debt (INRmm) 174,233.6
Enterprise Value (INRmm) 205,598.9
1.97 1.97 EV/Sales (x) 8.01 1.97 1.97
10.90 10.77 EV/EBITDA (x) 10.94 10.90 10.77
15.50 14.98 P/E (x) 9.56 15.50 14.98
12.58 11.94 P/BV (x) 1.61 12.58 11.94
As of 30 Sep 2013
T4
Author: Bloomberg
T5
Author: Q2 Sep 2013 p1
T7
Author: Q2 Sep 2013 p3
T8
Author: Q2 Sep 2013 p2
P11
Author: Bloomberg
Q11
Author: Bloomberg
U11
Author: Q2 Sep 2013 p1
V11
Author: Bloomberg
W11
Author: Bloomberg

Shriram CityFY 2013A FY 2014E FY 2015E
Share price (INR) 1,066.2
Number of shares 59.3
Market Cap. (INRmm) 63,201.2
Total Debt (INRmm) 87,011.7
Cash & Cash eq. (INRmm) 2,740.3
Net debt (INRmm) 84,271.4
Enterprise Value (INRmm) 147,472.6
EV/Sales (x) 4.80 1.97 1.97
EV/EBITDA (x) 7.02 10.90 10.77
P/E (x) 12.85 15.50 14.98
P/BV (x) 2.37 12.58 11.94
As of 30 Sep 2013
Z4
Author: Bloomberg
Z5
Author: Q2 Sep 2013 p1
Z7
Author: Q2 Sep 2013 p1
Z8
Author: Q2 Sep 2013 p1
AA11
Author: Q2 Sep 2013 p1
AB11
Author: Bloomberg
AC11
Author: Bloomberg

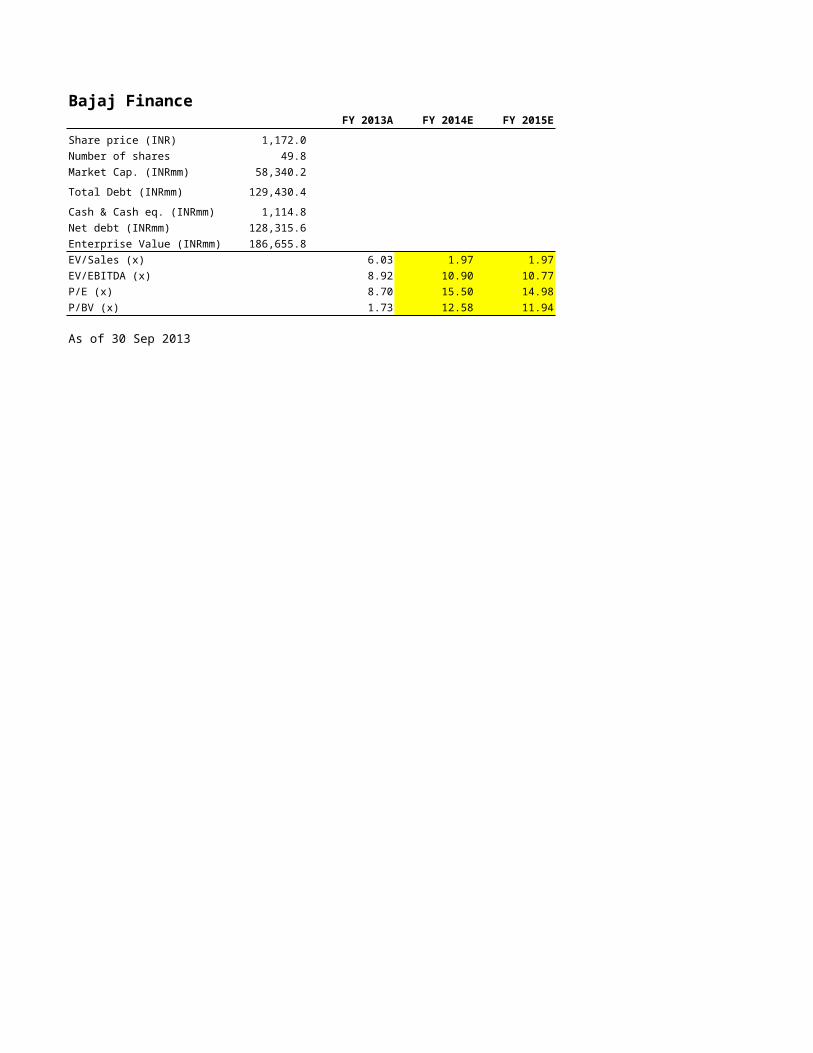
Bajaj Finance SREI InfrastructureFY 2013A FY 2014E FY 2015E
Share price (INR) 1,172.0 Share price (INR)
Number of shares 49.8 Number of shares
Market Cap. (INRmm) 58,340.2 Market Cap. (INRmm)
Total Debt (INRmm) 129,430.4 Total Debt (INRmm)
Cash & Cash eq. (INRmm) 1,114.8 Cash & Cash eq. (INRmm)
Net debt (INRmm) 128,315.6 Net debt (INRmm)
Enterprise Value (INRmm) 186,655.8 Enterprise Value (INRmm)
EV/Sales (x) 6.03 1.97 1.97 EV/Sales (x)
EV/EBITDA (x) 8.92 10.90 10.77 EV/EBITDA (x)
P/E (x) 8.70 15.50 14.98 P/E (x)
P/BV (x) 1.73 12.58 11.94 P/BV (x)
As of 30 Sep 2013 As of 30 Sep 2013
AF4
Author: Bloomberg
AF5
Author: Q2 Sep 2013 p1
AF7
Author: Q2 Sep 2013 p1
AF8
Author: Q2 Sep 2013 p1
AG11
Author: Q2 Sep 2013 p1
AH11
Author: Bloomberg
AI11
Author: Bloomberg
SREI Infrastructure Manappuram FinFY 2013A FY 2014E FY 2015E FY 2013A
18.3 Share price (INR) 14.7
503.1 Number of shares 841.2
9,181.3 Market Cap. (INRmm) 12,323.7
162,289.5 Total Debt (INRmm) 81,864.2
5,798.5 Cash & Cash eq. (INRmm) 8,836.1
156,491.0 Net debt (INRmm) 73,028.2
165,946.5 Enterprise Value (INRmm) 85,626.0
5.34 1.97 1.97 EV/Sales (x) 3.78
6.14 10.90 10.77 EV/EBITDA (x) 5.50
3.49 15.50 14.98 P/E (x) 5.91
0.27 12.58 11.94 P/BV (x) 0.50
As of 30 Sep 2013
AL4
Author: Bloomberg
AR4
Author: Bloomberg
AL5
Author: Q1 June 2013 page 1
AR5
Author: Q1 June 2013 page 1
AL7
Author: AR 2012-13 p170
AR7
Author: AR 2012-13 p50
AL8
Author: AR 2012-13 p170
AR8
Author: AR 2012-13 p50
AL10
Author: Add monority interest
AR10
Author: Add monority interest
AM11
Author: AR 2012-13 p171
AN11
Author: Bloomberg
AO11
Author: Bloomberg
AS11
Author: AR 2012-13 p50

Magma FincorpFY 2014E FY 2015E FY 2013A FY 2014E FY 2015E
Share price (INR) 63.4
Number of shares 190.1
Market Cap. (INRmm) 12,051.5
Total Debt (INRmm) 91,822.7
Cash & Cash eq. (INRmm) 5,002.2
Net debt (INRmm) 86,820.5
Enterprise Value (INRmm) 99,158.9
1.97 1.97 EV/Sales (x) 6.17 1.97 1.97
10.90 10.77 EV/EBITDA (x) 9.17 10.90 10.77
15.50 14.98 P/E (x) 9.68 15.50 14.98
12.58 11.94 P/BV (x) 0.75 12.58 11.94
As of 30 Sep 2013
AX4
Author: Bloomberg
AX5
Author: Q2 Sep 2013 page 1
AX7
Author: Q2 Sep 2013 p2
AX8
Author: Q2 Sep 2013 p2
AX10
Author: Add monority interest
AT11
Author: Bloomberg
AU11
Author: Bloomberg
AY11
Author: AR 2012-13 p50
AZ11
Author: Bloomberg
BA11
Author: Bloomberg

First LeasingFY 2013A FY 2014E FY 2015E
Share price (INR) 17.3
Number of shares 22.8
Market Cap. (INRmm) 394.3
Total Debt (INRmm) 11,917.0
Cash & Cash eq. (INRmm) 74.3
Net debt (INRmm) 11,842.8
Enterprise Value (INRmm) 12,237.0
EV/Sales (x) 5.74 1.97 1.97
EV/EBITDA (x) 3.87 10.90 10.77
P/E (x) 1.25 15.50 14.98
P/BV (x) 0.12 12.58 11.94
As of 30 Sep 2013
BD4
Author: Bloomberg
BD5
Author: Q2 Sep 2013 page 1
BD7
Author: AR 2011-12 page 16-17
BD8
Author: AR 2011-12 page 16-17
BE11
Author: AR 2011-12 page 16-17
BF11
Author: Bloomberg
BG11
Author: Bloomberg

Religare Finvest Tata Motors FinanceFY 2013A FY 2014E FY 2015E
Share price (INR) NM Share price (INR)
Number of shares 173.3 Number of shares
Market Cap. (INRmm) NM Market Cap. (INRmm)
Total Debt (INRmm) 713.7 Total Debt (INRmm)
Cash & Cash eq. (INRmm) 56.7 Cash & Cash eq. (INRmm)
Net debt (INRmm) 657.0 Net debt (INRmm)
Enterprise Value (INRmm) NM Enterprise Value (INRmm)
EV/Sales (x) nm nm nm EV/Sales (x)
EV/EBITDA (x) nm nm nm EV/EBITDA (x)
P/E (x) nm nm nm P/E (x)
P/BV (x) nm nm nm P/BV (x)
As of 30 Sep 2013 As of 30 Sep 2013
BI2
Author: Private Company
BO2
Author: Private Company
BJ4
Author: Private Company
BJ5
Author: AR 2012-13 page 22
BJ6
Author: Private Company
BJ7
Author: AR 2012-13 page 125
BJ8
Author: AR 2011-12 page 16-17
BJ10
Author: Private Company

Tata Motors FinanceFY 2013A FY 2014E FY 2015E
NM
NA
NM
NA
NA
NA
NM
nm nm nm
nm nm nm
nm nm nm
nm nm nm
BP4
Author: Private Company
BP6
Author: Private Company
BP10
Author: Private Company

Source: Bloomberg, Company filings and Broker Report
NBFCs Company Comparables
Price Market Cap. Enterprise Val.Company (INR) (INRmm) (INRmm)NBFCs Shriram Transport 574.1 130,253 313,128M&M Financial 257.4 146,372 334,325Sundaram Fin 503.8 55,974 145,936Cholamandalam 219.1 31,365 205,599Shriram City 1066.2 63,201 147,473Bajaj Finance 1172.0 58,340 186,656SREI Infra 18.3 9,181 165,947Mannapuram Fin 14.7 12,324 85,626Magma Fincorp 63.4 12,051 99,159First Leasing 17.3 394 12,237Religare Finvest NM NM NMTata Motors Finance NM NM NMMeanMedian
As of 30 Sep 2013
A17
Author: Private Company
A18
Author: Private Company

Assets Public Deposits Tier I Capital Tier II Capital Gross NPL(INRmm) (INRmm) (%) (%) (INRmm)
539,057 55,804 NA NA 10,254270,708 22,875 17.00% 2.70% NA158,227 14,684 NA NA NA215,707 5 11.07% 7.97% 1,996155,886 4 NA NA NA203,207 7 NA NA 1,889226,591 4 14.28% 7.40% NA127,278 1 20.59% 2.08% 1,20150,963 0 10.60% 6.20% 2,64617,696 0 NA NA 322,234 0 14.95% 4.89% 1,639
NA NA NA NA 8,93714.75% 5.21%14.62% 5.55%
E7
Author: http://www.stfc.in/pdf/financial-results/qr-sep-13-consolidated.pdf
F7
Author: AR 2012-13 page 11
I7
Author: HDFC RR 30 Oct 2013 page 6
E8
Author: Q2 Sep 2013 p2
F8
Author: AR 2012-2-13 page 23
G8
Author: AR 2012-13 page 74
H8
Author: AR 2012-13 page 74
E9
Author: Q2 Sep 2013 p2
F9
Author: AR 2012-2013 page 80
E10
Author: Q2 Sep 2013 p3
F10
Author: AR 2012-2013 page 77
I10
Author: AR 2012-13 page 101
E11
Author: Q2 Sep 2013 p1
F11
Author: AR 2012-13 page 97
E12
Author: Q2 Sep 2013 p1
F12
Author: AR 2012-13 page 79
I12
Author: AR 2012-13 page 81
E13
Author: AR 2012-13 page 172
F13
Author: AR 2012-13 page 129
G13
Author: AR 2012-13 page 163
H13
Author: AR 2012-13 page 163
E14
Author: AR 2012-13 p50
F14
Author: AR 2012-13 page 71
G14
Author: AR 2012-13 page 80
H14
Author: AR 2012-13 page 80
I14
Author: AR 2012-13 page 90
E15
Author: Q2 Sep 2013 p2
G15
Author: AR 2012-13 page 112
H15
Author: AR 2012-13 page 112
I15
Author: AR 2012-2013 page 51
E16
Author: AR 2011-12 page 60
F16
Author: AR 2012 page 3
I16
Author: AR 2011-12 page 32
E17
Author: AR 2012-13 page 125
F17
Author: AR 2012-13 page 117
G17
Author: AR 2012-13 page 108
H17
Author: AR 2012-13 page 108
I17
Author: AR 2012-13 page 111
I18
Author: https://www.tmf.co.in/tmfuniverse/tatamotorfinance/TMFLMarch2013.pdf

Net Spread CRAR Ratings Gross NPA to Gross Advance& Outlook FY 2013A
5.35% 20.74% IND AA/Stable 3.20%NA 19.70% IND AA+/Stable 3.00%NA 17.85% IND AA+/Stable 1.04%NA 19.04% IND AA-/Stable 1.05%NA 18.61% IND AA-/Stable 2.19%NA 21.95% NA NA
2.40% 21.68% AA- 2.77%NA 22.67% NA NA
4.91% 16.80% AA+ 1.60%NA 19.24% AA 0.18%NA 19.84% IND AA-/Negative 1.33%NA 16.13% AA-/Positive 4.64%
4.22% 19.52% 2.10%4.91% 19.47% 1.90%
L4
Author: India Ratings
J7
Author: AR 2012-13 page 11
K7
Author: AR 2012-13 page 11
M7
Author: AR 2012-13 page 11
K8
Author: AR 2012-13 page 41
M8
Author: AR 2012-13 page 73
K9
Author: AR 2012-13 page 7
M9
Author: AR 2012-13 page 7
K10
Author: AR 2012-13 page 35
M10
Author: AR 2012-13 page 38
K11
Author: AR 2012-2013 page 18
M11
Author: AR 2012-2013 page 18
K12
Author: AR 2012-2013 page 4
L12
Author: ratings available separately for each debt instrument not available overall
J13
Author: AR 2012-13 page 43
K13
Author: AR 2012-13 page 43
L13
Author: CARE Rating for Lomg term banking facilities
M13
Author: AR 2012-13 page 43
K14
Author: AR 2012-13 page 80
J15
Author: Ar 2012-13 page 38
K15
Author: AR 2012-13 page 112
L15
Author: AA+ for long-term NCDs by CARE AR 2012-13 page 37
M15
Author: AR 2012-13 page 4
K16
Author: AR 2012 page 3
L16
Author: "CARE "AA" (DOUBLE A) Long Term Bank facilities AR 2011-12 page 4
M16
Author: AR 2011-12 page 32
K17
Author: AR 2012-13 page 108
M17
Author: AR 2012-13 page 23
K18
Author: https://www.tmf.co.in/tmfuniverse/tatamotorfinance/TMFLMarch2013.pdf
L18
Author: CRISIL Rating https://www.tmf.co.in/tmfuniverse/tatamotorfinance/PrintCRISILRatings.pdf
M18
Author: https://www.tmf.co.in/tmfuniverse/tatamotorfinance/TMFLMarch2013.pdf

Net NPA to Net Advance Operating ProfitFY 2013A FY 2013A FY 2014E FY 2015E
0.80% 52,1641.00% 29,9270.45% 23,2210.23% 18,6220.81% 20,7620.19% 20,7732.30% 25,0740.77% 14,960
NA 10,6660.12% 1,9870.76% 3152.79% 23,1450.93%0.77%
N7
Author: AR 2012-13 page 11
O7
Author: http://www.stfc.in/pdf/financial-results/qr-sep-13-consolidated.pdf
N8
Author: AR 2012-13 page 75
O8
Author: AR 2012-13 page 131
N9
Author: AR 2012-13 page 7
O9
Author: AR 2012-2013 page 85
N10
Author: AR 2012-13 page 38
O10
Author: AR 2012-2013 page 107
N11
Author: AR 2012-2013 page 18
O11
Author: AR 2012-13 page 103
N12
Author: AR 2012-2013 page 4
O12
Author: AR 2012-13 page 51
N13
Author: AR 2012-13 page 43
O13
Author: AR 2012-13 page 171
N14
Author: AR 2012-13 page 9
O14
Author: AR 2012-13 p50
O15
Author: AR 2012-13 page 85
N16
Author: AR 2012 page 3
O16
Author: AR 2012 page 17
N17
Author: AR 2012-13 page 23
O17
Author: AR 2012-13 page 126
N18
Author: https://www.tmf.co.in/tmfuniverse/tatamotorfinance/TMFLMarch2013.pdf
O18
Author: https://www.tmf.co.in/tmfuniverse/tatamotorfinance/TMFLMarch2013.pdf

Net Profit EV/Revenue FY 2013A FY 2014E FY 2015E FY 2013A FY 2014E
14,634 4.46x 4.10x9,270 8.16x 1.97x5,640 7.07x 1.97x3,079 8.01x 1.97x4,494 4.80x 1.97x5,913 6.03x 1.97x2,601 5.34x 1.97x2,084 3.78x 1.97x1,228 6.17x 1.97x316 5.74x 1.97x136 nm nm
4,496 nm nm5.96x 2.18x5.88x 1.97x
R7
Author: http://www.stfc.in/pdf/financial-results/qr-sep-13-consolidated.pdf
R8
Author: AR 2012-13 page 131
R9
Author: AR 2012-2013 page 85
R10
Author: AR 2012-2013 page 107
R11
Author: AR 2012-13 page 103
R12
Author: AR 2012-13 page 51
R13
Author: AR 2012-13 page 171
R14
Author: AR 2012-13 p50
R15
Author: AR 2012-13 page 85
R16
Author: AR 2012 page 17
R17
Author: AR 2012-13 page 126
R18
Author: https://www.tmf.co.in/tmfuniverse/tatamotorfinance/TMFLMarch2013.pdf

EV/Revenue EV/EBITDA P/EFY 2015E FY 2013A FY 2014E FY 2015E FY 2013A
3.43x 5.98x 10.90x 10.77x 8.90x1.97x 11.15x 10.90x 10.77x 14.94x1.97x 8.65x 10.90x 10.77x 13.65x1.97x 10.94x 10.90x 10.77x 9.56x1.97x 7.02x 10.90x 10.77x 12.85x1.97x 8.92x 10.90x 10.77x 8.70x1.97x 6.14x 10.90x 10.77x 3.49x1.97x 5.50x 10.90x 10.77x 5.91x1.97x 9.17x 10.90x 10.77x 9.68x1.97x 3.87x 10.90x 10.77x 1.25xnm nm nm nm nmnm nm nm nm nm
2.12x 7.73x 10.90x 10.77x 8.89x1.97x 7.83x 10.90x 10.77x 9.23x

P/E P/BVFY 2014E FY 2015E FY 2013A FY 2014E FY 2015E
9.16x 14.98x 1.78x 12.58x 11.94x15.50x 14.98x 3.20x 12.58x 11.94x15.50x 14.98x 2.68x 12.58x 11.94x15.50x 14.98x 1.61x 12.58x 11.94x15.50x 14.98x 2.37x 12.58x 11.94x15.50x 14.98x 1.73x 12.58x 11.94x15.50x 14.98x 0.27x 12.58x 11.94x15.50x 14.98x 0.50x 12.58x 11.94x15.50x 14.98x 0.75x 12.58x 11.94x15.50x 14.98x 0.12x 12.58x 11.94x
nm nm nm nm nmnm nm nm nm nm
14.87x 14.98x 1.50x 12.58x 11.94x15.50x 14.98x 1.67x 12.58x 11.94x

RoA RoEFY 2013A FY 2014E FY 2015E FY 2013A FY 2014E
23.90%
1.48% 18.13%
1.25% 10.07%1.58% 7.91%1.36% 9.97%
2.20% 13.40%NA 1.63%
1.57% #DIV/0! #DIV/0! 12.14% #DIV/0!1.48% #VALUE! #VALUE! 10.07% #VALUE!
AJ8
Author: AR 2012-2013 page 74
AG10
Author: AR 2012-2013 page 38
AJ10
Author: AR 2012-2013 page 38
AG13
Author: AR 2012-13 page 43
AJ13
Author: AR 2012-13 page 42
AG14
Author: AR 2012-13 page 9
AJ14
Author: AR 2012-13 page 9
AG15
Author: AR 2012-13 page 74
AJ15
Author: AR 2012-13 page 74
AG17
Author: AR 2012-13 page 22
AJ17
Author: AR 2012-13 page 22
AJ18
Author: https://www.tmf.co.in/tmfuniverse/tatamotorfinance/TMFLMarch2013.pdf

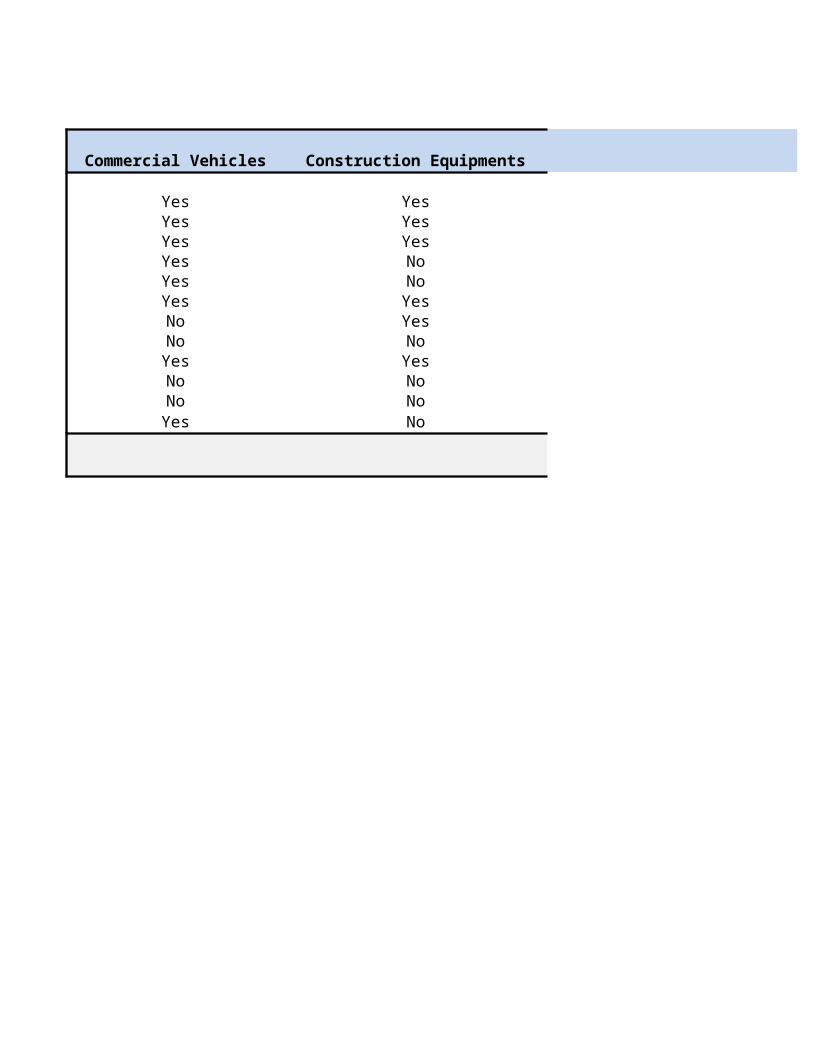
RoE Sector wise comparisonFY 2015E Commercial Vehicles Construction Equipments
Yes YesYes YesYes YesYes NoYes NoYes YesNo YesNo NoYes YesNo NoNo NoYes No
#DIV/0!#VALUE!

Sector wise comparisonAgricultural equipments Loans/Insurance/Mutual Funds
No NoNo YesNo YesNo YesNo YesNo YesNo YesNo YesYes YesNo YesNo YesNo No
AP16
Author: s engaged in financial activities, such as providing lease assistance, hire purchase financing and also granting loans to corporate and other entities

Sector wise comparisonSME, Small Business Loan Property, Housing etc
No NoYes YesNo YesNo YesYes YesYes NoNo NoNo NoYes YesNo NoYes NoNo No

Shriram Transport
http://www.bloomberg.com/news/2013-02-21/tpg-said-to-sell-shriram-transport-stake-for-about-303-million.htmlhttp://www.livemint.com/Companies/RxVScRbk37yFcaGSyoQImL/TPG-raises-305-million-from-Shriram-Transport-share-sale-s.html
Transaction Date 22-Feb-13Stake Sold 10.0%Transaction value (INR mm) 16,620.0
Company valuation (INR mm) 166,200.0
http://www.bloomberg.com/news/2013-02-21/tpg-said-to-sell-shriram-transport-stake-for-about-303-million.htmlhttp://www.livemint.com/Companies/RxVScRbk37yFcaGSyoQImL/TPG-raises-305-million-from-Shriram-Transport-share-sale-s.html
Related Documents


