NBER WORKING PAPER SERIES UNIONIZATION, MANAGEMENT ADJUSTMENT AND PRODUCTIVITY Kim B. Clark Working Paper No. 332 NATIONAL BUREAU OF ECONOMIC RESEARCH 1050 Massachusetts Avenue Cambridge MA 02138 April 1979 This research has been supported by grants from the U.S. Department of Labor, the National Science Foundation and the Wertheim Fund of Harvard University. Particularly helpful insights were provided by Lawrence Summers. Additional comments were received from John Dunlop, Richard Freeman, James Medoff, members of the Labor Seminar at Harvard University and the Labor Workshop at the University of Chicago Graduate School of Business. Laura Nelson assisted with the computations. The Research reported here is part of the NBER's research program in Labor Economics. Any opinions expressed are those of the author and not those of the National Bureau of Economic Research.

Welcome message from author
This document is posted to help you gain knowledge. Please leave a comment to let me know what you think about it! Share it to your friends and learn new things together.
Transcript

NBER WORKING PAPER SERIES
UNIONIZATION, MANAGEMENT ADJUSTMENTAND PRODUCTIVITY
Kim B. Clark
Working Paper No. 332
NATIONAL BUREAU OF ECONOMIC RESEARCH1050 Massachusetts Avenue
Cambridge MA 02138
April 1979
This research has been supported by grants from the U.S.Department of Labor, the National Science Foundation andthe Wertheim Fund of Harvard University. Particularlyhelpful insights were provided by Lawrence Summers.Additional comments were received from John Dunlop,Richard Freeman, James Medoff, members of the LaborSeminar at Harvard University and the Labor Workshop atthe University of Chicago Graduate School of Business.Laura Nelson assisted with the computations. The Researchreported here is part of the NBER's research program inLabor Economics. Any opinions expressed are those of theauthor and not those of the National Bureau of Economic
Research.
NBER Working Paper 332April 1979
Unionization, Management Adjustment and Productivity
The effect of unionization onproductivity is examined in this paper
using time—series data on selected establishments in the U.S. cement industry.
The analysis combines statistical estimation of the union impact and interviews
with union and management officials to forge a link between econometric esti-
mation and the traditional institutionalanalysis of union policy and manage-
ment adjustment. The econometric analysis primarily deals with the problem of
identifying the impact of the union in the face of firm specific effects and
adjustments in labor quality. The case studies are designed to shed light on
the question of how unionization affectsproductivity. The empirical results
support the conclusion that unionization leads to productive changes in the
operation of the enterprise. Evidence from the case studies suggests that
much of the gain in productivity derives from a series of extensive changes
in management personnel and procedure. These adjustments are a management
response to changes in the employment contract which follow unionization.
Kim B. ClarkNational Bureau ofEconomic Research1050 Massachusetts AvenueCambridge, MA 02138
(617) 868—3912

Unionization entails fundamental changes n the nature of the employment
relationship. In a non—union setting the rules governing the workplace
are largely determined by management, with worker influence limited
to exit from the firm if the implied labor contract is not attractive.
Collective bargaining establishes a more direct means of influence through
the processes of contract negotiation and administration. These procedures
involve workers and the union in setting the terms and conditions of employment,
and in day to day operations. The literature on collective bargaining is
replete with evidence that these procedural changes are accompanied by
changes in the substance of the employment relation Recent analysis of
cross section data on value added per hour worked suggests a positive
union productivity effect.2 Yet there is very little evidence about the
change in productivity within an enterprise after collective bargaining is
introduced. While numerous case studies have identified changes
in the internal operation of the firm after unionization, there has been
no attempt to link the institutional information with empirical analysis
of the union's effect on productivity. Both kinds of information are
essential to a full understanding of the impact of the union.
This paper examines the effect of the union on productivity using
data from the U.S. cement industry. The analysis uses establishment level
data together with interviews of management and union officials to forge
a link between econometric estimation and the traditional institutional
analysis of union policy and management adjustment. Particular focus in
the empirical work is on the problem of identifying the effect of unionization
on productivity in the face of firm specific effects, and adjustments in labor
—2—
quality. The case studies, and most of the econometric analysis, are
based on the experience of six cement plants which changed union status
in the 1953—1976 period. The statistical analysis is designed to provide an
estimate of what impactunionization had, while the institutional analysis
is intended to shed light on the question of how unionization influenced
the operation of the enterprise. The paper is divided into four sections.
The first section presents the basic framework used in the empirical analysis
and includes a discussion of the empirical model, the. characteristics of
the industry and the data. Section II presents the econometric analysis
of the union impact and section III contains evidence on changes in
internal operations after unionization. Section IV presents implications
and conclusions.
Section I: The Analytical Framework
The theoretical connection between unions and productivity has been
discussed at length elsewhere and will only be summarized briefly here In
the context of a representative production process in which output is
a function of capital and labor inputs, the productivity of labor depends
on the capital—labor ratio, the scale of operations and various institutional
factors — e.g. methods of organization, effectiveness of management, and
the motivation of workers. Traditional analysis limits the influence
of the union on productivity to capital—labor substitution induced by the
union wage effect.4 While increasing the capital—labor ratio in response
to a rise in the relative wage raises the productivity of labor, capital
productivity declines and the net effects are increased costs and misallocated
resources. A second channel of influence recognizes that unionization is

—3—
likely to affect methods of organization and other aspects of the internal
operation of the firm. If unionization puts pressure on management to
improve operations, for example, the production process may yield a larger
volume of output for any combination of capital and labor Of courBe, the
opposite conclusion holds if unionization reduces motivation or otherwise
impedes the effective operation.of the enterprise.
The effect of unionization on the organizational determinants of
productivity depends on changes in the labor contract and on adjustments
made by workers and management to new provisions. In most situations,
unionization entails a shift in relative power and increased worker
control over conditions of work. Freeman has argued that these changes
reduce turnover by giving workers a"voice" in the operation of the
enterprise.6 A reduction in turnover has clear implications for firm specific
training, the effectiveness of won: groups, and productivity. Similarly,
the use of seniority rules may improve training and morale. Where promotion
depends on seniority, rivalry among workers may be reduced and incentives
for assistance and cooperation increased? In addition, seniority criteria
may be less arbitrary than rankings based on managment's assessment of
ability (or other subjective criteria). Workers' perception of their
jobs may improve with consequent improvements in motivation and morale.8
The shift in power which accompanies unionization substantially alters
the task of management. The implication of these changes for productivity
is unclear. With higher wage rates and a formal grievance procedure,
there is an incentive for management to increase the effort obtained
from a given level of labor input, and to address aspects of the production
process which may have been neglected.9 The upshot is that management may
—4—
respond to unionization by taking steps to improve performance. Yet
unionization may lead to reductions in productivity. Union power may be
used to protect malfeasance and build reduced work effort into the
contract. Management's ability to fire undesirable workers may be reduced
and the union contract may advance rules which restrict management's
ability to adjust to changing conditions. Instead of improving morale,
seniority rules may force the promotion of less productive workers, and
rules limiting displacement of workers may impede technological advance.
Numerous petty issues may be raised through the grievance process, resulting
in a disruption of production.
These brief comments suggest that the effect of unionization depends
on a complex range of adjustments made by workers and management. Simply
identifying a particular change in the labor contract is not sufficient
to establish the impact of the union, or the process leading to changes
in performance. The resolution of the issue not only requires more
detailed information on organizational adjustments, but a statistical
estimate of the union effect as well.
The Empirical Model
Empirical analysis of the union impact and associated institutional
change poses several problems of identification. The basic difficulty
lies in constructing an empirical "experiment" which isolates union!
non—union differences in productivity due to changes in the internal
operation of the enterprise. There are three principle problems. First, where
union and non—union establishments compete in different markets, the effect of
unionization on productivity may be difficult to separate from its effect
on prices if output is not measured in physical units0 1oreover productivity

—5—
differences may arise from differences in technology if
11union and non—union establishments produce different products.
Second, establishments may differ in productivity because of inherent
differences in the quality of management or other organizational factors
which are difficult to measure and control for in statistical analysis.
Unless controls for such "firm effects" are developed, the effect of the
union on productivity cannot be identified without assuming that the fixed
effects are independent of union status. Third, the union wage effect
gives firms incentive to recover costs by substituting higher for lower
quality workers. The implication is that the dapital—labor ratio must
be adjusted for labor quality differences in order to identify the union
impact due to organization factors. It is well known, however, that
12measuring the quality of labor is inherently difficult.
Each of these problems affects the measurement and identification
of the union impact. Sitailar difficulties arise in attempting to identify
how the process of unionization affects productivity in a particular
establishment. In the first instance, simply finding out what changes in
internal operations occurred following unionization is not trivial.
Information sources may include company and union documents, but insight
into the details of actual practice can only be developed through retro-
spective interviews. The process is thus observed through the perceptions
and memory of participants. Furthermore, in the context of changes
in operations over time, the presence of technological change common to
all establishments complicates the process of inferring the role of
unionization.

—6—
The design of the empirical analysis in this paper reflects each of
the problems of identification. Case studies of six plants which change
union status are used to examine changes in operations after collective
bargaining is introduced. The problem of measuring the union impact is
studied in the context of a relatively simple model of production. Output is
assumed to be a function of the capital stock (K), the input of production
workers (L), and supervisory personnel (S). In addition, organizational
factors may influence the level of output obtained from a given combination
of the thre inputs. Principle focus in this paper is on the change
in output within a given establishment over time. In a time series
context, technological innovation is likely to lead to changes in the
methods of organization and management which improve the efficiency
of operations. Moreover, changes in the rate of capital utilization may
be an important source of variation in capital input. Assuming that
technology in the th firm is of the Cobb—Douglas form, these aspects of
production may be written as:
5t 2 IQ. =Ae [K R L. S Iit 0 itltit it
where R is the rate of utilization, and a simple exponential trend has been
assumed for technological change.13 In this framework output per manhour
of production workers is given by
ln(Q/L) = lnA + St + a1ln(K/L). +(2)
+ Iln(S/L). + (0 — 1) lnL.
where 0 = c1± c2 + y + is a measure of returns to scale. Equation (2 ) assumes
different elasticities of output with respect to the stock of capital and the rate
of utilization. This specification has found support in a variety of data sets and
—7—
will be examined here. The lack of employment data precludes extension of
the specification to the labor inputs as well.
The traditional effect of unionization on input ratios is assumed to be captured
in changes in the capital—labor ratio and the ratio of supervisory to direct produc-
tion manhours. The effect of the union on organization factors can be summarized
* *as A = A0 (1 + b), where A0 can be thought as the index of organizational
efficiency following unionization. In this formulation b is the productivity
differential between the union and non—union regimes; given':the theoretical. consid-
erations examined earlier, b may be either positive or negative. If we assume that
unionization does not affect the technology of production, then the organization effect
may be introduced into the empirical model by re—writing ( 2 ) as:
ln(Q/L). = mA + 5t + bUi + a1ln(K/L)jt + cz2ln(R/L)i(3)
+ yln(S/L). + (8 — l)lnL.where is a dummy variable which takes the value 1 if the firm's work force is
unionized and zero otherwise.-
The Cement Industry Data
Estimation of the basic model is based on establishment data from
the U.S. cement industry. The industry has a number of
characteristics which influence the structure and interpretation of the analysis. 15
Cement is a fine gray powder derived from a highly capital intensive process
in which limestone and clay (or shale) are crushed and ground, and fired to 2700°F
in a large rotating kiln to form partly fused pellets called "clinker." The clinker
is then finely ground, usually with a small amount of gypsum which controls setting
time. The cement powder produced in this process has a very low value—to—weight
ratio so that shipping costs generally preclude extensive geographic penetration by

—8—
a single establishment. The result is a highly regional market structure, with
the bulk of output from a given establishment shipped within a 200 mile radius.'6
The regional nature of the industry is reflected in th� structure of collective
bargaining, where single employer agreements with substantial local negotiations are
the rule. The unionized sector is dominated by the United Cement Lime and Gypsum
Workers International Union, who represent 75 percent of the plants in the industry.17
A little over 8 percent are non—union, and the remainder are divided among the Steel-
workers, joint councils and independent unions. In terms of employment
and compensation the cement industry is much like other
highly unionized, highly capital intensive sectors. Most tasks in a cement plant
involve operating, monitoring or maintaining large peices 01 equipment so that skill
levels range from semi—skilled operators to highly skilled machinists and electricians.
Most employment is concentrated in plants with 150—200 workers and the employment
relationship is relatively long term.18 From 1958 to 1974 the monthly quit rate in
cement averaged 0.648 percent compared to 1.910 percent for total manufacturing.1-9At
least part of the reason for extended job tenure lies in the relatively high rates
of compensation: in 1976, average hourly earnings in cement were $7.26 compared to
$5.19 in manufacturing. 20
Perhaps, the most crucial aspect of the industry for the current analysis is the
relatively homogeneous nature of the product. Cement isessentiallya commodity pro-
duced to universally accepted ASTM specifications with very little variance from one
plant to another.21-The homogeneous nature of the product together with official product
classifications and quality standards permits comparison of output in different
establishments in physical terms. Since 1919 the Portland Cement Association has
—9—
conducted an annual survey of association members which provides information on the
production of clinker, finished cement, cement shipments, and manhours for each of
the respondent firm's establishments. This survey constitutes the basic source of
data used in the empirical analysis.22
The PCA survey provides annual data on tons of finished cement, hours of work,
plant location, annual plant capacity and, for recent years, the age and capacity
of individual kilns. The data on manhours is broken down by department, permitting
the construction of variables measuring production and supervisory or non—production
labbr input. The supervisor category includes plant management, foremen and super-
visors, clerical staff and laboratory personnel. The production category includes
workers in the quarry, the raw grinding and finishing departments, and the general
labor group. Beginning in 1973 information is available on the installation date
and "practical" capacity of individual kilns. Letting C. be the capacity of kilns
of the •th vintage, the capital stock in the ith plant in year t is defined as
Kit = Ext 1C O<A<l(4)
The adjustment parameter X reflects the effects of depreciation, obsolescence23
and vintage. rhe data set is completed with information on utilization and union
status. Utilization is measured as the ratio of cement production to unadjusted
plant capacity. Union status was determined by examining records from the Cement
Employers Association, and the United Cement, Lime and Gypsum Workers International
Union.
Section II: Estimates of the Union Effect
The cement industry provides a useful empirical framework for the analysis of
unionization and productivity. The use of data on establishments producing homo—
genous output measured in physical units avoids the problems inherent in comparing
productivity in value terms. Moreover, among plants of the same vintage technology
is relativelystandardized, liinlttUe riwJ2r m1or_differene&
— 10 —
between union and non—union establishments. Evidence presented in Clark (1979)
shows that constraining the production process in the union and non—union sectors
to be identical does not obscure important technological distinctions and does
not affect inferences about the union effect. The evidence from cross
section data suggests the union productivity differential is about 6—8 percent
irrespective of the technology constraint. These results imply that price
and technology effects are controlled for in the choice of industry. Thus,
primary focus in the empirical work here is on the analysis of firm fixed
effects and labor quality using time series data on six establishments which
change union status.
Unionization and Firm Specific Effects
The model specified in ( 3) assumes that the parameters of the production
function are constant across firms and over time. Even with a common set of
output elasticities, however, productivity may vary across establishments because
of differences in organizational factors. It is common in production function
analysis, for example, to attribute part of any unexplained variation in output to
differences in managerial ability.24 Differences in morale and motivation may play
a similar role. If differences in managerial ability and motivation exist, omitting
them may lead to biased estimates of production parameters, Including the
union productivity effect. Without direct measures of the organizational factors,
productivity effects specific to the firm cannot be held fixed in cross section data.
With the addition of a time series dimension, however, firm specific effects can
be introduced through assumptions about the error term. In the present instance,
we assume that the errors in C 3) have the following "fixed effects" structure:
V =p.it 1 itEv. =ij..
(5)it 1
2
cov(v.,v.) =EE.tE5
= v when i = j and t = s
0 otherwise

- 11 -
We have assumed that the firm specific component () is fixed, and that
are uncorrelated across establishments and over time2.5 Under this specification,
consistent estimates of ( 3) can be obtained with pooled data by introducing
individual establishment intercepts.
The introduction of firm intercepts controls for a particular kind of auto—
correlation in the errorsof a given establishment. Without separate intercepts, the
errors of a given firm will appear to be serially correlated because the mean error
( ) is common to all observations. Even with the common mean removed, however, it1
is entirely possible that additional serial correlation will remain. To allow for
that possibility, ( 3 ) may be estimated assuming a first order autoregressive process:
£ = it—f"it(6)
where p is the autocorrelatjon coefficient and uj has mean zero and is uncorrej.ated
across establishments and over time. Under this assumption consistent estimates
of ( 3 ) can be obtained by covariance analysis with a non—linear procedure to estimate
p.
Estimation of the basic model and its several variants is based on data
for six establishments which underwent unionization in the 1953—1976 period.26
Since some of the plants were constructed after 1953 we do not have data
on all establishments for each year. There are a total of 104
observations Or an average of 17.3 per establishment. In order
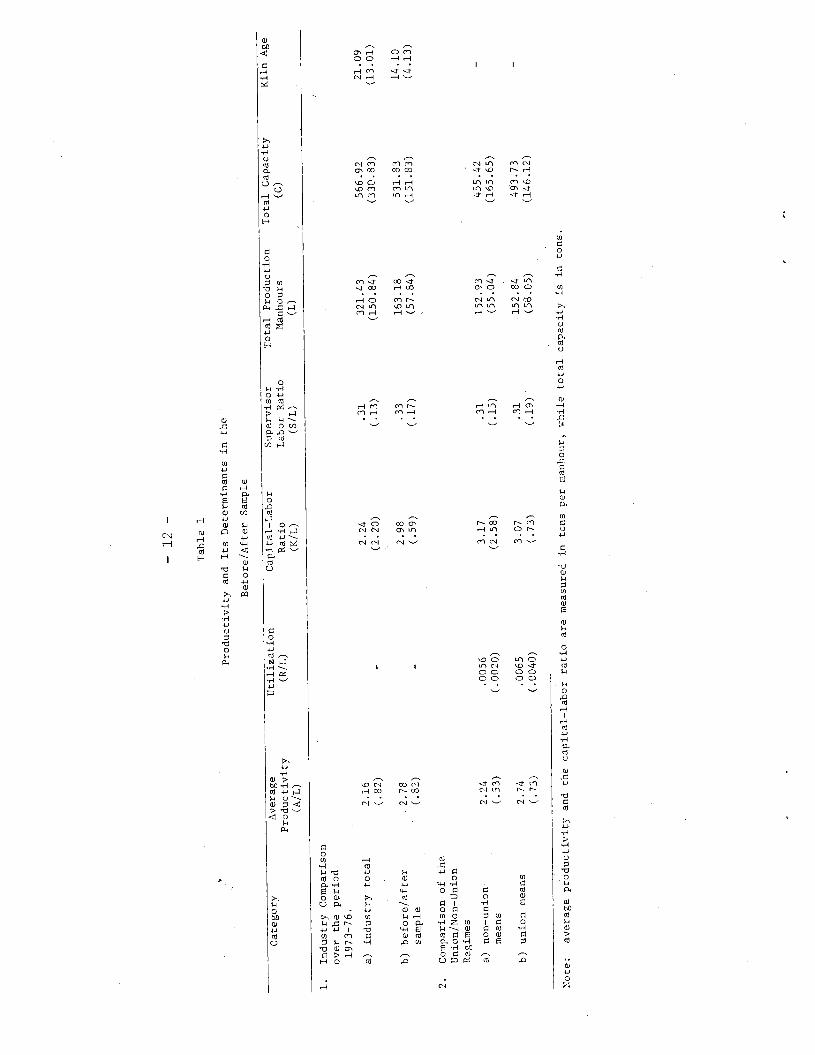
to provide perspective Table 1 presents summary measures of productivity and its
determinants for the industry as a whole and for the before/after sample.
The before/after sample is further examined in line 2 of the table
which presents mean values from the union and non—union regimes7 The data in
line 1 clearly indicate that most of the plants in the before/after sample are
—
12 —
Tab
le 1
Productivity and Its Determinants in the
Before/After Sample
Category
Average
Utilization
Capital—Labor
Supervisor
Total Production
Total Capacity
Kiln Age
Productivity
(R/L)
Ratio
Labor Ratio
Manhours
(C)
(A/L)
(K/L)
(S/L)
(L)
1.
Industry Comparison
over the period
1973—76.
a) industry total
2.16
2.24
.31
321.43
566.92
21.09
(.82)
(2.20)
(.13)
(150.84)
(330.83)
(13.01)
b) before/after
2.78
2.98
.33
163.18
531.83
14.10
sample
(.82)
(.59)
(.17)
(57.84)
(151.83)
(4.13)
2.
Comparison of the
Union/Non-Union
Reg
imes
a) non—union
2.24
.0056
3.17
.31
152.93
455.42
means
(.53)
(.0020)
(2.58)
(.15)
(55.04)
(165.65)
b) union means
2.74
.0065
3.07
.31
152.84
493.73
(.73)
(.0040)
(.73)
(.19)
(5a.05)
(146.12)
Note:
average productivity and the capital—labor ratio are measured in tons per manhour, while total capacity is in tons.
— 13 —
considerably younger than the industry average. The age of the plants is reflected
in the capital—labor ratio and the lvl of productivity. On average the before!
after plants are 25 percent more productive than the industry average, and operate
witha 28.7 percent higher capital—labor ratio. It should be noted that the average
level of productivity in the sample masks a good deal of diversity across plants. The
diversity appears to be more than might be explained by variation in input ratios,
suggesting the presence of firm specific effects. The data on total capacity suggest
that the before/after plants are slightly smaller than the industry average, but
are much more tightly grouped around the mean.
The differences in average productivity and input ratios following unionization
are presented in line 2. The data reveal a substantial increase in productivity in
the union regime, while the capital—labor ratio actually falls. The fall in the
capital—labor ratio reflects the adjustment procedure which reduces K as time passes,
unless new capacity is added. In general, changes in input ratios are quite small
and the evidence suggests that the sign and magnitude of the union differential will
depend more heavily on the effect of utilization rates, returns to scale and techno-
logy changes than on variation in input ratios.
Section II: Empirical Results
Table ( 2 ) presents estimates of the basic model un#v several alternative
specifications. Without parameter restrictiors, a full version of equation (3 )
cannot be estimated with the cement industry data. The rate of utilization is mea-
sured as the ratio of output to unadjusted capacity, which also serves as the basis
for our measure of the capital stock. Thus under the complete specification, equation 3
is almost an identity. In the absence of independent information about utilization
(or the capital stock) restrictions on the parameters are necessary to estimate the

- 14 -
union effect. One possibility is to adopt the specification that R is constant or
proportional to variations in the stock. A second possibility is to impose constant
returns to scale. This assumption is consistent with evidence from cross section
data reported in Clark (1979). Estimates under both assumptions are presented tn
table 2.
The empirical evidence suggests that unionization increases productivity after
controlling for capital—labor substitution, technological change and individual firm
effects. In line 1 utilization is assumed to be proportional to the capital stock and
is omitted from the equation. Before correcting for autocorrelation the point estimate
of the union effect lies between 8 and 10 percent with the, higher estimate coming
under non—constant returns to scale. Except for the estimated scale parameter in
line la, the production parameters are consistent with evidence from the cross section
data. Given the dominance of the time series dimension of the data, total man-
hours may be picking up variation in the omitted utilization variable. The
apparent bias in the scale coefficient, however, is of little consequence for estima-
tion of the union effect.
The unadjusted Durbin—Watson statistics in lines la and lb provide some indication
of the extent of serial correlation. The effects of autocorrelation are examined
assuming a first order autoregressive process in the errors. We retain the fixed
effects specification of the establishment component in the error, and constrain the
autocorrelation coefficient to be identical in each firm. We further estimate the
union effect conditional on values of the production parameters obtained in cross
section data. Initial unconstrained estimates yielded absurd values of the output
elasticities and returns to sca1e8 Fixing the production parameters transforms the
model into an equation explaining total factor productivity. In effect we regard
the time series evidence on the production parameters as relatively weak, and
have allowed the xesults from the cross section analysis to serve as dominant
prior information.
The autocorrelation. correction has little effect on the estimated union coef—

—
15 —
Tab
le
2
Estimates of the Union Effect in the
Before/After Sample
Firm
2
Model Specification
Cons
ln(R/L)
ln(K/L)
ln(S/L)
lnL
Time
Region
Union
Dunmdes
R
SEE
D.W.
1. CaDacity utilization proportional
to variations in the
capital stock
a)
non—constant
—17.14
.322
.075
—.235
.010
.107
x
.522
.179
.89
returns
(10.60)
(.109)
(.102)
(.132)
(.005)
(.064)
corrected for
3.260
.45]
[.121
[—.05]
—.001
.104
X
.456
.147
.576
autocorrelation
(17.262)
(.009)
(.070)
(.091)
b)
constant
—17.14
.410
.156
—
.009
.084
x
.503
.181
.83
returns
(10.70)
(.098)
(.093)
(.005)
(.063)
corrected for
3.311
—
[.45]
[.12]
—
—.0
01
.103
X
.467
.147
.590
autocorrelation
(17.72)
(.009)
(.070)
(.091)
CapacitY utilization allowed
to vary under constant returns
to scale —
para
met
ers
con—
strained to cross section
values
—12.28
[.45]
[.45]
[.12]
—
.008
.100
x
.764
.113
.82
(6.54)
(.003)
(.040)
corrected for
—1.610
[.45]
[.45]
[.12]
—
.002
.064
X
.856
084
.583
autocjrrelation
(20.00)
(.005)
(.040)
(.081)
i-ates controlling for
itted v
ariables
a)
non—constant
1.072
.244
.073
-.175
—
.473
.092
X
.593
.165
.81
returns
(.563)
(.100)
(.093)
(.122)
(.107)
(.046)
b)
constant returns
.293
.306
.131
—
.436
.069
X
.534
.166
.79
—
(.15
4)
(.093)
(.084)
(.137)
(.043)
c)
constant returns with
2.345
1.45
[.12]
—
.215
.1
21
X
.777
.1
10
.77
- -
(.06
6)
O9
utili
zatio
n (.04)
ot:
[ J
indi
cate
s a fixed parameter taken fron cross section estimates reported in Clark (1979
-

— 16 —
ficient in the basic model given in line 1. Under constant returns the estimated
coefficient actually increases, while the standard error rises slightly. Minor
changes are registered in the non—constant returns results. The insensitivity of
the results to the autocorrelation specification is not due to fixing the production
parameters. When the constrained version of line la was estimated without correcting
for autocorrelation, the union coefficient was .108 with a standard error
of .070.
Autocorrelation is a more important factor in line 2 where the utilization rate
is introduced under the assumption of constant returns to scale. Without correcting
for autocorrelation, the estimated union effect is little changed from the estimates
in line 1. Under the autocorrelation specification the estimated union effect dec-
lines to .064. Thus, allowing for autocorrelation makes the union effect more sen-
sitive to model specification and reduces somewhat the precision of estimates. In
general, however, the evidence suggests that unionization led to an increase in pro-
ductivity, with the iagnitude of the effect likely to fall in the range from 5—10
percent.
The estimates of the union effect take into account short run variations
in input ratios, scale, and establishment effects; trend movements in
basic variables, as well as technological change, are captured in the time trend.
In spite of these controls, the possibility that the union coefficient reflects
unmeasured changes in the environment cannot be ignored. It is not impossible
to conceive of abrupt changes in the environment of the firm which are coincident
with unionization, imperfectly reflected in input ratios and a smooth time trend,
and which raise productivity. The impact on productivity of any omitted
variables with the same time structure as the union variable will be compounded
in the union coefficient.29
— 17 —
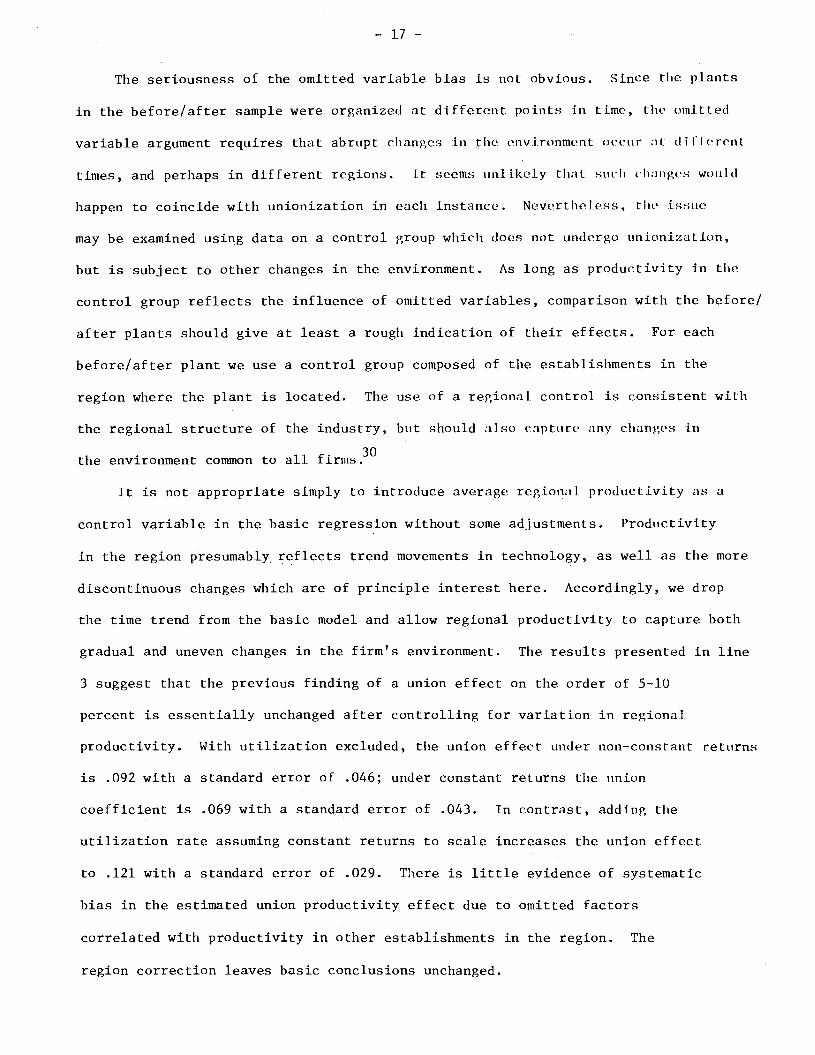
The seriousness of the omitted variable bias is not obvious. Since the plants
in the before/after sample were organized at different points in time, the omitted
variable argument requires that abrupt changes in the eiiv ironment occur at di lie rent
times, and perhaps in different regions. It seems unlikely that such changes would
happen to coincide with unionization in each instance. Nevertheless, the issue
may be examined using data on a control group which does not undergo unionization,
but is subject to other changes in the environment. As long as productivity in the
control group reflects the influence of omitted variables, comparison with the before!
after plants should give at least a rough indication of their effects. For each
before/after plant we use a control group composed of the establishments in the
region where the plant is located. The use of a regional control is consistent with
the regional structure of the industry, but should also capture any changes in
the environment common to all firms.3°
It is not appropriate simply to introduce average regional productivity as a
control variable in the basic regression without some adjustments. Productivity
in the region presumably reflects trend movements in technology, as well as the more
discontinuous changes which are of principle interest here. Accordingly, we drop
the time trend from the basic model and allow regional productivity to capture both
gradual and uneven changes in the firm's environment. The results presented in line
3 suggest that the previous finding of a union effect on the order of 5—10
percent is essentially unchanged after controlling for variation in regional
productivity. With utilization excluded, the union effect under non—constant returns
is .092 with a standard error of .046; under constant returns the union
coefficient is .069 with a standard error of .043. In contrast, adding the
utilization rate assuming constant returns to scale increases the union effect
to .121 with a standard error of .029. There is little evidence of systematic
bias in the estimated union productivity effect due to omitted factors
correlated with productivity in other establishments in the region. The
region correction leaves basic conclusions unchanged.
— 18 —
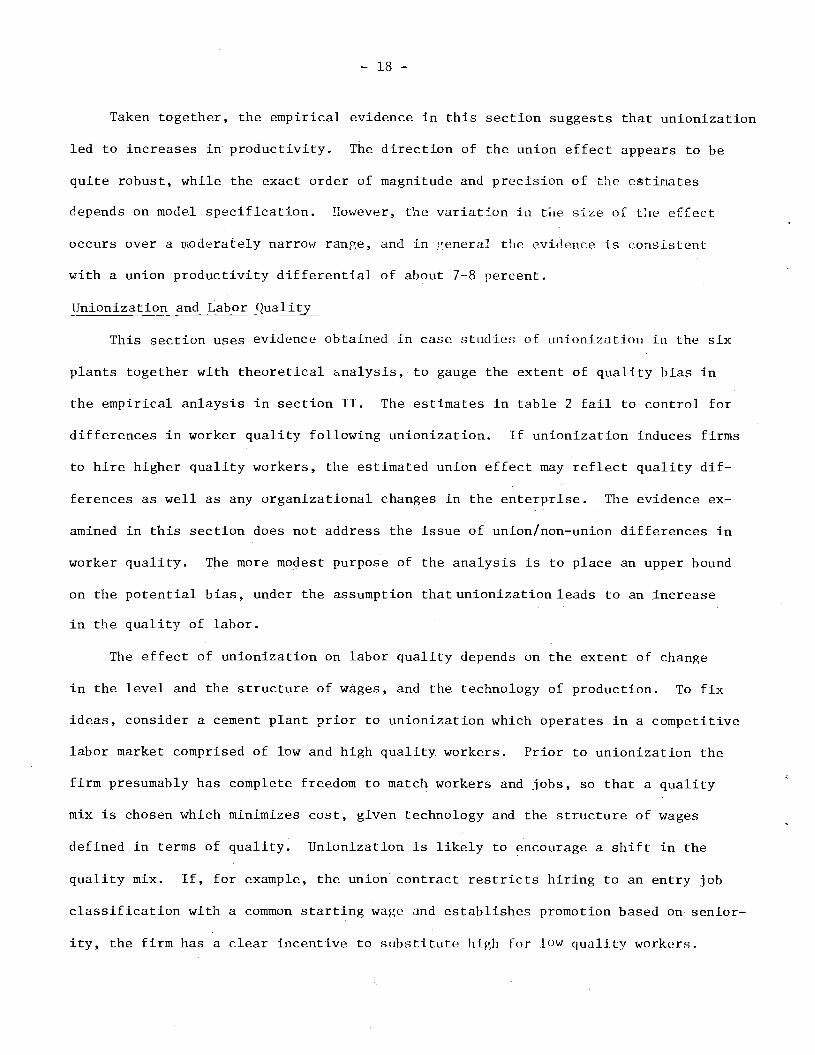
Taken together, the empirical evidence in this section suggests that unionization
led to increases in productivity. The direction of the union effect appears to be
quite robust, while the exact order of magnitude and precision of the estimates
depends on model specification. However, the variation in tiLe size of the effect
occurs over a moderaboly narrow range, and in general the evidence Is consistent
with a union productivity differential of about 7—8 percent.
Unionization and Labor Quality
This section uses evidence obtained in case studies of unionization in the six
plants together with theoretical analysis, to gauge the extent of quality bias in
the empirical anlaysis in section II. The estimates in table 2 fail to control for
differences in worker quality following unionization. If unionization induces firms
to hire higher quality workers, the estimated union effect may reflect quality dif-
ferences as well as any organizational changes in the enterprise. The evidence ex-
amined in this section does not address the issue of union/non—union differences in
worker quality. The more modest purpose of the analysis is to place an upper bound
on the potential bias, under the assumption thatunionization leads to an increase
in the quality of labor.
The effect of unionization on labor quality depends on the extent of change
in the level and the structure of wages, and the technology of production. To fix
ideas, consider a cement plant prior to unionization which operates in a competitive
labor market comprised of low and high quality workers. Prior to unionization the
firm presumably has complete freedom to match workers and jobs, so that a quality
mix is chosen which minimizes cost, given technology and the structure of wages
defined in terms of quality. Unionization is likely to encourage a shift in the
quality mix. If, for example, the union contract restricts hiring to an entry job
classification with a common starting wage and establishes 1)romotion based on senior-
ity, the firm has a clear incentive to substitute high [or lOW quality workers.
— 19 —
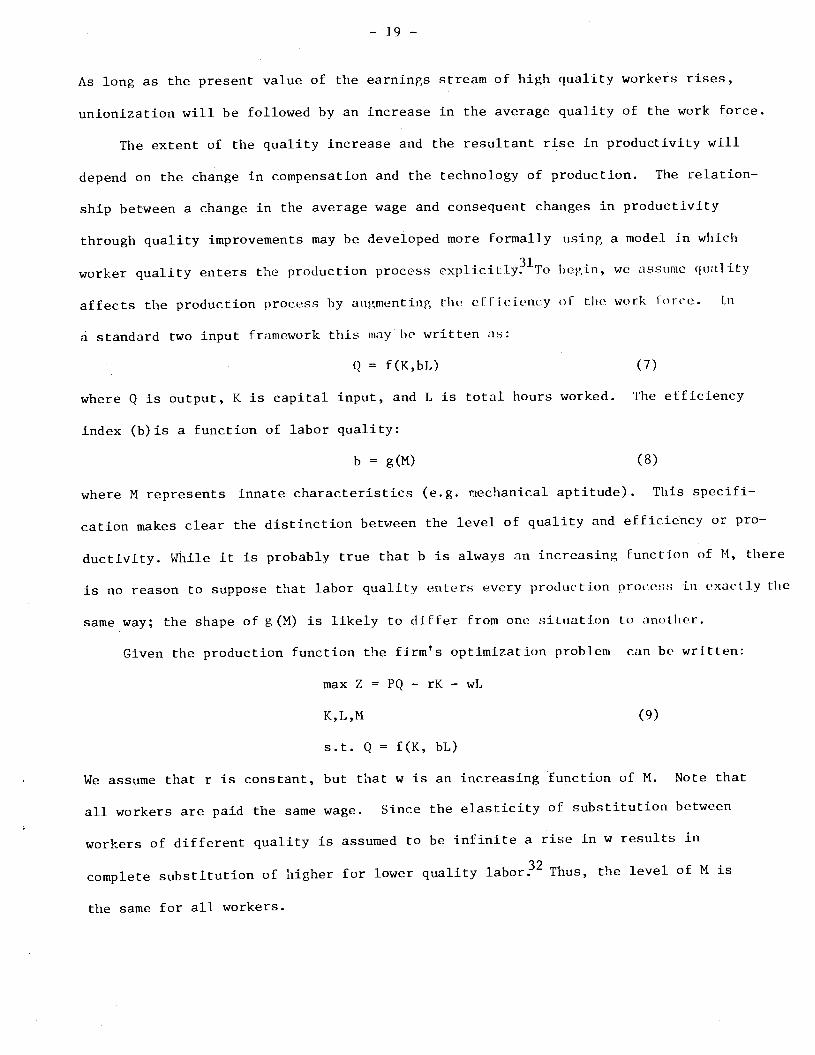
As long as the present value of the earnings stream of high quality workers rises,
unionization will be followed by an increase in the average quality of the work force.
The extent of the quality increase and the resultant rise in productivity will
depend on the change in compensation and the technology of production. The relation-
ship between a change in the average wage and consequent changes in productivity
through quality improvements may be developed more formally using a model in which
worker quality enters the production process explicitly?1To begin, we assume quality
affects the production process by augmenting the eFficiency oF the work Force. in
a standard two input framework this may be written as:
Q = f(K,bL) (7)
where Q is output, K is capital input, and L is total hours worked. The efficiency
index (b)is a function of labor quality:
b = g(M) (8)
where M represents innate characteristics (e.g. mechanical aptitude). This specifi-
cation makes clear the distinction between the level of quality and efficiency or pro-
ductivity. While it is probably true that b is always an increasing Function of N, there
is no reason to suppose that labor quality enters every production process in exactly the
same way; the shape of g(M) is likely to differ from one siLuation to another.
Given the production function the firm's optimization problem can be written:
max Z = PQ — rK - wL
K,L,N (9)
s.t. Q = f(K, bL)
We assume that r is constant, but that w is an increasing function of N. Note that
all workers are paid the same wage. Since the elasticity of substitution between
workers of different quality is assumed to be infinite a rise in w results in
complete substitution of higher for lower quality labor.32 Thus, the level of N is
the same for all workers.

— 20 —
The level of M the firm chooses depends on the following first order conditions:
Pb -—0(bL)
—(10)
P —r=0 (11)
P[db dw —0 (12)(bL) dm dm
Equations (10 ) and (12 ) yield
db 1 = dwl(13)dMb dMw
which determines the optimal level of N.
To illustrate the relation between productivity and an exogenous increase in the
wage we specify the following simple functional forms for ( 7 ), ( 8 ) and the wage—
qi-iality function:
Q = AK(bL) (14)
b = BM1 0< X (15)
w C±M 0< (16)
Using (15) and ( 16) and the reduced form expression for M from ( 13) we obtain an
expression relating b and w:
bB (w (17)
The elasticity of b with respect to exogenous changes in w (i.e. y/) is the key par-
ameter in the system. It determines the extent to which the firm can recover the
incremental cost of an exogenous wage increase by hiring workers of higher quality.
Stability requires (X/5)<1, so that wages rise more rapidly than productivity for a
given change in N. This makes good intuitive sense, since if it were not true, the
firm could lower unit costs by raising the wage. Given stability, the elasticity Is
bounded by zero and one, since and y are both positive. Whether the elasticity
is close to either bound in a given situation will depend on technology and the
wage—quality function facing the firm.
The model can be used to examine the effect of unIonization on labor quality
— 21 —
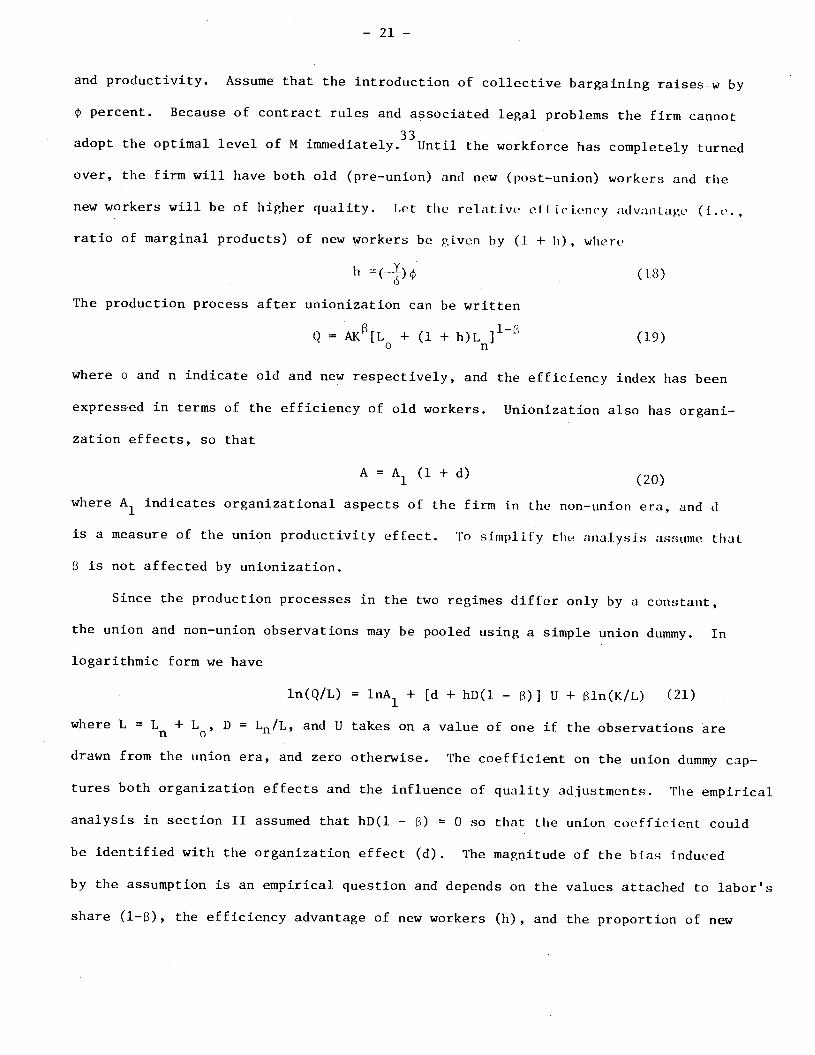
and productivity. Assume that the introduction of collective bargaining raises w by
percent. Because of contract rules and associated legal problems the firm cannot
adopt the optimal level of M immediately.33Until the workforce has completely turned
over, the firm will have both old (pre—union) and new (post—union) workers and the
new workers will be of higher quality. Let the retat lye ef I i clency adan tage (I .ratio of marginal products) of new workers be given by (I + h), where
Ii (18)
The production process after unionization can be written
Q = AK[L + (1 + h)L]1 (19)
where o and n indicate old and new respectively, and the efficiency index has been
expressed in terms of the efficiency of old workers. Unionization also has organi-
zation effects, so that
A=A1 (l+d) (20)
where A1 indicates organizational aspects of the firm in the non—union era, and d
is a measure of the union productivity effect. To simplify the analysis assume that
is not affected by unionization.
Since the production processes in the two regimes differ only by a constant,
the union and non—union observations may be pooled using a simple union dummy. In
logarithmic form we have
ln(Q/L) = lnA1 ÷ [d + hD(l — )] U + 3ln(K/L) (21)
where L = L + L, D = L11/L, and U takes on a value of one if the observations are
drawn from the union era, and zero otherwise. The coefficient on the union dummy cap-
tures both organization effects and the influence of quality adjustments. The empirical
analysis in section II assumed that hD(l — 13) = 0 so that the union coefficient could
be identified with the organization effect (d). The magnitude of the bias induced
by the assumption is an empirical question and depends on the values attached to labor's
share (1—8), the efficiency advantage of new workers (h), and the proportion of new

— 22 —
workers in the total workforce (D).
To gauge the influence of omitted quality measures, evidence has been gathered
on all three magnitudes. The share of production workers has been estimated in
Clark (1979); for the purpose of illustration, we use a value of 0.45. Estimates
of the other two parameters have been obtained in a less straightforward fashion.
The efficiency advantage of new workers depends on the union wage effect ( ) and
on the elasticity of efficiency with respect to changes in the wage (/cS). We have
no information on yore, beyond the condition 0< I'5 < 1. Since our purpose is to
obtain an upper bound on the quality effect, we have chose to use a relatively large
value of 0.8.
Information on the proportion of new workers in the workforce has been obtained
through case studies of unionization in the six cement plants, the full details of
which are examined in the next section. Information in Clark (1978) suggests that the
union wage effect falls in the range from 12 to 18 percent. Both values are used in the
calculations below. To measure D in a given plant, estimates of the percentage of
the 1976 workforce who were employed at the time the plant was unionized were
obtained. The average value of D in 1976 in the six plant sample was .34 with a range
from .05 to .65. This overstates the proportion of new workers relevant for present
purposes. Since the estimated union effect is an average, D should be measured by
an average value over the sample period. If D grows at a constant rate throughout
the union era, then the estimated value at the midpoint of the period would be appro-
priate. Both the midpoint and the endpoint values will be used below.
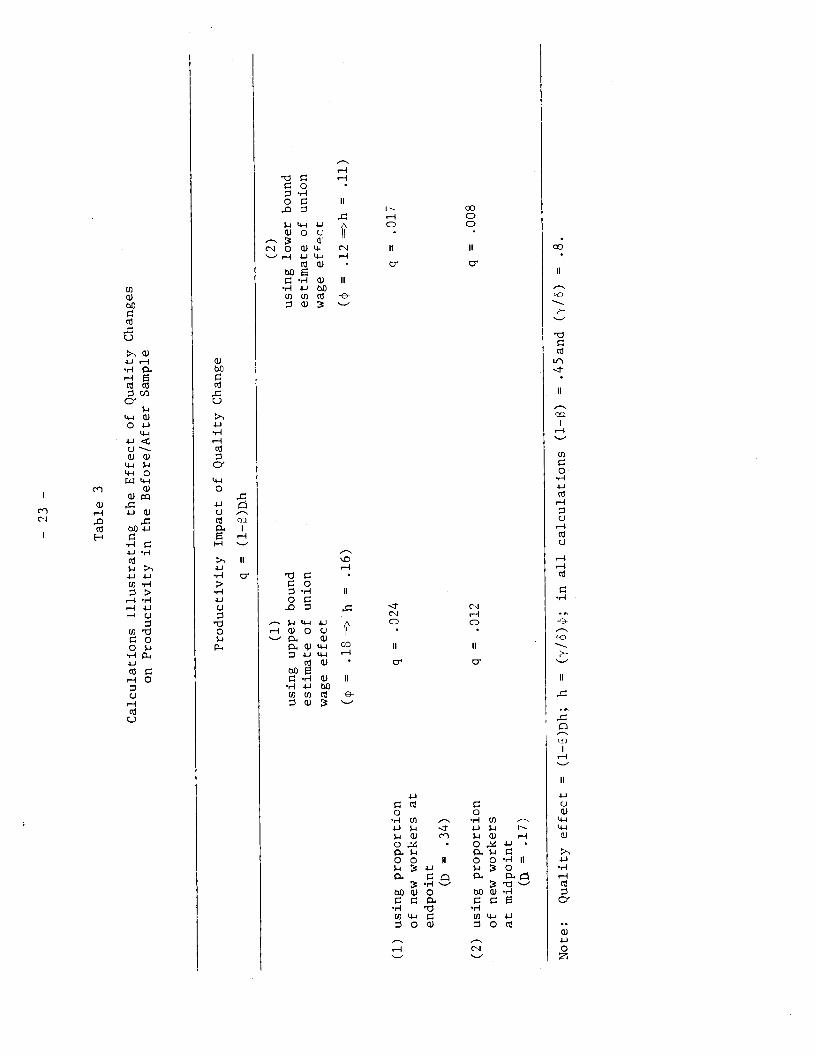
Table 3 summarizes the assumed values of (1—13), h and D and presents alterna-
tive calculations of the effect of quality on productivity. Columns 1 and 2 contain
estimates of the quality effect for alternative values of h. These calculations sup-
port the conclusion that changes in quality are likely to have had a small effect on
productivity. Under the most generous assumptions, quality improvements raise produc-
tivity by a little over two percent. Under more realistic assumptions about turnover,
— 23
—
Tab
le 3
Calculations Illustrating the Effect of Quality Changes
on Productivity in the Before/After Sample
Productivity Impact of Quality Change
q
(l—1)D.h
(1)
(2)
using upper bound
using lower bound
estimate of union
estimate of union
wage effect
wage eff'ct
( =
.1
8=>
h .16)
(p
=
.12
=>
h =
.11)
(1) using proportion
q
.024
q =
.017
of new workers at
endpoint
(D =
.34)
(2) using proportion
q
.012
q =
.008
of new workers
at midpoint
=
.17)
Note:
Quality effect = (l-
6)D
h; h
(y/6); in
all calculations (1-8)
.45and (y/)
= .8
.

— 24 —
the effect is close to one percent. These results suggest that while the
estimated union coefficient in the empirical analysis may be an overestimate of
the union productivity effect, the extent of the bias is quite small.
Correcting for changes in quality leaves the basic findings intact.
Section IV: Case Studies of the Union Organization Effect
Within the framework laid out in section I unionization may lead to a variety
of changes in the labor contract and the internal operation of the firm. The empirical
evidence in section II suggests that adjustments consequent to unionization are, on
balance, productive. Yet measurement of the impact of tile union deals with only half
of the issue. We argued earlier that the union effect arises through a complex
process of organizational and behavorial change. A complete analysis requires not
only measurement, but identification of the channels of union influence.
This section presents evidence from a series of case studies of tile unionization
experience in the six before/after plants. Through interviews with union and manage-
ment officials we attempted to identify worker and management response to changes in
the labor contract brought on by unionization. The interviews conducted were truc—
tured around the distinction between changes in contract provisions on the one hand,
and the response or adjustment to the changes on the other hand. In the first phase
of the interview we examined exisiting practices under the union contract in terms
of compensation, internal mobility (promotions, transfers), exit and entry (hiring,
layoffs), dispute settlement, technological change and work practices. The inter-
views were supplemented with evidence from written contracts. Once the procedures
governing each category were clear, respondents were asked to contrast experience
under collective bargaining with practice before unionizaton using the same categories.
— 25 —
The second phase of the interview dealt with responses and
adjustmen1to changes in the rules. Information was sought from both unton and
management representatives on the behavior and adjustment of both groups. However,
with management representatives, most of the second phasc was devoted to a discussion
of changes in management procedure and personnel, whi le the un ion [Utcry I ew- t etided
to focus on the grievance problem and the imptIc i L contr;icl In the non—un ion er; . t wa
apparent from these discussions that retrospective interviews provide only weak
evidence on the more subtle effects of unionization. Changes in morale and motiva-
tion, differences in work group efficiency, and the amount and quality of on —the—
job training appear to be difficult to assess without carefully designed question-
naires administered before and after unionization,and without measurement and obser-
vation of the process in question.
Changes in the Labor Contract
Differences in the labor contract serve as necessary or enabling conditions
for a union productivity effect. The extent of change in rules governing the employ-
ment relation is an important determinant of the scope and magnitude of union in-
fluence. Analysis of the labor contract thus serves as a useful check on the plausi-
bility of the statistical analysis and the examination of adjustments in
operations. Table 4 sunarizes contract changes in the before/after plants
following unionization.
The evidence on the labor contract under the union and non—union regimes reveals
a fundamental change in rules covering exit and entry, internal mobility, and dispute
settlement with a more moderate impact in compensation. The moderate union impact
on compensation evident in line 1, is consistent with evidence on the union wage
effect found in cross section data and with information obtained through interviews
and discussions with union and management officials not connected with the before/after
plants. The apparent increase in compensation occurs through a variety of forms,

Table 4
Changes in the Labor Contract
Contract Category
Non—union Practice
Union Practice
1.
Compensation
explicit policy of matching or coming
close to union rates; bonuses used in
some cases to match union earnings;
standard fringes available (paid
vacation, insurance, pension); no
penalty payments
increase in number of job classi-
fications; improvements in fringe
benefits; penalty payments (re-
porting, call out, etc); likely
range of union effect on compen-
sation:
12 to 18 percent (see
Clark
1978)
2.
Exit—Entry
hiring at bottom grade with some in-
ternal promotion; workers always on
probation; outside hiring common for
maintenance and other jobs; layoff and
recall based on decision of foremen
hiring at bottom grade with in-
ternal promotion; probationary
period of 30—90 days; internal
programs to equip employees for
maintenance jobs; outside hiring
extremely rare for jobs above
laborer; layoffs and recall plant—
wide, based on seniority
3.
Internal Mobility
promotions by department; openings ad-
vertised informally (word of mouth);
or by posting on bulletin board; no
formal procedure; criteria for promo-
tion not specified; decisions made by
foremen;. seniority not a governing
factor
mobility according to job posting
and bidding procedure; decison made
by plant manager; plantwide senior-
ity principle criteria
4.
Dispute Settlement
no formal procedure; grievances dis-
couraged; disputes dealt with by fore-
men or plant manager; no outside involve-
ment of impartial parties
disputes handled through grievance
procedure with outside arbitration
Source:
interviews with union and management officials; union contracts

— 27 —
with direct adjustments in straight—time rates often assuming a minor role. Four of
six plants followed a policy of paying union scale, and in one plant substantial bon-
uses were used to bring earnings on par with union plants. Even where union scale on
existing jobs was paid, some change in the average wage occurred through changes in
the number of job classifications, and in re—assignment of workers to different
(i.e., higher) classifications, Fringe payments were less closely linked to the union
contract, but even here, changes more often took the form of liberalizing the existing
package rather than adding totally new benefits.
In contrast to compensation, somewhat greater changes occured in provisions govern-
ing entry and exit, and internal mobility. In both union and non—union settings a
distinction is made between internal and external sources of labor. Under both
regimes, promotion from within was the most common form of filling job openings, but
the internal/external distinction was much looser in the non—union situation. We found
a policy of hiring "outsidet' workers into maintenance jobs in every plant, and in
three of the six plants, hiring from outside was practiced at all levels of the job
structure. Furthermore, in situations involving internal mobility the scope of manage-
ment discretion is broader and the rules governing internal movement were less explicit
and specific than is the case in the union setting. Without the union, job mobility
within the plant depended solely on the decisions of the department foreman or plant
manager, with no restrictions on the process of matching workers and jobs. The
criteria for making judgments about job requirements and qualifications were not
explicit; we found no evidence of formal evaluation systems, or attempts to communicate
management's views of ideal qualifications.
The contrast with the union setting is quite sharp. Internal mobility under
collective bargaining is governed by a formal plant—wide job posting and bidding
procedure, with explicit criteria for selection. Contracts in some of the plants
containprovisions allowing management to take ability into account, but in practice
plant—wide seniority is the principal factor. The existence of a formal procedure

— 28 —
with explicit criteria for choosing among workers has several organizational conse-
quences. Perhaps the clearest change is the reduced role of management judgment.
In the non—union setting, the foreman (or plant manager) decided both the criteriafor filling jobs, and who met the criteria in a specific situation. AbIlity con-
siderations were given greater weight in the non—union setting; but there is some
evidence that personal factors also were takeninto account. Union officials and
some representatives of management generally agreed that personalities were important
in determining who was promoted, and that foremen sometimes "played favorites."
Whether such preferences came at the expense of ability, or whether personalities
were important only in choosing among people of equal ability is not clear. It is
fair to say, however, that the introduction of the union essentially eliminated
personal considerations in decisions regarding post—hiring job mobility.
The changes in rules governing internal mobility underscore the fundamental
shift in authority and power which occurs with unionization. The limits on manage-
ment discretion are clearly revealed in line 4 which summarizes the different
methods of resolving disputes in the union and non—union regimes. In each plant
unionization was followed by the introduction of a formal grievance procedures with
outside arbitration. The grievance procedure replaced a "system" in which worker's
problems were dealt with in an ad hoc fashion. Prior to unionization, none of the
plants in the before/after sample had regular channels of communication through which
grievances or complaints could be expressed. Individuals with grievances had to
raise them with supervisors, who heard the dispute and rendered judgernent. in contrast to
the union regime where too frequent use of the system i.s often a problem, informationfrom both union and mangement officials suggests that in the non—union setting few
problems were ever raised. The evidence implies that the absence of quarantees against
recrimination was a strong deterrent.
Changes in the Behavior of Workers
For workers, the introduction of a grievance procedure and an increase in compen—
— 29 —
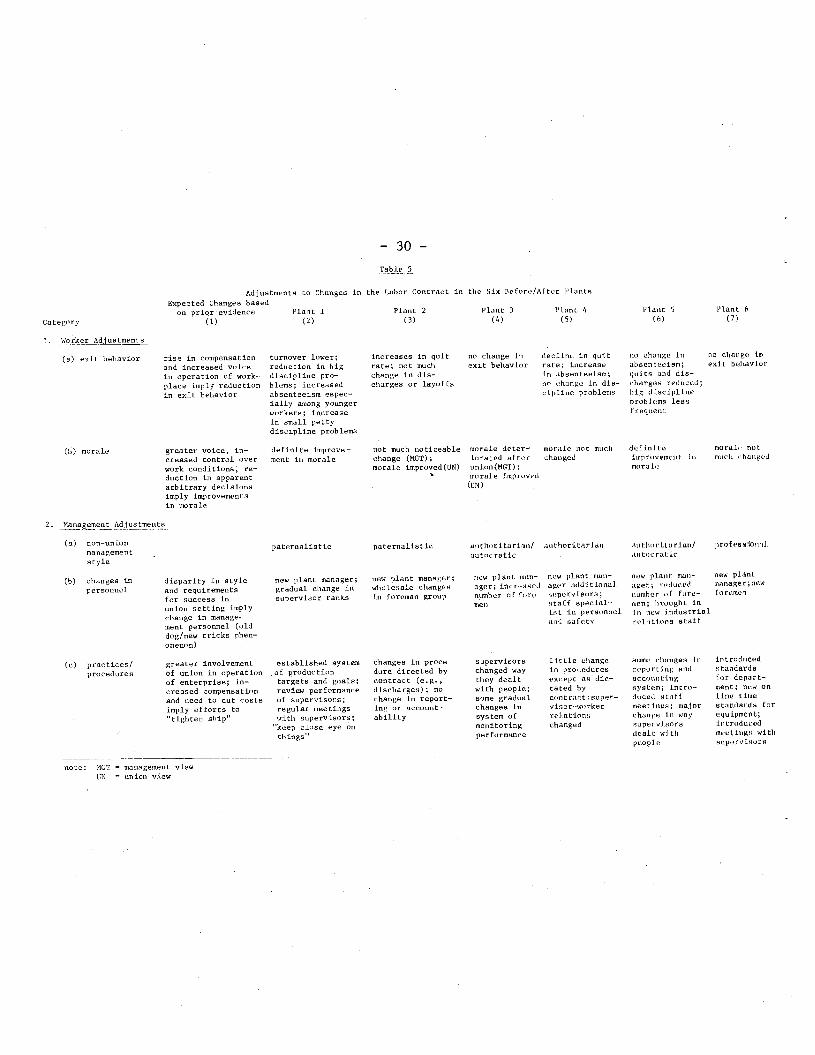
sation augur for adjustments of several kinds. In the interviews we sought to uncover
evidence on changes in worker morale, as well as exit behavior, including permanent
separations initiated by workers, absenteeism and subpar or disruptive work effort
evidenced in discipline problems. The evidence available through the interviews is
summarized in line 1 of Table 5 . The table presents a statement of prior expectations
about worker/management adjustments in column 1, and evidence on observed changes
in each of the six plants in columns 2—7. Unfortunately, neither survey data or
measures of quit or absenteeism rates were obtained. As a result, the evidence on
worker behavior is relatively weak. As the summaries in line la suggest, the inter-
views revealed a decline (3) or no change (2) in the quit rate in five of the six
plants studied; in one plant quits were perceived to have risen. We found some
evidence of an increase in absenteeism, and a decline in major discipline problems.
In the main, these results are indicative of verymoderate changes in exit behavior.
It seems likely that had quits or absenteeism changed substantially, we would have
uncovered much greater awareness of that adjustment. As it stands the interviews
lead to the conclusion that reductions in turnover and other forms of exit behavior
were not a principal connection in the union—productivity nexus.
The question of worker morale, examined in line lb, was one of the few issues
where substantial disagreement between union andmanagement representatives emerged.
In two of the plants examined, management officials felt that morale had declined
or had not changed, while union representatives perceived definite improvements. In
the four other situations, morale apparently improved in two and was not much affected
in the others. These conclusions are based on impressionistic and perceptual infor-
mation and underscore the point made earlier, that the interview format is not well
suited to the analysis of morale and motivation. Although the changes in the labor
contract provide strong prior grounds for expecting substantial changes in morale,
there appears to be insufficient evidence to confirm or disprove those expectations.
note: MGT = management viewUN = union view
— 30 —
Table 5
Adjustments La Changes in the Labor Centratt in the Six Before/After fLoutsbased
Plant 1(2)
Plant 2
(3)
Plant 3(4)
Pfasi 4
(5)Category
1.
Expected Changesnn prior evidence
(1)
Plant 5 Plant 6(6) (7)
(a) exit behavior rise in rompensationand increased voicein operation of work—place imply reductionin exit behavior
turnover lower;reduction in bigdiscipline pro—blems; increasedabsenteeism espec—ially among youngerworkers; increasein small pettydiscipline problems
increases in quitrate; not muchchange in dis—charges or layoffs
no change inexit behavior
decline in quitrate; increasein absenteeisn;no change in dis—cipline problems
no change in no choege Inabsenteeism; coiL bohaoior:;:iits nod dis-chorgos reduced;big dIsciplineproblems lessfrequent
(b) morale greatet voice, in—creased control overwork conditions, re—duction in apparentarbitrary decisionsimply improvementsin morale
definite improve—neat iu morale
not math noticeablechange (NuT) ;moraie improved(UN)
morale deterlorated after
uoion(MGT) ;norsie improved(UN)
moraie not mock
chsoged
dcffnfle morsir matloprovemeul in much hangedmoraic
-
2. Management Adjustments
(a)
ntyipaternalistic poreroalistic ant;mnrirarlan/
antncratlcaulburi tories
.
a:it;;nritarian/ prufesaioi:alantnt raf Ic
(h) changes in disparity in stylepersonnel and requirements
far success inunion setting implychange in manage—ment personnel (olddog/new tricks phen—
- ose000)
mew plant manager;gradual change insupervisor ranks
new plant manager;wholesale changesIs foreman gtoop
new plant mam—ager; inc reasednumber of fore—men
new plant van—ager additionals::porvlsorsstaff special—tat in personnelani safety
new pioot ma::— new plantager; reduced manager; newnumbor of fore— faremonmen; hroeght inIn new indostrialreiatl.ooa staff
(c) practices/ greater involvement
procedures of union in operationof enterprise; in—creased compensationand need to cut costsimply efforts to
"tighten ship"
established systemof produetiomrargetsand pools;review performanceof supervisors;
regular meetingswith supervisors;"keep close eye on
things"
changes in proce—dure directed bycontract (e.g.,discharges); nochange in report—ing or account—
ability
supervisorschanged waythep dealtwith people;some gradualchanges insystem ofmonitoringperformamee
Utile changein proceduresexcepi as die—
rated bycent tact; super—visor-workerrelations
changed
some changes is fotrudsted
reporting and arsadsrda
accoaaih:g for depart—system; Intro— sent; new usdoted staff han rimemeetings; majmr standards fur
change in woy eqoipmcmi;supervisors iotroducod
deaii with meelioga witi:
people supereleore

— 31 —
Management Adj ustments
The introduction of collective bargaining fundamentally changes the task of manage—
ment. Managers are faced with constraints on old procedures and practices, and the
processes of negotiation and contract administration constitute a reduction of manage-
ment power. Decisions traditionally within the purview of management are often chal—
lenged as a matter of routine. The magnitude of the change which unionization entails
depends on the style of management in the non—union era. As the summar-les in line
2a suggest, in five of the six plants studied an essentially authoritarian management
was confronted by a significant shift in power and authority. Previous methods,
particularly the manner of handling and dealing with workers, were no longer viable
(i.e., were much more expensive). The evidence suggests that successful management
in the union context required new management procedures and practices. Perhaps the
most cogent description of the differences in the management process before and after
unionization was given by a plant manager who remarked:" . . . before the union this
place was run like a family; now we run it like a business."
The major change in plant management uncovered in the interviews were introduced
by a new plant manager, and in some instances, new supervisors. Given the substantial
change in the nature of industrial relations, the identification of the old manager
with the non—union regime, and the likelihood that previous management was involved
in attempts to block unionization, the change in plant management is not surprising.
While re—training permitted many front line supervisors to make the adjustment to a
union regime, training was not a viable option in the case of plant managers. The
interviews suggest that a new manager was in some sense a pre—requisite for innovation
in management methods.
In most of the before/after plants, new management meant new procedures and prac-
tices. Before the interviews were conducted, changes in management procedure could
be expected on theoretical grounds. Apart from capital—labor substitution and labor
— 32 —
qualIty adjustments, the union wage affect creates incentives for management to extract
more work effort from a given level of employees. These expectations were clearly
realized. As line 2b reveals, the interviews uncovered changes in management
methods in all plants. The magnitude o: the change varied Iron sttuation to situation,
with a more professional, businesslike app roach to labor rd at ions by Iron t I Inc sup-
ervisors the most common adjustment. In four of the six plants we found at:temps to
increase work effort and work group efficiency primarily through introduction ol
formal methods of organizational control. The adjustments in formal control proce-
dures took several forms. In essence, however, they amounted to a system of produc-
tion goals or targets accompanied by procedures for the review and monitoring of
performance. The evaluation often occured in newly introduced staff meetings, which
were used for communication, training, and assessment of conditions and progress.
Substantial changes in formal procedures were not introduced in all plants. Yet,
even where formal procedures were changed only moderately, the interviews suggest that
management monitored work performance and manning requirements more closely.
Taken together, the evidence-summarized In Table 5 suggests that unionization
led to substantial changes in mangement in each of the before/after plants. Not
all adjustments noted were observed in all plants, but each plant experienced change
in a number of dimensions. The existence of a pattern of management adjustment across
plants organized at different points in time, suggests that the observed changes are
not due solely to general technical change. While technical change maybe at work
in the processes we observed, It seems clear from the interviews that unionization had
a significant independent effect. Our tentative conclusion, therefore, is that an
improvement in plant management is one of the key adjustments to unionization. These
results may be interpreted as evidence of a modern union "shock c[Icct." Tue Lnsti—
tutional analysis is consistent with a broad range of earlier studies on the effects
of unionization and provides a partial explanation of the union effect estimated
in setiofl II.

— 33 —
Section IV: Conclusions and Implications
The examination of collective bargaining and productivity in this study
has yielded empirical results on the magnitude of the union productivity effect,
and the case studies have provided some insight into the channels through which
unions influence productivity. The empirical evidence suggests that
unionization leads to gains in productivity of 6—8 percent. The finding appears
to be relatively robust with respect to model specification and adjustments for
changes in labor quality and other omitted factors. While the evidence is
indicative of productive changes in operations after unionization, the precision
of the estimates suggests caution in drawing conclusions about exact orders of
magnitude.
Similar caution applies to the institutional analysis. It is clear
from the evidence in section III, that additional information on worker behavior
is needed before definitive conclusions about the union effect may be drawn.
It does appear that unionization leads to fundamental changes in the labor
contract, which may lead to changes in the behavior of workers and managers.
The available evidence, however, provides a reasonably clear picture only about
management adjustments. In most of the plants studied, we found significant
changes in the style and substance of management. Observed changes ranged from
introduction of staff meetings, to on line time standards for equipment
maintenance. These results support the conclusion that unionization significantly
alters the processes of management. Union effects which work through other
channels——i.e. exit behavior, work group effectiveness——are less subject to
analysis through interviews, and evidence from the case studies is essentially
weak and inconclusive.

— 4
The results of the cement industry analysis have important implications
for understanding the function and impact of the union, and for questions
of organizational change and productivity. The finding that unionization induces
an increase in productivity implies that reductions in efficiency which follow
capital—labor substitution are offset to some extent by organization effects.
Thus, the efficiency effects of the union may be much different than previously
supposed. The question of overall efficiency is, of course, much broader than
adjustments made by the firm, and the effect of unions on productivity is only
one aspect of the overall impact of the union. Moreover, it is likely that
the effect of unionization will be different in different situations.
The processes of adjustment observed in the six plants seem to he coasisteut
with evidence from the organizational behavior literatare on the determinants of
successful organizatioflal change.4 Without examples of organizational failure,
however, it is difficult to draw conclusions about the specific circumstances
and policies which lead to successful adaptation. Further research on the
process of unionization in diverse industrial settings is essential to a
deeper understanding of the problem. Not only might further study sharpen
our understanding of the operation and broad consequences of the union, hut
it may yield insights into the general processes of organizationail change
and adaptation and thus contribute to the development of public and private
policies to enhance productivity.
— 35
Footnotes
1. The basic reference is Slichter, Healy and Livernash (1960).
2. See the papers by Brown and Medoff (1978), and Frantz (1976).
3. A review of the pre—1970 literature may be found in Bok and Dunlop (1970).A more theoretically oriented discussion is presented in Brown and Medoff(1978) and Clark (1978).
4. The capital—labor ratio is understood to be adjusted for differences in quality.The traditional channel of union influence is discussed in Johnson andMieskowskj (1970), and in the paper by Lewis in Bradley (1959).
5. This effect assumes the existence of unexploited opportunities to increaseprofits and is, therefore, closely related to the concept of X—efficiencydeveloped by Leibenstein; see Leibenstein (1976) for an extended analysis.
6. See Freeman (1976) for a statement of the "exit—voice" model of the union.
7. This effect is discussed in Williamson, Wachter and Harris (1975).
8. Research in organizational behavior suggests that there is no necessarylink between morale and productivity. However, it does appear thatmorale problems may inhibit performance, even though high morale neednot lead to high performance. Moreover, the link between motivation andproductivity is quite strong, and is affected by workers' perceptionsSee Lawler (1973).
9. See Radner (1975) for an analytical treatment of managerial behaviorgoverned by bounded rationality and satisf icing which are implicit inthis sentence.
10. This problem greatly complicates inferences based on comparison of valueadded per hour worked. Brown and Medoff (1978) have shown that if costdifferences are fully reflected in differences in prices, the estimatedunion coefficient in their model identifies only a price effect.
11. See Brown and Medoff (1978) for an illustration of the ambiguity introducedby potential differences in technology.
12. The point is that observable characteristics (age, sex, race, education etc.)may be poor indicators of the "true" attribute of interest (e.g. mechanical
aptitude). Thus hedonic wage equations, which are often used to capturequality differences, may be subject to serious bias due to omitted(unobservable) variables. See Brown and Medoff (1978) for an applicationof quality adjustments based on wage equations.
— 36 —
13. While the Cobb—Douglas form is restrictive, evidence presented in Clark
(1979) suggests that the form of the production function has little
affect on inferences about the union differential in the cement industry.
14. The formulation in (3) rests on the approximation
in (1 + x) = x
15. Sources of information on the cement industry include Loescher (1959),
Lesley (1924), Hadley (1945) and Hilts (1938).
16. The median shipping distance in 1976, for example, was 90 miles; seeU.S. Department of Commerce, Construction Review (June 1976).
17. Information on unionization is based on the records of the CementEmployers Association, and the United Cement, Lime and Gypsum Workers
International Union.
18. For information on average employment per establishment see the Census of
Manufacturers, table 32B—15, and p. 1—98 of the General Summary, 1972.
19. Bureau of Labor Statistics, Employment and Earnings — Historical Statistics
1909—1975.
20. Bureau of Labor Statistics, Employment and Earnings, January 1977.
21. ASTM stands for American Society for Testing Materials. There are 10
types of cement recognized by the ASTM, each specified according to
minimum quality standards.
22. The PCA survey covers about 80 percent of the industry. The compositionof the overall sample varies slightly from year to year, but there appears
to be no systematic variation in participation by region, union status,
size or productivity.
23. The use of equipment capacity to measure the stock of capital is common
in studies of electricity generation. See Nerlove (1963) for referencesto the basic literature.
24. See Mundiak (1963) for a discussion of this issue.
25. An alternative specification is provided by a variance components model.
A key assumption of that model, however, is that the firm specificcomponent is a random variable, and hence uncorrelated with other
explanatory variables. The issue of bias is thus assumed away.
26. One of the plants in the sample was organized following its acquisition bya larger cement producer. For this establishment we may be confounding
the effects of unionization with the effects of acquisition. However,dropping this plant from the sample did not change the basic results studied
in several specifications the estimated union effect was significantly larger.
— jI —
27. There is some question as to how to define union status. Many of theaffects of unionization could conceivably be felt with the organizationof local chapter of the union; some of the effects would follow therecognition of the union as the collective bargaining agent; whileothers would require the signing of a contract. In the results reportedhere, the union dummy takes on a value of one in each year following theyear in which the local was chartered by the international, if less than sixmonths elapsed between chartering and the end of the year. If more than sixmonths elapsed, the year of charter also received a value of one.
28. Under the specification in line 1, for example, the capital coefficientwas .137(.l32) and the coefficient on lnL was —.336(.l86).
29. The problem is similar to the difficulty encountered in estimating the effects oftraining programs. An important distinction is that the "treatment"(i.e. unionization) occurs at different points in time in the presentinstance.
30. The regional correction is only a very rough measure of the influenceof common factors. The appropriate measure would seem to be averageproductivity of plants of similar vintage in the region. Our measure ofregional productivity does not distinguish plants on the basis of vintage.The estimate of regional productivity is based on data available from thePCA. In the early years it includes plants older than the before/aftersample, and new plants in the later years. The effect is to rascthe average rate of regional productivity growth.
31. This model has been-used extensively; see Ashenfelter and Johnson (1972).
32. More sophisticated models might allow for less than infinite substitutabilitybetween workers of different quality. The result would be to reducequality adjustments.
33. It might be supposed that the firm would anticipate the inability to adjustimmediately, and compensate by hiring workers above the optimal level.But the wage rule obviates such behavior, since all workers would have tobe paid the necessarily higher wage. In addition, the higher wage wouldbecome the floor in future collective bargaining.
34. Greiner has suggested that successful changes in organizations involve thepresence of compelling internal or external pressure, the intervention ofa leader from outside the organization who acts as a catalyst, a thoroughre—examination of operations and problem solving through shared authorityor power. While not a reflection of the ideal in all respects, theunionization process in the six plants is broadly similar. See Clark (1978)and Greiner (1967) for a discussion of these issues.
— 38 —
BIBL IOGRAPHY
1. Ashenfelter, Orley and George Johnson, "Unionism, Relative Wages andLabor Quality in U.S. Manufacturing Industries" InternationalEconomic Review, October, 1972.
2. Brown, Charles and James L. Medoff, "Trade Unions in the ProductionProcess" Journal of Political Economy, (June, 1978).
3. Bok, Derek and John T. Dunlop, Labor and the American Community (N.Y., 1970).
4. Bradley, Philip ed. The Public Stake in Union Power (Charlottesville, 1959).
5. Clark, Kim B., "Unions and Productivity in the Cement Industry," UnpublishedPh.D. dissertation, Harvard University, 1978.
6. ________________________"UnIonization and Productivity: Micro—EconometricEvidence" NBER Working Paper No.
7. Frantz, John, "The Impact of Trade Unions on Productivity in the Wood
Household Furniture Industry," process (June, 1976).
8. Freeman, Richard B., "Inidividual Mobility and Collective Voice in the LaborMarket," American Economic Review, (May, 1976).
9. Greiner, Larry C., "Patterns of Organization Change" Harvard BusinessReview, 1967.
10. iladley, Earl J., The Magic Powder, (New York, 1945).
11. Hilts, H.E., The Manufacturing, Volume, and Costs of the Portland CementIndustry in the United States, (Washington, D.C., 1938).
12. Johnson, Harry and Peter Mieszkowski, "The Effects of Unionization on theDistribution of Income: A General Equilibrium Approach," Q1ity_Journalof Economics, November, 1970.
13. Lawler, E.E., Motivation in Work Organizations, (Monterey, 1973).
14. Leibenstein, Harvey, "Allocative Efficiency vs. 'X—Efficlency'" AmericanEconomic Review, June, 1966.
15. Lesley, Robert W., History of the Portland Cement Industry in the United
States, (Chicago, 1924).
16. Loescher, Samuel M., Imperfect Collusion in the Cement Industry, (Cambridge, 1959).
17. Mundlak, Yair, "Estimation of Production and Behavioral Functions from aCombination of Cross—Section and Time Series Data" in C. Christ ed.,Measurement in Economics (Stanford, 1963).
18. Nerlove, Marc, "Returns to Scale in Electricity Supply" in C. Christ, ed.Measurement In Economics, (Stanford, 1963).

— 39 —
19. Radner, Roy, "A Behavioral Model of Cost Reduction," Bell Journal ofEconomics, (Spring,. 1975).
20. Slichter, Sumner, James Healy and Robert Livernash, The Impact ofCollective Bargaining on Management, (Washington, D.C., 1960).
21. U.s. Department of Commerce, Construction Review, (June, 1976).
22. Williamson, 0., Jeffrey Harris and Michael Wachter, "Understanding theEmployment Relation: The Analysis of Idiosyncratic Exchange,"Bell Journal of Economics, (Spring 1975).
Related Documents


