NBER WORKING PAPER SERIES THE ACCURACY OF INDIVIDUAL AND GROUP FORECASTS FROM BUSINESS OUTLOOK SURVEYS Victor Zarnowitz Working Paper No. 1053 NATIONAL BUREAU OF ECONOMIC RESEARCH 1050 Massachusetts Avenue Cambridge MA 02138 December 1982 Financial support from the National Science Foundation and aid of the Graduate School of Business of the University of Chicago and NBER are gratefully acknowledged. I am greatly indebted to Louis Lambros for helpful suggestions and efficient research assistance. This paper contains revised parts of the NBER Working Paper No. 85. The research reported here is part of the NEER's research program in Economic Fluctuations. Any opinions expressed are those of the author and not those of the National Bureau of Economic Research.

Welcome message from author
This document is posted to help you gain knowledge. Please leave a comment to let me know what you think about it! Share it to your friends and learn new things together.
Transcript
NBER WORKING PAPER SERIES
THE ACCURACY OF INDIVIDUAL AND GROUP
FORECASTS FROM BUSINESS OUTLOOK SURVEYS
Victor Zarnowitz
Working Paper No. 1053
NATIONAL BUREAU OF ECONOMIC RESEARCH1050 Massachusetts Avenue
Cambridge MA 02138
December 1982
Financial support from the National Science Foundation and aid ofthe Graduate School of Business of the University of Chicago andNBER are gratefully acknowledged. I am greatly indebted to LouisLambros for helpful suggestions and efficient research assistance.This paper contains revised parts of the NBER Working Paper No.85. The research reported here is part of the NEER's researchprogram in Economic Fluctuations. Any opinions expressed are thoseof the author and not those of the National Bureau of EconomicResearch.
NBER Working Paper #1053December 1982
The Accuracy of Individual and GroupForecasts from Business Outlook Surveys
Abstract
This paper reports on a comprehensive study of the distributions of
summary measures of err1r for a large collection of quarterly multiperiod
predictions of six variables representing inflation, real qrowth, unemployment,
and percentage changes in nominal GNP and two of its more volatile components.
The data come from surveys conducted since 1968 by the National Bureau of
Economic Research and the American Statistical Association and cover more than
70 individuals professionally engaged in forecasting the course of the U. S.
economy (mostly economists, analysts, and executives from the world of corporate
business and finance). There is considerable differentiation among these fore-
casts, across the individuals, variables, and predictive horizons covered.
Combining corresponding predictions from different sources can result in
significant gains; thus the group mean forecasts are on the average over time
more accurate than most of the corresponding sets of individual forecasts. But
there is also a moderate deqree of consistency in the relative performance of a
sufficient number of the survey members, as evidenced in positive rank
correlations among ratios of the individual to group root mean square errors.
Victor Zarnowitz
University of ChicagoGraduate School of Business1101 East 58th StreetChicago, Illinois 60637
(312) 962—7130

I. Introduction
Empirical studies of forecasts and expectations based on survey data have
qenerally concentrated on the performance of time series of averaqes of the
participants' responses. As a rule, these represent means or medians for
groups whose size and composition vary over time. This raised the possibility
of serious aggregation errors due to the neqiect of the cross—section and dis-
tributional aspects of the data: differences among the individuals and sub-
groups; sampling variation; consistency and representativeness of the employed
averages. That such matters can be important is not in doubt, hut they seem to
have attracted relatively little attention in the literature.1
This paper examines the accuracy of a larqe number of individual forecast
series and of the corresponding average forecast series from a quarterly survey
conducted by the author for the National Bureau of Economic Research in collab-
oration with the American Statistical Association. The survey questionnaire is
mailed by the ASA in the middle month of each quarter to a list of persons who
are professionally enqaqed in forecasting the course of the economy, and
regular reports on the results are released in the third month.2 The respon-
dents are economists,. mainly from corporate business and finance hut also from
independent consulting firms, qovernmemt aqencies, academic and research
1An early study which dealt with certain characteristics of the relationbetween aggregate and individual forecasts is Zarnowitz, 1967, pp. 123—126. Arecent analysis of disaqqreqated data from surveys of inflation forecasts isFiglewski and Wachtel, 1981.
2The reports, prepared by the NBER, are now published in the NBERReporter, and in AmStat News. They discuss mainly the median predictions ofcurrent interest, For some of the broader historical evaluations, see Moore,1969, 1977; ZarnOwjtz, 1972, 1979; Fair, 1974; Christ, 1975; McNees, 1975,176; Su and Su, 1975.

—2—
organizations. This study covers 79 individuals (persons or firms) who
participated in at least 12 of the 42 surveys in the period from 1968:4 through
1979:1.
The forecasts relate to rates of change in four variables: gross national
product in current and constant dollars (labeled GNP and RGNP); the GNP impli—
cit price deflator (IPD); and consumer expenditures for durable qoods (CEDG).
The errors of percentage change forecasts are
=0
(1) e •=
t+j( t+j t+j—1 t+J t+j—i • • —
P—
A j1 , i j— ,...,4.t+j—i t+j-1
Here P is the predicted level and A is the actual level according to
the last national income and product accounts data released prior to the major
benchmark revisions of January 1976 and December 1980. is a .preliminary
estimate which is the most recent 'actual" value available at the time of the
forecast (since At is unknown, Pt is a true prediction with a horizon of
about one quarter). The subscripts refer to the suIvey quarter t, which is
the date when the forecast was made, and to the tarqet quarter, t + j, which
is the date to which the forecast refers (since all this applies to any of the
forecasters and to any of the variables covered, other subscripts are omitted).
It will be noted that (1) contains differences between the successive
levels predicted in a multiperiod forecast made at time t, namely p —
for the current quarter (j = 0) and — for any of the next four
future quarters (j 1, ..., 4). Accordingly, these are errors of the implicit
3For further discussion and analysis of the 7SA—NRER forecast data, andreferences to the literature, see Zarnowitz, 193
*
At1
—3-.
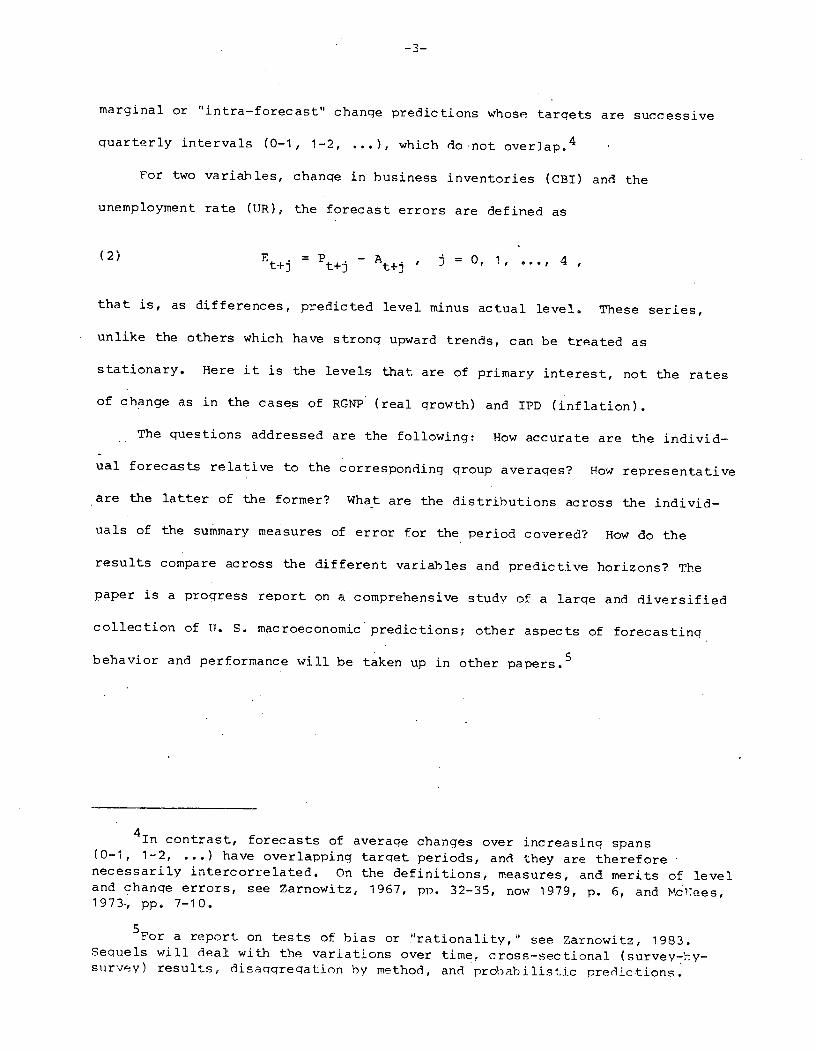
marginal or intra—forecast" change predictions whose tarqets are successive
quarterly intervals (0—1, 1—2, ...), which do not overlap.4
For two variables, chariqe in business inventories (CBI) and the
unemployment rate (UR), the forecast errors are defined as
(2) Et+. = — A. , j = 0, 1, ..., 4
that is, as differences, predicted level minus actual level. These series,
unlike the others which have strong upward trends, can be treated as
stationary. Here it is the levels that are of primary interest, not the rates
of change as in the cases of RGNP (real qrowth) and IPD (inflation).
The questions addressed are the following: How accurate are the individ-
ual forecasts relative to the corresponding group averages? How representative
•are the latter of the former? What are the distributions across the individ—
uals of the summary measures of error for the period covered? How do the
results compare across the different variables and predictive horizons? The
paper is a progress report on a comprehensive study of a larqe and diversified
collection of U. S. macroeconomic predictions; other aspects of forecastinq
behavior and performance will be taken up in other papers.5
41n contrast, forecasts of averaqe changes over increasing spans(0—1, 1—2, ...) have overlapping tarqet periods, and they are thereforenecessarily intercorrelated. On the definitions, measures, and merits of leveland chanqe errors, see Zarnowitz, 1967, pp. 32—35, now 1979, p. 6, and Mcees,1973., pp. 7—10.
5For a report on tests of bias or 'rationality," see Zarnowitz, 1983.Sequels will deal with the variations over time, cros—sectiona1 (survey—by—survey) results, disaqqreqatjon by method, and probabilistic predictions.

—4—
II. Measures of Relative curacy and Consistency
The root mean square error (RSME) of the th individual's set of
predictions can be written as
(3) M. =1
nj tEN.1
1
for any variable and forecast horizon.6 Here fN.) is the set of the tarqet1
periods of the th foreasts, while n. is the number of predictions in that
set. The numbers and dates of the surveys covered differ across the individ-
uals, and the error series in (3) have qaps at times when any of the
forecasters missed any of the surveys, which happened frequently.7
•Next we construct series of qroup means predictions that match the series
for each individual precisely in terms of the variable, horizon, and periods
covered. Thus for each series of predictions by a particular forecaster
(denoted by the subscript "i') there is now a corresponding series of qroup
averages ("q') of predictions by all those forecasters in our sample who
responded to the same surveys. In our simplified notation, the RMSE for the
croup mean series is
(4) M = (1 2 )1/2n. tEN.
6For level forecasts (tJR and CBI) C = Ext; for percentage changeforecasts (the other variables) Et = ext. qain there is no need here tocorwlicate the formula by adding subscripts for the variable and target period.
7Recall that, to he included, a forecaster must have participated in atlea t 12 surveys, hut the surveys need not he consecutive. The mean number ofsr:e'.'s covered is 23, with a standard deviation of 8; the minimum is 12, the:
37 (out of a total of 42).
—5—
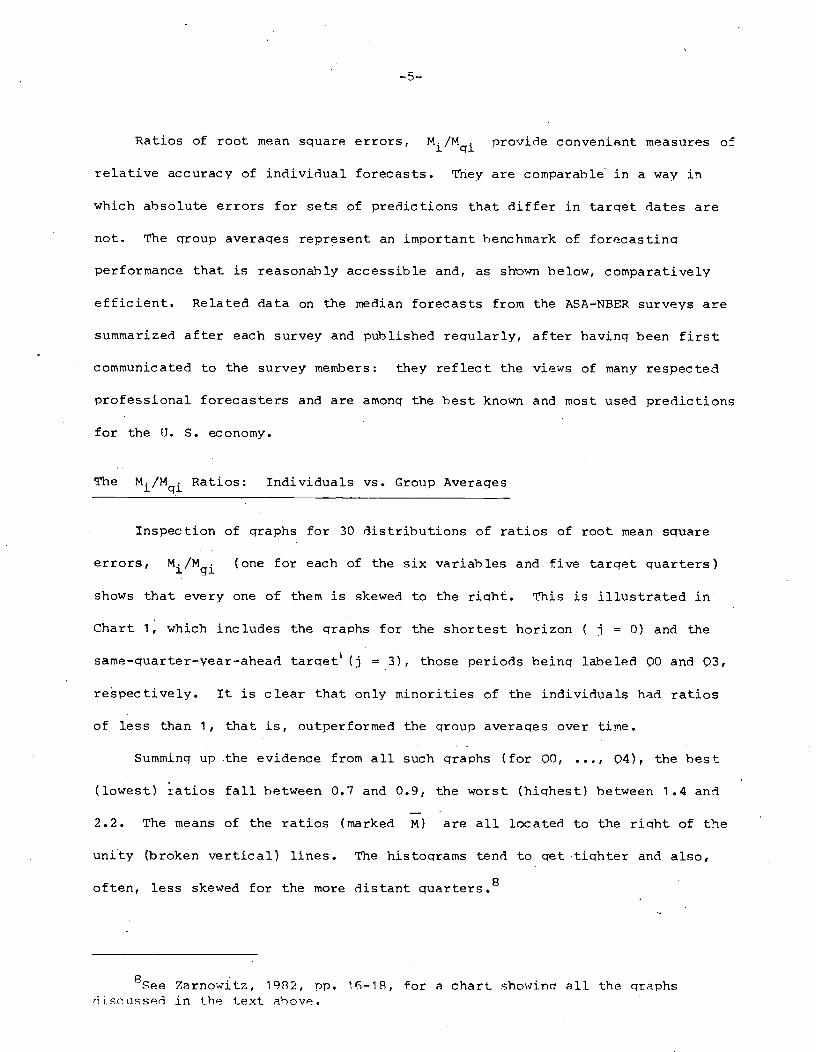
Ratios of root mean square errors, Mj/Mqj provide convenient measures of
relative accuracy of individual forecasts. They are comparable in a way in
which absolute errors for sets of predictions that differ in tarqet dates are
riot. The qroup averaqes represent an important benchmark of forecasting
performance that is reasonably accessible and, as shown below, comparatively
efficient. Related data on the median forecasts from the ASA-NBER surveys are
summarized after each survey and published reqularly, after having been first
communicated to the survey meuers: they reflect the views of many respected
professional forecasters arid are among the best known and most used predictions
for the Ti. S. economy.
The Mj/Mqj Ratios: Individuals vs. Group Averages
Inspection of qraphs for 30 d-istrihutions of ratios of root mean square
errors, Mj/Mqj (one for each of the six variables and five target quarters)
shows that every one of them is skewed to the riqht. This is illustrated in
Chart 1, which includes the qraphs for the shortest horizon ( j = 0) and the
same-quarter-year-ahead target' Ci =3), those periods heinq labeled QO and 03,
respectively. It is clear that only minorities of the individuals had ratios
of less than 1, that is, outperformed the qroup averages over time.
Summing up the evidence from all such qraphs (for 00, ..., Q4), the best
(lowest) iatios fall between 0.7 and 0.9, the worst (hiqhest) between 1.4 and
2.2. The means of the ratios (marked M) are all located to the right of the
unity (broken vertical) lines. The histograms tend to qet tiqhter and also,
often, less skewed for the more distant quarters.8
8See Zarnowitz, 1982, np. 1—18, for a chart showinq all the graphsdLscussed in the text above.

V . -' -, 1
0 0.5 1.0 1.5 2.0 2.5
0i
f'L,rd.flci
Ft
30
6
CHART '1
SEVENT?—NINE INDIVIDUAL FORECASTS OF 4ULTIFERIOD CHANGES INSIX AGGREGATE VARIADLES, COMPARISONS .tITH GROUP MEAN FORECASTS,
.968—1979
Xmoljcit Price Deflator (TF''NPLnCerrent Dollars ('VP)
20
10 QO
3Øfl
20
10
00.5 1,0 1.5 2.0 2.5
20
QO
n
30
ejfl10
0 0.5 l0 1.5 2.0 2.5il/N
3. 53.
fl /Ni gi
Q3
20
10
0.5 iO 1.5 2. 2.50
30
2Q
10
0
Q3
CiP in Constant Dollars (RGNP) Unerro1ovment Rate CUR)30
20.
10QO
10
Mj/Hqj
00
p4 /U
0p S 1O 1.5 2.0 2.5
Cnsurtion xoenditures— — 0Thble C.ocds(CD)
I-. QO
10 1.5 2.5
0.5 1.0 1.5
in Business Inventories (CBI)
QO
I; gi
Q3
14./N2. 52.
40
30
20
10
Ft - -
2 0.5 • 0.5 1.0 1.5 2.0. 2.5

—7—
Table 1 shows that the mean ratios are remarkably close: when rounded,
all but nine of the 30 statistics are 1.1. The higher mean ratios, ranging
from 1 .2 to 1 .4, refer to the shortest predictions, for QO and, less so, for
Q1, The standard deviations of the Mj/Mqj ratios tend to decreaase stronqly
with the distance to the tarqet quarter, from QO to 39 An exception is CBI,
where the horizon of the expectations apparently does not matter much (all the
means are approximately 1.1 and the decline in the dispersion of the ratios is
very small).
The proportions of the better—than—average forecasters (Mj/Mqj < 1) vary
strongly with the tarqet quarter for some variables, much less so for others.
Thus for IJR the rariqe is 8 to 42 percent, for CBI it is only. 29 to 38 percent.
Averaqed across Q0—Q4, the figures fall between 20 percent for GNP and 33
percent for CEI (see the last section of Table 1).
It is known from past studies (and shown again below) that the averaqe
accuracy of forecasts varies considerably across the individuals, variables,.
and target periods. Highly volatile series such as CEDG and CBI are much more
difficult to predict than relatively smooth, trend—dominated series such as
GNP. In general, the uncertainty and difficulty (hence errors) of prediction
tend to increase for the more distant future. . The remarkable degree of
standardization in the ratios stands in sharp contrast to the diversity
of the avraqe accuracy measures for the individuals, M.
9The series for QO, QI, 02, and Q3 start in 1968:4, 1969:1, 1969:2, and1969:3, respectively, and extend throuqh 1979:1. The series for Q4. start in1969:4 and end in 1979:1 but miss the first three quarters in 1970, 1971:1, and1975-:3 (because a few surveys did not ask for the Q4 predictions). For thesereasons, the number of the surveys covered is 42 for QO, 41 for Qi, 40 for 02,39 for Q3, and 33 for Q4. Our comparisons are somewhat impaired by these dis-parities; in particular, the relatively larqe fiqures for 04 compared to thosefor Q3 probably reflect the drop in survey coveraqe.

Average 20
Range 13-35
Note: Based on quarterly ASA—NBER business outlook surveys 1968:4—1979:1. Oncoveraqe and symbols used, see text and Chart 1.
GNP IPD RGNP
(1) (2)
—8—
TABLE 1
MEANS AND STANDARD DEVIATIONS OF THE Mj/Mqj RATIOS,BY VARIABLE AND TARGET QUARTER, 1968-1979
DR CEDG CBI
(4) (5) (6)
MEANS
1.18 1.101.10 1.111.07 1.091.06 1.101.08 1.10
(3)
QO 1.25 1.29 1.25 1.43Q1 1 .16 1 .16 1 .14 1.19Q2 1 .13 1 .11 1 .11 1.11Q3 1.14 1.08 1.09 1.08Q4 1.17 1.10 1.12 1.08
STANDARD DEVIATIONS
QO .38 .36 .31 .36 .28 .20Qi .21 .23 .18 .24 .18 .21Q2 .18 .16 .15 .19 .11 .19Q3 .17 .18 .15 .18 .09 .18Q4 .24 .20 .19 .19 .10 .19
PERCENTAGE OF CASES WHERE
26 22 2911—37 18—27 8—42
Mj/Mgj < 1
2419—31
3329—38

—9—
The advantage of the group means Mgi is the greatest for the nearest
targets and it becomes less and less important as the predictions reach out
further into the future. One may speculate that the individual forecasts for
QO and Qi contain more independent information than those for Q2-Q4, hence the
qains from averaging are larger for the former than .f or the latter.1° The
abilities to predict CBI are particularly limited, even for the nearest
quarters, so here the means and dispersion of the ratios Mi/Mgi depend little
on the distance to the target quarter (j = 0, 1, . . •, 4).Earlier data, on predictions by members of a larqe group of business
economists organized into the New York Forecasters' Club, produce similar
results. The distributions of Mi/Mgi ratios for six—rnonthand twelve—month
forecasts of industrial production in 1947-63 show strong positive skewness,
with most of the values falling between 1 .0 and 1.3, the classes below 0.8
almost empty, and the average values all concentrated in the narrow range, 1.1-
1.211
These findings indicate that it is difficult for most individuals to
predict consistently better than the group. Contemporaneous expectations for a
given target may be distributed more or less symmetrically about their mean,
but over time the individuals' positions within these distributions are likely
10Th large means and standard deviations of the ratios for QO may beassociated with the disparities in the quality of the current data available todifferent individuals. Although the survey questionnaire provides the mostrecent information on the values of the series to he predicted, some respond-ents choose to use different jump-off levels which may he more or less accur-ate. It is not quite clear why the figures for the shortest predictions of URshould be particularly high, as Table 1, column 4, shows them to he, but it issuqqestive that this is the only variable covered for which utonthly data areavailable. Some individuals are likely to laq behind the majority inabsorbincthese monthly data (and related weekly information on unemployment claims).
11See Zarnowitz, 1982, p. 22, for a chart showinq these results indetail. GNP forecasts made by members of the same group in the period 1956—3(Zarnowitz, 1967, np. 123—126), tell much the same story.
—10—
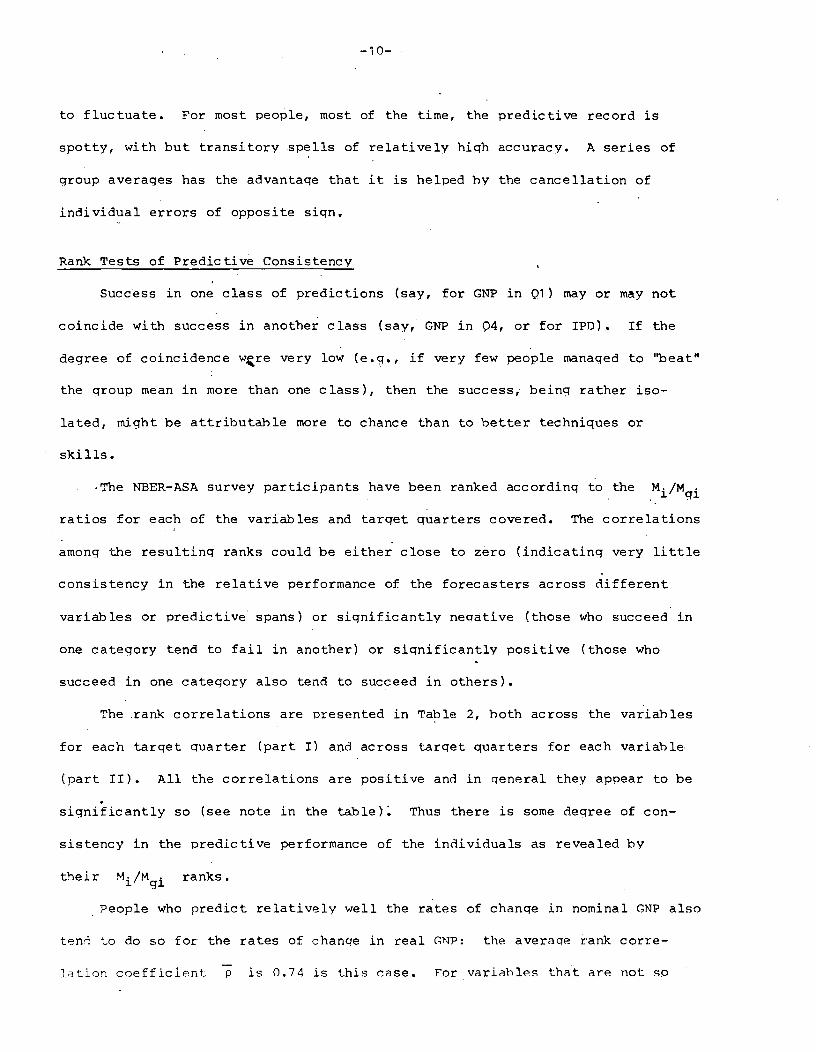
to fluctuate. For most people, most of the time, the predictive record is
spotty, with but transitory spells of relatively high accuracy. A series of
group averages has the advantage that it is helped by the cancellation of
individual errors of opposite sign.
Rank Tests of Predictive Consistency
Success in one class of predictions (say, for GNP in Q1) may or may not
coincide with success in another class (say, GNP in Q4, or for IPD). If the
degree of coincidence wre very low (e.g., if very few people managed to "beat"
the group mean in more than one class), then the success, being rather iso-
lated, might be attributable more to chance than to better techniques or
skills.
-The NBER—ASA survey participants have been ranked accordinq to the Mi/Mgi
ratios for each of the variables and target quarters covered. The correlations
among the resulting ranks could be either close to zero (indicatinq very little
consistency in the relative performance of the forecasters across different
variables or predictive spans) or significantly necative (those who succeed in
one category tend to fail in another) or significantly positive (those who
succeed in one category also tend to succeed in others).
The rank correlations are presented in Table 2, both across the variables
for each target quarter (part I) and across tarqet quarters for each variable
(part II). All the correlations are positive and in qeneral they appear to be
significantly so (see note in the table) Thus there is some degree of con-
sistency in the predictive performance of the individuals as revealed by
their Mi/Mgi ranks.
People who predict relatively well the rates of chanqe in nominal GNP also
ten-I to do so for the rates of change in real GNP: the averaqe rank corre—
1ition coeffici.r1t p is 0.74 is this oase. For variables that are not s

II
TABLE 2
RANK CORRELATIONS AMONG PARTICIPANTS IN ASA-NEER SURVEYSACCORDING TO RATIOS OF INDIVIDUAL TO GROUP ROOT MEAN
SQUARE ERRORS, MULTIPERIOD PREDICTIONS FOR SIX AGGREGATEVARIABLES, 1968—1979
aI. Across Variables, for Each Target QuarterQO Qi
GNP IPD RGNP UR EDG CEl GNP IPD RNP UR CEDG CBI
? 1.00 GNP 1.00I?D .57 1.00 iP .23 1.00RGN? .83 .65 1.00 RGNP .77 .48 1.00
UP. .42 .43 .39 1.00 UP. .20 .3 .40 1.00
cEDG .69 .56 .69 .50 1.00 CEDG .43 .20 .50 .30 1.00
c31 .40 .41 .36 .21 .42 1.00 CBI .39 .31 .38 .22 .38 1.00
Q2. — Q3GNP IPD RGNP UR CEDG CM GNP IPD RGNP UR DG 3I
GN•P i.bo. .
-. GNP 1.00
IPD. .35 1.00 IPD .27 1.00
RGN?' .66 .48 1.00 RGNP .69 .33 1.00
UP. .23 .48 .27 1.00 UR .41 .44 .49 1.00c .27 .15 .21 .12 1.00 DG .21 .05 .14 .19 1.00
C3I . .41 .43 .32 .36 .31 1.00. CBI .28 .42 .15 .37 .03. 1.00
Q4 Averace, Q0—Q4P IPD RGNP UR CEDG CM GNP IPD RGNP UP. CEDG C31
GNP 1.00 GNP 1.00PD .44 1.00 IPD 37 1.00
RGNP .76 .5]. 1.00 RGNP •74 .49 1.00
UP. .39 .49 .31 1.00 UR •33 .45 .35 1.00
IDG . .17 .17 .06 1.00 CEDG .36 .23 34 .23 1.00
C3I .49 .3'S .38 .19 .21 1.00 CBI .32 .39 .32 .27 .27 1.00
T:-ese reasures refer to 75 inivifua1s who artic±pated in at least 12 arter].vi-ess out_cok sur;evs 1968 —1979 1 .rd red.cted all s var_les :c —e sjo1s :cr t-ie ar_thies are cet_:ec ii tart :: o te ta1e "e- ;- refer : tie crreit :e fc.r siccessve f.tire c:rzers ra—<ccef:ies shc.in are 5ceara.-Ys = 1 — 6'/ç — ) wherete b'r each ranking.

12
TABLE 2(concluded)
II. Across Target Quarters, for Each Varjab1e
These measures refer to the sarnple covered in Chart 2: 79 individualsfor each of the variables excect CED' (80). The rank correlationcoefficients are Spearan's .NOTE: For rankincs without ties, the variance of ecual's —- (:<endall
l94, ..46). For n = 75, therefore, the standard error S, = 1/\/0.74 =
0.1162 (for n = 79, S = 0.1125; for n = 30, S = 0.1132). ence,all entres > 0.22 in the table are sicni±icant at the 5% .evel,and all > 0.20 at the 10% level.
Imnolicit Price Deflator (IPD)QO Ql Q2 Q3. Q4
• GNP in Current Dollars (GNP)
QO Ql Q2 Q3 Q4
QO 1.00 .
Ql .51 1.00
Q2 .18 .19 1.00
Q3 .14 .18 .40 1.00
Q4 .50 .32 .40 .47 1.00
GNP in0 Constant Dollars
Qi Q2 Q3
(RON?)
Q4
QO 1.00
Qi .55 1.00Q2 .45 .68 1.00
Q3 .41 .54 .60 1.00
Q4 .39 .52 .51 .62 1.00'
Unertiloytnent Rate (UP.)
QO Qi Q2 Q3 Q4
QO 1.00 QO 1.00 •
.57 1.00:
Q]. .64 1.00
•Q2 .33 .47 1.00 Q2 .38 .78 1.00 '
Q3 .05 .19 .48 1.00 . Q3 .32 .62 .85 1.00'
Q4 .38 .19 .33 .33 1.00 Q4 .27 .53 .75 .92 1.00
Conser Exenditures—Durab1e Goods (CEDG) Chance in Business Inventoris (Cal)QO Ql Q2 Q3 Q4 QO Q1 Q2 Q3 Q4
QO 1.00 .QO 1,00
.
Qi .66 1.00 • Q1 .70 1.00
Q2 .53 .43 1.00 Q2 .63 .76 1.00 .
Q3 .12 .07 .14 1.00 Q3 .51 .56 .31 1.00
Q4 .14 .00 .04 .08 1.00 Q4 .57 .62 • .63 .76 l.O0

—13—
closely related, the correlations are much lower (e.g., p = 0.23 for CEDG and
IPD, and also for CEDG and UR). However, only 15 of the 75 coefficients (P 1)
in part I of the table are less than 0.2. The overall mean of the p
statistics is 0.36.
For any of the variables, people who rank high (low) in predicting one
quarter also tend to rank hiqh (low) in predicting the next quarter. The
p's for 90—91 average 0.61, those for 91—92, Q2—Q3, and 93—94 average 0.52—
0.55 (see part II of Table 2). For non—adjoining target periods, the rank
correlations are lower, p being 0.40 where the distance is two quarters (90—
92, 91—93, and Q2—Q4) and 0.31 where it is three quarters (90—93 and Q1—Q4).
The further apart the target periods, the less correlated are the values to be
predicted, and the above results suggest that the ranking consistency declines
correspondingly. But the reductions in the rank correlations vary consider-
ably in size and regularity, beinq most pronounced for CEDG, least for GNP.
When averaged over the quarters 91—94, the p coefficients are relatively low
for CEDG, GNP, and RGNP (.27—.33) and hiqh for I?D, UR, and CBI (.55-66).
III. Distributions of Summary Measures of Error
It is instructive to examine the distributions of the statistics that sum
up the records of the individual forecasters. The discrepancies in time
coverage reduce the comparability of absolute accuracy measures across the
respondents to the surveys. However, in the ASA-NBER data there appears to be
no significant bias due to missed observations. No pattern has been found to
suqqest that the participants covered selected the times of their responses in
any systematic manner; rather it is random factors (absences, work pressure,
neqljqence) that account for the allocation of the missed surveys among the
individuals. Interest in the overall picture provided by the summary measures

—14—
of each forecaster's performance is also enhanced by the fact that the number
of surveys (42) is relatively large and the coverage of each is adequate (on
the average, 43 participants with a standard deviation of 9)•12
The distributions of the summary measures of error for the individual
forecasts are further compared with the corresponding measures for the overall
group forecasts. The latter refer to the series of mean predictions, of which
there are thirty, one for each of the targets covered (6 variables x 5
horizons). These averages comprise all forecasters who predicted the qiven
target at any time during the period under study, so that the series are
continuous, each including predictions from all surveys covered. Thus the
RMSE for any of these group mean ("q") series is simply
(5) Mq = 2)h1 t =1, 2, ...,
where n is the total number of consecutive surveys (42 j for QO—Q3, 33
for 94, see note 9).
Overall Accuracy
For each of the six variables, the means of the individual RMSE's taken
across the tarqet quarters 90, ...,Q4 exceed the corresponding RMSE's for the
overall qroup mean forecasts. The ratios of the summary statistics of error
(entries in column 2 of Table 3 divided by those in column 5) vary from 1 .04
to 1.16 and averaqe 1.11.
The performance of the series of group mean forecasts is also superior to
the averaqe performance of the series of individual forecasts in terms of
correlations with the actual values. The averages of the coefficients
12See Zarnowitz, 1983, for more numerical detail on the f9recast samplesfror the )\S—NRFR surveys.

—15—
Table 3
SELECTED OVERALL ACCURACY STATISTICS FOR INDIVIDUALAND GROUP MEAN FORECASTS, SIX VARIABLES, 1968-1979
Variablea Individual Forecastsb Group Mean ForecastsC Actual Valuesd
ME RSMF. _____ ME RSME r2 Mean SD RMSV
(1) (2) (3) (4) (5) (6) (7) (8) (9)
GNP —.11 1.00 .22 —.13 .88 .29 2.18 1.09 2.93
IPD —.39 .78 .21 —.38 .67 .27 1.50 .67 1.64
RGNP .28 1.21 .28 .25 1.05 .35 .68 1.24 1.41
UR —.14 .67 .66 —.10 .62 .69 5.78 1.68 6.02
CEDG —.28 4.04 .14 —.36 3.68 .18 2.25 3.97 4.57
CBI —1.72 10.00 .27 —1.77 9.57 .44 9.19 10.87 14.23
a0 the syrrbols used, see note d below.
bThese measures refer to the sample covered in Chart 1 (75 individuals forecastCEDG, 79 each of the other variables). They are means of the correspondinqstatistics for the fve target quarters, 00, ..., 04. ME = mean error; RMSE = rootmean square error; r = squared coefficient of correlation, corrected for thedegrees of freedom.
cThese measures refer to, the Overall croup mean forecasts Mg (see ec. 5 andtext) and are means of •the corresponding statistics for the tarqet quarters 00, ...,Q4).. See note b above for the explanation of the sythbols.
dFor the definition of actual values, see text. For the nominal and realgrossnational product' (GN'P and RGNP), the GNP implicit price deflator (IPD), and normalconsumer expenditures on durable goods (CEDG), the measures refer to percentagechanges; for the unemployment rate (UR) and the change in business inventories(CBI), they refer to levels. SD = standard deviation (corresponr1in to the rteans incolumn 7); RMSV = root mean square value computed as (mean)2 + (SD)'.

—16—
for the individuals vary between .14 and .28, except for the unemployment rate,
a relatively smooth level series, where the 2 is .66 (column 3). They are
60 to 80 percent lower than their counterparts for the overall group means
(colurnn6), except again for tiR, where the margin in favor of the aggreqate is
much smaller.
The mean errors have negative signs for all the variables, with the
important exception of RGNP. This reflects the familiar tendency toward under-
estimation of chanqes in most forecasts. The average overestimation of real
qrowth observed in our data is larqely explained by the fact that,, after a
decade of relative stability and an extraordinarily lonq business expansion,
the 1970s gave rise to a novel phenomenon commonly called staqflation and art
unexpectedly serious recession. As would he expected, since the individual
predictions are randomly distributed over the same period as that covered by
the overall group mean series, the two sets of forecasts have much the same
mean errors (cf. columns 1 and 4).
As a rule, it is some simple average rather than the underlying individual
forecasts from economic outlook that are regularly published and used, arid i.t
is certainly worth knowing that the predictive value of the former tends to be
measurably greater than that of the latter; hut how accurate have the men
predictions been, considering the accessible data and techniques? One approach
to answering this broad question would he through comparisons with benchmark
preditions from time—series models appropriately selected to fit the charact-
eristics of the variables in question and estimated with data available at the
time the ex ante forecasts to he assessed were actually made. This task is
beyond the scope of the present paper. To qath some insight into the order of
the magnitudes involved, however, it is useful to compare the average forecast
errors with the averaqe values of the outcomes for each of the target series,
—17--
and some summary statistics are provided for this purpose in the last section
of Table 3.
Plainly, the absolute values of the mean errors are at least smaller than
the mean actual values in every case, and they are indeed for most of the
variables quite small in these terms (cf. columns 1 and 4 with column 7). More
telling, the RMSEs are less than the corresponding root mean square values of
the tarqet series, again in most cases by larqe margins (cf. columns 2 and 5
with column 9). The RSME's for the group mean forecasts are also qenerally
less than the standard deviations of the actual values (columns 5 and 8). The
predictions of tJR and GNP rank as the first and second best in all of these
comparisons; IPD and RC,NP rank lowest when the ME figures are used, RGNP and
CEDG when the RMSE figures are.
Characteristics of the Distributions
The medians of the RMSE's for the individual forecasts are with few
exceptions lower than the means, but by relatively small margins (see Table 4,
columns 1 and 4). This indicates a weak tendency for these distributions to be
skewed to the right, that is, toward the large RMSE1S.
In virtually all instances, the averages of the individual RMSE's exceed
the RMSE's for the correspondjnq group mean forecasts (compare the entries in
columns land 4 with their counterparts in column 6). The measures for the
group mean tend to be closer to the lower quartile than to the median of the
distribution of the individual RMSE's (cf, columns 3, 4, and 6). This is
roughly consistent with the earlier finding, based on more strictly comparable
measures, that the overall proportion of cases in which M < Mqj isahout 26
percent (Table 1).
The more distant the tarqet quarter, the larqer tend to he the prediction
errors, as demonstrated by the increases from 00 throuqh 04 of the entries to

—18—
TABLE 4
ROOT MEAN SQUARE ERRORS AND CORRELATIONS BETWEEN PREDICTED AND ACTUAL VALUES,
SELECTED DISTRIBUTIONAL STATISTICS BY VARIABLE AND TARGET QUARTER,INDIVIDUAL AND GROUP MEAN FORECASTS, 1968-1979
NOTE: The measures refer to those individuals who participated in at least 12 of the
quarterv ASA—NEER business outlook surveys in 1968:4 —1979:1 (75 for CFDG, 79 for each ofthe other variables). 00 denotes the current (survey) quarter, 01—04 the followinq fourquarters (for details on coveraqe by tarqet quarter, see note ). M denotes mean; SD,
starar eviation, L0, lower2quartile; 110, upper quartile, and M, overall qroup mean&n text). The r rre corrected for the deqrees of freedom.
QuarterPredicted
Root Mean Square Errors (ENSE)Individual Forecasts Group Mean
Squared Correlations (r2)Individual Forecasts Group Mean
M SD M
(7) (8) (9)gH
(1)SD
(2)
LQ Me. UQ M
(3) (4) (5) (6GNP in Current Dollars (GNP)
00 .77 .27 .58 .68 .92 •.66 .49 .22 .6391 .95 .26 .78 .92 1.05 .86 .24 .16 .31
92 1.06 .19 .96 1.07 1.15 .96 .13 .12 .18
93 1.10 .26 .92 1.10 1.23 .98 .12 .13 .1694 1.12 .28 .94 1.08 1.22 .94 .12 .15 .18
Implicit Price Deflator90 .55 .16 .45 .49 .60 .42 .45 .20 .6491 .69 .16 .58 .66 .77 .59 .28 .18 .35
92 .79 .16 .69 .78 .87 .70 .14 .12 .17
93 .88 .19 .78 .86 .95 .77 .10 .10 .12
94 .98 .21 .86 .94 1.09 .88 .10
GNP in Constant Dollars (RGNP).10 •
.•
.08
90 .85 .28 .67 .78 .96 .70 .60 .18 .75
Q1 1.09 .28 .91 1.03 1.26 .95 .38 .17 .4892 1.24 .22 1.13 1.25 1.37 1.12 .18 .13 .25
93 1.39 .25 1.22 1.36 1.53 1.23 .10 .11 .10. 94 1.46 .31 1.25 1.39 1.69 1.23 .12 .15 .16
Unemployment Rate90 .22 .06 .17 .21 .26 .16 .97 .0201 .46 .11 .38 .44 .51 .41 .86 .06 .91
92 .71 .17 .60 .67 .81 .65 .68 .12 .75
93 .94 .23 .78 .91 1.09 .88 .48 .17 .53
94 1.04 .24 .88 1.00 1.19 .98 .32 .19 .27. Consumer Expenditures——Durable Goods (CEDG)
'
90 3.37 .96.78
2.64 3.10 3.85 2.87 .40 .25 .6391 4.16 3.79 4.13 4.60 3.77 .11 .15 .1392 4.24 .71 3.82 4.22 4.68 4.04 .05 .07 . .01
Q3 4.44 .65 4.12 4.41 4.78 4.09 .05 .07 .01
94 3.98 .69 3.47 3.99 4.47 3.64 .08 .08 .13, Change in Business Inventories (CBI)
90 8.21 2.65 6.70 8.10 9.61 . 8.07 .36 .21 .55
91 9.17 3.06 7.06 8.89 11.86 9.11 .31 .22 .51
92 10.42 3.36 8.22 10.08 12.87 9.79 .25 .19 .41
93 10.99 3.32 9.16 11.12 13.10 10.08 .20 .18 .4094 11.22 3.00 .9.13 11.14 13.12 10.80 .21 .17 .35
—19—
columns 1 and 3—6 of Table 4. However, the increases taper off: the fore-
casters on the average predict QO substantially better than Qi, and 01 still
noticeably better than Q2, but their ability to anticipate Q3, is not much less
limited than their ability to anticipate Q2, and the same applies even more to
Q4 vs. Q3. In short, these measures suqqest that the R1SE's tend to approach
asymptotically a hiqh plateau at the more distant target quarters.
Note that these results apply to the marqinal prediction errors for each
successive quarter (in a shorthand notation used earlier, to changes 0—1, 1—2,
...). To the extent that such errors are positively correlated, their
cumulation can produce much qreater increases in the average prediction errors
forchanges over increasing, overlapping spans (0—1, 0—2,
The absolute dispersion measures (standard deviations in column 2 and
interquartile ranges implied by columns 3 and 5) increase from QO to Q4 for tJR,
decrease for CEDG, and behave rather irregularly for other variables such as
GNP and RGNP. In contrast, relative dispersion measures, viz., the
coefficients of variation SD/M (ratios of entries in column 2 to those in
column 1) show strong tendencies to decrease for the more distant target
quarters. They are also on the average similar for most of the variables
(ranging from .23 tá .26, except for CEDG and CBI, where they are .19 and .31,
respectively).
12The buildup of average prediction errors with increasing spans is ageneral phenomenon to he expected and is well documented in forecast evalu-ations. However, some evidence for earlier periods has shown marginal errorsvarying narrowly and irregularly over the range of several quarters ahead,without any systematic upward drift (Zarnowitz 1967, pp. 64—72, and 1979, op.18—19; McNees 1973, pp. 24—25). The present results may differ because of thenature of the period covered (and Zarnowitz 1979 provides some support for thishypothesis), hut they also inspire more confidence than those of other stuiies,ei-iq based on much larqer samples of better controled data.

—20—
The qroup mean forecasts have tracked the actual changes better than the
average individual forecasts: the correlation measures in column 9 of Table 4
are, with but a few exceptions, higher than those in column 7. The listed r2
coefficients decline strongly with the lenqtheninq horizon between 00 and 02,
much less so for Q3 and Q4, for both the individual and group mean forecasts.
Only for UR, where the correlations are high for reasons already noted, do
these declines exteid clearly through the entire target range (Q0-Q4). The
dispersion of the coefficients across the individuals declines as the
distance to the tarqet quarter increases, except for UR where the opposite
happens (column 8).
IV. Summary and Interpretations of Findings
The results of the study support the following statements:
1 • The group mean forecasts from a series of surveys on the averaqe over
time more accurate than most of the correspondinq sets of individual
predictions. This is a strong conclusion, which applies to all vari-
ables and predictive horizons covered and is consistent with evidence
for different periods and from other studies. It is based on an
intensive analysis of a large collection of authentic macroeconomic
forecasts, in two forms: (1) individual-to—qroup PJ4SE ratios Mj/Mgj
which turn out to be predominantly larqer than 1 .0, and (2) distribu-
tions of summary measures of accuracy, in which the series of the
overall mean predictions Mg place better than half or more of the
individuals.
2. The minorities that did succeed in outperforming the group averages
vary in size across the variables (from 20% for (ZN? to 33% for CR1)
and, particularly, across the horizons 00—Q4 (e.g., 11-37% for IPD,

—21—
8—42% for UR). In each of the thirty cateqories combining specific
variables and target quarters, most of the forecasters show RMS errors
exceedinq those of the strictly comparable group mean forecasts, and in
most of the categories these majorities are larqe. The Mi/Mgi ratios
average 1.1 and cluster between 0.9 and 1.4.
3. Rank correlations amonq the respondents according to the same ratios
• are positive for all variables and target quarters, and they are sta-
tistically significant in most cases by the conventional tests. For
this result to obtain, a moderate deqree of consistency must have
• existed in the relative performance of a sufficient number of the
survey members. It is still true, as earlier reports also indicate,
that no sinqle forecaster has been cserved to earn a long record of
superior overall accuracyi13 and indeed nothing in the present study
would encourage us to expect any individual to reach this elusive qoal.
But a small number of the more regular participants in the ASA-NI3ER
surveys did perform better in most respects than the composite fore-
casts from the same surveys..
4. To go beyond the observations in point 3 above, a further study of the
characteristics, methods, and results of the forecasters with the best
records will he needed. To mention just one question of interest, it
remains to he seen whether weighted combinations of selected forecasts
from this subqroup would yield siqnificantly larqe and persistent gains
in accuracy, hut our results do not rule out this possibility. It
13See, e.g., Zarnowitz, 1967, pp. 123—132; and McNees, 1979, pp. 4—17.

—22—
seems more doubtful that weighting could be applied with much benefit
directly to large nuthbers of forecasts from the surveys.14
5. Absolute measures of error depend strongly on the characteristics of
the predicted variables and vary accordingly, in contrast to the
standardized Mi/Mgi ratios. For example, relatively smooth series
such as the unemployment rate and growth in nominal GNP are easier to
predict and are in fact much better predicted than the more volatile
series such as qrowth in real GNP and the IPD inflation, as indicated
by comparisons of average size and variability of foreôast errors and
realizations.
6. The overall composite forecasts Mg have RMSE's that are for almost
all categories smaller than the medians, and indeed often close to the
lower quartiles, of the distributions of the RMSE's for the correspond-
ing individual forecasts. Also, the correlations of predicted with
actual values (r2) are typically higher for Mg than fore most of the
individuals, frequently by substantial margins. These results are
apparently unrelated to the differential characteristics of the
variables covered.
7. The location and dispersion statistics for the distributions of •the RMSE
—2and r measures display much diversity hut also some apparent reqular—
ities. The medians tend to he smaller than the means, suqqestinq some
positive skewness in the RMSE distributions. While the standard devia-
tions of the individual RMS errors and coefficients vary greatly
across the different variables, the coefficients of variation do not.
1 4under circumstances that are not infrequently encountered. in practice,equal weightinq schemes have been found to yield more accurate composite fore—casts than differential weiqhtinq schemes derived by least squares; see inhornarv Hocarth, 197F.

—23--
8. There is a qeneral tendency for the errors to increase in absolute size
with the time distance to the target cuarter, but by decreasing margins.
1so, correlations between predictions and realizations typically
decline as the target, period recedes into the future, but again more so
for the nearest than for the more distant q.farters. The relative dis-
persion measures tend to decrease with the predictive horizon for 'the
RMSE's and rise for the correlation statistics, while the absolute
dispersion measures show no common patterns of change.

—24—
References
Christ, Carl F. 1975. "Judging the Performance of Econometric Models of the
U. S. Economy," International Economic Review 16, no. 1 (February): 54—74.
Einhorn, Hillel, and Hoqarth, Robin. 1975. "Unit Weighting Schemes for
Decision Making," Organizational Behavior and Human Per'formance 13, no. 2
(april): 171—192.
Fair, Ray C. 1974. "An Evaluation of a Short—Run Forecasting Model,"
International Econoic Review 15, no. 2 (June): 285—303.
McNees, Stephen K. 1973. "The Predictive 7ccuracy of Econometric Forecasts,"
New England Economic Review (September/October): 3—27.
McNees, Stephen K. 1975. "An Evaluation of Economic Forecasts," New England
Economic Review (November/December): 25—29.
McNees, Stephen K. 1976. "An Evaluation of Economic Forecasts: Extension and
Update," New England Economic Review (September/October): 30—44.
McNees, Stephen K. 1979. "The Forecastinq Record of the 1970s," New England
Economic Review (September/October): 33—53.
Moore, Geoffrey H. 1969. "Forecasting Short Term conomic Change," Journal of
the AmericanStatistical Association 64, no. 325 (March): 1—22.
Moore, Goffrey H. 1977. "Lessons of the 1973-1976 Recession and Recovery,"
in William Feliner, ed., Contemporary Economic Problems 1977.
Su, Vincent, and Su, Jospehine. 1975. "An Evaluation of the ASA/NBER Business
Outlook Survey Forecasts," Explorations in Economic Research 2, no. 4
(Fall): 588—618.
Zarnowitz, Victor. 1967. An Appraisal of Short-Term Economic Forecasts.
New York: National Bureau of Economic Research.

—25—
Zarnowjtz, Victor. 1972. "Forecasting Economic Conditions: The Record and
the Prospect," in V. Zarnowitz, ed., The Business Cycle Today. New York:
National Bureau of Economic Research: 183—239.
Zarnowjtz, Victor. 1979. "An Analysis of Annual and Multiperiod Quarterly
Forecasts of Aggregate Income, Output, and the Price Level," Journal of
Business 52, no. 1 (January): 1—33.
Zarnowitz, Victor. (1982). "Expectations and Forecasts from Business Outlook
Surveys," NBER Working Paper No. 845 (January).
Zarnowitz, Victor. 1983. "Rational Expectations and Macroeconomic Forecasts,"
Journal of Macroecnomics (forthcoming).
Related Documents