NBER WORKING PAPER SERIES INSTITUTIONAL ALLOCATION IN INITIAL PUBLIC OFFERINGS: EMPIRICAL EVIDENCE Reena Aggarwal Nagpurnanand R. Prabhala Manju Puri Working Paper 9070 http://www.nber.org/papers/w9070 NATIONAL BUREAU OF ECONOMIC RESEARCH 1050 Massachusetts Avenue Cambridge, MA 02138 July 2002 We are grateful to Rick Green (the editor) and an anonymous referee for very helpful comments. We also thank Walid Busaba, Vojislav Maksimovic, Gordon Phillips, Bill Wilhelm, and seminar participants at Tulane University and the 2001 Western Finance Association meetings for helpful comments. Aggarwal was partially supported by a Steers Faculty Research Fellowship awarded by the McDonough School of Business and by research assistance from the Capital Markets Research Center. The views expressed herein are those of the authors and not necessarily those of the National Bureau of Economic Research. © 2002 by Reena Aggarwal, Nagpurnanand R. Prabhala and Manju Puri. All rights reserved. Short sections of text, not to exceed two paragraphs, may be quoted without explicit permission provided that full credit, including © notice, is given to the source.

Welcome message from author
This document is posted to help you gain knowledge. Please leave a comment to let me know what you think about it! Share it to your friends and learn new things together.
Transcript

NBER WORKING PAPER SERIES
INSTITUTIONAL ALLOCATION IN INITIAL PUBLIC OFFERINGS:
EMPIRICAL EVIDENCE
Reena Aggarwal
Nagpurnanand R. Prabhala
Manju Puri
Working Paper 9070
http://www.nber.org/papers/w9070
NATIONAL BUREAU OF ECONOMIC RESEARCH
1050 Massachusetts Avenue
Cambridge, MA 02138
July 2002
We are grateful to Rick Green (the editor) and an anonymous referee for very helpful comments. We also
thank Walid Busaba, Vojislav Maksimovic, Gordon Phillips, Bill Wilhelm, and seminar participants at
Tulane University and the 2001 Western Finance Association meetings for helpful comments. Aggarwal was
partially supported by a Steers Faculty Research Fellowship awarded by the McDonough School of Business
and by research assistance from the Capital Markets Research Center. The views expressed herein are those
of the authors and not necessarily those of the National Bureau of Economic Research.
© 2002 by Reena Aggarwal, Nagpurnanand R. Prabhala and Manju Puri. All rights reserved. Short sections
of text, not to exceed two paragraphs, may be quoted without explicit permission provided that full credit,
including © notice, is given to the source.

Institutional Allocation In Initial Public Offerings: Empirical Evidence
Reena Aggarwal, Nagpurnanand R. Prabhala and Manju Puri
NBER Working Paper No. 9070
July 2002
JEL No. G2, G3
ABSTRACT
We analyze institutional allocation in initial public offerings (IPOs) using a new dataset of US
offerings between 1997 and 1998. We document a positive relationship between institutional allocation
and day one IPO returns. This is partly explained by the practice of giving institutions more shares in
IPOs with strong pre-market demand, consistent with book-building theories. However, institutional
allocation also contains private information about first-day IPO returns not reflected in pre-market
demand and other public information. Our evidence supports book-building theories of IPO underpricing,
but suggests that institutional allocation in underpriced issues is in excess of that explained by book-
building alone.
Reena Aggarwal Nagpurnanand R. Prabhala Manju Puri
School of Business Smith School of Business Stanford University
Georgetown University University of Maryland Graduate School of Business
Washington, DC 20057 4427 Van Munching Hall 518 Memorial Way
[email protected] College Park, MD 20742 Stanford, CA 94505
[email protected] and NBER

1
It is well known that initial public offerings (IPOs) are underpriced on average.
Underpricing is a robust phenomenon that extends across equity markets in several countries
and time periods (see, e.g., Loughran, Ritter, and Rydqvist (1994)). For example, in our
sample of IPOs offered during 1997-1998, the average day one return of issues is 19.25
percent. In these offerings, the total money “left on the table” due to underpricing is a
substantial $3.5 billion.1 While the existence of these initial gains is widely known and has
been exhaustively documented, there is surprisingly little research on how these gains are
divided between different investors in IPOs.
IPO underwriters play a central role in determining the division of first day gains between
different investors. Underwriters possess substantial information about issue demand as a result of
their information gathering activities during the book-building process, and in the U.S. market,
they have considerable latitude on how IPO shares are allocated. In principle, underwriters can
favor preferred investors by allocating them more shares in “hot” issues that are expected to trade
up strongly in the aftermarket. Whether underwriters do so is the subject of an active and ongoing
debate in the academic literature and the financial press, but formal empirical evidence on such
issues remains sparse.
Articles in the recent press certainly suggest that underwriters extend favors to their
institutional clientele (see Smith and Pulliam (2001), Pulliam, Smith, and Gasparino (2000),
Pulliam and Smith (2000), and Smith and Pulliam (2000)). These articles also report that the U.S.
Attorney’s office, the Securities and Exchange Commission (SEC), and the regulatory arm of the
National Association of Securities Dealers (NASDR) have initiated investigations into whether
investment banks allocate more shares in “hot” IPOs to favored institutional clientele, possibly in
exchange for unusually large trading commissions in subsequent trades, which could violate
NASDR rules requiring brokers and dealers to maintain standards of fair practice. Institutional

2
investors may also be granted more shares in an issue in exchange for a commitment to buy
additional shares in the aftermarket, although tying of IPO allocations to aftermarket purchases
may violate securities laws and thus concerns regulators. In addition to the investigations and the
debate in the recent financial press, the theoretical IPO literature also suggests that underwriters
may favor their institutional customers. However, the quid pro quo for such favorable treatment is
the information on IPO demand provided by such investors to underwriters, rather than short-term
trading commissions or aftermarket purchases that are the focus of current SEC investigation. It
has been suggested that the complete IPO process, including allocations practices, need to be
studied and is “an area ripe for rule-making” by the SEC (Gasparino, Schroeder, and Kranhold
(2000)).
While there has been much speculation about these aspects of the IPO process, the
available empirical evidence on these issues is limited and does little to inform the ongoing
debate. The primary obstacle to formal empirical research has been the lack of data. Regulations in
the U.S. do not mandate public disclosure of allocations followed by underwriters, and
consequently it remains a relatively opaque aspect of the IPO process. Our paper takes a step
towards filling in the gap. We contribute new empirical evidence using a new and unique dataset
of IPOs that includes information on the percentage of an issue allocated to institutional and retail
investors.
We find, not surprisingly, that institutions dominate IPO allocations, accounting for a
median of about three-quarters of shares offered in an issue. We investigate the cross-sectional
variation of the institutional allocation in IPOs, focusing on two themes. The first part of our
analysis examines whether institutions concentrate more in the better performing IPOs, while our
subsequent analysis evaluates alternative explanations for why there is a positive relationship
between institutional allocation and underpricing. We find that institutions do tend to earn greater
3
profits on their IPO investments compared to retail investors. Part of the institutional-retail
differential can indeed be attributed to favorable allocation patterns followed by underwriters.
Underwriters tend to allocate more shares to institutions in IPOs priced at the upper end of the
filing range, which are ex-ante expected to appreciate more in the aftermarket. Conversely,
institutional allocation is significantly lower in lower-end issues that are less likely to appreciate in
the aftermarket. These findings are consistent with book-building models of IPO underpricing
(Benveniste and Spindt (1989), Cornelli and Goldreich (2001), and Maksimovic and Pichler,
2001)), in which underwriters allocate more shares to institutions in issues in which they obtain
more favorable pre-market demand information. This information enables underwriters to
increase the offer price to the high end of the filing range. Hence, as per the book-building
models, we should see correlations between institutional allocation and issues priced in the high
end of the filing range, which is borne out in our results.
However, book-building does not appear to completely explain the entire institutional-
retail differential. Institutional allocation also contains private information about day one returns
not reflected in other variables, such as the offer price relative to filing range, that predict an IPO’s
day one return. In particular, institutions appear to be adept at avoiding “lemons” in the IPO
market, as suggested by the Rock (1986) theory of IPO underpricing. Thus, our results on
institutional allocation patterns support both major paradigms underlying the theoretical literature
on IPO underpricing, i.e., the book-building model of Benveniste and Spindt (1989) and the
“lemons” model of Rock. We also provide an economic measure of the institutional-retail
differential by estimating the returns to the aggregate pool of institutional and retail capital
invested in our sample of IPOs.
Our evidence adds to that in Hanley and Wilhelm (1995), the only published empirical
study on IPO allocations in the U.S. we are aware of.2 Hanley and Wilhelm (henceforth HW)

4
present a clinical study of institutional allocation patterns followed by one underwriter for 38 IPOs
offered between 1983 and 1988. We add to the HW evidence in terms of both scope and
substantive findings. Our sample is much larger, it is drawn from a more recent period of time,
and we have a cross-section of nine underwriters versus their one underwriter sample. Our
methodology is also different: We control for the endogeneity of institutional allocation and
explicitly distinguish between the effect of the endogenous and excess institutional allocation on
day one returns using two-stage estimates. Finally, we report new and different results. We find,
as do HW, that institutions get a greater percentage of shares in IPOs with strong pre-market
demand. However, while HW report that institutional allocations are similar in both strong and
weak-opening IPOs, we find that institutional allocation concentrates more in stronger opening
IPOs and less in IPOs with low day one returns. Additionally, we develop new evidence on
whether the positive relationship between underpricing and institutional allocation is beyond that
predicted by pre-market demand. We find that while book-building is important, institutional
allocation in underpriced issues is in excess of that explained by book-building alone.
The rest of the paper is organized as follows. Section I describes our unique dataset and
some cross-sectional characteristics of our sample. Section II examines institutional allocations
and profits in IPOs. We analyze whether institutions obtain preferential allocations in more
underpriced issues and explore how the first day gains in IPOs are divided between institutional
and retail investors. Section III provides two-stage least squares estimates that control for the
endogeneity of institutional allocation. Section IV offers a summary and conclusions.
I. Dataset and Cross-sectional Characteristics
We identify IPOs offered between May 1997 and June 1998 from the Securities Data
Company’s (SDC) New Issues database excluding American Depository Receipts, unit offerings,

5
closed-end funds, and real estate investment trusts (REITs). This time period is selected because
our SEC-collected allocation data come from this time period. These allocation records are not
submitted routinely to the regulators as part of any public disclosure requirements but are
maintained by the lead manager. For the purpose of this study, the information was requested
from nine investment banks for all issues in which they were a lead manager.3 Out of these nine
banks, five are among the ten largest banks based on market share during this time period, while
four do not belong to the top-ten category.
For 164 IPOs, we know the aggregate allocation to institutional and retail investors for the
entire issue. If allocation for the entire issue is not available, we use the lead manager’s allocation
as a proxy, resulting in a total sample of 174 issues. The correlation between total institutional
allocation and the lead investment bank’s institutional allocation is 0.76. The median and mean
institutional allocation in the sample of 174 issues equals 74.26 percent and 72.77 percent,
respectively. Issue-specific data such as the filing range, number of shares offered, and offer price
are obtained from the New Issues database of SDC. This information is supplemented with daily
closing prices for each offering from Bloomberg and the Dow Jones. We classify underwriters
based on their reputation (e.g., Carter and Manaster (1990) and Megginson and Weiss (1991)).
Following Megginson and Weiss, the market share of underwriters is used as a basis for assigning
underwriter reputation. The reputation dummy variable for an IPO equals one if the IPO's lead
manager is ranked among the top ten in terms of dollar proceeds among all IPOs issued between
May 1997 and June 1998, and it is zero otherwise.
Table I reports descriptive statistics for our sample as well as the population, which
comprises all firm commitment IPOs listed in the SDC New Issues database excluding ADRs,
units, closed-end funds, and REITs offered between May 1997 and June 1998. The sample of
IPOs has mean (median) proceeds of $132.2 million ($63.9 million) versus the population mean

6
(median) of $75.55 ($36.00) million. The mean (median) offer price for our sample is $15.09
($15) versus $12.37 ($12.00) for the population. Thus, the sample used in this study consists of
larger issues offered at higher prices compared to the population. Over two-thirds of our sample
clusters at a gross spread (statistics not reported in Table I) equal to seven percent, consistent with
Chen and Ritter (2000) and Hansen (2000).
Each IPO is classified based on whether the final offer price is above, within, or below the
initial filing range. The sample of IPOs shows some dispersion across this characteristic. About a
third of our sample issues are priced above the filing range, about a fifth are priced below the
range, while the vast majority, about 50 percent of our sample, is priced within the filing range.
The percentage difference between the midpoint of the filing range and the offer price, UPDATE,
has a median value of zero. The median IPO is priced at the mid-point of the filing range and
spends 69 days in the registration process. The mean and median underpricing in our sample
equals 19.25 percent and 12.80 percent, respectively, which exceed the population underpricing.
II. Institutional Allocations and Profits in IPOs
A key question in IPO allocations is whether institutional capital concentrates in better
performing issues, while leaving weaker-performing issues to retail investors. If, as it turns out,
institutions perform better than retail investors, why this differential? Is it because institutions
receive more shares in IPOs with strong pre-market demand and predictably better day one
returns, a central implication of book-building theories of IPO underpricing? Alternatively, do
INSERT TABLE I ABOUT HERE

7
institutions concentrate in better IPOs beyond what can be explained by pre-market demand and
the book-building process? We bring to light new evidence to address these questions.
Section A begins by developing some a priori evidence that institutions do perform better
than retail investors in IPOs. Sections B and C examine why institutions perform better. Section B
asks if underwriters favor institutions with more shares in IPOs with strong pre-market demand,
which are offered at the upper end of the filing range and have predictably greater day one returns.
We find evidence of such favorable treatment, consistent with the Benveniste and Spindt (1989)
theory of book-building in which underwriters favor investors in exchange for favorable demand
information.
Section C asks if institutional allocation has information about IPO underpricing beyond
what can be attributed to pre-market demand. We find that this is the case. Thus, institutional
allocation reflects information about underpricing not fully captured in other variables that are
publicly known at the offering. This suggests that institutions may be privately informed about
IPO value, as in Rock (1986). Alternatively, underwriters may have private information and use it
to favor institutions for reasons beyond book-building, since our specification controls for pre-
market demand. We end Section II by characterizing the economic magnitude of the return
differential between institutional and retail capital in the aggregate.
A. Dollar Profits to Institutional and Retail Investors: Do Institutions Perform Better?
Panel A of Table II reports the mean and median (the number in parentheses) dollar profit
per issue accruing to institutional and retail investors in IPOs. For each issue, we compute the total
first-day dollar gain as the product of the day one return and the issue proceeds. We multiply the
day one gain by the percentage allocated to institutional investors to obtain the portion of the day
one gain accruing to these investors. Likewise, the day one dollar gain of an issue is multiplied by

8
the percentage allocated to retail investors to obtain the dollar profits from the issue accruing to
retail investors.
For the overall sample, the mean profit per issue accruing to institutional investors is
$14.79 million (median = $6.61 million), while retail institutions average $5.28 million (median =
$2.29 million), a third of the average profit per issue for institutions. While the dollar profits are
quite different between institutional and retail investors, the capital invested by the two classes of
investors also differs by a similar order of magnitude. We examine differences in the rates of
return subsequently in Section D. The differences in profit-per-issue between institutions and retail
investors accords well with the average institutional allocation of 72.77 percent (first column of
Panel D in Table II), also about three times the allocation to retail investors. The total money left
on the table in our sample can be computed by adding the average per issue profits of both
categories of investors and multiplying by the number of IPOs (174); doing so gives the figure of
$3.5 billion reported earlier.
Panel A of Table II also reports returns and profits per issue classified by the size of the
day one return of the IPO. We divide IPOs into three categories: (1) overpriced IPOs, which have
a negative day one return, (2) moderately underpriced IPOs, which have positive returns of less
than 20 percent, and (3) highly underpriced IPOs, which have day one returns exceeding 20
percent. Zero return IPOs have zero returns and profits by definition, and these are excluded in
Table II.4 We find two interesting patterns in the dollar profits for IPOs.
INSERT TABLE II ABOUT HERE

9
(1) Per issue profits on both moderately and highly underpriced issues outweigh the per
issue losses on overpriced issues. For example, the average institutional profit on
moderately underpriced IPOs (column 3) equals $11.31 mm versus the mean per issue
loss on overpriced issues (column 2) of -$1.92 mm. The per issue loss in overpriced
IPOs is lower because the negative returns on overpriced IPOs are less in absolute
magnitude compared to positive day one returns, and also because negative return IPOs
tend to have lower issue proceeds.
(2) More interestingly, institutional-retail profit differentials are not constant across the
three categories of IPOs. Differentials are more pronounced in the most underpriced
issues and are less prominent in overpriced issues. In overpriced issues, institutions
lose an average of $1.92 mm per issue, about 1.08 times the average loss per issue of
$1.77 mm for retail investors. For moderately underpriced issues, institutions earn an
average of $11.31 mm, about 2.69 times the average of $4.20 mm for retail investors.
Finally, for the most underpriced issues, institutions earn an average of $27.32 mm per
issue, 2.83 times what retail investors take away from these issues. Thus, per issue
profit differentials are greater in the most underpriced and moderately underpriced
issues than in the overpriced issues.
The results provide some initial evidence that institutional capital in IPOs earns greater
profits in IPOs at the expense of retail investors because institutions earn a larger proportion on
the upside but share the downside in weaker issues more evenly with retail customers. The data on
institutional allocation (last row of Panel D, Table II) are consistent with this notion. The mean
(median) institutional allocation for overpriced issues is 59.73 percent (56.09 percent) versus
71.65 percent (72.87 percent) for moderately underpriced issues, and 76.69 percent (75.87
percent) for highly underpriced issues. Thus, institutions are allocated a lower proportion of shares

10
in overpriced issues compared to either group of underpriced issues or underpriced issues as a
whole (Wilcoxon z = 2.78, significant at one percent).
We extend the Panel A findings in two directions. First, we reexamine the results for
longer holding periods because the results based on day one returns may be biased by a
combination of price support and limits on flipping.5 For example, losses on overpriced issues
may be greater without price support and restrictions on flipping may limit investors’ ability to
realize gains on underpriced issues. These biases suggest that the true profit differentials may be
somewhat greater than suggested in Panel A, and it may be useful to consider returns over not just
one day but longer horizons as well. The longer data also offers the advantage of incorporating
allocation data from the significant number of IPOs opening with zero return (22 issues) excluded
from Panel A.
On the other hand, the longer horizon results may be less powerful. One reason is that at
longer horizons, there is greater likelihood of price movements unrelated to the initial IPO
uncertainty. Additionally, Ellis, Michaely, and O’Hara (2000) document a sharp decline in IPO
trading volume after the first two trading days, suggesting that investors mostly adjust their IPO
holdings within this initial period. A characterization of the true profitability of institutional and
retail investment in IPOs requires us to know when each type of investor sells in the aftermarket,
and the direct and indirect costs of selling (including diminished allocations in the future). While
this is an interesting avenue of research beyond our scope and data, it is certainly useful to
supplement the one-day analysis with some evidence from longer horizons.
An empirical question is the length of time over which we should consider the longer
horizon analysis. We look to prior literature for some guidance. Ellis, Michaely, and O’Hara
(2000, p. 1062) find that underwriters have built up 80 percent of their peak aftermarket inventory
in the first five trading days, while the inventory starts to decline after 20 days. This suggests that
11
support is concentrated in the first week and is altogether complete a month after the IPO.
Aggarwal (2000) reports that in her sample, price support activities end within 10 days of the
offering date. The median stabilized IPO in her sample has zero stabilization after a week; most
short covering is concentrated in the first few days of trading when volume is at a peak. These
considerations suggest that we should incorporate horizons of five to 20 trading days after the IPO
offer date. Panel B reports the evidence based on ten-day returns (the return cutoffs in Panel B are
based on ten-day returns being below or exceeding zero or 20 percent). The Panel B patterns are
broadly similar to those in Panel A. The profit of institutional investors is 1.89, 2.95, and 2.72
times that of retail investors for overpriced, moderately underpriced, and highly underpriced
issues, respectively. Thus, differentials between institutions and retail customers are less
prominent in the overpriced issues relative to the others. Panel C reports similar evidence for 20
trading days after the IPO’s opening.
A second extension of the evidence in Panel A of Table II is to consider return cutoffs
above 20 percent. One purpose of this analysis is to verify whether the patterns in Table II are
robust. In particular, popular accounts of underwriter favoritism often speculate that institutions
perform better because they get disproportionately more shares in the most highly underpriced
issues, while retail investors are essentially frozen out of participation in this segment of IPOs.
Using return cutoffs well above 20 percent allows us to evaluate this question. We experimented
with return cutoffs of 30 percent, 40 percent, and 50 percent, which approximately correspond to
the 80th, 85th, and 90th percentile of the day one returns. We find patterns essentially similar to
those in Panel A of Table II. The variation in IPO allocations within underpriced issues is modest
compared to the variation in allocation between underpriced and overpriced issues. For instance,
mean and median institutional allocation is 77.88 percent and 75.06 percent, respectively, for the
26 IPOs with initial returns greater than 40 percent versus 76.69 percent and 75.87 percent,

12
respectively, for IPOs with returns greater than 20 percent (last column in Table II, Panel D). On
the other hand, overpriced IPOs have mean and median institutional allocation of 59.73 percent
and 56.09 percent, respectively. Thus, favoritism on the part of underwriters seems to occur
primarily via the mechanism of lower institutional allocation in overpriced issues rather than even
higher allocations in the best performing IPOs.
Another interesting question relates to the variation in institutional allocation. Are
allocation schedules relatively flat, as might be suggested by a mechanical allocation rule of
giving fixed percentages to institutions, or is there some variation in allocation across or within
different return categories? The standard deviation of institutional allocation lies between 14
percent and 19 percent for all initial return categories except the highest return categories, where it
is significantly lower. For example, in the category of issues with initial return greater than 20
percent, the standard deviation of allocation is 7.97 percent, while it is 7.73 percent for issues with
return greater than 40 percent.
Section A has documented that institutions appear to perform better than retail investors in
IPOs. The next two sections investigate why. Section B asks if institutions do better because they
routinely receive more (less) shares in IPOs with strong (weak) pre-market demand, a central
implication of Benveniste and Spindt (1989), the book-building paradigm for explaining IPO
underpricing. Section C analyzes if institutional allocation reflects additional private information
that is not captured by the pre-market demand, as is suggested by the Rock (1986) framework for
explaining IPO underpricing.
B. Allocation Versus Pre-Market Demand
IPOs priced at the upper end of the filing range tend to have strong pre-market demand.
These IPOs have predictably higher day one returns compared to issues priced at the lower end of

13
the filing range. This well-known “partial adjustment’’ phenomenon (Hanley (1993)) is detailed
recently in Ritter (1998), who reports that virtually all IPOs priced above the filing range had
positive day one returns, while only about half of those priced below the filing range have positive
initial returns.6 In this section, we examine whether underwriters allocate more shares in IPOs to
institutions when the pre-market demand for an issue (and hence the likely day one appreciation
of the issue) is high.
Our proxy for pre-market interest is the variable UPDATE, the percentage difference
between the midpoint of the filing range and the offer price.7 Model 1 in Table III reports results
from a univariate regression of the percentage institutional allocation on UPDATE, whereas Model
2 reports estimates of a multivariate specification that includes other variables potentially related
to institutional allocation. Among these controls is the size of the IPO, or the dollar proceeds of an
issue excluding the Green Shoe amount. Large issues may have lower institutional allocation
because institutions are less likely to be able to absorb the entire supply of shares in large issues.
Additionally, large issues may be less risky and retail investors may face less lemons problems in
such issues (Beatty and Ritter (1986)). Institutions may also be reluctant to take up more shares in
small issues because of the disclosure requirements triggered by additional purchases when stakes
are five percent or above (Section 13G of the 1934 Securities Act). We consider three proxies for
size: (1) issue proceeds, (2) assets of the issuer before the offer, or (3) the number of shares
offered in the IPO. While all three proxies give similar results, we report the estimates based on
the number of shares.8 Because the size variables are all skewed, we specify the regression using
the natural logarithm of the number of shares offered (in millions) as an independent variable. We
also include the number of days spent in the registration process as an explanatory variable. IPOs
that spend more time in the registration process may be weaker issues that are associated with
lower institutional allocation (see, e.g., Hanley (1993), p. 239). Alternatively, issues may spend
14
more time in registration in times of high issuance volume (and high underpricing) because of the
relatively fixed processing capacity at the SEC in hot periods. This suggests that the correlation
between underpricing and time spent in registration may be positive. The regression also includes
an underwriter reputation dummy equal to one if the lead underwriter is among the ten largest
investment banks based on market share during this time period, and zero otherwise. Finally, one-
digit SIC dummies (not reported here) for industry controls are incorporated into our
specifications.
In both the univariate and multivariate regressions, UPDATE has a positive and significant
coefficient. Thus, underwriters do favor the aggregate pool of institutional capital by allocating
more shares in IPOs with stronger pre-market indications of interest. A change in UPDATE from
its first quartile to third quartile, 93.3 percent to 109.1 percent, results in an increase in
institutional allocation of 5.5 percent, or about a third of the interquartile variation in institutional
allocation (16.49 percent). On a standalone basis, the variable also explains an economically
significant 9.27 percent of the variation in institutional allocation. Underwriter reputation has a
negative coefficient, suggesting that reputed underwriters give more shares to retail customers.
This result should be interpreted with caution because our sample has nine underwriters but not
the universe of all underwriters. The number of days spent in registration is not significant.
The main result, a positive coefficient for UPDATE, is consistent with the book-building
explanation for IPO allocations. Benveniste and Spindt (1989) argue that underwriters give more
shares to institutions in issues with stronger pre-market interest as an incentive for institutional
INSERT TABLE III ABOUT HERE

15
investors to truthfully reveal their favorable information. Extraction of such information allows the
underwriter to set a higher offer price for the issue. This is what we observe empirically.
C. Institutional Allocation and Degree of Underpricing
Section B documents that one source of superior profits to institutions is greater allocations
in IPOs with strong pre-market demand. In this section, we examine whether this is the sole
explanation for the better performance of institutions, or whether institutional allocation is related
to underpricing even after controlling for pre-market demand. If so, the better performance of
institutional investors in IPOs would reflect not merely allocations in “hotter’’ issues with better
pre-market demand, but would also reflect private information that is not captured by publicly
known variables at the time of the IPO.
Panel A of Table IV reports estimates of a regression in which the dependent variable is
the day one return of an IPO and independent variables include institutional allocation along with
control variables. First among our controls is the variable UPDATE, the percentage difference
between the midpoint of the filing range and the offer price. This variable is an important control
as we are primarily interested in testing whether allocation is related to the degree of IPO
underpricing even after controlling for UPDATE. Among the other controls are variables that
might potentially explain IPO underpricing. Beatty and Ritter (1986) document that issue proceeds
are negatively related to the degree of underpricing of an issue. As before, we use the natural
logarithm of the number of shares offered in the empirical specification. We include the time spent
in registration and underwriter reputation as additional controls potentially related to IPO
underpricing. Finally, we include but do not report industry dummy variables based on one-digit
SIC codes.
INSERT TABLE IV ABOUT HERE

16
Panel A in Table IV reports the univariate and multivariate regression estimates. On a
standalone basis in the univariate specification, institutional allocation has a positive coefficient
and is statistically significant. Among the controls in the multivariate specification, log number of
shares has a negative coefficient and underwriter reputation has a positive coefficient. The variable
UPDATE has a significant and positive coefficient, indicating that IPOs offered at the top of the
filing range are indeed more likely to have higher day one returns. The time spent in registration is
not significant. Institutional allocation retains a positive coefficient even after including UPDATE
and the coefficient magnitude remains roughly equal to that in the univariate specification. The
coefficient for allocation is also economically significant. For instance, using the Panel A
estimates, a change in allocation from its first quartile to its third quartile, 64.95 percent to 81.44
percent, increases expected IPO underpricing by 5.12 percent.
For robustness, Panel B also reports estimates of an ordered probit specification in which
the left-hand side dependent variable is an ordinal variable denoting whether an IPO was
overpriced, moderately underpriced, or highly underpriced. The lowest category consists of
overpriced issues that have negative or zero first day returns. The next category consists of
moderately underpriced issues that have returns between zero and 20 percent, and the last category
of IPOs includes highly underpriced issues that have day one returns in excess of 20 percent.
Allocation remains significantly positively related to initial IPO returns even after including other
controls potentially related to IPO underpricing.
The sign and significance of institutional allocations in the multivariate regressions
suggests that it is not merely a proxy for publicly available information at the time of the offering.
Institutional money appears to contain private information about future IPO returns. Such private
information may well reflect superior information held by institutional investors, which allows
them to minimize participation in the “lemons” in the IPO market, consistent with the Rock (1986)

17
model of IPO underpricing and the empirical literature supporting these theories (e.g., Beatty and
Ritter (1986); Carter and Manaster (1990); Michaely and Shaw (1994); Jegadeesh, Weinstein and
Welch (1993)). As this literature suggests, if institutions have private information, the aggregate
demand flow from institutions is greater in more underpriced issues, and underwriters may
allocate them a greater number of shares in these issues. In contrast, institutional demand and
participation are lower in the “lemons.” Alternatively, private information may be held by
underwriters rather than by institutional investors, and underwriters may use this information to
ensure that institutions get less of the worse performing shares.
D. The Economic Magnitude of Return Differences
Next, we provide an economic characterization of the institutional-retail differential in
IPOs. To this end, we examine whether each dollar invested by an institutional investor earns the
same as each dollar invested by a retail investor. We define the return on each dollar invested by
each type of investor, say πt, where t is the investor type, institutional (t # 1) or retail (t # 2), as,
πt =
∑
∑
=
=n
iiit
n
iiiit
px
rpx
1
1
*
** (1)
where, i indexes the issue, xit denotes the percentage of issue i allocated to investor of type t, pi,
denotes the proceeds, and ri is the first-day return for issue i.
Equation (1) provides a simple metric for judging the performance of institutional versus
retail capital: The returns to each type of dollar invested in IPOs. If allocation xit = xjt ∀ i, or more
generally, if IPO allocation is independent of ex-post issue returns ri, then π1 = π2 and both types of
capital will experience the same returns on investment. On the other hand, if institutional

18
allocation tends to be high for more underpriced issues, i.e., ∂x1/∂r1 > 0, then π1 > π2. In our
sample, the total amount invested by institutions is $16.4 billion and the total amount earned by
institutions equals $2.57 billion, so the return to one institutional dollar is 15.69 percent. On the
other hand, retail investors earn only 13.92 percent, investing a total of $6.59 billion for a first-day
profit of $918 million. Therefore, an institutional dollar earns about 1.77 percent more than a
retail dollar for the IPOs in our sample based on day one returns of IPOs.
The first-day return difference of 1.77 percent is somewhat modest. Why is it so narrow?
Differences in returns are certainly likely to be lower than the differences in dollar profits reported
in Table II, because capital invested by retail investors is only about a third of that invested by
institutional investors. The allocation data from Table II provide additional pointers. From the
allocation statistics, the major variation in institutional allocation across IPOs comes from the fact
that institutions have fewer shares in IPOs that are overpriced ex-post. While there is some
variation in institutional allocation within the universe of underpriced issues, it is small in relation
to the variation between all underpriced and overpriced IPOs. Thus, the contribution of returns
from underpriced issues to an institutional-retail return differential is economically small, and the
difference is driven by variation due to overpriced issues. This component is small due to two
reasons. First, IPOs are underpriced rather than overpriced on average. Additionally, overpriced
issues tend to have lower dollar proceeds and therefore contribute less to the overall dollars
invested in IPOs.9 Hence, the cumulative impact of overpriced issues on the overall returns is also
small.
As discussed earlier in Section A, the existence of price support biases estimates of day
one returns upwards. Losses on overpriced issues may be greater without price support.
Additionally, profit and return differentials based on day one returns exclude the sample of 22
IPOs that have zero first-day returns. Therefore, we also compute return differentials based on the
19
longer horizons of 10 and 20 trading days, following Panels B and C of Table II. As expected,
return differentials between institutions and retail customers widen when considering these longer
horizons. Over 10 trading days, institutions earn 15.10 percent while retail investors earn 13
percent on their invested capital, giving a return differential of 2.10 percent. Over the 20 trading-
day horizon, the differentials widen somewhat to 2.39 percent, as institutions earn a return on
capital invested of 15.87 percent while retail investors earn 13.48 percent.
We have provided evidence on whether institutional capital performs better in IPOs
compared to retail investors and why. We find that institutions do tend to earn more than retail
investors in IPOs. Part of the explanation is the positive correlation between pre-market demand
and allocation, consistent with the book-building hypothesis of Benveniste and Spindt (1989).
However, institutional allocation also appears to reflect private information not in pre-market
demand, suggesting that either institutions are privately informed investors (Rock (1986)) or that
underwriters use their private information to favor institutions for reasons beyond book-building.
III. Two-Stage Estimates
The results in Table IV indicate that the day one return of an IPO is positively related to
institutional allocation. This positive relationship may reflect one or both of two explanations.
First, institutional allocation may contain private information about day one returns not reflected
in the price update and other explanatory variables related to day one returns. Alternatively, this
positive relationship may be driven by the endogeneity of institutional allocation. We know from
Hanley (1993) that initial returns and UPDATE are positively related, and from Table III that
institutional allocation is positively related to UPDATE because underwriters give more shares to
institutions when pre-market demand is high. Thus, the allocation-return relationship may reflect
the endogenous nature of institutional allocation rather than any private information about returns

20
it contains. We consider two-stage estimates to explicitly separate out the effect of the
endogenously determined portion of the institutional allocation on the initial IPO returns.
To model the endogenous nature of institutional allocation, rewrite the models estimated in
Tables III to IV as
E (RETURN) = β XRETURN + θ INST (2)
E (INST ) = α XINST (3)
where INST and RETURN denote institutional allocation and day one returns, respectively and the
X’s denote the regressors associated with the two equations. The key issue is whether the
significance of institutional allocation INST in Eq. (2) is merely because INST is an endogenous
function of the variable XINST .
We can test if there is an endogeneity bias by entering the endogenous portion of
institutional allocation INST rather than INST itself as a regressor to explain day one IPO returns.
Equivalently, rewrite Eq. (2) as
E (RETURN) = β XRETURN + θ1 [α XINST ] (4)
If the endogeneity hypothesis is correct, we would expect that θ1 is positive and
significant in Eq. (4). The specification can be estimated by two-stage least squares (2SLS)
methods. In the first step, institutional allocation is regressed on UPDATE and other regressors
in XINST. Fitted values from this regression [α XINST] are then entered into the return equation
instead of institutional allocation INST and the specification is estimated. Standard errors need
adjustments because we use generated regressors in the second step of the two-step procedure

21
(see, e.g., Murphy and Topel (1985) or Maddala (1983), Chapter 8). In addition, if institutional
allocation has private information not reflected in other public variables, excess allocation
should itself explain day one returns. This suggests generalizing Eq. (4) to incorporate excess
allocation, i.e., estimating
E (RETURN) = β XRETURN + θ1 [α XINST]+ θ2 [INST – α XINST] (5)
A positive and significant θ2 would support the private information hypothesis while a
positive and significant θ1 would reflect the existence of an endogeneity bias.10
Estimating the two equation system (3)-(5) requires us to specify regressors that enter
either equation. If, as in Tables III to IV, the same regressors enter the returns and allocation
equations, i.e., XRETURN = XINST, the equation-by-equation OLS coefficient θ for institutional
allocation INST in Eq. (4) is the same as regression coefficient θ2 for excess institutional
allocation. Thus, the significance of the coefficient for INST in the ordinary least square results
reported in Table IV, where XRETURN = XINST, can be interpreted as evidence that institutional
allocation has private information about day one returns. The same results obtain if XINST were to
be a subset of XRETURN rather than being identical to XRETURN. Thus, non-OLS structural estimates
of Eqs. (3) to (4) are only needed when there is at least one variable in the allocation equation (3)
that does not enter into the returns equation (4).11
We can specify an extra variable in the allocation equation by arbitrarily excluding one or
more regressors from the return equation (5) but including these variables in the allocation equation
(4). However, our strategy is to look outside the set of variables in Tables (3)-(4) to avoid biases
induced by specification searches (e.g., Lo and MacKinlay (1990)). We include the size of the
underwriting syndicate (NSYNDICATE), the field NUMAMGR in the SDC New Issues database,
as a potential determinant of the fraction of the issue allocated to institutions. We conjecture that

22
there exists a negative relationship between the institutional component of an issue and the
syndicate size. The reasoning is that retail investors are more likely to have relationships and
accounts with one or very few firms, while institutions are likely to have ongoing relationships with
multiple underwriters. Thus, issues with a more significant retail component require more extensive
distribution efforts in order to involve more retail customers and would probably involve more
underwriters being included in the syndicate, a view also borne out by informal conversations with
underwriters. This suggests a negative relationship between the syndicate size and the institutional
allocation of an issue. The correlation between the two variables is -0.46.
Table V presents the two-stage estimates. As before in Table IV, we present estimates when
the day one return is specified as a continuous variable, and also a specification in which it is an
ordinal variable. Panel A reports estimates of the allocation equation (3). As expected, the syndicate
size has a negative and significant coefficient, suggesting that issues with more retail (less
institutional) allocation have a greater number of managers. Panels B and C of Table V reports the
second stage estimates of return equation (4) based on an ordered probit model and OLS, as before.
In both specifications, fitted institutional allocation is not significant, suggesting that the
endogenous portion of institutional allocation is not significantly related to day one returns. Thus,
the positive relationship between institutional allocation and day one IPO returns does not reflect
the fact that allocation itself is related to other publicly available information. Allocation appears to
have private information about day one returns, consistent with which the coefficient for excess
allocation is positive and significant. Unusually high institutional allocation in IPOs is associated
with positive day one returns.
INSERT TABLE V ABOUT HERE

23
IV. Summary and Conclusions
The fact that IPOs are underpriced is widely known and extensively documented.
However, there is little empirical evidence on how the day one gains in IPOs are allocated
between institutional and retail investors. The question of whether IPO allocation practices
systematically favor institutions over retail investors is also a subject of much debate and ongoing
regulatory investigations. Using a new dataset, we examine patterns of institutional allocation in
IPOs.
Our analysis consists of two parts. The first part of the analysis investigates the cross-
sectional variation of institutional allocation in IPOs, and examines whether institutions do in fact
have higher allocation in the more underpriced issues. We find this is indeed the case, and
document that there is a positive relationship between institutional allocation and underpricing.
The next part of our analysis examines alternate explanations for why institutional
allocation is greater in underpriced issues. One explanation for this result comes from the book-
building theories of IPO underpricing, which suggest that underwriters attempt to extract favorable
pre-market demand information to help partially adjust the offer price upwards to the high end of
the filing range. In such theories, underwriters allocate more shares in issues with strong pre-
market demand, which are also more likely to have higher first day returns, as a quid pro quo for
obtaining favorable pre-market demand information. A second explanation is that institutional
allocation is positively related to IPO underpricing because of private information. Such
information can be held by institutions, so that they participate less in lemons, or by underwriters
who use this information to ensure that institutions get less of the worse performing issues. We
find support for both explanations.
Our results have implications for the ongoing debate regarding allocation practices
followed by U.S. underwriters. A key question in this debate is whether institutions are favored in
24
the IPO allocation process. Our evidence is certainly consistent with this view. We find that
institutions do tend to concentrate more in better performing IPOs. Part of this result is because
institutions get favorable allocations in IPOs with strong pre-market demand, which may be
economically justified from a firm’s viewpoint as quid pro quo to institutions for information that
allows underwriters to set higher prices for the IPO. However, we find that institutional allocation
is related to IPO underpricing beyond what can be explained by pre-market demand. This
suggests that there is private information, either with institutions or with underwriters, that
benefits institutional investors in IPOs. Thus, while book-building is important, institutional
allocation in underpriced IPOs is in excess of that explained by book-building alone.

25
REFERENCES
Aggarwal, Reena, 2000, Stabilization activities by underwriters after new offerings, Journal of Finance 55, 1075-1104.
Aggarwal, Reena, 2001, Allocation of initial public offerings and flipping activity, Journal of
Financial Economics, forthcoming. Beatty, Randolph, and Jay Ritter, 1986, Investment banking, reputation, and the underpricing
of initial public offerings, Journal of Financial Economics 15, 213-232. Benveniste, Lawrence M., and Paul A. Spindt, 1989, How investment banks determine the
offer price and allocation of new issues, Journal of Financial Economics 24, 343-362. Carter, Richard, and Steven Manaster, 1990, Initial public offerings and underwriter
reputation, Journal of Finance 45, 1045-1067. Chen, Hsuan-Chi, and Jay Ritter, 2000, The seven percent solution, Journal of Finance 55,
1105-1132. Cornelli, Francesca, and David Goldreich, 2001, Book-building and strategic allocation,
Journal of Finance, forthcoming. Ellis, Katrina, Roni Michaely, and Maureen O’Hara, 2000, When the underwriter is the
market maker: An examination of trading in the IPO aftermarket, Journal of Finance 55, 1039-1074.
Gasparino, C., Schroeder, M., and Kranhold, K., 2000, SEC targets IPO process with probes,
Wall Street Journal, December 19, C1. Habib, Michel A., and Alexander P. Ljungqvist, 1998, Underpricing and IPO proceeds: A
Note, Economics Letters 61, 381-383. Habib, Michel A., and Alexander P. Ljungqvist, 2001, Underpricing and entrepreneurial
wealth losses in IPOs: Theory and evidence, Review of Financial Studies 14, 433-458. Hanley, Kathleen W., 1993, The underpricing of initial public offerings and the partial
adjustment phenomenon, Journal of Financial Economics 34, 231-250. Hanley, Kathleen W., and William J. Wilhelm, 1995, Evidence on the strategic allocation of
initial public offerings, Journal of Financial Economics 37, 239-257. Hansen, Robert, 2000, Do investment banks compete in IPOs?: The advent of the ‘7% plus
contract’, Journal of Financial Economics 59, 313-346. Jegadeesh, Narasimhan, Mark Weinstein, and Ivo Welch, 1993, IPO signaling and subsequent
equity offerings: An empirical investigation, Journal of Financial Economics 34, 153-176.

26
Ljungqvist, Alexander, and William J. Wilhelm, 2001, IPO allocations: Discriminatory or discretionary?, Journal of Financial Economics, forthcoming
Lo, Andrew, and A. Craig MacKinlay, 1990, Data snooping biases in tests of asset pricing
models, Review of Financial Studies 3, 431-467. Loughran, Tim, Jay Ritter, and Kristian Rydqvist, 1994, Initial public offerings: International
insights, Pacific-Basin Finance Journal 2, 165-199. Loughran, Tim, and Jay Ritter, 2001, Why don’t issuers get upset about leaving money on the
table in IPOs? forthcoming, Review of Financial Studies. Lowry, Michelle, and G. William Schwert, 2001, IPO market cycles: bubbles or sequential
learning? forthcoming, Journal of Finance. Maddala, G., 1983, Limited Dependent and Qualitative Variables in Econometrics (Cambridge
University Press, New York, NY). Maksimovic, Vojislav, and Pegaret Pichler, 2001, Private versus public offerings: optimal selling mechanisms, working paper, University of Maryland. Megginson, William, and Kathleen A. Weiss, 1991, Venture capitalist certification in initial
public offerings, Journal of Finance 46, 879-903. Michaely, Roni, and Wayne H. Shaw, 1994, The pricing of initial public offerings: Tests of
adverse selection and signaling theories, Review of Financial Studies 7, 279-319. Murphy, K., and R. Topel, 1985, Estimation and inference in two step econometric models,
Journal of Business and Economic Statistics 3, 370-379 Pulliam, S., R. Smith, and C. Gasparino, 2000, SEC intensifies inquiry into commissions for
hot IPOs, Wall Street Journal, December 13, C1. Pulliam, S., and R. Smith, 2000, Linux deal is focus of IPO commission probe, Wall Street
Journal, December 12, C1. Ritter, Jay, 1998, Initial public offerings, Contemporary Finance Digest 2, 5-30. Rock, Kevin, 1986, Why new issues are underpriced, Journal of Financial Economics 15,
187-212. Smith, R., and S. Pulliam, 2000, U.S. probes inflated commissions for hot IPOs, Wall Street
Journal, December 7, C1. Smith, R., and S. Pulliam, 2001, CSFB and employees may face NASD charges over IPO sales,
Wall Street Journal, May 2, C1.

27
White, Halbert, 1980, A heteroskedasticity-consistent covariance matrix estimator and a direct test for heteroskedasticity, Econometrica 48, 817-838.

28
Table I Descriptive Statistics for Sample
The table reports the mean and median of several characteristics of IPOs offered between May 1997 and June 1998. Columns 2 and 3 report sample characteristics of 174 IPOs managed by nine underwriters for which institutional allocation is available. Columns 4 and 5 report characteristics of the population of 617 IPOs offered during this time period, which includes all firm-commitment IPOs in the SDC database except for American Depositary Receipts, unit offerings, closed-end funds and real estate investment trusts. Proceeds represent the amount raised (in $ million); assets denote the value of the issuer’s assets before the offer (in $ million); shares offered are in millions; the offer price is the price at which the issue if offered; UPDATE is the percentage difference between the midpoint of the filing range and the offer price; Days in registration denotes the number of days between the prospectus filing with SEC and the final offer; Syndicate size denotes the number of members in the underwriting syndicate (variable NUMAMGR in the SDC New Issues database); and % Reputed managers denotes the percentage of IPOs offered by underwriters in the top ten in the period. Initial return is the percentage return on the IPO from the offer price to the IPO’s closing price on the first day it is traded. Institutional allocation is the percentage of the IPO issue allocated to institutional investors. Allocation data were reported by the IPO book manager.
Characteristic Sample (N = 174) Mean Median
Population (N = 617) Mean Median
Proceeds (in $ million) $132.2 $63.9 $75.55 $36.00
Assets $75.95 $1,030 $31.6 $435.7
Shares offered 7.47 4.50 6.07 3.13
Offer price $15.09 $15.00 $12.37 $12.00
UPDATE 1.10% 0.00% 0.09% 0.00%
Days in registration 78.72 69.00 96.50 74.50
Syndicate size 16.01 16 15.25 16
% Reputed managers 65% - 43% -
Initial return 19.25% 12.80% 14.27% 8.98%
Institutional allocation 72.77% 74.26% - -

29
Table II
Allocations and Profits of Institutional and Retail Investors The table reports mean and median (in parentheses) initial returns, proceeds in millions of dollars, and percentage of an IPO allocated to institutional investors. We also report the hypothetical profits to institutional and retail investors from investing in the issue at the offer price and selling it on trading day one, trading day 10, and trading day 20 after the offer date. We report the data for three sets of IPOs: returns less than zero, returns between 0% and 20%, and returns exceeding 20%, as well as aggregate data for all IPOs. We do not report the profitability numbers for IPOs with zero returns (22 on day one and 1 on day 10) because profits for these IPOs are mechanically equal to zero by definition. Profit numbers are in millions of dollars. The data consist of 174 IPOs offered between May 1997 and June 1998 for which institutional allocation is available.
Variable All IPOs Return < 0% 0 < Return < 20% Return >20%
Panel A: Profits based on returns from offer to close of trading day one
Sample Size 174 8 84 60
Profits per issue – Institutional $14.79 ($6.61)
-$1.92 (-$1.30)
$11.31 ($4.59)
$27.32 ($18.37)
Profits per issue – Retail $5.28 ($2.29)
-$1.77 (-$0.82)
$4.20 ($1.95)
$9.66 ($6.09)
Panel B: Profits based on returns from offer to trading day 10
Sample Size 174 30 78 65
Profits per issue – Institutional $14.24 ($6.84)
-$5.34 (-$2.33)
$11.63 ($4.24)
$26.63 ($18.64)
Profits per issue – Retail $4.93 ($2.52)
-$2.82 (- $1.03)
$3.94 ($1.22)
$9.78 ($6.77)
Panel C: Profits based on returns from offer to trading day 20
Sample Size 174 48 49 77
Profits per issue – Institutional $14.96 ($7.04)
-$6.81 (- $2.99)
$8.73 ($4.73)
$32.48 ($19.11)
Profits per issue – Retail $5.11 ($1.89)
-$3.37 (-$0.94)
$3.30 ($1.51)
$11.54 ($6.86)
Panel D: Descriptive Statistics
Day one Returns 19.25% (12.80%)
-5.78% -5.96%
9.28% (9.00%)
$43.61 ($32.24)
Proceeds (in millions) $132.20 ($63.90)
$57.78 ($39.95)
$162.10 ($71.22)
$106.90 ($63.27)
Institutional Allocation 72.77% (74.26%)
59.73% (56.09%)
71.65% (72.87%)
76.69% (75.87%)
30
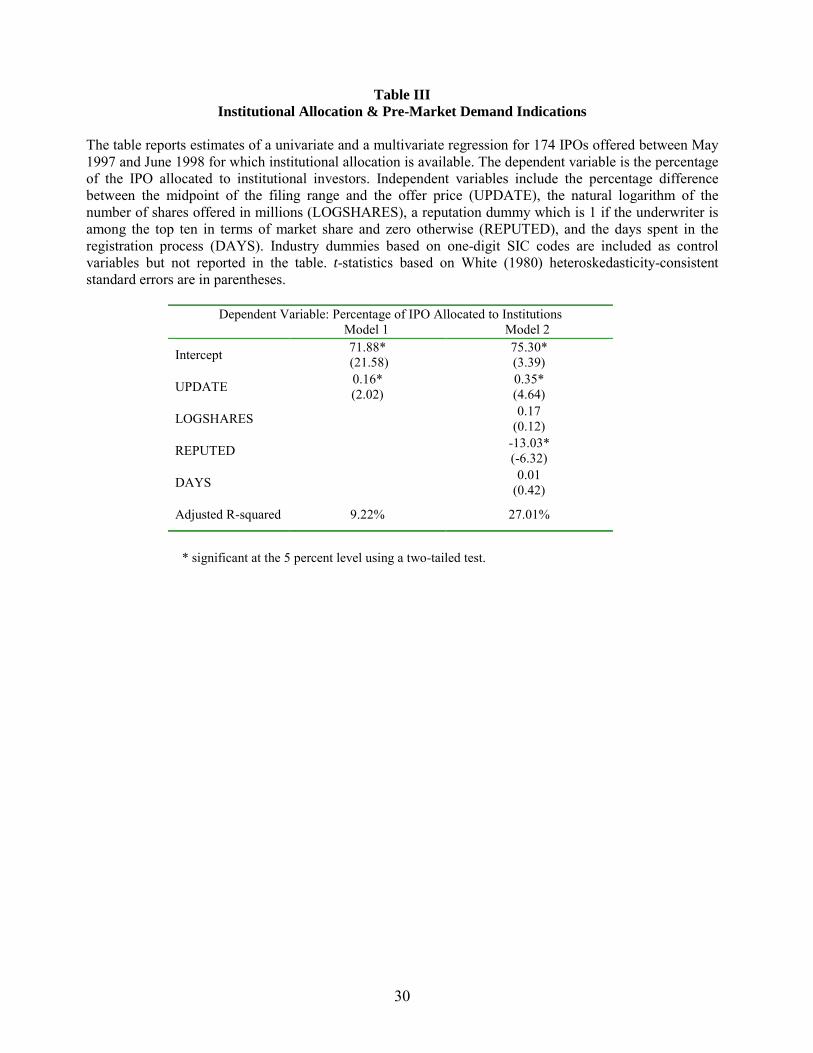
Table III Institutional Allocation & Pre-Market Demand Indications
The table reports estimates of a univariate and a multivariate regression for 174 IPOs offered between May 1997 and June 1998 for which institutional allocation is available. The dependent variable is the percentage of the IPO allocated to institutional investors. Independent variables include the percentage difference between the midpoint of the filing range and the offer price (UPDATE), the natural logarithm of the number of shares offered in millions (LOGSHARES), a reputation dummy which is 1 if the underwriter is among the top ten in terms of market share and zero otherwise (REPUTED), and the days spent in the registration process (DAYS). Industry dummies based on one-digit SIC codes are included as control variables but not reported in the table. t-statistics based on White (1980) heteroskedasticity-consistent standard errors are in parentheses.
Dependent Variable: Percentage of IPO Allocated to Institutions Model 1 Model 2
Intercept 71.88* (21.58)
75.30* (3.39)
UPDATE 0.16* (2.02)
0.35* (4.64)
LOGSHARES 0.17 (0.12)
REPUTED -13.03* (-6.32)
DAYS 0.01 (0.42)
Adjusted R-squared 9.22% 27.01%
* significant at the 5 percent level using a two-tailed test.

31
Table IV Institutional Allocation & Underpricing
The table reports OLS and ordered probit estimates for a sample of 174 IPOs offered between May 1997 and June 1998 for which institutional allocation is available. In OLS, the dependent variable is R, where R is the day one return of the IPO. In the ordered probit, the dependent variable is 0 if R < 0, 1 if 0 < R < 20%, 2 if R > 20%, where R is the day one return for the IPO. Independent variables include the percentage of the IPO allocated to institutional investors (INST), the natural logarithm of the number of shares offered (LOGSHARES), the percentage difference between the midpoint of the filing range and the offer price (UPDATE), a reputation dummy, which is 1 if the underwriter is among the top ten in terms of market share and zero otherwise (REPUTED), and the days spent in the registration process (DAYS). Industry dummies based on one-digit SIC codes are included in the regression but not reported in the table. t-statistics, based on White (1980) heteroskedasticity-consistent standard errors for OLS and Maddala (1983, Chapter 2) for the ordered probit model, are in parentheses.
Panel A: Ordinary Least Squares Dependent Variable: Day one Return Model 1 Model 2
Panel B: Ordered Probit Dependent Variable: 0 if R < 0%, 1 if 0< R <
20%, 2 if R > 20% Model 3 Model 4
Intercept -1.69 (-0.19)
108.97* (2.91)
-0.27 (-1.72)
2.06 (0.74)
INST 0.30* (3.05)
0.31* (2.62)
0.02* (2.46)
0.02* (2.46)
LOGSHARES -7.54* (-3.06) -0.16
(-0.90)
UPDATE 0.75* (4.45) 0.05*
(6.37)
REPUTED 12.09* (3.09) 0.57*
(2.08)
DAYS 0.01 (0.02) 0.003
(0.10) pseudo R2 (Ordered Probit) or Adj. R2 (OLS)
6.53%
30.13%
5.21%
20.51%
* significant at the 5 percent level using a two-tailed test.

32
Table V Institutional Allocation & Underpricing: Two-Stage Estimates
The table reports estimates of two-equation systems for a sample of 174 IPOs offered between May 1997 and June 1998 for which institutional allocation is available. In each system, equation A consists of the regression of institutional allocation on several variables x including the natural logarithm of the number of shares offered (LOGSHARES), the percentage difference between the midpoint of the filing range and the offer price (UPDATE), a reputation dummy which is 1 if the underwriter is among the top ten in terms of market share and zero otherwise (REPUTED), the days spent in the registration process (DAYS) and the number of underwriters in the syndicate (NSYNDICATE). In equation B, the dependent variable is either the day one return of the IPO (R) for OLS estimates, or it equals 0 if R < 0, 1 if 0 < R ≤ 20%, 2 if R > 20%. The independent variables include the fitted value and residuals from equation A and other firm-specific variables. Industry dummies based on one-digit SIC codes are included in the regression but not reported in the table. t-statistics are in parentheses.
Equation A Dependent Variable: Institutional Allocation (%)
Equation B
Ordinary Least Squares Dependent Variable: Day one Return (%)
Ordered Probit Dependent Variable: 0 if R < 0, 1 if 0< R < 20%, 2 if R > 20%
Intercept
69.95* (19.71) -75.63*
(-2.83) 2.60* (0.69)
Fitted Allocation 0.63
(1.53) 0.02
(0.44) Excess Allocation 0.28*
(2.35) 0.02* (2.38)
LOGSHARES
0.93 (0.73) -7.59*
(-2.92) -0.15
(-0.84) UPDATE
0.34* (4.48) 0.64*
(3.28) 0.05* (3.78)
REPUTED
-11.70* (-5.40) 16.26*
(2.37) 0.44
(0.83) DAYS
0.01 (0.44) -0.002
(-0.09) 0.002 (0.09)
NSYNDICATE
-0.38* (-3.52)
pseudo R2 (Ordered Probit) or Adjusted R2 (for OLS) 32.52% 29.85% 24.51%
* significant at the 5 percent level using a two-tailed test.

33
Endnotes
1. See Habib and Ljunqvist (2001) and Loughran and Ritter (2001) for detailed analyses of money
left on the table.
2. Ljungqvist and Wilhelm (2001) analyze institutional allocation focusing on issues offered in
France, Germany, and the U.K. Their dataset also includes a small sample of 30 Goldman Sachs
managed IPOs offered between March 1993 and July 1995.
3. We are unable to disclose the names of the investment banks but our empirical analysis does
use a reputation variable.
4. The 22 IPOs with zero returns on day one, which are excluded from Table II, have mean and
median institutional allocations of 71.12 percent and 73.54 percent, respectively. The difference in
institutional allocation between overpriced and underpriced IPOs continues to be significant
(Wilcoxon z (p) = -2.09 (0.04)) even when the zero return IPOs are included in the overpriced
group.
5. See Aggarwal (2001) for evidence on flipping.
6. See also Loughran and Ritter (2001) and Lowry and Schwert (2001) for other evidence on
partial adjustment.
7. We check for an asymmetric component in UPDATE by adding a variable UPDATE+, equal to
1 if the offer price is above the filing range, and zero otherwise. UPDATE+ itself was insignificant
and did not change the other coefficients.

34
8. With regard to issue proceeds, Habib and Ljungqvist (1998) argue that there is a mechanical
relationship between underpricing and issue proceeds even after controlling for uncertainty. On
the other hand, imposing the requirement that pre-IPO assets be available results in our losing
about a quarter of our sample.
9. Negative return IPOs tend to issue fewer shares and have lower offer prices compared to other
IPOs. These issues have mean (median) number of shares offered of 4.36 mm (3.19 mm) versus
7.47 mm (4.50 mm) for the full sample, while their mean and median offer price equal $12.50
($12.50) versus $15.09 ($15) for the full sample.
10. Eq. (5) has more information than 2SLS, i.e., Eq. (4), due to the extra term (INST – α XINST).
However, this term is orthogonal to other included variables (it is a regression error), and does not
affect other coefficient estimates.
11. When such a variable identifies the structural system, OLS is biased. The nature of such a bias
can be characterized analytically. These results are not reported here but are available upon
request.
Related Documents


