NBER WORKING PAPER SERIES THE TYRANNY OF NUMBERS: CONFRONTING THE STATISTICAL REALiTIES OF THE EAST ASIAN GROWTH EXPERIENCE Aiwyn Young Working Paper No. 4680 NATIONAL BUREAU OF ECONOMIC RESEARCH 1050 Massachusetts Avenue Cambridge, MA 02138 March 1994 This paper was supported by a grant from the M1T-NTLJ Collaboration Agreement and an NBER Olin Fellowship. I am indebted to (Iris Paxson for providing data tapes on Taiwan, to Chan Wing-Kwong, Chao Bi-Tsyr, Ho Kun-Lon, Peter Kisler, John Sharon and Woo Hyun-Sook for help in gathering and entering data, and, most especially, to Ho Veng-Si and Yang Shin-Kyu for extraordinary research assistance. Thanks are due the governments of Hong Kong, South Korea and Taiwan for providing unpublished data and answering queries. Special appreciation is due the government of Singapore which, while disagreeing with most of my analysis and all of my conclusions, has generously supplied me with both published and unpublished data on the Si.ngaporean economy. This paper is part of NBER's research programs in Growth and International Trade and Investment. Any opinions expressed are those of the author and not those of the National Bureau of Economic Research.

Welcome message from author
This document is posted to help you gain knowledge. Please leave a comment to let me know what you think about it! Share it to your friends and learn new things together.
Transcript
NBER WORKING PAPER SERIES
THE TYRANNY OF NUMBERS:CONFRONTING THE STATISTICALREALiTIES OF THE EAST ASIAN
GROWTH EXPERIENCE
Aiwyn Young
Working Paper No. 4680
NATIONAL BUREAU OF ECONOMIC RESEARCH1050 Massachusetts Avenue
Cambridge, MA 02138March 1994
This paper was supported by a grant from the M1T-NTLJ Collaboration Agreement and anNBER Olin Fellowship. I am indebted to (Iris Paxson for providing data tapes on Taiwan,to Chan Wing-Kwong, Chao Bi-Tsyr, Ho Kun-Lon, Peter Kisler, John Sharon and WooHyun-Sook for help in gathering and entering data, and, most especially, to Ho Veng-Si andYang Shin-Kyu for extraordinary research assistance. Thanks are due the governments ofHong Kong, South Korea and Taiwan for providing unpublished data and answering queries.Special appreciation is due the government of Singapore which, while disagreeing with mostof my analysis and all of my conclusions, has generously supplied me with both publishedand unpublished data on the Si.ngaporean economy. This paper is part of NBER's researchprograms in Growth and International Trade and Investment. Any opinions expressed arethose of the author and not those of the National Bureau of Economic Research.

NBER Working Paper #4680March 1994
THE TYRANNY OF NUMBERS:CONFRONTING THE STATISTICALREALITIES OF THE EAST ASIAN
GROV/TH EXPERIENCE
ABSTRACF
This paper documents the fimdamental role played by factor accumulation in explaining
the extraoixlinary postwar growth of Hong Kong, Singapore, South Korea and Taiwan.
Participation rates, educational levels and (with the exception of Hong Kong) investment rates
have risen rapidly in all four economies. In addition, there have been large intersectoral
reallocations of labour, with (again, excepting Hong Kong) non-agricultural and manufacturing
employment growing one and a half to two times as fast as the aggregate working population.
Thus, while the growth of output per capita in these economies has averaged 6% to 7% per
annum over the past two and a half decades, the growth of output per effective worker in the
non-agricultural sector of these economies has been only 3% to 4% per annum. If one then
allows for the doubling, tripling and even quadrupling of the investment to GDP ratio in these
economies, one arrives at total factor productivity growth rates, both for the non-agricultural
economy and for manufacturing in particular, which are well within the bounds of those
experienced by the OECD and Latin American economies over equally long periods of time.
While the growth of output and manufacturing exports in the newly industrializing economies
of East Asia is virtually unprecedented, the growth of total factor productivity in these economies
is not.
Aiwyn YoungSloan School of ManagementMassachusetts Institute of Technology50 Memorial DriveCambridge, MA 02139and NBER
I. Introduction
This is a fairly boring and tedious paper, and is intentionally so. This paper provides no
new interpretations of the East Asian experience to interest the historian, derives no new
theoretical implications of the forces behind the East Asian growth process to motivate the
theorist, and draws no new policy implications from the subtleties of East Asian government
intervention to excite the policy activist. Instead, this paper concentrates its energies on
providing a careful analysis of the historical patterns of output growth, factor accumulation and
productivity growth in the Newly Industrializing Countries of East Asia, i.e. Hong Kong,
Singapore, South Korea and Taiwan.
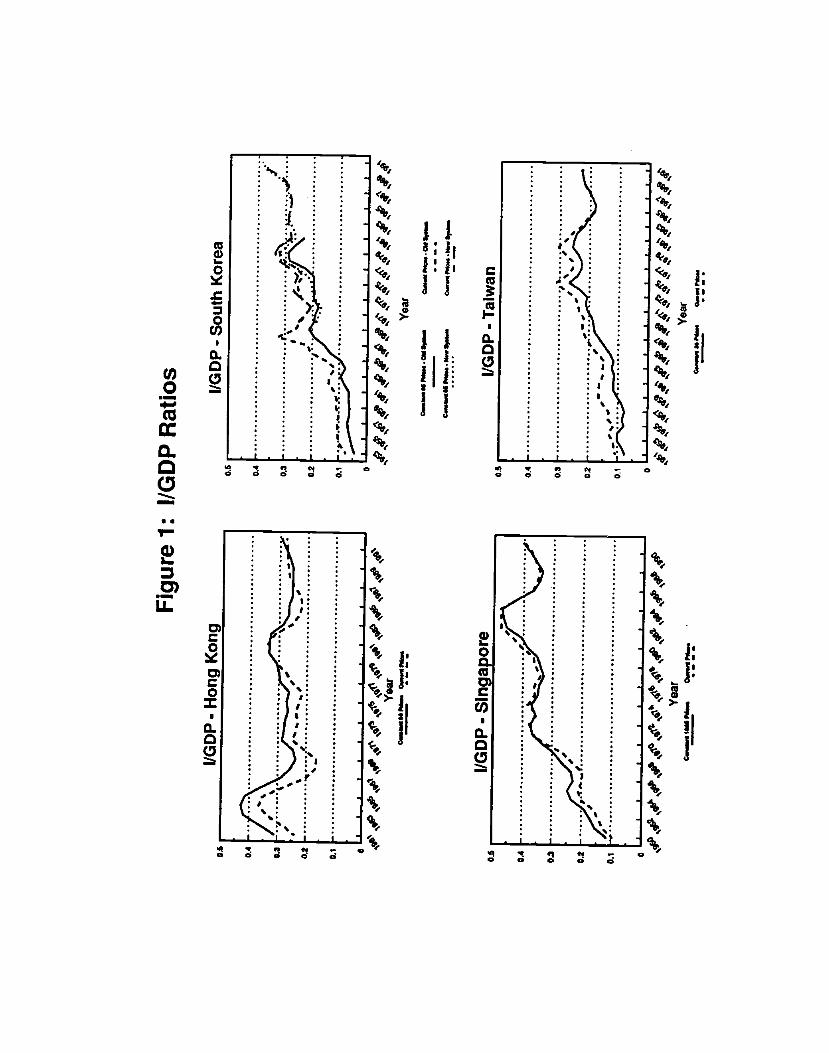
Tables 1-1 and 1-2 and figure 1 below present some basic information on growth in the
NICs, drawn from national accounts and census sources.' As seen in table 1-1, the
extraordinarily rapid and sustained growth of output per capita in all four economies, averaging
some 6% to 7% per annum for two and a half decades, is trnly remarkable. It is this record of
growth, along with its apparent association with the rapid growth of manufactured exports, that
has led most economists to believe that productivity growth in these economies must be
extraordinarily high, particularly in their manufacturing sectors. This view, however, ignores an
equally remarkable record of factor accumulation.
As table 1-1 shows, one important area of factor accumulation has been labour input. The
rapid post-war decline in birth rates (changing dependency ratios) and rising rates of female
labour force participation have led to a substantial rise in the aggregate participation rate in each
'The appendix provides a full description of sources. All growth rates reported in thispaper are logarithmic, rather than geometric, growth rates. The labour force estimates for Koreaand Taiwan exclude their large (predominantly conscript) armies, whose measured output (in theform of wages) is comparatively small. Section VI below examines the sensitivity of the resultsreported in this paper to the inclusion/exclusion of military personnel.
1
of the NICs.2 In moving to measures of output per worker, rising participation rates remove an
average of 1% per annum from the per capita growth rate of Hong Kong. 1.2% and 1.3% per
annum from Korea and Taiwan, respectively, and a stunning 2.6% per annum (for 24 years!)
from the growth rate of Singapore. Interscctoral transfers of labour have also beenextremely
important Thus, removing agriculture from the analysis lowers the growth rate of outputper
worker in Taiwan and South Korea by .6% and .7% per annum, respectively, reflecting therapid
decline in the share of agricultural employment in total employment in both economies.3
Although the growth of manufacturing output has been unusually rapid in these economies, so
has the growth of manufacturing employment Once one accounts for the transfer of labour into
manufacturing one finds, surprisingly, that, as regards labour productivity growth, manufacturing
in both Singapore and Taiwan actually underperformed the aggregate economy.
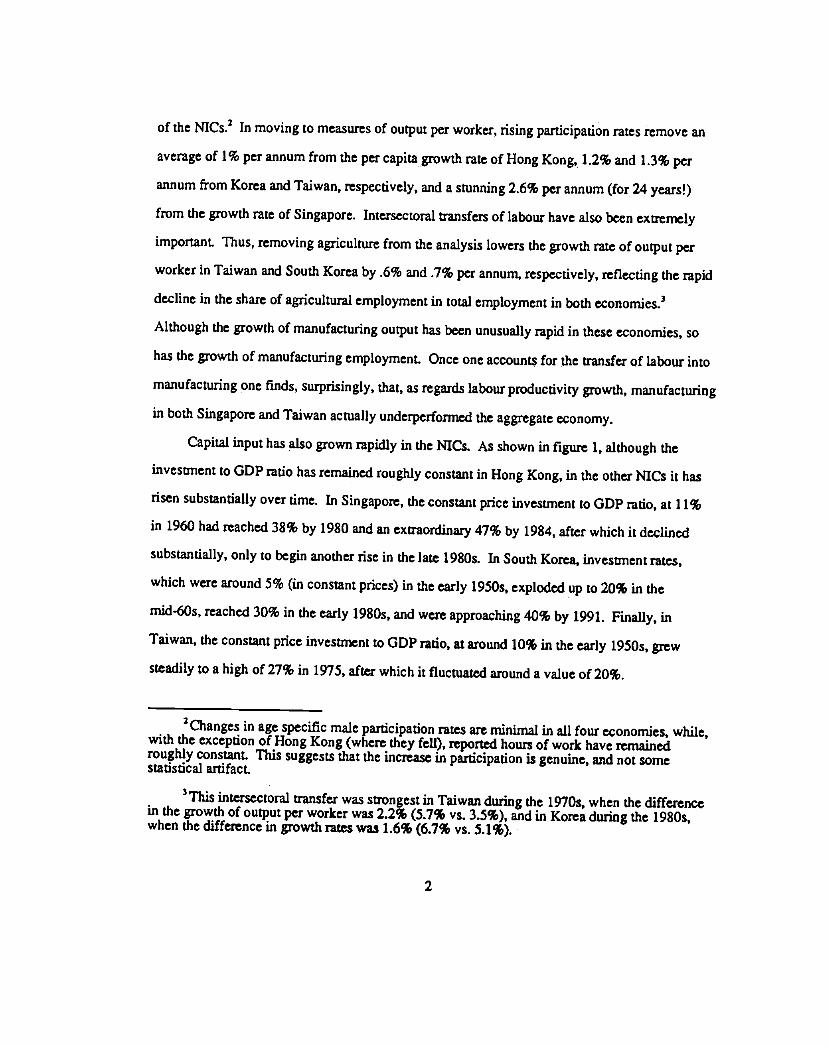
Capital input has also grown rapidly in the NICs. As shown in figure 1. although the
investment to GD? ratio has remained roughly constant in Hong Kong, in the other NICs it has
risen substantially over time. In Singapore, the constant price investmentto GD? ratio, at 11%
in 1960 had reached 38% by 1980 and an extraordinary 47% by 1984, after which it declined
substantially, only to begin another rise in the late 1980s. In South Korea, investmentrates,which were around 5% (in constant prices) in the early 1950s, exploded upto 20% in the
mid-60s, reached 30% in the early 1980s, and were approaching 40% by 1991. Finally, in
Taiwan, the constant price investment to GD? ratio, at around 10% in the early 1950s, grew
steadily to a high of 27% in 1975, after which it fluctuated around a value of 20%.
2Changes in age specific male participation rates are minimal in all foureconomies, while,with the exception of Hong Kong (where they fell), reported hours of work have remainedroughly constant. This suggests that the increase in participation is genuine, and not somestatistical artifact.
31'his intersectoral transfer was strongest in Taiwanduring the 1970s, when the differencein the growth of output per worker was 2.2% (5.7% vs. 3.5%), and in Koreaduring the 1980s,when the difference in growth rates was 1.6% (6.7% vs. 5.1%).
2

Table 1-1: Growth Rates (%)
Hong Kong (1966-1991) Singapore (1966-1990)N D N-D N D N-D
GDP per Capita: 7.3 1.6 5.7 8.5 1.9 6.6
GDP per Worker: 7.3 2.6 4.7 8.5 4.5 4.0
Excluding Agriculture NA 2.8 NA 8.6 4.6 4.0
Manufacturing NA 1.3 NA 10.1 6.2 3.9
Participation Rate: .38 -4.49 .27 -4 .51
South Korea (1966-1990) Taiwan (1966-1990)
N D N-D N D N-D
GDPperCapita: 8.5 1.8 6.9 8.6 1.8 6.8
GDP per Worker: 8.5 2.8 5.7 8.6 3.1 5.5
Excluding Agriculture 10.4 5.4 5.0 9.4 4.6 4.9
Manufacturing 14.1 6.3 7.8 10.8 5.9 4.9
Participation Rate: .27 -4 .36 .28 -9 .37
N Nwnezator, D Denominalor NA - The Hong Kong government has yet to develop constant priceestimates of GDP by sector. GDP measures are at market prices. i.e. including indirect taxes and import duties.
Table 1-2: Educational Attainment of the Working Population (%)
Hong Kong Singapore South Korea Taiwan
1966 1991 1966 1990 1966 1990 1966 1990
None 19.2 5.6 55.1 J.L 31.1 6.4 17.0 4.5
Primary 53.6 22.9 28.2 33.7 42.4 18.5 57.2 28.0
Secondary+ 27.2 71.4 15.8 66.3 26.5 75.0 25.8 67.6Notes: Self taught are included under primary. Hong Kong. Korean and Taiwanese data refer to highest
level of education "attended" rather than completed. All percentages calculated net of those reported as"unbown".
3
Fig
ure
1: I
/GD
P R
atio
s
I/GD
P-H
ong
Kon
g
Yea
r
0 •
• •
. I
I I
I I
I
$q?
Yea
r pi
ll.
I/GD
P -
Sou
th K
orea
0.
6
0.4
0.3
0.2
0.1
Yea
r
0N pill.
. S Q
1 ll
' I/GD
P -
Tai
wan
05
0.4
0.3
0.2
0.1
Yea
r C
. 1
Pil.
. .ll
Pil..
I.
I/GD
P -
Sin
gapo
re
Human capital accumulation in the East Asian NICs has also been quite rapid. As shown
in table 1.2 above, over the past two and a half decades the proportion of the working population
with a secondary education or more doubled in Hong Kong and Taiwan, tripled in Korea and
quadrupled in Singapore. By 1990/1991, some 18% to 20% of the working population in each
economy had some tertiary education.4 In weighting labour input by sex, age and educational
characteristics (discussed further below), I have found that the improving educational attainment
of the workforce contributes to about 1% per annum additional growth in labour input in each of
these economies.
All of the influences noted above, rising participation rates, intersectoral transfers of
labour, improving levels of education, and expanding investment rates, serve to chip away at the
productivity performance of the East Asian NICs, drawing them from the top of Mount Olympus
down to the plains of Thessaly. In a companion paper (Young 1993), I use simple back of the
envelope calculations and large international data sets to show that, as regards productivity
growth in the aggregate economy and in manufacturing in particular, the NICs cannot be
considered to be strong outliers in the post-war world economy. This paper concentrates on a
more careful analysis of these four economies, making use of the extensive statistical record
embodied in their national accounts, population censuses, and sectoral, wage and labour force
surveys.
The remainder of this paper is organized as follows: Section II presents a short review of
methodology. Sections ilI-VI then provide a country by country analysis of aggregate and
sectoral total factor productivity growth. Section VII contrasts this research with earlier work on
4Defined as junior college and above in Korea and Taiwan and matriculation/A levels andabove in Hong Kong and Singapore.
4

productivity growth in the NICs, while section VIII summarizes and concludes. An appendix
provides a description of sources and some of the problems encountered in linking different data
series.
5
IL Methodology
The Translog Index of Total Factor Productivity Growth
Consider the translogarithniic value added production function:
(2.1) Q =exp[cz0+ aKlnK +alnL + a,t +fB,(lnK)2
+ B(lnK)(lnL) + B inK.: +B(lnL)2+ B,lnL . t +Bt2J
where K, L and t denote capital input, labour input and time, and where, under the assumption of
constant returns to scale, the parameters cc and Bg satisfy the restrictions:
(2.2) a + cz =1 B + B = B+ BA = B4 + B,, = 0
First differencing the logarithm of the production function provides a measure of the causes of
growth across discrete time periods:
(2.3) i( Q(T_1)) = b{Ti) +J
+TFP,..1,.
e1(T)+e(T—1)where O =2
and where the 01's denote the share of each factor in total factor payments. The translog index
of TFP growth (TFP.1) provides a measure of the amount the log of output would have
increased had all inputs remained constant between twO discrete time periods. In essence, the
translog production function provides a theoretical justification for the use of average factor
shares and log differences as a means of extending the continuous time Divisia analysis of
6
productivity growth to data based upon discrete time periods.
To allow consideration of more fmely differentiated inputs, one can assume thataggregate
capital and labour input are, in turn, constant returns to scale translog indices of sub-inputs:5
(2.4) K=exp[alnKi+c4lnx2+...+cxKl
+ B(lnK1)2 +B(lnK1) (inK2) +... + B(lnK,j2]
L = exp[c4 lnL-f c4 lnL2 + ... + lnL
+ B1(lnL1)2 + Bt2(lnL1) (lnL2) + ... + B..,(lnL.,)2]
First differencing the logarithms of these translog indices providesa measure of the growth of
aggregate capital and labour input as weighted averages of the growth rates of their sub-inputs:
1K(T) ( K,(T) ) ( L(T) ( L1(T)(2.5)
IK(T-1))_ k 'K(T-l)) iL(T-1)) 'iL(T-1)— 0(T)+O(T—1)where 0 =
2
and where the 0's denote the share of each sub-input in totalpayments to its aggregate factor. In
a manner analogous to the continuous time Divisia analysis, these indices adjust for
improvements in the "quality" of aggregate capital and labour input by, to a first order
approximation, weighting the growth of each sub-input by its average marginal product.
The appropriate measure of capital and labour input is the flow of services emanating from
those inputs. For labour, one can reasonably assume that the flow of services is proportional to
total hours of work, i.e. L1(T) =H1(T), with:
5With similar restrictions on parameter values.
7

26 1 L(T) ( H1(T)'L(r-1)) 'lH1(T-l)
Since data on capital utilization are rare, it is customary to assume that the flow of capital
services is proportional to the measured capital stock (denoted byA,(T)). with K1(T) = ?A1(T)
and:
( K(T) ' ( A,(T)(2.7) 1'K(T — — 1)
Measuring Factor Supplies
My analysis focuses on two aggregate inputs, capital and labour, subdivided into finer
sub-input categories. In general, I divide capital input into five categories: residential buildings,
non-residential buildings, other durable structures, transport equipment and machinery. With the
exception of my analysis of Singaporean manufacturing, I do not include land input, which is
difficult to measure. To minimize any error, I focus my analysis of Taiwan and Korea on the
non-agricultural economy, where land input accounts for only a small percentage of total
payments to factors of production.' Labour is distinguished on the basis of sex (two categories),
age (nine to eleven categories, depending upon the country and time period under consideration),
and education (two to seven categories).
The stock of each capital input is measured using the perpetual inventory method with
6For example, Kim & Park (1985, table 5-13) estimate that during the 1960s and 1970sland input accounted for only about 4% of Korean non-agricultural non-residential income.
'I also do not include inventories. I have found that the "changes in stocks" seriespublished by most of the NICS are either (i) outright gross fabrications used to conceal largediscrepancies between the production and expenditure accounts; and/or (ii) based upon theflimsiest of data. In Young (1992)1 made use of unpublished stocks data provided to me by theSingaporean and Hong Kong governments. Problems with the existence of accurate stocks datafor the other economies, combined with a growin suspicion as to the accuracy of the HongKong numbers, have led to me to drop consideration of stocks from the analysis.
8
geometric depreciation, where I initialize the capital stock by assuming that the growth rate of
investment in the first five years of the investment series is representative of the growth of
investment prior to the beginning of the series.9"0 Given positive rates of depreciation and a
sufficiently long investment series prior to the first date of the analysis, the perpetual inventory
approach is fairly insensitive to the level of capital used to initialize the series. For Hong Kong,
the published investment series begins in 1961. I use my own estimates of capital formation,
which mimic the methodology of the Hong Kong government, to extend the series on all asset
types back to 1947. For Singapore the published investment series begins in 1960. I use data on
the construction of one-family equivalent residential units and retained imports of cement" to
extend the residential and non-residential durable structures investment series back to 1947,12For
'The depreciation rates are based upon the Hulten-Wykoff estimates of geometricdepreciation rates for detailed asset types. I derive the depreciation rate for each of the fivebroad asset types used in my analysis as the unweightedaverage of the depreciation rates of thedetailed asset types likely to be found in each industry. This approach is crude, but the resultsare, in any case, not sensitive to moderate adjustments in the depreciation rates (see, for example,Young 1992).
9
K= 1,_,(l —8)' =101/(g1+81)
where I is the first year of investment data for assctj, 8,, is the depreciation rate for assetj, andg is the average growth of investment in asset j in the first five years of the investment series.
exception is Singaporean manufacturing, where, because of a lack of lengthy (andconsistent) historical series, I use the Net Fixed Assets reported in the Census of Industrial ofProduction to initialize the capital stock in 1969.
"Singapore did not produce cement prior to 1961. See the Malavan Digest of Statistics.
'2The estimates using retained imports of cement are, admittedly, rather crude. These data,however, suggest a large surge in construction activity in the mid-1950s (which I have not beenable to corroborate), with the real value of investment in durable structures in the mid-1950sexceeding the levels recorded in the early-1960s. Although! feel these data are suspect,! makeuse of them in order to bias the results in favour of Singapore.
9
Taiwan the published investment series begins in 1951 and for South Korea in j953•13
general, I focus my analysis on the post-1966 period, allowing each economy 13 or more years
of investment data to establish the capital stock.'4
Turning now to the measurement of labour inputs, my task is to estimate the working
population, cross-classified by up to seven attributes, i.e., industry, sex, age, education, income,
hours of work, and class of worker. Census and survey data frequently contain information on
row and column sums in lower dimensions. Under the assumption that there are no interactions
across attributes other than those present in the available sub-dimensional tables, I derive an
approximation of the maximum likelihood estimate of each cell using the iterative proportional
fitting technique suggested by Bishop, Fienberg and Holland (1975). In general, I make use of
the information provided by additional worker characteristics, e.g. occupation, which, in their
cross-tabulation with attributes of interest to me provide additional information. Thus, for
example, I actually estimate the 1990 Singaporean working population cross-classified by
industry x occupation x class of worker x sex x age x education x income, using all available
census tabulations. For my TFP estimates, I then sum across occupational categories to derive
a reduced six-dimensional table of the variables of interest to me.
All four economies conduct occasional censuses and, on a more regular annual basis,
131 have found extensive Japanese data on pre-war investment in Korea and Taiwan. Ihave yet to find, however, an appropriate deflator with which to link the pre and post-war series,as well as a means of adjusting for wartime damage in Korea.
'4To analyze the sensitivity of the results to the value of capital used to initialize the series,I also tried initial values of (I) zero capital and (ii) double the capital implied by the proceduredescribed above. The impact of these (substantial) adjustments on average total factorproductivity growth during the 1966-1990 period was (-.1%,+.1%) per annum in Hong Kong andTaiwan, (-.1%,+.2%) per annum in Singapore, and (-.4%,+.3%) per annum in Korea (where thepre-1966 investment series is shorter).' ofwork data are drawn from other, non-Census, sources.
10

surveys of labour force conditions. The labour force surveys are, however, subject to an
enormous margin of error. Thus, for example, the 1989 Singaporean Labour Force Survey
estimated the working population at 1,277,254, with 51.2% having completed a secondary
education or more. The 1990 Census, however, found that the actual working population
numbered 1,537,011 (i.e 20% more than reported in the previous survey), with 66.3% having
completed a secondary education or more. Similarly, the 1980 Korean Economically Active
Population Survey estimated the non-agricultural working population at 9,048,000, whereas the
1980 Census put the number at 7,887,308, or 13% less. Aside from their small sample sizes,16
the principal problem underlying the inaccuracy of the labour force surveys is the fact that their
scaling factors are drawn from the previous census. Since these economies are experiencing
rapid transformation, these scaling factors tend to be grossly inaccurate. As the surveys are
updated with the new census scaling factors, their estimates become consistent with the most
recent census results. Thus, for example, the 1991 Singaporean Labour Force Survey estimated
the working population at 1,524,315. In the estimates below, I confine myself to census years,
treating the census results as the appropriate measure of the "population" and the survey results
as a "sample", making use of these, when they contain cross-tabulations which are unavailable in
the census, by conforming the survey row and column totals to those given by the census. Since,
over the long run, the labour force surveys track (with large variance) the census, the long-term
average rates of productivity growth reported below are not dependent on this choice of
16example, 25000 housing units in the case of the 1989 Singaporean labour force
survey and less than 15000 households in the case of the 1980 Korean economically activepopulation survey.
11

sources.'7
Finally, I should note that to improve the accuracy of my labour foite estimates I have
acquired thousands of pages of unpublished census tabulations from the governments of Hong
Kong and Singapore, while, in the case of Taiwan, I have made use of the Chinese language area
and district census tabulations, which contain additional tabulations over and beyond those
reported in the summary English language volumes. These additional tabulations provide
valuable information. Thus, for example, unpublished Hong Kong tabulations relate income by
class of worker (e.g. self-employed, employee, etc.) cross tabulated by attributes such as age, sex
and education. In contrast, the published tabulations rarely cross tabulate income with class of
worker. Consequently, relying on the published tabulations alone pollutes one's estimates of the
returns to different types of labour input with non-labour capital income.
Measuring Factor Shares
In order to estimate the share of labour and capital in total payments to factors of
production, it is necessary to measure value added from the point of view of the producer. This
requires removing all indirect business taxes on the value of output (including all sales and
excise taxes), while retaining all subsidies and taxes on factors of production (such as license
fees and profits taxes), a concept of value added midway between GDP at factor cost and GD? at
market prices. In the case of Hong Kong and Singapore, where indirect and sales taxes are
minimal, I simply take as my measure of output the national accounts estimates of GD? at
current factor cost. In Korea and Taiwan, however, "indirect taxes", as reported in the national
accounts, are enormous and defined in an extraordinarily broad manner, including items such as
fact, during the period emphasized in this paper (1966-1990) the labour force surveysactually imply faster growth in the non-agricultural working population in both South Korea andTaiwan (the labour force surveys for Hong Kong and Singapore began in the mid to late 1970sand hence do not cover the entire period of analysis).
12

taxes on the monopoly profits of producers of ginseng and cigarettes and land and building
property taxes. In these cases I use government financial statistics and unpublished data
provided to me by statistical authorities to separate out the "admissable" indirect taxes, i.e. those
which are part of the value of output from the point of view of the producer, and allocate them to
the different economic sectors. Of these adjustments, the principal one is the allocation of
monopoly profits taxes to value added in the manufacturing sector, so that the reader who makes
this adjustment (to GDP at factor cost) will arrive at estimates of value added from the point of
view of the producer close to those used in the analysis below.
To estimate the share of labour in total factor payments, I begin by constructing estimates
of the hourly incomes of employees cross-tabulated by industry, sex, age and education. I then
use these compensation data, and my estimates of hours of work cross-tabulated by industiy, sex,
age, education and class of worker, to estimate the incomes of employees and the implicit labour
income of employers, unpaid family workers and the self-employed. To determine the share of
labour in each sector, I then multiply the sectoral compensation of employees data reported in the
national accounts by one plus my sectoral estimates of the ratio of implicit to explicit labour
income.18 Combining my measures of implicit and explicit income provides an estimate of
sectoral labour income cross-classified by the sex, age and educational characteristics of workers
and, hence, an estimate of the share of each labour sub-input in total payments to labour by
sector.
Turning to capital input, under the assumption of perfect competition and constant returns
'1This rescaling using the national accounts data corrects for underreporting of income onthe part of workers and, also, adjusts for labour taxes and non-monctazy compensation, all ofwhich form a part of cost of labour input from the point of view of the producer.
13

to scale, I take the aggregate share of capital by sector to be simply one minus the estimated
share of labour. To allocate capital income by asset type, I note that with geometric
depreciation, and perfect foresight, the rental price of a capital good k1 is given by:'9
(2.8) Pk(T) = P,(T — 1)r(T) + 8P,(T) — [P1(T) — P,(T— I)]
where P, denotes the investment price of capital good i and r(T) is the nominal rate of return
between periods T- 1 and T. Under the assumption that all assets earn the same nominal rate of
return, I vary r(T) until total payments to capital equal my estimate of the aggregate share of
capital. This yields estimates of the rental price of each asset category and, by extension, its
share of payments to capital.
t9This equation can be modified to take into account taxes and depreciation allowances.
14
Ifl. Hong Kong
Table 3-1 below presents estimates of total factor productivity growth in Hong Kong.
With the exception of the 1981-1986 period, when business activity was depressed by the
Anglo-Chinese negotiations over the future of the colony, Hong Kong sustained total factor
productivity growth rates of 2% or more in each of the five year periods, averaging 2.3% over
the 1966-1991 period as a whole. As one would expect, given the constancy of the post-1966
investment to GD? ratio, there is little evidence of capital-deepening, with weighted capital input
growing only .7% faster per annum than output during the 1966-1991 period. Surprisingly, the
weighting of capital and labour input has little effect on the estimates of the growth of these
factors of production, with the growth rate of the "raw" inputs (the simple sum of the
sub-components) closely approximating that of the weighted inputs (weighting each
sub-component by its average factor share). In the case of labour input, this is simply due to the
fortuitous cancelling of various effects, with adjustments for sex, hours of work and age (prior to
1976) lowering the growth rate of labour input, and adjustments for education and age (after
1976) raising the growth rate of labour input. The net effect is, however, important in individual
sub-periods and, in particular, is substantially positive during the late 1980s, when the
stabilization of female participation rates, ageing of the labour force, and rising educational
attainment, all served to increase measured labour input. This pattern is repeated in the other
economies and, for reasons of space, will, in general, not be commented upon further.20
20Tables detailing the impact of each adjustment (age, sex, etc) in each sub-period for thefour economies are available upon request from the author.
15

Table 3-1: Total Factor Productivity Growth - Hong Kong
Annual Growth of:
TimePeriod
Output RawCapital
WeightedCapital
RawLabour
WeightedLabour
TFP LabourShare
61-6666-7171-7676-8181-8686-9 1
66-91
0.1090.0650.0810.0990.0580.063
0.073
0.1690.0750.0750.0930.0780.062
0.077
0.1620.0780.0800.0980.0790.066
0.080
0.0320.0250.0330.0510.0190.005
0.026
0.0250.0240.0240.0640.0270.022
0.032
0.0350.0230.0390.0220.0090.024
0.023
0.6430.6600.6620.6170.5930.609
0.628
Raw inputs, the azithmeucsum of sub-components, with no adjustment for hours of Work; "Weighted -translog indices of factor input growth, with labour services measured by hours of work.
16

IV. Singapore
Table 4-1 below presents estimates of total factor productivity growth in Singapore.
Although the late I 960s appear to have been a period of rapid productivity growth, these gains
were lost (and then some) during the 1970s and 1980s. With weighted capital input growing an
average of 3.0% per annum faster than output and output per unit of effective labour input
growing only 2.8% per annum, the total factor productivity residual for the aggregate economy
averages an extraordinaiy -0.3% per annum overa twenty-four year period, a virtually
unprecedented record of productivity regress.2' Interestingly, although the growth of capital
input has slowed down over time (as the investment rate has stabilized around 40% of GDP), the
growth of human capital has accelerated. While weighted labour input grew 2.1% slower than
raw labour in the late 1960s, it rose 3.0% faster in the 1980s (due to large increases in the age
and educational attainment of the workforce). The changing role of physical and humancapital
accumulation in sustaining growth is reflected in the decline in the growth ofoutput per effective
worker, which went from 9.2% in the late 1960s, to 2.7% in the 1970s, to .2% in the 1980s.
21j should emphasize to the reader that, as noted in section II above, I use data on cementimports to estimate extremely high levels of investment in durable structures during the 1950s(estimates which I have not been able to corrobate using other sources). If anything, the totalfactor productivity growth rates presented in table 4-1 are likely to be overestimates.
17
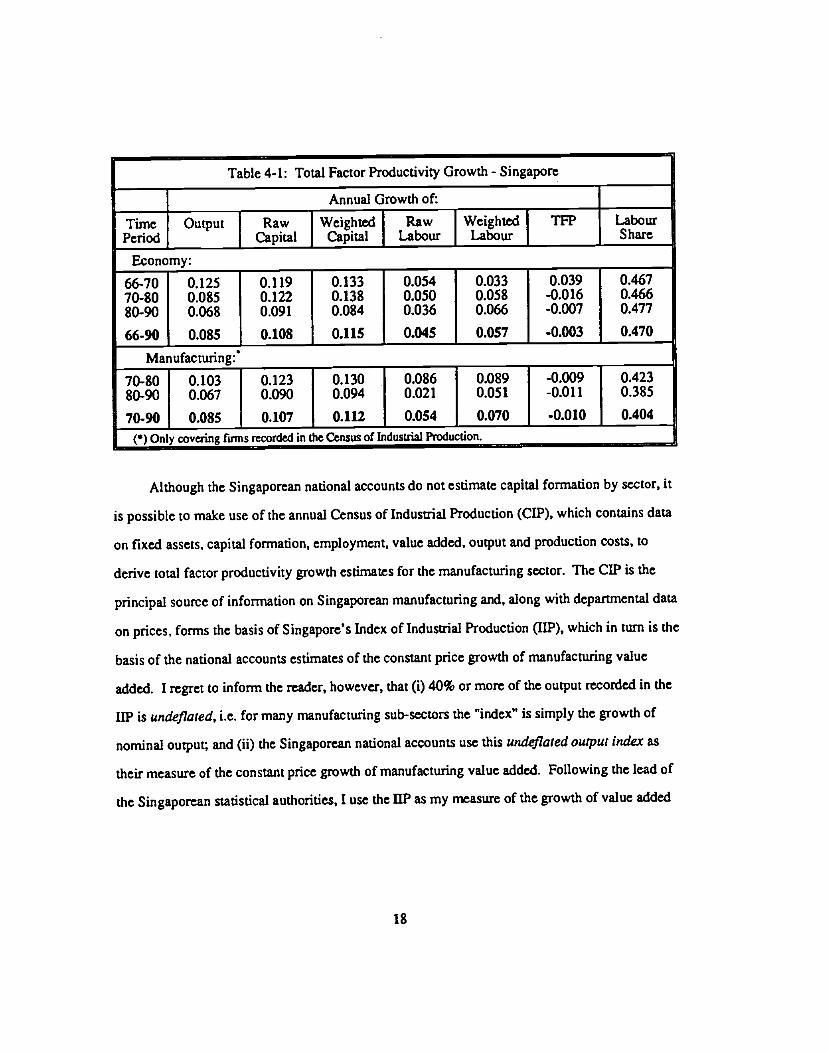
Table 4-1: Total Factor Productivity Growth - Singapore
Annual Growth of:
TimePeriod
Output RawCapital
WeightedCapital
RawLabour
WeightedLabour
TFP LabourShare
Economy:
66-7070-8080-90
66-90
0.1250.0850.068
0.085
0.1190.1220.091
0.108
0.1330.1380.084
0.115
0.0540.0500.036
0.045
0.0330.0580.066
0.057
0.039-0.016-0.007
-0.003
0.4670.4660.477
0.470
Manufacturing:
70-8080-90
70-90
0.1030.067
0.085
0.1230.090
0.107
0.1300.094
0.112
0.0860.021
0.054
0.0890.051
0.070
-0.009-0.011
-0.010
0.4230.385
0.404
(*) Only covering firms recorded in the Census of Industrial Production.
Although the Singaporean national accounts do not estimate capital formation by sector, it
is possible to make use of the annual Census of Industrial Production (CIP), which contains data
on fixed assets, capital formation, employment, value added, output and production costs, to
derive total factor productivity growth estimates for the manufacturing sector. The CIP is the
principal source of information on Singaporean manufacturing and, along with departmental data
on prices, forms the basis of Singapore's Index of Industrial Production (lIP), which in turn is the
basis of the national accounts estimates of the constant price growth of manufacturing value
added. I regret to inform the reader, however, that (i) 40% or more of the output recorded in the
LIP is w?deflated, i.e. for many manufacturing sub-sectors the "index" is simply the growth of
nominal output; and (ii) the Singaporean national accounts use this undeflated output index as
their measure of the constant price growth of manufacturing value added. Following the lead of
the Singaporean statistical authorities, I use the UP as my measure of the growth of value added
18

in the CIP firms.
As shown in table 4-1, over the 1970 to 1990 period as a whole total factor productivity
growth in Singaporean manufacturing averaged -1.0% per annum, a performance approximately
equal to that of the aggregate economy during the same period. As in the case of the aggregate
economy, the principal source of low productivity growth in Singaporean manufacturing is the
combination of a slow growth of output per weighted worker (1.6% per annum) and a rapid fall
in output per unit of capital input (-2.7% per annum). Given the liP's questionable (i.e.
non-existent) deflators, these estimates are clearly grossly inaccurate and are simply meant to
show what can be accomplished at the sectoral level given the current state of Singaporean data.
Although much of manufacturing output is undeflated, the reader should not jump to theconclusion that the lIP overstates the growth of the manufacturing sector. While the undeflateditems include many products whose prices have probably been increasing (e.g. printing andtransport equipment), they also include many electronics products, whose prices haveundoubtably been declining. Interestingly, at one point the Singaporean statistical authorities,who were concerned about their methodology, sought the assistance of the Japanese on thisissue, but were assured that non-deflation of manufacturing output was also common practice inthat economy (I)
Since the CIP does not contain any information on the age or educational characteristicsof the workers in the firms surveyed, I use census data to adjust for the age and educationalcharacteristics of the workforce under the assumption that the workers in the CIP shared thesame age and education characteristics as similar sex persons reported as manufacturing workersin the census.
19
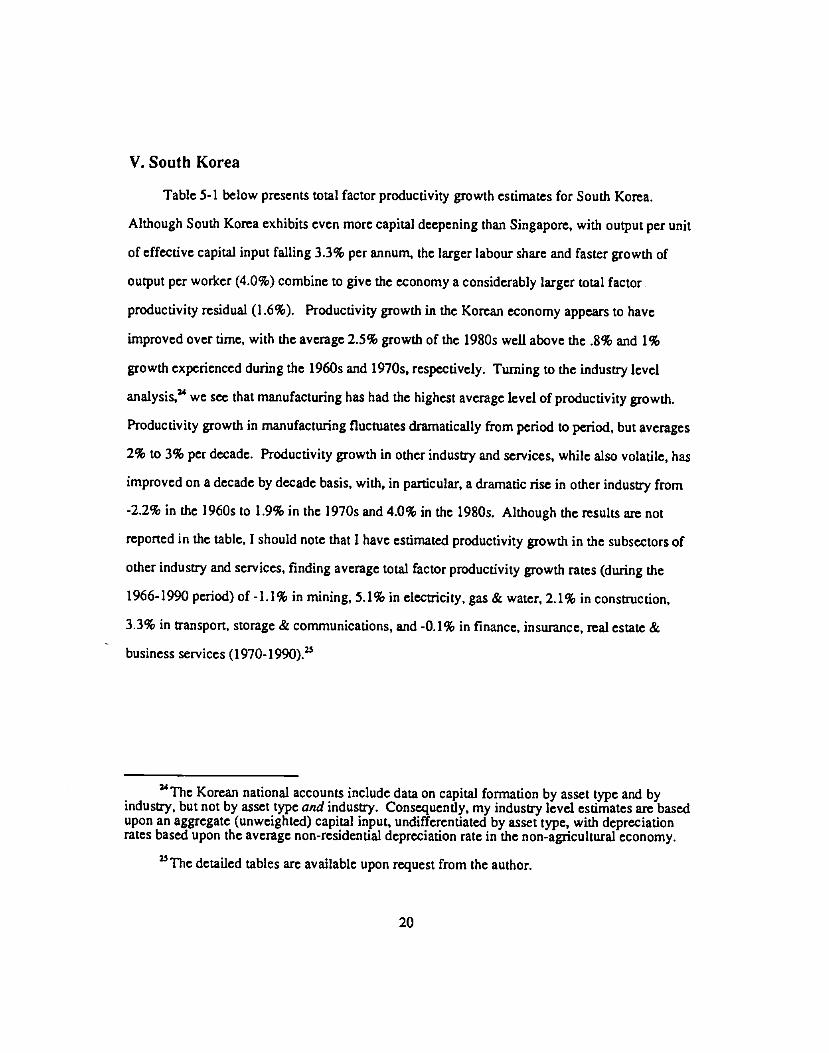
V. South Korea
Table 5-1 below presents total factor productivity growth estimates for South Korea.
Although South Korea exhibitseven more capital deepening than Singapore, with output per unit
of effective capital input failing 3.3% per annum, the larger labour share and faster growth of
output per worker (4.0%) combine to give the economy a considerably larger total factor
productivity residual (1.6%). Productivity growth in the Korean economy appears to have
improved over time, with the average 2.5% growth of the 1980s well above the .8% and 1%
growth experienced during the 1960s and 1970s, respectively. Turning to the industry level
analysis?' we see that manufacturing has had the highest average level of productivity growth.
Productivity growth in manufacturing fluctuates dramatically from period to period, but averages
2% to 3% per decade. Productivity growth in other industry and services, while also volatile, has
improved on a decade by decade basis, with, in particular, a dramatic rise in other industry from
-2.2% in the 1960s to 1.9% in the 1970s and 4.0% in the 1980s. Although the results are not
reported in the table, I should note that I have estimated productivity growth in the subsectors of
other industry and set-vices, finding average total factor productivity growth rates (during the
1966-1990 period) of -1.1% in mining, 5.1% in electricity, gas & water, 2.1% in construction,
3.3% in transport, storage & communications, and -0.1% in finance, insurance, real estate &
business services (1970-1990).
24The Korean national accounts include data on capital formation by asset type and byindustry, but not by asset type and industry. Consequently, my industry level estimates are basedupon an aggregate (unweighted) capital input, undifferentiated by asset type, with depreciationrates based upon the average non-residential depreciation rate in the non-agricultural economy.
The detailed tables are available upon request from the author.
20
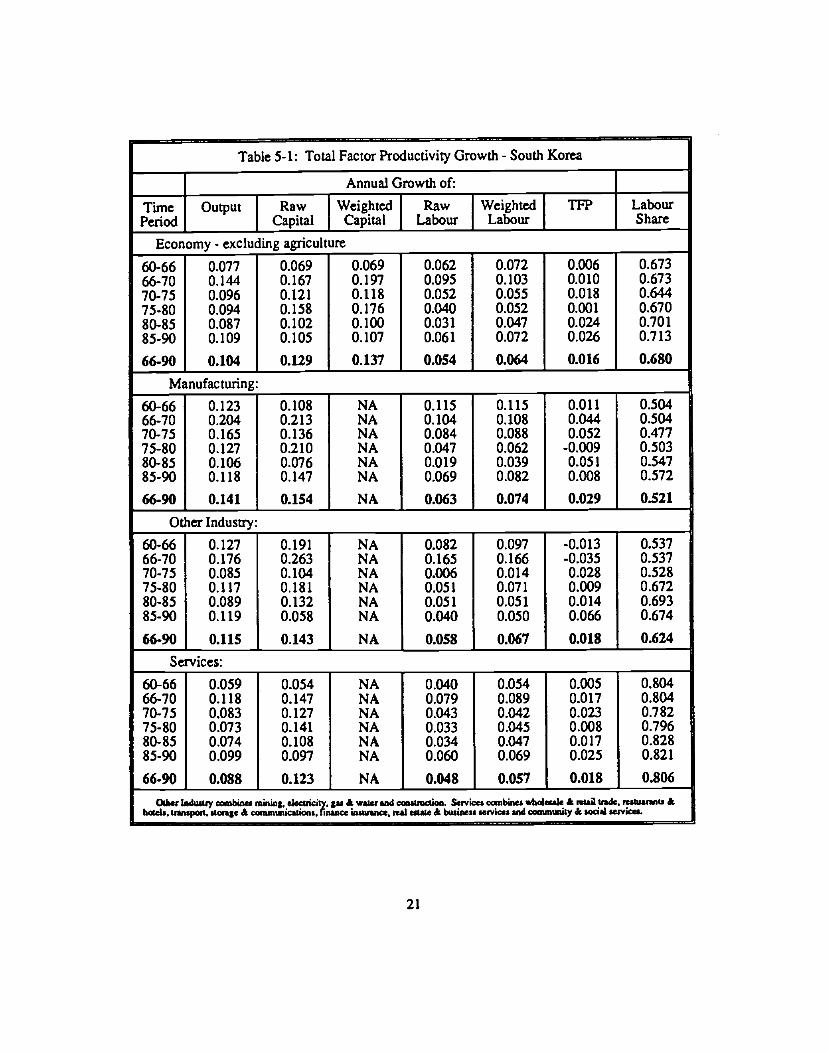
Table 5-1: Total Factor Productivity Growth - South Korea
Annual Growth of:
TimePeriod
Output RawCapital
WeightedCapital
RawLabour
WeightedLabour
TFP LabourShare
Economy - excluding_agriculture60-6666-7070-7575-8080-8585-90
66-90
0.0770.1440.0960.0940.0870.109
0.104
0.0690.1670.1210.1580.1020.105
0.129
0.0690.1970.1180.1760.1000.107
0.137
0.0620.0950.0520.0400.0310.061
0.054
0.0720.1030.0550.0520.0470.072
0.064
0.0060.0100.0180.0010.0240.026
0.016
0.6730.6730.6440.6700.7010.713
0.680
Manufacturing:60-6666-7070-7575-8080-8585-90
66-90
0.1230.2040.1650.1270.1060.118
0.141
0.1080.2130.1360.2100.0760.147
0.154
NANANANANANA
NA
0.1150.1040.0840.0470.0190.069
0.063
0.1150.1080.0880.0620.0390.082
0.074
0.0110.0440.052
-0.0090.0510.008
0.029
0.5040.5040.4770.5030.5470.572
0.521
Other Industry:
60-6666-7070-7575-8080-8585-90
66-90
0.1270.1760.0850.1170.0890.119
0.115
0.1910.2630.1040.1810.1320.058
0.143
NANANANANANA
NA
0.0820.1650.0060.0510.0510.040
0.058
0.0970.1660.0 140.0710.0510.050
0.067
-0.013-0.0350.0280.0090.0140.066
0.018
0.5370.5370.5280.6720.6930.674
0.624
Services:
60-6666-7070-7575-8080-8585-90
66-90
0.0590.1180.0830.0730.0740.099
0.088
0.0540.1470.1270.1410.1080.097
0.123
NANANANANANA
NA
0.0400.0790.0430.0330.0340.060
0.048
0.0540.0890.0420.0450.0470.069
0.057
0.0050.0170.0230.0080.0 170.025
0.018
0.8040.8040.7820.7960.8280.821
0.806
OIsr !nduiuy ooinbei muunI. c1ccuicty. pi waisrsi4 ca1uudon. Se,vice cnbiies wbak & ,tail *rde. rciuaiinis &hclth. tiwispolt. stocagc & cammicuoui. flnncc gt$UAnC*. ITa uU& & businen ecrvicei md coomimtity & sodal scsvicem.
21
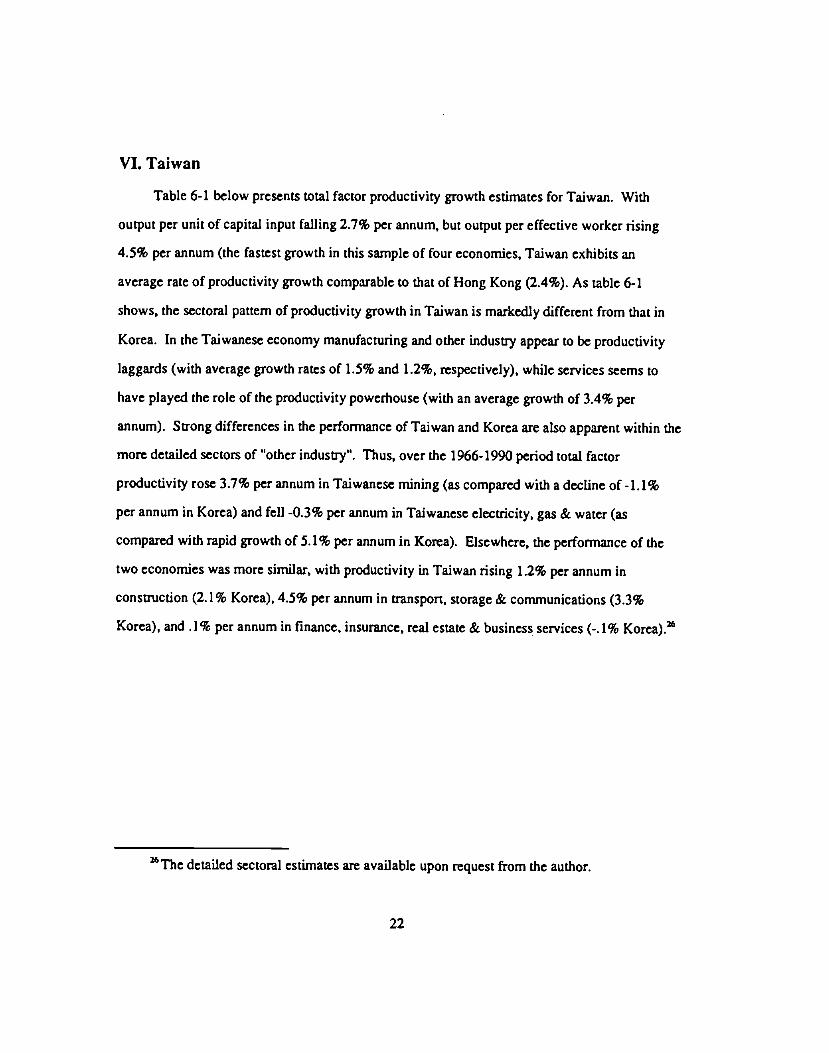
VI. Taiwan
Table 6-1 below presents total factor productivity growth estimates for Taiwan. With
output per unit of capital input falling 2.7% per annum, but output per effective worker rising
4.5% per annum (the fastest growth in this sample of four economies, Taiwan exhibits an
average rate of productivity growth comparable to that of Hong Kong (2.4%). As table 6-1
shows, the sectoral pattern of productivity growth in Taiwan is markedly different from that in
Korea. In the Taiwanese economy manufacturing and other industry appear to be productivity
laggards (with average growth rates of 1.5% and 1.2%, respectively), while services seems to
have played the role of the productivity powerhouse (with an average growth of 3.4% per
annum). Strong differences in the performance of Taiwan and Korea are also apparent within the
more detailed sectors of 'other industry". Thus, over the 1966-1990 period total factor
productivity rose 3.7% per annum in Taiwanesc mining (as compared with a decline of -1.1%
per annum in Korea) and fell -0.3% per annum in Taiwanese electricity, gas & water (as
compared with rapid growth of 5.1% per annum in Korea). Elsewhere, the performance of the
two economies was more similar, with productivity in Taiwan rising 1.2% per annum in
construction (2.1 % Korea), 4.5% per annum in transport, storage & communications (3.3%
Korea), and .1% per annum in finance, insurance, real estate & business services (-.1% Korea).
The detailed sectoral estimates are available upon request from the author.
22

Table 6-1: Total Factor Productivity Growth - Taiwan
Annuil Growth of:
TimePeriod
Output AggregateCapital
WeightedCapital
AggregateLabour
WeightedLabour
TFP LabourShare
Economy_(excluding_agriculture):66-7070-8080-90
66-90
0.1130.1060.080
0.096
0.1520.1370.085
0.118
0.1700.1430.083
0.123
0.0430.0680.024
0.046
0.0440.0690.036
0.051
0.0330.0150.030
0.024
0.7200.7080.70 1
0.710
Manufacturing:__________66-7070-8080-90
66-90
0.1680.1210.072
0.108
0.2070.1450.078
0.128
0.2140.1460.079
0.130
0.0780.1000.012
0.059
0.0750.1030.027
0.067
0.031-0.0010.025
0.015
0.5580.5660.613
0.579
Other Industry
66-7070-8080-90
66-90
0.1040.1120.059
0.088
0.1770.1650.058
0.122
0.1900.1690.060
0.127
0.1000.0630.012
0.048
0.0960.0660.025
0.054
-0.0200.0140.023
0.012
0.7020.6910.692
0.695
Services:
66-7070-8080-90
66-90
0.0870.0940.090
0.091
0.1450.1340.094
0.119
0.1620.1390.092
0.123
0.0180.0490.036
0.038
0.0230.0510.041
0.042
0.0400.0280.037
0.034
0.8280.8270.777
0.811
Oth.r Indusuy co,nbnes mining. clecuki*y. pa & war and cimuulioii. Scivicz canbnes wholasale & rUfl trade. ruUlailntZ &heidi, uinipoit. atorage & c mwucat4ona. finance inuuance. rail eSULC & bwnes, service, and comaniauty & mdii ae,vicei.
23
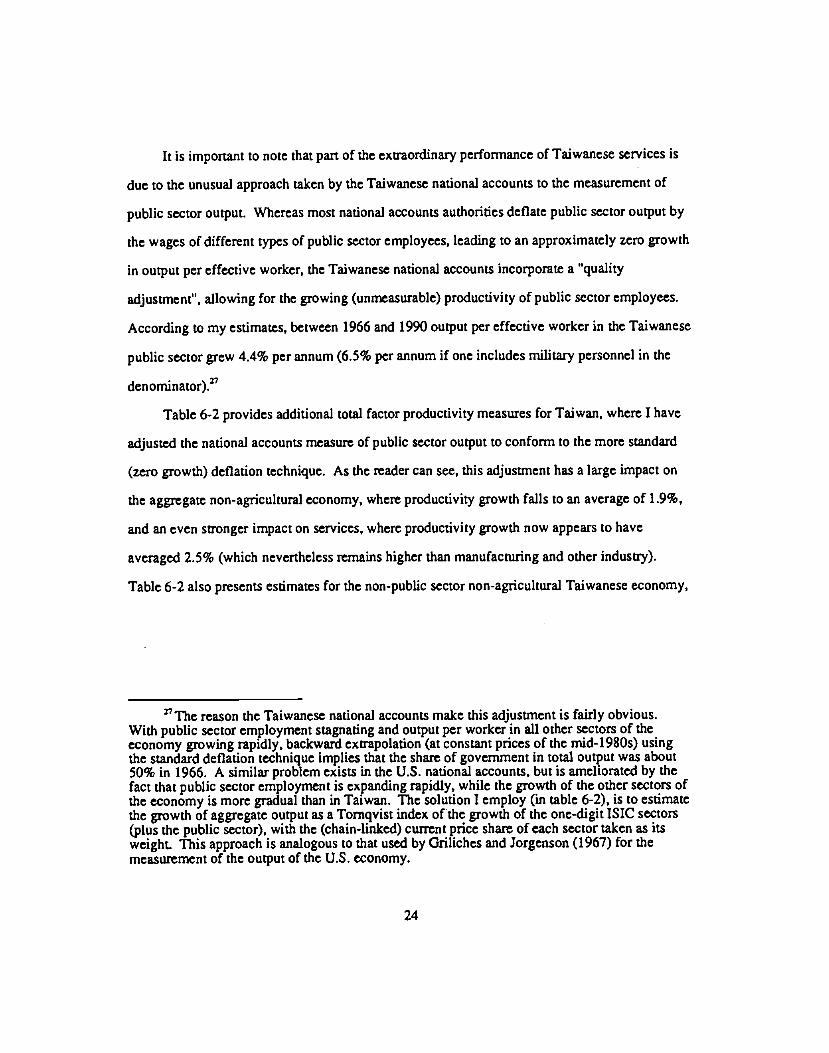
It is important to note that part of the extraordinary performance of Taiwanese services is
due to the unusual approach taken by the Taiwanese national accounts to the measurement of
public sector output. Whereas most national accounts authorities deflate public sector output by
the wages of different types of public sector employees, leading to an approximately zero growth
in output per effective worker, the Taiwanese national accounts incorporate a "quality
adjustment", allowing for the growing (unmeasurable) productivity of public sector employees.
According to my estimates, between 1966 and 1990 output per effective worker in the Taiwanese
public sector grew 4.4% per annum (6.5% per annum if one includes military personnel in the
denominator).'
Table 6-2 provides additional total factor productivity measures for Taiwan, where I have
adjusted the national accounts measure of public sector output to conform to the more standard
(zero growth) deflation technique. As the reader can see, this adjustment has a large impact on
the aggregate non-agricultural economy, where productivity growth falls to an average of 1.9%,
and an even stronger impact on services, where productivity growth now appears to have
averaged 2.5% (which nevertheless remains higher than manufacturing and other industry).
Table 6-2 also presents estimates for the non-public sector non-agricultural Taiwanese economy,
27 The reason the Taiwanese national accounts make this adjustment is fairly obvious.With public sector employment stagnating and output per worker in all other sectors of theeconomy growing rapidly, backward extrapolation (at constant prices of the mid-1980s) usingthe standard deflation technique implies that the share of government in total output was about50% in 1966. A similar problem exists in the U.S. national accounts, but is ameliorated by thefact that public sector employment is expanding rapidly, while the growth of the other sectors ofthe economy is more gradual than in Taiwan. The solution I employ (in table 6-2), is to estimatethe growth of aggregate output as a Tornqvist index of the growth of the one-digit ISIC sectors(plus the public sector), with the (chain-linked) current price share of each sector taken as itsweight. This approach is analogous to that used by Griliches and Jorgenson (1967) for themeasurement of the output of the U.S. economy.
24
which side-steps these measurement issues by excluding the public sector from consideration2 I
find that total factor productivity growth in the non-agricultural private sector Taiwanese
economy averaged 2.1% per annum between 1966 and 1990. Interestingly both sets of estimates
for the aggregate economy in table 6-2, both with and without the public sector, show a
substantial improvement in productivity growth during the 1980s, which is reminiscent of the
results for Korea.
This approach is not entirely satisfactory either, since the public sector provides manyunpriced services (e.g. roads & bridges) to the private sector. Variations across economies andacross time in the quantity of capital and labour services provided (free of charge) by the publicsector could potentially bias estimates of private sector productivity.
25
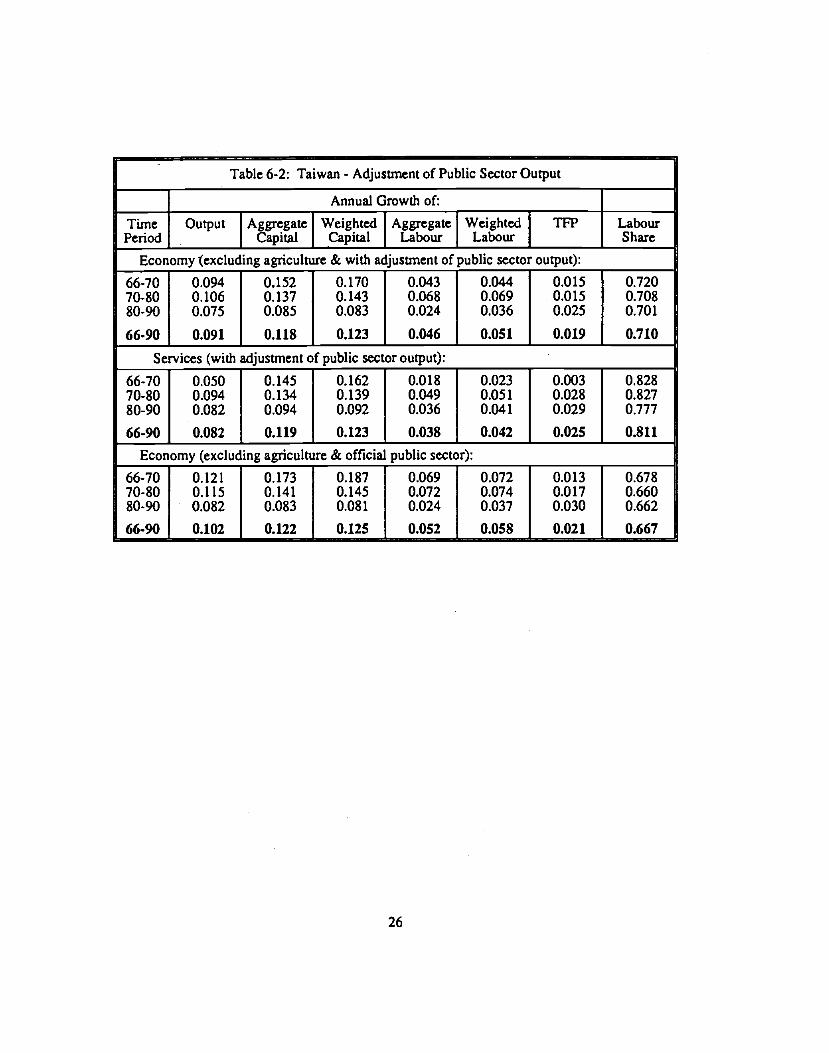
Table 6-2: Taiwan - Adjustment of Public Sector Output
Annual Growth of:
TimePeriod
Output AggregateCapital
WeightedCapital
AggregateLabour
WeightedLabour
TFP LabourShare
Economy (excluding_agriculture & with adjustment ofpublic sector output):
66-7070-8080-90
66-90
0.0940.1060.075
0.091
0.1520.1370.085
0.118
0.1700.1430.083
0.123
0.0430.0680.024
0.046
0.0440.0690.036
0.051
0.0150.0150.025
0.019
0.7200.7080.701
0.710
Services (with adjustment of public sector output):
66-7070-8080-90
66-90
0.0500.0940.082
0.082
0.1450.1340.094
0.119
0.1620.1390.092
0.123
0.0180.0490.036
0.038
0.0230.0510.041
0.042
0.0030.0280.029
0.025
0.8280.8270.777
0.811
Economy_(excluding_agriculture_& official public sector):
66-7070-8080-90
66-90
0.1210.1150.082
0.102
0.1730.1410.083
0.122
0.1870.1450.08 1
0.125
0.0690.0720.024
0.052
0.0720.0740.037
0.058
0.0130.0170.030
0.021
0.6780.6600.662
0.667
26
Finally, I remind the reader that in the results reported above I have excluded the large
conscript armies of Korea and Taiwan in measuring the growth of labour input in these
economies on the grounds that the measured output of these military personnel (i.e. their wages)
is a negligible proportion of total output. In the case of Taiwan, census sources provide
information on the sex, age and educational characteristics of military personnel. To analyze the
sensitivity of my results I make use of this information to incorporate military personnel into my
estimates. As shown in table 6-3, including military personnel raises the rate of total factor
productivity growth in the aggregate economy by .4%, to an average of 2.8% per annum."
However, if one considers military personnel as part of public sector employment, then the
"quality adjustment" of public sector output in the Taiwanese national accounts appears to be
even more exaggerated. Adjusting public sector output to standard deflation techniques yields an
average total factor productivity growth rate of 2.1% (table 6-3), i.e. only .2% higher than that
reported earlier (excluding military personnel) in table 6-2. Similiar estimates for services yield
average rates of productivity growth of 3.7% and 2.3%, which are only .3% greater and .2% less,
respectively, than the comparable figures reported earlier above. In sum, the estimates for
Taiwan are not extremely sensitive to the inclusion of military personnel, particularly once one
adjusts the growth of public sector output to international norms. The impact of military
personnel in Korea, where they constitute a much smaller percentage of the working population.
should be even smaller.
"The reader may note that including military personnel lowers slightly the estimated shareof labour. This follows from the fact that including the military lowers the ratio of theself-employed to the employed in the economy, implying (for a given aggregate wage bill) alower implicit wage for the self-employed.
27

Table 6-3: Taiwan - Inclusion of Military Personnel
Annual Growth of:
Time Output Aggregate Weighted Aggregate WeightedPeriod Capital Capital Labour Labour
TFP LabourShare
Economy (cxc. agriculture, inc. military):
66-90 0.096 0.118 0.122 0.039 0.042 0.028 0.677
Economy (cxc. agri., inc. ml!., with adj. of public sector output):
66-90 0.089 0.118 0.122 0.039 0.042 0.021 f 0.677
Services (inc. military):
66-90 0.091 0.119 0.122 0.029 0.030 0.037 0.738
Services (inc. military, with adj. of public sector output):
66-90 0.077 I 0.119 I 0.122 I 0.029 0.030 I 0.023 I 0.738
28

VII. Comparison with Earlier Research
Several total factor productivity studies of the East Asian NICs, some of them quite
rigorous, have preceeded this one. Tsao's (1982) detailed study of Singapore has generally been
ignored or dismissed as unbelievable. The methodology used in this paper is similar to hers, as
are the results. Tsao estimates a total factor productivity growth rate for the economy as a whole
of -.3% per annum for the 1966-1980 period and an average rate of -1.2% per annum for
twenty-eight manufacturing industries between 1970-1979.° With regards to Singapore, this
paper's principal contribution is to extend Tsao's analysis to the 1980s.
Turning to Korea, Kim and Park's (1985) study provides an impressively cataloged
analysis of total factor productivity growth in Korea, estimating average annual rates, for the
entire economy, of 4.03% during 1963-72 and 1.47% during 1972-1982.' Similarly,
Christensen and Cummings (1981) estimate an annual economywide total factor productivity
growth rate of 4.1% for the 1960-1973 period. Both studies fail to separate out the agricultural
sector. Table 7-1 below reproduces the capital stock estimates used by Christensen and
Cummings. As can be seen, land input (most of which was in agriculture) and agricultural
inventories accounted for 68% of their measured capital stock in 1959, but only 45% in 1973.
Thus, while their aggregate capital stock was growing by only 3.4% per. annum, the components
of greatest importance to the non-agricultural economy, i.e. non-residential structures and
equipment, were growing at rates well in excess of ten percent per annum. Similarly, for 1961
30Tsao (1982), pp. 91 & 149.
31Kim & Park (1985), p. 62.
I have serious doubts about their measures of non-farm inventories. According to theirestimates, the ratio of non-farm inventories to value added in manufacturing and wholesale &retail trade (at constant prices) fell from 1.23 in 1959 to .35 in 1973. As noted earlier. I havefound the inventory series published by these economies to be largely fictional.
29
Kim & Park allocate land a share of onà-half of all capital income, with inventories receiving an
additional quarter,33 and structures and equipment, which were growing at an explosive rate,
receiving only one quarter of capital income, or 9% of national income.3' And yet, Kim and
Park's study contains several tables indicating the small share of land in non-agricultural assets
and factor income. In sum, it is probably fair to say that the work of Kim and Park and
Christenson and Cummings, if disaggregated, would indicate extraordinary productivity growth
in agriculture, with low productivity growth in the non-agricultural sectors of the economy.
33Kim & Park's inventory series is also suspicious, with the inventory to GDP ratio (inmanufacturing and wholesale & retail trade) falling from 4.17 in 1961 to .50 in 1981.'
By the early 1 980s, however, they allocate over half of capital income to structures &equipment, as the growth of these inputs leads them to dominate their capital stock measures.This is why Kim & Park have lower estimated productivity growth rates for 1972-1982.
30

Table 7-1: Estimated Composition of the Korean Capital Stock(Billions of 1970 won)
Non-resid.siructures
Producerdurables
Residentialsnuc*ures
Non-farminveaiocies
Farminventoies
Consumerdurables
Land
1959 168.6 252.0 933.3 298.1 113.1 118.8 36273
1973 14953 1305.0 1288.8 485.1 341.0 269.0 3632.5
Avg.Growth 15.6% 11.7% 23% 3.5% 7.9% 5.8% 0.0%
Source: Christensen and Cummings (1981). table 7.
Finally, I turn to a recent study by Dollar and Sokoloff (1990), which found total factor
productivity growth rates in Korean manufacturing between 1963 and 1979 of 6.1% per annum.
This study does not make the best use of the available data, relying on the United Nations'
Yearbook of Industrial Statistics for its estimates of output and labour input and on the Economic
Planning Board and the Bank of Korea for its capital stock estimates and output deflators, while
estimating the share of labour using regression techniques. The most severe problem with Dollar
and Sokoloffs study, however, is that their measure of manufacturing output grows 3.5% faster
per annum for 16 years than the measure of manufacturing output reported by the Korean
national accounts!33 If one subtracts three and a half percent excess (overestimated) output
growth per annum from their series, one arrives, immediately, at an estimated total factor
productivity growth rate of around two and a half percent per annum, which is close to that
reported in this paper.
The origin of the problem seems to be the output data taken from the UN Yearbook ofIndustrial Statistics. These data are drawn from Korea's annual Survey of Mining andManufacturing. The output of the firms covered by this survey does, indeed, grow some 3.5%faster than the national accounts. I have repeatedly questioned the Korean national accountsauthorities on this issue and they steadfastly maintain that the Survey is not representative of theentire manufacturing sector. Apparently their adjustment of the survey data, using alternativesources, leads to a considerably lower estimate of the growth of the manufacturing sector.
31

VIII. Summary and Conclusions
Underlying the pervasive influence of the East Asian NICs on both theoretical and policy
oriented research in the economics profession lies a common premise: that productivity growth
in these economies,particularly in their manufacturing sectors, has been extraordinarily high.
The results of this paper, as summarized in table 8-1, suggest that this premise is largely
incorrect. Over the past two and a half decades, productivity growth in the aggregate
non-agricultural economy of the NICs ranges from a low of -0.3% in Singapore to a high of
2.3% in Hong Kong, whereas in manufacturing productivity growth ranges from a low of -1.0%
in Singapore to a high of 2.9% in South Korea. For the purposes of comparison, table 8-2
reproduces the results of two detailed cross-country studies of productivity growth, with
methodologies similar to that used in this paper. As the reader can see, it is not particularly
difficult to find either developed or less developed economies whose productivity perfomiance,
over time periods spanning two decades or more, has matched or rivaled that of the NICs.
Although, with the possible exception of Singapore, productivity growth in the NICs is not
particularly low, it is also, by post-war standards, not particularly high.TM
The results of this paper should be heartening to economists and policy makers alike, If
the remarkable post-war rise in East Asian living standards is primarily the result of one-shot
increases in output brought about by the rise in participation rates, investment to GDP ratios, and
educational standards and the intersectoral transfer of labour from agriculture to other sectors
(e.g. manufacturing) with higher value added per worker, then economic theory is admirably
well-equipped to explain the East Asian experience. Neo-classical growth theory, with its
TMIn this regard it is interesting to note that Lau and Kim (1992), using an econometricapproach to the study of productivity growth, find that productivity growth in the NICs in the1970s and 1980s was not significantly different from zero.
32

Table 8-1: Average Total Factor Productivity Growth(% per annum)
Hong Kong(1966-1991)
Singapore(1966-1990)
South Korea(1966-1990)
Taiwan(1966-1990)
Economy: 2.3 -0.3 1.6 1.9
Manufacturing NA -1.0 2.9 1.5
Other Industry NA NA 1.8 1.2
Services NA NA 1.8 2.5
Piivate Sector: NA NA NA 2.1
Notes: () In the caseofKorea and Taiwan, excluding agriculture; (#) In the case of Singapore.1970-1990.
Table 8-2: Comparative Total Factor Productivity Growth(% per annum)
Country Period Growth Country Period Growth
Canada 1947-1973 1.8 Argentina 1940-1980 1.0
France 1950-1973 3.0 Brazi1 1950-1980 2.0
Germany 1950-1973 3.7 Chile 1940-1980 1.2
Italy 1952-1973 3.4 Colombia 1940-1980 0.9
Japan 1952-1973 4.1 Mexico 1940-1980 1.7
Netherlands 1951-1973 2.5 Brazil (M) 1960-1980 1.0
United Kingdom 1955-1973 1.9. Mexico (M) 1940-1970 1.3
United States 1947-1973 1.4 Venezuela (M) 1950-1970 2.6
Notes: M manufactwing alone; developed economies from Christensen. Cwnmings and Jorgenson(1980), less developed economies from Elms (1990).
emphasis on level changes in income and its well-articulated quantitative framework, can explain
most, if not all, of the difference between the performance of the NICs and that of other post-war
economies.
33
Appendix I: Sources
Hong Kong: Estimates of Gross Domestic Product 1966 to 1992, Estimates of Gross
Domestic Product 1961 to 1975, and unpublished tabulations from the Hong Kong government37
provided data on GDP and GFCF by asset type at current and constant 1980 market prices for the
period 196l-199l? Estimates of 1947-1960 investment by asset type were derived from data on
retained imports of machinery and equipment, private construction expenditures and government
capital expenditure published in Hong Kong Statistics 1947-1967, deflated to 1961 prices using
the non-food retail price index (the only price index available) and then linked to 1980 prices
using the 61/80 deflators by asset type from the national accounts. Compensation of employees
as a percentage of GDP for all years except 1966 were taken from current and historical issues
of Estimates of Gross Domestic Product, data provided by the Hong Kong government, and the
pilot national income survey of Hong Kong (Report on the National Income Survey of Hong
Kong).
Estimates of the working population cross-tabulated by class of worker, sex, age,
education, income and hours of work were derived from published and unpublished census
tabulations. For earlier years hours of work and relative income's by worker characteristic were
assumed to be constant at the levels reported in the 1971 and 1976 censuses, respectively, the
earliest dates for which detailed data of each type were available.
37The 1961-1975 GDP estimates lacked several components introduced in the later series(e.g. adjustment for the profit margins of real estate developers). The data provided by the HongKong government allowed me to adjust the old series.
'The Hong Kong national accounts measure of GFCF includes the transfer (i.e.transactions) cost of (used and new) buildings and an adjustment for the profit margins of privatereal estate developers. I exclude the transfer cost from my measures of investment and capital,but include the margins of real estate developers (which I distribute across different types ofprivate sector construction in proportion to their value).
39Where the value was taken as the average of the 1961 and 1971 percentage shares.
34
Singapore: Singapore National Accounts 1987 and Yearbook of Statistics Singapore 1991
provided data on GDP and GFCF by asset type at current and constant 1985 prices for the period
1960- 1990.° 1947-1959 investment in buildings and structures was estimated from data on the
construction of one-family equivalent residential units and retained imports of cement (linked to
1985 prices using the overlap of these data with the 1960-1962 GFCF data) taken from the
monthly issues of the Malayan Digest of Statistics. Unpublished data on compensation of
employees as a percentage of GDP for 1972-1991 were provided by the Singaporean
government. I assume that the labour share for earlier years equals the estimated share in 1972.
Estimates of the working population cross-tabulated by industry, class of worker, sex, age,
education and income were derived from the published and unpublished tabulations of the
Sample Household Survey 1966 and 1970, 1980 and 1990 censuses. The 1966 Sample Survey
and 1970 Census provide little data on the income of workers.41 Average incomes by worker
characteristic, for use in computing the income weights for these years, were derived from the
1972173 Household Expenditure Survey and 1973 Labour Force Survey. Average hours of work
by industry for 1972-1990 were taken from annual issues of the Yearbook of Statistics, with
hours of work prior to 1972 assumed to be constant at the level reported in 1972.
South Korea: National Accounts 1990 and National Accounts 1991 provided data on
GDP and GFCF at current and constant 1985 prices for the period 1970-1990 (the "New System"
accounts), while National Income in Korea 1982 provided the same data (at 1975 constant
40The Singaporeans rebased the 1960-1977 estimates at 1968 prices to 1985 prices usingthe 78/85 and 78/68 deflators for each item. Consequently, the reported constant 1985 pricecategory totals (e.g. GFCF) do not equal the sum of their components (e.g. GFCF by asset type).I take, as my measure of aggregate GDP the sum of GDP by industrial sector while, for thepurposes of figure I, I take as my measure of GFCF the sum of GFCF by asset type.
1966 Sample Survey collected some data on the employee income of heads ofhouseholds, but the published tabulations only cross-tabulate this with occupation, which is oflittle use in estimating the full array by industry, sex, age and education.
35
prices) for the period 1953-1981 (the "Old System" accounts). Although the (revised) New
System accounts should be superior to the Old System accounts in their measures of output and
capital formation, they unfortunately follow the 1968 SNA in classifying capital formation by
industry of ownership, rather than industry of use (as was the case in the Old System accounts,
which followed the 1953 SNA). Provided the ratio of ownership to use remains roughly constant
over time, the New System accounts still provide a reasonable measure of the growth of capital
input by industry. A problem arises, however, in linking the Old and New System accounts,
when the change in definition induces a dramatic change in measured capital input by sector. To
ameliorate this problem, I use the Old System accounts to measure the growth of capital and
output by industry for the 1960-1975 period and the New System accounts (initializing the
capital stock with the 1969 Old System values) for the period 1975199O.42 Measures of indirect
taxes, and their distribution by type, were taken from the national accounts sources and the
annual issues of the Economic Statistics Yearbook. Data on compensation of employees by
economic sector are provided in National Accounts 1990. Since the Old System accounts do not
provide data with similar detail, I assume that the share of labour by sector in 1960 and 1966
equalled the ratio estimated for 1970.
Estimates of the working population cross-tabulated by class of worker, sex, age, and
education were derived from published census tabulations, supplemented with data from the
Economically Active Population Survey (where this contained tabulations unavailable in the
census). Incomes and hours of work by worker characteristic were estimated from the published
tabulations of the Occupational Wage Survey for the period 1971-1990. For earlier years hours
of work and relative income's by worker characteristic were assumed to be constant at the levels
42 the analysis of the aggregate non-agricultural economy, where the distinctionbetween user and owner is less significant, I use the Old System for 1960-1970 and the NewSystem (initialized with the Old System values of 1969) for 1970-1990.
36

reported in 1971 .
Taiwan: Unpublished data provided by the Taiwanese government included information
on capital formation and output in current and constant 1986 prices, as well compensation of
employees and indirect taxes. The publication National Income in TaiwanArea of the Republic
of China 1991 summarizes much of these data. Estimates of the working population by classof
worker, industry, sex, age and education were derived from English and Chinese language
census sources." Employee incomes by worker characteristic for the years 1976, 1980 and 1990
were estimated from the data tapes of the Survey of Personal Income Distribution (summarized
in the publication of the same name), with labour force estimates prior to 1976 weighted with the
relative wages of that year.43
43Both the Economically Active Population Survey and the Monthly Wage Survey(reported in the Yearbook of Labour Statistics) contain data on hours of work (in theformer caseextending back to the early 1960s). The hours of work data reported by both sources, however,are uncorrelated with movements in output (and with each other), which is not the case with theoccupational wage survey, which also provides considerably greater detail. In any case, nosource shows any substantial trend in non-agricultural hours of work.
"Since the national accounts data cover only the "Taiwan Area", I excluded those listed asworking in Fujian province from my estimates of the working population.
this time, I have not made any adjustment for hours of work for Taiwan. Theemployee earnings survey (most recently reported in the Yearbook of Earningsand ProductivityStatistics) provides data on monthly hours of work, but these series have historically been subjectto enormous revisions. I am currently trying to a compile a consistent historical series onhoursof work from the labour force survey (most recently reported in the Yearbook of ManpowerSurvey Statistics), which I hope to make use of in a later draft.
37

Bibliography
Bank of Korea (1992). Economic Statistics Yearbook 1992. Korea: Bank of Korea.
________ (1991). National Accounts 1991. Korea: Bank of Korea.
________ (1990). National Accounts 1990. Korea: Bank of Korea.
________ (1982). National Income in Korea 1982. Korea: Bank of Korea.
Chang, E.R. (1969). Report on the National Income Survey of Hong Kong. Hong Kong:Government Printer.
Christensen, Laurits R.; Cummings, Diane; and Jorgenson, Dale W (1980). "Economic Growth,1947-1973: An International Comparison." In John W. Kendrick and Beatrice Vaccara,editors. New Developments in Productivity Measurement and Analysis. Chicago:University of Chicago Press, 1980.
Christensen, Laurits R. and Cummings, Diane (1981). "Real Product, Real Factor Input, andProductivity in the Republic of Korea, 1960-1973." Journal of Development Economics 8(1981): 285-302.
Dollar, David and Sokoloff, Kenneth (1990). 'Patterns of Productivity Growth in South KoreanManufacturing Industries, 1963-1979." Journal of Development Economics 33 (1990):309-327.
Elias, Victor J (1990). Sources of Growth: A study of seven Latin American economies. SanFrancisco: Institute for Contemporaiy Studies Press, 1990.
Griliches, Zvi and Jorgenson, Dale W (1967). "The Explanation of Productivity Change."Review of Economic Studies 34 (July 1967): 249-280.
Hong Kong, Census and Statistics Department (1969). Hong Kong Statistics 1947-1967. HongKong: Government Printer.
(1977). Estimates of Gross Domestic Product 1961 to 1975. Hong Kong:Government Printer.
(1993). Estimates of Gross Domestic Product 1966 to 1992. Hong Kong:Government Printer.
Jorgenson, Dale W.; Gollop, Frank M.; and Fraumeni, Barbara M (1987). Productivity and U.S.Economic Growth. Cambridge, MA: Harvard University Press, 1987.
Kim, Kwang-suk and Park, Joon-kyung (1985). Sources of Economic Growth in Korea:1963-1982. Seoul: Korea Development Institute, 1985.
38
Lau, Lawrence J. and Kim, Jong-U. "The Sources of Economic Growth of the NewlyIndustrializing Countries on the Pacific Rim." Stanford University: Center for EconomicPolicy Research Publication #295, 1992.
Republic of China, Directorate-General of Budget, Accounting and Statistics (1991). NationalIncome in Taiwan Area of the Republic of China 1991. Republic of China: BGBAS.
________ (1991). Report on the Survey of Personal Income Distribution in Taiwan Area of theRepublic of China 1990. Republic of China: DGBAS.
(1991). Yearbook of Earnings and Productivity Statistics. Taiwan Area. Republic ofChina. 1990. Republic of China: DGBAS.
________ (1991). Yearbook of Manpower Survey Statistics. Taiwan Area. Republic of China.1990. Republic of China: DGBAS.
Republic of Korea, Ministry of Labour. Yearbook of Labour Statistics. Annual Issues.
Republic of Korea, National Statistical Office (1992). Annual Report on the EconomicallyActive Population Survey 1991. Korea: National Statistical Office.
Singapore. Department of Statistics (1988). Singapore National Accounts 1987. Singapore:National Printers.
________ (n4.). Yearbook of Statistics Singapore. Annual issues. Singapore: NationalPrinters.
Singapore, Economic Development Board. Report on the Census of Industrial Production.Annual issues. Singapore: National Printers.
Singapore, Ministry of National Development (n.d.). Singapore Sample Household Survey1966. Singapore: National Printers.
Tsao, Yuan (1982). Growth and Productivity in Singapore: A supply side analysis. Ph.D.thesis. Cambridge, MA: Harvard University.
Young, Alwyn (1992). "A Tale of Two Cities: Factor Accumulation and Technical Change inHong Kong and Singapore." In Olivier. I. Blanchard and Stanley Fischer, eds. NBERMacroeconomics Annual 1992. Cambridge, MA: The MIT Press, 1992.
Young, Alwyn (1993). "Lessons from the East Asian NICs: A Contrarian View." Forthcoming.European Economic Review, Papers and Proceedings, 1994.
39
Related Documents