1 November 13, 2019 Mr. Vernon Baker NB Properties & Development, Inc. 1220 Woodstock Road King George, Virginia 22485-6005 Bud: Attached is our completed draft market analysis for proposed new construction age- restricted apartment units to be built on your 35± acre property located on Lakeside Drive on the northwest side of the City of Lynchburg. The property is vacant, wooded and attractive and abuts a small stream on the north side. It is a unique property with a rural setting; yet with close proximity to an urban setting with a high “quality of life” rating. The site is large enough to support several apartment buildings within a fully landscaped, wooded setting. The site is in a mature residential section of the City, but is well served by the area highway system and with an abundance of nearby commercial businesses. It is close to a hospital and Lynchburg‘s only senior center. The defined market area has a total of 9,000± households, with the household head aged 62 to 79 and with incomes, reported in constant 2019 dollars, of $30,000 and above. This is the target market for new age-restricted apartments without the add-on cost of services. This sector of the area housing market is increasing by 140± households per year, on average. In spite of this fact, there are no truly independent living apartment properties in the Lynchburg Region that directly serve this active independent living housing market. What is available to seniors are IL apartment homes in CCRC’s, or with services, such as meals and housekeeping. A few area age-restricted properties are rent-restricted properties and modest. What is available for active seniors are apartments with monthly fees at generally $2,500 and up for a one-bedroom home and $3,000 and above for a two-bedroom home. Some of these apartment properties have large endowments (or entrance) fees. The five independent living apartment properties for seniors that exist in the market area are at near full occupancy. Except for the Ruck & Pratt facility at Liberty Ridge, these are mature properties of 18 to 30+ years of age.

Welcome message from author
This document is posted to help you gain knowledge. Please leave a comment to let me know what you think about it! Share it to your friends and learn new things together.
Transcript
1
November 13, 2019
Mr. Vernon Baker
NB Properties & Development, Inc.
1220 Woodstock Road
King George, Virginia 22485-6005
Bud:
Attached is our completed draft market analysis for proposed new construction age-
restricted apartment units to be built on your 35± acre property located on Lakeside Drive on the
northwest side of the City of Lynchburg.
The property is vacant, wooded and attractive and abuts a small stream on the north side.
It is a unique property with a rural setting; yet with close proximity to an urban setting with a
high “quality of life” rating. The site is large enough to support several apartment buildings
within a fully landscaped, wooded setting. The site is in a mature residential section of the City,
but is well served by the area highway system and with an abundance of nearby commercial
businesses. It is close to a hospital and Lynchburg‘s only senior center.
The defined market area has a total of 9,000± households, with the household head aged
62 to 79 and with incomes, reported in constant 2019 dollars, of $30,000 and above. This is the
target market for new age-restricted apartments without the add-on cost of services. This sector
of the area housing market is increasing by 140± households per year, on average.
In spite of this fact, there are no truly independent living apartment properties in the
Lynchburg Region that directly serve this active independent living housing market. What is
available to seniors are IL apartment homes in CCRC’s, or with services, such as meals and
housekeeping. A few area age-restricted properties are rent-restricted properties and modest.
What is available for active seniors are apartments with monthly fees at generally $2,500 and up
for a one-bedroom home and $3,000 and above for a two-bedroom home. Some of these
apartment properties have large endowments (or entrance) fees. The five independent living
apartment properties for seniors that exist in the market area are at near full occupancy. Except
for the Ruck & Pratt facility at Liberty Ridge, these are mature properties of 18 to 30+ years of
age.
2
Mr. Vernon Baker
November 13, 2019
Page 2
Aside from the five full-service age-restricted apartment properties under study, there is
only one other non-rent restricted housing community in the market area. This is the Glenbrook
property in Boonsboro in eastern Bedford County. These are detached single-family homes, built
in the early-2000’s at home prices in the mid-$100,000’s and up. There are still vacant lots here,
with no new development activity since the mid-2000’s.
The market area has approximately 4,000 apartment units, excluding downtown adaptive
reuse properties. Approximately 40% of these apartment homes are occupied by Liberty
University students. Active seniors likely occupy 5% of these units, or 200± units. These seniors
are paying the same rents as would be required at a new age-restricted property.
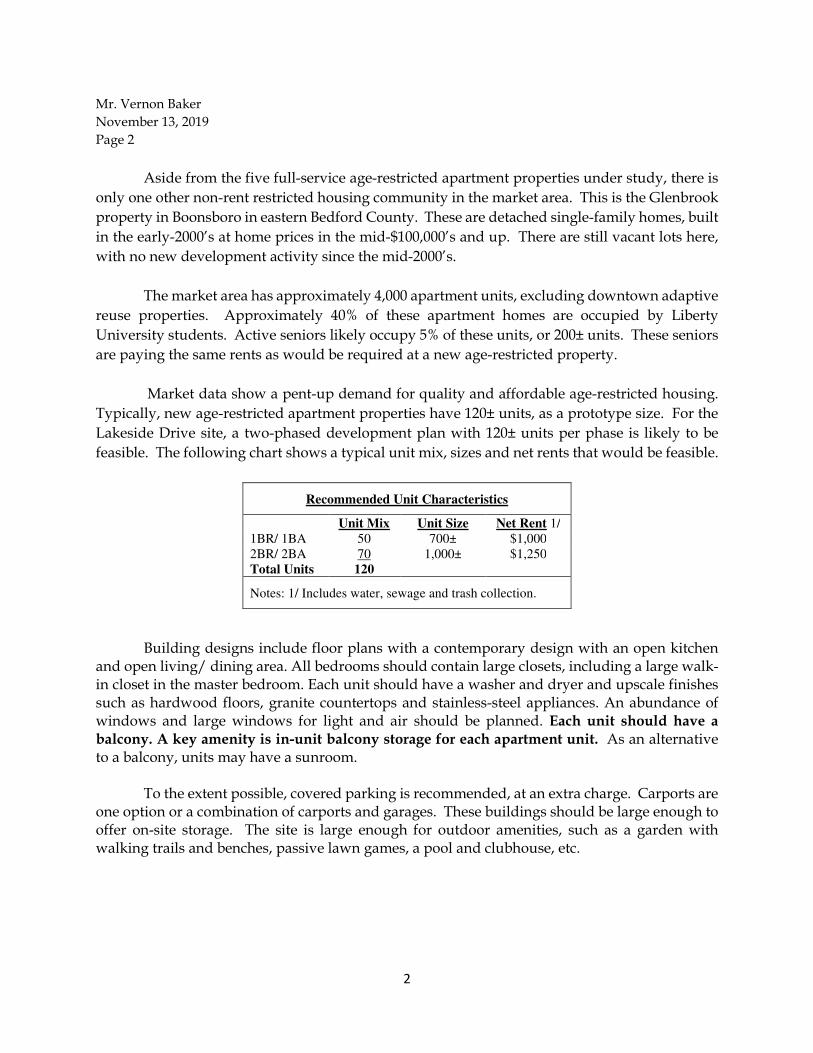
Market data show a pent-up demand for quality and affordable age-restricted housing.
Typically, new age-restricted apartment properties have 120± units, as a prototype size. For the
Lakeside Drive site, a two-phased development plan with 120± units per phase is likely to be
feasible. The following chart shows a typical unit mix, sizes and net rents that would be feasible.
Recommended Unit Characteristics
Unit Mix Unit Size Net Rent 1/ 1BR/ 1BA 50 700± $1,000 2BR/ 2BA 70 1,000± $1,250 Total Units 120
Notes: 1/ Includes water, sewage and trash collection.
Building designs include floor plans with a contemporary design with an open kitchen and open living/ dining area. All bedrooms should contain large closets, including a large walk-in closet in the master bedroom. Each unit should have a washer and dryer and upscale finishes such as hardwood floors, granite countertops and stainless-steel appliances. An abundance of windows and large windows for light and air should be planned. Each unit should have a balcony. A key amenity is in-unit balcony storage for each apartment unit. As an alternative to a balcony, units may have a sunroom.
To the extent possible, covered parking is recommended, at an extra charge. Carports are
one option or a combination of carports and garages. These buildings should be large enough to offer on-site storage. The site is large enough for outdoor amenities, such as a garden with walking trails and benches, passive lawn games, a pool and clubhouse, etc.

3
Mr. Vernon Baker
November 13, 2019
Page 3
Please review this report and let me know if you have any questions or require
clarification. We will be available to continue to assist you with the marketing of the property.
Sincerely,
Stuart M. Patz
President
SMP/mes

4
Market Analysis
Attached is our initial market analysis to evaluate market support for a new, age-restricted
apartment building, for rent, and proposed for development on part of four parcels totaling
nearly 35 acres located along Lakeside Drive, in the northern portion of the City of Lynchburg,
Virginia. The site is currently zoned R-4 (Medium-High Density Multi-Family Residential), which
permits 21.78 apartment units per acre. Thus, several hundred apartment units could be built on
the site. The two northern parcels, where development is most likely to occur, could be developed
with nearly 600 apartment units.
While site density can support a large number of apartment units, the development
concept is not for that level of density. 200± units is a more realistic development scenario. The
purpose of this study is to determine whether new age-restricted apartment units would be
feasible at this location, and these data would be part of a marketing plan to sell the property to
a builder who specializes in Independent Living (IL).
The age-restricted apartment market has many options. These include a truly
independent living (IL) apartment building with no services, but with an abundance of amenities.
A second option is an IL apartment building with services, such as daily meals and weekly
housekeeping and laundry service. These facilities are often part of an assisted living facility
(ALF), with both options – IL and AL—offered. This is not the type of building proposed for the
Lakeside Drive property, although this type of IL is the current market for seniors in Lynchburg.
The study to follow is for an IL apartment building with no services, but with amenities.
This is the apartment type that many builders are more interested in, as rental rates are
comparable with the current apartment market.
The following market study will show that the entirety of the Lynchburg Region is nearly
devoid of IL apartment units for active seniors. This refers to an age-restricted apartment
proposal without on-site services, such as meals, housekeeping and laundry service. The
5
expected resident is defined as an active senior, within the 62 to 79 age category, who can live
independently and without the need for services and are not willing to pay the higher rates for
services.
This lack of “product” for IL apartment units is in spite of a large market for active seniors
who are in the age and income category defined for the study site.
This report is not intended for submittal to a lender. It is intended to determine whether
the age-restricted, IL apartments are feasible in terms of market support and achievable rents.
The report is designed to be expanded into a full narrative market study, if feasible, or if a
purchaser is found for the site. All required market and economic data required for a full narrative
market report for submittal to a lender are included in this report.
Lakeside Drive Site Description
The study site consists of four irregularly-shaped parcels totaling 34.88 acres, located on
the north of U.S. Route 221 (Lakeside Drive) in the northern portion of the City of Lynchburg,
approximately 3.7 miles west of Downtown Lynchburg and 5.8 miles northwest of Liberty
University. The site’s location is shown in Map A below.

6
Map A - Site Location
Shown next is a northern aerial of the study site. All four parcels that comprise the site are
zoned R-4 (Medium-High Density Multi-Family Residential). Public water and sewage are
available to the site.
The aerial shows the site to be fully vacant and largely wooded, with some cleared areas
in the northern two parcels. Access to the site is from a narrow parcel along Lakeside Drive which
runs north into the “heart” of the property. An unpaved roadway currently provides access to
this portion of the site. This roadway is surrounded on both sides by wooded areas that obstruct
all views of nearby development. A stream (Blackwater Creek Tributary) runs along the north
side of the property and could be an attractive amenity for the future community, once built.
The aerial shows that the developments adjacent to the site are largely residential, with
some commercial uses to the southwest of the south. The southern side of the property is marked

7
by Lakeside Drive, while the northern side is marked by an active Norfolk-Southern rail line.
Across from the rail line from the study site is a single-family subdivision that was built in recent
years. Other adjacent developments are briefly described in the paragraphs that follow.
Lynchburg Shrine Club (Note 1). This facility contains a 3,970± square foot lodge,
which was built in 1964, and 7,140± square foot clubhouse, which was built in 1987. The development also contains two small detached garages that were built in 1964. The facility is affiliated with the Kazim Shrine Center.
Brenleigh Grove (Note 2). This is a small subdivision of single-family homes built along Brenleigh Court. Most of the homes here were built between 2011 and 2019 and are three-bedroom/ 2.5-bathroom units. These homes have sold in the upper $100,000’s.
Pleasant View (Note 3). This is mature neighborhood of single-family homes that
were largely built in the 1950’s and 1960’s. These homes are generally well maintained and have recently sold in the upper-$100,000’s.
Lakeside (Note 4). This subdivision is comprised of mature single-family homes
that were largely built in the 1960’s. Recent sales in this subdivision have been in the mid- to upper-$100,000’s.
Aztec Rental (Note 5). This facility is occupied by a party equipment rental
business. The 9,920± square foot facility was constructed in 1950.
Avis/ Budget (Note 6). This 570± square foot building, which was built in 1950, serves as a car rental facility for Avis and Budget.
Collins Siding & Windows (Note 7). This is a siding and windows contractor
business located in a 3,420± square foot building that was constructed in 1950.
El Camino (Note 8). This is a small Mexican restaurant.
High Point (Note 9). This is the location of six single-family homes that are currently being rented. These homes were built in the 1950’s.
Crescentwood Townhomes (Note 10). This is an attractive townhome community
with 36 homes. This community was built in three phases, with nine homes built in 2007, 18 homes built in 2013 and nine built in 2016. The homes range in size between 1,440 square feet for two-bedroom units and 1,720 square feet for three-bedroom units. Most homes are three-bedrooms in size. These homes have sold in the mid-$100,000’s. Several units are available for rent. The three-bedroom units rent for approximately $1,200.
8
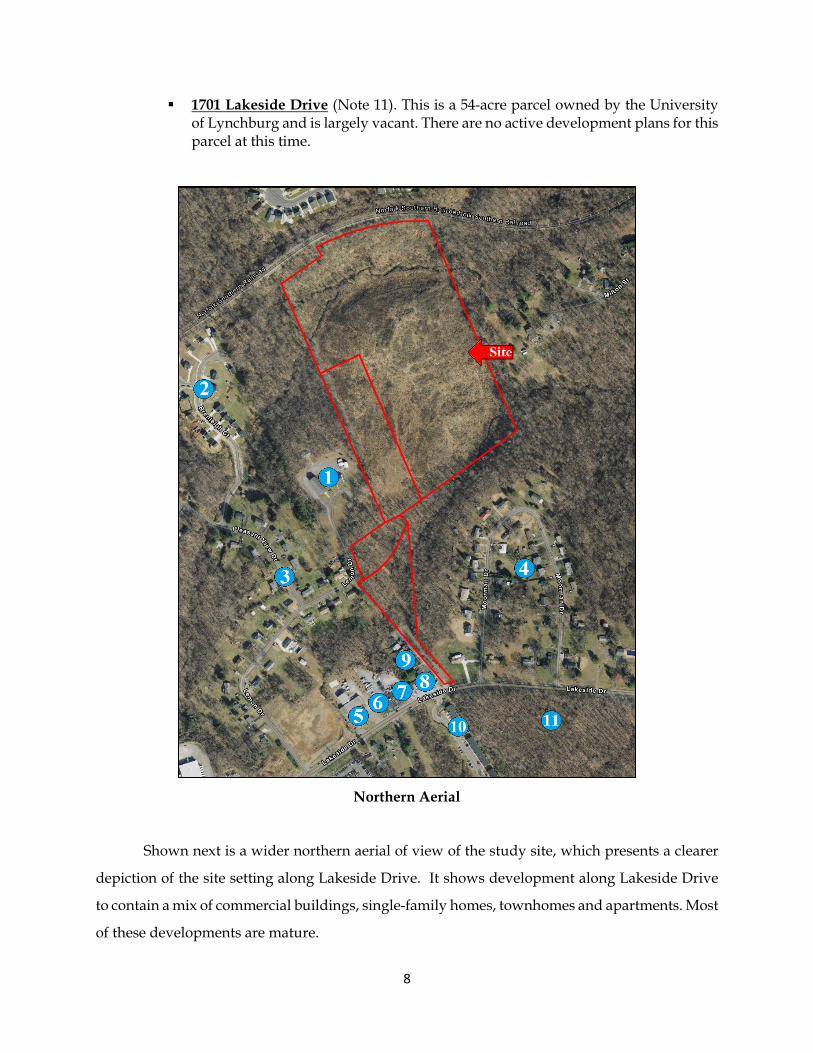
1701 Lakeside Drive (Note 11). This is a 54-acre parcel owned by the University of Lynchburg and is largely vacant. There are no active development plans for this parcel at this time.
Northern Aerial
Shown next is a wider northern aerial of view of the study site, which presents a clearer
depiction of the site setting along Lakeside Drive. It shows development along Lakeside Drive
to contain a mix of commercial buildings, single-family homes, townhomes and apartments. Most
of these developments are mature.

9
Of note is the site’s close proximity to the University of Lynchburg, approximately one
mile east of the study site. The University of Lynchburg, which spans 264 acres, is a private
university associated with the Christian Church (Disciples of Christ). Facilities include more than
40 buildings. The University enrolls 3,080 students as of the Fall, 2018 semester, which is an
increase of 440± since 2008, or an average annual increase of 50± students. Approximately 70
percent of the full-time students live on campus. Off-campus student demand for full-time
students totals only 620 students, as of the Fall, 2018 semester.
Wide Aerial
Summary. The Lakeside Drive site is located in a mature section of Lynchburg. The area
was largely developed during the 1950’s and 1960’s with small modest homes. The study site is
large and can be fully landscaped to buffer the mature homes on adjacent properties.
Next shown are photos of the study site and its setting.
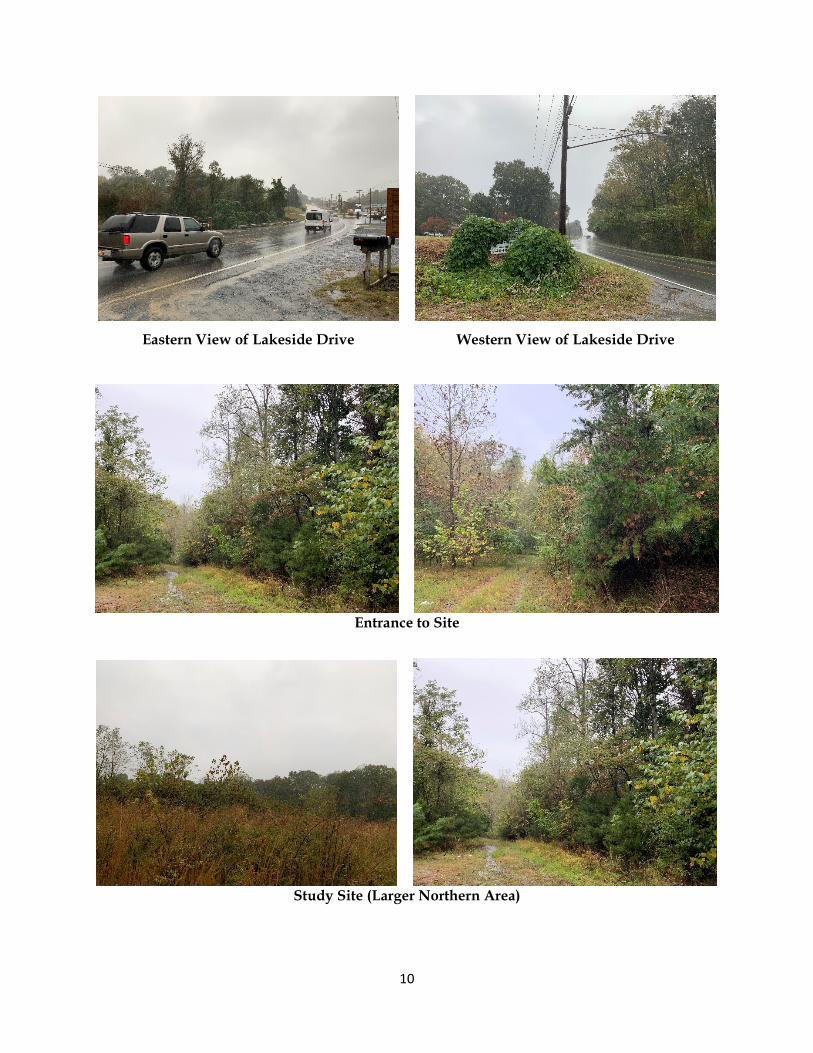
10
Eastern View of Lakeside Drive Western View of Lakeside Drive
Entrance to Site
Study Site (Larger Northern Area)
11
Overall, the study site is well-located. Given the parcel boundaries, development will
occur in the rear, northern portions of the site, that are removed from the site’s road frontage.
These areas are attractive, quiet and well-suited for an age-restricted apartment community.
Map B shows a wider view of the site setting. U.S. Route 221, which marks the southern
boundary of the study site, is part of the U.S. Highway System that runs from Perry, Florida to
Lynchburg. In Virginia, the Highway runs for nearly 150 miles from the North Carolina state line
near Independence north to its northern terminus at US 29 Business, US 460 Business, and US 501
Business near Downtown Lynchburg (Note 1). As previously noted, this roadway also accesses
the University of Lynchburg (Note 2) near the site.
Of note is that U.S. Route 221 accesses the Lynchburg Expressway approximately 1.3 miles
west of the site. This provides quick access to the Liberty University campus and an abundance
of shopping centers around the expanding campus, approximately 5.5 miles from the site. The
intersection of U.S. Route 221 and the Lynchburg Expressway is also the location of Fresh Market
Station (Note 3). This is a 65,060± square foot shopping center that is anchored by a Fresh Market
grocery store. Smaller tenants include Petco, Mattress Warehouse and Panera. This shopping
center opened in 2013. Also located near this shopping center is a 17,770± square foot Aldi grocery
store (Note 4), which opened in 2016.
Also located near the study site and along Old Forest Road is a 185,130± square foot
Walmart Supercenter (Note 5) that opened in 2010. Several restaurants and smaller retailers are
located adjacent to this Walmart.
Of importance is the sites’ close proximity to Centra Lynchburg General Hospital (Note
6), which is 2.6 miles northeast of the study site off Tate Springs Road. This 358-bed hospital is an
emergency and critical care center specializing in cardiology, emergency medicine, orthopedics,
oncology, neurology and neurosurgery. An abundance of medical office space is located near the
hospital. Medical tenants include Rehab Associates of Central Virginia, UVA Lynchburg Dialysis,
Home Instead Senior CareCuris Lynchburg Nursing and Rehabilitation Center and Audiology-
Hearing Aid Associates.

12
Map B - Site Setting
Templeton Senior Center. Lynchburg has one senior center that serves older adults of
all ages. The site of Templeton Senior Center is north off of Route 501, along Wiggington Road,
which is less than a 10-minute drive from the Lakeside Drive property. The senior center offers
card games, lectures, yoga, fitness center and other sports activities. Officials at the center
organize off-site activities, in addition to the on-site programs.
Site Setting
Map C shows the site setting within the greater Lynchburg Region. It shows the following:
The site quickly accesses U.S. Route 501, which connects with much of the region’s employment and retail centers, plus the senior center.
Liberty University is nearby via U.S. Route 501 for cultural events, college classes and other events.
Downtown Lynchburg is north of U.S. Route 29/ Lynchburg Expressway west
via CR 126 off of Route 501. It takes less than ten minutes to drive to Downtown.

13
The 358-bed Centra Lynchburg General Hospital, which is located 1901 Tate Springs Road, is an approximately seven-minute drive from the site. There is an abundance of medical office tenants near the hospital, which is one of the largest employers in the region.
Map C - Regional Setting
Market Area Economic Overview
The above analysis provided a detailed description of the study site and its setting within
the City of Lynchburg. At this time, there is no development plan for the property, other than
14
the desire to develop the property with independent living apartment homes. This section
presents an overview of the Lynchburg area economy, to show the stability of the Lynchburg
Region to support new apartment unit development, particularly the type under study.
The Economic Overview Analysis for the greater Lynchburg marketplace is presented in
this part of the report. First presented is the market area at-place job trends. This is followed by
employment and labor force data and then by a description of active area developments and the
likely total number of new jobs that these projects will generate. These data and trends will be
used to determine area demographic growth and the resulting housing unit demand.
The economic overview is an important part of the market analysis. It shows the stability
of the market area in terms of job growth and future job trends, but is also a key element in
evaluating demographic trends, as employment supports population and household growth and
housing unit demand, particularly of the type proposed. A key part of this sector is a detailed
description of enrollment growth, employment growth and expansion plans at Liberty
University, as Liberty University is the catalyst for growth in the greater Lynchburg area.
Another point related to the evaluation of the Lynchburg area economy is the fact that seniors
will remain in place, if the area economy is stable and employment of family is secure. This point
also relates to seniors moving to the area to be with family, as the expectation is that the economy
will support net new job growth.
Market Area
The traditional market area for new residential development in Lynchburg is the City of
Lynchburg and the adjacent areas of Campbell County and Bedford County. This is one area
under study for the study site. In both instances, i.e., Campbell County to the south and east and
Bedford County to the west “blend” into the development patterns in the City and represent
competitive locations for new residential development. The north side of Lynchburg, in Amherst
County, is not part of the Lynchburg market area, as new development has not yet expanded in
that direction.
15
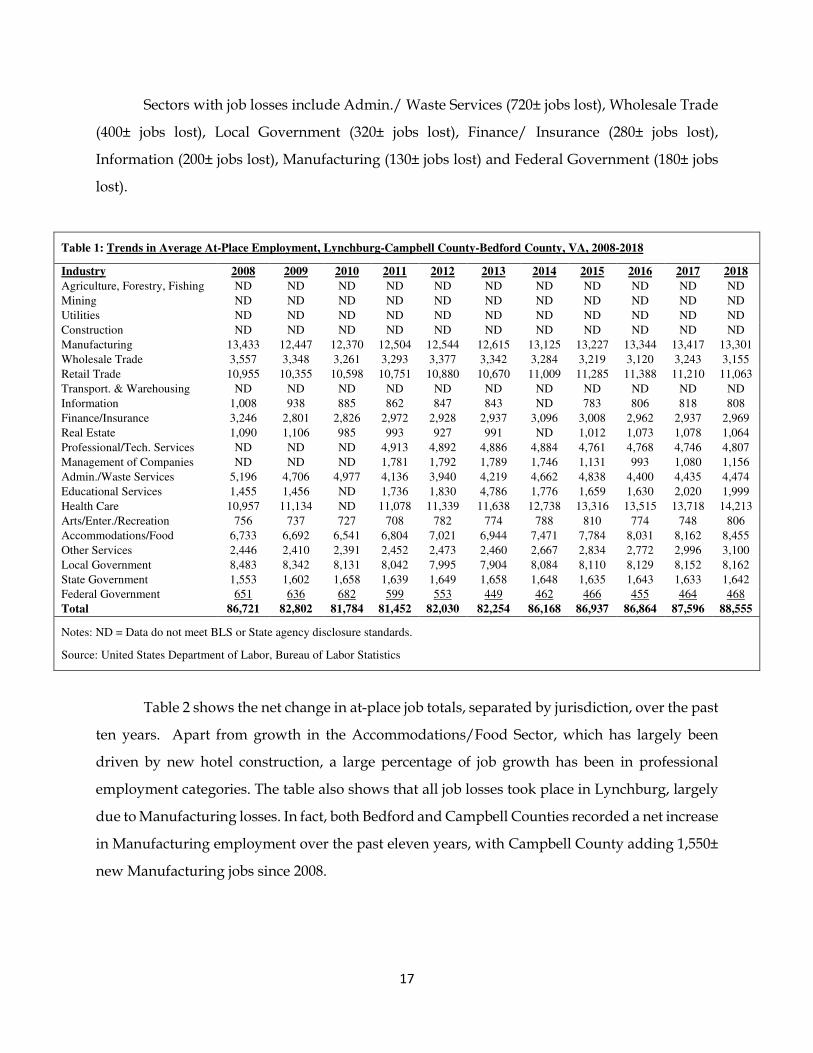
At-Place Jobs
At-place jobs refer to the number of jobs located within the market area and data in Table
1 show a total of 88,560± jobs as of year-end 2018 for the three jurisdictions that comprise the
Lynchburg Region. The market area under study is the City of Lynchburg and adjacent areas in
Bedford and Campbell counties. Bureau of Labor Statistics (BLS) from the U.S. Department of
Commerce, are provided only on a city-wide or county-wide basis. While the market area does
not include all of Bedford and Campbell counties, and only the areas near Lynchburg, we need
to include employment in the entire county (including the less developed areas away from the
City) for our research. That does not overtake the market as the areas not adjacent to Lynchburg
are largely low density residential.
The total number of jobs is up 960± from the previous year’s total and represents an
increase of 1,830± jobs over the 2008 total. As of year-end 2018, the Lynchburg Region has
recovered all jobs lost as a result of the past recession, as the current employment exceeds the pre-
recession employment peak.
Data in Table 1 also show that market area at-place jobs fell by 4.5 percent between 2008
and 2009, when 3,920± jobs were eliminated as a result of the recession at that time. At-place jobs
continued its decline into 2010 and 2011, before a slow recovery began in 2012. 800± new jobs
were created in 2012 and 2013. 2014 was a particularly strong growth year, as 3,910± jobs were
created during that year. This increased the total at-place jobs by 4.8 percent. Although
employment grew in 2015, it expanded at a slower pace compared with recent trends with the
addition of 770± jobs. It was during this year that total at-place jobs exceeded the pre-recession
peak. Job totals declined in 2016 by 60± jobs, but 730± jobs were added in 2017. Again, at-place
jobs grew by nearly 1,000 in 2018, the sharpest pace of employment growth since 2014.
The fastest growing and largest employment sector in the market area is the Health Care
sector, which added 3,260± new jobs over the past decade, with approximately 200 new jobs
created in both 2016 and 2017 and additional 500 jobs added most recently in 2018. With 14,210±
people working in this sector at year-end 2018, the Health Care sector represents 16.1 percent of
16
total employment in the market area. Centra Health, which owns and operates both Lynchburg
General Hospital and Virginia Baptist Hospital in the City of Lynchburg, as well as Bedford
Memorial Hospital and Oakwood Rehabilitation Center in Bedford County, employs over 7,000
people in the Lynchburg area alone and has added over 2,600 new jobs in the City over the past
decade. Approximately 300 people work for Centra Health in Bedford County, making it the
largest private employer in that county. Other major Health Care employers in the market area
include Horizon Behavioral Health, with over 500 employees.
The second largest employment sector in the market area is the Manufacturing sector,
which accounts for approximately 15 percent of total market area employment. Although still an
important sector, Manufacturing no longer dominates the region’s economy as it did in the past.
Employment in this sector has fallen by 130± since 2008.
A third important employment sector is the Accommodations and Food sector, which
added 1,700± jobs over the past eleven years. Much of this growth has been driven by the opening
of seven hotels with 750 rooms. These hotels include:
The Virginian Lynchburg – 115 rooms, built in 2018 Residence Inn Lynchburg - 116 rooms, built in 2018 Comfort Inn & Suites Lynchburg - 97 rooms, built in 2015 Hampton Inn & Suites Lynchburg - 112 rooms, built in 2014 Microtel Inn & Suites by Wyndham Lynchburg - 78 rooms, built in 2014 Springhill Suites Lynchburg Airport University Area - 106 rooms, built in 2009 Hilton Garden Inn Lynchburg - 126 rooms, built in 2008
This sector will continue to expand, given the recent opening of the 97-romm Homewood
Suites that opened in August, 2019.
Several employment sectors have added a significant number of jobs over the past decade,
apart from Health Care and Accommodations/ Food. These include Other Services (650± jobs
added), Educational Services (540± jobs added), Retail Trade (110± jobs added) and Arts/
Entertainment/ Recreation (50± jobs added). Employment in the State Government grew by 90±
since 2008.
17
Sectors with job losses include Admin./ Waste Services (720± jobs lost), Wholesale Trade
(400± jobs lost), Local Government (320± jobs lost), Finance/ Insurance (280± jobs lost),
Information (200± jobs lost), Manufacturing (130± jobs lost) and Federal Government (180± jobs
lost).
Table 1: Trends in Average At-Place Employment, Lynchburg-Campbell County-Bedford County, VA, 2008-2018
Industry 2008 2009 2010 2011 2012 2013 2014 2015 2016 2017 2018
Agriculture, Forestry, Fishing ND ND ND ND ND ND ND ND ND ND ND
Mining ND ND ND ND ND ND ND ND ND ND ND
Utilities ND ND ND ND ND ND ND ND ND ND ND
Construction ND ND ND ND ND ND ND ND ND ND ND
Manufacturing 13,433 12,447 12,370 12,504 12,544 12,615 13,125 13,227 13,344 13,417 13,301
Wholesale Trade 3,557 3,348 3,261 3,293 3,377 3,342 3,284 3,219 3,120 3,243 3,155
Retail Trade 10,955 10,355 10,598 10,751 10,880 10,670 11,009 11,285 11,388 11,210 11,063
Transport. & Warehousing ND ND ND ND ND ND ND ND ND ND ND
Information 1,008 938 885 862 847 843 ND 783 806 818 808
Finance/Insurance 3,246 2,801 2,826 2,972 2,928 2,937 3,096 3,008 2,962 2,937 2,969
Real Estate 1,090 1,106 985 993 927 991 ND 1,012 1,073 1,078 1,064
Professional/Tech. Services ND ND ND 4,913 4,892 4,886 4,884 4,761 4,768 4,746 4,807
Management of Companies ND ND ND 1,781 1,792 1,789 1,746 1,131 993 1,080 1,156
Admin./Waste Services 5,196 4,706 4,977 4,136 3,940 4,219 4,662 4,838 4,400 4,435 4,474
Educational Services 1,455 1,456 ND 1,736 1,830 4,786 1,776 1,659 1,630 2,020 1,999
Health Care 10,957 11,134 ND 11,078 11,339 11,638 12,738 13,316 13,515 13,718 14,213
Arts/Enter./Recreation 756 737 727 708 782 774 788 810 774 748 806
Accommodations/Food 6,733 6,692 6,541 6,804 7,021 6,944 7,471 7,784 8,031 8,162 8,455
Other Services 2,446 2,410 2,391 2,452 2,473 2,460 2,667 2,834 2,772 2,996 3,100
Local Government 8,483 8,342 8,131 8,042 7,995 7,904 8,084 8,110 8,129 8,152 8,162
State Government 1,553 1,602 1,658 1,639 1,649 1,658 1,648 1,635 1,643 1,633 1,642
Federal Government 651 636 682 599 553 449 462 466 455 464 468
Total 86,721 82,802 81,784 81,452 82,030 82,254 86,168 86,937 86,864 87,596 88,555
Notes: ND = Data do not meet BLS or State agency disclosure standards.
Source: United States Department of Labor, Bureau of Labor Statistics
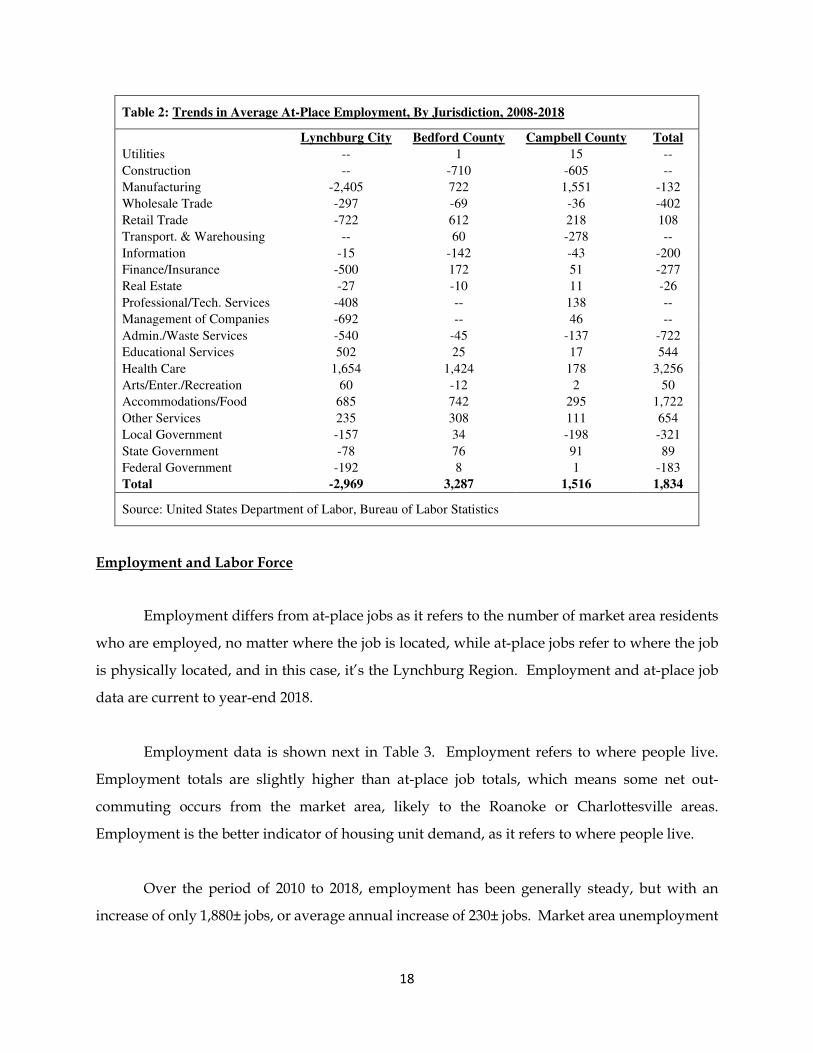
Table 2 shows the net change in at-place job totals, separated by jurisdiction, over the past
ten years. Apart from growth in the Accommodations/Food Sector, which has largely been
driven by new hotel construction, a large percentage of job growth has been in professional
employment categories. The table also shows that all job losses took place in Lynchburg, largely
due to Manufacturing losses. In fact, both Bedford and Campbell Counties recorded a net increase
in Manufacturing employment over the past eleven years, with Campbell County adding 1,550±
new Manufacturing jobs since 2008.
18
Table 2: Trends in Average At-Place Employment, By Jurisdiction, 2008-2018
Lynchburg City Bedford County Campbell County Total
Utilities -- 1 15 --
Construction -- -710 -605 --
Manufacturing -2,405 722 1,551 -132
Wholesale Trade -297 -69 -36 -402
Retail Trade -722 612 218 108
Transport. & Warehousing -- 60 -278 --
Information -15 -142 -43 -200
Finance/Insurance -500 172 51 -277
Real Estate -27 -10 11 -26
Professional/Tech. Services -408 -- 138 --
Management of Companies -692 -- 46 --
Admin./Waste Services -540 -45 -137 -722
Educational Services 502 25 17 544
Health Care 1,654 1,424 178 3,256
Arts/Enter./Recreation 60 -12 2 50
Accommodations/Food 685 742 295 1,722
Other Services 235 308 111 654
Local Government -157 34 -198 -321
State Government -78 76 91 89
Federal Government -192 8 1 -183
Total -2,969 3,287 1,516 1,834
Source: United States Department of Labor, Bureau of Labor Statistics
Employment and Labor Force
Employment differs from at-place jobs as it refers to the number of market area residents
who are employed, no matter where the job is located, while at-place jobs refer to where the job
is physically located, and in this case, it’s the Lynchburg Region. Employment and at-place job
data are current to year-end 2018.
Employment data is shown next in Table 3. Employment refers to where people live.
Employment totals are slightly higher than at-place job totals, which means some net out-
commuting occurs from the market area, likely to the Roanoke or Charlottesville areas.
Employment is the better indicator of housing unit demand, as it refers to where people live.
Over the period of 2010 to 2018, employment has been generally steady, but with an
increase of only 1,880± jobs, or average annual increase of 230± jobs. Market area unemployment

19
has decreased to a decade low of 3.5% from a high of 7.7 percent in 2009, at the time of the past
recession.
Employment growth has been slow since the recession. The apartment market has
increased. The increase is largely due to growth at Liberty University, as presented below.
Table 3: Trends in Employment and Unemployment, Lynchburg Region, 2008-2018
Labor Force Employment Unemployment Percent Unemployed
2008 101,653 97,452 4,201 4.1%
2009 99,687 92,353 7,334 7.4%
2010 102,650 94,714 7,936 7.7%
2011 102,186 94,814 7,372 7.2%
2012 101,014 94,314 6,700 6.6%
2013 100,916 94,593 6,323 6.3%
2014 101,004 95,302 5,702 5.6%
2015 100,058 95,130 4,928 4.9%
2016 99,285 94,698 4,587 4.6%
2017 100,135 95,819 4,316 4.3%
2018 100,060 96,589 3,471 3.5%
Net Change -1,593 -863 -730 -0.6%
Source: United States Department of Labor, Bureau of Labor Statistics
Future Employment Growth
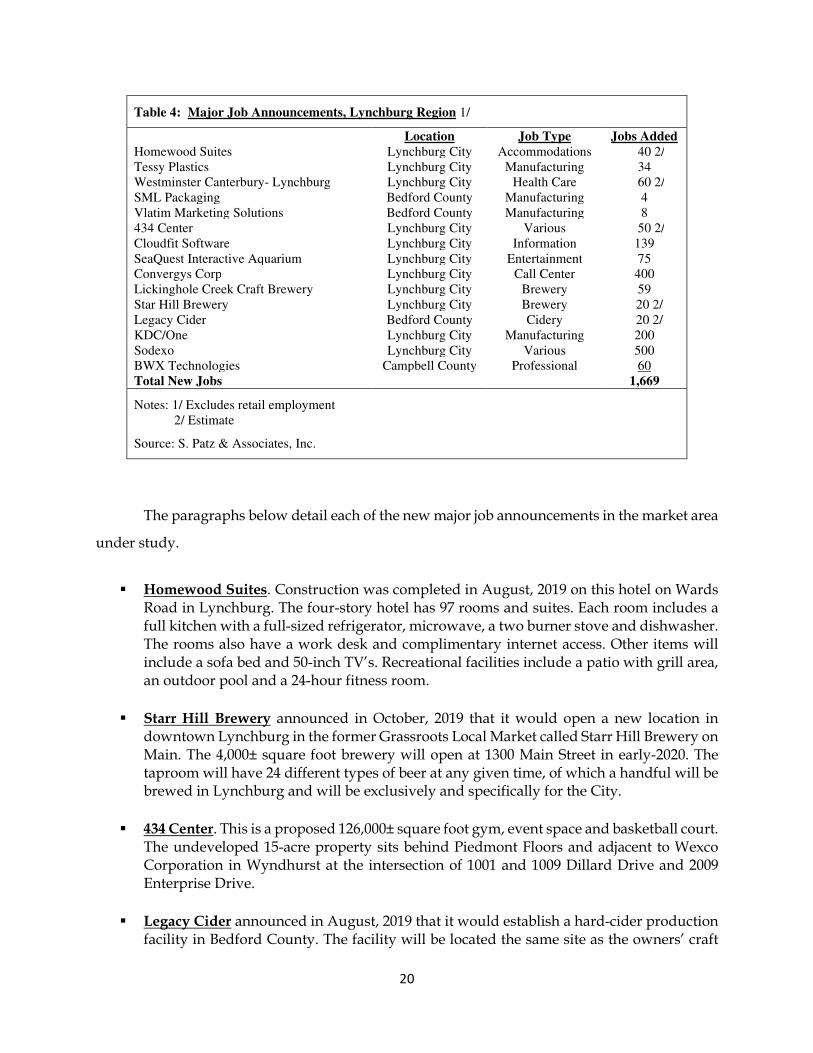
Table 4 below details the major job announcements in the Lynchburg region. In total, these
announcements could add 1,700± new, non-retail jobs to the market area. These trends are more
significant compared with past trends.
20
Table 4: Major Job Announcements, Lynchburg Region 1/
Location Job Type Jobs Added Homewood Suites Lynchburg City Accommodations 40 2/ Tessy Plastics Lynchburg City Manufacturing 34 Westminster Canterbury- Lynchburg Lynchburg City Health Care 60 2/ SML Packaging Bedford County Manufacturing 4 Vlatim Marketing Solutions Bedford County Manufacturing 8 434 Center Lynchburg City Various 50 2/ Cloudfit Software Lynchburg City Information 139 SeaQuest Interactive Aquarium Lynchburg City Entertainment 75 Convergys Corp Lynchburg City Call Center 400 Lickinghole Creek Craft Brewery Lynchburg City Brewery 59 Star Hill Brewery Lynchburg City Brewery 20 2/ Legacy Cider Bedford County Cidery 20 2/ KDC/One Lynchburg City Manufacturing 200 Sodexo Lynchburg City Various 500 BWX Technologies Campbell County Professional 60 Total New Jobs 1,669
Notes: 1/ Excludes retail employment 2/ Estimate
Source: S. Patz & Associates, Inc.
The paragraphs below detail each of the new major job announcements in the market area
under study.
Homewood Suites. Construction was completed in August, 2019 on this hotel on Wards Road in Lynchburg. The four-story hotel has 97 rooms and suites. Each room includes a full kitchen with a full-sized refrigerator, microwave, a two burner stove and dishwasher. The rooms also have a work desk and complimentary internet access. Other items will include a sofa bed and 50-inch TV’s. Recreational facilities include a patio with grill area, an outdoor pool and a 24-hour fitness room.
Starr Hill Brewery announced in October, 2019 that it would open a new location in downtown Lynchburg in the former Grassroots Local Market called Starr Hill Brewery on Main. The 4,000± square foot brewery will open at 1300 Main Street in early-2020. The taproom will have 24 different types of beer at any given time, of which a handful will be brewed in Lynchburg and will be exclusively and specifically for the City.
434 Center. This is a proposed 126,000± square foot gym, event space and basketball court. The undeveloped 15-acre property sits behind Piedmont Floors and adjacent to Wexco Corporation in Wyndhurst at the intersection of 1001 and 1009 Dillard Drive and 2009 Enterprise Drive.
Legacy Cider announced in August, 2019 that it would establish a hard-cider production facility in Bedford County. The facility will be located the same site as the owners’ craft

21
brewery, Apocalypse Ale Works, in Forest. The expansion also will include improvements to the brewery’s existing taproom and beer garden. Five jobs will be created.
Westminster Canterbury-Lynchburg is currently building a new, six-story health-care center. Construction on the 100,000± square foot facility was completed in August, 2019 and now houses approximately 80 residents. The building has 21 private rooms on four floors. There also are common spaces, big windows to let in lots of natural light and a neighborhood kitchen for residents to use that looks similar to one in a single-family home. Additional renovations could potentially add 15 assisted living accommodations after 2019.
Peaksview Brew & Games announced in August, 2019 that it would open a craft beer and games microbrewery in the winter of 2019 or early 2020 in the Timberlake area. The 4,500± square foot facility will be located in the old DAV building next to Timberlake Health & Wellness, formerly Timberlake Family Pharmacy, at 20276 Timberlake Road at the corner of Greenview Drive.
CloudFit Software, a company that focuses on service management and VIP monitoring services, announced in October, 2019 that it would employ 139 in its new location in Downtown Lynchburg. The company focuses on serving large companies and federal customers to help them use cloud computing and integrate it into the work they’re already doing with a data center. Cloudfit will occupy its new building in the spring of 2020.
Convergys Corporation opened a new call center at 2840 Linkhorne Drive in late-2017. Approximately 200 jobs were added with the opening and additional 400 will be added by the end of 2019.
SeaQuest Interactive Aquarium. This is a 22,000± square foot aquarium that opened in River Ridge Mall in October, 2019. The aquarium was built to the left of American Eagle Outfitters, where mall security, restrooms and administrative offices were formerly located. The mall will be SeaQuest’s ninth location. 75 people are employed at the facility.
Tessy Plastics, which processes plastic parts for the aviation, medical and other industries, announced in October, 2019 that it would add 34 new employees to its existing staff of 225 people. The company recently completed a 35,000± square foot expansion in April, 2019.
KDC/One, a manufacturer of surfactant, complex emulsions, OTC drug manufacturing as well as alcohol filling, announced in September, 2019 that it would expand and hire 200 new employees at its Lynchburg location.
Sodexo announced in July, 2019 that it would hire 500 employees for food service positions primarily serving Liberty University.
BWX Technologies announced in October, 2019 that it would restart its TRISO nuclear fuel production line and would hire 60 new employees as part of the move. Positions such

22
as engineers, technicians, quality analysis specialists and others will need to be filled at the Lynchburg plant. The expansion to BWXT's existing TRISO fuel production capability will position the company to meet emergent client interests in Department of Defense microreactors, space reactors, and civil advanced reactors.
Lickinghole Creek Craft Brewery announced in May, 2017 that it would open a new production facility in Lynchburg. The new brewery, which will be focused on sour beer production and barrel-aged brews, will result in the creation of 59 new jobs over three years.
Most of the new job announcements are small. The largest is the expansion of the call
center and Sodexo expansion, with lower, hourly wage positions. A total of nearly 1,700± new
jobs will be added by these companies, in addition to temporary construction jobs and spinoff
employment. Many of these new jobs are at hourly wages.
Liberty University
Liberty University is the primary job generator in the Lynchburg area. It has expanded
rapidly over the past four decades with a current on-campus student enrollment of 15,500± on-
campus students and 94,000± online students. The University is one of the prime economic
generators for the Lynchburg Region, as it employs 9,000± persons and generates sizable housing
unit demand, for both employees and students. Its active development programs create a
significant number of construction jobs.
In the paragraphs that follow, the University is described in terms of its student
enrollment trends and employment trends. The Liberty University campus is along the Route 460
Bypass and just north of the 460 Bypass/U.S. Route 29 interchange at the southern corner of the
City of Lynchburg.
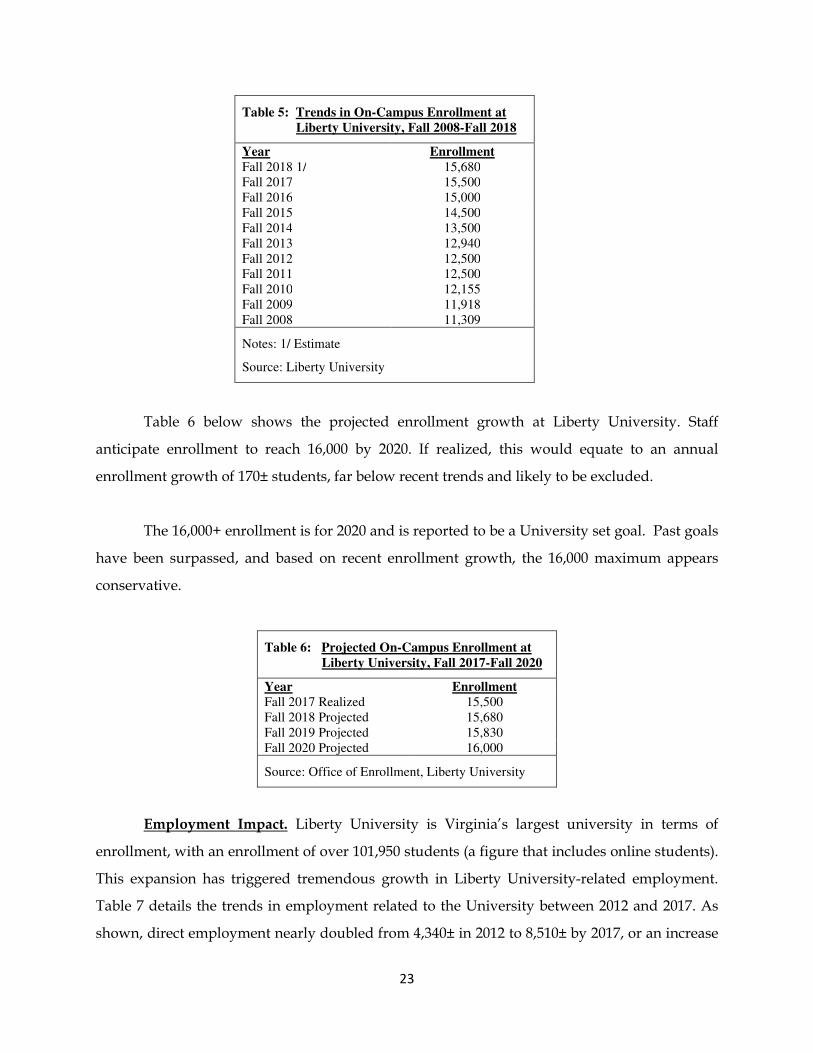
Enrollment. As of the Fall, 2017 semester, the date for which the most recent data are
available, there were 15,500± students enrolled on campus at Liberty University. Enrollment
likely grew by 180± students for Fall 2018 semester, but these figures have not been made public.
Enrollment grew by 560± for the Fall, 2014 semester, by 1,000± for the Fall, 2015 semester, and by
500± for the Fall, 2016 and Fall, 2017 semesters. Since 2008, enrollment at Liberty University has
increased by 4,370±, or by an annual average of 400± students.
23
Table 5: Trends in On-Campus Enrollment at Liberty University, Fall 2008-Fall 2018
Year Enrollment Fall 2018 1/ 15,680 Fall 2017 15,500 Fall 2016 15,000 Fall 2015 14,500 Fall 2014 13,500 Fall 2013 12,940 Fall 2012 12,500 Fall 2011 12,500 Fall 2010 12,155 Fall 2009 11,918 Fall 2008 11,309
Notes: 1/ Estimate
Source: Liberty University
Table 6 below shows the projected enrollment growth at Liberty University. Staff
anticipate enrollment to reach 16,000 by 2020. If realized, this would equate to an annual
enrollment growth of 170± students, far below recent trends and likely to be excluded.
The 16,000+ enrollment is for 2020 and is reported to be a University set goal. Past goals
have been surpassed, and based on recent enrollment growth, the 16,000 maximum appears
conservative.
Table 6: Projected On-Campus Enrollment at Liberty University, Fall 2017-Fall 2020
Year Enrollment Fall 2017 Realized 15,500 Fall 2018 Projected 15,680 Fall 2019 Projected 15,830 Fall 2020 Projected 16,000
Source: Office of Enrollment, Liberty University
Employment Impact. Liberty University is Virginia’s largest university in terms of
enrollment, with an enrollment of over 101,950 students (a figure that includes online students).
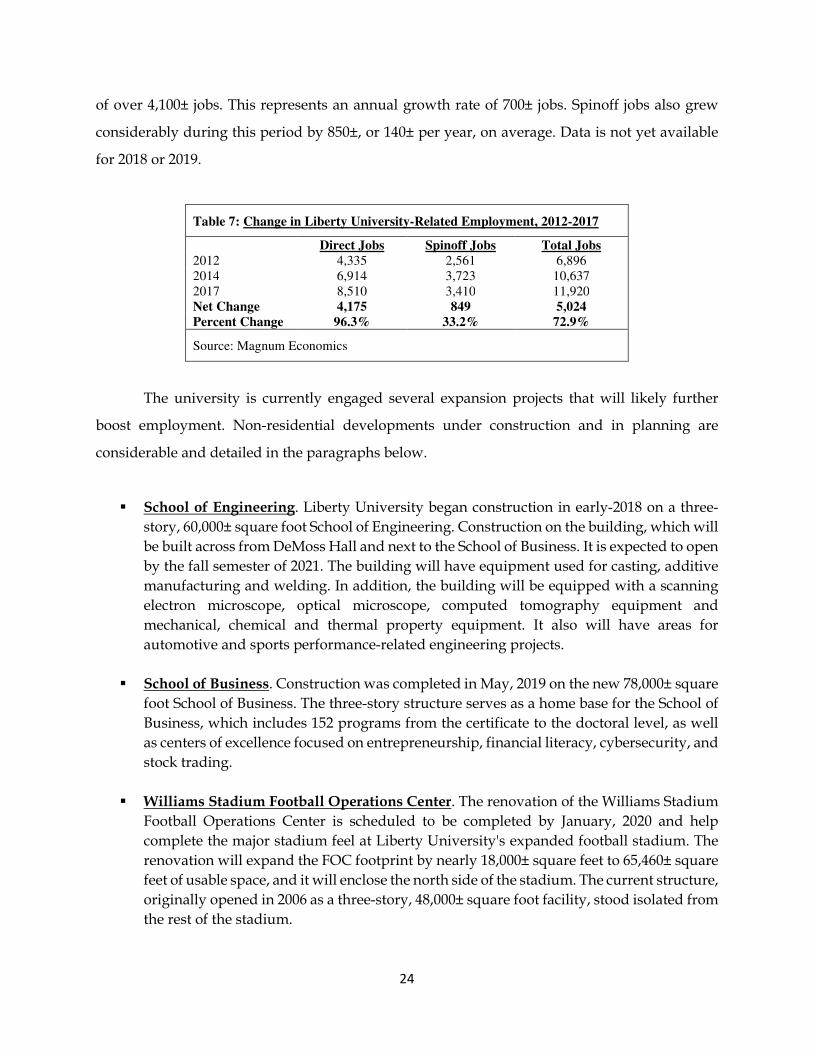
This expansion has triggered tremendous growth in Liberty University-related employment.
Table 7 details the trends in employment related to the University between 2012 and 2017. As
shown, direct employment nearly doubled from 4,340± in 2012 to 8,510± by 2017, or an increase
24
of over 4,100± jobs. This represents an annual growth rate of 700± jobs. Spinoff jobs also grew
considerably during this period by 850±, or 140± per year, on average. Data is not yet available
for 2018 or 2019.
Table 7: Change in Liberty University-Related Employment, 2012-2017
Direct Jobs Spinoff Jobs Total Jobs 2012 4,335 2,561 6,896 2014 6,914 3,723 10,637 2017 8,510 3,410 11,920 Net Change 4,175 849 5,024 Percent Change 96.3% 33.2% 72.9%
Source: Magnum Economics
The university is currently engaged several expansion projects that will likely further
boost employment. Non-residential developments under construction and in planning are
considerable and detailed in the paragraphs below.
School of Engineering. Liberty University began construction in early-2018 on a three-
story, 60,000± square foot School of Engineering. Construction on the building, which will
be built across from DeMoss Hall and next to the School of Business. It is expected to open
by the fall semester of 2021. The building will have equipment used for casting, additive
manufacturing and welding. In addition, the building will be equipped with a scanning
electron microscope, optical microscope, computed tomography equipment and
mechanical, chemical and thermal property equipment. It also will have areas for
automotive and sports performance-related engineering projects.
School of Business. Construction was completed in May, 2019 on the new 78,000± square
foot School of Business. The three-story structure serves as a home base for the School of
Business, which includes 152 programs from the certificate to the doctoral level, as well
as centers of excellence focused on entrepreneurship, financial literacy, cybersecurity, and
stock trading.
Williams Stadium Football Operations Center. The renovation of the Williams Stadium
Football Operations Center is scheduled to be completed by January, 2020 and help
complete the major stadium feel at Liberty University's expanded football stadium. The
renovation will expand the FOC footprint by nearly 18,000± square feet to 65,460± square
feet of usable space, and it will enclose the north side of the stadium. The current structure,
originally opened in 2006 as a three-story, 48,000± square foot facility, stood isolated from
the rest of the stadium.

25
Vines Center Addition. Construction is ongoing on a 125,00± square foot expansion to
the existing Vines Center. The facility will contain a multipurpose arena that will
accommodate sporting events and concerts that do not require the 10,000± seats that the
Vines Center currently provides. The new arena will accommodate events that hold 4,000±
attendees. The arena is anticipated to open in 2020.
Center for Advanced Engineering and Research. Liberty announced plans in October,
2018 build a technology park behind the Center for Energy Research & Education (CERE)
and put its School of Engineering. Plans are in the works to construct 10 additional
buildings in phases. The campus will be Liberty’s technology park and home for business
and industry partners to the school. The new engineering school now will be built next to
the School of Business across from DeMoss Hall.
East Campus Garage. Construction recently began on a new 80,000 square foot, nine-story parking garage on East Campus. The garage will be built in the place of two dormitory buildings near the field hockey and lacrosse fields. The dorms, which hold 90 students each, will be demolished as soon as students leave in May and construction will begin shortly after. The garage will hold 2,000 cars and will have spots for residential and commuter students as well as staff and visitors. The garage is expected to open by July or August of 2020.
In addition to the above, the following projects have been completed since 2013.
Center for Medical and Health Sciences (140,000 SF) Jerry Falwell Library (170,000 SF) LaHaye Student Union (230,000 SF) Science Hall (121,000 SF) Liberty Baseball Stadium (2,500 seats) Kamphius Field (1,000 seats) Center for Music and Worship Arts (140,000 SF) Demoss Campus Center (175,000 SF) Indoor Track Complex (169,000 SF) Natatorium (75,000 SF) Freedom Tower Liberty Athletics Center (60,000 SF) Indoor Practice Facility (95,000 SF) Expanded Equestrian Center
Liberty University Summary. Between Liberty University’s planned on-campus growth,
and the overall expansion of the Lynchburg area economy, sizable net employment and job
growth are being realized. Some of this growth is the result of activity and expansion at Liberty
University. Overall, there is considerable expansion in the Lynchburg market area economy
which will continue to generate employment growth and housing unit demand.

26
Age-Restricted Apartment Analysis
We defined the target market for the proposed age-restricted apartment units as
households with the head of household in the 62 to 79 age category and with incomes of $30,000
and above. This is the sector of the Lynchburg housing market that typically is attracted to age-
restricted housing of the type planned, where no home maintenance is required and no services
are included in the rent.
Typically, seniors at IL facilities are active and require no assistance for daily chores. The
“active” market is defined as persons aged 62 to 79. Many of those seniors will “age in place” at
an age-restricted community, but the original residents are typically under 80 years of age.
We used $30,000+ as the income category for seniors who typically are attracted to age-
restricted housing. At 40% of income allocated to net rent, active seniors in this income category
can afford monthly rents of $1,000+. Most general occupancy apartments generate net rents
below $1,000 for a one-bedroom, so this represents a realistic net rent for new independent living
apartment units.
As stated above, there are no direct comps in in the Lynchburg market that are IL
apartments without services. All area age-restricted apartments offer meals and other services.
Current age-restricted communities either offer services with high monthly fees, or have income
restrictions for low- and middle-income residents. The market area has two large CCRC’s
(Continuing Care Retirement Communities). These require major entry fees, plus fees for services
and meals. These are IL facilities with services or are part of a CCRC. We did not study any of
the age-restricted and rent-restricted apartment properties. The senior housing analysis, i.e., the
current “competition” is presented in the second part of this section.
Demographic Analysis
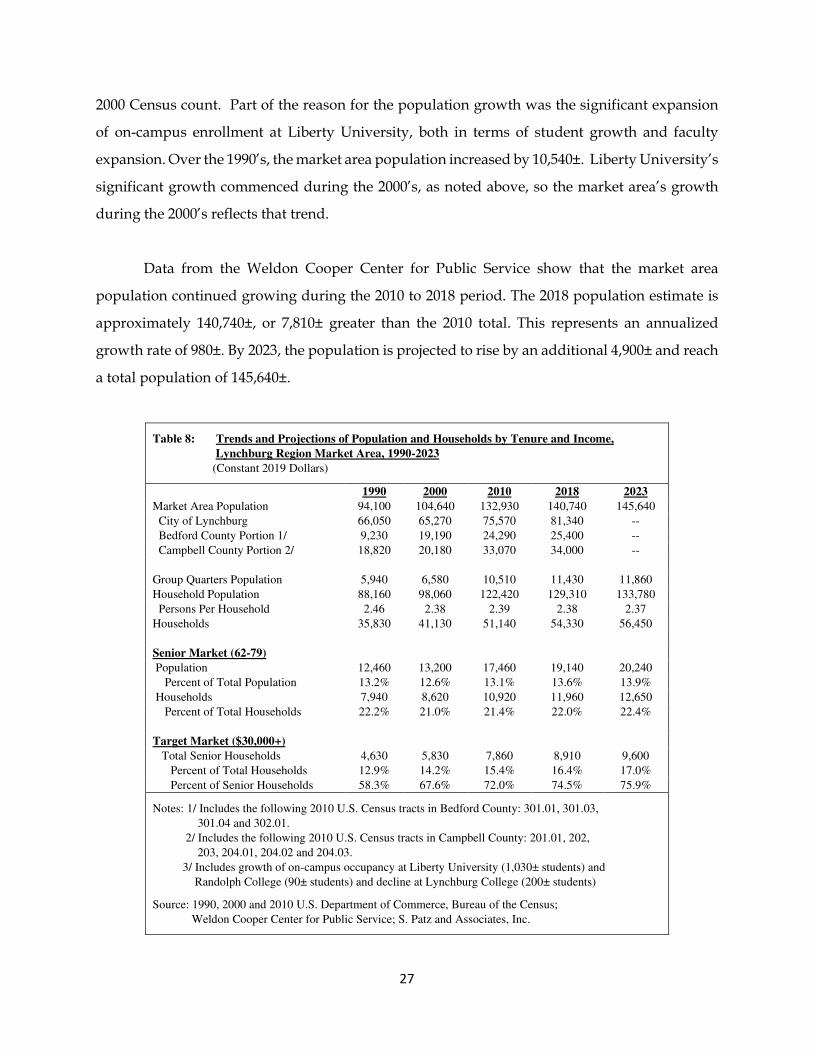
Population Trends and Projections. Table 8 presents the demographic analysis in
support of new market area IL apartment unit demand. The 2010 Census population count for
the market area totaled 132,930±. That figure represents a 28,300± population increase over the
27
2000 Census count. Part of the reason for the population growth was the significant expansion
of on-campus enrollment at Liberty University, both in terms of student growth and faculty
expansion. Over the 1990’s, the market area population increased by 10,540±. Liberty University’s
significant growth commenced during the 2000’s, as noted above, so the market area’s growth
during the 2000’s reflects that trend.
Data from the Weldon Cooper Center for Public Service show that the market area
population continued growing during the 2010 to 2018 period. The 2018 population estimate is
approximately 140,740±, or 7,810± greater than the 2010 total. This represents an annualized
growth rate of 980±. By 2023, the population is projected to rise by an additional 4,900± and reach
a total population of 145,640±.
Table 8: Trends and Projections of Population and Households by Tenure and Income,
Lynchburg Region Market Area, 1990-2023
(Constant 2019 Dollars)
1990 2000 2010 2018 2023
Market Area Population 94,100 104,640 132,930 140,740 145,640
City of Lynchburg 66,050 65,270 75,570 81,340 --
Bedford County Portion 1/ 9,230 19,190 24,290 25,400 --
Campbell County Portion 2/ 18,820 20,180 33,070 34,000 --
Group Quarters Population 5,940 6,580 10,510 11,430 11,860
Household Population 88,160 98,060 122,420 129,310 133,780
Persons Per Household 2.46 2.38 2.39 2.38 2.37
Households 35,830 41,130 51,140 54,330 56,450
Senior Market (62-79)
Population 12,460 13,200 17,460 19,140 20,240
Percent of Total Population 13.2% 12.6% 13.1% 13.6% 13.9%
Households 7,940 8,620 10,920 11,960 12,650
Percent of Total Households 22.2% 21.0% 21.4% 22.0% 22.4%
Target Market ($30,000+)
Total Senior Households 4,630 5,830 7,860 8,910 9,600
Percent of Total Households 12.9% 14.2% 15.4% 16.4% 17.0%
Percent of Senior Households 58.3% 67.6% 72.0% 74.5% 75.9%
Notes: 1/ Includes the following 2010 U.S. Census tracts in Bedford County: 301.01, 301.03,
301.04 and 302.01.
2/ Includes the following 2010 U.S. Census tracts in Campbell County: 201.01, 202,
203, 204.01, 204.02 and 204.03.
3/ Includes growth of on-campus occupancy at Liberty University (1,030± students) and
Randolph College (90± students) and decline at Lynchburg College (200± students)
Source: 1990, 2000 and 2010 U.S. Department of Commerce, Bureau of the Census;
Weldon Cooper Center for Public Service; S. Patz and Associates, Inc.
28
The market area population has had a steady growth since 1990 and prior. Once the
Liberty University population began growing, the market area population did so as well.
Notes 1 and 2 in Table 8 identify the Census tracts within Bedford and Campbell counties
that are included in the market area, along with the City of Lynchburg. There has been net
population growth since 1990 in each jurisdiction that comprises the market area. This is
particularly true for the City of Lynchburg.
Group Quarters Population. The market area has a large Group Quarters population,
which is primarily comprised of the on-campus student population at the three area universities
in Lynchburg, and, to a lesser extent, persons in nursing homes, seniors in hospitals and persons
in other institutional housing. The Group Quarters population increased since 2000, principally
driven by enrollment growth in dorms at Liberty University. Much of the new on-campus
residential development at Liberty University in recent years was based on the replacement of
older residence halls with newer and larger dorms, but a net on-campus bed count was realized.
The student population that lives in off-campus housing is counted in the Household
Population. The Group Quarters population is largely the on-campus population. It is subtracted
from total population to calculate Household Population. Household Population is the basis for
determining housing unit demand.
Households. In 2010, at the time of the most recent Census count, the market area had
51,140± households. The average household size was 2.39. Trend data over the past twenty years
show a slight decrease in household size. The market area average household size fell from 2.46
in 1990 to 2.38 in 2000, but slightly rose to the rate of 2.39 in 2010.
Part of the reason for the increase in the average household size during the 2000’s was
doubling up of households due to the recession. Adult children moved back home, and families
doubled up due to job losses. Historic, and more normal trends in the average household size
are not near normal and are expected to remain at that rate between 2018 and 2023.
29
The market area average household size is small. This reflects the fact that the City of
Lynchburg comprises nearly 58 percent of the market area population. It also reflects the large
number of students who live off campus, primarily with an estimated average of 2.3 students per
housing unit. Our research found that mostly students in one-bedroom apartment units are
single-person households and students in two-bedroom housing units are two-person
households. The market area also has a sizable senior population, one with small sized
households. The City of Lynchburg’s zoning code allows a maximum of three unrelated
individuals per household.
The market area had a growth of 10,010± households during the 2000’s, of which nearly
46 percent were renters. One key point to note in Table 8 is that the renter household growth was
modest during the 1990’s, but sizable during the 2000’s. This is the result of Liberty University’s
enrollment growth and the resulting increase in demand for off-campus housing, but also a result
of the recession in the last part of the 2000 decade. By 2023, the market area is proposed to add
2,120± new households to reach a total of 56,450± households.
Active Senior Demographics. In 2018, the active senior population (persons between the
ages of 62 and 79) in the market area totaled 19,140±, or 13.6 percent of the total market area
population. Although adults between the ages of 55 and 61 are often permitted to live in
independent living communities, this segment of the adult population comprise only a small
portion of the potential market for senior housing. Including this demographic would overstate
the market. The under 62 aged resident is often disabled. It is a small part of the total market for
independent living apartments.
During the 2010 to 2018 period, the net growth of this population was 1,680±, or 210±
people per year, on average. This is compared to an annualized growth rate of 70± during the
2000’s. By 2023, the market area is projected to total 20,240± persons in the age category under
study, or 13.9 percent of the total market area population. This forecast is for a net growth of
1,100± persons in the age category under study.
30
Data in Table 8 also show the growth in the number of households with the household
head aged 62 to 79. In 2018, the market area had 11,960± active senior-headed households, at an
average household size of 1.60. By 2023, this total is projected to grow by 690± and reach 12,650±.
Target Senior Market. The demographic analysis shows that as of 2018, the market area
had 8,910± households with the household head aged 62 to 79 and earning an annual income in
excess of $30,000, when reported in constant 2019 dollars. Senior renters in this income range can
afford net rents of $1,000, based on 40% of income allocated to net rent. This represents a growth
rate of 1,050± during the 2010 to 2018 period. By 2023, the market area is projected to number
9,600± households within this age an income category, or an increase of 690± households.
These demographic data show a sizable population growth within the Lynchburg Region
and that the defined “target” senior market is also growing. Of note is that nearly 75 percent of
senior headed households earn annual incomes of over $30,000. Also of note is the large average
household size of the County’s population. The average size of the active senior population is
1.60.
Census data do not provide data on the number of one- and two-person households with
a senior head of household, particularly for households by income category. Census data does
show that the average household size and at 1.64 persons per household, the majority are one-
and two-person households.
Senior Apartment Market Analysis
The market area has no age-restricted rental apartment communities that are direct
“comps” for the proposal on the study site. Within the market area are two large Continuing Care
Retirement Communities (CCRC’s) – Westminster Canterbury and The Summit -- in addition to
three independent living facilities – Runk & Pratt at Liberty Ridge, Bentley Commons and Valley
View. These are age-restricted facilities with services for seniors.
31
These communities have mostly older residents who are over the age of 75. These age-
restricted properties are full-service communities that offer meals, laundry service and
housekeeping as part of the monthly fees. All of these age-restricted apartments have higher
rental fees compared with standard area apartments. Additional charges are required for
additional care, if needed
Characteristics of the Senior Apartment Market. The market area’s senior apartment
properties are listed in Table 9 and contain a combined total of nearly 700 rental units.
Westminster Canterbury and The Summit are large CCRC’s, with a mix of independent
living, assisted living, memory care and nursing care. The units shown in Table 9 are the
independent living units, but with services, as described above. Both offer a mix of apartments
and cottages. They require entrance fees and are full-service communities. These communities,
which only have one vacant unit, have a mix of housing types along with a mix of levels of care.
The paragraphs below detail each of these communities
Westminster Canterbury is a large CCRC located on approximately 42 acres. It consists
of 36 cottages, three residential buildings containing 198 independent living units and
adjoining buildings containing 105 nursing beds, 47 assisted living beds, and a 14-bed
memory support center. The cottage units were built in 1997 and 1998 while the apartment
units were built in 1981.
Since this is a CCRC, entrance requires a large buy in, which ranges between $53,741 and
$423,035, depending on the unit size. The facility maintains an extensive wait list, with
management notes that the highest demand is for the larger two-bedroom/ two-bathroom
apartment units.
This is a fully amenitized community with common areas and amenities such as the
dining rooms, Canterbury Cafe, James River Grille, meeting and conference rooms, arts
and crafts room, Art Studio, exercise/fitness amenities, the Strickler Library, Weissert
Chapel, “The Commons” area, “Bridge” area, lobbies, lounges, indoor and outdoor
recreational areas
The Summit is a large CCRC owned and operated by Centra Health. It was built in 2003
and contains an 85-unit apartment building alongside 16 cottages. Since this is a CCRC,
entrance requires an entrance fee that ranges between $198,791 and $676,672, depending
on the unit size.
32
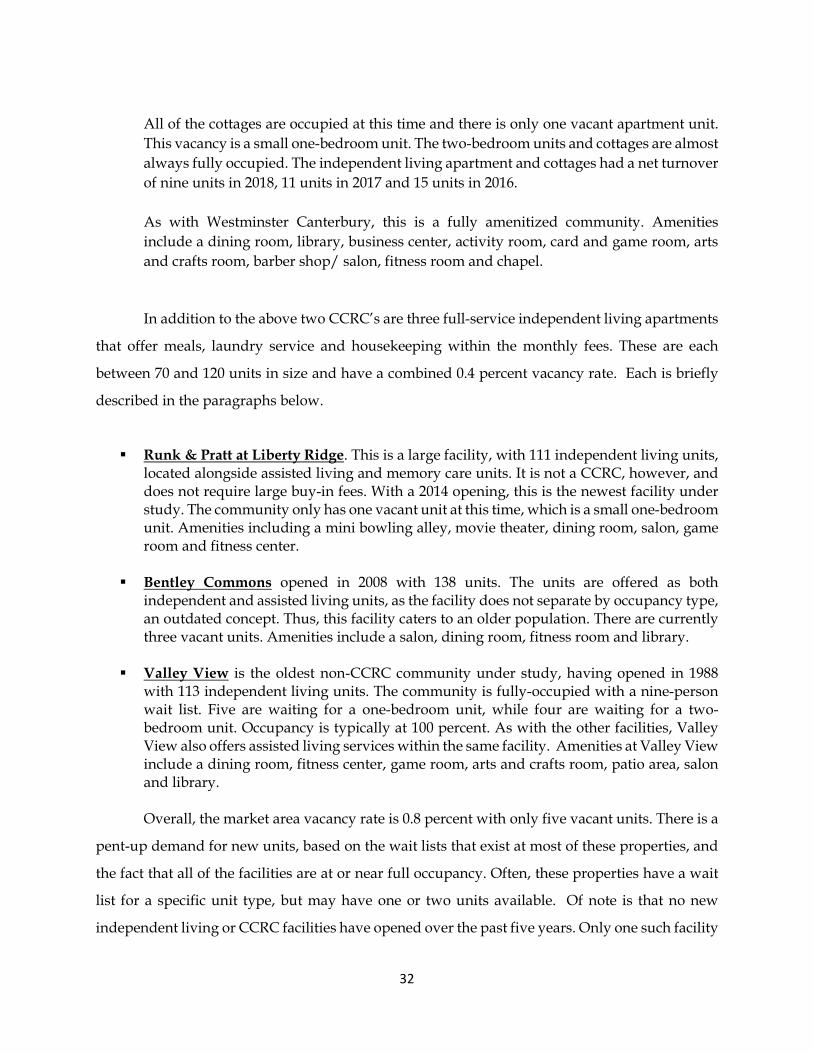
All of the cottages are occupied at this time and there is only one vacant apartment unit.
This vacancy is a small one-bedroom unit. The two-bedroom units and cottages are almost
always fully occupied. The independent living apartment and cottages had a net turnover
of nine units in 2018, 11 units in 2017 and 15 units in 2016.
As with Westminster Canterbury, this is a fully amenitized community. Amenities
include a dining room, library, business center, activity room, card and game room, arts
and crafts room, barber shop/ salon, fitness room and chapel.
In addition to the above two CCRC’s are three full-service independent living apartments
that offer meals, laundry service and housekeeping within the monthly fees. These are each
between 70 and 120 units in size and have a combined 0.4 percent vacancy rate. Each is briefly
described in the paragraphs below.
Runk & Pratt at Liberty Ridge. This is a large facility, with 111 independent living units, located alongside assisted living and memory care units. It is not a CCRC, however, and does not require large buy-in fees. With a 2014 opening, this is the newest facility under study. The community only has one vacant unit at this time, which is a small one-bedroom unit. Amenities including a mini bowling alley, movie theater, dining room, salon, game room and fitness center.
Bentley Commons opened in 2008 with 138 units. The units are offered as both independent and assisted living units, as the facility does not separate by occupancy type, an outdated concept. Thus, this facility caters to an older population. There are currently three vacant units. Amenities include a salon, dining room, fitness room and library.
Valley View is the oldest non-CCRC community under study, having opened in 1988 with 113 independent living units. The community is fully-occupied with a nine-person wait list. Five are waiting for a one-bedroom unit, while four are waiting for a two-bedroom unit. Occupancy is typically at 100 percent. As with the other facilities, Valley View also offers assisted living services within the same facility. Amenities at Valley View include a dining room, fitness center, game room, arts and crafts room, patio area, salon and library. Overall, the market area vacancy rate is 0.8 percent with only five vacant units. There is a
pent-up demand for new units, based on the wait lists that exist at most of these properties, and
the fact that all of the facilities are at or near full occupancy. Often, these properties have a wait
list for a specific unit type, but may have one or two units available. Of note is that no new
independent living or CCRC facilities have opened over the past five years. Only one such facility

33
opened over the past decade. Essentially all of the new apartment development in the region in
recent years has catered to the professional and student populations.
Table 9: Characteristics of Independent Living Communities, Lynchburg Region Market Area, November, 2019
Map D Key
Year Built
Total Units
Vacant Units
CCRC The Summit 1 Apartments 2003 85 1 Cottages 2003 16 0 Westminster Canterbury 2 Apartments 1981 198 0 Cottages 1997/98 36 0 (Subtotal) (335) (1) Independent Living Runk & Pratt at Liberty Ridge 3 2014 111 1 Bentley Commons 4 2008 74 3 Valley View 5 1988 113 0 (Subtotal) (298) (4) Total 633 5 Vacancy Rate 0.8%
Source: S. Patz & Associates, Inc.
Apart from the above communities, the only market area age-restricted apartment
communities that are not fully occupied by Section 8 voucher holders have income restrictions.
These include the 101-unit Jefferson House, 56-unit Tinbridge Manor and 150-unit Wesley
Apartments. These are mature apartments that have rents restricted to 50% and 60% of the Area
Median Income (AMI) and are routinely fully occupied. Nevertheless, rents at these properties
are low and would not be competitive with a new, market rate age-restricted apartment
community.
Of note is that management at each of these communities report that they turn prospective
tenants away who are over income qualified. Thus, some seniors are searching for an exclusively
senior community but have been unable to find a suitable fit.
Map D shows the locations of the age-restricted properties listed in Table 9. As shown,
nearly all are located in suburban settings. Runk & Pratt at Liberty Ridge is located off Candlers
Mountain Road near Liberty University. Valley View Retirement Community is located north of
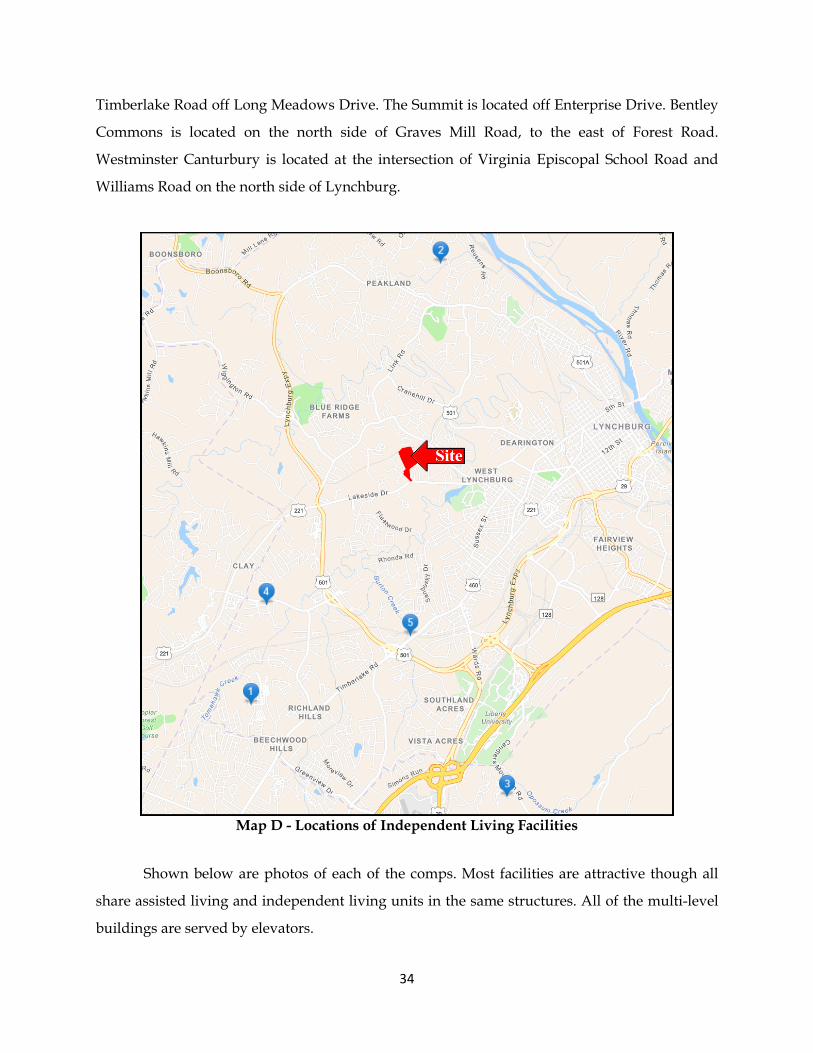
34
Timberlake Road off Long Meadows Drive. The Summit is located off Enterprise Drive. Bentley
Commons is located on the north side of Graves Mill Road, to the east of Forest Road.
Westminster Canturbury is located at the intersection of Virginia Episcopal School Road and
Williams Road on the north side of Lynchburg.
Map D - Locations of Independent Living Facilities
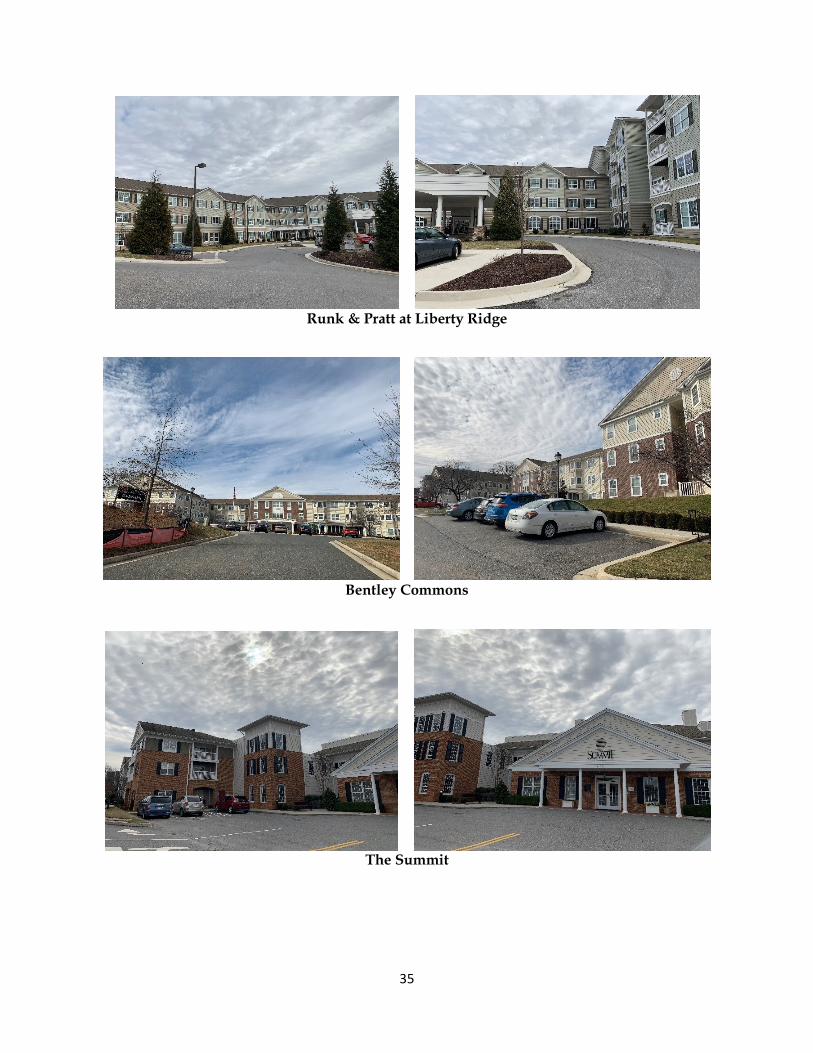
Shown below are photos of each of the comps. Most facilities are attractive though all
share assisted living and independent living units in the same structures. All of the multi-level
buildings are served by elevators.
35
Runk & Pratt at Liberty Ridge
Bentley Commons
The Summit

36
Valley View Retirement Community
Westminster Canterbury
Summary. The current IL market is at a near 100% occupancy rate, with a wait list for
some apartment units. On-site management reports that residents are primarily attracted to
larger units, at a sizable increase in monthly fees and endowment charges. So the issue at hand
is why are there not more facilities for active seniors and/or any independent apartments for
more moderate-income seniors.
The answer is four-fold:
1) Many of these facilities are church-related and market to church members; 2) Any CCRC requires a large parcel to support on-site amenities and features; 3) The cost of assembling land and providing a considerable amenity package for
residents is often too expensive for traditional home builders.
37
4) Most of the existing IL properties listed in Table 9 are mature. It is likely that these types of facilities cannot be built currently, due to land availability, and cost to construct.
The IL facility without services represents a viable alternative for active seniors. The
CCRC’s and age-restricted communities with services attract an over 75 population, who are not
particularly “active”.
Monthly Fees
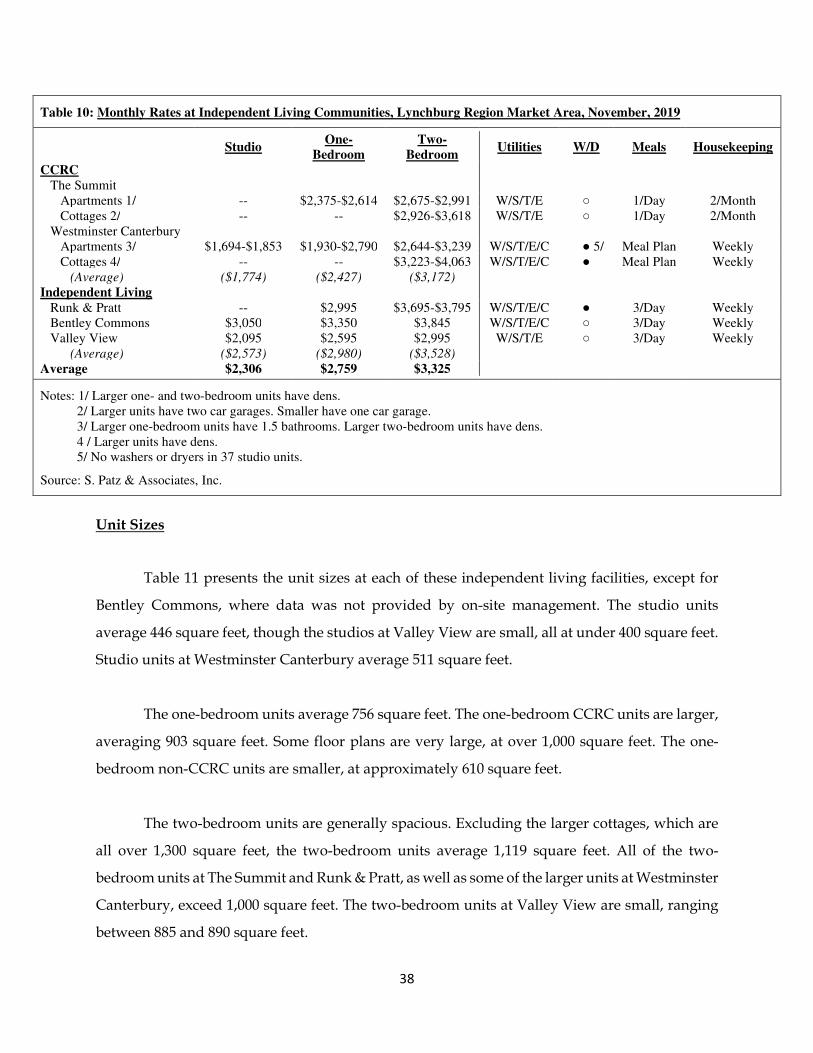
Table 10 presents the monthly fees (i.e., rents) at each of these independent living facilities
under study. With meals, housekeeping, laundry service, on-site staff, etc., these apartments
generate monthly fees of $2,310± for studio units, $2,760± for one-bedroom units and $3,330± for
three-bedroom units. The Summit and Westminster Canterbury have large two-bedroom
cottages, some with dens, that rent for between $2,926 and $4,063. Of note is that the one-bedroom
fees at the CCRC’s are below the non-CCRC facilities by $550±. This is because the CCRC’s are
now aging. The two-bedroom rents at the CCRC’s are nearly $360 below the non-CCRC facilities.
The fees shown include water, sewage, trash collection and electricity. Rents at
Westminster Canterbury, Runk & Pratt and Bentley Commons also include cable television.
These fees also each include between one and three daily meals and either a weekly or bimonthly
housekeeping schedule.
These rates are being fully accepted as evidenced by the high occupancy rates. However,
most of these properties are starting to mature and none market to the under 70 age population.
38
Unit Sizes
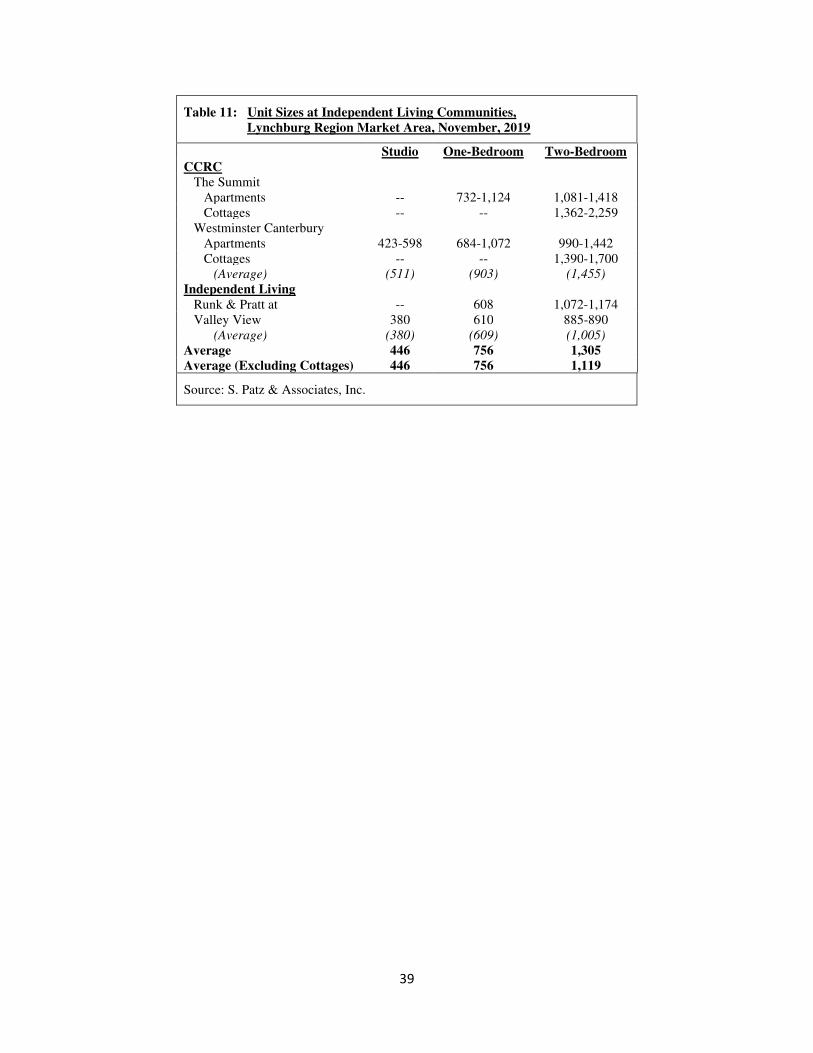
Table 11 presents the unit sizes at each of these independent living facilities, except for
Bentley Commons, where data was not provided by on-site management. The studio units
average 446 square feet, though the studios at Valley View are small, all at under 400 square feet.
Studio units at Westminster Canterbury average 511 square feet.
The one-bedroom units average 756 square feet. The one-bedroom CCRC units are larger,
averaging 903 square feet. Some floor plans are very large, at over 1,000 square feet. The one-
bedroom non-CCRC units are smaller, at approximately 610 square feet.
The two-bedroom units are generally spacious. Excluding the larger cottages, which are
all over 1,300 square feet, the two-bedroom units average 1,119 square feet. All of the two-
bedroom units at The Summit and Runk & Pratt, as well as some of the larger units at Westminster
Canterbury, exceed 1,000 square feet. The two-bedroom units at Valley View are small, ranging
between 885 and 890 square feet.
Table 10: Monthly Rates at Independent Living Communities, Lynchburg Region Market Area, November, 2019
Studio
One-Bedroom
Two-Bedroom
Utilities W/D Meals Housekeeping
CCRC The Summit Apartments 1/ -- $2,375-$2,614 $2,675-$2,991 W/S/T/E ○ 1/Day 2/Month Cottages 2/ -- -- $2,926-$3,618 W/S/T/E ○ 1/Day 2/Month Westminster Canterbury Apartments 3/ $1,694-$1,853 $1,930-$2,790 $2,644-$3,239 W/S/T/E/C ● 5/ Meal Plan Weekly Cottages 4/ -- -- $3,223-$4,063 W/S/T/E/C ● Meal Plan Weekly (Average) ($1,774) ($2,427) ($3,172) Independent Living Runk & Pratt -- $2,995 $3,695-$3,795 W/S/T/E/C ● 3/Day Weekly Bentley Commons $3,050 $3,350 $3,845 W/S/T/E/C ○ 3/Day Weekly Valley View $2,095 $2,595 $2,995 W/S/T/E ○ 3/Day Weekly (Average) ($2,573) ($2,980) ($3,528) Average $2,306 $2,759 $3,325
Notes: 1/ Larger one- and two-bedroom units have dens. 2/ Larger units have two car garages. Smaller have one car garage. 3/ Larger one-bedroom units have 1.5 bathrooms. Larger two-bedroom units have dens. 4 / Larger units have dens. 5/ No washers or dryers in 37 studio units.
Source: S. Patz & Associates, Inc.
39
Table 11: Unit Sizes at Independent Living Communities, Lynchburg Region Market Area, November, 2019
Studio One-Bedroom Two-Bedroom CCRC The Summit Apartments -- 732-1,124 1,081-1,418 Cottages -- -- 1,362-2,259 Westminster Canterbury Apartments 423-598 684-1,072 990-1,442 Cottages -- -- 1,390-1,700 (Average) (511) (903) (1,455) Independent Living Runk & Pratt at -- 608 1,072-1,174 Valley View 380 610 885-890 (Average) (380) (609) (1,005) Average 446 756 1,305 Average (Excluding Cottages) 446 756 1,119
Source: S. Patz & Associates, Inc.
Related Documents