Navigating Navigating the the Numbers: Numbers: Greenhouse Gas Greenhouse Gas Data and Data and International International Climate Policy Climate Policy COP11 December 5, 2005 Climate and Energy Program World Resources Institute

Navigating the Numbers: Greenhouse Gas Data and International Climate Policy COP11
Jan 22, 2016
Navigating the Numbers: Greenhouse Gas Data and International Climate Policy COP11 December 5, 2005. Climate and Energy Program World Resources Institute. Data providers CDIAC RIVM IPCC IEA World Bank. UNDP U.S. EPA U.S. EIA UNFCCC Houghton. Acknowledgements. Funding providers - PowerPoint PPT Presentation
Welcome message from author
This document is posted to help you gain knowledge. Please leave a comment to let me know what you think about it! Share it to your friends and learn new things together.
Transcript
Navigating the Navigating the Numbers:Numbers:
Greenhouse Gas Data Greenhouse Gas Data andand
InternationalInternationalClimate PolicyClimate Policy
COP11December 5, 2005
Climate and Energy ProgramWorld Resources Institute

• Data providers– CDIAC– RIVM – IPCC– IEA– World Bank
– UNDP– U.S. EPA– U.S. EIA– UNFCCC– Houghton
Acknowledgements
• Funding providers• U.S. EPA, Government of Norway, Wallace Global
Fund, Prospect Hill Foundation
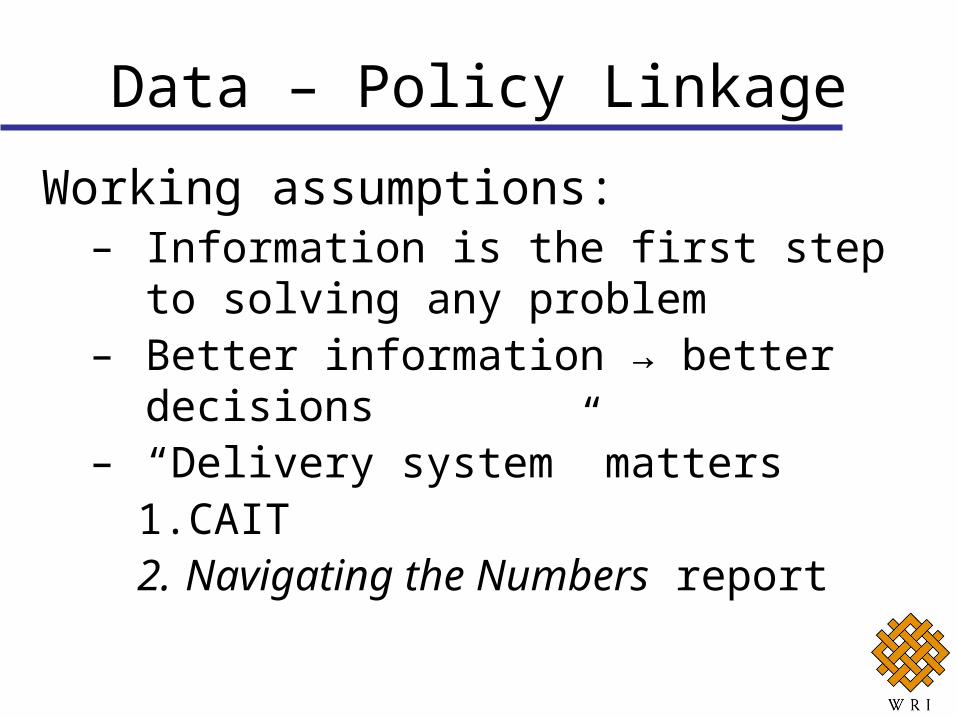
Working assumptions: – Information is the first step to solving any problem – Better information → better decisions– “Delivery system” matters
1. CAIT2. Navigating the Numbers report
Data – Policy Linkage
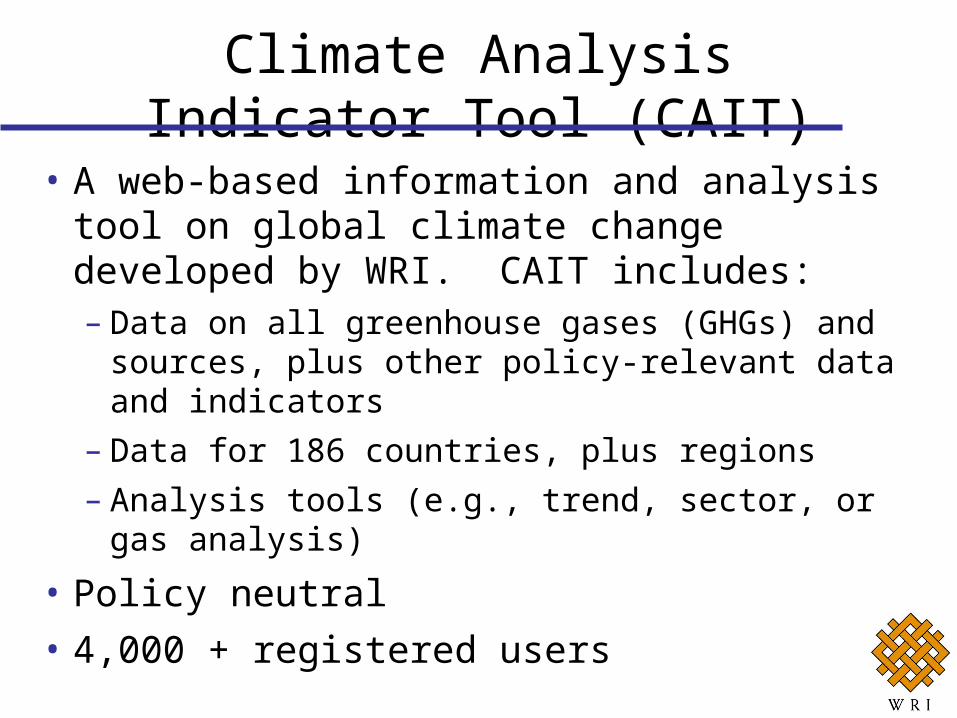
• A web-based information and analysis tool on global
climate change developed by WRI. CAIT includes:– Data on all greenhouse gases (GHGs) and sources, plus
other policy-relevant data and indicators– Data for 186 countries, plus regions– Analysis tools (e.g., trend, sector, or gas analysis)
• Policy neutral• 4,000 + registered users
Climate Analysis Indicator Tool (CAIT)

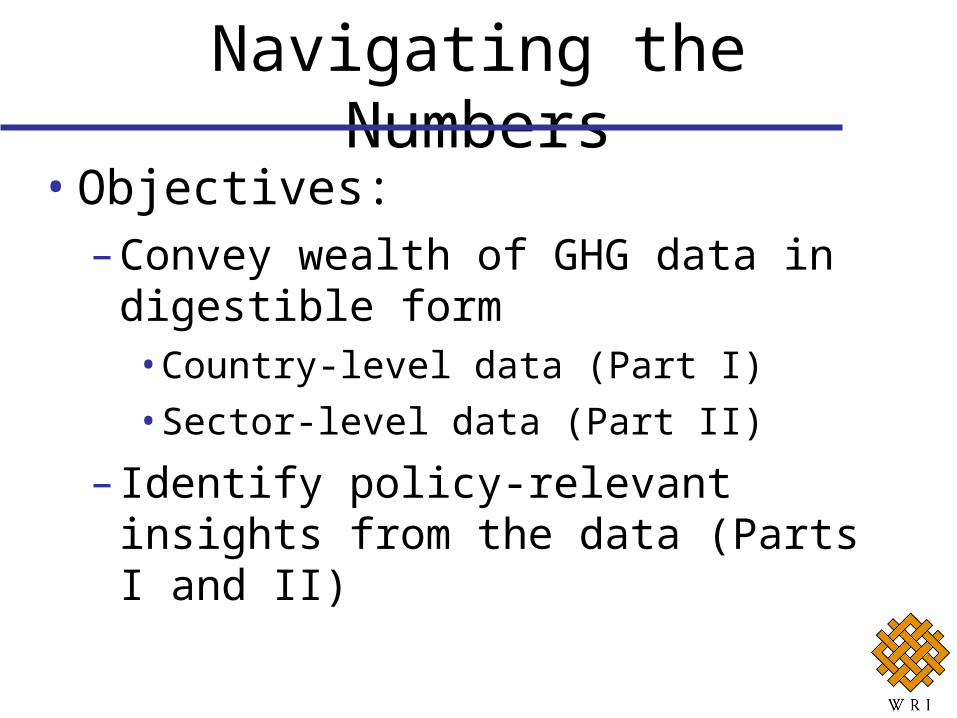
• Objectives:
– Convey wealth of GHG data in digestible form• Country-level data (Part I)• Sector-level data (Part II)
– Identify policy-relevant insights from the data (Parts I and II)
Navigating the Numbers
• Indicators
– Absolute, per capita, intensity• Time periods
– Present, past, and future trends• Emissions “Context”
– Drivers: GDP, population, fuel mix, efficiency, structure, trade, fossil fuel reserves, etc.
– Socio-economic context: development indicators
Part I: Country-level data
• Organize data: sector, end-use, gas
Part II: Sector-level data

GHG Flow Diagram: Global Greenhouse Gas Emissions

• Organize data: sector, end-use, gas• Identify and evaluate key sectors
– Absolute, per capita; past and future trends– Sector “context” data:
• Company-level production levels (e.g., iron, aluminum)• Trade flows, investment, MNC presence• GHG measurement and attribution issues• International cooperation assessed across six criteria
Part II: Sector-level data
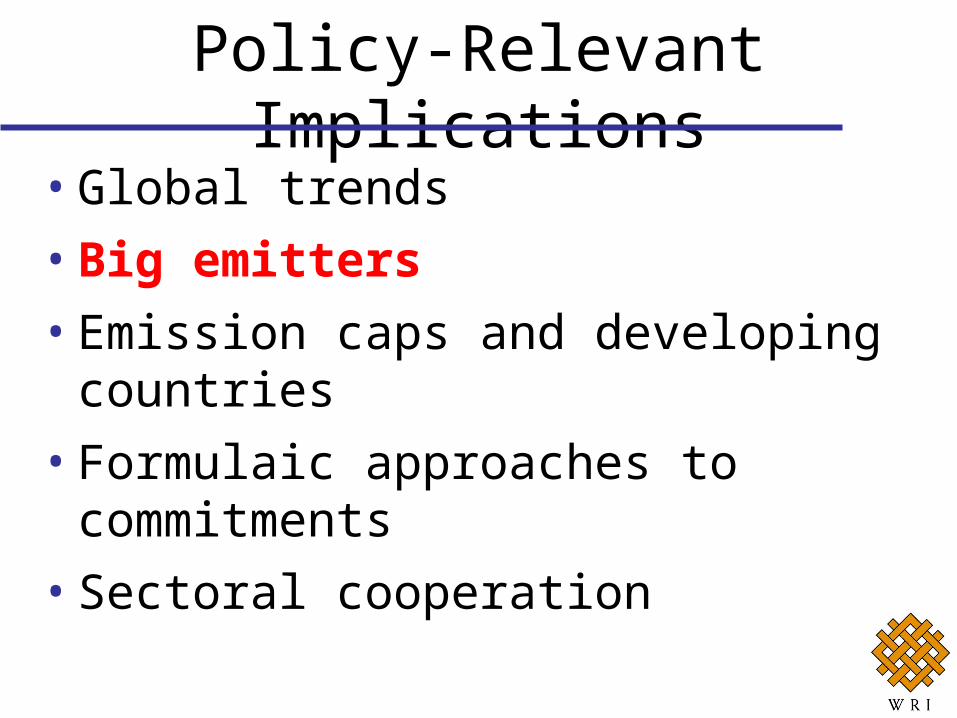
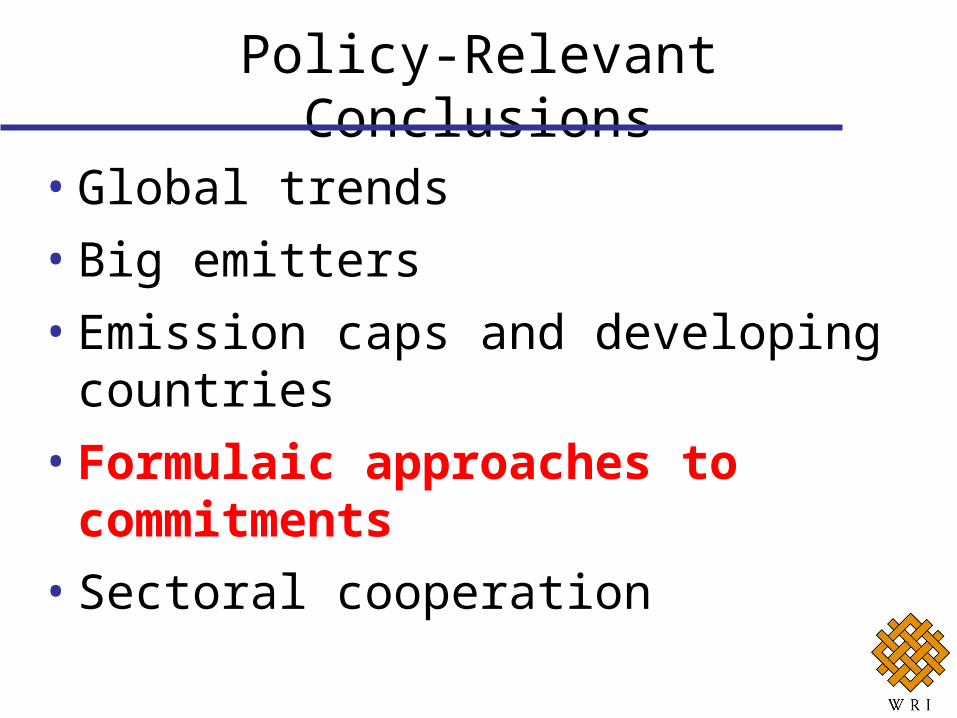
• Global trends• Big emitters• Emission caps and developing countries• Formulaic approaches to commitments• Sectoral cooperation
Policy-Relevant Implications

• Global trends• Big emitters• Emission caps and developing countries• Formulaic approaches to commitments• Sectoral cooperation
Policy-Relevant Implications
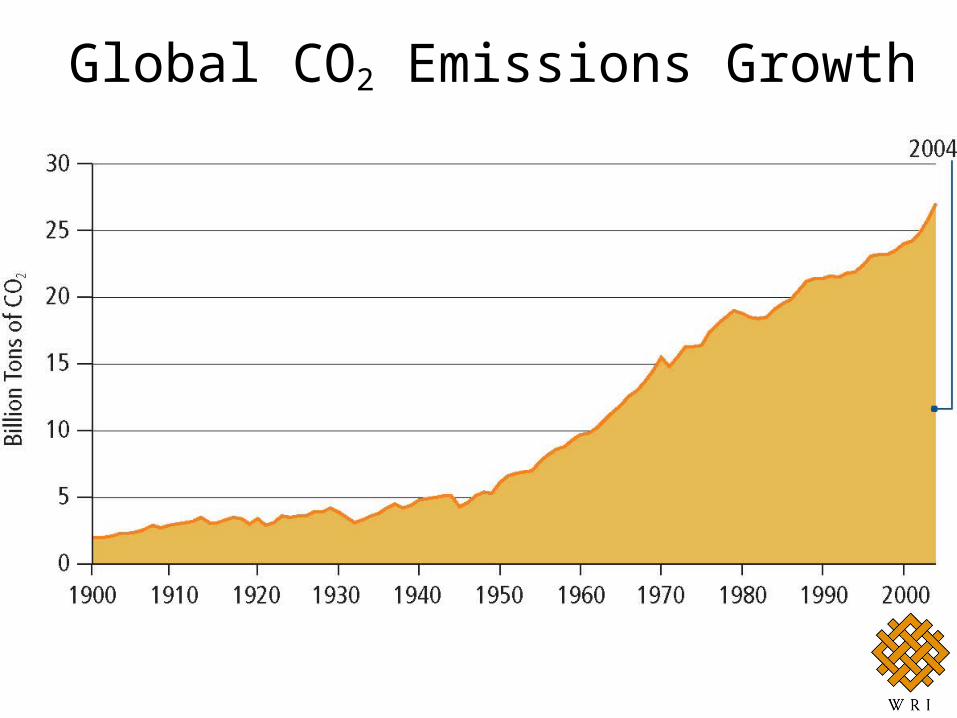
Global CO2 Emissions Growth
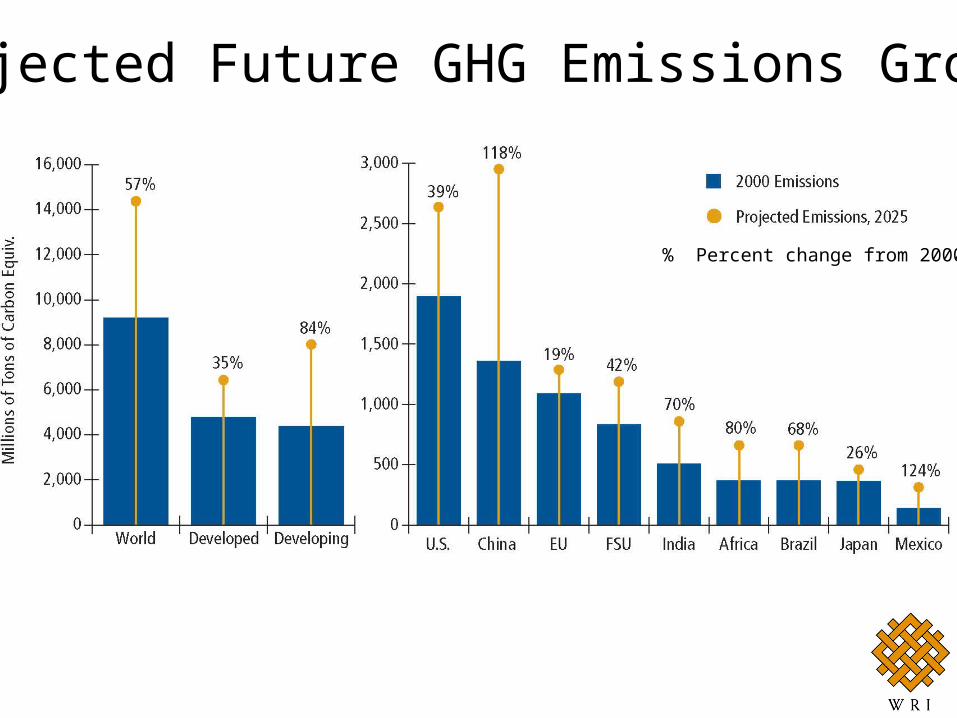
Projected Future GHG Emissions Growth
% Percent change from 2000
• Global trends• Big emitters• Emission caps and developing countries• Formulaic approaches to commitments• Sectoral cooperation
Policy-Relevant Implications
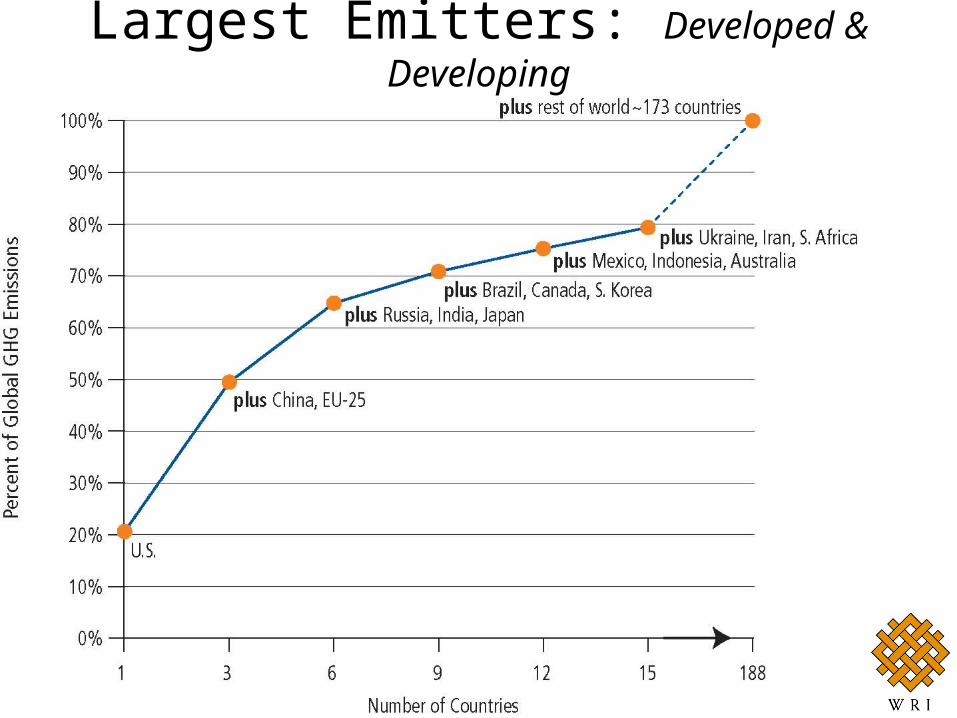
Largest Emitters: Developed & Developing

Most Countries Contribute Little to GHG Buildup
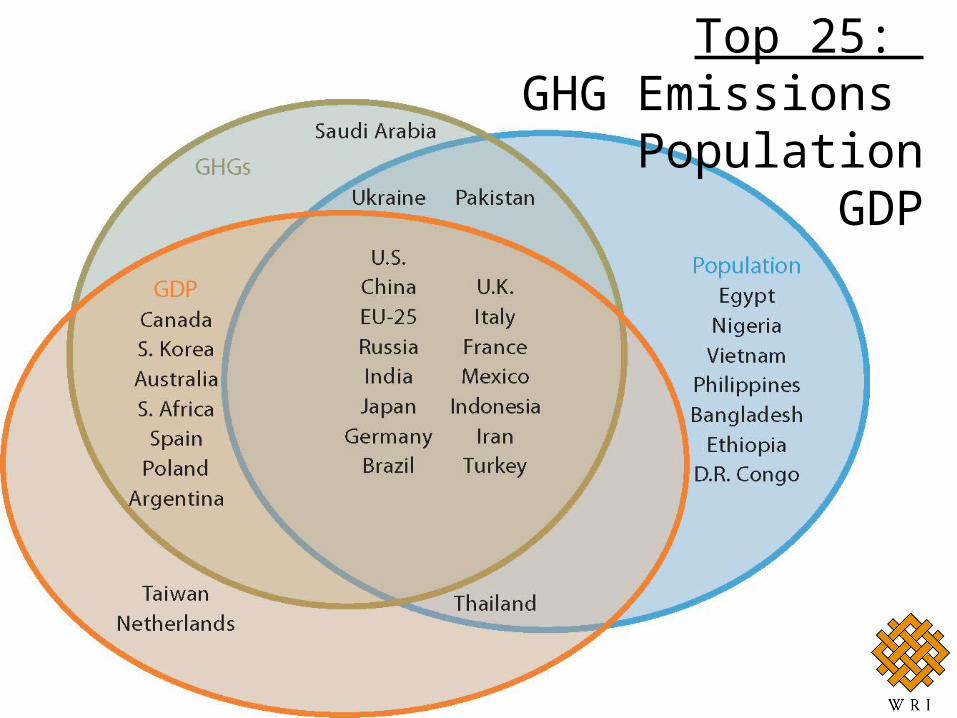
Top 25: GHG Emissions
PopulationGDP

Top 25: Extreme Diversity: Diversity of Approaches Needed

• Global trends• Big emitters• Emission caps and developing countries• Formulaic approaches to commitments• Sectoral cooperation
Policy-Relevant Conclusions

Fixed targets: challenging in the context of massive uncertainty
Projected CO2 Emissions Growth to 2025
• Global trends• Big emitters• Emission caps and developing countries• Formulaic approaches to commitments• Sectoral cooperation
Policy-Relevant Conclusions

Historical Contributions: Major Data Constraints
Cumulative CO2 Emissions, Comparison of Different Time Periods
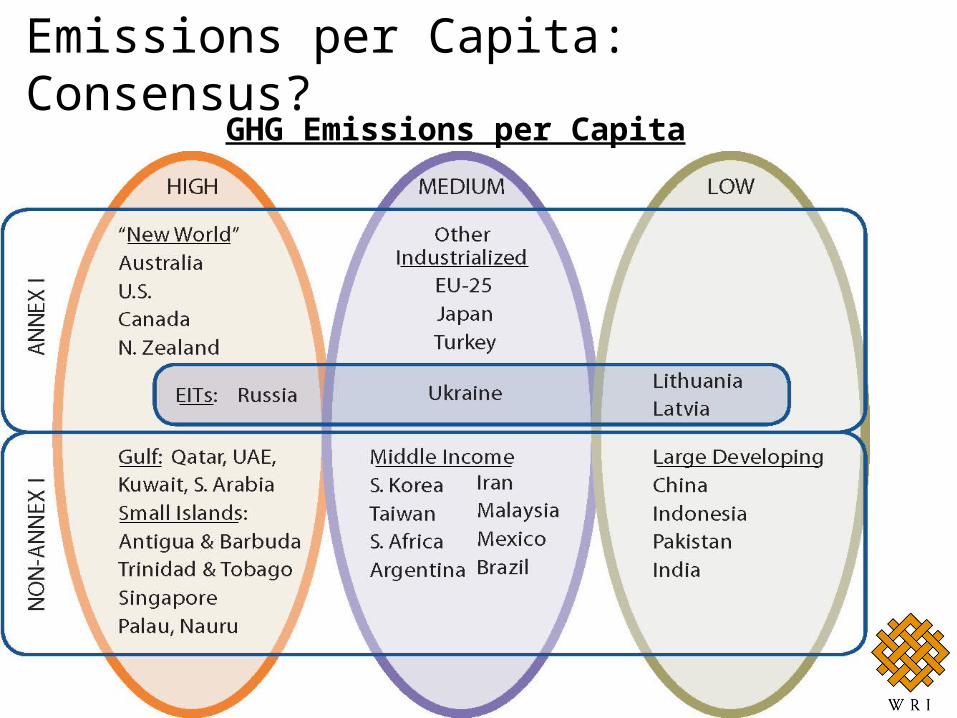
Emissions per Capita: Consensus?
GHG Emissions per Capita
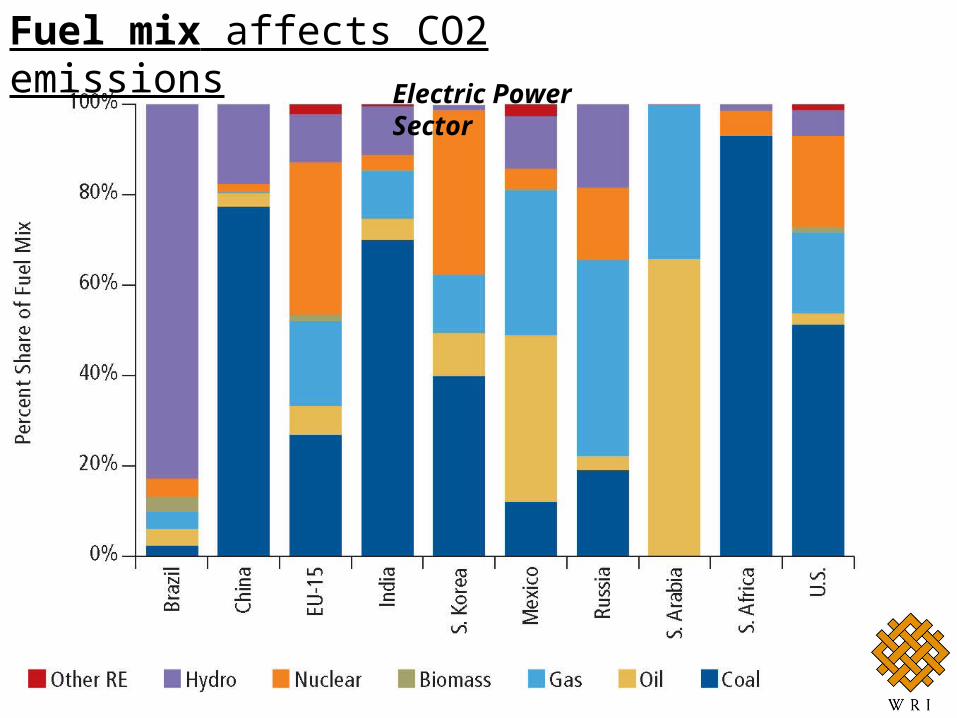
Fuel mix affects CO2 emissionsElectric Power Sector
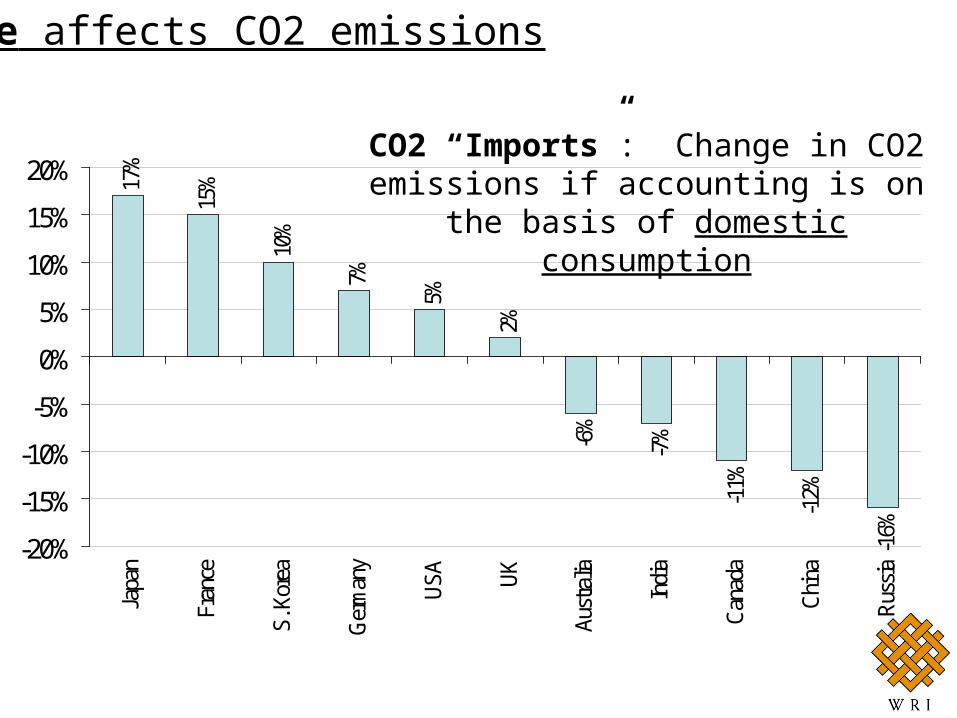
17%
15%
10%
7%
5%
2%
-6%
-7%
-11%
-12%
-16%-20%
-15%
-10%
-5%
0%
5%
10%
15%
20%Ja
pan
Fran
ce
S. K
orea
Ger
man
y
USA UK
Aust
ralia
Indi
a
Cana
da
Chin
a
Russ
ia
Trade affects CO2 emissions
CO2 “Imports”: Change in CO2 emissions if accounting is on the basis of domestic consumption
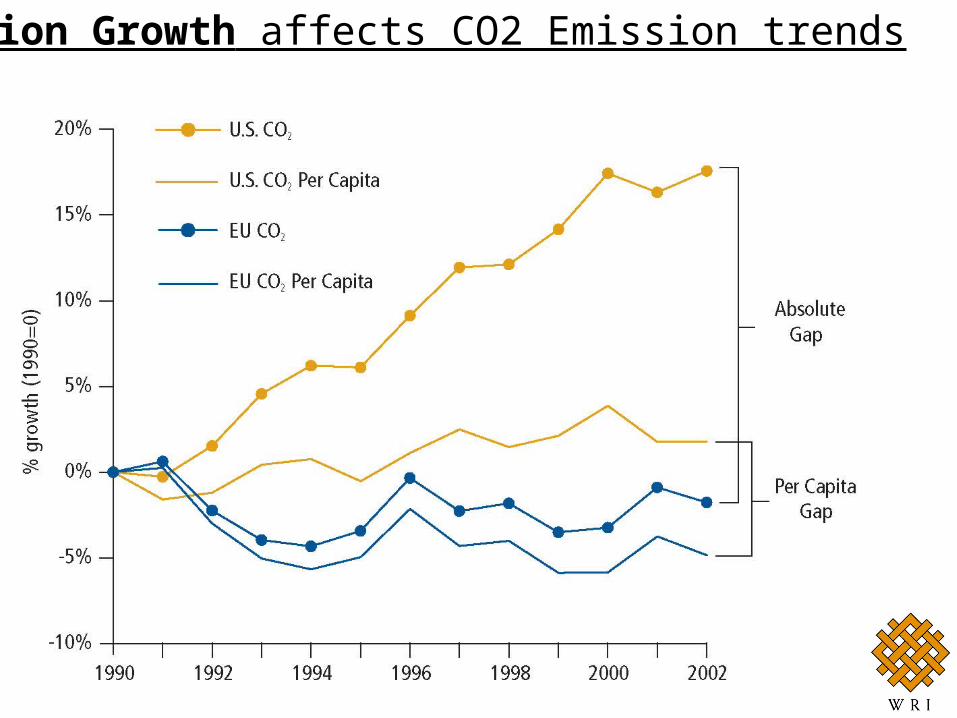
Population Growth affects CO2 Emission trends

• Global trends• Big emitters• Emission caps and developing countries• Formulaic approaches to commitments• Sectoral cooperation
Policy-Relevant Conclusions

• Did not address different “forms” of sectoral cooperation• How important is the sector? [% global GHGs] • Underlying rationale for sectoral cooperation
– Promote participation– Avoid “leakage”– Promote even regulatory playing field (competitiveness)
• How conductive to international cooperation? [6 criteria]• Simple grading system: “+” “–” or no grade.
International Sectoral Cooperation
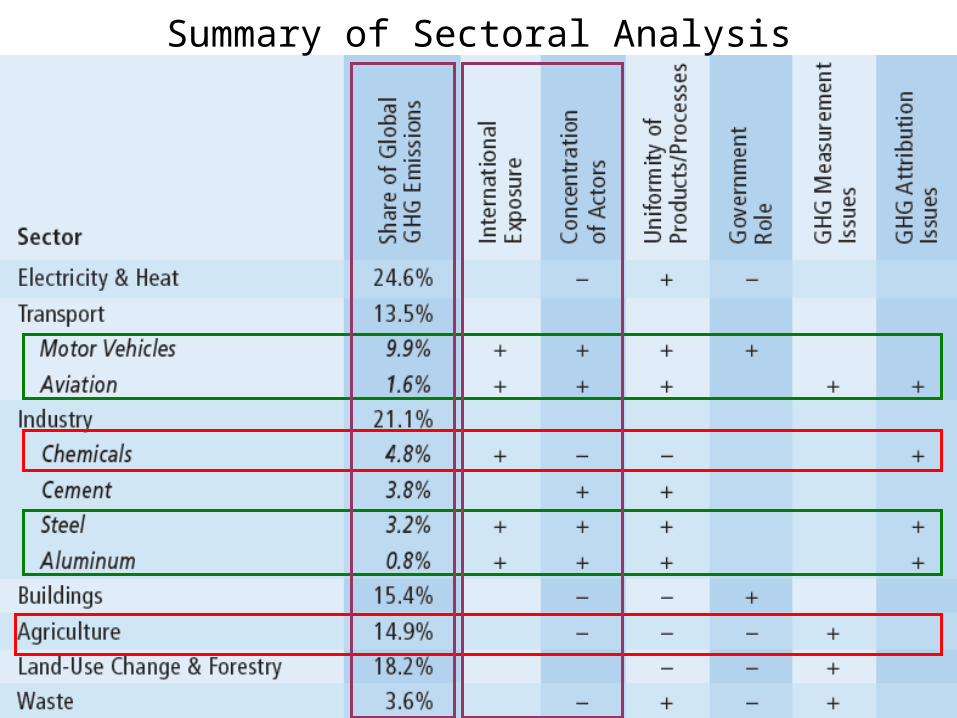
Summary of Sectoral Analysis

• “Sector-only” model is unlikely be effective• Comprehensive agreements can have:
– “Carve outs” [aviation]– Special sectoral provisions [LUCF]– Complementary sectoral agreements
• Analysis helps reveal:– Where to target investment, technology, and policy– Kyoto’s perceived success and failure
Sectoral Cooperation
• Global trends are in the wrong direction• Address GHGs in context of big emitting
countries and sectors– Int’l cooperation, investment, technology
• No single indicator tells a complete story• Data does not point directly toward a solution
– Nature and scale of problem– Diverse national circumstances
Conclusions
Related Documents