Entropy 2013, 15, 4066-4083; doi:10.3390/e15104066 OPEN ACCESS entropy ISSN 1099-4300 www.mdpi.com/journal/entropy Article Navigating the Chemical Space of HCN Polymerization and Hydrolysis: Guiding Graph Grammars by Mass Spectrometry Data Jakob L. Andersen 1,2 , Tommy Andersen 3 , Christoph Flamm 4 , Martin M. Hanczyc 3 , Daniel Merkle 1, * and Peter F. Stadler 2,4,5,6,7,8 1 Department of Mathematics and Computer Science, University of Southern Denmark, Odense M DK-5230, Denmark; E-Mail: [email protected] 2 Max Planck Institute for Mathematics in the Sciences, Leipzig D-04103, Germany 3 Institute of Physics, Chemistry and Pharmacy, University of Southern Denmark, Odense M DK-5230, Denmark; E-Mails: [email protected] (T.A.); [email protected] (M.M.H.) 4 Institute for Theoretical Chemistry, University of Vienna, Wien A-1090, Austria; E-Mails: [email protected] (C.F.); [email protected](P.F.S.) 5 Bioinformatics Group, Department of Computer Science, and Interdisciplinary Center for Bioinformatics, University of Leipzig, Leipzig D-04107, Germany 6 Fraunhofer Institute for Cell Therapy and Immunology, Leipzig, D-04103, Germany 7 Center for non-coding RNA in Technology and Health, University of Copenhagen, Frederiksberg C DK-1870, Denmark 8 Santa Fe Institute, 1399 Hyde Park Rd, Santa Fe NM 87501, USA * Author to whom correspondence should be addressed; E-Mail: [email protected]; Tel.: +45-6550-2322; Fax: +45-6550-2373. Received: 22 February 2013; in revised form: 10 September 2013 / Accepted: 11 September 2013 / Published: 25 September 2013 Abstract: Polymers of hydrogen cyanide and their hydrolysis products constitute a plausible, but still poorly understood proposal for early prebiotic chemistry on Earth. HCN polymers are generated by the interplay of more than a dozen distinctive reaction mechanisms and form a highly complex mixture. Here we use a computational model based on graph grammars as a means of exploring the chemical spaces of HCN polymerization and hydrolysis. A fundamental issue is to understand the combinatorial explosion inherent in large, complex chemical systems. We demonstrate that experimental data, here obtained by mass spectrometry, and computationally predicted free energies together can be used

Welcome message from author
This document is posted to help you gain knowledge. Please leave a comment to let me know what you think about it! Share it to your friends and learn new things together.
Transcript

Entropy 2013, 15, 4066-4083; doi:10.3390/e15104066OPEN ACCESS
entropyISSN 1099-4300
www.mdpi.com/journal/entropy
Article
Navigating the Chemical Space of HCN Polymerizationand Hydrolysis: Guiding Graph Grammars by MassSpectrometry DataJakob L. Andersen 1,2, Tommy Andersen 3, Christoph Flamm 4, Martin M. Hanczyc 3,Daniel Merkle 1,* and Peter F. Stadler 2,4,5,6,7,8
1 Department of Mathematics and Computer Science, University of Southern Denmark, Odense MDK-5230, Denmark; E-Mail: [email protected]
2 Max Planck Institute for Mathematics in the Sciences, Leipzig D-04103, Germany3 Institute of Physics, Chemistry and Pharmacy, University of Southern Denmark, Odense M DK-5230,
Denmark; E-Mails: [email protected] (T.A.); [email protected] (M.M.H.)4 Institute for Theoretical Chemistry, University of Vienna, Wien A-1090, Austria;
E-Mails: [email protected] (C.F.); [email protected] (P.F.S.)5 Bioinformatics Group, Department of Computer Science, and Interdisciplinary Center for
Bioinformatics, University of Leipzig, Leipzig D-04107, Germany6 Fraunhofer Institute for Cell Therapy and Immunology, Leipzig, D-04103, Germany7 Center for non-coding RNA in Technology and Health, University of Copenhagen, Frederiksberg C
DK-1870, Denmark8 Santa Fe Institute, 1399 Hyde Park Rd, Santa Fe NM 87501, USA
* Author to whom correspondence should be addressed; E-Mail: [email protected];Tel.: +45-6550-2322; Fax: +45-6550-2373.
Received: 22 February 2013; in revised form: 10 September 2013 / Accepted: 11 September 2013 /Published: 25 September 2013
Abstract: Polymers of hydrogen cyanide and their hydrolysis products constitute aplausible, but still poorly understood proposal for early prebiotic chemistry on Earth.HCN polymers are generated by the interplay of more than a dozen distinctive reactionmechanisms and form a highly complex mixture. Here we use a computational model basedon graph grammars as a means of exploring the chemical spaces of HCN polymerizationand hydrolysis. A fundamental issue is to understand the combinatorial explosion inherentin large, complex chemical systems. We demonstrate that experimental data, here obtainedby mass spectrometry, and computationally predicted free energies together can be used

Entropy 2013, 15 4067
to guide the exploration of the chemical space and makes it feasible to investigate likelypathways and chemical motifs even in potentially open-ended chemical systems.
Keywords: hydrogen cyanide; graph grammars; chemical space; mass spectrometry;chemical motif; polymerization; autocatalysis
1. Introduction
Hydrogen cyanide (HCN) has been recognized as a key molecule in abiogenesis already in theearliest studies of chemical evolution in the 1920s [1–3]. According to this line of reasoning,the organic complexity of Life on Earth arose abiotically through chemical reactions among simpleprecursor molecules and their products. In a landmark proof of principle experiment Urey and Millerdemonstrated in 1956, chemical evolution could have been initialized in a simulated atmosphere ofearly Earth [1,4,5]. HCN has been highlighted as a prebiotic precursor of particular interest not onlyin conceptual considerations [6] but also experimentally. HCN has been used to synthesize adenineby Oro in 1961 [7,8], amino acids [9], as well as many other molecules relevant to present-daybiology [9–15]. Most recently HCN has also been shown to play a key role in sugar synthesis [16].HCN and its derivatives and polymers have been detected in the current interstellar medium as chemicalcomponents in some extraterrestrial environments, most notably on planetoids, and moons, where itaccounts for dark colored regions [17,18], and on Saturn’s moon Titan [19]. Tholins, aerosols that areobtained in simulations of the atmosphere of the Saturnian moon Titan, are spectrometrically similar toHCN polymers [20–22].
The HCN monomer is highly reactive and can self-polymerize under certain conditions leadingto large dark insoluble precipitates [15,23]. The structure of the resulting complex polymer is notdetermined, albeit several models for its structure have been proposed [24–29]. The large complexpolymers consist mostly of H, C and N according to elemental analysis [27]. The introduction of oxygenatoms occurs largely through the subsequent hydrolysis of the polymer leading to the production ofbiologically relevant molecules in minor quantities. Early experiments [30] showed that the synthesisof amino acids results from the hydrolytic breakdown of HCN heteropolypeptides. Hydrolysis ofHCN polymers gives rise to self-assembling chemical structures that show proto-cell like dynamicalbehavior [31]. Recently, a high resolution MS analysis of HCN polymers was presented in [32], howeverwithout an underlying mathematical model of polymerization.
It is appealing to explore the generative chemistry of HCN monomers when polymerized andthen reacted with water as a feasible model of complex chemical evolution. The vast amountof chemical products produced renders a detailed analytical characterization infeasible. Thuscomputational approaches provide tools to locate interesting regions in this combinatorial complexchemical transformation space and help to characterize them.
We describe here a computational generative chemistry approach, and describe how this combinatorialdescription of the relevant chemical space can be interfaced closely with empirical data. In Section 2 wesummarize mass spectrometry data for the polymerization of HCN and the subsequent hydrolysis of the
Entropy 2013, 15 4068
resulting black HCN polymer. Our theoretical framework for systematic exploration of chemical spacesis outlined in Section 3. Results that integrate graph grammar approaches and the experimental resultsare given in Section 4, highlighting some of the complex chemical networks. We conclude in Section 5.
2. Experimental Part—Polymerization, Hydrolysis, and Mass Spectrometry
2.1. Acid-Catalyzed HCN Polymerization
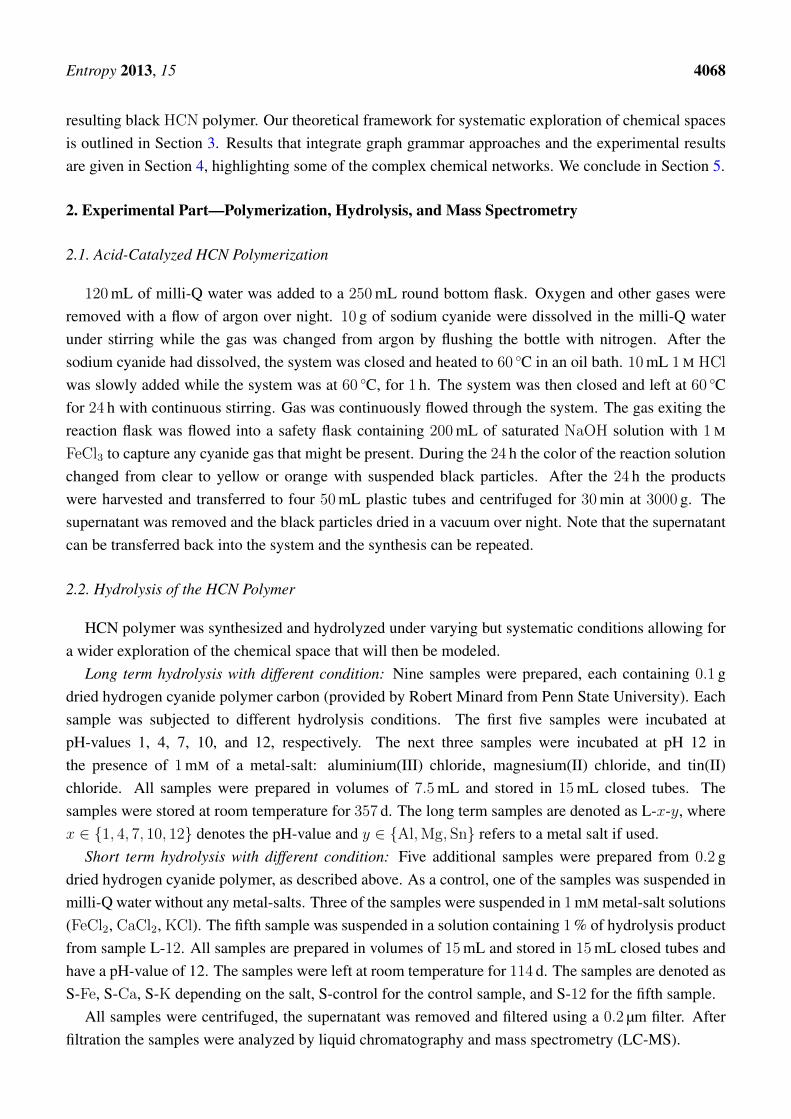
120mL of milli-Q water was added to a 250mL round bottom flask. Oxygen and other gases wereremoved with a flow of argon over night. 10 g of sodium cyanide were dissolved in the milli-Q waterunder stirring while the gas was changed from argon by flushing the bottle with nitrogen. After thesodium cyanide had dissolved, the system was closed and heated to 60 ◦C in an oil bath. 10mL 1 M HCl
was slowly added while the system was at 60 ◦C, for 1 h. The system was then closed and left at 60 ◦Cfor 24 h with continuous stirring. Gas was continuously flowed through the system. The gas exiting thereaction flask was flowed into a safety flask containing 200mL of saturated NaOH solution with 1 M
FeCl3 to capture any cyanide gas that might be present. During the 24 h the color of the reaction solutionchanged from clear to yellow or orange with suspended black particles. After the 24 h the productswere harvested and transferred to four 50mL plastic tubes and centrifuged for 30min at 3000 g. Thesupernatant was removed and the black particles dried in a vacuum over night. Note that the supernatantcan be transferred back into the system and the synthesis can be repeated.
2.2. Hydrolysis of the HCN Polymer
HCN polymer was synthesized and hydrolyzed under varying but systematic conditions allowing fora wider exploration of the chemical space that will then be modeled.
Long term hydrolysis with different condition: Nine samples were prepared, each containing 0.1 gdried hydrogen cyanide polymer carbon (provided by Robert Minard from Penn State University). Eachsample was subjected to different hydrolysis conditions. The first five samples were incubated atpH-values 1, 4, 7, 10, and 12, respectively. The next three samples were incubated at pH 12 inthe presence of 1mM of a metal-salt: aluminium(III) chloride, magnesium(II) chloride, and tin(II)chloride. All samples were prepared in volumes of 7.5mL and stored in 15mL closed tubes. Thesamples were stored at room temperature for 357 d. The long term samples are denoted as L-x-y, wherex ∈ {1, 4, 7, 10, 12} denotes the pH-value and y ∈ {Al,Mg, Sn} refers to a metal salt if used.
Short term hydrolysis with different condition: Five additional samples were prepared from 0.2 gdried hydrogen cyanide polymer, as described above. As a control, one of the samples was suspended inmilli-Q water without any metal-salts. Three of the samples were suspended in 1mM metal-salt solutions(FeCl2, CaCl2, KCl). The fifth sample was suspended in a solution containing 1% of hydrolysis productfrom sample L-12. All samples are prepared in volumes of 15mL and stored in 15mL closed tubes andhave a pH-value of 12. The samples were left at room temperature for 114 d. The samples are denoted asS-Fe, S-Ca, S-K depending on the salt, S-control for the control sample, and S-12 for the fifth sample.
All samples were centrifuged, the supernatant was removed and filtered using a 0.2 µm filter. Afterfiltration the samples were analyzed by liquid chromatography and mass spectrometry (LC-MS).

Entropy 2013, 15 4069
2.3. Liquid Chromatography and Mass Spectrometry
The supernatants of the HCN polymer hydrolysis samples were analyzed using a TSQ Vantage TripleStage Quadrupole Mass Spectrometer with an EASY-nLC 1000 Liquid Chromatography (LC) unit.Solvent A was milli-Q water with 1% formic acid and Solvent B was acetone with 1% formic acid withthe following gradient over time: 0, 0, 20, 100, 0% for the time series 0, 2, 20, 25, 30min. Althoughdiffered reaction times and conditions were tried, the same total amount of sample was injected to makethe samples comparable. The MS has a resolution of 0.7 atomic units and therefore isotopic peaks withsimilar mass but different sum formula are not resolved. We used a small percentage of formic acid inthe LC because formic acid is volatile and imparts a positive charge on some functional groups. Thesamples were run in positive scan mode only. We used unfragmented full MS scans for this study. Blankruns (solvent only) were commonly conducted to eliminate the possibility of sample carryover. We haveconfidence in the peaks observed in the optimum m/z range of 100–400. We nevertheless show all thedata as some major peaks are found below 100m/z. The mass spectrometer used eletrospray ionization,i.e., protons are added to charge the molecules. As an approximation we assume a single proton is added,and measured m/z ratios thus correspond approximately to molar mass +1. This approximation can ofcourse easily be replaced by a more sophisticated prediction which takes the proton affinity of eachmolecule into account.
3. Theoretical Part
3.1. Graph Grammars
Graph grammars provide a convenient and efficient method to investigate large, diverse chemicalspaces. In this framework, molecules are abstracted to simple edge and vertex labeled graphs whilereactions are correspondingly expressed as graph rewrite rules between the educts and products of achemical reaction [33]. Graph grammars can be thought of as an extension of context-free grammarsand their associated term rewriting systems to context-sensitive grammars, where labeled graphs thenreplace strings as the basic objects [34]. This computational model fully captures the inherent algebraicstructure of chemistry, i.e., molecules may react with each other to yield novel molecules.
Multiple approaches to specifying graph transformation rules have been explored, see e.g., [35] fora detailed technical presentation. We use the so-called Double Pushout (DPO) approach, in which atransformation rule p is specified as p = (L
l←− Kr−→ R). The graphs L, R, and K are called the left
graph, right graph, and context graph, respectively. The maps l and r are graph morphisms. If a rule p isapplicable to a graph G with the matching morphism, we can derive a new graph (or molecule) H . Moreinformally, if the left graph L can be found in one or potentially many molecules, then the correspondingedges of the graph (i.e., the chemical bonds of the molecule(s)) can be changed by removing all edgesdefined by L, and adding all the edges of R. Note, that such an operation can split and merge molecules.An example of a graph grammar rule application is shown in Figure 1.
Entropy 2013, 15 4070
Figure 1. Illustration of a chemical reaction using the Double Pushout approach. Thechemical transformation of complete molecules (i.e., the application of the graph grammarrule as defined in the first row) is represented as the graph derivation G =⇒ H in the secondrow. This shows an intermediate step in the synthesis of adenine as an HCN pentamer.Above, a possible rule p = (L
l←− Kr−→ R) underlying the concrete reaction is shown (i.e.,
the graph grammar rule defining the chemical reaction). Bonds in L that are removed andbonds in R that are inserted are all colored red. The green vertices form the context K ofthe rule.
NC
HN
L
NC
HN
K
NC
HN
R
l r
C
N
H
N
C
HN
C
C
H
N
H
G
C
N
H
N
C
HN
C
C
H
N
H
D
C
N
H
N
C
HN
C
C
H
N
H
H
The representation of chemical reactions as graph rewriting rules is closely related to theDugundji-Ugi theory [36,37], which is based on the concepts of bond and reaction matrices. Thisapproach has proved useful in particular in the analysis of metabolic reactions [38,39]. Thematrix-based approach, however, lacks the coherent formal framework that is available for the realmof graph grammars.
3.2. Exploration of the Chemical Space
The Graph Grammar framework utilizes algorithms for well-known computational problems,including the NP-complete subgraph isomorphism problem. Thus, in the general case, nopolynomial-time algorithms are known for solving the problem. However, since molecular graphshave limited degree and are relatively small, the framework is efficient enough in practice to explorechemical spaces. Conceptually, we apply all possible graph grammar rules to all possible (combinationsof) molecules in an iterative fashion starting from a small number of initial graphs, i.e., a seed set ofmolecules. In practice, however, even simple chemistries typically generate a plethora of differentchemical compounds. This combinatorial explosion makes it necessary to strategically limit theexploration. To this end we have developed a generic framework of exploration strategies that operates

Entropy 2013, 15 4071
in conjunction with a graph transformation system. A detailed description can be found in [40].The framework allows us to express pruning strategies for specific reactions and filtering rules for theresulting molecules. Here, we do not aim at a precise and full characterization of specific experimentalruns, but we introduce a new approach to constrain the generative exploration steps in order to findpathways and compounds of high interest, while limiting the inherent combinatorial explosion. We makeuse of filters that link the exploration procedure to the MS data by giving preference to molecules whosemass matches high intensity peaks in the spectrum and discouraging those with low-abundance m/zvalues. Due to the low-resolution of our available data we cannot infer atomic composition from the MSdata. In addition, we use energetic considerations to distinguish between compositional isomers. Thus,for this study we only use the basic data from the MS scans; the coupling of m/z and intensity values,with a basic model of electrospray ionization which assumes a single proton is added to each molecule.
For the calculation of preference of molecules we estimated equilibrium abundances from theBoltzmann factors px = exp(−Gx/RT ), where the free energy values Gx of a molecule x werecomputed with Open Babel [41], employing a Merck Molecular Force Field. Since relative abundancesare computed over families of isomers only, we treat families of molecules with different structure butsame molecular formula independently. Although this is a rather crude approximation, more refinedenergy computations are at present still too expensive in terms of computational resources to be used inlarge-scale network exploration.
The chemical space of HCN polymerization is modeled by a set of 8 reaction rules that have beenextracted from literature [7,13]. An additional 13 rules are added to implement hydrolysis, mostlyadditions to the C N and C N bonds. A full description on the rules is given in the Web Supplement.
3.3. Finding Chemical Motifs
A chemical motif is a collection of reactions which form an interesting pattern in the chemistry.E.g., the reactions connect given input molecules in order to create a specific product, constitute acatalytic cycle, or are collectively autocatalytic. Given a reaction network generated in the spaceexploration step, chemical motifs are identified using an integer linear programming (ILP) approach.The framework of ILP allows us to model both general pathways such as “the conversion of HCN toadenine” as well as pathways with specific structural properties such as “the presence of autocatalyticcycles” without specifying particular molecules.
The ILP formulations generically model each reaction by a non-negative integer variable that encodesthe multiplicity of the reaction. Constraints are introduced to ensure balance of mass. Specific motifsare further encoded as additional linear constraints. The detection of optimal or near-optimal chemicalmotif is then equivalent to finding an optimal assignment of (integer) variables. We used the softwarepackage IBM ILOG CPLEX Optimizer v12 in order to solve the underlying optimization problems.A detailed description of the modeling framework is forthcoming and will be published elsewhere.
4. Results and Discussion
The primary goal of this contribution is to demonstrate the possibility of coupling systematicexploration of complex chemical spaces with empirical data, despite the combinatorial explosions

Entropy 2013, 15 4072
associated with such an endeavor. Even in extreme cases, such as the HCN chemistry, graph grammarscan be employed in combination with suitable exploration strategies. A particularly appealing featureis the flexibility in which the exploration strategies can be written to incorporate data, here from massspectrometry experiments, in a natural way. This enables the identification of chemical motifs containedin the chemical spaces.
We begin our exposition with a discussion of the Mass Spectrometry (MS) data themselves beforeproceeding to the simulation results. In order to illustrate the potential of our systematic explorationapproach, we first consider alternatives to a well-know pathway for adenine synthesis that are identifiedby the automatic exploration of the space of HCN polymerization and hydrolysis reactions. As a secondexample, we describe an autocatalytic loop that can explain experimental data for the hydrolysis oftriazine. Again, the network motif was identified automatically.
4.1. Correlations in Mass Spectrometry Experiments
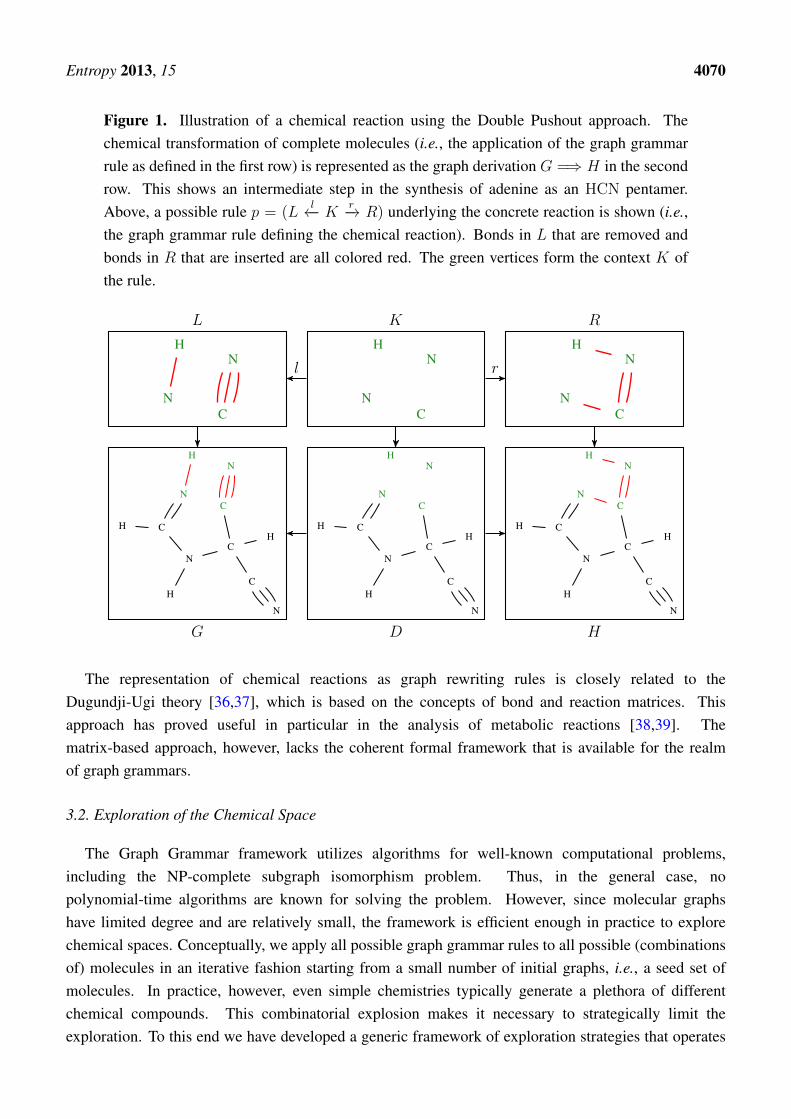
HCN polymer was synthesized and hydrolyzed under varying but systematic conditions allowing for awider exploration of the chemical space that will then be modeled, see Experimental Part. We processedthe 13 MS scans by a simple clustering methods and assigned each sample value an integer-valued m/zvalue. For each of the 13 scans we then computed values vmax
i , i ∈ {10, . . . , 1500}, where vmaxi is the
highest intensity that was found at m/z = i among the 1140 different retention times in the specificscan. The correlation matrix of these 13 vectors is shown in the left panel of Figure 2. In general, theindividual experiments are highly correlated. The smallest Pearson correlation coefficient, ρ = 0.21, wasobserved between scans L-1 and L-7. Both the short-term and the long-term hydrolysis scans are highlycorrelated within each of the two groups, ρ > 0.68 and ρ > 0.66, resp. Tin or magnesium chlorideas metal salt leads to the most divergent data sets. Based on the strong correlation of all the scans wedecided to merge all scans and use the vector of the highest vmax
i -value in any of the peaks for furtheranalysis. The highest peaks observed in any of the scans are depicted in Figure 2 (right).
4.2. Exploring the Chemical Space
The common starting points for the exploration of the chemical space are HCN and NH3. Weexpanded the chemical space by application of all graph grammar rules 15 times. Due to thecombinatorial explosion, the underlying strategy framework restricts the exploration by not allowingrecombination of two large molecules (i.e., one of the two molecules in a merging reaction needs tohave a molar mass that is smaller than 50). As a further filtering strategy we reject compounds basedon their relative equilibrium abundance as estimated from their Boltzmann factors normalized to theinterval 0 to 1, such that only high-probability compounds pass the filter. This results in a collection of356 compounds that, together with H2O, are taken as starting compounds to explore the chemical spacefor hydrolysis.
Entropy 2013, 15 4073
Figure 2. (Left): Correlation Matrix for long term and short hydrolysis scans under differentreaction conditions; no negative Pearson correlation coefficient ρ was observed; colour ofthe circles and radii of the circle sizes are scaled linearly with ρ; (Right): maximal observedintensity for each m/z-value observed in any of the scans.
S−control
S−Fe
S−Ca
S−K
S−12
L−1
L−4
L−7
L−10
L−12
L−12−Al
L−12−Mg
L−12−Sn
S−
cont
rol
S−
Fe
S−
Ca
S−
K
S−
12
L−1
L−4
L−7
L−10
L−12
L−12
−A
l
L−12
−M
g
L−12
−S
n●
●●
●
●
●
●
●●
●
●
●
●
●
●
●
●
●
●●
●
●
●
●●
●
●●
●
●●
●
●
●
●
●
●
●
●
●●
● ●
●●
● ●
●●
●●
●●
●
0 200 400 600 800 1,000 1,200 1,400100
101
102
103
104
105
106
107
m/z
Inte
nsity
In this step, the expansion strategy is now mainly biased in response to the maximal observedintensities of the MS results. More precisely, only the compounds with the best support from the MSdata are not discarded, while isomers are filtered based on their relative abundance, again using thenormalized Boltzmann factors. As the intensity values are only available for integer m/z values, weused the molar mass given by Open Babel to calculate an estimated intensity as a weighted average ofthe intensities of the two nearest integer m/z values, assuming each molecule has a single charge. Dueto the use of an electrospray ionization source, the m/z values was shifted by −1 to account for theadded proton.
Interestingly we observe that the exploration method converges for the HCN chemistry in the sensethat the constrained exploration reaches a state in which additional exploration steps do not furtherenlarge the chemical space. There is no theoretical guarantee for convergence in general. In oursimulation, we encountered 6,472 compounds through 9,197 reactions during hydrolysis. The final setof molecules after filtering, however, consists of only 94 compounds. Six of these molecules with verystrong support from the MS data (intensity at least 6.50 · 106) are shown in Figure 3. Within their isomerclass, these compounds are those with the highest support based on their normalized Boltzmann factorvalues. The complete set of molecules, listed as SMILES strings, their MS support and their equilibriumabundances in the final network is listed in Appendix 5. All the graph grammar rules used can be foundin the web supplement.

Entropy 2013, 15 4074
Figure 3. Six molecules with very strong support from the MS data that were foundby chemical space exploration with graph grammars; within their isomer class, thesecompounds are those with the largest relative equilibrium abundance as predicted using theOpen Babel energy calculation; all molecules are listed in Appendix 5.
OH
NH
NH
N
NH
NH
HN
N
Id: 1949
Molar Mass: 197.2
Intensity: 1.01 · 107
NH2HO
HN N
OH
NH
HN N N NH
NN
N O
Id: 5769
Molar Mass: 351.3
Intensity: 8.20 · 106
N
N
N
N
Id: 869
Molar Mass: 108.1
Intensity: 7.98 · 106
OH
NH
NH
N
NH
NH
O
N
Id: 4473
Molar Mass: 198.2
Intensity: 6.66 · 106
NH
N NH
O
O
N
NH
HN
O
N
Id: 5499
Molar Mass: 253.2
Intensity: 6.50 · 106
NH2
NH
HN
NH
NH
NHN
Id: 2276
Molar Mass: 169.2
Intensity: 6.07 · 106
4.3. Adenine Pathway
The formation of adenine as a HCN pentamer is one of the best-studied aspects of HCN
polymerization. Plausible pathways were suggested in the literature [7,8,42]. Figure 4 shows a pathwaysuggested by Oro [7,8], which uses nine reactions steps. To demonstrate the capabilities of our approachin finding multi-step pathways, we ask here whether there are alternative ways to obtain adenine viaintermediates that contain oxygen, i.e., that can be formed only after hydrolysis. To this end, weexpanded the chemical space after adding H2O by one exploration step with all rules. The resultingchemical space comprises 262 compounds and 1132 reactions. We then searched for chemical motifs thatuse HCN, NH3, and H2O as input compounds and produce adenine. The corresponding ILP formulationcan be used with different optimization functions, e.g., minimizing the overall number of reactions orselecting a pathway with maximum support from the MS data. To search for pathways that have a strongsupport from the MS scans we used the sum of all the intensities of all compounds of a pathway. Sincethese numbers cannot be meaningfully compared between pathways with different numbers of steps,we can use it either as a cut-off value instead of an optimization criterion, or we can fix the number ofchemical compounds to achieve comparability.

Entropy 2013, 15 4075
Figure 4. Hypergraph representation of the mechanistic route to adenine as proposed byOro [7,8]. Under NH3 catalysing conditions 5 HCN molecules polymerize into 1 moleculeof adenine (Note that the consumption of 4 NH3 molecules is counter balanced by 4 reactionsproducing NH3). The pathway uses nine different chemical reactions. The primary route ofthe pathway is highlighted by thick edges. Each reaction is visualized as a rectangle within-edges from the educts and out-edges to the products. Parallel edges denote the multiplicityof educts/products in reactions. Additionally, the flux of each reaction is shown, i.e., thereaction HCN + NH4 → CH4N2 is used twice. See [40] for a formal definition of theencoding and visualization of chemical reaction networks as hypergraphs.
NHN
1NH2
NN
1NH2
NNH2
HN
1 1
CHN NH3
NH2
NH2
NHNH2
HN
2 NH2HN 1NH2
NH2
NHNH2
N
HN
1 1 1
H2N
N
N
H2N
NH H2N
N
N
H2N
N
NH
NH2
N
N N
N
5
1
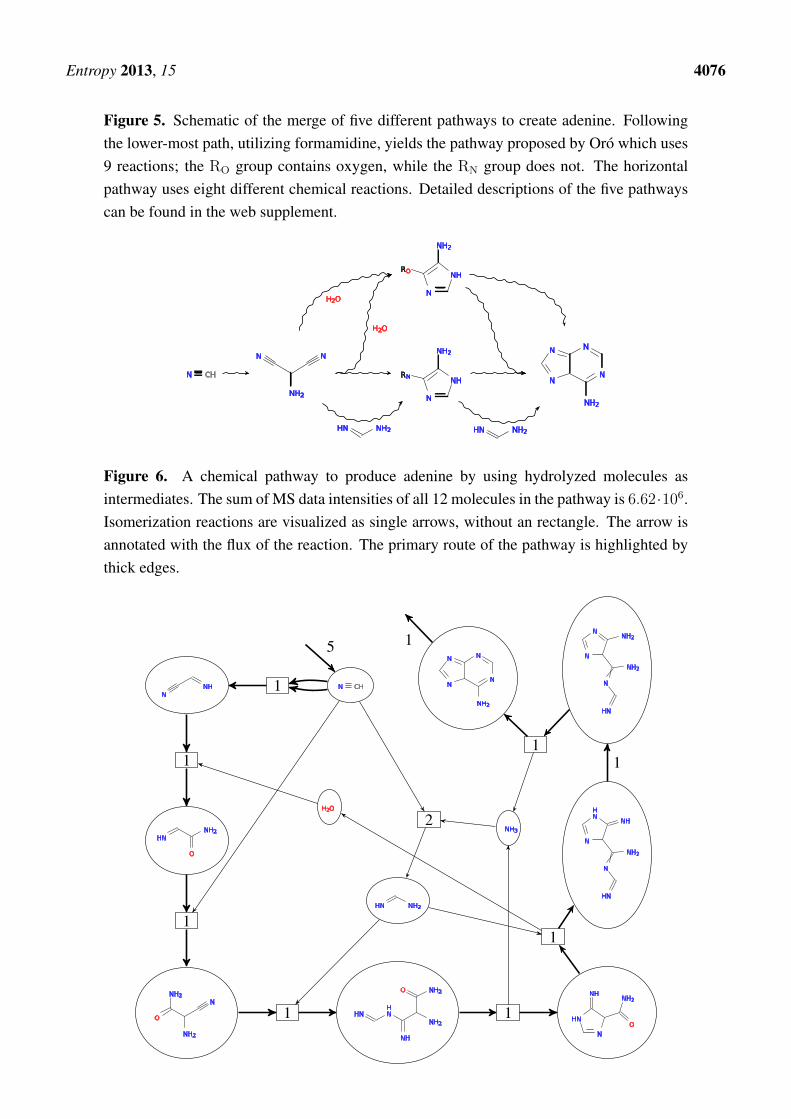
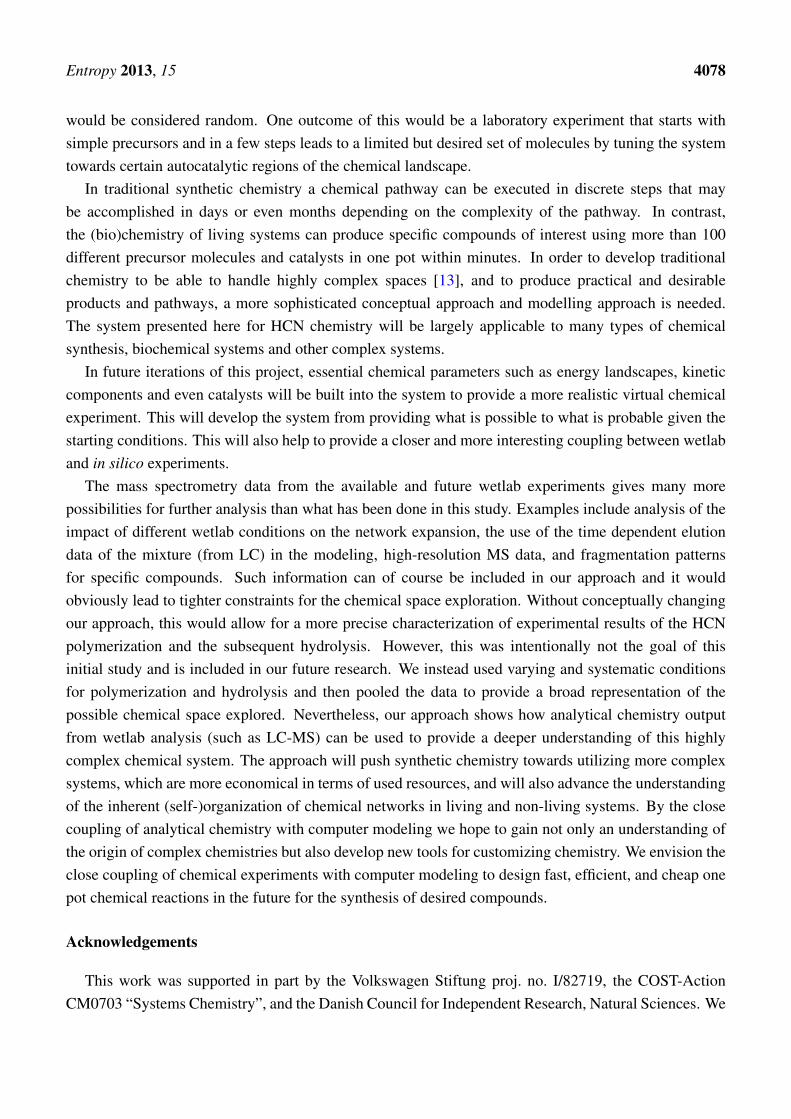
Figure 5 summarizes five alternatives to Oro’s pathways as an illustration of the explorative potentialof our method. The straight pathway in the middle of the schematic is one reaction step shorter thanthe original Oro pathway (which is shown at the bottom) but visits the same check-point intermediatesi.e., aminomalononitrile, and 4-Amino-5-imidazolecarboxamide (AICA). The pathways in the upperpart use H2O and accordingly passes through an oxygen-analog of AICA. Detailed descriptions ofthe five pathways can be found in the web supplement. Note, that we easily can find hundreds ofalternative adenine pathways in the chemical space, including solutions that do not use the check-pointintermediates. A solution biased towards utilizing hydrolyzed molecules are shown in Figure 6. Thispathway uses 12 molecules with a total sum of intensities of 6.62× 10⁶. The the pathway suggested byOro (Figure 4) uses 11 molecules with 4.14× 10⁶ as sum of intensities.
Entropy 2013, 15 4076
Figure 5. Schematic of the merge of five different pathways to create adenine. Followingthe lower-most path, utilizing formamidine, yields the pathway proposed by Oro which uses9 reactions; the RO group contains oxygen, while the RN group does not. The horizontalpathway uses eight different chemical reactions. Detailed descriptions of the five pathwayscan be found in the web supplement.
CHN
NH2
NNNH2
NH
N
NR
NH2
NH
N
OR
NH2
N
N N
N
NH2HN NH2HN
H2O
H2O
Figure 6. A chemical pathway to produce adenine by using hydrolyzed molecules asintermediates. The sum of MS data intensities of all 12 molecules in the pathway is 6.62·106.Isomerization reactions are visualized as single arrows, without an rectangle. The arrow isannotated with the flux of the reaction. The primary route of the pathway is highlighted bythick edges.
NHN
1 CHN
1
NH2HN
O
1
NH2
NNH2
O 1NH2
NH2O
NH
HN
NH
1NH2
N
HN
NH
O
NH2
N
NH
NH
N
HN
NH2
N
NNH2
N
HNNH2
N
N N
N
1
1
NH2HN
NH3
H2O
2
1
15

Entropy 2013, 15 4077
4.4. Autocatalytic Loops
Triazine is a small molecule HCN trimer that is quickly and completely removed from the solutionin a simple hydrolysis experiment. After 24 h the absorbance from the ring was no longer detectable byUV-VIS spectrometry (data not shown). This suggests that an autocatalytic network emerges that is fedby triazine or some of its decomposition products under the hydrolysis conditions. Therefore we queriedthe chemical space of HCN-hydrolysis for small autocatalytic sub networks with our computationalmethods (for a formal definition of autocatalysis, see [43]). We identified small sub-networks that areautocatalytic in formamide (shown in Figure 7). Interestingly, formamide is the most stable compoundwith molecular formula CHON. However, its role in prebiotic processes and the origin of life is underheavy debate (see review [44] and accompanying comments).
Figure 7. Putative autocatalytic loop in formamide, identified in the chemical space ofHCN-polymer hydrolysis. The autocatalytic loop is fed by cyanide molecules stemmingfrom triazine decomposition. Formamide is initially formed by the reaction shown in grey.
NH
NH
O
2
NH2
OH
NH
O
2NH2O
H2O1
N
N
N 11CHN
2
3
3
5. Conclusions
We have illustrated the first steps of a novel research program that combines computer science andmathematics with wetlab systems chemistry to dissect complex chemical systems at a hitherto unknownlevel of detail. Abstracting molecules to vertex and edge labeled graphs and chemical reactions to graphtransformation rules enables us to investigate the “language of chemical graphs” that can be generatedover a set of molecules and graph rewrite rules, in a rigorous manner. Simple iterative expansion of thelanguage of chemical graphs results quickly in a combinatorial explosion. We overcome this problemby biasing the distribution of generated molecules after each iterative step with experimental data. Onesuch strategy prefers molecules possessing high support in terms of the right mass to charge ratio in theexperimentally measured MS data and assuming one charge per molecule. With this interplay betweencomputational and wetlab methodology, we hope to undercover complex chemical system structure suchas autocatalytic cycles that would help to structure and bias in a meaningful way a chemical system that
Entropy 2013, 15 4078
would be considered random. One outcome of this would be a laboratory experiment that starts withsimple precursors and in a few steps leads to a limited but desired set of molecules by tuning the systemtowards certain autocatalytic regions of the chemical landscape.
In traditional synthetic chemistry a chemical pathway can be executed in discrete steps that maybe accomplished in days or even months depending on the complexity of the pathway. In contrast,the (bio)chemistry of living systems can produce specific compounds of interest using more than 100different precursor molecules and catalysts in one pot within minutes. In order to develop traditionalchemistry to be able to handle highly complex spaces [13], and to produce practical and desirableproducts and pathways, a more sophisticated conceptual approach and modelling approach is needed.The system presented here for HCN chemistry will be largely applicable to many types of chemicalsynthesis, biochemical systems and other complex systems.
In future iterations of this project, essential chemical parameters such as energy landscapes, kineticcomponents and even catalysts will be built into the system to provide a more realistic virtual chemicalexperiment. This will develop the system from providing what is possible to what is probable given thestarting conditions. This will also help to provide a closer and more interesting coupling between wetlaband in silico experiments.
The mass spectrometry data from the available and future wetlab experiments gives many morepossibilities for further analysis than what has been done in this study. Examples include analysis of theimpact of different wetlab conditions on the network expansion, the use of the time dependent elutiondata of the mixture (from LC) in the modeling, high-resolution MS data, and fragmentation patternsfor specific compounds. Such information can of course be included in our approach and it wouldobviously lead to tighter constraints for the chemical space exploration. Without conceptually changingour approach, this would allow for a more precise characterization of experimental results of the HCNpolymerization and the subsequent hydrolysis. However, this was intentionally not the goal of thisinitial study and is included in our future research. We instead used varying and systematic conditionsfor polymerization and hydrolysis and then pooled the data to provide a broad representation of thepossible chemical space explored. Nevertheless, our approach shows how analytical chemistry outputfrom wetlab analysis (such as LC-MS) can be used to provide a deeper understanding of this highlycomplex chemical system. The approach will push synthetic chemistry towards utilizing more complexsystems, which are more economical in terms of used resources, and will also advance the understandingof the inherent (self-)organization of chemical networks in living and non-living systems. By the closecoupling of analytical chemistry with computer modeling we hope to gain not only an understanding ofthe origin of complex chemistries but also develop new tools for customizing chemistry. We envision theclose coupling of chemical experiments with computer modeling to design fast, efficient, and cheap onepot chemical reactions in the future for the synthesis of desired compounds.
Acknowledgements
This work was supported in part by the Volkswagen Stiftung proj. no. I/82719, the COST-ActionCM0703 “Systems Chemistry”, and the Danish Council for Independent Research, Natural Sciences. We
Entropy 2013, 15 4079
thank Martin Overgaard for use of the MS instrument and guidance, and Robert Minard for supplyingHCN polymer samples.
Conflicts of Interest
The authors declare no conflict of interest.
References
1. Miller, S.L. A production of amino acids under possible primitive earth conditions. Science1953, 117, 528–529.
2. Cleaves, H.J. Prebiotic chemistry: What we know, what we don’t. Evol. Educ. Outreach 2012,5, 342–360.
3. Summers, D.P. The prebiotic chemistry of nitrogen and the origin of life. In Genesis—In TheBeginning: Precursors of Life, Chemical Models and Early Biological Evolution; Seckbach, J.,Ed.; Springer: Heidelberg, Germany, 2012; Volume 22, pp. 201–216.
4. Miller, S.L. Production of some organic compounds under possible primitive earth conditions.J. Am. Chem. Soc. 1955, 77, 2351–2361.
5. Miller, S.L. The mechanism of synthesis of amino acids by electric discharges. Biochim.Biophys. Acta 1957, 23, 480–489.
6. Oparin, A.I. The Origin of Life; Dover: Mineola, NY, USA, 1953.7. Oro, J.; Kimball, A. Synthesis of purines under possible primitive earth conditions. I. Adenine
from hydrogen cyanide. Arch. Biochem. Biophys. 1961, 94, 217–227.8. Oro, J.; Kimball, A. Synthesis of purines under possible primitive earth conditions: II. Purine
intermediates from hydrogen cyanide. Arch. Biochem. Biophys. 1962, 96, 293–313.9. Ferris, J.P.; Wos, J.D.; Nooner, D.W.; Oro, J. Chemical evolution. XXI. The amino acids released
on hydrolysis of HCN oligomers. J. Mol. Evol. 1974, 3, 225–231.10. Ferris, J.P.; Joshi, P.C.; Edelson, E.H.; Lawless, J.G.J. HCN: A plausible source of purines,
pyrimidines and amino acids on the primitive earth. J. Mol. Evol. 1978, 11, 293–311.11. Voet, A.; Schwartz, A. Prebiotic adenine synthesis from HCN-Evidence for a newly discovered
major pathway. Bioorg. Chem. 1983, 12, 8–17.12. Miyakawa, S.; Cleaves, H.J.; Miller, S.L. The cold origin of life: B. Implications based on
pyrimidines and purines produced from frozen ammonium cyanide solutions. Orig. Life Evol.Biosph. 2002, 32, 209–218.
13. Saladino, R.; Crestini, C.; Costanzo, G.; DiMauro, E. Advance in the prebiotic synthesis ofnucleic acids bases: Implications for the origin of life. Curr. Org. Chem. 2004, 8, 1425–1443.
14. Borquez, E.; Cleaves, H.J.; Lazcano, A.; Miller, S.L. An investigation of prebiotic purinesynthesis from the hydrolysis of HCN polymers. Orig. Life Evol. Biosph. 2005, 35, 79–90.
15. Matthews, C.N.; Minard, R.D. Hydrogen cyanide polymers, comets and the origin of life.Faraday Discuss. 2006, 133, 393–401, 427–452.
16. Ritson, D.; Sutherland, J.D. Prebiotic synthesis of simple sugars by photoredox systemschemistry. Nat. Chem. 2012, 4, 895–899.
Entropy 2013, 15 4080
17. Matthews, C.N. Hydrogen cyanide polymers from the impact of comet P/Shoemaker-Levy 9 onJupiter. Adv. Space Res. 1997, 19, 1087–1091.
18. Khare, B.N.; Bakes, E.L.; Cruikshank, D.; McKay, C.P. Solid organic matter in the atmosphereand on the surface of outer Solar System bodies. Adv. Space Res. 2001, 27, 299–307.
19. Hebrard, E.; Dobrijevic, M.; Loison, J.C.; Bergeat, A.; Hickson, K.M. Neutral productionof hydrogen isocyanide (HNC) and hydrogen cyanide (HCN) in Titan’s upper atmosphere.Astron. Astrophys. 2012, 541, A21.
20. Cable, M.L.; Horst, S.M.; Hodyss, R.; Beauchamp, P.M.; Smith, M.A.; Willis, P.A. Titantholins: Simulating Titan organic chemistry in the Cassini-Huygens era. Chem. Rev. 2012, 112,1882–1909.
21. Israel, G.; Szopa, C.; Raulin, F.; Cabane, M.; Niemann, H.B.; Atreya, S.K.; Bauer, S.J.;Brun, J.F.; Chassefiere, E.; Coll, P.; et al. Complex organic matter in Titan’s atmospheric aerosolsfrom in situ pyrolysis and analysis. Nature 2005, 438, 796–799.
22. Quirico, E.; Montagnac, G.; Lees, V.; Mcmillan, P.F.; Szopa, C.; Cernogora, G.; Rouzaud, J.N.;Simon, P.; Bernard, J.M.; Coll, P.; et al. New experimental constraints on the composition andstructure of tholins. Icarus 2008, 198, 218–231.
23. Mamajanov, I.; Herzfeld, J. HCN polymers characterized by SSNMR: Solid state reaction ofcrystalline tetramer (diaminomaleonitrile). J. Chem. Phys. 2009, 130, 134504.
24. Matthews, C.N.; Moser, R.E. Prebiological protein synthesis. Proc. Natl. Acad. Sci. USA 1966,56, 1087–1094.
25. Evans, R.A.; Lorencak, P.; Ha, T.K.; Wentrup, C. HCN dimers: Iminoacetonitrile andN-cyanomethanimine. J. Am. Chem. Soc. 1991, 113, 7261–7276.
26. Minard, R.D.; Hatcher, P.G.; Gourley, R.C.; Matthews, C.N. Structural investigations ofhydrogen cyanide polymers: New insights using TMAH thermochemolysis/GC-MS. Orig. LifeEvol. Biosph. 1998, 28, 461–473.
27. Eastman, M.P.; Helfrich, F.S.E.; Umantsev, A.; Porter, T.L.; Weber, R. Exploring the structureof a hydrogen cyanide polymers by electron spin resonance and scanning force microscopy.Scanning 2003, 25, 19–24.
28. Ruiz-Bermejo, M.; de la Fuente Jose, L.; Rogero, C.; Menor-Salvan, C.; Osuna-Estebana, S.;Martın-Gago, J.A. New Insights into the Characterization of ‘Insoluble Black HCN Polymers’.Chem. Biodiv. 2012, 9, 25–40.
29. He, C.; Lin, G.; Upton, K.T.; Imanaka, H.; Smith, M.A. Structural investigation of HCN polymerisotopomers by solution-state multidimensional NMR. J. Phys. Chem. A 2012, 116, 4751–4759.
30. Matthews, C.; Nelson, J.; Varma, P.; Minard, R. Deuterolysis of amino acid precursors: Evidencefor hydrogen cyanide polymers as protein ancestors. Science 1977, 198, 622–625.
31. Hanczyc, M.M. Metabolism and motility in prebiotic structures. Phil. Trans. R. Soc. B 2011,366, 2885–2893.
32. Bonnet, J.Y.; Thissen, R.; Frisari, M.; Vuitton, V.; Quirico, E.; Orthous-Daunay, F.R.; Dutuit,O.; Roy, L.L.; Fray, N.; Cottin, H.; et al. Compositional and structural investigation ofHCN polymer through high resolution mass spectrometry. Int. J. Mass Spectrom. 2013,doi:10.1016/j.ijms.2013.06.015.

Entropy 2013, 15 4081
33. Benko, G.; Flamm, C.; Stadler, P.F. A graph-based toy model of chemistry. J. Chem. Inf.Comput. Sci. 2003, 43, 1085–1093.
34. Rozenberg, G.; Ehrig, H. Handbook of Graph Grammars and Computing by GraphTransformation; World Scientific: Singapore, 1997; Volume 1.
35. Ehrig, H.; Ehrig, K.; Prange, U.; Taenthzer, G. Fundamentals of Algebraic GraphTransformation; Springer-Verlag: Berlin, Germany, 2006.
36. Dugundji, J.; Ugi, I.K. An algebraic model of constitutional chemistry as a basis for chemicalcomputer programs. Top. Curr. Chem. 1973, 39, 19–64.
37. Ugi, I.K.; Bauer, J.; Blomberger, C.; Brandt, J.; Dietz, A.; Fontain, E.; Gruber, B.;von Scholley-Pfab, A.; Senff, A.; Stein, N. Models, concepts, theories, and formal languagesin chemistry and their use as a basis for computer assistance in chemistry. J. Chem. Inf. Comput.Sci. 1994, 34, 3–16.
38. Hatzimanikatis, V.; Li, C.; Ionita, J.A.; Henry, C.S.; Jankowski, M.D.; Broadbelt, L.J. Exploringthe diversity of complex metabolic networks. Bioinformatics 2005, 21, 1603–1609.
39. Leber, M.; Egelhofer, V.; Schomburg, I.; Schomburg, D. Automatic assignment of reactionoperators to enzymatic reactions. Bioinformatics 2009, 25, 3135–3142.
40. Andersen, J.L.; Flamm, C.; Merkle, D.; Stadler, P.F. Generic strategies for chemical spaceexploration. Int. J. Comput. Biol. Drug Des. 2013, in press; see also arXiv:1302.4006.
41. O’Boyle, N.M.; Banck, M.; James, C.A.; Morley, C.; Vandermeersch, T.; Hutchison, G.R. OpenBabel: An open chemical toolbox. J. Cheminformatics 2011, 3, 33.
42. Roy, D.; Najafian, K.; von Rague Schleyer, P. Chemical evolution: The mechanism of theformation of adenine under prebiotic conditions. Proc. Natl. Acad. Sci. USA 2007, 104,17272–17277.
43. Andersen, J.L.; Flamm, C.; Merkle, D.; Stadler, P.F. Maximizing output and recognizingautocatalysis in chemical reaction networks is NP-complete. J. Syst. Chem. 2012, 3, 1–9.
44. Saladino, R.; Crestini, C.; Pino, S.; Costanzo, G.; Di Mauro, E. Formamide and the origin of life.Phys. Life Rev. 2012, 9, 84–104.
Appendix
Molecules with High Support from MS Scan Data
The following table lists all the molecules which passed the filters in each step of the chemicalspace expansion after polymerization and hydrolysis; given is the molar mass, the support based onthe intensity of the MS data, and the normalized Boltzmann factor within the class of isomers. Themolecules are grouped by isomer class and ordered by decreasing intensity. Each isomer class isinternally ordered by decreasing Boltzmann factor. The listed molecules correspond to many of thehigh-intensity peaks in the data set (comp. Figure 2 right). Further calculations with less strict filtersmay provide molecule suggestions for other peaks.

Entropy 2013, 15 4082
Id SMILES Molar Intensity Boltzmann factorMass (normalized)
1949 OC(NC=N)N(C=N)C(NC=N)C#N 197.2 1.01·107 0.56
3173 NC(O)N(C=NC=N)C(NC=N)C#N 197.2 1.01·107 0.44
428 OC(NC=NC=N)NC(NC=N)C#N 197.2 1.01·107 < 0.01
5769 NC(O)NC(N=CO)C(NC(NC=NC=NC=N)C#N)=NC=NC=O 351.3 8.20·106 0.55
5310 OC=NC(NC(O)NC=O)C(NC(NC=NC=NC=N)C#N)=NC=N 351.3 8.20·106 0.42
4363 OC=NC(O)NC(NC=NC=NC=NC=N)C(NC(NC=O)C#N)=N 351.3 8.20·106 0.03
4090 OC=NC(O)NC(NC=NC=NC=NC=N)C(NC(N=CO)C#N)=N 351.3 8.20·106 < 0.01
3472 OC=NC(O)N(C=N)C(NC=NC=NC=N)C(NC(N=CO)C#N)=N 351.3 8.20·106 0.00
869 C1N=CN=CN=CN=1 108.1 7.98·106 1.00
4473 OC(NC=N)N(C=N)C(NC=O)C#N 198.2 6.66·106 0.39
3243 NC(O)N(C=N)C(NC=NC=O)C#N 198.2 6.66·106 0.36
3260 NC(O)N(C=NC=O)C(NC=N)C#N 198.2 6.66·106 0.21
2382 OC(NC=NC=N)NC=NC=NC=O 198.2 6.66·106 0.02
1743 N=CN=CNC(NC=NC=N)OC=O 198.2 6.66·106 0.02
5499 N=CN(C=N)C(OC=O)N(C=N)C(NC=O)C#N 253.2 6.50·106 0.49
4659 OC(NC=NC=O)N(C=N)C(NC=NC=O)C#N 253.2 6.50·106 0.37
3701 OC(NC=NC=N)N(C=NC=O)C(NC=O)C#N 253.2 6.50·106 0.13
3392 OC=NC(C#N)N(C=NC=O)C(O)NC=NC=N 253.2 6.50·106 0.01
2276 NC(C(NC=N)NC=N)=NC=N 169.2 6.07·106 0.31
878 N=CNC(NC=N)C(NC=N)=N 169.2 6.07·106 0.28
1358 NC(NC=NC=N)C(NC=N)=N 169.2 6.07·106 0.22
5338 NC=NC(N)=C(N)NC=NC=N 169.2 6.07·106 0.18
4135 NC=NC(NC=NC=N)C(N)=N 169.2 6.07·106 0.01
4995 NC(O)NC(O)N(C=NC=O)C(NC=O)C#N 244.2 6.05·106 0.88
3769 OC(NC=NC=O)NC(NC=NC=N)OC=O 244.2 6.05·106 0.12
4535 NC(O)N(C=NC=O)C(NC=O)C#N 199.2 6.02·106 0.43
4541 N=CN=CNC(NC=NC=O)OC=O 199.2 6.02·106 0.43
3829 N=CNC(NC=NC=NC=O)OC=O 199.2 6.02·106 0.14
3468 OC=NC(O)N(C=N)C(N=CO)C#N 199.2 6.02·106 < 0.01
5259 OC(NC=NC=O)N(C=NC=O)C(NC=O)C#N 254.2 5.78·106 0.63
5494 N=CN(C(NC=NC=O)OC=O)C(NC=O)C#N 254.2 5.78·106 0.36
4359 NC(OC=O)N(C=NC=O)C(NC=NC=O)C#N 254.2 5.78·106 0.01
4114 O=COC(NC=NC=NC=O)NC=NC=NC=O 254.2 5.78·106 < 0.01
5785 NC=NC(NC(N)=C(N)N)=C1NC(O)NC=N1 241.3 5.63·106 0.47
5383 NC(N)=C(N)NC(NC=N)=C1NC(O)NC=N1 241.3 5.63·106 0.45
4733 NC(N)=C(N)NC(C1N=CNC(O)N1C=N)=N 241.3 5.63·106 0.07
2136 NC(O)NC(N(C=N)C=NC=N)C(NC=N)=N 241.3 5.63·106 < 0.01
3927 NC(NC(C1N=CNC(O)N1C=N)=N)C(N)=N 241.3 5.63·106 < 0.01
457 NC(O)NC(C(NC=N)NC=NC=NC=N)=N 241.3 5.63·106 < 0.01
6342 NC(N)=C(N)NC(O)NC=NC(C(NC=O)NC(O)NC=NC=O)=NC=N 386.4 5.33·106 0.65
6222 NC(N)=C(N)NC(O)NC=NC(C(NC=O)N(C=N)C(O)NC=NC=O)=N 386.4 5.33·106 0.25
6193 NC(N)=C(N)NC(O)NC=NC(C(N=CO)N(C=N)C(O)NC=NC=O)=N 386.4 5.33·106 0.10
5802 NC(NC(O)NC=NC(C(N=CO)N(C=N)C(O)NC=NC=O)=N)C(N)=N 386.4 5.33·106 < 0.01
4905 NC(C(NC(O)NC=N)NC(C(N=CO)N(C=N)C(NC=N)OC=O)=N)=N 386.4 5.33·106 < 0.01
3281 NC=NC(N(C=N)C(NC=NC=N)C#N)C(NC(C#N)N(C=N)C=N)=NC=O 386.4 5.30·106 0.84
2407 N=CNC(N(C=N)C(NC=NC=N)C#N)C(NC(C#N)N(C=N)C=N)=NC=O 386.4 5.30·106 0.16
5550 NC=NC(N)=C(N)NC(NC=N)C#N 196.2 4.49·106 0.58
1670 N=CNC(NC=N)C(NC=N)=NC=N 196.2 4.49·106 0.32
1323 NC(C(NC=N)N(C=N)C=NC=N)=N 196.2 4.49·106 0.11
2330 NC(C(NC=N)NC(C(NC=N)NC=N)=N)=N 240.3 4.18·106 1.00
5169 NC(NC(O)NC=NC(C(N=CO)N(C=N)C(O)NC=N)=N)C(N)=N 358.4 3.92·106 0.98
4452 NC(C(NC(O)NC=N)NC(C(N=CO)N(C=N)C(O)NC=N)=N)=N 358.4 3.92·106 0.02
744 N=CNC(N(C=N)C(NC=NC=N)C#N)C(NC(C#N)N(C=N)C=N)=N 358.4 3.90·106 1.00
4829 OC(N(C=N)C=N)N(C=N)C(NC=O)C#N 225.2 3.83·106 0.48
4828 OC(NC=N)N(C=N)C(C#N)N(C=N)C=O 225.2 3.83·106 0.37
2826 OC(NC=NC=N)N(C=N)C(NC=O)C#N 225.2 3.83·106 0.09
3007 OC(NC=N)N(C=N)C(NC=NC=O)C#N 225.2 3.83·106 0.07

Entropy 2013, 15 4083
Id SMILES Molar Intensity Boltzmann factorMass (normalized)
2375 OC(NC=NC=N)NC(NC=NC=O)C#N 225.2 3.83·106 < 0.01
2478 OC=NC(C#N)N(C=N)C(O)NC=NC=N 225.2 3.83·106 < 0.01
4362 OC(NC=O)NC(NC=N)C(NC(NC=NC=NC=N)C#N)=NC=N 350.3 3.80·106 0.98
4061 OC=NC(O)NC(NC=N)C(NC(NC=NC=NC=N)C#N)=NC=N 350.3 3.80·106 0.02
3343 OC=NC(O)NC(NC=NC=NC=N)C(NC(NC=N)C#N)=NC=N 350.3 3.80·106 < 0.01
2489 OC=NC(O)N(C=N)C(NC=NC=NC=N)C(NC(NC=N)C#N)=N 350.3 3.80·106 < 0.01
4475 OC(NC=N)N(C=NC=O)C(NC=O)C#N 226.2 3.71·106 0.73
4122 NC(O)N(C=NC=O)C(NC=NC=O)C#N 226.2 3.71·106 0.26
2820 N=CN=CNC(NC=NC=NC=O)OC=O 226.2 3.71·106 0.01
4921 OC(NC=NC=O)NC(NC=O)OC=O 218.2 3.60·106 0.96
4709 OC=NC(NC(O)NC=NC=O)OC=O 218.2 3.60·106 0.04
4619 NC(C(NC=NC=N)NC(C(NC(O)NC=NC=N)N=CO)=N)=N 340.3 3.17·106 0.96
4173 NC(C(NC=NC=N)NC(C(N=CO)N(C=N)C(O)NC=N)=N)=N 340.3 3.17·106 0.04
1914 OC1NC=NC(N1C=N)C(NC(NC=NC=N)C#N)=N 278.3 3.08·106 1.00
3066 NC=NC=NC(N(C=N)C(NC=NC=N)C#N)C(NC(C#N)N(C=N)C=N)=N 385.4 3.01·106 0.86
581 N=CN=CNC(C#N)N(C=N)C(NC=NC=N)C(NC(C#N)N(C=N)C=N)=N 385.4 3.01·106 0.14
548 OC(NC=NC=N)NC(N(C=N)C=NC=N)C(NC=N)=N 295.3 2.60·106 0.66
2754 NC(C(NC=NC=N)NC(C1N=CNC(O)N1C=N)=N)=N 295.3 2.60·106 0.34
2040 OC(NC=NC=N)N1C=NC1C#N 180.2 2.59·106 1.00
2945 OC(NC=N)NC(O)NC(NC=NC=O)C#N 243.2 2.48·106 0.53
2966 OC(O)NC(C#N)N(C=N)C(O)NC=NC=N 243.2 2.48·106 0.47
482 OC(NC=N)NC=NC=N 143.1 2.35·106 1.00
1706 OC(NC=NC=NC=N)NC(NC=NC=N)C(NC=O)=N 296.3 2.32·106 1.00
2243 N=CNC(NC=N)C(NC(NC=N)C(NC=N)=N)=N 267.3 2.20·106 1.00
2379 OC(NC=NC=N)N(C=N)C(NC=NC=O)C#N 252.2 2.19·106 0.59
2381 OC(NC=NC=N)N(C=NC=O)C(NC=N)C#N 252.2 2.19·106 0.41
488 OC(NC=NC=NC=N)NC(NC=NC=N)C#N 251.2 2.00·106 0.64
487 OC(NC=N)NC(NC=NC=NC=NC=N)C#N 251.2 2.00·106 0.36
1345 NC(C(NC=N)NC(C(NC=N)N(C=N)C=NC=N)=N)=N 294.3 1.94·106 1.00
722 N#CC1NC=NC=NC=N1 135.1 1.77·106 1.00
469 OC(NC=NC=N)NC=NC=N 170.2 1.61·106 1.00
464 OC(NC=NC=N)N(C=N)C(NC=N)C#N 224.2 1.27·106 1.00
1053 N=CN=CNC(NC(C1N=CN=CN1C=N)=N)C#N 260.3 1.23·106 1.00
890 N=CN1C=NC=NC=NC1C#N 162.2 1.12·106 1.00
529 OC(NC=NC=N)N(C=N)C(NC=NC=NC=N)C(NC(NC=N)C#N)=N 376.4 9.94·105 1.00
803 N=CNC(NC(C(NC=N)N(C=N)C=NC=N)=N)C(NC=N)=N 321.3 9.93·105 1.00
565 OC(NC=NC=N)NC(NC=NC=N)C(NC=N)=N 268.3 9.59·105 1.00
c© 2013 by the authors; licensee MDPI, Basel, Switzerland. This article is an open access articledistributed under the terms and conditions of the Creative Commons Attribution license(http://creativecommons.org/licenses/by/3.0/).
Related Documents