Navigating in Complex Process Model Collections Markus Hipp Dissertation Ulm University Institute of Databases and Information Systems 2015

Welcome message from author
This document is posted to help you gain knowledge. Please leave a comment to let me know what you think about it! Share it to your friends and learn new things together.
Transcript
Navigating in ComplexProcess Model Collections
Markus Hipp
Dissertation
Ulm UniversityInstitute of Databases andInformation Systems
2015

Titelbild:c©Benjamin Erb (www.benjamin-erb.de)
Fakultät fürIngenieurwissenschaften,Informatik und PsychologieInstitut für Datenbankenund InformationssystemeLeiter: Prof. Dr. Manfred Reichert
Navigating in ComplexProcess Model Collections
DISSERTATION
Dissertation zur Erlangung des Doktorgrades Dr. rer. nat. der Fakultät fürIngenieurwissenschaften und Informatik der Universität Ulm
Vorgelegt vonMarkus Hipp
aus Füssen, [email protected]
2015

Amtierende Dekanin:Prof. Dr. Tina Seufert
Gutachter:Prof. Dr. Manfred ReichertProf. Dr. Tina SeufertProf. Dr. Bela Mutschler
Tag der Promotion:29. Juli 2015
iv
Vorwort
Die vorliegende Arbeit ist das Resultat meiner Promotion, welche ich im Förderprojekt niPRO, in Zusam-menarbeit mit der Daimler AG, der Universität Ulm und der Hochschule Ravensburg-Weingarten ab-solviert habe. Während der gesamten Zeit hatten verschiedene Personen maßgeblichen Anteil am Gelin-gen dieses Schriftstückes. Einigen davon möchte ich an dieser Stelle persönlich danken.
Mein erster Dank gilt meinem Doktorvater Prof. Dr. Manfred Reichert. Die fachlichen Gespräche unddie zahllosen detaillierten Korrekturen und Anregungen haben maßgeblich zum Erfolg dieser Arbeit undaller dazugehörigen Veröffentlichungen und Vorträge beigetragen. Auch den Austausch zu fachfremdenThemen habe ich immer sehr genossen.
Ganz besonders bedanken möchte ich mich bei Prof. Dr. Bela Mutschler, der diese Arbeit über dengesamten Zeitraum mit unermüdlichem Einsatz unterstützt hat. Der enge Austausch zu fachlichen The-men sowie seine Bereitschaft in kürzester Zeit Schriftstücke zu lesen, machten diese Betreuung einzigar-tig. Ohne seine unerschöpfliche Motivation, jedes meiner Arbeitsergebnisse immer noch besser machenzu wollen, wäre die Arbeit in dieser Form sicher nicht so entstanden.
Frau Prof. Dr. Tina Seufert danke ich herzlich für ihr Interesse an meinem Thema und die Bereitschaft,die Zweitbegutachtung zu übernehmen. Vielen Dank auch für die wichtigen Tipps und die Hilfestellungzu empirischen Fragestellungen.
Ich danke dem Team um Michael Offergeld für die angenehmen vier Jahre bei der Daimler AG und dennötigen Freiraum, den ich bekommen habe, um diese Arbeit erfolgreich zu beenden.
Allen DBIS-Mitarbeitern möchte ich für die schöne Zeit danken. Obwohl ich nur selten vor Ort seinkonnte, so habe ich mich doch immer außerordentlich wohl und willkommen gefühlt. Speziell möchte ichmich bei Bernd Michelberger bedanken, der als direkter Kollege im gleichen Forschungsprojekt immerein offenes Ohr für alle Probleme hatte und dessen Anregungen mir immer eine große Hilfe waren. Ichmöchte mich auch bei allen Studenten bedanken, die mit ihren Abschlussarbeiten einen wichtigen Teil zudieser Arbeit beitragen konnten.
Zuletzt bedanke ich mich bei meiner Familie und meiner Freundin Nicola, ohne deren Unterstützung ichsicher nicht so weit gekommen wäre.
v

Abstract
The increasing adoption of process-aware information systems (PAIS) has led to the emergence of largeprocess model collections. In the automotive and healthcare domains, for example, such collections maycomprise hundreds or thousands of process models, each consisting of numerous process elements (e.g.,process tasks or data objects). In existing modeling environments, process models are presented to usersin a rather static manner; i.e., as image maps not allowing for any context-specific user interactions.As process participants have different needs and thus require specific presentations of available processinformation, such static approaches are usually not sufficient to assist them in their daily work. Forexample, a business manager only requires an abstract overview of a process model collection, whereas aknowledge worker (e.g., a requirements engineer) needs detailed information on specific process tasks.
In general, a more flexible navigation and visualization approach is needed, which allows process partici-pants to flexibly interact with process model collections in order to navigate from a standard (i.e., default)visualization of a process model collection to a context-specific one. With the Process Navigation andVisualization (ProNaVis) framework, this thesis provides such a flexible navigation approach for large andcomplex process model collections. Specifically, ProNaVis enables the flexible navigation within processmodel collections along three navigation dimensions. First, the geographic dimension allows zooming inand out of the process models. Second, the semantic dimension may be utilized to increase or decreasethe level of detail. Third, the view dimension allows switching between different visualizations. All threenavigation dimensions have been addressed in an isolated fashion in existing navigation approaches sofar, but only ProNaVis provides an integrated support for all three dimensions.
The concepts developed in this thesis were validated using various methods. First, they were implementedin the process navigation tool Compass, which has been used by several departments of an automotiveOEM (Original Equipment Manufacturer). Second, ProNaVis concepts were evaluated in two exper-iments, investigating both navigation and visualization aspects. Third, the developed concepts weresuccessfully applied to process-oriented information logistics (POIL). Experimental as well as empiricalresults have provided evidence that ProNaVis will enable a much more flexible navigation in processmodel repositories compared to existing approaches.
vii
Parts of this thesis have been published in the following referred papers:
Markus Hipp, Bela Mutschler, and Manfred Reichert. On the Context-aware, Personalized Delivery ofProcess Information: Viewpoints, Problems, and Requirements. in: Proc 6th Int’l Conf on Availability,Reliability and Security (ARES’11), LNCS 6908, pp. 390–397, Springer, 2011
Markus Hipp, Bela Mutschler, and Manfred Reichert. Navigating in Process Model Collections: A newApproach Inspired by Google Earth. in: Proc 1st Int’l Workshop on Process Model Collections (PMC’11),LNBIP 100, pp. 87–98, Springer, 2011
Markus Hipp, Bela Mutschler, and Manfred Reichert. Navigating in Complex Business Processes. in:Proc 23rd Int’l Conf on Database and Expert Systems Applications (DEXA’12), LNCS 7447, pp. 466–480,Springer, 2012
Markus Hipp, Bernd Michelberger, Bela Mutschler, and Manfred Reichert. A Framework for the Intel-ligent Delivery and User-adequate Visualization of Process Information. in: Proc 28th Symposium onApplied Computing (SAC’13), pp. 1383–1390, ACM, 2013
Bernd Michelberger, Armin Reisch, Bela Mutschler, Jörg Wurzer, Markus Hipp, and Manfred Reichert.iCare: Intelligent Medical Information Logistics. in: Proc 15th Int’l Conf on Information Integration andWeb-based Applications & Services (iiWAS’13), pp. 396–399, ACM, 2013
Bernd Michelberger, Bela Mutschler, Markus Hipp, and Manfred Reichert. Determining the Link andRate Popularity of Enterprise Process Information. in: Proc 21st Int’l Conf on Cooperative InformationSystems (CoopIS’13), LNCS 8185, pp. 112–129, Springer, 2013
Markus Hipp, Bernd Michelberger, Bela Mutschler, and Manfred Reichert. Navigating in Process ModelRepositories and Enterprise Process Information. in: Proc 8th Int’l Conf on Research Challenges inInformation Science (RCIS’14), IEEE, pp. 1–12, 2014
Bernd Michelberger, Bela Mutschler, Daniel Binder, Jan Meurer, and Markus Hipp. iGraph: IntelligentEnterprise Information Logistics. in: Proc 10th Int’l Conf on Semantic Systems (SEMANTiCS’14),Posters & Demonstrations Track, 1224, pp. 27–30, 2014
Markus Hipp, Achim Strauss, Bernd Michelberger, Bela Mutschler, and Manfred Reichert. Enabling aUser-Friendly Visualization of Business Process Models. in: Proc 3rd Int’l Workshop on Theory andApplications of Process Visualization (TaProViz’14), pp. 395-407, 2014
B. Michelberger, M. Hipp, and B. Mutschler. Process-oriented Information Logistics: Requirements,Techniques, Application. in: Advances in Intelligent Process-Aware Information Systems, 2015. Acceptedfor Publication
Table of Contents
I Introduction 1
1 Motivation 31.1 Problem Statement . . . . . . . . . . . . . . . . . . . . . . . . . . . . . . . . . . . . . . . . 5
1.1.1 Visualization . . . . . . . . . . . . . . . . . . . . . . . . . . . . . . . . . . . . . . . 51.1.2 Interaction . . . . . . . . . . . . . . . . . . . . . . . . . . . . . . . . . . . . . . . . 61.1.3 Navigation . . . . . . . . . . . . . . . . . . . . . . . . . . . . . . . . . . . . . . . . 6
1.2 Use Cases . . . . . . . . . . . . . . . . . . . . . . . . . . . . . . . . . . . . . . . . . . . . . 71.3 Research Questions . . . . . . . . . . . . . . . . . . . . . . . . . . . . . . . . . . . . . . . . 121.4 Research Methodology . . . . . . . . . . . . . . . . . . . . . . . . . . . . . . . . . . . . . . 131.5 Contribution . . . . . . . . . . . . . . . . . . . . . . . . . . . . . . . . . . . . . . . . . . . 141.6 Outline . . . . . . . . . . . . . . . . . . . . . . . . . . . . . . . . . . . . . . . . . . . . . . 14
2 Requirements Analysis 172.1 Case Study 1: Clinical Domain . . . . . . . . . . . . . . . . . . . . . . . . . . . . . . . . . 18
2.1.1 Problem Area 1: Process Tasks . . . . . . . . . . . . . . . . . . . . . . . . . . . . . 182.1.2 Problem Area 2: Process Execution . . . . . . . . . . . . . . . . . . . . . . . . . . 192.1.3 Problem Area 3: Process Information . . . . . . . . . . . . . . . . . . . . . . . . . 20
2.2 Case Study 2: Automotive Domain . . . . . . . . . . . . . . . . . . . . . . . . . . . . . . . 212.2.1 Problem Area 4: Roles . . . . . . . . . . . . . . . . . . . . . . . . . . . . . . . . . . 212.2.2 Problem Area 5: Access to Processes . . . . . . . . . . . . . . . . . . . . . . . . . . 22
2.3 Online Survey . . . . . . . . . . . . . . . . . . . . . . . . . . . . . . . . . . . . . . . . . . . 232.4 Requirements at a Glance . . . . . . . . . . . . . . . . . . . . . . . . . . . . . . . . . . . . 252.5 Summary . . . . . . . . . . . . . . . . . . . . . . . . . . . . . . . . . . . . . . . . . . . . . 25
II Framework 27
3 ProNaVis in a Nutshell 293.1 Basic Issues . . . . . . . . . . . . . . . . . . . . . . . . . . . . . . . . . . . . . . . . . . . . 303.2 Running Example . . . . . . . . . . . . . . . . . . . . . . . . . . . . . . . . . . . . . . . . . 313.3 The ProNaVis Framework . . . . . . . . . . . . . . . . . . . . . . . . . . . . . . . . . . . . 373.4 Applying the Approach . . . . . . . . . . . . . . . . . . . . . . . . . . . . . . . . . . . . . 393.5 Summary . . . . . . . . . . . . . . . . . . . . . . . . . . . . . . . . . . . . . . . . . . . . . 40
4 The Navigation Space 414.1 Motivation . . . . . . . . . . . . . . . . . . . . . . . . . . . . . . . . . . . . . . . . . . . . 414.2 Main Construction Steps . . . . . . . . . . . . . . . . . . . . . . . . . . . . . . . . . . . . . 41
ix
Table of Contents
4.3 Step 1: Constructing the Process Space . . . . . . . . . . . . . . . . . . . . . . . . . . . . 434.3.1 Step 1.1: Extracting Process Object Models . . . . . . . . . . . . . . . . . . . . . . 434.3.2 Step 1.2: Combining Process Models . . . . . . . . . . . . . . . . . . . . . . . . . . 484.3.3 Concluding Remarks . . . . . . . . . . . . . . . . . . . . . . . . . . . . . . . . . . . 49
4.4 Step 2: Constructing the Navigation Space . . . . . . . . . . . . . . . . . . . . . . . . . . 494.4.1 Step 2.1: The Semantic Dimension . . . . . . . . . . . . . . . . . . . . . . . . . . . 494.4.2 Step 2.2: The Geographic Dimension . . . . . . . . . . . . . . . . . . . . . . . . . . 504.4.3 Step 2.3: The Visualization Dimension . . . . . . . . . . . . . . . . . . . . . . . . . 524.4.4 Enhancing Process Navigation . . . . . . . . . . . . . . . . . . . . . . . . . . . . . 554.4.5 Concluding Remarks . . . . . . . . . . . . . . . . . . . . . . . . . . . . . . . . . . . 58
4.5 Summary . . . . . . . . . . . . . . . . . . . . . . . . . . . . . . . . . . . . . . . . . . . . . 58
5 Formalizing the Navigation Space 615.1 Basic Definitions . . . . . . . . . . . . . . . . . . . . . . . . . . . . . . . . . . . . . . . . . 615.2 Running Example . . . . . . . . . . . . . . . . . . . . . . . . . . . . . . . . . . . . . . . . . 635.3 Advanced Formalizations . . . . . . . . . . . . . . . . . . . . . . . . . . . . . . . . . . . . 65
5.3.1 Reachability . . . . . . . . . . . . . . . . . . . . . . . . . . . . . . . . . . . . . . . . 655.3.2 Distance . . . . . . . . . . . . . . . . . . . . . . . . . . . . . . . . . . . . . . . . . . 665.3.3 Quality . . . . . . . . . . . . . . . . . . . . . . . . . . . . . . . . . . . . . . . . . . 67
5.4 Applying the Navigation Space . . . . . . . . . . . . . . . . . . . . . . . . . . . . . . . . . 675.5 Related Approaches . . . . . . . . . . . . . . . . . . . . . . . . . . . . . . . . . . . . . . . 695.6 Summary . . . . . . . . . . . . . . . . . . . . . . . . . . . . . . . . . . . . . . . . . . . . . 71
6 Visualizing the Navigation Space 736.1 Background Information . . . . . . . . . . . . . . . . . . . . . . . . . . . . . . . . . . . . . 736.2 Visualization Types . . . . . . . . . . . . . . . . . . . . . . . . . . . . . . . . . . . . . . . 74
6.2.1 Time-based Visualization . . . . . . . . . . . . . . . . . . . . . . . . . . . . . . . . 756.2.2 Logic-based Visualization . . . . . . . . . . . . . . . . . . . . . . . . . . . . . . . . 766.2.3 Text-based Visualization . . . . . . . . . . . . . . . . . . . . . . . . . . . . . . . . . 776.2.4 List-based Visualization . . . . . . . . . . . . . . . . . . . . . . . . . . . . . . . . . 796.2.5 Discussion . . . . . . . . . . . . . . . . . . . . . . . . . . . . . . . . . . . . . . . . . 79
6.3 Logic-based Visualization Approachess . . . . . . . . . . . . . . . . . . . . . . . . . . . . . 816.3.1 Visualization Requirements . . . . . . . . . . . . . . . . . . . . . . . . . . . . . . . 826.3.2 Bubble Approach . . . . . . . . . . . . . . . . . . . . . . . . . . . . . . . . . . . . . 836.3.3 BPMN3D Approach . . . . . . . . . . . . . . . . . . . . . . . . . . . . . . . . . . . 846.3.4 Network Approach . . . . . . . . . . . . . . . . . . . . . . . . . . . . . . . . . . . . 846.3.5 ThinLine Approach . . . . . . . . . . . . . . . . . . . . . . . . . . . . . . . . . . . 856.3.6 Discussion . . . . . . . . . . . . . . . . . . . . . . . . . . . . . . . . . . . . . . . . . 86
6.4 Related Visualization Approaches . . . . . . . . . . . . . . . . . . . . . . . . . . . . . . . . 876.5 Summary . . . . . . . . . . . . . . . . . . . . . . . . . . . . . . . . . . . . . . . . . . . . . 89
7 Using the Navigation Space 917.1 Preliminaries . . . . . . . . . . . . . . . . . . . . . . . . . . . . . . . . . . . . . . . . . . . 91
7.1.1 Handling Navigation States with too few Objects . . . . . . . . . . . . . . . . . . . 937.1.2 Handling Navigation States with too many Objects . . . . . . . . . . . . . . . . . . 947.1.3 Methodology . . . . . . . . . . . . . . . . . . . . . . . . . . . . . . . . . . . . . . . 96
x
Table of Contents
7.2 Use Case 1 . . . . . . . . . . . . . . . . . . . . . . . . . . . . . . . . . . . . . . . . . . . . 967.3 Use Case 2 . . . . . . . . . . . . . . . . . . . . . . . . . . . . . . . . . . . . . . . . . . . . 997.4 Use Case 3 . . . . . . . . . . . . . . . . . . . . . . . . . . . . . . . . . . . . . . . . . . . . 1017.5 Use Case 4 . . . . . . . . . . . . . . . . . . . . . . . . . . . . . . . . . . . . . . . . . . . . 1037.6 Use Case 5 . . . . . . . . . . . . . . . . . . . . . . . . . . . . . . . . . . . . . . . . . . . . 1057.7 Use Case 6 . . . . . . . . . . . . . . . . . . . . . . . . . . . . . . . . . . . . . . . . . . . . 1087.8 Use Case 7 . . . . . . . . . . . . . . . . . . . . . . . . . . . . . . . . . . . . . . . . . . . . 1107.9 Discussion . . . . . . . . . . . . . . . . . . . . . . . . . . . . . . . . . . . . . . . . . . . . . 1137.10 Summary . . . . . . . . . . . . . . . . . . . . . . . . . . . . . . . . . . . . . . . . . . . . . 113
III Validation 117
8 Related Work 1198.1 1-Dimensional Navigation Concepts . . . . . . . . . . . . . . . . . . . . . . . . . . . . . . . 119
8.1.1 Basic Zoomable User Interfaces . . . . . . . . . . . . . . . . . . . . . . . . . . . . . 1198.1.2 3D Approaches . . . . . . . . . . . . . . . . . . . . . . . . . . . . . . . . . . . . . . 1228.1.3 Metaphor-based Approaches . . . . . . . . . . . . . . . . . . . . . . . . . . . . . . . 1238.1.4 Discussion . . . . . . . . . . . . . . . . . . . . . . . . . . . . . . . . . . . . . . . . . 125
8.2 2-Dimensional Navigation Concepts . . . . . . . . . . . . . . . . . . . . . . . . . . . . . . . 1268.2.1 Advanced Zoomable User Interfaces . . . . . . . . . . . . . . . . . . . . . . . . . . 1268.2.2 Geographic Information Systems . . . . . . . . . . . . . . . . . . . . . . . . . . . . 1308.2.3 Process Navigation Approaches . . . . . . . . . . . . . . . . . . . . . . . . . . . . . 1318.2.4 Discussion . . . . . . . . . . . . . . . . . . . . . . . . . . . . . . . . . . . . . . . . . 132
8.3 Summary . . . . . . . . . . . . . . . . . . . . . . . . . . . . . . . . . . . . . . . . . . . . . 133
9 Proof-of-Concept Prototypes 1359.1 ProNavigator . . . . . . . . . . . . . . . . . . . . . . . . . . . . . . . . . . . . . . . . . . . 136
9.1.1 The Navigation Element . . . . . . . . . . . . . . . . . . . . . . . . . . . . . . . . . 1369.1.2 Example . . . . . . . . . . . . . . . . . . . . . . . . . . . . . . . . . . . . . . . . . . 1379.1.3 Combined Navigation Possibilities . . . . . . . . . . . . . . . . . . . . . . . . . . . 1399.1.4 Conclusion . . . . . . . . . . . . . . . . . . . . . . . . . . . . . . . . . . . . . . . . 140
9.2 Compass . . . . . . . . . . . . . . . . . . . . . . . . . . . . . . . . . . . . . . . . . . . . . . 1429.2.1 User Interface Design . . . . . . . . . . . . . . . . . . . . . . . . . . . . . . . . . . 1439.2.2 Example . . . . . . . . . . . . . . . . . . . . . . . . . . . . . . . . . . . . . . . . . . 1439.2.3 The Semantic Dimension . . . . . . . . . . . . . . . . . . . . . . . . . . . . . . . . 1449.2.4 The Geographic Dimension . . . . . . . . . . . . . . . . . . . . . . . . . . . . . . . 1449.2.5 The Visualization Dimension . . . . . . . . . . . . . . . . . . . . . . . . . . . . . . 1459.2.6 Conclusion . . . . . . . . . . . . . . . . . . . . . . . . . . . . . . . . . . . . . . . . 147
9.3 Discussion . . . . . . . . . . . . . . . . . . . . . . . . . . . . . . . . . . . . . . . . . . . . . 1489.4 Summary . . . . . . . . . . . . . . . . . . . . . . . . . . . . . . . . . . . . . . . . . . . . . 150
10 Experiment 1: Process Navigation 15110.1 Motivation . . . . . . . . . . . . . . . . . . . . . . . . . . . . . . . . . . . . . . . . . . . . 15110.2 Experimental Design . . . . . . . . . . . . . . . . . . . . . . . . . . . . . . . . . . . . . . . 15210.3 Hypothesis Formulation . . . . . . . . . . . . . . . . . . . . . . . . . . . . . . . . . . . . . 153
xi
Table of Contents
10.4 Experiment Execution . . . . . . . . . . . . . . . . . . . . . . . . . . . . . . . . . . . . . . 15510.5 Preparation of Data . . . . . . . . . . . . . . . . . . . . . . . . . . . . . . . . . . . . . . . 156
10.5.1 Data Validation and Analysis . . . . . . . . . . . . . . . . . . . . . . . . . . . . . . 15610.5.2 Developing Scales . . . . . . . . . . . . . . . . . . . . . . . . . . . . . . . . . . . . . 15710.5.3 Control Variables and Correlations . . . . . . . . . . . . . . . . . . . . . . . . . . . 15710.5.4 Data Analysis . . . . . . . . . . . . . . . . . . . . . . . . . . . . . . . . . . . . . . . 158
10.6 Results . . . . . . . . . . . . . . . . . . . . . . . . . . . . . . . . . . . . . . . . . . . . . . . 15910.6.1 Understandability . . . . . . . . . . . . . . . . . . . . . . . . . . . . . . . . . . . . 15910.6.2 Usability . . . . . . . . . . . . . . . . . . . . . . . . . . . . . . . . . . . . . . . . . 16010.6.3 Process Navigation Speed . . . . . . . . . . . . . . . . . . . . . . . . . . . . . . . . 16110.6.4 Navigation Dimensions . . . . . . . . . . . . . . . . . . . . . . . . . . . . . . . . . . 162
10.7 Threats to Validity . . . . . . . . . . . . . . . . . . . . . . . . . . . . . . . . . . . . . . . . 16310.8 Discussion . . . . . . . . . . . . . . . . . . . . . . . . . . . . . . . . . . . . . . . . . . . . . 16410.9 Summary . . . . . . . . . . . . . . . . . . . . . . . . . . . . . . . . . . . . . . . . . . . . . 165
11 Experiment 2: Process Visualization 16711.1 Motivation . . . . . . . . . . . . . . . . . . . . . . . . . . . . . . . . . . . . . . . . . . . . 16711.2 Pretest . . . . . . . . . . . . . . . . . . . . . . . . . . . . . . . . . . . . . . . . . . . . . . . 168
11.2.1 Results . . . . . . . . . . . . . . . . . . . . . . . . . . . . . . . . . . . . . . . . . . 16811.2.2 Overall Rating . . . . . . . . . . . . . . . . . . . . . . . . . . . . . . . . . . . . . . 17011.2.3 Discussion . . . . . . . . . . . . . . . . . . . . . . . . . . . . . . . . . . . . . . . . . 170
11.3 Control Concept . . . . . . . . . . . . . . . . . . . . . . . . . . . . . . . . . . . . . . . . . 17111.4 Experimental Design . . . . . . . . . . . . . . . . . . . . . . . . . . . . . . . . . . . . . . . 17111.5 Hypothesis Formulation . . . . . . . . . . . . . . . . . . . . . . . . . . . . . . . . . . . . . 17211.6 Experiment Execution . . . . . . . . . . . . . . . . . . . . . . . . . . . . . . . . . . . . . . 17411.7 Data Preparation . . . . . . . . . . . . . . . . . . . . . . . . . . . . . . . . . . . . . . . . . 175
11.7.1 Data Validation and Analysis . . . . . . . . . . . . . . . . . . . . . . . . . . . . . . 17511.7.2 Developing Scales . . . . . . . . . . . . . . . . . . . . . . . . . . . . . . . . . . . . . 17511.7.3 Control Variables and Correlations . . . . . . . . . . . . . . . . . . . . . . . . . . . 17611.7.4 Data Analysis . . . . . . . . . . . . . . . . . . . . . . . . . . . . . . . . . . . . . . . 176
11.8 Results . . . . . . . . . . . . . . . . . . . . . . . . . . . . . . . . . . . . . . . . . . . . . . . 17711.8.1 Understandability . . . . . . . . . . . . . . . . . . . . . . . . . . . . . . . . . . . . 17711.8.2 Aesthetic Appearance . . . . . . . . . . . . . . . . . . . . . . . . . . . . . . . . . . 17911.8.3 Clarity . . . . . . . . . . . . . . . . . . . . . . . . . . . . . . . . . . . . . . . . . . . 179
11.9 Threats to Validity . . . . . . . . . . . . . . . . . . . . . . . . . . . . . . . . . . . . . . . . 18011.10Discussion . . . . . . . . . . . . . . . . . . . . . . . . . . . . . . . . . . . . . . . . . . . . . 18111.11Summary . . . . . . . . . . . . . . . . . . . . . . . . . . . . . . . . . . . . . . . . . . . . . 182
12 Applying ProNaVis to Process-oriented Information Logistics 18512.1 Process-oriented Information Logistics . . . . . . . . . . . . . . . . . . . . . . . . . . . . . 18512.2 Combining POIL and ProNaVis . . . . . . . . . . . . . . . . . . . . . . . . . . . . . . . . . 186
12.2.1 Layer A: Integration . . . . . . . . . . . . . . . . . . . . . . . . . . . . . . . . . . . 18612.2.2 Layer B: Analysis . . . . . . . . . . . . . . . . . . . . . . . . . . . . . . . . . . . . . 18812.2.3 Layer C: Navigation . . . . . . . . . . . . . . . . . . . . . . . . . . . . . . . . . . . 18912.2.4 Layer D: Visualization . . . . . . . . . . . . . . . . . . . . . . . . . . . . . . . . . . 191
12.3 Applying the Approach in the Healthcare Domain . . . . . . . . . . . . . . . . . . . . . . 191
xii
Table of Contents
12.4 Summary . . . . . . . . . . . . . . . . . . . . . . . . . . . . . . . . . . . . . . . . . . . . . 194
IV Discussion & Summary 197
13 Discussion 199
14 Summary and Outlook 209
Bibliography 211
A Appendix 227A.1 Requirements Engineering Process . . . . . . . . . . . . . . . . . . . . . . . . . . . . . . . 227A.2 Experiment 1 . . . . . . . . . . . . . . . . . . . . . . . . . . . . . . . . . . . . . . . . . . . 229
A.2.1 Introduction 1-dimensional Navigation Concept . . . . . . . . . . . . . . . . . . . . 229A.2.2 Introduction 3-dimensional Navigation Concept . . . . . . . . . . . . . . . . . . . . 234A.2.3 Questionnaire . . . . . . . . . . . . . . . . . . . . . . . . . . . . . . . . . . . . . . . 239A.2.4 Experiment Results . . . . . . . . . . . . . . . . . . . . . . . . . . . . . . . . . . . 245
A.3 Experiment 2 . . . . . . . . . . . . . . . . . . . . . . . . . . . . . . . . . . . . . . . . . . . 247A.3.1 Questionnaire . . . . . . . . . . . . . . . . . . . . . . . . . . . . . . . . . . . . . . . 247
xiii


Part I
Introduction
1

1 Motivation
In response to continuously increasing competitive pressure, shorter growing product lifecycles, and risingquality and cost demands, new ways of supporting business processes are needed. To the same extent,business processes are becoming increasingly complex and may comprise hundreds or thousands of pro-cess tasks. As examples consider distributed engineering processes [MHHR06, GOR12, GOR13], patienttreatment processes in integrated healthcare networks [LR07], data collection processes in a supply chain[GMS+13], or transportation and logistics processes [BKK04, Bas05]. Managing this complexity neces-sitates the introduction of process-aware information systems (PAIS) in enterprises [RW12]. Respective,PAIS usually rely on process models describing process logic and hence providing the schema for pro-cess execution [WRRM08]. In general, process models are managed by process management systems[MRB08], providing generic functions for modeling [Hav05], executing [WRWRM09, RRMD09, RW12],and monitoring processes [Men08]. This allows for a separation of concerns, which is a well establishedprinciple in computer science in order to increase maintainability and reduce complexity [Dij76].
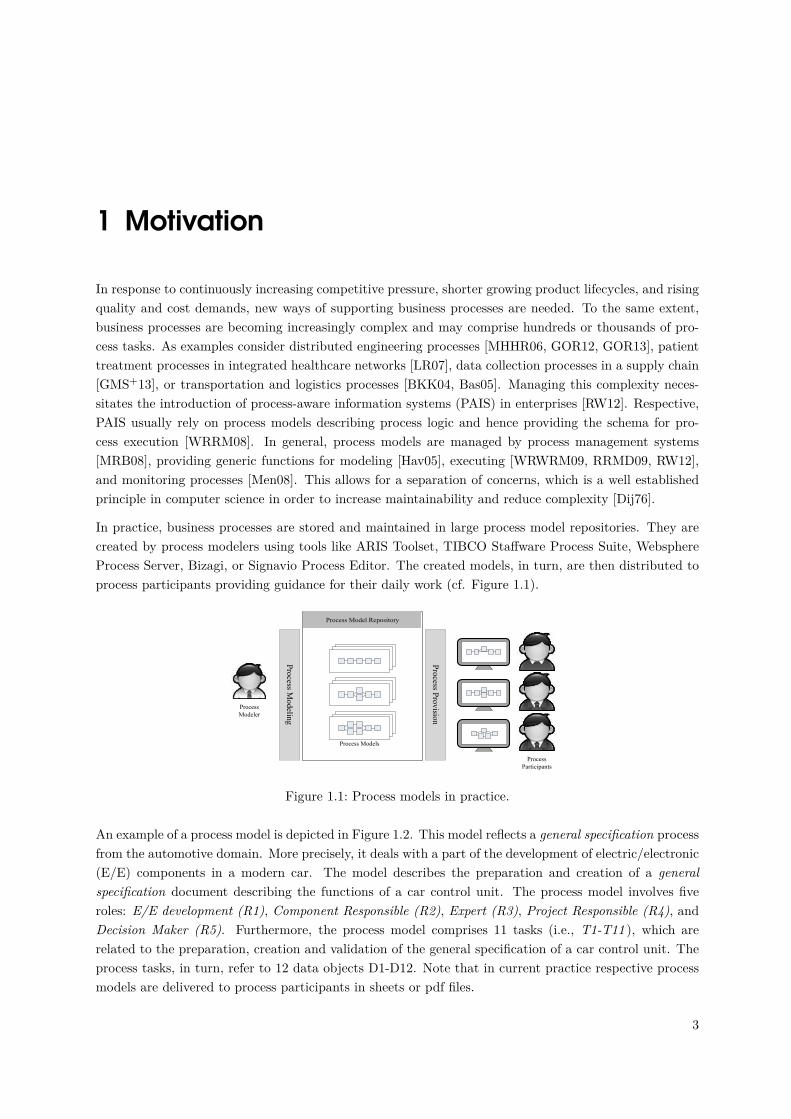
In practice, business processes are stored and maintained in large process model repositories. They arecreated by process modelers using tools like ARIS Toolset, TIBCO Staffware Process Suite, WebsphereProcess Server, Bizagi, or Signavio Process Editor. The created models, in turn, are then distributed toprocess participants providing guidance for their daily work (cf. Figure 1.1).
Process Model Repository
Process
Modeler
Process
Participants
Process Models
Pro
cess Mo
delin
g
Pro
cess Pro
visio
n
Figure 1.1: Process models in practice.
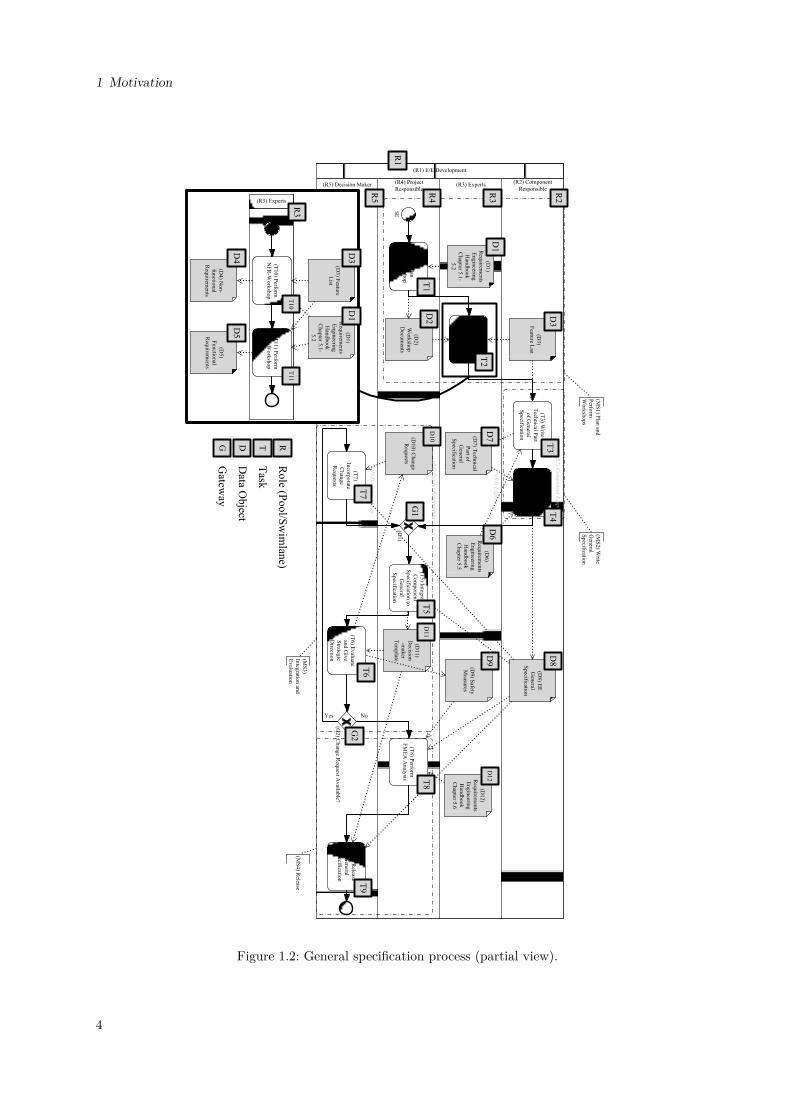
An example of a process model is depicted in Figure 1.2. This model reflects a general specification processfrom the automotive domain. More precisely, it deals with a part of the development of electric/electronic(E/E) components in a modern car. The model describes the preparation and creation of a generalspecification document describing the functions of a car control unit. The process model involves fiveroles: E/E development (R1), Component Responsible (R2), Expert (R3), Project Responsible (R4), andDecision Maker (R5). Furthermore, the process model comprises 11 tasks (i.e., T1-T11 ), which arerelated to the preparation, creation and validation of the general specification of a car control unit. Theprocess tasks, in turn, refer to 12 data objects D1-D12. Note that in current practice respective processmodels are delivered to process participants in sheets or pdf files.
3
1 Motivation
(R1) E/E Development
(R3) Experts
(R3
) Exp
erts
(T2
) Perfo
rm
RE
Wo
rksh
op
(D1
)
Req
uirem
ents
En
gin
eering
Han
db
oo
k
Ch
apter 5
.1-
5.2
(D7
) Tech
nical
Part o
f
Gen
eral
Sp
ecification
(D9
) Safety
Measu
res
(D6
)
Req
uirem
ents
En
gin
eering
Han
db
oo
k
Ch
apter 5
.5
(D1
2)
Req
uirem
ents
En
gin
eering
Han
db
oo
k
Ch
apter 5
.6
(R2) Component
Responsible
(R2
) Co
mp
on
ent R
espo
nsib
le
(T3
) Write
Tech
nical P
art
of G
eneral
Sp
ecification
(T4
) Write
Gen
eral
Sp
ecification
(D3
)
Featu
re List
(D8
) EE
Gen
eral
Sp
ecification
(R4) Project
Responsible
(R4
) Pro
ject Resp
on
sible
(T1
) Plan
RE
Wo
rksh
op
SE
(T5
) Integ
rate
Co
mp
on
ent
Sp
ecification
to
Gen
eral
Sp
ecification
(T8
) Perfo
rm
FM
EA
An
alysis
(D1
1)
Decisio
n
-mak
er
Tem
plate
(D1
0) C
han
ge
Req
uests
(D2
)
Wo
rksh
op
Do
cum
ents
(G1
)
(R5) Decision Maker
(R5
) Decisio
n M
aker
(T6
) Ev
aluate
and
Giv
e
Strateg
ic
Directio
n(G
2) C
han
ge R
equ
est Av
ailable?
(T7
)
Inco
rpo
rate
Ch
ang
e
Req
uests
(T9
) Release
Gen
eral
Sp
ecification
(MS
1) P
lan an
d
Perfo
rm
Wo
rksh
op
s
(MS
2) W
rite
Gen
eral
Sp
ecification
(MS
3)
Integ
ration
and
Ev
aluatio
n
(MS
4) R
elease
Yes No
(R3) Experts
(T1
0) P
erform
NF
R-W
ork
sho
p
(T1
1) P
erform
FR
-Wo
rksh
op
(D3
) Featu
re
List
(D1
)
Req
uirem
ents
En
gin
eering
Han
db
oo
k
Ch
apter 5
.1-
5.2
(D4
) No
n-
fun
ction
al
Req
uirem
ents
(D5
)
Fu
nctio
nal
Req
uirem
ents
R1
R2
R3
R4
R5
T1
T2
T3
T4
T5
T6
T7
T8
T9
T10
T11
D1
D3
D2
D4
D5
D1
D3
D7
D6
D8
D9
D10
D11
D12
RR
ole (P
ool/S
wim
lane)
TT
ask
DD
ata Object
R3
G1
G2
GG
ateway
Figure 1.2: General specification process (partial view).
4
1.1 Problem Statement
A well-defined set of process models is denoted as process model collection [WRMR11]. Usually, themodels of such a collection are distributed across multiple departments [Som12, SZ10, MHHR06]. Fur-thermore, there exist model collections comprising dozens or hundreds of process models [Ger05, Rei11,LPR12].
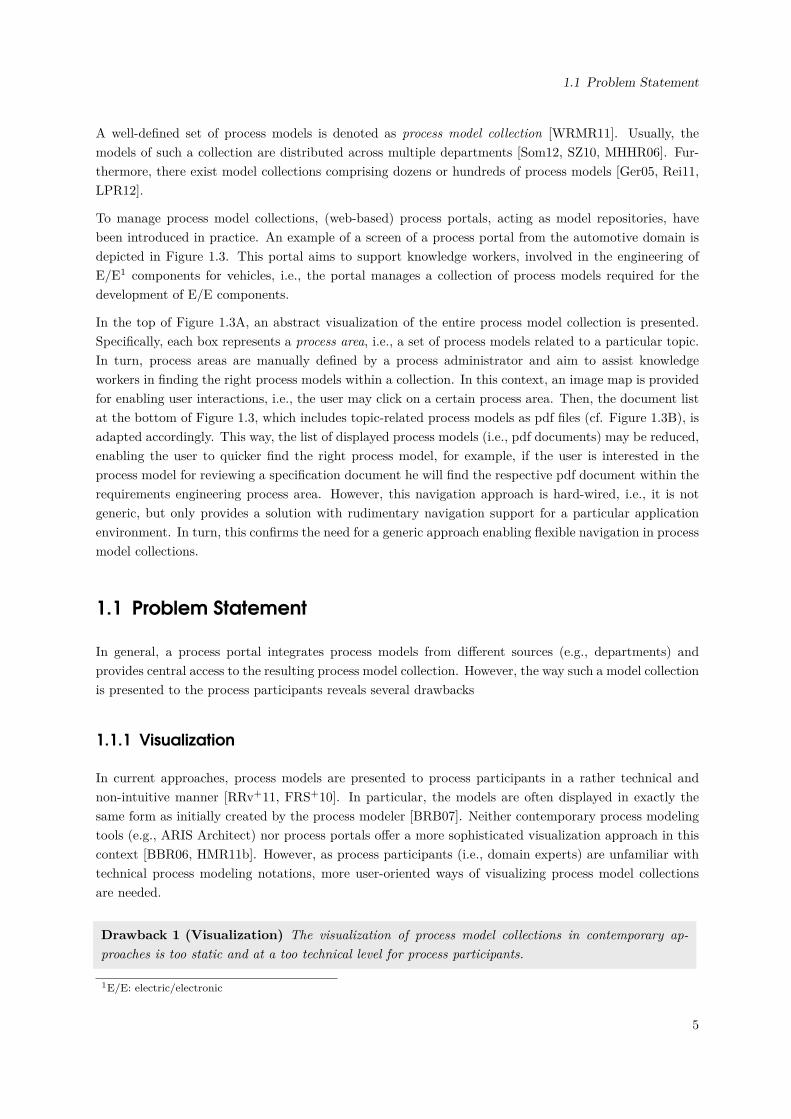
To manage process model collections, (web-based) process portals, acting as model repositories, havebeen introduced in practice. An example of a screen of a process portal from the automotive domain isdepicted in Figure 1.3. This portal aims to support knowledge workers, involved in the engineering ofE/E1 components for vehicles, i.e., the portal manages a collection of process models required for thedevelopment of E/E components.
In the top of Figure 1.3A, an abstract visualization of the entire process model collection is presented.Specifically, each box represents a process area, i.e., a set of process models related to a particular topic.In turn, process areas are manually defined by a process administrator and aim to assist knowledgeworkers in finding the right process models within a collection. In this context, an image map is providedfor enabling user interactions, i.e., the user may click on a certain process area. Then, the document listat the bottom of Figure 1.3, which includes topic-related process models as pdf files (cf. Figure 1.3B), isadapted accordingly. This way, the list of displayed process models (i.e., pdf documents) may be reduced,enabling the user to quicker find the right process model, for example, if the user is interested in theprocess model for reviewing a specification document he will find the respective pdf document within therequirements engineering process area. However, this navigation approach is hard-wired, i.e., it is notgeneric, but only provides a solution with rudimentary navigation support for a particular applicationenvironment. In turn, this confirms the need for a generic approach enabling flexible navigation in processmodel collections.
1.1 Problem Statement
In general, a process portal integrates process models from different sources (e.g., departments) andprovides central access to the resulting process model collection. However, the way such a model collectionis presented to the process participants reveals several drawbacks
1.1.1 Visualization
In current approaches, process models are presented to process participants in a rather technical andnon-intuitive manner [RRv+11, FRS+10]. In particular, the models are often displayed in exactly thesame form as initially created by the process modeler [BRB07]. Neither contemporary process modelingtools (e.g., ARIS Architect) nor process portals offer a more sophisticated visualization approach in thiscontext [BBR06, HMR11b]. However, as process participants (i.e., domain experts) are unfamiliar withtechnical process modeling notations, more user-oriented ways of visualizing process model collectionsare needed.
Drawback 1 (Visualization) The visualization of process model collections in contemporary ap-proaches is too static and at a too technical level for process participants.
1E/E: electric/electronic
5
1 Motivation
A: Process Model Collection; B: Process Information
B
A
Figure 1.3: Process portal from the automotive industry.
1.1.2 Interaction
As emphasized, process model collections are presented to the user in a static manner, e.g., as imagesor documents. As a consequence, there only exist rudimental ways for process participants to interactwith a process model collection. In most cases, there is only one abstract image of the process modelcollection (cf. Figure 1.3A). Single process models are then represented in terms of simple pdf files (cf.Figure 1.3B). Regarding the aforementioned process portal, for example, it is not possible to flexiblyswitch between different process models (i.e., documents or images). Thereby, interaction is limited tohard-wired links between the images and documents. Process modeling tools often do not even considerprocess model collections, i.e., single process models are handled separately and, therefore, no interactionis possible at all.
Drawback 2 (Interaction) The interaction within process model collections is limited to static linksbetween images and documents.
1.1.3 Navigation
The flexible navigation within a process model collection, e.g., to navigate from an abstract to a moredetailed visualization of a process model collection or from the visualization of a particular process model
6
1.2 Use Cases
to another one, is not considered by existing process modeling tools at all. Usually, only single processmodels are considered for navigation, and the combination of multiple process models must be realized bysub processes. The presented process portal, however, only provides the rigit navigation from an abstractvisualization of the entire process model collection to a detailed visualization of single process models.
Drawback 3 (Navigation) Process participants cannot flexibly navigate within process model collec-tions.
1.2 Use Cases
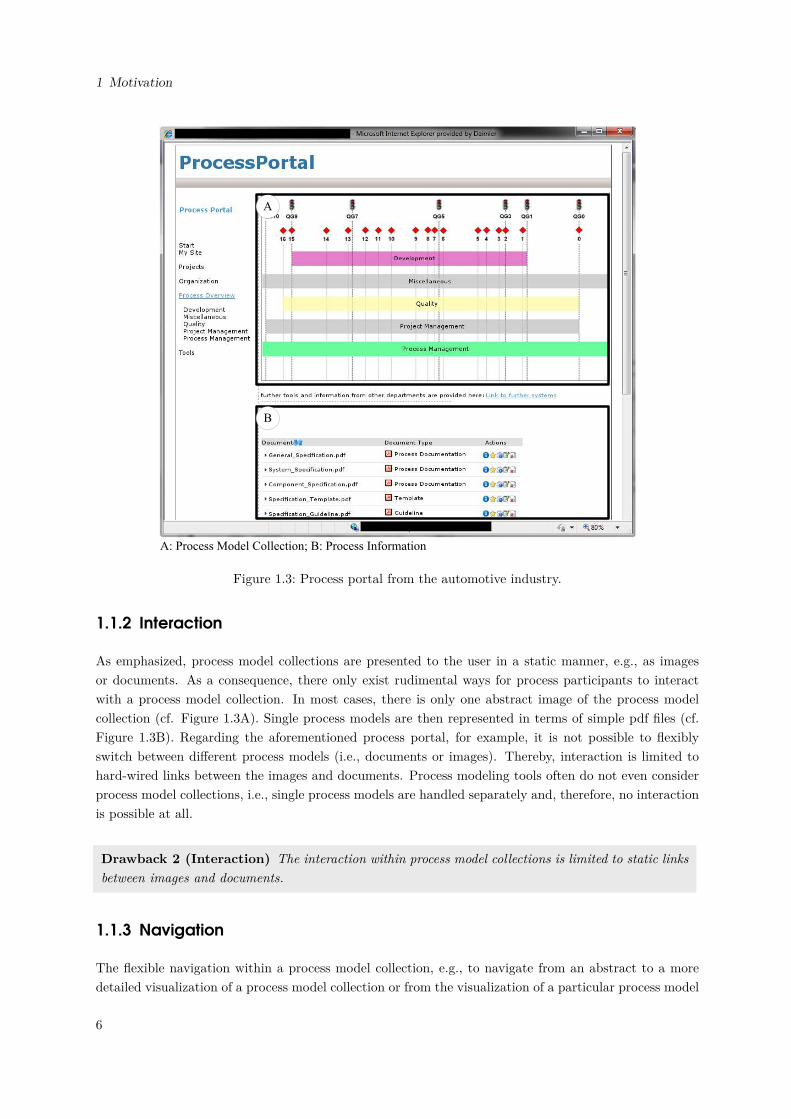
Due to the described drawbacks, current process portals are unable to support process participants inaccessing process model collections [BBR06]. Only hard-wired and limited navigation possibilities areprovided. Instead, a flexible navigation approach is needed that allows for a user-driven way of intuitivelynavigating within process model collections. Figure 1.4 illustrates the relations between visualization,interaction and navigation.
Process Navigation
Visualization 1 Visualization 2 Visualization 3
Interaction 1 Interaction 2
Figure 1.4: Basic process navigation approach.
To illustrate what kind of process navigation and visualization approach is actually needed, characteristicuse cases are provided in the following. In particular, these are related to the development of a carcontrol unit. The use cases allow us to illustrate the diversity of the requirements existing in the contextof handling process model collections. Note that similar use cases can be found in other domains, likehealthcare or finance, as well.
Process Model Collection
Process Area A Process Area B Process Area C Process Area D Process Area F
Project Manager?
Area of Interest
Figure 1.5: Use Case 1 - Project Manager.
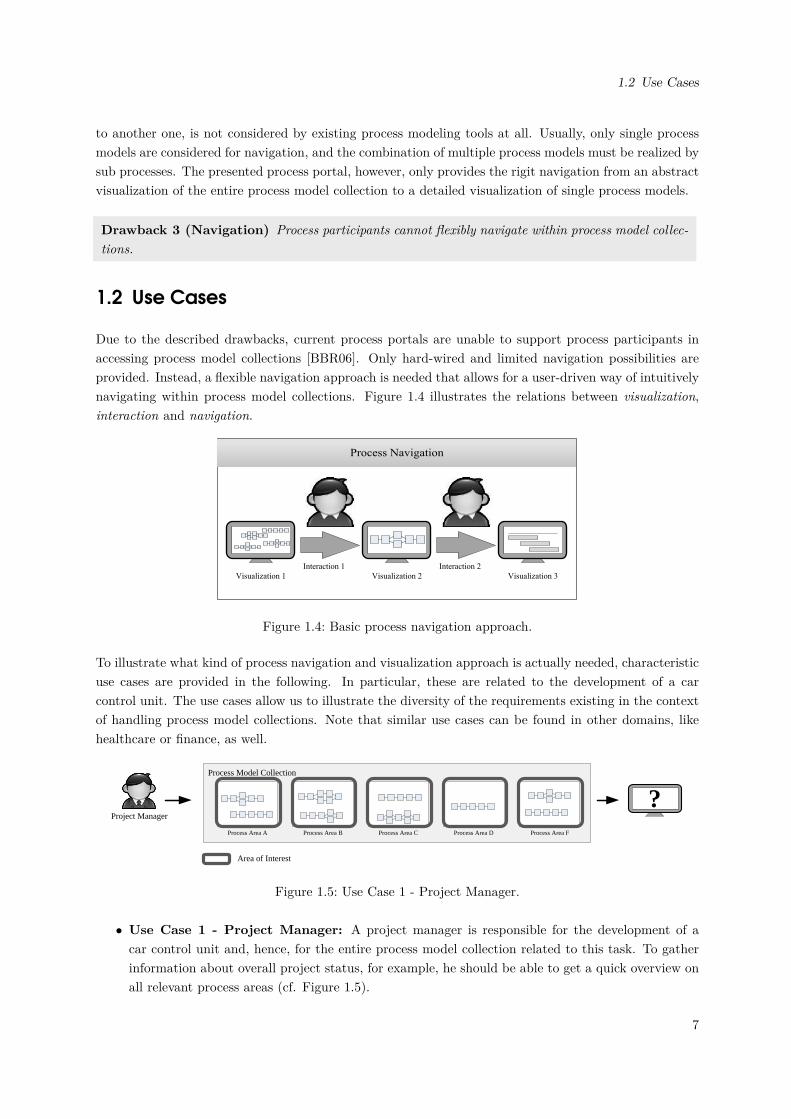
• Use Case 1 - Project Manager: A project manager is responsible for the development of acar control unit and, hence, for the entire process model collection related to this task. To gatherinformation about overall project status, for example, he should be able to get a quick overview onall relevant process areas (cf. Figure 1.5).
7
1 Motivation
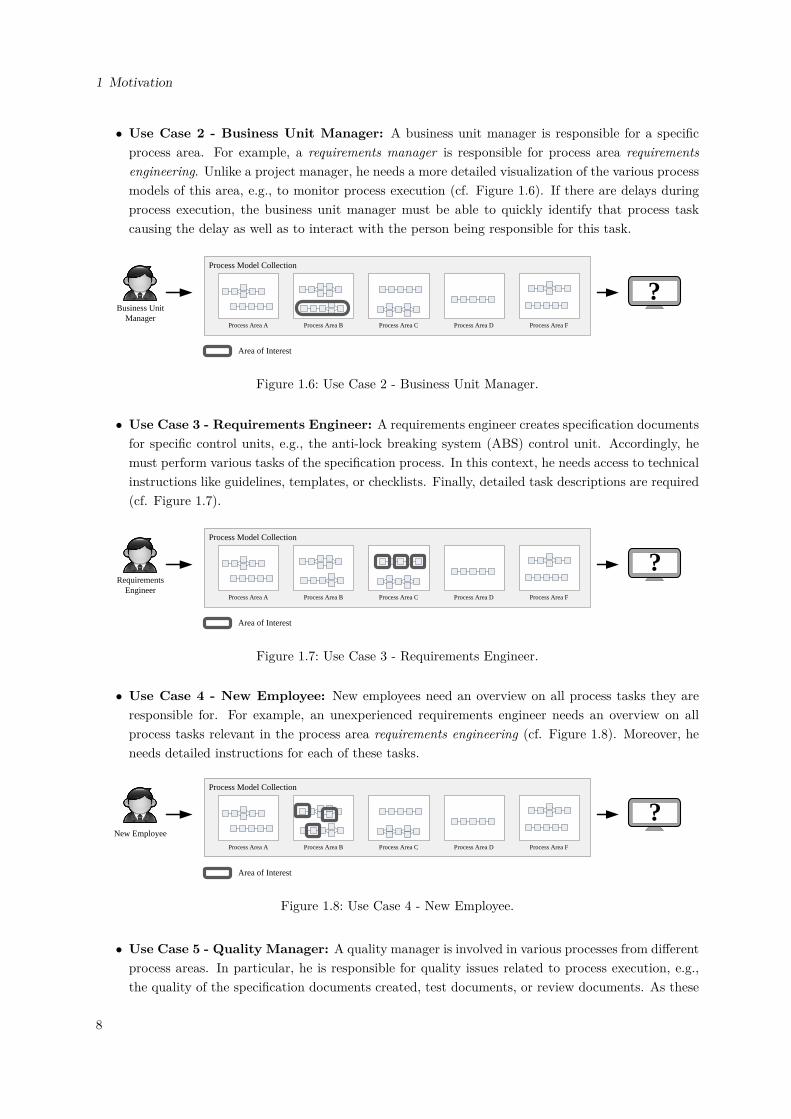
• Use Case 2 - Business Unit Manager: A business unit manager is responsible for a specificprocess area. For example, a requirements manager is responsible for process area requirementsengineering. Unlike a project manager, he needs a more detailed visualization of the various processmodels of this area, e.g., to monitor process execution (cf. Figure 1.6). If there are delays duringprocess execution, the business unit manager must be able to quickly identify that process taskcausing the delay as well as to interact with the person being responsible for this task.
Process Model Collection
Process Area A Process Area B Process Area C Process Area D Process Area F
Business Unit Manager
?
Area of Interest
Figure 1.6: Use Case 2 - Business Unit Manager.
• Use Case 3 - Requirements Engineer: A requirements engineer creates specification documentsfor specific control units, e.g., the anti-lock breaking system (ABS) control unit. Accordingly, hemust perform various tasks of the specification process. In this context, he needs access to technicalinstructions like guidelines, templates, or checklists. Finally, detailed task descriptions are required(cf. Figure 1.7).
Process Model Collection
Process Area A Process Area B Process Area C Process Area D Process Area F
Requirements Engineer
?
Area of Interest
Figure 1.7: Use Case 3 - Requirements Engineer.
• Use Case 4 - New Employee: New employees need an overview on all process tasks they areresponsible for. For example, an unexperienced requirements engineer needs an overview on allprocess tasks relevant in the process area requirements engineering (cf. Figure 1.8). Moreover, heneeds detailed instructions for each of these tasks.
Process Model Collection
Process Area A Process Area B Process Area C Process Area D Process Area F
New Employee
?
Area of Interest
Figure 1.8: Use Case 4 - New Employee.
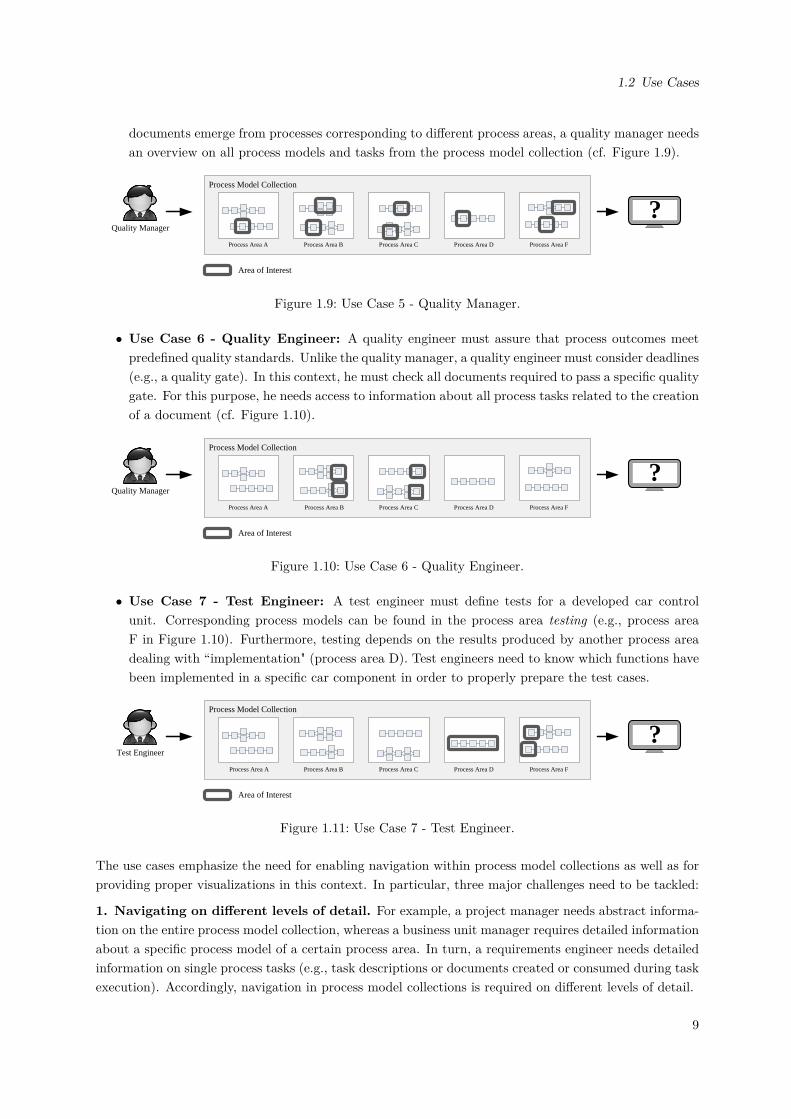
• Use Case 5 - Quality Manager: A quality manager is involved in various processes from differentprocess areas. In particular, he is responsible for quality issues related to process execution, e.g.,the quality of the specification documents created, test documents, or review documents. As these
8
1.2 Use Cases
documents emerge from processes corresponding to different process areas, a quality manager needsan overview on all process models and tasks from the process model collection (cf. Figure 1.9).
Process Model Collection
Process Area A Process Area B Process Area C Process Area D Process Area F
Quality Manager
?
Area of Interest
Figure 1.9: Use Case 5 - Quality Manager.
• Use Case 6 - Quality Engineer: A quality engineer must assure that process outcomes meetpredefined quality standards. Unlike the quality manager, a quality engineer must consider deadlines(e.g., a quality gate). In this context, he must check all documents required to pass a specific qualitygate. For this purpose, he needs access to information about all process tasks related to the creationof a document (cf. Figure 1.10).
Process Model Collection
Process Area A Process Area B Process Area C Process Area D Process Area F
Quality Manager
?
Area of Interest
Figure 1.10: Use Case 6 - Quality Engineer.
• Use Case 7 - Test Engineer: A test engineer must define tests for a developed car controlunit. Corresponding process models can be found in the process area testing (e.g., process areaF in Figure 1.10). Furthermore, testing depends on the results produced by another process areadealing with “implementation" (process area D). Test engineers need to know which functions havebeen implemented in a specific car component in order to properly prepare the test cases.
Process Model Collection
Process Area A Process Area B Process Area C Process Area D Process Area F
Test Engineer
?
Area of Interest
Figure 1.11: Use Case 7 - Test Engineer.
The use cases emphasize the need for enabling navigation within process model collections as well as forproviding proper visualizations in this context. In particular, three major challenges need to be tackled:
1. Navigating on different levels of detail. For example, a project manager needs abstract informa-tion on the entire process model collection, whereas a business unit manager requires detailed informationabout a specific process model of a certain process area. In turn, a requirements engineer needs detailedinformation on single process tasks (e.g., task descriptions or documents created or consumed during taskexecution). Accordingly, navigation in process model collections is required on different levels of detail.
9
1 Motivation
2. Navigation by zooming. The presented use cases demonstrate that process participants need to beable to navigate to different objects within a process model collection (e.g., process areas, process models,and process tasks). In turn, these objects may be spread across the entire process model collection. Thinkof a quality manager being interested in all process tasks he is responsible for. In turn, a requirementsengineer might be only interested in a single process task. The second challenge for navigating in processmodel collections, therefore, is to be able to zoom to specific objects (i.e., to a specific part of the processmodel collection).
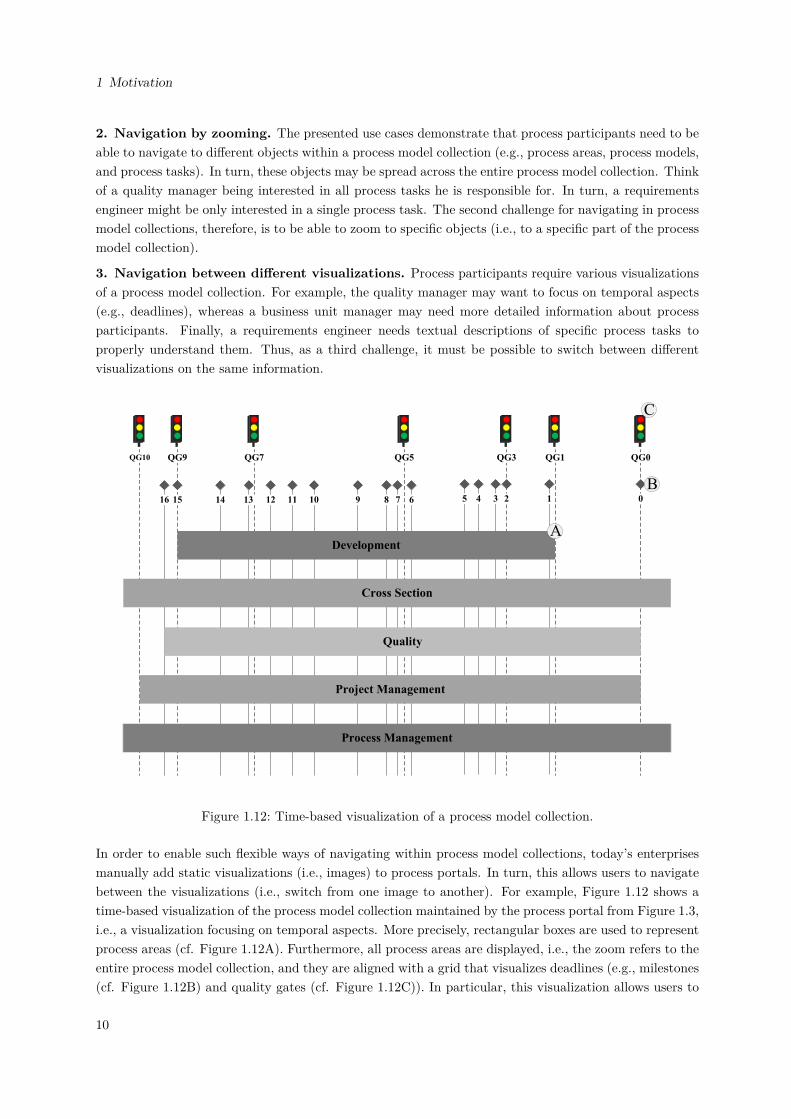
3. Navigation between different visualizations. Process participants require various visualizationsof a process model collection. For example, the quality manager may want to focus on temporal aspects(e.g., deadlines), whereas a business unit manager may need more detailed information about processparticipants. Finally, a requirements engineer needs textual descriptions of specific process tasks toproperly understand them. Thus, as a third challenge, it must be possible to switch between differentvisualizations on the same information.
QG10 QG9 QG7 QG5 QG3 QG1 QG0
1516 14 13 12 11 10 9 8 7 6 5 4 3 2 1 0
C
B
Project Management
Process Management
Quality
Cross Section
DevelopmentA
Figure 1.12: Time-based visualization of a process model collection.
In order to enable such flexible ways of navigating within process model collections, today’s enterprisesmanually add static visualizations (i.e., images) to process portals. In turn, this allows users to navigatebetween the visualizations (i.e., switch from one image to another). For example, Figure 1.12 shows atime-based visualization of the process model collection maintained by the process portal from Figure 1.3,i.e., a visualization focusing on temporal aspects. More precisely, rectangular boxes are used to representprocess areas (cf. Figure 1.12A). Furthermore, all process areas are displayed, i.e., the zoom refers to theentire process model collection, and they are aligned with a grid that visualizes deadlines (e.g., milestones(cf. Figure 1.12B) and quality gates (cf. Figure 1.12C)). In particular, this visualization allows users to
10
1.2 Use Cases
quickly scan the temporal properties and dependencies of the various process areas. For example, processmanagers can use this visualization to get quick overview on the entire process model collection.
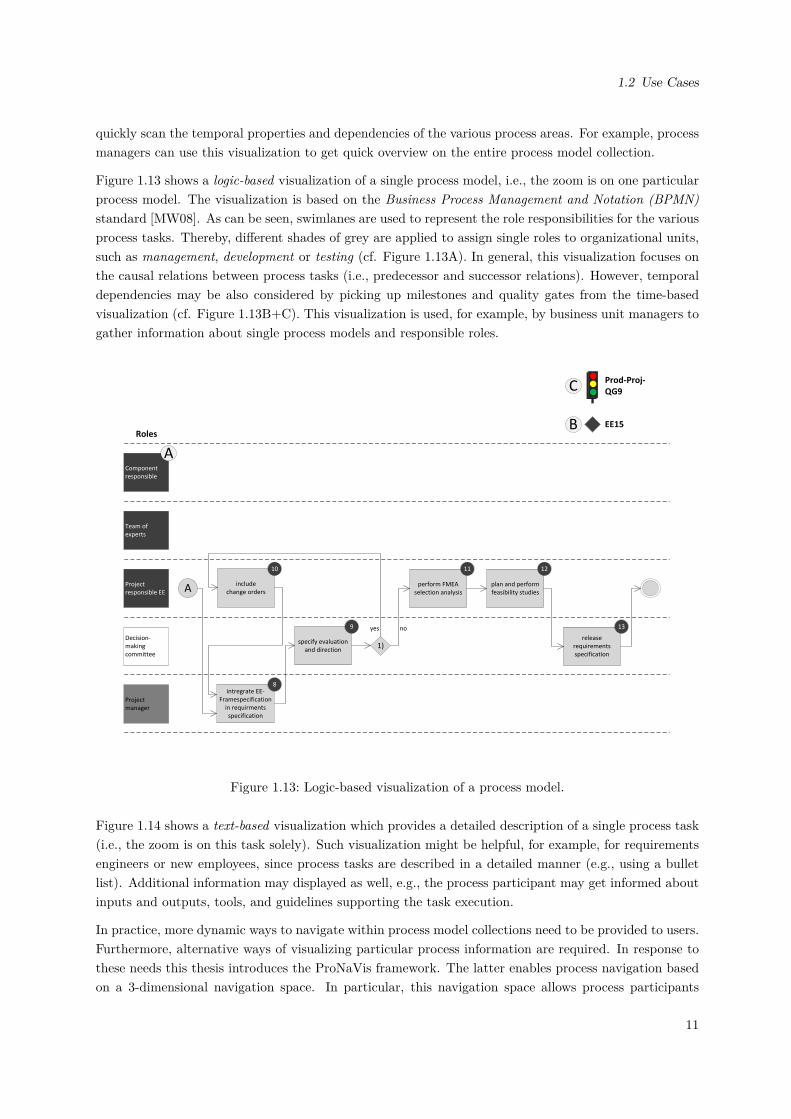
Figure 1.13 shows a logic-based visualization of a single process model, i.e., the zoom is on one particularprocess model. The visualization is based on the Business Process Management and Notation (BPMN)standard [MW08]. As can be seen, swimlanes are used to represent the role responsibilities for the variousprocess tasks. Thereby, different shades of grey are applied to assign single roles to organizational units,such as management, development or testing (cf. Figure 1.13A). In general, this visualization focuses onthe causal relations between process tasks (i.e., predecessor and successor relations). However, temporaldependencies may be also considered by picking up milestones and quality gates from the time-basedvisualization (cf. Figure 1.13B+C). This visualization is used, for example, by business unit managers togather information about single process models and responsible roles.
Component responsible
Team of experts
Project responsible EE
Project manager
Decision-making committee
intregrate EE-Framespecification
in requirments specification
include change orders
specify evaluation and direction
perform FMEA selection analysis
plan and perform feasibility studies
release requirements specification
A
B
C
10
A
11 12
139
8
1)
Roles
Prod-Proj-QG9
EE15
noyes
Figure 1.13: Logic-based visualization of a process model.
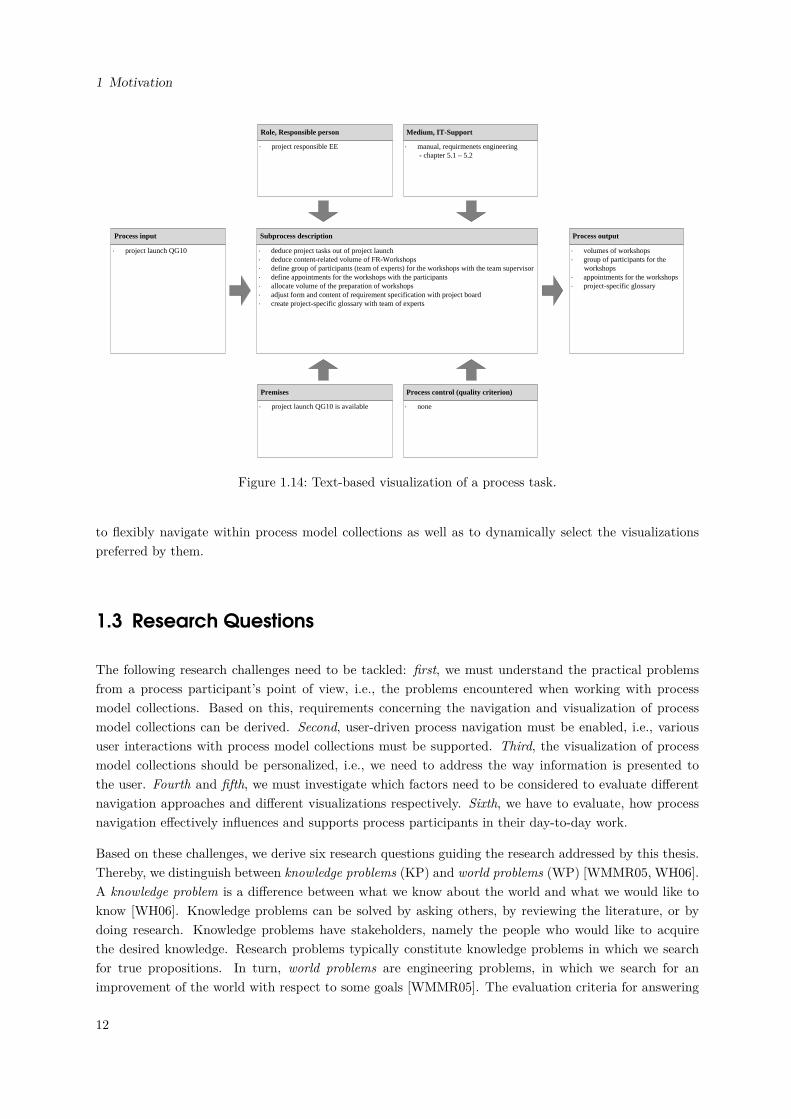
Figure 1.14 shows a text-based visualization which provides a detailed description of a single process task(i.e., the zoom is on this task solely). Such visualization might be helpful, for example, for requirementsengineers or new employees, since process tasks are described in a detailed manner (e.g., using a bulletlist). Additional information may displayed as well, e.g., the process participant may get informed aboutinputs and outputs, tools, and guidelines supporting the task execution.
In practice, more dynamic ways to navigate within process model collections need to be provided to users.Furthermore, alternative ways of visualizing particular process information are required. In response tothese needs this thesis introduces the ProNaVis framework. The latter enables process navigation basedon a 3-dimensional navigation space. In particular, this navigation space allows process participants
11
1 Motivation
Role, Responsible person
· project responsible EE
Medium, IT-Support
· manual, requirmenets engineering- chapter 5.1 – 5.2
Premises
· project launch QG10 is available
Process control (quality criterion)
· none
Subprocess description
· deduce project tasks out of project launch· deduce content-related volume of FR-Workshops· define group of participants (team of experts) for the workshops with the team supervisor· define appointments for the workshops with the participants· allocate volume of the preparation of workshops· adjust form and content of requirement specification with project board· create project-specific glossary with team of experts
Process input
· project launch QG10
Process output
· volumes of workshops· group of participants for the
workshops· appointments for the workshops· project-specific glossary
Figure 1.14: Text-based visualization of a process task.
to flexibly navigate within process model collections as well as to dynamically select the visualizationspreferred by them.
1.3 Research Questions
The following research challenges need to be tackled: first, we must understand the practical problemsfrom a process participant’s point of view, i.e., the problems encountered when working with processmodel collections. Based on this, requirements concerning the navigation and visualization of processmodel collections can be derived. Second, user-driven process navigation must be enabled, i.e., varioususer interactions with process model collections must be supported. Third, the visualization of processmodel collections should be personalized, i.e., we need to address the way information is presented tothe user. Fourth and fifth, we must investigate which factors need to be considered to evaluate differentnavigation approaches and different visualizations respectively. Sixth, we have to evaluate, how processnavigation effectively influences and supports process participants in their day-to-day work.
Based on these challenges, we derive six research questions guiding the research addressed by this thesis.Thereby, we distinguish between knowledge problems (KP) and world problems (WP) [WMMR05, WH06].A knowledge problem is a difference between what we know about the world and what we would like toknow [WH06]. Knowledge problems can be solved by asking others, by reviewing the literature, or bydoing research. Knowledge problems have stakeholders, namely the people who would like to acquirethe desired knowledge. Research problems typically constitute knowledge problems in which we searchfor true propositions. In turn, world problems are engineering problems, in which we search for animprovement of the world with respect to some goals [WMMR05]. The evaluation criteria for answering
12
1.4 Research Methodology
both kinds of problems are quite different: truth in case of knowledge problems and goal achievement incase of world problems.
• Research Question 1 (KP): What are existing problems and requirements regarding the naviga-tion within process model collections as well as the visualization of the latter from the perspectiveof the end user?
• Research Question 2 (WP): How should a navigation concept for process model collections beapproached?
• Research Question 3 (WP): How may process model collections be visualized in a comprehen-sible manner?
• Research Question 4 (WP): How can the benefit of a user-driven navigation concept be mea-sured?
• Research Question 5 (WP): How can comprehensibility and aesthetic appearance of processvisualizations be measured?
• Research Question 6 (WP): How does the navigation concept support process participants intheir daily work?
These research questions constitute the foundation of this thesis.
1.4 Research Methodology
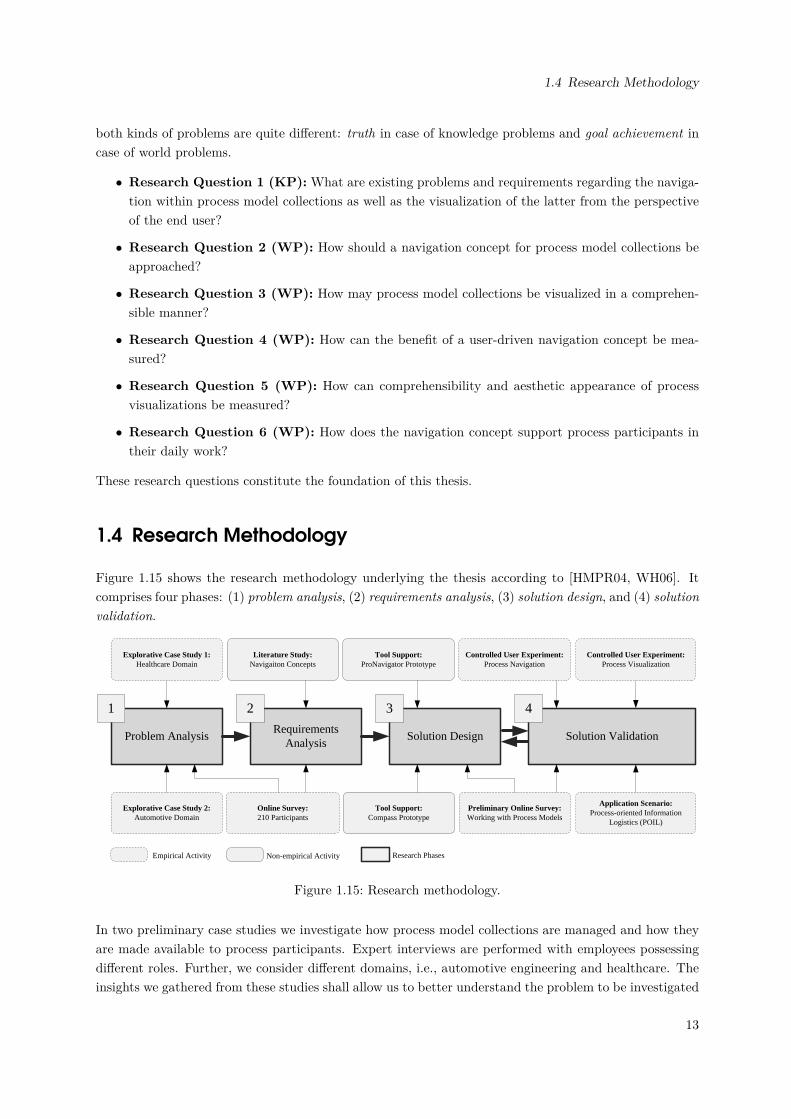
Figure 1.15 shows the research methodology underlying the thesis according to [HMPR04, WH06]. Itcomprises four phases: (1) problem analysis, (2) requirements analysis, (3) solution design, and (4) solutionvalidation.
Problem AnalysisRequirements
AnalysisSolution Design Solution Validation
Explorative Case Study 2:Automotive Domain
Explorative Case Study 1:Healthcare Domain
Online Survey:210 Participants
Literature Study: Navigaiton Concepts
Tool Support: ProNavigator Prototype
Application Scenario:Process-oriented Information
Logistics (POIL)
Preliminary Online Survey:Working with Process Models
Empirical Activity Non-empirical Activity Research Phases
1 2 3 4
Tool Support: Compass Prototype
Controlled User Experiment:Process Navigation
Controlled User Experiment:Process Visualization
Figure 1.15: Research methodology.
In two preliminary case studies we investigate how process model collections are managed and how theyare made available to process participants. Expert interviews are performed with employees possessingdifferent roles. Further, we consider different domains, i.e., automotive engineering and healthcare. Theinsights we gathered from these studies shall allow us to better understand the problem to be investigated
13
1 Motivation
(Phase 1 ). An additional online survey, a literature study, and practical experiences gathered in theautomotive domain will further allow us to derive requirements regarding the navigation within processmodel collections and their visualization (Phase 2 ). Specifically, Research Question 1 is addressed inthese first two phases. In Phase 3, sophisticated navigation and visualization concepts are developedbased on the results of Phases 1 and 2. To illustrate the applicability of these concepts, ProNavigatoris provided as proof-of-concept prototype. In turn, the Compass tool has been developed in cooperationwith an industrial partner to apply the concepts in the automotive domain (Phase 3). In particular,Compass supports knowledge workers dealing with complex E/E process model collections. This phaseaddresses Research Question 3. Finally, the navigation concepts are evaluated based on controlled userexperiments (Phase 4 ). One of these experiments focuses on user interactions, i.e., process navigation,whereas the other deals with the visualization of process model collections. The results obtained willthen be used to answer Research Questions 4 to 6.
1.5 Contribution
The contributions of this thesis are as follows:
• We present requirements regarding the navigation within process model collections as well as theirvisualization from the perspective of process participants. These requirements are derived frompractical experiences, case studies, and an online survey.
• We identify existing navigation and visualization approaches for complex information spaces andcompare them in respect to the requirements we identified.
• We develop the ProNaVis framework that enables sophisticated navigation possibilities and visual-ization approaches in respect to process model collections. Specifically, we introduce a 3-dimensionalnavigation space supporting users in navigating within process model collections. It provides a moreflexible navigation concept compared to existing approaches.
• The approach is implemented in a proof-of-concept prototype as well as in a software tool developedwith an industrial partner.
• We present results of user experiments and an online survey to validate the approach.
1.6 Outline
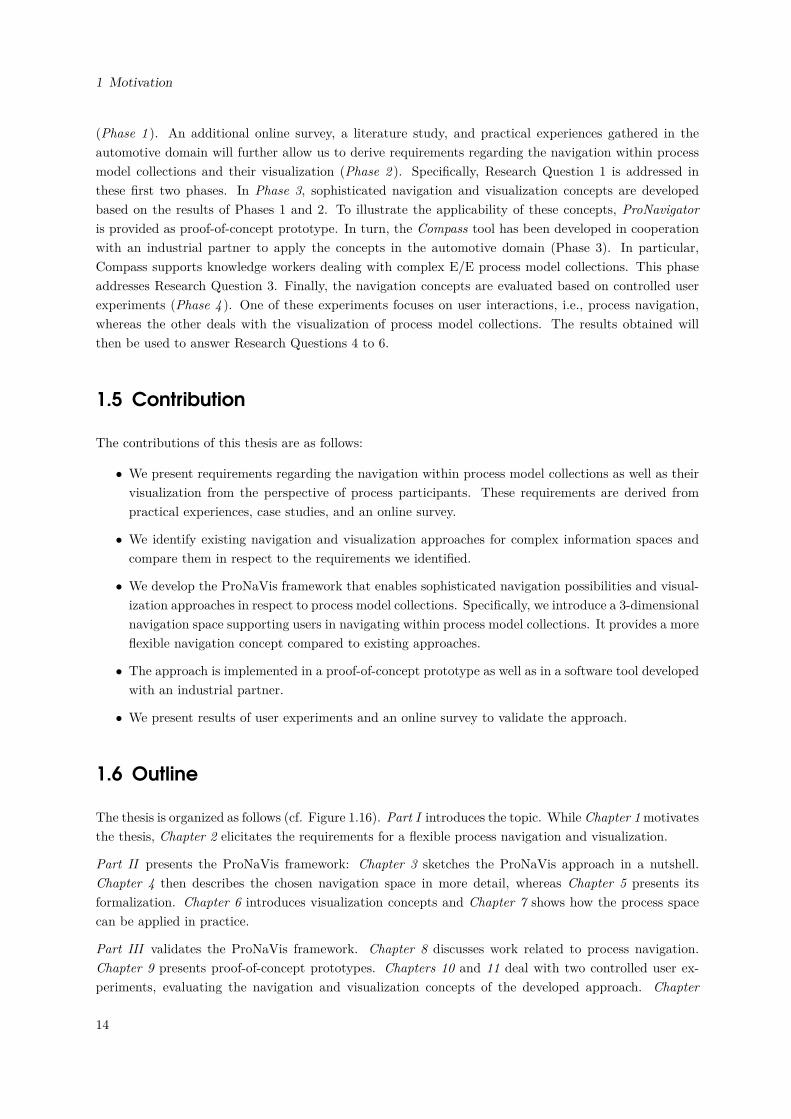
The thesis is organized as follows (cf. Figure 1.16). Part I introduces the topic. While Chapter 1motivatesthe thesis, Chapter 2 elicitates the requirements for a flexible process navigation and visualization.
Part II presents the ProNaVis framework: Chapter 3 sketches the ProNaVis approach in a nutshell.Chapter 4 then describes the chosen navigation space in more detail, whereas Chapter 5 presents itsformalization. Chapter 6 introduces visualization concepts and Chapter 7 shows how the process spacecan be applied in practice.
Part III validates the ProNaVis framework. Chapter 8 discusses work related to process navigation.Chapter 9 presents proof-of-concept prototypes. Chapters 10 and 11 deal with two controlled user ex-periments, evaluating the navigation and visualization concepts of the developed approach. Chapter
14
1.6 Outline
I. Introduction II. Framework III. Validation
Chapter 1Motivation
Chapter 2Requirements Analysis
Chapter 3ProNaVis in a Nutshell
Chapter 4The Navigation Space
Chapter 5Formalizing the
Navigation Space
Chapter 7Using the
Navigation Space
Chapter 6Visualizing the
Navigation Space
IV. Discussion & Summary
Chapter 9Proof of Concept
Prototypes
Chapter 10Experiment 1:
Process Navigation
Chapter 11Experiment 2:
Process Visualization
Chapter 13Discussion
Chapter 14Summary & Outlook
Chapter 8Related Work
Chapter 11Case Study:
Process-oriented Information Logistics
Figure 1.16: Outline of the thesis.
12 demonstrates how the ProNaVis framework can be applied to enable process-oriented informationlogistics.
Part IV discusses (Chapter 13) and summarizes (Chapter 14) the main contributions of the thesis.
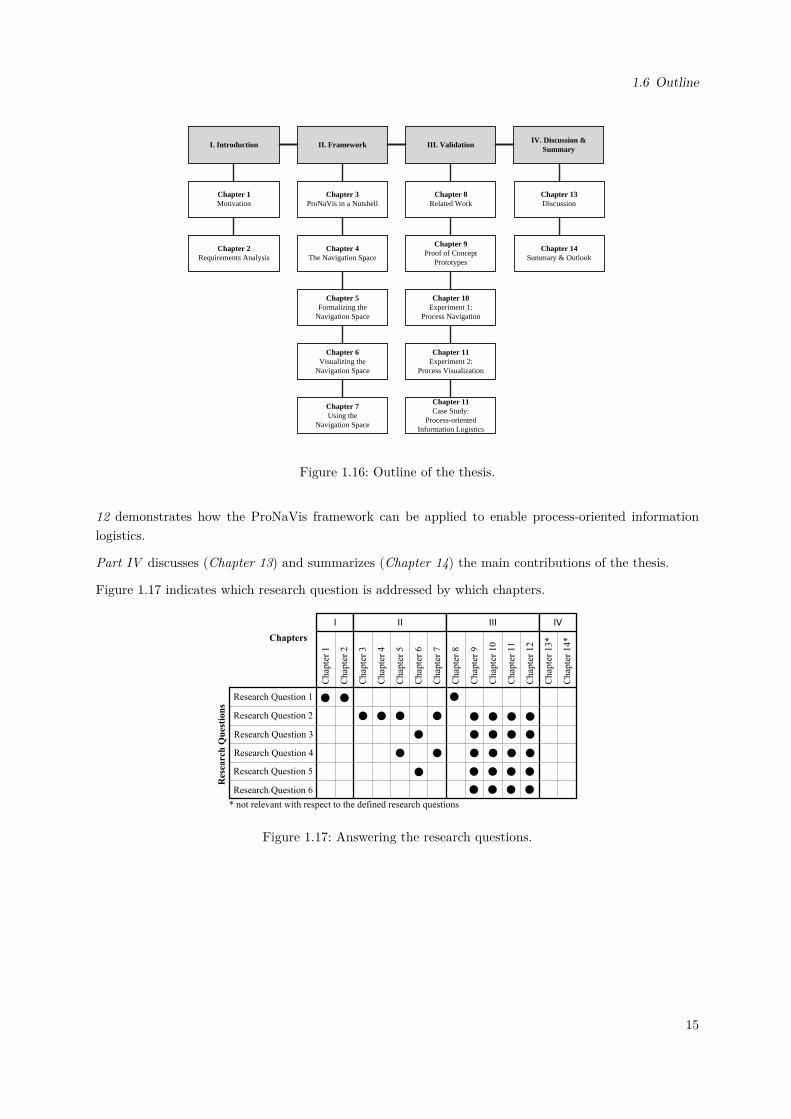
Figure 1.17 indicates which research question is addressed by which chapters.
Research Question 1
Research Question 2
Research Question 3
Chap
ter
1
Chap
ter
2
Chap
ter
3
Chap
ter
4
Chap
ter
5
Chap
ter
6
Chap
ter
7
Chap
ter
8
Chap
ter
10
Chap
ter
12
Chap
ter
9
Chap
ter
11
Chap
ter
13*
Chap
ter
14*
I II III IV
Chapters
Res
earc
h Q
ues
tion
s
Research Question 4
Research Question 5
Research Question 6
* not relevant with respect to the defined research questions
Figure 1.17: Answering the research questions.
15

2 Requirements Analysis
This chapter1 presents results from three empirical studies we performed to investigate the issue ofnavigating in large process model collections and their visualization: two exploratory case studies fromthe healthcare and automotive domains as well as an online survey with 219 participants. In a first step,we identify and describe problem areas with respect to process model collections in general as well asthe navigation within process model collections and their visualization in particular. In this context, weadopt a strict end user perspective, i.e., we perform interviews with various process participants. In asecond step, we derive requirements related to the user-driven navigation within process model collectionsand the proper visualization. Altogether, Chapter 2 addresses Research Question 1 (cf. Section 1.3):
What are existing problems and requirements regarding the navigation withinprocess model collections and their visualization from a user’s perspective?
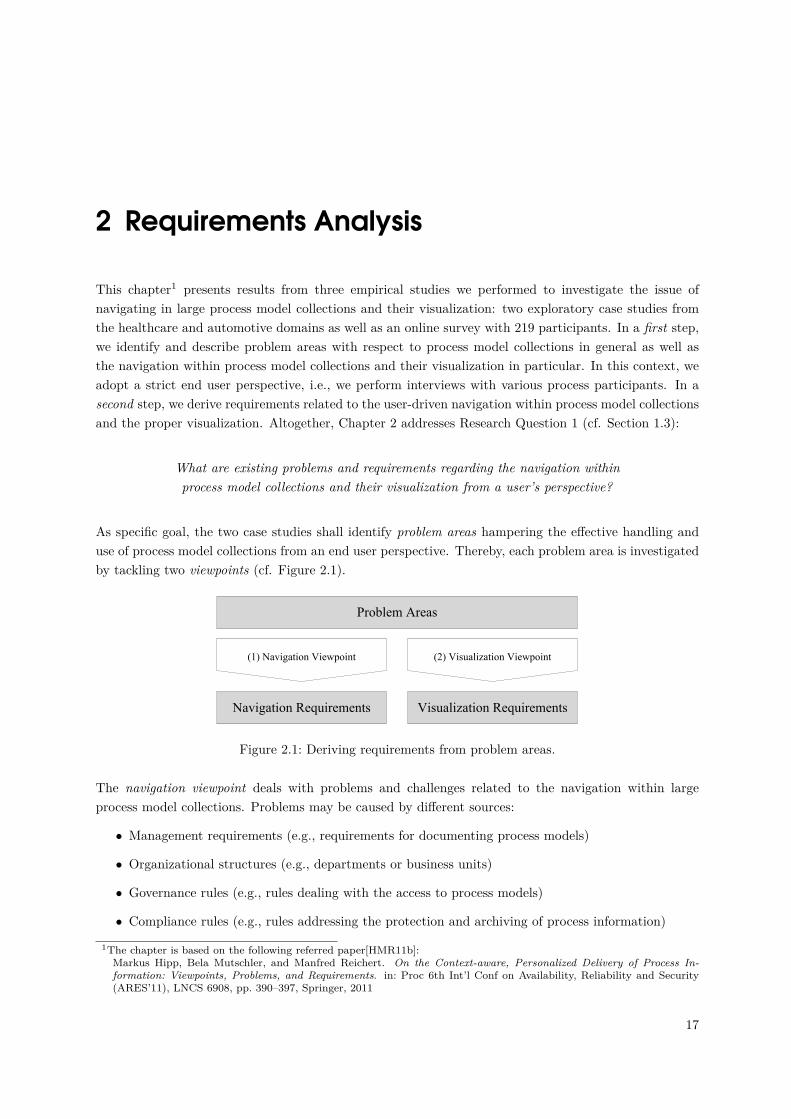
As specific goal, the two case studies shall identify problem areas hampering the effective handling anduse of process model collections from an end user perspective. Thereby, each problem area is investigatedby tackling two viewpoints (cf. Figure 2.1).
Problem Areas
Navigation Requirements Visualization Requirements
(2) Visualization Viewpoint(1) Navigation Viewpoint
Figure 2.1: Deriving requirements from problem areas.
The navigation viewpoint deals with problems and challenges related to the navigation within largeprocess model collections. Problems may be caused by different sources:
• Management requirements (e.g., requirements for documenting process models)
• Organizational structures (e.g., departments or business units)
• Governance rules (e.g., rules dealing with the access to process models)
• Compliance rules (e.g., rules addressing the protection and archiving of process information)
1The chapter is based on the following referred paper[HMR11b]:Markus Hipp, Bela Mutschler, and Manfred Reichert. On the Context-aware, Personalized Delivery of Process In-formation: Viewpoints, Problems, and Requirements. in: Proc 6th Int’l Conf on Availability, Reliability and Security(ARES’11), LNCS 6908, pp. 390–397, Springer, 2011
17
2 Requirements Analysis
In turn, the visualization viewpoint deals with issues related to the end user presentation and visualizationof process model collections. Usually, such problems are related to user interface design. When displayingtoo much information, for example, process participants are rather disturbed [vWN04].
Based on the derived problem areas, we consider both viewpoints to identify more specific problems, whichthen can be used to derive specific requirements for enabling a navigation and visualization support forprocess model collections. Depending on the considered viewpoints, requirements are either categorizedas navigation requirement (NavReq) or as visualization requirement (VisReq).
The remainder of this chapter is organized as follows. Sections 2.1 and 2.2 present problem areas andrequirements related to the two case studies. Section 2.3 then discusses results from the conducted onlinesurvey. Section 2.4 summarizes the derived requirements and Section 2.5 concludes this chapter.
2.1 Case Study 1: Clinical Domain
The first case study took place in a large hospital in Southern Germany [HMR11b]. Eight interviewswere performed in five different departments, taking about 45 minutes on average. The sequence of theinterviews followed a characteristic patient treatment process starting with patient admission and endingwith the invoicing. We were able to interview all stakeholders (doctors, nurses, administrative staff etc.)involved in the process, i.e., all process participants.
Process
Tasks
Process
Execution
Process
Information
PA 1 PA 2 PA 3
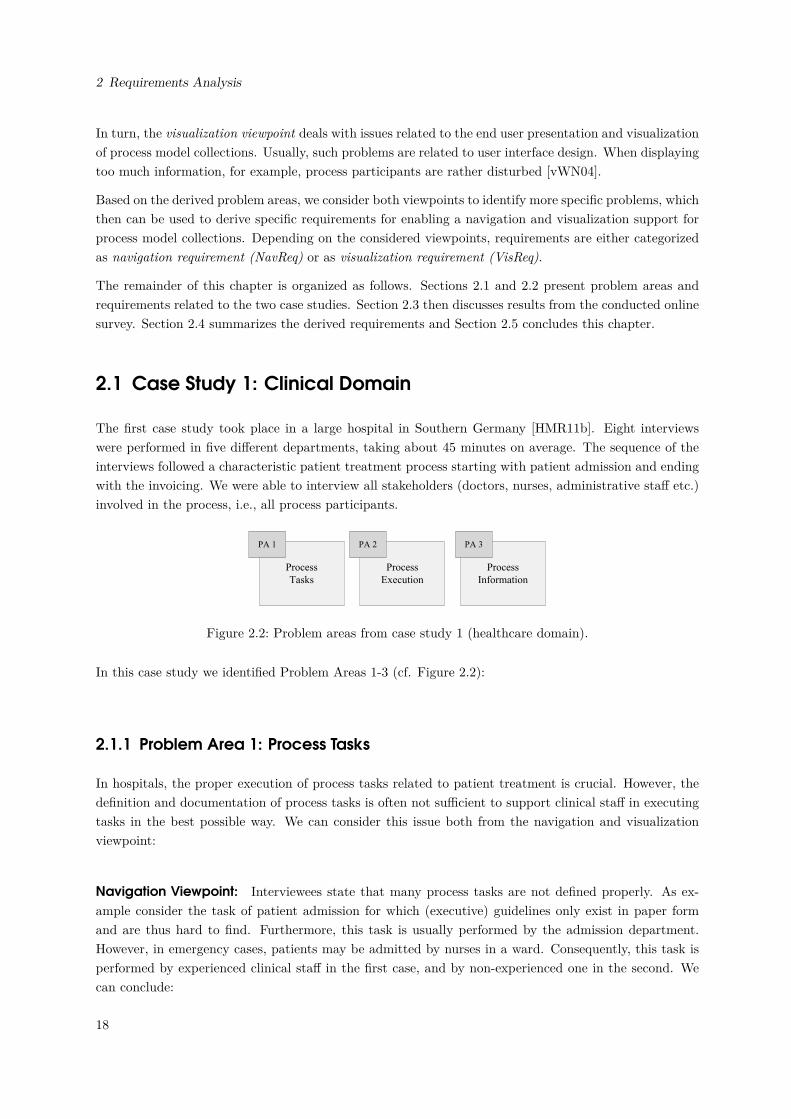
Figure 2.2: Problem areas from case study 1 (healthcare domain).
In this case study we identified Problem Areas 1-3 (cf. Figure 2.2):
2.1.1 Problem Area 1: Process Tasks
In hospitals, the proper execution of process tasks related to patient treatment is crucial. However, thedefinition and documentation of process tasks is often not sufficient to support clinical staff in executingtasks in the best possible way. We can consider this issue both from the navigation and visualizationviewpoint:
Navigation Viewpoint: Interviewees state that many process tasks are not defined properly. As ex-ample consider the task of patient admission for which (executive) guidelines only exist in paper formand are thus hard to find. Furthermore, this task is usually performed by the admission department.However, in emergency cases, patients may be admitted by nurses in a ward. Consequently, this task isperformed by experienced clinical staff in the first case, and by non-experienced one in the second. Wecan conclude:
18
2.1 Case Study 1: Clinical Domain
NavReq #1 : Depending on a process participant’s experience, the level of detail regarding a process taskshould be adjustable.
In addition, the distributed execution of process tasks might be critical. As a task may be performed bydifferent departments (i.e., it may be documented in different process models), it is hard to identify thesetasks across different process models. In this context, accessing only one single process model at oncehampers process participants in obtaining an overview on tasks being executed by different departments(i.e., documented in different process models), and thus the entire process model collection. Thus, wecan conclude:
NavReq #2 : Process participants should be able to adjust the level of detail regarding process modelcollection in order to obtain a quick overview on a specific task that is currently executed.
Visualization Viewpoint: Especially, non-experienced staff complained about missing task descriptions,directly accessible in the context of process models. Usually, finding documents including this informationis time-consuming, and might thereby affect the patient treatment. Moreover, only small parts of thesetask descriptions are needed. Therefore, documents comprising up to hundreds of pages in total must bemanually searched. However, interviewees explained that information has to be intuitively and quicklyunderstandable. Thus, we can conclude:
VisReq #1 : Task descriptions must be documented in a well understandable manner.
2.1.2 Problem Area 2: Process Execution
During patient treatment, a patient passes through different departments, e.g., admission, radiology, andsurgery. In this context, the documentation of single process tasks are only available in the departmentswhere the task is executed.This might affect the seamless execution of the entire patient treatment process.
Navigation Viewpoint: From the navigation viewpoint, a specific problem is the missing linkage ofprocess tasks (in the patient treatment) across different departments, i.e., process tasks (and their des-criptions) should be accessible across different departments. In particular, medical departments are oftenunaware of the current status of process tasks corresponding to processes from other areas. In turn, theseamless execution of cross-departmental patient treatment processes can not be guaranteed. Thus, wecan conclude:
NavReq #3 : Users should be enabled to access process tasks in other process areas.
Visualization Viewpoint: Participants stated that communication between departments was subop-timal. This is of particular importance when taking temporal constraints into account. Think of anotification of the operation theatre when patients need to be transferred back to their ward. In par-ticular, temporal relations between process tasks need to be explicitly visualized, e.g., the relation of aprocess task (e.g., an x-ray examination) to its preceding and subsequent tasks. Thus, we can conclude:
VisReq #2 : Temporal and logical dependencies must be considered when visualizing processes.
19
2 Requirements Analysis
2.1.3 Problem Area 3: Process Information
The patient record represents process information needed treatment. Interviewees stated that such recordsare often managed in paper-based form. Thus, the record can only be used in one single process task atthe same time. Hence, several problems occur.
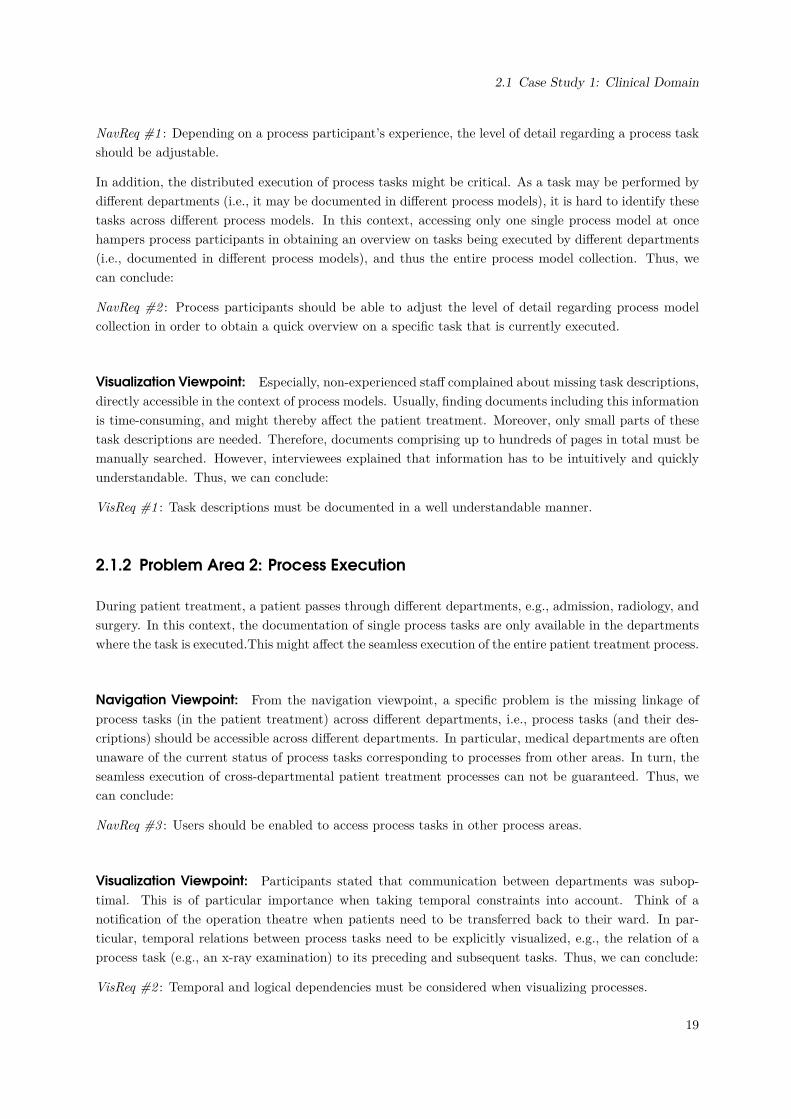
Navigation Viewpoint: In the context of paper-based medical records, both the access to patientinformation (e.g., findings from an x-ray examination) and the retrieval of needed information (e.g., onmedical problems of the patient) constitute delaying and time-consuming tasks for process participants.In turn, this leads to another problem: if needed patient information is not complete, process participantsmust search for it. Figure 2.3b summarizes answers of interviewees on the question whether importantinformation related to a specific process task can be quickly found. As can be seen, the median is neitheragree nor disagree. However, some interviewees seem to have problems with finding information needed.
I totally agree
I agree
Neutral
I disagree
I totally disagree
Statement: All information
needed is displayed at one
glance
I totally agree
I agree
Neutral
I disagree
I totally disagree
Statement: I quickly find
needed information.
(a) (b)
Figure 2.3: Handling of information 1.
All participants argued that quickly finding information is easier for experienced staff. New employees,in turn, confirmed to have difficulties with this. Thus, we can conclude:
NavReq #4 : Relevant process information must be accessible at the level of single process models fromthe process model collection.
Visualization Viewpoint: Since medical records may become large during patient treatment, the visu-alization of process-related information must be adapted (e.g., only specific views on this data shouldbe presented to users, depending on the executed process task). Figure 2.3a shows that the participantsdisagreed with the statement that the exact information needed shall be displayed at a glance. Forexample, earlier medication of the patient has to be identified within hundreds of handwritten sheets.Additionally, the way of presenting data to users must be adopted. For example, temperature curvesshould be visualized as graphs, whereas the actual medication should be displayed as a table. Thus, wecan conclude:
VisReq #3 : Complex process information must be visualized in a comprehensible manner.
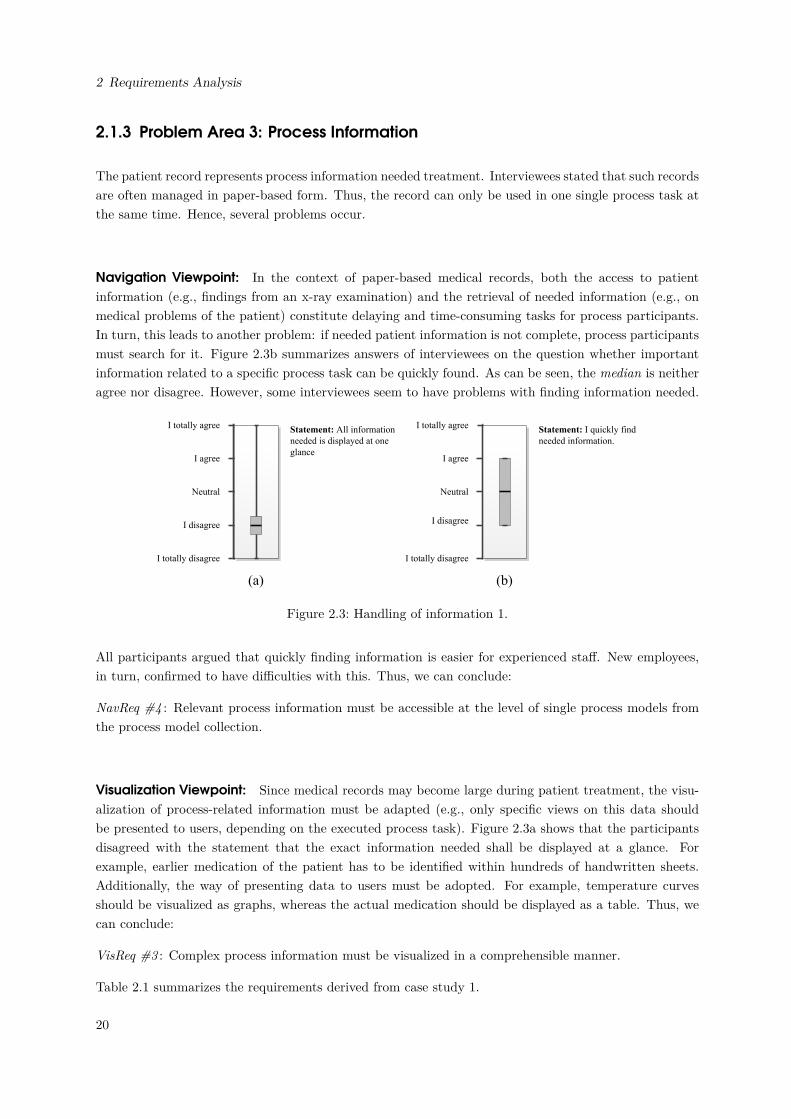
Table 2.1 summarizes the requirements derived from case study 1.
20
2.2 Case Study 2: Automotive Domain
Req # Requirement SourcePA 1 PA 2 PA 3
NavReq #1 Depending on a process participant’s experience, the level of detailregarding a process task should be adjustable.
l
NavReq #2 Process participants should be able to adjust the level of detail regard-ing process model collection in order to obtain a quick overview on aspecific task that is currently executed.
l
NavReq #3 Users should be enabled to access process tasks in other process areas. lNavReq #4 Relevant process information must be accessible at the level of single
process models from the process model collection.l
VisReq #1 Task descriptions must be documented in a well understandable man-ner.
l
VisReq #2 Temporal and logical dependencies must be considered when visualizingprocesses.
l
VisReq #3 Complex process information must be visualized in a comprehensiblemanner.
l
Table 2.1: Requirements derived from case study 1.
2.2 Case Study 2: Automotive Domain
The second case study was conducted in the automotive domain [HMR11b]. Nine interviews with sevenknowledge workers and two decision makers were conducted. Each interview lasted about 60 minutes.Like in the first case study, participants were selected based on a typical development process for carcontrol units.
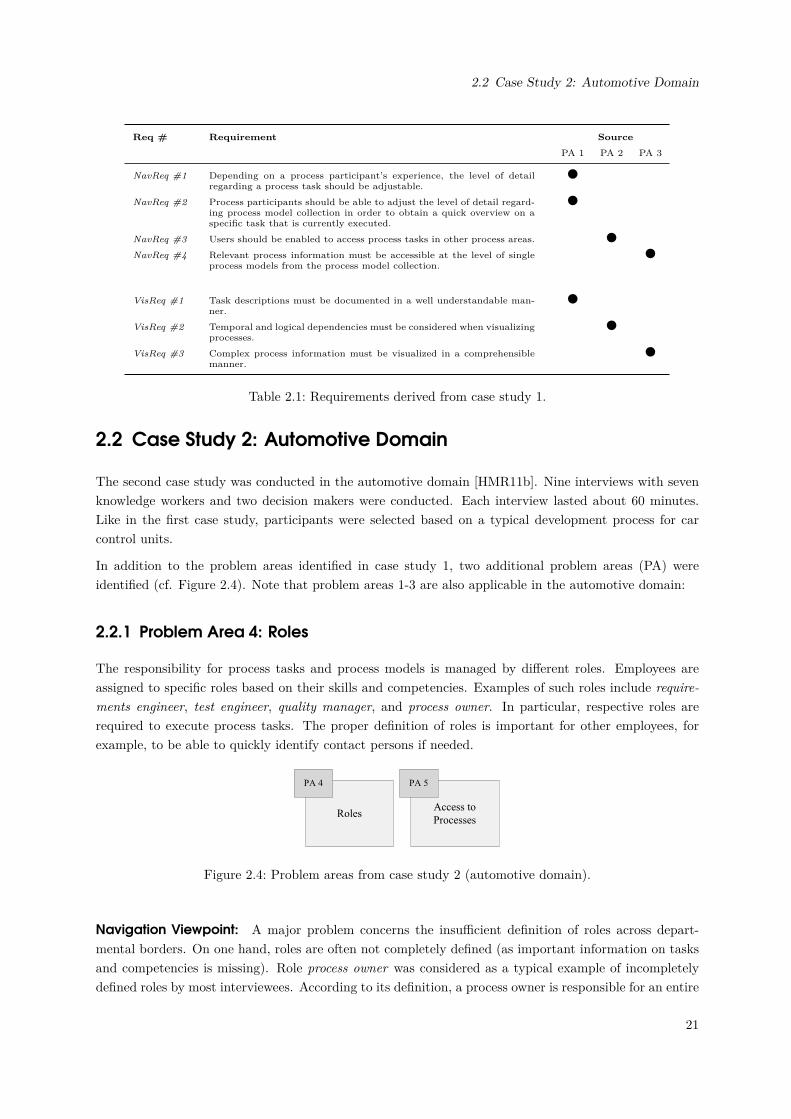
In addition to the problem areas identified in case study 1, two additional problem areas (PA) wereidentified (cf. Figure 2.4). Note that problem areas 1-3 are also applicable in the automotive domain:
2.2.1 Problem Area 4: Roles
The responsibility for process tasks and process models is managed by different roles. Employees areassigned to specific roles based on their skills and competencies. Examples of such roles include require-ments engineer, test engineer, quality manager, and process owner. In particular, respective roles arerequired to execute process tasks. The proper definition of roles is important for other employees, forexample, to be able to quickly identify contact persons if needed.
RolesAccess to
Processes
PA 4 PA 5
Figure 2.4: Problem areas from case study 2 (automotive domain).
Navigation Viewpoint: A major problem concerns the insufficient definition of roles across depart-mental borders. On one hand, roles are often not completely defined (as important information on tasksand competencies is missing). Role process owner was considered as a typical example of incompletelydefined roles by most interviewees. According to its definition, a process owner is responsible for an entire
21
2 Requirements Analysis
process. In practice, however, several people may be responsible for different process tasks. On the otherhand, role definitions are not consistently used across departmental borders, e.g., process owners mayhave different responsibilities depending on the different business units. Thus, we can conclude:
NavReq #5 : Roles must be globally defined in a detailed manner.
Visualization Viewpoint: From the visualization viewpoint, it is hard for process participants to iden-tify role affiliations (e.g., which role is responsible for process models or process tasks) as documentationis inconsistent in this respect. Thus, we can conclude:
VisReq #4 : Information about roles must be intuitively identifiable.
2.2.2 Problem Area 5: Access to Processes
Interviewees reported on needs regarding the access to processes. These needs may even vary for singleprocess participants due to a continuously changing work context.
Navigation Viewpoint: From the navigation viewpoint, participants argued that needed informationis not provided at an appropriate level of detail (e.g., depending on the user’s role). A knowledge worker,for example, requires detailed information on single process tasks (e.g., on guidelines, checklists or toolshe uses). Managers, in turn, need more abstract information, e.g., on an entire process as well as itsdependencies on other processes. Thus, processes need to be aggregated and provided on different levelsof details to fit the needs of process participants with different roles. Thus, we can conclude:
NavReq #6 : Process participants must be able to access process models on different levels of detail.
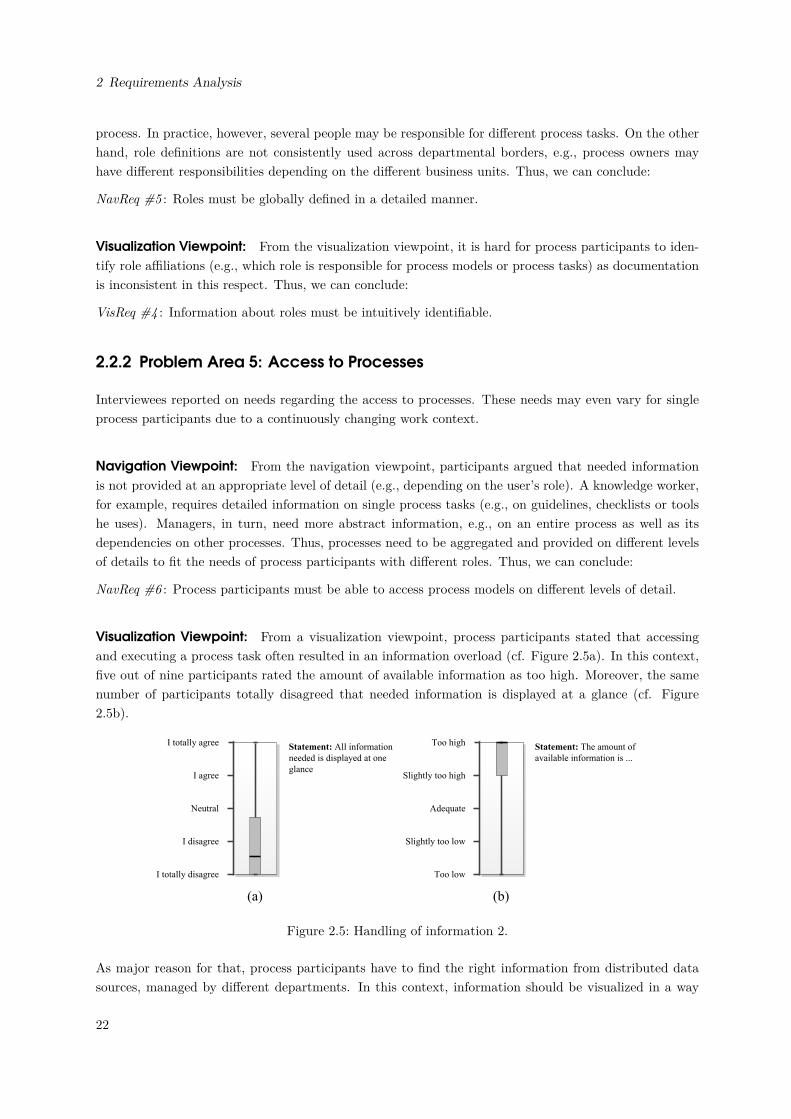
Visualization Viewpoint: From a visualization viewpoint, process participants stated that accessingand executing a process task often resulted in an information overload (cf. Figure 2.5a). In this context,five out of nine participants rated the amount of available information as too high. Moreover, the samenumber of participants totally disagreed that needed information is displayed at a glance (cf. Figure2.5b).
Statement: All information
needed is displayed at one
glance
Too high
Slightly too high
Adequate
Slightly too low
Too low
Statement: The amount of
available information is ...
(a) (b)
I totally agree
I agree
Neutral
I disagree
I totally disagree
Figure 2.5: Handling of information 2.
As major reason for that, process participants have to find the right information from distributed datasources, managed by different departments. In this context, information should be visualized in a way
22
2.3 Online Survey
suitable to support process participants in their resprctive working contexts. Users should not feelovertaxed by the amount of information provided. Thus, we can conclude:
VisReq #5 : The amount of visualized information should not overload process participants.
Table 2.2 sums up the requirements derived from our second case study.
Req # Requirement SourcePA 4 PA 5
NavReq #5 Roles must be globally defined in a detailed manner. lNavReq #6 Process participants must be able to access process mod-
els on different levels of detail.l
VisReq #4 Information about roles must be intuitively identifiable. lVisReq #5 The amount of visualized information should not over-
load process participants.l
Table 2.2: Requirements derived from case study 2.
2.3 Online Survey
To further validate case study results, we performed an additional online survey. 219 people (73% male,27% female) from more than 100 companies participated. The majority of them (96%) was located inGermany. 57% of the participants are knowledge workers, 26% are decision makers and 17% provided noinformation about their position.
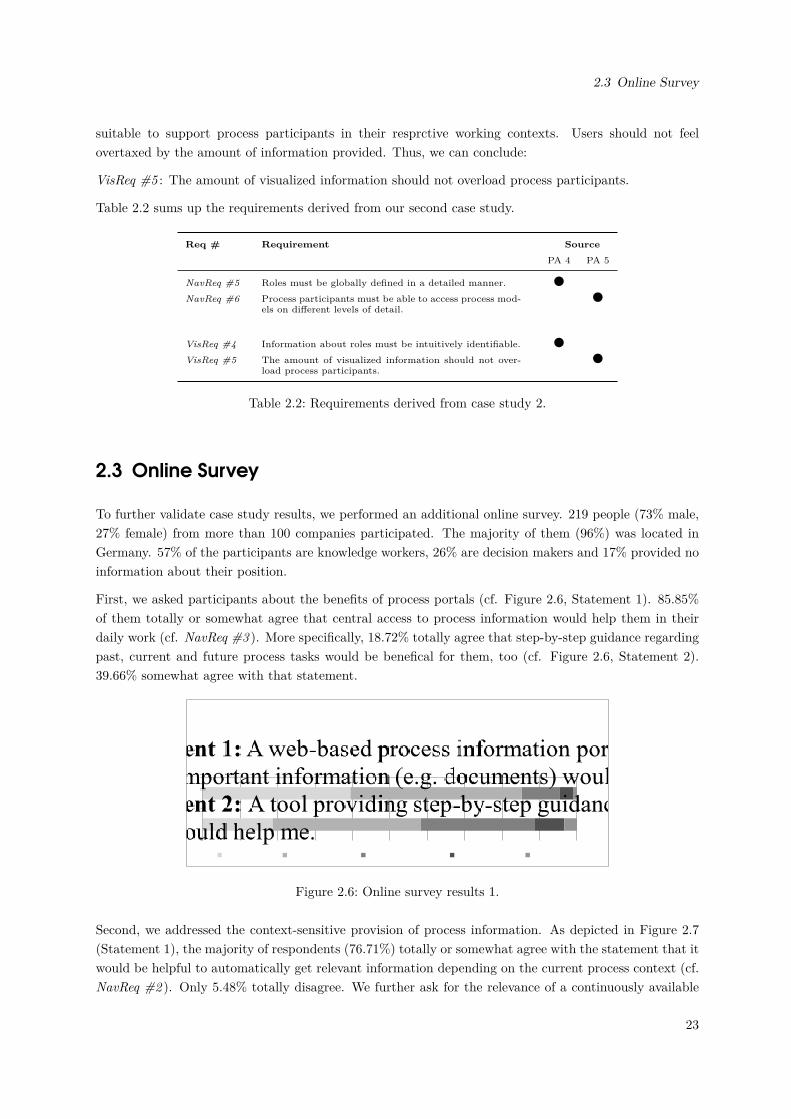
First, we asked participants about the benefits of process portals (cf. Figure 2.6, Statement 1). 85.85%of them totally or somewhat agree that central access to process information would help them in theirdaily work (cf. NavReq #3 ). More specifically, 18.72% totally agree that step-by-step guidance regardingpast, current and future process tasks would be benefical for them, too (cf. Figure 2.6, Statement 2).39.66% somewhat agree with that statement.
Figure 2.6: Online survey results 1.
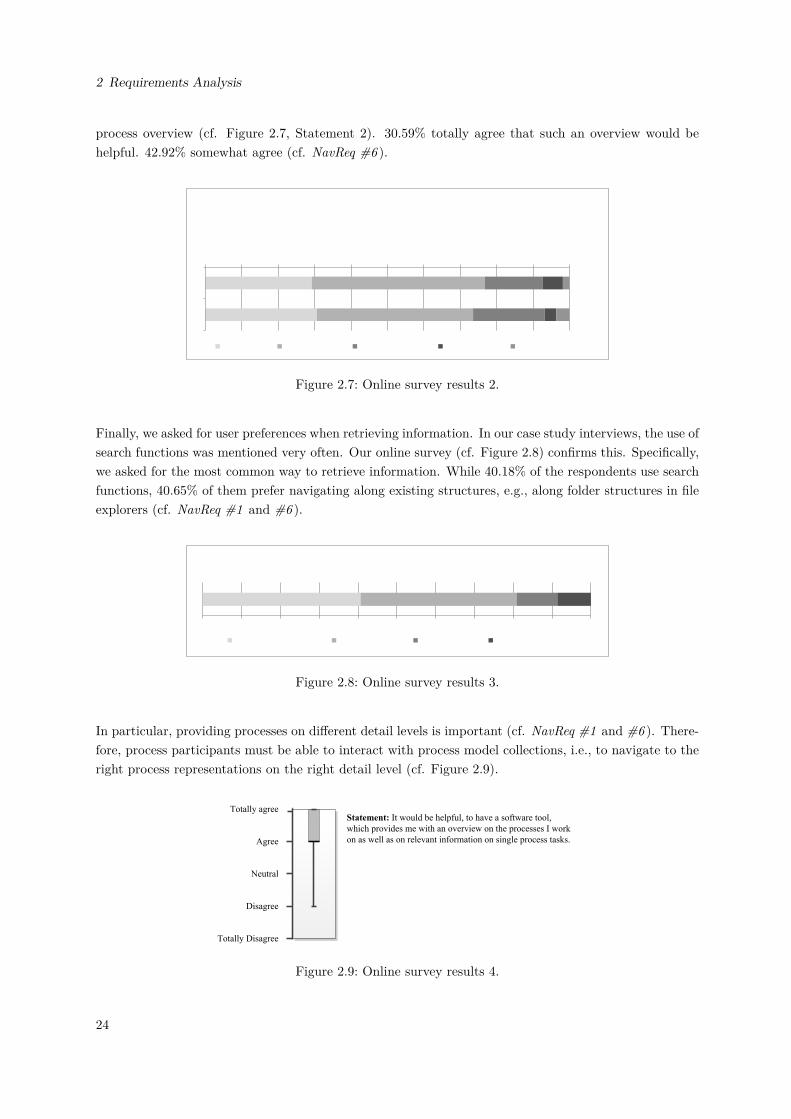
Second, we addressed the context-sensitive provision of process information. As depicted in Figure 2.7(Statement 1), the majority of respondents (76.71%) totally or somewhat agree with the statement that itwould be helpful to automatically get relevant information depending on the current process context (cf.NavReq #2 ). Only 5.48% totally disagree. We further ask for the relevance of a continuously available
23
2 Requirements Analysis
process overview (cf. Figure 2.7, Statement 2). 30.59% totally agree that such an overview would behelpful. 42.92% somewhat agree (cf. NavReq #6 ).
Figure 2.7: Online survey results 2.
Finally, we asked for user preferences when retrieving information. In our case study interviews, the use ofsearch functions was mentioned very often. Our online survey (cf. Figure 2.8) confirms this. Specifically,we asked for the most common way to retrieve information. While 40.18% of the respondents use searchfunctions, 40.65% of them prefer navigating along existing structures, e.g., along folder structures in fileexplorers (cf. NavReq #1 and #6 ).
Figure 2.8: Online survey results 3.
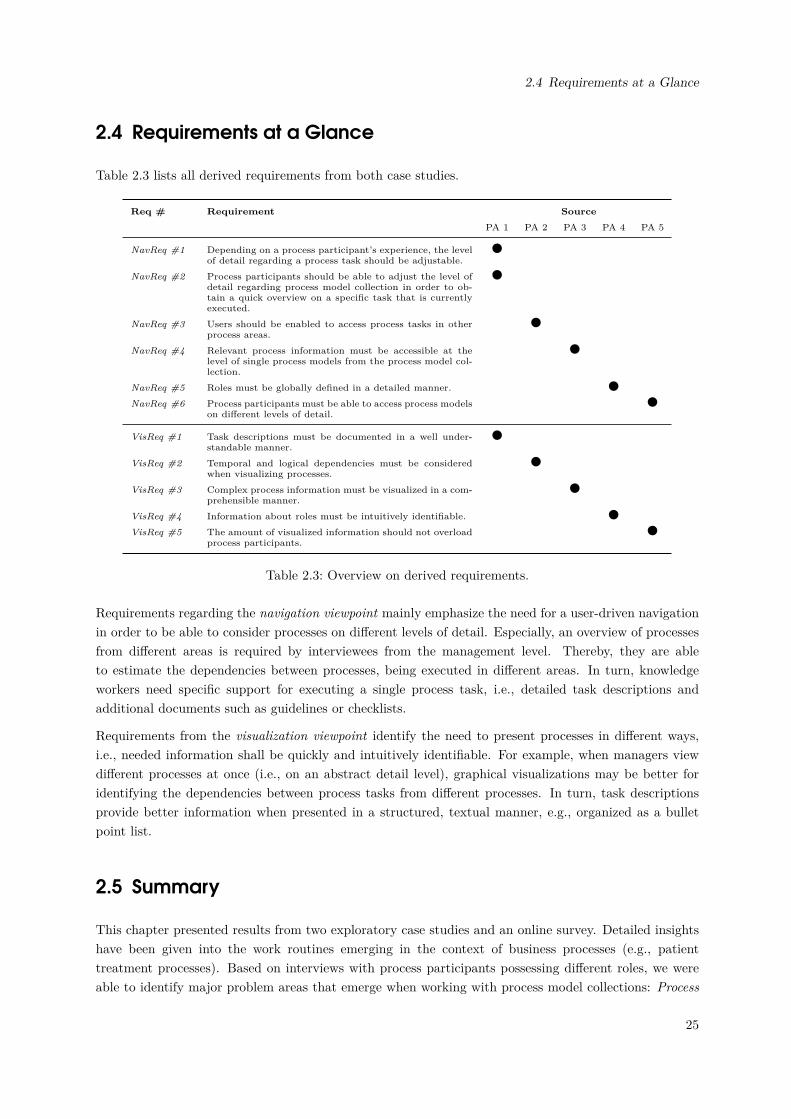
In particular, providing processes on different detail levels is important (cf. NavReq #1 and #6 ). There-fore, process participants must be able to interact with process model collections, i.e., to navigate to theright process representations on the right detail level (cf. Figure 2.9).
Totally agree
Agree
Neutral
Disagree
Totally Disagree
(a)
Statement: It would be helpful, to have a software tool,
which provides me with an overview on the processes I work
on as well as on relevant information on single process tasks.
Figure 2.9: Online survey results 4.
24
2.4 Requirements at a Glance
2.4 Requirements at a Glance
Table 2.3 lists all derived requirements from both case studies.
Req # Requirement SourcePA 1 PA 2 PA 3 PA 4 PA 5
NavReq #1 Depending on a process participant’s experience, the levelof detail regarding a process task should be adjustable.
l
NavReq #2 Process participants should be able to adjust the level ofdetail regarding process model collection in order to ob-tain a quick overview on a specific task that is currentlyexecuted.
l
NavReq #3 Users should be enabled to access process tasks in otherprocess areas.
l
NavReq #4 Relevant process information must be accessible at thelevel of single process models from the process model col-lection.
l
NavReq #5 Roles must be globally defined in a detailed manner. lNavReq #6 Process participants must be able to access process models
on different levels of detail.l
VisReq #1 Task descriptions must be documented in a well under-standable manner.
l
VisReq #2 Temporal and logical dependencies must be consideredwhen visualizing processes.
l
VisReq #3 Complex process information must be visualized in a com-prehensible manner.
l
VisReq #4 Information about roles must be intuitively identifiable. lVisReq #5 The amount of visualized information should not overload
process participants.l
Table 2.3: Overview on derived requirements.
Requirements regarding the navigation viewpoint mainly emphasize the need for a user-driven navigationin order to be able to consider processes on different levels of detail. Especially, an overview of processesfrom different areas is required by interviewees from the management level. Thereby, they are ableto estimate the dependencies between processes, being executed in different areas. In turn, knowledgeworkers need specific support for executing a single process task, i.e., detailed task descriptions andadditional documents such as guidelines or checklists.
Requirements from the visualization viewpoint identify the need to present processes in different ways,i.e., needed information shall be quickly and intuitively identifiable. For example, when managers viewdifferent processes at once (i.e., on an abstract detail level), graphical visualizations may be better foridentifying the dependencies between process tasks from different processes. In turn, task descriptionsprovide better information when presented in a structured, textual manner, e.g., organized as a bulletpoint list.
2.5 Summary
This chapter presented results from two exploratory case studies and an online survey. Detailed insightshave been given into the work routines emerging in the context of business processes (e.g., patienttreatment processes). Based on interviews with process participants possessing different roles, we wereable to identify major problem areas that emerge when working with process model collections: Process
25

2 Requirements Analysis
Tasks, Process Execution, Process Information, Roles, and Access to Process Models. Tackling theseproblem areas, we were able to derive requirements on the navigation in and visualization of processmodel collections. All requirements have been considered as basis for developing the ProNaVis framework.Considering the similar observations we made in the two different domains, we may assume that therequirements are applicable to other domains as well.
26

Part II
Framework
27

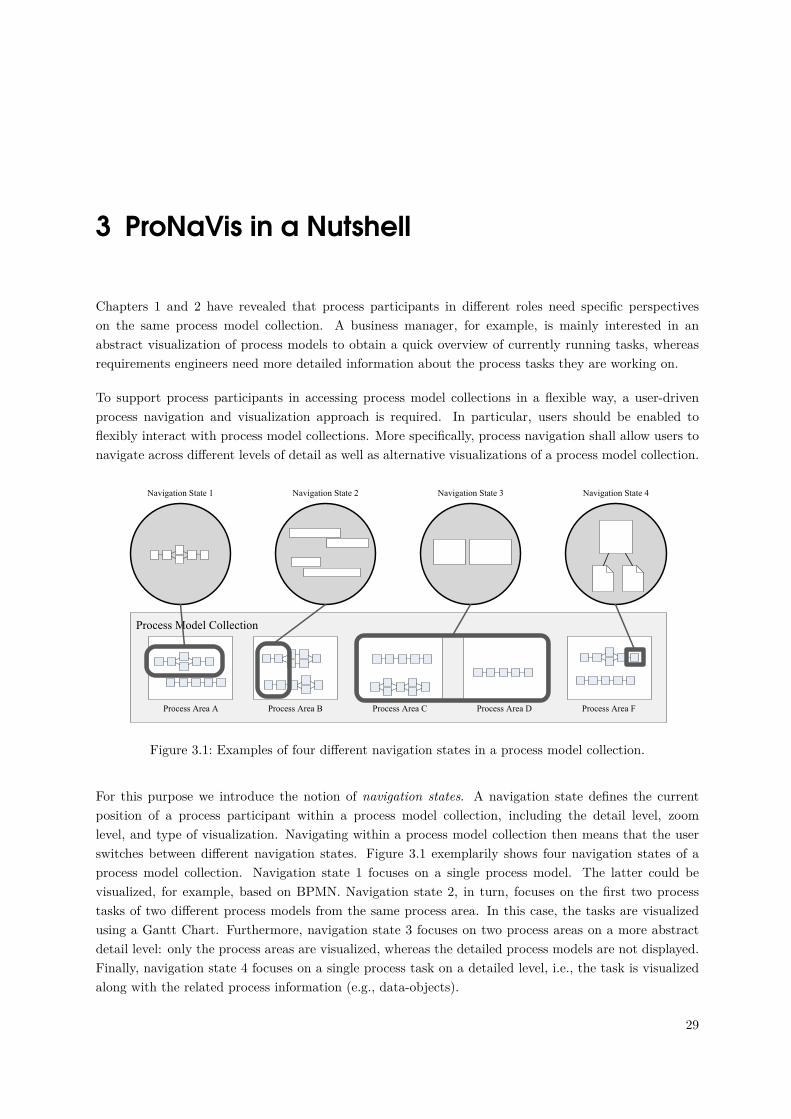
3 ProNaVis in a Nutshell
Chapters 1 and 2 have revealed that process participants in different roles need specific perspectiveson the same process model collection. A business manager, for example, is mainly interested in anabstract visualization of process models to obtain a quick overview of currently running tasks, whereasrequirements engineers need more detailed information about the process tasks they are working on.
To support process participants in accessing process model collections in a flexible way, a user-drivenprocess navigation and visualization approach is required. In particular, users should be enabled toflexibly interact with process model collections. More specifically, process navigation shall allow users tonavigate across different levels of detail as well as alternative visualizations of a process model collection.
Process Model Collection
Process Area A Process Area B Process Area C Process Area D Process Area F
Navigation State 1 Navigation State 2 Navigation State 3 Navigation State 4
Figure 3.1: Examples of four different navigation states in a process model collection.
For this purpose we introduce the notion of navigation states. A navigation state defines the currentposition of a process participant within a process model collection, including the detail level, zoomlevel, and type of visualization. Navigating within a process model collection then means that the userswitches between different navigation states. Figure 3.1 exemplarily shows four navigation states of aprocess model collection. Navigation state 1 focuses on a single process model. The latter could bevisualized, for example, based on BPMN. Navigation state 2, in turn, focuses on the first two processtasks of two different process models from the same process area. In this case, the tasks are visualizedusing a Gantt Chart. Furthermore, navigation state 3 focuses on two process areas on a more abstractdetail level: only the process areas are visualized, whereas the detailed process models are not displayed.Finally, navigation state 4 focuses on a single process task on a detailed level, i.e., the task is visualizedalong with the related process information (e.g., data-objects).
29
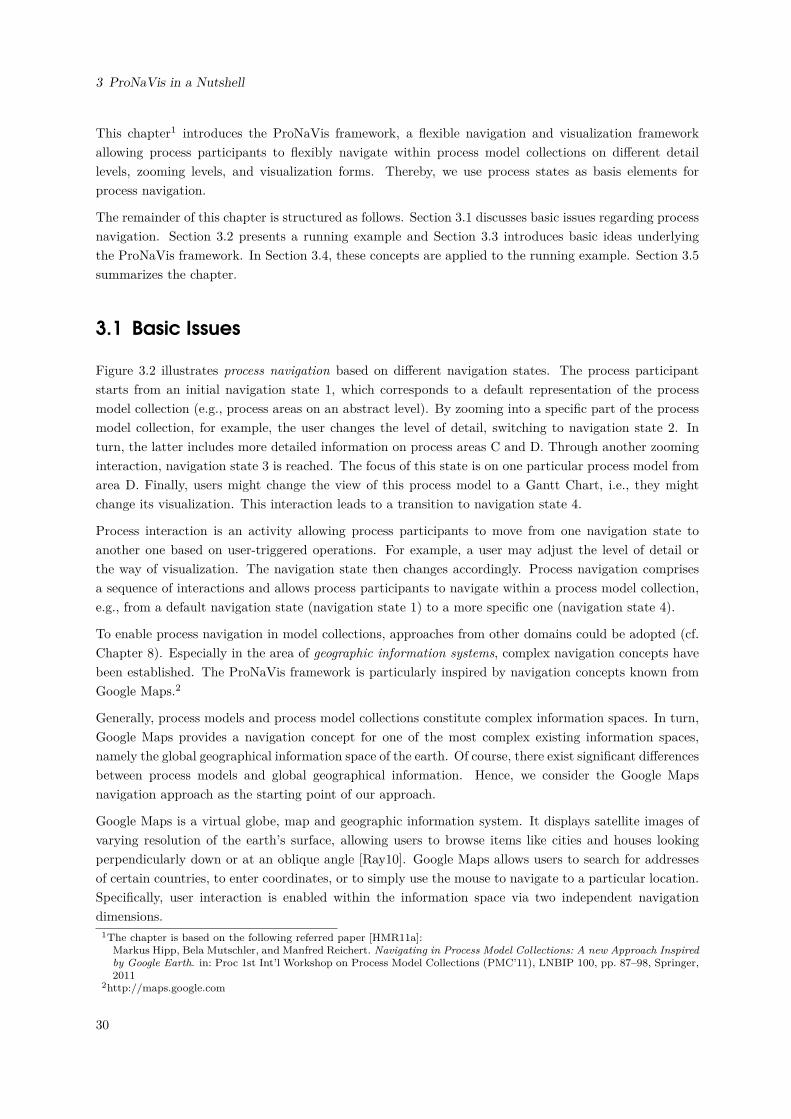
3 ProNaVis in a Nutshell
This chapter1 introduces the ProNaVis framework, a flexible navigation and visualization frameworkallowing process participants to flexibly navigate within process model collections on different detaillevels, zooming levels, and visualization forms. Thereby, we use process states as basis elements forprocess navigation.
The remainder of this chapter is structured as follows. Section 3.1 discusses basic issues regarding processnavigation. Section 3.2 presents a running example and Section 3.3 introduces basic ideas underlyingthe ProNaVis framework. In Section 3.4, these concepts are applied to the running example. Section 3.5summarizes the chapter.
3.1 Basic Issues
Figure 3.2 illustrates process navigation based on different navigation states. The process participantstarts from an initial navigation state 1, which corresponds to a default representation of the processmodel collection (e.g., process areas on an abstract level). By zooming into a specific part of the processmodel collection, for example, the user changes the level of detail, switching to navigation state 2. Inturn, the latter includes more detailed information on process areas C and D. Through another zoominginteraction, navigation state 3 is reached. The focus of this state is on one particular process model fromarea D. Finally, users might change the view of this process model to a Gantt Chart, i.e., they mightchange its visualization. This interaction leads to a transition to navigation state 4.
Process interaction is an activity allowing process participants to move from one navigation state toanother one based on user-triggered operations. For example, a user may adjust the level of detail orthe way of visualization. The navigation state then changes accordingly. Process navigation comprisesa sequence of interactions and allows process participants to navigate within a process model collection,e.g., from a default navigation state (navigation state 1) to a more specific one (navigation state 4).
To enable process navigation in model collections, approaches from other domains could be adopted (cf.Chapter 8). Especially in the area of geographic information systems, complex navigation concepts havebeen established. The ProNaVis framework is particularly inspired by navigation concepts known fromGoogle Maps.2
Generally, process models and process model collections constitute complex information spaces. In turn,Google Maps provides a navigation concept for one of the most complex existing information spaces,namely the global geographical information space of the earth. Of course, there exist significant differencesbetween process models and global geographical information. Hence, we consider the Google Mapsnavigation approach as the starting point of our approach.
Google Maps is a virtual globe, map and geographic information system. It displays satellite images ofvarying resolution of the earth’s surface, allowing users to browse items like cities and houses lookingperpendicularly down or at an oblique angle [Ray10]. Google Maps allows users to search for addressesof certain countries, to enter coordinates, or to simply use the mouse to navigate to a particular location.Specifically, user interaction is enabled within the information space via two independent navigationdimensions.
1The chapter is based on the following referred paper [HMR11a]:Markus Hipp, Bela Mutschler, and Manfred Reichert. Navigating in Process Model Collections: A new Approach Inspiredby Google Earth. in: Proc 1st Int’l Workshop on Process Model Collections (PMC’11), LNBIP 100, pp. 87–98, Springer,2011
2http://maps.google.com
30
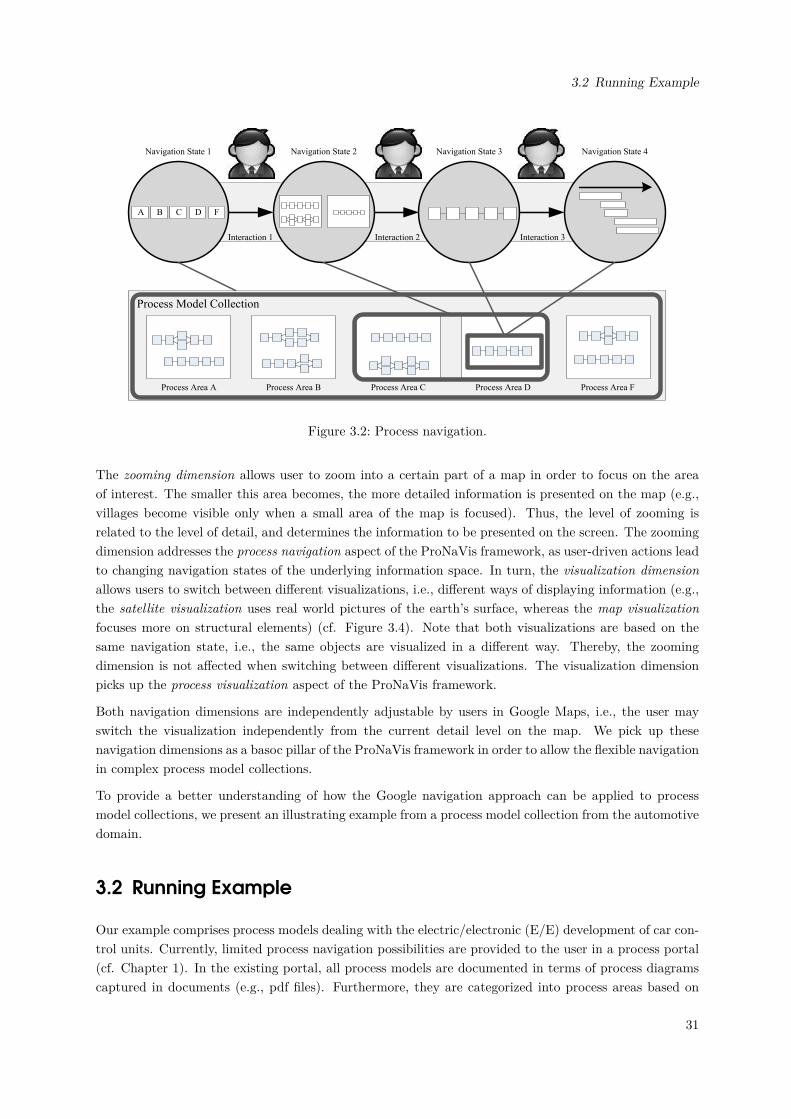
3.2 Running Example
Process Model Collection
Process Area A Process Area B Process Area C Process Area D Process Area F
Navigation State 1 Navigation State 2 Navigation State 3 Navigation State 4
Interaction 1 Interaction 2 Interaction 3
A B C D F
Figure 3.2: Process navigation.
The zooming dimension allows user to zoom into a certain part of a map in order to focus on the areaof interest. The smaller this area becomes, the more detailed information is presented on the map (e.g.,villages become visible only when a small area of the map is focused). Thus, the level of zooming isrelated to the level of detail, and determines the information to be presented on the screen. The zoomingdimension addresses the process navigation aspect of the ProNaVis framework, as user-driven actions leadto changing navigation states of the underlying information space. In turn, the visualization dimensionallows users to switch between different visualizations, i.e., different ways of displaying information (e.g.,the satellite visualization uses real world pictures of the earth’s surface, whereas the map visualizationfocuses more on structural elements) (cf. Figure 3.4). Note that both visualizations are based on thesame navigation state, i.e., the same objects are visualized in a different way. Thereby, the zoomingdimension is not affected when switching between different visualizations. The visualization dimensionpicks up the process visualization aspect of the ProNaVis framework.
Both navigation dimensions are independently adjustable by users in Google Maps, i.e., the user mayswitch the visualization independently from the current detail level on the map. We pick up thesenavigation dimensions as a basoc pillar of the ProNaVis framework in order to allow the flexible navigationin complex process model collections.
To provide a better understanding of how the Google navigation approach can be applied to processmodel collections, we present an illustrating example from a process model collection from the automotivedomain.
3.2 Running Example
Our example comprises process models dealing with the electric/electronic (E/E) development of car con-trol units. Currently, limited process navigation possibilities are provided to the user in a process portal(cf. Chapter 1). In the existing portal, all process models are documented in terms of process diagramscaptured in documents (e.g., pdf files). Furthermore, they are categorized into process areas based on
31
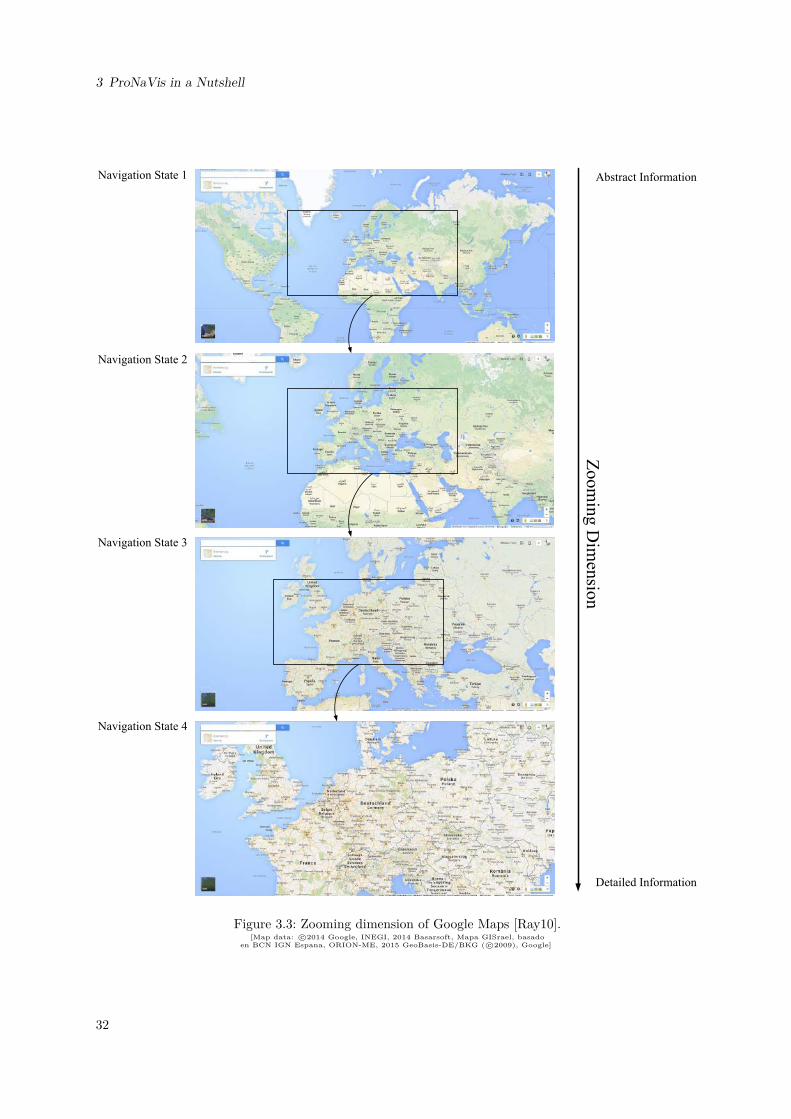
3 ProNaVis in a Nutshell
Zoom
ing D
imen
sion
Navigation State 1
Navigation State 2
Navigation State 3
Navigation State 4
Abstract Information
Detailed Information
Figure 3.3: Zooming dimension of Google Maps [Ray10].[Map data: c©2014 Google, INEGI, 2014 Basarsoft, Mapa GISrael, basado
en BCN IGN Espana, ORION-ME, 2015 GeoBasis-DE/BKG ( c©2009), Google]
32

3.2 Running Example
Visu
alization D
imen
sion
Map Visualization
Satellite Visualization
Navigation State 1
Navigation State 2
Figure 3.4: Visualization dimension of Google Maps [Ray10].[Map data: c©2014 Basarsoft, GeoBasis-DE/BKG ( c©2009), basado en BCN IGN Espana,
2014 Data SIO, NOAA, U.S. Navy, NGA, GEBCO, Landsat, Kartendaten c©2014, Google]
their topics. Moreover, each process area is depicted as image map. Hence, all available navigation stateswithin the process model collection are manually created with the visualization dimension. Therefore,they are hard-wired to the level of detail. Altogether, the entire process model collection comprises vari-ous process models and process areas on different levels of detail as well as in different visualizations (cf.Figure 3.5).
Navigation state 1 (cf. Figure 3.5a) covers the entire process model collection, including abstract processareas. As displaying single process models would be too complex at this point, only abstract processareas are depicted. The respective visualization is time-based, i.e., the length of rectangles correspondsto the duration of process areas. Navigation state 1 provides a starting point for the process navigationfor process participants entering the process portal. Based on it, a process participant may select theprocess area including the needed process task, e.g., for example, by choosing process area Development(by clicking on the according image map), the user navigates to a more detailed, but still time-basedvisualization of this process area in navigation state 2 (cf. Figure 3.5b). The contents of single processmodels may then be displayed at Level 3 (cf. Figure 3.5c).
In our example (cf. Figure 3.5), the Requirements Engineering process is depicted in terms of a processdiagram, in which single process tasks (T1. . . T5) are linked through a sequence flow to indicate logicalrelations. Furthermore, roles are introduced on this level and displayed as swimlanes. As opposed tonavigation states 1 and 2, the visualization in navigation state 3 is logic-based, e.g., it allows modellingfeedback loops (e.g., to jump back from T3 to T1) in case a certain condition is not met. Each processtask is further refined in navigation state 4, which provides a text-based visualization neither having timenor logic restrictions. This visualization only contains information about a single process task, i.e., a
33
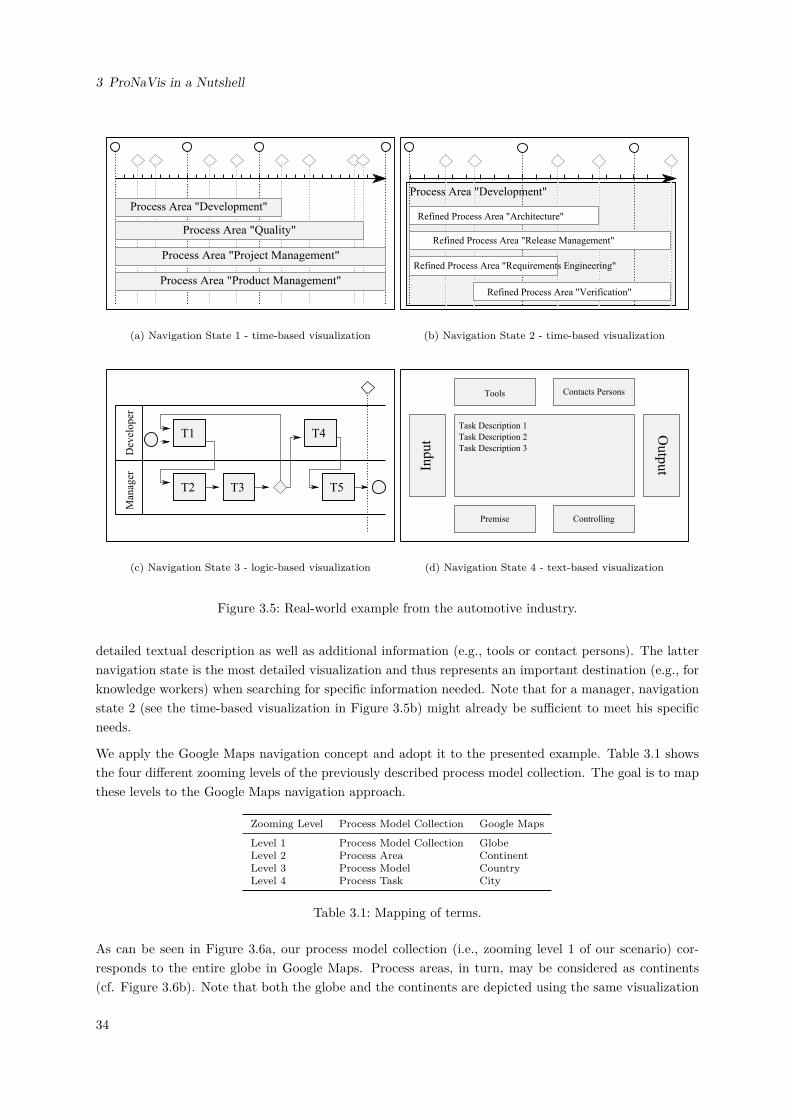
3 ProNaVis in a Nutshell
Process Area "Development"
Process Area "Quality"
Process Area "Project Management"
Process Area "Product Management"
(a) Navigation State 1 - time-based visualization
Refined Process Area "Architecture"
Refined Process Area "Release Management"
Refined Process Area "Requirements Engineering"
Refined Process Area "Verification"
Process Area "Development"
(b) Navigation State 2 - time-based visualization
(c) Navigation State 3 - logic-based visualization
Inpu
t
Output
Tools Contacts Persons
ControllingPremise
Task Description 1Task Description 2Task Description 3
(d) Navigation State 4 - text-based visualization
Figure 3.5: Real-world example from the automotive industry.
detailed textual description as well as additional information (e.g., tools or contact persons). The latternavigation state is the most detailed visualization and thus represents an important destination (e.g., forknowledge workers) when searching for specific information needed. Note that for a manager, navigationstate 2 (see the time-based visualization in Figure 3.5b) might already be sufficient to meet his specificneeds.
We apply the Google Maps navigation concept and adopt it to the presented example. Table 3.1 showsthe four different zooming levels of the previously described process model collection. The goal is to mapthese levels to the Google Maps navigation approach.
Zooming Level Process Model Collection Google Maps
Level 1 Process Model Collection GlobeLevel 2 Process Area ContinentLevel 3 Process Model CountryLevel 4 Process Task City
Table 3.1: Mapping of terms.
As can be seen in Figure 3.6a, our process model collection (i.e., zooming level 1 of our scenario) cor-responds to the entire globe in Google Maps. Process areas, in turn, may be considered as continents(cf. Figure 3.6b). Note that both the globe and the continents are depicted using the same visualization
34
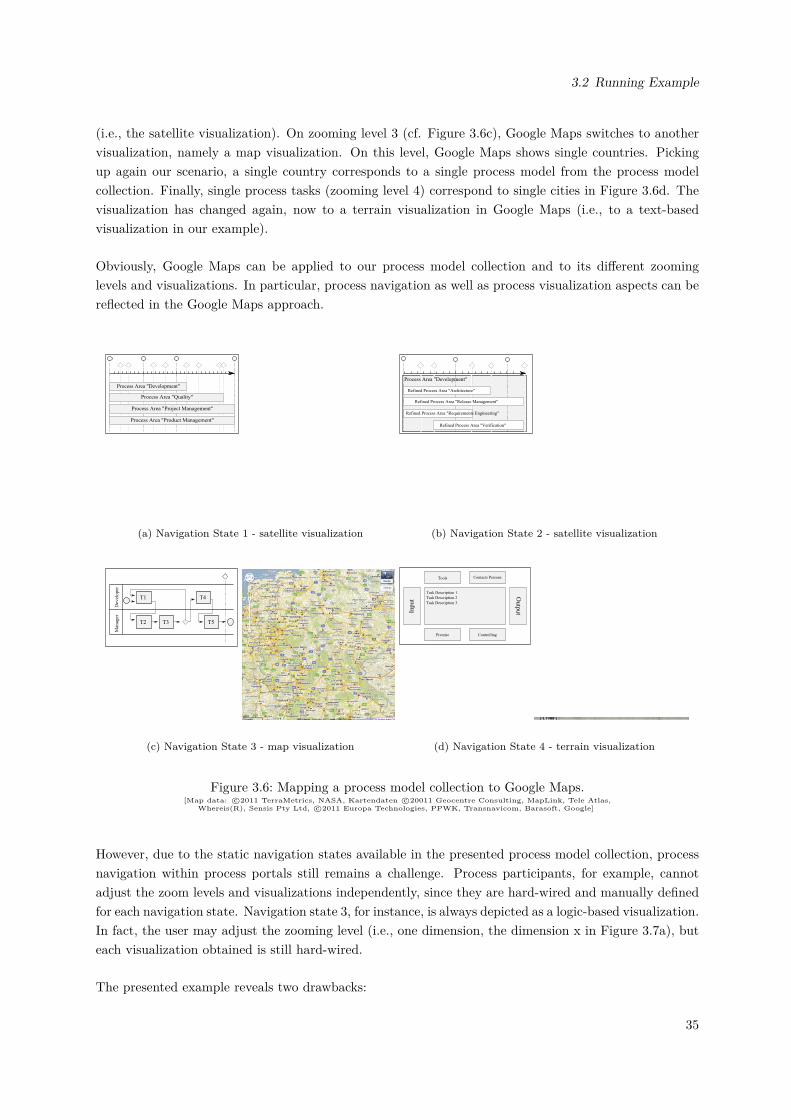
3.2 Running Example
(i.e., the satellite visualization). On zooming level 3 (cf. Figure 3.6c), Google Maps switches to anothervisualization, namely a map visualization. On this level, Google Maps shows single countries. Pickingup again our scenario, a single country corresponds to a single process model from the process modelcollection. Finally, single process tasks (zooming level 4) correspond to single cities in Figure 3.6d. Thevisualization has changed again, now to a terrain visualization in Google Maps (i.e., to a text-basedvisualization in our example).
Obviously, Google Maps can be applied to our process model collection and to its different zoominglevels and visualizations. In particular, process navigation as well as process visualization aspects can bereflected in the Google Maps approach.
Process Area "Development"
Process Area "Quality"
Process Area "Project Management"
Process Area "Product Management"
(a) Navigation State 1 - satellite visualization
Refined Process Area "Architecture"
Refined Process Area "Release Management"
Refined Process Area "Requirements Engineering"
Refined Process Area "Verification"
Process Area "Development"
(b) Navigation State 2 - satellite visualization
(c) Navigation State 3 - map visualization
Inpu
t
Output
Tools Contacts Persons
ControllingPremise
Task Description 1Task Description 2Task Description 3
(d) Navigation State 4 - terrain visualization
Figure 3.6: Mapping a process model collection to Google Maps.[Map data: c©2011 TerraMetrics, NASA, Kartendaten c©20011 Geocentre Consulting, MapLink, Tele Atlas,
Whereis(R), Sensis Pty Ltd, c©2011 Europa Technologies, PPWK, Transnavicom, Barasoft, Google]
However, due to the static navigation states available in the presented process model collection, processnavigation within process portals still remains a challenge. Process participants, for example, cannotadjust the zoom levels and visualizations independently, since they are hard-wired and manually definedfor each navigation state. Navigation state 3, for instance, is always depicted as a logic-based visualization.In fact, the user may adjust the zooming level (i.e., one dimension, the dimension x in Figure 3.7a), buteach visualization obtained is still hard-wired.
The presented example reveals two drawbacks:
35
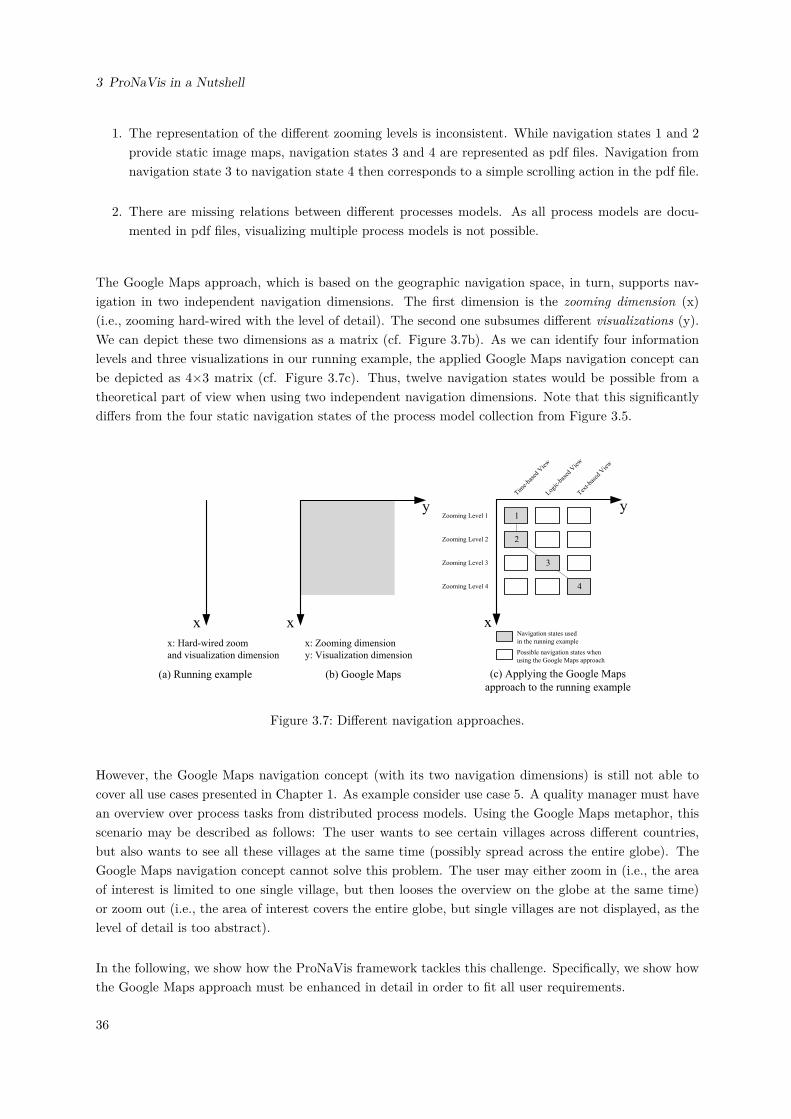
3 ProNaVis in a Nutshell
1. The representation of the different zooming levels is inconsistent. While navigation states 1 and 2provide static image maps, navigation states 3 and 4 are represented as pdf files. Navigation fromnavigation state 3 to navigation state 4 then corresponds to a simple scrolling action in the pdf file.
2. There are missing relations between different processes models. As all process models are docu-mented in pdf files, visualizing multiple process models is not possible.
The Google Maps approach, which is based on the geographic navigation space, in turn, supports nav-igation in two independent navigation dimensions. The first dimension is the zooming dimension (x)(i.e., zooming hard-wired with the level of detail). The second one subsumes different visualizations (y).We can depict these two dimensions as a matrix (cf. Figure 3.7b). As we can identify four informationlevels and three visualizations in our running example, the applied Google Maps navigation concept canbe depicted as 4×3 matrix (cf. Figure 3.7c). Thus, twelve navigation states would be possible from atheoretical part of view when using two independent navigation dimensions. Note that this significantlydiffers from the four static navigation states of the process model collection from Figure 3.5.
xx
y
x: Zooming dimension
y: Visualization dimension
x: Hard-wired zoom
and visualization dimension
(a) Running example (b) Google Maps
x
yZooming Level 1
Zooming Level 2
Zooming Level 3
Zooming Level 4
Time-
base
d V
iew
Logic
-bas
ed V
iew
Text-b
ased
Vie
w
Navigation states used
in the running example
Possible navigation states when
using the Google Maps approach
(c) Applying the Google Maps
approach to the running example
1
2
3
4
Figure 3.7: Different navigation approaches.
However, the Google Maps navigation concept (with its two navigation dimensions) is still not able tocover all use cases presented in Chapter 1. As example consider use case 5. A quality manager must havean overview over process tasks from distributed process models. Using the Google Maps metaphor, thisscenario may be described as follows: The user wants to see certain villages across different countries,but also wants to see all these villages at the same time (possibly spread across the entire globe). TheGoogle Maps navigation concept cannot solve this problem. The user may either zoom in (i.e., the areaof interest is limited to one single village, but then looses the overview on the globe at the same time)or zoom out (i.e., the area of interest covers the entire globe, but single villages are not displayed, as thelevel of detail is too abstract).
In the following, we show how the ProNaVis framework tackles this challenge. Specifically, we show howthe Google Maps approach must be enhanced in detail in order to fit all user requirements.
36
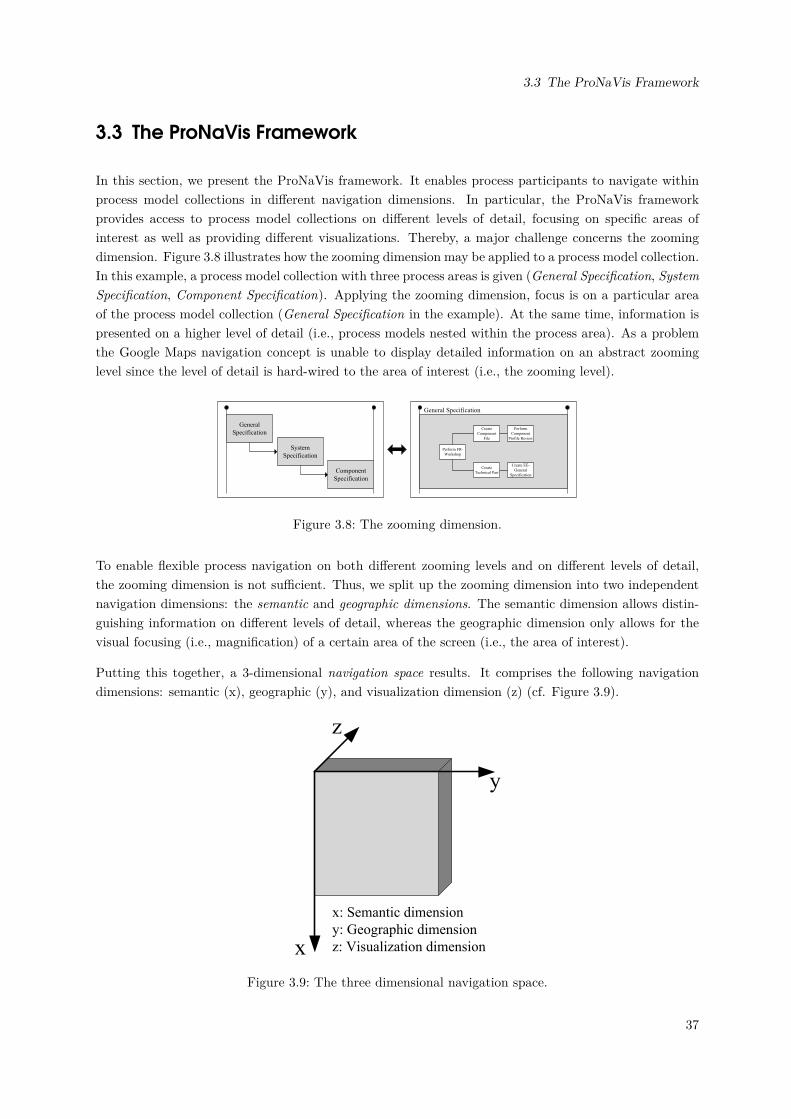
3.3 The ProNaVis Framework
3.3 The ProNaVis Framework
In this section, we present the ProNaVis framework. It enables process participants to navigate withinprocess model collections in different navigation dimensions. In particular, the ProNaVis frameworkprovides access to process model collections on different levels of detail, focusing on specific areas ofinterest as well as providing different visualizations. Thereby, a major challenge concerns the zoomingdimension. Figure 3.8 illustrates how the zooming dimension may be applied to a process model collection.In this example, a process model collection with three process areas is given (General Specification, SystemSpecification, Component Specification). Applying the zooming dimension, focus is on a particular areaof the process model collection (General Specification in the example). At the same time, information ispresented on a higher level of detail (i.e., process models nested within the process area). As a problemthe Google Maps navigation concept is unable to display detailed information on an abstract zoominglevel since the level of detail is hard-wired to the area of interest (i.e., the zooming level).
General
Specification
System
Specification
Component
Specification
Zooming dimension
Perform FR-
Workshop
Create
Technical Part
Create
Component
File
Perform
Component
Profile Review
Create EE-
General
Specification
General Specification
Figure 3.8: The zooming dimension.
To enable flexible process navigation on both different zooming levels and on different levels of detail,the zooming dimension is not sufficient. Thus, we split up the zooming dimension into two independentnavigation dimensions: the semantic and geographic dimensions. The semantic dimension allows distin-guishing information on different levels of detail, whereas the geographic dimension only allows for thevisual focusing (i.e., magnification) of a certain area of the screen (i.e., the area of interest).
Putting this together, a 3-dimensional navigation space results. It comprises the following navigationdimensions: semantic (x), geographic (y), and visualization dimension (z) (cf. Figure 3.9).
x
y
x: Semantic dimension
y: Geographic dimension
z: Visualization dimension
z
Figure 3.9: The three dimensional navigation space.
37
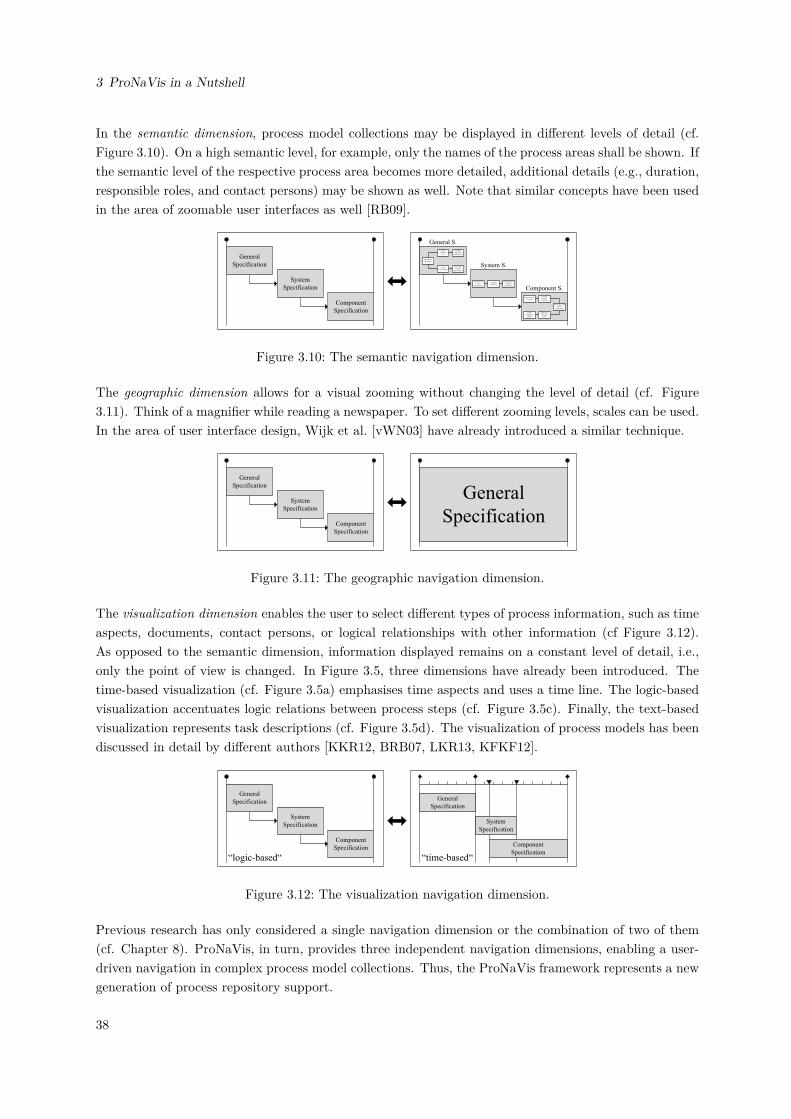
3 ProNaVis in a Nutshell
In the semantic dimension, process model collections may be displayed in different levels of detail (cf.Figure 3.10). On a high semantic level, for example, only the names of the process areas shall be shown. Ifthe semantic level of the respective process area becomes more detailed, additional details (e.g., duration,responsible roles, and contact persons) may be shown as well. Note that similar concepts have been usedin the area of zoomable user interfaces as well [RB09].
Semantic navigation dimension
General
Specification
System
Specification
Component
Specification
View navigation dimension
Perform FR-
Workshop
Create
Technical Part
Create
Component
File
Perform
Component
Profile Review
Create EE-
General
Specification
Develop Top-
Level
Requirements
Describe
Functions
Identification of
Function
Contributions
Check, Rate, and
Choose
Technologies
Develop
Function
Versions
Create SKLH
(document
NFRs)
Initiate
Component
FMEA
Define Display-
Concept
Component S.
System S.
General S.
Figure 3.10: The semantic navigation dimension.
The geographic dimension allows for a visual zooming without changing the level of detail (cf. Figure3.11). Think of a magnifier while reading a newspaper. To set different zooming levels, scales can be used.In the area of user interface design, Wijk et al. [vWN03] have already introduced a similar technique.
General
Specification
System
Specification
Component
Specification
General
Specification
Geographic navigation dimension
Semantic navigation dimensionFigure 3.11: The geographic navigation dimension.
The visualization dimension enables the user to select different types of process information, such as timeaspects, documents, contact persons, or logical relationships with other information (cf Figure 3.12).As opposed to the semantic dimension, information displayed remains on a constant level of detail, i.e.,only the point of view is changed. In Figure 3.5, three dimensions have already been introduced. Thetime-based visualization (cf. Figure 3.5a) emphasises time aspects and uses a time line. The logic-basedvisualization accentuates logic relations between process steps (cf. Figure 3.5c). Finally, the text-basedvisualization represents task descriptions (cf. Figure 3.5d). The visualization of process models has beendiscussed in detail by different authors [KKR12, BRB07, LKR13, KFKF12].
View navigation dimension
General
Specification
System
Specification
Component
Specification
General
Specification
System
Specification
Component
Specification“logic-based“ “time-based“
Figure 3.12: The visualization navigation dimension.
Previous research has only considered a single navigation dimension or the combination of two of them(cf. Chapter 8). ProNaVis, in turn, provides three independent navigation dimensions, enabling a user-driven navigation in complex process model collections. Thus, the ProNaVis framework represents a newgeneration of process repository support.
38
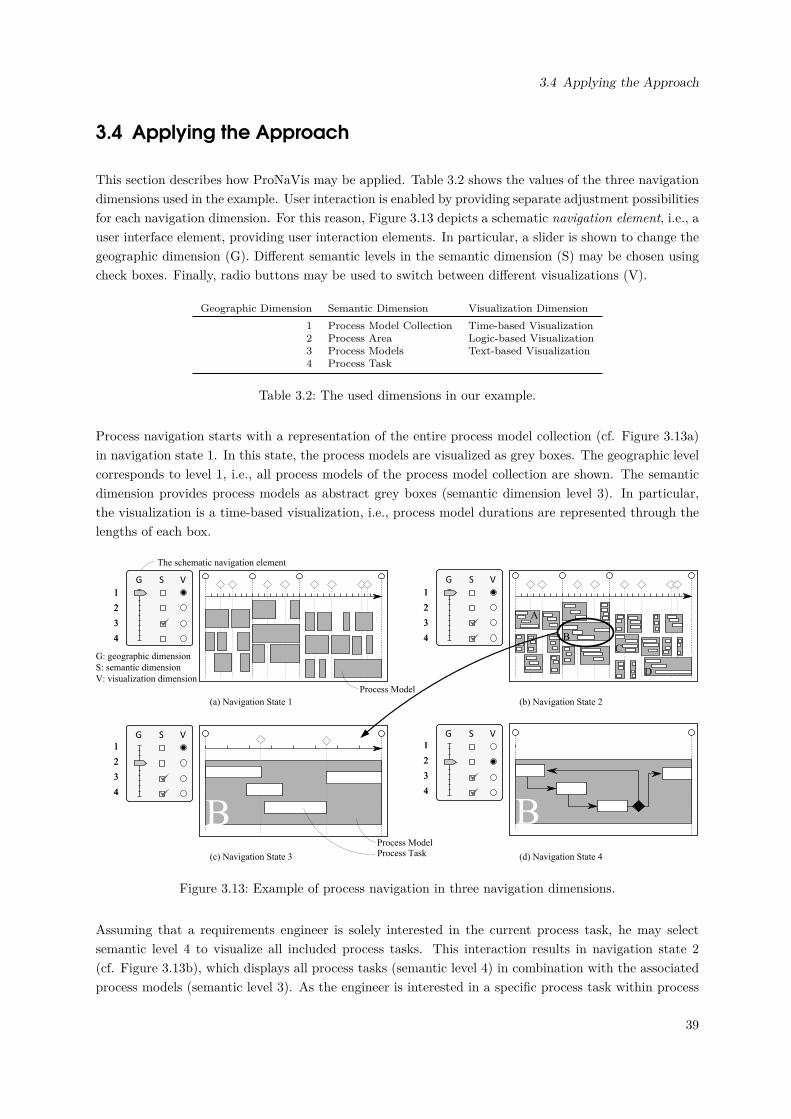
3.4 Applying the Approach
3.4 Applying the Approach
This section describes how ProNaVis may be applied. Table 3.2 shows the values of the three navigationdimensions used in the example. User interaction is enabled by providing separate adjustment possibilitiesfor each navigation dimension. For this reason, Figure 3.13 depicts a schematic navigation element, i.e., auser interface element, providing user interaction elements. In particular, a slider is shown to change thegeographic dimension (G). Different semantic levels in the semantic dimension (S) may be chosen usingcheck boxes. Finally, radio buttons may be used to switch between different visualizations (V).
Geographic Dimension Semantic Dimension Visualization Dimension1 Process Model Collection Time-based Visualization2 Process Area Logic-based Visualization3 Process Models Text-based Visualization4 Process Task
Table 3.2: The used dimensions in our example.
Process navigation starts with a representation of the entire process model collection (cf. Figure 3.13a)in navigation state 1. In this state, the process models are visualized as grey boxes. The geographic levelcorresponds to level 1, i.e., all process models of the process model collection are shown. The semanticdimension provides process models as abstract grey boxes (semantic dimension level 3). In particular,the visualization is a time-based visualization, i.e., process model durations are represented through thelengths of each box.
G S V
G S V G S V
G S V
1
2
3
4
1
2
3
4
1
2
3
4
1
2
3
4
1
2
3
4
1
2
3
4
1
2
3
4
1
2
3
4
A
BC
D
B B
(a) Navigation State 1 (b) Navigation State 2
(c) Navigation State 3 (d) Navigation State 4
G: geographic dimension
S: semantic dimension
V: visualization dimension
The schematic navigation element
Process Model
Process ModelProcess Task
Figure 3.13: Example of process navigation in three navigation dimensions.
Assuming that a requirements engineer is solely interested in the current process task, he may selectsemantic level 4 to visualize all included process tasks. This interaction results in navigation state 2(cf. Figure 3.13b), which displays all process tasks (semantic level 4) in combination with the associatedprocess models (semantic level 3). As the engineer is interested in a specific process task within process
39
3 ProNaVis in a Nutshell
B, he applies the geographic dimension to process B reaching navigation state 3 (cf. Figure 3.13c). Notethat all interactions are user-driven, i.e., triggered based on user interaction with the navigation element.
Finally, assume that the requirements engineer is less interested in time aspects, but more in what he hasto do next when finishing the current process task. Therefore, he switches to the logic-based visualizationin navigation state 4 (as depicted in Figure 3.13d). Using this visualization, he can quickly identifypredecessor and successor relations of all involved process tasks.
The presented example sketches the ProNaVis navigation concept and how process participants maynavigate in complex process model collections based on a flexible process navigation concept that makesuse of three independent navigation dimensions.
3.5 Summary
This chapter presented basic ideas of the ProNaVis framework. We first discussed basic issues and pro-vided a common understanding of process navigation and visualization. An illustrating example showedhow a process portal from the automotive domain is currently used to enable a 1-dimensional processnavigation in process model collections. Then, we investigated the navigation approach from GoogleMaps supporting two independent navigation dimensions (i.e., zooming dimension and visualization di-mension). These concepts, however, are still unable to cope with all use cases presented in Chapter1. Main reason is the zooming dimension (i.e., the hard-wired semantic and geographic dimension). Itallows changing the area of interest by zooming on a certain area on the map. However, the level ofdetail is automatically adjusted depending on the focused area. In particular, this dimension does notallow displaying detailed information on an abstract zooming level (i.e., area of interest). Based on theseobservations, the zooming dimension is not sufficient for a flexible navigation support in complex processmodel collections. Therefore, ProNaVis divides the zooming dimension into a semantic and a geographicdimension. In combination with the visualization dimension, these three navigation dimensions form the3-dimensional navigation space as the core of the ProNaVis framework.
The following chapters introduces the ProNaVis navigation concepts in a detailed manner, including thetechnical realization, formalizations and further use cases.
40
4 The Navigation Space
The three navigation dimensions introduced in Chapter 3 represent the navigation space. This chapter1
introduces the major steps to construct the latter for a given process model collection. The chapter isstructured as follows. Section 4.1 sketches main challenges for constructing the navigation space. Section4.2 then briefly summarizes the two major steps required to construct the navigation space. Then,Sections 4.3 and 4.4 describe these steps in detail. Finally, Section 4.5 summarizes the chapter.
4.1 Motivation
To support process participants in accessing process model collections in a flexible manner, it becomesnecessary to integrate all process models of the model collection into our 3-dimensional navigationspace [HMMR14].
This integration, however, is far from being a trivial task. In practice, process models are typicallydocumented inconsistently across different departments. While process management technology used insome departments, for example, can represent process models as XML files, other departments documenttheir process models with PowerPoint and pdf files.
However, to construct the navigation space, all process models of a collection need to be available in ahomogeneous, machine-readable form. This is the prerequisite to create a logical representation of thecollection’s process models and to combine and transfer them to a navigation space. Thus, in order realizea 3-dimensional navigation space, the following challenges need to be addressed:
• Process models must be extracted from heterogeneous sources and must be transferred to a homo-geneous, machine-readable representation.
• Process models must be integrated to enable cross-model navigation.
• Process models must be transformed into an integrated hierarchical structure serving as the basisto derive the navigation space, i.e., the three navigation dimensions.
Note that this work focuses on integrating process models which are already available as BPMN XMLfiles. For further information on integrating process models from other sources, please refer to [MUG+14,MMR12a, MMR12b].
4.2 Main Construction Steps
The navigation space is constructed in two consecutive steps taking a process model collection as input:1The chapter is based on the following referred paper [HMMR14]:Markus Hipp, Bernd Michelberger, Bela Mutschler, and Manfred Reichert. Navigating in Process Model Repositoriesand Enterprise Process Information. in: Proc 8th Int’l Conf on Research Challenges in Information Science (RCIS’14),IEEE, pp. 1–12, 2014
41
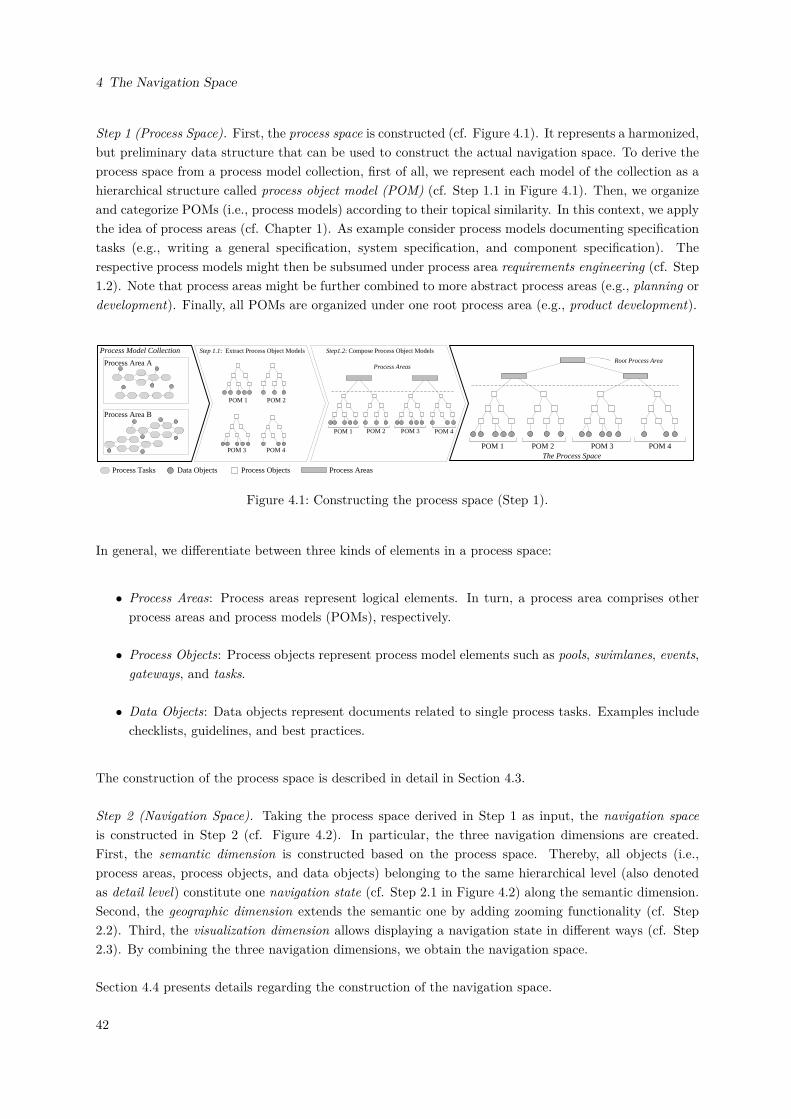
4 The Navigation Space
Step 1 (Process Space). First, the process space is constructed (cf. Figure 4.1). It represents a harmonized,but preliminary data structure that can be used to construct the actual navigation space. To derive theprocess space from a process model collection, first of all, we represent each model of the collection as ahierarchical structure called process object model (POM) (cf. Step 1.1 in Figure 4.1). Then, we organizeand categorize POMs (i.e., process models) according to their topical similarity. In this context, we applythe idea of process areas (cf. Chapter 1). As example consider process models documenting specificationtasks (e.g., writing a general specification, system specification, and component specification). Therespective process models might then be subsumed under process area requirements engineering (cf. Step1.2). Note that process areas might be further combined to more abstract process areas (e.g., planning ordevelopment). Finally, all POMs are organized under one root process area (e.g., product development).
Step 1.1: Extract Process Object Models Step1.2: Compose Process Object Models
The Process SpacePOM 4POM 3
POM 2POM 1
POM 1 POM 2 POM 3 POM 4
POM 1 POM 2 POM 3 POM 4
Process Area A
Process Area B
Process Model Collection
Process AreasRoot Process Area
Process Tasks Data Objects Process Objects Process Areas
Figure 4.1: Constructing the process space (Step 1).
In general, we differentiate between three kinds of elements in a process space:
• Process Areas: Process areas represent logical elements. In turn, a process area comprises otherprocess areas and process models (POMs), respectively.
• Process Objects: Process objects represent process model elements such as pools, swimlanes, events,gateways, and tasks.
• Data Objects: Data objects represent documents related to single process tasks. Examples includechecklists, guidelines, and best practices.
The construction of the process space is described in detail in Section 4.3.
Step 2 (Navigation Space). Taking the process space derived in Step 1 as input, the navigation spaceis constructed in Step 2 (cf. Figure 4.2). In particular, the three navigation dimensions are created.First, the semantic dimension is constructed based on the process space. Thereby, all objects (i.e.,process areas, process objects, and data objects) belonging to the same hierarchical level (also denotedas detail level) constitute one navigation state (cf. Step 2.1 in Figure 4.2) along the semantic dimension.Second, the geographic dimension extends the semantic one by adding zooming functionality (cf. Step2.2). Third, the visualization dimension allows displaying a navigation state in different ways (cf. Step2.3). By combining the three navigation dimensions, we obtain the navigation space.
Section 4.4 presents details regarding the construction of the navigation space.
42
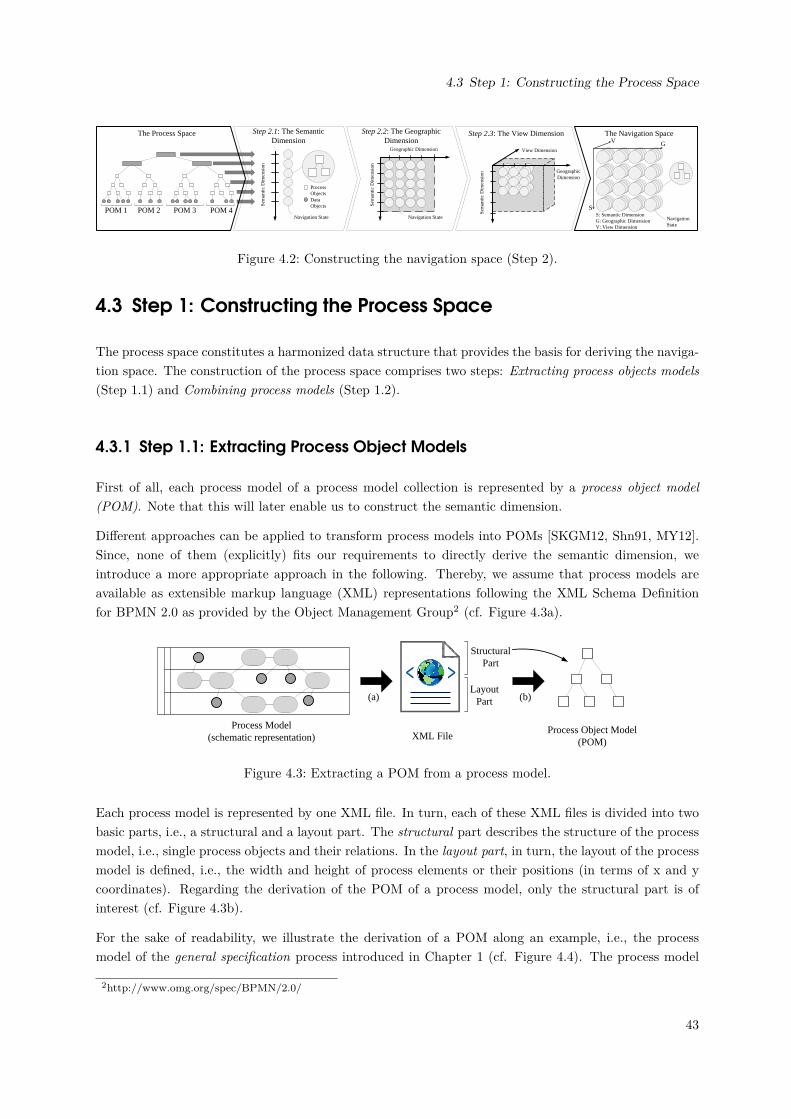
4.3 Step 1: Constructing the Process Space
The Process Space Step 2.1: The Semantic Dimension
Step 2.3: The View DimensionStep 2.2: The Geographic Dimension
The Navigation Space
S
GV
S: Semantic DimensionG: Geographic DimensionV: View Dimension
View DimensionGeographic Dimension
Sem
antic
Dim
ensi
on
Geographic Dimension
Sem
antic
Dim
ensi
on
Navigation State
Sem
antic
Dim
ensi
on
Process ObjectsData Objects
Navigation State Navigation State
POM 1 POM 2 POM 3 POM 4
Figure 4.2: Constructing the navigation space (Step 2).
4.3 Step 1: Constructing the Process Space
The process space constitutes a harmonized data structure that provides the basis for deriving the naviga-tion space. The construction of the process space comprises two steps: Extracting process objects models(Step 1.1) and Combining process models (Step 1.2).
4.3.1 Step 1.1: Extracting Process Object Models
First of all, each process model of a process model collection is represented by a process object model(POM). Note that this will later enable us to construct the semantic dimension.
Different approaches can be applied to transform process models into POMs [SKGM12, Shn91, MY12].Since, none of them (explicitly) fits our requirements to directly derive the semantic dimension, weintroduce a more appropriate approach in the following. Thereby, we assume that process models areavailable as extensible markup language (XML) representations following the XML Schema Definitionfor BPMN 2.0 as provided by the Object Management Group2 (cf. Figure 4.3a).
Process Model (schematic representation) XML File
Process Object Model (POM)
(a) (b)
Structural Part
LayoutPart
Figure 4.3: Extracting a POM from a process model.
Each process model is represented by one XML file. In turn, each of these XML files is divided into twobasic parts, i.e., a structural and a layout part. The structural part describes the structure of the processmodel, i.e., single process objects and their relations. In the layout part, in turn, the layout of the processmodel is defined, i.e., the width and height of process elements or their positions (in terms of x and ycoordinates). Regarding the derivation of the POM of a process model, only the structural part is ofinterest (cf. Figure 4.3b).
For the sake of readability, we illustrate the derivation of a POM along an example, i.e., the processmodel of the general specification process introduced in Chapter 1 (cf. Figure 4.4). The process model
2http://www.omg.org/spec/BPMN/2.0/
43
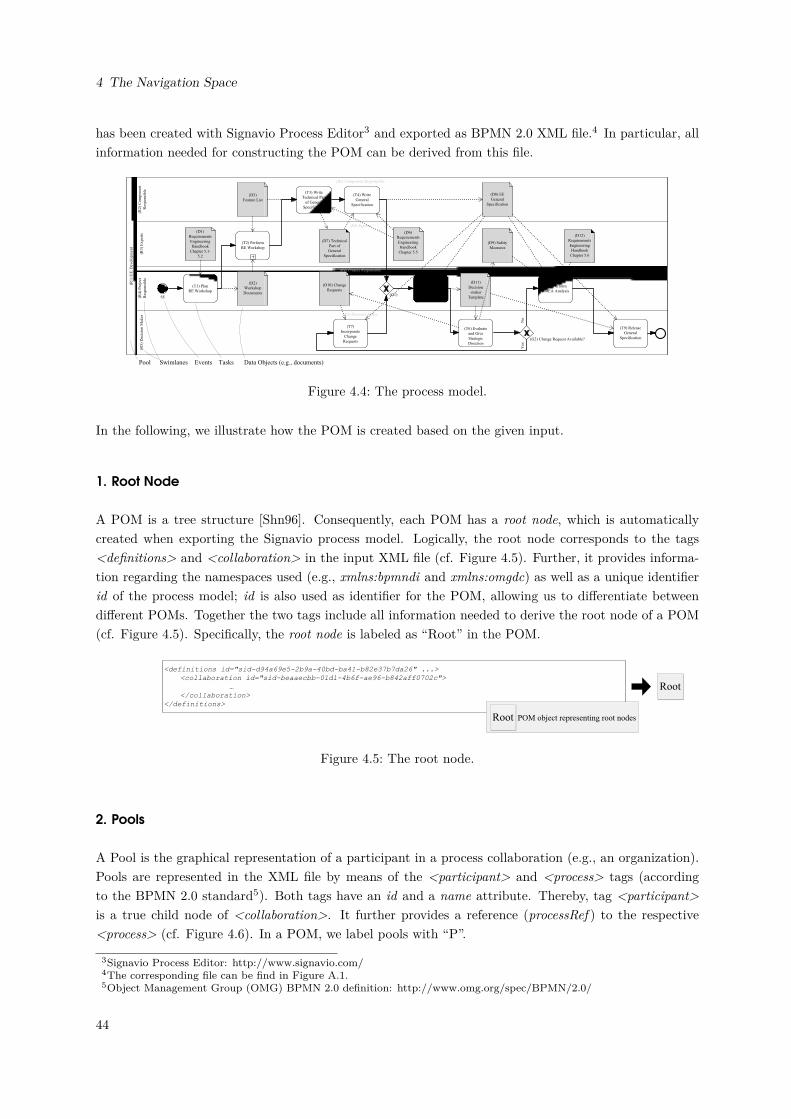
4 The Navigation Space
has been created with Signavio Process Editor3 and exported as BPMN 2.0 XML file.4 In particular, allinformation needed for constructing the POM can be derived from this file.
(R1)
E/E
Dev
elo
pm
ent
(R3
) E
xp
erts
(R3) Experts
(T2) Perform
RE Workshop
(D1)
Requirements
Engineering
Handbook
Chapter 5.1-
5.2
(D7) Technical
Part of
General
Specification
(D9) Safety
Measures
(D6)
Requirements
Engineering
Handbook
Chapter 5.5
(D12)
Requirements
Engineering
Handbook
Chapter 5.6
(R2
) C
om
po
nen
t
Res
po
nsi
ble
(R2) Component Responsible
(T3) Write
Technical Part
of General
Specification
(T4) Write
General
Specification
(D3)
Feature List
(D8) EE
General
Specification
(R4
) P
roje
ct
Res
po
nsi
ble
(R4) Project Responsible
(T1) Plan
RE Workshop
SE
(T5) Integrate
Component
Specification to
General
Specification
(T8) Perform
FMEA Analysis
(D11)
Decision
-maker
Template
(D10) Change
Requests
(D2)
Workshop
Documents (G1)
(R5
) D
ecis
ion M
aker
(R5) Decision Maker
(T6) Evaluate
and Give
Strategic
Direction(G2) Change Request Available?
(T7)
Incorporate
Change
Requests
(T9) Release
General
Specification
Yes
No
Pool Swimlanes Tasks Data Objects (e.g., documents)Events
Figure 4.4: The process model.
In the following, we illustrate how the POM is created based on the given input.
1. Root Node
A POM is a tree structure [Shn96]. Consequently, each POM has a root node, which is automaticallycreated when exporting the Signavio process model. Logically, the root node corresponds to the tags<definitions> and <collaboration> in the input XML file (cf. Figure 4.5). Further, it provides informa-tion regarding the namespaces used (e.g., xmlns:bpmndi and xmlns:omgdc) as well as a unique identifierid of the process model; id is also used as identifier for the POM, allowing us to differentiate betweendifferent POMs. Together the two tags include all information needed to derive the root node of a POM(cf. Figure 4.5). Specifically, the root node is labeled as “Root” in the POM.
<definitions id="sid-d94a69e5-2b9a-40bd-ba41-b82e37b7da26" ...>
<collaboration id="sid-beaaecbb-01d1-4b6f-ae96-b842aff0702c">
…
</collaboration>
</definitions>
Root
Root POM object representing root nodes
Figure 4.5: The root node.
2. Pools
A Pool is the graphical representation of a participant in a process collaboration (e.g., an organization).Pools are represented in the XML file by means of the <participant> and <process> tags (accordingto the BPMN 2.0 standard5). Both tags have an id and a name attribute. Thereby, tag <participant>is a true child node of <collaboration>. It further provides a reference (processRef ) to the respective<process> (cf. Figure 4.6). In a POM, we label pools with “P”.
3Signavio Process Editor: http://www.signavio.com/4The corresponding file can be find in Figure A.1.5Object Management Group (OMG) BPMN 2.0 definition: http://www.omg.org/spec/BPMN/2.0/
44
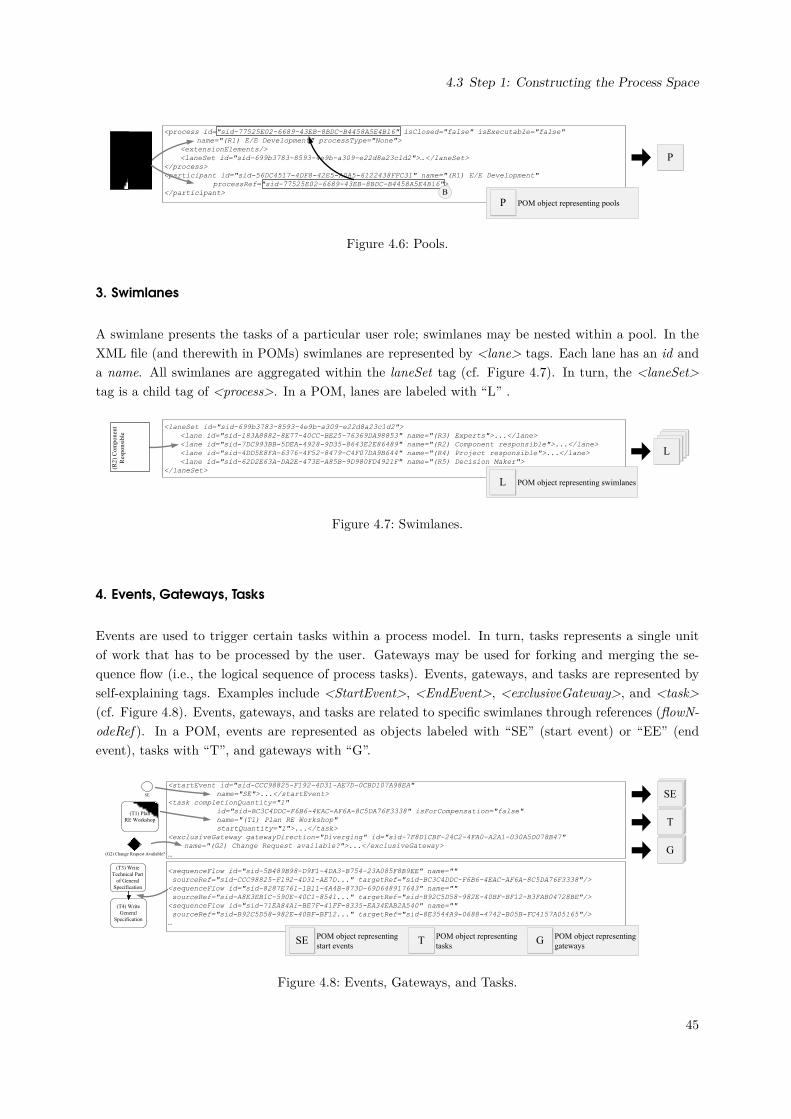
4.3 Step 1: Constructing the Process Space
<process id="sid-77525E02-6689-43EB-8BDC-B4458A5E4B16" isClosed="false" isExecutable="false"
name="(R1) E/E Development" processType="None">
<extensionElements/>
<laneSet id="sid-699b3783-8593-4e9b-a309-e22d8a23c1d2">…</laneSet>
</process>
<participant id="sid-56DC4517-4DF8-42E5-A0A5-6122438FFC31" name="(R1) E/E Development"
processRef="sid-77525E02-6689-43EB-8BDC-B4458A5E4B16">
</participant> B
(R1)
E/E
Dev
elopm
ent
P
P POM object representing pools
Figure 4.6: Pools.
3. Swimlanes
A swimlane presents the tasks of a particular user role; swimlanes may be nested within a pool. In theXML file (and therewith in POMs) swimlanes are represented by <lane> tags. Each lane has an id anda name. All swimlanes are aggregated within the laneSet tag (cf. Figure 4.7). In turn, the <laneSet>tag is a child tag of <process>. In a POM, lanes are labeled with “L” .
LLL
<laneSet id="sid-699b3783-8593-4e9b-a309-e22d8a23c1d2">
<lane id="sid-183A8882-8E77-40CC-BE25-76369DA98853" name="(R3) Experts">...</lane>
<lane id="sid-7DC993BB-5DEA-4928-9D35-8643E2E86489" name="(R2) Component responsible">...</lane>
<lane id="sid-4DD5E8FA-6376-4F52-8479-C4F07DA9B644" name="(R4) Project responsible">...</lane>
<lane id="sid-62D2E63A-DA2E-473E-A85B-9D980FD4921F" name="(R5) Decision Maker">
</laneSet>
(R2
) C
om
pon
ent
Res
pon
sib
le
L
L POM object representing swimlanes
Figure 4.7: Swimlanes.
4. Events, Gateways, Tasks
Events are used to trigger certain tasks within a process model. In turn, tasks represents a single unitof work that has to be processed by the user. Gateways may be used for forking and merging the se-quence flow (i.e., the logical sequence of process tasks). Events, gateways, and tasks are represented byself-explaining tags. Examples include <StartEvent>, <EndEvent>, <exclusiveGateway>, and <task>(cf. Figure 4.8). Events, gateways, and tasks are related to specific swimlanes through references (flowN-odeRef ). In a POM, events are represented as objects labeled with “SE” (start event) or “EE” (endevent), tasks with “T”, and gateways with “G”.
TT
TT
TT
<startEvent id="sid-CCC98825-F192-4D31-AE7D-0CBD107A98EA"
name="SE">...</startEvent>
<task completionQuantity="1"
id="sid-BC3C4DDC-F6B6-4EAC-AF6A-8C5DA76F3338" isForCompensation="false"
name="(T1) Plan RE Workshop"
startQuantity="1">...</task>
<exclusiveGateway gatewayDirection="Diverging" id="sid-7F8D1CBF-24C2-4FA0-A2A1-030A5D078B47"
name="(G2) Change Request available?">...</exclusiveGateway>
…
<sequenceFlow id="sid-5B489B98-D9F1-4DA3-B754-23A085F8B9EE" name=""
sourceRef="sid-CCC98825-F192-4D31-AE7D..." targetRef="sid-BC3C4DDC-F6B6-4EAC-AF6A-8C5DA76F3338"/>
<sequenceFlow id="sid-8287E761-1B11-4A4B-873D-69D648917643" name=""
sourceRef="sid-A8E3EB1C-590E-40C1-8541..." targetRef="sid-B92C5D58-982E-40BF-BF12-B3FAB04728BE"/>
<sequenceFlow id="sid-71EA84A1-BE7F-41FF-8335-EA34EAB2A540" name=""
sourceRef="sid-B92C5D58-982E-40BF-BF12..." targetRef="sid-8E3544A9-0688-4742-B05B-FC4157A05165"/>
…
SE
(T1) Plan
RE Workshop
(G2) Change Request Available?
(T4) Write
General
Specification
(T3) Write
Technical Part
of General
Specification
SE
T
GD
SEPOM object representing
start eventsT
POM object representing
tasksG
POM object representing
gateways
Figure 4.8: Events, Gateways, and Tasks.
45
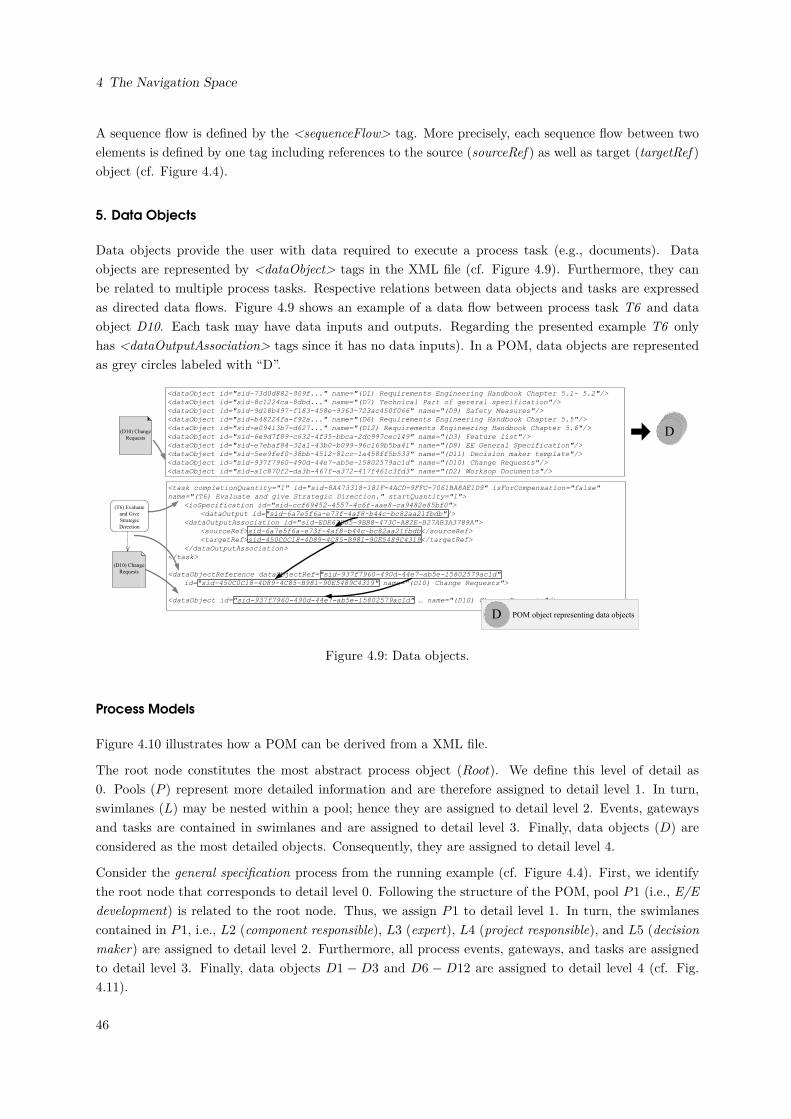
4 The Navigation Space
A sequence flow is defined by the <sequenceFlow> tag. More precisely, each sequence flow between twoelements is defined by one tag including references to the source (sourceRef ) as well as target (targetRef )object (cf. Figure 4.4).
5. Data Objects
Data objects provide the user with data required to execute a process task (e.g., documents). Dataobjects are represented by <dataObject> tags in the XML file (cf. Figure 4.9). Furthermore, they canbe related to multiple process tasks. Respective relations between data objects and tasks are expressedas directed data flows. Figure 4.9 shows an example of a data flow between process task T6 and dataobject D10. Each task may have data inputs and outputs. Regarding the presented example T6 onlyhas <dataOutputAssociation> tags since it has no data inputs). In a POM, data objects are representedas grey circles labeled with “D”.
DDD
<dataObject id="sid-73d0d882-909f..." name="(D1) Requirements Engineering Handbook Chapter 5.1- 5.2"/>
<dataObject id="sid-8c1224ca-8dbd..." name="(D7) Technical Part of gereral specification"/>
<dataObject id="sid-9d18b497-f183-458e-9363-723ac450f066" name="(D9) Safety Measures"/>
<dataObject id="sid-b48224fa-f92a..." name="(D6) Requirements Engineering Handbook Chapter 5.5"/>
<dataObject id="sid-e09413b7-d627..." name="(D12) Requirements Engineering Handbook Chapter 5.6"/>
<dataObject id="sid-6e9d7f89-c632-4f35-bbca-2dc997cec149" name="(D3) Feature list"/>
<dataObject id="sid-e7ebaf84-32a1-43b0-b099-96c169b5ba41" name="(D8) EE General Specification"/>
<dataObject id="sid-5ee9fef0-38bb-4512-81cc-1a458ff5b533" name="(D11) Decision maker template"/>
<dataObject id="sid-937f7960-490d-44e7-ab5e-15802579ac1d" name="(D10) Change Requests"/>
<dataObject id="sid-a1c870f2-da3b-467f-a372-417f461c3fd3" name="(D2) Worksop Documents"/>
<task completionQuantity="1" id="sid-8A473318-181F-4ACD-9FFC-7061BA8AE1D9" isForCompensation="false"
name="(T6) Evaluate and give Strategic Direction." startQuantity="1">
<ioSpecification id="sid-ccf69452-4557-4c6f-aae8-ca9482e85bf0">
<dataOutput id="sid-6a7e5f6a-e73f-4af8-b44c-bc82aa21fbdb"/>
<dataOutputAssociation id="sid-EDE62D05-9BB8-473C-A82E-B27AB3A3789A">
<sourceRef>sid-6a7e5f6a-e73f-4af8-b44c-bc82aa21fbdb</sourceRef>
<targetRef>sid-450C0C18-4D89-4C85-B981-90E5489C4319</targetRef>
</dataOutputAssociation>
</task>
<dataObjectReference dataObjectRef="sid-937f7960-490d-44e7-ab5e-15802579ac1d"
id="sid-450C0C18-4D89-4C85-B981-90E5489C4319" name="(D10) Change Requests">
<dataObject id="sid-937f7960-490d-44e7-ab5e-15802579ac1d" … name="(D10) Change Requests"/>
(D10) Change
Requests
(D10) Change
Requests
(T6) Evaluate
and Give
Strategic
Direction
DD
POM object representing data objectsD
Figure 4.9: Data objects.
Process Models
Figure 4.10 illustrates how a POM can be derived from a XML file.
The root node constitutes the most abstract process object (Root). We define this level of detail as0. Pools (P ) represent more detailed information and are therefore assigned to detail level 1. In turn,swimlanes (L) may be nested within a pool; hence they are assigned to detail level 2. Events, gatewaysand tasks are contained in swimlanes and are assigned to detail level 3. Finally, data objects (D) areconsidered as the most detailed objects. Consequently, they are assigned to detail level 4.
Consider the general specification process from the running example (cf. Figure 4.4). First, we identifythe root node that corresponds to detail level 0. Following the structure of the POM, pool P1 (i.e., E/Edevelopment) is related to the root node. Thus, we assign P1 to detail level 1. In turn, the swimlanescontained in P1, i.e., L2 (component responsible), L3 (expert), L4 (project responsible), and L5 (decisionmaker) are assigned to detail level 2. Furthermore, all process events, gateways, and tasks are assignedto detail level 3. Finally, data objects D1 − D3 and D6 − D12 are assigned to detail level 4 (cf. Fig.4.11).
46
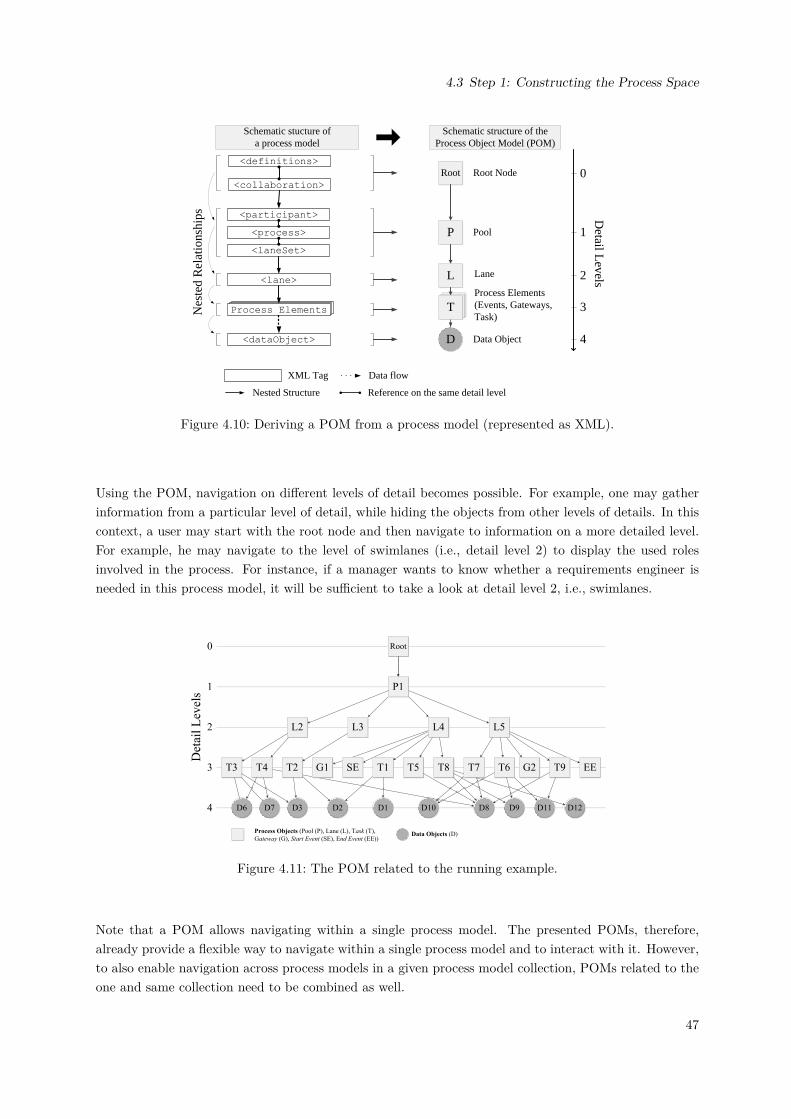
4.3 Step 1: Constructing the Process Space
TTProcess elementsProcess elements
<definitions>
<collaboration>
<participant>
<process>
<laneSet>
<lane>
Process Elements
<dataObject>
XML Tag
D
P
Root
L
T
Detail L
evels
Root Node 0
1
2
3
4
Data flow
Nested Structure
Pool
Process Elements(Events, Gateways,Task)N
este
d R
elat
ions
hips
Lane
Data Object
Schematic stucture of a process model
Schematic structure of the Process Object Model (POM)
Reference on the same detail level
Figure 4.10: Deriving a POM from a process model (represented as XML).
Using the POM, navigation on different levels of detail becomes possible. For example, one may gatherinformation from a particular level of detail, while hiding the objects from other levels of details. In thiscontext, a user may start with the root node and then navigate to information on a more detailed level.For example, he may navigate to the level of swimlanes (i.e., detail level 2) to display the used rolesinvolved in the process. For instance, if a manager wants to know whether a requirements engineer isneeded in this process model, it will be sufficient to take a look at detail level 2, i.e., swimlanes.
T1T2 SET3 T4 G1 T5 T6T7 G2T8 T9 EE
L4L3L2 L5
P1
Root
Process Objects (Pool (P), Lane (L), Task (T),
Gateway (G), Start Event (SE), End Event (EE))
D6 D7 D3 D2 D1 D10 D8 D9 D11 D12
Data Objects (D)
1
2
3
0
4
Det
ail
Lev
els
Figure 4.11: The POM related to the running example.
Note that a POM allows navigating within a single process model. The presented POMs, therefore,already provide a flexible way to navigate within a single process model and to interact with it. However,to also enable navigation across process models in a given process model collection, POMs related to theone and same collection need to be combined as well.
47
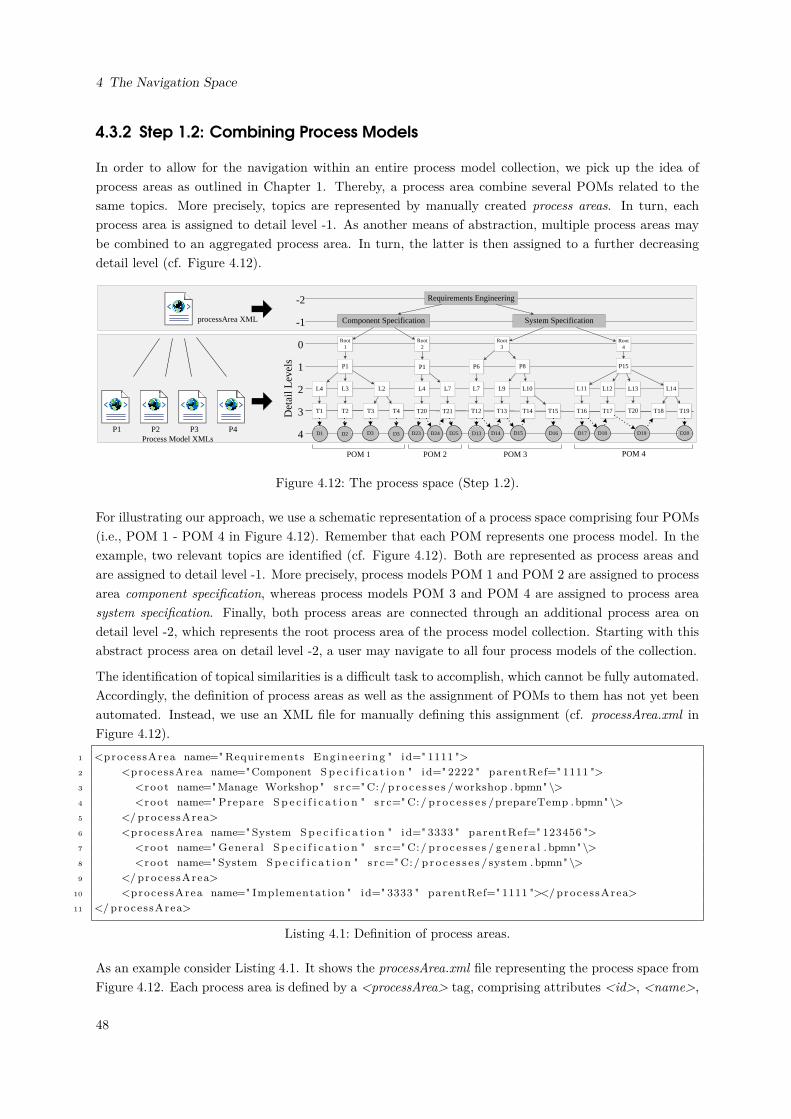
4 The Navigation Space
4.3.2 Step 1.2: Combining Process Models
In order to allow for the navigation within an entire process model collection, we pick up the idea ofprocess areas as outlined in Chapter 1. Thereby, a process area combine several POMs related to thesame topics. More precisely, topics are represented by manually created process areas. In turn, eachprocess area is assigned to detail level -1. As another means of abstraction, multiple process areas maybe combined to an aggregated process area. In turn, the latter is then assigned to a further decreasingdetail level (cf. Figure 4.12).
processArea XML
Process Model XMLs
T2 T3 T4
L3 L2
P1
Root1
L4
T1 T13 T14 T15
L9 L10
P8
Root3
P6
T12T21
L7
Root 2
L4
T20 T17 T18 T19
L12 L14L13
P15
L11
T16
POM 1 POM 2 POM 4POM 3
L7
Component Specification System Specification
Requirements Engineering-2
-1
0
1
2
3
4
Det
ail L
evel
s
D1 D2 D3 D3 D23 D24 D25 D13 D14 D15 D16 D17 D18 D19 D20
P1
Root4
T20
P1 P2 P4P3
Figure 4.12: The process space (Step 1.2).
For illustrating our approach, we use a schematic representation of a process space comprising four POMs(i.e., POM 1 - POM 4 in Figure 4.12). Remember that each POM represents one process model. In theexample, two relevant topics are identified (cf. Figure 4.12). Both are represented as process areas andare assigned to detail level -1. More precisely, process models POM 1 and POM 2 are assigned to processarea component specification, whereas process models POM 3 and POM 4 are assigned to process areasystem specification. Finally, both process areas are connected through an additional process area ondetail level -2, which represents the root process area of the process model collection. Starting with thisabstract process area on detail level -2, a user may navigate to all four process models of the collection.
The identification of topical similarities is a difficult task to accomplish, which cannot be fully automated.Accordingly, the definition of process areas as well as the assignment of POMs to them has not yet beenautomated. Instead, we use an XML file for manually defining this assignment (cf. processArea.xml inFigure 4.12).
1 <processArea name=" Requirements Engineer ing " id=" 1111 ">2 <processArea name="Component S p e c i f i c a t i o n " id=" 2222 " parentRef=" 1111 ">3 <root name="Manage Workshop " s r c="C:/ p r o c e s s e s /workshop .bpmn" \>4 <root name=" Prepare S p e c i f i c a t i o n " s r c="C:/ p r o c e s s e s /prepareTemp .bpmn" \>5 </processArea>6 <processArea name=" System Sp e c i f i c a t i o n " id=" 3333 " parentRef=" 123456 ">7 <root name=" General S p e c i f i c a t i o n " s r c="C:/ p r o c e s s e s / gene ra l . bpmn" \>8 <root name=" System Sp e c i f i c a t i o n " s r c="C:/ p r o c e s s e s / system .bpmn" \>9 </processArea>
10 <processArea name=" Implementation " id=" 3333 " parentRef=" 1111 "></processArea>11 </processArea>
Listing 4.1: Definition of process areas.
As an example consider Listing 4.1. It shows the processArea.xml file representing the process space fromFigure 4.12. Each process area is defined by a <processArea> tag, comprising attributes <id>, <name>,
48
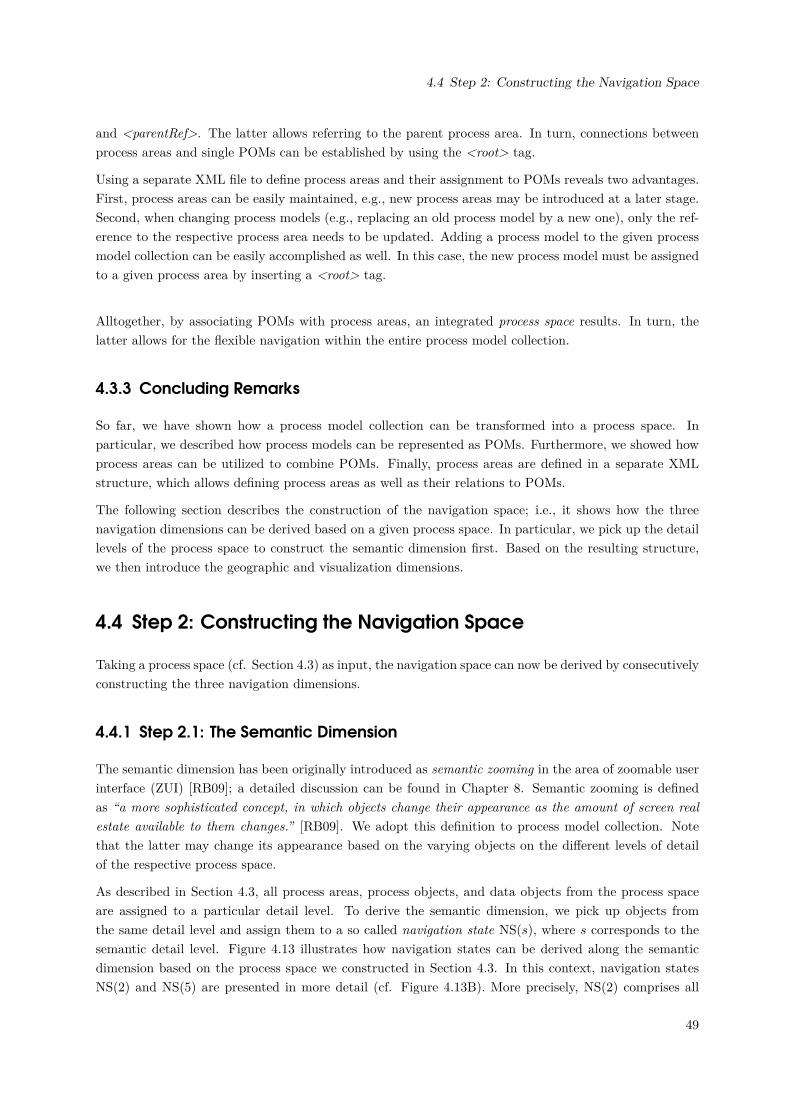
4.4 Step 2: Constructing the Navigation Space
and <parentRef>. The latter allows referring to the parent process area. In turn, connections betweenprocess areas and single POMs can be established by using the <root> tag.
Using a separate XML file to define process areas and their assignment to POMs reveals two advantages.First, process areas can be easily maintained, e.g., new process areas may be introduced at a later stage.Second, when changing process models (e.g., replacing an old process model by a new one), only the ref-erence to the respective process area needs to be updated. Adding a process model to the given processmodel collection can be easily accomplished as well. In this case, the new process model must be assignedto a given process area by inserting a <root> tag.
Alltogether, by associating POMs with process areas, an integrated process space results. In turn, thelatter allows for the flexible navigation within the entire process model collection.
4.3.3 Concluding Remarks
So far, we have shown how a process model collection can be transformed into a process space. Inparticular, we described how process models can be represented as POMs. Furthermore, we showed howprocess areas can be utilized to combine POMs. Finally, process areas are defined in a separate XMLstructure, which allows defining process areas as well as their relations to POMs.
The following section describes the construction of the navigation space; i.e., it shows how the threenavigation dimensions can be derived based on a given process space. In particular, we pick up the detaillevels of the process space to construct the semantic dimension first. Based on the resulting structure,we then introduce the geographic and visualization dimensions.
4.4 Step 2: Constructing the Navigation Space
Taking a process space (cf. Section 4.3) as input, the navigation space can now be derived by consecutivelyconstructing the three navigation dimensions.
4.4.1 Step 2.1: The Semantic Dimension
The semantic dimension has been originally introduced as semantic zooming in the area of zoomable userinterface (ZUI) [RB09]; a detailed discussion can be found in Chapter 8. Semantic zooming is definedas “a more sophisticated concept, in which objects change their appearance as the amount of screen realestate available to them changes.” [RB09]. We adopt this definition to process model collection. Notethat the latter may change its appearance based on the varying objects on the different levels of detailof the respective process space.
As described in Section 4.3, all process areas, process objects, and data objects from the process spaceare assigned to a particular detail level. To derive the semantic dimension, we pick up objects fromthe same detail level and assign them to a so called navigation state NS(s), where s corresponds to thesemantic detail level. Figure 4.13 illustrates how navigation states can be derived along the semanticdimension based on the process space we constructed in Section 4.3. In this context, navigation statesNS(2) and NS(5) are presented in more detail (cf. Figure 4.13B). More precisely, NS(2) comprises all
49
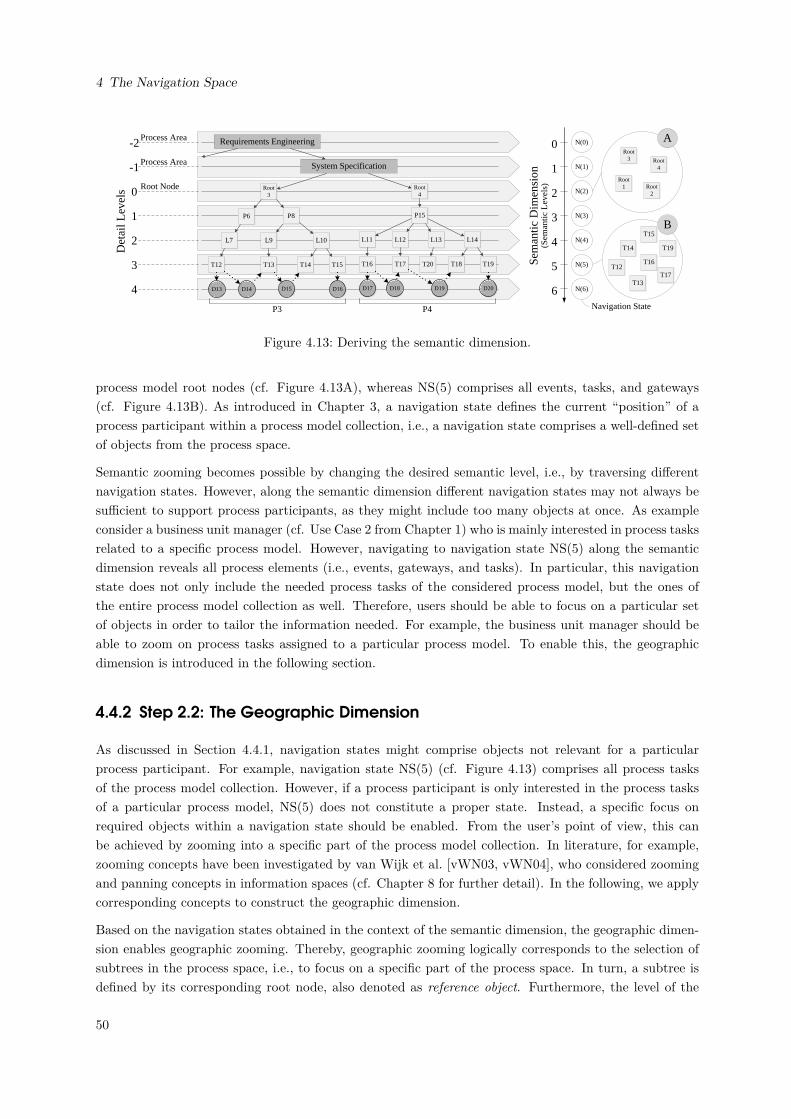
4 The Navigation Space
T13 T14 T15
L9 L10
P8
Root3
P6
T12 T17 T18 T19
L12 L14L13
P15
L11
T16
P4P3
L7
System Specification
Requirements Engineering-2
-1
0
1
2
3
4
Det
ail L
evel
s
Process Area
Process Area
Root Node
D13 D14 D15 D16 D17 D18 D19 D20
Root4
Sem
antic
Dim
ensi
on
N(0)
N(1)
N(2)
N(3)
N(4)
N(5)
N(6)T13
T14
T15
T12T17
T18
T19
T16
Root3 Root
4
Root1 Root
2
Navigation State
A
B
T20
0
1
2
3
4
5
6
(Sem
antic
Lev
els)
Figure 4.13: Deriving the semantic dimension.
process model root nodes (cf. Figure 4.13A), whereas NS(5) comprises all events, tasks, and gateways(cf. Figure 4.13B). As introduced in Chapter 3, a navigation state defines the current “position” of aprocess participant within a process model collection, i.e., a navigation state comprises a well-defined setof objects from the process space.
Semantic zooming becomes possible by changing the desired semantic level, i.e., by traversing differentnavigation states. However, along the semantic dimension different navigation states may not always besufficient to support process participants, as they might include too many objects at once. As exampleconsider a business unit manager (cf. Use Case 2 from Chapter 1) who is mainly interested in process tasksrelated to a specific process model. However, navigating to navigation state NS(5) along the semanticdimension reveals all process elements (i.e., events, gateways, and tasks). In particular, this navigationstate does not only include the needed process tasks of the considered process model, but the ones ofthe entire process model collection as well. Therefore, users should be able to focus on a particular setof objects in order to tailor the information needed. For example, the business unit manager should beable to zoom on process tasks assigned to a particular process model. To enable this, the geographicdimension is introduced in the following section.
4.4.2 Step 2.2: The Geographic Dimension
As discussed in Section 4.4.1, navigation states might comprise objects not relevant for a particularprocess participant. For example, navigation state NS(5) (cf. Figure 4.13) comprises all process tasksof the process model collection. However, if a process participant is only interested in the process tasksof a particular process model, NS(5) does not constitute a proper state. Instead, a specific focus onrequired objects within a navigation state should be enabled. From the user’s point of view, this canbe achieved by zooming into a specific part of the process model collection. In literature, for example,zooming concepts have been investigated by van Wijk et al. [vWN03, vWN04], who considered zoomingand panning concepts in information spaces (cf. Chapter 8 for further detail). In the following, we applycorresponding concepts to construct the geographic dimension.
Based on the navigation states obtained in the context of the semantic dimension, the geographic dimen-sion enables geographic zooming. Thereby, geographic zooming logically corresponds to the selection ofsubtrees in the process space, i.e., to focus on a specific part of the process space. In turn, a subtree isdefined by its corresponding root node, also denoted as reference object. Furthermore, the level of the
50
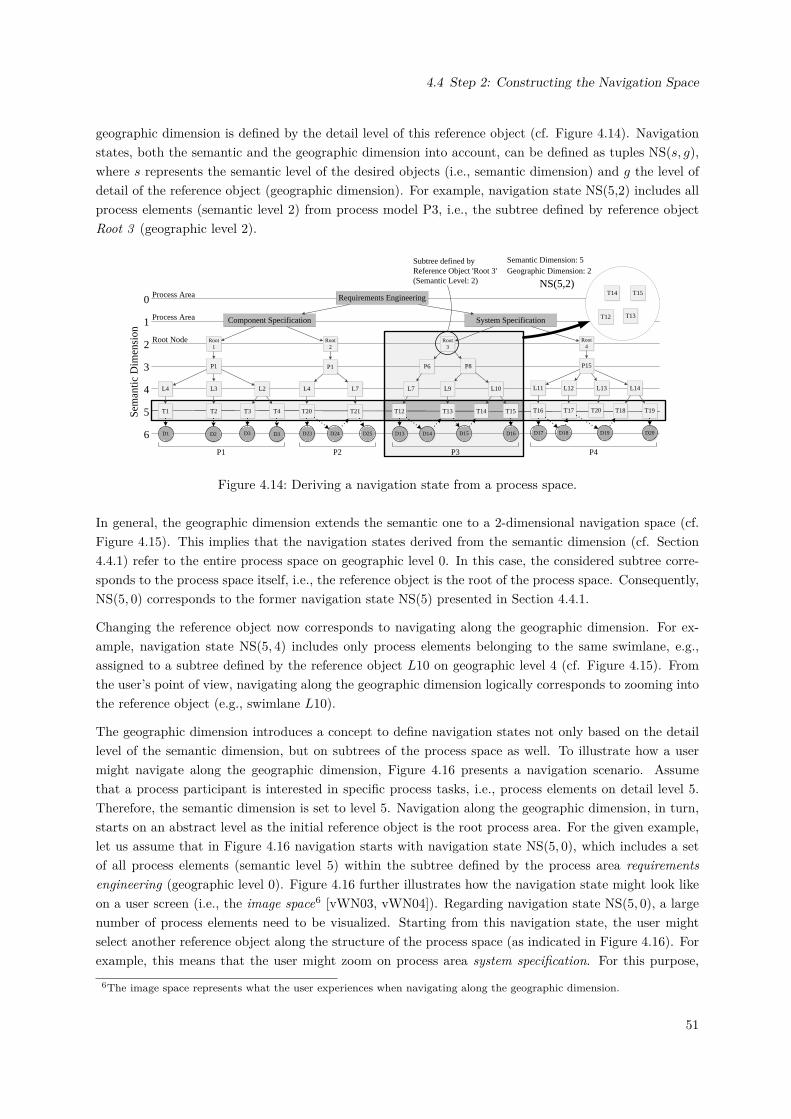
4.4 Step 2: Constructing the Navigation Space
geographic dimension is defined by the detail level of this reference object (cf. Figure 4.14). Navigationstates, both the semantic and the geographic dimension into account, can be defined as tuples NS(s, g),where s represents the semantic level of the desired objects (i.e., semantic dimension) and g the level ofdetail of the reference object (geographic dimension). For example, navigation state NS(5,2) includes allprocess elements (semantic level 2) from process model P3, i.e., the subtree defined by reference objectRoot 3 (geographic level 2).
T2 T3 T4
L3 L2
P1
Root1
L4
T1 T13 T14 T15
L9 L10
P8
Root3
P6
T12T21
L7
Root 2
L4
T20 T17 T18 T19
L12 L14L13
P15
L11
T16
P1 P2 P4P3
L7
Component Specification System Specification
Requirements Engineering0
1
2
3
4
5
6
Sem
antic
Dim
ensi
on
Process Area
Process Area
Root Node
D1 D2 D3 D3 D23 D24 D25 D13 D14 D15 D16 D17 D18 D19 D20
P1
Root4
T20
T14 T15NS(5,2)
T13T12
Subtree defined by Reference Object 'Root 3'(Semantic Level: 2)
Semantic Dimension: 5Geographic Dimension: 2
Figure 4.14: Deriving a navigation state from a process space.
In general, the geographic dimension extends the semantic one to a 2-dimensional navigation space (cf.Figure 4.15). This implies that the navigation states derived from the semantic dimension (cf. Section4.4.1) refer to the entire process space on geographic level 0. In this case, the considered subtree corre-sponds to the process space itself, i.e., the reference object is the root of the process space. Consequently,NS(5, 0) corresponds to the former navigation state NS(5) presented in Section 4.4.1.
Changing the reference object now corresponds to navigating along the geographic dimension. For ex-ample, navigation state NS(5, 4) includes only process elements belonging to the same swimlane, e.g.,assigned to a subtree defined by the reference object L10 on geographic level 4 (cf. Figure 4.15). Fromthe user’s point of view, navigating along the geographic dimension logically corresponds to zooming intothe reference object (e.g., swimlane L10).
The geographic dimension introduces a concept to define navigation states not only based on the detaillevel of the semantic dimension, but on subtrees of the process space as well. To illustrate how a usermight navigate along the geographic dimension, Figure 4.16 presents a navigation scenario. Assumethat a process participant is interested in specific process tasks, i.e., process elements on detail level 5.Therefore, the semantic dimension is set to level 5. Navigation along the geographic dimension, in turn,starts on an abstract level as the initial reference object is the root process area. For the given example,let us assume that in Figure 4.16 navigation starts with navigation state NS(5, 0), which includes a setof all process elements (semantic level 5) within the subtree defined by the process area requirementsengineering (geographic level 0). Figure 4.16 further illustrates how the navigation state might look likeon a user screen (i.e., the image space6 [vWN03, vWN04]). Regarding navigation state NS(5, 0), a largenumber of process elements need to be visualized. Starting from this navigation state, the user mightselect another reference object along the structure of the process space (as indicated in Figure 4.16). Forexample, this means that the user might zoom on process area system specification. For this purpose,
6The image space represents what the user experiences when navigating along the geographic dimension.
51
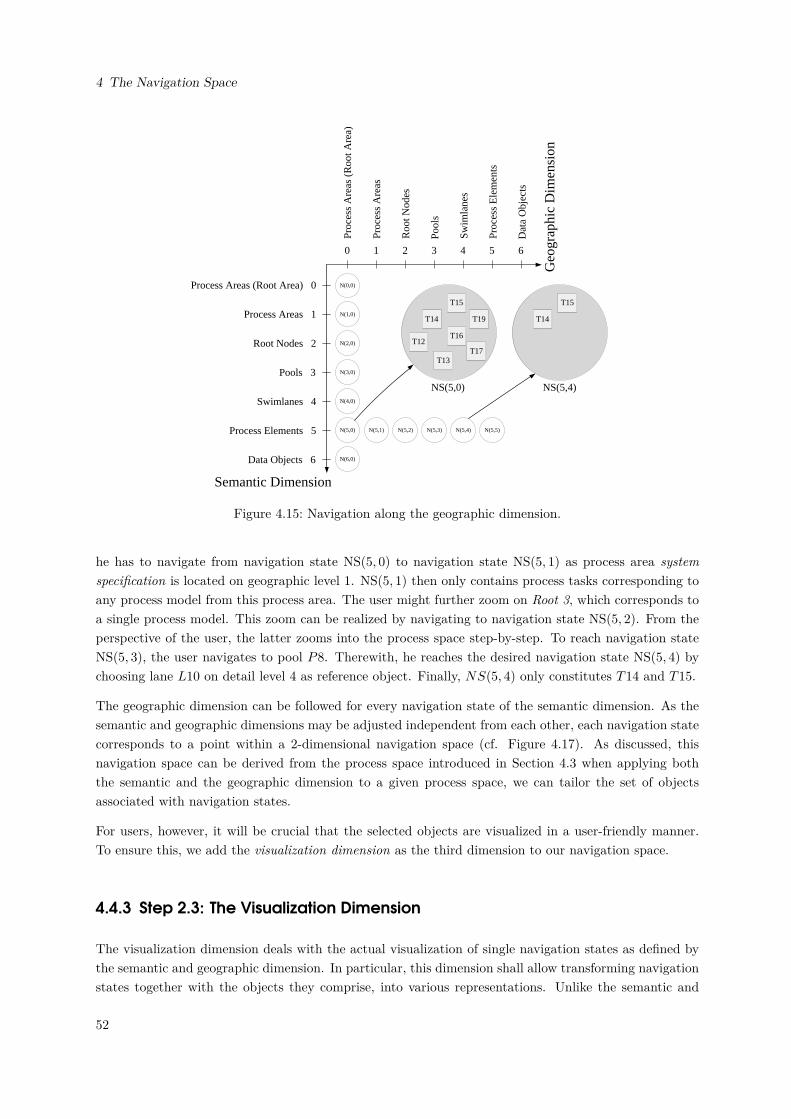
4 The Navigation Space
N(0,0)
N(1,0)
N(2,0)
N(3,0)
N(4,0)
N(5,0)
N(6,0)
Semantic Dimension
Process Areas (Root Area) 0
Process Areas 1
Root Nodes 2
Pools 3
Swimlanes 4
Process Elements 5
Data Objects 6
Proc
ess
Are
as (
Roo
t Are
a)
Proc
ess
Are
as
Roo
t Nod
es
Pool
s
Swim
lane
s
Proc
ess
Ele
men
ts
Dat
a O
bjec
ts
1 2 3 4 5 60
N(5,1) N(5,2) N(5,3) N(5,4)
Geo
grap
hic
Dim
ensi
on
T13
T14
T15
T12T17
T19
T16
T14
T15
NS(5,0) NS(5,4)
N(5,5)
Figure 4.15: Navigation along the geographic dimension.
he has to navigate from navigation state NS(5, 0) to navigation state NS(5, 1) as process area systemspecification is located on geographic level 1. NS(5, 1) then only contains process tasks corresponding toany process model from this process area. The user might further zoom on Root 3, which corresponds toa single process model. This zoom can be realized by navigating to navigation state NS(5, 2). From theperspective of the user, the latter zooms into the process space step-by-step. To reach navigation stateNS(5, 3), the user navigates to pool P8. Therewith, he reaches the desired navigation state NS(5, 4) bychoosing lane L10 on detail level 4 as reference object. Finally, NS(5, 4) only constitutes T14 and T15.
The geographic dimension can be followed for every navigation state of the semantic dimension. As thesemantic and geographic dimensions may be adjusted independent from each other, each navigation statecorresponds to a point within a 2-dimensional navigation space (cf. Figure 4.17). As discussed, thisnavigation space can be derived from the process space introduced in Section 4.3 when applying boththe semantic and the geographic dimension to a given process space, we can tailor the set of objectsassociated with navigation states.
For users, however, it will be crucial that the selected objects are visualized in a user-friendly manner.To ensure this, we add the visualization dimension as the third dimension to our navigation space.
4.4.3 Step 2.3: The Visualization Dimension
The visualization dimension deals with the actual visualization of single navigation states as defined bythe semantic and geographic dimension. In particular, this dimension shall allow transforming navigationstates together with the objects they comprise, into various representations. Unlike the semantic and
52
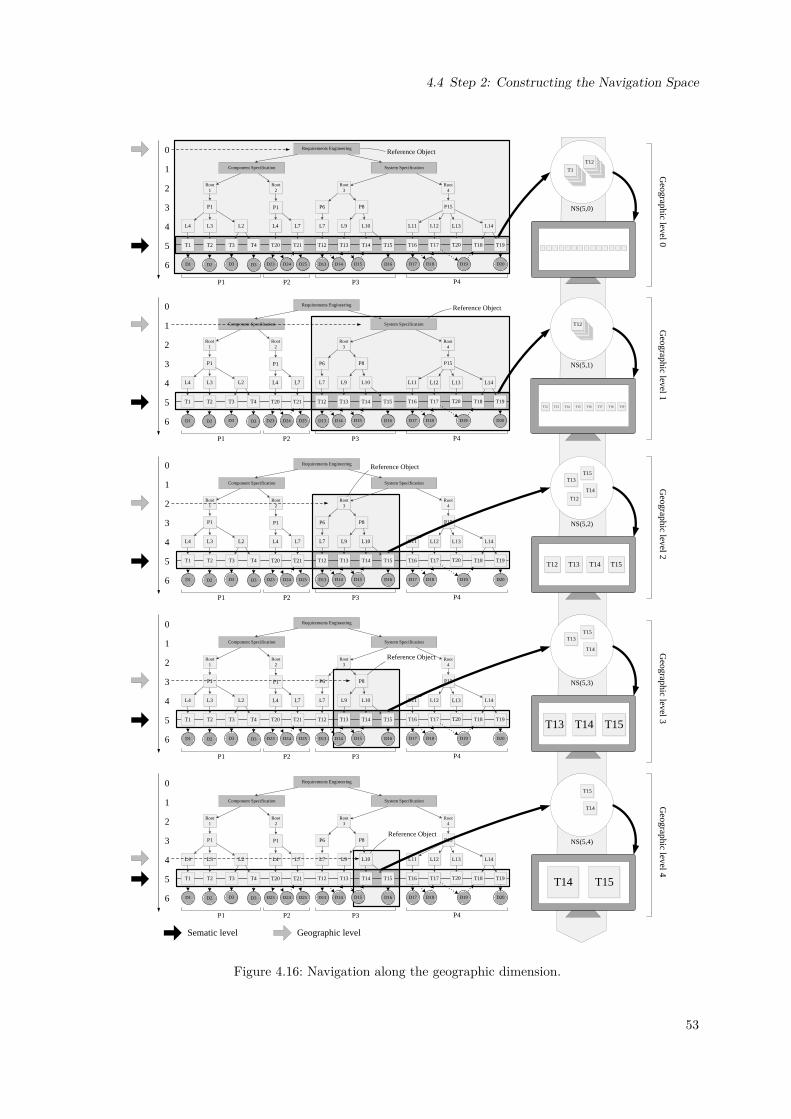
4.4 Step 2: Constructing the Navigation Space
P8
Root3
L3 L2
P1
Root1
L4 L9 L10
P8
Root3
P6
L7
Root 2
L4 L12 L14L13
P15
L11
P1 P2 P4P3
L7
Component Specification System Specification
D1 D2 D3 D3 D23 D24 D25 D13 D14 D15 D16 D17 D18 D19 D20
P1
Root4
0
1
2
3
4
5
6
Reference Object
T2 T3 T4T1 T13 T14 T15T12T21T20 T17 T18 T19T16
T1
NS(5,0)
T12
L3 L2
P1
Root1
L4 L9 L10
P8
Root3
P6
L7
Root 2
L4 L12 L14L13
P15
L11
P1 P2 P4P3
L7
Component Specification
Requirements Engineering
D1 D2 D3 D3 D23 D24 D25 D13 D14 D15 D16 D17 D18 D19 D20
P1
Root4
0
1
2
3
4
5
6
Reference Object
NS(5,1)
T12
T13 T14 T15T12 T17 T18 T19T16
L3 L2
P1
Root1
L4 L9 L10
P8P6
L7
Root 2
L4 L12 L14L13
P15
L11
P1 P2 P4P3
L7
Component Specification System Specification
Requirements Engineering
D1 D2 D3 D3 D23 D24 D25 D13 D14 D15 D16 D17 D18 D19 D20
P1
Root4
0
1
2
3
4
5
6
NS(5,2)
Reference Object
Root3
System Specification
T13 T14 T15T12
T13
T14
T15
T12
T2 T3 T4T1 T13 T14 T15T12T21T20 T17 T18 T19T16 T20
Requirements Engineering
T2 T3 T4T1 T13 T14 T15T12T21T20 T17 T18 T19T16 T20
T2 T3 T4T1 T13 T14 T15T12T21T20 T17 T18 T19T16 T20
L3 L2
P1
Root1
L4 L9 L10
P6
L7
Root 2
L4 L12 L14L13
P15
L11
P1 P2 P4P3
L7
Component Specification System Specification
Requirements Engineering
D1 D2 D3 D3 D23 D24 D25 D13 D14 D15 D16 D17 D18 D19 D20
P1
Root4
0
1
2
3
4
5
6
NS(5,3)
Reference Object
T13
T14
T15
T2 T3 T4T1 T13 T14 T15T12T21T20 T17 T18 T19T16 T20
P8
T13 T14 T15
Root3
L3 L2
P1
Root1
L4 L9
P6
L7
Root 2
L4 L12 L14L13
P15
L11
P1 P2 P4P3
L7
Component Specification System Specification
Requirements Engineering
D1 D2 D3 D3 D23 D24 D25 D13 D14 D15 D16 D17 D18 D19 D20
P1
Root4
0
1
2
3
4
5
6
NS(5,4)Reference Object
T14
T15
T2 T3 T4T1 T13 T14 T15T12T21T20 T17 T18 T19T16 T20 T14 T15
L10
Geographic levelSematic level
Geographic level 0
Geographic level 1
Geographic level 2
Geographic level 3
Geographic level 4
Figure 4.16: Navigation along the geographic dimension.
53
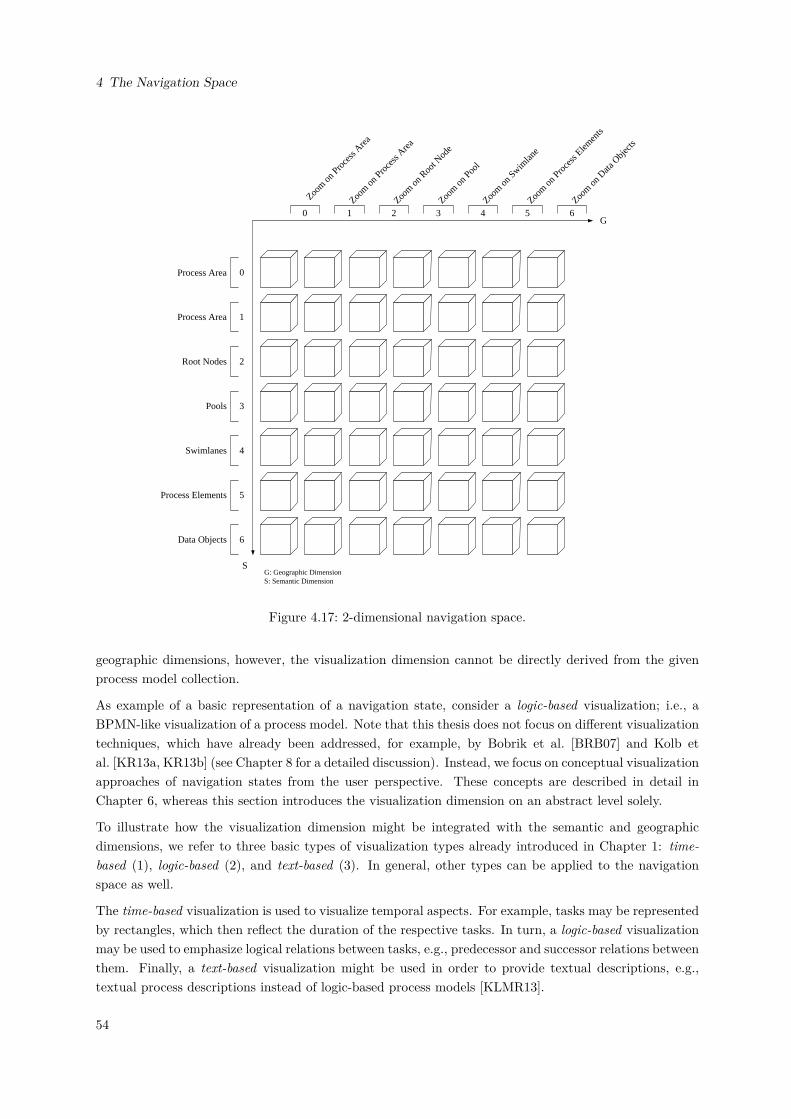
4 The Navigation Space
G
SG: Geographic DimensionS: Semantic Dimension
Process Area
Process Area
Root Nodes
Pools
Swimlanes
Process Elements
Data Objects
Zoom on
Pro
cess
Area
Zoom on
Roo
t Nod
e
Zoom on
Poo
l
Zoom on
Swim
lane
Zoom on
Pro
cess
Elemen
ts
Zoom on
Data
Obje
cts
Zoom on
Pro
cess
Area
1
0
2
3
4
5
6
0 1 2 3 4 5 6
Figure 4.17: 2-dimensional navigation space.
geographic dimensions, however, the visualization dimension cannot be directly derived from the givenprocess model collection.
As example of a basic representation of a navigation state, consider a logic-based visualization; i.e., aBPMN-like visualization of a process model. Note that this thesis does not focus on different visualizationtechniques, which have already been addressed, for example, by Bobrik et al. [BRB07] and Kolb etal. [KR13a, KR13b] (see Chapter 8 for a detailed discussion). Instead, we focus on conceptual visualizationapproaches of navigation states from the user perspective. These concepts are described in detail inChapter 6, whereas this section introduces the visualization dimension on an abstract level solely.
To illustrate how the visualization dimension might be integrated with the semantic and geographicdimensions, we refer to three basic types of visualization types already introduced in Chapter 1: time-based (1), logic-based (2), and text-based (3). In general, other types can be applied to the navigationspace as well.
The time-based visualization is used to visualize temporal aspects. For example, tasks may be representedby rectangles, which then reflect the duration of the respective tasks. In turn, a logic-based visualizationmay be used to emphasize logical relations between tasks, e.g., predecessor and successor relations betweenthem. Finally, a text-based visualization might be used in order to provide textual descriptions, e.g.,textual process descriptions instead of logic-based process models [KLMR13].
54
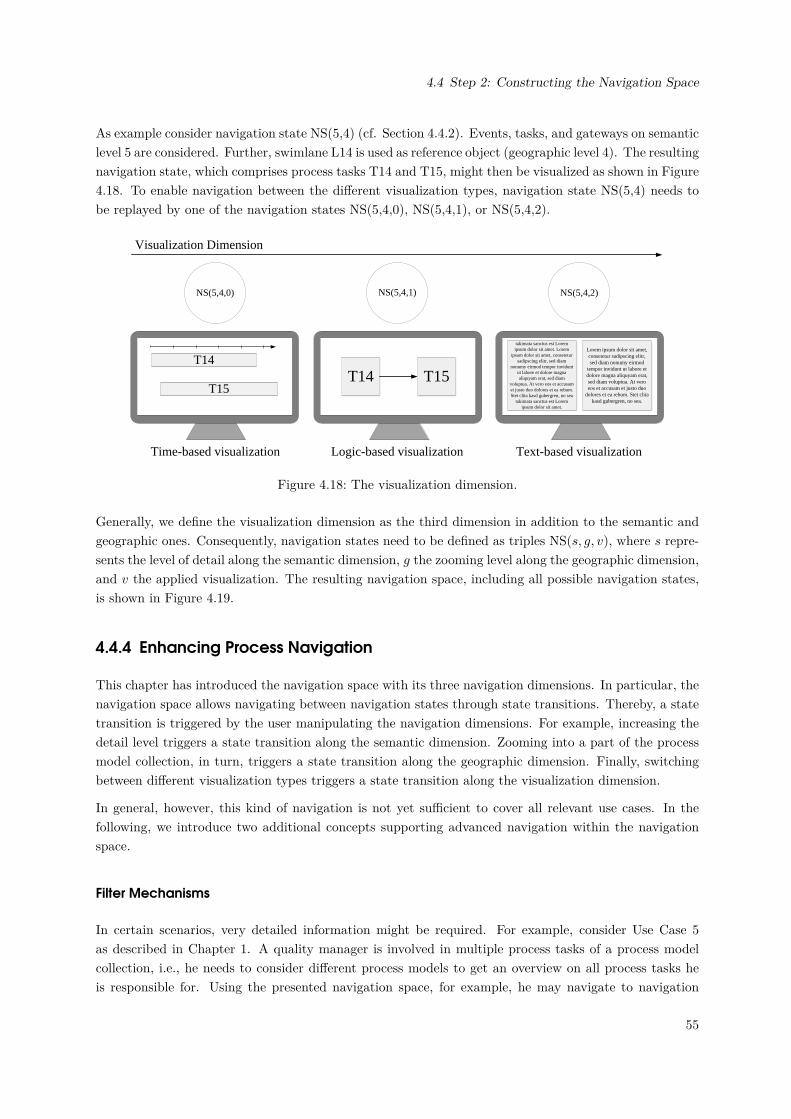
4.4 Step 2: Constructing the Navigation Space
As example consider navigation state NS(5,4) (cf. Section 4.4.2). Events, tasks, and gateways on semanticlevel 5 are considered. Further, swimlane L14 is used as reference object (geographic level 4). The resultingnavigation state, which comprises process tasks T14 and T15, might then be visualized as shown in Figure4.18. To enable navigation between the different visualization types, navigation state NS(5,4) needs tobe replayed by one of the navigation states NS(5,4,0), NS(5,4,1), or NS(5,4,2).
T14 T15
NS(5,4,0) NS(5,4,1) NS(5,4,2)
Visualization Dimension
T14
T15
takimata sanctus est Lorem ipsum dolor sit amet. Lorem
ipsum dolor sit amet, consetetur sadipscing elitr, sed diam
nonumy eirmod tempor invidunt ut labore et dolore magna aliquyam erat, sed diam
voluptua. At vero eos et accusam et justo duo dolores et ea rebum. Stet clita kasd gubergren, no sea
takimata sanctus est Lorem ipsum dolor sit amet.
Lorem ipsum dolor sit amet, consetetur sadipscing elitr, sed diam nonumy eirmod
tempor invidunt ut labore et dolore magna aliquyam erat, sed diam voluptua. At vero eos et accusam et justo duo
dolores et ea rebum. Stet clita kasd gubergren, no sea.
Time-based visualization Logic-based visualization Text-based visualization
Figure 4.18: The visualization dimension.
Generally, we define the visualization dimension as the third dimension in addition to the semantic andgeographic ones. Consequently, navigation states need to be defined as triples NS(s, g, v), where s repre-sents the level of detail along the semantic dimension, g the zooming level along the geographic dimension,and v the applied visualization. The resulting navigation space, including all possible navigation states,is shown in Figure 4.19.
4.4.4 Enhancing Process Navigation
This chapter has introduced the navigation space with its three navigation dimensions. In particular, thenavigation space allows navigating between navigation states through state transitions. Thereby, a statetransition is triggered by the user manipulating the navigation dimensions. For example, increasing thedetail level triggers a state transition along the semantic dimension. Zooming into a part of the processmodel collection, in turn, triggers a state transition along the geographic dimension. Finally, switchingbetween different visualization types triggers a state transition along the visualization dimension.
In general, however, this kind of navigation is not yet sufficient to cover all relevant use cases. In thefollowing, we introduce two additional concepts supporting advanced navigation within the navigationspace.
Filter Mechanisms
In certain scenarios, very detailed information might be required. For example, consider Use Case 5as described in Chapter 1. A quality manager is involved in multiple process tasks of a process modelcollection, i.e., he needs to consider different process models to get an overview on all process tasks heis responsible for. Using the presented navigation space, for example, he may navigate to navigation
55
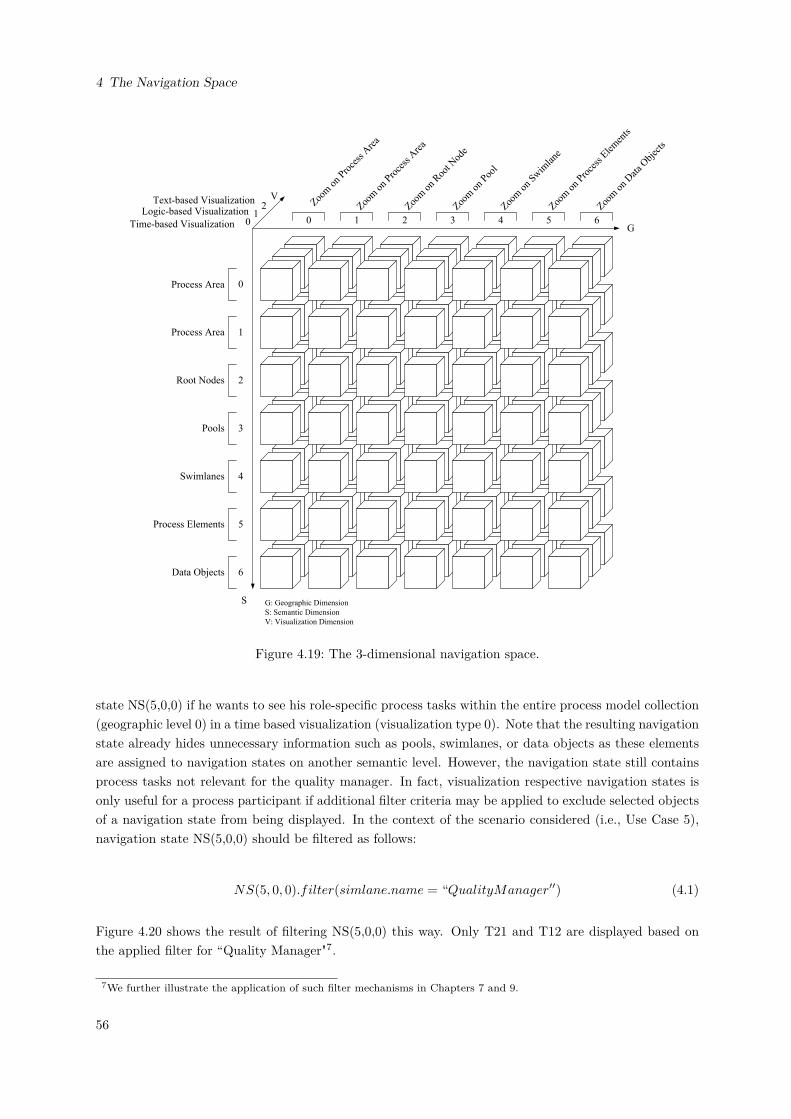
4 The Navigation Space
G
S
V
G: Geographic Dimension
S: Semantic Dimension
V: Visualization Dimension
Process Area
Process Area
Root Nodes
Pools
Swimlanes
Process Elements
Data Objects
Time-based Visualization
Logic-based VisualizationText-based Visualization Zoo
m o
n Pro
cess
Are
a
Zoom
on
Roo
t Nod
e
Zoom
on
Pool
Zoom
on
Swim
lane
Zoom
on
Proce
ss E
lem
ents
Zoom
on
Dat
a O
bjec
ts
Zoom
on
Proce
ss A
rea
10
2
1
0
2
3
4
5
6
0 1 2 3 4 5 6
Figure 4.19: The 3-dimensional navigation space.
state NS(5,0,0) if he wants to see his role-specific process tasks within the entire process model collection(geographic level 0) in a time based visualization (visualization type 0). Note that the resulting navigationstate already hides unnecessary information such as pools, swimlanes, or data objects as these elementsare assigned to navigation states on another semantic level. However, the navigation state still containsprocess tasks not relevant for the quality manager. In fact, visualization respective navigation states isonly useful for a process participant if additional filter criteria may be applied to exclude selected objectsof a navigation state from being displayed. In the context of the scenario considered (i.e., Use Case 5),navigation state NS(5,0,0) should be filtered as follows:
NS(5, 0, 0).filter(simlane.name = “QualityManager′′) (4.1)
Figure 4.20 shows the result of filtering NS(5,0,0) this way. Only T21 and T12 are displayed based onthe applied filter for “Quality Manager"7.
7We further illustrate the application of such filter mechanisms in Chapters 7 and 9.
56
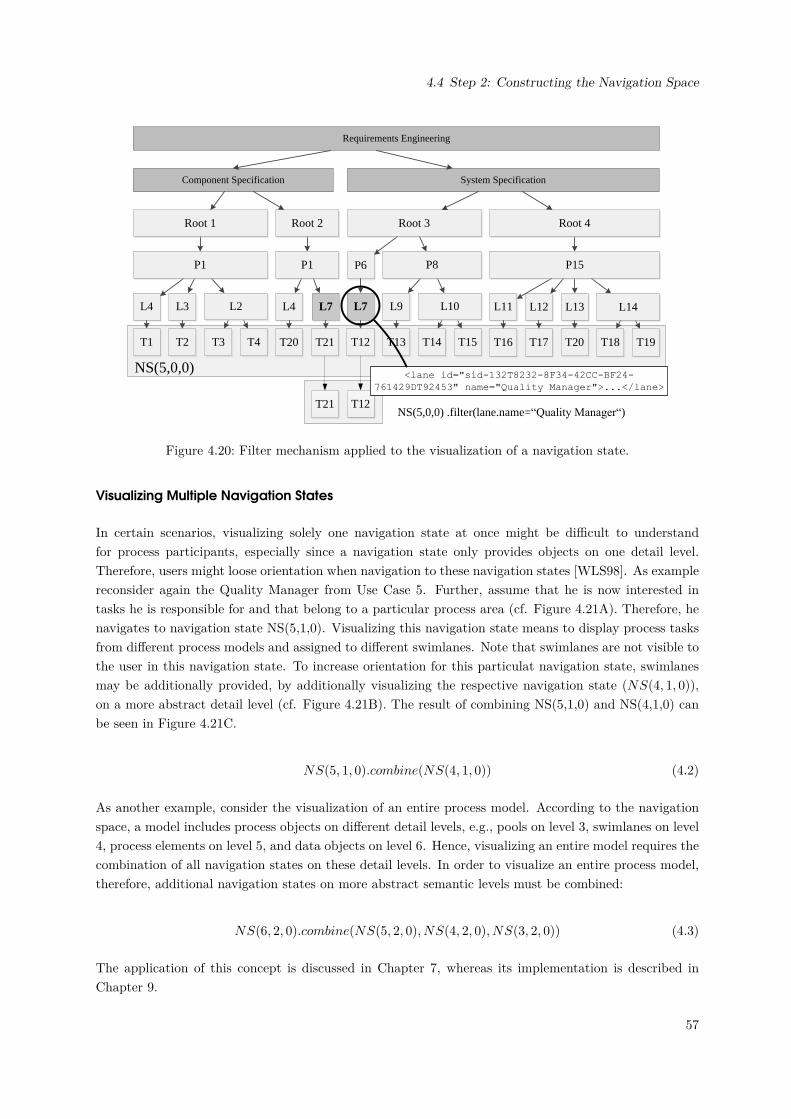
4.4 Step 2: Constructing the Navigation Space
T2 T3 T4T1 T13 T14 T15T12T21T20 T17 T18 T19T16 T20
NS(5,0,0)
T12T21NS(5,0,0) .filter(lane.name=“Quality Manager“)
L3L4 L9
P6
L7L4 L12 L13L11L7
Component Specification System Specification
Requirements Engineering
L2 L10 L14
P15P8P1P1
Root 1 Root 2 Root 3 Root 4
<lane id="sid-132T8232-8F34-42CC-BF24-
761429DT92453" name="Quality Manager">...</lane>
Figure 4.20: Filter mechanism applied to the visualization of a navigation state.
Visualizing Multiple Navigation States
In certain scenarios, visualizing solely one navigation state at once might be difficult to understandfor process participants, especially since a navigation state only provides objects on one detail level.Therefore, users might loose orientation when navigation to these navigation states [WLS98]. As examplereconsider again the Quality Manager from Use Case 5. Further, assume that he is now interested intasks he is responsible for and that belong to a particular process area (cf. Figure 4.21A). Therefore, henavigates to navigation state NS(5,1,0). Visualizing this navigation state means to display process tasksfrom different process models and assigned to different swimlanes. Note that swimlanes are not visible tothe user in this navigation state. To increase orientation for this particulat navigation state, swimlanesmay be additionally provided, by additionally visualizing the respective navigation state (NS(4, 1, 0)),on a more abstract detail level (cf. Figure 4.21B). The result of combining NS(5,1,0) and NS(4,1,0) canbe seen in Figure 4.21C.
NS(5, 1, 0).combine(NS(4, 1, 0)) (4.2)
As another example, consider the visualization of an entire process model. According to the navigationspace, a model includes process objects on different detail levels, e.g., pools on level 3, swimlanes on level4, process elements on level 5, and data objects on level 6. Hence, visualizing an entire model requires thecombination of all navigation states on these detail levels. In order to visualize an entire process model,therefore, additional navigation states on more abstract semantic levels must be combined:
NS(6, 2, 0).combine(NS(5, 2, 0), NS(4, 2, 0), NS(3, 2, 0)) (4.3)
The application of this concept is discussed in Chapter 7, whereas its implementation is described inChapter 9.
57
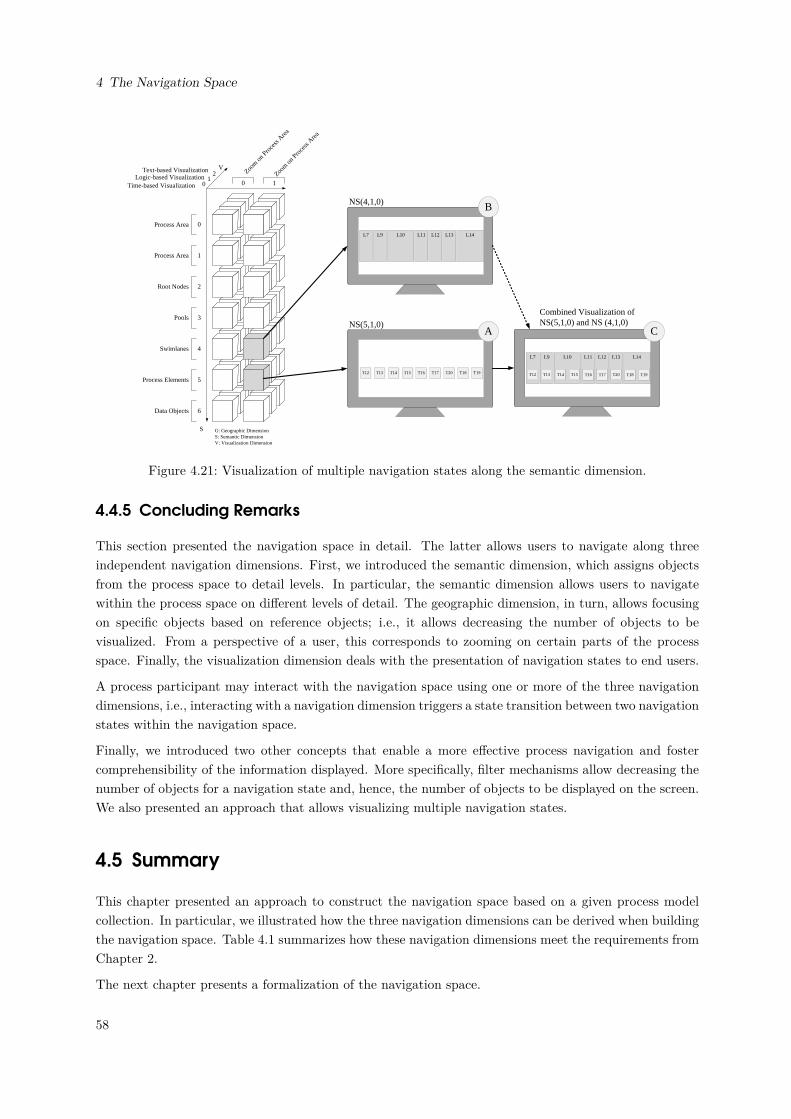
4 The Navigation Space
S
V
G: Geographic DimensionS: Semantic DimensionV: Visualization Dimension
Process Area
Process Area
Root Nodes
Pools
Swimlanes
Process Elements
Data Objects
Time-based VisualizationLogic-based Visualization
Text-based Visualization Zoom on
Pro
cess
Area
Zoom on
Pro
cess
Area
10
2
1
0
2
3
4
5
6
0 1
L7 L9 L10 L11 L12 L13 L14
L7 L9 L10 L11 L12 L13 L14
T13 T14 T15T12 T17 T18 T19T16 T20
NS(5,1,0)
T13 T14 T15T12 T17 T18 T19T16 T20
NS(4,1,0)
Combined Visualization of NS(5,1,0) and NS (4,1,0)
A
B
C
Figure 4.21: Visualization of multiple navigation states along the semantic dimension.
4.4.5 Concluding Remarks
This section presented the navigation space in detail. The latter allows users to navigate along threeindependent navigation dimensions. First, we introduced the semantic dimension, which assigns objectsfrom the process space to detail levels. In particular, the semantic dimension allows users to navigatewithin the process space on different levels of detail. The geographic dimension, in turn, allows focusingon specific objects based on reference objects; i.e., it allows decreasing the number of objects to bevisualized. From a perspective of a user, this corresponds to zooming on certain parts of the processspace. Finally, the visualization dimension deals with the presentation of navigation states to end users.
A process participant may interact with the navigation space using one or more of the three navigationdimensions, i.e., interacting with a navigation dimension triggers a state transition between two navigationstates within the navigation space.
Finally, we introduced two other concepts that enable a more effective process navigation and fostercomprehensibility of the information displayed. More specifically, filter mechanisms allow decreasing thenumber of objects for a navigation state and, hence, the number of objects to be displayed on the screen.We also presented an approach that allows visualizing multiple navigation states.
4.5 Summary
This chapter presented an approach to construct the navigation space based on a given process modelcollection. In particular, we illustrated how the three navigation dimensions can be derived when buildingthe navigation space. Table 4.1 summarizes how these navigation dimensions meet the requirements fromChapter 2.
The next chapter presents a formalization of the navigation space.
58
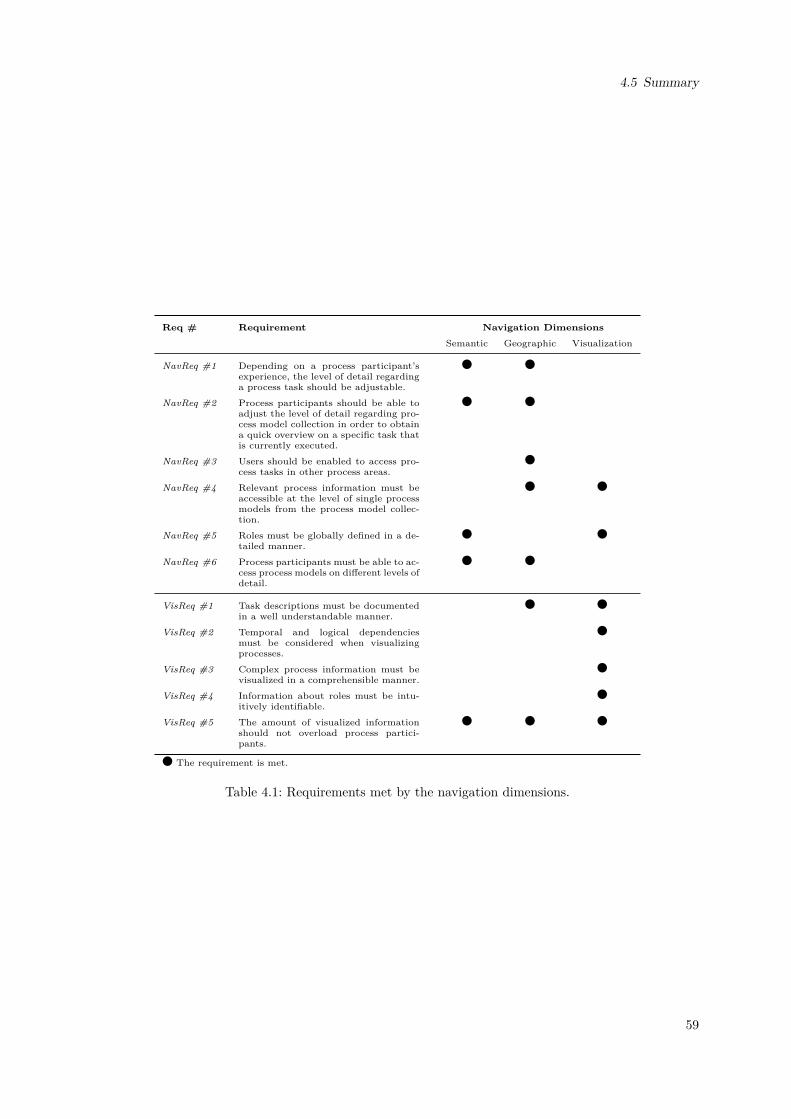
4.5 Summary
Req # Requirement Navigation DimensionsSemantic Geographic Visualization
NavReq #1 Depending on a process participant’sexperience, the level of detail regardinga process task should be adjustable.
l l
NavReq #2 Process participants should be able toadjust the level of detail regarding pro-cess model collection in order to obtaina quick overview on a specific task thatis currently executed.
l l
NavReq #3 Users should be enabled to access pro-cess tasks in other process areas.
l
NavReq #4 Relevant process information must beaccessible at the level of single processmodels from the process model collec-tion.
l l
NavReq #5 Roles must be globally defined in a de-tailed manner.
l l
NavReq #6 Process participants must be able to ac-cess process models on different levels ofdetail.
l l
VisReq #1 Task descriptions must be documentedin a well understandable manner.
l l
VisReq #2 Temporal and logical dependenciesmust be considered when visualizingprocesses.
l
VisReq #3 Complex process information must bevisualized in a comprehensible manner.
l
VisReq #4 Information about roles must be intu-itively identifiable.
l
VisReq #5 The amount of visualized informationshould not overload process partici-pants.
l l l
l The requirement is met.
Table 4.1: Requirements met by the navigation dimensions.
59

5 Formalizing the Navigation Space
This chapter1 provides a formalization of the navigation space introduced in Chapter 4. We use conceptsfrom Linear Algebra for this purpose. As the three navigation dimensions can be adjusted independently,the navigation space corresponds to a 3-dimensional Cartesian system based on three perpendicularaxes [DO01]. Consequently, navigation states correspond to single points within this system. In partic-ular, the provided formalization allows reasoning about navigation paths, e.g., on whether a particularpath is optimal in a given context or whether it is valid at all.
This chapter is organized as follows: Section 5.1 introduces basic definitions. Section 5.2 presents arunning example. Section 5.3 introduces advanced formalizations. Section 5.4 then shows how theformalizations can be applied. Alternative formalization approaches are discussed in Section 5.5. Section5.6 concludes the chapter with a summary.
5.1 Basic Definitions
This section introduces basic definitions required in the context of the formalizations.
Navigation State (NS). A navigation state corresponds to a specific point within the 3-dimensionalnavigation space. Thereby, the (discrete) levels of the three navigation dimensions are represented on anabsolute scale. For the sake of simplicity, we use natural numbers for this purpose. Hence, in our context,we can define a navigation state as a triple. Let s be the value of the semantic dimension, g be the valueof the geographic dimension, and v be the value of the view dimension. Then, a specific navigation stateNS can be represented as follows:
NS = (s, g, v) with s, g, v ∈ N (5.1)
Note that s, g and v may be manually selected by the user. Accordingly, the set of all potential navigationstates NStotal is as follows:
NStotal = {(g, s, v)|g, s, v ∈ N} (5.2)
Some of the navigation states make no sense from a semantic point of view, i.e., they disturb the user(as they are not relevant) or they are forbidden by definition (cf. Section 4.4.4). Reconsider the GoogleMaps metaphor (cf. Chapter 3) and assume the user wants to see all city names at the same time(semantic dimension) on the entire globe (geographic dimension). In such a navigation state, labels
1The chapter is based on the following referred paper [HMR12]:Markus Hipp, Bela Mutschler, and Manfred Reichert. Navigating in Complex Business Processes. in: Proc 23rd Int’lConf on Database and Expert Systems Applications (DEXA’12), LNCS 7447, pp. 466–480, Springer, 2012
61
5 Formalizing the Navigation Space
would significantly overlap due to limited screen space. Hence, such a navigation state should be notreachable and be added to the set of forbidden navigation states NSforbidden. In turn, we denote the setof allowed navigation states as basis model BM .
Basis Model (BM). The basis model corresponds to the set of allowed navigation states within the givennavigation space:
BM = NStotal\NSforbidden (5.3)
Process Interaction. Changing the values of the three navigation dimensions in a given navigaitonstate results in a state transition within the navigation space. Since respective state transitions are user-driven, we denote them as process interactions. In our navigation framework, process interactions arerepresented by vectors. Changing the view from ’logic-based’ to ’time-based’ constitutes an example ofsuch an interaction.
A 1-dimensional process interaction constitutes an activity transforming a given navigation state intoanother one by changing the value of exactly one navigation dimension. In general, a one-dimensionalprocess navigation IntoneDim can be defined as follows:
IntoneDim = {~e = (e1, e2, e3)|e1, e2, e3 ∈ {0, 1,−1} and ‖~e‖ = 1} (5.4)
In turn, amulti-dimensional process interaction can be defined as an interaction transforming a navigationstate into another one by changing the value of multiple navigation dimensions at the same time (e.g.,both the geographic and the semantic dimension may be changed at once). Google Maps, for example,implicitly uses multi-dimensional interactions when the user applies the scroll wheel to zoom (see thezooming dimension described in Section 3.3). If the geographic dimension is changed, the semantic onewill be changed accordingly. Since such behavior is well known and accepted by users, we apply it toprocess navigation as well. We define multi-dimensional process interaction as follows:
IntmultiDim = {(e1, e2, e3)|e1, e2, e3 ∈ {0, 1,−1}} (5.5)
Navigation Model (NM). A navigation model (NM) corresponds to a pre-defined set of allowed pro-cess interactions. This set may contain 1-dimensional as well as multi-dimensional process interactions.According to Formula (5.4) and (5.5), and due to the fact that 1-dimensional interactions constitute asubset of multi-dimensional process interactions (5.6a), the set of all possible process interactions Inttotalcan be defined as follows:
IntoneDim ⊂ IntmultiDim (5.6a)
Inttotal = IntmultiDim (5.6b)
The set of allowed process interactions may be further reduced by manually eliminating all elements fromthe set of forbidden process interactions Intforbidden. Thus, NM can be defined as follows:
NM = Inttotal\Intforbidden (5.7)
62
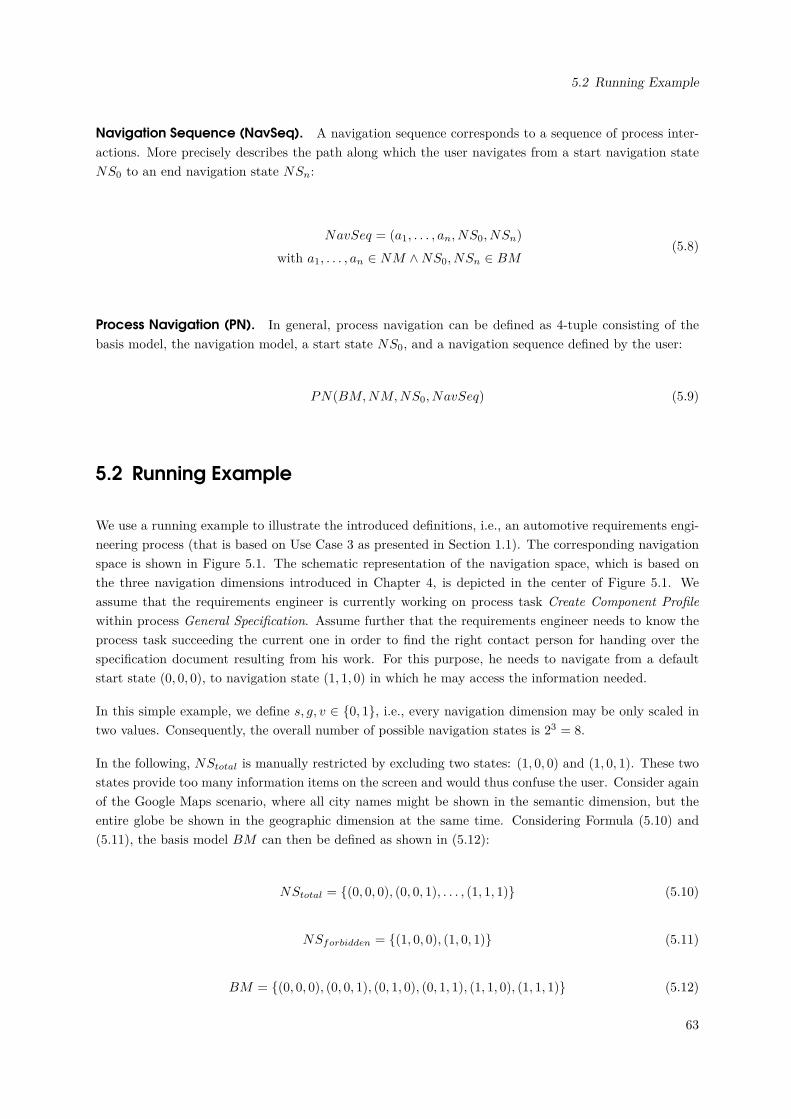
5.2 Running Example
Navigation Sequence (NavSeq). A navigation sequence corresponds to a sequence of process inter-actions. More precisely describes the path along which the user navigates from a start navigation stateNS0 to an end navigation state NSn:
NavSeq = (a1, . . . , an, NS0, NSn)
with a1, . . . , an ∈ NM ∧NS0, NSn ∈ BM(5.8)
Process Navigation (PN). In general, process navigation can be defined as 4-tuple consisting of thebasis model, the navigation model, a start state NS0, and a navigation sequence defined by the user:
PN(BM,NM,NS0, NavSeq) (5.9)
5.2 Running Example
We use a running example to illustrate the introduced definitions, i.e., an automotive requirements engi-neering process (that is based on Use Case 3 as presented in Section 1.1). The corresponding navigationspace is shown in Figure 5.1. The schematic representation of the navigation space, which is based onthe three navigation dimensions introduced in Chapter 4, is depicted in the center of Figure 5.1. Weassume that the requirements engineer is currently working on process task Create Component Profilewithin process General Specification. Assume further that the requirements engineer needs to know theprocess task succeeding the current one in order to find the right contact person for handing over thespecification document resulting from his work. For this purpose, he needs to navigate from a defaultstart state (0, 0, 0), to navigation state (1, 1, 0) in which he may access the information needed.
In this simple example, we define s, g, v ∈ {0, 1}, i.e., every navigation dimension may be only scaled intwo values. Consequently, the overall number of possible navigation states is 23 = 8.
In the following, NStotal is manually restricted by excluding two states: (1, 0, 0) and (1, 0, 1). These twostates provide too many information items on the screen and would thus confuse the user. Consider againof the Google Maps scenario, where all city names might be shown in the semantic dimension, but theentire globe be shown in the geographic dimension at the same time. Considering Formula (5.10) and(5.11), the basis model BM can then be defined as shown in (5.12):
NStotal = {(0, 0, 0), (0, 0, 1), . . . , (1, 1, 1)} (5.10)
NSforbidden = {(1, 0, 0), (1, 0, 1)} (5.11)
BM = {(0, 0, 0), (0, 0, 1), (0, 1, 0), (0, 1, 1), (1, 1, 0), (1, 1, 1)} (5.12)
63
5 Formalizing the Navigation Space
(0,0,0)
(0,0,1) (0,1,1)
(1,1,1)
(1,1,0)(1,0,0)
(1,0,1)
(0,1,0)
General Specification
SystemSpecification
ComponentSpecification
0,0,0
0,1,0
1,0,0
General Specification
1,1,0
PerformFR- Workshop
Create ComponentProfile
Create EE-GeneralSpecification
Create technicalpart of EE-GeneralSpecification
Perform ComponentProfile Review
0,0,1
General Specification
System Specification
Component Specification
1,0,1
0,1,1
1,1,1
General Specification
Perform FR- Workshop
Create Component Profile
Create EE-General Specification
Create technical part of EE-General Specification
Perform Component Profile Review
General Specification
System Specification
Component Specification
Perform FR- Workshop
Create Component Profile
Create EE-General Specification
Create technical part of EE-General Specification
Perform Component Profile Review
Develop Top-Level Requirements
Describe Functions
Identification and Description ofFunction Contributions
Define Display-Concept
Create SKLH (document NFRs)
Initiate Component FMEA
Develop Function Versions
Check and rate technologies/Chose optimal technology
General Specification
Check and rate technologies/Chose optimal technology
General Specification
ComponentSpecification
General Specification
System Specification
DevelopTop-LevelRequirements
Describe Functions
Identification andDescription ofFunction Contributions
Define Display-Concept
Create SKLH (document NFRs)
InitiateComponent FMEA
Develop FunctionVersions
PerformFR- Workshop
Create ComponentProfile
Create EE-GeneralSpecification
Create technical part of EE-GeneralSpecification
Perform ComponentProfile Review
Figure 5.1: Running example illustrating a navigation space with 8 navigation states.
In this simple example, only 1-dimensional process interactions shall be allowed. Therefore, we restrictInttotal by excluding all other possible process interactions (i.e., Intforbidden):
NM =
a0
1
0
, a
1
0
0
, a
0
0
1
, a ∈ {1,−1} (5.13)
Based on the definition of process navigation (cf. Formula 5.9), we can now investigate user-drivennavigation sequences. For each process interaction, we can calculate whether or not the requirementengineer leaves the BM (i.e., he reaches a navigation state not being an element of BM). For example,assume that he applies the following navigation sequence:
NavSeq =
i1 =
0
1
0
, i2 =
1
0
0
(5.14)
NavSeq comprises two process interactions. More precisely, i1 corresponds to a geographical zoomingwithout changing the level of information detail, whereas i2 corresponds to an increase of the level ofinformation detail. In the following, we apply both navigation interactions to the given BM .
64
5.3 Advanced Formalizations
Step 1: We first calculate navigation state NS1 (i.e., the requirements engineer adjusts the geographicdimension to zoom into the General Specification process, cf. Fig. 5.1). Therefore, we add the first vectori1 to start state NS0:
NS0 + i1 = NS1 =
0
0
0
+
0
1
0
=
0
1
0
(5.15)
As a result, we obtain navigation state (0, 1, 0) ∈ BM . Hence, Step 1 constitutes a valid process interac-tion.
Step 2: From the newly obtained state NS1 (i.e., the new start state) the requirements engineer nowwants to increase the level of information detail, i.e., the value of the semantic dimension is increasedto display the activities within process step General Specification. This process interaction i2 can beperformed similarly to Step 1:
NS1 + i2 = NS2 =
0
1
0
+
1
0
0
=
1
1
0
(5.16)
Since NS2 also constitutes an element of BM , NavSeq corresponds to an allowed navigation sequence.
If the user chooses another navigation sequence to reach the preferred end state (1, 1, 0), the result mightbe different. For example, a navigation sequence may start by increasing the value of the semanticdimension, i.e., by applying process interaction (0, 1, 0). Then, the resulting state will be (0, 1, 0), whichis not an element of BM ; i.e., (0, 1, 0) constitutes a forbidden state and hence user must not navigate tothis state.
By calculating allowed navigation options in advance, i.e., before the user action takes place, the frame-work can guide the user such that he does not follow a forbidden path during navigation. In turn, thisincreases navigation efficiency.
5.3 Advanced Formalizations
5.3.1 Reachability
Taking the running example (cf. Fig. 5.1), we investigate possibilities to navigate from a given navigationstate to other states. Such consideration is useful to effectively support users in navigating within thenavigation space. Think of a scenario in which a user is initially situated in navigation state (0, 0, 0). Asnavigation spaces could become much more complex than the one presented in the running example, theuser does not always know how the basis model BM looks like in detail, i.e., he does not know to whichnavigation state(s) he may navigate.
65
5 Formalizing the Navigation Space
To avoid invalid navigation, like the one from navigation state (0, 0, 0) to forbidden state (1, 0, 0), it isimportant to provide users with recommendations regarding the allowed navigation options (i.e., processinteractions) in a given state. In particular, it is important to identify allowed neighboring navigationstates.
The neighbor concept describes two navigation states P1 and P2 that my be reached from each other byapplying exactly one single process interaction. Since we differentiate between 1- and multi-dimensionalprocess interactions, we distinguish between 1- and multi-dimensional neighbors as well.
1-dimensional Neighbors. Two navigation states P1 and P2 are 1-dimensional neighbors if a user maynavigate from P1 to P2 (or vice versa) by applying exactly one 1-dimensional process interaction. If solely1-dimensional process interactions are allowed, the user may only navigate to 1-dimensional neighbors ofthe current state:
P1 is a 1-dimensional neighbor of P2 iff
P1, P2 ∈ BM ∧ ∃~e ∈ IntoneDim : P1 + ~e = P2
(5.17)
Multi-dimensional Neighbors. Reconsider the running example (cf. Fig. 5.1) and assume that auser wants to navigate from (0, 0, 0) to (1, 1, 0). This could be accomplished by two consecutive one-dimensional process interactions. Generally, two states P1 and P2 are multi-dimensional neighbors, if P2
is reachable from P1 through a multi-dimensional process interaction:
P1 is multi-dimensional neighbor of P2 iff
P1, P2 ∈ BM ∧ ∃~e ∈ IntmultiDim : P1 + ~e = P2
(5.18)
Reachable Navigation States. A state P2 is reachable from a state P1 if there exists a navigationsequence that allows the user to navigate from P1 to P2. Thereby, the neighbor concept may be appliedin every process navigation step. As precondition, both P1 and P2 must be elements of BM :
P1 is reachable from P2 iffP1, P2 ∈ BM ∧ ∃(n1, . . . , nz) with n1, . . . , nz ∈ IntmultiDim
∧ P1 +∑z
i=1 ni = P2 ∧ P1 +∑m
i=1 ni ∈ BM ∀m ∈ {1, . . . , z}(5.19)
Knowing neighbors and reachable navigation states allows determining the navigation options a userhas. If a user is currently in a certain navigation state, he can be guided by recommending only thoseprocess interactions to him that result in allowed neighbors. Note that this prohibits any trial-and-errornavigation.
5.3.2 Distance
A navigation sequence applied by a user also reflects the number of conducted state transitions betweentwo navigation states. In turn, state transitions may require several user interactions (e.g., mouse clicksin an Intranet portal). Assuming that a user only applies 1-dimensional process interactions, the numberof user interactions corresponds to the number of mouse clicks. To decrease the latter (i.e., to enablemore efficient process navigation), the length of the chosen navigation sequence from a start state to adesired target state should be minimized.
66
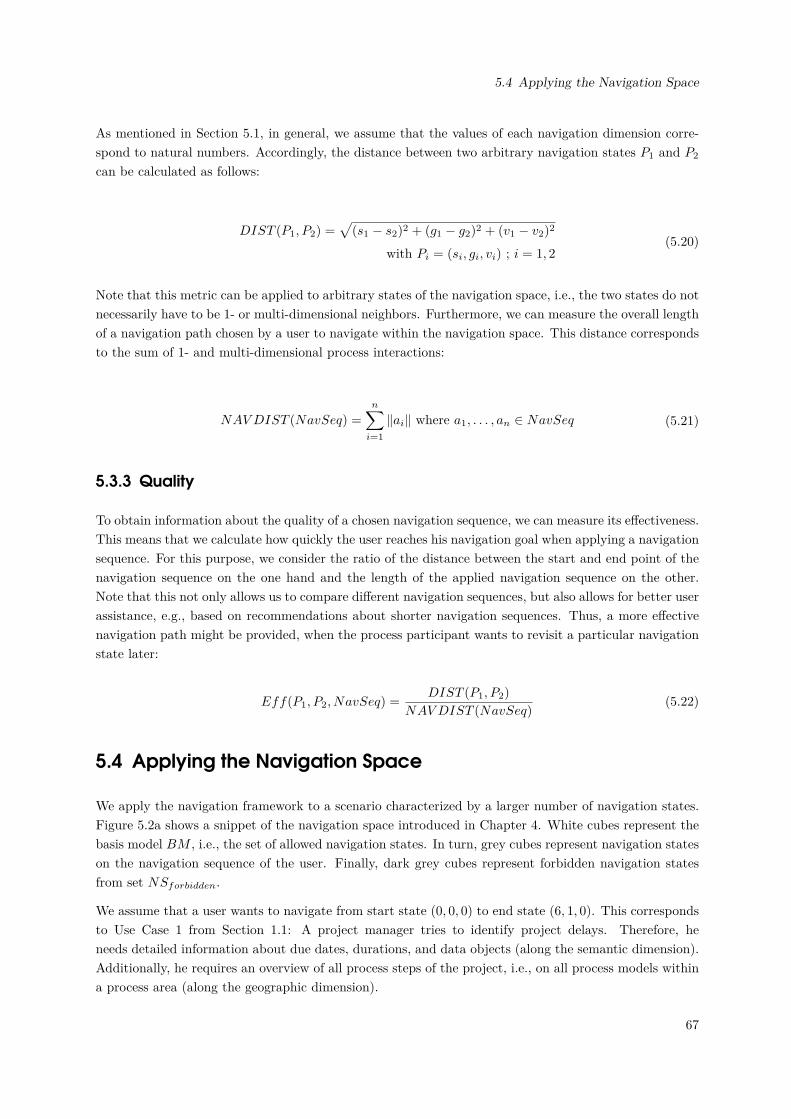
5.4 Applying the Navigation Space
As mentioned in Section 5.1, in general, we assume that the values of each navigation dimension corre-spond to natural numbers. Accordingly, the distance between two arbitrary navigation states P1 and P2
can be calculated as follows:
DIST (P1, P2) =√
(s1 − s2)2 + (g1 − g2)2 + (v1 − v2)2
with Pi = (si, gi, vi) ; i = 1, 2(5.20)
Note that this metric can be applied to arbitrary states of the navigation space, i.e., the two states do notnecessarily have to be 1- or multi-dimensional neighbors. Furthermore, we can measure the overall lengthof a navigation path chosen by a user to navigate within the navigation space. This distance correspondsto the sum of 1- and multi-dimensional process interactions:
NAVDIST (NavSeq) =
n∑i=1
‖ai‖ where a1, . . . , an ∈ NavSeq (5.21)
5.3.3 Quality
To obtain information about the quality of a chosen navigation sequence, we can measure its effectiveness.This means that we calculate how quickly the user reaches his navigation goal when applying a navigationsequence. For this purpose, we consider the ratio of the distance between the start and end point of thenavigation sequence on the one hand and the length of the applied navigation sequence on the other.Note that this not only allows us to compare different navigation sequences, but also allows for better userassistance, e.g., based on recommendations about shorter navigation sequences. Thus, a more effectivenavigation path might be provided, when the process participant wants to revisit a particular navigationstate later:
Eff(P1, P2, NavSeq) =DIST (P1, P2)
NAVDIST (NavSeq)(5.22)
5.4 Applying the Navigation Space
We apply the navigation framework to a scenario characterized by a larger number of navigation states.Figure 5.2a shows a snippet of the navigation space introduced in Chapter 4. White cubes represent thebasis model BM , i.e., the set of allowed navigation states. In turn, grey cubes represent navigation stateson the navigation sequence of the user. Finally, dark grey cubes represent forbidden navigation statesfrom set NSforbidden.
We assume that a user wants to navigate from start state (0, 0, 0) to end state (6, 1, 0). This correspondsto Use Case 1 from Section 1.1: A project manager tries to identify project delays. Therefore, heneeds detailed information about due dates, durations, and data objects (along the semantic dimension).Additionally, he requires an overview of all process steps of the project, i.e., on all process models withina process area (along the geographic dimension).
67
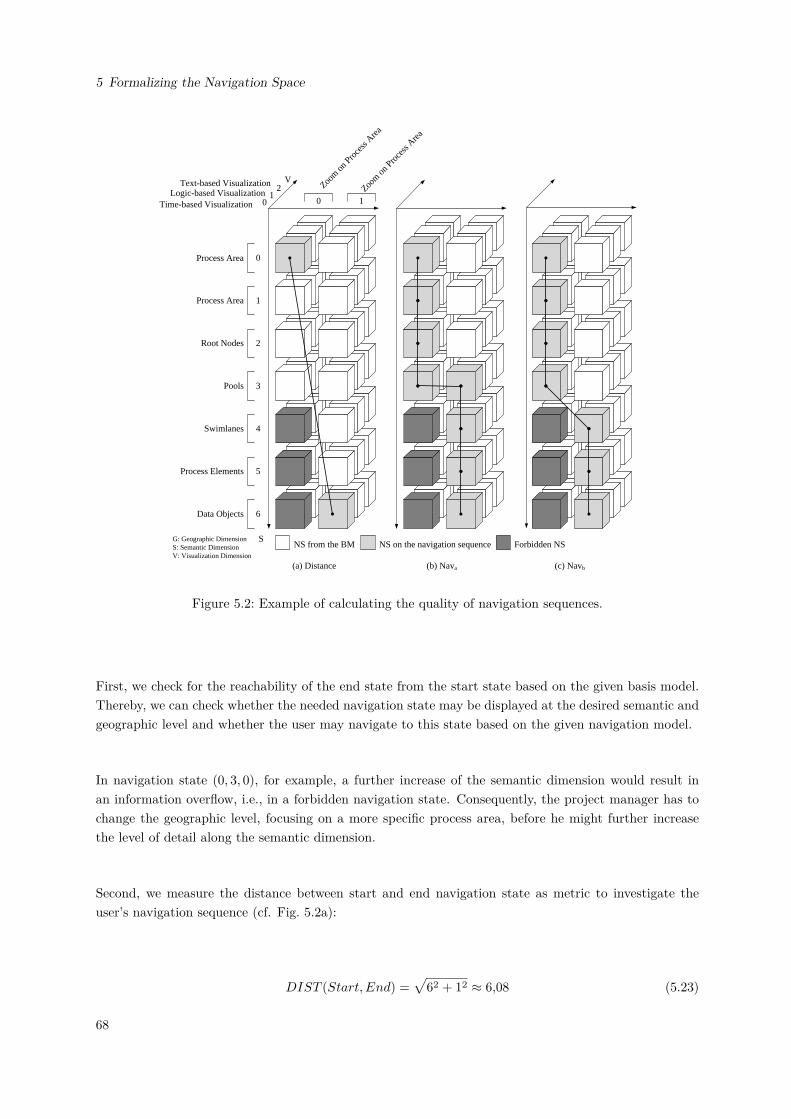
5 Formalizing the Navigation Space
S
V
G: Geographic DimensionS: Semantic DimensionV: Visualization Dimension
Process Area
Process Area
Root Nodes
Pools
Swimlanes
Process Elements
Data Objects
Time-based VisualizationLogic-based Visualization
Text-based Visualization Zoom on
Pro
cess
Area
Zoom on
Pro
cess
Area
10
2
1
0
2
3
4
5
6
0 1
(a) Distance (b) Nava (c) Navb
NS from the BM NS on the navigation sequence Forbidden NS
Figure 5.2: Example of calculating the quality of navigation sequences.
First, we check for the reachability of the end state from the start state based on the given basis model.Thereby, we can check whether the needed navigation state may be displayed at the desired semantic andgeographic level and whether the user may navigate to this state based on the given navigation model.
In navigation state (0, 3, 0), for example, a further increase of the semantic dimension would result inan information overflow, i.e., in a forbidden navigation state. Consequently, the project manager has tochange the geographic level, focusing on a more specific process area, before he might further increasethe level of detail along the semantic dimension.
Second, we measure the distance between start and end navigation state as metric to investigate theuser’s navigation sequence (cf. Fig. 5.2a):
DIST (Start, End) =√62 + 12 ≈ 6,08 (5.23)
68
5.5 Related Approaches
We now investigate the manager’s navigation sequence, while navigating within the navigation space, i.e.,navigation sequence Nava from Fig. 5.2b. The manager applies seven 1-dimensional process interactionsto reach the end state. Hence, the distance can be calculated as follows:
DIST (Nava) =
n−1∑i=0
DIST (Pi+1, Pi) =
6∑0
1 = 7 (5.24)
Regarding the considered scenario, the project manager might only be interested in adjusting the semanticdimension as his main goal is to obtain these data objects being independent from the applied geographicdimension. In particular, the geographic dimension could be adjusted accordingly (from navigation state(3, 0, 0) to state (4, 1, 0)) in order to avoid an information overflow. In this context, a multi-dimensionalprocess interaction could be applied automatically as soon as semantic zooming would result in a forbiddennavigation state. Additionally, applying a multi-dimensional process interaction reduces the user pathby one interaction (cf. Fig. 5.2c). The distance of Navb can then be calculated as follows:
DIST (Navb) =
n−1∑i=0
DIST (Pi+1, Pi) = 1 + 1 + 1 +√2 + 1 + 1 ≈ 6,41 (5.25)
Using the ratio to calculate the effectivity of a navigation sequence Eff , the following effectiveness ratioscan be calculated for Nava and Navb respectively:
Eff(Start, End,Nava) =6,08
7≈ 86,86% (5.26a)
Eff(Start, End,Navb) =6,08
6,41≈ 94,85% (5.26b)
As can be seen in Formula 5.26a and 5.26b, suggesting navigation shortcuts can result in a more effectivenavigation path in Navb as indicated by the effectiveness ratios 94,85% and 86,86%, respectively. Thiseffect increases with the number of shortcuts. If typical navigation sequences can be assigned to specificroles, further path suggestions could already be made before the user starts navigating.
Finally, the example indicates how the process navigation framework can be applied to Use Case 1. Again,we use neighbors to measure distances as well as to calculate the effectiveness of navigation sequences. Inparticular, more efficient navigation becomes possible when eliminating unnecessary process interactions.
5.5 Related Approaches
Besides Linear Algebra, other formalization approaches might be applicable to create a formal modelfor process navigation based on the presented navigation space. This section compares four alternativeapproaches and explains why we used Linear Algebra: Finit State Machines (FSM), process navigation(PN), State Transition Systems (STS), and Linear Algebra (LA).
Each approach is evaluated based on seven criteria:
1. Ease of modeling: Ease of modeling corresponds to the difficulty and the effort required todevelop a comprehensible formal model.
69
5 Formalizing the Navigation Space
2. Bidirectionality: Bidirectionality corresponds to the ability to reflect process navigation along allnavigation dimensions in both directions.
3. Extensibility: Extensibility corresponds to the effort to add additional navigation states or navi-gation dimensions to the formal model.
4. Complexity: Complexity refers to the increasing complexity of a formal model if the navigationspace increases.
5. Comprehensibility: Comprehensibility refers to the difficulty to comprehend a formal model.
6. Ease of use: Ease of use reflects the effort to map or apply a formalization approach to processnavigation.
7. Memory usage: Memory usage refers to the effort to save and maintain a formal model.
Creating Finit State Machines (FSM) [WSWW06, Ped13] is time consuming as each related state andrespective transitions must then be modeled separately (ease of modeling). However, bidirectional transi-tions can be expressed (bidirectionality). Extending the model by new navigation states will be complexas state transitions to other states must be considered (extensibility). Using FSM, complexity increases asthe number of states in the formal model increases exponentially in multi-dimensional navigation spaces.In turn, FSM are understandable as only few different modeling elements are required (comprehensibility).However, ease of use is limited due to the complexity of FSM. Finally, memory usage is considerablyhigh as the respective formal model must be predefined and states as well as state transitions must bemaintained separately.
process navigation (PN) [Rei13] provide different elements and rules. In general, the effort to formalizethe navigation space using PN would be considerably high (ease of modeling). Bidirectional navigationsequences may be realized by modeling two separate transitions (bidirectionality). The extensibility of aPN formal model, however, is limited as the number of states exponentially grows when adding navigationdimensions (complexity). Furthermore, comprehensibility and ease of use of PN are rather low. In turn,the memory usage is rather high as each navigation state must be maintained separately.
The STS [BK08] is complex as states and transitions must be modeled separately as well (ease of model-ing). An STS can be realized as simple table, thus designing a formal model is optional. Bidirectionalityis supported using directed transitions or respective table entries. The realization as a table also allowsfor simple extensibility. In turn, the complexity of the formalization approach can be compared to theone from FSM as for each new state all transitions to other states must be newly created. Consideringthe table visualization, comprehensibility of an STS is good. The formalization approach is easy to apply,as the set of allowed transitions is predefined and stored in the table. Included information can be easilyextracted (ease of use). Finally, storing the respective table is less space consuming compared to storingthe formal model (memory usage).
Using the Linear Algebra (LA) approach, the formal model of the navigation space can be representedby the Cartesian System (ease of modeling), which makes it easy to create a formal model. As statetransitions can be represented by vectors, bidirectionality is supported as well. The navigation spacecan be easily extended as the size of the Cartesian System is infinite (extensibility). Thus, enlargingthe navigation space only leads to an increase of complexity when dimensions are added. Moreover,the LA approach can deal with multi-dimensional navigation spaces without an exponentially increasingcomplexity. LA is a lean approach that can be easily understood by modelers (comprehensibility and ease
70
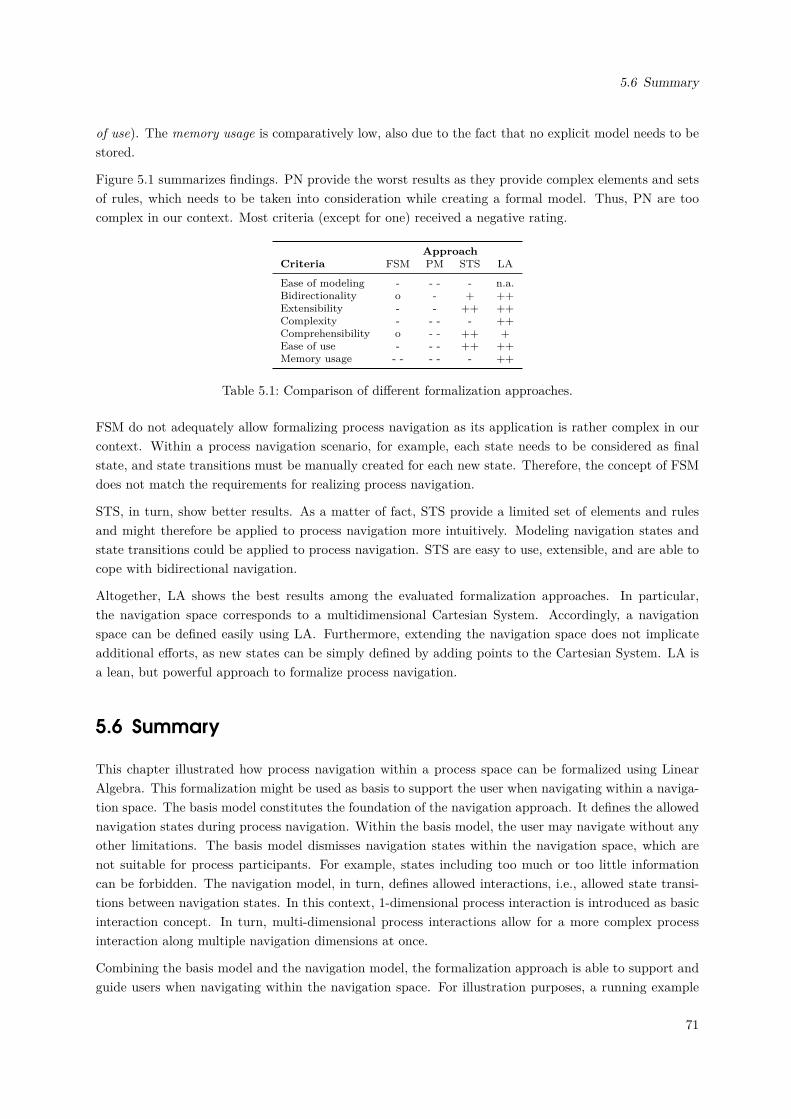
5.6 Summary
of use). The memory usage is comparatively low, also due to the fact that no explicit model needs to bestored.
Figure 5.1 summarizes findings. PN provide the worst results as they provide complex elements and setsof rules, which needs to be taken into consideration while creating a formal model. Thus, PN are toocomplex in our context. Most criteria (except for one) received a negative rating.
ApproachCriteria FSM PM STS LA
Ease of modeling - - - - n.a.Bidirectionality o - + ++Extensibility - - ++ ++Complexity - - - - ++Comprehensibility o - - ++ +Ease of use - - - ++ ++Memory usage - - - - - ++
Table 5.1: Comparison of different formalization approaches.
FSM do not adequately allow formalizing process navigation as its application is rather complex in ourcontext. Within a process navigation scenario, for example, each state needs to be considered as finalstate, and state transitions must be manually created for each new state. Therefore, the concept of FSMdoes not match the requirements for realizing process navigation.
STS, in turn, show better results. As a matter of fact, STS provide a limited set of elements and rulesand might therefore be applied to process navigation more intuitively. Modeling navigation states andstate transitions could be applied to process navigation. STS are easy to use, extensible, and are able tocope with bidirectional navigation.
Altogether, LA shows the best results among the evaluated formalization approaches. In particular,the navigation space corresponds to a multidimensional Cartesian System. Accordingly, a navigationspace can be defined easily using LA. Furthermore, extending the navigation space does not implicateadditional efforts, as new states can be simply defined by adding points to the Cartesian System. LA isa lean, but powerful approach to formalize process navigation.
5.6 Summary
This chapter illustrated how process navigation within a process space can be formalized using LinearAlgebra. This formalization might be used as basis to support the user when navigating within a naviga-tion space. The basis model constitutes the foundation of the navigation approach. It defines the allowednavigation states during process navigation. Within the basis model, the user may navigate without anyother limitations. The basis model dismisses navigation states within the navigation space, which arenot suitable for process participants. For example, states including too much or too little informationcan be forbidden. The navigation model, in turn, defines allowed interactions, i.e., allowed state transi-tions between navigation states. In this context, 1-dimensional process interaction is introduced as basicinteraction concept. In turn, multi-dimensional process interactions allow for a more complex processinteraction along multiple navigation dimensions at once.
Combining the basis model and the navigation model, the formalization approach is able to support andguide users when navigating within the navigation space. For illustration purposes, a running example
71

5 Formalizing the Navigation Space
was introduced to show how the basis model and the navigation model can be used within a givennavigation space and how a user can be guided, while interacting with the navigation space. Finally, wepresented selected approaches to formalize process navigation.
72
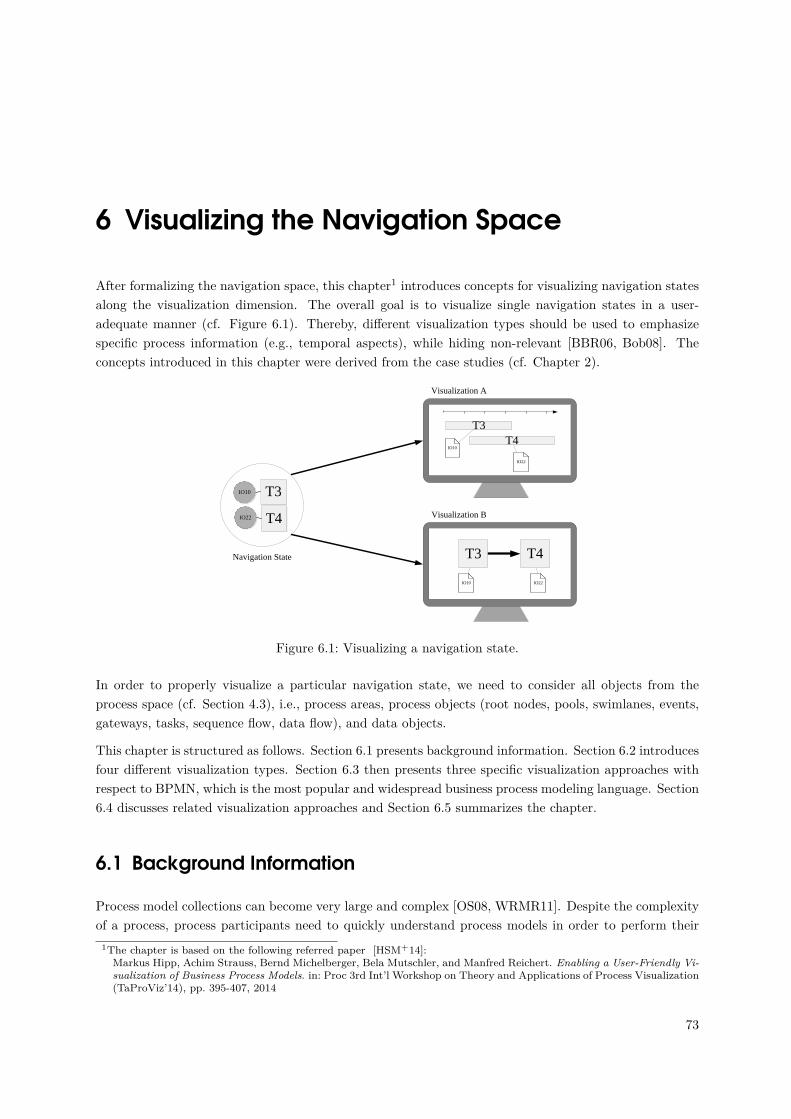
6 Visualizing the Navigation Space
After formalizing the navigation space, this chapter1 introduces concepts for visualizing navigation statesalong the visualization dimension. The overall goal is to visualize single navigation states in a user-adequate manner (cf. Figure 6.1). Thereby, different visualization types should be used to emphasizespecific process information (e.g., temporal aspects), while hiding non-relevant [BBR06, Bob08]. Theconcepts introduced in this chapter were derived from the case studies (cf. Chapter 2).
T3
T4
IO10
IO22
T3T4
IO10
IO22
IO10 IO22
T4T3Navigation State
Visualization A
Visualization B
Figure 6.1: Visualizing a navigation state.
In order to properly visualize a particular navigation state, we need to consider all objects from theprocess space (cf. Section 4.3), i.e., process areas, process objects (root nodes, pools, swimlanes, events,gateways, tasks, sequence flow, data flow), and data objects.
This chapter is structured as follows. Section 6.1 presents background information. Section 6.2 introducesfour different visualization types. Section 6.3 then presents three specific visualization approaches withrespect to BPMN, which is the most popular and widespread business process modeling language. Section6.4 discusses related visualization approaches and Section 6.5 summarizes the chapter.
6.1 Background Information
Process model collections can become very large and complex [OS08, WRMR11]. Despite the complexityof a process, process participants need to quickly understand process models in order to perform their
1The chapter is based on the following referred paper [HSM+14]:Markus Hipp, Achim Strauss, Bernd Michelberger, Bela Mutschler, and Manfred Reichert. Enabling a User-Friendly Vi-sualization of Business Process Models. in: Proc 3rd Int’l Workshop on Theory and Applications of Process Visualization(TaProViz’14), pp. 395-407, 2014
73
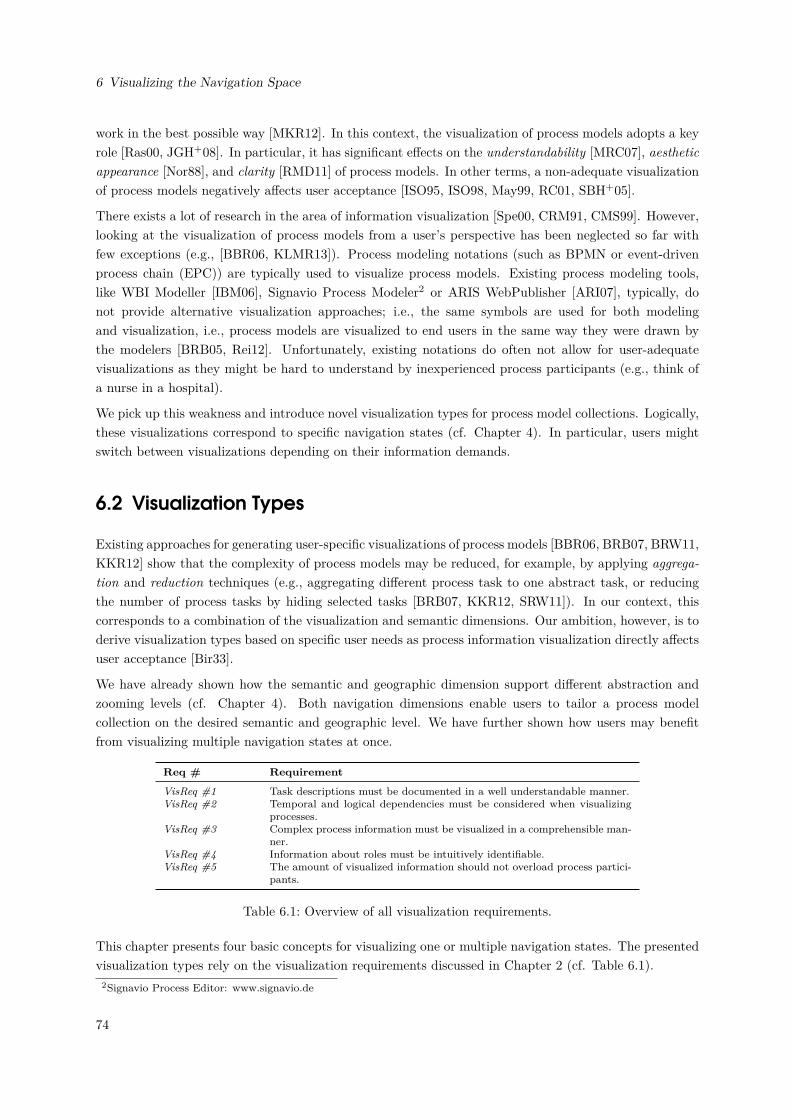
6 Visualizing the Navigation Space
work in the best possible way [MKR12]. In this context, the visualization of process models adopts a keyrole [Ras00, JGH+08]. In particular, it has significant effects on the understandability [MRC07], aestheticappearance [Nor88], and clarity [RMD11] of process models. In other terms, a non-adequate visualizationof process models negatively affects user acceptance [ISO95, ISO98, May99, RC01, SBH+05].
There exists a lot of research in the area of information visualization [Spe00, CRM91, CMS99]. However,looking at the visualization of process models from a user’s perspective has been neglected so far withfew exceptions (e.g., [BBR06, KLMR13]). Process modeling notations (such as BPMN or event-drivenprocess chain (EPC)) are typically used to visualize process models. Existing process modeling tools,like WBI Modeller [IBM06], Signavio Process Modeler2 or ARIS WebPublisher [ARI07], typically, donot provide alternative visualization approaches; i.e., the same symbols are used for both modelingand visualization, i.e., process models are visualized to end users in the same way they were drawn bythe modelers [BRB05, Rei12]. Unfortunately, existing notations do often not allow for user-adequatevisualizations as they might be hard to understand by inexperienced process participants (e.g., think ofa nurse in a hospital).
We pick up this weakness and introduce novel visualization types for process model collections. Logically,these visualizations correspond to specific navigation states (cf. Chapter 4). In particular, users mightswitch between visualizations depending on their information demands.
6.2 Visualization Types
Existing approaches for generating user-specific visualizations of process models [BBR06, BRB07, BRW11,KKR12] show that the complexity of process models may be reduced, for example, by applying aggrega-tion and reduction techniques (e.g., aggregating different process task to one abstract task, or reducingthe number of process tasks by hiding selected tasks [BRB07, KKR12, SRW11]). In our context, thiscorresponds to a combination of the visualization and semantic dimensions. Our ambition, however, is toderive visualization types based on specific user needs as process information visualization directly affectsuser acceptance [Bir33].
We have already shown how the semantic and geographic dimension support different abstraction andzooming levels (cf. Chapter 4). Both navigation dimensions enable users to tailor a process modelcollection on the desired semantic and geographic level. We have further shown how users may benefitfrom visualizing multiple navigation states at once.
Req # Requirement
VisReq #1 Task descriptions must be documented in a well understandable manner.VisReq #2 Temporal and logical dependencies must be considered when visualizing
processes.VisReq #3 Complex process information must be visualized in a comprehensible man-
ner.VisReq #4 Information about roles must be intuitively identifiable.VisReq #5 The amount of visualized information should not overload process partici-
pants.
Table 6.1: Overview of all visualization requirements.
This chapter presents four basic concepts for visualizing one or multiple navigation states. The presentedvisualization types rely on the visualization requirements discussed in Chapter 2 (cf. Table 6.1).
2Signavio Process Editor: www.signavio.de
74
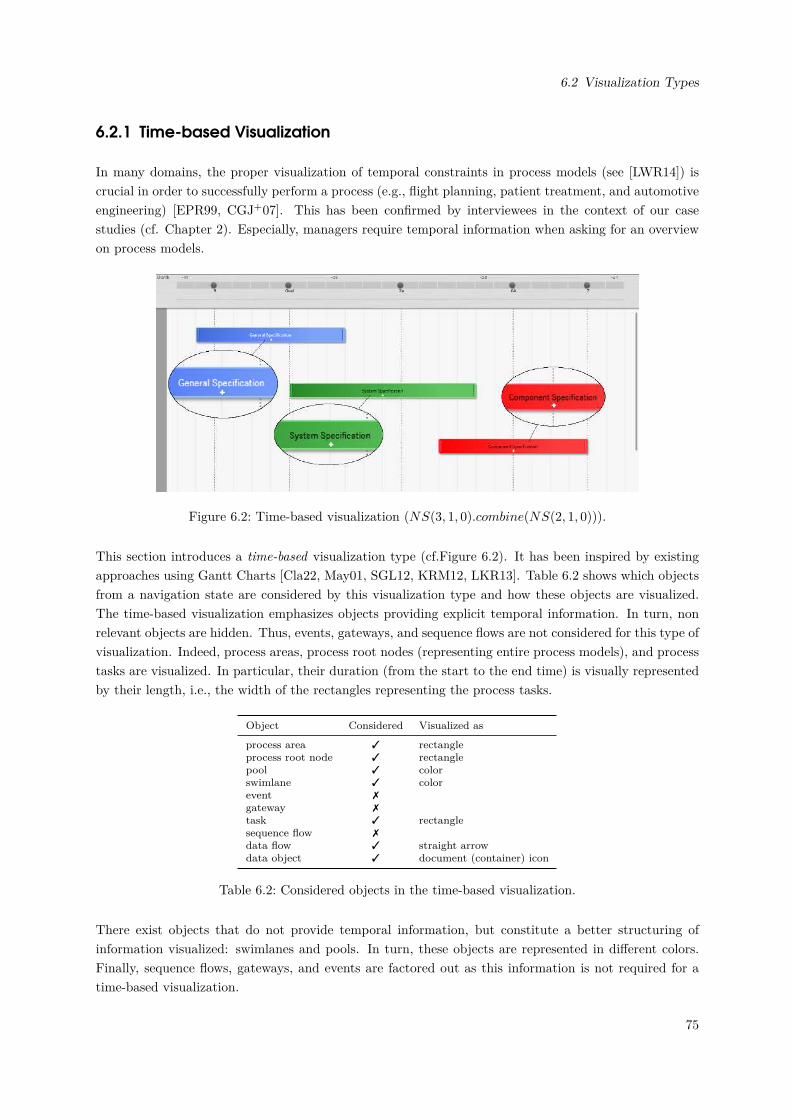
6.2 Visualization Types
6.2.1 Time-based Visualization
In many domains, the proper visualization of temporal constraints in process models (see [LWR14]) iscrucial in order to successfully perform a process (e.g., flight planning, patient treatment, and automotiveengineering) [EPR99, CGJ+07]. This has been confirmed by interviewees in the context of our casestudies (cf. Chapter 2). Especially, managers require temporal information when asking for an overviewon process models.
Figure 6.2: Time-based visualization (NS(3, 1, 0).combine(NS(2, 1, 0))).
This section introduces a time-based visualization type (cf.Figure 6.2). It has been inspired by existingapproaches using Gantt Charts [Cla22, May01, SGL12, KRM12, LKR13]. Table 6.2 shows which objectsfrom a navigation state are considered by this visualization type and how these objects are visualized.The time-based visualization emphasizes objects providing explicit temporal information. In turn, nonrelevant objects are hidden. Thus, events, gateways, and sequence flows are not considered for this type ofvisualization. Indeed, process areas, process root nodes (representing entire process models), and processtasks are visualized. In particular, their duration (from the start to the end time) is visually representedby their length, i.e., the width of the rectangles representing the process tasks.
Object Considered Visualized as
process area 3 rectangleprocess root node 3 rectanglepool 3 colorswimlane 3 colorevent 7gateway 7task 3 rectanglesequence flow 7data flow 3 straight arrowdata object 3 document (container) icon
Table 6.2: Considered objects in the time-based visualization.
There exist objects that do not provide temporal information, but constitute a better structuring ofinformation visualized: swimlanes and pools. In turn, these objects are represented in different colors.Finally, sequence flows, gateways, and events are factored out as this information is not required for atime-based visualization.
75
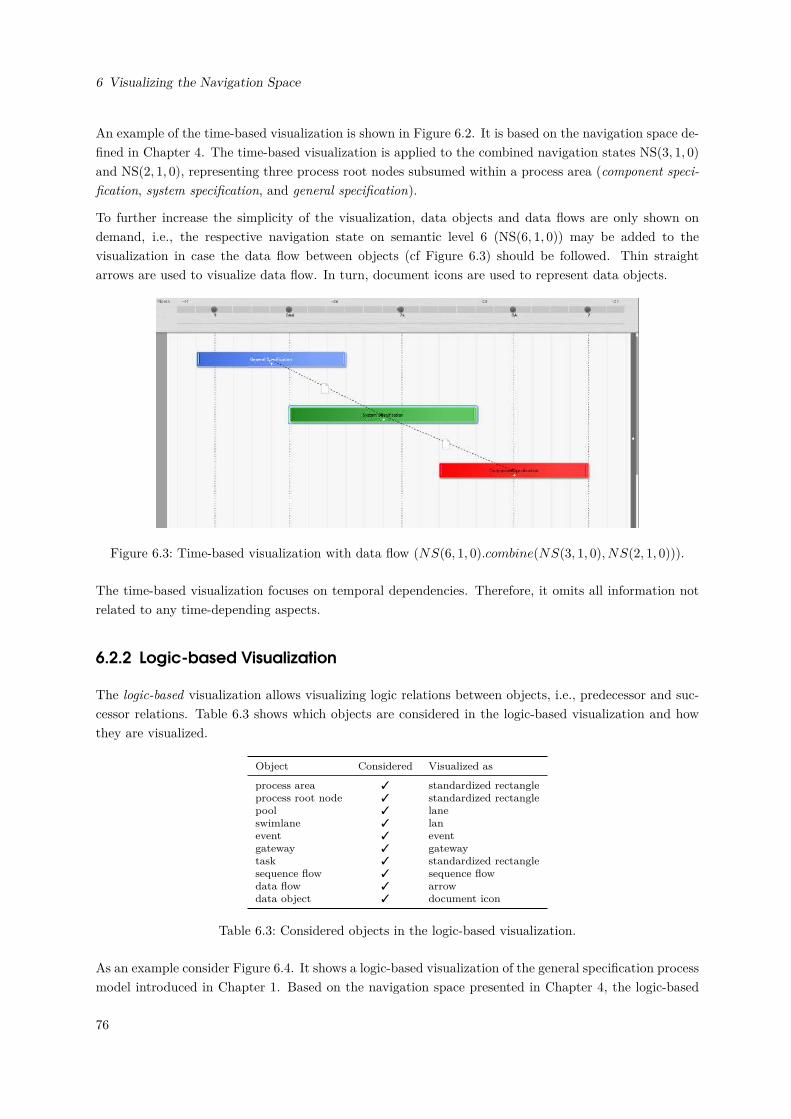
6 Visualizing the Navigation Space
An example of the time-based visualization is shown in Figure 6.2. It is based on the navigation space de-fined in Chapter 4. The time-based visualization is applied to the combined navigation states NS(3, 1, 0)and NS(2, 1, 0), representing three process root nodes subsumed within a process area (component speci-fication, system specification, and general specification).
To further increase the simplicity of the visualization, data objects and data flows are only shown ondemand, i.e., the respective navigation state on semantic level 6 (NS(6, 1, 0)) may be added to thevisualization in case the data flow between objects (cf Figure 6.3) should be followed. Thin straightarrows are used to visualize data flow. In turn, document icons are used to represent data objects.
Figure 6.3: Time-based visualization with data flow (NS(6, 1, 0).combine(NS(3, 1, 0), NS(2, 1, 0))).
The time-based visualization focuses on temporal dependencies. Therefore, it omits all information notrelated to any time-depending aspects.
6.2.2 Logic-based Visualization
The logic-based visualization allows visualizing logic relations between objects, i.e., predecessor and suc-cessor relations. Table 6.3 shows which objects are considered in the logic-based visualization and howthey are visualized.
Object Considered Visualized as
process area 3 standardized rectangleprocess root node 3 standardized rectanglepool 3 laneswimlane 3 lanevent 3 eventgateway 3 gatewaytask 3 standardized rectanglesequence flow 3 sequence flowdata flow 3 arrowdata object 3 document icon
Table 6.3: Considered objects in the logic-based visualization.
As an example consider Figure 6.4. It shows a logic-based visualization of the general specification processmodel introduced in Chapter 1. Based on the navigation space presented in Chapter 4, the logic-based
76
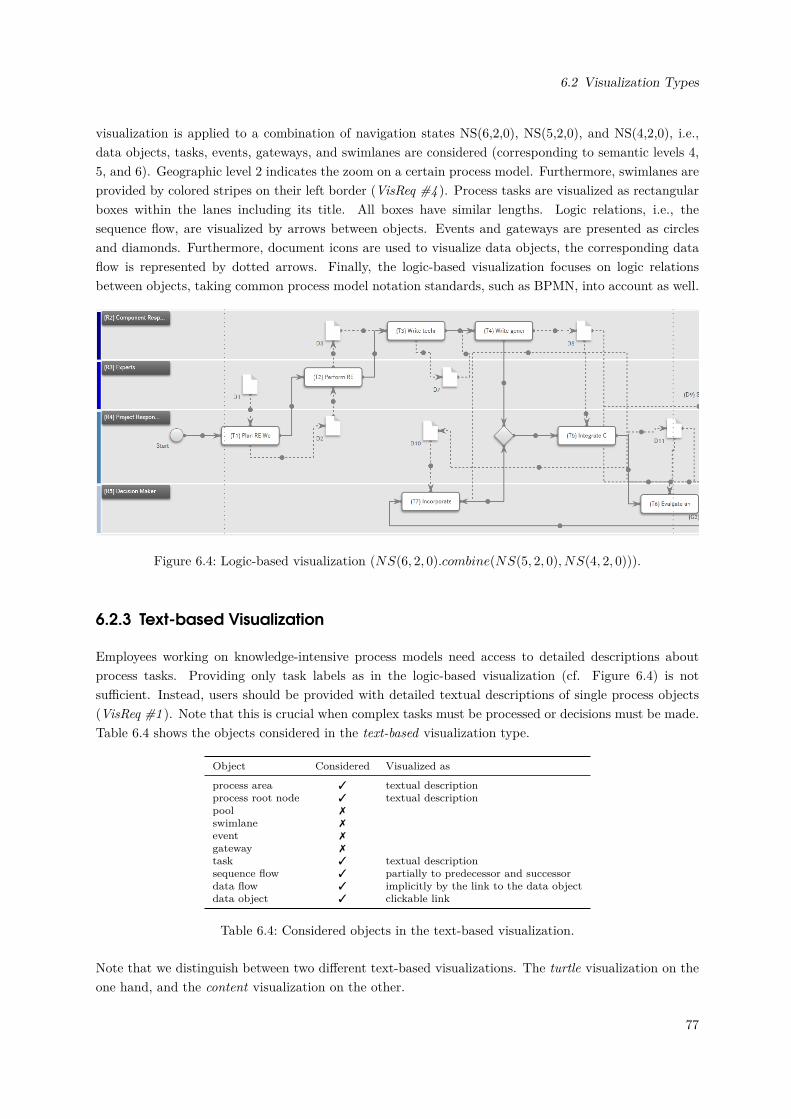
6.2 Visualization Types
visualization is applied to a combination of navigation states NS(6,2,0), NS(5,2,0), and NS(4,2,0), i.e.,data objects, tasks, events, gateways, and swimlanes are considered (corresponding to semantic levels 4,5, and 6). Geographic level 2 indicates the zoom on a certain process model. Furthermore, swimlanes areprovided by colored stripes on their left border (VisReq #4 ). Process tasks are visualized as rectangularboxes within the lanes including its title. All boxes have similar lengths. Logic relations, i.e., thesequence flow, are visualized by arrows between objects. Events and gateways are presented as circlesand diamonds. Furthermore, document icons are used to visualize data objects, the corresponding dataflow is represented by dotted arrows. Finally, the logic-based visualization focuses on logic relationsbetween objects, taking common process model notation standards, such as BPMN, into account as well.
Figure 6.4: Logic-based visualization (NS(6, 2, 0).combine(NS(5, 2, 0), NS(4, 2, 0))).
6.2.3 Text-based Visualization
Employees working on knowledge-intensive process models need access to detailed descriptions aboutprocess tasks. Providing only task labels as in the logic-based visualization (cf. Figure 6.4) is notsufficient. Instead, users should be provided with detailed textual descriptions of single process objects(VisReq #1 ). Note that this is crucial when complex tasks must be processed or decisions must be made.Table 6.4 shows the objects considered in the text-based visualization type.
Object Considered Visualized as
process area 3 textual descriptionprocess root node 3 textual descriptionpool 7swimlane 7event 7gateway 7task 3 textual descriptionsequence flow 3 partially to predecessor and successordata flow 3 implicitly by the link to the data objectdata object 3 clickable link
Table 6.4: Considered objects in the text-based visualization.
Note that we distinguish between two different text-based visualizations. The turtle visualization on theone hand, and the content visualization on the other.
77
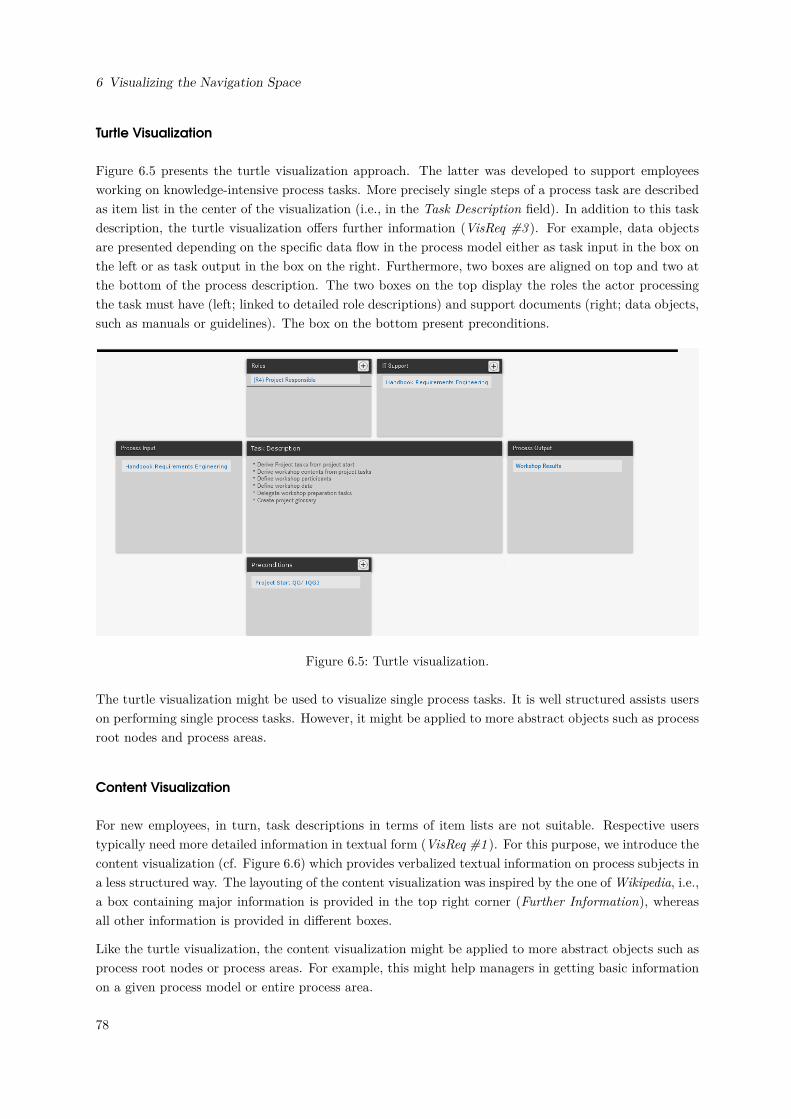
6 Visualizing the Navigation Space
Turtle Visualization
Figure 6.5 presents the turtle visualization approach. The latter was developed to support employeesworking on knowledge-intensive process tasks. More precisely single steps of a process task are describedas item list in the center of the visualization (i.e., in the Task Description field). In addition to this taskdescription, the turtle visualization offers further information (VisReq #3 ). For example, data objectsare presented depending on the specific data flow in the process model either as task input in the box onthe left or as task output in the box on the right. Furthermore, two boxes are aligned on top and two atthe bottom of the process description. The two boxes on the top display the roles the actor processingthe task must have (left; linked to detailed role descriptions) and support documents (right; data objects,such as manuals or guidelines). The box on the bottom present preconditions.
Figure 6.5: Turtle visualization.
The turtle visualization might be used to visualize single process tasks. It is well structured assists userson performing single process tasks. However, it might be applied to more abstract objects such as processroot nodes and process areas.
Content Visualization
For new employees, in turn, task descriptions in terms of item lists are not suitable. Respective userstypically need more detailed information in textual form (VisReq #1 ). For this purpose, we introduce thecontent visualization (cf. Figure 6.6) which provides verbalized textual information on process subjects ina less structured way. The layouting of the content visualization was inspired by the one of Wikipedia, i.e.,a box containing major information is provided in the top right corner (Further Information), whereasall other information is provided in different boxes.
Like the turtle visualization, the content visualization might be applied to more abstract objects such asprocess root nodes or process areas. For example, this might help managers in getting basic informationon a given process model or entire process area.
78
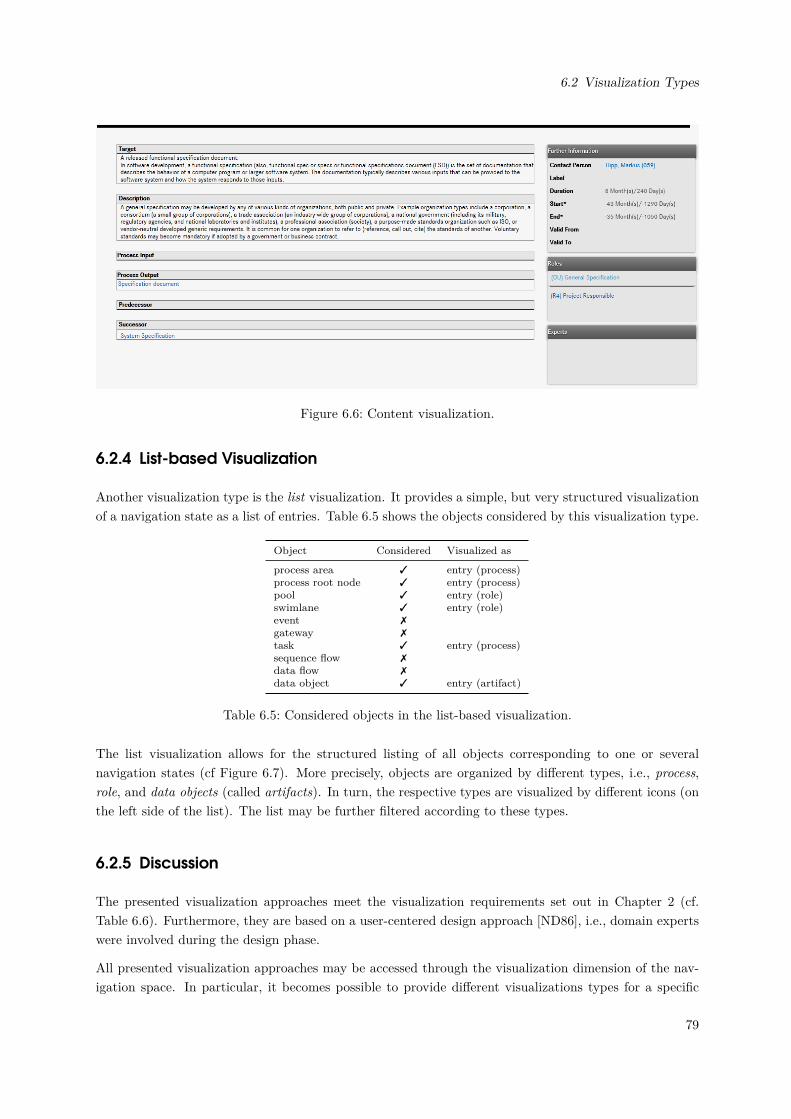
6.2 Visualization Types
Figure 6.6: Content visualization.
6.2.4 List-based Visualization
Another visualization type is the list visualization. It provides a simple, but very structured visualizationof a navigation state as a list of entries. Table 6.5 shows the objects considered by this visualization type.
Object Considered Visualized as
process area 3 entry (process)process root node 3 entry (process)pool 3 entry (role)swimlane 3 entry (role)event 7gateway 7task 3 entry (process)sequence flow 7data flow 7data object 3 entry (artifact)
Table 6.5: Considered objects in the list-based visualization.
The list visualization allows for the structured listing of all objects corresponding to one or severalnavigation states (cf Figure 6.7). More precisely, objects are organized by different types, i.e., process,role, and data objects (called artifacts). In turn, the respective types are visualized by different icons (onthe left side of the list). The list may be further filtered according to these types.
6.2.5 Discussion
The presented visualization approaches meet the visualization requirements set out in Chapter 2 (cf.Table 6.6). Furthermore, they are based on a user-centered design approach [ND86], i.e., domain expertswere involved during the design phase.
All presented visualization approaches may be accessed through the visualization dimension of the nav-igation space. In particular, it becomes possible to provide different visualizations types for a specific
79
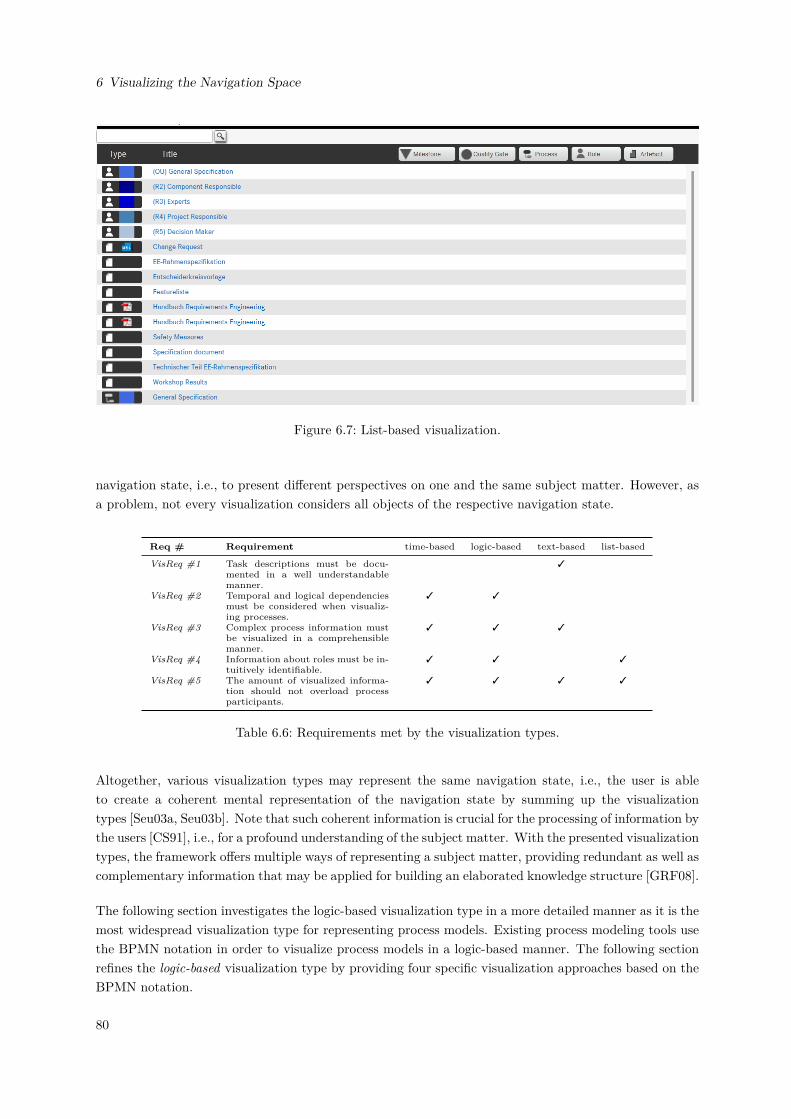
6 Visualizing the Navigation Space
Figure 6.7: List-based visualization.
navigation state, i.e., to present different perspectives on one and the same subject matter. However, asa problem, not every visualization considers all objects of the respective navigation state.
Req # Requirement time-based logic-based text-based list-based
VisReq #1 Task descriptions must be docu-mented in a well understandablemanner.
3
VisReq #2 Temporal and logical dependenciesmust be considered when visualiz-ing processes.
3 3
VisReq #3 Complex process information mustbe visualized in a comprehensiblemanner.
3 3 3
VisReq #4 Information about roles must be in-tuitively identifiable.
3 3 3
VisReq #5 The amount of visualized informa-tion should not overload processparticipants.
3 3 3 3
Table 6.6: Requirements met by the visualization types.
Altogether, various visualization types may represent the same navigation state, i.e., the user is ableto create a coherent mental representation of the navigation state by summing up the visualizationtypes [Seu03a, Seu03b]. Note that such coherent information is crucial for the processing of information bythe users [CS91], i.e., for a profound understanding of the subject matter. With the presented visualizationtypes, the framework offers multiple ways of representing a subject matter, providing redundant as well ascomplementary information that may be applied for building an elaborated knowledge structure [GRF08].
The following section investigates the logic-based visualization type in a more detailed manner as it is themost widespread visualization type for representing process models. Existing process modeling tools usethe BPMN notation in order to visualize process models in a logic-based manner. The following sectionrefines the logic-based visualization type by providing four specific visualization approaches based on theBPMN notation.
80
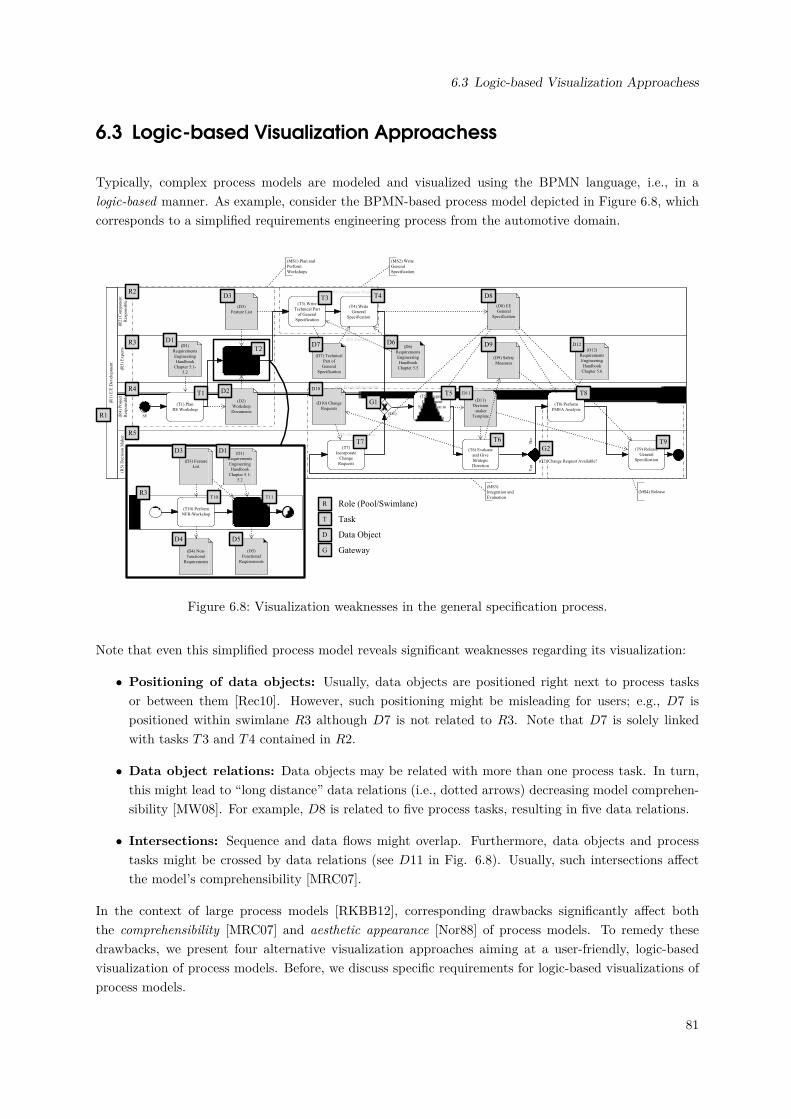
6.3 Logic-based Visualization Approachess
6.3 Logic-based Visualization Approachess
Typically, complex process models are modeled and visualized using the BPMN language, i.e., in alogic-based manner. As example, consider the BPMN-based process model depicted in Figure 6.8, whichcorresponds to a simplified requirements engineering process from the automotive domain.
(R1
) E
/E D
evel
op
men
t
(R3
) E
xp
erts
(R3) Experts
(T2) Perform
RE Workshop
(D1)
Requirements
Engineering
Handbook
Chapter 5.1-
5.2
(D7) Technical
Part of
General
Specification
(D9) Safety
Measures
(D6)
Requirements
Engineering
Handbook
Chapter 5.5
(D12)
Requirements
Engineering
Handbook
Chapter 5.6
(R2
) C
om
po
nen
t
Res
po
nsi
ble
(R2) Component Responsible
(T3) Write
Technical Part
of General
Specification
(T4) Write
General
Specification
(D3)
Feature List
(D8) EE
General
Specification
(R4
) P
roje
ct
Res
po
nsi
ble
(R4) Project Responsible
(T1) Plan
RE Workshop
SE
(T5) Integrate
Component
Specification to
General
Specification
(T8) Perform
FMEA Analysis
(D11)
Decision
-maker
Template
(D10) Change
Requests
(D2)
Workshop
Documents (G1)
(R5
) D
ecis
ion
Mak
er
(R5) Decision Maker
(T6) Evaluate
and Give
Strategic
Direction(G2) Change Request Available?
(T7)
Incorporate
Change
Requests
(T9) Release
General
Specification
(MS1) Plan and
Perform
Workshops
(MS2) Write
General
Specification
(MS3)
Integration and
Evaluation
(MS4) Release
Yes
No
(R3
) E
xp
erts
(T10) Perform
NFR-Workshop
(T11) Perform
FR-Workshop
(D3) Feature
List
(D1)
Requirements
Engineering
Handbook
Chapter 5.1-
5.2
(D4) Non-
functional
Requirements
(D5)
Functional
Requirements
R1
R2
R3
R4
R5
T1
T2
T3 T4
T5
T6T7
T8
T9
T10 T11
D1
D3
D2
D4 D5
D1D3
D7 D6
D8
D9
D10D11
D12
R Role (Pool/Swimlane)
T Task
D Data Object
R3
G1
G2
G Gateway
Figure 6.8: Visualization weaknesses in the general specification process.
Note that even this simplified process model reveals significant weaknesses regarding its visualization:
• Positioning of data objects: Usually, data objects are positioned right next to process tasksor between them [Rec10]. However, such positioning might be misleading for users; e.g., D7 ispositioned within swimlane R3 although D7 is not related to R3. Note that D7 is solely linkedwith tasks T3 and T4 contained in R2.
• Data object relations: Data objects may be related with more than one process task. In turn,this might lead to “long distance” data relations (i.e., dotted arrows) decreasing model comprehen-sibility [MW08]. For example, D8 is related to five process tasks, resulting in five data relations.
• Intersections: Sequence and data flows might overlap. Furthermore, data objects and processtasks might be crossed by data relations (see D11 in Fig. 6.8). Usually, such intersections affectthe model’s comprehensibility [MRC07].
In the context of large process models [RKBB12], corresponding drawbacks significantly affect boththe comprehensibility [MRC07] and aesthetic appearance [Nor88] of process models. To remedy thesedrawbacks, we present four alternative visualization approaches aiming at a user-friendly, logic-basedvisualization of process models. Before, we discuss specific requirements for logic-based visualizations ofprocess models.
81
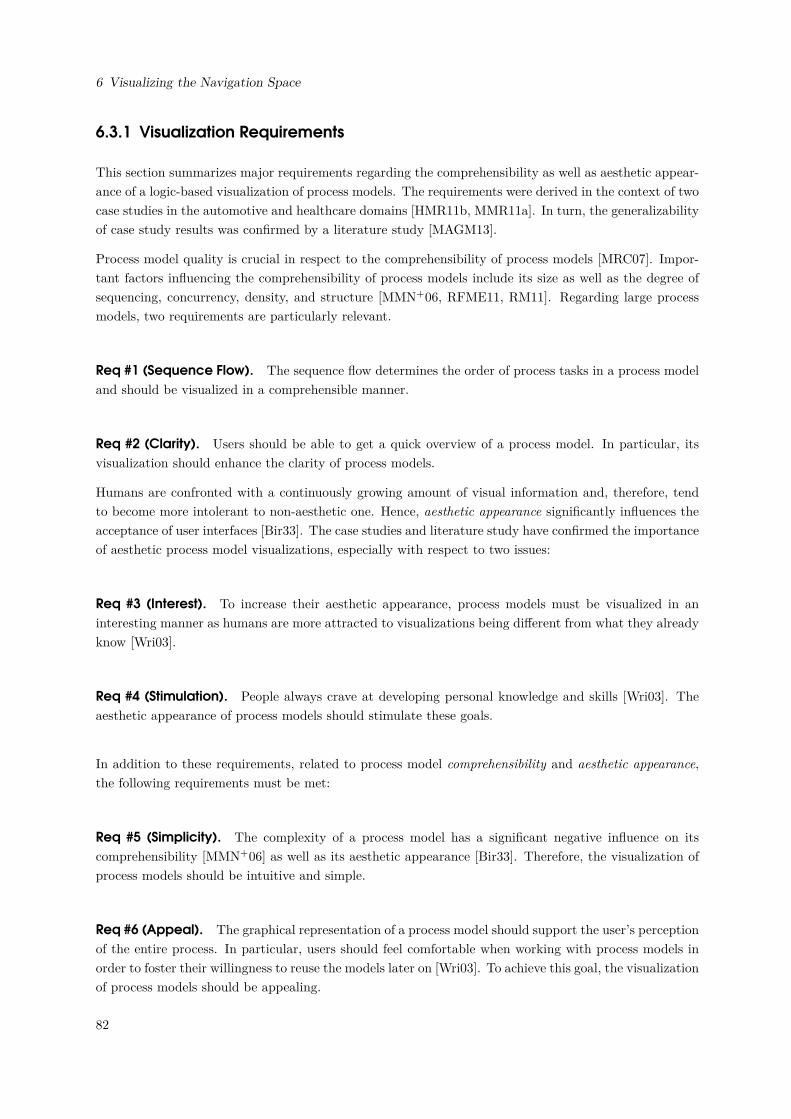
6 Visualizing the Navigation Space
6.3.1 Visualization Requirements
This section summarizes major requirements regarding the comprehensibility as well as aesthetic appear-ance of a logic-based visualization of process models. The requirements were derived in the context of twocase studies in the automotive and healthcare domains [HMR11b, MMR11a]. In turn, the generalizabilityof case study results was confirmed by a literature study [MAGM13].
Process model quality is crucial in respect to the comprehensibility of process models [MRC07]. Impor-tant factors influencing the comprehensibility of process models include its size as well as the degree ofsequencing, concurrency, density, and structure [MMN+06, RFME11, RM11]. Regarding large processmodels, two requirements are particularly relevant.
Req #1 (Sequence Flow). The sequence flow determines the order of process tasks in a process modeland should be visualized in a comprehensible manner.
Req #2 (Clarity). Users should be able to get a quick overview of a process model. In particular, itsvisualization should enhance the clarity of process models.
Humans are confronted with a continuously growing amount of visual information and, therefore, tendto become more intolerant to non-aesthetic one. Hence, aesthetic appearance significantly influences theacceptance of user interfaces [Bir33]. The case studies and literature study have confirmed the importanceof aesthetic process model visualizations, especially with respect to two issues:
Req #3 (Interest). To increase their aesthetic appearance, process models must be visualized in aninteresting manner as humans are more attracted to visualizations being different from what they alreadyknow [Wri03].
Req #4 (Stimulation). People always crave at developing personal knowledge and skills [Wri03]. Theaesthetic appearance of process models should stimulate these goals.
In addition to these requirements, related to process model comprehensibility and aesthetic appearance,the following requirements must be met:
Req #5 (Simplicity). The complexity of a process model has a significant negative influence on itscomprehensibility [MMN+06] as well as its aesthetic appearance [Bir33]. Therefore, the visualization ofprocess models should be intuitive and simple.
Req #6 (Appeal). The graphical representation of a process model should support the user’s perceptionof the entire process. In particular, users should feel comfortable when working with process models inorder to foster their willingness to reuse the models later on [Wri03]. To achieve this goal, the visualizationof process models should be appealing.
82
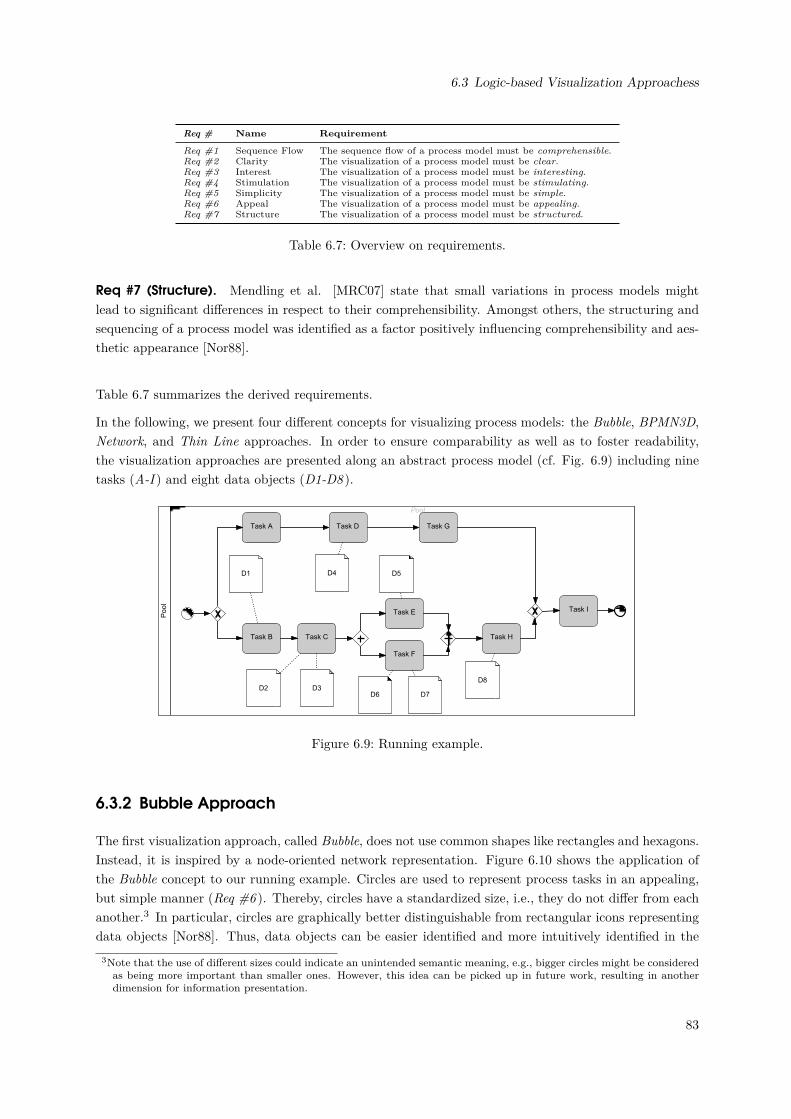
6.3 Logic-based Visualization Approachess
Req # Name Requirement
Req #1 Sequence Flow The sequence flow of a process model must be comprehensible.Req #2 Clarity The visualization of a process model must be clear.Req #3 Interest The visualization of a process model must be interesting.Req #4 Stimulation The visualization of a process model must be stimulating.Req #5 Simplicity The visualization of a process model must be simple.Req #6 Appeal The visualization of a process model must be appealing.Req #7 Structure The visualization of a process model must be structured.
Table 6.7: Overview on requirements.
Req #7 (Structure). Mendling et al. [MRC07] state that small variations in process models mightlead to significant differences in respect to their comprehensibility. Amongst others, the structuring andsequencing of a process model was identified as a factor positively influencing comprehensibility and aes-thetic appearance [Nor88].
Table 6.7 summarizes the derived requirements.
In the following, we present four different concepts for visualizing process models: the Bubble, BPMN3D,Network, and Thin Line approaches. In order to ensure comparability as well as to foster readability,the visualization approaches are presented along an abstract process model (cf. Fig. 6.9) including ninetasks (A-I ) and eight data objects (D1-D8 ).
Po
ol
Pool
Task A
Task B
Task D Task G
Task C
Task E Task I
Task F
Task H
D1
D2 D3
D4 D5
D6 D7
D8
Figure 6.9: Running example.
6.3.2 Bubble Approach
The first visualization approach, called Bubble, does not use common shapes like rectangles and hexagons.Instead, it is inspired by a node-oriented network representation. Figure 6.10 shows the application ofthe Bubble concept to our running example. Circles are used to represent process tasks in an appealing,but simple manner (Req #6 ). Thereby, circles have a standardized size, i.e., they do not differ from eachanother.3 In particular, circles are graphically better distinguishable from rectangular icons representingdata objects [Nor88]. Thus, data objects can be easier identified and more intuitively identified in the
3Note that the use of different sizes could indicate an unintended semantic meaning, e.g., bigger circles might be consideredas being more important than smaller ones. However, this idea can be picked up in future work, resulting in anotherdimension for information presentation.
83
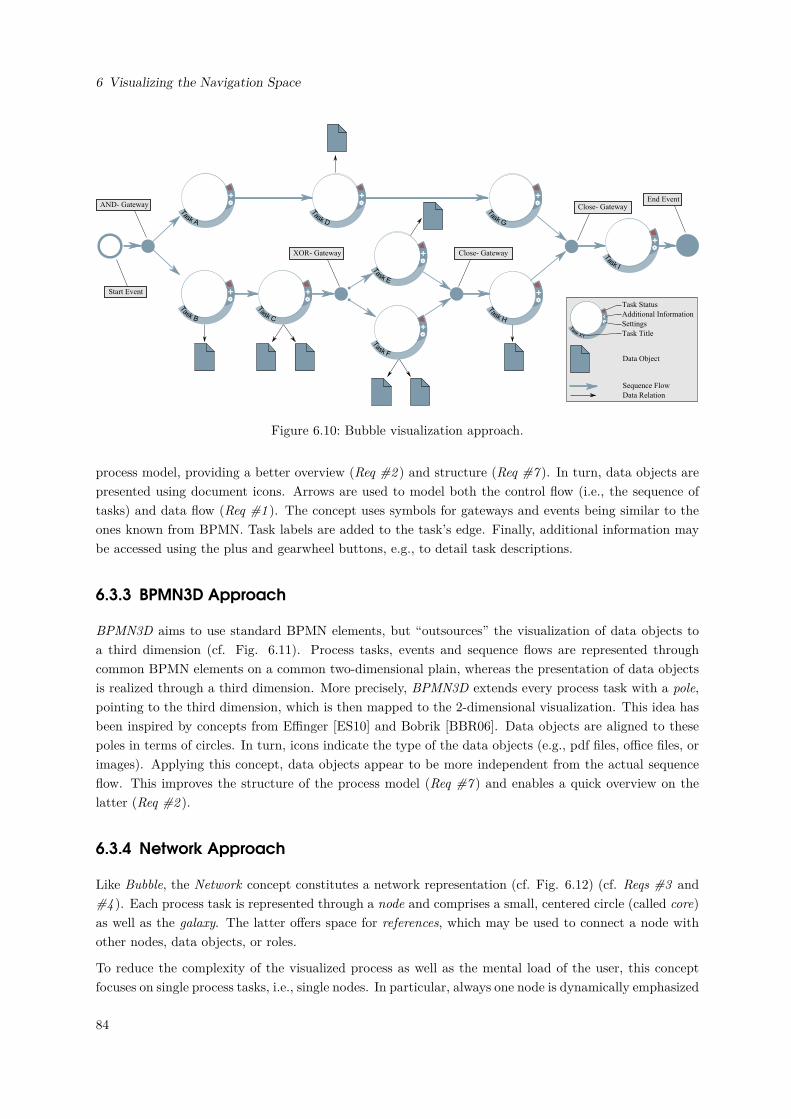
6 Visualizing the Navigation Space
Figure 6.10: Bubble visualization approach.
process model, providing a better overview (Req #2 ) and structure (Req #7 ). In turn, data objects arepresented using document icons. Arrows are used to model both the control flow (i.e., the sequence oftasks) and data flow (Req #1 ). The concept uses symbols for gateways and events being similar to theones known from BPMN. Task labels are added to the task’s edge. Finally, additional information maybe accessed using the plus and gearwheel buttons, e.g., to detail task descriptions.
6.3.3 BPMN3D Approach
BPMN3D aims to use standard BPMN elements, but “outsources” the visualization of data objects toa third dimension (cf. Fig. 6.11). Process tasks, events and sequence flows are represented throughcommon BPMN elements on a common two-dimensional plain, whereas the presentation of data objectsis realized through a third dimension. More precisely, BPMN3D extends every process task with a pole,pointing to the third dimension, which is then mapped to the 2-dimensional visualization. This idea hasbeen inspired by concepts from Effinger [ES10] and Bobrik [BBR06]. Data objects are aligned to thesepoles in terms of circles. In turn, icons indicate the type of the data objects (e.g., pdf files, office files, orimages). Applying this concept, data objects appear to be more independent from the actual sequenceflow. This improves the structure of the process model (Req #7 ) and enables a quick overview on thelatter (Req #2 ).
6.3.4 Network Approach
Like Bubble, the Network concept constitutes a network representation (cf. Fig. 6.12) (cf. Reqs #3 and#4 ). Each process task is represented through a node and comprises a small, centered circle (called core)as well as the galaxy. The latter offers space for references, which may be used to connect a node withother nodes, data objects, or roles.
To reduce the complexity of the visualized process as well as the mental load of the user, this conceptfocuses on single process tasks, i.e., single nodes. In particular, always one node is dynamically emphasized
84
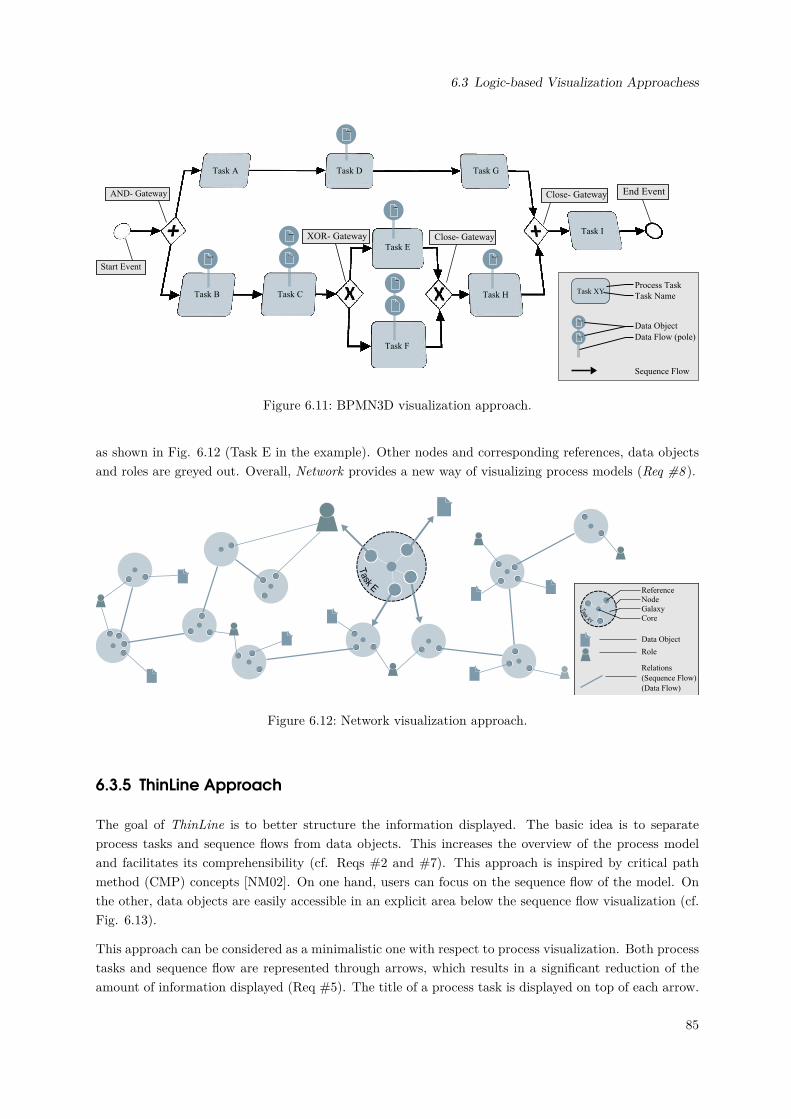
6.3 Logic-based Visualization Approachess
Figure 6.11: BPMN3D visualization approach.
as shown in Fig. 6.12 (Task E in the example). Other nodes and corresponding references, data objectsand roles are greyed out. Overall, Network provides a new way of visualizing process models (Req #8 ).
Figure 6.12: Network visualization approach.
6.3.5 ThinLine Approach
The goal of ThinLine is to better structure the information displayed. The basic idea is to separateprocess tasks and sequence flows from data objects. This increases the overview of the process modeland facilitates its comprehensibility (cf. Reqs #2 and #7). This approach is inspired by critical pathmethod (CMP) concepts [NM02]. On one hand, users can focus on the sequence flow of the model. Onthe other, data objects are easily accessible in an explicit area below the sequence flow visualization (cf.Fig. 6.13).
This approach can be considered as a minimalistic one with respect to process visualization. Both processtasks and sequence flow are represented through arrows, which results in a significant reduction of theamount of information displayed (Req #5). The title of a process task is displayed on top of each arrow.
85
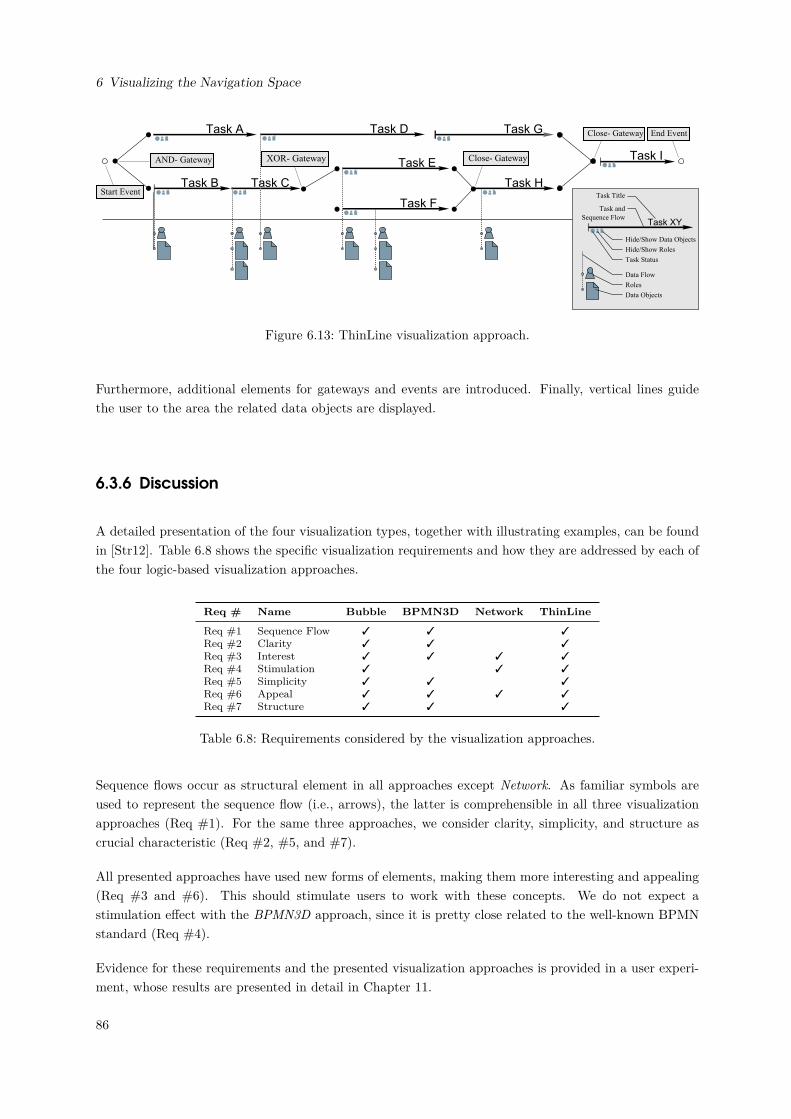
6 Visualizing the Navigation Space
Figure 6.13: ThinLine visualization approach.
Furthermore, additional elements for gateways and events are introduced. Finally, vertical lines guidethe user to the area the related data objects are displayed.
6.3.6 Discussion
A detailed presentation of the four visualization types, together with illustrating examples, can be foundin [Str12]. Table 6.8 shows the specific visualization requirements and how they are addressed by each ofthe four logic-based visualization approaches.
Req # Name Bubble BPMN3D Network ThinLine
Req #1 Sequence Flow 3 3 3Req #2 Clarity 3 3 3Req #3 Interest 3 3 3 3Req #4 Stimulation 3 3 3Req #5 Simplicity 3 3 3Req #6 Appeal 3 3 3 3Req #7 Structure 3 3 3
Table 6.8: Requirements considered by the visualization approaches.
Sequence flows occur as structural element in all approaches except Network. As familiar symbols areused to represent the sequence flow (i.e., arrows), the latter is comprehensible in all three visualizationapproaches (Req #1). For the same three approaches, we consider clarity, simplicity, and structure ascrucial characteristic (Req #2, #5, and #7).
All presented approaches have used new forms of elements, making them more interesting and appealing(Req #3 and #6). This should stimulate users to work with these concepts. We do not expect astimulation effect with the BPMN3D approach, since it is pretty close related to the well-known BPMNstandard (Req #4).
Evidence for these requirements and the presented visualization approaches is provided in a user experi-ment, whose results are presented in detail in Chapter 11.
86
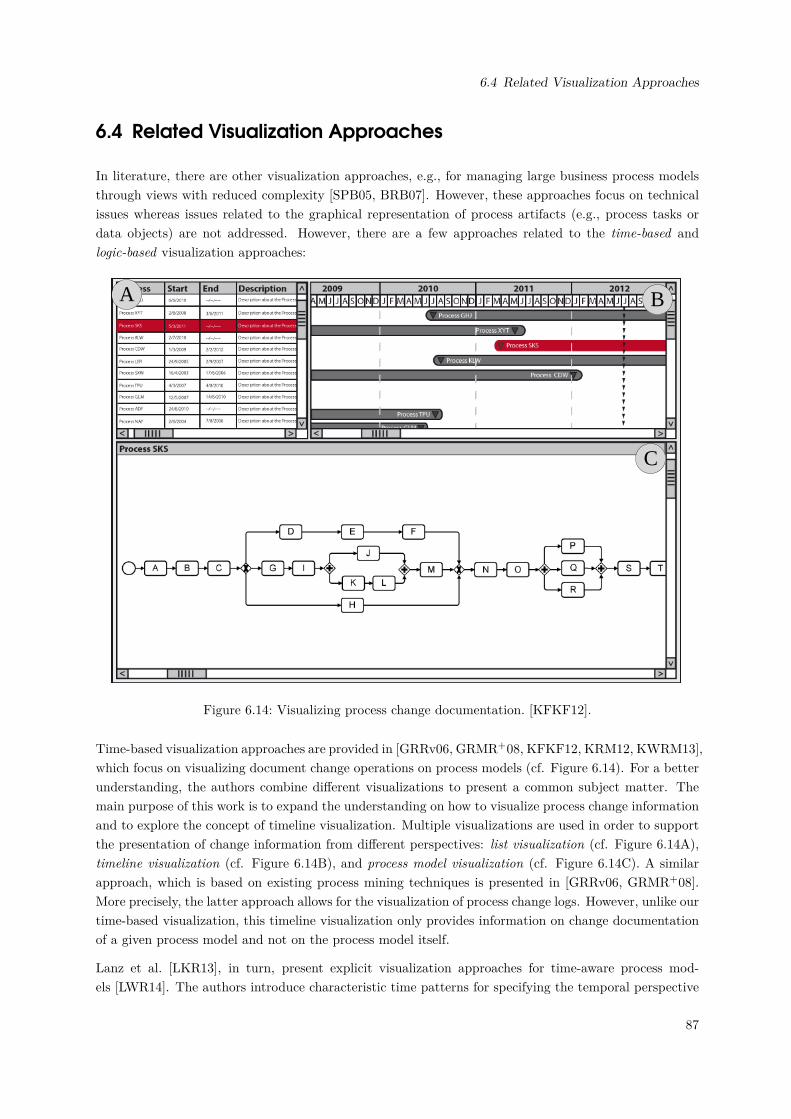
6.4 Related Visualization Approaches
6.4 Related Visualization Approaches
In literature, there are other visualization approaches, e.g., for managing large business process modelsthrough views with reduced complexity [SPB05, BRB07]. However, these approaches focus on technicalissues whereas issues related to the graphical representation of process artifacts (e.g., process tasks ordata objects) are not addressed. However, there are a few approaches related to the time-based andlogic-based visualization approaches:
A B
C
Figure 6.14: Visualizing process change documentation. [KFKF12].
Time-based visualization approaches are provided in [GRRv06, GRMR+08, KFKF12, KRM12, KWRM13],which focus on visualizing document change operations on process models (cf. Figure 6.14). For a betterunderstanding, the authors combine different visualizations to present a common subject matter. Themain purpose of this work is to expand the understanding on how to visualize process change informationand to explore the concept of timeline visualization. Multiple visualizations are used in order to supportthe presentation of change information from different perspectives: list visualization (cf. Figure 6.14A),timeline visualization (cf. Figure 6.14B), and process model visualization (cf. Figure 6.14C). A similarapproach, which is based on existing process mining techniques is presented in [GRRv06, GRMR+08].More precisely, the latter approach allows for the visualization of process change logs. However, unlike ourtime-based visualization, this timeline visualization only provides information on change documentationof a given process model and not on the process model itself.
Lanz et al. [LKR13], in turn, present explicit visualization approaches for time-aware process mod-els [LWR14]. The authors introduce characteristic time patterns for specifying the temporal perspective
87
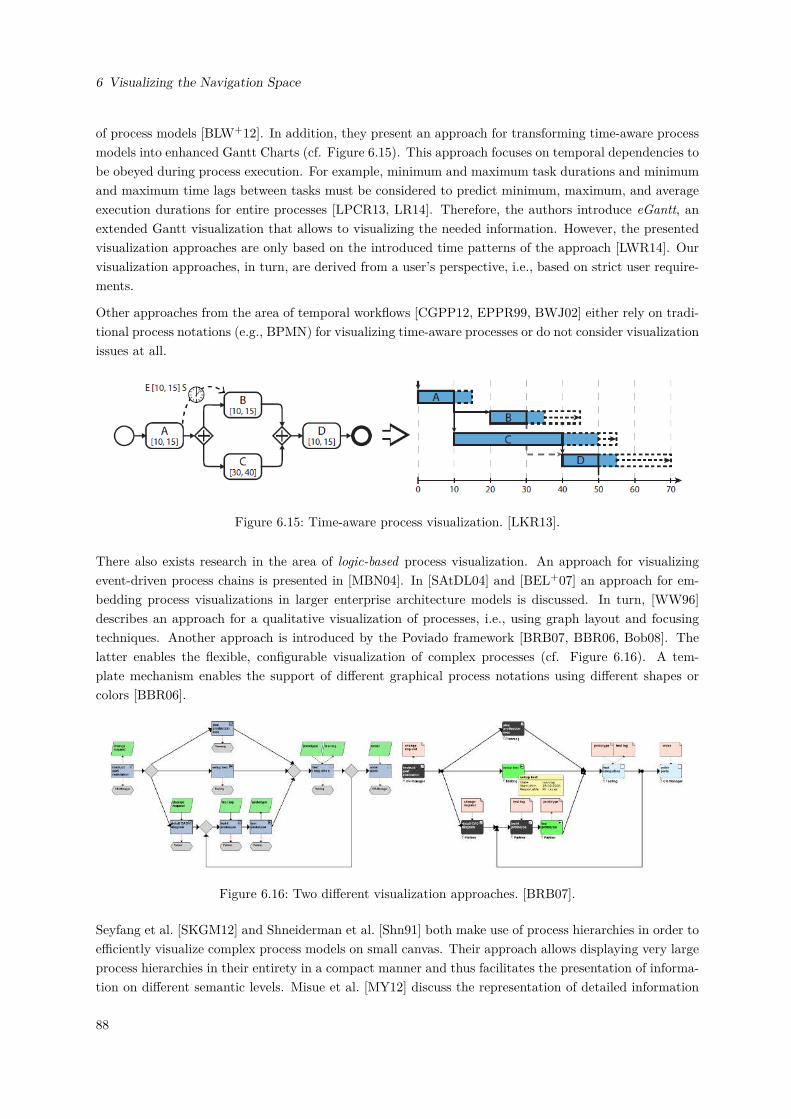
6 Visualizing the Navigation Space
of process models [BLW+12]. In addition, they present an approach for transforming time-aware processmodels into enhanced Gantt Charts (cf. Figure 6.15). This approach focuses on temporal dependencies tobe obeyed during process execution. For example, minimum and maximum task durations and minimumand maximum time lags between tasks must be considered to predict minimum, maximum, and averageexecution durations for entire processes [LPCR13, LR14]. Therefore, the authors introduce eGantt, anextended Gantt visualization that allows to visualizing the needed information. However, the presentedvisualization approaches are only based on the introduced time patterns of the approach [LWR14]. Ourvisualization approaches, in turn, are derived from a user’s perspective, i.e., based on strict user require-ments.
Other approaches from the area of temporal workflows [CGPP12, EPPR99, BWJ02] either rely on tradi-tional process notations (e.g., BPMN) for visualizing time-aware processes or do not consider visualizationissues at all.
Figure 6.15: Time-aware process visualization. [LKR13].
There also exists research in the area of logic-based process visualization. An approach for visualizingevent-driven process chains is presented in [MBN04]. In [SAtDL04] and [BEL+07] an approach for em-bedding process visualizations in larger enterprise architecture models is discussed. In turn, [WW96]describes an approach for a qualitative visualization of processes, i.e., using graph layout and focusingtechniques. Another approach is introduced by the Poviado framework [BRB07, BBR06, Bob08]. Thelatter enables the flexible, configurable visualization of complex processes (cf. Figure 6.16). A tem-plate mechanism enables the support of different graphical process notations using different shapes orcolors [BBR06].
Figure 6.16: Two different visualization approaches. [BRB07].
Seyfang et al. [SKGM12] and Shneiderman et al. [Shn91] both make use of process hierarchies in order toefficiently visualize complex process models on small canvas. Their approach allows displaying very largeprocess hierarchies in their entirety in a compact manner and thus facilitates the presentation of informa-tion on different semantic levels. Misue et al. [MY12] discuss the representation of detailed information
88
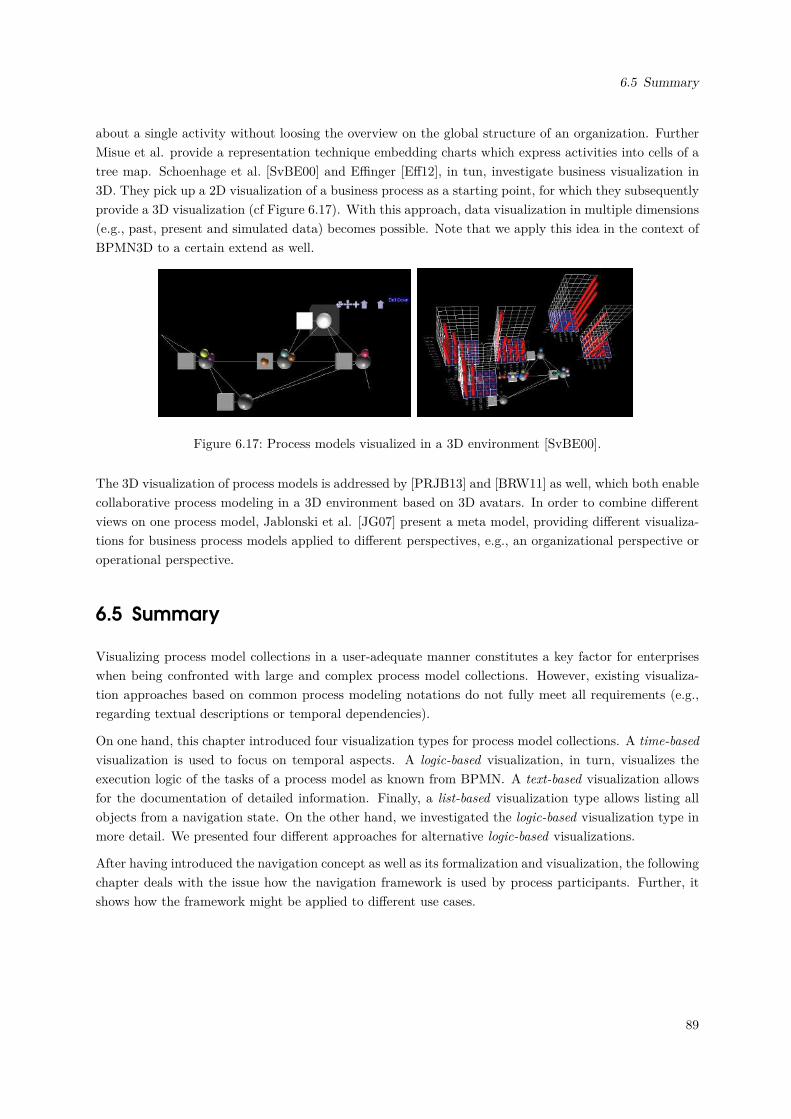
6.5 Summary
about a single activity without loosing the overview on the global structure of an organization. FurtherMisue et al. provide a representation technique embedding charts which express activities into cells of atree map. Schoenhage et al. [SvBE00] and Effinger [Eff12], in tun, investigate business visualization in3D. They pick up a 2D visualization of a business process as a starting point, for which they subsequentlyprovide a 3D visualization (cf Figure 6.17). With this approach, data visualization in multiple dimensions(e.g., past, present and simulated data) becomes possible. Note that we apply this idea in the context ofBPMN3D to a certain extend as well.
Figure 6.17: Process models visualized in a 3D environment [SvBE00].
The 3D visualization of process models is addressed by [PRJB13] and [BRW11] as well, which both enablecollaborative process modeling in a 3D environment based on 3D avatars. In order to combine differentviews on one process model, Jablonski et al. [JG07] present a meta model, providing different visualiza-tions for business process models applied to different perspectives, e.g., an organizational perspective oroperational perspective.
6.5 Summary
Visualizing process model collections in a user-adequate manner constitutes a key factor for enterpriseswhen being confronted with large and complex process model collections. However, existing visualiza-tion approaches based on common process modeling notations do not fully meet all requirements (e.g.,regarding textual descriptions or temporal dependencies).
On one hand, this chapter introduced four visualization types for process model collections. A time-basedvisualization is used to focus on temporal aspects. A logic-based visualization, in turn, visualizes theexecution logic of the tasks of a process model as known from BPMN. A text-based visualization allowsfor the documentation of detailed information. Finally, a list-based visualization type allows listing allobjects from a navigation state. On the other hand, we investigated the logic-based visualization type inmore detail. We presented four different approaches for alternative logic-based visualizations.
After having introduced the navigation concept as well as its formalization and visualization, the followingchapter deals with the issue how the navigation framework is used by process participants. Further, itshows how the framework might be applied to different use cases.
89

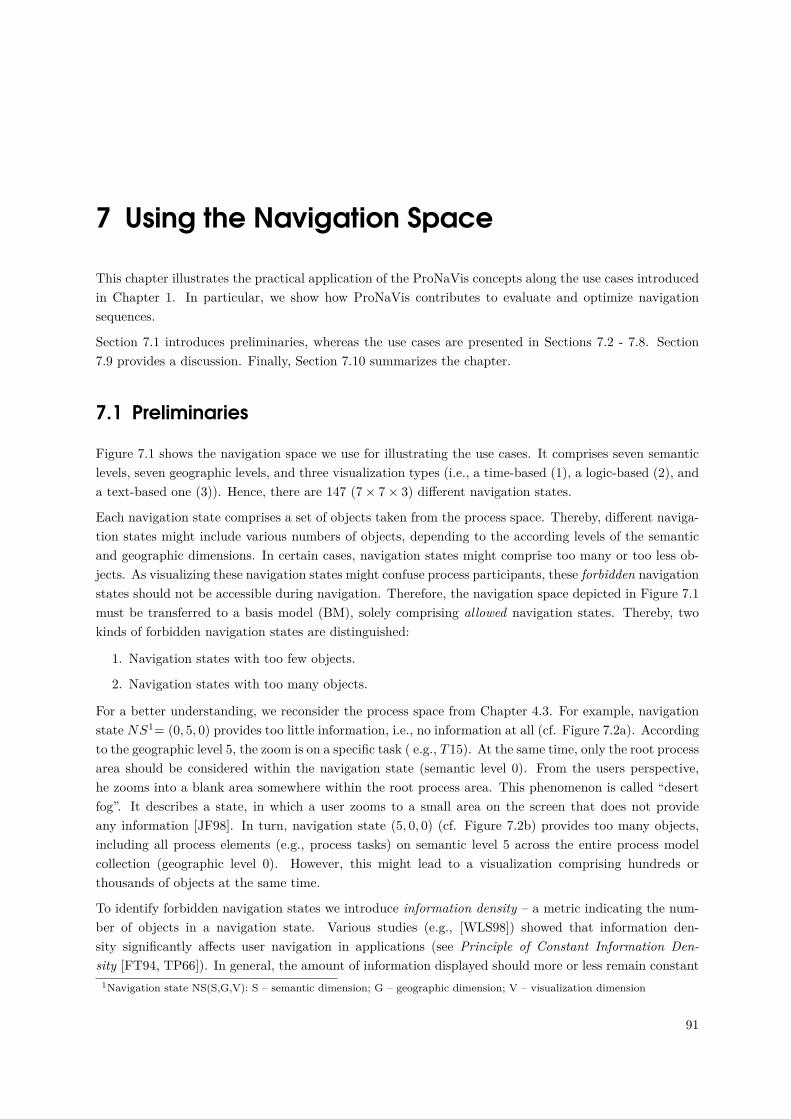
7 Using the Navigation Space
This chapter illustrates the practical application of the ProNaVis concepts along the use cases introducedin Chapter 1. In particular, we show how ProNaVis contributes to evaluate and optimize navigationsequences.
Section 7.1 introduces preliminaries, whereas the use cases are presented in Sections 7.2 - 7.8. Section7.9 provides a discussion. Finally, Section 7.10 summarizes the chapter.
7.1 Preliminaries
Figure 7.1 shows the navigation space we use for illustrating the use cases. It comprises seven semanticlevels, seven geographic levels, and three visualization types (i.e., a time-based (1), a logic-based (2), anda text-based one (3)). Hence, there are 147 (7× 7× 3) different navigation states.
Each navigation state comprises a set of objects taken from the process space. Thereby, different naviga-tion states might include various numbers of objects, depending to the according levels of the semanticand geographic dimensions. In certain cases, navigation states might comprise too many or too less ob-jects. As visualizing these navigation states might confuse process participants, these forbidden navigationstates should not be accessible during navigation. Therefore, the navigation space depicted in Figure 7.1must be transferred to a basis model (BM), solely comprising allowed navigation states. Thereby, twokinds of forbidden navigation states are distinguished:
1. Navigation states with too few objects.
2. Navigation states with too many objects.
For a better understanding, we reconsider the process space from Chapter 4.3. For example, navigationstate NS1= (0, 5, 0) provides too little information, i.e., no information at all (cf. Figure 7.2a). Accordingto the geographic level 5, the zoom is on a specific task ( e.g., T15). At the same time, only the root processarea should be considered within the navigation state (semantic level 0). From the users perspective,he zooms into a blank area somewhere within the root process area. This phenomenon is called “desertfog”. It describes a state, in which a user zooms to a small area on the screen that does not provideany information [JF98]. In turn, navigation state (5, 0, 0) (cf. Figure 7.2b) provides too many objects,including all process elements (e.g., process tasks) on semantic level 5 across the entire process modelcollection (geographic level 0). However, this might lead to a visualization comprising hundreds orthousands of objects at the same time.
To identify forbidden navigation states we introduce information density – a metric indicating the num-ber of objects in a navigation state. Various studies (e.g., [WLS98]) showed that information den-sity significantly affects user navigation in applications (see Principle of Constant Information Den-sity [FT94, TP66]). In general, the amount of information displayed should more or less remain constant
1Navigation state NS(S,G,V): S – semantic dimension; G – geographic dimension; V – visualization dimension
91
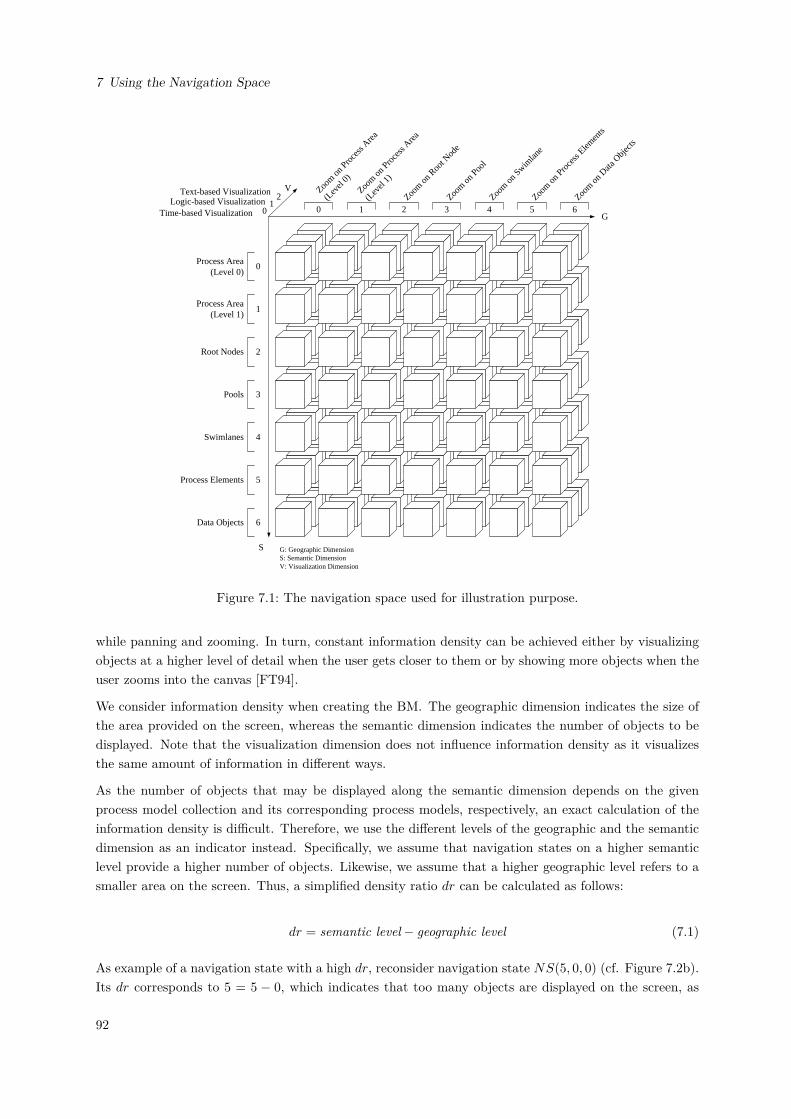
7 Using the Navigation Space
G
S
V
G: Geographic DimensionS: Semantic DimensionV: Visualization Dimension
Process Area (Level 0)
Process Area (Level 1)
Root Nodes
Pools
Swimlanes
Process Elements
Data Objects
Time-based VisualizationLogic-based Visualization
Text-based Visualization Zoom on
Pro
cess
Area
(Lev
el 0)
Zoom on
Roo
t Nod
e
Zoom on
Poo
l
Zoom on
Swim
lane
Zoom on
Pro
cess
Elemen
ts
Zoom on
Data
Obje
cts
Zoom on
Pro
cess
Area
(Lev
el 1)
10
2
1
0
2
3
4
5
6
0 1 2 3 4 5 6
Figure 7.1: The navigation space used for illustration purpose.
while panning and zooming. In turn, constant information density can be achieved either by visualizingobjects at a higher level of detail when the user gets closer to them or by showing more objects when theuser zooms into the canvas [FT94].
We consider information density when creating the BM. The geographic dimension indicates the size ofthe area provided on the screen, whereas the semantic dimension indicates the number of objects to bedisplayed. Note that the visualization dimension does not influence information density as it visualizesthe same amount of information in different ways.
As the number of objects that may be displayed along the semantic dimension depends on the givenprocess model collection and its corresponding process models, respectively, an exact calculation of theinformation density is difficult. Therefore, we use the different levels of the geographic and the semanticdimension as an indicator instead. Specifically, we assume that navigation states on a higher semanticlevel provide a higher number of objects. Likewise, we assume that a higher geographic level refers to asmaller area on the screen. Thus, a simplified density ratio dr can be calculated as follows:
dr = semantic level− geographic level (7.1)
As example of a navigation state with a high dr, reconsider navigation state NS(5, 0, 0) (cf. Figure 7.2b).Its dr corresponds to 5 = 5 − 0, which indicates that too many objects are displayed on the screen, as
92
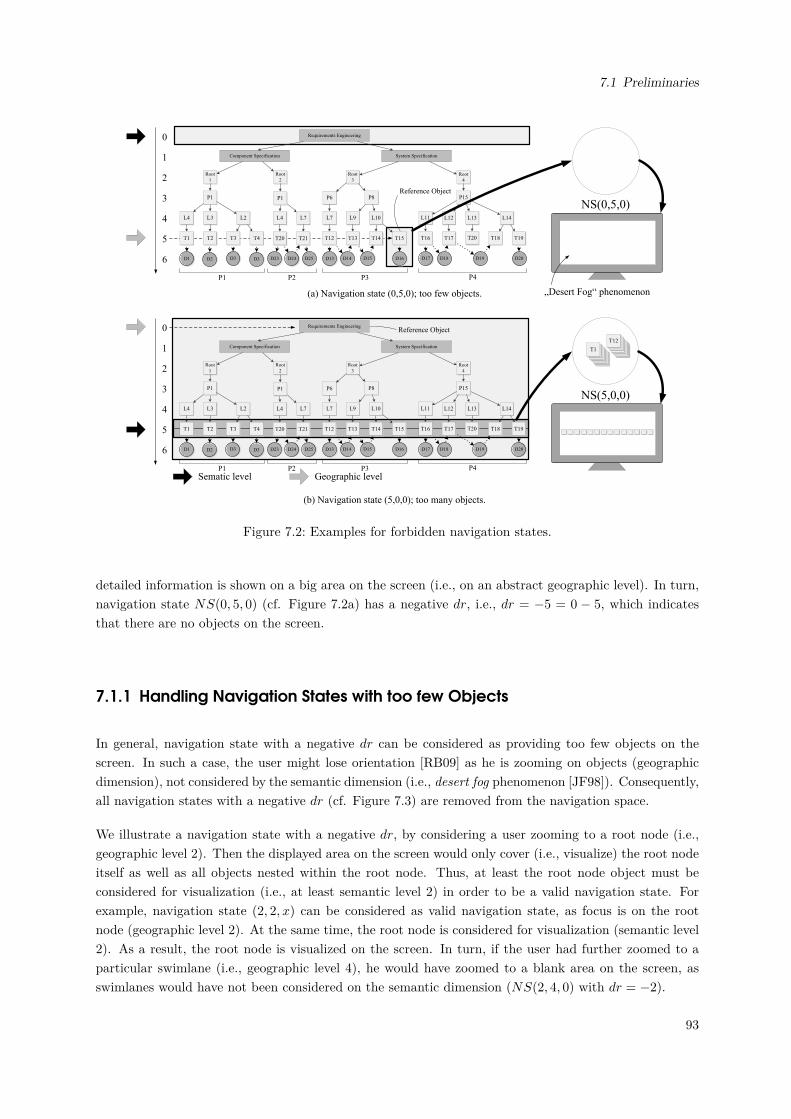
7.1 Preliminaries
P8
L3 L2
P1
Root
1
L4 L9 L10
P8
Root
3
P6
L7
Root
2
L4 L12 L14L13
P15
L11
P1 P2 P4P3
L7
Component Specification System Specification
D1 D2 D3 D3 D23 D24 D25 D13 D14 D15 D16 D17 D18 D19 D20
P1
Root
4
0
1
2
3
4
5
6
Reference Object
T2 T3 T4T1 T13 T14 T15T12T21T20 T17 T18 T19T16
T1
NS(5,0,0)
T12
T2 T3 T4T1 T13 T14 T15T12T21T20 T17 T18 T19T16 T20
Requirements Engineering
Root
3
L3 L2
P1
Root
1
L4 L9
P6
L7
Root
2
L4 L12 L14L13
P15
L11
P1 P2 P4P3
L7
Component Specification System Specification
Requirements Engineering
D1 D2 D3 D3 D23 D24 D25 D13 D14 D15 D16 D17 D18 D19 D20
P1
Root
4
0
1
2
3
4
5
6
NS(0,5,0)
Reference Object
T2 T3 T4T1 T13 T14 T15T12T21T20 T17 T18 T19T16 T20
L10
Geographic levelSematic level
„Desert Fog“ phenomenon
(b) Navigation state (5,0,0); too many objects.
(a) Navigation state (0,5,0); too few objects.
Figure 7.2: Examples for forbidden navigation states.
detailed information is shown on a big area on the screen (i.e., on an abstract geographic level). In turn,navigation state NS(0, 5, 0) (cf. Figure 7.2a) has a negative dr, i.e., dr = −5 = 0 − 5, which indicatesthat there are no objects on the screen.
7.1.1 Handling Navigation States with too few Objects
In general, navigation state with a negative dr can be considered as providing too few objects on thescreen. In such a case, the user might lose orientation [RB09] as he is zooming on objects (geographicdimension), not considered by the semantic dimension (i.e., desert fog phenomenon [JF98]). Consequently,all navigation states with a negative dr (cf. Figure 7.3) are removed from the navigation space.
We illustrate a navigation state with a negative dr, by considering a user zooming to a root node (i.e.,geographic level 2). Then the displayed area on the screen would only cover (i.e., visualize) the root nodeitself as well as all objects nested within the root node. Thus, at least the root node object must beconsidered for visualization (i.e., at least semantic level 2) in order to be a valid navigation state. Forexample, navigation state (2, 2, x) can be considered as valid navigation state, as focus is on the rootnode (geographic level 2). At the same time, the root node is considered for visualization (semantic level2). As a result, the root node is visualized on the screen. In turn, if the user had further zoomed to aparticular swimlane (i.e., geographic level 4), he would have zoomed to a blank area on the screen, asswimlanes would have not been considered on the semantic dimension (NS(2, 4, 0) with dr = −2).
93
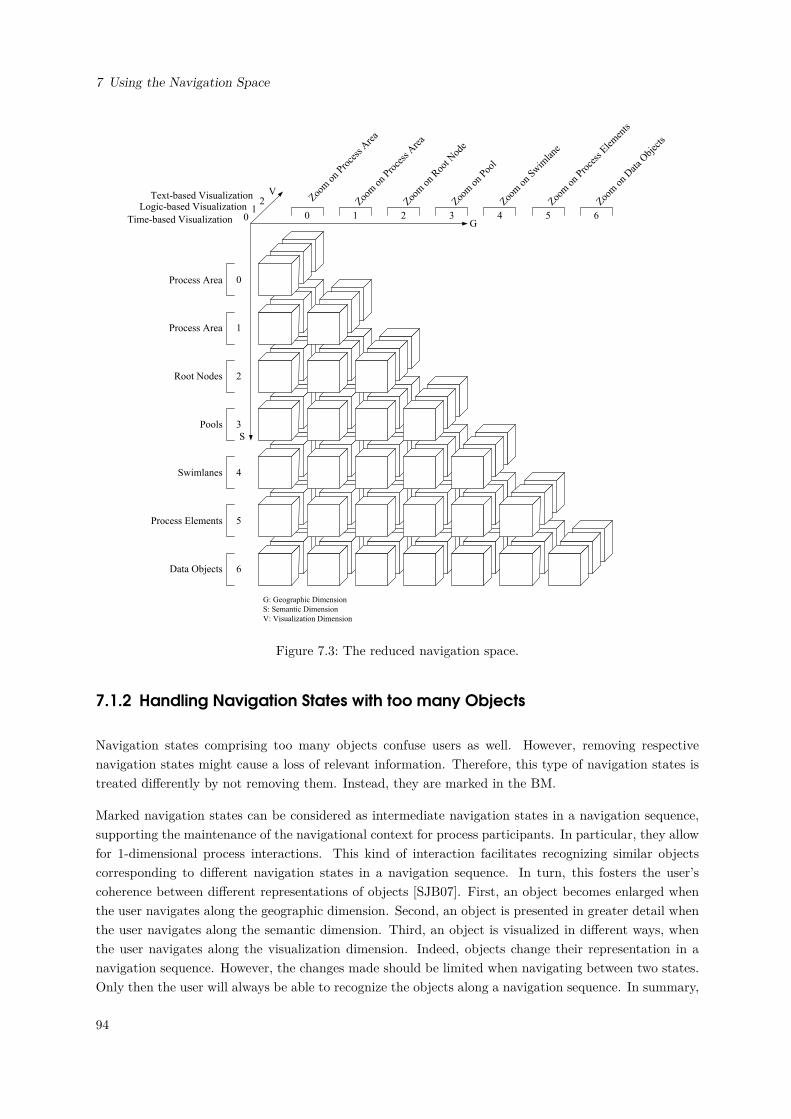
7 Using the Navigation Space
G
S
V
G: Geographic Dimension
S: Semantic Dimension
V: Visualization Dimension
Process Area
Process Area
Root Nodes
Pools
Swimlanes
Process Elements
Data Objects
Time-based Visualization
Logic-based VisualizationText-based Visualization Zoo
m o
n Pro
cess
Are
a
Zoom
on
Roo
t Nod
e
Zoom
on
Pool
Zoom
on
Swim
lane
Zoom
on
Proce
ss E
lem
ents
Zoom
on
Dat
a O
bjec
ts
Zoom
on
Proce
ss A
rea
10
2
1
0
2
3
4
5
6
0 1 2 3 4 5 6
Figure 7.3: The reduced navigation space.
7.1.2 Handling Navigation States with too many Objects
Navigation states comprising too many objects confuse users as well. However, removing respectivenavigation states might cause a loss of relevant information. Therefore, this type of navigation states istreated differently by not removing them. Instead, they are marked in the BM.
Marked navigation states can be considered as intermediate navigation states in a navigation sequence,supporting the maintenance of the navigational context for process participants. In particular, they allowfor 1-dimensional process interactions. This kind of interaction facilitates recognizing similar objectscorresponding to different navigation states in a navigation sequence. In turn, this fosters the user’scoherence between different representations of objects [SJB07]. First, an object becomes enlarged whenthe user navigates along the geographic dimension. Second, an object is presented in greater detail whenthe user navigates along the semantic dimension. Third, an object is visualized in different ways, whenthe user navigates along the visualization dimension. Indeed, objects change their representation in anavigation sequence. However, the changes made should be limited when navigating between two states.Only then the user will always be able to recognize the objects along a navigation sequence. In summary,
94
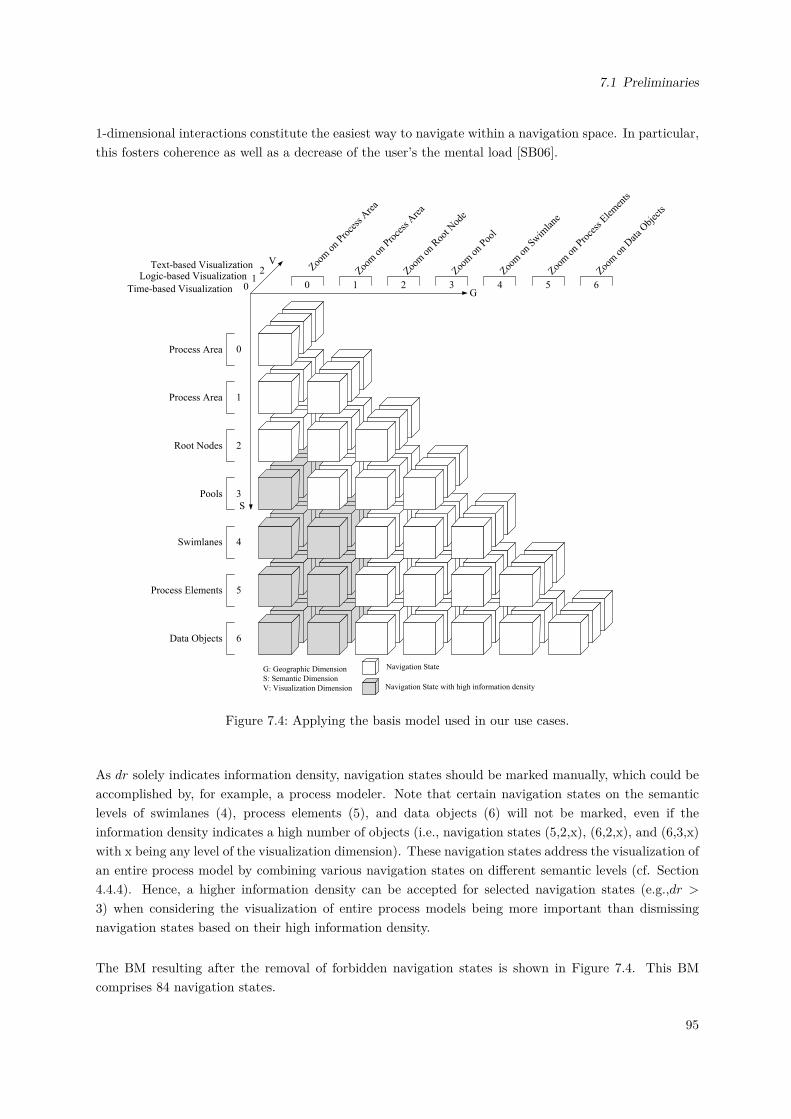
7.1 Preliminaries
1-dimensional interactions constitute the easiest way to navigate within a navigation space. In particular,this fosters coherence as well as a decrease of the user’s the mental load [SB06].
G
S
V
G: Geographic Dimension
S: Semantic Dimension
V: Visualization Dimension
Process Area
Process Area
Root Nodes
Pools
Swimlanes
Process Elements
Data Objects
Time-based Visualization
Logic-based VisualizationText-based Visualization Zoo
m o
n Pro
cess
Are
a
Zoom
on
Roo
t Nod
e
Zoom
on
Pool
Zoom
on
Swim
lane
Zoom
on
Proce
ss E
lem
ents
Zoom
on
Dat
a O
bjec
ts
Zoom
on
Proce
ss A
rea
10
2
1
0
2
3
4
5
6
0 1 2 3 4 5 6
Navigation State
Navigation State with high information density
Figure 7.4: Applying the basis model used in our use cases.
As dr solely indicates information density, navigation states should be marked manually, which could beaccomplished by, for example, a process modeler. Note that certain navigation states on the semanticlevels of swimlanes (4), process elements (5), and data objects (6) will not be marked, even if theinformation density indicates a high number of objects (i.e., navigation states (5,2,x), (6,2,x), and (6,3,x)with x being any level of the visualization dimension). These navigation states address the visualization ofan entire process model by combining various navigation states on different semantic levels (cf. Section4.4.4). Hence, a higher information density can be accepted for selected navigation states (e.g.,dr >3) when considering the visualization of entire process models being more important than dismissingnavigation states based on their high information density.
The BM resulting after the removal of forbidden navigation states is shown in Figure 7.4. This BMcomprises 84 navigation states.
95
7 Using the Navigation Space
7.1.3 Methodology
In the following, we refer to the use cases presented in Chapter 1 (cf. Table 7.1). In particular, weinvestigate navigation sequences required to realize the use cases.
# Name Title
1 Project Manager A project manager needs an overview on the entire processmodel collection.
2 Business Unit Manager A business unit manager needs information about the processmodels refering to his business unit.
3 Requirements Engineer A requirements engineer needs detailed descriptions of a cer-tain process task.
4 New Employee A new employee wants to get an overview of all process steps,he must perform.
5 Quality Manager A quality manager shall ensure the quality of all documentscorresponding to a process model collection.
6 Quality Engineer A quality engineer shall identify the process tasks related toa certain deadline.
7 Test Engineer A test engineer needs access to process models from differentprocess areas.
Table 7.1: Considered use cases.
For describing these navigation sequences, we apply the structure proposed by Fowler [Fow04]. In thefollowing subsections, each use case is structured as follows:
• Title: The use case is associated with a title.
• Description: The main goal of the use case is briefly described (based on the use case descriptionsintroduced in Chapter 1).
• Main Success Scenario (Navigation Sequence): Based on the given BM, we present a defaultnavigation sequence for the use case. This sequence consists of 1-dimensional process interactionsand can be directly derived from the use case descriptions. Note that NS(0, 0, 0) is used as startingstate for the navigation sequence.
We structure the navigation sequence along the three navigation dimensions. In the first step, weillustrate which navigation steps are required with respect to the semantic dimension. In the secondstep, navigation steps required for the geographic dimension are considered. The third step dealswith navigation steps required in the context of the visualization dimension. Finally, in a fourthstep, we show how filter mechanisms can be applied to better support the use case.
• Analysis: We analyze the default navigation sequence by calculating the linear distance DISTbetween the start and the end point of the sequence. Further, we calculate the length of the givennavigation sequence, i.e., NAVDISTNavSeq (cf. Section 5.3).
• Improvement: We illustrate how the default navigation sequence can be replaced by a betteralternative, e.g., considering multi-dimensional process interactions (cf. Section 5.4). We calculatethe effectivity Eff for both the old and the new navigation sequence, and compare them with eachother.
7.2 Use Case 1
Title: A project manager needs an overview on the entire process model collection.
96
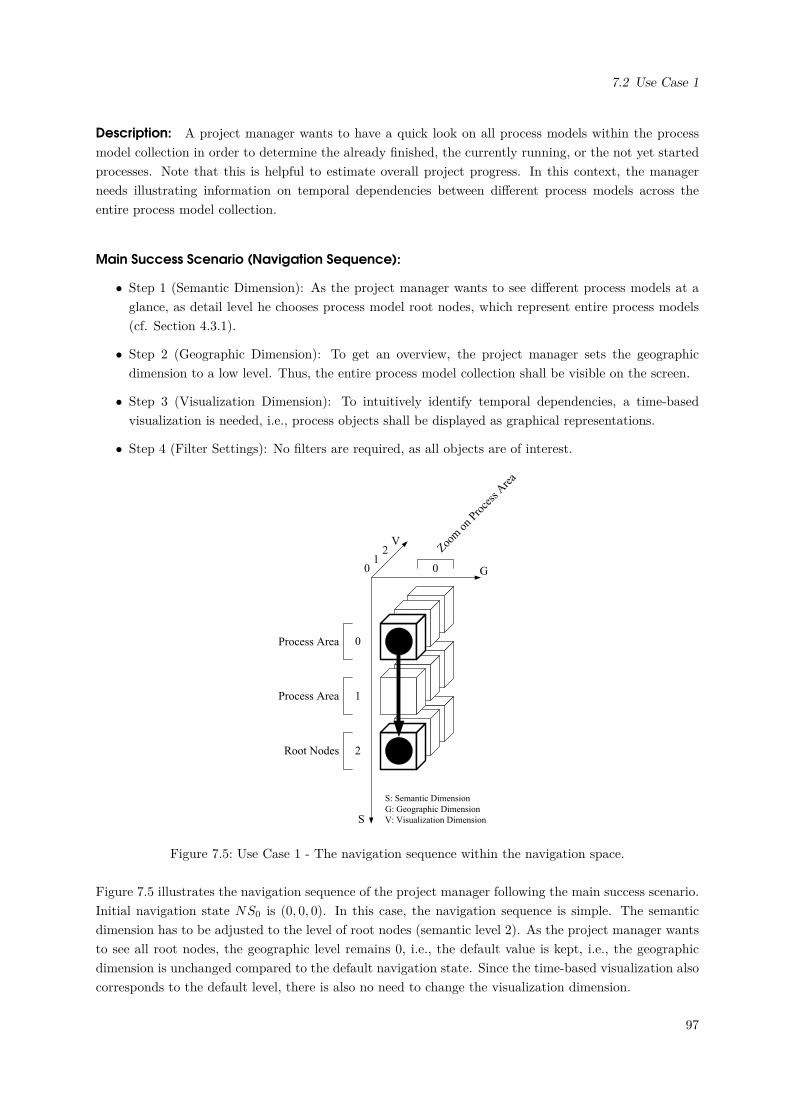
7.2 Use Case 1
Description: A project manager wants to have a quick look on all process models within the processmodel collection in order to determine the already finished, the currently running, or the not yet startedprocesses. Note that this is helpful to estimate overall project progress. In this context, the managerneeds illustrating information on temporal dependencies between different process models across theentire process model collection.
Main Success Scenario (Navigation Sequence):
• Step 1 (Semantic Dimension): As the project manager wants to see different process models at aglance, as detail level he chooses process model root nodes, which represent entire process models(cf. Section 4.3.1).
• Step 2 (Geographic Dimension): To get an overview, the project manager sets the geographicdimension to a low level. Thus, the entire process model collection shall be visible on the screen.
• Step 3 (Visualization Dimension): To intuitively identify temporal dependencies, a time-basedvisualization is needed, i.e., process objects shall be displayed as graphical representations.
• Step 4 (Filter Settings): No filters are required, as all objects are of interest.
G
S
V
S: Semantic Dimension
G: Geographic Dimension
V: Visualization Dimension
Process Area
Process Area
Root Nodes
Zoom
on
Proce
ss A
rea
1
0
2
01
0
2
Figure 7.5: Use Case 1 - The navigation sequence within the navigation space.
Figure 7.5 illustrates the navigation sequence of the project manager following the main success scenario.Initial navigation state NS0 is (0, 0, 0). In this case, the navigation sequence is simple. The semanticdimension has to be adjusted to the level of root nodes (semantic level 2). As the project manager wantsto see all root nodes, the geographic level remains 0, i.e., the default value is kept, i.e., the geographicdimension is unchanged compared to the default navigation state. Since the time-based visualization alsocorresponds to the default level, there is also no need to change the visualization dimension.
97
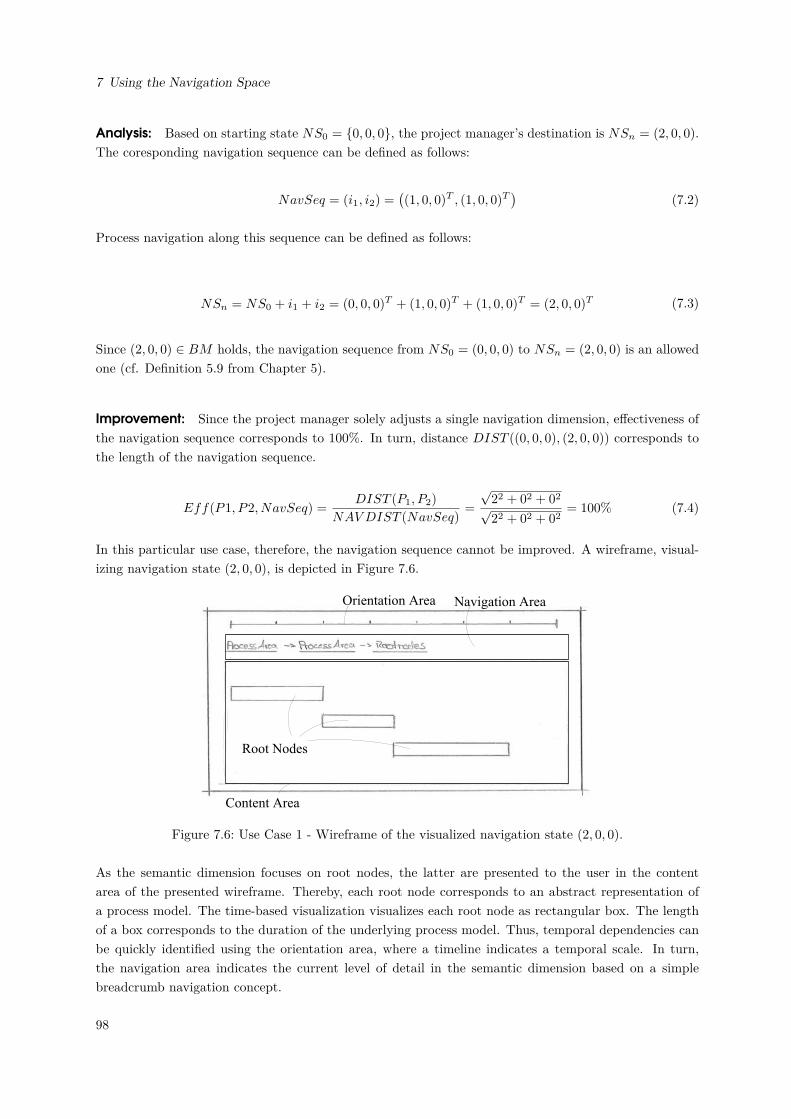
7 Using the Navigation Space
Analysis: Based on starting state NS0 = {0, 0, 0}, the project manager’s destination is NSn = (2, 0, 0).The coresponding navigation sequence can be defined as follows:
NavSeq = (i1, i2) =((1, 0, 0)T , (1, 0, 0)T
)(7.2)
Process navigation along this sequence can be defined as follows:
NSn = NS0 + i1 + i2 = (0, 0, 0)T + (1, 0, 0)T + (1, 0, 0)T = (2, 0, 0)T (7.3)
Since (2, 0, 0) ∈ BM holds, the navigation sequence from NS0 = (0, 0, 0) to NSn = (2, 0, 0) is an allowedone (cf. Definition 5.9 from Chapter 5).
Improvement: Since the project manager solely adjusts a single navigation dimension, effectiveness ofthe navigation sequence corresponds to 100%. In turn, distance DIST ((0, 0, 0), (2, 0, 0)) corresponds tothe length of the navigation sequence.
Eff(P1, P2, NavSeq) =DIST (P1, P2)
NAVDIST (NavSeq)=
√22 + 02 + 02√22 + 02 + 02
= 100% (7.4)
In this particular use case, therefore, the navigation sequence cannot be improved. A wireframe, visual-izing navigation state (2, 0, 0), is depicted in Figure 7.6.
Root Nodes
Content Area
Navigation AreaOrientation Area
Figure 7.6: Use Case 1 - Wireframe of the visualized navigation state (2, 0, 0).
As the semantic dimension focuses on root nodes, the latter are presented to the user in the contentarea of the presented wireframe. Thereby, each root node corresponds to an abstract representation ofa process model. The time-based visualization visualizes each root node as rectangular box. The lengthof a box corresponds to the duration of the underlying process model. Thus, temporal dependencies canbe quickly identified using the orientation area, where a timeline indicates a temporal scale. In turn,the navigation area indicates the current level of detail in the semantic dimension based on a simplebreadcrumb navigation concept.
98
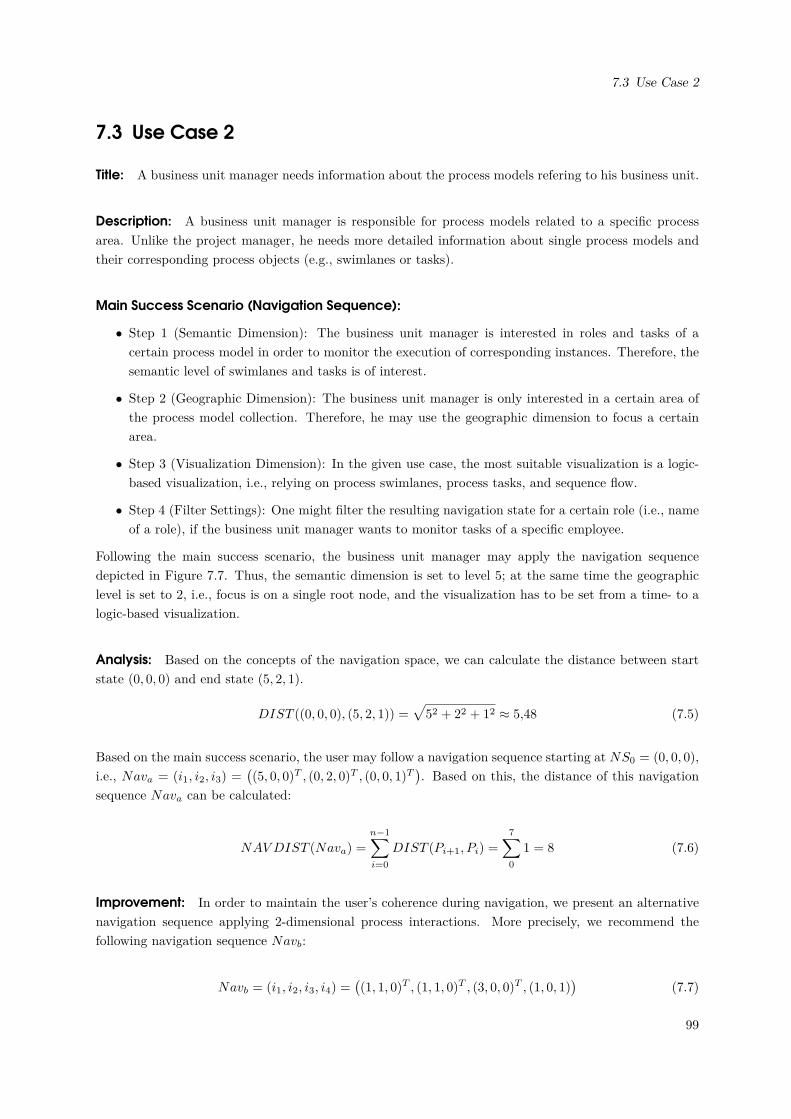
7.3 Use Case 2
7.3 Use Case 2
Title: A business unit manager needs information about the process models refering to his business unit.
Description: A business unit manager is responsible for process models related to a specific processarea. Unlike the project manager, he needs more detailed information about single process models andtheir corresponding process objects (e.g., swimlanes or tasks).
Main Success Scenario (Navigation Sequence):
• Step 1 (Semantic Dimension): The business unit manager is interested in roles and tasks of acertain process model in order to monitor the execution of corresponding instances. Therefore, thesemantic level of swimlanes and tasks is of interest.
• Step 2 (Geographic Dimension): The business unit manager is only interested in a certain area ofthe process model collection. Therefore, he may use the geographic dimension to focus a certainarea.
• Step 3 (Visualization Dimension): In the given use case, the most suitable visualization is a logic-based visualization, i.e., relying on process swimlanes, process tasks, and sequence flow.
• Step 4 (Filter Settings): One might filter the resulting navigation state for a certain role (i.e., nameof a role), if the business unit manager wants to monitor tasks of a specific employee.
Following the main success scenario, the business unit manager may apply the navigation sequencedepicted in Figure 7.7. Thus, the semantic dimension is set to level 5; at the same time the geographiclevel is set to 2, i.e., focus is on a single root node, and the visualization has to be set from a time- to alogic-based visualization.
Analysis: Based on the concepts of the navigation space, we can calculate the distance between startstate (0, 0, 0) and end state (5, 2, 1).
DIST ((0, 0, 0), (5, 2, 1)) =√
52 + 22 + 12 ≈ 5,48 (7.5)
Based on the main success scenario, the user may follow a navigation sequence starting at NS0 = (0, 0, 0),i.e., Nava = (i1, i2, i3) =
((5, 0, 0)T , (0, 2, 0)T , (0, 0, 1)T
). Based on this, the distance of this navigation
sequence Nava can be calculated:
NAVDIST (Nava) =
n−1∑i=0
DIST (Pi+1, Pi) =
7∑0
1 = 8 (7.6)
Improvement: In order to maintain the user’s coherence during navigation, we present an alternativenavigation sequence applying 2-dimensional process interactions. More precisely, we recommend thefollowing navigation sequence Navb:
Navb = (i1, i2, i3, i4) =((1, 1, 0)T , (1, 1, 0)T , (3, 0, 0)T , (1, 0, 1)
)(7.7)
99
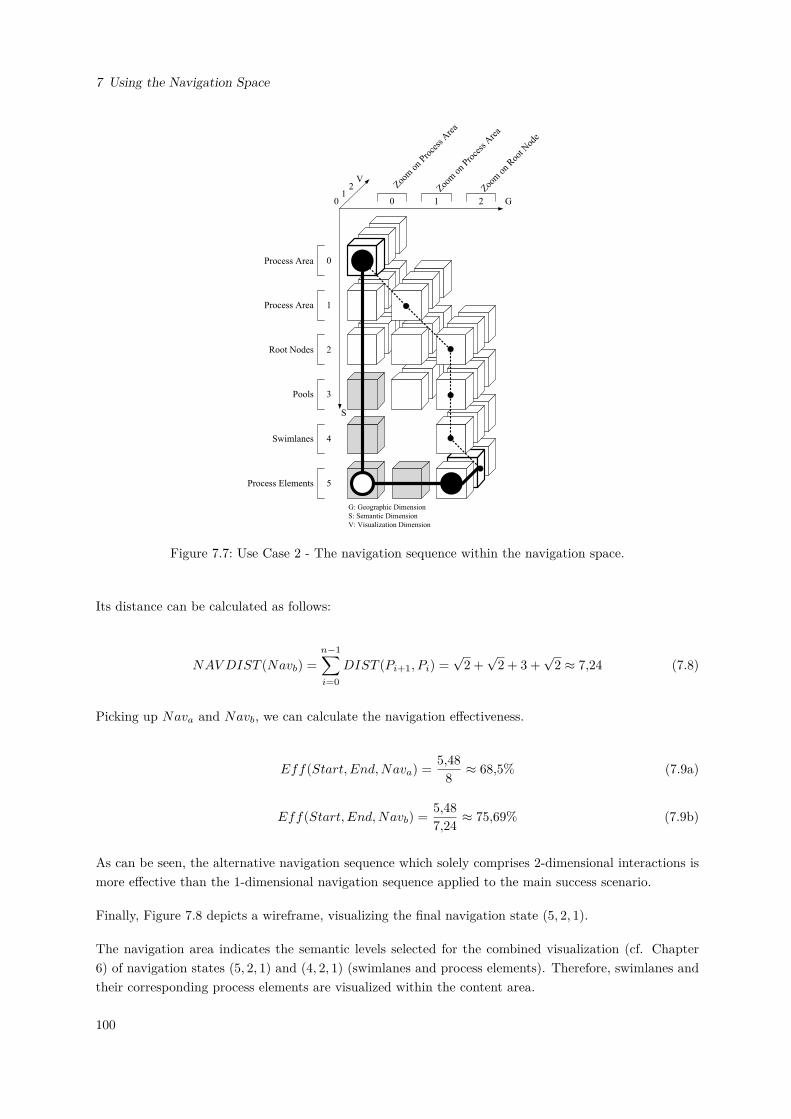
7 Using the Navigation Space
G
S
V
G: Geographic Dimension
S: Semantic Dimension
V: Visualization Dimension
Process Area
Process Area
Root Nodes
Pools
Swimlanes
Process Elements
Zoom
on
Proce
ss A
rea
Zoom
on
Roo
t Nod
e
Zoom
on
Proce
ss A
rea
1
0
2
3
4
5
0 1 21
0
2
Figure 7.7: Use Case 2 - The navigation sequence within the navigation space.
Its distance can be calculated as follows:
NAVDIST (Navb) =
n−1∑i=0
DIST (Pi+1, Pi) =√2 +√2 + 3 +
√2 ≈ 7,24 (7.8)
Picking up Nava and Navb, we can calculate the navigation effectiveness.
Eff(Start, End,Nava) =5,48
8≈ 68,5% (7.9a)
Eff(Start, End,Navb) =5,48
7,24≈ 75,69% (7.9b)
As can be seen, the alternative navigation sequence which solely comprises 2-dimensional interactions ismore effective than the 1-dimensional navigation sequence applied to the main success scenario.
Finally, Figure 7.8 depicts a wireframe, visualizing the final navigation state (5, 2, 1).
The navigation area indicates the semantic levels selected for the combined visualization (cf. Chapter6) of navigation states (5, 2, 1) and (4, 2, 1) (swimlanes and process elements). Therefore, swimlanes andtheir corresponding process elements are visualized within the content area.
100
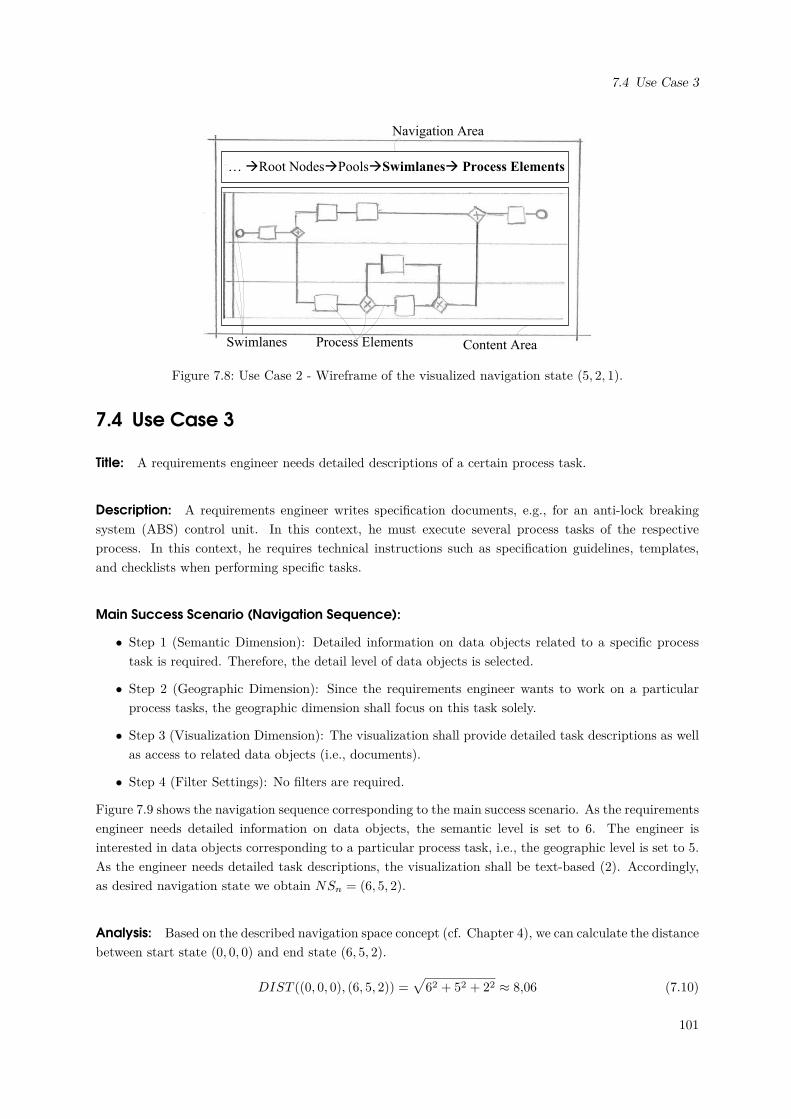
7.4 Use Case 3
… àRoot NodesàPoolsàSwimlanesà Process Elements
Swimlanes Process Elements
Navigation Area
Content Area
Figure 7.8: Use Case 2 - Wireframe of the visualized navigation state (5, 2, 1).
7.4 Use Case 3
Title: A requirements engineer needs detailed descriptions of a certain process task.
Description: A requirements engineer writes specification documents, e.g., for an anti-lock breakingsystem (ABS) control unit. In this context, he must execute several process tasks of the respectiveprocess. In this context, he requires technical instructions such as specification guidelines, templates,and checklists when performing specific tasks.
Main Success Scenario (Navigation Sequence):
• Step 1 (Semantic Dimension): Detailed information on data objects related to a specific processtask is required. Therefore, the detail level of data objects is selected.
• Step 2 (Geographic Dimension): Since the requirements engineer wants to work on a particularprocess tasks, the geographic dimension shall focus on this task solely.
• Step 3 (Visualization Dimension): The visualization shall provide detailed task descriptions as wellas access to related data objects (i.e., documents).
• Step 4 (Filter Settings): No filters are required.
Figure 7.9 shows the navigation sequence corresponding to the main success scenario. As the requirementsengineer needs detailed information on data objects, the semantic level is set to 6. The engineer isinterested in data objects corresponding to a particular process task, i.e., the geographic level is set to 5.As the engineer needs detailed task descriptions, the visualization shall be text-based (2). Accordingly,as desired navigation state we obtain NSn = (6, 5, 2).
Analysis: Based on the described navigation space concept (cf. Chapter 4), we can calculate the distancebetween start state (0, 0, 0) and end state (6, 5, 2).
DIST ((0, 0, 0), (6, 5, 2)) =√
62 + 52 + 22 ≈ 8,06 (7.10)
101
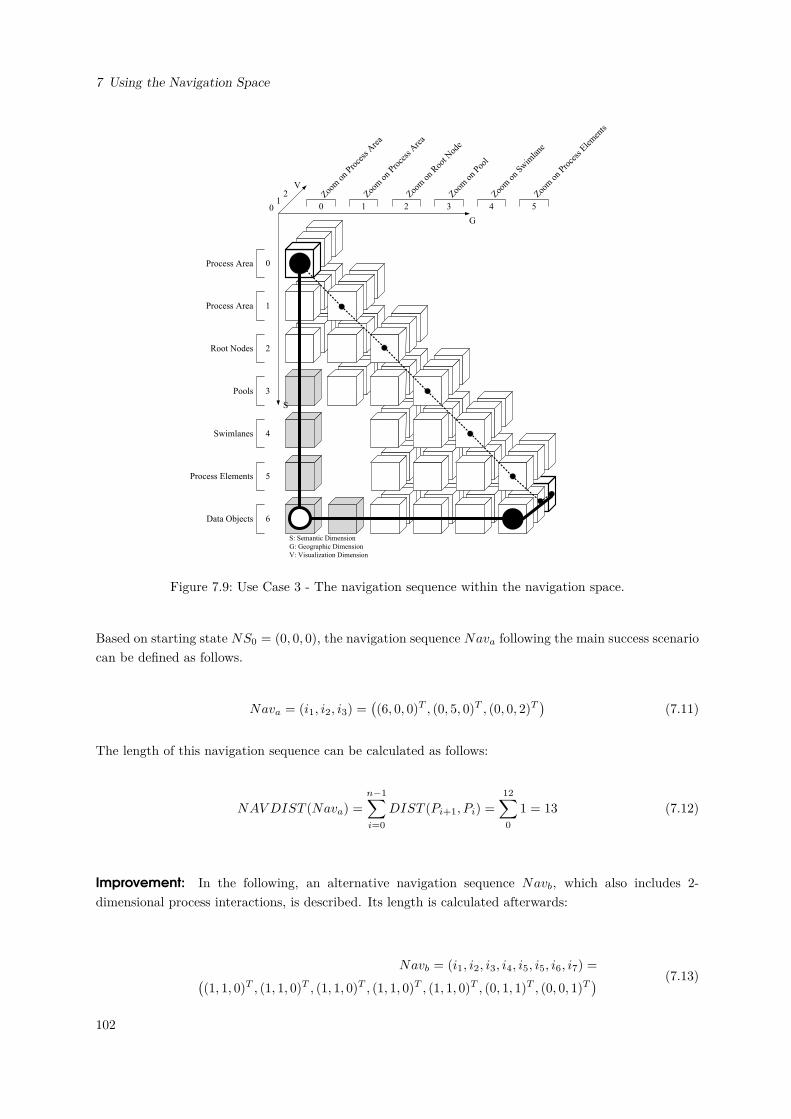
7 Using the Navigation Space
G
S
V
S: Semantic Dimension
G: Geographic Dimension
V: Visualization Dimension
Process Area
Process Area
Root Nodes
Pools
Swimlanes
Process Elements
Data Objects
1
0
2
3
4
5
6
Zoom
on
Proce
ss A
rea
Zoom
on
Pool
Zoom
on
Swim
lane
Zoom
on
Proce
ss E
lem
ents
Zoom
on
Proce
ss A
rea
Zoom
on
Roo
t Nod
e
10
2
0 1 2 3 4 5
Figure 7.9: Use Case 3 - The navigation sequence within the navigation space.
Based on starting state NS0 = (0, 0, 0), the navigation sequence Nava following the main success scenariocan be defined as follows.
Nava = (i1, i2, i3) =((6, 0, 0)T , (0, 5, 0)T , (0, 0, 2)T
)(7.11)
The length of this navigation sequence can be calculated as follows:
NAVDIST (Nava) =
n−1∑i=0
DIST (Pi+1, Pi) =
12∑0
1 = 13 (7.12)
Improvement: In the following, an alternative navigation sequence Navb, which also includes 2-dimensional process interactions, is described. Its length is calculated afterwards:
Navb = (i1, i2, i3, i4, i5, i5, i6, i7) =((1, 1, 0)T , (1, 1, 0)T , (1, 1, 0)T , (1, 1, 0)T , (1, 1, 0)T , (0, 1, 1)T , (0, 0, 1)T
) (7.13)
102
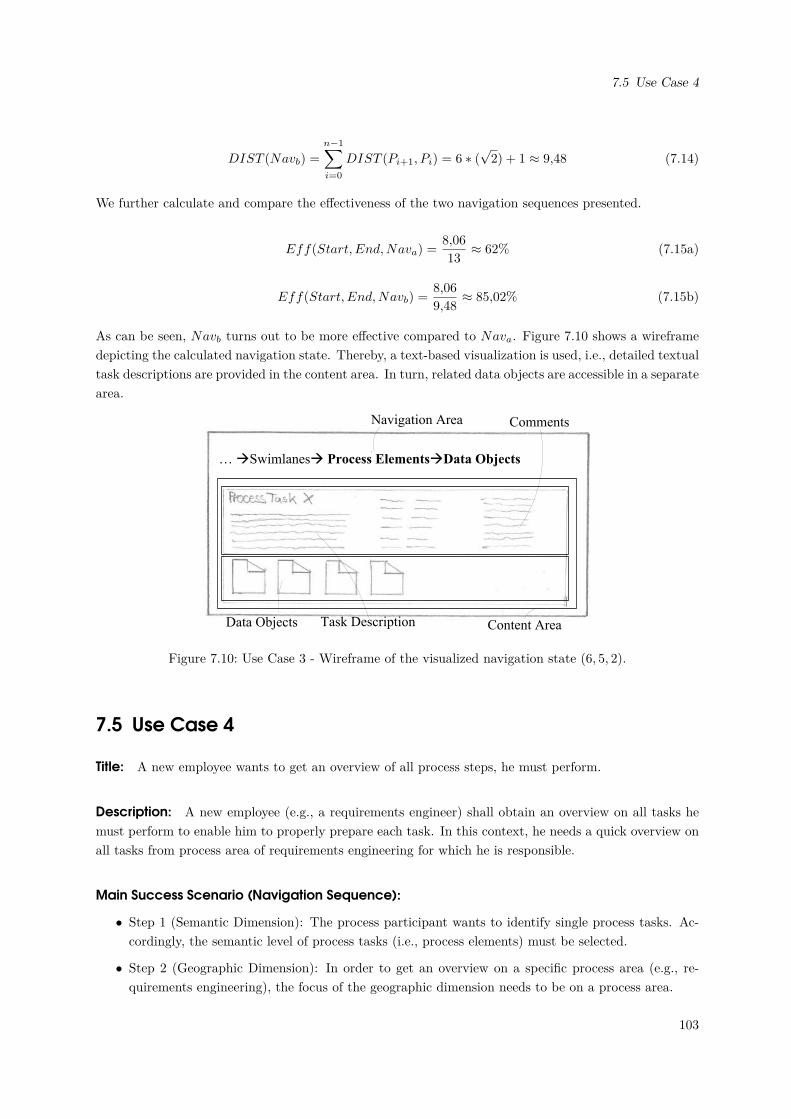
7.5 Use Case 4
DIST (Navb) =
n−1∑i=0
DIST (Pi+1, Pi) = 6 ∗ (√2) + 1 ≈ 9,48 (7.14)
We further calculate and compare the effectiveness of the two navigation sequences presented.
Eff(Start, End,Nava) =8,06
13≈ 62% (7.15a)
Eff(Start, End,Navb) =8,06
9,48≈ 85,02% (7.15b)
As can be seen, Navb turns out to be more effective compared to Nava. Figure 7.10 shows a wireframedepicting the calculated navigation state. Thereby, a text-based visualization is used, i.e., detailed textualtask descriptions are provided in the content area. In turn, related data objects are accessible in a separatearea.
Content Area
… àSwimlanesà Process ElementsàData Objects
Navigation Area
Data Objects Task Description
Comments
Figure 7.10: Use Case 3 - Wireframe of the visualized navigation state (6, 5, 2).
7.5 Use Case 4
Title: A new employee wants to get an overview of all process steps, he must perform.
Description: A new employee (e.g., a requirements engineer) shall obtain an overview on all tasks hemust perform to enable him to properly prepare each task. In this context, he needs a quick overview onall tasks from process area of requirements engineering for which he is responsible.
Main Success Scenario (Navigation Sequence):
• Step 1 (Semantic Dimension): The process participant wants to identify single process tasks. Ac-cordingly, the semantic level of process tasks (i.e., process elements) must be selected.
• Step 2 (Geographic Dimension): In order to get an overview on a specific process area (e.g., re-quirements engineering), the focus of the geographic dimension needs to be on a process area.
103
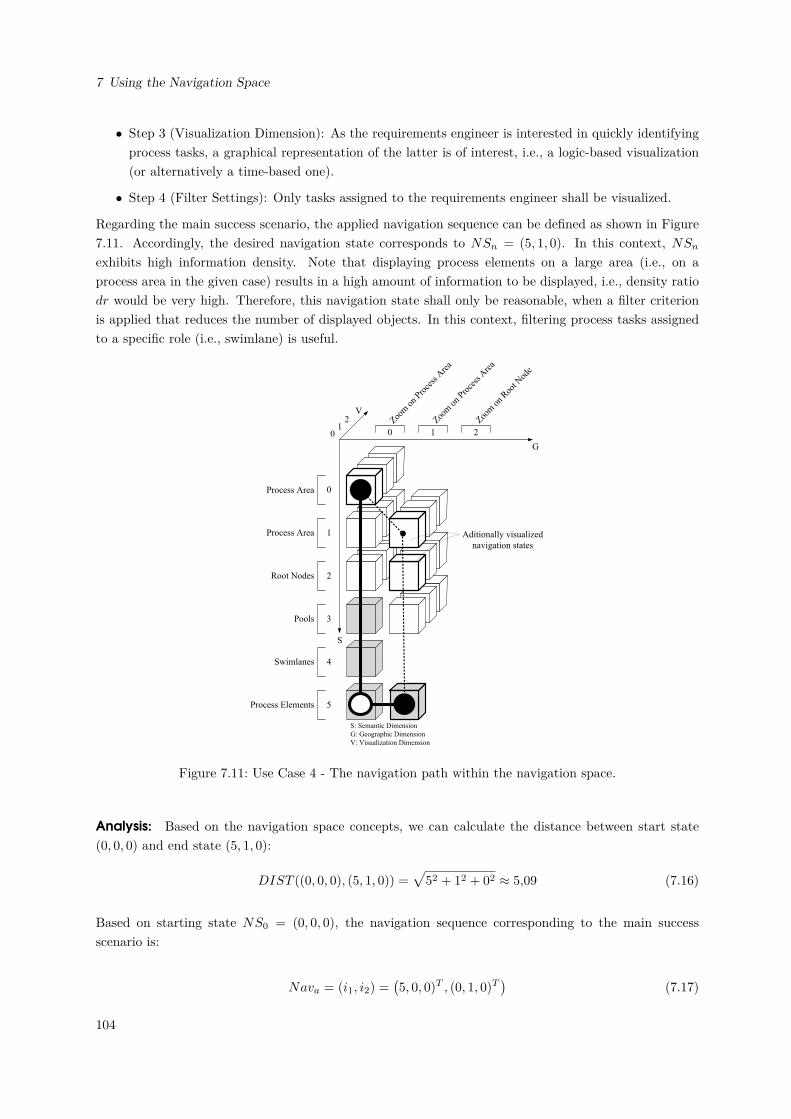
7 Using the Navigation Space
• Step 3 (Visualization Dimension): As the requirements engineer is interested in quickly identifyingprocess tasks, a graphical representation of the latter is of interest, i.e., a logic-based visualization(or alternatively a time-based one).
• Step 4 (Filter Settings): Only tasks assigned to the requirements engineer shall be visualized.
Regarding the main success scenario, the applied navigation sequence can be defined as shown in Figure7.11. Accordingly, the desired navigation state corresponds to NSn = (5, 1, 0). In this context, NSn
exhibits high information density. Note that displaying process elements on a large area (i.e., on aprocess area in the given case) results in a high amount of information to be displayed, i.e., density ratiodr would be very high. Therefore, this navigation state shall only be reasonable, when a filter criterionis applied that reduces the number of displayed objects. In this context, filtering process tasks assignedto a specific role (i.e., swimlane) is useful.
G
S
V
S: Semantic Dimension
G: Geographic Dimension
V: Visualization Dimension
Process Area
Process Area
Root Nodes
Pools
Swimlanes
Process Elements
1
0
2
3
4
5
Zoom
on
Proce
ss A
rea
Zoom
on
Proce
ss A
rea
Zoom
on
Roo
t Nod
e
10
2
Aditionally visualized
navigation states
0 1 2
Figure 7.11: Use Case 4 - The navigation path within the navigation space.
Analysis: Based on the navigation space concepts, we can calculate the distance between start state(0, 0, 0) and end state (5, 1, 0):
DIST ((0, 0, 0), (5, 1, 0)) =√
52 + 12 + 02 ≈ 5,09 (7.16)
Based on starting state NS0 = (0, 0, 0), the navigation sequence corresponding to the main successscenario is:
Nava = (i1, i2) =(5, 0, 0)T , (0, 1, 0)T
)(7.17)
104
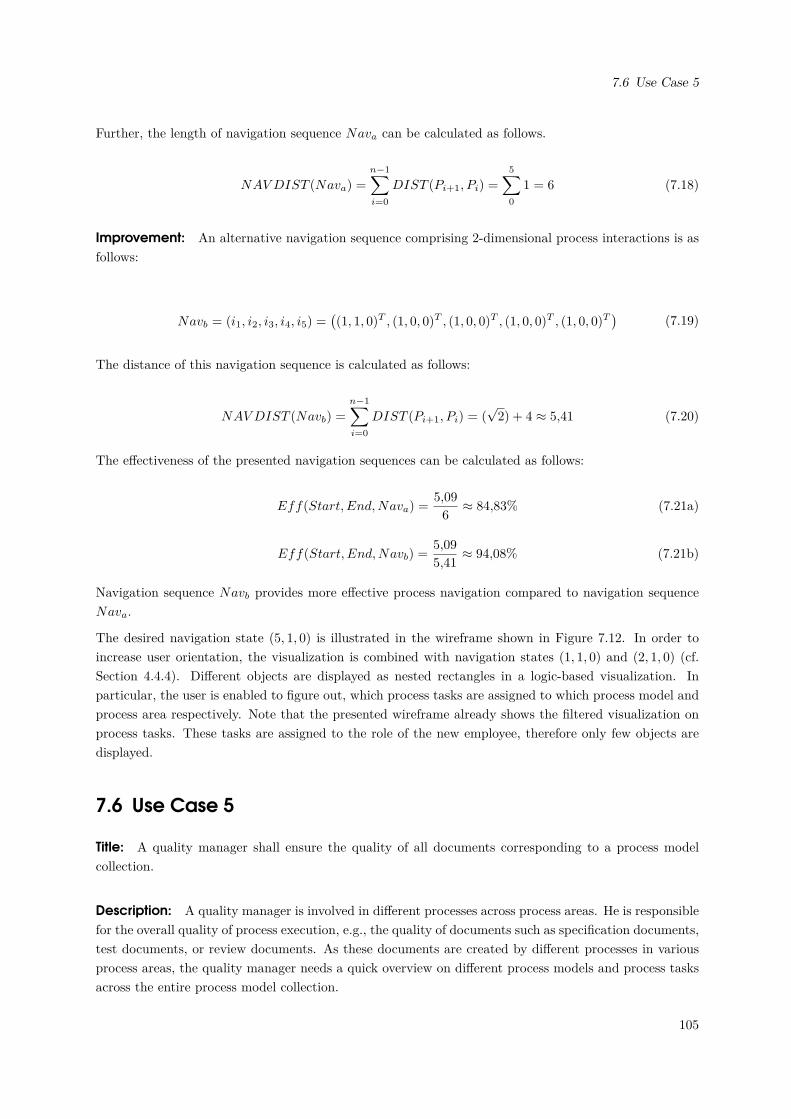
7.6 Use Case 5
Further, the length of navigation sequence Nava can be calculated as follows.
NAVDIST (Nava) =
n−1∑i=0
DIST (Pi+1, Pi) =
5∑0
1 = 6 (7.18)
Improvement: An alternative navigation sequence comprising 2-dimensional process interactions is asfollows:
Navb = (i1, i2, i3, i4, i5) =((1, 1, 0)T , (1, 0, 0)T , (1, 0, 0)T , (1, 0, 0)T , (1, 0, 0)T
)(7.19)
The distance of this navigation sequence is calculated as follows:
NAVDIST (Navb) =
n−1∑i=0
DIST (Pi+1, Pi) = (√2) + 4 ≈ 5,41 (7.20)
The effectiveness of the presented navigation sequences can be calculated as follows:
Eff(Start, End,Nava) =5,09
6≈ 84,83% (7.21a)
Eff(Start, End,Navb) =5,09
5,41≈ 94,08% (7.21b)
Navigation sequence Navb provides more effective process navigation compared to navigation sequenceNava.
The desired navigation state (5, 1, 0) is illustrated in the wireframe shown in Figure 7.12. In order toincrease user orientation, the visualization is combined with navigation states (1, 1, 0) and (2, 1, 0) (cf.Section 4.4.4). Different objects are displayed as nested rectangles in a logic-based visualization. Inparticular, the user is enabled to figure out, which process tasks are assigned to which process model andprocess area respectively. Note that the presented wireframe already shows the filtered visualization onprocess tasks. These tasks are assigned to the role of the new employee, therefore only few objects aredisplayed.
7.6 Use Case 5
Title: A quality manager shall ensure the quality of all documents corresponding to a process modelcollection.
Description: A quality manager is involved in different processes across process areas. He is responsiblefor the overall quality of process execution, e.g., the quality of documents such as specification documents,test documents, or review documents. As these documents are created by different processes in variousprocess areas, the quality manager needs a quick overview on different process models and process tasksacross the entire process model collection.
105
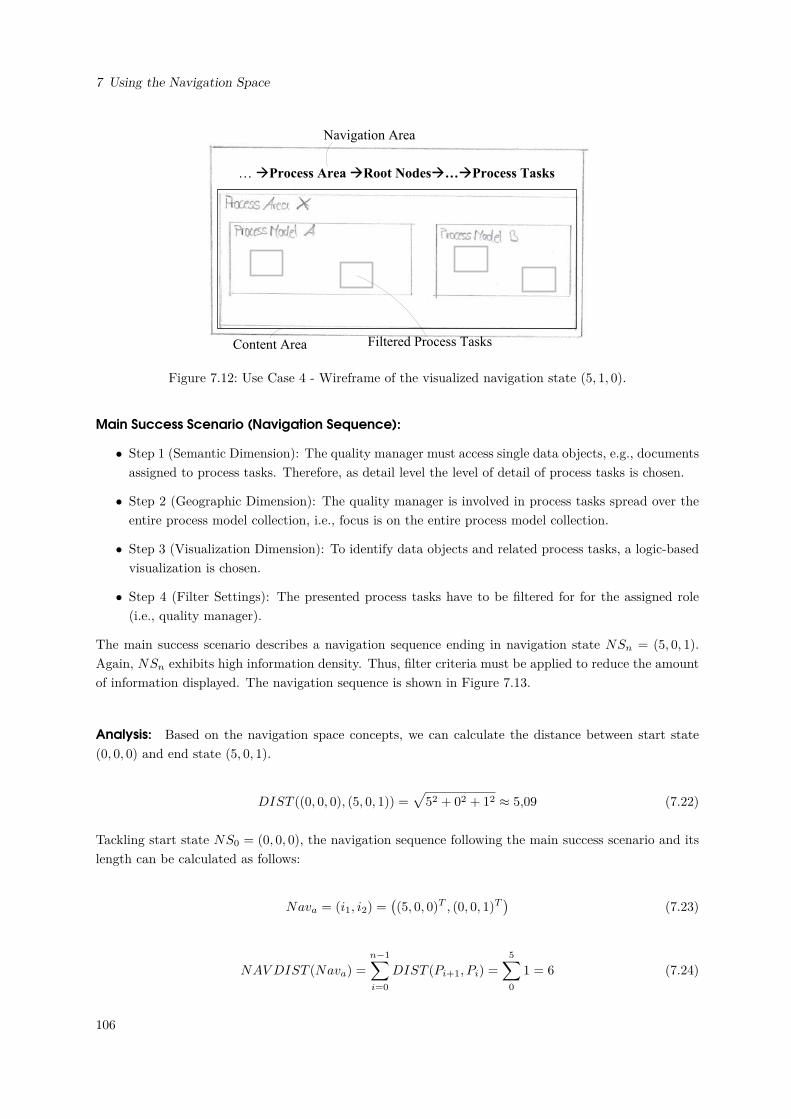
7 Using the Navigation Space
… àProcess Area àRoot Nodesà…àProcess Tasks
Navigation Area
Content Area Filtered Process Tasks
Figure 7.12: Use Case 4 - Wireframe of the visualized navigation state (5, 1, 0).
Main Success Scenario (Navigation Sequence):
• Step 1 (Semantic Dimension): The quality manager must access single data objects, e.g., documentsassigned to process tasks. Therefore, as detail level the level of detail of process tasks is chosen.
• Step 2 (Geographic Dimension): The quality manager is involved in process tasks spread over theentire process model collection, i.e., focus is on the entire process model collection.
• Step 3 (Visualization Dimension): To identify data objects and related process tasks, a logic-basedvisualization is chosen.
• Step 4 (Filter Settings): The presented process tasks have to be filtered for for the assigned role(i.e., quality manager).
The main success scenario describes a navigation sequence ending in navigation state NSn = (5, 0, 1).Again, NSn exhibits high information density. Thus, filter criteria must be applied to reduce the amountof information displayed. The navigation sequence is shown in Figure 7.13.
Analysis: Based on the navigation space concepts, we can calculate the distance between start state(0, 0, 0) and end state (5, 0, 1).
DIST ((0, 0, 0), (5, 0, 1)) =√
52 + 02 + 12 ≈ 5,09 (7.22)
Tackling start state NS0 = (0, 0, 0), the navigation sequence following the main success scenario and itslength can be calculated as follows:
Nava = (i1, i2) =((5, 0, 0)T , (0, 0, 1)T
)(7.23)
NAVDIST (Nava) =
n−1∑i=0
DIST (Pi+1, Pi) =
5∑0
1 = 6 (7.24)
106
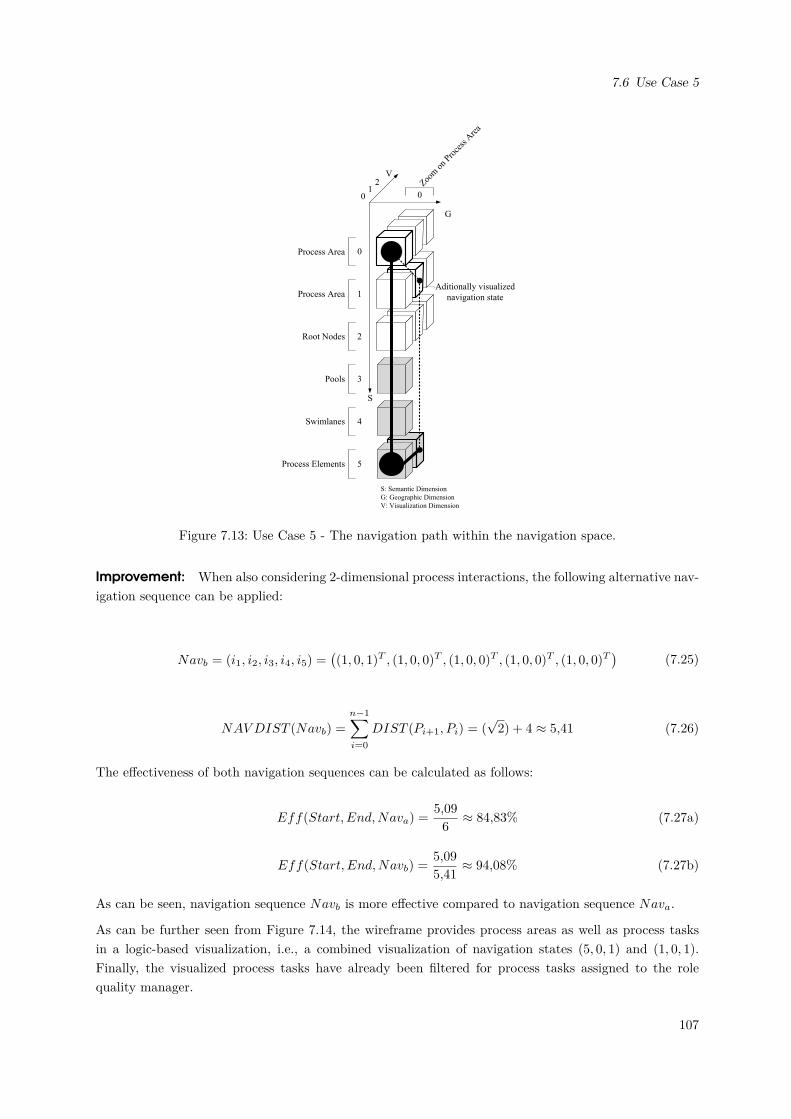
7.6 Use Case 5
S
V
S: Semantic Dimension
G: Geographic Dimension
V: Visualization Dimension
Process Area
Process Area
Root Nodes
Pools
Swimlanes
Process Elements
1
0
2
3
4
5
Zoom
on
Proce
ss A
rea
10
2
0
G
Aditionally visualized
navigation state
Figure 7.13: Use Case 5 - The navigation path within the navigation space.
Improvement: When also considering 2-dimensional process interactions, the following alternative nav-igation sequence can be applied:
Navb = (i1, i2, i3, i4, i5) =((1, 0, 1)T , (1, 0, 0)T , (1, 0, 0)T , (1, 0, 0)T , (1, 0, 0)T
)(7.25)
NAVDIST (Navb) =
n−1∑i=0
DIST (Pi+1, Pi) = (√2) + 4 ≈ 5,41 (7.26)
The effectiveness of both navigation sequences can be calculated as follows:
Eff(Start, End,Nava) =5,09
6≈ 84,83% (7.27a)
Eff(Start, End,Navb) =5,09
5,41≈ 94,08% (7.27b)
As can be seen, navigation sequence Navb is more effective compared to navigation sequence Nava.
As can be further seen from Figure 7.14, the wireframe provides process areas as well as process tasksin a logic-based visualization, i.e., a combined visualization of navigation states (5, 0, 1) and (1, 0, 1).Finally, the visualized process tasks have already been filtered for process tasks assigned to the rolequality manager.
107
7 Using the Navigation Space
… àProcess Area à…àProcess Elements
Navigation Area
Content Area Process Tasks
Figure 7.14: Use Case 5 - Wireframe of the visualized navigation state (5, 0, 1).
7.7 Use Case 6
Title: A quality engineer shall identify the process tasks related to a certain deadline.
Description: A quality engineer must assure that business process results fulfil predefined quality stan-dards. Unlike the quality manager, the quality engineer must consider certain deadlines. In particular,a quality engineer must check all resulting documents necessary to pass a certain deadline. Accordingly,he needs information about all process tasks related to the creation of a document and to be completeduntil a specific deadline.
Main Success Scenario (Navigation Sequence):
• Step 1 (Semantic Dimension): As the quality engineer must check process tasks, the semanticdimension must be set to the detail level of process tasks.
• Step 2 (Geographic Dimension): The geographic focus shall be on process areas, to enable anoverview on process tasks aligned to a deadline.
• Step 3 (Visualization Dimension): To visualize process tasks referring to a certain deadline, atime-based visualization is of need.
• Step 4 (Filter Settings): Only those process tasks shall be visualized, which are associated with adeadline (i.e., tasks to be completed until a certain point in time).
Figure 7.15 describes the navigation sequence for the main success scenario. The quality manager needsan overview on multiple process models of a particular process area. Then, he must identify process tasksin this area. Furthermore, the desired navigation state NSn = (5, 1, 0) shows high information density.Thus, filter criteria should be applied to reduce the number of displayed objects. In the given case, atemporal filter can be applied, solely visualizing those process tasks finished unitl a certain deadline.
108
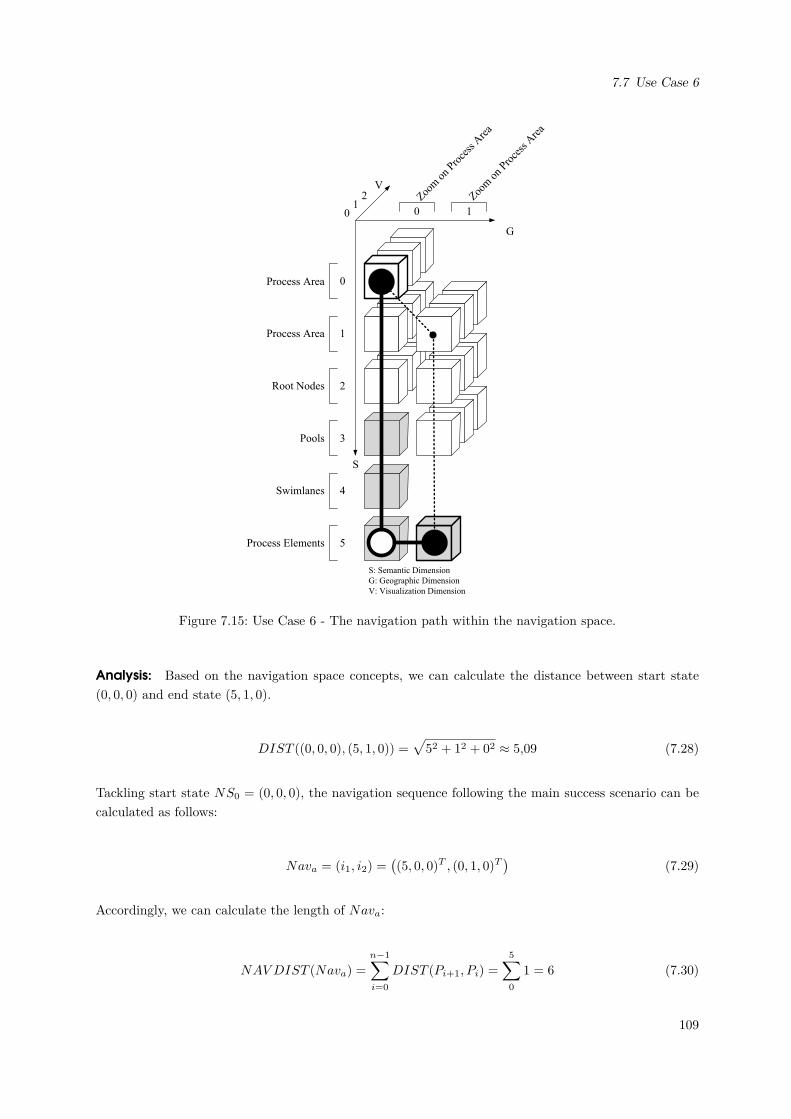
7.7 Use Case 6
S
V
S: Semantic Dimension
G: Geographic Dimension
V: Visualization Dimension
Process Area
Process Area
Root Nodes
Pools
Swimlanes
Process Elements
1
0
2
3
4
5
Zoom
on
Proce
ss A
rea
Zoom
on
Proce
ss A
rea
10
2
0 1
G
Figure 7.15: Use Case 6 - The navigation path within the navigation space.
Analysis: Based on the navigation space concepts, we can calculate the distance between start state(0, 0, 0) and end state (5, 1, 0).
DIST ((0, 0, 0), (5, 1, 0)) =√
52 + 12 + 02 ≈ 5,09 (7.28)
Tackling start state NS0 = (0, 0, 0), the navigation sequence following the main success scenario can becalculated as follows:
Nava = (i1, i2) =((5, 0, 0)T , (0, 1, 0)T
)(7.29)
Accordingly, we can calculate the length of Nava:
NAVDIST (Nava) =
n−1∑i=0
DIST (Pi+1, Pi) =
5∑0
1 = 6 (7.30)
109
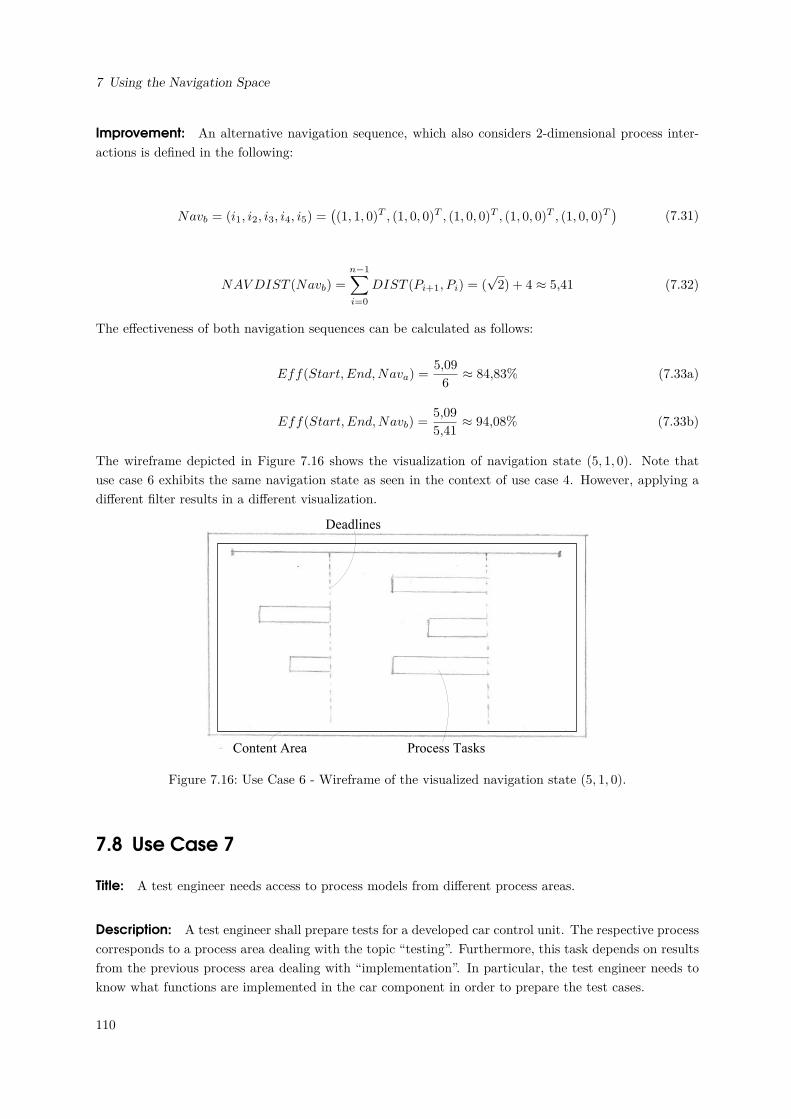
7 Using the Navigation Space
Improvement: An alternative navigation sequence, which also considers 2-dimensional process inter-actions is defined in the following:
Navb = (i1, i2, i3, i4, i5) =((1, 1, 0)T , (1, 0, 0)T , (1, 0, 0)T , (1, 0, 0)T , (1, 0, 0)T
)(7.31)
NAVDIST (Navb) =
n−1∑i=0
DIST (Pi+1, Pi) = (√2) + 4 ≈ 5,41 (7.32)
The effectiveness of both navigation sequences can be calculated as follows:
Eff(Start, End,Nava) =5,09
6≈ 84,83% (7.33a)
Eff(Start, End,Navb) =5,09
5,41≈ 94,08% (7.33b)
The wireframe depicted in Figure 7.16 shows the visualization of navigation state (5, 1, 0). Note thatuse case 6 exhibits the same navigation state as seen in the context of use case 4. However, applying adifferent filter results in a different visualization.
Content Area Process Tasks
Deadlines
Figure 7.16: Use Case 6 - Wireframe of the visualized navigation state (5, 1, 0).
7.8 Use Case 7
Title: A test engineer needs access to process models from different process areas.
Description: A test engineer shall prepare tests for a developed car control unit. The respective processcorresponds to a process area dealing with the topic “testing”. Furthermore, this task depends on resultsfrom the previous process area dealing with “implementation”. In particular, the test engineer needs toknow what functions are implemented in the car component in order to prepare the test cases.
110
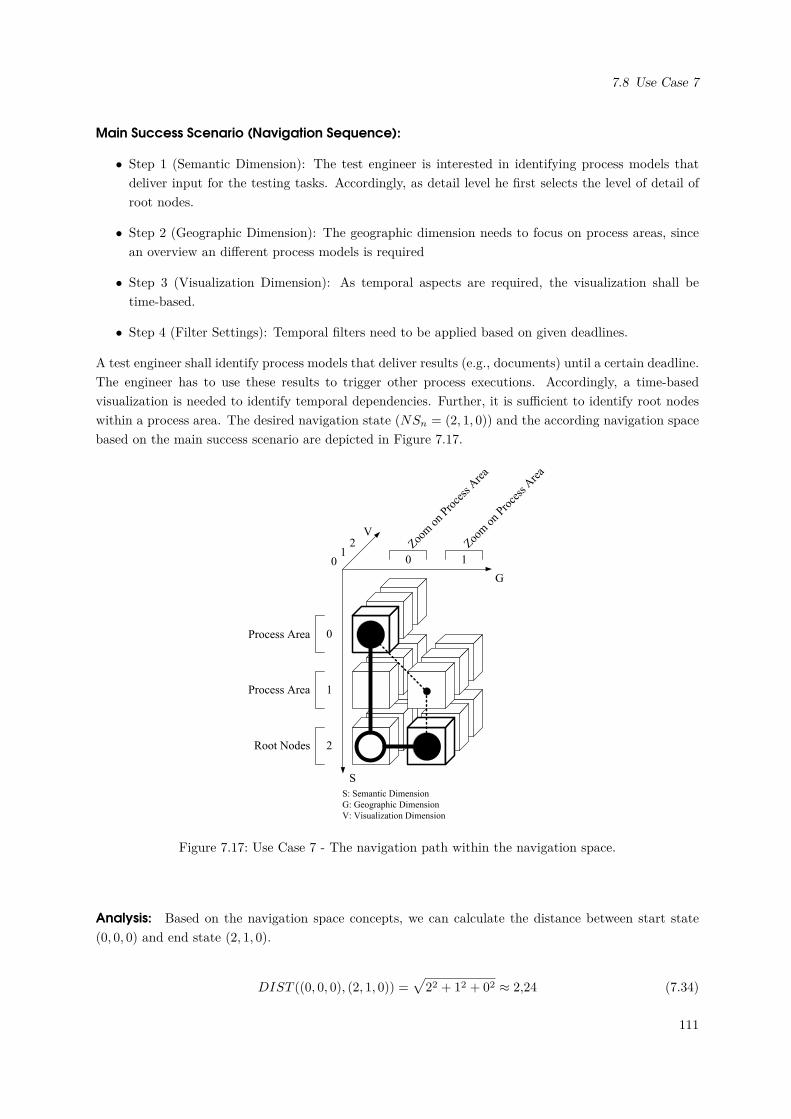
7.8 Use Case 7
Main Success Scenario (Navigation Sequence):
• Step 1 (Semantic Dimension): The test engineer is interested in identifying process models thatdeliver input for the testing tasks. Accordingly, as detail level he first selects the level of detail ofroot nodes.
• Step 2 (Geographic Dimension): The geographic dimension needs to focus on process areas, sincean overview an different process models is required
• Step 3 (Visualization Dimension): As temporal aspects are required, the visualization shall betime-based.
• Step 4 (Filter Settings): Temporal filters need to be applied based on given deadlines.
A test engineer shall identify process models that deliver results (e.g., documents) until a certain deadline.The engineer has to use these results to trigger other process executions. Accordingly, a time-basedvisualization is needed to identify temporal dependencies. Further, it is sufficient to identify root nodeswithin a process area. The desired navigation state (NSn = (2, 1, 0)) and the according navigation spacebased on the main success scenario are depicted in Figure 7.17.
G
S
V
S: Semantic Dimension
G: Geographic Dimension
V: Visualization Dimension
Process Area
Process Area
Root Nodes
1
0
2
Zoom
on
Proce
ss A
rea
Zoom
on
Proce
ss A
rea
10
2
0 1
Figure 7.17: Use Case 7 - The navigation path within the navigation space.
Analysis: Based on the navigation space concepts, we can calculate the distance between start state(0, 0, 0) and end state (2, 1, 0).
DIST ((0, 0, 0), (2, 1, 0)) =√
22 + 12 + 02 ≈ 2,24 (7.34)
111
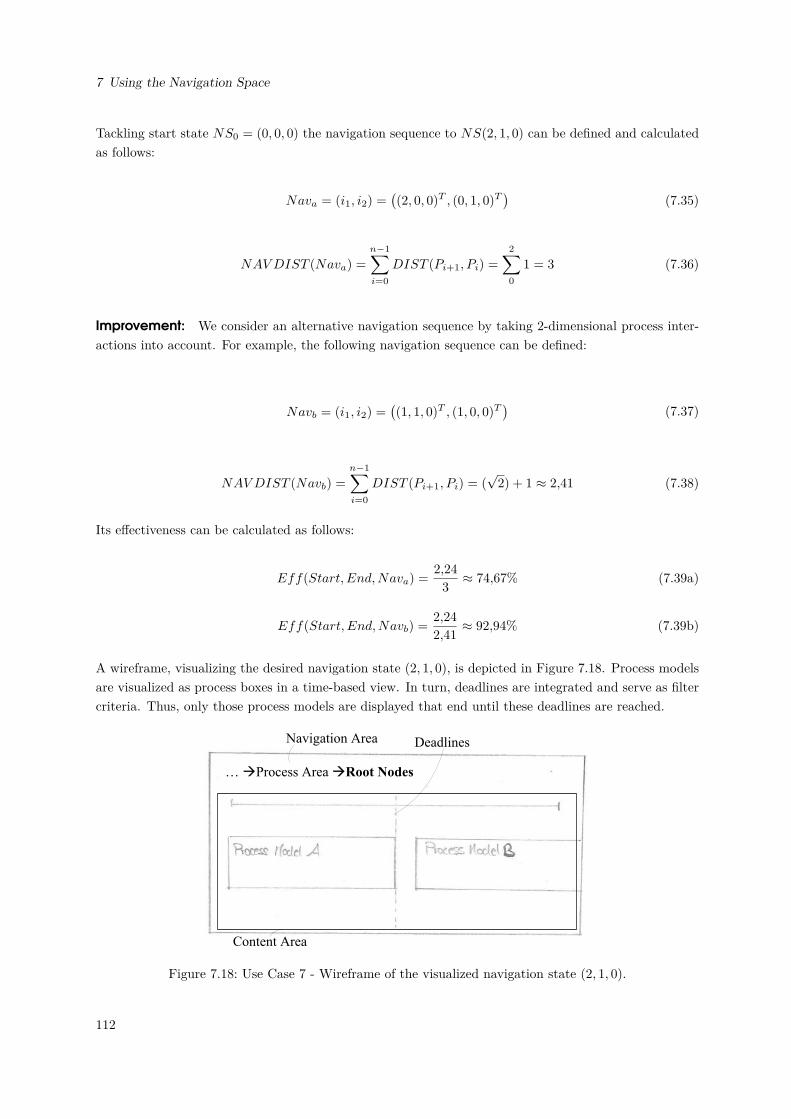
7 Using the Navigation Space
Tackling start state NS0 = (0, 0, 0) the navigation sequence to NS(2, 1, 0) can be defined and calculatedas follows:
Nava = (i1, i2) =((2, 0, 0)T , (0, 1, 0)T
)(7.35)
NAVDIST (Nava) =
n−1∑i=0
DIST (Pi+1, Pi) =
2∑0
1 = 3 (7.36)
Improvement: We consider an alternative navigation sequence by taking 2-dimensional process inter-actions into account. For example, the following navigation sequence can be defined:
Navb = (i1, i2) =((1, 1, 0)T , (1, 0, 0)T
)(7.37)
NAVDIST (Navb) =
n−1∑i=0
DIST (Pi+1, Pi) = (√2) + 1 ≈ 2,41 (7.38)
Its effectiveness can be calculated as follows:
Eff(Start, End,Nava) =2,24
3≈ 74,67% (7.39a)
Eff(Start, End,Navb) =2,24
2,41≈ 92,94% (7.39b)
A wireframe, visualizing the desired navigation state (2, 1, 0), is depicted in Figure 7.18. Process modelsare visualized as process boxes in a time-based view. In turn, deadlines are integrated and serve as filtercriteria. Thus, only those process models are displayed that end until these deadlines are reached.
Content Area
… àProcess Area àRoot Nodes
Navigation Area Deadlines
Figure 7.18: Use Case 7 - Wireframe of the visualized navigation state (2, 1, 0).
112
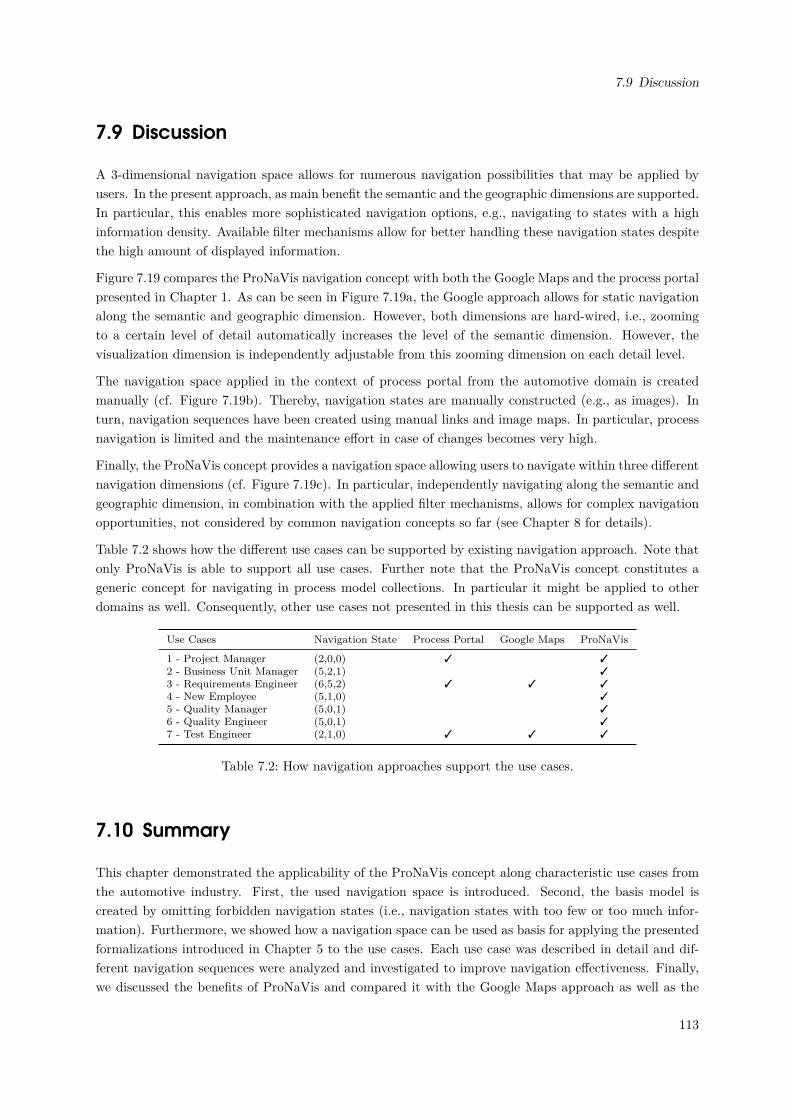
7.9 Discussion
7.9 Discussion
A 3-dimensional navigation space allows for numerous navigation possibilities that may be applied byusers. In the present approach, as main benefit the semantic and the geographic dimensions are supported.In particular, this enables more sophisticated navigation options, e.g., navigating to states with a highinformation density. Available filter mechanisms allow for better handling these navigation states despitethe high amount of displayed information.
Figure 7.19 compares the ProNaVis navigation concept with both the Google Maps and the process portalpresented in Chapter 1. As can be seen in Figure 7.19a, the Google approach allows for static navigationalong the semantic and geographic dimension. However, both dimensions are hard-wired, i.e., zoomingto a certain level of detail automatically increases the level of the semantic dimension. However, thevisualization dimension is independently adjustable from this zooming dimension on each detail level.
The navigation space applied in the context of process portal from the automotive domain is createdmanually (cf. Figure 7.19b). Thereby, navigation states are manually constructed (e.g., as images). Inturn, navigation sequences have been created using manual links and image maps. In particular, processnavigation is limited and the maintenance effort in case of changes becomes very high.
Finally, the ProNaVis concept provides a navigation space allowing users to navigate within three differentnavigation dimensions (cf. Figure 7.19c). In particular, independently navigating along the semantic andgeographic dimension, in combination with the applied filter mechanisms, allows for complex navigationopportunities, not considered by common navigation concepts so far (see Chapter 8 for details).
Table 7.2 shows how the different use cases can be supported by existing navigation approach. Note thatonly ProNaVis is able to support all use cases. Further note that the ProNaVis concept constitutes ageneric concept for navigating in process model collections. In particular it might be applied to otherdomains as well. Consequently, other use cases not presented in this thesis can be supported as well.
Use Cases Navigation State Process Portal Google Maps ProNaVis
1 - Project Manager (2,0,0) 3 32 - Business Unit Manager (5,2,1) 33 - Requirements Engineer (6,5,2) 3 3 34 - New Employee (5,1,0) 35 - Quality Manager (5,0,1) 36 - Quality Engineer (5,0,1) 37 - Test Engineer (2,1,0) 3 3 3
Table 7.2: How navigation approaches support the use cases.
7.10 Summary
This chapter demonstrated the applicability of the ProNaVis concept along characteristic use cases fromthe automotive industry. First, the used navigation space is introduced. Second, the basis model iscreated by omitting forbidden navigation states (i.e., navigation states with too few or too much infor-mation). Furthermore, we showed how a navigation space can be used as basis for applying the presentedformalizations introduced in Chapter 5 to the use cases. Each use case was described in detail and dif-ferent navigation sequences were analyzed and investigated to improve navigation effectiveness. Finally,we discussed the benefits of ProNaVis and compared it with the Google Maps approach as well as the
113
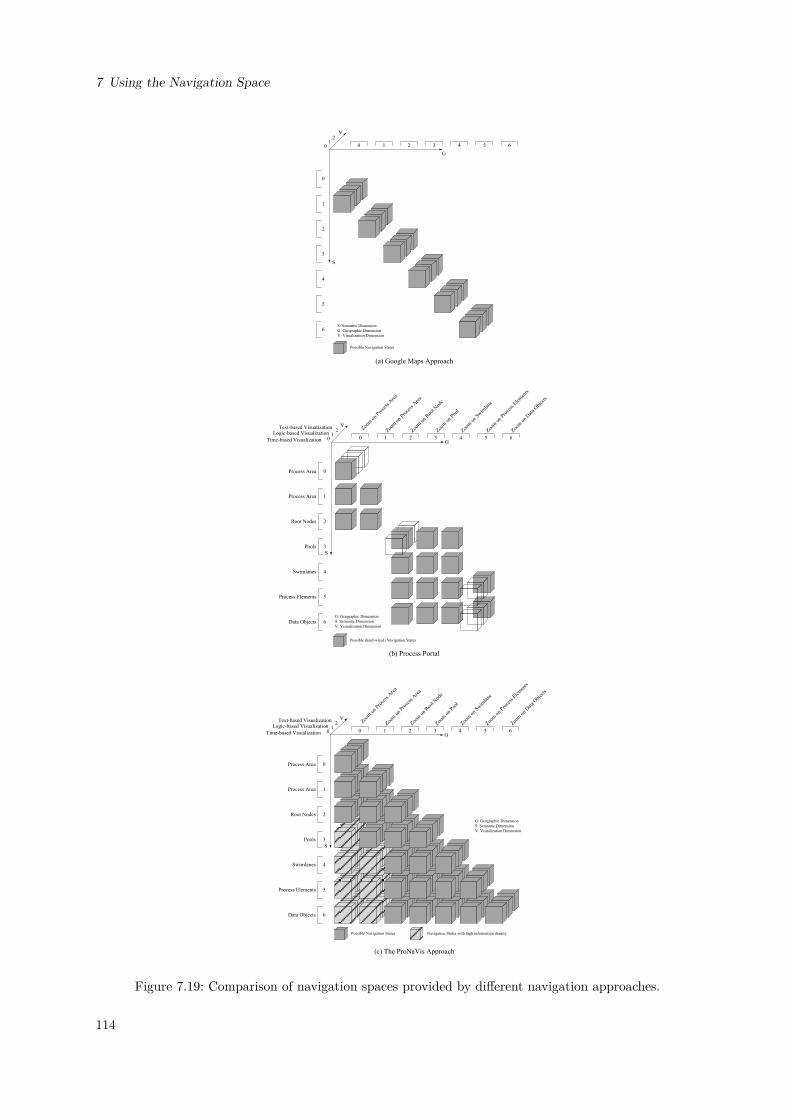
7 Using the Navigation Space
G
S
V
G: Geographic Dimension
S: Semantic Dimension
V: Visualization Dimension
Process Area
Process Area
Root Nodes
Pools
Swimlanes
Process Elements
Data Objects
Time-based Visualization
Logic-based VisualizationText-based Visualization Zoo
m o
n Pro
cess
Are
a
Zoom
on
Roo
t Nod
e
Zoom
on
Pool
Zoom
on
Swim
lane
Zoom
on
Proce
ss E
lem
ents
Zoom
on
Dat
a O
bjec
ts
Zoom
on
Proce
ss A
rea
10
2
1
0
2
3
4
5
6
0 1 2 3 4 5 6
Possible Navigation States
(c) The ProNaVis Approach
Navigation States with high information density
G
S
V
G: Geographic Dimension
S: Semantic Dimension
V: Visualization Dimension
Process Area
Process Area
Root Nodes
Pools
Swimlanes
Process Elements
Data Objects
Time-based Visualization
Logic-based VisualizationText-based Visualization Zoo
m o
n Pro
cess
Are
a
Zoom
on
Roo
t Nod
e
Zoom
on
Pool
Zoom
on
Swim
lane
Zoom
on
Proce
ss E
lem
ents
Zoom
on
Dat
a O
bjec
ts
Zoom
on
Proce
ss A
rea
10
2
1
0
2
3
4
5
6
0 1 2 3 4 5 6
Possible (hard-wired) Navigation States
(b) Process Portal
G
S
V
S: Semantic Dimension
G: Geographic Dimension
V: Visualization Dimension
1
0
2
3
4
5
6
10
2
0 1 2 3 4 5 6
Possible Navigation States
(a) Google Maps Approach
Figure 7.19: Comparison of navigation spaces provided by different navigation approaches.
114

7.10 Summary
process portal from the automotive domain. In this context, the separation of semantic and geographicdimension is a key factor to successfully support process navigation along different navigation dimensions.
115


Part III
Validation
117

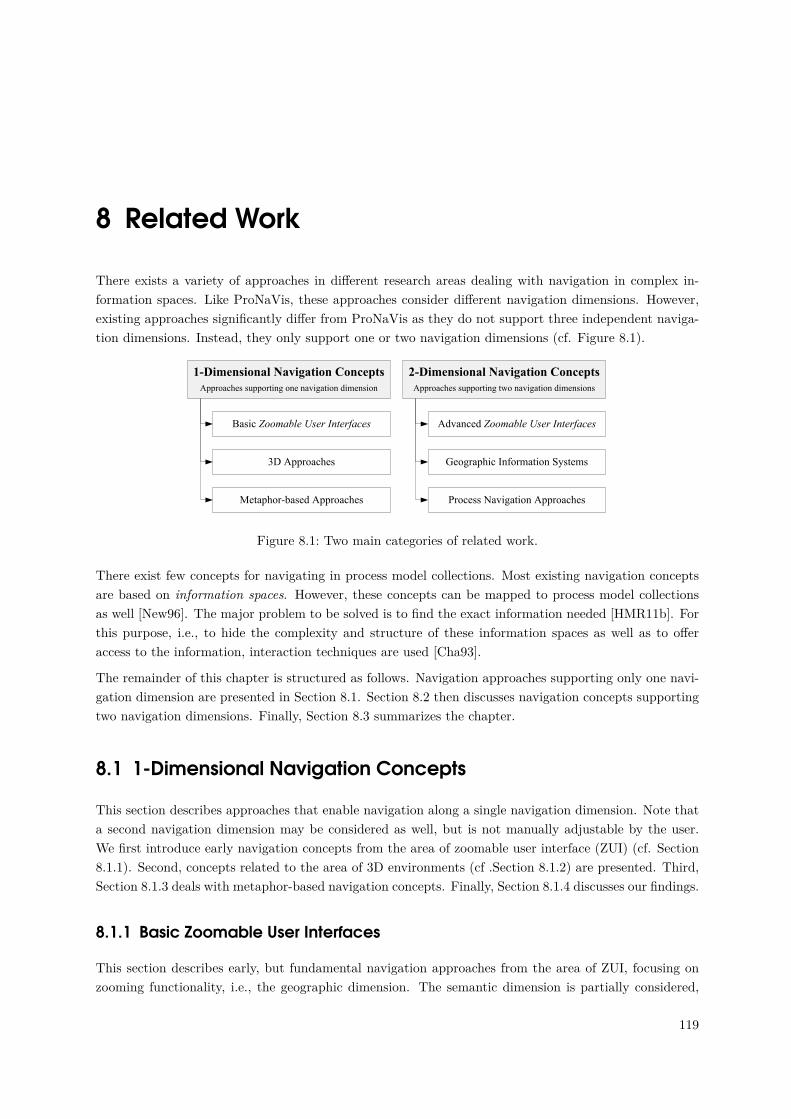
8 Related Work
There exists a variety of approaches in different research areas dealing with navigation in complex in-formation spaces. Like ProNaVis, these approaches consider different navigation dimensions. However,existing approaches significantly differ from ProNaVis as they do not support three independent naviga-tion dimensions. Instead, they only support one or two navigation dimensions (cf. Figure 8.1).
1-Dimensional Navigation Concepts
Approaches supporting one navigation dimension
2-Dimensional Navigation Concepts
Approaches supporting two navigation dimensions
Basic Zoomable User Interfaces
3D Approaches
Metaphor-based Approaches
Geographic Information Systems
Advanced Zoomable User Interfaces
Process Navigation Approaches
Figure 8.1: Two main categories of related work.
There exist few concepts for navigating in process model collections. Most existing navigation conceptsare based on information spaces. However, these concepts can be mapped to process model collectionsas well [New96]. The major problem to be solved is to find the exact information needed [HMR11b]. Forthis purpose, i.e., to hide the complexity and structure of these information spaces as well as to offeraccess to the information, interaction techniques are used [Cha93].
The remainder of this chapter is structured as follows. Navigation approaches supporting only one navi-gation dimension are presented in Section 8.1. Section 8.2 then discusses navigation concepts supportingtwo navigation dimensions. Finally, Section 8.3 summarizes the chapter.
8.1 1-Dimensional Navigation Concepts
This section describes approaches that enable navigation along a single navigation dimension. Note thata second navigation dimension may be considered as well, but is not manually adjustable by the user.We first introduce early navigation concepts from the area of zoomable user interface (ZUI) (cf. Section8.1.1). Second, concepts related to the area of 3D environments (cf .Section 8.1.2) are presented. Third,Section 8.1.3 deals with metaphor-based navigation concepts. Finally, Section 8.1.4 discusses our findings.
8.1.1 Basic Zoomable User Interfaces
This section describes early, but fundamental navigation approaches from the area of ZUI, focusing onzooming functionality, i.e., the geographic dimension. The semantic dimension is partially considered,
119
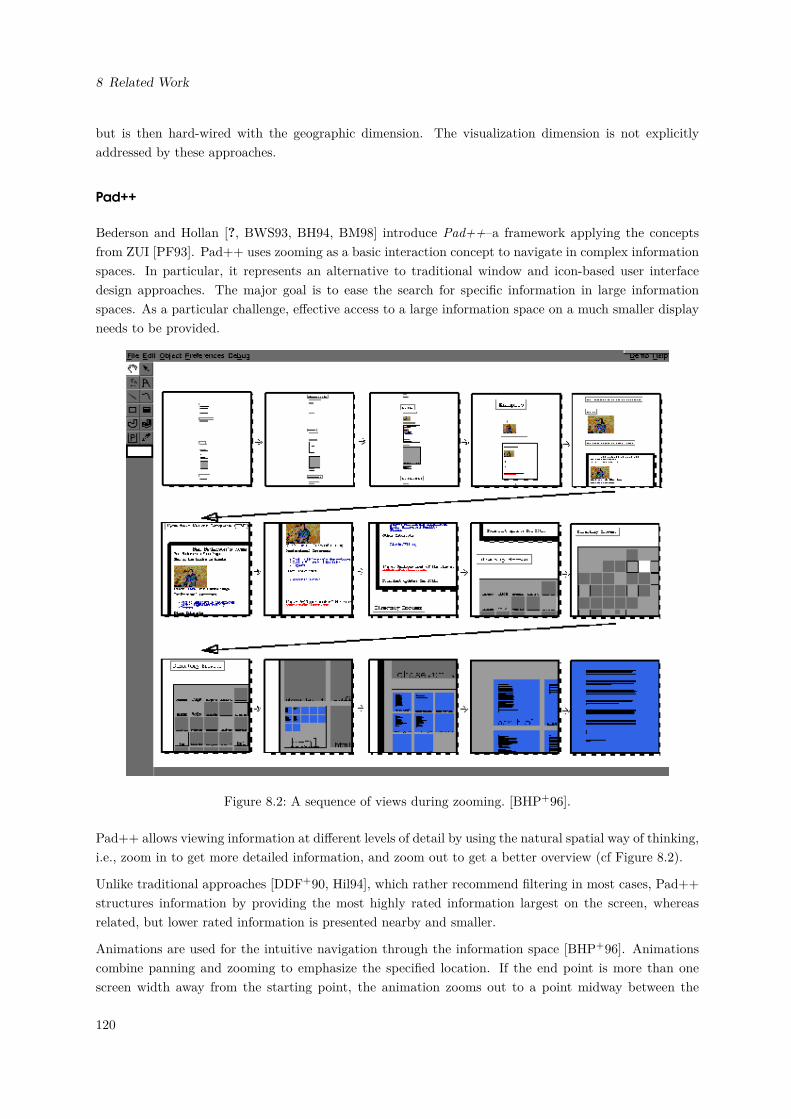
8 Related Work
but is then hard-wired with the geographic dimension. The visualization dimension is not explicitlyaddressed by these approaches.
Pad++
Bederson and Hollan [?, BWS93, BH94, BM98] introduce Pad++–a framework applying the conceptsfrom ZUI [PF93]. Pad++ uses zooming as a basic interaction concept to navigate in complex informationspaces. In particular, it represents an alternative to traditional window and icon-based user interfacedesign approaches. The major goal is to ease the search for specific information in large informationspaces. As a particular challenge, effective access to a large information space on a much smaller displayneeds to be provided.
Figure 8.2: A sequence of views during zooming. [BHP+96].
Pad++ allows viewing information at different levels of detail by using the natural spatial way of thinking,i.e., zoom in to get more detailed information, and zoom out to get a better overview (cf Figure 8.2).
Unlike traditional approaches [DDF+90, Hil94], which rather recommend filtering in most cases, Pad++structures information by providing the most highly rated information largest on the screen, whereasrelated, but lower rated information is presented nearby and smaller.
Animations are used for the intuitive navigation through the information space [BHP+96]. Animationscombine panning and zooming to emphasize the specified location. If the end point is more than onescreen width away from the starting point, the animation zooms out to a point midway between the
120
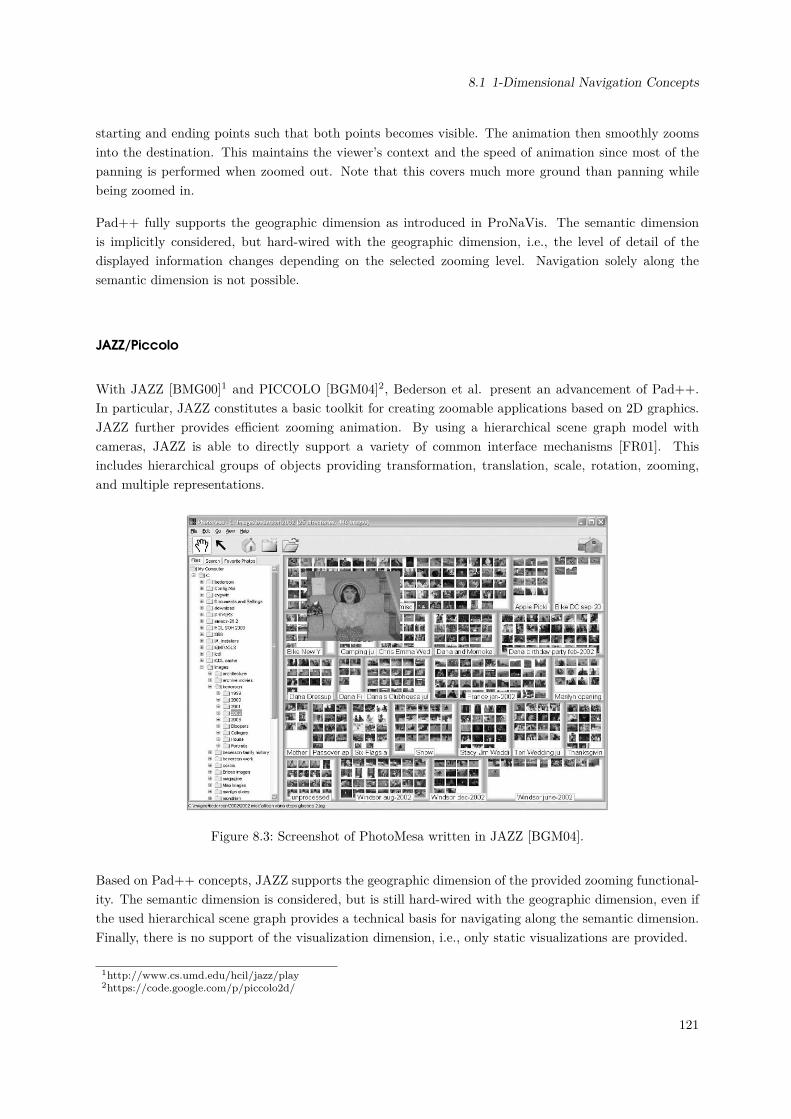
8.1 1-Dimensional Navigation Concepts
starting and ending points such that both points becomes visible. The animation then smoothly zoomsinto the destination. This maintains the viewer’s context and the speed of animation since most of thepanning is performed when zoomed out. Note that this covers much more ground than panning whilebeing zoomed in.
Pad++ fully supports the geographic dimension as introduced in ProNaVis. The semantic dimensionis implicitly considered, but hard-wired with the geographic dimension, i.e., the level of detail of thedisplayed information changes depending on the selected zooming level. Navigation solely along thesemantic dimension is not possible.
JAZZ/Piccolo
With JAZZ [BMG00]1 and PICCOLO [BGM04]2, Bederson et al. present an advancement of Pad++.In particular, JAZZ constitutes a basic toolkit for creating zoomable applications based on 2D graphics.JAZZ further provides efficient zooming animation. By using a hierarchical scene graph model withcameras, JAZZ is able to directly support a variety of common interface mechanisms [FR01]. Thisincludes hierarchical groups of objects providing transformation, translation, scale, rotation, zooming,and multiple representations.
Figure 8.3: Screenshot of PhotoMesa written in JAZZ [BGM04].
Based on Pad++ concepts, JAZZ supports the geographic dimension of the provided zooming functional-ity. The semantic dimension is considered, but is still hard-wired with the geographic dimension, even ifthe used hierarchical scene graph provides a technical basis for navigating along the semantic dimension.Finally, there is no support of the visualization dimension, i.e., only static visualizations are provided.
1http://www.cs.umd.edu/hcil/jazz/play2https://code.google.com/p/piccolo2d/
121
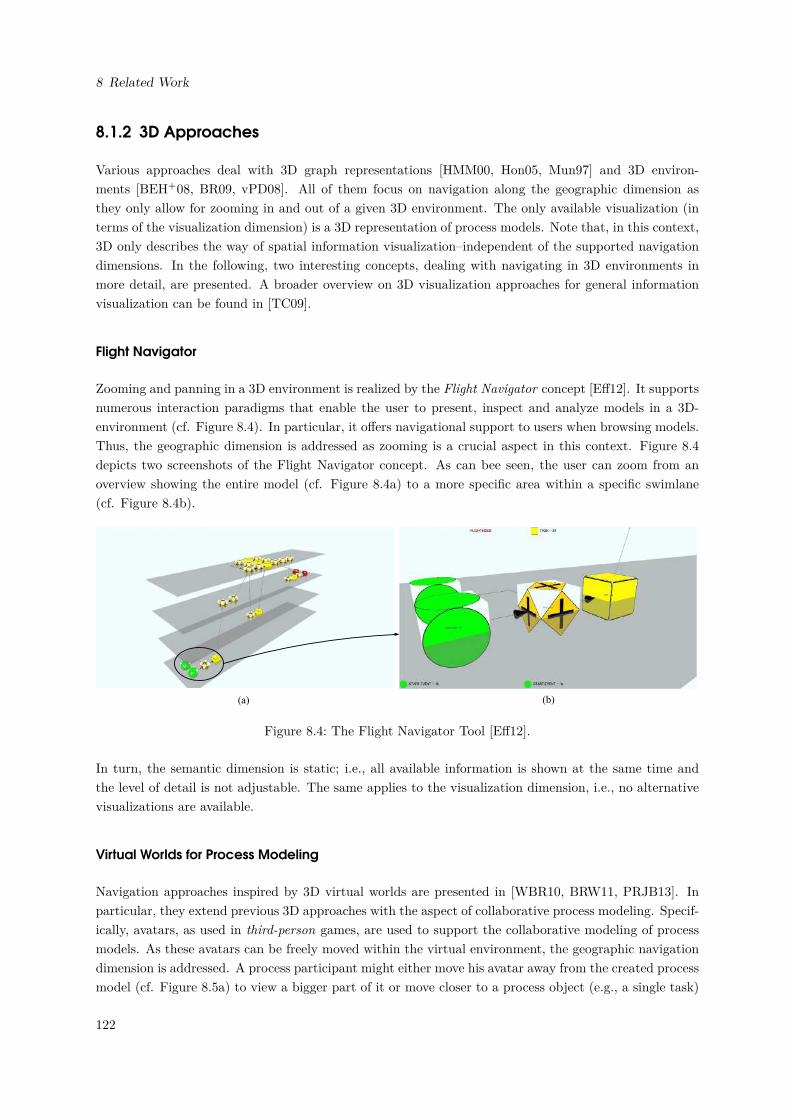
8 Related Work
8.1.2 3D Approaches
Various approaches deal with 3D graph representations [HMM00, Hon05, Mun97] and 3D environ-ments [BEH+08, BR09, vPD08]. All of them focus on navigation along the geographic dimension asthey only allow for zooming in and out of a given 3D environment. The only available visualization (interms of the visualization dimension) is a 3D representation of process models. Note that, in this context,3D only describes the way of spatial information visualization–independent of the supported navigationdimensions. In the following, two interesting concepts, dealing with navigating in 3D environments inmore detail, are presented. A broader overview on 3D visualization approaches for general informationvisualization can be found in [TC09].
Flight Navigator
Zooming and panning in a 3D environment is realized by the Flight Navigator concept [Eff12]. It supportsnumerous interaction paradigms that enable the user to present, inspect and analyze models in a 3D-environment (cf. Figure 8.4). In particular, it offers navigational support to users when browsing models.Thus, the geographic dimension is addressed as zooming is a crucial aspect in this context. Figure 8.4depicts two screenshots of the Flight Navigator concept. As can bee seen, the user can zoom from anoverview showing the entire model (cf. Figure 8.4a) to a more specific area within a specific swimlane(cf. Figure 8.4b).
(a) (b)
Figure 8.4: The Flight Navigator Tool [Eff12].
In turn, the semantic dimension is static; i.e., all available information is shown at the same time andthe level of detail is not adjustable. The same applies to the visualization dimension, i.e., no alternativevisualizations are available.
Virtual Worlds for Process Modeling
Navigation approaches inspired by 3D virtual worlds are presented in [WBR10, BRW11, PRJB13]. Inparticular, they extend previous 3D approaches with the aspect of collaborative process modeling. Specif-ically, avatars, as used in third-person games, are used to support the collaborative modeling of processmodels. As these avatars can be freely moved within the virtual environment, the geographic navigationdimension is addressed. A process participant might either move his avatar away from the created processmodel (cf. Figure 8.5a) to view a bigger part of it or move closer to a process object (e.g., a single task)
122
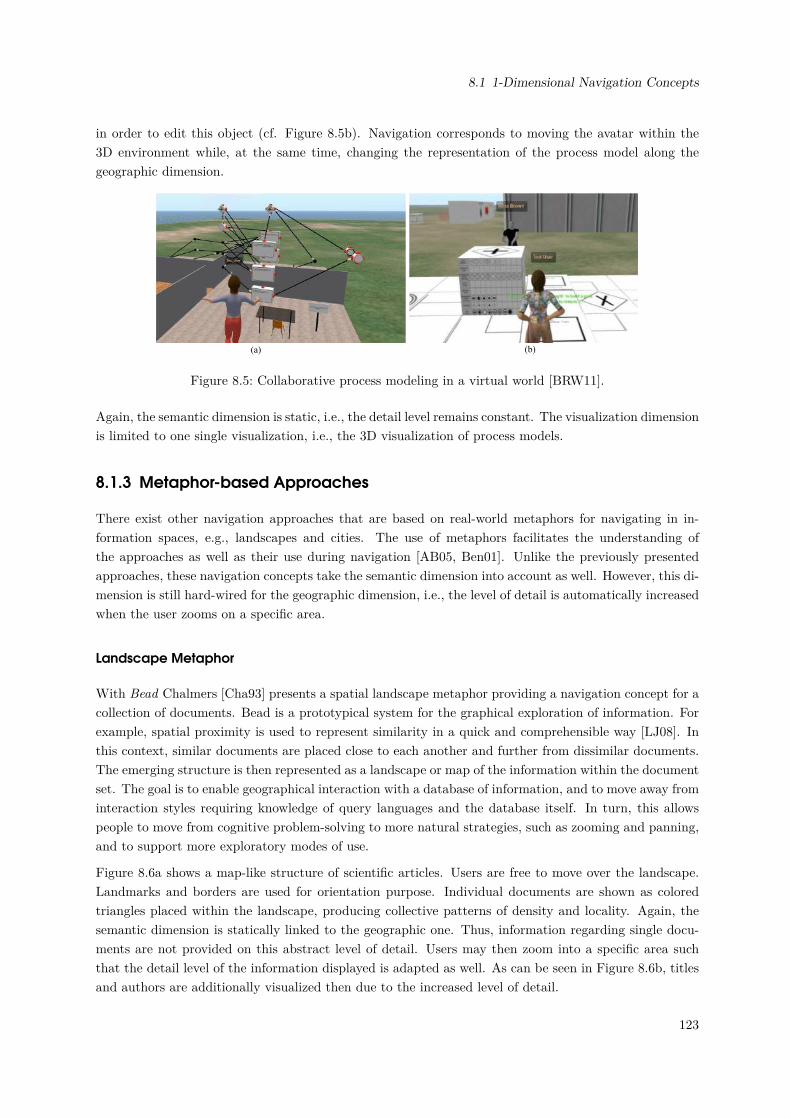
8.1 1-Dimensional Navigation Concepts
in order to edit this object (cf. Figure 8.5b). Navigation corresponds to moving the avatar within the3D environment while, at the same time, changing the representation of the process model along thegeographic dimension.
(a) (b)
Figure 8.5: Collaborative process modeling in a virtual world [BRW11].
Again, the semantic dimension is static, i.e., the detail level remains constant. The visualization dimensionis limited to one single visualization, i.e., the 3D visualization of process models.
8.1.3 Metaphor-based Approaches
There exist other navigation approaches that are based on real-world metaphors for navigating in in-formation spaces, e.g., landscapes and cities. The use of metaphors facilitates the understanding ofthe approaches as well as their use during navigation [AB05, Ben01]. Unlike the previously presentedapproaches, these navigation concepts take the semantic dimension into account as well. However, this di-mension is still hard-wired for the geographic dimension, i.e., the level of detail is automatically increasedwhen the user zooms on a specific area.
Landscape Metaphor
With Bead Chalmers [Cha93] presents a spatial landscape metaphor providing a navigation concept for acollection of documents. Bead is a prototypical system for the graphical exploration of information. Forexample, spatial proximity is used to represent similarity in a quick and comprehensible way [LJ08]. Inthis context, similar documents are placed close to each another and further from dissimilar documents.The emerging structure is then represented as a landscape or map of the information within the documentset. The goal is to enable geographical interaction with a database of information, and to move away frominteraction styles requiring knowledge of query languages and the database itself. In turn, this allowspeople to move from cognitive problem-solving to more natural strategies, such as zooming and panning,and to support more exploratory modes of use.
Figure 8.6a shows a map-like structure of scientific articles. Users are free to move over the landscape.Landmarks and borders are used for orientation purpose. Individual documents are shown as coloredtriangles placed within the landscape, producing collective patterns of density and locality. Again, thesemantic dimension is statically linked to the geographic one. Thus, information regarding single docu-ments are not provided on this abstract level of detail. Users may then zoom into a specific area suchthat the detail level of the information displayed is adapted as well. As can be seen in Figure 8.6b, titlesand authors are additionally visualized then due to the increased level of detail.
123
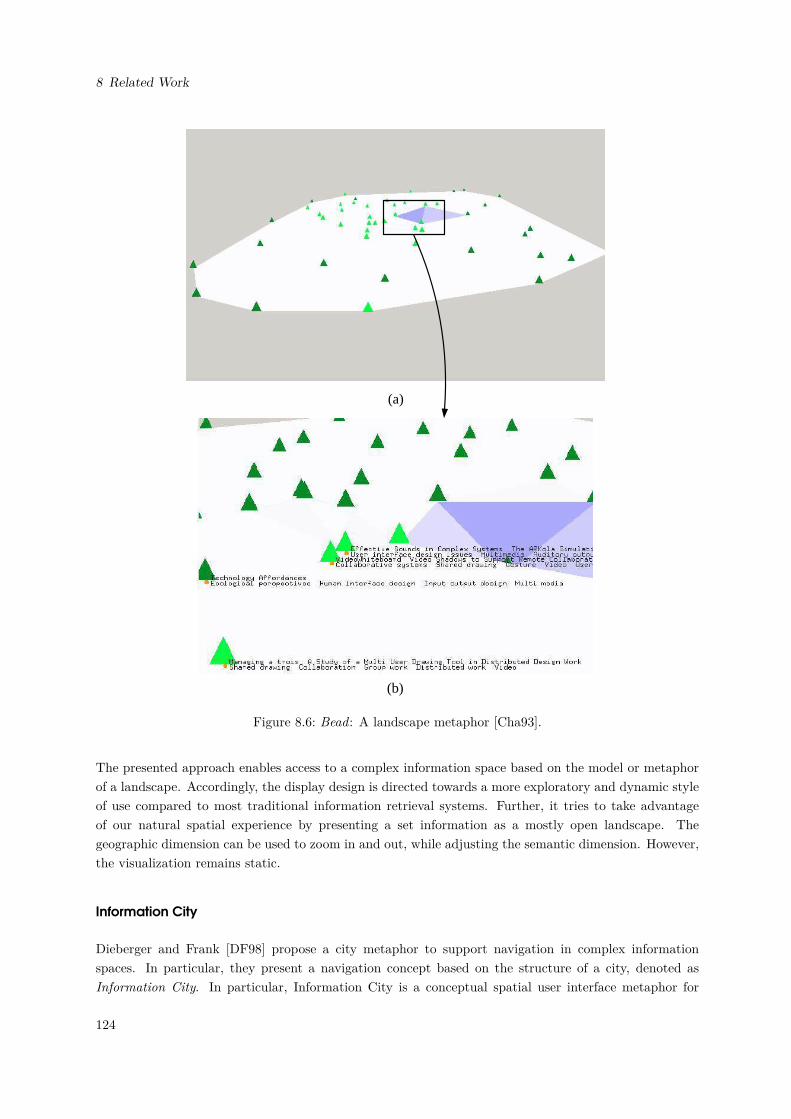
8 Related Work
(a)
(b)
Figure 8.6: Bead: A landscape metaphor [Cha93].
The presented approach enables access to a complex information space based on the model or metaphorof a landscape. Accordingly, the display design is directed towards a more exploratory and dynamic styleof use compared to most traditional information retrieval systems. Further, it tries to take advantageof our natural spatial experience by presenting a set information as a mostly open landscape. Thegeographic dimension can be used to zoom in and out, while adjusting the semantic dimension. However,the visualization remains static.
Information City
Dieberger and Frank [DF98] propose a city metaphor to support navigation in complex informationspaces. In particular, they present a navigation concept based on the structure of a city, denoted asInformation City. In particular, Information City is a conceptual spatial user interface metaphor for
124
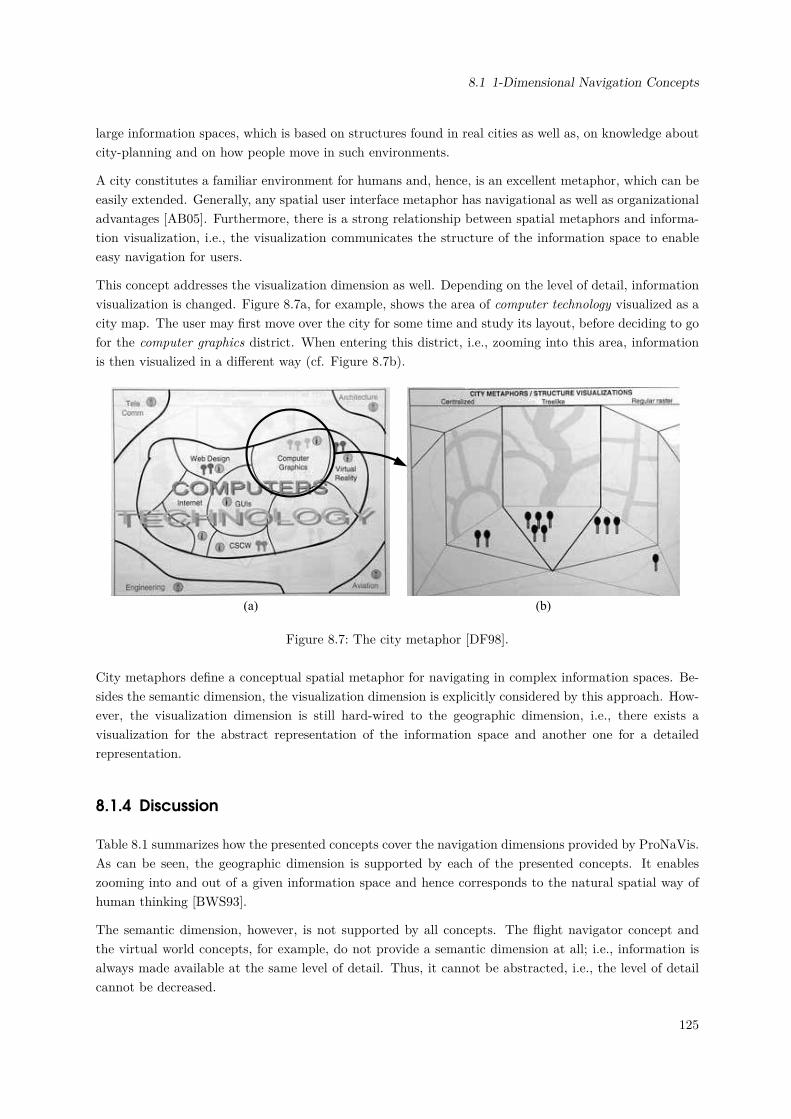
8.1 1-Dimensional Navigation Concepts
large information spaces, which is based on structures found in real cities as well as, on knowledge aboutcity-planning and on how people move in such environments.
A city constitutes a familiar environment for humans and, hence, is an excellent metaphor, which can beeasily extended. Generally, any spatial user interface metaphor has navigational as well as organizationaladvantages [AB05]. Furthermore, there is a strong relationship between spatial metaphors and informa-tion visualization, i.e., the visualization communicates the structure of the information space to enableeasy navigation for users.
This concept addresses the visualization dimension as well. Depending on the level of detail, informationvisualization is changed. Figure 8.7a, for example, shows the area of computer technology visualized as acity map. The user may first move over the city for some time and study its layout, before deciding to gofor the computer graphics district. When entering this district, i.e., zooming into this area, informationis then visualized in a different way (cf. Figure 8.7b).
(a) (b)
Figure 8.7: The city metaphor [DF98].
City metaphors define a conceptual spatial metaphor for navigating in complex information spaces. Be-sides the semantic dimension, the visualization dimension is explicitly considered by this approach. How-ever, the visualization dimension is still hard-wired to the geographic dimension, i.e., there exists avisualization for the abstract representation of the information space and another one for a detailedrepresentation.
8.1.4 Discussion
Table 8.1 summarizes how the presented concepts cover the navigation dimensions provided by ProNaVis.As can be seen, the geographic dimension is supported by each of the presented concepts. It enableszooming into and out of a given information space and hence corresponds to the natural spatial way ofhuman thinking [BWS93].
The semantic dimension, however, is not supported by all concepts. The flight navigator concept andthe virtual world concepts, for example, do not provide a semantic dimension at all; i.e., information isalways made available at the same level of detail. Thus, it cannot be abstracted, i.e., the level of detailcannot be decreased.
125
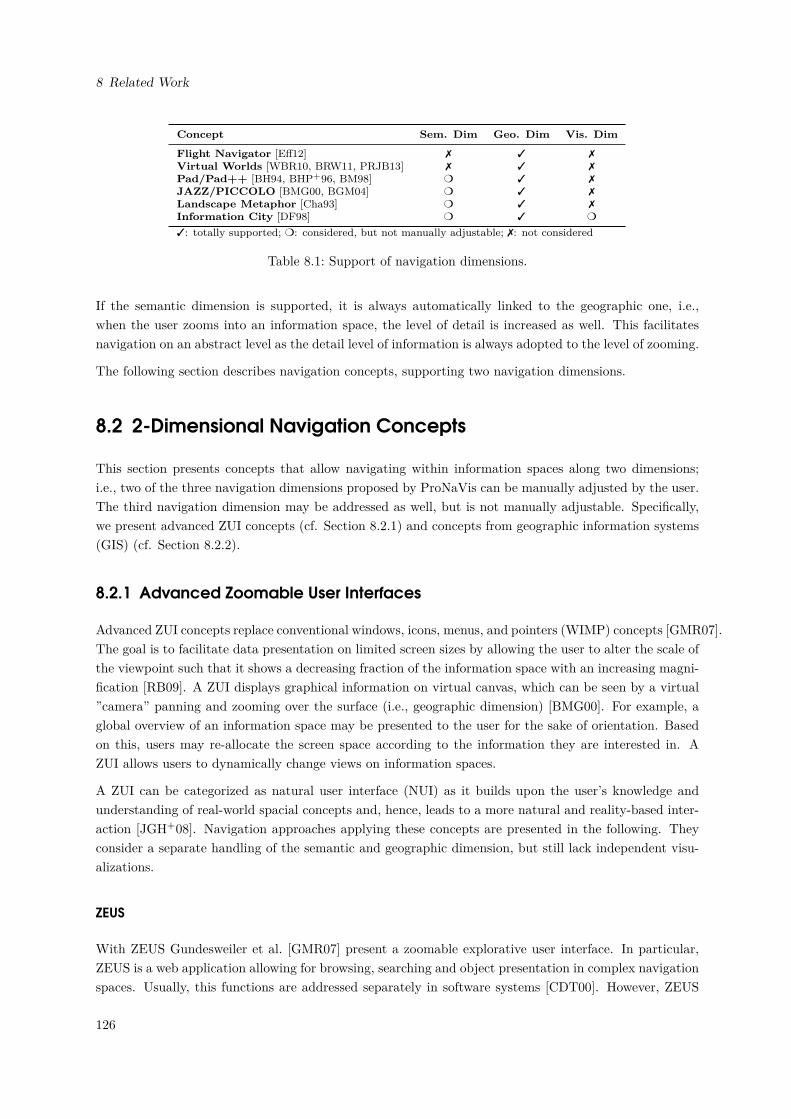
8 Related Work
Concept Sem. Dim Geo. Dim Vis. Dim
Flight Navigator [Eff12] 7 3 7Virtual Worlds [WBR10, BRW11, PRJB13] 7 3 7Pad/Pad++ [BH94, BHP+96, BM98] m 3 7JAZZ/PICCOLO [BMG00, BGM04] m 3 7Landscape Metaphor [Cha93] m 3 7Information City [DF98] m 3 m
3: totally supported; m: considered, but not manually adjustable; 7: not considered
Table 8.1: Support of navigation dimensions.
If the semantic dimension is supported, it is always automatically linked to the geographic one, i.e.,when the user zooms into an information space, the level of detail is increased as well. This facilitatesnavigation on an abstract level as the detail level of information is always adopted to the level of zooming.
The following section describes navigation concepts, supporting two navigation dimensions.
8.2 2-Dimensional Navigation Concepts
This section presents concepts that allow navigating within information spaces along two dimensions;i.e., two of the three navigation dimensions proposed by ProNaVis can be manually adjusted by the user.The third navigation dimension may be addressed as well, but is not manually adjustable. Specifically,we present advanced ZUI concepts (cf. Section 8.2.1) and concepts from geographic information systems(GIS) (cf. Section 8.2.2).
8.2.1 Advanced Zoomable User Interfaces
Advanced ZUI concepts replace conventional windows, icons, menus, and pointers (WIMP) concepts [GMR07].The goal is to facilitate data presentation on limited screen sizes by allowing the user to alter the scale ofthe viewpoint such that it shows a decreasing fraction of the information space with an increasing magni-fication [RB09]. A ZUI displays graphical information on virtual canvas, which can be seen by a virtual”camera” panning and zooming over the surface (i.e., geographic dimension) [BMG00]. For example, aglobal overview of an information space may be presented to the user for the sake of orientation. Basedon this, users may re-allocate the screen space according to the information they are interested in. AZUI allows users to dynamically change views on information spaces.
A ZUI can be categorized as natural user interface (NUI) as it builds upon the user’s knowledge andunderstanding of real-world spacial concepts and, hence, leads to a more natural and reality-based inter-action [JGH+08]. Navigation approaches applying these concepts are presented in the following. Theyconsider a separate handling of the semantic and geographic dimension, but still lack independent visu-alizations.
ZEUS
With ZEUS Gundesweiler et al. [GMR07] present a zoomable explorative user interface. In particular,ZEUS is a web application allowing for browsing, searching and object presentation in complex navigationspaces. Usually, this functions are addressed separately in software systems [CDT00]. However, ZEUS
126
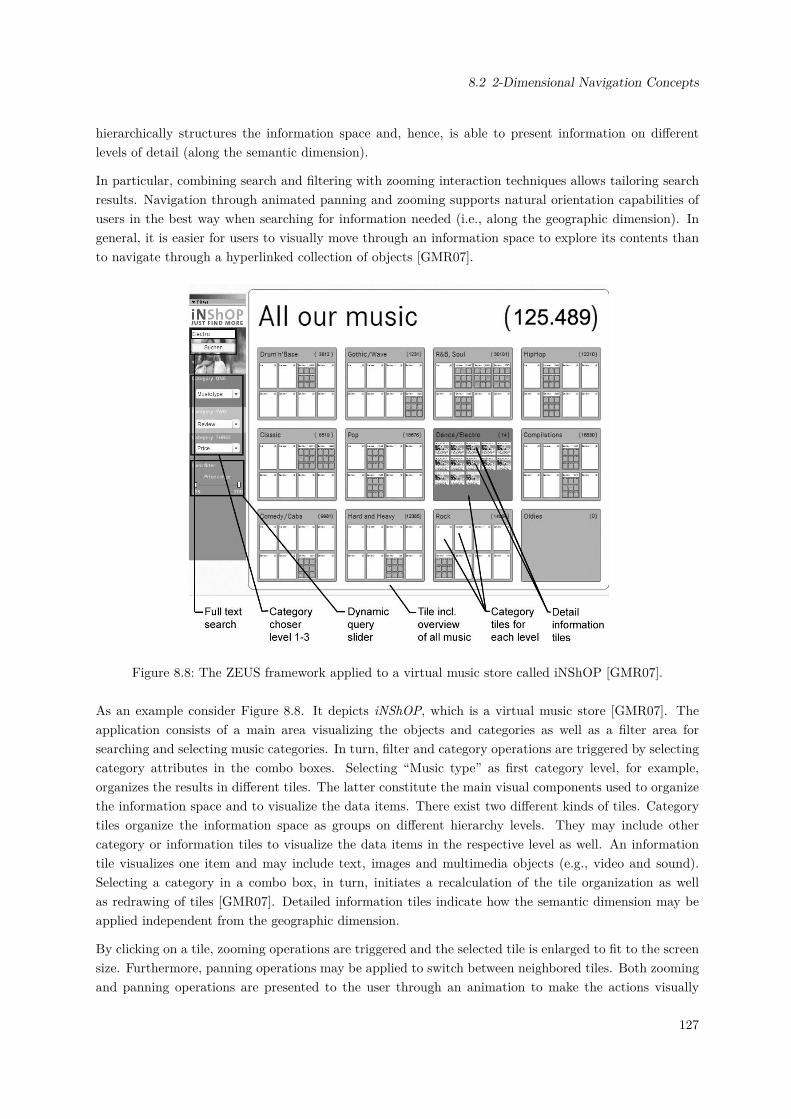
8.2 2-Dimensional Navigation Concepts
hierarchically structures the information space and, hence, is able to present information on differentlevels of detail (along the semantic dimension).
In particular, combining search and filtering with zooming interaction techniques allows tailoring searchresults. Navigation through animated panning and zooming supports natural orientation capabilities ofusers in the best way when searching for information needed (i.e., along the geographic dimension). Ingeneral, it is easier for users to visually move through an information space to explore its contents thanto navigate through a hyperlinked collection of objects [GMR07].
Figure 8.8: The ZEUS framework applied to a virtual music store called iNShOP [GMR07].
As an example consider Figure 8.8. It depicts iNShOP, which is a virtual music store [GMR07]. Theapplication consists of a main area visualizing the objects and categories as well as a filter area forsearching and selecting music categories. In turn, filter and category operations are triggered by selectingcategory attributes in the combo boxes. Selecting “Music type” as first category level, for example,organizes the results in different tiles. The latter constitute the main visual components used to organizethe information space and to visualize the data items. There exist two different kinds of tiles. Categorytiles organize the information space as groups on different hierarchy levels. They may include othercategory or information tiles to visualize the data items in the respective level as well. An informationtile visualizes one item and may include text, images and multimedia objects (e.g., video and sound).Selecting a category in a combo box, in turn, initiates a recalculation of the tile organization as wellas redrawing of tiles [GMR07]. Detailed information tiles indicate how the semantic dimension may beapplied independent from the geographic dimension.
By clicking on a tile, zooming operations are triggered and the selected tile is enlarged to fit to the screensize. Furthermore, panning operations may be applied to switch between neighbored tiles. Both zoomingand panning operations are presented to the user through an animation to make the actions visually
127
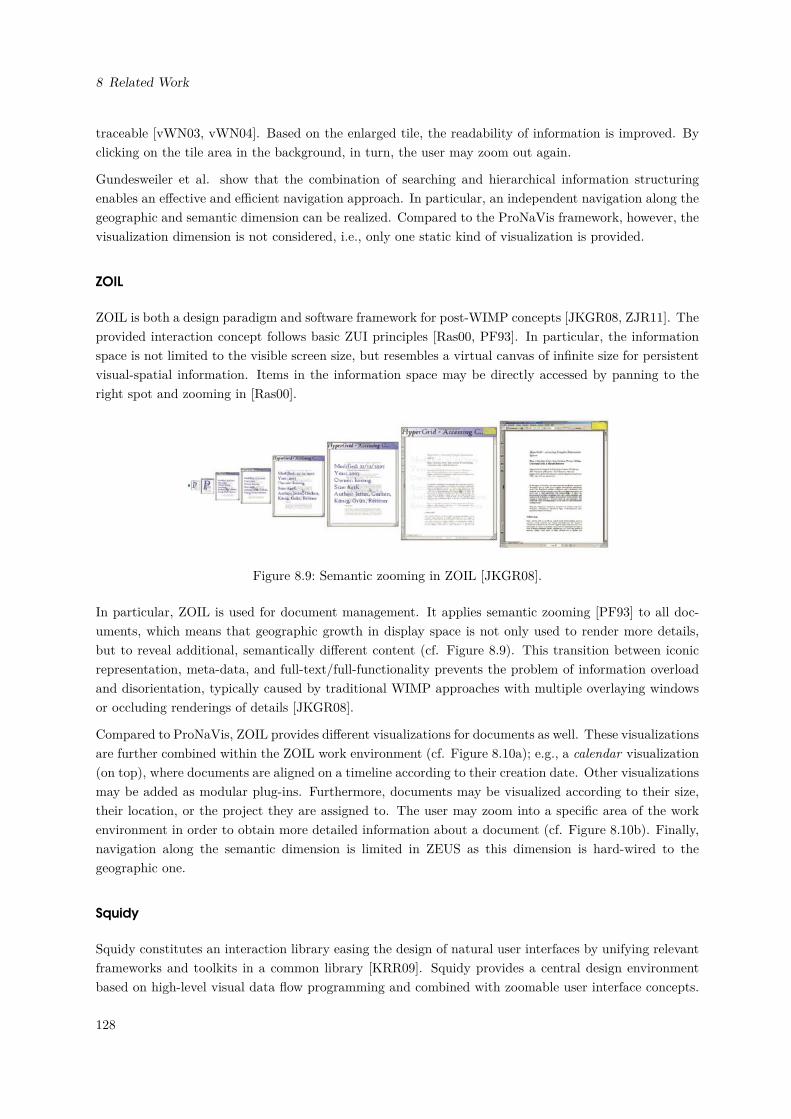
8 Related Work
traceable [vWN03, vWN04]. Based on the enlarged tile, the readability of information is improved. Byclicking on the tile area in the background, in turn, the user may zoom out again.
Gundesweiler et al. show that the combination of searching and hierarchical information structuringenables an effective and efficient navigation approach. In particular, an independent navigation along thegeographic and semantic dimension can be realized. Compared to the ProNaVis framework, however, thevisualization dimension is not considered, i.e., only one static kind of visualization is provided.
ZOIL
ZOIL is both a design paradigm and software framework for post-WIMP concepts [JKGR08, ZJR11]. Theprovided interaction concept follows basic ZUI principles [Ras00, PF93]. In particular, the informationspace is not limited to the visible screen size, but resembles a virtual canvas of infinite size for persistentvisual-spatial information. Items in the information space may be directly accessed by panning to theright spot and zooming in [Ras00].
Figure 8.9: Semantic zooming in ZOIL [JKGR08].
In particular, ZOIL is used for document management. It applies semantic zooming [PF93] to all doc-uments, which means that geographic growth in display space is not only used to render more details,but to reveal additional, semantically different content (cf. Figure 8.9). This transition between iconicrepresentation, meta-data, and full-text/full-functionality prevents the problem of information overloadand disorientation, typically caused by traditional WIMP approaches with multiple overlaying windowsor occluding renderings of details [JKGR08].
Compared to ProNaVis, ZOIL provides different visualizations for documents as well. These visualizationsare further combined within the ZOIL work environment (cf. Figure 8.10a); e.g., a calendar visualization(on top), where documents are aligned on a timeline according to their creation date. Other visualizationsmay be added as modular plug-ins. Furthermore, documents may be visualized according to their size,their location, or the project they are assigned to. The user may zoom into a specific area of the workenvironment in order to obtain more detailed information about a document (cf. Figure 8.10b). Finally,navigation along the semantic dimension is limited in ZEUS as this dimension is hard-wired to thegeographic one.
Squidy
Squidy constitutes an interaction library easing the design of natural user interfaces by unifying relevantframeworks and toolkits in a common library [KRR09]. Squidy provides a central design environmentbased on high-level visual data flow programming and combined with zoomable user interface concepts.
128
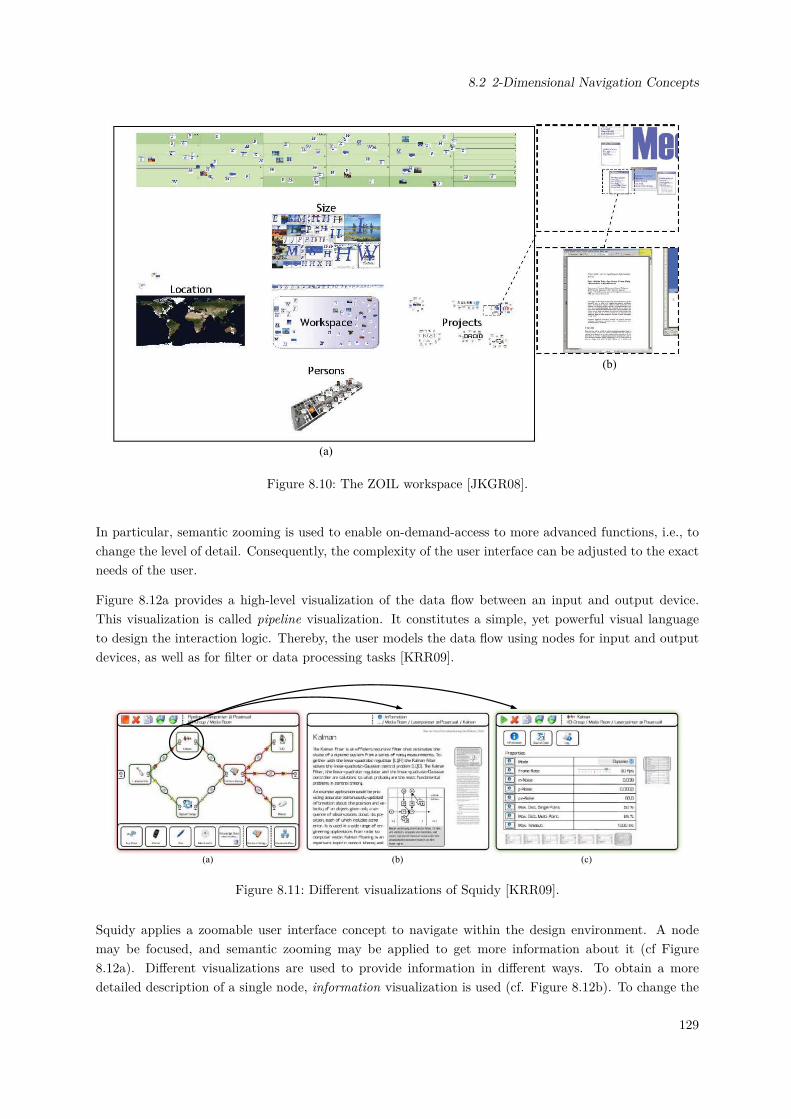
8.2 2-Dimensional Navigation Concepts
(a)
(b)
Figure 8.10: The ZOIL workspace [JKGR08].
In particular, semantic zooming is used to enable on-demand-access to more advanced functions, i.e., tochange the level of detail. Consequently, the complexity of the user interface can be adjusted to the exactneeds of the user.
Figure 8.12a provides a high-level visualization of the data flow between an input and output device.This visualization is called pipeline visualization. It constitutes a simple, yet powerful visual languageto design the interaction logic. Thereby, the user models the data flow using nodes for input and outputdevices, as well as for filter or data processing tasks [KRR09].
(a) (b) (c)
Figure 8.11: Different visualizations of Squidy [KRR09].
Squidy applies a zoomable user interface concept to navigate within the design environment. A nodemay be focused, and semantic zooming may be applied to get more information about it (cf Figure8.12a). Different visualizations are used to provide information in different ways. To obtain a moredetailed description of a single node, information visualization is used (cf. Figure 8.12b). To change the
129
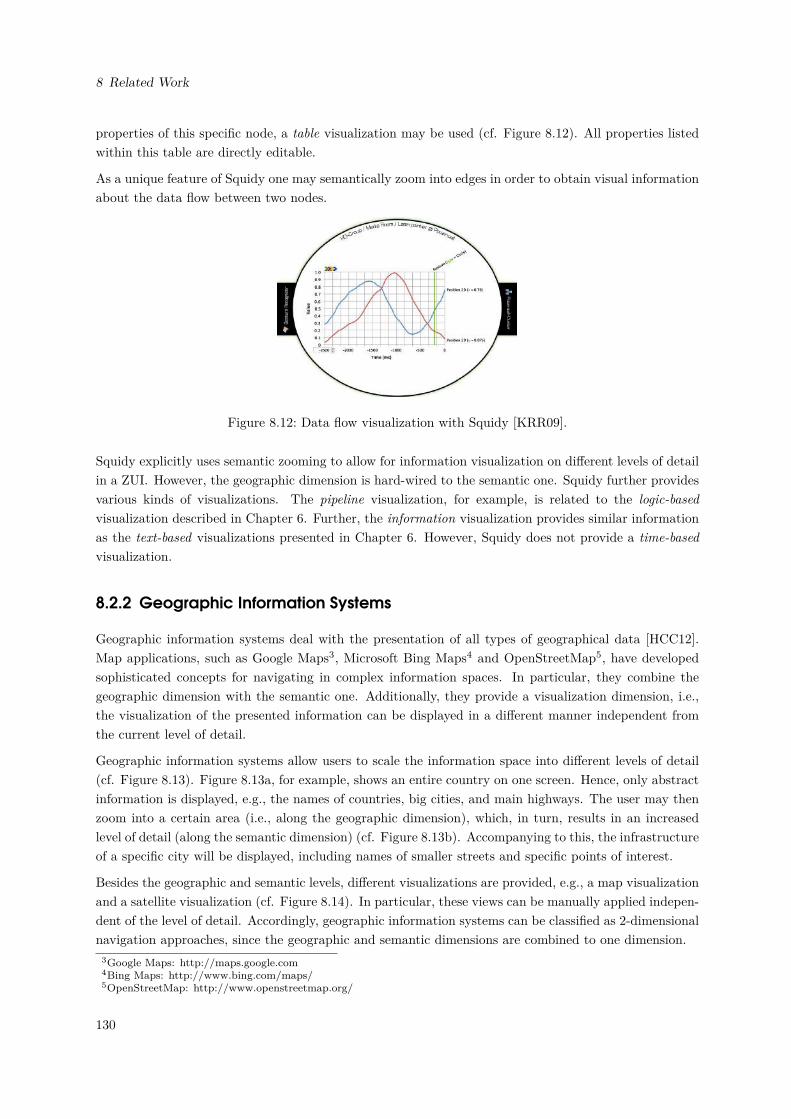
8 Related Work
properties of this specific node, a table visualization may be used (cf. Figure 8.12). All properties listedwithin this table are directly editable.
As a unique feature of Squidy one may semantically zoom into edges in order to obtain visual informationabout the data flow between two nodes.
Figure 8.12: Data flow visualization with Squidy [KRR09].
Squidy explicitly uses semantic zooming to allow for information visualization on different levels of detailin a ZUI. However, the geographic dimension is hard-wired to the semantic one. Squidy further providesvarious kinds of visualizations. The pipeline visualization, for example, is related to the logic-basedvisualization described in Chapter 6. Further, the information visualization provides similar informationas the text-based visualizations presented in Chapter 6. However, Squidy does not provide a time-basedvisualization.
8.2.2 Geographic Information Systems
Geographic information systems deal with the presentation of all types of geographical data [HCC12].Map applications, such as Google Maps3, Microsoft Bing Maps4 and OpenStreetMap5, have developedsophisticated concepts for navigating in complex information spaces. In particular, they combine thegeographic dimension with the semantic one. Additionally, they provide a visualization dimension, i.e.,the visualization of the presented information can be displayed in a different manner independent fromthe current level of detail.
Geographic information systems allow users to scale the information space into different levels of detail(cf. Figure 8.13). Figure 8.13a, for example, shows an entire country on one screen. Hence, only abstractinformation is displayed, e.g., the names of countries, big cities, and main highways. The user may thenzoom into a certain area (i.e., along the geographic dimension), which, in turn, results in an increasedlevel of detail (along the semantic dimension) (cf. Figure 8.13b). Accompanying to this, the infrastructureof a specific city will be displayed, including names of smaller streets and specific points of interest.
Besides the geographic and semantic levels, different visualizations are provided, e.g., a map visualizationand a satellite visualization (cf. Figure 8.14). In particular, these views can be manually applied indepen-dent of the level of detail. Accordingly, geographic information systems can be classified as 2-dimensionalnavigation approaches, since the geographic and semantic dimensions are combined to one dimension.
3Google Maps: http://maps.google.com4Bing Maps: http://www.bing.com/maps/5OpenStreetMap: http://www.openstreetmap.org/
130
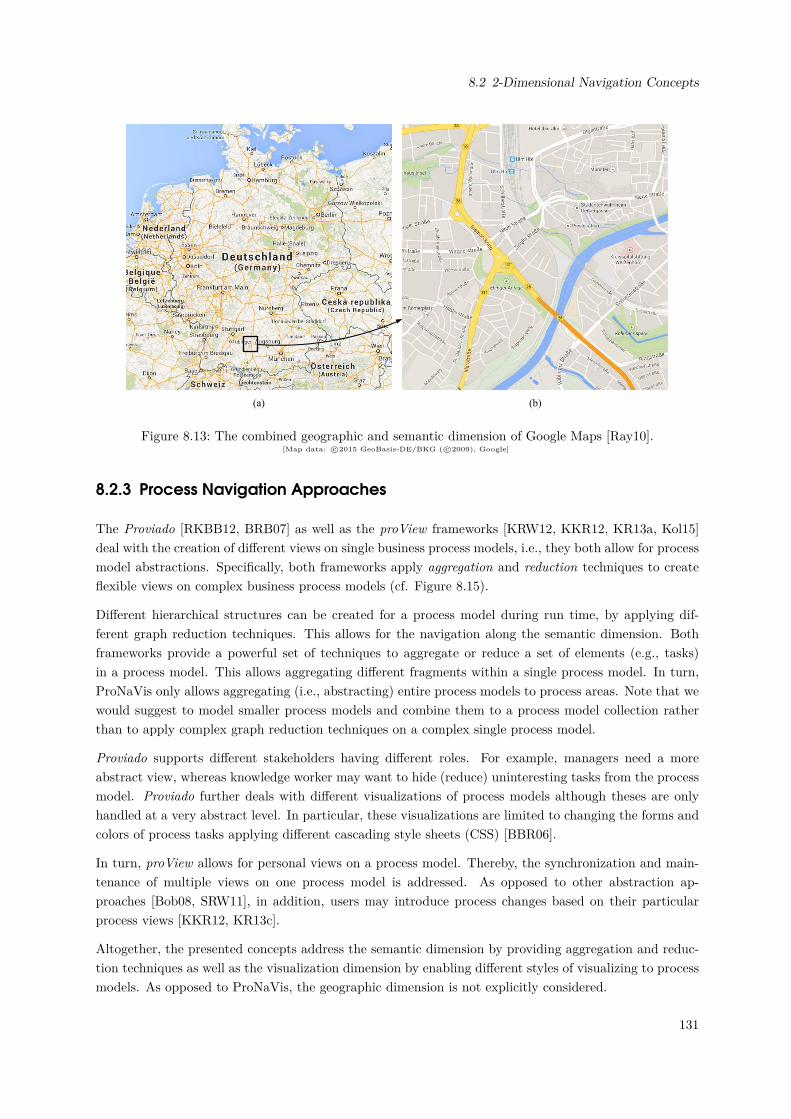
8.2 2-Dimensional Navigation Concepts
(a) (b)
Figure 8.13: The combined geographic and semantic dimension of Google Maps [Ray10].[Map data: c©2015 GeoBasis-DE/BKG ( c©2009), Google]
8.2.3 Process Navigation Approaches
The Proviado [RKBB12, BRB07] as well as the proView frameworks [KRW12, KKR12, KR13a, Kol15]deal with the creation of different views on single business process models, i.e., they both allow for processmodel abstractions. Specifically, both frameworks apply aggregation and reduction techniques to createflexible views on complex business process models (cf. Figure 8.15).
Different hierarchical structures can be created for a process model during run time, by applying dif-ferent graph reduction techniques. This allows for the navigation along the semantic dimension. Bothframeworks provide a powerful set of techniques to aggregate or reduce a set of elements (e.g., tasks)in a process model. This allows aggregating different fragments within a single process model. In turn,ProNaVis only allows aggregating (i.e., abstracting) entire process models to process areas. Note that wewould suggest to model smaller process models and combine them to a process model collection ratherthan to apply complex graph reduction techniques on a complex single process model.
Proviado supports different stakeholders having different roles. For example, managers need a moreabstract view, whereas knowledge worker may want to hide (reduce) uninteresting tasks from the processmodel. Proviado further deals with different visualizations of process models although theses are onlyhandled at a very abstract level. In particular, these visualizations are limited to changing the forms andcolors of process tasks applying different cascading style sheets (CSS) [BBR06].
In turn, proView allows for personal views on a process model. Thereby, the synchronization and main-tenance of multiple views on one process model is addressed. As opposed to other abstraction ap-proaches [Bob08, SRW11], in addition, users may introduce process changes based on their particularprocess views [KKR12, KR13c].
Altogether, the presented concepts address the semantic dimension by providing aggregation and reduc-tion techniques as well as the visualization dimension by enabling different styles of visualizing to processmodels. As opposed to ProNaVis, the geographic dimension is not explicitly considered.
131
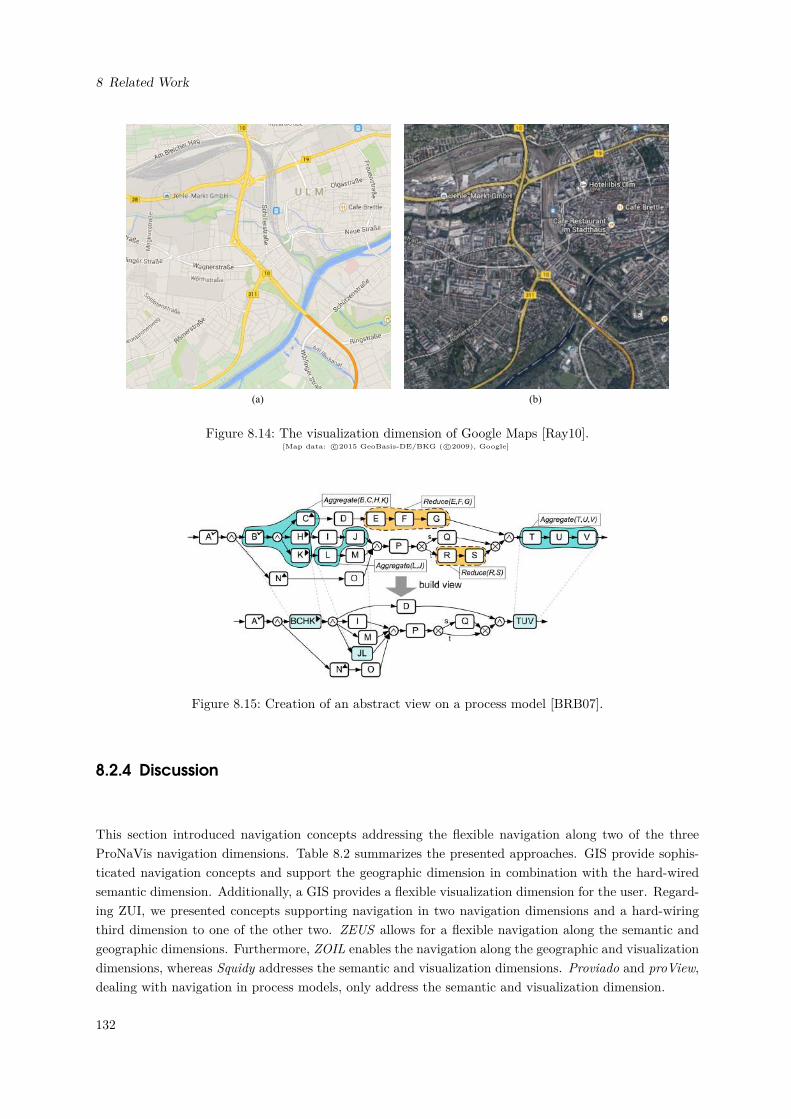
8 Related Work
(a) (b)
Figure 8.14: The visualization dimension of Google Maps [Ray10].[Map data: c©2015 GeoBasis-DE/BKG ( c©2009), Google]
Figure 8.15: Creation of an abstract view on a process model [BRB07].
8.2.4 Discussion
This section introduced navigation concepts addressing the flexible navigation along two of the threeProNaVis navigation dimensions. Table 8.2 summarizes the presented approaches. GIS provide sophis-ticated navigation concepts and support the geographic dimension in combination with the hard-wiredsemantic dimension. Additionally, a GIS provides a flexible visualization dimension for the user. Regard-ing ZUI, we presented concepts supporting navigation in two navigation dimensions and a hard-wiringthird dimension to one of the other two. ZEUS allows for a flexible navigation along the semantic andgeographic dimensions. Furthermore, ZOIL enables the navigation along the geographic and visualizationdimensions, whereas Squidy addresses the semantic and visualization dimensions. Proviado and proView,dealing with navigation in process models, only address the semantic and visualization dimension.
132
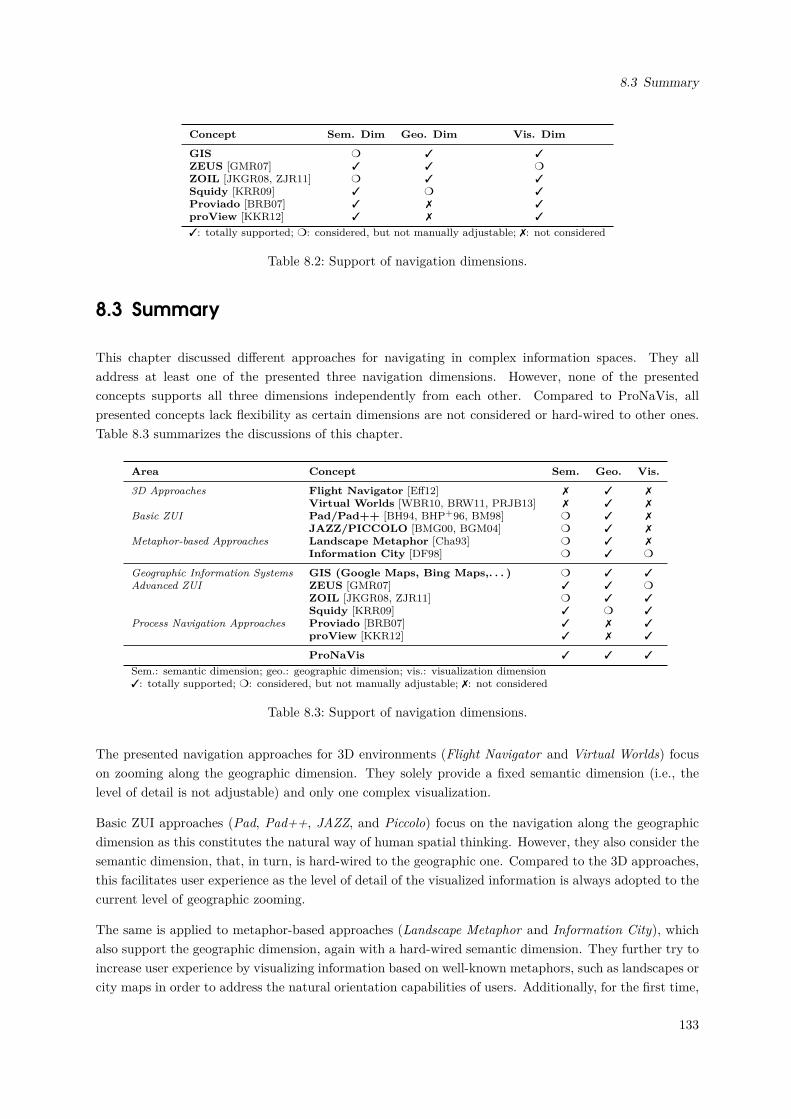
8.3 Summary
Concept Sem. Dim Geo. Dim Vis. Dim
GIS m 3 3ZEUS [GMR07] 3 3 mZOIL [JKGR08, ZJR11] m 3 3Squidy [KRR09] 3 m 3Proviado [BRB07] 3 7 3proView [KKR12] 3 7 3
3: totally supported; m: considered, but not manually adjustable; 7: not considered
Table 8.2: Support of navigation dimensions.
8.3 Summary
This chapter discussed different approaches for navigating in complex information spaces. They alladdress at least one of the presented three navigation dimensions. However, none of the presentedconcepts supports all three dimensions independently from each other. Compared to ProNaVis, allpresented concepts lack flexibility as certain dimensions are not considered or hard-wired to other ones.Table 8.3 summarizes the discussions of this chapter.
Area Concept Sem. Geo. Vis.
3D Approaches Flight Navigator [Eff12] 7 3 7Virtual Worlds [WBR10, BRW11, PRJB13] 7 3 7
Basic ZUI Pad/Pad++ [BH94, BHP+96, BM98] m 3 7JAZZ/PICCOLO [BMG00, BGM04] m 3 7
Metaphor-based Approaches Landscape Metaphor [Cha93] m 3 7Information City [DF98] m 3 m
Geographic Information Systems GIS (Google Maps, Bing Maps,. . . ) m 3 3Advanced ZUI ZEUS [GMR07] 3 3 m
ZOIL [JKGR08, ZJR11] m 3 3Squidy [KRR09] 3 m 3
Process Navigation Approaches Proviado [BRB07] 3 7 3proView [KKR12] 3 7 3
ProNaVis 3 3 3
Sem.: semantic dimension; geo.: geographic dimension; vis.: visualization dimension3: totally supported; m: considered, but not manually adjustable; 7: not considered
Table 8.3: Support of navigation dimensions.
The presented navigation approaches for 3D environments (Flight Navigator and Virtual Worlds) focuson zooming along the geographic dimension. They solely provide a fixed semantic dimension (i.e., thelevel of detail is not adjustable) and only one complex visualization.
Basic ZUI approaches (Pad, Pad++, JAZZ, and Piccolo) focus on the navigation along the geographicdimension as this constitutes the natural way of human spatial thinking. However, they also consider thesemantic dimension, that, in turn, is hard-wired to the geographic one. Compared to the 3D approaches,this facilitates user experience as the level of detail of the visualized information is always adopted to thecurrent level of geographic zooming.
The same is applied to metaphor-based approaches (Landscape Metaphor and Information City), whichalso support the geographic dimension, again with a hard-wired semantic dimension. They further try toincrease user experience by visualizing information based on well-known metaphors, such as landscapes orcity maps in order to address the natural orientation capabilities of users. Additionally, for the first time,
133
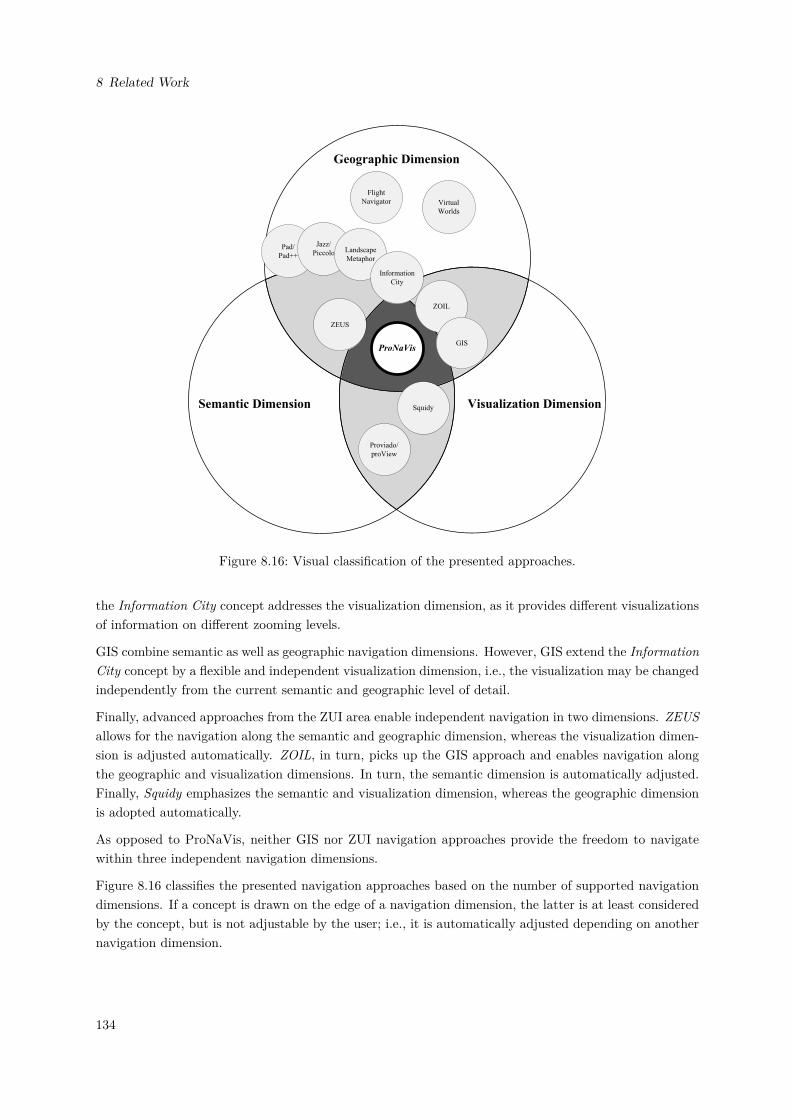
8 Related Work
Flight
Navigator Virtual
Worlds
ZEUS
Squidy
Proviado/
proView
ProNaVis
Geographic Dimension
Semantic Dimension Visualization Dimension
ZOIL
GIS
Pad/
Pad++
Jazz/
Piccolo Landscape
Metaphor
Information
City
Figure 8.16: Visual classification of the presented approaches.
the Information City concept addresses the visualization dimension, as it provides different visualizationsof information on different zooming levels.
GIS combine semantic as well as geographic navigation dimensions. However, GIS extend the InformationCity concept by a flexible and independent visualization dimension, i.e., the visualization may be changedindependently from the current semantic and geographic level of detail.
Finally, advanced approaches from the ZUI area enable independent navigation in two dimensions. ZEUSallows for the navigation along the semantic and geographic dimension, whereas the visualization dimen-sion is adjusted automatically. ZOIL, in turn, picks up the GIS approach and enables navigation alongthe geographic and visualization dimensions. In turn, the semantic dimension is automatically adjusted.Finally, Squidy emphasizes the semantic and visualization dimension, whereas the geographic dimensionis adopted automatically.
As opposed to ProNaVis, neither GIS nor ZUI navigation approaches provide the freedom to navigatewithin three independent navigation dimensions.
Figure 8.16 classifies the presented navigation approaches based on the number of supported navigationdimensions. If a concept is drawn on the edge of a navigation dimension, the latter is at least consideredby the concept, but is not adjustable by the user; i.e., it is automatically adjusted depending on anothernavigation dimension.
134

9 Proof-of-Concept Prototypes
To be able to demonstrate the concepts developed in the context of ProNaVis and to discuss themwith users, we implemented two different prototypes. ProNavigator was created to illustrate the holisticProNaVis functionality, i.e., the 3-dimensional navigation space. In particular ProNaVis constitutes thebasis for a user experiment addressing the navigation functionality (cf. Chapter 10). In turn, Compasswas developed as process navigation tool to be used by an industrial partner as process navigationtool supporting process participants when developing E/E car components. Both tools have taken therequirements presented in Chapter 2 into account (cf. Table 9.1).
Req # Requirement
NavReq #1 Depending on a process participant’s experience, the level of detailregarding a process task should be adjustable.
NavReq #2 Process participants should be able to adjust the level of detail re-garding process model collection in order to obtain a quick overviewon a specific task that is currently executed.
NavReq #3 Users should be enabled to access process tasks in other processareas.
NavReq #4 Relevant process information must be accessible at the level of singleprocess models from the process model collection.
NavReq #5 Roles must be globally defined in a detailed manner.NavReq #6 Process participants must be able to access process models on dif-
ferent levels of detail.
VisReq #1 Task descriptions must be documented in a well understandablemanner.
VisReq #2 Temporal and logical dependencies must be considered when visu-alizing processes.
VisReq #3 Complex process information must be visualized in a comprehensiblemanner.
VisReq #4 Information about roles must be intuitively identifiable.VisReq #5 The amount of visualized information should not overload process
participants.
Table 9.1: Overview on the derived requirements.
The remainder of the chapter is structured as follows. Section 9.1 presents the ProNavigator prototype.This click-prototype demonstrates different interaction concepts for navigating in a 3-dimensional nav-igation space. In turn, Section 9.2 presents Compass, a powerful process navigation and visualizationtool, developed in collaboration with an industrial partner. In particular, Compass supports knowledgeworkers dealing with the engineering of E/E components for cars, trucks, and buses. Section 9.3 discussesthe presented applications and Section 9.4 concludes the chapter with a summary.
135
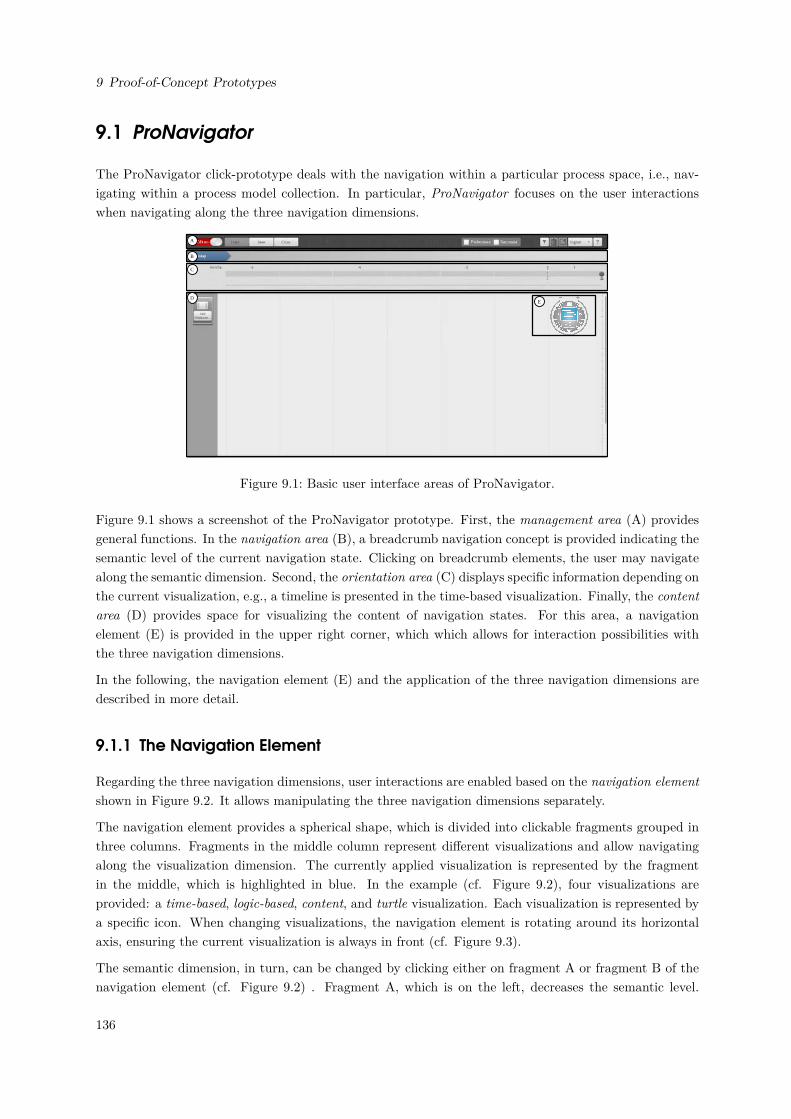
9 Proof-of-Concept Prototypes
9.1 ProNavigator
The ProNavigator click-prototype deals with the navigation within a particular process space, i.e., nav-igating within a process model collection. In particular, ProNavigator focuses on the user interactionswhen navigating along the three navigation dimensions.
A
B
C
DE
Figure 9.1: Basic user interface areas of ProNavigator.
Figure 9.1 shows a screenshot of the ProNavigator prototype. First, the management area (A) providesgeneral functions. In the navigation area (B), a breadcrumb navigation concept is provided indicating thesemantic level of the current navigation state. Clicking on breadcrumb elements, the user may navigatealong the semantic dimension. Second, the orientation area (C) displays specific information depending onthe current visualization, e.g., a timeline is presented in the time-based visualization. Finally, the contentarea (D) provides space for visualizing the content of navigation states. For this area, a navigationelement (E) is provided in the upper right corner, which which allows for interaction possibilities withthe three navigation dimensions.
In the following, the navigation element (E) and the application of the three navigation dimensions aredescribed in more detail.
9.1.1 The Navigation Element
Regarding the three navigation dimensions, user interactions are enabled based on the navigation elementshown in Figure 9.2. It allows manipulating the three navigation dimensions separately.
The navigation element provides a spherical shape, which is divided into clickable fragments grouped inthree columns. Fragments in the middle column represent different visualizations and allow navigatingalong the visualization dimension. The currently applied visualization is represented by the fragmentin the middle, which is highlighted in blue. In the example (cf. Figure 9.2), four visualizations areprovided: a time-based, logic-based, content, and turtle visualization. Each visualization is represented bya specific icon. When changing visualizations, the navigation element is rotating around its horizontalaxis, ensuring the current visualization is always in front (cf. Figure 9.3).
The semantic dimension, in turn, can be changed by clicking either on fragment A or fragment B of thenavigation element (cf. Figure 9.2) . Fragment A, which is on the left, decreases the semantic level.
136
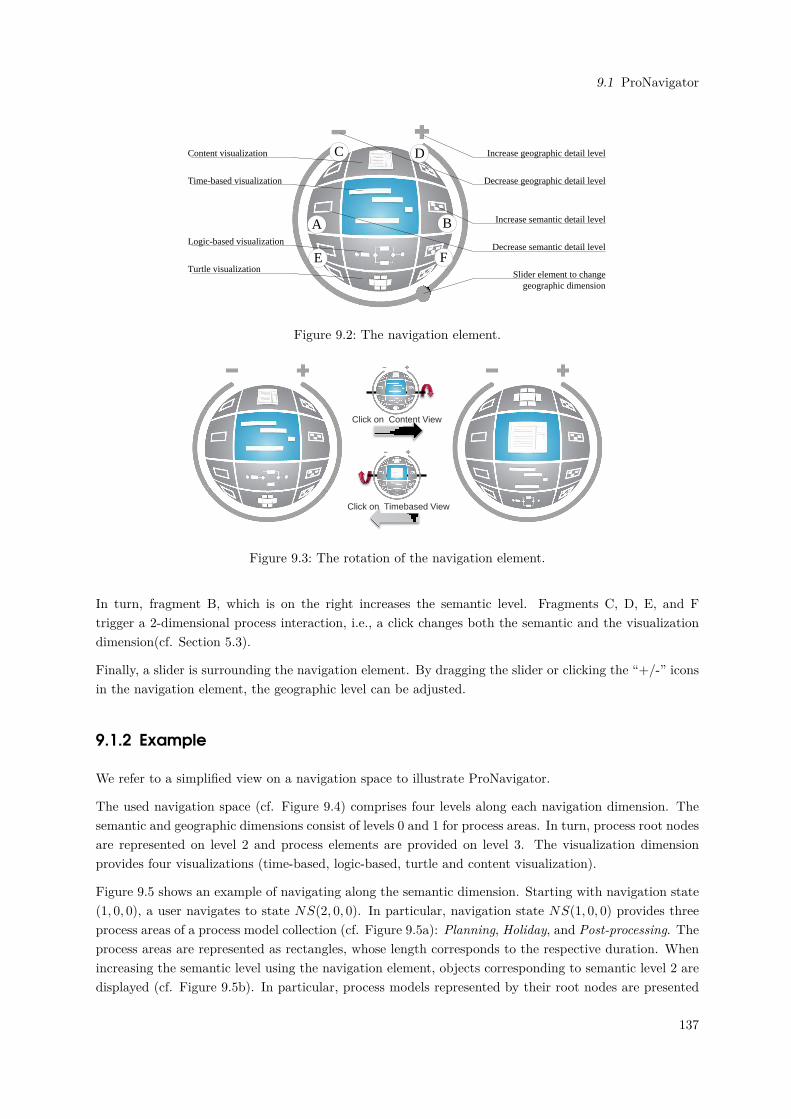
9.1 ProNavigator
Content visualization
Time-based visualization
Logic-based visualization
Turtle visualization
Increase semantic detail level
Decrease semantic detail level
Slider element to change geographic dimension
Increase geographic detail level
Decrease geographic detail level
A B
FE
C D
Figure 9.2: The navigation element.
Click on Content View
Click on Timebased View
Figure 9.3: The rotation of the navigation element.
In turn, fragment B, which is on the right increases the semantic level. Fragments C, D, E, and Ftrigger a 2-dimensional process interaction, i.e., a click changes both the semantic and the visualizationdimension(cf. Section 5.3).
Finally, a slider is surrounding the navigation element. By dragging the slider or clicking the “+/-” iconsin the navigation element, the geographic level can be adjusted.
9.1.2 Example
We refer to a simplified view on a navigation space to illustrate ProNavigator.
The used navigation space (cf. Figure 9.4) comprises four levels along each navigation dimension. Thesemantic and geographic dimensions consist of levels 0 and 1 for process areas. In turn, process root nodesare represented on level 2 and process elements are provided on level 3. The visualization dimensionprovides four visualizations (time-based, logic-based, turtle and content visualization).
Figure 9.5 shows an example of navigating along the semantic dimension. Starting with navigation state(1, 0, 0), a user navigates to state NS(2, 0, 0). In particular, navigation state NS(1, 0, 0) provides threeprocess areas of a process model collection (cf. Figure 9.5a): Planning, Holiday, and Post-processing. Theprocess areas are represented as rectangles, whose length corresponds to the respective duration. Whenincreasing the semantic level using the navigation element, objects corresponding to semantic level 2 aredisplayed (cf. Figure 9.5b). In particular, process models represented by their root nodes are presented
137
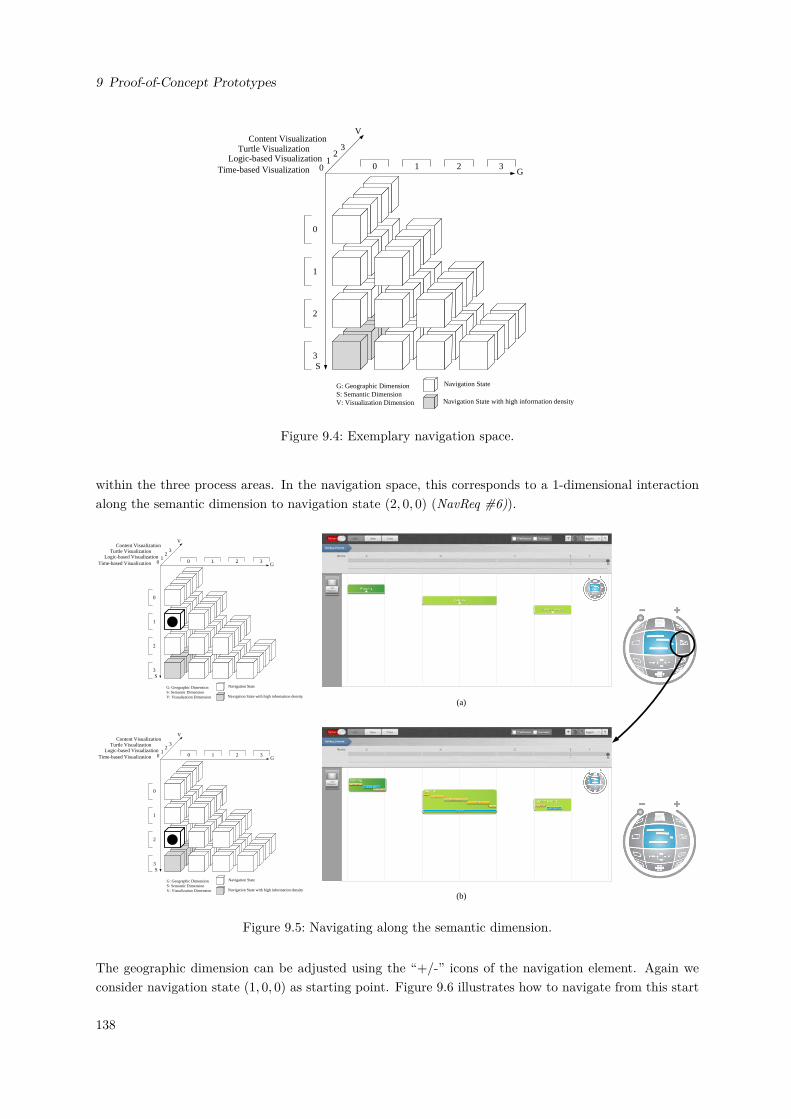
9 Proof-of-Concept Prototypes
G
S
V
G: Geographic DimensionS: Semantic DimensionV: Visualization Dimension
Time-based VisualizationLogic-based Visualization
Turtle Visualization1
0
2
1
0
2
3
0 1 2 3
Navigation State
Navigation State with high information density
3Content Visualization
Figure 9.4: Exemplary navigation space.
within the three process areas. In the navigation space, this corresponds to a 1-dimensional interactionalong the semantic dimension to navigation state (2, 0, 0) (NavReq #6)).
G
S
V
G: Geographic DimensionS: Semantic DimensionV: Visualization Dimension
Time-based VisualizationLogic-based Visualization
Turtle Visualization1
0
2
1
0
2
3
0 1 2 3
Navigation State
Navigation State with high information density
3Content Visualization
Planning
Holiday
Postprocessing
Holiday_Process
G
S
V
G: Geographic DimensionS: Semantic DimensionV: Visualization Dimension
Time-based VisualizationLogic-based Visualization
Turtle Visualization1
0
2
1
0
2
3
0 1 2 3
Navigation State
Navigation State with high information density
3Content Visualization
Planning
Holiday
Write Report
Develop Photos
Research
Find Appointment
Booking
Plan Trips
Supervise Trips
Beach
Outbound
Flight
Inward Flight
Take Pictures
Postprocessing
Holiday_Process
(a)
(b)
Figure 9.5: Navigating along the semantic dimension.
The geographic dimension can be adjusted using the “+/-” icons of the navigation element. Again weconsider navigation state (1, 0, 0) as starting point. Figure 9.6 illustrates how to navigate from this start
138
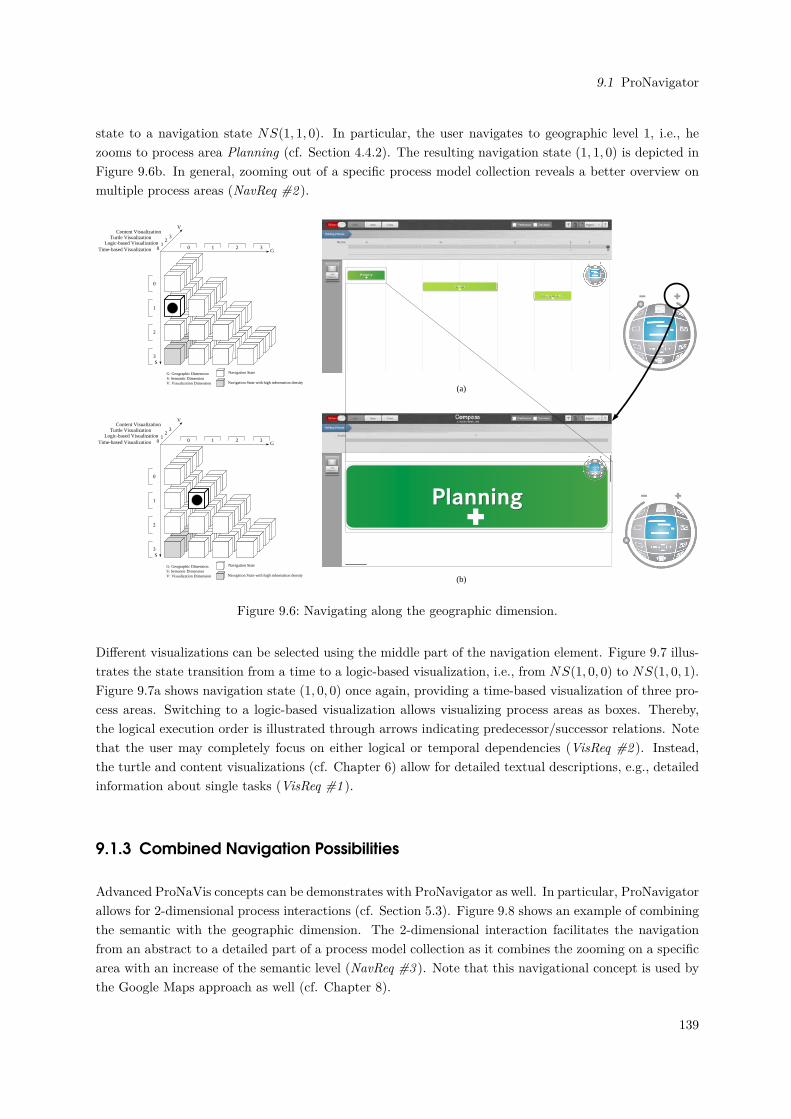
9.1 ProNavigator
state to a navigation state NS(1, 1, 0). In particular, the user navigates to geographic level 1, i.e., hezooms to process area Planning (cf. Section 4.4.2). The resulting navigation state (1, 1, 0) is depicted inFigure 9.6b. In general, zooming out of a specific process model collection reveals a better overview onmultiple process areas (NavReq #2 ).
G
S
V
G: Geographic DimensionS: Semantic DimensionV: Visualization Dimension
Time-based VisualizationLogic-based Visualization
Turtle Visualization1
0
2
1
0
2
3
0 1 2 3
Navigation State
Navigation State with high information density
3Content Visualization
Planning
Holiday
Postprocessing
Holiday_Process
(a)
Planning
-6
Holiday_Process
G
S
V
G: Geographic DimensionS: Semantic DimensionV: Visualization Dimension
Time-based VisualizationLogic-based Visualization
Turtle Visualization1
0
2
1
0
2
3
0 1 2 3
Navigation State
Navigation State with high information density
3Content Visualization
(b)
Figure 9.6: Navigating along the geographic dimension.
Different visualizations can be selected using the middle part of the navigation element. Figure 9.7 illus-trates the state transition from a time to a logic-based visualization, i.e., from NS(1, 0, 0) to NS(1, 0, 1).Figure 9.7a shows navigation state (1, 0, 0) once again, providing a time-based visualization of three pro-cess areas. Switching to a logic-based visualization allows visualizing process areas as boxes. Thereby,the logical execution order is illustrated through arrows indicating predecessor/successor relations. Notethat the user may completely focus on either logical or temporal dependencies (VisReq #2 ). Instead,the turtle and content visualizations (cf. Chapter 6) allow for detailed textual descriptions, e.g., detailedinformation about single tasks (VisReq #1 ).
9.1.3 Combined Navigation Possibilities
Advanced ProNaVis concepts can be demonstrates with ProNavigator as well. In particular, ProNavigatorallows for 2-dimensional process interactions (cf. Section 5.3). Figure 9.8 shows an example of combiningthe semantic with the geographic dimension. The 2-dimensional interaction facilitates the navigationfrom an abstract to a detailed part of a process model collection as it combines the zooming on a specificarea with an increase of the semantic level (NavReq #3 ). Note that this navigational concept is used bythe Google Maps approach as well (cf. Chapter 8).
139
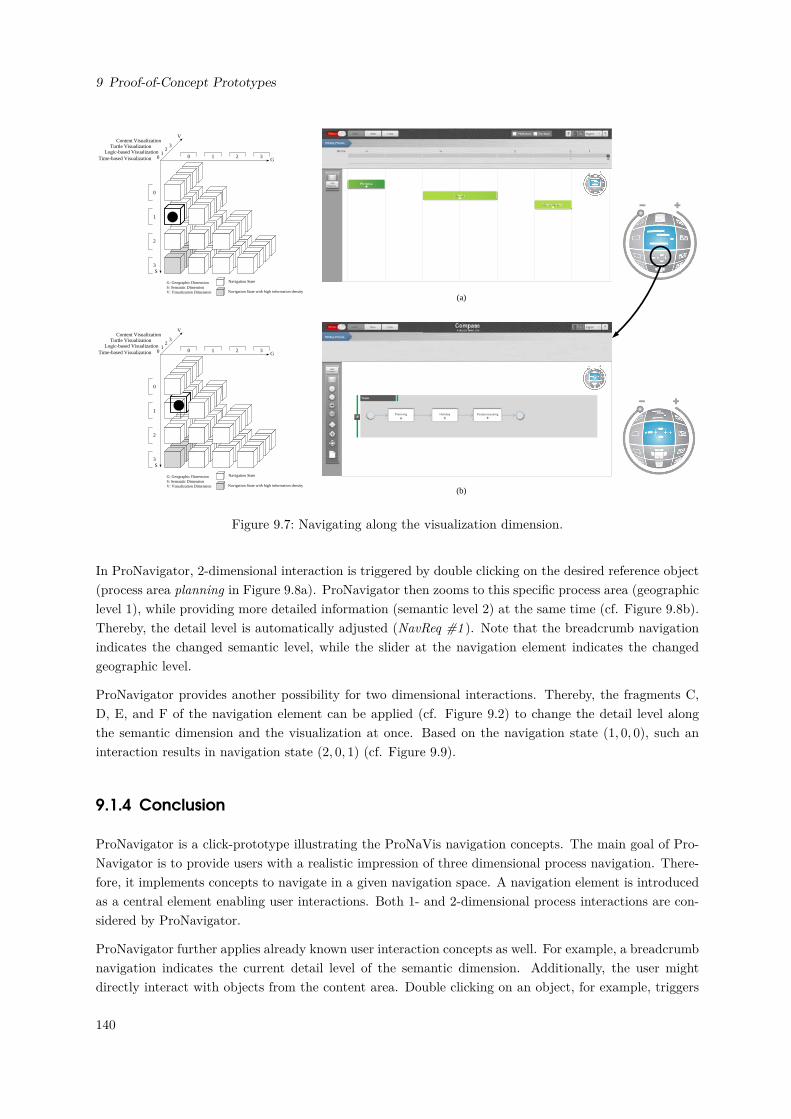
9 Proof-of-Concept Prototypes
G
S
V
G: Geographic DimensionS: Semantic DimensionV: Visualization Dimension
Time-based VisualizationLogic-based Visualization
Turtle Visualization1
0
2
1
0
2
3
0 1 2 3
Navigation State
Navigation State with high information density
3Content Visualization
Planning
Holiday
Postprocessing
Holiday_Process
(a)
Planning Holiday Postprocessing
Team
Holiday_Process
G
S
V
G: Geographic DimensionS: Semantic DimensionV: Visualization Dimension
Time-based VisualizationLogic-based Visualization
Turtle Visualization1
0
2
1
0
2
3
0 1 2 3
Navigation State
Navigation State with high information density
3Content Visualization
(b)
Figure 9.7: Navigating along the visualization dimension.
In ProNavigator, 2-dimensional interaction is triggered by double clicking on the desired reference object(process area planning in Figure 9.8a). ProNavigator then zooms to this specific process area (geographiclevel 1), while providing more detailed information (semantic level 2) at the same time (cf. Figure 9.8b).Thereby, the detail level is automatically adjusted (NavReq #1 ). Note that the breadcrumb navigationindicates the changed semantic level, while the slider at the navigation element indicates the changedgeographic level.
ProNavigator provides another possibility for two dimensional interactions. Thereby, the fragments C,D, E, and F of the navigation element can be applied (cf. Figure 9.2) to change the detail level alongthe semantic dimension and the visualization at once. Based on the navigation state (1, 0, 0), such aninteraction results in navigation state (2, 0, 1) (cf. Figure 9.9).
9.1.4 Conclusion
ProNavigator is a click-prototype illustrating the ProNaVis navigation concepts. The main goal of Pro-Navigator is to provide users with a realistic impression of three dimensional process navigation. There-fore, it implements concepts to navigate in a given navigation space. A navigation element is introducedas a central element enabling user interactions. Both 1- and 2-dimensional process interactions are con-sidered by ProNavigator.
ProNavigator further applies already known user interaction concepts as well. For example, a breadcrumbnavigation indicates the current detail level of the semantic dimension. Additionally, the user mightdirectly interact with objects from the content area. Double clicking on an object, for example, triggers
140
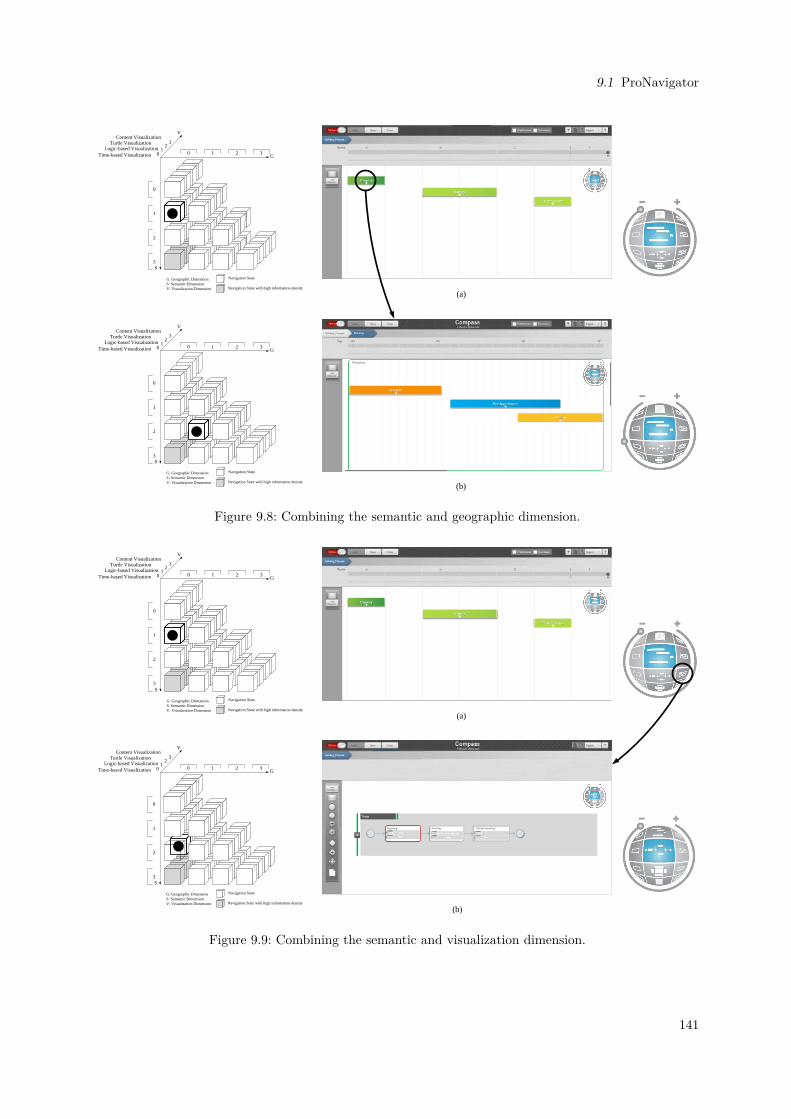
9.1 ProNavigator
G
S
V
G: Geographic DimensionS: Semantic DimensionV: Visualization Dimension
Time-based VisualizationLogic-based Visualization
Turtle Visualization1
0
2
1
0
2
3
0 1 2 3
Navigation State
Navigation State with high information density
3Content Visualization
Planning
Holiday
Postprocessing
Holiday_Process
(a)
Planning
Research
Find Appointment
Booking
Holiday_Process Planning
G
S
V
G: Geographic DimensionS: Semantic DimensionV: Visualization Dimension
Time-based VisualizationLogic-based Visualization
Turtle Visualization1
0
2
1
0
2
3
0 1 2 3
Navigation State
Navigation State with high information density
3Content Visualization
(b)
Figure 9.8: Combining the semantic and geographic dimension.
G
S
V
G: Geographic DimensionS: Semantic DimensionV: Visualization Dimension
Time-based VisualizationLogic-based Visualization
Turtle Visualization1
0
2
1
0
2
3
0 1 2 3
Navigation State
Navigation State with high information density
3Content Visualization
Planning
Holiday
Postprocessing
Holiday_Process
(a)
G
S
V
G: Geographic DimensionS: Semantic DimensionV: Visualization Dimension
Time-based VisualizationLogic-based Visualization
Turtle Visualization1
0
2
1
0
2
3
0 1 2 3
Navigation State
Navigation State with high information density
3Content Visualization
Team
Planning Holiday Postprocessing
Holiday_Process
(b)
Figure 9.9: Combining the semantic and visualization dimension.
141
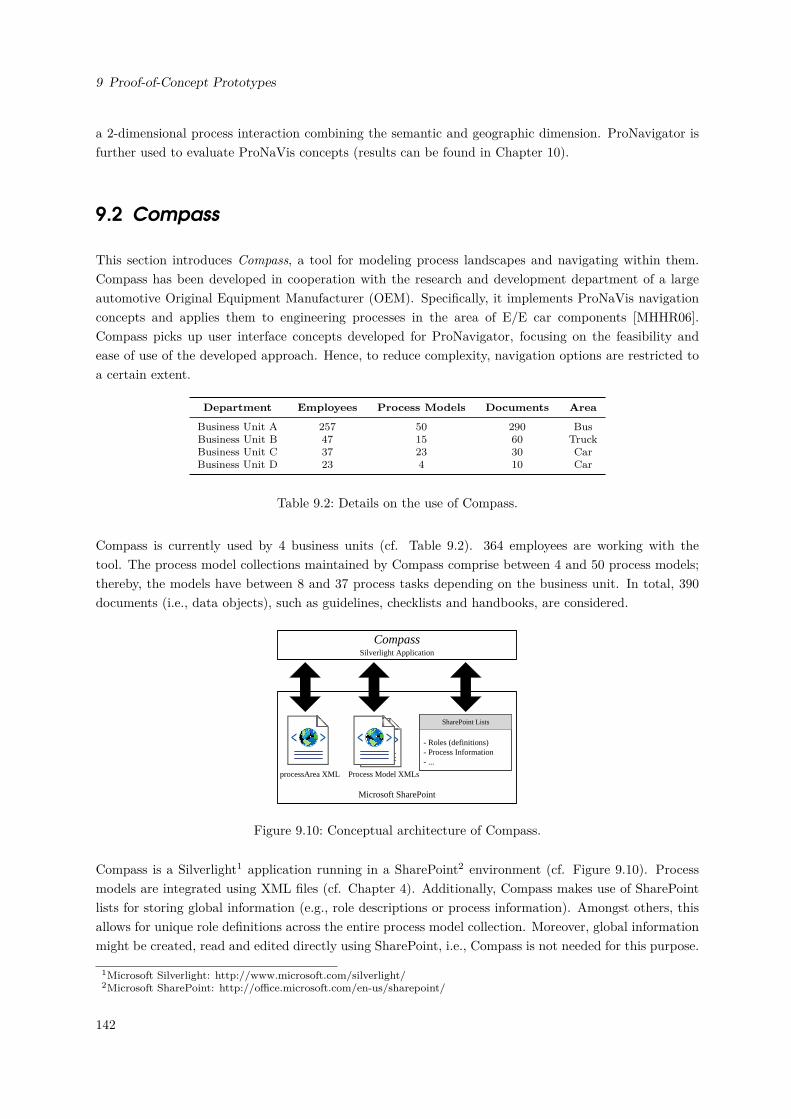
9 Proof-of-Concept Prototypes
a 2-dimensional process interaction combining the semantic and geographic dimension. ProNavigator isfurther used to evaluate ProNaVis concepts (results can be found in Chapter 10).
9.2 Compass
This section introduces Compass, a tool for modeling process landscapes and navigating within them.Compass has been developed in cooperation with the research and development department of a largeautomotive Original Equipment Manufacturer (OEM). Specifically, it implements ProNaVis navigationconcepts and applies them to engineering processes in the area of E/E car components [MHHR06].Compass picks up user interface concepts developed for ProNavigator, focusing on the feasibility andease of use of the developed approach. Hence, to reduce complexity, navigation options are restricted toa certain extent.
Department Employees Process Models Documents Area
Business Unit A 257 50 290 BusBusiness Unit B 47 15 60 TruckBusiness Unit C 37 23 30 CarBusiness Unit D 23 4 10 Car
Table 9.2: Details on the use of Compass.
Compass is currently used by 4 business units (cf. Table 9.2). 364 employees are working with thetool. The process model collections maintained by Compass comprise between 4 and 50 process models;thereby, the models have between 8 and 37 process tasks depending on the business unit. In total, 390documents (i.e., data objects), such as guidelines, checklists and handbooks, are considered.
Microsoft SharePoint
CompassSilverlight Application
processArea XML Process Model XMLs
- Roles (definitions)- Process Information- ...
SharePoint Lists
Figure 9.10: Conceptual architecture of Compass.
Compass is a Silverlight1 application running in a SharePoint2 environment (cf. Figure 9.10). Processmodels are integrated using XML files (cf. Chapter 4). Additionally, Compass makes use of SharePointlists for storing global information (e.g., role descriptions or process information). Amongst others, thisallows for unique role definitions across the entire process model collection. Moreover, global informationmight be created, read and edited directly using SharePoint, i.e., Compass is not needed for this purpose.
1Microsoft Silverlight: http://www.microsoft.com/silverlight/2Microsoft SharePoint: http://office.microsoft.com/en-us/sharepoint/
142
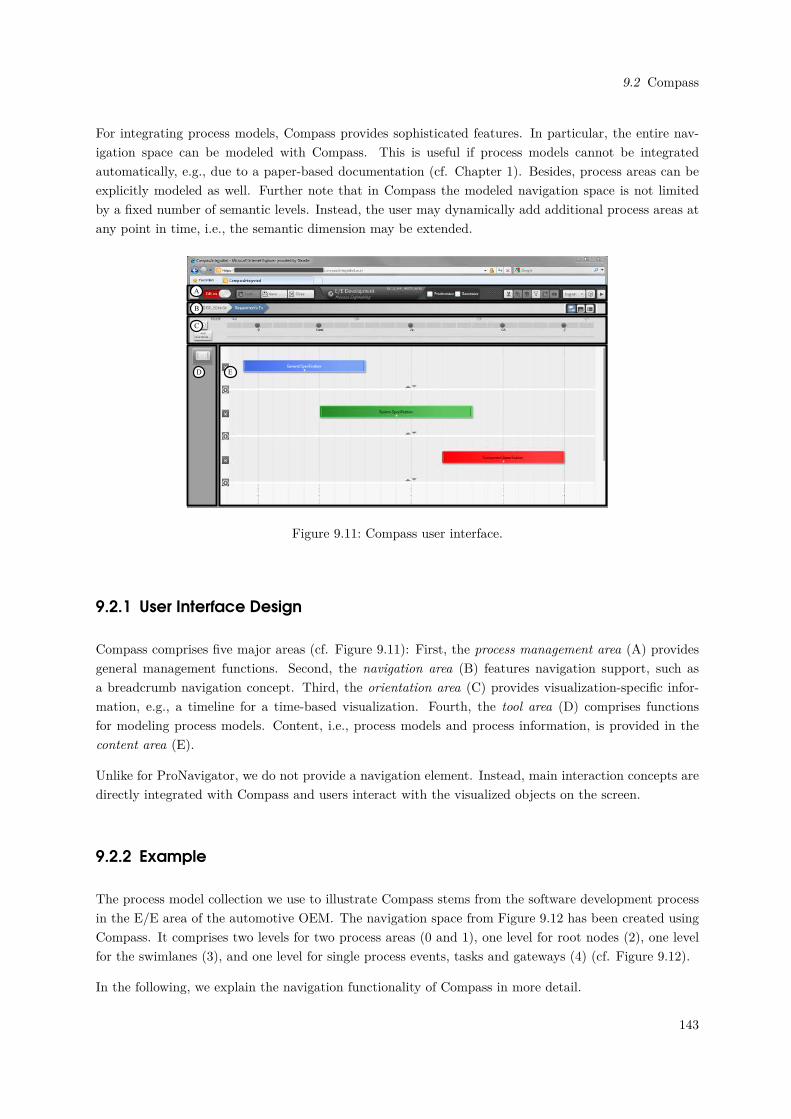
9.2 Compass
For integrating process models, Compass provides sophisticated features. In particular, the entire nav-igation space can be modeled with Compass. This is useful if process models cannot be integratedautomatically, e.g., due to a paper-based documentation (cf. Chapter 1). Besides, process areas can beexplicitly modeled as well. Further note that in Compass the modeled navigation space is not limitedby a fixed number of semantic levels. Instead, the user may dynamically add additional process areas atany point in time, i.e., the semantic dimension may be extended.
A
B
C
D E
Figure 9.11: Compass user interface.
9.2.1 User Interface Design
Compass comprises five major areas (cf. Figure 9.11): First, the process management area (A) providesgeneral management functions. Second, the navigation area (B) features navigation support, such asa breadcrumb navigation concept. Third, the orientation area (C) provides visualization-specific infor-mation, e.g., a timeline for a time-based visualization. Fourth, the tool area (D) comprises functionsfor modeling process models. Content, i.e., process models and process information, is provided in thecontent area (E).
Unlike for ProNavigator, we do not provide a navigation element. Instead, main interaction concepts aredirectly integrated with Compass and users interact with the visualized objects on the screen.
9.2.2 Example
The process model collection we use to illustrate Compass stems from the software development processin the E/E area of the automotive OEM. The navigation space from Figure 9.12 has been created usingCompass. It comprises two levels for two process areas (0 and 1), one level for root nodes (2), one levelfor the swimlanes (3), and one level for single process events, tasks and gateways (4) (cf. Figure 9.12).
In the following, we explain the navigation functionality of Compass in more detail.
143
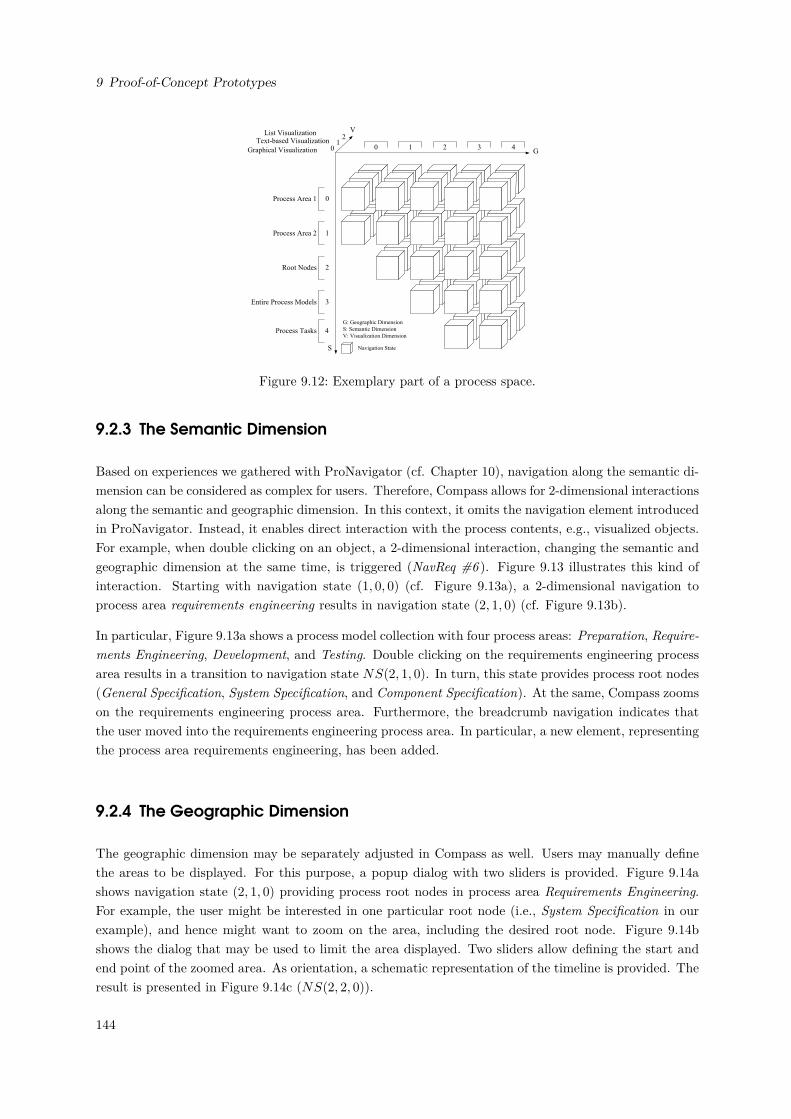
9 Proof-of-Concept Prototypes
G
S
V
G: Geographic Dimension
S: Semantic Dimension
V: Visualization Dimension
Graphical Visualization
Text-based VisualizationList Visualization
10
2
1
0
2
3
0 1 2 3
Navigation State
Process Area 1
Process Area 2
Root Nodes
Entire Process Models
4
4Process Tasks
Figure 9.12: Exemplary part of a process space.
9.2.3 The Semantic Dimension
Based on experiences we gathered with ProNavigator (cf. Chapter 10), navigation along the semantic di-mension can be considered as complex for users. Therefore, Compass allows for 2-dimensional interactionsalong the semantic and geographic dimension. In this context, it omits the navigation element introducedin ProNavigator. Instead, it enables direct interaction with the process contents, e.g., visualized objects.For example, when double clicking on an object, a 2-dimensional interaction, changing the semantic andgeographic dimension at the same time, is triggered (NavReq #6 ). Figure 9.13 illustrates this kind ofinteraction. Starting with navigation state (1, 0, 0) (cf. Figure 9.13a), a 2-dimensional navigation toprocess area requirements engineering results in navigation state (2, 1, 0) (cf. Figure 9.13b).
In particular, Figure 9.13a shows a process model collection with four process areas: Preparation, Require-ments Engineering, Development, and Testing. Double clicking on the requirements engineering processarea results in a transition to navigation state NS(2, 1, 0). In turn, this state provides process root nodes(General Specification, System Specification, and Component Specification). At the same, Compass zoomson the requirements engineering process area. Furthermore, the breadcrumb navigation indicates thatthe user moved into the requirements engineering process area. In particular, a new element, representingthe process area requirements engineering, has been added.
9.2.4 The Geographic Dimension
The geographic dimension may be separately adjusted in Compass as well. Users may manually definethe areas to be displayed. For this purpose, a popup dialog with two sliders is provided. Figure 9.14ashows navigation state (2, 1, 0) providing process root nodes in process area Requirements Engineering.For example, the user might be interested in one particular root node (i.e., System Specification in ourexample), and hence might want to zoom on the area, including the desired root node. Figure 9.14bshows the dialog that may be used to limit the area displayed. Two sliders allow defining the start andend point of the zoomed area. As orientation, a schematic representation of the timeline is provided. Theresult is presented in Figure 9.14c (NS(2, 2, 0)).
144
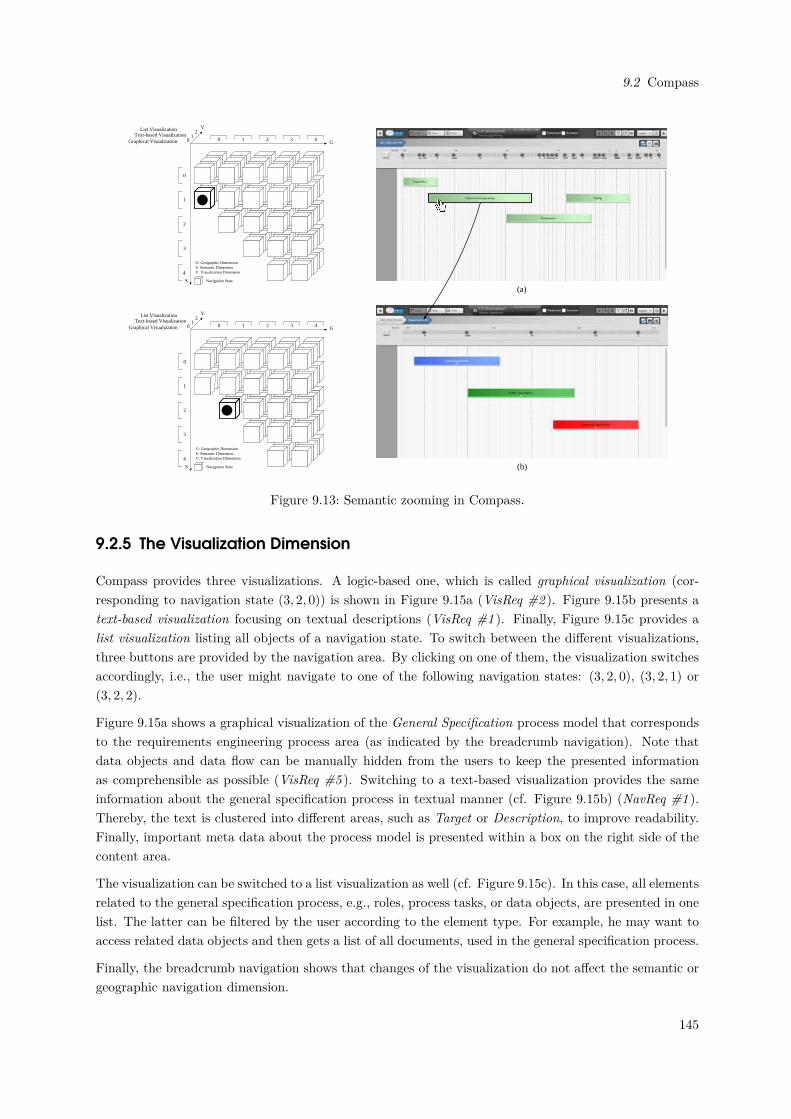
9.2 Compass
(a)
(b)
G
S
V
G: Geographic DimensionS: Semantic DimensionV: Visualization Dimension
Graphical VisualizationText-based Visualization
List Visualization1
0
2
1
0
2
3
0 1 2 3
Navigation State
4
4
G
S
V
G: Geographic DimensionS: Semantic DimensionV: Visualization Dimension
Graphical VisualizationText-based Visualization
List Visualization1
0
2
1
0
2
3
0 1 2 3
Navigation State
4
4
Figure 9.13: Semantic zooming in Compass.
9.2.5 The Visualization Dimension
Compass provides three visualizations. A logic-based one, which is called graphical visualization (cor-responding to navigation state (3, 2, 0)) is shown in Figure 9.15a (VisReq #2 ). Figure 9.15b presents atext-based visualization focusing on textual descriptions (VisReq #1 ). Finally, Figure 9.15c provides alist visualization listing all objects of a navigation state. To switch between the different visualizations,three buttons are provided by the navigation area. By clicking on one of them, the visualization switchesaccordingly, i.e., the user might navigate to one of the following navigation states: (3, 2, 0), (3, 2, 1) or(3, 2, 2).
Figure 9.15a shows a graphical visualization of the General Specification process model that correspondsto the requirements engineering process area (as indicated by the breadcrumb navigation). Note thatdata objects and data flow can be manually hidden from the users to keep the presented informationas comprehensible as possible (VisReq #5 ). Switching to a text-based visualization provides the sameinformation about the general specification process in textual manner (cf. Figure 9.15b) (NavReq #1 ).Thereby, the text is clustered into different areas, such as Target or Description, to improve readability.Finally, important meta data about the process model is presented within a box on the right side of thecontent area.
The visualization can be switched to a list visualization as well (cf. Figure 9.15c). In this case, all elementsrelated to the general specification process, e.g., roles, process tasks, or data objects, are presented in onelist. The latter can be filtered by the user according to the element type. For example, he may want toaccess related data objects and then gets a list of all documents, used in the general specification process.
Finally, the breadcrumb navigation shows that changes of the visualization do not affect the semantic orgeographic navigation dimension.
145
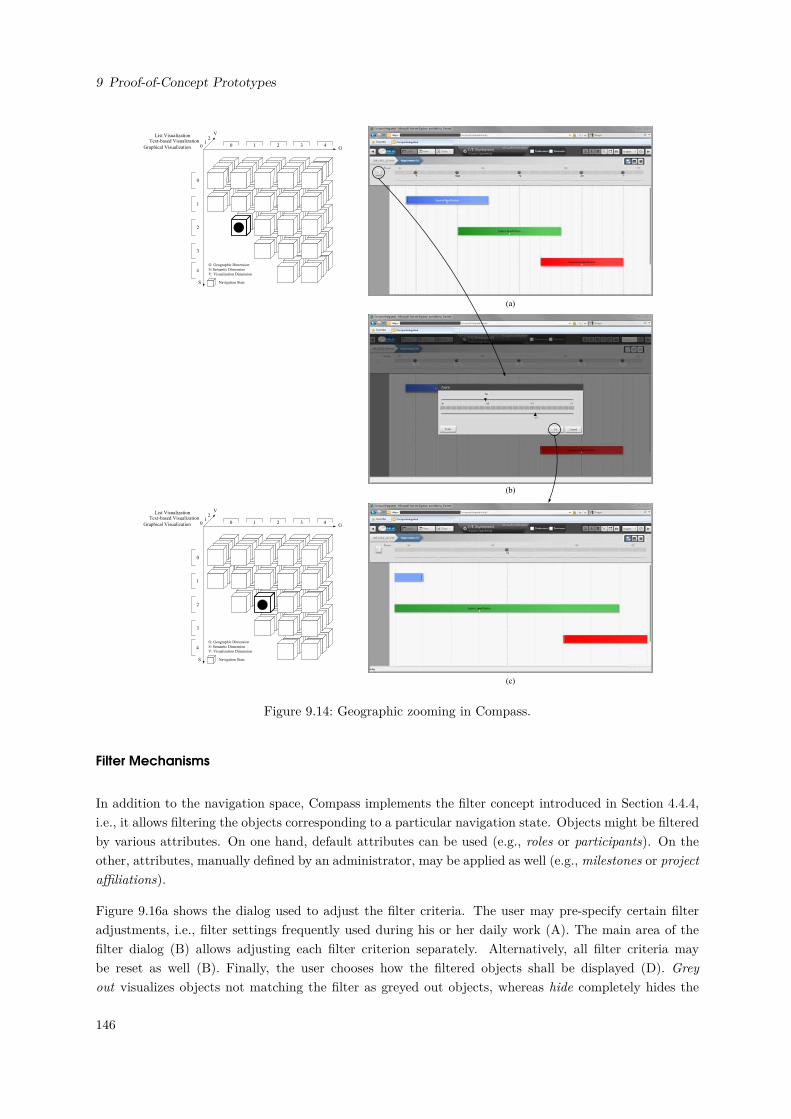
9 Proof-of-Concept Prototypes
G
S
V
G: Geographic Dimension
S: Semantic Dimension
V: Visualization Dimension
Graphical Visualization
Text-based VisualizationList Visualization
10
2
1
0
2
3
0 1 2 3
Navigation State
4
4
G
S
V
G: Geographic Dimension
S: Semantic Dimension
V: Visualization Dimension
Graphical Visualization
Text-based VisualizationList Visualization
10
2
1
0
2
3
0 1 2 3
Navigation State
4
4
(a)
(b)
(c)
Figure 9.14: Geographic zooming in Compass.
Filter Mechanisms
In addition to the navigation space, Compass implements the filter concept introduced in Section 4.4.4,i.e., it allows filtering the objects corresponding to a particular navigation state. Objects might be filteredby various attributes. On one hand, default attributes can be used (e.g., roles or participants). On theother, attributes, manually defined by an administrator, may be applied as well (e.g., milestones or projectaffiliations).
Figure 9.16a shows the dialog used to adjust the filter criteria. The user may pre-specify certain filteradjustments, i.e., filter settings frequently used during his or her daily work (A). The main area of thefilter dialog (B) allows adjusting each filter criterion separately. Alternatively, all filter criteria maybe reset as well (B). Finally, the user chooses how the filtered objects shall be displayed (D). Greyout visualizes objects not matching the filter as greyed out objects, whereas hide completely hides the
146
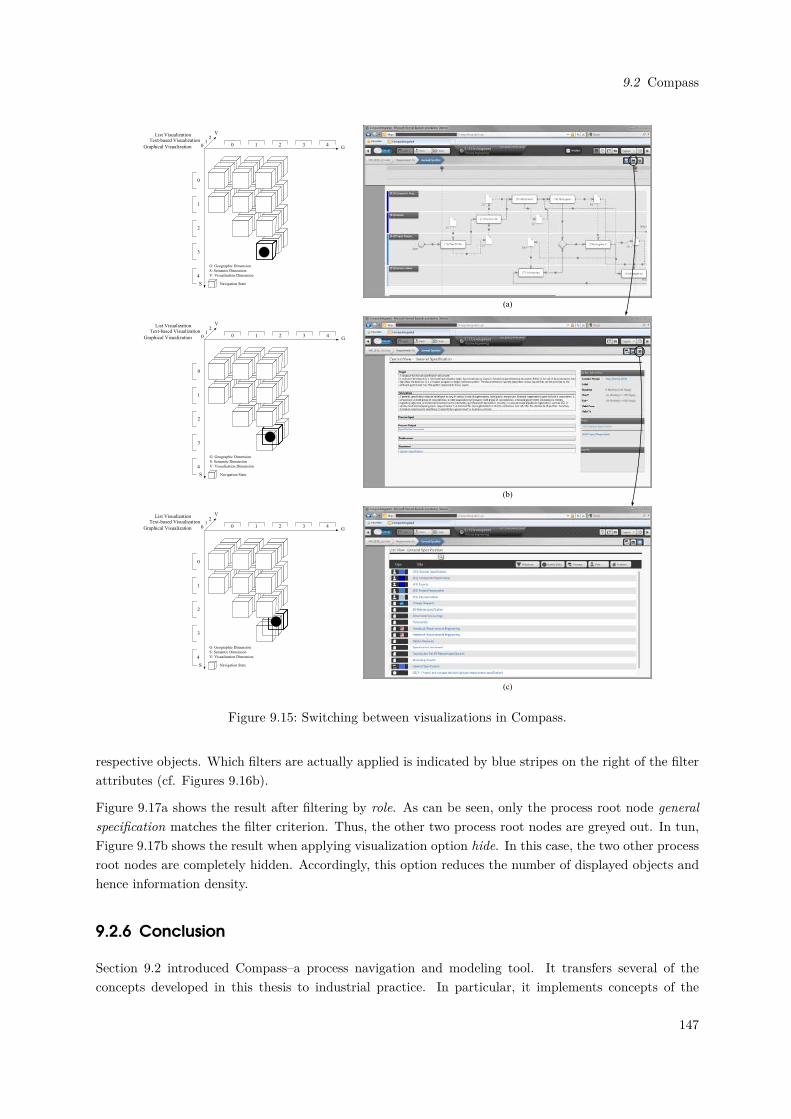
9.2 Compass
G
S
V
G: Geographic Dimension
S: Semantic Dimension
V: Visualization Dimension
Graphical Visualization
Text-based VisualizationList Visualization
10
2
1
0
2
3
0 1 2 3
Navigation State
4
4
G
S
V
G: Geographic Dimension
S: Semantic Dimension
V: Visualization Dimension
Graphical Visualization
Text-based VisualizationList Visualization
10
2
1
0
2
3
0 1 2 3
Navigation State
4
4
G
S
V
G: Geographic Dimension
S: Semantic Dimension
V: Visualization Dimension
Graphical Visualization
Text-based VisualizationList Visualization
10
2
1
0
2
3
0 1 2 3
Navigation State
4
4
(a)
(b)
(c)
Figure 9.15: Switching between visualizations in Compass.
respective objects. Which filters are actually applied is indicated by blue stripes on the right of the filterattributes (cf. Figures 9.16b).
Figure 9.17a shows the result after filtering by role. As can be seen, only the process root node generalspecification matches the filter criterion. Thus, the other two process root nodes are greyed out. In tun,Figure 9.17b shows the result when applying visualization option hide. In this case, the two other processroot nodes are completely hidden. Accordingly, this option reduces the number of displayed objects andhence information density.
9.2.6 Conclusion
Section 9.2 introduced Compass–a process navigation and modeling tool. It transfers several of theconcepts developed in this thesis to industrial practice. In particular, it implements concepts of the
147
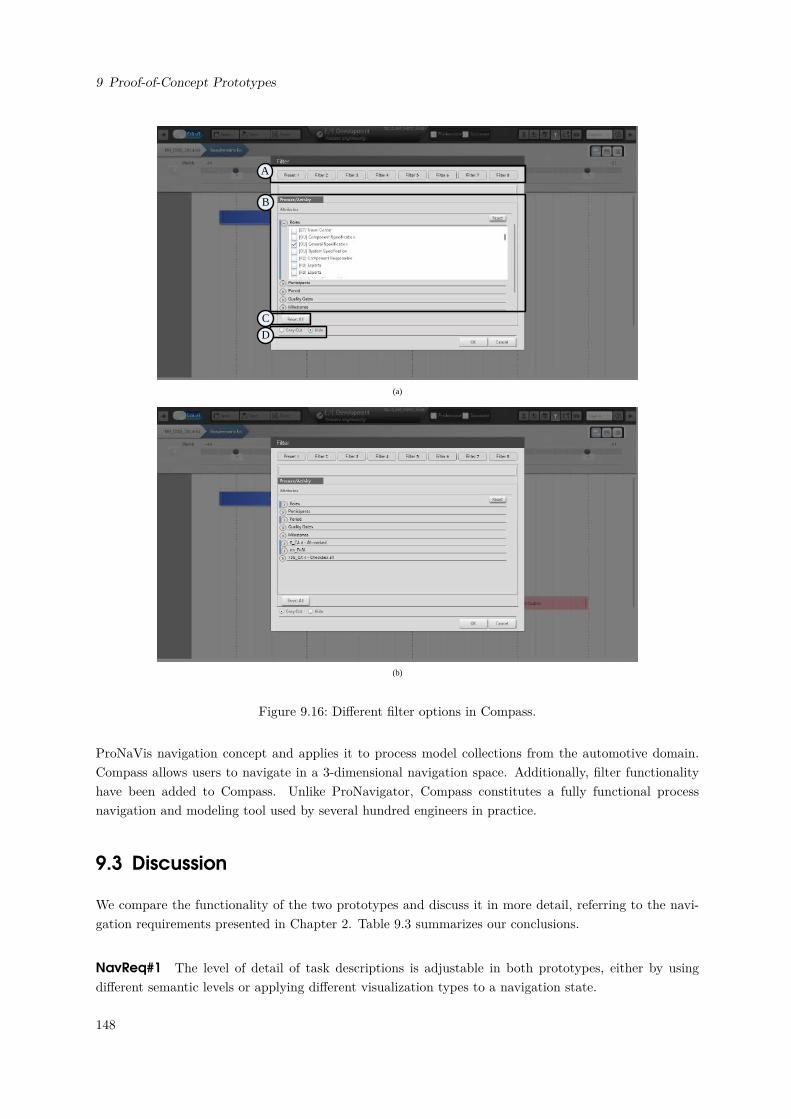
9 Proof-of-Concept Prototypes
(a)
(b)
A
B
C
D
Figure 9.16: Different filter options in Compass.
ProNaVis navigation concept and applies it to process model collections from the automotive domain.Compass allows users to navigate in a 3-dimensional navigation space. Additionally, filter functionalityhave been added to Compass. Unlike ProNavigator, Compass constitutes a fully functional processnavigation and modeling tool used by several hundred engineers in practice.
9.3 Discussion
We compare the functionality of the two prototypes and discuss it in more detail, referring to the navi-gation requirements presented in Chapter 2. Table 9.3 summarizes our conclusions.
NavReq#1 The level of detail of task descriptions is adjustable in both prototypes, either by usingdifferent semantic levels or applying different visualization types to a navigation state.
148
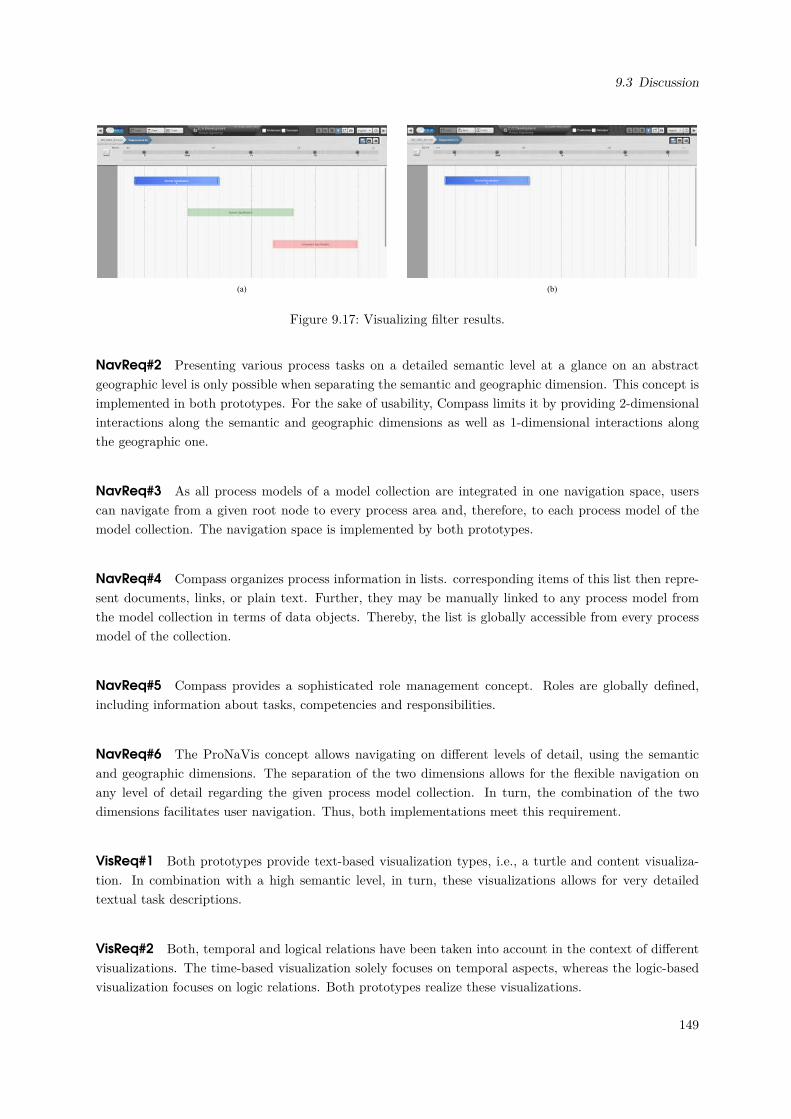
9.3 Discussion
(a) (b)
Figure 9.17: Visualizing filter results.
NavReq#2 Presenting various process tasks on a detailed semantic level at a glance on an abstractgeographic level is only possible when separating the semantic and geographic dimension. This concept isimplemented in both prototypes. For the sake of usability, Compass limits it by providing 2-dimensionalinteractions along the semantic and geographic dimensions as well as 1-dimensional interactions alongthe geographic one.
NavReq#3 As all process models of a model collection are integrated in one navigation space, userscan navigate from a given root node to every process area and, therefore, to each process model of themodel collection. The navigation space is implemented by both prototypes.
NavReq#4 Compass organizes process information in lists. corresponding items of this list then repre-sent documents, links, or plain text. Further, they may be manually linked to any process model fromthe model collection in terms of data objects. Thereby, the list is globally accessible from every processmodel of the collection.
NavReq#5 Compass provides a sophisticated role management concept. Roles are globally defined,including information about tasks, competencies and responsibilities.
NavReq#6 The ProNaVis concept allows navigating on different levels of detail, using the semanticand geographic dimensions. The separation of the two dimensions allows for the flexible navigation onany level of detail regarding the given process model collection. In turn, the combination of the twodimensions facilitates user navigation. Thus, both implementations meet this requirement.
VisReq#1 Both prototypes provide text-based visualization types, i.e., a turtle and content visualiza-tion. In combination with a high semantic level, in turn, these visualizations allows for very detailedtextual task descriptions.
VisReq#2 Both, temporal and logical relations have been taken into account in the context of differentvisualizations. The time-based visualization solely focuses on temporal aspects, whereas the logic-basedvisualization focuses on logic relations. Both prototypes realize these visualizations.
149
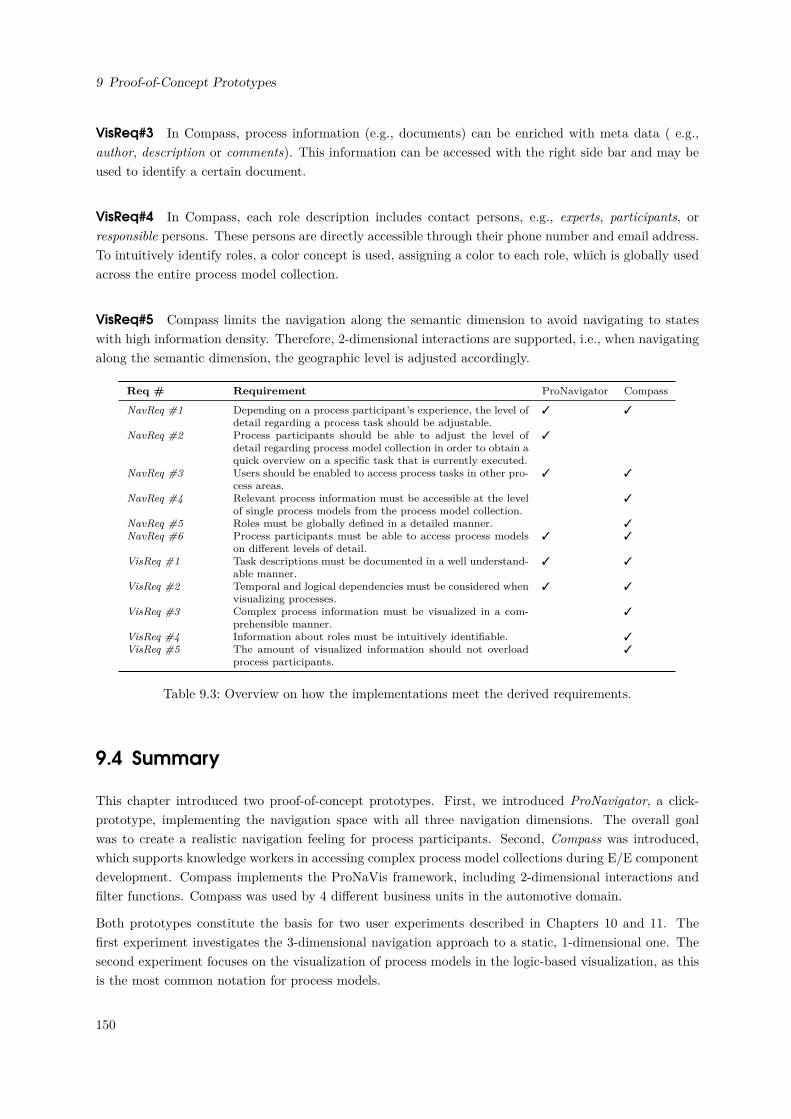
9 Proof-of-Concept Prototypes
VisReq#3 In Compass, process information (e.g., documents) can be enriched with meta data ( e.g.,author, description or comments). This information can be accessed with the right side bar and may beused to identify a certain document.
VisReq#4 In Compass, each role description includes contact persons, e.g., experts, participants, orresponsible persons. These persons are directly accessible through their phone number and email address.To intuitively identify roles, a color concept is used, assigning a color to each role, which is globally usedacross the entire process model collection.
VisReq#5 Compass limits the navigation along the semantic dimension to avoid navigating to stateswith high information density. Therefore, 2-dimensional interactions are supported, i.e., when navigatingalong the semantic dimension, the geographic level is adjusted accordingly.
Req # Requirement ProNavigator Compass
NavReq #1 Depending on a process participant’s experience, the level ofdetail regarding a process task should be adjustable.
3 3
NavReq #2 Process participants should be able to adjust the level ofdetail regarding process model collection in order to obtain aquick overview on a specific task that is currently executed.
3
NavReq #3 Users should be enabled to access process tasks in other pro-cess areas.
3 3
NavReq #4 Relevant process information must be accessible at the levelof single process models from the process model collection.
3
NavReq #5 Roles must be globally defined in a detailed manner. 3NavReq #6 Process participants must be able to access process models
on different levels of detail.3 3
VisReq #1 Task descriptions must be documented in a well understand-able manner.
3 3
VisReq #2 Temporal and logical dependencies must be considered whenvisualizing processes.
3 3
VisReq #3 Complex process information must be visualized in a com-prehensible manner.
3
VisReq #4 Information about roles must be intuitively identifiable. 3VisReq #5 The amount of visualized information should not overload
process participants.3
Table 9.3: Overview on how the implementations meet the derived requirements.
9.4 Summary
This chapter introduced two proof-of-concept prototypes. First, we introduced ProNavigator, a click-prototype, implementing the navigation space with all three navigation dimensions. The overall goalwas to create a realistic navigation feeling for process participants. Second, Compass was introduced,which supports knowledge workers in accessing complex process model collections during E/E componentdevelopment. Compass implements the ProNaVis framework, including 2-dimensional interactions andfilter functions. Compass was used by 4 different business units in the automotive domain.
Both prototypes constitute the basis for two user experiments described in Chapters 10 and 11. Thefirst experiment investigates the 3-dimensional navigation approach to a static, 1-dimensional one. Thesecond experiment focuses on the visualization of process models in the logic-based visualization, as thisis the most common notation for process models.
150
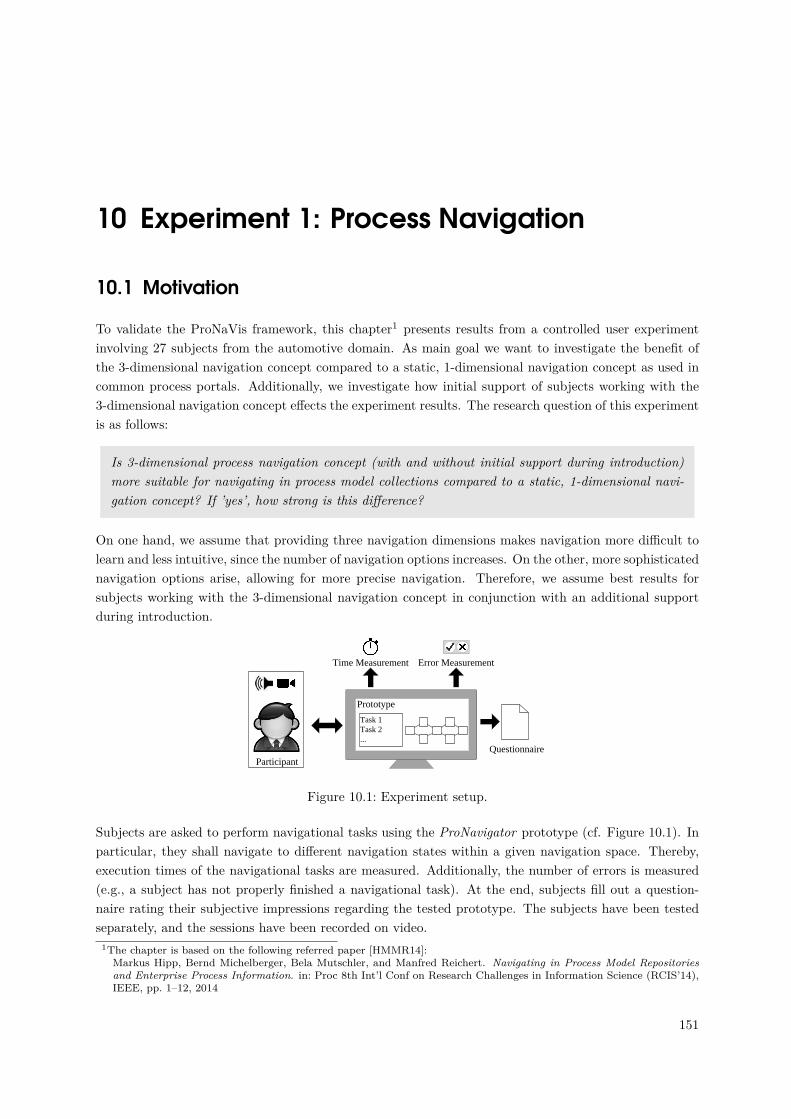
10 Experiment 1: Process Navigation
10.1 Motivation
To validate the ProNaVis framework, this chapter1 presents results from a controlled user experimentinvolving 27 subjects from the automotive domain. As main goal we want to investigate the benefit ofthe 3-dimensional navigation concept compared to a static, 1-dimensional navigation concept as used incommon process portals. Additionally, we investigate how initial support of subjects working with the3-dimensional navigation concept effects the experiment results. The research question of this experimentis as follows:
Is 3-dimensional process navigation concept (with and without initial support during introduction)more suitable for navigating in process model collections compared to a static, 1-dimensional navi-gation concept? If ’yes’, how strong is this difference?
On one hand, we assume that providing three navigation dimensions makes navigation more difficult tolearn and less intuitive, since the number of navigation options increases. On the other, more sophisticatednavigation options arise, allowing for more precise navigation. Therefore, we assume best results forsubjects working with the 3-dimensional navigation concept in conjunction with an additional supportduring introduction.
Participant
Questionnaire
Time Measurement Error Measurement
Prototype
Task 1Task 2...
Figure 10.1: Experiment setup.
Subjects are asked to perform navigational tasks using the ProNavigator prototype (cf. Figure 10.1). Inparticular, they shall navigate to different navigation states within a given navigation space. Thereby,execution times of the navigational tasks are measured. Additionally, the number of errors is measured(e.g., a subject has not properly finished a navigational task). At the end, subjects fill out a question-naire rating their subjective impressions regarding the tested prototype. The subjects have been testedseparately, and the sessions have been recorded on video.
1The chapter is based on the following referred paper [HMMR14]:Markus Hipp, Bernd Michelberger, Bela Mutschler, and Manfred Reichert. Navigating in Process Model Repositoriesand Enterprise Process Information. in: Proc 8th Int’l Conf on Research Challenges in Information Science (RCIS’14),IEEE, pp. 1–12, 2014
151
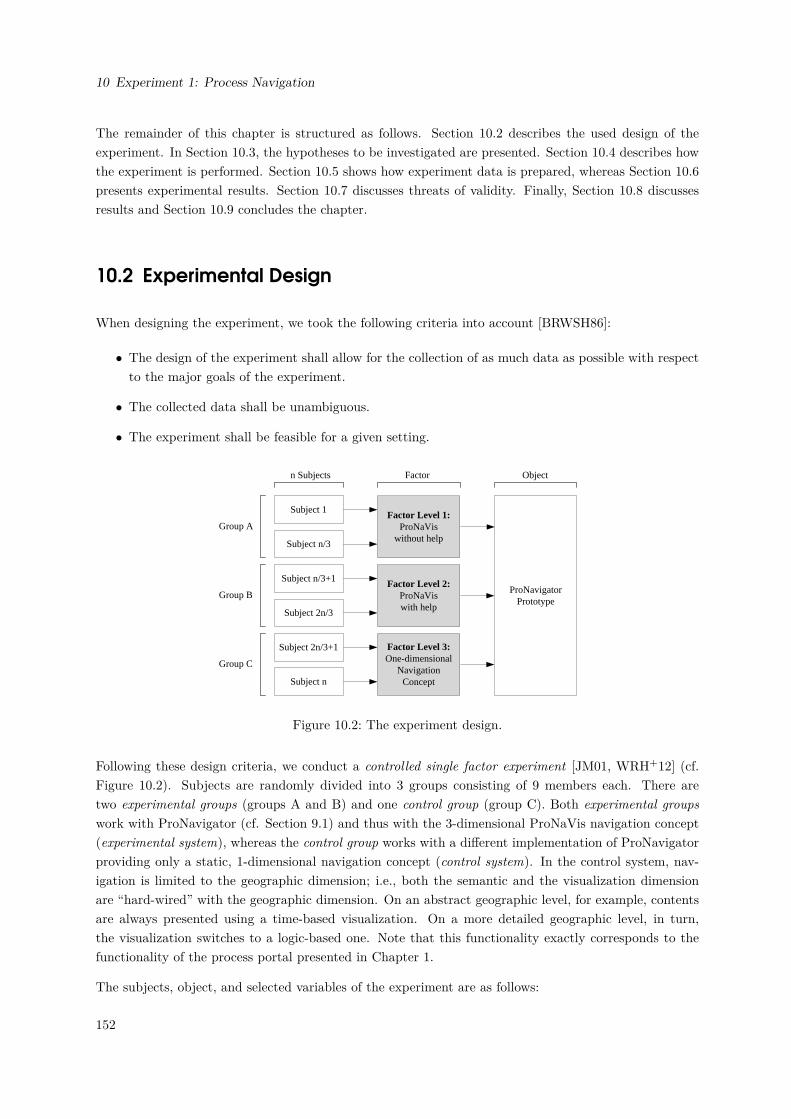
10 Experiment 1: Process Navigation
The remainder of this chapter is structured as follows. Section 10.2 describes the used design of theexperiment. In Section 10.3, the hypotheses to be investigated are presented. Section 10.4 describes howthe experiment is performed. Section 10.5 shows how experiment data is prepared, whereas Section 10.6presents experimental results. Section 10.7 discusses threats of validity. Finally, Section 10.8 discussesresults and Section 10.9 concludes the chapter.
10.2 Experimental Design
When designing the experiment, we took the following criteria into account [BRWSH86]:
• The design of the experiment shall allow for the collection of as much data as possible with respectto the major goals of the experiment.
• The collected data shall be unambiguous.
• The experiment shall be feasible for a given setting.
Subject 1
Subject n/3
Subject n/3+1
Subject 2n/3
Subject 2n/3+1
Subject n
Factor Level 1:ProNaVis
without help
Factor Level 3:One-dimensional
Navigation Concept
ProNavigatorPrototype
n Subjects Factor Object
Factor Level 2:ProNaVis with help
Group A
Group B
Group C
Figure 10.2: The experiment design.
Following these design criteria, we conduct a controlled single factor experiment [JM01, WRH+12] (cf.Figure 10.2). Subjects are randomly divided into 3 groups consisting of 9 members each. There aretwo experimental groups (groups A and B) and one control group (group C). Both experimental groupswork with ProNavigator (cf. Section 9.1) and thus with the 3-dimensional ProNaVis navigation concept(experimental system), whereas the control group works with a different implementation of ProNavigatorproviding only a static, 1-dimensional navigation concept (control system). In the control system, nav-igation is limited to the geographic dimension; i.e., both the semantic and the visualization dimensionare “hard-wired” with the geographic dimension. On an abstract geographic level, for example, contentsare always presented using a time-based visualization. On a more detailed geographic level, in turn,the visualization switches to a logic-based one. Note that this functionality exactly corresponds to thefunctionality of the process portal presented in Chapter 1.
The subjects, object, and selected variables of the experiment are as follows:
152
10.3 Hypothesis Formulation
Subjects: The subjects are 27 engineers from the automotive domain. Subjects are divided into 3groups, of which each comprises 9 members. Subjects are randomly assigned to the groups prior to thestart of each experiment.
Object: The object to be evaluated by each subject is the process navigation prototype ProNavigator(cf. Section 9.1).
Factor and Factor Levels: The factor is the process navigation concept applied to ProNavigator. Theconsidered factor levels include 3-dimensional navigation and 1-dimensional navigation. They are realizedby two different implementations of ProNavigator. Groups A and B work with the ProNavigator versionthat allows for 3-dimensional navigation (cf. Section 9.1). In turn, group C works with the ProNavigatorversion only allowing for 1-dimensional navigation.
Dependent Variables: The following dependent variables are considered to investigate how users per-ceive the prototype [MRC07, Men08, Nor88]: comprehensibility, traceability, simplicity, intuitiveness,interest, and stimulation. Additionally, execution times for navigational tasks are logged during the ex-periment to investigate how fast the different tasks are accomplished [HFL12]. Finally, the number oferrors made during the experiment is considered as a measurement for subjects’ performance [ZPR+12].
Instrumentation: To collect data, we use an online tool2 providing an implemented stop watch as wellas automated error recognition functions. The tool further allows collecting qualitative feedback, i.e., astructured questionnaire can be provided. For video and audio recording, CamStudio3 is used.
Data Analysis Procedure: For performing data analysis, well-established statistical methods and stan-dard metrics are applied, i.e., Mann-Whitney U test, Kolmogorov-Smirnov test, and Shapiro-Wilk test (cf.Section 10.4).
10.3 Hypothesis Formulation
To address the research question of the experiment, we present 3 hypotheses clustering response vari-ables (cf. Figure 10.3): (H1) Understandability, (H2) Usability, and (H3) Process Navigation Speed. Weconsider understandability of the navigation concept, which is a crucial factor when evaluating processmodels [MRC07, RM11]. Furthermore, usability aspects play a role when designing user interactionconcepts [HH93, ND86]. The conducted case studies [HMR11b] have confirmed that quickly finding in-formation is crucial for process participants. Therefore, execution times of experiment tasks are measuredas indicator for process model understandability [MMRS09, MS08]. Therefore, process navigation speedis considered as hypothesis as well. All response variables have been selected based on their relation tothe respective hypothesis.
2http://onlineumfrage.com3CamStudio - Open Source: http://camstudio.org/
153
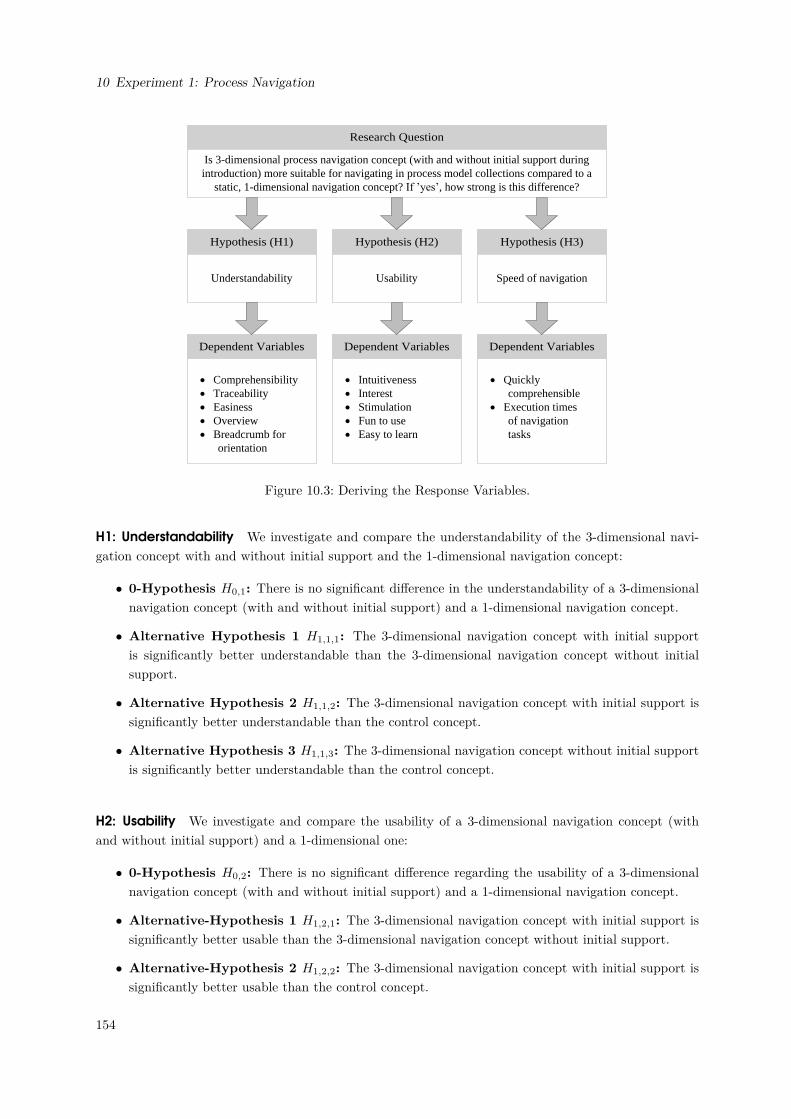
10 Experiment 1: Process Navigation
Hypothesis (H1) Hypothesis (H2) Hypothesis (H3)
Research Question
Dependent Variables Dependent Variables Dependent Variables
Understandability Usability Speed of navigation
Is 3-dimensional process navigation concept (with and without initial support during introduction) more suitable for navigating in process model collections compared to a
static, 1-dimensional navigation concept? If ’yes’, how strong is this difference?
· Comprehensibility· Traceability· Easiness· Overview· Breadcrumb for
orientation
· Intuitiveness· Interest· Stimulation· Fun to use· Easy to learn
· Quickly comprehensible
· Execution times of navigation tasks
Figure 10.3: Deriving the Response Variables.
H1: Understandability We investigate and compare the understandability of the 3-dimensional navi-gation concept with and without initial support and the 1-dimensional navigation concept:
• 0-Hypothesis H0,1: There is no significant difference in the understandability of a 3-dimensionalnavigation concept (with and without initial support) and a 1-dimensional navigation concept.
• Alternative Hypothesis 1 H1,1,1: The 3-dimensional navigation concept with initial supportis significantly better understandable than the 3-dimensional navigation concept without initialsupport.
• Alternative Hypothesis 2 H1,1,2: The 3-dimensional navigation concept with initial support issignificantly better understandable than the control concept.
• Alternative Hypothesis 3 H1,1,3: The 3-dimensional navigation concept without initial supportis significantly better understandable than the control concept.
H2: Usability We investigate and compare the usability of a 3-dimensional navigation concept (withand without initial support) and a 1-dimensional one:
• 0-Hypothesis H0,2: There is no significant difference regarding the usability of a 3-dimensionalnavigation concept (with and without initial support) and a 1-dimensional navigation concept.
• Alternative-Hypothesis 1 H1,2,1: The 3-dimensional navigation concept with initial support issignificantly better usable than the 3-dimensional navigation concept without initial support.
• Alternative-Hypothesis 2 H1,2,2: The 3-dimensional navigation concept with initial support issignificantly better usable than the control concept.
154
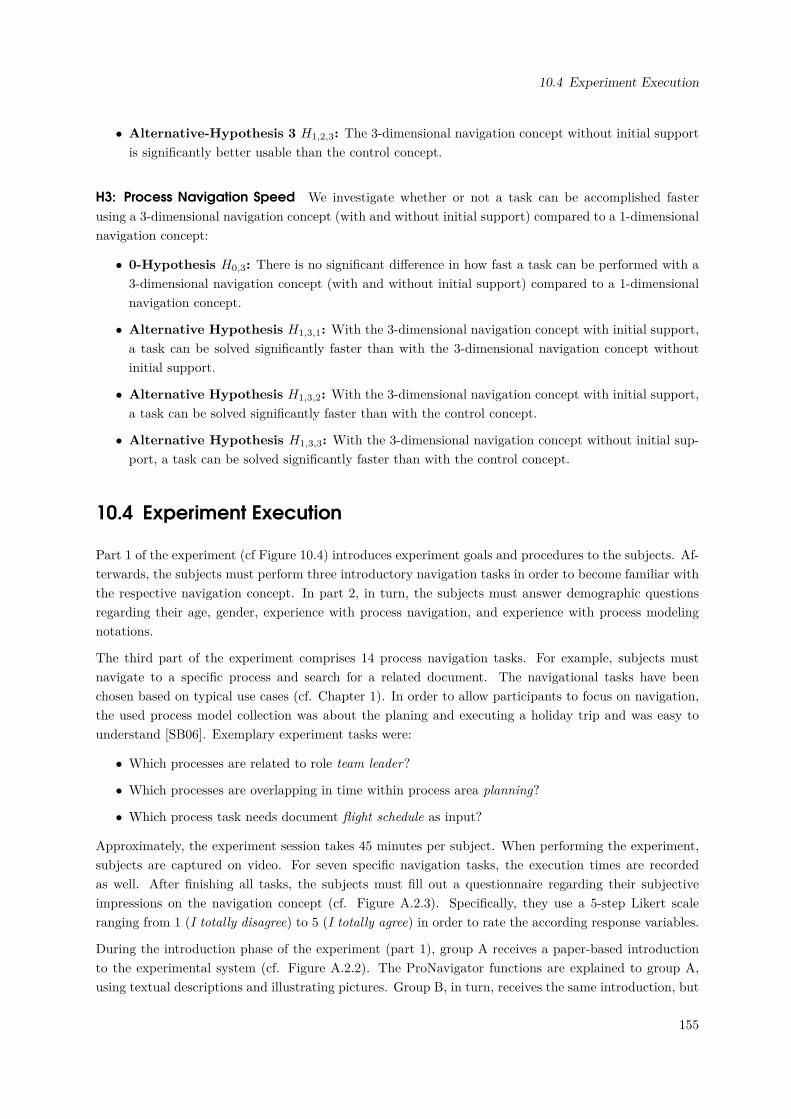
10.4 Experiment Execution
• Alternative-Hypothesis 3 H1,2,3: The 3-dimensional navigation concept without initial supportis significantly better usable than the control concept.
H3: Process Navigation Speed We investigate whether or not a task can be accomplished fasterusing a 3-dimensional navigation concept (with and without initial support) compared to a 1-dimensionalnavigation concept:
• 0-Hypothesis H0,3: There is no significant difference in how fast a task can be performed with a3-dimensional navigation concept (with and without initial support) compared to a 1-dimensionalnavigation concept.
• Alternative Hypothesis H1,3,1: With the 3-dimensional navigation concept with initial support,a task can be solved significantly faster than with the 3-dimensional navigation concept withoutinitial support.
• Alternative Hypothesis H1,3,2: With the 3-dimensional navigation concept with initial support,a task can be solved significantly faster than with the control concept.
• Alternative Hypothesis H1,3,3: With the 3-dimensional navigation concept without initial sup-port, a task can be solved significantly faster than with the control concept.
10.4 Experiment Execution
Part 1 of the experiment (cf Figure 10.4) introduces experiment goals and procedures to the subjects. Af-terwards, the subjects must perform three introductory navigation tasks in order to become familiar withthe respective navigation concept. In part 2, in turn, the subjects must answer demographic questionsregarding their age, gender, experience with process navigation, and experience with process modelingnotations.
The third part of the experiment comprises 14 process navigation tasks. For example, subjects mustnavigate to a specific process and search for a related document. The navigational tasks have beenchosen based on typical use cases (cf. Chapter 1). In order to allow participants to focus on navigation,the used process model collection was about the planing and executing a holiday trip and was easy tounderstand [SB06]. Exemplary experiment tasks were:
• Which processes are related to role team leader?
• Which processes are overlapping in time within process area planning?
• Which process task needs document flight schedule as input?
Approximately, the experiment session takes 45 minutes per subject. When performing the experiment,subjects are captured on video. For seven specific navigation tasks, the execution times are recordedas well. After finishing all tasks, the subjects must fill out a questionnaire regarding their subjectiveimpressions on the navigation concept (cf. Figure A.2.3). Specifically, they use a 5-step Likert scaleranging from 1 (I totally disagree) to 5 (I totally agree) in order to rate the according response variables.
During the introduction phase of the experiment (part 1), group A receives a paper-based introductionto the experimental system (cf. Figure A.2.2). The ProNavigator functions are explained to group A,using textual descriptions and illustrating pictures. Group B, in turn, receives the same introduction, but
155
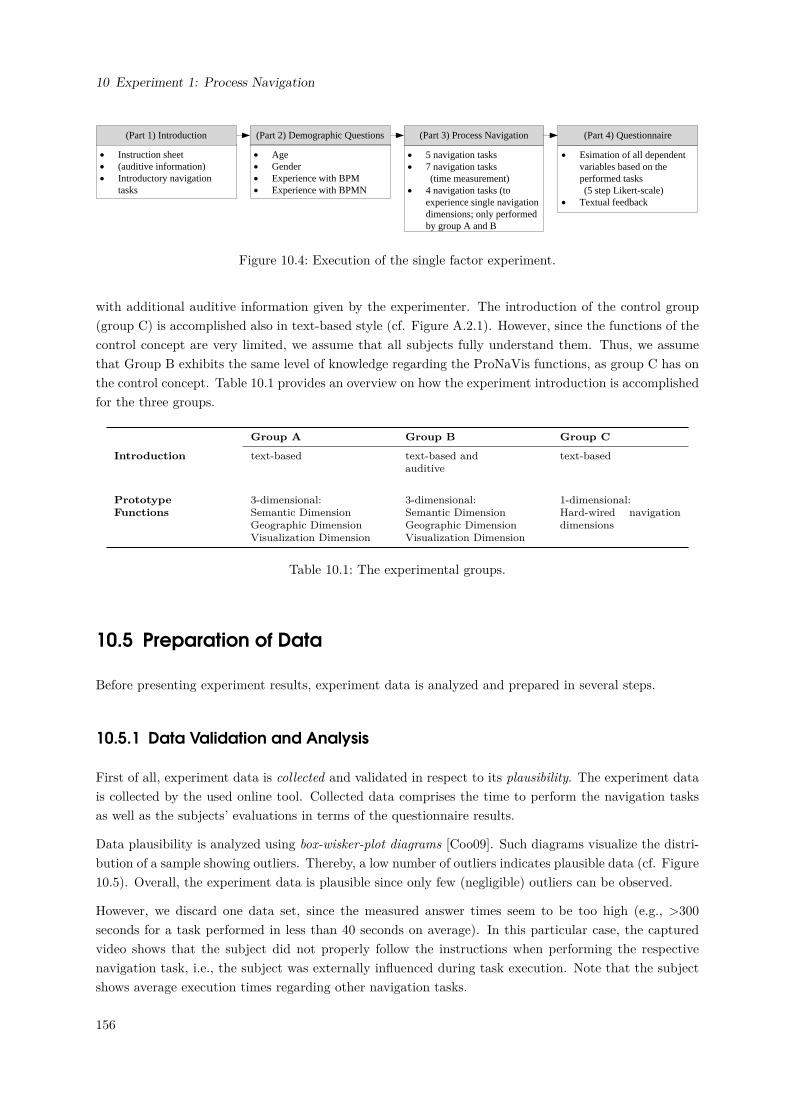
10 Experiment 1: Process Navigation
· Instruction sheet· (auditive information)· Introductory navigation
tasks
(Part 1) Introduction (Part 2) Demographic Questions (Part 3) Process Navigation (Part 4) Questionnaire
· Age· Gender· Experience with BPM· Experience with BPMN
· 5 navigation tasks· 7 navigation tasks (time measurement)· 4 navigation tasks (to
experience single navigation dimensions; only performed by group A and B
· Esimation of all dependent variables based on the performed tasks
(5 step Likert-scale)· Textual feedback
Figure 10.4: Execution of the single factor experiment.
with additional auditive information given by the experimenter. The introduction of the control group(group C) is accomplished also in text-based style (cf. Figure A.2.1). However, since the functions of thecontrol concept are very limited, we assume that all subjects fully understand them. Thus, we assumethat Group B exhibits the same level of knowledge regarding the ProNaVis functions, as group C has onthe control concept. Table 10.1 provides an overview on how the experiment introduction is accomplishedfor the three groups.
Group A Group B Group C
Introduction text-based text-based andauditive
text-based
PrototypeFunctions
3-dimensional:Semantic DimensionGeographic DimensionVisualization Dimension
3-dimensional:Semantic DimensionGeographic DimensionVisualization Dimension
1-dimensional:Hard-wired navigationdimensions
Table 10.1: The experimental groups.
10.5 Preparation of Data
Before presenting experiment results, experiment data is analyzed and prepared in several steps.
10.5.1 Data Validation and Analysis
First of all, experiment data is collected and validated in respect to its plausibility. The experiment datais collected by the used online tool. Collected data comprises the time to perform the navigation tasksas well as the subjects’ evaluations in terms of the questionnaire results.
Data plausibility is analyzed using box-wisker-plot diagrams [Coo09]. Such diagrams visualize the distri-bution of a sample showing outliers. Thereby, a low number of outliers indicates plausible data (cf. Figure10.5). Overall, the experiment data is plausible since only few (negligible) outliers can be observed.
However, we discard one data set, since the measured answer times seem to be too high (e.g., >300seconds for a task performed in less than 40 seconds on average). In this particular case, the capturedvideo shows that the subject did not properly follow the instructions when performing the respectivenavigation task, i.e., the subject was externally influenced during task execution. Note that the subjectshows average execution times regarding other navigation tasks.
156
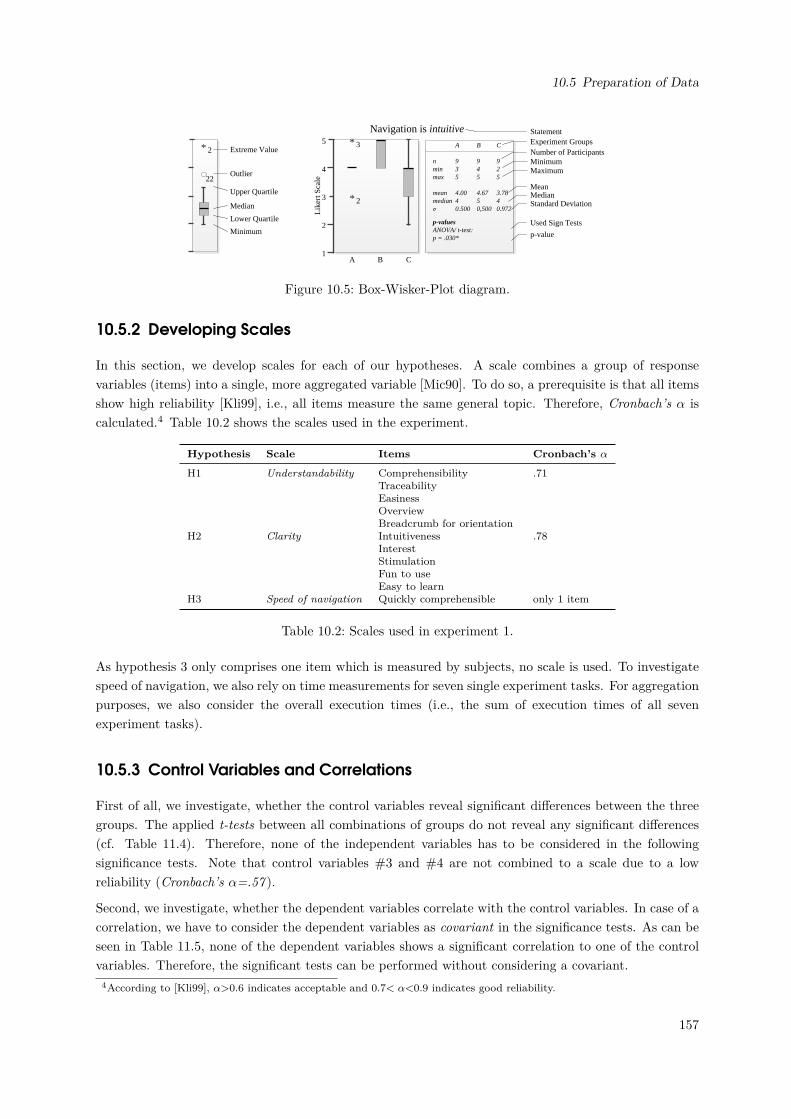
10.5 Preparation of Data
* 2
22
Minimum
Lower Quartile
Median
Upper Quartile
Outlier
Extreme Value
Navigation is intuitive5
4
3
2
1
Lik
ert S
cale
nminmax
meanmedianσ
A
935
4.0040.500
C
925
3.7840.972
B
945
4.6750,500
p-valuesANOVA/ t-test: p = .030*
* 3
* 2
A B C
Experiment GroupsNumber of Participants
Statement
MinimumMaximum
MeanMedianStandard Deviation
Used Sign Tests
p-value
Figure 10.5: Box-Wisker-Plot diagram.
10.5.2 Developing Scales
In this section, we develop scales for each of our hypotheses. A scale combines a group of responsevariables (items) into a single, more aggregated variable [Mic90]. To do so, a prerequisite is that all itemsshow high reliability [Kli99], i.e., all items measure the same general topic. Therefore, Cronbach’s α iscalculated.4 Table 10.2 shows the scales used in the experiment.
Hypothesis Scale Items Cronbach’s α
H1 Understandability ComprehensibilityTraceabilityEasinessOverviewBreadcrumb for orientation
.71
H2 Clarity IntuitivenessInterestStimulationFun to useEasy to learn
.78
H3 Speed of navigation Quickly comprehensible only 1 item
Table 10.2: Scales used in experiment 1.
As hypothesis 3 only comprises one item which is measured by subjects, no scale is used. To investigatespeed of navigation, we also rely on time measurements for seven single experiment tasks. For aggregationpurposes, we also consider the overall execution times (i.e., the sum of execution times of all sevenexperiment tasks).
10.5.3 Control Variables and Correlations
First of all, we investigate, whether the control variables reveal significant differences between the threegroups. The applied t-tests between all combinations of groups do not reveal any significant differences(cf. Table 11.4). Therefore, none of the independent variables has to be considered in the followingsignificance tests. Note that control variables #3 and #4 are not combined to a scale due to a lowreliability (Cronbach’s α=.57 ).
Second, we investigate, whether the dependent variables correlate with the control variables. In case of acorrelation, we have to consider the dependent variables as covariant in the significance tests. As can beseen in Table 11.5, none of the dependent variables shows a significant correlation to one of the controlvariables. Therefore, the significant tests can be performed without considering a covariant.
4According to [Kli99], α>0.6 indicates acceptable and 0.7< α<0.9 indicates good reliability.
157
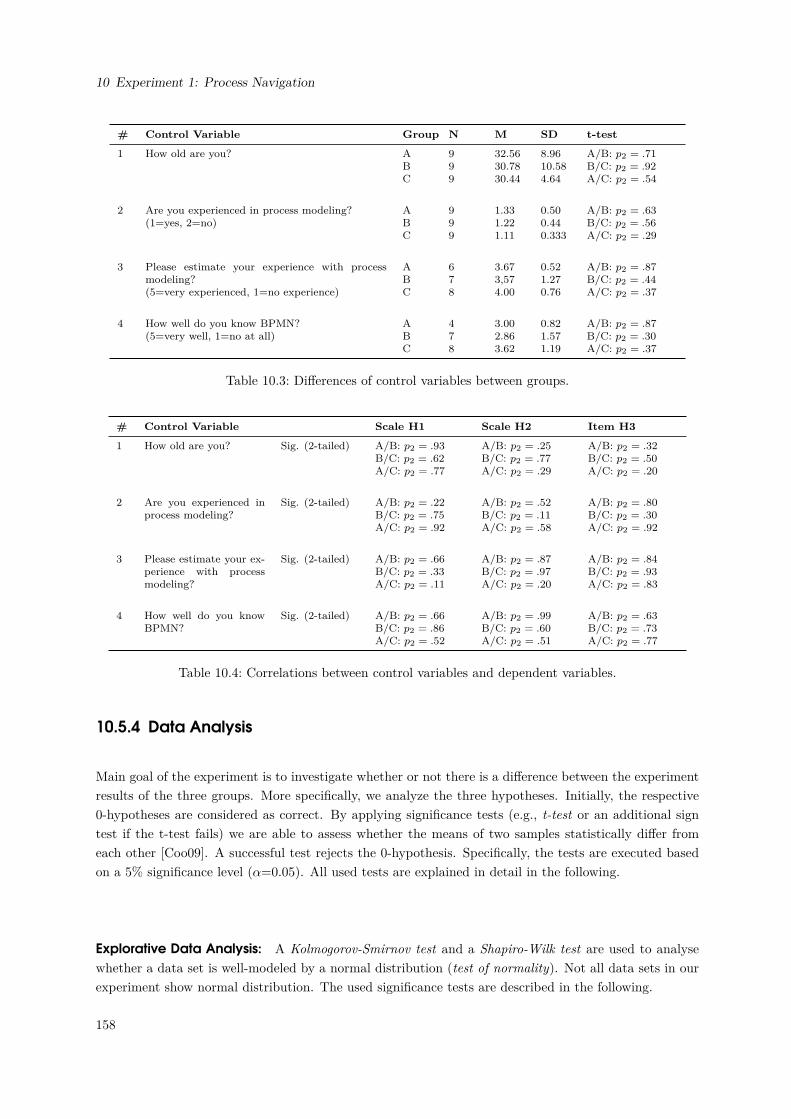
10 Experiment 1: Process Navigation
# Control Variable Group N M SD t-test
1 How old are you? ABC
999
32.5630.7830.44
8.9610.584.64
A/B: p2 = .71B/C: p2 = .92A/C: p2 = .54
2 Are you experienced in process modeling?(1=yes, 2=no)
ABC
999
1.331.221.11
0.500.440.333
A/B: p2 = .63B/C: p2 = .56A/C: p2 = .29
3 Please estimate your experience with processmodeling?(5=very experienced, 1=no experience)
ABC
678
3.673,574.00
0.521.270.76
A/B: p2 = .87B/C: p2 = .44A/C: p2 = .37
4 How well do you know BPMN?(5=very well, 1=no at all)
ABC
478
3.002.863.62
0.821.571.19
A/B: p2 = .87B/C: p2 = .30A/C: p2 = .37
Table 10.3: Differences of control variables between groups.
# Control Variable Scale H1 Scale H2 Item H3
1 How old are you? Sig. (2-tailed) A/B: p2 = .93B/C: p2 = .62A/C: p2 = .77
A/B: p2 = .25B/C: p2 = .77A/C: p2 = .29
A/B: p2 = .32B/C: p2 = .50A/C: p2 = .20
2 Are you experienced inprocess modeling?
Sig. (2-tailed) A/B: p2 = .22B/C: p2 = .75A/C: p2 = .92
A/B: p2 = .52B/C: p2 = .11A/C: p2 = .58
A/B: p2 = .80B/C: p2 = .30A/C: p2 = .92
3 Please estimate your ex-perience with processmodeling?
Sig. (2-tailed) A/B: p2 = .66B/C: p2 = .33A/C: p2 = .11
A/B: p2 = .87B/C: p2 = .97A/C: p2 = .20
A/B: p2 = .84B/C: p2 = .93A/C: p2 = .83
4 How well do you knowBPMN?
Sig. (2-tailed) A/B: p2 = .66B/C: p2 = .86A/C: p2 = .52
A/B: p2 = .99B/C: p2 = .60A/C: p2 = .51
A/B: p2 = .63B/C: p2 = .73A/C: p2 = .77
Table 10.4: Correlations between control variables and dependent variables.
10.5.4 Data Analysis
Main goal of the experiment is to investigate whether or not there is a difference between the experimentresults of the three groups. More specifically, we analyze the three hypotheses. Initially, the respective0-hypotheses are considered as correct. By applying significance tests (e.g., t-test or an additional signtest if the t-test fails) we are able to assess whether the means of two samples statistically differ fromeach other [Coo09]. A successful test rejects the 0-hypothesis. Specifically, the tests are executed basedon a 5% significance level (α=0.05). All used tests are explained in detail in the following.
Explorative Data Analysis: A Kolmogorov-Smirnov test and a Shapiro-Wilk test are used to analysewhether a data set is well-modeled by a normal distribution (test of normality). Not all data sets in ourexperiment show normal distribution. The used significance tests are described in the following.
158
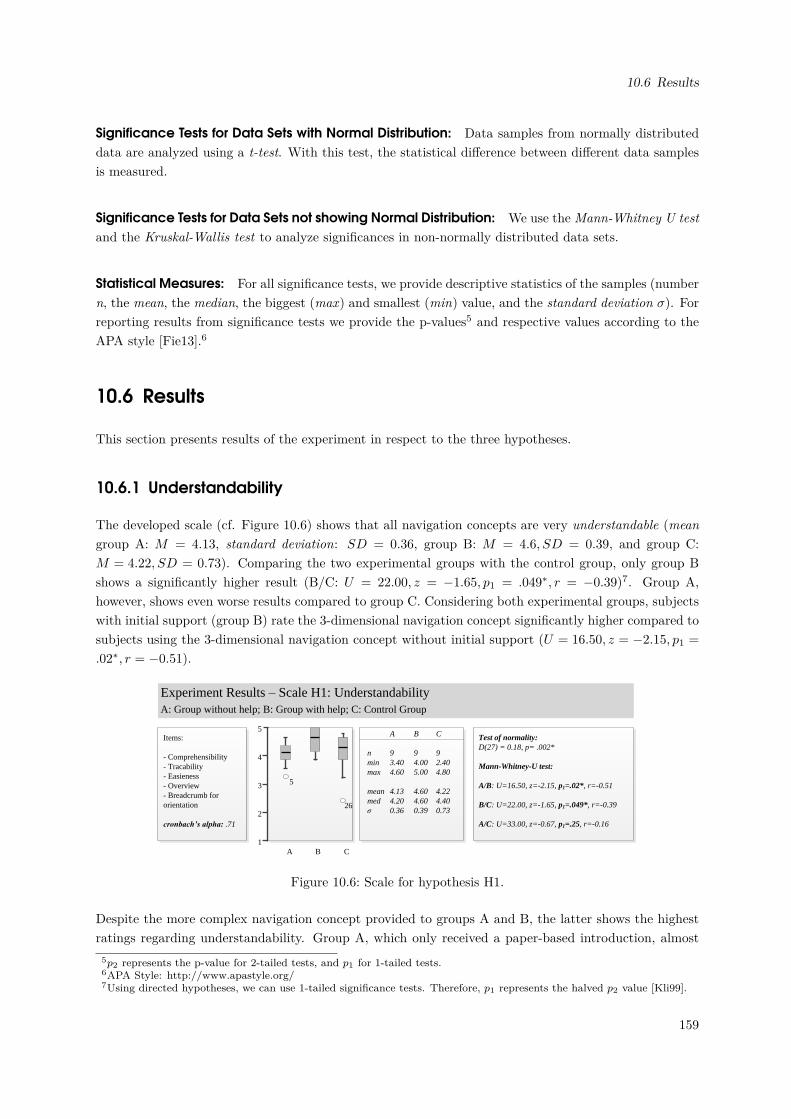
10.6 Results
Significance Tests for Data Sets with Normal Distribution: Data samples from normally distributeddata are analyzed using a t-test. With this test, the statistical difference between different data samplesis measured.
Significance Tests for Data Sets not showing Normal Distribution: We use the Mann-Whitney U testand the Kruskal-Wallis test to analyze significances in non-normally distributed data sets.
Statistical Measures: For all significance tests, we provide descriptive statistics of the samples (numbern, the mean, the median, the biggest (max) and smallest (min) value, and the standard deviation σ). Forreporting results from significance tests we provide the p-values5 and respective values according to theAPA style [Fie13].6
10.6 Results
This section presents results of the experiment in respect to the three hypotheses.
10.6.1 Understandability
The developed scale (cf. Figure 10.6) shows that all navigation concepts are very understandable (meangroup A: M = 4.13, standard deviation: SD = 0.36, group B: M = 4.6, SD = 0.39, and group C:M = 4.22, SD = 0.73). Comparing the two experimental groups with the control group, only group Bshows a significantly higher result (B/C: U = 22.00, z = −1.65, p1 = .049∗, r = −0.39)7. Group A,however, shows even worse results compared to group C. Considering both experimental groups, subjectswith initial support (group B) rate the 3-dimensional navigation concept significantly higher compared tosubjects using the 3-dimensional navigation concept without initial support (U = 16.50, z = −2.15, p1 =
.02∗, r = −0.51).
5
4
3
2
1A B C
nminmax
meanmedσ
A
93.404.60
4.134.200.36
C
92.404.80
4.224.400.73
B
94.005.00
4.604.600.39
5
26
Test of normality:D(27) = 0.18, p= .002*
Mann-Whitney-U test:
A/B: U=16.50, z=-2.15, p1=.02*, r=-0.51
B/C: U=22.00, z=-1.65, p1=.049*, r=-0.39
A/C: U=33.00, z=-0.67, p1=.25, r=-0.16
Items:
- Comprehensibility- Tracability- Easieness- Overview- Breadcrumb for orientation
cronbach’s alpha: .71
Experiment Results – Scale H1: UnderstandabilityA: Group without help; B: Group with help; C: Control Group
Figure 10.6: Scale for hypothesis H1.
Despite the more complex navigation concept provided to groups A and B, the latter shows the highestratings regarding understandability. Group A, which only received a paper-based introduction, almost
5p2 represents the p-value for 2-tailed tests, and p1 for 1-tailed tests.6APA Style: http://www.apastyle.org/7Using directed hypotheses, we can use 1-tailed significance tests. Therefore, p1 represents the halved p2 value [Kli99].
159
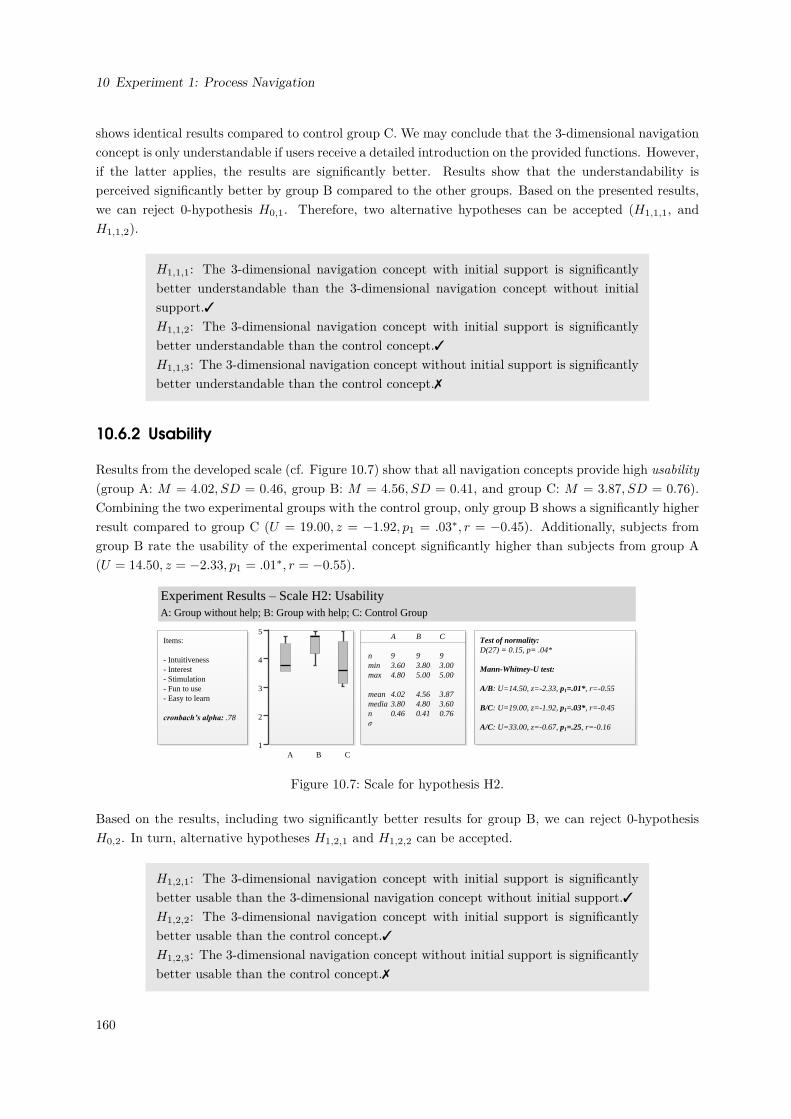
10 Experiment 1: Process Navigation
shows identical results compared to control group C. We may conclude that the 3-dimensional navigationconcept is only understandable if users receive a detailed introduction on the provided functions. However,if the latter applies, the results are significantly better. Results show that the understandability isperceived significantly better by group B compared to the other groups. Based on the presented results,we can reject 0-hypothesis H0,1. Therefore, two alternative hypotheses can be accepted (H1,1,1, andH1,1,2).
H1,1,1: The 3-dimensional navigation concept with initial support is significantlybetter understandable than the 3-dimensional navigation concept without initialsupport.3H1,1,2: The 3-dimensional navigation concept with initial support is significantlybetter understandable than the control concept.3H1,1,3: The 3-dimensional navigation concept without initial support is significantlybetter understandable than the control concept.7
10.6.2 Usability
Results from the developed scale (cf. Figure 10.7) show that all navigation concepts provide high usability(group A: M = 4.02, SD = 0.46, group B: M = 4.56, SD = 0.41, and group C: M = 3.87, SD = 0.76).Combining the two experimental groups with the control group, only group B shows a significantly higherresult compared to group C (U = 19.00, z = −1.92, p1 = .03∗, r = −0.45). Additionally, subjects fromgroup B rate the usability of the experimental concept significantly higher than subjects from group A(U = 14.50, z = −2.33, p1 = .01∗, r = −0.55).
A B C
Experiment Results – Scale H2: UsabilityA: Group without help; B: Group with help; C: Control Group
5
4
3
2
1A B C
nminmax
meanmedianσ
A
93.604.80
4.023.800.46
C
93.005.00
3.873.600.76
B
93.805.00
4.564.800.41
Test of normality:D(27) = 0.15, p= .04*
Mann-Whitney-U test:
A/B: U=14.50, z=-2.33, p1=.01*, r=-0.55
B/C: U=19.00, z=-1.92, p1=.03*, r=-0.45
A/C: U=33.00, z=-0.67, p1=.25, r=-0.16
Items:
- Intuitiveness- Interest- Stimulation- Fun to use- Easy to learn
cronbach’s alpha: .78
Figure 10.7: Scale for hypothesis H2.
Based on the results, including two significantly better results for group B, we can reject 0-hypothesisH0,2. In turn, alternative hypotheses H1,2,1 and H1,2,2 can be accepted.
H1,2,1: The 3-dimensional navigation concept with initial support is significantlybetter usable than the 3-dimensional navigation concept without initial support.3H1,2,2: The 3-dimensional navigation concept with initial support is significantlybetter usable than the control concept.3H1,2,3: The 3-dimensional navigation concept without initial support is significantlybetter usable than the control concept.7
160
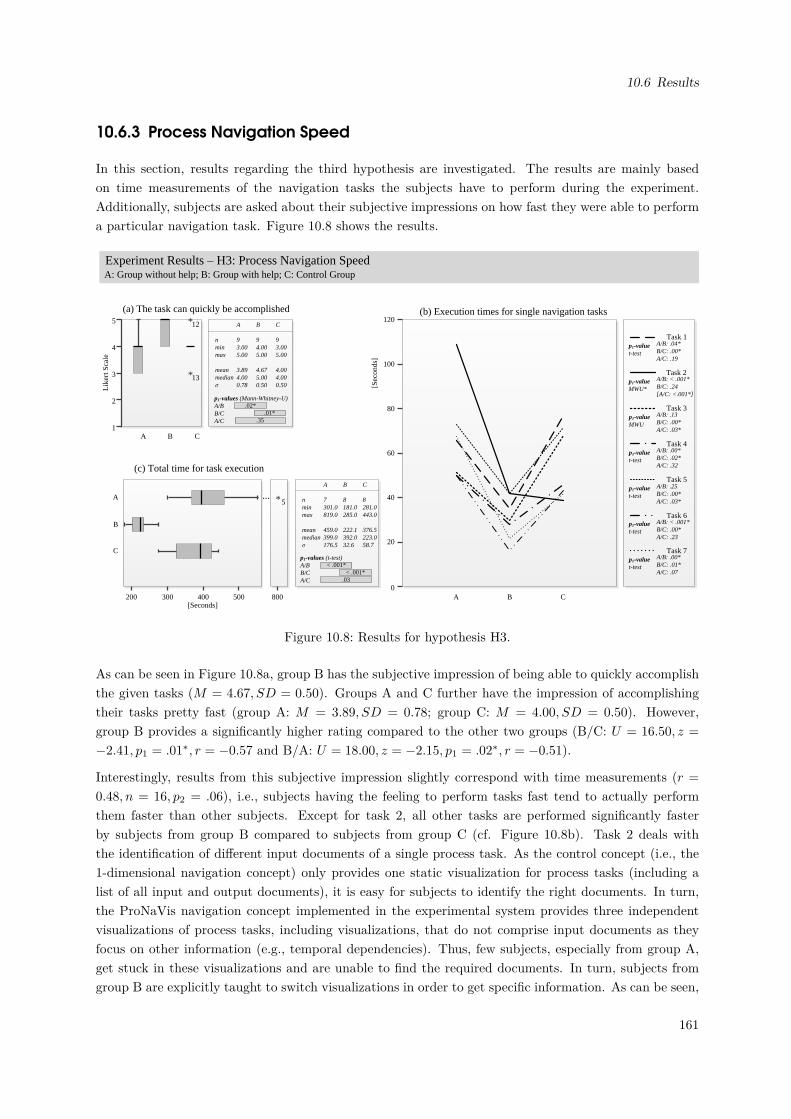
10.6 Results
10.6.3 Process Navigation Speed
In this section, results regarding the third hypothesis are investigated. The results are mainly basedon time measurements of the navigation tasks the subjects have to perform during the experiment.Additionally, subjects are asked about their subjective impressions on how fast they were able to performa particular navigation task. Figure 10.8 shows the results.
5
4
3
2
1
Lik
ert S
cale
nminmax
meanmedianσ
A
93.005.00
3.894.000.78
C
93.005.00
4.004.000.50
B
94.005.00
4.675.000.50
(a) The task can quickly be accomplished*12
*13
A B C
A: Group without help; B: Group with help; C: Control GroupExperiment Results – H3: Process Navigation Speed
200 300 400 500 800
A
B
C
0
20
40
60
80
100
120
A B C
Task 2
Task 1
Task 3
Task 4
[Sec
onds
]
*5...
[Seconds]
(c) Total time for task execution
(b) Execution times for single navigation tasks
nminmax
meanmedianσ
A
7301.0819.0
459.0399.0176.5
C
8281.0443.0
376.5223.058.7
B
8181.0285.0
222.1392.032.6
Task 5
Task 6
Task 7
p1-valuet-test
p1-valueMWU*
p1-valueMWU
p1-valuet-test
p1-valuet-test
p1-valuet-test
p1-valuet-test
.02*.01*
.35
p1-values (Mann-Whitney-U)A/BB/CA/C
< .001*< .001*
.03
p1-values (t-test)A/BB/CA/C
A/B: .04*B/C: .00*A/C: .19
A/B: < .001*B/C: .24[A/C: <.001*]
A/B: .13B/C: .00*A/C: .03*
A/B: .00*B/C: .02*A/C: .32
A/B: .25B/C: .00*A/C: .03*
A/B: < .001*B/C: .00*A/C: .23
A/B: .00*B/C: .01*A/C: .07
Figure 10.8: Results for hypothesis H3.
As can be seen in Figure 10.8a, group B has the subjective impression of being able to quickly accomplishthe given tasks (M = 4.67, SD = 0.50). Groups A and C further have the impression of accomplishingtheir tasks pretty fast (group A: M = 3.89, SD = 0.78; group C: M = 4.00, SD = 0.50). However,group B provides a significantly higher rating compared to the other two groups (B/C: U = 16.50, z =
−2.41, p1 = .01∗, r = −0.57 and B/A: U = 18.00, z = −2.15, p1 = .02∗, r = −0.51).
Interestingly, results from this subjective impression slightly correspond with time measurements (r =
0.48, n = 16, p2 = .06), i.e., subjects having the feeling to perform tasks fast tend to actually performthem faster than other subjects. Except for task 2, all other tasks are performed significantly fasterby subjects from group B compared to subjects from group C (cf. Figure 10.8b). Task 2 deals withthe identification of different input documents of a single process task. As the control concept (i.e., the1-dimensional navigation concept) only provides one static visualization for process tasks (including alist of all input and output documents), it is easy for subjects to identify the right documents. In turn,the ProNaVis navigation concept implemented in the experimental system provides three independentvisualizations of process tasks, including visualizations, that do not comprise input documents as theyfocus on other information (e.g., temporal dependencies). Thus, few subjects, especially from group A,get stuck in these visualizations and are unable to find the required documents. In turn, subjects fromgroup B are explicitly taught to switch visualizations in order to get specific information. As can be seen,
161
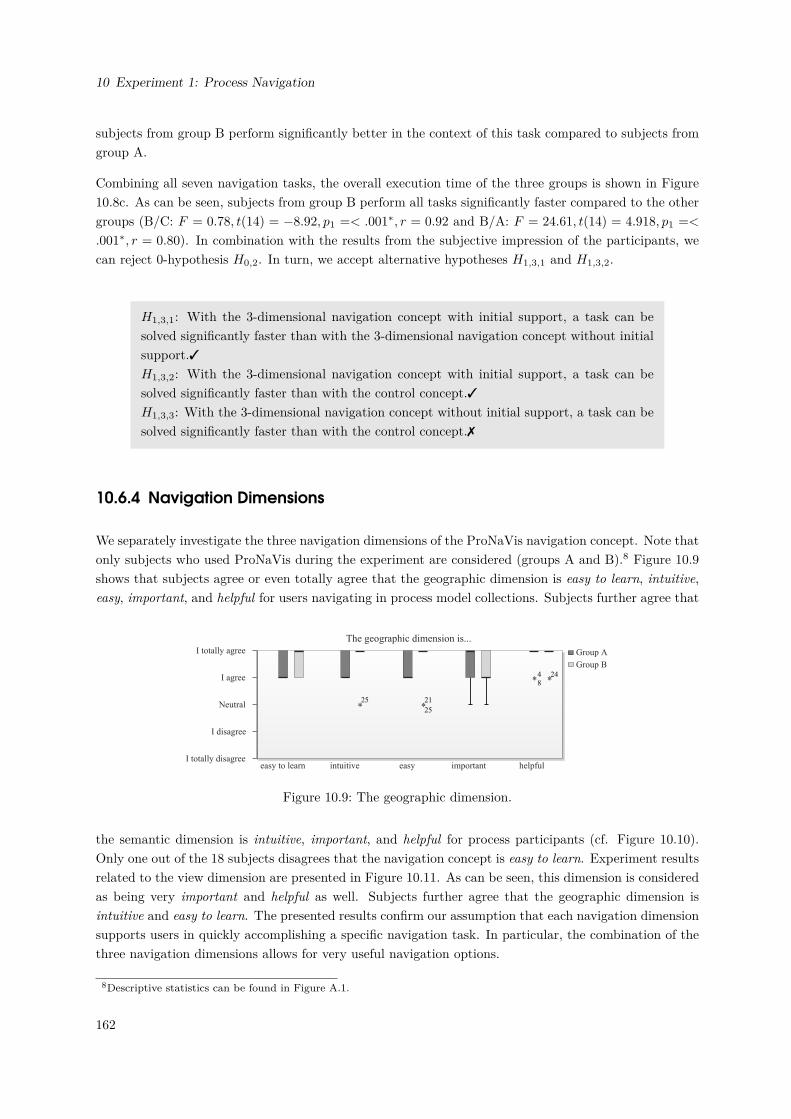
10 Experiment 1: Process Navigation
subjects from group B perform significantly better in the context of this task compared to subjects fromgroup A.
Combining all seven navigation tasks, the overall execution time of the three groups is shown in Figure10.8c. As can be seen, subjects from group B perform all tasks significantly faster compared to the othergroups (B/C: F = 0.78, t(14) = −8.92, p1 =< .001∗, r = 0.92 and B/A: F = 24.61, t(14) = 4.918, p1 =<
.001∗, r = 0.80). In combination with the results from the subjective impression of the participants, wecan reject 0-hypothesis H0,2. In turn, we accept alternative hypotheses H1,3,1 and H1,3,2.
H1,3,1: With the 3-dimensional navigation concept with initial support, a task can besolved significantly faster than with the 3-dimensional navigation concept without initialsupport.3H1,3,2: With the 3-dimensional navigation concept with initial support, a task can besolved significantly faster than with the control concept.3H1,3,3: With the 3-dimensional navigation concept without initial support, a task can besolved significantly faster than with the control concept.7
10.6.4 Navigation Dimensions
We separately investigate the three navigation dimensions of the ProNaVis navigation concept. Note thatonly subjects who used ProNaVis during the experiment are considered (groups A and B).8 Figure 10.9shows that subjects agree or even totally agree that the geographic dimension is easy to learn, intuitive,easy, important, and helpful for users navigating in process model collections. Subjects further agree that
I totally agree
I agree
Neutral
I totally disagree
The geographic dimension is...
intuitive important helpful
I disagree
easy
*
easy to learn
84
*25
*21
25
*24
Group A
Group B
Figure 10.9: The geographic dimension.
the semantic dimension is intuitive, important, and helpful for process participants (cf. Figure 10.10).Only one out of the 18 subjects disagrees that the navigation concept is easy to learn. Experiment resultsrelated to the view dimension are presented in Figure 10.11. As can be seen, this dimension is consideredas being very important and helpful as well. Subjects further agree that the geographic dimension isintuitive and easy to learn. The presented results confirm our assumption that each navigation dimensionsupports users in quickly accomplishing a specific navigation task. In particular, the combination of thethree navigation dimensions allows for very useful navigation options.
8Descriptive statistics can be found in Figure A.1.
162
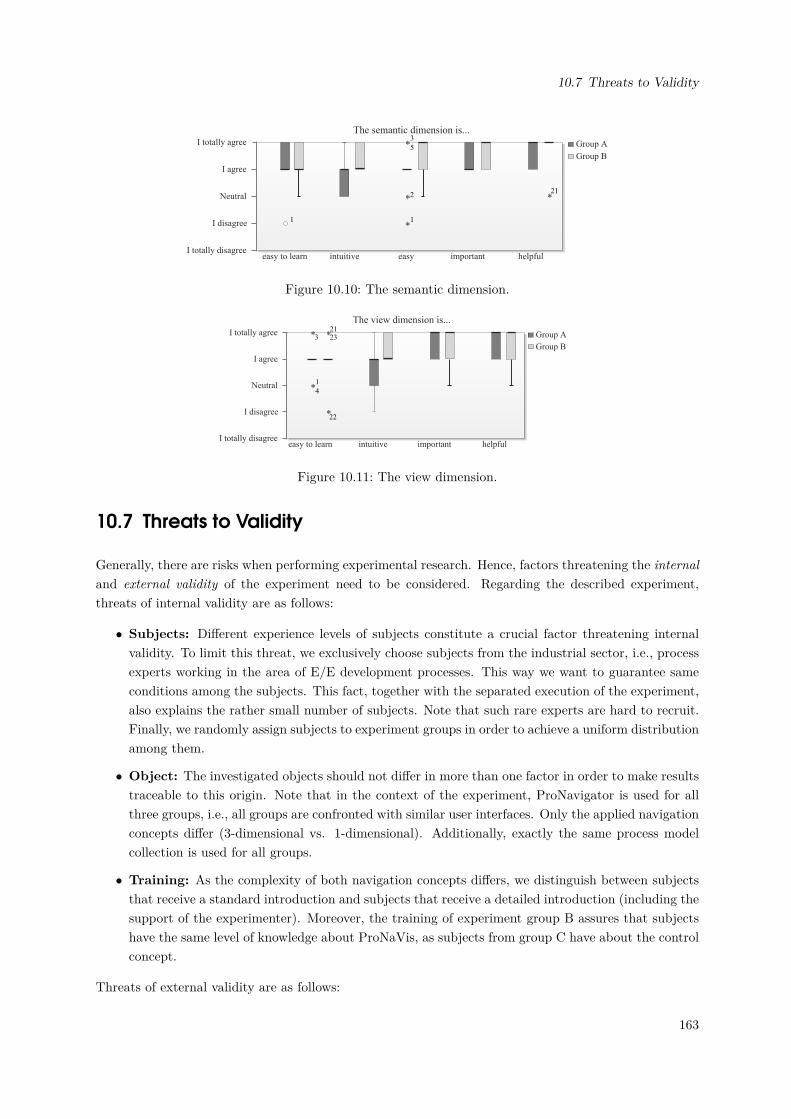
10.7 Threats to Validity
The semantic dimension is...
intuitive important helpfuleasyeasy to learn
*
*
*
I totally agree
I agree
Neutral
I totally disagree
I disagree 1
3
5
2
1
*21
Group A
Group B
Figure 10.10: The semantic dimension.
The view dimension is...
intuitive helpfuleasy to learn important
*
*I totally agree
I agree
Neutral
I totally disagree
I disagree
1
4
3
*
*
22
2321
Group A
Group B
Figure 10.11: The view dimension.
10.7 Threats to Validity
Generally, there are risks when performing experimental research. Hence, factors threatening the internaland external validity of the experiment need to be considered. Regarding the described experiment,threats of internal validity are as follows:
• Subjects: Different experience levels of subjects constitute a crucial factor threatening internalvalidity. To limit this threat, we exclusively choose subjects from the industrial sector, i.e., processexperts working in the area of E/E development processes. This way we want to guarantee sameconditions among the subjects. This fact, together with the separated execution of the experiment,also explains the rather small number of subjects. Note that such rare experts are hard to recruit.Finally, we randomly assign subjects to experiment groups in order to achieve a uniform distributionamong them.
• Object: The investigated objects should not differ in more than one factor in order to make resultstraceable to this origin. Note that in the context of the experiment, ProNavigator is used for allthree groups, i.e., all groups are confronted with similar user interfaces. Only the applied navigationconcepts differ (3-dimensional vs. 1-dimensional). Additionally, exactly the same process modelcollection is used for all groups.
• Training: As the complexity of both navigation concepts differs, we distinguish between subjectsthat receive a standard introduction and subjects that receive a detailed introduction (including thesupport of the experimenter). Moreover, the training of experiment group B assures that subjectshave the same level of knowledge about ProNaVis, as subjects from group C have about the controlconcept.
Threats of external validity are as follows:
163
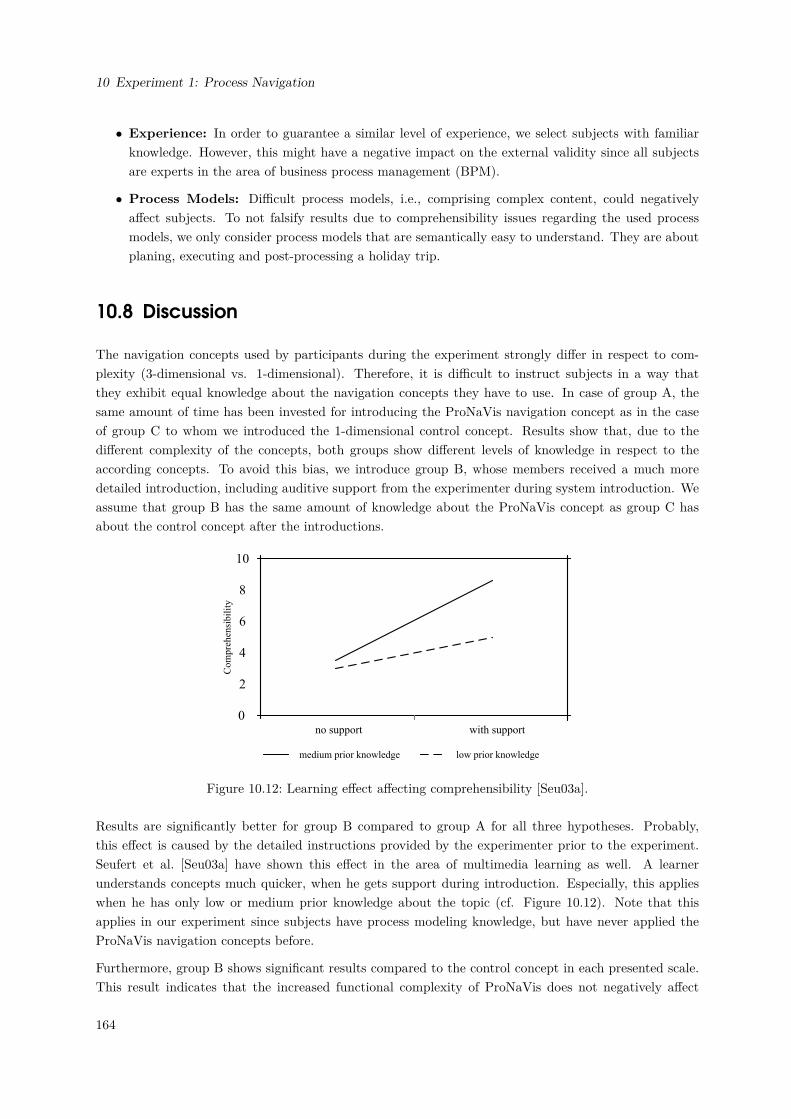
10 Experiment 1: Process Navigation
• Experience: In order to guarantee a similar level of experience, we select subjects with familiarknowledge. However, this might have a negative impact on the external validity since all subjectsare experts in the area of business process management (BPM).
• Process Models: Difficult process models, i.e., comprising complex content, could negativelyaffect subjects. To not falsify results due to comprehensibility issues regarding the used processmodels, we only consider process models that are semantically easy to understand. They are aboutplaning, executing and post-processing a holiday trip.
10.8 Discussion
The navigation concepts used by participants during the experiment strongly differ in respect to com-plexity (3-dimensional vs. 1-dimensional). Therefore, it is difficult to instruct subjects in a way thatthey exhibit equal knowledge about the navigation concepts they have to use. In case of group A, thesame amount of time has been invested for introducing the ProNaVis navigation concept as in the caseof group C to whom we introduced the 1-dimensional control concept. Results show that, due to thedifferent complexity of the concepts, both groups show different levels of knowledge in respect to theaccording concepts. To avoid this bias, we introduce group B, whose members received a much moredetailed introduction, including auditive support from the experimenter during system introduction. Weassume that group B has the same amount of knowledge about the ProNaVis concept as group C hasabout the control concept after the introductions.
10
8
6
4
2
0no support with support
medium prior knowledge low prior knowledge
Com
pre
hen
sibil
ity
Figure 10.12: Learning effect affecting comprehensibility [Seu03a].
Results are significantly better for group B compared to group A for all three hypotheses. Probably,this effect is caused by the detailed instructions provided by the experimenter prior to the experiment.Seufert et al. [Seu03a] have shown this effect in the area of multimedia learning as well. A learnerunderstands concepts much quicker, when he gets support during introduction. Especially, this applieswhen he has only low or medium prior knowledge about the topic (cf. Figure 10.12). Note that thisapplies in our experiment since subjects have process modeling knowledge, but have never applied theProNaVis navigation concepts before.
Furthermore, group B shows significant results compared to the control concept in each presented scale.This result indicates that the increased functional complexity of ProNaVis does not negatively affect
164
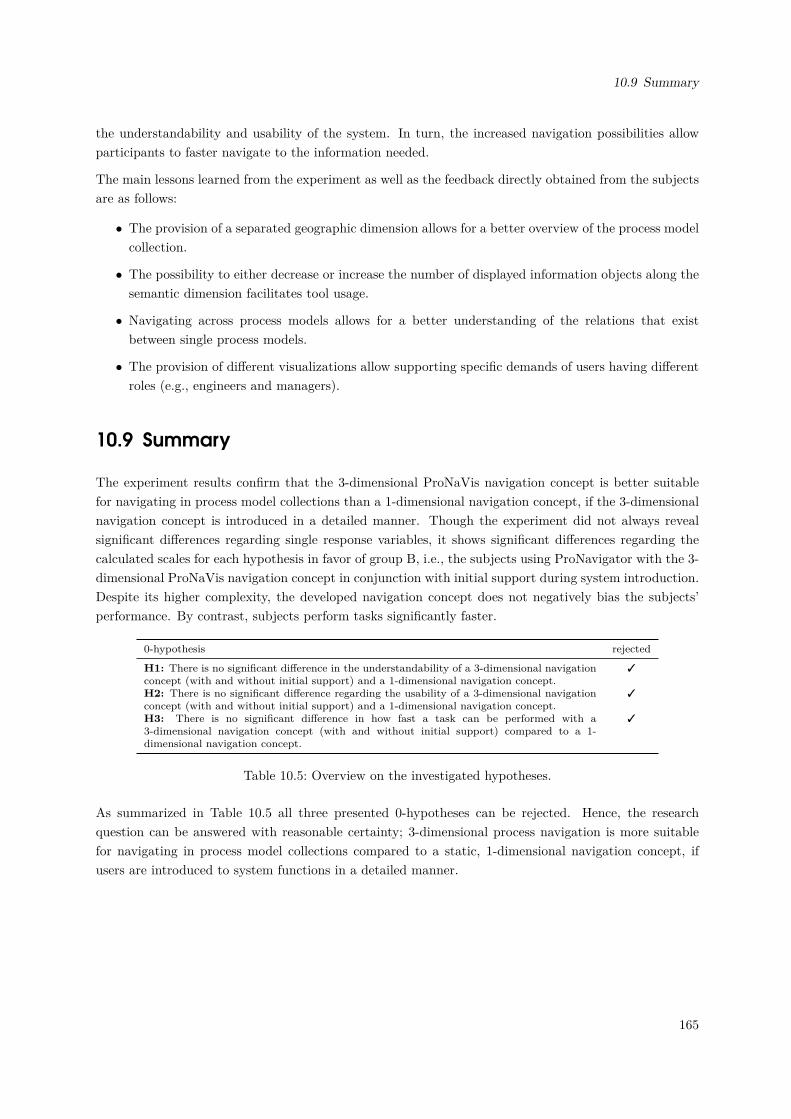
10.9 Summary
the understandability and usability of the system. In turn, the increased navigation possibilities allowparticipants to faster navigate to the information needed.
The main lessons learned from the experiment as well as the feedback directly obtained from the subjectsare as follows:
• The provision of a separated geographic dimension allows for a better overview of the process modelcollection.
• The possibility to either decrease or increase the number of displayed information objects along thesemantic dimension facilitates tool usage.
• Navigating across process models allows for a better understanding of the relations that existbetween single process models.
• The provision of different visualizations allow supporting specific demands of users having differentroles (e.g., engineers and managers).
10.9 Summary
The experiment results confirm that the 3-dimensional ProNaVis navigation concept is better suitablefor navigating in process model collections than a 1-dimensional navigation concept, if the 3-dimensionalnavigation concept is introduced in a detailed manner. Though the experiment did not always revealsignificant differences regarding single response variables, it shows significant differences regarding thecalculated scales for each hypothesis in favor of group B, i.e., the subjects using ProNavigator with the 3-dimensional ProNaVis navigation concept in conjunction with initial support during system introduction.Despite its higher complexity, the developed navigation concept does not negatively bias the subjects’performance. By contrast, subjects perform tasks significantly faster.
0-hypothesis rejected
H1: There is no significant difference in the understandability of a 3-dimensional navigationconcept (with and without initial support) and a 1-dimensional navigation concept.
3
H2: There is no significant difference regarding the usability of a 3-dimensional navigationconcept (with and without initial support) and a 1-dimensional navigation concept.
3
H3: There is no significant difference in how fast a task can be performed with a3-dimensional navigation concept (with and without initial support) compared to a 1-dimensional navigation concept.
3
Table 10.5: Overview on the investigated hypotheses.
As summarized in Table 10.5 all three presented 0-hypotheses can be rejected. Hence, the researchquestion can be answered with reasonable certainty; 3-dimensional process navigation is more suitablefor navigating in process model collections compared to a static, 1-dimensional navigation concept, ifusers are introduced to system functions in a detailed manner.
165

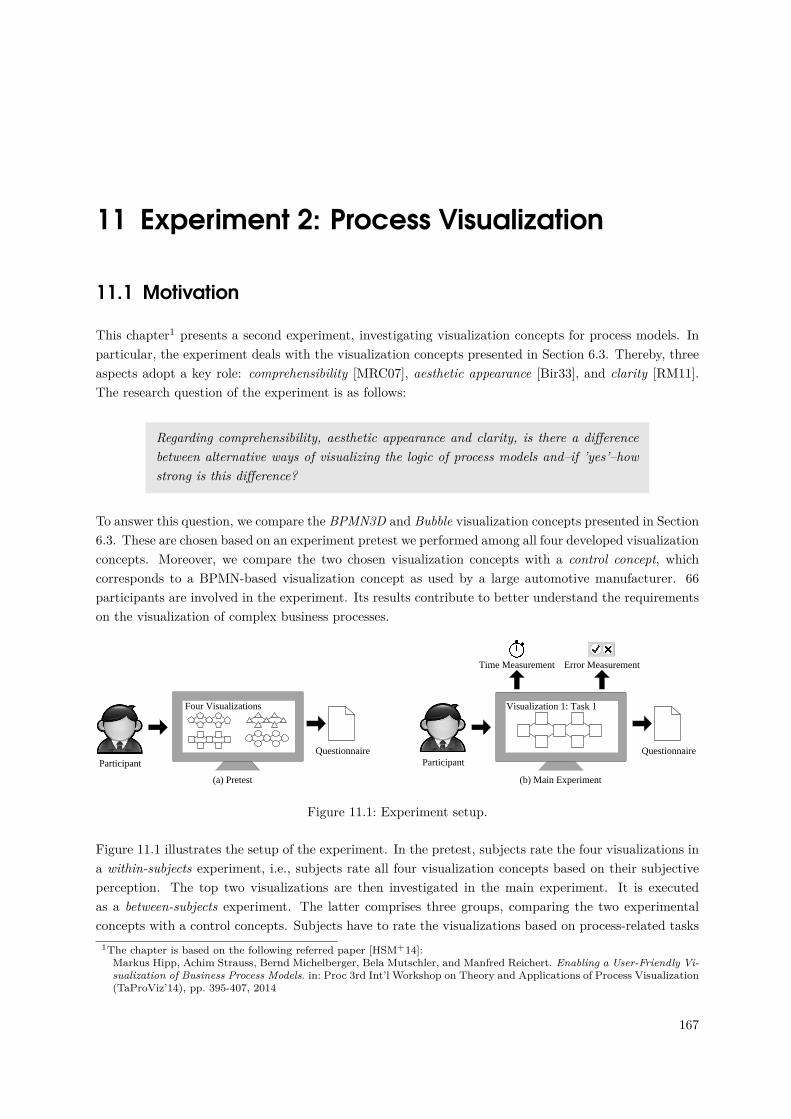
11 Experiment 2: Process Visualization
11.1 Motivation
This chapter1 presents a second experiment, investigating visualization concepts for process models. Inparticular, the experiment deals with the visualization concepts presented in Section 6.3. Thereby, threeaspects adopt a key role: comprehensibility [MRC07], aesthetic appearance [Bir33], and clarity [RM11].The research question of the experiment is as follows:
Regarding comprehensibility, aesthetic appearance and clarity, is there a differencebetween alternative ways of visualizing the logic of process models and–if ’yes’–howstrong is this difference?
To answer this question, we compare the BPMN3D and Bubble visualization concepts presented in Section6.3. These are chosen based on an experiment pretest we performed among all four developed visualizationconcepts. Moreover, we compare the two chosen visualization concepts with a control concept, whichcorresponds to a BPMN-based visualization concept as used by a large automotive manufacturer. 66participants are involved in the experiment. Its results contribute to better understand the requirementson the visualization of complex business processes.
Participant
Questionnaire
Time Measurement Error Measurement
Visualization 1: Task 1Four Visualizations
ParticipantQuestionnaire
(a) Pretest (b) Main Experiment
Figure 11.1: Experiment setup.
Figure 11.1 illustrates the setup of the experiment. In the pretest, subjects rate the four visualizations ina within-subjects experiment, i.e., subjects rate all four visualization concepts based on their subjectiveperception. The top two visualizations are then investigated in the main experiment. It is executedas a between-subjects experiment. The latter comprises three groups, comparing the two experimentalconcepts with a control concepts. Subjects have to rate the visualizations based on process-related tasks
1The chapter is based on the following referred paper [HSM+14]:Markus Hipp, Achim Strauss, Bernd Michelberger, Bela Mutschler, and Manfred Reichert. Enabling a User-Friendly Vi-sualization of Business Process Models. in: Proc 3rd Int’l Workshop on Theory and Applications of Process Visualization(TaProViz’14), pp. 395-407, 2014
167
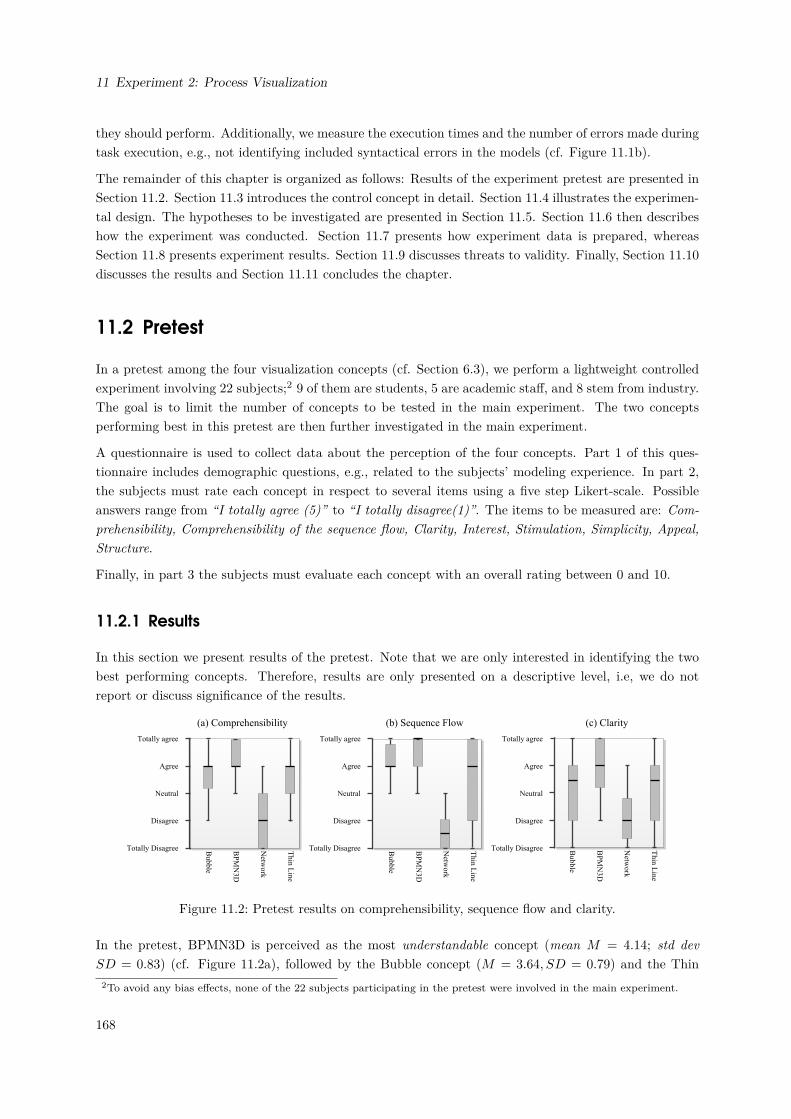
11 Experiment 2: Process Visualization
they should perform. Additionally, we measure the execution times and the number of errors made duringtask execution, e.g., not identifying included syntactical errors in the models (cf. Figure 11.1b).
The remainder of this chapter is organized as follows: Results of the experiment pretest are presented inSection 11.2. Section 11.3 introduces the control concept in detail. Section 11.4 illustrates the experimen-tal design. The hypotheses to be investigated are presented in Section 11.5. Section 11.6 then describeshow the experiment was conducted. Section 11.7 presents how experiment data is prepared, whereasSection 11.8 presents experiment results. Section 11.9 discusses threats to validity. Finally, Section 11.10discusses the results and Section 11.11 concludes the chapter.
11.2 Pretest
In a pretest among the four visualization concepts (cf. Section 6.3), we perform a lightweight controlledexperiment involving 22 subjects;2 9 of them are students, 5 are academic staff, and 8 stem from industry.The goal is to limit the number of concepts to be tested in the main experiment. The two conceptsperforming best in this pretest are then further investigated in the main experiment.
A questionnaire is used to collect data about the perception of the four concepts. Part 1 of this ques-tionnaire includes demographic questions, e.g., related to the subjects’ modeling experience. In part 2,the subjects must rate each concept in respect to several items using a five step Likert-scale. Possibleanswers range from “I totally agree (5)” to “I totally disagree(1)”. The items to be measured are: Com-prehensibility, Comprehensibility of the sequence flow, Clarity, Interest, Stimulation, Simplicity, Appeal,Structure.
Finally, in part 3 the subjects must evaluate each concept with an overall rating between 0 and 10.
11.2.1 Results
In this section we present results of the pretest. Note that we are only interested in identifying the twobest performing concepts. Therefore, results are only presented on a descriptive level, i.e, we do notreport or discuss significance of the results.
Totally agree
Agree
Neutral
Disagree
Totally Disagree
(a) Comprehensibility
Totally agree
Agree
Neutral
Disagree
Totally Disagree
(c) Clarity
Totally agree
Agree
Neutral
Disagree
Totally Disagree
(b) Sequence Flow
BP
MN
3D
Th
in L
ine
Bu
bb
le
Netw
ork
BP
MN
3D
Th
in L
ine
Bu
bb
le
Netw
ork
BP
MN
3D
Th
in L
ine
Bu
bb
le
Netw
ork
Figure 11.2: Pretest results on comprehensibility, sequence flow and clarity.
In the pretest, BPMN3D is perceived as the most understandable concept (mean M = 4.14; std devSD = 0.83) (cf. Figure 11.2a), followed by the Bubble concept (M = 3.64, SD = 0.79) and the Thin
2To avoid any bias effects, none of the 22 subjects participating in the pretest were involved in the main experiment.
168
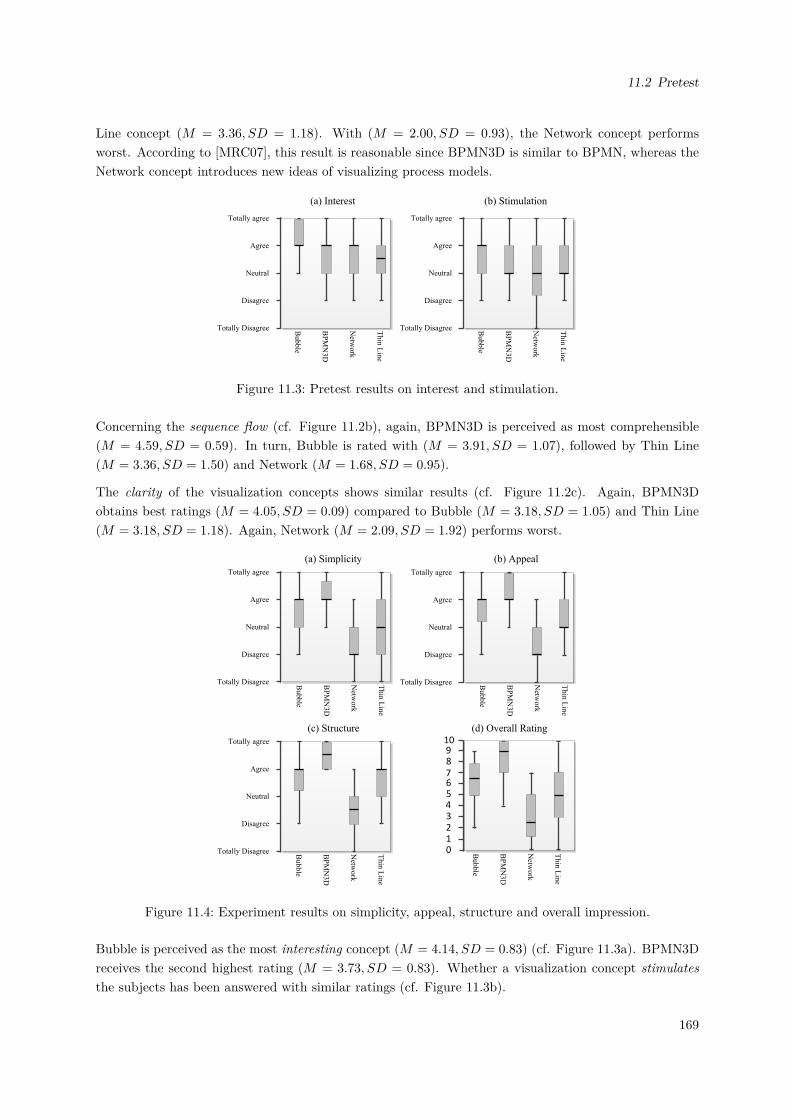
11.2 Pretest
Line concept (M = 3.36, SD = 1.18). With (M = 2.00, SD = 0.93), the Network concept performsworst. According to [MRC07], this result is reasonable since BPMN3D is similar to BPMN, whereas theNetwork concept introduces new ideas of visualizing process models.
Totally agree
Agree
Neutral
Disagree
Totally Disagree
(b) Stimulation
Totally agree
Agree
Neutral
Disagree
Totally Disagree
(a) Interest
BP
MN
3D
Thin
Lin
e
Bubble
Netw
ork
BP
MN
3D
Thin
Lin
e
Bubble
Netw
ork
Figure 11.3: Pretest results on interest and stimulation.
Concerning the sequence flow (cf. Figure 11.2b), again, BPMN3D is perceived as most comprehensible(M = 4.59, SD = 0.59). In turn, Bubble is rated with (M = 3.91, SD = 1.07), followed by Thin Line(M = 3.36, SD = 1.50) and Network (M = 1.68, SD = 0.95).
The clarity of the visualization concepts shows similar results (cf. Figure 11.2c). Again, BPMN3Dobtains best ratings (M = 4.05, SD = 0.09) compared to Bubble (M = 3.18, SD = 1.05) and Thin Line(M = 3.18, SD = 1.18). Again, Network (M = 2.09, SD = 1.92) performs worst.
10987654
1
32
0
(d) Overall Rating
Totally agree
Agree
Neutral
Disagree
Totally Disagree
(c) Structure
Totally agree
Agree
Neutral
Disagree
Totally Disagree
(b) Appeal
Totally agree
Agree
Neutral
Disagree
Totally Disagree BP
MN
3D
Thin
Lin
e
Bubble
Netw
ork
(a) Simplicity
BP
MN
3D
Thin
Lin
e
Bubble
Netw
ork
BP
MN
3D
Thin
Lin
e
Bubble
Netw
ork
BP
MN
3D
Thin
Lin
e
Bubble
Netw
ork
Figure 11.4: Experiment results on simplicity, appeal, structure and overall impression.
Bubble is perceived as the most interesting concept (M = 4.14, SD = 0.83) (cf. Figure 11.3a). BPMN3Dreceives the second highest rating (M = 3.73, SD = 0.83). Whether a visualization concept stimulatesthe subjects has been answered with similar ratings (cf. Figure 11.3b).
169
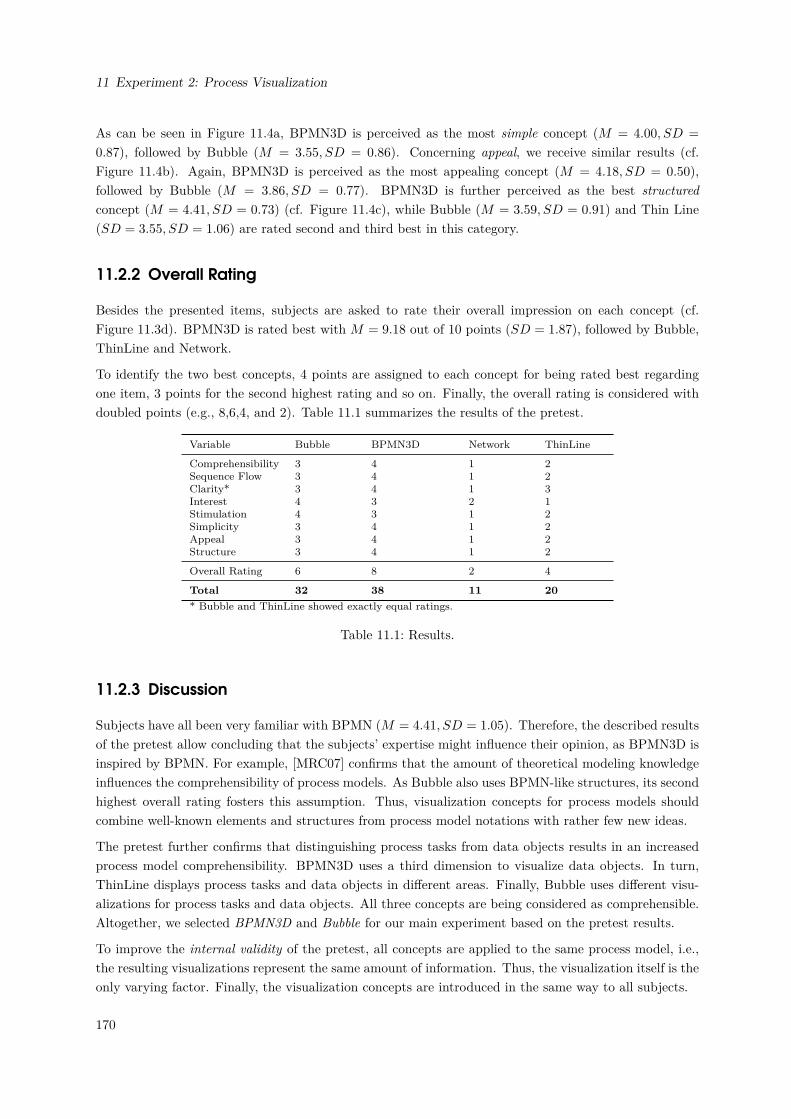
11 Experiment 2: Process Visualization
As can be seen in Figure 11.4a, BPMN3D is perceived as the most simple concept (M = 4.00, SD =
0.87), followed by Bubble (M = 3.55, SD = 0.86). Concerning appeal, we receive similar results (cf.Figure 11.4b). Again, BPMN3D is perceived as the most appealing concept (M = 4.18, SD = 0.50),followed by Bubble (M = 3.86, SD = 0.77). BPMN3D is further perceived as the best structuredconcept (M = 4.41, SD = 0.73) (cf. Figure 11.4c), while Bubble (M = 3.59, SD = 0.91) and Thin Line(SD = 3.55, SD = 1.06) are rated second and third best in this category.
11.2.2 Overall Rating
Besides the presented items, subjects are asked to rate their overall impression on each concept (cf.Figure 11.3d). BPMN3D is rated best with M = 9.18 out of 10 points (SD = 1.87), followed by Bubble,ThinLine and Network.
To identify the two best concepts, 4 points are assigned to each concept for being rated best regardingone item, 3 points for the second highest rating and so on. Finally, the overall rating is considered withdoubled points (e.g., 8,6,4, and 2). Table 11.1 summarizes the results of the pretest.
Variable Bubble BPMN3D Network ThinLine
Comprehensibility 3 4 1 2Sequence Flow 3 4 1 2Clarity* 3 4 1 3Interest 4 3 2 1Stimulation 4 3 1 2Simplicity 3 4 1 2Appeal 3 4 1 2Structure 3 4 1 2
Overall Rating 6 8 2 4
Total 32 38 11 20* Bubble and ThinLine showed exactly equal ratings.
Table 11.1: Results.
11.2.3 Discussion
Subjects have all been very familiar with BPMN (M = 4.41, SD = 1.05). Therefore, the described resultsof the pretest allow concluding that the subjects’ expertise might influence their opinion, as BPMN3D isinspired by BPMN. For example, [MRC07] confirms that the amount of theoretical modeling knowledgeinfluences the comprehensibility of process models. As Bubble also uses BPMN-like structures, its secondhighest overall rating fosters this assumption. Thus, visualization concepts for process models shouldcombine well-known elements and structures from process model notations with rather few new ideas.
The pretest further confirms that distinguishing process tasks from data objects results in an increasedprocess model comprehensibility. BPMN3D uses a third dimension to visualize data objects. In turn,ThinLine displays process tasks and data objects in different areas. Finally, Bubble uses different visu-alizations for process tasks and data objects. All three concepts are being considered as comprehensible.Altogether, we selected BPMN3D and Bubble for our main experiment based on the pretest results.
To improve the internal validity of the pretest, all concepts are applied to the same process model, i.e.,the resulting visualizations represent the same amount of information. Thus, the visualization itself is theonly varying factor. Finally, the visualization concepts are introduced in the same way to all subjects.
170
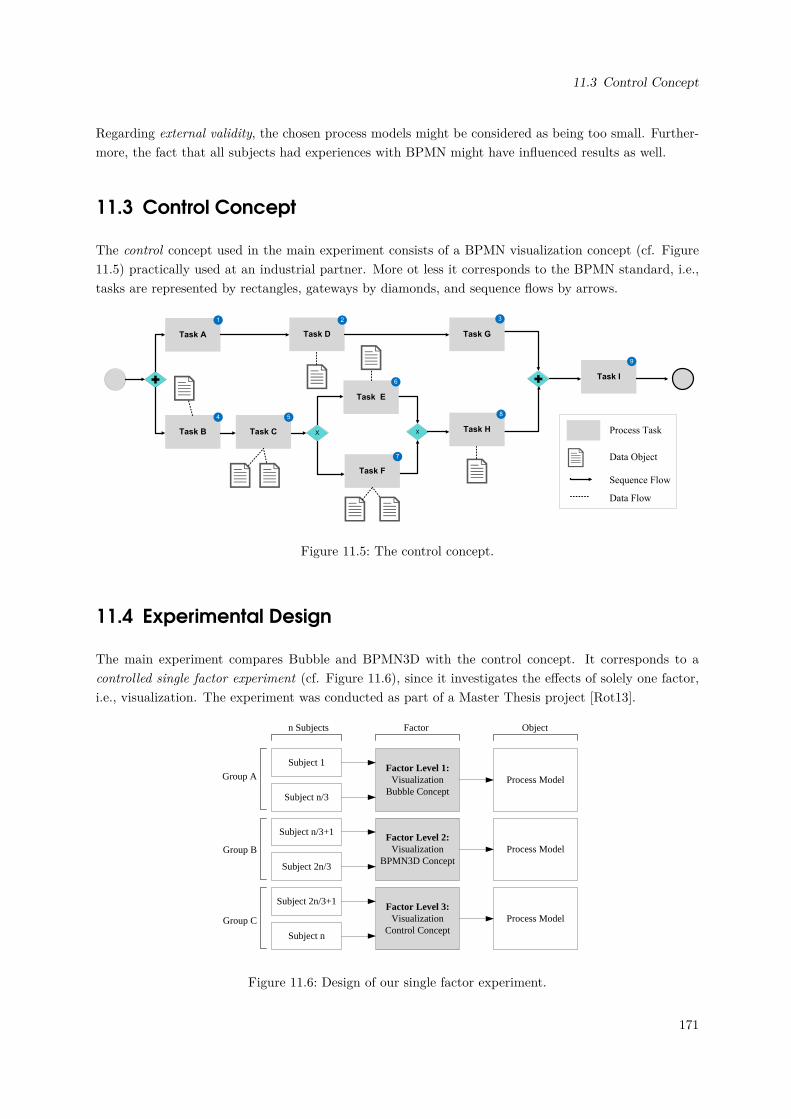
11.3 Control Concept
Regarding external validity, the chosen process models might be considered as being too small. Further-more, the fact that all subjects had experiences with BPMN might have influenced results as well.
11.3 Control Concept
The control concept used in the main experiment consists of a BPMN visualization concept (cf. Figure11.5) practically used at an industrial partner. More ot less it corresponds to the BPMN standard, i.e.,tasks are represented by rectangles, gateways by diamonds, and sequence flows by arrows.
Task A
1
X X
Task E
6
Task F
7
Task G
3
Task H
8
Task I
9
Task CTask B
Task D
2
4 5
Process Task
Data Object
Sequence Flow
Data Flow
Figure 11.5: The control concept.
11.4 Experimental Design
The main experiment compares Bubble and BPMN3D with the control concept. It corresponds to acontrolled single factor experiment (cf. Figure 11.6), since it investigates the effects of solely one factor,i.e., visualization. The experiment was conducted as part of a Master Thesis project [Rot13].
Subject 1
Subject n/3
Subject n/3+1
Subject 2n/3
Subject 2n/3+1
Subject n
Factor Level 1:Visualization
Bubble Concept
Factor Level 2:Visualization
BPMN3D Concept
Factor Level 3:Visualization
Control Concept
Process Model
Process Model
Process Model
n Subjects Factor Object
Group A
Group B
Group C
Figure 11.6: Design of our single factor experiment.
171
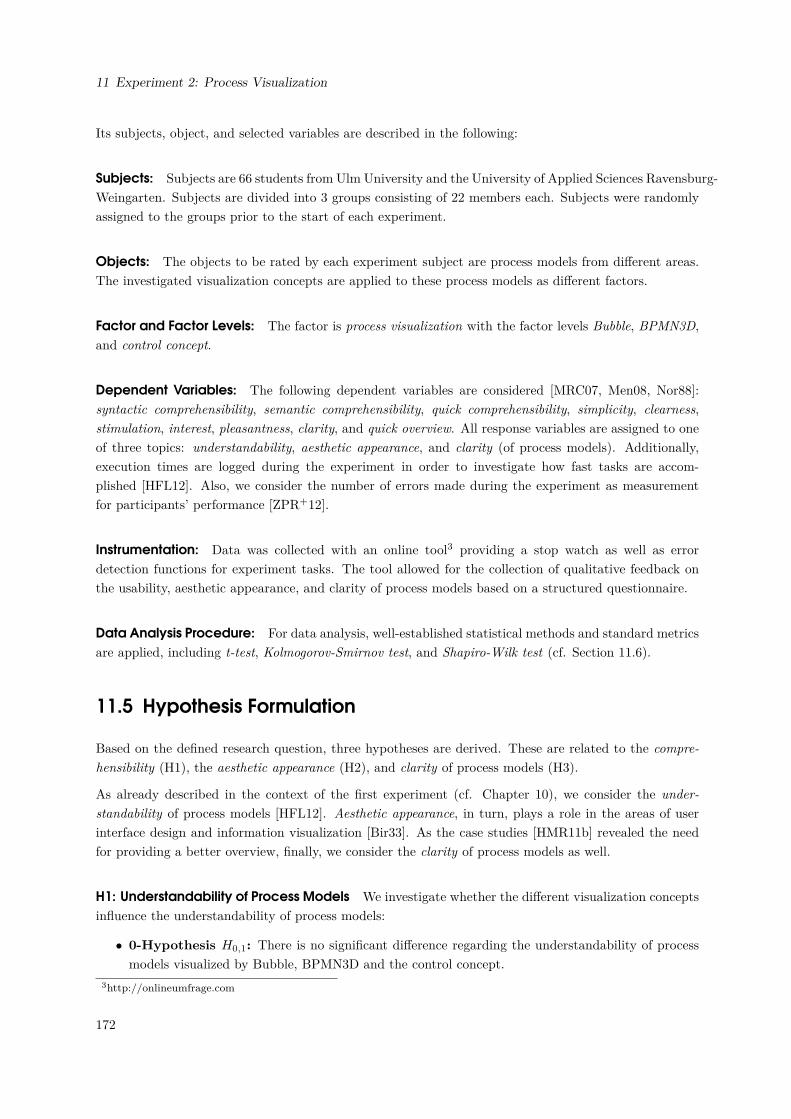
11 Experiment 2: Process Visualization
Its subjects, object, and selected variables are described in the following:
Subjects: Subjects are 66 students from Ulm University and the University of Applied Sciences Ravensburg-Weingarten. Subjects are divided into 3 groups consisting of 22 members each. Subjects were randomlyassigned to the groups prior to the start of each experiment.
Objects: The objects to be rated by each experiment subject are process models from different areas.The investigated visualization concepts are applied to these process models as different factors.
Factor and Factor Levels: The factor is process visualization with the factor levels Bubble, BPMN3D,and control concept.
Dependent Variables: The following dependent variables are considered [MRC07, Men08, Nor88]:syntactic comprehensibility, semantic comprehensibility, quick comprehensibility, simplicity, clearness,stimulation, interest, pleasantness, clarity, and quick overview. All response variables are assigned to oneof three topics: understandability, aesthetic appearance, and clarity (of process models). Additionally,execution times are logged during the experiment in order to investigate how fast tasks are accom-plished [HFL12]. Also, we consider the number of errors made during the experiment as measurementfor participants’ performance [ZPR+12].
Instrumentation: Data was collected with an online tool3 providing a stop watch as well as errordetection functions for experiment tasks. The tool allowed for the collection of qualitative feedback onthe usability, aesthetic appearance, and clarity of process models based on a structured questionnaire.
Data Analysis Procedure: For data analysis, well-established statistical methods and standard metricsare applied, including t-test, Kolmogorov-Smirnov test, and Shapiro-Wilk test (cf. Section 11.6).
11.5 Hypothesis Formulation
Based on the defined research question, three hypotheses are derived. These are related to the compre-hensibility (H1), the aesthetic appearance (H2), and clarity of process models (H3).
As already described in the context of the first experiment (cf. Chapter 10), we consider the under-standability of process models [HFL12]. Aesthetic appearance, in turn, plays a role in the areas of userinterface design and information visualization [Bir33]. As the case studies [HMR11b] revealed the needfor providing a better overview, finally, we consider the clarity of process models as well.
H1: Understandability of Process Models We investigate whether the different visualization conceptsinfluence the understandability of process models:
• 0-Hypothesis H0,1: There is no significant difference regarding the understandability of processmodels visualized by Bubble, BPMN3D and the control concept.
3http://onlineumfrage.com
172
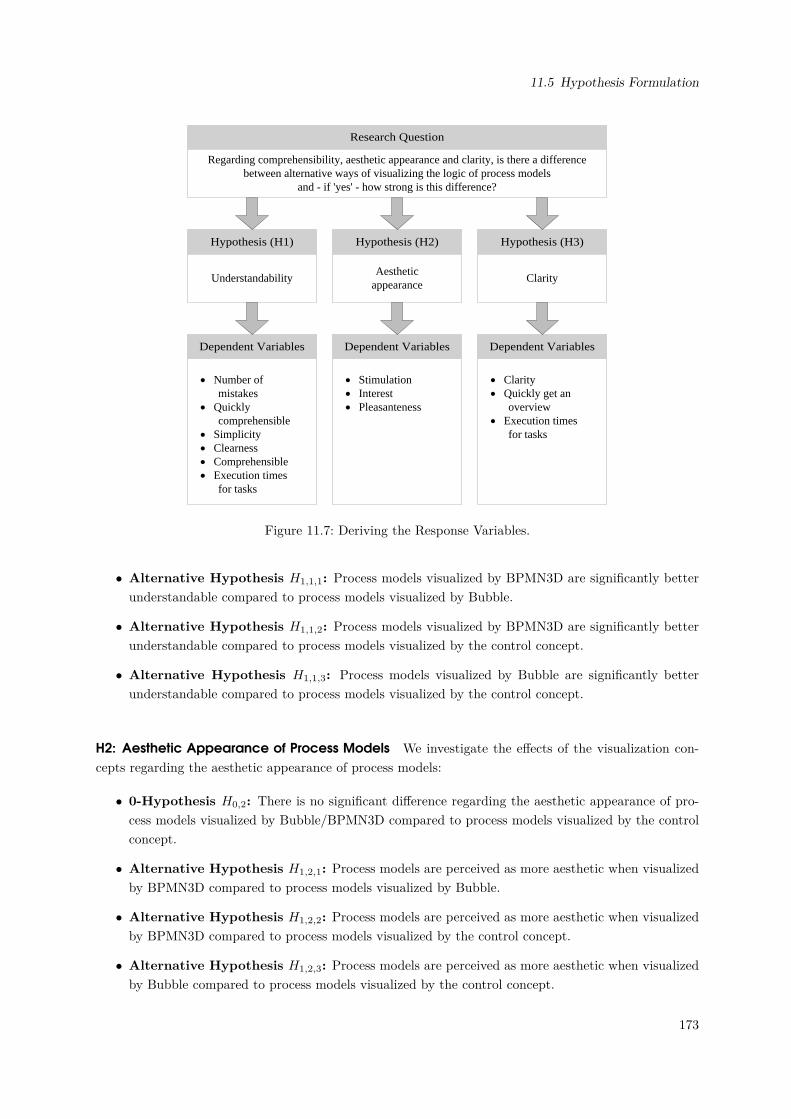
11.5 Hypothesis Formulation
Hypothesis (H1) Hypothesis (H2) Hypothesis (H3)
Research Question
Dependent Variables Dependent Variables Dependent Variables
UnderstandabilityAesthetic
appearanceClarity
Regarding comprehensibility, aesthetic appearance and clarity, is there a difference between alternative ways of visualizing the logic of process models
and - if 'yes' - how strong is this difference?
· Number of mistakes
· Quickly comprehensible
· Simplicity· Clearness· Comprehensible· Execution times
for tasks
· Stimulation· Interest· Pleasanteness
· Clarity· Quickly get an
overview· Execution times
for tasks
Figure 11.7: Deriving the Response Variables.
• Alternative Hypothesis H1,1,1: Process models visualized by BPMN3D are significantly betterunderstandable compared to process models visualized by Bubble.
• Alternative Hypothesis H1,1,2: Process models visualized by BPMN3D are significantly betterunderstandable compared to process models visualized by the control concept.
• Alternative Hypothesis H1,1,3: Process models visualized by Bubble are significantly betterunderstandable compared to process models visualized by the control concept.
H2: Aesthetic Appearance of Process Models We investigate the effects of the visualization con-cepts regarding the aesthetic appearance of process models:
• 0-Hypothesis H0,2: There is no significant difference regarding the aesthetic appearance of pro-cess models visualized by Bubble/BPMN3D compared to process models visualized by the controlconcept.
• Alternative Hypothesis H1,2,1: Process models are perceived as more aesthetic when visualizedby BPMN3D compared to process models visualized by Bubble.
• Alternative Hypothesis H1,2,2: Process models are perceived as more aesthetic when visualizedby BPMN3D compared to process models visualized by the control concept.
• Alternative Hypothesis H1,2,3: Process models are perceived as more aesthetic when visualizedby Bubble compared to process models visualized by the control concept.
173
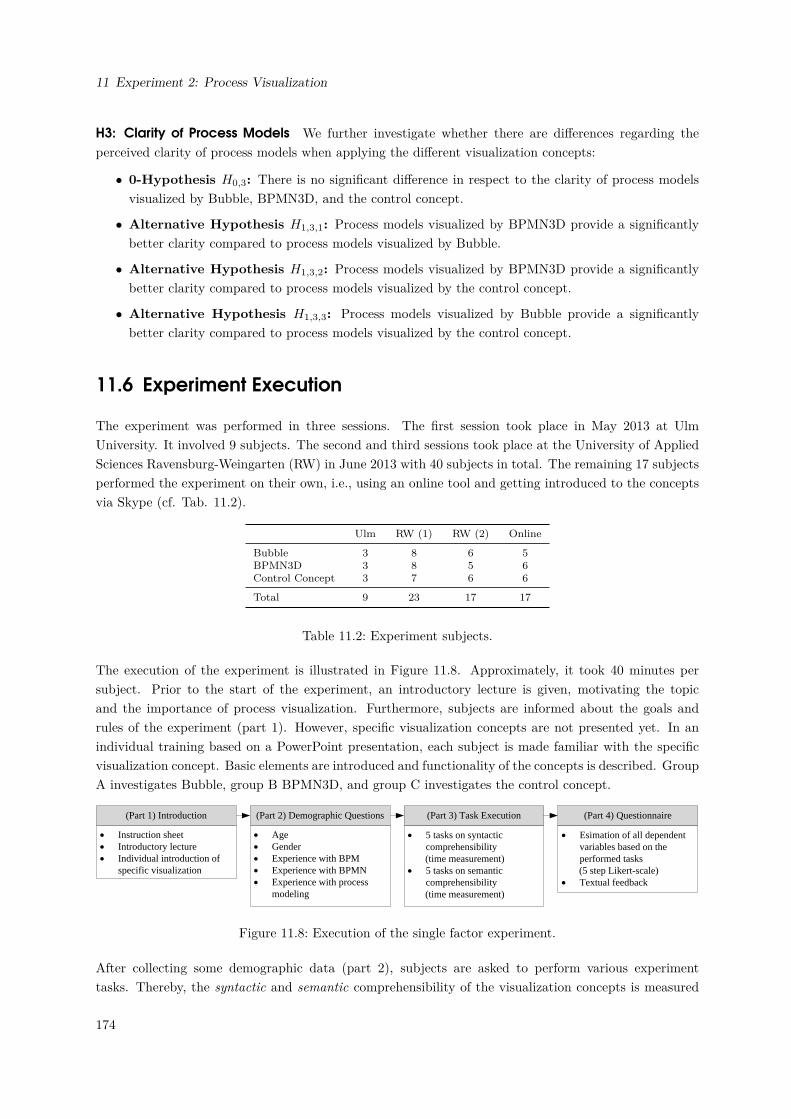
11 Experiment 2: Process Visualization
H3: Clarity of Process Models We further investigate whether there are differences regarding theperceived clarity of process models when applying the different visualization concepts:
• 0-Hypothesis H0,3: There is no significant difference in respect to the clarity of process modelsvisualized by Bubble, BPMN3D, and the control concept.
• Alternative Hypothesis H1,3,1: Process models visualized by BPMN3D provide a significantlybetter clarity compared to process models visualized by Bubble.
• Alternative Hypothesis H1,3,2: Process models visualized by BPMN3D provide a significantlybetter clarity compared to process models visualized by the control concept.
• Alternative Hypothesis H1,3,3: Process models visualized by Bubble provide a significantlybetter clarity compared to process models visualized by the control concept.
11.6 Experiment Execution
The experiment was performed in three sessions. The first session took place in May 2013 at UlmUniversity. It involved 9 subjects. The second and third sessions took place at the University of AppliedSciences Ravensburg-Weingarten (RW) in June 2013 with 40 subjects in total. The remaining 17 subjectsperformed the experiment on their own, i.e., using an online tool and getting introduced to the conceptsvia Skype (cf. Tab. 11.2).
Ulm RW (1) RW (2) Online
Bubble 3 8 6 5BPMN3D 3 8 5 6Control Concept 3 7 6 6
Total 9 23 17 17
Table 11.2: Experiment subjects.
The execution of the experiment is illustrated in Figure 11.8. Approximately, it took 40 minutes persubject. Prior to the start of the experiment, an introductory lecture is given, motivating the topicand the importance of process visualization. Furthermore, subjects are informed about the goals andrules of the experiment (part 1). However, specific visualization concepts are not presented yet. In anindividual training based on a PowerPoint presentation, each subject is made familiar with the specificvisualization concept. Basic elements are introduced and functionality of the concepts is described. GroupA investigates Bubble, group B BPMN3D, and group C investigates the control concept.
· Age· Gender· Experience with BPM· Experience with BPMN · Experience with process
modeling
· Instruction sheet· Introductory lecture· Individual introduction of
specific visualization
(Part 1) Introduction (Part 2) Demographic Questions (Part 3) Task Execution (Part 4) Questionnaire
· 5 tasks on syntactic comprehensibility
(time measurement) · 5 tasks on semantic
comprehensibility (time measurement)
· Esimation of all dependent variables based on the performed tasks
(5 step Likert-scale)· Textual feedback
Figure 11.8: Execution of the single factor experiment.
After collecting some demographic data (part 2), subjects are asked to perform various experimenttasks. Thereby, the syntactic and semantic comprehensibility of the visualization concepts is measured
174
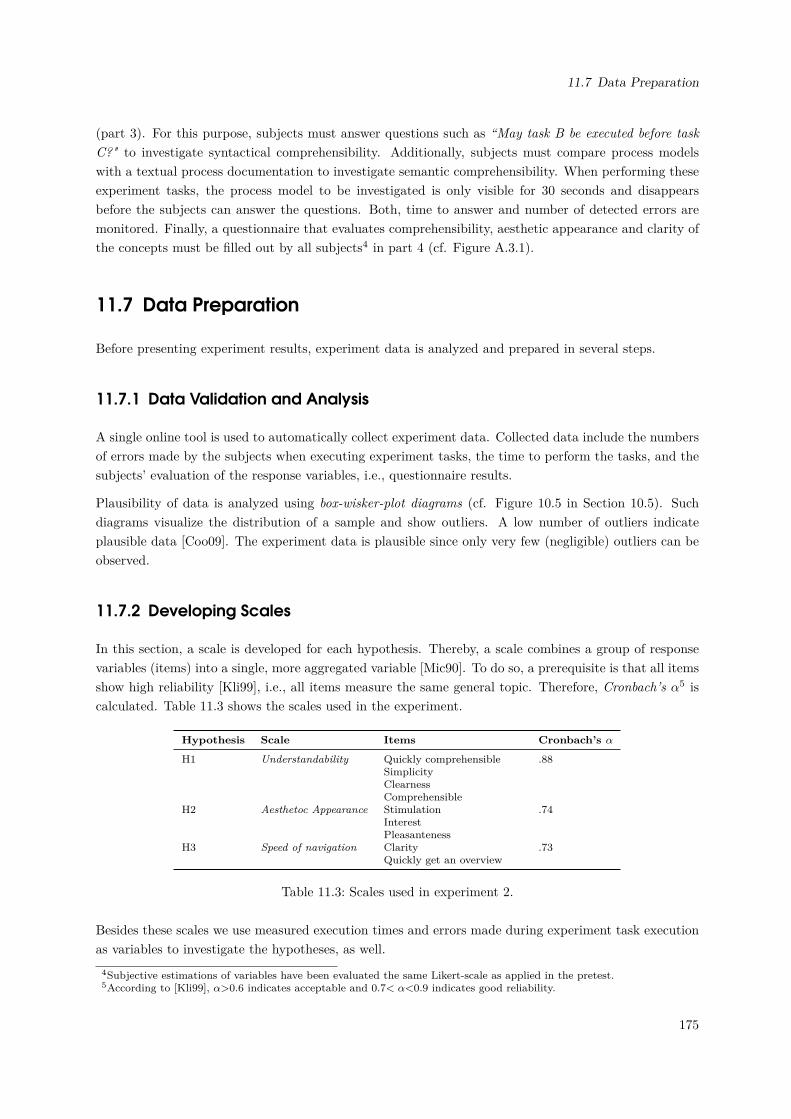
11.7 Data Preparation
(part 3). For this purpose, subjects must answer questions such as “May task B be executed before taskC?" to investigate syntactical comprehensibility. Additionally, subjects must compare process modelswith a textual process documentation to investigate semantic comprehensibility. When performing theseexperiment tasks, the process model to be investigated is only visible for 30 seconds and disappearsbefore the subjects can answer the questions. Both, time to answer and number of detected errors aremonitored. Finally, a questionnaire that evaluates comprehensibility, aesthetic appearance and clarity ofthe concepts must be filled out by all subjects4 in part 4 (cf. Figure A.3.1).
11.7 Data Preparation
Before presenting experiment results, experiment data is analyzed and prepared in several steps.
11.7.1 Data Validation and Analysis
A single online tool is used to automatically collect experiment data. Collected data include the numbersof errors made by the subjects when executing experiment tasks, the time to perform the tasks, and thesubjects’ evaluation of the response variables, i.e., questionnaire results.
Plausibility of data is analyzed using box-wisker-plot diagrams (cf. Figure 10.5 in Section 10.5). Suchdiagrams visualize the distribution of a sample and show outliers. A low number of outliers indicateplausible data [Coo09]. The experiment data is plausible since only very few (negligible) outliers can beobserved.
11.7.2 Developing Scales
In this section, a scale is developed for each hypothesis. Thereby, a scale combines a group of responsevariables (items) into a single, more aggregated variable [Mic90]. To do so, a prerequisite is that all itemsshow high reliability [Kli99], i.e., all items measure the same general topic. Therefore, Cronbach’s α5 iscalculated. Table 11.3 shows the scales used in the experiment.
Hypothesis Scale Items Cronbach’s α
H1 Understandability Quickly comprehensibleSimplicityClearnessComprehensible
.88
H2 Aesthetoc Appearance StimulationInterestPleasanteness
.74
H3 Speed of navigation ClarityQuickly get an overview
.73
Table 11.3: Scales used in experiment 2.
Besides these scales we use measured execution times and errors made during experiment task executionas variables to investigate the hypotheses, as well.
4Subjective estimations of variables have been evaluated the same Likert-scale as applied in the pretest.5According to [Kli99], α>0.6 indicates acceptable and 0.7< α<0.9 indicates good reliability.
175
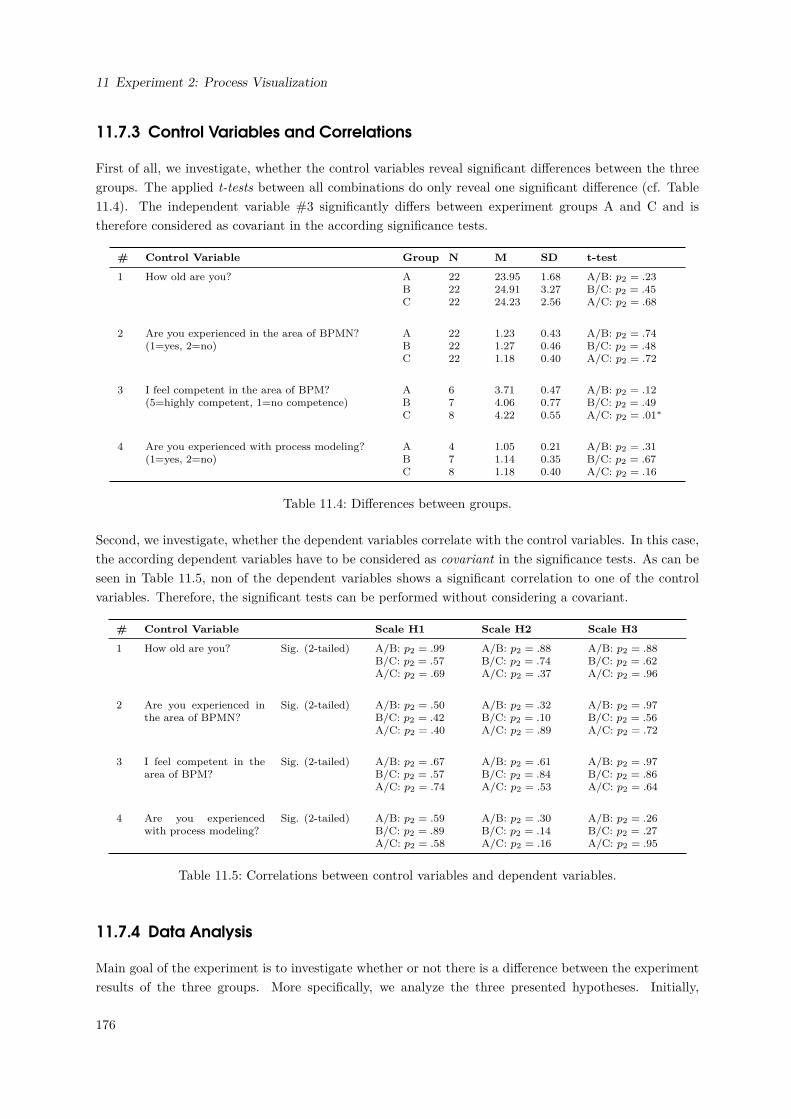
11 Experiment 2: Process Visualization
11.7.3 Control Variables and Correlations
First of all, we investigate, whether the control variables reveal significant differences between the threegroups. The applied t-tests between all combinations do only reveal one significant difference (cf. Table11.4). The independent variable #3 significantly differs between experiment groups A and C and istherefore considered as covariant in the according significance tests.
# Control Variable Group N M SD t-test
1 How old are you? ABC
222222
23.9524.9124.23
1.683.272.56
A/B: p2 = .23B/C: p2 = .45A/C: p2 = .68
2 Are you experienced in the area of BPMN?(1=yes, 2=no)
ABC
222222
1.231.271.18
0.430.460.40
A/B: p2 = .74B/C: p2 = .48A/C: p2 = .72
3 I feel competent in the area of BPM?(5=highly competent, 1=no competence)
ABC
678
3.714.064.22
0.470.770.55
A/B: p2 = .12B/C: p2 = .49A/C: p2 = .01∗
4 Are you experienced with process modeling?(1=yes, 2=no)
ABC
478
1.051.141.18
0.210.350.40
A/B: p2 = .31B/C: p2 = .67A/C: p2 = .16
Table 11.4: Differences between groups.
Second, we investigate, whether the dependent variables correlate with the control variables. In this case,the according dependent variables have to be considered as covariant in the significance tests. As can beseen in Table 11.5, non of the dependent variables shows a significant correlation to one of the controlvariables. Therefore, the significant tests can be performed without considering a covariant.
# Control Variable Scale H1 Scale H2 Scale H3
1 How old are you? Sig. (2-tailed) A/B: p2 = .99B/C: p2 = .57A/C: p2 = .69
A/B: p2 = .88B/C: p2 = .74A/C: p2 = .37
A/B: p2 = .88B/C: p2 = .62A/C: p2 = .96
2 Are you experienced inthe area of BPMN?
Sig. (2-tailed) A/B: p2 = .50B/C: p2 = .42A/C: p2 = .40
A/B: p2 = .32B/C: p2 = .10A/C: p2 = .89
A/B: p2 = .97B/C: p2 = .56A/C: p2 = .72
3 I feel competent in thearea of BPM?
Sig. (2-tailed) A/B: p2 = .67B/C: p2 = .57A/C: p2 = .74
A/B: p2 = .61B/C: p2 = .84A/C: p2 = .53
A/B: p2 = .97B/C: p2 = .86A/C: p2 = .64
4 Are you experiencedwith process modeling?
Sig. (2-tailed) A/B: p2 = .59B/C: p2 = .89A/C: p2 = .58
A/B: p2 = .30B/C: p2 = .14A/C: p2 = .16
A/B: p2 = .26B/C: p2 = .27A/C: p2 = .95
Table 11.5: Correlations between control variables and dependent variables.
11.7.4 Data Analysis
Main goal of the experiment is to investigate whether or not there is a difference between the experimentresults of the three groups. More specifically, we analyze the three presented hypotheses. Initially,
176
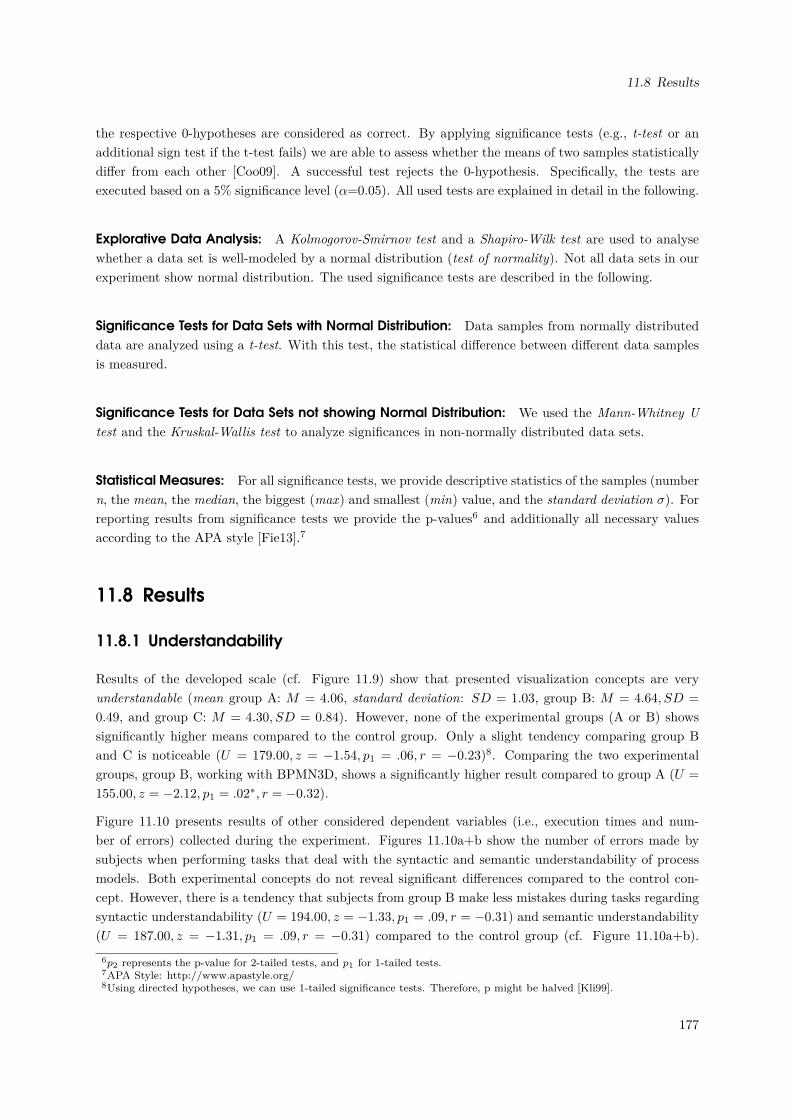
11.8 Results
the respective 0-hypotheses are considered as correct. By applying significance tests (e.g., t-test or anadditional sign test if the t-test fails) we are able to assess whether the means of two samples statisticallydiffer from each other [Coo09]. A successful test rejects the 0-hypothesis. Specifically, the tests areexecuted based on a 5% significance level (α=0.05). All used tests are explained in detail in the following.
Explorative Data Analysis: A Kolmogorov-Smirnov test and a Shapiro-Wilk test are used to analysewhether a data set is well-modeled by a normal distribution (test of normality). Not all data sets in ourexperiment show normal distribution. The used significance tests are described in the following.
Significance Tests for Data Sets with Normal Distribution: Data samples from normally distributeddata are analyzed using a t-test. With this test, the statistical difference between different data samplesis measured.
Significance Tests for Data Sets not showing Normal Distribution: We used the Mann-Whitney Utest and the Kruskal-Wallis test to analyze significances in non-normally distributed data sets.
Statistical Measures: For all significance tests, we provide descriptive statistics of the samples (numbern, the mean, the median, the biggest (max) and smallest (min) value, and the standard deviation σ). Forreporting results from significance tests we provide the p-values6 and additionally all necessary valuesaccording to the APA style [Fie13].7
11.8 Results
11.8.1 Understandability
Results of the developed scale (cf. Figure 11.9) show that presented visualization concepts are veryunderstandable (mean group A: M = 4.06, standard deviation: SD = 1.03, group B: M = 4.64, SD =
0.49, and group C: M = 4.30, SD = 0.84). However, none of the experimental groups (A or B) showssignificantly higher means compared to the control group. Only a slight tendency comparing group Band C is noticeable (U = 179.00, z = −1.54, p1 = .06, r = −0.23)8. Comparing the two experimentalgroups, group B, working with BPMN3D, shows a significantly higher result compared to group A (U =
155.00, z = −2.12, p1 = .02∗, r = −0.32).
Figure 11.10 presents results of other considered dependent variables (i.e., execution times and num-ber of errors) collected during the experiment. Figures 11.10a+b show the number of errors made bysubjects when performing tasks that deal with the syntactic and semantic understandability of processmodels. Both experimental concepts do not reveal significant differences compared to the control con-cept. However, there is a tendency that subjects from group B make less mistakes during tasks regardingsyntactic understandability (U = 194.00, z = −1.33, p1 = .09, r = −0.31) and semantic understandability(U = 187.00, z = −1.31, p1 = .09, r = −0.31) compared to the control group (cf. Figure 11.10a+b).
6p2 represents the p-value for 2-tailed tests, and p1 for 1-tailed tests.7APA Style: http://www.apastyle.org/8Using directed hypotheses, we can use 1-tailed significance tests. Therefore, p might be halved [Kli99].
177
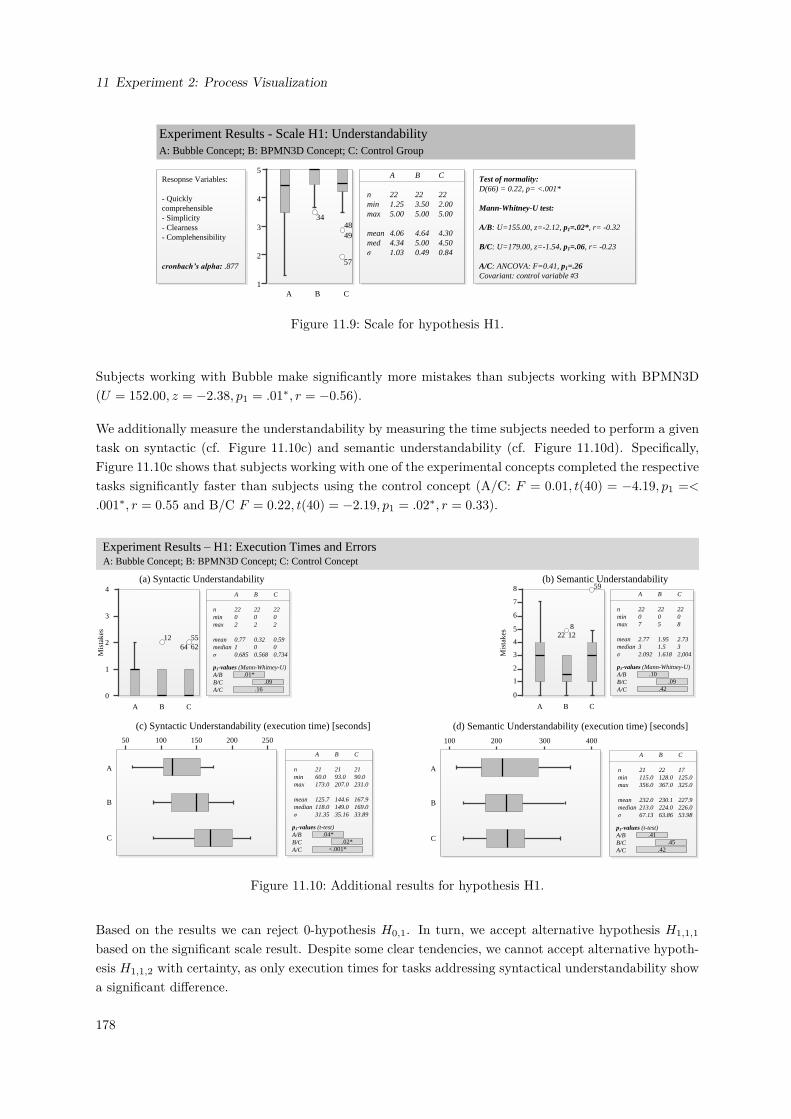
11 Experiment 2: Process Visualization
5
4
3
2
1A B C
nminmax
meanmedσ
A
221.255.00
4.064.341.03
C
222.005.00
4.304.500.84
B
223.505.00
4.645.000.49
49
3448
57
Test of normality:D(66) = 0.22, p= <.001*
Mann-Whitney-U test:
A/B: U=155.00, z=-2.12, p1=.02*, r= -0.32
B/C: U=179.00, z=-1.54, p1=.06, r= -0.23
A/C: ANCOVA: F=0.41, p1=.26Covariant: control variable #3
Resopnse Variables:
- Quickly comprehensible- Simplicity- Clearness- Complehensibility
cronbach’s alpha: .877
Experiment Results - Scale H1: UnderstandabilityA: Bubble Concept; B: BPMN3D Concept; C: Control Group
A/C: U=216.00, z=-0.620, p2=.536, r= -0.09
Figure 11.9: Scale for hypothesis H1.
Subjects working with Bubble make significantly more mistakes than subjects working with BPMN3D(U = 152.00, z = −2.38, p1 = .01∗, r = −0.56).
We additionally measure the understandability by measuring the time subjects needed to perform a giventask on syntactic (cf. Figure 11.10c) and semantic understandability (cf. Figure 11.10d). Specifically,Figure 11.10c shows that subjects working with one of the experimental concepts completed the respectivetasks significantly faster than subjects using the control concept (A/C: F = 0.01, t(40) = −4.19, p1 =<
.001∗, r = 0.55 and B/C F = 0.22, t(40) = −2.19, p1 = .02∗, r = 0.33).
(b) Semantic Understandability(a) Syntactic Understandability4
3
2
1
0
12 556264
8
6
4
0
7
5
3
2
1
81222
59
A: Bubble Concept; B: BPMN3D Concept; C: Control Concept
A B C A B C
Mis
take
s
nminmax
meanmedianσ
A
2202
0.7710.685
B
2202
0.3200.568
C
2202
0.5900.734
.01*.09
.16
p1-values (Mann-Whitney-U)A/BB/CA/C
nminmax
meanmedianσ
A
2207
2.7732.092
B
2205
1.951.51.618
C
2208
2.7332,004
.10.09
.42
p1-values (Mann-Whitney-U)A/BB/CA/C
Mis
take
s
50 100 150 200 250
A
B
C
nminmax
meanmedianσ
A
2160.0173.0
125.7118.031.35
B
2193.0207.0
144.6149.035.16
C
2190.0231.0
167.9169.033.89
.04*.02*
<.001*
p1-values (t-test)A/BB/CA/C
100 300200 400
A
B
C
nminmax
meanmedianσ
A
21115.0356.0
232.0213.067.13
B
22128.0367.0
230.1224.063.86
C
17125.0325.0
227.9226.053.98
.41.45
.42
p1-values (t-test)A/BB/CA/C
(d) Semantic Understandability (execution time) [seconds]
Experiment Results – H1: Execution Times and Errors
(c) Syntactic Understandability (execution time) [seconds]
Figure 11.10: Additional results for hypothesis H1.
Based on the results we can reject 0-hypothesis H0,1. In turn, we accept alternative hypothesis H1,1,1
based on the significant scale result. Despite some clear tendencies, we cannot accept alternative hypoth-esis H1,1,2 with certainty, as only execution times for tasks addressing syntactical understandability showa significant difference.
178
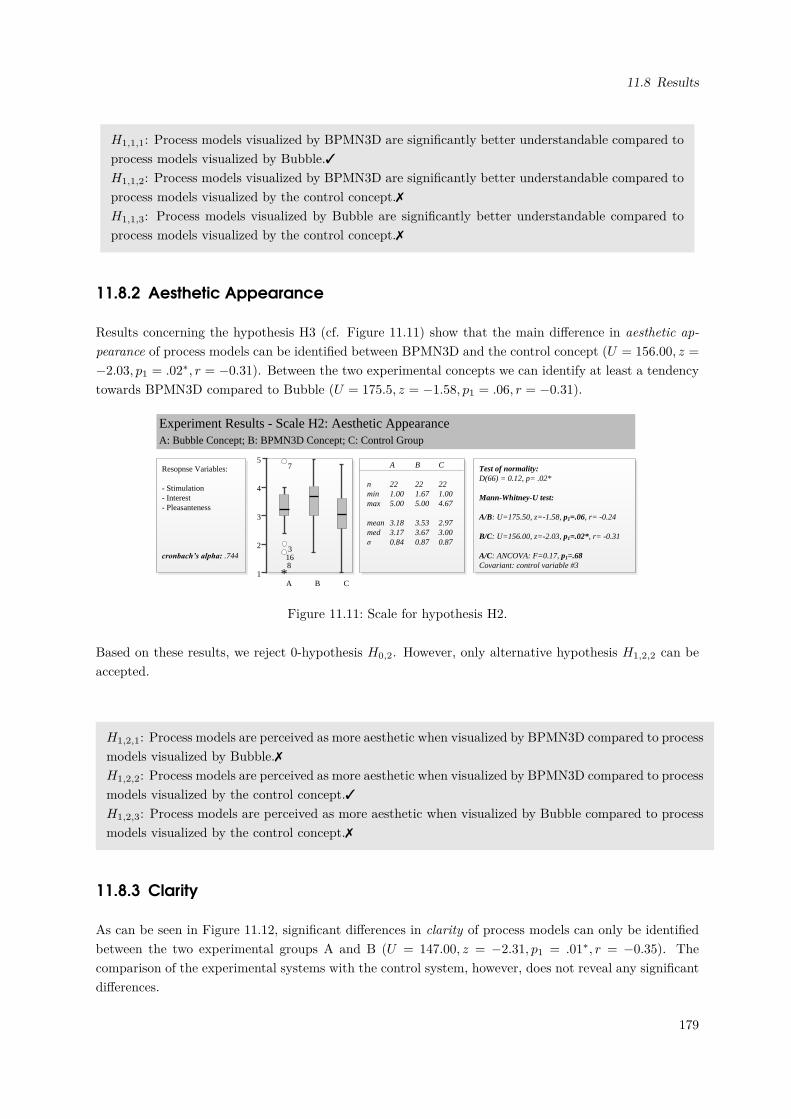
11.8 Results
H1,1,1: Process models visualized by BPMN3D are significantly better understandable compared toprocess models visualized by Bubble.3H1,1,2: Process models visualized by BPMN3D are significantly better understandable compared toprocess models visualized by the control concept.7H1,1,3: Process models visualized by Bubble are significantly better understandable compared toprocess models visualized by the control concept.7
11.8.2 Aesthetic Appearance
Results concerning the hypothesis H3 (cf. Figure 11.11) show that the main difference in aesthetic ap-pearance of process models can be identified between BPMN3D and the control concept (U = 156.00, z =
−2.03, p1 = .02∗, r = −0.31). Between the two experimental concepts we can identify at least a tendencytowards BPMN3D compared to Bubble (U = 175.5, z = −1.58, p1 = .06, r = −0.31).
5
4
3
2
1A B C
nminmax
meanmedσ
A
221.005.00
3.183.170.84
C
221.004.67
2.973.000.87
B
221.675.00
3.533.670.87
7
3168
*
Resopnse Variables:
- Stimulation- Interest- Pleasanteness
cronbach’s alpha: .744
Test of normality:D(66) = 0.12, p= .02*
Mann-Whitney-U test:
A/B: U=175.50, z=-1.58, p1=.06, r= -0.24
B/C: U=156.00, z=-2.03, p1=.02*, r= -0.31
A/C: ANCOVA: F=0.17, p1=.68Covariant: control variable #3
Experiment Results - Scale H2: Aesthetic AppearanceA: Bubble Concept; B: BPMN3D Concept; C: Control Group
Figure 11.11: Scale for hypothesis H2.
Based on these results, we reject 0-hypothesis H0,2. However, only alternative hypothesis H1,2,2 can beaccepted.
H1,2,1: Process models are perceived as more aesthetic when visualized by BPMN3D compared to processmodels visualized by Bubble.7H1,2,2: Process models are perceived as more aesthetic when visualized by BPMN3D compared to processmodels visualized by the control concept.3H1,2,3: Process models are perceived as more aesthetic when visualized by Bubble compared to processmodels visualized by the control concept.7
11.8.3 Clarity
As can be seen in Figure 11.12, significant differences in clarity of process models can only be identifiedbetween the two experimental groups A and B (U = 147.00, z = −2.31, p1 = .01∗, r = −0.35). Thecomparison of the experimental systems with the control system, however, does not reveal any significantdifferences.
179
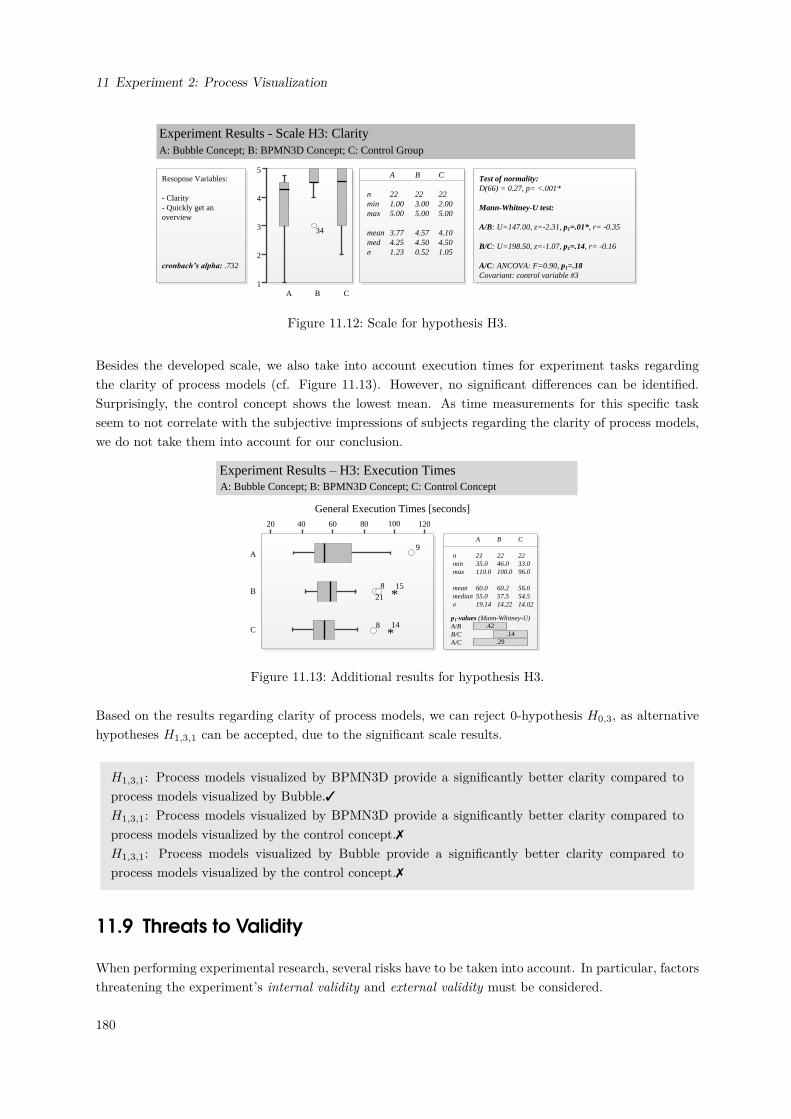
11 Experiment 2: Process Visualization
5
4
3
2
1A B C
nminmax
meanmedσ
A
221.005.00
3.774.251.23
C
222.005.00
4.104.501.05
B
223.005.00
4.574.500.52
34
Resopnse Variables:
- Clarity- Quickly get an overview
cronbach’s alpha: .732
Test of normality:D(66) = 0.27, p= <.001*
Mann-Whitney-U test:
A/B: U=147.00, z=-2.31, p1=.01*, r= -0.35
B/C: U=198.50, z=-1.07, p1=.14, r= -0.16
A/C: ANCOVA: F=0.90, p1=.18Covariant: control variable #3
Experiment Results - Scale H3: ClarityA: Bubble Concept; B: BPMN3D Concept; C: Control Group
Figure 11.12: Scale for hypothesis H3.
Besides the developed scale, we also take into account execution times for experiment tasks regardingthe clarity of process models (cf. Figure 11.13). However, no significant differences can be identified.Surprisingly, the control concept shows the lowest mean. As time measurements for this specific taskseem to not correlate with the subjective impressions of subjects regarding the clarity of process models,we do not take them into account for our conclusion.
20 40 60 80 120
A
B
C
nminmax
meanmedianσ
A
2135.0110.0
60.055.019.14
B
2246.0100.0
60.257.514.22
C
2233.096.0
56.054.514.02
.42.14
.29
p1-values (Mann-Whitney-U)A/BB/CA/C
General Execution Times [seconds]100
9
821
15*
8 14*
Experiment Results – H3: Execution TimesA: Bubble Concept; B: BPMN3D Concept; C: Control Concept
Figure 11.13: Additional results for hypothesis H3.
Based on the results regarding clarity of process models, we can reject 0-hypothesis H0,3, as alternativehypotheses H1,3,1 can be accepted, due to the significant scale results.
H1,3,1: Process models visualized by BPMN3D provide a significantly better clarity compared toprocess models visualized by Bubble.3H1,3,1: Process models visualized by BPMN3D provide a significantly better clarity compared toprocess models visualized by the control concept.7H1,3,1: Process models visualized by Bubble provide a significantly better clarity compared toprocess models visualized by the control concept.7
11.9 Threats to Validity
When performing experimental research, several risks have to be taken into account. In particular, factorsthreatening the experiment’s internal validity and external validity must be considered.
180
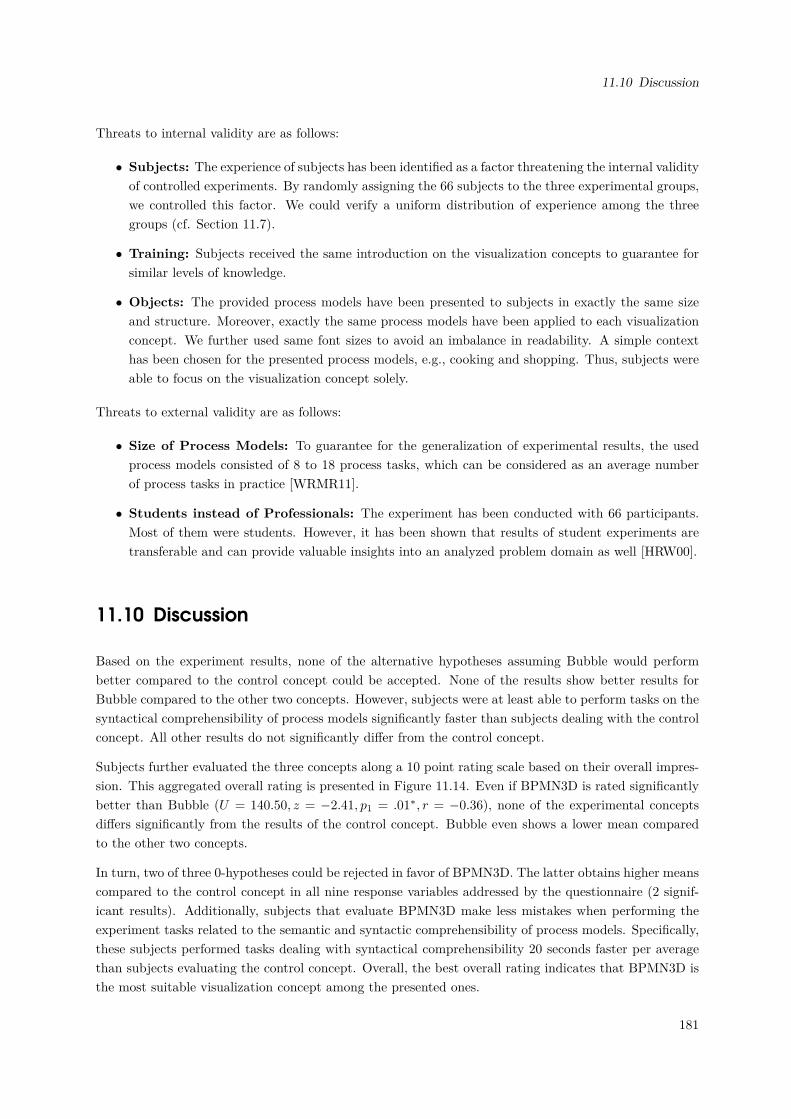
11.10 Discussion
Threats to internal validity are as follows:
• Subjects: The experience of subjects has been identified as a factor threatening the internal validityof controlled experiments. By randomly assigning the 66 subjects to the three experimental groups,we controlled this factor. We could verify a uniform distribution of experience among the threegroups (cf. Section 11.7).
• Training: Subjects received the same introduction on the visualization concepts to guarantee forsimilar levels of knowledge.
• Objects: The provided process models have been presented to subjects in exactly the same sizeand structure. Moreover, exactly the same process models have been applied to each visualizationconcept. We further used same font sizes to avoid an imbalance in readability. A simple contexthas been chosen for the presented process models, e.g., cooking and shopping. Thus, subjects wereable to focus on the visualization concept solely.
Threats to external validity are as follows:
• Size of Process Models: To guarantee for the generalization of experimental results, the usedprocess models consisted of 8 to 18 process tasks, which can be considered as an average numberof process tasks in practice [WRMR11].
• Students instead of Professionals: The experiment has been conducted with 66 participants.Most of them were students. However, it has been shown that results of student experiments aretransferable and can provide valuable insights into an analyzed problem domain as well [HRW00].
11.10 Discussion
Based on the experiment results, none of the alternative hypotheses assuming Bubble would performbetter compared to the control concept could be accepted. None of the results show better results forBubble compared to the other two concepts. However, subjects were at least able to perform tasks on thesyntactical comprehensibility of process models significantly faster than subjects dealing with the controlconcept. All other results do not significantly differ from the control concept.
Subjects further evaluated the three concepts along a 10 point rating scale based on their overall impres-sion. This aggregated overall rating is presented in Figure 11.14. Even if BPMN3D is rated significantlybetter than Bubble (U = 140.50, z = −2.41, p1 = .01∗, r = −0.36), none of the experimental conceptsdiffers significantly from the results of the control concept. Bubble even shows a lower mean comparedto the other two concepts.
In turn, two of three 0-hypotheses could be rejected in favor of BPMN3D. The latter obtains higher meanscompared to the control concept in all nine response variables addressed by the questionnaire (2 signif-icant results). Additionally, subjects that evaluate BPMN3D make less mistakes when performing theexperiment tasks related to the semantic and syntactic comprehensibility of process models. Specifically,these subjects performed tasks dealing with syntactical comprehensibility 20 seconds faster per averagethan subjects evaluating the control concept. Overall, the best overall rating indicates that BPMN3D isthe most suitable visualization concept among the presented ones.
181
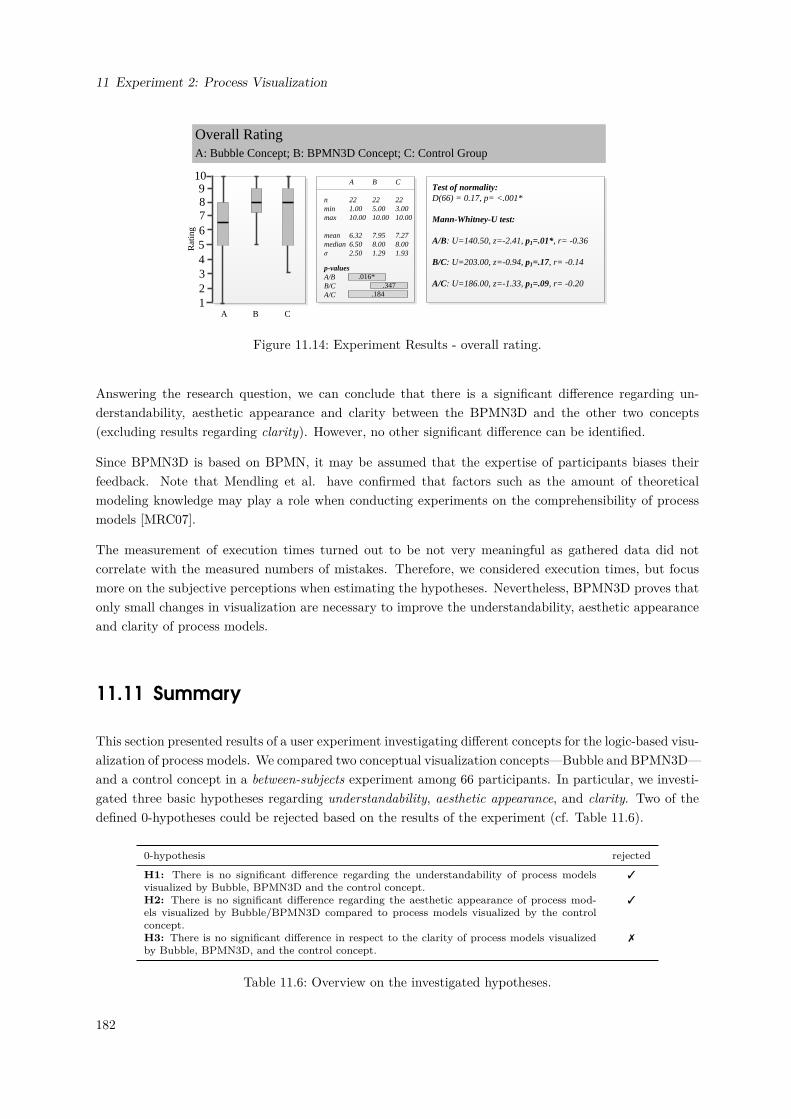
11 Experiment 2: Process Visualization
10987654
1
32
A B C
Rat
ing
nminmax
meanmedianσ
A
221.0010.00
6.326.502.50
B
225.0010.00
7.958.001.29
C
223.0010.00
7.278.001.93
.016*.347
.184
p-valuesA/BB/CA/C
Test of normality:D(66) = 0.17, p= <.001*
Mann-Whitney-U test:
A/B: U=140.50, z=-2.41, p1=.01*, r= -0.36
B/C: U=203.00, z=-0.94, p1=.17, r= -0.14
A/C: U=186.00, z=-1.33, p1=.09, r= -0.20
Overall RatingA: Bubble Concept; B: BPMN3D Concept; C: Control Group
Figure 11.14: Experiment Results - overall rating.
Answering the research question, we can conclude that there is a significant difference regarding un-derstandability, aesthetic appearance and clarity between the BPMN3D and the other two concepts(excluding results regarding clarity). However, no other significant difference can be identified.
Since BPMN3D is based on BPMN, it may be assumed that the expertise of participants biases theirfeedback. Note that Mendling et al. have confirmed that factors such as the amount of theoreticalmodeling knowledge may play a role when conducting experiments on the comprehensibility of processmodels [MRC07].
The measurement of execution times turned out to be not very meaningful as gathered data did notcorrelate with the measured numbers of mistakes. Therefore, we considered execution times, but focusmore on the subjective perceptions when estimating the hypotheses. Nevertheless, BPMN3D proves thatonly small changes in visualization are necessary to improve the understandability, aesthetic appearanceand clarity of process models.
11.11 Summary
This section presented results of a user experiment investigating different concepts for the logic-based visu-alization of process models. We compared two conceptual visualization concepts—Bubble and BPMN3D—and a control concept in a between-subjects experiment among 66 participants. In particular, we investi-gated three basic hypotheses regarding understandability, aesthetic appearance, and clarity. Two of thedefined 0-hypotheses could be rejected based on the results of the experiment (cf. Table 11.6).
0-hypothesis rejected
H1: There is no significant difference regarding the understandability of process modelsvisualized by Bubble, BPMN3D and the control concept.
3
H2: There is no significant difference regarding the aesthetic appearance of process mod-els visualized by Bubble/BPMN3D compared to process models visualized by the controlconcept.
3
H3: There is no significant difference in respect to the clarity of process models visualizedby Bubble, BPMN3D, and the control concept.
7
Table 11.6: Overview on the investigated hypotheses.
182

11.11 Summary
For the measurement we used several dependent variables combined to three different scales. Both thenumber of errors made during task execution and execution times were considered as well. Addition-ally, subjects gave a subjective estimation on different variables regarding understandability, aestheticappearance and clarity. These variables were considered to calculate various scales. Further, subjectswere asked to provide an overall rating of the presented visualization concepts (cf. Figure 11.14). Again,the result designates BPMN3D as the highest rated concept, with a significant difference compared toBubble (U = 140.50, z = −2.412, p1 = .01∗, r = −0.36).
According to the presented results, BPMN3D provides better understandability and better aestheticappearance compared to the control concept. However, in respect to clarity no significant statements canbe made, i.e., the presented research question can only be partially answered.
183

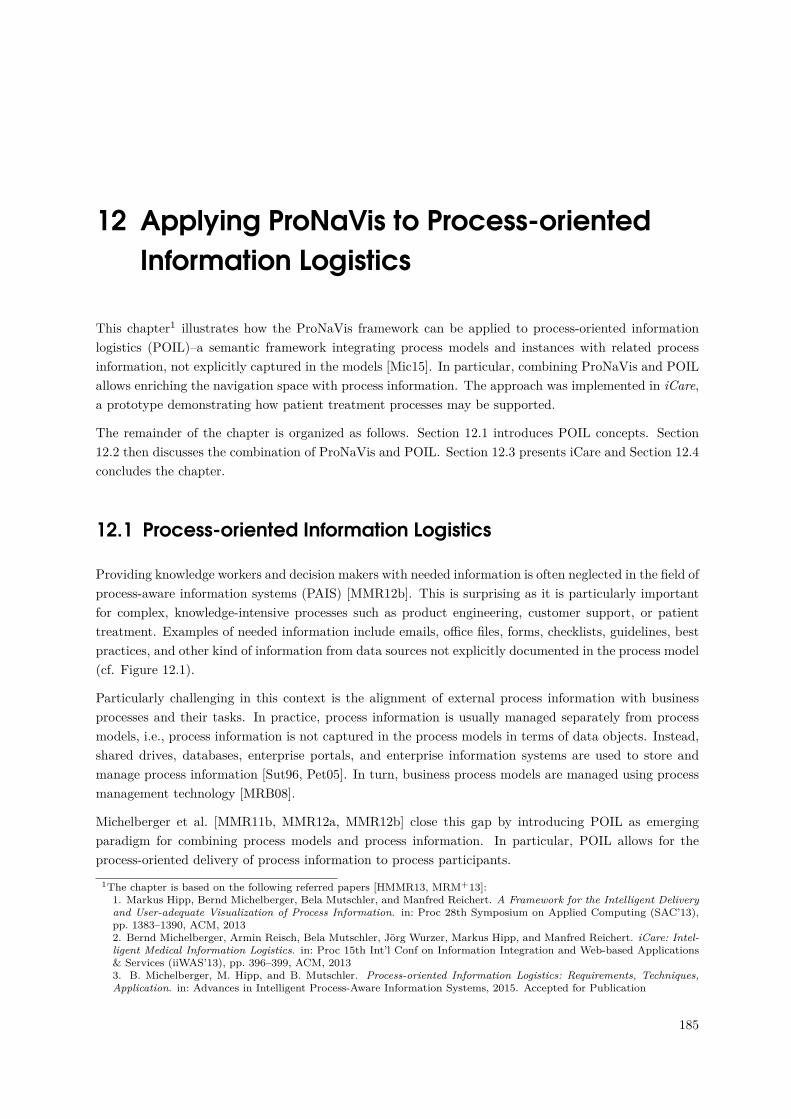
12 Applying ProNaVis to Process-orientedInformation Logistics
This chapter1 illustrates how the ProNaVis framework can be applied to process-oriented informationlogistics (POIL)–a semantic framework integrating process models and instances with related processinformation, not explicitly captured in the models [Mic15]. In particular, combining ProNaVis and POILallows enriching the navigation space with process information. The approach was implemented in iCare,a prototype demonstrating how patient treatment processes may be supported.
The remainder of the chapter is organized as follows. Section 12.1 introduces POIL concepts. Section12.2 then discusses the combination of ProNaVis and POIL. Section 12.3 presents iCare and Section 12.4concludes the chapter.
12.1 Process-oriented Information Logistics
Providing knowledge workers and decision makers with needed information is often neglected in the field ofprocess-aware information systems (PAIS) [MMR12b]. This is surprising as it is particularly importantfor complex, knowledge-intensive processes such as product engineering, customer support, or patienttreatment. Examples of needed information include emails, office files, forms, checklists, guidelines, bestpractices, and other kind of information from data sources not explicitly documented in the process model(cf. Figure 12.1).
Particularly challenging in this context is the alignment of external process information with businessprocesses and their tasks. In practice, process information is usually managed separately from processmodels, i.e., process information is not captured in the process models in terms of data objects. Instead,shared drives, databases, enterprise portals, and enterprise information systems are used to store andmanage process information [Sut96, Pet05]. In turn, business process models are managed using processmanagement technology [MRB08].
Michelberger et al. [MMR11b, MMR12a, MMR12b] close this gap by introducing POIL as emergingparadigm for combining process models and process information. In particular, POIL allows for theprocess-oriented delivery of process information to process participants.
1The chapter is based on the following referred papers [HMMR13, MRM+13]:1. Markus Hipp, Bernd Michelberger, Bela Mutschler, and Manfred Reichert. A Framework for the Intelligent Deliveryand User-adequate Visualization of Process Information. in: Proc 28th Symposium on Applied Computing (SAC’13),pp. 1383–1390, ACM, 20132. Bernd Michelberger, Armin Reisch, Bela Mutschler, Jörg Wurzer, Markus Hipp, and Manfred Reichert. iCare: Intel-ligent Medical Information Logistics. in: Proc 15th Int’l Conf on Information Integration and Web-based Applications& Services (iiWAS’13), pp. 396–399, ACM, 20133. B. Michelberger, M. Hipp, and B. Mutschler. Process-oriented Information Logistics: Requirements, Techniques,Application. in: Advances in Intelligent Process-Aware Information Systems, 2015. Accepted for Publication
185
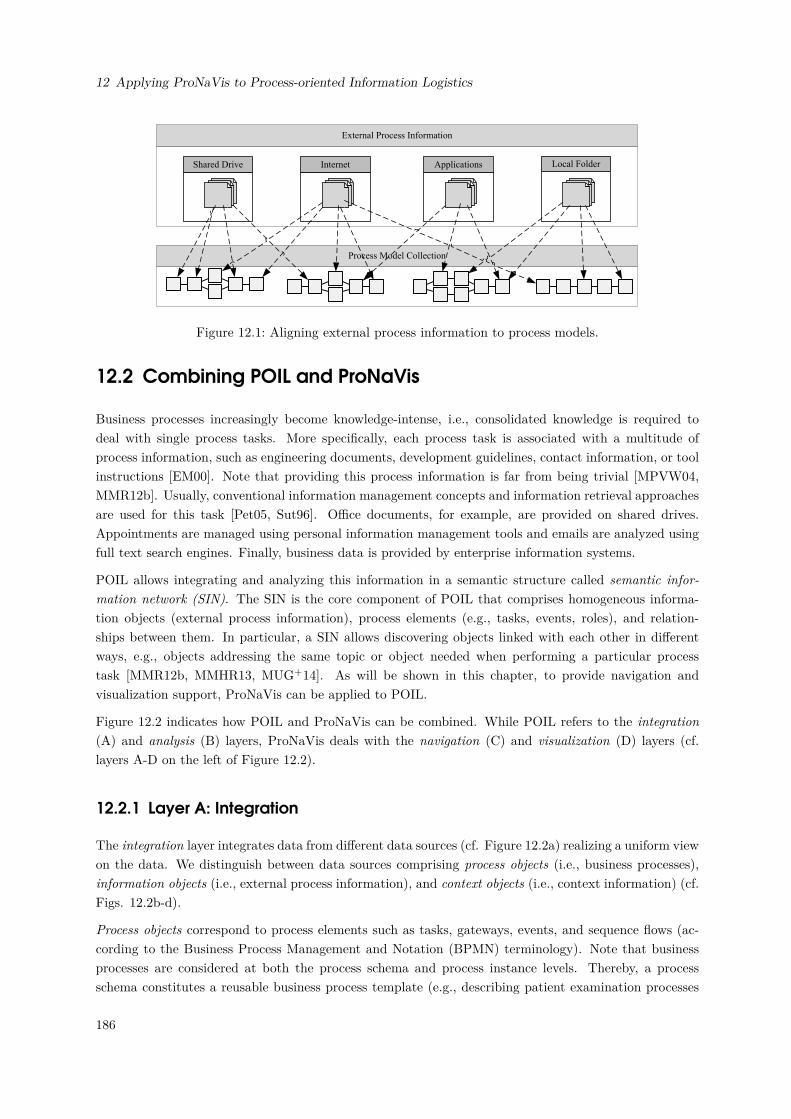
12 Applying ProNaVis to Process-oriented Information Logistics
Process Model Collection
External Process Information
Shared Drive Internet Applications Local Folder
Figure 12.1: Aligning external process information to process models.
12.2 Combining POIL and ProNaVis
Business processes increasingly become knowledge-intense, i.e., consolidated knowledge is required todeal with single process tasks. More specifically, each process task is associated with a multitude ofprocess information, such as engineering documents, development guidelines, contact information, or toolinstructions [EM00]. Note that providing this process information is far from being trivial [MPVW04,MMR12b]. Usually, conventional information management concepts and information retrieval approachesare used for this task [Pet05, Sut96]. Office documents, for example, are provided on shared drives.Appointments are managed using personal information management tools and emails are analyzed usingfull text search engines. Finally, business data is provided by enterprise information systems.
POIL allows integrating and analyzing this information in a semantic structure called semantic infor-mation network (SIN). The SIN is the core component of POIL that comprises homogeneous informa-tion objects (external process information), process elements (e.g., tasks, events, roles), and relation-ships between them. In particular, a SIN allows discovering objects linked with each other in differentways, e.g., objects addressing the same topic or object needed when performing a particular processtask [MMR12b, MMHR13, MUG+14]. As will be shown in this chapter, to provide navigation andvisualization support, ProNaVis can be applied to POIL.
Figure 12.2 indicates how POIL and ProNaVis can be combined. While POIL refers to the integration(A) and analysis (B) layers, ProNaVis deals with the navigation (C) and visualization (D) layers (cf.layers A-D on the left of Figure 12.2).
12.2.1 Layer A: Integration
The integration layer integrates data from different data sources (cf. Figure 12.2a) realizing a uniform viewon the data. We distinguish between data sources comprising process objects (i.e., business processes),information objects (i.e., external process information), and context objects (i.e., context information) (cf.Figs. 12.2b-d).
Process objects correspond to process elements such as tasks, gateways, events, and sequence flows (ac-cording to the Business Process Management and Notation (BPMN) terminology). Note that businessprocesses are considered at both the process schema and process instance levels. Thereby, a processschema constitutes a reusable business process template (e.g., describing patient examination processes
186
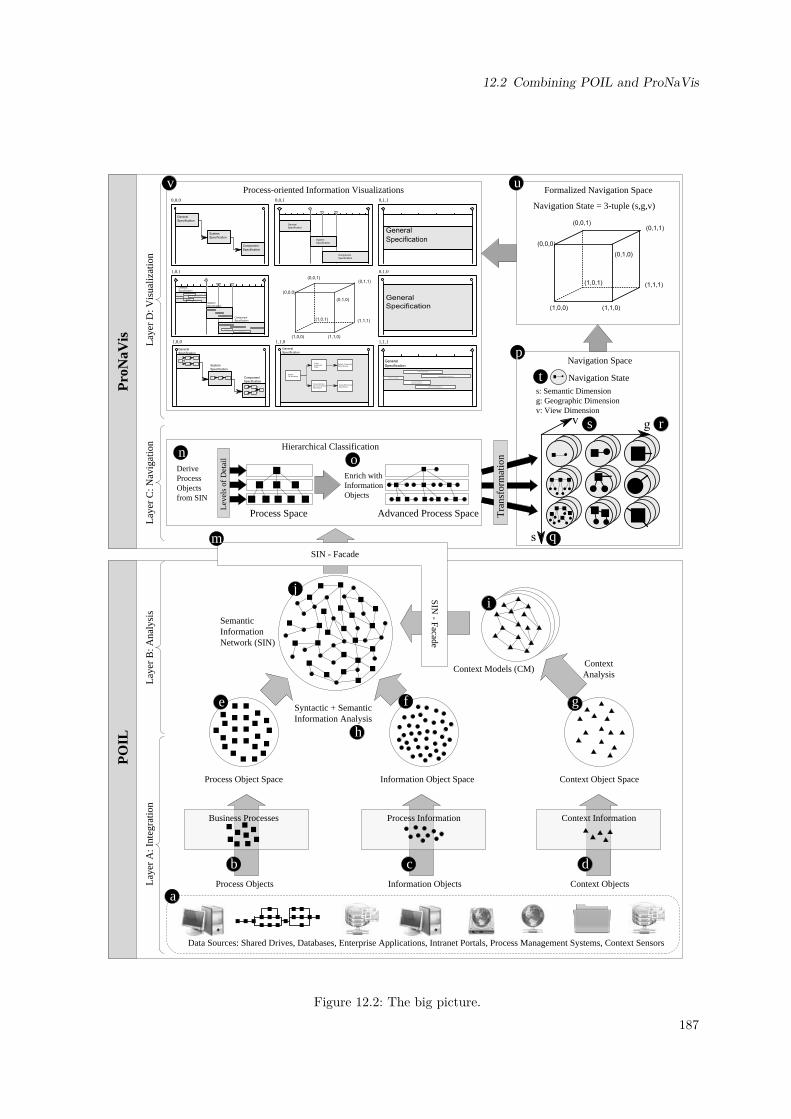
12.2 Combining POIL and ProNaVis
Process Objects
Business Processes
Context Objects
Context Information
Information Objects
Process Information
Process Object Space Information Object Space Context Object Space
Syntactic + Semantic Information Analysis
Semantic InformationNetwork (SIN)
ContextAnalysis
Context Models (CM)
Hierarchical Classification
Process Space Advanced Process Space
Derive Process Objects from SIN
Enrich withInformationObjects
Navigation Space
Navigation State
Tra
nsfo
rmat
ion
Formalized Navigation Space
Navigation State = 3-tuple (s,g,v)
Process-oriented Information Visualizations
Lay
er A
: Int
egra
tion
Lay
er B
: Ana
lysi
sL
ayer
C: N
avig
atio
nL
ayer
D: V
isua
lizat
ion
Pro
NaV
isP
OIL
a
b c d
e f g
ij
m
n o
p
s
q
r
t
uv
h
SIN - Facade
SIN - Facade
Data Sources: Shared Drives, Databases, Enterprise Applications, Intranet Portals, Process Management Systems, Context Sensors
s: Semantic Dimensiong: Geographic Dimensionv: View Dimension
Lev
els
of D
etai
l
Figure 12.2: The big picture.187
12 Applying ProNaVis to Process-oriented Information Logistics
in general) that comprises, for example, tasks and sequence flows. In turn, a process instance (e.g., anexamination of a certain patient) corresponds to a case concurrently executed with other instances ofthe same or other process schemas by a process management system [RRD04]. Note that data objectsare considered as process objects as well in this context. Process objects are represented in the SIN assquares. In turn, information objects refer to external process information needed when working on busi-ness processes. In the SIN, they are represented as circles. Examples include emails, office files, informalprocess descriptions, or best practices. Finally, context objects represent information characterizing thework context of a process participant such as user name, roles, experiences, current tasks, used devices,locations, and time [MMR12a] (represented as triangles in the SIN).
For each data source, at least one interface must be implemented. Interfaces transform proprietarydata objects into generic process, information or context objects. All generic objects follow the samestructure and comprise attributes such as id, url, author, file format, or raw content (e.g., the entire textof an email, the coordinates of a user’s position). Note that the uniform object structure constitutes aprerequisite to accomplish the syntactical and semantical analyses for identifying the associations betweenobjects. Specific results of the integration are three independent object spaces: the process object space,information object space, and context object space (cf. Figs. 12.2e-g). In turn, an object space (OS) canbe defined as a set of generic process, information and context objects (o): OS = {o1, o2, ..., on}.
12.2.2 Layer B: Analysis
The mentioned object spaces constitute the foundation of the analysis layer. The main purpose of thislayer is to create a SIN (cf. Figure 12.2j) based on the available information and process object space.The SIN is constructed and maintained in six consecutive phases (cf. Figure 12.2h): (1) integration ofprocess objects, (2) integration of information objects, (3) identification of process object relationships,(4) identification of information object relationships, (5) identification of cross-object relationships, and(6) maintenance. In [MMR12b], these phases are described in detail.
POkeyword;0.3
keyword;0.22
text-similarity;0.76
usage;0.3
text-similarity;0.12
author;0.29
format;0.83
usage;0.6
IO = Information Object, PO = Process Object
PO
IO IO
IO IO
Figure 12.3: Simplified part of a SIN.
Figure 12.3 shows a simplified part of a SIN. As can be seen, the SIN not only comprises information (i.e.,circles) and process objects (i.e., squares), but also relations (i.e., black arrows) between these objects.Relations may exist between process objects (e.g., an event triggering a task), between information andprocess objects (e.g., a file required for the execution of a process step), and between information objects(e.g., a file similar to another one). Relations are labeled with the reason of the relation and are weightedwith its relevance (cf. Figure 12.4). A weight is expressed in terms of a number ranging from 0 to 1(with 1 indicating the strongest possible relationship) [Wur08]. This allows determining why objects are
188
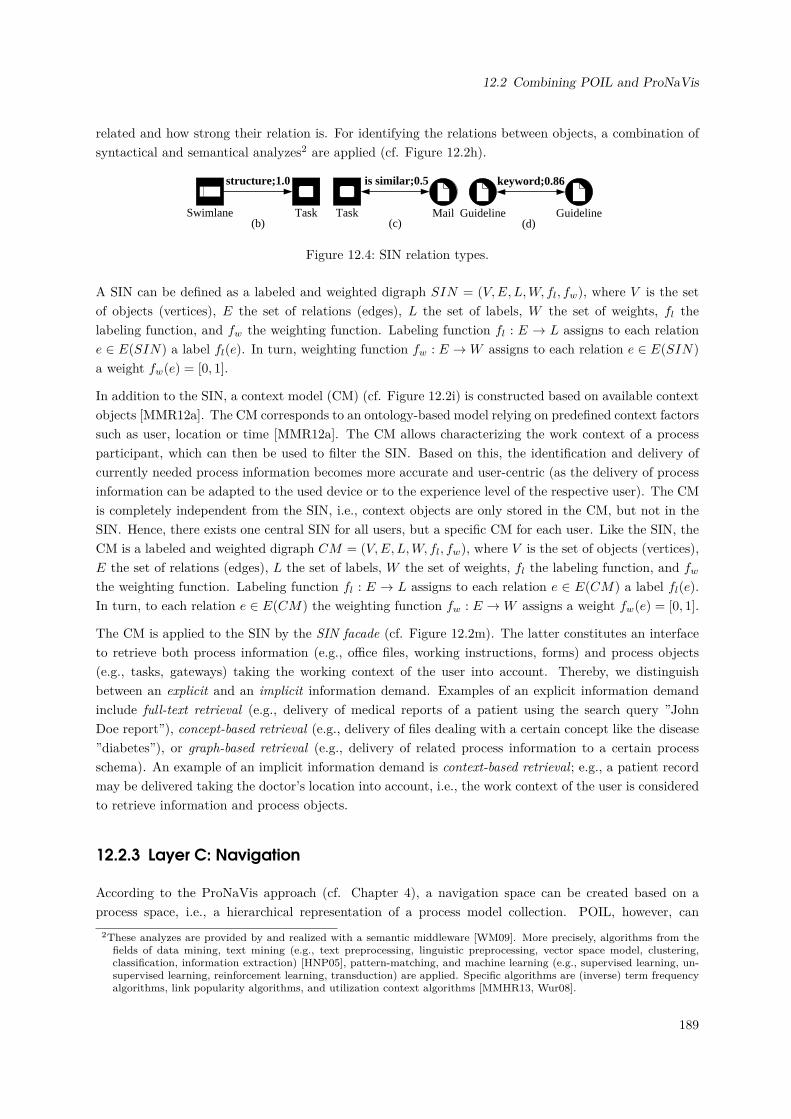
12.2 Combining POIL and ProNaVis
related and how strong their relation is. For identifying the relations between objects, a combination ofsyntactical and semantical analyzes2 are applied (cf. Figure 12.2h).
Guideline Guideline
keyword;0.86
Swimlane
structure;1.0
Task(d)(b)
Task Mail
is similar;0.5
(c)
Figure 12.4: SIN relation types.
A SIN can be defined as a labeled and weighted digraph SIN = (V,E, L,W, fl, fw), where V is the setof objects (vertices), E the set of relations (edges), L the set of labels, W the set of weights, fl thelabeling function, and fw the weighting function. Labeling function fl : E → L assigns to each relatione ∈ E(SIN) a label fl(e). In turn, weighting function fw : E →W assigns to each relation e ∈ E(SIN)
a weight fw(e) = [0, 1].
In addition to the SIN, a context model (CM) (cf. Figure 12.2i) is constructed based on available contextobjects [MMR12a]. The CM corresponds to an ontology-based model relying on predefined context factorssuch as user, location or time [MMR12a]. The CM allows characterizing the work context of a processparticipant, which can then be used to filter the SIN. Based on this, the identification and delivery ofcurrently needed process information becomes more accurate and user-centric (as the delivery of processinformation can be adapted to the used device or to the experience level of the respective user). The CMis completely independent from the SIN, i.e., context objects are only stored in the CM, but not in theSIN. Hence, there exists one central SIN for all users, but a specific CM for each user. Like the SIN, theCM is a labeled and weighted digraph CM = (V,E, L,W, fl, fw), where V is the set of objects (vertices),E the set of relations (edges), L the set of labels, W the set of weights, fl the labeling function, and fwthe weighting function. Labeling function fl : E → L assigns to each relation e ∈ E(CM) a label fl(e).In turn, to each relation e ∈ E(CM) the weighting function fw : E →W assigns a weight fw(e) = [0, 1].
The CM is applied to the SIN by the SIN facade (cf. Figure 12.2m). The latter constitutes an interfaceto retrieve both process information (e.g., office files, working instructions, forms) and process objects(e.g., tasks, gateways) taking the working context of the user into account. Thereby, we distinguishbetween an explicit and an implicit information demand. Examples of an explicit information demandinclude full-text retrieval (e.g., delivery of medical reports of a patient using the search query ”JohnDoe report”), concept-based retrieval (e.g., delivery of files dealing with a certain concept like the disease”diabetes”), or graph-based retrieval (e.g., delivery of related process information to a certain processschema). An example of an implicit information demand is context-based retrieval; e.g., a patient recordmay be delivered taking the doctor’s location into account, i.e., the work context of the user is consideredto retrieve information and process objects.
12.2.3 Layer C: Navigation
According to the ProNaVis approach (cf. Chapter 4), a navigation space can be created based on aprocess space, i.e., a hierarchical representation of a process model collection. POIL, however, can
2These analyzes are provided by and realized with a semantic middleware [WM09]. More precisely, algorithms from thefields of data mining, text mining (e.g., text preprocessing, linguistic preprocessing, vector space model, clustering,classification, information extraction) [HNP05], pattern-matching, and machine learning (e.g., supervised learning, un-supervised learning, reinforcement learning, transduction) are applied. Specific algorithms are (inverse) term frequencyalgorithms, link popularity algorithms, and utilization context algorithms [MMHR13, Wur08].
189
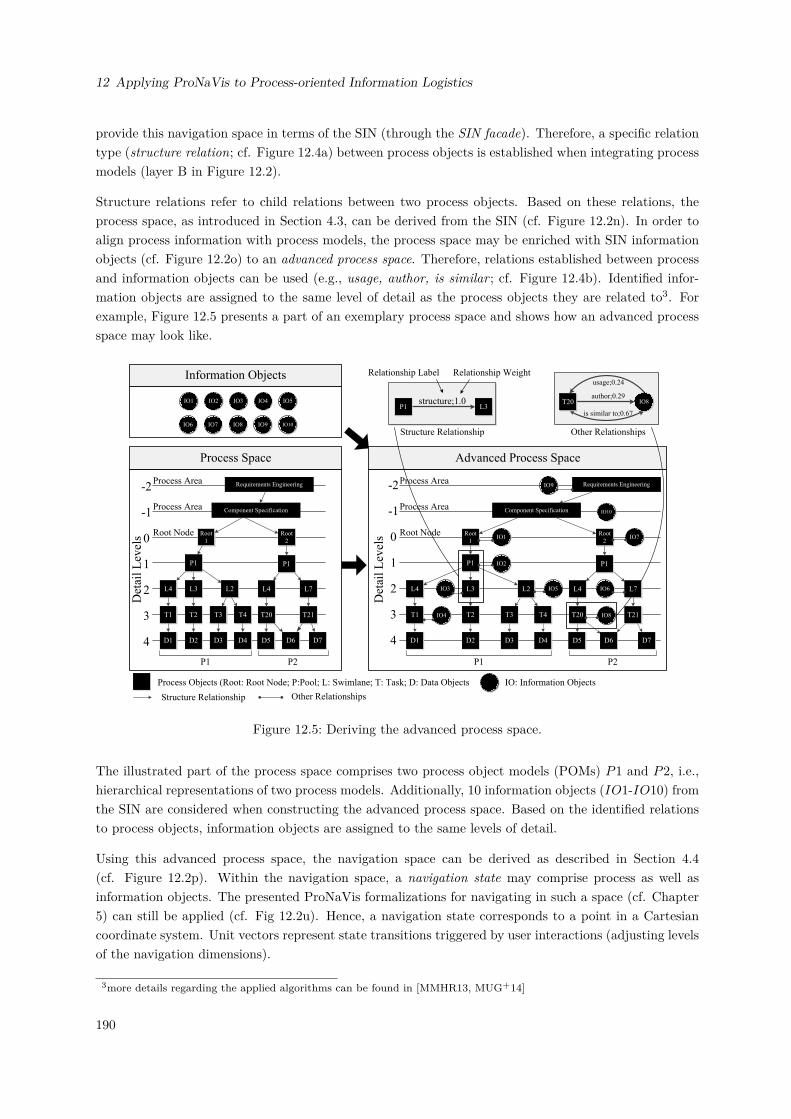
12 Applying ProNaVis to Process-oriented Information Logistics
provide this navigation space in terms of the SIN (through the SIN facade). Therefore, a specific relationtype (structure relation; cf. Figure 12.4a) between process objects is established when integrating processmodels (layer B in Figure 12.2).
Structure relations refer to child relations between two process objects. Based on these relations, theprocess space, as introduced in Section 4.3, can be derived from the SIN (cf. Figure 12.2n). In order toalign process information with process models, the process space may be enriched with SIN informationobjects (cf. Figure 12.2o) to an advanced process space. Therefore, relations established between processand information objects can be used (e.g., usage, author, is similar ; cf. Figure 12.4b). Identified infor-mation objects are assigned to the same level of detail as the process objects they are related to3. Forexample, Figure 12.5 presents a part of an exemplary process space and shows how an advanced processspace may look like.
T2 T3 T4
L3 L2
P1
Root
1
L4
T1 T21
L7
Root
2
L4
T20
P1 P2
Component Specification
Requirements Engineering-2
-1
0
1
2
3
4
Det
ail
Lev
els
Process Area
Process Area
Root Node
IO1 IO2 IO3 IO4 IO5
IO6 IO7
P1
D2 D3 D4D1 D7D6D5
T2 T3 T4
L3 L2
P1
Root
1
L4
T1 T21
L7
Root
2
L4
T20
P1 P2
Component Specification
Requirements Engineering
Det
ail
Lev
els
Process Area
Process Area
Root Node
P1
D2 D3 D4D1 D7D6D5
-2
-1
0
1
2
3
4
IO8 IO9 IO10
Information Objects
IO1
IO2
IO3
IO4
IO5 IO6
IO7
IO8
IO9
IO10
IO8
usage;0.24
is similar to;0.67
author;0.29T20structure;1.0
Structure Relationship
L3P1
Process Space Advanced Process Space
Relationship Label Relationship Weight
Other Relationships
Process Objects (Root: Root Node; P:Pool; L: Swimlane; T: Task; D: Data Objects IO: Information Objects
Structure Relationship Other Relationships
Figure 12.5: Deriving the advanced process space.
The illustrated part of the process space comprises two process object models (POMs) P1 and P2, i.e.,hierarchical representations of two process models. Additionally, 10 information objects (IO1-IO10) fromthe SIN are considered when constructing the advanced process space. Based on the identified relationsto process objects, information objects are assigned to the same levels of detail.
Using this advanced process space, the navigation space can be derived as described in Section 4.4(cf. Figure 12.2p). Within the navigation space, a navigation state may comprise process as well asinformation objects. The presented ProNaVis formalizations for navigating in such a space (cf. Chapter5) can still be applied (cf. Fig 12.2u). Hence, a navigation state corresponds to a point in a Cartesiancoordinate system. Unit vectors represent state transitions triggered by user interactions (adjusting levelsof the navigation dimensions).
3more details regarding the applied algorithms can be found in [MMHR13, MUG+14]
190
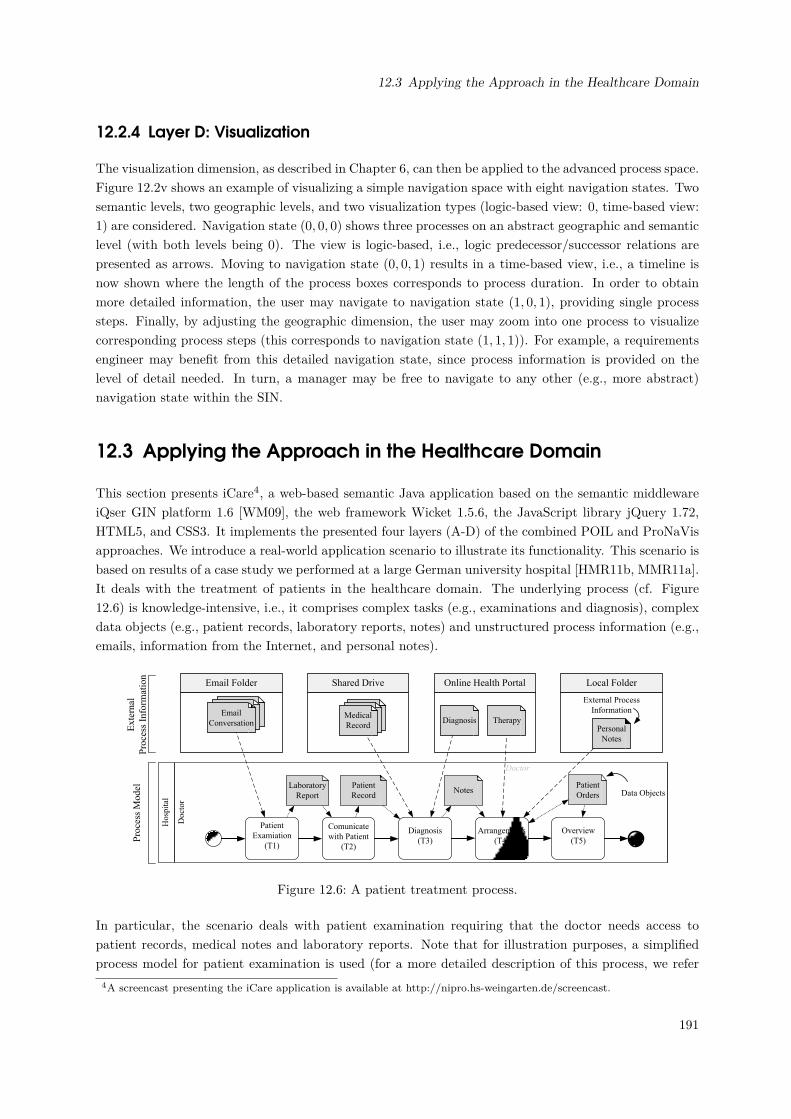
12.3 Applying the Approach in the Healthcare Domain
12.2.4 Layer D: Visualization
The visualization dimension, as described in Chapter 6, can then be applied to the advanced process space.Figure 12.2v shows an example of visualizing a simple navigation space with eight navigation states. Twosemantic levels, two geographic levels, and two visualization types (logic-based view: 0, time-based view:1) are considered. Navigation state (0, 0, 0) shows three processes on an abstract geographic and semanticlevel (with both levels being 0). The view is logic-based, i.e., logic predecessor/successor relations arepresented as arrows. Moving to navigation state (0, 0, 1) results in a time-based view, i.e., a timeline isnow shown where the length of the process boxes corresponds to process duration. In order to obtainmore detailed information, the user may navigate to navigation state (1, 0, 1), providing single processsteps. Finally, by adjusting the geographic dimension, the user may zoom into one process to visualizecorresponding process steps (this corresponds to navigation state (1, 1, 1)). For example, a requirementsengineer may benefit from this detailed navigation state, since process information is provided on thelevel of detail needed. In turn, a manager may be free to navigate to any other (e.g., more abstract)navigation state within the SIN.
12.3 Applying the Approach in the Healthcare Domain
This section presents iCare4, a web-based semantic Java application based on the semantic middlewareiQser GIN platform 1.6 [WM09], the web framework Wicket 1.5.6, the JavaScript library jQuery 1.72,HTML5, and CSS3. It implements the presented four layers (A-D) of the combined POIL and ProNaVisapproaches. We introduce a real-world application scenario to illustrate its functionality. This scenario isbased on results of a case study we performed at a large German university hospital [HMR11b, MMR11a].It deals with the treatment of patients in the healthcare domain. The underlying process (cf. Figure12.6) is knowledge-intensive, i.e., it comprises complex tasks (e.g., examinations and diagnosis), complexdata objects (e.g., patient records, laboratory reports, notes) and unstructured process information (e.g.,emails, information from the Internet, and personal notes).
Hosp
ital
Doct
or
Doctor
Patient
Examiation
(T1)
Comunicate
with Patient
(T2)
Diagnosis
(T3)
Arrangements
(T4)
Overview
(T5)
Patient
RecordNotes
Laboratory
Report
Patient
Orders
Online Health Portal Local FolderShared DriveEmail Folder
Personal
Notes
Diagnosis TherapyMedical
Record
Conversation
Pro
cess
Mod
elE
xte
rnal
Pro
cess
In
form
atio
n
Data Objects
External Process
Information
Figure 12.6: A patient treatment process.
In particular, the scenario deals with patient examination requiring that the doctor needs access topatient records, medical notes and laboratory reports. Note that for illustration purposes, a simplifiedprocess model for patient examination is used (for a more detailed description of this process, we refer
4A screencast presenting the iCare application is available at http://nipro.hs-weingarten.de/screencast.
191
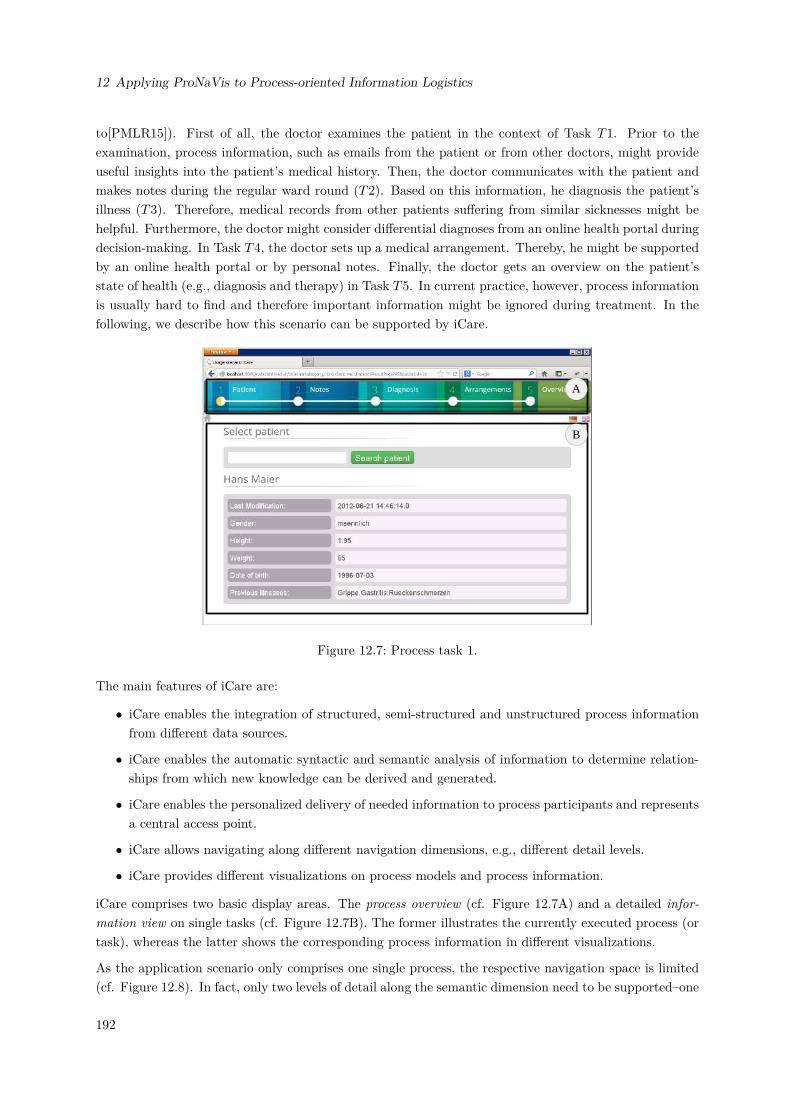
12 Applying ProNaVis to Process-oriented Information Logistics
to[PMLR15]). First of all, the doctor examines the patient in the context of Task T1. Prior to theexamination, process information, such as emails from the patient or from other doctors, might provideuseful insights into the patient’s medical history. Then, the doctor communicates with the patient andmakes notes during the regular ward round (T2). Based on this information, he diagnosis the patient’sillness (T3). Therefore, medical records from other patients suffering from similar sicknesses might behelpful. Furthermore, the doctor might consider differential diagnoses from an online health portal duringdecision-making. In Task T4, the doctor sets up a medical arrangement. Thereby, he might be supportedby an online health portal or by personal notes. Finally, the doctor gets an overview on the patient’sstate of health (e.g., diagnosis and therapy) in Task T5. In current practice, however, process informationis usually hard to find and therefore important information might be ignored during treatment. In thefollowing, we describe how this scenario can be supported by iCare.
A
B
Figure 12.7: Process task 1.
The main features of iCare are:
• iCare enables the integration of structured, semi-structured and unstructured process informationfrom different data sources.
• iCare enables the automatic syntactic and semantic analysis of information to determine relation-ships from which new knowledge can be derived and generated.
• iCare enables the personalized delivery of needed information to process participants and representsa central access point.
• iCare allows navigating along different navigation dimensions, e.g., different detail levels.
• iCare provides different visualizations on process models and process information.
iCare comprises two basic display areas. The process overview (cf. Figure 12.7A) and a detailed infor-mation view on single tasks (cf. Figure 12.7B). The former illustrates the currently executed process (ortask), whereas the latter shows the corresponding process information in different visualizations.
As the application scenario only comprises one single process, the respective navigation space is limited(cf. Figure 12.8). In fact, only two levels of detail along the semantic dimension need to be supported–one
192
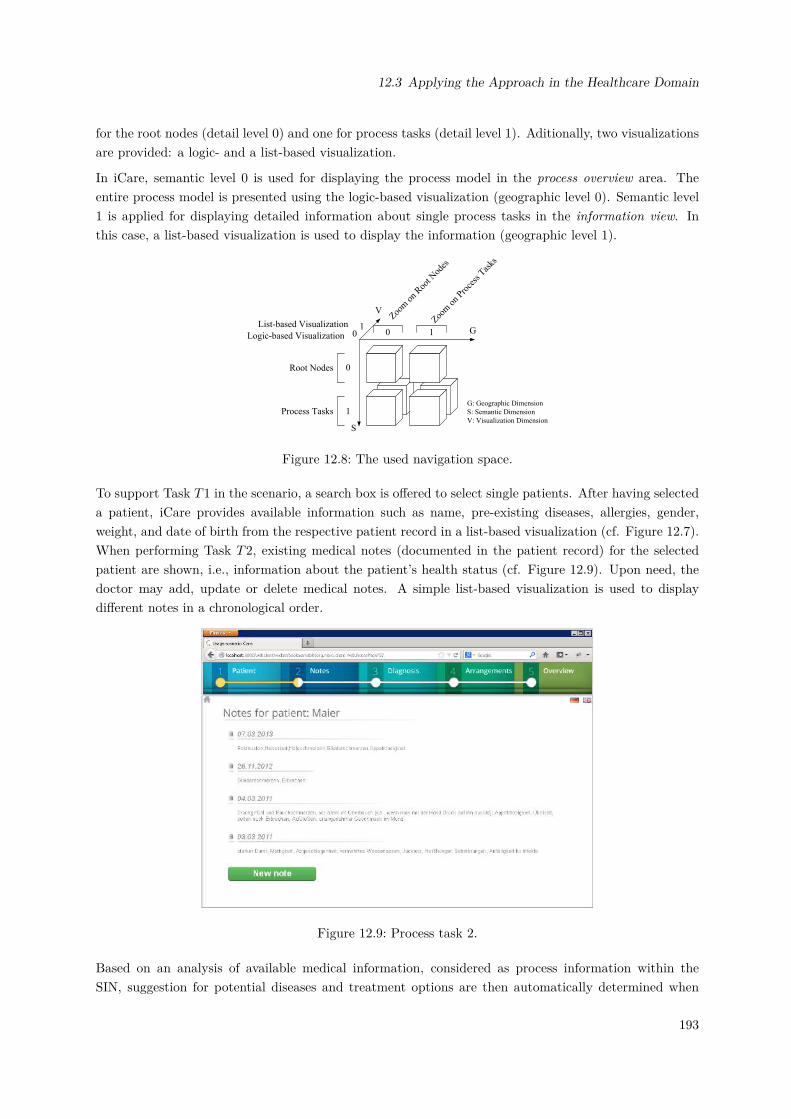
12.3 Applying the Approach in the Healthcare Domain
for the root nodes (detail level 0) and one for process tasks (detail level 1). Aditionally, two visualizationsare provided: a logic- and a list-based visualization.
In iCare, semantic level 0 is used for displaying the process model in the process overview area. Theentire process model is presented using the logic-based visualization (geographic level 0). Semantic level1 is applied for displaying detailed information about single process tasks in the information view. Inthis case, a list-based visualization is used to display the information (geographic level 1).
V
G: Geographic Dimension
S: Semantic Dimension
V: Visualization Dimension
Root Nodes
Process Tasks
Logic-based Visualization
List-based VisualizationZoo
m o
n Roo
t Nod
es
Zoom
on
Proce
ss T
asks
10
1
0
0 1 G
S
Figure 12.8: The used navigation space.
To support Task T1 in the scenario, a search box is offered to select single patients. After having selecteda patient, iCare provides available information such as name, pre-existing diseases, allergies, gender,weight, and date of birth from the respective patient record in a list-based visualization (cf. Figure 12.7).When performing Task T2, existing medical notes (documented in the patient record) for the selectedpatient are shown, i.e., information about the patient’s health status (cf. Figure 12.9). Upon need, thedoctor may add, update or delete medical notes. A simple list-based visualization is used to displaydifferent notes in a chronological order.
Figure 12.9: Process task 2.
Based on an analysis of available medical information, considered as process information within theSIN, suggestion for potential diseases and treatment options are then automatically determined when
193
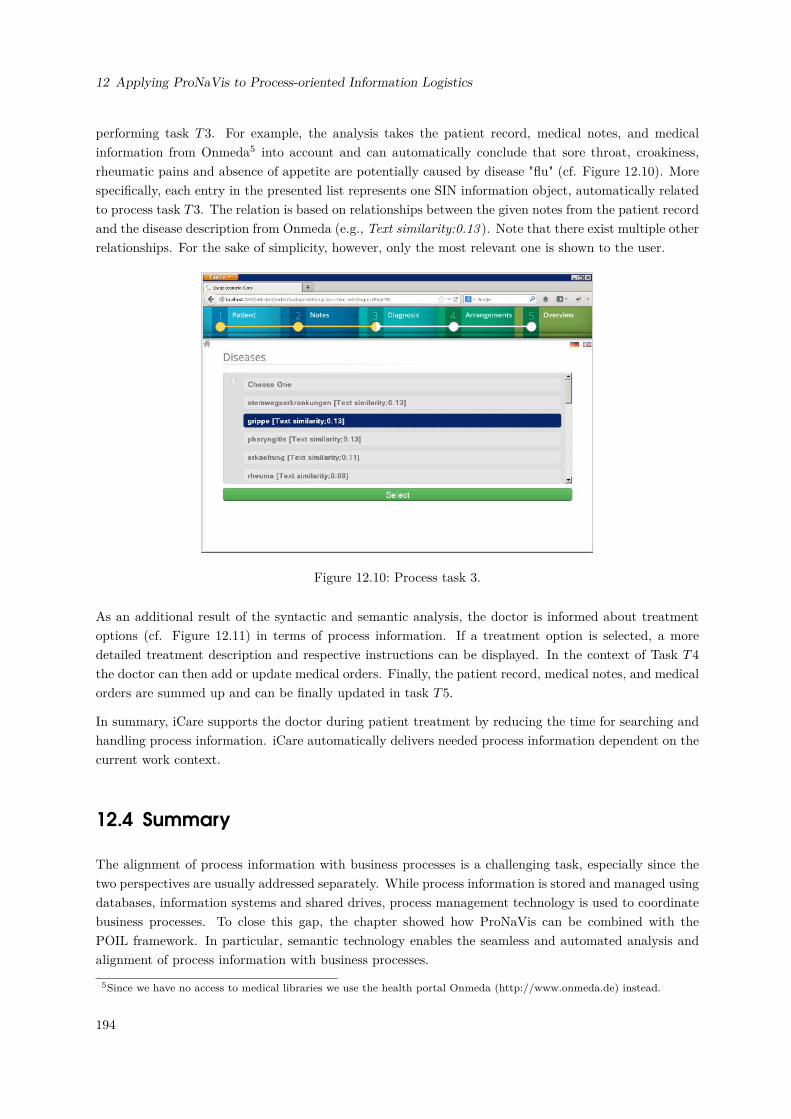
12 Applying ProNaVis to Process-oriented Information Logistics
performing task T3. For example, the analysis takes the patient record, medical notes, and medicalinformation from Onmeda5 into account and can automatically conclude that sore throat, croakiness,rheumatic pains and absence of appetite are potentially caused by disease "flu" (cf. Figure 12.10). Morespecifically, each entry in the presented list represents one SIN information object, automatically relatedto process task T3. The relation is based on relationships between the given notes from the patient recordand the disease description from Onmeda (e.g., Text similarity:0.13 ). Note that there exist multiple otherrelationships. For the sake of simplicity, however, only the most relevant one is shown to the user.
Figure 12.10: Process task 3.
As an additional result of the syntactic and semantic analysis, the doctor is informed about treatmentoptions (cf. Figure 12.11) in terms of process information. If a treatment option is selected, a moredetailed treatment description and respective instructions can be displayed. In the context of Task T4the doctor can then add or update medical orders. Finally, the patient record, medical notes, and medicalorders are summed up and can be finally updated in task T5.
In summary, iCare supports the doctor during patient treatment by reducing the time for searching andhandling process information. iCare automatically delivers needed process information dependent on thecurrent work context.
12.4 Summary
The alignment of process information with business processes is a challenging task, especially since thetwo perspectives are usually addressed separately. While process information is stored and managed usingdatabases, information systems and shared drives, process management technology is used to coordinatebusiness processes. To close this gap, the chapter showed how ProNaVis can be combined with thePOIL framework. In particular, semantic technology enables the seamless and automated analysis andalignment of process information with business processes.
5Since we have no access to medical libraries we use the health portal Onmeda (http://www.onmeda.de) instead.
194
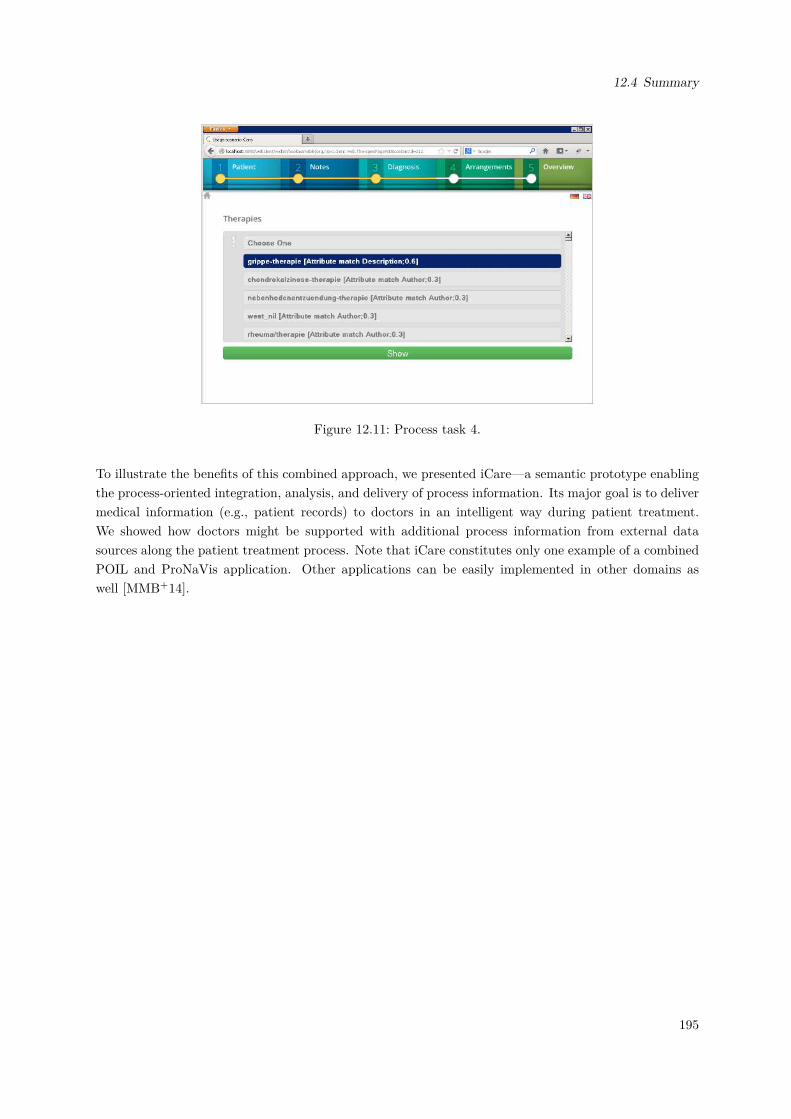
12.4 Summary
Figure 12.11: Process task 4.
To illustrate the benefits of this combined approach, we presented iCare—a semantic prototype enablingthe process-oriented integration, analysis, and delivery of process information. Its major goal is to delivermedical information (e.g., patient records) to doctors in an intelligent way during patient treatment.We showed how doctors might be supported with additional process information from external datasources along the patient treatment process. Note that iCare constitutes only one example of a combinedPOIL and ProNaVis application. Other applications can be easily implemented in other domains aswell [MMB+14].
195


Part IV
Discussion & Summary
197

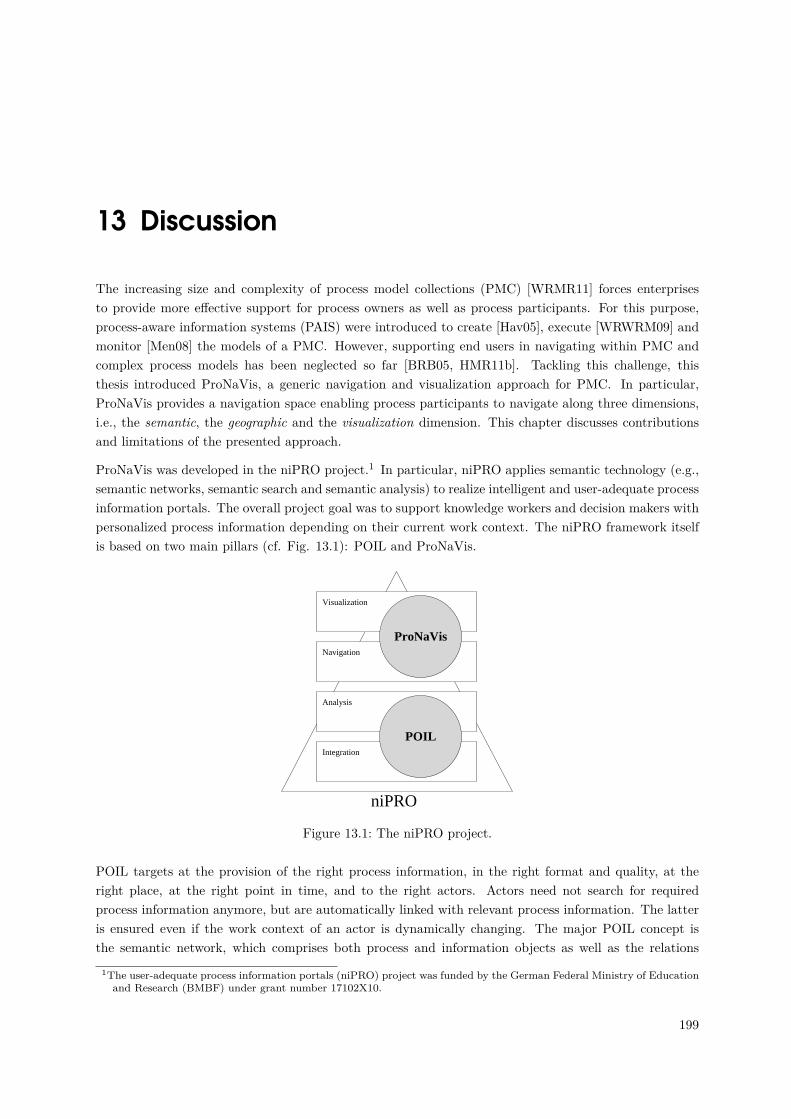
13 Discussion
The increasing size and complexity of process model collections (PMC) [WRMR11] forces enterprisesto provide more effective support for process owners as well as process participants. For this purpose,process-aware information systems (PAIS) were introduced to create [Hav05], execute [WRWRM09] andmonitor [Men08] the models of a PMC. However, supporting end users in navigating within PMC andcomplex process models has been neglected so far [BRB05, HMR11b]. Tackling this challenge, thisthesis introduced ProNaVis, a generic navigation and visualization approach for PMC. In particular,ProNaVis provides a navigation space enabling process participants to navigate along three dimensions,i.e., the semantic, the geographic and the visualization dimension. This chapter discusses contributionsand limitations of the presented approach.
ProNaVis was developed in the niPRO project.1 In particular, niPRO applies semantic technology (e.g.,semantic networks, semantic search and semantic analysis) to realize intelligent and user-adequate processinformation portals. The overall project goal was to support knowledge workers and decision makers withpersonalized process information depending on their current work context. The niPRO framework itselfis based on two main pillars (cf. Fig. 13.1): POIL and ProNaVis.
Visualization
Navigation
Analysis
Integration
ProNaVis
POIL
niPRO
Figure 13.1: The niPRO project.
POIL targets at the provision of the right process information, in the right format and quality, at theright place, at the right point in time, and to the right actors. Actors need not search for requiredprocess information anymore, but are automatically linked with relevant process information. The latteris ensured even if the work context of an actor is dynamically changing. The major POIL concept isthe semantic network, which comprises both process and information objects as well as the relations
1The user-adequate process information portals (niPRO) project was funded by the German Federal Ministry of Educationand Research (BMBF) under grant number 17102X10.
199
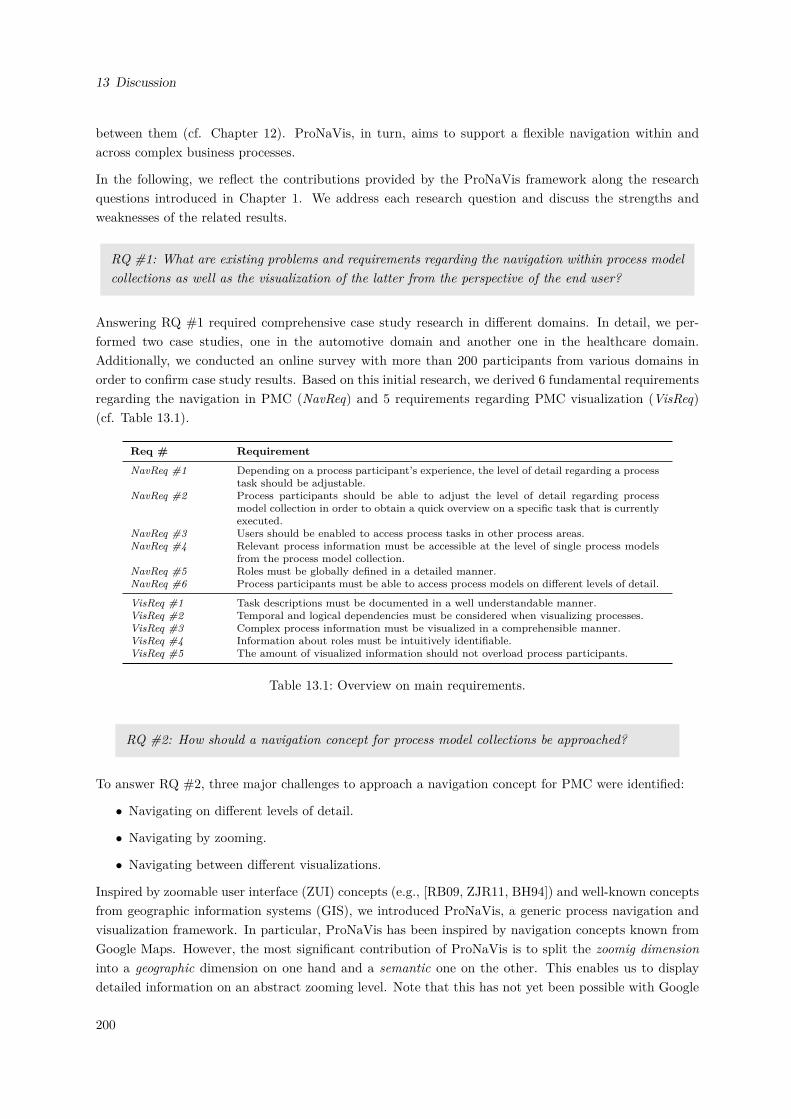
13 Discussion
between them (cf. Chapter 12). ProNaVis, in turn, aims to support a flexible navigation within andacross complex business processes.
In the following, we reflect the contributions provided by the ProNaVis framework along the researchquestions introduced in Chapter 1. We address each research question and discuss the strengths andweaknesses of the related results.
RQ #1: What are existing problems and requirements regarding the navigation within process modelcollections as well as the visualization of the latter from the perspective of the end user?
Answering RQ #1 required comprehensive case study research in different domains. In detail, we per-formed two case studies, one in the automotive domain and another one in the healthcare domain.Additionally, we conducted an online survey with more than 200 participants from various domains inorder to confirm case study results. Based on this initial research, we derived 6 fundamental requirementsregarding the navigation in PMC (NavReq) and 5 requirements regarding PMC visualization (VisReq)(cf. Table 13.1).
Req # Requirement
NavReq #1 Depending on a process participant’s experience, the level of detail regarding a processtask should be adjustable.
NavReq #2 Process participants should be able to adjust the level of detail regarding processmodel collection in order to obtain a quick overview on a specific task that is currentlyexecuted.
NavReq #3 Users should be enabled to access process tasks in other process areas.NavReq #4 Relevant process information must be accessible at the level of single process models
from the process model collection.NavReq #5 Roles must be globally defined in a detailed manner.NavReq #6 Process participants must be able to access process models on different levels of detail.
VisReq #1 Task descriptions must be documented in a well understandable manner.VisReq #2 Temporal and logical dependencies must be considered when visualizing processes.VisReq #3 Complex process information must be visualized in a comprehensible manner.VisReq #4 Information about roles must be intuitively identifiable.VisReq #5 The amount of visualized information should not overload process participants.
Table 13.1: Overview on main requirements.
RQ #2: How should a navigation concept for process model collections be approached?
To answer RQ #2, three major challenges to approach a navigation concept for PMC were identified:
• Navigating on different levels of detail.
• Navigating by zooming.
• Navigating between different visualizations.
Inspired by zoomable user interface (ZUI) concepts (e.g., [RB09, ZJR11, BH94]) and well-known conceptsfrom geographic information systems (GIS), we introduced ProNaVis, a generic process navigation andvisualization framework. In particular, ProNaVis has been inspired by navigation concepts known fromGoogle Maps. However, the most significant contribution of ProNaVis is to split the zoomig dimensioninto a geographic dimension on one hand and a semantic one on the other. This enables us to displaydetailed information on an abstract zooming level. Note that this has not yet been possible with Google
200
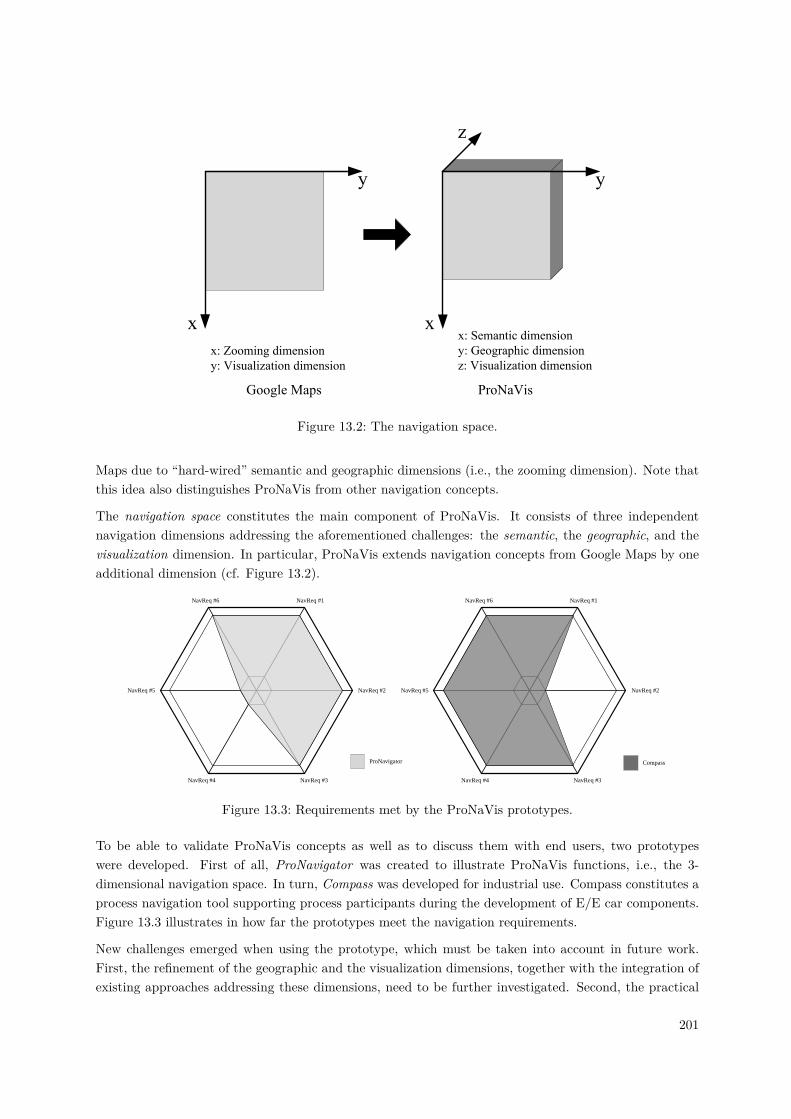
x
y
x: Zooming dimension
y: Visualization dimension
Google Maps
y
x: Semantic dimension
y: Geographic dimension
z: Visualization dimension
z
ProNaVis
x
Figure 13.2: The navigation space.
Maps due to “hard-wired” semantic and geographic dimensions (i.e., the zooming dimension). Note thatthis idea also distinguishes ProNaVis from other navigation concepts.
The navigation space constitutes the main component of ProNaVis. It consists of three independentnavigation dimensions addressing the aforementioned challenges: the semantic, the geographic, and thevisualization dimension. In particular, ProNaVis extends navigation concepts from Google Maps by oneadditional dimension (cf. Figure 13.2).
ProNavigator
NavReq #1
NavReq #2
NavReq #3NavReq #4
NavReq #5
NavReq #6
Compass
NavReq #1
NavReq #2
NavReq #3NavReq #4
NavReq #5
NavReq #6
Figure 13.3: Requirements met by the ProNaVis prototypes.
To be able to validate ProNaVis concepts as well as to discuss them with end users, two prototypeswere developed. First of all, ProNavigator was created to illustrate ProNaVis functions, i.e., the 3-dimensional navigation space. In turn, Compass was developed for industrial use. Compass constitutes aprocess navigation tool supporting process participants during the development of E/E car components.Figure 13.3 illustrates in how far the prototypes meet the navigation requirements.
New challenges emerged when using the prototype, which must be taken into account in future work.First, the refinement of the geographic and the visualization dimensions, together with the integration ofexisting approaches addressing these dimensions, need to be further investigated. Second, the practical
201
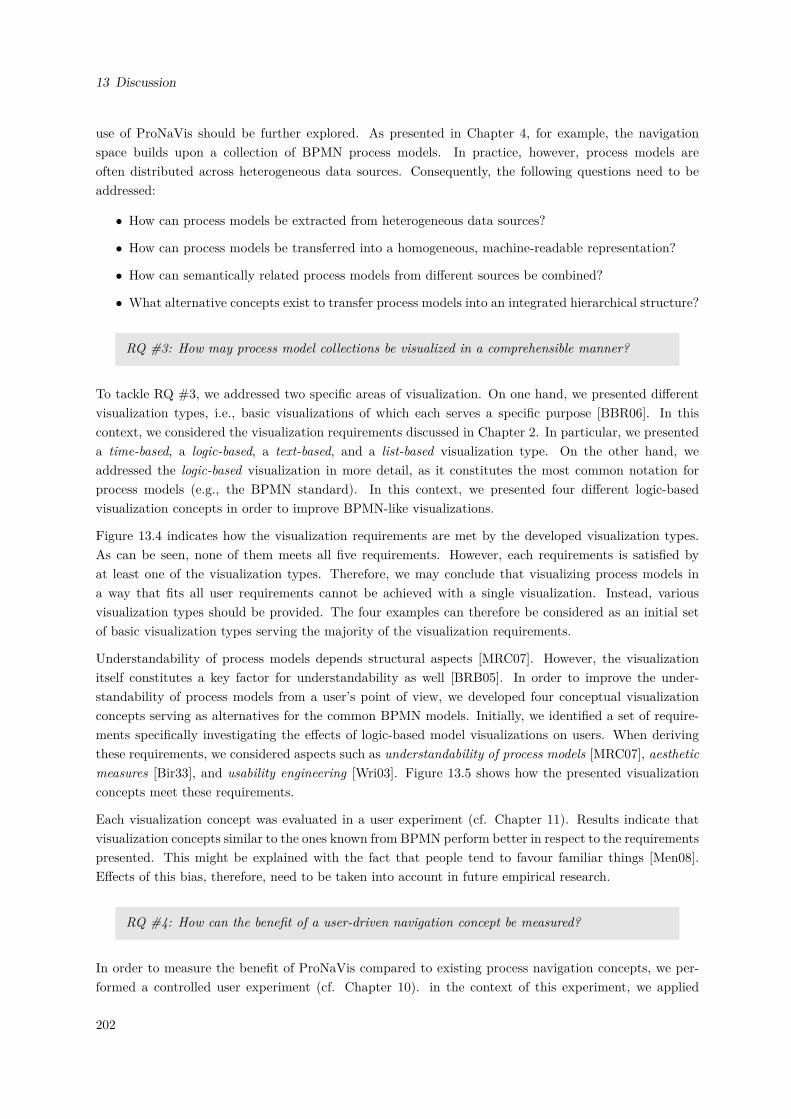
13 Discussion
use of ProNaVis should be further explored. As presented in Chapter 4, for example, the navigationspace builds upon a collection of BPMN process models. In practice, however, process models areoften distributed across heterogeneous data sources. Consequently, the following questions need to beaddressed:
• How can process models be extracted from heterogeneous data sources?
• How can process models be transferred into a homogeneous, machine-readable representation?
• How can semantically related process models from different sources be combined?
• What alternative concepts exist to transfer process models into an integrated hierarchical structure?
RQ #3: How may process model collections be visualized in a comprehensible manner?
To tackle RQ #3, we addressed two specific areas of visualization. On one hand, we presented differentvisualization types, i.e., basic visualizations of which each serves a specific purpose [BBR06]. In thiscontext, we considered the visualization requirements discussed in Chapter 2. In particular, we presenteda time-based, a logic-based, a text-based, and a list-based visualization type. On the other hand, weaddressed the logic-based visualization in more detail, as it constitutes the most common notation forprocess models (e.g., the BPMN standard). In this context, we presented four different logic-basedvisualization concepts in order to improve BPMN-like visualizations.
Figure 13.4 indicates how the visualization requirements are met by the developed visualization types.As can be seen, none of them meets all five requirements. However, each requirements is satisfied byat least one of the visualization types. Therefore, we may conclude that visualizing process models ina way that fits all user requirements cannot be achieved with a single visualization. Instead, variousvisualization types should be provided. The four examples can therefore be considered as an initial setof basic visualization types serving the majority of the visualization requirements.
Understandability of process models depends structural aspects [MRC07]. However, the visualizationitself constitutes a key factor for understandability as well [BRB05]. In order to improve the under-standability of process models from a user’s point of view, we developed four conceptual visualizationconcepts serving as alternatives for the common BPMN models. Initially, we identified a set of require-ments specifically investigating the effects of logic-based model visualizations on users. When derivingthese requirements, we considered aspects such as understandability of process models [MRC07], aestheticmeasures [Bir33], and usability engineering [Wri03]. Figure 13.5 shows how the presented visualizationconcepts meet these requirements.
Each visualization concept was evaluated in a user experiment (cf. Chapter 11). Results indicate thatvisualization concepts similar to the ones known from BPMN perform better in respect to the requirementspresented. This might be explained with the fact that people tend to favour familiar things [Men08].Effects of this bias, therefore, need to be taken into account in future empirical research.
RQ #4: How can the benefit of a user-driven navigation concept be measured?
In order to measure the benefit of ProNaVis compared to existing process navigation concepts, we per-formed a controlled user experiment (cf. Chapter 10). in the context of this experiment, we applied
202
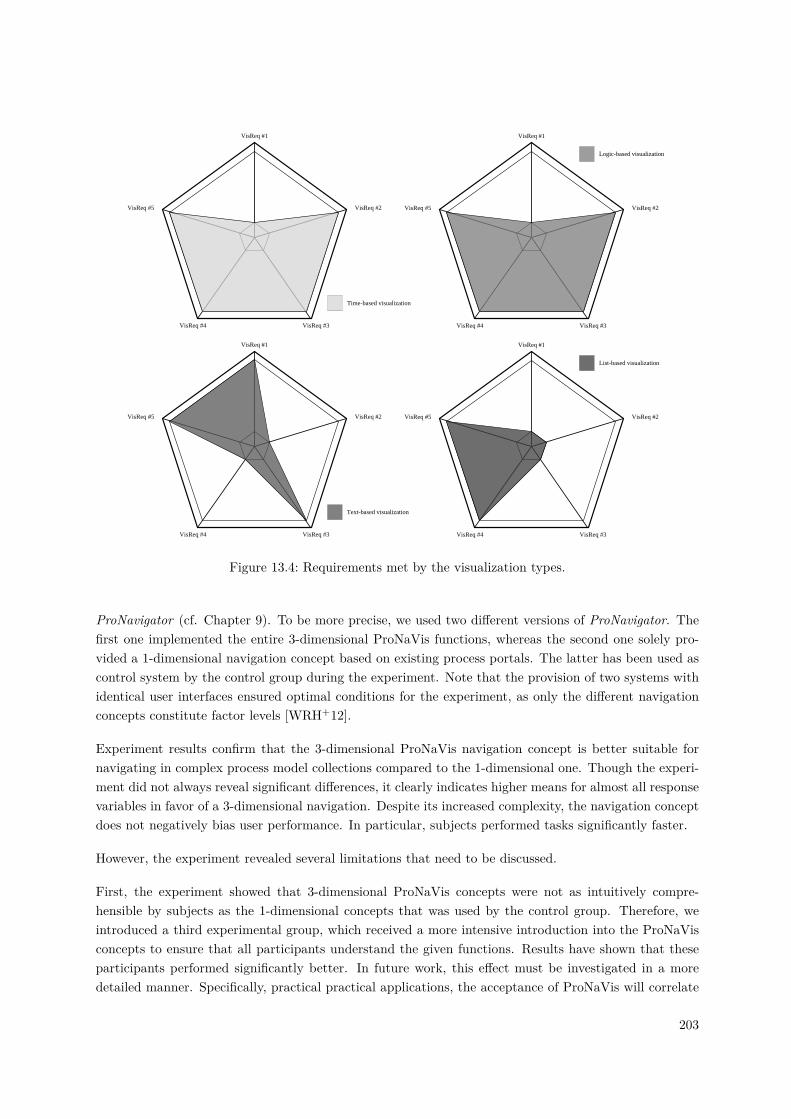
VisReq #1
VisReq #2
VisReq #3VisReq #4
VisReq #5
Text-based visualization
VisReq #1
VisReq #2
VisReq #3VisReq #4
VisReq #5
List-based visualization
VisReq #1
VisReq #2
VisReq #3VisReq #4
VisReq #5
Time-based visualization
VisReq #1
VisReq #2
VisReq #3VisReq #4
VisReq #5
Logic-based visualization
Figure 13.4: Requirements met by the visualization types.
ProNavigator (cf. Chapter 9). To be more precise, we used two different versions of ProNavigator. Thefirst one implemented the entire 3-dimensional ProNaVis functions, whereas the second one solely pro-vided a 1-dimensional navigation concept based on existing process portals. The latter has been used ascontrol system by the control group during the experiment. Note that the provision of two systems withidentical user interfaces ensured optimal conditions for the experiment, as only the different navigationconcepts constitute factor levels [WRH+12].
Experiment results confirm that the 3-dimensional ProNaVis navigation concept is better suitable fornavigating in complex process model collections compared to the 1-dimensional one. Though the experi-ment did not always reveal significant differences, it clearly indicates higher means for almost all responsevariables in favor of a 3-dimensional navigation. Despite its increased complexity, the navigation conceptdoes not negatively bias user performance. In particular, subjects performed tasks significantly faster.
However, the experiment revealed several limitations that need to be discussed.
First, the experiment showed that 3-dimensional ProNaVis concepts were not as intuitively compre-hensible by subjects as the 1-dimensional concepts that was used by the control group. Therefore, weintroduced a third experimental group, which received a more intensive introduction into the ProNaVisconcepts to ensure that all participants understand the given functions. Results have shown that theseparticipants performed significantly better. In future work, this effect must be investigated in a moredetailed manner. Specifically, practical practical applications, the acceptance of ProNaVis will correlate
203
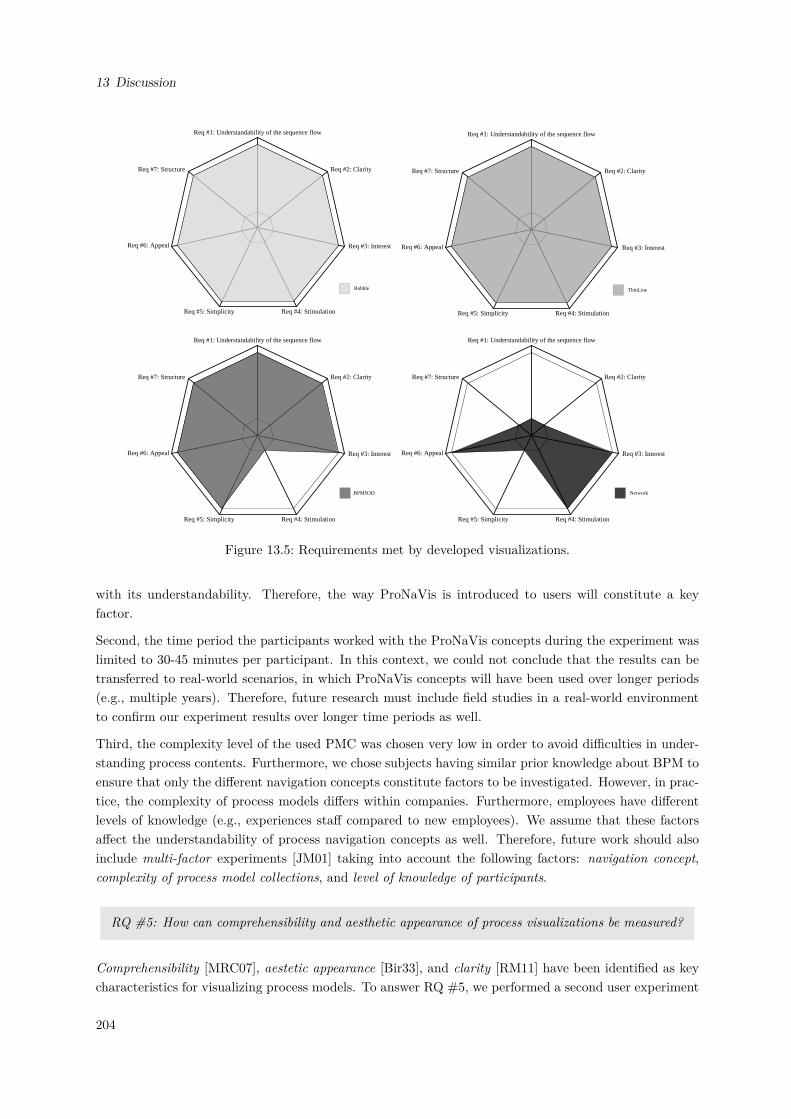
13 Discussion
BPMN3D
Req #1: Understandability of the sequence flow
Req #2: Clarity
Req #3: Interest
Req #4: StimulationReq #5: Simplicity
Req #6: Appeal
Req #7: Structure
Network
Req #1: Understandability of the sequence flow
Req #2: Clarity
Req #3: Interest
Req #4: StimulationReq #5: Simplicity
Req #6: Appeal
Req #7: Structure
Bubble
Req #1: Understandability of the sequence flow
Req #2: Clarity
Req #3: Interest
Req #4: StimulationReq #5: Simplicity
Req #6: Appeal
Req #7: Structure
ThinLine
Req #1: Understandability of the sequence flow
Req #2: Clarity
Req #3: Interest
Req #4: StimulationReq #5: Simplicity
Req #6: Appeal
Req #7: Structure
Figure 13.5: Requirements met by developed visualizations.
with its understandability. Therefore, the way ProNaVis is introduced to users will constitute a keyfactor.
Second, the time period the participants worked with the ProNaVis concepts during the experiment waslimited to 30-45 minutes per participant. In this context, we could not conclude that the results can betransferred to real-world scenarios, in which ProNaVis concepts will have been used over longer periods(e.g., multiple years). Therefore, future research must include field studies in a real-world environmentto confirm our experiment results over longer time periods as well.
Third, the complexity level of the used PMC was chosen very low in order to avoid difficulties in under-standing process contents. Furthermore, we chose subjects having similar prior knowledge about BPM toensure that only the different navigation concepts constitute factors to be investigated. However, in prac-tice, the complexity of process models differs within companies. Furthermore, employees have differentlevels of knowledge (e.g., experiences staff compared to new employees). We assume that these factorsaffect the understandability of process navigation concepts as well. Therefore, future work should alsoinclude multi-factor experiments [JM01] taking into account the following factors: navigation concept,complexity of process model collections, and level of knowledge of participants.
RQ #5: How can comprehensibility and aesthetic appearance of process visualizations be measured?
Comprehensibility [MRC07], aestetic appearance [Bir33], and clarity [RM11] have been identified as keycharacteristics for visualizing process models. To answer RQ #5, we performed a second user experiment
204
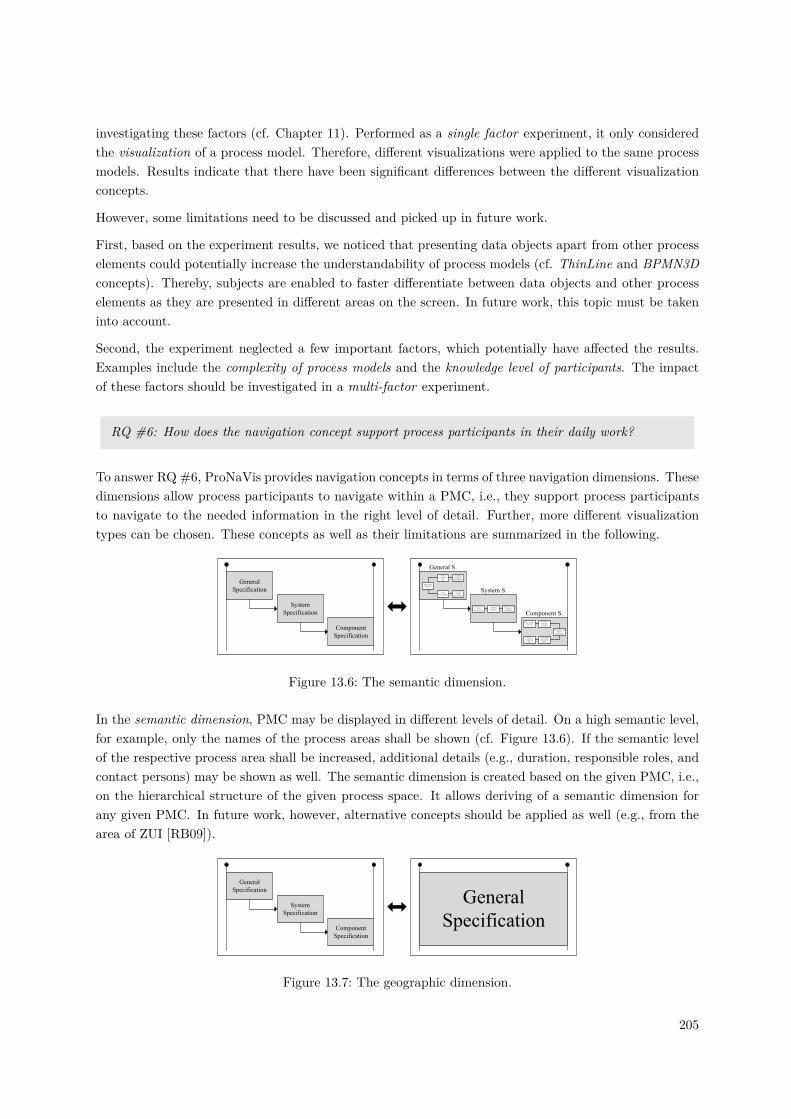
investigating these factors (cf. Chapter 11). Performed as a single factor experiment, it only consideredthe visualization of a process model. Therefore, different visualizations were applied to the same processmodels. Results indicate that there have been significant differences between the different visualizationconcepts.
However, some limitations need to be discussed and picked up in future work.
First, based on the experiment results, we noticed that presenting data objects apart from other processelements could potentially increase the understandability of process models (cf. ThinLine and BPMN3Dconcepts). Thereby, subjects are enabled to faster differentiate between data objects and other processelements as they are presented in different areas on the screen. In future work, this topic must be takeninto account.
Second, the experiment neglected a few important factors, which potentially have affected the results.Examples include the complexity of process models and the knowledge level of participants. The impactof these factors should be investigated in a multi-factor experiment.
RQ #6: How does the navigation concept support process participants in their daily work?
To answer RQ #6, ProNaVis provides navigation concepts in terms of three navigation dimensions. Thesedimensions allow process participants to navigate within a PMC, i.e., they support process participantsto navigate to the needed information in the right level of detail. Further, more different visualizationtypes can be chosen. These concepts as well as their limitations are summarized in the following.
Semantic navigation dimension
General
Specification
System
Specification
Component
Specification
View navigation dimension
Perform FR-
Workshop
Create
Technical Part
Create
Component
File
Perform
Component
Profile Review
Create EE-
General
Specification
Develop Top-
Level
Requirements
Describe
Functions
Identification of
Function
Contributions
Check, Rate, and
Choose
Technologies
Develop
Function
Versions
Create SKLH
(document
NFRs)
Initiate
Component
FMEA
Define Display-
Concept
Component S.
System S.
General S.
Figure 13.6: The semantic dimension.
In the semantic dimension, PMC may be displayed in different levels of detail. On a high semantic level,for example, only the names of the process areas shall be shown (cf. Figure 13.6). If the semantic levelof the respective process area shall be increased, additional details (e.g., duration, responsible roles, andcontact persons) may be shown as well. The semantic dimension is created based on the given PMC, i.e.,on the hierarchical structure of the given process space. It allows deriving of a semantic dimension forany given PMC. In future work, however, alternative concepts should be applied as well (e.g., from thearea of ZUI [RB09]).
General
Specification
System
Specification
Component
Specification
General
Specification
Geographic navigation dimension
Semantic navigation dimensionFigure 13.7: The geographic dimension.
205
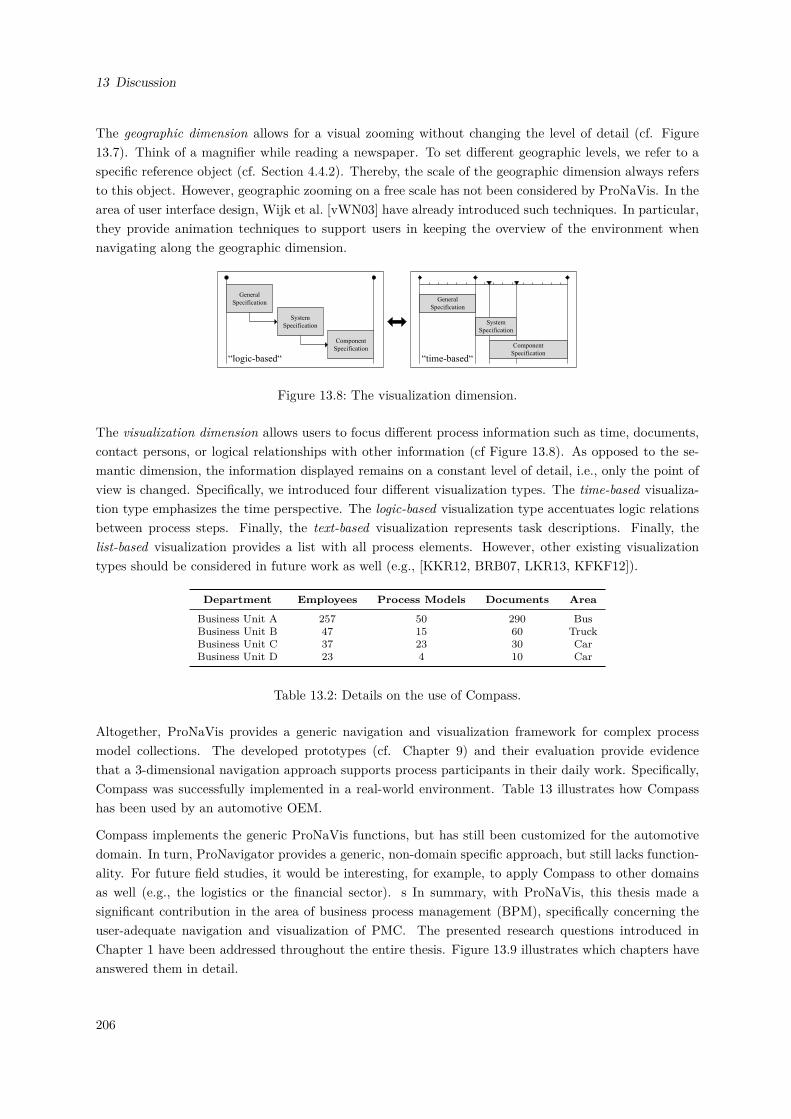
13 Discussion
The geographic dimension allows for a visual zooming without changing the level of detail (cf. Figure13.7). Think of a magnifier while reading a newspaper. To set different geographic levels, we refer to aspecific reference object (cf. Section 4.4.2). Thereby, the scale of the geographic dimension always refersto this object. However, geographic zooming on a free scale has not been considered by ProNaVis. In thearea of user interface design, Wijk et al. [vWN03] have already introduced such techniques. In particular,they provide animation techniques to support users in keeping the overview of the environment whennavigating along the geographic dimension.
View navigation dimension
General
Specification
System
Specification
Component
Specification
General
Specification
System
Specification
Component
Specification“logic-based“ “time-based“
Figure 13.8: The visualization dimension.
The visualization dimension allows users to focus different process information such as time, documents,contact persons, or logical relationships with other information (cf Figure 13.8). As opposed to the se-mantic dimension, the information displayed remains on a constant level of detail, i.e., only the point ofview is changed. Specifically, we introduced four different visualization types. The time-based visualiza-tion type emphasizes the time perspective. The logic-based visualization type accentuates logic relationsbetween process steps. Finally, the text-based visualization represents task descriptions. Finally, thelist-based visualization provides a list with all process elements. However, other existing visualizationtypes should be considered in future work as well (e.g., [KKR12, BRB07, LKR13, KFKF12]).
Department Employees Process Models Documents Area
Business Unit A 257 50 290 BusBusiness Unit B 47 15 60 TruckBusiness Unit C 37 23 30 CarBusiness Unit D 23 4 10 Car
Table 13.2: Details on the use of Compass.
Altogether, ProNaVis provides a generic navigation and visualization framework for complex processmodel collections. The developed prototypes (cf. Chapter 9) and their evaluation provide evidencethat a 3-dimensional navigation approach supports process participants in their daily work. Specifically,Compass was successfully implemented in a real-world environment. Table 13 illustrates how Compasshas been used by an automotive OEM.
Compass implements the generic ProNaVis functions, but has still been customized for the automotivedomain. In turn, ProNavigator provides a generic, non-domain specific approach, but still lacks function-ality. For future field studies, it would be interesting, for example, to apply Compass to other domainsas well (e.g., the logistics or the financial sector). s In summary, with ProNaVis, this thesis made asignificant contribution in the area of business process management (BPM), specifically concerning theuser-adequate navigation and visualization of PMC. The presented research questions introduced inChapter 1 have been addressed throughout the entire thesis. Figure 13.9 illustrates which chapters haveanswered them in detail.
206
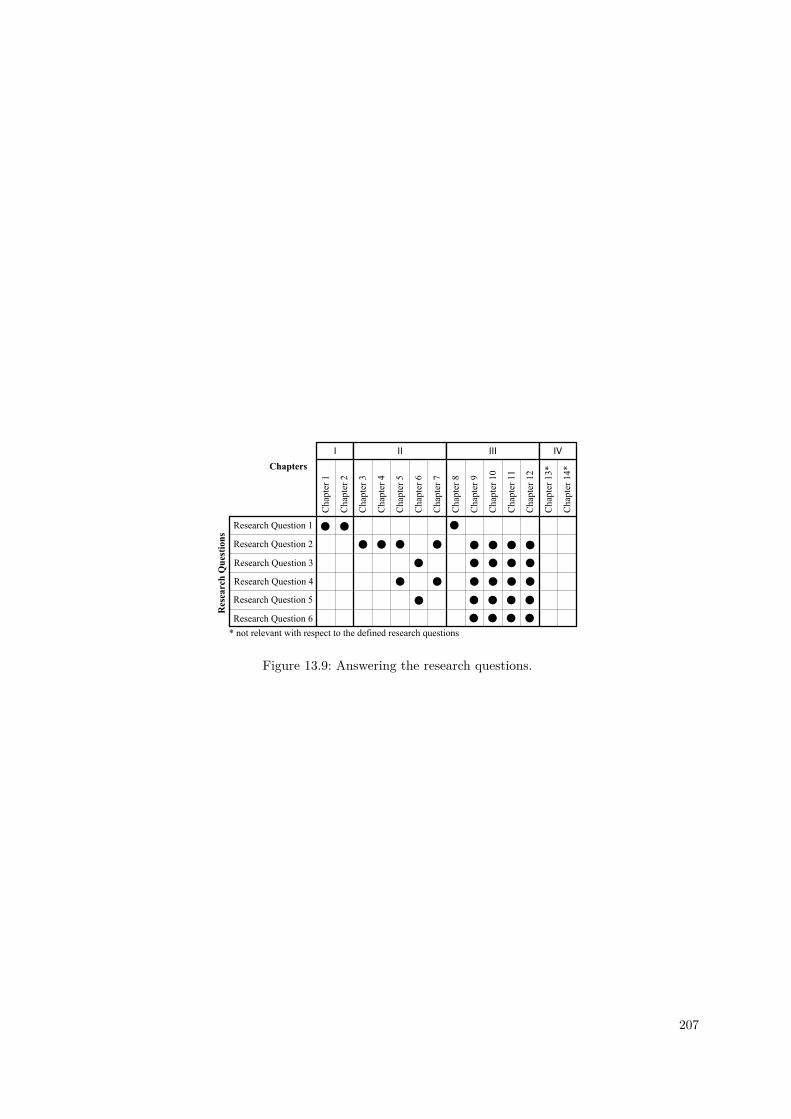
Research Question 1
Research Question 2
Research Question 3
Chap
ter
1
Chap
ter
2
Chap
ter
3
Chap
ter
4
Chap
ter
5
Chap
ter
6
Chap
ter
7
Chap
ter
8
Chap
ter
10
Chap
ter
12
Chap
ter
9
Chap
ter
11
Chap
ter
13*
Chap
ter
14*
I II III IV
Chapters
Res
earc
h Q
ues
tion
s
Research Question 4
Research Question 5
Research Question 6
* not relevant with respect to the defined research questions
Figure 13.9: Answering the research questions.
207

14 Summary and Outlook
Enterprises and organizations struggle with the increasing size and complexity of process model collections(PMC). A particular challenge constitutes the handling of PMC by domain experts or subject matterexperts. Typically, existing PMC are presented to these user groups as well as to the process participantsthemselves in a rather static manner, e.g., as images not allowing for any context-specific user interaction.However, as the various user groups have different roles and needs, such rigid approaches are by far notsufficient to assist them in their daily work.
To tackle this challenge, the thesis introduced the Process Navigation and Visualization (ProNaVis)framework. In particular, ProNaVis provides navigation concepts for complex PMC. In detail, navigationis based on a 3-dimensional navigation space, which comprises three independent navigation dimensionsallowing for a flexible navigation within a PMC.
Starting with two case studies and an online survey we were able to gather insights into practical issuesand challenges related to PMC navigation and visualization. Based on real-world use cases and two casestudies, we then derived fundamental requirements for designing the ProNaVis framework. Picking upideas from Google Maps, we developed a PMC navigation space, consisting of three navigation dimension;i.e., the semantic, the geographic, and the visualization dimension. Thereby, the semantic and geographicdimensions are independent from each other, which distinguishes ProNaVis from related approaches.Furthermore, to provide a sound basis we formalized the developed navigation concepts. Moreover, wepresented different PMC visualization types as well as specific visualization concepts for the logic-basedvisualization of process models.
We validated the ProNaVis framework and practically applied it in cooperation with an industrial partner.In the latter context, selected ProNaVis concepts were implemented in Compass–a tool that allowsnavigating in complex PMC in the area of E/E engineering processes. With ProNavigator and iCare, wefurther realized two additional prototypes implementing ProNaVis concepts in other domains. Moreover,in a controlled experiment we were able to demonstrate practical benefits of the 3-dimensional ProNaVisnavigation space compared to a 1-dimensional navigation space. In another experiment, we showedthat ProNaVis visualization concepts are more comprehensible to users compared to standard processmodel notations. Finally, we combined ProNaVis with the process-oriented information logistics (POIL)approach to illustrate the generic applicability of the ProNaVis navigation concepts.
In summary, the main contributions of this thesis are as follows:
• The case study research allowed identifying fundamental real-world use cases for process navigation.
• Generic requirements on the navigation and visualization of PMC were elicited.
• A process space for PMC consisting of three independent navigation dimensions was designed andformalized.
• Four novel PMC visualization concepts were introduced.
209
14 Summary and Outlook
• The practical applicability of the ProNaVis approach was demonstrated.
• In two experiments, we provided evidence that the navigation and visualization concepts performbetter than existing navigation approaches.
The development of the ProNaVis concepts has not come to an end yet. Future work will become neces-sary, for example, to further evaluate the use of ProNaVis in practice. In particular, process participantsshould be provided with the developed navigation concepts over a longer time period in order to getfamiliar with them. Moreover, it will be crucial to take performance issues into account as well, i.e., toensure that the developed framework is scalable and will be applicable even when facing repositories withthousands of process models or dealing with very large process models. Furthermore, the applicability ofProNaVis should be validated in other domains as well.
Future work on ProNaVis must also address various disciplines in the BPM area that emerged during thelast years. For example, a PMC might comprise process families [ATR+12, ATW+13]; i.e., collectionsof related process model variants that share common parts, but may also exhibit variant-specific partsdepending on the context model variants are used [HBR10, Hal10]. The challenge will be to adopt thedescribed navigation concept to be also applicable when facing process families. Another challenge willbe to provide navigation support for approaches targeting at a tighter integration of processes, dataand users from the very beginning [KR11, Kün13]. Finally, cross-organizational processes must be alsoconsidered when further developing ProNaVis. Thereby, the challenge will be to cope with collaborativeprocesses and adopt the presented concepts to navigate within process choreographies as well [FIRMR15].
Finally, it needs to be investigated how ProNaVis concepts can be integrated with existing processmodeling tools. We showed that visualizing process models in the same way as modeled by processdesigners is far from being appropriate for process participants in their different roles and domains.This thesis, however, indicates that business process management should prioritize end user needs overfunctional complexity of modeling tools. Therefore, a much stronger consideration of user interface designand usability engineering will be required in future.
210
Bibliography
[AB05] Ishtiaq Ahmed and James Blustein. Navigation in information space. in: Proc 2nd Int’lConf on Web Based Communities (WBC’05), pp. 281–286, IADIS, 2005.
[ARI07] IDS Scheer AG: ARIS Web Publisher 7.0.2. Fact Sheet, 2007.
[ATR+12] Clara Ayora, Victoria Torres, Manfred Reichert, Barbara Weber, and Vicente Pelechano.Towards Run-time Flexibility for Process Families: Open Issues and Research Challenges.in: Proc 2nd Int’l Workshop on Process Model Collections (PMC’12), LNBIP 132, pp.477–488, Springer, 2012.
[ATW+13] Clara Ayora, Victoria Torres, Barbara Weber, Manfred Reichert, and VincentePelechano. Enhancing Modeling and Change Support for Process Families throughChange Patterns. in: Proc 14th Int’l Working Conference on Business Process Modeling,Development, and Support (BPMDS’13), LNBIP 147, pp. 246–260, Springer, 2013.
[Bas05] Sarita Bassil. Workflow technology for complex socio-technical systems. PhD Thesis,Universite de Montreal, 2005.
[BBR06] Ralph Bobrik, Thomas Bauer, and Manfred Reichert. Proviado – Personalized andConfigurable Visualizations of Business Processes. in: Proc 7th Int’l Conf on ElectronicCommerce and Web Technologies (EC-WEB’06), LNCS 4082, pp. 61-71, Springer, 2006.
[BEH+08] Stefanie Betz, Daniel Eichhorn, Susan Hickl, Stefan Klink, Agnes Koschmider, Yu Li,Andreas Oberweis, and Ralf Trunko. 3D Representation of Business Process Models.Modellierung betrieblicher Informationssysteme - Modellierung zwischen SOA undCompliance Management (MobIS’08), LNI 141, pp. 73–87, Springer, 2008.
[BEL+07] Sabine Buckl, Alexander M. Ernst, Josef Lankes, Florian Matthes, Christian M.Schweda, and André Wittenburg. Generating Visualizations of Enterprise Architecturesusing Model Transformations. in: Proc Enterprise Modelling and Information SystemsArchitectures (EMISA’07), LNI P-119, pp. 33–46, Springer, 2007.
[Ben01] David Benyon. The new HCI navigation of information space. in: J Knowl.-Based Syst,14(8), pp. 425–430, 2001.
[BGM04] Benjamin B. Bederson, Jesse Grosjean, and Jon Meyer. Toolkit Design for InteractiveStructured Graphics. in: J IEEE Trans. Software Eng., 30(8), pp.535-546, 2004.
[BH94] Benjamin B. Bederson and James D. Hollan. Pad++: A Zooming Graphical Interface forExploring Alternate Interface Physics. in: Proc 7th ACM Symposium on User InterfaceSoftware and Technology (UIST’94), pp. 17–26, ACM, 1994.
[BHP+96] Benjamin B. Bederson, James D. Hollan, Ken Perlin, Jonathan Meyer, David Bacon, andGeorge W. Furnas. Pad++: A Zoomable Graphical Sketchpad For Exploring AlternateInterface Physics. in: J Vis. Lang. Comput., 7(1), 27, pp. 3–32, ACM, 1996.
211
Bibliography
[Bir33] George D. Birkhoff. Aesthetic Measure. Cambridge Massachusetts University Press, 1933.
[BK08] Christel Baier and Joost-Pieter Katoen. Principles of Model Checking. The MIT Press,2008.
[BKK04] Sarita Bassil, Rudolf K. Keller, and Peter G. Kropf. A Workflow-Oriented SystemArchitecture for the Management of Container Transportation. in: Proc 2nd Int’l Confon Business Process Management (BPM’04), LNCS 3080, pp. 116–131, Springer, 2004.
[BLW+12] Irene Barba, Andreas Lanz, Barbara Weber, Manfred Reichert, and Carmelo Del Valle.Optimized Time Management for Declarative Workflows. in: Proc 13th BPMDS’12Working Conference (BPMDS’12), LNBIP 113, pp. 195–210, Springer, 2012.
[BM98] Ben Bederson and Jon Meyer. Abstract Implementing a Zooming User Interface:Experience Building Pad++. in: J on Software: Practice and Experience, 28(10), pp.1101–1135, 1998.
[BMG00] Benjamin B. Bederson, Jon Meyer, and Lance Good. Jazz: An Extensible Zoomable UserInterface Graphics Toolkit in Java. in: Proc 13th ACM Symposium on User InterfaceSoftware and Technology (UIST’00), pp. 171–180, ACM, 2000.
[Bob08] Ralph Bobrik. Konfigurierbare Visualisierung komplexer Prozessmodelle. PhD Thesis,University of Ulm, 2008.
[BR09] Ross A. Brown and Jan C. Recker. Improving the Traversal of Large Hierarchical ProcessRepositories. in: Proc 20th Australasian Conference on Information Systems (ACIS’09),pp. 144–153, 2009.
[BRB05] Ralph Bobrik, Manfred Reichert, and Thomas Bauer. Requirements for the Visualizationof System-Spanning Business Processes. in: Proc 1st Int’l Workshop on Business ProcessMonitoring and Performance Management (BPMPM’05), pp. 948–954, IEEE, 2005.
[BRB07] Ralph Bobrik, Manfred Reichert, and Thomas Bauer. View-Based Process Visualization.in: 5th Int’l Conf on Business Process Management (BPM’07), LNCS 4714, pp. 88–95,Springer, 2007.
[BRW11] Ross Brown, Jan Recker, and Stephen West. Using virtual worlds for collaborativebusiness process modeling. in: Business Proc Manag Journal 17(3), pp. 546–564, 2011.
[BRWSH86] Victor R. Basili, Jr. Richard W. Selby, and David H. Hutchens. Experimentation inSoftware Engineering. in: J IEEE Trans. Software Engineering, pp. 733–743, 1986.
[BWJ02] Claudio Bettini, Xi-Shi Wang, and Suchil Jajodia. Temporal reasoning in workflowsystems. in: J on Distributed and Parallel Databases, 11(3), pp. 269-306, 2002.
[BWS93] Benjamin. B. Bederson, Richard. S. Wallace, and Eric. L. Schwartz. Control and Designof the Spherical Pointing Motor. in: Proc Int’l Conf on Robotics and Automation:Volume 2, pp.630–636, IEEE, 1993.
[CDT00] Chun Wei Choo, Brian Detlor, and Don Turnbull. Information Seeking on the Web: AnIntegrated Model of Browsing and Searching. in: J First Monday, 5(2), 2000.
[CGJ+07] Carlo Combi, Matteo Gozzi, Jose M. Juarez, Barbara Oliboni, and Giuseppe Pozzi.Conceptual Modeling of Temporal Clinical Workflows. in: Proc 20th Int’l Symp onTemporal Representation and Reasoning, pp. 70–81, IEEE, 2007.
212

Bibliography
[CGPP12] Carlo Combi, Matteo Gozzi, Roberto Posenato, and Giuseppe Pozzi. ConceptualModeling of Flexible Temporal Workflows. in: J on Trans. Auton. Adapt. Syst., 7(2), pp.19:1–19:29, ACM, 2012.
[Cha93] Matthew Chalmers. Using a Landscape Metaphor to Represent a Corpus of Documents.in: Proc Conf on Spatial Information Theory (COSIT’93), LNCS 716, pp. 377–390,Springer, 1993.
[Cla22] Wallace Clark. The Gantt Chart. The Ronald Press Co., 1922.
[CMS99] Stuart K. Card, Jock D. Mackinlay, and Ben Schneiderman. Readings in InformationVisualization: Using Vision to Think (Interactive Technologies). Morgan Kaufmann,1999.
[Coo09] Hugh Coolican. Research Methods and Statistics in Psychology. Routledge, 2009.
[CRM91] Stuart K. Card, George G. Robertson, and Jock D. Mackinlay. The InformationVisualizer, an Information Workspace. in: Proc Conf Human Factors in ComputingSystems (CHI’91), pp. 181–188, ACM, 1991.
[CS91] Paul Chandler and John Sweller. Cognitive Load Theory and the Format of Instruction.in: J Cognition and Instruction 8(4). pp. 293–332, 1991.
[DDF+90] Scott Deerwester, Susan T. Dumais, George W. Furnas, Thomas K. Landauer, andRichard Harshman. Indexing by Latent Semantic Analysis. in: J on the AmericanSociety for Information Science, 41(6), pp. 391–407, 1990.
[DF98] Andreas Dieberger and Andrew U. Frank. A City Metaphor to Support Navigation inComplex Information Spaces. in: J Vis. Lang. Comput., 9(6), pp. 597–622, 1998.
[Dij76] Edsger W. Dijkstra. A Discipline of Programming. Prentice-Hall, 1976.
[DO01] Rene Descartes and Paul J. Olscamp. Discourse on Method, Optics, Geometry, andMeteorology. Hackett Publishing Co., 2001.
[Eff12] Philip Effinger. A 3D-Navigator for Business Process Models. in: Proc 1st Int’lWorkshop on Theory and Applications of Process Visualization (TAProViz’12), LNBIP132, pp. 737–743, Springer, 2012.
[EM00] Angela Edmunds and Anne Morris. The Problem of Information Overload in BusinessOrganisations: A Review of the Literature. in: Int’l J on Information Management,20(1), pp. 17–28, 2000.
[EPPR99] Johann Eder, Euthimios Panagos, Heinz Pozewaunig, and Michael Rabinovich. TimeManagement in Workflow Systems. in: Proc 3rd Int’l Conf on Business InformationSystems (BIS’99), LNBIP 21, pp. 265–280, Springer, 1999.
[EPR99] Johann Eder, Euthimios Panagos, and Michael Rabinovich. Time Constraints inWorkflow Systems. in: Proc 11th Int’l Conf on Advanced Information SystemsEngineering (CAiSE’99), LNCS 1626, pp. 286–300, Springer, 1999.
[ES10] Philip Effinger and Johannes Spielmann. Lifting business process diagrams to 2.5dimensions. in: Proc Visualization and Data Analysis (VDA’10), 7530, p. 75300, SPIE,2010.
213
Bibliography
[Fie13] Andy Field. Discovering Statistics using IBM SPSS Statistics. SAGE Publications Ltd,2013.
[FIRMR15] Walid Fdhila, Conrad Indiono, Stefanie Rinderle-Ma, and Manfred Reichert. Dealing withchange in process choreographies: Design and implementation of propagation algorithms.in: J on Information Systems, 49, pp. 1–24, Elsevier, 2015.
[Fow04] Martin Fowler. UML Distilled: A Brief Guide to the Standard Object ModelingLanguage. Addison-Wesley (Addison-Wesley object technology series), 2004.
[FR01] Michael T. French and John S. Robotham. Time inheritance scene graph forrepresentation of media content. Google Patents (US6266053 B1), 2001.
[FRS+10] Marie-Christine Fauvet, Marcello La Rosa, Mehrad Sadegh, Abdurrahman Alshareef,Remco M. Dijkman, Luciano García-Bañuelos, Hajo A. Reijers, Wil M. P. van der Aalst,Marlon Dumas, and Jan Mendling. Managing Process Model Collections withAProMoRe. in: Proc 8th Int’l Conf on Service Oriented Computing (ICSOC’10), LNCS6470, pp. 699–701, Springer, 2010.
[FT94] Andrew U. Frank and Sabine Timpf. Multiple representations for cartographic objects ina multi-scale tree - An intelligent graphical zoom. in: J Computer & Graphics, 18(6), pp.823–829, 1994.
[Ger05] German Association of the Automotive Industry (VDA). Engineering ChangeManagement. Part 1: Engineering Change Request (ECR). V 1.1, Doc. No. 4965, 2005.
[GMR07] Fredrik Gundelsweiler, Thomas Memmel, and Harald Reiterer. ZEUS - ZoomableExplorative User Interface for Searching and Object Presentation. Symposium on HumanInterface (HCI’07), LNCS 4557, pp. 288–297, Springer, 2007.
[GMS+13] Gregor Grambow, Nicolas Mundbrod, Vivian Steller, Manfred Reichert, AndreasSchiffleitner, Thomas Bley, and Christian Feick. State-of-the-Art and Requirements forCollecting and Managing Sustainability Data Along Today’s Supply Chains. in: 6th Int’lConf on Life Cycle Management (LCM’13), pp. 548–552, 2013.
[GOR12] Gregor Grambow, Roy Oberhauser, and Manfred Reichert. Enabling AutomaticProcess-aware Collaboration Support in Software Engineering Projects. in: SelectedPapers of the ICSOFT’11 Conference, CCIS 303, pp. 73–89, Springer, 2012.
[GOR13] Gregor Grambow, Roy Oberhauser, and Manfred Reichert. Automated SoftwareEngineering Process Assessment: Supporting Diverse Models using an Ontology. in: Int’lJ on Advances in Software, 6 (1 & 2), pp. 213–224, 2013.
[GRF08] Tera Marie Green, William Ribarsky, and Brian D. Fisher. Visual analytics for complexconcepts using a human cognition model. in: Proc Int’l IEEE Symposium on VisualAnalytics Science and Technology (VAST’08), pp. 91–98, IEEE, 2008.
[GRMR+08] Christian W. Guenther, Stefanie Rinderle-Ma, Manfred Reichert, Wil M. P. van derAalst, and Jan Recker. Using Process Mining to Learn from Process Changes inEvolutionary Systems. in: Int’l J on Business Process Integration and Management,Special Issue on Business Process Flexibility, 3(1), pp.61–78, 2008.
214
Bibliography
[GRRv06] Christian W. Guenther, Stefanie Rinderle, Manfred Reichert, and Wil M. P. van derAalst. Change Mining in Adaptive Process Management Systems. in: Proc 14th Int’lConf on Cooperative Information Systems (Coopls’06), LNCS 4275, pp. 309–326,Springer, 2006.
[Hal10] Alena Hallerbach. Management von Prozessvarianten. PhD Thesis, Ulm University, 2010.
[Hav05] Michael Havey. Essential Business Process Modeling. O’Reilly Media, 2005.
[HBR10] Alena Hallerbach, Thomas Bauer, and Manfred Reichert. Capturing Variability inBusiness Process Models: The Provop Approach. in: J on Software Maintenance andEvolution: Research and Practice, 22(6-7), pp. 519–546, Wiley InterScience, 2010.
[HCC12] Ian Heywood, Sarah Cornelius, and Steve Carver. An Introduction to GeographicalInformation Systems (4th Edition). Prentice Hall, 2012.
[HFL12] Constantin Houy, Peter Fettke, and Peter Loos. Understanding Understandability ofConceptual Models - What Are We Actually Talking about? in: Proc 31st Int’lConference on Conceptual Modeling (ER’12), LNCS 7532, pp. 64–77, Springer, 2012.
[HH93] Deborah Hix and H. Rex Hartson. Developing User Interfaces: Ensuring UsabilityThrough Product & Process. John Wiley & Sons, Inc., 1993.
[Hil94] Wiliam C. Hill. Recommending and evaluating items on the basis of communal history ofuse. in: Bellcore, Technical Report #TM-ARH-023560, NJ 07960, 1994.
[HMM00] Ivan Herman, Guy Melançon, and M. Scott Marshall. Graph Visualization andNavigation in Information Visualization: A Survey. in: J IEEE Transactions onVisualization and Computer Graphics, 6(1), pp. 24–43, 2000.
[HMMR13] Markus Hipp, Bernd Michelberger, Bela Mutschler, and Manfred Reichert. A Frameworkfor the Intelligent Delivery and User-adequate Visualization of Process Information. in:Proc 28th Symposium on Applied Computing (SAC’13), pp. 1383–1390, ACM, 2013.
[HMMR14] Markus Hipp, Bernd Michelberger, Bela Mutschler, and Manfred Reichert. Navigating inProcess Model Repositories and Enterprise Process Information. in: Proc 8th Int’l Confon Research Challenges in Information Science (RCIS’14), IEEE, pp. 1–12, 2014.
[HMPR04] Alan R. Hevner, Salvatore T. March, Jinsoo Park, and Sudha Ram. Design Science inInformation Systems Research. in: J MIS Quarterly, 28(1), pp. 75–105, 2004.
[HMR11a] Markus Hipp, Bela Mutschler, and Manfred Reichert. Navigating in Process ModelCollections: A new Approach Inspired by Google Earth. in: Proc 1st Int’l Workshop onProcess Model Collections (PMC’11), LNBIP 100, pp. 87–98, Springer, 2011.
[HMR11b] Markus Hipp, Bela Mutschler, and Manfred Reichert. On the Context-aware,Personalized Delivery of Process Information: Viewpoints, Problems, and Requirements.in: Proc 6th Int’l Conf on Availability, Reliability and Security (ARES’11), LNCS 6908,pp. 390–397, Springer, 2011.
[HMR12] Markus Hipp, Bela Mutschler, and Manfred Reichert. Navigating in Complex BusinessProcesses. in: Proc 23rd Int’l Conf on Database and Expert Systems Applications(DEXA’12), LNCS 7447, pp. 466–480, Springer, 2012.
215
Bibliography
[HNP05] Andreas Hotho, Andreas Nürnberger, and Gerhard Paa ss. A Brief Survey of TextMining. in: J for Computational Linguistics and Language Technology, 20(1), pp. 19–62,2005.
[Hon05] Seok-Hee Hong. MultiPlane: A New Framework for Drawing Graphs in ThreeDimensions. in: Graph Drawing, 13th Int’l Symp, LNCS 3843, pp. 514–515, Springer,2005.
[HRW00] Martin Höst, Björn Regnell, and Claes Wohlin. Using Students as Subjects-AComparative Study of Students and Professionals in Lead-Time Impact Assessment. in: JEmpirical Software Engineering, 3(5), pp. 201–214, 2000.
[HSM+14] Markus Hipp, Achim Strauss, Bernd Michelberger, Bela Mutschler, and ManfredReichert. Enabling a User-Friendly Visualization of Business Process Models. in: Proc3rd Int’l Workshop on Theory and Applications of Process Visualization (TaProViz’14),pp. 395-407, 2014.
[IBM06] Best Practices for Using WebSphere Business Modeler and Monitor. IBM RedbookPaper, 2006.
[ISO95] Ergonomic requirements for office work with visual display terminals (VDTs) - Part 10:Dialogue principles. European Standard EN ISO 9241-10, 1995.
[ISO98] Ergonomic requirements for office work with visual display terminals (VDTs) - Part 11 :Guidance on usability. European Standard EN ISO 9241-11, 1998.
[JF98] Susanne Jul and George W. Furnas. Critical Zones in Desert Fog: Aids to MultiscaleNavigation. in: ACM Symposium on User Interface Software and Technology, pp.97–106, 1998.
[JG07] Stefan Jablonski and Manuel Goetz. Perspective Oriented Business ProcessVisualization. in: Proc Business Process Management Workshops (BPM’07), LNCS 4928,pp. 144–155, Springer, 2007.
[JGH+08] Robert J. K. Jacob, Audrey Girouard, Leanne M. Hirshfield, Michael S. Horn, OritShaer, Erin Treacy Solovey, and Jamie Zigelbaum. Reality-based interaction: aframework for post-WIMP interfaces. in: Proc Int’l Conf on Human Factors inComputing Systems (CHI’08), pp. 201–210, ACM, 2008.
[JKGR08] Hans-Christian Jetter, Werner A. König, Jens Gerken, and Harald Reiterer. ZOIL - ACross-Platform User Interface Paradigm for Personal Information Management. in: ProcCHI 2008 Workshop - The Disappearing Desktop: Personal Information Management(CHI’08), pp. 1–9, ACM, 2008.
[JM01] Natalia Juristo Juzgado and Ana María Moreno. Basics of software engineeringexperimentation. Kluwer, 2001.
[KFKF12] Sonja Kabicher-Fuchs, Simone Kriglstein, and Kathrin Figl. Timeline Visualization forDocumenting Process Model Change. in: Proc 5th Int’l Workshop on EnterpriseModelling and Information Systems Architectures (EMISA’12), LNI 206, pp. 95–108,Springer, 2012.
216

Bibliography
[KKR12] Jens Kolb, Klaus Kammerer, and Manfred Reichert. Updatable Process Views forUser-centered Adaption of Large Process Models. in: Proc 10th Int’l Conf on ServiceOriented Computing (ICSOC’12), LNCS 7636, pp. 484–498, Springer, 2012.
[Kli99] Paul Kline. Handbook of Psychological Testing. Routledge, 1999.
[KLMR13] Jens Kolb, Henrik Leopold, Jan Mendling, and Manfred Reichert. Creating and UpdatingPersonalized and Verbalized Business Process Descriptions. in: Proc 6th IFIP WG 8.1Working Conference on the Practice of Enterprise Modeling (PoEM’13), LNBIP 165, pp.191–205, Springer, 2013.
[Kol15] Jens Kolb. Abstraction, Visualization, and Evolution of Process Models. PhD Thesis,Ulm University, 2015.
[KR11] Vera Künzle and Manfred Reichert. PHILharmonicFlows: towards a framework forobject-aware process management. in: J on Software Maintenance and Evolution:Research and Practice, 23(4), pp. 205–244, Wiley, 2011.
[KR13a] Jens Kolb and Manfred Reichert. Data Flow Abstractions and Adaptations throughUpdatable Process Views. in: Proc 28th Symposium on Applied Computing (SAC’13),pp. 1447-1453, ACM, 2013.
[KR13b] Jens Kolb and Manfred Reichert. A Flexible Approach for Abstracting and PersonalizingLarge Business Process Models. in: J on Applied Computing Review, 13(1), pp. 6–17,ACM SIGAPP, 2013.
[KR13c] Jens Kolb and Manfred Reichert. Supporting Business and IT through Updatable ProcessViews: The proView Demonstrator. Demo Track of the 10th Int’l Conference on ServiceOriented Computing (ICSOC’12), LNCS 7759, pp. 460–464, Springer, 2013.
[KRM12] Simone Kriglstein and Stefanie Rinderle-Ma. A Visualization Concept for High-LevelComparison of Process Model Versions. in: Proc Business Process ManagementWorkshops (BPM’12), LNBIP 132, pp. 465-476, Springer, 2012.
[KRR09] Werner A. König, Roman Rädle, and Harald Reiterer. Squidy: a zoomable designenvironment for natural user interfaces. in: Proc 27th Int’l Conf on Human Factors inComputing Systems (CHI’09), pp. 4561–4566, ACM, 2009.
[KRW12] Jens Kolb, Manfred Reichert, and Barbara Weber. Using Concurrent Task Trees forStakeholder-centered Modeling and Visualization of Business Processes. in: Proc 4th Int’lConf on Subject-Oriented Business Process Management (S-BPM ONE’12), CCIS 284,pp. 237–251, Springer, 2012.
[Kün13] Vera Künzle. Object-Aware Process Management. PhD Thesis, Ulm University, 2013.
[KWRM13] Simone Kriglstein, Günter Wallner, and Stefanie Rinderle-Ma. A Visualization Approachfor Difference Analysis of Process Models and Instance Traffic. in: Proc 11th Int’l Confon Business Process Management (BPM’13), LNCS 8094, pp. 219–226, Springer, 2013.
[LJ08] George Lakoff and Mark Johnson. Metaphors We Live By (2nd). University of ChicagoPress, 2008.
217
Bibliography
[LKR13] Andreas Lanz, Jens Kolb, and Manfred Reichert. Enabling Personalized ProcessSchedules with Time-aware Process Views. in: Proc CAiSE 2013 Workshops, 2nd Int’lWorkshop on Human-Centric Information Systems (HCIS’13), LNBIP 148, pp. 205–216,Springer, 2013.
[LPCR13] Andreas Lanz, Roberto Posenato, Carlo Combi, and Manfred Reichert. Controllability ofTime-Aware Processes at Run Time. in: Proc 21st Int’l Conf on Cooperative InformationSystems (CoopIS 2013), LNCS 8185, pp. 39–56, Springer, 2013.
[LPR12] Richard Lenz, Mor Peleg, and Manfred Reichert. Healthcare Process Support:Achievements, Challenges, Current Research. in J on Knowledge-Based Organizations(IJKBO), 2(4), 2012.
[LR07] Richard Lenz and Manfred Reichert. IT Support for Healthcare Processes - Premises,Challenges, Perspectives. in: Data and Knowledge Engineering, 61(1), pp. 39–58, 2007.
[LR14] Andreas Lanz and Manfred Reichert. Dealing with Changes of Time-Aware Processes. in:Proc 12th Int’l Conf on Business Process Management (BPM 2014), LNCS 8659, pp.217–233, Springer, 2014.
[LWR14] Andreas Lanz, Barbara Weber, and Manfred Reichert. Time patterns for process-awareinformation systems. in: Requirements Engineering, 19(2), pp.113–141, Springer, 2014.
[MAGM13] Bernd Michelberger, Ralph-Josef Andris, Hasan Girit, and Bela Mutschler. A LiteratureSurvey on Information Logistics. in: 16th Int’l Conf on Business Information Systems(BIS’13), LNBIP 157, pp. 138-150, Springer, 2013.
[May99] Deborah J. Mayhew. The Usability Engineering Lifecycle: A Practitioner’s Guide toUser Interface Design. Morgan Kaufmann Publishers, 1999.
[May01] Harvey Maylor. Beyond the gantt chart: Project management moving on. in: EuropeanManagement Journal, 19(1), pp. 92–100, 2001.
[MBN04] Jan Mendling, Alberto Brabenetz, and Gustaf Neumann. EPML2SVG - GeneratingWebsites from EPML Processes. in: Proc 3rd GI Workshop on Event-Driven ProcessChains (EPK’04), pp. 55–64, 2004.
[Men08] Jan Mendling. Metrics for Process Models: Empirical Foundations of Verification, ErrorPrediction, and Guidelines for Correctness. Springer, 2008.
[MHHR06] Dominic Müller, Joachim Herbst, Markus Hammori, and Manfred Reichert. IT Supportfor Release Management Processes in the Automotive Industry. in: Proc 4th Int’l Confon Business Process Management (BPM’06), LNCS 4102, pp. 368–377, Springer, 2006.
[MHM15] B. Michelberger, M. Hipp, and B. Mutschler. Process-oriented Information Logistics:Requirements, Techniques, Application. in: Advances in Intelligent Process-AwareInformation Systems, 2015. Accepted for Publication.
[Mic90] Joel Michell. An Introduction To the Logic of Psychological Measurement. PsychologyPress, 1990.
[Mic15] Bernd Michelberger. Process-Oriented Information Logistics: Aligning ProcessInformation with Business Processes. PhD Thesis, Ulm University, 2015.
218
Bibliography
[MKR12] Nicolas Mundbrod, Jens Kolb, and Manfred Reichert. Towards a System Support ofCollaborative Knowledge Work. in: Proc 1st Int’l Workshop on Adaptive CaseManagement (ACM’12), LNBIP 132, pp. 31–42, Springer, 2012.
[MMB+14] Bernd Michelberger, Bela Mutschler, Daniel Binder, Jan Meurer, and Markus Hipp.iGraph: Intelligent Enterprise Information Logistics. in: Proc 10th Int’l Conf onSemantic Systems (SEMANTiCS’14), Posters & Demonstrations Track, 1224, pp. 27–30,2014.
[MMHR13] Bernd Michelberger, Bela Mutschler, Markus Hipp, and Manfred Reichert. Determiningthe Link and Rate Popularity of Enterprise Process Information. in: Proc 21st Int’l Confon Cooperative Information Systems (CoopIS’13), LNCS 8185, pp. 112–129, Springer,2013.
[MMN+06] Jan Mendling, Malte Moser, Gerhard Neumann, H. M. W. Verbeek, and BoudewijnF. Van Dongen. Faulty EPCs in the SAP Reference Model. in: Proc 4th Int’l Conf onBusiness Process Management (BPM’06), LNCS 4102, pp. 451–457, Springer, 2006.
[MMR11a] Bernd Michelberger, Bela Mutschler, and Manfred Reichert. On Handling ProcessInformation: Results from Case Studies and a Survey. in: Proc 2nd Int’l Workshop onEmpirical Research in Business Process Management (ER-BPM’11), LNBIP 99, pp.333–344, Springer, 2011.
[MMR11b] Bernd Michelberger, Bela Mutschler, and Manfred Reichert. Towards Process-orientedInformation Logistics: Why Quality Dimensions of Process Information Matter. in: Proc4th Int’l Workshop on Enterprise Modelling and Information Systems Architectures(EMISA’11), LNI 190, pp. 107–120, Springer, 2011.
[MMR12a] Bernd Michelberger, Bela Mutschler, and Manfred Reichert. A Context Framework forProcess-oriented Information Logistics. in: Proc 15th Int’l Conf on Business InformationSystems (BIS’12), LNBIP 117, pp. 260–271, Springer, 2012.
[MMR12b] Bernd Michelberger, Bela Mutschler, and Manfred Reichert. Process-orientedInformation Logistics: Aligning Enterprise Information with Business Processes. in: 16thInt’l Enterprise Distributed Object Computing Conference (EDOC’12), pp. 21–30, IEEE,2012.
[MMRS09] Joachim Melcher, Jan Mendling, Hajo A. Reijers, and Detlef Seese. On Measuring theUnderstandability of Process Models. in: Proc Business Process Management Workshops(BPM’09), LNBIP 43, pp. 465–476, Springer, 2009.
[MPVW04] Ulrich Meissen, Stefan Pfennigschmidt, Agnès Voisard, and Tjark Wahnfried. Context-and Situation-Awareness in Information Logistics. in: Proc Current Trends in DatabaseTechnology Workshops (EDBT’04), pp. 335–344, Springer, 2004.
[MRB08] Bela Mutschler, Manfred Reichert, and Johannes Bumiller. Unleashing the Effectivenessof Process-oriented Information Systems: Problem Analysis, Critical Success Factors andImplications. in: J Transactions on Systems, Man, and Cybernetics (SMC) - Part C:Applications & Reviews, 38(3), pp. 280-291, IEEE, 2008.
[MRC07] Jan Mendling, Hajo A. Reijers, and Jorge Cardoso. What Makes Process ModelsUnderstandable? in: Proc 5th Int’l Confon Business Process Management (BPM’07),LNCS 4714, pp. 48–63, Springer, 2007.
219
Bibliography
[MRM+13] Bernd Michelberger, Armin Reisch, Bela Mutschler, Jörg Wurzer, Markus Hipp, andManfred Reichert. iCare: Intelligent Medical Information Logistics. in: Proc 15th Int’lConf on Information Integration and Web-based Applications & Services (iiWAS’13), pp.396–399, ACM, 2013.
[MS08] Jan Mendling and Mark Strembeck. Influence Factors of Understanding BusinessProcess Models. in: Proc 11th Int’l Conference on Business Information Systems(BIS’08), LNBIP 7, pp. 142–153, Springer, 2008.
[MUG+14] Bernd Michelberger, Klaus Ulmschneider, Birte Glimm, Bela Mutschler, and ManfredReichert. Maintaining Semantic Networks: Challenges and Algorithms. in: Proc 16thInt’l Conf on Information Integration and Web-based Applications & Services (iiWAS2014), pp. 365–374, ACM, 2014.
[Mun97] Tamara Munzner. H3: laying out large directed graphs in 3D hyperbolic space. in:Symposium on Information Visualization (InfoVis’97), pp. 2–10, IEEE, 1997.
[MW08] Derek Miers and Stephen A. White. BPMN Modeling and Reference Guide -Understanding and Using BPMN. Future Strategies Inc., 2008.
[MY12] Kazuo Misue and Seiya Yazaki. Panoramic View for Visual Analysis of Large-ScaleActivity Data. in: Proc 1st Int’l Workshop on Theory and Applications of ProcessVisualization (TAProViz’12), LNBIP 132, pp. 756–767, Springer, 2012.
[ND86] Donald A. Norman and Stephen W. Draper, editors. User Centered System Design: NewPerspectives on Human-Computer Interaction. Erlbaum, 1986.
[New96] Gregory B. Newby. Metric Multidimensional Information Space. in: 5th Text RetrievalConf (TREC-5’96), 1996.
[NM02] Klaus Neumann and Martin Morlock. Operations Research. Hanser Fachbuch, 2002.
[Nor88] Donald A. Norman. The Design of Everyday Things. The MIT Press, 1988.
[OS08] Annika Oehgren and Kurt Sandkuhl. Information Overload in Industrial Enterprises -Results of an Empirical Investigation. in: Proc 2nd European Conf on InformationManagement and Evaluation (ECIME’08), pp. 343-350, Academic Publishing, 2008.
[Ped13] Volnei A. Pedroni. Finite State Machines in Hardware - Theory and Design (with VHDLand SystemVerilog). MIT Press, 2013.
[Pet05] Tom Petrocelli. Data Protection and Information Lifecycle Management. Prentice Hall,2005.
[PF93] Ken Perlin and David Fox. Pad: An Alternative Approach to the Computer Interface. in:J on Computer Graphics (SIGGRAPH ‘93), ACM, 1993.
[PMLR15] Rüdiger Pryss, Nicolas Mundbrod, David Langer, and Manfred Reichert. Supportingmedical ward rounds through mobile task and process management. in: J on InformationSystems and e-Business Management, 13(1), pp. 107–146, Springer, 2015.
[PRJB13] Erik Poppe, Jan Recker, Daniel Johnson, and Ross Brown. Using Natural User Interfacesfor Collaborative Process Modelling in Virtual Environments. in: Proc Workshop onModels and their Role in Collaboration (MoRoCo’13), 1037, pp. 65–67, CEUR, 2013.
220
Bibliography
[Ras00] Raskin, Jef. Humane Interface: New Directions for Designing Interactive Systems.Addison-Wesley Publishing, 2000.
[Ray10] Roger Rayle. Google Earth: A Platform for Open Data. in: J Solstice : ElectronicJournal of Geography and Mathematics, Institute of Mathematical Geography, 2010.
[RB09] Harald Reiterer and Thorsten Büring. Zooming Techniques. Ency. of Database Systems,pp. 3684–3689, 2009.
[RC01] Mary B. Rosson and John M. Carroll. Usability Engineering: Scenario-BasedDevelopment of Human-Computer Interaction (Interactive Technologies). MorganKaufmann, 2001.
[Rec10] Jan C. Recker. Opportunities and constraints : the current struggle with BPMN. in: J onBusiness Process Management, 16(1), pp. 181–201, 2010.
[Rei11] Manfred Reichert. What BPM Technology Can Do for Healthcare Process Support. in:Proc 3th Conf on Artificial Intelligence in Medicine (AIME’11), LNAI 6747, pp.2–13,Springer, 2011.
[Rei12] Manfred Reichert. Visualizing Large Business Process Models: Challenges, Techniques,Applications. 1st Int’l Workshop on Theory and Applications of Process Visualization(TAProViz’12), BPM’12 Workshops (Invited Keynote), LNBIP 132, pp. 725–736,Springer, 2012.
[Rei13] Wolfgang Reisig. Understanding Petri Nets - Modeling Techniques, Analysis Methods,Case Studies. Springer, 2013.
[RFME11] Hajo A. Reijers, Thomas Freytag, Jan Mendling, and Andreas Eckleder. Syntaxhighlighting in business process models. in: J on Decision Support Systems, 51(3), pp.339-349, 2011.
[RKBB12] Manfred Reichert, Jens Kolb, Ralf Bobrik, and Thomas Bauer. Enabling PersonalizedVisualization of Large Business Processes through Parameterizable Views. in: 27th ACMSymp. On Applied Computing (SAC’12), pp. 1653-1660, ACM, 2012.
[RM11] Hajo A. Reijers and Jan Mendling. A Study Into the Factors That Influence theUnderstandability of Business Process Models. in: J on Transactions on Systems, Man,and Cybernetics, 41(3), Part A, IEEE, 2011.
[RMD11] Hajo A. Reijers, Jan Mendling, and Remco M. Dijkman. Human and automaticmodularizations of process models to enhance their comprehension. in: J on InformationSystems, 36(5), pp. 881–897, 2011.
[Rot13] Edgar Rot. Kontrollierte Experimente zur Verständlichkeit, Ästhetik undÜbersichtlichkeit von Prozessmodellen. Master Thesis, University of Applied Science,Ravensburg-Weingarten, Germany, 2013.
[RRD04] Stefanie Rinderle, Manfred Reichert, and Peter Dadam. On Dealing with StructuralConflicts between Process Type and Instance Changes. in: Proc 2nd. Int’l Conf BusinessProcess Management (BPM’04), LNCS 3080, pp. 274–289, Springer, 2004.
221
Bibliography
[RRMD09] Manfred Reichert, Stefanie Rinderle-Ma, and Peter Dadam. Flexibility in Process-awareInformation Systems. LNCS Transactions on Petri Nets and Other Models ofConcurrency (ToPNoC), Special Issue on Concurrency in Process-aware InformationSystems. Vol. 2, LNCS 5460, pp. 115–135, Springer, 2009.
[RRv+11] Marcello La Rosa, Hajo A. Reijers, Wil M. P. van der Aalst, Remco M. Dijkman, JanMendling, Marlon Dumas, and Luciano García-Bañuelos. APROMORE: An advancedprocess model repository. in: J Expert Syst. Appl., 38(6), pp. 7029–7040, 2011.
[RW12] Manfred Reichert and Barbara Weber. Enabling Flexibility in Process-Aware InformationSystems: Challenges, Methods, Technologies. Springer, 2012.
[SAtDL04] Maarten W.A. Steen, David H. Akehurst, H. t. Doest, and Marc M. Lankhorst.Supporting Viewpoint-Oriented Enterprise Architecture. in: Proc 8th Int’l EnterpriseDistributed Object Computing Conference (EDOC’04), pp. 201-211, IEEE, 2004.
[SB06] Tina Seufert and Roland Bruenken. Cognitive load and the format of instructional aidsfor coherence formation. in: J Applied Cognitive Psychology, 20(3), pp. 321–331, 2006.
[SBH+05] Hartmut Schulze, Henning Brau, Siegmar Haasis, Michael Weyrich, and Tobias Rhatje.Human-Centered design of engineering applications: Success factors from a case study inthe automotive industry. in: J Human Factors in Ergonomics and Manufacturing, 15(4),pp. 421–443, 2005.
[Seu03a] Tina Seufert. Supporting coherence formation in learning from multiple representations.in: J Learning and Instruction 13(2), pp. 227–237, 2003.
[Seu03b] Tina Seufert. Wissenserwerb mit multiplen Repräsentationen: Wirksamkeit vonKohärenzbildungshilfen. PhD Thesis: Logos Verlag Berlin, 2003.
[SGL12] Jonas Söderland, Joana Geraldi, and Thomas Lechter. Gantt charts revisited. in: Int’l Jon Managing Projects in Business, 5(4), pp. 578–594, 2012.
[Shn91] Ben Shneiderman. Tree visualization with Tree-maps: A 2-d space-filling approach. in: JACM Transactions on Graphics, 11, pp. 92–99, 1991.
[Shn96] Ben Shneiderman. The Eyes Have It: A Task by Data Type Taxonomy for InformationVisualizations. in: Proc Symposium on Visual Languages, pp. 336–343, IEEE, 1996.
[SJB07] Tina Seufert, Inge Jänen, and Roland Bruenken. The impact of intrinsic cognitive loadon the effectiveness of graphical help for coherence formation. in: J Computers in HumanBehavior, 23(3), pp. 1055–1071, 2007.
[SKGM12] Andreas Seyfang, Katharina Kaiser, Theresia Gschwandtner, and Silvia Miksch.Visualizing Complex Process Hierarchies during the Modeling Process. in: Proc 1st Int’lWorkshop on Theory and Applications of Process Visualization (TAProViz’12), LNBIP132, pp.768–779, Springer, 2012.
[Som12] Ian Sommerville. Software Engineering. Pearson Studium, 2012.
[SPB05] Alexander T. Streit, Binh L. Pham, and Ross A. Brown. Visualisation Support forManaging Large Business Process Specifications. in: Proc Int’l Conf on Business ProcessManagement (BPM’05), LNCS 3649, pp. 205–219, Springer, 2005.
[Spe00] Robert Spence. Information Visualization. Addison Wesley, ACM, 2000.
222

Bibliography
[SRW11] Sergey Smirnov, Hajo A. Reijers, and Mathias Weske. A Semantic Approach for BusinessProcess Model Abstraction. in: Proc 23rd Int’l Conf on Advanced Information SystemsEngineering (CAiSE’11), LNCS 6741, pp. 497–511, Springer, 2011.
[Str12] Achim Strauss. Information Visualisation in Process-Oriented Semantic InformationNetworks. Diploma Thesis, Ulm University, 2012.
[Sut96] Michael J. D. Sutton. Document Management for the Enterprise: Principles, Techniques,and Applications. Wiley, 1996.
[SvBE00] Bastiaan Schönhage, Alex van Ballegooij, and Anton Eliëns. 3D Gadgets for BusinessProcess Visualization. in: Proc 5th Symposium on the Virtual Reality ModelingLanguage (WEB3D-VRML-00), pp. 131–138, ACM, 2000.
[SZ10] Jörg Schäuffele and Thomas Zurawka. Automotive Software Engineering. Springer DE,2010.
[TC09] Alfredo Raúl Teyseyre and Marcelo R. Campo. An Overview of 3D SoftwareVisualization. in: J IEEE Trans. Vis. Comput. Graph, 1(15), pp. 87–105, 2009.
[TP66] F. Töpfer and Wolfgang Pillewizer. The Principles of Selection, A Means of CartographicGeneralization. in: Cartographic J, 3(1), pp. 10–16, 1966.
[vPD08] Jens von Pilgrim and Kristian Duske. Gef3D: a framework for two-, two-and-a-half-, andthree-dimensional graphical editors. in: Proc Symposium on Software Visualization(SOFTVIS’08), pp. 95–104, ACM, 2008.
[vWN03] Jarke J. van Wijk and Wim. A. A. Nuij. Smooth and Efficient Zooming and Panning. in:Proc 9th annual IEEE Conf on Information Visualization (InfoVis’03), pp. 15-23, IEEE,2003.
[vWN04] Jarke J. van Wijk and Wim A. A. Nuij. A Model for Smooth Viewing and Navigation ofLarge 2D Information Spaces. in: J Transactions on Visualization and ComputerGraphics, 10(4), pp. 447–458, IEEE, 2004.
[WBR10] Stephen West, Ross A. Brown, and Jan C. Recker. Collaborative business processmodeling using 3D virtual environments. in: Proc 16th Americas Conference onInformation Systems : Sustainable IT Collaboration around the Globe, Association forInformation Systems (AMCIS’10), p. 249, Association for Information Systems, 2010.
[WH06] Roel J. Wieringa and Hans J.M.G. Heerkens. The methodological soundness ofrequirements engineering papers: a conceptual framework and two case studies. in: JRequirements Engineering, 11(4), pp. 295–307, Springer, 2006.
[WLS98] Allison Woodruff, James A. Landay, and Michael Stonebraker. Constant informationdensity in zoomable interfaces. in: Proc Working Conference on Advanced VisualInterfaces (AVI’98), pp. 57–65, ACM, 1998.
[WM09] Jörg Wurzer and Bela Mutschler. Bringing innovative Semantic Technology to Practice:The iQser Approach and its Use Cases. in: Proc 4th Int’l Workshop on Applications ofSemantic Technologies (AST’09), LNI 154, pp. 3026–3040, Springer, 2009.
[WMMR05] Roel J. Wieringa, Neil Maiden, Nancy Mead, and Colette Rolland. Requirementsengineering paper classification and evaluation criteria: a proposal and a discussion.Requirements Engineering 11(1), 102-107. (2006), Springer, 2005.
223
Bibliography
[WRH+12] Claes Wohlin, Per Runeson, Martin Höst, Magnus C. Ohlsson, Björn Regnell, and AndersWesslén. Experimentation in Software Engineering. Springer Berlin Heidelberg, 2012.
[Wri03] Peter C. Wright. Funology - From Usability to Enjoyment. in: J Human-ComputerInteraction, 3, Springer, 2003.
[WRMR11] Barbara Weber, Manfred Reichert, Jan Mendling, and Hajo A. Reijers. Refactoring largeprocess model repositories. Computers in Industry, 62(5), pp. 467–486, Elsevier, 2011.
[WRRM08] Barbara Weber, Manfred Reichert, and Stefanie Rinderle-Ma. Change Patterns andChange Support Features - Enhancing Flexibility in Process-Aware Information Systems.in: J Data & Knowledge Engineering Archive, 66(3), pp. 438–466, 2008.
[WRWRM09] Barbara Weber, Manfred Reichert, Werner Wild, and Stefanie Rinderle-Ma. ProvidingIntegrated Life Cycle Support in Process-Aware Information Systems. in: Int’l Journal ofCooperative Information Systems (IJCIS’09) , 18(1), pp. 115-165, 2009.
[WSWW06] Ferdinand Wagner, Ruedi Schmuki, Peter Wolstenholme, and Thomas Wagner. ModelingSoftware with Finite State Machines - A Practical Approach. Taylor & Francis, 2006.
[Wur08] Jörg Wurzer. New approach for semantic web by automatic semantics. in: ProcEuropean Conf on Semantic Technology (ESTC’08), 2008.
[WW96] Kent Wittenburg and Louis Weitzman. Qualitative Visualization of Processes: AttributedGraph Layout and Focusing Techniques. in: Proc Symposium on Graph Drawing(GD’96), LNCS 1190, pp. 401-408, Springer, 1996.
[ZJR11] Michael Zöllner, Hans-Christian Jetter, and Harald Reiterer. ZOIL: A Design Paradigmand Software Framework for Post-WIMP Distributed User Interfaces. in: J onDistributed User Interfaces, pp. 87–94, HCI Series, 2011.
[ZPR+12] Stefan Zugal, Jakob Pinggera, Hajo Reijers, Manfred Reichert, and Barbara Weber.Making the Case for Measuring Mental Effort. in: Proc 2nd Workshop on Experiencesand Empirical Studies in Software Modelling (EESSMod’12), pp. 37–42, ACM, 2012.
224
Acronyms
ABS anti-lock breaking system
ANOVA analysis of variance
BM basis model
BPM business process management
BPMN Business Process Management and Notation
CM context model
CMP critical path method
CSS cascading style sheets
DOM document object model
dr density ratio
E/E electric/electronic
EPC event-driven process chain
FSM Finit State Machines
GIS geographic information systems
HCI Human-computer interaction
LA Linear Algebra
NavSeq navigation sequence
niPRO user-adequate and intelligent process information portals
niPRO user-adequate process information portals
NM navigation model
NS navigation state
NUI natural user interface
OEM Original Equipment Manufacturer
PAIS process-aware information systems
PL Predicate Logic
PMC process model collection
PN Petri Nets
225
Bibliography
PN process navigation
POIL process-oriented information logistics
POIL process-oriented information logistics
POM process object model
ProNaVis Process Navigation and Visualization
SESE single entry single exit
SIN semantic information network
STS State Transition Systems
WIMP windows, icons, menus, and pointers
WS-BPEL WS-business process execution language
XML extensible markup language
ZUI zoomable user interface
226
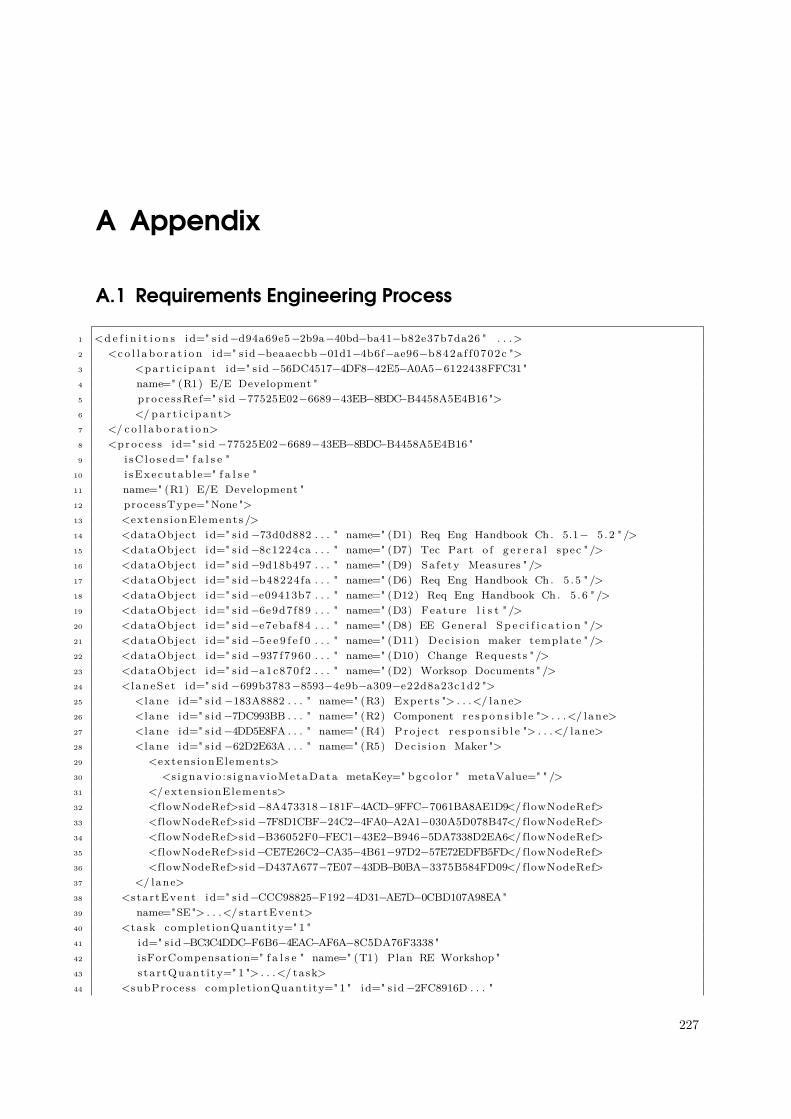
A Appendix
A.1 Requirements Engineering Process
1 <d e f i n i t i o n s id=" s id−d94a69e5−2b9a−40bd−ba41−b82e37b7da26 " . . .>2 <co l l a b o r a t i o n id=" s id−beaaecbb−01d1−4b6f−ae96−b842a f f0702c ">3 <pa r t i c i p an t id=" s id −56DC4517−4DF8−42E5−A0A5−6122438FFC31"4 name=" (R1) E/E Development "5 proces sRe f=" s id −77525E02−6689−43EB−8BDC−B4458A5E4B16 ">6 </ pa r t i c i p an t>7 </ co l l a b o r a t i o n>8 <proce s s id=" s id −77525E02−6689−43EB−8BDC−B4458A5E4B16 "9 i sC l o s ed=" f a l s e "
10 i sExecutab l e=" f a l s e "11 name=" (R1) E/E Development "12 processType="None ">13 <extens ionElements />14 <dataObject id=" s id −73d0d882 . . . " name=" (D1) Req Eng Handbook Ch . 5.1− 5 .2 " />15 <dataObject id=" s id−8c1224ca . . . " name=" (D7) Tec Part o f g e r e r a l spec " />16 <dataObject id=" s id−9d18b497 . . . " name=" (D9) Sa fe ty Measures " />17 <dataObject id=" s id−b48224fa . . . " name=" (D6) Req Eng Handbook Ch . 5 .5 " />18 <dataObject id=" s id−e09413b7 . . . " name=" (D12) Req Eng Handbook Ch . 5 .6 " />19 <dataObject id=" s id−6e9d7f89 . . . " name=" (D3) Feature l i s t " />20 <dataObject id=" s id−e7ebaf84 . . . " name=" (D8) EE General S p e c i f i c a t i o n " />21 <dataObject id=" s id−5e e 9 f e f 0 . . . " name=" (D11) Dec i s i on maker template " />22 <dataObject id=" s id −937 f7960 . . . " name=" (D10) Change Requests " />23 <dataObject id=" s id−a1c870f2 . . . " name=" (D2) Worksop Documents " />24 <laneSet id=" s id −699b3783−8593−4e9b−a309−e22d8a23c1d2 ">25 <lane id=" s id −183A8882 . . . " name=" (R3) Experts "> . . .</ lane>26 <lane id=" s id−7DC993BB . . . " name=" (R2) Component r e s p on s i b l e "> . . .</ lane>27 <lane id=" s id−4DD5E8FA . . . " name=" (R4) Pro j e c t r e s p on s i b l e "> . . .</ lane>28 <lane id=" s id −62D2E63A . . . " name=" (R5) Dec i s i on Maker ">29 <extens ionElements>30 <signav io : s i gnav ioMetaData metaKey=" bgco lo r " metaValue=" " />31 </ extens ionElements>32 <flowNodeRef>sid−8A473318−181F−4ACD−9FFC−7061BA8AE1D9</ flowNodeRef>33 <flowNodeRef>sid−7F8D1CBF−24C2−4FA0−A2A1−030A5D078B47</ flowNodeRef>34 <flowNodeRef>sid−B36052F0−FEC1−43E2−B946−5DA7338D2EA6</ flowNodeRef>35 <flowNodeRef>sid−CE7E26C2−CA35−4B61−97D2−57E72EDFB5FD</flowNodeRef>36 <flowNodeRef>sid−D437A677−7E07−43DB−B0BA−3375B584FD09</ flowNodeRef>37 </ lane>38 <startEvent id=" s id−CCC98825−F192−4D31−AE7D−0CBD107A98EA"39 name="SE"> . . .</ startEvent>40 <task complet ionQuantity=" 1 "41 id=" s id−BC3C4DDC−F6B6−4EAC−AF6A−8C5DA76F3338"42 isForCompensation=" f a l s e " name=" (T1) Plan RE Workshop "43 s ta r tQuant i ty=" 1 "> . . .</ task>44 <subProcess complet ionQuantity=" 1 " id=" s id−2FC8916D . . . "
227
A Appendix
45 isForCompensation=" f a l s e " name=" (T2) Perform RE Wokshop"46 s ta r tQuant i ty=" 1 " tr iggeredByEvent=" f a l s e "> . . .</ subProcess>47 <task complet ionQuantity=" 1 " id=" s id−A8E3EB1C−590E−40C1−8541−37F53E5F8A2A"48 isForCompensation=" f a l s e " name=" (T3) Write t e c hn i c a l part o f g ene ra l spec . "49 s ta r tQuant i ty=" 1 ">50 <extens ionElements>51 <signav io : s i gnav ioMetaData metaKey=" bgco lo r " metaValue="#f f f f c c " />52 </ extens ionElements>53 <incoming>sid−1C4B2088−2BEF−45F0−AEB7−AF82190A1972</ incoming>54 <outgoing>sid −8287E761−1B11−4A4B−873D−69D648917643</ outgoing>55 <i o S p e c i f i c a t i o n id=" s id−6ce29bfb−7dd3−4088−8ede−01bab8259bcd ">56 <dataInput id=" s id−f f 1 5 c f a c −51f5−4cbf−a5e4−3864126adae6 " />57 <dataInput id=" s id−5b26bd6e−330c−4b2a−bb5f−09afe905c598 " />58 <dataOutput id=" s id−3bba1abe−359 f−4bba−b080−3d2a9f3e5401 " />59 <inputSet id=" s id−1ab95166 . . . " name=" Defau l t InputSet ">60 <dataInputRefs>sid−f f 1 5 c f a c −51f5−4cbf−a5e4−3864126adae6</dataInputRefs>61 <dataInputRefs>sid−5b26bd6e−330c−4b2a−bb5f−09afe905c598</dataInputRefs>62 <outputSetRefs>sid−f 932 f3c6−f fb7 −4394−80af−61da39ecc94b</ outputSetRefs>63 </ inputSet>64 <outputSet id=" s id−f 9 32 f 3 c6 . . . " name=" DefaultOutputSet ">65 <dataOutputRefs>sid−3bba1abe . . .</dataOutputRefs>66 <inputSetRe f s>sid−1ab95166−4e04−4fe6−93da−0269ea2e164d</ inputSetRe f s>67 </outputSet>68 </ i o S p e c i f i c a t i o n>69 <dataInputAssoc ia t i on id=" s id−4F7D6235−B2D8−4A6E−B49B−A7E6D296E8BF">70 <sourceRef>sid−6A749F2A−BF2B−4978−A18C−072A91CE813C</ sourceRef>71 <targe tRe f>sid−f f 1 5 c f a c −51f5−4cbf−a5e4−3864126adae6</ targe tRe f>72 </dataInputAssoc ia t i on>73 <dataInputAssoc ia t i on id=" s id−4B488B0F−E3E3−48E3−908D−7A9F5948E3FD">74 <sourceRef>sid−B9AF53EB−1A35−4234−91F3−2AA31E439307</ sourceRef>75 <targe tRe f>sid−5b26bd6e−330c−4b2a−bb5f−09afe905c598</ targe tRe f>76 </dataInputAssoc ia t i on>77 <dataOutputAssoc iat ion id=" s id−C04666E6−56C7−4424−9AFB−EFEBBC1A886C">78 <sourceRef>sid−3bba1abe−359 f−4bba−b080−3d2a9f3e5401</ sourceRef>79 <targe tRe f>sid−B3E7CCC6−02C5−4F00−AA36−9FC0364B8C78</ targe tRe f>80 </dataOutputAssoc iat ion>81 </ task>82 <task complet ionQuantity=" 1 " id=" s id−B92C5D58−982E−40BF−BF12−B3FAB04728BE"83 sForCompensation=" f a l s e " name=" (A4) Write g ene ra l s p e c i f i c a t i o n . "84 s ta r tQuant i ty=" 1 "> . . .</ task>85 <startEvent id=" s id−CCC98825−F192−4D31−AE7D−0CBD107A98EA"86 name="SE"> . . .</ startEvent>87 <task complet ionQuantity=" 1 " id=" s id−1D11883F−21B9−44FF−9EA3−3190C301C73E"88 isForCompensation=" f a l s e " name=" (A5) In t e g r a t e component s p e c i f i c a t i o n to89 gene ra l s p e c f i c a t i o n . " s ta r tQuant i ty=" 1 "> . . .</ task>90 <task complet ionQuantity=" 1 " id=" s id−CAF40F33−571A−471B−A867−3163163E8075 "91 isForCompensation=" f a l s e " name=" (A8) Perform FMEA ana l y s i s "92 s ta r tQuant i ty=" 1 "> . . .</ task>93 <exclus iveGateway gatewayDirect ion=" Converging "94 id=" s id−8E3544A9−0688−4742−B05B−FC4157A05165 " name=" (G1) ">95 . . .</ exclus iveGateway>96 <task complet ionQuantity=" 1 " id=" s id−8A473318−181F−4ACD−9FFC−7061BA8AE1D9"97 isForCompensation=" f a l s e " name=" (A6) Evaluate and g ive s t r a t e g i c d i r e c t i o n . "98 s ta r tQuant i ty=" 1 "> . . .</ task>99 <exclus iveGateway gatewayDirect ion=" Diverg ing "
100 id=" s id−7F8D1CBF−24C2−4FA0−A2A1−030A5D078B47"101 name=" (G2) Change Request a v a i l a b l e ? "> . . .</ exclus iveGateway>
228
A.2 Experiment 1
102 <task complet ionQuantity=" 1 " id=" s id−B36052F0−FEC1−43E2−B946−5DA7338D2EA6"103 isForCompensation=" f a l s e " name=" (A7) Inco rpora te change r eque s t s . "104 s ta r tQuant i ty=" 1 "> . . .</ task>105 <task complet ionQuantity=" 1 " id=" s id−CE7E26C2−CA35−4B61−97D2−57E72EDFB5FD"106 isForCompensation=" f a l s e " name=" (A9) Re lease gene ra l s p e c i f i c a t i o n . "107 s ta r tQuant i ty=" 1 "> . . .</ task>108 <endEvent id=" s id−D437A677−7E07−43DB−B0BA−3375B584FD09" name=" ">109 . . .</endEvent>110 <sequenceFlow id=" s id−5B489B98 . . . " name=" " sourceRef=" s id−CCC98825 . . . "111 ta rge tRe f=" s id−BC3C4DDC . . . " />112 <sequenceFlow id=" s id −8287E761 . . . " name=" " sourceRef=" s id−A8E3EB1C . . . "113 ta rge tRe f=" s id−B92C5D58 . . . " />114 <sequenceFlow id=" s id −71EA84A1 . . . " name=" " sourceRef=" s id−B92C5D58 . . . "115 ta rge tRe f=" s id−8E3544A9 . . . " />116 <sequenceFlow id=" s id−BA42AF6D . . . " name=" " sourceRef=" s id−8A473318 . . . "117 ta rge tRe f=" s id−7F8D1CBF . . . " />118 . . .119 <dataObjectReference dataObjectRef=" s id −73d0d882 . . . " id=" s id−E8059C91 . . . "120 name=" (D1) Requirements Engineer ing Handbook Chapter 5.1− 5 .2 ">121 <extens ionElements>122 <signav io : s i gnav ioMetaData metaKey=" bgco lo r " metaValue="#f f f f f f " />123 </ extens ionElements>124 </dataObjectReference>125 <dataObjectReference dataObjectRef=" s id−8c1224ca . . . " id=" s id−B3E7CCC6 . . . "126 name=" (D7) Technica l Part o f g e r e r a l s p e c i f i c a t i o n "> . . .</ dataObjectReference>127 <dataObjectReference dataObjectRef=" s id−9d18b497 . . . " id=" s id−F51A38B0 . . . "128 name=" (D9) Sa fe ty Measures "> . . .</ dataObjectReference>129 <dataObjectReference dataObjectRef=" s id−b48224fa . . . " id=" s id−B9AF53EB . . . "130 name=" (D6) Requirements Engineer ing Handbook Chapter 5 . 5 ">131 . . .</ dataObjectReference>132 <dataObjectReference dataObjectRef=" s id−e09413b7 . . . " id=" s id−BF0D50F3 . . . "133 name=" (D12) Requirements Engineer ing Handbook Chapter 5 . 6 ">134 . . .</ dataObjectReference>135 </ proce s s>136 <bpmndi:BPMNDiagram id=" s id−eaa5bccf−47ca−44c7−9742−8c7b9e8abf f1 ">137 . . .138 </bpmndi:BPMNDiagram>139 </ d e f i n i t i o n s>
Listing A.1: XML file of the requirements engineering process model.
A.2 Experiment 1
A.2.1 Introduction 1-dimensional Navigation Concept
229
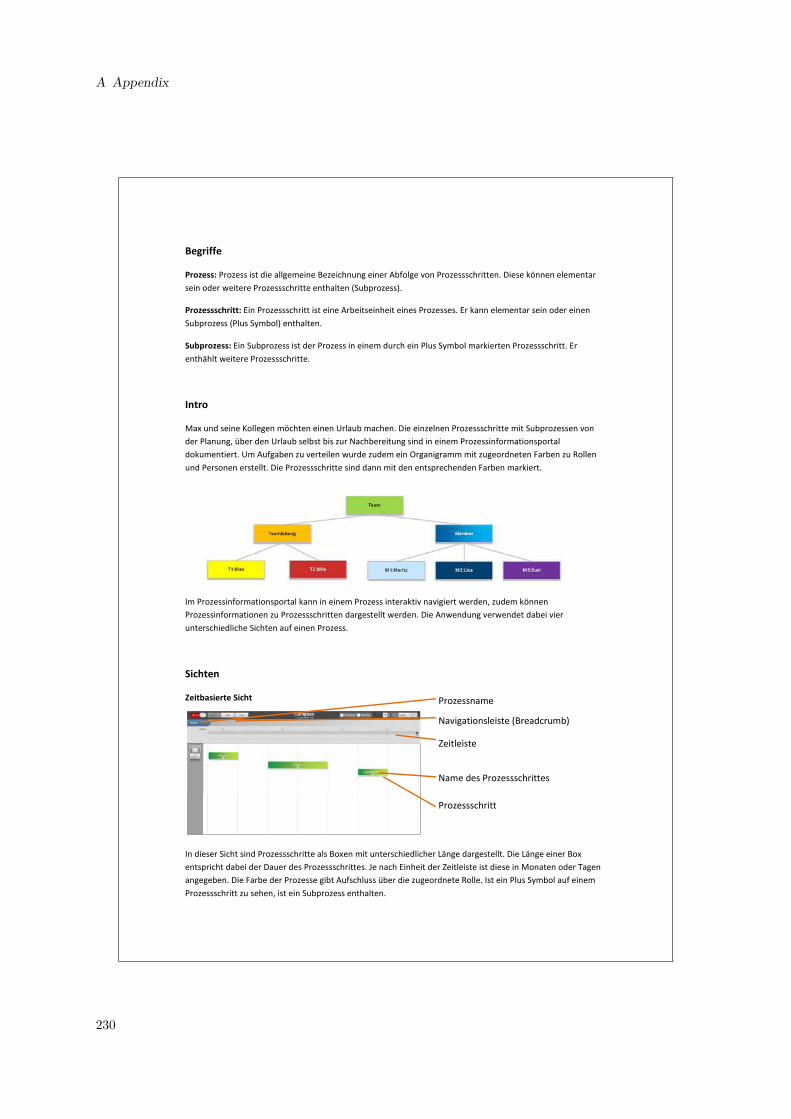
Begriffe
Prozess: Prozess ist die allgemeine Bezeichnung einer Abfolge von Prozessschritten. Diese können elementar
sein oder weitere Prozessschritte enthalten (Subprozess).
Prozessschritt: Ein Prozessschritt ist eine Arbeitseinheit eines Prozesses. Er kann elementar sein oder einen
Subprozess (Plus Symbol) enthalten.
Subprozess: Ein Subprozess ist der Prozess in einem durch ein Plus Symbol markierten Prozessschritt. Er
enthählt weitere Prozessschritte.
Intro
Max und seine Kollegen möchten einen Urlaub machen. Die einzelnen Prozessschritte mit Subprozessen von
der Planung, über den Urlaub selbst bis zur Nachbereitung sind in einem Prozessinformationsportal
dokumentiert. Um Aufgaben zu verteilen wurde zudem ein Organigramm mit zugeordneten Farben zu Rollen
und Personen erstellt. Die Prozessschritte sind dann mit den entsprechenden Farben markiert.
Im Prozessinformationsportal kann in einem Prozess interaktiv navigiert werden, zudem können
Prozessinformationen zu Prozessschritten dargestellt werden. Die Anwendung verwendet dabei vier
unterschiedliche Sichten auf einen Prozess.
Sichten
Zeitbasierte Sicht
In dieser Sicht sind Prozessschritte als Boxen mit unterschiedlicher Länge dargestellt. Die Länge einer Box
entspricht dabei der Dauer des Prozessschrittes. Je nach Einheit der Zeitleiste ist diese in Monaten oder Tagen
angegeben. Die Farbe der Prozesse gibt Aufschluss über die zugeordnete Rolle. Ist ein Plus Symbol auf einem
Prozessschritt zu sehen, ist ein Subprozess enthalten.
Prozessschritt
Zeitleiste
Navigationsleiste (Breadcrumb)
Name des Prozessschrittes
Prozessname
A Appendix
230
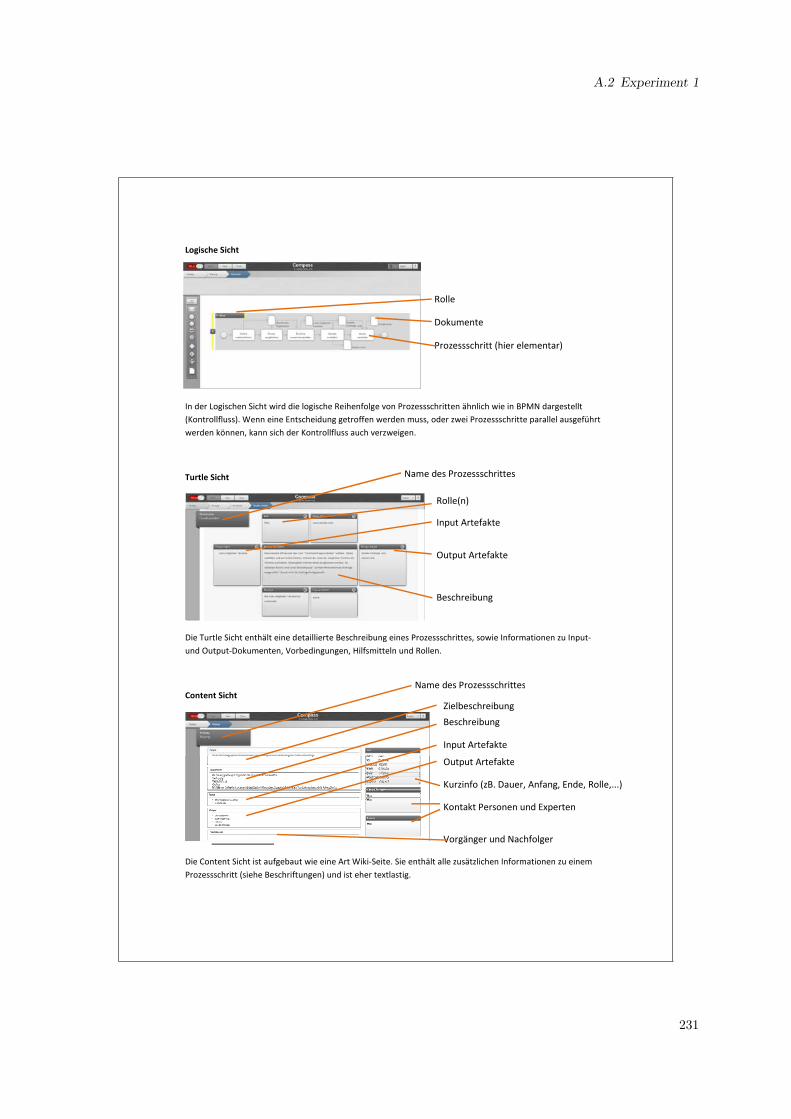
Logische Sicht
In der Logischen Sicht wird die logische Reihenfolge von Prozessschritten ähnlich wie in BPMN dargestellt
(Kontrollfluss). Wenn eine Entscheidung getroffen werden muss, oder zwei Prozessschritte parallel ausgeführt
werden können, kann sich der Kontrollfluss auch verzweigen.
Turtle Sicht
Die Turtle Sicht enthält eine detaillierte Beschreibung eines Prozessschrittes, sowie Informationen zu Input-
und Output-Dokumenten, Vorbedingungen, Hilfsmitteln und Rollen.
Content Sicht
Die Content Sicht ist aufgebaut wie eine Art Wiki-Seite. Sie enthält alle zusätzlichen Informationen zu einem
Prozessschritt (siehe Beschriftungen) und ist eher textlastig.
Rolle
Dokumente
Prozessschritt (hier elementar)
Input Artefakte
Output Artefakte
Beschreibung
Name des Prozessschrittes
Rolle(n)
Zielbeschreibung
Beschreibung
Input Artefakte
Output Artefakte
Vorgänger und Nachfolger
Kurzinfo (zB. Dauer, Anfang, Ende, Rolle,...)
Kontakt Personen und Experten
Name des Prozessschrittes
A.2 Experiment 1
231
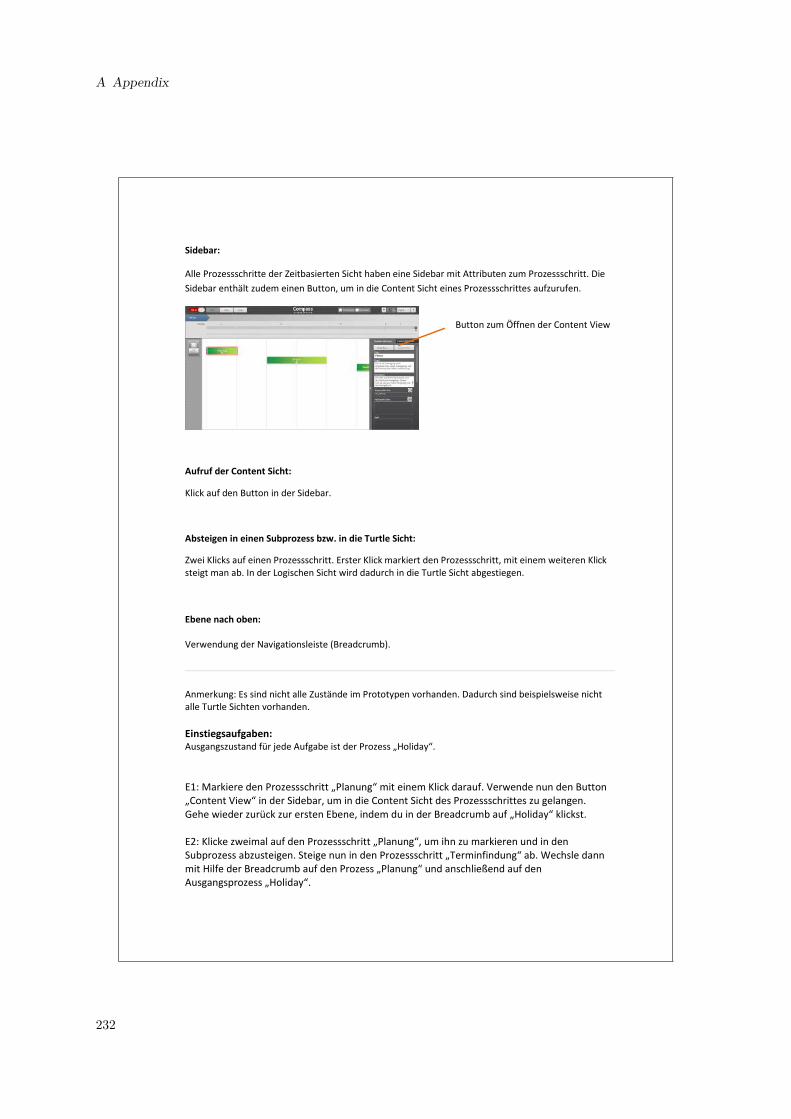
Sidebar:
Alle Prozessschritte der Zeitbasierten Sicht haben eine Sidebar mit Attributen zum Prozessschritt. Die
Sidebar enthält zudem einen Button, um in die Content Sicht eines Prozessschrittes aufzurufen.
Aufruf der Content Sicht:
Klick auf den Button in der Sidebar.
Absteigen in einen Subprozess bzw. in die Turtle Sicht:
Zwei Klicks auf einen Prozessschritt. Erster Klick markiert den Prozessschritt, mit einem weiteren Klick
steigt man ab. In der Logischen Sicht wird dadurch in die Turtle Sicht abgestiegen.
Ebene nach oben:
Verwendung der Navigationsleiste (Breadcrumb).
Anmerkung: Es sind nicht alle Zustände im Prototypen vorhanden. Dadurch sind beispielsweise nicht
alle Turtle Sichten vorhanden.
Einstiegsaufgaben:
Ausgangszustand für jede Aufgabe ist der Prozess „Holiday“.
E1: Markiere den Prozessschritt „Planung“ mit einem Klick darauf. Verwende nun den Button
„Content View“ in der Sidebar, um in die Content Sicht des Prozessschrittes zu gelangen.
Gehe wieder zurück zur ersten Ebene, indem du in der Breadcrumb auf „Holiday“ klickst.
E2: Klicke zweimal auf den Prozessschritt „Planung“, um ihn zu markieren und in den
Subprozess abzusteigen. Steige nun in den Prozessschritt „Terminfindung“ ab. Wechsle dann
mit Hilfe der Breadcrumb auf den Prozess „Planung“ und anschließend auf den
Ausgangsprozess „Holiday“.
Button zum Öffnen der Content View
A Appendix
232

E3: Steige wieder in den Prozessschritt „Planung“ ab. Danach in den Prozessschritt
„Recherche“. Dieser Prozess wurde in der Logischen Sicht modelliert. Mache nun zwei Klicks
auf den Prozessschritt „Termine zusammenstellen“, um die Turtle des Prozessschrittes
aufzurufen. Verwende anschließend die Breadcrumb, um zum Ausgangsprozess „Holiday“ zu
gelangen.
A.2 Experiment 1
233

A Appendix
A.2.2 Introduction 3-dimensional Navigation Concept
234
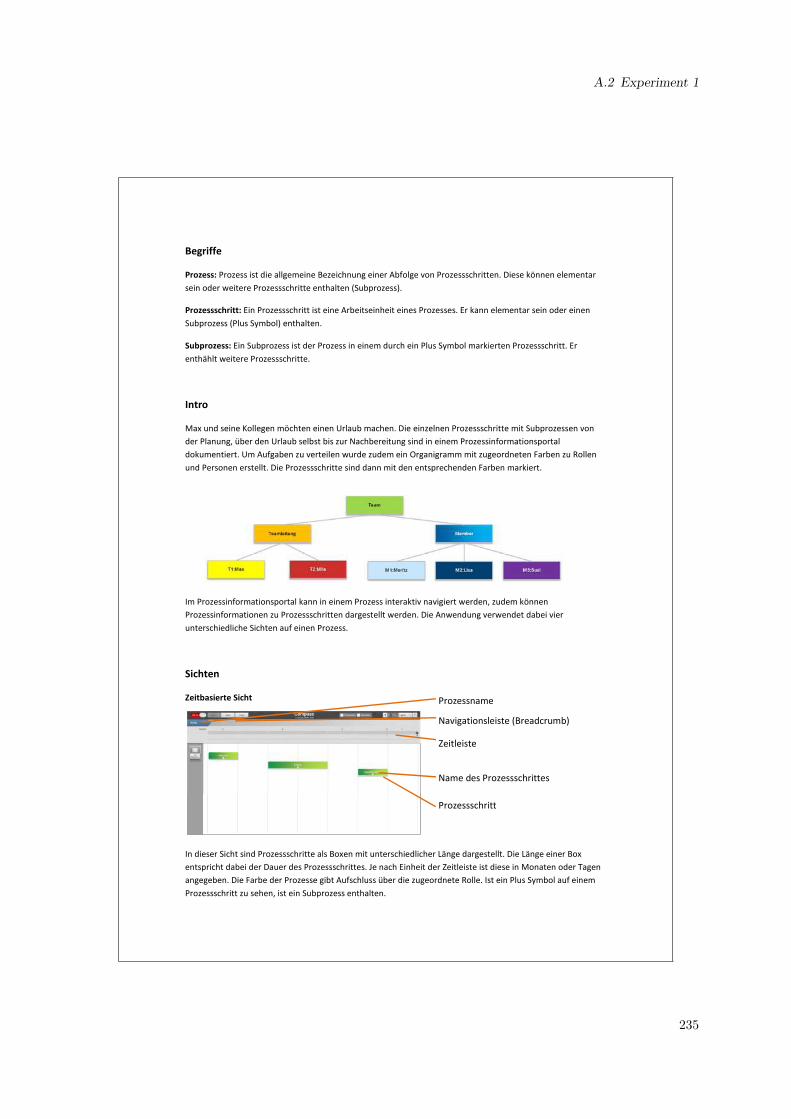
Begriffe
Prozess: Prozess ist die allgemeine Bezeichnung einer Abfolge von Prozessschritten. Diese können elementar
sein oder weitere Prozessschritte enthalten (Subprozess).
Prozessschritt: Ein Prozessschritt ist eine Arbeitseinheit eines Prozesses. Er kann elementar sein oder einen
Subprozess (Plus Symbol) enthalten.
Subprozess: Ein Subprozess ist der Prozess in einem durch ein Plus Symbol markierten Prozessschritt. Er
enthählt weitere Prozessschritte.
Intro
Max und seine Kollegen möchten einen Urlaub machen. Die einzelnen Prozessschritte mit Subprozessen von
der Planung, über den Urlaub selbst bis zur Nachbereitung sind in einem Prozessinformationsportal
dokumentiert. Um Aufgaben zu verteilen wurde zudem ein Organigramm mit zugeordneten Farben zu Rollen
und Personen erstellt. Die Prozessschritte sind dann mit den entsprechenden Farben markiert.
Im Prozessinformationsportal kann in einem Prozess interaktiv navigiert werden, zudem können
Prozessinformationen zu Prozessschritten dargestellt werden. Die Anwendung verwendet dabei vier
unterschiedliche Sichten auf einen Prozess.
Sichten
Zeitbasierte Sicht
In dieser Sicht sind Prozessschritte als Boxen mit unterschiedlicher Länge dargestellt. Die Länge einer Box
entspricht dabei der Dauer des Prozessschrittes. Je nach Einheit der Zeitleiste ist diese in Monaten oder Tagen
angegeben. Die Farbe der Prozesse gibt Aufschluss über die zugeordnete Rolle. Ist ein Plus Symbol auf einem
Prozessschritt zu sehen, ist ein Subprozess enthalten.
Prozessschritt
Zeitleiste
Navigationsleiste (Breadcrumb)
Name des Prozessschrittes
Prozessname
A.2 Experiment 1
235

Logische Sicht
In der Logischen Sicht wird die logische Reihenfolge von Prozessschritten ähnlich wie in BPMN dargestellt
(Kontrollfluss). Wenn eine Entscheidung getroffen werden muss, oder zwei Prozessschritte parallel ausgeführt
werden können, kann sich der Kontrollfluss auch verzweigen.
Turtle Sicht
Die Turtle Sicht enthält eine detaillierte Beschreibung eines Prozessschrittes, sowie Informationen zu Input-
und Output-Dokumenten, Vorbedingungen, Hilfsmitteln und Rollen.
Content Sicht
Die Content Sicht ist aufgebaut wie eine Art Wiki-Seite. Sie enthält alle zusätzlichen Informationen zu einem
Prozessschritt (siehe Beschriftungen) und ist eher textlastig.
Rolle
Dokumente
Prozessschritt (hier elementar)
Input Artefakte
Output Artefakte
Beschreibung
Name des Prozessschrittes
Rolle(n)
Zielbeschreibung
Beschreibung
Input Artefakte
Output Artefakte
Vorgänger und Nachfolger
Kurzinfo (zB. Dauer, Anfang, Ende, Rolle,...)
Kontakt Personen und Experten
Name des Prozessschrittes
A Appendix
236
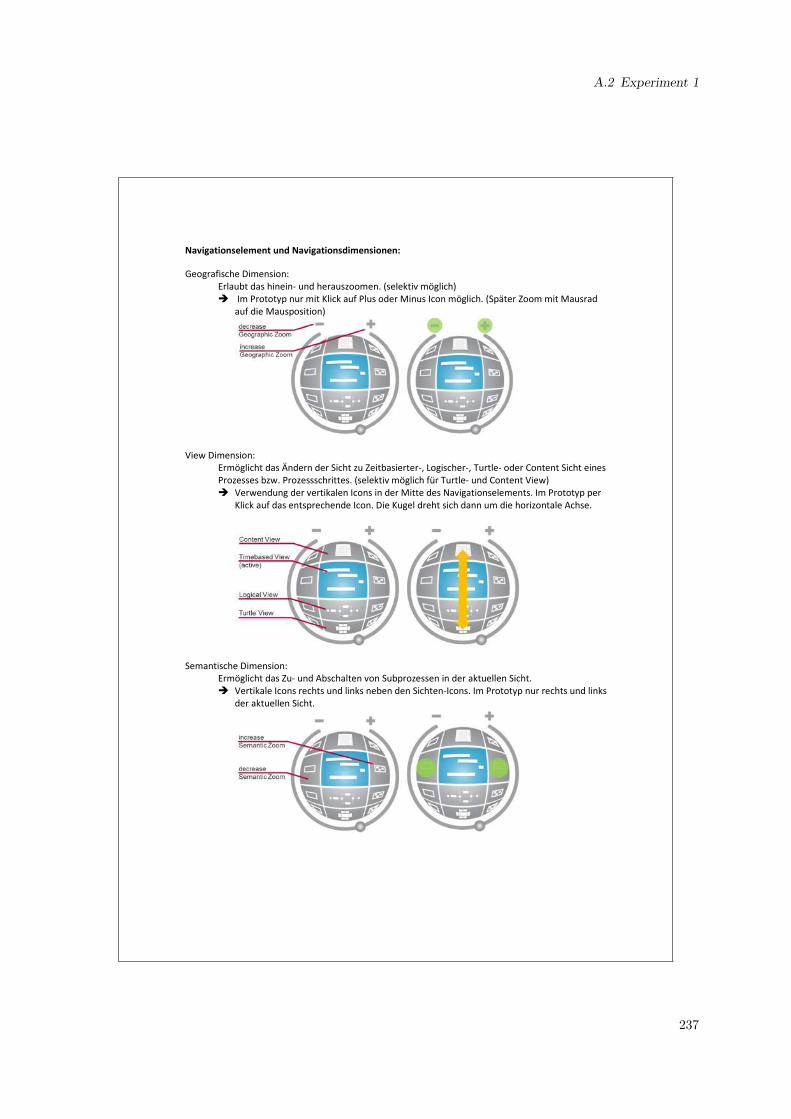
Navigationselement und Navigationsdimensionen:
Geografische Dimension:
Erlaubt das hinein- und herauszoomen. (selektiv möglich)
� Im Prototyp nur mit Klick auf Plus oder Minus Icon möglich. (Später Zoom mit Mausrad
auf die Mausposition)
View Dimension: Ermöglicht das Ändern der Sicht zu Zeitbasierter-, Logischer-, Turtle- oder Content Sicht eines
Prozesses bzw. Prozessschrittes. (selektiv möglich für Turtle- und Content View)
� Verwendung der vertikalen Icons in der Mitte des Navigationselements. Im Prototyp per
Klick auf das entsprechende Icon. Die Kugel dreht sich dann um die horizontale Achse.
Semantische Dimension: Ermöglicht das Zu- und Abschalten von Subprozessen in der aktuellen Sicht.
� Vertikale Icons rechts und links neben den Sichten-Icons. Im Prototyp nur rechts und links
der aktuellen Sicht.
A.2 Experiment 1
237
Absteigen in einen Subprozess:
(Kombination von Semantischer und Geografischer Navigationsdimension)
1.Möglk.:
Selektives Heranzoomen an einen Prozessschritt und Zuschalten der Subprozesse. Ein Prozessschritt
wird mit einem Klick markiert, dann wird mit dem Plus Icon herangezoomt und anschließend werden
Subprozesse zugeschaltet.
2.Möglk.: Zwei Klicks auf einen Prozessschritt. Erster Klick markiert den Prozessschritt, mit einem weiteren Klick
steigt man ab.
Ebene nach oben:
Herauszoomen oder Verwendung der Navigationsleiste (Breadcrumb).
Anmerkung: Es sind nicht alle Zustände im Prototypen vorhanden und damit sind beispielsweise nicht
immer alle Sichten aufrufbar.
Einstiegsaufgaben:
Ausgangszustand für jede Aufgabe ist der Prozess „Holiday“ in der zeitbasierten Sicht.
E1: Verwende mehrmals das Plus-Icon am Navigationselement, um auf den Prozessschritt „Planung“
zu zoomen. (Simuliert das Zoomen auf die Position des Mauszeigers mit Strg + Mausrad. Dabei zeigt
der graue Rahmen jeweils zuerst an, wo im nächsten Schritt hingezoomt wird.) Zoome anschließend mit dem Minus-Icon wieder vollständig heraus.
E2: Verwende das Icon rechts neben dem Icon der aktuellen Sicht, um Subprozesse zu allen
sichtbaren Prozessschritten zuzuschalten. Schalte die Subprozesse anschließend wieder ab.
E3: Mache zwei Klicks auf den Prozessschritt „Planung“, um in den Subprozess abzusteigen.
Verwende anschließend mehrmals das Minus-Icon oder die Breadcrumb um wieder den
übergeordneten Prozess „Holiday“ vollständig darzustellen. Schalte die Subprozesse ab.
E4: Ändere nun mit Hilfe des Navigationselements die Sicht auf den Prozess. Klicke dazu beispielsweise auf das Icon der Logischen Sicht. Wechsle dann auf die Content Sicht und verwende
das Plus Icon zum Zoomen. Zoome anschließend wieder heraus und wechsle auf die Zeitbasierte
Sicht.
E5: Selektiere den Prozessschritt „Planung“ und wechsle auf die Turtle Sicht. Durch das selektive
Wechseln der Sicht wird automatisch an die Turtle herangezoomt. Zoome heraus und wechsle
wieder zur Zeitbasierten Sicht.
E6: Schalte Subprozesse zu und markiere den Prozessschritt „Planung“. Mache noch einen Klick auf
den Prozessschritt, um in den Subprozess abzusteigen. Schalte dann noch einmal Subprozesse zu. Verwende nun die Breadcrumb, um zum Ausgangszustand im Prozess „Holiday“ in der Zeitbasierten
Sicht zu gelangen.
E7: Teste selbst.
A Appendix
238

A.2 Experiment 1
A.2.3 Questionnaire
239
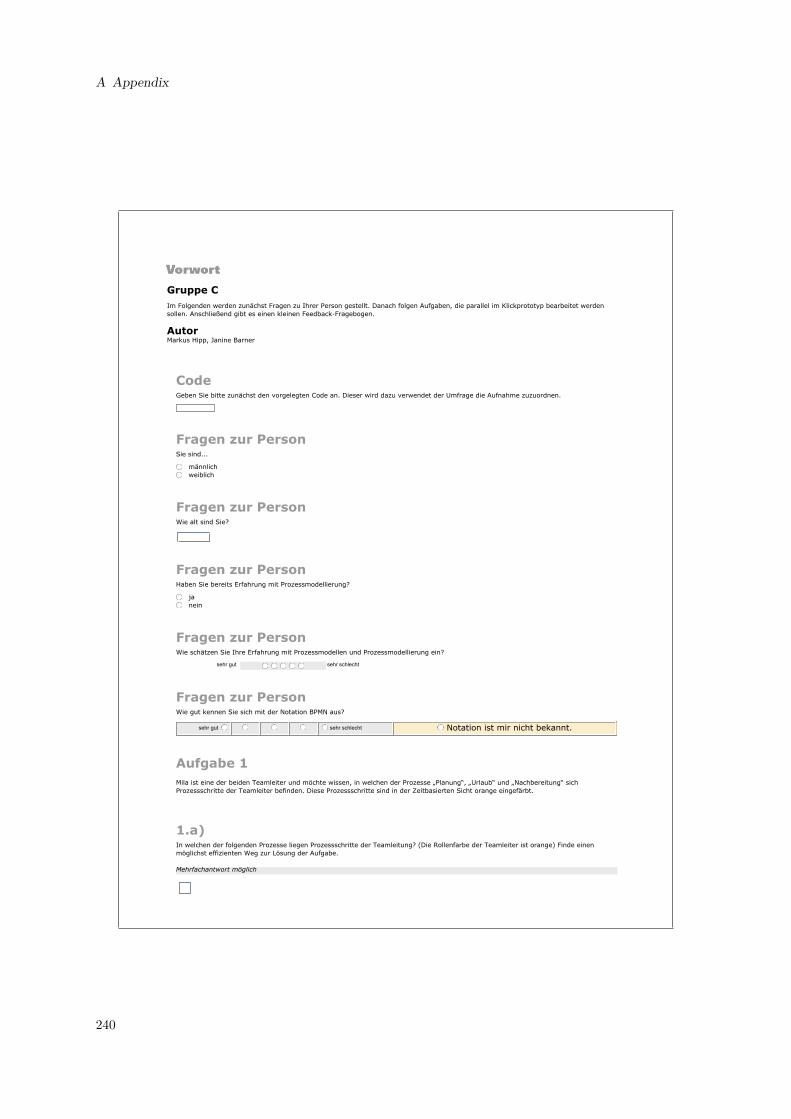
Gruppe CIm Folgenden werden zunächst Fragen zu Ihrer Person gestellt. Danach folgen Aufgaben, die parallel im Klickprototyp bearbeitet werdensollen. Anschließend gibt es einen kleinen Feedback-Fragebogen.
AutorMarkus Hipp, Janine Barner
Code
Geben Sie bitte zunächst den vorgelegten Code an. Dieser wird dazu verwendet der Umfrage die Aufnahme zuzuordnen.
Fragen zur Person
Sie sind...
männlich weiblich
Fragen zur Person
Wie alt sind Sie?
Fragen zur Person
Haben Sie bereits Erfahrung mit Prozessmodellierung?
ja nein
Fragen zur Person
Wie schätzen Sie Ihre Erfahrung mit Prozessmodellen und Prozessmodellierung ein?
sehr gut sehr schlecht
Fragen zur Person
Wie gut kennen Sie sich mit der Notation BPMN aus?
sehr gut sehr schlecht Notation ist mir nicht bekannt.
Aufgabe 1Mila ist eine der beiden Teamleiter und möchte wissen, in welchen der Prozesse „Planung“, „Urlaub“ und „Nachbereitung“ sichProzessschritte der Teamleiter befinden. Diese Prozessschritte sind in der Zeitbasierten Sicht orange eingefärbt.
1.a)
In welchen der folgenden Prozesse liegen Prozessschritte der Teamleitung? (Die Rollenfarbe der Teamleiter ist orange) Finde einenmöglichst effizienten Weg zur Lösung der Aufgabe.
Mehrfachantwort möglich
"Planung"
A Appendix
240
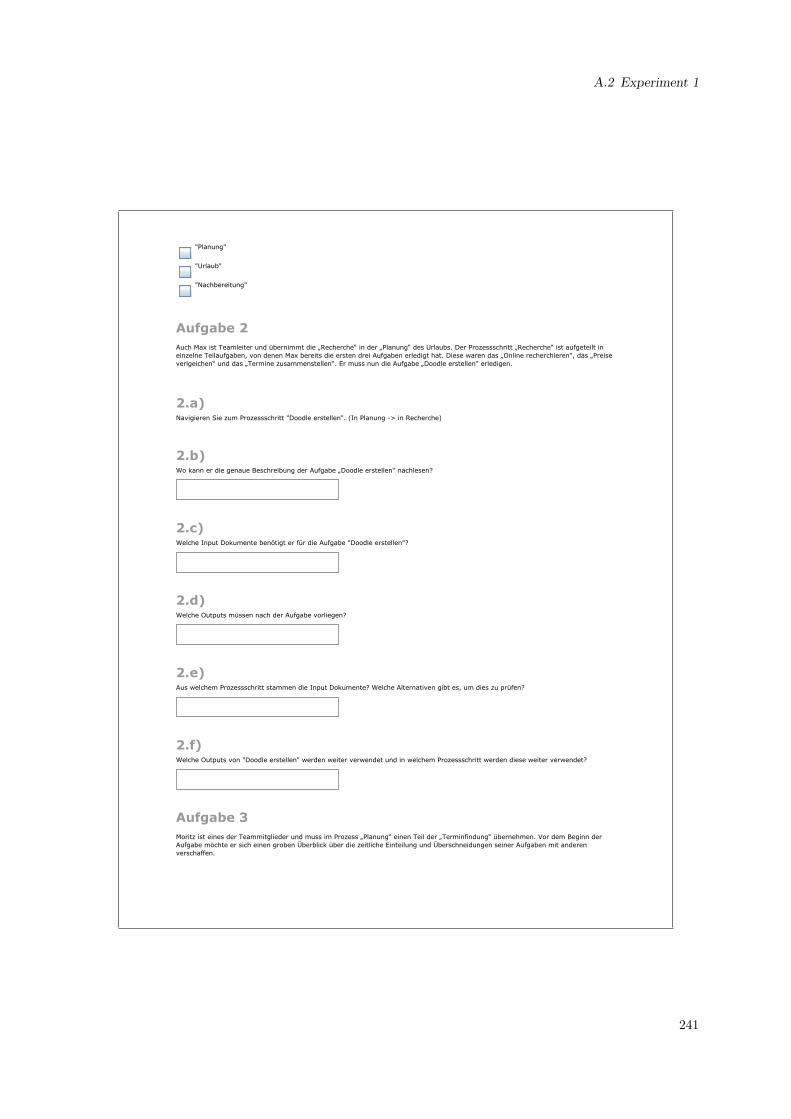
"Planung"
"Urlaub"
"Nachbereitung"
Aufgabe 2Auch Max ist Teamleiter und übernimmt die „Recherche“ in der „Planung“ des Urlaubs. Der Prozessschritt „Recherche“ ist aufgeteilt ineinzelne Teilaufgaben, von denen Max bereits die ersten drei Aufgaben erledigt hat. Diese waren das „Online recherchieren“, das „Preiseverlgeichen“ und das „Termine zusammenstellen“. Er muss nun die Aufgabe „Doodle erstellen“ erledigen.
2.a)
Navigieren Sie zum Prozessschritt "Doodle erstellen". (In Planung -> in Recherche)
2.b)
Wo kann er die genaue Beschreibung der Aufgabe „Doodle erstellen“ nachlesen?
2.c)
Welche Input Dokumente benötigt er für die Aufgabe "Doodle erstellen"?
2.d)
Welche Outputs müssen nach der Aufgabe vorliegen?
2.e)
Aus welchem Prozessschritt stammen die Input Dokumente? Welche Alternativen gibt es, um dies zu prüfen?
2.f)
Welche Outputs von "Doodle erstellen" werden weiter verwendet und in welchem Prozessschritt werden diese weiter verwendet?
Aufgabe 3Moritz ist eines der Teammitglieder und muss im Prozess „Planung“ einen Teil der „Terminfindung“ übernehmen. Vor dem Beginn derAufgabe möchte er sich einen groben Überblick über die zeitliche Einteilung und Überschneidungen seiner Aufgaben mit anderenverschaffen.
A.2 Experiment 1
241
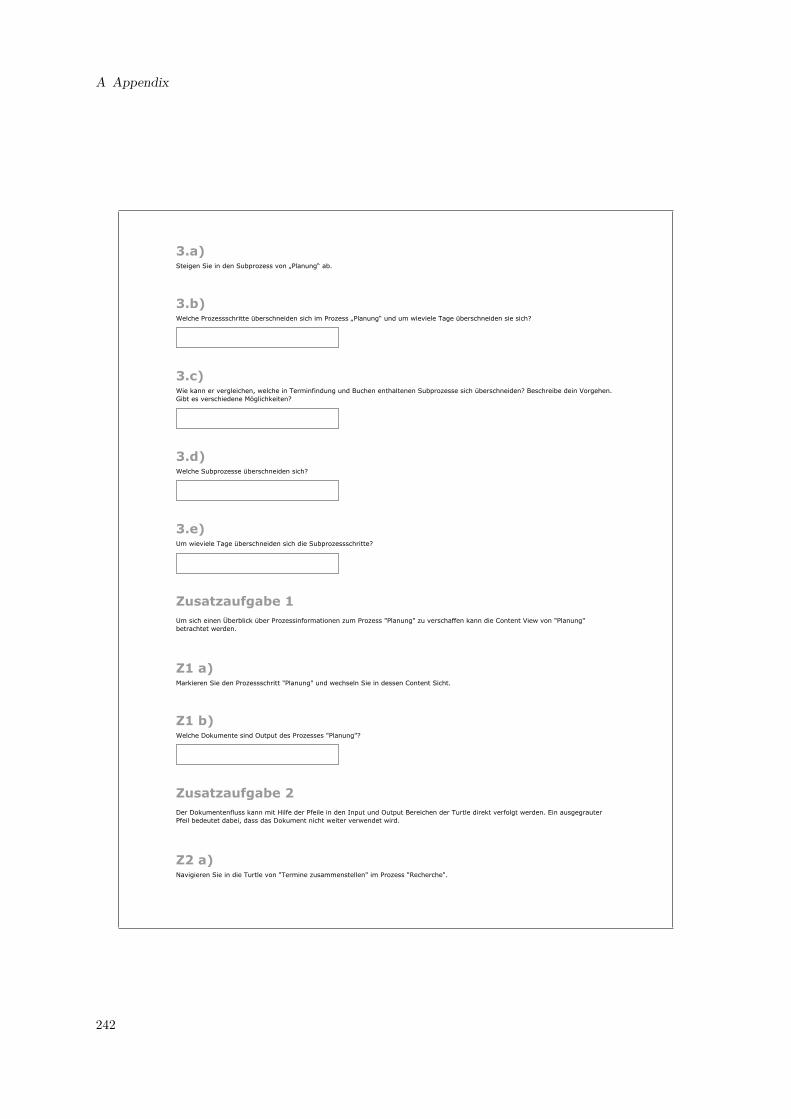
3.a)
Steigen Sie in den Subprozess von „Planung“ ab.
3.b)
Welche Prozessschritte überschneiden sich im Prozess „Planung“ und um wieviele Tage überschneiden sie sich?
3.c)
Wie kann er vergleichen, welche in Terminfindung und Buchen enthaltenen Subprozesse sich überschneiden? Beschreibe dein Vorgehen.Gibt es verschiedene Möglichkeiten?
3.d)
Welche Subprozesse überschneiden sich?
3.e)
Um wieviele Tage überschneiden sich die Subprozessschritte?
Zusatzaufgabe 1Um sich einen Überblick über Prozessinformationen zum Prozess "Planung" zu verschaffen kann die Content View von "Planung"betrachtet werden.
Z1 a)
Markieren Sie den Prozessschritt "Planung" und wechseln Sie in dessen Content Sicht.
Z1 b)
Welche Dokumente sind Output des Prozesses "Planung"?
Zusatzaufgabe 2Der Dokumentenfluss kann mit Hilfe der Pfeile in den Input und Output Bereichen der Turtle direkt verfolgt werden. Ein ausgegrauterPfeil bedeutet dabei, dass das Dokument nicht weiter verwendet wird.
Z2 a)
Navigieren Sie in die Turtle von "Termine zusammenstellen" im Prozess "Recherche".
A Appendix
242
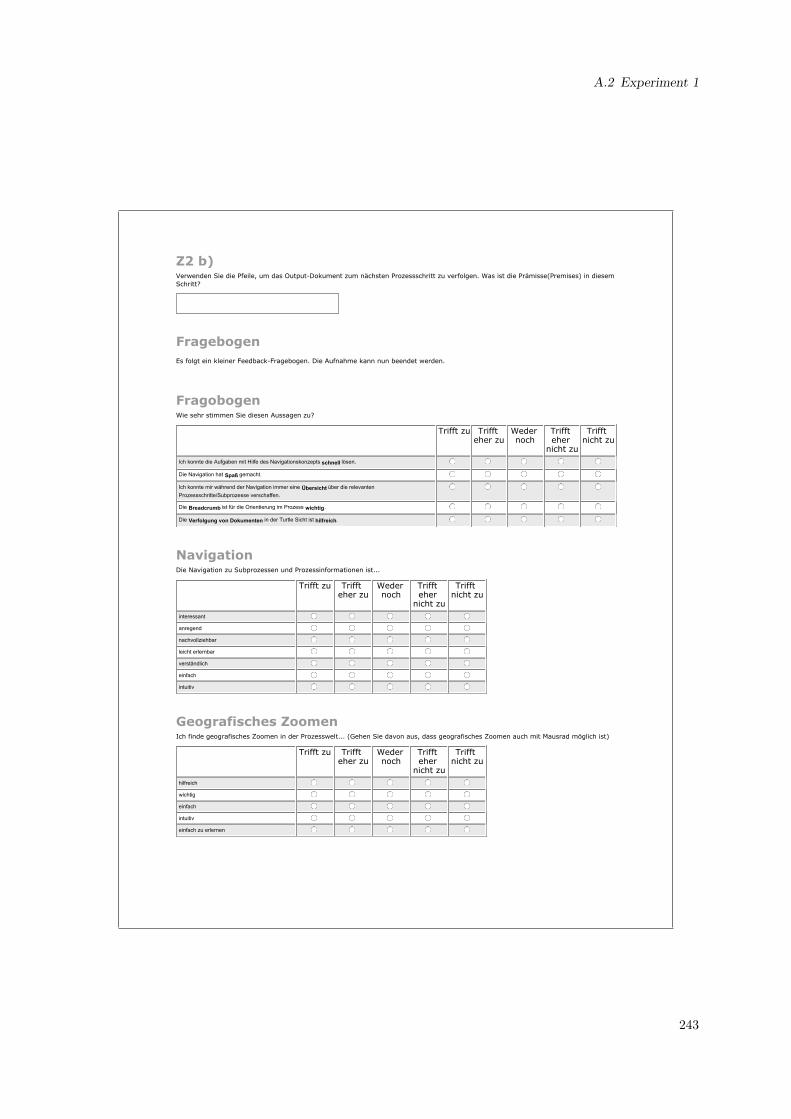
Z2 b)
Verwenden Sie die Pfeile, um das Output-Dokument zum nächsten Prozessschritt zu verfolgen. Was ist die Prämisse(Premises) in diesemSchritt?
FragebogenEs folgt ein kleiner Feedback-Fragebogen. Die Aufnahme kann nun beendet werden.
Fragobogen
Wie sehr stimmen Sie diesen Aussagen zu?
Trifft zu Trifft
eher zuWedernoch
Triffteher
nicht zu
Trifftnicht zu
Ich konnte die Aufgaben mit Hilfe des Navigationskonzepts schnell lösen. Die Navigation hat Spaß gemacht. Ich konnte mir während der Navigation immer eine Übersicht über die relevantenProzessschritte/Subprozesse verschaffen.
Die Breadcrumb ist für die Orientierung im Prozess wichtig. Die Verfolgung von Dokumenten in der Turtle Sicht ist hilfreich.
Navigation
Die Navigation zu Subprozessen und Prozessinformationen ist...
Trifft zu Trifft
eher zuWedernoch
Triffteher
nicht zu
Trifftnicht zu
interessant anregend nachvollziehbar leicht erlernbar verständlich einfach intuitiv
Geografisches Zoomen
Ich finde geografisches Zoomen in der Prozesswelt... (Gehen Sie davon aus, dass geografisches Zoomen auch mit Mausrad möglich ist)
Trifft zu Trifft
eher zuWedernoch
Triffteher
nicht zu
Trifftnicht zu
hilfreich wichtig einfach intuitiv einfach zu erlernen
A.2 Experiment 1
243
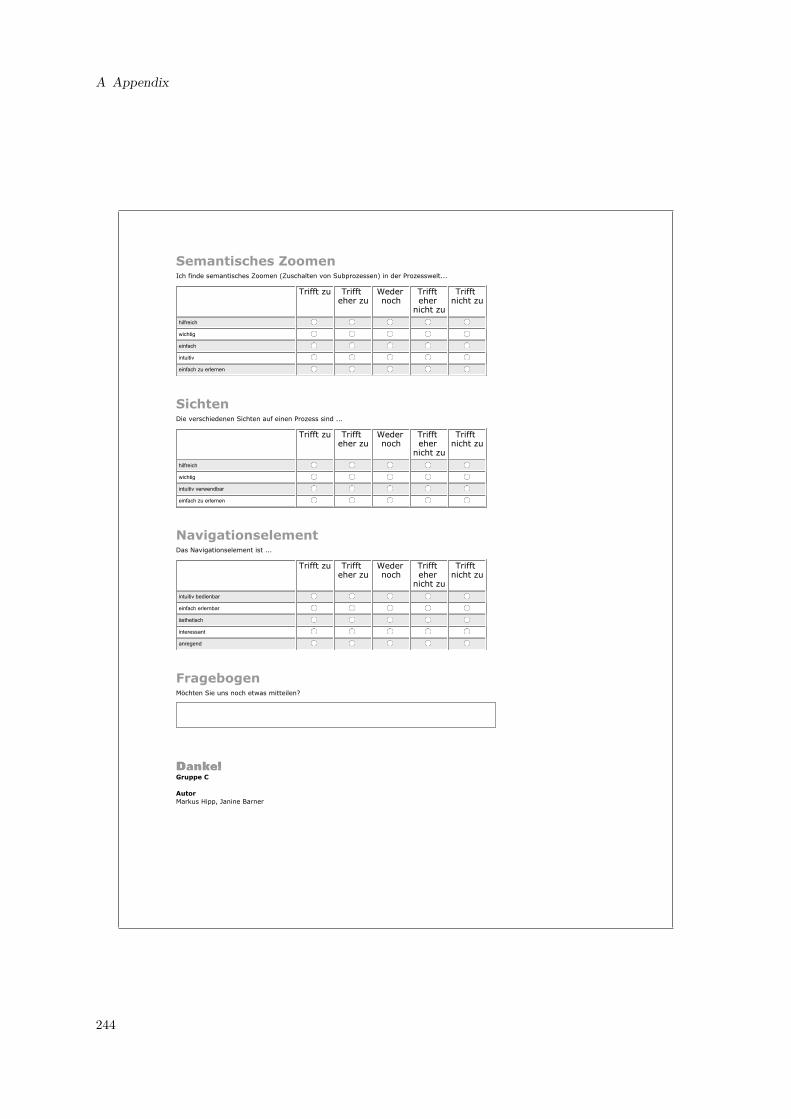
Semantisches Zoomen
Ich finde semantisches Zoomen (Zuschalten von Subprozessen) in der Prozesswelt...
Trifft zu Trifft
eher zuWedernoch
Triffteher
nicht zu
Trifftnicht zu
hilfreich wichtig einfach intuitiv einfach zu erlernen
Sichten
Die verschiedenen Sichten auf einen Prozess sind ...
Trifft zu Trifft
eher zuWedernoch
Triffteher
nicht zu
Trifftnicht zu
hilfreich wichtig intuitiv verwendbar einfach zu erlernen
Navigationselement
Das Navigationselement ist ...
Trifft zu Trifft
eher zuWedernoch
Triffteher
nicht zu
Trifftnicht zu
intuitiv bedienbar einfach erlernbar ästhetisch interessant anregend
Fragebogen
Möchten Sie uns noch etwas mitteilen?
Gruppe C
AutorMarkus Hipp, Janine Barner
A Appendix
244

A.2 Experiment 1
A.2.4 Experiment Results
Note that the used statistic tool SPSS1 inverts the Likert scale. In turn to Chapter 10, tables presentedin the appendix use 1 for I totally agree and 5 for I totally disagree. This does not affect the results ofthe experiment.
1IBM SPSS: http://www-01.ibm.com/software/analytics/spss/
245
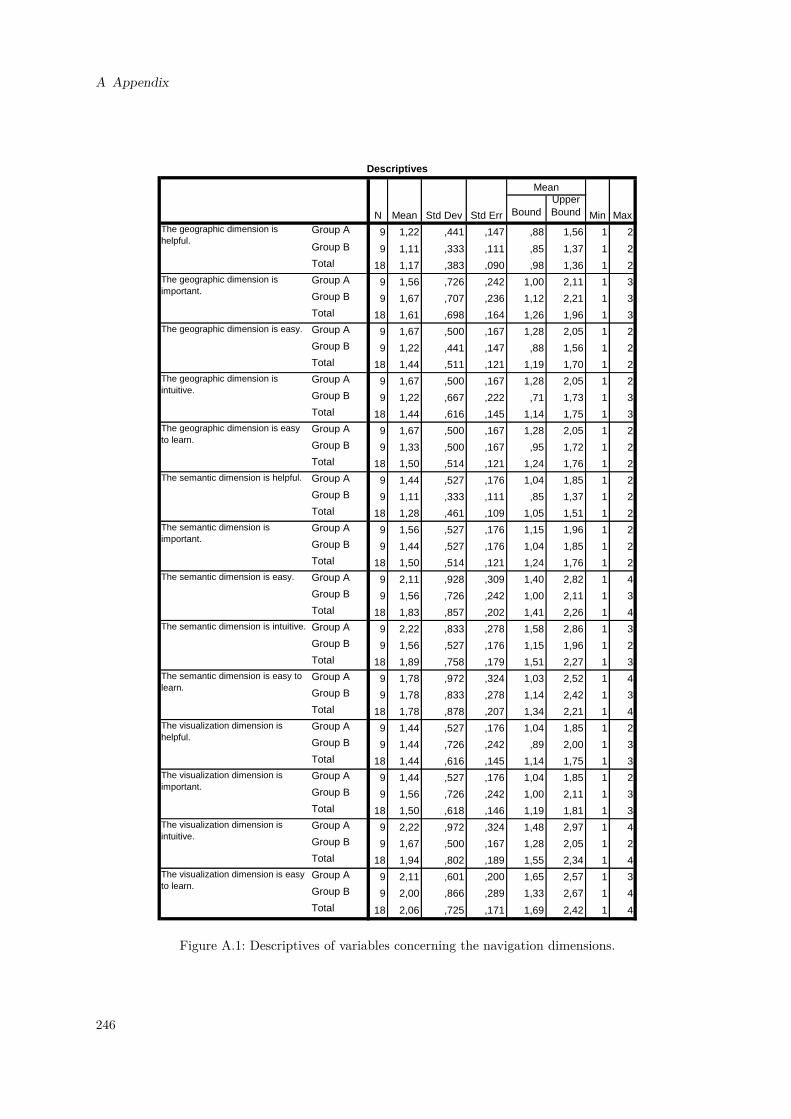
A Appendix
BoundUpper Bound
Group A 9 1,22 ,441 ,147 ,88 1,56 1 2
Group B 9 1,11 ,333 ,111 ,85 1,37 1 2Total 18 1,17 ,383 ,090 ,98 1,36 1 2Group A 9 1,56 ,726 ,242 1,00 2,11 1 3Group B 9 1,67 ,707 ,236 1,12 2,21 1 3Total 18 1,61 ,698 ,164 1,26 1,96 1 3Group A 9 1,67 ,500 ,167 1,28 2,05 1 2Group B 9 1,22 ,441 ,147 ,88 1,56 1 2Total 18 1,44 ,511 ,121 1,19 1,70 1 2Group A 9 1,67 ,500 ,167 1,28 2,05 1 2Group B 9 1,22 ,667 ,222 ,71 1,73 1 3Total 18 1,44 ,616 ,145 1,14 1,75 1 3Group A 9 1,67 ,500 ,167 1,28 2,05 1 2Group B 9 1,33 ,500 ,167 ,95 1,72 1 2Total 18 1,50 ,514 ,121 1,24 1,76 1 2Group A 9 1,44 ,527 ,176 1,04 1,85 1 2Group B 9 1,11 ,333 ,111 ,85 1,37 1 2Total 18 1,28 ,461 ,109 1,05 1,51 1 2Group A 9 1,56 ,527 ,176 1,15 1,96 1 2Group B 9 1,44 ,527 ,176 1,04 1,85 1 2Total 18 1,50 ,514 ,121 1,24 1,76 1 2Group A 9 2,11 ,928 ,309 1,40 2,82 1 4Group B 9 1,56 ,726 ,242 1,00 2,11 1 3Total 18 1,83 ,857 ,202 1,41 2,26 1 4Group A 9 2,22 ,833 ,278 1,58 2,86 1 3Group B 9 1,56 ,527 ,176 1,15 1,96 1 2Total 18 1,89 ,758 ,179 1,51 2,27 1 3Group A 9 1,78 ,972 ,324 1,03 2,52 1 4Group B 9 1,78 ,833 ,278 1,14 2,42 1 3Total 18 1,78 ,878 ,207 1,34 2,21 1 4Group A 9 1,44 ,527 ,176 1,04 1,85 1 2Group B 9 1,44 ,726 ,242 ,89 2,00 1 3Total 18 1,44 ,616 ,145 1,14 1,75 1 3Group A 9 1,44 ,527 ,176 1,04 1,85 1 2Group B 9 1,56 ,726 ,242 1,00 2,11 1 3Total 18 1,50 ,618 ,146 1,19 1,81 1 3Group A 9 2,22 ,972 ,324 1,48 2,97 1 4Group B 9 1,67 ,500 ,167 1,28 2,05 1 2Total 18 1,94 ,802 ,189 1,55 2,34 1 4Group A 9 2,11 ,601 ,200 1,65 2,57 1 3Group B 9 2,00 ,866 ,289 1,33 2,67 1 4Total 18 2,06 ,725 ,171 1,69 2,42 1 4
The semantic dimension is helpful.
Descriptives
N Mean Std Dev Std Err
Interval for Mean
Min MaxThe geographic dimension is helpful.
The geographic dimension is important.
The geographic dimension is easy.
The geographic dimension is intuitive.
The geographic dimension is easy to learn.
The visualization dimension is intuitive.
The visualization dimension is easy to learn.
The semantic dimension is important.
The semantic dimension is easy.
The semantic dimension is intuitive.
The semantic dimension is easy to learn.
The visualization dimension is helpful.
The visualization dimension is important.
Figure A.1: Descriptives of variables concerning the navigation dimensions.
246

A.3 Experiment 2
A.3 Experiment 2
Note that the following questionnaire exemplarily shows the questionnaire dealing with the BPMN3Dconcept. Questionnaires dealing with the Bubble and the control concept have the same structure andcontents and are thereby not explicitly presented in this appendix.
A.3.1 Questionnaire
247
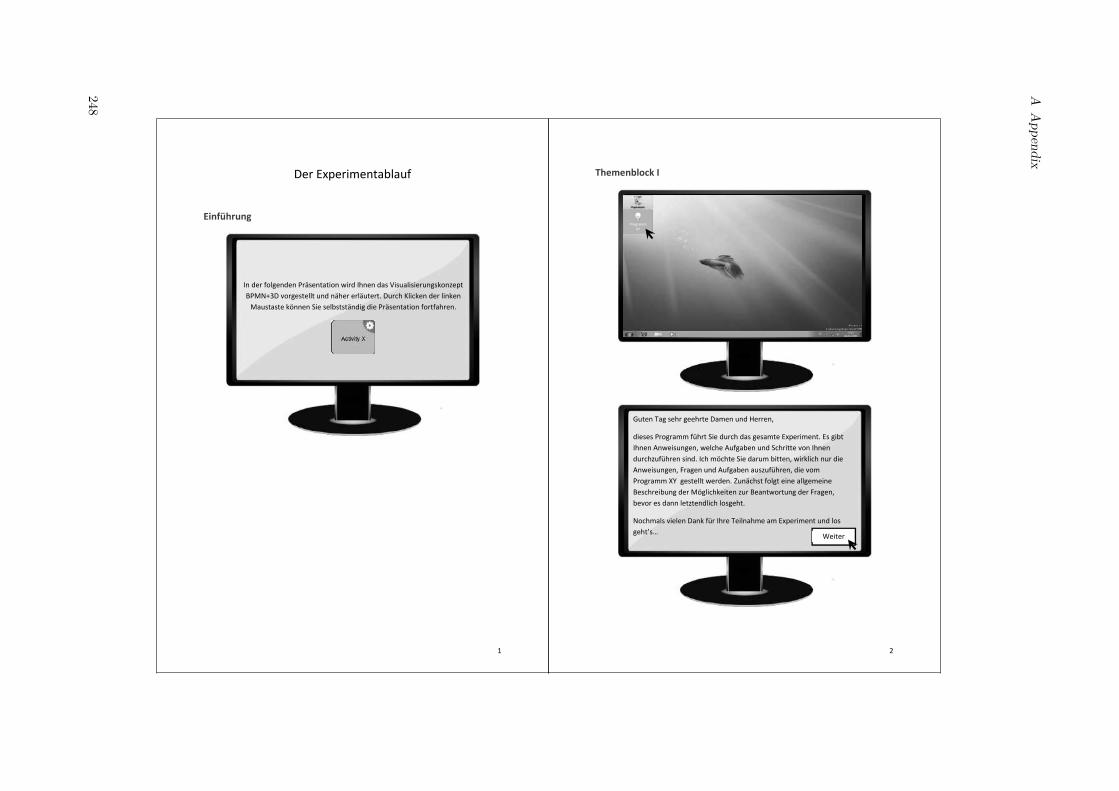
Der Experimentablauf
Einführung
In der folgenden Präsentation wird Ihnen das Visualisierungskonzept BPMN+3D vorgestellt und näher erläutert. Durch Klicken der linken
Maustaste können Sie selbstständig die Präsentation fortfahren.
1
Themenblock I
Programm XY
Guten Tag sehr geehrte Damen und Herren,
dieses Programm führt Sie durch das gesamte Experiment. Es gibt Ihnen Anweisungen, welche Aufgaben und Schritte von Ihnen durchzuführen sind. Ich möchte Sie darum bitten, wirklich nur die Anweisungen, Fragen und Aufgaben auszuführen, die vom Programm XY gestellt werden. Zunächst folgt eine allgemeine Beschreibung der Möglichkeiten zur Beantwortung der Fragen, bevor es dann letztendlich losgeht.
Nochmals vielen Dank für Ihre Teilnahme am Experiment und los geht’s… Weiter
2
AA
ppendix
248
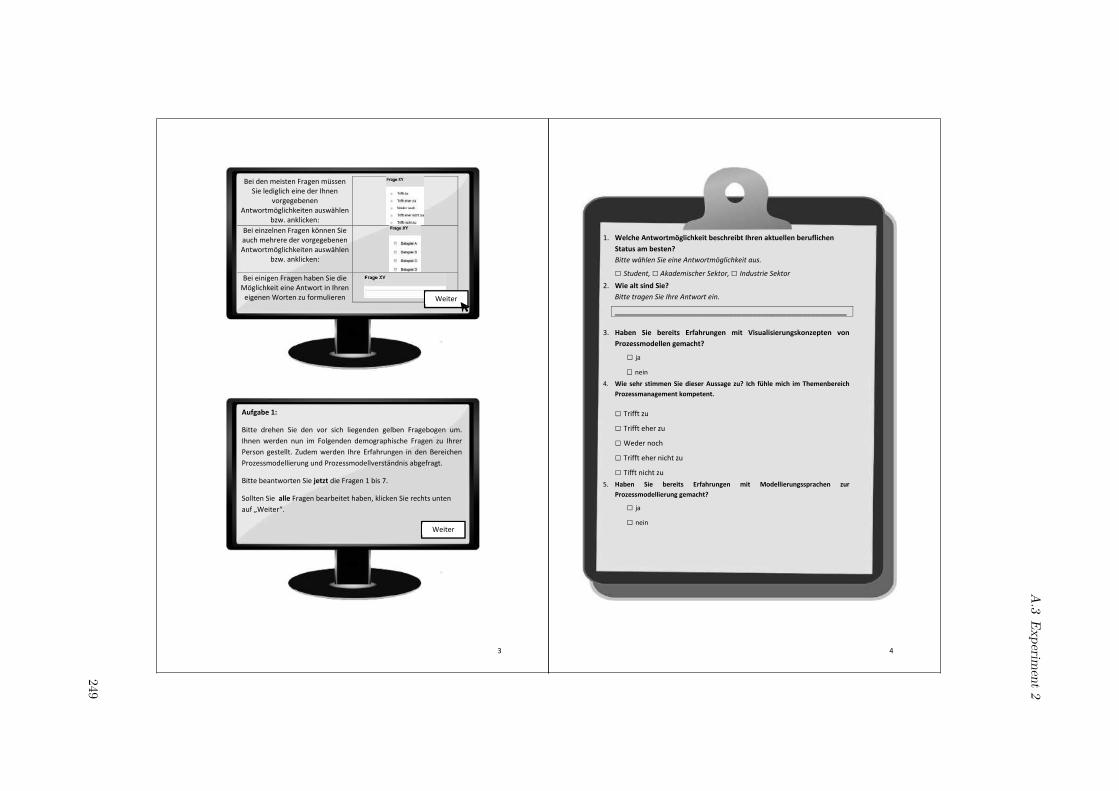
Aufgabe 1:
Bitte drehen Sie den vor sich liegenden gelben Fragebogen um. Ihnen werden nun im Folgenden demographische Fragen zu Ihrer Person gestellt. Zudem werden Ihre Erfahrungen in den Bereichen Prozessmodellierung und Prozessmodellverständnis abgefragt.
Bitte beantworten Sie jetzt die Fragen 1 bis 7.
Sollten Sie alle Fragen bearbeitet haben, klicken Sie rechts unten auf „Weiter“.
Weiter
Bei den meisten Fragen müssen Sie lediglich eine der Ihnen
vorgegebenen Antwortmöglichkeiten auswählen
bzw. anklicken: Bei einzelnen Fragen können Sie auch mehrere der vorgegebenen Antwortmöglichkeiten auswählen
bzw. anklicken:
Bei einigen Fragen haben Sie die Möglichkeit eine Antwort in Ihren
eigenen Worten zu formulieren Weiter
3
1. Welche Antwortmöglichkeit beschreibt Ihren aktuellen beruflichen Status am besten? Bitte wählen Sie eine Antwortmöglichkeit aus.
Student, Akademischer Sektor, Industrie Sektor 2. Wie alt sind Sie?
Bitte tragen Sie Ihre Antwort ein.
___________________________________________________________
3. Haben Sie bereits Erfahrungen mit Visualisierungskonzepten von Prozessmodellen gemacht?
ja
nein 4. Wie sehr stimmen Sie dieser Aussage zu? Ich fühle mich im Themenbereich
Prozessmanagement kompetent.
Trifft zu
Trifft eher zu
Weder noch
Trifft eher nicht zu
Tifft nicht zu 5. Haben Sie bereits Erfahrungen mit Modellierungssprachen zur
Prozessmodellierung gemacht?
ja
nein
4
A.3
Experiment
2
249
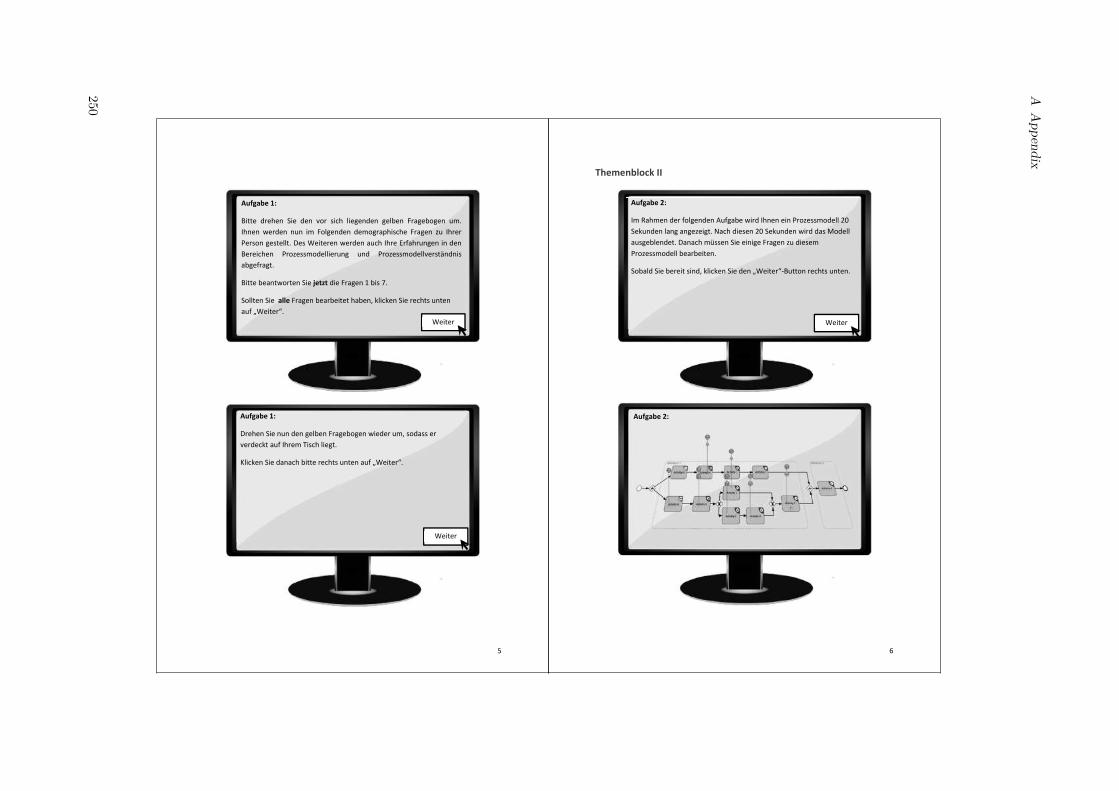
Aufgabe 1:
Drehen Sie nun den gelben Fragebogen wieder um, sodass er verdeckt auf Ihrem Tisch liegt.
Klicken Sie danach bitte rechts unten auf „Weiter“.
Weiter
Aufgabe 1:
Bitte drehen Sie den vor sich liegenden gelben Fragebogen um. Ihnen werden nun im Folgenden demographische Fragen zu Ihrer Person gestellt. Des Weiteren werden auch Ihre Erfahrungen in den Bereichen Prozessmodellierung und Prozessmodellverständnis abgefragt.
Bitte beantworten Sie jetzt die Fragen 1 bis 7.
Sollten Sie alle Fragen bearbeitet haben, klicken Sie rechts unten auf „Weiter“.
Weiter
5
Themenblock II
Aufgabe 2:
Im Rahmen der folgenden Aufgabe wird Ihnen ein Prozessmodell 20 Sekunden lang angezeigt. Nach diesen 20 Sekunden wird das Modell ausgeblendet. Danach müssen Sie einige Fragen zu diesem Prozessmodell bearbeiten.
Sobald Sie bereit sind, klicken Sie den „Weiter“-Button rechts unten.
Weiter
Aufgabe 2:
6
AA
ppendix
250
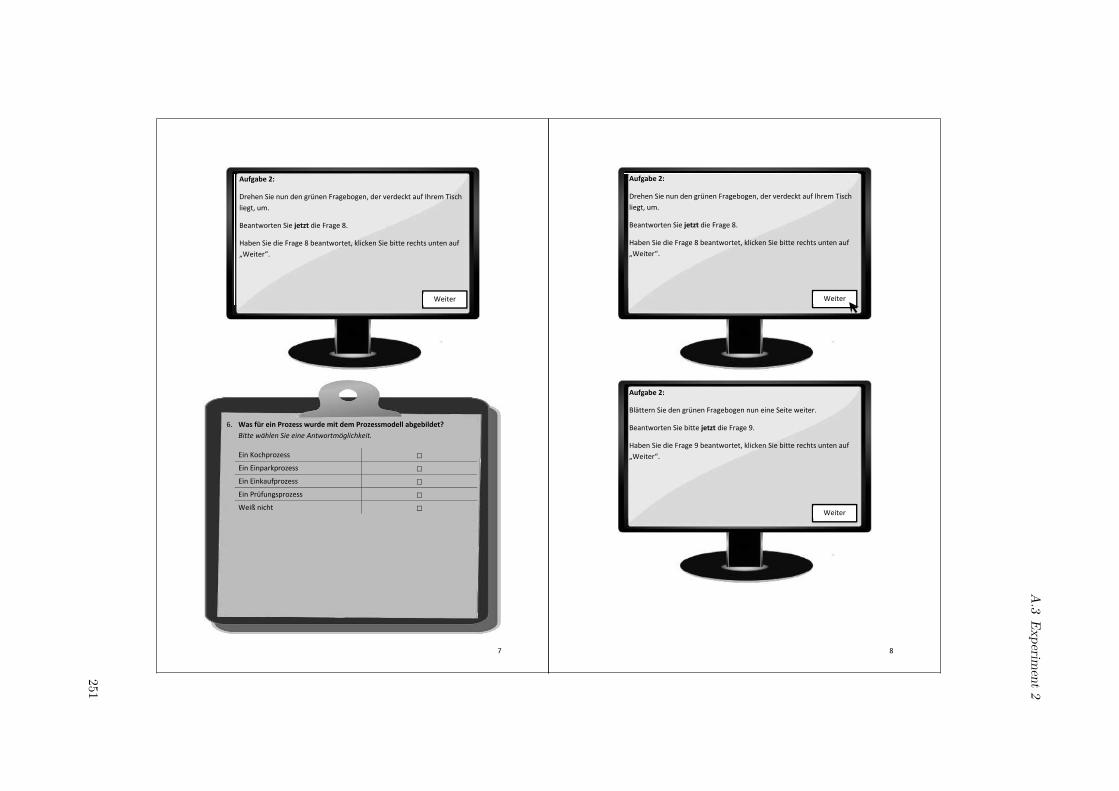
Aufgabe 2:
Drehen Sie nun den grünen Fragebogen, der verdeckt auf Ihrem Tisch liegt, um.
Beantworten Sie jetzt die Frage 8.
Haben Sie die Frage 8 beantwortet, klicken Sie bitte rechts unten auf „Weiter“.
Weiter
6. Was für ein Prozess wurde mit dem Prozessmodell abgebildet? Bitte wählen Sie eine Antwortmöglichkeit.
Ein Kochprozess Ein Einparkprozess Ein Einkaufprozess Ein Prüfungsprozess Weiß nicht
7
Aufgabe 2:
Drehen Sie nun den grünen Fragebogen, der verdeckt auf Ihrem Tisch liegt, um.
Beantworten Sie jetzt die Frage 8.
Haben Sie die Frage 8 beantwortet, klicken Sie bitte rechts unten auf „Weiter“.
Weiter
Aufgabe 2:
Blättern Sie den grünen Fragebogen nun eine Seite weiter.
Beantworten Sie bitte jetzt die Frage 9.
Haben Sie die Frage 9 beantwortet, klicken Sie bitte rechts unten auf „Weiter“.
Weiter
8
A.3
Experiment
2
251
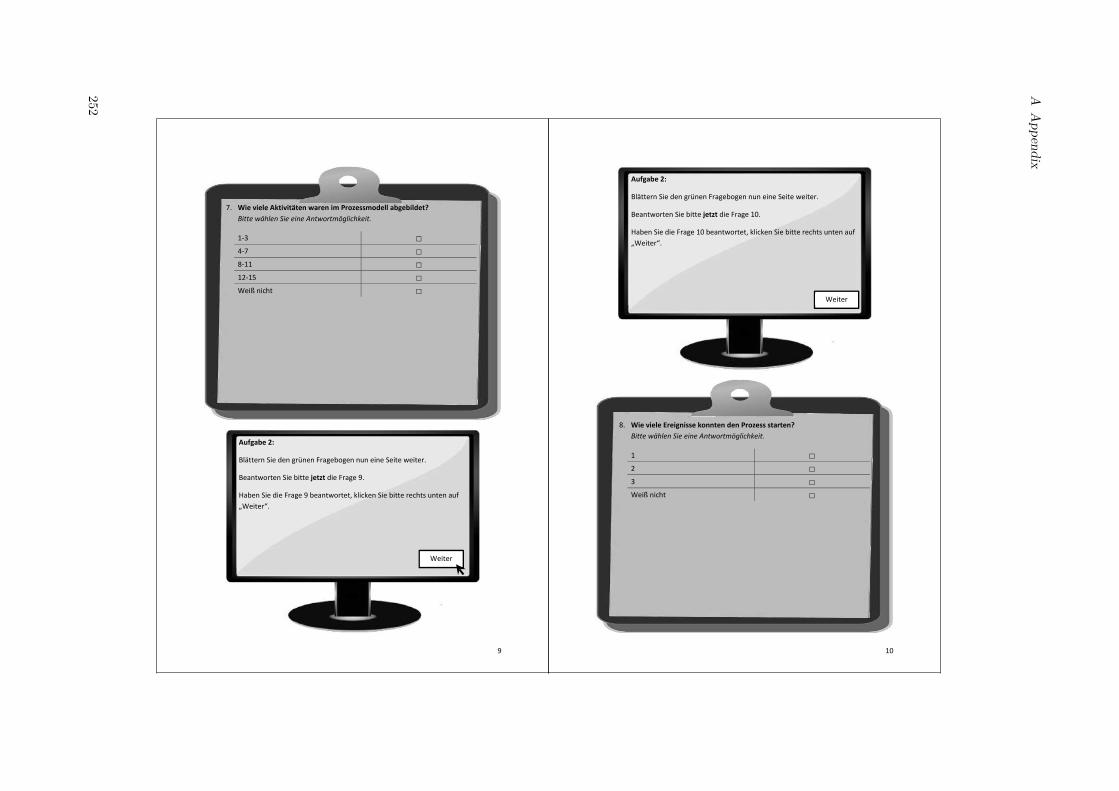
7. Wie viele Aktivitäten waren im Prozessmodell abgebildet? Bitte wählen Sie eine Antwortmöglichkeit.
1-3 4-7 8-11 12-15 Weiß nicht
Aufgabe 2:
Blättern Sie den grünen Fragebogen nun eine Seite weiter.
Beantworten Sie bitte jetzt die Frage 9.
Haben Sie die Frage 9 beantwortet, klicken Sie bitte rechts unten auf „Weiter“.
Weiter
9
Aufgabe 2:
Blättern Sie den grünen Fragebogen nun eine Seite weiter.
Beantworten Sie bitte jetzt die Frage 10.
Haben Sie die Frage 10 beantwortet, klicken Sie bitte rechts unten auf „Weiter“.
Weiter
8. Wie viele Ereignisse konnten den Prozess starten? Bitte wählen Sie eine Antwortmöglichkeit.
1 2 3 Weiß nicht
10
AA
ppendix
252
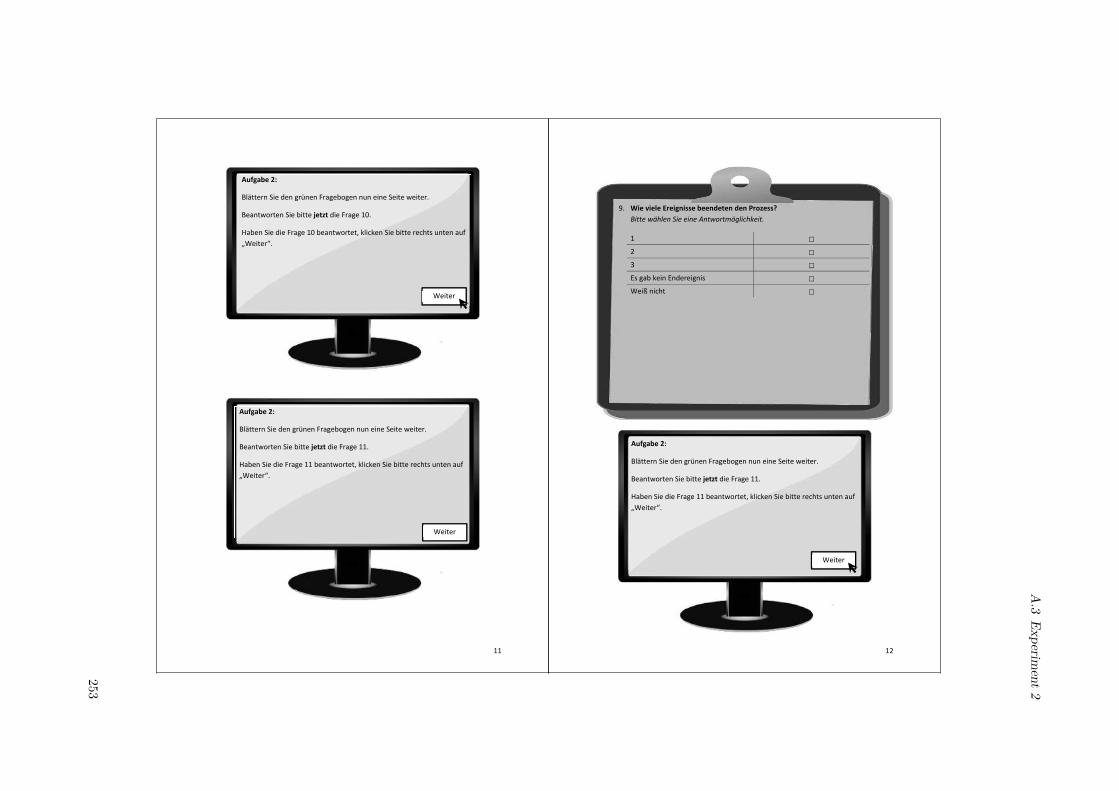
Aufgabe 2:
Blättern Sie den grünen Fragebogen nun eine Seite weiter.
Beantworten Sie bitte jetzt die Frage 10.
Haben Sie die Frage 10 beantwortet, klicken Sie bitte rechts unten auf „Weiter“.
Weiter
Aufgabe 2:
Blättern Sie den grünen Fragebogen nun eine Seite weiter.
Beantworten Sie bitte jetzt die Frage 11.
Haben Sie die Frage 11 beantwortet, klicken Sie bitte rechts unten auf „Weiter“.
Weiter
11
9. Wie viele Ereignisse beendeten den Prozess? Bitte wählen Sie eine Antwortmöglichkeit.
1 2 3 Es gab kein Endereignis Weiß nicht
Aufgabe 2:
Blättern Sie den grünen Fragebogen nun eine Seite weiter.
Beantworten Sie bitte jetzt die Frage 11.
Haben Sie die Frage 11 beantwortet, klicken Sie bitte rechts unten auf „Weiter“.
Weiter
12
A.3
Experiment
2
253

Aufgabe 3:
Im Rahmen der nächsten Aufgabe wird Ihnen wieder ein Prozessmodell angezeigt. Im Gegensatz zur vorhergegangenen Aufgabe wird das Prozessmodell nicht ausgeblendet. Im Folgenden werden Ihnen wieder nacheinander verschiedene Fragen gestellt, die Sie bearbeiten müssen.
Sollten Sie bereit sein, dann klicken Sie rechts unten auf „Weiter“.
Weiter
Aufgabe 3: Bitte blättern Sie nun den grünen Fragebogen zwei Seiten weiter. Beantworten Sie jetzt Frage 12. Haben Sie die Frage 12 bearbeitet, klicken Sie rechts unten auf „Weiter“.
Weiter
13
10. Können Aktivität A und B gleichzeitig bearbeitet bzw. durchlaufen werden? Bitte wählen Sie eine Antwortmöglichkeit.
Ja
Nein Weiß nicht
Aufgabe 3: Bitte blättern Sie nun den grünen Fragebogen zwei Seiten weiter. Beantworten Sie jetzt Frage 12. Haben Sie die Frage 12 bearbeitet, klicken Sie rechts unten auf „Weiter“.
Weiter
14
AA
ppendix
254
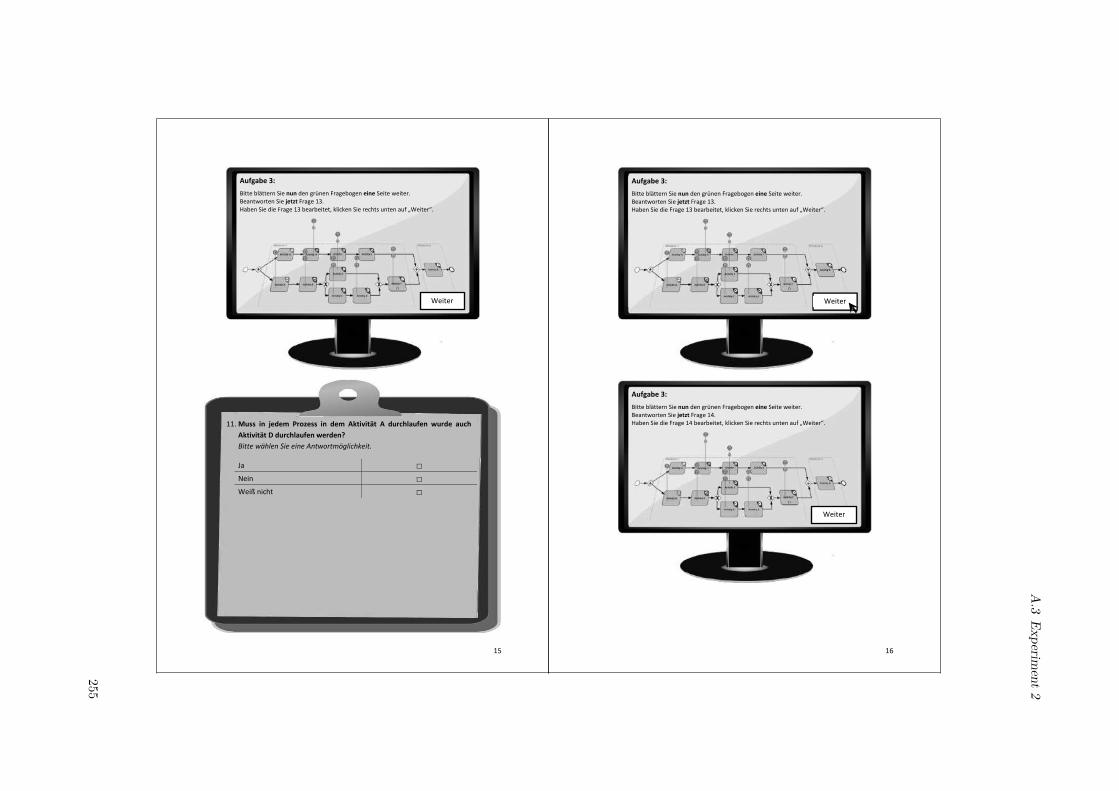
Aufgabe 3: Bitte blättern Sie nun den grünen Fragebogen eine Seite weiter. Beantworten Sie jetzt Frage 13. Haben Sie die Frage 13 bearbeitet, klicken Sie rechts unten auf „Weiter“.
Weiter
11. Muss in jedem Prozess in dem Aktivität A durchlaufen wurde auch Aktivität D durchlaufen werden? Bitte wählen Sie eine Antwortmöglichkeit.
Ja Nein Weiß nicht
15
Aufgabe 3: Bitte blättern Sie nun den grünen Fragebogen eine Seite weiter. Beantworten Sie jetzt Frage 13. Haben Sie die Frage 13 bearbeitet, klicken Sie rechts unten auf „Weiter“.
Weiter
Aufgabe 3: Bitte blättern Sie nun den grünen Fragebogen eine Seite weiter. Beantworten Sie jetzt Frage 14. Haben Sie die Frage 14 bearbeitet, klicken Sie rechts unten auf „Weiter“.
Weiter
16
A.3
Experiment
2
255
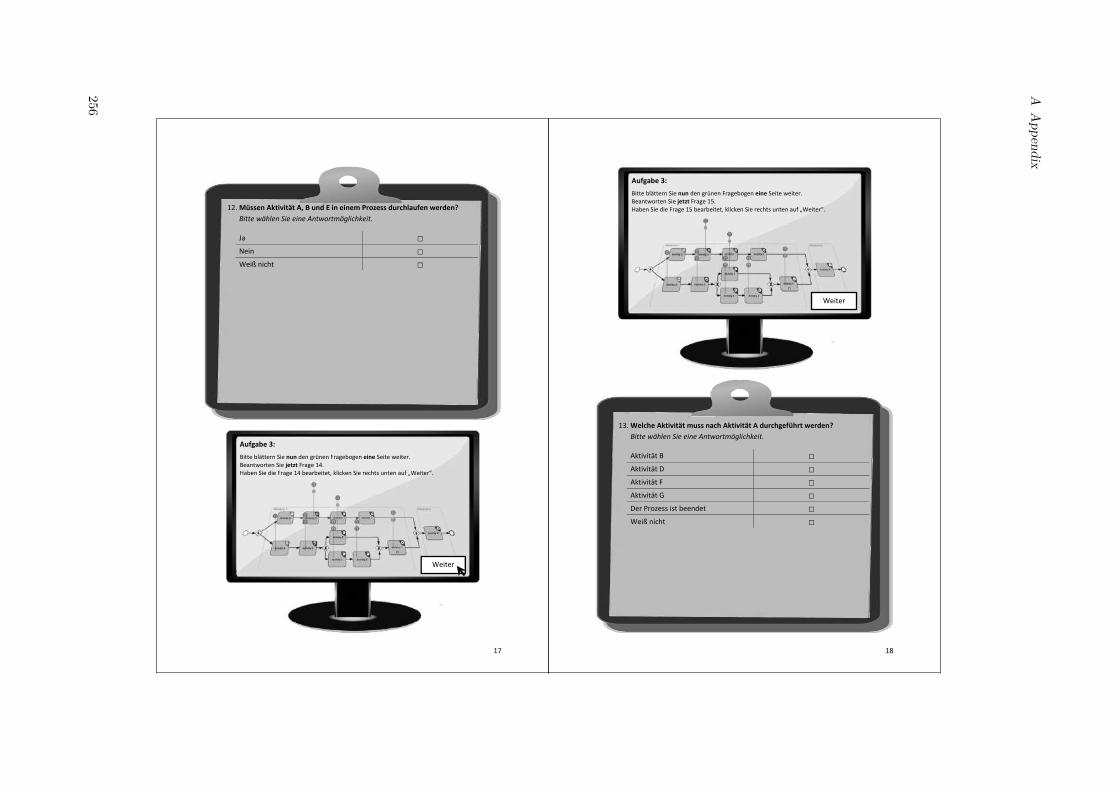
Aufgabe 3: Bitte blättern Sie nun den grünen Fragebogen eine Seite weiter. Beantworten Sie jetzt Frage 14. Haben Sie die Frage 14 bearbeitet, klicken Sie rechts unten auf „Weiter“.
Weiter
12. Müssen Aktivität A, B und E in einem Prozess durchlaufen werden? Bitte wählen Sie eine Antwortmöglichkeit.
Ja Nein Weiß nicht
17
Aufgabe 3: Bitte blättern Sie nun den grünen Fragebogen eine Seite weiter. Beantworten Sie jetzt Frage 15. Haben Sie die Frage 15 bearbeitet, klicken Sie rechts unten auf „Weiter“.
Weiter
13. Welche Aktivität muss nach Aktivität A durchgeführt werden? Bitte wählen Sie eine Antwortmöglichkeit.
Aktivität B Aktivität D Aktivität F Aktivität G Der Prozess ist beendet Weiß nicht
18
AA
ppendix
256
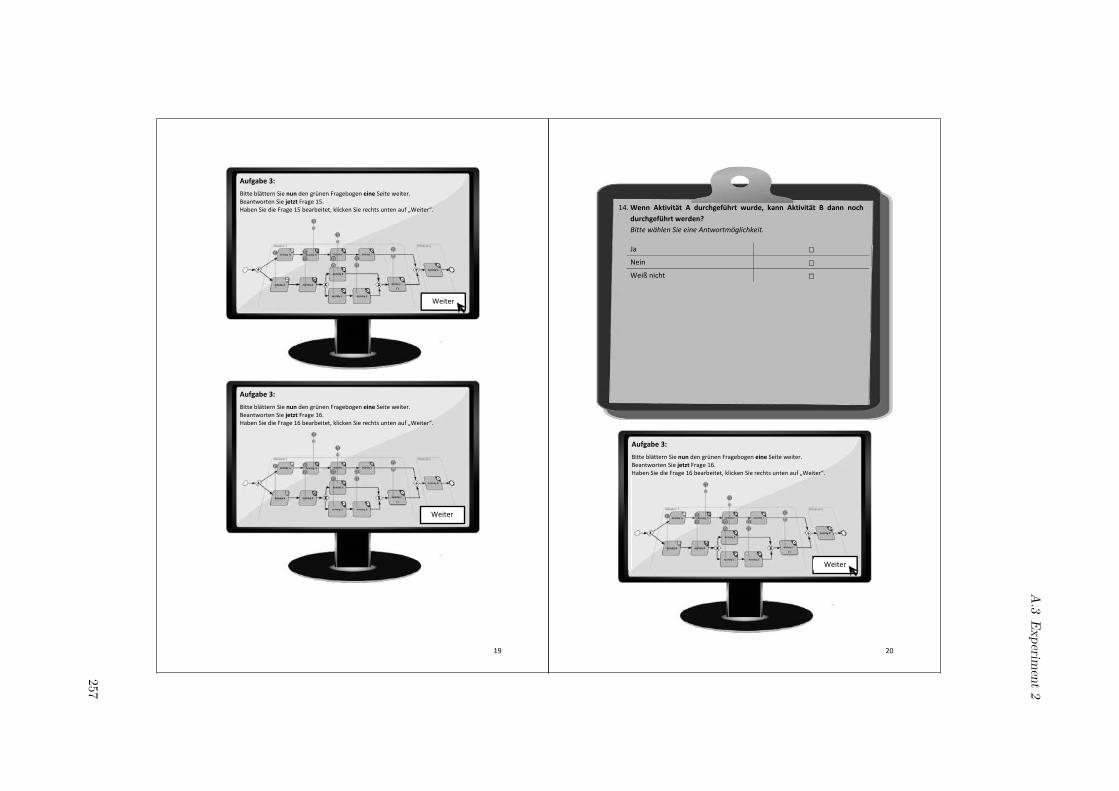
Aufgabe 3: Bitte blättern Sie nun den grünen Fragebogen eine Seite weiter. Beantworten Sie jetzt Frage 15. Haben Sie die Frage 15 bearbeitet, klicken Sie rechts unten auf „Weiter“.
Weiter
Aufgabe 3: Bitte blättern Sie nun den grünen Fragebogen eine Seite weiter. Beantworten Sie jetzt Frage 16. Haben Sie die Frage 16 bearbeitet, klicken Sie rechts unten auf „Weiter“.
Weiter
19
Aufgabe 3: Bitte blättern Sie nun den grünen Fragebogen eine Seite weiter. Beantworten Sie jetzt Frage 16. Haben Sie die Frage 16 bearbeitet, klicken Sie rechts unten auf „Weiter“.
Weiter
14. Wenn Aktivität A durchgeführt wurde, kann Aktivität B dann noch durchgeführt werden? Bitte wählen Sie eine Antwortmöglichkeit.
Ja Nein Weiß nicht
20
A.3
Experiment
2
257

Aufgabe 3: Bitte blättern Sie nun den grünen Fragebogen eine Seite weiter. Beantworten Sie jetzt Frage 17. Haben Sie die Frage 17 bearbeitet, klicken Sie rechts unten auf „Weiter“.
Weiter
15. Aktivität A wurde gerade durchlaufen. Welche Aktivität muss bearbeitet werden, wenn auch Aktivität B und F durchlaufen werden soll? Bitte wählen Sie eine Antwortmöglichkeit.
Aktivität C Aktivität D Aktivität G Weiß nicht
21
Aufgabe 3: Bitte blättern Sie nun den grünen Fragebogen eine Seite weiter. Beantworten Sie jetzt Frage 17. Haben Sie die Frage 17 bearbeitet, klicken Sie rechts unten auf „Weiter“.
Weiter
Aufgabe 3: Bitte blättern Sie nun den grünen Fragebogen eine Seite weiter. Beantworten Sie jetzt Frage 18. Haben Sie die Frage 18 bearbeitet, klicken Sie rechts unten auf „Weiter“.
Weiter
22
AA
ppendix
258
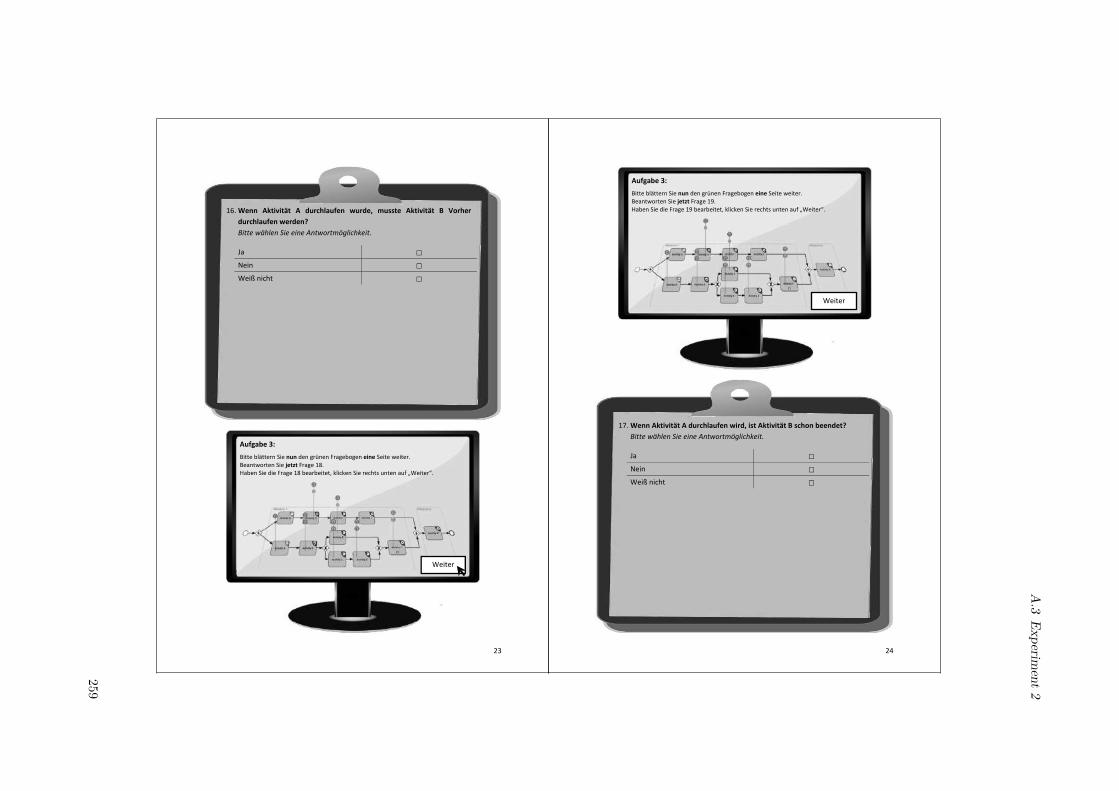
Aufgabe 3: Bitte blättern Sie nun den grünen Fragebogen eine Seite weiter. Beantworten Sie jetzt Frage 18. Haben Sie die Frage 18 bearbeitet, klicken Sie rechts unten auf „Weiter“.
Weiter
16. Wenn Aktivität A durchlaufen wurde, musste Aktivität B Vorher durchlaufen werden? Bitte wählen Sie eine Antwortmöglichkeit.
Ja
Nein Weiß nicht
23
Aufgabe 3: Bitte blättern Sie nun den grünen Fragebogen eine Seite weiter. Beantworten Sie jetzt Frage 19. Haben Sie die Frage 19 bearbeitet, klicken Sie rechts unten auf „Weiter“.
Weiter
17. Wenn Aktivität A durchlaufen wird, ist Aktivität B schon beendet? Bitte wählen Sie eine Antwortmöglichkeit.
Ja Nein Weiß nicht
24
A.3
Experiment
2
259
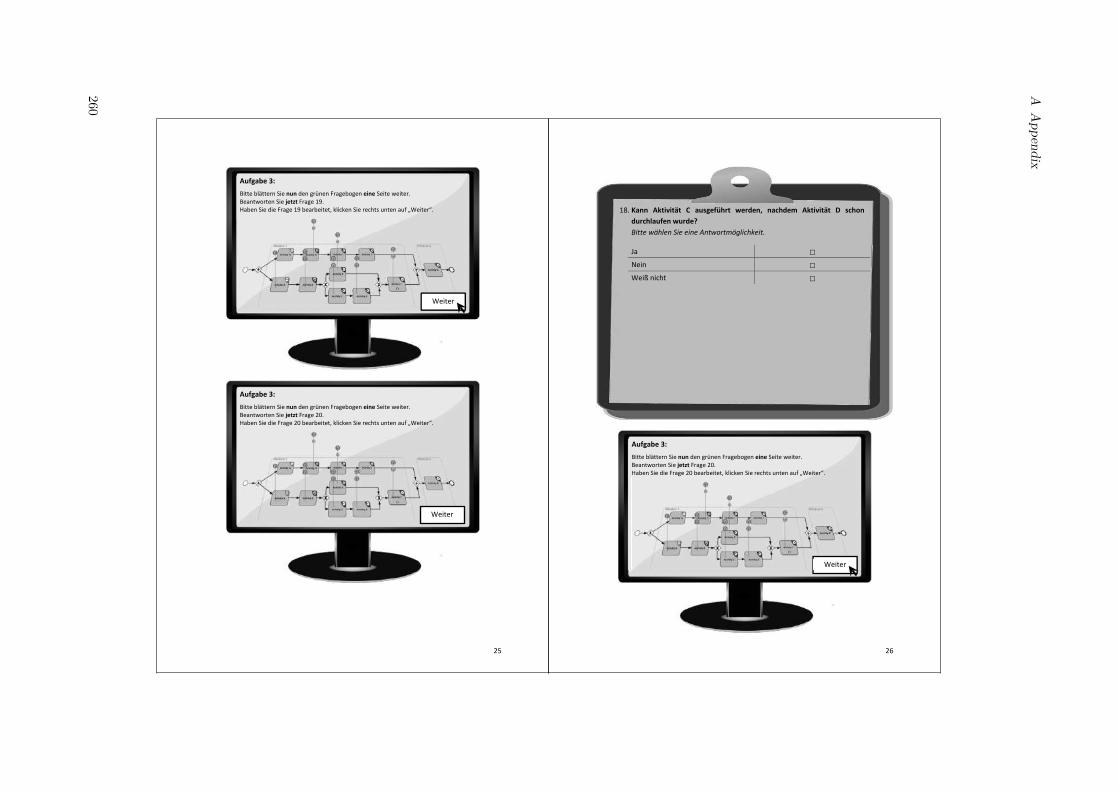
Aufgabe 3: Bitte blättern Sie nun den grünen Fragebogen eine Seite weiter. Beantworten Sie jetzt Frage 19. Haben Sie die Frage 19 bearbeitet, klicken Sie rechts unten auf „Weiter“.
Weiter
Aufgabe 3: Bitte blättern Sie nun den grünen Fragebogen eine Seite weiter. Beantworten Sie jetzt Frage 20. Haben Sie die Frage 20 bearbeitet, klicken Sie rechts unten auf „Weiter“.
Weiter
25
Aufgabe 3: Bitte blättern Sie nun den grünen Fragebogen eine Seite weiter. Beantworten Sie jetzt Frage 20. Haben Sie die Frage 20 bearbeitet, klicken Sie rechts unten auf „Weiter“.
Weiter
18. Kann Aktivität C ausgeführt werden, nachdem Aktivität D schon durchlaufen wurde? Bitte wählen Sie eine Antwortmöglichkeit.
Ja Nein Weiß nicht
26
AA
ppendix
260
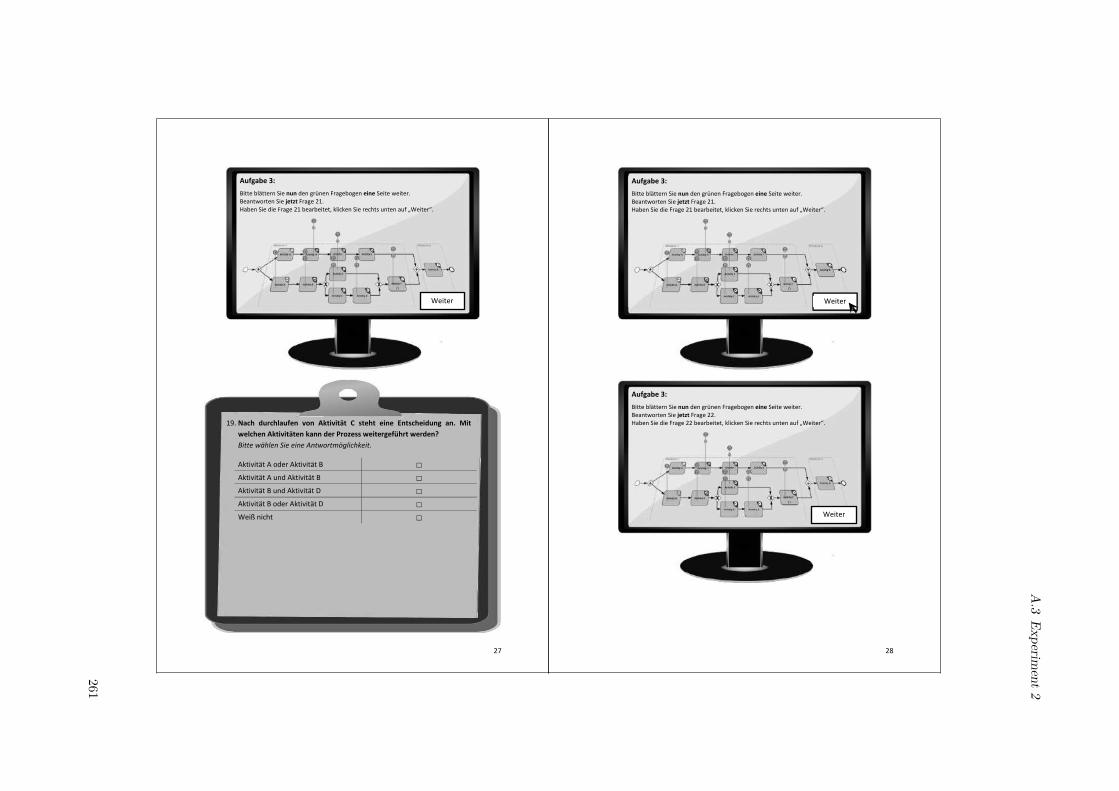
Aufgabe 3: Bitte blättern Sie nun den grünen Fragebogen eine Seite weiter. Beantworten Sie jetzt Frage 21. Haben Sie die Frage 21 bearbeitet, klicken Sie rechts unten auf „Weiter“.
Weiter
19. Nach durchlaufen von Aktivität C steht eine Entscheidung an. Mit welchen Aktivitäten kann der Prozess weitergeführt werden? Bitte wählen Sie eine Antwortmöglichkeit.
Aktivität A oder Aktivität B Aktivität A und Aktivität B Aktivität B und Aktivität D Aktivität B oder Aktivität D Weiß nicht
27
Aufgabe 3: Bitte blättern Sie nun den grünen Fragebogen eine Seite weiter. Beantworten Sie jetzt Frage 21. Haben Sie die Frage 21 bearbeitet, klicken Sie rechts unten auf „Weiter“.
Weiter
Aufgabe 3: Bitte blättern Sie nun den grünen Fragebogen eine Seite weiter. Beantworten Sie jetzt Frage 22. Haben Sie die Frage 22 bearbeitet, klicken Sie rechts unten auf „Weiter“.
Weiter
28
A.3
Experiment
2
261
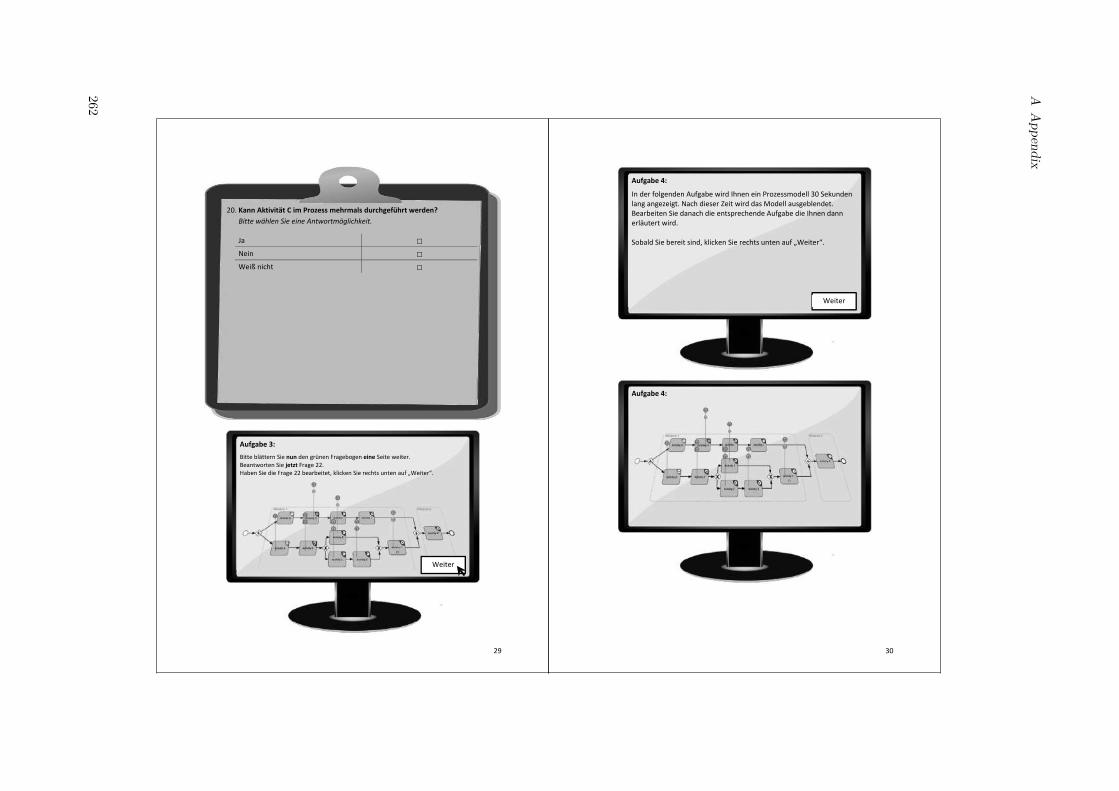
Aufgabe 3: Bitte blättern Sie nun den grünen Fragebogen eine Seite weiter. Beantworten Sie jetzt Frage 22. Haben Sie die Frage 22 bearbeitet, klicken Sie rechts unten auf „Weiter“.
Weiter
20. Kann Aktivität C im Prozess mehrmals durchgeführt werden? Bitte wählen Sie eine Antwortmöglichkeit.
Ja Nein Weiß nicht
29
Aufgabe 4:
In der folgenden Aufgabe wird Ihnen ein Prozessmodell 30 Sekunden lang angezeigt. Nach dieser Zeit wird das Modell ausgeblendet. Bearbeiten Sie danach die entsprechende Aufgabe die Ihnen dann erläutert wird.
Sobald Sie bereit sind, klicken Sie rechts unten auf „Weiter“.
Weiter
Aufgabe 4:
30
AA
ppendix
262
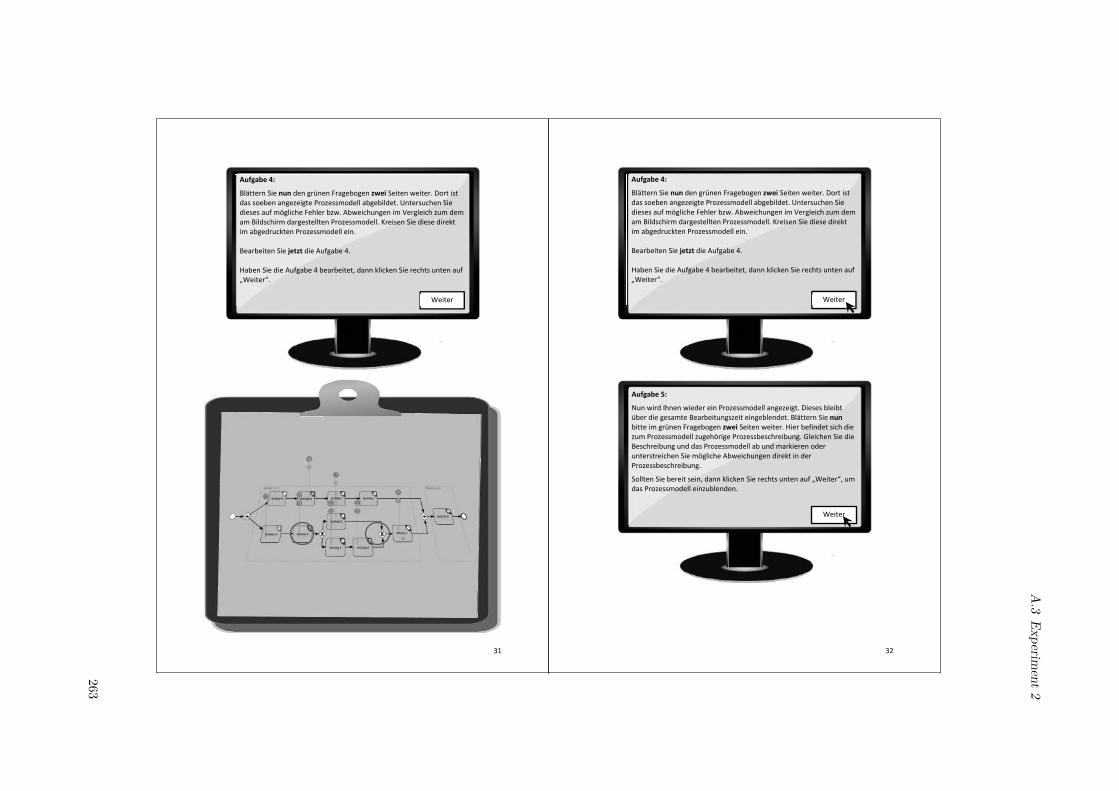
Aufgabe 4:
Blättern Sie nun den grünen Fragebogen zwei Seiten weiter. Dort ist das soeben angezeigte Prozessmodell abgebildet. Untersuchen Sie dieses auf mögliche Fehler bzw. Abweichungen im Vergleich zum dem am Bildschirm dargestellten Prozessmodell. Kreisen Sie diese direkt im abgedruckten Prozessmodell ein. Bearbeiten Sie jetzt die Aufgabe 4. Haben Sie die Aufgabe 4 bearbeitet, dann klicken Sie rechts unten auf „Weiter“.
Weiter
31
Aufgabe 5:
Nun wird Ihnen wieder ein Prozessmodell angezeigt. Dieses bleibt über die gesamte Bearbeitungszeit eingeblendet. Blättern Sie nun bitte im grünen Fragebogen zwei Seiten weiter. Hier befindet sich die zum Prozessmodell zugehörige Prozessbeschreibung. Gleichen Sie die Beschreibung und das Prozessmodell ab und markieren oder unterstreichen Sie mögliche Abweichungen direkt in der Prozessbeschreibung.
Sollten Sie bereit sein, dann klicken Sie rechts unten auf „Weiter“, um das Prozessmodell einzublenden.
Weiter
Aufgabe 4:
Blättern Sie nun den grünen Fragebogen zwei Seiten weiter. Dort ist das soeben angezeigte Prozessmodell abgebildet. Untersuchen Sie dieses auf mögliche Fehler bzw. Abweichungen im Vergleich zum dem am Bildschirm dargestellten Prozessmodell. Kreisen Sie diese direkt im abgedruckten Prozessmodell ein. Bearbeiten Sie jetzt die Aufgabe 4. Haben Sie die Aufgabe 4 bearbeitet, dann klicken Sie rechts unten auf „Weiter“.
Weiter
32
A.3
Experiment
2
263
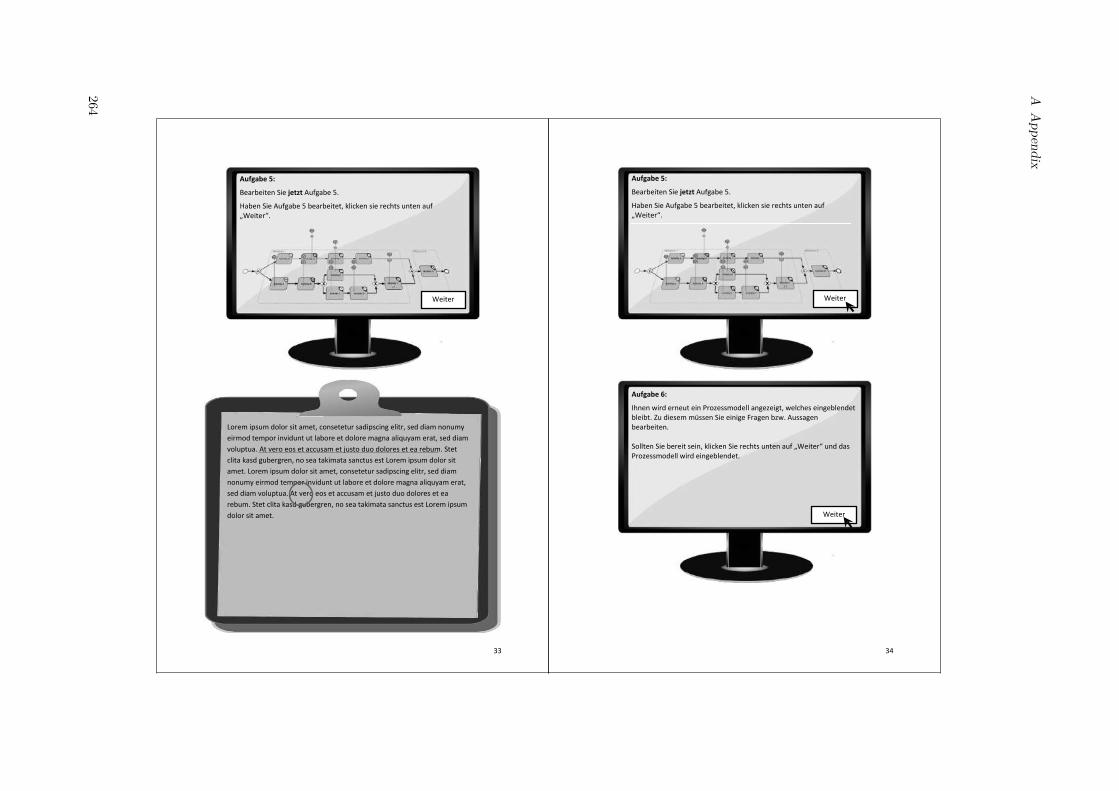
Aufgabe 5:
Bearbeiten Sie jetzt Aufgabe 5.
Haben Sie Aufgabe 5 bearbeitet, klicken sie rechts unten auf „Weiter“.
Weiter
Lorem ipsum dolor sit amet, consetetur sadipscing elitr, sed diam nonumy eirmod tempor invidunt ut labore et dolore magna aliquyam erat, sed diam voluptua. At vero eos et accusam et justo duo dolores et ea rebum. Stet clita kasd gubergren, no sea takimata sanctus est Lorem ipsum dolor sit amet. Lorem ipsum dolor sit amet, consetetur sadipscing elitr, sed diam nonumy eirmod tempor invidunt ut labore et dolore magna aliquyam erat, sed diam voluptua. At vero eos et accusam et justo duo dolores et ea rebum. Stet clita kasd gubergren, no sea takimata sanctus est Lorem ipsum dolor sit amet.
33
Aufgabe 6:
Ihnen wird erneut ein Prozessmodell angezeigt, welches eingeblendet bleibt. Zu diesem müssen Sie einige Fragen bzw. Aussagen bearbeiten.
Sollten Sie bereit sein, klicken Sie rechts unten auf „Weiter“ und das Prozessmodell wird eingeblendet.
Weiter
Aufgabe 5:
Bearbeiten Sie jetzt Aufgabe 5.
Haben Sie Aufgabe 5 bearbeitet, klicken sie rechts unten auf „Weiter“.
Weiter
34
AA
ppendix
264
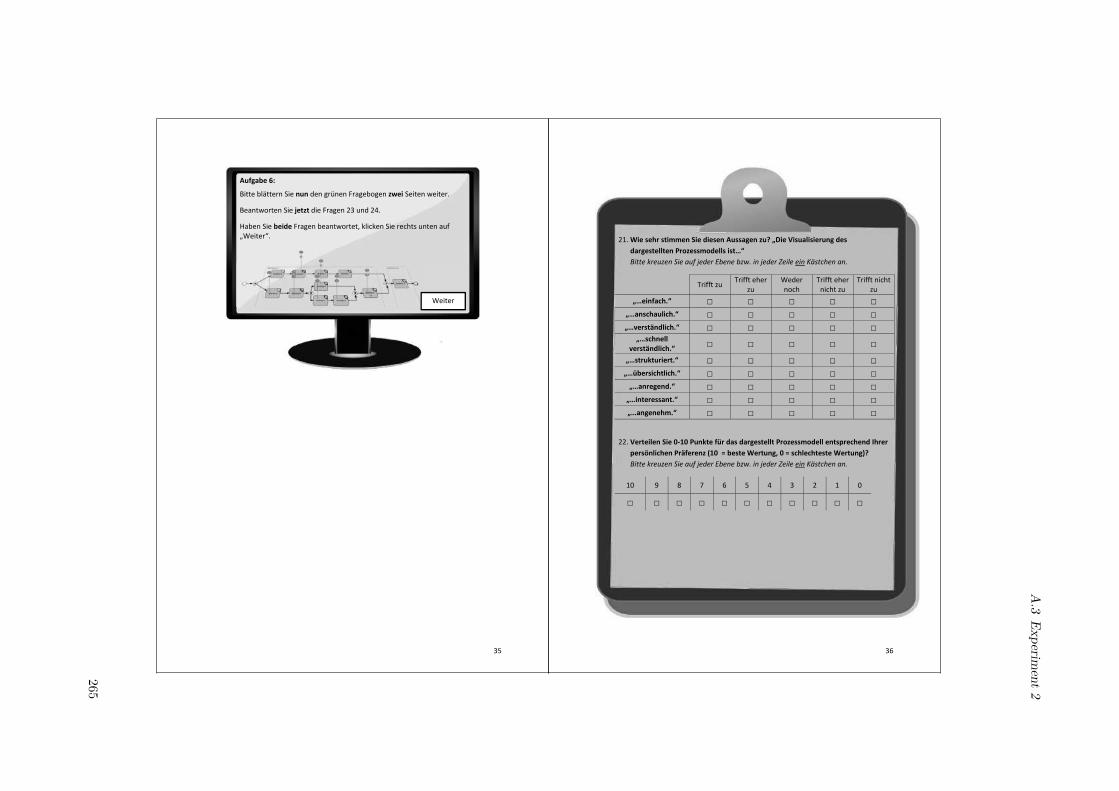
Aufgabe 6:
Bitte blättern Sie nun den grünen Fragebogen zwei Seiten weiter.
Beantworten Sie jetzt die Fragen 23 und 24.
Haben Sie beide Fragen beantwortet, klicken Sie rechts unten auf „Weiter“.
Weiter
35
21. Wie sehr stimmen Sie diesen Aussagen zu? „Die Visualisierung des dargestellten Prozessmodells ist…“Bitte kreuzen Sie auf jeder Ebene bzw. in jeder Zeile ein Kästchen an.
Trifft zu Trifft eher zu
Weder noch
Trifft eher nicht zu
Trifft nicht zu
„…einfach.“ „…anschaulich.“ „…verständlich.“
„…schnell verständlich.“
„…strukturiert.“ „…übersichtlich.“
„…anregend.“ „…interessant.“ „…angenehm.“
22. Verteilen Sie 0-10 Punkte für das dargestellt Prozessmodell entsprechend Ihrer persönlichen Präferenz (10 = beste Wertung, 0 = schlechteste Wertung)? Bitte kreuzen Sie auf jeder Ebene bzw. in jeder Zeile ein Kästchen an.
10 9 8 7 6 5 4 3 2 1 0
36
A.3
Experiment
2
265
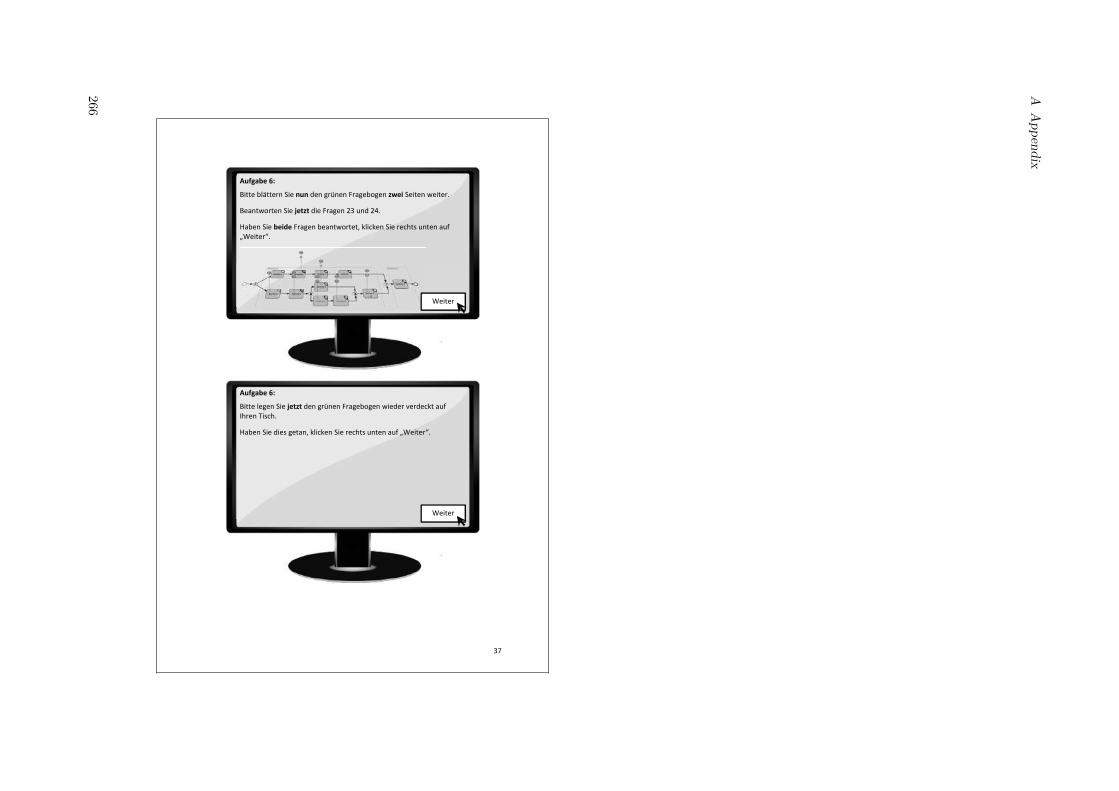
Aufgabe 6:
Bitte blättern Sie nun den grünen Fragebogen zwei Seiten weiter.
Beantworten Sie jetzt die Fragen 23 und 24.
Haben Sie beide Fragen beantwortet, klicken Sie rechts unten auf „Weiter“.
Weiter
Aufgabe 6:
Bitte legen Sie jetzt den grünen Fragebogen wieder verdeckt auf Ihren Tisch.
Haben Sie dies getan, klicken Sie rechts unten auf „Weiter“.
Weiter
37
AA
ppendix
266
Related Documents