NAVARRO COLLEGE FACT BOOK 2014‐15

Welcome message from author
This document is posted to help you gain knowledge. Please leave a comment to let me know what you think about it! Share it to your friends and learn new things together.
Transcript

NAVARRO COLLEGE FACT BOOK 2014‐15

2 | P a g e
NAVARRO COLLEGE FACT BO0K
Cover .............................................................................................................................................................................................................................. 1 Table of Contents ....................................................................................................................................................................................................... 2‐4 Welcome ........................................................................................................................................................................................................................ 5 History of the College .................................................................................................................................................................................................... 6 Mission & Goals ............................................................................................................................................................................................................. 7 Board of Trustees .......................................................................................................................................................................................................... 8 Campus Locations .......................................................................................................................................................................................................... 9 Service Area ................................................................................................................................................................................................................. 10 Household Income & Educational Attainment within Navarro College Service Area ............................................................................................. 11 Annual Unemployment Rate .................................................................................................................................................................................... 12 Percent of Families with Incomes Below Poverty Level within Navarro College Service Area ................................................................................ 12 Navarro College 2014 Student Enrollment by Zip Code .......................................................................................................................................... 12 Percent of Population Employed in Various Industries within Navarro College Service Area ............................................................................... 13 Fastest Growing Occupations in Texas .................................................................................................................................................................... 14
Navarro College District .............................................................................................................................................................................................. 15 Student Demographics ........................................................................................................................................................................................ 16‐17 Students with Special Needs .................................................................................................................................................................................... 18 District‐wide Annual Enrollment & Contact Hours .................................................................................................................................................. 19 District‐wide Fall Enrollment & Contact Hours ....................................................................................................................................................... 20 District‐wide Spring Enrollment & Contact Hours .................................................................................................................................................. 21 District‐wide Summer Enrollment & Contact Hours ............................................................................................................................................... 22 District‐wide Annual Enrollment & Contact Hours by Campus ............................................................................................................................... 23
Corsicana Campus ....................................................................................................................................................................................................... 24 Corsicana Fall Enrollment & Contact Hours ............................................................................................................................................................ 25 Corsicana Spring Enrollment & Contact Hours ....................................................................................................................................................... 26 Corsicana Summer Enrollment & Contact Hours .................................................................................................................................................... 27
Waxahachie Campus ................................................................................................................................................................................................... 28 Waxahachie Fall Enrollment & Contact Hours ........................................................................................................................................................ 29 Waxahachie Spring Enrollment & Contact Hours ................................................................................................................................................... 30

3 | P a g e
NAVARRO COLLEGE FACT BO0K
Waxahachie Summer Enrollment & Contact Hours ................................................................................................................................................ 31 Midlothian Campus ..................................................................................................................................................................................................... 32 Midlothian Fall Enrollment & Contact Hours .......................................................................................................................................................... 33 Midlothian Spring Enrollment & Contact Hours ..................................................................................................................................................... 34
Midlothian Summer Enrollment & Contact Hours ........................................................................................................................................................................ 35 South Campus .............................................................................................................................................................................................................. 36 South Campus Fall Enrollment & Contact Hours .................................................................................................................................................... 37 South Campus Spring Enrollment & Contact Hours ................................................................................................................................................ 38
South Campus Summer Enrollment & Contact Hours ................................................................................................................................................................... 39 eLearning ..................................................................................................................................................................................................................... 40 eLearning Fall Enrollment & Contact Hours ............................................................................................................................................................ 41 eLearning Spring Enrollment & Contact Hours ....................................................................................................................................................... 42
eLearning Summer Enrollment & Contact Hours .......................................................................................................................................................................... 43 Dual Credit ................................................................................................................................................................................................................... 44 Sources of Dual Credit Students .............................................................................................................................................................................. 45 Dual Credit Percent of Total Enrollment & Dual Credit by Campus ........................................................................................................................ 46 Dual Credit Enrollment by School District ................................................................................................................................................................ 47 District‐wide Dual Credit Fall Enrollment & Contact Hours .................................................................................................................................... 48
Accountability .............................................................................................................................................................................................................. 49 First Time Full Time Persistence Fall 2014 Cohort Returning in Spring by Campus................................................................................................. 50 Annual Student Success Points ............................................................................................................................................................................... 50 Degrees Awarded ..................................................................................................................................................................................................... 51 Certificates Awarded ................................................................................................................................................................................................ 51 Accountability .......................................................................................................................................................................................................... 52 Service Area High School Graduation Comparison ................................................................................................................................................. 53 Annual Licensure Report ......................................................................................................................................................................................... 54 Students Pursuing Additional Education ................................................................................................................................................................. 55
Employees ................................................................................................................................................................................................................... 56 Number of Employees & Status ............................................................................................................................................................................... 57

4 | P a g e
NAVARRO COLLEGE FACT BO0K
Full Time Employee by Gender & Ethnicity.............................................................................................................................................................. 58 Faculty Status & Degrees ........................................................................................................................................................................................ 59
Finances ....................................................................................................................................................................................................................... 60 Source of Revenues .................................................................................................................................................................................................. 61 Distribution of Funds ................................................................................................................................................................................................ 61 Tuition and Fees Chart ............................................................................................................................................................................................. 62 Educational & General Fund Expenditure Summary FY 2014‐15 ............................................................................................................................ 63 Financial Aid Awarded 2014..................................................................................................................................................................................... 63

5 | P a g e
NAVARRO COLLEGE FACT BO0K
Welcome
Vice President of Access and Accountability
The Navarro College Fact Book, published annually, provides a detailed profile of the district, including data on students, employees, programs, and services. The Office of Access and Accountability is responsible for assembling the information and data included in the 2014‐15 Fact Book. Other key resources used include the Texas Higher Education Coordinating Board (THECB) and Integrated Postsecondary Education Data System (IPEDS). The Office of Access and Accountability endeavors to ensure accurate data included in the Fact Book. We hope you find the data presented in this report useful and readable. Should you have any questions about the information presented or suggestions for next year’s Fact Book, please feel free to contact us: 903‐875‐7376 or email [email protected]
Institutional Effectiveness & Institutional Research Staff
Dean Director Specialist Institutional Effectiveness Institutional Research Institutional Research Sina Ruiz Elizabeth Chivers Debbie Pickett

6 | P a g e
NAVARRO COLLEGE FACT BO0K
History of the College
In the spring of 1946, a group of local citizens met to form a steering committee for the purpose of establishing a junior college in Navarro County. In a general election held July 16, 1946, voters approved the creation of Navarro Junior College and authorized a county tax to help finance the institution. In that same election voters chose a seven member board of trustees to govern the College. The first students began classes in September, 1946. Most of the 238 members of that first student body were returning veterans from World War II taking advantage of assistance available under the newly enacted GI Bill. The first campus of Navarro College was the site of the Air Activities of Texas, a World War II primary flight school located six miles south of Corsicana.
In 1951 the campus was moved to its present location, a 47 acre tract west of downtown Corsicana on State Highway 31. The campus has expanded to 103 acres with 23 buildings. In 1954 Navarro was accredited by the Southern Association of Colleges and Schools. The accreditation was reaffirmed in 1964, 1974, 1985, 1995, and again in 2006.
In 1974 the College broadened its philosophy and purpose to encompass the comprehensive community based educational concept, adding occupational education programs and implementing new education concepts including individualized and self‐paced instruction and the use of audio‐tutorial instructional media. In keeping with the new educational role, the word “junior” was dropped from the Institution’s name, and the official name Navarro College was adopted by the Board of Trustees. In an attempt to address the growing needs of its service area, which consists of Navarro, Ellis, Freestone, Limestone, and Leon counties, the College began offering courses in various locations in those areas in the early 1970s and eventually established two permanent centers, Navarro College South at Mexia and the Ellis County Center at Waxahachie. In January 2006, a new campus in Midlothian opened to better serve students in the Midlothian area. In 2014 Navarro established a campus in Fairfield with a focus primarily on vocational and technical programs to serve communities in Freestone, Limestone, and Leon counties.
Navarro College has had six presidents: Mr. Ray Waller, the founding president served until his death in 1956. Dr. Ben W. Jones served from 1956 until 1973. In 1974 the Board named Dr. Kenneth P. Walker as president, and he served until 1988. Dr. Gerald E. Burson joined the College in 1989, serving until his retirement in January of 1998. The Board named Dr. Richard Sanchez as Navarro’s fifth president in 1998, and he served until his retirement in 2013. In September 2013 Dr. Barbara Kavalier began her administration as Navarro’s sixth president.

7 | P a g e
NAVARRO COLLEGE FACT BO0K
Mission and Goals
Mission Statement
Navarro College provides educational opportunities that empower students to achieve their personal, academic, and career goals and that promote life‐long learning for all communities.
Strategic Goals
Set the Path to Success
Goal 1: Create, maintain, and improve a pathway where students are guided through an enriched educational experience and the potential individual success of each student is maximized.
Empower and Support Student’s Journey to Success
Goal 2: Provide students individualized support throughout the education process ensuring each student is empowered to learn and is fully informed of choices and opportunities.
Develop and Sustain Our Resources to Deliver Optimal Educational Opportunities
Goal 3: Ensure resources are adequate for their intended purpose and are sustained and continuously upgraded as we advance the mission of the College.
Ensure Institutional Effectiveness and Transparency
Goal 4: Advance and maintain a culture of ongoing accountability and transparency to those we serve and to whom we are responsible.

8 | P a g e
NAVARRO COLLEGE FACT BO0K
Board of Trustees
Back Row: Loran Seely, Corsicana; Tod McGraw, Blooming Grove; A.L. Atkeisson, Kerens.
Front Row: Phil Judson, Vice Chairman, Corsicana; Lloyd Huffman, Chairman, Corsicana; Faith Holt, Corsicana; Richard Aldama, Secretary/Treasurer, Corsicana

9 | P a g e
NAVARRO COLLEGE FACT BO0K
Campus Locations

10 | P a g e
NAVARRO COLLEGE FACT BO0K
SERVICE AREA

11 | P a g e
NAVARRO COLLEGE FACT BO0K
Ellis County Freestone County
Leon County Limestone County
Navarro County
5 County Service Area
Texas United States
2014 Population Estimate 159,317 19,762 16,861 23,524 48,195 267,659 26,956,958 318,857,056
Median Household Income $61,952 $44,502$44,452
$38,823 $40,795 $46,105 $51,900 $53,046
Educational Level Ellis County Freestone County
Leon County Limestone County
Navarro County
5 County Service Area
Texas United States
Population 25 years and over (Estimate)
95,060 13,708 11,865 16,010 30,719 167,362 16,080,307 206,587,852
Less than 9th grade 6.8% 5.3% 7.4% 9.5% 8.4% 7.5% 9.4% 5.9%
9th to 12th grade, no diploma
9.5% 15.9% 9.7% 11.2% 13.0% 11.9% 9.4% 8.0%
High school graduate (includes equivalency)
30.0% 34.4% 35.6% 37.7% 32.9% 34.1% 25.3% 28.1%
Some college, no degree 25.9% 25.2% 27.3% 22.4% 22.5% 24.7% 22.7% 21.2%
Associate's degree 7.1% 7.4% 5.2% 6.8% 6.7% 6.6% 6.5% 7.8%
Bachelor's degree 14.4% 8.6% 10.3% 9.2% 11.9% 10.9% 17.7% 18.0%
Graduate or professional degree
6.3% 3.1% 4.5% 3.2% 4.6% 4.3% 8.9% 10.8%
Percent High School Graduate or below
46.3% 55.6% 52.7% 58.4% 54.3% 53.5% 44.1% 42.0%
Percent High School Graduate or higher
83.6% 78.8% 82.9% 79.3% 78.6% 80.6% 81.2% 86.0%
Percent Bachelor's degree or higher
20.7% 11.7% 14.8% 12.4% 16.5% 15.2% 26.7% 28.8%
Source: 2009‐2013 American Community Survey 5 Year Estimates (DP02), U.S. Census (data collected 2009‐2013)
Household Income & Educational Attainment within Navarro College Service Area

12 | P a g e
NAVARRO COLLEGE FACT BO0K
4.04.55.05.56.06.57.07.58.08.59.09.510.0
2009 2010 2011 2012 2013 2014
Une
mploymen
t Rate (%
)
Annual Unemployment Rate
US Texas Ellis Freestone Leon Limestone Navarro

13 | P a g e
NAVARRO COLLEGE FACT BO0K
Source: 2009‐2013 American Community Survey 5 Year Estimates (DP02), US Census Data collected 2009‐2013

14 | P a g e
NAVARRO COLLEGE FACT BO0K
Source: careerinfonet.org (sponsored by the US Department of Labor
*Programs we offer align with these occupations

15 | P a g e
NAVARRO COLLEGE FACT BO0K
NAVARRO COLLEGE DISTRICT

16 | P a g e
NAVARRO COLLEGE FACT BO0K
Student Demographics Fall 2014
Female59%
Male41%
Gender
Female Male
White57%Black
21%
Hispanic18%
Other3% International
1%
Ethnicity
White Black Hispanic Other International
Full‐time39%
Part‐Time61%
FT/PT Status
Full‐time Part‐Time
In District18%
Out of District79%
Out of State2%
International 1%
Residency
In District Out of District Out of State International

17 | P a g e
NAVARRO COLLEGE FACT BO0K
Corsicana69%
Waxahachie12%
Midlothian13%
eLearning6%
International Students by Campus
Corsicana Waxahachie Midlothian eLearning
Fall 2014 Spring 2015 Fall 2015Returning 24 19
New 29 16 37
0
10
20
30
40
50
60
American Honors Students Corsicana Campus
White 24.9%
Black 57.5%
Hispanic 9.0%
Non‐Resident4.4%
Other 4.3%
Residence Life Ethnicity
White Black Hispanic Non‐Resident Other
< 18 18‐19 20‐21 22‐24 25‐29 30‐34 35‐39 40‐49 50 & >Age Group 2,474 2,539 1,316 905 912 590 431 533 299
0
500
1,000
1,500
2,000
2,500
3,000
Student Age Group

18 | P a g e
NAVARRO COLLEGE FACT BO0K
Economically Disadvantaged
Academically Disadvantaged
First Generation
First Time in College Disabilities Veterans
Percentage Overall 44.7% 39.2% 31.3% 18.6% 3.0% 1.9%CampusCorsicana 1,730 1,325 1,063 907 196 82Waxahachie 924 1,165 701 460 72 70Midlothain 236 309 236 187 21 23Mexia 283 543 214 106 13 13eLearning 1,300 579 917 205 NA NAEthnicityTwo or More Races 52 48 28 36 NA 0White 2,012 1,995 1,588 884 NA 145Black 1,555 1,075 829 530 NA 23
Hispanic 793 706 646 375 NA 19Asian 24 28 11 10 NA 1Indian 24 23 19 12 NA 0International 3 42 2 16 NA 0Pacific Islander 10 4 8 2 NA 0
Students with Special Needs
19 | P a g e
NAVARRO COLLEGE FACT BO0K
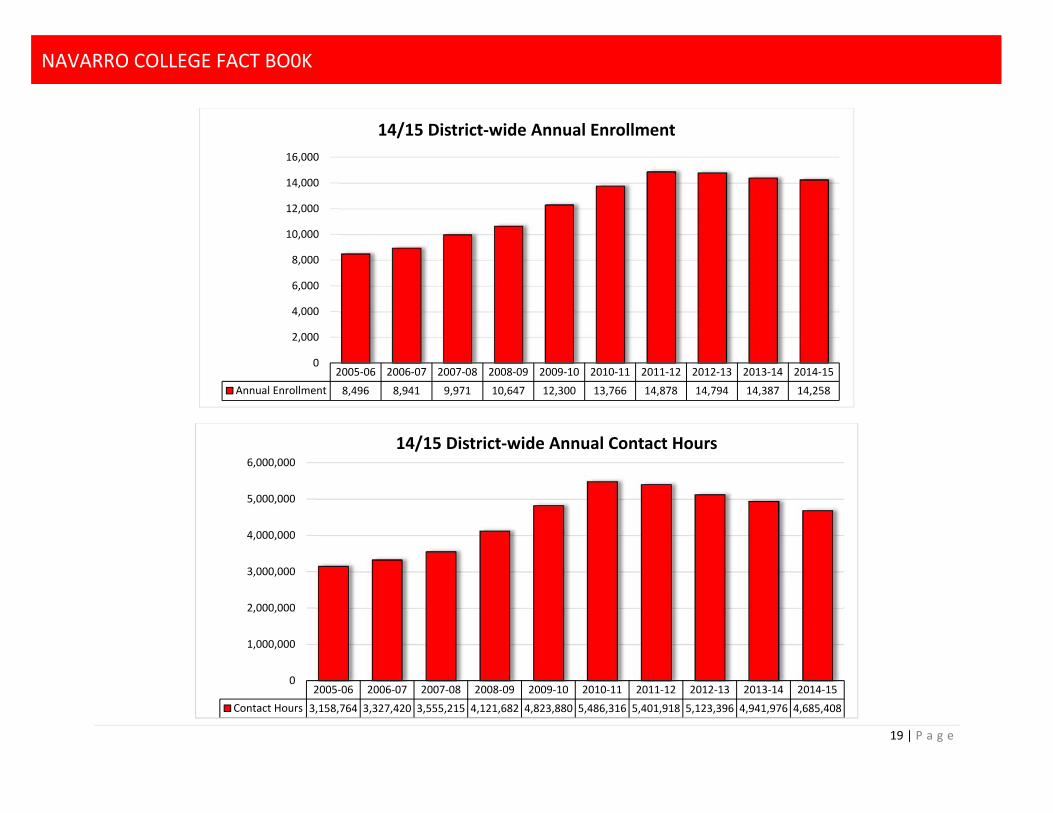
2005‐06 2006‐07 2007‐08 2008‐09 2009‐10 2010‐11 2011‐12 2012‐13 2013‐14 2014‐15Annual Enrollment 8,496 8,941 9,971 10,647 12,300 13,766 14,878 14,794 14,387 14,258
0
2,000
4,000
6,000
8,000
10,000
12,000
14,000
16,000
14/15 District‐wide Annual Enrollment
2005‐06 2006‐07 2007‐08 2008‐09 2009‐10 2010‐11 2011‐12 2012‐13 2013‐14 2014‐15Contact Hours 3,158,764 3,327,420 3,555,215 4,121,682 4,823,880 5,486,316 5,401,918 5,123,396 4,941,976 4,685,408
0
1,000,000
2,000,000
3,000,000
4,000,000
5,000,000
6,000,00014/15 District‐wide Annual Contact Hours

20 | P a g e
NAVARRO COLLEGE FACT BO0K
2005 2006 2007 2008 2009 2010 2011 2012 2013 2014Fall 6,512 7,406 7,560 8,328 9,200 10,166 10,433 10,098 10,257 9,999
0
2,000
4,000
6,000
8,000
10,000
12,000
District‐wide Fall Enrollment
2005 2006 2007 2008 2009 2010 2011 2012 2013 2014Fall 1,397,328 1,484,928 1,537,024 1,722,452 1,963,072 2,193,180 2,225,338 2,156,992 2,120,400 2,016,736
0
500,000
1,000,000
1,500,000
2,000,000
2,500,000
District‐wide Fall Contact Hours

21 | P a g e
NAVARRO COLLEGE FACT BO0K
2006 2007 2008 2009 2010 2011 2012 2013 2014 2,015Spring 6,434 7,285 7,628 8,918 10,150 10,858 10,697 10,254 10,165 9,970
0
2,000
4,000
6,000
8,000
10,000
12,000
District‐wide Spring Enrollment
2006 2007 2008 2009 2010 2011 2012 2013 2014 2,015Spring 1,384,368 1,460,136 1,610,463 1,842,578 2,189,264 2,389,936 2,243,280 2,188,288 2,098,612 2,013,396
0
500,000
1,000,000
1,500,000
2,000,000
2,500,000
3,000,000
District‐wide Spring Contact Hours

22 | P a g e
NAVARRO COLLEGE FACT BO0K
2005 2006 2007 2008 2009 2010 2011 2012 2013 2014Summer 1 2,250 2,911 3,129 3,393 3,590 4,368 4,989 4,157 3,962 3,634
Summer 2 1,311 1,074 1,108 1,327 1,864 2,722 2,527 2,147 1,811 1,743
0
1,000
2,000
3,000
4,000
5,000
6,000
District‐wide Summer Enrollment
2005 2006 2007 2008 2009 2010 2011 2012 2013 2014Summer 1 278,860 297,220 318,288 425,068 506,392 635,968 689,780 568,020 554,180 499,804
Summer 2 98,208 85,136 89,440 131,584 165,152 267,232 243,520 210,096 168,784 155,472
0
100,000
200,000
300,000
400,000
500,000
600,000
700,000
800,000
District‐wide Summer Contact Hours

23 | P a g e
NAVARRO COLLEGE FACT BO0K
Corsicana Waxahachie Midlothian South eLearningHeadcount 6,966 7,292 2,419 2,768 10,695
0
2,000
4,000
6,000
8,000
10,000
District‐wide Annual Enrollment by Campus
Corsicana Waxahachie Midlothian South eLearningContact Hours 1,625,952 1,112,160 331,840 517,536 1,097,920
‐100,000
100,000
300,000
500,000
700,000
900,000
1,100,000
1,300,000
1,500,000
1,700,000
District‐wide Annual Contact Hours by Campus

24 | P a g e
NAVARRO COLLEGE FACT BO0K
CORSICANA CAMPUS

25 | P a g e
NAVARRO COLLEGE FACT BO0K
2010 2011 2012 2013 2014Fall 3,729 3,675 3,542 3,442 3,123
0
500
1,000
1,500
2,000
2,500
3,000
3,500
4,000
Corsicana Fall Enrollment
2010 2011 2012 2013 2014Fall 895,392 896,400 885,408 872,272 786,672
0
100,000
200,000
300,000
400,000
500,000
600,000
700,000
800,000
900,000Corsicana Fall Contact Hours

26 | P a g e
NAVARRO COLLEGE FACT BO0K
2011 2012 2013 2014 2015Spring 3,610 3,576 3,404 3,087 2,878
0
500
1,000
1,500
2,000
2,500
3,000
3,500
4,000
Corsicana Spring Enrollment
2011 2012 2013 2014 2015Spring 834,736 803,264 825,104 749,360 678,368
0
100,000
200,000
300,000
400,000
500,000
600,000
700,000
800,000
900,000
Corsicana Spring Contact Hours

27 | P a g e
NAVARRO COLLEGE FACT BO0K
2010 2011 2012 2013 2014Summer 1 738 780 612 788 590
Summer 2 507 510 513 428 375
0
100
200
300
400
500
600
700
800
900Corsicana Summer Enrollment
2010 2011 2012 2013 2014Summer 1 144,144 154,720 154,676 148,968 122,656
Summer 2 38,112 52,560 68,416 20,144 38,256
0
20,000
40,000
60,000
80,000
100,000
120,000
140,000
160,000
180,000
Corsicana Summer Contact Hours
28 | P a g e
NAVARRO COLLEGE FACT BO0K
WAXAHACHIE CAMPUS

29 | P a g e
NAVARRO COLLEGE FACT BO0K
2010 2011 2012 2013 2014Fall 3,123 3,287 3,088 3,208 3,114
0
500
1,000
1,500
2,000
2,500
3,000
3,500Waxahachie Fall Enrollment
2010 2011 2012 2013 2014Fall 533,660 552,656 513,744 502,352 487,360
0
100,000
200,000
300,000
400,000
500,000
600,000Waxahachie Fall Contact Hours

30 | P a g e
NAVARRO COLLEGE FACT BO0K
2011 2012 2013 2014 2015Spring 3,408 3,205 3,036 3,133 3,075
0
500
1,000
1,500
2,000
2,500
3,000
3,500
4,000
Waxahachie Spring Enrollment
2011 2012 2013 2014 2015Spring 587,264 520,784 528,832 529,028 497,540
0
100,000
200,000
300,000
400,000
500,000
600,000
700,000
Waxahachie Spring Contact Hours

31 | P a g e
NAVARRO COLLEGE FACT BO0K
2010 2011 2012 2013 2014Summer 1 1,090 1,249 946 923 704
Summer 2 608 610 464 445 399
0
200
400
600
800
1,000
1,200
1,400Waxahachie Summer Enrollment
2010 2011 2012 2013 2014Summer 1 132,848 141,492 129,904 122,924 96,636
Summer 2 61,152 45,936 38,416 36,224 30,624
0
20,000
40,000
60,000
80,000
100,000
120,000
140,000
160,000
Waxahachie Summer Contact Hours

32 | P a g e
NAVARRO COLLEGE FACT BO0K
MIDLOTHIAN CAMPUS

33 | P a g e
NAVARRO COLLEGE FACT BO0K
2010 2011 2012 2013 2014Fall 999 1,050 1,037 1,139 1,068
0
200
400
600
800
1,000
1,200
Midlothian Fall Enrollment
2010 2011 2012 2013 2014Fall 144,720 145,088 146,592 160,304 164,048
0
20,000
40,000
60,000
80,000
100,000
120,000
140,000
160,000
180,000Midlothian Fall Contact Hours

34 | P a g e
NAVARRO COLLEGE FACT BO0K
2011 2012 2013 2014 2015Spring 1,068 1,056 1,023 1,079 1,069
0
200
400
600
800
1,000
1,200
Midlothian Spring Enrollment
2011 2012 2013 2014 2,015Spring 145,696 140,816 140,480 152,144 147,008
0
20,000
40,000
60,000
80,000
100,000
120,000
140,000
160,000
Midlothian Spring Contact Hours
35 | P a g e
NAVARRO COLLEGE FACT BO0K
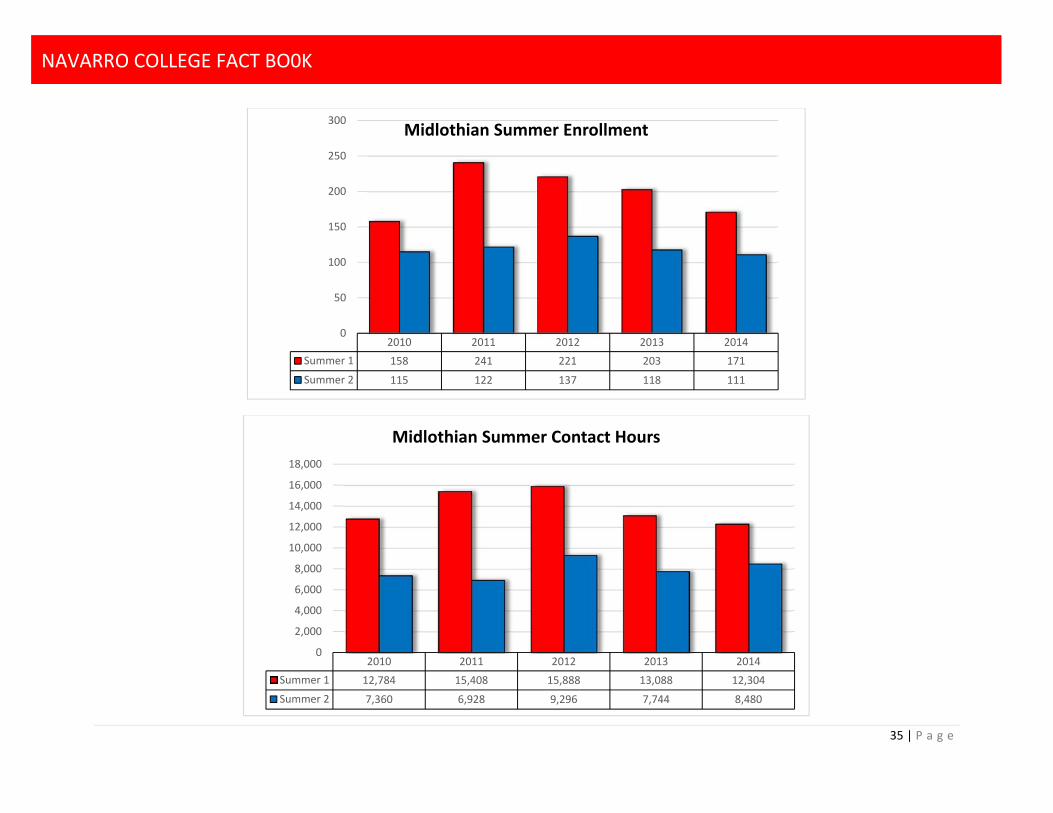
2010 2011 2012 2013 2014Summer 1 158 241 221 203 171
Summer 2 115 122 137 118 111
0
50
100
150
200
250
300Midlothian Summer Enrollment
2010 2011 2012 2013 2014Summer 1 12,784 15,408 15,888 13,088 12,304
Summer 2 7,360 6,928 9,296 7,744 8,480
0
2,000
4,000
6,000
8,000
10,000
12,000
14,000
16,000
18,000
Midlothian Summer Contact Hours

36 | P a g e
NAVARRO COLLEGE FACT BO0K
SOUTH CAMPUS

37 | P a g e
NAVARRO COLLEGE FACT BO0K
2010 2011 2012 2013 2014Fall 1,192 1,119 1,055 1,011 1,015
0
200
400
600
800
1,000
1,200
1,400
South Campus Fall Enrollment
2010 2011 2012 2013 2014Fall 220,080 202,496 177,024 154,992 190,608
0
50,000
100,000
150,000
200,000
250,000South Campus Fall Contact Hours

38 | P a g e
NAVARRO COLLEGE FACT BO0K
2011 2012 2013 2014 2015Spring 1,288 1,091 1,084 1,038 1,081
0
200
400
600
800
1,000
1,200
1,400
South Campus Spring Enrollment
2011 2012 2013 2014 2,015Spring 297,376 228,848 200,576 179,360 211,632
0
50,000
100,000
150,000
200,000
250,000
300,000
350,000
South Campus Spring Contact Hours

39 | P a g e
NAVARRO COLLEGE FACT BO0K
2010 2011 2012 2013 2014Summer 1 283 430 293 307 349
Summer 2 122 161 108 92 113
050100150200250300350400450500
South Campus Summer Enrollment
2010 2011 2012 2013 2014Summer 1 133,776 127,648 60,304 77,264 89,120
Summer 2 25,104 48,256 27,056 11,440 22,016
‐10,000
10,000
30,000
50,000
70,000
90,000
110,000
130,000
150,000
South Campus Summer Contact Hours

40 | P a g e
NAVARRO COLLEGE FACT BO0K
eLEARNING

41 | P a g e
NAVARRO COLLEGE FACT BO0K
2010 2011 2012 2013 2014Fall 3,450 3,757 3,691 3,836 3,395
0
500
1,000
1,500
2,000
2,500
3,000
3,500
4,000
4,500eLearning Fall Enrollment
2010 2011 2012 2013 2014Fall 399,328 428,698 434,224 430,480 388,048
0
50,000
100,000
150,000
200,000
250,000
300,000
350,000
400,000
450,000
500,000eLearning Fall Contact Hours

42 | P a g e
NAVARRO COLLEGE FACT BO0K
2011 2012 2013 2014 2015Fall 4,425 4,601 4,233 4,262 4,300
0
500
1,000
1,500
2,000
2,500
3,000
3,500
4,000
4,500
5,000eLearning Spring Enrollment
2011 2012 2013 2014 2,015Spring 524,864 549,568 493,296 488,720 478,848
0
100,000
200,000
300,000
400,000
500,000
600,000
eLearning Spring Contact Hours

43 | P a g e
NAVARRO COLLEGE FACT BO0K
2010 2011 2012 2013 2014Summer 1 1,665 2,820 2,373 2,253 2,132
Summer 2 1,149 1,360 1,011 961 868
0
500
1,000
1,500
2,000
2,500
3,000
eLearning Summer Enrollment
2010 2011 2012 2013 2014Summer 1 212,416 250,512 207,248 191,936 175,168
Summer 2 105,504 89,840 66,912 63,232 55,856
0
50,000
100,000
150,000
200,000
250,000
300,000eLearning Summer Contact Hours

44 | P a g e
NAVARRO COLLEGE FACT BO0K
DUAL CREDIT

45 | P a g e
NAVARRO COLLEGE FACT BO0K

46 | P a g e
NAVARRO COLLEGE FACT BO0K
Corsicana Waxahachie Midlothian Mexia eLearningCredit 3,123 3,114 1,068 1,154 3,395
Dual Credit 13.9% 37.8% 29.5% 46.3% 3.4%
0.0%5.0%10.0%15.0%20.0%25.0%30.0%35.0%40.0%45.0%50.0%
0
500
1,000
1,500
2,000
2,500
3,000
3,500
4,000
Dual Credit Percent of Total Enrollment
Headcount Fall 2010 Fall 2011 Fall 2012 Fall 2013 Fall 2014Corsicana 369 336 349 415 435Waxahachie 700 834 1,004 1,137 1,176Midlothian 278 293 297 401 315South 451 358 444 419 445eLearning 44 38 95 78 115Total 1,842 1,859 2,189 2,450 2,486Contact Hours Fall 2010 Fall 2011 Fall 2012 Fall 2013 Fall 2014Corsicana 38,112 32,928 38,384 42,512 38,736Waxahachie 70,208 89,744 114,480 120,784 130,928Midlothian 23,600 22,624 25,376 29,456 26,768South 36,720 26,304 36,832 24,224 51,120eLearning 0 3,552 6,656 6,208 11,920Total 168,640 175,152 221,728 223,184 259,472
Dual Credit by Campus

47 | P a g e
NAVARRO COLLEGE FACT BO0K
Dual Credit Enrollment By School District High School Enrollment High School Enrollment
Ellis County Freestone County Avalon High School 16 Fairfield High School 87Ennis High School 75 Teague High School 47Ferris High School 76 Wortham High School 22Italy High School 39 Leon County Life School Red Oak 69 Buffalo High School 50Maypearl High School 65 Centerville High School 50Midlothian High School 255 Leon High School 40Milford High School 5 Normangee High School 25Ovilla High School 27 Oakwood High School 7Palmer High School 63 Limestone County Red Oak High School 229 Coolidge High School 6Rice High School 68 Groesbeck High School 131Waxahachie Global High School 406 Mexia High School 67Waxahachie High School 197 Other Waxahachie Preparatory Academy 4 Cedar Hill High School 7
Navarro County Crossroads Christian Academy 1Agape Christian Academy 1 Desoto High School 1Blooming Grove High School 63 Eustace High School 1Corsicana High School 128 Foreign High School 1Dawson High School 21 Home Schooled 10Frost High School 12 Life Charter School 4Kerens High School 37 Lipan High School 1Mildred High School 62 Other High School in State 10
Total Dual Credit Enrollment 2,486

48 | P a g e
NAVARRO COLLEGE FACT BO0K
High School Enrollment High School Enrollment
Avalon High School 16 Fairfield High School 87Ennis High School 75 Teague High School 47Ferris High School 76 Wortham High School 22Italy High School 39Life School Red Oak 69 Buffalo High School 50Maypearl High School 65 Centerville High School 50Midlothian High School 255 Leon High School 40Milford High School 5 Normangee High School 25Ovilla High School 27 Oakwood High School 7Palmer High School 63Red Oak High School 229 Coolidge High School 6Rice High School 68 Groesbeck High School 131Waxahachie Global High School 406 Mexia High School 67Waxahachie High School 197Waxahachie Preparatory Academy 4 Cedar Hill High School 7
Crossroads Christian Academy 1Agape Christian Academy 1 Desoto High School 1Blooming Grove High School 63 Eustace High School 1Corsicana High School 128 Foreign High School 1Dawson High School 21 Home Schooled 10Frost High School 12 Life Charter School 4Kerens High School 37 Lipan High School 1Mildred High School 62 Other High School in State 10
Dual Credit Enrollment By School District
Total Dual Credit Enrollment 2,486
Navarro County
Other
Ellis County Freestone County
Leon County
Limestone County

49 | P a g e
NAVARRO COLLEGE FACT BO0K
2010 2011 2012 2013 2014Fall 1,842 1,859 2,190 2,450 2,486
0
500
1,000
1,500
2,000
2,500
3,000
District‐wide Dual Credit Fall Enrollment
2010 2011 2012 2013 2014Fall 168,640 175,152 221,728 223,184 259,472
0
50,000
100,000
150,000
200,000
250,000
300,000District‐wide Dual Credit Fall Contact Hours

50 | P a g e
NAVARRO COLLEGE FACT BO0K
ACCOUNTABILITY

51 | P a g e
NAVARRO COLLEGE FACT BO0K
Corsicana Mexia Waxahachie Midlothian Distance
LearningFall 2014 77.1% 85.5% 78.5% 80.3% 69.6%
0.0%10.0%20.0%30.0%40.0%50.0%60.0%70.0%80.0%90.0%
First Time Full Time PersistenceFall 2014 Cohort Returning in Spring 2015
by Campus

52 | P a g e
NAVARRO COLLEGE FACT BO0K
2010 2011 2012 2013 2014Degrees 664 627 786 960 1,204
0
200
400
600
800
1,000
1,200
1,400
Degrees Awarded 2014‐15
2010 2011 2012 2013 2014Certificates 538 500 519 644 882
0
100
200
300
400
500
600
700
800
900
1,000
Certificates Awarded 2014‐15

53 | P a g e
NAVARRO COLLEGE FACT BO0K
Retention Rates FY 2010‐11 FY 2011‐12 FY 2012‐13 FY 2013‐1485.9% 86.4% 87.1% 88.2%
Graduation Rates FY 2010‐11 FY 2011‐12 FY 2012‐13 FY 2013‐1418.3% 20.0% 17.3% 18.8%
Persistence Rates FY 2010‐11 FY 2011‐12 FY 2012‐13 FY 2013‐1452.7% 51.3% 48.6% 45.8%
Course Completion Rates FY 2010‐11 FY 2011‐12 FY 2012‐13 FY 2013‐1468.7% 68.9% 69.2% 69.1%
Transfer Rates FY 2010‐11 FY 2011‐12 FY 2012‐13 FY 2013‐1419.4% 18.3% 21.5% 19.1%
Licensure Exam Rates FY 2010‐11 FY 2011‐12 FY 2012‐13 FY 2013‐1489.3% 87.6% 87.9% 94.8%
Access Fall Semesters FY 2010‐11 FY 2011‐12 FY 2012‐13 FY 2013‐14First‐Time in College 2,331 2,061 2,273 1,956First Generation N/A N/A 1,281 3,131Low‐Income 4,953 4,588 4,475 4,473Degrees/Certificates FY 2010‐11 FY 2011‐12 FY 2012‐13 FY 2013‐14
1,127 1,305 1,604 2,086Success Points FY 2010‐11 FY 2011‐12 FY 2012‐13 FY 2013‐14Annual Success Point Totals 16,381 15,665 16,158 17,749
Accountability
Source: Texas Higher Education Coordinating Board Data & Navarro College Records

54 | P a g e
NAVARRO COLLEGE FACT BO0K
High School2014 Total Graduates
2014 Attending College %
2014 Not Attending College %
2014 Attending Navarro College %
Increase/ Decrease
2014 to 2013
Bound Students Attending Navarro
Ennis High School 341 172 50.44% 169 49.56% 77 22.58% -0.03% 44.77%Ferris High School 157 87 55.41% 70 44.59% 36 22.93% 5.77% 41.38%Italy High School 38 20 52.63% 18 47.37% 5 13.16% -5.99% 25.00%Maypearl High School 75 39 52.00% 36 48.00% 9 12.00% -12.36% 23.08%Midlothian High School 527 317 60.15% 210 39.85% 106 20.11% -3.69% 33.44%Palmer High School 71 48 67.61% 23 32.39% 30 42.25% 10.25% 62.50%Red Oak High School 451 259 57.43% 192 42.57% 61 13.53% -1.53% 23.55%Waxahachie High School 557 292 52.42% 265 47.58% 103 18.49% -2.70% 35.27%
Ellis County Total 2,217 1,234 55.66% 983 44.34% 427 19.26% -1.66% 34.60%Fairfield High School 102 58 56.86% 44 43.14% 18 17.65% 1.55% 31.03%Teague High School 73 36 49.32% 37 50.68% 13 17.81% -1.11% 36.11%Wortham High School 37 28 75.68% 9 24.32% 18 48.65% 31.63% 64.29%Freestone County Total 212 122 57.55% 90 42.45% 49 23.11% 5.96% 40.16%Buffalo High School 51 23 45.10% 28 54.90% 0 0.00% 0.00% 0.00%Centerville High School 47 24 51.06% 23 48.94% 0 0.00% 0.00% 0.00%Leon High School 35 17 48.57% 18 51.43% 0 0.00% 0.00% 0.00%Normangee High School 35 16 45.71% 19 54.29% 0 0.00% 0.00% 0.00%
Leon County Total 168 80 47.62% 88 52.38% 0 0.00% 0.00% 0.00%Groesbeck High School 96 57 59.38% 39 40.63% 13 13.54% 2.63% 22.81%Mexia High School 149 63 42.28% 86 57.72% 26 17.45% -6.66% 41.27%Limestone County Total 245 120 48.98% 125 51.02% 39 15.92% -1.65% 32.50%Blooming Grove High Scho 71 41 57.75% 30 42.25% 23 32.39% -10.46% 56.10%Corsicana High School 390 230 58.97% 160 41.03% 150 38.46% -3.68% 65.22%Dawson High School 28 14 50.00% 14 50.00% 5 17.86% -6.28% 35.71%Frost High School 26 16 61.54% 10 38.46% 11 42.31% 42.31% 68.75%Kerens High School 34 23 67.65% 11 32.35% 13 38.24% -10.48% 56.52%Mildred High School 58 36 62.07% 22 37.93% 29 50.00% 20.37% 80.56%Rice High School 74 36 48.65% 38 51.35% 25 33.78% 0.45% 69.44%
Navarro County Total 681 396 58.15% 285 41.85% 256 37.59% -2.15% 64.65%Service Area Total 3,523 1,952 55.41% 1,571 44.59% 771 21.88% -0.38% 39.50%
Service Area High School Graduation Comparison

55 | P a g e
NAVARRO COLLEGE FACT BO0K
Source: Texas Higher Education Coordinating Board (THECB)

56 | P a g e
NAVARRO COLLEGE FACT BO0K
Academic Technical Tech-Prep10 1 111 0 017 1 13 2 176 4 261 7 41 0 0
149 11 7150 5 5182 20 158 1 17 1 07 0 16 0 1
101 5 286 7 144 4 02 0 0
195 19 830 1 222 0 111 0 040 3 14 0 019 0 12 1 03 0 1
115 2 329 2 15 3 00 0 1
1,396 100 61
Student Type
Prairie View A&M University
Lamar University
Sam Houston State University
Sul Ross State UniversityTarleton State University
Texas A&M University at Commerce
Stephen F. Austin State University
Institution Attended
Angelo State University
University of HoustonUniversity of Houston DowntownUniversity of Houston at Victoria
Texas Tech UniversityTexas Women's University
The University of Texas-Pan AmericanThe University of Texas at Arlington
The University of Texas at AustinThe University of Texas at Dallas
The University of Texas at San AntonioThe University of Texas at Tyler
University of Texas of the Permian Basin
Texas State University
Midwestern State University
Total
Texas A&M University
University of North TexasUniversity of North Texas at Dallas
West Texas A&M UniversityOther
Texas A&M University at Corpus ChristiTexas A&M University at KingsvilleTexas A&M University at Galveston
Texas Southern University
Navarro College Students Pursuing Additional Education2013‐2014 Graduates

57 | P a g e
NAVARRO COLLEGE FACT BO0K
EMPLOYEES

58 | P a g e
NAVARRO COLLEGE FACT BO0K
2010 2011 2012 2013 2014Employees 802 987 859 866 871
0
200
400
600
800
1000
1200
Number of Employees
2010 2011 2012 2013 2014Part Time 56.1% 64.2% 56.6% 57.0% 57.3%
Full Time 43.9% 35.8% 43.4% 43.0% 42.7%
0.0%
20.0%
40.0%
60.0%
80.0%
100.0%
Employee Status

59 | P a g e
NAVARRO COLLEGE FACT BO0K
2010 2011 2012 2013 2014Female 63.1% 62.0% 63.5% 64.0% 62.1%
Male 36.9% 38.0% 36.5% 36.0% 37.9%
0.0%
20.0%
40.0%
60.0%
80.0%
100.0%
Full Time Employee Gender
2010 2011 2012 2013 2014White 79.5% 79.9% 78.0% 79.8% 78.5%
Hispanic 8.0% 7.6% 7.8% 6.2% 6.5%
Black 11.1% 10.8% 12.3% 12.4% 13.4%
Other 1.4% 1.7% 1.9% 1.6% 1.6%
0.0%
20.0%
40.0%
60.0%
80.0%
100.0%
Full Time Employee Ethnicity

60 | P a g e
NAVARRO COLLEGE FACT BO0K
Full Time24%
Part Time76%
Faculty Status
Doctorate6%
Masters53%
Bachelors26%
Associate14%
Certificates1%
Degrees Held by Faculty

61 | P a g e
NAVARRO COLLEGE FACT BO0K
FINANCES

62 | P a g e
NAVARRO COLLEGE FACT BO0K
Financial …
Auxiliary Enterprises,
9.9%
Plant Funds, 0.3%
Debt Services, 3.1%
Local Income, 0.7%
Federal Funds, 3.6%
State Support, 16.3%
Taxes, 3.0%
Tuition/Fees, 20.3%
Source of Revenues 2014‐15
Instructional, 36.5%
General Administration,
3.8%Student
Services, 6.9%
Grants, 9.0%Transfer/Contingencies, 12.2%
General Instructional,
31.6%
Distibution of Funds 2014‐15

63 | P a g e
NAVARRO COLLEGE FACT BO0K

64 | P a g e
NAVARRO COLLEGE FACT BO0K
Personnel/Benefits63%
Transfer/Contigency/Debt16%
Maintenance & Operations
Utilities
Supplies/Software/PREquipment Travel
1%
E & G Fund Expenditures FY 2014‐15
Scholarships4.6%
Grants 44.0%Loans 51.5%
Financial Aid Awarded Fall 2014
Related Documents