NAVAL POSTGRADUATE SCHOOL MONTEREY, CALIFORNIA THESIS Approved for public release. Distribution is unlimited. DESIGN AND ANALYSIS OF A HYDROGEN COMPRESSION AND STORAGE STATION by Edward A. Fosson December 2017 Thesis Advisor: Anthony Gannon Co-Advisor: Andrea Holmes

Welcome message from author
This document is posted to help you gain knowledge. Please leave a comment to let me know what you think about it! Share it to your friends and learn new things together.
Transcript

NAVAL
POSTGRADUATE
SCHOOL
MONTEREY, CALIFORNIA
THESIS
Approved for public release. Distribution is unlimited.
DESIGN AND ANALYSIS OF A HYDROGEN
COMPRESSION AND STORAGE STATION
by
Edward A. Fosson
December 2017
Thesis Advisor: Anthony Gannon
Co-Advisor: Andrea Holmes

THIS PAGE INTENTIONALLY LEFT BLANK

i
REPORT DOCUMENTATION PAGE Form Approved OMB
No. 0704–0188 Public reporting burden for this collection of information is estimated to average 1 hour per response, including the time for reviewing
instruction, searching existing data sources, gathering and maintaining the data needed, and completing and reviewing the collection
of information. Send comments regarding this burden estimate or any other aspect of this collection of information, including suggestions for reducing this burden, to Washington Headquarters Services, Directorate for Information Operations and Reports, 1215
Jefferson Davis Highway, Suite 1204, Arlington, VA 22202-4302, and to the Office of Management and Budget, Paperwork
Reduction Project (0704-0188) Washington, DC 20503.
1. AGENCY USE ONLY
(Leave blank)
2. REPORT DATE December 2017
3. REPORT TYPE AND DATES COVERED Master’s thesis
4. TITLE AND SUBTITLE
DESIGN AND ANALYSIS OF A HYDROGEN COMPRESSION AND
STORAGE STATION
5. FUNDING NUMBERS
6. AUTHOR(S) Edward A. Fosson
7. PERFORMING ORGANIZATION NAME(S) AND ADDRESS(ES)
Naval Postgraduate School
Monterey, CA 93943-5000
8. PERFORMING
ORGANIZATION REPORT
NUMBER
9. SPONSORING /MONITORING AGENCY NAME(S) AND
ADDRESS(ES)
Project supported by the Office of Naval Research’s (ONR) Energy Systems
Technology Evaluation Program (ESTEP), supported by Dr. Richard Carlin
and under the technical monitoring of Marissa Brand.
10. SPONSORING /
MONITORING AGENCY
REPORT NUMBER
11. SUPPLEMENTARY NOTES The views expressed in this thesis are those of the author and do not reflect the
official policy or position of the Department of Defense or the U.S. Government. IRB number ____N/A____.
12a. DISTRIBUTION / AVAILABILITY STATEMENT Approved for public release. Distribution is unlimited.
12b. DISTRIBUTION CODE
13. ABSTRACT (maximum 200 words)
This research investigates the use of an electrochemical hydrogen compressor in an energy storage
station. The electrochemical hydrogen compressor, as a solid-state device, offers the ability to
continuously operate for long periods without the need to replace mechanical seals, lubricants, or filters.
The two-part study consists of station design and performance testing of a commercial-off-the-shelf
electrochemical hydrogen compressor. Station design used American Society of Mechanical Engineers
(ASME), National Fire Protection Association (NFPA), and Compressed Gas Association (CGA)
standards for risk mitigation and determination of feasibility for Department of Defense (DOD) and Navy
application. Analysis of the compressor includes a comparison of actual field performance to ideal
isothermal and adiabatic compression of hydrogen. Performance characteristics are investigated over a
range of variable inputs for use during future optimization of the compression and storage station.
The hydrogen compression and storage station is one subsystem of a multi-system demonstration of
solar energy storage using hydrogen as the primary storage medium. The larger system integrates
commercial-off-the-shelf photovoltaic solar panels, solid-state hydrogen electrolyzers, solid-state
electrochemical compressors, and proton exchange membrane fuel cells to demonstrate renewable energy
storage. The compression and storage station design allows for reconfiguration and further research in
hydrogen technologies. Similar systems could be used on Navy shore installations, on expeditionary bases,
and at sea to increase resiliency and reduce logistical demand for fuels.
14. SUBJECT TERMS electrochemical hydrogen compressor, hydrogen compression, hydrogen storage, energy
storage, renewable energy storage
15. NUMBER OF
PAGES 139
16. PRICE CODE
17. SECURITY
CLASSIFICATION OF
REPORT Unclassified
18. SECURITY
CLASSIFICATION OF THIS
PAGE
Unclassified
19. SECURITY
CLASSIFICATION OF
ABSTRACT
Unclassified
20. LIMITATION
OF ABSTRACT
UU
NSN 7540–01-280-5500 Standard Form 298 (Rev. 2–89)
Prescribed by ANSI Std. 239–18

ii
THIS PAGE INTENTIONALLY LEFT BLANK

iii
Approved for public release. Distribution is unlimited.
DESIGN AND ANALYSIS OF A HYDROGEN COMPRESSION AND STORAGE
STATION
Edward A. Fosson
Lieutenant Commander, United States Navy
B.S., United States Naval Academy, 2005
Submitted in partial fulfillment of the
requirements for the degree of
MASTER OF SCIENCE IN MECHANICAL ENGINEERING
from the
NAVAL POSTGRADUATE SCHOOL
December 2017
Approved by: Anthony Gannon
Thesis Advisor
Andrea Holmes
Co-Advisor
Garth Hobson
Chair, Department of Mechanical and Aerospace Engineering

iv
THIS PAGE INTENTIONALLY LEFT BLANK

v
ABSTRACT
This research investigates the use of an electrochemical hydrogen compressor in
an energy storage station. The electrochemical hydrogen compressor, as a solid-state
device, offers the ability to continuously operate for long periods without the need to
replace mechanical seals, lubricants, or filters. The two-part study consists of station
design and performance testing of a commercial-off-the-shelf electrochemical hydrogen
compressor. Station design used American Society of Mechanical Engineers (ASME),
National Fire Protection Association (NFPA), and Compressed Gas Association (CGA)
standards for risk mitigation and determination of feasibility for Department of Defense
(DOD) and Navy application. Analysis of the compressor includes a comparison of actual
field performance to ideal isothermal and adiabatic compression of hydrogen.
Performance characteristics are investigated over a range of variable inputs for use during
future optimization of the compression and storage station.
The hydrogen compression and storage station is one subsystem of a multi-system
demonstration of solar energy storage using hydrogen as the primary storage medium.
The larger system integrates commercial-off-the-shelf photovoltaic solar panels, solid-
state hydrogen electrolyzers, solid-state electrochemical compressors, and proton
exchange membrane fuel cells to demonstrate renewable energy storage. The
compression and storage station design allows for reconfiguration and further research in
hydrogen technologies. Similar systems could be used on Navy shore installations, on
expeditionary bases, and at sea to increase resiliency and reduce logistical demand for
fuels.

vi
THIS PAGE INTENTIONALLY LEFT BLANK

vii
TABLE OF CONTENTS
I. INTRODUCTION..................................................................................................1
A. WHY IS A COMPRESSION AND STORAGE STATION
NECESSARY? ...........................................................................................1
B. WHAT ARE ELECTROCHEMICAL COMPRESSORS AND
WHY USE THEM?....................................................................................2
C. WHY COMPRESS HYDROGEN GAS? ................................................5
D. CURRENT HYDROGEN STORAGE STRATEGIES ........................10
II. DESIGN ................................................................................................................15
A. REQUIREMENTS DEFINITION .........................................................15
1. Previous Research Performed at NPS........................................15
2. Concurrent Work at NPS ............................................................17
3. Future Work at NPS ....................................................................18
B. CODES, STANDARDS, AND EXISTING GUIDANCE .....................19
C. SAFETY ANALYSIS...............................................................................21
1. Combustion and Explosion Safety ..............................................22
2. High-Pressure Gas Safety............................................................29
3. Fire Protection Requirements .....................................................42
4. Piping and Identification .............................................................45
D. EQUIPMENT SELECTION ..................................................................46
1. Compressor Selection ..................................................................46
2. Storage Device Selection ..............................................................52
3. Filtration Systems ........................................................................55
III. TESTING AND DATA COLLECTION ............................................................57
A. DATA ACQUISITION STRATEGY .....................................................57
B. TESTS CONDUCTED ............................................................................59
1. Specific Power versus Outlet Pressure .......................................59
2. Endurance Testing .......................................................................74
IV. DISCUSSION .......................................................................................................77
A. NAVY PHOTOVOLTAIC INFRASTRUCTURE................................77
B. OPPORTUNITIES ..................................................................................80
1. Stationary Installations ...............................................................80
2. Expeditionary Application ..........................................................80
3. Hydrogen at Sea ...........................................................................82

viii
V. CONCLUSION ....................................................................................................85
APPENDIX A. VACUUM/PRESSURE PURGING CALCULATIONS ....................87
APPENDIX B. PIPE WALL THICKNESS CALCULATIONS .................................89
APPENDIX C. PIPING AND IDENTIFICATION (P&ID) DIAGRAM ...................91
APPENDIX D. MATLAB SCRIPT FOR EXPERIMENT DATA
COLLECTION ....................................................................................................95
APPENDIX E. SENSOR SPECIFICATIONS ..............................................................97
A. NATIONAL INSTRUMENTS CDAQ 9185 SPECIFICATIONS
[60] .............................................................................................................97
B. ALICAT M-SERIES MASS FLOW METER
SPECIFICATIONS [61] ..........................................................................98
C. CR MAGNETICS DC CURRENT TRANSDUCER
SPECIFICATIONS [62] ..........................................................................99
D. NOSHOK INC ANALOG PRESSURE GAUGE
SPECIFICATIONS [63] ........................................................................100
E. HONEYWELL MLH SERIES PRESSURE TRANSDUCER
SPECIFICATIONS [64] ........................................................................101
F. WIKAI ANALOG TEMPERATURE GAUGE/BIMETAL
THERMOMETER SPECIFICATIONS [65] ......................................104
G. TYPE K THERMOCOUPLE PROBE SPECIFICATIONS [66] .....105
H. NATIONAL INSTRUMENTS NI 9211 ANALOG
THERMOCOUPLE INPUT MODULE SPECIFICATIONS [67]....106
I. NATIONAL INSTRUMENTS NI 9215 ANALOG VOLTAGE
INPUT SPECIFICATIONS [68] ..........................................................109
LIST OF REFERENCES ..............................................................................................113
INITIAL DISTRIBUTION LIST .................................................................................119
ix
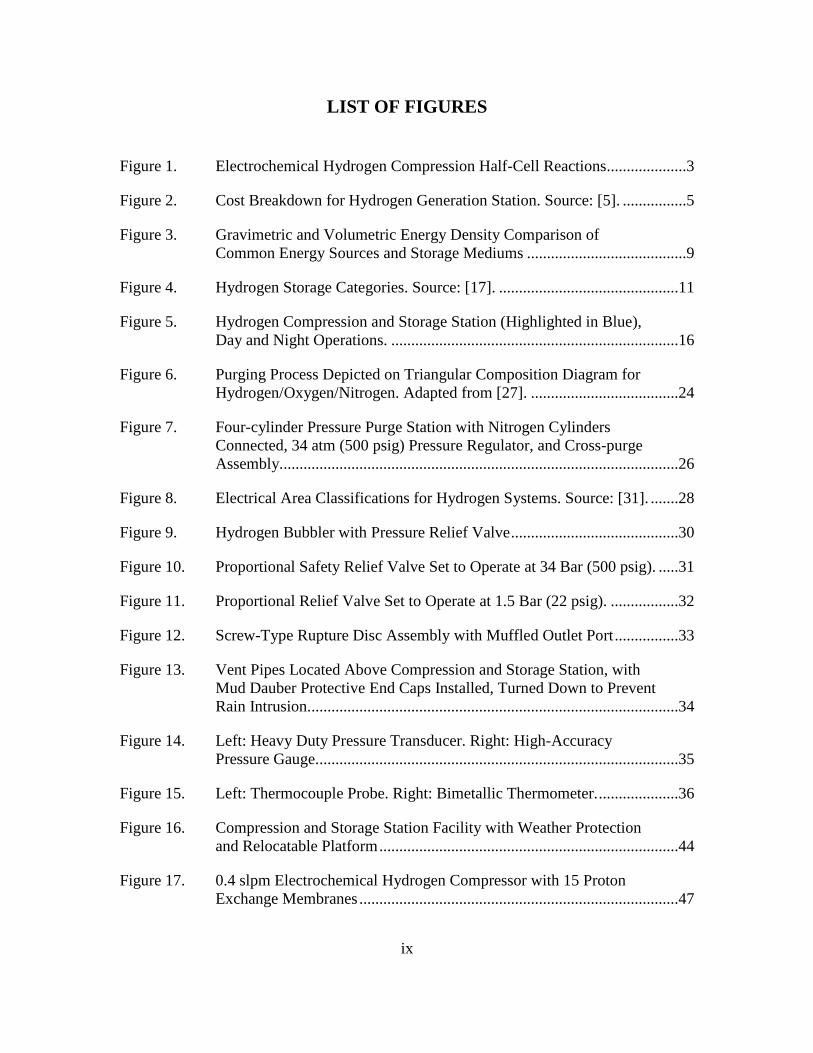
LIST OF FIGURES
Figure 1. Electrochemical Hydrogen Compression Half-Cell Reactions ....................3
Figure 2. Cost Breakdown for Hydrogen Generation Station. Source: [5]. ................5
Figure 3. Gravimetric and Volumetric Energy Density Comparison of
Common Energy Sources and Storage Mediums ........................................9
Figure 4. Hydrogen Storage Categories. Source: [17]. .............................................11
Figure 5. Hydrogen Compression and Storage Station (Highlighted in Blue),
Day and Night Operations. ........................................................................16
Figure 6. Purging Process Depicted on Triangular Composition Diagram for
Hydrogen/Oxygen/Nitrogen. Adapted from [27]. .....................................24
Figure 7. Four-cylinder Pressure Purge Station with Nitrogen Cylinders
Connected, 34 atm (500 psig) Pressure Regulator, and Cross-purge
Assembly....................................................................................................26
Figure 8. Electrical Area Classifications for Hydrogen Systems. Source: [31]. .......28
Figure 9. Hydrogen Bubbler with Pressure Relief Valve ..........................................30
Figure 10. Proportional Safety Relief Valve Set to Operate at 34 Bar (500 psig). .....31
Figure 11. Proportional Relief Valve Set to Operate at 1.5 Bar (22 psig). .................32
Figure 12. Screw-Type Rupture Disc Assembly with Muffled Outlet Port ................33
Figure 13. Vent Pipes Located Above Compression and Storage Station, with
Mud Dauber Protective End Caps Installed, Turned Down to Prevent
Rain Intrusion.............................................................................................34
Figure 14. Left: Heavy Duty Pressure Transducer. Right: High-Accuracy
Pressure Gauge...........................................................................................35
Figure 15. Left: Thermocouple Probe. Right: Bimetallic Thermometer. ....................36
Figure 16. Compression and Storage Station Facility with Weather Protection
and Relocatable Platform ...........................................................................44
Figure 17. 0.4 slpm Electrochemical Hydrogen Compressor with 15 Proton
Exchange Membranes ................................................................................47

x
Figure 18. 4.0 slpm Electrochemical Hydrogen Compressor with 120 Proton
Exchange Membranes ................................................................................48
Figure 19. Minimum Inlet Pressure Measured Against Maximum Outlet
Pressure for Both Piston and Diaphragm Type Mechanical Hydrogen
Compressors. Adapted from [41], [42], [43]. ............................................49
Figure 20. Minimum Inlet Pressure Measured Against Maximum Outlet
Pressure for Mechanical Hydrogen Compressors Meeting Research
Requirements. Adapted From: [41] ...........................................................50
Figure 21. Compact Mechanical Hydrogen Compressor, Piston-Type, Single
Stage, Oil-Less, Air Cooled. Source: [41] .................................................51
Figure 22. Mechanical Hydrogen Compressor, Piston-Type, One–Five Stage,
Oil-Less, Air or Water Cooled. Source: [41] .............................................51
Figure 23. All-Steel, Standard Size, Compressed Gas Cylinders Used for
Hydrogen Storage Placed in OSHA, UFC, NFPA, and CGA
Compliant Stand with Polypropylene Straps and Steel Chain Straps
for Support. ................................................................................................54
Figure 24. Stainless Steel Tee-type Particulate Filters. ...............................................56
Figure 25. Stainless Steel High-pressure Adsorption Filter. Source: [45]. .................56
Figure 26. National Instruments CompactDAQ Model cDAQ-9184 with Analog
Thermocouple and Voltage Input modules. ...............................................57
Figure 27. Data Acquisition System Wiring Diagram. ...............................................58
Figure 28. Voltage and Outlet Pressure Characteristics for 0.4 slpm EHC with
1.07 Bar Average Inlet Pressure ................................................................64
Figure 29. Power Input and Volumetric Flow Characteristics for 0.4 slpm EHC
with 1.07 Bar Average Inlet Pressure ........................................................65
Figure 30. Measured Voltage, Theoretical Voltage, and Efficiency
Characteristics for 0.4 slpm EHC with 1.07 Bar Average Inlet
Pressure ......................................................................................................66
Figure 31. Measured Specific Work vs. Ideal Adiabatic Compression
Characteristics for 0.4 slpm EHC with 1.07 Bar Average Inlet
Pressure ......................................................................................................67
Figure 32. Adiabatic Efficiency Characteristics for 0.4 slpm EHC with 1.07 Bar
Average Inlet Pressure ...............................................................................68

xi
Figure 33. Measured Specific Work vs. Ideal Isothermal Compression
Characteristics for 0.4 slpm EHC with 1.07 Bar Average Inlet
Pressure ......................................................................................................69
Figure 34. Isothermal Efficiency Characteristics for 0.4 slpm EHC with 1.07
Bar Average Inlet Pressure ........................................................................70
Figure 35. Comparison of 0.4 slpm EHC with 1.07 Bar Average Inlet Pressure
to Mechanical Compressors .......................................................................71
Figure 36. Specific Energy for 0.4 slpm EHC at Various Inlet Pressures ..................72
Figure 37. Specific Energy of 4.0 slpm EHC at 1.56 Bar Inlet Pressure ....................73
Figure 38. Combined Results of 0.4 slpm and 4.0 slpm Electrochemical
Compressors at Various Inlet Pressures .....................................................74
Figure 39. Department of the Navy Photovoltaic Facility Investment. Source:
[48]. ............................................................................................................78
Figure 40. California Independent System Operator (CAISO) Renewable
Curtailment Totals (2014 – 2015). Source: [49]. .......................................79
Figure 41. NATO Camp Hybrid Power Station ..........................................................82

xii
THIS PAGE INTENTIONALLY LEFT BLANK
xiii
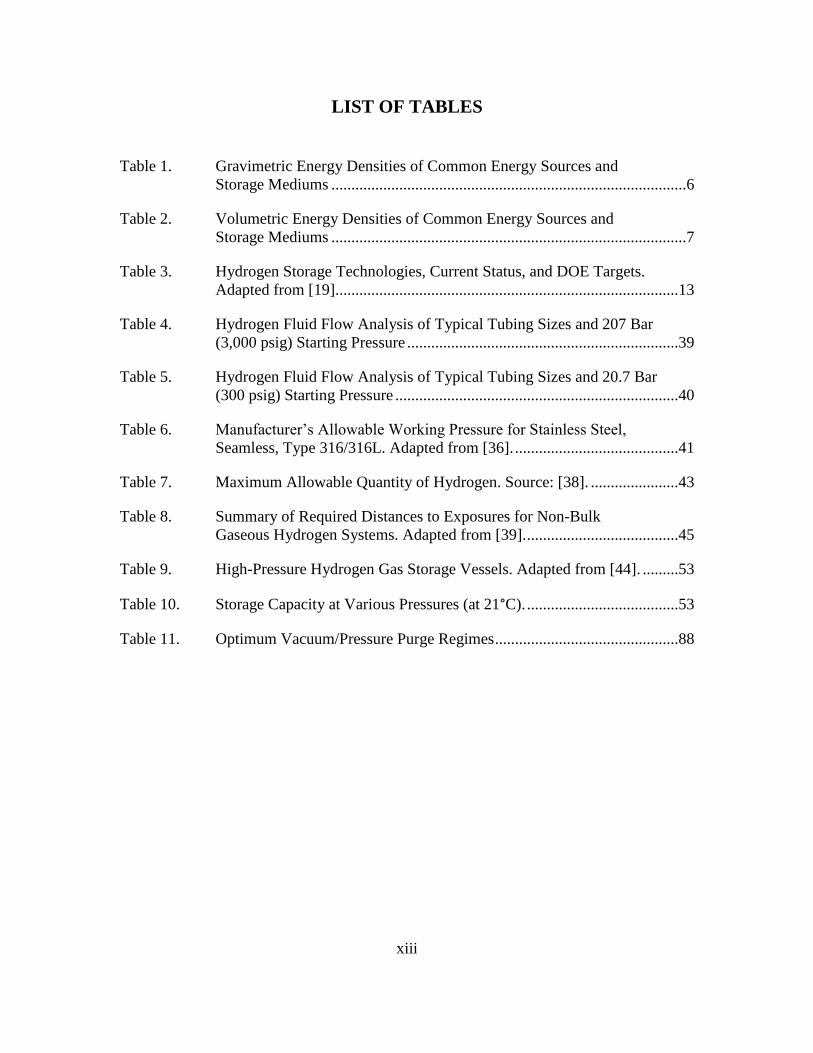
LIST OF TABLES
Table 1. Gravimetric Energy Densities of Common Energy Sources and
Storage Mediums .........................................................................................6
Table 2. Volumetric Energy Densities of Common Energy Sources and
Storage Mediums .........................................................................................7
Table 3. Hydrogen Storage Technologies, Current Status, and DOE Targets.
Adapted from [19]......................................................................................13
Table 4. Hydrogen Fluid Flow Analysis of Typical Tubing Sizes and 207 Bar
(3,000 psig) Starting Pressure ....................................................................39
Table 5. Hydrogen Fluid Flow Analysis of Typical Tubing Sizes and 20.7 Bar
(300 psig) Starting Pressure .......................................................................40
Table 6. Manufacturer’s Allowable Working Pressure for Stainless Steel,
Seamless, Type 316/316L. Adapted from [36]. .........................................41
Table 7. Maximum Allowable Quantity of Hydrogen. Source: [38]. ......................43
Table 8. Summary of Required Distances to Exposures for Non-Bulk
Gaseous Hydrogen Systems. Adapted from [39]. ......................................45
Table 9. High-Pressure Hydrogen Gas Storage Vessels. Adapted from [44]. .........53
Table 10. Storage Capacity at Various Pressures (at 21°C). ......................................53
Table 11. Optimum Vacuum/Pressure Purge Regimes ..............................................88

xiv
THIS PAGE INTENTIONALLY LEFT BLANK

xv
LIST OF ACRONYMS AND ABBREVIATIONS
ASME American Society of Mechanical Engineers
C4ISR Command, Control, Communications, Computers, Intelligence,
Surveillance, and Reconnaissance
CAISO California Independent System Operator
CFR United States Code of Federal Regulations
CGA Compressed Gas Association
DOD Department of Defense
EHC electrochemical hydrogen compressor
ESTEP Energy Systems Technology Evaluation Program
EXWC Engineering and Expeditionary Warfare Center
HAZCOM hazard communication standard
HMC&M hazardous material control and management
ISD inherently safer design
NAVFAC Naval Facilities Engineering Command
NFPA National Fire Protection Association
OEM original equipment manufacturer
OSHA Occupational Safety and Health Administration
PEM proton exchange membrane
psig pounds per square inch gauge
PSM process safety management
RMP risk management program
slpm standard liters per minute
TTPs tactics, techniques, and procedures
UAV unmanned aerial vehicle

xvi
THIS PAGE INTENTIONALLY LEFT BLANK

xvii
ACKNOWLEDGMENTS
First and foremost, I thank my beautiful, loving, patient, and inspiring wife. She
has sacrificed her career and time spent with friends and family to accompany me during
my own pursuit of happiness.
I also owe a debt of gratitude to the Naval Postgraduate School’s Mechanical and
Aerospace Engineering Department and Energy Academic Group staff and faculty for
providing unparalleled leadership, instruction, and support during my project.
I would like to specifically thank Professor Anthony Gannon for his inspiration
and dedication to helping students and supporting the Navy and Department of Defense
energy mission. I am very grateful for your wisdom and guidance and wish you the very
best as you continue tackling the Navy’s engineering, administrative, and acquisition
challenges. I also thank Professor Garth Hobson for his enthusiastic support of my
research and steadfast pursuit of excellence in the MAE department. Your sound
leadership and genius are displayed through all the brilliant students who pass through
the department, and I am grateful to have been among them. I also thank Professor
Maximilian Platzer and Professor Christopher Brophy for their encouragement and
kindness as well as the Turbopropulsion Laboratory staff, Andrea Holmes and John
Gibson, for their direct support and guidance during all stages of my project. I could not
have completed this project without your help and I am truly grateful to have worked
with you. And lastly, many thanks to the Rocket Propulsion Laboratory staff, Bobby
Wright and David Dausen, who provided invaluable expertise, material, advice, and time
to help in getting the station running. Thank you, gentlemen.

xviii
THIS PAGE INTENTIONALLY LEFT BLANK
1
I. INTRODUCTION
The purpose of this research is to design, build, and test a renewably powered
hydrogen gas compression and storage station incorporating an electrochemical hydrogen
gas compressor. The research, funded through the Office of Naval Research Engineering
Systems Technology Evaluation Program, is intended to further the ongoing efforts to
develop low-cost hydrogen infrastructure in the Navy. Potential applications of this
research include energy storage at shore installations with renewably generated power,
expeditionary microgrids, and sea-based hydrogen harvesting.
A. WHY IS A COMPRESSION AND STORAGE STATION NECESSARY?
Generating renewable and sustainable energy is the cornerstone of the ongoing
Department of Defense (DOD) drive for increasing resiliency at shore installations. There
are several methods of generating power from renewable energy sources, but most of
these are limited in their reliability due to existing energy storage options. Significant
investments have been made in developing advanced batteries and superconductors as a
solution. Currently, supply chains are developing to provide grid-scale electrical power
storage using batteries and supercapacitors. With a high gravimetric energy density,
hydrogen gas offers an enticing alternative. Hydrogen could serve as either an alternative
to batteries and supercapacitors or a supplementary storage medium within a portfolio of
several storage technologies.
Previous research by Aviles at the Naval Postgraduate School demonstrated the
feasibility of using solar photovoltaic electricity to extract water from ambient air and
then use the water to make hydrogen gas [1]. This project also used the hydrogen gas in a
fuel cell to produce electricity. Adding a hydrogen compression and storage station to this
system will enable electrical power generation during times when the photovoltaic array
cannot operate. Once compressed hydrogen gas is made readily available onsite, other
systems can make use of the fuel such as generators, fuel cell powered vehicles, and
unmanned vehicles.

2
The DOD has traditionally focused its alternative fuel investments in drop-in
alternative fuels for existing platforms. The DOD and Navy define alternative fuels as
those derived from materials other than fossil fuels [2]. Renewably generated hydrogen
gas, such as the hydrogen station demonstrated at NPS, falls into this category of
alternative fuels. Current DOD policy is to “diversify and expand energy supplies and
sources, including renewable energy sources and alternative fuels” [3]. By analyzing
hydrogen storage technologies, this research is helping to achieve the DOD’s “policy to
enhance military capability, improve energy security, and mitigate costs in its use and
management of energy” [3].
B. WHAT ARE ELECTROCHEMICAL COMPRESSORS AND WHY USE
THEM?
Electrochemical hydrogen compressors (EHCs) are solid-state devices that use
direct current electricity to transport hydrogen through a proton exchange membrane and
build pressure into a pressure vessel. Their physical construction, operation, and theory
are very similar to that of a proton exchange membrane fuel cell. There are numerous
potential advantages to using EHCs as opposed to traditional mechanical compressors;
most notably, the solid-state EHCs are not subject to the same mechanical friction and
thermodynamic losses of their mechanical counterparts. The EHC is also designed to
follow an isothermal compression process which requires less energy than the adiabatic
process of mechanical compressors. A third core advantage is the inherent purification
process that happens as hydrogen gets transported through the membranes.
Figure 1 illustrates the process of hydrogen transfer through the membrane. As
low-pressure hydrogen is supplied to the inlet (anode), it oxidizes due to the electrical
potential. Each hydrogen atom loses an electron at the anode, and this electron gets
transported via the electrical power supply to the cathode. Since the former hydrogen
atom is now missing an electron, it becomes a proton which is attracted to the cathode
and pulled through the membrane. At the cathode, each proton receives an electron,
becomes a hydrogen atom, bonds with another hydrogen atom, and exits through the
compressor outlet. As hydrogen flows out of the compressor outlet, it fills the storage

3
vessel and increases the vessel pressure until the power supply is turned off, a relief valve
is opened, or the compressor reaches its maximum compression.
Figure 1. Electrochemical Hydrogen Compression Half-Cell Reactions
One half-cell consists of the oxidation of hydrogen along the anode,
2 2 2H H e . The other consists of its reduction along the cathode, 22 2H e H .
Together, these reactions are governed by the Nernst Equation (1), which can provide the
theoretical cell potential needed from the power supply to drive the reactions:
2
1
lntheoretical
PR TV
n F P
(1)
This theory and governing equation will be discussed later along with the results from
testing the EHC.

4
Most hydrogen compressors used today are mechanical diaphragm or piston
compressors. Mechanical compression systems have relatively simple construction,
maintenance, and repair procedures. Several major manufacturers offer mechanical
compressors with a wide range of inlet and outlet pressure configurations, with and
without integrated cooling, lubricated or unlubricated, and several other options that must
be considered when selecting a compressor. While the technology for mechanical
compression is mature, they have several inherent drawbacks.
Mechanical compressors are limited to how much compression they can achieve.
Piston compressors are limited to a single stage compression ratio of 4–6:1 while
diaphragm compressors can achieve 15–20:1 ratios in a single stage. EHCs, however, are
scalable to achieve a desired flow rate and have demonstrated compression ratios of
300:1 [4].
Mechanical compressors are also expensive both in up-front capital expenditure
requirements and operation and maintenance. Figure 2 demonstrates the high cost of
compression using traditional mechanical compressors. The cost breakdown comes from
a study conducted by the National Renewable Energy Laboratory in 2014 and includes
initial capital expenditure, as well as, operation and maintenance costs. The study noted
that the compressors had wide ranges of reliability and efficiency, making it more
difficult to break down the relative costs of compression.

5
Figure 2. Cost Breakdown for Hydrogen Generation Station. Source: [5].
Mechanical compressors are also large, heavy, loud, and usually, require several
hazardous materials to operate efficiently. ‘Small’ mechanical compressors can weigh as
much as 200–400 kg. The smallest mechanical compressor found on the market was 170
kg and 0.5 m3 while it could only compress to 51 Bar. Operating this compressor would
require hearing protection and handling of hydraulic fluid and lubricants. EHCs, on the
other hand, are silent, compact, and do not require handling hazardous materials. The
small compression and storage station designed and tested for this research would not be
feasible without the EHC. Neither the space available, budget, or gas generator could
support using a mechanical compressor.
C. WHY COMPRESS HYDROGEN GAS?
Hydrogen is considered an energy storage medium and not an energy source.
Hydrogen is the third most abundant element on Earth, but it is not found naturally in
large and concentrated quantities. Energy sources such as fossil fuels, solar, and wind can
be found naturally in both useable form and quantities. Hydrogen, on the other hand,
must be extracted from other molecules. Hydrogen can be generated as a byproduct in
chemical and biological processes, from electrolysis, or extracted from hydrocarbon
molecules, but it cannot be mined, drilled, or captured from the atmosphere in significant
quantities.
6
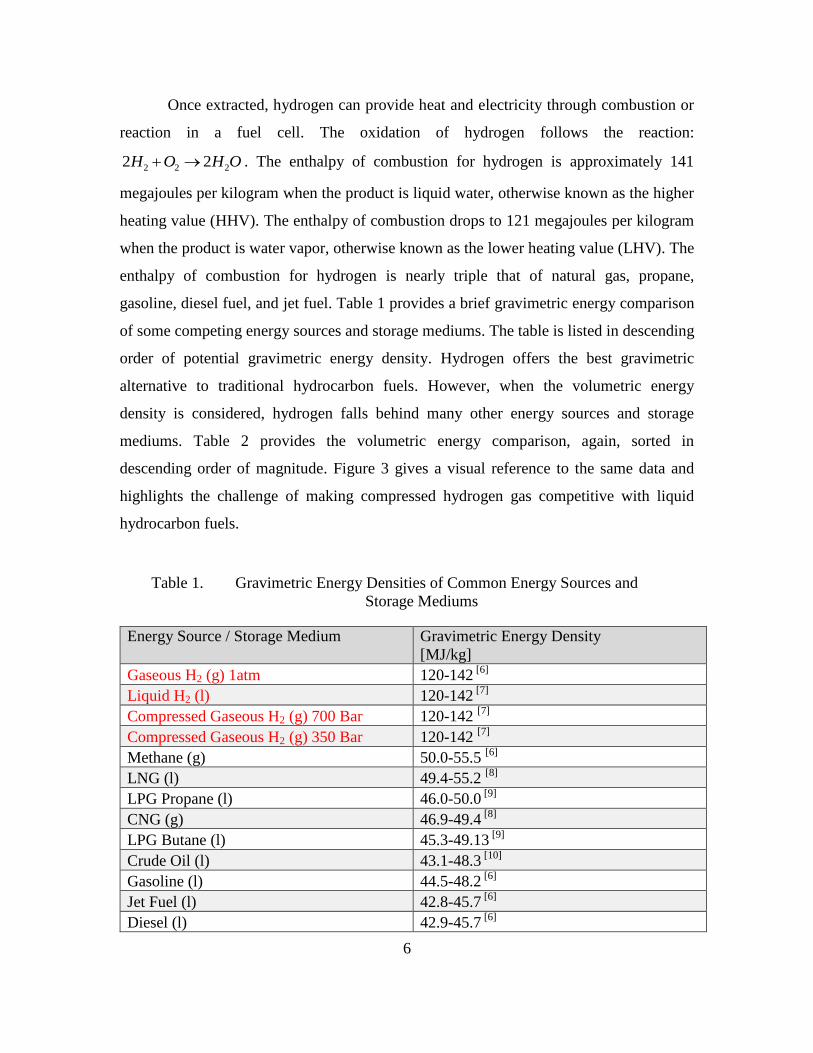
Once extracted, hydrogen can provide heat and electricity through combustion or
reaction in a fuel cell. The oxidation of hydrogen follows the reaction:
2 2 22 2H O H O . The enthalpy of combustion for hydrogen is approximately 141
megajoules per kilogram when the product is liquid water, otherwise known as the higher
heating value (HHV). The enthalpy of combustion drops to 121 megajoules per kilogram
when the product is water vapor, otherwise known as the lower heating value (LHV). The
enthalpy of combustion for hydrogen is nearly triple that of natural gas, propane,
gasoline, diesel fuel, and jet fuel. Table 1 provides a brief gravimetric energy comparison
of some competing energy sources and storage mediums. The table is listed in descending
order of potential gravimetric energy density. Hydrogen offers the best gravimetric
alternative to traditional hydrocarbon fuels. However, when the volumetric energy
density is considered, hydrogen falls behind many other energy sources and storage
mediums. Table 2 provides the volumetric energy comparison, again, sorted in
descending order of magnitude. Figure 3 gives a visual reference to the same data and
highlights the challenge of making compressed hydrogen gas competitive with liquid
hydrocarbon fuels.
Table 1. Gravimetric Energy Densities of Common Energy Sources and
Storage Mediums
Energy Source / Storage Medium
Gravimetric Energy Density
[MJ/kg]
Gaseous H2 (g) 1atm 120-142 [6]
Liquid H2 (l) 120-142 [7]
Compressed Gaseous H2 (g) 700 Bar 120-142 [7]
Compressed Gaseous H2 (g) 350 Bar 120-142 [7]
Methane (g) 50.0-55.5 [6]
LNG (l) 49.4-55.2 [8]
LPG Propane (l) 46.0-50.0 [9]
CNG (g) 46.9-49.4 [8]
LPG Butane (l) 45.3-49.13 [9]
Crude Oil (l) 43.1-48.3 [10]
Gasoline (l) 44.5-48.2 [6]
Jet Fuel (l) 42.8-45.7 [6]
Diesel (l) 42.9-45.7 [6]

7
Energy Source / Storage Medium
Gravimetric Energy Density
[MJ/kg]
Biogas Fuel Oil (l) 24.4-41.9 [11]
Commercial by-products (used tires) 38.2 [12]
Coal (s) 16.3-33.5 [11]
Ethanol (l) 26.8-29.7 [6]
Commercial by-products (coffee grounds) 23.8 [12]
Biomass (wood) 19.9-21.3 [11]
Biomass (peat) 8.61-18.6 [11]
Commercial by-products (cow manure) 17.2 [12]
Fuel Cells (2015 Actual) 2.37 [13]
Fuel Cells (2020 Target) 2.34 [13]
Fuel Cells (Ultimate Target) 2.34 [13]
Primary Batteries 0.20-2.12 [14]
Secondary Batteries 0.11-0.72 [14]
Supercapacitors 0.007-0.036 [15]
Values in table are calculated based on physical property values obtained in references listed for
each energy source/storage medium.
Table 2. Volumetric Energy Densities of Common Energy Sources and
Storage Mediums
Energy Source / Storage Medium
Volumetric Energy Density
[MJ/L]
Crude Oil (l) 34.4-47.6 [10]
Jet Fuel (l) 36.0-38.4 [6]
Diesel (l) 36.0-38.4 [6]
Gasoline (l) 33.4-36.2 [6]
Biogas Fuel Oil (l) 17.3-31.4 [11]
Coal (s) 11.0-31.1 [11]
LPG Propane (l) 23.5-25.5 [9]
LPG Butane (l) 23.1-25.1 [9]
Ethanol (l) 23.5 [6]
LNG (l) 22.2 [8]
Biomass (wood) 7.97-21.3 [11]
Commercial by-products (used tires) 14.7-20.2 [12]
Commercial by-products (cow manure) 17.1-17.9 [12]
Biomass (peat) 2.07-17.9 [11]
Liquid H2 (l) 8.5-9 [7]
CNG (g) 8.44-8.90 [8]
Commercial by-products (coffee grounds) 7.45 [12]

8
Energy Source / Storage Medium
Volumetric Energy Density
[MJ/L]
Primary Batteries 0.5-4.86 [14]
Compressed Gaseous H2 (g) 700 Bar 4.7 [7]
Fuel Cells (Ultimate Target) 3.06 [13]
Compressed Gaseous H2 (g) 350 Bar 2.7 [7]
Fuel Cells (2020 Target) 2.34 [13]
Fuel Cells (2015 Actual) 2.304 [13]
Secondary Batteries 0.20-2.05 [14]
Supercapacitors 0.005-0.05 [15]
Methane (g) 0.03-0.04 [6]
Gaseous H2 (g) 1 atm 0.0098-0.0115 [6]
Values in table are calculated based on physical property values obtained in references listed for
each energy source/storage medium.

9
Figure 3. Gravimetric and Volumetric Energy Density Comparison of Common
Energy Sources and Storage Mediums
The only way to compensate for the low volumetric energy density of hydrogen is
to either compress the gas, liquefy it, or bond hydrogen into another substance.
Compression is a straightforward method for increasing the volumetric energy density for
short periods of time for two key reasons. First, hydrogen is a gas under practical
temperatures and pressures. Its critical temperature, -239.96 °C, and pressure, 12.98
atmospheres, necessitates the use of cryogenic refrigeration to bring hydrogen into liquid
form [16]. Second, hydrogen is most commonly used as a fuel under atmospheric

10
temperatures and pressures. Storage in the same form in which the hydrogen will
ultimately be used will not require additional active subsystems to maintain the storage
temperature and pressure.
D. CURRENT HYDROGEN STORAGE STRATEGIES
Hydrogen storage technology falls into two broad categories. The first category,
physical storage of the hydrogen molecule, is the most common. Physical storage
includes compressed hydrogen, liquefied hydrogen, and combined compressed and
cooled hydrogen. The second category is material-based storage of hydrogen atoms.
Material-based storage includes hydrides, sorbents, and chemical storage. Among the
storage methods outlined in Figure 4, physical storage remains the most mature
technology and the most economical.

11
Figure 4. Hydrogen Storage Categories. Source: [17].
Liquid hydrogen storage requires cooling systems that are capable of maintaining
temperatures below hydrogen’s boiling point, -252.882 °C. The National Aeronautics and
Space Administration pioneered the process of liquefying hydrogen to fuel space
exploration and has been successfully using liquid hydrogen since the 1950s [18].
Combined compressed/cooled hydrogen storage can be maintained at slightly higher
temperatures because compression is used to raise the boiling point. On a volumetric
energy density basis, liquefied hydrogen is competitive with compressed natural gas
(CNG), but it has significant disadvantages in other areas. Both storage methods require a
tremendous amount of energy and large infrastructure investments. This is primarily due
to the large amount of energy needed to liquefy hydrogen and store it in liquid form. Any

12
heat transferred to the hydrogen results in boil-off and venting, reducing the amount of
usable fuel and time hydrogen can remain in liquid form without expending energy for
cooling.
Material-based storage is one of the fastest growing research areas for increasing
hydrogen adoption. The Department of Energy (DOE) budget for hydrogen storage
research and development was $15.6M in 2016, and 42% of that went into materials-
based storage research programs [19]. Bonding hydrogen with other substances for
storage purposes is typically accomplished through the use of metal hydrides, sorbents, or
chemical storage. Metal-hydride storage devices have been proven to work for long-term
hydrogen storage but are heavy, contain rare and expensive materials, and typically
require thermal management systems to absorb and release hydrogen.
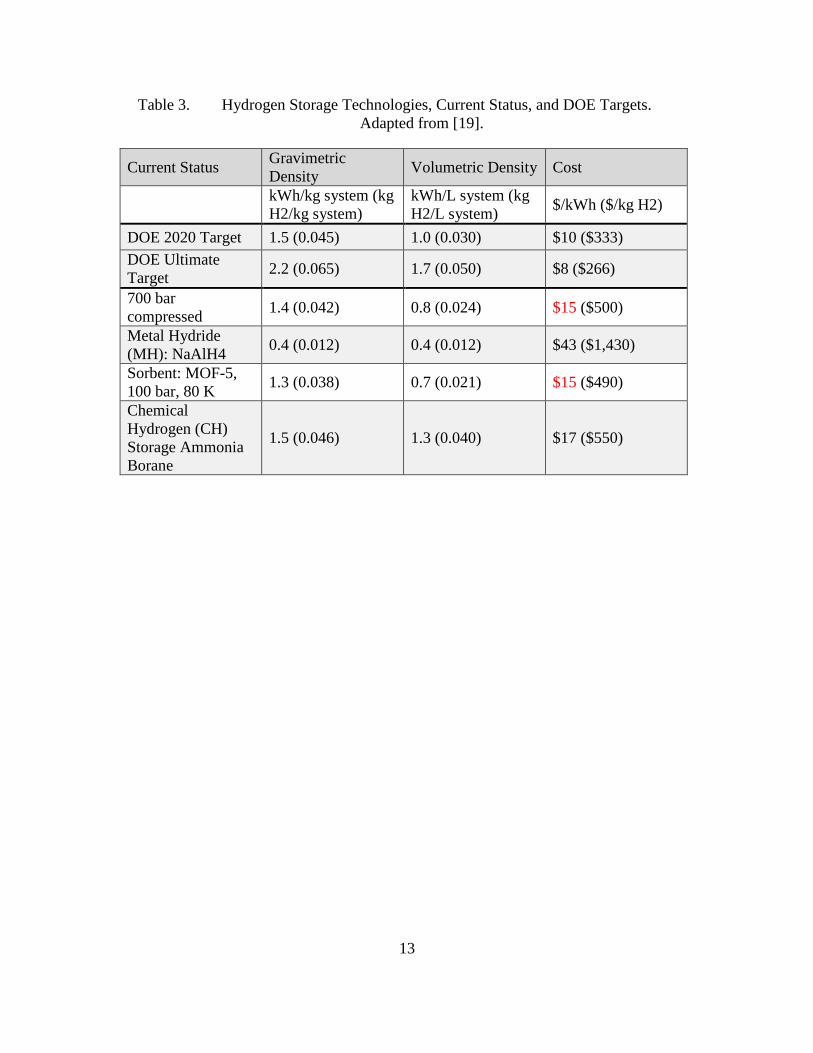
Table 3 compares current storage system gravimetric, volumetric, and cost
metrics against the DOE’s goals for hydrogen storage technologies. The two cheapest
systems are compressed gas storage and sorbent-based storage. The 700 Bar storage
systems cost roughly the same as the most advanced sorbent-based systems,
approximately $15 per kilowatt hour or $54 per megajoule.
13
Table 3. Hydrogen Storage Technologies, Current Status, and DOE Targets.
Adapted from [19].
Current Status Gravimetric
Density Volumetric Density Cost
kWh/kg system (kg
H2/kg system)
kWh/L system (kg
H2/L system) $/kWh ($/kg H2)
DOE 2020 Target 1.5 (0.045) 1.0 (0.030) $10 ($333)
DOE Ultimate
Target 2.2 (0.065) 1.7 (0.050) $8 ($266)
700 bar
compressed 1.4 (0.042) 0.8 (0.024) $15 ($500)
Metal Hydride
(MH): NaAlH4 0.4 (0.012) 0.4 (0.012) $43 ($1,430)
Sorbent: MOF-5,
100 bar, 80 K 1.3 (0.038) 0.7 (0.021) $15 ($490)
Chemical
Hydrogen (CH)
Storage Ammonia
Borane
1.5 (0.046) 1.3 (0.040) $17 ($550)

14
THIS PAGE INTENTIONALLY LEFT BLANK
15
II. DESIGN
A. REQUIREMENTS DEFINITION
Although no formal requirements documents were drafted before design, the following
outlines a few of the performance characteristics and operating elements desired to
support ongoing and future hydrogen research at NPS.
1. Previous Research Performed at NPS
The compression and storage station was a necessary addition to the hydrogen
generation and fuel cell station demonstrated by Aviles [1] to enable continuous power
generation throughout a 24-hour period. While the photovoltaic array could provide
useful energy during daylight hours, an energy storage station was needed to provide
electrical power during periods of darkness. The 100W Horizon proton exchange
membrane (PEM) fuel cell used previously by Aviles [1] would serve as the power
source after the photovoltaic array shut down. The PEM requires a steady supply of
hydrogen gas at approximately 1.5 bar and uses approximately 1.3 liters of gas per
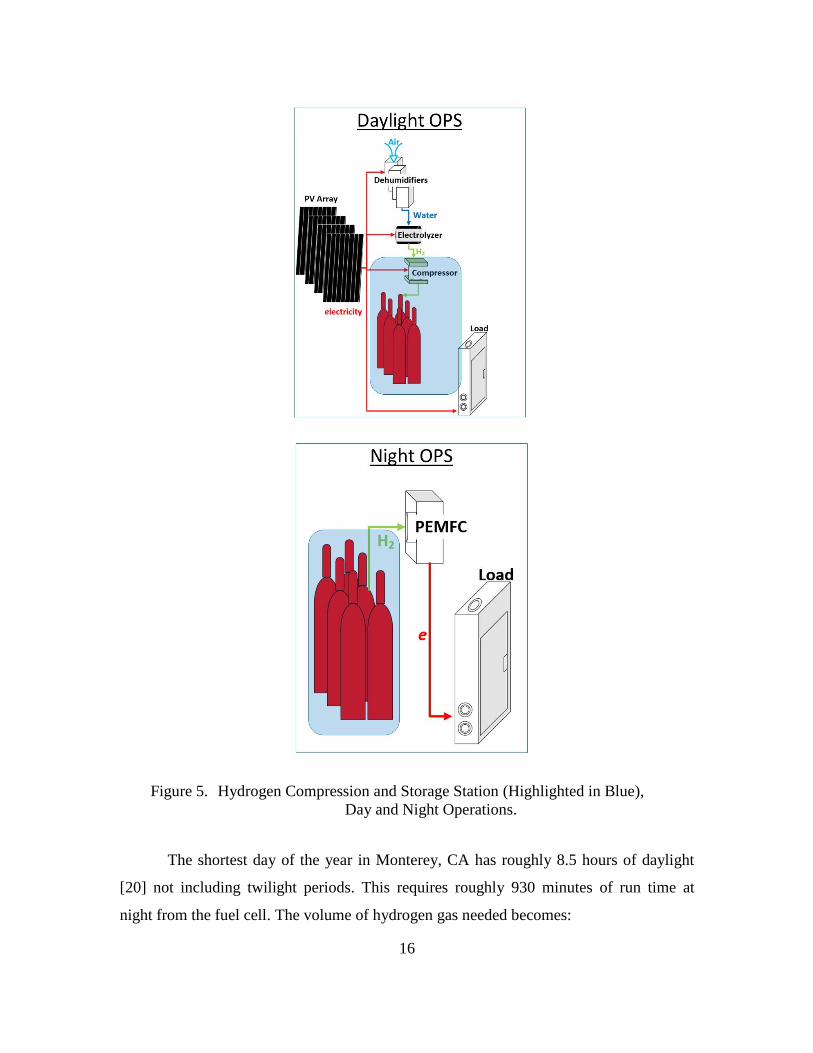
minute at standard temperature and 1.5 bar. The two operating regimes, daytime
operations and nighttime operations, are illustrated in Figure 5.
16
Figure 5. Hydrogen Compression and Storage Station (Highlighted in Blue),
Day and Night Operations.
The shortest day of the year in Monterey, CA has roughly 8.5 hours of daylight
[20] not including twilight periods. This requires roughly 930 minutes of run time at
night from the fuel cell. The volume of hydrogen gas needed becomes:

17
930min 1.3 1209 @1.5 .min
LL Bar (2)
A total mass quantity is calculated using (3) the Ideal Gas Law (PV=mRT) and the gas
constant for Hydrogen (4124.5 J kg-1
K-1
):
31.5 1,209 100,000 0.001
1 14,124.5 298.15
0.14748 .
PV Bar L Pa mm
LRT Bar LK
kg K
m kg
(3)
The mass quantity in (3) is the amount of hydrogen gas needed to operate a single
100W PEM fuel cell for the longest night of the year in Monterey. This initial estimate
will aid in determining the final size of the storage station.
2. Concurrent Work at NPS
Previous work focused on demonstrating the photovoltaic array, dehumidifiers,
electrolyzer, and fuel cell when connected as a system. Concurrent work to this research
by Yu [21] focuses on developing realistic performance profiles for the same elements.
This work included refining the system design and reconfiguring for a wider range of
testing. Therefore, the compression and storage station design, fabrication, assembly, and
commissioning could not interfere with the parallel work. Connections to shared power
supply, hydrogen pipelines, and test and measurement equipment were required to tie the
two stations together. The electrolyzer used previously by LT Aviles produced a
maximum of 1.7 standard liters per minute (slpm) of hydrogen. The concurrent research
designed replacement of this unit with one rated for four slpm using a 12–14 Vdc power
supply. For design purposes, the station would ideally be capable of simultaneous
operation with the electrolyzer, compressing the same four slpm using a 12–14 Vdc
power supply.

18
3. Future Work at NPS
Because the hydrogen compression and storage station will be used for future
research, it was required to be flexible and scalable in design. Research has already begun
to integrate a micro-turbine to test the use of hydrogen gas in small turbine generators.
The station needed to deliver hydrogen gas at a flow rate and for a duration useful to
collect data and analyze system performance. An initial estimate was made based on a
small commercial-off-the-shelf turbine.
In 2016, the DOE began testing hydrogen and synthetic fuel syngas on Capstone
microturbines [22]. Although the DOE research has not yet concluded and detailed data is
not readily available, Capstone microturbine specifications can provide a starting point
for designing a hydrogen storage station. The smallest Capstone C30 microturbine was
selected as a suitable example, and its specifications were used to make an initial estimate
for required hydrogen fuel flow characteristics.
A Capstone C30 requires a nominal fuel flow of approximately 444,000-457,000
kJ/hr [23]. Using Hydrogen’s Higher Heating Value of 141,781 kJ/kg, a mass flow rate of
hydrogen can be calculated using (4):
444,000 457,000
0.000870 0.000900 .
141,781 3,600
kJ
kghrkJ s s
kg hr
(4)
At start-up, the flow requirement could be 1.5 times higher than the values in
Capstone’s published specifications. The values in (4) become approximately 0.00130-
0.00134 kg/s for start-up purposes.
An alternative method of determining fuel demand is used to verify these
calculations. The Capstone C30 is a 30kW gas turbine with advertised lower heating
value efficiency of 25% using approved fuels. An expected efficiency of 18% or less can
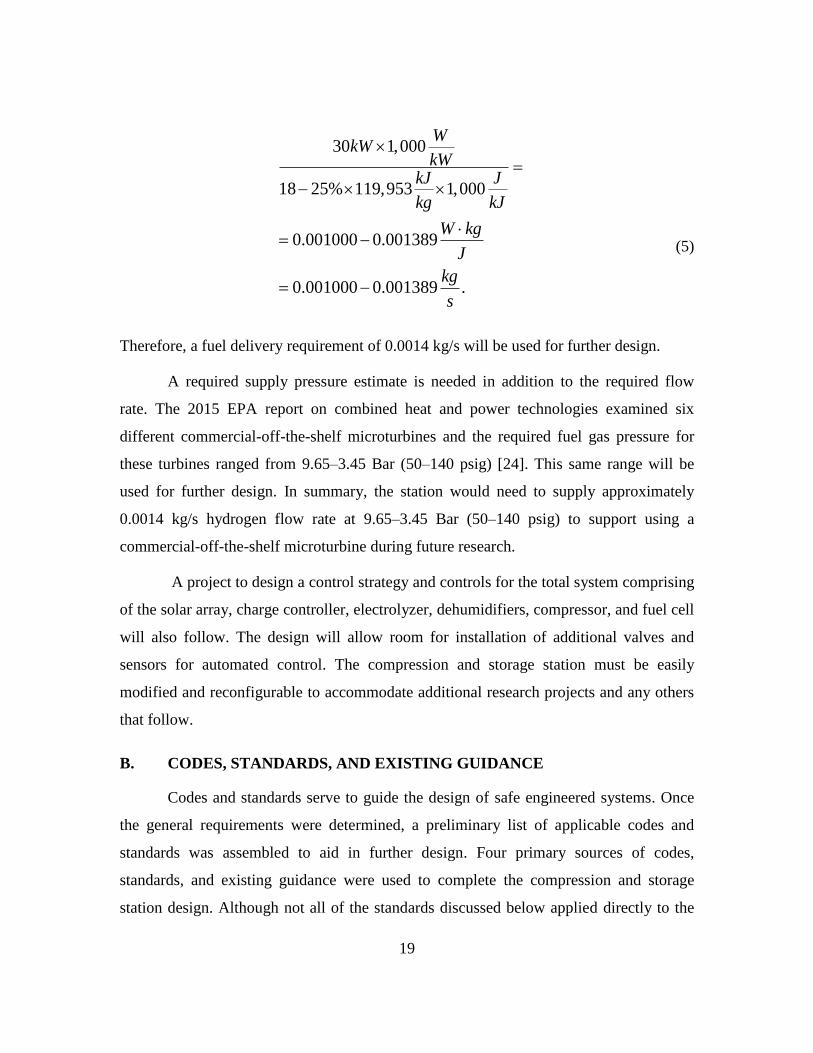
be assumed when using hydrogen. A second mass flow rate of hydrogen was calculated
using (5) and hydrogen’s lower heating value of 119,953 kJ/kg:
19
30 1,000
18 25% 119,953 1,000
0.001000 0.001389
0.001000 0.001389 .
WkW
kWkJ J
kg kJ
W kg
J
kg
s
(5)
Therefore, a fuel delivery requirement of 0.0014 kg/s will be used for further design.
A required supply pressure estimate is needed in addition to the required flow
rate. The 2015 EPA report on combined heat and power technologies examined six
different commercial-off-the-shelf microturbines and the required fuel gas pressure for
these turbines ranged from 9.65–3.45 Bar (50–140 psig) [24]. This same range will be
used for further design. In summary, the station would need to supply approximately
0.0014 kg/s hydrogen flow rate at 9.65–3.45 Bar (50–140 psig) to support using a
commercial-off-the-shelf microturbine during future research.
A project to design a control strategy and controls for the total system comprising
of the solar array, charge controller, electrolyzer, dehumidifiers, compressor, and fuel cell
will also follow. The design will allow room for installation of additional valves and
sensors for automated control. The compression and storage station must be easily
modified and reconfigurable to accommodate additional research projects and any others
that follow.
B. CODES, STANDARDS, AND EXISTING GUIDANCE
Codes and standards serve to guide the design of safe engineered systems. Once
the general requirements were determined, a preliminary list of applicable codes and
standards was assembled to aid in further design. Four primary sources of codes,
standards, and existing guidance were used to complete the compression and storage
station design. Although not all of the standards discussed below applied directly to the

20
station being designed, they did provide useful information that helped determine the
station’s capability for future expansion and use.
The American Society of Mechanical Engineers (ASME) serves as an
authoritative source for codes and standards relating to pressure vessels, piping, and
piping systems. The ASME B31(series) standards provide detailed requirements for
piping and piping systems and are adopted in most Federal, State, and Local laws.
Specifically, ASME B31.12 “Standard on Hydrogen Piping and Pipelines” provides
requirements for the piping used in gaseous hydrogen service. Additionally, ASME
B31.3 “Process Piping” provided additional piping design requirements and material
specifications. The AMSE Boiler and Pressure Vessel code is also widely adopted and
provides detailed requirements for the pressure vessels and auxiliary equipment needed in
the compression and storage station.
The National Fire Protection Association (NFPA) codes and standards mitigate
risks to people and property by reducing the likelihood and severity of fire. Two of
NFPA’s codes were consulted during the design of the compression and storage station.
First, NFPA 2 Hydrogen Technologies Code provides safety requirements for hydrogen
systems. Second, NFPA 70, also known as the National Electric Code, provides safety
requirements for electrical wiring and equipment.
The Compressed Gas Association (CGA) prepares standards relating to the
production, transportation, handling, and storage of hydrogen gas. Four of CGAs
standards were consulted during the design and offered valuable recommendations not
found elsewhere. First, CGA G-5 “Hydrogen” provides industry-standard physical and
chemical characteristics for hydrogen along with storage requirements. Second, CGA G-
5.4 “Standard for Hydrogen Piping Systems at User Locations” guides designing piping
systems, system fabrication, start-up, and maintenance. Third, CGA G-5.6 “Hydrogen
Pipeline Systems” guides design, fabrication, start-up, maintenance, and shut-down of
hydrogen pipelines. Lastly, ANSI/CGA H-5 “Standard for Bulk Hydrogen Supply
Systems” provides additional design guidance and outlines regulatory and safety
requirements for hydrogen systems.
21
Daniel Crowl, the American Institute of Chemical Engineers, and the Center for
Chemical Process Safety served as the fourth primary source for guidance. Their
publications relating to chemical process safety, inerting, purging, and the behavior of
flammable materials was invaluable during the design process.
C. SAFETY ANALYSIS
The safety analysis started with determining the applicable regulations and level
of effort required for the risk management. Federal, DOD, Department of the Navy, and
Naval Postgraduate School regulations and policies were consulted. The hydrogen
compression and storage station is intended to be a relatively small and temporary
installation to aid in research. Therefore, many of the more stringent safety regulations do
not apply.
Title 29 of the U.S. Code of Federal Regulations (29 CFR) Part 1910 contains the
Occupational Safety and Health Standards. 29CFR lists hydrogen as a Hazardous
Material under Subpart H and Standard Number 1910.103. However, the standard “does
not apply to gaseous hydrogen systems having a total hydrogen content of less than 400
cubic feet.” Furthermore, hydrogen is not listed in Standard Number 1910.119 Appendix
A List of Highly Hazardous Chemicals, Toxics and Reactives and is not subject to the
Process Safety Management (PSM) requirements under 29CFR in quantities less than
4,536 kg (10,000 lbs). The station design will not exceed either 11.3 m3 (400 cubic feet)
or 4,536 kg (10,000 lbs). The safety precautions and guidance outlined in 29CFR
Standard Number 1910.103 for Hydrogen were followed nonetheless to ensure the
system and operators remained safe during research.
Title 40 of the U.S. Code of Federal Regulations (40CFR) Part 68 contains the
Chemical Accident Prevention Provisions, also known as the EPA Risk Management
Program (RMP). An RMP includes a detailed risk management plan which is published
to the general public, submitted to the Environmental Protection Agency, and updated
every five years. 40CFR lists hydrogen in its Tables 3 and 4 as a regulated flammable
substance in quantities greater than 4,536 kg (10,000 lbs). The station design will not
exceed this threshold quantity, and the RMP requirements do not apply.

22
Since hydrogen is a flammable gas and hazardous material, Navy Occupational
Safety and Health Program and Operational Risk Management requirements still apply.
Among these requirements include following OPNAVINST 5100.23G Chapter 7
Hazardous Material Control and Management (HMC&M) policies and the 29CFR
Section 1910.1200 Occupational Safety and Health Administration (OSHA) Hazard
Communication Standard (HAZCOM). These applicable safety regulations are general
and contain too many requirements to list here.
The design process incorporated Process Risk Management in addition to
following the design requirements, codes, and regulations. Process Risk Management
encompasses the design, tactics, techniques, and procedures (TTPs), and overall life cycle
approach to managing risk in a process station. The four broad categories of Process Risk
Management begin with Inherently Safer Design (ISD) by eliminating hazards through
the complete removal of hazardous conditions. The second Process Risk Management
strategy is to design passive risk mitigation measures that do not rely on the active
operation of a device or person. The third strategy is to use active design elements that
continually operate such as controls, detectors, alarms, and automated safety devices. The
fourth category of design strategy is to incorporate administrative requirements to
mitigate risks such as standard operating procedures, training, certifications, inspections,
and process reviews [25]. Three primary safety considerations are discussed in detail
along with the measures taken to mitigate risk.
1. Combustion and Explosion Safety
a. Hazards Analysis
Several physical and chemical characteristics of gaseous hydrogen contribute to it
being a hazard to personnel, equipment, and facilities. As mentioned earlier, 29CFR
classifies hydrogen as a Hazardous Material. Compressed hydrogen gas is also classified
as a Class 2, Division 2.1 flammable gas under 49CFR Part 173. NFPA further classifies
hydrogen with its highest flammability rating of 4 in NFPA 704 “Standard System for the
Identification of the Hazards of Materials for Emergency Response.” Hydrogen is
difficult to detect as “a colorless, odorless, tasteless, flammable, nontoxic gas” [26]. It

23
ignites easily with a minimum ignition energy of “0.02 millijoule, which is an order of
magnitude less than the ignition energy for hydrocarbons” [26]. Hydrogen burns with an
almost invisible flame and produces only heat and water as combustion products. It will
burn in atmospheric air at concentrations ranging from 4% to 75%, a much wider range
than most hydrocarbon fuels. In oxygen environments, the limits of flammability for
hydrogen gas extend from 4.6% to 93.9% [26]. For these reasons, combustion and
explosion of hydrogen gas are considered a high risk and the design for this research
mitigated this risk using various methods.
b. Mitigation
The first step in Inherently Safer Design is to remove hazardous conditions
completely. For hydrogen gas, this involves purging station components of oxygen and
removing all ignition sources. The first goal was designing the system for adequate
purging capabilities. The purpose of inerting and purging the system is to ensure there is
never a mixture of hydrogen gas (fuel), oxygen (oxidant), and ignition source capable of
starting or sustaining combustion. Thoroughly purging the station ensures the fluid
remaining is incapable of maintaining a flame and no longer a flammability risk to users
or facilities.
When the station was first assembled, it contained atmospheric air, which is
roughly 21% oxygen. If one were to simply start pumping compressed hydrogen gas into
the station, there would be sufficient oxygen present to support combustion when and if a
spark were to ignite the gas. Inert gas was used to mitigate this risk by removing enough
oxygen from the station to make combustion impossible. This process is demonstrated on
a triangular composition diagram of hydrogen/oxygen/nitrogen in Figure 6. The
assembled station starts at position F which is simple atmospheric air. Purging the station
to an in-service oxygen concentration of 5.7% O2 is represented by moving from point F
to point G on the figure. This ensures that when hydrogen is added, the fluid composition
will never enter the combustible region and will follow the line from point G to point A.
Only fluid compositions inside the combustible region will support combustion.

24
Figure 6. Purging Process Depicted on Triangular Composition Diagram for
Hydrogen/Oxygen/Nitrogen. Adapted from [27].
The Compressed Gas Association Standard for Hydrogen Piping Systems at User
Locations specifies using sweep purging, evacuation (vacuum) purging, or pressure
purging to residual oxygen levels below 1% [28]. Siphon purging involves using water to
displace the combustible gas, it is not included in the standard and therefore was not
considered during the design. Sweep-through purging is accomplished by passing the
purge gas through the system continuously until residual oxygen levels are acceptable.
This method requires large volumes of purge gas and is susceptible to failure due to
incomplete mixing of the residual and purge gases. Sweep-through purging requires
precise placement of inlet and outlet ports and thorough understanding of the turbulent
mixing of gasses. Since the station will use standard commercial steel storage cylinders,
which only have one port for both inlet and outlet operations, and conservation of purge
gas is desired, sweep-through purging was eliminated as an option during design.
Evacuation (vacuum) purging uses vacuum pumps to remove the air from the
tanks. The mechanical vacuum pumps require energy and thereby lower the overall
station efficiency. Vacuum pumps also require lubricating fluid to operate, a hazardous
25
material according to the Navy, and this would add an unwanted burden for researchers.
Vacuum pumps also require routine maintenance which adds to the overall cost. The
station must also be capable of sustaining a vacuum. All components, tubes, sensors, and
the compressor would need to be designed and rated for vacuum service in addition to
pressure service. Despite the drawbacks associated with vacuum purging, it can save
significant quantities of purge gas over the other methods.
Pressure purging is accomplished by pressurizing the station using pure inert gas,
allowing the air/inert gas mixture to mix, and then venting the air/inert gas mixture. Each
cycle through the process results in lowering the total amount of oxygen in the station. A
combination of vacuum and pressure purging was used for this research to conserve the
amount of purge gas needed to reach a safe level of oxygen content in the station
cylinders and piping. The ideal gas law was used to determine the minimum number of
vacuum/pressure purge cycles needed to reduce the oxygen concentration from
atmospheric air to 1% with pure nitrogen gas. The equations are derived and outlined in
detail in Understanding Explosions by Daniel Crowl, and the result is shown in Appendix
A [27].
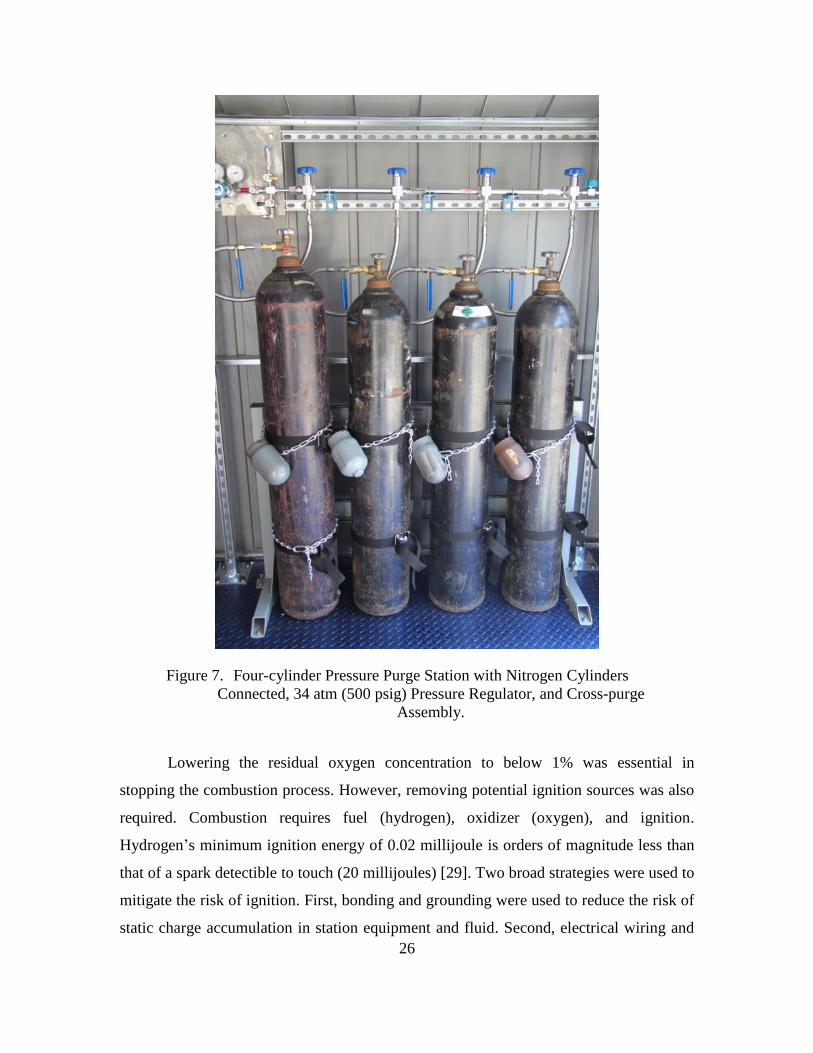
Purging was accomplished using the four-cylinder pressure purge station shown
in Figure 7. After pressurizing, the gasses were given enough time to thoroughly mix by
allowing the station to remain pressurized overnight with nitrogen. This also allowed for
a 24-hr pressure test to guarantee no leaks were present.
26
Figure 7. Four-cylinder Pressure Purge Station with Nitrogen Cylinders
Connected, 34 atm (500 psig) Pressure Regulator, and Cross-purge
Assembly.
Lowering the residual oxygen concentration to below 1% was essential in
stopping the combustion process. However, removing potential ignition sources was also
required. Combustion requires fuel (hydrogen), oxidizer (oxygen), and ignition.
Hydrogen’s minimum ignition energy of 0.02 millijoule is orders of magnitude less than
that of a spark detectible to touch (20 millijoules) [29]. Two broad strategies were used to
mitigate the risk of ignition. First, bonding and grounding were used to reduce the risk of
static charge accumulation in station equipment and fluid. Second, electrical wiring and
27
components were selected that reduce the likelihood of mixing exposed electrical
connections with flammable gas.
Bonding and grounding best practices are covered under NFPA 77 Recommended
Practice on Static Electricity. For this research, basic grounding paths were established
for electrical equipment to reduce the risk of static discharge. Daniel Crowl warns in
Understanding Explosions that static can build on both the equipment and the process
fluid. Grounding of the hydrogen as the process material is required as well as the
equipment. If the station were intended to be a permanent installation, a more thorough
electrical design based on NFPA 77 recommendations would be necessary to make sure
the process fluid is grounded.
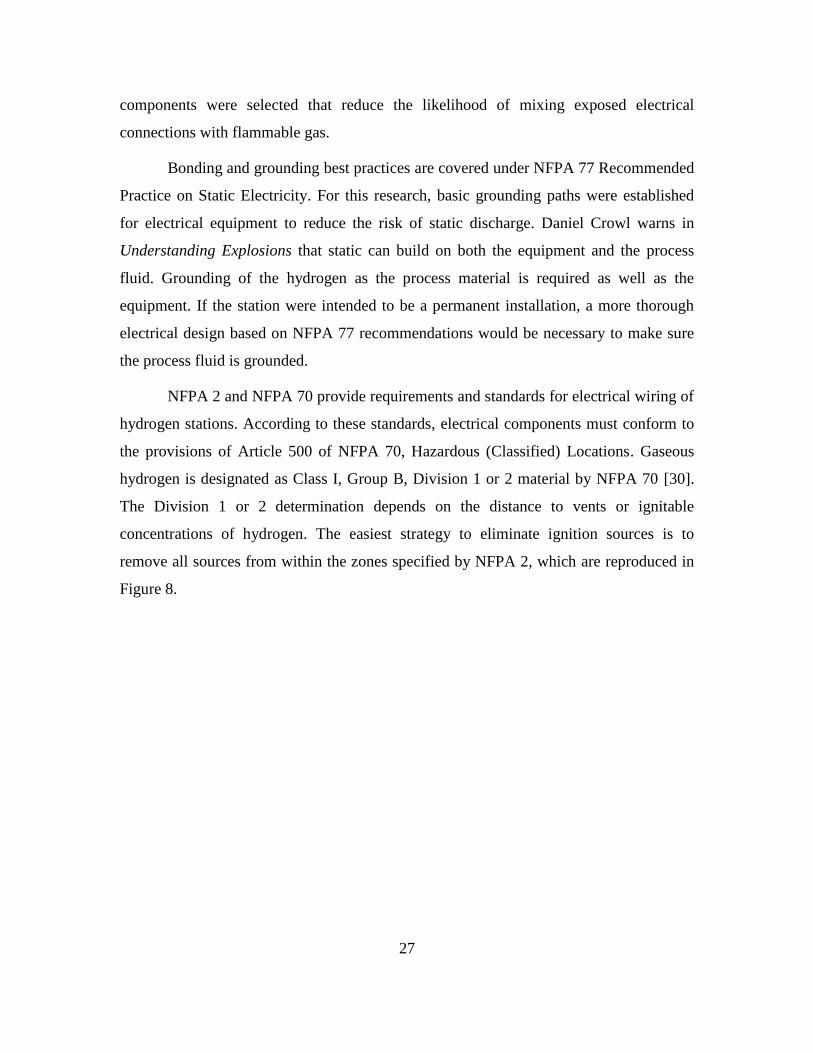
NFPA 2 and NFPA 70 provide requirements and standards for electrical wiring of
hydrogen stations. According to these standards, electrical components must conform to
the provisions of Article 500 of NFPA 70, Hazardous (Classified) Locations. Gaseous
hydrogen is designated as Class I, Group B, Division 1 or 2 material by NFPA 70 [30].
The Division 1 or 2 determination depends on the distance to vents or ignitable
concentrations of hydrogen. The easiest strategy to eliminate ignition sources is to
remove all sources from within the zones specified by NFPA 2, which are reproduced in
Figure 8.

28
Figure 8. Electrical Area Classifications for Hydrogen Systems. Source: [31].
All electrical components were designed to be greater than 1 m from any Class I
Division 1 zone. This eliminated some of the more stringent requirements and the risk of
ignition during normal conditions. However, some of the electrical components remained
within Class I Division 2 zones and were required to meet the requirements of NFPA 70
Article 501. These requirements were not followed for two reasons. First, the initial
assembly and testing of the station utilized an alternating current power supply from the
adjacent building. These connections were temporary by design and will be removed
once the station is ready for connection to the photovoltaic power supply. Second, power
connections to the compressor are not enclosed and sealed from potential hydrogen
exposure. This is a design deficiency of the compressor. Future compressor designs will
need to address this deficiency before they are suitable for permanent installation in a
hydrogen station. The deficiency was assessed as a low risk since the manufacturer had
not experienced problems after several thousands of hours of work with their product.
Future station upgrades will be made when connection to the photovoltaic power supply

29
is completed that incorporate a redesign of the electrical connections, wiring, and
equipment location, alleviating most of the Class I Division 2 deficiencies.
2. High-Pressure Gas Safety
In addition to the flammability and combustion hazard, the use of compressed
hydrogen involves several other hazards that had to be mitigated. The risk of
unintentional discharge of the compressed gas was also considered as a hazard and
addressed during design. Four methods were utilized in reducing the risks associated with
high-pressure gas safety. First, the design incorporated overpressure protection to ensure
the station could not be pressurized beyond the design limits of the various components
and piping. Second, both analog and digital monitoring devices were used to ensure
accurate temperature and pressure monitoring regardless of whether the station had
electrical power. Third, the materials selected for use in the station are all allowable
materials according to the various applicable standards, and they are not susceptible to
hydrogen embrittlement at the pressures and temperatures the station will encounter.
Lastly, the piping sizes and station components were all selected in accordance with
ASME B31.12 Hydrogen Piping and Pipelines to withstand pressures of 200 atm (3,000
psi) or greater, 6–10 times the compressor’s expected capability.
a. Overpressure Protection
Overpressure protection was designed for three distinct zones of the station. First,
the inlet side of the compressor, which is expected to operate around 1 atm, should not
exceed 1.2 atm. Excessively high pressures on the compressor inlet would result in
halting hydrogen production by the hydrogen generator and could result in uncontrolled
release of hydrogen, oxygen, or both at the generation station. The second zone is the
compressor outlet and storage station which is designed to a 200 atm (3,000 psi) working
pressure. The third zone is the hydrogen fuel supply line running from the storage station
back to the fuel cell. All three zones were designed to have at least two relief devices to
ensure redundancy.
The first zone relies on the pressure relief devices installed on the water
“bubblers.” The pressure relief valve is located at the top of the bubbler and releases the
30
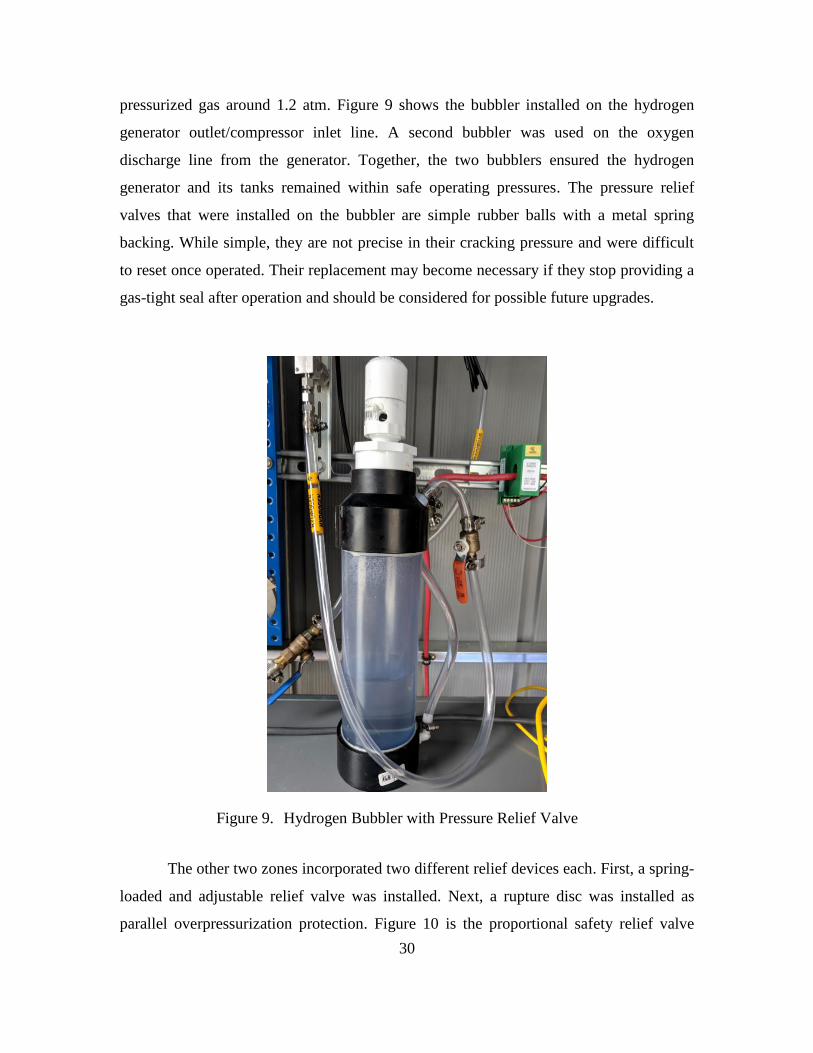
pressurized gas around 1.2 atm. Figure 9 shows the bubbler installed on the hydrogen
generator outlet/compressor inlet line. A second bubbler was used on the oxygen
discharge line from the generator. Together, the two bubblers ensured the hydrogen
generator and its tanks remained within safe operating pressures. The pressure relief
valves that were installed on the bubbler are simple rubber balls with a metal spring
backing. While simple, they are not precise in their cracking pressure and were difficult
to reset once operated. Their replacement may become necessary if they stop providing a
gas-tight seal after operation and should be considered for possible future upgrades.
Figure 9. Hydrogen Bubbler with Pressure Relief Valve
The other two zones incorporated two different relief devices each. First, a spring-
loaded and adjustable relief valve was installed. Next, a rupture disc was installed as
parallel overpressurization protection. Figure 10 is the proportional safety relief valve

31
used in the second zone with high-pressure storage. It is rated for service up to 413 Bar
(6,000 psi) and will open gradually as the pressure increases above the set pressure. Once
the relief valve was adjusted to a desired set pressure of 34 Bar (500 psi), a locking nut
was tightened, tamper cover installed, and lock-wire applied to ensure the set pressure
adjustment could not be inadvertently changed.
Figure 10. Proportional Safety Relief Valve Set to Operate at 34 Bar (500 psig).
Figure 11 is the proportional relief valve used in the third zone leading to the fuel
cell. It is also rated for service up to 413 Bar (6,000 psi) and will open gradually as the
pressure increases above the set pressure. However, the spring operating this valve has a
narrower operating range and must be replaced based on the desired set pressure. A
spring for pressures between 0.7 - 15.5 Bar (10 - 225 psig) was used and set to 1.5 Bar for

32
service to the fuel cell. If the fuel cell is replaced by a higher capacity unit requiring
greater than 15.5 Bar hydrogen, the spring and seals will need to be replaced. Once the
relief valve was adjusted to 1.5 Bar set pressure, a locking nut was tightened to ensure the
set pressure did not change. This valve does not include a tamper cover, but lock wire
was used to prevent inadvertent changing of the set pressure.
Figure 11. Proportional Relief Valve Set to Operate at 1.5 Bar (22 psig).
Both the second and third zones also received rupture discs manufactured to open
at prescribed pressures as redundant overpressure protection. Figure 12 shows one of the
two assemblies used including the rupture disc holder, non-fragmenting rupture disc, and
muffled outlet port. For the second zone, high-pressure storage area, a Type 316 stainless
steel rupture disc designed to burst at 207 Bar (3,000 psig) was used. For the third zone,
lower-pressure service to the fuel cell, an aluminum rupture disc designed to burst at 4.5
Bar (65 psig) was used. By using burst discs designed to operate at or below the
maximum allowable operating pressures, the risk of over pressurization and uncontrolled
release of hydrogen has been reduced. The burst discs and pressure relief valves will

33
direct any vented hydrogen away from the station, its operators, and sources of ignition
through the vent pipes shown in Figure 13.
Figure 12. Screw-Type Rupture Disc Assembly with Muffled Outlet Port

34
Figure 13. Vent Pipes Located Above Compression and Storage Station, with
Mud Dauber Protective End Caps Installed, Turned Down to Prevent
Rain Intrusion.
b. System Monitoring
Station monitoring was accomplished using both analog and digital sensors. The
analog sensors were necessary to monitor the station temperature and pressure when the
data acquisition system was not in use or powered up. The digital sensors provided high-
accuracy measurements during data collection and analysis. The pressure gauges used
were Type 304 stainless steel, high-accuracy, fluid-filled, vibration and corrosion
resistant models designed for use in industrial areas. The digital transducers were heavy
duty sensors featuring integrated digital circuits for amplifying the output signal and
compensating for temperature fluctuations. Examples of both pressure sensors are shown
in Figure 14. Specifications including accuracy and precision of these sensors can be
found in Appendix E.
35
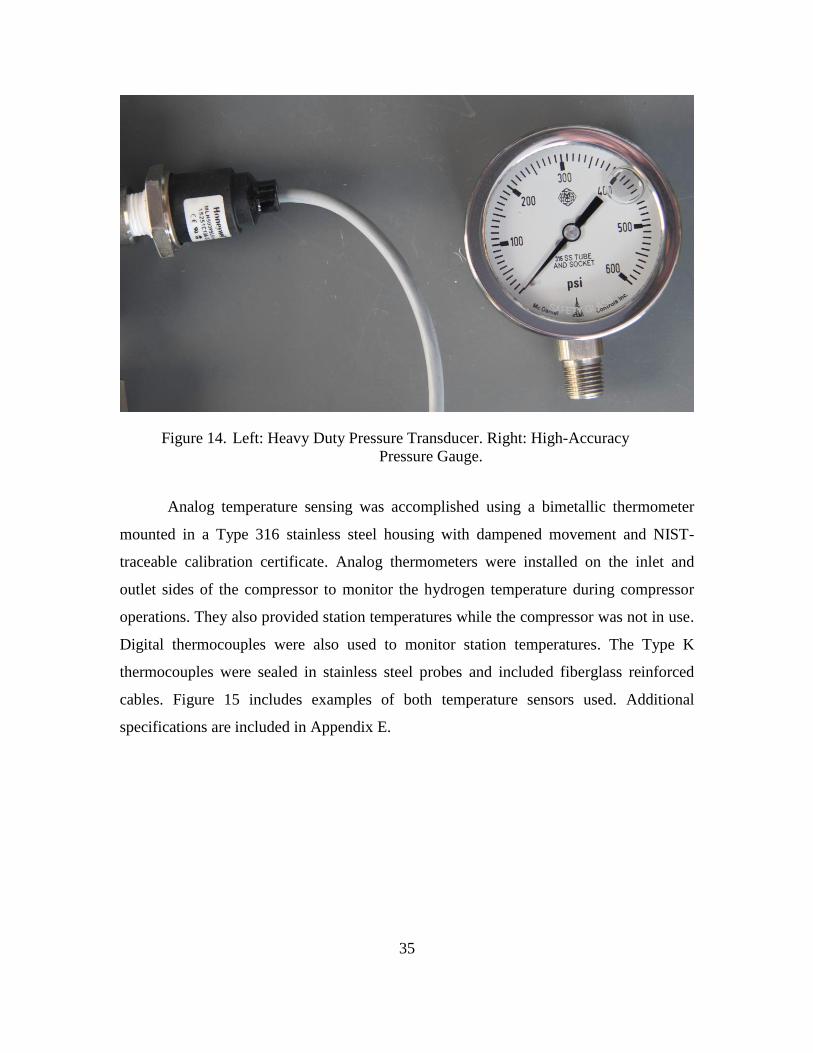
Figure 14. Left: Heavy Duty Pressure Transducer. Right: High-Accuracy
Pressure Gauge.
Analog temperature sensing was accomplished using a bimetallic thermometer
mounted in a Type 316 stainless steel housing with dampened movement and NIST-
traceable calibration certificate. Analog thermometers were installed on the inlet and
outlet sides of the compressor to monitor the hydrogen temperature during compressor
operations. They also provided station temperatures while the compressor was not in use.
Digital thermocouples were also used to monitor station temperatures. The Type K
thermocouples were sealed in stainless steel probes and included fiberglass reinforced
cables. Figure 15 includes examples of both temperature sensors used. Additional
specifications are included in Appendix E.

36
Figure 15. Left: Thermocouple Probe. Right: Bimetallic Thermometer.
c. Materials Selection
ASME B31.12 Hydrogen Piping and Pipelines details the appropriate and
allowable materials for pressurized hydrogen service. Specifically, the nonmandatory
Appendix A Precautionary Considerations Table A-2-1 “Materials Compatible with
Hydrogen Service” was consulted as a starting point. Austenitic stainless steels with
greater than 7% nickel are listed as acceptable for gaseous hydrogen service. These
include type 304/304L and 316 stainless steels. Other acceptable materials listed include
aluminum and aluminum alloys, copper and copper alloys such as brass, and low-alloy
steels. Materials not suitable according to this table include nickel and nickel alloys such
as Inconel and Monel, gray, ductile, or cast iron, and nickel steels. One of the
unacceptable materials is commonly found in commercially available gas handling

37
equipment, Monel, and care was taken to avoid using these items. ASME B31.12 Chapter
GR-2 General Requirements for Materials further defines specific ASME, ASTM, and
API materials specifications that are allowable for hydrogen service. The tables and lists
provided by ASME were used during market research and equipment selection to make
sure all components were compliant and safe to use with hydrogen.
ASME B31.12 lists a very wide range of acceptable materials, but the most
specific guidance for materials selection came from CGA G-5.4 Standard for Hydrogen
Piping Systems at User Location. The CGA standard states “Austenitic (300 series)
stainless steels meeting the temperature limits of ASME B31.12 are recommended for
liquid and gaseous hydrogen product piping, tubing, valves, and fittings. The most stable
grade is Type 316/316L” [32]. The temperature limits referenced are listed in ASME
B31.12 mandatory Appendix IX Allowable Stresses and Quality Factors for Metallic
Piping, Pipeline, and Bolting Materials. For Type 316 and Type 316L stainless steel, the
temperature limits are between -425 °C and 538 °C. The station designed for this research
operates well within these allowable temperatures. Therefore, Types 316 and 316L
stainless steels were used when available.
d. Tubing and Tube Fittings
Piping and tubing selection started with determining the appropriate inside
diameter for the fluid flow. After an appropriate inside diameter was selected, pipe wall
thickness, and outside diameter was determined. A fluid flow analysis was completed for
hydrogen flow through a circular pipe to determine an appropriate inside diameter. The
volumetric flow expected from the hydrogen generator is four standard liters of hydrogen
per minute (6.6667e-5
m3/s). The largest mass flow expected is to a gas turbine at
approximately 0.0014 kg/s. At standard temperature and pressure, the volumetric flow to
the turbine can be calculated using the ideal gas law and hydrogen density as follows:
3
30.0168m / s.
0.08
0.0014 /
342 /k
k
g m
g s (6)

38
The two flow regimes allowed the piping to be designed in two sections. The first
section extended from the hydrogen generator through the compressor and into the
storage tanks. The second section extended from the storage tanks to the turbine. An
acceptable inside diameter for the tubing was determined using an iterative process. The
fluid analysis outlined in [33] was used along with manufacturer-provided data for
various standard tubing sizes. The results for both high-pressure and low-pressure flow
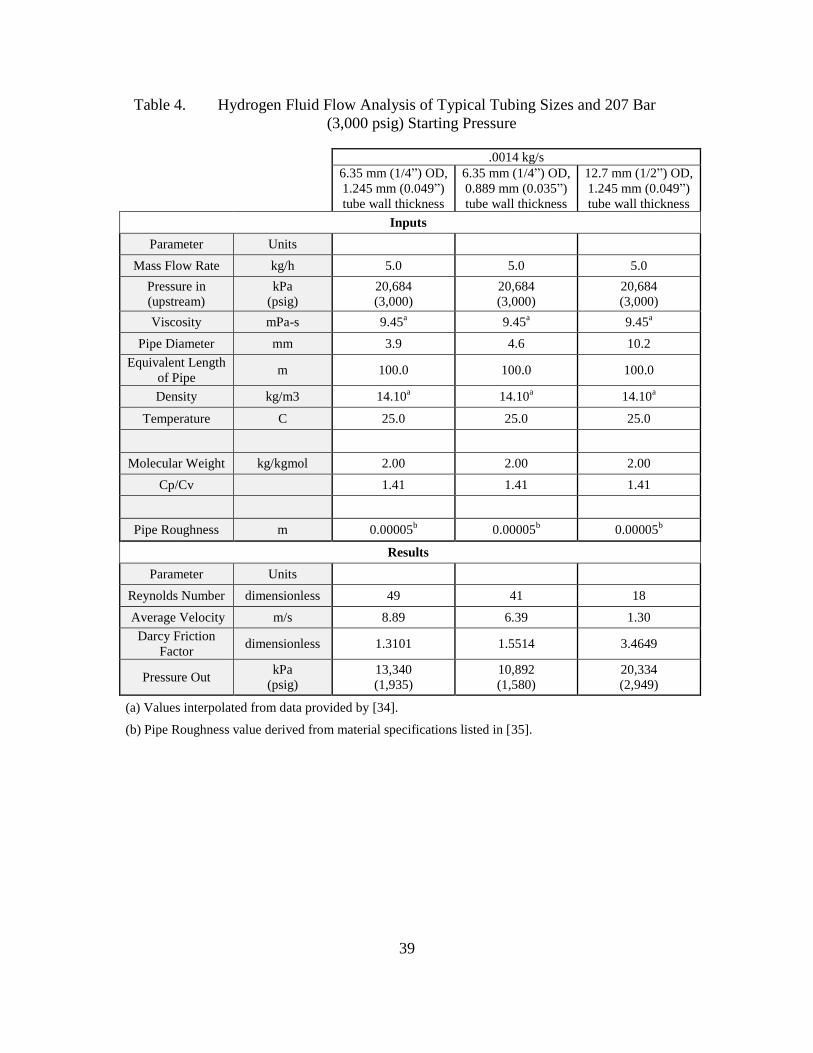
are listed in Tables 4 and 5. These results indicated the use of all three tubing sizes would
remain in a low Reynold’s number regime, and frictional losses were negligible. They
also indicate an acceptable pressure drop for service to the turbine through 100 meters of
tubing. All three standard tubing sizes are capable of delivery pressure (pressure out) well
within the 3.4–9.7 bar (50–140 psig) requirement for a gas turbine. However, use of the
smaller diameter tubing would result in fluid flow velocities greater than the
recommended 18 meters per second if used at lower pressures. Therefore, the larger
diameter tubing was selected for service to the turbine while the smaller diameter tubing
was selected for service from the compressor into the storage tanks.
39
Table 4. Hydrogen Fluid Flow Analysis of Typical Tubing Sizes and 207 Bar
(3,000 psig) Starting Pressure
.0014 kg/s
6.35 mm (1/4”) OD,
1.245 mm (0.049”)
tube wall thickness
6.35 mm (1/4”) OD,
0.889 mm (0.035”)
tube wall thickness
12.7 mm (1/2”) OD,
1.245 mm (0.049”)
tube wall thickness
Inputs
Parameter Units
Mass Flow Rate kg/h 5.0 5.0 5.0
Pressure in
(upstream)
kPa
(psig)
20,684
(3,000)
20,684
(3,000)
20,684
(3,000)
Viscosity mPa-s 9.45a 9.45
a 9.45
a
Pipe Diameter mm 3.9 4.6 10.2
Equivalent Length
of Pipe m 100.0 100.0 100.0
Density kg/m3 14.10a 14.10
a 14.10
a
Temperature C 25.0 25.0 25.0
Molecular Weight kg/kgmol 2.00 2.00 2.00
Cp/Cv 1.41 1.41 1.41
Pipe Roughness m 0.00005b 0.00005
b 0.00005
b
Results
Parameter Units
Reynolds Number dimensionless 49 41 18
Average Velocity m/s 8.89 6.39 1.30
Darcy Friction
Factor dimensionless 1.3101 1.5514 3.4649
Pressure Out kPa
(psig)
13,340
(1,935)
10,892
(1,580)
20,334
(2,949)
(a) Values interpolated from data provided by [34].
(b) Pipe Roughness value derived from material specifications listed in [35].

40
Table 5. Hydrogen Fluid Flow Analysis of Typical Tubing Sizes and 20.7 Bar
(300 psig) Starting Pressure
.0014 kg/s
6.35 mm (1/4”) OD,
1.245 mm (0.049”)
tube wall thickness
6.35 mm (1/4”) OD,
0.889 mm (0.035”)
tube wall thickness
12.7 mm (1/2”) OD,
1.245 mm (0.049”)
tube wall thickness
Inputs
Parameter Units
Mass Flow Rate kg/h 5.0 5.0 5.0
Pressure in
(upstream)
kPa
(psig)
2,068
(300)
2,068
(300)
2,068
(300)
Viscosity mPa-s 8.91a 8.91
a 8.91
a
Pipe Diameter mm 3.9 4.6 10.2
Equivalent
Length of Pipe m 100.0 100.0 100.0
Density kg/m3 1.59a 1.59
a 1.59
a
Temperature C 25.0 25.0 25.0
Molecular
Weight kg/kgmol 2.00 2.00 2.00
Cp/Cv 1.41 1.41 1.41
Pipe Roughness m 0.00005b 0.00005
b 0.00005
b
Results
Reynolds
Number dimensionless 52 44 20
Average
Velocity m/s 88.9 63.9 13.0
Darcy Friction
Factor dimensionless 1.2355 1.4631 3.2676
Pressure Out kPa
(psig)
1,334
(193)
1,334
(193)
1,334
(193)
(a) Values interpolated from data provided by [34].
(b) Pipe Roughness value derived from material specifications listed in [35].
ASME B31.12 was used to determine whether the standard tube wall thicknesses
were adequate based on corrosion, erosion, joining, and mechanical strength allowances.
The three standard tubing sizes used for the fluid analysis are manufactured in
accordance with standards listed in ASME B31.12 Table IP-8.1.1-1 Component
Standards and are suitable for use at the pressure-temperature ratings specified by their
manufacturers. These pressure-temperature ratings are summarized for each tubing size
in Table 6. A more rigorous design was completed in accordance with ASME B31.12
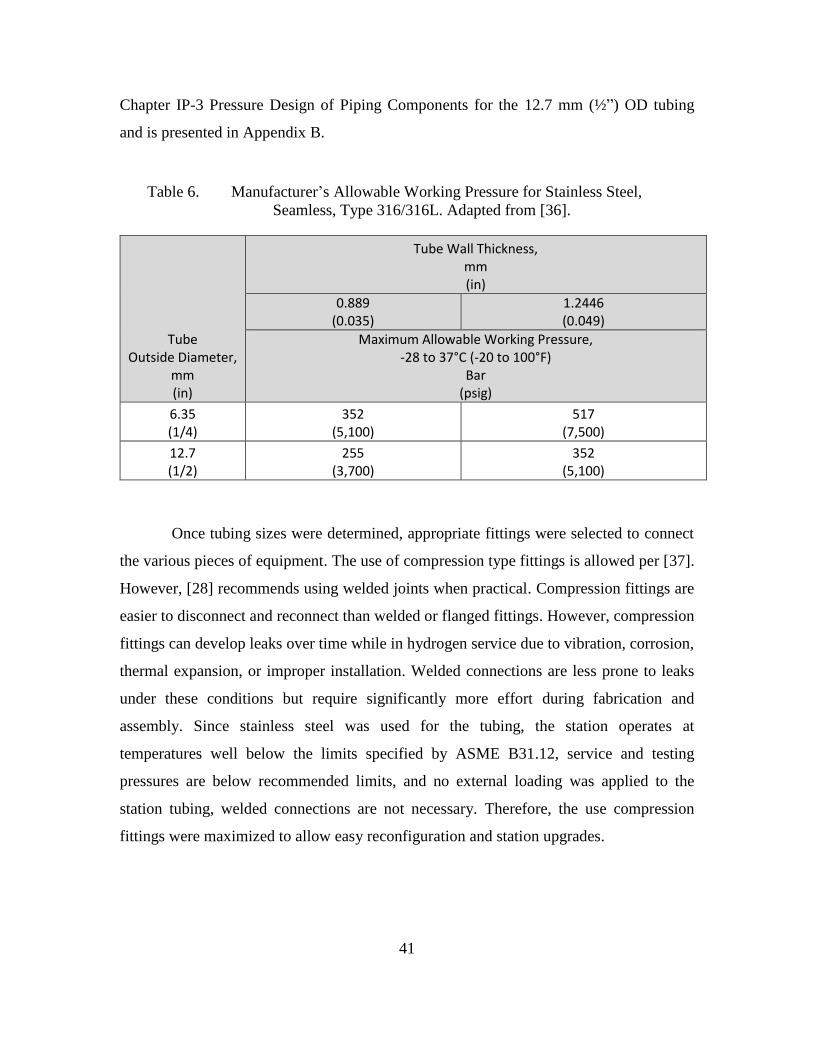
41
Chapter IP-3 Pressure Design of Piping Components for the 12.7 mm (½”) OD tubing
and is presented in Appendix B.
Table 6. Manufacturer’s Allowable Working Pressure for Stainless Steel,
Seamless, Type 316/316L. Adapted from [36].
Tube Outside Diameter,
mm (in)
Tube Wall Thickness, mm (in)
0.889 (0.035)
1.2446 (0.049)
Maximum Allowable Working Pressure, -28 to 37°C (-20 to 100°F)
Bar (psig)
6.35 (1/4)
352 (5,100)
517 (7,500)
12.7 (1/2)
255 (3,700)
352 (5,100)
Once tubing sizes were determined, appropriate fittings were selected to connect
the various pieces of equipment. The use of compression type fittings is allowed per [37].
However, [28] recommends using welded joints when practical. Compression fittings are
easier to disconnect and reconnect than welded or flanged fittings. However, compression
fittings can develop leaks over time while in hydrogen service due to vibration, corrosion,
thermal expansion, or improper installation. Welded connections are less prone to leaks
under these conditions but require significantly more effort during fabrication and
assembly. Since stainless steel was used for the tubing, the station operates at
temperatures well below the limits specified by ASME B31.12, service and testing
pressures are below recommended limits, and no external loading was applied to the
station tubing, welded connections are not necessary. Therefore, the use compression
fittings were maximized to allow easy reconfiguration and station upgrades.
42
3. Fire Protection Requirements
a. Storage Limits
The compression and storage station limit was established under NFPA 2
Hydrogen Technologies Code. Two criteria were used to determine the maximum
allowable station size. First, the Maximum Allowable Quantity of Hydrogen per Control
Area outlines the general requirements for indoor areas and is reproduced in Table 7.
Additionally, Chapter 16 Laboratory Operations requirements must be met when the
amount of gaseous hydrogen exceeds 2.2 standard cubic meters (75 scf). The lower of the
two values was used to establish the maximum allowable size of the storage station, 2.2
standard cubic meters, or 0.1832 kg H2. The minimum amount of hydrogen required to
operate a single 100W fuel cell for one night was determined as 0.14748 kg. Therefore,
the station was designed to store approximately 0.15-0.18 kg H2 while under pressure.

43
Table 7. Maximum Allowable Quantity of Hydrogen. Source: [38].
b. Station Siting
The location for the construction and operation of the compression and storage
station was selected based on several factors. First, the original station prototyped and
demonstrated by Aviles [1] was located inside the NPS High-Speed Micro-Propulsion
Lab, building number 216. While the original location served well for a small
demonstration, it was unsuitable for a larger storage station capable of supporting 24-hr
operations. Installing the station inside building 216 would require expensive fire and
safety upgrades that would be unnecessary after the research was completed. Second,
siting the station outdoors was ideal to minimize the number of required fire protection

44
and safety subsystems. Lastly, NFPA 2 Section 7 Gaseous Hydrogen details the various
setback distances required for hydrogen storage and compression stations. Adherence to
these setbacks was a primary goal in the siting process. Table 8 lists several of the
setback distances considered during the siting process. A site adjacent to building 216
was selected and ultimately used along with a structure for weather protection (shown in
Figure 16).
Figure 16. Compression and Storage Station Facility with Weather Protection and
Relocatable Platform

45
Table 8. Summary of Required Distances to Exposures for Non-Bulk
Gaseous Hydrogen Systems. Adapted from [39].
Separation Category Distance, m Distance, ft
Gas storage (toxic, pyrophoric, oxidizing, corrosive, unstable) 6.1 20
Group 1 Exposures: Lot lines, air intakes, operable openings in buildings, ignition sources 2 5
Public Thoroughfares 2 5
Buildings with firewall separation 0 0
Group 2 Exposures: Exposed persons, parked cars 1 4
Group 3 Exposures: Combustible Buildings, hazardous materials storage, overhead utilities, combustibles storage, non-openable openings in buildings 2 5
A permanent hydrogen station would be required to meet all of the NFPA 2
requirements along with state and local zoning ordinances and codes. The National
Renewable Energy Laboratory H2First Reference Station Design Task report from 2015
[40] describes some of the difficulties in properly siting a hydrogen fueling station. First,
the required setback distances for higher density liquid hydrogen storage are so great that
any station utilizing liquid hydrogen would be too large to fit into typical city lots.
Second, state and local requirements can unintentionally add greater distances than the
NFPA standards. Additionally, stations based on compressed hydrogen storage are
required to separate compressors, storage cylinders, and fueling points. This also
increases the required station size, real estate costs, and could negatively impact future
use at Navy installations.
4. Piping and Identification
A piping and identification (P&ID) diagram was used to detail the various
equipment, connections, and tubing needed for the compression and storage station.
Several of the hydrogen-specific standards discussed earlier provided P&ID templates
and examples for compliant systems. The examples were used, along with subject matter
expert advice from the NPS Rocket Propulsion Laboratory staff, to design a piping and
equipment arrangement that would support testing and evaluation of the various
46
hydrogen technologies undergoing research. The final result is shown in Appendix C
along with the detailed lists of equipment, valves, and piping needed for assembly.
D. EQUIPMENT SELECTION
Selecting appropriate equipment for the compression and storage station was
paramount for successful research and safety. The major elements of the station had
significant impacts on how the station performed during experiments. Selection results
are presented here for three of the major pieces of equipment. Cost, capacity, ruggedness,
compliance with standards, and simplicity were among the top criteria for selecting the
station components.
1. Compressor Selection
a. Electrochemical Hydrogen Compressors
The primary objective of this research involved the investigation of EHCs.
Therefore, only EHCs were considered for the compression cycle. Two companies were
discovered during market research that offered commercial-off-the-shelf EHCs. Of these
two, one was selected for testing and evaluation. The steady-state hydrogen production
rate of the two electrolysis hydrogen generators varied from as little as 0.1 slpm up to 4
slpm. Two EHCs of different flow capacities were selected to use in the station that could
handle this range of flow from the electrolysis station. The first compressor purchased,
shown in Figure 17, was a small 0.4 slpm compressor that used approximately 10–15
Watts to compress hydrogen up to 21–34 Bar (300-500 psi). The second compressor was
rated for 4.0 slpm at a slightly higher power and the same pressure capability, shown in
Figure 18.

47
Figure 17. 0.4 slpm Electrochemical Hydrogen Compressor with 15 Proton
Exchange Membranes

48
Note the stack of Belleville washers under the tightening nut. The washers are intended to
apply constant pressure on the stack as temperature changes and membrane material
compresses.
Figure 18. 4.0 slpm Electrochemical Hydrogen Compressor with 120 Proton
Exchange Membranes
b. Mechanical Compressors
Almost all hydrogen compression and storage stations worldwide utilize
mechanical compressors to achieve higher density hydrogen storage. Although EHCs
offer advantages in weight and volume over their mechanical competitors, mechanical
compressors are a mature technology with better logistics support. Before the EHCs were
purchased for this research, market research was conducted into the mechanical

49
compressors available and their performance in the field. Figure 19 is a plot of
commercially available mechanical compressors rated for hydrogen service based on
their maximum outlet pressure and minimum inlet pressure.
Figure 19. Minimum Inlet Pressure Measured Against Maximum Outlet Pressure
for Both Piston and Diaphragm Type Mechanical Hydrogen
Compressors. Adapted from [41], [42], [43].
Only five out of 125 mechanical compressors were capable of operating with a 1
atm inlet pressure like the one used during this research. Two more were capable of
operating with a 1.2 atm inlet pressure and were added to Figure 20, a plot of the seven
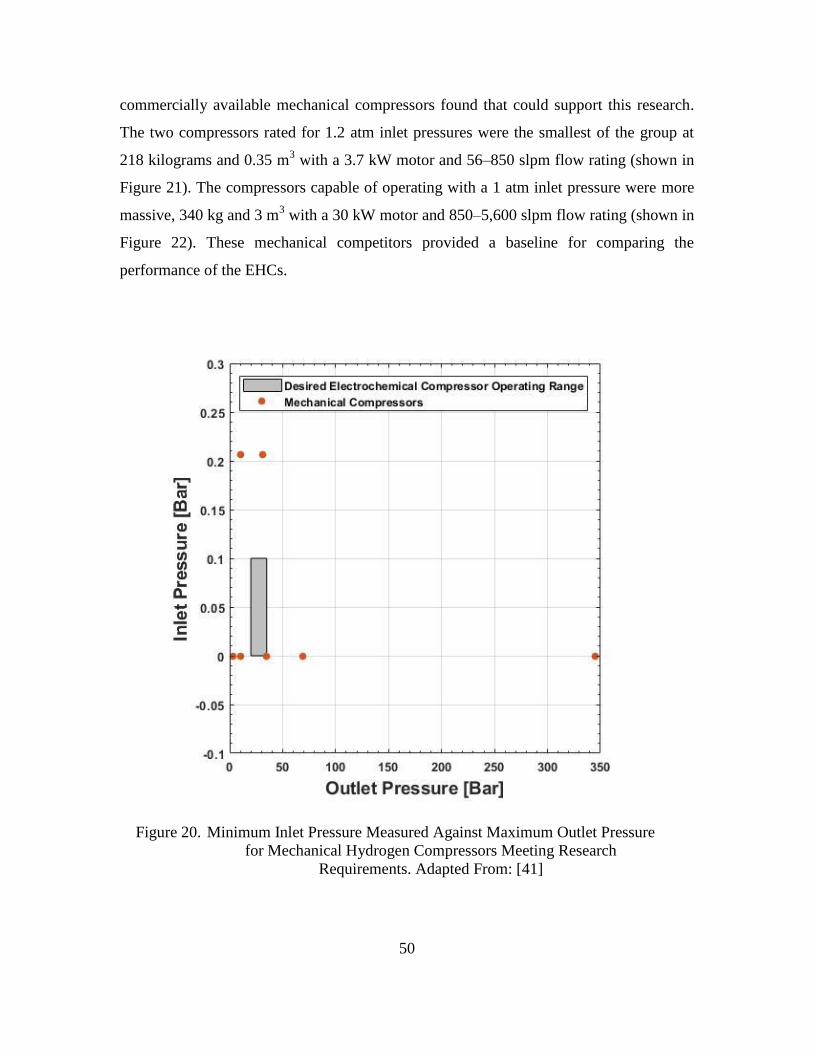
50
commercially available mechanical compressors found that could support this research.
The two compressors rated for 1.2 atm inlet pressures were the smallest of the group at
218 kilograms and 0.35 m3 with a 3.7 kW motor and 56–850 slpm flow rating (shown in
Figure 21). The compressors capable of operating with a 1 atm inlet pressure were more
massive, 340 kg and 3 m3 with a 30 kW motor and 850–5,600 slpm flow rating (shown in
Figure 22). These mechanical competitors provided a baseline for comparing the
performance of the EHCs.
Figure 20. Minimum Inlet Pressure Measured Against Maximum Outlet Pressure
for Mechanical Hydrogen Compressors Meeting Research
Requirements. Adapted From: [41]

51
Figure 21. Compact Mechanical Hydrogen Compressor, Piston-Type, Single
Stage, Oil-Less, Air Cooled. Source: [41]
Figure 22. Mechanical Hydrogen Compressor, Piston-Type, One–Five Stage, Oil-
Less, Air or Water Cooled. Source: [41]
Although the market for mechanical compressors offers a wide range of inlet and
outlet pressure ranges, there were no compressors that would sustain low flow rates like
the ones expected from the hydrogen generators used during this study. A production rate
of 0.1-4.0 slpm was expected, and all of the mechanical compressors surveyed would
quickly develop a vacuum suction on the electrolyzer if a buffer tank were not used. A
buffer tank is necessary when using a mechanical compressor to ‘buffer’ fluctuating inlet
52
pressures due to the cyclical movement of the piston or diaphragm and allow accurate
control of the compressor.
2. Storage Device Selection
Storage devices were selected after a compressor was identified for purchase.
Compressed hydrogen is typically stored in one of four types of cylinders, listed in Table
9 along with their relative costs. Since the purpose of compressing hydrogen is to
increase its volumetric energy density, selecting a lightweight storage device is ideal. The
lightest cylinders are Type III and IV composite-wrapped cylinders which are
commercially available from several suppliers. The composite cylinders are ideal for
applications where reduced weight is a design criterion such as mobile applications, but
costly due to their complex manufacturing and certification process.
Several suppliers were queried for pricing and estimated lead times for various
cylinder types. Prices for composite-wrapped cylinders ranged from $27.00-$49.00 per
liter of storage, and all suppliers required greater than eight weeks for delivery. All-steel
cylinders were found already in stock in large quantities, and typical prices were $4.00-
$5.00 per liter of storage. In addition to the better price, all-steel cylinders offered higher
safety factors, Department Of Transportation compliance, and greater ruggedness. The
standard all-steel compressed gas cylinders shown in Figure 23 were selected for this
research after considering the designed working pressure, price, and availability of
cylinders.

53
Table 9. High-Pressure Hydrogen Gas Storage Vessels. Adapted from [44].
Type Description Relative Cost
I All-metal cylinder $
II Load-bearing metal liner hoop wrapped with
resin-impregnated continuous filament
$$
III Non-load-bearing metal liner axial and hoop
wrapped with resin-impregnated continuous
filament
$$$
IV Non-load-bearing, non-metal liner axial and
hoop wrapped with resin-impregnated
continuous filament
$$$$
The steel cylinders have a DOT service pressure of 156.2 Bar (2,265 psi) and
43.2-liter capacity. The desired storage quantity was previously determined to be between
0.15-0.18 kg H2. A single cylinder would need to be compressed to 43 Bar (670 psig) to
meet the minimum storage requirement. Therefore, six cylinders were used and placed in
parallel service with a common manifold. Storage capacity at various pressures is shown
in Table 10.
Table 10. Storage Capacity at Various Pressures (at 21°C).
Pressure, Bar (psig) H2 Stored, Single-Cylinder, kg H2 Stored, 6-Pack, kg
10 (155) 0.036 0.214
20 (310) 0.071 0.427
100 (1,550) 0.356 2.136
200 (3,100) 0.712 4.273
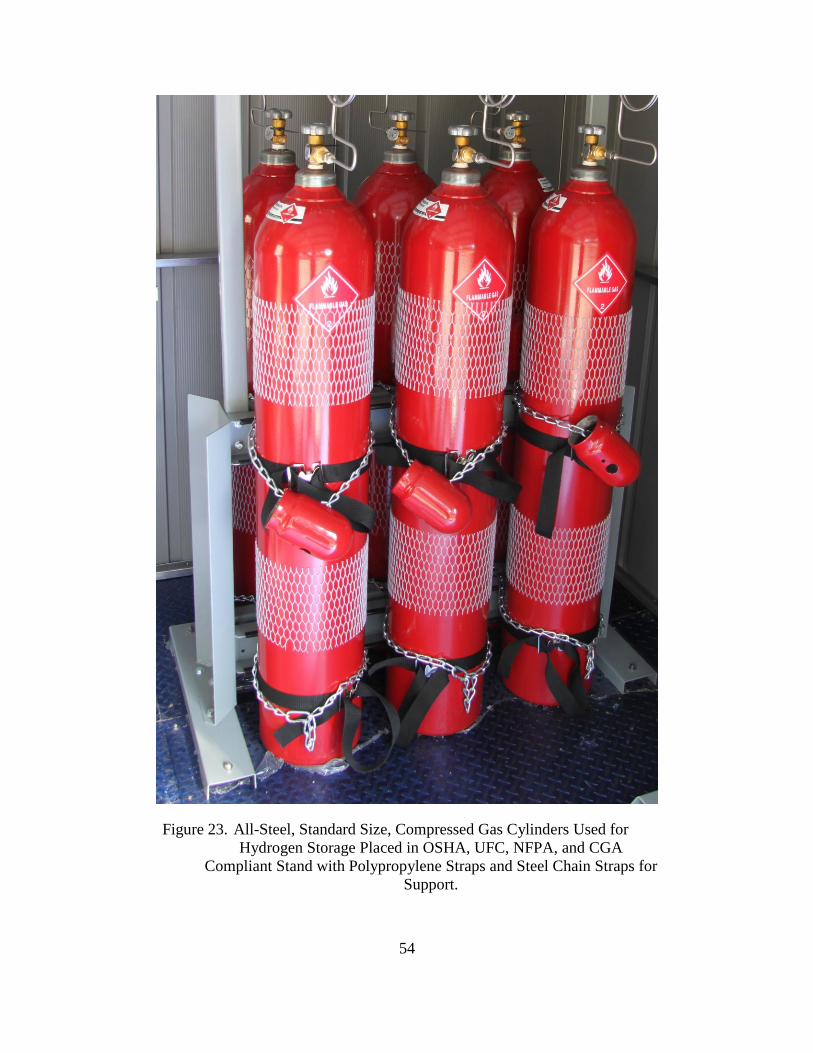
54
Figure 23. All-Steel, Standard Size, Compressed Gas Cylinders Used for
Hydrogen Storage Placed in OSHA, UFC, NFPA, and CGA
Compliant Stand with Polypropylene Straps and Steel Chain Straps for
Support.

55
3. Filtration Systems
Two different filtration subsystems were included in the design for the
compression and storage station. Particulate filtration was added for safety reasons, and
water adsorption was added to protect the steel storage cylinders from corrosion and the
fuel cell from poisoning. Tee-type particulate filters, shown in Figure 24, with three
different pore sizes were used to protect the safety relief devices, gas regulators, fuel cell,
and sensors from damage caused by particles. The tee-type filters allowed filter element
replacement without removing the filter housing from the piping system.
Water adsorption was achieved through the use of high-pressure adsorption filters
with cleanable and reusable filter elements. The all stainless steel filters and housing
bodies, Figure 25, are rated for service up to 414 Bar (6,000 psi) and included drain traps
to remove the water from the housing. Two units were purchased with the expectation
that they could be tied together in a regenerative cycle arrangement using actuated valves
and industrial controllers during station upgrades for future research.

56
Figure 24. Stainless Steel Tee-type Particulate Filters.
Figure 25. Stainless Steel High-pressure Adsorption Filter. Source: [45].
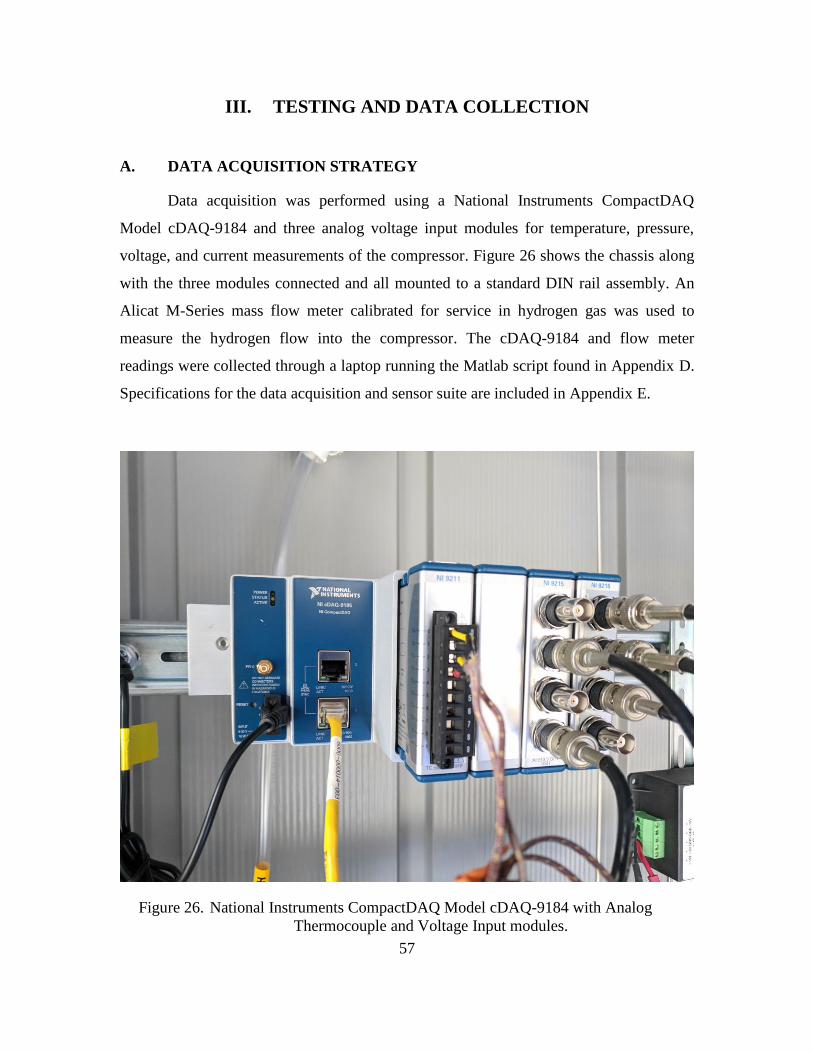
57
III. TESTING AND DATA COLLECTION
A. DATA ACQUISITION STRATEGY
Data acquisition was performed using a National Instruments CompactDAQ
Model cDAQ-9184 and three analog voltage input modules for temperature, pressure,
voltage, and current measurements of the compressor. Figure 26 shows the chassis along
with the three modules connected and all mounted to a standard DIN rail assembly. An
Alicat M-Series mass flow meter calibrated for service in hydrogen gas was used to
measure the hydrogen flow into the compressor. The cDAQ-9184 and flow meter
readings were collected through a laptop running the Matlab script found in Appendix D.
Specifications for the data acquisition and sensor suite are included in Appendix E.
Figure 26. National Instruments CompactDAQ Model cDAQ-9184 with Analog
Thermocouple and Voltage Input modules.

58
The total suite of sensors was connected according to Figure 27.
Figure 27. Data Acquisition System Wiring Diagram.
59
B. TESTS CONDUCTED
1. Specific Power versus Outlet Pressure
The EHCs were expected to be more efficient than mechanical compressors
because of their solid state operating principle. Performance was also expected to vary
based on inlet pressure, DC voltage applied, and DC current density. Two methods of
analysis are presented to compare the EHCs to ideal compression cycles. The first
method is a comparison of measured voltage versus the theoretical voltage calculated
using the Nernst Equation referenced earlier. The Nernst Equation provides the
theoretical cell potential needed from the for each cell to compress the hydrogen from
one pressure to the next:
2
1
lntheoretical
pR TV
n F p
, (7)
where
Vtheoretical = Theoretical potential to compress hydrogen, V
R = Universal gas constant, 8.314472 J/(K.mol)
T = Measured Cell Temperature, K
n = number of electrons transferred in the cell reaction, 2
F = Faraday Constant, 9.648533 x 10⁴ C/mol
p1 = Inlet Pressure, Bar
p2 = Outlet Pressure, Bar.
The equation results in a logarithmic growth of voltage as pressure increases.
Since this equation applies to a single cell, direct comparison of the theoretical
voltage versus actual voltage requires monitoring each cell voltage in the compressor
stack. The compressor and data acquisition system was not designed for individual cell
voltage monitoring and data collection. Therefore, an assumption is made that the

60
theoretical voltage multiplied by the number of cells in the compressor stack can be
reasonably compared to the total voltage across the compressor. Efficiency of the
compressor becomes:
,
,
theoretical cellscomp Nernst
total measured
V N
V
, (8)
where
,comp Nernst Efficiency of the compressor using Nernst Voltage
Ncells = Number of cells stacked in the compressor
Vtotal, measured = Measured total voltage across all cells in the compressor.
The second method of analysis presented is a specific work comparison against
ideal compression cycles. Specific work is the work rate divided by the mass flow rate. It
provides a convenient analysis of a steady state system in which a control volume can be
applied:
where
Work Rate = Power =
. .. .
C VC V
W kJW kWor
dt s
(9)
Mass Flow Rate =
m kg
mdt s
(10)
and
Specific Work =
. .
. .
C V
C V
W
WWorkRate kJdtmMassFlowRate m kg
dt
(11)
61
The ideal compression cycles used for analysis were the adiabatic and isothermal
compression of an ideal gas. Mechanical compressors are governed by the adiabatic
compression cycle while the EHC is governed by the isothermal process. For the
adiabatic compression of an ideal gas, the specific work required is calculated as follows:
1 2 2 11
W P Rw T T
m m
. (12)
Using the polytropic relationship for an isentropic compression of an ideal gas:
1
2 2
1 1
T P
T P
.
Specific work becomes:
1
21 2 1
1
11
pw RT
p
, (13)
where
= the specific heat ratio for hydrogen, 1.4065 [33]
R = hydrogen specific gas constant, 4124.48 J/(K.mol) [33]
and
T1 = Inlet temperature, [K].
Efficiency of the compressor, compared against the adiabatic process becomes:
1
2,
1,
1,
1 2,
,
1 2, ,
11
/
measured
measured
measured
ideal
comp adiabatic
actual total measured measured
pRT
pw
w P m
(14)
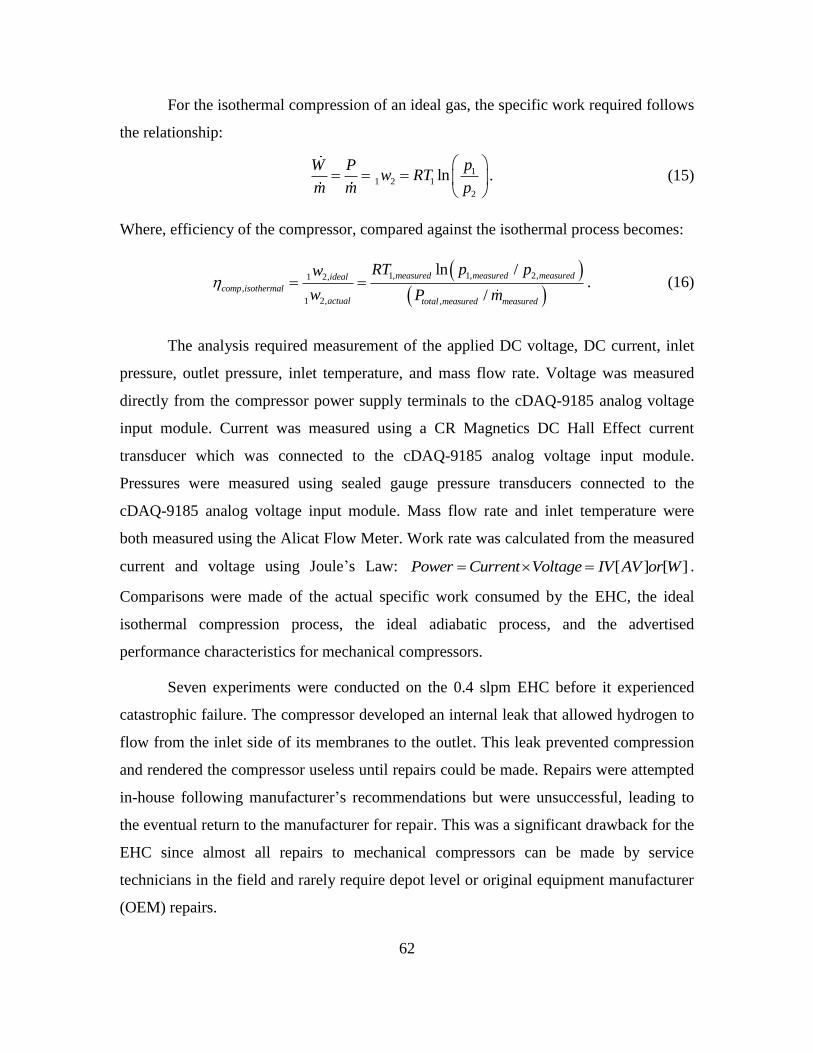
62
For the isothermal compression of an ideal gas, the specific work required follows
the relationship:
11 2 1
2
lnpW P
w RTm m p
. (15)
Where, efficiency of the compressor, compared against the isothermal process becomes:
1, 1, 2,1 2,
,
1 2, ,
ln /
/
measured measured measuredideal
comp isothermal
actual total measured measured
RT p pw
w P m . (16)
The analysis required measurement of the applied DC voltage, DC current, inlet
pressure, outlet pressure, inlet temperature, and mass flow rate. Voltage was measured
directly from the compressor power supply terminals to the cDAQ-9185 analog voltage
input module. Current was measured using a CR Magnetics DC Hall Effect current
transducer which was connected to the cDAQ-9185 analog voltage input module.
Pressures were measured using sealed gauge pressure transducers connected to the
cDAQ-9185 analog voltage input module. Mass flow rate and inlet temperature were
both measured using the Alicat Flow Meter. Work rate was calculated from the measured
current and voltage using Joule’s Law: [ ] [ ]Power Current Voltage IV AV or W .
Comparisons were made of the actual specific work consumed by the EHC, the ideal
isothermal compression process, the ideal adiabatic process, and the advertised
performance characteristics for mechanical compressors.
Seven experiments were conducted on the 0.4 slpm EHC before it experienced
catastrophic failure. The compressor developed an internal leak that allowed hydrogen to
flow from the inlet side of its membranes to the outlet. This leak prevented compression
and rendered the compressor useless until repairs could be made. Repairs were attempted
in-house following manufacturer’s recommendations but were unsuccessful, leading to
the eventual return to the manufacturer for repair. This was a significant drawback for the
EHC since almost all repairs to mechanical compressors can be made by service
technicians in the field and rarely require depot level or original equipment manufacturer
(OEM) repairs.

63
One experiment was conducted with the larger 4.0 slpm compressor. During this
experiment, the compressor functioned adequately until it reached around 4.5-5 Bar (65-
73 psig) compression. At 4.5 Bar the compressor developed an internal leak, releasing the
compressed hydrogen from the storage cylinder, and failed to restart until the system was
depressurized entirely. The larger compressor was then shipped back to the OEM for
repair.
a. 0.4 SLPM EHC Tested at 1.07 Bar Average Inlet Pressure
The first experiment presented was the last test conducted with of the 0.4 slpm
compressor before failure, a 60-minute test with the hydrogen inlet pressure set to 1.07
Bar and DC power supply set to 3 amps in controlled current (CC) mode. This test is
presented because it is the closest to real-world conditions when the compressor is
connected to the hydrogen gas generator. A cylinder of compressed hydrogen regulated
to 1.07 Bar was used to simulate the actual operating conditions. Figure 28 shows the
resulting voltage and pressure relationship as a function of time.

64
Figure 28. Voltage and Outlet Pressure Characteristics for 0.4 slpm EHC with
1.07 Bar Average Inlet Pressure

65
Figure 29 shows the total power consumption and volumetric flow rate of the
compressor as a function of time.
Figure 29. Power Input and Volumetric Flow Characteristics for 0.4 slpm EHC
with 1.07 Bar Average Inlet Pressure
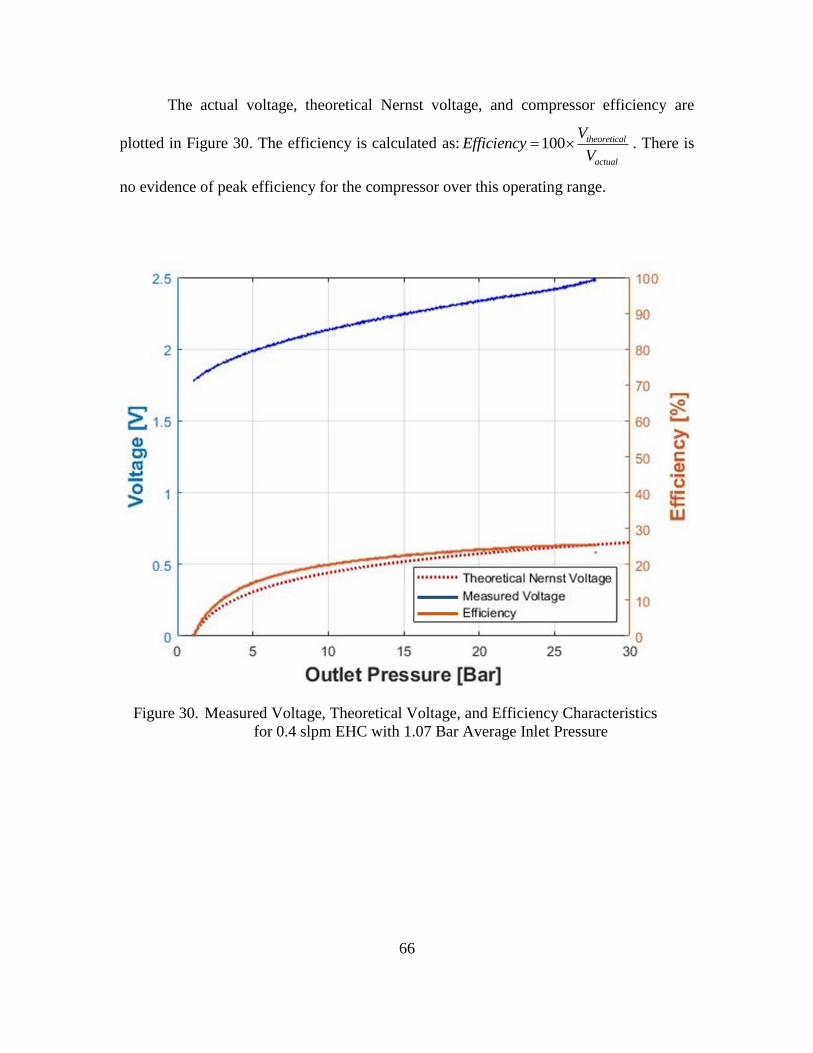
66
The actual voltage, theoretical Nernst voltage, and compressor efficiency are
plotted in Figure 30. The efficiency is calculated as: 100 theoretical
actual
VEfficiency
V . There is
no evidence of peak efficiency for the compressor over this operating range.
Figure 30. Measured Voltage, Theoretical Voltage, and Efficiency Characteristics
for 0.4 slpm EHC with 1.07 Bar Average Inlet Pressure
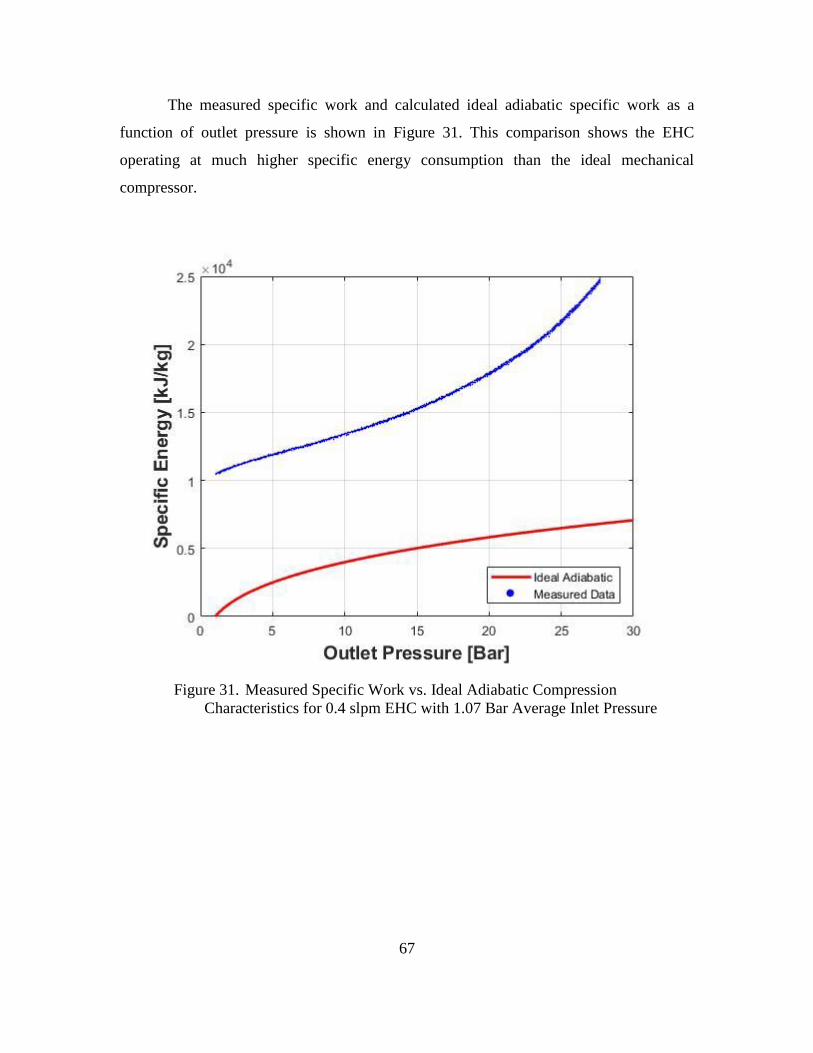
67
The measured specific work and calculated ideal adiabatic specific work as a
function of outlet pressure is shown in Figure 31. This comparison shows the EHC
operating at much higher specific energy consumption than the ideal mechanical
compressor.
Figure 31. Measured Specific Work vs. Ideal Adiabatic Compression
Characteristics for 0.4 slpm EHC with 1.07 Bar Average Inlet Pressure
68
The calculated efficiency is plotted in Figure 32. Unlike with the Nernst
comparison previously, the adiabatic comparison shows a maximum efficiency for the
compressor around 17 [Bar].
Figure 32. Adiabatic Efficiency Characteristics for 0.4 slpm EHC with 1.07 Bar
Average Inlet Pressure
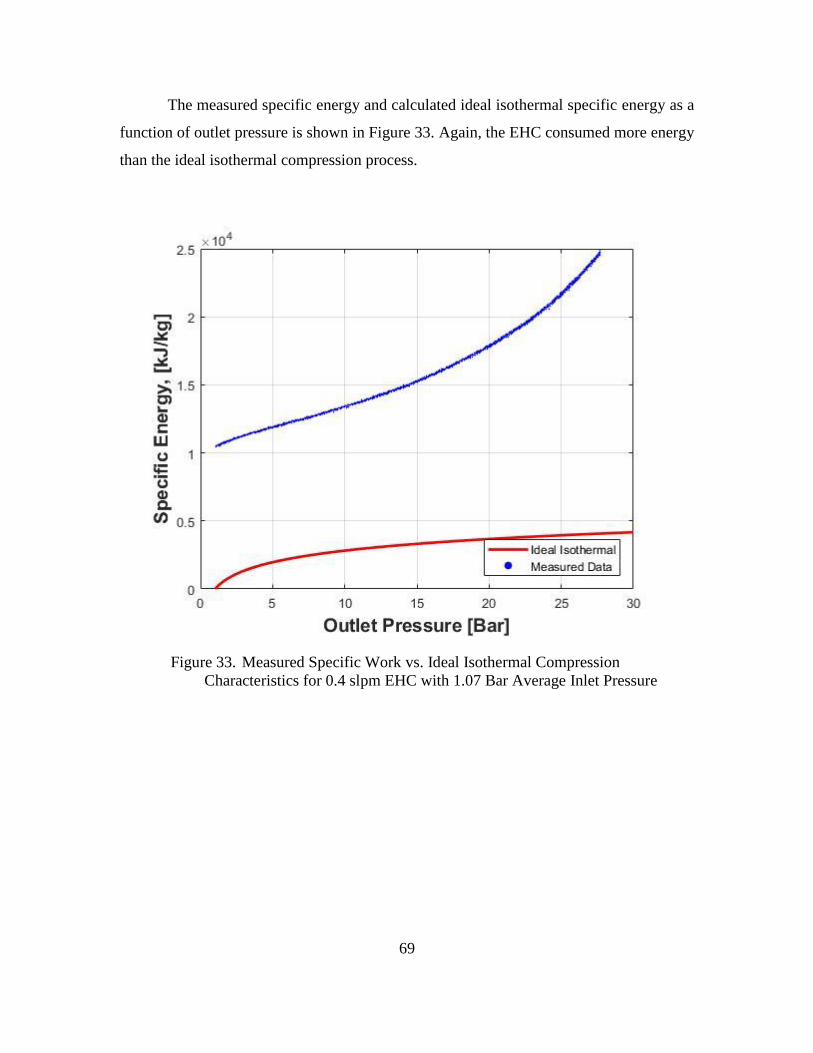
69
The measured specific energy and calculated ideal isothermal specific energy as a
function of outlet pressure is shown in Figure 33. Again, the EHC consumed more energy
than the ideal isothermal compression process.
Figure 33. Measured Specific Work vs. Ideal Isothermal Compression
Characteristics for 0.4 slpm EHC with 1.07 Bar Average Inlet Pressure
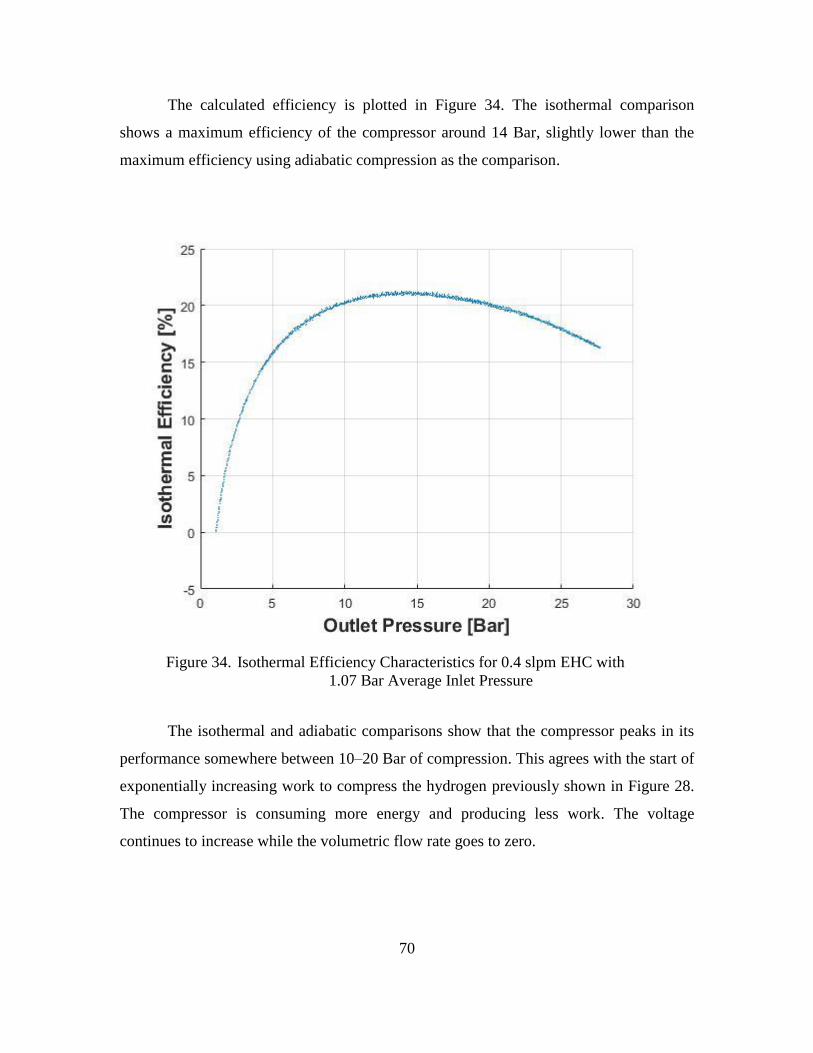
70
The calculated efficiency is plotted in Figure 34. The isothermal comparison
shows a maximum efficiency of the compressor around 14 Bar, slightly lower than the
maximum efficiency using adiabatic compression as the comparison.
Figure 34. Isothermal Efficiency Characteristics for 0.4 slpm EHC with
1.07 Bar Average Inlet Pressure
The isothermal and adiabatic comparisons show that the compressor peaks in its
performance somewhere between 10–20 Bar of compression. This agrees with the start of
exponentially increasing work to compress the hydrogen previously shown in Figure 28.
The compressor is consuming more energy and producing less work. The voltage
continues to increase while the volumetric flow rate goes to zero.
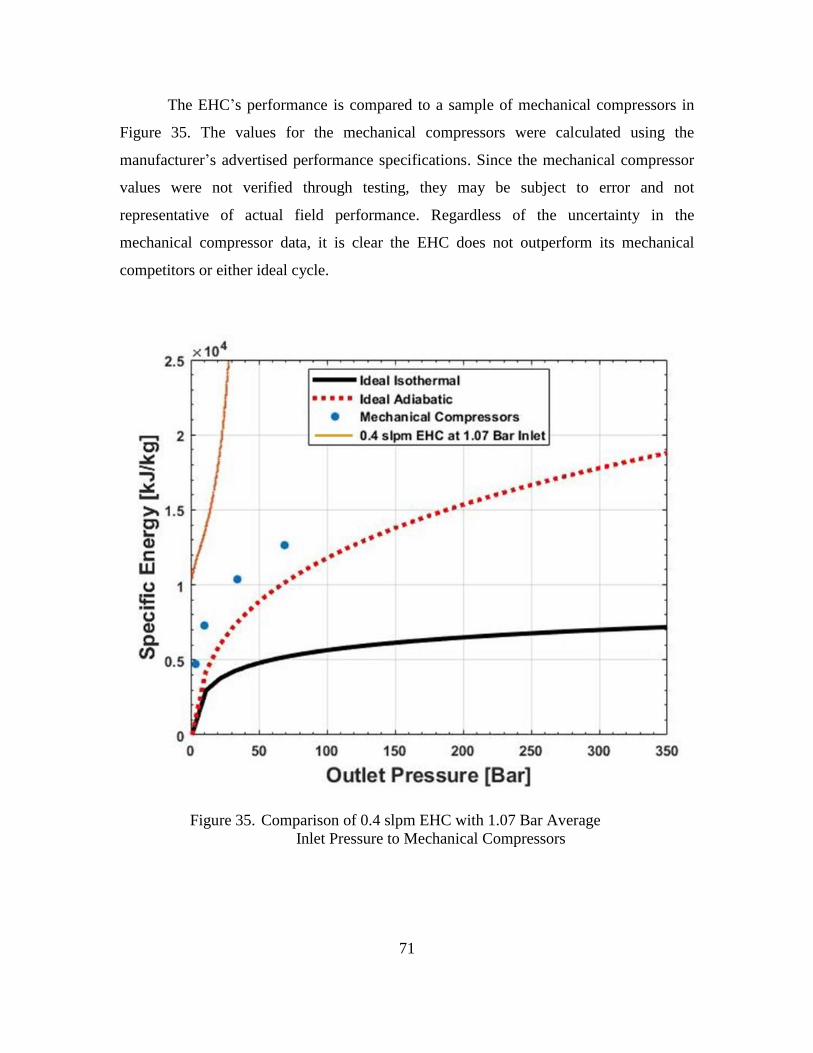
71
The EHC’s performance is compared to a sample of mechanical compressors in
Figure 35. The values for the mechanical compressors were calculated using the
manufacturer’s advertised performance specifications. Since the mechanical compressor
values were not verified through testing, they may be subject to error and not
representative of actual field performance. Regardless of the uncertainty in the
mechanical compressor data, it is clear the EHC does not outperform its mechanical
competitors or either ideal cycle.
Figure 35. Comparison of 0.4 slpm EHC with 1.07 Bar Average
Inlet Pressure to Mechanical Compressors
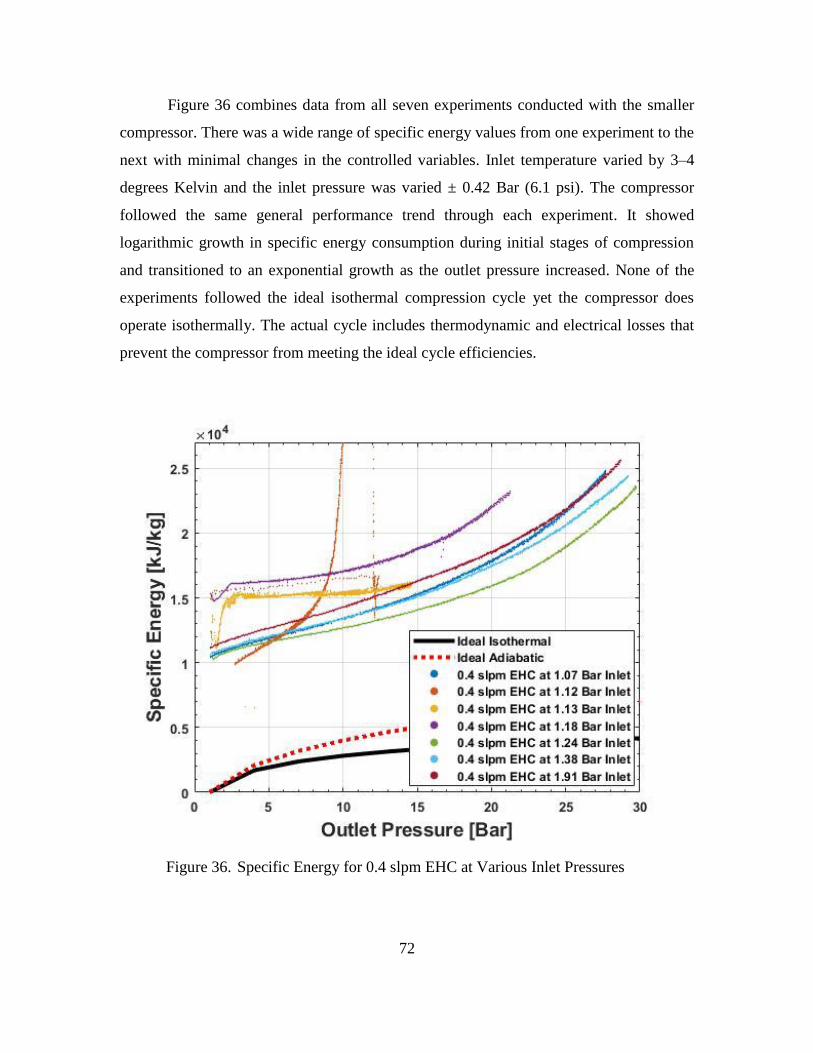
72
Figure 36 combines data from all seven experiments conducted with the smaller
compressor. There was a wide range of specific energy values from one experiment to the
next with minimal changes in the controlled variables. Inlet temperature varied by 3–4
degrees Kelvin and the inlet pressure was varied ± 0.42 Bar (6.1 psi). The compressor
followed the same general performance trend through each experiment. It showed
logarithmic growth in specific energy consumption during initial stages of compression
and transitioned to an exponential growth as the outlet pressure increased. None of the
experiments followed the ideal isothermal compression cycle yet the compressor does
operate isothermally. The actual cycle includes thermodynamic and electrical losses that
prevent the compressor from meeting the ideal cycle efficiencies.
Figure 36. Specific Energy for 0.4 slpm EHC at Various Inlet Pressures
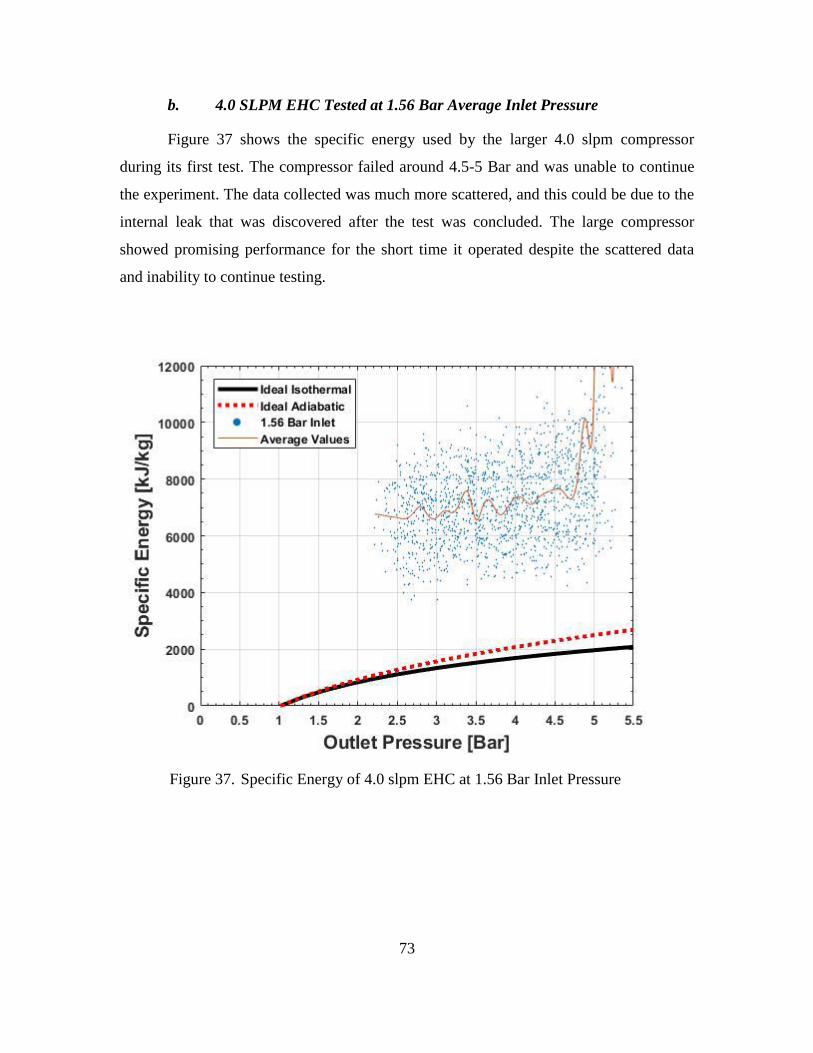
73
b. 4.0 SLPM EHC Tested at 1.56 Bar Average Inlet Pressure
Figure 37 shows the specific energy used by the larger 4.0 slpm compressor
during its first test. The compressor failed around 4.5-5 Bar and was unable to continue
the experiment. The data collected was much more scattered, and this could be due to the
internal leak that was discovered after the test was concluded. The large compressor
showed promising performance for the short time it operated despite the scattered data
and inability to continue testing.
Figure 37. Specific Energy of 4.0 slpm EHC at 1.56 Bar Inlet Pressure
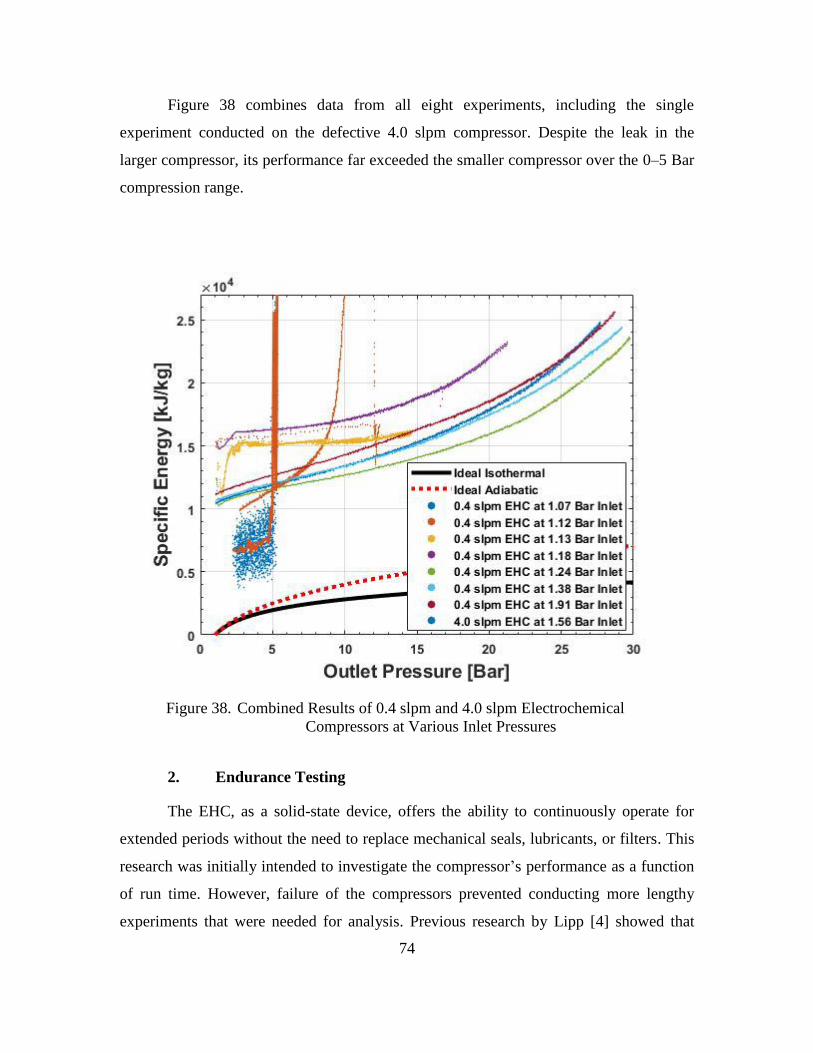
74
Figure 38 combines data from all eight experiments, including the single
experiment conducted on the defective 4.0 slpm compressor. Despite the leak in the
larger compressor, its performance far exceeded the smaller compressor over the 0–5 Bar
compression range.
Figure 38. Combined Results of 0.4 slpm and 4.0 slpm Electrochemical
Compressors at Various Inlet Pressures
2. Endurance Testing
The EHC, as a solid-state device, offers the ability to continuously operate for
extended periods without the need to replace mechanical seals, lubricants, or filters. This
research was initially intended to investigate the compressor’s performance as a function
of run time. However, failure of the compressors prevented conducting more lengthy
experiments that were needed for analysis. Previous research by Lipp [4] showed that

75
EHCs could run for >10,000 hours without significant degradation in performance.
Mechanical compressors, in comparison, have a mean time between failure around 900
hrs [46]. The significantly longer mean time between failure for EHCs suggests that
operation, maintenance, and repair cost savings over mechanical compressors may prove
to offset the slightly lower efficiencies witnessed during this study.

76
THIS PAGE INTENTIONALLY LEFT BLANK

77
IV. DISCUSSION
A. NAVY PHOTOVOLTAIC INFRASTRUCTURE
The Navy and Marine Corps have installed approximately 405 photovoltaic arrays
worldwide over the last 30 years. The estimated value of this investment is $1.9B (Plant
Replacement Value). However, Figure 39 shows most of this investment has been made
in the past ten years. Plant Replacement Value is an estimate of the cost to design and
construct a replacement facility at the same location meeting current code requirements.
This metric is used throughout the DOD as a measurement of size, to calculate condition
ratings, and to estimate long-term recapitalization requirements. The estimate is
calculated using the equation outlined in Unified Facilities Criteria (UFC) 3–701-01
Chapter 3, Unit Costs for DOD Facilities Cost Models [47]. Since the Department of the
Navy has already made substantial investments in photovoltaic arrays, it makes sense to
take efforts to increase reliability and resiliency of these systems. One method of
increasing resiliency is to incorporate energy storage capability with the renewable
energy generation. Only a few demonstration projects have been planned in the DOD for
renewable energy storage. The Navy Resilient Energy Program Office is working on
microgrids in Connecticut and Arizona that incorporate battery storage, as well as two
battery storage stations in California. The other services are also investing in microgrids
with energy storage and energy storage stations. So far, all of these demonstration
projects have relied on battery technology for their energy storage.

78
Figure 39. Department of the Navy Photovoltaic Facility Investment.
Source: [48].
Over half of the photovoltaic arrays installed by the Department of the Navy are
located in California where the grid operators are battling a growing oversupply problem.
The oversupply results from an increase of solar and wind generation during periods of
low demand that has forced grid operators like California Independent System Operator
(CAISO) to curtail renewable energy production. Figure 40 shows the renewable
curtailment CAISO has had to enact over the past few years and highlights an increasing
trend.

79
Figure 40. California Independent System Operator (CAISO) Renewable
Curtailment Totals (2014 – 2015). Source: [49].
Adding hydrogen generation and storage to existing photovoltaic facilities could
serve to increase the diversity of energy storage technologies in the Navy’s portfolio of
renewable energy investments. Investing in only one technology, batteries, will make it
more challenging to conduct life cycle comparisons between the different shore energy
storage technologies available. Additional demonstration projects that incorporate
hydrogen generation and storage should be pursued to allow realistic comparisons.
Selection criteria for candidate sites could include potential users of the hydrogen
alternative fuel, local utility rate structures, and existing local grid reliability.

80
B. OPPORTUNITIES
1. Stationary Installations
The European Union is investing heavily in Hydrogen and Fuel Cell technology.
The Fuel Cell and Hydrogen Joint Undertaking has funded approximately 532M€
($622M) for 170 major projects relating to hydrogen and fuel cell technologies [50].
Lessons learned from these projects can provide insight and guidance for any DOD
agency seeking to implement a hydrogen energy storage station into a microgrid or
remote outpost. For instance, the 2011–2014 ELYGRID (electrolyzer to grid) project
concluded long returns on investment and complex site-specific power and gas markets
contribute to slow adoption of using electrolyzers in grid-scale applications [51]. One
other European Union project to note is the “Combined Hybrid Solution of Multiple
Hydrogen Compressors for Decentralized Energy Storage and Refueling Stations” project
in Germany. This 3-year, 2.5M€ ($2.9M) project started in January 2017 and will focus
on integrating small, silent, low-cost compressors with traditional mechanical
compressors in decentralized environments [52]. Decentralized environments include
both small-scale refueling and hydrogen storage facilities on islands. The same scope of
effort could be applied to Navy installations in the Pacific.
2. Expeditionary Application
In his white paper, “The Future Navy,” the Chief of Naval Operations outlined the
need to increase forward presence of persistent, self-sufficient platforms to execute long-
term U.S. strategy [53]. Among these platforms, he specifically mentions the “increasing
numbers of unmanned air vehicles” and asserts “[t]here is no question that unmanned
systems must also be an integral part of the future fleet” [53]. A hydrogen production,
compression, and storage system modeled after the one built during this research project
could fuel forward deployed unmanned systems without long fuel logistics lines of
communication. A small-scale, reliable hydrogen station coupled with persistent
unmanned Command, Control, Communications, Computers, Intelligence, Surveillance
and Reconnaissance (C4ISR) assets could meet the demand for self-sustaining assets
worldwide.

81
Multiple unmanned aerial vehicle manufacturers are already demonstrating
commercially available hydrogen fuel cell powered drones. Last year, for instance,
Intelligent Energy demonstrated their Unmanned Aerial Vehicle (UAV) Fuel Cell
Module proving it could fly for longer durations and farther distances than battery-only
units [54]. Longer flight times, farther travel distance, and greater lift capacity are the key
advantages advertised by manufacturers. If these claims are proven correct, using
renewably produced hydrogen to fuel squadrons of unmanned aerial vehicles is a
possibility worth investigating.
A site visit to Lithuania was conducted during this research to investigate the
performance of a hybrid power generation and management system built for North
Atlantic Treaty Organization (NATO) deployed forces. The demonstration station, shown
in Figure 41, managed three different types of power generators (wind, solar, diesel), a
battery energy storage bank, and 150kW of intermittent loads. The entire system fits into
two 6 m (20ft) ISO containers for rapid transport and deployment. A 35% savings in fuel
usage was demonstrated during a field exercise supporting 70 tents and 500–600 troops
[55]. The battery energy storage utilized expensive lithium-ion batteries that required a
separate chiller plant to maintain low temperatures in the field. Similar systems could be
built with hydrogen storage that offered peak shaving like the one demonstrated in
Lithuania, as well as, hydrogen fuel for vehicles in the field.

82
Figure 41. NATO Camp Hybrid Power Station
Aside from military C4ISR applications, hydrogen fueling infrastructure can also
support UAVs used for installation surveying, inspection, and assessments. An ongoing
Energy Systems Technology Evaluation Program (ESTEP) demonstration project by
Naval Facilities Engineering Command (NAVFAC) Engineering and Expeditionary
Warfare Center (EXWC) is using UAVs to survey and inspect existing electric utility
infrastructure in remote areas to reduce manning requirements and personnel safety risks
[56]. These surveying and inspection UAVs could be used for many routine inspections
of building envelopes, critical infrastructure, real estate and protected environmental
areas. In 2015, the Minnesota Department of Transportation successfully proved this
concept in their “Unmanned Aerial Vehicle Bridge Inspection Demonstration Project”
concluding the UAVs offered a cost-effective and safe means of gathering detailed visual
and infrared data on bridges, waterways, and embankments [57].
3. Hydrogen at Sea
Most progress in fuel cell powered unmanned vehicles has been made in aerial
applications. However, if the Navy invested in hydrogen stations, unmanned subsurface
and surface vehicles could also benefit from having their fuel generated locally in remote
regions using renewable sources of energy. EHCs like the ones tested during this research

83
could be used to significantly reduce the overall size and weight of the compression
stations needed to fuel such unmanned vehicles. Their compactness would also benefit
sea-based energy strategies such as the novel “energy ship” concept proposed by Dr.
Maximilian Platzer. He proposed using sailing ships to harvest wind energy through
hydrokinetic turbines, converting the turbine shaft energy into electricity, using the
electricity to generate hydrogen, and then using the hydrogen to power shore installations
and transport vehicles [58] and [59]. This concept requires compressed hydrogen storage
onboard the sailing vessels. Reducing weight through storage is unlikely since storage at
high pressures requires heavy cylinders due to hydrogen’s physical properties and
tendency to cause embrittlement. Saving weight by reducing the compressor size is more
achievable, and EHCs offer a means of reducing overall system weight significantly.

84
THIS PAGE INTENTIONALLY LEFT BLANK
85
V. CONCLUSION
The purpose of this research was to design, build, and test a renewably powered
hydrogen gas compression and storage station incorporating an electrochemical hydrogen
gas compressor. The station designed, constructed, and tested during this research has
confirmed that EHCs operate as advertised and can be used in energy storage
applications. The solid-state operation alleviates the problem of expensive operations and
maintenance costs associated with mechanical hydrogen compressors. However, the
breakdown of both EHCs tested during this research highlight a significant reliability
concern. Additionally, EHCs are still in an early design and development state and
require additional engineering before they can compete with mechanical compressors.
The EHCs used during this research lacked NFPA/NEC compliant connections,
automated passive and active safety devices, and industrial controls. If manufacturers can
correct both reliability deficiencies and design deficiencies, EHCs could serve in multiple
Navy environments for a wide range of hydrogen applications.
Experimental performance data was obtained for two EHCs with different rated
flow capacities. This data was analyzed based on three different operating principles:
Nernst electrochemical process efficiency, comparison to ideal adiabatic operation of
mechanical compressors, and ideal isothermal compression efficiency. The tests indicate
EHCs do not necessarily follow the ideal isothermal compression cycle and will be less
efficient than the ideal case. A maximum isothermal efficiency can be determined
experimentally at specific compressor outlet pressures. The smaller EHC’s efficiency
peaked at 21% when the outlet pressure reached 14 Bar. The larger EHC failed before its
efficiency could be determined.

86
THIS PAGE INTENTIONALLY LEFT BLANK

87
APPENDIX A. VACUUM/PRESSURE PURGING CALCULATIONS
The purge station was designed to deliver at least 34 atm (500 psi) nitrogen using
a commercial-off-the-shelf gas cylinder header and regulator. The vacuum pump
available for use by the laboratory was capable of delivering a maximum of 711 mm (28
in) Hg (gauge) vacuum (0.064 atm).
The number of vacuum/pressure purge cycles required is calculated according to
the formula found in [27] as follows:
0.01ln ln
0.21
ln ln
1,2,3,...
safe
air
Low Low
High High
C
CN
P P
P P
N
, (17)
where,
Csafe = Safe concentration of residual oxygen, 1% per CGA G-5.4
Cair = Initial concentration of oxygen in air, 21%
PLow = Absolute pressure after vacuum
and,
PHigh = Purging pressure of inert gas, 34 atm N2 (500 psi) maximum.
The total mass of N2 required for the vacuum/pressure purge process is calculated
as follows:
1000 /
High LowP P V Mm n M
R T g kg
, (18)
where,
n = Moles of purge gas added to the station, mol
M = Molar Mass of Nitrogen, 28.0134 g
mol

88
V = Total Volume of vessels, 0.2592 m3
R = Universal Gas Constant, 8.314 J
mol K
T = normal temperature, 298.15 K (25 °C).
Table 11 provides list of optimum vacuum/pressure combinations to conserve
purge gas.
Table 11. Optimum Vacuum/Pressure Purge Regimes
PLow , atm PHigh , atm N Total Mass of N2
Required, kg
0.064 1.7 1 0.5
0.332 1.7 2 0.8
0.064 1.3 2 0.8
0.332 1.3 3 0.9
0.666 2.0 3 1.2
0.666 3.4 2 1.6
1.0 3.0 3 1.8
0.332 7.1 1 2.0
1.0 4.7 2 2.2
0.666 14.3 1 4.0
1.0 21.0 1 6.0

89
APPENDIX B. PIPE WALL THICKNESS CALCULATIONS
The minimum tube wall thickness is calculated using the following formula from
[37]:
mt t c (19)
Where c = sum of the mechanical allowances (thread or groove depth) plus corrosion and
erosion allowances. A value of 0.0762 mm (0.003 in) was used because
negligible corrosion and erosion are expected during the stations short
period of operation.
D = outside diameter of pipe as listed in tables of standards or specifications, or as
measured. A value of 12.7±0.0762mm (0.5±0.003 in) was provided by the
manufacturer.
d = inside diameter of the pipe.
E = quality factor from Table IX-3B Longitudinal Joints Factors for Pipeline
Materials. A value of 1.0 is listed for all seamless piping.
Mf = material performance factor that addresses the loss of material properties
associated with hydrogen gas service. Austenitic stainless steels do not
have a material performance factor listed. A value of 1.0 was used.
P = internal design pressure gauge pressure. A maximum of 2.0684x10⁷ Pa (3,000
psi) was used.
S = stress value for material from Table IX-1A. 1.15142450 x10⁸ Pa (16.7 ksi) is
listed for 316L at 37.7778 °C (100°F).
T = pipe wall thickness (measured or minimum per purchase specification)
t = pressure design thickness, not less than that calculated in accordance with
either equation below. For straight pipe under internal pressure with t < D/
6=2.1167±0.0127 mm (0.0833±0.0005 in):

90
7
8 7
7
8 7
2.0684 10 12.7 0.0762
2 2 1.15142450 10 1 1 2.0684 10 0.4
1.0642 0.0064
2.0684 10 12.7 0.0762
2 (1 ) 2 1.15142450 10 1 1 2.0684 10 1 0.4
1.0297 0.0062
f
f
PDt
SEM PY
mm
PDt
SEM P Y
mm
A value of 1.0706 mm was used for t.
Therefore, tm = t + c = 1.0706 + 0.0762 = 1.1468 mm (0.0452 in). The minimum
thickness is less than the standard tube size selected for the ½” OD tubing, and there is no
need for thicker wall tubing.

91
APPENDIX C. PIPING AND IDENTIFICATION (P&ID) DIAGRAM
Filename: Deimos - E:\FOSSON\Drawings and Sketches\ Compression P&ID (Draft).vsd

92

93
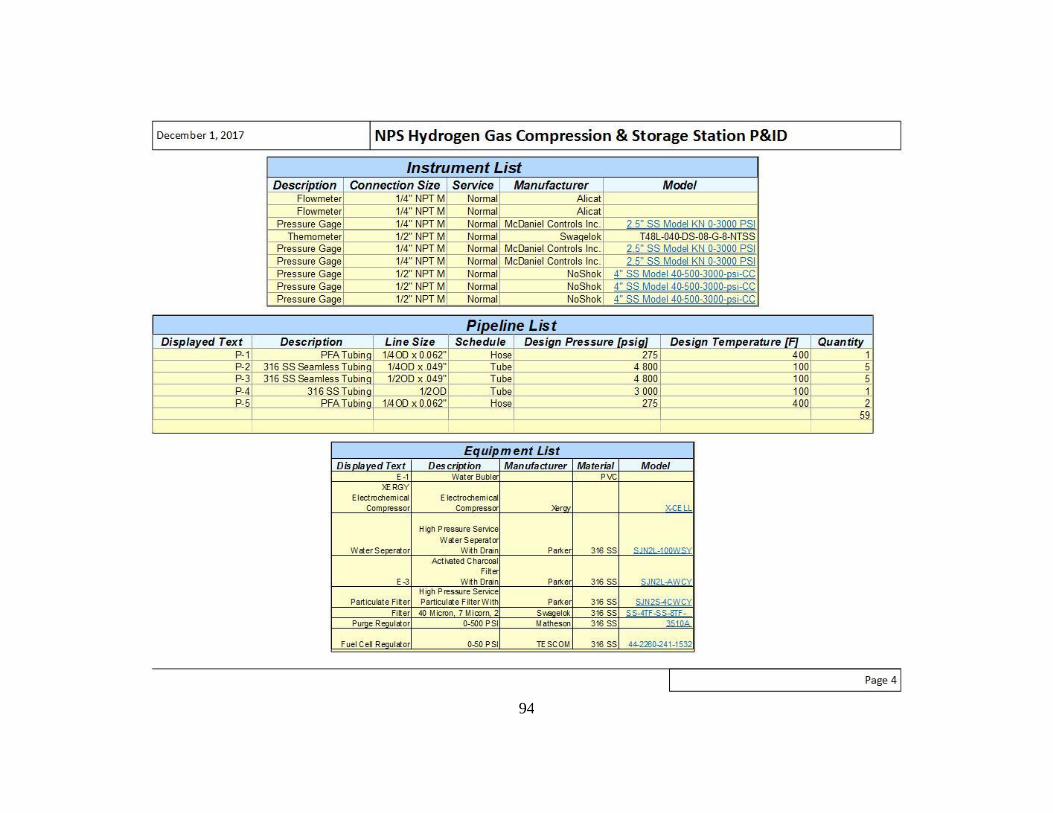
94

95
APPENDIX D. MATLAB SCRIPT FOR EXPERIMENT DATA
COLLECTION
Filename: Deimos - E:\FOSSON\NI cDAQ Tests and Scripts\TestScript.m
%% Hydrogen Compression Station Data Acquisition Using NI CompactDAQ
9184
% (1) Verify COM port for Alicat Flow Meter using Device Manager
% (2) Open NI MAX and test CompacDAQ Chasis to verify communications
% (3) Enter filename below
filename='20171017'
%% Reset NI DAQ
daqreset
devices = daq.getDevices
s = daq.createSession('ni')
%%
% Establish Communications with Alicat Flow Meter
flowMeter=serial('COM3','TimeOut',2,'BaudRate',19200,'Terminator','CR')
;
fopen(flowMeter);
% Preallocate Data Arrays
runtime = 60; %seconds
time = zeros(1,runtime);
NIdata = zeros(8,runtime);
timerecord=zeros(1,runtime);
inletflowrate=zeros(1,runtime);
inletpressure=zeros(1,runtime);
inlettemp=zeros(1,runtime);
% Temperature Measurement
% Add Thermocouples and Configure
%%
addAnalogInputChannel(s,'cDAQ9185-1C7CD98Mod1',0:2, 'Thermocouple');
%%
tc1 = s.Channels(1);
set(tc1);
tc1.ThermocoupleType = 'K';
tc1.Units = 'Celsius';
tc2 = s.Channels(2);
set(tc2);
tc2.ThermocoupleType = 'K';
tc2.Units = 'Celsius';
tc3 = s.Channels(3);
set(tc3);
tc3.ThermocoupleType = 'K';
tc3.Units = 'Celsius';
%%
% Voltage Measurement
% Add Analog Input Channels
addAnalogInputChannel(s,'cDAQ9185-1C7CD98Mod3', 0:1, 'Voltage');
addAnalogInputChannel(s,'cDAQ9185-1C7CD98Mod4', 0:2, 'Voltage');
%%
for i=1:runtime % # of samples to collect data for

96
tic
time(i)=now;
fprintf(flowMeter,'A');
IN=fscanf(flowMeter);
[OUT.ID,OUT.pressure,OUT.temp,OUT.LPM,OUT.SLPM,OUT.gas]=strread(IN,...
'%s%f%f%f%f%s', 'delimiter', ' ');
inletflowrate(i)=OUT.SLPM;
inletpressure(i)=OUT.pressure;
inlettemp(i)=OUT.temp;
NIdata(:,i) = s.inputSingleScan;
% yyaxis left
% hold on
% plot(i,inletflowrate(i),'.')
% plot(i,NIdata(4,i),'.',i,NIdata(5,i),'.')
% yyaxis right
% plot(i,NIdata(6,i),'.',i,NIdata(7,i),'.')
toc
pause(2-toc)
end
datestr(time);
%
%% Clean up the serial object
fclose(flowMeter);
delete(flowMeter);
clear flowMeter;
%% Write data to file
A=[time',inletflowrate',inletpressure',inlettemp',NIdata'];
xlswrite(filename,A)
%% Read data in file
B=xlsread(filename)
% plot(time,data(:,3),time,data(:,4),time,data(:,5),time,data(:,6), ...
% time,data(:,7),time,data(:,8),time,data(:,9),time,data(:,10));
% xlabel('Time (secs)');
% ylabel('Voltage')
% figure
% plot(time, data(:,1),time,data(:,2))
% xlabel('Time (secs)');
% ylabel('Temperature (Celcius)');
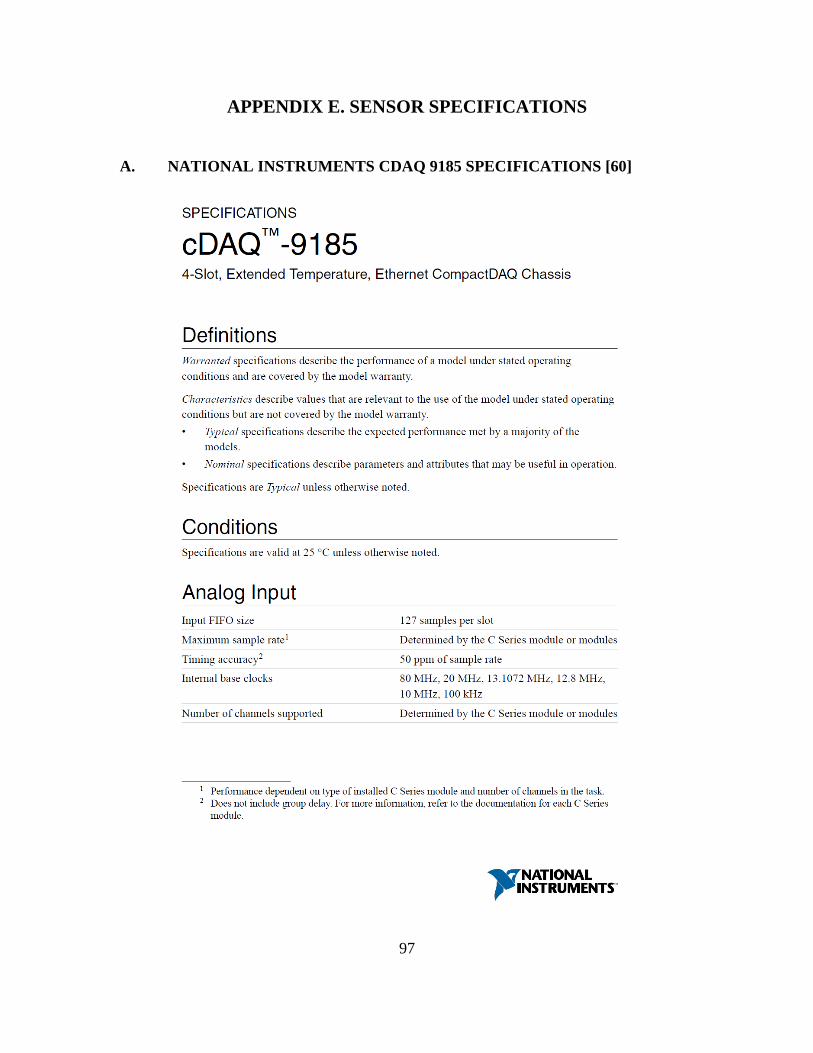
97
APPENDIX E. SENSOR SPECIFICATIONS
A. NATIONAL INSTRUMENTS CDAQ 9185 SPECIFICATIONS [60]

98
B. ALICAT M-SERIES MASS FLOW METER SPECIFICATIONS [61]

99
C. CR MAGNETICS DC CURRENT TRANSDUCER SPECIFICATIONS [62]

100
D. NOSHOK INC ANALOG PRESSURE GAUGE SPECIFICATIONS [63]
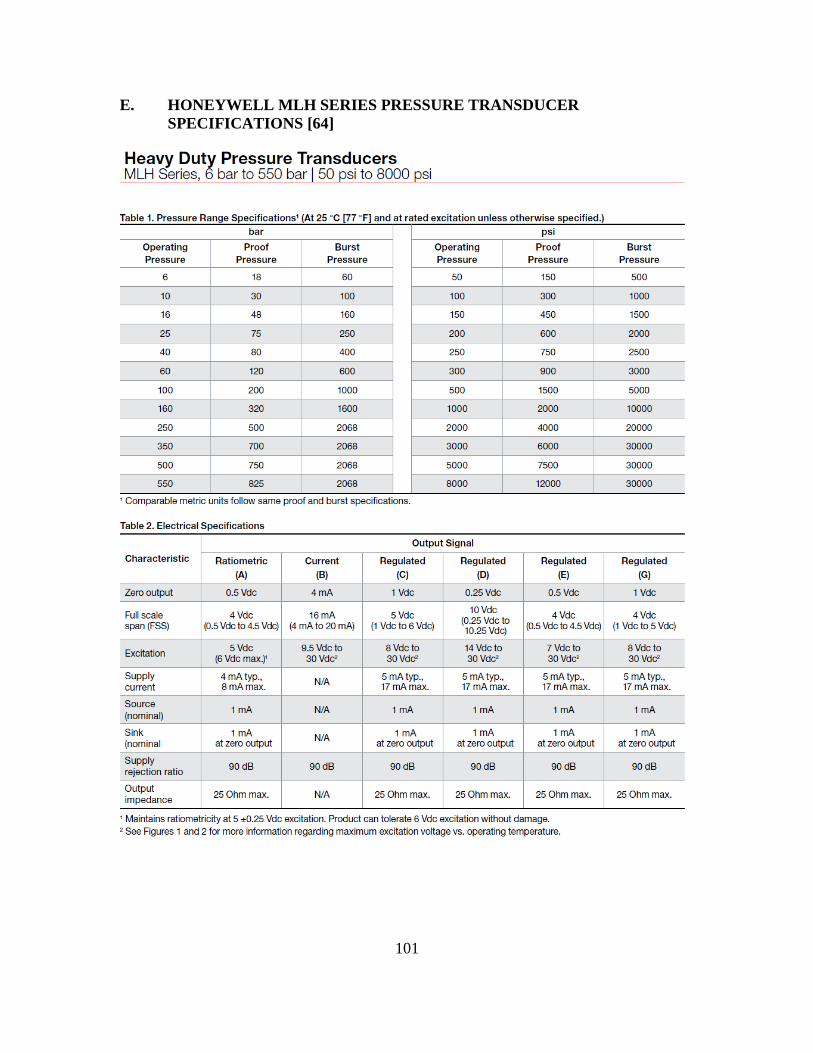
101
E. HONEYWELL MLH SERIES PRESSURE TRANSDUCER
SPECIFICATIONS [64]
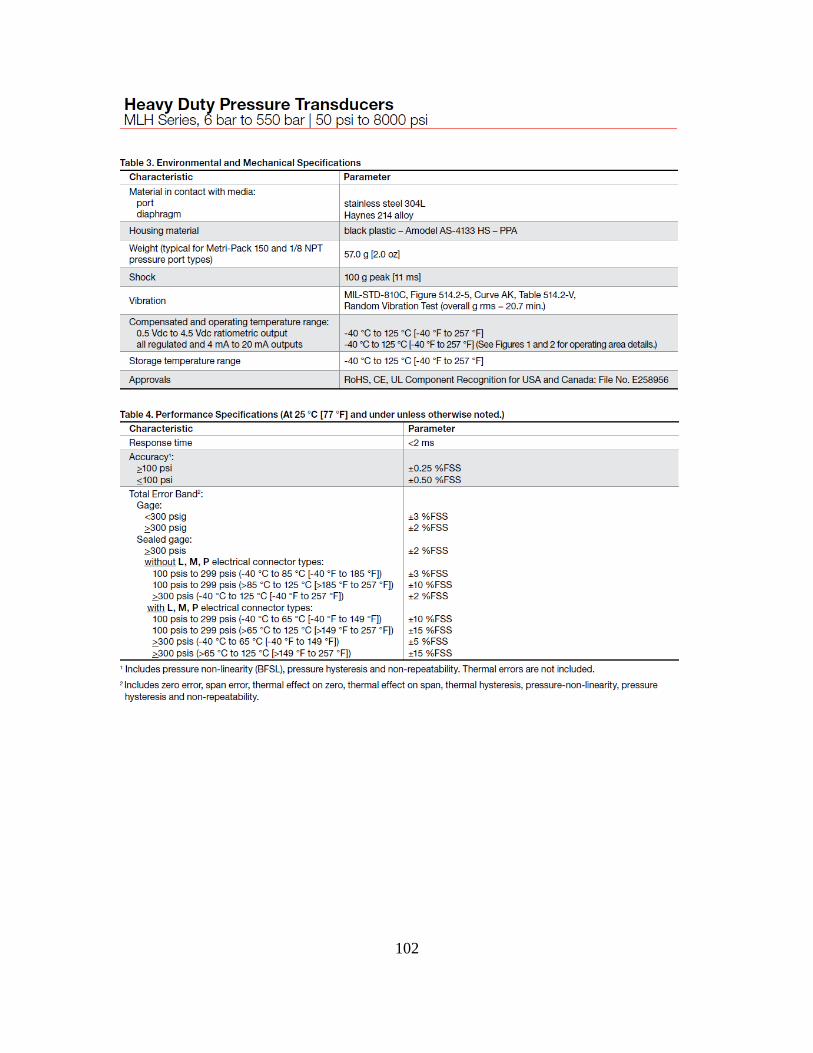
102
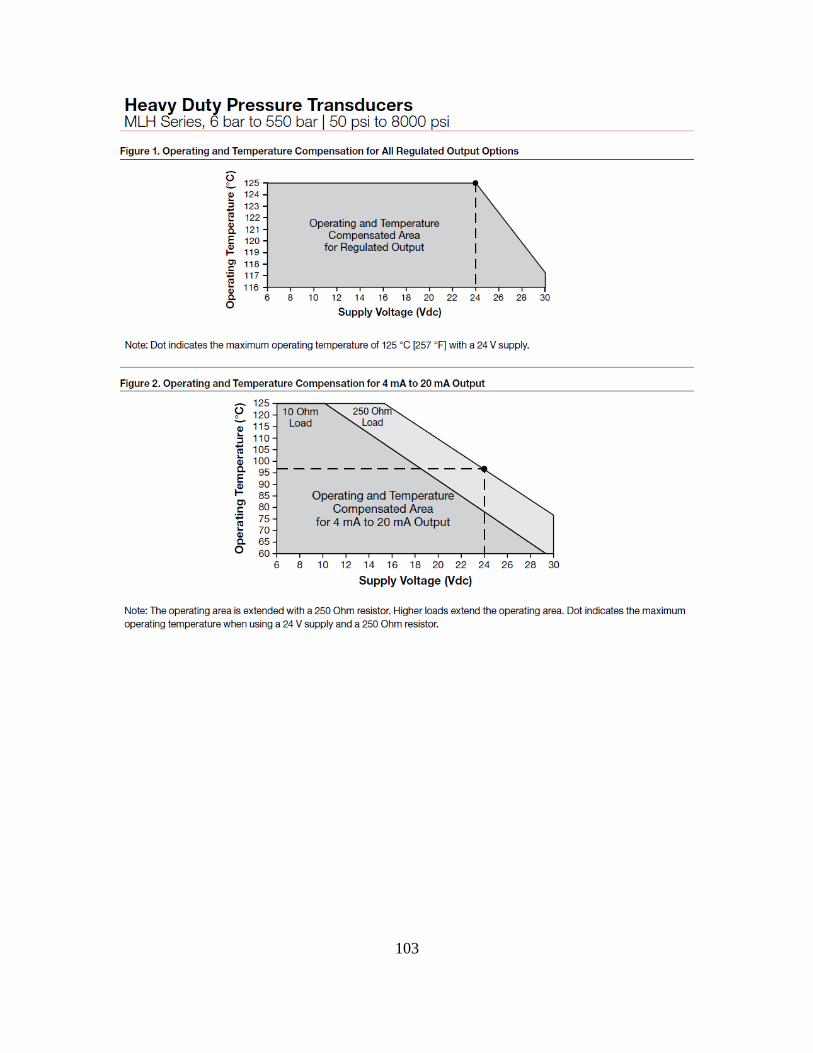
103
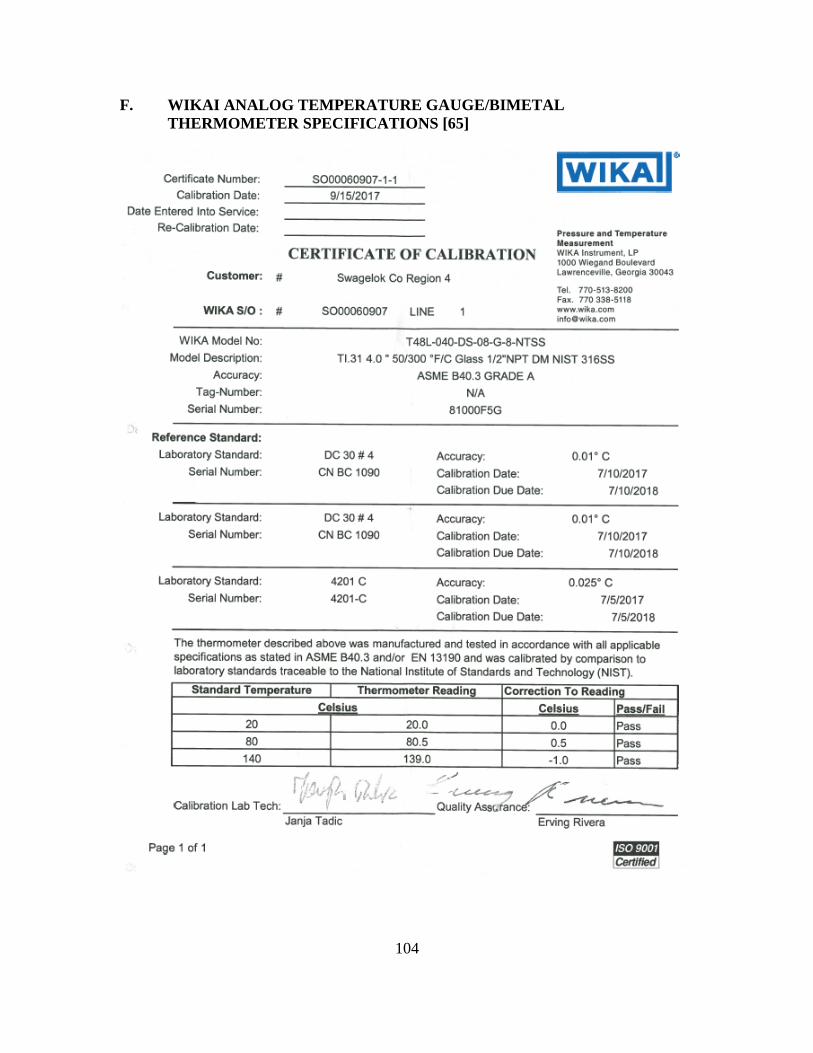
104
F. WIKAI ANALOG TEMPERATURE GAUGE/BIMETAL
THERMOMETER SPECIFICATIONS [65]

105
G. TYPE K THERMOCOUPLE PROBE SPECIFICATIONS [66]
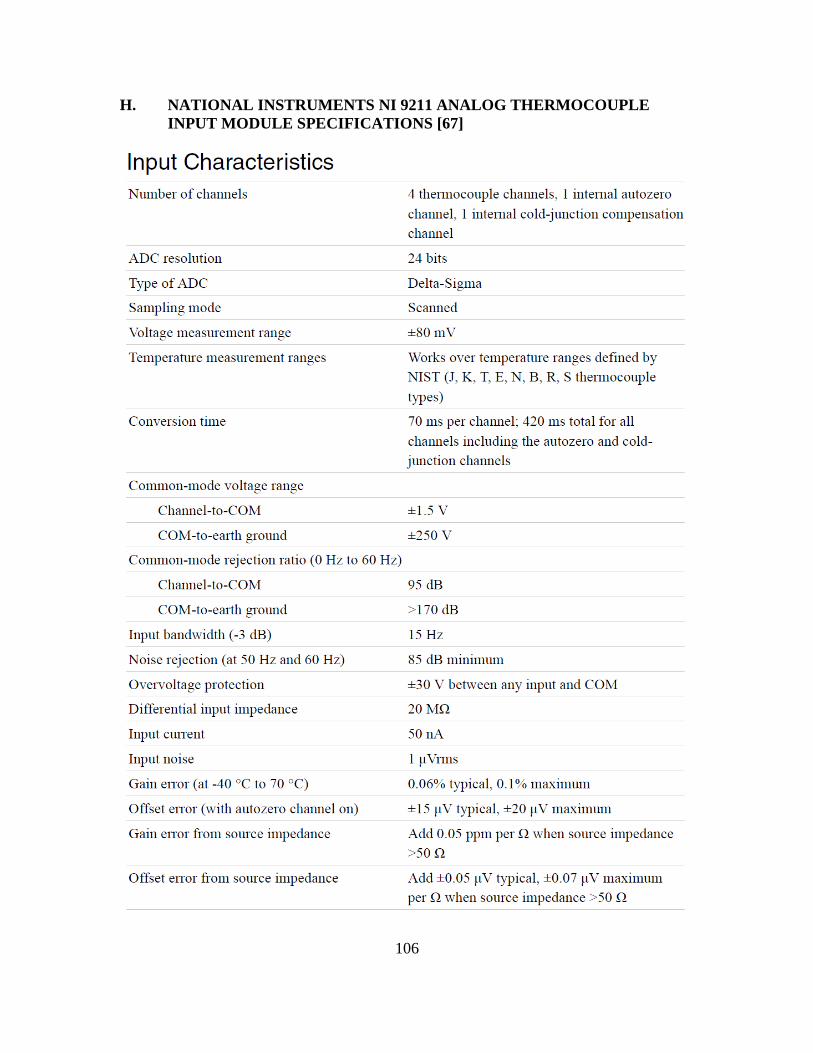
106
H. NATIONAL INSTRUMENTS NI 9211 ANALOG THERMOCOUPLE
INPUT MODULE SPECIFICATIONS [67]

107

108
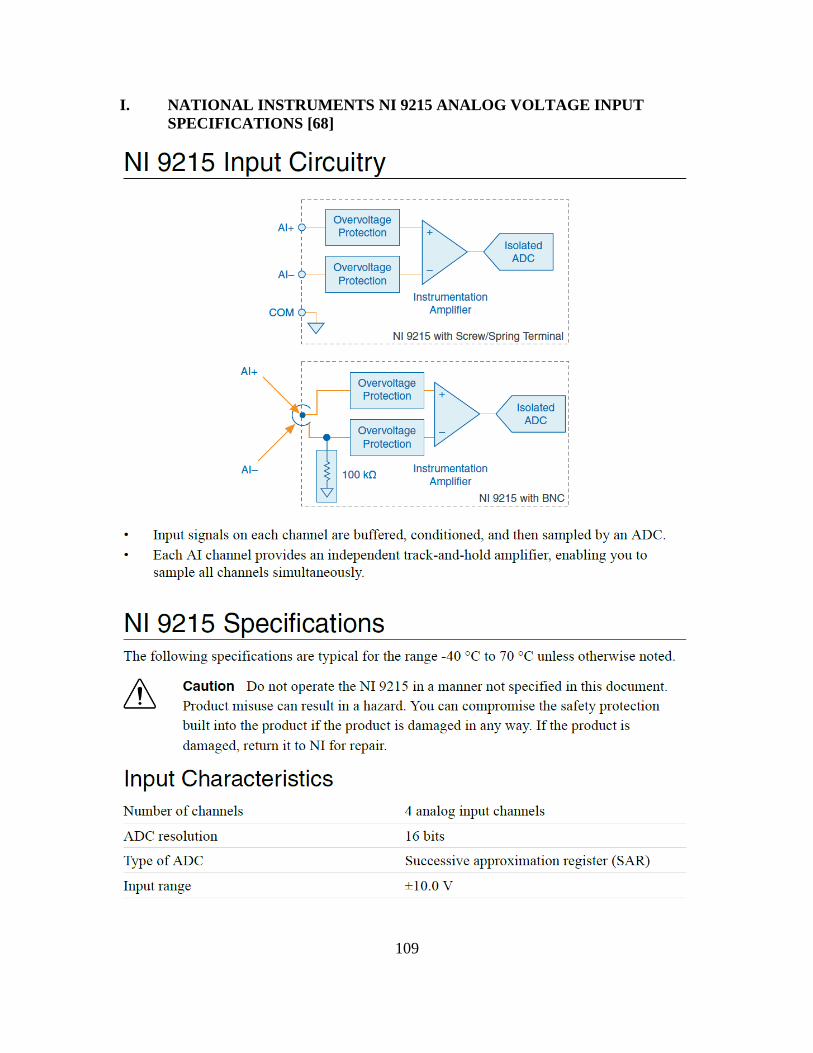
109
I. NATIONAL INSTRUMENTS NI 9215 ANALOG VOLTAGE INPUT
SPECIFICATIONS [68]
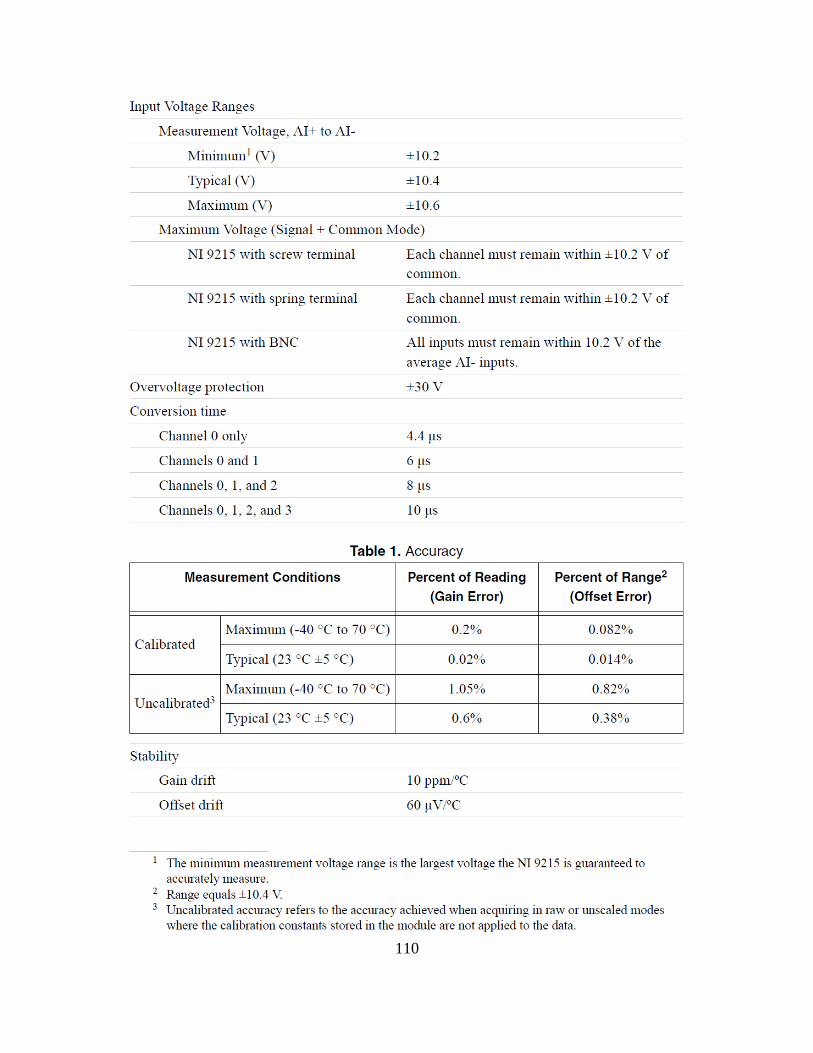
110

111

112
THIS PAGE INTENTIONALLY LEFT BLANK

113
LIST OF REFERENCES
[1] Aviles, A., 2016,”Renewable production of water, hydrogen, and power from
ambient moisture,” Masters Thesis, Department of Mechanical Engineering,
Naval Postgraduate School, accessed April 15, 2017, https://calhoun.nps.edu/
handle/10945/51584.
[2] U.S. Department of the Navy, 2012, “Department of the Navy Energy Program
for Security and Independence Roles and Responsibilities,” SECNAVINST
4101.3, Washington, DC, p.2.
[3] U.S. Department of Defense, 2014, “DOD Energy Policy,” DoDD 4180.01,
Washington, DC, p.1.
[4] Lipp, L., 2012, “Electrochemical Hydrogen Compressor.” Final Scientific/
Technical Report Under DOE Award Number DE-EE003727, FuelCell Energy,
Inc.
[5] Parks, G., Boyd, R., Cornish, J., and Remick, R., 2014, “Hydrogen Station
Compression, Storage, and Dispensing Technical Status and Costs,” Technical
Report NREL/BK-6A10-58564, p. 9, https://www.nrel.gov/docs/fy14osti/
58564.pdf.
[6] Borgnakke, S., 2013, Fundamentals of Thermodynamics Seventh Edition, John
Wiley and Sons, University of Michigan, Table 15.3.
[7] Dunlap, R., 2014, Sustainable Energy Cengage Learning Engineering, Stamford,
CT, 1 ed., Table 20.3.
[8] Alternative Fuels Data Center, 2014, Data Chart, accessed September 9, 2017,
https://www.afdc.energy.gov/fuels/fuel_comparison_chart.pdf.
[9] Parkash, S., 2010, Petroleum Fuels Manufacturing Handbook: Including
Specialty Products and Sustainable Manufacturing Techniques, McGraw-Hill,
Columbus, OH, p.1.
[10] Avallone, E., Baumeister III, T., and Sadegh, A., 2007, Marks’ Standard
Handbook for Mechanical Engineers, Eleventh Edition. McGraw-Hill, Columbus,
OH, Table 7.1.8.
[11] Avallone, E., Baumeister III, T., and Sadegh, A., 2007, Marks’ Standard
Handbook for Mechanical Engineers, Eleventh Edition. McGraw-Hill, Columbus,
OH, para 7.1.2.

114
[12] Avallone, E., Baumeister III, T., and Sadegh, A., 2007, Marks’ Standard
Handbook for Mechanical Engineers, Eleventh Edition. McGraw-Hill, Columbus,
OH, Table 7.1.7.
[13] U.S. Department of Energy, 2017, DOE Technical Targets for Fuel Cell Systems
and Stacks for Transportation Applications, Fuel Cell Technologies Office,
Accessed September 9, 2017. https://energy.gov/eere/fuelcells/doe-technical-
targets-fuel-cell-systems-and-stacks-transportation-applications.
[14] Reddy, T., 2011, Linden’s Handbook of Batteries, Fourth Edition, McGraw-Hill,
Columbus, OH, Table 1.2.
[15] Dunlap, R., 2014, Sustainable Energy Cengage Learning Engineering, Stamford,
CT, 1 ed., Table 19.1.
[16] Avallone, E., Baumeister III, T., and Sadegh, A., 2007, Marks’ Standard
Handbook for Mechanical Engineers, Eleventh Edition. McGraw-Hill, Columbus,
OH, Section 9.1.12.
[17] U.S. Department of Energy, Fuel Cell Technologies Office, Hydrogen Storage
website, Accessed 25 October 2017, https://energy.gov/eere/fuelcells/hydrogen-
storage.
[18] Dawson, V., and Bowles, M., 2004, Taming Liquid Hydrogen: The Centaur
Upper Stage Rocket 1958–2002, National Aeronautics and Space Administration,
Washington, DC, pp.v-vii.
[19] Stetson, N., 2017, Hydrogen Storage Program Overview, U.S. Department of
Energy, FY 2016 Annual Progress Report, Washington, DC, p.7.
[20] U.S. Naval Observatory, 2017, “Monterey, California Rise and Set for the Sun for
2017,” Astronomical Applications Department, Washington, DC, accessed April
20, 2017, http://aa.usno.navy.mil/cgi-bin/aa_rstablew.pl?ID=AA&year=2017&
task=0&state=CA&place=monterey.
[21] Yu, S., 2017, “Analysis of an Improved Solar-Powered Hydrogen Generation
System for Sustained Renewable Energy Production,” Masters Thesis,
Department of Mechanical Engineering, Naval Postgraduate School, Monterey,
CA.
[22] Capstone Turbine Corp., 2016, “DOE Funds Argonne National Lab to Test
Capstone Microturbines with Hydrogen and Synthetic Fuels,” Press Release,
Chatsworth, CA, accessed October 15, 2017, https://ir.capstoneturbine.com/press-
releases/detail/3506/doe-funds-argonne-national-lab-to-test-capstone.

115
[23] Capstone Turbine Corp., 2002, “Technical Specifications and Descriptions for a
Single Capstone Microturbine,” Product Specification, Chatsworth, CA, accessed
October 15, 2017, http://www.capstone.ru/imgcompany/capstone/pdf/
ProductSpecification.pdf.
[24] Darrow, K., Tidball, R., Wang, J., and Hampson, A., 2017, “Catalog of CHP
Technologies Section 5. Technology Characterization – Microturbines,” U.S.
Environmental Protection Agency Combined Heat and Power Partnership,
accessed October 19, 2017, https://www.epa.gov/sites/production/files/2015-07/
documents/catalog_of_chp_technologies_section_5._characterization_-
_microturbines.pdf.
[25] American Institute of Chemical Engineers, Center for Chemical Process Safety,
2009, Inherently Safer Chemical Processes: A Life Cycle Approach, John Wiley
and Sons, Inc., New York, p.9.
[26] Compressed Gas Association Inc., 2011, “CGA G-5-2011 Hydrogen,” Chantilly,
VA, p.1.
[27] Crowl, D., 2003, Understanding Explosions, Center for Chemical Process Safety,
New York, New York, pp.122-125.
[28] Compressed Gas Association Inc., 2012, “CGA G-5.4-2012 Standard for
Hydrogen Piping Systems at User Locations,” Chantilly, VA, p.7.
[29] Crowl, D., 2012, Minimize the Risks of Flammable Materials, American Institute
of Chemical Engineers, CEP, p.30.
[30] Early, M., Coache, C., Cloutier, M., Moniz, G., and Vigstol, D., 2016, National
Electrical Code Handbook, Fourteenth Edition, National Fire Protection
Association, Quincy, Massachusetts, p.587.
[31] National Fire Protection Association, 2016, NFPA 2 Hydrogen Technologies
Code 2016 Edition, Quincy, MA, pp. 2–45.
[32] Compressed Gas Association Inc., 2012, “CGA G-5.4-2012 Standard for
Hydrogen Piping Systems at User Locations,” Chantilly, VA, p.2.
[33] Nayyar, M., 2000, Piping Handbook, Seventh Edition. McGraw-Hill Professional,
Columbus, OH, Section B8.4.
[34] National Institute of Standards and Technology, “NIST Reference Fluid
Thermodynamic and Transport Properties Database (REFPROP),” Version 8.0,
accessed April 24, 2017. https://h2tools.org/hyarc/data/hydrogen-properties.

116
[35] Avallone, E., Baumeister III, T., and Sadegh, A., 2007, Marks’ Standard
Handbook for Mechanical Engineers, Eleventh Edition. McGraw-Hill, Columbus,
OH, Chapter 8.7 Pipe, Pipe Fittings, and Valves.
[36] Swagelok, 2017, “Tubing Data,” product specifications, pp.4-5, accessed October
10, 2017, https://www.swagelok.com/downloads/webcatalogs/en/MS-01-107.pdf.
[37] American Society of Mechanical Engineers, 2015, “ASME B31.12 Hydrogen
Piping and Pipelines,” New York, NY, IP-5.5.3 Tubing Joints, p.95.
[38] National Fire Protection Association, 2016, NFPA 2 Hydrogen Technologies
Code 2016 Edition, Quincy, MA, pp.2-27.
[39] National Fire Protection Association, 2016, NFPA 2 Hydrogen Technologies
Code 2016 Edition, Quincy, MA, pp.2-27. pp. 2–38-2-45.
[40] Pratt, J., Terlip, D., Ainscough, C., Kurtz, J., and Elgowainy, A., 2015, “H2First
Reference Station Design Task Project Deliverable 2–2,” National Renewable
Energy Laboratory Technical Report, NREL/TP-5400-64107, p.34.
[41] RIX Industries, 2016, “Hydrogen Compressors Sales Sheets,” accessed 20
November 2016, http://www.rixindustries.com/industrial-compressors/hydrogen-
compressors.
[42] PDC Machines,2016, “Diaphragm Compressor Brochure,” accessed 20 November
2016, http://www.pdcmachines.com/diaphragm-compressors/brochure.
[43] Hydro-PAC, Inc, 2016, “Compressor Brochure,” accessed 20 November 2016,
http://www.hydropac.com/literature.html.
[44] Tzimas, E., Filiou, C., Peteves, S.D., and Veyret, J.-B, 2003, Hydrogen Storage:
State-of-the-art and Future Perspective, European Commission, Directorate
General Joint Research Center, Institute for Energy, Petten, The Netherlands, p.
29.
[45] Parker Hannifin Corp, “High Pressure Filters,” Catalog, Filtration and Separation
Division Bulletin 1300–997/USA, Oxford, MI, p.24.
[46] National Renewable Energy Laboratory (NREL), 2016, “Hydrogen Compressor
Reliability Investigation and Improvement,” Cooperative Research and
Development (CRADA) Final Report CRD-13-514, p.1.
[47] U.S. Department of Defense, 2017, DOD Facilities Pricing Guide, Unified
Facilities Criteria (UFC) 3–701-01, Washington, DC, pp. 6–7, accessed
November 6, 2017, https://www.wbdg.org/ffc/dod/unified-facilities-criteria-ufc/
ufc-3-701-01.

117
[48] Naval Facilities Engineering Command, 2017, Internet Navy Facilities Asset Data
Store (iNFADS), Database, query date August 16, 2017.
[49] California Independent System Operator, 2017, “Historical Curtailment,” graphic,
accessed November 7, 2017, http://www.caiso.com/informed/Pages/
ManagingOversupply.aspx.
[50] Fuel Cells and Hydrogen Joint Undertaking, 2017, Projects Key Figures, website,
accessed November 6, 2017, http://www.fch.europa.eu/page/key-figures.
[51] Fuel Cells and Hydrogen Joint Undertaking, 2015, “ELYGRID,” Final Report,
accessed November 6, 2017, http://www.fch.europa.eu/sites/default/files/
project_publisheable_reports/278824_ELYGRID_Final_Report-
12_20150218_125803_CET.3-24.pdf.
[52] European Commission, 2016, “FCH-01-8-2016 - Development of innovative
hydrogen compressor technology for small scale decentralized applications for
hydrogen refuelling or storage,” program summary, accessed November 6, 2017,
http://cordis.europa.eu/programme/rcn/700839_en.html.
[53] Richardson, J., 2017, “The Future Navy,” White Paper, Washington, DC, p. 6,
accessed November 6, 2017, http://www.navy.mil/navydata/people/cno/
Richardson/Resource/TheFutureNavy.pdf.
[54] Intelligent Energy P.L.C., 2017, “UAV Fuel Cell Module,” brochure,
Loughborough, GB, accessed November 6, 2017, http://www.intelligent-
energy.com/uploads/product_docs/Final_UAV_brochure_web_version.pdf.
[55] North Atlantic Treaty Organization (NATO) Energy Security Center of
Excellence, June 29, 2017 briefing.
[56] Richards, L., 2017, “Energy, Utility, and Emergency Response Solutions Using
Unmanned Aerial Systems,” proposal made at ESTEP Program Review, Naval
Postgraduate School, July 27, 2017.
[57] Lovelace, B., 2015, “Unmanned Aerial Vehicle Bridge Inspection Demonstration
Project,” Research Project Final Report 2015–40, Minnesota Department of
Transportation, Office of Transportation System Management, accessed
November 6, 2017, http://www.dot.state.mn.us/research/TS/2015/201540.pdf.
[58] Platzer, M., and Sarigul-Klijn, N., 2015, Energy Ships and Plug-in Hybrid
Electric Vehicles: Are they the Key for a Rapid Transition to and Emission-Free
Economy?, ASME 2015 International Mechanical Engineering Congress and
Exposition Proceedings IMECE2015-50652, Houston, TX.
[59] Pelz, P., Holl, M., and Platzer, M., 2015, Analytical Method Towards and
Optimal Energetic and Economical Wind-Energy Converter, Energy, 95.

118
[60] National Instruments, 2017, “cDAQ™-9185,” Specifications, accessed December
4, 2017, http://www.ni.com/pdf/manuals/376606a.pdf.
[61] Alicat, 2017, “Technical Data for Alicat M-Series Mass Flow Meters,”
Specifications, accessed December 4, 2017, http://www.alicat.com/documents/
specifications/Alicat_Mass_Meter_Specs.pdf.
[62] CR Magnetics, 2017, “DC Current Transducer,” Specifications, accessed
December 4, 2017, http://www.crmagnetics.com/Assets/ProductPDFs/
CR5200%20Series.pdf.
[63] NOSHOK, 2017, “400/500 Series All Stainless Steel Pressure Gauges,”
Specifications, accessed December 4, 2017, http://www.noshok.com/400-500-
series-ss-specs.shtml.
[64] Honeywell, 2017, “Heavy Duty Pressure Transducers,” Specifications, accessed
December 4, 2017, https://sensing.honeywell.com/honeywell-sensing-heavy-duty-
pressure-transducers-mlh-series-datasheet-008118-8-en.pdf.
[65] Wikai, 2017, “Bimetal Thermometer,” Specifications, accessed December 4,
2017, http://www.wika.us/upload/DS_TMTI_31_en_us_16144.pdf.
[66] McMaster-Carr, 2017, “Threaded Thermocouple Probe for Liquids & Gases,”
Specifications, accessed December 4, 2017,
https://www.mcmaster.com/#1245n12/=1ag1nx0.
[67] National Instruments, 2017, “NI 9211 Analog Thermocouple Input,”
Specifications, accessed December 4, 2017, http://www.ni.com/pdf/manuals/
373466a_02.pdf.
[68] National Instruments, 2017, “NI 9215 Analog Voltage Input,” Specifications,
accessed December 4, 2017, http://www.ni.com/pdf/manuals/373779a_02.pdf.

119
INITIAL DISTRIBUTION LIST
1. Defense Technical Information Center
Ft. Belvoir, Virginia
2. Dudley Knox Library
Naval Postgraduate School
Monterey, California
Related Documents