NAVAL POSTGRADUATE SCHOOL Monterey, California THESIS LOGISTICS PLANNING AND LOGISTICS PLANNING FACTORS FOR HUMANITARIAN OPERATIONS by Donna M. Sullivan September 1995 Thesis Advisor: David A. Schrady Approved for public release; distribution is unlimited 19960208 100 wrac qoMm mse&QTKD i

Welcome message from author
This document is posted to help you gain knowledge. Please leave a comment to let me know what you think about it! Share it to your friends and learn new things together.
Transcript

NAVAL POSTGRADUATE SCHOOL Monterey, California
THESIS LOGISTICS PLANNING AND LOGISTICS PLANNING
FACTORS FOR HUMANITARIAN OPERATIONS
by
Donna M. Sullivan
September 1995
Thesis Advisor: David A. Schrady
Approved for public release; distribution is unlimited
19960208 100 wrac qoMm mse&QTKD i

REPORT DOCUMENTATION PAGE Form Approved OMB No. 0704-0188
Public reporting burden for this collection of information is estimated to average 1 hour per response, including the time for reviewing instruction, searching existing data sources, gathering and maintaining the data needed, and completing and reviewing the collection of information. Send comments regarding this burden estimate or any other aspect of this collection of information, including suggestions for reducing this burden, to Washington Headquarters Services, Directorate for Information Operations and Reports, 1215 Jefferson Davis Highway, Suite 1204, Arlington, VA 22202-4302, and to the Office of Management and Budget, Paperwork Reduction Project (0704-0188) Washington DC 20503.
1. AGENCY USE ONLY (Leave blank) 2. REPORT DATE
September 1995 3. REPORT TYPE AND DATES COVERED
Master's Thesis
4. TITLE AND SUBTITLE
LOGISTICS PLANNING AND LOGISTICS PLANNING FACTORS FOR HUMANITARIAN OPERATIONS 6. AUTHOR(S)
Sullivan, Donna M.
5. FUNDING NUMBERS
7. PERFORMING ORGANIZATION NAME(S) AND ADDRESS(ES) Naval Postgraduate School Monterey CA 93943-5000
8. PERFORMING ORGANIZATION REPORT NUMBER
9. SPONSORING/MONITORING AGENCY NAME(S) AND ADDRESS(ES) 10. SPONSORING/MONITORING AGENCY REPORT NUMBER
11. SUPPLEMENTARY NOTES
The views expressed in this thesis are those of the author and do not reflect the official policy or position of the Department of Defense or the U.S. Government. 12a. DISTRIBUTION/AVAILABILITY STATEMENT
Approved for public release; distribution is unlimited. 12b. DISTRIBUTION CODE
13. ABSTRACT (maximum. 200 words)
Due to the increasing demand on the military to conduct humanitarian operations, the need for logistics planning factors that are applicable to these operations has arisen. This thesis develops a model for humanitarian operations and employs the model to develop logistics planning factors for material consumption and a computer- assisted planning aid relating to the support of the victim population.
14. SUBJECT TERMS Logistics, Logistics Planning, Logistics Planning Factors, Planning Factors, Humanitarian Operations, Disaster Relief, Operations Other Than War
15. NUMBER OF PAGES
206 16. PRICE CODE
17. SECURITY CLASSIFICA- TION OF REPORT
Unclassified
18. SECURITY CLASSIFICA- TION OF THIS PAGE
Unclassified
19. SECURITY CLASSIFICA- TION OF ABSTRACT
Unclassified
20. LIMITATION OF ABSTRACT
UL
NSN 7540-01-280-5500 Standard Form 298 (Rev. 2-89) Prescribed by ANSI Std. 239-18 298-102

11
Approved for public release; distribution is unlimited
LOGISTICS PLANNING AND LOGISTICS PLANNING FACTORS FOR HUMANITARIAN OPERATIONS
Donna Marie Sullivan Lieutenant, United States Navy BS, Auburn University, 1990
Submitted in partial fulfillment of the requirements for the degree of
MASTER OF SCIENCE IN OPERATIONS RESEARCH
from the
NAVAL POSTGRADUATE SCHOOL September 1995
Author:
Approved by:
lö-^w^/tw Donna Marie Sullivan
<& David Sclirady,/Thesis Advisor
William Kroshl, Second Reader
Frank C. Petho, Chairman Department of Operations Research
111

IV
ABSTRACT
Due to the increasing demand on the military to conduct humanitarian operations,
the need for logistics planning factors that are applicable to these operations has arisen.
This thesis develops a model for humanitarian operations and employs the model to
develop logistics planning factors for material consumption and a computer-assisted
planning aid relating to the support of the victim population.
v

VI
THESIS DISCLAIMER
The reader is cautioned that computer programs developed in this research may
not have been exercised for all cases of interest. While every effort has been made, within
the time available, to ensure that the programs are free of computational and logic errors,
they cannot be considered validated. Any application of these programs without
additional verification is at the risk of the user.
VI1

Vlll

TABLE OF CONTENTS
I. INTRODUCTION 1 A. BACKGROUND 1 B. THESIS MOTIVATION 3 C. OBJECTIVES 5
1. Methodology 5 2. Logistics Planning Factors 6 3. Computer Assisted Planning Tool 7
II. MODEL STRUCTURE 9 A. HISTORICAL PERSPECTIVE 9
1. Operation Provide Comfort, 1991 9 2. Operation Sea Angel, 1991 11 3. Operation Provide Hope, 1991 12 4. Operation Provide Promise, 1992 13 5. Florida, Hurricane Andrew, 1992 14 6. Operation Restore Hope, 1992 15
B. CLASSIFICATION OF DISASTER 16 1. Natural Disasters '. 17 2. Man-made Disasters 18
C. PHASES OF RELIEF 20 1. Warning 21 2. Impact 21 3. Decision to Intervene 22 4. Relief 22 5. Sustainment 23 6. Restructure 23
D. FACTORS AFFECTING HUMANITARIAN AID 23 1. Location 24 2. Population Demographics 27 3. Physical Condition of the Recipients 28 4. Remaining Infrastructure 30 5. Duration of the Operation 31 6. Additional Considerations 32
E. CHAPTER SUMMARY 33
III. PLANNING FACTORS 37 A. BACKGROUND 37 B. CLASSES OF SUPPLY 39 C. DERIVATION 42
1. Assumptions 42
ix
2. Development ofthe Planning Factors 42 a. Class I- Subsistence 43 b. ClassII -Personal Supplies 59 c. Class III-POL 63 d. Class IV - Construction Materials 65 e. Class VI - Hygiene Items 69 f. Class VII - Support Equipment 72 g. Class VIII - Medical Supplies 77 h. Class X - Humanitarian Specific Items 80
D. CHAPTER SUMMARY 85
IV. APPLICATION AND VALIDATION 87 A. BACKGROUND 87 B. THE SCENARIO 87 C. ANALYSIS 89
1. Class I- Subsistence 89 2. ClassII -Personal Supplies 100 3. Class VI - Hygiene Items 103 4. Class VIII - Medical Supplies 103 5. Class X - Humanitarian Specific Items 105 6. Class IV - Construction Materials 108 7. Class VII - Support Equipment and Class III - POL Ill
D. CHAPTER SUMMARY 121
V. COMPUTER ASSISTED PLANNING AID 123 A. INTRODUCTION 123 B. OPERATION 124
1. Greeting Screen 125 2. Planning Screen 125 3. Input Review Screen 128 4. Planning Factors Screen 129
a. Class I Requirements Screen 130 b. Class II Requirements Screen 133 c. Class VI Requirements Screen 137 d. Class VIII Requirements Screen 138 e. Class X Requirements Screen 139 f. Class IV Requirements Screen 143 g. Class VII Requirements Screen 144 h. Class III Requirements Screen 147
5. Review All Screen 148 C. CHAPTER SUMMARY 149
VI. CONCLUDING REMARKS 151
x

A. SUMMARY 151 B. RECOMMENDATIONS FOR FUTURE STUDY 152
APPENDIX A. RECIPIENTS OF U.S. GOVERNMENT ASSISTANCE 1964-1992.155
APPENDIX B. STANDARD HEIGHT/WEIGHT TABLES 157
APPENDIX C. RECOMMENDED DAILY DIETARY ALLOWANCES 159
APPENDIX D. CALORIES PER POUND OF BODY WEIGHT 161
APPENDIXE. FAMILY FOOD PLAN 163
APPENDIX F. RESULTS OF LINEAR REGRESSION INCLUDING MTLK PRODUCTS 165
APPENDIX G. RESULTS OF LINEAR REGRESSION EXCLUDING MILK PRODUCTS 169
APPENDrXH. SUMMARY OF DERIVED PLANNING FACTORS 173
APPENDDC I. CONDENSED DATA FOR SUBSISTENCE CONSUMPTION AND THE ASSOCIATED SUMMARY STATISTICS 181
APPENDDC J. CONDENSED DATA FOR WATER CONSUMPTION AND THE ASSOCIATED SUMMARY STATISTICS 183
LIST OF REFERENCES 185
INITIAL DISTRIBUTION LIST 189
XI
Xll

ACKNOWLEDGMENTS
The author would like to acknowledge the assistance received from the soldiers,
sailors, and marines assigned in Guantanamo Bay, Cuba as well as the staff of
CINCLANTFLT's Logistics Readiness Center for their contributions to this thesis.
Without the knowledge of those currently supporting humanitarian operations, this thesis
would not be possible.
I would also like to thank my husband, Mark, and my Mother. As always my
mother, has believed in me, loved me, and encouraged me to reach for the stars. Without
her love and guidance, I would not be the person I am today and I certainly would not
have believed in my ability to compose such a document. My husband has spent the first
few months of our marriage beside a computer terminal cheering me on. He is my
greatest supporter and his never failing belief in me and my abilities has allowed me to
reach the stars.
Xlll
XIV
EXECUTIVE SUMMARY
In the past 30 years, the Services have assisted in over 300 humanitarian
operations in over 60 different countries and yet humanitarian assistance has historically
failed to be designed a primary or secondary mission of the Services. This has resulted in
a lack of cohesion among the operations. Each operation has been conducted
independently of the others. Although today's technology allows the lessons learned to be
studied, there is very little known regarding the consumption rates experienced when
assisting civilian populations. Many documents state that the current logistics planning
factors for military operations should be used to support the victim population.
Unfortunately, these planning factors do not adequately address the needs of the
populations being supported as illustrated by shortages and excessive stockpiling that are
continually experienced by the Services when conducting humanitarian operations. The
shortfalls have required costly airlifts to avoid disaster while the stockpiling has resulted in
tons of supplies being destroyed. In these days of dwindling funds, these logistical errors
consume thousands of dollars that could be better spent elsewhere. A sound logistics
planning model can reduce the amount of guess work incurred by the planners, produce a
reliable planning tool for all humanitarian operations, and thereby help to preserve funds.
This thesis develops a model from which logistics planning factors for materiel
consumption can evolve. The model is based on the origin of the disaster that resulted in
the Services' rendering assistance and the five major variables that have been incorporated
into the model. The scope of the model is limited to the direct support of the victim
population. The variables that have been included in the model are the location of the
operation, demographics of the population to be supported, the physical condition of the
population to be supported, the condition of the infrastructure, and the duration of the
operation. Each variable directly affects the materiel requirements necessary to support
these operations. Once all the variables have been defined the logistics planning factors
can be calculated using the formulas and baseline logistics planning factor that are derived
and described in this thesis.
xv

In order to develop credibility in the eyes of the planners, the development of the
logistics planning factors is described in detail. The planning factors developed in this
thesis only include the basic requirements necessary to support the recipient population. If
additional supplies not considered by this model are required, the detailed explanation of
the derivation will also help the planners alter the logistics planning factors to
accommodate the special needs that have arisen in the planning process. Finally, to further
facilitate the use of the planning factors developed in the thesis, a computer-assisted
planning tool was developed. The program allows the user to input the variables that
relate to the operation they are supporting and provides the user with the appropriate
planning factors. The program eliminates the need for the planner to learn the calculations
and provides the planner with limited contingency planning capabilities.
Finally, this thesis attempts to validate the planning factors that were derived.
Data was collected amidst Operation Sea Signal in Guantanamo Bay, Cuba. The actual
consumption rates were compared with the planning factors computed by the model.
Although the data was not sufficient to thoroughly validate the model's planning factors,
the results of the analysis present a startling correlation between the model's output and
the actual consumption rates experienced during Operation Sea Signal.
XVI
I. INTRODUCTION
A. BACKGROUND
Suppose a brother or a sister is without clothes and daily food. If one of you says to him, "Go, I wish you well; keep warm and well fed," but does nothing about his physical needs, what good is it? James 2:16.
Long before this country became a nation, humanity has sought to help those less
fortunate than themselves. Because of our society's desire to assist those in need, the
United States military has historically come to the aid of nations in peril. The break up of
the Soviet Union has hastened this philosophy as our country truly assumes the role of the
Superpower and expands the mission of our military beyond its normal capacity. Today,
our military is called upon to execute a variety of contingency operations that have
become known as Operations Other Than War (OOTW). These operations include peace-
keeping, noncombatant evacuations, rescues at sea, refugee assistance, and emergency
relief operations.
In many cases, the main mission of OOTW is humanitarian assistance. The
Doctrine for Joint Operations states that humanitarian assistance is a program designed to
relieve or reduce the results of natural or man-made disasters. Interestingly enough,
humanitarian assistance has historically failed to be designated a primary or secondary
mission of the Armed Services. [Ref. 1: p. 34] However, the Goldwater-Nichols
Department of Defense (DOD) Reorganization Act of 1986 gave humanitarian operations
a higher priority by designating them as "special operations activity." [Ref. 1: pp. 34-35]
Today, humanitarian assistance is designated as a collateral activity of Special Operations
Forces by "the virtue of their inherent capabilities." [Ref. 2: p. 11-12] Humanitarian
operations were designed to be supplemental to the efforts of the host nation, civil
authorities or other agencies; and, they were originally intended to be limited in scope and
duration. However, our Services are now tasked to sustain these operations for extended
periods of time and in many cases as the principal provider. For example, the aid provided
to the Kurds in Operation Provide Comfort is now well into its third year. Furthermore,
Operation Sea Signal which is supporting the Haitian and Cuban Refugees in Guantanamo
Bay, Cuba is certainly not supplemental in nature. In fact, the United States is the primary
source of support for this ongoing operation. As the scope, duration, and responsibilities
of these operations expand, the Services' original definition of humanitarian assistance is
obsolescent.
There is a great deal of political debate on the applicability of using forces, whose
primary goal is to protect our country from hostile nations, to feed the needy. As the
debate continues, each Commander in Chief/Unified Combatant Commander (CINC) has
been directly tasked to budget, defend, and protect humanitarian/civic action funds in their
Program Objective Memoranda. [Ref. 3: p. 3] This has left the CINCs in a precarious
position as they have found themselves financially responsible for actions for which they
have no specifically designated mission. , As a result, the doctrine for humanitarian
operations is developing slowly and the taskings have been conducted in an ad hoc
fashion. Unfortunately, lack of coherence and guidance does not stop the floods, famine,
or strife throughout the world or the tasking of the Services. Instead, lack of coherence
among the operations creates an obstacle for planners as they are forced to develop
strategic and logistics plans without the benefit of the planning and decision making tools
currently available for traditional missions. Humanitarian operations are, by their nature,
very complex and can be extremely taxing to a Commander and his staff. With the proper
tools, a Commander can be afforded the benefit of lessons learned from past operations
when developing his strategic plans and the logisticians will have a logical place to begin
the initial assessment of the mission's needs. However, planning tools, other than mission
specific operations manuals, designed to assist Commanders in planning for OOTW are
not readily available.
Logistics is a common denominator in all humanitarian operations. The basic
problem is relating the employment of operating military forces and the requirements for
supporting dependent populations to the utilization of logistics resources. The problem is
usually addressed with the development of logistics planning factors or consumption rates.
The planning factors are normally based on experience or usage data from previous
operations and they provide planners a satisfactory baseline for logistics planning.
Unfortunately, the ad hoc manner in which humanitarian operations have been conducted
has failed to accumulate the necessary data to create suitable planning factors for
humanitarian operations. Further, the manuals currently available for traditional military
employment such as the Army Field Manual 101-10-1/2, "Organization, Technical, and
Logistical Data Planning Factors," or the Navy 'Logistics Reference Data" are proving to
be inadequate for the conditions experienced during humanitarian operations. The
inadequacies are seen when repeated shortfalls and excesses can not be avoided from
operation to operation. The discrepancy between what is required and what is delivered
directly affects the CINC's budget and has created a general interest in the development of
suitable planning factors. Traditional derivation techniques analyze operational data while
making concessions for current policy. Unfortunately, operational data and policy are
limited so other ways to derive logistic planning factors need to be considered. A very
viable option is to analyze documented histories from both military and civilian relief
agencies to determine the broad aggregation of logistic requirements and which items will
be decisive or critical to the operational readiness of humanitarian operations.
B. THESIS MOTIVATION
The motivation for this thesis stems from the difficulties encountered by the staff
of the Commander in Chief, Atlantic Fleet (CINCLANTFLT) in supplying and sustaining
emigrant operations in Guantanamo Bay, Cuba. During the first six months of the
operation, the logistics personnel realized that the logistics planning factors currently in
use by the Services do not adequately address the special needs encountered when
supporting civilian populations. For instance, the needs of infants and children are not
considered in any of the military manuals on planning factors. Since the manuals were
designed to determine the needs of the Services during traditional operations during both
peacetime and wartime, it is understandable that infants are not included. However, with
the rapid transition to Operations Other Than War, a very large void is emerging that if
unaddressed can become quite an obstacle for our logistics planners to overcome. A lack
of sound decision making tools forces planners to guess what is required to complete the
missions successfully.
In the past the planners' guesses, although well thought out, have failed to
encompass the scope of the operations. Drastic shortages in critical items have required
costly airlifts to avoid disaster. Excess stockpiling of items deemed critical has resulted in
huge losses due to spoilage, waste, and a variety of other damage. Excess expenditures
are also incurred when cultural norms and,population demographics are not considered.
The miscalculations are costing the taxpayers millions. Further, these operations are not
yet folly funded by Congress or the Host Nations, so the Services are forced to reallocate
scarce training dollars to ensure the success of the contingency operations they are tasked
to execute. In spite of fiscal supplements exceeding three billion dollars in FY 95, these
operations are rapidly consuming training dollars which directly affects the overall
operational readiness of our forces. Strategically, operational readiness is of utmost
importance to our military leaders so there is a great deal of interest in reducing the
expenditures incurred by these contingencies. A sound logistics planning model can
reduce the amount of guess work incurred by planners and thereby help to preserve
training dollars.
A second motivation is the need for rapid response. Historically, OOTW require
immediate response, rarely allowing for the timely planning process to occur. For
instance, how often are planners privy to the onset of an earthquake? Earthquakes are a
type of natural disaster that can result in a large number of injured and displaced persons.

These people need food, shelter, and medical care. In many cases, individuals may be left
in life-threatening situations and even a single day spent planning could result in the loss of
life. The speed in which assistance is rendered can greatly influence the success of the
mission. Logistics planning factors and an organized means to access them can help
simplify the planning process thereby reducing the time necessary to successfully assess
the mission's needs. Furthermore, planning factors can standardize the material
requirements for these contingencies which will allow planners to predict the needs of
current and future operations.
C. OBJECTIVES
The object of this thesis is not to develop a "how to" manual for Humanitarian
Operations but to develop a methodology or model from which planning factors for
material consumption can evolve. The scppe is limited to direct support of the victim
population. Although not specifically addressed by this thesis, the importance of material
readiness for the forces should not be understated. However, it is believed the existing
logistics planning factors can adequately address the needs of the military personnel. With
this in mind, there are three main objectives of this thesis and they are summarized as
follows:
1. Methodology
The first objective is to develop and document a methodology for constructing and
organizing planning factors for humanitarian operations. In essence, the methodology
encompasses creating the structure for a model concerning humanitarian operations. First,
a means to classify the variety of contingencies that require humanitarian assistance is
developed. Each possible option is described briefly to provide the details of the various
scenarios to the logisticians. The categories that are omitted are discussed as well as the
rationale for their disqualification. The model is then partitioned with respect to the
variables that are regularly encountered when planning for humanitarian operations. The

specific variables discussed include geographical location, demographics of the recipients,
physical condition of the recipients, duration of the operation, and the remaining
infrastructure. The variables are defined to ensure the differences between the operations
are identified and to remove any ambiguity in the terminology. Finally, cultural norms will
be discussed to make the distinction between variables that affect the quantity of supplies
needed and variables that affect specific item ordering which will explain why the later will
remain independent of the model.
2. Logistics Planning Factors
The second objective is to develop Logistics Planning Factors for Humanitarian
Operations. The development includes two stages: a construction phase and a validation
phase. The construction phase discusses the actual derivation of the multipliers for the
different classes of supply. The methodology used is based on argumentative reasoning
rather than quantitative analysis so the multiplier may be specified as range of possibilities
rather than a single number. There are two reasons for this methodology. First, the
method is more simplistic which encourages a better understanding of the derivation and it
produces believability and credibility in the model. Second, there is a lack of accurate and
consistent raw data from humanitarian operations which makes using traditional data
analysis techniques to derive the figures extremely difficult. Furthermore, if data were
available, the resultant figures would be too mission specific to have any application in the
large number of operations that may need to be evaluated.
The construction phase points out all the basic assumptions behind the
development of the planning factors as well as the applicability of the various classes of
supply to humanitarian operations. In some cases, the traditional units of measure are
replaced to make the multiplier more responsive to the mission at hand. Unfortunately,
the uncertainty surrounding planning is difficult to include in the model so inconsistency
will still need to be compensated for by the logisticians. Every effort has been made to
point out the inconsistencies so that planners recognize the critical areas and can
compensate appropriately. Finally, since the multipliers are derived from historical studies

and lessons learned rather than raw data, a brief study of the applicability of the
methodology and the developed planning factors will be conducted to enhance the
confidence that logisticians will have in the numbers.
During the validation phase, the model's output is compared with actual data
compiled from the operations in Cuba. The data collection process is discussed. The
discussion includes the identification of the assumptions regarding the data and the
inconsistencies found in the data. The major discrepancies between the model's output
and the data are identified as well as the associated causes.
3. Computer Assisted Planning Tool
The final objective is to develop a computer assisted planning tool that
incorporates the methodology and planning factors derived in this thesis. The system will
serve two purposes. Foremost, the program will provide a user friendly interface between
the logistician and the planning factors. In many cases, the derivation of the planning
factors can be difficult for some individuals to comprehend. Furthermore, thumbing
through manual after manual to find the scenario that accurately depicts the mission at
hand can be extremely time consuming. This system will eliminate the need for the
planner to comprehend the derivation of the factors or to thumb through stacks of
manuals. The logistician will be able to "click" his way to an appropriate scenario and
quickly compute his material surge and resupply requirements. With the initial needs in
hand, the planner can quickly design a mobilization strategy.
Secondly, the program will be a planning tool for future operations The program
is not intended to identify the specific mission needs but rather to predict the materials
quantities that are required at the onset of a contingency. As a predictive model, it can
explore the range of contingencies and provide a basis for contingency and prepositioning
planning. Once a Task Force is assigned, the advance party can assess and augment the
program for mission specific details that will be beneficial to future Commanders handling
similar operations.

The development of model and the methodology is explained in Chapter II.
Chapter III explains logistics planning factors to the reader. In addition, Chapter III
contains the derivation of the planning factors while Chapter IV contains a limited
validation (or verification) of the planning factors developed in this thesis. The details of
the computer assisted planning aid are contained in Chapter IV. The final Chapter
contains concluding remarks as well as suggestions for further research on the subjects of
logistics planning factors and humanitarian operations.
II. MODEL STRUCTURE
A. HISTORICAL PERSPECTIVE
A quick review of some of the more recent humanitarian operations the military
has participated in will provide an opportunity to analyze any similarities and differences
surrounding these operations. The goal is to introduce the reader to the variety of
operations that are currently classified as humanitarian operations by the military while
identifying the lack of a unified plan for these operations. Unfortunately, many of the
specifics surrounding these operations, especially regarding population demographics, are
still classified so many of the numbers are estimates based on the studies of the recipient
populations. To develop a plan, a structure that can adequately encompass the spectrum
of operations is needed. By studying past operations, the consistencies can be used to
support the model's aggregated structure. The differences can then be incorporated into
the model as variables to provide the required flexibility and adaptability needed for a truly
robust model. With this in mind, six recent humanitarian operations are presented as
background for the development of the model's structure that will follow.
1. Operation Provide Comfort, 1991
To overpower the rising Kurdish independence movement that began in early
March 1991, Saddam Hussein began a series of brutal attacks against the Iraqi Kurdish
population. The Kurds, who were unable to withstand the Iraqi troops and feared Iraq's
formidable chemical arsenal, fled into the mountains of Northern Iraq and Southern
Turkey. By April 3, the Kurds were no longer an active resistance. The area the
estimated 750,000 Kurds and their families fled to was a rugged, mountainous area,
without any supporting infrastructure, that experiences bitterly cold temperatures due to
the elevation. The Kurds were homeless, weak, and lacked adequate food, clothing, and
water. The public outcry was overwhelming. On April 5, 1991, the United Nations
Security Council passed U.N. Resolution 688 condemning Iraq for its repression of the
Kurds and appealed to the member states to provide relief to the Kurdish refugees. [Ref.
4: p. 7]
Under intense international and domestic pressure which was spurred by the
media, President Bush tasked the DOD to provide humanitarian relief to the Kurdish
people. The Commander in Chief, U.S. European Command responded quickly as
deployments for Operation Provide Comfort started the next day and the first relief
supplies were air dropped within 24 hours. The initial mission of the combined task force
(CTF) was to feed the Kurds and reduce their suffering by providing short-term delivery
of supplies. However, the Iraqi government's reluctance to allow the relief effort to
continue as well as the absence of civilian relief organizations forced the mission to be
expanded. The expanded mission included the sustainment of the entire refugee
population until the civilian relief agencies could respond. The support was to include
food, water, medical care, the set up and organization of refugee camps, and to improve
sanitation. The CTF was forced to extend this mission further as the civilian relief
organizations and the United Nations High Commission for Refugees in particular took
much longer than expected to become involved. On July 17, the U.N. High Commissioner
for Refugees assumed responsibility for the humanitarian relief effort and the CTF was
redeployed. In the end, Provide Comfort was credited with delivering 17,000 tons of
relief supplies using the combined efforts of 12,300 U.S. and 10,900 coalition forces. [Ref.
5 pp.19-22]
Unfortunately, this would not end U.S. involvement. On July 17, the operation
entered a new phase, Operation Provide Comfort II. The mission of this operation is to
maintain the secure area in Northern Iraq and Southeastern Turkey so that non-
governmental organizations can continue to provide humanitarian assistance to the Kurds.
[Ref. 6: p. 22] To this day, the Kurds and the Iraqi have been unable to resolve their
political differences and United States European Command is still actively participating in
Operation Provide Comfort II.
10

2. Operation Sea Angel, 1991
On April 29, 1991, cyclone Marian hit the South east coast of Bangladesh. Winds
were more than 235 KPH and tidal surges were between 15 and 20 feet. The Bangladesh
government estimated that 139,000 people and over a million cattle died. [Ref. 7: p. 2]
Furthermore, the infrastructure was destroyed. More than a million homes were destroyed
or damaged, leaving the occupants without shelter. Chittagong, the major port, was
rendered non-operational, key bridges were washed out, sea walls collapsed, jetties
disappeared, dirt roads were flooded, and most of the transportation was destroyed. To
further complicate matters, the Bangladesh government was young and inexperienced.
Although the government had adequate relief supplies, it was unable to successfully
distribute the supplies due to the poorly developed and otherwise damaged infrastructure.
Even when the stores were brought to Chittagong, the Bangladesh Navy was unable to
distribute the items to the islands that were in great need of support because many of the
Navy's ships had been sunk by the storm and effectively blocked the port. [Ref. 7: p. 3-4]
On May 10, the U.S. Ambassador formally requested military assistance.
On May 10, 1991, the President directed the U.S. military to provide humanitarian
assistance to Bangladesh. The operation began on May 12 and became known as
Operation Sea Angel. After the initial disaster relief survey teams performed the disaster
assessment, LtGen. Stackpole developed a plan that dealt with the political instability as
well as the disaster. His plan consisted of three phases: Phase I entailed delivering food,
water, and medicine to reduce the loss of life; Phase II was to restore the situation so that
the Bangladesh government could take control of the relief efforts; and, Phase III was the
turn over to the Bangladesh government and the withdrawal of U. S. troops. [Ref. 8: p.
114] One of the elements that made this operation a success was minimizing the number
of forces on Bangladesh soil. This was accomplished by establishing sea based support.
The primary concerns of the forces were rapid administration of medical support and the
production and distribution of water. The major stumbling blocks of the relief effort were
the lack of infrastructure and the resulting effects on distribution.
11

The population of Bangladesh is approximately 120 million with a large growth
rate. The large population is believed to be the primary reason for the high death toll
incurred by the storm. The high growth rate also provided the logisticians with some
interesting problems as nearly half the population is under the age of fifteen. Furthermore,
the calorie consumption per day is less than 2000 with the main staple being rice. To
complicate matters more, only 44 percent of the population has access to safe water.
Finally, the potential for medical disaster was real, because the fresh water sources had
been contaminated and thousands of dead bodies lay unburied.
The operation spanned just over 4 weeks, delivered approximately 4,000 tons of
supply by air, 2,000 tons by Landing Craft Air Cushion (LCAC), over 266,000 gallons of
water were produced by Reverse Osmosis Water Purification Units (ROWPU), and 7,000
Bangladesh citizens were provided medical treatment. [Ref. 9]
3. Operation Provide Hope, 1991
As the Soviet Union collapsed and the Commonwealth of Independent States
(CIS) began to emerge, the former republics began having trouble establishing
independence from their former economic policies and Moscow. The dependence on the
government led to the possibility of much of the population starving during the winter of
1991-1992. As a result, the United States Air Force , under the Denton Space Available
Transportation Program, airlifted 230 short tons of food and medical supplies to St.
Petersburg, Moscow, Minsk, and Yerevan from 17 to 22 December 1991. [Ref. 10: p. 11]
It took an additional six weeks before the Joint Chiefs of Staff would issue the order to
execute Operation Provide Hope. The mission of this operation was not to feed the entire
CIS population but rather to get essential food and medical supplies to the hospitals,
orphanages, community shelters, retirement homes, schools, and other charitable agencies.
[Ref. 10: p. 11] U.S. troops were not involved in administering aid during this operation.
In fact, very little was known about the recipient population other than the they were
hungry and ailing. The Services were essentially responding to the requests of the CIS's,
charitable organizations. The country representative receiving the property was
12

responsible for its distribution. [Ref. 11: p. 2] The main goal of the operation was to
transport aid to distribution centers. To accomplish this task the operation was conducted
in two phases. The first phase involved airlifting the supplies into the theater and the
second phase involved the use of CIS ground transportation to deliver the supplies to one
of the 33 designated locations inside the CIS. The airlift portion of the operation was
conducted by the Air Force while a few Army personel directed ground movement. Very
few U.S. forces were on the ground in the CIS; yet, during the operation, lasting from 10
February until 1 August 1993, more than 7,012 short tons of food and medical supplies
were delivered. [Ref. 10: p. 12]
4. Operation Provide Promise, 1992
This operation was established to counter the effects of the Yugoslavia Civil War.
This war began when Yugoslavia started its transition from communism to democracy in
1991. During this period, several provinces, including Bosnia - Herzegovina, declared
their independence. Religious differences fueled a great deal of the strife as the three
major players, the Roman Catholic Croats, the Orthodox Christian Serbs, and the Muslim
Bosnians, fought for dominance. By April 1992, the U. S. and much of the European
community had recognized the independence of Bosnia. Unfortunately, a successful
cease-fire had not yet been accomplished and the Serbian militia continued their relentless
and brutal efforts to "cleanse" Bosnia - Herzegovina of Muslims. The women were raped,
and the men and boys were put into concentration camps. The fierce fighting had
destroyed the capital, Sarajevo, and was causing severe shortages of food, water, fuel, and
medical supplies. [Ref. 10: p. 16] More than two million people had fled the province
and about 140,000 were missing — presumed dead. The campaign of terrorism and
genocide had already taken its toll on Bosnian demographics. Some estimates reflect
reductions in the Muslim populations as high as ten percent with proportionally high shifts
in the population's make-up as the men were being killed by the hundreds. Those that had
managed to survive were scared, homeless, hungry, and in many cases injured. On May
14, 1992, the Joint Chiefs of Staff authorized the release of excess food and medical
13

supplies, including 80,000 pounds of Meals, Ready to Eat (MRE), to the United Nations
High Committees on Refugees. Almost two months later, on July 3, 1992, the order to
execute Operation Provide Promise was issued to United States European Command.
[Ref. 12: p. 82] The mission was to act as the U.S. agent for humanitarian support to the
U. N. and to plan airlift relief operations into Sarajevo. The operation was able to deliver
over 42,843 tons of food and medical supplies in spite of the extensive damage the
fighting had caused on the infrastructure. [Ref. 10: p. 17] For the duration of the
operation, the U.S. remained as an agent to the U.N. and did not attempt to assume
mission responsibility. However, in response to increasing refugee needs, the U.S. started
an airdrop mission late February 1993. Though 27 March 1994,16,916 tons of food, 159
tons of medical supplies, and 485 tons of weather protection material had been airdropped
into Bosnia. [Ref. 10: p. 18-19]
5. Florida, Hurricane Andrew, 1992
On August 24, 1992, Southern Florida was struck by Hurricane Andrew. The
storm killed at least 26 Floridians, damaged or destroyed 85,000 Dade County homes, and
shut down uncounted businesses. Further, the storm paralyzed the infrastructure,
especially the power distribution grid. Although physical injuries to the victims were
minimal, thousands of families were left homeless and hungry. A week later 625,000
people, the pumping station for the water supply, and the waste treatment plants were still
without electricity. [Ref. 13: pp. 8-9] Within three days of the storm, the Federal
Emergency Management Agency (FEMA) tasked the Department of Defense to provide
disaster assistance. Joint Task Force Andrew (JTFA) was established to set-up feeding
sites, supply food kitchens, store and distribute supplies, set-up temporary housing for the
homeless, conduct cargo transfer operations, and provide any other logistical support
required by the local population. [Ref. 14] This operation also consisted of three phases:
Phase I, the relief phase, provided immediate relief consisting of food, water, shelter,
medical, sanitation, and transportation; Phase II, the recovery phase, sustained phase I
while assisting the government to reestablish public services; and, Phase III, the
14

reconstitution phase, continues the re-establishment of services under the control of non-
DOD agencies while the JTFA redeployed. Luckily, the damage to the transportation
infrastructure was limited to downed power lines and traffic signals so the flow of relief
items into the affected communities was not hampered. [Ref. 13: p. 9] The operation
lasted just over three weeks and included over 23,000 military personnel. During the
operation over 1,000,000 meals ready to eat (MRE's) were served, over 2,800 tents and
54,000 cots were set up, and medical care was provided to over 48,000 people. [Ref. 14]
6. Operation Restore Hope, 1992
The problems in Somalia began in January 1991, when General Mohammed Siad
Barre, the country's current ruler, was forced to flee the country by the warring factions
that were attempting to overthrow the government. In the next two years, approximately
300,000 people would be killed by fighting, disease, or starvation. By the summer of
1992, more than 65% of Somalia's citizens were on the brink of starvation. [Ref. 15: p. 6]
The effects of malnutrition began to manifest quickly due to the fact that over 50 percent
of Somalia's population is under the age of 15. [Ref. 16: p. 76] The already staggering
infant morality rate increased and many diseases associated with the malnourished, like
dermatitis and chronic anemia, began to emerge. To make matters worse, the government
and the supporting infrastructure ceased to exist, eliminating the possibility of the children
receiving government sponsored medical care or aid.
There was a great deal of political debate regarding the employment of the U. S.
military to administer humanitarian assistance in regions with no government. While the
debate ensued in early 1992, the media focused on images of the starving Somalis.
UNISOM, the UN's attempt to lead a humanitarian mission with the U.S.'s involvement
(named Operation Provide Relief) was a complete failure. The relief efforts were poorly
planned, had no identifiable support system, and the Somalis were still starving. On
December 9, 1992, with the public support of America, 25,000 Marines went ashore in
Mogadishu and took control of the operation the U. S. named Restore Hope (the U. N.
name for this operation was UNITAF). The goal of this operation was to establish a
15
secure environment and start the aid by providing assistance to the humanitarian relief
organizations. The operation covered 40 percent of the country's land mass, created eight
separate and secure humanitarian sectors to distribute assistance, and delivered more than
37,305 tons of supplies. [Ref. 15: p. 14]
On May 5, 1993, the Security Council took control of the operation, now named
UNOSOM II. However, this was not the end of U.S. involvement. To ensure a smooth
transition from one operation to the next, Joint Task Force Somalia (JTFS) was created.
The mission of JTFS was to underwrite the operation as a Quick Reaction Force and to
provide the initial logistics support. As of March 31, 1994, 91,295 tons of supplies were
delivered into Somalia. [Ref. 10: p. 14] Although the operation was deemed a success
once the U. S. took control, the lack of infrastructure as well as the difficulty surrounding
the coordination of non-governmental relief organization was a continual source of
problems.
B. CLASSIFICATION OF DISASTER
The historical perspective indicates that humanitarian assistance is rendered for
many reasons. However, a more extensive literature review suggests that humanitarian
operations are executed to counter the effects of disasters. There are many types of
disasters each one is unique in its own right. Because of the unique distinctions in the
various disasters, their material requirements differ which makes logistics planning more
difficult. To simplify the planning process, it would be helpful to classify disasters with
common effects. Once the types of disasters are classified, the planner can more readily
assess the requirements that are constant and those that have a tendency to vary. The
highest level of classification can be attained by determining the underlying cause to the
disaster. Was the disaster caused by nature or was it caused by man? Unfortunately, not
every disaster will fall neatly into one category so planners must use their discretion when
categorizing an unusual disaster. As a general rule, the logistician tasked to determine the
16

material requirements for the relief operation should consider the main source of the
destruction, rather than the underlying cause. For example, a broken dam that floods a
neighboring valley is a man-made disaster yet the effects resemble a natural disaster. In
this case, the population will need immediate assistance recovering from the flood damage
while repairing the dam becomes a secondary priority. Therefore, it would be classified as
a natural disaster.
A more comprehensive discussion of the natural and man-made disasters as well as
the categories used to break down the types of man-made and natural disasters are
discussed below and they are summarized in Table 1.1.
1. Natural Disasters
A natural disaster is associated with the destruction incurred as a result of natural
phenomena. Natural disasters have been in existence since the birth of man and any
number of texts document the thousands of lives these disasters consume every year.
These disasters encompass a variety of specific types of calamity. Again these disasters
can be classified based on the origins of their destructive nature. There are four categories
of natural phenomena. The categories are meteorological disasters, topological disasters,
telluric and tectonic disasters, and biological disasters. [Ref. 17: pp. 1-2]
Meteorological disasters are the result of atmospheric disturbances; or, in layman's
terms, these disasters are a result of the weather. There are four categories of weather
induced disasters: storms, cold spells, heatwaves, and droughts. Storms include cyclones,
hailstorms, hurricanes, tornadoes, typhoons, and snowstorms. Each type of storm has the
potential to destroy everything in its path. Cold spells and heatwaves, on the other hand,
tend to concentrate their damage on a single commodity usually agriculture or livestock.
Although an unexpected freeze could quickly reduce a citrus crop and a heatwave could
destroy the poultry industry, no documented cases of humanitarian assistance being
rendered by the military as a result of these drastic temperature swings was found. The
final weather induced disaster is a drought. By definition, a drought is a long period with
little or no rain. Like cold and heat waves, droughts affect our agriculture and livestock.
17
However, in Third World or impoverished nations, a drought can be the prelude to many
other disasters like famine and disease; in which case, the destructive potential is unlimited
and the probability of military relief being rendered in these areas is very high.
The remaining categories of natural disaster are the result of natural phenomenon
other than the weather. Topological disasters occur as a result of the physical features of
a region. For instance, mountainous regions experience avalanches while valleys are prone
to flooding. The three most prevalent examples of topological disasters are avalanches,
landslides, and floods. Telluric and tectonic disasters deal with the earth's structural
deformation. They include earthquakes, tsunamis, volcanic eruptions. The finally
category of nature disaster is biological disasters. Examples of biological disasters
include: insect swarms and epidemics of communicable disease.
It is important to remember that the destructive nature of a natural disaster is
dependent on the disaster's proximity to population centers, the state of disaster
preparedness, and the duration of the disaster. If a blizzard occurred in the middle of the
tundra, it may not even be noticed. However, an earthquake in the middle of Los Angeles
does make the headlines. Further, today's superior technology allows some natural
disasters to be predicted. This is particularly true concerning meteorological disasters.
Unfortunately, knowledge of an impending disaster can not stop the destruction. Advance
knowledge does provide the planners and future victims alike the opportunity to execute
evacuation plans or prepare appropriately for the onset of the calamity.
2. Man-made Disasters
A man-made disaster is the result of mankind's self destructive tendencies. As the
name implies, these disasters are caused by people or their creations. There are three main
categories of man-made disaster. The categories are civil disturbances, warfare, and
accidents. [Ref. 17: p. 10] Civil disturbances can range from a demonstration to the fall
of a government. Civil disturbances also include unrest resulting from economic or social
instability, both perceived or actual. The results of civil disturbances can have severe
consequences as the country's citizens may flee to a more stable country. Warfare
18
disasters are the result of armed conflict. Recent history shows that most warfare
disasters requiring military assistance are the result of a country or people fighting for
independence. No matter what the cause of the hostilities, warfare disasters take their toll
on the local population. The suffering the people endure is remarkable and the media
plays a big role awakening the conscious of the American public. In many cases, the
military is brought in to ease the suffering of the citizens of the warring countries. In other
cases, the people do not wait for aid; instead, they actively seek assistance by migrating to
another area. There are three common types of warfare employed that can be used to
further categorize these disasters: conventional, non-conventional, and guerrilla. Any war
that uses traditional war fighting techniques, bombardment, blockade, and siege, can be
classified as conventional warfare. Nuclear, biological, and chemical (NBC) warfare is an
example of non-traditional warfare. The use of irregular military forces that employ
harassing tactics against their enemies, like terrorists, can be categorized as guerrilla
warfare.
The next category is accidents and it is divided into four parts: transportation
disasters, structural disasters, fire disasters, and technological disasters. Train crashes,
plane crashes, and sunken ships are all examples of transportation disasters. They all are
linked because they involve a mode of transportation. Structural disasters, on the other
hand, are caused by the failure or destruction of a made-made structure like a building,
bridge, or dam. Fire disasters are the result of the destructive nature of fire and smoke.
Technological disasters are the result of failures or mishaps with the technical innovations
of the day. A leak in a nuclear power plant, the dumping of hazardous chemicals, and oil
spills are all examples of technological disasters. Again, Table 1.1 summarizes all the
types of disasters, their origins, and provides examples for each category.
19

Type of Disaster Origins of the Disaster Examples
Natural Meteorological Storms Cold Spells Heatwaves Droughts
Topological Avalanches Landslides Floods
Telluric and Tectonic Earthquakes Tsunamis Volcanic Eruptions
Biological Insect Swarms Epidemics
Man-made Civil Disturbances Demonstrations Governmental Collapse
Warfare Conventional Non-conventional Guerrilla
Accidents Transportation Calamities Structural Damage Fire Disasters Technological Failures
After: Ref. 17: p. 10-11
Table 1.1. Summary of the Types of Disaster Included in the Model
C. PHASES OF RELIEF
Since the immediate need for relief supplies causes logistics to be the driving factor
in humanitarian operations, it is critical for the logistician to determine when the supplies
can be delivered. A working knowledge of a disaster's cycle will identify critical time lines
for supplies and allow planners to establish shipment dates for impending operations which
will reduce delays. Unfortunately, there is no definite sequence of events that will occur
20

as a disaster runs it course. However, most disasters do appear to cycle through a series
of phases. This model includes six distinct phases. Although the Services historically
render assistance only in the last three of the six stages, each phase and its logistical
concerns will be addressed to reduce ambiguity.
1. Warning
The time between notification of an impending disaster and the actual onset of a
disaster is identified as the warning phase. The type of disaster and the ability to predict
its occurrence affect the duration of this stage. For example, the chance of predicting a
transportation calamity or an earthquake is very small; therefore, the warning phase of
these disasters could go undetected. Conversely, the chance of predicting a hurricane or a
drought is very high; therefore, the warning phase will have an identifiable duration.
During the warning phase, logisticians are provided the opportunity to plan for possible
contingency operations and the potential victims are provided the opportunity to prepare
for the impending calamity. The additional planning time afforded when this stage is
present has the potential to reduce the need for crisis planning should the disaster require
military intervention later. This is because the logistician can begin an assessment of the
anticipated victim population and begin analyzing the material requirements and
transportation alternatives should aid be needed.
2. Impact
The impact stage is identified by the actual occurrence of the disaster. For
example, the time a hurricane is actually ravaging a coastline or the time refugees are
actually fleeing their homeland are both examples of the impact stage. Again, the duration
is dependent on the type of disaster occurring. The impact stage of an earthquake lasts
only a few minutes while the impact stage of a drought can last months. Unlike the other
stages of a disaster, every disaster that occurs will enter this stage. Unfortunately, there is
very little that can be done for the victims during this stage; however, planners can wisely
use this time to prepare for the possibility of assisting the victims in the near future.
21

3. Decision to Intervene
During this stage, the decision as to whether or not U.S. Forces should be used to
aid the victims is made. This phase usually occurs after a disaster has run its course;
however, when a disaster has a very long impact stage, like famine, this phase could
overlap the impact stage. The affected area's outside communications are limited during
this stage so the victims must help one another until communications can be established
and outside relief can be obtained. That is, the victims are essentially isolated from the
world around them because no outside assistance has been afforded to them. This phase is
highlighted by the heroic measures individuals summon to rescue others from life-
threatening situations. Like the impact stage, there is little that relief workers can do to
assist the victims until communications can be established and the decision to provide
relief is made. However, if there is a high likelihood that the Services will intervene, the
planners can continue the contingency planning they began in the earlier stages of the
disaster. In some cases, the decision to provide relief has already been made but can not
be executed until aid is requested by the recipients. For example, before Operation Sea
Angel, our country was fully aware of the devastating cyclone that had hit Bangladesh, but
until the Bangladesh government asked the U.S. government for assistance nothing could
be done.
4. Relief
This stage begins when organized assistance reaches the victims. The stage is
designed to help the victims get their lives back in order and is intended to be short in
duration. This is the first stage where military assistance can be rendered. The victims
basic needs are the primary concern as they are provided food, clothing, shelter, and
medical care as appropriate. The military's mission is established in the Chairman of the
Joint Chiefs of Staff executive order. [Ref. 18: p. 6-24] The logisticians must support the
mission requirements.. To support the mission, the logistician has to assess the needs of
the victims, their unique cultural requirements, and the infrastructure available to receive
and distribute aid. Without prior knowledge of the operating area or the victim
22
population, this job can be very taxing. To make the assessment process easier, the CINC
can send an advance party from his staff to survey the recipient population's composition,
the disaster's damage, and to determine any unique operational requirements. If time
constraints preclude an advance party, the logistician is forced to rely upon current
literature or diplomatic disaster surveys for background information.
5. Sustainment
The sustainment phase is an extended relief phase. The victims do not or can not
regain their "normal" existence; they depend on the aid exclusively. More often than not,
this stage is seen when administering aid to refugees or victims of prolonged famine.
Although this stage can be recognized in a variety of operations around the globe both
past and present, there is no documented evidence that this stage has ever been identified.
This phase is unique to this model. It is identified because distinct logistical problems
arise from the victims' dependence on aid. Low morale of the victims and providers,
quality of life of the victims, and funding are major obstacles of this phase. Logisticians
primary concerns are replenishment, replacement of worn items, quality of life items, and
personal demand items of those being supported.
6. Restructure
This is the stage where the victims begin rebuilding their lives. When the Services
are involved in this stage it is known as civic action. Civic action has existed as a distinct
mission of the Services since World War II, is carefully pre-planned and is usually carried
out by Army civil affairs units or Navy Seabees. [Ref. 19: p. 6] Although the logistical
concerns of this phase are immense, policy and guidance for civic action operations have
already been established so further details will not be included in this thesis.
D. FACTORS AFFECTING HUMANITARIAN AID
Since the onset of a disaster is essentially unpredictable, modeling the possibilities
and analyzing the needs of potential victims of various disasters will ensure rapid response
23
time and reduce the need to rely on crisis planning. Unfortunately, no two disasters are
exactly alike. They vary in many ways including magnitude, duration, and location.
Further, the populations that are affected by disasters also vary greatly as well as their self-
recovery ability. For example, a country that has a sound government and infrastructure is
less likely to require outside aid than a third world country whose government has
collapsed. In addition, the condition of the recipients will also vary the material
requirements. The existence of unpredictable variables that will require special handling
by the logistician is commonplace in executing humanitarian operations. The object of this
thesis is to develop a model that is capable of accommodating much of the variability
present in these operations to ensure adequate material response. In addition, the
variables selected can be categorized for general use during the planning phase of an
operation. The five factors are location, demographics of the population concerned,
condition of the recipients, remaining infrastructure, and duration of the operation.
1. Location
Researching the various locations of potential disasters gives a great deal of insight
into the logistical concerns that may arise. Geographical location and its associated
climate have the potential to greatly influence the material requirements of a relief
operation. For example, hotter climates require water due to the effects of evaporation
while the same climate requires less food and clothing than cold climates. Further, the
requirements for medical supply are affected by the types of diseases that are prevalent in
a particular region or climate.
After reviewing the 67 locations that have received U.S. Government Disaster
Assistance (from either man-made or natural disasters) five times or more in the last
twenty nine years, which are found in Appendix A, nearly 60% of the countries also fall
within two geographical patterns. One runs along the Mediterranean basin to the Middle
East, Afghanistan, Pakistan, India, Bangladesh down to Indonesia and then North through
the Far East, the other runs along the Andes through the Caribbean into the United States.
[Ref. 17: p. 5] Of the remaining 40% of the countries, over 28% are in Africa or in close
24

proximity to Africa, like Madagascar. Oddly enough, out of 67 countries that have
repeatedly called on the U.S. for assistance, only six are currently being reviewed by the
Services as probable areas for executing humanitarian, evacuation, or peacekeeping
operations in the future. [Ref. 20: p. 2-18] The areas currently being considered include
Haiti, Nigeria, Sudan, Somalia, Bosnia, and Bangladesh. A seventh region, Cambodia,
which has not required extensive assistance in the past is also being considered. Figure
2.1 is a visual display of the anticipated and past operational areas. The checks indicate
the areas currently being reviewed by the services while the asterisks indicate the areas
that have repeatedly relied on military intervention to recover from a disaster.
lit*7 ^P^PjiKsx
* ** *f - * */ u*5r* ** Air
* K, *
* * ^ - * Ü ^l!!L % sfc «w™ WS: m * ML *
5/j Country currently being reviewed * Country has repeated relied on military intervention
Figure 2.1. Countries Continually Requiring Military Intervention After: Ref. 20: p. 2-19
Haiti is a nation with a great deal of political instability. The country's government
is continually in danger of a complete breakdown and its people are some of the poorest in
this hemisphere. On at least three occasions in the last decade, this sad combination has
resulted in large numbers of Haitians fleeing their homeland seeking refuge in United
25
States. Further, Haiti is located in an area frequented by natural disasters. Given the
instability of the Haitian government, it is generally accepted that the nation would be
unable to recover from a disaster independent of foreign assistance.
Nigeria's scenario involves evacuation and aid operations as a result of a
breakdown in civil order. It is anticipated that this scenario will be very brief yet difficult
to execute due to lack of civil order. Similarly, the Sudan scenario involves evacuation
and aid. However, this scenario is modeled not because of the possibility of civil disorder
but because of the increasing amount of terrorism connected with the country and its
radical Islamic groups. Somalia, on the other hand, is considered because the internal civil
war between rival warlords has left the country in shambles. As history points out, the
aftermath of war leaves many people wanting or needing the essentials. Without a
functioning government to assist the citizens' recovery, it is accepted that Somalia would
require outside assistance to become a functioning nation again. Bosnia is also considered
because of the potential damage that can be caused by the various warring factions.
Somalia and Bosnia are both expected to be extended operations as it can take many years
for a nation to recover from any type of national war. Finally, Bangladesh is considered
because it is a nation that has been plagued with natural disasters and civil strife. Damage
from natural disasters in this area tends to be severe due to the low terrain, the population
density, shoddy housing, substandard or non-existent roads, and limited communications.
In the past thirty years, Bangladesh has received U.S. aid at least fourteen times and the
country continues to rely on outside assistance for disaster recovery.
Unfortunately, the literature points out that disasters do not discriminate and that
they strike all around the globe. Although several of the locations previously discussed
should be considered "hot spots," there are many other locations that should not be
eliminated. Again. Appendix A justifies this claim. To incorporate the logistical needs of
all various locations that may require humanitarian assistance, this model breaks down
location based on the temperature or climate of the area. There are five climates that will
be considered: desert, tropical, temperate, cold, and arctic. A desert climate is found in an
26
area where temperatures exceed 80 degrees and where little humidity is experienced.
Typically desert climates experience extremely high temperatures during the day and very
cool temperatures during the night. Many desert areas also have radical temperature
changes in the winter months that need to be considered when determining material
requirements. A tropical climate is found in a region where temperatures are in excess of
80 degrees Fahrenheit and high humidity levels are experienced (usually more than forty
percent). There is little temperature variation in a tropical region which greatly simplifies
the planning process. Temperate areas experience temperatures between 32 and 80
degrees Fahrenheit. In most cases, the temperature variations of a temperate area are in
response to seasonal changes. A cold climate is one that has temperatures ranging
between 0 and 32 degrees Fahrenheit. Cold climates are experienced when seasonal
changes occur in desert, temperate, and arctic climates. Finally, an arctic climate is one
that has temperatures below 0 degrees Fahrenheit. Although there are very few recorded
operations in arctic regions, the climate is considered to provide additional robustness to
the model.
2. Population Demographics
Population demographics refer to the statistical make-up of the recipients. That is,
how many men, women, and children of what ages require assistance. Military logistics
planning factors are based on a predominately male population between the ages of 18 and
35. It is obvious that these planning factors fail to encompass the needs of a population
comprised of both sexes between the ages of 0 and 99.
This variable is included to address the different needs of men, women, and
children. If the logistician were to order supplies for a mixed population based solely on
the needs of adult males, many shortfalls and excesses would be experienced. For
instance, men traditionally require substantially more calories than women or children.
When all the food items are purchased the operation will experience a great deal of waste
as most women and children can not possibly consume the calories required by a male.
Moreover, the actual make-up of an adult male's diet fails to address the higher quantities
27
of milk required by children which will result in shortfalls. To accommodate for the
variation in needs, this model is broken down into four basic categories: children below
three years of age, children between the ages of three and twelve, females above twelve
years of age, and males above twelve years of age. In addition, another category will be
included when considering medical requirements. The additional category is adults over
the age of 65. Once the planner determines what sexes and ages are involved in a disaster
he can then select the appropriate mixes. The model provides for mix combinations in five
percent increments. For example, a disaster could result in a victim population consisting
of 5% children below the age of three, 20% children between the ages of three and twelve,
35% females above the age of twelve, and 40% males above the age of twelve.
3. Physical Condition of the Recipients
The physical condition of the recipients comes into play when detennining
subsistence and medical requirements. A population that is ailing before a crisis will need
more medical care than a population without prior ailments. Furthermore, many Third
World nations are severely malnourished and require special diets to recover. To include
these unique variations in this model, two general categories of physical condition are
included. The first category is the physical condition of the recipients before the disaster.
This refers primary to the recipients nutritional status. This model will use three broad
classifications for nutritional status: nourished, undernourished, and malnourished.
Because of the variations in cultures around the globe, there is no definitive measure
established to determine the nutritional status of a population. Furthermore, there is a
great deal of overlapping between the categories which makes the classification of the
population difficult.
For this model, the categories will be oversimplified to establish unambiguous
separations. A nourished population is a population that has adequate amounts of food
and calories. Since adequate varies from culture to culture, the key identifying feature of
this category is that the population as a whole was not lacking food or nutrients.
Examples of nourished populations include the United States, Great Britain, and France.
28

Undernourished and malnourished populations, on the other hand, lack adequate amounts
of food and calories. Bangladesh is an example of a undernourished country while
Ethiopia is historically classified as a malnourished country.
To make the distinction between undernourished and malnourished, anatomical
changes will be considered. An undernourished population will lack a sufficient diet yet
the damage caused by insufficient nutrients has not yet manifested into any outward
anatomical changes. In layman's terms, the population is hungry. If a population remains
undernourished for long periods of time, it will slowly transition to the malnourished
category. Malnutrition is essentially bad nutrition. Unfortunately, this definition can be
misleading because an undernourished population also has bad nutrition. The technical
definition of malnutrition is a condition in which there is an impairment of health, growth
or physiologic functioning resulting from the failure of a person to obtain all the essential
nutrients in proper quantity or balance. [Ref. 21: p. 6-7] In other words, a malnourished
population has noticeable outward signs of poor nourishment. The children are normally
the first to display the outward effects of malnutrition with ailments like Protein-Calorie
Malnutrition. Some of the manifestations of malnutrition include growth inhibition, poor
wound healing capabilities, tissue breakdown, abnormal metabolic processes, and
ultimately death. [Ref. 21: p. 17] It is also important to note that most areas where
malnutrition is prevalent are very poor. In addition, these areas also experience a high
number of parasite type diseases and high infection rates which are a consideration when
determining medical requirements.
The second category of physical condition is determined by the extent of damage
the victims receive from the disaster. This refers to the type, severity, and number of
injuries obtained. The model will include the following breakdown: injured, homeless, and
those in need of assistance. The advance party can contact local medical facilities and
government agencies to estimate the numbers for each category. The classifications are
self-explanatory, but to ensure proper classification each category will be explored briefly.
The term injured refers to the number of people who require medical attention. Homeless
29
refers to the number of people that have been left without adequate shelter. Finally,
individuals in need of assistance are those people that require food and clothing. In most
cases, individuals that are classified as homeless also require food and clothing. The
model allows the planner to classify the number of people in the various categories by
estimating the percentage of the population that fall into each category much like the
system used to determine the population's demographics.
4. Remaining Infrastructure
The remaining infrastructure is particularly important when considering
construction materials, equipment, fuel, water requirements, and how material will be
distributed for an operation. Infrastructure refers to housing, hospitals, roads, utilities,
etc. Generally speaking, a community's infrastructure is all the property that binds a
group of people or families into a town or a city. A sound infrastructure can reduce the
planner's work. For example, the existence of adequate community structures to house
the homeless significantly reduces the material and manpower requirements of an
operation. Construction materials to build temporary housing and the personnel to build
the housing will not be required. Furthermore, operating hospitals reduce the need for
rapid shipment of medical supplies and a good highway and street system makes delivery
of time critical items much more efficient. Unfortunately, many of the countries that
continually lean on the United States for disaster assistance, like Bangladesh, have weak to
non-existent infrastructures. Weak infrastructures increase the demands on the planners
and operational staff.
To include this variable in the model, infrastructure is broken into three categories.
The categories are functional, damaged, or non-existent. If the remaining infrastructure
after a disaster is at least 80% functional, it is classified as functional. For instance, if the
public utilities are or can be made functional quickly, there is minimal damage to public
buildings that are capable of housing the homeless and protecting the injured, and the road
system does not handicap the relief effort, the infrastructure can be classified functional.
A functional infrastructure is most likely to be found in a developed country that has
30
experienced a disaster. The 1989 earthquake in San Francisco did a great deal of damage
to the community, yet there was still a functional infrastructure remaining to house the
homeless, conduct rescue operations, and care for the wounded. Unfortunately, this may
not always be the case. For example, if a nuclear bomb was dropped on San Francisco, it
is doubtful that infrastructure would be classified as functional after the blast. An
infrastructure is classified as damaged if significant repairs or supplements are required for
the area to become self-sufficient. A recent example of a weak infrastructure is the
infrastructure that was available to support Operation Sea Signal in Guantanamo Bay,
Cuba. Although Guantanamo is a fully functional naval base, it was not prepared for
supporting 30,000 additional personnel. The base lacked housing, water, and supporting
personnel. All three areas had to be supplemented before a functional infrastructure
emerged. Finally, an infrastructure is classified non-existent if very little to no identifiable
infrastructure exists or remains. In November 1970, Bangladesh (then East Pakistan) was
struck by a cyclone which was immediately followed by the worst tidal wave in recent
history. The result of this compounded disaster was complete destruction of the country's
infrastructure, the majority of the livestock, and water system. It took over two years for
the country's infrastructure to be rebuilt. Without the outside aid that was afforded to the
country, it is doubtful that the infrastructure could have been rebuilt.
5. Duration of the Operation
The duration of the operation is extremely important to logistics planners because
it allows planners the opportunity to determine whether a replenishment cycle needs to be
established or whether a one time issuance of aid will suffice. For this model an
operation's duration will be classified into one of following categories: brief, temporary,
extended, and indefinite. To be considered a brief operation, the mission can not exceed
one month. Brief operations normally do not require resupply. Examples of brief
operations include the disaster relief operations conducted in Mauritius following Cyclone
Cervaise in February 1975 and the four day journey of FFG-24 Jack Williams to deliver
medical supplies to Antigua in 1990. An operation is considered temporary if it lasts more
31

than a month but less than six months. These operations require replenishment cycles.
The assistance provided by LPD-10 Jurteau and LSD-43 FortMcHenry during the clean-
up effort of the Exxon Valdez's oil spill in 1989 and Operation Sea Angel, which provided
humanitarian assistance to people of Bangladesh after Cyclone Marian in 1991, are
examples of temporary operations. Operations that run between six months and a year are
classified as extended. Along with replenishment cycles, these operations may also require
planning to replace worn items. Operation Sea Signal which supports the Haitian and
Cuban refugees in Guantanamo Bay, Cuba is currently an extended duration operation.
Indefinite refers to operations where no termination of military assistance is anticipated for
more than a year. Examples of indefinite operations include Operation Provide Comfort
which is assisting the Kurdish refugees in Iraq and the sporadic rescues of thousands of
Vietnamese refugees in the South China Sea which began in May of 1979 and continued
through 1980. [Ref. 22]
Until recently, very few military humanitarian operations have exceeded six months
in duration. Actually, the overwhelming majority (more than 80%) of documented
operations are concluded in less than a month. The literature review of these
contingencies suggests that operations with longer durations are confined to operations
involving refugees and famine victims. Although these distinctions are notable, they do
not eliminate the need to provide additional flexibility in the model by including all the
above categories.
6. Additional Considerations
Although many variables will affect the specific items that should be purchased to
support humanitarian operations, very few additional variables affect the actual quantities
required. For example, a population's cultural and religious background will certainly
affect what is ordered but these variations will have little effect on the actual requirement.
Perhaps a population will not eat any pork. The people still require the specified
quantities of food, just no pork. It is easy to see how the variables that affect specific
ordering requirements can be confused with variables that affect material requirements.
32

For this model, the main concern is not the specific requirements so cultural norms and
other variables that do not directly affect quantities required will not be included.
Furthermore, since this model is intended to encompass the spectrum of humanitarian
operations it would be very difficult to assess and quantify the degree of cultural variation
experienced from country to country much less village to village. However, once the
required quantities are determined, the logistician must the research the cultural norms of
the recipient population to determine what items to order.
E. CHAPTER SUMMARY
Figures 2.2 and 2.3 have been created to summarize the chapter. The figures use
the model structure developed in this chapter and a flowchart type methodology to classify
a variety of modern humanitarian operations. Figure 2.2 addresses natural disaster while
Figure 2.3 addresses man-made disasters. In addition, when the data is available, the
figure will identify the appropriate variables for each of the humanitarian operations. The
figures are not intended to address every humanitarian operation ever conducted by the
military. However, they are designed to provide the reader with an understanding of how
the model can be applied to past and fixture operations.
33
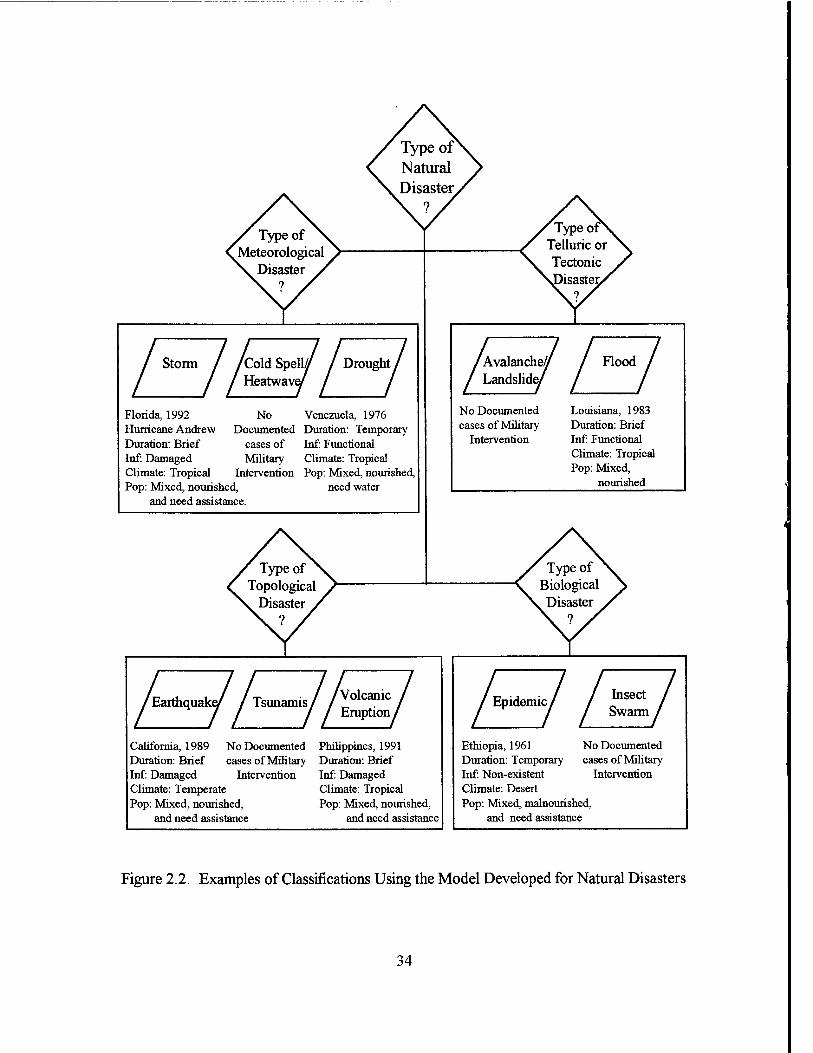
/ Storm / /Cold Spell/ /Drought/ / Heatwave/ / /
Florida, 1992 No Venezuela, 1976 Hurricane Andrew Documented Duration: Temporary Duration: Brief cases of Inf: Functional Inf: Damaged Military Climate: Tropical Climate: Tropical Intervention Pop: Mixed, nourished, Pop: Mixed, nourished, need water
and need assistance.
/Avalanche/ / Flood / / Landslide/
/ /
No Documented Louisiana, 1983 cases of Military Duration: Brief
Intervention Inf: Functional Climate: Tropical Pop: Mixed,
nourished
Earthquake/ Tsunamis Volcanic Eruption y
California, 1989 No Documented Duration: Brief cases of Military Inf: Damaged Intervention Climate: Temperate Pop: Mixed, nourished,
and need assistance
Philippines, 1991 Duration: Brief Inf: Damaged Climate: Tropical Pop: Mixed, nourished,
and need assistance
Ethiopia, 1961 Duration: Temporary Inf: Non-existent Climate: Desert Pop: Mixed, malnourished,
and need assistance
No Documented cases of Military
Intervention
Figure 2.2. Examples of Classifications Using the Model Developed for Natural Disasters
34

Guerrilla Non7 Conventional
Somalia, 1992 Duration: Extended Inf: Non-Existent Climate: Tropical Pop: Mixed, undernourished^
and need assistance.
No Documented cases of Military
Intervention
Japan, 1945 Duration: Indefinite Inf: Non-existent Climate: Varies Pop: Unknown
/Transportation/ /Structural /
/ / / Damage /
France, 1959 Prince William Sound 1989, Exxon Valdez Dam Burst Duration: Temporary Duration: Brief Inf: Functional Inf: Damaged Climate: Cold Climate: Temperate Pop: N/A
.... Pop: Unknown f r 7
/Technological/ / Fire / / Failure /
/ /
No Documented California, 1970 cases of Military Duration: Brief
Intervention Inf: Functional Climate: Temperate Pop: N/A
/Demonstrations/ / Government / / / / Collapse /
No Documented
cases of Military
Intervention
Common Wealth of Independent States, 1991 Duration: Extended Inf: Functional Climate: varies Pop: Mixed, undernourished, and in need of assistance
Figure 2.3. Examples of Classifications Using the Model Developed for Man-made
Disasters
35

36
m. PLANNING FACTORS
A. BACKGROUND
It is unfortunate, though often not realized, that people seldom estimate random events correctly; they always tend to remember the "exciting one" and forget the others, and as a result their opinions are nearly always unconsciously biased...Military personnel (and indeed most people without rigorous scientific training) tend to take opposite opinion of the relative validity of opinion versus facts.. .If science has learned one thing in the past three centuries, it is that such a point of view must be avoided if valid scientific results are to be achieved. [Ref. 23: p.5]
According to Joint Publication 1-02, a planning factor is a properly selected
multiplier used in planning to estimate the amount and type of effort involved in a
contemplated operation. For those whose knowledge of logistics is limited, this definition
uses terminology, like multiplier and effort, that may be ambiguous. A more descriptive
definition of a planning factor is given in Logistics in the National Defense, FMFRP 12-
14. The field manual's definition is a numerical representative of the qualitative
relationship between the composition and employment of military forces and the
availability, consumption, or utilization of materials, personnel, facilities, and services.
However, this definition fails to make the distinction that planning factors are estimates.
The definition used for this thesis combines the best elements of the previous two
definitions:
a numerical multiplier used in planning to estimate the qualitative
relationship between the population being supported and consumption or
utilization of materials, personnel, facilities, and services.
As such, they are based on experience or usage data. They are a predictive planning tool.
For the logistics planning factors to be good planning tools, the planners should know the
circumstances under which the fundamental usage data was collected and how the factors
were derived. Unfortunately, usage data and documentation for the spectrum of
37

humanitarian operations is very scarce, so alternative methods of developing .the planning
factors need to be considered. Since humanitarian operations are documented sufficiently
by international relief organizations (e.g., the United Nations, Red Cross, World Food
Program, etc.), one option is to review the operations conducted by the various
organizations to derive planning factors based on these operations and argumentative
reasoning.
The goal of logistic planning factors is two-fold. The factors must aid the
determination of quantity and mix of material to support budgeting and buying decisions
while, at the same time, they should aid in the determination of material and transportation
requirements for contingency support. [Ref. 24: p. 21] To successfully aid planners, a
planning factor should be flexible, scenario-driven, and realistic. Furthermore, since the
planners rotate regularly, planning factors should be simple to minimize turn-over time.
Good logistic planning factors can be beneficial to logisticians and Commanders.
First, planning factors allow a large number of situations to be readily evaluated. They
give a Commander a feel for the quantity of supplies he needs to support the various
missions that he is considering. In other words, the factors offer contingency planning
capabilities. Second, planning factors help the logisticians determine the broad aggregate
of supplies required while identifying mission critical items. For instance, a logistician may
be tasked to support 3000 people who require 2.2 pounds of food per person with kitchen
facilities that can only prepare 4500 pounds of food a day per day. Some quick arithmetic
points out that the kitchen facilities are unable to support the 6600 pound per day
requirement and provides the logistician an opportunity to evaluate the alternatives before
the problem becomes a crisis. In short, logistics planning factors speed up and simplify the
initial push planning process.
Unfortunately, planning factors are not without their faults. An alarming number
of reports indicate that many senior officers and logisticians do not trust the accuracy of
logistic planning factors. [Ref. 24: p. 4] The main reason for this distrust is lack of
documentation regarding the origins of the existing planning factors. The uncertainty
38

surrounding the factors causes planners to speculate whether the numbers are valid for
"their mission." As a result, planners have the tendency to alter the numbers to levels they
believe fit the situation at hand. When logistical errors like under- and overestimations are
experienced, regardless of the cause, the planner distrust is heightened. Finally, many
leaders believe that some things are not quantifiable and that a single number can not
possibly cover the myriad of operations that the military executes. However, logistics
planning factors continue to be formally used in all military planning.
B. CLASSES OF SUPPLY
Although not traditionally used by the Navy, the commodities discussed in this
thesis are classified according to the classes and subclasses of supply prevalent in the
Army and the Marine Corps. A summary of the traditional classes of supply and their
associated planning factors is found in Table 3.1. [Ref. 18: p. 6-51] Using the classes of
supply provides a standardized approach to classifying the materials required for these
operations that is insightful and adheres to the Federal Supply System (FSS).
Class Description Representative Planning Factor Pounds/per person/per day
Combat active replacement factor (CARF)
Gallons/per item/per day CARF/bill of material
Rounds/per weapon/per day Pounds/per person/per day
CARF Casualty rate/per day
Mean time between failure rate none established
Table 3.1. Traditional Classes of Supply and their Associated Planning Factors
I Subsistence n Individual Equipment
m Petroleum, Oils, and Lubricants (POL) IV Barrier and Construction Materials V Ammunition VI Personal Demand Items VII Major End Items VIII Medical Materials IX Repair Parts X Material for Nonmilitary Programs
39
A quick examination of the representative planning factors currently used
illustrates that they are not ideal for humanitarian operations. For humanitarian
operations, the primary concerns are food, shelter, medical care and clothing. With this in
mind, the Classes I, II, IV, and VIII will be main focus of the thesis. However, if these
were the only classes of supply that were considered, the model would lack the flexibility
to address the special needs of humanitarian operations with unique circumstances or
longer durations. For instance, while the Joint Task Force in Guantanamo Bay, Cuba was
establishing the emigrant camps, they came across a problem with the terrain. Because of
the lack of level surfaces, the JTF was forced to clear the land before they could begin
setting up the emigrants' camps. Clearing land requires large equipment that needs fuel
and repair parts. Therefore, there is a need for Class III, Class VII and Class IX supplies
to be considered. Even civilian operations like the bombing in Kansas City have seen the
need for large equipment to continue the rescue effort. For operations that extend beyond
a few days, the logisticians may want to consider Class VI items like shampoo, soap, and
toothbrushes. Furthermore, operations that are considered extended or indefinite may
consider purchasing quality of life items for the victims. These items can be school books,
art supplies, or just baseballs. Regardless of the item, they are all considered Class X
supplies for this model since they have no appropriate military classification.
As the previous discussion indicates, almost every class of supply is befitting to the
planning process for humanitarian operation. However, two classes of supply are omitted
from this study, Class V and Class DC. The primary reason for omitting Class V is lack of
documentation to formulate logical factors. Since most humanitarian operations, civilian
and military, involve rendering assistance to individuals that are in dire straits, guns and
ammunition are rarely an issue. In addition, much of the literature on these operations
recognizes that civilian organizations are not trained nor tasked to carry arms. The
exception is humanitarian operations that are conducted in conjunction with peace-keeping
operations. In the case of dual mission operations, like Somalia, the current planning
factors for ammunition were used. Fortunately, these planning factors appear to be
40

sufficient since even small scale combat is considered combat and the models currently
available to simulate combat can assess these needs. It should be stressed that although
Class V supplies are not considered by this model, their relevance should not be
understated. Whenever large numbers of people are "detained" for an extended period of
time there is a tendency for internal uprisings. The uprising by the Cuban emigrants in
Panama is a very good example of the problems that can occur when peoples' lives remain
in limbo for extended periods of time. At the very least, the logisticians should consider
shipping standard riot gear to any operations exceeding thirty days. Regarding Class IX
supplies, repair parts are normally demand supported with the assumption that all critical
items will be airlifted. Since the literature review appears to back this assumption, the
current planning factors will suffice.
Table 3.2 summarizes the classes of supply that are included in the model. It
should be noted that some of the classes' descriptive names have been changed to better
suit the needs of humanitarian operations. Also, the table contains a brief overview of the
items that are included in each class of supply.
Class Humanitarian Title Includes I Subsistence Food, water, and serving items II Personal Supplies Clothing, shoes, personal equipment
(tents, cots, sheets, and misc. furniture) and housekeeping equipment and supplies
HI POL All fuel (solid, liquid, and gas), lubricants, and chemical products
IV Construction Materials All fortification, barrier, and infrastructure (hospitals, kitchens, etc.) materials
VI Hygiene Items Soap, shampoo, toothpaste, etc. VII Support Equipment Waste Disposal Vehicles, trucks,
buses, forklifts, etc. VIII Medical Supplies Medical emergency supplies, vaccines,
blood, general clinic supplies, etc. X Humanitarian Specific Items Quality of life items
Table 3.2. Classes of Supply Included in the Model
41

C. DERIVATION
In this section, the assumptions made to develop the planning factors are described
as well as the derivation of each planning factor. For some classes of supply, a discussion
regarding the methodology employed is provided. A summary of all the derived logistics
planning factors can be found in Appendix H.
1. Assumptions
• The military is the sole provider of aid.
This assumption is made because whether an outside agency will decide to
participate or whether the host nation will be able (or willing) to participate can not be
readily determined. Furthermore, the degree of assistance provided by the Host Nation
and other agencies varies greatly from operation to operation. With this assumption, the
planning factors will have more flexibility. Since the factors are aggregated requirements,
it is much easier to reduce the quantity required by the amount that an outside agency
provides than it is to guess how much should be ordered to compensate when an agency
fails to participate.
• The operations are not intended to be permanent in nature.
Although several past humanitarian operations appear to have slighted this
assumption, it is generally accepted that the military's involvement in these operations
should be kept to a minimum. [Ref. 1: p. 34] Furthermore, case studies show that the
overwhelming majority of humanitarian operations that the military participates in are
short in duration. [Ref. 22] The military generally sets up initial communications and
maintains the operation through the relief stage. When the initial emergency is over, the
mission is turned over to the Host Nation or an international relief organization who will
maintain the operation for the duration.
2. Development of the Planning Factors
Classes I, II, III, IV, VI, and X are historically characterized by fixed planning
factors that are derived from a simple consumption methodology that is based primary on
42
policy. [Ref. 25: p. 11] All the planning factors derived for this model will make use of
this methodology. The advantage of this method is its simplicity. Although, the
methodology is easy to use and understand, it lacks supporting documentation like
historical and operational data. Therefore, the derivation of the planning factors should be
thoroughly understood by the planners so that the factors can be properly employed. In
addition, the planners need to understand how the variables are incorporated into the
derivation so that they do not compensate for variation already considered by the model.
In the following sections, the planning factors for each class of supply will be derived and
a discussion regarding the incorporation of the variables that affect the class of supply will
be conducted.
a. Class I - Subsistence
For this model, subsistence is broken into three parts and each part is
derived separately. The parts are food, water, and eating utensils. There are two reasons
for separating this class of supply into three parts. First, the units of measure differ. Food
and utensils are measured in pounds per person per day while water is measured in gallons
per person per day. Second, the planner may not be required to supply food, water, and
utensils. The breakdown allows the planner to assess the needs based on the mission
requirements rather than providing the planners a single figure that exceeds the actual
requirements.
The first step in determining a planning factor for food is to establish the
nutritional requirements for a population. The most conspicuous requirement is that of
energy for the body to work. The human body gets its energy from food and the
traditional unit of measure for the energy value of food is a Calorie. Therefore, the
following analysis will be conducted to determine the daily caloric requirements of an
individual rather than the number of pounds required by an individual. The problem of
converting calories to pounds will be taken up later.
Scientists use the basal metabolic rate (BMR) as the starting point to
determine how many calories an individual's body needs to maintain vital functions when
43

nothing is being done. BMR designates the energy metabolized by the body when in
complete rest. Due to the number of items that affect a person's BMR like sex, age,
weight, body composition, and activity level, it is difficult to develop a standard that is
able to accommodate the needs and habits of everyone. However, researchers have
developed dietary standards for various activity levels, ages, sexes, and weights using the
BMR as a baseline. [Ref. 26: pp. 187-196] The results have been presented in many ways.
The most recognized way to present dietary requirements is the Recommended Dietary
Allowances (RDA) table which presents the prescribed level of nutrition that will maintain
good health for a large percentage of a population. The RDAs are not "requirements;"
however, they are based on the idea that an individual consuming a diet that provides the
recommended amounts of all nutrients would be unlikely to suffer nutritional inadequacy.
To accomplish this, the scientists assume a normal distribution of individual requirements
and set the standards two standard deviations above the average requirement. [Ref. 21: p.
68-73] Unfortunately, the RDA's do not make the direct calculation of the caloric
requirements for an undernourished or malnourished population very easy. However, a
second more flexible way to determine caloric requirements is available which identifies
the calories required per pound of body weight.
To determine which method is appropriate for the situation at hand, an
assessment of the population's nutritional status is helpful. There are many ways to assess
the nutritional status of a population but, with the time constraints imposed on these
operations, a quick height/weight comparison is by far the easiest and most common
method. Furthermore, the only equipment that is required to make the assessment is an
accurate hospital scale. The notion is that the advance party would take height/weight
samples from the recipient population and compare the sample values to the standard
height/weight tables found in Appendix B. The comparison would involve calculating a
44

percentage of the table's standard values, P, by dividing the observed weight of the
person, W0, by the standard weight from the chart, Ws, associated with the sampled
person's height. The resulting formula is
P = W0/WS. (3.1)
The interpretation of the calculated percentage is describe in Table 3.3. [Ref. 21: pp. 84-
85]
Percentage Interpretation <80% Malnourished
80-90% Undernourished 90-110% Nourished 110-120% Overnourished
>120% Obese
Table 3.3. Interpretation of Calculated Height/Weight Percentages
If the calculated percentage' is 90% or greater, the RDA tables found in
Appendix C can be used to determine caloric requirements. This is acceptable because, if
an individual falls into the overnourished or obese category, there is strong evidence
indicating that the individuals current intake is well above what their bodies require to
function properly. A reduction in these individuals' caloric intake should not adversely
affect their health but, it may reduce their body mass. Again, this is not a steadfast rule
because body-builders tend to fall into the overnourished category and yet they require
higher caloric intakes than those established by the RDA. However, body-builders do not
account for large percentage of the population so the rule will apply in most cases.
There are two ways to estimate the caloric requirements of an
undernourished population. First, part of the RDA equivalent to the percentage
previously calculated, can be used. In other words, the percentage already calculated, P,
will be multiplied by the caloric requirement given in the RDA. The result will be a
reduced caloric requirement that can be increased slowly as the populations nutritional
45
Status improves. The second method involves determining the average weight of each
demographic group found in the population and then using the required calories per pound
of body weight chart located in Appendix D. To use the chart, the demographic group in
question is located in the chart and the multiplier for that group is extracted and multiplied
by the estimated average weight for the group that has already been calculated. The
multipliers from Appendix D can also be used if the RDA charts are unavailable or if the
recipient population's heights exceed or fail to meet the minimums listed in the standard
height/weight charts.
If the recipient population is assessed as malnourished, medical personnel
need to be consulted before establishing caloric requirements. As stated earlier in the text,
these individuals may require special or medically supervised diets. However, in cases of
minor malnutrition, the medical expects may advise a low calorie, bland diet. The calories
for the low calorie diet can be determined using the same method described previously for
undernourished populations. Regardless of the initial diet given to an undernourished or
malnourished population, the recipient population requires constant monitoring because as
time passes their caloric requirements and in many cases their entire diet can be expected
to change. The logisticians need to keep a close eye on the nutritional requirements to
avoid supply shortages that may occur as a population's caloric intake changes.
When assessing the nutritional status of adolescents there is more variation
in what is considered normal due to the varying growth rates. In many cases, an
adolescent will "outgrow" the chart designed for his age group and the logistician is
forced to assess the child as a adult. As a general rule, when assessing the nutritional
status of children, Table 3.4 should be used. All other calculations remain the same. The
difference between Table 3.3 and Table 3.4 is the category considered normal, or
nourished, is larger to accommodate a child's growth spurts. It is interesting to note that
the minimums are not altered. This is because there is a minimum weight established for
each height regardless of age.
46

Percentage Interpretation <80% Malnourished
80-90% Undernourished 90-120% Nourished 120-130% Overnourished
>130% Obese
Table 3.4. Interpretation of Calculated Height /Weight Percentages for Adolescents
Unfortunately, there will be cases when even a simple height/weight
comparison is too time consuming. If this should be the case, the logistician can use
reference manuals or information obtained from the Host Nation to estimate the nutritional
status of the recipient population. One reference text that provides a great deal of
information to the planner with minimal effort is a computerized version of the World
Atlas. [Ref. 27] The software not only gives the planner information on the geography
of the region but also gives many statistics on the region's population including the caloric
consumption. Although the figures in reference manuals are population averages, they can
be used as a baseline until further validation is available. Once the operation begins, the
logisticians, with the assistance of the medical staff, can quickly make an assessment of the
nutritional status of the population and compensate appropriately. The assessment can be
accomplished using the height/weight comparison already discussed or any other medically
approved technique (e. g. skin fold caliper test, blood testing, etc.).
Now that the caloric requirements for the population have been
determined, the problem of converting calories into a usable logistics planning factor
remains. Starting with the RDA table that they have developed, scientists have been able
to develop a food plan that effectively transforms the chemical factors surrounding
nutrition into articles of food that one actually chooses and consumes. [Ref. 26: p.516-
517] The food plan divides the calories into broad categories of everyday foods with the
same goal as before, dietary adequacy. The divisions are much like servings; however,
47

they are expressed in the scientific equivalent, pounds. The result, which is reproduced in
Appendix E, is a table that converts calories into pounds.
The final problem is to determine the relationship between calories and
pounds. First, regardless of the caloric requirements of an individual, the nutritional goals
remain the same. That is, whether an individual intakes 1500 calories or 3000 calories, the
calories consumed should still comprise a maximum of 30% fat, 12% protein, and 58%
carbohydrates. [Ref. 28: p. 10] Therefore, as caloric requirements increase the quantity of
food required increases proportionately but the specific food items are still distributed as
they were at the lower caloric requirement. With this in mind, a linear relationship
between calories and pounds of food per person was explored.
Using the calories and pounds found in the Family Food Plan (Appendix
E), a linear regression model was established with pound per person per day, PP, as a
function of calories per day, C. Thus,
PP = a + bC + e (3.2)
where a and b, are unknown parameters in the model and where e is the error term. The
error terms, e, are assumed to be Normal (\x - 0, a2). Only fourteen of the seventeen
categories were used because three of the categories, pregnancy, lactating, and children
under the age of one, have special caloric requirements. For instance, children under the
age of one get most of their calories from milk rather than a variety of foods. Finally,
using the method of least squares, the model was fit and the fitted line is
PP = 1.384 + .00096C. (3.3)
The results of the analysis are summarized in Appendix F. Although this model fits quite
well, attaining a R2 value of .979, it assumes that all milk and milk products will be
shipped in the liquid form. That is, liquid milk will be shipped to fulfill these requirements.
This assumption is unlikely and uneconomical. The form of the milk products shipped
depends on the availability of refrigeration space, the availability of fresh water, and the
palates of the recipient population. Therefore, a second linear regression model was
48
considered that excludes the requirements for milk products. Again, using the method of
least squares, the model was fit and the fitted line is
PP = .1811 + .00083C. (3.4)
The results of this analysis are summarized in Appendix G. The model fit very well. This
time the R2 value that was attained was .995, indicating a very strong linear relationship
between calories per person and pounds per person.
The final step was to verify the assumption that the errors are
approximately Normal (|x = 0, a2). Again, the results are summarized in Appendix G.
The analysis estimated u. to be -2.47E-19 and the confidence interval successfully covered
zero. Finally, all the goodness of fit tests attained p-values in excess of. 15 which provides
sufficient evidence to conclude that the errors can be adequately described by a normal
random variable with (j. = 0 and a constant a2.
The next concern is to establish a logistics planning factor for water. There
are two schools of thought regarding the establishment of a logistics planning factor for
water consumption. The first method involves a gross requirement figure that combines
all water needs into one requirement adjusting only for climate. While this method is
certainly easy to understand and adjusts for climate (considered the primary factor in
water consumption [Ref. 25: p. 13]), the methodology does not allow the planner to
determine whether specific provisions, like medical requirements, have been included in
the aggregated figure. Furthermore, this method does not allow the planners to assess the
specific requirements for potable and nonpotable water. The second method still uses a
gross requirement figure but, the figure is derived by breaking down the water
requirements into smaller planning factors such as drinking water requirements, hygiene
requirements, etc. Unfortunately, the factors the Services have developed by this method
are extremely conservative. For instance, although there is a half a gallon a day provision
for a sponge bath, the recommended consumption rate for hygiene water allows for only
one shower a week; and, regardless of the climate, and the shower is only to consume
seven gallons of water. [Ref. 29: p. 2-8] It is very unlikely that any European or North
49

American civilian community will take any shower that only consumes seven gallons of
water. The Services themselves have conducted several studies to validate the current
planning factors for water consumption. All the sources led to different conclusions, but
they all allow for additional water for hygiene purposes. [Ref. 29: p.2-8; Ref. 30: p. D-2;
Ref. 31: p. 4, Ref. 32: p. D-2] Therefore, some adjustments need to be made to these
planning factors if they are to adequately reflect the requirements of a civilian population.
Because the second method appears to offer the most versatility, it will be
the methodology used in this thesis. However, the breakdown will be slightly different
from the breakdown traditionally used by the Services. The breakdown will be composed
of six smaller planning factors. The breakdown includes drinking requirements, hygiene
requirements, food preparations, laundry, medical treatment in the operating area
(including heat treatment), and waste. There are additional water requirements for vehicle
and aircraft maintenance, NBC decontamination, and grave registrations. However, the
Services' planning factors thoroughly describe the requirements so they will not be
discussed here.
Because water is essential to life, drinking requirements are considered a
critical planning factor for most operations, especially humanitarian operations. The
planning factors developed are based on the medical intake requirements displayed in
Table 3.5. As Table 3.5 indicates, demographics play a key role in determining the water
needs. Since these values are the average requirement, ten percent will be added to each
category to account for individuals who consume more than average amount of water. In
addition, these requirements vary greatly in different climates because temperature
influences the amount of water the body loses. For instance, a person is not likely to
perspire a great deal in an arctic environment; but, the water loss due to perspiration in a
desert climate can be elevated as much as 100% from the losses experienced in an arctic
environment. [Ref. 33: p. 2280] To accommodate the water requirement variations
experienced in different operating areas, the climate factor will be used. Although, the
actual water requirements for humanitarian operations differ from the Services'
50
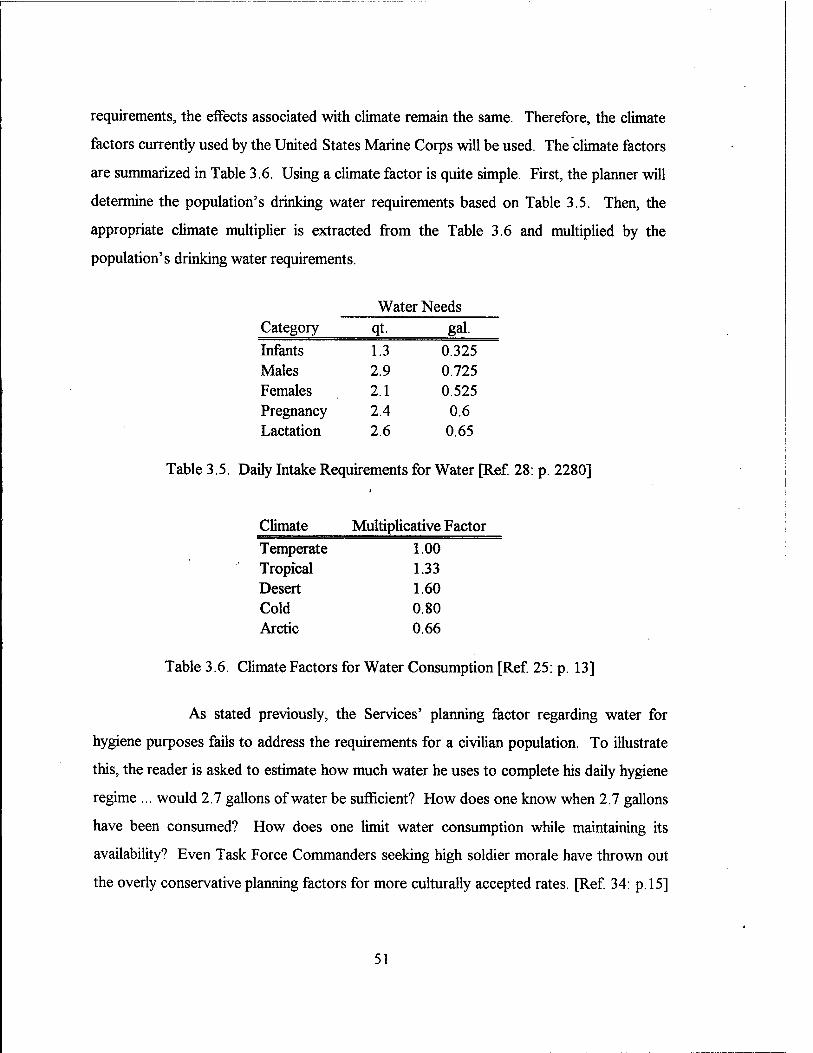
requirements, the effects associated with climate remain the same. Therefore, the climate
factors currently used by the United States Marine Corps will be used. The climate factors
are summarized in Table 3.6. Using a climate factor is quite simple. First, the planner will
determine the population's drinking water requirements based on Table 3.5. Then, the
appropriate climate multiplier is extracted from the Table 3.6 and multiplied by the
population's drinking water requirements.
Water Needs Category qt. gal.
Infants 1.3 0.325 Males 2.9 0.725 Females 2.1 0.525 Pregnancy 2.4 0.6 Lactation 2.6 0.65
Table 3.5. Daily Intake Requirements for Water [Ref. 28: p. 2280]
Climate Multiplicative Factor Temperate 1.00 Tropical 1.33 Desert 1.60 Cold 0.80 Arctic 0.66
Table 3.6. Climate Factors for Water Consumption [Ref 25: p. 13]
As stated previously, the Services' planning factor regarding water for
hygiene purposes fails to address the requirements for a civilian population. To illustrate
this, the reader is asked to estimate how much water he uses to complete his daily hygiene
regime ... would 2.7 gallons of water be sufficient? How does one know when 2.7 gallons
have been consumed? How does one limit water consumption while maintaining its
availability? Even Task Force Commanders seeking high soldier morale have thrown out
the overly conservative planning factors for more culturally accepted rates. [Ref. 34: p. 15]
51

This is not say the population should be granted an unlimited water supply, just a more
liberal rationing policy. With this in mind, the planning factor for hygiene will be derived
using more realistic requirements, understanding that the only way to truly limit water
consumption is to restrict its availability.
The first step in determining the amount of water needed to satisfy the
hygiene requirements is to decide what is included in the personal hygiene and what
variables affect the requirements. For this model, hygiene requirements include water for
shaving, washing hands, brushing teeth and showering while the primary factor affecting
the requirements is the operating area. From a medical standpoint, at the very least, a
population needs to maintain dental hygiene. The military uses a planning factor of 1.7
gallons per person per day for shaving, dental hygiene, sponge baths, and hand washing.
[Ref. 29: p. 2-8] Again, this is difficult to enforce but it is certainly not unreasonable and
can adequately address dental hygiene. Therefore, this value will be the minimum personel
hygiene planning factor for males. For females and children, .7 gallons (the amount
allotted for shaving) will be subtracted from the 1.7 gallons per male per day requirement,
resulting in a 1 gallon per female (or child) per day hygiene requirement. The final hygiene
requirement is the water required for bathing. Unfortunately, determining bathing or
showering requirements is one area where cultural norms could affect the quantities
required. Although it is true that frequent showering is not medically necessary and can be
considered a luxury, most cultures accept daily bathing as a norm. The degree to which
this norm is applied has a great deal to do with the literacy rate of the victim population.
However, as a minimum, the Office of the Surgeon General has recommended from a
health maintenance standpoint one shower per week. [Ref. 32: p. D-2] Therefore, for
limited periods of time, the Services' planning factor of one shower per person per week
will serve as the minimum bathing requirement. If the infrastructure exists or as it
develops, more liberal limits should be established to accommodate the population's
hygiene norms.
52

To determine the quantity of water required for a shower, an extensive
literature search was conducted. It was found that normal commercial shower heads
deliver approximately 5 gallons per minute while commercial, restricted flow shower
heads deliver approximately 3 gallons per minute. Even using the restricted flow values,
the current hygiene planning factor of 7 gallons per person per week only provides one, 2
minute and 20 second shower once a week. Unfortunately, most civilians do not time
their showers; and, if they did, 2 minutes, 20 seconds is not a common time increment.
So, the goal was to find a showering time with a more common increment that can easily
absorb excess use by small portions of the population without limiting the availability of
water.
Interesting enough, the Army Field Manuals (FM 10-280) state that each
soldier is permitted a seven minute shower. Even using the shower head flow values
derived by the Army of 2.2 gallons per minute, the 7 gallons per person per week is not
sufficient to address the seven minute shower. [Ref. 32: p. D-2] In fact, the Services
would require 15.4 gallons per person per shower to satisfactorily address their
requirements using their flow rates or 21 gallons per person per shower using commercial
shower heads. The literature search showed that 17.5 gallons per person per shower has
been successfully used by the Services for longer duration operations. [Ref. 31: p. 15]
This planning factor combined with commercial restricted flow shower heads provides the
population with over five minutes of shower time while combined with the military shower
head this factor provides over seven minutes of shower time. Furthermore, using the five
minute time increment with the 17.5 gallons per person per shower planning factor
provides a built-in allowance of approximately 15% for noncompliance. That is, 50
seconds or 2.5 gallons of water per person per shower is allotted for those who refuse to
comply with the established shower allowances. Although this quantity certainly can not
be considered excessive, it does provide the population with a slightly less restrictive
allowance and a more common time increment than the Services planning factor. The
derived quantity also has the added advantage that it still complies with the Services'
53
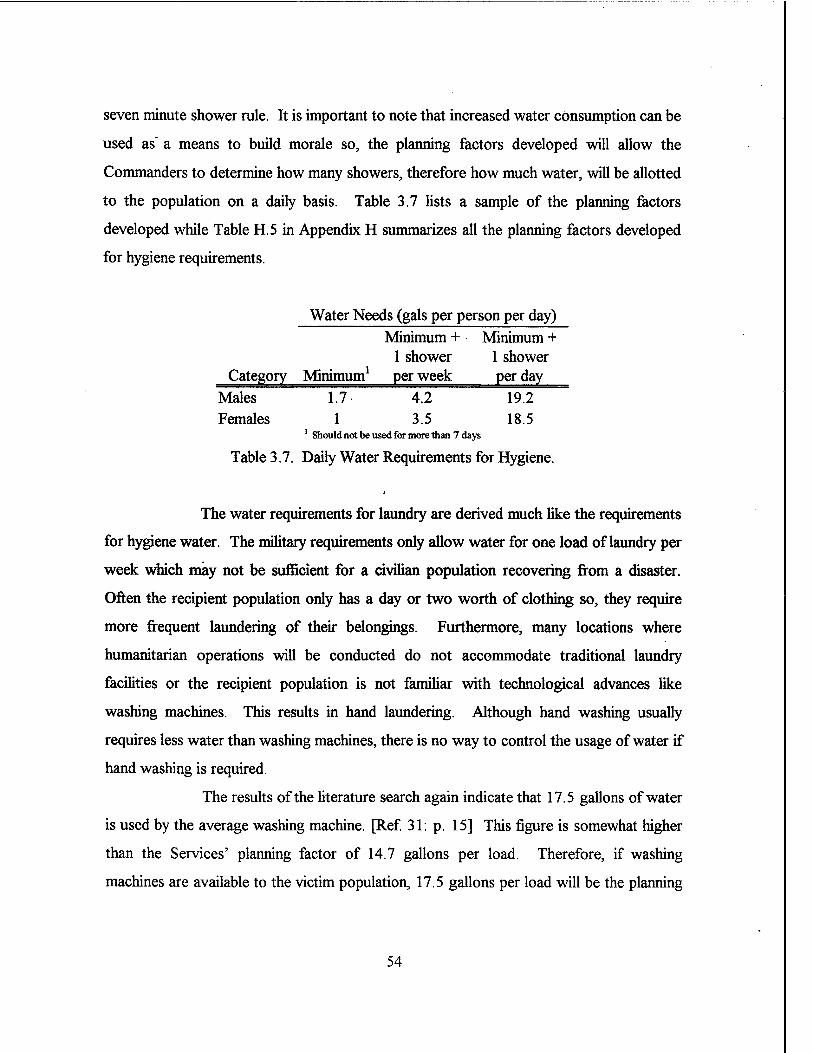
seven minute shower rule. It is important to note that increased water consumption can be
used as" a means to build morale so, the planning factors developed will allow the
Commanders to determine how many showers, therefore how much water, will be allotted
to the population on a daily basis. Table 3.7 lists a sample of the planning factors
developed while Table H.5 in Appendix H summarizes all the planning factors developed
for hygiene requirements.
Water Needs (gals per person per day) Minimum + Minimum +
1 shower 1 shower Category Minimum1 per week per day
Males TT 42 192 Females 1 3.5 18.5
1 Should not be used for more than 7 days
Table 3.7. Daily Water Requirements for Hygiene.
The water requirements for laundry are derived much like the requirements
for hygiene water. The military requirements only allow water for one load of laundry per
week which may not be sufficient for a civilian population recovering from a disaster.
Often the recipient population only has a day or two worth of clothing so, they require
more frequent laundering of their belongings. Furthermore, many locations where
humanitarian operations will be conducted do not accommodate traditional laundry
facilities or the recipient population is not familiar with technological advances like
washing machines. This results in hand laundering. Although hand washing usually
requires less water than washing machines, there is no way to control the usage of water if
hand washing is required.
The results of the literature search again indicate that 17.5 gallons of water
is used by the average washing machine. [Ref. 31: p. 15] This figure is somewhat higher
than the Services' planning factor of 14.7 gallons per load. Therefore, if washing
machines are available to the victim population, 17.5 gallons per load will be the planning
54

factor. The actual gallons per person will be based on the availability of clothing to the
victims. For instance, if the victim population is only provided one change of clothing,
provisions need to be made to allow more frequent laundering. To complete the
discussion on the water requirements for laundry, an assumption needs to be made. The
assumption is that several people, perhaps families, do laundry together. This assumption
is essential because more frequent laundering implies smaller loads. If several people
combine their clothing to make a full load, the required number of wash loads is reduced.
For example, if three people combine their laundry which requires laundering every other
day, they need to wash three or four loads of laundry and use as much as 70 gallons of
water each week. If four loads are washed a week, the planning factor remains 17.5
gallons per person per week (one load per person) or 2.5 gallons per person per day. A
similar argument can be used to estimate the water requirements for handwashing. As a
final note, potable water is not required for laundry and the rinse water may be recycled
and used as wash water. [Ref. 33: p. F-l] ,
In determining the water requirements for medical treatment, the physical
condition of the recipients is the primary consideration. Physical condition is important
because illnesses in which fever^ vomiting, and/or diarrhea are present can rapidly result in
dehydration. This is particularly true of infants, children and older individuals.
Furthermore, increased water supplies may be required if the victims have received a large
number of injuries. This is to compensate for the fluids lost as a result of their injuries.
The planning factor that is developed for medical treatment will be broken into two parts:
heat treatment requirements and medical treatment facility requirements. The heat
treatment portion is used for heat related casualities or ailments and is generally limited to
desert climates. The current military planning factor of .2 gallons per person will be used.
This planning factor is acceptable because it was derived under worst case conditions
where the troops are unclimatized. [Ref. 32: p. B-l] Since it is unlikely that the activity
level of the recipient population will exceed the activity level of those administering the
aid, the current planning factor is believed to be sufficient.
55
If medical services are to be provided, the Academy of Health Sciences
recommends a planning factor of 24.4 gallons per patient per day be used for the care and
cleaning of patients and associated equipment. [Ref. 32: p. G-2] There are several uses of
the water included in this planning factor. Three of the uses are drinking (one gallon),
showers (4 gallons), and food preparation (1.5 gallons). [Ref. 32: p. G-3] Since the
model has already accounted for uses, the uses and their respective planning factors will be
omitted from the recommended planning factor. The resulting planning factor is 17.9
gallons per bed per day. To convert this planning factor into a per person per day
quantity, research was required regarding the allocation of hospital beds. The majority of
the documentation on this subject indicates that the bed allocation policy depends on
anticipated patient load, the evacuation policy in the operating area, and the average
length of stay of the patients. [Ref 29: p. 5-8] Unfortunately, none of this information is
known before a humanitarian operation is conducted.
In an effort to address the, allocation of hospital beds in general, field
manuals on health services in the theater of operations were obtained. Since the type of
care required during these operations is believed to model that administered by a
traditional hospital rather than hospitals found in a combat zone, data on a general hospital
was used for the computations. The FM 8-10 shows that a general hospital is allocated
one per supported division. [Ref. 35: p. B-3] The average end strength of a division is
15,500 personnel; and, a notional corps support command includes over 22,000 personnel.
[Ref. 36: pp. A-l - A-10] Assuming there are four divisions in a corps implies the
support structure for a division has approximately 5500. Combining the average division
strength with the support structure strength would indicate that a supported division
includes approximately 21,000 people. The general hospital is a 476-bed facility; so, .02
general hospital beds are allocated per person (two beds for every 100 people) in the
operating area. Finally, multiplying the bed allocation rate by the water requirement per
bed results in a .358 gallons per person per day requirement for medical treatment
facilities.
56
It should be noted that it is unlikely a field hospital will be dispatched to
support a humanitarian operation. In fact, it is more likely that a more mobile type of unit,
like a Mobile Army Surgical Hospital (MASH), will be dispatched for these operations.
Using the same argument previously discussed, a MASH has a .012 bed per person
allotment rate. However, if a MASH were used to support a humanitarian operation, the
type of services required by the unit would be indicative of a general hospital rather than
the traditional emergency resuscitative services; so, the .02 beds per person allocation
would correspond to the different workload.
In regards to food preparations, the water requirements are menu
dependent rather than population dependent. The Services planning factors state that
when serving an MRE no water is needed to prepare a meal [Ref. 30: p. 2-8]; however,
anyone who has eaten an MRE will agree that water is required to prepare the drink. For
this reason, when a MRE is being served, a .25 gallons per person planning factor will be
provided. The field manuals also state that, when full kitchen services are provided, as
much as 4.5 gallons per person per day can be required. [Ref. 30: p. 2-8] Although the
specific menu affects the exact water requirements, the 4.5 gallons per person is sufficient
for gross planning requirements. However, some operations do not serve three prepared
meals a day so the planning factor needs to be a per meal quantity. Unfortunately, the
current manuals do not adequately describe the breakdown of the food preparation
planning factor. Inferred by the definition of a planning factor is that the factor includes
sufficient water to prepare a day's worth of meals and to complete the necessary kitchen
sanitation after the meals. If three MREs are served the minimum requirement of zero is
attained. If the assumptions are made that the kitchen must be cleaned between meals and
that the maximum planning factor is comprised of three kitchen prepared meals, the per
meal factor of 1.5 gallons per person is attained. After reviewing a variety of sample
menus provided by the Navy Food Management Team, this figure can successfully be
reduced to one gallon per person per meal for food preparation with .5 gallons per person
per meal allotted for kitchen sanitation.
57
The remaining category, waste, can be taken directly from the planning
factors derived by the Services. The primary sources of waste are excessive use by the
recipient population, overfilling holding tanks, pipe or storage tanks leaks. Regardless of
the recipient population, overflow, and leak rates will remain fairly constant. The Services
figure will suffice because the primary source of water waste experienced in Humanitarian
operation, excessive use, has been reviewed and the associated planning factors have been
developed to compensate for a non-military population. The current factor for waste is
ten percent of the total water requirement. Although the planning factor for waste is
believed to be excessive, especially since this model has already provided substantial water
allowances, it certainly would adequately address the aggregated requirements until
operational data can be obtained by the JTF.
The final consideration for Class I supplies is eating utensils. Fortunately,
there is very little variation in the required items. Regardless of the operation, if cooked
meals are to be served, eating utensils are, required. Although the manufacturer many
vary, the types of eating utensils are somewhat standardized from operation to operation.
Past operations illustrate that a plate, cup, utensils, and napkins will be distributed with
cooked meals. When MRE's are served there is no need for additional eating utensils, so
no planning factor will be derived.
To attain a valid logistics planning factor, the Federal Supply Center was
contacted. [Ref. 37] Each of the required item's shipping data was retrieved from the
Federal Stock System's computer. Then, the bulk weights were transformed into per item
weights by simply dividing the bulk weight by the bulk quantity. Finally, all the per item
weights for similar items were averaged together to develop a planning factor of each
item. Because the items distributed are menu driven, each item will have its own planning
factor. The planner can then determine what utensils will be issued. Table 3.8
summarizes the logistics planning factors for eating utensils that are provide by this model.
58

Item P 'ounds Per Item Plate 0.038 Napkins 0.005 Cups. 0.014 Forks 0.0165 Knives 0.0167 Spoon 0.0122
Table 3.8. Planning Factors for Eating Utensils Included in the Model
b. Class II- Personal Supplies.
Class II supplies include all clothing, individual equipment, tents, and
housekeeping supplies. In many cases, not all types of Class II supplies are required. For
instance, homeless hurricane victims may only require housing as they may have been able
to salvage ample clothing. In another scenario, the infrastructure may be able to house the
homeless but is unable to clothe them. Considering these are only two possible scenarios
and each has very different needs, each major division of personal supplies will be derived
separately.
If clothing is to be provided, the goal is to adequately address the
immediate needs of the population. In the worst case, where the Services are tasked to
completely clothe the population, a shirt, pants, undergarments, shoes, and a jacket
(should the climate dictate the requirement), will satisfactorily clothe the recipient
population. For extremely brief operations (less than a week), a single issue of clothing
should suffice. However, as the duration increases, the number of issues should also
increase. The reason is two-fold. First, a single issue of clothing does not allow for a
weekly change of clothes which is recommended by the Office of the Surgeon General.
[Ref. 32: p. D-2] Secondly, the life cycle of an item is assumed to increase when its use
decreases. Personal equipment, on the other hand, can be considered to be items that
provide additional comfort to the recipient population. Personal equipment includes cots,
blankets, towels, pillows, and a variety of additional items which can make the recipient
population feel more comfortable.
59
The methodology used to develop the clothing and the personal equipment
planning factors is very similar to that used for eating utensils. The main difference is that
for Class II items some assumptions were made. The assumptions involve the life cycle of
each item. Because of the nature of humanitarian operations and the amount of wear each
item will receive, the items are not expected to have a very long life cycle. This model will
assume the life cycle of cloth clothing items, like a shirt or shorts, will be two months. For
shoes, the life cycle depends on the durability of the item. Sneakers are assumed to have a
three month life cycle, boots (or a strong shoe) a six month life cycle, and flip-flops or
sandals a two month life cycle. In addition, it is assumed that the life cycle of an item will
increase if additional items of the same type are provided. For instance, if two shirts are
provided, the life cycle of each shirt is assumed to increase to four months. If three shirts
are provided, the life cycle increases to six month, and so on. Table 3.9 summarizes the
weights and life cycles used for each clothing item for both warm and cold climates.
To determine the per person per day planning factor for each item, the
item's weight, Iw, is divided by the life cycle of the item, lie. For instance, to determine
the per person per day planning factor for a man's shirt in a desert or tropical climate the
following calculation would take place
= Iw/hc (3.5)
= .125/60 (3.6)
= .002. (3.7)
For temperate climates, this planning factor would be increased by ten percent to
accommodate the larger temperature variation. The calculations for a cold climate are
done the same way as those for a desert or tropical except that the item weights are
extracted from the cold climate portion of Table 3.9. Finally, arctic planning factors are
derived by increasing the cold climate factors by ten percent. Table H. 11 in Appendix H
summarizes the baseline planning factors for warm and cold climates.
60

Item Life Cycle Men Women Children Infants Warm Climate Clothing
shirts 60 0.500 0.400 0.300 0.100 shorts 60 0.500 0.450 0.400 N/A underwear 60 0.125 0.100 0.070 N/A bras 60 N/A 0.250 N/A N/A socks 60 0.180 0.150 0.080 0.017 sneakers 90 2.000 1.750 1.500 1.000 flip-flops 60 0.400 0.300 0.200 N/A
Cold Climate Clothing shirts 60 1.200 1.000 0.600 0.500 pants 60 1.200 1.000 0.600 0.500 thermal 60 1.200 1.150 0.600 0.250 socks 60 0.250 0.200 0.100 0.080 jacket 365 4.000 3.500 2.800 1.750 boots 180 4.500 4.000 3.000 N/A gloves 90 0.500 0.400 0.300 0.250
Table 3.9. Summary of Data Used to Derive the Class II Clothing Planning Factors
The calculations for personal equipment follow the calculations for clothing
items very closely. The main differences are reduced variation due to climate and reduced
variation due to demographics.- In this model, only one personal equipment item will be
altered in response to the climate. The one item is a blanket. The need for increased
blanket weight as the temperature drops is understandable. Therefore, the following
variations will be included: blanket weight for a desert or tropical climate remains
constant; blanket weight for a temperate climate increases by ten percent; blanket weight
for a cold climate is increased by twenty percent; and blanket weight for an arctic climate
is increased by thirty percent. Also, only one demographic group will maintain separate
planning factors for personal equipment, infants. Because infants are so small and are so
dependent on adults, many items are not required by infants. The weight for a cot is
maintained because it is believed that a cot could suffice in the absence of a crib.
However, if infant specific items are unavailable, the general populous items will suffice.
The individual items' planning factors are summarized in Table 3.10.
61
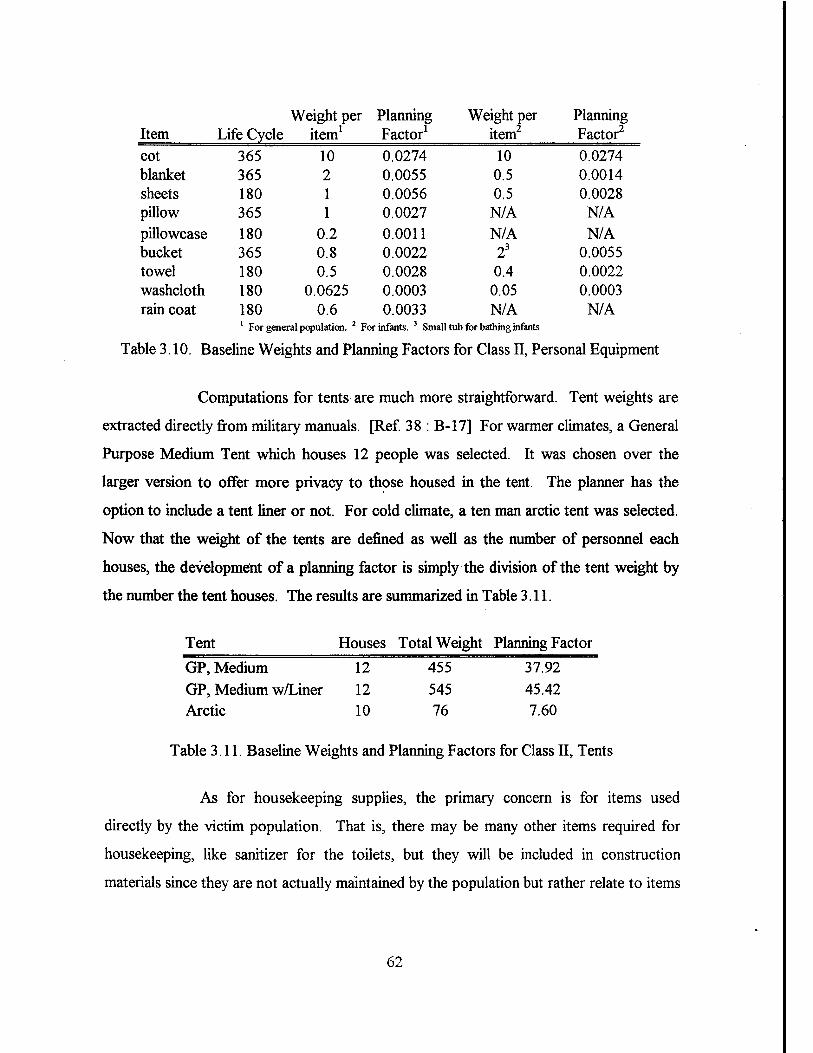
Weight per Planning Weight per Planning Item Life Cycle item1 Factor1 item2 Factor2
cot 365 10 0.0274 10 0.0274 blanket 365 2 0.0055 0.5 0.0014 sheets 180 1 0.0056 0.5 0.0028 pillow 365 1 0.0027 N/A N/A pillowcase 180 0.2 0.0011 N/A N/A bucket 365 0.8 0.0022 23 0.0055 towel 180 0.5 0.0028 0.4 0.0022 washcloth 180 0.0625 0.0003 0.05 0.0003 rain coat 180 0.6 0.0033 N/A N/A
1 For general population. 2 For infants. 3 Small tub for bathing infants
Table 3.10. Baseline Weights and Planning Factors for Class II, Personal Equipment
Computations for tents are much more straightforward. Tent weights are
extracted directly from military manuals. [Ref. 38 : B-17] For warmer climates, a General
Purpose Medium Tent which houses 12 people was selected. It was chosen over the
larger version to offer more privacy to those housed in the tent. The planner has the
option to include a tent liner or not. For cold climate, a ten man arctic tent was selected.
Now that the weight of the tents are defined as well as the number of personnel each
houses, the development of a planning factor is simply the division of the tent weight by
the number the tent houses. The results are summarized in Table 3.11.
Tent Houses Total Weight Planning Factor
GP, Medium 12 455 37.92
GP, Medium w/Liner 12 545 45.42 Arctic 10 76 7.60
Table 3.11. Baseline Weights and Planning Factors for Class II, Tents
As for housekeeping supplies, the primary concern is for items used
directly by the victim population. That is, there may be many other items required for
housekeeping, like sanitizer for the toilets, but they will be included in construction
materials since they are not actually maintained by the population but rather relate to items
62
that are brought into the area, built by, or maintained by the JTF. There are only two
items believed necessary to distribute to the population itself, trash bags and laundry soap.
A maximum of one standard trash bag per person per day will be provided which amounts
to one ounce per person day or .0625 pounds per person per day. For laundry soap, a
planning factor of one cup of soap per load of laundry is provided. Therefore, the soap
requirements hinge on the laundry policy established. If one load of laundry per week is
allotted, a planning factor of .5 pounds per person per week or .0714 pounds per day is
required. If two loads of laundry a week are planned, a planning factor of a pound per
person per week or . 143 pounds per person per day is required.
Finally, the reader should be aware that although the computations of
logistics planning factors for Class II supplies were successfully calculated to adhere to the
Army's traditional units of measure, it is unlikely that the pounds per person quantity is
the most useful unit of measure. This is because the items in question wear at the rate
identified by the planning factor rather than being consumed at that rate. The items are
distributed as a whole so, the logistician might find the unit weight more helpful. If the
unit weight is used, the life cycle of the item can be used as a resupply interval. That is, if
two shirt are issued on day one of an operation, the planner can prepare for the possibility
of replacing the two shirts on day 120.
c Class III - POL.
The planning factors for Class III are derived directly from the current fuel
planning factors used by the services. The requirements are broken into two categories:
packaged petroleum products and bulk fuels. It is assumed that the number of different
types of fuels and petroleum products that will be used will be kept to a minimum to
reduce the problems associated with handling and storage of this volatile commodity. The
planning factor used by the services to determine the consumption rate of packaged POL
products is .59 pounds per person per day. However, this figure is based on wartime
operations and includes the requirements for tanks and aircraft. Since it is believed that
wartime consumption would greatly exceed the requirements of humanitarian operations
63

and since aircraft are not considered in this model, the services' planning factor will be cut
in half to address the requirements for humanitarian operations. The resulting packaged
POL planning that will be used for this model is .295 pounds per person per day.
Although it is believed that this figure is still excessive, it will adequately reflect the worst
case scenario.
The requirements for bulk fuel are derived from the number of fuel
consuming equipment items maintained in the theater of operations and the consumption
rate of the equipment. Table 3.12 identifies the major equipment items included in the
model, each equipment's fuel usage rate, and the type of fuel the equipment uses. To
determine the fuel requirements for any one equipment type, F„ equation 3.8 can be used.
In the equation, the total number of a particular equipment type, £,, is multiplied by the
equipment's fuel usage rate, URt, and the number of miles or hours of usage the
equipment provides each day, EOpst.
Fi = Ei*,Uri*Eopsi (3.8)
Once the fuel requirements for each individual item have been considered the total fuel
requirements, TF, can be calculated by summing the fuel requirements for each of the
individual items. Finally, the Class HI planning factor is derived by dividing the total bulk
fuel requirements, TF, by the number of people being supported, PS, and then adding in
the packaged POL planning factor, POL, as illustrated in equation 3.9.
FPF= (TF'/PS) + POL (3.9)
Since the actual requirements and fuel consumption rates needed to operate
cooking equipment were unknown, several assumption had to be made. First, it will be
assumed that cooking equipment, like stoves, will consume fuel at approximately the same
rate as heaters. In addition, it will be assumed that the majority of cooking equipment
used will be powered by generators and that the fuel consuming equipment is allocated in
such a way that one piece of equipment can service 1000 people.
64

Item Usage Rate1 Gallons Per Fuel Type 5-Ton Truck 0.1243 Mile Diesel 6000 Lb. Rough Terrain Forklift 5 Hour Diesel Rough Terrain Container Handler 8.5 Hour Diesel 1000 Gal. Water Transport 0.1243 Mile Gas 1200 Gal. Fuel Transport 0.0932 Mile Gas Sanitation Trucks 0.1243 Mile Gas 5-Ton Wrecker 0.2237 Mile Gas Garbage Truck .0621 Mile Gas ROWPU 9.4 Hour Diesel Refrigerated Container 1.09 Hour Diesel Generator 6 Hour Diesel Yukon Heater .63 Hour Gas Cooking Equipment .63 Hour Gas
1 [Ref. 29: pp. 2-20-2-52]
Table 3.12. Fuel Usage Rates for the Equipment Include in the Model
d Class IV- Construction Materials.
The first step in deterrnining the construction materials needed is to define
the operational requirements. For this model, construction materials will be broken into
five categories based on what structures must be built. The categories are housing,
latrines, kitchens, storage facilities, and medical facilities (when deployable assets are not
provided). Unfortunately, due to the inability to quantify the required items, a modified
version of the Services planning factor will be used to address the construction
requirements for humanitarian operations and many assumptions will be made.
The immediate concern is to house the homeless. Since humanitarian
operations are not designed to be permanent, tents will satisfy the housing requirements
and these requirements have already been derived with Class It supplies. The only
considerations that remain are clearing the land, tent maintenance, heating requirements,
and protective barriers. Clearing the land itself does not require additional supplies, just
equipment. [Ref. 29: 1-45] Again, because these operations are not intended to be
permanent, it will be assumed that only the land will be cleared, no surfaces will be laid.
Tent maintenance will not be a factor until an operation has been going on for some time;
in which case, replacement tenting should be considered. In this model, it will be assumed
65

that tent replacement will not begin until after the operation has been in place for a year.
Until that time, the equivalent of a single tent which will serve as a repair kit will be
provided for every 50 tents in use or for every 600 homeless people. After a year, the
operational Commander and his staff must determine whether to begin a replacement cycle
or continue tent maintenance. In either case, the baseline planning factor will be the tent
weights discussed in the Class II requirements section.
Heating requirements are only a consideration in the cooler climates. The
GP Medium tent previously discussed can accommodate two heaters while the 10-man
arctic tent can only accommodate a single heater. [Ref. 38: p. B-17] These figures will
serve as the allocation rate. In addition, there is a general desire to keep the number of
fuel commodities to a minimum, so fuel burning heaters or stoves will be used to heat the
tents. In this model, the Ml 950 Yukon heater will be considered. The actual weight of a
Yukon heater is unknown. The weight that will be used is 35 pounds which equates to
2.92 pounds per homeless person when using GP Medium tents and 3.5 pounds per
homeless person when using the 10-man arctic tents (the weight of the heater and the
associated planning factors can be updated in the model when the true weight is located).
Protective barriers only need to be considered when population safety is a
concern. The Services use a planning factor of 4.0 pounds per person per day for
protective barrier and fortification material. Since humanitarian operations are stationary
operation, it is not believed that a daily resupply is necessary. However, it is also believed
that 4.0 pounds per person will not adequately address the requirements due to the weight
of traditional fortification materials. Expedient barbed concertina wire weighs
approximately 56 pounds per 50 foot roll which is approximately 1.12 pounds per foot of
wire. [Ref. 39. p. 108] It will be assumed that a single roll will be able to cover three
linear feet and each person will be allotted three linear feet. This assumption is based on
concertina wire being erected with a four foot diameter and four feet to interconnect each
successive loop. With this assumption, each member of the supported population will
66
require approximately 50 feet of concertina wire or 56 pounds. Therefore, the
requirement for barrier materials will be 56 pounds per homeless person.
Latrines are comprised of two components: restrooms and bathing
facilities. In the worst case, port-o-lets can be used and they tend to weigh more than
traditional temporary restroom facilities. Therefore, port-o-lets will be used in this model.
The allocation rate is one port-o-let per twenty supported personnel. At 208 pounds per
port-o-let, a per person planning factor of 10.4 pounds can be derived for restroom
facilities. [Ref. 40] In addition, .0625 gallons or .5313 pounds of chemicals per port-o-let
per week is required for sanitation purposes. [Ref. 40] Bathing facilities have been
minimal in the past and it is believed that the limited availability of bathing facilities is
designed to reduce the overall consumption of water. With this in mind, one shower head
will be provided for every 500 homeless people supported. After reviewing the blueprints
of several small and temporary bathing facilities, it is estimated that each shower stall will
require approximately 1500 pounds of supplies. The estimate is based on known weights
of piping, screws, nails, and plywood. All other weights were estimated using the advice
of local merchandisers. Using the allocation rate of one shower head for every 500
homeless people, the 1500 pounds of supplies breaks down to three pounds per person.
Kitchen facilities will require a large amount of supplies. The actual
quantity is believed to exceed the requirements for shower facilities as a kitchen requires
similar plumbing supplies as well as large quantities of galley equipment. Until more
detailed weights can be obtained, this model will allow six pounds per person in need of
assistance, twice the planning factor for showers, to construct kitchen facilities.
The requirements for storage facilities depend greatly on the amount of
supplies in theater and the percentage of the supplies that require storage. This model will
use the estimated storage rates developed by the Services. The Services have developed
gross storage factors for the various classes of supply which are summarized in Table
3.13. To obtain the total square feet of storage required equation 3.10 is used. [Ref. 29:p.
1-41]
67

gross storage sq. ft of storage X population X covered = covered (3.10) factor (days) storage
Once the total square footage required is determined, the number of storage tents needed
can be calculated by dividing by 358, the square footage available in a storage tent. [Ref.
38: p B-17] Then, the actual planning factor can be determined by multiplying the
required number of tents by 402, the weight of an individual storage tent. Finally, dividing
by the population size will determine the per person requirements for storage space.
Gross Storage Factor Supply Class (sq. ft/person/day) Class I 0.0353 Class II 0.0169 Class in 0.0005 Class IV 0.0073 Class VI 0.0248 Class Vn 0.0055 Class Vm 0.0054 Class X 0.0169
. Table 3.13. Gross Storage Rates [After Ref. 29: p. 1-41]
If deployable medical units are not used, some considerations need to be
made for medical facilities. The bed allocation rate derived in the Class I section of this
thesis will be used. The planner should determine the number of beds required by
multiplying the size of the population by the appropriate bed allocation rate. For every
twenty beds required, one hospital ward tent, twenty cots and three heaters, when
applicable, will be allotted. In warm climates, this equates to approximately 45 pounds
per bed while in cool climates it equates to approximately 50 pounds per bed. Using the
initial load list for an Air Transportable Hospital, it was determined that each bed requires
approximately 480 pounds of medical equipment (large equipment like generators not
considered here). Therefore, the planning factor for medical facilities in warm climates
will be 525 pounds per bed and 530 pounds per bed in cool climates. For an operation
68
exceeding six months, this planning factor will be increased by 50 percent to account for
upgraded facilities including plumbing and air-conditioning.
Although only minimally addressed by this model, the planner should not
rule out the necessity to provide materials to maintain the structures that have been built
or the construction equipment required to build the structures. The need for structural
maintenance becomes apparent during the longer duration operations. Fortunately, the
requirements for structural repairs will not be a major factor in the planning effort until
several months have passed. This allows the planner to consult the appropriate engineers
and construction battalions to properly assess the necessary requirements. Moreover,
once the planner has determined what structures are required to support the population,
the engineers can provide the planner guidance regarding the type of equipment required.
e. Class VI - Hygiene Items.
The primary difference between the Service's derived planning factor for
Class VI items and the planning factor derived for this model is what is actually included in
the class of supply. The planning factor derived for this model contains only items relating
to the personal hygiene of the recipient population. Included in the Service's figure are
allotments for items like civilian clothing, camera equipment, and stationary supplies. For
humanitarian operations, these items are considered excessive; primarily, because the goal
of these operations is to provide life-saving aid. Although shampoo, soap, and toothpaste
are unlikely to save a life, they are some of the items considered basic requirements to
maintain personel hygiene. For this model, all the other items traditionally included in this
class of supply will be incorporated into Class X.
The basic hygiene products that are included in this model are soap,
shampoo, a toothbrush, toothpaste, deodorant, shaving cream, a razor, toilet paper, a
comb or a brush, and feminine hygiene products. In some countries, alternate hygiene
items may be more appropriate. For instance, some countries use items similar to
toothpicks, rather than toothbrushes, for dental hygiene while other countries do not
believe in shaving. As long as planners are aware of the items included in the planning
69
factor and the items' contribution to the planning factor, they can compensate accordingly.
The planning factors derived for Class VI employ a methodology very similar to the
methodology used to derive the planning factors for the utensils portion of Class I and
Class II. The difference is that the manufacturers were contacted to determine average
"serving size" for each of the products rather than a life cycle. The manufacturers'
customer service representatives provided the average number of uses in a standard size
item. This data was quickly converted into average quantity consumed per use and the
average number of days any one item can be used. Combining the expected daily usage
with the average quantity consumed per use resulted in the derivation of the average
quantity used per day.
For example, Crest® representatives offered data on the 181 gram tube of
toothpaste and the 132 gram tube. The smaller tube provides sufficient paste for 100
brushings while the larger tube provides sufficient paste for 135 brushings. The usage rate
is computed by dividing the weight of the product, 132 grams, by the number of
"servings" in the product, 100, which equated to approximately 1.32 grams per brushing
for both tubes. Assuming each person will brush their teeth after each meal, a 132 gram
tube of toothpaste will provide 33.33 days of supply. By dividing the weight of the
product, 132 grams, by the days of supply the product provides, 33.33 days, results in a
daily usage rate of 3.96 grams. A ten percent allowance was then provided for error that
can be experienced due to excessive use and waste while varying allowances from one
percent to ten percent were allotted to accommodate for product packaging. The reason
for varying the allowances for packaging is general knowledge of the products' packaging.
For instance, a shaving cream can certainly outweighs the plastic or paper wrap that holds
toilet paper. Therefore, shaving cream has a ten percent allowance for packaging while
toilet paper has only a one percent allowance. Continuing the toothpaste example, the
error allowance equals .40 grams and the one percent packaging allowance is .04 grams
for a total of .44 grams of additional weight. Adding the .44 grams to the daily usage rate
of 3.96 results in a planning factor of 5.4 grams. Finally, the total planning factor for
70

toothpaste, 5.4 grams, has to be converted into pounds. The new planning factor equates
to .0118 pounds per person per day. A summary of the data and the initial computations
is found in Table 3.14.
Once the planning factors for the individual items were calculated, they had
to be aggregated into planning factors for the various demographic groups. The following
assumption were made in the aggregation: men do not need feminine hygiene products;
women do not need shaving cream; children do not require shaving items, feminine
hygiene products, or deodorant, and infants only require shampoo, soap and a comb. The
resulting planning factors are summarized in Table 3.15. Note that the planning factor for
infants exceeds the amount allotted for shampoo, soap, and a comb. This is to allow for
items that may be required by infants due to the sensitivity of their skin, like powder and
lotion.
Item
Number Number of Average Average Packaging Size of of days of quantity quantity and error Planning
item uses use per use per day allowances Factors gms gms gms gms gms
toothpaste 132 100 - 33.33 1.32 3.96 0.44 5.4 toothbrush 10 90 30 0.11 0.33 0.04 1.37 shampoo 457.6 40 40 11.44 11.44 1.26 14.7 deodorant 48 60 60 0.80 0.80 0.09 2.89 soap 143 30 15 4.77 9.53 1.05 11.58 shaving cream 228.8 60 60 3.81 3.81 0.42 14.23 comb 10 120 60 0.08 0.17 0.02 1.185 brush 85.8 120 60 0.72 1.43 0.16 11.59 razor 5 5 5 1.00 1.00 0.11 2.11 toilet paper 171.6 40 10 4.29 17.16 1.89 20.05 feminine hygiene 343.2 28 28 12.26 12.26 1.35 13.61
Table 3.14. Summary of Data and Computations used derive Class VI Planning Factors
71
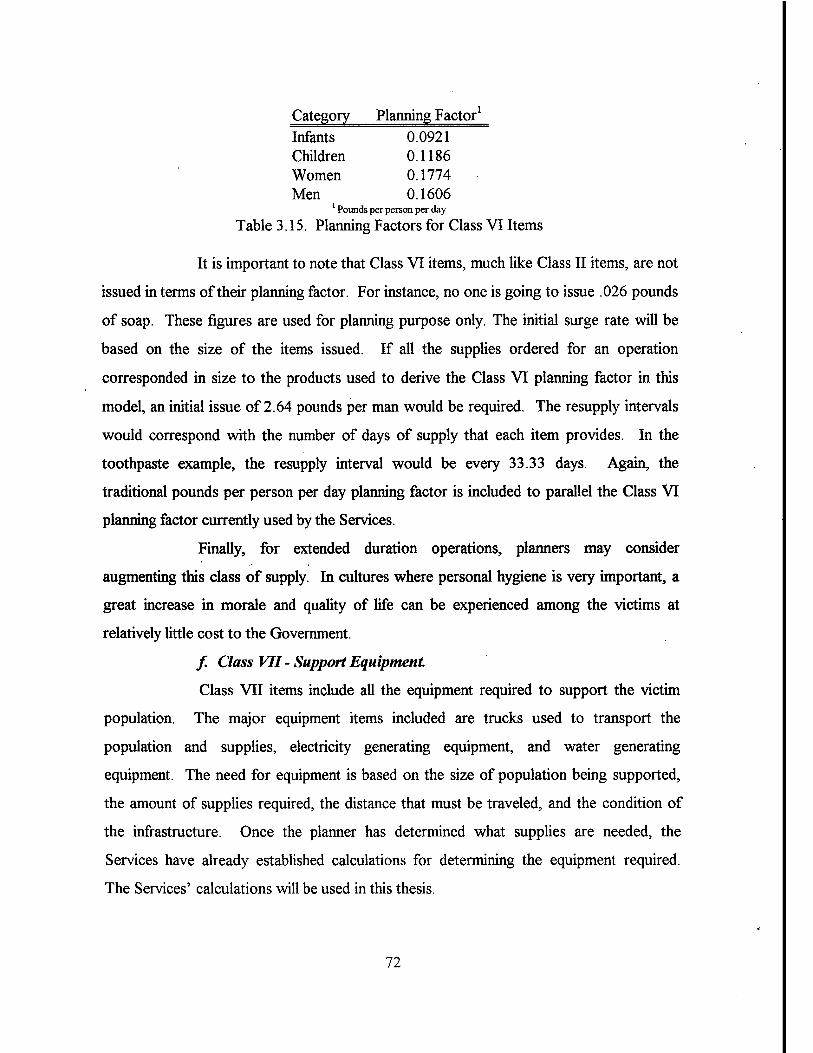
Category Planning Factor1
Infants 0.0921 Children 0.1186 Women 0.1774 Men 0.1606
1 Pounds per person per day
Table 3.15. Planning Factors for Class VI Items
It is important to note that Class VI items, much like Class II items, are not
issued in terms of their planning factor. For instance, no one is going to issue .026 pounds
of soap. These figures are used for planning purpose only. The initial surge rate will be
based on the size of the items issued. If all the supplies ordered for an operation
corresponded in size to the products used to derive the Class VT planning factor in this
model, an initial issue of 2.64 pounds per man would be required. The resupply intervals
would correspond with the number of days of supply that each item provides. In the
toothpaste example, the resupply interval would be every 33.33 days. Again, the
traditional pounds per person per day planning factor is included to parallel the Class VI
planning factor currently used by the Services.
Finally, for extended duration operations, planners may consider
augmenting this class of supply. In cultures where personal hygiene is very important, a
great increase in morale and quality of life can be experienced among the victims at
relatively little cost to the Government.
/ Class VII - Support Equipment.
Class VII items include all the equipment required to support the victim
population. The major equipment items included are trucks used to transport the
population and supplies, electricity generating equipment, and water generating
equipment. The need for equipment is based on the size of population being supported,
the amount of supplies required, the distance that must be traveled, and the condition of
the infrastructure. Once the planner has determined what supplies are needed, the
Services have already established calculations for determining the equipment required.
The Services' calculations will be used in this thesis.
72

To begin the calculations a few assumptions must be made.. First, it is
assumed that the equipment will be available a minimum of 80% of the time. It is also
assumed that the cargo to be transported can be loaded to the weight capacity of the
vehicle without exceeding the size or cube capacity of the vehicle. That is, if a truck is
rated for loads up to 10 tons, 10 tons of supplies can be loaded into the vehicle regardless
of the size of the object. It is assumed that the round trip journey from the supply storage
area to the distribution area is less than 180 miles and that supplies and personnel will be
transported using motor vehicles.
The transport vehicle used in this model is a five-ton cargo truck. It was
chosen because it is a very common vehicle with a reasonable cargo capacity. To compute
the required number of vehicles several things need to be known. First, the amount cargo,
supplies or personnel, to be transported needs to be calculated. Therefore, this is one of
the last classes of supply to be considered. Once the amount of cargo that needs to be
transported has been identified, the one way distance in miles to be traveled, Dist, the
speed of travel in miles per hour, S, and any number of hours of delays in the transit time,
Delays, need to be determined to calculate the turnaround time of a vehicle, TA. The
turnaround time is computed as follows
TA = ((2 * Dist) /S) + Delays. (3.11)
and it is measured in hours. [Ref. 38:p. 3-23] Next, the length of the operational day for
the vehicles in hours, VOps, needs to be identified. Then, the tonnage or the number of
personnel the vehicle can transport, VCap, needs to be identified. VCap for the items
included in this model can be found in Table 3.16. Once these items are identified the
number of vehicles required to transport supplies in the theater, Vc, can be calculated using
equation (3.12) where Tc is the number of short tons to be transported. The same
equation can be used to calculate the number of vehicles needed to transport personnel,
Vp, but Tc is replaced with Tp, the number of personnel to be transported.
Vc = (Tc * TA)/(VCap * Vops) [Ref. 38:p. 3-23] (3.12)
73

When computing the requirements for water or fuel trucks, equation 3.12 can also be
used. However, Tc and VCap are both measured in gallons.
It is interesting to note that there is a circular relationship between fuel
transports and fuel required. That is, identifying the need for fuel transports also identifies
the need for additional fuel which in turn requires additional fuel transports. Fortunately,
the requirements eventually converge as the additional fuel requirements sustained by
adding more transports is absorbed by the remaining storage space of the fuel transports
previously calculated.
Item Item Weight Capacity 5-Ton Truck 22000 6000 Lb. Rough Terrain Forklift 27100 Rough Terrain Container Handler 105120 1000 Gal. Water Transport 14500 1200 Gal. Fuel Transport 15000 Sanitation Trucks 14500 5-TonWrecker 34400 Garbage Truck 360001
ROWPU 37960 Refrigerated Container 4000 Generator 7540
1 Estimated weigjit
Table 3.16. Equipment Included in the Model and their Weights and Capacities
6 STONS 3 STONS
25 STONS 1000 Gallons 1200 Gallons 1000 Gallons
N/A N/A
60000 Gallons 41300 Pounds
60 KW
The number of forklifts required, FL, is a function of the tonnage of
supplies to be moved each day, Tc, and the number of tons the forklift can move in a day.
It has been determined that a forklift can load and unload 120 pallets per day. [Ref. 41] In
addition, it is assumed that average pallet holds one short ton. The formula used to derive
the forklift requirements is
FL=TC/120. (3.13)
The water production/purification equipment requirements, WPER, are
based on the quantity of water required each day, WR, the infrastructure's ability to
generate water each day, Ia, the speed at which the water can be produced, Ps, and the
74

number of hours the equipment operates each day, WQ. la is the percentage of the total
water requirement, WR, the infrastructure is capable of producing." Ps is measured in
gallons per hour while WR is measured in gallons per day. The formula that is used to
compute the number of water producing or purifying machines is as follows
WPER = WR * (Ma) /P, * W0. (3.14)
In this model, the wrecker requirements are based on the number of
vehicles in the theater. That is, one wrecker will be allocated for every one hundred
vehicles in the theater of operations. Similarly, one container handler will be allocated for
every fifty containers in the theater and one garbage truck will be allotted for every 25,000
people.
Generator requirements are traditionally based upon the theater energy
requirements. Unfortunately, there is no way to identify the actual quantity of energy a
humanitarian operation is likely to require. However, it can be assumed that the
operations will use as little energy as possible. The historical review has identified that the
primary uses for the generators are cooking, security lighting, and water distribution.
Therefore, it seems reasonable to use an allocation policy based on the size of the
population being supported arid the condition of the infrastructure. To establish an
allocation rate, several of the Services' deployable assets were reviewed. A fully
functional medical facility capable of supporting a medical surge of 150 people, requires
only a single five kilowatt (KW) generator with an identical back-up. [Ref. 42: P.77-78]
Traditionally medical facilities require a great deal of energy due to the nature of their
mission, so using a similar allocation rate would surely satisfy the minimal energy
requirements of a population being supported during humanitarian operations. With the
knowledge that this model will be using 60KW generators, the allocation policy will be as
follows. If the infrastructure is functional, one generator will be issued for every 1800
people. If the infrastructure is damaged, one generator will be issued for every 900 people
supported. If the no infrastructure exists, one generator will be issued for every 450
people.
75
The need for refrigerated containers is driven by the number of meals
served each day, the quantity of medical supplies requiring refrigeration, and the condition
of the infrastructure. For instance, when a meal is prepared in the theater with a non-
existent infrastructure, it is assumed that twenty percent of the food requires refrigeration.
When the infrastructure is only damaged this figure drops to ten percent because it is
believed that the infrastructure has the means to refrigerate the remaining ten percent. If
the infrastructure is functional, ample refrigerated containers to house five percent of the
served food will be allotted. If all the meals being served are MRE's, there is essentially
no need for refrigeration other than that required for milk. To accommodate the
refrigeration of milk, the same infrastructure variations will apply but the refrigeration
rates will be applied to only one-sixth of the total food requirements. That is, if three
MRE's, which equates to 4.41 pounds per person, are served in an area with a functional
infrastructure, the twenty percent refrigeration rate will be applied to only .735 pounds of
the total per person food requirement. Finally, it is assumed that all deployable medical
assets will be deployed with ample refrigeration facilities to handle any self-generated
requirements. When medical facilities are built, it is assumed the refrigeration
requirements are built into the construction materials planning factor previously discussed.
Once the planner has determined the total number of each item required, all
these number should be increased by twenty percent to allow for maintenance and down
time. This is done by multiplying the total number required by 1.2. Once these
calculations are completed the total weight of the required equipment, Tw, is calculated as
follows
Tv>=^(Ni*Wi) (3.15) Alii
where JV, is the total number of equipment /' and Wt is the weight of equipment z, which can
be extracted from Table 3.16. Finally the planning factor for support equipment can be
calculated by dividing Tw by the size of the population. It is important to note that this
planning factor is a one time requirement. That is, there is no sustainment rate. In
76

addition, the requirements for support equipment will be the greatest when handling the
initial surge requirementsso they should be calculated based on the surge requirements.
g. Class VIII - Medical Supplies.
This class of supply includes all the medical materials required to support
the victims of a disaster. To establish the planning factor, several things must be
considered: whether medical services will be provided; the level of medical service to be
provided; whether the medical services being rendered are supplemental or complete in
nature; and the current physical condition of the population being supported. Again, there
is no way to predict the demand before the execution of a humanitarian operation. This is
because demand depends on all aspects of the population's physical condition. Therefore,
the planning factor will be based on "notional" requirements using the same arguments
described when deriving the water requirements for medical services.
The worst case scenario, where the services must provide complete
medical care to a severely injured population, will be considered first. Again using a
general hospital as a baseline, the amount of supplies used on a daily basis when in an
operational status must be determined. Fortunately, a recent document generated by the
Academy of Health Services has determined the average daily usage of supplies by a
general hospital using historical data. [Ref. 43] The Academy's findings indicate that
general hospitals use an average of 33589.416 pounds of supplies a day. As previously
noted, a general hospital is a 476 bed faculty. Dividing the total consumption of supplies
of the hospital, TC, by the number of beds in the hospital, B, results in the planning factor
for the amount of medical supplies required per bed, MSPFb. That is,
MSPFb = TC/B (3.16)
or in this case
MSPFb = 33589.416/ 476 (3.17)
which equals 70.566 pounds of supplies per bed per day. The maximum bed allocation
rate was already determined to be .02 beds per person. So, the medical supplies planning
factor, MSPFP, can be determined by multiplying the MSPFb by the bed allocation rate
77

which results in a 1.41 pounds per person per day factor. This planning factor should
adequately address the needs of the victim population in the worst case scenario since,
much like a combat zone, an area struck by a disaster may be quickly inundated with
casualties.
There is one demographic group that requires special consideration when
determining Class VIE requirements. The group is infants. Many supplies required by
infants are now being requisitioned with medical supplies. [Ref. 43] These supplies
include formula, bottles, and diapers. Formula has been included in the nutritional
requirements and will not be reconsidered here. However, to accommodate some of the
special needs of infants an additional allotment of 12 ounces or .75 pounds per day will be
included in the planning factor for medical supplies provided for infants. The quantity
includes eight diapers per day per infant, bottle liners, bottles, pacifiers, and teething rings.
Of course, each item's planning factor, except diapers, is calculated using the life cycle
method described in Class II supply requirements.
Regardless of the extent of medical services the military provides or the
physical condition of the population, the maximum planning factor should be able to
address all the medical requirements for the worst case scenario. However, when the
extent of the services is reduced or when the physical condition of the population being
supported is extremely good, the maximum planning factor is likely to be excessive. The
most obvious example is when no medical services are provided. Although no medical
services are provided, it is believed that a minimal amount of basic first aid supplies will be
maintained. A breakdown of the required Class VIII supplies was reviewed to determine
the minimal requirements. It is found that 8.1 percent of the daily allowance is used for x-
ray film and developing, test kits, and patient care accessories. [Ref. 42] The exact
breakdown is unknown but, it is believed that five percent of the daily allowance should
accommodate the patient care accessories. Computing five percent of the maximum
quantity of supplies required per person, 1.41 pounds, results in a planning factor of .07
pounds per person that can be used to account for basic first aid supplies. By dividing the
78
supplies per bed, 70.566, by the .07 pounds per person planning factor equates to a beds
per person rate of .001 or 1 bed per 1000 people being support. If the .02 beds per person
planning factor and the associated medical supplies planning factor were used, it is
obvious that a large surplus of supplies would result.
To offer planners a means to differentiate between the various degrees of
services that are to be provided, the model offers several bed allocation rates ranging from
.001 beds per person when no services are being rendered to .02 beds per person when
complete services are being rendered and a high percentage of the population requires
medical attention. In this case, a high percent refers to eighty percent of the population or
more. The high percentage is believed to correspond to the high patient loads experienced
by hospitals in combat zones. [Ref. 29: pp. 5-9 -5-26] As the percentage of the
population that requires medical attention decreases, the number of hospital beds required
should also decrease. This corresponds directly with the relationship between hospital
admission rates and hospital bed requirements found in the Service's methodology for
determining bed requirements. [Ref. 29: p 5-10] If the percentage drops below eighty
percent but remains above sixty percent, the bed allocation rate drops to 1.5 beds for
every 100 people. This may seem like a drastic reduction, but it is important to note that a
large majority of the patients seen shortly after a disaster are treated and released. The
patients do not fill the hospital beds.
Should the required (or authorized) medical services drop even further, the
model accommodates three additional bed allocation rates. The first is one bed for every
100 individuals being supported. This allocation rate is believed to adequately address the
medical needs when forty to sixty of the supported population requires medical attention.
A bed allocation rate of eight beds per 1000 supported personnel can be used when twenty
to forty percent of the population requires medical attention. Finally; a bed allocation rate
of five beds for every thousand individuals being supported can be used when supporting
populations with few injuries (twenty percent or less) or when administering a Wellness
clinic. That is, a clinic that provides the every day needs of an otherwise healthy
79

population (i.e. immunizations, colds, etc.). No documentation can be found to justify a
bed allocation rates below .005 when medical services are being provided. Therefore, the
final bed allocation rate of .001, which was previously discussed, will be used exclusively
for operations that are either not providing medical care or are providing services that
equate to distributing aspirin and Band-Aids.
In the event an operation requires the Services to augment existing medical
facilities, the medical personnel assigned should coordinate with the local medical
personnel to determine what medical supplies, if any, the Services need to supplement and
notify the planners as quickly as possible. Finally, because the equipment and shipping
requirements for the Services' mobile medical facilities are already thoroughly analyzed in
several documents [Ref 35; Ref. 42], this thesis will not attempt to reevaluate the work
completed by medical experts.
h. Class X - Humanitarian Specific Items.
The Army's current planning factor manual states that the supplies included
in Class X are materials required to support nonmilitary programs and that a pounds per
person per day planning factor is not appropriate. [Ref. 29: p. 2-174] Yet, Service
Support Manuals state that Class X includes supplies for civilian relief and supplies for
economic aid. [Ref. 44 :p 3-5] This relief and aid can include food, clothing, shelter, and
medical supplies; in which case, a pounds per person per day would certainly be
appropriate. The Services have chosen not to derive a planning factor for this class of
supply. Considering the vast amount of ambiguity surrounding what the class of supply
entails, the omission seems reasonable. However, this thesis has taken an entirely different
approach to this class of supply. Since all the food, clothing, shelter, and medical supplies
have been considered separately, there is no need to consider these items here. In
addition, nation building is considered a civic action rather than a humanitarian operation
so supplies relating to civic action do not need to be considered either. The question
remains as to what is included in Class X supplies.
80

For this model, Class X supplies are any supplies purchased strictly to
enhance the quality of life of the recipients. The supplies can include radios, recreational
equipment, school books, religious items, etc. The specific items can vary greatly from
operation to operation. Many people are of the thought that anything beyond the essential
items (food, clothing, shelter, and medical care) is extravagant and the Services should not
be required to accommodate such wastefulness. Regardless of whether the Services
should or should not provide such items, provisions should be considered in case a higher
authority dictates the purchases. One of the major considerations is when these items
should be supplied. Since the goal of the items is to enhance the recipients quality of life,
the key is to determine when the population's quality of life becomes an issue. For any
short term operation, quality of life is riot believed to be an issue. The recipient population
is most likely more concerned about living than whether or not they can listen to a radio.
Fortunately, most humanitarian operations are short in duration so Class X items do not
need to be considered. However, during, long term operations, particularly when the
recipient population is unable to move about freely, the population gets restless and bored.
Restlessness and boredom can manifest into depression, aggression, and various other
potentially dangerous emotions. Therefore, the object of Class X supplies is to occupy the
minds and souls of the recipient population to avoid security problems.
Any operation that exceeds one month can reasonably consider the
purchase of Class X supplies. In considering the items to be purchased, an assumption
will be made. The assumption is that the purchases are one time buys. That is, if Class X
supplies are to be purchased, they are purchased in bulk with limited considerations for
resupply. Much like Class II supplies, a basketball is not consumed on a daily basis. It is
purchased once and issued. Therefore, the planning factor will be a per person per issue
quantity. If the operation goes on indefinitely, purchase cycles might be considered. For
example, every three months supplemental or replacement items can be purchased.
Because these items are considered luxury items, they should be kept to a minimum.
However, it is preferable that everyone in the population receive something small of their
81
own to eliminate the possibility of perceived favoritism among individuals in the recipient
population. Since at the point Class X items are considered the recipient population is
known, they should be consulted as to the recreation sports, games, and activities that are
popular in their culture to reduce waste.
The methodology used to derive the planning factors mirrors the
methodology used to derive Class II and Class VI items. For Class X, four separate
planning factors will be derived: individual items, community items, school items, and
resupply items. Individual items are supplies given to everyone in the population, like
writing tablets, playing cards, or transistor radios. Community items are supplies like
baseball and basketball equipment, art supplies, and sewing materials that are issued on an
allotment basis. For example, one complete baseball set will be ordered for every 500
people being supported. School specific items include the necessary supplies to establish
temporary schoolhouses like books, notebooks, and pencils and are ordered based on the
percentage of the population that requires schooling. Resupply items are items needing
regular replacement. For instance, radios need batteries, basketballs need patch kits, and
schools run out of paper. The model provides for resupply in thirty day increments.
Again, all the factors will be derived with the understanding that these items should be
kept to a minimum.
The individual items that are included in the model are radios, writing
materials, cards, board games, hats, sunglasses, religious materials, and cigarettes. These
items were selected because they are relatively inexpensive and small. In addition, many
of the items have universal appeal. Cigarettes will only be issued to a portion of the
population which is the size of the adult male population. Religious materials will be
distributed to the adults and the remaining items are distributed to all but the infants in the
population. The community issue items that are included are baseball equipment,
basketball equipment, soccer equipment, sewing equipment and supplies, arts and craft
supplies, books, and barber supplies. The items included in the model are designed to give
the planner some insight into the types of items that he may consider supplying and are not
82
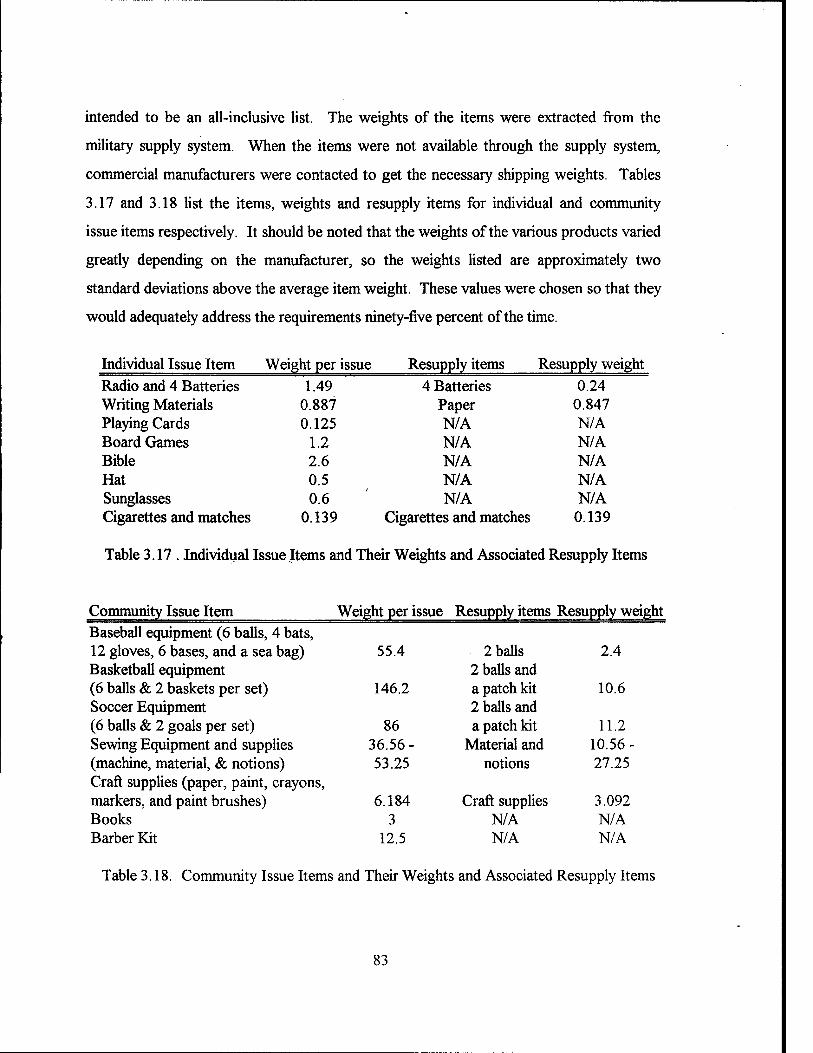
intended to be an all-inclusive list. The weights of the items were extracted from the
military supply system. When the items were not available through the supply system,
commercial manufacturers were contacted to get the necessary shipping weights. Tables
3.17 and 3.18 list the items, weights and resupply items for individual and community
issue items respectively. It should be noted that the weights of the various products varied
greatly depending on the manufacturer, so the weights listed are approximately two
standard deviations above the average item weight. These values were chosen so that they
would adequately address the requirements ninety-five percent of the time.
Individual Issue Item Weight per issue Resupply items Resupply weight Radio and 4 Batteries 1.49 4 Batteries 0.24 Writing Materials 0.887 Paper 0.847 Playing Cards 0.125 N/A N/A Board Games 1.2 N/A N/A Bible 2.6 N/A N/A Hat 0.5 N/A N/A Sunglasses 0.6 N/A N/A Cigarettes and matches 0.139 Cigarettes and matches 0.139
Table 3.17. Individual Issue Items and Their Weights and Associated Resupply Items
Community Issue Item Weight per issue Resupply items Resupply weight Baseball equipment (6 balls, 4 bats, 12 gloves, 6 bases, and a sea bag) 55.4 2 balls 2.4 Basketball equipment 2 balls and (6 balls & 2 baskets per set) 146.2 a patch kit 10.6 Soccer Equipment 2 balls and (6 balls & 2 goals per set) 86 a patch kit 11.2 Sewing Equipment and supplies 36.56- Material and 10.56- (machine, material, & notions) 53.25 notions 27.25 Craft supplies (paper, paint, crayons, markers, and paint brushes) 6.184 Craft supplies 3.092 Books 3 N/A N/A Barber Kit 12.5 N/A N/A
Table 3.18. Community Issue Items and Their Weights and Associated Resupply Items
83
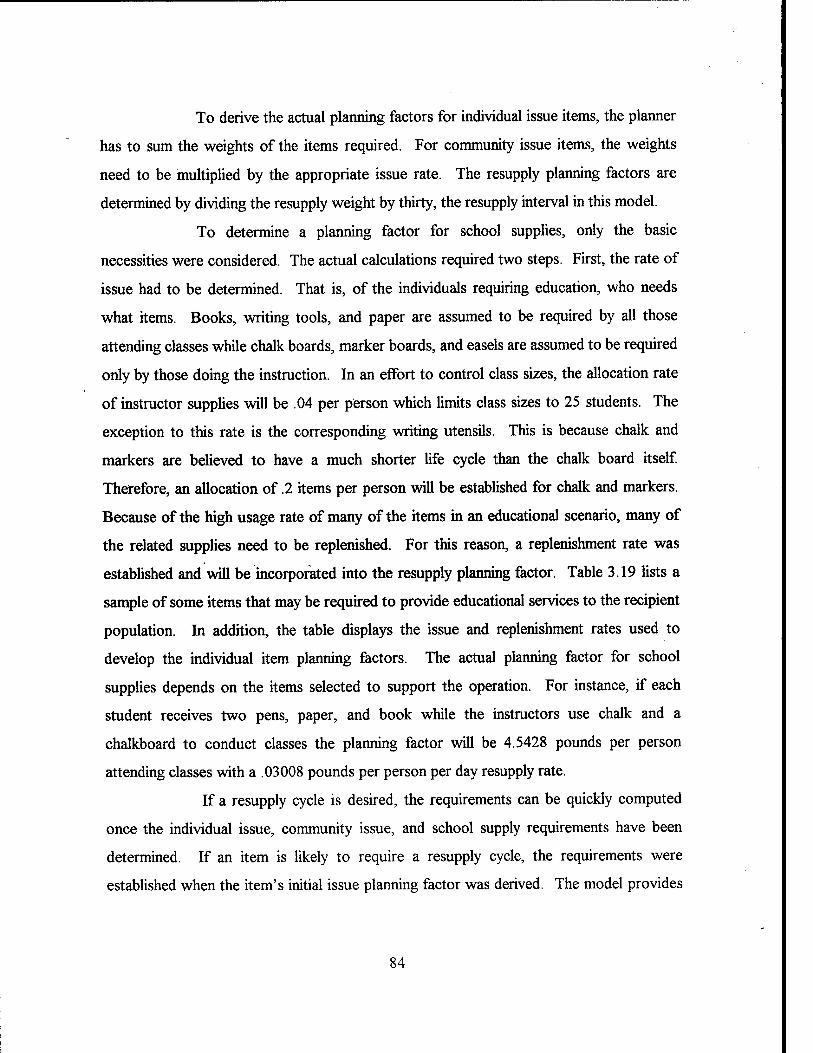
To derive the actual planning factors for individual issue items, the planner
has to sum the weights of the items required. For community issue items, the weights
need to be multiplied by the appropriate issue rate. The resupply planning factors are
determined by dividing the resupply weight by thirty, the resupply interval in this model.
To determine a planning factor for school supplies, only the basic
necessities were considered. The actual calculations required two steps. First, the rate of
issue had to be determined. That is, of the individuals requiring education, who needs
what items. Books, writing tools, and paper are assumed to be required by all those
attending classes while chalk boards, marker boards, and easels are assumed to be required
only by those doing the instruction. In an effort to control class sizes, the allocation rate
of instructor supplies will be .04 per person which limits class sizes to 25 students. The
exception to this rate is the corresponding writing utensils. This is because chalk and
markers are believed to have a much shorter life cycle than the chalk board itself.
Therefore, an allocation of .2 items per person will be established for chalk and markers.
Because of the high usage rate of many of the items in an educational scenario, many of
the related supplies need to be replenished. For this reason, a replenishment rate was
established and will be incorporated into the resupply planning factor. Table 3.19 lists a
sample of some items that may be required to provide educational services to the recipient
population. In addition, the table displays the issue and replenishment rates used to
develop the individual item planning factors. The actual planning factor for school
supplies depends on the items selected to support the operation. For instance, if each
student receives two pens, paper, and book while the instructors use chalk and a
chalkboard to conduct classes the planning factor will be 4.5428 pounds per person
attending classes with a .03008 pounds per person per day resupply rate.
If a resupply cycle is desired, the requirements can be quickly computed
once the individual issue, community issue, and school supply requirements have been
determined. If an item is likely to require a resupply cycle, the requirements were
established when the item's initial issue planning factor was derived. The model provides
84
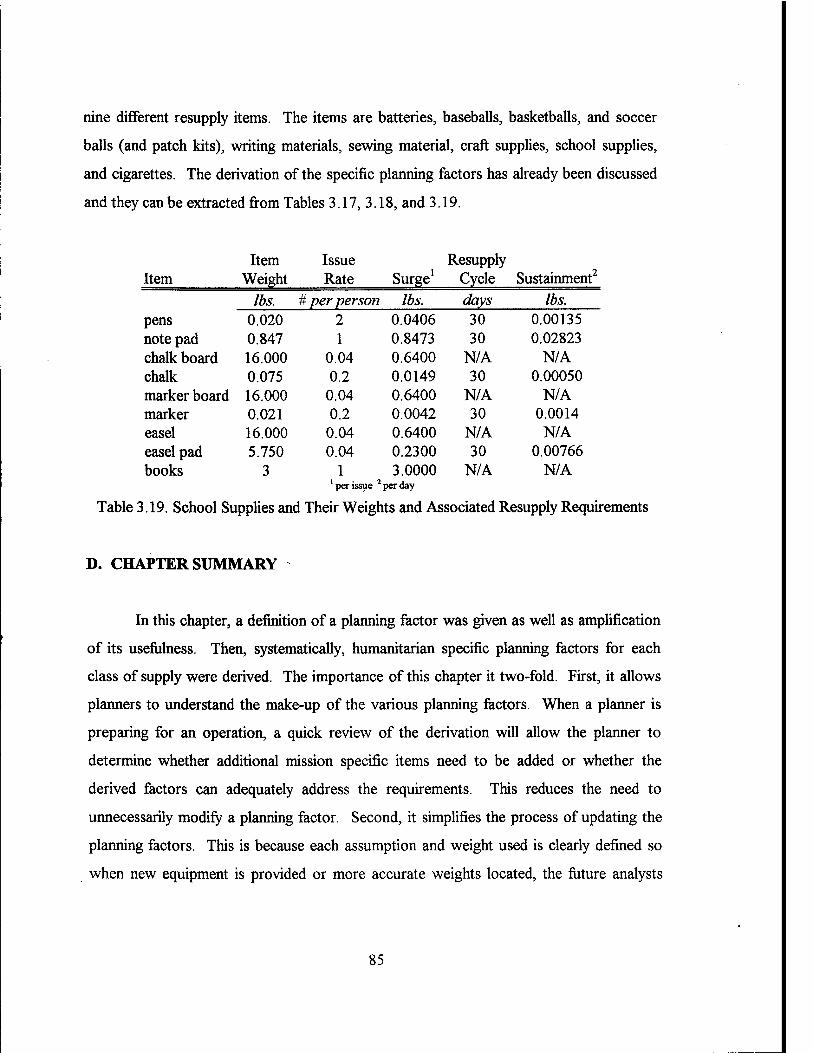
nine different resupply items. The items are batteries, baseballs, basketballs, and soccer
balls (and patch kits), writing materials, sewing material, craft supplies, school supplies,
and cigarettes. The derivation of the specific planning factors has already been discussed
and they can be extracted from Tables 3.17,3.18, and 3.19.
Item Issue Resupply Item Weight Rate Surge1 Cycle Sustainment2
lbs. # per person lbs. days lbs. pens 0.020 2 0.0406 30 0.00135 note pad 0.847 1 0.8473 30 0.02823 chalk board 16.000 0.04 0.6400 N/A N/A chalk 0.075 0.2 0.0149 30 0.00050 marker board 16.000 0.04 0.6400 N/A N/A marker 0.021 0.2 0.0042 30 0.0014 easel 16.000 0.04 0.6400 N/A N/A easel pad 5.750 0.04 0.2300 30 0.00766 books 3 1
'perissue 2 3.0000
per day N/A N/A
Table 3.19. School Supplies and Their Weights and Associated Resupply Requirements
D. CHAPTER SUMMARY
In this chapter, a definition of a planning factor was given as well as amplification
of its usefulness. Then, systematically, humanitarian specific planning factors for each
class of supply were derived. The importance of this chapter it two-fold. First, it allows
planners to understand the make-up of the various planning factors. When a planner is
preparing for an operation, a quick review of the derivation will allow the planner to
determine whether additional mission specific items need to be added or whether the
derived factors can adequately address the requirements. This reduces the need to
unnecessarily modify a planning factor. Second, it simplifies the process of updating the
planning factors. This is because each assumption and weight used is clearly defined so
when new equipment is provided or more accurate weights located, the future analysts
85

need only update the appropriate assumption or weight. All the derived planning factors
are summarized in Appendix H. The next chapter will attempt to show the derived
planning factors' validity.
86

IV. APPLICATION AND VALIDATION
A. BACKGROUND
In the process of validating a model, in this case a logistics decision support model,
one should ask "does the model offer informed judgment, decisions, or even descriptions?
More precisely, does it help, when due consideration is paid to the omissions,
approximations, communications effectiveness, and so on?" [Ref. 24: p. 45] Validation
can be very subjective. This is because validation depends on accurate and timely
operational data. If the data is incomplete, the model can not be effectively validated.
Unfortunately, some organizations choose approval over validation. That is, models are
declared valid because they support an organization's bureaucratic position.
This model can not be completely validated because of the lack of operational
data. However, sufficient operational data has been collected on Operation Sea Signal to
partially validate the model. The validation will only apply to the scenario described
herein. The methodology used to validate this model will be a direct comparison of the
values derived by the model against the actual consumption rate experienced during the
operation. Both the derivation of the values obtained by the model and the derivation of
the actual consumption rates will be explained to the reader.
B. THE SCENARIO
The data that will be used to validate a portion of this model was collected amidst
Operation Sea Signal in Guantanamo Bay, Cuba in November 1994. This operation
supports emigrant operations. That is, the operation is supporting the results of a man-
made disaster. The operating area is Guantanamo Bay, Cuba, a tropical climate, and the
operation is currently an extended duration operation. There were two populations being
supported, a Cuban population and a Haitian population. The size of the populations has
87
varied throughout the operation. However, the demographics remained fairly constant.
[Ref. 45] The breakdown of the Haitian population can be found in Table 4.1 while the
breakdown of the Cuban population can be found in Table 4.2. Both populations could be
classified nourished, although the Haitians are just above the undernourished category
indicating they require a lower calorie intake than the Cubans. Many individuals were
dehydrated when they first arrived, some were suffering from exposure, and some were
injured on their journey to Guantanamo Bay. The actual number of individuals that could
be classified as injured is unknown. All the emigrants were homeless and in need of
assistance. Finally, Guantanamo Bay was a functioning naval base, but the base's
infrastructure was not capable of supporting an additional 30,000 individuals indefinitely.
Therefore, the infrastructure could be classified damaged as the existing infrastructure
would require significant modification to adequately function with the enlarged
population.
Category Percentage Children below 3 5 Children 3-12 8 Females over 12 20 Males over 12 67
Table 4.1. Breakdown of Haitian Demographics
Category Percentage Children below 3 1 Children 3-12 6 Females over 12 18 Males over 12 75
Table 4.2. Breakdown of Cuban Demographics
88

C. ANALYSIS
Since the requirements for Class III and Class VII supplies are dependent on the
quantity of supplies required to support the population, they will be the last classes of
supply considered. All the other classes of supply will be considered in the same order as
the previous chapter. For each class of supply, the model's output will be derived first.
Then when possible, the actual consumption rate will be evaluated and compared to the
model's output. Any inconsistencies will be evaluated.
1. Class I - Subsistence
There are two ways that the model can derive the planning factors for Class I
supplies relevant to this operation. The first method uses just one planning factor for the
whole population. The primary fault of the first method is that it does not take into
account the population's demographics. Using this method assumes the whole population
consumes the same amount of calories, uses the same amount of water, requires the same
personal items, etc. If little is know about the population to be supported, this method
would suffice because the model's base planning factors do account for some variation
among the recipients. However, if the demographics of the population are known, this is
not an acceptable assumption. To compensate for this fault, the second method uses
weighted averages. That is, the requirements for each demographic group are determined
by the average requirements for each respective category. Then, the total requirements
are determined by averaging the various demographic group's requirements. Throughout
the validation process, examples of both methods will be used. Yet, the second
methodology will be used as the primary means to validate the model's planning factors.
The first step in validating the planning factors for Class I supplies is to evaluate
the nutritional status of the population. Since the opportunity to conduct weight/height
comparisons never presented itself, the nutritional status of the populations will be derived
from literature studies on populations found on the Internet and other automated reference
89

materials. The published average calorie consumption for the Cubans is 3,129 calories per
person per day while the average calorie consumption published for the Haitians is 2,005
calories per person per day. [Ref. 27] This data indicates the Cuban's caloric intake is at
the high end of the "normal" range while the Haitians requirements are at the lower end.
There are two reasons that explain the large variation in the caloric requirements of the
two populations. First, the literature indicates nearly 45 percent of the Haitian population
is comprised of children under the age of 15. Since the caloric requirements of children
are lower than adults, the larger percentage of children would drive the country's average
caloric requirements down. Second, Cuba has a much stronger economic base than Haiti.
Therefore, the Cubans have more money to spend on food. Using this background
information, the caloric requirements that are used for this operation are derived using a
minor modification of the recommended daily dietary allowance chart, Appendix C. That
is, the moderately active category is used to determine the caloric requirements for the
Cubans, but the category average is increased by ten percent to compensate for the
country's high consumption rate. The Haitian's caloric requirements, on the other hand,
are based on the sedentary category minus ten percent. Table 4.3 summarizes how the
modification was applied using a sample population, PT, of 10,000 Cubans with the
demographics described previously. Then, to apply the weighted averages method, the
final column, total calories required (7U), is summed and then divided by the population
total, PT. Resulting in a population average calorie consumption rate, C, of
C = CT/PT = 30,688,000/10,000 = 3068 (4.1)
calories per person per day. Now, placing this calorie requirement into the equation that
includes milk products developed in the previous chapter which converts calories into
pounds per person,
PP = 1.384 + . 00096C, (4.2)
results in
PP = 4.33 (4.3)
pounds per person per day.
90

Average Calorie Percent of Number.of Calorie Required Total Calories
Category Population Population Requirement Per Person Required Infants 1 100 1000 1100 110000 Children under 12 6 600 1600 1760 1056000 Women (over 12) 18 1800 2500 2750 4950000 Men (over 12) 75 7500 3000 3300 24750000
Table 4.3. Application of Weighted Averages to Determine Caloric Requirements of the Cuban Population
Applying the same techniques described above to derive the Haitian requirements
results in an average calorie requirement of 2054.7 calories per person per day or 3.36
pounds per person per day. Again, this quantity exceeds the published requirement
because the portion of the population under the age of 15 is lower for the population being
supported than for the nation as a whole. Interesting enough, both populations' planning
factors for consumption exceed the 2.2 pounds per person per day requirement which is
soon to be published in a document on emigrant operations. [Ref. 41]
To determine the actual subsistence consumption rate experienced during the
operation, work load reports from one of the kitchens were used. Unfortunately, the data
has many faults. First, the data was not in a usable unit of measure. For example, when
fruit was served, it was distributed by the case. When an item is identified by the case, it
required two conversions. The first conversion is from a case to servings per case; and,
the second conversion is from a serving to pounds per serving. Although requisitions,
menus, and the JTF's serving sizes from the operation were used to make the conversions,
there is no way to verify the conversions are 100 percent accurate. The second problem
with the data is it only addresses one population, the Cubans. Furthermore, only 50
percent of the Cuban population was serviced by this kitchen and the specific
demographics of the group is not known. Since no suitable data was located to address
the Haitians' consumption rate, it can not be validated. Although, it is known that all
demographic groups were serviced by this kitchen, the data does not include any food that
91
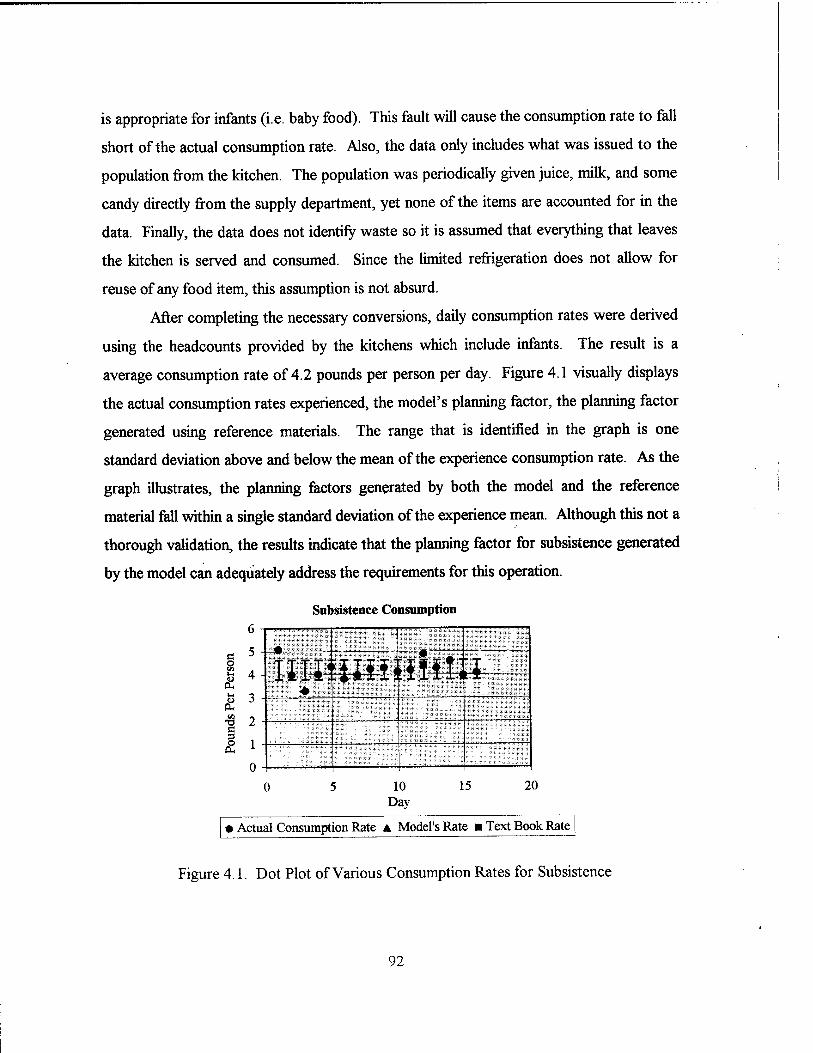
is appropriate for infants (i.e. baby food). This fault will cause the consumption rate to fall
short of the actual consumption rate. Also, the data only includes what was issued to the
population from the kitchen. The population was periodically given juice, milk, and some
candy directly from the supply department, yet none of the items are accounted for in the
data. Finally, the data does not identify waste so it is assumed that everything that leaves
the kitchen is served and consumed. Since the limited refrigeration does not allow for
reuse of any food item, this assumption is not absurd.
After completing the necessary conversions, daily consumption rates were derived
using the headcounts provided by the kitchens which include infants. The result is a
average consumption rate of 4.2 pounds per person per day. Figure 4.1 visually displays
the actual consumption rates experienced, the model's planning factor, the planning factor
generated using reference materials. The range that is identified in the graph is one
standard deviation above and below the mean of the experience consumption rate. As the
graph illustrates, the planning factors generated by both the model and the reference
material fall within a single standard deviation of the experience mean. Although this not a
thorough validation, the results indicate that the planning factor for subsistence generated
by the model can adequately address the requirements for this operation.
Subsistence Consumption
e o VI M
PU M
£ ■9 c s a
6 -i
5
4
3
2
1
0
t
TIT I *ilff< Ü1 v. J * ^p 9* J" »■» • .mi H I
0 10 Day
15 20
| • Actual Consumption Rate A Model's Rate ■ Text Book Rate
Figure 4.1. Dot Plot of Various Consumption Rates for Subsistence
92
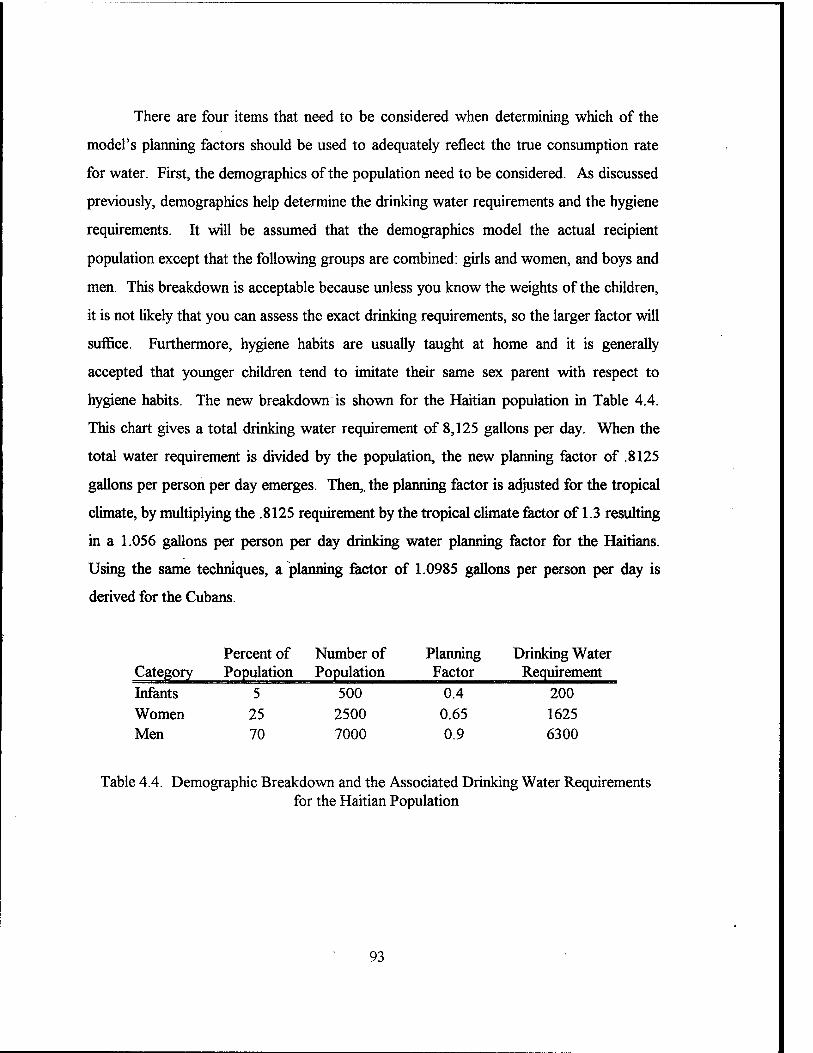
There are four items that need to be considered when determining which of the
model's planning factors should be used to adequately reflect the true consumption rate
for water. First, the demographics of the population need to be considered. As discussed
previously, demographics help determine the drinking water requirements and the hygiene
requirements. It will be assumed that the demographics model the actual recipient
population except that the following groups are combined: girls and women, and boys and
men. This breakdown is acceptable because unless you know the weights of the children,
it is not likely that you can assess the exact drinking requirements, so the larger factor will
suffice. Furthermore, hygiene habits are usually taught at home and it is generally
accepted that younger children tend to imitate their same sex parent with respect to
hygiene habits. The new breakdown is shown for the Haitian population in Table 4.4.
This chart gives a total drinking water requirement of 8,125 gallons per day. When the
total water requirement is divided by the population, the new planning factor of .8125
gallons per person per day emerges. Then,, the planning factor is adjusted for the tropical
climate, by multiplying the .8125 requirement by the tropical climate factor of 1.3 resulting
in a 1.056 gallons per person per day drinking water planning factor for the Haitians.
Using the same techniques, a planning factor of 1.0985 gallons per person per day is
derived for the Cubans.
Percent of Number of Planning Drinking Water Category Population Population Factor Requirement Infants 5 500 0.4 200 Women 25 2500 0.65 1625 Men 70 7000 0.9 6300
Table 4.4. Demographic Breakdown and the Associated Drinking Water Requirements for the Haitian Population
93
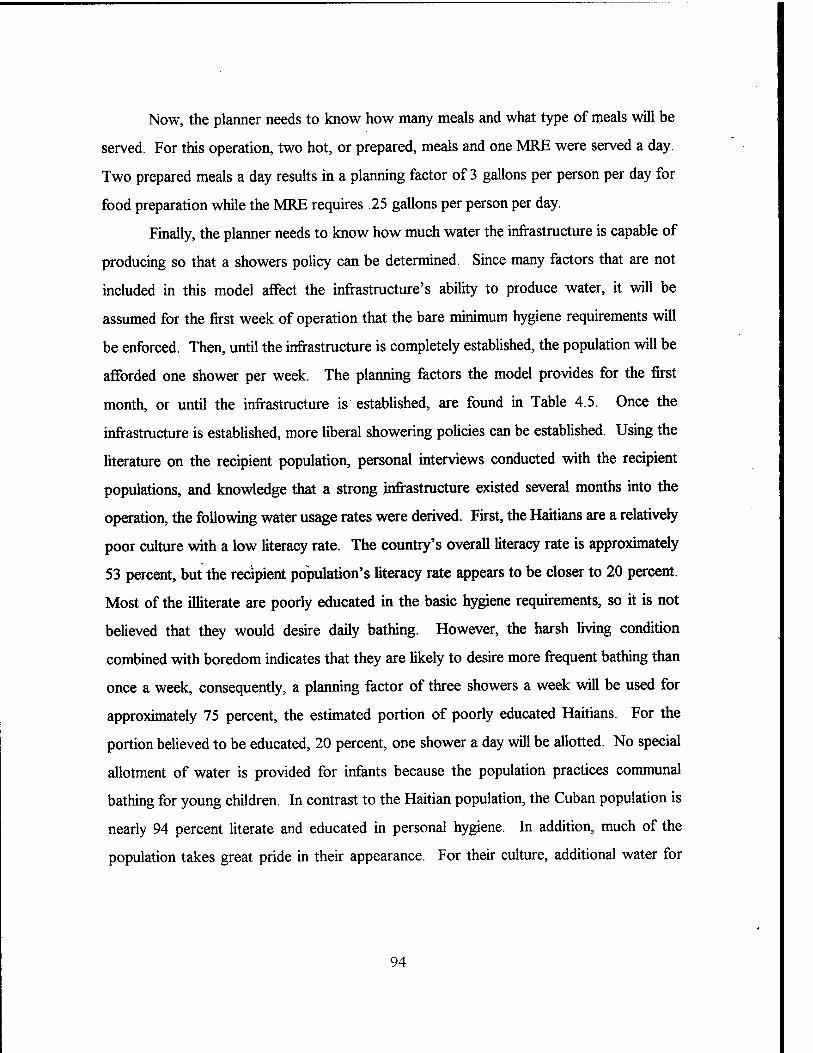
Now, the planner needs to know how many meals and what type of meals will be
served. For this operation, two hot, or prepared, meals and one MRE were served a day.
Two prepared meals a day results in a planning factor of 3 gallons per person per day for
food preparation while the MRE requires .25 gallons per person per day.
Finally, the planner needs to know how much water the infrastructure is capable of
producing so that a showers policy can be determined. Since many factors that are not
included in this model affect the infrastructure's ability to produce water, it will be
assumed for the first week of operation that the bare minimum hygiene requirements will
be enforced. Then, until the infrastructure is completely established, the population will be
afforded one shower per week. The planning factors the model provides for the first
month, or until the infrastructure is established, are found in Table 4.5. Once the
infrastructure is established, more liberal showering policies can be established. Using the
literature on the recipient population, personal interviews conducted with the recipient
populations, and knowledge that a strong infrastructure existed several months into the
operation, the following water usage rates were derived. First, the Haitians are a relatively
poor culture with a low literacy rate. The country's overall literacy rate is approximately
53 percent, but the recipient population's literacy rate appears to be closer to 20 percent.
Most of the illiterate are poorly educated in the basic hygiene requirements, so it is not
believed that they would desire daily bathing. However, the harsh living condition
combined with boredom indicates that they are likely to desire more frequent bathing than
once a week, consequently, a planning factor of three showers a week will be used for
approximately 75 percent, the estimated portion of poorly educated Haitians. For the
portion believed to be educated, 20 percent, one shower a day will be allotted. No special
allotment of water is provided for infants because the population practices communal
bathing for young children. In contrast to the Haitian population, the Cuban population is
nearly 94 percent literate and educated in personal hygiene. In addition, much of the
population takes great pride in their appearance. For their culture, additional water for
94
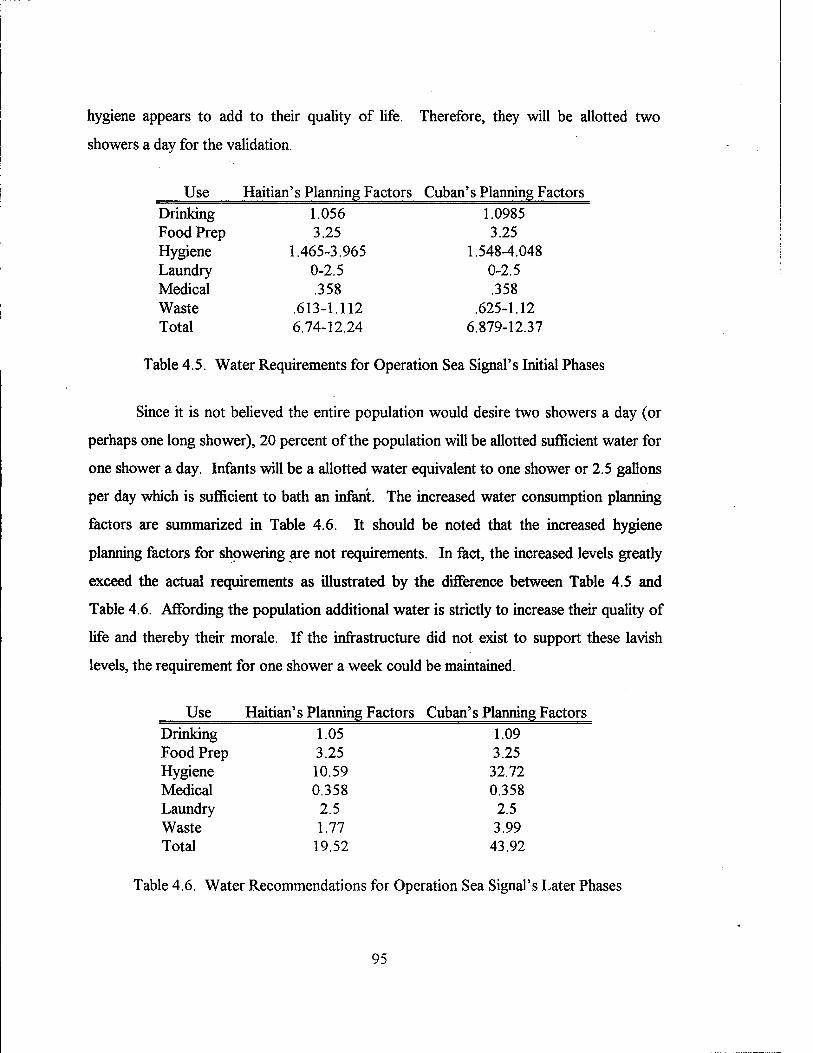
hygiene appears to add to their quality of life. Therefore, they will be allotted two
showers a day for the validation.
Use Haitian's Planning Factors Cuban's Planning Factors Drinking 1.056 1.0985 Food Prep 3.25 3.25 Hygiene 1.465-3.965 1.548-4.048 Laundry 0-2.5 0-2.5 Medical .358 .358 Waste .613-1.112 .625-1.12 Total 6.74-12.24 6.879-12.37
Table 4.5. Water Requirements for Operation Sea Signal's Initial Phases
Since it is not believed the entire population would desire two showers a day (or
perhaps one long shower), 20 percent of the population will be allotted sufficient water for
one shower a day. Infants will be a allotted water equivalent to one shower or 2.5 gallons
per day which is sufficient to bath an infant. The increased water consumption planning
factors are summarized in Table 4.6. It should be noted that the increased hygiene
planning factors for showering are not requirements. In fact, the increased levels greatly
exceed the actual requirements as illustrated by the difference between Table 4.5 and
Table 4.6. Affording the population additional water is strictly to increase their quality of
life and thereby their morale. If the infrastructure did not exist to support these lavish
levels, the requirement for one shower a week could be maintained.
Use Haitian's Planning Factors Cuban's Planning Factors _
3.25 32.72 0.358 2.5 3.99
43.92
Table 4.6. Water Recommendations for Operation Sea Signal's Later Phases
95
Drinking 1.05 Food Prep 3.25 Hygiene 10.59 Medical 0.358 Laundry 2.5 Waste 1.77 Total 19.52

To validate the planning factor for water, meter readings published by Guantanamo
Bay's Public Works Department were compared to the population size. The total water
consumed each day was broken into what was consumed by the Haitians and what was
consumed by the Cubans. Then, the consumption rates were compared with the
respective population total. The analysis provides two separate consumption rates, both
measured in gallons per person. The two rates were made possible because the two
populations were segregated and housed in separate camps throughout the operation.
After analyzing the data, a sample of 42 consecutive days, beginning on October 12, was
chosen. This sample was chosen because it was the only sample of the data where the
available data relating to population demographics and camp organization (including
which populations were housed in which camps) was also complete. There are a few
flaws with the data. First, the data is not broken down by specific use of the water;
therefore, only one daily consumption rate which includes all the uses could be attained for
each population. Secondly, it does not cover the entire operation so only the sustainment
rate can be validated. A summary of the sample data can be found in Table J. 1 in
Appendix J.
Once the data sample was converted into daily consumption rates, the daily
consumption rates were averaged and basic data analysis techniques were applied to the
sample. The results of the analysis show that the average water consumption rate
experienced during the sample period of the operation was 18.71 gallons per person per
day for the Haitians with a standard deviation of 6.31. The average consumption rate
experienced during the operation was compared with the water consumption planning
factor generated by the model for Sea Signal's later phases, 19.52, since the sample data is
dated almost three months into the operation. A dot plot of the daily consumption rates
experienced during the operation as well as the rate predicted by the model can be found
in Figure 4.2 to visually display the results. As the figure illustrates, the model's planning
factor of 19.52 can certainly satisfy the aggregate water requirements as it only exceeds
the actual consumption rate by .81 gallons per person per day which is well within a single
96
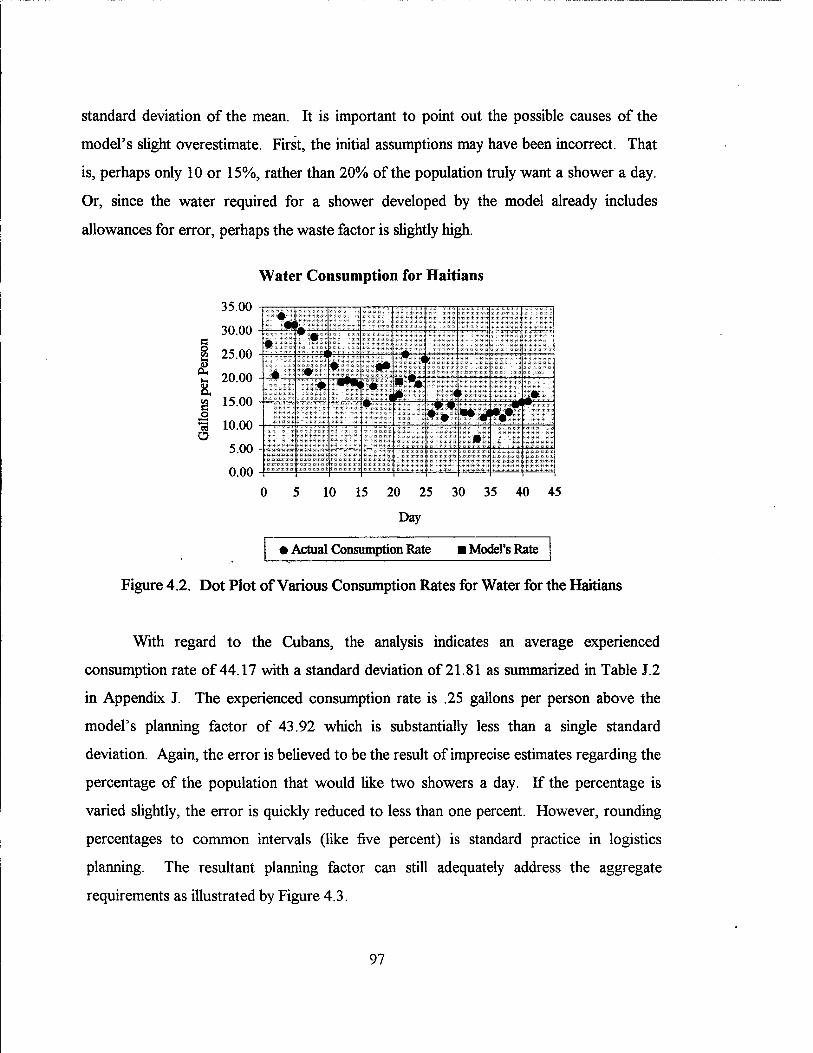
Standard deviation of the mean. It is important to point out the possible causes of the
model's slight overestimate. First, the initial assumptions may have been incorrect. That
is, perhaps only 10 or 15%, rather than 20% of the population truly want a shower a day.
Or, since the water required for a shower developed by the model already includes
allowances for error, perhaps the waste factor is slightly high.
Water Consumption for Haitians
35.00
30.00
g 25.00
t 20.00
g 15.00
=3 10.00 o
5.00
0.00
iris • fill
0 1P111 ill! •• • * ►
• • • ■ •• < Hill py
•—i • • •• *4V^
•
10 15 20 25 30 35 40 45
Day
• Actual Consumption Rate I Model's Rate
Figure 4.2. Dot Plot of Various Consumption Rates for Water for the Haitians
With regard to the Cubans, the analysis indicates an average experienced
consumption rate of 44.17 with a standard deviation of 21.81 as summarized in Table J.2
in Appendix J. The experienced consumption rate is .25 gallons per person above the
model's planning factor of 43.92 which is substantially less than a single standard
deviation. Again, the error is believed to be the result of imprecise estimates regarding the
percentage of the population that would like two showers a day. If the percentage is
varied slightly, the error is quickly reduced to less than one percent. However, rounding
percentages to common intervals (like five percent) is standard practice in logistics
planning. The resultant planning factor can still adequately address the aggregate
requirements as illustrated by Figure 4.3.
97

Water Consumption for Cubans
§ t-i <D
OH
Ö a t» s o
140.00 120.00 100.00 80.00 60.00 40.00 20.00
0.00 4
__ 1 j— _, ■ ;;| » :
'■■"■'•• :/' • — ■ ' ' ■■ "' • ■ " — —
0 5 10 15 20 25 30 35 40 45
Day
• Actual Consumption Rate ■ Model's Rate
Figure 4.3. Dot Plot of Various Consumption Rates for Water for the Cubans
To determine the planning factor for, utensils, the planner needs to know how many
prepared meals will be served and what type of menu items will be served. As stated
before, two prepared meals will be served. The remaining meal, a MRE, already has
utensils supplied so it does not heed to be considered. After reviewing the menus, it was
determined that for the breakfast a plate, napkin, cup, knife, and spoon would be required.
For the evening meal, a plate, napkin, and a fork appear to be sufficient. Adding the
planning factors for the various utensils required for each meal, see Table H.7 in Appendix
H, results in a planning factor of .0859 pounds per person for the morning meal and a
planning factor of .0595 pounds per person for the evening meal. The end result is a
planning factor of .1454 pounds per person per day for utensils with one exception.
Children under 3 do not need knives because it is assumed their parents will help them, so
.0167 pounds is deducted from the adult planning factor resulting in .1287 pounds per
person per day for this demographic group. Then, using weighted averages results in a
planning factor of .14 pounds per person per day for the Haitians and .145 pounds per
person for the Cubans.
98
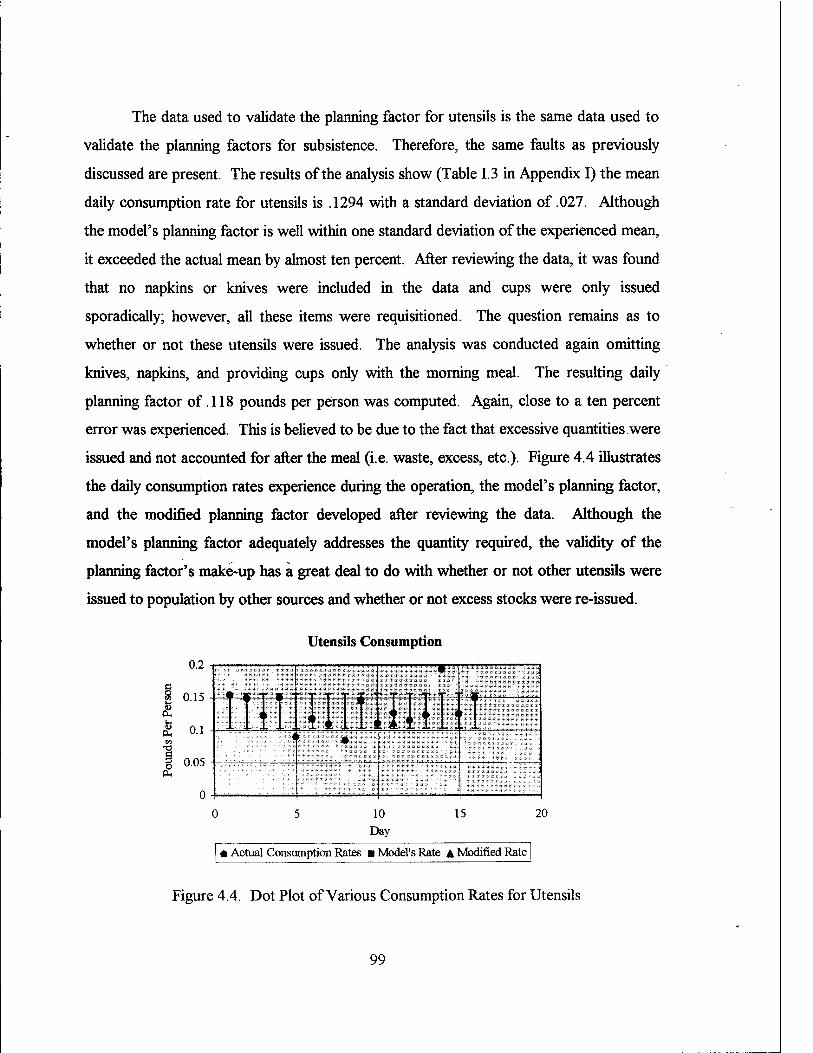
The data used to validate the planning factor for utensils is the same data used to
validate the planning factors for subsistence. Therefore, the same faults as previously
discussed are present. The results of the analysis show (Table 1.3 in Appendix I) the mean
daily consumption rate for utensils is .1294 with a standard deviation of .027. Although
the model's planning factor is well within one standard deviation of the experienced mean,
it exceeded the actual mean by almost ten percent. After reviewing the data, it was found
that no napkins or knives were included in the data and cups were only issued
sporadically; however, all these items were requisitioned. The question remains as to
whether or not these utensils were issued. The analysis was conducted again omitting
knives, napkins, and providing cups only with the morning meal. The resulting daily
planning factor of. 118 pounds per person was computed. Again, close to a ten percent
error was experienced. This is believed to be due to the fact that excessive quantities were
issued and not accounted for after the meal (i.e. waste, excess, etc.). Figure 4.4 illustrates
the daily consumption rates experience during the operation, the model's planning factor,
and the modified planning factor developed after reviewing the data. Although the
model's planning factor adequately addresses the quantity required, the validity of the
planning factor's make-up has a great deal to do with whether or not other utensils were
issued to population by other sources and whether or not excess stocks were re-issued.
§
0.2
0.15 0u
£ 0.1
0.05
Utensils Consumption
• X T M " t T T T T V
■"!"■.» "'
T T T T " ..—;■■■
HI'. .Ik:,, ihh > < •
10 Day
15 20
• Actual Consumption Rates ■ Model's Rate A Modified Rate
Figure 4.4. Dot Plot of Various Consumption Rates for Utensils
99
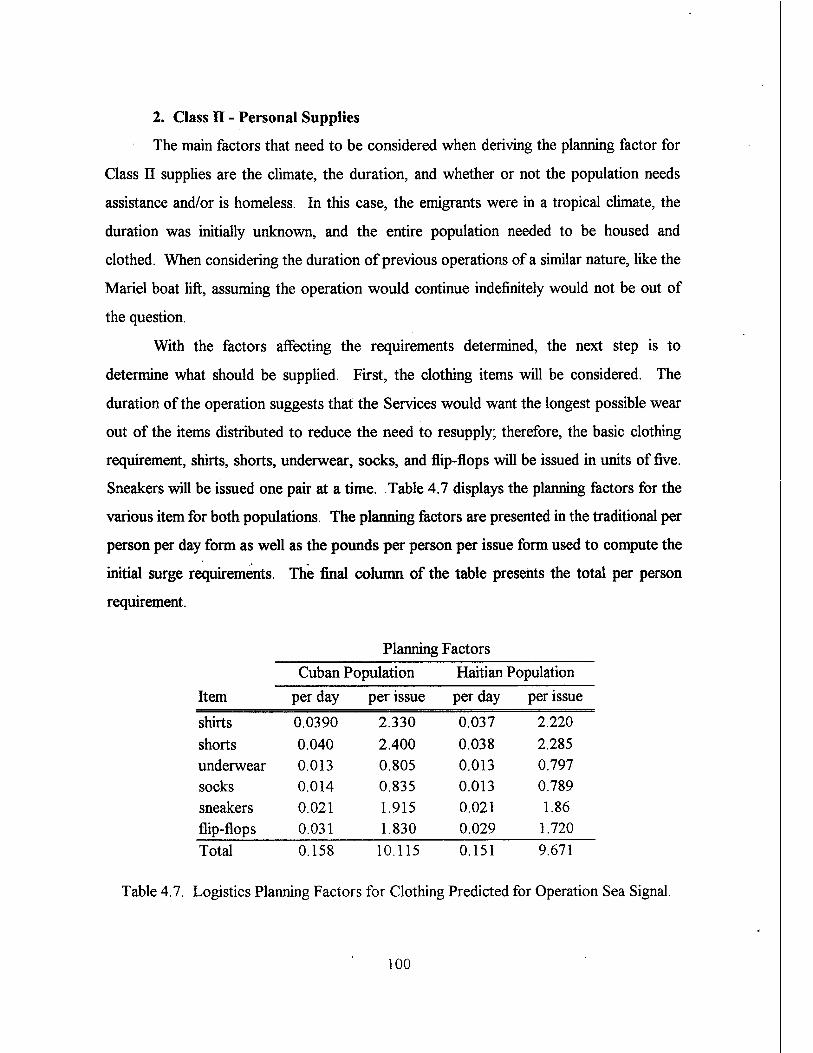
2. Class II - Personal Supplies
The main factors that need to be considered when deriving the planning factor for
Class II supplies are the climate, the duration, and whether or not the population needs
assistance and/or is homeless. In this case, the emigrants were in a tropical climate, the
duration was initially unknown, and the entire population needed to be housed and
clothed. When considering the duration of previous operations of a similar nature, like the
Mariel boat lift, assuming the operation would continue indefinitely would not be out of
the question.
With the factors affecting the requirements determined, the next step is to
determine what should be supplied. First, the clothing items will be considered. The
duration of the operation suggests that the Services would want the longest possible wear
out of the items distributed to reduce the need to resupply; therefore, the basic clothing
requirement, shirts, shorts, underwear, socks, and flip-flops will be issued in units of five.
Sneakers will be issued one pair at a time. Table 4.7 displays the planning factors for the
various item for both populations. The planning factors are presented in the traditional per
person per day form as well as the pounds per person per issue form used to compute the
initial surge requirements. The final column of the table presents the total per person
requirement.
Planning Factors Cuban Population Haitian Population
Item per day per issue per day per issue
shirts 0.0390 2.330 0.037 2.220
shorts 0.040 2.400 0.038 2.285 underwear 0.013 0.805 0.013 0.797 socks 0.014 0.835 0.013 0.789 sneakers 0.021 1.915 0.021 1.86 flip-flops 0.031 1.830 0.029 1.720 Total 0.158 10.115 0.151 9.671
Table 4.7. Logistics Planning Factors for Clothing Predicted for Operation Sea Signal.
100
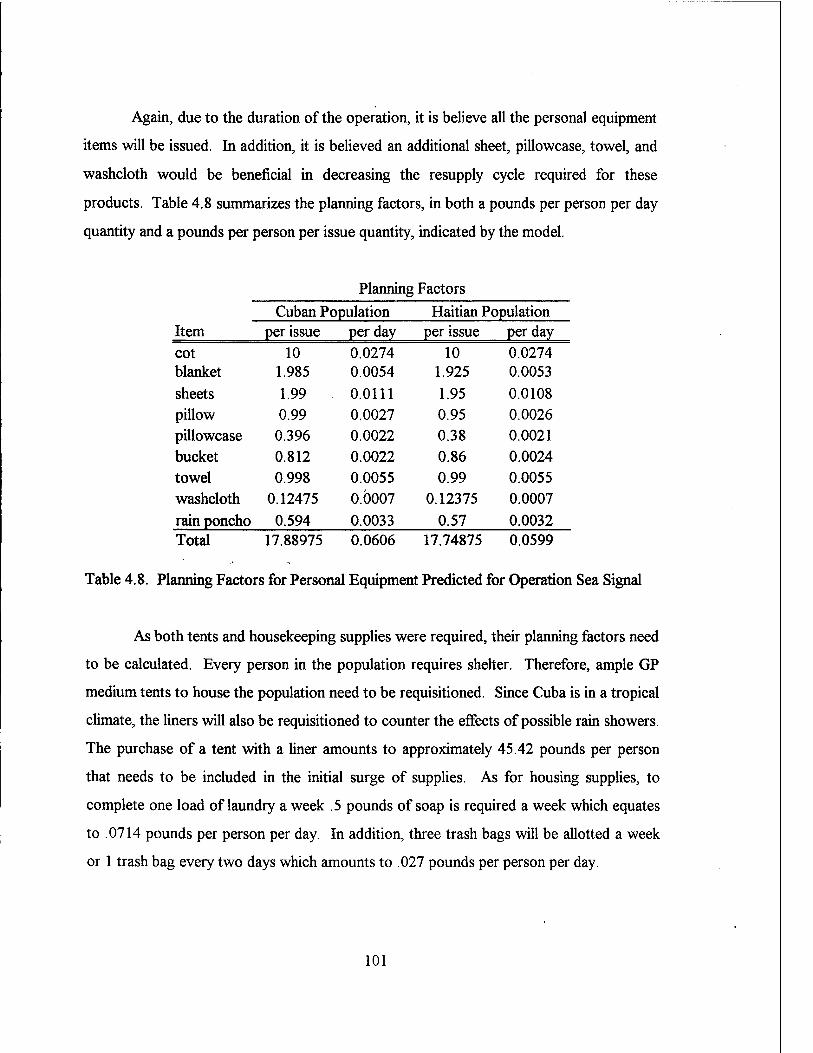
Again, due to the duration of the operation, it is believe all the personal equipment
items will be issued. In addition, it is believed an additional sheet, pillowcase, towel, and
washcloth would be beneficial in decreasing the resupply cycle required for these
products. Table 4.8 summarizes the planning factors, in both a pounds per person per day
quantity and a pounds per person per issue quantity, indicated by the model.
Planning Factors
Cuban Population Haitian Population Item per issue per day per issue per day cot 10 0.0274 10 0.0274 blanket 1.985 0.0054 1.925 0.0053 sheets 1.99 0.0111 1.95 0.0108 pillow 0.99 0.0027 0.95 0.0026 pillowcase 0.396 0.0022 0.38 0.0021 bucket 0.812 0.0022 0.86 0.0024 towel 0.998 0.0055 0.99 0.0055 washcloth 0.12475 0.0007 0.12375 0.0007 rain poncho 0.594 0.0033 0.57 0.0032 Total 17.88975 0.0606 17.74875 0.0599
Table 4.8. Planning Factors for Personal Equipment Predicted for Operation Sea Signal
As both tents and housekeeping supplies were required, their planning factors need
to be calculated. Every person in the population requires shelter. Therefore, ample GP
medium tents to house the population need to be requisitioned. Since Cuba is in a tropical
climate, the liners will also be requisitioned to counter the effects of possible rain showers.
The purchase of a tent with a liner amounts to approximately 45.42 pounds per person
that needs to be included in the initial surge of supplies. As for housing supplies, to
complete one load of laundry a week .5 pounds of soap is required a week which equates
to .0714 pounds per person per day. In addition, three trash bags will be allotted a week
or 1 trash bag every two days which amounts to .027 pounds per person per day.
101
There are many reasons why the actual consumption rate of this class of supply can
not be reviewed. Class II items were issued on board the ships as the emigrants were
taken aboard, as the emigrants were being entered into the Deployable Mass Population
Identification and Tracking System, and within the camps in which they were assigned to
live. Furthermore, very little evidence was found indicating that tracking of these items
occurred. It is believed that the huge influx of emigrants is the reason little tracking was
found. In addition, civilian organizations augmented the Class II requirements, but no
tracking of the items occurred. There was no way to identify if all the items were
distributed to the recipient population or not. In fact, there were many instances when
entire shipments had to be disposed of because they were exposed to the weather and yet
no written documentation was located.
Each person was supposed to receive a sundry pack that includes Class II and
Class VI items when entering a camp. The Class II items include: a towel, a washcloth, a
gallon bucket, a soap dish, a toothbrush holder, a laundry bag, two sheets, a blanket, a
pillow, a pillowcase, two shirts, two pairs of shorts, and a pair of flip-flops. Upon
interviewing the emigrants, it was found that they were also issued undergarments and
additional shirts. There was a great deal of diversity in the clothing found in the various
camps indicating a great deal of contributions from the civilian organizations. The only
requests that were solicited for the populations were for shoes, socks, and size specific
items.
The only conclusion that could be drawn is that items provided by this model are
similar to those actually used in Operation Sea Signal. The noted exceptions are that the
model does not provide a soap dish, a toothbrush holder, and a laundry bag. None of
these items are believed to be absolute necessities. For instance, the recipient population
does not have enough clothing to warrant a laundry bag. Furthermore, the bucket or
washbasin can be used for storing the toothbrush and soap. However, including these
items is certainly not unreasonable. The validity of the actual planning factor will remain
unknown until actual data can be obtained.
102

3. Class VI - Hygiene Items
To derive the planning factor for Class VI that is applicable to operation Sea
Signal, only two factors will be considered. First, the duration of the operation has
already been established as indefinite so it will be assumed the JTF will be tasked to
provide the population with the necessary products to maintain their personal hygiene. As
stated before, each demographic group requires different hygiene products so the
population make-up should also be reviewed when determining the hygiene requirements.
Using weighted averages on the requirements for each demographic group results in a
planning factor of .1605 pounds per person per day for the Cuban population and .1572
pounds per person per day for the Haitian population. To establish the initial surge
requirements, these planning factors will be multiplied by 30, a resupply cycle that can be
used. The resulting planning factors are 4.8135 pounds per person per issue (per month)
for the Cubans and 4.7162 pounds per person for the Haitians.
For many of the same reasons discussed when attempting to verify the Class II
planning factors, the Class VI planning factors developed by the model could not be
validated. Again, all that can be said is that the items that were provided to the population
are similar to the ones contained in this model. In addition, Operation Sea Signal planners
also provided the victim population with body lotion. Since lotion is not considered a
necessity it is not included in the model but, as stated previously, the model is developed
to give the planners a logical place to begin logistics planning for humanitarian operations
and it is at the logisticians' and Commanders' discretion to augment the basics
requirements as they deem necessary.
4. Class Vin - Medical Supplies
To derive the medical requirements for this operation a few questions should be
asked. First, what level of medical services will be provided to the population?
Considering the general isolation of the recipient population from civilian medical
facilities, it is assumed the Services will be tasked to render all medical care to the victim
103
population. The second question that needs to be asked is; What is the general health
status of the recipient population? Although a small portion of the populationwas injured
or suffering from exposure when they were received in Cuba, the majority of the victims
were in good health. The general good health of the recipient population, indicates that
the maximum of .02 beds per person would be excessive for this operation.
Unfortunately, the exact percentage of the population that was injured is unknown;
therefore it will be assumed that less than 20% of the population secured in Cuba received
injuries during their journey. This assumption would establish a bed allotment rate of .005
beds per person. Maintaining the same basic quantity of supplies per hospital bed of
70.566 pounds, the quantity of medical supplies required per person would be .3528
pounds per day. For the infants being supported, the planning factor would be increased
to 1.1028 pounds per infant per day. These planning factors would apply to both
populations being supported by Operation Sea Signal. Applying the weighted average
technique described previously results in a, population specific planning factor of .3603
pounds per person per day for the Cuban population and .3857 pounds per person per day
for the Haitian population.
To support the medical requirements for the operation, two Air Transportable
Hospitals (ATHs) were deployed. At the time the two hospitals were deployed, the
population being supported was approaching 30,000. Each hospital contains 50 beds
which provided a total of 100 hospital beds that were dedicated to the support of the
emigrants. [Ref. 46] This equates to a hospital bed allocation rate of approximately .003
or 3 beds for every 1000 people. Although this figure is lower than the figure predicted by
the model, it is important to note that there is a fully functional hospital on the base that
was also assisting with medical services. The exact extent of the base hospital's
participation is unknown; however, only 50 additional beds would have to be available to
meet the .005 beds per person allocation rate identified by the model.
In an attempt to determine the actual consumption of medical supplies, the initial
load lists for the ATHs were obtained. The initial load lists are supposed to contain
104

enough supplies to operate for thirty days. [Ref. 43] Therefore, the total supplies shipped
should be divided by 150 (50 beds x 30 days of supply) to obtain a per bed requirement
for medical supplies. The problem that was encountered is that the cargo included in the
deployment shipments varied throughout the course of the deployment. That is, the
predicted supplies in each ATH cargo increment differed from the line item description
which varied from the supplies that were declared with the customs agents. Since the
listing of the customs declarations is the last step until the deployment was complete these
are the figures that were used. The customs forms identify 139,460 pounds of medical
supplies which equates to 92.97 pounds of medical supplies per hospital bed. Under the
assumption that the hospital does not augment the ATHs (the worst case scenario), the
ATHs provide .2789 pounds per person per day. Any assistance the ATHs receive from
the hospital will increase this planning factor. Unfortunately, the extent to which the
hospital augmented the ATHs is unknown. All that can be said regarding the validity of
the planning factors derived by the model is that, although excessive, they appear to
address the needs of the recipient population. They resultant excess in supplies amount to
approximately .1068 pounds per person per day for the Haitians and .0817 pounds per
person for the Cubans. Fortunately, resupply lines for medical supplies are determined by
actual usage rates, so it is believed that excess can be addressed expediently.
5. Class X - Humanitarian Specific Items
Since Operation Sea Signal is an extended duration operation and the population is
not free to move about, there is an obvious need for Class X items. The requirements for
the Cuban population will be established first; then the Haitian requirements will be
computed. The first step in determining the requirements is to decide what items will be
distributed. Because of the high probability of restlessness within the Cuban population, it
is assumed all possible Class X items will be considered.
Primarily because of the excessive duration of the operation, the individual issue
items that will be allotted are a radio, writing materials, playing cards, board games, a
Bible, and cigarettes. Again, cigarettes will be issued to the portion of the population that
105

equates to the size of the male population, Bibles will only be issued to the adults, and the
other items will be issued to all but the infants in the population. To compute the planning
factor, the total weight required for each of the items is calculated. For example, for a
population size of 10,000 with demographics similar to the Cuban population found in
Guantanamo Bay, 1042.5 pounds of cigarettes are required. Continuing these calculations
results in the following weights: 24,180 pounds of Bibles, 11,880 pounds of board games,
8781.3 pounds of writing materials, 1237.5 pounds of playing cards, and 14,751 pounds
of radios. When these six weights are summed together and divided by the population
size, the planning factor associated with individual issue items results. This planning
factor is 6.1872 pounds per person. The corresponding resupply requirement is .0393
pounds per person per day.
To calculate the planning factor for community issue items, the weights of each
community issue item are summed then multiplied by the allocation rate. The total weight
of the supplies being considered is 345.8440 pounds. Multiplying this figure by the
allocation rate of .004, one per every 250 personnel supported, results in a 1.3834 pounds
per person planning factor. Using the same calculations, the resupply rate of .1514
pounds is derived. By dividing by the resupply cycle of thirty days, the sustainment rate of
.0050 pounds per person per day results.
Approximately fifteen percent of the population is between the ages of six and
eighteen, so it is assumed that school supplies will be considered for fifteen percent of the
population. The specific items that will be considered are books, writing utensils, paper,
chalk boards, and chalk. Each item's planning factor can be extracted from Table H.20 in
Appendix H and summed. This equates to a surge requirement of 4.5428 pounds per
student and a sustainment quantity of .03008 pounds per student. These planning factors
can then be converted to a pounds per person planning factor by determining the total
weight requirement of the school supplies and then dividing the weight by the population
size. Using the arbitrary population size of 10,000, there are 1500 anticipated students.
These students require a total of 6814.2 pounds of school supplies. Dividing by the
106

population size of 10,000 results in a planning factor of .6814 pounds per person per day
which can be applied to the whole population. Similarly, the sustainment requirement for
school supplies would be .0045 pound per person per day.
The total resupply requirement can be computed by summing the three resupply
quantities previous discussed. The total resupply requirement that is calculated for Class
X supplies is .04880 pounds per person per day. Finally, to determine the total surge
planning factor for Class X items, all the surge quantities are totaled for a 8.2520 pounds
per person surge requirement.
Using the same calculations, the Class X planning factors for the Haitian
population were derived. The individual items required amount to 5.8720 pounds per
person with a sustainment requirement of .0375 pounds per person per day. It is assumed
that the community issue items will be distributed at a lower rate then the one used to
determine the requirements for the Cuban population. This assumption is based on the
educational level of the Haitians. Due to the lower educational level, it is believed less
outside stimulation is required to reduce the probability of the population experiencing
boredom. So, an allocation rate of one item per 500 supported personnel will be used
which amounts to a .6917 pounds per person surge requirement and a .0025 pounds per
person per day sustainment requirement. Approximately twenty percent of the Haitian
population is school age. Allotting the same school supplies to the Haitians as was
allotted to the Cubans results in a .9085 pounds per person planning factor for the surge
and .0060 pounds per person per day for sustainment. When all these planning factors are
combined, the Class X planning factors for the Haitian population are completed. The
planning factors are 7.4818 pounds per person for surge and .0461 pounds per person per
day for sustainment.
It was very difficult to identify any correlation between the model's planning
factors and the actual consumption rates for Class X items for three reasons. First,
although the data contained all the items and quantities that were purchased, it did not
provide the weights of the items. Secondly, Operation Sea Signal did not establish a
107
resupply cycle for Class X items, so the surge rate that was experienced greatly exceeds
the surge rate identified by the model. For example, the number of soccer balls that would
be purchased using the six per 250 supported Cubans allocation rate described previously
would amount to 566.4 soccer balls. During the operation, 750 soccer balls were
purchased for the Cubans. Adding the equivalent of a single month's sustainment rate of
soccer balls, 188.8 balls, fills the gap nicely; however, each successive month's
replenishment rate will rapidly exceed the amount actually purchased. Since the actual
intentions of the Commander are unknown, there is no way to identify a relationship
between the actual requirements and the model's output.
Finally, although some tracking of the supplies occurred in the theater, not all the
purchased items could be traced to the hands of the intended population. Moreover, there
is no way to tell whether the items were actually used or if shortfalls of certain items
occurred. For example, 210 sewing machines were actually ordered to support the Cuban
population, but after completing tours of the Cuban camps only 10 sewing machines were
actually found in operation.
The items that were actually purchased also include many toys and musical
instruments which were not built into this model. The uniqueness of this operation
appears to be the driving force for such items. Although the need for these items is not
believed to be the norm, operations specific items that are required can be provided by this
model if the planner has the applicable shipping weights. No further analysis was
conducted since the shipping Weights of the items were not available.
6. Class IV - Construction Materials
During Operation Sea Signal, the entire population was completely dependent on
the Services. For the analysis, a Cuban population of 23,600 people and a Haitian
population of 11,700 people will be used. Since the infrastructure was unable to support
the size of the population, the Services had to build housing, latrines, and kitchens.
Medical facilities were also required, but the Services chose to use deployable assets.
Therefore, no construction materials for medical facilities will be considered.
108
The first area that will be considered is housing. Because of the large quantity of
excess tents located while touring the operational area, it will be assumed that tent
maintenance will be conducted. So, an allotment of 545 pounds, the weight of a GP
Medium tent, will be provided for every 600 people. This amounts to approximately
.9083 pounds per person. Since the operation was conducted in a tropical climate, no
considerations for heating equipment are required. Finally, considerations for barrier
material are required because the population was being housed on a United States military
installation and the supported personnel are not U.S. citizens. Including the 56 pounds
per person allotment for barrier materials the total per person planning factor for housing
is 56.9083. No replenishment cycle will be considered.
The Services were also tasked to provide the emigrants restrooms, bathing
facilities, and kitchen services. Using the allocation rates described in the previous
chapter, 1180 port-o-lets and 48 shower stalls are required to support the Cuban
population. To support the Haitians, only 585 port-o-lets and 24 shower stalls are
required. The calculation of the associated planning factor is simply a matter of
multiplying the required number of port-o-lets by the weight of a port-o-let (including 30
days of chemicals) and dividing by the size of the supported population. Similarly, the
required number of shower stalls is multiplied by the weight of a shower stall and divided
by the size of the supported population. Then, the two values are added together. In the
case of the Cuban population, the planning factor for latrines is 13.5571 pounds per
person. That is, 10.50625 pounds per person is required for toilet facilities and 3.0508
pounds per person for showers. The latrine planning factor for the Haitians is 13.5832
pounds per person. Because the chemicals in the port-o-lets must be replaced on a weekly
basis, a resupply rate of .0035 pounds per person per day will also be established. Finally,
kitchen services require an allotment of six pounds per person.
Using the gross planning factors identified in Chapter 3, the total square footage
required for storage, 86626.2 square feet, can be obtained by summing the two square
footage columns in Table 4.9. Then, by dividing the total required storage space by the
109
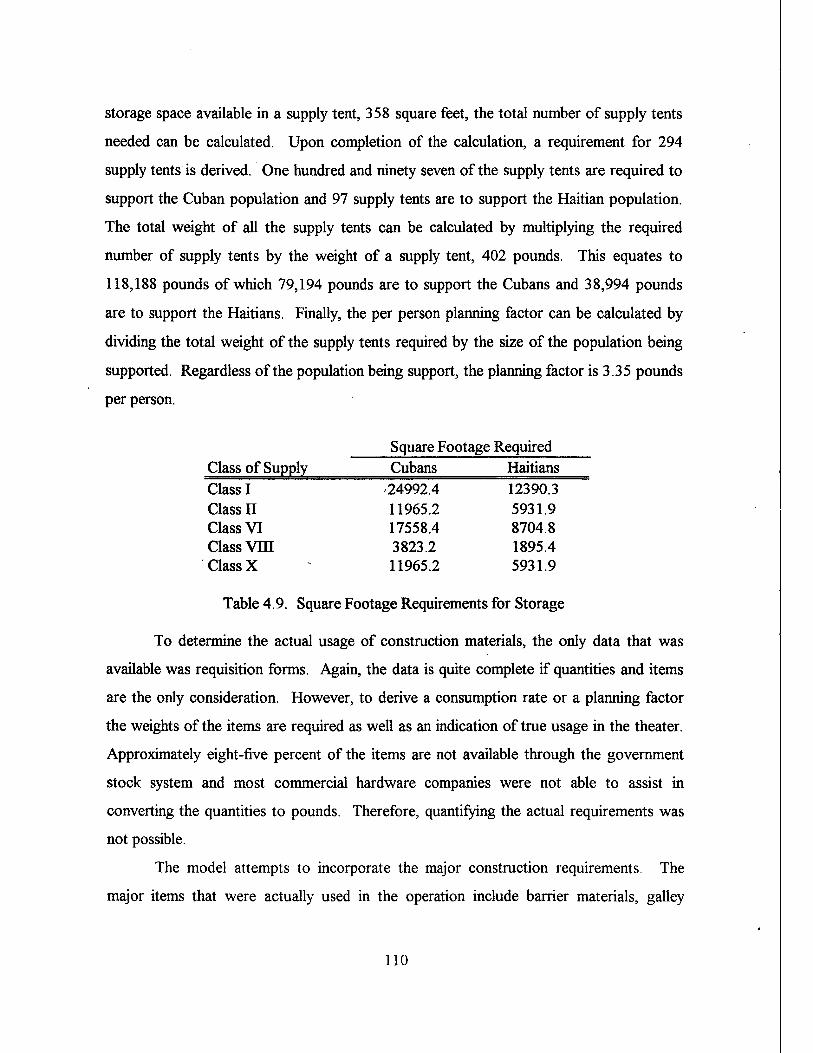
storage space available in a supply tent, 358 square feet, the total number of supply tents
needed can be calculated. Upon completion of the calculation, a requirement for 294
supply tents is derived. One hundred and ninety seven of the supply tents are required to
support the Cuban population and 97 supply tents are to support the Haitian population.
The total weight of all the supply tents can be calculated by multiplying the required
number of supply tents by the weight of a supply tent, 402 pounds. This equates to
118,188 pounds of which 79,194 pounds are to support the Cubans and 38,994 pounds
are to support the Haitians. Finally, the per person planning factor can be calculated by
dividing the total weight of the supply tents required by the size of the population being
supported. Regardless of the population being support, the planning factor is 3.35 pounds
per person.
Square Footage Required Class of Supply Cubans Haitians Class I -24992.4 12390.3 Class H 11965.2 5931.9 Class VI 17558.4 8704.8 Class Vffl 3823.2 1895.4 Class X 11965.2 5931.9
Table 4.9. Square Footage Requirements for Storage
To determine the actual usage of construction materials, the only data that was
available was requisition forms. Again, the data is quite complete if quantities and items
are the only consideration. However, to derive a consumption rate or a planning factor
the weights of the items are required as well as an indication of true usage in the theater.
Approximately eight-five percent of the items are not available through the government
stock system and most commercial hardware companies were not able to assist in
converting the quantities to pounds. Therefore, quantifying the actual requirements was
not possible.
The model attempts to incorporate the major construction requirements. The
major items that were actually used in the operation include barrier materials, galley
110

equipment, port-o-lets, and shower materials. The model contains all these items.
However, the degree of accuracy in the derived planning factors is unknown. Upon
further validation, any inconsistencies in the derived planning factors can be corrected.
7. Class Vm - Support Equipment and Class m - POL
Once all the material requirements have been determined, the planning factor for
support equipment can be calculated. Calculating the number of vehicles required to
handle the surge should provide the maximum number of vehicles required at any one time
during the operation. Up to this point, 3,699.0286 tons of supplies have been identified to
support the Cuban population and 1660.0537 short tons of supplies have been identified to
support the Haitian population. These values include thirty days of supply. The actual
number of vehicles in the theater is heavily dependent on the operating environment. That
is, how far do the vehicles have to travel, how fast will they travel, how long will the
vehicles be loading and unloading, and how long will the vehicles operate? It will be
assumed that the average one-way distancctraveled will be 20 miles, the average speed is
30 miles per hour, 1.5 hours will be allotted to unload and load the vehicles for each trip,
and the average day of vehicle operations is ten hours. From these assumptions, the
turnaround time of the vehicles can be calculated. Using the formula to calculate the turn-
around time discussed in the previous chapter, a turnaround time of 2.83 can be
calculated. In other words, each trip a vehicle makes takes 2.83 hours.
The number of vehicles required to transport cargo and personnel are both
calculated using the same formula. The requirements can be calculated by multiplying the
quantity of cargo to be transported by the turnaround time and then dividing by the
capacity of the vehicle to move cargo and the length of the operational day. The capacity
of the vehicles was described in the previous chapter and the total requirement will be
increased by 20 percent to accommodate a maintenance schedule. Namely, if five ton
cargo trucks are used, six short tons of supplies or 20 passengers can be moved. After
completing the calculations, a requirement for 210 vehicles to transport cargo is identified
for the Cuban population and 95 vehicles for the Haitian population. Assuming only five
111
percent of the population requires transportation at one time, 21 vehicles are required to
transport Cuban personnel and 10 vehicles to transport the Haitians.
Forklift requirements are very easy to calculate. The total surge quantity of cargo
just needs to be divided by 120, the average number of pallets a forklift can move in a day.
For the Cuban population, 31 forklifts are required. However, to accommodate a
maintenance schedule, the required number of forklifts will be increased by 20 percent
which increases the forklift requirements to 37. Similarly, 17 forklifts are required to
support the Haitian population.
Generator requirements for this model depend on the condition of the
infrastructure and the size of the population being supported. In this case, the
infrastructure is damaged and there are 23,600 Cubans and 11,700 Haitians. The current
condition of the infrastructure establishes the allocation rate at .0011 generators per
person. However, this figure will have to be increased by 20 percent to accommodate the
readiness rate of 80 percent. Therefore, each of the population sizes need to be multiplied
by .00132 to determine the number of generators required. The results of the calculations •
is a requirement for 32 generators to support the Cuban population and 16 generators for
the Haitian population.
The number of refrigerated containers required depends on the condition of the
infrastructure and the number of the meals served each day. Again, the infrastructure is
considered damaged so the model calls for ten percent of the weight of the two prepared
meals to be refrigerated. Assuming each meal weighs exactly the same, the two prepared
meals weigh 2.8867 pounds per person for the Cubans and 2.24 pounds per person for the
Haitians. Ten percent of these quantities equates to .2887 pounds per person for the
Cuban population and .224 pounds per person for the Haitian population. Determining
the total quantity of supplies requiring refrigeration is simply a matter of multiplying the
pounds per person quantity by the size of the respective population. After completing the
calculations, 6812.5333 pounds require refrigeration to support the Cuban population and
2620.8 pounds require refrigeration to support the Haitian population. However, it will be
112
assumed that 30 days of supply will be maintained so these figures need to be multiplied
by 30. Consequently, the total quantity of supplies that require refrigeration is 204,376
pounds for the Cuban population and 78,623 pounds for the Haitians. The only
calculation that remains to determine the number of refrigerated containers needed is to
divide the total quantity of supplies requiring refrigeration by the cargo capacity of a
refrigerated container. A refrigerated container has a 41,300 pound cargo capacity.
However, it will be assumed only 80 percent of the cargo space will be used since the
containers are being used as kitchen refrigerators and the cooks must be able to maneuver
around in the container. Therefore, eight containers are required to support the
refrigeration requirements of the Cuban population and three containers are required to
support the Haitian population.
The requirements for container handlers are derived directly from the number of
containers in the theater. That is, one container handler is allocated for every fifty
containers in the theater. Based on the number of refrigerated containers required, one
container handler is required to support both populations. However, it should be noted
that a second handler should be considered to allow time to conduct preventive
maintenance.
To determine the number of water purification units, ROWPUs, and water trucks
required, the total quantity of water that is required on a daily basis must be computed.
For the Cubans, 1,035,376.8 gallons of water are required each day while only 229,388.44
gallons for the Haitians. It will assumed that the infrastructure is capable of producing 50
percent of the water so, the ROWPUs only need to produce 517,688.4 gallons for the
Cubans and 114,694.22 gallons for the Haitians. The ROWPUs included in this model
produce approximately 3000 gallons per hour. Assuming the ROWPUs operate a
maximum of twenty hours a day, each ROWPU can produce 60,000 gallons. Therefore,
using equation 3.14 on page 75, to produce 517,688 gallons of water and to allow for a
twenty percent down-time, 11 ROWPUs would be required to support the Cubans.
Similarly, three ROWPUs would be required to support the Haitian population. It will
113
also be assumed that only ten percent of the total daily water requirements will have to be
delivered. This is because the water produced by the ROWPUs can be pumped directly
into the camps so, there is no need to transport the water to the camps. This means only
103,537.6 gallons of water need to be transported each day to support the Cubans and
22,938.844 gallons need to be transported to support the Haitians. Assuming 1000 gallon
capacity water trucks are used to transport the water, the same turn-around time is used,
and the requirements still need to be increased by 20 percent to address maintenance
schedules, 36 water trucks are required to move ample water to support the Cuban
population and 8 water trucks are required to move ample water to support the Haitian
population.
The requirements for sanitation and garbage trucks are based on a location policy
rather than the traditional policy previously described. This is primary due to the nature of
the services these vehicles provide. To maintain the operators morale, it will be assumed
that these vehicles will only be required to make one transit per day. That is, the vehicle
will fill to capacity, return, and unload only once. To determine the requirements for
sanitation vehicles, the number of port-o-lets being used must be known. Using the
combined population total of 35,300 and the port-o-let allocation rate of .05,1765 port-o-
lets are required to support the two populations. Using a sanitation vehicle with a 1000
gallon capacity, 200 port-o-lets can be serviced by a single truck. So, a total of nine
operating sanitation trucks are required. Allowing for 20 percent down-time increases the
requirement to 11 trucks. However, if the populations were supported separately, 12
sanitation trucks would be required, eight to support the Cubans and four to support the
Haitians. In a similar augment, two garbage trucks are required to support the combined
populations as one truck is required to support every 25,000 people. Separately, two
garbage trucks would be required to support the Cubans and one to support the Haitians.
The requirements for wreckers are based on the number of vehicles in the theater.
This model allocates wreckers at a rate of one per 100 vehicles in the operating area. With
323 wheeled vehicles identified to support the Cuban population and 140 wheeled vehicles
114
identified to support the Haitian population, four wreckers are required to support the
Cuban population and two are required to support the Haitian population.
Before the actual planning factor for support equipment can be determined, the
fuel requirements must be established as the fuel requirements will increase the quantity of
support equipment required to support the operation. The first fuel consideration is
packaged POL. The planning factor that was developed for packaged POL is .295 pounds
per person. Adding the 104.43 short tons associated with a thirty day supply of packaged
POL to support the Cuban population increases the requirements for forklifts and cargo
trucks. Using the same calculation previously discussed, two additional forklifts and six
additional trucks are required to support the Cuban population. Similarly, to handle the
addition 51.7725 short tons of supplies generated by packaged POL requirements to
support the Haitians population requires one additional forklift and three additional cargo
trucks.
The only other calculation that needs to be completed before the actual POL
planning factor can be calculated is deterrnining the number of fuel consuming items that
are not considered support equipment, namely, heaters and galley equipment. As stated
before, heaters are not a consideration for this operation. Galley equipment, on the other
hand, is a consideration. It was assumed that the all fuel consuming galley equipment will
be allocated such that one piece of equipment can service 1000 people. Therefore, 24
pieces of fuel consuming galley equipment are required to support the Cuban population
and 12 pieces are required to support the Haitian population.
To compute the quantity of fuel used each day, each piece of equipment has to be
multiplied by its fuel consumption rate and the number of hours the equipment will operate
or the number of miles the equipment will travel in a day. Given that the vehicles will
operate ten hours a day, each vehicle can make approximately 3.5 trips a day or travel
141.1765 miles a day. The exceptions are sanitation and garbage trucks. The
requirements for these trucks were based on allocation policies (i.e., one per 200 port-o-
lets) and are only expected to make one round trip journey each day which amounts to 40
115

miles per day. The equipment with an hourly consumption rate will have one of two
different operational rates. That is, it will be assumed that equipment that requires a full-
time operator, like a forklift, will have a ten hour work day while equipment that does not
require a full-time operator, like a generator, will operate for twenty hours a day. Again,
there are two expections. Refrigerated containers are expected to operate around the
clock and kitchens are excepted to operate 16 hours a day. Table 4.10 summarizes all the
fuel consuming equipment required to support each of the populations as well as the total
fuel required to operate the equipment for a day.
Quantity Quantity Required Required
to Support Total Fuel to Support Total Fuel Item Cubans Requirements Haitians Requirements 5-Ton Cargo Truck 237 4158.93 108 1895.21 4000 Lb. Rough Terrain Forklift 39 1950.00 18 900.00 Rough Terrain Container Handler 1 85.00 1 85.00 1000 Gal. Water Transport 36 631.74 8 140.39 Sanitation Truck 8 39.78 4 19.89 Garbage Truck 2 49.68 1 24.84 5 - Ton Wrecker 4 126.32 2 63.16 ROWPU 11 2068.00 3 564.00 Refrigerated Container 8 209.28 3 78.48 Generator 32 3840.00 16 1920.00 Kitchen Equipment 24 241.92 12 120.96
Table 4.10. Vehicles Identified to Support Operation Sea Signal and their Associated Daily Fuel Consumption Rates
Interestingly enough, knowing the quantity of fuel required in the theater generates
additional equipment and fuel requirements because the fuel must be delivered as well.
The requirements for fuel tankers are determined by the quantity of fuel in the theater that
must be transported. It will be assumed that all the fuel will require transportation and
that separate vehicles are required to transport diesel fuel and motor fuel. As Table 4.10
116
illustrates 13,355.94 gallons of fuel are required to support the Cubans and 5,789.57
gallons for the Haitian population. These requirements break down to 12,311.21 gallons
of diesel fuel and 1,044.73 gallons of motor fuel to support the Cubans and 5,442.69
gallons of diesel fuel and 346.88 gallons of motor fuel to support the Haitian population.
The capacity of the fuel tankers included in this model is 1200 gallons and the turnaround
time will remain 2.83 hours. Therefore, five tankers are required to support the Cuban
population and two tankers are required to support the Haitian population. Now, the
additional tankers need fuel. The fuel required to operate the tankers required to support
the Cuban population is 65.79 gallons while the fuel required to operate the tankers to
support the Haitian population is 26.32 gallons. The question remains as to whether
additional tankers are required to move the fuel which operates the tankers.
Each tanker has the capacity of moving 4240.28 gallons of fuel each day and a
tanker operates on motor fuel. Therefore, if the motor fuel required to operate the tankers
and the motor fuel required to operate the other motor fuel driven equipment do not
exceed the capacity of the number of tankers required to deliver motor fuel, then no
additional tankers are required. Otherwise, the number of additional tankers required will
have to be calculated and the whole process begins again. In both case, the additional fuel
required to operate the tankers does not exceed the current capacity of the tankers, so no
additional equipment is required.
Now that the total fuel requirements are determined, the planning factor for POL
can be determined. The only computation that remains is to divide the total fuel required,
13421.73 gallons to support the Cuban population and 5815.89 gallons to support the
Haitian population, by the size of the respective populations. This results in a POL
planning factor of .5687 gallons per person to support the Cuban population and .4971
gallons per person to support the Haitian population.
Finally, the computations required to derive the planning factor for support
equipment can begin again. Table 4.11 displays all the equipment that has been identified
117

and the total weight of the equipment in question. The only calculation that remains is to
divide the total weight by the size of the population.
Quantity Quantity Required Required
to Support Total Fuel to Support Total Fuel Item Cubans Requirements Haitians Requirements 5-Ton Cargo Truck 237 5214000 108 2376000 4000 Lb. Rough Terrain Forklift 39 1056900 18 487800 Rough Terrain Container Handler 1 105120 1 105120 1000 Gal. Water Transport 36 522000 8 116000 1200 Gal. Fuel Transport 5 . 75000 3 45000 Sanitation Truck 8 116000 4 58000 Garbage Truck 2 72000 1 36000 5 - Ton Wrecker 4 137600 2 68800 ROWPU 11 417560 3 113880 Refrigerated Container 8 32000 3 12000 Generator 32 241280 16 120640
Table 4.11. Vehicles Identified to Support Operation Sea Signal and their Associated Weights
The only data that was obtained for Guantanamo Bay regarding fuel consumption
was the average monthly consumption rate. The Fuels Division from Guantanamo Bay,
Cuba was able to provide the average monthly consumption rate of 41,382 gallons for the
base's service stations. Unfortunately, this figure is only about a third of the value
predicted by the model. The reason is believed to be two-fold. First, the figures provided
by the Fuels Division do not include all the sources of fuel on the island. For instance,
port services and the air field both provided the JTF motor fuel but the quantity is not
included in the Fuels Division estimate. Secondly, the model calculates fuel consumption
based on all the vehicles required being operated on a full-time basis (i.e., all 40 forklifts
will be consuming fuel ten hours a day every day). Therefore, the quantity identified by
the model is a worst case analysis of the fuel requirements and even if accurate and
118
complete fuel consumption data was available, the model's consumption rate should
exceed the actual consumption experienced.
The data that was available to validate the support equipment planning factor
generated by the model is a listing of the JTF's equipment fleet. Again, the data is not
perfect. First, the data makes no distinction between the equipment used to support the
troops and the equipment used to support the emigrants. Second, the data breaks down
the equipment to the smallest end unit. For example, a ROWPU contains a 60 KW
generator, a pump, and a water purification unit. The model maintains all the pieces in
one unit since that is the way a ROWPU is deployed but, the equipment list identifies each
item separately. Third, the data did not identify a usage rate or a vehicle capacity. There
is no way of knowing whether or not all the equipment identified as operational was being
used or if the items can be compared. The model includes 3000 gallon per hour
ROWPUs. All that is identified on the equipment list is ROWPU. Without the capacities
of the items there is no basis for comparison. Finally, many of the vehicles used during the
operation were listed using nomenclatures that could not be translated to a known vehicle
type with the available reference material.
Since the data includes equipment to support both populations, the equipment
requirements for both populations will be considered. The first item that will be
considered is generators. After including that generators from each of the 14 ROWPUs
and the two Air Transportable Hospitals (there are three generators deployed with each
ATH), the model identifies the need for 68 generators. Because the generators in the JTF
inventory had many different kilowatt ratings, the total kilowatt rating provided will be
compared. The kilowatt rating on the generators for the ROWPUs and the general ones
included in the model is 60 KW. The kilowatt rating on the hospitals' generators is not
known. Since hospitals generally require a great deal more power, it is believed that the
generators are at least 60 KW each. Therefore, the model provides 4080 kilowatts of
power. The equipment list identifies 10,492 kilowatts of generators. However, included
in the equipment list are 7 generators with extremely high kilowatt rating, each more than
119

700 KW. It is not believed that all of these generators were used to support the
emigrants. It is believed that many of the larger generators were used to support the Air
Force's Bare Bones packages which were deployed as berthing for many of the troops and
all the berthing compartments were air-conditioned. The emigrants did not receive air-
conditioning. Although it is not believed any of the larger generators were used to
support the emigrants, it will be assumed that two of the five 750 KW generators were
used to support the emigrants. This reduces the power allotment to actually support the
emigrants to 4242 kilowatts of which 211 kilowatts were not operational. This figure is
more in line with the model's output but, the actual power allotted is only speculative.
The model provides 59 forklifts to support the two populations. The equipment
list identifies 66 different forklifts and three different cranes. However, only 44 of the
forklifts and two of the cranes were operational because the actual operational readiness
was much lower than the model anticipated. Considering the forklifts and cranes
identified in the equipment list also supported the troops, it is believed that the model's
prediction would adequately handle the requirements of the operation even with the
reduced readiness level.
The model's predictions for garbage trucks and wreckers matched the equipment
list. This implies the model's predictions can handle the requirements as it is believed that
the assets identified on the equipment list also serviced the soldiers. As for the sanitation
vehicles, the model identified a need for eleven trucks to support the two populations and
the equipment list identifies 18. Again, the readiness level is about 20 percent lower than
was anticipated by the model. Furthermore, since the capacity of the sanitation vehicles is
not known, there is no way to compare to model's output to the actual equipment allotted.
As for the remaining equipment items, nothing definitive can be said. Primary
because the equipment list does not give enough information to determine a relationship
between the model's predictions and the actual assets. For instance, it is known that water
was transported and yet no appropriate equipment could be identified on the equipment
list.
120
D. CHAPTER SUMMARY
This chapter reviewed each class of supply to explain how the planning factors can
be applied and to attempt to validate the planning factors derived in this thesis. The
comparison data was obtained during Operation Sea Signal. Except for Class I supplies,
nothing definitive can be said about the model's ability to predict the actual consumption
rates experienced. This is primarily because the comparison data was not very useful
which is one of the motivating factors for this thesis in the first place. That is, the data just
defined quantities of items not weights, so the actual consumption rates could not be
defined. All that can be said is that there is a very high correlation between the types of
items included in the model and the items actual used in Operation Sea Signal. This
should not negate the validity of the planning factors in the eyes of the planners as
Operation Sea Signal is very unique. Very few past operations involve supporting two
entirely different populations for such a long time. Moreover, many of the assumptions
used to derive the model's planning factors, like allocation rates, are purely speculative.
Perhaps, if the Commander's true intentions regarding the distribution of supplies were
known or if the data was useful, more correlation would have been seen. It should be
noted that planning factors are planning tools themselves and the actual validation process
takes many years. The first step that should be taken to progress the validation process is
to collect suitable comparison data.
121

122
V. COMPUTER ASSISTED PLANNING AID
A. INTRODUCTION
The purpose of the computer interface is to put the methodology developed in this
thesis in a format that would facilitate its actual use. In essence, the program allows the
planner to generate planning factors for various scenarios using the methodologies
identified in this thesis without learning the cumbersome methods, algebra, and arithmetic.
The program was developed using a Windows™ based Microsoft® product known as
Visual Basic™. Visual Basic™ was chosen first, to comply with DOD's transition to
Microsoft® products and second, for the outstanding user interfaces it can produce.
Furthermore, Visual Basic™ can produce stand-alone executable files, one of which is the
program developed to complement this thesis. The program is called the Humanitarian
Operations Planning System (HOPS). The details of the program are explained in this
chapter.
This chapter will take the user through the various HOPS screens explaining the
appropriate inputs and the associated outputs. All the screens displayed will be using
inputs relating to Operation Sea Signal in Guantanamo Bay, Cuba. This is to allow the
user to see the relationship between the inputs and the outputs. This is possible because
the outputs were already derived in the previous chapter. Although the order in which the
screens are presented is also the desired method for reviewing the classes of supply,, the
user is not limited to reviewing the classes of supply in this order. However, the user
should remember that Class VII and Class III items should be the last classes of supply
considered because they are heavily dependent on the requirements generated by the other
classes of supply.
123

B. OPERATION
All that is required to run HOPS is a computer with Windows™ software.
Although the speed of the program may be reduced, the program does not need to be
loaded on a hard drive. It can be successfully operated from an external or internal floppy
drive. To run the program from a floppy drive, the user needs to insert the diskette in an
appropriate floppy drive and type HOPS.EXE at the MS-DOS® prompt for the respective
floppy drive. To run the program from the hard drive the user has two options. The user
can create a program item in Windows™(see the Windows™ manual) or type HOPS.EXE
from the MOS-DOS® prompt.
Another piece of hardware that speeds the use of the program is a mouse. The use
of a mouse is strictly optional as the program has been written in such a way that the
keyboard can sufficiently access all the necessary data. If no mouse is available, the
planner can transverse a screen using the TAB key or shortcut keys. Shortcut keys are
available whenever a button, option, or check box has a letter in its title underlined. For
instance, most screens provide an options menu. If the O in the word options is
underlined, the user should press ALT + O to access the options menu.
The model provides planning factors in a per person per day quantity. However, if
there was any question as to whether the traditional planning factor would be useful or
not, like Class II items, the model does provide the option to display a per person per
issue quantity. When the user needs to determine the surge requirements, the per person
per day planning factor provided by this model needs to be multiplied by the desired days
of supply and the population size. The per person per issue planning factor just needs to
multiplied by the population size to acquire a minimum of 60 days of supply.
Finally, the program has been designed so that if errors in the underlining planning
factors, item weights, or item life cycles are identified, only changes to the main module
are required. All the other code operates independently and will not be affected by a
change in the underlining planning factors.
124
1. Greeting Screen
Upon execution of the program, the screen similar to Figure 5.1 will emerge. This
screen is called the Greeting Screen. The sole purpose of this screen is to allow
individuals that have inadvertently started the program to exit. If the YES button is
selected the program will be started. If the NO button is selected, the user will exit the
program. If the user makes no entry in two minutes, the program will be automatically
aborted.
Figure 5.1. HOPS Greeting Screen
2. Planning Screen
As Figure 5.2 illustrates, the Planning Screen is divided into five sections that
correspond with the variables in the model. The first section is the Population
Demographics section. When the screen is first displayed all values are zero and the
cursor is set at the population size input box. The user is to enter the appropriate
population size. If the user attempts to enter non-numeric symbols, an error will result.
To clear the error, the OK button must be chosen. Once the error is cleared the user will
be prompted back to the population size input box to try again. Next, the demographics
are inputted as percentages. That is, if one percent of the population is infants, the user
will just enter 1, not 0.01, in the input box labeled infants. The user can use the TAB key
125
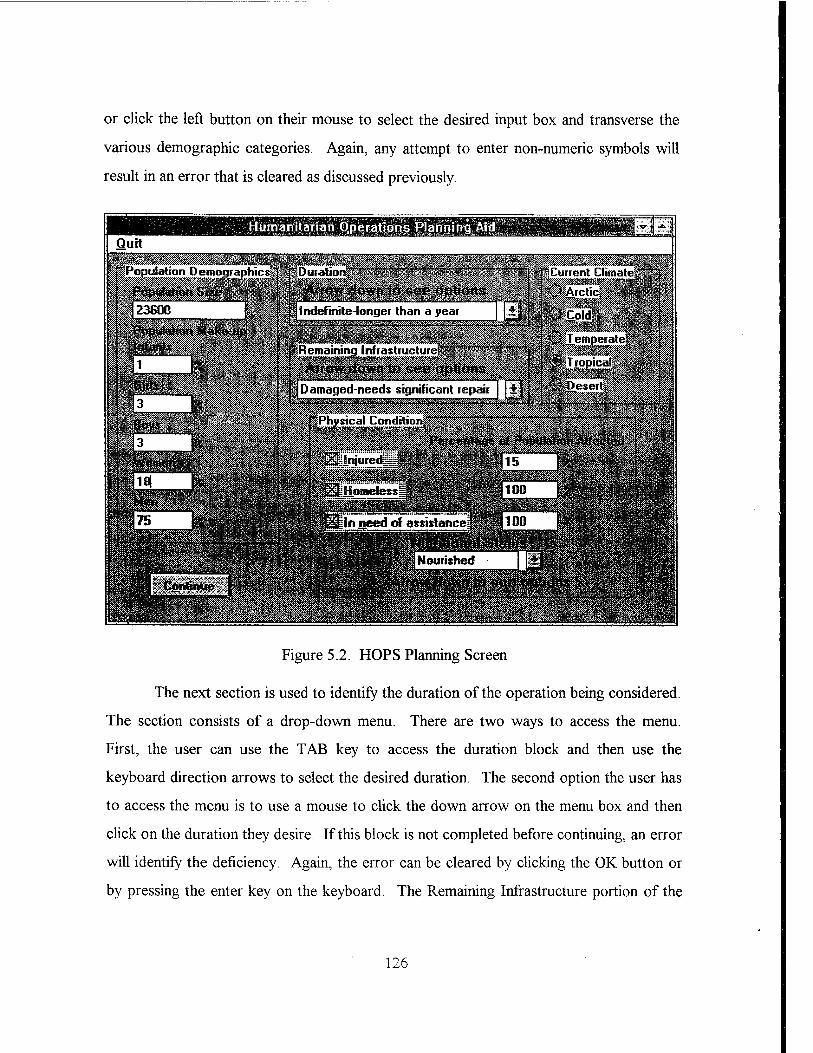
or click the left button on their mouse to select the desired input box and transverse the
various demographic categories. Again, any attempt to enter non-numeric symbols will
result in an error that is cleared as discussed previously.
TfT
Quit
Population Demographics!
23600 rM
WMMm
pDwation^/y-ff:;^ pCuiient Cjimate:f^3|
i Indefinite-
1 ^Remaining
^ iDamaged-needs significant iepaii I |±|t ^^M^^^S0^^M&
Figure 5.2. HOPS Planning Screen
The next section is used to identify the duration of the operation being considered.
The section consists of a drop-down menu. There are two ways to access the menu.
First, the user can use the TAB key to access the duration block and then use the
keyboard direction arrows to select the desired duration. The second option the user has
to access the menu is to use a mouse to click the down arrow on the menu box and then
click on the duration they desire. If this block is not completed before continuing, an error
will identify the deficiency. Again, the error can be cleared by clicking the OK button or
by pressing the enter key on the keyboard. The Remaining Infrastructure portion of the
iZO
screen is set up exactly like the Duration section. The section is completed in the same
fashion and a similar error results if the block is not completed.
The next section is used to identify the climate of the operating area. All five
options are seen at run time. To select a climate, the user may choose the desired option
with the mouse or by using the appropriate shortcut keys. If no climate is selected, an
error will result. The error is cleared by selecting the OK button.
The Physical Condition portion of the screen is broken into two parts, as is the
model. The first portion requires the user to identify or estimate the physical state of the
population and what percentage of the population is affected by the associated physical
condition. For example, if 25 percent of the population is injured in some way, the user
would check the Injured block and enter 25 in the Percent Affected box which is directly
adjacent to the Injured check block. Again, the blocks can be accessed using a mouse or
the TAB keys. The check boxes are marked by using the shortcut keys discussed
previously or by selecting the desired physical condition block using the mouse keys. The
Percentage of the Population Affected block is accessed in the same matter as the
Population Demographics blocks. If the user attempts to enter non-numeric symbols or
the percentage, the user will receive an error. Once the error is cleared by selecting the
OK button, the user will have the option to try inputting again. The second part of the
Physical Condition section of the screen is the Nutritional Status block. It operates in the
same manner as the Duration and the Remaining Infrastructure blocks. The user may
choose the down arrow on the menu to drop down the menu options or TAB to the menu
and use the arrow keys on the keyboard to select the appropriate nutritional status.
Once the user has finished entering the variables, the CONTINUE button must be
selected to proceed. This button verifies the entries and points out any additional errors.
For instance, if the population demographics do not total to 100, an error will result. If a
physical condition is checked and no percentage of the population is identified for that
condition, an error will result. All the errors are cleared by selecting the OK button.
When the error is cleared, the user is prompted back to the site of the error to make the
127
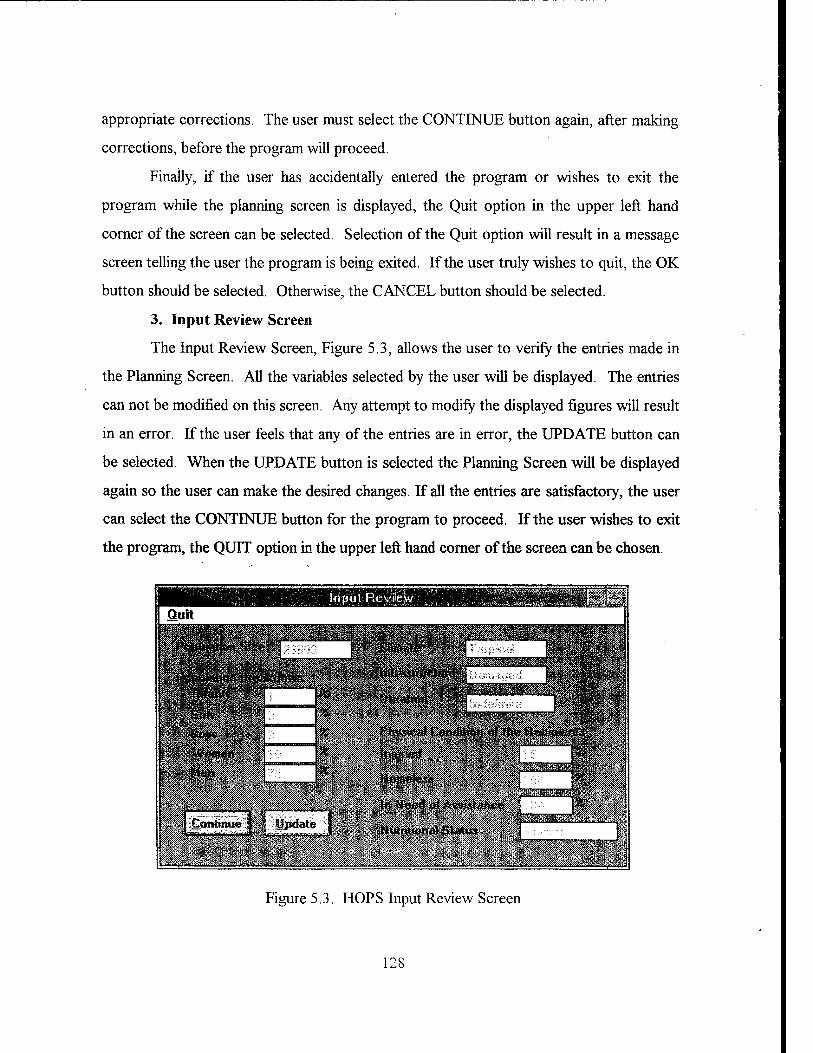
appropriate corrections. The user must select the CONTINUE button again, after making
corrections, before the program will proceed.
Finally, if the user has accidentally entered the program or wishes to exit the
program while the planning screen is displayed, the Quit option in the upper left hand
corner of the screen can be selected. Selection of the Quit option will result in a message
screen telling the user the program is being exited. If the user truly wishes to quit, the OK
button should be selected. Otherwise, the CANCEL button should be selected.
3. Input Review Screen
The Input Review Screen, Figure 5.3, allows the user to verify the entries made in
the Planning Screen. All the variables selected by the user will be displayed. The entries
can not be modified on this screen. Any attempt to modify the displayed figures will result
in an error. If the user feels that any of the entries are in error, the UPDATE button can
be selected. When the UPDATE button is selected the Planning Screen will be displayed
again so the user can make the desired changes. If all the entries are satisfactory, the user
can select the CONTINUE button for the program to proceed. If the user wishes to exit
the program, the QUIT option in the upper left hand corner of the screen can be chosen.
Input Review iHSIld
Continue j S Update i£aSSs£H&K|s|
te | t^i&MmaiBii^ ■: _J
Figure 5.3. HOPS Input Review Screen
128

4. Planning Factors Screen
Figure 5.4 is the Planning Factors Screen and it allows the user to select the class
of supply he is interested in analyzing. Selection of a class of supply button will result in
the respective class of supply requirements screen being displayed. Each screen will be
discussed shortly. Access into the various classes of supply depends on the variables that
were defined. For example, if a brief or temporary duration was selected, Class X can not
be accessed. In any case, the user is notified. If the user still wishes to access the class of
supply in question, the Options menu can be selected and the Update option can be
chosen. When this option is chosen, the Planning Screen is redisplayed and the user can
make the appropriate changes to the variables to access the class of supply desired. In the
example discussed above, the user would have to change the duration of the operation to
extended or indefinite.
Das« 111 and VII - POL andIquspas I Oats VIII- Medical Suppfie* j£| IB
^S^s^M^m^SS^S&l^ Review AB MMm^mlmM^Wm iffl ifri*lip .tV*' •y.*^gfi.^y:\:->^0
Figure 5.4. HOPS Planning Factors Screen
Once the user has analyzed all the classes of supply, he may choose to review what
has already been calculated by pressing the REVIEW ALL button. When the REVIEW
ALL button has been selected the Review All screen is displayed which will also be
discussed shortly. Again, if the user wishes to exit the program, the Quit option can be
chosen on the Options menu.
129
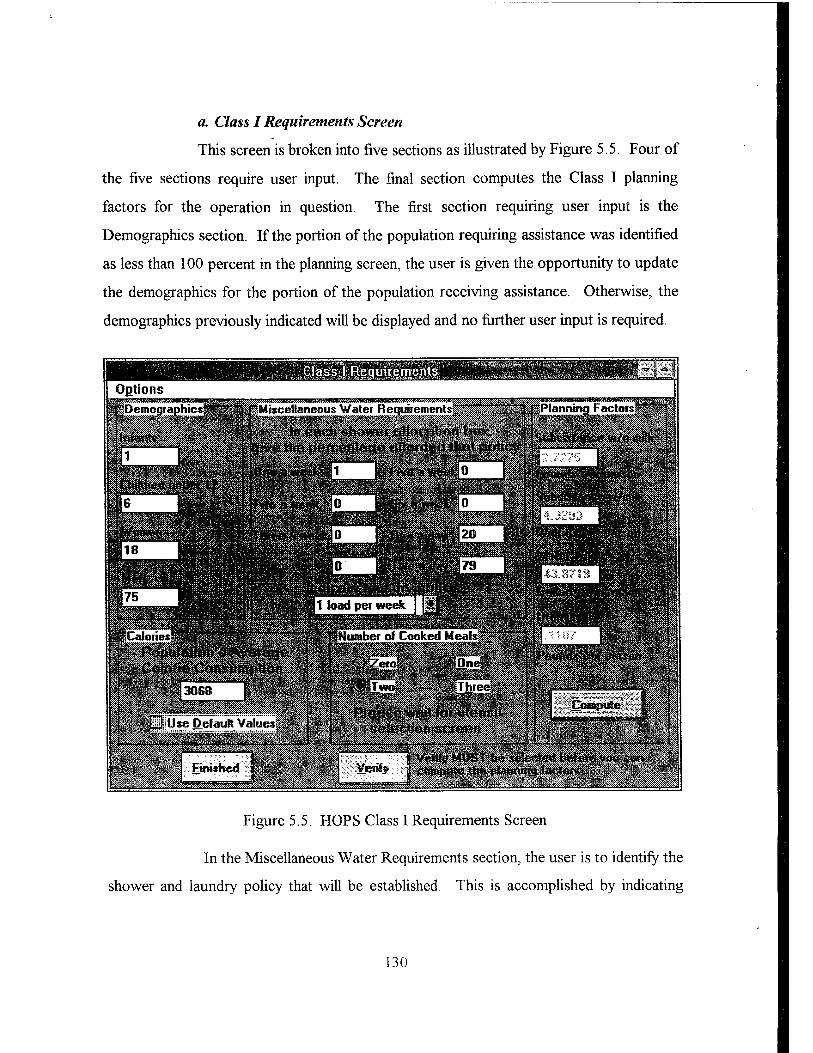
a. Class I Requirements Screen
This screen is broken into five sections as illustrated by Figure 5.5. Four of
the five sections require user input. The final section computes the Class I planning
factors for the operation in question. The first section requiring user input is the
Demographics section. If the portion of the population requiring assistance was identified
as less than 100 percent in the planning screen, the user is given the opportunity to update
the demographics for the portion of the population receiving assistance. Otherwise, the
demographics previously indicated will be displayed and no further user input is required.
Options
ID emogr aphicsl
tu
vj^-!«Ai.v!MiwM^»m»uro;.i:l.i^l'jE;,,.'.r IgPlanningFactoisfeS?^
Us?«»
Figure 5.5. HOPS Class I Requirements Screen
In the Miscellaneous Water Requirements section, the user is to identify the
shower and laundry policy that will be established. This is accomplished by indicating
130
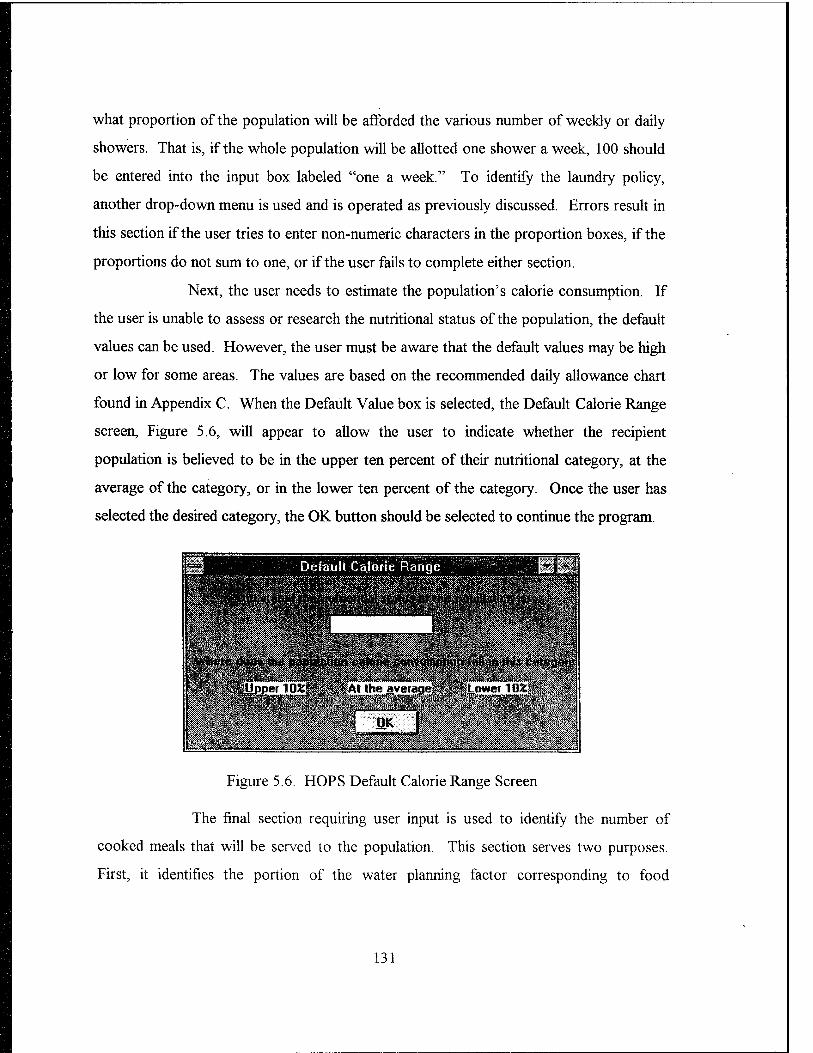
what proportion of the population will be afforded the various number of weekly or daily
showers. That is, if the whole population will be allotted one shower a week, 100 should
be entered into the input box labeled "one a week." To identify the laundry policy,
another drop-down menu is used and is operated as previously discussed. Errors result in
this section if the user tries to enter non-numeric characters in the proportion boxes, if the
proportions do not sum to one, or if the user fails to complete either section.
Next, the user needs to estimate the population's calorie consumption. If
the user is unable to assess or research the nutritional status of the population, the default
values can be used. However, the user must be aware that the default values may be high
or low for some areas. The values are based on the recommended daily allowance chart
found in Appendix C. When the Default Value box is selected, the Default Calorie Range
screen, Figure 5.6, will appear to allow the user to indicate whether the recipient
population is believed to be in the upper ten percent of their nutritional category, at the
average of the category, or in the lower ten percent of the category. Once the user has
selected the desired category, the OK button should be selected to continue the program.
S'^lSUpper lOfclflllllAt the aveiageSSIpiLower 10Xp&Ä^
Figure 5.6. HOPS Default Calorie Range Screen
The final section requiring user input is used to identify the number of
cooked meals that will be served to the population. This section serves two purposes.
First, it identifies the portion of the water planning factor corresponding to food
131
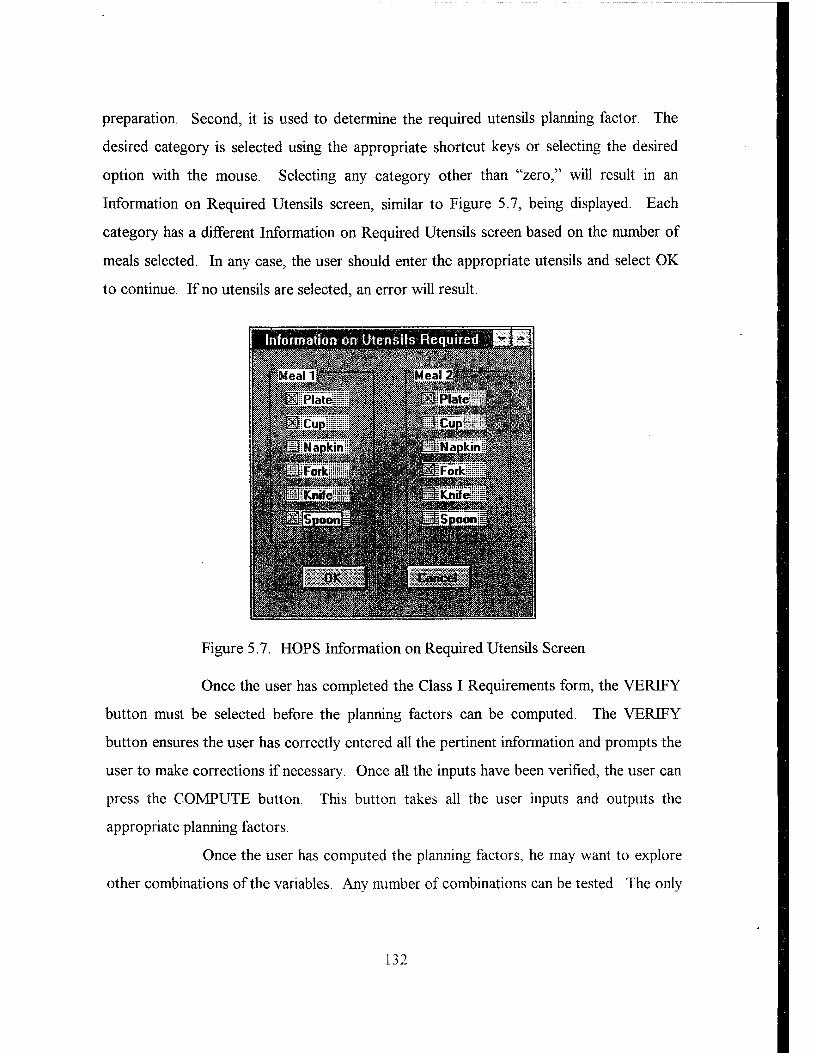
preparation. Second, it is used to determine the required utensils planning factor. The
desired category is selected using the appropriate shortcut keys or selecting the desired
option with the mouse. Selecting any category other than "zero," will result in an
Information on Required Utensils screen, similar to Figure 5.7, being displayed. Each
category has a different Information on Required Utensils screen based on the number of
meals selected. In any case, the user should enter the appropriate utensils and select OK
to continue. If no utensils are selected, an error will result.
Figure 5.7. HOPS Information on Required Utensils Screen
Once the user has completed the Class I Requirements form, the VERIFY
button must be selected before the planning factors can be computed. The VERIFY
button ensures the user has correctly entered all the pertinent information and prompts the
user to make corrections if necessary. Once all the inputs have been verified, the user can
press the COMPUTE button. This button takes all the user inputs and outputs the
appropriate planning factors.
Once the user has computed the planning factors, he may want to explore
other combinations of the variables. Any number of combinations can be tested. The only
132

requirement is that the planner press the VERIFY button before the COMPUTE button
each time. After the user has finished exploring the various combinations, he has several
options to leave this screen. The Options menu can be selected and the user can select the
New Class of Supply option, the Update option, or the Quit option. The New Class of
Supply option will return the user to the Planning Factors screen, Figure 5.4, so that the
other classes of supply can be reviewed. It should be noted that when the user leaves this
screen, the last inputs will be saved. The Update option returns the user to the Planning
Screen to revise the initial inputs and, the Quit option leaves the program. The user also
has the option to select the FINISHED button. When the user selects the FINISHED
button, the Options Screen, Figure 5.8, is displayed. This screen offers two choices. The
user can either return to the Planning Factors screen or quit the program. If the QUIT
button is selected in error, the user should press the CANCEL button on the message box
and he will be returned to the Planning Factors Screen to continue.
Figure 5.8. HOPS Options Screen
b. Class II Requirements Screen
Much like the Class I Requirements screen, the Class II Requirements
screen, Figure 5.9, is split into five sections. However, only three of the sections on this
screen require user inputs. Again, if the user has identified the percentage of the
1 JJ

population that requires assistance to be less than 100 percent, the user will be prompted
to update the demographics when the screen is displayed. The climate section is just to
remind the user what climate was selected on the Planning Screen. This is important
because it is one of the major factors that affect the quantities of Class II items required.
| , JfcS$&$ *m lertK^^&^MiM
Options
CDemooraphics^p:
I"■ ^'tilllll Iffl £ei$onal Equipment« Ö<5 i^iEläiM^Äs
sneous Needs!
^^S^^H»fS«^eM«S£ mm ^Housekeeping Supplies!
^Planning Factors!!
m
.0606 'iiÄI
Figure 5.9. Class II Requirements Screen
The Miscellaneous Needs section is the heart of this screen. To display the
appropriate planning factors, the user is to select the items that he wishes to distribute to
the recipient population. If tents are required to house the population, the Tents check
box should be selected. If housekeeping supplies are required, the Housekeeping Supplies
check box should be selected. When this box is checked the Housekeeping Requirements
screen, Figure 5.10, is displayed. If clothing is to be distributed, the Clothing check box
134

should be selected. Checking the Clothing check box results in the Clothing Requirements
screen, Figure 5.11, being displayed. When this screen is displayed, the user is to indicate
the quantity of each of the different items he wishes to distribute per person. When the
screen is completed, the OK button needs to be selected. This button verifies the user's
entries, notifies the user of any entries that are in conflict with the current climate or
appear excessive, and makes the appropriate corrections before returning the user to the
Class II Requirements screen. The Personal Equipment check box is selected when
personal equipment is to be offered to the population. When it is selected the Personal
Equipment screen, Figure 5.12, is displayed. Again, the user is to select the required items
and select the OK when finished. If any unusual entries are made the user will be
prompted to make appropriate changes. It is important to note that the program limits the
amount of each item that can be distributed to five.
Figure 5.10. HOPS Housekeeping Requirements Screen
135
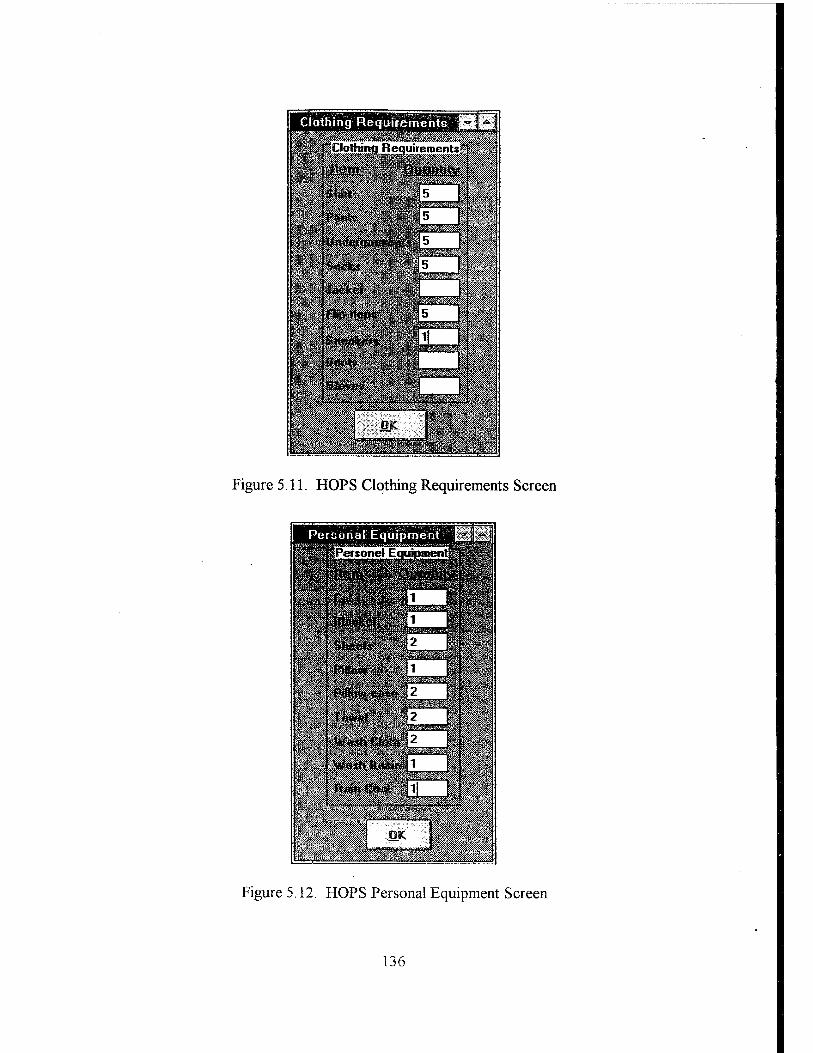
»^^^a:^lK^■^^i^^-^^^g^«':fei''V^■^^^^^^^■^t'^^^;- ': ■■:;■■■ r-ii:^^\^^^i^r}^-''*~"''ti»- <v,.
rf-^^^^^^^ir^ Nr*.•<■?•;
JMBy Ip
Figure 5.11. HOPS Clothing Requirements Screen
Figure 5.12. HOPS Personal Equipment Screen
136

Once the user has completed the Miscellaneous Requirements section of
the screen, the user has the option of selecting an error allowance. The error allowance is
provided because of the large variation in the weight of clothing and personal equipment
among manufacturers. To select an error allowance, the user must select the Error
Allowance menu box and use the down arrow on the keyboard to view the options. Once
the screen is completed to the user's satisfaction, the VERIFY button must be selected.
Again, the VERIFY button checks all entries for errors and prompts the user if corrections
are required. Finally, the COMPUTE button can be selected to display the planning
factors. This screen gives the user two options when displaying the planning factors. The
user can display the planning factors in a per person per day quantity (the default) or a per
person per issue quantity. The display choice can be selected by using the shortcut keys
on the option buttons.
This screen also provides the user the opportunity to experiment with the
various provisions that are provided to the. recipient population. The only requirement is
that the VERIFY button be selected after all entries are updated before the COMPUTE
button is selected. When the user is finished evaluating Class II items, this screen provides
the same options as the Class I Requirements screen to leave the screen. Again, the
Options menu can be selected and the user can select one of the following: the New Class
of Supply option, which will return the user to the Planning Factors screen; the Update
option, which returns the user to the Planning Screen; or the Quit option, which leaves the
program. The final option is to select the FINISHED button which displays the Options
Screen (shown in Figure 5.8). From the Options screen, the user can either return to the
Planning Factors screen or quit the program. It should be noted that when the user leaves
this screen, the last inputs will be saved.
c. Class VI Requirements Screen
The Class VI Requirement Screen is very simple, see Figure 5.13. The
user has a maximum of three inputs. First, if the percentage of the population requiring
assistance is less than 100 percent, the user has the option to update the demographics like
137

the Class I and Class II Requirements screens. Secondly, the user is to identify whether or
not Class VI items are required. If the items are required, the user should select the Class
VI Items are Required button. Finally, the user is to press the COMPUTE button to
calculate the appropriate planning factor. Like all the previous screens, the Class VI
Requirements screen has the same options to leave the screen once the calculations are
completed.
itmmnn11in 11B»»- .-; Options
lillteDemographicsfe^ ^w^^r^f^Äw^-k-^^-^f^ariCIaw VI ilems are required^
KM!»?-* ^Planning FacXoiim^M $$$$$&&>
^ij^i^^^^^^^l .
fei &™*s: kimmt
Fint*hed R^^l
Figure 5.13. HOPS Class VI Requirements Screen
d. Class VIII Requirements Screen
The medical supply requirements in this model are driven by the bed
allocation policy in the theater of operations and is the only user input required as
illustrated by Figure 5.14. Based on the user's input regarding the percentage of the
population that is injured on the Planning Screen, the default bed allocation policy will be
established. If the user chooses to override the default values, the user has to select the
option he prefers. Once the preferred option is selected, the user must select the VERIFY
button before the planning factors can be computed. Then, the COMPUTE button can be
selected to calculate the appropriate planning factor. Again, the remaining options mirror
those of the previous requirement screens.
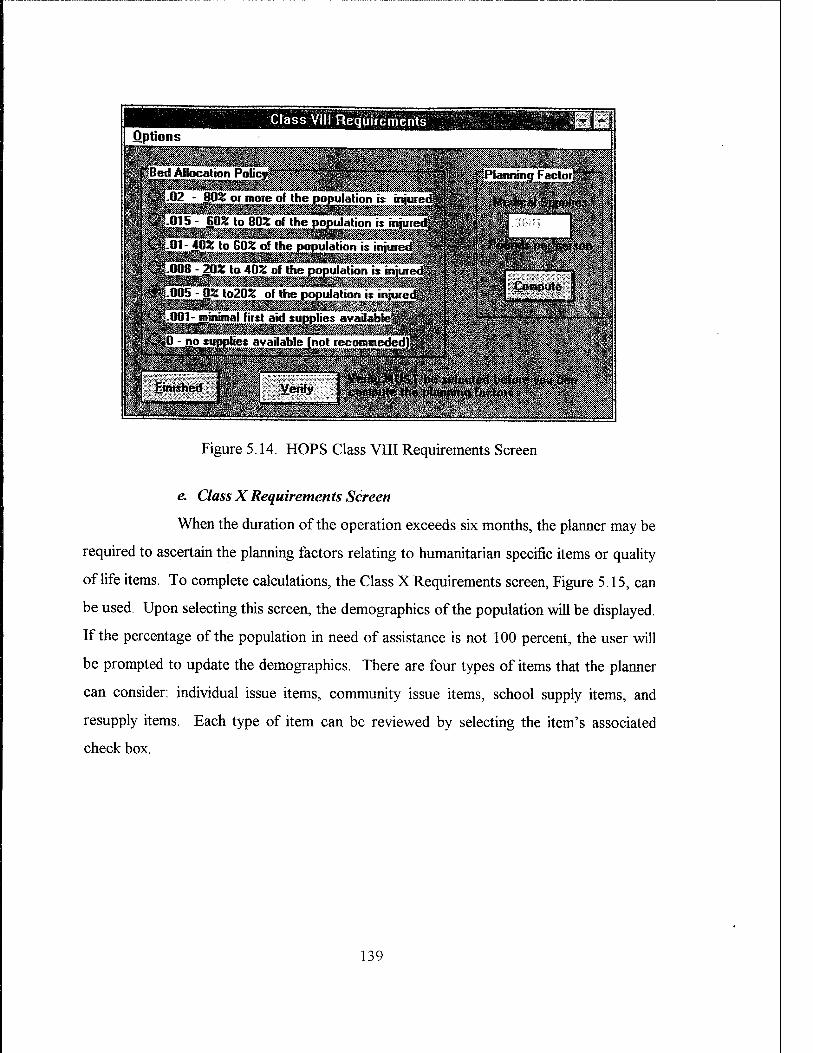
Options
*Bed Allocation PMc^ß^^&W^^^
|S*&.02 - 80% or more of Ihe population is iniuredü
S|.Öl5 * GOJriTsWonhe^i^ütan^^s
?fS.OOG - 2ÖX toVoVoiflheV^^Uoli^niured1
! Ä!005'^OX lo2olT or The pop^ltionTs miuredS
;MiJ-001- minimal first aid supplies availablelī^
5 #«0 - no supplies available (not recommededj^*%$M%
Üp|i#Planning Factor
K^l '£p»pute |1
&$$Wtä'Jpfäifctäu£z4
m I 1 1Ü'
^^^^^^i^|
Figure 5.14. HOPS Class VIII Requirements Screen
e. Class X Requirements Screen
When the duration of the operation exceeds six months, the planner may be
required to ascertain the planning factors relating to humanitarian specific items or quality
of life items. To complete calculations, the Class X Requirements screen, Figure 5.15, can
be used. Upon selecting this screen, the demographics of the population will be displayed.
If the percentage of the population in need of assistance is not 100 percent, the user will
be prompted to update the demographics. There are four types of items that the planner
can consider: individual issue items, community issue items, school supply items, and
resupply items. Each type of item can be reviewed by selecting the item's associated
check box.
139
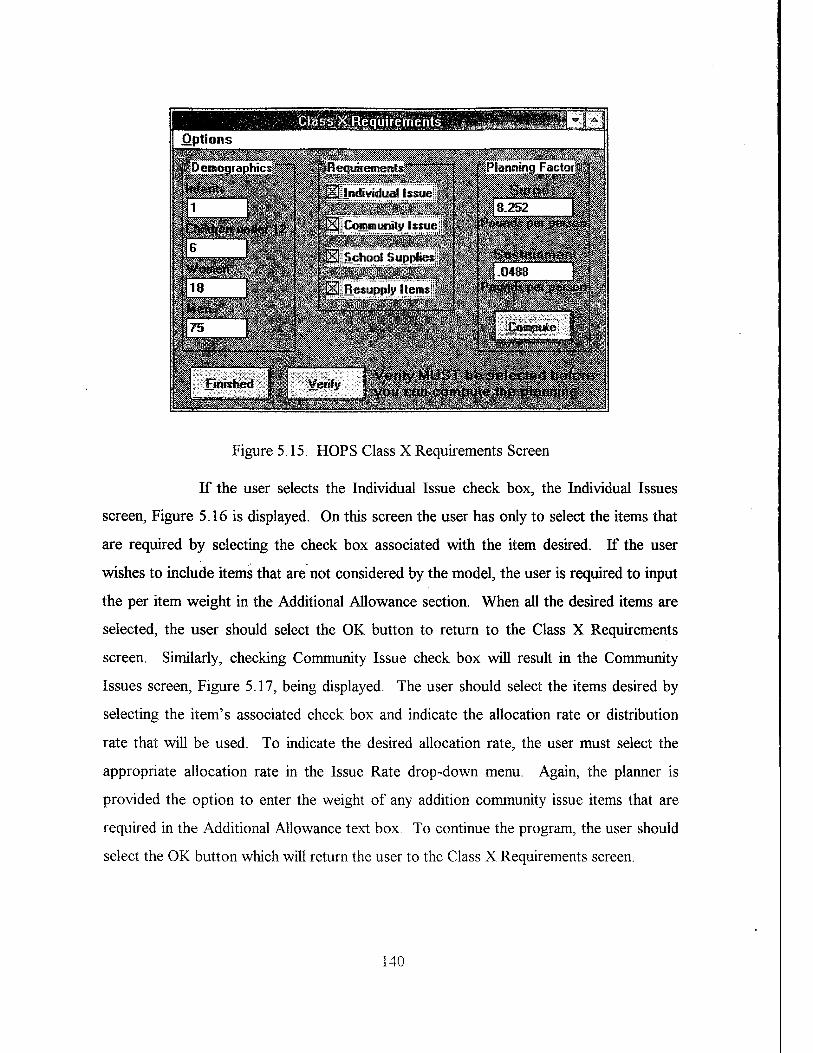
fmmmm®m. m^m^^^^^^^^^^^H Options
VM D emographicsi'S^li'ii [R equif ements Tt'S-"
Ppindividual Issue!
iian lg Community Issue;!
School SuDDÜesü
illslResupply Items
^Planning FactoS
sir V*' "'.v?1 ■•' ■■■i'-.>';V:;-'t?';'-''>.:'
£..3.0488H
I!!! 'CoflffiWJi !* f-Vag^siBs^a^ssii
Figure 5.15. HOPS Class X Requirements Screen
If the user selects the Individual Issue check box, the Individual Issues
screen, Figure 5.16 is displayed. On this screen the user has only to select the items that
are required by selecting the check box associated with the item desired. If the user
wishes to include items that are not considered by the model, the user is required to input
the per item weight in the Additional Allowance section. When all the desired items are
selected, the user should select the OK button to return to the Class X Requirements
screen. Similarly, checking Community Issue check box will result in the Community
Issues screen, Figure 5.17, being displayed. The user should select the items desired by
selecting the item's associated check box and indicate the allocation rate or distribution
rate that will be used. To indicate the desired allocation rate, the user must select the
appropriate allocation rate in the Issue Rate drop-down menu. Again, the planner is
provided the option to enter the weight of any addition community issue items that are
required in the Additional Allowance text box. To continue the program, the user should
select the OK button which will return the user to the Class X Requirements screen.
140
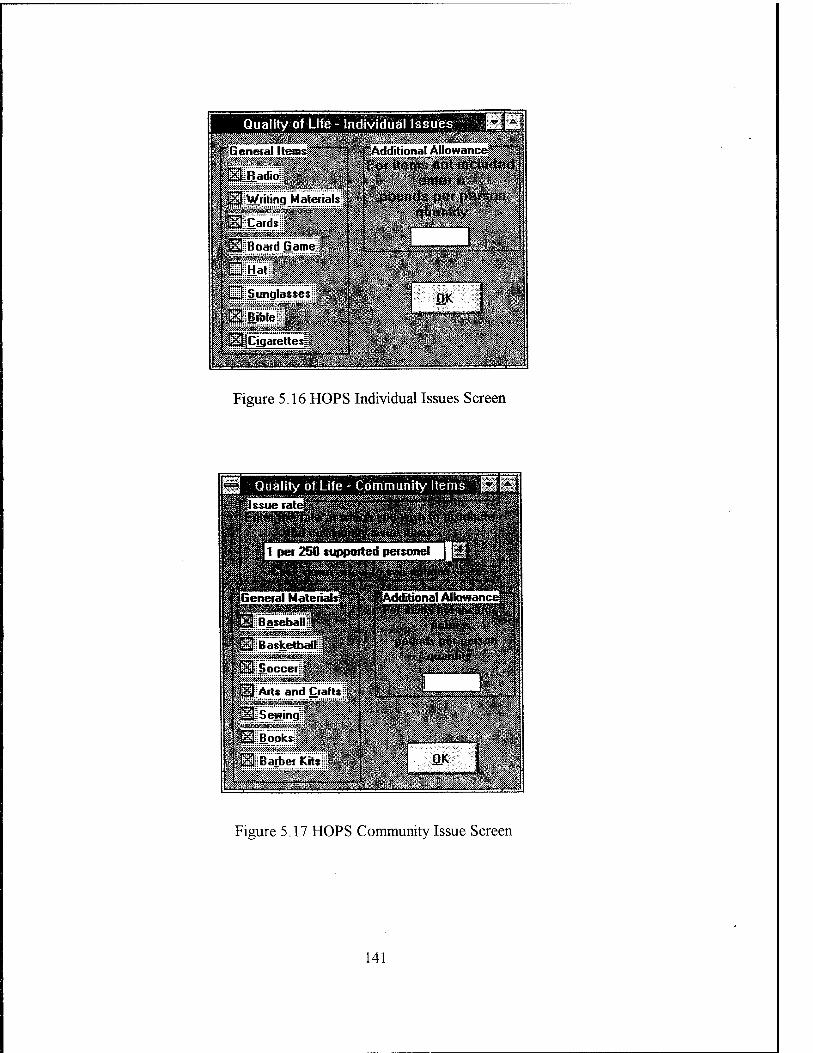
I A|
^riillililUlh ' ' ■General Item; ^^^«^
* .'* . ►
Willing Materials'! SSssa ;: Cards ii^iSS j£$i
I Boaid Game 'W'°|
Q Sunglassrc
Ipbie'liH l|Cigariettes:
llSsöiM^
m
^Additional Mowance*S*£i
l4vv.'.v';-:a'■'■•■■'''' ■•'"■V ;&.'J°V'
OK I
Figure 5.16 HOPS Individual Issues Screen
>«>^«.f»ii1.,T.;.<;;iyvi;in...«tl(,,,;lt.til
wmm
Figure 5.17 HOPS Community Issue Screen
141
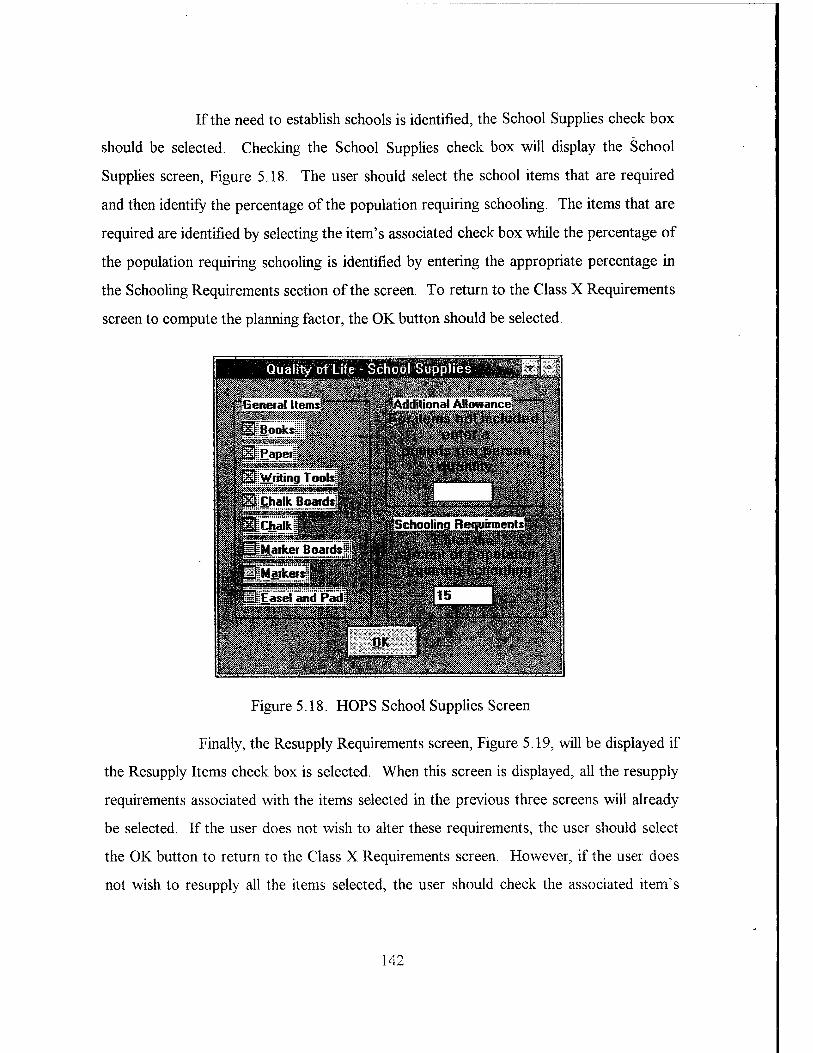
If the need to establish schools is identified, the School Supplies check box
should be selected. Checking the School Supplies check box will display the School
Supplies screen, Figure 5.18. The user should select the school items that are required
and then identify the percentage of the population requiring schooling. The items that are
required are identified by selecting the item's associated check box while the percentage of
the population requiring schooling is identified by entering the appropriate percentage in
the Schooling Requirements section of the screen. To return to the Class X Requirements
screen to compute the planning factor, the OK button should be selected.
Quality of Life - School Supplies mummM.-yi^z
sigSßC&i;
msm,^^^^'W: mMBmm ^^m^^^^
Figure 5.18. HOPS School Supplies Screen
Finally, the Resupply Requirements screen, Figure 5.19, will be displayed if
the Resupply Items check box is selected. When this screen is displayed, all the resupply
requirements associated with the items selected in the previous three screens will already
be selected. If the user does not wish to alter these requirements, the user should select
the OK button to return to the Class X Requirements screen. However, if the user does
not wish to resupply all the items selected, the user should check the associated item's
142

check box to deselect the item. In addition, if there are any additional items the planner
wishes to consider resupplying, the user can either select the item's associated check box
or enter the resupply weight into the Additional Allowance section of the screen,
whichever is applicable.
»General Items"'"' V\
]i| Baseballs
|B«&ÜbaNpg^
Soccer Balls , ' ^
Batteries £§;£'£$
jpCraft Supplies ->'
ggpiWriting Materials!
iSchool Supplies.il
.?.§KJ5!9^ypi0*es||
■Adifitianal Allowance^^^
j-tifejJ:»;
_J
- CigaieUespif^p||
Figure 5.19 HOPS Resupply Screen
After the user has reviewed all the items that are to be distributed to the
population, the VERIFY button should be selected to allow the Class X planning factors
to be calculated. To initiate the calculations, the COMPUTE button must be selected.
Selecting this button will result in two planning factors being displayed. The first planning
factor is the pounds per person per day planning factor required for the initial surge. The
second planning factor is the pounds per person per day required for sustainment. To
continue the planning process, the user may use any of the previously discussed options
for leaving a requirements screen.
f. Class IV Requirements Screen
To determine the construction materials required to support an operation,
the Class IV Requirements screen, Figure 5.20, can be displayed. When the Class IV
143
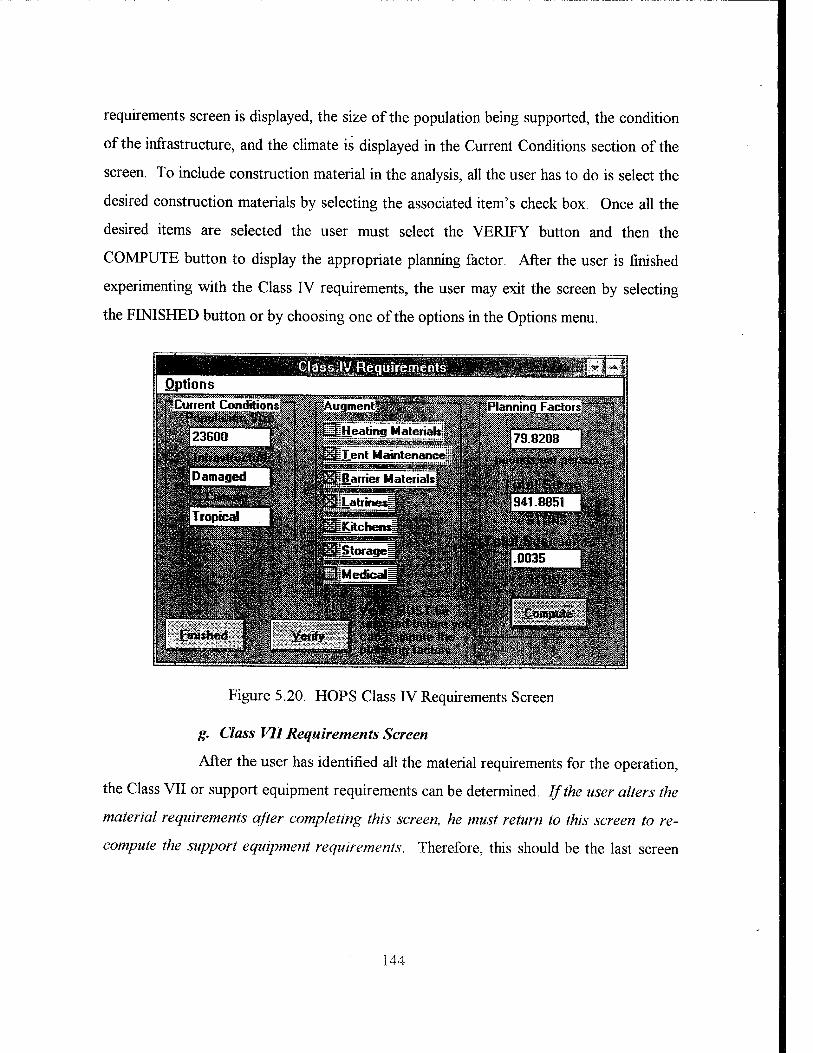
requirements screen is displayed, the size of the population being supported, the condition
of the infrastructure, and the climate is displayed in the Current Conditions section of the
screen. To include construction material in the analysis, all the user has to do is select the
desired construction materials by selecting the associated item's check box. Once all the
desired items are selected the user must select the VERIFY button and then the
COMPUTE button to display the appropriate planning factor. After the user is finished
experimenting with the Class IV requirements, the user may exit the screen by selecting
the FINISHED button or by choosing one of the options in the Options menu.
Current Conditions
'-"l '-r, - f^'tt'V" -:-"J ■■"-■"* -f n>'Hi'fc '„ .' :* •: *■.-•
Options Class IV Requirements ^tfpKiftSI Wä**M~
23600 !*!
iAujmei
Heating MaterialfcS
it Maintenance!
<5asiKjPlanning Factorsllill
^^filS^SS^^^ii Figure 5.20. HOPS Class IV Requirements Screen
g. Class VII Requirements Screen
After the user has identified all the material requirements for the operation,
the Class VII or support equipment requirements can be determined. If the user alters the
material requirements after completing this screen, he must return to this screen to re-
compute the support equipment requirements. Therefore, this should be the last screen
144

entered in the planning process. This is the most complicated screen in the HOPS
program so, the user should make his entries carefully.
Upon entering the Class VII Requirements screen, Figure 5.21 will appear
and the user must determine whether to calculate the support equipment requirements for
the surge or sustainment portion of the operation. This is done by selecting the
appropriate button from Supply Movement box. It should be noted that in most
operations, the surge movement requirements will need the most vehicles. It is
recommended, but not required, that the user compute the requirements related to surge
movement. Once the appropriate button is selected, the short ton (STON) quantity of
supplies is displayed. If neither option is selected, an error will result.
Class VII Requirements
Figure 5.21. HOPS Class VII Requirements Screen
145
The next section to be completed is the Transportation Specifics section.
There are three drop-down menu boxes in this section, the One-way Distance menu, the
Average Speed menu, and the Operation Day menu. The One-way Distance menu is to
identify the average one-way distance that must be traveled by the vehicles. The Average
Speed menu box is to identify the speed at which the vehicles will be traveling. The
Operational Day menu box is to identify the number of hours the vehicles will be operated
each day. Again, the options for each box are displayed by selecting the box and using the
down arrow keys on the keyboard or by clicking on the down arrow with a mouse.
Failure to complete any one of the boxes will result in an error.
The next two sections, Water Production and Personnel Movement, are
used to identify the need for vehicles to transport water and personnel respectively. If the
need for water has been identified, the quantity of water required each day is displayed.
The user has only to input the percentage of the water requirements that the infrastructure
is capable of producing and the percentage, of the water that must be transported. If no
water is required, no entries are required by the user. However, in the Personnel
Movement section, the user must always enter the percentage of the population that
requires transportation each day. If no movement is anticipated, the user can select zero
from the menu options. Again, errors result when the user fails to complete the applicable
boxes.
Once all the user entry boxes previously described have been completed,
the user must select the VERIFY button to continue. Once the VERIFY button has been
selected, the user can calculate the fuel requirements or the planning factor. If the user
does not wish to calculate the fuel requirements, the CALCULATE button should be
selected. A message box will then be displayed to notify the user that the calculated
values will be inaccurate since the fuel requirements have not been identified and will ask
the user if he wishes to continue. The user has only to select the YES button to continue.
However, if the user truly wishes to calculate the fuel requirements first, the NO button
should be selected. Selecting the NO button allows the user to check the Calculate Fuel
146

check box. Checking this box, either before or after the CALCULATE, will result in the
Class III requirements screen being displayed. When the Class III requirements screen is
completed, which will be discussed shortly, the user will be returned to the Class VII
requirements screen.
Once the user returns to the Class VII requirements screen, the
CALCULATE button can be selected without an error resulting and the Number Required
boxes will display the calculated requirements. The user can then select the COMPUTE
button in Planning Factor section to compute the corresponding planning factor. Finally,
the user can leave this screen using any of the previously discussed exiting methods.
h. Class HI Requirements Screen
This screen can only be accessed through the Class VII requirements
screen since the requirements for fuel are primary driven by the amount of support
equipment utilized during the operation. Upon entering the Class III Requirements screen,
Figure 5.22, all the current equipment requirements are displayed. There are no user entry
blocks on this screen. All the user has to do to display the fuel statistics is to select the
VERIFY button. This not only computes the diesel and gas requirements but it also
computes the number of fuel trucks that are required and their associated fuel requirement.
Selecting the COMPUTE button in the Planning Factor section will result in the traditional
pounds per person per day planning factor being displayed.
This screen does not allow the user to explore the variables. Any
contingency planning must be done in the other requirement screens. This screen only
responds to the previously inputted requirements. In addition, there are only two ways to
leave this screen. First, the user can select Quit from the Options menu and exit the
program. Secondly, the user can select the FINISHED button and return to the Class VII
Requirements screen.
147
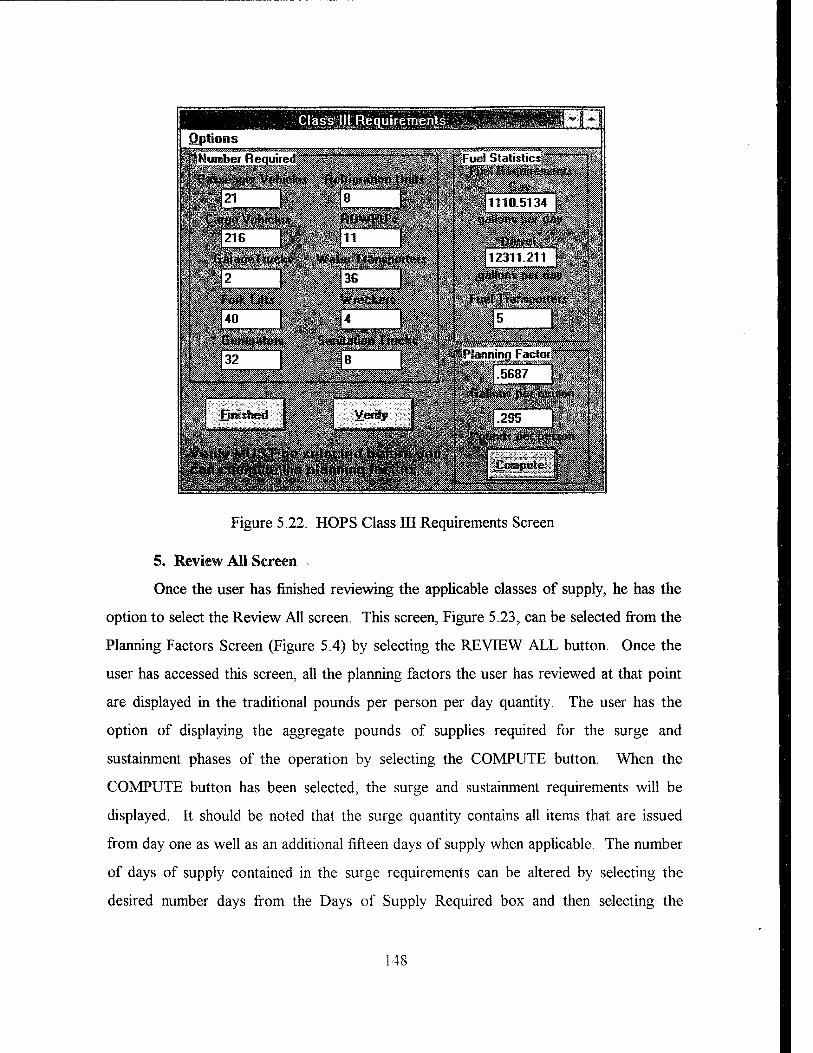
Class III Requirements Options
Fuel StatisÜios:^:!;;.':::
11110.513'«. f
SyjjäfclftSftfr f>tt -JAW* ■; '
•^JT~.l-;.i Planning Factor V"""""
>.:• • j -^33 f':;..'■ ri':
Figure 5.22. HOPS Class HI Requirements Screen
5. Review All Screen
Once the user has finished reviewing the applicable classes of supply, he has the
option to select the Review All screen. This screen, Figure 5.23, can be selected from the
Planning Factors Screen (Figure 5.4) by selecting the REVIEW ALL button. Once the
user has accessed this screen, all the planning factors the user has reviewed at that point
are displayed in the traditional pounds per person per day quantity. The user has the
option of displaying the aggregate pounds of supplies required for the surge and
sustainment phases of the operation by selecting the COMPUTE button. When the
COMPUTE button has been selected, the surge and sustainment requirements will be
displayed. It should be noted that the surge quantity contains all items that are issued
from day one as well as an additional fifteen days of supply when applicable. The number
of days of supply contained in the surge requirements can be altered by selecting the
desired number days from the Days of Supply Required box and then selecting the
148

COMPUTE button. The sustainment requirements are measured in pounds per day and
included only items that are consumed on a daily basis. That is, classes of supply whose
pounds per person per day planning factor does not seem appropriate, like clothing and
quality of life items, are not included. These figures will prove invaluable to the logistician
planning the lift assets required to support and sustain humanitarian operations.
Review All Print liPlanninq Fa
■iL..^ 1
iPlanninq Factor!
ClofevW
r-3 include milkl
msHBKSA r
|¥t^i'#S^t^$>: 31061269.8
pJ2651^53 ' g
Figure 5.23. HOPS Review All Screen
C. CHAPTER SUMMARY
The purpose of this chapter was to walk the user through the Humanitarian
Operations Planning System. Each of user screens included in the program were
discussed as well as inputs required by the user and techniques to transverse the various
149
screens. In addition, the visual snapshot of each of the screens amplified the derivation of
the planning factors for Operation Sea Signal described in the previous chapter. After
reading this chapter, the planner should be able to transverse the various screens with
minimal effort. The end result is a very quick analysis of the materials required to support
a population during a humanitarian operation and this should also aid in transportation
planning.
150

VI. CONCLUDING REMARKS
A. SUMMARY
This thesis has built a foundation for planners who are preparing to support
humanitarian operations. Specifically, a structure has been defined which will enable
planners to accurately classify and identify the major factors affecting the materials
required to support the victims of a disaster. Moreover, using the structure this thesis has
developed logistics planning factors relating to the support of the victims. Except for
Class V, ammunition, and Class IX, repair parts, each class of supply was reviewed and an
associated logistics planning factor was developed using a three-step process.
The first step entailed determining the actual requirements for each class of
supply. The requirements were derived from historical studies of past operations, the
Service's requirements, and argumentative reasoning. The second step involved
quantifying the requirements. During this step, the requirements were converted into
usable logistics quantities like pounds or gallons. In many cases, untraditional methods
were used. For instance, several manufacturers for a product were contacted and the
established weight of a product was computed as average of the various manufacturer's
product weights. Unfortunately, not all classes of supply could be accurately quantified.
When quantifying the requirements was not possible, the requirements were estimated by
varying the Service's current planning factors to address the situation at hand based on the
quantities that were known. The final step was to convert the quantities into a usable
logistics planning factor. This was accomplished by analyzing the lifecycles and
replenishment rates of the various commodities. The end result was planning factors that
corresponded to the Service's current planning factors in that they are both measured in
pounds per person.
To facilitate the use of the derived planning factors, a computer assisted planning
tool was derived. The program, known as the Humanitarian Operations Planning System,
151

allows the user to input the appropriate variables and select the items that are to be
distributed. Then, the program outputs the appropriate logistics planning factors. The
planner does not need to know the mathematics to calculate the planning factors and the
calculation can be completed in minutes. More importantly, the program can quickly
aggregate the requirements so that the planner can get a feel for the quantity and types of
transportation required to bring the materials into the theater of operations.
The derived planning factors were compared to the actual consumption rates
experienced during Operation Sea Signal in Guantanamo Bay, Cuba. The majority of the
data available proved to be unsuitable for comparison. This was not much of a surprise
because the lack of accurate data was one of the motivating factors of this thesis.
However, when the data was comparable, there was a remarkable correlation between the
derived planning factors and the actual consumption rates. For the remaining classes of
supply, all that can be said is the model appears to account for the majority of the items
used in the operation or allows the planner to add to the model's built-in provisions. Since
the planning factors are designed to assist the planners begin the planning process, not to
dictate the planning requirements, it is believed the model will prove to be quite helpful to
the planner in the initial stages of the planning process. This is because humanitarian
operations are often short-fused and offer very little guidance on the material requirements
necessary to support the victims. The model lays the groundwork from which the planner
can begin the planning process for the material support of humanitarian operations.
B. RECOMMENDATIONS FOR FUTURE STUDY
Recommendations that directly build on this thesis include: developing a tracking
system that can be used by the JTF in-theater, a more detailed analysis of the Class IV
requirements, further validation of the planning factors described within, and expanding
the existing structure to accommodate additional variables. As noted when attempting to
validate the planning factors that were derived, the tracking of supplies for these
operations is very poor. Unfortunately, the problem does not appear to be improving, but
152
the problem is rapidly gaining attention of senior logisticians. The senior logisticians are
interested in accurate tracking of supplies to reduce the number of shipments, or large
portions of shipments, being "misplaced" due to poor tracking. Moreover, validation of
the planning factors to support humanitarian operations hinge on accurate and timely data
collection. This thesis was unable to accurately quantify the Class IV requirements so any
effort to update the base line planning factors to reflect the actual usage rate would greatly
improve the model. Finally, exploring additional variables has the potential to further
focus the planning factors on the situation at hand.
There are many areas that still need to be explored when considering the logistics
involved in supporting humanitarian operations. This thesis has only explored one aspect
of material consumption. That is, the consumption of supplies by the recipient population.
No consideration was given to supplying the troops, moving the required supplies into the
theater of operations, prepositioning the necessary supplies in the various hot spots, or
determining the optimal force and force mix allocations to support humanitarian
operations. The results from research on any of the aforementioned topics would be
beneficial to the decision makers as well as establish a baseline for supporting budgetary
decisions regarding funding for these operations in the future.
153

154
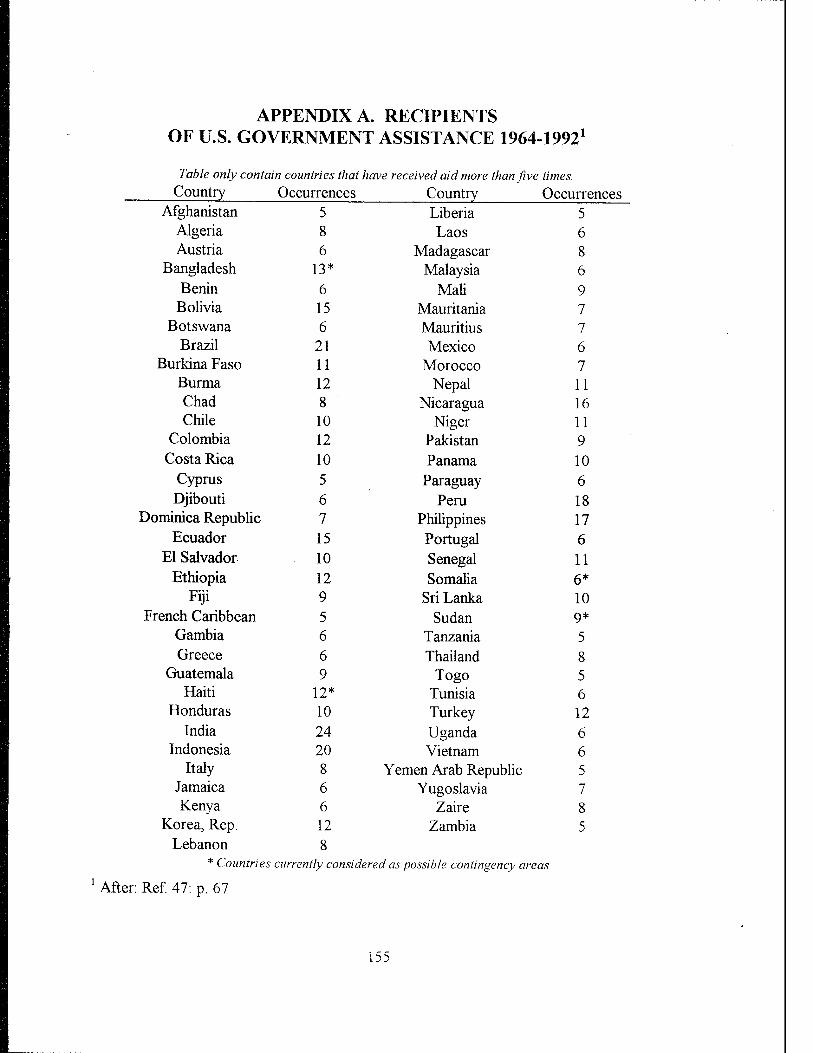
APPENDIX A. RECIPIENTS OF U.S. GOVERNMENT ASSISTANCE 1964-19921
Table only contain countries that
Country Occurrences Afghanistan 5
Algeria 8 Austria 6
Bangladesh 13* Benin 6
Bolivia 15 Botswana 6
Brazil 21 Burkina Faso 11
Burma 12 Chad 8 Chile 10
Colombia 12 Costa Rica 10
Cyprus 5 Djibouti 6
Dominica Republic 7 Ecuador 15
El Salvador 10 Ethiopia 12
Fiji 9 French Caribbean 5
Gambia 6 Greece 6
Guatemala 9 Haiti 12*
Honduras 10 India 24
Indonesia 20 Italy 8
Jamaica 6 Kenya 6
Korea, Rep. 12 Lebanon 8
* Countries currently consi 1 After: Ref. 47: p. 67
have received aid more than five times.
Country Occurrences Liberia 5 Laos 6
Madagascar 8 Malaysia 6
Mali 9 Mauritania 7 Mauritius 7 Mexico 6
Morocco 7 Nepal 11
Nicaragua 16 Niger 11
Pakistan 9 Panama 10
Paraguay 6 Peru 18
Philippines 17 Portugal 6 Senegal 11 Somalia 6*
Sri Lanka 10 Sudan 9*
Tanzania 5 Thailand 8
Togo 5 Tunisia 6 Turkey 12 Uganda 6 Vietnam 6
Yemen Arab Republic 5 Yugoslavia 7
Zaire 8 Zambia 5
dered as possible contingency areas
15:
156

APPENDIX B. STANDARD HEIGHT/WEIGHT TABLES
The following tables are adaptations of references 26, 27 ,28. The first table is for
adults, the second table is for children and the final table is for infants. Because children
grow at different rates, there may be cases when a child has outgrown his chart. When
this occurs, the child will be assessed using the table for adults but the normal weight
range for the child height is extended to include 85% to 120% of the standard weight.
Weight Normal Range Normal Range
Height Women Men 58 116 104 - 128 59 118 106- 130 60 120 108-132 126 113- 139 61 122 110- 134 128 115- 141 62 124 112- 136 130 117-143 63 127 114-140 133 120 - 146 64 131 118-144 137 123-151 65 134 121 - 147 140 126 - 154 66 138 124 - 152 144 130-158 67 142 128- 156 148 133 - 163 68 146 131 -161 152 137- 167 69 150 135-165 156 140-172 70 154 139-169 161 145 - 177 71 157 141 - 173 166 149- 183 72 161 145- 177 172 155- 189 73 178 160- 196 74 184 166 - 202 75 190 171 -209 76 196 176-216
Table B. 1. Standard Height/Weight Chart for Individuals Age 16 and Over.
15:

Height Weight Normal Range
36 28 24 -32 38 32 27-37 40 35 30-40 42 38 32-44 44 42 36-48 46 45 38-54 48 49 42-59 50 55 47-66 52 63 54-76 54 70 60-84 56 75 64-90 58 82 70-98 60 90 81 - 108 62 100 90 - 120 64 110 99 - 132
Table B.2. Standard Height/Weight Chart for Children Ages 3 to 16.
Height Weight Normal Range 20 7.5 6-10 22. 10 8-12 24 13 11-15 26 16 13-18 28 19 16-22 30 22 19-25 32 24 21-29 34 26 23-30 36 28 24-32
Table B.3. Standard Height/Weight Chart for Children Ages 0 to 3.
158

APPENDIX C. RECOMMENDED DAILY DIETARY
ALLOWANCES1
Vitamin Ascorbic Vitamin Category Calories Protein Calcium Iron A Thiamine Riboflavin Niacin Acid D
Men grams grams mg. I.U. mg. mg. mg. mg. I.U.
Sedentary 2500 70 0.8 12 5000 1.2 1.6 12 75 n/a Moderately
Active 3000 70 0.8 12 5000 1.5 2 15 75 n/a Very Active 4500 70 0.8 12 5000 2 2.6 20 75 n/a
boys 13-15 3200 85 1.4 15 5000 1.5 2 15 90 400 16-20 3800 100 1.4 15 6000 1.8 2.5 18 100 400
Women
Sedentary 2100 60 0.8 12 5000 1.1 1.5 11 70 n/a Moderately
Active 2500 60 0.8 12 5000 1.2 1.6 12 70 n/a Very Active 3000 60 0.8 12 5000 1.5 2 15 70 n/a
Pregnant 300+ 85 1.5 15 6000 1.8 2.5 18 100 400-800 Lactating 500+ 100 2 15 8000 2 3 20 150 400-800
girls 13-15 2600 80 1.3 15 5000 1.3 2 13 80 400 16 -20 2400 75 1 15 5000 1.2 1.8 12 80 400
Children
Under 1 100/Kg. 3.5/Kg. 1 6 1500 0.4 0.6 4 30 400-800
lto3 1200 40 1 7 2000 0.6 0.9 6 35 400 4 to 6 1600 50 1 8 2500 0.8 1.2 8 50 400 7 to 9 2000 60 1 10 3500 1 1.5 10 60 400
10 to 12 2500 70 1.2 12 4500 1.2 1.8 12 75 400
1 After: Ref. 26: p. 51 f
159
-

160

APPENDIX D. CALORIES PER POUND OF BODY WEIGHT
The following table provides multipliers for the various demographic groups. The
multipliers are used in conjunction with the mean body weight for the demographic group
in question to compute the estimated calories required by the group to sustain normal
body function. Also included in this appendix are two applications of the table.
Category Calories per pound1 Calories per pound2
Men
Sedentary 16.234 16 Light 16.883
Moderately Active 19.481 21 Very Active 29.221 26
boys 15 -18 19 Women
Sedentary 16.406 14 Light 15.625
Moderately Active 19.531 18 Very Active 23.438 22
girls 13 - 18 35 - (1.1 x age in years) Children
Under 1 45 boys 1 to 14 45-(1.4 x age in years) girls 1 to 12 45 - (1.4 x age in years)
Calculated directly from Recommended Daily Dietary Allowances Numbers or equations extracted from References 26,27, and 28
Application A Sample population: male Activity level: Light Multiplier: 19 Average weight: 160
Calories required per person: 160 x 19 = 3040
Application B Sample Population: girls, age 15 Activity level: moderate Multiplier: 35 -(1.1 X age in years) Average weight: 105
Calories required per person: 105 x (35 -(1.1 x 15)) = 2047.5
161

162

APPENDIX E. FAMILY FOOD PLAN1
This table was adapted from Doctor Sherman's book Chemistry of Food and
Nutrition. It presents nutritional guidance in a non-technical way. The data from this
chart is the basis for further analysis regarding the relationship between calories per person
and pounds per person.
Fruits Meat, Fats Milk and Poultry, Flour, and
Category Calories Products Vegetables Fish Cereals Sugars Men qt. oz. oz. oz. oz.
Sedentary 2500 .71 19.4 6 8 3.42 Moderately Active 3000 .71 21.71 6.85 10.85 4
Very Active 4500 .85 28.57 7.42 20.57 5.42 boys
13-15 3200 .85 24.57 6.42 11.42 4.28 16-20 3800 .85 26.85 7 16 4.85
Women
Sedentary 2100 .64 17.14 5.71 5.71 3.42 Moderately Active 2500 .64 19.4 6 8 3.42
Very Active 3000 .79 21.71 6.85 10.85 4 Pregnant 300+ 1 19.4 7 6.85 3.14 Lactating 500+ 1.5 30.85 7 6.85 3.14
girls 13-15 2600 .85 18.85 5.85 9.14 3.42 16-20 2400 .71 17.71 5.85 8 3.14
Children
Under 1 45/lb. 1 10.28 1 1.14 .28 1 to 3 1200 .71 12 1.85 3.42 .85 4 to 6 1600 .71 13.71 3.28 4.57 2 7 to 9 2000 .71 18.28 4.42 5.71 2.57
10 to 12 2500 .85 19.4 5.57 7.42 3.14
After: Ref. 26: p.515
163
164
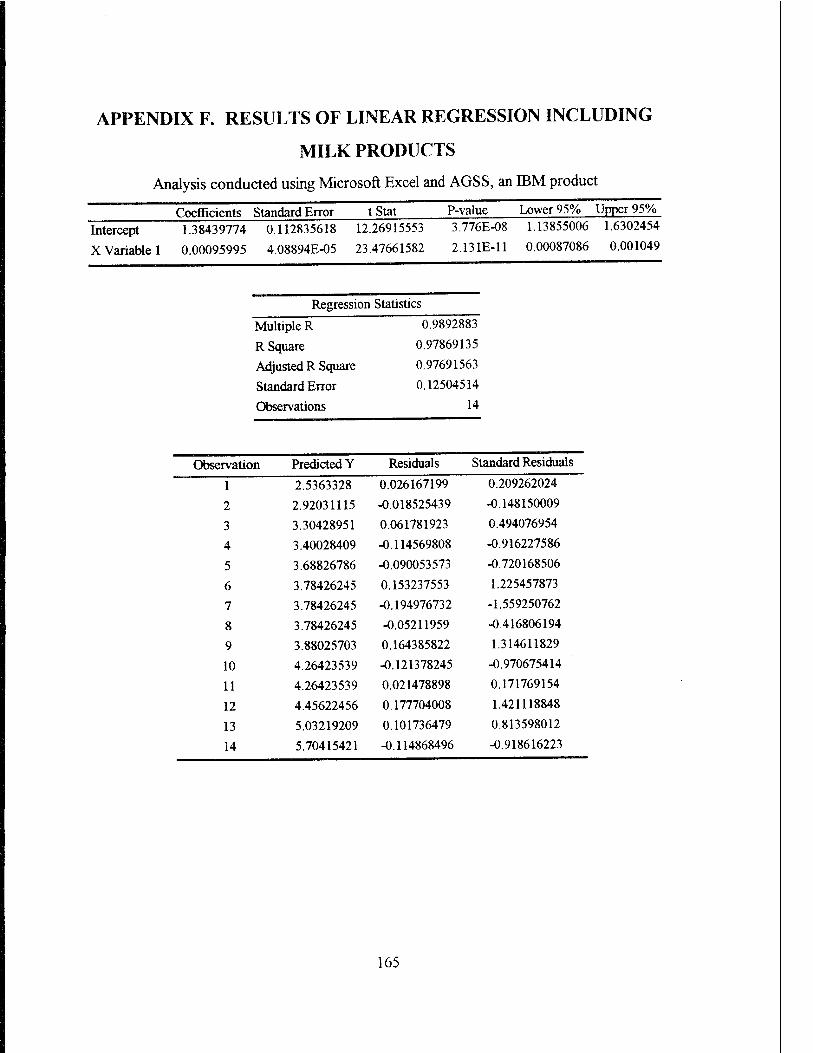
APPENDIX F. RESULTS OF LINEAR REGRESSION INCLUDING
MILK PRODUCTS
Analysis conducted using Microsoft Excel and AGSS, an IBM product
Coefficients Standard Error t Stat P-value Lower 95% Upper 95%
Intercept 1.38439774 0.112835618 12.26915553 3.776E-08 1.13855006 1.6302454
X Variable 1 0.00095995 4.08894E-05 23.47661582 2.131E-11 0.00087086 0.001049
Regressio ii Statistics
Multiple R 0.9892883
R Square 0.97869135
Adjusted R Square 0.97691563
Standard Error 0.12504514
Observations 14
Observation Predicted Y Residuals Standard Residuals
1 2.5363328 0.026167199 0.209262024
2 2.92031115 -0.018525439 -0.148150009
3 3.30428951 0.061781923 0.494076954
4 3.40028409 -0.114569808 -0.916227586
5 3.68826786 -0.090053573 -0.720168506
6 3.78426245 0.153237553 1.225457873
7 3.78426245 -0.194976732 -1.559250762
8 3.78426245 -0.05211959 -0.416806194
9 3.88025703 0.164385822 1.314611829
10 4.26423539 -0.121378245 -0.970675414
11 4.26423539 0.021478898 0.171769154
12 4.45622456 0.177704008 1.421118848
13 5.03219209 0.101736479 0.813598012
14 5.70415421 -0.114868496 -0.918616223
165
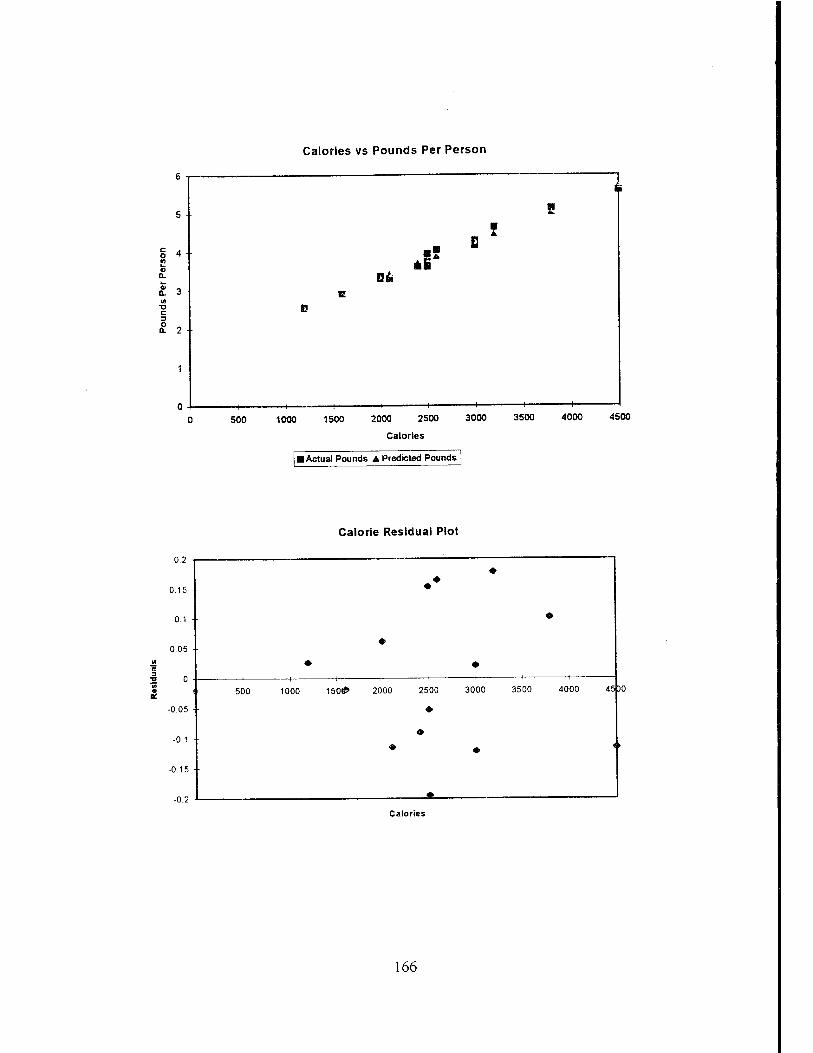
Calories vs Pounds Per Person
0-2 i
0.15
0.05
-0.05
-0.1
-0.15
500 1000 1500 2000 2500
Calories
3000 3500 4000 4500
■ Actual Pounds A Predicted Pounds
Calorie Residual Plot
Calories
166
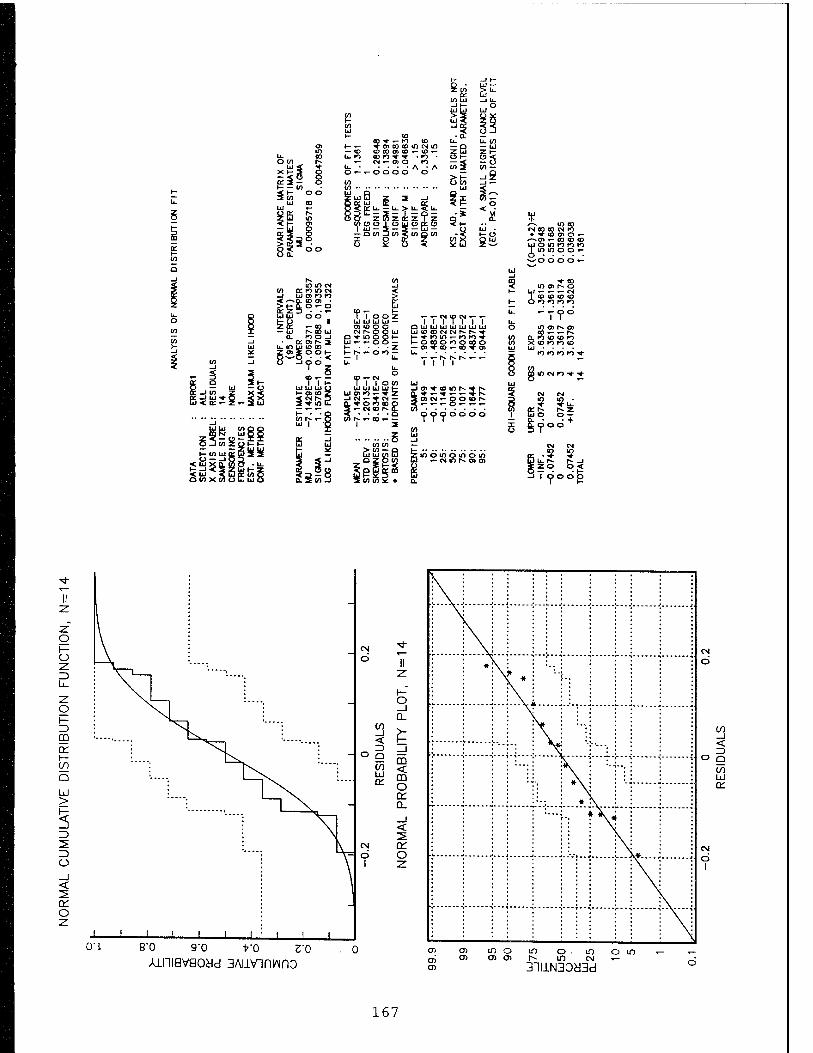
CO ■* *- tO CD "f a> to to m ot tn to co o» co •- CD ■*- COK)** • K) • 04 — 0)0 K) .... A • A
«- o o o o o
3 Q
)< K --2 —:
CO N UQQ
OJtnJühH
<UX{L ÖSÖ •!*-
< üj < □ cc: (/) o
ßLü ÜJ ÜJ Ul UJ Ul ÜJ CO CD <N CN f» fs. **■
t-* ro in *- K> ro ■* O CO O K) O CO O
— o>*co«-co*o>
-Jo^coior^^rN.
O» CN *- o o co r*.
oo o o o o o
*-■* tO CD CN eg op CM PS • *« 0)0'-
*-^0> »- CO CO CD uj o in K) fo ro TiomoO'- 'O o o o •-
co o) r^ o i T- *- *- CN
CO CD CD CD
: to io ro to j . . . .
ro ro ro ro '
l if) fN ro •<- ■*■
7
g I— o z:
Z3 CD
Q: r—
Q
UJ >
Z)
Ü
cc o
¥ -z. I—" o _l CL
CD < m o en 0_
or o
8'0 9*0 f0 Z'O
Aiiiiavaoad aAiivirirAino mo in o in o in o oi r-^ in cN »-
31llN30d3d
167
168

APPENDIX G. RESULTS FROM LINEAR REGRESSION
EXCLUDING MILK PRODUCTS
Analysis conducted using Microsoft Excel and AGSS, an IBM product
Coefficients Standard Error t Stat P-value Lower 95% Upper 95%
Intercept 0.1811921 0.047588765 3.807455488 0.002495" ' 0.077505094 0.284879113
X Variable 0.0008396 1.72452E-05 48.68575817 3.693E-lf 0.000802024 0.000877172
Regression Statistics
Multiple R 0.99747825
R Square 0.99496286
Adjusted R Square 0.9945431
Standard Error 0.05273817
Observations 14
Observation Predicted Y Residuals Standard Residuals
1 1.18870975 -0.054781181 -1.038738776
2 1.52454897 -0.051334683 -0.973387661
3 1.86038818 0.077111815 1.462163314
4 1.94434799 0.055652011 1.055251118
5 2.1962274 -0.026584544 -0.504085451
6 2.2801872 -0.056972919 -1.080297637
7 2.2801872 0.023384224 0.443402273
8 2.2801872 0.023384224 0.443402273
9 2.36414701 -0.033789866 -0.640709883
10 2.69998622 0.014299489 0.271141182
11 2.67 0.014299489 0.271141182
12 2.86790583 0.051737024 0.981016699
13 3.37166466 0.0479782 0.909743382
14 3.95938329 -0.084383286 -1.600042012
169

Calories vs. Pounds per person
500 1000 1500 2000 2500
Calories
3000
[Actual Pounds i. Predicted Pounds
3500 4000 4500
Calories Residual Plot
0.08
0.06
0.04 --
0.02 -
1 0-
1 2 -0.02 ■
-0.04
-0.06
-0.08
-0.1
500 1000
170

: tu *- 2 *-
(/) K CM tO <0 _J LU 0> *- Q <<~s.Q- CM (D *
^§°^ DU O O CM
5§ 58"
_IO 0<
CD Ö 1-N-
I I I- UJ ÜJ UJ I- CM rO
< T-CM ÜJ
| | o o t- UJUJ ÜJ UJZ CM f) <
CD O *- CM T-
I I otn UJ ÜJ ÜJ UJ t-
uj CM (O ro r*. z _i co r- r> <M — ", r- «O CM CM p
■M- o *- I^CL
J UJ UJ Ul UJ
j CM CM cn *
TT IO «*■ »O (O CD
»0 IO f* *- . 5 r^ ^ Mf ep io i^ ? co in io *- * r ~
???'
- CM O •" I co to cn in to WNOO +
'd ^ d d CM
r*- r* to to
t X55s5
u. U) M- ^ IO x m MV MT w UJ • • ■ •
) in*- MT <*• *
i?«
: Z o O <
o I— ü z 3
m et: t— C/) o ÜJ > 1—
r>
Z> ü
o
II
£ m < m o er CL
o
■ \ i : : : • : : : i i i
i i *K i : '"■ i
o
o
o l
1 ; : ; '•!■• ; * * \ : : : ;
in < Q V) UJ
o'i 8"o 9'0 ro vo Ainiavaoad 3Aiiv"irmno
en in o in o mom o) o) en l~- m CM T-
3~lllN30a3d
171
372
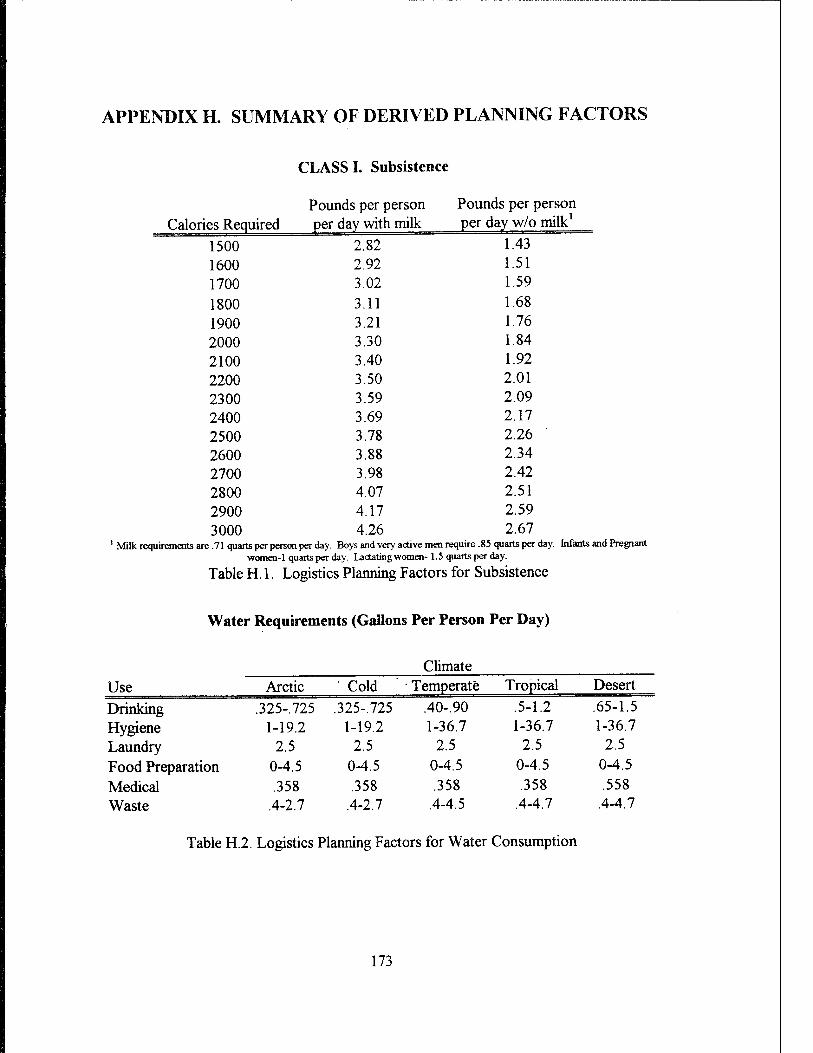
APPENDIX H. SUMMARY OF DERIVED PLANNING FACTORS
CLASS I. Subsistence
Pounds per person Pounds per person Calories Required per day with milk per day w/o milk
1500 2.82 1.43 1600 2.92 1.51 1700 3.02 1.59 1800 3.11 1.68 1900 3.21 176 2000 3.30 1.84 2100 3.40 1.92 2200 3.50 2.01 2300 3.59 2.09 2400 3.69 2.17 2500 3.78 2.26 2600 3.88 2.34 2700 3.98 2.42 2800 4.07 2.51 2900 4.17 2.59 3000 4.26 2.67
1 Milk requirements are .71 quarts per person per day. Boys and very active men require .85 quarts per day. Infants and Pregnant women-1 quarts per day. Lactating women-1.5 quarts per day.
Table H. 1. Logistics Planning Factors for Subsistence
Water Requirements (Gallons Per Person Per Day)
Climate Use Arctic Cold • Temperate Tropical Desert
Drinking .325-725 .325-725 .40-.90 .5-1.2 .65-1.5 Hygiene 1-19.2 1-19.2 1-36.7 1-36.7 1-36.7 Laundry 2.5 2.5 2.5 2.5 2.5 Food Preparation 0-4.5 0-4.5 0-4.5 0-4.5 0-4.5 Medical .358 .358 .358 .358 .558 Waste .4-2.7 4.2.7 .4-4.5 .4-4.7 .4-4.7
Table H.2 Logistics Planning Factors for Water Consumption
173

The following tables explain the water uses with ranges in more detail. The charts
are developed for a temperate climate.
Minimum Gallons Standard Gallons1
Category per person per day per person per day
Infants 0.325 0.40 Males 0.725 0.90 Females 0.525 0.65 Pregnancy 0.600 0.75 Lactation 0.650 0.80
1 This value is calculated by adding ten percent to the minimum factor
Table H.3. Logistics Planning Factors for Drinking Water
Gallons per Meal person per meal
MRE 25 Kitchen Prepared 1 5
1 Includes a factor of .25 gallons per person for kitchen sanitation
Table H.4. Logistics Planning Factors for Water Used in Food Preparations
1 shower 2 showers 3 showers 1 shower 2 showers Category Minimum per week per week per week per day per day
Males 1.7 4.2 6.7 9.2 19.2 36.7 Females 1 3.5 6 8.5 18.5 36
Table H.5. Logistics Planning Factors for Water Used for Personal Hygiene
Climate Multiplicative Factor
Temperate 10 Tropical 13 Desert 16 Cold 0.8 Arctic 0.7
Table H.6. Climate Factors for Water Consumption
174

Utensils (Pounds per person per day)
Item Pounds per Item
Plate 0.038 Napkins 0.005 Cups. 0.014 Forks 0.0165 Knives 0.0167 Spoon 0.0122
Table H.7. Logistics Planning Factors for Eating Utensils
Class II. Personal Supplies
Tents
Total Weight Planning Factor
Tent Surge Daily
GP, Medium GP, Medium w/Liner Arctic
455 545 76
37.92 0.104 45.42 0.124 7.60 0.021
Table H.8. Logistics Planning Factors for Tent Requirements
Housekeeping Requirements
Quantity Laundry Policy Lbs per week Lbs per day none 0 0 1 load per week 0.5 0.071 2 loads per week 1 0.143
Table H.9. Logistics Planning Factors for Laundry Soap
175
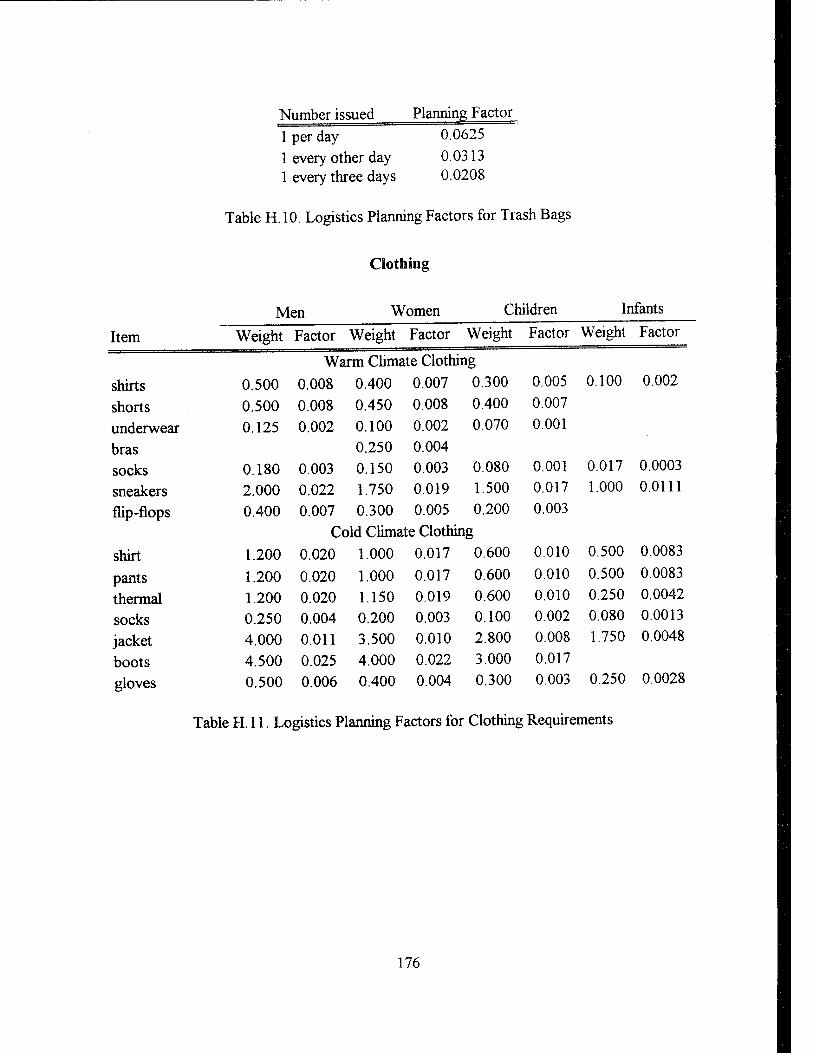
Number issued Planning Factor 1 per day 0.0625 1 every other day 0.0313 1 every three days 0.0208
Table H. 10. Logistics Planning Factors for Trash Bags
Men
Clothing
Women Children Infants
Item Weight Factor Weight Factor Weight Factor Weight Factor
Warm Climate Clothing
shirts 0.500 0.008 0.400 0.007 0.300 0.005 0.100 0.002
shorts 0.500 0.008 0.450 0.008 0.400 0.007
underwear 0.125 0.002 0.100 0.002 0.070 0.001
bras 0.250 0.004
socks 0.180 0.003 0.150 0.003 0.080 0.001 0.017 0.0003
sneakers 2.000 0.022 1.750 0.019 1.500 0.017 1.000 0.0111
flip-flops 0.400 0.007 0.300 0.005 0.200 0.003
Cold Climate Clothing
shirt 1.200 0.020 1.000 0.017 0.600 0.010 0.500 0.0083
pants 1.200 0.020 1.000 0.017 0.600 0.010 0.500 0.0083
thermal 1.200 0.020 1.150 0.019 0.600 0.010 0.250 0.0042
socks 0.250 0.004 0.200 0.003 0.100 0.002 0.080 0.0013
jacket 4.000 0.011 3.500 0.010 2.800 0.008 1.750 0.0048
boots 4.500 0.025 4.000 0.022 3.000 0.017
gloves 0.500 0.006 0.400 0.004 0.300 0.003 0.250 0.0028
Table H. 11. Logistics Planning Factors for Clothing Requirements
176

Personal Equipment
General Infants
Item Weight Factor Weight Factor
cot 10 0.0274 10 0.0274
blanket 2 0.0055 0.5 0.0014 sheets 1 0.0056 0.5 0.0028 pillow 1 0.0027 N/A N/A
pillowcase 0.2 0.0011 N/A N/A bucket 0.8 0.0022 2 0.0055 towel 0.5 0.0028 0.4 0.0022 washcloth 0.063 0.0003 0.05 0.0003 rain poncho 0.6 0.0033 N/A N/A
Table H. 12. Logistics Planning Factors for Personal Equipment
Class in - POL
Bulk Requirements
Item Usage Rate1 Gallons Per Fuel Type 5-Ton Truck 0.1243 Mile Diesel 6000 Lb. Rough Terrain Forklift 5 Hour Diesel Rough Terrain Container Handler 8.5 1000 Gal. Water Transport 0.1243 1200 Gal. Fuel Transport 0.0932 Sanitation Trucks 0.1243
Hour Diesel Mile Gas Mile Gas Mile Gas
5-TonWrecker 0.2237 Mile Gas Garbage Truck .0621 Mile Gas ROWPU 94 Hour Diesel Refrigerated Container 1.09 Generator 6
Hour Diesel Hour Diesel
Yukon Heater .63 Hour Gas Cooking Equipment .63
1 [Ref. 29: pp. 2-20 - 2-52] Hour Gas
Table H. 13. Logistics Planning Factors for Fuel Consumption
177

Packaged Requirements
Item Pounds per person Package POL 0.295
Table H. 14. Logistics Planning Factors for Packaged Fuel Consumption
Class IV
Required Materials Po unds per person
Barrier Supplies 56 Heating Supplies (Arctic Climates) 3.5 Heating Supplies 2.92 Restroom Supplies 10.4 Shower Supplies 3 Kitchen Supplies 6 Storage Supplies 4021
Medical Supplies (Cool Climates) 5302
Medical Supplies 5252
Pounds per required tent
Table H. 15. Logistics Planning Factors for Construction Materials
Class VI
Item Weight Factor gms. lbs.
toothpaste 132 0.0118 toothbrush 10 0.0030 shampoo 457.6 0.0321 deodorant 48 0.0063 soap 143 0.0253 shaving cream 228.8 0.0311 comb 10 0.0026 brush 85.8 0.0253 razor 5 0.0046 toilet paper 171.6 0.0438 feminine hygiene 343.2 0.0297
Table H. 16. Logistics Planning Factors for Individual Hygiene Items
178

Category Planning Factor
Infants 0.0921
Children 0.1186
Women 0.1774
Men 0.1606
Table H. 17. General Logistics Planning Factors for Class VI
Class Vn
Item Item Weight Capacity
5-Ton Truck 22000 6 STONS 6000 Lb. Rough Terrain Forklift 27100 120 STONS Rough Terrain Container Handler 105120 50 Containers 1000 Gal. Water Transport 14500 1000 Gallons 1200 Gal. Fuel Transport 15000 1200 Gallons Sanitation Truck 14500 1000 Gallons 5 - Ton Wrecker 34400 N/A Garbage Truck 360001 N/A ROWPU 37960 60,000 Gallons Refrigerated Container 4000 33040 Pounds Generator 7540 60 KW
1 Estimated weight
Table H. 18. Logistics Planning Factors for Individual Hygiene Items
Class Vffl
Level of Services
Medical Requirement Full Services No Services
Beds (per person) 0.02 0.001
Supplies (per person per day) 1.41 0.07
Infant Supplies (per infant per day) 0.75 0.75
Table H. 19. Logistics Planning Factors for Class VIII
179
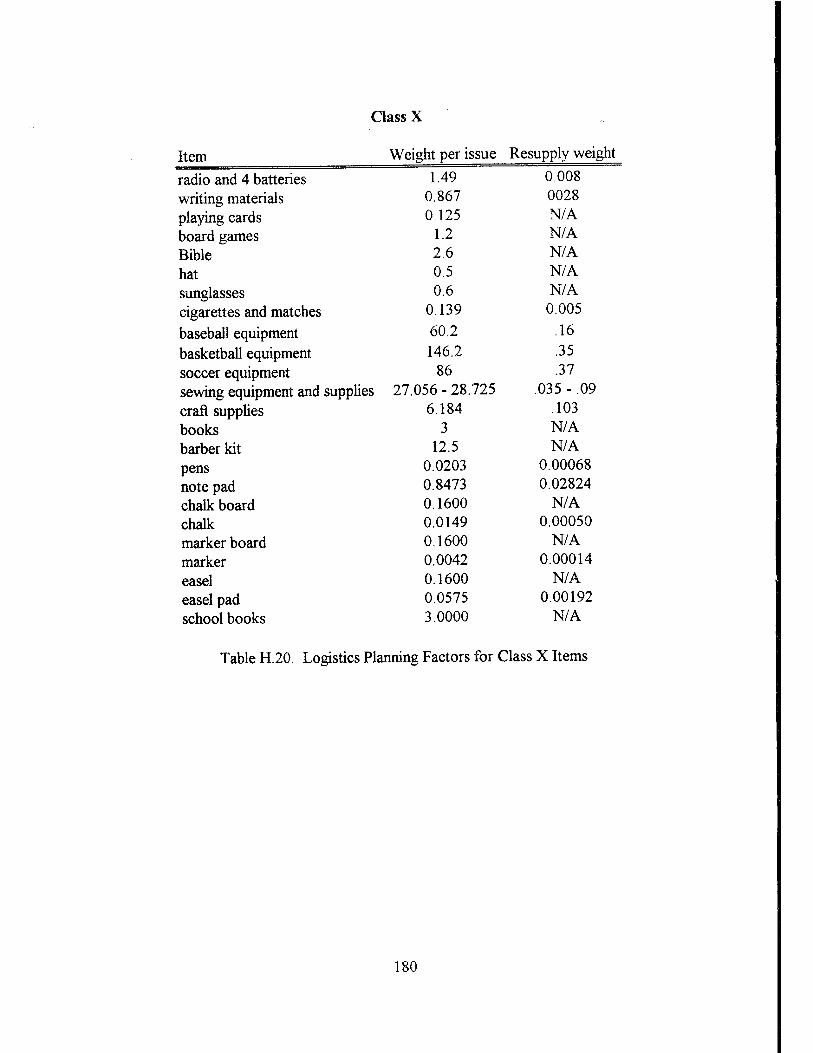
Class X
Item Weight per issue Resupply weight
radio and 4 batteries 1.49 0.008 writing materials 0.867 0028 playing cards 0.125 N/A board games 1.2 N/A
Bible 2.6 N/A
hat 0.5 N/A sunglasses 0.6 N/A cigarettes and matches 0.139 0.005
baseball equipment 60.2 .16
basketball equipment 146.2 .35 soccer equipment 86 .37 sewing equipment and supplies 27.056 - 28.725 .035 - .09 craft supplies 6.184 .103 books 3 N/A barber kit 12.5 N/A pens 0.0203 0.00068 note pad 0.8473 0.02824 chalk board 0.1600 N/A chalk 0.0149 0.00050 marker board 0.1600 N/A marker 0.0042 0.00014
easel 0.1600 N/A easel pad 0.0575 0.00192 school books 3.0000 N/A
Table H.20. Logistics Planning Factors for Class X Items
180

APPENDIX I. CONDENSED DATA FOR SUBSISTENCE CONSUMPTION, UTENSIL CONSUMPTION AND THE
ASSOCIATED SUMMARY STATISTICS
Breakfast Lunch Dinner Total
Date Food Utensüs MRE Food utensils Food Utensils
3-Nov 2.428 0.077 1.470 1.181 0.077 5.079 0.155
4-Nov 1.057 0.066 1.470 1.468 0.083 3.995 0.149
7-Nov 0.587 0.043 1.470 1.227 0.080 3.285 0.123
22-Nov 0.879 0.089 1.470 1.670 0.061 4.018 0.150
23-Nov 1.210 0.030 1.470 1.669 0.061 4.349 0.090
24-Nov 1.040 0.057 1.470 1.303 0.061 3.813 0.118
25-Nov 0.890 0.064 1.470 1.629 0.046 3.988 0.110
26-Nov 0.942 0.022 1.470 1.822 0.063 4.234 0.085
27-Nov 0.960 0.089 1.470 1.869 0.057 4.299 0.146
28-Nov 0.956 0.036 1.470 1.684 0.075 4.111 0.111
29-Nov 1.511 0.087 1.470 1.214 0.039 4.195 0.126
30-Nov 1.920 0.059 1.470 1.505 0.056 4.895 0.115
1-Dec 1.188 0.063 1.470 1.631 0.061 4.289 0.124
2-Dec 1.510 0.086 1.470 1.614 0.108 4.594 0.194
3-Dec 0.890 0.061 1.470 1.611 0.064 3.972 0.126
4-Dec 1.006 0.069 1.470 1.602 0.081 4.078 0.150
Table 1.1. Condensed Data for Cuban Subsistence Consumption and Utensil Utiliz
Statistic Value
Mean 4.19 Standard Error 0.10 Median 4.15 Standard Deviation 0.42 Sample Variance 0.18
Range 1.79 Minimum 3.28 Maximum 5.08 Sum 67.19 Count 16
Table 1.2. Summary of Statistics for Cuban Subsistence Consumption
181

Statistic Value Mean 0.129 Standard Error 0.007 Median 0.125 Standard Deviation 0.027 Sample Variance 0.001 Range 0.109 Minimum 0.085 Maximum 0.194 Sum 2.071 Count 16
Table 1.3. Summary of Statistics for Cuban Consumption of Eating Utensils
182
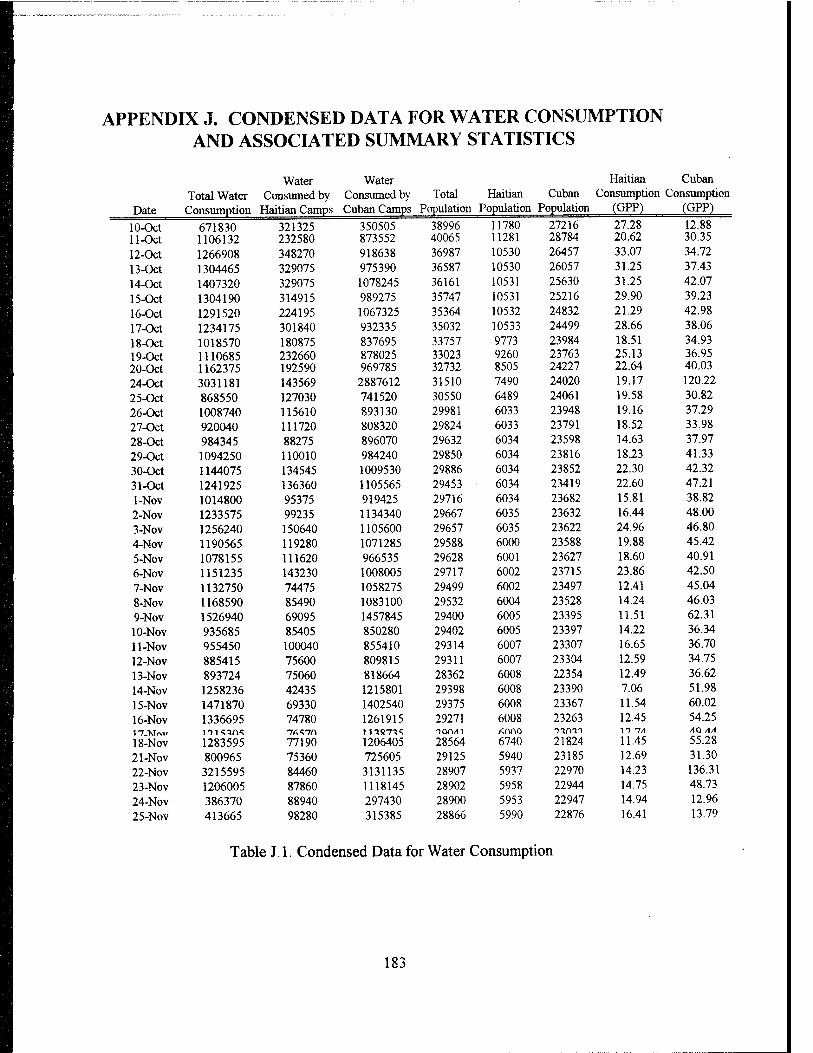
APPENDIX J. CONDENSED DATA FOR WATER CONSUMPTION AND ASSOCIATED SUMMARY STATISTICS
Water Water Haitian Cuban
Date Total Water Consumption
Consumed by Haitian Camps
Consumed by Total Cuban Camps Population
Haitian Cuban Population Population
Consumption (GPP)
Consumption (GPP)
10-Oct 11-Oct
671830 1106132
321325 232580
350505 873552
38996 40065
11780 11281
27216 28784
27.28 20.62
12.88 30.35
12-Oct 1266908 348270 918638 36987 10530 26457 33.07 34.72
13-Oct 1304465 329075 975390 36587 10530 26057 31.25 37.43
14-Oct 1407320 329075 1078245 36161 10531 25630 31.25 42.07
15-Oct 1304190 314915 989275 35747 10531 25216 29.90 39.23
16-Oct 1291520 224195 1067325 35364 10532 24832 21.29 42.98
17-Oct 1234175 301840 932335 35032 10533 24499 28.66 38.06
18-Oct 19-Oct 20-Oct
1018570 1110685 1162375
180875 232660 192590
837695 878025 969785
33757 33023 32732
9773 9260 8505
23984 23763 24227
18.51 25.13 22.64
34.93 36.95 40.03
24-Oct 3031181 143569 2887612 31510 7490 24020 19.17 120.22
25-Oct 868550 127030 741520 30550 6489 24061 19.58 30.82
26-Oct 1008740 115610 893130 29981 6033 23948 19.16 37.29
27-Oct 920040 111720 808320 29824 6033 23791 18.52 33.98
28-Oct 984345 88275 896070 29632 6034 23598 14.63 37.97
29-Oct 1094250 110010 984240 29850 6034 23816 18.23 41.33
30-Oct 1144075 134545 1009530 29886 6034 23852 22.30 42.32
31-Oct 1241925 136360 1105565 29453 6034 23419 22.60 47.21
1-Nov 1014800 95375 919425 29716 6034 23682 15.81 38.82
2-Nov 1233575 99235 1134340 29667 6035 23632 16.44 48.00
3-Nov 1256240 150640 1105600 29657 6035 23622 24.96 46.80
4-Nov 1190565 119280 1071285 29588 6000 23588 19.88 45.42
5-Nov 1078155 111620 966535 29628 6001 23627 18.60 40.91
6-Nov 1151235 143230 1008005 29717 6002 23715 23.86 42.50
7-Nov 1132750 74475 1058275 29499 6002 23497 12.41 45.04
8-Nov 1168590 85490 1083100 29532 6004 23528 14.24 46.03
9-Nov 1526940 69095 1457845 29400 6005 23395 11.51 62.31
10-Nov 935685 85405 850280 29402 6005 23397 14.22 36.34
11-Nov 955450 100040 855410 29314 6007 23307 16.65 36.70
12-Nov 885415 75600 809815 29311 6007 23304 12.59 34.75
13-Nov 893724 75060 818664 28362 6008 22354 12.49 36.62
14-Nov 1258236 42435 1215801 29398 6008 23390 7.06 51.98
15-Nov 1471870 69330 1402540 29375 6008 23367 11.54 60.02
16-Nov 1336695 74780 1261915 29271 6008 23263 12.45 54.25 1 *7_KIrw 18-Nov 1283595
~iAs.nn 77190
111871^ 1206405
TQA/11 28564
Anna 6740 21824
n -7/1 11.45
4Q /1/1 55.28
21-Nov 800965 75360 725605 29125 5940 23185 12.69 31.30
22-Nov 3215595 84460 3131135 28907 5937 22970 14.23 136.31
23-Nov 1206005 87860 1118145 28902 5958 22944 14.75 48.73
24-Nov 386370 88940 297430 28900 5953 22947 14.94 12.96
25-Nov 413665 98280 315385 28866 5990 22876 16.41 13.79
Table J. 1. Condensed Data for Water Consumption
183

Statistic Value
Mean 44.17 Standard Error 3.37 Median 40.47 Standard Deviation 21.81 Sample Variance 475.60 Range 123.44 Minimum 12.88 Maximum 136.31
Sum 1855.09
Count 42
Table J.2. Summary of Statistics for Actual Cuban Water Consumption
Statistic Value Mean 18.71 Standard Error 0.97 Median 18.37 Standard Deviation 6.31 Sample Variance 39.76 Range 26.01 Minimum 7.06 Maximum 33.07 Sum 785.69 Count 42
Table J.3. Summary of Statistics for Actual Haitian Water Consumption
184
LIST OF REFERENCES
1. RudolfC. Barnes, "Civic Action, Humanitarian and Civic Assistance, and Disaster Relief," Special Warfare, Fall 1989.
2. U.S. DOD, JCS, Doctrine for Joint Special Operations Joint Test Pub 3-05 Washington, 1990.
3. U.S. DOD, JCS, Humanitarian/Civic Assistance, Washington, no date.
4. Cavavaugh, LtCol. John P., "Operation Provide Comfort - A Model for Future NATO Operation," United States Army Command and General Staff College, 1991-1992.
5. Weber, B. A., "Combined Task Force Provide Comfort: A New Role for 'Lead Nation' Command?", Naval War College, 1994.
6. Collins. Maj. J. W., "Logistics Support for Operation Provide Comfort 11 "Army Logistician, May-June 1992.
7. McCarthy, P.A., "Operation Sea Angel: A Case Study," RAND, 1994.
8. Stackpole, LtGen. Henry C, "Angels from the Sea," Proceedings, May 1992.
9. Gangle, Col. R. A., "Summary - Operation Sea Angel "Marine Corps Lessons Learned, 61048-62515, May 11, 1991.
10. Wagner, Michael J., "Hershey Bar Diplomacy: The Employment of Military Forces in Humanitarian Operations," Air War College, April 1994.
11. Government Accounting Office, "Defense Inventory, DOD's Humanitarian Assistance Program," GAO/NSAID-91-87FS, January 18,1991.
12. U.S., Congress, Senate, Committee on Armed Services, "Joint Chiefs of Staff Briefing on Current Military Operations in Somalia, Iraq, and Yugoslavia," Hearing, 103rd Congress, 1st Sess., January 29,1993, Washington: Government Printing Office, 1993
13. Korman, R. and others, "Andrew Exposes Safety Gaps " ENR, Vol. 229, September 7, 1992.
14. Department of Army, "Hurricane Andrew, Typhoon Omar, Hurricane Iniki After Action Report," Director of Military Support Report, February 1993.
185
15. Easton, R. C, 'Somalia: Key Operational Considerations and Implications in an Era of Peace-Enforcement and Forced Humanitarian Assistance Ventures," Naval War College, 1993.
16. Nelson, Harold D., Somalia, A Country Study, United States Government Printing Office, Washington, D. C, 1982.
17. Skeet, Muriel H, Manual for Disaster Relief, London, 1977.
18. , The Joint Staff Officer's Guide 1993 (AFSC PUB I), National Defense University, 1993.
19. RudolfC. Barnes, "Civil Affairs: Diplomat-Warriors in Contemporary Conflict," Special Warfare, Winter 1991.
20. Martin, R., "MAA for Military Operations Other Than War -Final Report," Virginia, January 1994.
21. Caliendo, M. A., Nutrition and the World Food Crisis, New York, 1979.
22. Siegel, Adam B., "A Sampling of U.S. Naval Humanitarian Operations," Center for Naval Analysis, November 1990.
23. Morse, M. M. and Kimball, G. TL., Methods of Operations Research, Navy Department, Washington, DC, 1946.
24. Sagaser, M. B , "Planning Factors Approach Study - Phase 1," MAGTF Warfighting Center, January 1992.
25. Ivancovich, J. A. and Mclntosh, D. R," A Review of Marine Corps Planning Factors Methodologies," Center for Naval Analysis, April 1993.
26. Sherman, Henry C, Chemistry of Food and Nutrition, The MacMillan Company, New York, 1947.
27. The Software Toolworks, World Atlas, California, 1993 (CD Version)
28. Brody, Jane E., Jane Brody 's Nutrition Book, New York, 1981.
29. Headquarters, Department of Army, Field Manual FM 101-10-1/ 2, Staff Officers' Field Manual: Organization, Technical, and Logistical Data Planning Factors, Washington, 1990.
186
30. Director of Combat Developments, "Water Consumption Planning Factors Study," United States Army Quartermaster School, Virginia, Revised July 1988.
31. Director of Combat Developments, "Potable Water Consumption Planning Factors by Environmental Region and Command Level," United States Army Quartermaster School, Virginia, Revised December 1988.
32. Director of Combat Developments, "Water Consumption Planning," United States Army Quartermaster School, Virginia, Revised May 1994.
33. Ensminger, Audrey H. and others, Foods and Nutrition Encyclopedia, Pegus Press, California, 1983.
34. Biering, Maj Michael W., "Water Distribution in a Bare-Bones Base Camp," Engineer, July 1994.
35. Headquarters, Department of the Army, Field Manual FM 8-10, Health Services in a Theater of Operations, Washington, 1991.
36. Military Traffic Management Command Transportation Engineering Agency, Deployment Planning Guide, Virigina, 1994.
37. Based on telephone interviews between Tony Micheal, Supply Technician with the Federal Supply Centers' Customer Service Branch, and the writer, May 1995.
38. Headquarters, Department of the Army, Field Manual FM 55-15, Transportation Reference Data, Washington, 1986.
39. Headquarters, Department of the Army, Field Manual FM 5-34, Engineer Field Data, Washington, 1976.
40. Based on telephone interviews between Pam Ctvrtnik, Satellite Industries, and the writer, August 1995.
41. United States Altantic Command, Tactics, Techniques, and Procedures (TTP)for Migrant Camp Operations, Proposed Final Pub, Virginia, 1994
42. Guadalupe, Linda A., "Prioritization of Advanced Base Functional Components" (Unpublished Master's Thesis, Naval Postgraduate School, 1988)
43. Academy of Health Services, Medical Force 2000 (MF2K) Hospital Planning Factors, Washington, no date.
187

43. Based on telephone interviews between Mr. Robinson, Item Manager with Defense Personnal Support Center, and the writer, July 1995.
44. Headquarters, Department of the Army, Feild Manual FM 63-6, Combat Service Support in Low-Intensity Conflict, Washington, 1992.
45. Data extracted for the Deployable Mass Population Indentification and Tracking System covering July 1, 1994 to November 30, 1994
46. Based on telephone interview between Col. Bridge, United States Atlantic Command, and the writer, August 1995.
47. United States General Accounting Office, Time-Critical Disaster Reconstruction Assistance - A Better Delivery System is Needed, Washington, October 1986.
188
INITIAL DISTRIBUTION LIST
1. Defense Technical Information Center 2 Cameron Station Alexandria, Virginia 22304-6145
2. Library, Code 013 2 Naval Postgraduate School Monterey, California 93943-5101
3. Defense Logistics Studies Information Exchange 1 U.S. Army Logistics Management College Fort Lee, Virginia 23801-6043
4. CDR Frank C.Petho Code OR/Pe 1 Naval Postgraduate School Monterey, California 93943-5000
5. Professor David Schrady Code OR/So 1 Naval Postgraduate School Monterey, California 93943-5000
6. CDR William Kroshl Code OR/Kr 1 Naval Postgraduate School Monterey, California 93943-5000
7. Commander in Chief 3 US Atlantic Fleet ATTN: N41 Norfolk, Virginia 23511-5210
8. Chief of Naval Operations 1 N424D 2000 Navy Petagon Washington, DC. 20350-2000
9. LT Donna Sullivan Code PSD 1 Naval Postgraduate School Monterey, California 93943
189
Related Documents