NAVAL POSTGRADUATE SCHOOL MONTEREY, CALIFORNIA THESIS AERODYNAMIC PERFORMANCE PREDICTIONS OF A SA-2 MISSILE USING MISSILE DATCOM by Andrew F. Maurice September 2009 Thesis Advisor: Muguru Chandrasekhara Second Reader: Christopher Brophy Approved for public release; distribution is unlimited

Welcome message from author
This document is posted to help you gain knowledge. Please leave a comment to let me know what you think about it! Share it to your friends and learn new things together.
Transcript
NAVAL
POSTGRADUATE SCHOOL
MONTEREY, CALIFORNIA
THESIS
AERODYNAMIC PERFORMANCE PREDICTIONS OF A SA-2 MISSILE USING MISSILE DATCOM
by
Andrew F. Maurice
September 2009
Thesis Advisor: Muguru Chandrasekhara Second Reader: Christopher Brophy
Approved for public release; distribution is unlimited
i
REPORT DOCUMENTATION PAGE Form Approved OMB No. 0704-0188 Public reporting burden for this collection of information is estimated to average 1 hour per response, including the time for reviewing instruction, searching existing data sources, gathering and maintaining the data needed, and completing and reviewing the collection of information. Send comments regarding this burden estimate or any other aspect of this collection of information, including suggestions for reducing this burden, to Washington headquarters Services, Directorate for Information Operations and Reports, 1215 Jefferson Davis Highway, Suite 1204, Arlington, VA 22202-4302, and to the Office of Management and Budget, Paperwork Reduction Project (0704-0188) Washington DC 20503.
1. AGENCY USE ONLY (Leave blank)
2. REPORT DATE September 2009
3. REPORT TYPE AND DATES COVERED
Master’s Thesis
4. TITLE AND SUBTITLE Aerodynamic Performance Predictions of a SA-2 Missile using Missile DATCOM
6. AUTHOR(S) Andrew F. Maurice
5. FUNDING NUMBERS
7. PERFORMING ORGANIZATION NAME(S) AND ADDRESS(ES) Naval Postgraduate School Monterey, CA 93943-5000
8. PERFORMING ORGANIZATION REPORT NUMBER
9. SPONSORING /MONITORING AGENCY NAME(S) AND ADDRESS(ES)
MSIC/DIA, Huntsville, AL
10. SPONSORING/MONITORING AGENCY REPORT NUMBER
11. SUPPLEMENTARY NOTES The views expressed in this thesis are those of the author and do not reflect the official policy or position of the Department of Defense or the U.S. Government.
12a. DISTRIBUTION / AVAILABILITY STATEMENT Approved for public release; distribution is unlimited
12b. DISTRIBUTION CODE
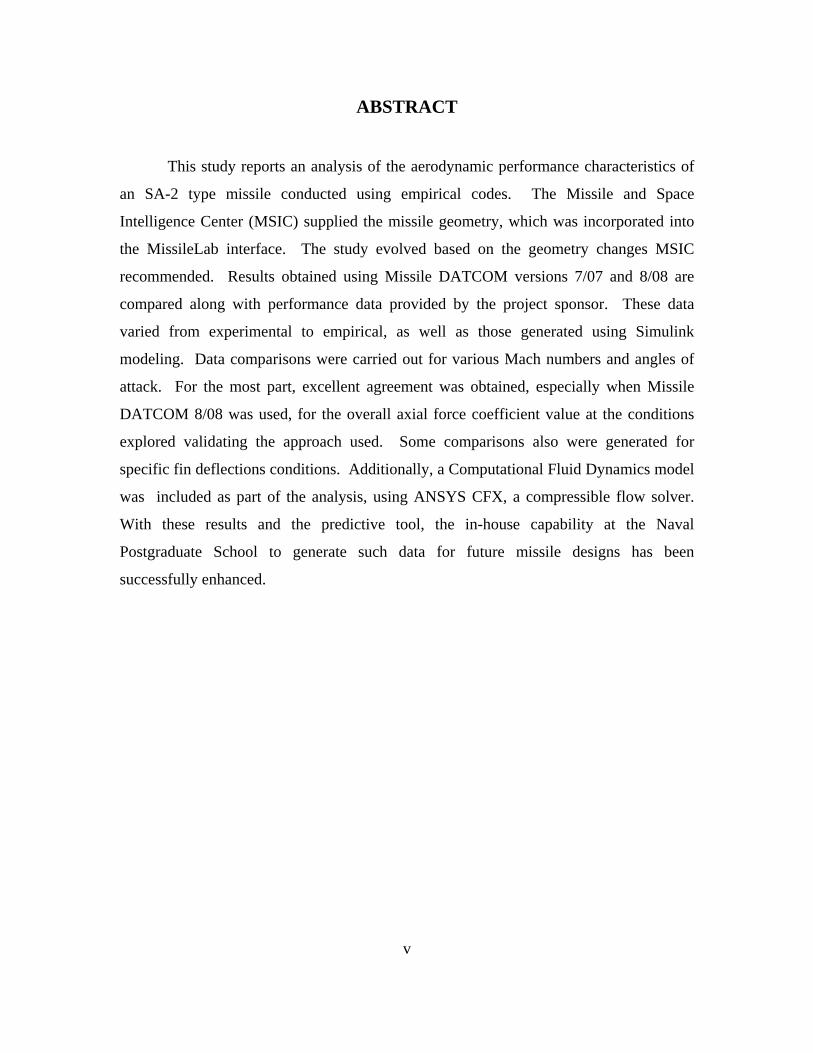
13. ABSTRACT (maximum 200 words) This study reports an analysis of the aerodynamic performance characteristics of an SA-2 type missile conducted using empirical codes. The Missile and Space Intelligence Center (MSIC) supplied the missile geometry, which was incorporated into the MissileLab interface. The study evolved based on the geometry changes MSIC recommended. Results obtained using Missile DATCOM versions 7/07 and 8/08 are compared along with performance data provided by the project sponsor. These data varied from experimental to empirical, as well as those generated using Simulink modeling. Data comparisons were carried out for various Mach numbers and angles of attack. For the most part, excellent agreement was obtained, especially when Missile DATCOM 8/08 was used, for the overall axial force coefficient value at the conditions explored validating the approach used. Some comparisons also were generated for specific fin deflections conditions. Additionally, a Computational Fluid Dynamics model was included as part of the analysis, using ANSYS CFX, a compressible flow solver. With these results and the predictive tool, the in-house capability at the Naval Postgraduate School to generate such data for future missile designs has been successfully enhanced.
15. NUMBER OF PAGES
77
14. SUBJECT TERMS Missile Aerodynamics, Missile DATCOM, Missilelab, SA-2 Missile
16. PRICE CODE
17. SECURITY CLASSIFICATION OF REPORT
Unclassified
18. SECURITY CLASSIFICATION OF THIS PAGE
Unclassified
19. SECURITY CLASSIFICATION OF ABSTRACT
Unclassified
20. LIMITATION OF ABSTRACT
UU
NSN 7540-01-280-5500 Standard Form 298 (Rev. 2-89) Prescribed by ANSI Std. 239-18

ii
THIS PAGE INTENTIONALLY LEFT BLANK
iii
Approved for public release; distribution is unlimited
AERODYNAMIC PERFORMANCE PREDICTIONS OF A SA-2 MISSILE USING MISSILE DATCOM
Andrew F. Maurice
Lieutenant, United States Navy B.S., University of Florida, 2001
Submitted in partial fulfillment of the requirements for the degree of
MASTER OF SCIENCE IN MECHANICAL ENGINEERING
from the
NAVAL POSTGRADUATE SCHOOL September 2009
Author: Andrew F. Maurice
Approved by: Muguru Chandrasekhara Thesis Advisor
Christopher Brophy Second Reader
Knox Millsaps Chairman, Department of Mechanical and Astronautical Engineering

iv
THIS PAGE INTENTIONALLY LEFT BLANK
v
ABSTRACT
This study reports an analysis of the aerodynamic performance characteristics of
an SA-2 type missile conducted using empirical codes. The Missile and Space
Intelligence Center (MSIC) supplied the missile geometry, which was incorporated into
the MissileLab interface. The study evolved based on the geometry changes MSIC
recommended. Results obtained using Missile DATCOM versions 7/07 and 8/08 are
compared along with performance data provided by the project sponsor. These data
varied from experimental to empirical, as well as those generated using Simulink
modeling. Data comparisons were carried out for various Mach numbers and angles of
attack. For the most part, excellent agreement was obtained, especially when Missile
DATCOM 8/08 was used, for the overall axial force coefficient value at the conditions
explored validating the approach used. Some comparisons also were generated for
specific fin deflections conditions. Additionally, a Computational Fluid Dynamics model
was included as part of the analysis, using ANSYS CFX, a compressible flow solver.
With these results and the predictive tool, the in-house capability at the Naval
Postgraduate School to generate such data for future missile designs has been
successfully enhanced.

vi
THIS PAGE INTENTIONALLY LEFT BLANK
vii
TABLE OF CONTENTS
I. INTRODUCTION........................................................................................................1 A. RESEARCH MOTIVATION .........................................................................1 B. TACTICAL MISSILE DRAG ESTIMATION.............................................2
1. General Concepts .................................................................................2 2. Component Build-up Method .............................................................3
a. Body Drag..................................................................................4 b. Inlet Drag and Fin Drag...........................................................6
C. AERODYNAMIC PREDICTION SOFTWARE EMPLOYED..................8 D. SUPERSONIC AERODYNAMIC PREDICTION THEORIES.................8 E. SURVEY OF RECENT IMPROVEMENTS TO MISSILE DATCOM.....9
II. GEOMETRY MODELING AND RESEARCH APPROACH..............................15 A. GEOMETRY MODELING ..........................................................................15
1. Missilelab ............................................................................................15 a. Interface with Missile DATCOM ...........................................15 b. Modeling Trade-offs ...............................................................16
2. Solid Modeling for CFD Domain......................................................17 3. Computational Domain Characteristics and Computing
Resources ............................................................................................17 B. EXPERIMENTAL DATA.............................................................................18 C. RESEARCH APPROACH............................................................................19 D. TEST CONDITIONS ....................................................................................19
III. PRESENTATION OF RESULTS ............................................................................21 A. MOTIVATION FOR FURTHER STUDY FROM THE RESULTS
OF PREVIOUS WORK ................................................................................21 B. MISSILE DATCOM 7/07 AND MISSILE DATCOM 8/08.......................21 C. AXIAL FORCE COEFFICIENT.................................................................24
1. Axial Force Coefficient as a Function of Angle of Attack..............24 2. Axial Force Coefficient as a Function of Mach Number................28
D. SKIN FRICTION...........................................................................................30 E. CONTROL SURFACE DEFLECTIONS....................................................31 F. NORMAL FORCE COEFFICIENTS .........................................................34 G. CFD COMPARISONS ..................................................................................37
IV. CONCLUDING REMARKS ....................................................................................39
V. FUTURE WORK.......................................................................................................41
APPENDIX A.........................................................................................................................43 A. VAN DYKE HYBRID THEORY.................................................................43 B. TRANSONIC AREA RULE AND VON KÁRMÁN SIMILARITY ........47
APPENDIX B .........................................................................................................................49
APPENDIX C.........................................................................................................................51

viii
LIST OF REFERENCES......................................................................................................57
INITIAL DISTRIBUTION LIST .........................................................................................59
ix
LIST OF FIGURES
Figure 1. Component Build-up model (From Mendenhall & Hemsch, 1992, p. 7) ..........4 Figure 2. Drag component variation with Mach number (From Mendenhall &
Hemsch, 1992, p. 8) ...........................................................................................5 Figure 3. Missile body flow changes with increasing Mach number (From
Mendenhall & Hemsch, 1992, p. 11).................................................................6 Figure 4. Missile fin flow changes with increasing Mach number (From Mendenhall
& Hemsch, 1992, p. 21) .....................................................................................7 Figure 5. Axial Force Methodology for Missile DATCOM 7/07 (After Doyle,
Rosema, Underwood, & Auman, 2009, p. 3)...................................................12 Figure 6. Graphical Representation of Interpolation Scheme for Axial Force in the
Supersonic region for Missile DATCOM 8/08 (From Doyle, Rosema, Underwood, & Auman, 2009, p. 10) ...............................................................14
Figure 7. SA-2 solid rendition from Missilelab ..............................................................15 Figure 8. Modeled missile geometry with major dimensions (meters)...........................16 Figure 9. SA-2 missile solid model created in Solidworks 2008 ....................................17 Figure 10. Comparison of CA for calculations performed using the old geometry with
DATCOM 7/07 and those using the new geometry with DATCOM 8/08 ......21 Figure 11. CA vs. Angle of Attack for Missile DATCOM 7/07 and Missile DATCOM
8/08 for M = 0.8, 0.95, 1.05, and 1.2 ...............................................................22 Figure 12. CA vs Angle of Attack for MSIC Data, Missile DATCOM 7/07, and
Missile DATCOM 8/08 for M = 0.8 and 1.2 ...................................................23 Figure 13. CA vs Mach Number for Missile DATCOM 7/07 and Missile DATCOM
8/08 for Angle of Attack 0° and 20° including MSIC data at M = 0.8 and 1.2 for comparison ...........................................................................................24
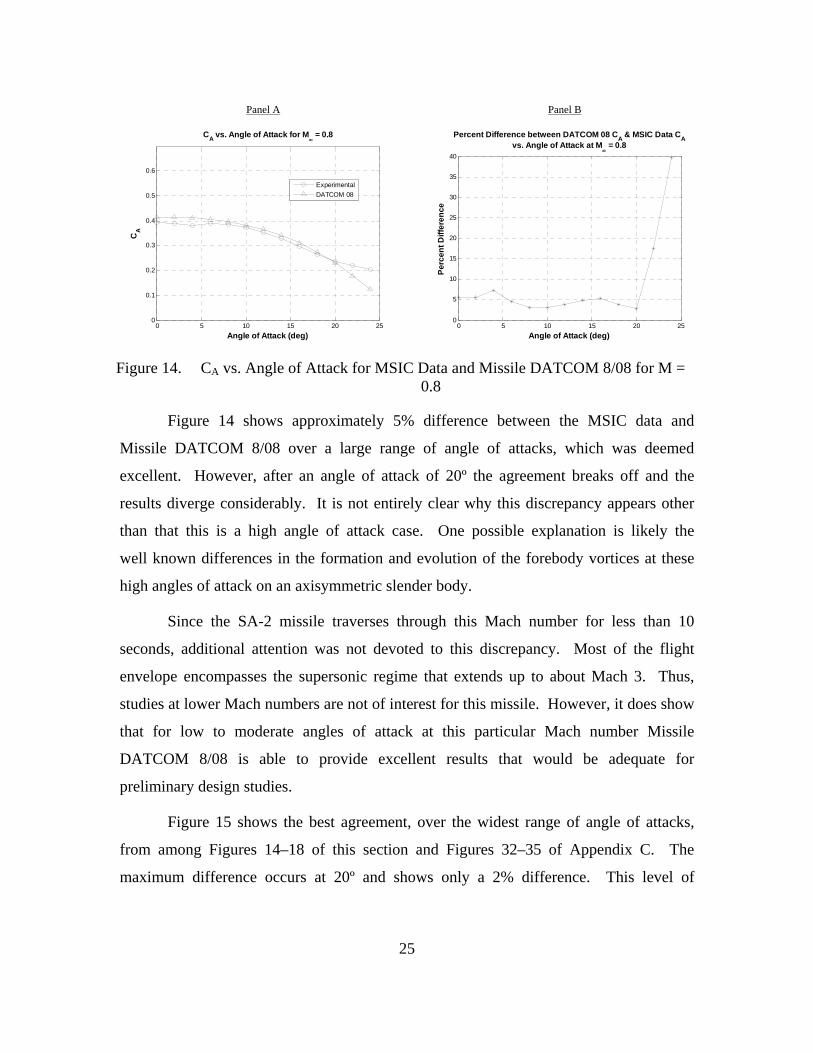
Figure 14. CA vs. Angle of Attack for MSIC Data and Missile DATCOM 8/08 for M = 0.8 .................................................................................................................25
Figure 15. CA vs. Angle of Attack for MSIC Data and Missile DATCOM 8/08 for M = 1.2 .................................................................................................................26
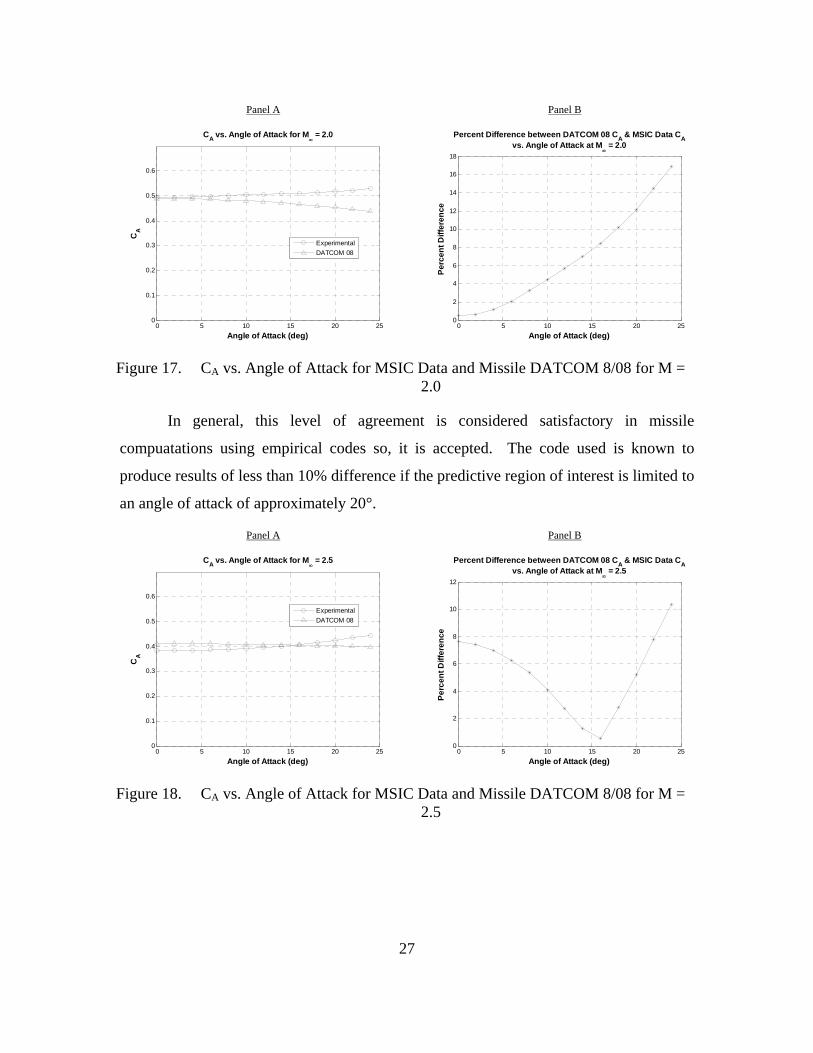
Figure 16. CA vs. Angle of Attack for MSIC Data and Missile DATCOM 8/08 for M = 1.6 .................................................................................................................26
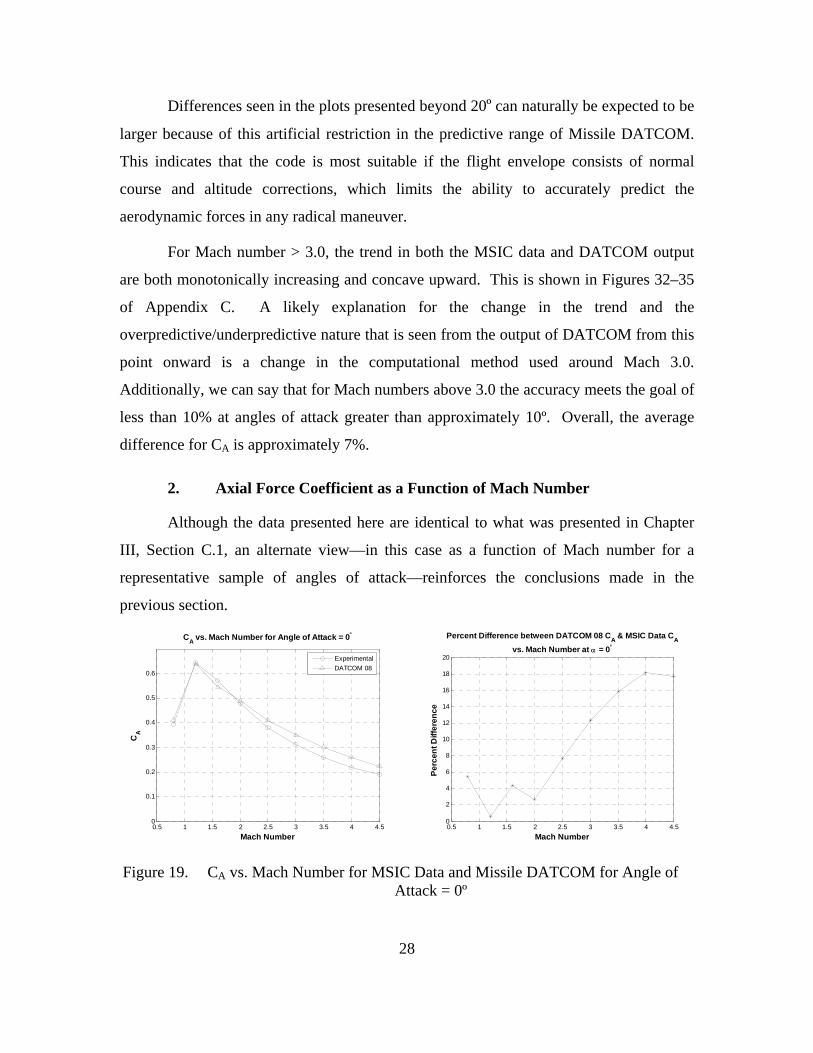
Figure 17. CA vs. Angle of Attack for MSIC Data and Missile DATCOM 8/08 for M = 2.0 .................................................................................................................27
Figure 18. CA vs. Angle of Attack for MSIC Data and Missile DATCOM 8/08 for M = 2.5 .................................................................................................................27
Figure 19. CA vs. Mach Number for MSIC Data and Missile DATCOM for Angle of Attack = 0º .......................................................................................................28
Figure 20. CA vs. Mach Number for MSIC Data and Missile DATCOM for Angle of Attack = 10º .....................................................................................................29
Figure 21. CA vs. Mach Number for MSIC Data and Missile DATCOM for Angle of Attack = 20º .....................................................................................................30
Figure 22. Cf vs. Mach Number for MSIC data and Missile DATCOM 8/08 at Sea Level ................................................................................................................31
x
Figure 23. CA vs. Angle of Attack at M = 1.2 for control surface deflections of 5º and 10º ....................................................................................................................32
Figure 24. CA vs. Angle of Attack at M = 2.0 for control surface deflections of 5º and 10º ....................................................................................................................32
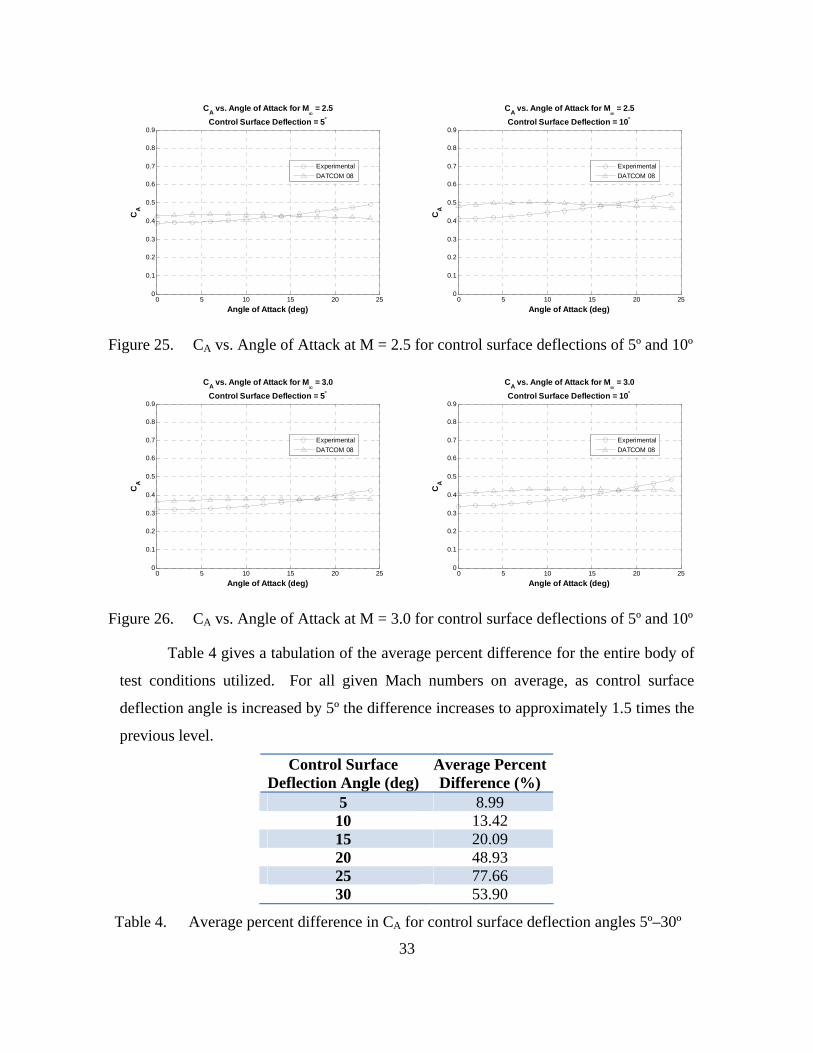
Figure 25. CA vs. Angle of Attack at M = 2.5 for control surface deflections of 5º and 10º ....................................................................................................................33
Figure 26. CA vs. Angle of Attack at M = 3.0 for control surface deflections of 5º and 10º ....................................................................................................................33
Figure 27. CN vs. Angle of Attack for M = 0.8 and 1.2 ....................................................34 Figure 28. CN vs. Angle of Attack for M = 2.0 and 2.5 ....................................................35 Figure 29. CN vs. Angle of Attack for M = 3.0 .................................................................35 Figure 30. CN vs. Mach Number for Angles of Attack of 2º, 6°, 10º, and 20º with a 4th
order correction................................................................................................37 Figure 31. CA vs. Mach Number for MSIC data, DATCOM 08, and CFD ......................38 Figure 32. CA vs. Angle of Attack for MSIC Data and Missile DATCOM 8/08 for M
= 3.0 (Panels A and B).....................................................................................51 Figure 33. CA vs. Angle of Attack for MSIC Data and Missile DATCOM 8/08 for M
= 3.5 (Panels A and B).....................................................................................51 Figure 34. CA vs. Angle of Attack for MSIC Data and Missile DATCOM 8/08 for M
= 4.0 (Panels A and B).....................................................................................52 Figure 35. CA vs. Angle of Attack for MSIC Data and Missile DATCOM 8/08 for M
= 4.5 (Panels A and B).....................................................................................52 Figure 36. Cf vs. Mach number for MSIC and Missile DATCOM 8/08 at altitudes of
5000 m, 10000 m, 20000 m, and 30000 m (Panels A – D) .............................53 Figure 37. CA vs. Angle of Attack at M = 0.8, 1.6, 3.5, 4.0, and 4.5 for control surface
deflections of 5º and 10º (Panels A – J)...........................................................55 Figure 38. CN vs Angle of Attack for M = 1.6, 3.5, 4.0, and 4.5 (Panels A-D) ................56
xi
LIST OF TABLES
Table 1. Recent Version History for Missile DATCOM (After Auman, Doyle, Rosema, Underwood, & Blake, 2008) .............................................................10
Table 2. Modeled fin dimensions (dimensions in meters, angles in degrees; positive sweep is towards the rear of the tail of the missile).........................................16
Table 3. Test conditions .................................................................................................19 Table 4. Average percent difference in CA for control surface deflection angles 5º–
30º ....................................................................................................................33 Table 5. Body Alone Aerodynamic Methodology for Axial Force Coefficient
(After Auman, Doyle, Rosema, Underwood, & Blake, 2008, p. 98)...............49 Table 6. Fin Alone Aerodynamic Methodology for Axial Force Coefficient (After
Auman, Doyle, Rosema, Underwood, & Blake, 2008, p. 100) .......................49 Table 7. Body-Fin Synthesis Aerodynamic Methodology for Axial Force
Coefficient (After Auman, Doyle, Rosema, Underwood, & Blake, 2008, p. 102) ..................................................................................................................50

xii
THIS PAGE INTENTIONALLY LEFT BLANK

xiii
ACKNOWLEDGMENTS
Many thanks go to Professor Chandrasekhara, without whom this endeavor would
not be possible. His guidance and patience have strengthened my will to complete this
study.
I owe my family a debt of gratitude. Without their unwavering devotion, I would
not have the strength to carry on this task.
Lastly, I would like to thank my classmates for their support and constant
encouragement during this process.

xiv
THIS PAGE INTENTIONALLY LEFT BLANK

xv
NOMENCLATURE
AFRL Air Force Research Lab
AFB Air Force Base
AGARD Advisory Group for Aerospace Research and Development
AIAA American Institute of Aeronautics and Astronautics
AMRDEC Aviation and Missile Research, Development, and Engineering Center
AOA Angle of Attack
CFD Computational Fluid Dynamics
EOM Equations of Motion
MAE Mechanical and Astronautical Engineering
MDAC McDonnell Douglas Aircraft Company
MSIC Missile and Space Intelligence Center
NACA National Advisory Committee for Aeronautics
NASA National Air and Space Agency
NEAR Nielsen Engineering and Research, Inc.
NSWC Naval Surface Warfare Center
SOSE Second Order Shock Expansion
USAF United States Air Force
VDHT Van Dyke Hybrid Theory
CD Drag Coefficient (wind axis)
CL Lift Coefficient (wind axis)
CA Axial Force Coefficient (body axis)
CN Normal Force Coefficient (body axis)
Cp Pressure Coefficient
CA,0 Axial Force Coefficient at Zero Angle of Attack
CA,α Axial Force Coefficient Due to Angle of Attack
CApres Axial Force Coefficient Due to Pressure Drag
CApres-trun Axial Force Coefficient Due to Pressure Drag for a Truncated Nose
Geometry
CAform Axial Force Coefficient Due to Form Drag
CAfric Axial Force Coefficient Due to Skin Friction
Cf Skin Friction Coefficient Invariant of Angle of Attack
CA,δ Axial Force Coefficient Due to Control Surface Deflection Angle
M Mach Number
V Velocity
m Mass
T Thrust
α Angle of Attack
q Dynamic Pressure
S Reference Area
g Gravitational Acceleration
χ Flight Path Angle
h Altitude
Ф Total Aerodynamic Potential
r Radial Coordinate Variable
φ Angular Coordinate Variable
x Axial Coordinate Variable
M∞ Freestream Mach Number
β 21 M
rb Body Radius
ψ Axial Flow Potential Solution
ζ Cross Flow Potential Solution
ξ Dummy Variable of Itegration
γ Ratio of Specific Heats
U∞ Freestream Velocity
u X-direction Perturbation Velocity (Cartesian Coordinate System)
v Y-direction Perturbation Velocity (Cartesian Coordinate System)
w Z-direction Perturbation Velocity (Cartesian Coordinate System)
k Induced Drag Parameter
xvi
1
I. INTRODUCTION
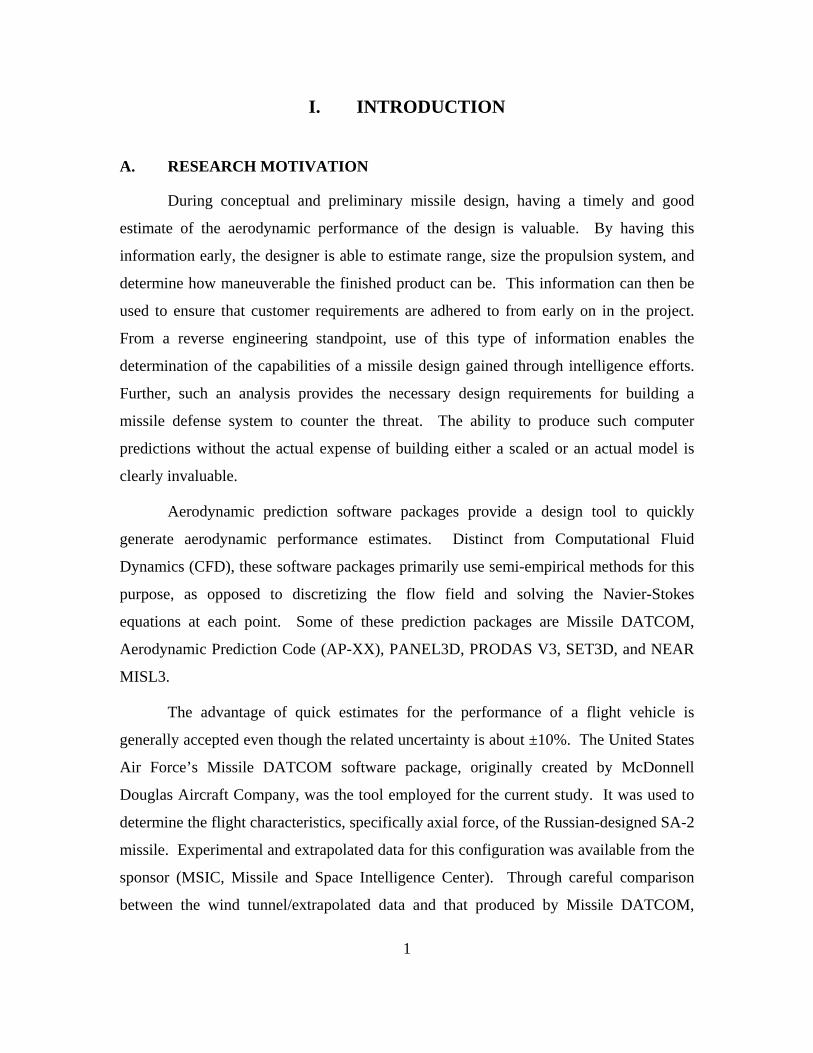
A. RESEARCH MOTIVATION
During conceptual and preliminary missile design, having a timely and good
estimate of the aerodynamic performance of the design is valuable. By having this
information early, the designer is able to estimate range, size the propulsion system, and
determine how maneuverable the finished product can be. This information can then be
used to ensure that customer requirements are adhered to from early on in the project.
From a reverse engineering standpoint, use of this type of information enables the
determination of the capabilities of a missile design gained through intelligence efforts.
Further, such an analysis provides the necessary design requirements for building a
missile defense system to counter the threat. The ability to produce such computer
predictions without the actual expense of building either a scaled or an actual model is
clearly invaluable.
Aerodynamic prediction software packages provide a design tool to quickly
generate aerodynamic performance estimates. Distinct from Computational Fluid
Dynamics (CFD), these software packages primarily use semi-empirical methods for this
purpose, as opposed to discretizing the flow field and solving the Navier-Stokes
equations at each point. Some of these prediction packages are Missile DATCOM,
Aerodynamic Prediction Code (AP-XX), PANEL3D, PRODAS V3, SET3D, and NEAR
MISL3.
The advantage of quick estimates for the performance of a flight vehicle is
generally accepted even though the related uncertainty is about ±10%. The United States
Air Force’s Missile DATCOM software package, originally created by McDonnell
Douglas Aircraft Company, was the tool employed for the current study. It was used to
determine the flight characteristics, specifically axial force, of the Russian-designed SA-2
missile. Experimental and extrapolated data for this configuration was available from the
sponsor (MSIC, Missile and Space Intelligence Center). Through careful comparison
between the wind tunnel/extrapolated data and that produced by Missile DATCOM,
validation of the Missile DATCOM product became possible, thus furthering its use as a
predictive tool in conceptual and preliminary design efforts.
B. TACTICAL MISSILE DRAG ESTIMATION
1. General Concepts
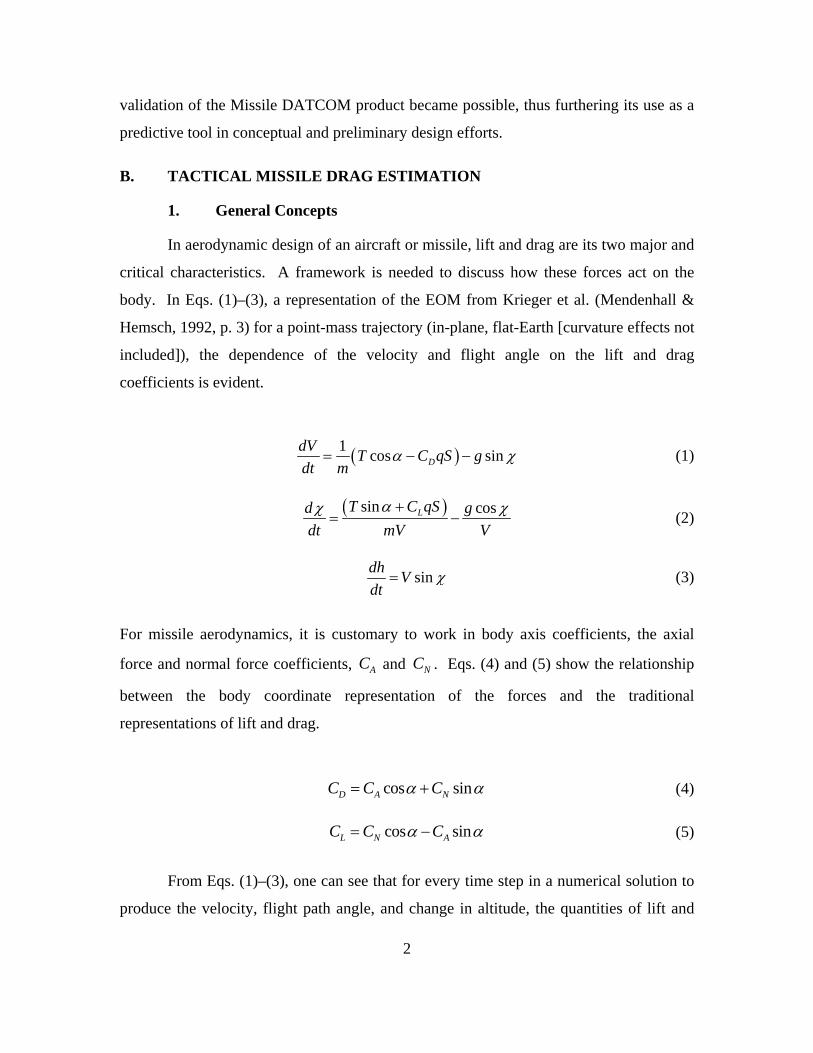
In aerodynamic design of an aircraft or missile, lift and drag are its two major and
critical characteristics. A framework is needed to discuss how these forces act on the
body. In Eqs. (1)–(3), a representation of the EOM from Krieger et al. (Mendenhall &
Hemsch, 1992, p. 3) for a point-mass trajectory (in-plane, flat-Earth [curvature effects not
included]), the dependence of the velocity and flight angle on the lift and drag
coefficients is evident.
1cos sinD
dVT C qS g
dt m (1)
sin cosLT C qSd
dt mV V
g (2)
sindh
Vdt
(3)
For missile aerodynamics, it is customary to work in body axis coefficients, the axial
force and normal force coefficients, and . Eqs. AC NC (4) and (5) show the relationship
between the body coordinate representation of the forces and the traditional
representations of lift and drag.
cos sinD A NC C C (4)
cos sinL N AC C C (5)
From Eqs. (1)–(3), one can see that for every time step in a numerical solution to
produce the velocity, flight path angle, and change in altitude, the quantities of lift and
2
3
drag must be known. To this end, the aerodynamicist must produce a large and accurate
database of aerodynamic coefficients for a range of flight conditions to accurately
represent a missile’s behavior. The aerodynamic prediction software packages provide
this capability.
Aerodynamic lift is important to maintain the missile in flight. However, drag is
of greater interest because it governs the ability of the missile to achieve the speeds
necessary to intercept and neutralize a threat. It is also more complex to calculate.
Therefore, only drag prediction methods are discussed in this chapter.
2. Component Build-up Method
Conventional missiles consist of a circular cylindrical body with distinct wings
and tails and are typically axisymmetric. For these types of missiles, the primary method
for computing drag is the component build-up method (Mendenhall & Hemsch, 1992).
This approach consists of identifying the individual distinct features of the missile such
as the wings, tails and inlets, and calculating the drag produced by each of these
separately. Figure 1 gives a graphic representation of the process to use the component
build-up method. The influence of the individual parts on other features is often
relatively small and, thus, is neglected. All of the individual drag components are
summed to get the final total for the whole body, hence the name “component build-up.”
For a non-conventional missile (i.e., a blended body design), the interference between
individual parts is often not small and thus cannot be neglected. In this case, the
component build-up method does not produce very accurate results.
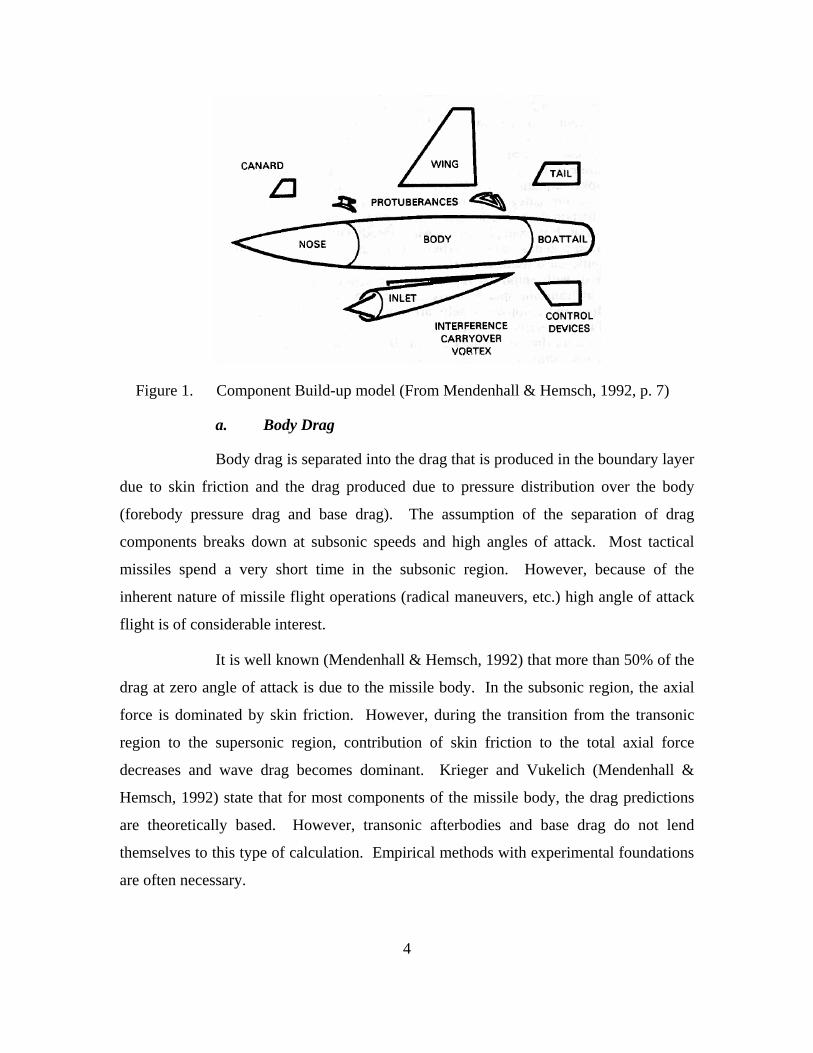
Figure 1. Component Build-up model (From Mendenhall & Hemsch, 1992, p. 7)
a. Body Drag
Body drag is separated into the drag that is produced in the boundary layer
due to skin friction and the drag produced due to pressure distribution over the body
(forebody pressure drag and base drag). The assumption of the separation of drag
components breaks down at subsonic speeds and high angles of attack. Most tactical
missiles spend a very short time in the subsonic region. However, because of the
inherent nature of missile flight operations (radical maneuvers, etc.) high angle of attack
flight is of considerable interest.
It is well known (Mendenhall & Hemsch, 1992) that more than 50% of the
drag at zero angle of attack is due to the missile body. In the subsonic region, the axial
force is dominated by skin friction. However, during the transition from the transonic
region to the supersonic region, contribution of skin friction to the total axial force
decreases and wave drag becomes dominant. Krieger and Vukelich (Mendenhall &
Hemsch, 1992) state that for most components of the missile body, the drag predictions
are theoretically based. However, transonic afterbodies and base drag do not lend
themselves to this type of calculation. Empirical methods with experimental foundations
are often necessary.
4
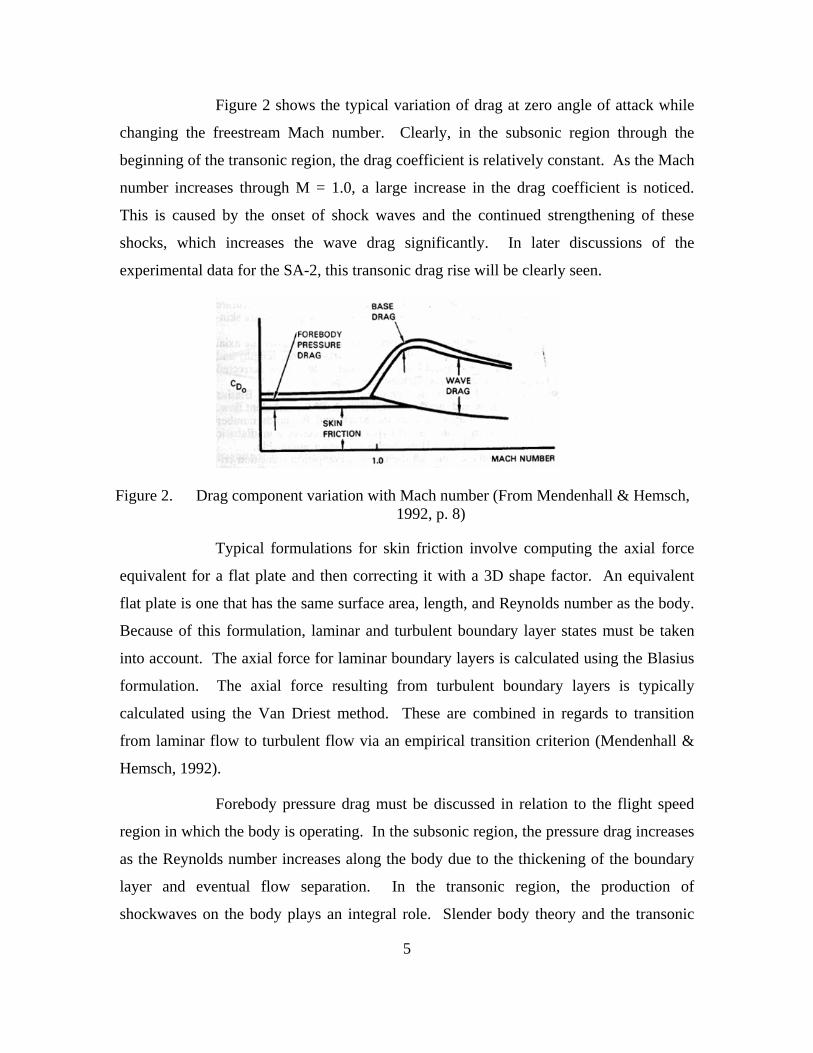
Figure 2 shows the typical variation of drag at zero angle of attack while
changing the freestream Mach number. Clearly, in the subsonic region through the
beginning of the transonic region, the drag coefficient is relatively constant. As the Mach
number increases through M = 1.0, a large increase in the drag coefficient is noticed.
This is caused by the onset of shock waves and the continued strengthening of these
shocks, which increases the wave drag significantly. In later discussions of the
experimental data for the SA-2, this transonic drag rise will be clearly seen.
Figure 2. Drag component variation with Mach number (From Mendenhall & Hemsch, 1992, p. 8)
Typical formulations for skin friction involve computing the axial force
equivalent for a flat plate and then correcting it with a 3D shape factor. An equivalent
flat plate is one that has the same surface area, length, and Reynolds number as the body.
Because of this formulation, laminar and turbulent boundary layer states must be taken
into account. The axial force for laminar boundary layers is calculated using the Blasius
formulation. The axial force resulting from turbulent boundary layers is typically
calculated using the Van Driest method. These are combined in regards to transition
from laminar flow to turbulent flow via an empirical transition criterion (Mendenhall &
Hemsch, 1992).
Forebody pressure drag must be discussed in relation to the flight speed
region in which the body is operating. In the subsonic region, the pressure drag increases
as the Reynolds number increases along the body due to the thickening of the boundary
layer and eventual flow separation. In the transonic region, the production of
shockwaves on the body plays an integral role. Slender body theory and the transonic
5
area rule are methods for calculating forebody drag in this region. When the flight
regime becomes fully supersonic, local shocks no longer appear on the body and bow and
stern shocks attach to the body. Because of the attached shocks at the nose, wave drag
dominates. Van Dyke’s hybrid theory (VDHT) and second-order shock expansion
(SOSE) theory are typically used to calculate the forces.
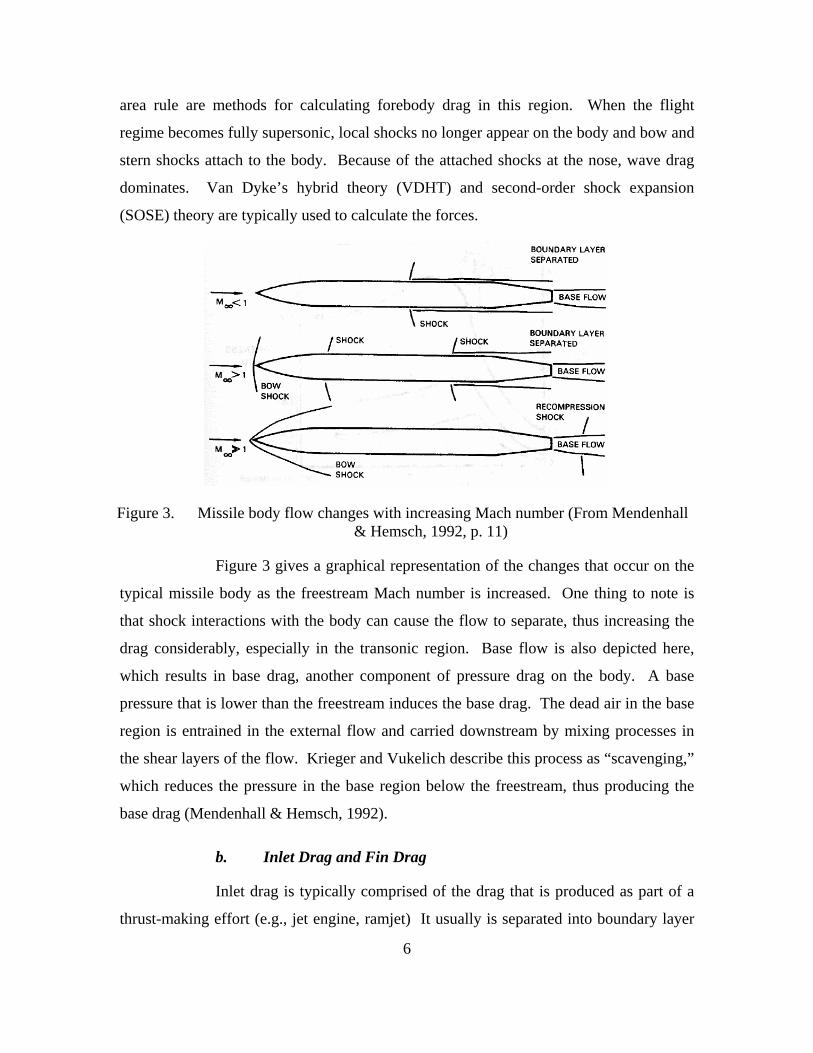
Figure 3. Missile body flow changes with increasing Mach number (From Mendenhall & Hemsch, 1992, p. 11)
Figure 3 gives a graphical representation of the changes that occur on the
typical missile body as the freestream Mach number is increased. One thing to note is
that shock interactions with the body can cause the flow to separate, thus increasing the
drag considerably, especially in the transonic region. Base flow is also depicted here,
which results in base drag, another component of pressure drag on the body. A base
pressure that is lower than the freestream induces the base drag. The dead air in the base
region is entrained in the external flow and carried downstream by mixing processes in
the shear layers of the flow. Krieger and Vukelich describe this process as “scavenging,”
which reduces the pressure in the base region below the freestream, thus producing the
base drag (Mendenhall & Hemsch, 1992).
b. Inlet Drag and Fin Drag
Inlet drag is typically comprised of the drag that is produced as part of a
thrust-making effort (e.g., jet engine, ramjet) It usually is separated into boundary layer
6
diverter drag, ram drag (for bleed air), additive wave drag, cowl wave drag, internal skin
friction (i.e., head loss), inlet fairing drag, and inlet fairing base drag. This list, although
not complete, describes most physical phenomena that are occurring (Mendenhall &
Hemsch, 1992).
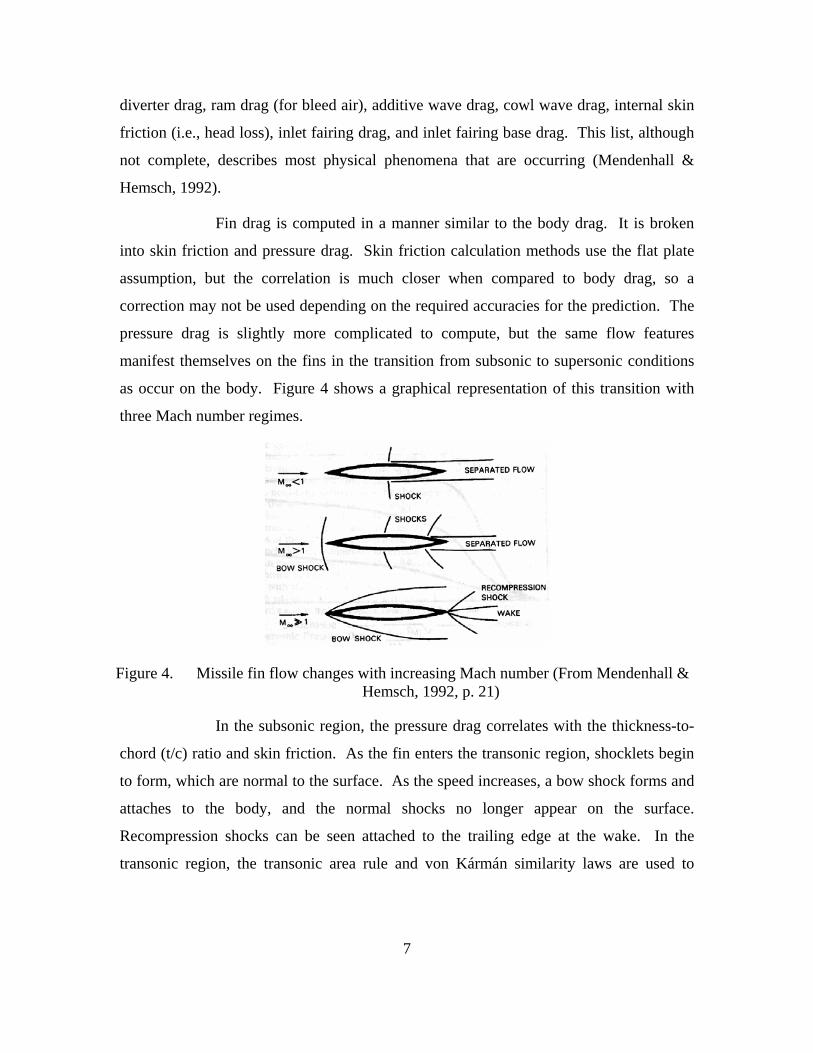
Fin drag is computed in a manner similar to the body drag. It is broken
into skin friction and pressure drag. Skin friction calculation methods use the flat plate
assumption, but the correlation is much closer when compared to body drag, so a
correction may not be used depending on the required accuracies for the prediction. The
pressure drag is slightly more complicated to compute, but the same flow features
manifest themselves on the fins in the transition from subsonic to supersonic conditions
as occur on the body. Figure 4 shows a graphical representation of this transition with
three Mach number regimes.
Figure 4. Missile fin flow changes with increasing Mach number (From Mendenhall & Hemsch, 1992, p. 21)
In the subsonic region, the pressure drag correlates with the thickness-to-
chord (t/c) ratio and skin friction. As the fin enters the transonic region, shocklets begin
to form, which are normal to the surface. As the speed increases, a bow shock forms and
attaches to the body, and the normal shocks no longer appear on the surface.
Recompression shocks can be seen attached to the trailing edge at the wake. In the
transonic region, the transonic area rule and von Kármán similarity laws are used to
7
8
calculate the wave drag. In the supersonic region, linear supersonic theory, Busemann
Theory, and shock expansion theory are used to calculate the wave drag if the bow shock
is attached.
C. AERODYNAMIC PREDICTION SOFTWARE EMPLOYED
Missile DATCOM-08 was used in the present study. It is an aerodynamic
prediction software package that has been updated to incorporate the newer coding
features of FORTRAN 90 and is maintained by the US Army Aviation and Missile
Research, Development, and Engineering Center (AMRDEC) in conjunction with the Air
Vehicles Directorate of the Air Force Research Laboratory (AFRL), Wright Patterson
AFB, Ohio. Missile DATCOM’s allure as a useful tool in the preliminary design of a
wide variety of missiles stems from the speed at which it is able to produce useful and
accurate predictions of a missile’s aerodynamic characteristics. Both the current and
previous versions of the software (7/07 and 8/08) are used as part of this study. Tables 5–
7 of Appendix B summarize the methods for calculating axial force coefficient for the
body and fins and their combined effect in the body-fin synthesis.
D. SUPERSONIC AERODYNAMIC PREDICTION THEORIES
The SA-2 is primarily a supersonic missile. Thus, a discussion of the supersonic
prediction theories is relevant. Missile DATCOM uses the VDHT and SOSE theory to
calculate missile flight parameters in the supersonic region. Since the Mach number of
interest here was 0.8 and higher, no discussion of the subsonic methods employed by
Missile DATCOM will be made. Hypersonic Newtonian Theory (HNT) is additionally
used in the high supersonic to hypersonic regimes and where SOSE theory is possibly
valid as well, but experimental data is not available for the missile configuration being
studied, so a discussion of HNT is also not included.
Van Dyke’s hybrid theory combines a second-order axial solution to the full
potential equation with a first order cross flow solution. Perturbations in the flow
resulting from the presence of the body affect the axial direction more prominently than
the cross flow direction. The second order solution is thus required in the axial direction
to obtain the desired accuracy. Since the presence of the body has a smaller effect in the
9
cross flow direction, only a first-order solution is required to obtain the desired accuracy.
These two solutions are then combined linearly to form a solution to the full potential
equation. Subsequently, the perturbation velocities arise from this solution and enable
the calculation of the pressure coefficient. The pressure coefficient is then integrated
over the body to get the axial and normal force coefficients. A more detailed explanation
including equations is presented in Appendix A for VDHT.
Syvertson and Dennis (1957) developed SOSE theory in the late 1950s from the
first-order shock expansion theory first proposed by Eggers et al. (1953). In first-order
theory, the flow parameters are computed at the leading edge of a two-dimensional
surface with oblique shock wave relations or with a conical solution for a three-
dimensional body. Prandtl-Meyer expansion calculations are then performed along the
surface at different points to determine the pressure distribution over the body. For
curved bodies, at each point, conical tangent elements are used and the pressure is
assumed to be constant over each individual element. In order to get an accurate pressure
distribution, a sufficient number of points must be used to approximate the curvature of
the body. Syvertson and Dennis proposed that a second-order solution be employed
because, the first order calculations were not accurate for axial force computations. The
main difference between first and second order is that in second order, the pressure is not
assumed to be constant over each conical tangent element but varies in a roughly
exponential fashion (Moore, 2000).
E. SURVEY OF RECENT IMPROVEMENTS TO MISSILE DATCOM
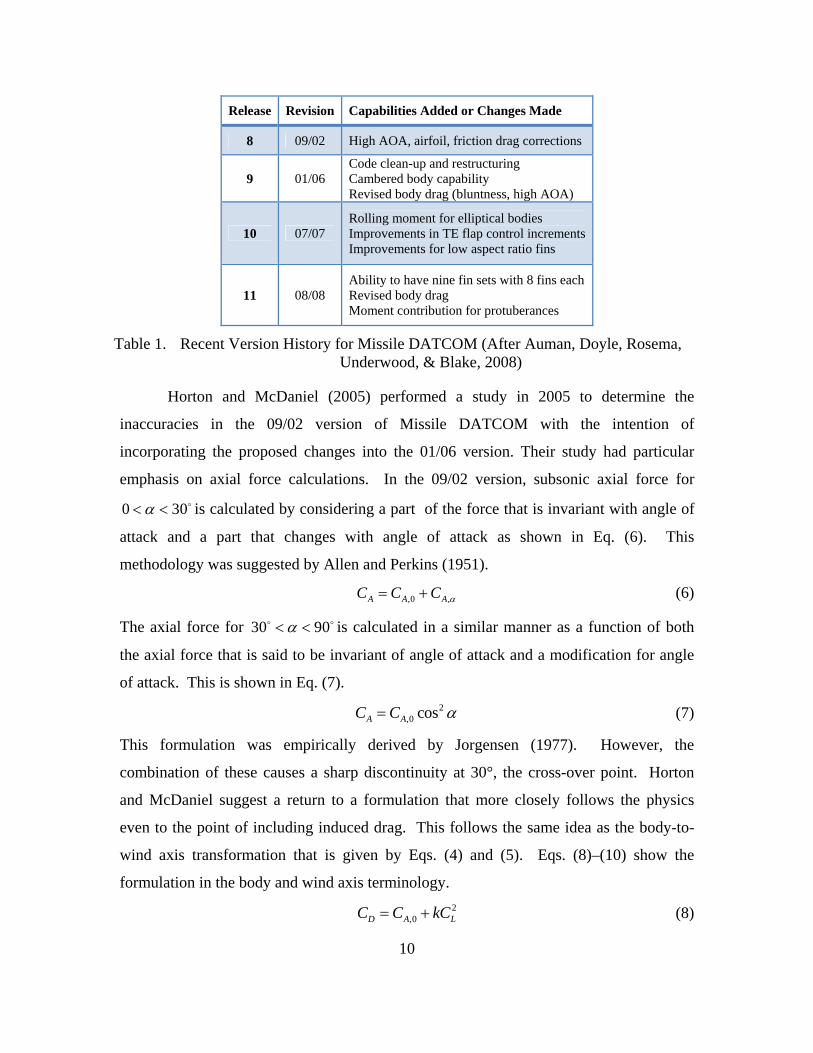
Table 1 chronicles the recent version history of Missile DATCOM from 2002 to
the present revision. The most important capabilities and changes that are applicable to
this research manifest in release 9 and release 11.
Release Revision Capabilities Added or Changes Made
8 09/02 High AOA, airfoil, friction drag corrections
9 01/06 Code clean-up and restructuring Cambered body capability Revised body drag (bluntness, high AOA)
10 07/07 Rolling moment for elliptical bodies Improvements in TE flap control increments Improvements for low aspect ratio fins
11 08/08 Ability to have nine fin sets with 8 fins each Revised body drag Moment contribution for protuberances
Table 1. Recent Version History for Missile DATCOM (After Auman, Doyle, Rosema, Underwood, & Blake, 2008)
Horton and McDaniel (2005) performed a study in 2005 to determine the
inaccuracies in the 09/02 version of Missile DATCOM with the intention of
incorporating the proposed changes into the 01/06 version. Their study had particular
emphasis on axial force calculations. In the 09/02 version, subsonic axial force for
is calculated by considering a part of the force that is invariant with angle of
attack and a part that changes with angle of attack as shown in Eq.
0 3 0
(6). This
methodology was suggested by Allen and Perkins (1951).
,0 ,A A AC C C (6)
The axial force for 30 is calculated in a similar manner as a function of both
the axial force that is said to be invariant of angle of attack and a modification for angle
of attack. This is shown in Eq.
90
(7).
2,0 cosA AC C (7)
This formulation was empirically derived by Jorgensen (1977). However, the
combination of these causes a sharp discontinuity at 30°, the cross-over point. Horton
and McDaniel suggest a return to a formulation that more closely follows the physics
even to the point of including induced drag. This follows the same idea as the body-to-
wind axis transformation that is given by Eqs. (4) and (5). Eqs. (8)–(10) show the
formulation in the body and wind axis terminology.
2,0D AC C kC L (8)
10
cos sinA D LC C C (9)
,0cos sin cosL N AC C C (10)
Combining these equations while assuming that k = 1, and only keeping normal force
coefficient terms that are coupled with axial force coefficients, the formulation becomes
2 2 3 2
,0 ,0
3,0
sin cos cos sin cos
2 cos sin
A A A
N A
C C C
C C
(11)
They show that this new formulation improves the accuracy of the simulation up to about
an angle of attack of 45°. They recommend that further work be done in this particular
area to further improve the accuracy.
Also as part of this study, they propose a change for the supersonic axial force
calculation. In the previous version, the supersonic axial force due to pressure alone is
considered invariant of angle of attack in the VDHT method and the hypersonic
Newtonian method as implemented. This introduces additional errors when the geometry
is at angle of attack. They propose as part of the change to calculate the axial force at
each angle of attack to eliminate this discrepancy. A code structure change was
suggested to eliminate these angle-of-attack errors. The SOSE theory is also employed
but is not affected by the angle-of-attack errors mentioned here.
The most recent revision of Missile DATCOM (version 8/08) was released in
2008. This version included the ability to have nine fin sets with up to eight fins for each
set, revised body axial force calculations, and the addition of moment contributions from
protuberances. Doyle et al. (2009) discuss the last two upgrades mentioned above. First,
the method to calculate the axial force coefficient for bodies with blunted, truncated, and
low fineness ratio noses was updated. Second, adding the ability to specify the angular
orientation of protuberances enabled the additional of pitching and yawing moment
contributions from these protuberances to the total body moments. Changes in the axial
force calculation methodology are of great interest. However, since the choice was made
not to model the protuberances on the SA-2 missile, the change to implement angular
position of protuberances will not be discussed.
11
Updated
Updated
Figure 5. Axial Force Methodology for Missile DATCOM 7/07 (After Doyle, Rosema, Underwood, & Auman, 2009, p. 3)
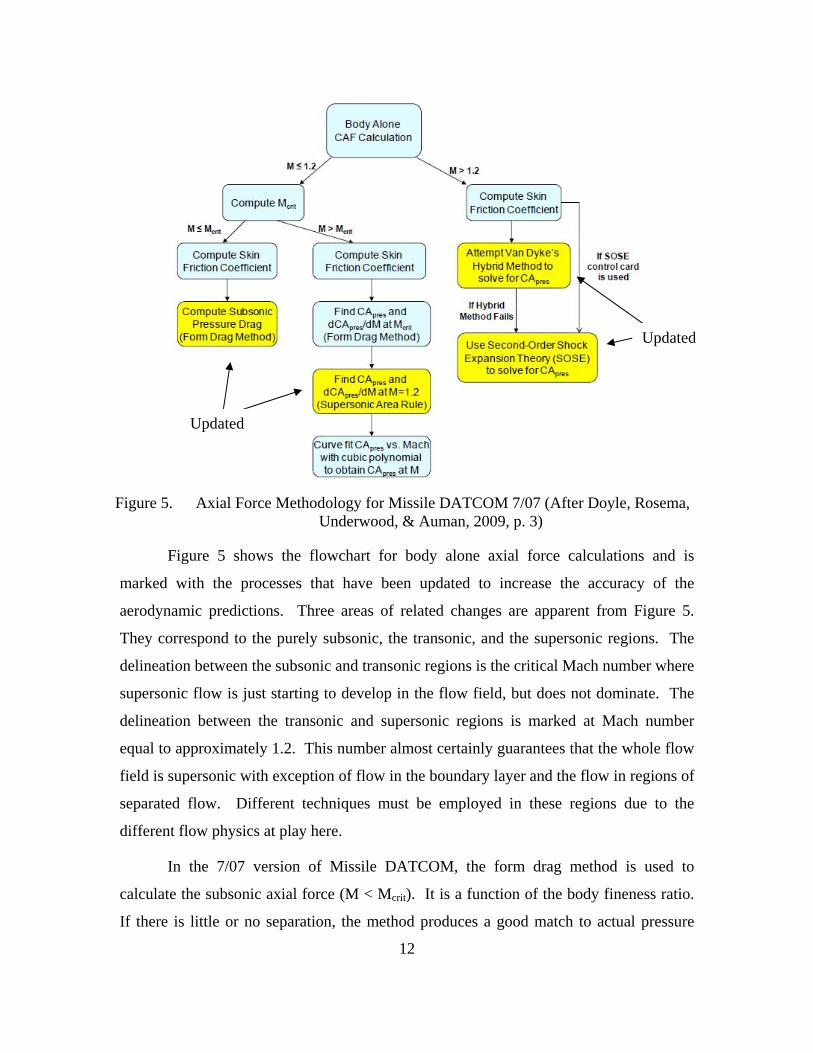
Figure 5 shows the flowchart for body alone axial force calculations and is
marked with the processes that have been updated to increase the accuracy of the
aerodynamic predictions. Three areas of related changes are apparent from Figure 5.
They correspond to the purely subsonic, the transonic, and the supersonic regions. The
delineation between the subsonic and transonic regions is the critical Mach number where
supersonic flow is just starting to develop in the flow field, but does not dominate. The
delineation between the transonic and supersonic regions is marked at Mach number
equal to approximately 1.2. This number almost certainly guarantees that the whole flow
field is supersonic with exception of flow in the boundary layer and the flow in regions of
separated flow. Different techniques must be employed in these regions due to the
different flow physics at play here.
In the 7/07 version of Missile DATCOM, the form drag method is used to
calculate the subsonic axial force (M < Mcrit). It is a function of the body fineness ratio.
If there is little or no separation, the method produces a good match to actual pressure
12
drag on the body. However, if there is moderate to severe separation, as seen in nose
geometries with low fineness approaching fully truncated, the method severely
underpredicts the pressure drag. Based on parametric studies for a range of fineness
ratios conducted using CFD, Doyle et al. (2009) proposed a correction that fits a curve to
a conical nose factor as a function of fineness ratio and implemented it. This conical
nose factor is used in Eq. (12) and (13) to adjust the axial force coefficient.
Apres Apres trun Aform AformC ConicalNoseFactor C C C (12)
0.86Apres trun AfricC C (13)
As the conical nose factor approaches zero (i.e., for fineness ratios greater than 1.5), the
pressure drag component of the axial force approaches the axial force produced by the
form drag method alone.
For fully truncated noses, Missile DATCOM 7/07 interpolated between the
pressure drag calculated via the form drag method and an empirically determined
truncated drag based on the truncation ratio, defined as the truncated diameter divided by
the nose base diameter. In a similar manner to the corrections implemented for noses
with low fineness ratios, a correction was proposed via a curve fit from parametric CFD
studies to correct for the underprediction for this geometry.
In the transonic region (Mcrit to M=1.2), use of Missile DATCOM 7/07 yielded
large differences in the axial force values. The method to determine the pressure
component of axial force involves a curve fit of a cubic polynomial to the calculated
values of the axial force coefficient. In order to produce this cubic curve fit, one must
know the endpoints and slopes at the endpoints. The derivatives are approximated at
these endpoints by a finite difference formulation. The Mcrit endpoint is perturbed by
0.01, and the M = 1.2 endpoint is perturbed by 0.1. The left endpoint follows as a
carryover from the subsonic discussion mentioned above. The right endpoint axial force
coefficients are both evaluated using the supersonic area rule, which is integrated over the
body. The supersonic area rule uses an area for calculations that is the projection of the
slice made by the Mach cone angle at a particular point on the plane that is perpendicular
to the body axis. Therefore, the area is dependent on both Mach number and the actual
cross sectional area. For M > 1.2, VDHT or SOSET is used and a discontinuity develops
13
because of this switch. The correction proposed for Missile DATCOM 8/08 is to use
VDHT and SOSET to calculate the values at the right endpoint for the curve fit,
eliminating the erroneously large axial force coefficients that result from using the
supersonic area rule when high conical nose half angles are present in the geometry.
These changes also eliminate the discontinuity that was present at the right endpoint
because of the switch to VDHT or SOSET.
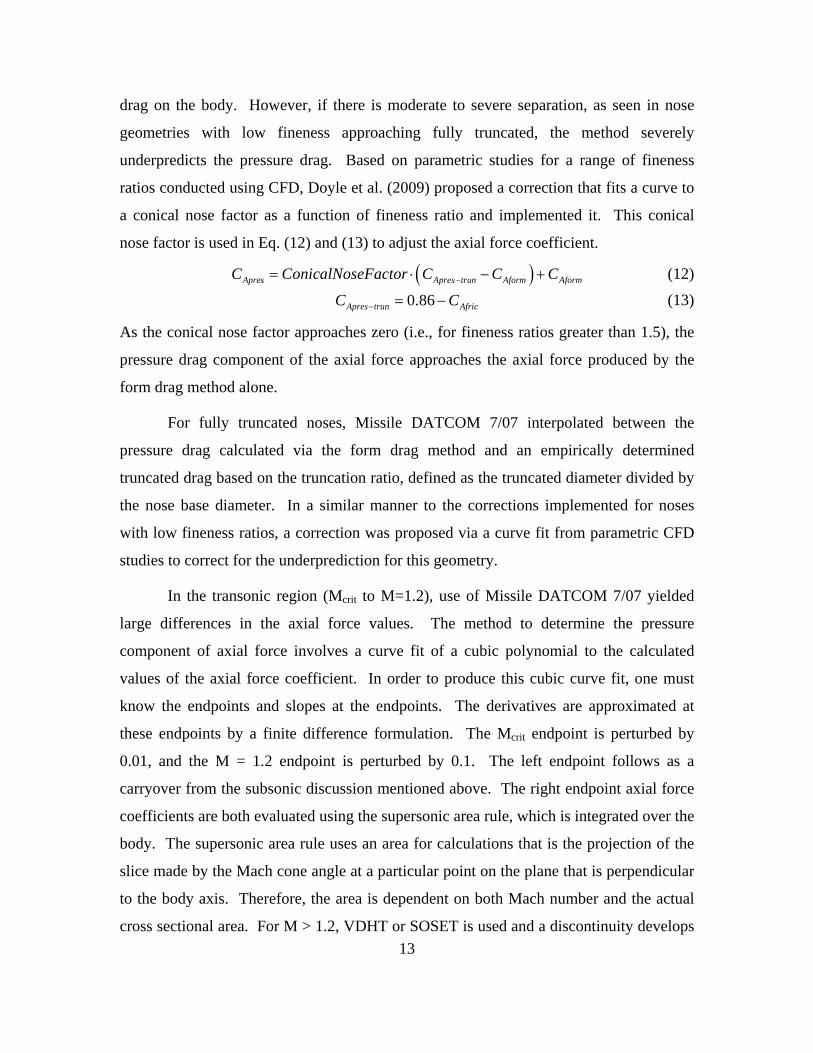
In the purely supersonic region (M > 1.2), the 7/07 version of Missile DATCOM
uses both VDHT and SOSE. VDHT is used until its applicability ends and the program
abruptly switches to SOSE. The end of the applicability of VDHT occurs when the slope
of the body at any point is greater than the Mach cone angle calculated from the
freestream Mach number. This switch causes a distinct discontinuity. To resolve it,
Doyle et al. (2009) propose a smoothing routine that interpolates between VDHT and
SOSET for a particular nose fineness ratio as a function of Mach number. Figure 6 gives
an excellent graphical representation of this interpolation scheme.
Figure 6. Graphical Representation of Interpolation Scheme for Axial Force in the Supersonic region for Missile DATCOM 8/08 (From Doyle, Rosema,
Underwood, & Auman, 2009, p. 10)
14
II. GEOMETRY MODELING AND RESEARCH APPROACH
A. GEOMETRY MODELING
1. Missilelab
a. Interface with Missile DATCOM
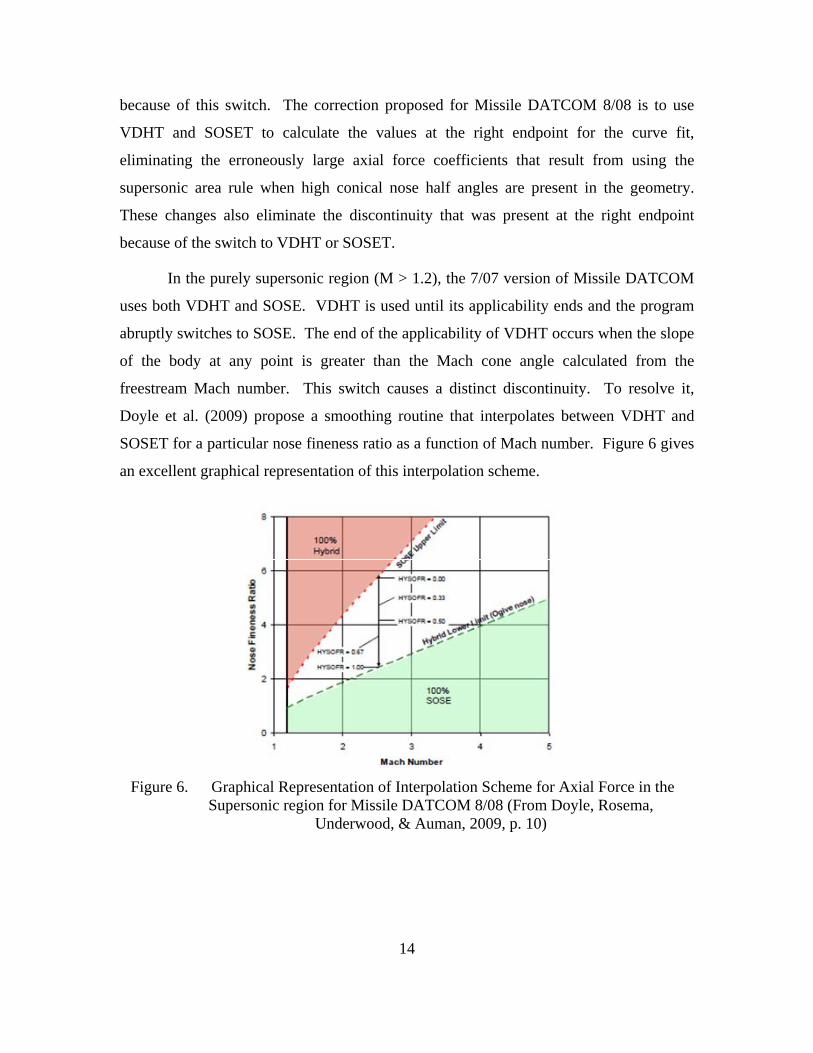
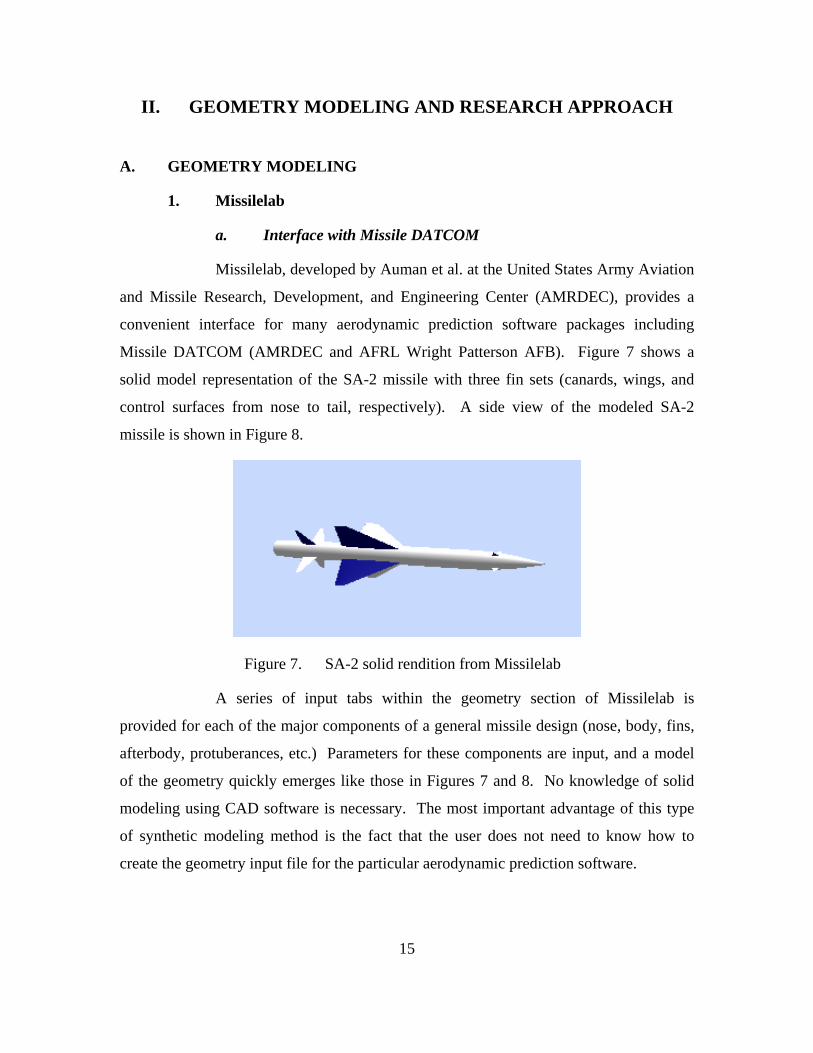
Missilelab, developed by Auman et al. at the United States Army Aviation
and Missile Research, Development, and Engineering Center (AMRDEC), provides a
convenient interface for many aerodynamic prediction software packages including
Missile DATCOM (AMRDEC and AFRL Wright Patterson AFB). Figure 7 shows a
solid model representation of the SA-2 missile with three fin sets (canards, wings, and
control surfaces from nose to tail, respectively). A side view of the modeled SA-2
missile is shown in Figure 8.
Figure 7. SA-2 solid rendition from Missilelab
A series of input tabs within the geometry section of Missilelab is
provided for each of the major components of a general missile design (nose, body, fins,
afterbody, protuberances, etc.) Parameters for these components are input, and a model
of the geometry quickly emerges like those in Figures 7 and 8. No knowledge of solid
modeling using CAD software is necessary. The most important advantage of this type
of synthetic modeling method is the fact that the user does not need to know how to
create the geometry input file for the particular aerodynamic prediction software.
15
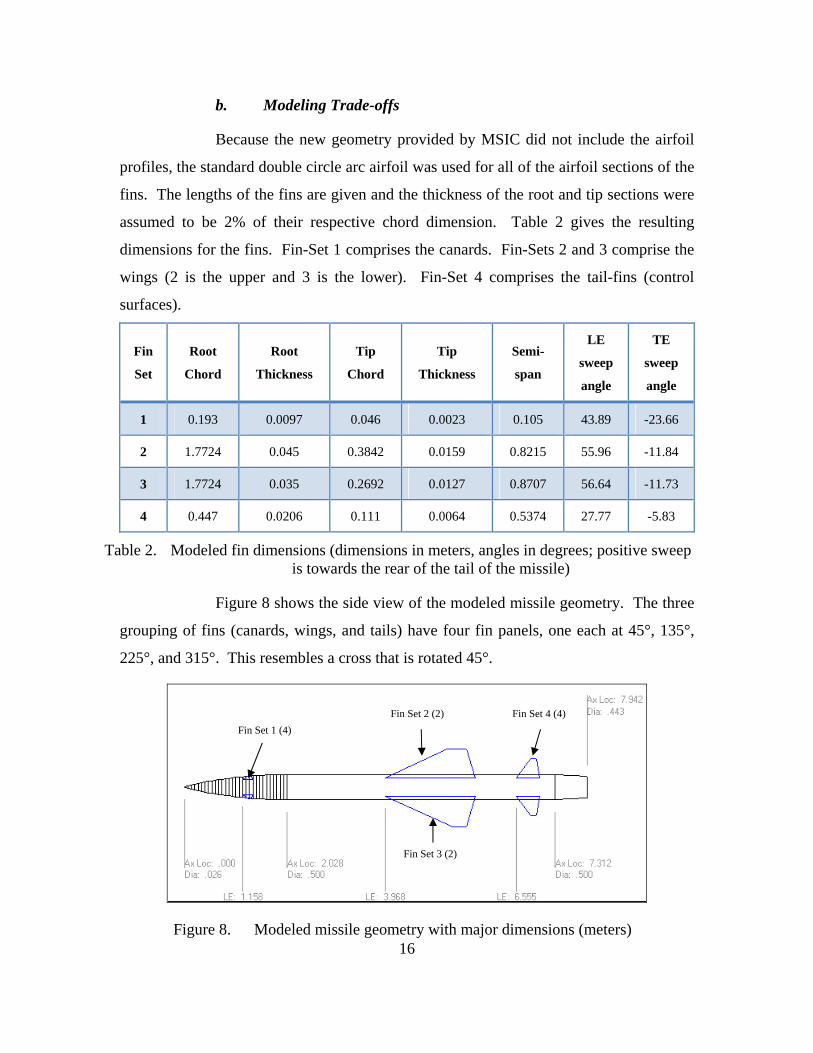
b. Modeling Trade-offs
Because the new geometry provided by MSIC did not include the airfoil
profiles, the standard double circle arc airfoil was used for all of the airfoil sections of the
fins. The lengths of the fins are given and the thickness of the root and tip sections were
assumed to be 2% of their respective chord dimension. Table 2 gives the resulting
dimensions for the fins. Fin-Set 1 comprises the canards. Fin-Sets 2 and 3 comprise the
wings (2 is the upper and 3 is the lower). Fin-Set 4 comprises the tail-fins (control
surfaces).
Fin
Set
Root
Chord
Root
Thickness
Tip
Chord
Tip
Thickness
Semi-
span
LE
sweep
angle
TE
sweep
angle
1 0.193 0.0097 0.046 0.0023 0.105 43.89 -23.66
2 1.7724 0.045 0.3842 0.0159 0.8215 55.96 -11.84
3 1.7724 0.035 0.2692 0.0127 0.8707 56.64 -11.73
4 0.447 0.0206 0.111 0.0064 0.5374 27.77 -5.83
Table 2. Modeled fin dimensions (dimensions in meters, angles in degrees; positive sweep is towards the rear of the tail of the missile)
Figure 8 shows the side view of the modeled missile geometry. The three
grouping of fins (canards, wings, and tails) have four fin panels, one each at 45°, 135°,
225°, and 315°. This resembles a cross that is rotated 45°.
Fin Set 2 (2) Fin Set 4 (4)
Fin Set 1 (4)
Fin Set 3 (2)
16Figure 8. Modeled missile geometry with major dimensions (meters)
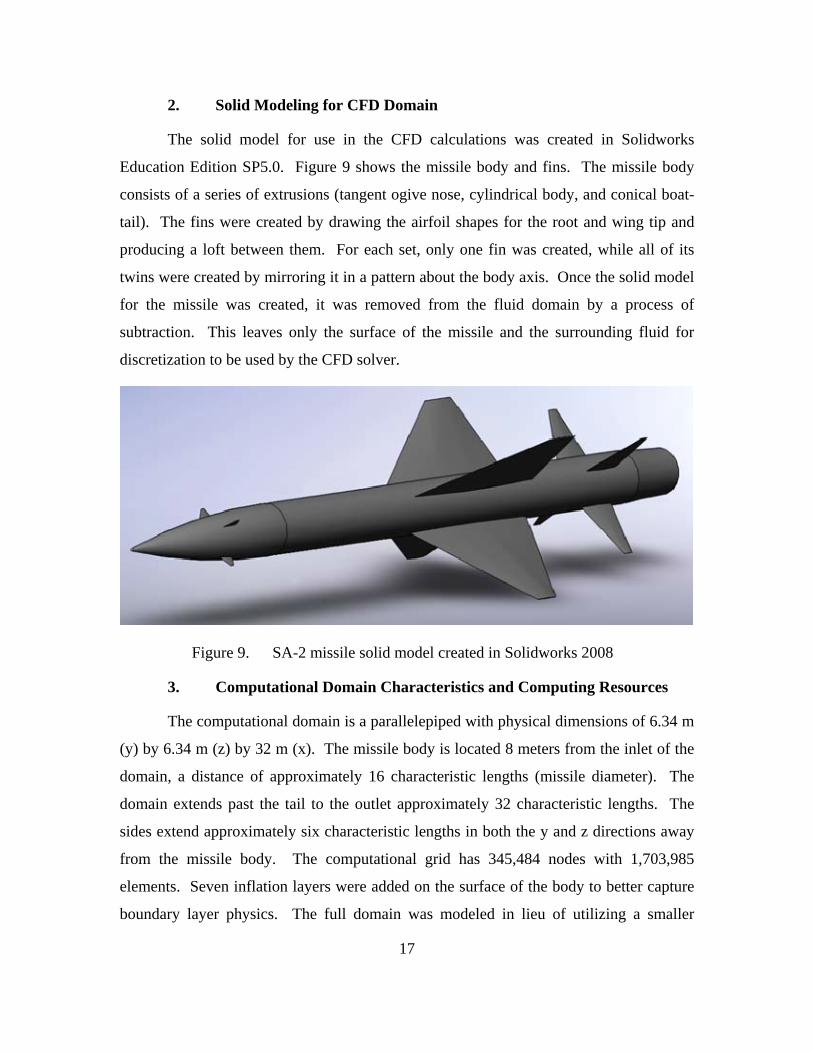
2. Solid Modeling for CFD Domain
The solid model for use in the CFD calculations was created in Solidworks
Education Edition SP5.0. Figure 9 shows the missile body and fins. The missile body
consists of a series of extrusions (tangent ogive nose, cylindrical body, and conical boat-
tail). The fins were created by drawing the airfoil shapes for the root and wing tip and
producing a loft between them. For each set, only one fin was created, while all of its
twins were created by mirroring it in a pattern about the body axis. Once the solid model
for the missile was created, it was removed from the fluid domain by a process of
subtraction. This leaves only the surface of the missile and the surrounding fluid for
discretization to be used by the CFD solver.
Figure 9. SA-2 missile solid model created in Solidworks 2008
3. Computational Domain Characteristics and Computing Resources
The computational domain is a parallelepiped with physical dimensions of 6.34 m
(y) by 6.34 m (z) by 32 m (x). The missile body is located 8 meters from the inlet of the
domain, a distance of approximately 16 characteristic lengths (missile diameter). The
domain extends past the tail to the outlet approximately 32 characteristic lengths. The
sides extend approximately six characteristic lengths in both the y and z directions away
from the missile body. The computational grid has 345,484 nodes with 1,703,985
elements. Seven inflation layers were added on the surface of the body to better capture
boundary layer physics. The full domain was modeled in lieu of utilizing a smaller
17
domain with symmetry planes because the original intention for this part of the study was
to simulate changes in the angle of attack for the missile. However, this part of the
analysis was ultimately not performed. The fluid dynamic computations using the
discretized domain were carried out on the NPS/MAE cluster computer, a Unix-based
computing platform with 32 nodes and 4 processors per node.
B. EXPERIMENTAL DATA
Data for this study were provided by MSIC/Defense Intelligence Agency. The
data set consists of some wind tunnel data and modeled data generated using
MATLAB/Simulink. However, all the data are deemed to be from an experimental
source. The full details of the experimental procedures that were used to produce this
data set are not available. Equation (14) summarizes the inputs given for the total axial
force coefficient. Data for normal force and moment coefficients including their
derivatives are also given as part of the data set.
,0 , ,A A A f AC C C C C (14)
These data and a similar geometry were studied previously by Teo (2008) using
Missile LAB code. However, the missile geometry then was set up from a rudimentary
drawing and not one that represented a high fidelity version as used in the present study.
Unavailable dimensions were scaled off the drawing as best as possible. Additionally,
certain details of the SA-2 missile’s construction were not visible in the drawing and for
such situations; the fidelity level is less in the calculations. The differences with the
prototype included airfoil cross-sections and the presence of a boat-tail on the second
stage housed within the first stage. Updated geometry drawings were subsequently
provided by MSIC for this particular study that included protuberances and the
aforementioned boat-tail. Reasonable guesses were made for the airfoil cross-sections.
It is unclear whether boundary layer trips were used on the model to fix the
transition onset point to better match the flow characteristics of the full-scale missile.
Early results generated in the study lead to the surmise that boundary layer trips were
used during testing. Thus, in Missile DATCOM calculations, the boundary layer is
assumed to be fully turbulent.
18
19
C. RESEARCH APPROACH
Parametric studies of the missile performance were conducted using Missile
DATCOM to produce data for comparison with the range of flow conditions included in
the MSIC data. A large amount of data for many different flight conditions have been
computed. Most of the Missile DATCOM output was produced for specific values of
Mach number, angle of attack, control surface deflection, and flight altitude for which the
MSIC data were provided. If anomalies were noticed, other flight parameters were used
to investigate the workings of Missile DATCOM.
CFD analysis is also included in this study to see how the results from these types
of simulations can compare. Complete agreement between these computational tools
may not be possible, but seeing some similarities may give good insight into the ability to
use both Missile DATCOM and CFD as powerful design tools.
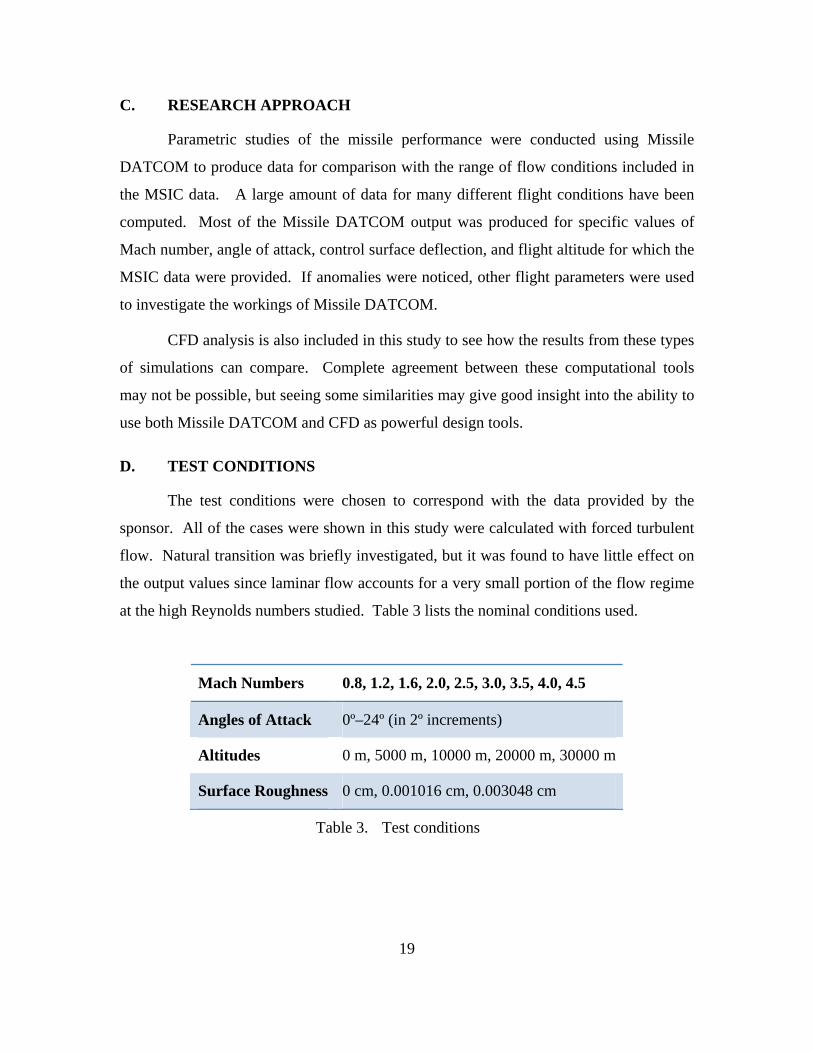
D. TEST CONDITIONS
The test conditions were chosen to correspond with the data provided by the
sponsor. All of the cases were shown in this study were calculated with forced turbulent
flow. Natural transition was briefly investigated, but it was found to have little effect on
the output values since laminar flow accounts for a very small portion of the flow regime
at the high Reynolds numbers studied. Table 3 lists the nominal conditions used.
Mach Numbers 0.8, 1.2, 1.6, 2.0, 2.5, 3.0, 3.5, 4.0, 4.5
Angles of Attack 0º–24º (in 2º increments)
Altitudes 0 m, 5000 m, 10000 m, 20000 m, 30000 m
Surface Roughness 0 cm, 0.001016 cm, 0.003048 cm
Table 3. Test conditions

20
THIS PAGE INTENTIONALLY LEFT BLANK
III. PRESENTATION OF RESULTS
A. MOTIVATION FOR FURTHER STUDY FROM THE RESULTS OF PREVIOUS WORK
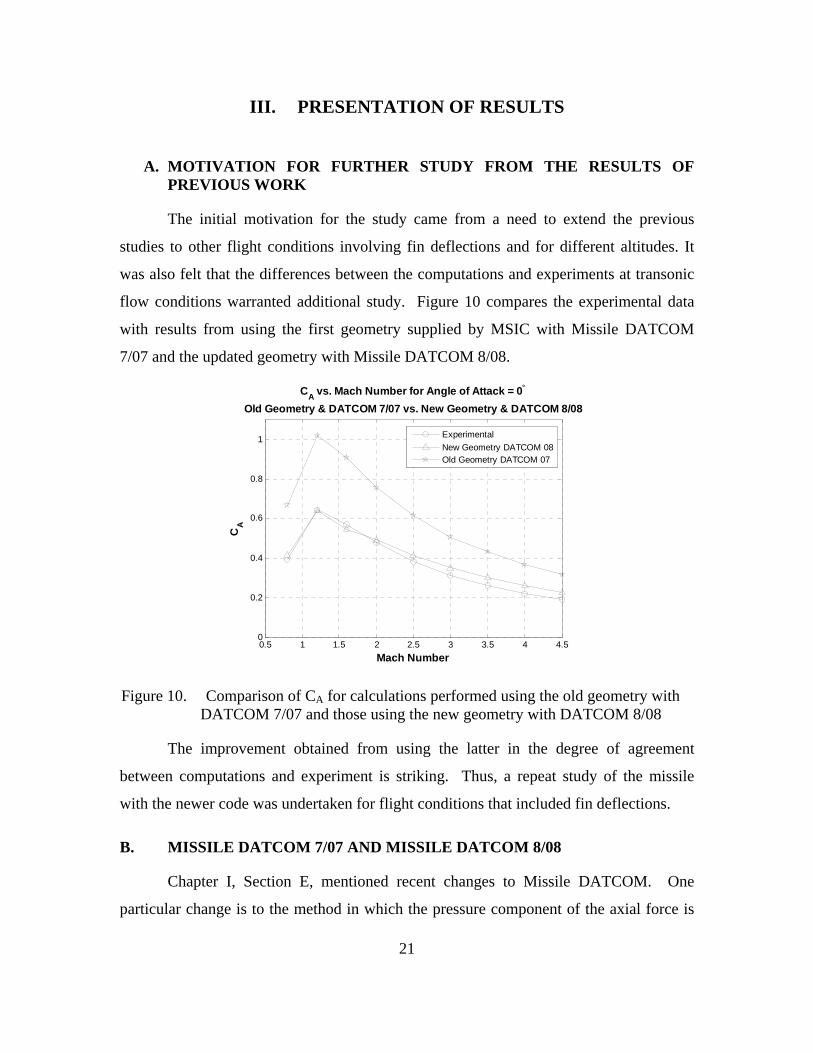
The initial motivation for the study came from a need to extend the previous
studies to other flight conditions involving fin deflections and for different altitudes. It
was also felt that the differences between the computations and experiments at transonic
flow conditions warranted additional study. Figure 10 compares the experimental data
with results from using the first geometry supplied by MSIC with Missile DATCOM
7/07 and the updated geometry with Missile DATCOM 8/08.
0.5 1 1.5 2 2.5 3 3.5 4 4.50
0.2
0.4
0.6
0.8
1
CA vs. Mach Number for Angle of Attack = 0
Old Geometry & DATCOM 7/07 vs. New Geometry & DATCOM 8/08
Mach Number
CA
Experimental
New Geometry DATCOM 08Old Geometry DATCOM 07
Figure 10. Comparison of CA for calculations performed using the old geometry with DATCOM 7/07 and those using the new geometry with DATCOM 8/08
The improvement obtained from using the latter in the degree of agreement
between computations and experiment is striking. Thus, a repeat study of the missile
with the newer code was undertaken for flight conditions that included fin deflections.
B. MISSILE DATCOM 7/07 AND MISSILE DATCOM 8/08
Chapter I, Section E, mentioned recent changes to Missile DATCOM. One
particular change is to the method in which the pressure component of the axial force is
21
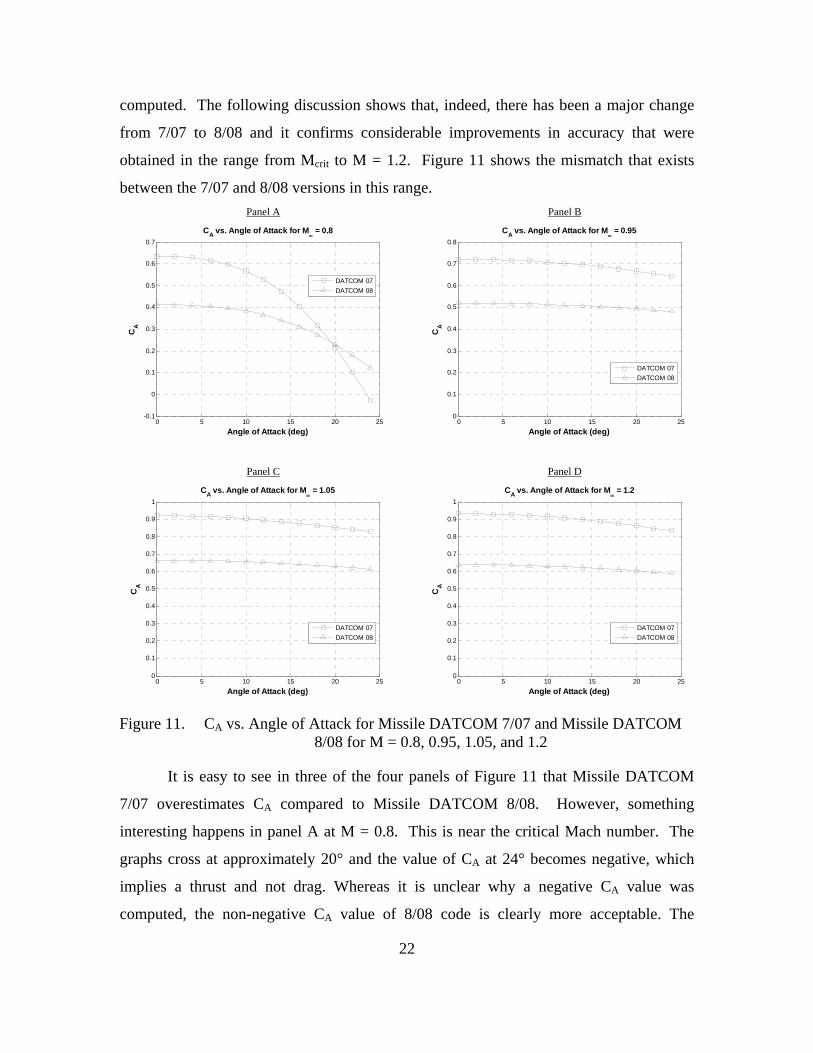
computed. The following discussion shows that, indeed, there has been a major change
from 7/07 to 8/08 and it confirms considerable improvements in accuracy that were
obtained in the range from Mcrit to M = 1.2. Figure 11 shows the mismatch that exists
between the 7/07 and 8/08 versions in this range.
Panel A
0 5 10 15 20 25-0.1
0
0.1
0.2
0.3
0.4
0.5
0.6
0.7
CA vs. Angle of Attack for M
= 0.8
Angle of Attack (deg)
CA
DATCOM 07
DATCOM 08
Panel B
0 5 10 15 20 250
0.1
0.2
0.3
0.4
0.5
0.6
0.7
0.8
CA vs. Angle of Attack for M
= 0.95
Angle of Attack (deg)C
A
DATCOM 07
DATCOM 08
Panel C
0 5 10 15 20 250
0.1
0.2
0.3
0.4
0.5
0.6
0.7
0.8
0.9
1
CA vs. Angle of Attack for M
= 1.05
Angle of Attack (deg)
CA
DATCOM 07
DATCOM 08
Panel D
0 5 10 15 20 250
0.1
0.2
0.3
0.4
0.5
0.6
0.7
0.8
0.9
1
CA vs. Angle of Attack for M
= 1.2
Angle of Attack (deg)
CA
DATCOM 07
DATCOM 08
Figure 11. CA vs. Angle of Attack for Missile DATCOM 7/07 and Missile DATCOM 8/08 for M = 0.8, 0.95, 1.05, and 1.2
It is easy to see in three of the four panels of Figure 11 that Missile DATCOM
7/07 overestimates CA compared to Missile DATCOM 8/08. However, something
interesting happens in panel A at M = 0.8. This is near the critical Mach number. The
graphs cross at approximately 20° and the value of CA at 24° becomes negative, which
implies a thrust and not drag. Whereas it is unclear why a negative CA value was
computed, the non-negative CA value of 8/08 code is clearly more acceptable. The
22
negative value that is seen at 24º is an anomaly that is obviously not present anywhere in
the full range of experimental values provided by MSIC.
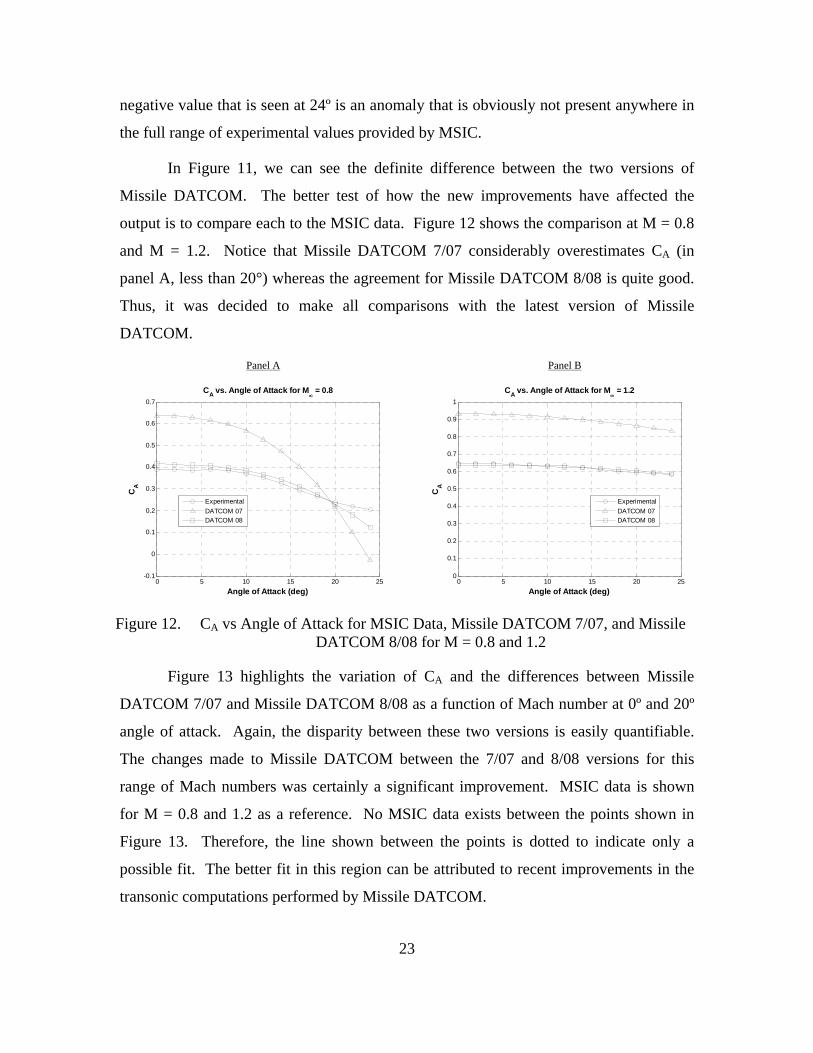
In Figure 11, we can see the definite difference between the two versions of
Missile DATCOM. The better test of how the new improvements have affected the
output is to compare each to the MSIC data. Figure 12 shows the comparison at M = 0.8
and M = 1.2. Notice that Missile DATCOM 7/07 considerably overestimates CA (in
panel A, less than 20°) whereas the agreement for Missile DATCOM 8/08 is quite good.
Thus, it was decided to make all comparisons with the latest version of Missile
DATCOM.
Panel A
0 5 10 15 20 25-0.1
0
0.1
0.2
0.3
0.4
0.5
0.6
0.7
CA vs. Angle of Attack for M
= 0.8
Angle of Attack (deg)
CA
Experimental
DATCOM 07DATCOM 08
Panel B
0 5 10 15 20 250
0.1
0.2
0.3
0.4
0.5
0.6
0.7
0.8
0.9
1
CA vs. Angle of Attack for M
= 1.2
Angle of Attack (deg)
CA
Experimental
DATCOM 07DATCOM 08
Figure 12. CA vs Angle of Attack for MSIC Data, Missile DATCOM 7/07, and Missile DATCOM 8/08 for M = 0.8 and 1.2
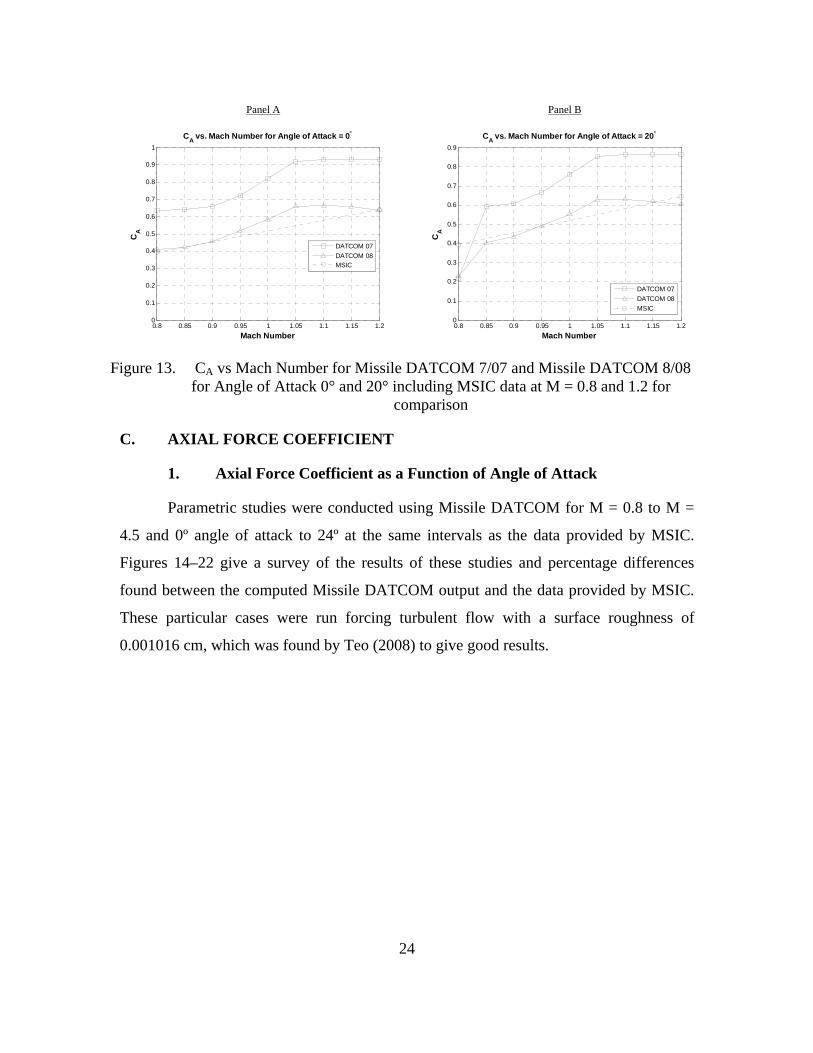
Figure 13 highlights the variation of CA and the differences between Missile
DATCOM 7/07 and Missile DATCOM 8/08 as a function of Mach number at 0º and 20º
angle of attack. Again, the disparity between these two versions is easily quantifiable.
The changes made to Missile DATCOM between the 7/07 and 8/08 versions for this
range of Mach numbers was certainly a significant improvement. MSIC data is shown
for M = 0.8 and 1.2 as a reference. No MSIC data exists between the points shown in
Figure 13. Therefore, the line shown between the points is dotted to indicate only a
possible fit. The better fit in this region can be attributed to recent improvements in the
transonic computations performed by Missile DATCOM.
23
Panel A
0.8 0.85 0.9 0.95 1 1.05 1.1 1.15 1.20
0.1
0.2
0.3
0.4
0.5
0.6
0.7
0.8
0.9
1
CA vs. Mach Number for Angle of Attack = 0
Mach Number
CA
DATCOM 07
DATCOM 08MSIC
Panel B
0.8 0.85 0.9 0.95 1 1.05 1.1 1.15 1.20
0.1
0.2
0.3
0.4
0.5
0.6
0.7
0.8
0.9
CA vs. Mach Number for Angle of Attack = 20
Mach Number
CA
DATCOM 07
DATCOM 08
MSIC
Figure 13. CA vs Mach Number for Missile DATCOM 7/07 and Missile DATCOM 8/08 for Angle of Attack 0° and 20° including MSIC data at M = 0.8 and 1.2 for
comparison
C. AXIAL FORCE COEFFICIENT
1. Axial Force Coefficient as a Function of Angle of Attack
Parametric studies were conducted using Missile DATCOM for M = 0.8 to M =
4.5 and 0º angle of attack to 24º at the same intervals as the data provided by MSIC.
Figures 14–22 give a survey of the results of these studies and percentage differences
found between the computed Missile DATCOM output and the data provided by MSIC.
These particular cases were run forcing turbulent flow with a surface roughness of
0.001016 cm, which was found by Teo (2008) to give good results.
24
Panel A
0 5 10 15 20 250
0.1
0.2
0.3
0.4
0.5
0.6
CA vs. Angle of Attack for M
= 0.8
Angle of Attack (deg)
CA
Experimental
DATCOM 08
Panel B
0 5 10 15 20 250
5
10
15
20
25
30
35
40
Percent Difference between DATCOM 08 CA & MSIC Data C
Avs. Angle of Attack at M
= 0.8
Angle of Attack (deg)
Pe
rcen
t D
iffe
ren
ce
Figure 14. CA vs. Angle of Attack for MSIC Data and Missile DATCOM 8/08 for M = 0.8
Figure 14 shows approximately 5% difference between the MSIC data and
Missile DATCOM 8/08 over a large range of angle of attacks, which was deemed
excellent. However, after an angle of attack of 20º the agreement breaks off and the
results diverge considerably. It is not entirely clear why this discrepancy appears other
than that this is a high angle of attack case. One possible explanation is likely the
well known differences in the formation and evolution of the forebody vortices at these
high angles of attack on an axisymmetric slender body.
Since the SA-2 missile traverses through this Mach number for less than 10
seconds, additional attention was not devoted to this discrepancy. Most of the flight
envelope encompasses the supersonic regime that extends up to about Mach 3. Thus,
studies at lower Mach numbers are not of interest for this missile. However, it does show
that for low to moderate angles of attack at this particular Mach number Missile
DATCOM 8/08 is able to provide excellent results that would be adequate for
preliminary design studies.
Figure 15 shows the best agreement, over the widest range of angle of attacks,
from among Figures 14–18 of this section and Figures 32–35 of Appendix C. The
maximum difference occurs at 20º and shows only a 2% difference. This level of
25
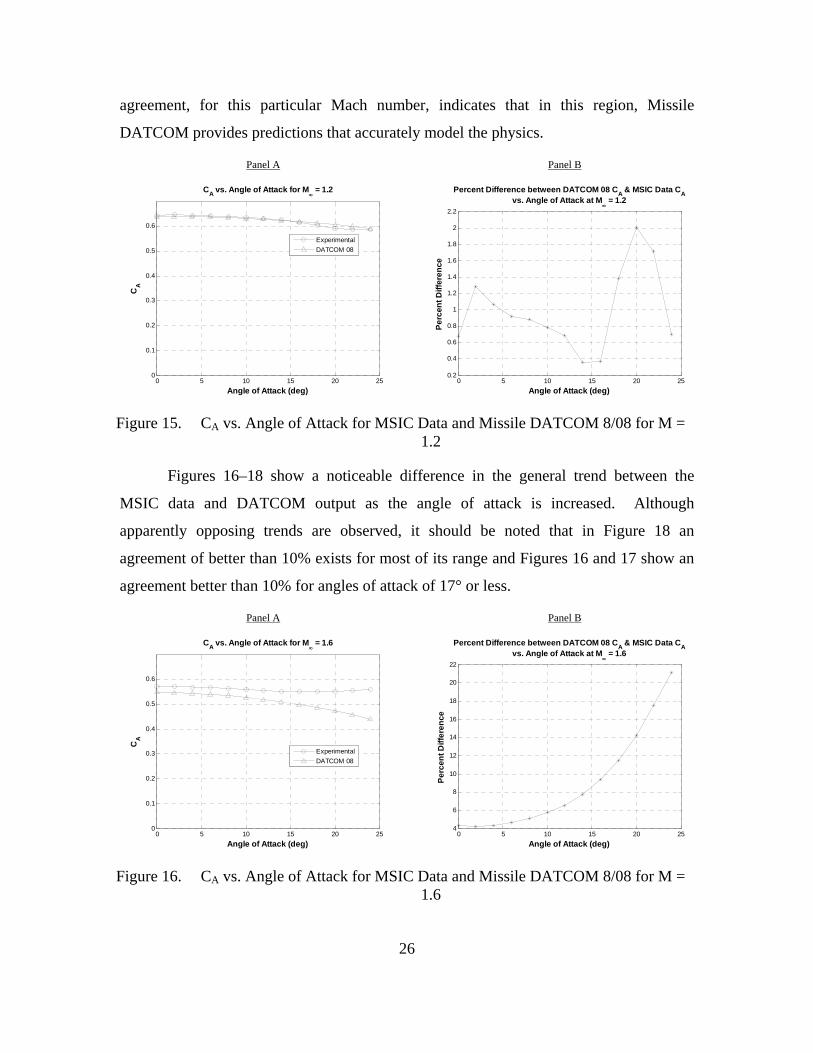
agreement, for this particular Mach number, indicates that in this region, Missile
DATCOM provides predictions that accurately model the physics.
Panel A
0 5 10 15 20 250
0.1
0.2
0.3
0.4
0.5
0.6
CA vs. Angle of Attack for M
= 1.2
Angle of Attack (deg)
CA
Experimental
DATCOM 08
Panel B
0 5 10 15 20 250.2
0.4
0.6
0.8
1
1.2
1.4
1.6
1.8
2
2.2
Percent Difference between DATCOM 08 CA & MSIC Data C
Avs. Angle of Attack at M
= 1.2
Angle of Attack (deg)
Pe
rcen
t D
iffe
ren
ce
Figure 15. CA vs. Angle of Attack for MSIC Data and Missile DATCOM 8/08 for M = 1.2
Figures 16–18 show a noticeable difference in the general trend between the
MSIC data and DATCOM output as the angle of attack is increased. Although
apparently opposing trends are observed, it should be noted that in Figure 18 an
agreement of better than 10% exists for most of its range and Figures 16 and 17 show an
agreement better than 10% for angles of attack of 17° or less.
Panel A
0 5 10 15 20 250
0.1
0.2
0.3
0.4
0.5
0.6
CA vs. Angle of Attack for M
= 1.6
Angle of Attack (deg)
CA
Experimental
DATCOM 08
Panel B
0 5 10 15 20 254
6
8
10
12
14
16
18
20
22
Percent Difference between DATCOM 08 CA & MSIC Data C
Avs. Angle of Attack at M
= 1.6
Angle of Attack (deg)
Pe
rcen
t D
iffe
ren
ce
Figure 16. CA vs. Angle of Attack for MSIC Data and Missile DATCOM 8/08 for M = 1.6
26
Panel A
0 5 10 15 20 250
0.1
0.2
0.3
0.4
0.5
0.6
CA vs. Angle of Attack for M
= 2.0
Angle of Attack (deg)
CA
Experimental
DATCOM 08
Panel B
0 5 10 15 20 250
2
4
6
8
10
12
14
16
18
Percent Difference between DATCOM 08 CA & MSIC Data C
Avs. Angle of Attack at M
= 2.0
Angle of Attack (deg)
Pe
rcen
t D
iffe
ren
ce
Figure 17. CA vs. Angle of Attack for MSIC Data and Missile DATCOM 8/08 for M = 2.0
In general, this level of agreement is considered satisfactory in missile
compuatations using empirical codes so, it is accepted. The code used is known to
produce results of less than 10% difference if the predictive region of interest is limited to
an angle of attack of approximately 20°.
Panel A
0 5 10 15 20 250
0.1
0.2
0.3
0.4
0.5
0.6
CA vs. Angle of Attack for M
= 2.5
Angle of Attack (deg)
CA
Experimental
DATCOM 08
Panel B
0 5 10 15 20 250
2
4
6
8
10
12
Percent Difference between DATCOM 08 CA & MSIC Data C
Avs. Angle of Attack at M
= 2.5
Angle of Attack (deg)
Pe
rcen
t D
iffe
ren
ce
Figure 18. CA vs. Angle of Attack for MSIC Data and Missile DATCOM 8/08 for M = 2.5
27
Differences seen in the plots presented beyond 20º can naturally be expected to be
larger because of this artificial restriction in the predictive range of Missile DATCOM.
This indicates that the code is most suitable if the flight envelope consists of normal
course and altitude corrections, which limits the ability to accurately predict the
aerodynamic forces in any radical maneuver.
For Mach number > 3.0, the trend in both the MSIC data and DATCOM output
are both monotonically increasing and concave upward. This is shown in Figures 32–35
of Appendix C. A likely explanation for the change in the trend and the
overpredictive/underpredictive nature that is seen from the output of DATCOM from this
point onward is a change in the computational method used around Mach 3.0.
Additionally, we can say that for Mach numbers above 3.0 the accuracy meets the goal of
less than 10% at angles of attack greater than approximately 10º. Overall, the average
difference for CA is approximately 7%.
2. Axial Force Coefficient as a Function of Mach Number
Although the data presented here are identical to what was presented in Chapter
III, Section C.1, an alternate view—in this case as a function of Mach number for a
representative sample of angles of attack—reinforces the conclusions made in the
previous section.
0.5 1 1.5 2 2.5 3 3.5 4 4.50
0.1
0.2
0.3
0.4
0.5
0.6
CA vs. Mach Number for Angle of Attack = 0
Mach Number
CA
Experimental
DATCOM 08
0.5 1 1.5 2 2.5 3 3.5 4 4.50
2
4
6
8
10
12
14
16
18
20
Percent Difference between DATCOM 08 CA & MSIC Data C
A
vs. Mach Number at = 0
Mach Number
Pe
rcen
t D
iffe
ren
ce
Figure 19. CA vs. Mach Number for MSIC Data and Missile DATCOM for Angle of Attack = 0º
28
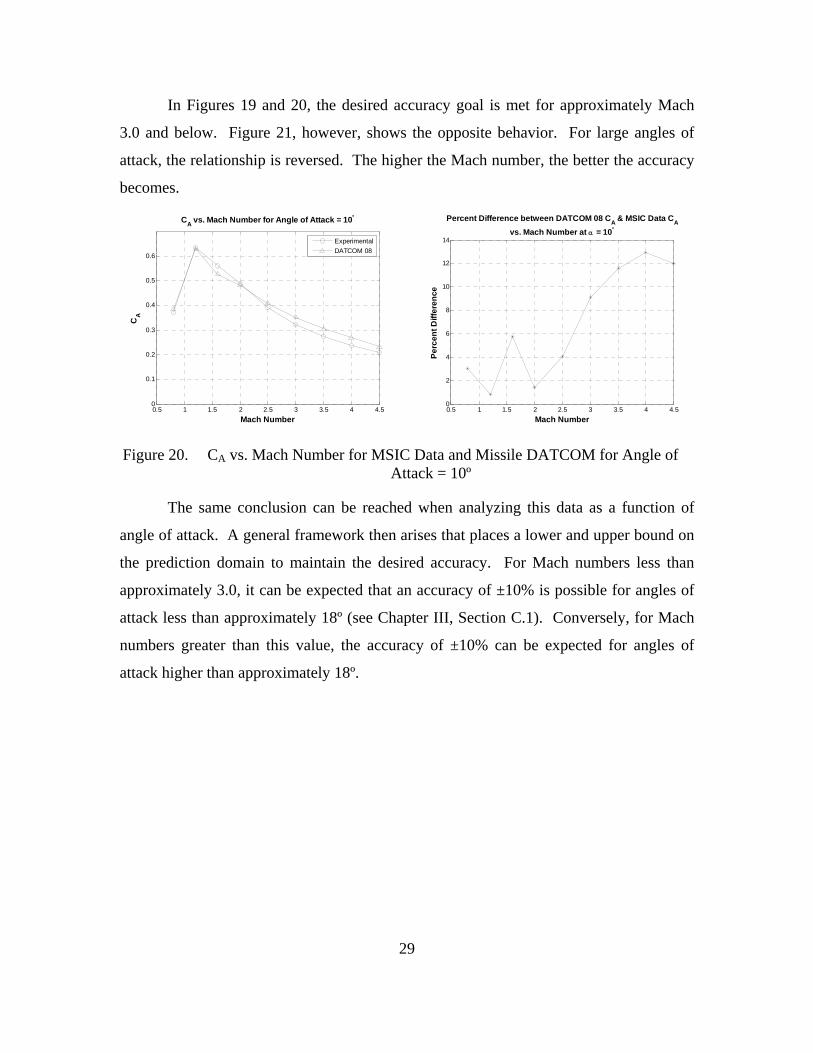
In Figures 19 and 20, the desired accuracy goal is met for approximately Mach
3.0 and below. Figure 21, however, shows the opposite behavior. For large angles of
attack, the relationship is reversed. The higher the Mach number, the better the accuracy
becomes.
0.5 1 1.5 2 2.5 3 3.5 4 4.50
0.1
0.2
0.3
0.4
0.5
0.6
CA vs. Mach Number for Angle of Attack = 10
Mach Number
CA
Experimental
DATCOM 08
0.5 1 1.5 2 2.5 3 3.5 4 4.50
2
4
6
8
10
12
14
Percent Difference between DATCOM 08 CA & MSIC Data C
A
vs. Mach Number at = 10
Mach Number
Pe
rcen
t D
iffe
ren
ce
Figure 20. CA vs. Mach Number for MSIC Data and Missile DATCOM for Angle of Attack = 10º
The same conclusion can be reached when analyzing this data as a function of
angle of attack. A general framework then arises that places a lower and upper bound on
the prediction domain to maintain the desired accuracy. For Mach numbers less than
approximately 3.0, it can be expected that an accuracy of ±10% is possible for angles of
attack less than approximately 18º (see Chapter III, Section C.1). Conversely, for Mach
numbers greater than this value, the accuracy of ±10% can be expected for angles of
attack higher than approximately 18º.
29
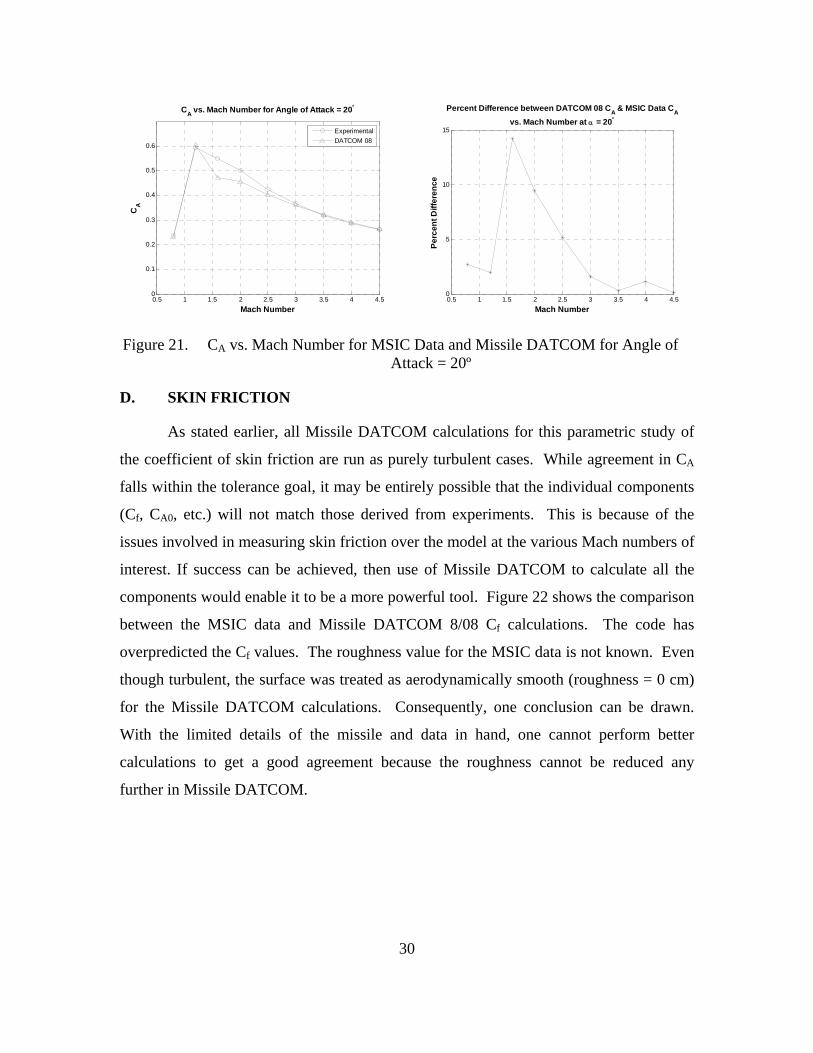
0.5 1 1.5 2 2.5 3 3.5 4 4.50
0.1
0.2
0.3
0.4
0.5
0.6
CA vs. Mach Number for Angle of Attack = 20
Mach Number
CA
Experimental
DATCOM 08
0.5 1 1.5 2 2.5 3 3.5 4 4.50
5
10
15
Percent Difference between DATCOM 08 CA & MSIC Data C
A
vs. Mach Number at = 20
Mach Number
Pe
rcen
t D
iffe
ren
ce
Figure 21. CA vs. Mach Number for MSIC Data and Missile DATCOM for Angle of Attack = 20º
D. SKIN FRICTION
As stated earlier, all Missile DATCOM calculations for this parametric study of
the coefficient of skin friction are run as purely turbulent cases. While agreement in CA
falls within the tolerance goal, it may be entirely possible that the individual components
(Cf, CA0, etc.) will not match those derived from experiments. This is because of the
issues involved in measuring skin friction over the model at the various Mach numbers of
interest. If success can be achieved, then use of Missile DATCOM to calculate all the
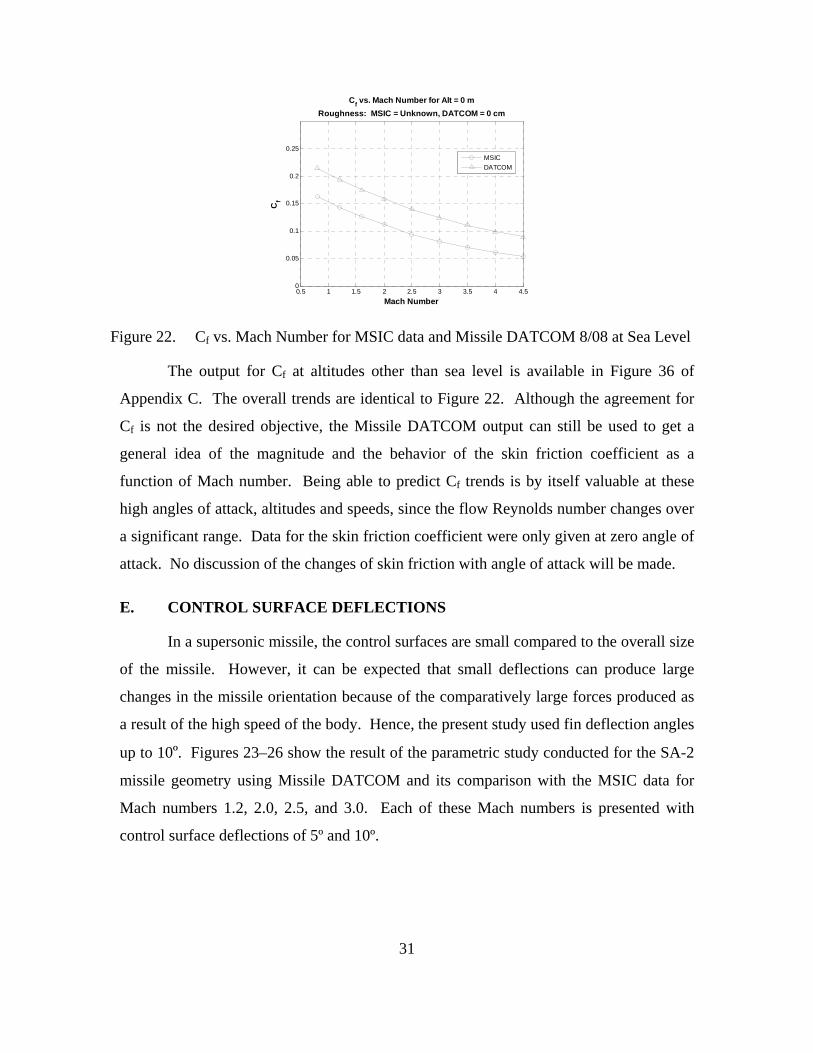
components would enable it to be a more powerful tool. Figure 22 shows the comparison
between the MSIC data and Missile DATCOM 8/08 Cf calculations. The code has
overpredicted the Cf values. The roughness value for the MSIC data is not known. Even
though turbulent, the surface was treated as aerodynamically smooth (roughness = 0 cm)
for the Missile DATCOM calculations. Consequently, one conclusion can be drawn.
With the limited details of the missile and data in hand, one cannot perform better
calculations to get a good agreement because the roughness cannot be reduced any
further in Missile DATCOM.
30
0.5 1 1.5 2 2.5 3 3.5 4 4.50
0.05
0.1
0.15
0.2
0.25
Cf vs. Mach Number for Alt = 0 m
Roughness: MSIC = Unknown, DATCOM = 0 cm
Mach Number
Cf
MSIC
DATCOM
Figure 22. Cf vs. Mach Number for MSIC data and Missile DATCOM 8/08 at Sea Level
The output for Cf at altitudes other than sea level is available in Figure 36 of
Appendix C. The overall trends are identical to Figure 22. Although the agreement for
Cf is not the desired objective, the Missile DATCOM output can still be used to get a
general idea of the magnitude and the behavior of the skin friction coefficient as a
function of Mach number. Being able to predict Cf trends is by itself valuable at these
high angles of attack, altitudes and speeds, since the flow Reynolds number changes over
a significant range. Data for the skin friction coefficient were only given at zero angle of
attack. No discussion of the changes of skin friction with angle of attack will be made.
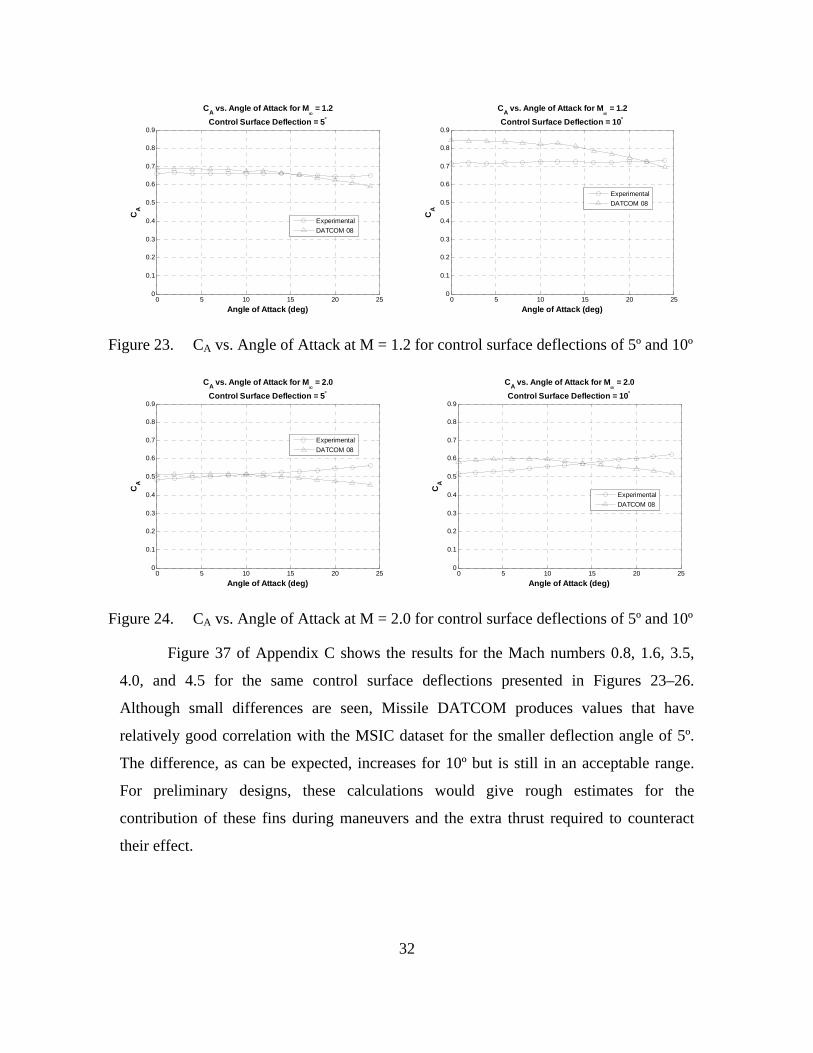
E. CONTROL SURFACE DEFLECTIONS
In a supersonic missile, the control surfaces are small compared to the overall size
of the missile. However, it can be expected that small deflections can produce large
changes in the missile orientation because of the comparatively large forces produced as
a result of the high speed of the body. Hence, the present study used fin deflection angles
up to 10º. Figures 23–26 show the result of the parametric study conducted for the SA-2
missile geometry using Missile DATCOM and its comparison with the MSIC data for
Mach numbers 1.2, 2.0, 2.5, and 3.0. Each of these Mach numbers is presented with
control surface deflections of 5º and 10º.
31
0 5 10 15 20 250
0.1
0.2
0.3
0.4
0.5
0.6
0.7
0.8
0.9
CA vs. Angle of Attack for M
= 1.2
Control Surface Deflection = 5
Angle of Attack (deg)
CA
Experimental
DATCOM 08
0 5 10 15 20 250
0.1
0.2
0.3
0.4
0.5
0.6
0.7
0.8
0.9
CA vs. Angle of Attack for M
= 1.2
Control Surface Deflection = 10
Angle of Attack (deg)
CA
Experimental
DATCOM 08
Figure 23. CA vs. Angle of Attack at M = 1.2 for control surface deflections of 5º and 10º
0 5 10 15 20 250
0.1
0.2
0.3
0.4
0.5
0.6
0.7
0.8
0.9
CA vs. Angle of Attack for M
= 2.0
Control Surface Deflection = 5
Angle of Attack (deg)
CA
Experimental
DATCOM 08
0 5 10 15 20 250
0.1
0.2
0.3
0.4
0.5
0.6
0.7
0.8
0.9
CA vs. Angle of Attack for M
= 2.0
Control Surface Deflection = 10
Angle of Attack (deg)
CA
Experimental
DATCOM 08
Figure 24. CA vs. Angle of Attack at M = 2.0 for control surface deflections of 5º and 10º
Figure 37 of Appendix C shows the results for the Mach numbers 0.8, 1.6, 3.5,
4.0, and 4.5 for the same control surface deflections presented in Figures 23–26.
Although small differences are seen, Missile DATCOM produces values that have
relatively good correlation with the MSIC dataset for the smaller deflection angle of 5º.
The difference, as can be expected, increases for 10º but is still in an acceptable range.
For preliminary designs, these calculations would give rough estimates for the
contribution of these fins during maneuvers and the extra thrust required to counteract
their effect.
32
0 5 10 15 20 250
0.1
0.2
0.3
0.4
0.5
0.6
0.7
0.8
0.9
CA vs. Angle of Attack for M
= 2.5
Control Surface Deflection = 5
Angle of Attack (deg)
CA
Experimental
DATCOM 08
0 5 10 15 20 250
0.1
0.2
0.3
0.4
0.5
0.6
0.7
0.8
0.9
CA vs. Angle of Attack for M
= 2.5
Control Surface Deflection = 10
Angle of Attack (deg)
CA
Experimental
DATCOM 08
Figure 25. CA vs. Angle of Attack at M = 2.5 for control surface deflections of 5º and 10º
0 5 10 15 20 250
0.1
0.2
0.3
0.4
0.5
0.6
0.7
0.8
0.9
CA vs. Angle of Attack for M
= 3.0
Control Surface Deflection = 5
Angle of Attack (deg)
CA
Experimental
DATCOM 08
0 5 10 15 20 250
0.1
0.2
0.3
0.4
0.5
0.6
0.7
0.8
0.9
CA vs. Angle of Attack for M
= 3.0
Control Surface Deflection = 10
Angle of Attack (deg)
CA
Experimental
DATCOM 08
Figure 26. CA vs. Angle of Attack at M = 3.0 for control surface deflections of 5º and 10º
Table 4 gives a tabulation of the average percent difference for the entire body of
test conditions utilized. For all given Mach numbers on average, as control surface
deflection angle is increased by 5º the difference increases to approximately 1.5 times the
previous level.
Control Surface Deflection Angle (deg)
Average PercentDifference (%)
5 8.99 10 13.42 15 20.09 20 48.93 25 77.66 30 53.90
Table 4. Average percent difference in CA for control surface deflection angles 5º–30º
33
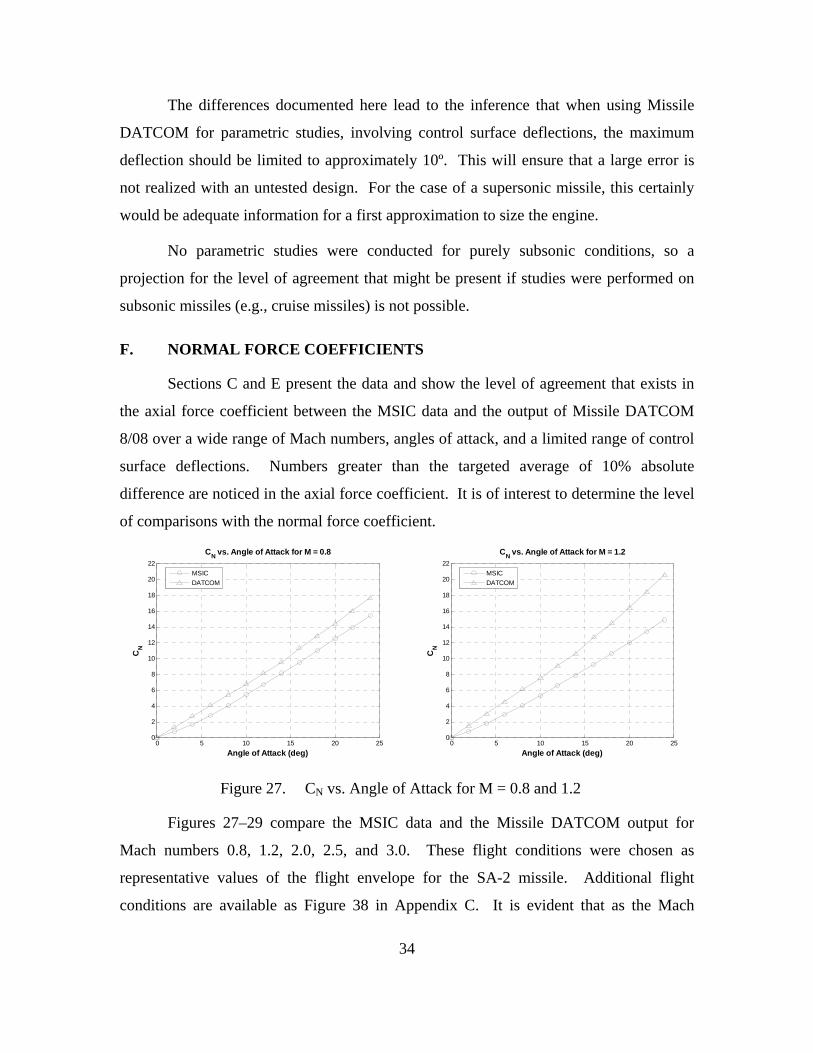
The differences documented here lead to the inference that when using Missile
DATCOM for parametric studies, involving control surface deflections, the maximum
deflection should be limited to approximately 10º. This will ensure that a large error is
not realized with an untested design. For the case of a supersonic missile, this certainly
would be adequate information for a first approximation to size the engine.
No parametric studies were conducted for purely subsonic conditions, so a
projection for the level of agreement that might be present if studies were performed on
subsonic missiles (e.g., cruise missiles) is not possible.
F. NORMAL FORCE COEFFICIENTS
Sections C and E present the data and show the level of agreement that exists in
the axial force coefficient between the MSIC data and the output of Missile DATCOM
8/08 over a wide range of Mach numbers, angles of attack, and a limited range of control
surface deflections. Numbers greater than the targeted average of 10% absolute
difference are noticed in the axial force coefficient. It is of interest to determine the level
of comparisons with the normal force coefficient.
0 5 10 15 20 250
2
4
6
8
10
12
14
16
18
20
22
CN vs. Angle of Attack for M = 0.8
Angle of Attack (deg)
CN
MSIC
DATCOM
0 5 10 15 20 250
2
4
6
8
10
12
14
16
18
20
22
CN vs. Angle of Attack for M = 1.2
Angle of Attack (deg)
CN
MSIC
DATCOM
Figure 27. CN vs. Angle of Attack for M = 0.8 and 1.2
Figures 27–29 compare the MSIC data and the Missile DATCOM output for
Mach numbers 0.8, 1.2, 2.0, 2.5, and 3.0. These flight conditions were chosen as
representative values of the flight envelope for the SA-2 missile. Additional flight
conditions are available as Figure 38 in Appendix C. It is evident that as the Mach
34
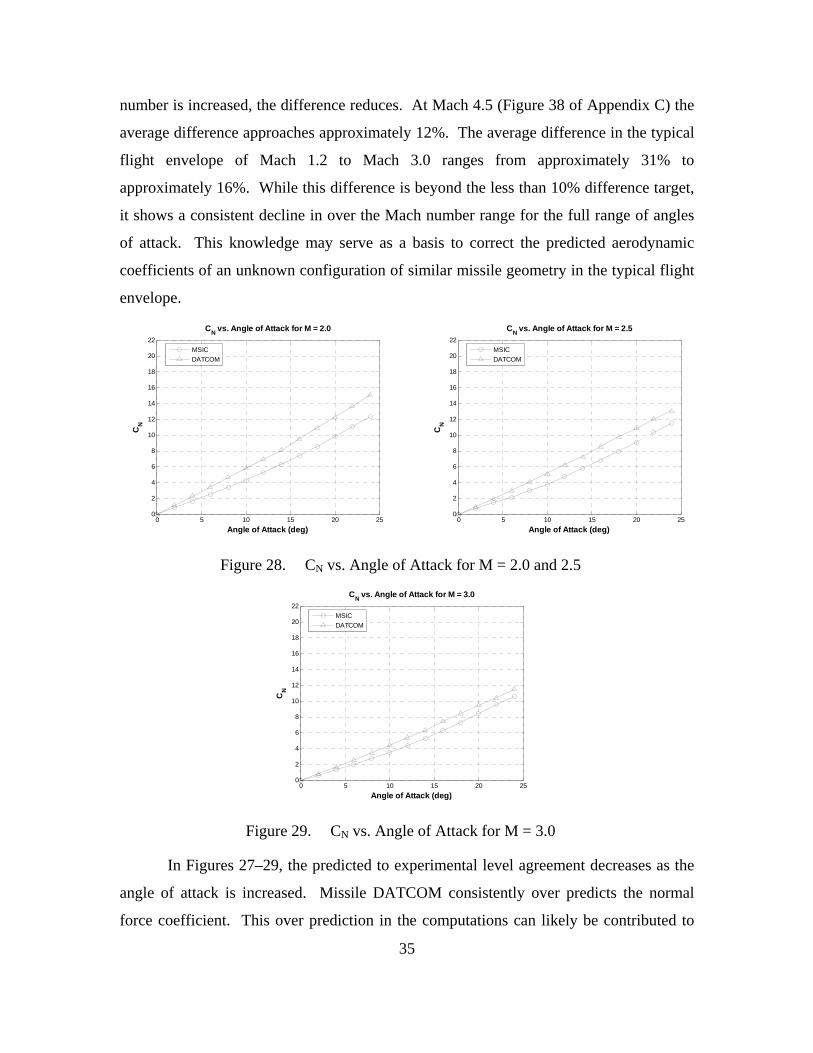
number is increased, the difference reduces. At Mach 4.5 (Figure 38 of Appendix C) the
average difference approaches approximately 12%. The average difference in the typical
flight envelope of Mach 1.2 to Mach 3.0 ranges from approximately 31% to
approximately 16%. While this difference is beyond the less than 10% difference target,
it shows a consistent decline in over the Mach number range for the full range of angles
of attack. This knowledge may serve as a basis to correct the predicted aerodynamic
coefficients of an unknown configuration of similar missile geometry in the typical flight
envelope.
0 5 10 15 20 250
2
4
6
8
10
12
14
16
18
20
22
CN vs. Angle of Attack for M = 2.0
Angle of Attack (deg)
CN
MSIC
DATCOM
0 5 10 15 20 250
2
4
6
8
10
12
14
16
18
20
22
CN vs. Angle of Attack for M = 2.5
Angle of Attack (deg)
CN
MSIC
DATCOM
Figure 28. CN vs. Angle of Attack for M = 2.0 and 2.5
0 5 10 15 20 250
2
4
6
8
10
12
14
16
18
20
22
CN vs. Angle of Attack for M = 3.0
Angle of Attack (deg)
CN
MSIC
DATCOM
Figure 29. CN vs. Angle of Attack for M = 3.0
In Figures 27–29, the predicted to experimental level agreement decreases as the
angle of attack is increased. Missile DATCOM consistently over predicts the normal
force coefficient. This over prediction in the computations can likely be contributed to
35
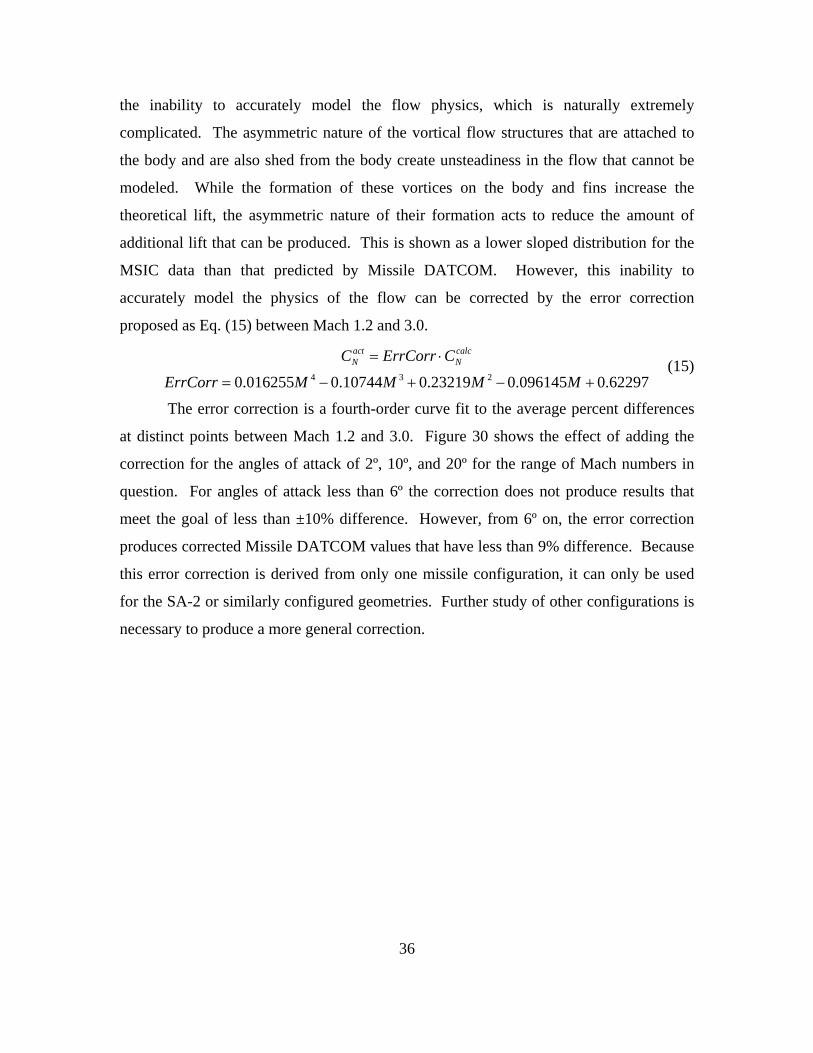
the inability to accurately model the flow physics, which is naturally extremely
complicated. The asymmetric nature of the vortical flow structures that are attached to
the body and are also shed from the body create unsteadiness in the flow that cannot be
modeled. While the formation of these vortices on the body and fins increase the
theoretical lift, the asymmetric nature of their formation acts to reduce the amount of
additional lift that can be produced. This is shown as a lower sloped distribution for the
MSIC data than that predicted by Missile DATCOM. However, this inability to
accurately model the physics of the flow can be corrected by the error correction
proposed as Eq. (15) between Mach 1.2 and 3.0.
(15) 4 3 20.016255 0.10744 0.23219 0.096145 0.62297
act calcN NC ErrCorr C
ErrCorr M M M M
The error correction is a fourth-order curve fit to the average percent differences
at distinct points between Mach 1.2 and 3.0. Figure 30 shows the effect of adding the
correction for the angles of attack of 2º, 10º, and 20º for the range of Mach numbers in
question. For angles of attack less than 6º the correction does not produce results that
meet the goal of less than ±10% difference. However, from 6º on, the error correction
produces corrected Missile DATCOM values that have less than 9% difference. Because
this error correction is derived from only one missile configuration, it can only be used
for the SA-2 or similarly configured geometries. Further study of other configurations is
necessary to produce a more general correction.
36
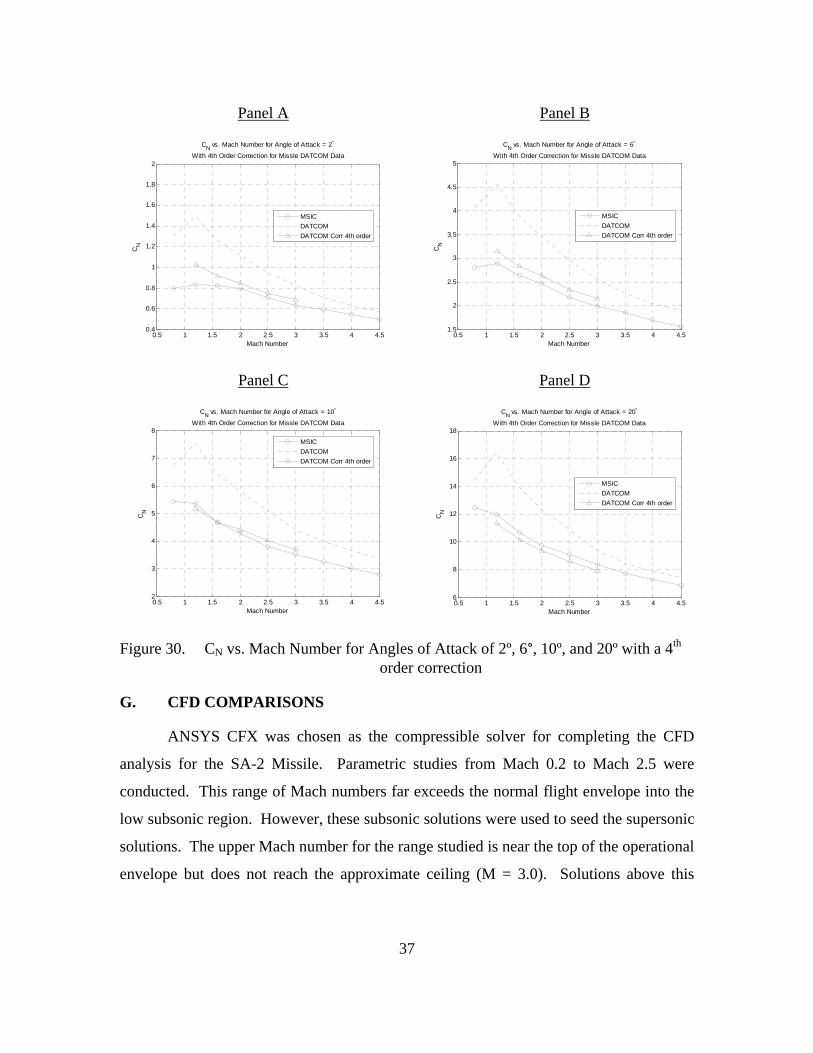
Panel A
0.5 1 1.5 2 2.5 3 3.5 4 4.50.4
0.6
0.8
1
1.2
1.4
1.6
1.8
2
CN vs. Mach Number for Angle of Attack = 2
With 4th Order Correction for Missle DATCOM Data
Mach Number
CN
MSIC
DATCOM
DATCOM Corr 4th order
Panel B
0.5 1 1.5 2 2.5 3 3.5 4 4.51.5
2
2.5
3
3.5
4
4.5
5
CN vs. Mach Number for Angle of Attack = 6
With 4th Order Correction for Missle DATCOM Data
Mach Number
CN
MSIC
DATCOM
DATCOM Corr 4th order
Panel C
0.5 1 1.5 2 2.5 3 3.5 4 4.52
3
4
5
6
7
8
CN vs. Mach Number for Angle of Attack = 10
With 4th Order Correction for Missle DATCOM Data
Mach Number
CN
MSIC
DATCOM
DATCOM Corr 4th order
Panel D
0.5 1 1.5 2 2.5 3 3.5 4 4.56
8
10
12
14
16
18
CN vs. Mach Number for Angle of Attack = 20
With 4th Order Correction for Missle DATCOM Data
Mach Number
CN
MSIC
DATCOM
DATCOM Corr 4th order
Figure 30. CN vs. Mach Number for Angles of Attack of 2º, 6°, 10º, and 20º with a 4th order correction
G. CFD COMPARISONS
37
ANSYS CFX was chosen as the compressible solver for completing the CFD
analysis for the SA-2 Missile. Parametric studies from Mach 0.2 to Mach 2.5 were
conducted. This range of Mach numbers far exceeds the normal flight envelope into the
low subsonic region. However, these subsonic solutions were used to seed the supersonic
solutions. The upper Mach number for the range studied is near the top of the operational
envelope but does not reach the approximate ceiling (M = 3.0). Solutions above this
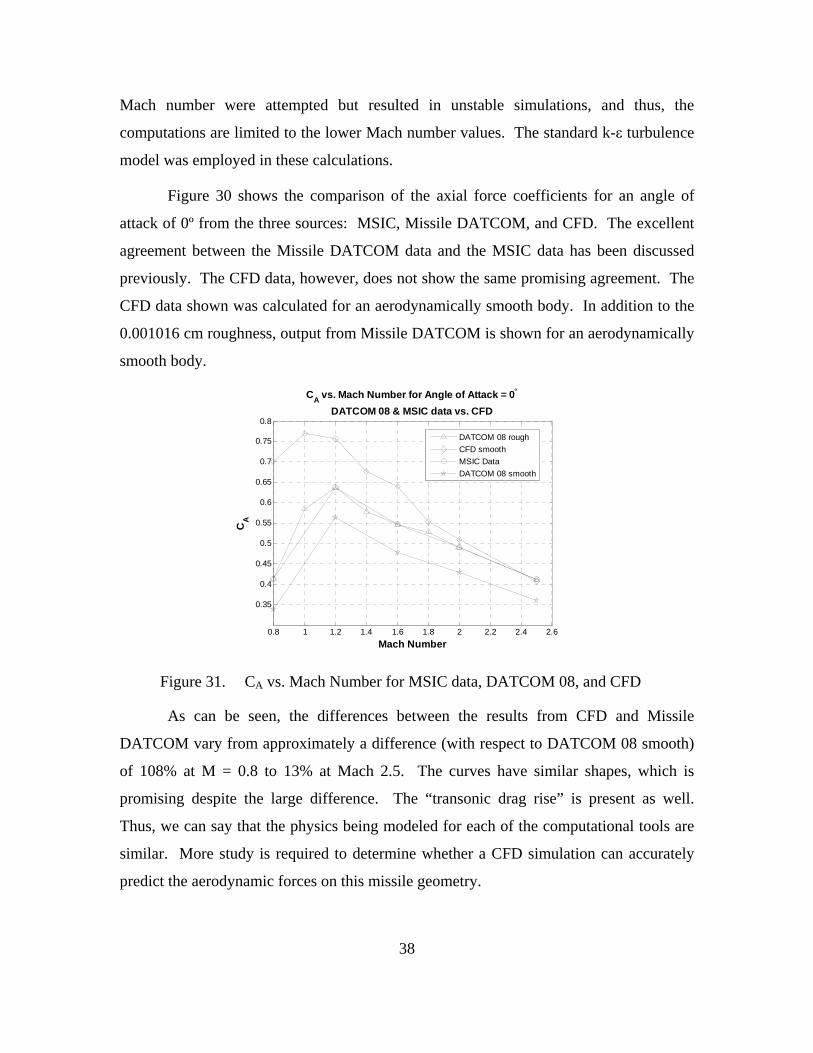
Mach number were attempted but resulted in unstable simulations, and thus, the
computations are limited to the lower Mach number values. The standard k-ε turbulence
model was employed in these calculations.
Figure 30 shows the comparison of the axial force coefficients for an angle of
attack of 0º from the three sources: MSIC, Missile DATCOM, and CFD. The excellent
agreement between the Missile DATCOM data and the MSIC data has been discussed
previously. The CFD data, however, does not show the same promising agreement. The
CFD data shown was calculated for an aerodynamically smooth body. In addition to the
0.001016 cm roughness, output from Missile DATCOM is shown for an aerodynamically
smooth body.
0.8 1 1.2 1.4 1.6 1.8 2 2.2 2.4 2.6
0.35
0.4
0.45
0.5
0.55
0.6
0.65
0.7
0.75
0.8
CA vs. Mach Number for Angle of Attack = 0
DATCOM 08 & MSIC data vs. CFD
Mach Number
CA
DATCOM 08 rough
CFD smooth
MSIC Data
DATCOM 08 smooth
Figure 31. CA vs. Mach Number for MSIC data, DATCOM 08, and CFD
As can be seen, the differences between the results from CFD and Missile
DATCOM vary from approximately a difference (with respect to DATCOM 08 smooth)
of 108% at M = 0.8 to 13% at Mach 2.5. The curves have similar shapes, which is
promising despite the large difference. The “transonic drag rise” is present as well.
Thus, we can say that the physics being modeled for each of the computational tools are
similar. More study is required to determine whether a CFD simulation can accurately
predict the aerodynamic forces on this missile geometry.
38
39
IV. CONCLUDING REMARKS
The following major conclusions can be drawn from this research study.
A distinctly superior level of agreement was obtained in regards to the axial
force coefficient using Missile DATCOM 08, when compared to its
predecessor version DATCOM 07. This was made possible by the more
detailed geometry that was provided and the predictive ability of Missile
DATCOM 8/08 in the transonic and supersonic speed regions.
Based on a critical comparison between experimental/extrapolated data and
Missile DATCOM 8/08, it can be said with relative certainty that Missile axial
force predictions can be accomplished with a confidence level of ±10% from
the upper transonic to the beginning of the hypersonic speed regions.
Employing the error correction scheme proposed in Chapter III Section G for
the normal force coefficient produces Missile DATCOM output that has a
confidence level of ±10% in the range of Mach 1.2 to 3.0 for angles of attack
greater than 6º.
Axial force component level agreements require much finer modeling than is
presently available in the semi-empirical models. A far more involved CFD
effort may be of some value here.

40
THIS PAGE INTENTIONALLY LEFT BLANK
41
V. FUTURE WORK
The continuing development of aerodynamic prediction codes such as Missile
DATCOM will drive increased accuracy and promote the increased utility of this
aerodynamic prediction tool. As accuracy increases, less time will have to be spent using
more expensive (e.g., more time, higher cost) computational tools and performing
expensive experiments. The necessity to use these more expensive tools will not be
eliminated altogether, however. Essentially, the key to maximizing the benefit for all the
more expensive computational tools available is to use programs such as Missile
DATCOM, which produce fairly accurate results, to steer analyses that must be
performed using these tools.
The goal of this project was to produce an in-house capability to quickly analyze
missile designs from this academic institution and the defense industry (through
collaborative efforts). The base is now set for using Missile DATCOM as a regular
computational tool, whether it be for instructional use, intelligence analyses, or full-scale
design.

42
THIS PAGE INTENTIONALLY LEFT BLANK
43
APPENDIX A
Appendix A presents the summary derivation of concepts that may be important,
but do not necessarily need to remain in the body of this work.
A. VAN DYKE HYBRID THEORY
Van Dyke (1952) postulated that higher-order solutions to the full potential
equation could be beneficial if viscous effects were indeed small (Mendenhall &
Hemsch, 1992). This theory combines a second-order axial flow solution to the potential
equation with a first-order cross flow solution (Moore, 2000). Because perturbations in
the flow from the body have more effect in the axial direction, a second-order solution is
required to get the desired accuracy particularly for drag calculations. However,
perturbations in the cross flow are less sensitive to the body’s presence so a first-order
approximation provides the necessary accuracy. The cross flow calculations produce the
normal and center of pressure distributions. For the body, the nose shape plays a major
role in the size of the perturbations produced. If the nose is slender and long, the
perturbations will be small and a first-order solution may be employed. However, in
reality, this configuration is rarely seen in practice. So in order to achieve the goal of
±10% accuracy a second-order solution must be employed (Moore, 2000).
The following series of equations lay out the general way that VDHT is used to
calculate the flow conditions for the supersonic flow field. This summary of the VDHT
method is a synthesis of explanations of the method provided by Jenn (Mendenhall &
Hemsch, 1992, pp. 44–50) and Moore (2000, pp. 52-57). To begin the second order
solution of the full potential equation, all the third order terms are eliminated. However,
Van Dyke proposed not eliminating all third order terms, but instead, retaining those that
involve only derivatives normal to the freestream. Thus, the perturbation form of the full
potential equation becomes
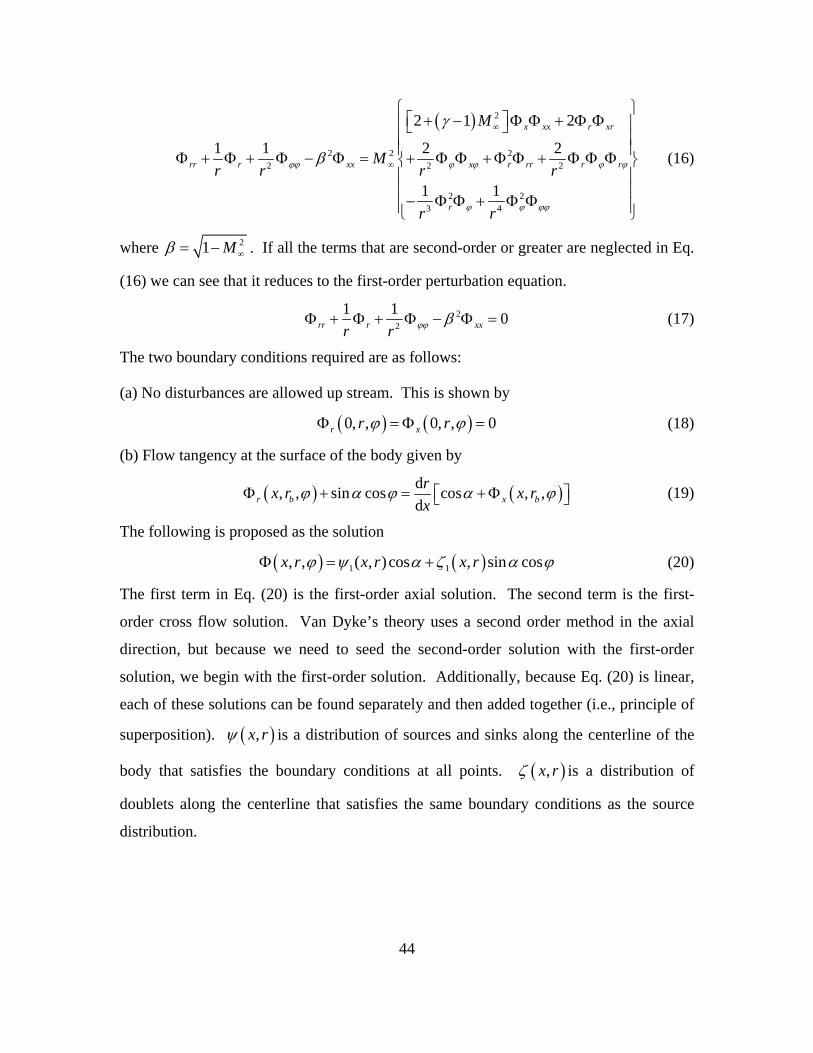
2
2 2 22 2 2
2 23 4
2 1 2
1 1 2 2
1 1
x xx r xr
rr r xx x r rr r r
r
M
Mr r r r
r r
(16)
where 21 M . If all the terms that are second-order or greater are neglected in Eq.
(16) we can see that it reduces to the first-order perturbation equation.
22
1 10rr r xxr r (17)
The two boundary conditions required are as follows:
(a) No disturbances are allowed up stream. This is shown by
0, , 0, , 0r xr r (18)
(b) Flow tangency at the surface of the body given by
d, , sin cos cos , ,
dr b x b
rx r x r
x (19)
The following is proposed as the solution
1 1, , ( , ) cos , sin cosx r x r x r
(20)
The first term in Eq. (20) is the first-order axial solution. The second term is the first-
order cross flow solution. Van Dyke’s theory uses a second order method in the axial
direction, but because we need to seed the second-order solution with the first-order
solution, we begin with the first-order solution. Additionally, because Eq. (20) is linear,
each of these solutions can be found separately and then added together (i.e., principle of
superposition). ,x r is a distribution of sources and sinks along the centerline of the
body that satisfies the boundary conditions at all points. ,x r is a distribution of
doublets along the centerline that satisfies the same boundary conditions as the source
distribution.
44
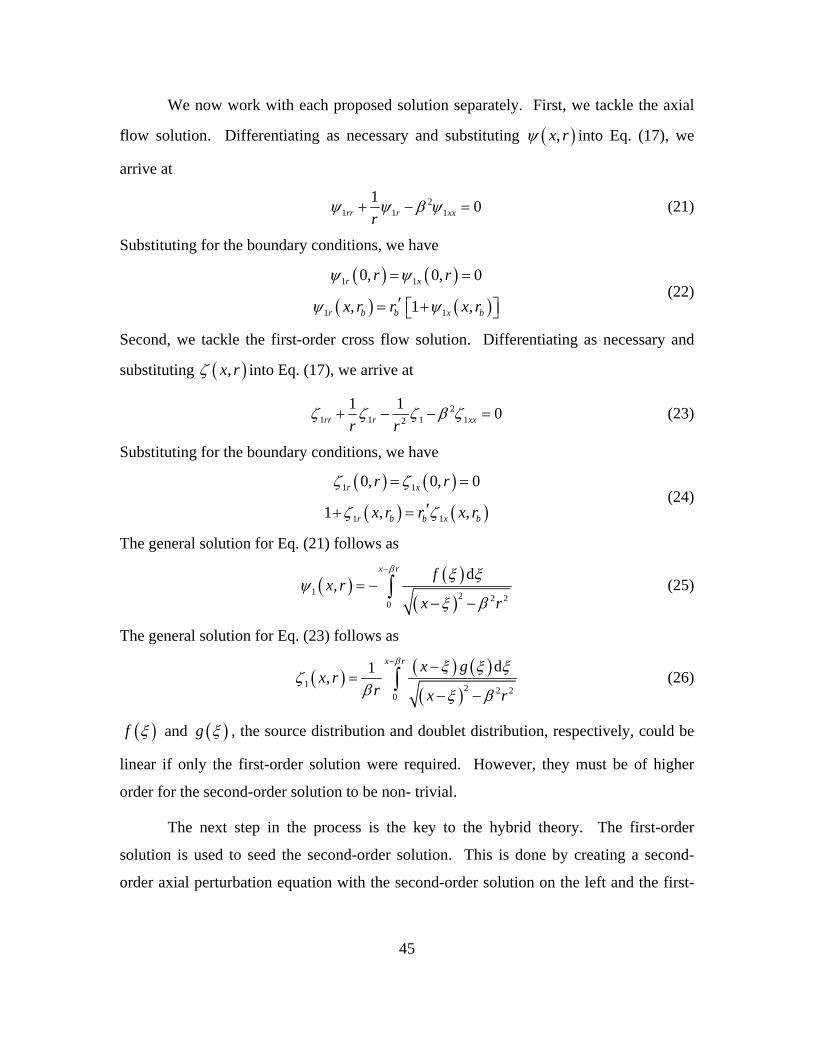
We now work with each proposed solution separately. First, we tackle the axial
flow solution. Differentiating as necessary and substituting ,x r into Eq. (17), we
arrive at
21 1 1
10rr r xxr
(21)
Substituting for the boundary conditions, we have
1 1
1 1
0, 0, 0
, 1 ,
r x
r b b x b
r r
x r r x r
(22)
Second, we tackle the first-order cross flow solution. Differentiating as necessary and
substituting , x r into Eq. (17), we arrive at
21 1 1 12
1 10rr r xxr r
(23)
Substituting for the boundary conditions, we have
1 1
1 1
0, 0, 0
1 , ,
r x
r b b x b
r r
x r r x r
(24)
The general solution for Eq. (21) follows as
1 2 2 20
d,
x r fx r
x r
(25)
The general solution for Eq. (23) follows as
1 2 2 20
d1,
x r x gx r
r x r
(26)
f and g , the source distribution and doublet distribution, respectively, could be
linear if only the first-order solution were required. However, they must be of higher
order for the second-order solution to be non- trivial.
The next step in the process is the key to the hybrid theory. The first-order
solution is used to seed the second-order solution. This is done by creating a second-
order axial perturbation equation with the second-order solution on the left and the first-
45
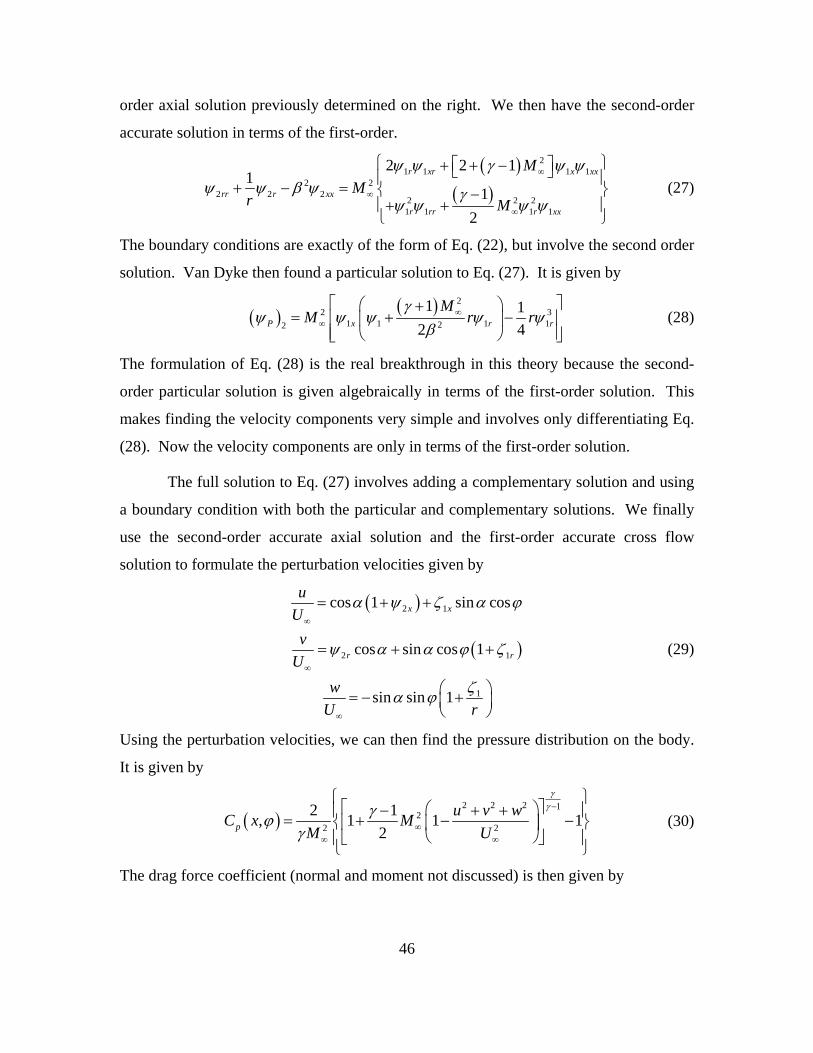
order axial solution previously determined on the right. We then have the second-order
accurate solution in terms of the first-order.
21 1 1 1
2 22 2 2
2 2 21 1 1 1
2 2 11
1
2
r xr x xx
rr r xx
r rr r xx
M
Mr M
(27)
The boundary conditions are exactly of the form of Eq. (22), but involve the second order
solution. Van Dyke then found a particular solution to Eq. (27). It is given by
22
1 1 1 122
1 1
2 43
P x r
MM r
rr
(28)
The formulation of Eq. (28) is the real breakthrough in this theory because the second-
order particular solution is given algebraically in terms of the first-order solution. This
makes finding the velocity components very simple and involves only differentiating Eq.
(28). Now the velocity components are only in terms of the first-order solution.
The full solution to Eq. (27) involves adding a complementary solution and using
a boundary condition with both the particular and complementary solutions. We finally
use the second-order accurate axial solution and the first-order accurate cross flow
solution to formulate the perturbation velocities given by
2 1
2
1
cos 1 sin cos
cos sin cos 1
sin sin 1
x x
r
u
U
v
U
w
U r
1r
(29)
Using the perturbation velocities, we can then find the pressure distribution on the body.
It is given by
2 2 2 1
22 2
2 1, 1 1
2p
u v wC x M
M U
1
(30)
The drag force coefficient (normal and moment not discussed) is then given by
46
20 0
2 d, d
d
l
A Pr
rC C x
r x
rdx
(31)
Therefore, we only need use quadratic order source and sink distributions to define the
axial and cross flow distributions, perform the integrations numerically, and we get the
pressure distribution and the force coefficients from it.
The limitations of the theory are: 1) The range of operation of this theory is from
approximately a Mach number of 1.2 to from 2.0 to 3.0, depending on the body
configuration; 2) The lower limit corresponds with the condition where weak shocks are
present, and the flow field is supersonic with the exception of the boundary layer and
areas where the flow may be separated; 3) The upper limit of this theory is governed by
the location of the Mach cone with respect to the surface. Thus, it may be used except
when Mach cone lies on the surface. The angle of the Mach cone varies with nose angle.
B. TRANSONIC AREA RULE AND VON KÁRMÁN SIMILARITY
The transonic area rule comprises the idea that two bodies with identical cross-
sectional areas produce the same wave drag at a particular Mach number. The von
Kármán “similarity laws state that, for two-dimensional flow, the flow patterns over two
similar, non-lifting airfoils must be the same if the parameter 1/3 2/ 1t c M has the
same value for each airfoil” (Mendenhall & Hemsch, 1992, p. 23). Thus, this can be used
to determine unknown values with a range of experimentally determined values.
47

48
THIS PAGE LEFT INTENTIONALLY BLANK
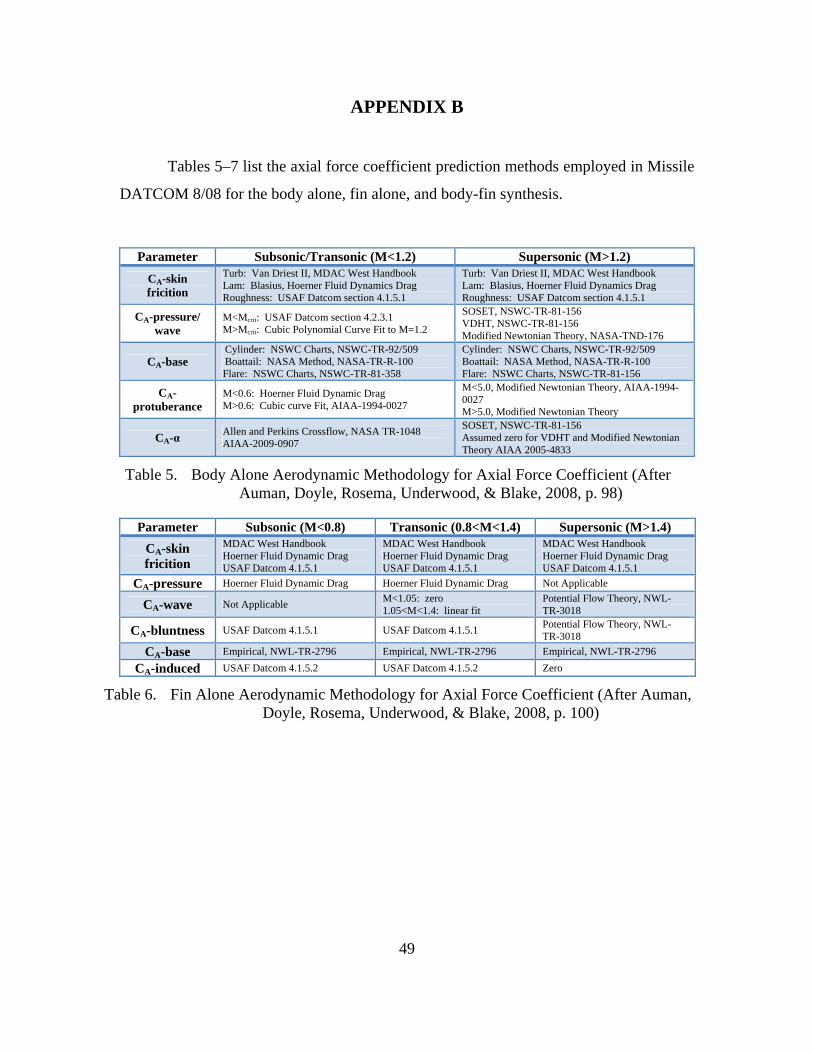
49
APPENDIX B
Tables 5–7 list the axial force coefficient prediction methods employed in Missile
DATCOM 8/08 for the body alone, fin alone, and body-fin synthesis.
Parameter Subsonic/Transonic (M<1.2) Supersonic (M>1.2)
CA-skin fricition
Turb: Van Driest II, MDAC West Handbook Lam: Blasius, Hoerner Fluid Dynamics Drag Roughness: USAF Datcom section 4.1.5.1
Turb: Van Driest II, MDAC West Handbook Lam: Blasius, Hoerner Fluid Dynamics Drag Roughness: USAF Datcom section 4.1.5.1
CA-pressure/ wave
M<Mcrit: USAF Datcom section 4.2.3.1 M>Mcrit: Cubic Polynomial Curve Fit to M=1.2
SOSET, NSWC-TR-81-156 VDHT, NSWC-TR-81-156 Modified Newtonian Theory, NASA-TND-176
CA-base Cylinder: NSWC Charts, NSWC-TR-92/509 Boattail: NASA Method, NASA-TR-R-100 Flare: NSWC Charts, NSWC-TR-81-358
Cylinder: NSWC Charts, NSWC-TR-92/509 Boattail: NASA Method, NASA-TR-R-100 Flare: NSWC Charts, NSWC-TR-81-156
CA-protuberance
M<0.6: Hoerner Fluid Dynamic Drag M>0.6: Cubic curve Fit, AIAA-1994-0027
M<5.0, Modified Newtonian Theory, AIAA-1994-0027 M>5.0, Modified Newtonian Theory
CA-α Allen and Perkins Crossflow, NASA TR-1048 AIAA-2009-0907
SOSET, NSWC-TR-81-156 Assumed zero for VDHT and Modified Newtonian Theory AIAA 2005-4833
Table 5. Body Alone Aerodynamic Methodology for Axial Force Coefficient (After Auman, Doyle, Rosema, Underwood, & Blake, 2008, p. 98)
Parameter Subsonic (M<0.8) Transonic (0.8<M<1.4) Supersonic (M>1.4)
CA-skin fricition
MDAC West Handbook Hoerner Fluid Dynamic Drag USAF Datcom 4.1.5.1
MDAC West Handbook Hoerner Fluid Dynamic Drag USAF Datcom 4.1.5.1
MDAC West Handbook Hoerner Fluid Dynamic Drag USAF Datcom 4.1.5.1
CA-pressure Hoerner Fluid Dynamic Drag Hoerner Fluid Dynamic Drag Not Applicable
CA-wave Not Applicable M<1.05: zero 1.05<M<1.4: linear fit
Potential Flow Theory, NWL-TR-3018
CA-bluntness USAF Datcom 4.1.5.1 USAF Datcom 4.1.5.1 Potential Flow Theory, NWL-TR-3018
CA-base Empirical, NWL-TR-2796 Empirical, NWL-TR-2796 Empirical, NWL-TR-2796
CA-induced USAF Datcom 4.1.5.2 USAF Datcom 4.1.5.2 Zero
Table 6. Fin Alone Aerodynamic Methodology for Axial Force Coefficient (After Auman, Doyle, Rosema, Underwood, & Blake, 2008, p. 100)
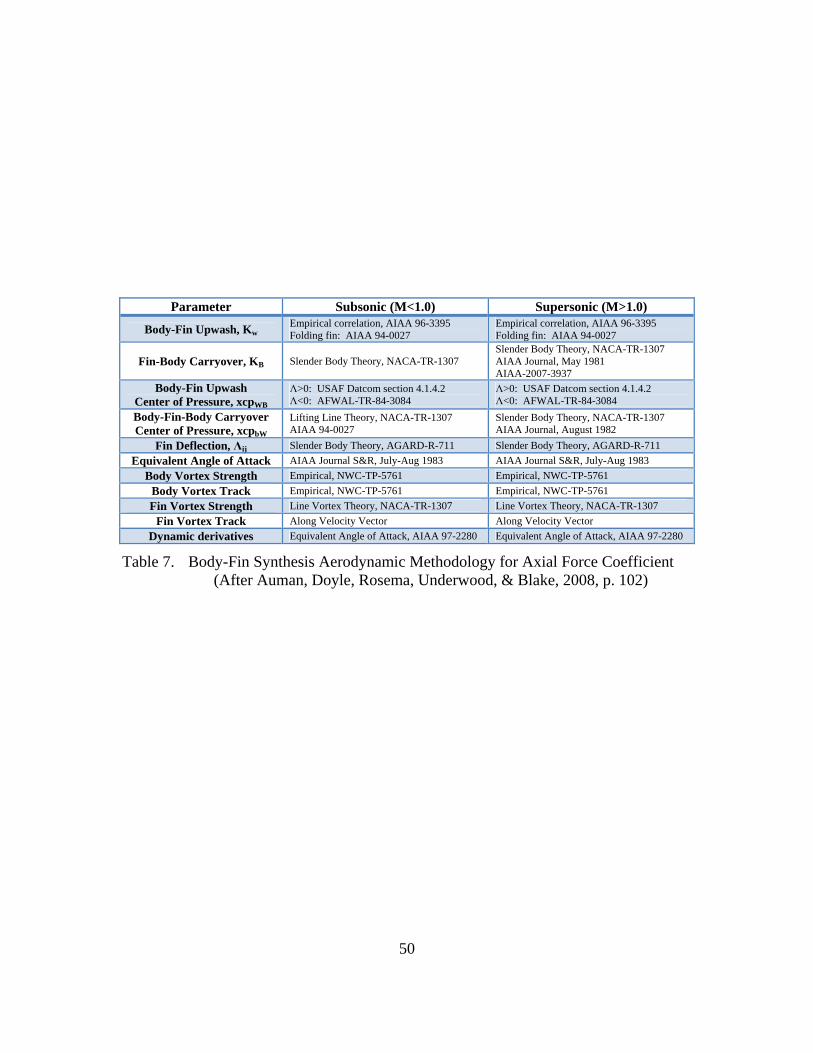
50
Parameter Subsonic (M<1.0) Supersonic (M>1.0)
Body-Fin Upwash, Kw Empirical correlation, AIAA 96-3395 Folding fin: AIAA 94-0027
Empirical correlation, AIAA 96-3395 Folding fin: AIAA 94-0027
Fin-Body Carryover, KB Slender Body Theory, NACA-TR-1307 Slender Body Theory, NACA-TR-1307 AIAA Journal, May 1981 AIAA-2007-3937
Body-Fin Upwash Center of Pressure, xcpWB
Λ>0: USAF Datcom section 4.1.4.2 Λ<0: AFWAL-TR-84-3084
Λ>0: USAF Datcom section 4.1.4.2 Λ<0: AFWAL-TR-84-3084
Body-Fin-Body Carryover Center of Pressure, xcpbW
Lifting Line Theory, NACA-TR-1307 AIAA 94-0027
Slender Body Theory, NACA-TR-1307 AIAA Journal, August 1982
Fin Deflection, Λij Slender Body Theory, AGARD-R-711 Slender Body Theory, AGARD-R-711
Equivalent Angle of Attack AIAA Journal S&R, July-Aug 1983 AIAA Journal S&R, July-Aug 1983
Body Vortex Strength Empirical, NWC-TP-5761 Empirical, NWC-TP-5761
Body Vortex Track Empirical, NWC-TP-5761 Empirical, NWC-TP-5761
Fin Vortex Strength Line Vortex Theory, NACA-TR-1307 Line Vortex Theory, NACA-TR-1307
Fin Vortex Track Along Velocity Vector Along Velocity Vector
Dynamic derivatives Equivalent Angle of Attack, AIAA 97-2280 Equivalent Angle of Attack, AIAA 97-2280
Table 7. Body-Fin Synthesis Aerodynamic Methodology for Axial Force Coefficient (After Auman, Doyle, Rosema, Underwood, & Blake, 2008, p. 102)
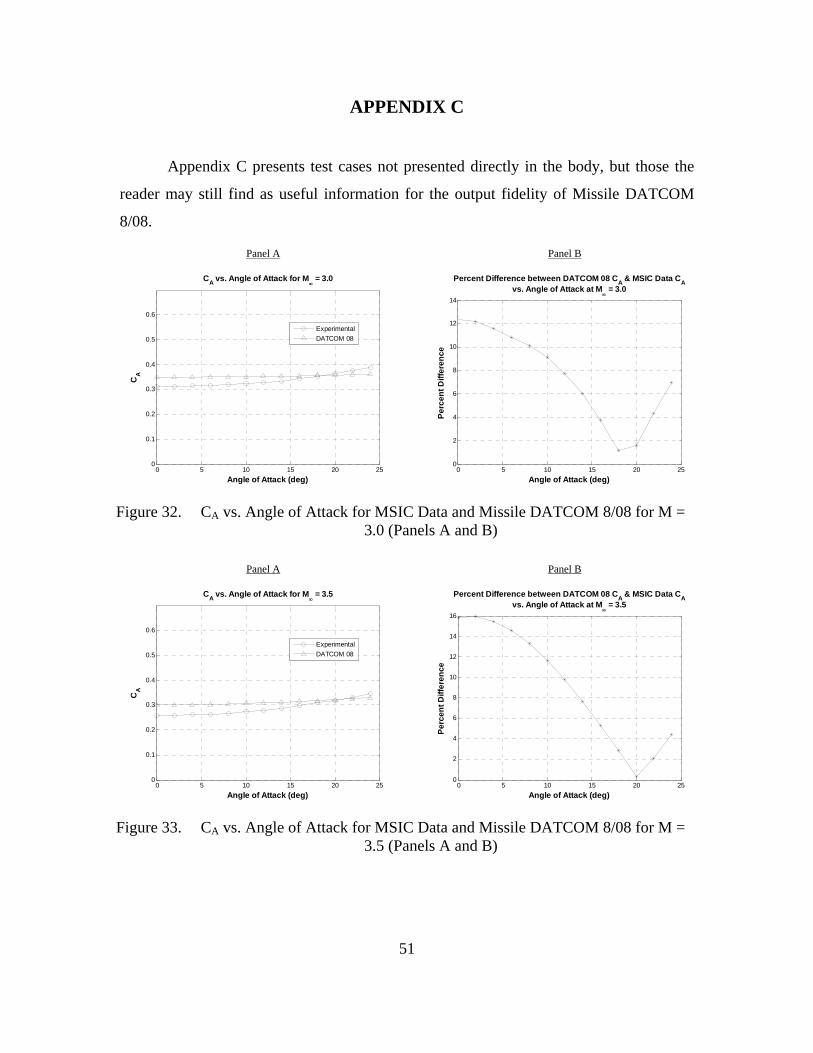
APPENDIX C
Appendix C presents test cases not presented directly in the body, but those the
reader may still find as useful information for the output fidelity of Missile DATCOM
8/08.
Panel A
0 5 10 15 20 250
0.1
0.2
0.3
0.4
0.5
0.6
CA vs. Angle of Attack for M
= 3.0
Angle of Attack (deg)
CA
Experimental
DATCOM 08
Panel B
0 5 10 15 20 250
2
4
6
8
10
12
14
Percent Difference between DATCOM 08 CA & MSIC Data C
Avs. Angle of Attack at M
= 3.0
Angle of Attack (deg)
Pe
rcen
t D
iffe
ren
ce
Figure 32. CA vs. Angle of Attack for MSIC Data and Missile DATCOM 8/08 for M = 3.0 (Panels A and B)
Panel A
0 5 10 15 20 250
0.1
0.2
0.3
0.4
0.5
0.6
CA vs. Angle of Attack for M
= 3.5
Angle of Attack (deg)
CA
Experimental
DATCOM 08
Panel B
0 5 10 15 20 250
2
4
6
8
10
12
14
16
Percent Difference between DATCOM 08 CA & MSIC Data C
Avs. Angle of Attack at M
= 3.5
Angle of Attack (deg)
Pe
rcen
t D
iffe
ren
ce
Figure 33. CA vs. Angle of Attack for MSIC Data and Missile DATCOM 8/08 for M = 3.5 (Panels A and B)
51
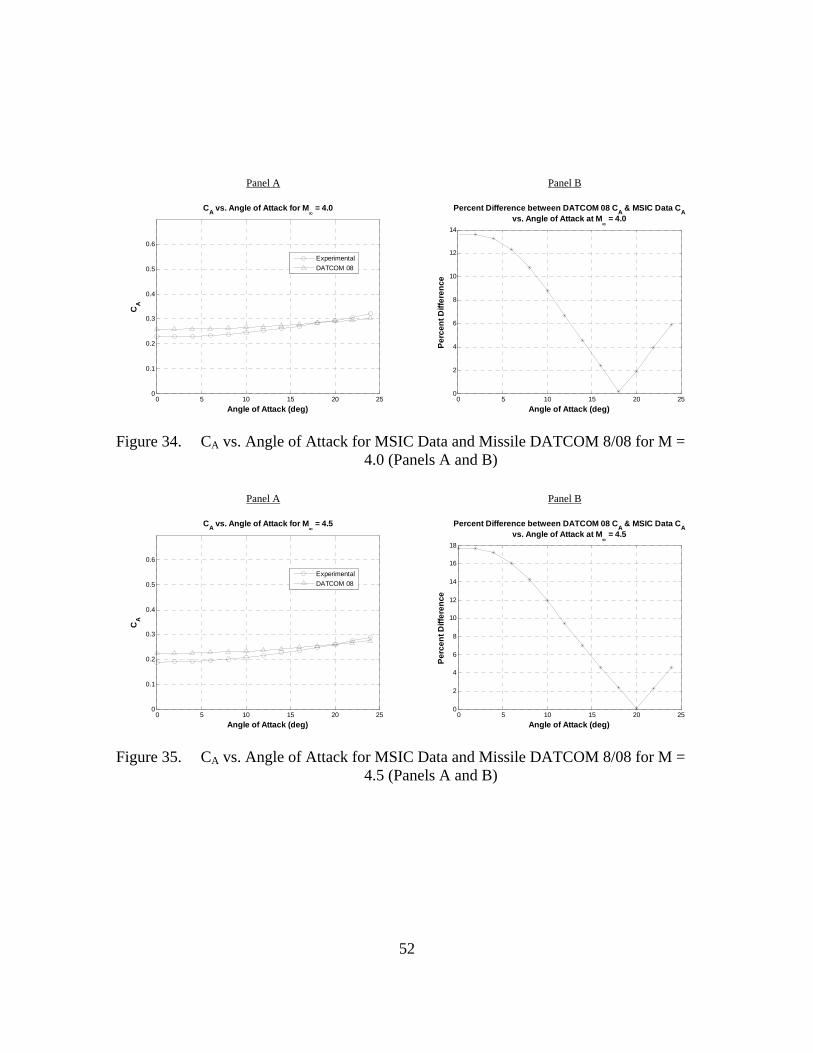
Panel A
0 5 10 15 20 250
0.1
0.2
0.3
0.4
0.5
0.6
CA vs. Angle of Attack for M
= 4.0
Angle of Attack (deg)
CA
Experimental
DATCOM 08
Panel B
0 5 10 15 20 250
2
4
6
8
10
12
14
Percent Difference between DATCOM 08 CA & MSIC Data C
Avs. Angle of Attack at M
= 4.0
Angle of Attack (deg)
Pe
rcen
t D
iffe
ren
ce
Figure 34. CA vs. Angle of Attack for MSIC Data and Missile DATCOM 8/08 for M = 4.0 (Panels A and B)
Panel A
0 5 10 15 20 250
0.1
0.2
0.3
0.4
0.5
0.6
CA vs. Angle of Attack for M
= 4.5
Angle of Attack (deg)
CA
Experimental
DATCOM 08
Panel B
0 5 10 15 20 250
2
4
6
8
10
12
14
16
18
Percent Difference between DATCOM 08 CA & MSIC Data C
Avs. Angle of Attack at M
= 4.5
Angle of Attack (deg)
Pe
rcen
t D
iffe
ren
ce
Figure 35. CA vs. Angle of Attack for MSIC Data and Missile DATCOM 8/08 for M = 4.5 (Panels A and B)
52
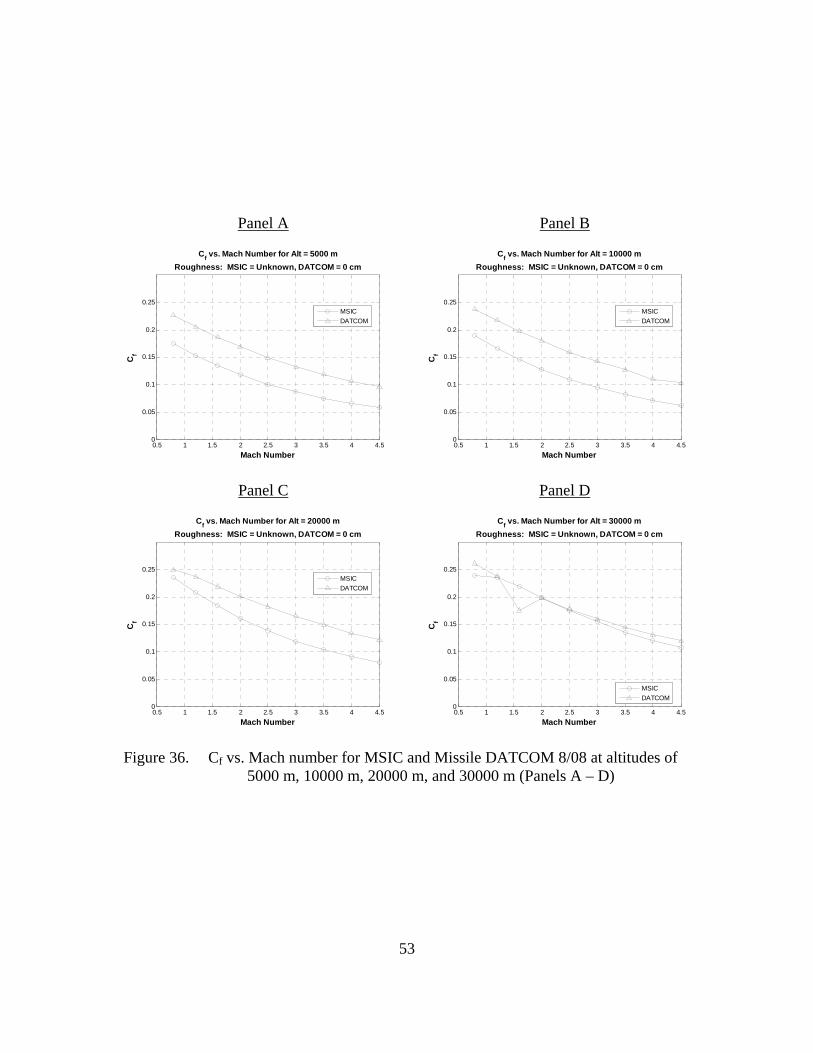
Panel A
0.5 1 1.5 2 2.5 3 3.5 4 4.50
0.05
0.1
0.15
0.2
0.25
Cf vs. Mach Number for Alt = 5000 m
Roughness: MSIC = Unknown, DATCOM = 0 cm
Mach Number
Cf
MSIC
DATCOM
Panel B
0.5 1 1.5 2 2.5 3 3.5 4 4.50
0.05
0.1
0.15
0.2
0.25
Cf vs. Mach Number for Alt = 10000 m
Roughness: MSIC = Unknown, DATCOM = 0 cm
Mach Number
Cf
MSIC
DATCOM
Panel C
0.5 1 1.5 2 2.5 3 3.5 4 4.50
0.05
0.1
0.15
0.2
0.25
Cf vs. Mach Number for Alt = 20000 m
Roughness: MSIC = Unknown, DATCOM = 0 cm
Mach Number
Cf
MSIC
DATCOM
Panel D
0.5 1 1.5 2 2.5 3 3.5 4 4.50
0.05
0.1
0.15
0.2
0.25
Cf vs. Mach Number for Alt = 30000 m
Roughness: MSIC = Unknown, DATCOM = 0 cm
Mach Number
Cf
MSIC
DATCOM
Figure 36. Cf vs. Mach number for MSIC and Missile DATCOM 8/08 at altitudes of 5000 m, 10000 m, 20000 m, and 30000 m (Panels A – D)
53
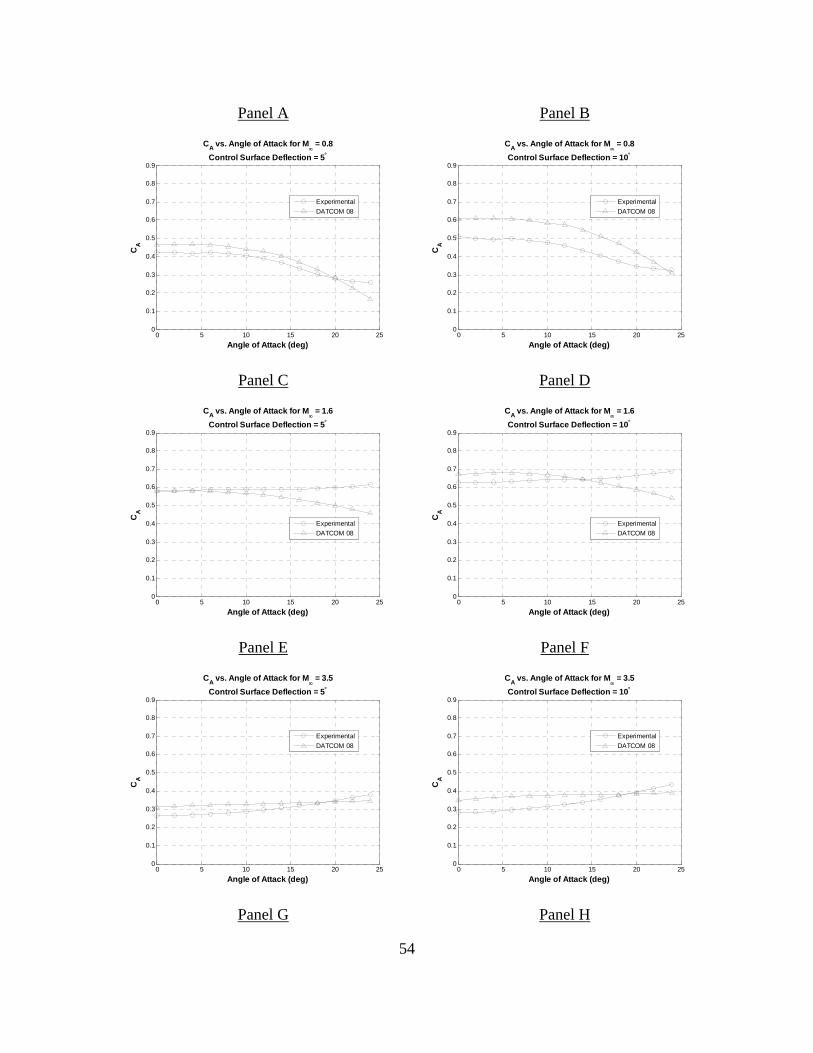
Panel A
0 5 10 15 20 250
0.1
0.2
0.3
0.4
0.5
0.6
0.7
0.8
0.9
CA vs. Angle of Attack for M
= 0.8
Control Surface Deflection = 5
Angle of Attack (deg)
CA
Experimental
DATCOM 08
Panel B
0 5 10 15 20 250
0.1
0.2
0.3
0.4
0.5
0.6
0.7
0.8
0.9
CA vs. Angle of Attack for M
= 0.8
Control Surface Deflection = 10
Angle of Attack (deg)
CA
Experimental
DATCOM 08
Panel C
0 5 10 15 20 250
0.1
0.2
0.3
0.4
0.5
0.6
0.7
0.8
0.9
CA vs. Angle of Attack for M
= 1.6
Control Surface Deflection = 5
Angle of Attack (deg)
CA
Experimental
DATCOM 08
Panel D
0 5 10 15 20 250
0.1
0.2
0.3
0.4
0.5
0.6
0.7
0.8
0.9
CA vs. Angle of Attack for M
= 1.6
Control Surface Deflection = 10
Angle of Attack (deg)
CA
Experimental
DATCOM 08
Panel E
0 5 10 15 20 250
0.1
0.2
0.3
0.4
0.5
0.6
0.7
0.8
0.9
CA vs. Angle of Attack for M
= 3.5
Control Surface Deflection = 5
Angle of Attack (deg)
CA
Experimental
DATCOM 08
Panel F
0 5 10 15 20 250
0.1
0.2
0.3
0.4
0.5
0.6
0.7
0.8
0.9
CA vs. Angle of Attack for M
= 3.5
Control Surface Deflection = 10
Angle of Attack (deg)
CA
Experimental
DATCOM 08
Panel G Panel H
54
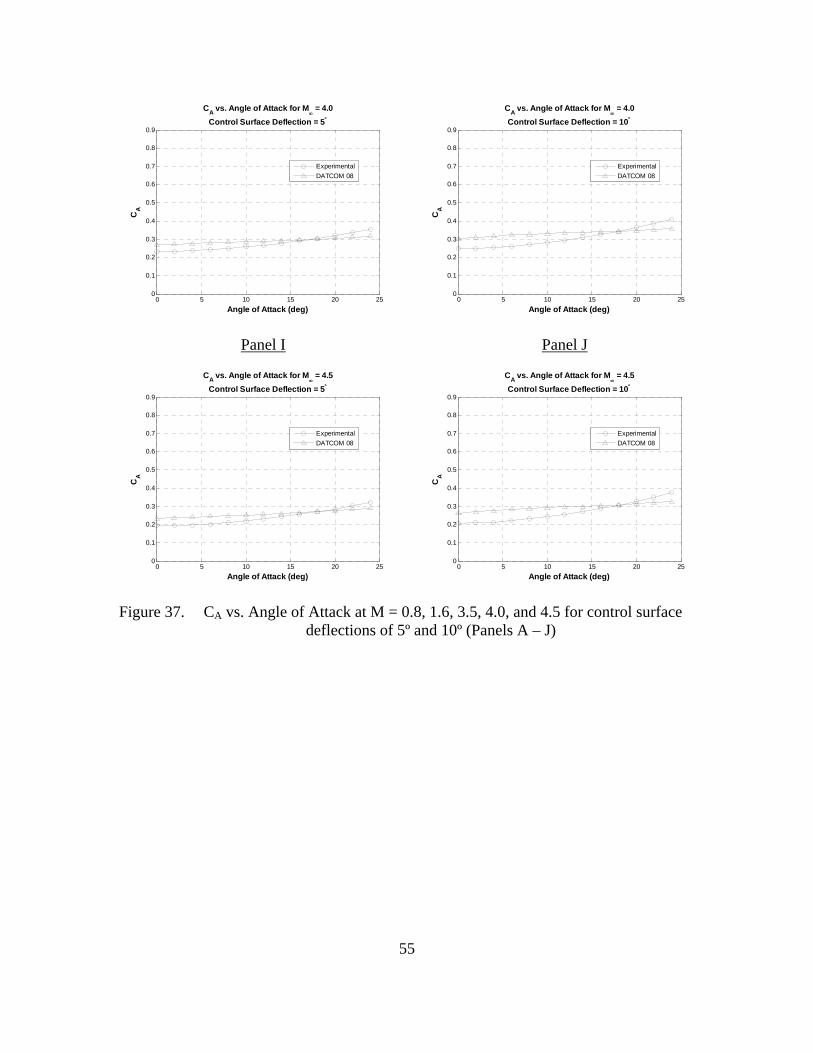
0 5 10 15 20 250
0.1
0.2
0.3
0.4
0.5
0.6
0.7
0.8
0.9
CA vs. Angle of Attack for M
= 4.0
Control Surface Deflection = 5
Angle of Attack (deg)
CA
Experimental
DATCOM 08
0 5 10 15 20 250
0.1
0.2
0.3
0.4
0.5
0.6
0.7
0.8
0.9
CA vs. Angle of Attack for M
= 4.0
Control Surface Deflection = 10
Angle of Attack (deg)
CA
Experimental
DATCOM 08
Panel I
0 5 10 15 20 250
0.1
0.2
0.3
0.4
0.5
0.6
0.7
0.8
0.9
CA vs. Angle of Attack for M
= 4.5
Control Surface Deflection = 5
Angle of Attack (deg)
CA
Experimental
DATCOM 08
Panel J
0 5 10 15 20 250
0.1
0.2
0.3
0.4
0.5
0.6
0.7
0.8
0.9
CA vs. Angle of Attack for M
= 4.5
Control Surface Deflection = 10
Angle of Attack (deg)
CA
Experimental
DATCOM 08
Figure 37. CA vs. Angle of Attack at M = 0.8, 1.6, 3.5, 4.0, and 4.5 for control surface deflections of 5º and 10º (Panels A – J)
55
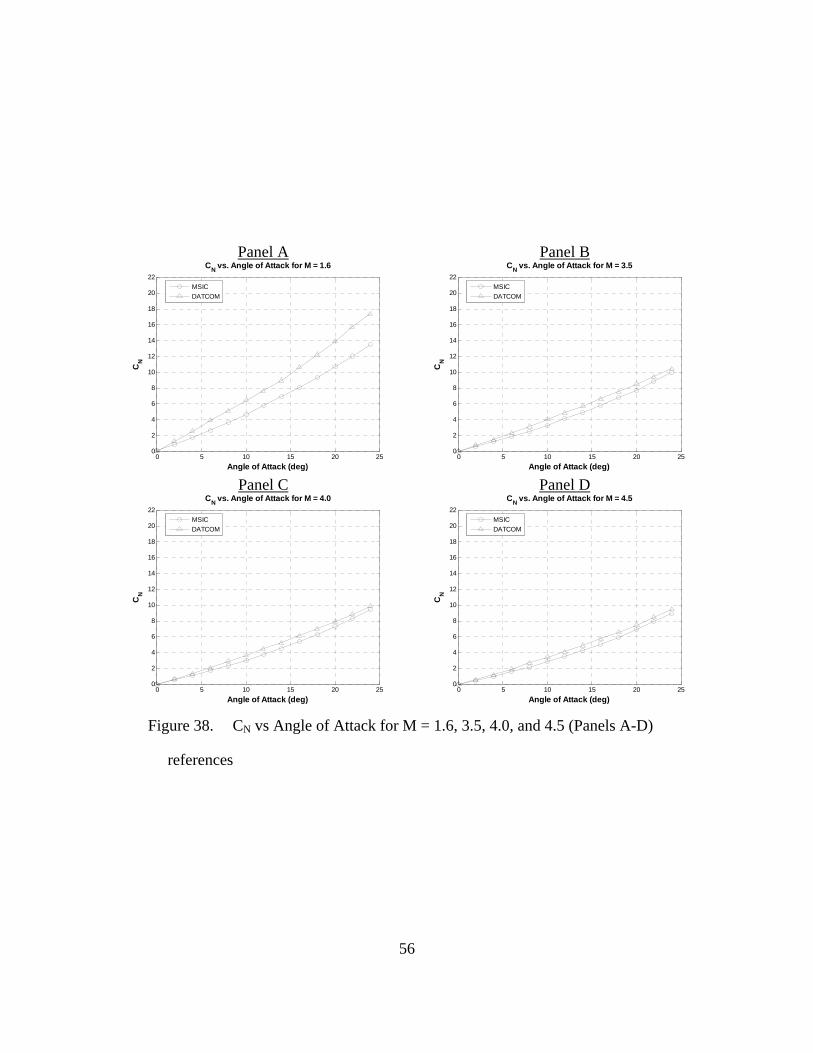
Panel A Panel B
56
0 5 10 15 20 250
2
4
6
8
10
12
14
16
18
20
22
CN vs. Angle of Attack for M = 1.6
Angle of Attack (deg)
CN
22
MSIC
DATCOM
0 5 10 15 20 250
2
4
6
8
10
12
14
16
18
20
CN vs. Angle of Attack for M = 3.5
Angle of Attack (deg)
CN
MSIC
DATCOM
Panel C Panel D
0 5 10 15 20 250
2
4
6
8
10
12
14
16
18
20
22
CN vs. Angle of Attack for M = 4.0
Angle of Attack (deg)
CN
22
MSIC
DATCOM
0 5 10 15 20 250
2
4
6
8
10
12
14
16
18
20
CN vs. Angle of Attack for M = 4.5
Angle of Attack (deg)
CN
MSIC
DATCOM
Figure 38. CN vs Angle of Attack for M = 1.6, 3.5, 4.0, and 4.5 (Panels A-D)
references
57
LIST OF REFERENCES
Allen, J. H., & Perkins, E. W. (1951). A study of effects of viscosity on flow over slender inclined bodies of revolution No. NACA-TR-1048. Washington, D.C.: National Advisory Council on Aeronautics.
Auman, L., Doyle, J., Rosema, C., Underwood, M., & Blake, W. (2008). MISSILE
DATCOM user's manual-2008 revision No. AFRL-RB-WP-TR-2009-3015. Doyle, J. B., Rosema, C. C., Underwood, M. L., & Auman, L. M. (2009). Recent
improvements for the 8/08 release of missile datcom. 47th AIAA Aerospace Sciences Meeting Including the New Horizons Forum and Aerospace Exposition, Orlando, Florida.
Doyle, J. B., Rosema, C. C., Wilks, B. L., & Auman, L. M. (2009). Improvements in fin-
shed vortex treatment for missile datcom. 27th AIAA Applied Aerodynamics Conference, San Antonio, Texas.
Eggers, A. J., Syvertson, C. A., & Kraus, S. (1953). A study of inviscid flow about
airfoils at high supersonic speeds No. NACA-TR-1123. Washington, D.C.: National Advisory Council on Aeronautics.
Horton, A. N., & McDaniel, M. A. (2005). Identification and correction of axial force
prediction discrepancies due to angle of attack effects in missile DATCOM. 23rd AIAA Applied Aerodynamics Conference, Toronto, Ontario, Canada.
Jorgensen, L. H. (1977). Prediction of static aerodynamic characteristics for slender
bodies alone and with lifting surfaces to very high angles of attack No. NASA TR-R-474. Washington, D.C.: National Aeronautics and Space Administration.
Mendenhall, M. R., & Hemsch, M. J. (Eds.). (1992). Tactical missile aerodynamics:
Prediction methodology (2nd ed.). Washington, DC: American Institute of Aeronautics and Astronautics.
Moore, F. G. (2000). Approximate methods for weapon aerodynamics American Institute
of Aeronautics and Astronautics. Syvertson, C. A., & Dennis, D. H. (1957). A second-order shock expansion method to
inclined bodies of revolution traveling at high supersonic speeds No. NACA-TR-1323. Washington, D.C.: National Advisory Council on Aeronautics.
Teo, H. H. (2008). Aerodynamic predictions, comparisons, and validations using
missilelab and missile datcom. Master's thesis, Naval Postgraduate School.

58
Van Dyke, M. D. (1952). Practical calculation of second-order supersonic flow past nonlifting bodies of revolution No. NACA-TN-2744. Washington, D.C.: National Advisory Committee on Aeronautics.
59
INITIAL DISTRIBUTION LIST
1. Defense Technical Information Center Ft. Belvoir, Virginia
2. Dudley Knox Library Naval Postgraduate School Monterey, California
3. Professor M. S. Chandrasekhara
Department of Mechanical and Astronautical Engineering NASA Ames Research Center, M.S. 215-1 Moffett Field, California
Related Documents