NAVAL POSTGRADUATE SCHOOL 00 Monterey, California o ~fl1C ILE Cup)~ 0 TNNI TIIESIES MACHINERY DIAGNOSTICS VIA .MECHAICAL VIBR.ATION1 NNALYSIS USING SPECTRAL ANALYSIS I ECHNIQUES by James A. Stamn September 1988 Thesis Advisor Y.S. Shin I F I Approved for public release; distribution is unlimited. 9 104 019 .°- -- - • .. ..

Welcome message from author
This document is posted to help you gain knowledge. Please leave a comment to let me know what you think about it! Share it to your friends and learn new things together.
Transcript
NAVAL POSTGRADUATE SCHOOL00 Monterey, California
o ~fl1C ILE Cup)~0
TNNI
TIIESIESMACHINERY DIAGNOSTICS
VIA .MECHAICAL VIBR.ATION1 NNALYSISUSING SPECTRAL ANALYSIS I ECHNIQUES
by
James A. Stamn
September 1988
Thesis Advisor Y.S. ShinI F I
Approved for public release; distribution is unlimited.
9 104 019
.°- -- - • .. ..
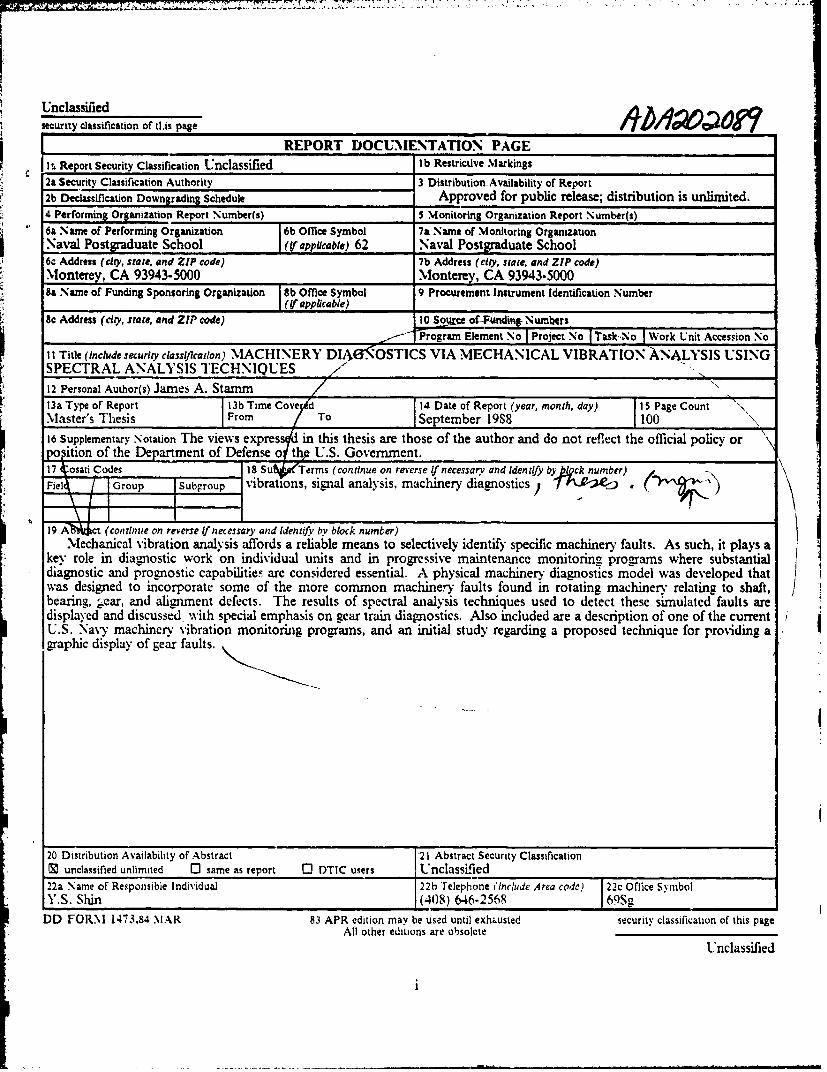
Unclassifiedseurity classification of tl~is page 4~ ~ ~
REPORT DOCUMENTATION PAGEI , Report Security Classification Unclassified lb Restrictive Markings
2a Security Classification Authority 3 Distribution. Availability of Report2b Declassification Downgrading Schedule Approved for public release; distribution is unlimited.4 Performing Organization Report Number(s) 5 Monitoring Organization Report Number(s)6a Name of Performing Organization 6b Office Symbol 7a Name of Monitoring OrganizationNaval Postgraduate School (If appucable) 62 Naval Postaraduate School6c Address (city, state, and ZIP code) 7b Address (city, state, and ZIP code)Monterey, CA 93943-5000 Monterey, CA 93943-50008a Name of Funding Sponsoring Organization Sb Office Symbol 9 Procurement Instrument Identification Number
W ! applicable )
8c Address (city, state, and ZIP code) 10 Soqu of-Funding NumbqrsProgram Element No I Project No ITask-No Work Unit Accession No
11 Title (include security classylcailon) MACHINERY DI.AG. OSTICS VIA MECHANICAL VIBRATION ANALYSIS USINGSPECTRAL ANALYSIS TECHNIQUES
12 Personal Author(s) James A. Statmm13a Type of Report 13b Time Cove d 14 Date of Report (year, month, day) 15 Page Count \Master's Thesis From Vr To September 1988 10016 Supplementary Notation The views express d in this thesis are those of the author and do not reflect the official policy orpoaition of the Department of Defense of thg U.S. Government.17 kosati Codes 18 Su* Terms (continue on revcrse If necessary and Identify by ,&¢k number)Fiel I Group vibrations, signal analysis, machinery diagnostics, -)
19 A B ct (continue on reverse If necessary and identify by block number)Mechanical vibration analvsis affords a reliable means to selectively identify specific machinery faults. As such, it plays a
key role in diagnostic work on individual units and in progressive maintenance monitoring programs where substantialdiagnostic and prognostic capabilities are considered essential. A physical machinery diagnostics model was developed thatwas designed to incorporate some of the more common machinery faults found in rotating machinery relating to shaft,bearing, =ear, and alignment defects. The results of spectral analysis techniques used to detect these simulated faults aredisplayed and discussed with special emphasis on gear train diagnostics. Also included are a description of one of the current;U.S. Navy machinery vibration monitoring programs, and an initial study regarding a proposed technique for providing agraphic display of gear faults.
20 Distribution Availability of Abstract *21 Abstract Security Classification[] unclassified unlimited F' same as report CF DTIC users Unclassified22a Name of Responsible Individual 22b'Telephone Include Area code) 22c office symbolY.S. Shinl (408) 646-21568 69Sg
DD FORM 1473.84 MAR 83 APR edition may be used until exhLusted security classification of this pageAll other editions are obsolete
Unclassified
Approved for public release; distribution is unlimited.
Machinery DiagnosticsVia Mechanical Vibration AnalysisUsing Spectral Analysis Techniques
by
James A. Stamm
Lieutenant Commander, United States Coast GuardB.S., United States Merchant Marine Academy
Submitted in partial fulfillment of therequirements for the degree of
MASTER OF SCIENCE IN MECHANICAL ENGINEERING
from the
NAVAL POSTGRADUATE SCHOOLSeptember 1988
I ~~~Author:__ _ _ _ _ __ _ _ _
James A. Stan~
Approved oy: .
S'Y.S. Shin, Thesis Advisor
~~A .lealy cond Reader
Gordon E. Schacher,Dean of Science and Engineering
ABSTRACT
Mechanical vibration analysis affords a reliable means to selectively identify specific
machinery faults. As such, it plays a key role in diagnostic work on individual units and
in progressive maintenance monitoring programs where substantial diagnostic and
prognostic capabilities are considered essential. A physical machinery diagnostics modelwas developed that was designed to incorporate some of the more common machinery
faults found in rotating machinery relating to shaft, bearing, gear, and alignment defects.
The results of spectral analysis techniques used to detect these simulated faults are dis-
played and discussed, with special emphasis on gear train diagnostics. Also included are
a description of one of the current U.S. Navy machinery vibration monitoring programs,
and an initial study regarding a proposed technique for providing a graphic display of
gear faults.
Accession For?•TIS GRA I
DTIC TABUnannouncOd 0justificatio
Distribution/Availability Codes
Ava il a nd/ orDist Special
iii
J
TABLE OF CONTENTS
1. INTRODUCTION .............................................. IA. GENERAL ................................................ I
B. BACKGROUND AND APPLICATIONS .......................... 2
II. U.S. NAVY MACHINERY VIBRATION MONITORING PROGRAM .... 9A. PROGRAM OVERVIEW ..................................... 9B. DATA ACQUISITION ...................................... 10C. DATA PROCESSING AND ANALYSIS ......................... 11D. DOCUMENTATION AND REPORTS .......................... 12E. FUTURE DEVELOPMENTS .................................. 13
Ill. MECHANICAL VIBRATION SIGNATURE ANALYSIS ............. 14A. VIBILATION F'NDAMENTALS ............................. 14B. MEASUREMENT AND PROCESSING FUNDAMENTALS ......... 19C. SIGNAL MEASUREMENT AND PROCESSING EQUIPMENT ...... 28D. TIM E DOM AIN ........................................... 32E. FREQUENCY DOMAIN .................................. 37
IV. MACHINERY DIAGNOSTICS MODEL .......................... 40A. MODEL DESIGN AND DEVELOPMENT ....................... 40B. TEST EQUIPMENT ........................................ 46C. M ODEL TESTING ......................................... 50
D. SPECIAL GEA t STUDY .................................... 55
V. RESULTS AND DISCUSSION ................................ 58A. IN ITIAL TESTS ........................................... 58B. MACHINERY FAULT SIMULATIONS ......................... 61C. SPECIAL GEAR STUDY .................................... 75
VI. CONCLUSIONS ............................................. 84
iv

VII. RECOMMENDATION'S ....................85
A. MODEL IMPROVEMENTS ........................... 6
B. FUTURE STUDIES........................................ 86
LIST OF REFERENCES ......................................... 88
INITIAL DISTRIBUTION LIST ................................... 90
... .... . .
LIST OF FIGURES
Figure 1. Component wear rate versus time . ............ ............ 6
Figure 2. Time history of x(t) represented as an ensemble of N samples ........ 15Figure 3. Measurement taken using the uniform window ................... 21
Figure 4. Measurement taken using the 1-anning window .................. 22Figure S. Measurement taken using the flat topwindow .................. 23Figure 6. Average afterl10samples................................. 24
Figure 7. Average after 160samples............................ 25
Figure 8. Displays using linear amplitude scale (upper) and decibel scale (lower.). . 26Figure 9. Acceleration measurement ................................. 28Figure 10. Velocity measurement .................................... 29Figure 11. Displacement measurement................................. 30Figure 12. Autocorrelation and filtered linear spectrum measurements of gear train
events................................................ 34JFigure 13. Plan view of the model.................................... 41
Figure 14. Close up view of gear train- defective gear in mesh ................ 47
Figure 15. Front view of model and mneasurement equipment................. 4S
Figure 16. Transducer calibration results................................ 5Figure 17. Transducer mount comparisons: stud mounted (upper) and magnetically
mounted (lower) using the Hanning wvindow..................... 60Figure 18. Transducer mount comparisons-. stud mounted (upper) and magnetically
mounted (lower) using the flat top window...................... 61Figure 19. Mlodel resonance (bumip test) results .......................... 62Figure 20. Baseline imbalance signature ............................... 6Figure 21. Imbalance signature with one imbalance mass per disc ............. 64Figure 22. Imbalance signatur.ý with six imbalan~ce masses per disc ............ 65Figure 23. Misalignment signatures: vertical direction (upper) and axial direction
(lower)............................................... 66Figure 24. Drive belt defect signature................................. 6Figure 25. Signature of the defect-free bearing ........................... 69Figure 26. Signature of bearing with inner race defect ............... ...... 70Figure 27. Signature of first reduction gear set, no damage .................. 72
vi
Figure 28. 4ignature of first reduction gear set, one tooth missing from Sear.... 73
Figure 29. One gear tooth filed . ................. . . ........... . 74Figure 30. Two Sear teeth filed .................................... 75
Figure 31. Three gear teeth filed . ................ . ............ 76
Figure 32. Four r,;ar teeth filed ................................... 77
Figure 33. Major sidebanding by 30 Hz signal . ............. 78
Figure 34. Secondary sidebanding by 3 Hz signal ....................... 79
Figure 35. 10 Hz waveforms as measured ........... 80Figure 16. Sum of 10 Hz and 500 Hz waveforms ........................ 81
Figure 37. Summed waveforms after conversion into complex form . ........... 82
Figure 38. Final Nyquist coordinate plot of complex waveform .............. 83
"Vii
1. INTRODU'TI" ON
A. GENERAL
Vibratory motion is a phenomenon inherent to all types of machinery regardless of
their material condition or qtate of performance and is tyoically measured in terms of
either the physical response of the machine itself or the sound produced by the vibratory
motion that is induced. Thus, the vibrations in general may be separated, respectively,
into •wo categories; mechanical vibrations and acoustic vibrations (termed machinery
noisel by many authors). Macb-.7cry diagnostics involves the measurement and analysis
of various phenomena associated with machinery operation and is specifically aimed at
the detection and identification of machinery faults. Vibrational behavior is a prime
indicator of machinery condition and so plays a key role in machinery diagnostics and
health monitoring. Mechanical vibration measurements are favored as the measures of
merit in the evaluation of machinery condition and performance, whereas acousticvibration measurements, although applicable to machinery condition assessment, have
greater importance and more widespread use in work regarding noise control and noise
reduction analyses. In this regard, Lyon [Ref. I] states
The greatest difference between diagnostics and noise reduction lies in theirrespective goals. A machine operating properly and without faults can still be verynoisy, and a machine that has developed a major fault may operate quietly.
Consequently, acoustic vibrations are addressed in part, but the focus of this paper
remains on the measurement and analysis of mechanical vibration signals with special
emphasis on dynamic signal analysis techniques as they apply to machinery diagnostics
and machinery maintenance programs.
Initially established as one of the primary goals of this thesis work was the
development of a machinery diagnostics model to satisfy two specific objectives. First,
to provide a working model whic,- could be used to simulate some of the more common
machinery faults and fault detection techniques that were to be discussed; and second,
I Throughout this paper, the term noise is specifically reserved for referring to those portionsof a vibration signal whi,;h come from signal contamination by non-machine related sources and,hence, undesirable and of no interest except for the degree to which i.s pr-sense may aftect thedetectability of the signals of interest.
to create the means by which a new analysis method and display technique regarding
gear defects could be experimentally tested and evaluated.
This paper summarizes and discusses some of the measurements and currenttechniques employed in mechanical vibration signature analysis as applied to detailed
diagnostics conducted on individual machines and to machinery maintenance programs
in general. The remainder of this introductory section provides background material
regarding vibration analysis and its applications to machinery diagnostics. The later
sections discuss, in order, one of the current U.S. Navy surface fleet maintenance
monitoring programs, basic signature analysis measurements and methods, the
diagnostics model that was developed, a special study on gear train diagnostics, and
lastly, a summary of conclusions and recommendations for continued study in this field.
B. BACKGROUND AND APPLICATIONS1. Why Vibration Analysis
Both consciously and subconsciously, operating engineers routinely use at least
four of the five human senses to varying degres to assess the condition of the machineryunder their care. Sight, hearing, touch, and (although to a lesser degree) smell are useful
* in monitoring overall plant status, but sight and smell become virtually useless in
evaluating the condition of an individual machine until long after an abnormality, or anabnormal trend, has become quite obviois. Normally they are limited to detecting the
existence of a problem which has advanced to a point where some fionn of corrective
action is called for without delay, whether it be as minor as a simple adjustment that
may be made wNith the unit running, or as major as the immediate shutdown of a piece
of equipment. On the other hand, hearing and touch are more sensitive to smallvariations in operating conditions and, writh respect to an individual machine, the onset
of specific problems such as pump cavititation, bearing defects, drive belt defects,
mechanical looseness, and the like, may be detected. In general , though, what is beingfelt or heard is the vibration, or the sound produced by the vibration, wvhich results from
some specific change which has occurred in either the operating parameters or the
material condition of the machine components or their alignment. Unfortunately, evenwith the significant dyiaamic range and filtering capabilities of the human ear which
enable the selective identification of small signals (sounds) in the presense of large
random signals (background noise), the changes so detected may be due to specific
maladies or component defects which are %'ell on their way toward necessitating an
unscheduled shutdown for repairs. Conseque -tly, vibration analysis is a logical choice
of a field to explore and in which to develop measurement and analysis techniques which
can serve as natural extensions of those basic human senses which are inherently moreresponsive to, hence more informative about, machinery condition.
2. The Uaskc ConceptVibration analysis is based upon the concept that once a mnachine is placed into
service and a baseline vibration signature 2 is obtained, any subsequent change in its
F - operating parameters or material condition will be reflected by a change in its vibration
signature. More importantly, the converse is assumed to be true, that if there is no
change in its signature, then there has been no change in the operating parameters or
material condition of the m~achine or any of its components. This basic concept is
well-established both in theory and in pr. Atce. In accordance with its strict definition,
the use of the term signature implies a uniqueness, and rightly so. Much of the analysis
work done relies in part upon pattern recognition in order to categorize the type(s) of
machinery fault(s) present, and this is commonly the first step taken in any analysis
procedure.Under controlled laboratory conditions or simulations using artificially
produced signals, the duplication of results for identical Zonditions is not difficult to
obtain. This is evidenced by several of the figures which appear later in which a signal
generator was used to proviae the input signals; each figure developed this way is
referenced as such. In actual practice in the field, point-for-point reproduction of
signatures for repeated conditions are not truly expected nor obtained; however, the
same conditions will yield signatures which are unmistakably "the same". Indeed, it is
precisely this high degree of repeatability that promotes high confidence and popularity
in the use of vibration analysis for machinery diagnostics and for short and long termn
maintenance monitoring needs. Mechanical vibration analysis covers a wide assortment
of instrumentation, methods, and techniques used to collect and analyze vibration data
either in its raw form or after it has been processed to display it in alternate forms which
facilitate the detection of sp'~ific machinery flults. Where vibration monitoring is
implemented as part of an overall machinery w-R'intenance program, the more useful,
hence more common, forms of display are in the frequency domain. The equipment -.
required varies from simple hand-held trreters, to sophisticated multi-channel solid-state
signal analyzers which offer a multitude of data processing functions and display
2 The term signature refers to any graphical display of signal information .egardiig a vibrationparameter; velocity amplitude vs. time, acceleration amplitude vs. frequency, etc.
3
formats, to systems where permanently installed sensors feed into a computer equippedwith diagnostic software.
3. Applictkon to Machinery Maintenance ProramsMachinery maintenance is well-recognized as accounting for a substanticzl
portion of overall plant operating cost. Small advances in maintenance programs reaplarge benefits, not only in cost savings, but also in improved safety, availability,
elficiency, etc. Success stories are abundant in the literature on this subject, and
payback periods for the initial investments are typically reported in terms of months.
Consequently, there are many people in various engineering disciplines actively pursuing
improvements to existing methods and technologies of machine condition and
performance analysis,-eflorts which are extensive and well justified.
Maintenance programs may be viewed as belonging to one of several hierarchal
levels based on whether or not a structured nwaintenance plin is in effect and on the
degree to which a plan incorporates the aforementioned methods and technologies that
are available which relates directly to the intended ,ouls of the plan.
a. Crisis Mlainteanwce
The lowest level program is popularly referred to as a crisis maintenance
program. This is one where no specific monitoring, performance evaluation, condition
evaluation, or maintenance routine exists. Such a program relies strictly upon
observations which may be made by the operators for gaining any forewarning oftrouble, with the result that machines and or their components all too often degrade to
a state of being unfit for service before any maintenance or repair efforts are undertaken.
.Note that this is nor a criticism of the performance of operating engineers, but rather a
statement on the general inadequacy of the naked human senses to detect machinery
degradation at a sufficiently early stage to prevent serious problems, as well as a
statemenE on how rapidly some machinery faults may develop and grow to unacceptable
limits.
b. Preventive Mlaintenance
The next program level is that of the preventive maintenance program in
which maintenance is carried out on a regular schedule which is based upon a specified
time interval, a specified number of operating hours, or some other measure of
machinery operating life. An example of this would be automotive maintenance
schedules which typically specify a limitting number of months or miles driven between
maintenance work. This is certainly an improvement on the previous level, but the
quality of this type of program relies upon the ability to accurately determine the
4
.-.........- ~ ... __ -
aptlmal interval(s), arnd presumes that all machines of the same class (thus assignedthe same intervals) will degrade identically in fashion, rate, and amount, As accurateas they may be, the assigned intervals, at best, can reflect only statistically averagedmeasures of what have proven to be acceptable intervals. In order to be even minimallyconservative W:. avoiding serious outages, these mintervals result in wasted time, money,rnd effort in servicing those units which are performing above the average. In short, theintervals will only be optimal for those units which degrade exactly as does the averageunit of the class. Those which perform below average may fail before the maintenanceis done as well as cause premature development of faults in related components; thosewhich perform above average receive unnecessary maintenance and also invites theadded risk that their condition may actually be worsened by the maintenance, especially
if it involves opening of the unit and, or rouzine replacement of components. There isalso the consideration that, to. be cost effective, such a program must be limitted toaddressing a finite number of the higher probability faults wvhich has the effect that theprogram may essentially be blind to many problems that can lead to chronic trouble andrepetition of work that only treats the symptoms.
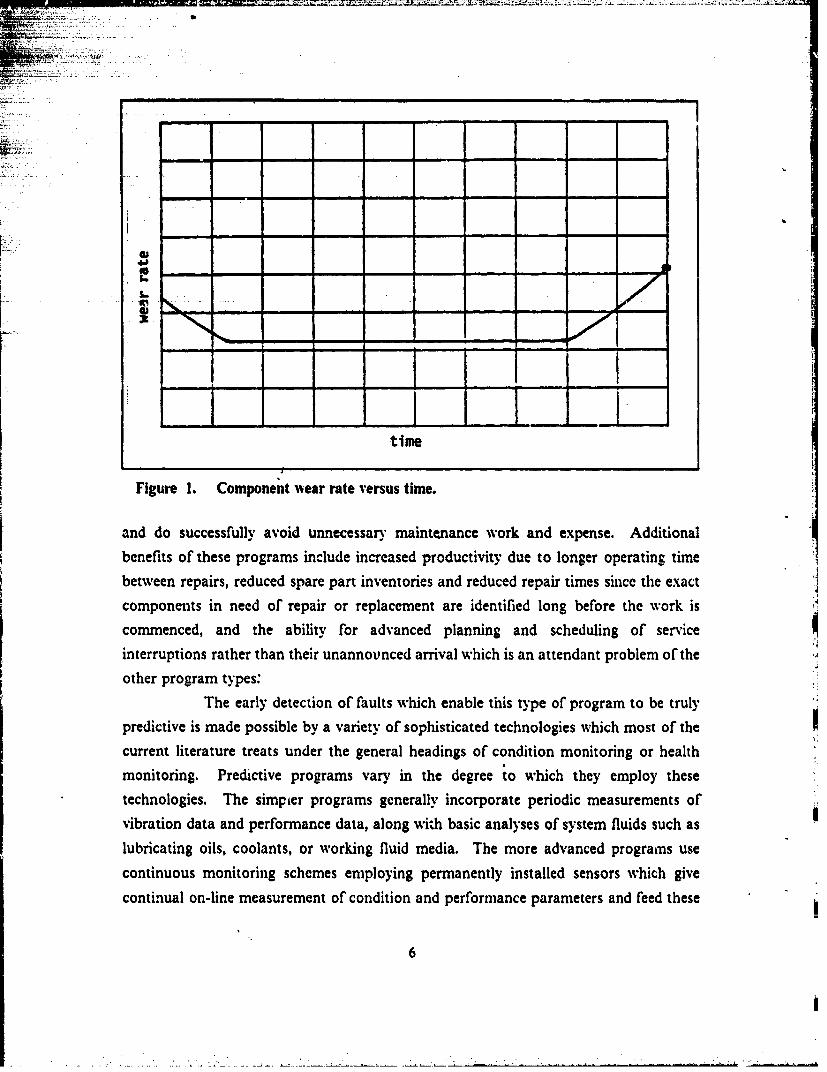
c. Predictive Mtaintenance
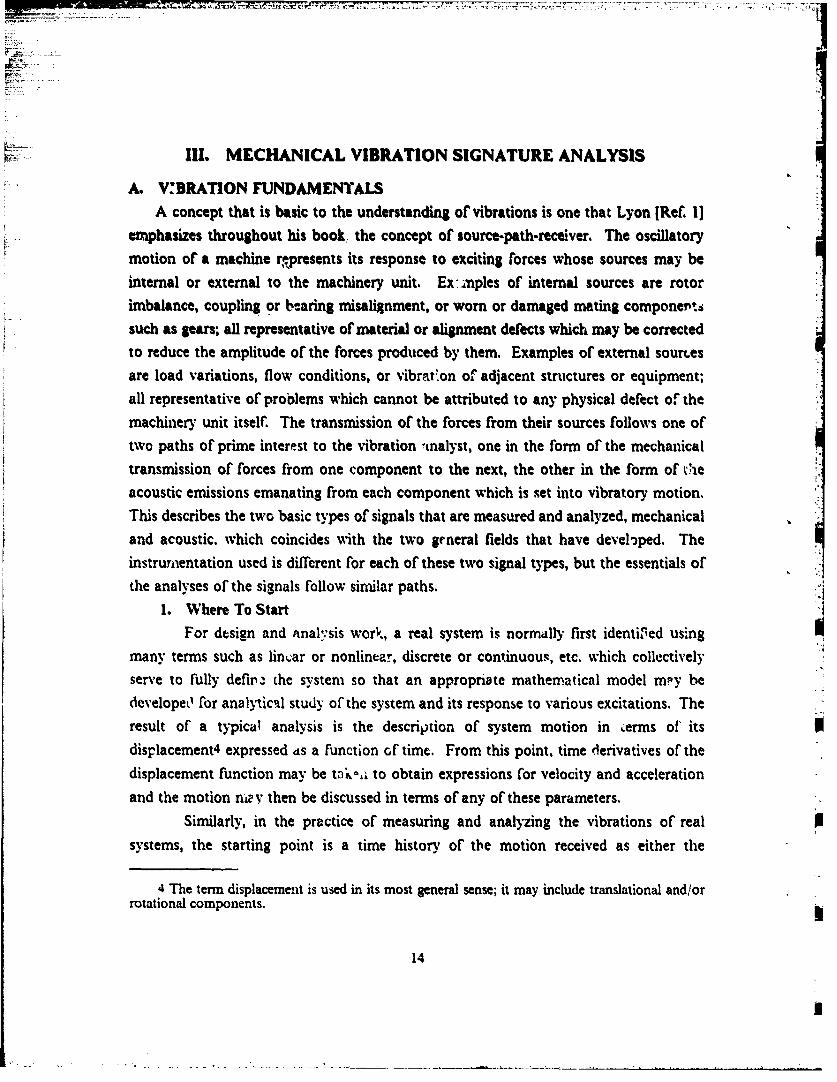
The final level is that of the predictive maintenance program in which, asthe name implies, machinery faults are detected at the early stages of their developmentso that maintenance needs are able to be predicted, with the result that maintenance isperformed only when it is needed and only on those components which need it.Figure 1 shows what is commonly referred to as the "bathtub curve" which displays howwear rate varies wvith time for most machinery components. Specifically, it shows therun-in period characterized by a decreasing wear rate as the initial manufacturing andassembly imperfections become smoothed out, followed by a period of normal operatingwear at a constant rate, followed by a period of increasing wear rate due to creation andgrowth of defects until final failure occurs. Time-based preventive maintenance
programs may interrupt the service life of a component which may still be in its normalwear rate period, whereas predictive maintenance programs will only remove a unit formaintenance when it is in its final stage of serviceable life, i.e., somewhere in theincreasing wear rate portion of the curve. Close monitoring and experience can providevery good estimates of projected time to failure which allows the programs to realizeoptimal maintenance intervals on a machine-sýpecific basis.
Although predictive programs cannot assure that unexpec-ted failures willnot occur since somne faults may still develop and proceed to failure too rapidly, they can
5
2E.3
Es - --- -
tim
Figure 1. Component ivear rate versus time.
and do successfully avoid unnecessary maintenance work and expense. Additionalbenefits of these programs include increased productivity due to longer operating timebetween repairs, reduced spare part inventories and reduced repair times since the exact
components in need ofr~epair or replacement are identified long before the work iscommenced, and the ability for advanced planning and scheduling of serviceinterruptions rather than their unannounced arrival which is an attendant problem of theother program types:
preiciveisThe early detection of faults which enable this type of program to be trulypreiciveismade possible by a variety of sophisticated technologies which most of the
current literature treats under the general headings of condition monitoring or healthmonitoring. Predictive programs vary in the degree to which they employ thesetechnologies. The simpier programs generally incorporate periodic measurements of
vibration data and performance data, along with basic analyses of system fluids such aslubricating oils, coolants, or working fluid media. The more advanced programns use
continuous monitoring schemes employing permanently installed sensors which givecontinual on-line measurement of condition and performance parameters and feed these
6
directly to central computers and automatic data logging devices. The repeatability and
accuracy with which mechanicai vibration analysis techniques can identify specific
machinery faults has also led to the demand for their use in the development of expert-systems with artificial intelligence where the signals are automatically analyzed and the
fault condition is automatically outputted to the operator. For simple systems, this
replacement of the vibration analyst with a computer that can decode the signal maynot be too difficult. Unfortunately, most signals are too complex and require the analyst
to employ methods which very from case to case. Even identifying the same type ofr L fault may require different techniques that change from one machine to the next. In
short, the procedures that are followed by the analyst are not structured to the pointwhere there are universally aplicable to all diagnostic work. This is primarily what
retards progress in the full development of artificial intelligence applications for theseexpert systems.
Most of the literature on the subject tends to reserve the term conditionmonitoring for use in specifically addressing predictive maintenance methods, althoughIlvonen [Ref. 2] applies it to both preventive and predictive programs. In the mid 1970's,
the conventional preventive maintenance programs were beginning to give way topredictive maintenance theories and practices. As originally established, these new
programs were essentially two-headed. The overall program was termed "On-ConditionMaintenance" which meant that units of equipment would only receive maintenanceservice as needed based upon their condition. The term "Condition Monitoring" was
applied to one facet of the program which monitored the condition of units of secondaryimportance, but allowed them to remain in service until they failed. This was done in
order to generate a data bank of machine vibrational data which could help establishwhat vibration levels were to be considered normal and abnormal. This was necessary
at the time because of the limited amount of statistical data available regarding
machinery vibrations. [Ref. 3]As the term is currently used, it involves the acquisition of information
which is used for evaluating the condition of machinery. The wide variety of
instrumentation and analysis techniques employed were classified by Mathew [Ref. 4]
into six maiin categories: aural, visual, operating variables, temperature, debrismonitoring, and vibration monitoring. The first four generally include conventionalmethods which have long been in use except perhaps for some of the newer technologiessuch as boroscopic exams, thermography, and acoustic monitoring. Debris monitoring
includes both oil and gas path monitoring. In wear debris analysis, oil samples from
sumps and/or samples from magnetic plugs strategically placed in the lubrication system
are analyzed using ferrography and spectrometry in order to determine the concentration
and type of debris found. This information can then be used to determine the rate ofwear of specific components. rhe gas path debris analysis similarly attempts to isolate
the source and nature of the debris, specifically, in order to differentiate between fuelcontaminants or combustion products and actual material debris such as from eroded
or broken blading. Also included is a collection of process variables data such as flow
rates, pressures, temperatures, etc. which are conventionally obtained and recorded,often with the use of an automatic data logging device. No one information group is
able to stand alone and provide sufficient data to 7ffectively run a maintenance program.In the more advanced programs, all of the aforementioned work in concert to provide
operators and management personnel wvith status and long run trend information whicbis used to establish maintenance schedules. Each serves to supply system information
which the other cannot.4. Other Applications
Vibration analysis has bcen applied in all facets of engineering including design,
manufacturing, operations and control, maintenance, and in surveys, inspections and
tests. In design, much of the work is related to mathematical modelling and model
testing; actual field wor" in vibrations have their impact on design by providing feedback
on the service performance which, at times, may call for redesign to adequately correcta certain problem. Also, it provides more accurate estimates of such statistical data as
mean time between fhilures, maintenance downtime, and other associated time, material,
labor and cost figures used by the design engineers to do systems analysis and life cyclecost studies. In manufacturing, vibrations of certain component3 such as lathe spindles,
cutting tools, etc. are monitored to control tolerances of manufacture and to indicate to
the operators when the components should be replaced or rcnewed in order to maintainthe required tolerances, and vibration readings are used in quality control applications
of the manufacturing process as well. Vibration signals have been incorporated into
control system designs to provide feedback on system performance or response tooperational changes. And vibration readings are also being used more and mnore as part
of machi±aery service and installation acceptance criteria. i
8
11. US. NAVY MACHINERY VIBRATION MONITORING PROGRAM
A. PROGRAM OVERVIEWThe U.S. Navy conducts several different vibration monitoring programs for the
machinery onboard its surface fleet. A total of approximately 32,000 machinery units
are involved, with about 12,000 of these being monitored under the. Systems and
Equipment Maintenance Monitoring for Surface Ships (SEMMSS) program; the exact
number of units monitored on any given ship depends upon the vessel class. Of thevarious programs, the SEMMSS program is of particular interest because it is an
example of an increasingly common event occurring in many industries; namely, the
replacement of a preventive maintenance program with a predictive maintenanceprogram in which mechanical vibration monitoring was relied upon heavily to make the
transition. The SEMMSS program is administrated by the Naval Ship System
Engineering Station (NAVSSES) located in Philadelphia, Pennsylvania. Initial studies
were commenced to access the program's effectiveness; in particular, the effect it has hadon overall maintenance cost and ship availability figures. Although final reports are not
yet available since the study is still underway, discussions with program administrators
indicate that its impact should prove to be extremely positive. NAVSSES functions toprovide technical guidance, including the training of the personnel who perform the task
of data acquisition in the field. It also sees to the selection, procurement, disposition,and maintenance of the field monitoring instrumentation; and it is responsible for
overseeing data processing procedures and the development and distribution of
documentation and reports of survey results. Some of these tasks are performed by aprivate engineering firm specifically contracted to do this work.
The program currently calls for vibration readings of each unit to be recorded and
analyzed every three months. With the number of units involved and their geographicdistribution, the attendant logistics problem and the need for minimal interruption of
vessel operations w.-re dealt with by the establishment of Performance Monitoring
Teams (PMTs). The teams are based in the vessels' home ports, equipped with portable
data acquisition kits, and are responsible for field testing, data collection, and
transmission of the data to the analysis center. The field offices have dynamic signal
analyzers for local analysis needs and for conversion of the analog data to digital data
which can then be transmnitted via modems over commercial telephone lines. The
It9
analysis center handles the data processing and analysis, the permanent data storage,
and the report preparation phases, then furnishes NAVSSES with the final written
reports of the survey results. The vessels each receive a copy of the report on t ieirmachinery which includes a summary of which units were tested, which ones were nottested and why3 , a prioritized listing of machinery in need of attention along withspecific recommendations on what work should be expected, and an updated copy of thevibration severity history of those units which were tested.[Ref. 5]
B. DATA ACQUISITION
Each machinery unit is fitted with two or three small transducer m'.,nting discs
made of 416 stainless steel, secured to the casings in way of the bearings using ahigh-strength epoxy compound, each covered with a removeable protective cap. The
choice of disc material provides pieces which are resistant to the adverse environmentalconditions and allow for magnetic attachment of the transducers. Accelerometers fitted
with magnetic bases are used exclusively with a silicon-based grease applied as alubricant; couplant which protects the machined surfaces of the disc and magnetic base
while improv'ing the transmissibility characteristics of the arrangement. The suitabilityand performance of this method of attachment was verified by a special study whichcompared transmissibilities for various arrangements to the quality obtained withstud-mounted assemblies [Ref. 6]. The number and location of monitoring points are
unit ,'lass specific; i.e., all identical machinery units throughout the program haveidentical transducer mount locations. Most units have one radial fitting at each load
bearing (in the same plane) and one axial fitting at one of the bearings, normally the one
nearer the coupling. Exceptions to this are centrifuges and purifiers which only haveradial fittings. The prescribed location of all discs is cataloged in a written programguide which allows the PMT technician to accurately locate any mounts which need to
be replaced or realixed. This, along with the fact that they are "permanently" affixed,supports strong confidence in the validity of measurement comparisons made between
monitoring periods as well as between units of the same class. Of cou'se, the impedanceof each mount location will be different from one machine to the next, but at least thenumber of variables is somewhat reduced by ensuring that those readings which are to
be compared to ,one another are at least taken at precisely the same location on each
unit every time.
3 Typical reason, for not testing include no water available, boilers secured,maintenance,'repairs in progress, etc.
10
'. . . . : . . . . . . . .. . . . ... . . .. .. . .. . . . . • . .. .. -. .. i -- . . . • _ - : • . ..
F4 Low impedance coaxial cable is used to transmnit the signals from the accelerometerto and through a broadband velocity meter and on to a specially designed FM tape
recorder where the analog data is stored on standard, high quality cassette tape. Thevelocity meter displays the overall broadband vibration velocity amplitude on a decibelscale referenced to 10-' crn/sec rms. This reading is manually entered on a written recordmaintained by the PMT technician. The duration of each reading is "timed" by referringto the counter on the tape recorder. The recorders are fitted with multiphc heads forrecording the data plus a separate voice track on which the technician may recordcomments or other information regarding the measurement or test conditions. After allreadings for a ship have been taken, the tapes are brought back to the local PMT officewhere a signal analyzer is used to convert the analog data to digital data which is thentemporarily stored locally in a microprocessor. Using a modem and commercial
telephone lines, the data are then transmitted to the analysis center. Other equipmentused by the technicians includes a portable tachometer for measuring machine rpm attime of testing, a transducer calibration kit for periodic verification of transducer
performance. and a dual trace oscilloscope which is used primarily to verify signalquality and tape recorder performance before each reading is taken.
C. DATA PROCESSING AND ANALYEIS
At the analysis center, signal analyzers and microprocessors are used for processing,display, analysis, and storage of the data. The analysis is performed with the datadisplayed in terms of velocity decibels versus orders of revolutions, and all final writtenreports are similarly prepared. The ability to display the data in orders is accompli.shedby referencing the spectral display to the rpm reported by the technician. Use of anorders representation of the spectra is advantageous for monitoring machines withvariable operating speeds since it will automatically maintain the same spectral registryof those events that track directly to shaft speed, and this includes most of the commonmachinery faults. For example, imbalance creates a spectral line at I x rpm regardlessof what that rpm may be. A machine operating at 1200 rpm will show a spectral lineat 20 hertz, at 1800 rpm it will show at 30 hertz; but in either case it will show at one
order in an orders representation. Exceptions to this are events which occurr at the samefrequencies regardless of shaft speed. Events such as electrical signals from motors orresonant excitations of natural frequencies are common examples of this. When acomponent is excited into resonance, a spectral line will appear at the component'snatural frequency and will not move as the machine speed changes. It may, and
11
normally does, change in amplitude with changes in shaft speed, but itis spectral locationwill remain fixed with respect to frequency. The assured consistancy of spectral locationfor most major events when displayed in terms of orders facilitates trending studies byeliminating one of the variables (operating rpm) which normally would be an extrafactor to consider when comparing past and present data.
Reliability of trending information is very good since all acquired data isK permanently stored. As the program continues, the data bank generated provides an
increasingly valuable resource for statistical studies aimed at establishing and updatingsuitable criteria for alarm levels and condition evaluation of individual classes ofmachinery. At present, the criteria for alert are:
e a rise of over 6 dB in any amplituoe as compared to its previous level,
* a rise above a level established statistically as two standard deviations above themean value for that class machine, and
a a rise above the absolute levels set by military specifications.
A violation of any one of the above is considered an alarm or warning condition. Animportant distinction between the selection of these criteria and the criteria used bysimilar programs is the tracking of individual events (spectral lines). In some programs,the critzria are based only on overall broadband amplitude limits; this leaves theprogram "blind" to any smaller but more rapidly developing faults that may exist. Forexample, a 95 dB reading at 100 hertz and a 75 dB reading at 250 hertz would give anoverall amplitude reading of 95 dB, the higher of the two. Assumning an alert level setat 100 dB, should the 100 hertz reading remain steady while the 250 hertz readingincreases by 10 dB every three months, it wouid not register any warning until ninemonths later when its overall level wvould then be 105.
D. DOCUMENTATION AND REPORTSThe final written reports consist of tabular and graphical data. One graph shows
trend history in the form of overall broadband readings plotted against time for thecurrent and the several prior visits. A series of spectral graphs are made, one for eachmounting location on cach unit. -I many or these are also shown on two separate orderranges. Typically, a high speed device may have one series of plots covering from zeroMto 100 orders, and a second series covering from zero to 10 orders in order to providebetter resolution of lower order events. This is important because it is often problemsin the lower frequency ranges that occur first and cause problems which appear later onin the upper frequency ranges.
12
The turnaround tiri' from data collection to receipt of results and recommendationscan be very fast, within one working day. This is a benefit bccause it allows the PMNTtechnician to conduct foliowup testing on any unit which may warrant closer scrutinybased upon initial readings that were taken, and the ability to do so without need tore-visit the vessel at some future date which may be a less convenient time with regardto interruption of vessel operations.
Vibration data alone is not all that is reviewed before recommendations areformulated; it is augmented by information on the performance parameters of the units.In this way, the recommendations reflect an accounting for other variables which mayhave created either normal or abnormal changes in the signatures. The long termstorage of the data permits the creation of waterfall plots used to simplifyi trendingstudies, and (ideally) improves the quality of information on machinery. history statisticsand the suitability of alert level values and evaluation criteria.
E. FUTURE DEVELOPMENTSFuture developments of the program are to include the use of digital data
acquisition devices in place of the analog units now being used. This would allow directtransmission of the data when collected and cut out one miajor data processingprocedure in the system. This would also allow for imnmediate cihannelling of data intolocal microprocessors onboard for on-site analysis which is another feature underconsideration. Having these capabilities onboard ship will also permit the use ofvibration readings as a machinery installation acceptance criteria. There is also aplanned change over to electronic transmission of both the data and the reports. Andfinally, there is consideration being given to extendingz the monitoring interval from threeto six months.
13
I11. MECHANICAL VIBRATION SIGNATURE ANALYSIS
A. V:"•RATION FUNDAMENTALSA concept that is basic to the understanding of vibrations is one that Lyon [Ref. 11
emphasizes throughout his book the concept of source-path-receiver. The oscillatorymotion of a machine rpresents its response to exciting 'orces whose sources may beinternal or external to the machinery unit. Ex-mples of internal sources are rotorimbalance, coupling or bearing misalignment, or worn or damaged mating compone,'tssuch as gears; all representative of material or alignment defects which may be correctedto reduce the amplitude of the forces produced by them. Examples of external sourmesare load variations, flow conditions, or vibraton of adjacent structures or equipment;all representative of problems which cannot be attributed to any physical defect of themachinery unit itself. The transmission of the forces from their sources follows one oftwo paths of prime interest to the vibration ftnalyst, one in the form of the mechanicaltransmission of forces from one component to the next, the other in the form of Oleacoustic emissions emanating from each component which is set into vibratory motion.This describes the two basic types of signals that are measured and analyzed, mechanicaland acoustic, which coincides with the two general fields that have developed. Theinstrumientation used is different for each of these two signal types, but the essentials ofthe analyses of the signals follow similar paths..i
1. Where To StartFor design and anal,'sis work, a real system is normally first identiled using
many terms such as linear or nonlinear, discrete or continuous, etc. which collectivelyserve to fully defin. the system so that an appropriate mathematical model m.y bedeveloped' for analytical study of the system and its response to various excitations. Theresult of a typical analysis is the description of system motion in ýerms of itsdisplacement4 expressed as a function of time. From this point, time derivatives of thedisplacement function may be takoi to obtain expressions for velocity and accelerationand the motion n,,y then be discussed in terms of any of these parameters.
Similarly, in the practice of measuring and analyzing the vibrations of real Psystems, the starting point is a time history of the motion received as either the
4 The term displacement is used in its most general sense; it may include translational and/orrotational components. b
14
". .. .-
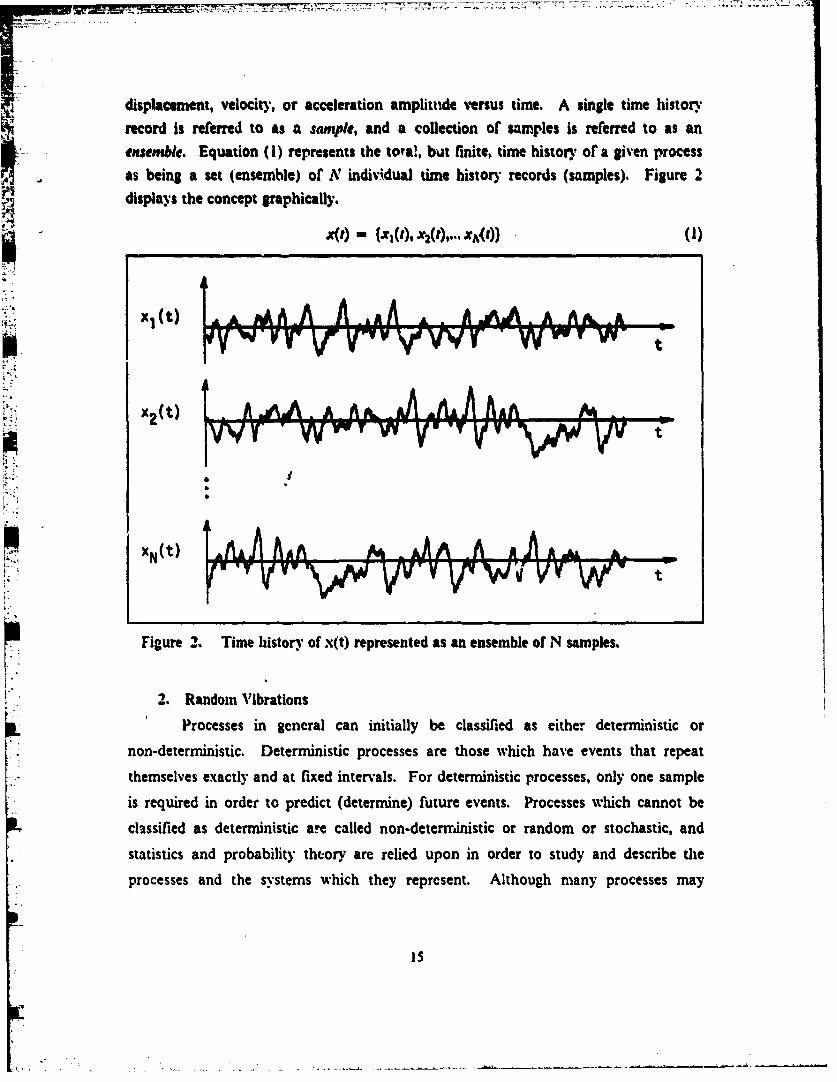
displacemnent, velocity, or acceleration amplitude versus time. A single time historyrecord is referred to as a sample, and a collection of samples is referred to as anensemble. Equation (I) represents the total, but finite, time history of a given processas being a set (ensemble) of N individual time history records (samples). Figure 2displays the concept graphically.
X (XM i)-- A
x1(t)
x2 (t)
i XNlt)
i Figure 2 Tmehistory o x(t) represented as an esblofNsamples.
2. Random Vibrations
! Processes in general can initially be classified as either deterministic or
non-deterministic. Deterministic processes are those which have events that repeat
themselves exactly and at fixed intervals. For deterministic processes, only one sample
• ~is required in order to predict (determine) future events. Processes wvhich cannot be
IL ~clhssified as deterministic a.,e called non-deterministic or random or stochastic, and
S~statistics and probability theory are relied upon in order to study and describe rthe
S~processes and the systems which they represent. Although many processes may
• 15
PAAA A A A. .-
........................ r vv- t
sometimes be adequately modelled as being deterministic, all real processes are
technically lassiied as random processes.Using statistical averages of their data, random processes may be farther
dla.-:'ied as being either stationary or non-stationary. A stationary process is one whereeach of all possible statistical properties as averaged over the ensemble converges to toa finite value as the number of samples in the ensemble increases. A non-stationary
process is one where any one statistical property Mails to converge. A weakly stationaryprocess is one where not all statistical properties, but at least certain essential ones, have
convergent limits. The basic criteria normally applied to establish weak stationarity arethat the mean value, equation (2), the mean square value, equation (3), and the
autocorrelation, equation (4), have convergent limits.
$z(1i)= lima N4. Z•(ri) (2)N
A' -- oo iftl
A-.(,,r T) lir I X(, + ,r) (4)
N-+ oo
Authors differ somewhat with regard to which statistical values shouldspecifically be included in the criteria used to establish stationarity. Bendat and Piersol
[Ref. 71 perhaps stated it most appropriately in saying
For the special case where all average values of interest remain constant withchanges in the time t,, the data are said to be stationary.
This would make it a case-specific determination. In practice, proving a process to be
weakly stationary is usually sufficient to allow the process to be treated as if it were fully
stationary. Bendat and Piersol IRef. 7] expand on this where they state
In most laboratory experiments, one can usually force the results of the experimentto be stationary by simply maintaining constant experimental conditions. Forexample, if one is interested in the surface pressures inside a pipe due to highvelcity air flow, stationary data will be generated if the air flow velocity, density,
16
and temperature are held constant during each experiment .... In many fieldexperintnts as well, ther; ;. nc difficulty in performing the experiments underconstant conditions to obtain stationary data.
The classilication of a process as either stationary or non-stationary gives an idea of the"degree" of randomness of the process and serves as an indication of how relevant andmaningfial statistical values may be in describing the process.
A further classification of stationary p-cesses is in identiP•ng them as eitherergodic or non-ergodic. A stationary process is ergodic if the values of statisticalproperties as averaged over time for a single sample (equations (5), (6), and (7)) yield thesame values as obtained to establish stationatity (equations (2), (3),and (4)).
lim fj J (t)dt (5)T-*oo
rili- i'+t)de (6)
T --+ oo f
RXX(T) - lira + xt)xNt + T)dt (7)
T--,oo
This implies that, similar to the case of the deterministic process, only a single sampleis required in order to obtain information about the entire process history. Another time
domain estimate-S of importance is the cross correlation, equation (8).
R.(T)- im _Jx)y(: + L)dt (8)
T-+oo
By taki'•g the Fouricr Transform of the time history records, the data aretransformed into the frequency domain. In this domain there are several spectralestimates or importance; namely, the linear spectrum (equation (9)), the power spectrum
5 The term estimate is used because, although values are theoretically defined by integralstaken over all time, actual values are computed for finite record lengths, thus they can only beestimates of the true values.
17
=- _77- .- 12 Z z. .
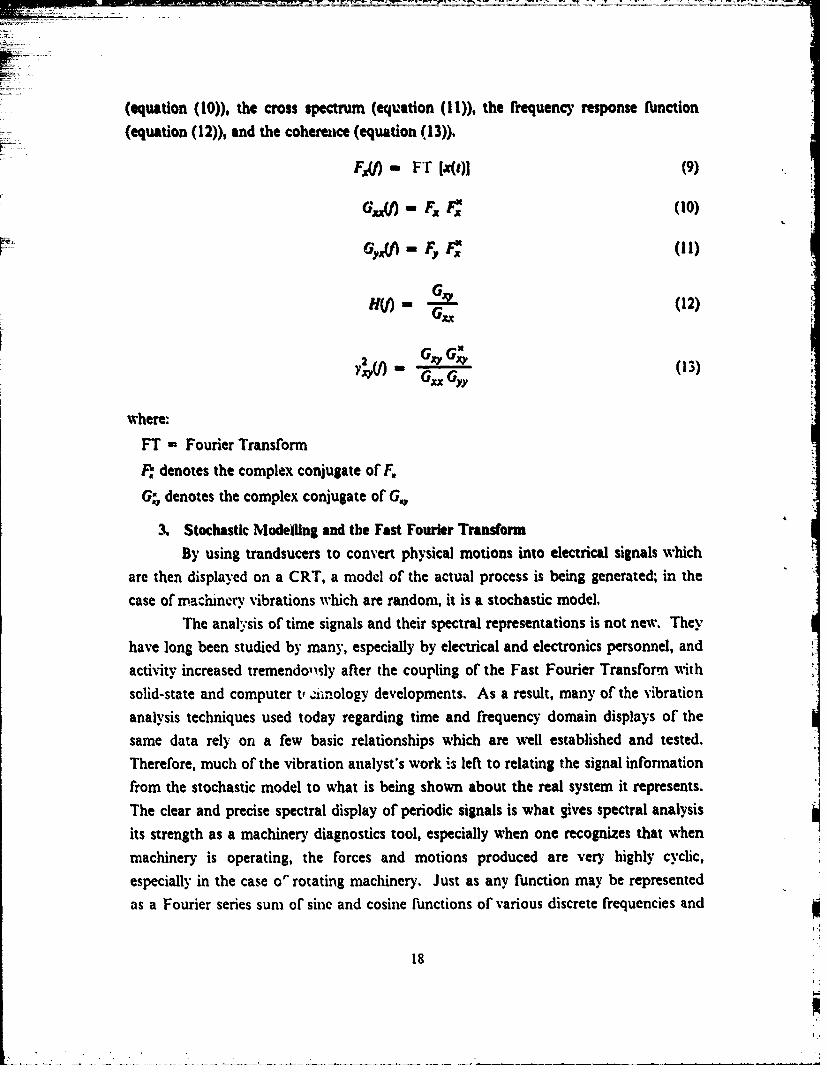
(equation (10)), the cross spectrum (equation (11)), the frequency response flinction(equation (12)), and the cohereaice (equation (13)).
FxW) - FT lx(t)] (9)
where:FT - Fourier TransformF denotes the complex conjugate of F.
G,• denotes the complex conjugate of •,,
3. Stochastic Mode~llg and the Fast Fourier TransformBy using trandsucers to convert physical motions into electrical signals which
are then displayed on a CRT, a model of the actual process is being generated; in the
case of mac~hinery vibrations which are random, it is a stochastic model.
The analysis of time signals and their spectral representations is not new. They
have long been studied by many, especially by electrical and electronics personnel, and
activity increased tremendo,•sly after the coupling of the Fast Fourier Transformn with
solid-state and computer t, ,:1nology developments. As a result, many of the vibrationanalysis techniques used today regarding time and frequency domain displays of the
same data rely on a few basic relationships which are well established and tested.
Therefore, much of the vibration analyst's work i.s left to relating the signal information
from the stochastic model to what is being shown about the real system it represents.The clear and precise spectral display of periodic signals is what gives spectral analysis
its strength as a machinery diagnostics tool, especially when one recognizes that when
machinery is operating, the forces and motions produced are very highly cyclic,
especially in the case or" rotating machinery. Just as any function may be represented
as a Fourier series sum of sine and cosine f'unctions of various discrete frequencies and
18
•Z

amplitudes, a machine's overall vibration signal may be viewed similarly. When the
.ignal is decomposed, the discrete frequencies and amplitudes obtained can be directly
related to specific components and/or conditions occurring inside the unit.
B& MEASUREMENT AND PROCESSING FUNDAMENTALS
in the acquisition, processing, and display of vibration data, there are certain terms
and aspects which should be understood in order to effectively measure and analyze the
signals; and if designing a system, some are crucial to understand so that the appropriate
hardware/software items are included in the design to minimize errors. Solid-state
- - analyzers often have all required components already incorporated in their design. Even
so, knowledge of these aspects will assist greatly in a user's choice of signal display
format and its interpretation. Each of the foilowing subheadings briefly introduces some
of the more important terms and aspects.
I. Aliasing
Aliasing is a problem which occurs when there is no prefiltering of the raw data.
For a given frequency span selected for analysis, the absense of any prefilters will result
in frequency components above the upper limit of the selected span to be reflected or
'folded back" into the span being analyzed. The reason for this is related to the rate at
which the data is sampled. A common example of this is the apparent reversed rotation
of a spinning object such as a car tire as it turns at different speeds. Blackburn [Ref. 8]
uses the wagon wheel example, but one perhaps more common to engineers might be the
apparent rotation reversals of a spinning shaft as viewed under a strobe light while the
shaft speed varies. Elimination of this effect is attained by ensuring that the data
sampling frequency is at least twice the maximum frequency desired to be analyzed. It
is accomplished in practice by prefiltering the data with a low-pass filter (called an
anti-aliasing filter) set at the maximum frequency to be analyzed. Off-the-shelf analyzers
have an anti-aliasing filter incorporated in them; often they are reset automatically to the jmaximum frequency that the user selects for a particular measurement run.
2. Leakage
Leakage is a phenomenon occurring when unweighted non-periodic samples are
processed. If a perfectly periodic signal is sampled such that the beginning and end of
each sample coincides with the period of the signal and at its zero crossing, then the
unweighted FFT of that sample will be accurate. However, a non-periodic signal will
have an FFT display where the amplitudes are distortedly spread out across the domain
of the display. To counteract this effect, the data is multiplied by a weighting function,
19
commondly called a windouing function or simply a window, which has the effect of-shaping: the data in the sample so as to. force the amplitudes at the beginning and endof the record toward zero. In this way, the data is forced into a periodic form andaccurately" transformed by the FFT into the frequency domain. The word accurately
is used in quotes because this windowing process distorts the data from its true naturewhich means that all the displayed frequencies and amplitudes will not be exact, butthese inaccuracies are overcome by reanalyzing portions of the data over smaller
frequency spans to improve the resolution. There are several basic types of windows,each for a specific application, and there are many variations on several of these types.Off-the-shelf analyzers generally offer selection from a listing of several windows andF some provide a user-defined window option so that the user may enter his/lher ownweighting function. Computer-based systems normally include these as menu-selectableitems which come with the software.
It is often this problem of leakage which demands that several measurement
runs be made covering various frequency spans in order to complete a diagnostic study.Use of smaller spans will improve both the amplitude and the frequency resolution. Theselection of howv small to go and when to stop is up to the analyst and usually basedupon what is being searched for and how accurate the results need to be. In diagnosticleswmortatkha thedereo refinement mybqutdeaildnd mcinre impniortant tatptheimatosurementwes morknth rehnmet matbhqie detailee oreinemnn machier importnitoringapplicmatioemnstiparameters be consistent from one set of readings to the next.
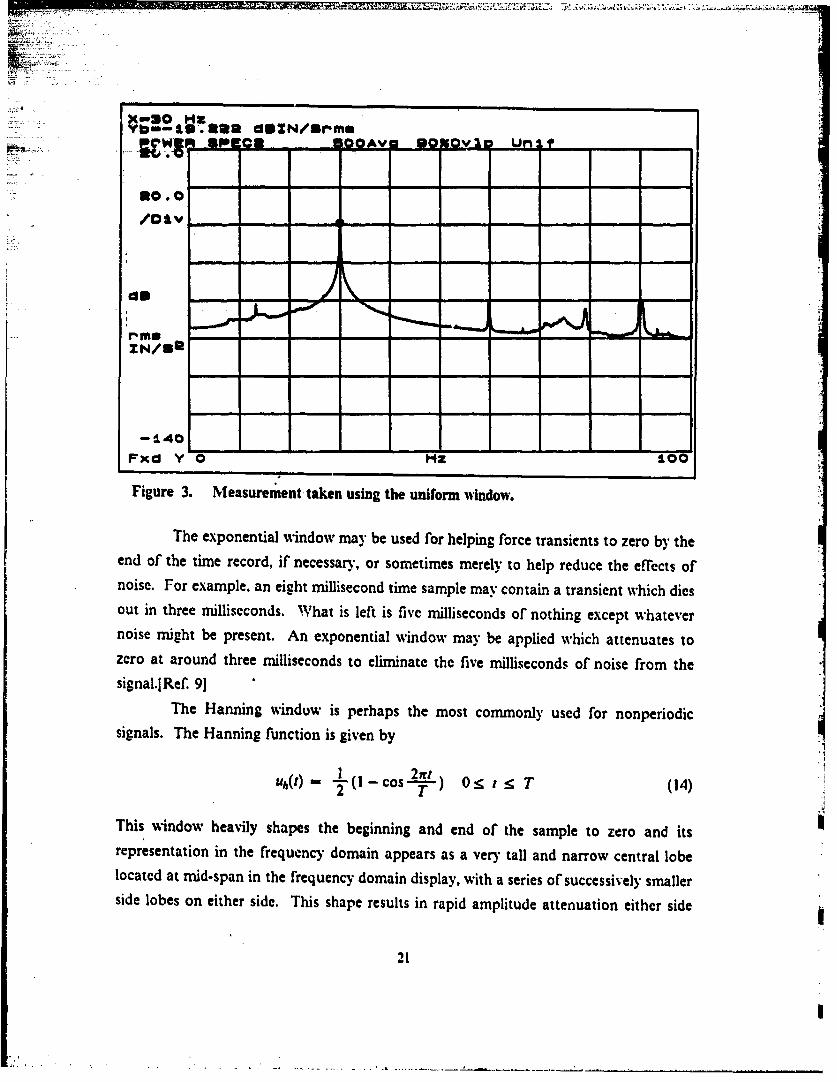
~id~.To show the effects of leakage, a measurement was taken using a uniformwno.The measurement display is shown in Figure 3. The wide spread of the peak
at 30 Hz shows how~ the phenomenon of leakage presents itself. Ideally this peak shouldappear as a straight vertical line at 30 Hz indicating a vibration which is physicallyrelated to some machinery event occurring at 30 Hz (1800 rpm). In this case it was shaftimbalance where the shaft speed was 1800 rpm.
3. WlndouiingWindowing is the application of weighting functions to the raw data samples.
Of the many types of windows, four of the more commonly encountered ones arementioned here; uniform, exponential, Harming, and flat top.
The uniform window, also called the rectangular window, is merely a unit stepfunction. Its affect on the sample is to weigh all components equally. It is mainly usedfor transients, impulses, or any other self-windowing signals where the amplitudesnaturally attenuate to zero by the end of the time record.
20
I. & g . . .. .. - -
- - -..--.--
30.0/O. 0/DIV ....
ZN/m•
--1,40
x Yd HZ 100
Figure 3. Measurement taken using the uniform window.
The exponential window may be used for helping force transients to zero by theend of the time record, if necessary, or sometimes merely to help reduce the effrects ofnoise. For example, an eight millisecond time sample may contain a transient which diesout in three milliseconds. What is left is five milliseconds of nothing except whatevernoise might be present. An exponential window may be applied which attenuates tozero at around three milliseconds to eliminate the five milliseconds of noise from thesignal. Ref. 9)
The Hanning window is perhaps the most commonly used for nonperiodicsignals. The Hanning function is given by
-I
2&: T~lcsT. 0~ 1• T (14)
This window heavily shapes the beginning and end of the sample to zero and itsrepresentation in the frequency domain appears as a very tall and narrow central lobelocated at mid-span in the frequency domain display, with a series of successively smallerside lobes on either side. This shape results in rapid amplitude attenuation either side
21
... •D•,-S•. DTlldlZN/ir~mS PMrt-1l3.2 Ha -l
XiO. 0H
Y /D~ .N ...... . . -
on-/
all _ - - -
-40
0 Hz S00
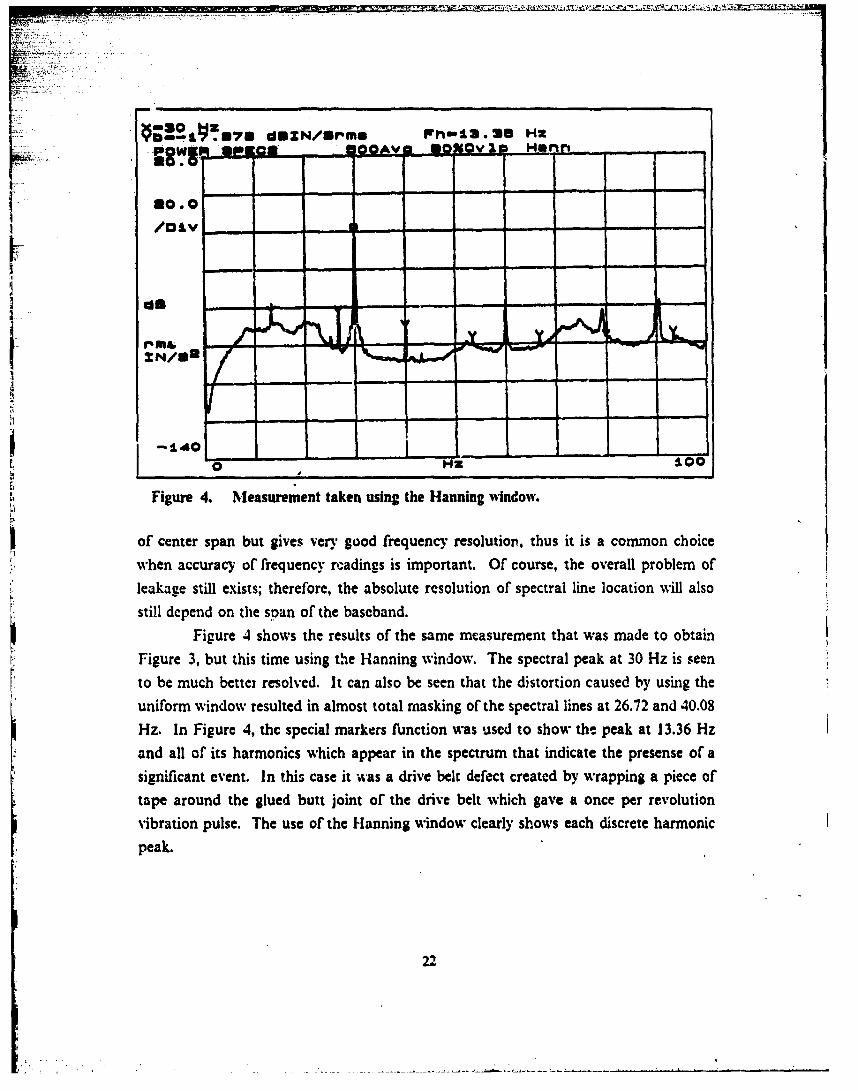
Figure 4. Measurement taken using the Hanning window.
of center span but gives very good frequency resolution., thus it is a common choice
when accuracy of frequency readings is important. Of course, the overall problem of
leakage still exists; therefore, the absolute resolution of spectral line location will also
still dcpend on the span of the bascband.
Figure 4 shows the results of the same measurement that was made to obtain
Figure 3, but this time using the Hanning window. The spectral peak at 30 Hz is seen
to be much better resolved. It can also be seen that the distortion caused by using the
uniform window resulted in almost total masking of the spectral lines at 26.72 and 40.08
Hz. In Figure 4, the special markers function was used to show the peak at 13.36 Hz
and all of its harmonics which appear in the spectrum that indicate the presense of a
significant event. In this case it was a drive belt defect created by wrapping a piece of
tape around the glued butt joint of the drive belt which gave a once per revolution
vibration pulse. The use of the Hanning window clearly shows each discrete harmonic
peak.
22
O. 9.II doZN/xernms Fh-i-- . ! HzPOWE1 q 3 or~ am0 501V _fXVI -r
•. II10.0
/0l
ib me
-140H;-i;0 HZ 1L0 0'
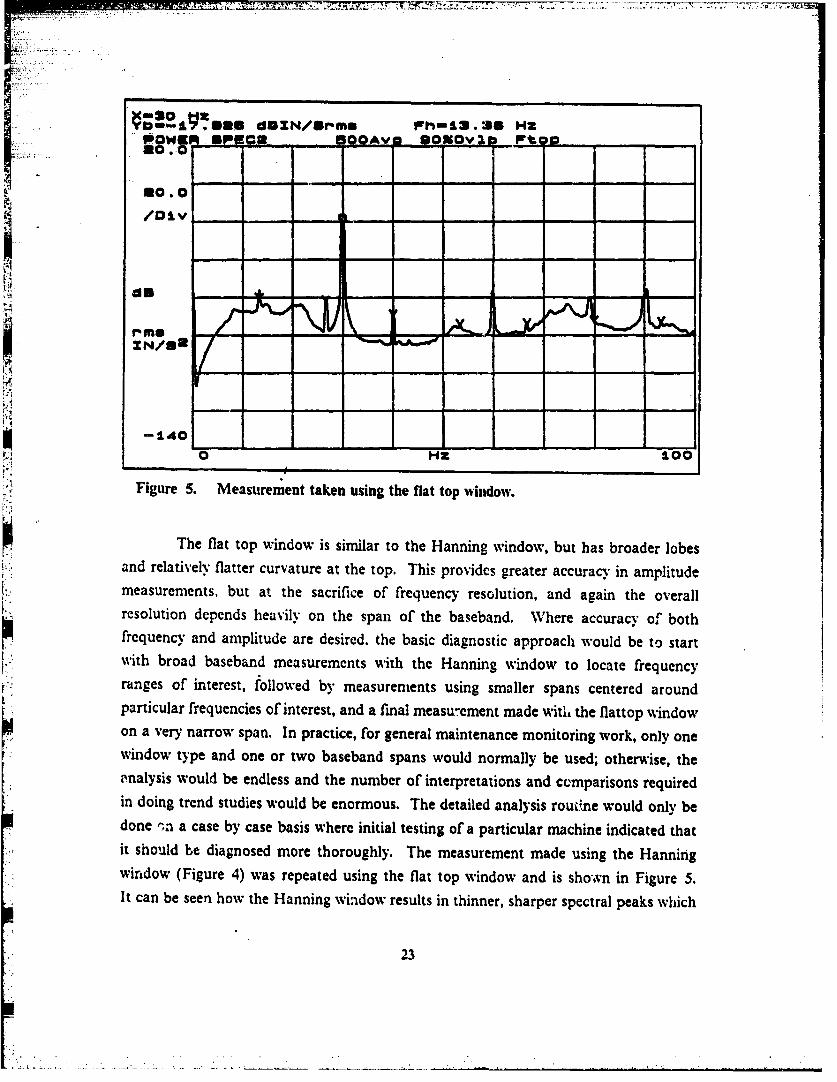
S' Figure 5. Measurement taken using the flat top window.
The flat top window is similar to the Hanning window, but has broader lobesand relatively flatter curvature at the top. This provides greater accuracy in amplitudemeasurements, but at the sacrifice of frequency resolution, and again the overallresolution depends heavily on the span of the baseband. Where accuracy ofI bothfrequency and amplitude are desired, the basic diagnostic approach would be to startfith broad baseband measurements with the Hanning window to locate frequency
ranges of interest, followed by measurements using smaller spans centered aroundparticular frequencies of interest, and a final measw-ement made witi, the flattop windowon a very narrow span. In practice, for general maintenance monitoring work, only onewindow type and one or two baseband spans would normally be used; otherwise, the,'nalysis would be endless and the number of interpretations and comparisons requiredin doing trend studies would be enormous. The detailed analysis rou.ne would only bedone •,n a case by case basis where initial testing of a particular machine indicated thatit should be diagnosed more thoroughly. The measurement made using the Hanringwindow (Figure 4) was repeated using the flat top window and is showvn in Figure 5.It can be seen how the Hanning window results in thinner, sharper spectral peaks which
23
gives good definition to the spectral locations (frequencies) of the periodic eventsoccurring in the process being measured. In contrast, the flat top window gives betteramplitude accuracy but, as seen in the widened and rounded-off appearance of thespectral peaks, the frequency resolution is poorer. Similar to the Harming window, theflat top window was also very good at clearly showing the drive belt defect and itsI-• harmonics.
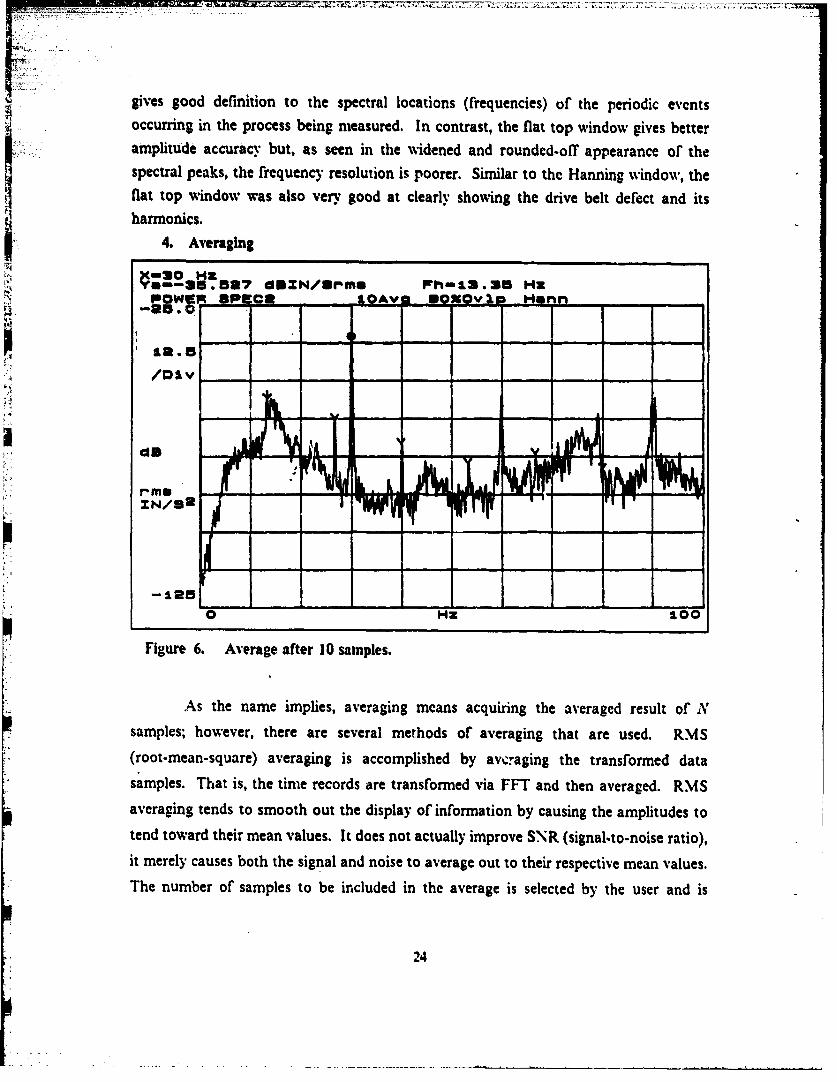
!• 4. Averaging
1= 4!52 •1.8 oJxN/o~rme Pah-13.35 HZ
POWER lost SPO DOIO IDiHe ,-3 5lJ * 0 -. .
/I
.Am
rm s -, _ ... .ZN/92r
-125 I] Hz zLoo
Figure 6. Average after 10 samples.
As the name implies, averaging means acquiring the averaged result of Nsamples; however, there are several methods of averaging that are used. RMS
(root-mean-square) averaging is accomplished by averaging the transformed datasamples. That is, the time records are transformed via FFT and then averaged. RMS
averaging tends to smooth out the display of information by causing the amplitudes totend toward their mean values. It does not actually improve SNR (signal-to-noise ratio),it merely causes both the signal and noise to average out to their respective mean values.
The number of samples to be included in the average is selected by the user and is
24
dE~N3rmmPh-1.2SHz
/01V
CID
-125
0 HZ 100
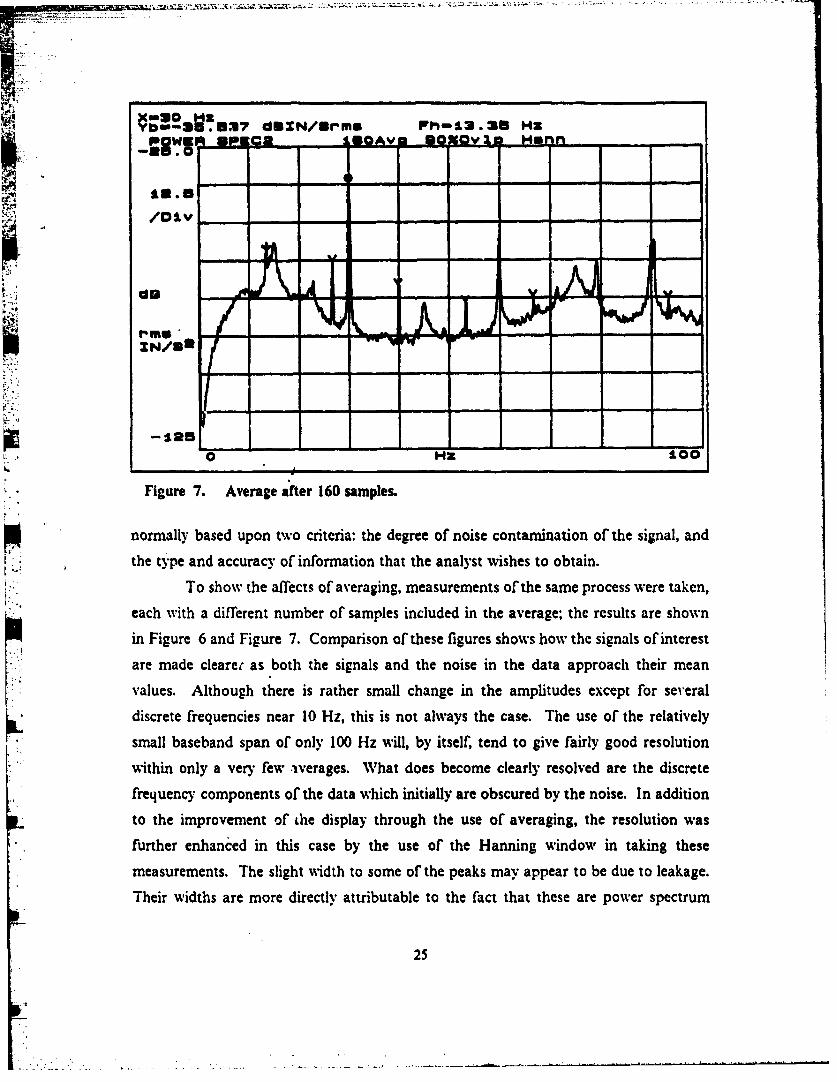
Figure 7. Average after 160 samples.
normally based upon two criteria: the degree of noise contamination of the signal, and
the type and accuracy of information that the analyst wishes to obtain.
To show the affects of averaging, measurements of the same process were taken,
each with a different number of samples included in the average; the results are shown
in Figure 6 and Figure 7. Comparison of these figures shows how the signals of interest
are made cleare, as both the signals and the noise in the data approach their mean
values. Although there is rather small change in the amplitudes except for sev-eral
discrete frequencies near 10 Hz, this is not always the case. The use of the relatively
small baseband span of only 100 Hz will, by itself, tend to give fairly good resolution
"within only a very few averages. What does become clearly resolved are the discrete
frequency components of the data which initially are obscured by the noise. In addition
to the improvement of ihe display through the use of averaging, the resolution was
further enhanced in this case by the use of the Hanning window in taking these
measurements. The slight width to some of the peaks may appear to be due to leakage.
Their widths are more directly attributable to the fact that these are power spectrum
25
~.1
measurements and due to there having been a slight bit of wander in rpm during these
particular test runs.
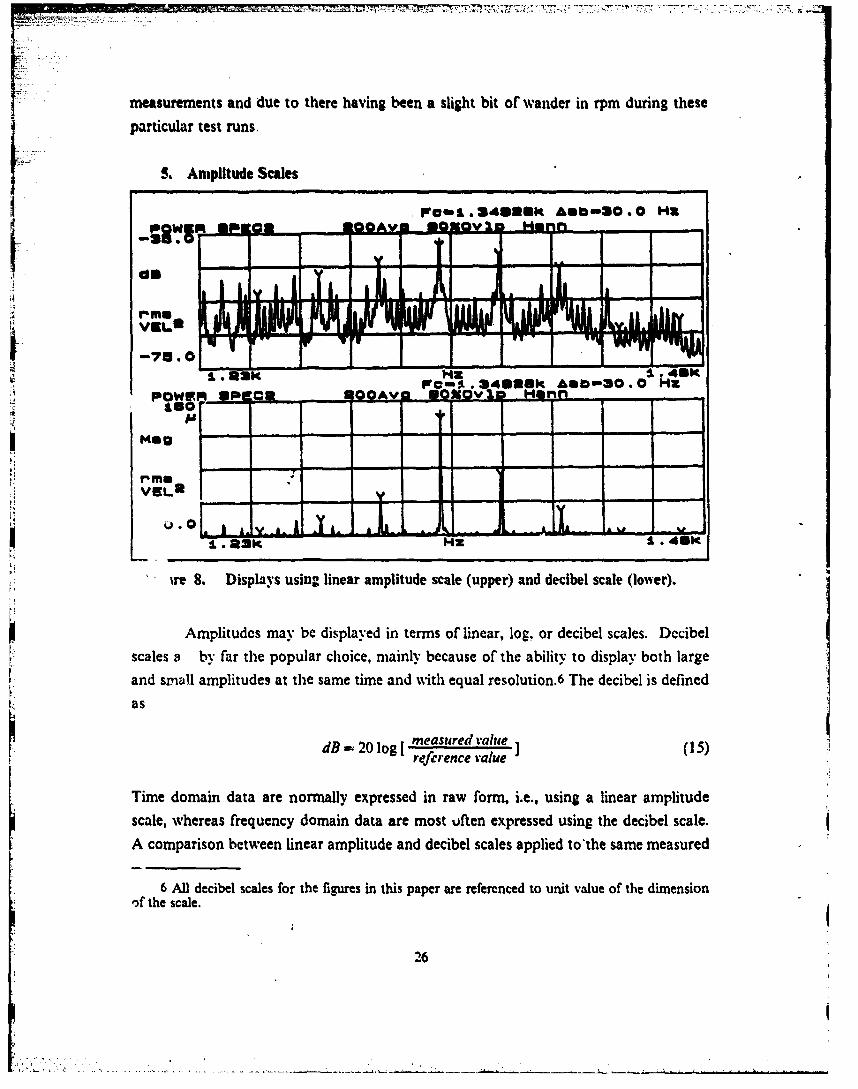
S. Amplitude Scales
a n
Fwl.41U111f1 Asbm-ao.O Hz
-L - - - -- - -VEL*
VU ,,a Iiv1.lifI
ask *z 1.48k(
Oire 8. Dipleys using linea amltdHae(p er andecelsae(or)
Amltdsmyb dslydi em o ier o.o deie scls Deie
VV
and s .Dipay uigllna amplitudeathe samee timeer and ~iheulrslto. h decibel isal dloefine
as
dB 2 logmeasured value (5
dBg - 20 lo(5
reference value
Time domain data are normally expressed in raw form, i.e., using a linear amplitudescale, whereas frequency domain data are most often expressed using the decibel scale.A comparison between linear amplitude and decibel scales applied to'the same measured
6 All decibel scales for the figures in this paper are referenced to unit value of the dimensionsf the scale.
26
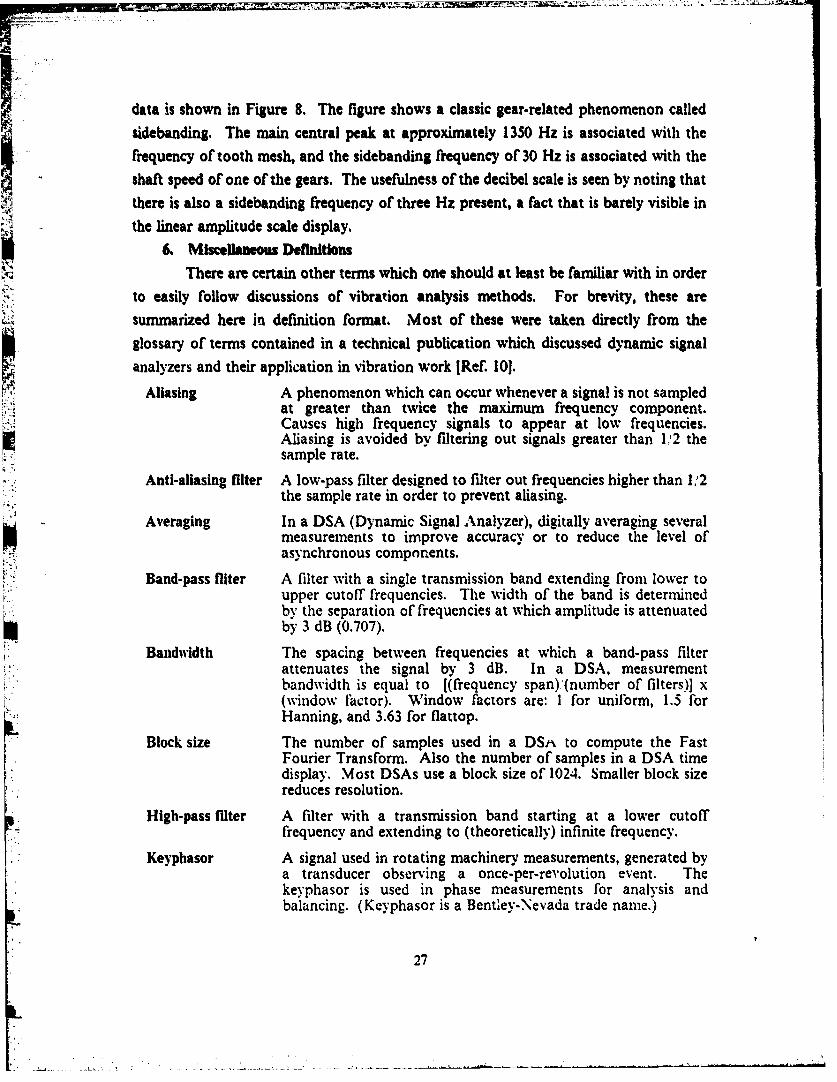
data is shown in Figure 8. The figure shows a classic gear-related phenomenon called
sidebanding. The main central peak at approximately 1350 Hz is associated with theI frequency of tooth mesh, and the sidebanding frequency of 30 Hz is associated with the
shaft speed of one of the gears. The usefulness of the decibel scale is seen by noting thatthere is also a sidebanding frequency of three Hz present, a fact that is barely visible in
the linear amplitude scale display.
6. Miscellanea= Definitions
There are certain other terms which one should at least be familiar with in orderto easily follow discussions of vibration analysis methods. For brevity, these are
summarized here in definition format. Most of these were taken directly from the
glossary of terms contained in a technical publication which discussed dynamic signal
analyzers and their application in vibration work [Ref. 10].Aliasing A phenomenon which can occur whenever a signal is not sampled
at greater than twice the maximum frequency component.Causes high frequency signals to appear at low frequencies.Aliasing is avoided by filtering out signals greater than 1!2 thesample rate.
Anti-aliasing filter A low-pass filter designed to filter out frequencies higher than 1U2the sample rate in order to prevent aliasing.
Averaging In a DSA (Dynamic Signal Analyzer), digitally averaging severalmeasurements to improve accuracy or to reduce the level ofasynchronous components.
Band-pass fliter A filter with a single transmission band extending from lower toupper cutoff frequencies. The width of the band is determinedby the separation of frequencies at which amplitude is attenuatedby 3 dB (0.707).
Bandwidth The spacing between frequencies at which a band-pass filterattenuates the signal by 3 dB. In a DSA, measurementbandwidth is equal to [(frequency span) '(number of filters)] x(window flctor). Window factors are: 1 for uniform, 1.5 forHanning, and 3.63 for flattop.
Block size The number of samples used in a DS^ to compute the FastFourier Transform. Also the number of samples in a DSA timedisplay. Most DSAs use a block size of 1024. Smaller block sizereduces resolution.
High-pass filter A filter with a transmission band starting at a lower cutofffrequency and extending to (theoretically) infinite frequency.
Keyphasor A signal used in rotating machinery measurements, generated bya transducer observing a once-per-revolution event. Thekeyphasor is used in phase measurements for analysis andbalancing. (Keyphasor is a Bentley-Nevada trade name.)
27
Leakap In DSAs, a result of finite time record length that results insmearing of frequency components. Its effects are greatlyreduced by the use of weighted window functions such as flattopand Hanning.
Low-pass filter A filter whose transmission band extends from dc to an uppercutoff frequency,
Octave The interval between two frequencies with a ratio of 2 to 1.
Spectral map A three dimensional plot of the vibration amplitude spectrumversus another variable, usually time or rpm. Also known as acascade plot or waterfall plot.
Tracking filter A low-pass or band-pass filter which automatically tracks theinput signal. A tracking filter is usually required for aliasingprotection when data sampling is controlled externally.
C. SIGNAL MEASUREMENT AND PROCESSING EQUIPMENT1. Transducers
The proper selection of transducers is one of the more important choices to
make in the initial design of any vibration measurement system. A myriad of types andspecific models suited for special applications are available from which to choose.
POWEk uSpce I•- Sj WtOo -40.0
5.11 - - - - - - - - - - - - - -
I
-_ -
IA
Nag - - ----
r-me - - - -..-....-
ZN/atm
0.0'x d Y* 0 H a •1 . 5 k
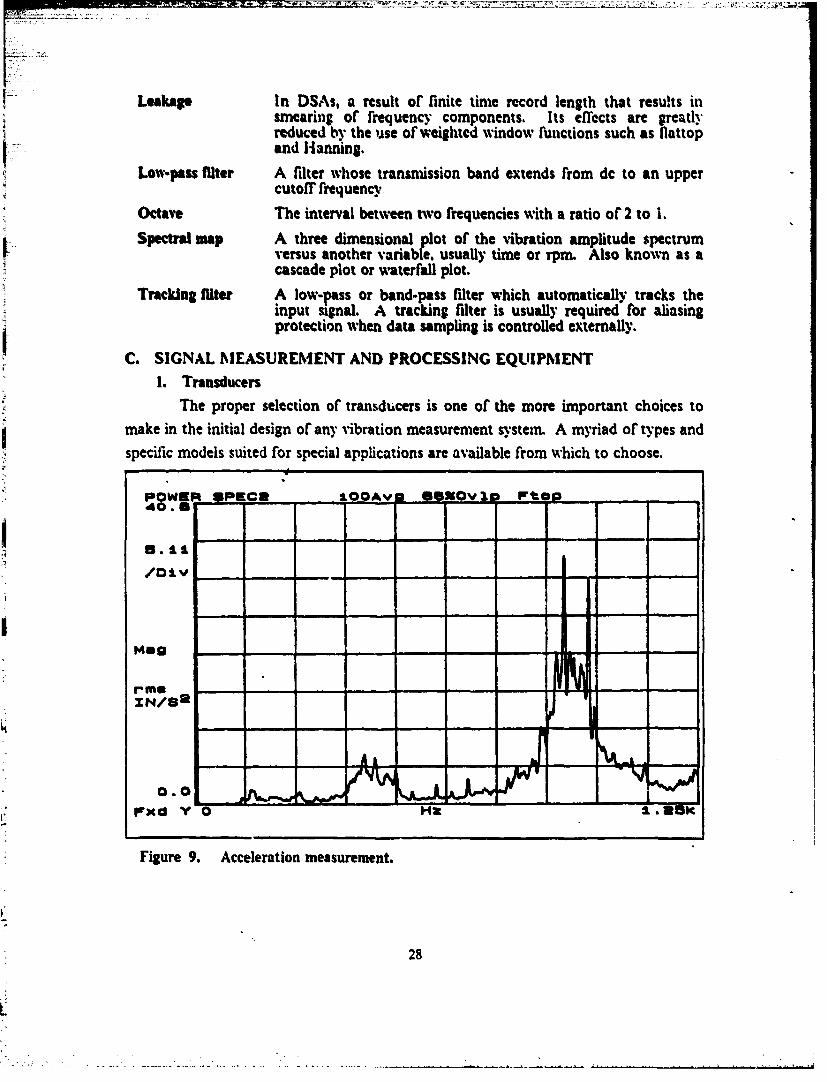
Figure 9. Acceleration measurement.
28
US,
FMd Y - 1. -26--k
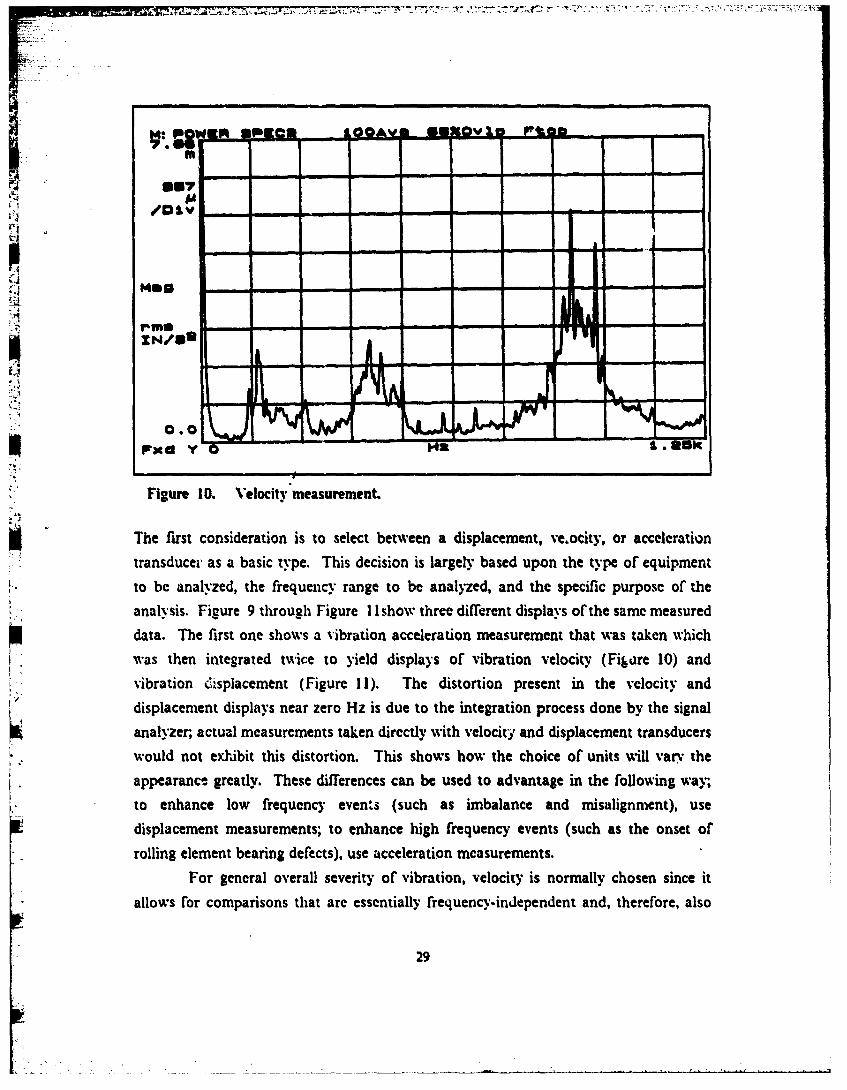
Fiue1. Vlciymaueet
Tefrst cosieato -s -o seec bewe- ipaeet eo raclrto
vbainCslcmn(Figure 11). ThVitrinpeeti h elocity mesuemdt
Thlyer fartua cosieasrationtis toaselecdibectlyween aeoitn displacement, teoi ransduers* traldnsducexhaiabaic tyeThis d ecorin.Tisisonws larel based upoihetye of equs %ipmvvten
to benhanalyed lhe frequency raenge to buc analyzedandtc specmisaicnen) pupocofse
anyisplcmn meisuurens to thogiuenlhanchre dighfferuenty displas ofuthe asa theaosuredr
data.n Telfirst oerne showcs) usibeto acceleration measurementsta. astkn hc
wasthe ienteratoedal severitoyil diplf ofvibration, velocity isForalyhoen 10)c and
tlow or enacmaisn lowarssnial frequency-ee sc simblncepedn and, mitlgnent)or, ulse
29
Mh !I
/OLV
II!.
- - - -, - -
"410
-i -
0. 0 N
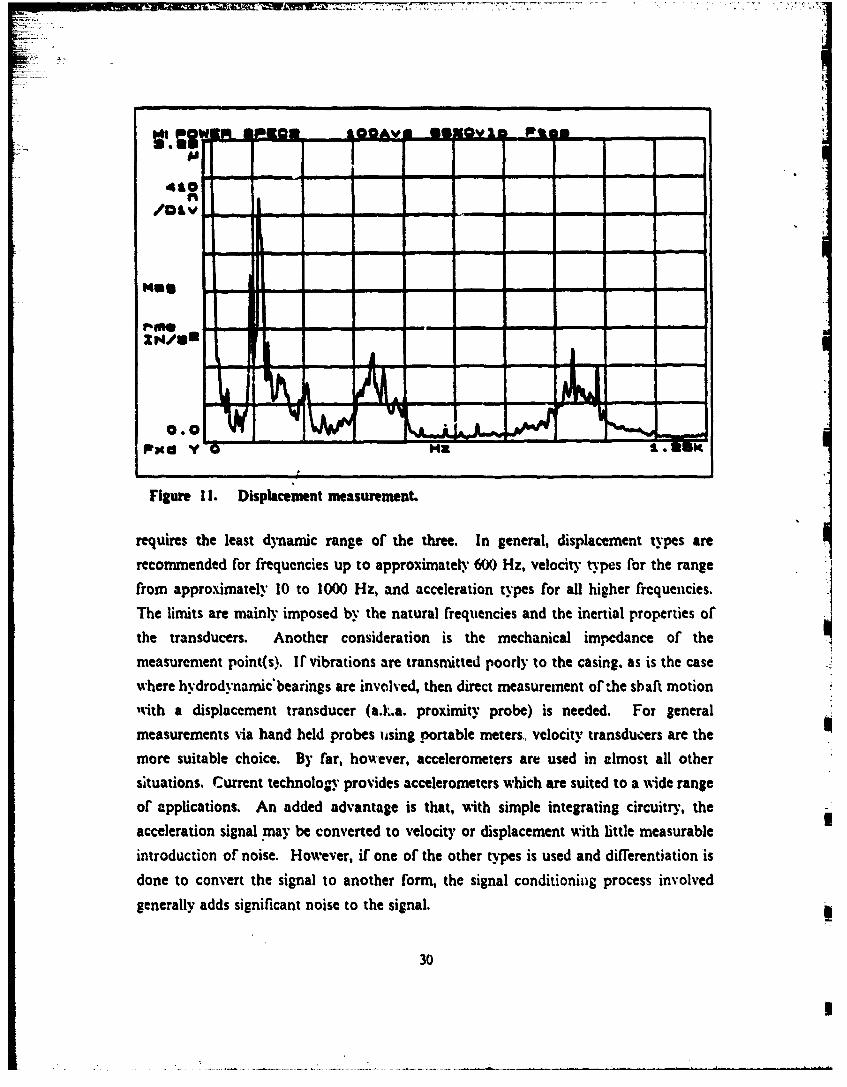
Figure 11. Displacement measurement.
requires the least dynamic range of the three. In general, displacement types are
recommended for frequencies up to approximately 600 Hz, velocity types for the rangefrom approximately 10 to 1000 Hz, and acceleration types for all higher frequencies.
The limits are mainly imposed by the natural frequencies and the inertial properties ofthe transducers. Another consideration is the mechanical impedance of themeasurement point(s). If vibrations are transmitted poorly to the casing, as is the casewhere hydrodynamic'bearings are involved, then direct measurement of the shaft motion
with a displacement transducer (a.k.a. proximity probe) is needed. For generalmeasurements via hand held probes using portable meters., velocity transducers are themore suitable choice. By far, however, accelerometers are used in almost all othersituations. Current technology provides accelerometers which are suited to a wide range
of applications. An added advantage is that, with simple integrating circuitry, theacceleration signal may be converted to velocity or displacement with little measurableintroduction of noise. However, if one of the other types is used and differentiation is
done to convert the signal to another form, the signal conditioning process involvedgenerally adds significant noise to the signal.
30
2. Signal ConditionersVelocity transducers require no signal conditioning since the principle of
operation (upring-loaded magnet moving through a housing-mounted coil which inducesan electro-motive force in the windings of the coil) generates its own uutput voltagesignal. But displacement and many accelerometers require signal conditioning
equipment. Accelerometers are available which contain integrated circuitry which allowsthem to be directly connected to an analyzer provided that the analyzer is designed toaccomodate this. In some cases, signals may require amplification and this normally is
attained by line power amplifiers in place of the line power units. Also, all signals will
be required to pass through anti-aiasing filters which, technically, should be includedas a type of signal conditioner, however, many analyzers will usually have these designedinto their hardware which makes them go unnoticed and often forgotten.
3. Portable Equipment
Portable meters of more common use are displacement meters, velocity meters,and sound level meters which measure wideband overall levels of vibration or sound.
In general they are used to satisfy simple periodic monitoring needs regarding theequipment of secondary importance in predictive maintenance programs, and are used
as the primary% detectio-, and measurement devices in lower level monitoring programs.Again, many. varieties abound, some have selectable units of their displays to alloweither displacement or v:locity measurements to be made with the same meter, others
have different filtering capabilities such that either overall unfiltered or filtered Axidcbandreadings may be taken, and some include switchable settings to allow display of eitherpeak or rms values. These meters are of general use to plant operators who wish to take
overall periodic readings on specific units and they can be used quite effectively for
maintenance monitoring applications, but only on a small scale, and they are notadequate for detailed diagnostic work.
Aside from the meters, there are many compact portable solid-state analyzerswith FFT capabilities, screen display of spectra, nrnd printed output of tables or graphs.
Computer technology has made these units powerful and affordable, and they maysuffice for maintenance monitoring needs, but they are not fully adequate forcomprehensive diagnostics, especially when compared to the larger, more sophisticated
dynamic signal analyzers.4. Non-portable Equipment
Semiportable equipment includes devices which are essentially larger, more fully
functioned vibration meters which have adjustable or tunable filters plus other
31
miscellaneous options. Several known designs operate by manually tuning thenarrow.bandpass filter up through a frequency range of interest and observing
deflections on the frequency and amplitude meters that are mounted on the device.
Many of these can be connected directly to X-Y plotters to generate spectral displays
and some are fitted with strobe light connections Ovhich enable a strobe light to be
triggered by the incoming vibration signal. Thit can be a big time saver in many
instances by helping to isolate which component in a group is the one that contains the
faulty condition, especially when the component is out in the open such as when thedefects are associated with the drive belts of an assembly. As various attributes and
special functions are added, these units evolve into more highly sophisticated units
known as real time analyzers or dynamic signal analyzers. These have digital filters,
analog-to-digital converters, built-in microprocessors with preprogrammed FFT andmany other special functions which are usually menu or soft key selectable from the
main control panel. Input signals from transducers are received as analog signals whichget prefiltered, digitized, then processed, and many also have conventional inputvoutput
ports for access to and from digital sources and storage media. These are extremely wellequipped to handle most diagnostic needs. The next step up from the dynamic signal
analyzers is a totally computer-based system. Various companies carry. lines oFrhardware
and software which provide a uscr with all that is required to establish a complete
diagnostic system. Computer-based sysLems are typically only used in very large plants
where, mainly based on the economics of the situation, it is more advantageous to optfor a continuous monitoring system and or there are a very large number of monitoring
points to be covered.
D. TIME DOMAINAs previously mentioned, there are occasions when an analysis may be done directly
in the time domain. Ai least in some cases the time waveform can give immediate
indications which, even if not useful to directly identify a specific fault, might be useful
in classifying an event which helps determine appropriate subsequent techniques, and
often it can be used to support observations made in other domains. The impulsiveevents associated with bearings and gears, the appearance of modulations which arecommon in faulty bearings and gears, and the truncation of amplitudes occurring when
mechanical looseness is present are all instances when the time domain waveform shape
or pattern may help lend strong direction to continued analysis efforts. Transient events
are also very clearly displayed, making the time domain a natural one to use for their
32
study. Several specific time domain measurements and techniques are of particular
importance; a brief discussion of each follows.
I. Analysis Measurements
a. Autocorrelation
Recognizing that the prefix "auto" means Oself, the term autocorrelation
becomes self-explanatory; it is essentially a measure of a signal's correlation with itself.
Referring back to equation (6), it is not a single value, but rather a distributed function
of the independent time variable T, which is why it is more properly referred to by its full
name, the autocorrelation function. The function is obtained by multiplying the signal
by an increasingly time shifted version of itself. In doing so, any periodic content in the
signal will be reinforced and any nonperiodic content will eventually die out.
The autocorrelation function serves as an indicator of the periodic content
of a signal. As such it may be useful in detecting the presense of periodic events which
are hidden in signal noise. An example of this is shown in Figure 12 where the
autocorrelation and the filtered linear spectrum for a particular event are shown. For
-•- this measurement, a 15-tooth gear and a 50-tooth gear were running in mesh, lightly
loaded, and the 50-tooth gear had one tooth intentionally removed. The shaft speed for
the defective gear was 300 rpm. The autocorrelation measurement shown has a basic
periodic wave whose period is 3.125 milliseconds as measured from peak to peak usingthe cursor controls. This corresponds to a frequency of 320 Hz, just a little higher than
the meshing frequency which is discretely shown in the accompanying linear spectrum.
The difference is due to the digitization of the data and the resolution attainable for the
frequency span that was used for the measurement. The distinctive periodic spikes in the
autocorrelation arise due to the missing tooth which creates a periodic impulsive strike.When a synchronized trigger signal is available, time averaging is the better technique
to use to separate the signal from the noise.
h. Cross Correlation
The cross correlation is a two channel measurement that shows the degree
of time domain similarity between the two signals. In the autocorrelation measurement,
signal components which were similar (periodic) were reinforced when the signal was
compared to itself. Lik-wise, the cross correlation is obtained by multiplying the signal
on one channel by an increasingly time shifted version of the signal on the other channel.
Both measurements enhance those components which are similar, but only the
autocorrelation measurement may declare them to be periodic because the similarities
are in the same signal.
33
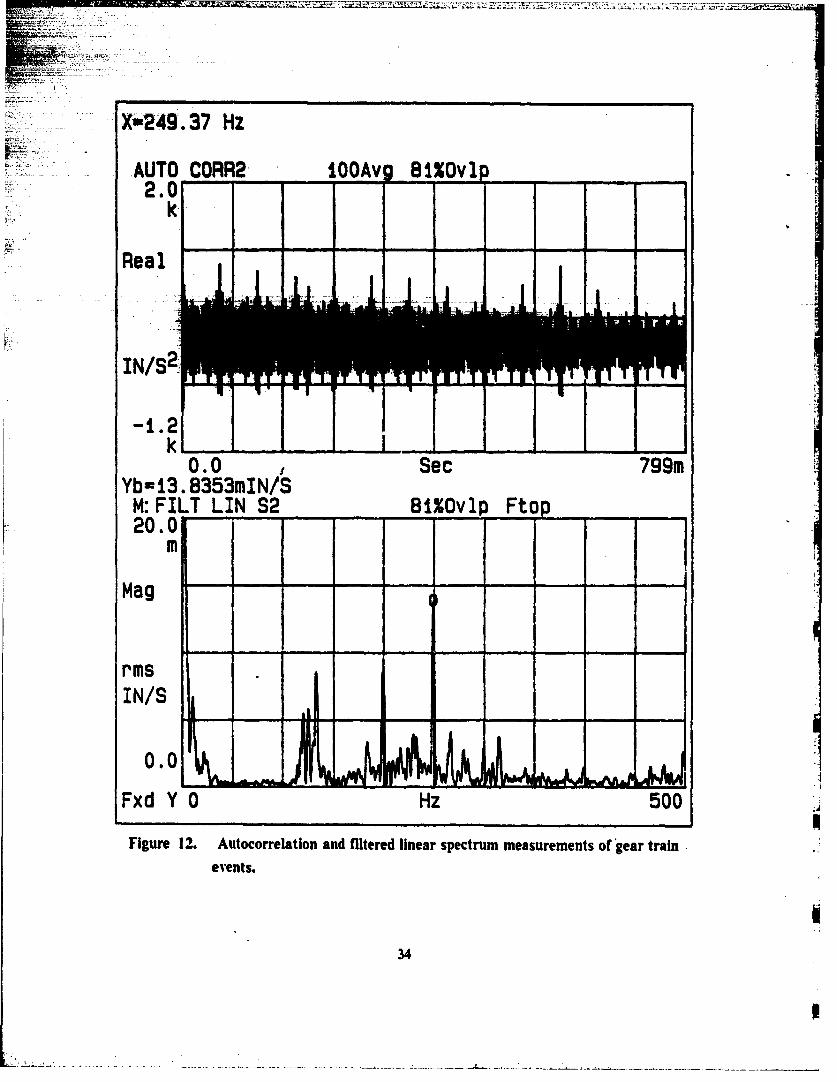
.,Tvr•. 7 hr•vcv --..:'--.- " .
.,....- - .-
-- X-w249. 37 Hz
AUTO CORR2 0OOAvL %0vlp --
* ~2.0-k,
Real --
IN/I
I -Pý
-1.2k .0 Sec 799m
Yb=•13.8353mIN/SM: FILT LIN S2 81Ovlp Ftop -
20.0m
Mag -
rms
IN/S
0.0
Fxd Y 0 Hz 500
Figure 12. Autocorrelation and filtered linear spectrum measurements of gear train
events.
34
•.. , • . . . . . : . ... . . . . .: . .. ... . . _ . . . . .. . . . .. . . . .. ., ... .. . . .. .. . .: , _ : . . . . . . .. . . . .. .. . . . ..
c. Crest FactorThe crest factor is determined by ratioing the averaged peak amplitude to
the averaged RMS amplitude. This factor provides a quantitative measure of a signalpattern. In gear analysis, it gives indications of certain specific conditions. For example,a broken tooth will raise the peak level but have minor influence on the RMS level;conversely, heavy overall wear will reduce RMS values but show little change in peakvalues. [Ref. 11]
d. KurtosisKurtosis is defined as the fourth central moment of the data normalized by
the square of the variance. It functions similarly to the crest factor in that it is anumerical value which reflects changes in peak levels or the number of peak impulsesoccurring. Kurtosis measurements have been successfully applied to both gear andbearing analyses. Normal values are taken to be around 3.0; as defects begin to appear,the kurtosis value increases. For rolling element bearings, the values will grow to around10, then as the defects spread and overall degradation occurs, the kurtosis value begins
V, to fall again back toward the initial level. This is noted in a Bruel & Kjaer publication[Ref. 12] and supported by research done by Reif and Lai [Ref. 13], Swansson andFavaloro [Ref. 141. Stronach, Cudworth, and Johnston [Ref. 151, and many others. Asexplained by Braun [Ref. 9], crest factor and kurtosis measurements are able to bemeaningful measures of peaks in the signal because of their relation to the probabilitydensity function of the data. The probability density function will be affected at itsextremeties by peaks occurring in the process, and moments of the data will reflectchanges in these portions of the probability density function curve.p 2. Analysis Techniques
a. Thne Domain AveragingTime domain averaging (a.k.a. time averaging, synchronous averaging, or
lnear averaging) is a special technique used to greatly improve the SNR and to focusmeasurement on one particular component or event occurring in a machine. In thistechnique, a keyphasor or other timing signal is used to trigger the start of each samplerecord data capture. In this way, any events that are synchronous with the trigger will
L. appear at the same offset in each sample record; all non-synchronous events will occurat random times throughout the samples. As the number of records sampled increases,there is greater reinforcement of synchronous signal amplitudes and greater attenuationor cancellation of asynchronous signal amplitudes. Since any noise in the data will betotally random, it too will eventually average out to zero, leaving a very clean time trace
35
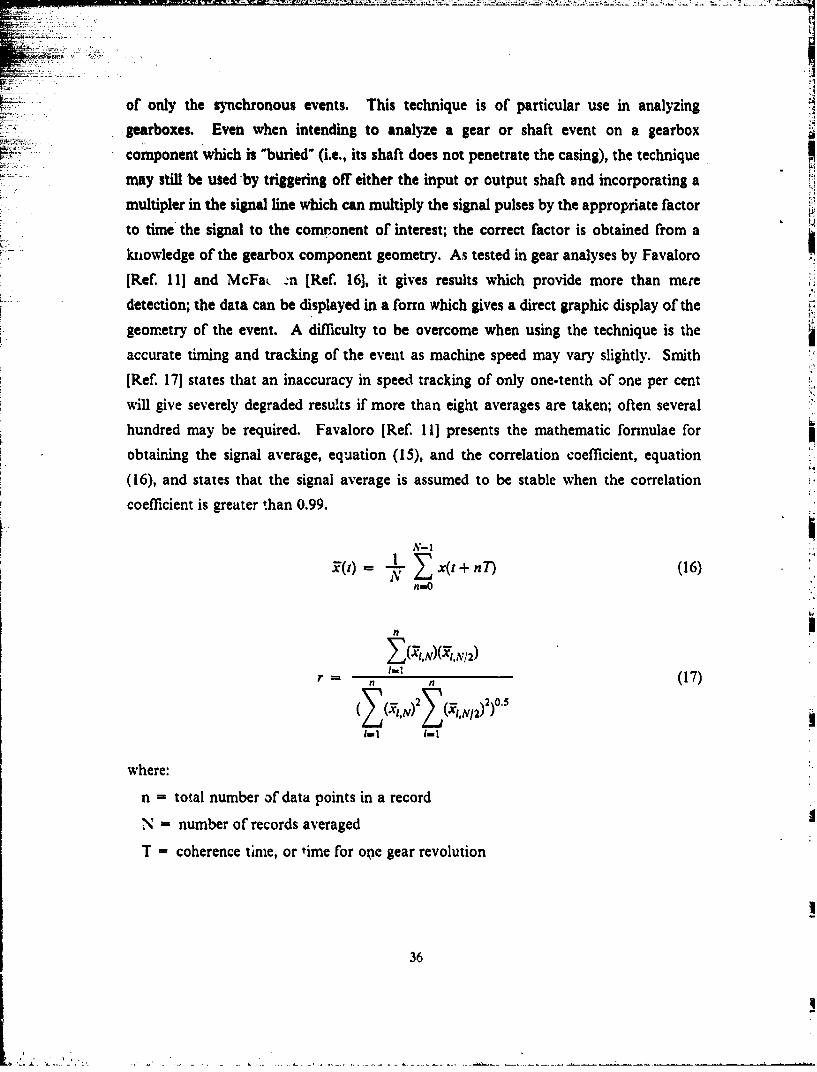
of only the synchronous events. This technique is of particular use in analyzing
gearboxes. Even when intending to analyze a gear or shaft event on a gearbox
component which is "buried" (i.e., its shaft does not penetrate the casing), the technique Imay still -be used -by triggering off either the input or output shaft and incorporating a
multipler in the signal line which can multiply the signal pulses by the appropriate factorto time the signal to the comronent of interest; the correct factor is obtained from a
lkowledge of the gearbox component geometry. As tested in gear analyses by Favaloro
[Ref, 11] and McFaL -,n [Ref. 16], it gives results which provide more than mere
detection; the data can be displayed in a form which gives a direct graphic display of the
geometry of the event. A difficulty to be overcome when using the technique is the
accurate timing and tracking of the event as machine speed may vary slightly. Smith
[Ref. 17] states that an inaccuracy in speed tracking of only one-tenth of one per cent
will give severely degraded results if more than eight averages are taken; often several
hundred may be required. Favaloro [Ref. 11] presents the mathematic formulae for
obtaining the signal average, equation (15), and the correlation coefficient, equation
(16), and states that the signal average is assumed to be stable when the correlation
coefficient is greater than 0.99.
7()= x(t + n) (16)n=O
n
n n (17)
where:
n - total number of data points in a record
N number of records averaged
T = coherence time, or time for oie gear revolution
36
E. FREQUENCY DOMAINMuch of the work done in mechanical vibration analysis is done in the frequency
domain. Especially with regard to rotating machinery which can be viewed as acollection. of periodic events occurring simultaneously, the FFT of the time signals
provide very discrete information about each specific event involved. The time domain
methods m'tntioned earlier are mostly geared toward investigations of specific events
that are known to be present or specifically searched for. The methodologies in thefrequency domain tend to be more investigative in nature in that, more often than not,they are used to see What events are occurring at unacceptable levels as opposed toselectively searching for fine details about events that are known to exist. So for routine
diagnostic work the analysis generally begins more globally to scan for trouble areasshown in the spectral displays, then follow-up s,-.ns at higher resolutions (smnallerfrequency spans) are conducted to isolate and better definie specific faults. The measuresobtained are quantitative, but mostly onar relative scale rather than on an absolute scale.There are certain absolute standards in existence, e.g. ISO 2372 published by theInternational Standards Organization, and many manufacturers publish their ownrecommendations and guidelines for acceptable levels of vibration that their productsshould show in service. Most of the literature shows, though, that the end users ofvibration analysis equipment generally have their own in-house standards and limitswhich often are far more stringent than those mandated or recommended by outsidesources. Many of the limits used in maintenance monitoring programs are based onrelative changes in amplitudes detected between two consecutive readings, and it mayoften occur that this type of criteria is violated before any fixed absolute limidts areapproached. Some of the more commonly used measures and techniques done in thefrequency domain are briefly discussed below under separate headings.
1. Analysis Measurementsa. Line Spectrum
A line spectrum is simply the Fourier Transform of the time signal of themotion being measured. This is by far the most commonly used measure in spectralanalysis as applied to machinery diagnostics. It incorporates the three basic pieces ofinformation normally looked for: which frequencies are showing high amplitudes, whatare the amplitudes. and how do they compare to each other and to previous records.The vibrations are highly direction oriented and zhis is of great importance in conludingwhat faults exist. Therefore, it is common to take readings in three coordinatedirections; two radial readings mutually perpendicular, and one axial reading. WVith this
37
information at hand, the analyst is well-equipped to commence comparisons of the data
to identify the sources of trouble. Line spectrum measurements are cbtainable through
the use of a single channel, that is, a single transducer signal fed into a signal analyzer
or FFT processing device, and this is what is normally done for routine monitoring work.
In the case of detailed investigative diagnostics carried out on a particular machine to
locate one or more problems which could not be isolated by the information provided
by monitoring data alone, there would normally be a second transducer or at least a keyphasor used in order to provide phase information. This is the main drawback to all
forms of single channel measurements which do not use a keyphasor, they can provide
no phase information.b. Autospectrunt
The autospectrum (also known as the power spectrum) gives a measure of
the power contained in "he signal at various frequencies. Although not normally used
in machinery diagnostics to any great length, it can provide a means to quickly see where
the problem areas are and where the analysis should focus its attention. As such, it can
find usefulness in diagnostic work, but is not useful in maintenance monitoring activities.
Readings of the power levels in the signals are of greater interest and use to acoustic
engineers working on noise control methods and analyses. It also can, and usually is,
obtained as a single channel measurement and, as with the line spectrum, will provide
no phase information when so obtained.
c. Cross Spectrum
The cross spectrum is a two channel measurement which gives a mixture
of information regarding the power spectrum of each of the two signals. Referring backto equation (11), it represents the amplitude product of the two spectra and the phase
difference between them. It is mainly used in the computation of the transfer function
which is obtained by dividing the cross spectrum by the power spectrum of the input
signal. Beyond this, the literature gives very little mention of this measurement; it
appears to be of little use in diagnostic work to date.d. Frequency Response Function
The frequency response function is a two channel measurement which gives
the ratio of a system's output to its input. It contains both magnitude (gain) and phase
information displayed as functions of frequency. The measurement is normally used in
modal analysis work for determining natural frequencies, damping facto:'s, and other
structural response characteristics.
38
e. CoherenceCoherence is a two channel measurement which indicates the amount of
power in the output power spectrum that is related to the power in the input power[ spectrum. It is a function with amplitude ranging from zero to one and plotted as a
function of frequency. It provides an index of the quality of the transfer functionmeasurement and, consequently, should always be reviewed before any gain or phaseinformation from the transfer function is accepted as valid. Coherence values less thanunity are normally due to poor resolution (frequency analysis span too large), nonlinearsystem behavior, uncorrelated noise, or uncorrelated input signals [Ref. 71.
39
IV. MACHINERY DIAGNOSTICS MODEL
A. MODEL DESIGN AND DEVELOPMENT
Since the most useful aspect of the model was to be its ability to show machineryfaults and their characteristics, no specific detailed design was required; however, theselection of components and their fabrication and assembly were carried out with careand precision to ensure that the model could also give vibration patterns representativeof machinery that was well-balanced, well-aligned, and in otherwise normal, defect-freecondition. In this way, meaningful comparisons between normal and abnormalconditions could be mrLde. The faults intended to be included were damaged anti-frictionbearings, damaged gears, rotating imbalance, mechanical looseness, defective drive belts,and misalignment. This assortment was felt to provide a reasonable number of commonfaults which could be incorporated into a single assembly whose size, weight, portability,
and power and load requirements were within practical limits with respect to its intendedimmediate and future uses.
1. General ArrangementFigure 13 shows a plan view of the model. It consists of four parallel htlafts
which may be interchangeably driven by either gears or flexible belts. The first threeshafts as viewed from right to left were used in conducting misalignment, gear defect,and bearing defect - 2eriments; the fourth shaft was used in conducting imbalance, drivebelt defect, and mcchanical looseness experiments. The specific construction of the
balance discs on the fourth shaft also allow them to be used to demonstrate a typicalrotor balancing procedure which may be of use in future vibration laboratory exercises.
The drive selected for the assembly was a one fifteenth horsepower, variablespeed, permanent magiiet dc motor. The motor controller provided constant speedcontrol and had two separate speed setting knobs, one graduated from zero to 100 percent (100 per cent E-"'-. a r,: A speed of 26S0 rpm), and one for extended speed range,graduated from- W0 to 2('j per cent. It was also equipped with a three-amp circuitbreaker and a switch to change motor rotational direction. A dc ammeter was installedto measure motor current draw which was used as an indicator of relative load. Theactual load was not a require - -asurement for the experiments that were conducted,but it was necessary that ma.-.. of the runs be done it the same load for sake of makingvalid comparisons of other parameters, and the meter served this purpose.
40
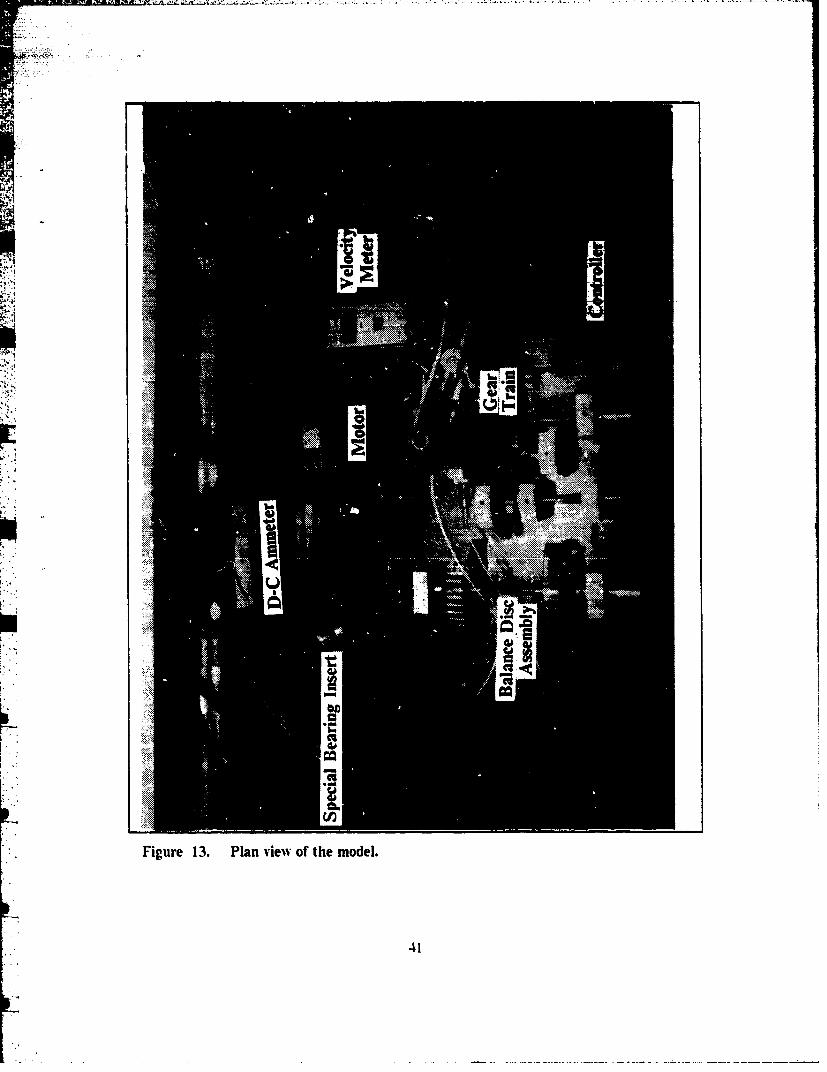
Figure 13. Plan view of the model.
41
Initially, an arrangement ising a small 60:1 speed reducer run in reverse was
used as a load to be driven by the third ,thaft of the Sear train. Its a-vailability and lack
of need for ancillary equipment were prime reasons for its selection. This unit wvassufficient to -provide a countertorque which required approximately half the motor ratedcurrent and was a very steady load. Unfortunately, the arrangement suffered several
material failures and associated complications in its connection to the gear shaft and it
was eventually abandoned in favor of a direct friction drag on a disc mounted on theforward end of the third shaft of the train (the disc is not shown in the figure; a smallsingle groove pulley can be seen in the place where the disc was mounted). Althoughthe friction drag was acceptable for most of the experiments that were conducted, a load
source with greater stability would be required to avoid any speed changes due to load
variations if more detailed experiments are planned for this model.2. Component Details
The shafts were cut from a single six foot length of 0.375 inch (+ 0.0000 to
-0.0002) C-60 case hardened and ground steel red. The selection of material and
tolerance,%was intended to guarantee minimal deflection under load and a secure fit v'-th
mating components.
The anti-friction bearings used were Fafnir model AS3K radial ball bearings
with a static load rating of 312 pounds and a dynamic load rating of 830 pounds. Theinside and outside diameters were listed as 0.3750 inch (+ 0.0000 to -0.0003) and 0.8750inch ( + 0.0000 to -0.0004), respectively. Ball diameter was measured to be 0. 155 inch;
and pitch diameter was calculated from the above dimensions as 0.675 inch. It was
intended to obtain the lightest duty bearings as possible in order to keep required loadsto a minimum; however, bearing sizes smaller than this would have greatly limited the
size and selection of available gears to fit the same shaft. Obvious alternatives were to
use a stepped shaft or to use as small a shaft as desired and install bushings in the gears
to make up the difference in diameters. This led to two concerns; one was that bearingsany smaller would be extremely difficult to disassemble, damage, and reassemble as was
contemplated for the bearing study; the other was that adding more interfaces and
material types (i.e., the bushings) would be adding more places where signal attenuation
might occur due to transmissibility losses. For a detailed study on either gears or
bearings alone, the choices would be simple, but the combined effort made comprom-ise
a necessity. No thrust bearings were used anywhere in the design since the only axial
loads present would be due to angular misalignment of the spur gears, and the small
42
amount of axial load able to be absorbed by the radial bearings was assumed to besufficient to handle any loads so generated.
All the gears selected were common steel stock spur gears with three eighthsinch face width, 14.5 degree pressure angle, and had no specified hardness or surface
finish attributes. For detailed experiments of gears, these attributes would be ofimportance, but at the'time of selection of these components no such studies werecontemplated. Two 50 tooth, two 70 tooth, and four 15 tooth gears were obtained. The
selection was guided by-;-hat was readily available in the 0.375 inch bore size and wasotherwise based on what the meshing frequencies would be for various geararrangements. This latter point was important in order to avoid overlapping of theirevents in spectral displays when the full train of gears was actively in mesh.
The pulleys wer fabricated from two-inch thick aluminum plate machined toprovide radiused grooves to accommodate flexible belts of circular cross-section.Envisioned for light loads and primarily to be used for step up or step down of shaftspeeds when the gears were not to be in mesh, the round belts were considered to be agood choice because they were simple, effective, and inexpensive. The belts were madefrom straight lengths of threr.-sixteenths inch Buna-N, type 0-ring material which werecut to length and adhesively bonded. Several belt sizes were made, all similarlyconstructed.
Two balancing discs were fabricated from one inch thick plexiglass in the shapeof a gear blank. This shape was chosen in order to keep the weight concentrated nearits periphery, and a series of holes spaced at intervals of ten degrees were drilled andtapped in the outer rim to accommodate cap screws that were used to create and alterthe state and degree of imbalance. The specific use and arrangement of the holes wa3designed to allow the same assembly to be used for demonstrating a rotor balancingprocedure, if desired, in future vibration laboratory sessions. The choice of plexiglasswas made to ensure that the amount of imbalance required in order to have a noticeableaffect would be minimal.
The bearing blocks were fabricated from three-quarter inch aluminum plate and
V measured four inches high by two inches wide. These dimensions are common to allblocks except for the two ball bearing blocks on the third shaft which required slightmilling of one side of each block to provide extra clearance from adjacent gears. In eachof five of the blocks there is a 0.875 inch staight bore located 2.75 inches from thebottom to accommodate the ball bearings. One of the blocks (the first one down fromthe top of the figure on the last shaft or the gear train) has a 1.25 inch bore to
43
accommodate one of two special !nserts that were made which were fitted with theundamaged and the intentionally damaged ball bearings, one each per insert. The useI " of the inserts enabled a quick means to change the bearings with minimal effort and
movement of other components. The three remaining bearing blocks shown in the figurewere each fitted with a nominal 0.375 inch bronze bushing; two of these blocks were the
main bearings for the balance disc shaft, and the third block served as a steady bearing
for the extended portion of the third shaft of the gear train. The bearing blocks could
have been directly drilled and tapped to allow for stud mounting of the transducers, but
it was desired to also test out the use of magnetic mounts which is the method practiced
by the Navy in their machinery maintenance monitoring program. To satisfy this desire,
small steel pads measuring one inch by three quarters of an inch by one quarter inch
thick were fabricated rnd were drilled and tapped to accommodate the transducer
mounting studs. These pads were finish ground and then affixed to the tops and sides
of the bearing blocks (some side mounts were omitted due to clearance restrictions). In
accordance with a special study regarding the attachment of transducer mounts, these
pads were affixed using a cyanoacrylate ester compound (super glue) which reportedly
gave the most favorable overall performance in the transmissibility studies that were
conducted.
A three quarter inch plexiglass plate measuring 20 inches by 24 inches was used
as the base for the assembly. Plexiglass was chosen because it was available on-hand in
stock, was very easy to work with, and (for the thickness used) it was considered
sufficiently rigid to serve as a suitable foundation and yet help minimize the overall
weight of the assembly. A thin hard rubber mat was laid beneath the base to secure it
from sliding and to prevent any vibrations which might be caused by the base resting
on the hardwood countertop. Foam padding was initially used for this purpose, but it
was found that this allowed excessive motion of the entire assembly which caused
resonant frequencies of the model as a whole to appear in the spectral displays,especially during the imbalance studies. The use of the hard rubber mat avoided this.
3. Component Assembly
All ball bearings in the assembly were pressed into their housings (bearing
blocks or sleeve inserts) and onto the shafts. All balance discs, gears, and pulleys were
secured in place by means of set screws which were threaded through tapped holes in the
hubs of the components to bear against the shafts. Each of the bearing blocks was
secured by two 10.24 steel capscrews which were passed up through counterbored holes
44
In the base. For the blocks of the gear train, these holes were made slightly oversizedto allow for small alignment adjustments in assembling the train.
The input shaft was couplet; to the three-eighths inch motor output shaft usinga short section of one-half inch reinforced rubber hose that was force fit over the endsof the shafts. This was found to be sufficiently tight to transmit the torque of the motorwithout slippage and yet allow for small alignment inaccuracies as well as dampen outany motor related vibrations form the assembly. Two of the 15 tooth gears are carriedon this shaft between two ball bearing supports; the near end of the shaft extendsthrough the forward bearing and is fitted with a double groove pulley.
The intermediate shaft of the gear train carries two of the S0 tooth gears andone of the 15 tooth gears betweven ball bearing supports. Neither end of' this shaft wasextended to allow for individual drive via flexible belt since the size of the gearing madefor very small clearances between bearing blocks and moving parts at this point in theassembly.
The final shaft of the train carries one of the 70 tooth gears at mirdspan betweentwo ball bearing supports and extends forward through a steady bearing. The forward
end of this shaft is fitted with either a small single groove pulley (as pictured in the planview of the model) or the friction disc that was used to provide system load. Alternately,
any combination of pu"eys may be interchanged among the various shafts to suit theneeds of the user, with the exception that there is insufficient clearance to mount the twolarge pulleys on the first and third shafts of the train simultaneously.
The fourth shaft carries the two balance discs between plain bearing supports* and two aluminum collars just outboard of' the discs which served to limit axial travel
of the shaft. In use, the light weight of the assembly coupled with the freedom for axial
travel allowed by the use of the sleeve bearings would tend to make the shaft assume an* axial position as determined by the pulley and belt alignments. The collars were merely
provided in anticipation of the possiblity of belt failure or disengagement in operation
and were secured to the shaft with sufficient clearance from the bearing blocks topreclude any rubbing contact which could create additional events to appear in spectralmeasurements. The forward end of the shaft extends through the forward bearing andis fitted with another double groove pulley which has twvo different diameters to allowsome versatility in the speed step up; step down arrangement that may be desired. Uponcompletion of the assembly, the discs were turned so that their locating set screws were
symnrnetrically offset, then one was secured in place via its set screws. The other disc
was then rotated just enough to bring its holes into index with those of the first disc and
45
its sot screws awer then tightened. Finally. the pulley and the two collars weoe similarlyadjusted to have a syn'metric distribution of their set screws before they were tightened.This procedure placed the final assembly in a state of near-minimal imbalance which was
considered sufficiently accurate to use as a baseline condition for future imbalancestudies.
The mounting of redundant gears on the first and second shafts of the trainallowed for one set to be retained in good condition while the other could have defectsintentionally seeded in, and changeover from one set to the other could be accomplishedwith as little variation in the set up and alignment as possible, thereby improving thevalidity of comparisons to be made.
A close-up -view of the gear assembly is shown in Figure 14 where the full trainis seen in mesh, and with the defective gear on the intermediate shaft pictured in meshwith the site of its missing tooth appearing at the top of the gear.
BL TEST EQUIPMENTAn overall view or the model and measurement equipment layout is shown in
Figure 15. Referring to the figure, the main components of the test equipment includeda signal analyzer, a signal pow~er amplifier rack, two accelerometers, a disc drive, an
optical tachometer, a plotter, and a dc ammeter. A description of each piece ofequipment follows.
1. Mleasurement DevicesFor measuring shaft speeds, small pieces of reflective tape were attached to each
shaft (or to components on the shaft) and an optical tachometer, ANMETEK modelnumber 1723, wxith an operating range of 100 rpm to 9999 rpm displayed the speed in
terms of rpm on a LED readout. The dark coaxial cable leading from the back of thetachometer display and -onnected to the front of the analyzer was a later modification
made to the unit which tapped into the once-per-revolution pulse signal it received fromthe optical probe and f-d this as a trigger signal to the analyzer. This trigger wasrequired in order to use the time domain averaging technique which the analyzer
supports.A dc ammeter (seen best in Figure 13), Weston model number 901, was used -
to read motor current on a scale of zero to one amperes. The motor rated current is 0.75amperes; most experiments were run in the range of 0.25 to 0.30 amperes. This currentreading was merely used as a relative load indicator. For the experiments conducted, the
absolute value of the load was not required to be measured; it was only necessary that,
46
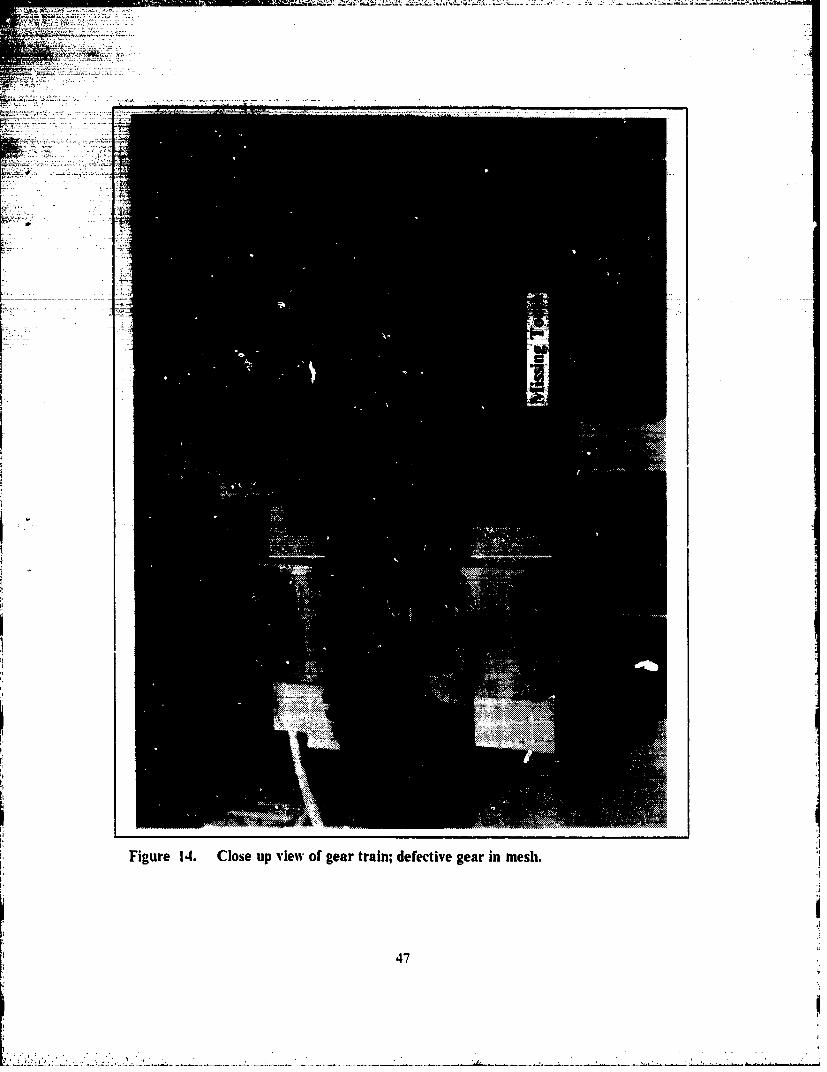
Figure 14. Close up vilew of gear train; defective gear in mesh.
47
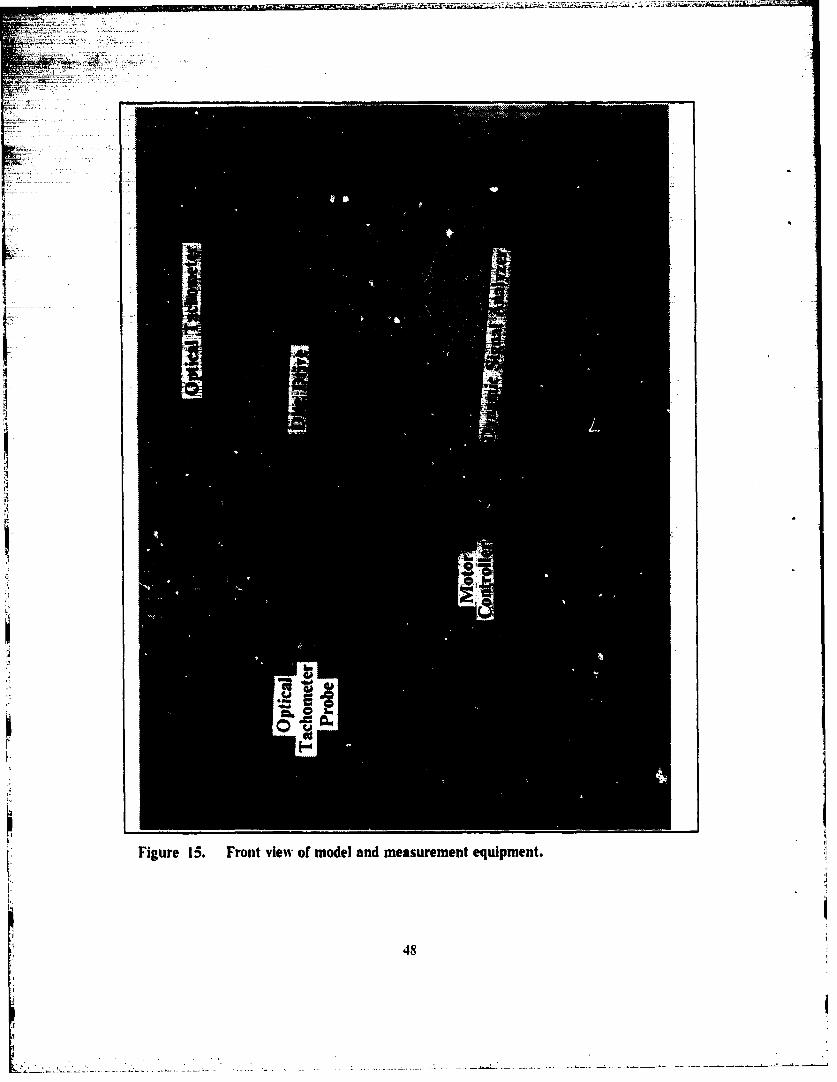
k[I
I
I
p
IFigure 15. Front view or model and measurement equipment.
48
-.. �
where repeated conditions were sought, there was a means to ensure that the loads were
repeated as well.
The transducers used were PCB Piezotronics, Inc. model number 302A06 quartz
accelerometers, ground isolated with built-in amplifiers, rated for a frequency range of
0.7 to 10,000 Hz, and with a voltage sensitivity of 10.01 mV/g. These were either stud
mounted or, in some cases, magnetically mounted using the magnetic attraction bases
(PCB model 080A27) provided with the accelerometers. In both cases, a thin coat of
silicon grease was applied as a couplant/lubricant at all interfaces between the
transducers and the mounts. The transducer cables used were PCB model 002C standard
coaxial cables fitted with 10-32 micro and BNC plug connectors.
2. Data Processing, Display, and Storage
The transducer cables were connected to a PCB model, 483A08 six channel
power supply,, amplifier fitted with individually adjustable gain settings from zero to 100.
Gain settings of 10 on each channel were used throughout the experiments. The outputsfrom the amplifier were connected via standard coaxial cables to the input channels of
a Hewlett Packard model 3562A two-channei dynamic signal analyzer (DSA). All
subsequent operations of filtering, processing, display, storage, and output were
controlled via the functions incorporated in the DSA. Data to be permanently stored
was output to a Hewlett Packard model 9122 dual flexible disc drive, and plots were
created by outputting to a Hewlett Packard ColorPro model 7440A plotter.
For several initial measurements, a PCB model 302B08 accelerometer, having
the same specifications as the others, was used in conjunction with a battery powered
PCB model 396B velocity vibration meter which measured overall vibration velocity in
the frequency range from 10 to 10,000 Hz and displayed it on a digital LED readout in
terms oe'decibels referenced to 10-6 cm,:s. Two 10-32 micro fittings on the meter served
as throughputs that could be directly connected to the analyzer channels. One provided
an acceleration signal with voltage sensitivity of 10 mV/g, the other provided a velocity
signal with sensitivity of 1000 mV,'g. These were used on many of the initial single point
measurements to directly provide an acceleration measurement on channel 1 and avelocity measurement on channel 2. For iater work with two point measurements, the
previous setup (accelerometers and amplifier) was used exclusively and any velocity
measurements desired were obtained by integration and the other math functions
available in the DSA.
49
C. MODEL TESTING1. Initial Tests
In preparation for model testing, several specific initial tests were conducted toverify the performance of the measurement equipment and its arrangement. Anadditional test was also found necessary soon after the first model test had begun.
a. Transducer Calibration•: ,To ensure that the newly acquired acceierometers had not been damaged in
transit, a simplified calibration test was performed in order to compare their measuredsensitivities to those reported in the literature which accompanied them.
A solid, cylindrical steel weight with a small, through-drilled hole at the topwas suspended by a short length of string that was connected to the midspan of fourrubber bands which had been secured end-to-end. The ends of the outermost rubberbands were connected to solid supports which were spaced apart to provide tension inthe bands. Each accelerometer was in turn connected to the bottom of the weight usingthe magnetic attraction base that was provided and connected to the analyzer via thepower amplifier. The analyzer was then set up for a time domain measurement with aspecified trigger level and delay. The point of attachment of the string to the rubberbands was then given a quick downward strike. This caused a I g change in accelerationto be experienced by the weight and accelerometer. The maximum amplitude observedon the time domain display of this measurement indicated the amount of voltagegenerated for an acceleration of lg, hence gave a direct measure of the transducervoltage sensitivity.
b. Transducer Mlounting
Although there were studies conducted regarding the suitability of magneticmounting of the transducers, a comparison test between stud and magnetic mountingperformance was made to ensure that similar results would prevail in such use on thisparticular model, and also to verify that the steel mounting plates on the bearing blockshad been adequately prepared and affixed in place. A total of four measurementE weremade, 500 averages taken in each case. First, two stud mounted transducermeasurements were taken, one using a Hanning window and one using a flat topwindow; then two magnetically mounted transducer measurements were taken, againone using each of the window types. The Hanning windowed measurements were
,c6mpared for the accuracy and repeatability of the frequency resolution of the spectra,and the flat top windowed measurements were compared for the accuracy andrepeatability of the amplitudes ofr the spectra.
50
id
.. a...................................- ...
c. Tache meter TeatA performance check on the optical tachometer was conducted in
accordance with the manufacturer's instructions. This involved aiming the probe at afluores.zent -light and observing a certain value on the digital display. The operatingguide emphasized the importance of sufficient size and proper placement of the reflectivetape used on the device being measured to ensure proper readings would be obtained.N Consequently, to verify that the amount and application of reflective tape were correct,the rpm display of the tachometer was compared against shaft frequency readingsobtained using the signal analyzer. An intentional imbalance was imposed on one of theshafts and a high resolution measurement was made using a Hanning wrindow for
frequency accuracy. The test was repeated several times at various speeds between 200and 2000 rpm.
d. Model Resonance TestInitially the model was supported on foam padding to isolate it from the
hardwood countertop and to secure it from sliding. Shortly after commencing theimbalance tests it was noted that there were several frequencies that could not beaccounted for. Several simplified resonance tests confirmed that resonant motion of themodel as a whole was the problem. The tests were conducted by taking a single channelpower spectrum reading and exciting the base of the model with a hardwood stick. Usedas a crude but effective measure of the frequency response of the unit, it providedinformation regarding the frequencies at which the unit naturally would tend to vibrateas indicated by frequency bands in the spectrum where significant power levels developedwhen the unit was impulsively excited.
2. Machinery Fault Simulation Proceduresa. Imbalance
The balance disc assembly of the model was specifically designed fordisplaying imbalance and, therefore, was used for this simulation. With the sh~aftassembly having been pre-adjusted to obtain a state of minimal imbalance, the vibrationsignature of this state was obtained to serve as a reference, then intentional imbalanceswere created, measured, and the signatures compared to the original baseline signature.
The balance disc shaft was fittedurith the two balance discs, two alumninumncollars which served as physical stops to limit shaft axial travel, and a four-inch doublegroove pulley. When originally assembled,'this shaft and its components had beenadjusted to obtain minimal residual imbalance by the procedure described earlier under
* Component Assembly and had not been altered since that time. All the cap screws in

...... 1
the rims of the balance discs were -removed and the optical tachometer probe was
supported in the clamp stand and trained on the reflective tape on the balance disc shaft
to provide the most accurate speed measurement. With the two 15 tooth gears on the
input shaft locked in position out of mesh, a flexible belt was installed around the input
shaft and balance shaft pulleys which gave a one-to-one drive ratio. The balance discshaft was brought to, and held at, a speed of 899 rpm. Power spectrum and filtered line
spectrum measurements were then taken covering a baseband span from zero to 100
Hz and using 500 averages, 90 percent overlap processing, and a Hanning window. The
signal was measured and received as vibration acceleration, and the filtered linear
spectrum display was then integrated to convert it to vibration velocity..
One cap screw was the n inserted at the same location in each disc and the
measurement procedure repeated. All other conditions were exactly duplicated except
that the shaft speed fluctuated slighily between 899 and 900 rpm, with the latter being
more prevalent. This procedure was repeated several more times until, finally, all the
original cap screws were reinstalled, six per disc, evenly spaced. The shaft speed for the
final run was steady at a value of 89S rpm.
b. Misalignment
Followving the imbalance tests, the balance shaft was retained in its final
state, i.e., with six cap screws symmetrically spaced in each disc. The far bearing block
(away from the pulley) was then loosened, skewed horizontally relative to the shaft, and
re-secured. This was done to intentionally create a misaligned bearing condition. With
the signal analyzer in the same setup state (500 averages, 90 per cent overlap processing,
and a Hanning: window.), the shaft was brought up to a speed of 1200 rpm. Two
accelerometers were stud mounted to the bearing block; one in the axial direction and
one in the vertical direction. Filtered linear spectra measurements were then taken and
converted to velocity readings via integration as before.
c. Belt DefectThe misaligned bearing block was re-squared to the shaft, re-secured, and
all screws were removed from the balance discs. To simulate a belt defect, a piece of
electrical tape was wrapped around the glued butt joint of one of the drive belts which
was then installed around the four-inch pulleys mounted on the input and balance shafts.
An accelerometer was located in the horizontal direction on the bearing block adjacent
to the balance shaft pulley. A filtered linear spectrum measurement was taken on a
baseband of zero to 100 Hz using 500 averages, 90 percent overlap processing, and a
52
1IHanninj window. The shaft speed was maintained at 899 rpm and, again, the
measurement was integrated to yield vibration velocity.
W -. d. Mechmieial Looseness
To simulate mechanical looseness the mounting screws for the far bearingblock (away from the pulley) of the balance disc shaft were backed off slightly to permit
"motion of the bearing block relative to the base. The cap screws of the balance discs
were left symmetrically distributed on their discs and the shaft brought up to a speed of800 rpm. A filtered linear spectrum measurement was made with the two accelerometers
in place as they had been for the misalignment test, and the analyzer setup state the
same as well. Severa" variations on the arrangement were attempted to attain a
distinctive signature. The mounting screws were tightened and re-loosened to variousdegrees, and the cap scrm,':s in the discs were repositioned closer together and in greater
number to help excite motion of the block. Typical indications sought in reviewing the
measured data were a large number of harmonics without significant peaks in the axial
direction, along with truncations of the time domain waveform.
e. Bearing Defects
The model was fitted with six radial ball bearings, one pair for each shaft
of the double reduction gear train. Two additional bearings of identical make and size
were acquired, each to have an intentional da-fect imposed; an inner race defect in one,
and a ball defect in the other. The bearings used were Fafnir model AS3K with seven
balls per bearing and the following dimensions.
0 inside diameter (bore) ........................ 0.375 inch
e outside diameter ................................ 0.875 inch
a pitch diameter ................................... 0.675 inch
* ball diameter ............... 0.155 inch
From equations (18) through (21), the bearing characteristic frequencies were calculatedas follows, wheref, is the shaft frequency.7
9 ball passing frequency, inner (f) ...... 4.368f, Hz
* ball passing frequency, outer (/).....2.632f, Hz
• ball spin frequency (f,) .................... 3.784f, Hz
* cage frequency f) ............................ 0.376f, Hz
7 Note that if the frequency axis of a spectral display is converted into orders of rcvolution,
then the coefficients off, become the characteristic orders.
53

To create the defects, the bearings were disassembled and a single defect
made in each using a fine tooth file to generate a flat spot. The author's previous
experience in evaluation of bearing condition was limitted to visual inspection and
feeling for roughness in the bearing's motion. With no prior experience as to the size
of detict required to create a significant spectral line, the defects were made just large
enough that they would be noticeable upon visual examination.
Reassembly of the bearings was very difficult due to their small size and the
lack of any tools on hand that may be specifically designed for this procedure. As a
result, only one of the bearings was subsequently able to be tested. The bearing with the
ball defect suffered from extreme binding which is presumed to havie been caused by
slight deformation of its outer race as it was being held in place to install and secure its
other components. Although unfortunate, it was seen as a minor loss to the study since
only about 10 percent of all ball bearing failures are attributed to faults in the balls or
cages. A repeated attempt to obtain a ball defect sample was not felt justified due to the
difficulties in assembly/reassembly of such small components, and the relative impact its
exclusion might have on the thesis work as a whole.
The exper;:nents involved acquiring vibration signatures for identical
conditions with a different bearing installed at the monitord location for each run. The
far bearing block of the third shaft of the gear train was the one specially fitted with the
replaceable inserts which housed the bearings to be tested. With the good 50 tooth gear
cn the intermediate shaft in mesh, and the optical tachometer trained on the input shaft,
the input shaft was brought up to a speed of 1800 rpm. Multiplying this by the
reduction ratio of the gear set, a value of 115.7 rpm was calculated as the speed of the
third shaft; therefore, the frequencies of interest were expected to be found at
approximately 10 Hz and below. With a baseband span of zero to 50 Hz, 90 percent
overlap processing, a Hanning window, and the number of averages set at 50, a power
spectrum measurement was taken of the good bearing with the accelerometer stud
mounted in the vertical direction.
f. Gear Defects
The examination of gear defects primarily concentrated on two specific
areas; a missing tooth, and the spread of tooth wear. One of the 50 tooth gears on the
intermediate shaft had one of its teeth removed by filing, and one of the 70 tooth gears
had a successive number of tooth profiles slightly filed to simulate the spread of localized
wear. The predominant phenomenon to look for in each case was sidebanding of the
meshing frequency by the shaft frequency. As described by Smith [Ref. 17], the relative
54
amplitudes or the meshing frequency and its sidebands lives an indication of the extent
of modulation or damage. For both studies the same procedure was followed, only thefrequencies or interest differed. For measurements of the first reduction gearmeshevents, a transducer was mounted vertically on the bearing block of the intermediateshaft nearer to the defective gear. For measurements or the second reduction gearmesh
events, a transducer was mounted vertically on the far bearing of the third shaft of thetrain. The signal analyzer was set for a small frequency span centered on the meshingfrequency of the gear to be studied. Since it was decided ahead of time that the input
shaft speed would remain at 1800 rpm, the meshing frequencies for the first and second
reductions were calculated to be 430 Hz and 133 Hz, respectively. The flat top window
was used in some cases and the Hanning in others, the choice depending upon thenumber of spectral lines appearing in the region of interest and their separation. A high
number of averages were taken and the overlap processing and fast averagingcapabilities of the DSA were used to advantage. It was expected that in each case the
meshing frequency would be quite prominent; and that in the case of the missing tooth
the impact event would cause high sidebands, whereas the gear showing wear wouldpresent smaller sidebands at first which grew with increased damage.
D. SPECIAL GEAR STUDY1. Gear Fault Display Using DSA Math Functions
A new technique for displaying gear defects was explored. The technique, if
* successful, would provide a display of a selected gear in a gear train in a manner which
would duplicate the Sear profile on the screen of the DSA and, theoretically, would show
sufficient details of proille irregularities to enable it to be utilized in identifing specificlocations of gear wear and! 'or damage [ Ref. 18]. The study was conducted in two parts.
First, the concept was simulated using artificially produced (pure) signals obtained
through use of the DSA internal signal generator, then an actual measurement was madep on the model in an attempt to prove the practical application of the technique.The technique involved obtaining time domain displays of the signals from two
transducers mounted in mutually orthogonal directions in the radial plane of a gear train
bearing and utilizing the math functions of the DSA to convert these into a single traceP which contained both real and imaginary components. Assuming the gear mesh and
shaft rotation events could be satisfactorily extracted and were contained in the
measured signals, a Nyquist coordinate representation of the final combined signal
would provide a detailed profile of the gear.
To isolate the gear of interest, the demodulation feature of the DSA was initially
thought to be of use in that it deals specifically with the carrier wave/sideband wave
phenomenon which characterizes the event and might, therefore, provide the required
gear mesh plus shaft rotation temporal waveform. It was hoped that it might prove to
be a single measurement which could provide a time domain waveform that was created
strictly from the carrier and sideband waves, with minimal noise or signal content fromother machinery, events. Fwther review of the demodulation process and the results itprovides showed that it would not be useful for this purpose. In place of this, it was
attempted to obtain only the gearmesh event time domain signal from the model and
combine this with a synthesized signal representing the shaft rotation event.
The first task was to verify the mechanics of the procedure by using simulated
signals to see how an ideal result would appear. The simulation selected was to show a
50 tooth gear which was rotating at a shaft speed of 600 rpm. This would then involve
a 10 Hz signal (the shaft frequency) and a 500 Hz signal (the gearmesh frequency). The
first step was to obtain two time domain traces of one of the two signals and store them
in local memory. For the simulation conducted, the 10 Hz signal was selected. With
both channels of the DSA active, the source output from the DSA internal signal
generator was connected to the channel I and channel 2 inputs. The frequency range
selected for the measurement was 2 kHz. This selection was arbitrary; the only
requirement was that the time domain of the measurement display be large enough to
accomodate at least one full period of the final time traces to be displayed in the Nyquist
coordinate system; less than a full period would give an incomplete plot. A Hanning
window was used and, since these would be pure signals, only one average was needed
to be obtained. The source signal was set as a 10 Hz sine wave with a source level
(amplitude) of 1.0 volt. The measurement was then set to trigger on the channel 1 signal
reception at a trigger level of 1.0 volt. To simulate the fact that the real measuremant
made on the model would be done with two transducers which would be orthogonally
mounted, a time delay equivalent to one fourth of a period was introduced on channel
2; for the 10 Hz signiI this was calculated to be 25 msec. With all measurement
parameters having been established, trace A was set to display the time record of channel
1 and trace B was set to. display the time record of channel 2. The measurement was
then commenced and the acquired traces were then stored in local memory, trace A
stored in 'saved data I" and trace B stored in saved data 2, as they arc annotated on
the DSA local memory softkey menu.
56
The next step was to obtain a similar measurement for the 500 Hz signal. Theonly changes in the procedure were to select a 500 Hz sine wave as the signal to begenerated, to reduce the source level (signal amplitude) to a level which would be"representative of the degree of modulation to be expected in the real system, to matchthe trigger level to this new source level, and to adjust the trigger delay to correspond
to one fourth of the period of a 500 Hz wave. Accordingly, the source level was set at25 mV (an assumed amount of modulation effect), the trigger level was set to 25mV, and
the channel 2 delay was set at 0.5 msec. The measurement was then started and the timerecords obtained. The rpmainder of the procedure strictly involved the use of the mathfunctions of the DSA in manipulating these waveforms.
The 500 Hz waveform on trace A was added to "saved data I" (trace A of the10 Hz signal) and then multiplied by the complex number (1,0) to make this signal acomplex waveform with no imaginary part. Then the 500 Hz waveform on trace B wasadded to "saved data 2' (trace B of the 10 Hlz signal) and then multiplied by the complexnumber (0,1) to make this signal a complex waveforn with no real part. The two traceswere then added together to create a single trace which now contained both real andimaginary parts which were non-zero. This trace was then displayed in the Nyquistcoordinate system.
The next part of the study involved following this same procedure with a realsignal obtained from the model relating solely to the gearmesh (carrier wave event)combined with an artificially produced signal which would represent shaft rotation(sideband wave event). Two transducers were mounted on the bearing block next to theundamaged 50 tooth gear; one vertically and the other horizontally. The frequency spanwas set to 10 Hz and was centered on 500 Hz. A Hanning window was used and timedomain averaging was selected with the number of averages set at 5. With theintermediate shaft of the gear train assembly at a speed of 600 rpm, the measurementwas commenced. When completed, the waveform math procedures detailed above werefollowed exactly as described; the 10 Hz waveforms were still in local memory from theprevious simulation run.
i
57
. • . . . - . . .. .: . . ... . . . .. .. . . .. . .. . .. .
V. RESULTS AND DISCUSSIONAs a general comment on the figures which accompany the discussions that follow,
and contrary to common practice in diagnostic work, line spectrum displays were notused exclusively throughout. Although machinery diagnostics measurements arepredominantly in terms of line spectra, in many cases the power spectra of the
measurements were used. This was done mainly for the sake of allowing displays and
discussions of signature comparisons to be clearly viewed and followed by the reader,but also in part because of the low signal levels often measured. Many signatures
obtained from the model were very% low in amplitude, some so close to the noise floorI of the measurement that line spectrum displays became too confusing and cluttered withthe peaks created by the noise. Wherever signals were sufficiently elevated and distinct,
or where actual amplitude values were of interest, filtered line spectra displays were used.WVhere it was only intended to show general features of the signatures, power spectrum
displays were used.For most measurements, an overlap processing value of 90 percent was used. This
was done to allow the measurement process to run as quickly as possible in order toovercome the difficulties of maintaining constant apparatus rpm over long periods of
time and thus avoid the attendant distortion and errors that are associated with speed
drift. The windows used for the measurements were either 1-anning or flat top, the
choice made was based on the relative importance of obtaining accurate frequency
resolution, the amount of speed drift that was experienced, and the clarity with whichimportant features to be discussed would be seen in the final display that was to be
achieved.
A. INITIAL TESTS1. Transducer Calibration
The time domain measurements for the simplified transducer calibration tests
K are shown in Figure 16. The notations "Ov I" appearing at the upper right hand comner
of each trace indicates that an overload occurred on the channel during the
measurement. This does not invalidate the measurements since, as can be seen in the
figure, the signal clipping which occurred and caused the overload condition only
aflected that portion of the time signal beyond the point of interest. The clipping is
shown by the flat portion of the trace beginning at approximately 100 msec. The
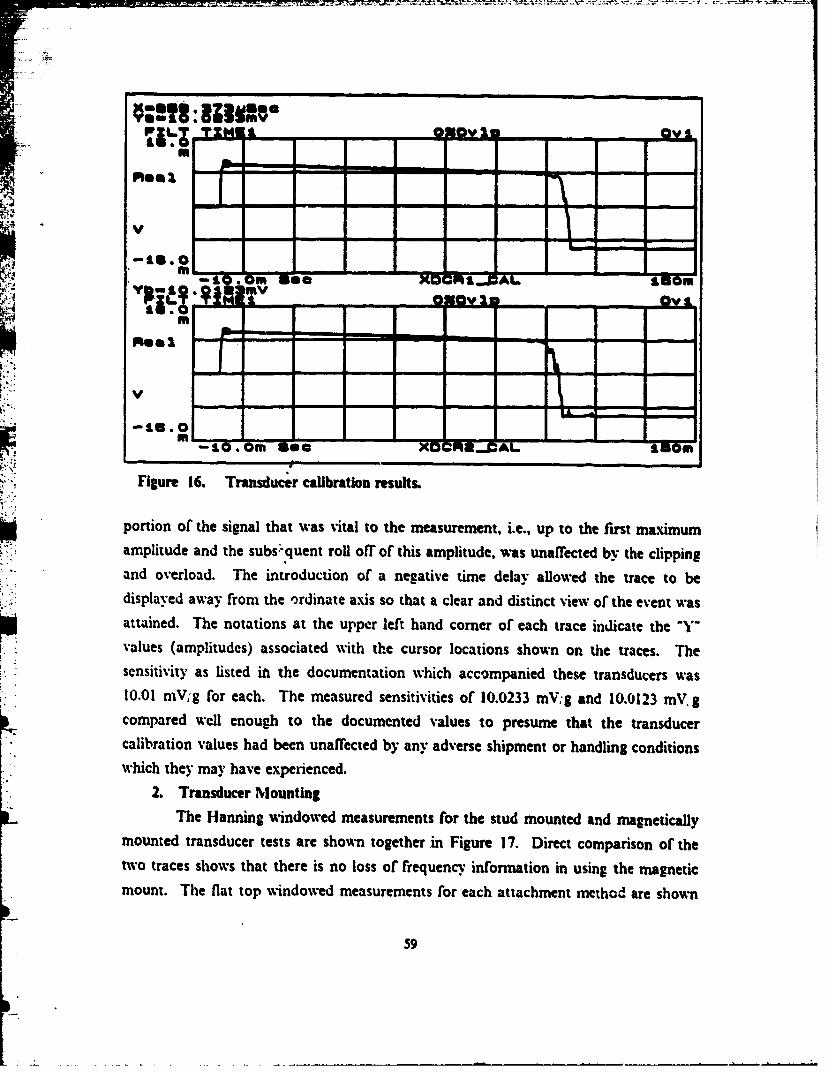
S8!31 : oIIII
eN~ -O.m so-191LI
Y-Pil. O lM
Reel-V
"Z- a
Figure 16. Transducer calibration results.
portion of the signal that was vital to the measurement, i.e., up to the first maximum
amplitude and the subs.'-quent roll off of" this amplitude, was unaffected by the clipping
and ov'erload. The introduction of a negative time delay allowed the trace to be
displayed away from the o•rdinate axis so that a clear and distinct view of the ev'ent was
attained. The notations at the upper left hand corner of each trace indicate the "Y"
• values (amplitudes) associated with the cursor locations shown on he traces. The
sensitivity as listed in the documentation w'hich accompanied these transducers was
10.01 mV,'g for each. The measured sensitivities of 10.0233 mV,,g and 10.0123 inV.g
compared well enough to the documented values to presume that the transducer
calibration values had been unaffected by any adverse shipment or handling conditionswhich they may have experienced.
2. Transducer Mounting
The Harming windowed measurements for the stud mounted and magnetically
mounted transducer tests are shown together in Figure 1"7. Direct comparison of the
two traces shows that there is no loss of frequenc" information in using the magnetic
mount. The flat top vindowed measurements for each attachment method are shown
59
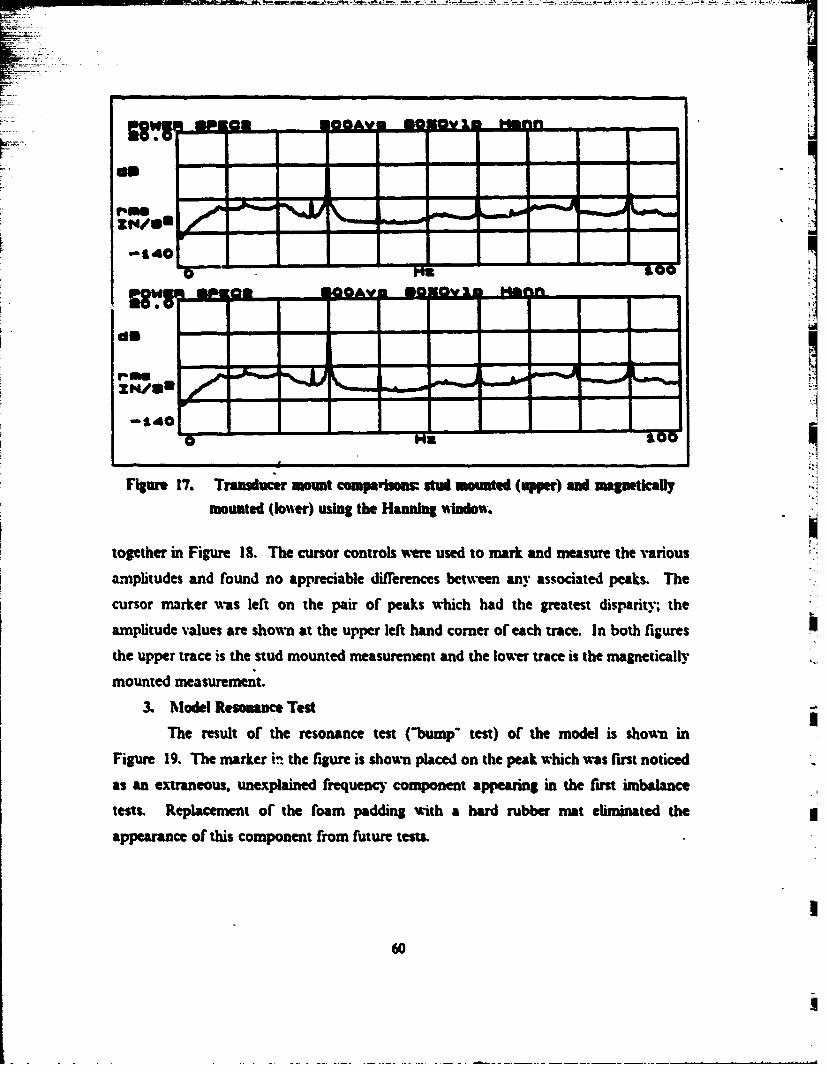
rams"dio
mounted (Ioser) using the Hanning %indow.
together in Figure 18. The cursor controls were used to mark and measure the various
amplitudes and found no appreciable differences between any associated peaks. The
cursor marker was left on the pair of peaks which had the greatest disparity; the
amplitude values are shown at the upper left hand comer of each trace. In both figures
the upper trace is the stud mounted measurement and the lower trace is the magnetically
mounted measurement.
3. Model Resonance Test
The result of the resonance test (-bump" test) of the model is shown in
Figure 19. The marker in the figure is shown placed on the peak which was first noticed
as an extraneous, unexplained frequency component appearing in the first imbalance
tests. Replacement of the foam padding with a hard rubber mat eliminated the
appearance of this component from future tests.
60
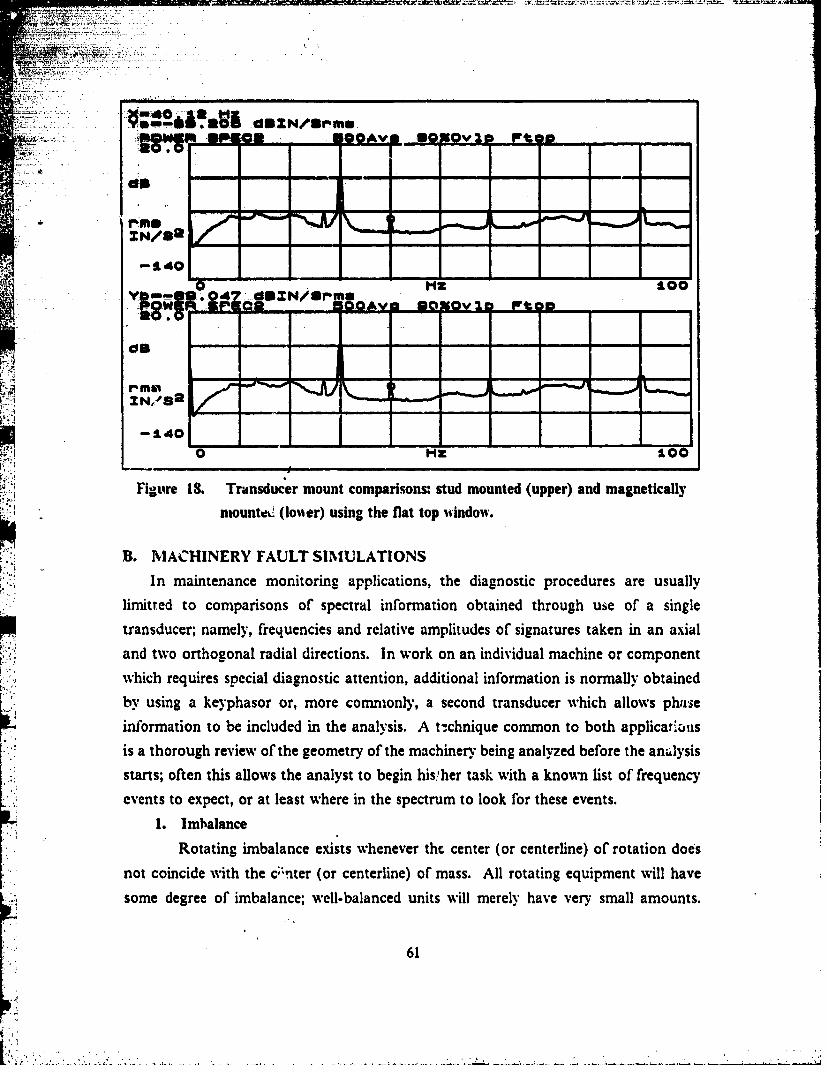
r MO
-140
donow
":•,-X....8i
B. MACHINERY FAULT SIMULATIONS
In ainenace oniorig apliatinsthediagnostic procedures are usuallyfritdto comparisons of spectral information obtained through use of a single
transducer; namely, frequencies and relative amplitudes of signatures taken in an axialand two orthogonal radial directions. In work on an individual machine or componentwhich requires special diagnostic attention, additional information is normally obtainedby using a keyphasor or, more commonly, a second transducer which allows phas~einformation to be included in the analysis. A t,:chnique common to both applicar'ialisis a thorough review of the geometry of the machinery being analyzed before the anudysisstarts; often this allows the analyst to begin his,'her task with a known lst of frequencyevents to expect, or at least where in the spectrum to look for these events.
1. Imbalance
Rotating imbalance exists whenever then center (or centerline) of rotation does
not coincide with the &nter (or centerline) or mass. All rotating equipment will have
some degree ofr imbalance; well-balanced units will merely have very small amounts.
61
an.-1rhgnlrda ircin.I oko nidiiulmcieo opnn
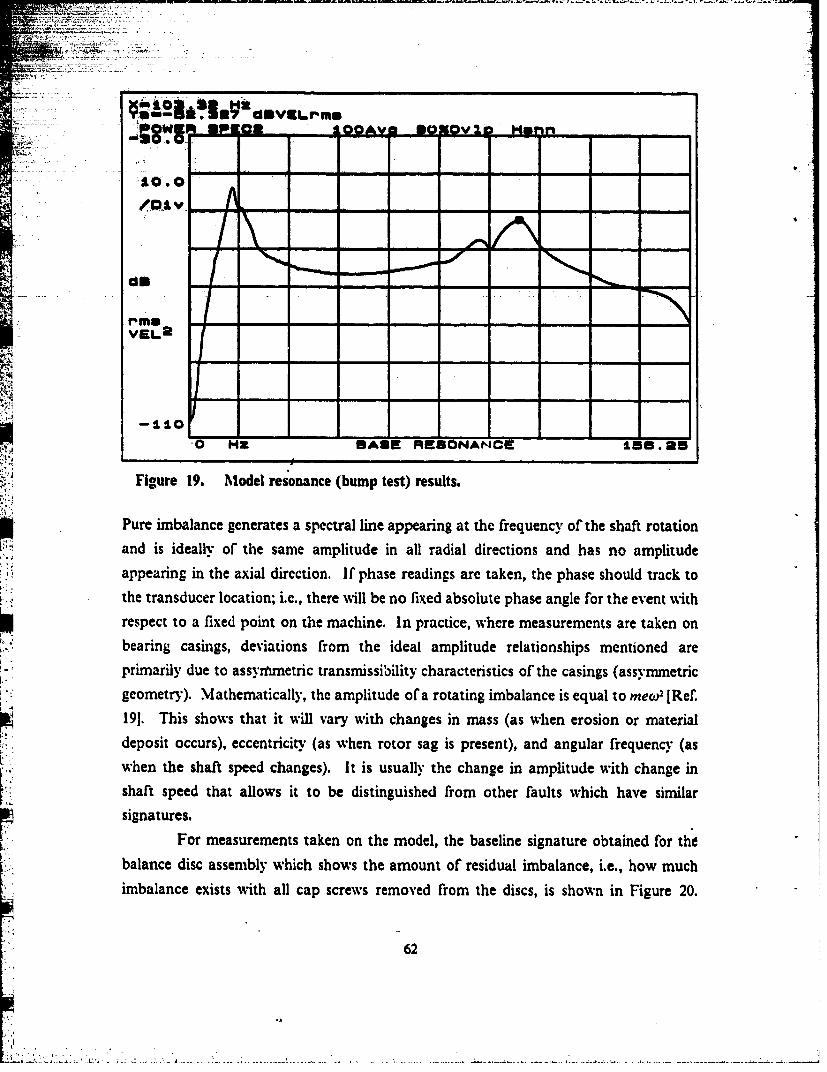
as... .mu - ,...nv L,-
-110. 0
.odo
0 HZ BASE RESONANCE 158.25
Figure 19. Model resonance (bump test) results.
Pure imbalance generates a spectral line appearing at the frequency of the shaft rotationand is ideally or the same amplitude in all radial directions and has no amplitude
appearing in the axial direction. If phase readings are taken, the phase should track tothe transducer location; i.e., there will be no fixed absolute phase angle for the event withrespect to a fixed point on the machine. In practice, where measurements are taken onbearing casings, deviations from the ideal amplitude relationships mentioned are
primarily due to assyrmmetric transmissibility characteristics of the casings (assymmetricgeometry). Mathematically, the amplitude of a rotating imbalance is equal to mew, [Ref.
191. This shows that it will vary with changes in mass (as when erosion or materialdeposit occurs), eccentricity (as when rotor sag is present), and angular frequency (aswhen the shaft speed changes). It is usually the change in amplitude with change inshaft speed that allows it to be distinguished from other faults which have similar
signatures.
For measurements taken on the model, the baseline signature obtained for thebalance disc assembly which shows the amount of residual imbalance, i.e., how much
imbalance exists with all cap screws removed from the discs, is shown in Figure 20.
62
'--,:•,:.: ..... ,• . ... •: .. ................. ................ . .............. ..................... ...... ...... . .. .. . ... •....
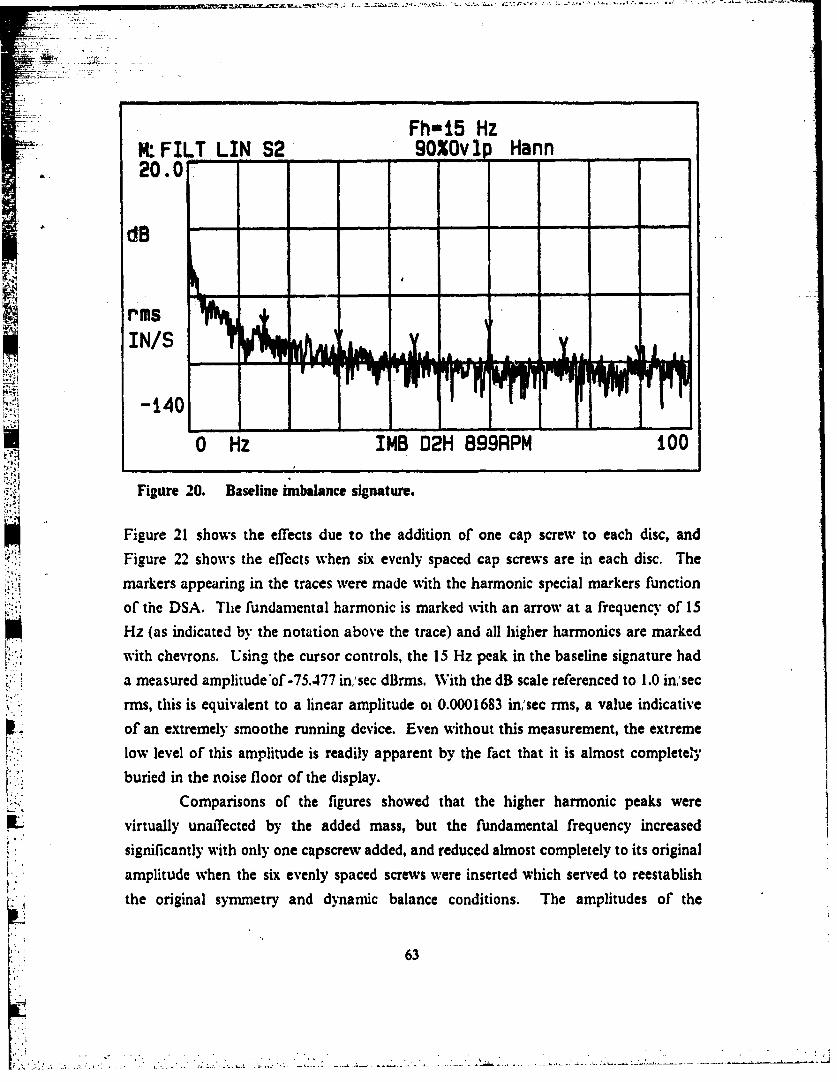
Fh-15 Hz7 M:FILT LIN 2 - 90Ovlp Hann
20.0
dB
IN/S
-140
0 Hz IMB D2H 899RPM - 00
Figure 20. Baseline imbalance signature.
Figure 21 shows the effects due to the addition of one cap screw to each disc, and
Figure 22 shows the effiects when six evenly spaced cap screws are in each disc. The
markers appearing in the traces were made with the harmonic special markers function
of the DSA. The fundamental harmonic is marked with an arrow at a frequency of 15
Hz (as indicated by the notation above the trace) and all higher harmonics are marked
with chevrons. Using the cursor controls, the 15 Hz peak in the baseline signature had
a measured amplitude'of-75.477 in/sec dBrms. With the dB scale referenced to 1.0 in,'sec
rms, this is equivalent to a linear amplitude oi 0.0001683 inisec rms, a value indicative
of an extremely smoothe running device. Even without this measurement, the extreme
low level of this amplitude is readily apparent by the fact that it is almost completely
buried in the noise floor of the display.
Comparisons of the figures showed that the higher harmonic peaks were
virtually unaffected by the added mass, but the fundamental frequency increased
significantly with only one capscrew added, and reduced almost completely to its original
amplitude when the six evenly spaced screws were inserted which served to reestablish
the original symmetry and dynamic balance conditions. The amplitudes of the
63
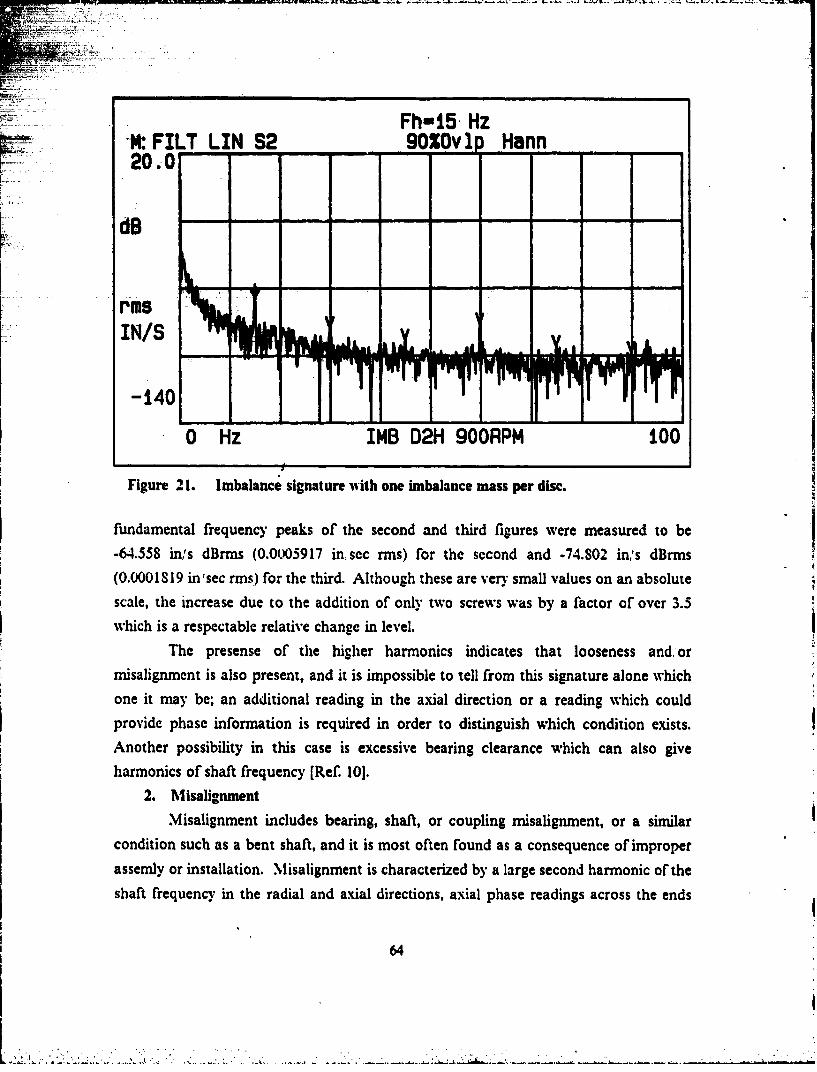
Fh=15, HzW.FILT LIN S2 90SOv1 Hann20.0 -. -..
dB
S...... ... r m $IN/S ••'
0 Hz IMB 02H 900RPM '100
Figure .2.1. Imbalance signature wvith one imbalance mass per disc.
fundamental frequency peaks of the second and third figures were measured to be
-64.55S in/'s dBrms (0.000)5917 in/see rms) for the second and -74.802 in/'s dBrms
(0.000I1S9 in-'see rms.) for the third. Although these are very small values on an absolute
scale, the increase due to the addition of only two screws was by a factor of over 3.5
which is a respectable relative change in level.
The presense of the higher harmonics indicates that looseness and, or
misalignment is also present, and it is impossible to tell from this signature alone which
one it may be; an additional reading in the axial direction or a reading which could
provide phase information is required in order to distinguish which condition exists.
Another possibility in this case is excessive bearing clearance which can also give
harmonics of shaft frequency [R ef. 10].2. Misalignment
Misalignment includes bearing, shaft, or coupling misalignment, or a similar
condition such as a bent shaft, and it is most often found as a consequence Of improper
assemly or installation. Misalignment is characterized by a large second harmonic of the
shaft frequency in the radial and axial directions, axial phase readings across the ends
64
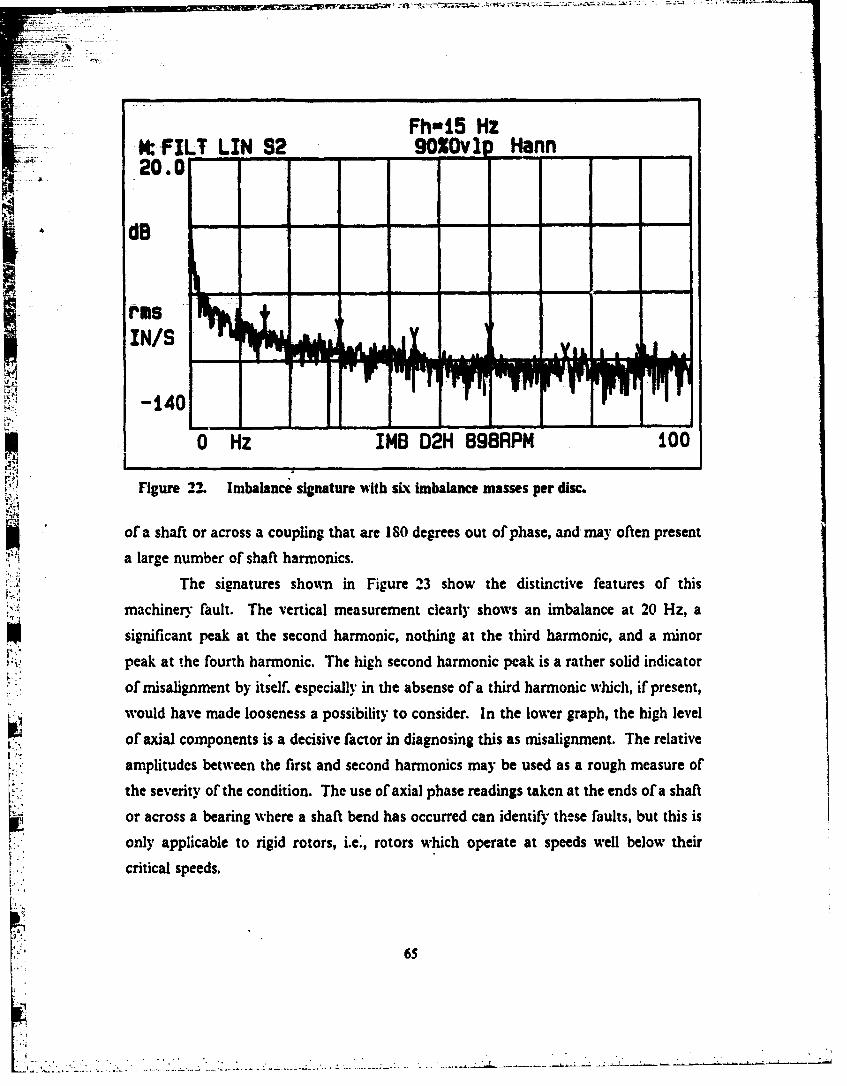
Fh-15 HzI MfILT LIN S2 9010v1 Hann20.0 -
2d1
IN/SAl
-140
Fu 0 Hz IMB D2H 898RPM t00
Figure 22. Imbalance signature with six imbalance masses per disc.
of a shaft or across a coupling that are ISO degrees out of phase, and may often present
a large number of shaft harmonics.
The signatures shown in Figure 23 show the distinctive features of this
machinery fault. The vertical measurement clearly shows an imbalance at 20 Hz, a
significant peak at the second harmonic, nothing at the third harmonic, and a minor
peak at the fourth harmonic. The high second harmonic peak is a rather solid indicator
of misalignment by itself, especially in the absense of a third harmonic which, if present,
would have made looseness a possibility to consider. In the lower graph, the high level
of axial components is a decisive factor in diagnosing this as misalignment. The relative
amplitudes between the first and second harmonics may be used as a rough measure of
the severity of the condition. The use of axial phase readings taken at the ends of a shaft
or across a bearing where a shaft bend has occurred can identify these faults, but this is
only applicable to rigid rotors, i.e:, rotors which operate at speeds well below their
critical speeds.
65
i •"
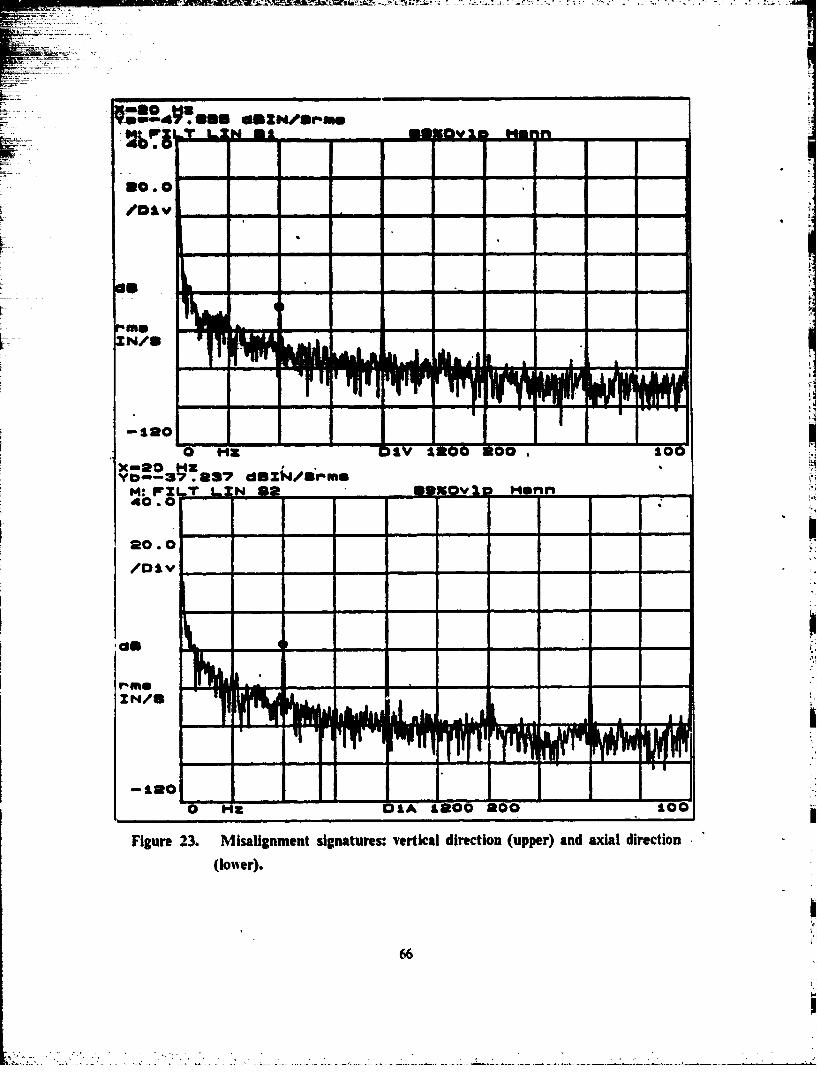
PZZNZumu - -
NM I
-l - - - - - - - -
-120
X-0 "atHSE5 H 0Y i~7 . 27 dmZ4/4r'mm
M: FX T L.2N 82f - -2 m40.0
20.0 -- - - --
/DIV - - - - - - - - - -
TTV
-1200 Hz 1IA Sa00 500
Figure 23. Misalignment signatures: vertical direction (upper) and axial direction
(lower).
66
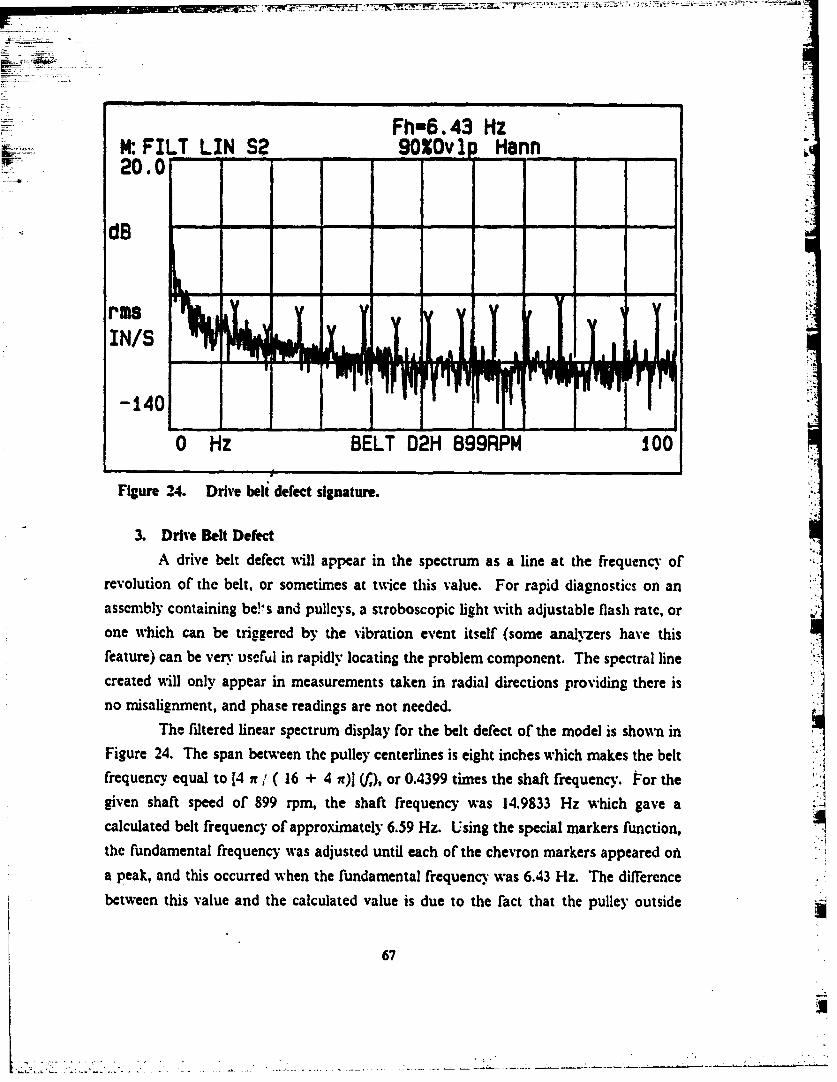
Fh-6.43 HzI:FILT LIN S2 -90ZOv Hann20.0
dlB - - - --
rasIN/S
-140
0 Hz BELT D2H 899RPM 100
Figure 24. Drive belt defect signature.
3. Drive Belt Defect
A drive belt defect will appear in the spectrum as a line at the frequency of
revolution of the belt, or sometimes at twice this value. For rapid diagnostics on an
assembly containing bel's and pulleys, a stroboscopic fight with adjustable flash rate, or
one which can be triggered by the vibration event itself (some analyzers have thisfeature) can be very useful in rapidly locating the problem component. The spectral line
created will only appear in measurements taken in radial directions providing there isno misalignment, and phase readings are not needed.
The filtered linear spectrum display for the belt defect of the model is shown in
Figure 24. The span between the pulley centerlines is eight inches which makes the beltfrequency equal to [4 it / (16 + 4 n)] (/), or 0.4399 times the shaft frequency. For the
given shaft speed of 899 rpm, the shaft frequency was 14.9833 Hz which gave acalculated belt frequency of approximately 6.59 Hz. Using the special markers function,the fundamental frequency was adjusted until each of the chevron markers appeared oil
a peak, and this occurred when the fundamental frequency was 6.43 Hz. The difference
between this value and the calculated value is due to the fact that the pulley outside
67
diameter was used in the formula as an approximation whereas the belt actually travels
in the groove which has a slightly smaller diameter.
- The ability to retrieve a sinal such as this that was intentionally implanted wasnot difficult and, perhap. by itself, not too interesting. However, a feature of this
signature that is significant is one which appears in other fault signatures and worthy
of special note. Many harmonics ar seen to appear, yet the fundamental frequency is
completely undetectablr, in this case it is so low in level that even its marker arrow is
buried in the noise flcor of the trace. This same condition can occur with faults such
as rolling element bearin;s [Ref. 101 and others as well. Being aware of this phenomenon
helps in the analysis of signatures which may have many hanronic multiples if different
events, especially if they may be overlapped in the spectrum display.
4. Mechanical LoosenessMechanical looseness includes all forms of relative motion between components
which are not designed to be present, usually found where bolts have been overlooked
or improperly tightened, or have vibrated loose in service. It is characterized by a large
number of shaft harmonics and sometimes subharmonics, and it is highly directional,Therefore, the amplitude will be greatest when the transducer is nearest the location of
the fault and in alignment with the direction of the looseness. If flexible belts are in the
assembly, the harmonics may be damped out and leave only the once per revolution
spectral peak which appears as an imbalance [Ref. 10].
The tests conducted to detect mechanical looseness gave results which wereidentical to those obtained for misalignment in that none were able to be obtainc'. which
did not have axial components and, therefore, the appearance of misalignment
indications precluded the ability to declare any specific traces as showing only
mechanical looseness. Many traces obtained may actually have mechanical looseness
as a part of them, but it was not possible to distinguish this fault separately and
distinctly by itself in any trace.
5. Bearing Defects
Approximately 90 percent of all rolling element bearing failures are due to
defects in one of the raceways, and 10 percent are due to defects in the rolling elements
or the cages [Ref. 20]. The defects typically begin as microscopic pits where Hertzian
stresses have caused local surface hardening and spalling of the material. As the small
pits grow in size, the transit of the damaged region becomes an increasingly impulsiveevent. Consequently, both the frequency of the impact event and the bearing natural
frequency may show in the spectrum. Knowing the geometry of the bearing and the
68
I
- - - --
10N
Figure 25. Signature of the defect-free bearing.
shaft rotational speed, there are four characteristic bearing frequencies that can be
calculated: the outer ball passing frequency, equation (18), the inner ball passingfrequency, equation (19), the ball spin frequency, equation (20), and the cage frequency,
equation (21). The ball spin frequency formula has a factor of two already included init to account for the fact that there are two impact events per ball revolution, one with
each race.
BD cs,(:f- (n12)(I - cos)((18)
PD
BDfj- (n/2)(1 + PD- cosat)(/((9
b- (n)( _L_ )[1 _ ( _&_ cosc,) 2 )f) (20)BD ~PD (0
fc-(112)(1 - BD cosa)(f,) (21)PD
69
0.
/D~v -
Figur 26. Signture of bearing with innr race defect.
where:n - number of rolling elements in the b-aring
BD - ball diameter
PD - pitch diameter of the bearingaN- contact angle
Z, shaft frequency" in Hz
The spectral signature varies depending on how far the damage has progressed. For anundamaged bearing. all of the above frequencies may be foundh but they eill be at
extremely low amplitudesl As a denect sets ing the frequency associated with the derectlocation -il begin to show. As the defect worsens or the number of small deaects
increase, the events become more impulsive and random and cause the natural frequency
of the bearing to be excited which gives a small 'area* of amplitude on a spectral display
as opposed to one or more lines.
In hydrodynamic bearings, the main problems which arise are oil whirl and oil
whip. Oil whirl occurs when the pressure difference (oil pressure) across the load region
70
of the bearing causes rotor precession, and this wAill generate a spectral line at slightly
less thaun half the shaft frequency. As the shaft speed increases and approaches twice itscritical speed (meaning the oil whirl condition is now occurring near the shaft critical
speed), the oil whirl changes to oil whip which may cause the oil to lose its ability tosupport the shaft due to the large vibrational forces generated.
The tests conducted to detect the bearing characteristic frequencies weresuccessful in that the characteristic frequency for an inner race defect was foundappearing in both the damaged and the defect-ifm bearing. Fium 2S shows the powersetum reading taken for the good bearing. As can be seen there is a predominantpeak at the shaft frequency of 30 Hz. Also showing are a number of other discrete peaks
in the upper half of the baseband. As was the caa in the drive belt tests, these upperrange peaks are harmonically related to an event which is of too low an amplitude to
appear. The signature obtained for the inner race defect bearing is shown in Figure 26
and looks almost identical to the signature for the good bearing, including theappearance of the harnionics. The main distictive feature is the very small peak just
below 10 Hz. This peak is at a frequency of 4.5 times shaft frequency and it is theharmonics of this that are appearing throughout the spectrum of each. The calculated
characteristic frequency for an inner race defect was 4.368 times the shaft frequency.
p These signatures indicate that both bearings have inner race defects.
6. Gear Defects
As with bearings, gears have characteristic frequencies which can always be
found, but are not always high in amplitude. The predominant frequency is the gear
mesh frequency which is equal to the shaft frequency times the number of teeth on the
gear. The exact number and size of spectral lines vary depending upon the specificproblem and its severity, but a general signature is one where the gear mesh frequencyis sidebanded by a series of spectral lines at shaft frequency. The relative amplitudes of
the lines are indicative of the degree of damage, but the amplitude of the gearmesh
frequency peak alone is not meaningful since it may normally alter due to changes inoperating conditions. A-ain, as with bearings, the gear natural frequencies may also
appear in the spectrum which indicates that a problem exists of an impulsive nature.
For the first gear damage test done on the model, the good 50 tooth gear wasrun at a shaft speed of 540 rpm which gave it a calculated gear mesh frequency of 450
Hz, and a shaft frequency of 9 Hz. As expected, the initial signature, seen inFigure 27, showed the gear mesh frequency as a predominant peak sidebanded by peaks
at 9 Hz spacings. The 50 tooth gear with the one tooth missing was expected to have
71
• I III I - -I
/Div
dO A
,I0m
400 N Z Boo
Figure .-7. Signature of first reduction gear set, no damage.
a similar signature but with higher sideband amplitudes. As shown in Figure 28, thiswas not exactly achieved. Although most sideband amplitudes remained the same or
increased slightly, two of the upper sidebands were found to diminish into the noise floor
of the measurement. The difficulty in these, as in many other measurements, was the
very low level of the signals and their strong dependence on the level and steadiness of
the load.
Test results for the second part of the reduction set were closer to what was
expected. Figure 29 shows the signature obtained when only one tooth profile had been
slightly shaved. The gearmesh frequency was found to be of equivalent amplitude toalmost all sideband levels. In Figure 30 where two tooth profiles have been filed, all
levels have elevated slightly, and the gearmesh frequency begins to stand out
significantly from the rest of the events. Figure 31 was taken after three tooth proildeshad been filed, and the signature may be seen to appear more similar to the original
trace. Finally, in Figure 32 where four teeth had been filed, the signature begins to
appear as would be expected for a case of advancing gear %%car.
72
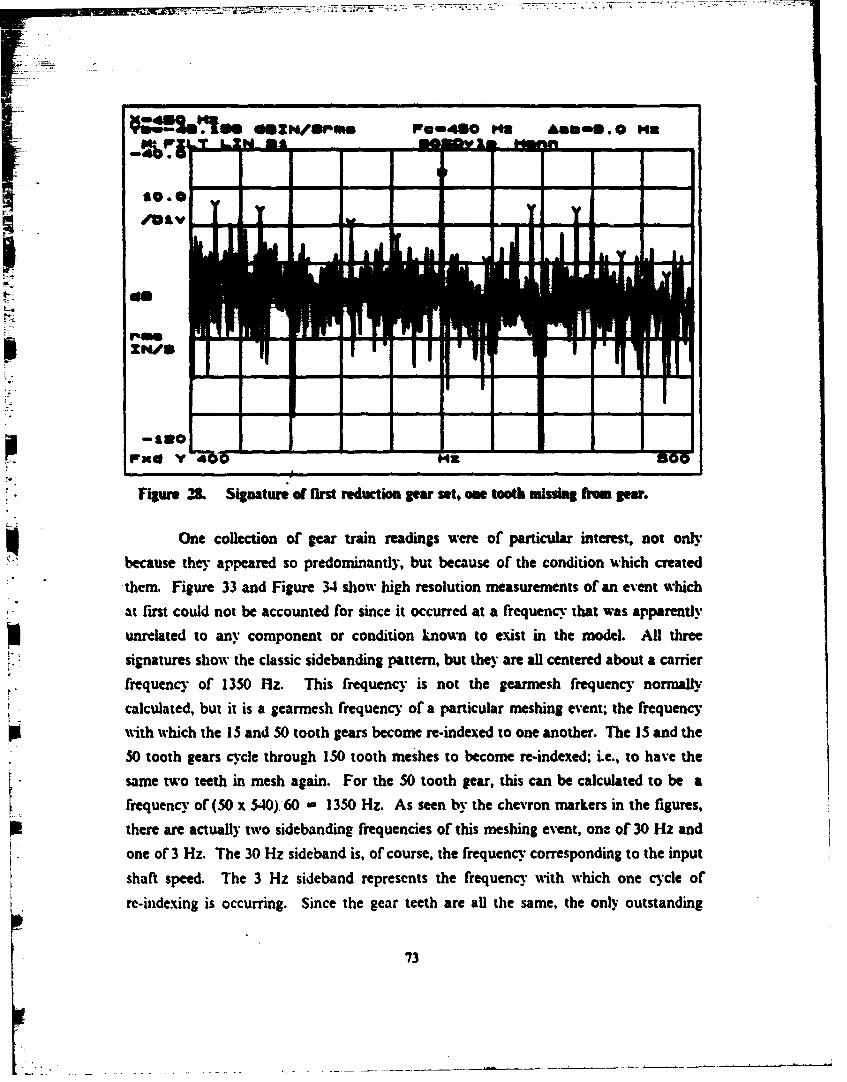
~!2~s. U/Pffb P3450 Ae£bmU. 0 "a
I*DIS1~o o
a c
ZINtN
Figure 28. Signature of first reduction gear set, one tooth missing frm gear.
One collection of gear train readings were of particular interest, not only
because they appeared so predominantly, but because of the condition which createdthem. Figure 33 and Figure 34 show high resolution measurements of an event which
at first could not be accounted for since it occurred at a frequency that was apparently
unrelated to any component or condition known to exist in the model. All threesignatures show the classic sidebanding pattern, but they are all centered about a carrierfrequency of 1350 Hz. This frequency is not the gearmesh frequency normally
calculated, but it is a gearmesh frequency of a particular meshing event; the frequencywith which the 15 and 50 tooth gears become re-indexed to one another. The 15 and the
50 tooth gears cycle through 150 tooth meshes to become re-indexed; i.e., to have the
same two teeth in mesh again. For the 50 tooth gear, this can be calculated to be afrequency of(50 x 540) 60 - 1350 Hz. As seen by the chevron markers in the figures,there are actually two sidebanding frequencies of this meshing event, one of 30 Hz and
one of 3 Hz. The 30 Hz sideband is, of course, the frequency corresponding to the input
shaft speed. The 3 Hz sideband represents the frequency with which one cycle ofre-indexing is occurring. Since the gear teeth are all the same, the only outstanding
73
K _
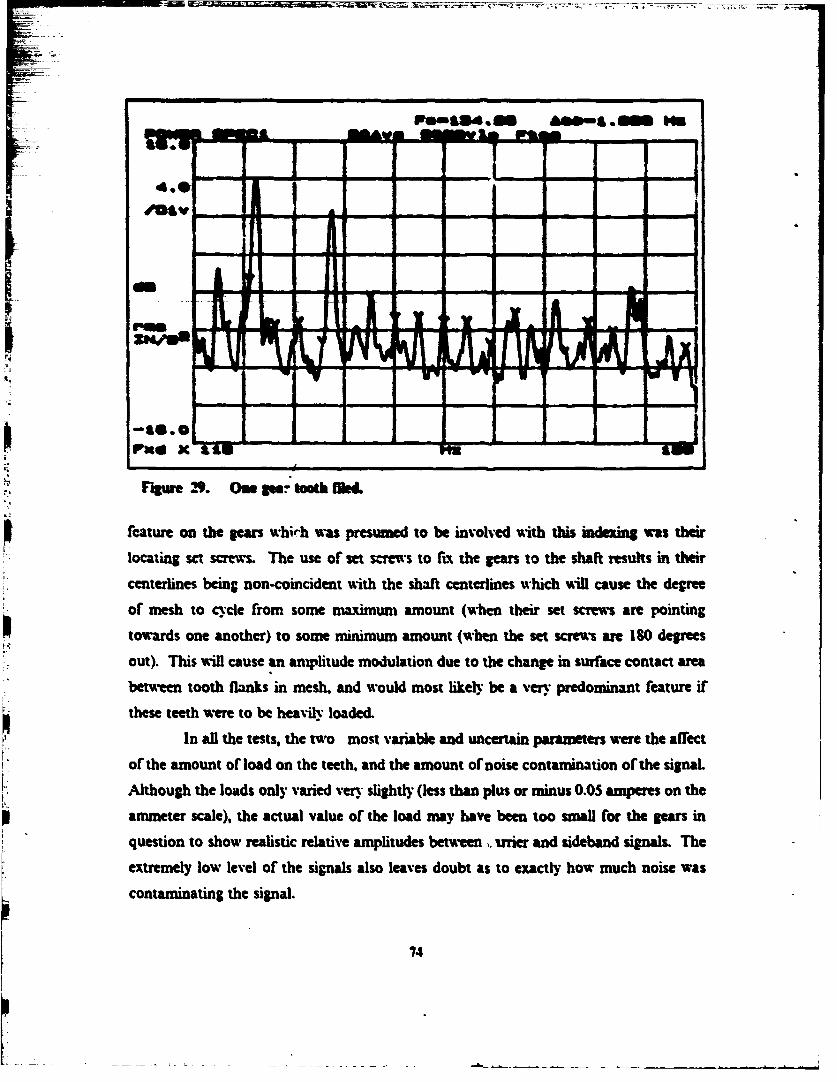
PinmS34l *, Ass-a * m M~qmq• (A - " " I- - '
#Mp A
I -,. iL L LA
Figure. Ow Suatooth MLfd
feature on the gears whirh was presumed to be involved %ith this indexing was their
locating set screws. The use of set s.-remws to frx the gears to the shaft results in their
centerines being non-coincident with the shaft centerlines which will cause the dere
of mesh to cycle from some maximum amount (when their set screms are pointing
towards one another) to some minimum amount (when the set screws are 180 degrees
out). This will cause an amplitude modulation due to the change in surface contact area
between tooth flanks in mesh, and would most likely be a very predominant feature if
these teeth were to be heavily loaded.
In all the tests, the two most variable and uncertain parameters were the affect
of the amount of load on the teeth, and the amount of noise contamination of the signal.
Although the loads only varied very slightly (less than plus or minus 0.05 amperes on theammeter scale), the actual value of the load may have been too small for the gears in
question to show realistic relative amplitudes between ,. Trrier and sideband signals. The
extremely low level of the signals also leaves doubt as to exactly how much noise was
contaminating the signal.
74
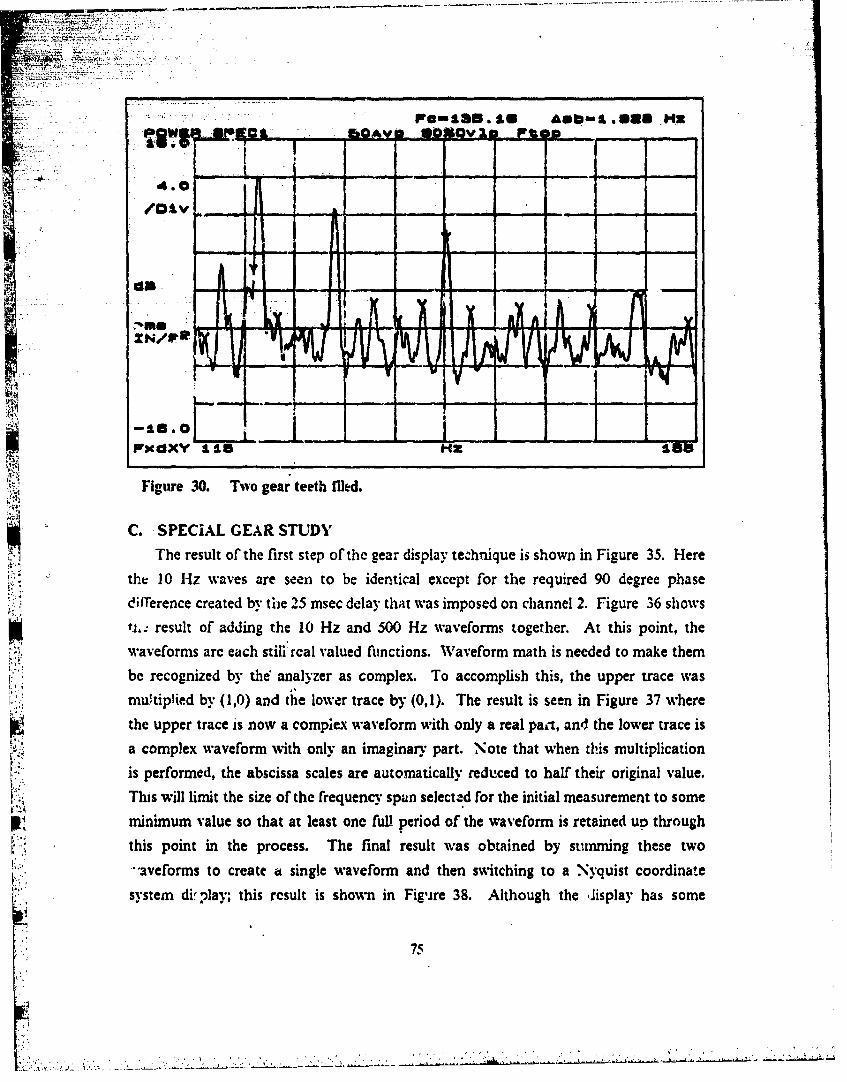
WOm135.16U Aeb-1*028 NX
/Dvi~j1A 14 --1---h IV - - V A. -
.: . ... .. . - - .
'-6. II -IID
30. Two gear teeth riled.
C. SPECIAL GEAR STUDYThe result of the first step of the gear display teChnique is shown in Figure 35. Here
the 10 Hiz waves are seen to be identical except for the required 90 degree phaseei~ference created by tile25 msec delay that was imposed on channel 2. Figure .36 showsti. result of adding the 10 Hz and 500 Hz waveforms together. At this point, the
waveforms arc each stillrcal valued functions. Waveform math is needed to make them
be recognized by the analyzer as complex. To accomplish this, the upper trace was
mutiphled by (1,0) and the lower trace by (0,i). The result is seen in Figure 37 where
the upper trace is now a complex waveform with only a real paqr, and the lower trace is
a complex waveform w~ith only an imaginary part. Note that when this multiplicationis performed, the abscissa scales are automatically reduced to half their original value.
This will limit the size of the frequency spun selected for the initial measurement to some
minimum value so that at least onc full period of the waveform is retained up through
this point in the process. The final result was obtained by senming these two
aveforms to create a single waveform and then switching to a .yquist coordinate
system &i.play; this result is shown in Figsre 38. Although the mJisplay has some
75
:.:k c .. : , '.:.. : : .L - : : • " • . .. : "
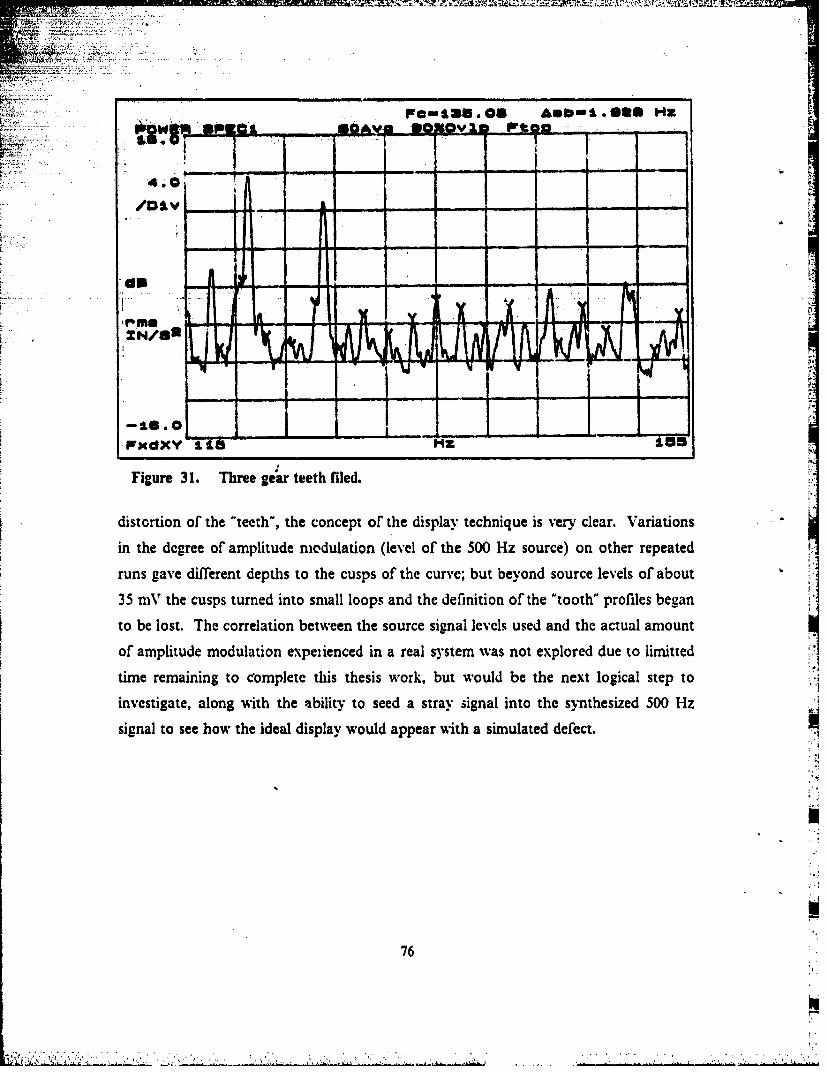
37-Pa- &as. On A*._l.SUS MM
4.0/D... . ...... ...i - , - - -
A •
"-I " - I - ,
-16.00-- - i I ;ýFxdXY N15
Figure 31. Three gear teeth filed.
distortion of the "teeth", the concept of the display technique is very clear. Variations
in the degree of amplitude modulation (level of the 500 Hz source) on other repeated
runs gave difTerent depths to the cusps of the curve; but beyond source levels of about
35 mV the cusps turned into small loops and the definition of the "tooth" profiles began
to be lost. The correlation between the source signal levels used and the actual amount
of amplitude modulation expeiienced in a real system was not explored due to limitted
time remaining to complete this thesis work, but would be the next logical step to
investigate, along with the ability to seed a stray signal into the synthesized 500 Hz
signal to see how the ideal display would appear with a simulated defect.
76
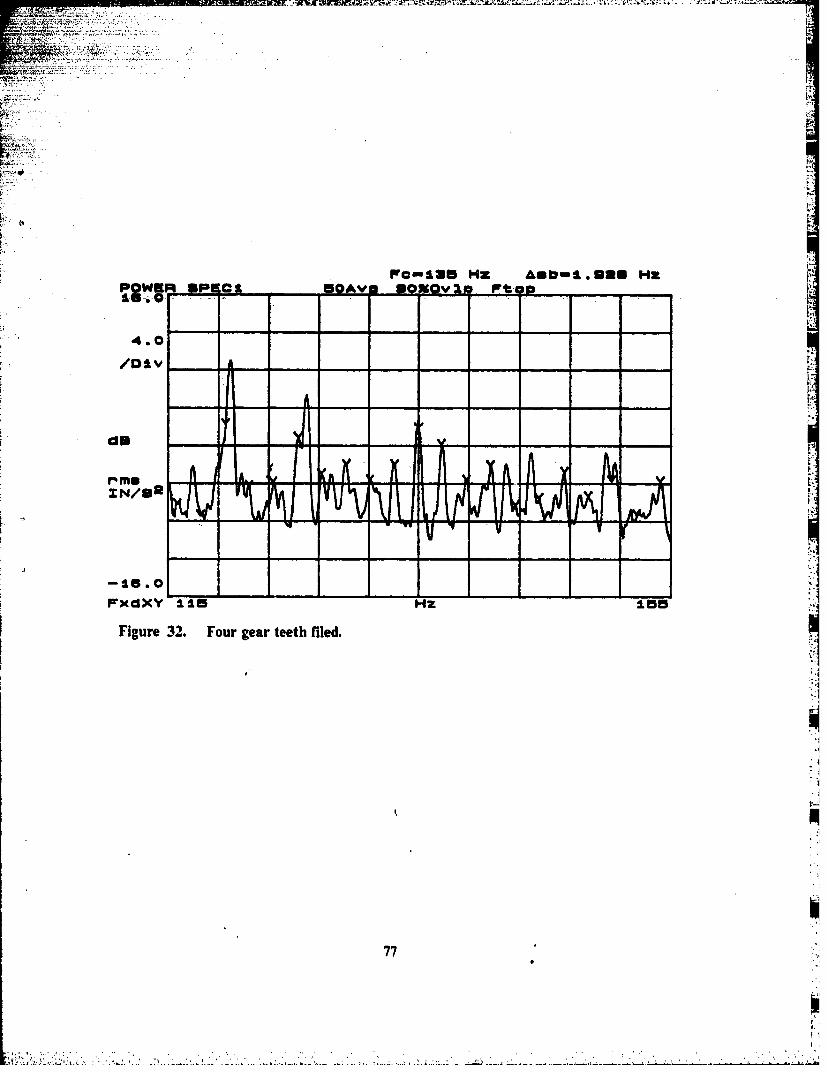
AM
FomlaU Hz AUD-1.UUU Hz fs
cisg
rNe/tU
-X--1-- -
Fxdxy lie Hz lea'5
Figure 32. Four gear teeth riled.
77

-- * d.SA1UUIkHZ-- 3..22 dOBVELrms Ic,,,l.24936k Albm3O.0 HZ
pow* 14 g -p aE 0AVN MVI He n
8.0
/DIV
rbMe
Fins I
V•EL.
I. 2 3Ak HZ 1.48k
Figure 33. Major sidebanding by 30 Hz signal.
78
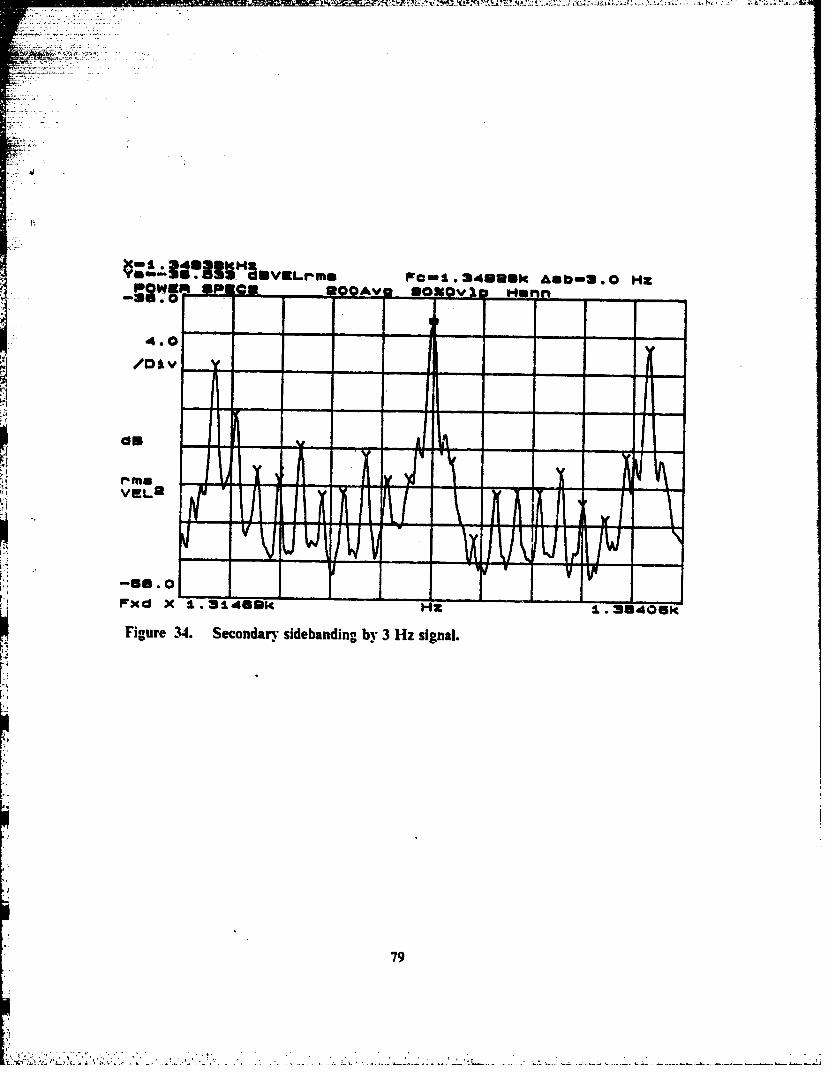
~rnu-IS.33~*g~rm . 39U~k&sbm * 0 HX
-RIK mp -c -NJ n
/0
VEL2
PXd X 1.31469k 1346
Figure .14. Secondary sidebanding by 3 Hz signal.
79
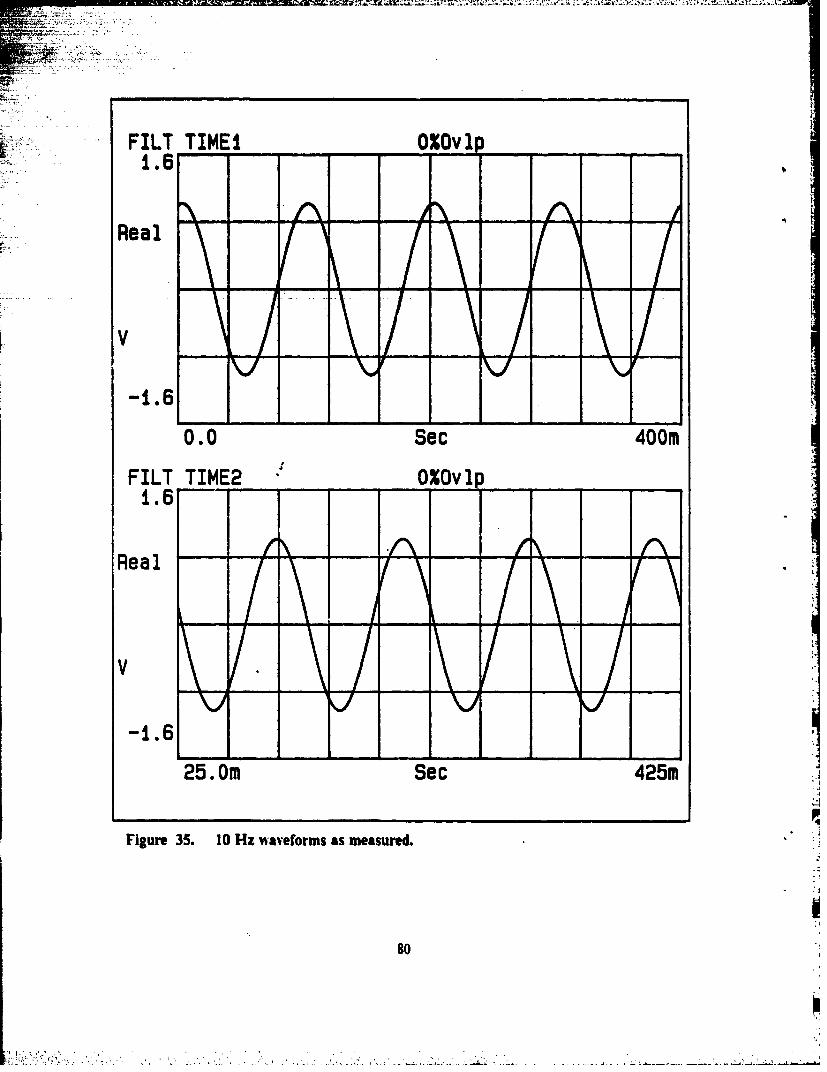
FILT IIMEI 0%0vlp
Real---
-1.6
0.0 Sec 400m
FILT TIME2 '0 0OVl
Real -
-1.6
25.Om Sec 425m
Figure 35. 10 Hz waveforms as measured.J
soa
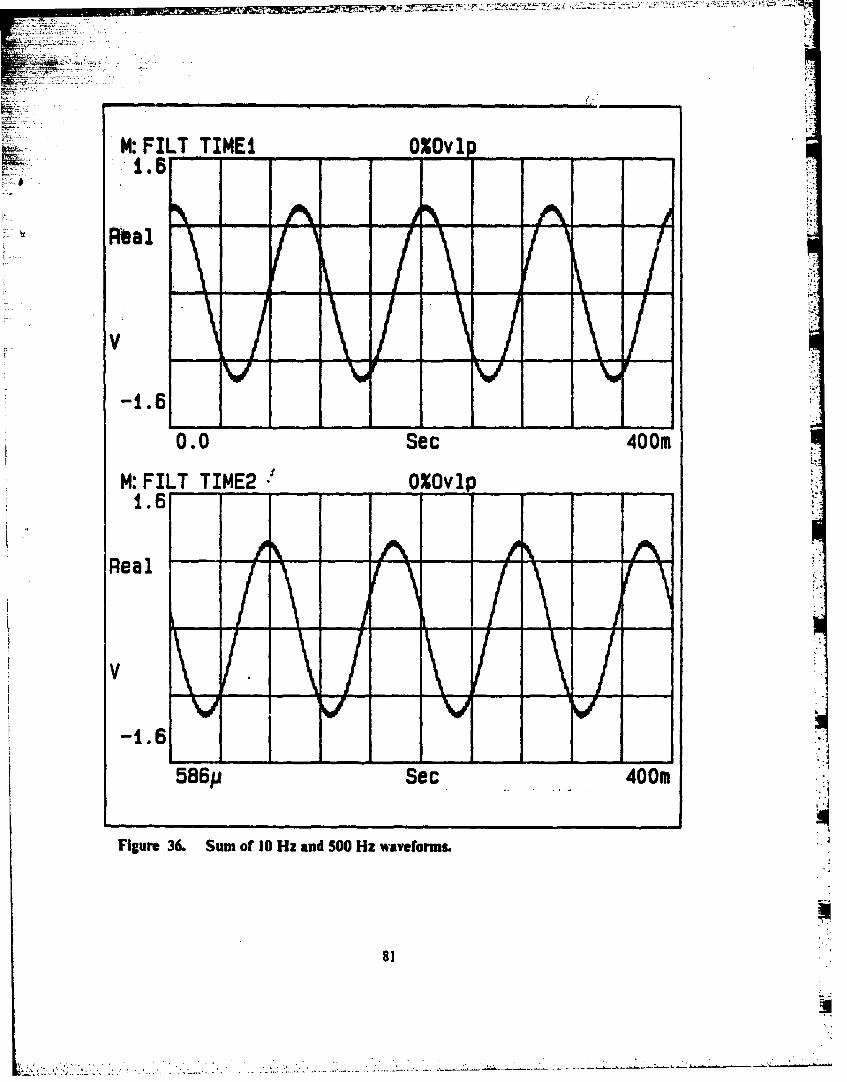
M: FILT TIME1 0 ovlp
Real
0.0 Sec 400m
t4:FILT TIME2 OXovlp
Real ----
586p Sec 400m
Figure 36. Sum of 10 Hz and 500 Hz waveforMs.
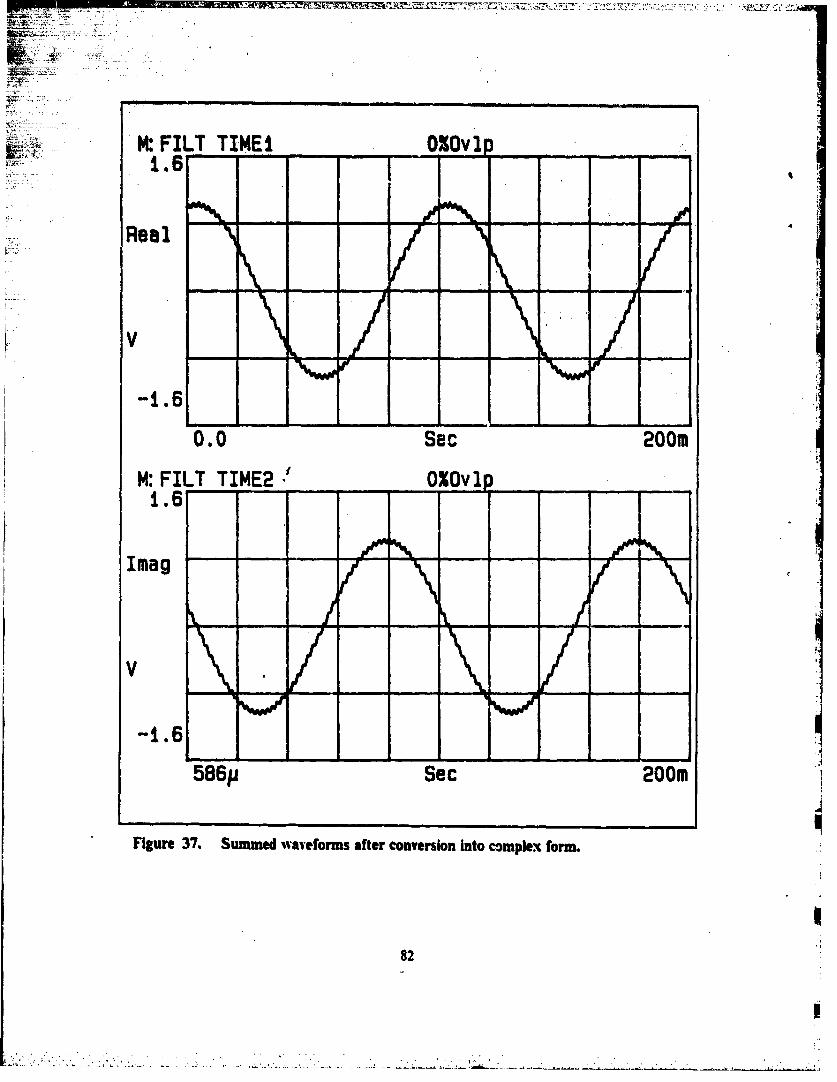
M: FILT TIMEI Ov -WW- I /Real- I-/
0. 0 sec 200m
M: FILT TIME2 -O -Ovl-1.6
Imag / - -- f-- -ilei
VIn
-1.6 •
5 8 6p Sec 200m
Figure 37. Summed waveforms after conversion Into complex form.
82
!
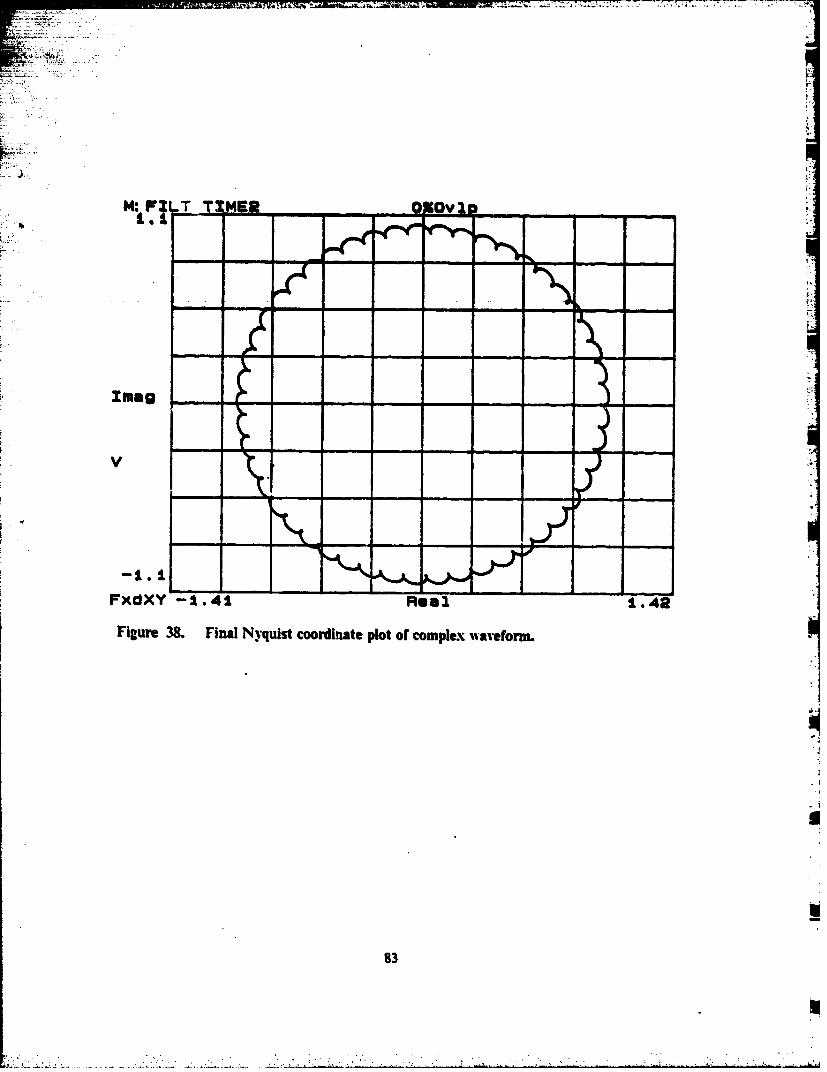
FxdXY-1.41Real1.42
Figure 38. Final Nyquist coordinate plot of complex waveformn.
83
., nLE"T -- _•M • i4t •• • ••• •:•...ii->b ,<,a S .Zt.~% rt , *. . -. :- ' .-- :•.t ':.:.;-'• •'- •:.,-r o , mt--' z il±
VI. CONCLUSIONS
A physical machinery diagnostics model was developed that was designed toincorporate some of the more common machinery faults found in rotating machinery
relating to shaft, bearing, Sear, and alignment defects. Based upon the results of the
model tests, the model was found to be effective in displaying designed machinery faults
with the exception of" mechanical looseness. The balance disc performed precisely asdesigned in that it was found to be very sensitive to mass addition. The results of this
study clearly demonstr&-e that it is not always possible to distinctly identify all specific
machinery faults which may be present by obtaining signatures using only a singletransducer. The implicelion is that more complete and reliable machinery diagnostics
might only be realized through the use of two channel measurements.
'1U-
84i
i~i . 'g , . ••i ."•- : , ' , " , .. .. . ' ' ' ' . . ..
VII. RECOMMENDATIONS
A. MODEL IMPROVEMENTSIn view of the results of the model tests, the following recommendations are made
with regard to model improvements.
For the balance disc assembly, a changeover t.• ball bearings might remove the
appearance of the multiple shaft harmonics from the spectra which are thought to becaused by excessive clearance in the sleeve bearings currently being used. This would
also remove the requirement to retain the aluminum collars on the shaft which accountfor a small protion of the residual imbalance, and this would preclude introducingextraneous signals (rubs) in the event that the collars were inadvertantly spaced too close
to the bearing blocks. Also, even though the shaft axial position tends to track to thedrive belt plane, there may some slight wander or jitter in its tracking which may be the
cause for the axial readings that were seen in many displays.
The difficulties in working on the ball bearing assemblies shows the need forobtaining larger sized components for conductin; specific damage studies. This wouldalso create more workinr sp:.-e on the assembly itself which would facilitate positioning
of components and measurement devices; some bearing blocks on this model could notbe fitted in any but the vertical direction with the transducers that were obtained (of
course the option of smaller transducers exists, but this may involve greater expense).This directly eliminated the ability to take readings in other directions in order to gain
phase information which would have been of benefit in many cases.
The difficulty with speed control points out the need for more refinement of thisfeature. It is possible that removing the motor controller from the base plate might helpif the instability is due to controller vibration, but even if this is so, it is not expected that
this will suffice since the problem seems to be more related to a deadband in the speed
control knob. The use of the external sampling featuic of the DSA is recommended asthe best alternative method available to avoid errors induced by speed drift.
All bearings should be solidly pressed and or crimped into place to firmly seat them
in the bearing block bores and guarantee best transmissibility of signals. Also the proper
method of installation must be observed. The last bearing that was installed was seen
to be pressed into place by pushing down on the inner race, a practice which may be the
85
" .. .. . .. . . • .: " •i : •.. -• . .. . . . ,• - :• .. ii . , .. ....... .. .. .. . .. . .. .. .. . . ,. . . . .. . . .. .. .. . . . . . "
reason why both bearings showed inner race defects and not only the one which wasintentionally damaged.
All components to be shaft mounted should be pressed or shrink-fit in place to avoidthe introduction of imbalances due to set screws, flats ground on the shaft. etc.Additionally, this is presumed to have had a pronounced affect on the final alignmentor the gears, and so it is recommended that any components which similarly involve
F mating contact or close tolerances be specifically so installed.A more suitable load should be acquired for the model. The load presently used
was insufficiently steady for the long time periods involved with several types ofmeasurements such as when time domain averaging was used where overlap processingwas automatically set to zero perm-ent which greatly increased the time needed to takehigh resolution measurements. A recommended alternative is a variable core magneticbrake type asscmbly. The assembly is driven by a small constant speed motor and thestrength of the magnetic brake is varied by the degree to which the core is axiallyengaged in the field. The load from such a device should be very steady, easilycontrolled, and of sufficient capacity to provide what is needed to adequately test thecomponents presently incorporated in the model.
L. FUTURE STUDIESIn vriew of the uncertainty of the amount of noise contamination in the signals, it is
recommended that two channel studies be pursued which would then allowmeasurements of signal coherence as an excellent indicator of the amount of noisepresent.
It is recommended 1hat phase readings be made a part of future experiments sincethis information is, in many cases, vital and necessary for effective diagnostic work. Thisneed for phase inrorwittion further underscores the importance and benefits oftwo-channel measurement studies.
In continued work on the gear display technique, it is recommended that efforts bedirected toward further studies using ideal signals, especially their correlation to realmeasured events and parameters. Simulation studies which try to quantify the degreeof amplitude modulation and its resulting influence on the gear display, and the resultof an 'ideal defect" in a simulated signal are two areas which may quickly prove ordisprove the usefulness of continued efforts to perfect the technique. The studies donethus far have used a 25 millivolt modulating signal and produced a gear profilesimulation of reasonable proportions, but levels of 35 millivolts and higher cause severe
86
"tooth" distortion. I" the actual ratio of carrier to modulating wave amplitude is farfrom this, there could be enough distortion in the display to render the technique useless.This is why continued eflorts are recommended to remain in pursuit of ;. ýubstantialtheoretical groundwork to support the potential benefits of this display tL. . e. This,of course, should then be followed by actual model tests if the techniqu,. Ows
promise. In obtaining real signals, the main effort should be in trying to c.. .e as"clean" a signal as possible since this is critical in the quality of duplication of the profile.Also, the signal sought might best be restricted to the gearmesh event alone which couldthen be superimposed on a simulated signal which represents the shaft frequency sincethe lower (shaft) frequency serves merely to create the 'base circle' of the gear.
In general, the difficulties experienced in the model testing were primarily in theareas of speed drift, load stability, amount of load, and size of components. Futuremachinery models, or changes to this one, should consider these factors seriously in the
early stages of the design. The load and power supplies must be very carefully sized toensure that the device under test is able to be loaded to the desired or required levelswhich will give meaningful results, and the load stability is important because and theuse of some of the more beneficial techniques in reducing noise and otherwise improvingmeasurement content (such as time averaging) requires extremely tight control of speed.
87
LIST OF REFERENCES
1. Lyon, R.H., Machnry Noise and Dlqnostcs. Butterworths, 1987.
2. llvonen, P., Experiences From General Purpose Condition MoWtoring System SAFE
2000. Condition Monitoring "84, Proceedings of an International Conference onCondition Monitoring, 1984.
3. Personal conversation with Professor P.F. Pucci, U.S. Naval Postgraduate School,Monterey, CA, September, 1988.
4. Mathew, J., Machine Condition Monitoring Using Vibration Analysis. Acoustic
Australia, 1987.
5. Marshall, B. R., A Surface Naiy Vibration Program Overview: Standardization andState.of.ehe.Art, Naval Engineers Journal, May 1988.
6. Strunk, W.D., The Evaluation of Accelerometer Mount Transmissibility for U.S.
Navy Applications, Proceedings of the 6th International Modal AnalysisConference, January 1988.
7. Bendat, J.S. and Piersol, A.G., Engineering Applications of Correlation and SpectralAnaltsis, John Wiley & Sons, 1980.
L
8. Blackburn, J.A., Spectral Analysis: Methods and Techniques. Marcel Dekker, Inc.,
1970.
9. Braun, S., Mechanical Signature Analysis Theory and Applications, Academic Press,1986.
10. Hewlett Packard, Dynamic Signal Analyier Applications. F.fective MachineryMlaitenance Using Vibration Analysis. Application Note 243-1, Hewlett-Packard
Company, 1983.
88
nil
11. Favaloro, S.C., A Preliminary Evaluation of Some Gear Diagnostics Using Vibration
Analysis, Department of Defense, Defense Science and Technology Organization
Aeronautical Research Laboratories, Commonwealth of Australia, 1985.
12. Bruel & Kjaer Publication, Machine Health Monitoring, Bruel & Kjaer, Denmark,
1984.
13. Reif, Z. and Lai, M.S., Detection of Bearing Failures by Means of Vibration,
Proceedings of the 6th International Modal Analysis Conference, January, 1988.
14. Swansson, N.S. and Favaloro, S.C., Applications of Vibration Analysis to the
Condition Monitoring of Rolling Elemem, Bearings, Department of Defense, Defense
Science and Technology Organization Aeronautical Research Laboratories,
Commonwealth of Australia, 1984.
15. Stronach, A.F., Cudworth, C.J., and Johnston, A.B., Condition Monitoring of
Rolling E!ement Bearings, Condition Monitoring '84, Pineridge Press, 1984.
16. McFadden, P.D., Examination of a Technique for the Early Detection of Failure in
Gears by Signal Processing of the Time Domain Average of the Meshing Vibration,
Department of Defense, Defense Science and Technolcgy Organization
A-,-onautical Research Laboratories, Commonwealth of Australia, 1986.
17. Smith, J.D., Gears and Their Vibration, Marcel Dekker, Inc., 1983.
18. Personal conversations with MIr. John Jensen, Senior Applications Representative
for Hewlett-Packard, September, 1988.
19. Thomson, W.T., Theory of Vibration With Applicntions, Prentice-Hall, 1988.
20. Sandy, J., Monitoring and Diagnostics for Rolling Element Bearings, Sound and
Vibration, June 1988.
89
• ,. . . . -
INITIAL DISTRIBUTION LIST
No. Copies
W1. I. Defense Technical Information Center 2Cameron StationAlexandria, VA 22304-6145
2. Library, Code 0142 2Naval Postgraduate SchoolMonterey, CA 93943-5002
3. Dean of Science and Engineering, Code 06 2Naval Postgraduate SchoolMonterey, CA 93943-5000
4. Research Administration Office, Code 012 1Naval Postgraduate SchoolMonterey, CA 93943-5000
5. Department Chairman, Code 69 1Department of Mechanical EngineeringNaval Postgraduate SchoolMonterey, CA 93943-5000
6. Professor Young S. Shin, Code 69Sg 3Department of Mechanical EngineeringNaval Postgraduate SchoolMcnterey, CA 93943-5000
7. RADM (Sel) J. R. Lang, USNNaval Sea Systems Command, PMS 393Washington. DC 20362
8. Mr. Alan PrideSubmarine Maintenance and Support OfficeNaval Sea Systems Command, PMS 390Washington, DC 20362
9. Mr. Bruce R. Marshall 2Mr. Art CurtilliNaval Ship System Engineering StationPhiladelphia, PA 19112-5083
1O. Commandant (G-PTE-1) 2U.S. Coast GuardWashington, DC 20590
90

1I. Lcdr. James A. Stamm 215812 Moncure DriveDumfries, VA 22026
I 9
91
Related Documents