NAVAL POSTGRADUATE SCHOOL MONTEREY, CALIFORNIA MBA PROFESSIONAL REPORT Depot Level Repairable Carcass Tracking and the Electronic Retrograde Management System By: Troy D. Carr, Brett K. Wilcox December 2006 Advisors: Geraldo Ferrer, Bryan Hudgens Approved for public release; distribution is unlimited.

Welcome message from author
This document is posted to help you gain knowledge. Please leave a comment to let me know what you think about it! Share it to your friends and learn new things together.
Transcript

NAVAL POSTGRADUATE
SCHOOL
MONTEREY, CALIFORNIA
MBA PROFESSIONAL REPORT
Depot Level Repairable Carcass
Tracking and the Electronic Retrograde Management System
By: Troy D. Carr,
Brett K. Wilcox December 2006
Advisors: Geraldo Ferrer,
Bryan Hudgens
Approved for public release; distribution is unlimited.

THIS PAGE INTENTIONALLY LEFT BLANK

i
REPORT DOCUMENTATION PAGE Form Approved OMB No. 0704-0188 Public reporting burden for this collection of information is estimated to average 1 hour per response, including the time for reviewing instruction, searching existing data sources, gathering and maintaining the data needed, and completing and reviewing the collection of information. Send comments regarding this burden estimate or any other aspect of this collection of information, including suggestions for reducing this burden, to Washington headquarters Services, Directorate for Information Operations and Reports, 1215 Jefferson Davis Highway, Suite 1204, Arlington, VA 22202-4302, and to the Office of Management and Budget, Paperwork Reduction Project (0704-0188) Washington DC 20503. 1. AGENCY USE ONLY (Leave blank)
2. REPORT DATE December 2006
3. REPORT TYPE AND DATES COVERED MBA Professional Report
4. TITLE AND SUBTITLE: Depot Level Repairable Carcass Tracking and the Electronic Retrograde Management System 6. AUTHOR(S) Troy D. Carr, LCDR, USN & Brett K. Wilcox LCDR, USN
5. FUNDING NUMBERS
7. PERFORMING ORGANIZATION NAME(S) AND ADDRESS(ES) Naval Postgraduate School Monterey, CA 93943-5000
8. PERFORMING ORGANIZATION REPORT NUMBER
9. SPONSORING / MONITORING AGENCY NAME(S) AND ADDRESS(ES) N/A
10. SPONSORING / MONITORING AGENCY REPORT NUMBER
11. SUPPLEMENTARY NOTES The views expressed in this report are those of the author(s) and do not reflect the official policy or position of the Department of Defense or the U.S. Government. 12a. DISTRIBUTION / AVAILABILITY STATEMENT Approved for public release; distribution is unlimited.
12b. DISTRIBUTION CODE
13. ABSTRACT (maximum 200 words) The purpose of this Project is to develop a Department of the Navy related case study for use in future
Supply Chain Management courses at the Naval Postgraduate School, Monterey, CA. Pursuant to this objective the Depot Level Repairable program of the U. S. Navy will be studied. The case progresses through a background of the DLR program, the Advanced Traceability and Control (ATAC) system currently in fleet wide use and the improved process being implemented, the Electronic Retrograde Management System (e-RMS). Through a study of the component processes partnered with selected data for analysis the case will highlight several fundamental concepts of supply chain management and provide for both qualitative and quantitative discussion.
15. NUMBER OF PAGES
61
14. SUBJECT TERMS DLR, Depot Level Repairable, Carcass Tracking, ATAC, Advanced Traceability and Control, Electronic Retrograde Management System
16. PRICE CODE
17. SECURITY CLASSIFICATION OF REPORT
Unclassified
18. SECURITY CLASSIFICATION OF THIS PAGE
Unclassified
19. SECURITY CLASSIFICATION OF ABSTRACT
Unclassified
20. LIMITATION OF ABSTRACT
UL NSN 7540-01-280-5500 Standard Form 298 (Rev. 2-89) Prescribed by ANSI Std. 239-18

ii
THIS PAGE INTENTIONALLY LEFT BLANK

iii
Approved for public release, distribution is unlimited
DEPOT LEVEL REPAIRABLE CARCASS TRACKING AND THE ELECTRONIC RETROGRADE MANAGEMENT SYSTEM
Troy D. Carr, Lieutenant Commander, United States Navy Brett K. Wilcox, Lieutenant Commander, United States Navy
Submitted in partial fulfillment of the requirements for the degree of
MASTER OF BUSINESS ADMINISTRATION
from the
NAVAL POSTGRADUATE SCHOOL December 2006
Authors: _____________________________________
Troy D. Carr _____________________________________
Brett K. Wilcox Approved by: _____________________________________
Geraldo Ferrer, Lead Advisor _____________________________________ Bryan Hudgens, Support Advisor _____________________________________ Robert N. Beck, Dean
Graduate School of Business and Public Policy

iv
THIS PAGE INTENTIONALLY LEFT BLANK

v
DEPOT LEVEL REPAIRABLE CARCASS TRACKING AND THE ELECTRONIC RETROGRADE MANAGEMENT SYSTEM
ABSTRACT
The purpose of this Project is to develop a Department of the Navy related case
study for use in future Supply Chain Management courses at the Naval Postgraduate
School, Monterey, CA. Pursuant to this objective the Depot Level Repairable program of
the U. S. Navy will be studied. The case progresses through a background of the DLR
program, the Advanced Traceability and Control (ATAC) system currently in fleet wide
use and the improved process being implemented, the Electronic Retrograde
Management System (e-RMS). Through a study of the component processes partnered
with selected data for analysis the case will highlight several fundamental concepts of
supply chain management and provide for both qualitative and quantitative discussion.

vi
THIS PAGE INTENTIONALLY LEFT BLANK

vii
TABLE OF CONTENTS
I. DEPOT LEVEL REPAIRABLE CARCASS TRACKING ................................- 1 - A. INTRODUCTION.......................................................................................- 1 - B. THE DLR SUPPLY CHAIN......................................................................- 2 - C. DLR COST STRUCTURE ........................................................................- 2 - D. INTERNAL RETROGRADE MANAGEMENT.....................................- 4 -
II. ATAC – THE FIRST GENERATION SOLUTION............................................- 7 - A. BACKGROUND .........................................................................................- 7 - B. ATAC DLR SUPPLY CHAIN...................................................................- 8 - C. ATAC SYSTEM COMMUNICATION AND THE BK PROCESS.....- 12 - D. ATAC SUMMARY...................................................................................- 15 -
III. E-RMS – THE NEXT GENERATION...............................................................- 17 - A. BACKGROUND .......................................................................................- 17 - B. E-RMS SUPPLY CHAIN AND COMMUNICATION .........................- 18 - C. E-RMS IMPLEMENTATION ................................................................- 19 - D. NAVSUP ACTIVITY MANAGEMENT THROUGH E-RMS ............- 21 - E. ACTIVITY COMMUNICATION THROUGH E-RMS.......................- 22 - F. TECHNICAL ASSISTANCE FOR REPAIRABLE PROTECTION..- 23 - G. ATAC CLOSURES...................................................................................- 24 - H. WHAT IS THE VALUE OF E-RMS? ....................................................- 24 -
IV. ANALYSIS AND RECOMMENDATIONS.......................................................- 27 - A. TARP’S EFFECT ON THE WHOLESALE SUPPLY CHAIN...........- 27 - B. DOES E-RMS ADD VALUE TO THE SUPPLY CHAIN?..................- 29 - C. REWARD VS RISK .................................................................................- 31 - D. THE IMPACT ON READINESS............................................................- 32 -
V. APPENDICES.......................................................................................................- 35 - APPENDIX A: NAVSUP RETROGRADE DASHBOARD ....................- 35 - APPENDIX B: PROOF OF SHIPMENT QA REPORT.........................- 37 - APPENDIX C: E-RMS SUPPLY DISCREPANCY REPORTING........- 38 - APPENDIX D: CVN 72 CARCASS TRACKING COMPARISON .......- 39 - APPENDIX E: TARP SAMPLING DATA...............................................- 40 - APPENDIX F: ATAC RESTRUCTURING .............................................- 41 -
LIST OF REFERENCES.................................................................................................- 43 -
INITIAL DISTRIBUTION LIST ....................................................................................- 45 -

viii
THIS PAGE INTENTIONALLY LEFT BLANK

ix
LIST OF FIGURES
Figure 1. Basic DLR Supply Chain..............................................................................- 2 - Figure 2. Activity DLR Decision Tree.........................................................................- 5 - Figure 3. ATAC Hubs & Nodes...................................................................................- 8 - Figure 4. Three stop DLR Supply Chain......................................................................- 8 - Figure 5. Full DLR Supply Chain ................................................................................- 9 - Figure 6. ATAC Process Flow ...................................................................................- 10 - Figure 7. ATAC System Retrograde Material Pipeline .............................................- 12 - Figure 8. Fleet BK Process Overview........................................................................- 12 - Figure 9. ATAC System BK Timeline Process Flow ................................................- 13 - Figure 10. OCONUS e-RMS Retrograde Pipeline.......................................................- 19 - Figure 11. CONUS e-RMS Retrograde Pipeline..........................................................- 19 - Figure 12. Value Chain ................................................................................................- 30 - Figure 13. CVN 72 Carcass Tracking Comparison......................................................- 39 -

x
THIS PAGE INTENTIONALLY LEFT BLANK

xi
LIST OF TABLES
Table 1. Retrograde DASHBOARD Metrics............................................................- 35 - Table 2. Proof of Shipment Quality Assurance Report ............................................- 37 - Table 3. TARP Efficiency Sampling Data................................................................- 40 - Table 4. ATAC Manning Levels Pre e-RMS............................................................- 41 - Table 5. ATAC Manning Levels, 1st Stage e-RMS ..................................................- 41 - Table 6. ATAC Manning Levels, 2nd Stage e-RMS .................................................- 42 -

xii
THIS PAGE INTENTIONALLY LEFT BLANK

xiii
ACKNOWLEDGMENTS
First and foremost we would like to thank Professor Ferrer who took on our
project before it really was a project and stuck with us through the often laborious and
sometimes painful process of nailing it down to what it is today. To Lieutenant Colonel
Hudgens, thank you for taking us on at the very last minute on top of an already imposing
workload and providing such timely and excellent feedback. To you both we say thank
you for the guidance and direction needed to bring this project to completion.
Ms. Beverly Thomas of NAVICP without whom this project could not have been
done, the education, information and data she provided were absolutely crucial to it’s
success.
Mr. Gregg Gibeault, Mr. Paul Wells, Mr. Stephen Enck and Mr. Russell
McCullough who provided us with focused insights of their respective areas of expertise.
Though often at odds with one another, these insights led us down the path that this
project took and made us take comparative looks at the programs that we otherwise
would have missed.
The Fleet Supply Personnel of the Bonhomme Richard and Tarawa who took time
out of their busy days to provide us with the end-user perspective of the e-RMS system
and its impact on their operations. To Commander Hughes, Lieutenant Sean Andrews,
SK2 Avendano, SK2 Edenburgh and SK2 Roldan-Castillo of the Tarawa and
Commander Breth, Lieutenant Andy DeLeon, SK2 Cabangcalan and SK2 Corrales of the
Bonhomme Richard, thank you. Shipmates, we wish you fair winds and following seas.

xiv
THIS PAGE INTENTIONALLY LEFT BLANK

- 1 -
I. DEPOT LEVEL REPAIRABLE CARCASS TRACKING
A. INTRODUCTION The Navy’s Depot Level Repairable (DLR) program was established as a means
of battling the ever increasing cost of repair parts for an array of technologically
advanced weapon systems, ships and aircraft. Through the DLR program, selected
components are specially identified for repair or refurbishment at the depot level of
maintenance, typically at a Naval Aviation Depot (NADEP), or the original equipment
manufacturer such as Raytheon or Hughes1. By repairing or refurbishing equipment and
components, the Navy saves a significant amount of money over acquisition of new
replacement components. This process utilizes a supply chain that links the end use
activity (ship, aviation squadron, shore station) with the depot level maintenance site.
For two decades the Navy DLR program has utilized the Advanced Traceability
and Control (ATAC) system for retrograde material management. At its inception ATAC
was a dramatic step forward; however, as will be shown in the following pages, there
were still some significant shortcomings that needed to be overcome.
Over the last few years the Navy has been implementing the electronic Retrograde
Management System (e-RMS) at select shore activities and aboard certain ship classes,
eventually planning to have the system implemented fleet-wide2. An evolutionary next
step, e-RMS utilizes current technologies such as a web-based interface and bar-code
scanning to provide for some dramatic improvements in the retrograde supply chain.
This case will take the reader through an explanation of the basic DLR concept
into the ATAC application and its affects on the supply chain and finally discuss the next
generation system currently being fielded, the electronic Retrograde Management
System. Data for further analysis and process recommendations will close out the case.
1 Repair is now approximately 50% commercial and 50% organic (Navy or interservice), Beverly Thomas, NAVICP 0344, Repairable Distribution
2 Over 150 sites had been activated as of 25SEP06, Data provided by Paul Wells, TARP

- 2 -
B. THE DLR SUPPLY CHAIN The general concept of the DLR program is a simple closed loop supply chain that
manages retrograde material by linking an end use activity such as a ship, aviation
squadron or shore station with the depot level maintenance site as depicted in Figure 1.
Through this supply chain an activity returns a broken part, referred to as a Not Ready
For Issue (NRFI) part, to the assigned Depot, which performs the required repair and
refurbishment actions to return the component to a Ready For Issue (RFI) condition at
which point it is available for issue to a fleet unit.
NRFI
RFIActivity
DepotNRFI
RFIActivityActivity
DepotDepot
Figure 1. Basic DLR Supply Chain
Retrograde supply chain management has two basic phases, phase one occurs
within the lifelines of the activity and consists of the internal processes undertaken to
move the material off the ship to the turn-in point, known as the “Carcass Tracking”
phase. Phase two, the “SIT” (Stock in Transit) phase, handles the movement of the
material from the turn-in point to the depot or storage point. This will be discussed in
greater detail in chapter two.
C. DLR COST STRUCTURE A critical component in the DLR program is the cost structure built into the
system. DLR parts carry two distinct prices, a Standard Price and a Net Price. The
Standard Price is the price paid for a new component from a manufacturer while Net
Price is what gets charged for a refurbished part.
As an example3, consider a Klystron Tube for a radar assembly: it is a single large
component with, say, one hundred internal subassemblies and due to its complexity is
3 Example is for illustrative purposes only, component design and prices are not factual.

- 3 -
beyond the capability of organizational level (O-level) or intermediate level (I-level)
maintenance and must be returned to the manufacturer (Depot level) for repair.
Our Klystron tube costs the Navy $115,000 to purchase new from the
manufacturer; this includes the cost to acquire or produce the 100 subassemblies and then
assemble the single component, and this $115,000 price tag is the Standard Price. The
Net Price is either a contractually agreed upon price based on known component failure
rates and associated repair costs or it is determined as the average price of repairs made to
the component over time.
Assuming the former is the case a realistic assumption for repair would be a price
of $20,000 per tube repaired. In this case the Navy pays $20,000 to get a refurbished
Klystron tube into the inventory and recognizes a cost avoidance of $95,000, a savings of
nearly 83%.
If we assume the latter is the case and that ten repair actions have been made on
Klystron tubes over time and individually they cost (including all parts, materials and
labor) $11000, $8000, $18000, $19000, $27000, $32000, $9000, $14000, $12000 and
$20000 then a Net Price of $17,000 would be charged for the next component issued in
RFI condition from the manufacturer. The DLR program just saved the Navy $98,000 on
a single component, a savings of roughly 85% off the new component cost.
There is, however, a catch. The wholesale system provides the RFI components
to the Navy stock system at the Net Price with the understanding that at some point they
will receive the NRFI part (referred to as a carcass). If an activity fails to return the
carcass, then they will be charged the Standard Price for the component. The difference
between the Net and Standard Prices is known as a carcass charge and it can have
significant negative impacts on an activity’s budget. Since Net Price is typically between
25% and 75% of the Standard Price (about 15% in our example), it is extremely
important that DLR carcasses are returned promptly to the designated point.
Traditionally the Navy has paid millions of dollars in carcass charges annually
due to the loss, damage or misidentification of retrograde material returned to the DLR

- 4 -
system. In addition to the direct dollar cost of the material there are also indirect costs to
consider such as the man-hours spent managing the program and the operational impact
of down or degraded systems.
D. INTERNAL RETROGRADE MANAGEMENT While all activities differ to some degree in their internal management practices it
is important to recognize some of the common steps undertaken by all activities. Certain
shore activities and large ships (aircraft carriers and large-deck amphibious ships) have
an inherent maintenance capability to repair components that would otherwise be
considered depot level. A circuit card for a radar assembly on a cruiser may be
considered a DLR while that same circuit card could be repaired locally on the aircraft
carrier because of the facilities, test equipment and trained technicians available. There
are also distinctions made between normal DLRs and Aviation DLRs (AVDLRs).
However, the basic process flow is similar and the key points of failure are common
enough to warrant a general discussion based on the operations of a small surface
combatant (cruiser, destroyer, frigate) in order to retain simplicity.
When a piece of equipment onboard ship fails, the responsible technician for that
equipment will perform some level of troubleshooting to determine the probable cause.
A parts request is submitted, a requisition is generated, and a carcass turn-in is received
and processed for shipment to the nearest turn-in point. This generic process is outlined
in figure 2 below; processes which are shaded are possible points of failure due to manual
entry and human action. In addition to some of the more common causes highlighted in
the bubbles there are other possible circumstances, too numerous to mention, that could
lead to a ship receiving a carcass charge for retrograde material that is lost or damaged
beyond repair.
Some key points to draw from this process are the amount of manual entries
required for the submission of the parts request, parts requisition and carcass turn-in
document as well as the reliance upon possibly outdated reference materials. This
process is the basis of the Carcass Tracking phase and it is important to note that the ship
is responsible for any carcass charges incurred throughout this phase until the retrograde

- 5 -
material is received and TIRed (Transaction Item Record)4 by the turn-in point. Also of
note is the timeline attached to this process, discussed later in chapter 2 and visually
represented in Figure 9. While the actual gates are not as important, what is important is
that failure to meet a gate will result in a carcass charge to the ship. While it can be
reversed it places additional workload on the activity concerned.
Figure 2. Activity DLR Decision Tree
4 Transaction Item Record is any electronic record update affecting a DLR component. Typical TIRs
will be such things as receipt of a turn-in by the ATAC, shipment to a depot, and receipt at depot. TIRs are used to track the progress of a DLR carcass.
Parts Request via OMMS-NG to R-Supply
Storekeeper reviews tech data on part against FEDLOG
If in stock, part is issued, if not
requisition released
5S: Carcass can Remain In Place until issue
5G: Carcass Turn-In required
Carcass verified and 1348 BC1 prepared
DLR packed and/or preserved IAW P-700
DLR carcass manifested and shipped to turn-in point, POS
posted to FACTS
Is part a
DLR?
5G or 5S?
Carcass received and issue made
Yes
5G
5S No
Based on initial entry data,
FEDLOG may not be current
Manual data entry, NIIN, part number, wrong tech manual
referenced, etc. Is carcass
actually received by
supply?
Is it the right carcass?
Does supply have right
materials & containers?
Did supply obtain proof of shipment

- 6 -
OMMS-NG: Organizational Maintenance Management System – Next
Generation
R-Supply: Relational Supply (Supply system used for stock management)
FEDLOG: Federal Logistics – Listing of all parts and material in service
as well as individual identifying information
NIIN: National Item Identification Number
1348: Form used to document turn-in of the material
BC1: Code that identifies material being turned in as not being verified
ready for shipment to a depot, requires independent verification of
material at the turn-in point
POS: Proof of Shipment
FACTS: Fleet Automated Control Tracking System
At this point the activity should have a DLR carcass ready for shipment; but
where should it be sent? Is it really the right carcass relative to the documentation
prepared? Does the activity have the necessary packaging materials and containers and
have they prepared the carcass for shipment properly? Who will be responsible for the
material once it is shipped? The baseline DLR program had no answers to these
questions. The Navy recognized these issues and set out to develop an improved way of
managing the retrograde material pipeline.

- 7 -
II. ATAC – THE FIRST GENERATION SOLUTION
A. BACKGROUND In 1986 the Navy instituted the Advanced Traceability and Control (ATAC)
system as an improved means of managing the DLR return process. ATAC was created
to simplify and improve the retrograde supply chain for the fleet. ATAC aimed to reduce
the work-in-process inventory of individual parts and to shorten the overall pipeline for
returning NRFI parts to the depot. Operating on a hub and node concept, ATAC
promised transportation savings through consolidation of activity shipments at the hubs
and nodes as well as labor and processing savings recognized through improved
utilization of information systems in addition to the gains made by consolidation.
ATAC benefit objectives included a reduction in fleet workload, a reduction in
the amount of damage to material beyond the initial failure, reduced number of lost and
misdirected shipments, reduced transportation costs and an improvement in the accuracy
of the right part getting to the right repair site at the right time.
The ATAC hubs provide a defined set of services which include:
Receiving Material from fleet units
Material Identification (screening for accuracy)
Disposition Instructions (what to do with the part)
Packaging and Protection in accordance with the P-7005
TIR (Transaction Item Reporting) Data Reporting
Transportation (Carcass Express or Routine)
Proof of Shipment Data (In-Transit Visibility)
Customer services related to frustrated or missing shipments
5 Now known as the Common Naval Packaging P-700 or CNP-P700, it is a web based search tool used
to find packaging requirements for Navy items managed by the Naval Inventory Control Point (NAVICP), the Naval Operational Logistics Support Center (NOLSC) and the Marine Corps. Searches for packaging requirements can be done using the nine digit NIIN (National Item Identification Number), part number or the part name

- 8 -
ATAC established two hub sites, one on the east coast in Norfolk, VA and one on
the west coast in San Diego, CA. Numerous nodes were established in high fleet
concentration areas around the world.
Figure 3. ATAC Hubs & Nodes6
B. ATAC DLR SUPPLY CHAIN Revising the basic process laid out in Figure 1, an intermediate step is now
inserted between the activity and the depot. Material originates from an activity and
depending upon the unit’s geographic location is turned in either directly to the local hub
or to the nearest node. If material is sent to a node it is consolidated at that node and then
shipped to the appropriate hub site for further disposition.
ATAC Hub Norfolk or San Diego
Activity
DepotNRFI
RFI
NRFIATAC Hub Norfolk or San Diego
ActivityActivity
DepotDepotNRFI
RFI
NRFI
Figure 4. Three stop DLR Supply Chain
6 Graphic taken from MBA Professional Report, “A Review of Reverse Logistics and Depot Level
Repairable Tracking in the United States Navy” of June 2005, Stevenson, Toussaint and Edwards

- 9 -
ATAC hubs have their own set of processes (Figure 6), which they apply to each
NRFI (“F” condition) part they receive from an activity. The process flow determines the
disposition of the part in question with each part sent either to a Designated Overhaul
Point (DOP) for repair/refurbishment or to a Designated Support Point (DSP) for storage
until such time as they are needed to replenish RFI (“A” condition) stocks for fleet issue
when they will be pulled from storage, re-inspected and sent to a DOP.
The revised supply chain for DLR material now looks like this:
ATAC Hub Norfolk or San Diego
Activity
DOP (Depot)“F”
“A”
“F”
DSP“F”
RFI Stock Point “A”
“F”
ATAC Hub Norfolk or San Diego
ActivityActivity
DOP (Depot)DOP (Depot)“F”
“A”
“F”
DSP“F”
RFI Stock Point “A”
“F”
Figure 5. Full DLR Supply Chain
While the ATAC system did provide many improvements and met most of its
objectives there were still serious shortcomings in the system’s accuracy (many points of
manual entry = many points of potential failure), its ability to provide accountability over
stock in transit (SIT), and limited in-transit visibility of parts moving between an activity
and a depot. Additionally there was an “alarmingly high rate”7 of parts arriving at the
DOPs in a “beyond capability of repair”8 condition due to improper handling and
packaging which caused additional carcass charges to be issued to fleet units. In addition
to all this, there remained an excessive amount of work required by the operational units
to track carcasses and research and resolve carcass charges.
7 Gregg Gibeault, CNSF Fleet Carcass Tracking Office 8 Beyond capability of repair means that a component has been so heavily damaged that it either
cannot be repaired or it is not financially viable to repair it (i.e. melted circuit card , crushed gyro assembly)

- 10 -
Material Fails
at Activity
Processed at Node
Processed at Hub
Ship to Node Ship to Hub
Secondary Screening
Is Item Repairable Disposal
Is item designated for repair at
DOP
Is item designated for storage
at other DSP?
Hub consolidation & packing
Ship to alternate storage location
Ship to Depot Item to be stowed in local facility
NO
YES
NO YES
YES
NO
Figure 6. ATAC Process Flow9
Similar to what was outlined in the “Activity DLR Decision Tree” diagram
(Figure 2) there are numerous points of potential failure within the ATAC system (figure
6) as indicated again by the shaded process boxes.
Shipment to the hubs or nodes bore a high loss rate due to the high operational
tempo and multimodal means often employed to get a part from origin to destination. A
DLR from a small ship may go via helicopter or high-line transfer to another ship then
cross-decked again to a logistics force vessel that will carry the part into their next port of
call where it gets handled through local sources for transshipment to a regional node or
9 Adapted from MBA Professional Report, “A Review of Reverse Logistics and Depot Level
Repairable Tracking in the United States Navy” of June 2005, Stephenson, Toussaint and Edwards

- 11 -
stateside hub. The attention to detail given to manifests and document numbers during
this entire process is often lacking, not because of negligence but due to the pace at which
material is physically moved from point to point, necessitating a high “box-kicking”
throughput in order to keep the decks clear.
Hub and node processing requires manual reading and entry of manifest and item
data followed by the secondary screening process that physically opens every part
submitted under a “BC1” document, removes the part from its packaging, inspects the
part for accuracy against the shipping documents and then repackages the part, hopefully
in accordance with the P-700 requirements.
Hub consolidation induces errors in manifesting or routing due primarily to the
human involvement required to screen documents and route material accordingly. The
hubs then have to generate their own 1348 document to ship the material to the
appropriate site, at this point the material is labeled as “BC2” meaning that what the label
says is in the box is accurate.
This combination of processes may involve as few as three people given certain
assumptions such as one technician, one storekeeper who handles the DLR from cradle
(technician) to grave (hand-carries it to the ATAC hub) and one ATAC employee who
performs all the necessary processes to TIR the DLR, ship or store it and close out the
process. On the other hand, a DLR from a deployed vessel may realistically pass through
the hands of twenty or more different people before reaching its final destination, each of
whom has the potential to induce an error into the process.
Summarizing and visualizing the two phases previously described we can view
the traditional retrograde material pipeline as such:

- 12 -
Carcass Tracking Stock In Transit
ATACReceive AVDLR/DLRUnpack AVDLR/DLRScreen material1348 BC2 (to repair
facility)Pack/Preserve materialSend item to ShippingShip to Repair Facility
DOP/DSPReceive AVDLR/DLRRepair or Store Item
AVDLR/DLR Turn-in1348 BC1 (to ATAC)Pack/Preserve MaterialManifestShip material to ATACPost POS in FACTSOld (FEDLOG) data used
Figure 7. ATAC System Retrograde Material Pipeline
C. ATAC SYSTEM COMMUNICATION AND THE BK PROCESS Using ATAC as a choke point for the DLR supply chain provided Naval
Inventory Control Point (NAVICP) with a system of checks and balances that sought to
prevent activity carcass charges by forwarding DLR carcasses from the originating
activity to an ATAC hub or node for processing and further shipment to the proper DOP
or DSP (Figure 8). Activities were relieved of the carcass charge burden once ATAC
processed and eventually TIRed the carcass associated with the DLR requisition.
ATAC HUB NAVICPNRFI BC1
TIR
Carcass Tracking Begins with unit DLR issue
Carcass Tracking Ends when NAVICP receives
TIR from ATAC
96 Days from issue to charge – The BK Process
ATAC HUB NAVICPNRFI BC1
TIR
Carcass Tracking Begins with unit DLR issue
Carcass Tracking Ends when NAVICP receives
TIR from ATAC
96 Days from issue to charge – The BK Process Figure 8. Fleet BK Process Overview10
10 BK is a two-letter code prefix used in association with carcass tracking, it has no independent meaning.

- 13 -
The BK process timeline is depicted in figure 9. Key time gates are 45 days from
part issue at the activity to issuance of a BK1 from NAVICP if the carcass has not been
TIRed by the ATAC site. The activity then has 21 days to research the discrepancy and
respond with a BK2 before receiving a BK3 notification of charge. Once a BK3 has been
issued the activity has 30 days to dispute it (via BK2 response) before the activity has to
accept the carcass charge. 11
Unit Issues Part Clock Starts on NRFI Turn-In
NAVICP issues BK1
to Unit
Unit Responds to BK1
Unit Submits
BK2
Valid BK2
NRFI Carcass Shipped to ATAC
ATAC Receives NRFI, Verifies & TIR to NAVICP
NRFI Process
Problems
NAVICP receives TIR, Carcass
Tracking Closes
NAVICP issues BK3
to Unit
Carcass Tracking Closes
NAVICP issues BKR
to Unit Unit
Researches
Unit Resubmits
BK2
Valid BK2
Unit Submits
BK2
Unit Responds to BK3
Unit is Charged
Valid BK2
NAVICP issues BK4 to
credit Unit
NAVICP issues BKR
to Unit Unit
Researches
Unit Resubmits
BK2
Valid BK2
21 Days 30 Days 45 Days
Yes
No Yes Yes
Yes
Yes Yes
Yes
No No
No
No No
No
Figure 9. ATAC System BK Timeline Process Flow
The fundamental problem with the ATAC system is the lack of real-time
communication and visibility of the carcass between the activity, NAVICP, and ATAC.
As described, the BK process has three predominant failings:
11 BK1: (NAVICP to activity) Where is the carcass?
BK2: (activity response to NAVICP) This is what happened to the carcass.
BK3: (NAVICP notice to activity) We are billing you for the lost carcass.
BK4: (NAVICP notice to activity) We are crediting you for the erroneous carcass charge
BKR: (NAVICP response to activity) Your BK2 was not considered adequate response

- 14 -
It is a reactive system
It is an administrative burden
Financial liability is not correlated with physical ownership
Activities are dependent upon the efficiency of the ATAC hubs and nodes
charged with TIRing carcass turn-ins. If a hub or node is inefficient, misplaces a turn-in
or experiences some other unexpected impact on operations the originating activity is not
aware of the discrepancy until after NAVICP issues the BK1. Responding reactively the
activity now has 21 days in which to research and resolve the discrepancy. This process
can be complicated by a multitude of factors including; lack of access to the carcass (it
was already transferred off site), disputes over component serial numbers, conflicts in
documentation due to data entry errors and a host of others. Often times these delays
cause the activity to miss the 21 day deadline and they are now faced with a BK3 notice
of a pending carcass charge. The activity now has another 30 days to achieve resolution
of the issue before being forced to accept the charge into their accounting system, while
the charge can be refunded via a BK4 at a later date if the issue is resolved it should be
readily apparent that a great deal of time and effort is expended on carcass tracking.
The issue of financial liability revolves around the way carcass charges are
assessed. An activity that loses or destroys a carcass is rightly liable for the charge,
however, when the activity does everything properly and the material is lost or destroyed
at some later point in the pipeline but before it is TIRed out of carcass tracking by an
ATAC site the charge is still assessed against the originating activity. What this led to
was a practice amongst fleet units to hold carcasses at the activity until they could be
hand-carried to one of the ATAC hubs or nodes. To avoid BK3 charges at the 45 day
point the activities would manipulate the BK system to defer the BK3 long enough to
deliver the material directly to ATAC and then obtain hardcopy proof of delivery to
ATAC and in many cases wait until ATAC personnel actually processed and TIRed the
material. While beneficial to the individual activity this practice delayed the entry of
repairable items into the pipeline, usually to the detriment of overall fleet readiness.
- 15 -
Another key function of the ATAC sites is the 100% inspection of all material
received under a BC1 document code (material requires inspection for verification).
ATAC personnel would open and inspect all items for proper identification of material
against the shipping documentation, correct preservation and packaging in accordance
with the CNP-700 and general condition of material to ensure it is actually “F” condition
vice “BCM”. This inspection was a preventive means of maintaining the integrity of the
DLR pipeline, because all material was inspected prior to induction to a DOP or DSP
there was a reasonable assurance that what was held as inventory was truly repairable,
which meant that NAVICP could forecast quite accurately what it would cost to
repair/refurbish any given number of items. Once ATAC had inspected and repackaged
the material they would code it as BC2 (material has been inspected and verified, no
further action necessary) and ship it to the designated point for repair or storage.
This inspection policy would prove to be costly; both in the labor required to
perform the inspections and in the additional errors induced in the system from a second
tier of human interface and manual data entry. Time delays caused by backlogs at the
sites would lead to carcass charges being incurred at the activities requiring additional
administrative efforts to resolve and although material left the ATAC sites coded BC2
this wasn’t always the case leading to erroneous inventories in the DLR pipeline.
D. ATAC SUMMARY The ATAC system provided a central management system for the handling of
DLR retrograde material and achieved to some degree all of the objectives it was
originally meant to accomplish.
While objectively successful there are certain areas in which the ATAC system
was noticeably lacking, particularly asset visibility and communication between
stakeholders. ATAC’s policy of 100% verification on all BC1 retrograde material
ensured accuracy and integrity of material in the wholesale supply chain. ATAC was
able to reduce the WIP inventory by streamlining the turn-in process and consolidating
shipment of material. Resident experts at the ATAC sites were well-versed on the
requirement of the CNP-700 and had the materials available to ensure retrograde was

- 16 -
properly packaged, avoiding further damage during shipment. TIR reporting for
retrograde returned was moved closer to the customer than it had been before.
ATAC did introduce some new weaknesses into the system, the 100% inspection
policy required that material be opened and removed from its packaging, adding touch-
points to the carcass processing and increasing the chances for damage. Delays
introduced at the ATAC sites often resulted in erroneous carcass charges being issued to
the fleet activities. As an intermediate station in the pipeline ATAC was forced to read,
enter and produce documentation for material moving through their sites introducing an
entire new level of potential human interface errors. Perhaps most significantly though
was the loss of asset visibility by the fleet unit that owned the carcass once the retrograde
left their activity.
Although ATAC served the Navy well for nearly two decades the new
millennium ushered in changes in the global environment that highlighted the operational
shortcomings of the legacy system and served as an impetus for the next generational
change to DLR asset management.

- 17 -
III. E-RMS – THE NEXT GENERATION
A. BACKGROUND September 11, 2001 marked the beginning of a new age of operations for the
Navy, one which would see a sustained operational tempo unmatched in recent decades
and a concurrent reduction in operational and maintenance funding. This combination of
factors brought to the forefront the inherent weaknesses and expense of the traditional
DLR retrograde handling pipeline and an improved solution was sought.
The Naval Supply Systems Command sponsored a Retrograde Reengineering
program beginning in October of 2002 which highlighted three key factors12:
#1) Information Technology – the cause of, and solution to, most of the problems
One IT platform = e-RMS
e-RMS was already ERP and NMCI compliant
Provide all retrograde functionality in one system
Retire or migrate 5 legacy systems (AORS, ATAC, RDO/RFI, WMPS,
WMRS)
$900,000 in annual savings beginning in FY05
#2) Do it right the first time
Move TIR closer to the customer
Allow the Fleet to screen BCMs (Beyond Capability of Maintenance),
validate against requisitions with e-RMS
Grant real-time access to live ICP data (disposition, priority, etc.)
Let each activity do only as much as they can (site surveys)…China Lake
vs. Norfolk vs. Singapore vs. USS LINCOLN vs. USS MITSCHER etc.
#3) Supply must drive transportation decisions
12 NAVICP e-RMS brief prepared by Louis Koplin, NAVICP

- 18 -
Single carrier contract, expected to save $1.5+ million beginning FY04
Priority and speed of carcass returns based on current supply posture
The IT platform chosen to spearhead the reengineering initiative was e-RMS
which is a web based tool that is designed to streamline the retrograde pipeline by
allowing the proper identification, packaging and documentation of the asset. It matches
the turn-in carcass against the requisition to ensure that credit is received by the activity.
The system provides shipment tracking and asset visibility throughout the entire pipeline
in real-time and greatly reduces the number of carcass “touch points”.
B. E-RMS SUPPLY CHAIN AND COMMUNICATION The supply chain for e-RMS is conceptually identical to that for the ATAC
system, retrograde material still moves from fleet units through the ATAC hubs and
nodes until reaching its final destination for repair or storage. The major differences
between the systems are the transition point from carcass tracking to stock in transit and
the real time visibility of the carcass at all points in the supply chain.
The conceptual flow of material and associated process actions throughout the e-
RMS retrograde pipelines are shown in figures 10 and 11. These graphics also illustrate
the potential value of adding a web-based utility to track retrograde material throughout
the wholesale supply chain. Touch points are greatly reduced by initiating SIT and
turning off carcass tracking at the activity level. Each entity within the chain is
independent of one another, which reduces the reliance of multiple touch points for
carcass TIRing. Having independent entities also gives Naval Inventory Control Point
(NAVICP) the ability to isolate problems that occur within the chain without sacrificing
the readiness of the non-effected entities within the chain.

- 19 -
AVDLR/DLR turn-inScreening1348 BC2 (to repair facility)Pack/Preserve AVDLR/DLRManifestAVDLR/DLR shipped to ATACPost POS in eRMSLive ICP data used
Stock in Transit (SIT) begins/Carcass
Tracking turned OFF=Decreased
Workload
OCONUS Turn-In Site MSC ATAC AMC/FedEx DOP/DSP
Receive AVDLR/DLRSegregate Carcass
Express items, if necessarySend item to ShippingShip to Repair Facility
Receive ItemRepair ItemGet back on shelf
VISIBILITY VIA eRMS
Carcass Express Items Identified and easily
expedited = READINESS
AVDLR/DLR turn-inScreening1348 BC2 (to repair facility)Pack/Preserve AVDLR/DLRManifestAVDLR/DLR shipped to ATACPost POS in eRMSLive ICP data used
Stock in Transit (SIT) begins/Carcass
Tracking turned OFF=Decreased
Workload
OCONUS Turn-In Site MSC ATAC AMC/FedEx DOP/DSP
Receive AVDLR/DLRSegregate Carcass
Express items, if necessarySend item to ShippingShip to Repair Facility
Receive ItemRepair ItemGet back on shelf
VISIBILITY VIA eRMSVISIBILITY VIA eRMS
Carcass Express Items Identified and easily
expedited = READINESS
Figure 10. OCONUS e-RMS Retrograde Pipeline13
AVDLR/DLR turn-inScreening1348 BC2 (to repair facility)Pack/Preserve MaterialManifestAVDLR/DLR shipped to ATACPost POS in eRMSLive ICP data used
CONUS Turn-In Site ATAC DOP/DSP
Receive MaterialSegregate Carcass Express
items, if necessarySend item to ShippingShip to Repair Facility
Receive ItemRepair ItemGet back on shelf
Carcass Express direct from site to repair facility
VISIBILITY VIA eRMS
Carcass Express Items Identified and easily
expedited = READINESS
Stock in Transit (SIT) begins/Carcass
Tracking turned OFF=Decreased
Workload
AVDLR/DLR turn-inScreening1348 BC2 (to repair facility)Pack/Preserve MaterialManifestAVDLR/DLR shipped to ATACPost POS in eRMSLive ICP data used
CONUS Turn-In Site ATAC DOP/DSP
Receive MaterialSegregate Carcass Express
items, if necessarySend item to ShippingShip to Repair Facility
Receive ItemRepair ItemGet back on shelf
Carcass Express direct from site to repair facility
VISIBILITY VIA eRMSVISIBILITY VIA eRMS
Carcass Express Items Identified and easily
expedited = READINESS
Stock in Transit (SIT) begins/Carcass
Tracking turned OFF=Decreased
Workload
Figure 11. CONUS e-RMS Retrograde Pipeline14
C. E-RMS IMPLEMENTATION By developing and implementing e-RMS NAVICP/Navy Supply Information
Systems Activity (NAVSISA)/Navy Supply Systems Command (NAVSUP) provided
activities with a web based “cradle to grave” visibility that was not accessible to them
13 Adapted from brief provided by Beverly Thomas, NAVICP 0344, Repairable Distribution 14 Ibid.

- 20 -
through the legacy ATAC system. Prior to e-RMS activities only had the ability to
perform the following functions under the ATAC system:
Identify retrograde
Initiate Stock in Transit (SIT)
Create bar-coded turn-in/shipping documents (DD1348-1s)
Create shipping manifests and Military Shipping Labels (DD1387s
Print a bar-coded DD1348-1 turn-in shipping document reflecting the
Designated Overhaul Point (DOP)/Depot Supply Point (DSP) and other
critical information
Create shipping documentation for Repair and Return assets
Identify appropriate shipping containers, Carcass Express, Crown
Jewel, and Hazardous designated NRFI assets.
Through e-RMS activities became Retrograde Asset Managers with the ability to
perform the actions listed above plus the following additional functions:
Terminate carcass tracking
Capture Proof of Shipment (POS)
Capture Proof of Delivery (POD)
These additional features provide a proactive posture for activities within the
wholesale supply chain. Activities can dictate the TIRing process and initiate SIT by
posting POS/POD; effectively ending carcass tracking and eliminating the burden of
reactively monitoring the BK process timeline. Communication difficulties experienced
under the legacy system are eliminated with ATAC’s role reduction to router and shipper
and the activities ability to transfer carcass accountability to ATAC after posting
POS/POD to e-RMS.

- 21 -
D. NAVSUP ACTIVITY MANAGEMENT THROUGH E-RMS NAVSUP developed two management tools assist in tracking the progress of
activities involved with e-RMS implementation. The first was the Retrograde
Dashboard, which tracked wholesale supply chain effectiveness; and the second was the
Proof of Shipment Quality Assurance Report (POS QA), which tracked the activities use
of POS postings in relation to stock in transit ordering (SIT).
The Retrograde Dashboard management tool, shown in Appendix A, measured
efficiency of the wholesale supply chain in time (Cycle time, measured in number of
calendar days, for NRFI material to travel through the wholesale system) and Quality
(General health of the wholesale system). Measurements of time were weighted at 60%
of importance for management purposes and concentrated on the following metrics:
Fleet (or Supply) Time: Days until NRFI is either received at ATAC or is
worked and shipped (POS posted) using e-RMS
ATAC (or Transportation) Time: # of Days until ATAC provides proof of
delivery (POD) to DOP/DSP
DOP/DSP Time: # of Days until DOP/DSP processes receipt TIR
Measurements of quality were weighted at 40% importance and
concentrated on the following metrics:
Percent Turned-In: Did the Fleet turn in as many carcasses as were owed?
Percent Delivered: Did NAVSUP get 100% POD on the carcasses that
were turned in?
Percent TIRed: Did the DOP/DSP provide receipt TIR on every delivery?
The POS QA report, shown in Appendix 2, provided NAVSUP with a
means of determining which activities where fully utilizing e-RMS and
which required additional training by examining the following metrics:
Number of BC2s produced: NRFI Material worked and screened

- 22 -
Number of Auto POS transactions: Activity did not post POS, but ATAC
reported receipt, so “dummy” POS was automatically loaded instead by e-
RMS.
Number missing POS with DOP/DSP TIR: NFRI arrived at DOP/DSP
without activity posting POS or going through ATAC for transportation.
Number missing POS without DOP/DSP TIR: Activity did not post POS
and did not receive credit for turn-in. Carcass Tracking still open, material
may be onsite or lost.
Number of local deliveries without POD – In this case, activity must post
POD also to get credit for turn-in
Activities are required to submit NFRI materials to ATAC under a BC2 code.
The POS QA management tool allowed NAVSUP to determine which activities were
failing to code their NRFI materials, posting POS or POD, and failing to submit NRFI
materials after requesting SIT.
E. ACTIVITY COMMUNICATION THROUGH E-RMS The legacy ATAC system offered a BK Timeline messaging system for activities
needing to communicate with NAVICP about discrepancy issues concerning NRFI
materials. Activity BK2 message responses to NAVICP generated BK1/3/4 messages
were essentially the only way to communicate discrepancies concerning NRFI materials
within the wholesale supply chain. As part of the web based functionality of e-RMS
NAVSUP developed a web Shipping Discrepancy Reporting system (SDR)15 to improve
communication efficiency for activities using the e-RMS system. Instead of waiting for a
discrepancy message an activity can post information concerning a NRFI submission to
ATAC. SDR also allows NAVICP to track SIT requisitions initiated without POS/POD
posting to e-RMS by the activities. With SDR the frustration of singular points of
communication is replaced by interactive problem solving with all entities involved in the
wholesale supply chain.
15 Snapshot of SDR login page is pictured in Appendix C

- 23 -
F. TECHNICAL ASSISTANCE FOR REPAIRABLE PROTECTION Between August 2000 and July 2002 the USS ABRAHAM LINCOLN (CVN72)
lost accountability of 954 DLR carcasses valued at more than $16 million while operating
under the ATAC system16. Appendix D shows the carcasses processed by the LINCOLN
from August 2000 through July 2002 and the percentage of those that made it
successfully through the ATAC system. NAVICP determined through interviews with
CVN72 Supply Department and ATAC site personnel that a majority of the lost carcasses
were attributed to packaging errors. It was at this point that NAVSUP decided to
incorporate a packaging tutorial into the e-RMS system.
Technical Assistance for Repairable Protection (TARP) presents the DLR
custodian with a step-by-step tutorial for packaging NFRI material in preparation for
shipment within the wholesale supply chain. The tutorial is essentially a web-based
CNP-700 instruction offered through e-RMS to the custodian once the NFRI material is
determined to be BCM and requires shipment from the activity to ATAC. All aspects of
packaging are included; method of packaging, required materials, container requirements
and required labeling. If the CNP-700 instructions are followed correctly the custodian
can greatly reduce the potential for additional damage to retrograde material during
shipment within the wholesale supply chain.
Appendix D also shows the August 2002 through July 2003 improvements
experienced by CVN72 after implementing e-RMS w/TARP. These improvements were
instrumental in NAVICP developing a policy of coding all NRFI submitted through e-
RMS to ATAC as BC2. Unlike BC1 coding, which is subject to ATAC’s 100%
inspection policy, BC2 coded NRFI material does not require inspection. As mentioned
earlier in the case NRFI material was historically returned from ATAC hubs to the
originating activities at a rate of 12% reflective of the errors discovered by ATAC
personnel executing the 100% open and inspect policy. This is an important procedural
change because it places the responsibility of effective packaging directly on the DLR
custodian without using ATAC as a check point for packaging errors.
16 Data provided by NAVSUP and Beverly Thomas, ATAC, e-RMS, and TARP program manager.

- 24 -
To track DLR custodian packaging efficiency NAVICP instructed ATAC to
conduct random inspections on NFRI material turn-ins and outgoing shipments to the
DOP/DSP. Appendix E represents the random inspection data collected from sampling
5461 out of 213,601 BC2 coded retrograded material items submitted to ATAC from
June 16th through Nov 9th of 2006.
G. ATAC CLOSURES The success of e-RMS onboard CVN72 coupled with the start of fleet wide e-
RMS implementation signaled a change in the historical workloads normally experienced
by ATAC personnel. Appendix F charts the progressive reduction in manning levels at
the ATAC sites of both contractor personnel and Full Time Equivalent (FTE) government
personnel. From pre-implementation through stage one and into stage two there have
been significant reductions in manpower across the ATAC sites. This reduction and
associated labor savings results from the dramatic change in workload at the ATAC sites
brought about by the policy changes of e-RMS. By eliminating BC1 material the labor-
intensive process of 100% inspection at the ATAC sites was also eliminated, essentially
reducing the site responsibilities to that of a trans-shipper only. Stage two e-RMS
implementation removed enough workload to justify the complete closure of seven
ATAC sites (compare tables 5 and 6 in appendix F).
H. WHAT IS THE VALUE OF E-RMS? NAVICP’s introduction of e-RMS into the wholesale supply chain solved many
of the communication issues between the activities and ATAC. Supply Officers formerly
reliant on ATAC efficiency to prevent carcass charges were now in control of the TIRing
process reports to NAVICP, which left them free to worry less about the possibility of
carcass charges and concentrate more on improving the overall supply chain. However,
the question still remains: how positive the introduction of e-RMS was for the wholesale
supply chain? To answer that question we will need to answer the following questions:

- 25 -
1. Can the wholesale supply chain maintain integrity from potentially damaging
NRFI materials if ATAC is removed as a packaging error safety checkpoint and
packaging responsibilities are placed with the activities?
2. Does replacing a non-web based legacy system – built on a single choke point –
with a web-based system that provides proactive possibilities for all entities add value to
the supply chain?
3. Does it make sense to risk the validity of the material within the wholesale
supply chain for the cost savings recognized through reductions in operating expenses?
4. Is there an impact on readiness brought on by the elimination of the ATAC
inspection policy and the subsequent potential for non-repairable items to exist within the
wholesale supply chain?

- 26 -
THIS PAGE INTENTIONALLY LEFT BLANK

- 27 -
IV. ANALYSIS AND RECOMMENDATIONS
A. TARP’S EFFECT ON THE WHOLESALE SUPPLY CHAIN To examine the question of TARP’s effectiveness in reducing activity packaging
errors and the effect of changing activity NRFI submission coding from BC1 to BC2 we
examine the data provided in appendix 4. ATAC hubs received 213,601 NRFI materials
during a five month period in 2006, during that same period a total 5,461 items were
randomly sampled for an inspection rate of 2.5%
%5.2601,213
5461=
Under the legacy ATAC system NRFI materials coded BC1 were inspected 100%
of the time. The submission code change to BC2 under e-RMS has dropped the rate to
2.5%, which implies that NAVICP relies heavily on the TARP tutorial within the e-RMS
database to be an effective training tool for DLR custodians.
Of the 5461 sampled BCM material items, 661 errors were detected. 509 of those
errors were caused by packaging deficiencies, 5 were caused by misidentification of
BCM material, and 147 were caused by what ATAC considered other discrepancies.
Other errors are those errors that are associated with internal mis-steps within ATAC, and
do not apply towards the error rate associated with activity DLR custodian deficiencies.
Dismissing other errors and misidentification errors, because of their small percentage,
we isolate the packaging errors to focus on DLR custodian efficiency. Of the 509
packaging errors 460 were associated with NRFI material submissions and 49 were
associated with transfers from ATAC to the DOP/DSP. As mentioned earlier in the case,
the historical rate of NRFI returns to activities due to packaging discrepancies and
misidentifications is 12%. Assuming that most of the errors were due to packaging we
can use the historical 12% as the return rate for packaging errors. Using the Null
Hypothesis method we determine if the historical rate continued to occur under the new
coding policy or if it has substantially changed.

- 28 -
H0: p = 0.12 (“the error rate continues at the historical level of 12%”)
H1: p <> 0.12 (“the error rate has changed”)
Using the 16.5% total sample error rate as sample population we can use the
following formula to examine the null hypothesis:
(.165( %) 0.12( _ ) 8.34(1 0.12).12( _ ) (
3,626(# _ _ )
Z Sample historical rate
historical rate xof random samples
= −=
−
Normally if the results of the Null Hypothesis were closer to 1 or 2 we could infer
that is true, which means that the historical rate of 12% packaging errors is continuing
under e-RMS. The result of 8.34 indicates that the alternative hypothesis (that the error
rate has changed) is a more accurate accounting of the random inspection process.
Taking this into account when examining a 2.5% sample rate we can conclude that the
TARP tutorial within e-RMS is less effective in reducing the packaging discrepancies
than the ATAC legacy system of physical inspection. Furthermore, there is a strong
possibility that a large percentage of incorrectly packaged NFRI material is finding its
way into the wholesale supply chain.
To further support this argument we can look at the accuracy of ATAC’s random
inspection error rate by determining the validity of using the error rate as a barometer for
the actual number of incorrectly packaged NFRI materials within ATAC. It is logical to
assume that 12.69% packaging error rate discovered from a sample of 3,626 NFRI
materials could be applied to the 213,601 NRFI materials that flowed through ATAC
during the 5 month period; which means that approximately 27,105 incorrectly packaged
materials have become part of the wholesale supply chain. To examine the confidence of
the inspection we can use the following confidence interval formula:
(1 0.1269)0.1269( _ ) / 1.96( _ 0.12693,626
Confidence error rate confidence interval)x x −= + −

- 29 -
The results put the confidence interval between 10.89% and 13.77% so it is highly
likely that the error rate can be applied to the total number of NRFI materials that flowed
through ATAC during the 5 month period.
Although it would appear to be a damning statement for TARP and ultimately e-
RMS the data only shows that packaging errors are still occurring at an unacceptable rate.
Because packaging errors by the activities increase the possibility of additional and often
severe damage to NRFI materials during wholesale supply chain cycle time, it is logical
to assume that a significant number will be damaged beyond repair and require full cost
replacement. However, without actually sampling the NRFI materials currently in
DSP/DOP and determining the dollar value of potentially damaged carcasses we cannot
definitively state that the TARP tutorial is failing.
B. DOES E-RMS ADD VALUE TO THE SUPPLY CHAIN?
Determining if e-RMS adds value to the wholesale supply chain requires analysis
of the organizations within the chain as they relate to improving the strength of the
framework. Figure 12 shows the standard Value Chain, which uses primary and support
entities to examine the competitive value added to a business model. The primary
entities: inbound logistics, operations, outbound logistics, marketing and sales service;
are linked to support entities: procurement, technology development, human resource
management, and infrastructure to gauge value of the business framework. The linkage
between the primary and support entities is critical to examine the framework of the chain
because of the margins they produce in conjunction with one another; and it is the
analysis of those margins that determine if a process can add value to a supply chain. In
the case of the DLR retrograde material wholesale supply chain determining if the
addition of e-RMS adds value to the margin depends heavily on the linkage between the
Primary Entities: Inbound and Outbound Logistics, and the Support Entities: Human
Resource Management and Technology Development.

- 30 -
Figure 12. Value Chain17
Under the legacy ATAC system the linkage between the primary and support
entities was hampered by a lack of communication between the activities, ATAC, and
NAVICP. Lack of visibility prevented inbound and outbound logistics associated with
the wholesale supply chain from performing efficiently, which in turn led to wasted
efforts in human resource management attempting to correct NRFI submissions errors.
Activity Supply Departments forced to deal with the reactionary nature of the BK Process
regarding NRFI submission errors could potentially waste valuable man hours responding
to BK1 and BK3 messages. Without a significant advancement in technology that would
allow the activities to gain a proactive posture, the antiquated ATAC system’s primary
and support entities did not share a value added linkage and therefore devalued the
wholesale supply chain.
The addition of e-RMS added value to the wholesale supply chain by both
improving the technological development entity and reducing the workload on the human
resource management entities. The web based functionality improved visibility for
inbound and outbound logistics efficiency and decreased wholesale supply chain cycle
17Porter, Michael E., “Competitive Advantage”. 1985, The Free Press, New York

- 31 -
time through value added linkages to the human resource management and technological
development support entities. With e-RMS, activity Supply Departments were able to
eliminate the loss of and time and human resource man hours associated with tracking
submission errors under the legacy ATAC system. The step-by-step tracking
demonstrated within the ATAC BK Timeline Process Flow Chart displayed in Figure 9
shows the potential savings of human resource management assets that could be realized
once the BK process requirements are eliminated by e-RMS.
C. REWARD VS RISK As mentioned earlier in the analysis of packaging efficiency the e-RMS system of
submitting NRFI materials to ATAC under BC2 is likely producing a 12.69% packaging
error rate. If the average NRFI material is valued at $50,000 that would mean there is
potential for $1.35B NRFI materials losses. But the question of risk is not that easily
answered. Packaging errors do not necessarily translate into lost NRFI material; the
NRFI material may still be repairable only with incorrect packaging. The question of
necessity of replacement costs also comes into play when trying to estimate the cost of
risk. All NRFI material within the wholesale supply chain has a safety stock supply to
support high tempo operations that may require a larger percent of SIT requests. The
Klystron tube, mentioned earlier in the case, has a new replacement cost of $115,000. If
a packaging error to that tube occurred while it was in NRFI status the decision to
procure the item would not be automatic. If the Klystron tube has a low frequency of SIT
requests the decision would more likely be to absorb one from the safety stock rather than
to procure a new one.
E-RMS has reduced contractor and FTE manning totals at the ATAC sites from
230 to 75 positions (see Appendix G) with an associated costs saving of $40,785,42218.
It has also reduced activity and NAVICP workloads dramatically and continues to
streamline the wholesale supply chain. Without actual data to support perceived losses
18 Totals take from restructuring data provided from Commander Fleet Industrial Supply Center
Program Management Update for Naval Supply Systems FY06 Transportation Brief.

- 32 -
associated with packaging errors the tangible costs savings favor the reward of
implementing e-RMS over the potential risk associated with the policies established by e-
RMS.
D. THE IMPACT ON READINESS From a fleet perspective DLR readiness comes down to the material being
available when it is needed. Current practice is to maintain some level of safety stock as
mentioned, however when certain circumstances such as low demand and high cost
combine the decision is often made to draw a replacement from stock without
replenishment. While there is a threat to readiness due to the draw-down in safety stock
it is offset by the low rate of demand. This gives NAVICP time to recognize the need for
replenishment, draw NRFI components from the DSP, have them repaired and replenish
stock levels before any negative impact on fleet readiness occurs.
The more dangerous situation and far greater threat to readiness is the loss of
visibility as pertains to the quality of the NRFI items in the DSP inventories. Over time
as components fail in the fleet there will be an inflow of NRFI carcasses to the DSP and
an outflow of RFI components from the supply sites. Under e-RMS practices the ATAC
sites are no longer verifying the condition of material turned in and the system is
assuming that all carcasses are in fact repairable.
If we return to the Klystron tube once again as an example and assess two time
values to it we can see where the problem lies. Assume that it takes two weeks to open,
inspect and repair the average damaged tube and that historical usage data indicates that a
safety stock of twelve RFI tubes is required. Now assume that it takes the manufacturer
three months to build a new tube from scratch.
As the low limit established by NAVICP of five RFI tubes is reached they will
contact the responsible DSP and direct them to release seven NRFI carcasses to the DOP
for repair and return to RFI inventory. NAVICP is expecting this to take approximately

- 33 -
fourteen weeks. However, when the seven NRFI carcasses are pulled from inventory it is
discovered that they are damaged beyond repair, it will now take twenty-one months to
return safety stock to its high limit.
Just to make the problem more apparent let’s also assume that during the repair
period a sizable portion of the fleet was sortied for a major series of operations and the
demand for Klystron tubes doubles, the last of the safety stock is issued and a lot of
requisitions go unfilled. Radars are out of commission and the combat capability of the
fleet is seriously degraded, this is an obvious readiness degrader.
Another serious impact brought about by this situation is the financial cost.
NAVICP may have an annual expected repair cost for Klystron tubes of $216K (12
repairs at $18K each), now they have to fund the acquisition of seven new components at
a cost of $805,000 in addition to any other repair costs throughout the year.

- 34 -
THIS PAGE INTENTIONALLY LEFT BLANK
- 35 -
V. APPENDICES
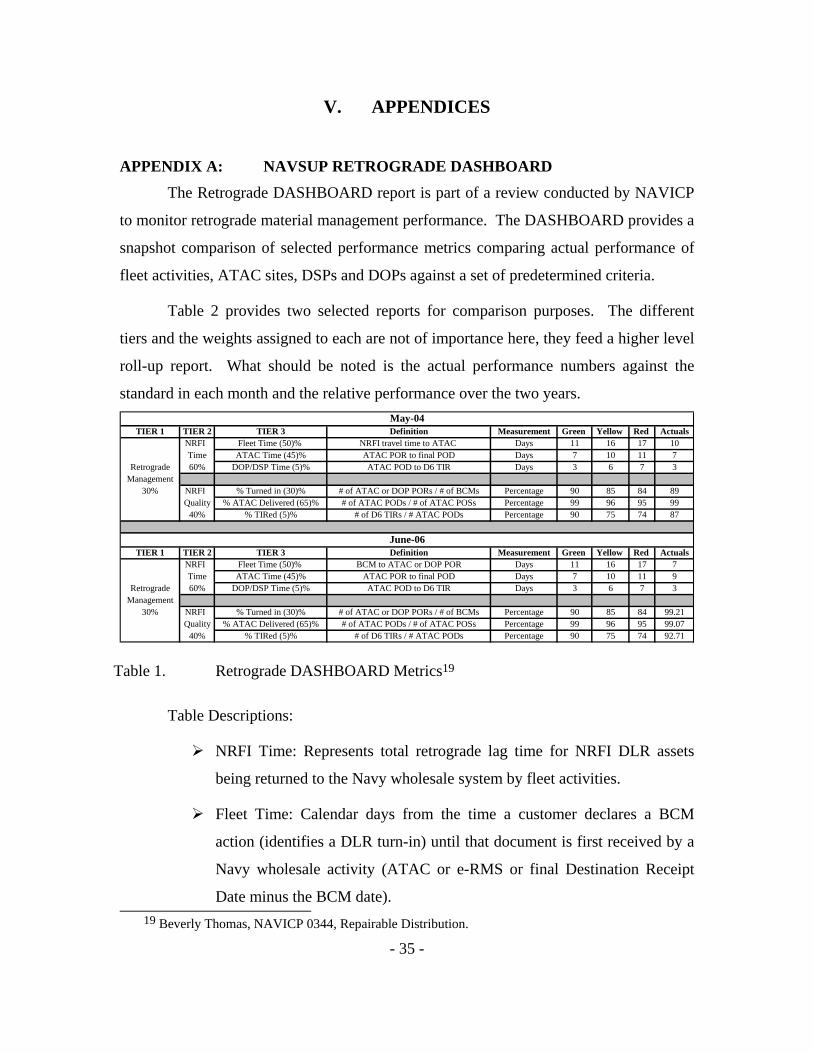
APPENDIX A: NAVSUP RETROGRADE DASHBOARD The Retrograde DASHBOARD report is part of a review conducted by NAVICP
to monitor retrograde material management performance. The DASHBOARD provides a
snapshot comparison of selected performance metrics comparing actual performance of
fleet activities, ATAC sites, DSPs and DOPs against a set of predetermined criteria.
Table 2 provides two selected reports for comparison purposes. The different
tiers and the weights assigned to each are not of importance here, they feed a higher level
roll-up report. What should be noted is the actual performance numbers against the
standard in each month and the relative performance over the two years.
TIER 1 TIER 2 TIER 3 Definition Measurement Green Yellow Red Actuals NRFI Fleet Time (50)% NRFI travel time to ATAC Days 11 16 17 10 Time ATAC Time (45)% ATAC POR to final POD Days 7 10 11 7
Retrograde 60% DOP/DSP Time (5)% ATAC POD to D6 TIR Days 3 6 7 3Management
30% NRFI % Turned in (30)% # of ATAC or DOP PORs / # of BCMs Percentage 90 85 84 89 Quality % ATAC Delivered (65)% # of ATAC PODs / # of ATAC POSs Percentage 99 96 95 99 40% % TIRed (5)% # of D6 TIRs / # ATAC PODs Percentage 90 75 74 87
TIER 1 TIER 2 TIER 3 Definition Measurement Green Yellow Red Actuals NRFI Fleet Time (50)% BCM to ATAC or DOP POR Days 11 16 17 7 Time ATAC Time (45)% ATAC POR to final POD Days 7 10 11 9
Retrograde 60% DOP/DSP Time (5)% ATAC POD to D6 TIR Days 3 6 7 3Management
30% NRFI % Turned in (30)% # of ATAC or DOP PORs / # of BCMs Percentage 90 85 84 99.21 Quality % ATAC Delivered (65)% # of ATAC PODs / # of ATAC POSs Percentage 99 96 95 99.07 40% % TIRed (5)% # of D6 TIRs / # ATAC PODs Percentage 90 75 74 92.71
May-04
June-06
Table 1. Retrograde DASHBOARD Metrics19
Table Descriptions:
NRFI Time: Represents total retrograde lag time for NRFI DLR assets
being returned to the Navy wholesale system by fleet activities.
Fleet Time: Calendar days from the time a customer declares a BCM
action (identifies a DLR turn-in) until that document is first received by a
Navy wholesale activity (ATAC or e-RMS or final Destination Receipt
Date minus the BCM date).
19 Beverly Thomas, NAVICP 0344, Repairable Distribution.

- 36 -
ATAC/e-RMS Time: Calendar days from the first ATAC or e-RMS
receipt date until proof of delivery (POD) to final destination date. (Final
POD date minus ATAC/e-RMS receipt date).
DOP/DSP Time: Designated Overhaul Point/Designated Support Point
TIR time. Calendar days it takes the delivery destination to provide a
receipt TIR to the ICP from the date on which proof of delivery was
provided to the ICP. (Receipt TIR date minus POD date).
NRFI Quality: Represents the total percentage of NRFI DLR assets being
returned to the Navy wholesale system after customers have determined
material cannot be repaired at the Intermediate level.
% Turned-In: Percent of exchange retrograde returns made by a customer
after declaring it BCM for which ATAC or the e-RMS supply activity has
acknowledged a receipt (# of ATAC or e-RMS receipts divided by # of
BCM actions).
% Retrograde Delivered: This is the Proof Of Delivery (POD) percentage
for all retrograde shipments made by ATAC and e-RMS supply activities.
It is the number of documents for which POD was provided to the ICP
divided by the number of documents for which ATAC / e-RMS Proof Of
Shipment was provided (# of ATAC or e-RMS PODs divided by # of
ATAC or e-RMS POSs).
% TIRed: This is the DOP/DSP receipt TIR percentage for all retrograde
deliveries. The number of DOP/DSP receipt TIRs divided by the number
of PODs provided to the ICP (# receipt TIRs divided by # PODs).

- 37 -
APPENDIX B: PROOF OF SHIPMENT QA REPORT
The Proof of Shipment Quality Assurance report is a comparison tool to measure
the quality of recording for activity shipment and delivery actions. E-RMS has two key
retrograde functions – item screening and proof of shipment (POS), the fleet activities are
good at the first but bad at the second. The POS QA report helps NAVICP to identify
those sites which need training.
UIC Site Name Month # BC2 # Autopos
# No POS w/ D6K
# No POS No POR
# Local Delv No POD
% Autopos
% No POS w/ D6K
% No POS No POR
% Local Delv No POD
N60201 NAS MAYPORT 06 MAR 510 4 0 4 0 0.8% 0.0% 0.8% 0.0%N60201 NAS MAYPORT 06 APR 420 98 0 8 0 23.3% 0.0% 1.9% 0.0%R09808 MALS-39 (PENDLETON) 06 MAR 563 6 0 0 0 1.1% 0.0% 0.0% 0.0%R09808 MALS-39 (PENDLETON) 06 APR 479 154 0 0 0 32.2% 0.0% 0.0% 0.0%R09111 MALS-11 (MIRAMAR) 06 MAR 934 18 0 0 0 1.9% 0.0% 0.0% 0.0%R09111 MALS-11 (MIRAMAR) 06 APR 925 4 1 1 0 0.4% 0.1% 0.1% 0.0%R09808 MALS-39 (PENDLETON) 06 MAR 563 6 0 0 0 1.1% 0.0% 0.0% 0.0%R09808 MALS-39 (PENDLETON) 06 APR 479 154 0 0 0 32.2% 0.0% 0.0% 0.0%R20550 USS TARAWA LHA-1 06 MAR 15 10 0 0 5 66.7% 0.0% 0.0% 33.3%R20550 USS TARAWA LHA-1 06 APR 8 1 1 2 4 12.5% 12.5% 25.0% 50.0%V21829 USS VELLA GULF CG 72 06 MAR 63 0 0 0 0 0.0% 0.0% 0.0% 0.0%V21829 USS VELLA GULF CG 72 06 APR 93 61 0 0 0 65.6% 0.0% 0.0% 0.0%
Table 2. Proof of Shipment Quality Assurance Report20
Number of BC2s produced (retrograde assets worked and screened)
Number of AutoPOS transactions – Activity did not post POS, but ATAC
reported receipt, so “dummy” POS was automatically loaded instead by e-
RMS. Training issue – sites must post 100% POS.
Number missing POS, but with DOP/DSP TIR – Activity did not post
POS and did not go through ATAC for transportation, but the asset arrived
at destination anyway. Training needed.
Number missing POS, no DOP/DSP TIR – Activity did not post POS, did
not receive credit for turn-in. Carcass Tracking still open, material may be
onsite or lost.
Number of local deliveries, no POD – In this case, activity must post POD
also to get credit for turn-in.
20 Beverly Thomas, NAVICP 0344, Repairable Distribution.

- 38 -
APPENDIX C: E-RMS SUPPLY DISCREPANCY REPORTING
The e-RMS Supply Discrepancy Reporting21 tool is a web-based interface
allowing activity supply personnel to submit reports of discrepancy in material shipments
or receipts in real-time, information is automatically tied to the related DLR transaction
record and made available to anyone with the appropriate access. This interface allows
for rapid reporting of supply chain errors so that appropriate action can be undertaken by
the site associated with the error.
21 Snapshot of SDR webpage tutorial provided by Naval Supply Systems. Snapshot provided by Greg
Gibeault, Fleet Carcass Tracking Manager for Commander Naval Surface Forces Pacific Fleet.

- 39 -
APPENDIX D: CVN 72 CARCASS TRACKING COMPARISON
The USS ABRAHAM LINCOLN was a test site for the original implementation
of the e-RMS system. The graphics below represent two operationally relative time
periods, prior to and subsequent to e-RMS implementation. What the charts compare is
the percentage of carcass turn-ins from the unit for which NAVICP has positive proof of
delivery. In this comparison, activity return rate improved from 85.71% to 99.56%
meaning that less than one percent of activity returns are subject to carcass charges. 22
Lincoln PreviousAug 00 – Jul 02
Lincoln Cruise eRMSAug 02 – Jun 03
No Receipt954 ATAC or D6K receipt
5876
No Receipt35 ATAC or D6K receipt
8,006
85.71%
99.56%
Total Returns Reviewed6830
Total Returns Reviewed8041
Figure 13. CVN 72 Carcass Tracking Comparison
22 Beverly Thomas, NAVICP 0344, Repairable Distribution.

- 40 -
APPENDIX E: TARP SAMPLING DATA
Table 3 represents the sampling data collected by representatives of the Technical
Assistance for Repairable Protection office over a five month period (June 18, 2006
through November 9, 2006) at the ATAC hub site in San Diego, CA. Total retrograde
material processing over this period was 213,601 pieces. 23
Mis-ID Packaging OtherTotal 5461 5 509 147 661
Incoming 3626 3 460 136 599Outgoing 1835 2 49 11 62
TARP Efficiency Sampling Number Sampled
Number of Deficiencies Total Error
Table 3. TARP Efficiency Sampling Data
23 Beverly Thomas, NAVICP 0344, Repairable Distribution.

- 41 -
APPENDIX F: ATAC RESTRUCTURING
The following tables show the three stages of personnel manning at the ATAC
sites worldwide. 24
Pre e-RMS Implementation Site Contractor Contractor Value Gov FTE Gov FTE ValueNorfolk 8 $125,000 40 $2,240,000Bahrain 10 $350,000 10 $700,000Sigonella 4 $270,000 5 $300,000Yokota 3 $105,000 5 $300,000San Diego 10 $800,000 60 $33,420,844Puget - Everett 4 $60,000 8 $480,000NASWI 3 $120,000 6 $240,000Guam 4 $240,000 5 $180,000Singapore 4 $240,000 5 $200,000Japan 2 $140,000 10 $700,000Australia 3 $180,000 5 $375,000Jax 2 $80,000 7 $364,000Pearl 2 $160,000 5 $2,775,000Total 59 $2,870,000 171 $42,274,844
Table 4. ATAC Manning Levels Pre e-RMS
First Stage of e-RMS Implementation (Transition manning level) Site Contractor Contractor Value Gov FTE Gov FTE ValueNorfolk 2 $125,000 22 $1,232,000Bahrain 4 $140,000 0 $ - Sigonella 2 $135,000 0 $ - Yokota 1 $35,000 0 $ - San Diego 5 $400,000 30 $1,710,422Puget - Everett 1.5 $45,000 2 $120,000NASWI 0.5 $20,000 0 $ - Guam 2 $120,000 0 $ - Singapore 2 $120,000 0 $ - Japan 0 $ - 5 $350,000Australia 2 $120,000 0 $ - Jax 0 $ - 3 $156,000Pearl 0 $ - 2 $111,000Total 22 $1,260,000 64 $3,679,422
Table 5. ATAC Manning Levels, 1st Stage e-RMS
24 Restructuring data provided from Commander Fleet Industrial Supply Center Program Management Update for Naval Supply Systems FY06 Transportation Brief.

- 42 -
Second Stage of e-RMS Implementation (Current manning level) Site Contractor Contractor Value Gov FTE Gov FTE ValueNorfolk 2 $125,000 22 $1,232,000Bahrain 4 $140,000 0 $ - Sigonella 2 $135,000 0 $ - San Diego 5 $400,000 30 $1,710,422Japan 0 $ - 5 $350,000Jax 0 $ - 3 $156,000Pearl 0 $ - 2 $111,000Total 13 $800,000 62 $3,559,422
Table 6. ATAC Manning Levels, 2nd Stage e-RMS

- 43 -
LIST OF REFERENCES
Bruner, Charles D. and Honeycutt, Thomas W., An Analysis of the Advanced
Traceability and Control System Goals, Master’s Thesis in Management, Naval
Postgraduate School, December 1987.
Commander, Naval Surface Forces Atlantic / Commander, Naval Surface Forces Pacific,
Instruction 4400.1J, Surface Force Supply Procedures, 2004.
Defense Logistics Agency, website, www.dla.mil, accessed October-November 2006.
Edwards, Mark A., Stevenson, Edward L., and Toussaint, Cane A., A Review of Reverse
Logistics and Depot Level Repairable Tracking in the United States Navy, MBA
Professional Report, Naval Postgraduate School, June 2005.
Enck, Steven E., Conversations and electronic mail between authors and Mr. Enck, Naval
Inventory Control Point, Mechanicsburg, e-RMS Implementation Office.
Gibeault, Gregg C., Conversations and electronic mail between authors and Mr. Gibeault,
CACI Inc., Supply System Analyst for Carcass Tracking, Afloat Training Group, San
Diego, CA., July-November 2006.
McCullough, Russell, Conversations between authors and Mr. McCullough, Naval
Supply Systems Command, ATAC San Diego, Deputy Director Western Region, August-
October 2006.
Naval Supply Systems Command, Publication 485, Afloat Supply Procedures, July 1999.
Naval Supply Systems Command, Publication 545, Depot Level Repairable (DLR)
Requisitioning, Turn-In, and Carcass Tracking, January 1993.

- 44 -
Naval Supply Systems Command, website, www.navsup.navy.mil, accessed July-
October 2006.
Thomas, Beverly, Conversations and electronic mail between authors and Beverly
Thomas, Naval Inventory Control Point, Philadelphia, Code 0344, Repairable
Distribution
USS BONHOMME RICHARD (LHD 6) Supply Department Personnel, Conversation
between authors and Commander Breth, Lieutenant Andy DeLeon, SK2 Cabangcalan and
SK2 Corrales, San Diego, CA, 25 September 2006.
USS TARAWA (LHA 1) Supply Department Personnel, Conversation between authors
and Commander Hughes, Lieutenant Sean Andrews, SK2 Avendano, SK2 Edenburgh
and SK2 Roldan-Castillo, San Diego, CA, 27 September 2006.
Wells, Paul, Conversation between authors and Mr. Wells, Technical Assistance for
Repairable Processing, San Diego, CA, 26 September 2006.

- 45 -
INITIAL DISTRIBUTION LIST
1. Defense Technical Information Center Ft. Belvoir, Virginia
2. Dudley Knox Library Naval Postgraduate School Monterey, California
Related Documents