NAVAL HEALTH RESEARCH CENTER DEVELOPMENT OF THE DoD BODY COMPOSITION ESTIMATION EQUATIONS J.A. Hodgdon K. Friedl Technical Document No. 99-2B Approved for public release; distribution unlimited. NAVAL HEALTH RESEARCH CENTER P.O. BOX 85122 SAN DIEGO, CA 92186-5122 BUREAU OF MEDICINE AND SURGERY (MED-02) 2300 E STREET, NW WASHINGTON, DC 20372-5300

Welcome message from author
This document is posted to help you gain knowledge. Please leave a comment to let me know what you think about it! Share it to your friends and learn new things together.
Transcript

NAVAL HEALTH RESEARCH CENTER
DEVELOPMENT OF THE DoD BODYCOMPOSITION ESTIMATION EQUATIONS
J.A. Hodgdon
K. Friedl
Technical Document No. 99-2B
Approved for public release; distribution unlimited.
NAVAL HEALTH RESEARCH CENTERP.O. BOX 85122
SAN DIEGO, CA 92186-5122
BUREAU OF MEDICINE AND SURGERY (MED-02)2300 E STREET, NW
WASHINGTON, DC 20372-5300

DEVELOPMENT OF THE DoD BODY COMPOSITION ESTIMATION EQUATIONS
James A. Hodgdon, Ph.D.Naval Health Research Center
San Diego, CA 92152
Karl Friedl, LTC, MS, USAU.S. Army Medical Research & Materiel Command
Fort Detrick, MD 21702-5012
Technical Document No. 99-2B. This work was supported by the Department of Defense(Personnel & Readiness) under work unit 6430. The opinions expressed in this report are thoseof the authors and do not reflect official policy or position of the Department of the Navy, theDepartment of the Army, the Department of Defense, or the United States Government. Humansubjects participated in this study after giving their free and informed consent. This research hasbeen conducted in compliance with all applicable Federal Regulations governing the Protectionof Human Subjects in Research.

2
Summary
This report summarizes the research findings that led to the policy decisions for
development of the body fat content screening procedures and equations that are currently under
consideration for inclusion in the Department of Defense (DoD) Instruction (DoDI) 1308.3,
Physical Fitness and Body Fat Programs.
At a DoD meeting on 21 May 1998, results of a review by the Committee on Body
Composition, Nutrition and Health, Military Nutrition Committee, Institute of Medicine were
presented. It was recommended that a tiered body fat content standard be adopted. A weight-
for-height screen would be adopted based on the recommendations of the Healthy People 2000
Committee: Healthy weights are represented by body mass index (BMI) values between 19 and
25, irrespective of gender. Service members exceeding the weight-for-height standards would
have their body fat content determined. Men with body fat content values less than 20% body
weight and women with values less than 30% body weight would be considered within
standards. Men with values greater than 20% fat, but less than or equal to 26% fat, would be in a
“cautionary zone” and acceptability of their body fat content would depend on performance on
the Service’s physical fitness test. For women, the cautionary zone values would be 30 to 36%
fat.
Results of work performed at the Naval Health Research Center (NAVHLTHRSCHCEN)
also were presented at the meeting. The use of a four-compartment model to determine body fat
content was shown to reduce the error variance associated with body fat content measurement by
13 to 20%. Additionally, the use of a four-compartment model eliminates a systematic
difference in body fat content estimation associated with ethnicity, which is inherent in the two-
compartment model.
A variety of equations predicting four-compartment body fat content from body
circumferences and height was presented. Prediction was shown to improve slightly by utilizing
a non-linear equation form involving logarithms. It also was found that prediction of four-
compartment body fat content from circumferences, as currently used by most of the Services,
and in the logarithmic transform equations currently used, did not differ significantly (p < 0.05)
in predictive accuracy from a variety of other model forms. It was recommended that work
continue on equation development and, further, among the equations presented, the current

3
circumference measures would be retained. It also was recommended that a research group from
outside DoD be contracted to conduct a parallel investigation to determine the best predictive
equations from circumference values.
On 9 October 1998, a second meeting was held to review progress. At this meeting,
researchers from Wright State University, Yellow Springs, OH, presented findings from the
parallel equation development. Their final model was judged too complex to be used. In
addition, the equations developed at NAVHLTHRSCHCEN were reviewed. Concern was raised
about the form of the four-compartment analysis used at NAVHLTHRSCHCEN, specifically
about the use of whole-body bioelectrical impedance analysis (BIA) to predict total body water
(TBW). The group decided to recommend retention of the equations currently in use by the
Navy and the Air Force. The rationale was that development of these equations has been
documented in technical reports. Thus, a review of their development and validity was possible.
In their original development, body density was predicted, and then converted to percent
fat. These equations were reformulated to allow direct prediction of percent body fat.
Additionally, predicted percent fat values were analyzed for the influence of moderating
variables. None were identified. The equations recommended for use by DoD were:
Men:
% body fat = 86.010 x log10(abdomen II - neck) - 70.041 x log10(height) + 36.76
(n = 594, R = 0.903, SEE = 3.52 % fat)
Women:
% body fat = 163.205 x log10(abdomen I + hip - neck) - 97.684 x log10(height) - 78.387
(n = 202, R = 0.856, SEE = 3.61 % fat)

4
Purpose
This report summarizes the research findings that led to development of the body fat content
equations currently under consideration for inclusion in the next Department of Defense (DoD)
Instruction (DoDI) 1308.3, Physical Fitness and Body Fat Programs.
Background
The Under Secretary of Defense (Personnel & Readiness), and Assistant Secretary of
Defense (Force Management Policy) sponsored a meeting at the Pentagon on 21 May 1998 to
review on-going research related to development of body fat content standards and prediction
equations.
A proposal for new body fat content standards derived, in part, from the findings of a review
conducted by the Committee on Body Composition, Nutrition and Health, Military Nutrition
Committee, Institute of Medicine, under the Defense Women’s Health Research Program (1998).
LTC Karl Friedl of the U.S. Army Medical Research and Materiel Command presented these
findings. The principal features of the proposal were that: (1) a tiered approach to body fat
content standards be taken; (2) allowed levels of body fat content be tied to performance on the
Service’s physical fitness tests, and (3) the weight-for-height screening values be based on the
recommendations of the Healthy People 2000 (i.e., that healthy weights correspond to body mass
index [BMI] values between 19 and 25 kg⋅m-2, irrespective of gender or age) (Abernathy and
Black, 1996). The tiered body fat content standards consisted of three levels: first, a lower
boundary of 20% fat for men and 30% fat for women, at or below which body fat content is
judged satisfactory irrespective of performance on the physical fitness test. Second, a cautionary
zone of 20% < fat < 26% for men, and 30% < fat < 36% for women within which body fat
content is judged satisfactory only if the person “performs well” on the Service physical fitness
test. Determination of what constitutes performing well was to be left to the Services. Third, an
upper boundary of 26% fat for men and 36% fat for women above which body fat content is
judged to be unsatisfactory, irrespective of performance on fitness tests. This proposal differs
from current Service practices in that there is no adjustment of the standards for age and that
there is a tiered structure to the standards. Those in attendance at the meeting tentatively
accepted the proposal or said they would take it under advisement.

5
Researchers at the Naval Health Research Center (NAVHLTHRSCHCEN) in San Diego
were undertaking most of the on-going work in development of body fat content prediction for
the Services. This work focused on use of percent body fat, derived from a four-compartment
analysis of body fat content, as the criterion measure for equation development. Equations
currently in use by the Services used a two-compartment analysis of body fat content as the
criterion.
Dr. James Hodgdon presented the findings of the NAVHLTHRSCHCEN researchers. The
first presentation dealt with an explanation of four-compartment body fat content measurement.
The principal points were: first, that the assumption of equal fat-free mass density across
individuals, which is part of the commonly employed two-compartment model, is invalid. The
principal sources of deviation from this assumption, water and bone, can be measured and are
used with determination of the fat and non-fat components of the non-bone, non-water body to
make up a four-compartment analysis of body fat content. In the NAVHLTHRSCHCEN
analysis, bone mineral content of the body was measured by dual-energy x-ray absorptiometry
(DXA), and total body water (TBW) was estimated from bioelectrical impedance analysis (BIA).
Second, the deviations from the assumption of equal fat-free mass density differ systematically
across ethnic groups (e.g., African-Americans tends to have greater bone densities than
Caucasian-Americans). Predictions based on equations developed using a two-compartment
analysis will have systematic over or under estimation of body fat content associated with
ethnicity. Estimations from equations based on a four-compartment analysis of body fat content
will not have this systematic over or under prediction. Third, a four-compartment analysis yields
a more precise estimate of body fat content. Based on the reliability coefficients presented by
Friedl and coworkers (1992) the four-compartment analysis leads to a 13% reduction in error
variance, compared with a two-compartment analysis. Comparison of the variances of the two-
and four-compartment body fat content values in the NAVHLTHRSCHCEN data set revealed a
20% reduction in variance when the four-compartment analysis was used. Since the “true score”
variance should be the same (the analyses were conducted on the same set of individuals), the
reduction was attributed to the error variance.

6
Dr. Hodgdon also provided a presentation on prediction of body fat content from
anthropometric variables. In his presentation, Dr. Hodgdon presented equations utilizing a
variety of
circumference
measures and
stature to predict
four-
compartment
body fat content.
Some of the
predictive
equations for
men are
provided in
Table 1. In the NAVHLTHRSCHCEN data set, abdominal circumference is the best predictor of
body fat content; therefore, it was always the first variable entered in the development of these
comparative models. The multiple correlations for these equations do not differ significantly (p
> 0.05), and they are
reasonably equivalent
models. Note that
stature only
contributes to the
model when relaxed
arm girth or neck girth
is included.
Table 2 provides
a similar comparison
among equations to
predict the body fat
content of women. For women, waist circumference was the best predictor of body fat content,
and was entered first in each of the modes. Again, these equations all represent equivalent
Table 2. Equations to Predict Four-compartment Body Fat Content ofWomen from Circumferences and Height*
Var1 Var2 Var3 Var4 Const. R SEE
Eq. 1 Waist Hip Height Neck0.499 0.413 -0.167 -0.701 -0.169 0.89 3.08
Eq. 2 Waist Hip Height Shoulder0.492 0.448 -0.161 -0.256 -1.007 0.89 3.10
Eq. 3 Waist Hip Height Wrist0.412 0.437 -0.151 -1.119 -4.538 0.88 3.14
Eq. 4 Waist Thigh Neck Height0.549 0.492 -0.731 -0.123 1.264 0.86 3.12
Eq. 5 Waist Thigh Shoulder Height0.547 0.542 -0.277 -0.112 0.813 0.88 3.13
Eq. 6 Waist Thigh Wrist Height0.460 0.520 -1.147 -0.104 -3.319 0.88 3.19
* Numbers below the variable names are the regression weights.
Table 1. Equations to Predict Four-compartment Body Fat Content of Menfrom Circumferences and Height*
Var1 Var2 Var3 Const. R SEE
Eq. 1 Abdomen Forearm0.622 -0.629 -18.887 0.90 2.99
Eq. 2 Abdomen Ankle0.624 -0.833 -18.691 0.89 3.05
Eq. 3 Abdomen Wrist0.614 -1.419 -11.982 0.90 3.02
Eq. 4 Abdomen Shoulder0.619 -0.144 -20.296 0.89 3.10
Eq. 5 Abdomen Relaxed Arm Height0.608 -0.209 -0.064 -17.832 0.89 3.09
Eq. 6 Abdomen Neck Height0.613 -0.306 -0.058 -14.629 0.89 3.11
* Numbers below the variable names are the regression weights.

7
models. For these regression models, the 4th variable accounts for approximately 1% of the
variance and would not be included in most final equations.
The point of displaying these models was to show that once the initial predictor was selected
(abdomen girth for men and waist girth for women), the models were equivalent, irrespective of
the variables chosen later. This implies that the variables used currently by the Navy, the Marine
Corps, and the Air Force (those in Eq. 6 for men and Eq. 1 for women) are as good as any other
combination. Therefore, there was no compelling reason to select a set of variables different
from those now in use by three of the four Services.
In the presentation of alternative predictive models, it was also shown that using the log
transforms of the variables or logs of linear combinations of variables improved the fit of the
model, but not significantly. Again, the point was that there was no compelling reason to change
the form of the current equations, which involve logs of linear combinations of circumference
values.
Dr. Hodgdon also showed the cross-validation of the equation currently used by the Marine
Corps on the more-recent segment of the NAVHLTHRSCHCEN data set. The Marine Corps
equation has the form of the current Navy equations, but was developed using the
NAVHLTHRSCHCEN four-compartment analysis data set. The equations (men’s and
women’s) cross-validated well, but were not the best model for the entire data set.
Comments on the NAVHLTHRSCHCEN presentations focused on the question of when
sufficient data would be collected to decide when the “final” equation would be developed and
concern over whether BIA as the method of measuring TBW was suitably accurate or precise to
justify thinking of the analysis as being truly a four-compartment model.
From this meeting, it was concluded that (1) the proposed body fat content standards would
be taken under advisement, and (2) NAVHLTHRSCHCEN would continue to collect data until
August, 1998 with their findings evaluated in September, 1998.
Subsequent to the May, 1998 meeting, LTC Karl Friedl and Mr. Frank Spencer from Office
of the Secretary of Defense (Personnel & Readiness) decided that an independent development
of an anthropometry-based equation for prediction of body fat content be carried out. The
objectives of the development were to determine whether an anthropometrically based equation
could be developed that was sensitive to small changes in body fat content. A U.S. Army data
set was provided as the basis for this development. This dataset contained body fat content,

8
determined from DXA and anthropometric variables recorded prior to and following Army Basic
Training on a sample of female Army trainees. The NAVHLTHRSCHCEN data set was to be
used for cross-validation. Additionally, NAVHLTHRSCHCEN was tasked with determining
whether the suggested equations were subject to any moderating influences that might show
gender differences and lead to unequal application of the predictive equations between genders.
Meeting of 9 October 1998
On 9 October 1998, a meeting was held at NAVHLTHRSCHCEN to review progress on the
development of a body fat prediction equation for the Services. Present were Mr. Frank Spencer
from OSD (P&R), LTC Karl Friedl from USAMRMC, MAJ Neal Baumgartner from U.S. Air
Force School of Aerospace Medicine, Dr. James Hodgdon and LCDR Kathleen Kujawa from
NAVHLTHRSCHCEN, and Dr. Shumei Guo and Dr. W. Cameron Chumlea from Wright State
University (contractors carrying out the independent equation development).
LTC Friedl gave a status review, and Dr. Guo provided a presentation of findings (Guo,
1998). Wright State Univeristy investigated the range of possible equations for body fat content
prediction in the U.S. Army data set using the all-sets regression technique (Guo & Chumlea,
1996). The final model presented was judged too complex to be used practically.
There followed a discussion of the NAVHLTHRSCHCEN equations presented at the May
meeting. The group had sufficient discomfort with the use of BIA as a predictor of TBW and the
fact that the study findings had not yet been published or peer reviewed, that it was decided to
use the current Navy equations (Hodgdon & Beckett, 1984a, 1984b) as the DoD body fat content
prediction equations. The development of these equations was published in technical report form
and had been presented before the American College of Sports Medicine, where it was favorably
reviewed. The equations also have been cross-validated in several research studies, with suitable
predictive accuracy (correlation coefficients of 0.85 or greater).
Moderators of Percent Fat Prediction
A variety of variables were examined to determine whether they influenced the prediction of
four-compartment fat from the Navy equations. Two analysis schemes were used. For category
variables (e.g., race and gender), the influence of the variable on the regression between Navy-
predicted fat and four-compartment fat were tested using Analysis of Variance. This analysis
determines whether there are significant differences in the slope or intercept of the regression

9
model associated with category membership. For continuous variables (e.g., stature, weight, and
neck size), a regression analysis was used. Percent fat from the Navy equations was forced in as
the first step in the regression to predict four-compartment fat. The moderator being tested was
then allowed to enter using stepwise criterion. This analysis determines whether a variable
accounts for a significant increment in the accounted-for variance in the regression. Because the
sample size was approximately 500 individuals, a variable did not have to account for much
more than 0.15 percent of the variance to be a significant predictor.
Table 3 shows the
effect of category
moderator variables upon
the predictions. Table 4
provides the analysis of the
effects of continuous
moderator variables upon
the predictions.
As can be seen in
Table 3, neither gender nor
race has a meaningful
effect on the prediction of
four-compartment fat for
the Navy equations. The
lack of a significant gender
moderating effect implies
that the models fit equally
well for both genders. Although there is a “significant” effect on the regression associated with
Table 3. Results of Analysis of Variance for Category Moderators of Percent Fat Prediction*
Variable Effect on Intercept Effect on Slope
F501,1 Significance% of
varianceF501,1 Significance
% ofVariance
Gender (male/female) 1.35 NS 1.97 NSRace (black/white) 12.15 p < 0.01 0.3 8.09 p < 0.01 0.2
* With significant effects, the percentage of the total variance accounted for is displayed
Table 4. Results of Analysis of Variance for ContinuousModerators of Percent Fat Prediction
Variable Effect on Regression
F502,1 Significance% of
varianceHeight 15.67 p < 0.01 0.5Weight 7.951 p < 0.01 0.2Waistcircumference
NS
Abdomencircumference
6.16 p < 0.01 0.2
Hipcircumference
6.71 p < 0.01 0.2
Neckcircumference
NS
Age NSBMI NSBone MineralContent
NS
Resistance at50KHz
70.23 p < 0.01 1.8
EstimatedTBW
NS

10
race, the total percentage of the variance accounted for by the slope and intercept effects is less
than 0.5%.
As was the case with the category variables, none of the continuous variables examined had
a meaningful effect on the prediction of four-compartment fat using the Navy equations (see
Table 4). Whole-body electrical resistance from BIA accounted for an additional 1.8% of the
variance when added to the prediction model. Two percent of the variance or greater explained
is a common criterion for inclusion in a regression model. Therefore, whole body electrical
resistance has a “nearly meaningful” effect on the regression and should be investigated as a
meaningful variable for inclusion in body fat predictive equations. In conclusion, it does not
appear that there are biases in prediction of body fat content associated with the variables
examined in these analyses.
Reformulation of the Navy equations.
Prior to inclusion in the DoDI, it was requested that the form of the Navy equations be
changed from prediction of body density (the form that was originally developed) to prediction
of percent body fat. Additionally, it was requested that the equations be expressed in English,
rather than metric units (inches rather than centimeters). The mathematics involved in achieving
these changes is difficult. Therefore, it was decided to calculate the desired regressions from the
original Navy sample. However, the sample upon which the density prediction equations were
developed could not be matched exactly. A few individuals appear to have been dropped from
the sample after the original data analysis. The equations to predict body density from metric
measurements on this subset of the original sample are virtually identical to those in the original
technical reports (Hodgdon and Beckett; 1984a, 1984b), and they produce virtually the same
results when they are rounded to the nearest percent fat. In the subsample:
Males: (n = 594 vs. 602 in the original development)
% body fat = 86.010 x log10(abdomen II - neck) - 70.041 x log10(height) + 36.76
(R = 0.903, SEE = 3.52 % fat)
Females: (n = 202 vs. 206 in the original development)
% body fat = 163.205 x log10(abdomen I + hip - neck) - 97.684 x log10(height) - 78.387
(R = 0.856, SEE = 3.61 % fat)

11
where all measurements are in inches.
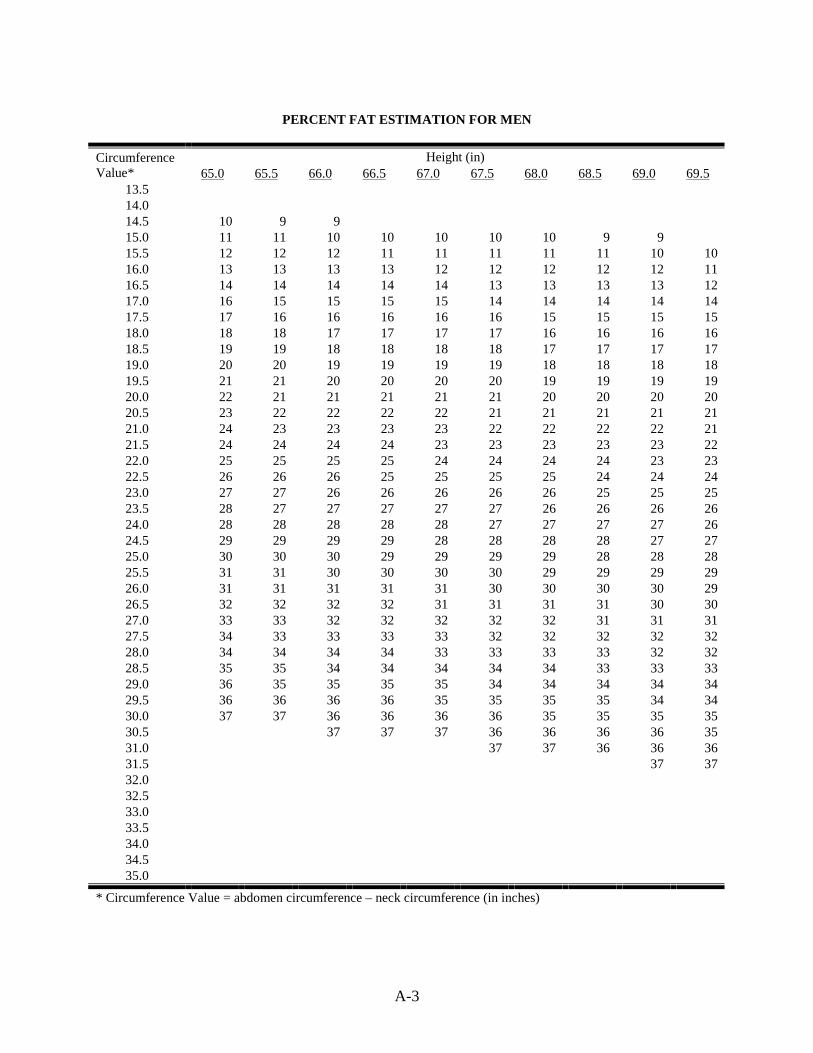
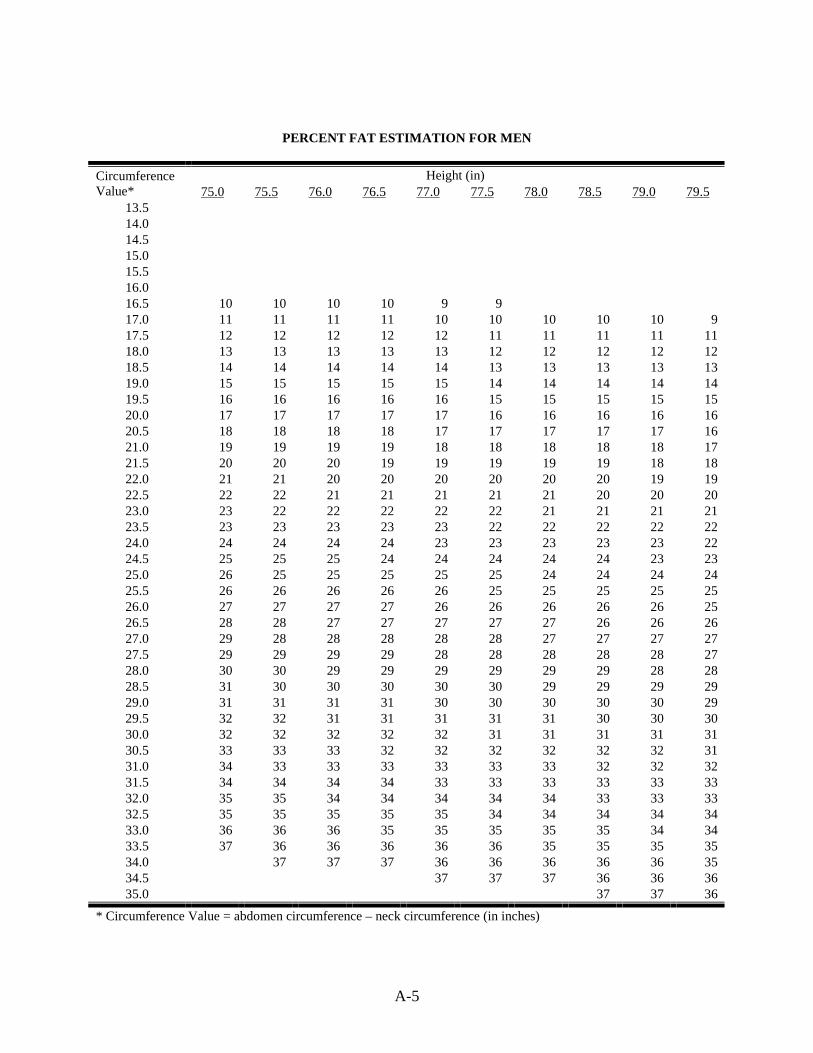
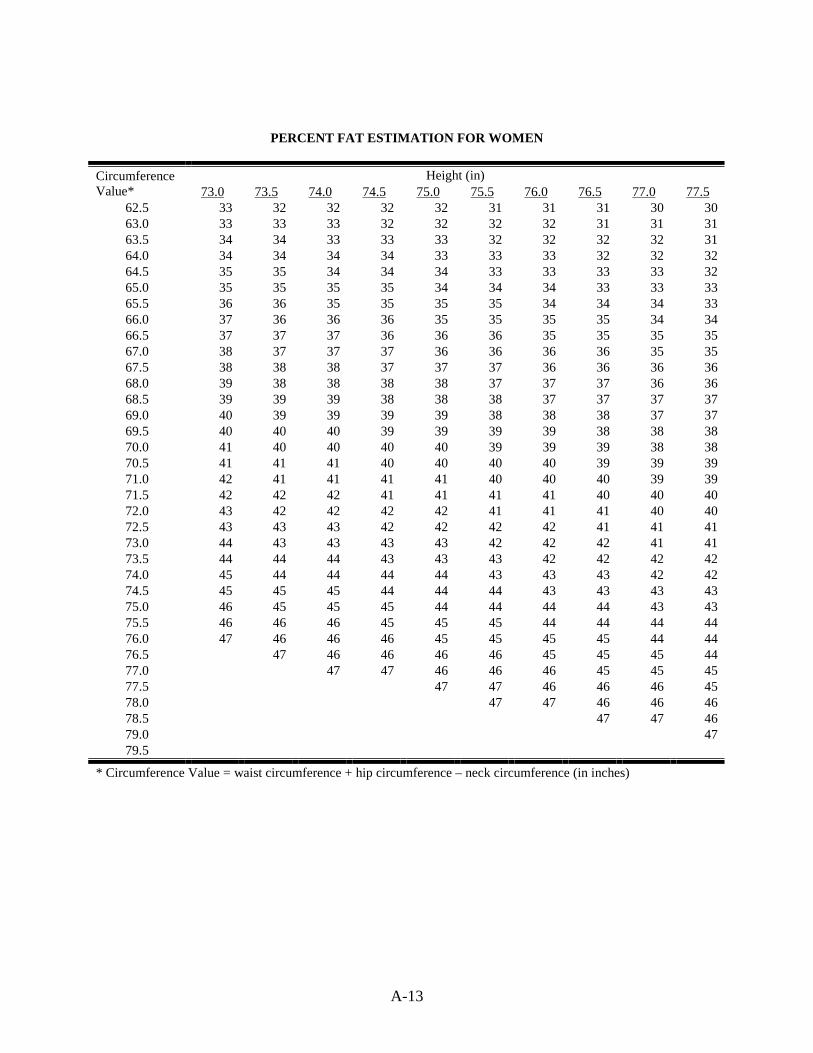
Tables of estimated percent body fat utilizing these equations are attached as Appendix A of thisreport.
Predicted percent fat values from the equations provided above have been compared with
percent fat values from four-compartment analysis in the current NAVHLTHRSCHCEN data
set. For men, the correlation coefficient was 0.885 and the standard error of measurement is
3.15% fat. The mean difference between measured and predicted values is -0.833% fat, the
predicted values being greater, on average, than the measured four-compartment percent fat.
Comparisons with two-compartment fat values reveal a correlation coefficient of 0.89, a standard
error of measurement of 3.37% fat, and a mean difference of –1.25% fat; again, with the
predicted value being greater than the measured. For women, comparisons with four-
compartment fat provide a correlation coefficient of 0.89, a standard error of measurement of
3.12% fat, and a mean difference of –2.00% fat. Comparisons with two-compartment fat
produced a correlation coefficient of 0.82, standard error of measurement of 4.15% fat, and a
mean difference of –3.22% fat. It is noteworthy that, in this newer sample, the Navy equations
are better predictors of the percent fat values from four-compartment analysis than they are of
values from a two-compartment analysis.
When compared with the current Marine Corps equations, the reformulated Navy equations
are correlated almost perfectly (R ≅ 1.0). This is to be expected since both sets of equations
involve the same variables organized in the same fashion. However, the mean differences
between percent fat values predicted by the Navy equations and those predicted by the Marine
Corps equations are 1.09% fat for men and 3.04% fat for women. This means that, with the
implementation of these Navy equations, Marines will be predicted to have greater percent fat
values than at present.
Summary and Recommendations
The method of body water estimation from BIA needs to be validated for use in the
estimation of multicompartment models of body fat content. Further, the Marine Corps
equations based on this approach should be further validated against the Navy sample or against
another sample to determine which of the equations (Navy or Marine Corps) has the greater
validity. The need for comparative cross-validation is not justification for delaying

12
implementation of a new DoDI. The two sets of equations are based on the same measurements
and of the same general form. Therefore, changes in the equation can be implemented simply by
substitution of a new body fat table.

13
References
Institute of Medicine (1998). Assessing Readiness in Military Women. Washington, DC.National Academy Press.
Abernathy, R.P. and D.R. Black (1996). Healthy body weights: an alternative perspective.American Journal of Clinical Nutrition. 63(suppl):448S-451S.
Friedl, K.E., J.P. DeLuca, L.J. Marchitelli, and J.A. Vogel (1992). Reliability of body-fatestimations from a four-compartment model by using density, body water, and bone mineralmeasurements. American Journal of Clinical Nutrition. 55:764-770
Guo, S, and W. C. Chumlea (1996). Statistical methods for the development and testing ofpredictive equations. In: Human Body Composition. AF Roche, SB Heymsfield, TGLohman (eds.). Human Kenetics Books, Champaign, IL pp. 191-202.
Guo, S. and W.C. Chumlea (1998). Prediction equations for percent body fat. Interim Reportfor Consortium Research Fellows Program, Contract Number DASW01-97-C-0077. WrightState University School of Medicine, Yellow Springs, OH.
Hodgdon, J.A. and M.B. Beckett (1984a). Prediction of percent body fat for U.S. Navy men frombody circumferences and height. Report No. 84-11, Naval Health Research Center, SanDiego, CA
Hodgdon, J.A. and M.B. Beckett (1984b). Prediction of percent body fat for U.S. Navy womenfrom body circumferences and height. Report No. 84-29, Naval Health Research Center,San Diego, CA

A-1
Appendix A
Tables for the Estimation of Body Fat Content from Circumferences and Stature

A-2
PERCENT FAT ESTIMATION FOR MEN
Height (in)CircumferenceValue* 60.0 60.5 61.0 61.5 62.0 62.5 63.0 63.5 64.0 64.5
13.5 9 914.0 11 11 10 10 10 10 9 914.5 12 12 12 11 11 11 11 10 10 1015.0 13 13 13 13 12 12 12 12 11 1115.5 15 14 14 14 14 13 13 13 13 1216.0 16 16 15 15 15 15 14 14 14 1416.5 17 17 16 16 16 16 15 15 15 1517.0 18 18 18 17 17 17 17 16 16 1617.5 19 19 19 18 18 18 18 17 17 1718.0 20 20 20 19 19 19 19 18 18 1818.5 21 21 21 20 20 20 20 19 19 1919.0 22 22 22 21 21 21 21 20 20 2019.5 23 23 23 22 22 22 22 21 21 2120.0 24 24 24 23 23 23 23 22 22 2220.5 25 25 25 24 24 24 24 23 23 2321.0 26 26 25 25 25 25 24 24 24 2421.5 27 27 26 26 26 26 25 25 25 2522.0 28 27 27 27 27 26 26 26 26 2522.5 29 28 28 28 28 27 27 27 27 2623.0 29 29 29 29 28 28 28 28 27 2723.5 30 30 30 29 29 29 29 28 28 2824.0 31 31 30 30 30 30 29 29 29 2924.5 32 31 31 31 31 30 30 30 30 2925.0 32 32 32 32 31 31 31 31 30 3025.5 33 33 33 32 32 32 32 31 31 3126.0 34 34 33 33 33 33 32 32 32 3226.5 35 34 34 34 34 33 33 33 33 3227.0 35 35 35 35 34 34 34 34 33 3327.5 36 36 36 35 35 35 35 34 34 3428.0 37 36 36 36 36 35 35 35 35 3428.5 37 37 36 36 36 36 35 3529.0 37 37 37 36 36 3629.5 37 37 3630.030.531.031.532.032.533.033.534.034.535.0
* Circumference Value = abdomen circumference – neck circumference (in inches)
A-3
PERCENT FAT ESTIMATION FOR MEN
Height (in)CircumferenceValue* 65.0 65.5 66.0 66.5 67.0 67.5 68.0 68.5 69.0 69.5
13.514.014.5 10 9 915.0 11 11 10 10 10 10 10 9 915.5 12 12 12 11 11 11 11 11 10 1016.0 13 13 13 13 12 12 12 12 12 1116.5 14 14 14 14 14 13 13 13 13 1217.0 16 15 15 15 15 14 14 14 14 1417.5 17 16 16 16 16 16 15 15 15 1518.0 18 18 17 17 17 17 16 16 16 1618.5 19 19 18 18 18 18 17 17 17 1719.0 20 20 19 19 19 19 18 18 18 1819.5 21 21 20 20 20 20 19 19 19 1920.0 22 21 21 21 21 21 20 20 20 2020.5 23 22 22 22 22 21 21 21 21 2121.0 24 23 23 23 23 22 22 22 22 2121.5 24 24 24 24 23 23 23 23 23 2222.0 25 25 25 25 24 24 24 24 23 2322.5 26 26 26 25 25 25 25 24 24 2423.0 27 27 26 26 26 26 26 25 25 2523.5 28 27 27 27 27 27 26 26 26 2624.0 28 28 28 28 28 27 27 27 27 2624.5 29 29 29 29 28 28 28 28 27 2725.0 30 30 30 29 29 29 29 28 28 2825.5 31 31 30 30 30 30 29 29 29 2926.0 31 31 31 31 31 30 30 30 30 2926.5 32 32 32 32 31 31 31 31 30 3027.0 33 33 32 32 32 32 32 31 31 3127.5 34 33 33 33 33 32 32 32 32 3228.0 34 34 34 34 33 33 33 33 32 3228.5 35 35 34 34 34 34 34 33 33 3329.0 36 35 35 35 35 34 34 34 34 3429.5 36 36 36 36 35 35 35 35 34 3430.0 37 37 36 36 36 36 35 35 35 3530.5 37 37 37 36 36 36 36 3531.0 37 37 36 36 3631.5 37 3732.032.533.033.534.034.535.0
* Circumference Value = abdomen circumference – neck circumference (in inches)

A-4
PERCENT FAT ESTIMATION FOR MEN
Height (in)CircumferenceValue* 70.0 70.5 71.0 71.5 72.0 72.5 73.0 73.5 74.0 74.5
13.514.014.515.015.5 10 10 9 9 916.0 11 11 11 10 10 10 10 10 9 916.5 12 12 12 12 11 11 11 11 11 1017.0 13 13 13 13 13 12 12 12 12 1117.5 14 14 14 14 14 13 13 13 13 1318.0 15 15 15 15 15 14 14 14 14 1418.5 17 16 16 16 16 15 15 15 15 1519.0 18 17 17 17 17 16 16 16 16 1619.5 18 18 18 18 18 17 17 17 17 1720.0 19 19 19 19 19 18 18 18 18 1820.5 20 20 20 20 19 19 19 19 19 1821.0 21 21 21 21 20 20 20 20 20 1921.5 22 22 22 21 21 21 21 21 20 2022.0 23 23 23 22 22 22 22 22 21 2122.5 24 24 23 23 23 23 23 22 22 2223.0 25 24 24 24 24 24 23 23 23 2323.5 25 25 25 25 25 24 24 24 24 2424.0 26 26 26 26 25 25 25 25 25 2424.5 27 27 27 26 26 26 26 26 25 2525.0 28 28 27 27 27 27 26 26 26 2625.5 29 28 28 28 28 27 27 27 27 2726.0 29 29 29 29 28 28 28 28 28 2726.5 30 30 30 29 29 29 29 28 28 2827.0 31 30 30 30 30 30 29 29 29 2927.5 31 31 31 31 30 30 30 30 30 2928.0 32 32 32 31 31 31 31 31 30 3028.5 33 32 32 32 32 32 31 31 31 3129.0 33 33 33 33 32 32 32 32 32 3129.5 34 34 34 33 33 33 33 32 32 3230.0 35 34 34 34 34 34 33 33 33 3330.5 35 35 35 35 34 34 34 34 34 3331.0 36 36 35 35 35 35 35 34 34 3431.5 36 36 36 36 36 35 35 35 35 3532.0 37 37 37 36 36 36 36 36 35 3532.5 37 37 36 36 36 36 3633.0 37 37 36 3633.5 3734.034.535.0
* Circumference Value = abdomen circumference – neck circumference (in inches)
A-5
PERCENT FAT ESTIMATION FOR MEN
Height (in)CircumferenceValue* 75.0 75.5 76.0 76.5 77.0 77.5 78.0 78.5 79.0 79.5
13.514.014.515.015.516.016.5 10 10 10 10 9 917.0 11 11 11 11 10 10 10 10 10 917.5 12 12 12 12 12 11 11 11 11 1118.0 13 13 13 13 13 12 12 12 12 1218.5 14 14 14 14 14 13 13 13 13 1319.0 15 15 15 15 15 14 14 14 14 1419.5 16 16 16 16 16 15 15 15 15 1520.0 17 17 17 17 17 16 16 16 16 1620.5 18 18 18 18 17 17 17 17 17 1621.0 19 19 19 19 18 18 18 18 18 1721.5 20 20 20 19 19 19 19 19 18 1822.0 21 21 20 20 20 20 20 20 19 1922.5 22 22 21 21 21 21 21 20 20 2023.0 23 22 22 22 22 22 21 21 21 2123.5 23 23 23 23 23 22 22 22 22 2224.0 24 24 24 24 23 23 23 23 23 2224.5 25 25 25 24 24 24 24 24 23 2325.0 26 25 25 25 25 25 24 24 24 2425.5 26 26 26 26 26 25 25 25 25 2526.0 27 27 27 27 26 26 26 26 26 2526.5 28 28 27 27 27 27 27 26 26 2627.0 29 28 28 28 28 28 27 27 27 2727.5 29 29 29 29 28 28 28 28 28 2728.0 30 30 29 29 29 29 29 29 28 2828.5 31 30 30 30 30 30 29 29 29 2929.0 31 31 31 31 30 30 30 30 30 2929.5 32 32 31 31 31 31 31 30 30 3030.0 32 32 32 32 32 31 31 31 31 3130.5 33 33 33 32 32 32 32 32 32 3131.0 34 33 33 33 33 33 33 32 32 3231.5 34 34 34 34 33 33 33 33 33 3332.0 35 35 34 34 34 34 34 33 33 3332.5 35 35 35 35 35 34 34 34 34 3433.0 36 36 36 35 35 35 35 35 34 3433.5 37 36 36 36 36 36 35 35 35 3534.0 37 37 37 36 36 36 36 36 3534.5 37 37 37 36 36 3635.0 37 37 36
* Circumference Value = abdomen circumference – neck circumference (in inches)

A-6
PERCENT FAT ESTIMATION FOR WOMEN
Height (in)CircumferenceValue* 58.0 58.5 59.0 59.5 60.0 60.5 61.0 61.5 62.0 62.5
45.0 1945.5 20 20 1946.0 21 20 20 20 1946.5 21 21 21 20 20 20 19 1947.0 22 22 22 21 21 20 20 20 19 1947.5 23 23 22 22 22 21 21 21 20 2048.0 24 23 23 23 22 22 22 21 21 2148.5 24 24 24 23 23 23 22 22 22 2149.0 25 25 24 24 24 23 23 23 22 2249.5 26 26 25 25 24 24 24 23 23 2350.0 27 26 26 26 25 25 24 24 24 2350.5 27 27 27 26 26 26 25 25 25 2451.0 28 28 27 27 27 26 26 26 25 2551.5 29 28 28 28 27 27 27 26 26 2652.0 29 29 29 28 28 28 27 27 27 2652.5 30 30 29 29 29 28 28 28 27 2753.0 31 30 30 30 29 29 29 28 28 2853.5 31 31 31 30 30 30 29 29 29 2854.0 32 32 31 31 31 30 30 30 29 2954.5 33 32 32 32 31 31 31 30 30 3055.0 33 33 33 32 32 32 31 31 31 3055.5 34 34 33 33 33 32 32 32 31 3156.0 35 34 34 34 33 33 33 32 32 3156.5 35 35 35 34 34 34 33 33 32 3257.0 36 36 35 35 34 34 34 33 33 3357.5 37 36 36 35 35 35 34 34 34 3358.0 37 37 36 36 36 35 35 35 34 3458.5 38 37 37 37 36 36 36 35 35 3559.0 38 38 38 37 37 37 36 36 36 3559.5 39 39 38 38 38 37 37 36 36 3660.0 40 39 39 38 38 38 37 37 37 3660.5 40 40 39 39 39 38 38 38 37 3761.0 41 40 40 40 39 39 39 38 38 3861.5 41 41 41 40 40 40 39 39 38 3862.0 42 42 41 41 40 40 40 39 39 39
* Circumference Value = waist circumference + hip circumference – neck circumference (in inches)

A-7
PERCENT FAT ESTIMATION FOR WOMEN
Height (in)CircumferenceValue* 58.0 58.5 59.0 59.5 60.0 60.5 61.0 61.5 62.0 62.5
62.5 42 42 42 41 41 41 40 40 40 3963.0 43 43 42 42 42 41 41 41 40 4063.5 44 43 43 42 42 42 41 41 41 4064.0 44 44 43 43 43 42 42 42 41 4164.5 45 44 44 44 43 43 43 42 42 4265.0 45 45 45 44 44 43 43 43 42 4265.5 46 45 45 45 44 44 44 43 43 4366.0 46 46 46 45 45 45 44 44 43 4366.5 47 46 46 46 45 45 45 44 44 4467.0 47 46 46 46 45 45 45 4467.5 47 46 46 46 45 45 4568.0 47 47 46 46 46 4568.5 47 46 46 4669.0 47 47 4669.5 4770.070.571.071.572.072.573.073.574.074.575.075.576.076.577.077.578.078.579.079.5
* Circumference Value = waist circumference + hip circumference – neck circumference (in inches)

A-8
PERCENT FAT ESTIMATION FOR WOMEN
Height (in)CircumferenceValue* 63.0 63.5 64.0 64.5 65.0 65.5 66.0 66.5 67.0 67.5
45.045.546.046.547.047.5 19 1948.0 20 20 20 1948.5 21 21 20 20 20 1949.0 22 21 21 21 20 20 20 19 1949.5 22 22 22 21 21 21 20 20 20 1950.0 23 23 22 22 22 21 21 21 21 2050.5 24 23 23 23 23 22 22 22 21 2151.0 25 24 24 24 23 23 23 22 22 2251.5 25 25 25 24 24 24 23 23 23 2252.0 26 26 25 25 25 24 24 24 23 2352.5 27 26 26 26 25 25 25 24 24 2453.0 27 27 27 26 26 26 25 25 25 2453.5 28 28 27 27 27 26 26 26 25 2554.0 29 28 28 28 27 27 27 26 26 2654.5 29 29 29 28 28 28 27 27 27 2655.0 30 30 29 29 29 28 28 28 27 2755.5 31 30 30 30 29 29 29 28 28 2856.0 31 31 30 30 30 30 29 29 29 2856.5 32 31 31 31 30 30 30 29 29 2957.0 32 32 32 31 31 31 30 30 30 2957.5 33 33 32 32 32 31 31 31 30 3058.0 34 33 33 33 32 32 32 31 31 3158.5 34 34 34 33 33 33 32 32 32 3159.0 35 35 34 34 34 33 33 33 32 3259.5 35 35 35 34 34 34 33 33 33 3360.0 36 36 35 35 35 34 34 34 33 3360.5 37 36 36 36 35 35 35 34 34 3461.0 37 37 37 36 36 36 35 35 35 3461.5 38 37 37 37 36 36 36 36 35 3562.0 38 38 38 37 37 37 36 36 36 35
* Circumference Value = waist circumference + hip circumference – neck circumference (in inches)

A-9
PERCENT FAT ESTIMATION FOR WOMEN
Height (in)CircumferenceValue* 63.0 63.5 64.0 64.5 65.0 65.5 66.0 66.5 67.0 67.5
62.5 39 39 38 38 38 37 37 37 36 3663.0 40 39 39 39 38 38 38 37 37 3763.5 40 40 39 39 39 38 38 38 37 3764.0 41 40 40 40 39 39 39 38 38 3864.5 41 41 41 40 40 40 39 39 39 3865.0 42 41 41 41 40 40 40 39 39 3965.5 42 42 42 41 41 41 40 40 40 3966.0 43 42 42 42 41 41 41 41 40 4066.5 43 43 43 42 42 42 41 41 41 4067.0 44 44 43 43 43 42 42 42 41 4167.5 44 44 44 43 43 43 42 42 42 4168.0 45 45 44 44 44 43 43 43 42 4268.5 45 45 45 44 44 44 43 43 43 4369.0 46 46 45 45 45 44 44 44 43 4369.5 46 46 46 45 45 45 44 44 44 4470.0 47 47 46 46 46 45 45 45 44 4470.5 47 46 46 46 46 45 45 4571.0 47 47 46 46 46 45 4571.5 47 47 46 46 4672.0 47 47 46 4672.5 47 4773.073.574.074.575.075.576.076.577.077.578.078.579.079.5
* Circumference Value = waist circumference + hip circumference – neck circumference (in inches)

A-10
PERCENT FAT ESTIMATION FOR WOMEN
Height (in)CircumferenceValue* 68.0 68.5 69.0 69.5 70.0 70.5 71.0 71.5 72.0 72.5
45.045.546.046.547.047.548.048.549.049.5 1950.0 20 20 1950.5 21 20 20 20 19 1951.0 21 21 21 20 20 20 19 1951.5 22 22 21 21 21 20 20 20 20 1952.0 23 22 22 22 21 21 21 21 20 2052.5 23 23 23 22 22 22 22 21 21 2153.0 24 24 23 23 23 22 22 22 22 2153.5 25 24 24 24 23 23 23 23 22 2254.0 25 25 25 24 24 24 24 23 23 2354.5 26 26 25 25 25 24 24 24 24 2355.0 27 26 26 26 25 25 25 25 24 2455.5 27 27 27 26 26 26 25 25 25 2556.0 28 28 27 27 27 26 26 26 25 2556.5 29 28 28 28 27 27 27 26 26 2657.0 29 29 29 28 28 28 27 27 27 2657.5 30 29 29 29 29 28 28 28 27 2758.0 30 30 30 29 29 29 29 28 28 2858.5 31 31 30 30 30 29 29 29 29 2859.0 32 31 31 31 30 30 30 29 29 2959.5 32 32 32 31 31 31 30 30 30 2960.0 33 32 32 32 32 31 31 31 30 3060.5 33 33 33 32 32 32 32 31 31 3161.0 34 34 33 33 33 32 32 32 32 3161.5 35 34 34 34 33 33 33 32 32 3262.0 35 35 35 34 34 34 33 33 33 32
* Circumference Value = waist circumference + hip circumference – neck circumference (in inches)

A-11
PERCENT FAT ESTIMATION FOR WOMEN
Height (in)CircumferenceValue* 68.0 68.5 69.0 69.5 70.0 70.5 71.0 71.5 72.0 72.5
62.5 36 35 35 35 34 34 34 34 33 3363.0 36 36 36 35 35 35 34 34 34 3463.5 37 37 36 36 36 35 35 35 34 3464.0 37 37 37 36 36 36 36 35 35 3564.5 38 38 37 37 37 36 36 36 36 3565.0 38 38 38 38 37 37 37 36 36 3665.5 39 39 38 38 38 37 37 37 37 3666.0 40 39 39 39 38 38 38 37 37 3766.5 40 40 39 39 39 39 38 38 38 3767.0 41 40 40 40 39 39 39 39 38 3867.5 41 41 41 40 40 40 39 39 39 3868.0 42 41 41 41 40 40 40 40 39 3968.5 42 42 42 41 41 41 40 40 40 3969.0 43 42 42 42 41 41 41 41 40 4069.5 43 43 43 42 42 42 41 41 41 4170.0 44 43 43 43 43 42 42 42 41 4170.5 44 44 44 43 43 43 42 42 42 4271.0 45 44 44 44 44 43 43 43 42 4271.5 45 45 45 44 44 44 43 43 43 4372.0 46 45 45 45 45 44 44 44 43 4372.5 46 46 46 45 45 45 44 44 44 4473.0 47 46 46 46 45 45 45 45 44 4473.5 47 47 46 46 46 45 45 45 4474.0 47 46 46 46 46 45 4574.5 47 47 46 46 46 4575.0 47 46 46 4675.5 47 47 4676.0 4776.577.077.578.078.579.079.5
* Circumference Value = waist circumference + hip circumference – neck circumference (in inches)

A-12
PERCENT FAT ESTIMATION FOR WOMEN
Height (in)CircumferenceValue* 73.0 73.5 74.0 74.5 75.0 75.5 76.0 76.5 77.0 77.5
45.045.546.046.547.047.548.048.549.049.550.050.551.051.552.0 20 19 1952.5 20 20 20 19 1953.0 21 21 20 20 20 20 19 1953.5 22 21 21 21 21 20 20 20 19 1954.0 22 22 22 21 21 21 21 20 20 2054.5 23 23 22 22 22 22 21 21 21 2055.0 24 23 23 23 22 22 22 22 21 2155.5 24 24 24 23 23 23 23 22 22 2256.0 25 25 24 24 24 23 23 23 23 2256.5 26 25 25 25 24 24 24 24 23 2357.0 26 26 26 25 25 25 24 24 24 2457.5 27 26 26 26 26 25 25 25 25 2458.0 27 27 27 27 26 26 26 25 25 2558.5 28 28 27 27 27 27 26 26 26 2559.0 29 28 28 28 27 27 27 27 26 2659.5 29 29 29 28 28 28 27 27 27 2760.0 30 30 29 29 29 28 28 28 28 2760.5 30 30 30 30 29 29 29 28 28 2861.0 31 31 30 30 30 30 29 29 29 2861.5 32 31 31 31 30 30 30 30 29 2962.0 32 32 32 31 31 31 30 30 30 30
* Circumference Value = waist circumference + hip circumference – neck circumference (in inches)
A-13
PERCENT FAT ESTIMATION FOR WOMEN
Height (in)CircumferenceValue* 73.0 73.5 74.0 74.5 75.0 75.5 76.0 76.5 77.0 77.5
62.5 33 32 32 32 32 31 31 31 30 3063.0 33 33 33 32 32 32 32 31 31 3163.5 34 34 33 33 33 32 32 32 32 3164.0 34 34 34 34 33 33 33 32 32 3264.5 35 35 34 34 34 33 33 33 33 3265.0 35 35 35 35 34 34 34 33 33 3365.5 36 36 35 35 35 35 34 34 34 3366.0 37 36 36 36 35 35 35 35 34 3466.5 37 37 37 36 36 36 35 35 35 3567.0 38 37 37 37 36 36 36 36 35 3567.5 38 38 38 37 37 37 36 36 36 3668.0 39 38 38 38 38 37 37 37 36 3668.5 39 39 39 38 38 38 37 37 37 3769.0 40 39 39 39 39 38 38 38 37 3769.5 40 40 40 39 39 39 39 38 38 3870.0 41 40 40 40 40 39 39 39 38 3870.5 41 41 41 40 40 40 40 39 39 3971.0 42 41 41 41 41 40 40 40 39 3971.5 42 42 42 41 41 41 41 40 40 4072.0 43 42 42 42 42 41 41 41 40 4072.5 43 43 43 42 42 42 42 41 41 4173.0 44 43 43 43 43 42 42 42 41 4173.5 44 44 44 43 43 43 42 42 42 4274.0 45 44 44 44 44 43 43 43 42 4274.5 45 45 45 44 44 44 43 43 43 4375.0 46 45 45 45 44 44 44 44 43 4375.5 46 46 46 45 45 45 44 44 44 4476.0 47 46 46 46 45 45 45 45 44 4476.5 47 46 46 46 46 45 45 45 4477.0 47 47 46 46 46 45 45 4577.5 47 47 46 46 46 4578.0 47 47 46 46 4678.5 47 47 4679.0 4779.5
* Circumference Value = waist circumference + hip circumference – neck circumference (in inches)

REPORT DOCUMENTATION PAGE Form ApprovedOMB No. 0704-0188
Public reporting burden for this collection of information is estimated to average 1 hour per response, including the time for reviewing instructions, searching existing data sources,gathering and maintaining the data needed, and completing and reviewing the collection of information. Send comments regarding this burden estimate or any other aspect of thiscollection of information, including suggestions for reducing this burden, to Washington Headquarters Services, Directorate for Information Operations and Reports, 1215 JeffersonDavis Highway, Suite 1204, Arlington, VA 22202-4302, and to the Office of Management and Budget, Paperwork Reduction Project (0704-0188), Washington, DC 20503
1. AGENCY USE ONLY (Leave blank) 2. REPORT DATE
September 19993. REPORT TYPE & DATE COVERED
Final 980701-981031
4. TITLE AND SUBTITLE
Development of the DoD Body Composition Estimation Equations
6. AUTHOR(S)
J.A. Hodgdon; Karl Friedl
5. FUNDING NUMBERS
Program Element:DoD-Reimb.
Work Unit Number:6430
7. PERFORMING ORGANIZATION NAME(S) AND ADDRESS(ES)
Naval Health Research CenterP.O. Box 85122San Diego, CA 92186-5122
8. PERFORMING ORGANIZATION
Technical Document 99-2B
9. SPONSORING/MONITORING AGENCY NAMES(S) AND ADDRESS(ES)
Bureau of Medicine and Surgery Code 26 2300 E Street NW Washington DC 20372-5300
10. SPONSORING/MONITORING AGENCY REPORT NUMBER
11. SUPPLEMENTARY NOTES
12a. DISTRIBUTION/AVAILABILITY STATEMENT
Approved for public release; distribution is unlimited.
12b. DISTRIBUTION CODE
A
13. ABSTRACT (Maximum 200 words)
This report summarizes the research findings that led to the policy decisions for development of thebody fat content screening procedures and equations that are currently under consideration forinclusion in the Department of Defense (DoD) Instruction (DoDI) 1308.3, Physical Fitness and BodyFat Programs. After reviewing research results, a DoD ad hoc working group recommended that atiered body fat content standard be adopted. A weight-for-height screen would be adopted based onthe recommendations of the Healthy People 2000 Committee: Healthy weights are represented bybody mass index (BMI) values between 19 and 25, irrespective of gender. Service membersexceeding the weight-for-height standards would have their body fat content determined usingequations currently in use by the Navy and Air Force.
15. NUMBER OF PAGES
2614. SUBJECT TERMS
Body fat; Physical fitness; Bioelectrical impedance16. PRICE CODE
17. SECURITY CLASSIFI-CATION OF REPORT
Unclassified
18. SECURITY CLASSIFI-CATION OF THISPAGE
Unclassified
19. SECURITY CLASSIFI-CATION OFABSTRACT
Unclassified
20. LIMITATION OFABSTRACT
Unlimited
NSN 7540-01-280-550 Standard Form 298 (Rev. 2-89)Prescribed by ANSI Std. Z39-18298-102
Related Documents