Nature and timing of brittle structures at the Challenger Gold Mine Caitlin Rowett- corresponding author Dept of Geology and Geophysics, School of Earth and Environmental Sciences University of Adelaide, South Australia, 5005 [email protected] Prof. David Giles Director, Centre for Mineral Exploration Under Cover, School of Earth and Environmental Sciences, University of Adelaide, South Australia, 5005.

Welcome message from author
This document is posted to help you gain knowledge. Please leave a comment to let me know what you think about it! Share it to your friends and learn new things together.
Transcript
Nature and timing of brittle structures at the Challenger
Gold Mine
Caitlin Rowett- corresponding author
Dept of Geology and Geophysics, School of Earth and Environmental Sciences
University of Adelaide, South Australia, 5005
Prof. David Giles
Director, Centre for Mineral Exploration Under Cover, School of Earth and Environmental Sciences,
University of Adelaide, South Australia, 5005.
Nature and timing of brittle structures at the Challenger Gold Mine 2010
2 | P a g e
TABLE OF CONTENTS ABSTRACT ................................................................................................................................................ 4
1.0 INTRODUCTION ................................................................................................................................. 6
1.1 Regional Geology .................................................................................................................... 7
2.0 METHOD .......................................................................................................................................... 13
3.0 RESULTS........................................................................................................................................... 16
3.1 Geometry of the Late Structures .......................................................................................... 16
3.2 Relationship to intrusions ..................................................................................................... 19
3.3 Textures and Mineralogy of Alteration ................................................................................. 20
3.4 40Argon/39Argon Results ........................................................................................................ 22
CHALLENGER-880-8 ....................................................................................................................... 22
CHALLENGER-880-9A .................................................................................................................... 23
CHALLENGER-880-9B .................................................................................................................... 23
4.0 DISCUSSION ..................................................................................................................................... 23
4.1 Significance of Argon Data .................................................................................................... 23
4.2 Interpretation of Fault Geometry ......................................................................................... 27
4.3 Regional Setting of Structures .............................................................................................. 31
4.4 Regional Setting of Lamprophyres ........................................................................................ 33
5.0 CONCLUSION ................................................................................................................................... 36
REFERENCES .......................................................................................................................................... 38
ACKNOWLEDGEMENTS ......................................................................................................................... 41
FIGURE CAPTIONS ................................................................................................................................. 42
Figure 1: Background ........................................................................................................................ 42
Figure 2: Stereo-graphic representations of structural data ............................................................ 43
Figure 3: Photomicrographs .............................................................................................................. 43
Figure 4: Wall Maps and Photos of Mapped Area ............................................................................ 44
Figure 5: Field Observations ............................................................................................................. 45
Figure 6: goCad® Model .................................................................................................................... 46
Figure 7: Potential Model Geometry ................................................................................................ 46
Figure 8: Argon Age Plateau Plots ..................................................................................................... 47
Figure 9: Interpretation of Stress and Strain .................................................................................... 48
Figure 10: Cooling History of the Challenger Deposit ....................................................................... 48
Figure 11: Geological History of Selected Gawler Craton Domains .................................................. 49
TABLE CAPTIONS ................................................................................................................................... 49
Nature and timing of brittle structures at the Challenger Gold Mine 2010
3 | P a g e
Table 1: Joint Characteristics ............................................................................................................ 49
APPENDICES .......................................................................................................................................... 50
Appendix 1: goCad® Legend .............................................................................................................. 50
Appendix 2: Wall and Backs Maps .................................................................................................... 51
Appendix 3: Challenger-880-8 Raw Data .......................................................................................... 66
Appendix 4: Challenger-880-8 Normal and Inverse Isochron ........................................................... 69
Appendix 5: Challenger-880-9a Raw Data ........................................................................................ 70
Appendix 6: Challenger-880-9a Normal and Inverse Isochron ......................................................... 73
Appendix 7: Challenger-880-9b Raw Data ........................................................................................ 74
Appendix 8: Challenger-880-9b Normal and Inverse Isochron ......................................................... 77
FIGURES ................................................................................................................................................. 78
Figure 1: Background ........................................................................................................................ 78
Figure 2: Stereo-graphic Representations of Structural Data ........................................................... 80
Figure 3: Photomicrographs .............................................................................................................. 81
Figure 4: Wall Maps and Photos of Mapped Area ............................................................................ 82
Figure 5: Field Observations ............................................................................................................. 84
Figure 6: goCad® Model representations and mapped data ............................................................ 85
Figure 7: Potential Model Geometries .............................................................................................. 87
Figure 8: Argon Age Plateau Graphs ................................................................................................. 88
Figure 9: Interpretation of Stress and Strain .................................................................................... 90
Figure 10: Cooling History of the Challenger Gold Mine .................................................................. 91
Figure 11: Geological History of Selected Gawler Craton Domains .................................................. 92
Nature and timing of brittle structures at the Challenger Gold Mine 2010
4 | P a g e
ABSTRACT
The Challenger Gold Mine in the western Gawler Craton exhibits brittle deformation
features that post-date mineralisation. This study has looked at the geometric relationships
of the observed joint sets and has identified a dominant shallowly north-east dipping thrust
fault package with a crosscutting vertical joint set. In the 880rL, a lamprophyric sill is
emplaced within the shallowly north-east dipping fault.
Structural observations were made over 40 vertical metres in three of the
underground mining levels the 920rL, the 900rL and the 880rL. Observations of these
structural features culminated in the production of an interpreted 3D model using goCad®
showing the connection of the fault package between the mapped levels. These
observations in conjunction with alteration information and structural data showed that the
fault network had a consistent dip across the package despite the undulations in the fault
plane and that the series of splays observed linked the package together. The displacement
and structural data both concluded that the shallowly north-east dipping fault network is a
brittle deformation thrust system.
Three biotite samples from the lamprophyre were analysed using 39Argon/40Argon
Thermochronology. Challenger-880-8 shows a plateau with 90% of cumulative 39Argon
released between 1750 Ma and 1900 Ma. Challenger-880-9a produced a plateau using 55%
cumulative 39Argon realised between 1800 Ma and 2100 Ma. Challenger-880-9b produces a
plateau at 1860 Ma using five continuous steps where 45% of Cumulative 39Argon is
released. Sample Challenger-880-9a provided an approximate crystallisation age of 1950
Ma. This is a coarser grained sample from close to the lamprophyre centre and produced a
poorly defined plateau and consequently is thought to represent the minimum age of
crystallisation. Challenger-880-9b and Challenger-880-8 both are fine grained samples from

Nature and timing of brittle structures at the Challenger Gold Mine 2010
5 | P a g e
the chill margin of the lamprophyre and present ages of approximately 1860 Ma. This is
interpreted as an age of structural significance associated with the Cornian Orogeny,
illustrating reactivation along the fault package during the Paleoproterozic which had not
been previously recognised in the western Gawler Craton.
The lamprophyre intruded into a pre-existing fault indicating that the shallowly
north-east dipping fault package is older than 1950 Ma (the age of crystallisation). This
provides information regarding the early-mid Paleoproterozoic in the western Gawler
Craton.
Key Words: Challenger Gold Mine, Structural Analysis, 40Argon/39Argon Thermochronology,
Paleoproterozoic Gawler Craton
Nature and timing of brittle structures at the Challenger Gold Mine 2010
6 | P a g e
1.0 INTRODUCTION
Faults define fundamental architecture for both Orogenic events and basin
development accommodating a significant component of strain during deformation. In
addition they are often the focus for intraplate deformation by exploiting crustal
weaknesses (Hand & Sandiford 1999). Faults have been observed to cause lithospheric
weakening and as a result are the sites of reactivation in varying extensional and
compressional events (Hand & Sandiford 1999).
Faults also have the potential to be used as conduits for melts and hydrothermal
fluids (Barton et al. 1995; Caine et al. 1996). Brittle fault zones are a primary control on the
permeability of the rock type and can act as either conduits or barriers for fluid (Caine et al.
1996) as a result of connectedness, movement direction and hydraulic conductivity (Barton
et al. 1995). A record of fluid movement along faults is often preserved by some
combination of veining (Brown & Bruhn 1996), hydrothermal alteration of the fault zone
and wall rock (Curewitz & Karson 1997) or in the case of melt migration by the preservation
of igneous rocks (dykes and sills) in the fault zone (Murphy 2006).
Structural features of ore deposits have long been studied and used as an
exploration tool, of particular interest are associations between fault movement and
mineralisation for which we require an understanding of fault geometry, connectivity
kinematics and timing. A strong understanding of such features is critical in determining
deposit shape and style, fluid transport, predicting potential offsets and determining paleo-
stress directions (Miller & Wilson 2002, 2004a). These exploration techniques are also vital
to determine the offset within a deposit which has been dismembered (Miller & Wilson
2004b). A key problem associated with the study of faults and shear zones is the accurate
dating of deformation. This is due to the lack of fault rocks which can be dated by Electron
Nature and timing of brittle structures at the Challenger Gold Mine 2010
7 | P a g e
Spin Resonance spectroscopy (Buhay et al. 1988) or in the case of ductile rocks which can be
dated using isotopic methods (Eide et al. 1997). Brittle fault rocks are more difficult to date
using standard isotopic methods than ductile fault rocks due to their low temperature and
associated open system (Eide et al. 1997).
This project aims to produce a detailed analysis of the brittle deformation structures
associated with the Challenger Gold Mine in the Gawler Craton, South Australia. An analysis
of the surrounding joints sets, linking structures and provide a regional context. The data
collected throughout this project can be of both geotechnical and economic benefit. The
project links the Christie Domain’s structural geology with that of the Challenger deposit
through the dating of the lamprophyre in order to constrain the age of the late fault set.
Challenger provides one of the few outcrops within the domain and therefore this
information will have regional significance.
1.1 Regional Geology
The Challenger Gold Mine is situated approximately 1180km northwest of Adelaide,
in the Gawler Craton South Australia (Tomkins & Mavrogenes 2002). The Gawler Craton has
had a long tectonic and metamorphic history, dominated by two major periods of tectonic
activity, the late Archean and the late Paleoproterozic to early Mesoproterozoic (Hand et al.
2007).
The Archean period is associated with basin development in the Gawler Craton with
arc-like felsic magmatism, localised mafic to ultra-mafic magmatism (Hand et al. 2007). It
was during the Archean that the Christie Gneiss which plays host to the Challenger Gold
Deposit was developed (Tomkins & Mavrogenes 2002). The Christie Gneiss comprises
banded-iron-formation, cordierite-garnet gneiss, layered calc-silicate rocks, marble (locally
Nature and timing of brittle structures at the Challenger Gold Mine 2010
8 | P a g e
dolomite), basic gneiss and a quartzite (Tomkins & Mavrogenes 2002). At the Challenger site
the host rock is known as the Challenger Gneiss which is defined as pelitic garnet-biotite
gneiss with varying amounts of cordierite and orthopyroxene (Tomkins & Mavrogenes
2002). At a mine scale there are 6 different types of gneiss logged based on differences in
texture and mineralogy. These have been interpreted as granulite facies metasedimentary
rocks with interbedded pelitic and psammopelitic sediments.
The Challenger deposit was metamorphosed during the Sleafordian Orogeny. The
Sleafordian Orogeny occurred during the Archean with prograde metamorphism occurring
at approximately 2460 to 2440 Ma (Reid et al. 2008). This is followed by the Kimban
Orogeny at approximately 1730-1700 (Reid et al. 2008), which was concurrent with the
Strangeways Orogeny in Central Australia (Betts & Giles 2006). Within the literature there is
some ambiguity over the exact dates of the Kimban Orogeny, with some authors believing
there were 3 phases of deformation recorded (Hand et al. 2007). During the Kimban
Orogeny deformation was most intense along the eastern edge of the Galwer Craton (within
the Hutchinson Group). However, deformation and metamorphism was regional, affecting
the entire Craton (Betts & Giles 2006). The early stages of the orogeny observed on the Eyre
Peninsula, were subjugated by transpressional deformation, illustrated by dextral top to the
north shearing and contemporary north-south shearing (Vassallo & Wilson cited in Betts &
Giles 2006). This resulted in orogen parallel shear zones and crustal scale sheath folds
(Vassallo & Wilson cited in Betts & Giles 2006).
Prior to the commencement of the Kararan Orogeny approximately 1570-1540 Ma
(Hand et al. 2007) the Ifould and the Tunkillia Suites were emplaced along the western edge
of the Craton (Betts & Giles 2006). This orogenic event follows the emplacement of the
Gawler Range Volcanics and the Hiltaba Suite which are commonly associated with Cu, Au
Nature and timing of brittle structures at the Challenger Gold Mine 2010
9 | P a g e
and U mineralisation in the Olympic Dam region (Hand et al. 2007; Reid et al. 2008). Hand et
al, 2007 states that the youngest phase of deformation is observed between 1470 and 1450
Ma in the reactivation of shear zones and regional cooling.
Peak metamorphic conditions recorded in the Challenger Gneiss are ~7.5±1.5 kbars
and at least 800oC (Tomkins & Mavrogenes 2002). This was determined by Zircon U-Pb and
garnet Sm-Nd dating which indicated that peak metamorphism was at ~2440 Ma (Early
Proterozoic) (Tomkins & Mavrogenes 2002). From correlation of the Challenger gneiss with
the Christie gneiss it has been proposed that the peak metamorphic conditions could be
associated with the Sleafordian Orogeny (2637-2300 Ma) (Tomkins et al. 2004).
The Archean basins and subsequent metamorphism and deformation have been
interpreted as being associated with subduction related tectonism (Betts & Giles 2006; Reid
et al. 2008). The Sleaford and Mulgathing complexes which host the Challenger deposit have
had a complex history which has involved many rift and accretionary phases (Betts & Giles
2006). This has involved three main orogenic events, at least two accretionary phases, plate
convergence and subduction events, with a late period of tectonic stabilisation within the
structures of the western Gawler Craton (Swain et al. 2005). The Christie Gneiss which plays
host to the Challenger Gold Mine is the dominant lithology of the Christie domain (Tomkins
& Mavrogenes 2002). The domain is located in the northwest of the craton (Fig. 1c). The
Christie domain has had a unique history and records some of the events which affected the
Gawler Craton as a whole.
Subsequent to peak metamorphism the deposit and host rocks were overprinted by
brittle faulting and the intrusion of mafic and lamprophyric dykes and sills. Preliminary
40Argon/39Argon suggests cooling of the hot gneiss between approximately 2000 and 1500
Nature and timing of brittle structures at the Challenger Gold Mine 2010
10 | P a g e
Ma. However the timing of faulting, magmatism and exhumation is poorly constrained and
relationships with Paleoproterozoic tectonics elsewhere in the Gawler Craton are unknown.
The Christie Domain is distinguished from adjacent domains in the Gawler Craton by
a series of large shear zones (Tomkins et al. 2004; Direen et al. 2005). The northern
boundary is defined by the Karari Shear Zone and the southern boundary is largely defined
by the Tallacootra Shear Zone (Tomkins et al. 2004; Direen et al. 2005). The use of gravity
and magnetic forward modelling has indicated that these shear zones form an imbricate
oblique thrust stack with movement top to the west and left lateral transport (Direen et al.
2005). The Challenger sub-domain is centrally located and between two interpreted
subsidiary faults (Fig. 1c). These are the Tallacootra shear zone and the Coorabie fault zone
(Direen et al. 2005). The Coorabie fault zone is a nucleus for splaying faults (Direen et al.
2005).
Interpretation of structural relationships have suggested that these features
occurred after ca. 1590 Ma (Direen et al. 2005). This period of tectonic reworking has been
associated with the stabilisation of Rodinia in the Proterozoic based on the metamorphism
and deformation in the Gawler Craton between ca. 1550 and 1450 Ma (Direen et al. 2005).
As a result of recent above ground drilling a large brittle fault has been identified
intersecting the Challenger deposit at approximately the 220rL (Reid et al. 2010). This fault
has been observed to show left lateral transport of between 120 to 150m (Reid et al. 2010).
This offset was determined by the use of the ore body as indicators on each side of the fault
(Reid et al. 2010). Through the use of K-Ar Thermochronology on a sample of fault gouge
this faulting event has been dated at 1405±28 Ma which infers that the area was
approximately 2km below the Earth’s surface at that time (Reid et al. 2010).
Nature and timing of brittle structures at the Challenger Gold Mine 2010
11 | P a g e
Geochronology work carried out at Challenger provides a timeline of events that
shaped the metamorphic evolution of the deposit and regionally the effects of the Kimban
and Sleafordian orogenies on the Christie/Challenger Gneiss (Tomkins et al. 2004). In
addition to the geochronology described above, work was carried out on biotite, white mica
and potassium feldspar using argon-argon analysis (Tomkins et al. 2004). The minerals being
tested came from three samples of Challenger Gneiss unaffected by subsequent
deformation and two samples that had been strongly altered by a fluid infiltration event
(Tomkins et al. 2004).
This argon analysis provided inconclusive dates for the initial closure of the minerals.
This can be observed on the age spectrum charts (Fig.1(d)). These show there is no distinct
plateau in argon loss which would provide more consistent ages (Tomkins et al. 2004). The
analyses conducted on the micas show no overlap in dates, including the error margins
(Tomkins et al. 2004). Tomkins et al (2004) concluded that the argon could have been
partially reset by a series of short-lived moderate heating events after the initial closure.
Consequently, the inconclusive nature of the results has meant that the Kimban and the
Kararan orogenies cannot be resolved from one another (Tomkins et al. 2004).
Other geochronology work done by Tomkins and Mavrogenes (2002) was conducted
using Sm-Nd dating of garnet. These whole rock ages identify the rocks as Archean (Tomkins
& Mavrogenes 2002).
The Challenger ore body is defined by a laterally extensive shear zone with the ore
shoots plunging at ~30o (30o-35o) (Androvic et al. 2008). The ore body has been defined as
four distinct regions these are the M1, M2, M3 and the M1 Shadow zone (DML, 2010).
Current exploration has concluded that the high-grade gold-bearing M1, M2, and M3 shoots
Nature and timing of brittle structures at the Challenger Gold Mine 2010
12 | P a g e
extend to considerable depths (DML, 2010). The ore body is characterised by a series of
tightly folded leucosomes which show ptygmatic folding (Androvic et al. 2008). Specifically
the M1 ore shoot is an anticlinal fold that is defined by a package of upright tightly folded
quartz veins and leucosomes, the fold axes of this package are parallel to the ore shoot at
30O towards 60O (Androvic et al. 2008).
The ore shoot lithologies are a dark-grey granoblastic garnet-cordierite proximal
gneiss with locally elevated arsenic, metatexite migmatites containing 30-40% coarse
grained stromatic leucosomes and bluish quartz-rich veins (McFarlane et al. 2007). These
proximal lithologies contain disseminated pyrrhotite, arsenopyrite, löllingite, chalcopyrite,
pentlandite, gold and bismuth (McFarlane et al. 2007). Other lithologies encountered at
Challenger include late mafic-ultramafic dykes and sills (Tomkins et al. 2004). These have
been observed to crosscut the gneissic foliation and exploit the joint networks. The dykes
and sills have been affected by greenschist facies retrograde metamorphism where
muscovite and chlorite have replaced all minerals, except quartz (Tomkins et al. 2004). This
localised metamorphism has been attributed to competency contrasts between the mafic
intrusions and the Challenger Gneiss developed when the fluid intruded (Tomkins et al.
2004).
Nature and timing of brittle structures at the Challenger Gold Mine 2010
13 | P a g e
2.0 METHOD
I collected Challenger field data while mapping wall and backs over three
underground levels, i.e. the 880rL, 900rL and the 920rL. In the course of the project a total
of 2110 m2 was mapped. Maps were created using a 1:100 ratio with metres derived from
distance from survey station. Mapping had a focus on the geometric relationships of joints,
dip and dip direction data, displacement of gneissic features, size of joint planes and the
scale of these interactions. An example of this can be observed in appendix 2.
In conjunction with the mapping, a series of field observations identifying
displacement and characteristics of the fault plane, paying specific attention to texture,
mineralogy along the plane, degree of infill and rock type. Further diagrams were produced
that show small scale features such as linking structures and kinematic features. Structural
information was presented using Georient®. The joint sets were plotted as both poles to
planes and as planes. This information was subsequently plotted with the mineral lineations
to indicate movement direction and to confirm data validity.
I selected a series of petrographic samples to show the progression of alteration into
a joint and how it is changed along the joint margins. These were selected as
representatives of the changes in the Challenger Gneiss, the lamprophyre and the mafic
intrusion. The mafic sample was collected from the 360rL to confirm the difference between
the lamprophyre and the mafic intrusion. One lamprophyre sample was collected from
outside the mapping area to illustrate an example of a wide lamprophryic sill, all other
samples were from the 3 mapped levels. Mineralogy, textural features and micro-tectonics
were determined using an optical microscope.
I constructed a 3D model of the joint geometry using goCad® modelling software.
Each wall map was imported and aligned with the wall segments in the solid polygons
Nature and timing of brittle structures at the Challenger Gold Mine 2010
14 | P a g e
representing the 880rL, 900rL and 920rL. Using the survey station and associated distances
the maps were correctly aligned and the joints were digitised onto the level solid (provided
by Dominion Survey). The dip data was imported onto the joint planes and represented as a
disc, which allowed for surfaces to be created linking the joints. Like joints were linked
across the drives and throughout the levels. Where readings were consistent some
interpretation was made to link features between levels and across drives.
Argon-argon analysis was conducted on biotite grains from within three samples
from a lamprophyre in the 880rL. These samples I prepared at the University of Adelaide.
The samples were coarsely crushed and sieved using a 1mm mesh. Following this the fines
were panned saving the light fraction. This light fraction was then dried and separated using
the Frantz magnetic separator at 0.5 and 0.8 mV. Large impurities were removed from the
heavy fraction using a microscope, leaving a pure biotite sample.
The samples were then sent to the West Australian Argon Isotope Institute for
analysis, where three representative samples from Challenger Gold Mine samples
Challenger-880-8, Challenger-880-9A and Challenger-880-9B were selected by them for
40Ar/39Ar dating and separated into 580x310µm and 520x320 µm sized single biotite grains
for sample Challenger-880-9A and Challenger-880-9B respectively. For sample Challenger-
880-8 a few smaller biotite grains were selected. These minerals were further separated
using a Frantz magnetic separator before being carefully handpicked under a binocular
microscope. The selected biotite grains were then thoroughly rinsed using distilled water in
an ultrasonic cleaner.
The selected samples were loaded into 3 large wells with a 1.9cm diameter and
0.3cm depth aluminium disc. These wells were bracketed by smaller wells that contained
Fish Canyon sanidine (FCs) which was used as a neutron fluence monitor for which an age of
Nature and timing of brittle structures at the Challenger Gold Mine 2010
15 | P a g e
28.305±0.036 Ma (1σ) was adopted (Renne et al. 2010) based on the calibration by (Jourdan
& Renne 2007). The aluminium discs were cadmium-shielded (to minimise nuclear
interference reactions) and irradiated for a period of 25 hours in the Hamilton McMaster
University (Canada) nuclear reactor in position 5C.
Mean J-values of 0.0095820 ± 0.0000517 (0.54%) were computed from standard
grains within the small wells. These were determined to be the average and standard
deviation of the J values of the standards for each radiation disc. Mass discrimination was
monitored using an automated air pipette and provided a mean value of 1.002703 n(0.28%)
per dalton (atomic mass unit) relative to an air ratio of 298.56 ± 0.31 (Lee et al. 2006). The
correction factors for interfering isotopes were (39Ar/37Ar)Ca = 7.30x10⁻⁴ (± 11%), (36Ar/37Ar)Ca
= 2.82x10⁻⁴ (± 1%) and (40Ar/39Ar)K = 6.76x10⁻⁴ (± 32%).
The Western Australian Argon Isotope Institute is operated by a consortium consisting
of Curtin University and the University of Western Australia, where I assisted in data
acquisition. Sample 8 was wrapped in 0-blank Niobium foil to create a package of grains
whereas samples 9A and 9B were single grain analyses and step-heated using an 110W
Spectron Laser Systems, with a continuous Nd-YAG (IR; 1064 nm) laser rastered over the
package during 1mn to ensure a homogenously temperature distribution. The gas was
purified in a stainless steel extraction line using a GP50 and 2 AP10 SAES getters and a liquid
nitrogen condensation trap. Argon isotopes were measured in static mode using a MAP 215-
50 mass spectrometer (resolution of ~500; sensitivity of 4x10-14 mol/V) with a Balzers SEV
217 electron multiplier generally using 9 to 10 cycles of peak-hopping.
The data acquisition was performed using the Argus program written by M.O.
McWilliams and ran under a LabView environment. The raw data were processed using the
ArArCALC software (Koppers 2002) and the ages have been calculated using the decay
Nature and timing of brittle structures at the Challenger Gold Mine 2010
16 | P a g e
constants described by Renne et al. (2010). Blanks were monitored every 3 to 4 steps with
typical 40Ar blanks ranging from 1 x 10-16 to 2 x 10-16 mol. Argon isotopic data which were
corrected for blank, mass discrimination and radioactive decay are given in appendix 3.
The criteria used for the determination of plateaus are as follows:
Plateaus must include at least 70% of 39Ar.
The plateau should be distributed over a minimum of 3 consecutive
steps with a 95% confidence level and satisfying a probability of fit (P) of
at least 0.05.
Plateau ages (appendices 3,5 and 7 and Fig.8) are given at the 2σ level
and are calculated using the mean of all the plateau steps, each weighted
by the inverse variance of their individual analytical error.
Mini-plateaus are defined using similar features except that they include between
50% and 70% of 39Ar. Integrated ages (2σ) are calculated using the total gas released for
each Argon isotope and inverse isochrons include the maximum number of steps with a
probability of fit ≥ 0.05. All sources of uncertainties have been accounted for within the
calculation.
3.0 RESULTS
3.1 Geometry of the Late Structures
Three main joint sets have been observed in the Walls and Backs at Challenger.
These are the shallowly dipping joints and one set of conjugate vertical joints. The shallowly
dipping joints have a range of dips from approximately north to east with an average of
approximately north-east with east-west trending vertical joints. The joint sets are seen to
crosscut one another with minor displacement to the vertical joints observed. The vertical
Nature and timing of brittle structures at the Challenger Gold Mine 2010
17 | P a g e
joints had two main orientations at approximately 90° to each other. A third set of joints
was not observed in the 880rL and consequently has been deemed a minor feature.
A common feature of all the joints observed was their tendency to form splays from
a dominant joint. The shallowly north-east dipping faults often occurred in packages with a
dominant fault plane that had a series of splays linking to form a duplex-like structure (Fig.
5(c&d)). Another feature common to the joint sets was the presence of shear bands which
vary in thickness from 10cm to 50cm and represent an area of intense deformation caused
by continual splaying and linking between joints that follow the same general trend.
The observed large shallowly north-east dipping faults offset the quartz (qz) - veining
and pegmatite emplacements. In the 900 Right Hand (RH) pillar the shallowly dipping joint
offsets a pegmatite vein by approximately 3m (seen in the map and photo in Fig. 4(b)). This
offset indicated a thrusting motion and was concluded to be a thrust fault with top to the
north-east. An offset was also observed in the 920 RH drive where quartz veining that
passed through both the left and right walls had been truncated by a shallowly dipping fault
(Fig. 5(b)). However, the distance of the offset could not be quantified as the veining
package could not be confidently identified in the drive. The movement along this same
fault has produced brecciation of a large quartz-vein observed in the RH wall. This
brecciation is shown in Fig. 5g where a change in the clast size can be observed towards the
centre of the shear zone.
Occasional offsets were also observed along the vertical joints. These were on a
much smaller scale approximately 2-5cm (as illustrated in Fig. 5(a & b)). Many of the vertical
joints did not show signs of movement and were tightly closed.
Varying types of brittle deformation features were observed in the walls in
conjunction with the brittle faults. In the 900 vent-return left hand (LH) wall boudinaging of

Nature and timing of brittle structures at the Challenger Gold Mine 2010
18 | P a g e
the qz-veining was observed (photo at Fig.5 (f)). Other structural features observed were a
series of linking structures, which merge into one another along a specific plane (images
available in Fig. 5 (c &d)).
In some situations the gneissic foliation was observed to follow the joint planes. In
these cases the foliation became intensely strung out with mottled intergrowths of garnet
and cordierite. Generally, the gneissic fabric has been disrupted by the jointing.
A key observation made about the joint sets was the level of undulation along the
joint surface, particularly in the vertical joints which ran parallel with the walls. Along these
joint planes large curvatures of the plane could be observed. These planes gave varying dip
direction data, which in some cases varied by approximately 30 degrees such as in the 900
internal stockpile.
Four stereonets were produced showing the relationships between the joint sets and
their associated mineral lineations (Fig. 2). Fig. 2a shows the measured joint planes and
their associated mineral lineations. This image shows three distinct groups of joints. These
three groups are further recognised in Fig. 2 b, c and d. In Fig. 2b the poles to planes were
plotted, demonstrating a cluster of data on a central band. There is a concentration of data
in the north to north-east quadrant and another minor grouping in the west to north-west
quadrant. Fig.2c further confirms the three groups.
The band of data centrally located corresponds to the shallowly north-east dipping
faults and the two other data populations correspond to the conjugate vertical joint sets.
This density of data is also represented in Fig 2c which shows an example of a contoured
density plot which indicates three zones of greater than 8% correlating to the joint sets
described above.
Nature and timing of brittle structures at the Challenger Gold Mine 2010
19 | P a g e
Fig. 2d is a contoured density plot that illustrates the concentration of mineral
lineations. This plot shows two regions of high density, one approximately 90O from the
shallowly north-east dipping faults providing evidence for their movement direction. The
second group is smaller in size and shows no specific alignment with a joint set.
Joint characteristics have been summarised in Table 1 which highlights three joint
sets, the first two are the most dominant throughout the three mapped levels. With the set
named vertical joint 2 being dominant in the 900rL.
3.2 Relationship to intrusions
In the 880rL access right hand wall a lamprophyre sill is observed to be exploiting the
shallowly dipping joint set (Fig. 4). In this wall two lamprophyre sills are observed, one is
seen to run through into the neighbouring vent return and the other tapering off in the wall.
The lower sill is observed to have a mineral lineation running along the base of the
lamprophyre with an approximate strike of 70/230 SE. The joint plane at this location has a
dip dip-direction of 20/014. The lamprophyre was observed to be fine grained at the contact
with the gneiss and gradually coarsening towards the centre of the sill. In some of the very
narrow sills (approximately 10cm wide) the lamprophyres were very fine grained, with
individual minerals undeterminable by the naked eye.
The lamprophyres have not seen major displacement and are only observed to be
offset by a single joint where displacement is less than 10cm. The geometry of the
lamprophyre system can be observed in Fig.4c where the lamprophyres can be seen to run
along the shallowly dipping joint surfaces and link through linking structures. Within this
level the lamprophyre is not observed without structural control.
Nature and timing of brittle structures at the Challenger Gold Mine 2010
20 | P a g e
Fine grained mafic intrusions were more common in the 920 and 900 levels. They
showed intense jointing (of the intrusion) but were not seen to be exploiting the joint sets.
The mafic intrusions have a distinct fracture pattern in which the mafic breaks off in circular
fractures. In the 920 level the mafic intrusion was seen to be offset by the vertical joint set.
Large gneissic inclusions are observed in the intrusions both the 920 and 900 levels. These
inclusions did not follow the gneissic trend. In Fig.5(e) there is a small gneiss inclusion with
quartz veining trending in a different direction to the surrounding veining.
3.3 Textures and Mineralogy of Alteration Challenger Gneiss
The Challenger Gneiss has a dominant composition of quartz, plagioclase, cordierite,
biotite, and garnet with sericite alteration. The collected samples of gneiss: Challenger-900-
1, Challenger-900-3, Challenger-900-4 and Challenger-880-2 are all dominantly granoblastic
with no distinct foliation. Along the fracture planes there is a slight elongation to the garnet
grains in some areas but this is not observed in all cases.
The gneiss shows the greatest alteration along joints of the three rock types. The
gneiss shows a reduction in grain size closest to a joint surface. Moving from a joint plane
the level of sericitisation also decreases, with the majority of sericitisation focused along the
joint margin (Fig.3a). Sericitisation has preferentially occurred within the cordierite grains.
This was particularly evident in sample Challenger-900-3 where a large altered cordierite
grain is observed in hand specimen but is not observed in the thin-section, where at the
same location sericite is abundant. The sericite was observed to be an alteration product
and was subsequently observed close to the joint margin. This was particularly noticeable in
Nature and timing of brittle structures at the Challenger Gold Mine 2010
21 | P a g e
a fracture set which ran parallel to the joint plane in sample Challenger-900-3 where sericite
had begun to infill these fractures.
Along the contact between the lamprophyre and gneiss (Fig.3e & f), is
microcrystalline quartz which occurs in a very fine band. Other examples of microcrystalline
quartz within fractures are observed (Fig.3a) where the individual quartz grains are
approximately 10 microns in diameter and all exhibit undulose extinction.
The quartz grains provided the best evidence of movement along the joint planes. In
sample Challenger-880-4 a series of splaying micro-fractures are observed coming from the
lamprophyre gneiss contact. These micro-fractures dissect a series of quartz grains, within
an individual grain there are three micro-fractures each showing a few μm of movement.
This is illustrated in Fig.3(g) where the offset is demonstrated.
Mafic The mafic intrusion is a fine-grained igneous rock composed of abundant
disseminated magnetite, biotite, chlorite and plagioclase with minor carbonate and
sulphides. The groundmass is dominated by plagioclase lathes with biotite and chlorite
intergrowths and euhderal fine grained magnetite. Dispersed throughout are minor groups
of carbonates.
Sample Challenger-360-1 shows a veinlet of chalcopyrite indicating sulphide
mineralisation does occur within the unit. A fracture running through the sample shows a
concentration of magnetite along the feature, delineating the area. The magnetite has
grown to fill in the fracture, producing larger grains. This area also shows a reduction in
grain size of the biotite and the growth of sericite in the area. Other fractures observed are
infilled by very fine grained sericite.
Nature and timing of brittle structures at the Challenger Gold Mine 2010
22 | P a g e
Lamprophyre- The lamprophyre is an intrusive igneous rock with an ultra-mafic mineral
composition. The lamprophyre has an amphibole-rich matrix composed of acicular inter-
grown aegirine and sanderine/nephline grains with minor biotite. Supported by the matrix
are a series of olivine porphyroblasts, that are retrogressed to actinolite and tremolite,
clinopyroxene (including diopside), orthopyroxene, and plagioclase (Fig 3b). The
lamprophyre is dominantly fine grained in the narrow intrusions of the mapping area. In the
larger sill sampled in the 640rL the lamprophyre is coarse grained with large porphyroblasts
(Fig 3d).
These grain size reductions correspond with the size of the sill and the distance from
the contact. In Fig. 3(c) an increase in grain size can be seen progressing away from the
contact between the gneiss and the lamprophyre. Similarly the number of phenocrysts also
increases away from the margins. The lamprophyre also exhibits a distinct foliation which
can be observed bending around the phenocrysts (observed in Fig. 3 c).
3.4 40Argon/39Argon Results
CHALLENGER-880-8 This sample shows little evidence of contamination from atmospheric argon with an
inverse isochron showing data clustered around 0.00 36Ar/40Ar ratio. The few outliers
observed however all sit below 0.0020 36Ar/40Ar ratio. The age plateau (Fig. 8(a)) shows a
gradual increase in the percentage of 39Argon released with ages varying between
approximately 1750 Ma and 1900 Ma with approximately 90% of 39Argon being discharged
in this range. A plateau-like region is reached using 13 of the sampled steps producing an
Nature and timing of brittle structures at the Challenger Gold Mine 2010
23 | P a g e
age of 1851 ± 14 Ma (0.77%). This number is qualified by a MSWD of 1.14 and a probability
of 0.32.
CHALLENGER-880-9A This sample shows little contamination from atmospheric argon with all data on the
inverse isochron plotting at 0.00 36Ar/40Ar ratio. The age plateau (Fig. 8 (b)) shows an initial
step at approximately 1100 Ma before increasing in age to 1800 Ma with the following step.
A plateau-like feature is observed between 1800 and 2100 Ma during which 55% cumulative
39Ar is released. This produces an age of 1944 ± 45 Ma (±2.31%). This is qualified with a
MSWD of 1.86.
CHALLENGER-880-9B This sample shows no contamination from atmospheric argon with all data on the
inverse isochron plotting at 0.00 36Ar/40Ar ratio. The age spectrum (Fig. 8(c)) has an initial
step at approximately 1400 Ma before increasing to approximately 1450 Ma. From this
range the age significantly increases to approximately 1700 Ma before producing a plateau-
like region at approximately 1860Ma where 47% of the cumulative 39Ar is released. This
sample produces an age of 1861 ±16 Ma (±0.84%). Following this is a minor decline to
approximately 1800 Ma. This data is qualified by a MSWD of 0.40.
4.0 DISCUSSION
4.1 Significance of Argon Data
Sample Challenger-880-9a was sampled close to the centre of the lamprophyric sill
and consequently has a coarser grain size than the other two samples analysed. This sample
provided a mean age of approximately 1950 Ma and a large standard deviation of 50 Ma.
We interpret the degree of scatter to be the result of post-crystallisation isotopic
Nature and timing of brittle structures at the Challenger Gold Mine 2010
24 | P a g e
disturbance (possibly at 1860 Ma) and thus infer that rapid cooling following igneous
crystallisation occurred prior to approximately 1950 Ma.
Samples Challenger-880-9b and Challenger-880-8 yielded plateau-like regions with
ages of approximately 1860 Ma. These samples are observed in hand specimen and in thin
section to have finer grained matrix than sample Challenger-880-9a. The fine-grained nature
corresponds to the chilled margins caused by the temperature contrasts between the hot
lamprophyric magma and the colder Challenger Gneiss at the time of intrusion. Within these
margins a foliation can be observed (Fig. 3 c) which is thought to have developed during the
faulting event which in turn has caused the mineral lineation observed on the lamprophyre
when exposed in the fault plane.
Challenger-880-9b and Challenger-880-8 show a minimum age of 1860 Ma. Due to
the location of these samples, the textural differences, the overprinting foliation and the
replication of this result it is thought that the younger date is of structural significance.
Further evidence for this is the idea that the chilled margins would cool quicker than the
centre of the sill providing an older crystallisation age. This has not happened which
supports an overprinting event. The lack of overprinting event provides further constrains
on the timing of fault movement to be applied. As such the relationship of the lamprophyre
and the fault implies that the lamprophyre was emplaced into an existing joint which infers
that the fault must be older than 1950 Ma.
One of the benefits of 40Argon/39Argon thermochronology is that it allows the
determination of temperature from the closure temperature of the analysed mineral. The
closure temperature of biotite is approximately 300°C with variation due to grain size and
shape (McDougall & Harrison 1999). This information in conjunction the cooling history
Nature and timing of brittle structures at the Challenger Gold Mine 2010
25 | P a g e
developed by Tomkins et al (2004) and recent information from Reid et al (2010) has
allowed revision of the cooling history of the Challenger area.
From the original cooling history produced by Tomkins et al, (2004) two data points
have been excluded due to the inconclusive nature of the data (Fig. 10). One was a biotite
sample that produced an age of 2060 Ma that had no obvious plateau in cumulative 39argon
released and was inconsistent with the other samples of biotite analysed during the 2004
study. The other sample excluded was a monazite grain. The rims of which provided an age
of 1710 Ma, however the temperature at which the monozite rims grew is unknown.
Monazite rims can grow in low temperature and pressure metamorphic conditions when
there is a hydrothermal fluid present (Rasmussen et al. 2001). The reasoning for the
assigned temperature is not provided by Tomkins et al (2004). Further concerns with the
assigned temperature of 350oC are that the older biotite has not been reset, despite it being
above the biotite closure temperature.
Muscovite is not a primary mineral within the Challenger Gneiss, and as such, the
1614 Ma age of the white mica (Tomkins et al. 2004), is thought to represent an alteration
phase. Reid et al (2010), described this sample as sericite alteration along a mafic intrusion
and suggested that the age relates to the crystallisation of the sericite in response to the
presence of the mafic intrusion fluids. Similarly the 1950 Ma age from the biotite grain from
the centre of the 880rL lamprophyre sill is thought to represent the crystallisation age of the
biotite (Fig. 10).
The closure temperature of the Sm-Nd system within the garnets has been
estimated at 850-750oC by Tomkins et al (2004). This closure temperature is consistent with
the temperature used by Tomkins et al (2004) and takes into account the suggestion that
garnets can preserve their Sm-Nd character up to 900oC (Cohen et al. 1988), that the
Nature and timing of brittle structures at the Challenger Gold Mine 2010
26 | P a g e
temperature of peak metamorphism was above 800oC (Tomkins & Mavrogenes 2002) and
that age data indicates its after the peak metamorphism.
The closure temperature for un-mixed potassium feldspar (Ksp) is approximately
150oC. However, variation in grain size, shape and composition can greatly influence the
temperature span over which argon gas is retained (Lovera et al. 2002);(McDougall &
Harrison 1999). For example Lovera et al (2002) demonstrates that closure temperatures
can span window between approximately 300oC and 150oC, which is illustrated on Fig. 10
with large error bars on the Ksp samples.
The illite sample on Fig. 10, is a result of movement along the 79 fault at the
approximate 200rL (Reid et al. 2010) and is thought to have an approximate closure
temperature of 100oC (Roden et al. 1993).
The resultant cooling history (Fig. 10) is consistent with monotonic cooling between
2450 Ma and approximately 1860 Ma at a rate of approximately 1oC/Ma, followed by a
period of slower cooling to 1400 Ma. However, a number of cooling paths cannot be ruled
out in the interval 2450 Ma to 1860 Ma, including rapid cooling followed by reheating to
approximately 350oC at 1860 Ma or rapid cooling at 1860 Ma after a period of prolonged
high temperature.
A low temperature setting during faulting is supported by microcrystalline quartz
that was identified within the Challenger Gneiss as fracture fill. This alteration style is
considered an example of dynamic recrystallisation by Passchier & Trouw (2005). Movement
along the fracture plane, however results in the internal lattices of the quartz grains
becoming distorted producing the undulose extinction and the observed decrease in grain
size.
Nature and timing of brittle structures at the Challenger Gold Mine 2010
27 | P a g e
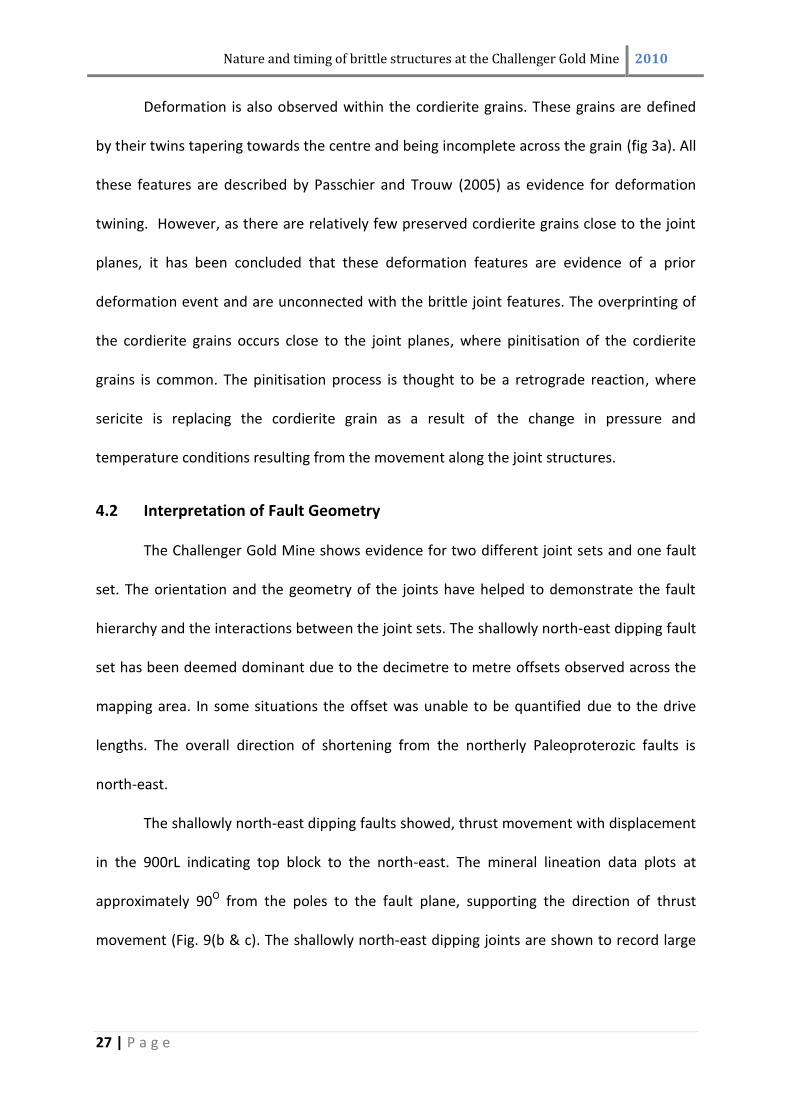
Deformation is also observed within the cordierite grains. These grains are defined
by their twins tapering towards the centre and being incomplete across the grain (fig 3a). All
these features are described by Passchier and Trouw (2005) as evidence for deformation
twining. However, as there are relatively few preserved cordierite grains close to the joint
planes, it has been concluded that these deformation features are evidence of a prior
deformation event and are unconnected with the brittle joint features. The overprinting of
the cordierite grains occurs close to the joint planes, where pinitisation of the cordierite
grains is common. The pinitisation process is thought to be a retrograde reaction, where
sericite is replacing the cordierite grain as a result of the change in pressure and
temperature conditions resulting from the movement along the joint structures.
4.2 Interpretation of Fault Geometry
The Challenger Gold Mine shows evidence for two different joint sets and one fault
set. The orientation and the geometry of the joints have helped to demonstrate the fault
hierarchy and the interactions between the joint sets. The shallowly north-east dipping fault
set has been deemed dominant due to the decimetre to metre offsets observed across the
mapping area. In some situations the offset was unable to be quantified due to the drive
lengths. The overall direction of shortening from the northerly Paleoproterozic faults is
north-east.
The shallowly north-east dipping faults showed, thrust movement with displacement
in the 900rL indicating top block to the north-east. The mineral lineation data plots at
approximately 90O from the poles to the fault plane, supporting the direction of thrust
movement (Fig. 9(b & c). The shallowly north-east dipping joints are shown to record large
Nature and timing of brittle structures at the Challenger Gold Mine 2010
28 | P a g e
displacements greater than 3m and as such are more accurately described as faults (Kearey
2001).
The vertical joints had two main orientations which were inferred as conjugates of
one another. This was evident when looking at the mapped walls and seeing wedges of rock
missing due to similarly angled faults dipping in the opposite direction. The change in dip of
similarly angled joints was also observed in closed joints in the walls.
The geometric relationships of the joint sets have also helped to identify a relative
time line for the observed brittle deformation. The shallowly north-east dipping faults have
undergone very minor, non-systematic offsets caused by the vertical east-west joint sets.
There are a number of possibilities for this relationship that would also explain the offsets
observed to the other joint sets. It is possible that the surrounding joints have developed as
a sympathetic form of brittle deformation in the weakened area (Fig. 9(a)). This could be in a
similar manner as to how Riedel Structures form (Katz et al. 2004) or they possibly were the
initial structures that developed, weakening the area allowing linking features to cut
through and produce the fault network. Both possibilities suggest that the geometric
relationship cannot be used to determine age relationships.
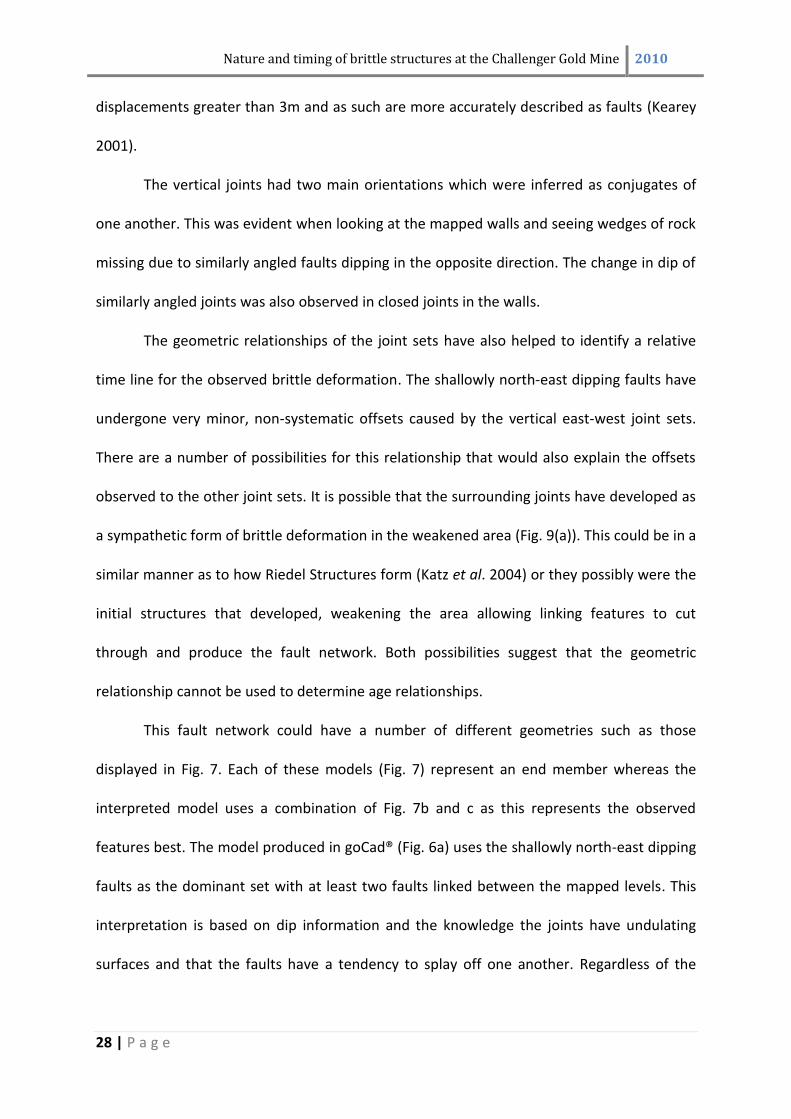
This fault network could have a number of different geometries such as those
displayed in Fig. 7. Each of these models (Fig. 7) represent an end member whereas the
interpreted model uses a combination of Fig. 7b and c as this represents the observed
features best. The model produced in goCad® (Fig. 6a) uses the shallowly north-east dipping
faults as the dominant set with at least two faults linked between the mapped levels. This
interpretation is based on dip information and the knowledge the joints have undulating
surfaces and that the faults have a tendency to splay off one another. Regardless of the
Nature and timing of brittle structures at the Challenger Gold Mine 2010
29 | P a g e
model selected the fault network has a consistent dip that can be projected through the
mine levels.
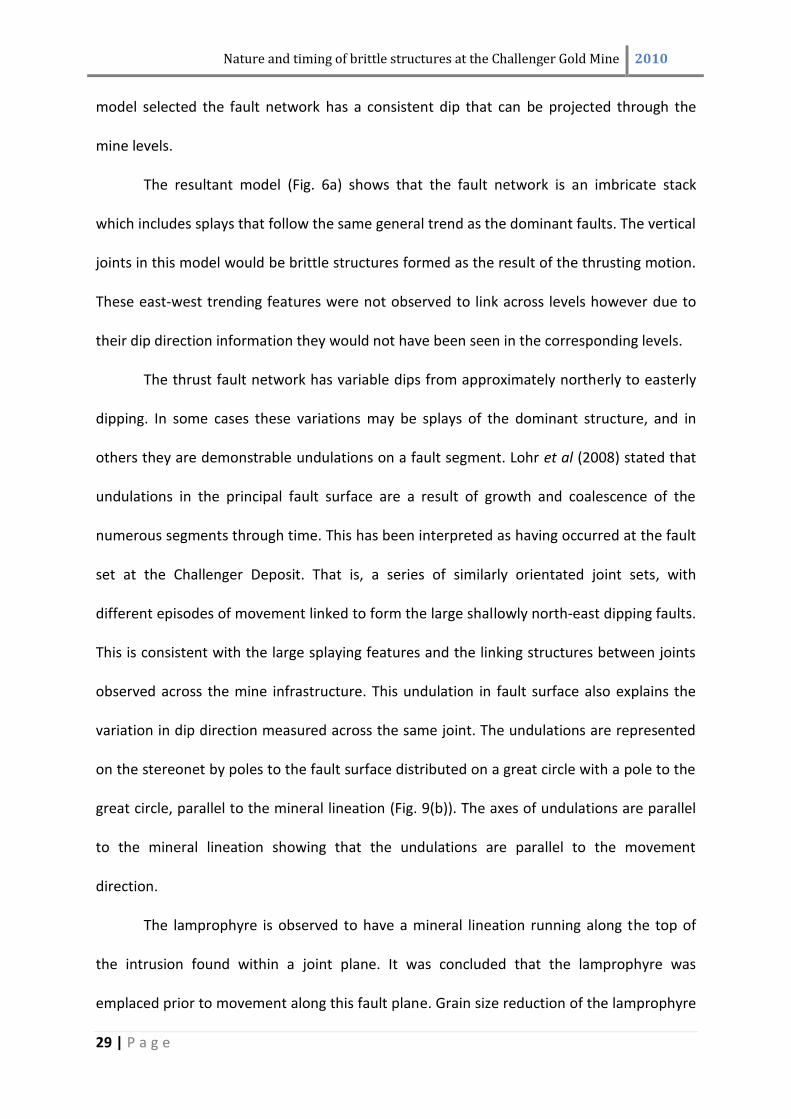
The resultant model (Fig. 6a) shows that the fault network is an imbricate stack
which includes splays that follow the same general trend as the dominant faults. The vertical
joints in this model would be brittle structures formed as the result of the thrusting motion.
These east-west trending features were not observed to link across levels however due to
their dip direction information they would not have been seen in the corresponding levels.
The thrust fault network has variable dips from approximately northerly to easterly
dipping. In some cases these variations may be splays of the dominant structure, and in
others they are demonstrable undulations on a fault segment. Lohr et al (2008) stated that
undulations in the principal fault surface are a result of growth and coalescence of the
numerous segments through time. This has been interpreted as having occurred at the fault
set at the Challenger Deposit. That is, a series of similarly orientated joint sets, with
different episodes of movement linked to form the large shallowly north-east dipping faults.
This is consistent with the large splaying features and the linking structures between joints
observed across the mine infrastructure. This undulation in fault surface also explains the
variation in dip direction measured across the same joint. The undulations are represented
on the stereonet by poles to the fault surface distributed on a great circle with a pole to the
great circle, parallel to the mineral lineation (Fig. 9(b)). The axes of undulations are parallel
to the mineral lineation showing that the undulations are parallel to the movement
direction.
The lamprophyre is observed to have a mineral lineation running along the top of
the intrusion found within a joint plane. It was concluded that the lamprophyre was
emplaced prior to movement along this fault plane. Grain size reduction of the lamprophyre
Nature and timing of brittle structures at the Challenger Gold Mine 2010
30 | P a g e
occurs progressing toward the joint planes. This reduction of grain size is thought to be
related to the cooling history of the intrusion. When the lamprophyre is found in a wider sill
such as observed in the 640rL, grain size is greatly increased. Evidence shows that the
temperature contrast of the gneiss and the lamprophryic intrusion is the major control on
grain size (Tomkins et al. 2004).
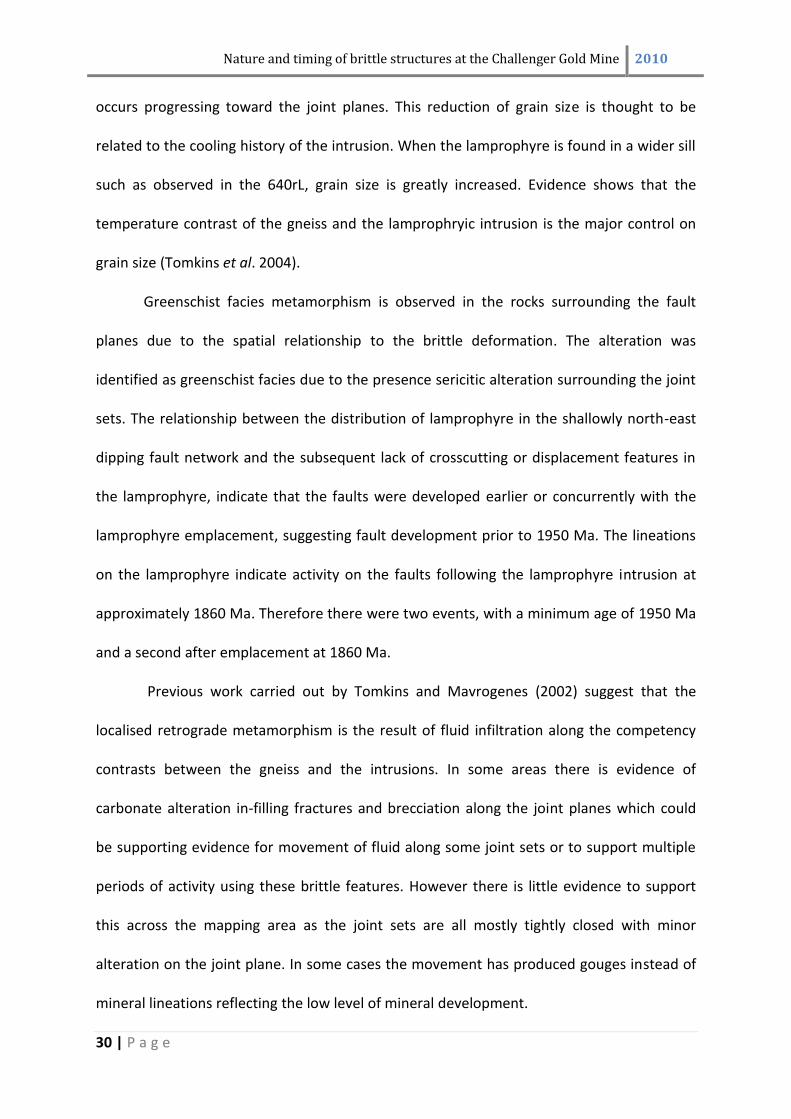
Greenschist facies metamorphism is observed in the rocks surrounding the fault
planes due to the spatial relationship to the brittle deformation. The alteration was
identified as greenschist facies due to the presence sericitic alteration surrounding the joint
sets. The relationship between the distribution of lamprophyre in the shallowly north-east
dipping fault network and the subsequent lack of crosscutting or displacement features in
the lamprophyre, indicate that the faults were developed earlier or concurrently with the
lamprophyre emplacement, suggesting fault development prior to 1950 Ma. The lineations
on the lamprophyre indicate activity on the faults following the lamprophyre intrusion at
approximately 1860 Ma. Therefore there were two events, with a minimum age of 1950 Ma
and a second after emplacement at 1860 Ma.
Previous work carried out by Tomkins and Mavrogenes (2002) suggest that the
localised retrograde metamorphism is the result of fluid infiltration along the competency
contrasts between the gneiss and the intrusions. In some areas there is evidence of
carbonate alteration in-filling fractures and brecciation along the joint planes which could
be supporting evidence for movement of fluid along some joint sets or to support multiple
periods of activity using these brittle features. However there is little evidence to support
this across the mapping area as the joint sets are all mostly tightly closed with minor
alteration on the joint plane. In some cases the movement has produced gouges instead of
mineral lineations reflecting the low level of mineral development.
Nature and timing of brittle structures at the Challenger Gold Mine 2010
31 | P a g e
The lamprophyre displays some alteration properties such as the breakdown of
olivine to actionolite and tremolite. This change in mineralogy is thought to be a result of
the change in melt composition during crystallisation following the principles from Bowens
reaction series and the varying mineral stabilities (Winter 2010). However there is little
retrograde metamorphism recorded within the lamprophyre found in the shallowly north-
east dipping fault in the 880rL that correlates with the alteration observed in the adjacent
Challenger Gneiss.
4.3 Regional Setting of Structures
Since the peak metamorphism of the Sleafordian Orogeny at approximately 2440 Ma
(Tomkins et al. 2004) the Challenger Deposit has undergone only low grade greenschist
facies metamorphism. This lack of significant later thermal events would suggest that the
Christie Domain was largely exhumed at the time of the Kimban and Kararan Orogenies
which affected the surrounding Gawler Craton. From the geometry of the faults and the
overprinting relationships observed in the mapping area, it has been interpreted that the
lamprophyres intruded after the faults formed as they have not been crosscut or displaced
and show the same level of alteration as the surrounding gneiss. This would suggest that the
lamprophyres are syn-deformational.
The assumption that the faults are older than the lamprophyre crystallisation age of
approximately 1950 Ma supports the suggestion that the Christie Domain was exhumed
earlier than the Kimban and Kararan Orogenies. The brittle nature of the faults would
suggest that they developed in the upper top 10 to 15km of the crust depending on the
geothermal gradient and fluid presence in the local area (Davis & Reynolds 1996). The
geothermal gradient within the Christie Domain is not known therefore it is hard to
Nature and timing of brittle structures at the Challenger Gold Mine 2010
32 | P a g e
constrain the depth of the deformation zones from the standard range of brittle
deformation (Davis & Reynolds 1996).
The minimum age of 1860 Ma for movement along the fault corresponds with the
timing of the Cornian Orogeny which has been approximated at 1850 Ma (Reid & Hand
2008) or 1860 Ma to 1850 Ma (Payne et al. 2006). This orogeny has previously been
recorded only in the south-eastern Gawler Craton (Fig. 11), where the event has been
characterised by emplacement of the Donnington Suite within a compressional tectonic
setting (Reid & Hand 2008). Reid and Hand (2008) have interpreted the event as occurring
over a 10 Ma window from 1850-1840 Ma with contractional deformation and peak
metamorphism of amphibolite to granulite facies.
From the data collected at Challenger Gold Mine it could be suggested that the
Cornian Orogeny had a much larger spatial distribution than originally thought. The focus of
deformation may have been associated with the Donnington Suite in the south-east of the
Gawler Craton (Fig. 11), and only brittle deformation occurring within the Christie Domain in
the initial contractional phase. It is thought that rapid changes in subduction zone dynamics
are the cause for the deformation observed in the south-east of the craton and these have
an inboard reach of hundreds of kilometres from the subduction zone (Collins, cited in Reid
& Hand 2008), which could also explain the deformation within the Christie Domain.
The areas that underwent the highest levels of deformation during the Cornian
Orogeny reached pressure levels of 600 MPa and temperatures of 700oC (Payne et al. 2008),
which are most likely to have occurred with depth. The lack of such high temperatures and
pressures at the Challenger Deposit is consistent with the brittle deformation observed,
being an upper crustal expression of the Cornian Orogeny.
Nature and timing of brittle structures at the Challenger Gold Mine 2010
33 | P a g e
Reid et al (2010) has proposed that brittle faulting along the 79 fault which offsets
the Challenger ore body occurred at shallow depth of less than 2km. This suggests that the
Christie Domain continued to be subjected to episodic fault activity and possibly
exhumation into the Mesoproterozoic. The period of brittle deformation is consistent with
the regional tectonic setting where reactivation of faults at this time was thought to be
associated with a period of regional stabilisation (Swain et al. 2005). It commenced at
approximately 1500 Ma when a series of faults and shear zone were active in the western
Gawler Craton and persisted till approximately 1450 Ma (Swain et al. 2005). This is constant
with the second thermal event observed on the argon plateaus in samples Challenger-880-
9b which provided an approximate age of 1400 Ma.
4.4 Regional Setting of Lamprophyres
There is little consensus on the development of lamprophyres with many different
settings identified as hosting lamprophryic intrusions. This may be due to the lack of a single
definition or classification for ultra-mafic lamprophyres (Tappe et al. 2005). Winter (2010)
described the lamprophyre group as being a repository for any difficult to characterise
porphyritic rock and its exclusion from the International Union of Geological Sciences (IUGS)
classification scheme (Tappe et al. 2005). As a result the term lamprophyre is used to
describe many ultra-mafic alkaline porphyitic rock types. Without the chemical composition
of the lamprophyre sampled it cannot be further classified but the petrographic data
collected does provide a general idea of the composition and allows the assumption to be
made that the lamprophyre is part of the general group.
The tectonic settings of alkaline rocks have been classified into three main settings
by Srivastava & Chalapathi Rao (2007) (from (Blichert-Toft et al. 1996)): (i) continental rift
Nature and timing of brittle structures at the Challenger Gold Mine 2010
34 | P a g e
and intra-plate magmatism, (ii) oceanic intra-plate magmatism and (iii) alkaline magmatism
related to subduction processes (island and continental arcs). With further analysis the
Challenger lamprophyres can be potentially designated to one of these three broad
categories through their chemical signature.
Lamprophyres are closely associated with some mesothermal gold deposits and are
thought to be a transporting agent for gold from gold-rich mantle sources (Rock & Groves
1988). However, at Challenger the lamprophyre has not been associated with mineralisation
and due to its relationship with the brittle deformation (which is observed crosscutting the
mineralisation) it is considered a secondary event. The three samples which were analysed
using 40Argon/39Argon Thermochronology provided crystallisation ages of later than 1950
Ma. This period within the Gawler Craton is generally thought to be a period of tectonic
quiescence (Hand et al. 2007).
As the lamprophyre has intruded along an existing fault it can be assumed that the
fault is older than the crystallisation age of the biotite grains within the lamprophyre. The
gneissic foliation of the deposit can also be used as a control on the age of the fault, as the
fault crosscuts the foliation and is a brittle deformation feature. It can be inferred that the
gneiss was deformed and crystallised prior to the faults movement, providing a window of
fault development prior to approximately 1950 Ma.
A possible explanation for the preferential emplacement of the lamprophyre within
the fault network comes from the theory that lamprophyre magmatism is associated with
deep faulting (Vaughn 1996). This idea fits with the observed features of the fault network
and the proposed model of the fault network (Fig. 6).
Vaughn (1996) provides a model for the emplacement of lamprophryic and
shoshonititc intrusions within Riedel Shear structures associated with primary shear zones.
Nature and timing of brittle structures at the Challenger Gold Mine 2010
35 | P a g e
As the lamprophyre found at the Challenger Deposit is found within a secondary splay
feature off a dominant fault, a similar model for its development could be applied. However,
as not all faults in the mapping area contain lamprophyre intrusions and in the absence of a
significant vertical cross-section being observed it is impossible to note the systematic
variations that may be related to the fault and/or the intrusion mechanism, when referring
to the secondary features and consequently such a model is only speculative.
The generation of the lamprophyic magmas is thought to be a result of adiabatic
decompression; resulting from a lithospheric scale fault which intersects the continental
crust down to the mechanical boundary within the lithospheric mantle (Vaughn 1996). This
boundary is located at the base of the cold rigid mantle anchor, which is attached to the
base of the continental crust and through this area heat is transmitted via conduction
(Vaughn 1996). The area directly below the mechanical boundary is a site of metasomatism
where the potassium-rich intrusions have frozen and remain isolated for significant periods
(Vaughn 1996). A series of methods have been suggested for the melting and migration of
these intrusions. However, due to the conditions identified within the Gawler Craton at the
time of the biotite crystallisation, the notion of adiabatic gradient changes as a result of a
crustal scale faulting event seems the most plausible.
In the period preceding the intrusion of the lamprophyres the Gawler Craton is
known to have experienced granulite facies metamorphism during the Sleafordian Orogeny
(2637-2300 Ma) (Tomkins et al. 2004). This large scale orogenic event produced pressure
and temperature conditions of approximately 9 kbars and temperatures between 800-860oC
(Daly et al. 1998). The interpreted arc-back arc setting could provide a regional setting for
the mantle wedge metasomatism from subduction.
Nature and timing of brittle structures at the Challenger Gold Mine 2010
36 | P a g e
The subduction of hot, young Archean crust may have been the source of potassium
enrichment when the crust reached the melting conditions prior to becoming dehydrated
(Martin 1986), allowing for the metasomatism of the mantle. Such conditions were thought
to be associated with the generation of komatiites (Martin 1986), which in the past have
been described as being genetically similar to lamprophyres (Rock 1977). This
metasomatism is important in order to provide the chemical composition of the fluid
required to produce a lamprophyre (Vaughn 1996).
The fault network being the path of least resistance acted as a focus for the
potassium-rich magma. This melting during simple shear processes focuses melts within the
fault, which acts as a conduit resulting in hydrostatic overpressure which facilitates rapid
fluid extraction (Vaughn 1996). As the lamprophyres are preferentially found in sills of
varying width throughout the mine it can be assumed that these represent the sites of
percolation within features analogous to the Riedel Shear structures described by Vaughn
(1996).
5.0 CONCLUSION
The consequence of having multiple low angle faults is that care needs to be taken
when there are multiple intersecting splays. However, as the fault network has a consistent
dip throughout the package it allows the fault network to be easily predicted in the
subsequent mined levels. These shallowly north-east dipping faults have been observed as
the most problematic set for mining operations due to their shallow dip and the potential to
cause rock-wedges where splays intersect one another. Of further concern are the presence
of the lamprophyre within the fault plane and the alteration mineralisation of chlorite and
sericite along the fault plane, potentially causing weakness along the fault.
Nature and timing of brittle structures at the Challenger Gold Mine 2010
37 | P a g e
The presence of a lamprophyre sill provided evidence about the potential for
lithospheric mantle intersecting faults and the metasomatism of the mantle as a result of
subducted material prior to the age of emplacement.
From the 40Argon/39Argon thermochronology and the geometric relationships
between the lamprophyre and the shallowly north-east dipping fault network, it has been
concluded that these faults are Paleoproterozoic in age with development occurring prior to
emplacement of the lamprophyres at approximately 1950 Ma. This minimum age of
crystallisation is also thought to be overprinted by an event of structural significance at
approximately 1860 Ma. The timing of this event is consistent with the Cornian Orogeny
and is thought to show an upper crustal manifestation of the Cornian event. This data has
provided important information about the Paleoproterozoic era in the western Gawler
Craton where previously there has been very little information. This study provides
important links between observed features elsewhere in the craton.
Nature and timing of brittle structures at the Challenger Gold Mine 2010
38 | P a g e
REFERENCES
ANDROVIC P., BAMFORD P. & SANDY M. 2008. The Challenger Gold Mine. Narrow Vein Mining Conference Proceedings, Ballarat Vic.
BARTON C. A., ZOBACK M. D. & MOOS D. 1995. Fluid flow along potentially active faults in crystalline rock. Geology 23, 683-686.
BETTS P. G. & GILES D. 2006. The 1800-1100 Ma tectonic evolution of Australia. Precambrian Research 144, 92-125.
BLICHERT-TOFT J., ARNDT N. T. & LUDDEN J. N. 1996. Precambrian alkaline magmatism. Lithos 37, 97-111.
BROWN S. R. & BRUHN R. L. 1996. Formation of voids and veins during faulting. Journal of Structural Geology 18, 657-671.
BUHAY W. M., SCHWARCZ H. P. & GRÜN R. 1988. ESR dating of fault gouge: The effect of grain size. Quaternary Science Reviews 7, 515-522.
CAINE J. S., EVANS J. P. & FORSTER C. B. 1996. Fault zone architecture and permeability structure. Geology 24, 1025-1028.
COHEN A. S., O'NIONS R. K., SIEGENTHALER R. & GRIFFIN W. L. 1988. Chronology of the pressure-temperature history recorded by a granulite terrain. Contributions to Mineralogy and Petrology 98, 303-311.
CUREWITZ D. & KARSON J. A. 1997. Structural settings of hydrothermal outflow: Fracture permeability maintained by fault propagation and interaction. Journal of Volcanology and Geothermal Research 79, 149-168.
DALY S. J., FANNING C. M. & FAIRCLOUGH M. C. 1998. Tectonic Evolution and exploration potential of the Gawler Craton, South Australia. AGSO Journal of Australian Geology and Geophysics 17, 145-168.
DAVIS G. & REYNOLDS S. 1996. Structural Geology of Rocks and Regions (2nd edition). John Wiley and Sons, Inc.
DIREEN N. G., CADD A. G., LYONS P. & TEASDALE J. P. 2005. Architecture of Proterozoic shear zones in the Christie Domain, western Gawler Craton, Australia: Geophysical appraisal of a poorly exposed orogenic terrane. Precambrian Research 142, 28-44.
EIDE E. A., TORSVIK T. H. & ANDERSEN T. B. 1997. Absolute dating of brittle fault movements: Late Permian and late Jurassic extensional fault breccias in western Norway. Terra Nova 9, 135-139.
HAND M., REID A. & JAGODZINSKI L. 2007. Tectonic Framework and Evolution of the Gawler Craton, Southern Australia. Economic Geology 102, 1377-1395.
HAND M. & SANDIFORD M. 1999. Intraplate deformation in central Australia, the link between subsidence and fault reactivation. Tectonophysics 305, 121-140.
JOURDAN F. & RENNE P. R. 2007. Age calibration of the Fish Canyon sanidine 40Ar/39Ar dating standard using primary K-Ar standards. Geochimica et Cosmochimica Acta 71, 387-402.
KATZ Y., WEINBERGER R. & AYDIN A. 2004. Geometry and kinematic evolution of Riedel shear structures, Capitol Reef National Park, Utah. Journal of Structural Geology 26, 491-501.
KEAREY P. 2001. The New Penguin Dictionary of Geology (2nd edition). The Penguin Group. KOPPERS A. A. P. 2002. ArArCALC--software for 40Ar/39Ar age calculations. Computers &
Geosciences 28, 605-619.
Nature and timing of brittle structures at the Challenger Gold Mine 2010
39 | P a g e
LEE J.-Y., MARTI K., SEVERINGHAUS J. P., KAWAMURA K., YOO H.-S., LEE J. B. & KIM J. S. 2006. A redetermination of the isotopic abundances of atmospheric Ar. Geochimica et Cosmochimica Acta 70, 4507-4512.
LOHR T., KRAWCZYK C. M., ONCKEN O. & TANNER D. C. 2008. Evolution of a fault surface from 3D attribute analysis and displacement measurements. Journal of Structural Geology 30, 690-700.
LOVERA O. M., GROVE M. & HARRISON T. M. 2002. Systematic analysis of K-feldspar 40Ar/39Ar step heating results II: relevance of laboratory argon diffusion properties to nature. Geochimica et Cosmochimica Acta 66, 1237-1255.
MARTIN H. 1986. Effect of steeper Archean geothermal gradient on geochemistry of subduction-zone magmas. Geology 14, 753-756.
MCDOUGALL I. & HARRISON T. M. 1999. Geochronology and Thermochronology by the 40Ar/39Ar Method (2nd edition). Oxford University Press, New York.
MCFARLANE C. R. M., MAVROGENES J. A. & TOMKINS A. G. 2007. Recognizing hydrothermal alteration through a granulite facies metamorphic overprint at the challenger Au deposit, South Australia. Chemical Geology 243, 64-89.
MILLER J. M. & WILSON C. J. L. 2002. The Magdala Lode System, Stawell, Southeastern Australia: Structural Style and Relationship to Gold Mineralization across the Western Lachlan Fold Belt. Economic Geology 97, 325-349.
MILLER J. M. & WILSON C. J. L. 2004a. Stress Controls on Intrusion-Related Gold Lodes: Wonga Gold Mine, Stawell, Western Lachlan Fold Belt, Southeastern Australia. Economic Geology 99, 941-963.
MILLER J. M. & WILSON C. J. L. 2004b. Structural analysis of faults related to a heterogeneous stress history: reconstruction of a dismembered gold deposit, Stawell, western Lachlan Fold Belt, Australia. Journal of Structural Geology 26, 1231-1256.
MURPHY J. B. 2006. Fault-controlled emplacement of arc-related magmas along the Neoproterozoic northern Gondwanan margin: An example from the Antigonish Highlands, Nova Scotia. Precambrian Research 147, 305-319.
PASSCHIER C. W. & TROUW R. A. J. 2005. Deformation Mechanisms In, Micro-Tectonics (2 edition), pp 25-66, Springer Berlin
PAYNE J. L., BAROVICH K. M. & HAND M. 2006. Provenance of metasedimentary rocks in the northern Gawler Craton, Australia: Implications for Palaeoproterozoic reconstructions. Precambrian Research 148, 275-291.
PAYNE J. L., HAND M., BAROVICH K. M. & WADE B. P. 2008. Temporal constraints on the timing of high-grade metamorphism in the northern Gawler Craton: implications for assembly of the Australian Proterozoic. Australian Journal of Earth Sciences: An International Geoscience Journal of the Geological Society of Australia 55, 623 - 640.
POUSTIE T. 2009. Challenger A Mine for the Geologist RASMUSSEN B., FLETCHER I. R. & MCNAUGHTON N. J. 2001. Dating low-grade metamorphic events
by SHRIMP U-Pb analysis of monazite in shales. Geology 29, 963-a-966. REID A. & HAND M. 2008. Aspects of Palaeoproterozoic orogenesis in the Gawler Craton: the
c. 1850 Ma Cornian Orogeny. MESA Journal 50, 26-31. REID A., HAND M., JAGODZINSKI E., KELSEY D. & PEARSON N. 2008. Paleoproterozoic orogenesis in
the southeastern Gawler Craton, South Australia. Australian Journal of Earth Sciences: An International Geoscience Journal of the Geological Society of Australia 55, 449 - 471.
Nature and timing of brittle structures at the Challenger Gold Mine 2010
40 | P a g e
REID A., ZWINGMANN H. & GILES A. 2010. Constraints on the Timing of Brittle Faulting at Challenger Mine In, Report Book 2010/00015, Department of Primary Industries and Resources South Australia
RENNE P. R., MUNDIL R., BALCO G., MIN K. & LUDWIG K. R. 2010. Joint determination of 40K decay constants and 40Ar*/40K for the Fish Canyon sanidine standard, and improved accuracy for 40Ar/39Ar geochronology. Geochimica et Cosmochimica Acta 74, 5349-5367.
ROCK N. M. S. 1977. The nature and origin of lamprophyres: some definitions, distinctions, and derivations. Earth-Science Reviews 13, 123-169.
ROCK N. M. S. & GROVES D. I. 1988. Can lamprophyres resolve the genetic controversy over mesothermal gold deposits? Geology 16, 538-541.
RODEN M. K., ELLIOTT W. C., ARONSON J. L. & MILLER D. S. 1993. A Comparison of Fission-Track Ages of Apatite and Zircon to the K/Ar Ages of Illite-Smectite (I/S) from Ordovician K-Bentonites, Southern Appalachian Basin. The Journal of Geology 101, 633-641.
SRIVASTAVA R. K. & CHALAPATHI RAO N. V. 2007. Petrology, geochemistry and tectonic significance of Palaeoproterozoic alkaline lamprophyres from the Jungel Valley, Mahakoshal supracrustal belt, Central India Mineralogy and Petrology 89, 189-215.
SWAIN G. M., HAND M., TEASDALE J., RUTHERFORD L. & CLARK C. 2005. Age constraints on terrane-scale shear zones in the Gawler Craton, southern Australia. Precambrian Research 139, 164-180.
TAPPE S., FOLEY S. F., JENNER G. A. & KJARSGAARD B. A. 2005. Intergrating Ultramafic lamprophyres into the IUGS Classification of Igneous Rocks: Rationale and Impications Journal of Petrology 46, 1893-1900.
THOMAS J. L., DIREEN N. G. & HAND M. 2008. Blind orogen: Integrated appraisal of multiple episodes of Mesoproterozoic deformation and reworking in the Fowler Domain, western Gawler Craton, Australia. Precambrian Research 166, 263-282.
TOMKINS A. G., DUNLAP W. J. & MAVROGENES J. A. 2004. Geochronological constraints on the polymetamorphic evolution of the granulite-hosted Challenger gold deposit: implications for assembly of the northwest Gawler Craton*. Australian Journal of Earth Sciences 51, 1-14.
TOMKINS A. G. & MAVROGENES J. A. 2002. Mobilization of Gold as a Polymetallic Melt during Pelite Anatexis at the Challenger Deposit, South Australia: A Metamorphosed Archean Gold Deposit. Economic Geology 97, 1249-1271.
VAUGHN A. P. M. 1996. A tectonomagamtic model for the genesis and emplacement of Caledonian clac-alkaline lamprophyres Journal of the Geological Society, London 153, 613-623.
WINTER J. D. 2010. Principles of Igneous and Metamorphic Geology (Second Edition edition). Prentice Hall New Jersey
Nature and timing of brittle structures at the Challenger Gold Mine 2010
41 | P a g e
ACKNOWLEDGEMENTS
Sincere thanks go to my supervisor David Giles for all his help and knowledge in the
course of this project. I would also like to thank Dominion Gold Operations for their financial
and organisational support of this project, including all the people on site at Challenger
including the Dominion Team and the HWE mining contractors. A special thank you goes to
the Mine Geology Team in particular Paul Androvic, for their help with transportation,
equipment and for sharing their vast knowledge on the deposit and the various aspects of
geology.
Thank you to Dr Fred Jourdan at the West Australian Argon Isotope Facility for
teaching me the intricacies of Argon Thermochronology and answering all my questions
regarding the analysis. Thank you also to Dr Justin Payne for his help in preparing the biotite
samples for analysis and for his discussions regarding the Gawler Craton.
Thank you to my family for all their love and support throughout the year. And finally
thanks to the 2010 Geology Honours Class for making this a memorable year.
Nature and timing of brittle structures at the Challenger Gold Mine 2010
42 | P a g e
FIGURE CAPTIONS
Figure 1: Background Image (a): Map of the Gawler Craton geology showing the locations of major mines in the
region including Challenger Gold Mine within the Sleaford and Multhagating Complex. Image from
Hand et al 2007
Image (b): Ore Shoot Geometry showing the shape of both the M1 and M2 ore bodies and the
associated level development. Ore body folds are not shown down plunge. This image from
Dominion Mining Limited presentation (Poustie 2009).
Image (c): The Christie Domain showing the location of Challenger and the regional shear
zones. These structures have been interpreted from a Total Magnetic Intensity first vertical
derivative image (seen on the right). The thick black lines indicate they have been partially ground-
truthed, the grey and thin black lines are wholly interpreted. The grey and thin black lines show
subsidiary faults and the general structural grain. Images from Tomkins et al 2004.
Image (d): (a) Age spectrum measured on biotite from sample AGT089. (b) Age spectrum
measured on biotite from sample AGT090. (c) Age spectrum measured on biotite from sample
AGT091. (d) Age spectrum measured on retrograde muscovite from sample AGT083. (e) Age
spectrum measured on retrograde muscovite from sample AGT087. (f) Age spectrum measured on
K-feldspar from sample AGT089. (g) Age spectrum measured on K-feldspar from sample AGT090. (h)
Age spectrum measured on K-feldspar from sample AGT091. These show the different ages found
for the pristine Challenger gneiss samples AGT 089-091 and sample affected by a late fluid intrusion
AGT 083 and 087. Each of these samples has an extensive age range. Image from Tomkins et al 2004.
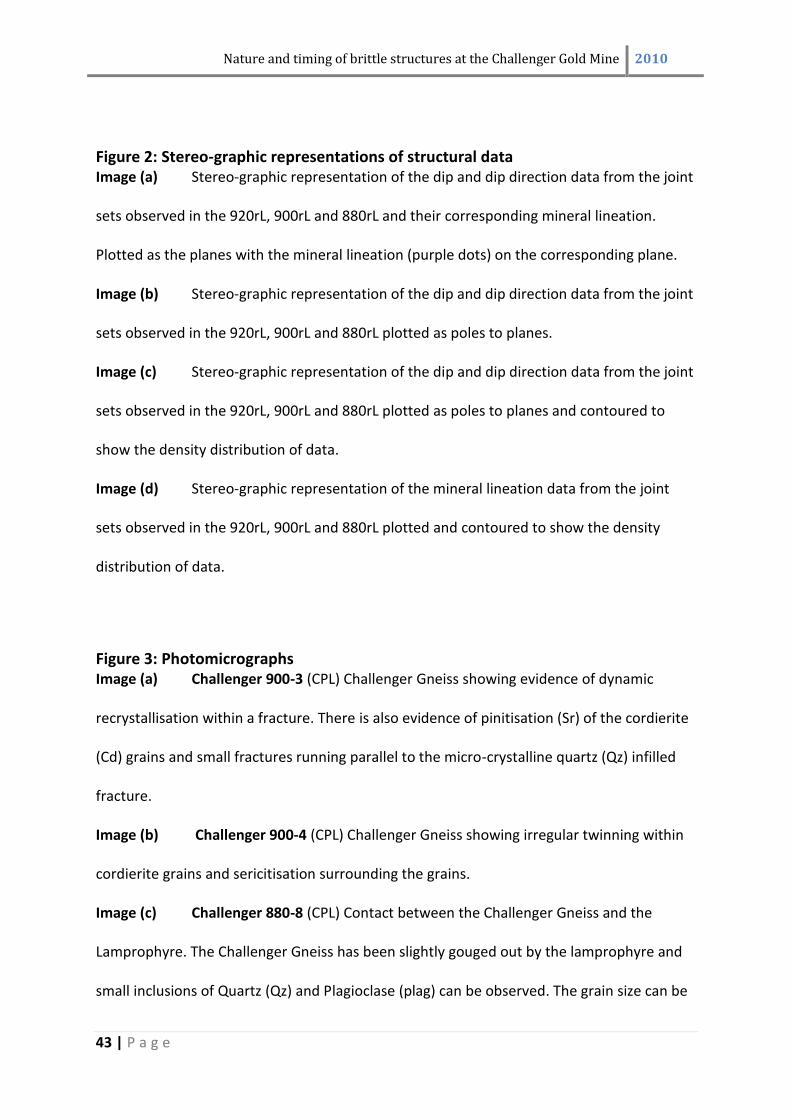
Nature and timing of brittle structures at the Challenger Gold Mine 2010
43 | P a g e
Figure 2: Stereo-graphic representations of structural data Image (a) Stereo-graphic representation of the dip and dip direction data from the joint
sets observed in the 920rL, 900rL and 880rL and their corresponding mineral lineation.
Plotted as the planes with the mineral lineation (purple dots) on the corresponding plane.
Image (b) Stereo-graphic representation of the dip and dip direction data from the joint
sets observed in the 920rL, 900rL and 880rL plotted as poles to planes.
Image (c) Stereo-graphic representation of the dip and dip direction data from the joint
sets observed in the 920rL, 900rL and 880rL plotted as poles to planes and contoured to
show the density distribution of data.
Image (d) Stereo-graphic representation of the mineral lineation data from the joint
sets observed in the 920rL, 900rL and 880rL plotted and contoured to show the density
distribution of data.
Figure 3: Photomicrographs Image (a) Challenger 900-3 (CPL) Challenger Gneiss showing evidence of dynamic
recrystallisation within a fracture. There is also evidence of pinitisation (Sr) of the cordierite
(Cd) grains and small fractures running parallel to the micro-crystalline quartz (Qz) infilled
fracture.
Image (b) Challenger 900-4 (CPL) Challenger Gneiss showing irregular twinning within
cordierite grains and sericitisation surrounding the grains.
Image (c) Challenger 880-8 (CPL) Contact between the Challenger Gneiss and the
Lamprophyre. The Challenger Gneiss has been slightly gouged out by the lamprophyre and
small inclusions of Quartz (Qz) and Plagioclase (plag) can be observed. The grain size can be
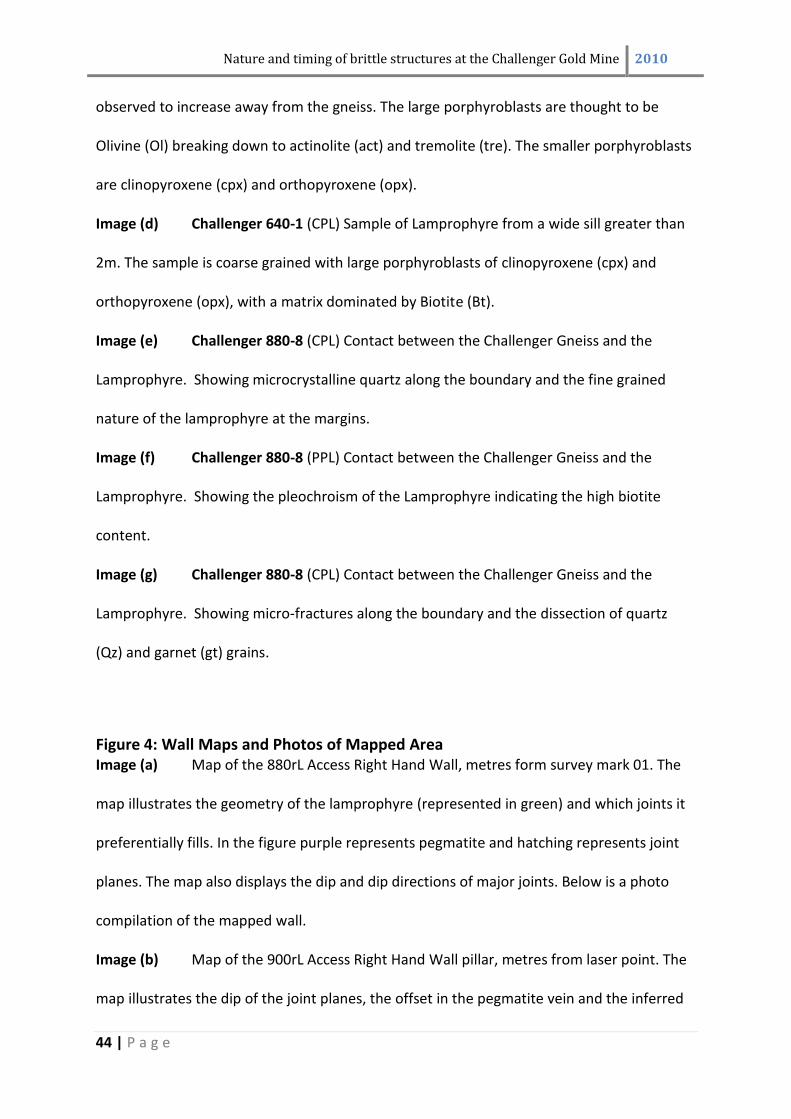
Nature and timing of brittle structures at the Challenger Gold Mine 2010
44 | P a g e
observed to increase away from the gneiss. The large porphyroblasts are thought to be
Olivine (Ol) breaking down to actinolite (act) and tremolite (tre). The smaller porphyroblasts
are clinopyroxene (cpx) and orthopyroxene (opx).
Image (d) Challenger 640-1 (CPL) Sample of Lamprophyre from a wide sill greater than
2m. The sample is coarse grained with large porphyroblasts of clinopyroxene (cpx) and
orthopyroxene (opx), with a matrix dominated by Biotite (Bt).
Image (e) Challenger 880-8 (CPL) Contact between the Challenger Gneiss and the
Lamprophyre. Showing microcrystalline quartz along the boundary and the fine grained
nature of the lamprophyre at the margins.
Image (f) Challenger 880-8 (PPL) Contact between the Challenger Gneiss and the
Lamprophyre. Showing the pleochroism of the Lamprophyre indicating the high biotite
content.
Image (g) Challenger 880-8 (CPL) Contact between the Challenger Gneiss and the
Lamprophyre. Showing micro-fractures along the boundary and the dissection of quartz
(Qz) and garnet (gt) grains.
Figure 4: Wall Maps and Photos of Mapped Area Image (a) Map of the 880rL Access Right Hand Wall, metres form survey mark 01. The
map illustrates the geometry of the lamprophyre (represented in green) and which joints it
preferentially fills. In the figure purple represents pegmatite and hatching represents joint
planes. The map also displays the dip and dip directions of major joints. Below is a photo
compilation of the mapped wall.
Image (b) Map of the 900rL Access Right Hand Wall pillar, metres from laser point. The
map illustrates the dip of the joint planes, the offset in the pegmatite vein and the inferred
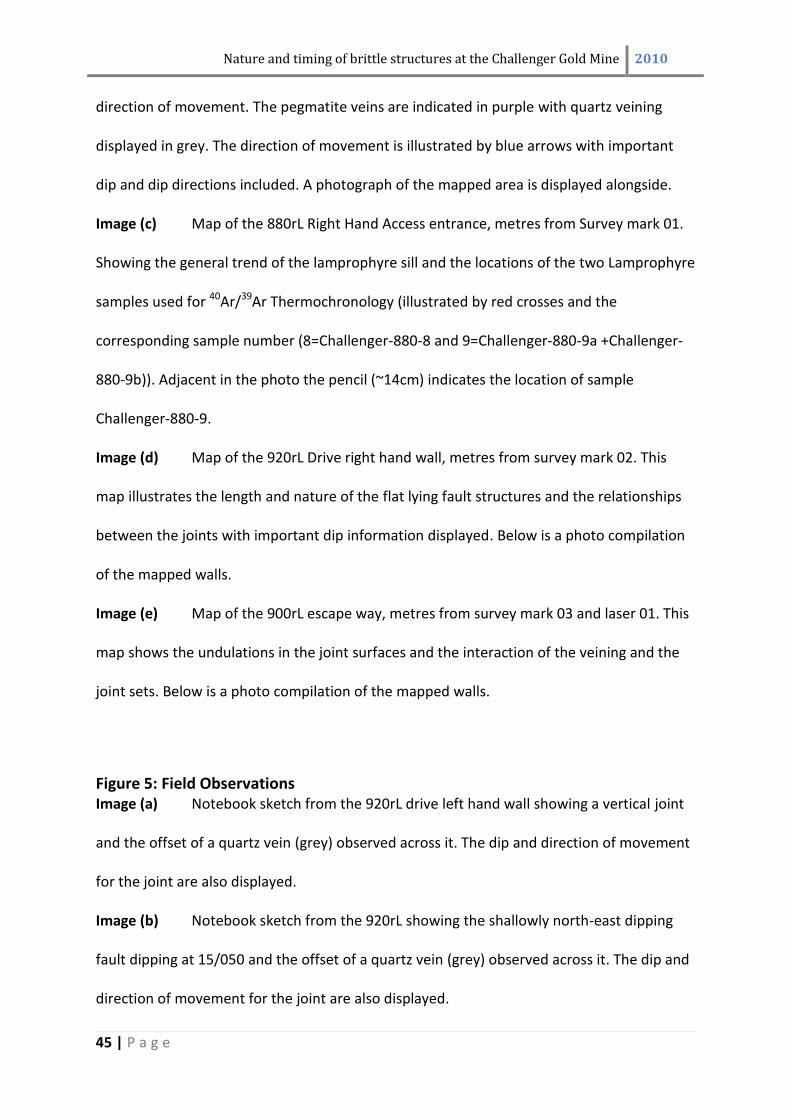
Nature and timing of brittle structures at the Challenger Gold Mine 2010
45 | P a g e
direction of movement. The pegmatite veins are indicated in purple with quartz veining
displayed in grey. The direction of movement is illustrated by blue arrows with important
dip and dip directions included. A photograph of the mapped area is displayed alongside.
Image (c) Map of the 880rL Right Hand Access entrance, metres from Survey mark 01.
Showing the general trend of the lamprophyre sill and the locations of the two Lamprophyre
samples used for 40Ar/39Ar Thermochronology (illustrated by red crosses and the
corresponding sample number (8=Challenger-880-8 and 9=Challenger-880-9a +Challenger-
880-9b)). Adjacent in the photo the pencil (~14cm) indicates the location of sample
Challenger-880-9.
Image (d) Map of the 920rL Drive right hand wall, metres from survey mark 02. This
map illustrates the length and nature of the flat lying fault structures and the relationships
between the joints with important dip information displayed. Below is a photo compilation
of the mapped walls.
Image (e) Map of the 900rL escape way, metres from survey mark 03 and laser 01. This
map shows the undulations in the joint surfaces and the interaction of the veining and the
joint sets. Below is a photo compilation of the mapped walls.
Figure 5: Field Observations Image (a) Notebook sketch from the 920rL drive left hand wall showing a vertical joint
and the offset of a quartz vein (grey) observed across it. The dip and direction of movement
for the joint are also displayed.
Image (b) Notebook sketch from the 920rL showing the shallowly north-east dipping
fault dipping at 15/050 and the offset of a quartz vein (grey) observed across it. The dip and
direction of movement for the joint are also displayed.

Nature and timing of brittle structures at the Challenger Gold Mine 2010
46 | P a g e
Image (c) Notebook sketch from the 920rL escape way cutty showing a linking structure
where a series of small fractures link into two main joints in a similar manner to a C-S plane.
The dip and direction of movement for the joint are also displayed.
Image (d) Notebook sketch form the 920rL escape way cutty showing a linking structure
where a series of small fractures link into two main joints in a similar manner to a C-S plane.
The dip and direction of movement for the joint are also displayed.
Image (e) Photo of the 900rL access right hand pillar, shows a mafic intrusion and a
centrally located, quartz-rich gneissic inclusion which has rotated.
Image (f) Photo from the 900rL escape way right hand wall, showing boudinaging of
the quartz veining.
Image (g) Photo from the 920rL drive left hand wall, showing the brecciation of a quartz
vein as it enters the dominant shallowly north-east dipping fault.
Figure 6: goCad® Model Image (a) Interpreted model constructed over the three mapped levels. Illustrating the
role of the collected data and the interpreted features geometry.
Image (b) Showing the interpreted model in relation to the mine infrastructure.
Image (c) Location of the mapped areas in respect to the mine infrastructure showing
the geometry of the mine levels.
Image (d) A birds-eye view of the mine levels with the collected map data displayed.
Figure 7: Potential Model Geometry Image (a) Shows a series of unconnected faults that run parallel to one another but do
not link or provide a site of nucleation for other fault splays.
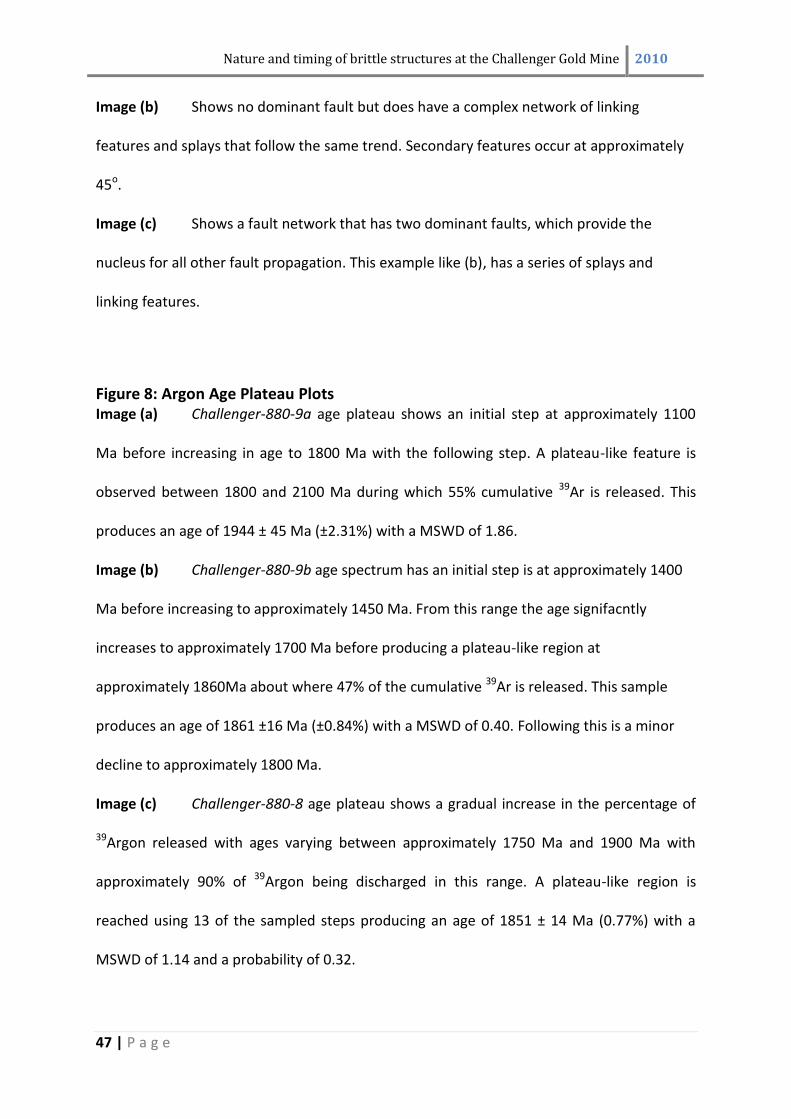
Nature and timing of brittle structures at the Challenger Gold Mine 2010
47 | P a g e
Image (b) Shows no dominant fault but does have a complex network of linking
features and splays that follow the same trend. Secondary features occur at approximately
45o.
Image (c) Shows a fault network that has two dominant faults, which provide the
nucleus for all other fault propagation. This example like (b), has a series of splays and
linking features.
Figure 8: Argon Age Plateau Plots Image (a) Challenger-880-9a age plateau shows an initial step at approximately 1100
Ma before increasing in age to 1800 Ma with the following step. A plateau-like feature is
observed between 1800 and 2100 Ma during which 55% cumulative 39Ar is released. This
produces an age of 1944 ± 45 Ma (±2.31%) with a MSWD of 1.86.
Image (b) Challenger-880-9b age spectrum has an initial step is at approximately 1400
Ma before increasing to approximately 1450 Ma. From this range the age signifacntly
increases to approximately 1700 Ma before producing a plateau-like region at
approximately 1860Ma about where 47% of the cumulative 39Ar is released. This sample
produces an age of 1861 ±16 Ma (±0.84%) with a MSWD of 0.40. Following this is a minor
decline to approximately 1800 Ma.
Image (c) Challenger-880-8 age plateau shows a gradual increase in the percentage of
39Argon released with ages varying between approximately 1750 Ma and 1900 Ma with
approximately 90% of 39Argon being discharged in this range. A plateau-like region is
reached using 13 of the sampled steps producing an age of 1851 ± 14 Ma (0.77%) with a
MSWD of 1.14 and a probability of 0.32.
Nature and timing of brittle structures at the Challenger Gold Mine 2010
48 | P a g e
Figure 9: Interpretation of Stress and Strain Image (a) Stylised stress ellipsoid showing the direction of fault movement towards the
north-east with the conjugate joint set overlayed, showing that all brittle deformation could
have occurred in the same stress conditions.
Image (b) Stereo-graphic representation showing a contoured plot of poles to the
shallowly north-east dipping fault, with a great circle and associated beta-axis representing
the average dip of the shallowly north-east dipping faults. The contoured band represents
the undulations in dip across the fault package.
Image (c) Stereo-graphic representation of the mineral lineation data from the joint
sets observed in the 920rL, 900rL and 880rL plotted and contoured to show the density
distribution of data which can be observed to have a high density area at the same locations
as the beta-axis shown in image (b).
Figure 10: Cooling History of the Challenger Deposit Figure complied using data from Tomkins et al (2004) and Reid et al (2010), in
conjunction with the data collected in the course of the project. The blue samples are data
from Tomkins et al (2004) which has been excluded from the cooing history for reasons
outlined in the discussion. The red samples indicate crystallisation ages and consequently
are not included at the cooling history. The closure temperatures are used to define the
temperature at a specific time. A number of cooling paths cannot be ruled out in the
interval 2450 Ma to 1860 Ma including rapid cooling followed by reheating to approximately
350oC at 1860 Ma or rapid cooling at 1860 Ma after a period of prolonged high temperature
or monotonic cooling between 2450 Ma and approximately 1860 Ma at a rate of
Nature and timing of brittle structures at the Challenger Gold Mine 2010
49 | P a g e
approximately 1oC/Ma. (The black bars signify biotite grains and shades of grey signify other
minerals.)
Figure 11: Geological History of Selected Gawler Craton Domains Figure complied from Reid et al (2008), Thomas et al (2008) and Direen et al (2005).
Using further information from Tomkins et al (2004), Daly et al (1998) and Reid et al (2010)
in conjunction with the data collected during the project (blue).
This figure shows parallels with the between the Christie domain and the Southern Gawler
Craton (Spencer and Cleve) and features unique each domain. The differences between the
Christie domain and the surrounding domains (Nawa and Fowler) are also indicated.
TABLE CAPTIONS
Table 1: Joint Characteristics Showing Characteristic features of the three main joint sets observed. The shallowly
north-east dipping fault and vertical set 1 were the dominant sets with vertical set 2 only
being observed in situations where the mine infrastructure was suited.
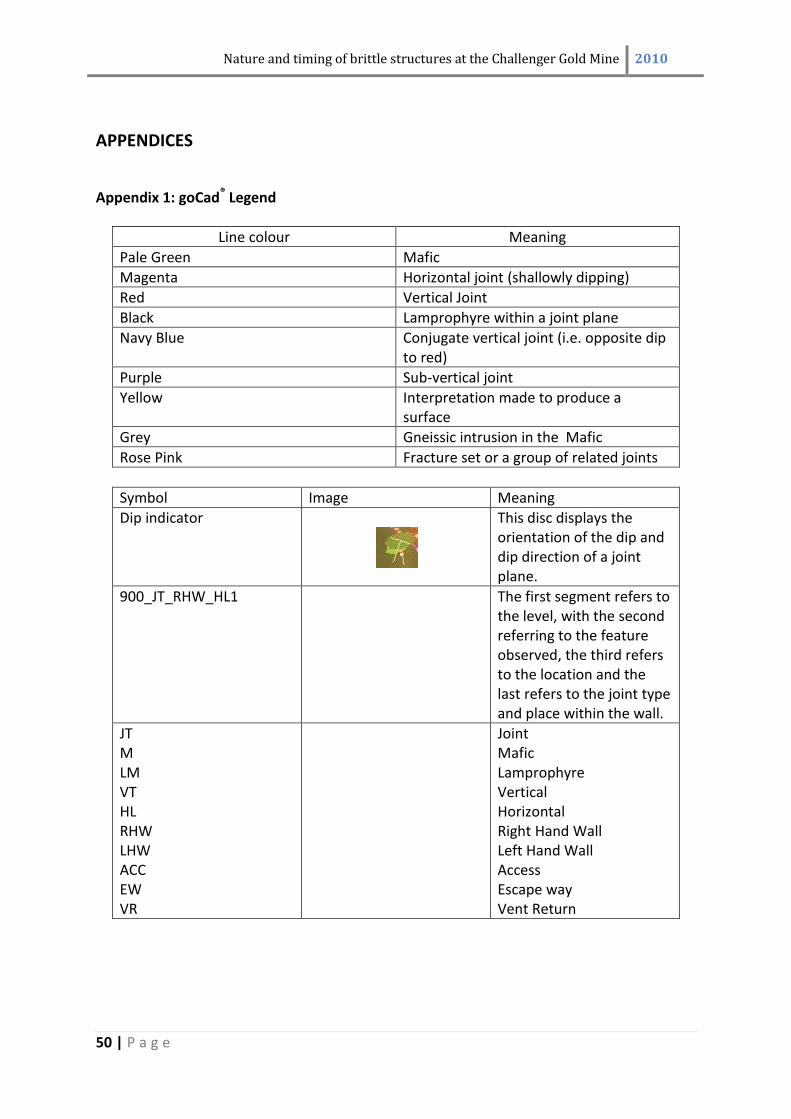
Nature and timing of brittle structures at the Challenger Gold Mine 2010
50 | P a g e
APPENDICES
Appendix 1: goCad® Legend
Line colour Meaning
Pale Green Mafic
Magenta Horizontal joint (shallowly dipping)
Red Vertical Joint
Black Lamprophyre within a joint plane
Navy Blue Conjugate vertical joint (i.e. opposite dip to red)
Purple Sub-vertical joint
Yellow Interpretation made to produce a surface
Grey Gneissic intrusion in the Mafic
Rose Pink Fracture set or a group of related joints
Symbol Image Meaning
Dip indicator
This disc displays the orientation of the dip and dip direction of a joint plane.
900_JT_RHW_HL1 The first segment refers to the level, with the second referring to the feature observed, the third refers to the location and the last refers to the joint type and place within the wall.
JT M LM VT HL RHW LHW ACC EW VR
Joint Mafic Lamprophyre Vertical Horizontal Right Hand Wall Left Hand Wall Access Escape way Vent Return
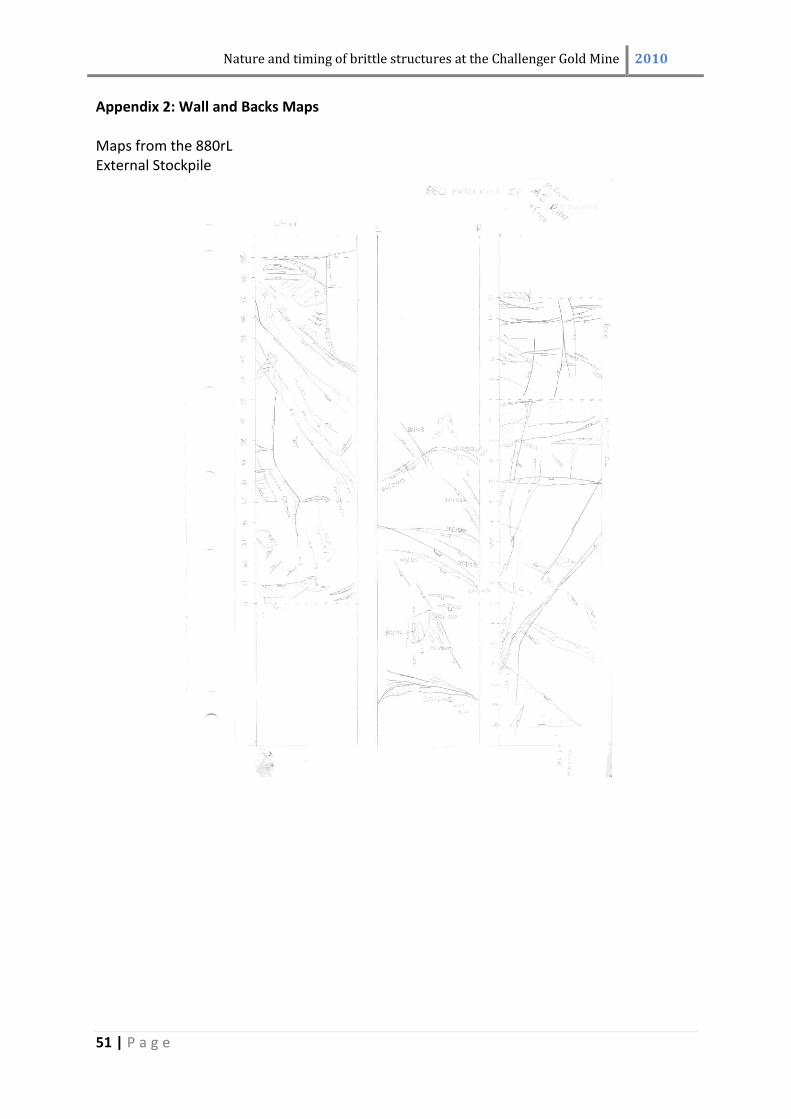
Nature and timing of brittle structures at the Challenger Gold Mine 2010
51 | P a g e
Appendix 2: Wall and Backs Maps Maps from the 880rL External Stockpile
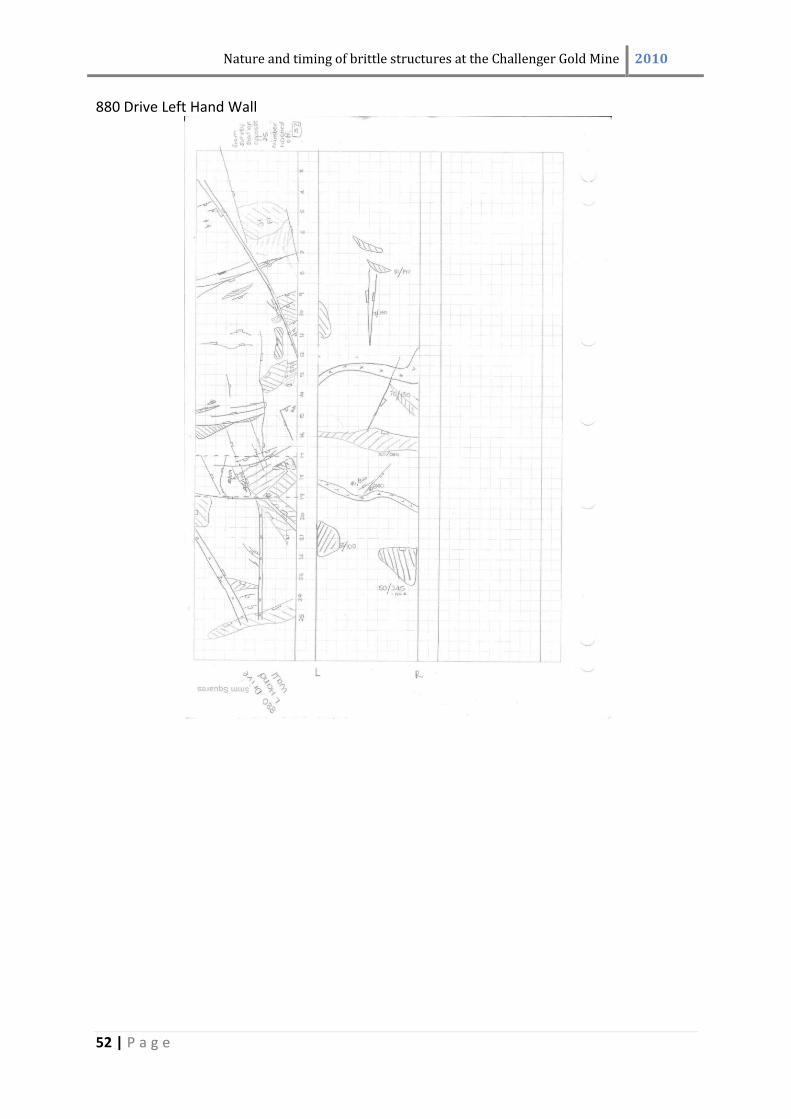
Nature and timing of brittle structures at the Challenger Gold Mine 2010
52 | P a g e
880 Drive Left Hand Wall
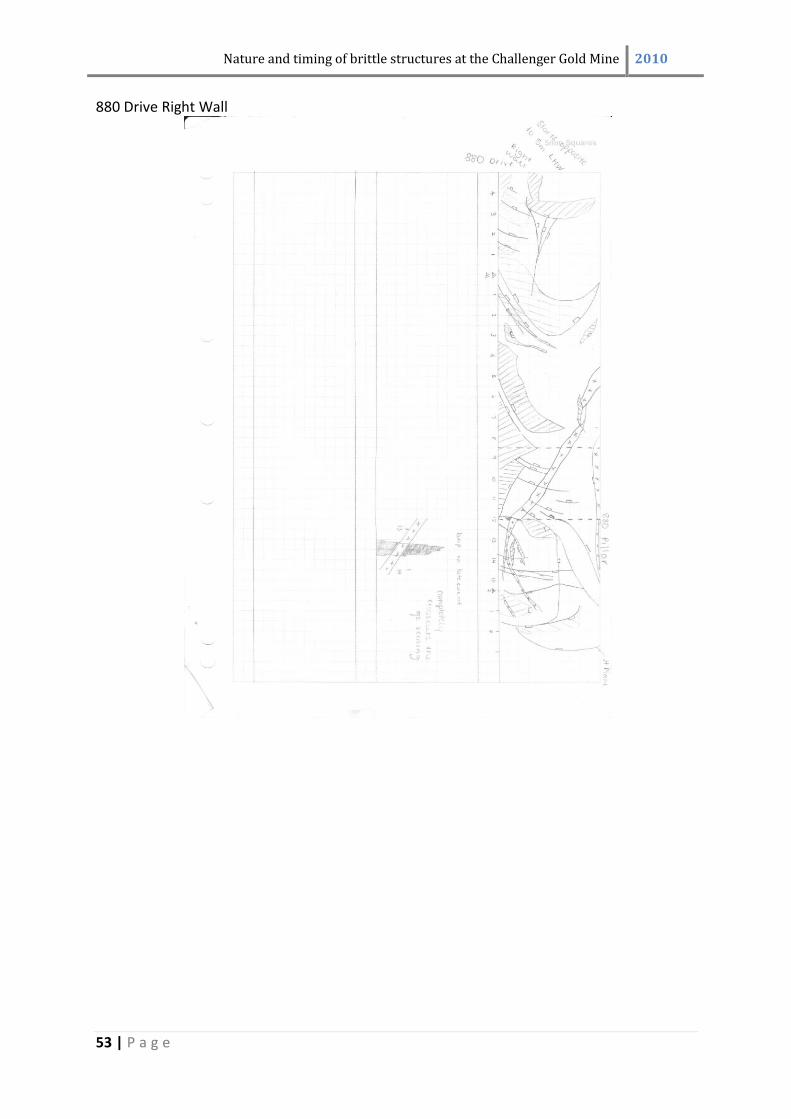
Nature and timing of brittle structures at the Challenger Gold Mine 2010
53 | P a g e
880 Drive Right Wall
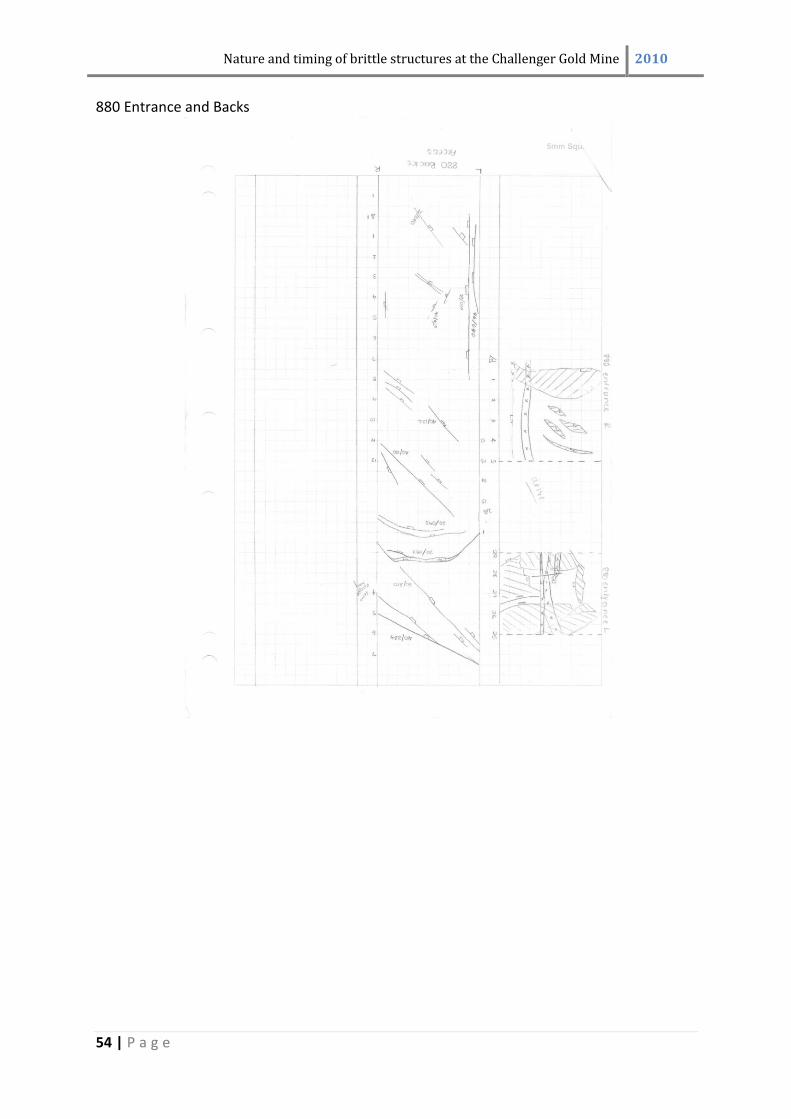
Nature and timing of brittle structures at the Challenger Gold Mine 2010
54 | P a g e
880 Entrance and Backs
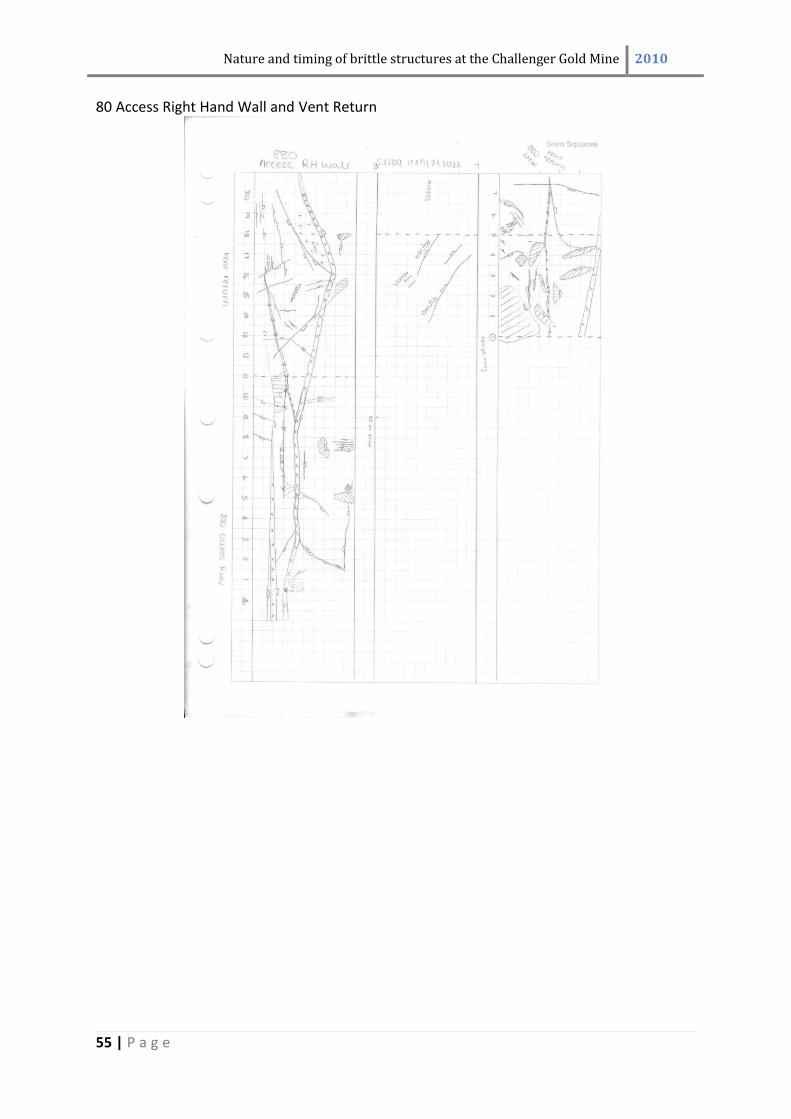
Nature and timing of brittle structures at the Challenger Gold Mine 2010
55 | P a g e
80 Access Right Hand Wall and Vent Return
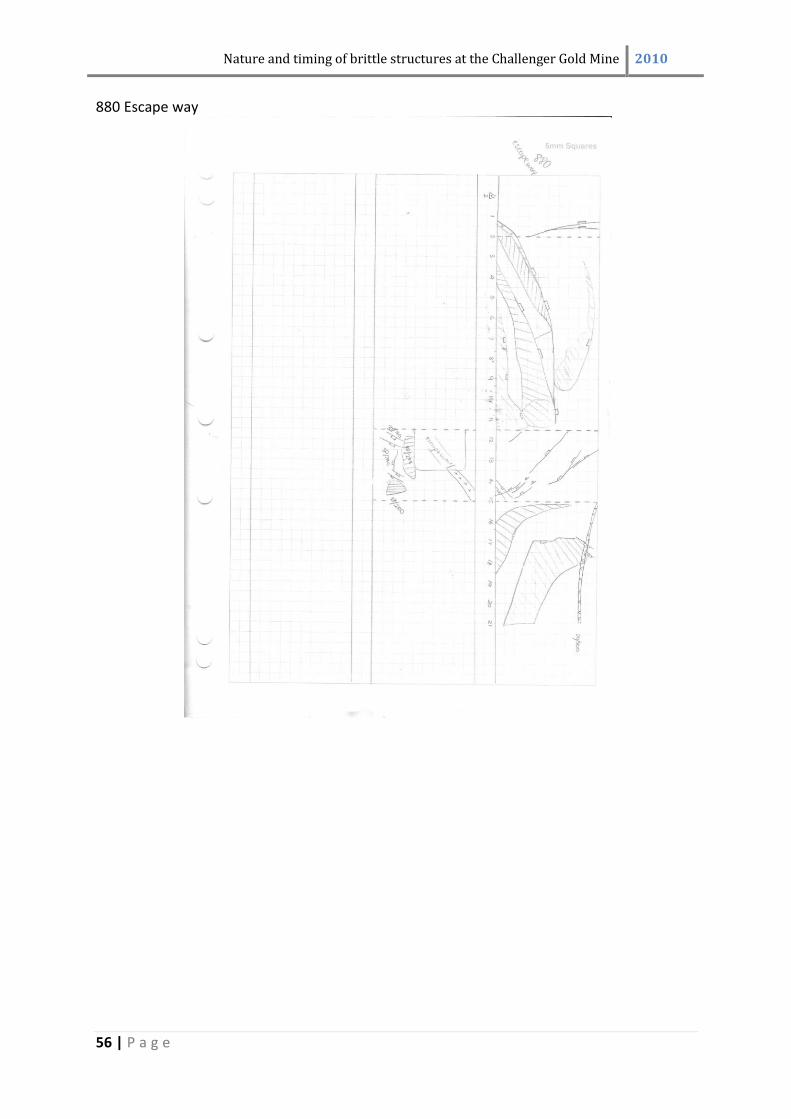
Nature and timing of brittle structures at the Challenger Gold Mine 2010
56 | P a g e
880 Escape way
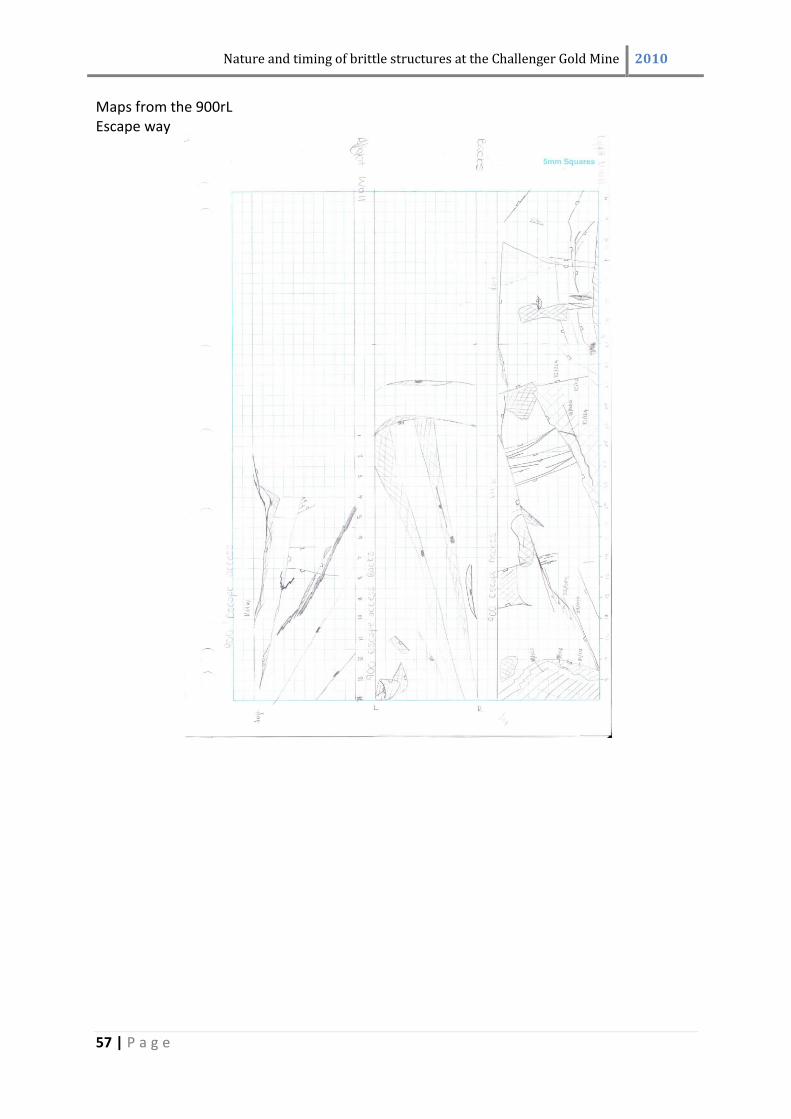
Nature and timing of brittle structures at the Challenger Gold Mine 2010
57 | P a g e
Maps from the 900rL Escape way
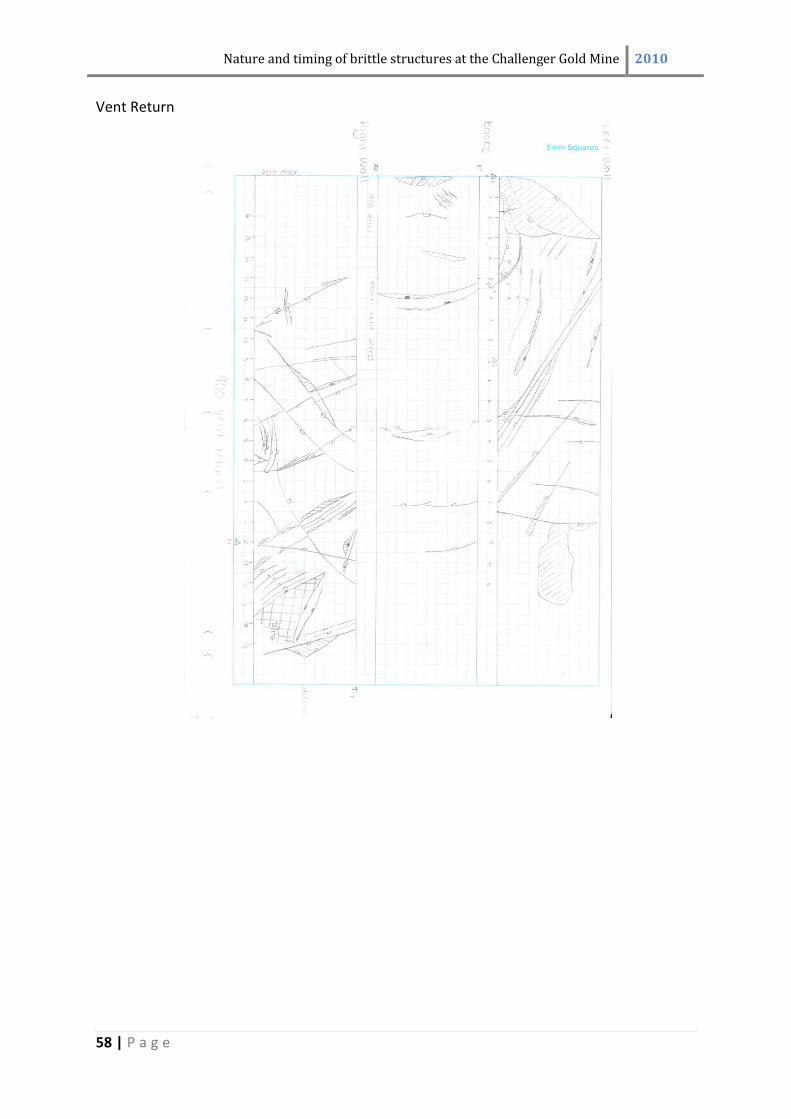
Nature and timing of brittle structures at the Challenger Gold Mine 2010
58 | P a g e
Vent Return
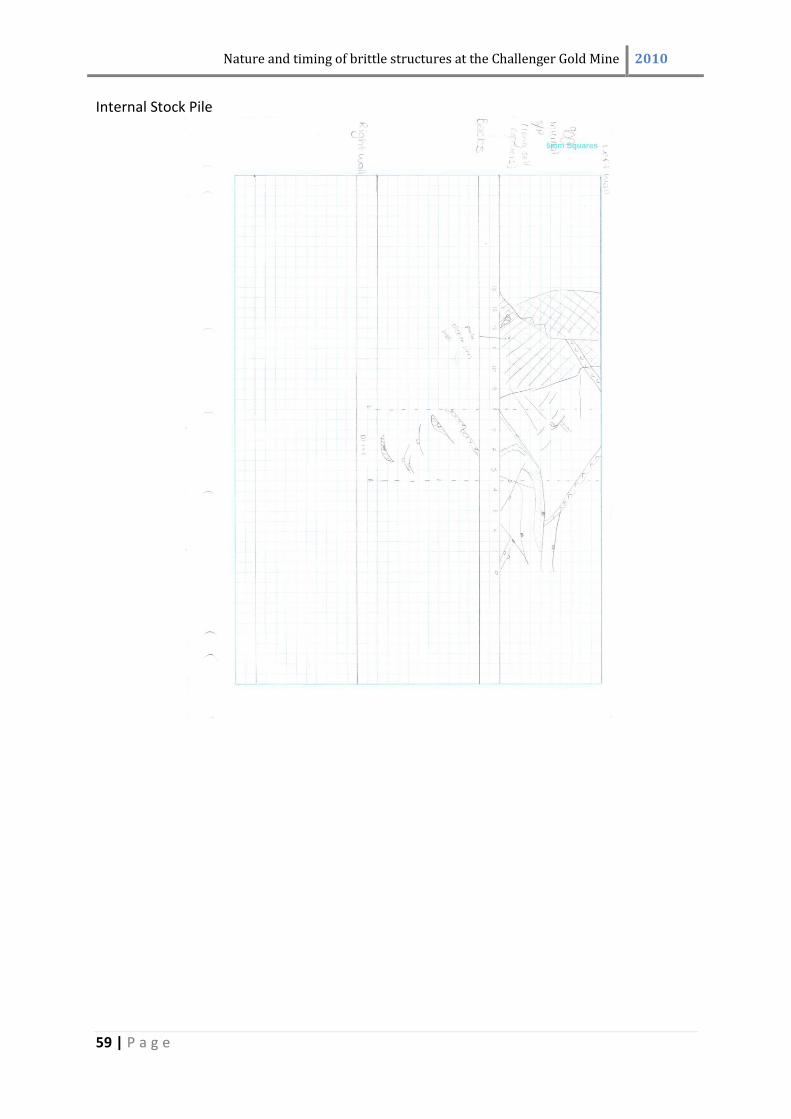
Nature and timing of brittle structures at the Challenger Gold Mine 2010
59 | P a g e
Internal Stock Pile
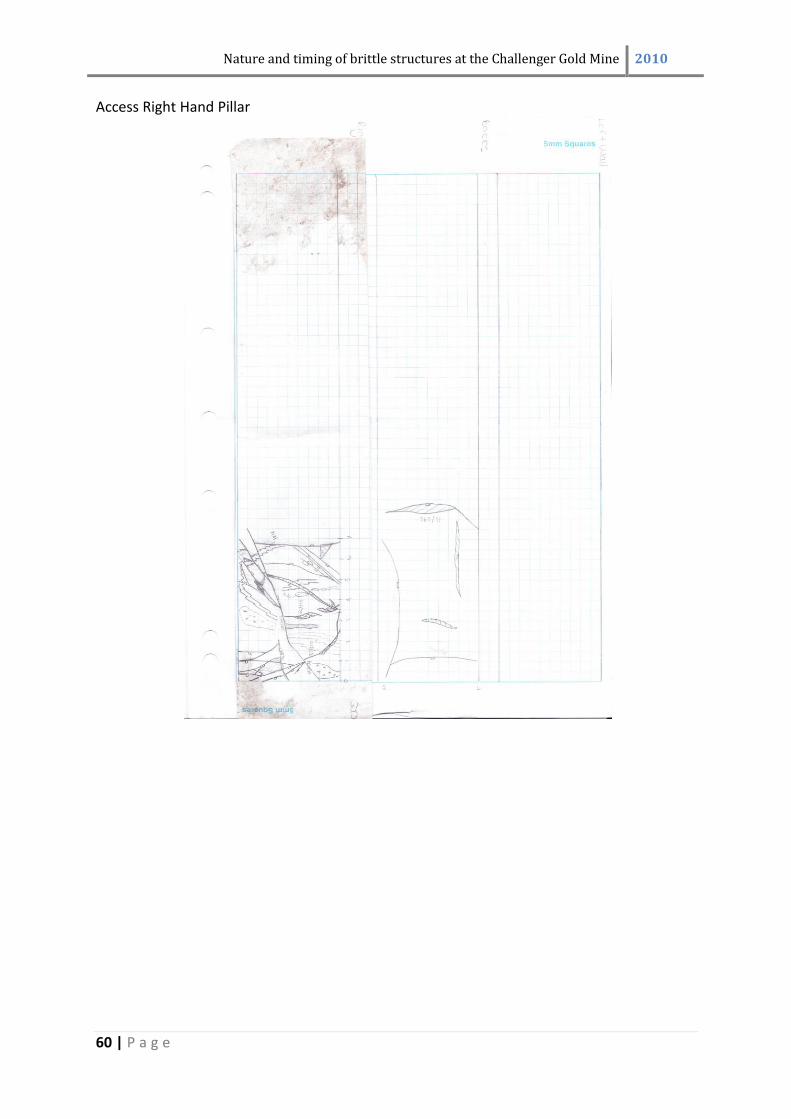
Nature and timing of brittle structures at the Challenger Gold Mine 2010
60 | P a g e
Access Right Hand Pillar
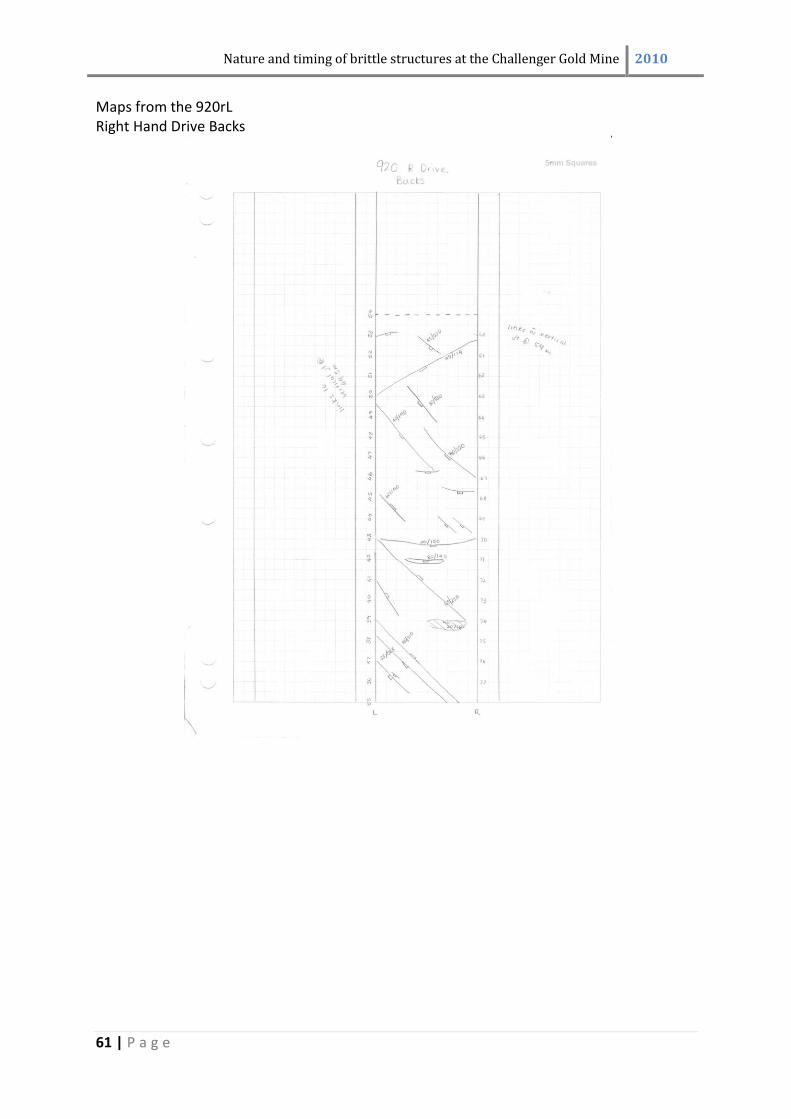
Nature and timing of brittle structures at the Challenger Gold Mine 2010
61 | P a g e
Maps from the 920rL Right Hand Drive Backs
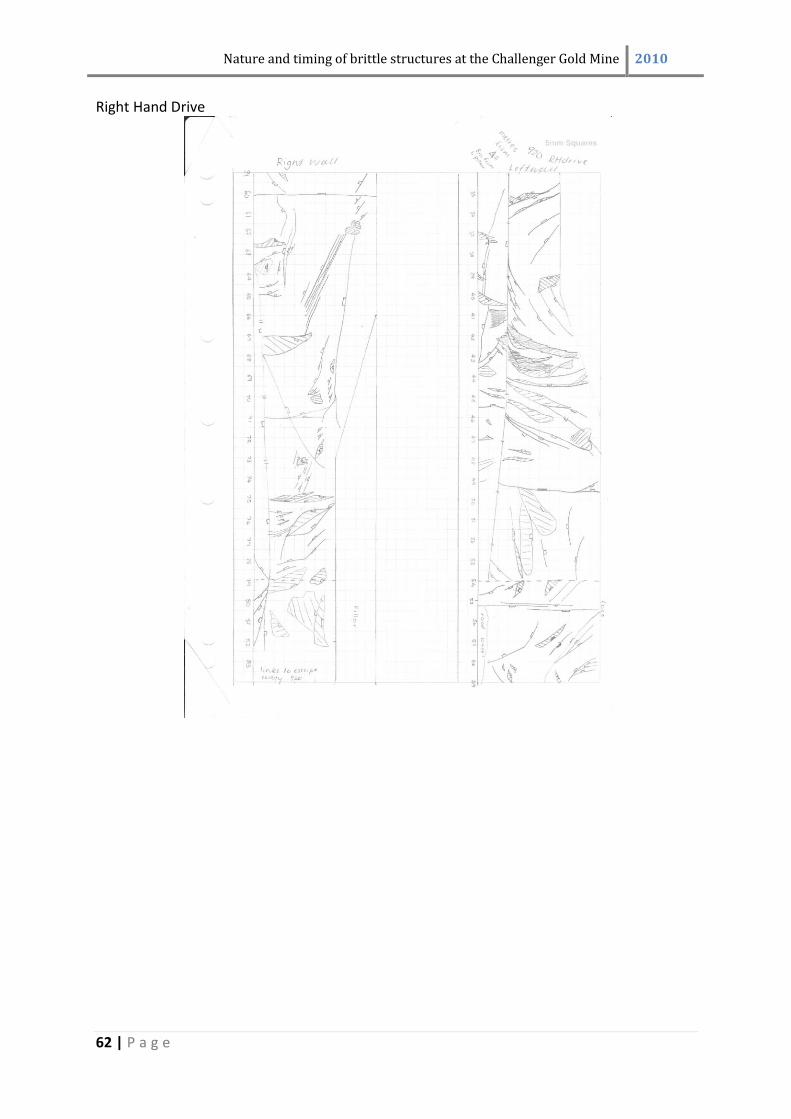
Nature and timing of brittle structures at the Challenger Gold Mine 2010
62 | P a g e
Right Hand Drive
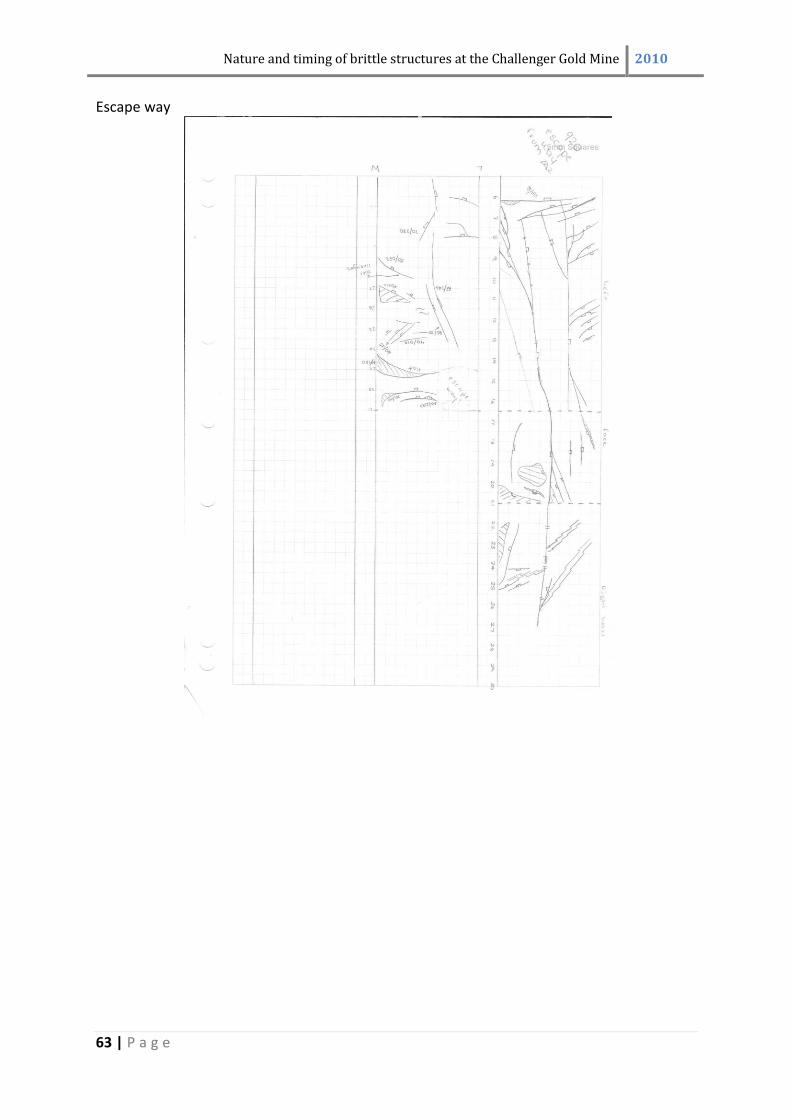
Nature and timing of brittle structures at the Challenger Gold Mine 2010
63 | P a g e
Escape way
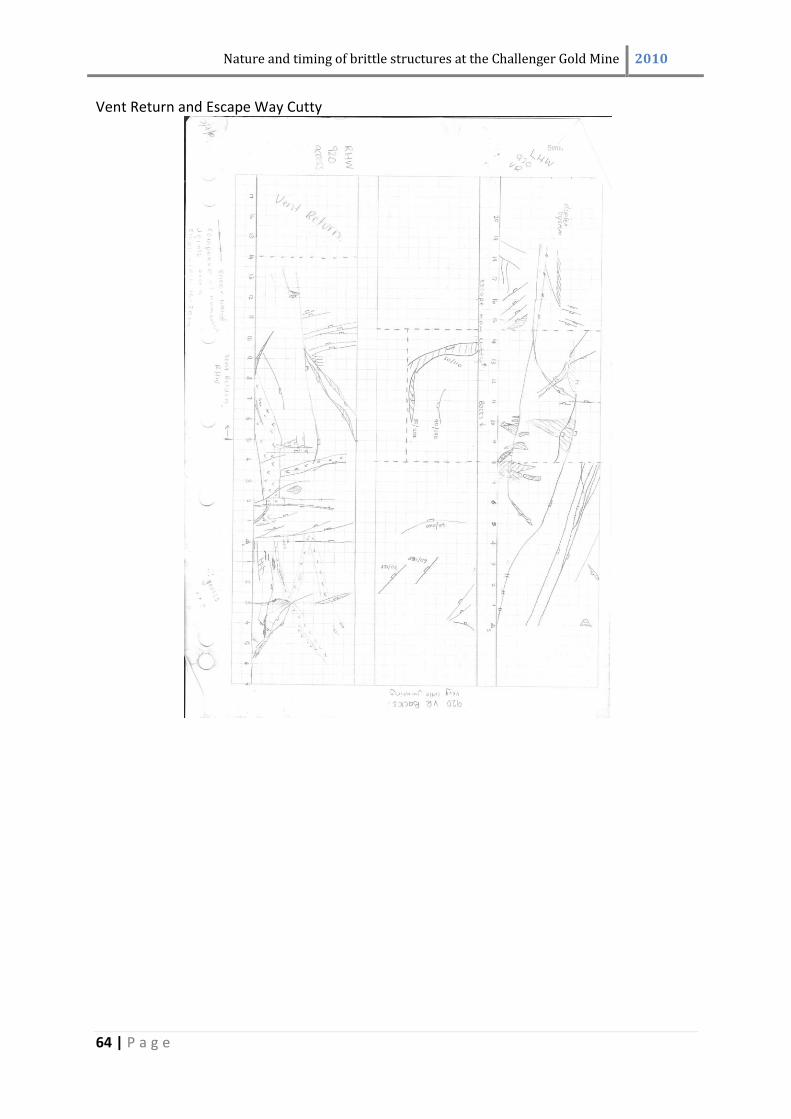
Nature and timing of brittle structures at the Challenger Gold Mine 2010
64 | P a g e
Vent Return and Escape Way Cutty
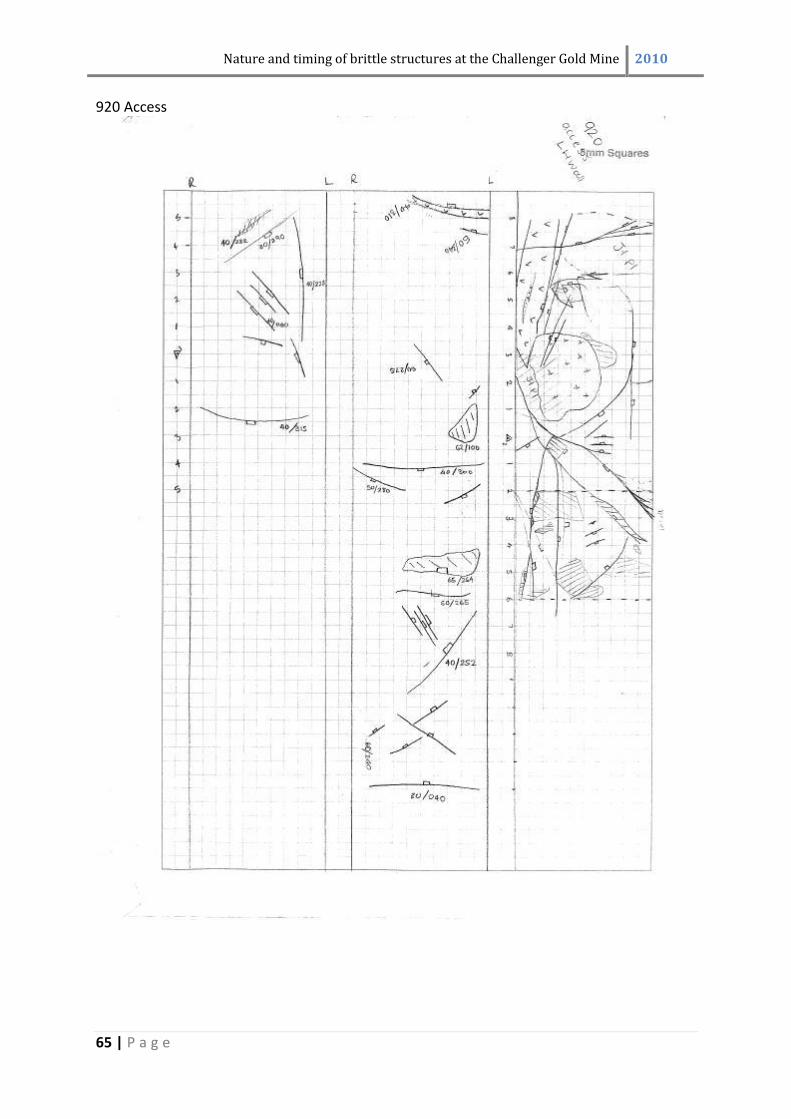
Nature and timing of brittle structures at the Challenger Gold Mine 2010
65 | P a g e
920 Access
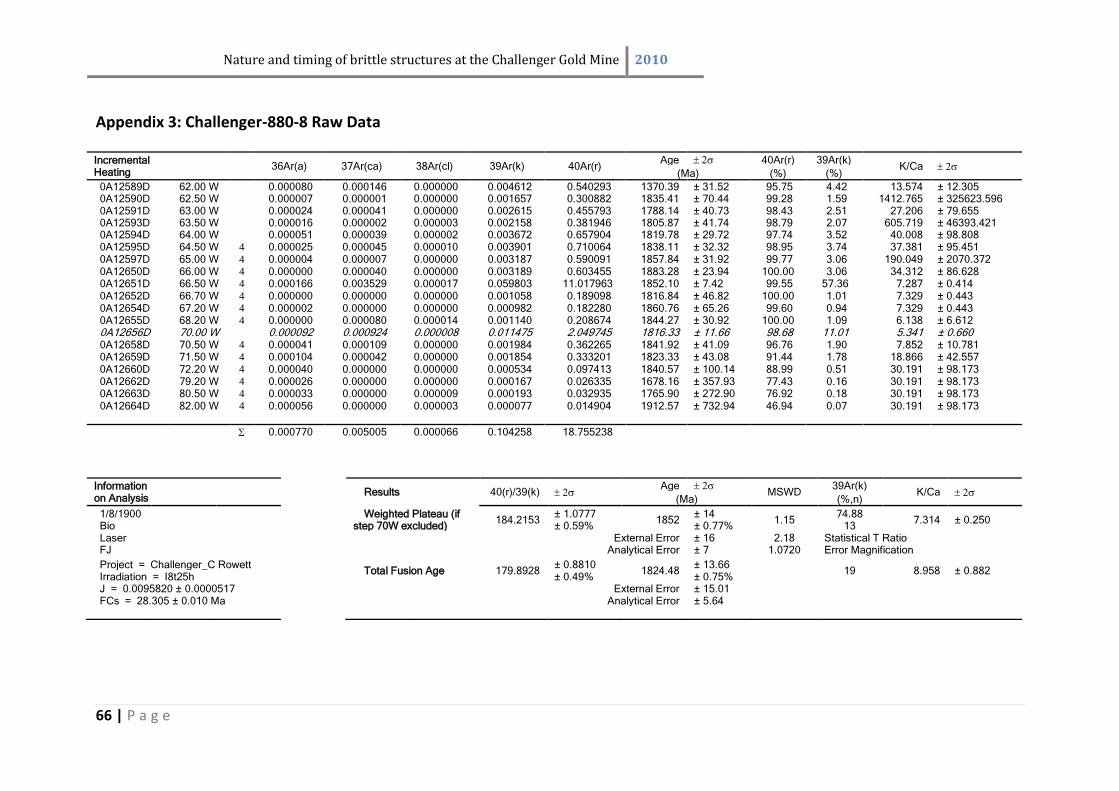
Nature and timing of brittle structures at the Challenger Gold Mine 2010
66 | P a g e
Appendix 3: Challenger-880-8 Raw Data Incremental Heating
36Ar(a) 37Ar(ca) 38Ar(cl) 39Ar(k) 40Ar(r)
Age 40Ar(r) 39Ar(k) K/Ca
(Ma) (%) (%)
0A12589D 62.00 W
0.000080 0.000146 0.000000 0.004612 0.540293 1370.39 ± 31.52 95.75 4.42 13.574 ± 12.305 0A12590D 62.50 W
0.000007 0.000001 0.000000 0.001657 0.300882 1835.41 ± 70.44 99.28 1.59 1412.765 ± 325623.596
0A12591D 63.00 W
0.000024 0.000041 0.000000 0.002615 0.455793 1788.14 ± 40.73 98.43 2.51 27.206 ± 79.655 0A12593D 63.50 W
0.000016 0.000002 0.000003 0.002158 0.381946 1805.87 ± 41.74 98.79 2.07 605.719 ± 46393.421
0A12594D 64.00 W
0.000051 0.000039 0.000002 0.003672 0.657904 1819.78 ± 29.72 97.74 3.52 40.008 ± 98.808 0A12595D 64.50 W 4 0.000025 0.000045 0.000010 0.003901 0.710064 1838.11 ± 32.32 98.95 3.74 37.381 ± 95.451 0A12597D 65.00 W 4 0.000004 0.000007 0.000000 0.003187 0.590091 1857.84 ± 31.92 99.77 3.06 190.049 ± 2070.372 0A12650D 66.00 W 4 0.000000 0.000040 0.000000 0.003189 0.603455 1883.28 ± 23.94 100.00 3.06 34.312 ± 86.628 0A12651D 66.50 W 4 0.000166 0.003529 0.000017 0.059803 11.017963 1852.10 ± 7.42 99.55 57.36 7.287 ± 0.414 0A12652D 66.70 W 4 0.000000 0.000000 0.000000 0.001058 0.189098 1816.84 ± 46.82 100.00 1.01 7.329 ± 0.443 0A12654D 67.20 W 4 0.000002 0.000000 0.000000 0.000982 0.182280 1860.76 ± 65.26 99.60 0.94 7.329 ± 0.443 0A12655D 68.20 W 4 0.000000 0.000080 0.000014 0.001140 0.208674 1844.27 ± 30.92 100.00 1.09 6.138 ± 6.612 0A12656D 70.00 W
0.000092 0.000924 0.000008 0.011475 2.049745 1816.33 ± 11.66 98.68 11.01 5.341 ± 0.660
0A12658D 70.50 W 4 0.000041 0.000109 0.000000 0.001984 0.362265 1841.92 ± 41.09 96.76 1.90 7.852 ± 10.781 0A12659D 71.50 W 4 0.000104 0.000042 0.000000 0.001854 0.333201 1823.33 ± 43.08 91.44 1.78 18.866 ± 42.557 0A12660D 72.20 W 4 0.000040 0.000000 0.000000 0.000534 0.097413 1840.57 ± 100.14 88.99 0.51 30.191 ± 98.173 0A12662D 79.20 W 4 0.000026 0.000000 0.000000 0.000167 0.026335 1678.16 ± 357.93 77.43 0.16 30.191 ± 98.173 0A12663D 80.50 W 4 0.000033 0.000000 0.000009 0.000193 0.032935 1765.90 ± 272.90 76.92 0.18 30.191 ± 98.173 0A12664D 82.00 W 4 0.000056 0.000000 0.000003 0.000077 0.014904 1912.57 ± 732.94 46.94 0.07 30.191 ± 98.173
0.000770 0.005005 0.000066 0.104258 18.755238
Information on Analysis
Results 40(r)/39(k) Age
MSWD 39Ar(k)
K/Ca
(Ma) (%,n)
1/8/1900
Weighted Plateau (if step 70W excluded)
184.2153 ± 1.0777
1852 ± 14
1.15 74.88
7.314 ± 0.250 Bio
± 0.59% ± 0.77% 13
Laser
External Error ± 16 2.18 Statistical T Ratio
FJ
Analytical Error ± 7 1.0720 Error Magnification
Project = Challenger_C Rowett
Total Fusion Age 179.8928 ± 0.8810
1824.48 ± 13.66
19 8.958 ± 0.882
Irradiation = I8t25h
± 0.49% ± 0.75% J = 0.0095820 ± 0.0000517
External Error ± 15.01
FCs = 28.305 ± 0.010 Ma
Analytical Error ± 5.64
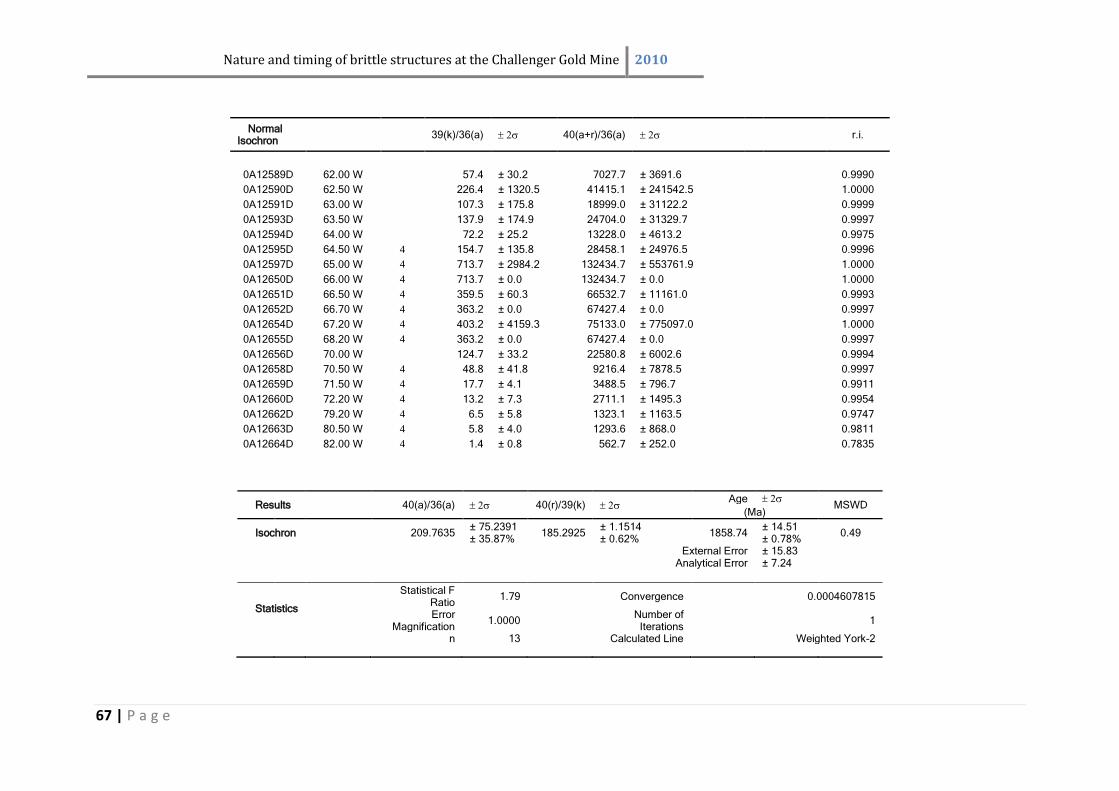
Nature and timing of brittle structures at the Challenger Gold Mine 2010
67 | P a g e
Normal
Isochron 39(k)/36(a) 40(a+r)/36(a)
r.i.
0A12589D 62.00 W
57.4 ± 30.2 7027.7 ± 3691.6
0.9990
0A12590D 62.50 W
226.4 ± 1320.5 41415.1 ± 241542.5
1.0000
0A12591D 63.00 W
107.3 ± 175.8 18999.0 ± 31122.2
0.9999
0A12593D 63.50 W
137.9 ± 174.9 24704.0 ± 31329.7
0.9997
0A12594D 64.00 W
72.2 ± 25.2 13228.0 ± 4613.2
0.9975
0A12595D 64.50 W 4 154.7 ± 135.8 28458.1 ± 24976.5
0.9996
0A12597D 65.00 W 4 713.7 ± 2984.2 132434.7 ± 553761.9
1.0000
0A12650D 66.00 W 4 713.7 ± 0.0 132434.7 ± 0.0
1.0000
0A12651D 66.50 W 4 359.5 ± 60.3 66532.7 ± 11161.0
0.9993
0A12652D 66.70 W 4 363.2 ± 0.0 67427.4 ± 0.0
0.9997
0A12654D 67.20 W 4 403.2 ± 4159.3 75133.0 ± 775097.0
1.0000
0A12655D 68.20 W 4 363.2 ± 0.0 67427.4 ± 0.0
0.9997
0A12656D 70.00 W
124.7 ± 33.2 22580.8 ± 6002.6
0.9994
0A12658D 70.50 W 4 48.8 ± 41.8 9216.4 ± 7878.5
0.9997
0A12659D 71.50 W 4 17.7 ± 4.1 3488.5 ± 796.7
0.9911
0A12660D 72.20 W 4 13.2 ± 7.3 2711.1 ± 1495.3
0.9954
0A12662D 79.20 W 4 6.5 ± 5.8 1323.1 ± 1163.5
0.9747
0A12663D 80.50 W 4 5.8 ± 4.0 1293.6 ± 868.0
0.9811
0A12664D 82.00 W 4 1.4 ± 0.8 562.7 ± 252.0
0.7835
Results
40(a)/36(a) 40(r)/39(k) Age
MSWD (Ma)
Isochron
209.7635
± 75.2391 185.2925
± 1.1514 1858.74
± 14.51 0.49
± 35.87% ± 0.62% ± 0.78% External Error ± 15.83
Analytical Error ± 7.24
Statistics
Statistical F Ratio
1.79
Convergence 0.0004607815
Error
Magnification 1.0000
Number of
Iterations 1
n 13
Calculated Line Weighted York-2
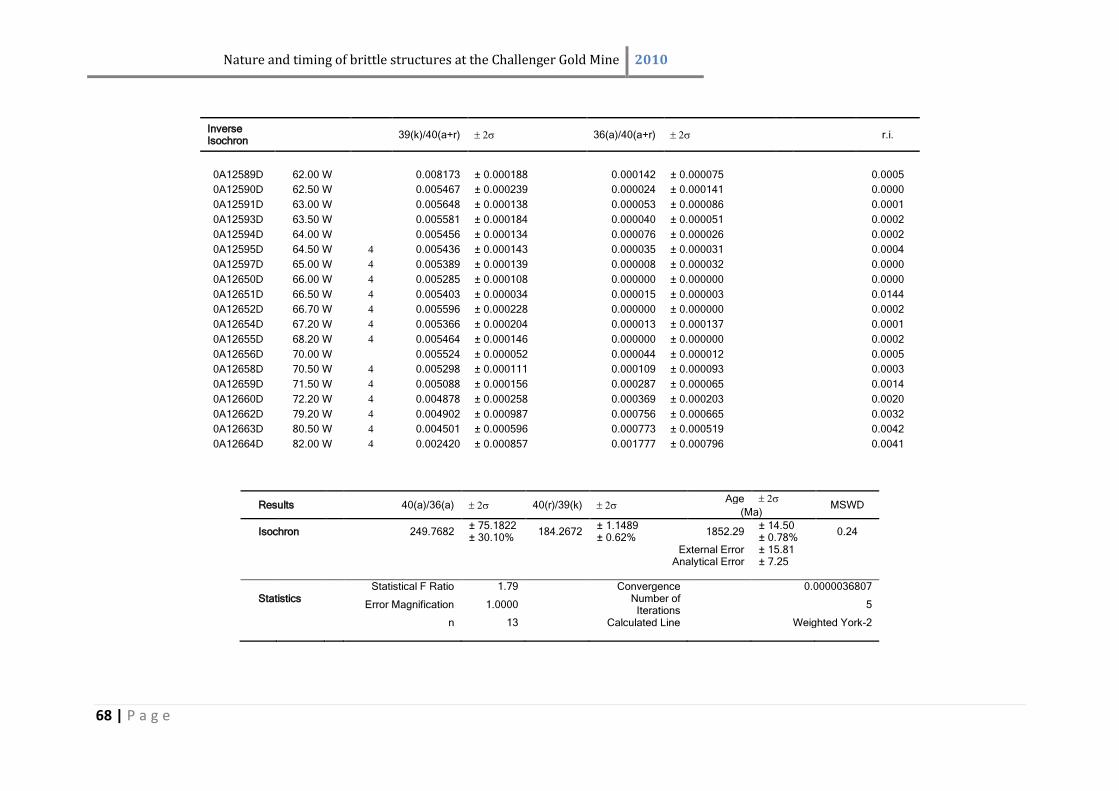
Nature and timing of brittle structures at the Challenger Gold Mine 2010
68 | P a g e
Inverse Isochron
39(k)/40(a+r) 36(a)/40(a+r)
r.i.
0A12589D 62.00 W
0.008173 ± 0.000188 0.000142 ± 0.000075
0.0005
0A12590D 62.50 W
0.005467 ± 0.000239 0.000024 ± 0.000141
0.0000
0A12591D 63.00 W
0.005648 ± 0.000138 0.000053 ± 0.000086
0.0001
0A12593D 63.50 W
0.005581 ± 0.000184 0.000040 ± 0.000051
0.0002
0A12594D 64.00 W
0.005456 ± 0.000134 0.000076 ± 0.000026
0.0002
0A12595D 64.50 W 4 0.005436 ± 0.000143 0.000035 ± 0.000031
0.0004
0A12597D 65.00 W 4 0.005389 ± 0.000139 0.000008 ± 0.000032
0.0000
0A12650D 66.00 W 4 0.005285 ± 0.000108 0.000000 ± 0.000000
0.0000
0A12651D 66.50 W 4 0.005403 ± 0.000034 0.000015 ± 0.000003
0.0144
0A12652D 66.70 W 4 0.005596 ± 0.000228 0.000000 ± 0.000000
0.0002
0A12654D 67.20 W 4 0.005366 ± 0.000204 0.000013 ± 0.000137
0.0001
0A12655D 68.20 W 4 0.005464 ± 0.000146 0.000000 ± 0.000000
0.0002
0A12656D 70.00 W
0.005524 ± 0.000052 0.000044 ± 0.000012
0.0005
0A12658D 70.50 W 4 0.005298 ± 0.000111 0.000109 ± 0.000093
0.0003
0A12659D 71.50 W 4 0.005088 ± 0.000156 0.000287 ± 0.000065
0.0014
0A12660D 72.20 W 4 0.004878 ± 0.000258 0.000369 ± 0.000203
0.0020
0A12662D 79.20 W 4 0.004902 ± 0.000987 0.000756 ± 0.000665
0.0032
0A12663D 80.50 W 4 0.004501 ± 0.000596 0.000773 ± 0.000519
0.0042
0A12664D 82.00 W 4 0.002420 ± 0.000857 0.001777 ± 0.000796
0.0041
Results
40(a)/36(a) 40(r)/39(k) Age
MSWD (Ma)
Isochron
249.7682 ± 75.1822
184.2672 ± 1.1489
1852.29 ± 14.50
0.24 ± 30.10% ± 0.62% ± 0.78%
External Error ± 15.81 Analytical Error ± 7.25
Statistics
Statistical F Ratio 1.79
Convergence 0.0000036807
Error Magnification 1.0000
Number of
Iterations 5
n 13
Calculated Line Weighted York-2
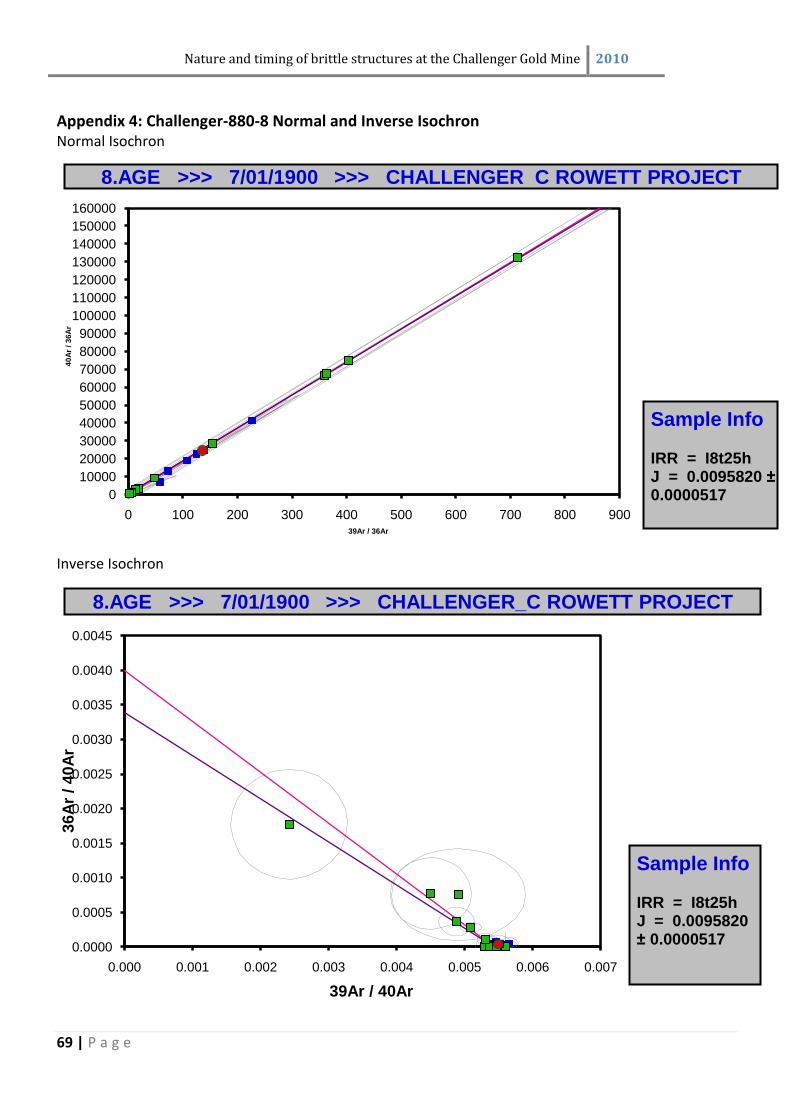
Nature and timing of brittle structures at the Challenger Gold Mine 2010
69 | P a g e
Appendix 4: Challenger-880-8 Normal and Inverse Isochron Normal Isochron
Inverse Isochron
0
10000
20000
30000
40000
50000
60000
70000
80000
90000
100000
110000
120000
130000
140000
150000
160000
0 100 200 300 400 500 600 700 800 900
40
Ar
/ 3
6A
r
39Ar / 36Ar
8.AGE >>> 7/01/1900 >>> CHALLENGER_C ROWETT PROJECT
Sample Info
IRR = I8t25hJ = 0.0095820 ±0.0000517
0.0000
0.0005
0.0010
0.0015
0.0020
0.0025
0.0030
0.0035
0.0040
0.0045
0.000 0.001 0.002 0.003 0.004 0.005 0.006 0.007
36
Ar
/ 4
0A
r
39Ar / 40Ar
8.AGE >>> 7/01/1900 >>> CHALLENGER_C ROWETT PROJECT
Sample Info
IRR = I8t25hJ = 0.0095820 ± 0.0000517
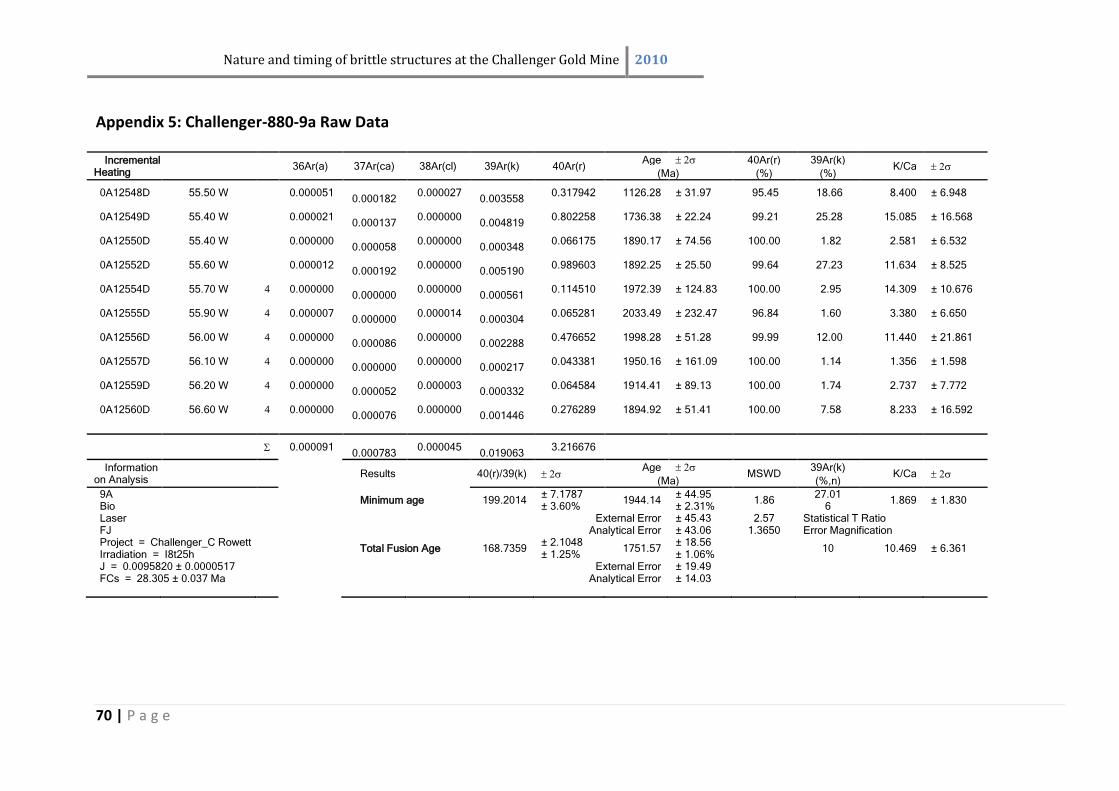
Nature and timing of brittle structures at the Challenger Gold Mine 2010
70 | P a g e
Appendix 5: Challenger-880-9a Raw Data
Incremental Heating
36Ar(a) 37Ar(ca) 38Ar(cl) 39Ar(k) 40Ar(r)
Age 40Ar(r) 39Ar(k) K/Ca
(Ma) (%) (%)
0A12548D 55.50 W
0.000051
0.000182 0.000027
0.003558
0.317942 1126.28 ± 31.97 95.45 18.66 8.400 ± 6.948
0A12549D 55.40 W
0.000021
0.000137 0.000000
0.004819
0.802258 1736.38 ± 22.24 99.21 25.28 15.085 ± 16.568
0A12550D 55.40 W
0.000000
0.000058 0.000000
0.000348
0.066175 1890.17 ± 74.56 100.00 1.82 2.581 ± 6.532
0A12552D 55.60 W
0.000012
0.000192 0.000000
0.005190
0.989603 1892.25 ± 25.50 99.64 27.23 11.634 ± 8.525
0A12554D 55.70 W 4 0.000000
0.000000 0.000000
0.000561
0.114510 1972.39 ± 124.83 100.00 2.95 14.309 ± 10.676
0A12555D 55.90 W 4 0.000007
0.000000 0.000014
0.000304
0.065281 2033.49 ± 232.47 96.84 1.60 3.380 ± 6.650
0A12556D 56.00 W 4 0.000000
0.000086 0.000000
0.002288
0.476652 1998.28 ± 51.28 99.99 12.00 11.440 ± 21.861
0A12557D 56.10 W 4 0.000000
0.000000 0.000000
0.000217
0.043381 1950.16 ± 161.09 100.00 1.14 1.356 ± 1.598
0A12559D 56.20 W 4 0.000000
0.000052 0.000003
0.000332
0.064584 1914.41 ± 89.13 100.00 1.74 2.737 ± 7.772
0A12560D 56.60 W 4 0.000000
0.000076 0.000000
0.001446
0.276289 1894.92 ± 51.41 100.00 7.58 8.233 ± 16.592
0.000091
0.000783 0.000045
0.019063
3.216676
Information on Analysis
Results 40(r)/39(k) Age
MSWD 39Ar(k)
K/Ca
(Ma) (%,n)
9A
Minimum age 199.2014 ± 7.1787
1944.14 ± 44.95
1.86 27.01
1.869 ± 1.830 Bio
± 3.60% ± 2.31% 6
Laser
External Error ± 45.43 2.57 Statistical T Ratio
FJ
Analytical Error ± 43.06 1.3650 Error Magnification
Project = Challenger_C Rowett
Total Fusion Age 168.7359 ± 2.1048
1751.57 ± 18.56
10 10.469 ± 6.361
Irradiation = I8t25h
± 1.25% ± 1.06% J = 0.0095820 ± 0.0000517
External Error ± 19.49
FCs = 28.305 ± 0.037 Ma
Analytical Error ± 14.03
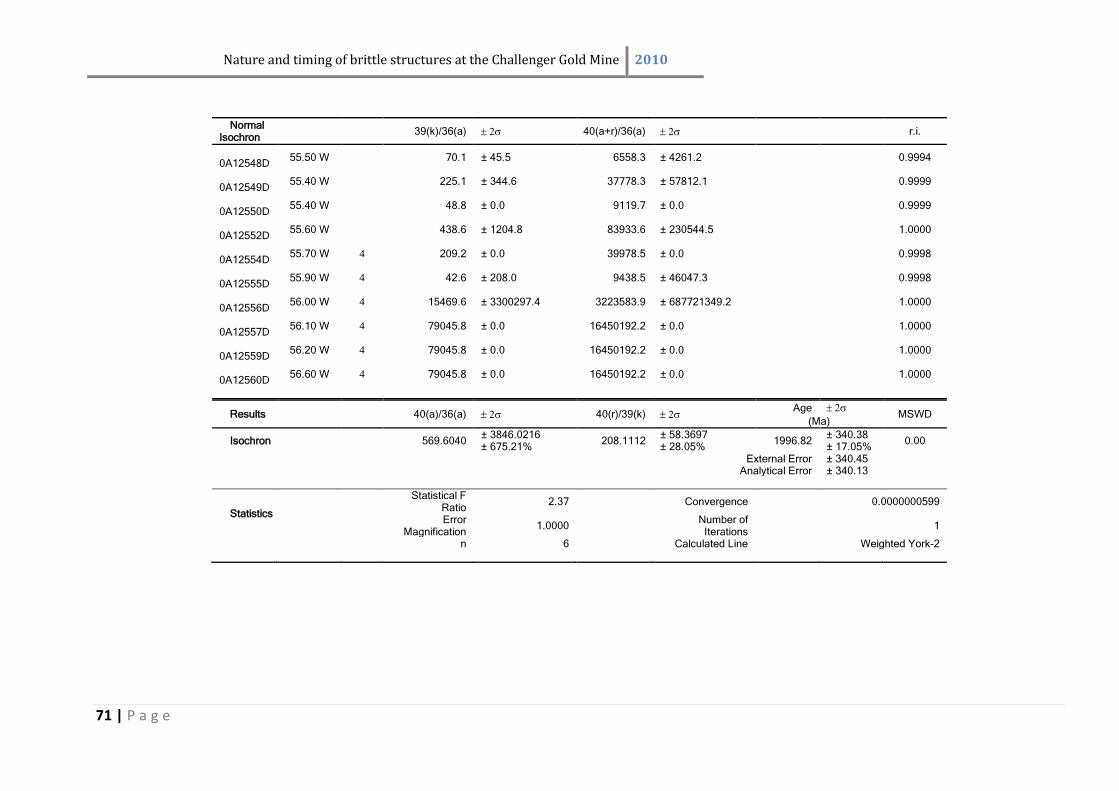
Nature and timing of brittle structures at the Challenger Gold Mine 2010
71 | P a g e
Normal
Isochron 39(k)/36(a) 40(a+r)/36(a)
r.i.
0A12548D
55.50 W
70.1 ± 45.5 6558.3 ± 4261.2
0.9994
0A12549D
55.40 W
225.1 ± 344.6 37778.3 ± 57812.1
0.9999
0A12550D
55.40 W
48.8 ± 0.0 9119.7 ± 0.0
0.9999
0A12552D
55.60 W
438.6 ± 1204.8 83933.6 ± 230544.5
1.0000
0A12554D
55.70 W 4 209.2 ± 0.0 39978.5 ± 0.0
0.9998
0A12555D
55.90 W 4 42.6 ± 208.0 9438.5 ± 46047.3
0.9998
0A12556D
56.00 W 4 15469.6 ± 3300297.4 3223583.9 ± 687721349.2
1.0000
0A12557D
56.10 W 4 79045.8 ± 0.0 16450192.2 ± 0.0
1.0000
0A12559D
56.20 W 4 79045.8 ± 0.0 16450192.2 ± 0.0
1.0000
0A12560D
56.60 W 4 79045.8 ± 0.0 16450192.2 ± 0.0
1.0000
Results
40(a)/36(a) 40(r)/39(k) Age
MSWD (Ma)
Isochron
569.6040 ± 3846.0216
208.1112 ± 58.3697
1996.82 ± 340.38
0.00 ± 675.21% ± 28.05% ± 17.05%
External Error ± 340.45 Analytical Error ± 340.13
Statistics
Statistical F Ratio
2.37
Convergence 0.0000000599
Error
Magnification 1.0000
Number of
Iterations 1
n 6
Calculated Line Weighted York-2
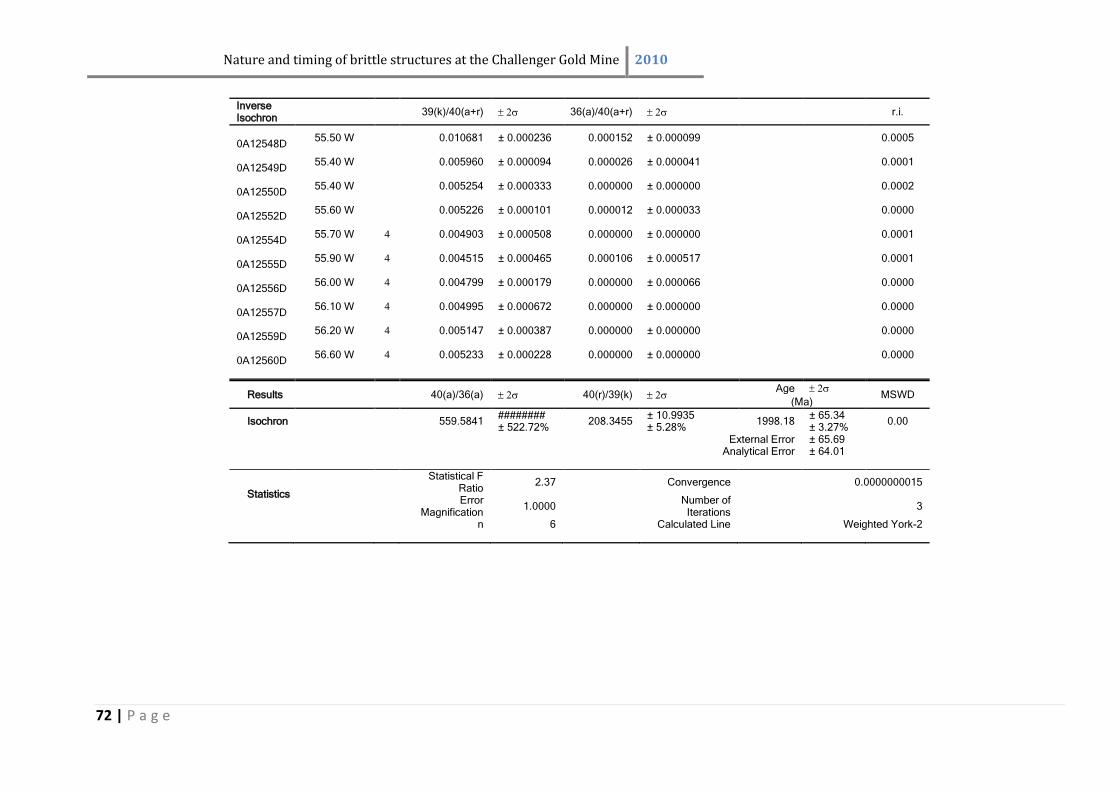
Nature and timing of brittle structures at the Challenger Gold Mine 2010
72 | P a g e
Inverse Isochron
39(k)/40(a+r) 36(a)/40(a+r)
r.i.
0A12548D
55.50 W
0.010681 ± 0.000236 0.000152 ± 0.000099
0.0005
0A12549D
55.40 W
0.005960 ± 0.000094 0.000026 ± 0.000041
0.0001
0A12550D
55.40 W
0.005254 ± 0.000333 0.000000 ± 0.000000
0.0002
0A12552D
55.60 W
0.005226 ± 0.000101 0.000012 ± 0.000033
0.0000
0A12554D
55.70 W 4 0.004903 ± 0.000508 0.000000 ± 0.000000
0.0001
0A12555D
55.90 W 4 0.004515 ± 0.000465 0.000106 ± 0.000517
0.0001
0A12556D
56.00 W 4 0.004799 ± 0.000179 0.000000 ± 0.000066
0.0000
0A12557D
56.10 W 4 0.004995 ± 0.000672 0.000000 ± 0.000000
0.0000
0A12559D
56.20 W 4 0.005147 ± 0.000387 0.000000 ± 0.000000
0.0000
0A12560D
56.60 W 4 0.005233 ± 0.000228 0.000000 ± 0.000000
0.0000
Results
40(a)/36(a) 40(r)/39(k) Age
MSWD (Ma)
Isochron
559.5841 ########
208.3455 ± 10.9935
1998.18 ± 65.34
0.00 ± 522.72% ± 5.28% ± 3.27%
External Error ± 65.69 Analytical Error ± 64.01
Statistics
Statistical F Ratio
2.37
Convergence 0.0000000015
Error
Magnification 1.0000
Number of
Iterations 3
n 6
Calculated Line Weighted York-2
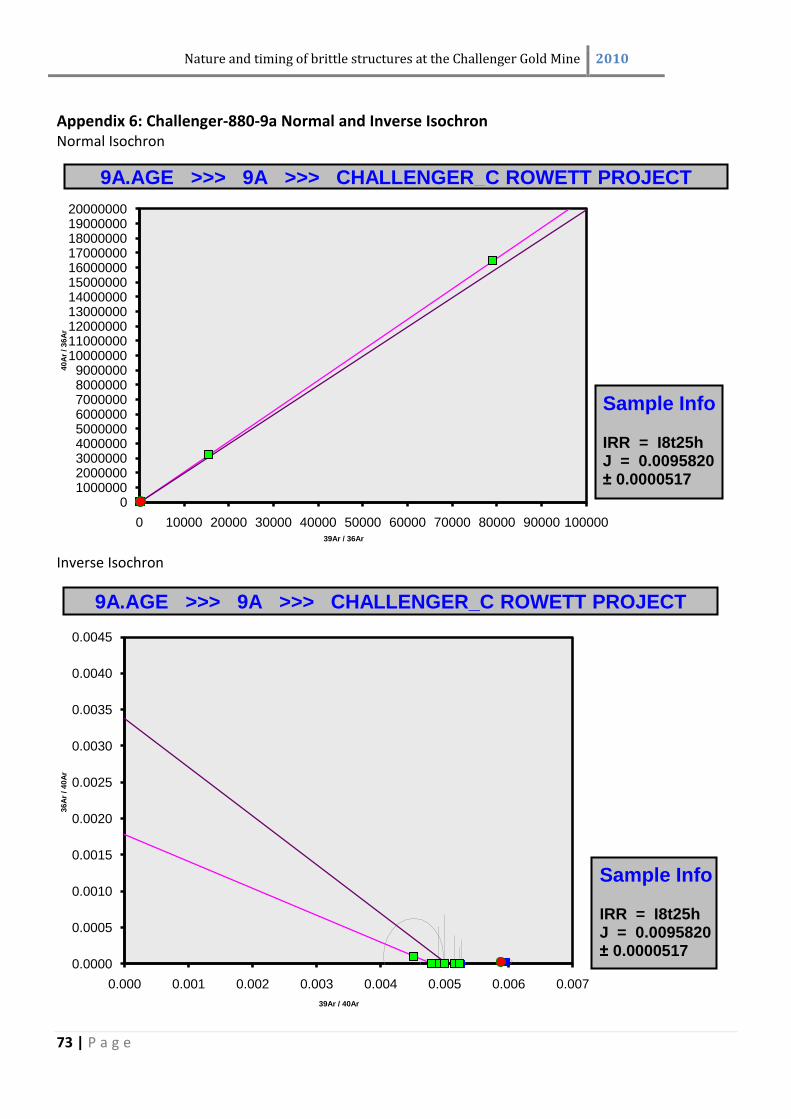
Nature and timing of brittle structures at the Challenger Gold Mine 2010
73 | P a g e
Appendix 6: Challenger-880-9a Normal and Inverse Isochron Normal Isochron
Inverse Isochron
0100000020000003000000400000050000006000000700000080000009000000
1000000011000000120000001300000014000000150000001600000017000000180000001900000020000000
0 10000 20000 30000 40000 50000 60000 70000 80000 90000 100000
40
Ar
/ 3
6A
r
39Ar / 36Ar
9A.AGE >>> 9A >>> CHALLENGER_C ROWETT PROJECT
Sample Info
IRR = I8t25hJ = 0.0095820 ± 0.0000517
0.0000
0.0005
0.0010
0.0015
0.0020
0.0025
0.0030
0.0035
0.0040
0.0045
0.000 0.001 0.002 0.003 0.004 0.005 0.006 0.007
36
Ar
/ 4
0A
r
39Ar / 40Ar
9A.AGE >>> 9A >>> CHALLENGER_C ROWETT PROJECT
Sample Info
IRR = I8t25hJ = 0.0095820 ± 0.0000517
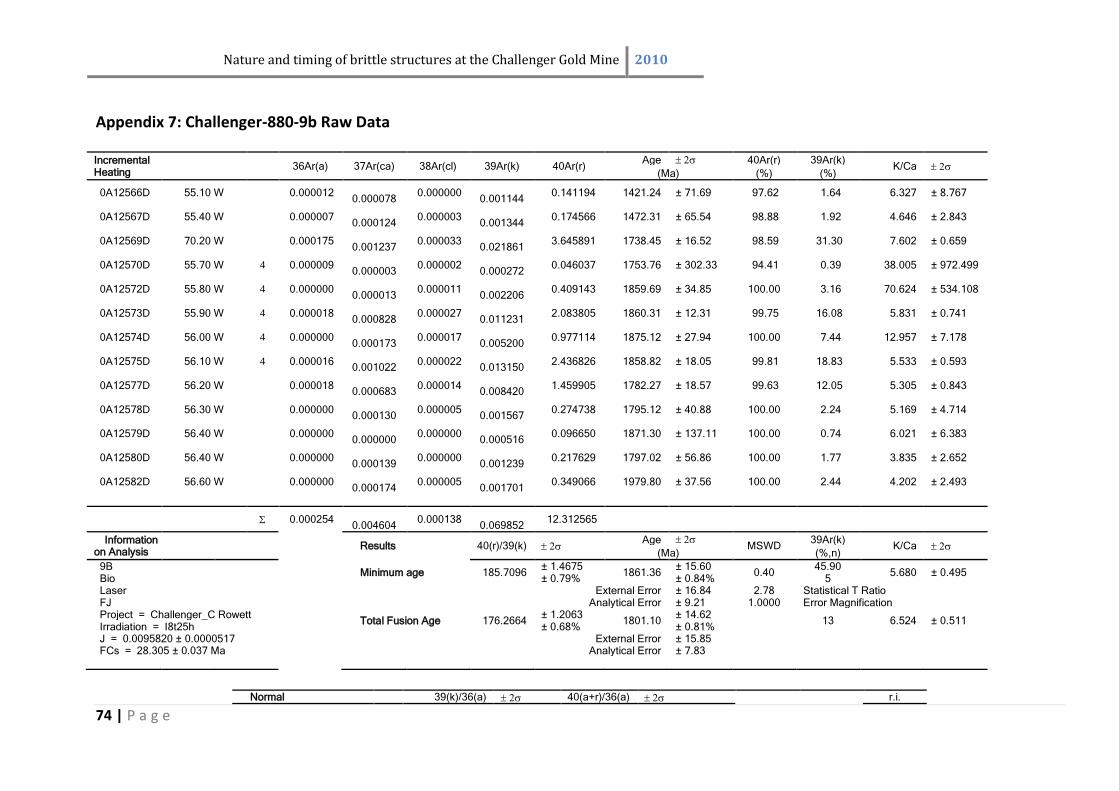
Nature and timing of brittle structures at the Challenger Gold Mine 2010
74 | P a g e
Appendix 7: Challenger-880-9b Raw Data Incremental Heating
36Ar(a) 37Ar(ca) 38Ar(cl) 39Ar(k) 40Ar(r)
Age 40Ar(r) 39Ar(k) K/Ca
(Ma) (%) (%)
0A12566D 55.10 W
0.000012
0.000078 0.000000
0.001144
0.141194 1421.24 ± 71.69 97.62 1.64 6.327 ± 8.767
0A12567D 55.40 W
0.000007
0.000124 0.000003
0.001344
0.174566 1472.31 ± 65.54 98.88 1.92 4.646 ± 2.843
0A12569D 70.20 W
0.000175
0.001237 0.000033
0.021861
3.645891 1738.45 ± 16.52 98.59 31.30 7.602 ± 0.659
0A12570D 55.70 W 4 0.000009
0.000003 0.000002
0.000272
0.046037 1753.76 ± 302.33 94.41 0.39 38.005 ± 972.499
0A12572D 55.80 W 4 0.000000
0.000013 0.000011
0.002206
0.409143 1859.69 ± 34.85 100.00 3.16 70.624 ± 534.108
0A12573D 55.90 W 4 0.000018
0.000828 0.000027
0.011231
2.083805 1860.31 ± 12.31 99.75 16.08 5.831 ± 0.741
0A12574D 56.00 W 4 0.000000
0.000173 0.000017
0.005200
0.977114 1875.12 ± 27.94 100.00 7.44 12.957 ± 7.178
0A12575D 56.10 W 4 0.000016
0.001022 0.000022
0.013150
2.436826 1858.82 ± 18.05 99.81 18.83 5.533 ± 0.593
0A12577D 56.20 W
0.000018
0.000683 0.000014
0.008420
1.459905 1782.27 ± 18.57 99.63 12.05 5.305 ± 0.843
0A12578D 56.30 W
0.000000
0.000130 0.000005
0.001567
0.274738 1795.12 ± 40.88 100.00 2.24 5.169 ± 4.714
0A12579D 56.40 W
0.000000
0.000000 0.000000
0.000516
0.096650 1871.30 ± 137.11 100.00 0.74 6.021 ± 6.383
0A12580D 56.40 W
0.000000
0.000139 0.000000
0.001239
0.217629 1797.02 ± 56.86 100.00 1.77 3.835 ± 2.652
0A12582D 56.60 W
0.000000
0.000174 0.000005
0.001701
0.349066 1979.80 ± 37.56 100.00 2.44 4.202 ± 2.493
0.000254
0.004604 0.000138
0.069852
12.312565
Information on Analysis
Results 40(r)/39(k) Age
MSWD 39Ar(k)
K/Ca
(Ma) (%,n)
9B
Minimum age 185.7096 ± 1.4675
1861.36 ± 15.60
0.40 45.90
5.680 ± 0.495 Bio
± 0.79% ± 0.84% 5
Laser
External Error ± 16.84 2.78 Statistical T Ratio
FJ
Analytical Error ± 9.21 1.0000 Error Magnification
Project = Challenger_C Rowett
Total Fusion Age 176.2664 ± 1.2063
1801.10 ± 14.62
13 6.524 ± 0.511
Irradiation = I8t25h
± 0.68% ± 0.81% J = 0.0095820 ± 0.0000517
External Error ± 15.85
FCs = 28.305 ± 0.037 Ma
Analytical Error ± 7.83
Normal
39(k)/36(a) 40(a+r)/36(a) r.i.
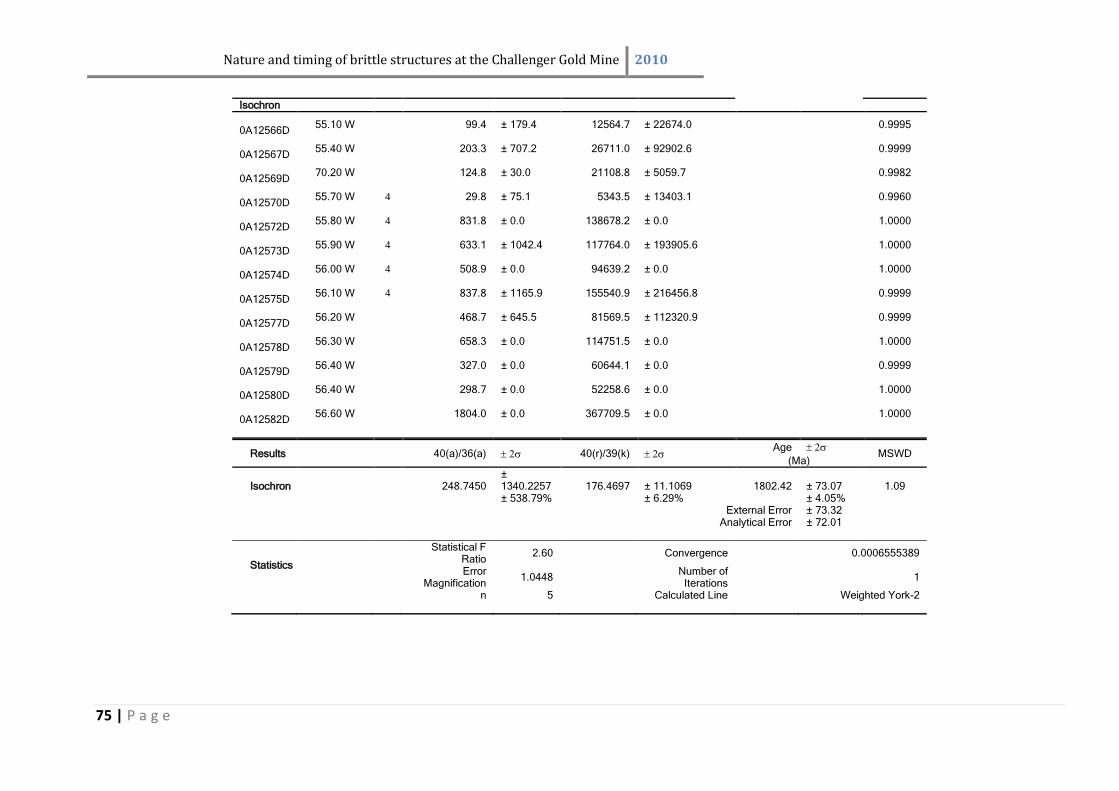
Nature and timing of brittle structures at the Challenger Gold Mine 2010
75 | P a g e
Isochron
0A12566D
55.10 W
99.4 ± 179.4 12564.7 ± 22674.0
0.9995
0A12567D
55.40 W
203.3 ± 707.2 26711.0 ± 92902.6
0.9999
0A12569D
70.20 W
124.8 ± 30.0 21108.8 ± 5059.7
0.9982
0A12570D
55.70 W 4 29.8 ± 75.1 5343.5 ± 13403.1
0.9960
0A12572D
55.80 W 4 831.8 ± 0.0 138678.2 ± 0.0
1.0000
0A12573D
55.90 W 4 633.1 ± 1042.4 117764.0 ± 193905.6
1.0000
0A12574D
56.00 W 4 508.9 ± 0.0 94639.2 ± 0.0
1.0000
0A12575D
56.10 W 4 837.8 ± 1165.9 155540.9 ± 216456.8
0.9999
0A12577D
56.20 W
468.7 ± 645.5 81569.5 ± 112320.9
0.9999
0A12578D
56.30 W
658.3 ± 0.0 114751.5 ± 0.0
1.0000
0A12579D
56.40 W
327.0 ± 0.0 60644.1 ± 0.0
0.9999
0A12580D
56.40 W
298.7 ± 0.0 52258.6 ± 0.0
1.0000
0A12582D
56.60 W
1804.0 ± 0.0 367709.5 ± 0.0
1.0000
Results
40(a)/36(a) 40(r)/39(k) Age
MSWD (Ma)
Isochron
248.7450 ± 1340.2257 176.4697 ± 11.1069 1802.42 ± 73.07 1.09
± 538.79% ± 6.29% ± 4.05% External Error ± 73.32
Analytical Error ± 72.01
Statistics
Statistical F Ratio
2.60
Convergence 0.0006555389
Error
Magnification 1.0448
Number of
Iterations 1
n 5
Calculated Line Weighted York-2
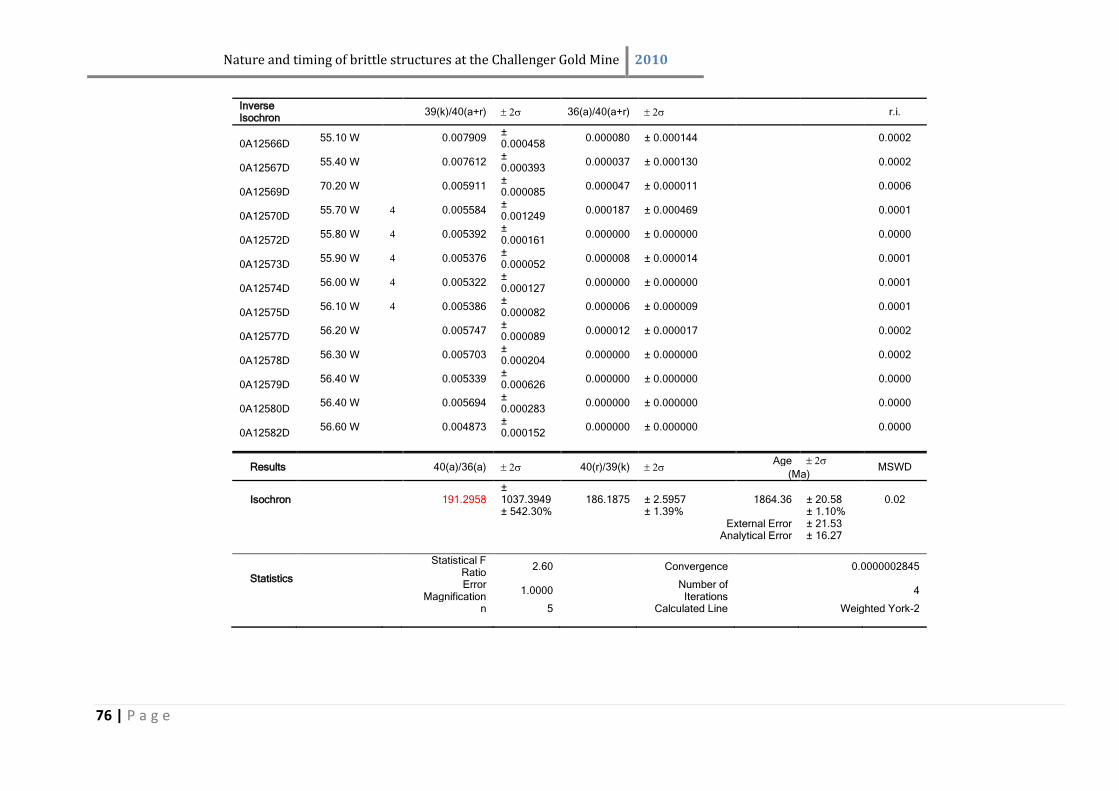
Nature and timing of brittle structures at the Challenger Gold Mine 2010
76 | P a g e
Inverse Isochron
39(k)/40(a+r) 36(a)/40(a+r)
r.i.
0A12566D
55.10 W
0.007909 ± 0.000458
0.000080 ± 0.000144
0.0002
0A12567D
55.40 W
0.007612 ± 0.000393
0.000037 ± 0.000130
0.0002
0A12569D
70.20 W
0.005911 ± 0.000085
0.000047 ± 0.000011
0.0006
0A12570D
55.70 W 4 0.005584 ± 0.001249
0.000187 ± 0.000469
0.0001
0A12572D
55.80 W 4 0.005392 ± 0.000161
0.000000 ± 0.000000
0.0000
0A12573D
55.90 W 4 0.005376 ± 0.000052
0.000008 ± 0.000014
0.0001
0A12574D
56.00 W 4 0.005322 ± 0.000127
0.000000 ± 0.000000
0.0001
0A12575D
56.10 W 4 0.005386 ± 0.000082
0.000006 ± 0.000009
0.0001
0A12577D
56.20 W
0.005747 ± 0.000089
0.000012 ± 0.000017
0.0002
0A12578D
56.30 W
0.005703 ± 0.000204
0.000000 ± 0.000000
0.0002
0A12579D
56.40 W
0.005339 ± 0.000626
0.000000 ± 0.000000
0.0000
0A12580D
56.40 W
0.005694 ± 0.000283
0.000000 ± 0.000000
0.0000
0A12582D
56.60 W
0.004873 ± 0.000152
0.000000 ± 0.000000
0.0000
Results
40(a)/36(a) 40(r)/39(k) Age
MSWD (Ma)
Isochron
191.2958 ± 1037.3949 186.1875 ± 2.5957 1864.36 ± 20.58 0.02
± 542.30% ± 1.39% ± 1.10% External Error ± 21.53
Analytical Error ± 16.27
Statistics
Statistical F Ratio
2.60
Convergence 0.0000002845
Error
Magnification 1.0000
Number of
Iterations 4
n 5
Calculated Line Weighted York-2
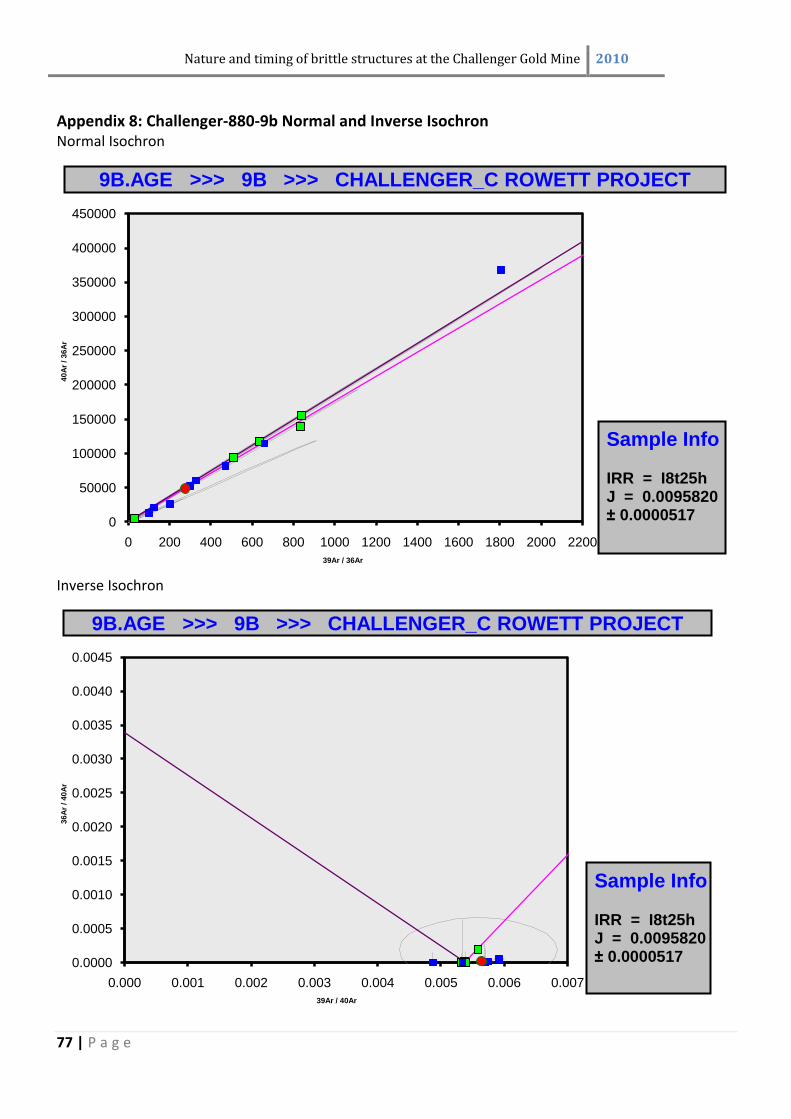
Nature and timing of brittle structures at the Challenger Gold Mine 2010
77 | P a g e
Appendix 8: Challenger-880-9b Normal and Inverse Isochron Normal Isochron
Inverse Isochron
0
50000
100000
150000
200000
250000
300000
350000
400000
450000
0 200 400 600 800 1000 1200 1400 1600 1800 2000 2200
40
Ar
/ 3
6A
r
39Ar / 36Ar
9B.AGE >>> 9B >>> CHALLENGER_C ROWETT PROJECT
Sample Info
IRR = I8t25hJ = 0.0095820 ± 0.0000517
0.0000
0.0005
0.0010
0.0015
0.0020
0.0025
0.0030
0.0035
0.0040
0.0045
0.000 0.001 0.002 0.003 0.004 0.005 0.006 0.007
36
Ar
/ 4
0A
r
39Ar / 40Ar
9B.AGE >>> 9B >>> CHALLENGER_C ROWETT PROJECT
Sample Info
IRR = I8t25hJ = 0.0095820 ± 0.0000517
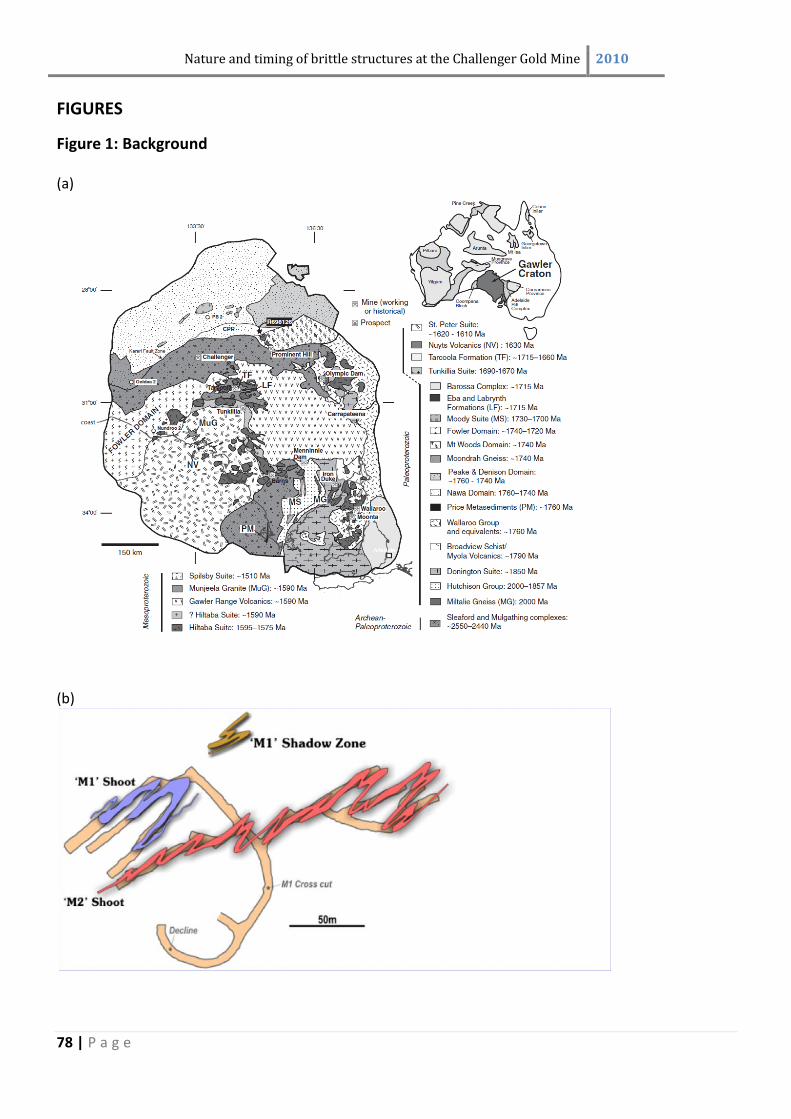
Nature and timing of brittle structures at the Challenger Gold Mine 2010
78 | P a g e
FIGURES
Figure 1: Background (a)
(b)
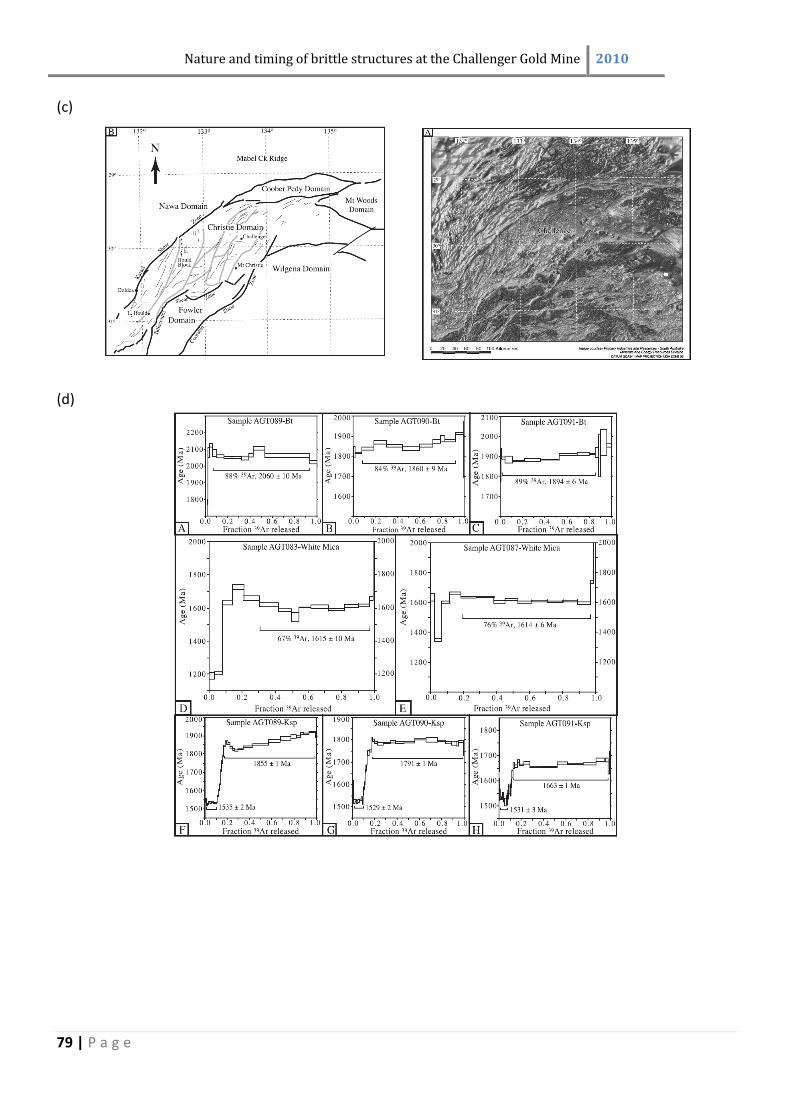
Nature and timing of brittle structures at the Challenger Gold Mine 2010
79 | P a g e
(c) (d)
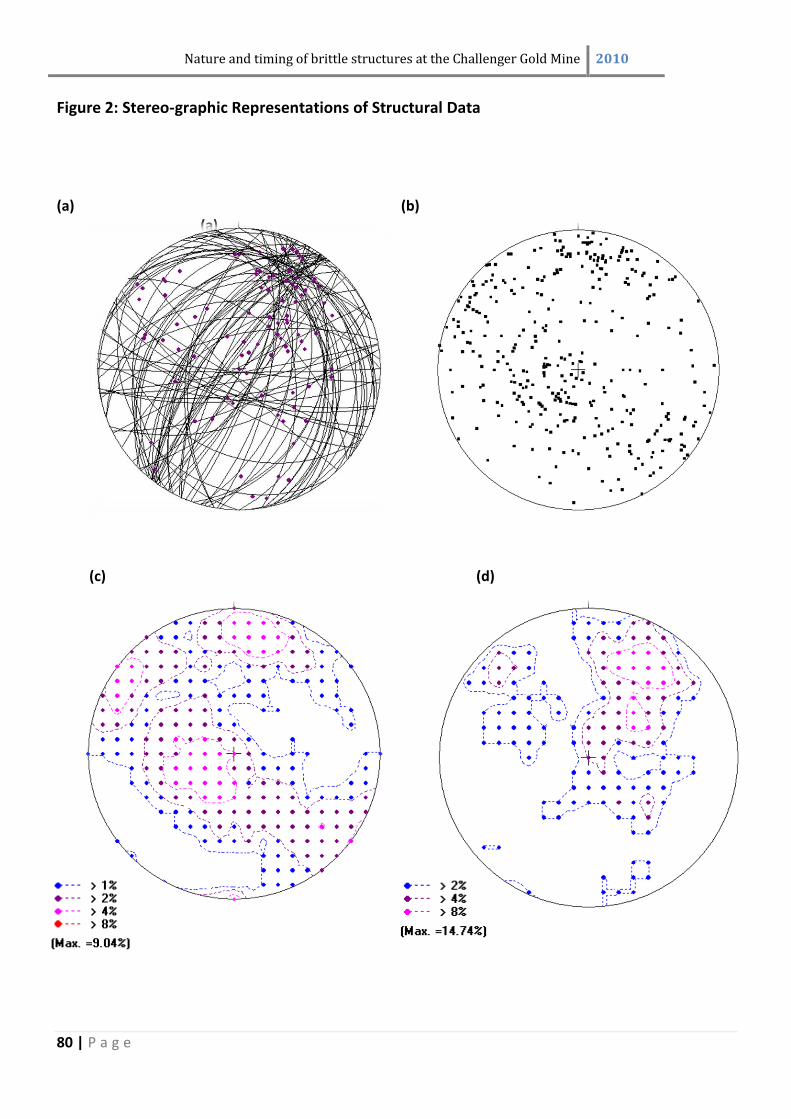
Nature and timing of brittle structures at the Challenger Gold Mine 2010
80 | P a g e
Figure 2: Stereo-graphic Representations of Structural Data (a) (b)
(a) (c) (d)
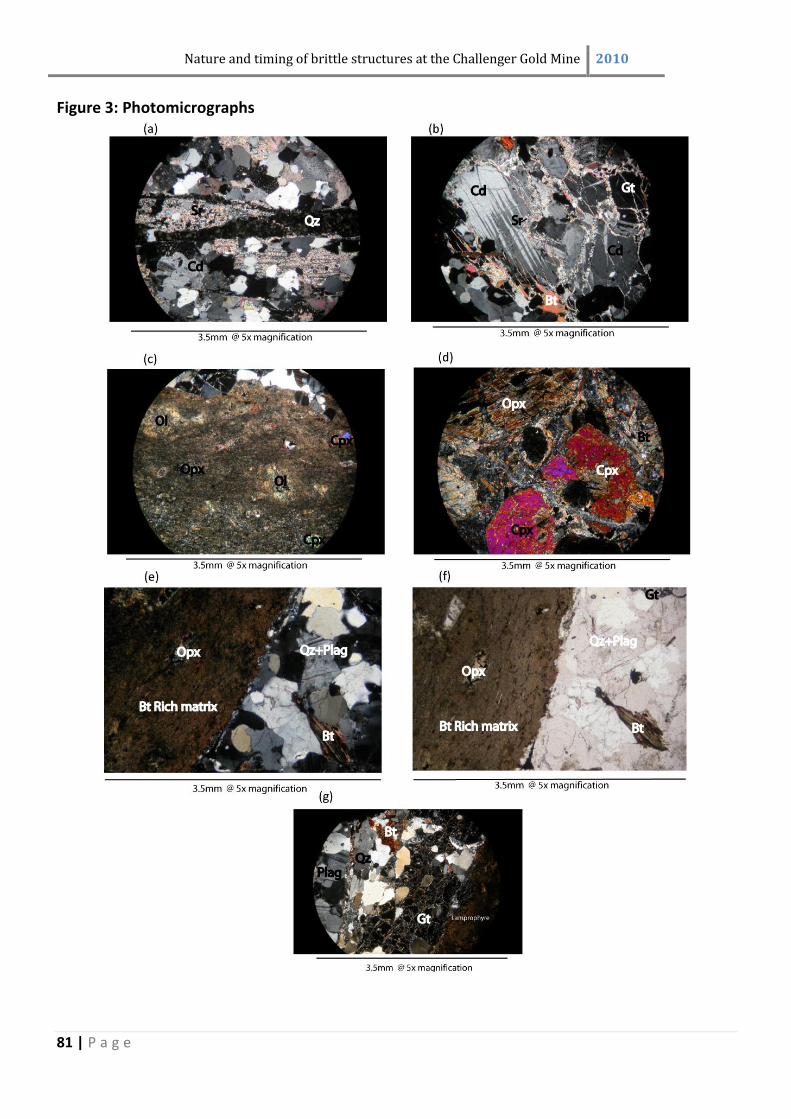
Nature and timing of brittle structures at the Challenger Gold Mine 2010
81 | P a g e
Figure 3: Photomicrographs
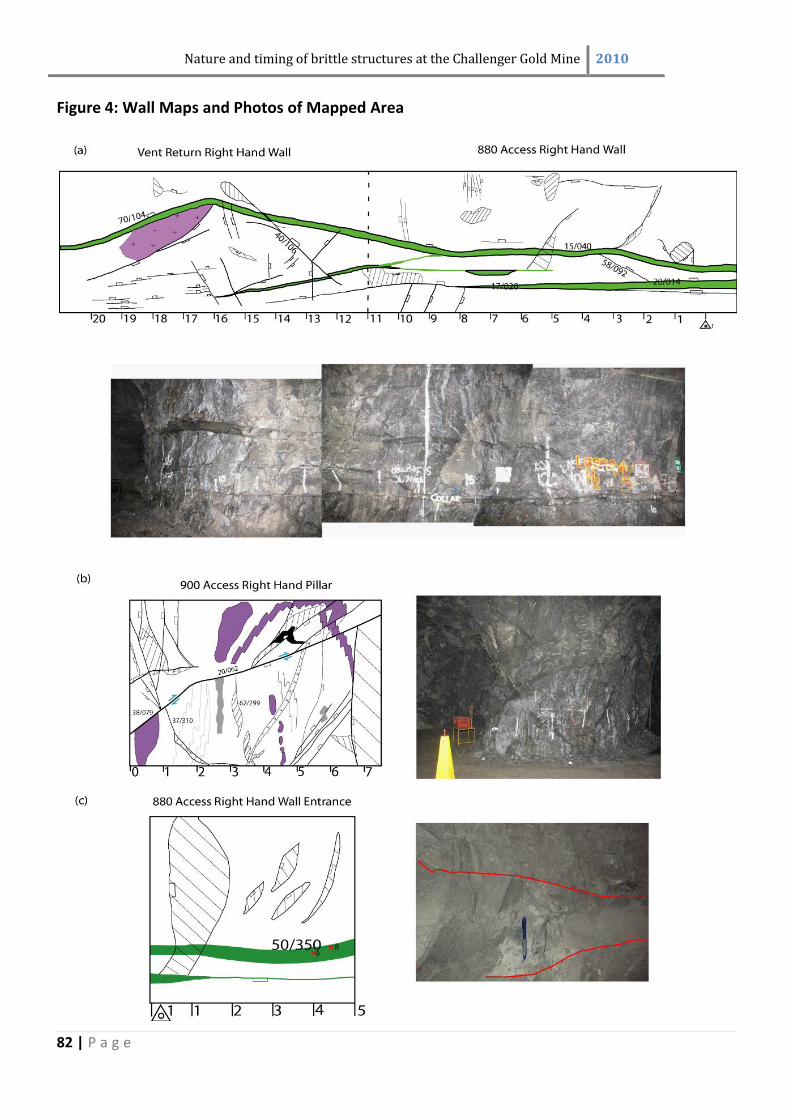
Nature and timing of brittle structures at the Challenger Gold Mine 2010
82 | P a g e
Figure 4: Wall Maps and Photos of Mapped Area
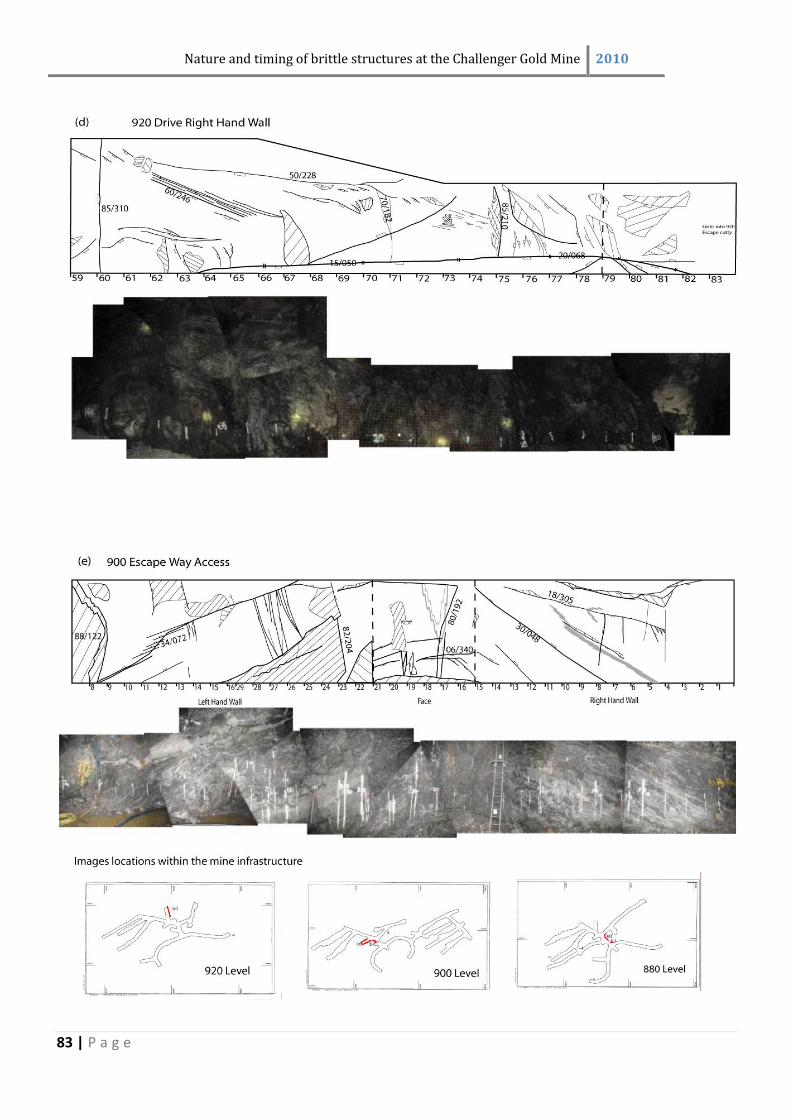
Nature and timing of brittle structures at the Challenger Gold Mine 2010
83 | P a g e
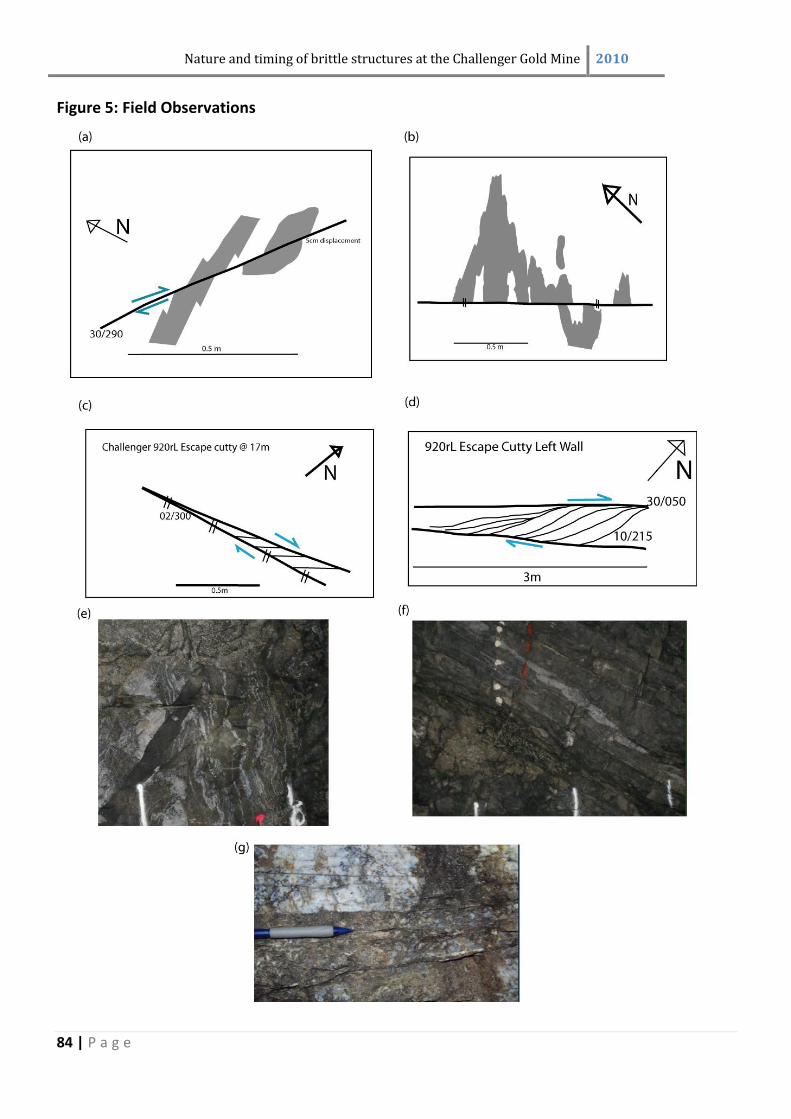
Nature and timing of brittle structures at the Challenger Gold Mine 2010
84 | P a g e
Figure 5: Field Observations
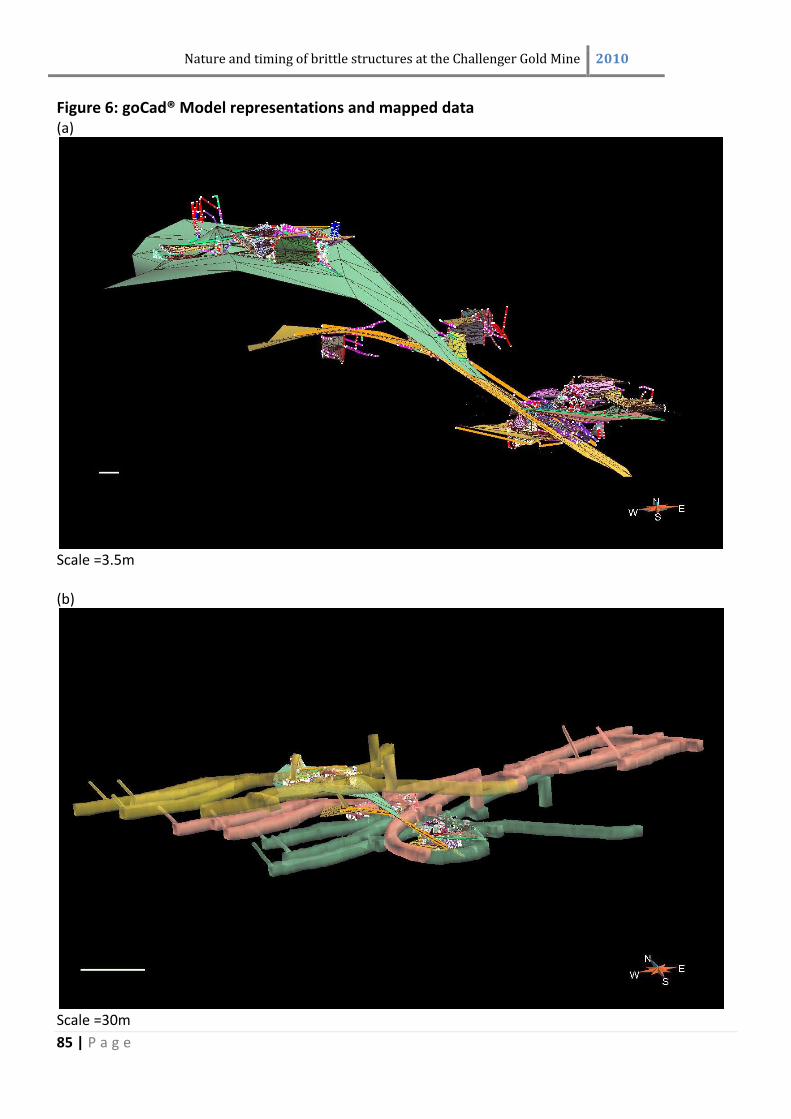
Nature and timing of brittle structures at the Challenger Gold Mine 2010
85 | P a g e
Figure 6: goCad® Model representations and mapped data (a)
Scale =3.5m (b)
Scale =30m
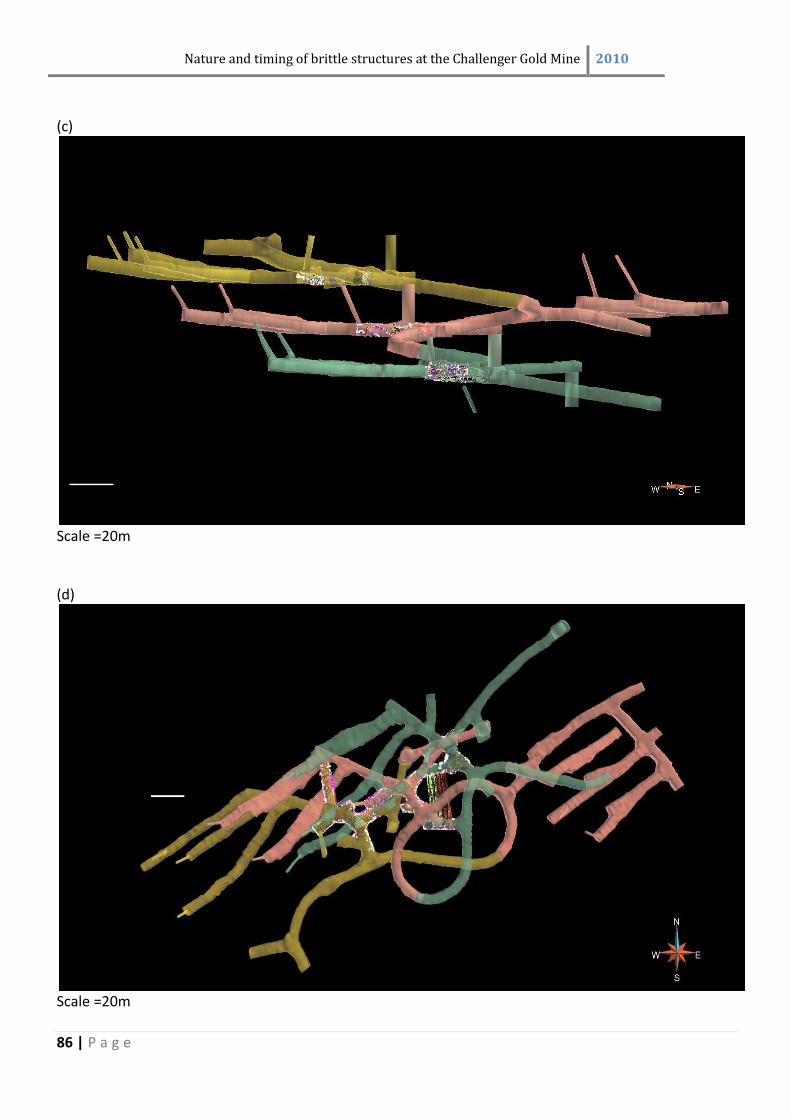
Nature and timing of brittle structures at the Challenger Gold Mine 2010
86 | P a g e
(c)
Scale =20m (d)
Scale =20m
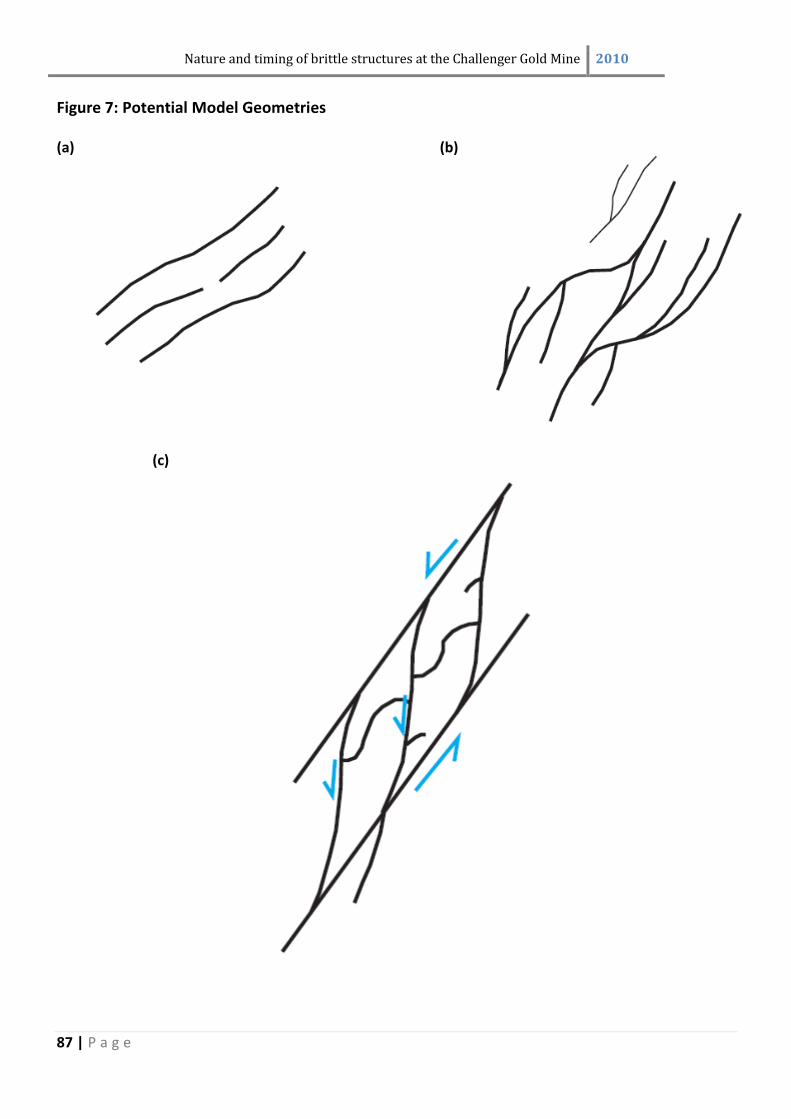
Nature and timing of brittle structures at the Challenger Gold Mine 2010
87 | P a g e
Figure 7: Potential Model Geometries (a) (b)
(c)
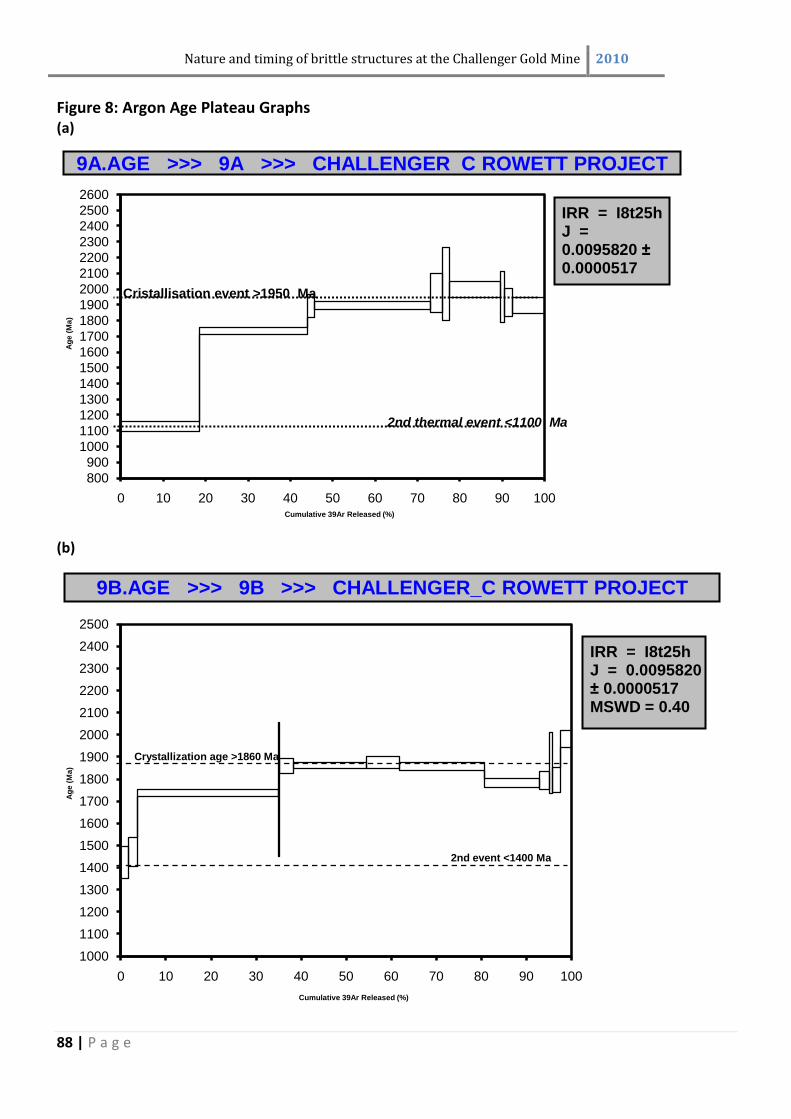
Nature and timing of brittle structures at the Challenger Gold Mine 2010
88 | P a g e
Figure 8: Argon Age Plateau Graphs (a)
(b)
800
900
1000
1100
1200
1300
1400
1500
1600
1700
1800
1900
2000
2100
2200
2300
2400
2500
2600
0 10 20 30 40 50 60 70 80 90 100
Ag
e (
Ma
)
Cumulative 39Ar Released (%)
9A.AGE >>> 9A >>> CHALLENGER_C ROWETT PROJECT
IRR = I8t25hJ = 0.0095820 ±0.0000517
Cristallisation event >1950 Ma
2nd thermal event <1100 Ma
1000
1100
1200
1300
1400
1500
1600
1700
1800
1900
2000
2100
2200
2300
2400
2500
0 10 20 30 40 50 60 70 80 90 100
Ag
e (
Ma
)
Cumulative 39Ar Released (%)
9B.AGE >>> 9B >>> CHALLENGER_C ROWETT PROJECT
IRR = I8t25hJ = 0.0095820 ± 0.0000517MSWD = 0.40
Crystallization age >1860 Ma
2nd event <1400 Ma
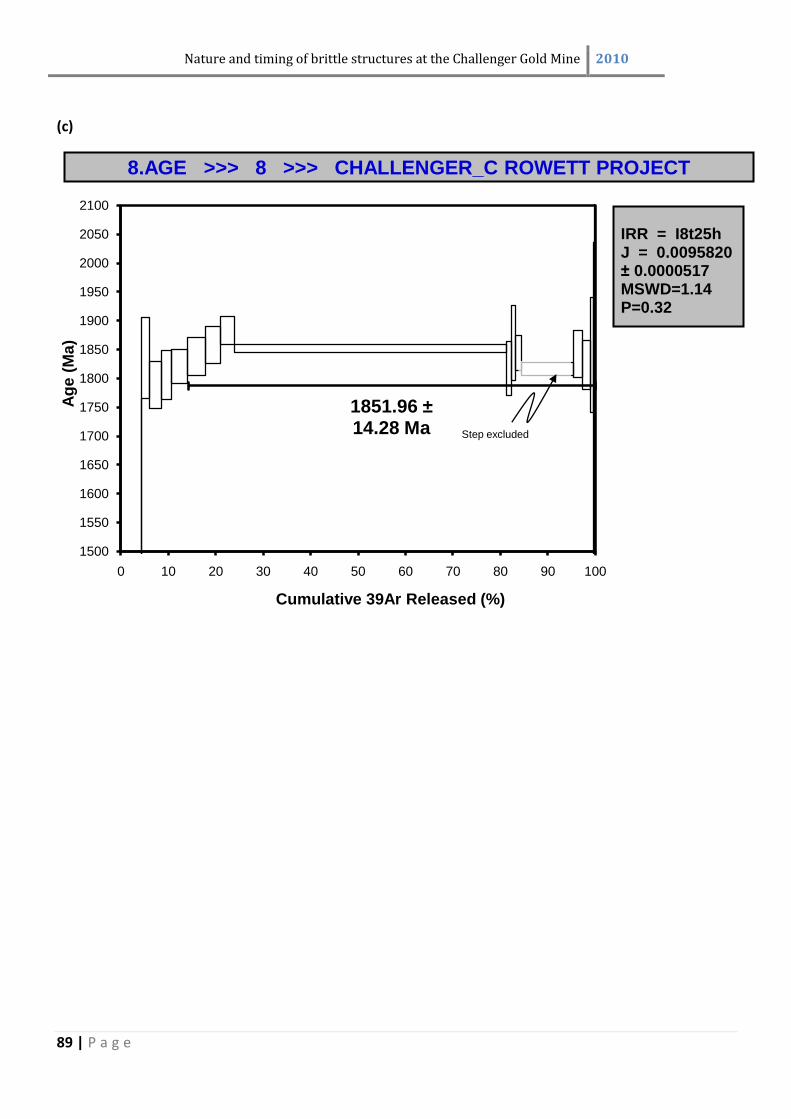
Nature and timing of brittle structures at the Challenger Gold Mine 2010
89 | P a g e
(c)
1851.96 ±14.28 Ma
1500
1550
1600
1650
1700
1750
1800
1850
1900
1950
2000
2050
2100
0 10 20 30 40 50 60 70 80 90 100
Ag
e (
Ma
)
Cumulative 39Ar Released (%)
8.AGE >>> 8 >>> CHALLENGER_C ROWETT PROJECT
IRR = I8t25hJ = 0.0095820 ± 0.0000517MSWD=1.14P=0.32
Step excluded
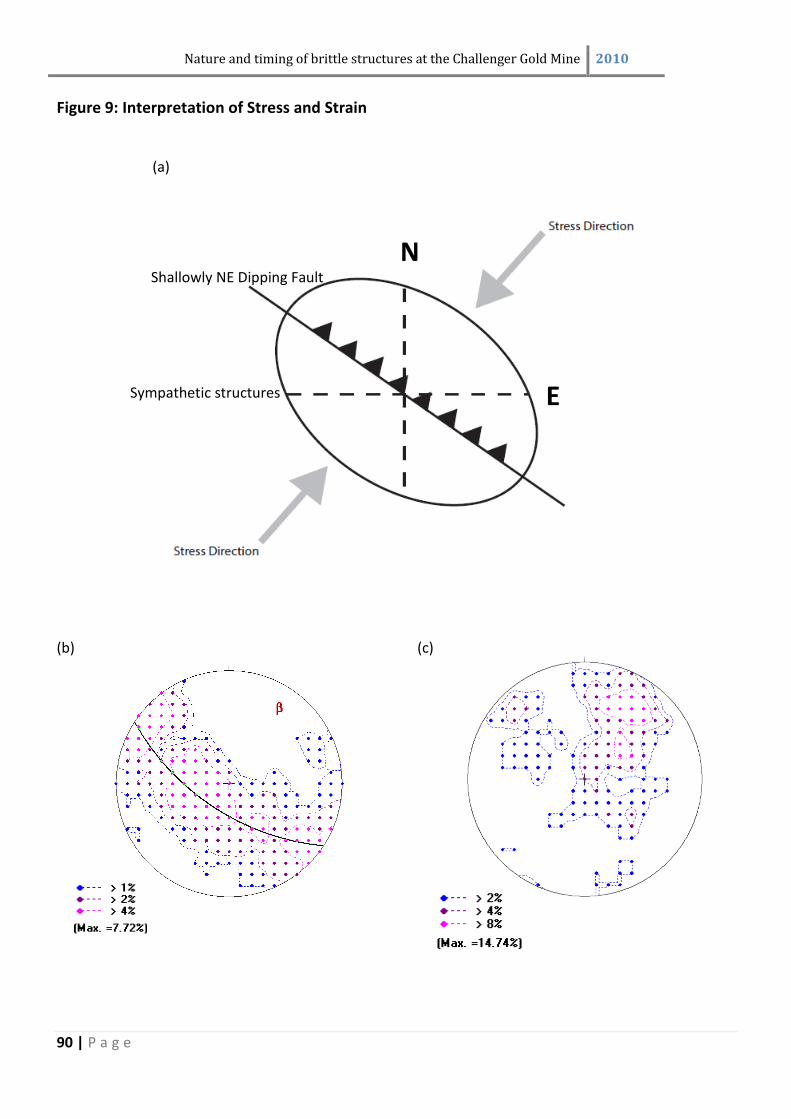
Nature and timing of brittle structures at the Challenger Gold Mine 2010
90 | P a g e
Figure 9: Interpretation of Stress and Strain
(a)
(b) (c)
N N
E Sympathetic structures
Shallowly NE Dipping Fault
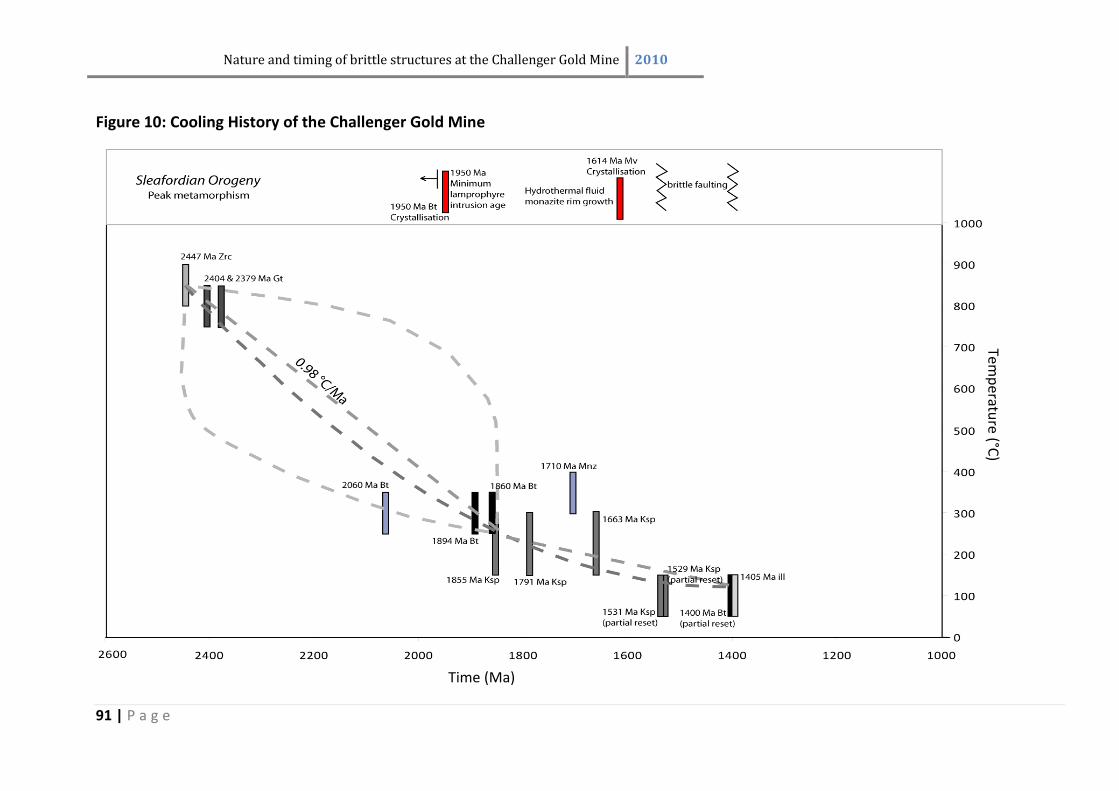
Nature and timing of brittle structures at the Challenger Gold Mine 2010
91 | P a g e
Figure 10: Cooling History of the Challenger Gold Mine
Time (Ma)
Temp
erature (°C
)
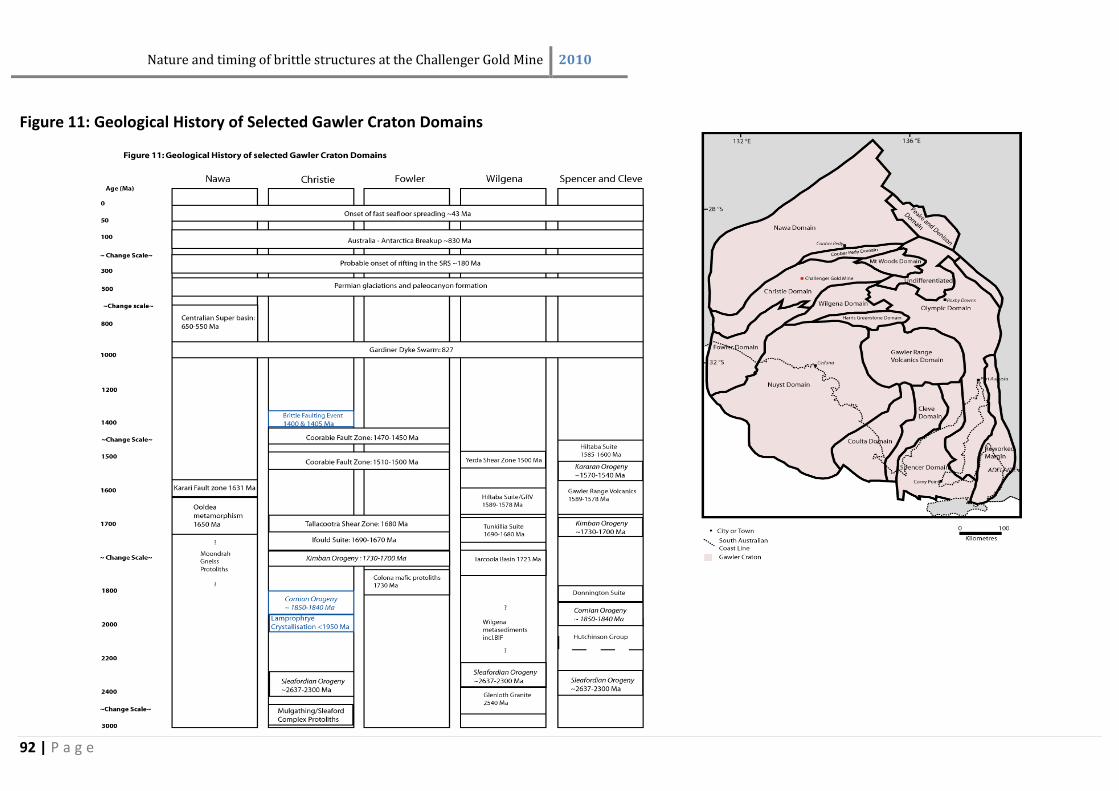
Nature and timing of brittle structures at the Challenger Gold Mine 2010
92 | P a g e
Figure 11: Geological History of Selected Gawler Craton Domains

Related Documents