Proceedings of the 2020 Conference on Empirical Methods in Natural Language Processing, pages 8427–8444, November 16–20, 2020. c 2020 Association for Computational Linguistics 8427 Natural Language Processing for Achieving Sustainable Development: the Case of Neural Labelling to Enhance Community Profiling Costanza Conforti 1,2 , Stephanie Hirmer 1,3 , David Morgan 4 , Marco Basaldella 2 , Yau Ben Or 1 1 Rural Senses Ltd. 2 Language Technology Lab, University of Cambridge 3 Energy and Power Group, University of Oxford 4 Centre for Sustainable Development, University of Cambridge [email protected] Abstract In recent years, there has been an increasing interest in the application of Artificial Intel- ligence – and especially Machine Learning – to the field of Sustainable Development (SD). However, until now, NLP has not been sys- tematically applied in this context. In this paper, we show the high potential of NLP to enhance project sustainability. In particu- lar, we focus on the case of community pro- filing in developing countries, where, in con- trast to the developed world, a notable data gap exists. Here, NLP could help to ad- dress the cost and time barrier of structuring qualitative data that prohibits its widespread use and associated benefits. We propose the new extreme multi-class multi-label Auto- matic User-Perceived Value classification task. We release Stories2Insights (S2I), an expert- annotated dataset of interviews carried out in Uganda, we provide a detailed corpus analysis, and we implement a number of strong neural baselines to address the task. Experimental re- sults show that the problem is challenging, and leaves considerable room for future research at the intersection of NLP and SD. 1 Introduction Sustainable Development (SD) is an interdisci- plinary field which studies the integration and bal- ancing of economic, environmental and social con- cerns to tackle the broad goal of achieving inclusive and sustainable growth (Brundtland, 1987; Keeble, 1988; Sachs, 2015). As a collective, trans-national effort toward sustainability, in 2015 the United Na- tions approved the 2030 Agenda (United Nations, 2015), which identifies 17 Sustainable Develop- ment Goals (SDGs) to be reached by 2030 (Lee et al., 2016). In recent years, there has been in- creasing recognition of the fundamental role played by data in achieving the objectives set out in the SDGs (Griggs et al., 2013; Nilsson et al., 2016; Vinuesa et al., 2020). In this paper, we focus on data-driven planning and delivery of projects 1 which address one or more of the SDGs in a developing country con- text. When dealing with developing countries, a deep understanding of project beneficiaries’ needs and values (hereafter referred to as User-Perceived Values or UPVs, Hirmer and Guthrie (2016)) is of particular importance. This is because benefi- ciaries with limited financial means are especially good at assessing needs and values (Hirji, 2015). When a project fails to create value to a benefit- ing community, the community is less likely to care about its continued operation (Watkins et al., 2012; Chandler et al., 2013; Hirmer, 2018) and as a consequence, the chances of the project’s long- term success is jeopardised (Bishop et al., 2010). Therefore, comprehensive community profiling 2 plays a key role in understanding what is important for a community and act upon it, thus ensuring a project’s sustainability (van der Waldt, 2019). Obtaining data with such characteristics requires knowledge extraction from qualitative interviews which come in the form of unstructured free text (Saggion et al., 2010; Parmar et al., 2018). This step is usually done manually by domain experts (Lundeg ˚ ard and Wickman, 2007), which further raises the costs. Thus, structured quali- tative data is often unaffordable for project de- velopers. As a consequence, project planning heavily relies upon sub-optimal aggregated statis- tical data, like household surveys (WHO, 2016) or remotely-sensed satellite imagery (Bello and Aina, 2014; Jean et al., 2016), which unfortu- 1 Examples of projects for SD include physical infras- tructures (as the installation of a solar mini-grid to provide light (Bhattacharyya, 2012)) or of programmes to change a population’s behaviour (as the awareness raising campaigns against HIV transmission implemented by Avert (2019)). 2 Community profiling is the detailed and holistic descrip- tion of a community’s needs and resources (Blackshaw, 2010).

Welcome message from author
This document is posted to help you gain knowledge. Please leave a comment to let me know what you think about it! Share it to your friends and learn new things together.
Transcript

Proceedings of the 2020 Conference on Empirical Methods in Natural Language Processing, pages 8427–8444,November 16–20, 2020. c©2020 Association for Computational Linguistics
8427
Natural Language Processing for Achieving Sustainable Development:the Case of Neural Labelling to Enhance Community Profiling
Costanza Conforti1,2, Stephanie Hirmer1,3, David Morgan4, Marco Basaldella2, Yau Ben Or11Rural Senses Ltd.
2Language Technology Lab, University of Cambridge3Energy and Power Group, University of Oxford
4Centre for Sustainable Development, University of [email protected]
Abstract
In recent years, there has been an increasinginterest in the application of Artificial Intel-ligence – and especially Machine Learning –to the field of Sustainable Development (SD).However, until now, NLP has not been sys-tematically applied in this context. In thispaper, we show the high potential of NLPto enhance project sustainability. In particu-lar, we focus on the case of community pro-filing in developing countries, where, in con-trast to the developed world, a notable datagap exists. Here, NLP could help to ad-dress the cost and time barrier of structuringqualitative data that prohibits its widespreaduse and associated benefits. We proposethe new extreme multi-class multi-label Auto-matic User-Perceived Value classification task.We release Stories2Insights (S2I), an expert-annotated dataset of interviews carried out inUganda, we provide a detailed corpus analysis,and we implement a number of strong neuralbaselines to address the task. Experimental re-sults show that the problem is challenging, andleaves considerable room for future research atthe intersection of NLP and SD.
1 Introduction
Sustainable Development (SD) is an interdisci-plinary field which studies the integration and bal-ancing of economic, environmental and social con-cerns to tackle the broad goal of achieving inclusiveand sustainable growth (Brundtland, 1987; Keeble,1988; Sachs, 2015). As a collective, trans-nationaleffort toward sustainability, in 2015 the United Na-tions approved the 2030 Agenda (United Nations,2015), which identifies 17 Sustainable Develop-ment Goals (SDGs) to be reached by 2030 (Leeet al., 2016). In recent years, there has been in-creasing recognition of the fundamental role playedby data in achieving the objectives set out in theSDGs (Griggs et al., 2013; Nilsson et al., 2016;
Vinuesa et al., 2020).In this paper, we focus on data-driven planning
and delivery of projects1 which address one ormore of the SDGs in a developing country con-text. When dealing with developing countries, adeep understanding of project beneficiaries’ needsand values (hereafter referred to as User-PerceivedValues or UPVs, Hirmer and Guthrie (2016)) isof particular importance. This is because benefi-ciaries with limited financial means are especiallygood at assessing needs and values (Hirji, 2015).When a project fails to create value to a benefit-ing community, the community is less likely tocare about its continued operation (Watkins et al.,2012; Chandler et al., 2013; Hirmer, 2018) and asa consequence, the chances of the project’s long-term success is jeopardised (Bishop et al., 2010).Therefore, comprehensive community profiling2
plays a key role in understanding what is importantfor a community and act upon it, thus ensuring aproject’s sustainability (van der Waldt, 2019).
Obtaining data with such characteristics requiresknowledge extraction from qualitative interviewswhich come in the form of unstructured freetext (Saggion et al., 2010; Parmar et al., 2018).This step is usually done manually by domainexperts (Lundegard and Wickman, 2007), whichfurther raises the costs. Thus, structured quali-tative data is often unaffordable for project de-velopers. As a consequence, project planningheavily relies upon sub-optimal aggregated statis-tical data, like household surveys (WHO, 2016)or remotely-sensed satellite imagery (Bello andAina, 2014; Jean et al., 2016), which unfortu-
1Examples of projects for SD include physical infras-tructures (as the installation of a solar mini-grid to providelight (Bhattacharyya, 2012)) or of programmes to change apopulation’s behaviour (as the awareness raising campaignsagainst HIV transmission implemented by Avert (2019)).
2Community profiling is the detailed and holistic descrip-tion of a community’s needs and resources (Blackshaw, 2010).

8428
nately is of considerable lower resolution in de-veloping countries. Whilst these quantitative datasets are important and necessary, they are insuffi-cient to ensure successful project design, lackinginsights on UPVs that are crucial to success. Inthis context, the application of NLP techniques canhelp to make qualitative data more accessible toproject developers by dramatically reducing timeand costs to structure data. However, despite hav-ing been successfully applied to many other do-mains – ranging from biomedicine (Simpson andDemner-Fushman, 2012), to law (Kanapala et al.,2019) and finance (Loughran and McDonald, 2016)– to our knowledge, NLP has not yet been appliedto the field of SD in a systematic and academicallyrigorous format3.
In this paper, we make the following contribu-tions: (1) we articulate the potential of NLP toenhance SD—at the time of writing this is the firsttime NLP is systematically applied to this field;(2) as a case-study at the intersection between NLPand SD, we focus on enhancing project planningin the context of a developing country, namelyUganda; (3) we propose the new task of UPV Clas-sification, which consists in labeling qualitativeinterviews using an annotation schema developedin the field of SD; (4) we annotate and releaseStories2Insights, a corpus of UPV-annotated inter-views in English; (5) we provide a set of strongneural baselines for future reference; and (6) weshow – through a detailed error analysis – that thetask is challenging and important, and we hope itwill raise interest from the NLP community.
2 Background
2.1 Artificial Intelligence for SustainableDevelopment
While NLP has not yet been applied to the field ofSD, in recent years there have been notable appli-cations of Artificial Intelligence (AI) in this area.This is testified by the rise of young research fieldsthat seek to help meet the SDGs, as ComputationalSustainability (Gomes et al., 2019) and AI for So-cial Good (Hager et al., 2017; Shi et al., 2020).
In this context, Machine Learning, in particu-lar in the field of Computer Vision (De-Arteagaet al., 2018), has been applied to contexts rang-ing from conservation biology (Kwok, 2019),
3We have found sporadic examples of the application ofNLP, e.g. for analysing data from a gaming app used in adeveloping country (Pulse Lab Jakarta, 2016).
to poverty (Blumenstock et al., 2015) and slav-ery mapping (Foody et al., 2019), to deforesta-tion and water quality monitoring (Holloway andMengersen, 2018).
2.2 Ethics of AI for Social Good
Despite its positive impact, it is important to recog-nise that some AI techniques can act both as an en-hancer and inhibitor of sustainability. As recentlyshown by Vinuesa et al. (2020), AI might inhibitmeeting a considerable number of targets acrossthe SDGs and may result in inequalities withinand across countries due to application biases. Un-derstanding the implications of AI and its relatedfields on SD, or Social Good more generally, isparticularly important for countries where actionon SDGs is being focused and where issues aremost acute (UNESCO, 2019a,b).
2.3 Project biases
Various works highlight the importance of under-standing the local context and engaging with localstakeholders, including beneficiaries, to achieveproject sustainability. Where such informationis not available, projects are designed and deliv-ered based on the judgment of other actors (e.g.project funders, developers or domain experts,(Risal, 2014; Axinn, 1988; Harman and Williams,2014)). Their judgment, in turn, is subject to biases(Kahneman, 2011) that are shaped by past experi-ences, beliefs, preferences and worldviews: such bi-ases can include, for example, preferences towardsa specific sector (e.g. energy or water), technology(e.g. solar, hydro) or gender-group (e.g. solutionswhich benefit a gender disproportionately), whichare pushed without considering the local needs.
NLP has the potential to increase the availabilityof community-specific data to key decision makersand ensure project design is properly informed andappropriately targeted. However, careful attentionneeds to be paid to the potential for bias in datacollection resulting from the interviewers (Bryman,2016), as well as the potential to introduce newbias through NLP.
3 User-Perceived Values (UPVs) forData-driven Sustainable Projects
3.1 The User-Perceived Values (UPV)Framework.
As a means to obtain qualitative data with thecharacteristics mentioned above, we adapt the

8429
(a) User-Perceived Value wheel. (b) Flowchart of the intersection between NLP (purple square) and the delivery of SD projects.
Figure 1: Using UPVs (1a) to build sustainable projects: note the role of NLP (purple square in 1b).
User-Perceived Values (UPV) framework (Hirmer,2018). The UPV framework builds on value the-ory, which is widely used in marketing and productdesign in the developed world (Sheth et al., 1991;Woo, 1992; Solomon, 2002; Boztepe, 2007). Valuetheory assumes that a deep connection exists be-tween what consumers perceive as important andtheir inclinations to adopt a new product or ser-vice (Nurkka et al., 2009).
In the context of developing countries, our UPVframework identifies a set of 58 UPVs which canbe used to frame the wide range of perspectiveson what is of greatest concern to project beneficia-ries (Hirmer and Guthrie, 2016). UPVs (or tier 3(T3) values) can be clustered into 17 tier 2 (T2)value groups, each one embracing a set of similarT3 values; in turn, T2 values can be categorizedinto 6 tier 1 (T1) high-level value pillars, as fol-lows: (Hirmer and Guthrie, 2014):
1. Emotional: contains the T2 values Conscience,Contentment, Human Welfare (tot. 9 T3 values)
2. Epistemic: contains the T2 values Informationand Knowledge (tot. 2 T3 values)
3. Functional: contains the T2 values Convenience,Cost Economy, Income Economy and Qualityand Performance (tot. 21 T3 values)
4. Indigenous: containing the T2 values SocialNorm and Religion (tot. 5 T3 values)
5. Intrinsic Human: Health, Physiological andQuality of Life (tot. 11 T3 values)
6. Social significance: contains the T2 Identity,Status and Social Interaction (tot. 11 T3 values)
The interplay between T1, T2 and T3 values isgraphically depicted in the UPV Wheel (Figure 1a).See Appendix A for the full set of UPV definitions.
3.2 Integrating UPVs into SustainableProject Planning.
The UPV approach offers a theoretical frameworkto place communities at the centre of project design(Figure 1b). Notably, it allows to (a) facilitate moreresponsible and beneficial project planning (Gal-larza and Saura, 2006); and (b) enable effectivecommunication with rural dwellers. The latter al-lows the use of messaging of project benefits ina way that resonates with the beneficiaries’ ownunderstanding of benefits, as discussed by Hirji(2015). This results in a higher end-user accep-tance, because the initiative is perceived to have per-sonal value to the beneficiaries: as a consequence,community commitment will be increased, eventu-ally enhancing the project success rate and leadingto more sustainable results (Hirmer, 2018).
3.3 The role of NLP to enhance SustainableProject Planning.
Data conveying the beneficiaries’ perspective isseldom considered in practical application, mainlydue to the fact that it comes in the form of un-structured qualitative interviews. As introducedabove, data needs to be structured in order to beuseful (OECD, 2017; UN Agenda for SustainableDevelopment, 2018). This makes the entire processvery long and costly, thus making it almost pro-hibitive to afford in practice for most small-scaleprojects. In this context, the role of AI, and morespecifically NLP, can have a yet unexplored oppor-tunity. Implementing successful NLP systems toautomatically perform the annotation process oninterviews (Figure 1b, purple square), which con-stitutes the major bottleneck in the project planningpipeline (Section 4.1), would dramatically speed upthe entire project life-cycle and drastically reduceits costs.
8430
(a) (b) (c)
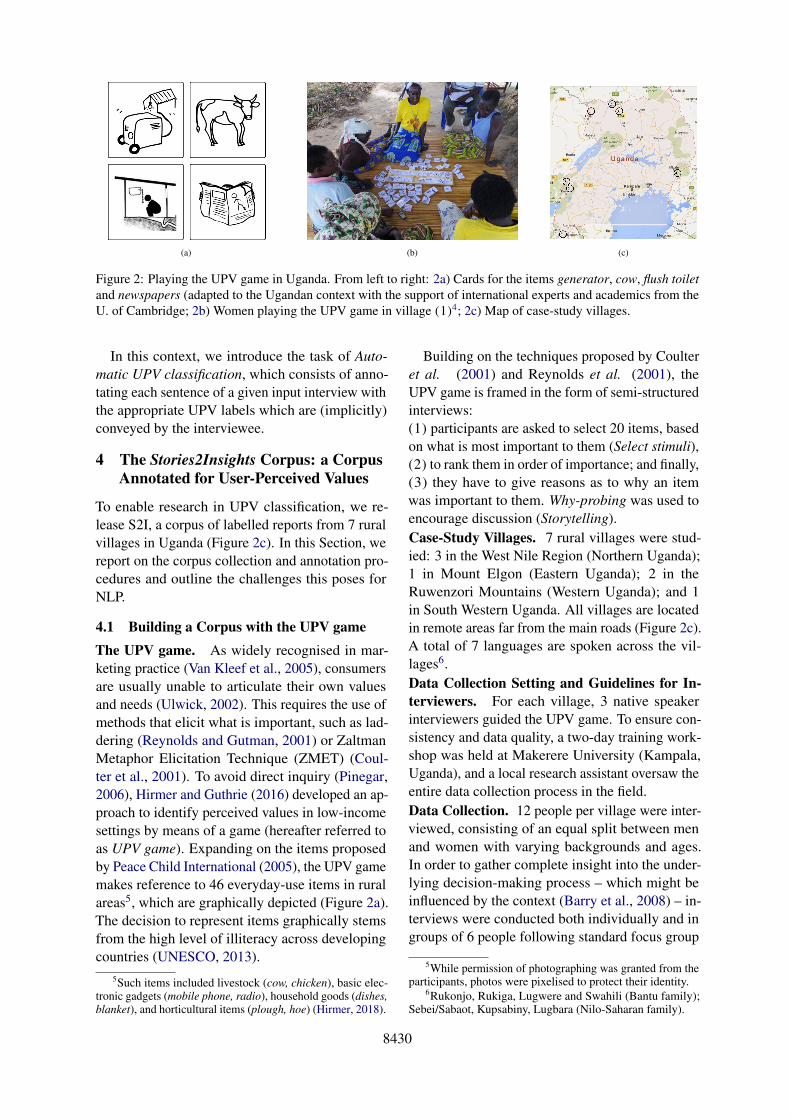
Figure 2: Playing the UPV game in Uganda. From left to right: 2a) Cards for the items generator, cow, flush toiletand newspapers (adapted to the Ugandan context with the support of international experts and academics from theU. of Cambridge; 2b) Women playing the UPV game in village (1)4; 2c) Map of case-study villages.
In this context, we introduce the task of Auto-matic UPV classification, which consists of anno-tating each sentence of a given input interview withthe appropriate UPV labels which are (implicitly)conveyed by the interviewee.
4 The Stories2Insights Corpus: a CorpusAnnotated for User-Perceived Values
To enable research in UPV classification, we re-lease S2I, a corpus of labelled reports from 7 ruralvillages in Uganda (Figure 2c). In this Section, wereport on the corpus collection and annotation pro-cedures and outline the challenges this poses forNLP.
4.1 Building a Corpus with the UPV gameThe UPV game. As widely recognised in mar-keting practice (Van Kleef et al., 2005), consumersare usually unable to articulate their own valuesand needs (Ulwick, 2002). This requires the use ofmethods that elicit what is important, such as lad-dering (Reynolds and Gutman, 2001) or ZaltmanMetaphor Elicitation Technique (ZMET) (Coul-ter et al., 2001). To avoid direct inquiry (Pinegar,2006), Hirmer and Guthrie (2016) developed an ap-proach to identify perceived values in low-incomesettings by means of a game (hereafter referred toas UPV game). Expanding on the items proposedby Peace Child International (2005), the UPV gamemakes reference to 46 everyday-use items in ruralareas5, which are graphically depicted (Figure 2a).The decision to represent items graphically stemsfrom the high level of illiteracy across developingcountries (UNESCO, 2013).
5Such items included livestock (cow, chicken), basic elec-tronic gadgets (mobile phone, radio), household goods (dishes,blanket), and horticultural items (plough, hoe) (Hirmer, 2018).
Building on the techniques proposed by Coulteret al. (2001) and Reynolds et al. (2001), theUPV game is framed in the form of semi-structuredinterviews:(1) participants are asked to select 20 items, basedon what is most important to them (Select stimuli),(2) to rank them in order of importance; and finally,(3) they have to give reasons as to why an itemwas important to them. Why-probing was used toencourage discussion (Storytelling).Case-Study Villages. 7 rural villages were stud-ied: 3 in the West Nile Region (Northern Uganda);1 in Mount Elgon (Eastern Uganda); 2 in theRuwenzori Mountains (Western Uganda); and 1in South Western Uganda. All villages are locatedin remote areas far from the main roads (Figure 2c).A total of 7 languages are spoken across the vil-lages6.Data Collection Setting and Guidelines for In-terviewers. For each village, 3 native speakerinterviewers guided the UPV game. To ensure con-sistency and data quality, a two-day training work-shop was held at Makerere University (Kampala,Uganda), and a local research assistant oversaw theentire data collection process in the field.Data Collection. 12 people per village were inter-viewed, consisting of an equal split between menand women with varying backgrounds and ages.In order to gather complete insight into the under-lying decision-making process – which might beinfluenced by the context (Barry et al., 2008) – in-terviews were conducted both individually and ingroups of 6 people following standard focus group
5While permission of photographing was granted from theparticipants, photos were pixelised to protect their identity.
6Rukonjo, Rukiga, Lugwere and Swahili (Bantu family);Sebei/Sabaot, Kupsabiny, Lugbara (Nilo-Saharan family).

8431
Figure 3: UPV frequencies from the S2I corpus (see Appendix A for UPV definitions).
methods (Silverman, 2013; Bryman, 2016). Eachinterview lasted around 90 minutes. The data col-lection process took place over a period of 3 monthsand resulted in a total of 119 interviews.Ethical Considerations. Participants receivedcompensation in the amount of 1 day of labour.An informed consent form was read out loud bythe interviewer prior to the UPV game, to cater forthe high-level of illiteracy amongst participants. Toensure integrity, a risk assessment following theUniversity of Cambridge’s Policy on the Ethics ofResearch Involving Human Participants and Per-sonal Data was completed. To protect the partic-ipants’ identity, locations and proper names wereanonymized.Data Annotation. The interviews were trans-lated7 into English, analysed and annotated by do-main experts8 using the computer-assisted qualita-tive data analysis software HyperResearch (Hesse-Biber et al., 1991). To ensure consistency acrossinterviews, they were annotated following Bry-man (2012), using cross-sectional indexing (Mason,2002). Due to the considerable size of collecteddata, the annotation process took around 6 months.
4.2 Corpus Statistics and NLP ChallengesWe obtain a final corpus of 5102 annotated utter-ances from the interviews. Samples present anaverage length of 20 tokens. The average number
7Note that translating into English (or other lan-guages commonly spoken in international workplaces,https://www.un.org/en/sections/about-un/official-languages/) is often a crucial step whenapplying knowledge to practical application in SD, in thiscase project decision-making (Bergstrom et al., 2012).
8A team of researchers from the Department of Engineer-ing for Sustainable Development, supported by researchers inDevelopment Studies and Linguistics, all at the University ofCambridge.
of samples per T3 label is 169.1, with an extremelyskewed distribution: the most frequent T3, Eco-nomic Opportunity, occurs 957 times, while theleast common, Preservation of the Environment,only 7 (Figure 3).
58.8% of the samples are associated with morethan 1 UPV, and 22.3% with more than 2 UPVs(refer to Appendix B for further details on UPVcorrelation). Such characteristics make UPV clas-sification highly challenging to model: the task isan extreme multi-class multi-label problem, withhigh class imbalancy. Imbalanced label distribu-tions pose a challenge for many NLP applications– as sentiment analysis (Li et al., 2011), sarcasmdetection (Liu et al., 2014), and NER (Tomanekand Hahn, 2009) – but are not uncommon in user-generated data (Imran et al., 2016). The followinginterview excerpt illustrates the multi-class multi-label characteristics of the problem:1. If I have a flush toilet in my house I can be a
king of all kings because I can’t go out on thosesquatting latrines [Reputation][Aspiration]
2. And recently I was almost rapped (sic.) when Iescorted my son to the latrine [Security]
3. That [...] we have so many cases in our villageof kids that fall into pit latrine [Safety][Caring]
Further challenges for NLP are introduced by thefrequent use of non-standard grammar and poorsentence structuring, which often occur in oral pro-duction (Cole et al., 1995). Moreover, manual tran-scription of interviews may lead to spelling errors,thus increasing OOVs. This is illustrated in thebelow excerpts (spelling errors are underlined):• Also men like phone there are so jealous for
their women for example like in the morning myhusband called me and asked that are you inchurch; so that’s why they picked a phone.

8432
Figure 4: Multi-task neural architecture for UPV classification.
Figure 5: Examples of nega-tive samples generated throughdata augmentation.
• A house keeps secrecy for example [...] I can bebitten by a snake if I had sex outside [...] yousee, me I cannot because may child is lookingfor mangoes in the bush and finds me there, howdo I explain, can you imagine!!
5 User-Perceived Values Classification
As outlined above, given an input interview, thetask consists in annotating each sentence with theappropriate UPV(s). The extreme multi-class multi-label quality of the task (Section 4.2) makes it im-practical to tackle as a standard multi-class clas-sification problem—where, given an input samplex, a system is trained to predict its label from atagset T = {l1, l2, l3} as x → l2 (i.e. [0,1,0]). In-stead, we model the task as a binary classificationproblem: given x, the system learns to predict itsrelatedness with each one of the possible labels,i.e. (x, l1)→ 0, (x, l2)→ 1 and (x, l3)→ 0 9.
We consider the samples from the S2I corpus aspositive instances. Then, we generate three kindsof negative instances by pairing the sample textwith random labels. To illustrate, consider the threeT2 classes Convenience, Identity and Status, whichcontain the following T3 values:• ContentmentT2 = {AestheticT3, ComfortT3, ...}• IdentityT2 = {AppearanceT3, DignityT3...}• StatusT2 = {AspirationT3, ReputationT3, ...}Moreover, ContentmentT2 ∈ EmotionalT1 and{IdentityT2, StatusT2} ∈ SocialSignificanceT1.Given a sample x and its gold label AspirationT3,we can generate the following training samples:• (x,AspirationT3) is a positive sample;
9Note that this is different to the classic binary relevancemethod, where a separated binary classifier is learned for eachconsidered label (Read et al., 2011).
• (x,ReputationT3) is a mildly negative sample,as x is linked with a wrong T3 with the same T2;• (x,DignityT3) is negative sample, as x is a asso-
ciated with a wrong T3 from a different T2 class,but both T2 classes belong to the same T1; and• (x,AestheticT3) is a strictly negative sample, asx is associated with a wrong label from the an-other T2 class in a different T1.
In this way, during training the system is exposedto positive (real) samples and negative (randomlygenerated) samples.
A UPV classification system should satisfy thefollowing desiderata: (1) it should be relativelylight, given that it will be used in the context of de-veloping countries, which may suffer from accessbias10 and (2) the goal of such a system isn’t tocompletely replace the work of human SD experts,but rather to reduce the time needed for interviewannotation. In this context, false positives are quickto notice and delete, while false negatives are moredifficult to spot and correct. Moreover, when as-sessing a community’s needs and values, missinga relevant UPV is worse than including one whichwasn’t originally present. For these reasons, recallis particularly important for a UPV classifier.
In the next Section, we provide a set of strongbaselines for future reference.
5.1 Neural Models for UPV Classification5.1.1 Baseline ArchitectureEmbedding Layer. The system receives an in-put sample (x, T3), where x is the sample text(e1, ..., en), T3 is the T3 label as the sequence ofits tokens (e1, ..., em), and ei is the word embed-
10With access bias we refer to contexts with limited com-putational capacity and cloud services accessibility.

8433
ding representation of a token at position i. Weobtain a T3 embedding eT3 for each T3 label usinga max pool operation over its word embeddings:given the short length of T3 codes, this proved towork well and it is similar to findings in relation ex-traction and targeted sentiment analysis (Tang et al.,2016). We replicate eT3 n times and concatenate itto the text’s word embeddings x (Figure 4).Encoding Layer. We obtain a hidden representa-tion ~htext with a forward LSTM (Gers et al., 1999)over the concatenated input. We then apply at-tention to capture the key parts of the input textw.r.t. the given T3. In detail, given the outputmatrix of the LSTM layer H = [h1, ..., hn], weproduce a hidden representation htext as follows:
M = tanh(
[WhH
Wveupv ⊗ eN
])
αtext = softmax(wTM)
htext = HαT
This is similar in principle to the attention-basedLSTM by Wang et al. (2016), and proved to workbetter than classic attention over H on our data.Decoding Layer. We predict y ∈ [0, 1] with adense layer followed by a sigmoidal activation.
5.1.2 Including Description InformationEach T3 comes with a short description, which waswritten by domain experts and used during manuallabelling (the complete list is in the Appendix A).We integrate information from such descriptionsinto our model as follows: given the ordered wordembeddings from the UPV description (e1, ..., ed),we obtain a description representation hdescr fol-lowing the same steps as for the sample text.
In line with previous studies on siamese net-works (Yan et al., 2018), we observe better resultswhen sharing the weights between the two LSTMs.We keep two separated attention layers for sampletexts and descriptions. We concatenate htext andhdescr and feed the obtained vector to the outputlayer.
5.1.3 Multi-task TrainingA clear hierarchy exists between T3, T2 and T1values (Section 3). We integrate such informationusing multi-task learning (Caruana, 1997; Ruder,2017). Given an input sample, we predict its re-latedness not only w.r.t. a T3 label, but also withits corresponding T2 and T1 labels11. In practice,
11The mapping between sample and correct labels [T3, T2,T1] is as follows: positive: [1, 1, 1]; slightly negative: [0, 1,1]; negative: [0, 0, 1]; strictly negative: [0, 0, 0].
text +att +descr +att+descr
P 77.5 78.1 80.4 78.9R 65.5 71.0 66.5 70.6F1 71.0 74.2 72.8 74.4
Table 1: Results of ablation study (single-task).
given the hidden representation h = htext⊕hdescr,we first feed it into a dense layer denseT1 to ob-tain hT1, and predict yT1 with a sigmoidal function.We then concatenate hT1 with the previously ob-tained h, and we predict yT2 with a T2-specificdense layer σ(denseT2(h⊕ hT1)). Finally, yT3 ispredicted as σ(denseT3(h⊕ hT2)).
In this way, the prediction yi is based on boththe original h and the hidden representation com-puted in the previous stage of the hierarchy, hi−1
(Figure 4).
6 Experiments and Discussion
6.1 Experimental Setting
6.1.1 Data Preparation
For each positive sample, we generate 40 negativesamples (we found empirically that this was thebest performing ratio, see Appendix C).
Moreover, to expose the system to more di-verse input, we slightly deform the sample’s textwhen generating negative samples. Following Weiand Zou (2019), we implement 4 operations: ran-dom deletion, swap, insertion, and semantically-motivated substitution. We also implement charac-ter swapping to increase the system’s robustness tospelling errors (Figure 5).
We consider only samples belonging to UPVlabels with a support higher than 30 in the S2Icorpus, thus rejecting 12 very rare UPVs. We selecta random 80% proportion from the data as trainingset; out of the remaining 980 samples, we randomlyselect 450 as dev and use the rest as test set.
6.1.2 Training Setting
In order to allow for robust handling of OOVs, ty-pos and spelling errors in the data, we use FastTextsubword-informed pretrained vectors (Bojanowskiet al., 2017) to initialise the word embedding ma-trix. We train using binary cross-entropy loss, withearly stopping monitoring the development set losswith a patience of 5. Sample weighting was usedto account for the different error seriousness (1 fornegative and strictly neg and 0.5 for mildly neg).

8434
Multi-task train setting
Label T3 T2+T3 T1+T2+T3
T3P 78.9 83.5 79.5R 70.6 67.0 72.0F1 74.4 74.4 75.4
T2P – 92.0 84.9R – 40.5 62.3F1 – 56.2 71.9
T1P – – 89.8R – – 70.1F1 – – 78.7
Table 2: Results considering all granularities and all(multi-)task training settings (T3, T2+T3, T1+T2+T3).
Network hyperparameters are reported in AppendixC for replication.
6.2 Results and Discussion6.2.1 Models PerformanceDuring experiments, we monitor precision, recalland F1 score. For evaluation, we consider a test setwhere negative samples appear in the same propor-tion as in the train set (1/40 positive/negative ratio).The results of our experiments are reported in Ta-ble 1. Notably, adding attention and integratingsignal from descriptions to the base system lead tosignificant improvements in performance.
6.2.2 Multi-task TrainingWe consider the best performing model and runexperiments with the three considered multi-tasktrain settings (Section 5.1.3). We consider 3 layersof performance, corresponding to T3, T2 and T1labels. This is useful because, in the applicationcontext, different levels of granularity can be mon-itored. As shown in Table 2, we observe relevantimprovements in F1 scores when jointly learningmore than one training objective. This holds truenot only for T3 classification, but also for T2 classi-fication when training with the T3+T2+T1 setting.This seems to indicate that the signal encoded inthe additional training objectives indirectly con-veys information about the label hierarchy whichis indeed useful for classification.
6.2.3 Real-World Simulation and ErrorAnalysis
To simulate a real scenario where we annotate anew interview with the corresponding UPVs, weperform further experiments on the test set by gen-erating, for each sample, all possible negative sam-ples. We annotate using the T1+T2+T3 model,
T1 T3 P R F1 Support (%)
Em
otio
nal
Harmony 16.7 50.0 25.0 47 0.9Appealing 30.0 75.0 42.9 85 1.7Aesthetics 08.8 60.0 15.4 45 0.9Comfort 52.0 52.0 52.0 226 4.4Entertainment 40.0 54.5 46.2 108 2.1Memorability 16.7 12.5 14.3 77 1.5Safety 59.4 76.0 66.7 233 4.6Sec. People 46.2 75.0 57.1 113 2.2
Epi
st Info. Access 84.6 55.0 66.7 198 3.9Knowl. attain. 06.2 09.8 07.5 433 8.5
Fun
ctio
n
Communication 05.4 58.8 10.0 156 3.1Mobile Acc. 81.8 81.8 81.8 54 1.1Mobility 79.4 81.8 80.6 466 9.1Multipurpose 57.1 33.3 42.1 111 2.2Availability 01.4 33.3 02.6 104 2.0Time Benefit 51.9 66.7 58.3 217 4.3Time Manag. 76.9 83.3 80.0 102 2.0Unburden 41.9 72.0 52.9 190 3.7Cap. Expend. 85.0 53.1 65.4 241 4.7School Fees 94.4 73.9 82.9 240 4.7Econ. Oppor. 80.4 86.3 83.2 957 18.8Effectiveness 17.1 24.0 20.0 157 3.1Lastingness 83.3 38.5 52.6 116 2.3Productivity 52.4 66.7 58.7 200 3.9Usability 25.0 33.3 28.6 75 1.5
Indi
gen.
Celebration 100 50.0 66.7 55 1.1Manners 83.3 45.5 58.8 100 2.0Morality 20.0 22.2 21.1 98 1.9Tradition 85.7 70.6 77.4 175 3.4Faith 96.7 96.7 96.7 245 4.8
Intr
insi
cH
uman
Longevity 09.1 60.0 15.8 46 0.9Healthc. Acc. 72.2 76.5 74.3 176 3.4Treatment 78.3 85.7 81.8 218 4.3Educ. Acc. 80.0 54.5 64.9 103 2.0Energy Acc. 82.1 84.2 83.1 280 5.5Food Security 64.9 87.7 74.6 519 10.2Shelter 42.9 54.5 48.0 92 1.8Water Access 68.2 78.9 73.2 158 3.1Water Quality 37.0 90.9 52.6 148 2.9Wellbeing 09.8 59.1 16.9 245 4.8
Soci
alSi
gnifi
canc
e Appearance 62.5 71.4 66.7 88 1.7Dignity 85.7 60.0 70.6 123 2.4Pers. Perf. 33.3 11.1 16.7 111 2.2Aspiration 56.2 56.2 56.2 186 3.6Modernisation 57.1 40.0 47.1 98 1.9Reputation 52.9 69.2 60.0 189 3.7Fam. Caring 63.6 58.3 60.9 258 5.1Role Fulf. 37.5 50.0 42.9 126 2.5Togetherness 53.3 57.1 55.2 132 2.6
Total 44.9 70.3 50.5
Table 3: Single label results in the Real-World Simula-tion setting, with label support in S2I corpus.
finetuning the threshold for each UPV on the devel-opment set, and perform a detailed error analysisof the results on the test set.
As reported in Table 3, we observe a significantdrop in precision, which confirms the extreme dif-ficulty of the task in a real-world setting due to theextreme data imbalancy. Note, however, that recall
8435
remains relatively stable over changes in evalua-tion settings. This is particularly important for asystem which is meant to enhance the annotators’speed, rather than to completely replace humanexperts: in this context, missing labels are moretime consuming to recover than correcting falsepositives.
Not surprisingly, particularly good performanceis often obtained on T3 labels which tend to corre-late with specific terms (as School Fees, or Faith).In particular, we observe a correlation between aT3 label’s support in the corpus and the system’sprecision in predicting that label: with very fewexceptions, all labels where the system obtained aprecision lower than 30 had a support similar orlower than 3%.
The analysis of the ROC curves shows that, over-all, satisfactory results are obtained for all T1 labelsconsidered (Appendix D), leaving, however, con-siderable room for future research.
7 Conclusions and Future Work
In this study, we provided a first stepping stone to-wards future research at the intersection of NLP andSustainable Development (SD). As a case study, weinvestigated the opportunity of NLP to enhancingproject sustainability through improved communityprofiling by providing a cost effective way towardsstructuring qualitative data.
This research is in line with a general call for AItowards social good, where the potential positiveimpact of NLP is notably missing. In this context,we proposed the new challenging task of AutomaticUser-Perceived Values Classification: we providedthe task definition, an annotated dataset (the Sto-ries2Insights corpus) and a set of light (in terms ofoverall number of parameters) neural baselines forfuture reference.
Future work will investigate ways to improveperformance (and especially precision scores) onour data, in particular on low-support labels. Possi-ble research direction could include more sophis-ticated thresholding selection techniques (Fan andLin, 2007; Read et al., 2011) to replace the sim-ple threshold finetuning which is currently used forsimplicity. While deeper and computationally heav-ier models as Devlin et al. (2019) could possiblyobtain notable gains in performance on our data, itis the responsibility of the NLP community – es-pecially with regards to social good applications –to provide solutions which don’t penalise countries
suffering from access biases (as contexts with lowaccess to computational power), as it is the case ofmany developing countries.
We hope our work will spark interest and opena constructive dialogue between the fields of NLPand SD, and result in new interesting applications.
Acknowledgments
We thank the anonymous reviewers for their effortin reviewing this paper, their constructive feedbackand suggestions. We are grateful to Dr. Nigel Col-lier (University of Cambridge) for providing valu-able feedback on early versions of this paper. Wealso thank Simon Anthony Patterson for helpingto define the UPV hierarchy. Data collection wasfunded by QUALCOMM European Research Stu-dentships in Technology (Grant No. 1068) andthe Engineering and Physical Sciences ResearchCouncil (EPSRC) (Grant No. EP/K503009/1). Fi-nally, we are particularly grateful to Rural Sensesfor helping to define this research and guide usalong.
ReferencesAvert. 2019. Hiv prevention programming. Technical
report, Avert HIV and AIDS organisation.
George H Axinn. 1988. International technical inter-ventions in agriculture and rural development: Somebasic trends, issues, and questions. Agriculture andHuman Values, 5(1-2):6–15.
Marie-Louise Barry, Herman Steyn, and Alan Brent.2008. Determining the most important factors forsustainable energy technology selection in africa:Application of the focus group technique. InPICMET’08-2008 Portland International Confer-ence on Management of Engineering & Technology,pages 181–187. IEEE.
Olalekan Mumin Bello and Yusuf Adedoyin Aina.2014. Satellite remote sensing as a tool in disastermanagement and sustainable development: towardsa synergistic approach. Procedia-Social and Behav-ioral Sciences, 120:365–373.
Anna Bergstrom, Stefan Peterson, Sarah Namusoko,Peter Waiswa, and Lars Wallin. 2012. Knowledgetranslation in uganda: a qualitative study of ugandanmidwives’ and managers’ perceived relevance of thesub-elements of the context cornerstone in the parihsframework. Implementation Science, 7(1):117.
Subhes C. Bhattacharyya. 2012. Energy access pro-grammes and sustainable development: A critical re-view and analysis. Energy for Sustainable Develop-ment, 16(3):260 – 271.
8436
Steven Bird and Edward Loper. 2004. NLTK: The nat-ural language toolkit. In Proceedings of the ACL In-teractive Poster and Demonstration Sessions, pages214–217, Barcelona, Spain. Association for Compu-tational Linguistics.
S Bishop, J Blum, Pursnani Pradeep, Bhavnani Anu-radha, et al. 2010. Marketing lessons from the roomto breathe campaign. Boiling Point, (58):2–17.
Tony Blackshaw. 2010. Key concepts in communitystudies. Sage.
Joshua Blumenstock, Gabriel Cadamuro, and RobertOn. 2015. Predicting poverty and wealth from mo-bile phone metadata. Science, 350(6264):1073–1076.
Piotr Bojanowski, Edouard Grave, Armand Joulin, andTomas Mikolov. 2017. Enriching word vectors withsubword information. Transactions of the Associa-tion for Computational Linguistics, 5:135–146.
Suzan Boztepe. 2007. User value: Competing theoriesand models. International journal of design, 1(2).
Gro Harlem Brundtland. 1987. Our common fu-ture—call for action. Environmental Conservation,14(4):291–294.
A Bryman. 2012. Mixed methods research; combin-ing qualitative and quantitative research. Social Re-search Methods, pages 627–651.
Alan Bryman. 2016. Social research methods, 4 edi-tion. Oxford university press.
Rich Caruana. 1997. Multitask learning. Machinelearning, 28(1):41–75.
Clare IR Chandler, James Kizito, Lilian Taaka, Chris-tine Nabirye, Miriam Kayendeke, Deborah DiLib-erto, and Sarah G Staedke. 2013. Aspirations forquality health care in uganda: How do we get there?Human resources for health, 11(1):13.
Ron Cole, Lynette Hirschman, Les Atlas, Mary Beck-man, Alan Biermann, Marcia Bush, Mark Clements,L Cohen, Oscar Garcia, Brian Hanson, et al. 1995.The challenge of spoken language systems: Re-search directions for the nineties. IEEE transactionson Speech and Audio processing, 3(1):1–21.
Robin A Coulter, Gerald Zaltman, and Keith S Coulter.2001. Interpreting consumer perceptions of advertis-ing: An application of the zaltman metaphor elicita-tion technique. Journal of advertising, 30(4):1–21.
Maria De-Arteaga, William Herlands, Daniel B Neill,and Artur Dubrawski. 2018. Machine learning forthe developing world. ACM Transactions on Man-agement Information Systems (TMIS), 9(2):1–14.
Jacob Devlin, Ming-Wei Chang, Kenton Lee, andKristina Toutanova. 2019. BERT: pre-training ofdeep bidirectional transformers for language under-standing. In Proceedings of the 2019 Conference
of the North American Chapter of the Associationfor Computational Linguistics: Human LanguageTechnologies, NAACL-HLT 2019, Minneapolis, MN,USA, June 2-7, 2019, Volume 1 (Long and Short Pa-pers), pages 4171–4186. Association for Computa-tional Linguistics.
Rong-En Fan and Chih-Jen Lin. 2007. A studyon threshold selection for multi-label classification.Department of Computer Science, National TaiwanUniversity, pages 1–23.
Christiane Fellbaum. 2012. Wordnet. The encyclope-dia of applied linguistics.
Giles M. Foody, Feng Ling, Doreen S. Boyd, XiaodongLi, and Jessica Wardlaw. 2019. Earth observationand machine learning to meet sustainable develop-ment goal 8.7: Mapping sites associated with slaveryfrom space. Remote Sensing, 11(3):266.
Martina G Gallarza and Irene Gil Saura. 2006. Valuedimensions, perceived value, satisfaction and loy-alty: an investigation of university students’ travelbehaviour. Tourism management, 27(3):437–452.
Felix A Gers, Jurgen Schmidhuber, and Fred Cummins.1999. Learning to forget: Continual prediction withlstm.
Carla Gomes, Thomas Dietterich, Christopher Barrett,Jon Conrad, Bistra Dilkina, Stefano Ermon, FeiFang, Andrew Farnsworth, Alan Fern, Xiaoli Fern,et al. 2019. Computational sustainability: Comput-ing for a better world and a sustainable future. Com-munications of the ACM, 62(9):56–65.
David Griggs, Mark Stafford-Smith, Owen Gaffney, Jo-han Rockstrom, Marcus C Ohman, Priya Shyamsun-dar, Will Steffen, Gisbert Glaser, Norichika Kanie,and Ian Noble. 2013. Policy: Sustainable de-velopment goals for people and planet. Nature,495(7441):305.
Gregory D Hager, Ann Drobnis, Fei Fang, RayidGhani, Amy Greenwald, Terah Lyons, David CParkes, Jason Schultz, Suchi Saria, Stephen F Smith,et al., editors. 2017. AAAI Symposium on AI for So-cial Good. Stanford University, CA, United States.
Sophie Harman and David Williams. 2014. Interna-tional development in transition. International Af-fairs, 90(4):925–941.
Sharlene Hesse-Biber, Paul Dupuis, and T Scott Kinder.1991. Hyperresearch: A computer program for theanalysis of qualitative data with an emphasis on hy-pothesis testing and multimedia analysis. Qualita-tive Sociology, 14(4):289–306.
K Hirji. 2015. Accelerating access to energy: lessonslearnt from efforts to build inclusive energy marketsin developing countries. Boil Point, pages 2–6.

8437
Stephanie Hirmer. 2018. Improving the Sustainabilityof Rural Electrification Schemes: Capturing Valuefor Rural Communities in Uganda. Ph.D. thesis,University of Cambridge, Department of Engineer-ing.
Stephanie Hirmer and Peter Guthrie. 2014. The user-value of rural electrification: An analysis and adop-tion of existing models and theories. Renewable andSustainable Energy Reviews, 34:145 – 154.
Stephanie Hirmer and Peter Guthrie. 2016. Identifyingthe needs of communities in rural uganda: A methodfor determining the “user-perceived values” of ruralelectrification initiatives. Renewable and Sustain-able Energy Reviews, 66:476 – 486.
Jacinta Holloway and Kerrie L. Mengersen. 2018. Sta-tistical machine learning methods and remote sens-ing for sustainable development goals: A review.Remote Sensing, 10(9):1365.
Muhammad Imran, Prasenjit Mitra, and Carlos Castillo.2016. Twitter as a lifeline: Human-annotated twit-ter corpora for NLP of crisis-related messages. InProceedings of the Tenth International Conferenceon Language Resources and Evaluation LREC 2016,Portoroz, Slovenia, May 23-28, 2016. European Lan-guage Resources Association (ELRA).
Neal Jean, Marshall Burke, Michael Xie, W MatthewDavis, David B Lobell, and Stefano Ermon. 2016.Combining satellite imagery and machine learningto predict poverty. Science, 353(6301):790–794.
Daniel Kahneman. 2011. Thinking, fast and slow.Macmillan.
Ambedkar Kanapala, Sukomal Pal, and Rajendra Pa-mula. 2019. Text summarization from legal doc-uments: a survey. Artificial Intelligence Review,51(3):371–402.
Brian R Keeble. 1988. The brundtland report:‘our com-mon future’. Medicine and War, 4(1):17–25.
Roberta Kwok. 2019. AI empowers conservation biol-ogy. Nature, 567(7746):133–134.
Bandy X Lee, Finn Kjaerulf, Shannon Turner, LarryCohen, Peter D Donnelly, Robert Muggah, RachelDavis, Anna Realini, Berit Kieselbach, Lori SnyderMacGregor, et al. 2016. Transforming our world:implementing the 2030 agenda through sustainabledevelopment goal indicators. Journal of publichealth policy, 37(1):13–31.
Shoushan Li, Guodong Zhou, Zhongqing Wang,Sophia Yat Mei Lee, and Rangyang Wang. 2011. Im-balanced sentiment classification. In Proceedings ofthe 20th ACM international conference on Informa-tion and knowledge management, pages 2469–2472.
Peng Liu, Wei Chen, Gaoyan Ou, Tengjiao Wang,Dongqing Yang, and Kai Lei. 2014. Sarcasm detec-tion in social media based on imbalanced classifica-tion. In Web-Age Information Management, pages459–471, Cham. Springer International Publishing.
Tim Loughran and Bill McDonald. 2016. Textual anal-ysis in accounting and finance: A survey. Journal ofAccounting Research, 54(4):1187–1230.
Iann Lundegard and Per-Olof Wickman. 2007. Con-flicts of interest: An indispensable element of edu-cation for sustainable development. EnvironmentalEducation Research, 13(1):1–15.
Jennifer Mason. 2002. Organizing and indexing quali-tative data. Qualitative Researching, 2:147–72.
Mans Nilsson, Dave Griggs, and Martin Visbeck. 2016.Policy: map the interactions between sustainable de-velopment goals. Nature, 534(7607):320–322.
Piia Nurkka, Sari Kujala, and Kirsi Kemppainen. 2009.Capturing users’ perceptions of valuable experi-ence and meaning. Journal of Engineering Design,20(5):449–465.
OECD. 2017. Development Co-operation Report 2017.Organisation for Economic Co-operation and Devel-opment.
Manojkumar Parmar, Bhanurekha Maturi,Jhuma Mallik Dutt, and Hrushikesh Phate. 2018.Sentiment analysis on interview transcripts: Anapplication of NLP for quantitative analysis. In2018 International Conference on Advances inComputing, Communications and Informatics,ICACCI 2018, Bangalore, India, September 19-22,2018, pages 1063–1068. IEEE.
Peace Child International. 2005. Needs and wantsgame. vol3.
F. Pedregosa, G. Varoquaux, A. Gramfort, V. Michel,B. Thirion, O. Grisel, M. Blondel, P. Prettenhofer,R. Weiss, V. Dubourg, J. Vanderplas, A. Passos,D. Cournapeau, M. Brucher, M. Perrot, and E. Duch-esnay. 2011. Scikit-learn: Machine learning inPython. Journal of Machine Learning Research,12:2825–2830.
Jeffrey S Pinegar. 2006. What customers want: usingoutcome-driven innovation to create breakthroughproducts and services by anthony w. ulwick. Journalof Product Innovation Management, 23(5):464–466.
Pulse Lab Jakarta. 2016. The 1st research dive on natu-ral language processing for sustainable development.Technical report, Pulse Lab Jakarta Technical Re-port.
Jesse Read, Bernhard Pfahringer, Geoff Holmes, andEibe Frank. 2011. Classifier chains for multi-labelclassification. Mach. Learn., 85(3):333–359.
Thomas J Reynolds and Jonathan Gutman. 2001. Lad-dering theory, method, analysis, and interpretation.In Understanding consumer decision making, pages40–79. Psychology Press.
Subas Risal. 2014. Mismatch between ngo servicesand beneficiaries’ priorities: examining contextualrealities. Development in Practice, 24(7):883–896.

8438
Sebastian Ruder. 2017. An overview of multi-tasklearning in deep neural networks. Computing Re-search Repository, arXiv:1706.05098.
Jeffrey D Sachs. 2015. The age of sustainable develop-ment. Columbia University Press.
Horacio Saggion, Elena Stein-Sparvieri, David Mal-davsky, and Sandra Szasz. 2010. NLP resourcesfor the analysis of patient/therapist interviews. InProceedings of the International Conference on Lan-guage Resources and Evaluation, LREC 2010, 17-23 May 2010, Valletta, Malta. European LanguageResources Association.
Jagdish N Sheth, Bruce I Newman, and Barbara LGross. 1991. Why we buy what we buy: A theory ofconsumption values. Journal of business research,22(2):159–170.
Zheyuan Ryan Shi, Claire Wang, and Fei Fang. 2020.Artificial intelligence for social good: A survey.Computing Research Repository, arXiv:2001.01818.
David Silverman. 2013. Doing qualitative research: Apractical handbook. SAGE publications limited.
Matthew S Simpson and Dina Demner-Fushman. 2012.Biomedical text mining: a survey of recent progress.In Mining text data, pages 465–517. Springer.
Michael R Solomon. 2002. The value of status and thestatus of value. In Consumer value, pages 77–98.Routledge.
Latanya Sweeney. 2000. Simple demographics oftenidentify people uniquely.
Duyu Tang, Bing Qin, Xiaocheng Feng, and Ting Liu.2016. Effective LSTMs for target-dependent sen-timent classification. In Proceedings of COLING2016, the 26th International Conference on Compu-tational Linguistics: Technical Papers, pages 3298–3307, Osaka, Japan. The COLING 2016 OrganizingCommittee.
Katrin Tomanek and Udo Hahn. 2009. Reducing classimbalance during active learning for named entityannotation. In Proceedings of the fifth internationalconference on Knowledge capture, pages 105–112.
Anthony W Ulwick. 2002. Turn customer input intoinnovation. Harvard business review, 80(1):91–98.
UN Agenda for Sustainable Development. 2018.Overview of standards for data disaggregation.Technical report, United Nations Working Paper.
UNESCO. 2013. Adult and youth literacy: National,regional and global trends, 1985–2015. UNESCOInstitute for Statistics Montreal.
UNESCO. 2019a. Artificial intelligence for sustain-able development: challenges and opportunitiesfor unesco’s science and engineering programmes.Technical report, UNESCO Working Paper.
UNESCO. 2019b. Artificial intelligence for sustain-able development: synthesis report, mobile learningweek 2019. Technical report, UNESCO Working Pa-per.
United Nations. 2015. Transforming our world: The2030 agenda for sustainable development. GeneralAssembley 70 session.
Ellen Van Kleef, Hans CM Van Trijp, and PieternelLuning. 2005. Consumer research in the early stagesof new product development: a critical review ofmethods and techniques. Food quality and prefer-ence, 16(3):181–201.
Ricardo Vinuesa, Hossein Azizpour, Iolanda Leite,Madeline Balaam, Virginia Dignum, Sami Domisch,Anna Fellander, Simone Daniela Langhans, MaxTegmark, and Francesco Fuso Nerini. 2020. Therole of artificial intelligence in achieving the sustain-able development goals. Nature Communications,11(1):1–10.
Gerrit van der Waldt. 2019. Community profiling asinstrument to enhance project planning in local gov-ernment. African Journal of Public Affairs, 11(3):1–21.
Yequan Wang, Minlie Huang, Xiaoyan Zhu, andLi Zhao. 2016. Attention-based LSTM for aspect-level sentiment classification. In Proceedings ofthe 2016 Conference on Empirical Methods in Nat-ural Language Processing, pages 606–615, Austin,Texas. Association for Computational Linguistics.
Ryan Watkins, Maurya West Meiers, and Yusra Visser.2012. A guide to assessing needs: Essential toolsfor collecting information, making decisions, andachieving development results. The World Bank.
Jason Wei and Kai Zou. 2019. EDA: Easy data aug-mentation techniques for boosting performance ontext classification tasks. In Proceedings of the2019 Conference on Empirical Methods in Natu-ral Language Processing and the 9th InternationalJoint Conference on Natural Language Processing(EMNLP-IJCNLP), pages 6382–6388, Hong Kong,China. Association for Computational Linguistics.
WHO. 2016. World health statistics 2016: monitoringhealth for the SDGs sustainable development goals.World Health Organization.
Henry KH Woo. 1992. Cognition, value, and price: ageneral theory of value. Univ of Michigan Pr.
Leiming Yan, Yuhui Zheng, and Jie Cao. 2018. Few-shot learning for short text classification. Multime-dia Tools and Applications, 77(22):29799–29810.

8439
Appendix A – Definitions ofUser-Perceived Values
Em
otio
nal
ConsciencePreservation of Environment Preservation of natural resourcesHarmony Being at peace with one another
ContentmentAppealing Senses Being pleasing to the senses taste and smellAesthetics Items Physical appearance of item or person which is pleasing to look atComfort State of being content, having a positive feelingEntertainment Something affording pleasure, diversion or amusementMemorability Association to a past event with emotional significance
Human WelfareSafety (Animals Items Nature) Being protected from or prevent injuries or accidents by animals or natureSecurity People Being free from danger and threat posed by people
Epi
stem
ic InformationInformation Access Ability to stay informed
KnowledgeKnowledge attainment The ability to learn or being taught new knowledge
Fun
ctio
n
ConvenienceBanking Access Having continuous access to banking servicesCommunication Ability to interact with someone who is farMobile Phone Access Having continuous access to mobile telecommunication servicesMobility Being able to transport goods, or to carry people from one place to anotherMultipurpose Able to be used for a multitude of purposesPortable An item that can easily be carried, transported or conveyed by handAvailability Possible to get, buy or find in the areaTime Benefit Accomplish something with the least waste of time or minimum expenditure of timeTime Management Being able to work or plan towards a scheduleUnburden Making a task easier by simplifying
Cost EconomyCapital Expenditure Cost savings achievedSchool Fees Ability to pay for school fee
Income EconomyEconomic Opportunity Obtaining cash, assets, income through one-off sales or ongoing business opportunitiesBarter Trade Non-monetary trade of goods or services
Quality and PerformanceEffectiveness Adequate to accomplish a purpose or producing the resultLastingness Continuing or enduring a long timeProductivity Rate of output and means that lead to increased productivityReliability The ability to rely or depend on operation or function of an item or serviceUsability Refers to physical interaction with item being easy to operate handle or look after
Indi
geno
us
Social NormCelebration Association chosen as they play important part during celebrationManners Ways of behaving with reference to polite standards and social componentsMorality Following rules and the conductTradition Expected form of behaviour embedded into the specific culture of city or village
ReligionFaith Belief in god or in the doctrines or teachings of religion
Intr
insi
cH
uman
HealthLongevity Means that lead to an extended life spanHealth Care Access Being able to access medical services or medicineTreatment To require a hospital or medical attention as a consequence of illness or injuryPreserv. of Health Practices performed for the preservation of health
PhysiologicalEducation Access Being able to access educational servicesEnergy Access Being able to obtain energy services or resourcesFood Security The ability to have a reliable and continuous supply of foodShelter A place giving protection from bad weather or dangerWater Access Continuous access or availability of waterWater Quality To have clean water as sickness, colour and taste
Quality of LifeWellbeing Obtaining good or satisfying living condition (for people or for the community)
Sign
ifica
nce Identity
Appearance Act or fact of appearing as to the eye or mind of the publicBelongingness Association with a certain group, their values and interestsDignity The State or quality of being worthy of honour or respectPersonal Performance The productivity to which someone executes or accomplishes work
Status

8440
Aspiration Desire or aim to become someone better or more powerful or wiseSo
cial
Modernisation Transition to a modern society away from a traditional societyReputation Commonly held opinion about ones character
Social InteractionAltruism The principle and practice of unselfish concernFamily Caring Displaying kindness and concern for family membersRole Fulfilling Duty to fulfilling tasks or responsibilities associated with a certain roleTogetherness Warm fellowship, as among friends or members of a family
.

8441
Figure 6: Co-occurrence matrix of T3 labels in the S2I corpus.
Appendix B – Co-occurrence matrix ofUser-Perceived Values in the S2I corpus.
The co-occurrence matrix in Figure 6 depicts theinter-relatedness between different T3 labels. Theintensity of colour corresponds to the number ofsamples in the S2I corpus where the given T3 labelsco-occur.
The analysis of labels co-occurrence can offervaluable insights on commonly associated User-Perceived Values (UPVs, (Hirmer and Guthrie,2014)): this can be useful to highlight challengesand problems in the considered community, whichmight not be known to the dwellers themselves.While some correlations are typical and expected,
others are related to the specific Ugandan context,and might be surprising to those external to thelocation.
For example, Economic Opportunity, Food Secu-rity and Preservation of Health appear to frequentlyco-occur with other T3 labels. Note that the lack ofemployment opportunity, the availability of foodand the quality of healthcare services representendemic problems in the rural context studied inthis paper. As they constitute primary concernsfor most interviewees, it is therefore unsurprisingthat they were mentioned frequently in relation tomany of the items selected as part of the UPV game(Section 4). A further illustrative example of thecultural context - in this case rural Uganda - is the

8442
high concurrence of Unburden and Mobility. Thiscan be explained by the fact that rural roads areoften of poor quality and villages or areas are inac-cessible by motorised vehicles. Henceforth, peopleare required to find alternatives moves of transportfor moving themselves to hospital or crops to thenearest market for sell, for example. As a final ex-ample, the frequent mentioning of Faith, Harmonyand Morality, which also tend to co-occur in simi-lar contexts, testifies the fundamental role playedby religion in the rural villages considered in thisstudy.
The information on the (co-)occurrence of UPVsin a community is also particularly valuable for de-signing appropriate project communication (Figure1b), which can increase project buy-in through fo-cused messaging (Section 3).
Appendix C – Experimental Specifications.
In this Appendix, we report on the exact experimen-tal setting used for experiments to aid experimentreproducibility.
C.1 Data Specifications
Data Selection and Splitting. We select all sen-tences from the 119 interviews which were at least3 tokens long and which were annotated with atleast one UPV. We then randomly select an 80%proportion of the data as training set, and take therest as heldout data (with a dev/test split of respec-tively 450 and 530 samples). Figure 7 shows thatthe obtained label distribution is similar.
Figure 7: From top to bottom: distribution of UPVs inthe training and heldout (dev+test) sets. Labels in thex axis follow the same order as in Figure 3 of the maindocument.
Data Anonymization. In order to prevent theidentification of the interviewees (Sweeney, 2000),data was manually anonymized. We anonymizedall occurrences of: proper names, names of villages,cities or other geographical elements, and othernames that might be sensitive (as names of tribes,languages, ...).
Data Sample. We are providing a sample of thedata in the supplementary material. Each data sam-ple is associated with the following fields:
• id: a unique identifier of the sample;• text: a sentence to be classified;• t3 labels: a list of the gold T3 labels associ-
ated with the sample.
For privacy reasons, we are not releasing metadatainformation associated with the samples (as the in-terviewee’s name, gender, age, or the exact villagename).Data Preprocessing. For sentence split-ting and word tokenization, we used NLTK’ssent tokenize and word tokenize tok-enizers (Bird and Loper, 2004)12. We use a set ofregex to find interviewer comments and questions.Given that Why-Probing (Section 4.1, Reynoldsand Gutman (2001)) was used, interviewers’ com-ments are very limited and standard.Negative Samples Generation. To generate nega-tive samples (Section 6.1), we slightly modify Weiand Zou (2019)’s implementation13 EDA (EasyData Augmentation techniques) by adding a newfunction for character swapping and by adaptingthe stopword list. For semantic-based replacement,we rely on NLTK’s interface14 to WordNet (Fell-baum, 2012). Random shuffling and choice arecontrolled by a seed.
C.2 Further Specifications(Hyper)-Parameters Selection. All parametersused for experiments are reported in Table 4.
parameter value parameter value
mildly neg s. ratio 5 embedding size 300neg sample ratio 11 LSTM hid. size 128strictly neg s. ratio 24 dropout (all l.) 0.2max sample len 25 batch size 32max descr len 15 no epochs 70max UPV code len 4 optimizer Adam
Table 4: Adopted (hyper-)parameters.
We use 300-dimensional FastText subword-informed pretrained vectors (Bojanowski et al.,
12https://www.nltk.org/api/nltk.tokenize.html
13https://github.com/jasonwei20/eda_nlp/blob/d75e8bd4631f4d93260cb291aa47852d8eacd51d/code/eda.py#L65
14https://www.nltk.org/_modules/nltk/corpus/reader/wordnet.html

8443
2017)15 to get the word embedding representationsfor each input sample.
Note that the goal of this paper is to present anew interesting NLP application, namely NLP forSustainable Development: therefore, our goal hereis to provide a set of robust baselines on our newS2I dataset, which can be referenced for future re-search. For this reason, we don’t perform extensivehyper-parameter tuning on the selected models.
The only parameters we optimize are the numberof generated negative samples of each type (mildlynegative, negative and strictly negative). The bestratios were found empirically through experiments.The ratio used for optimization are reported in Ta-ble 5.
total mildly negative negative strictly negative
0 0 0 05 1 2 2
10 2 2 615 3 4 820 4 7 925 5 8 1230 5 11 1435 5 11 1940 5 11 2445 5 10 3050 5 12 3355 5 13 3760 5 14 41
Table 5: Details of the relative number of mildly nega-tive, negative and strictly negative samples used for ex-periments. Best ratio (used in all reported experiments)is in bold.
The analysis of the performance progression overtraining (Figure 8) shows that, in line with Wei andZou (2019), adding negative examples is useful toimprove performance: in our case, the plateau isreached around 40 augmented samples. In particu-lar, we observe gains in all considered output levels(T1, T2 and T3 labels).
Number of Parameters and Runtime Specifica-tions. Table 6 reports on the total number of (train-able) parameters and the average runtime/step foreach considered model. Embeddings are kept fixedover training to avoid overfitting.
Computing Infrastructure. We run experimentson an NVIDIA GeForce GTX 1080 GPU.
Evaluation Specifications. For computing theevaluation metrics, we use the sklearn’s (Pedregosa
15We chose the wiki.en.zip model pretrained on theEnglish Wikipedia https://fasttext.cc/docs/en/pretrained-vectors.html
Figure 8: Progression of performance gains in F1-Score, considering the three labels T1, T2 and T3.
(Multi-)task Model #pars avg runtime/Setting step
T3
text 373,377 55s+att 590,013 56s+descr 373,505 74s+att+descr 806,777 75s
T2T3 +att+descr 844,154 78sT1T2T3 +att+descr 865,019 85s
Table 6: Number of trainable parameters and averageruntime/step for all considered models and (multitask)training settings.
et al., 2011) implementation of precision, recalland F1 score16.
16https://scikit-learn.org/stable/modules/classes.html#module-sklearn.metrics

8444
Figure 9: ROC curves for each T3 label, grouped by T1 categories.
Appendix D – Single-Label Performance.
In this Appendix, we report the ROC curves foreach T3 label, grouped by T1 categories. Figure 9reports results obtained with the best performingmodel (Base+Attention+Description) trained withthe T1+T2+T3 multi-task framework.
We evaluate with the “real-world” evaluationsetting (Section 6.1), that is, we generate all posi-tive and negative instances for each training sam-ple. In practice, for a test sample x associatedwith the T3 labels T32 and T345, we would gener-ate 50 test instances {(x, T31) → 0, (x, T31) →0, (x, T32)→ 1, ..., (x, T350)→ 0}, one for eachof the T3 considered during training. All generatedtest samples would be negative, with the exceptionof (x, T32) and (x, T345).
The single T3 labels’ AUC show that satisfactoryresults are obtained overall for all T1 macro-labels:in particular, we obtain an AUC >= 70 for 47out of 50 labels. Despite these promising results,our best model still struggles with some T3 labels,notably Knowledge Attainment, Availability andCommunication. While the paper leaves ampleroom for future research, preliminary results areencouraging.
Refer to Section 6.2 for further details.
Related Documents