NAT'L INST. OF STAND & TECH R.I.C. NIST AlllQS b275Mfl PUBLICATIONS Nisr United States Department of Commerce Technology Administration National Institute of Standards and Technology NIST Technical Note 1500-7 Materials Reliability Series Structure-Property Relationships in Steel Produced in Hot-Strip Mills P.T. Purtscher Y.W. Cheng C.N. McCowan QC 100 .U5753 NO.1500-7 1999

Welcome message from author
This document is posted to help you gain knowledge. Please leave a comment to let me know what you think about it! Share it to your friends and learn new things together.
Transcript

NAT'L INST. OF STAND & TECH R.I.C.
NIST
AlllQS b275Mfl PUBLICATIONS
Nisr United States Department of CommerceTechnology AdministrationNational Institute of Standards and Technology
NIST Technical Note 1500-7Materials Reliability Series
Structure-Property Relationships in Steel
Produced in Hot-Strip Mills
P.T. Purtscher
Y.W. ChengC.N. McCowan
QC
100
.U5753
NO.1500-7
1999


NIST Technical Note 1500-7Materials Reliability Series
Structure-Property Relationships in Steel
Produced in Hot-Strip Mills
P.T. Purtscher
Y.W. ChengC.N. McCowan
Materials Reliability Division
Materials Science and Engineering Laboratory
National Institute of Standards and Technology
325 BroadwayBoulder, Colorado 80303-3328
August 1999
IT OF
'^TES
U.S. DEPARTMENT OF COMMERCE, William M. Daley, Secretary
TECHNOLOGY ADMINISTRATION, Gary R. Bachula, Acting Under Secretary for Technology
NATIONAL INSTITUTE OF STANDARDS AND TECHNOLOGY, Raymond G. Kammer, Director

National Institute of Standards and Technology Technical Note
Natl. Inst. Stand. Techno!., Tech. Note 1500-7, 72 pages (August 1999)CODEN:NTNOEF
U.S. GOVERNMENT PRINTING OFFICEWASHINGTON: 1999
For sale by the Superintendent of Documents, U.S. Government Printing Office, Washington, DC 20402-9325

Contents
Foreword v
1. Introduction 2
1.1 Scope 2
1.2 Relationship of the Commercial Product to the Experimental Models 3
1.3 Project Justification 3
1.3.1 Hot-Rolled Products 3
1.3.2 Other Benefits 4
1.3.2.1 Grade Consolidation 4
1.3.2.2 Control Optimization for New Grades 4
1.3.2.3 Cold-Rolled and Annealed Products 4
1.3.2.4 Hot-Strip Mill Productivity 5
2. Structure-Property Goals 5
3. Structure-Property Approach 5
3.1 Grain Refinement 7
3.2 Dislocation Strengthening 7
3.3 Transformation Strengthening 8
3.4 Texture Strengthening 8
3.5 Precipitation Strengthening 8
3.6 Solid-Solution Strengthening 9
4. Results 9
4.1 A36 Steel 9
4.1.1 Through-Thickness Gradients and Nonpolygonal Microstructures 1
1
4.1.2 Toughness 14
4.2 DQSK Steel 16
4.3 HSLA-V, 350 MPa Grade Steel 18
4.3.1 Temper-Rolling 20
4.3.2 Within-Coil Variations 20
4.3.3 Influence of Test Orientation 21
4.3.4 Aging of Coil Samples 22
4.4 HSLA-Nb, 350 MPa Grade Steel 23
4.4.1 Within-Coil Variations 27
4.4.2 Aging of Coil Samples 28
4.5 HSLA-Nb-Ti, 360 MPa Grade Steel without Excess Titanium 29
4.5.1 Within-Coil Variations 30
4.5.2 Aging of Coil Samples 30
III

4.6 HSLA-Nb-Ti, 550 MPa Grade Steel with Excess Titanium 30
4.6.1 Grain-Size Measurements 30
4.6.2 Coil-to-Coil Variation 31
4.6.3 Within-Coil Variations 33
4.6.4 Aging of Coil Samples 33
4.6.5 Effect of Heat Treatment 34
4.7 Nb-Ti and Niobium-Lean IF Grade Steel 34
4.8 Other HSLA-Nb Grade Steel 37
4.8.1 Within-Coil Variations 40
4.8.2 Aging of Coil Samples 40
4.9 Ferrite Grain-Size Measurements—Round Robin 41
5. Discussion 42
5.1 Equations to Predict Properties 42
5.1.1 Plain-Carbon Steel: Base Strength 42
5.1.1.1 Review of Equations in the Literature 43
5.1.1.2 Application to the Hot-Strip Model 45
5.1.2 HSLA Steel: Precipitation Strengthening 45
5.1.2.1 Review of Equations in the Literature 46
5.1.2.2 Application to the Hot-Strip Model 47
5.2 Fine-Tuning of Equations 49
5.3 Validation of Equations 50
5.3.1 Plain-Carbon Steel 50
5.3.2 HSLA Steel 52
5.3.2.1 HSLA-V Grade Steel 52
5.3.2.2 HSLA-Nb Grade Steel without Excess Titanium 53
5.3.2.3 HSLA-Nb-Ti Grade Steel with Excess Titanium 53
5.3.3 Validation from the Steel Companies 57
6. Additional Applications 61
7. Limitations 62
8. Summary and Recommendations 61
9. References 64
IV

Foreword
The Materials Reliability Series ofNIST Technical Notes are reportis covering significant
research accomplishments of the Materials Reliability Division. The division develops measurement
technologies that enable the producers and users of materials to improve the quality and reliability of their
products. Measurement technologies are developed for process control to improve the quality and
consistency of materials, for nondestructive evaluation to assure quality of finished materials and
products, and for materials evaluation to assure reliable performance. Within these broad areas of
measurement technology, the division has focused its resources on three research themes:
• Intelligent Processing of Materials—To develop on-line sensors for measuring the materials'
characteristics and/or processing conditions needed for real-time process control.
• Ultrasonic Characterization of Materials—To develop ultrasonic measurements for
characterizing internal geometries of materials, such as defects, microstructures, and lattice
distortions.
• Micrometer-Scale Measurements for Materials Evaluation—To develop measurement
techniques for evaluating the mechanical, thermal, and magnetic behavior of thin films and
coatings at the appropriate size scale.
This report is the seventh in the series. It covers research on structure-property relationships in
steel produced in hot-strip mills, one of the projects on Intelligent Processing of Materials. Previous
reports in this series are:
Technical Note 1500-1 Tensile Testing of Thin Films: Techniques and Results,
byD.T. Read, 1997
Technical Note 1500-2 Procedures for the Electron-Beam Moire Technique,
by E.S. Drexler, 1998
Technical Note 1500-3 High-Energy, Transmission X-ray Diffraction for
Monitoring Tubine-Blade Solidification, by D.W. Fitting,
W.P. Dube, and T.A. Siewert, 1998
Technical Note 1500-4 Nondestructive Characterization of Reactor Pressure
Vessel Steels: A Feasibility Study, by H.I. McHenr>' and
G.A. Alers, 1998
Technical Note 1500-5 Electron-Beam Moire Technique: Advances, Verification,
Application, by E.L. Drexler, 1998
Technical Note 1500-6 Constitutive Behavior Modeling of Steels under Hot-
Rolling Conditions, by Y.W. Cheng, R.L. Tobler, B.J. Filla,
and K.J. Coakley, 1999


Structure-Property Relationships in Steel
Produced in Hot-Strip Mills
Patrick T. Purtscher, Yi-Wen Cheng, and Chris N. McCowan
Materials Reliability Division
National Institute of Standards and Technology
Boulder, CO 80303
The purpose of this work was to develop equations for the Microstructural Engi-
neering-Hot-Strip Mills project that predict the mechanical properties of steel produced
in hot-strip mills as functions of chemical composition and microstructural variables,
such as ferrite grain size and fraction, at ambient temperatures after hot-rolling. Data for
eight steel grades, A36, DQSK (drawing quality special killed), HSLA-V, HSLA-Nb,HSLA-50/Nb-Ti, HSLA-80/Nb-Ti and two interstitial-free grades, produced by three
different companies, were used to evaluate the equations.
To develop and evaluate the equations, mill-produced products were supplemented
by laboratory-produced samples. For the plain-carbon grades (A3 6 and DQSK), the
laboratory-produced samples provided a wider range of microstructural variables than
those supplied by the mills. For the high-strength, low-alloy (HSLA) grades, the labora-
tory treatments were successful in simulating the precipitation-coarsening kinetics only.
Equations to predict the yield strength, ultimate strength, and total elongation
for the eight steel grades have been developed and were used in the hot-strip mill model
(HSMM). For A36, an equation to predict the ductile-to-brittle transition temperature in
the Charpy impact test is also given. The equations' predictions correlate well with the
available experimental data, indicating that the equations adequately describe the prop-
erties of the eight steel grades that were considered. The equations' predictions for
strength in plain-carbon steel were further validated with data obtained from one manu-
facturer. To demonstrate the application of the equations to other HSLA grades, the pre-
dicted strength properties of HSLA steel were compared with those obtained from similar
niobium-containing grades from two other producers.
The equations have been used, along with the separate thermal, rolling, transforma-
tion, and coiling models, to calculate the properties in the HSMM developed at the Uni-
versity of British Columbia in Canada. The accuracy of the mechanical property predic-
tions critically depends upon the accuracy of the thermal and transformation models'
predictions.
Key words: grain size; hot-strip rolling; HSLA steel; mechanical properties; plain-
carbon steel; precipitation strengthening.

1. Introduction
1.1 Scope
This research project was proposed in 1992 to enhance the competitiveness of American Iron and
Steel Institute (AISl) member companies by developing a predictive tool that could quantitatively link the
properties of hot-rolled steel products to the process parameters of a hot strip mill. It is part of an overall
advanced process-control program operated through AISI with the majority of the funding provided by
the U.S. Department of Energy. The scope of the program, excerpted from the initial proposal (1992)
follows.
The predictive tool would be a user-friendly computer model that incorporates heat
flow, knowledge of microstructural phenomena (recrystallization, grain growth, precipita-
tion, and austenite decomposition), and structure-property relationships, to compute the
thermal and microstructural evolution of steel during hot-rolling, as well as final product
properties (at the downcoiler), as a function of hot-strip mill design and operating practice.
This project focuses on the heart of the competitiveness issue—the linkage of product and
process. This project will concentrate on difficult, property-critical microalloyed (niobium-
and vanadium-bearing) steel grades and will be unique in its capability compared with
counterparts that have been under development in countries such as Japan, England, Aus-
tralia, and Canada. Owing to itsfundamental knowledge base, the model will have universal
applicability and will be capable ofexpansion to include a wide variety ofsteel grades.
Development of the model will follow well-established principles of microstructural
engineering involving computer programming, quantitative characterization of the kinetics
of the different microstructural phenomena, measurement of surface heat extraction in the
different zones of the hot-strip mill (scale breakers, rolls, interstand coolers, and runout
table) and other experimental work in the plant and pilot plant to obtain steel samples (slabs,
transfer bar, and coil), roll-separating forces, and temperature measurements for model
verification.
Each of the microstructural engineering activities will be based upon earlier work, the
experience of the individuals in the research team, and established experimental facilities.
The computer model will be built upon models that have been developed to predict the ther-
mal evolution and change to austenite grain size in the roughing and finishing sections of a
hot-strip mill, as well as the deformation of the work piece in the roll bite (strain, strain-rate
distributions), which permits calculation of the roll separating force. In addition, a newly
developed coiling model is a part of the effort. These models will be integrated into an over-
all predictive tool that is user friendly.
The major thrust of the project is the research to characterize the kinetics of the
microstructure phenomena together with the constitutive behavior and structure-property
relationships of the steel grades under study. The National Institute of Standards and Tech-
nology (NIST) will develop the constitutive equations to predict the basic material response
at rolling temperatures and the structure-property equations at ambient temperatures. The
University of British Columbia (UBC) is responsible for the computer modeling and various
physical-metallurgy investigations (grain growth, recrystallization, precipitation, and trans-
formation). The steel to be investigated will primarily include microalloyed grades (con-
taining niobium and/or vanadium) in two carbon ranges, 0.07 % to 0.09 % and 0.17 % to
0.20 %.

A summary of the existing and emerging technology revealed that substantial modeling exists in
a qualitative state, with the exception of the coiling model. This project proposed extensive physical
metallurgy research and experimentation to develop quantitative models for property-critical micro-
alloyed hot-rolling grades. The process models developed at UBC included the roughing mill, finishing
mill, runout table, and coiling; the constitutive properties at hot-working temperature and the structure-
property relationships at room temperature were determined at NIST. Prior work in C-Mn steel formed
the basis of some of the individual modeling of hot-rolling, but the integration effort, the particular grades
we were working on, and the physical metallurgy behind the resulting quantitative model made this work
both challenging and unique. The project included linking the quantitative models to produce a deliver-
able project that would accurately predict the properties of microalloyed hot-rolled grades.
1.2 Relationship of the Commercial Product to the Experimental Models
In this project, the involvement of the commercial partner was critical because a high degree of
flexibility had to be designed into the software product for it to be useful to the industry as a whole.
Many coefficients and parameters were necessary for the proper operation of the integrated model.
These parameters were based on physical metallurgy principles, although there was an element of site in-
fluence. Determining the coefficients at a given site was not the problem because extensive operating data
are available. (Hot-strip mills are among the most instrumented of steel producers.) The problem was to
ensure that the model enables simple editing of these items by the user. All coefficients and parameters
had to be adjustable for the different configurations at different companies. It was not sufficient to wait
until the model was proven and then build in the flexibility during commercialization, because this would
prolong the commercialization phase. Our design of model experiments minimizes the amount of modi-
fication necessary during commercialization.
1.3 Project Justification
The production of hot-strip mill products with specific mechanical properties or with specific
microstructural attributes currently requires numerous and costly full-production trials before both the
ranges of chemical composition and of hot-strip mill processing parameters can be comfortably defined.
However, the basic components of current technology enable the calculation of austenite microstructural
development and refinement during hot-rolling as a function of workpiece composition, temperature,
starting microstructure and deformation strains, and strain rates. In addition, austenite transformation
can be described mathematically as a function of steel composition, prior austenite microstructure. and
thermal path during cooling. Such microstructural calculations, as a function of thermomechanical
processing history, could be coupled with established microstructure-property relationships so that final
mechanical properties could be predicted as a function of steel composition and thermomechanical
history. In addition to the use of the proposed microstructural model for hot-strip mill products, it is clear
that the hot-strip mill model (HSMM) could be readily adapted to other hot-working operations; in parti-
cular, it could be directly applied to plate-mill rolling by simply using the appropriate modules in the
model.
1.3.1 Hot-Rolled Products
Manufacturing hot-rolled products with a given initial range of properties is desirable for hot-
rolled products that receive no significant further processing or those with well-characterized property
changes due to fabrication. The production of high-strength, hot-rolled sheet products to specific le\els
and to very tight ranges of mechanical properties requires that rolling and cooling conditions be \aricd

from slab to slab as minor changes in steel composition and/or processing temperatures are encountered.
In addition, hot-rolled bands that are converted to tubing or electric-resistance welded pipe generally
require minimum levels of Charpy-impact notch toughness in addition to minimum strength levels, and
microstructural control is essential for the development of proper balance of grain size, solid-solution
strengthening, and precipitation strengthening. Further, hot-strip mill plate products (plate-type products
rolled on the hot-strip mill rather than on a plate mill), such as A36 and A572, grade 50 steel, must also
be produced with minimum strength and toughness levels, which are controlled by microstructure. Hot-
rolled and controlled plate products are also produced to similar strength and toughness requirements
where control of microstructure is critical. Twenty-two million tons of steel are produced annually in
North American hot-strip mills.
1.3.2 Other Benefits
1.3.2.1 Grade Consolidation
The numerous grades normally produced in the steel-making shop (continuous cast to slab form,
inventoried ahead of the hot-strip mill or plate mill, and finally rolled to finished product) could be com-
bined. Combination of grades would require computational techniques that could adjust the processing
variables for a given composition to produce various fixed sets of properties rather than having a different
composition for each mechanical property requirement. The reduction in the number of steel composi-
tions within a steel plant would have significant positive economic effects.
1.3.2.2 Control Optimization for New Grades
When a new steel grade is rolled on a hot-strip mill or plate mill, a significant learning curve is
encountered as the computer control system "learns" what to expect of this new steel grade and develops
a set of internal tables (such a hardness curves) within its memory for subsequent rolling of this product.
If force and microstructural models were available as a function of steel composition, a significant reduc-
tion in this learning time and associated cost savings would be realized. Further, lowering of slab reheat-
ing temperatures is more feasible for plate-mill than for strip-mill processing, and consequently, energy
savings could be realized.
1.3.2.3 Cold-Rolled and Annealed Products
For hot-rolled coils that will be subjected to subsequent processing, particularly cold reduction and
annealing, it is normally desirable to produce the hot band with specific microstructural attributes that
are necessary to optimize properties after the subsequent processing steps. In other words, producing the
optimum properties off the hot-strip mill will enable tighter, more efficient control of properties in cold-
rolling and annealing.
With the reduction in carbon and nitrogen contents in such grades as interstitial-free (IF) and bake-
hardening steel, the control of interstitial and/or precipitated nitrogen and carbon atoms is essential for
determining of the final properties of the annealed sheet products. Thus, microstructural control on a
submicroscopic scale is necessary in these cold-rolled products, and such control begins on the hot-strip
mill, starting with slab reheating and finishing with coiling. Although this aspect of the modeling process
may present the greatest challenge, the understanding and control of these precipitate dissolution and re-
precipitation reactions through application of transformation and coiling modules will produce significant
benefits in controlling the level and uniformity of cold-rolled strip products.

1.3.2.4 Hot-Strip Mill Productivity
Mill productivity is partially limited by the maximum acceleration or zoom rate that is imposed
on the mill to maintain a relatively constant finishing temperature. However, productivity could be
improved by reducing the time required for any given bar in the finishing train, which might be possible
( 1) if the finishing temperature could be allowed to increase and the runout table cooling could be modi-
fied to give a variable coiling temperature with constant properties in the finished coil or (2) if interstand
strip cooling could be introduced to maintain a constant finishing temperature. The model would enable
off-line calculation of potential scenarios and development of advanced control strategies. Such improved
throughput on the hot-strip mill would be applicable to all product lines. In addition, by considering
different profiles (other than constant) for the coiling-temperature trace for a given coil, end effects at
the head and tail of coils could be minimized, and, consequently, the yields would increase.
2. Structure-Property Goals
This report summarizes the work related to development of structure-property equations at ambient
temperatures for steel rolled in hot-strip mills (a subtask in the overall program). Three main technical
hurdles associated with this subtask are
• characterization of fine, sometimes complex microstructural features
• development of non-process-specific constants in the equations
• relating the other subtasks to the proposed structure-property equations, including verification
of the predictions from the computer program with mill data
The responsibility for the first two hurdles is self-contained within the subtask and is reported on here.
Responsibility for the third hurdle is ultimately shared among the partners in the program (NIST, UBC,and the AISI members) and can be only partially evaluated with the information currently available at this
time.
3. Structure-Property Approach
Good room-temperature mechanical properties, such as yield strength (YS) and (ductile-to-brittle
transition temperature (DBTT), are requirements for many hot-rolled steel products. These properties are
usually related to product composition and ferrite grain size. Empirical equations, based on principles of
physical metallurgy that relate properties to composition and grain size, are widely available for the air-
cooled C-Mn steel. However, for high-strength, low-alloy (HSLA) steel, the correlation of structure and
properties has not been well-characterized in the literature.
Lack of good physical models to represent a given mechanical property is another problem related
to the development of structure-property equations based on physical metallurgy principles. The simplest
mechanical property of interest would be YS, but even here, there are complications. The yield-point
elongation (YPE) can vary significantly, depending upon the ferrite grain size and the volume fraction
of the second phase, and it will change the measured lower YS (LYS); yet no approach to separate the
microstructural dependence of YPE from the true structural dependence of YS exists.
The basis of most equations for structure-property relationships is the assumption that the different
mechanisms responsible for the properties can be described individually by the composition and micro-
structure and that the effects of each are additive. For example, the YS has been described as a sum of
the strength contributions from different mechanisms—grain refinement (^v >; ci~ ^'), dislocation
(Jdisi, transformation crtr, texture cTtex, precipitation cjppt, and solid solution ctss—as shown below:

,-0.5YS = CTQ + kyd ^-^ + a disl + O" tr + cr tex + cr ppt + cr ss
,
(1)
where cfqxs assumed to represent the lattice friction for pure iron. This approach makes the implicit
assumption that the contributions from the different mechanisms are additive. This assumption is useful
from a practical point of view, and it is the approach taken in most studies. Experiments in which the
strengthening mechanisms were not additive have been reported [1].
Examples of some of the equations to predict the ultimate tensile strength (UTS) of steel found
in the literature are shown in table 1 [2-7]. Several variations on the basic approach are evident. Several
groups tried to predict the hardness of the individual microstructural components from the transformation
temperatures and then inferred the UTS from hardness. Processing parameters, such as the cooling rate,
Table 1 . Summary of UTS predictions found in the literature for steel.
Investigator Ultimate tensile strength, MPa
Pickering [2] 1977, England
Choquetetal. [3] 1990,
France
Suehiroetal. [4] 1988, Japan
Mitchell et al. [5] 1993,
England
Kwon[6] 1992, Korea
Hodgson and Gibbs [7] 1992,
Australia
UTS = 294 + 27.7[Mn] + 83.2[Si] + 385^^,+ 7.85cf"'
UTS = UTSo + UTS, + l.lAX^d-"- + 500A;
UTSo = 237; UTS, = 29[Mn] + 79[Si] + 700[P] + 5369[Nf,ee]
UTS = 3 .04 //„, where H,=X^H^ + X,^,, + X^,;
//„=361- 0.3477;,'' + 50[Si]; 7/^=175;
//,= 508 -0.5887;,"
UTS = 74.1 + 985.1CEV + (31 125[Nfree] - 39)[V]"'+ 181.5r"^
where
CEV = [C] + [Mn]/6 + {[Cr] + [Mo]}/5 + {[Ni] + [Cu]}/15
UTS = 0.095A;/4+ 0.264^^^^ + 0.2nXJ{>,+ 1 let'"
+ 15.5X^d-"'+ 1 3.4 a; (1 -a;) + 3.8
where
//„= 27.72 exp(980/7;«) + 39.8[Si] + 9.1
H,, = 215.4 - 0.0167;/' - 34.04[Mn] + 58.26[Si]
H, = 27.72 exp(980/7;,'') +39.8[Si] + 9.1
UTS = 164.9 + 634.7[C] + 53.6[Mn] + 1 Ict^"
Xa Xj, , and Xf, = volume fraction of ferrite, pearlite, and bainite
d - ferrite grain size in millimeters
Hy = Vickers hardness number; //„, Z/^,, and ///,= Vickers hardness for ferrite, pearlite, and bainite
7;," and Z;,* = average transformation temperature in degrees centigrade for ferrite and bainite
[Nf.ee] =[N]-3.42[Ti]
I = thickness of plate in millimeters

were sometimes used as input. Several researchers have specifically incorporated precipitation strength-
ening into their predictions but without the use of the related microstructural features like the particle
size and spacing between particles. The carbon equivalence (CEV) was used in one case to describe the
solid-solution strengthening where welded applications are of interest. An alternative and more rigorous
approach to predict UTS (not shown in table 1) has been proposed by Tomota et al. [8]: the entire stress-
strain curve is predicted, and the UTS is given by the point where the true flow stress is equal to the strain
hardening rate.
For this project, we incorporated some of the details of the different approaches that seem to work
best for our intended goal. In the next sections, the individual components of the equations are discussed
briefly with respect to this project.
3.1 Grain Refinement
Grain size is a critical factor influencing YS; grain size is also the most important parameter that
can change with different processing routes in the hot-strip model to enable the predicted property to
change. Yet no physical model for the interaction between grain size and YS has been proposed and vali-
dated for the type of ferritic sheet steel that we were studying. Mintz [9] has discussed the importance of
the grain-size dependence (Hall-Petch slope k,) in determining YS of steel and summarized the literature
on this subject. Variations in A:,, for commercial compositions range from a low of 14 MPa x mm''^ to a
high of 24 MPa x mm°^ When all the carbon and nitrogen are removed from solid solution, values as
low as 5 MPa x mm°' to 6 MPa x mm"^ have been reported. Physically, the variation is almost certainly
related to segregation of interstitial atoms to grain boundaries, which increases the stress needed to nu-
cleate new dislocations from the boundary regions. In practice, the variations in ky do not translate into
significant differences in the predicted YS because there are systematic changes in Oq that counteract the
variations in ky. Part of the variation in ky is also related to how grain size is measured. This factor has
been discussed in more detail by Gladman and Pickering [10].
The grain size dependence of the UTS is certainly less than that of YS. In the equations for YSand UTS proposed by Hodgson and Gibbs [7], the factors are 19.7 MPa x mm°^ and 1 1 MPa x mm°^Pickering [2, 11] used 15.1 MPa x mm°^ and 7.7 MPa x mm°^ for ky in his equations for YS and UTS.
In both cases, the dependence of YS on grain size is about twice that for UTS. Campbell et al. [12] have
proposed a different trend where the ky for YS is 1 1.8 MPa x mm°^ and for UTS, 15.9 MPa x rnm°-. The
fact that equations from different sources predict different trends in a given property reflects more upon
the database used to generate the equations than any fundamental characteristic of the steel's behavior.
The predictions from the equations in this report for elongation and DBTT are a strong function of
ferrite grain size, but the equations are derived mainly from literature reports rather than developed from
our own data base. For total elongation, the prediction varies with the UTS.
3.2 Dislocation Strengthening
Dislocation strengthening has little influence on properties of most hot-rolled, low-carbon sheet
steel because the mill conditions (finishing and coiling temperatures) are such that the structure is usuall\
polygonal ferrite, which is free of excess dislocations. With higher carbon content, larger austenite grain
size, and high local cooling rates, nonpolygonal transformation products can form and excess dislocations
are an issue for property prediction. The presence of excess dislocations in the structure (ones liiat affect
the prediction of properties) can be difficult to detect. Often, light microscopy can pro\ idc oiil> hiiiis

as to the dislocation content. The best way to characterize dislocations is transmission electron micros-
copy (TEM), but difficulties in sample preparation and quantitative interpretation ofTEM results limit its
use for model development.
For our project, A3 6 and HSLA-Nb-Ti are the only grades where nonpolygonal microstructures
are important and then only for specific processing routes. Literature data [13] suggest that some modi-
fications to the equations for polygonal ferrite microstructure are necessary to describe the strength of
the nonpolygonal microstructures. For the limited conditions under which dislocation strengthening is
relevant, we have modified the strength equations used for polygonal structures to reflect the change in
strength due to the nonpolygonal microstructures. The total elongation is assumed to be influenced only
by the relative change in UTS. Predictions for the DBTT are not changed by the nonpolygonal structure
because we did not have any database to quantify the effects.
3.3 Transformation Strengthening
Transfomiation strengthening is one area of the program where it is difficult to separate the
individual models within the HSSM. The equations that describe transformation and the structure-
property' equations are intimately related. For example, the equations for strength from Campbell et al.
[12] require a pearlite spacing, but the transformation model does not predict that level of detail. The
transformation model developed at UBC takes into consideration the steel grade (not exact composition),
austenite grain size, cooling rate, and transformation heat. The output of the model gives ferrite fraction,
ferrite grain size, and the microalloy content in solution at the transformation temperature.
3.4 Texture Strengthening
Texture plays an important role in the ductility and forming properties of steel, but it has only a
minor role in determining the strength of the final product. Typically, texture contributes about 30 MPato strength [11], with the transverse properties higher than the longitudinal properties. The influence of
texture on total elongation is assumed to be represented by the predicted change in UTS. The prediction
of the other properties is unaffected by texture.
3.5 Precipitation Strengthening
Precipitation strengthening refers to the increase in strength that is associated with the formation of
small particles of a second phase in a matrix, where the elements that make up the particles were initially
dissolved in the matrix. Precipitation is a minor factor for plain-carbon steel (AIN precipitation deter-
mines the free nitrogen content that contributes to solid-solution strengthening); however, it is important
in HSLA steel. When a steel is alloyed with niobium, titanium, and/or vanadium, microalloy carbonitrides
can precipitate in austenite and/or ferrite. Precipitation in austenite retards recrystallization and grain
growth and also increases the deformation resistance of the steel. With regard to the mechanical proper-
ties at ambient temperatures, precipitation in austenite is generally assumed to limit the amount of alloy-
ing elements available to fonn precipitates in ferrite, which increases the measured mechanical properties.
Precipitation strengthening in ferrite is controlled by the volume fraction of the particles and the coarsen-
ing of precipitates; the volume fraction of particles can be estimated from the chemical composition, but
information on the kinetics of carbonitride coarsening in ferrite is absent from the literature. A major part
of our effort has been to characterize the kinetics for precipitates that form in ferrite. These precipitates
are mostly carbonitrides with niobium, niobium-titanium, or vanadium.

Table 2. Element vectors for structure-property relationships (MPa/mass %)in commercial C-Mn and microalloyed steel.
Hodgson and Gibbs [7] Choquetetal. [3] Pickering [2]
Element
LYS UTS LYS UTS LYS UTS
Mn 26.1 53.6 23 29 37 27.7
Si 60.2 99.7 53 79 83 83.2
P 759 651.9 700 700 680 —Cu 212.9 — — 38 —Ni — 472.6 — — 33 —N 3286.0 3339.4 5000 5369 5000 —
3.6 Solid-Solution Strengthening
Solid-solution strengthening has been studied extensively, and it is widely accepted that the solid-
solution strengthening adds to the lattice friction in eq (1). Theory and experiment have shown that the
increase in strength is proportional to the square root of the concentration of the solute atom. For dilute
solutions, such as low-carbon sheet steel, a linear relationship is generally assumed. The exact value of
the strengthening coefficients varies from one study to the next. The values published for LYS and UTSfrom three different sources are shown in table 2. The differences are significant and again reflect the
different databases from which the equations were developed. The property predictions from the different
sources are similar because the differences tend to cancel for the compositions typically encountered.
Problems will almost certainly arise if the equations are applied outside of the range of compositions in
the database for which each was developed.
4. Results
4.1 A36 Steel
A summary of all the tensile tests along with the microstructural characterization [equivalent grain
diameter (EQAD) and ferrite fraction,X] is shown in table 3. Both as-received coil and heat-treated sam-
ples are included. The microstructure of the thinnest A36 coil is shown in figure 1 . Grain size and ferrite
fraction change with the processing conditions. The ferrite grain size for the five coils received from one
steel producer (shown in the table) varied from 5 x10^ mm to 6.5 x
10"^ mm, whereas the ferrite fraction
varied from 0.87 xlO"^ mm to 0.81 xlO"^ mm. The major unknown factor in the microstructure relates to
the second phase. Locally, the second phase can be more than 0.4 mm from the top surface, and the grains
are less polygonal when the section size is greater than 6 mm. Additional tests were performed to evaluate
the influence of microstructure in thicker products (>10 mm thick) on the DBTT in this grade. Laboratory
processing of A36 was a very valuable procedure to expand the range of microstructures to be e\akiated
in the mill samples.

Table 3. Summary of tensile tests on A36 steel coils.
Coil
numberGauge,
mmLocation^ Coiling
temp., °C
EQAD,mm /a
YS,
MPaUTS,
MPaElong.,
%
1 9.4 MC 665 5.4 X 10"-' 0.81 285 445 30
2 6.1 MC 669 5.0 X 10"^ 0.85 312 474 34.5
3 9.1 MC 685 5.5 X 10-^
(6.5 X 10-^)
0.85 277 426 39.5
4 4.8 MC 684 6.5 X 10-'
(5.5 X 10"^)
0.87 319 457 37
5 4.3 HC 688 5.9 X 10"' 0.86 315 442 36
5 4.3 TC 688 6.2 X 10"^ 0.87 302 455 34
5 4.3 b 915' 12.0 X 10^' 0.80 257 393 39
5 4.3 b 915^^ 7.6 X 10"' 0.80 313 428 34
MC = middle center; HC = head center; TC = tail center
laboratory heat-treated
reheat temperature followed by furnace cooling
reheat temperature followed by air cooling
, t
.,.*v« _y \
^^1*
i.
>*•» :.\^ >-'s >>.. .
J.
V*»C!iK.
Figure 1 . Typical microstructure for A36 steel. Bar in picture represents 10 x 10 mm.

4.1.1 Through-Thickness Gradients and Nonpolygonal Microstructures
The A36 grade presented some different problems because it has the highest carbon content of
any of the grades in the program and because the samples received from the mill covered a wider range
(approximately 4 mm to 10 mm) in thickness. For the thickest coil, there was a gradient in the micro-
structure; the top surface exhibited nearly all nonpolygonal ferrite grains and the center and bottom sur-
face exhibited polygonal grains. Figure 2 shows the appearance of the second phase in a 9.7 mm thick
sheet, near the top surface and in the middle. The properties of the pearlite with its lamellar carbides
found in the middle are well-characterized in the literature; the properties of the patches of degenerate
pearlite or bainite found near the top are not. Hardness profiles through the thickness of the two thickest
coils are shown in figure 3, and quantitative metallography from the thickest coil is shown in figure 4.
These variations are produced in the hot strip mill because the top surface of a thick plate cools faster.
(A sheet of water tends to cover the top surface and promotes better heat transfer.)
For the prediction of properties in the case where there is a gradient in microstructure, the follow-
ing guidelines have been adopted: The cross-section is divided into 100 evenly spaced points; each point
is assigned specific values for temperature and ferrite grain size and fraction by the HSMM. The HSMMdivides the cross section into quarters, and the YS for the coil is taken to be the lowest average YS for
any quarter, whereas the UTS for the coil is simply the average of all points.
A complication resulting from a steep thermal gradient through the thickness is that low-
temperature, nonpolygonal transformation products like bainite or martensite can form near the surface
of the coil on the runout table. The subsequent coiling temperature can be higher than the transformation
temperature. This type of complication will temper the nonpolygonal structure, changing its strength.
A modification to the equations for A36 has been developed to decrease the predicted mechanical
properties of the nonpolygonal microstructures found near the top surface of coils with a thickness greater
than 6 mm. Figure 5 shows data for 1016 steel (carbon content is 0.16 %, manganese content is 0.75 %)taken from the literature [14]. For three cooling conditions that produce microstructures containing bain-
ite, the as-quenched hardness is shown to be reduced after tempering at temperatures between 500 °C and
700 °C. The ratio of tempered hardness to as-quenched hardness changes at nearly a constant rate for the
temperature range of interest, that is, the temperature at which the strip is coiled.
Without a correction to the properties for coiling temperature, the model for A36 predicts strength
properties that are higher than expected for those regions of the coil with nonpolygonal microstructures.
Given this limited set of data for 1016 steel that has nearly the same composition as A3 6, we suggest that
the predicted properties be modified to reflect the influence of coiling temperature in a similar fashion.
Therefore, whenever the local transformation temperature is lower than the coiling temperature, the
model will need to multiply the current strength predictions by a factor O that varies from about 0.9 to
0.72, depending on the coiling temperature within the range of 500 °C to 700°C. Given the limited
amount of data on which this modification is based, a linear dependence ofO on coiling temperatures
between 500 °C and 700°C seems appropriate.
n

(a)
(b)
Figure 2. A36 microstructure found in as-received coil, 9.7 mm thick,
(a) near top surface and (b) middle of cross section.
12

.^ 170DCDO 160O)
,- 150
ai 140Q(/)" 130CO
O 120v_03
o 110
o^ 100
A36 steel
9.7 mm thick coil
+ ++ +
9.0 mm thick coil
2 4 6 8
Distance from top surface, mmFigure 3. Hardness profiles through the two thickest A36 coils.
10
cooCD
M—CD
(D
100
90
80
70
60
50
40
30
20
10
non-
-polygonal
-t>.
for 9.7 mm thick coil
1,1,11,1,1,1
14
12
10
8
6
01 23456789 10
Distance from top surface, mm
Figure 4. Quantitative metallography from the thickest A36 coil as a function
of location through the thickness of the sheet.
N(/i
C.
CD
CD4 Si
13

0)szoc(DDD"
I
C/5
CD
DCD
cxe0)
o
CO
CDc•ou-coX
1
-
1016 steel
0.9-
*\
0.8-
.^"^""""-^^
x^^^^.,^^^
0.7-X
35% bainiteU.b- + 90% bainite
X 1 00% bainite
1'
\
— ''1 ' 1 '
0.5- ' \-'
1
400 450 500 550 600 650
Tempering temperature for 1 h, °C
700 750
Figure 5. Ratio of tempered hardness to as-quenched hardness for 1016 steel
as a function of tempering temperature.
4.1.2 Toughness
To predict toughness, Pickering [11] used the following equation:
DBTT = -19 + 44Si + 700Nf,ee'" +2.2/^- W. Set' (2)
where DBTT is in degrees centigrade, the compositions are in mass percent,^ is the pearlite fraction,
and the grain diameter d is in millimeters. To verify the equation's prediction, we tested A36 in two con-
ditions. Thermomechanical processing was performed on A3 6 crop samples (30 mm thick) to provide
samples for toughness evaluation. The blanks for processing were 80 mm long with a cross section of
13 mm X 30 mm. The blanks were soaked at 1 100 °C for 10 min, furnace-cooled to the deformation
temperature, deformed, cooled rapidly (about 50 °C/s at the surface) to about 700 °C, and then air-cooled.
The deformation conditions and the resulting microstructural characterization are summarized in table 4.
Results from tensile testing are summarized in table 5. Figure 6 shows the results of the Charpy V-notch
tests. The relationship between the measured transition (27 J was used) and the transition predicted from
Pickering's equation is shown in figure 7. The difference between measured and predicted values is 5 °C.
The effect of the nonpolygonal transformation product on toughness is not clear. Acicular ferrite
and tempered bainitic microstructures can have relatively good toughness; however, the effects of grain
refinement and alloy additions for nonpolygonal microstructures have not been systematically studied.
14

Table 4. Summary of processing and resulting microstructure for toughness samples (A36 crop).
ConditionDeformation
temperature, °CStrain Ferrite grain
size, mmPearl ite
content, %
8.4 X 10"^
ll.Ox 10'^
30
30
A
B
1000
1050
0.90
0.26
Table 5. Summary of tensile properties for the toughness samples (A36 crop).
Condition YS, MPa UTS, MPa Uniform strain, % Reduction of area. %
A
B
317
270
467
450
22
17
67
68
100
90
-^ 80
^ 70 I-
0) 60c(D
TD(D
OC/)
<
50
40
30
20
10
A36 crop
finegrained
//
/
-27 J DBTT-^
/
Ox
A/
. + +
/ + ' +.
coarsegrained
-1 10
80
70^
60 ^>-,
bO Oi1—0)
40 c0)
"O30 <D
XJi_
20oCOJH
M\ <
-60 -50 -40 -30 -20-10 10 20 30 40
Temperature, °C
Figure 6. Charpy V-notch test results from A36 after thermomechanical processing.
15

o
20
0-
-20-
-40-
DQ -60-
Q-80-1
100-
-120
A36 steel
-^\
>
\
'
1 1
'
\
'
\
'I
'~
0.002 0.004 0.006 0.008 0.01 0.012 0.014 0.016
Ferrite grain size, mm
Figure 7. Comparison between equation predictions and measured values for the DBTTin A36 after thermomechanical processing.
4.2 DQSK Steel
A summary of all the tensile tests is shown in table 6. Both as-received coil and heat-treated
samples are included. Figure 8 shows the microstructure that is typical of DQSK steel. Grain size and
properties changed with processing conditions, but the ferrite fraction was relatively constant. The
grains were polygonal, and little second phase was present. The ferrite grain size for the four coils
(shown in table 6) varied from 8 x 10" mm to 10 x 10" mm, and the ferrite fraction was assumed to
be 0.97. Laboratory processing of DQSK expanded the range of microstructures to be evaluated.
The changes in YS and UTS cannot be attributed solely to the variation in ferrite grain size; weexpect that the dissolved interstitial content is the other significant factor that determines the properties.
Carbon and nitrogen are interstitial alloying elements that have a large solid-solution strengthening ef-
fect (about 50 MPa per 0.01 %) when they are dissolved in the matrix. For hot-rolled strip with typical
coiling conditions, we assumed that the carbon was completely tied up as FcjC. There is usually more
than enough aluminum to combine with all of the nitrogen; however, we know that with a low coiling
temperature, such as 550 °C, most of the nitrogen remains in ferrite and does not precipitate out as AIN.
To evaluate the content of free nitrogen, we performed a series of strain-aging tests where the
samples were pulled in tension to a strain of 5 % and then aged in boiling water for 4 h before resuming
the tension test. Table 7 shows these results. The aging index (increase in flow stress due to precipita-
tion of carbides on the newly formed dislocations) was about 50 MPa for all the as-received coil samples
and was zero for the laboratory-annealed samples. Our results can then be taken to indicate that there is
at least 0.01 % free nitrogen in all the as-received samples, but an absolute value cannot be estimated.
A torsion-pendulum test would be required to obtain better experimental data.
16

An existing model for AIN formation found in the literature has been adopted in the coihng module
to calculate free nitrogen [15]. The calculation assumes that aluminum diffusion in ferrite controls the
precipitation. The model was not validated because the temperature predictions in the coiling model and
the free nitrogen content in the sample could not be verified.
Table 6. Summary of tensile tests on DQSK.
Coil Coil temp.. Measured Measured Grain
number °C YS, MPa UTS, MPa size, mm
1 665 320 390 7.9 X 10'^
2 550 310 375 9.4 X lO"''
3 550 244 335 10.4 X 10-'
4 550 245 331 10.3 X 10-'
1 915^ 259 325 13.1 X 10-'
1 950^ 254 318 15 X 10"'
reheat temperature followed by air-cooling
Figure 8. Typical microstructure for DQSK steel. Bar in picture represents 1x
1' mm.
17

Table 7. Summary of strain-aging experiments on DQSK steel coils.
Coil number YP, YS, UTS. YP Uniform Total Aging index,^
and location MPa MPa MPa elong., % elong., % elong, % MPa
1 - head middle 368 330 — 2.8 — 46
1' "head middle 346 321 — 4.9
2 - tail left edge 282 269 — 2.6 — — 46
2 - tail center 322 277-
321
375 2.7 18 29 54
2*' - tail center 280 267 — 5.0 — —3 - tail left edge 253 253 339 2.3 23.8 35.3 52
3 - tail center 266 252 332 3.2 25.8 37 52
3'' ~ tail center 256 253 — 5.5 — —
strained 5 % and then immersed in boiling water for 4 h
annealed at 650 °C for 1 h before strain-aging test
4.3 HSLA-V, 350 MPa Grade Steel
A summary of all the tensile tests is shown in table 8. Both as-received coils and heat-treated
samples are included. The mechanical properties of the as-received samples show a 50 MPa variation
in YS and a 45 MPa variation in UTS. Figure 9 shows the microstructure that is typical of this grade.
The grain shapes are somewhat irregular compared with those in DQSK, but no special significance
could be associated with the irregular shapes. Grain size changes with heat treating conditions, but the
ferrite fraction (not shown in the table) was relatively constant at about 0.95. Laboratory processing of
the HSLA-V crop samples was not a valuable procedure to expand the range of microstructures to be
evaluated beyond those of the mill samples.
The unknown factor in the microstructure is the state of vanadium precipitation; the aging experi-
ments on mill-produced coil samples demonstrate the hardening potential from vanadium. The maximumstrengthening from the 0.08 % vanadium addition can be estimated by comparing the DQSK coiled at
665 °C with the vanadium steel coiled at 690 °C and then aged at 600 °C for 1 1 80 min; the grain size and
ferrite fractions are nearly the same, but the strength of the aged vanadium samples were about 1 10 MPahigher than those for the DQSK coil. This value for precipitation strengthening is typical for a vanadium-
containing steel, given the vanadium and nitrogen contents [16].
18

Table 8. Summary of all tensile tests on HSLA-V, 350 MPa grade steel.
Coil number Coiling temp., Measured Measured Grain size.
and location^ °C YS, MPa UTS, MPa mm
Al -HR — 356 464 —
Al''-HC — 360 474 —
Al^-HL — 343 453 —
Al^'-MR — 372 483 —
Al^'-MC 692 377 493 8.5 X 10"^
Al'^-TR — 360 474 —
Al''-TC — 355 468 —
Al^'-TL — 350 465 —
Al^'-TL 692 327 448 8.5 X 10"^
A2"' - MC 693 375 466 10.6 X 10'^
as" - MC 693 379 475 10.6 X 10"^
A4 -HC 650 367 445 7.7 X 10"^
A4 -TC 660 360 446 5.1 X 10"^
Coil number
and location^''^Aging condition
Measured
YS, MPaMeasured
UTS, MPaGrain size,
mm
Al -TL 600 °C/1180min 430 504
Al -TL 720 °C/35min 368-401 470 —Al -TL 720 °C/134min 348-379 440 —Al -TL 720 °C /290 min 326 401 —Al -TL 720 °C/1200min 231-264 333-357 —
HR = head right; HC = head center; HL = head left; MR = middle right; MC = middle center:
TR = tail right; TC = tail center; TL = tail left
temper-rolled
heat-treated at NIST
19

/
V .ii\r
Figure 9. Typical microstructure for HSLA-V, 350 MPa grade. Bar in picture represents 10x10 mm.
4.3.1 Temper-Rolling
The YPE for the HSLA-V grade was distinctly different from that of the DQSK. The low values
of YPE in the HSLA-V grade indicated that the samples had been temper-rolled after coiling. Temper-
rolling can have some influence on the measured YS; usually, it decreases the YS. Temper-rolling has
essentially no effect on UTS, so the net effect is an increase in the difference between YS and UTS.
From table 8, the temper-rolled coil samples typically had a difference of 100 MPa to 1 15 MPa between
YS and UTS, whereas the as-rolled coil samples showed a difference of 80 MPa to 85 MPa.
4.3.2 Within-Coll Variations
Samples from one HSLA-V coil were received in which nine separate areas in the coil could be
studied and compared with each other to evaluate within-coil variations. The strengths varied with
position in the coil, but the ferrite grain size and ferrite fraction did not. The data in table 9 show that
there was a 50 MPa variation in YS and UTS depending upon the location within the coil. The maximumvariation from sample to sample for identical material was about 10 MPa.
20

Table 9. Tensile test results from as-received HSLA-V coil Al
LocationYP, LYS;' UTS, YP Uniform Total
MPa MPa MPa elong, % elong, % elong, %
Right edge 357 357 468 0.5 15 27
356 356 460 0.7 16 31
Center b 358 469 b 14 27
b 367 479 b 16 28
Left edge 353 348 458 1.4 17 29
337 337 448 0.6 17 28
Right edge b 374 485 b 14 25
369 369 482 0.6 16 29
Center b 380 499 b 14 27
b 375 486 b 13 25
Left edge 362 362 476 0.7 15 27
363 358 472 0.9 16 28
Right edge b 362 471 b 16 28
b 349 465 b 16 28
Center b 351 465 b 16 29
b 350 465 b 15 29
Left edge b 331 451 b 16 31
b 324 445 b 18 34
lower yield strength or offset yield strength, 0.2 %continuous yielding; no yield point
4.3.3 Influence of Test Orientation
The influence of test orientation on the hot-rolled coil samples was studied with the first HSLA-Vcoil. Samples from the head, middle, and tail where tested in the longitudinal (0°), transverse (90°). and
diagonal (45°) orientations with respect to the rolling direction. The results summarized in table 1 in-
dicate that the 0° orientation had the lowest YS, and the 90° samples had about 20 MPa higher strength;
the strengths of samples from 45° were approximately the average of the other two.
21

Table 10. Summary of mechanical tests in HSLA-V steel as a function of orientation.
Coil and Strength, MPa Elongation, %location
YP LYS UTS YP Uniform Total
Coil A4 -- head
long. 386 367 446 2.5 18.5 33
trans. +25 +18 +5 + 1.0 -0.5 -1
45° +5 +13 +3 +0.4 -0.5 +2
Coil A4 -- middle
long. 377 370 455 1.5 16.5 31
trans. +22 + 16 -A +1.0 —45° +27 +27 +16 + 1.0 +0.5 +3
Coil A4 --tail
long. 367 360 446 1.6 19.5 33
trans. +31 +22 +5 + 1.5 + 1.5 -2.5
45° +16 +13 +0.4 -0.5 -0.5
CoilA2-- middle
long. 377 375 466 1.4 16.5 28.5
trans. +17 +15 +8 +0.1 -1.5 -1.5
Coil A3 -- middle
long. 381 379 475 1.3 15 27.5
trans. + 14 + 14 + 1 +0.1
4.3.4 Aging of Coil Samples
A special set of tests was initiated to age the lowest-strength (most underaged) section of coil and
to determine the properties as a function of the aging conditions. The results are summarized in table 1
1
for peak-aged and overaged conditions. With aging, the YPE returned to the typical values; the overall
strength level peaked after 1 160 min at 600 °C and then decreased with continued aging at 720 °C. The
measured grain size of samples aged at 720 °C for 1200 min was the same as the that of the as-rolled
samples; therefore, the increase in tensile properties was attributed to an increased volume fraction of
precipitates, and the subsequent decrease was attributed to coarsening of precipitates. The peak strength
occurred after aging at 600 °C for 1 160 min. The UTS was similar to that of the sample taken from the
middle section, center of width, but the YS of the peak-aged sample was about 50 MPa higher. We attrib-
uted the lower YS of the as-received coil to the temper-rolling.
22

Table 1 1. Tensile properties of aged coil samples, HSLA-V steel coil Al
left edge of tail section.
Strength, MPa Elongation, %
ID YP LYS UTS YP Uniform Total
A-1 431 431 509 3.6 13.6 27
A-2 428 428 498 4.4 16.8 29.5
B-1 368 368 468 6.6 17.8 34
B-2 401 401 473 3.8 14.2 26
C-1 379 379 441 3.4 16 28
C-2 348 348 440 9.8 21 34
D-1 333 333 407 3.1 15.4 27
D-2 322 319 395 1.1 16.1 29
E-1 264 264 357 4.4 26 39
E-2 231 231 333 1.4 24.1 37
A = 600 °C/1160 min - peak-aged Rg 83
B = 720 °C/35 min - overaged Rg 78.2
C = 720 °C/134 min - overaged Re 74.5
D = 720 °C/295 min - overaged Rg 69 to 72
E = 720 °C/1200 min - overaged Rq 63 to 66
4.4 HSLA-Nb, 350 MPa Grade Steel
A summary of all the tensile tests on these coil samples is shown in table 12. Tensile tests from
laboratory-treated samples are summarized in table 13. Data for both as-received coil and heat-treated
samples are included. The mechanical properties of the as-received samples were remarkably consistent:
only a 24 MPa variation in YS and a 3 1 MPa variation in UTS. Laboratory processing of the HSLA-Nbcrop samples was not a valuable procedure to expand the range of microstructures to be evaluated be-
yond those supplied from the mill. Figure 10 shows the microstructure that was typical of the HSLA-Nb:three orientations are shown in this case because they differed significantly. In the rolling plane, the allo\
exhibited isolated patches of nonpolygonal grains with a higher second-phase content. In thicker products
where toughness is important, these isolated patches could degrade the properties. The structure in ilie
transverse view was used to correlate to longitudinal properties. The ferrite grain size for the four mill
coils (shown in the table) varied from 3.6 x 10"^ mm to 4.7 x 10" mm, but the ferrite fraction (not shown
in the table) was relatively constant at about 0.95. The grains were polygonal in nature, but not al\\a>s
equiaxed; the grain diameter was twice as large in the rolling direction. No correlation was found be-
tween the slight elongation of the grains and the mechanical properties that we are concerned w iih in this
program.

Table 12. Summary for all tensile tests on HSLA-Nb, 350 MPa grade steel.
Coil number Coiling temp., Measured Measured Nb content. Grain size,
and location'' °C YS, MPa UTS, MPa mass % mm
Bl-HC 662 461 529 0.041 4.2 X 10"^
Bl -TC 650 460 528 0.041 4.1 X 10"^
Bl-MC 666 472 541 0.035 4.7 X 10"^
(4.5 X 10^^)
B2-HR — 480 558 0.043 —
B3-HC 482 555 0.043
B3-HL — 481 558 0.043
B3-MR — 473 558 0.043 —
B3-MC 577 474 551 0.043 3.6 X 10"^
(4.0 X 10"^)
B3-ML 477 552 0.043 —
B3-TR — 484 558 0.043 —
B3-TC — 470 549 0.043 —
B3-TR — 467 550 0.043 —
underaged - TC — 466 527 0.036 3.7 X lO"^
HC = head center; HL = head left; HR = head right; MC = middle center; ML = middle left;
MR = middle right; TC = tail center; TL = tail left; TR = tail right.
24

Table 13. Summary of ail laboratory-treated HSLA-Nb steel samples.
ID^' Aging conditionMeasured
YS, MPaMeasured
UTS, MPaNb content,
mass percent
Grain <
mniize.
1
B3 750 °C/63 min 422 474 0.043 4.8 ^ 0^
B3 750 °C/76 min 405 466 0.043 4.9 X 10-^
B3 650 °C/4290 min 465 516 0.043 4.9 X 10-^
83 750 °C/234 min 386 434 0.043 5.1 X 0-^
83 750 °C/234 min 343 417 0.043 5.4 X 10-^
83 700°C/1400min 439 472 0.043 4.9 X 0-^
83 600 °C/70 min 494 563 0.043 4.0 X 10-^
underaged - TC 600 °C/ 100 min 494 552 0.036 3.7 X 10-^
underaged - TC 550 °C/30 min 455 520 0.036 3.7 X 10-^
underaged - TC 600°C/210min 490 552 0.036 3.7 X 10-^
X- rolling- 1 as-received 391 471 0.041 5.4 X 10-^
X- rolling - 2 as-received 433 — 0.041 8.9 X 0-^
X- rolling - 2 600 °C/30 min 421 506 — 8.9 X 0-^
X- rolling - 2 600°C/100min 438 523 0.041 8.9 X 0-^
X- rolling - 2 525 °C/30 min 473 540 0.041 8.9 X 0-^
X- rolling - 3 as-received 391 454 0.041 7.3 X 0-^
X- rolling -4 as-received 401 468 0.041 7.5 X 0-^
X- rolling - 5 as-received 442 501 0.041 6.8 X 0-^
X- rolling- 5 600 °C/30 min 445 514 0.041 6.8 X 0-^
X- rolling - 5 600°C/100min 448 519 0.041 6.8 X 0-^
X- rolling- 5 525 °C/30 min 455 520 0.041 6.8 X1
'
X- rolling -6 as-received 399 469 0.041 8.1 X1
0-^
'tc == tail center; X indicates that the hot-nailing was done on an experimental mill
25

X 6" ~ ,..
8C
%-^
r\ V" "^--^[/-.J^
^.i^;' -'its •-»*-.< \.>^Jk,-^--
J^.
*^
.
s. K
\-,^
I
'•V.""•"^
>
^--vr
^•-S..-^'
4.^-
\.
It lO'Afm
(a)
1 •-.. /^ '
—J
(b)
. \
Y-%i^ ^i
%
r *\ v*
'^ * - '
.AC
(c)
Figure 10. Typical microstructure for the HSLA-Nb, 350 MPa grade steel: (a) rolling plane,
(b) longitudinal, (c) transverse orientations. Bar in (a) represents 10 x 10" mm.
26

4.4.1 Within-Coil Variations
Samples from one HSLA-Nb coil were received in which nine separate areas in the coil could be
studied and compared with each other to evaluate within-coil variations. The properties and microstruc-
ture varied little with position in the coil. Data in table 14 show that there was a 24 MPa variation in YSdepending upon the location within the coil.
Table 14. Within-coil variations in tensile properties of HSLA-Nb coil B3.
LocationYP,
MPaLYS,^
MPaUTS,
MPaYP elong.,
%Uniform
elong., %Total
elong., %
Head
right edge 488 476 557 — — 23
493 484 560 — — 25
center 483 480 549 3.6 16 26
501 484 561 3.5 15 26
left edge 490 481 558 3.2 16 24
491 482 558 3.1 15 24
Middle
right edge 494 473 558 3.2 16 26488 474 559 2.8 16 24
center- 486 474 549 3.6 16 26long. 477 475 553 3.6 15 24
center- 522 517 577 4.3 16 26trans. 516 511 571 3.9 15 24
left edge 489 472 549 3.5 16 24488 482 556 3.5 17 28
Tail
right edge 493 488 557 3.3 16 25
492 480 559 3.2 17 29
center 487 473 551 3.2 17 27
482 468 547 3.4 14 22
left edge 475 469 550 2.8 16 24478 466 550 2.8 16 26
LYS = lower yield strength or offset yield strength, 0.2 %
27

4.4.2 Aging of Coil Samples
Extra tests were initiated to determine the properties as a function of the aging conditions. Those
results are summarized in table 15.
Table 15. Tensile test results from niobium steel after aging (heat-treated at NIST).
SampleStrength, MPa Elongation, %
YP LYS UTS YP Uniform Total
HSLA-0.036 % Nb,
extreme coil sample
as-received, Rb 82, underaged,
3.7 X 10~" mm grain size
as-received + 550 °C, 30 min-
Rb 81.5, underaged
as-received + 600 °C, 100 min-
Rb 87.5, peak aged
as-received + 600 °C, 210 min-
Rb 87.5, peak aged
Coil B3 -Nb middle section
as-received-Rg 87, underaged,
4.0 X 10 mm grain size
600 °C /70 min-Re 87.4, peak
aged, 4.0 x 10~" mm grain size
650 °C /4290 min- Rb 84.0,
overaged, 4.9 x 10" mm grain size
700 °C/1400 min-Re 82.0,
overaged, 4.9 x 10 mm grain size 457
750 °C/63 min-Re 78.6,
overaged, 4.8 x 10"^ mm grain size 454
750 °C/76 min-Re 75.8,
overaged, 4.9 x 10^ mm grain size 41
1
750 °C/234 min-Re 71, overaged,
5.2 X 10 mm grain size
466 466 528 3.8 15.7 27.1
465 465 527 3.8 16.4 30.1
466 466 525 3.5 15.6 29.0
467 467 529 3.6 15.6 28.3
456 453 518 3.6 17.0 26.9
456 459 521 3.6 16.0 27.4
493 493 549 3.8 15.7 25.7
495 495 554 3.8 15.3 25.2
481 487 549 3.8 15.6 27.7
491 494 556 3.9 13.5 24.7
465- 550- — — 22-
485 560 29
511 494 566 3.9 16.4 26.5
515 494 559 3.0 12.9 22.0
498 463 516 5.4 15.4 25.5
489 468 516 5.5 16.7 26.9
464 438 472 6.5 17.2 27.9
457 439 472 7.7 16.2 26.9
435 421 473 5.5 17.5 28.3
454 424 474 5.5 16.1 25.2
434 413 467 6.3 16.1 25.7
411 398 466 3.9 16.2 24.9
407 386 434 7.1 20.5 33.1
358 343 417 4.9 19.7 30.1
28
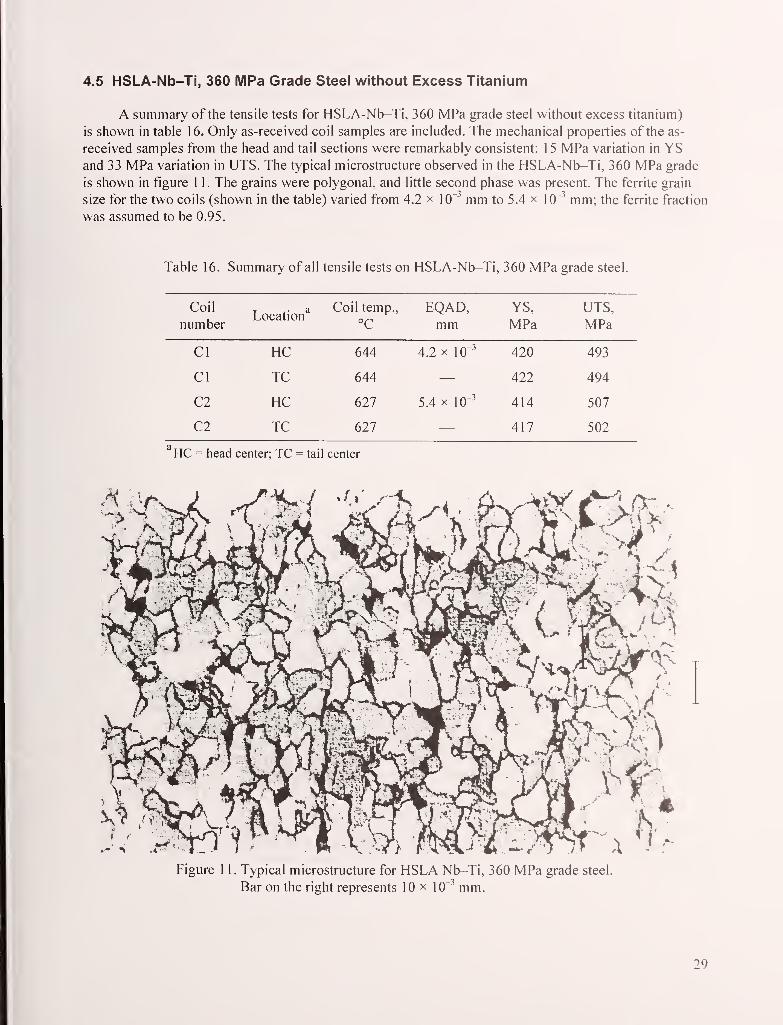
4.5 HSLA-Nb-Ti, 360 MPa Grade Steel without Excess Titanium
A summary of the tensile tests for HSLA-Nb-Ti, 360 MPa grade steel without excess titanium)
is shown in table 16. Only as-received coil samples are included. The mechanical properties of the as-
received samples from the head and tail sections were remarkably consistent: 1 5 MPa variation in YSand 33 MPa variation in UTS. The typical microstructure observed in the HSLA-Nb-Ti, 360 MPa grade
is shown in figure 1 1 . The grains were polygonal, and little second phase was present. The ferrite grain
size for the two coils (shown in the table) varied from 4.2 x 10^ mm to 5.4 x 10~^ mm; the ferrite fraction
was assumed to be 0.95.
Table 16. Summary of all tensile tests on HSLA-Nb-Ti, 360 MPa grade steel.
Coil a Coil temp., EQAD, YS, UTS,
number °C mm MPa MPa
4.2 X 10"^
5.4 X 10"^
11 —'HC = head center; TC = tail center
CI HC 644
CI TC 644
C2 HC 627
C2 TC 627
420 493
422 494
414 507
417 502
^M ^^^Mk
Figure 1 1 . Typical microstructure for HSLA Nb-Ti, 360 MPa grade steel.
Bar on the right represents 10 x 10'' mm.
29

4.5.1 Within-Coil Variations
We received head and tail sections from two different coils (no middle section was included as was
the case for the vanadium and HSLA-Nb-Ti steels); each section included a sample from the left edge,
center, and right edge of the coil for a total of six different areas on each of two coils. The properties were
extremely uniform, as mentioned earlier; the microstructure was not as uniform as that observed in the
niobium grade, having a slightly larger distribution of grain sizes, but the variations are considered to be
of little consequence.
4.5.2 Aging of Coil Samples
Only hardness tests were done on the aged coil samples. The hardness of the starting block for the
aging experiment varied from Rb 78 to 81; this variation probably reflects the variations observed in the
grain size and is important only on a local scale, as the tensile properties, which better reflect the bulk,
were uniform. With aging at 650 °C, the hardness did not increase above 81, and it started to decrease
after about 200 min.
4.6 HSLA-Nb-Ti, 550 MPa Grade Steel with Excess Titanium
A summary of the tensile tests for HSLA-Nb-Ti, 550 MPa grade with excess titanium is shown in
table 17. As-received and heat-treated coil samples are included. Laboratory processing of the crop sam-
ples was not a valuable procedure to expand the range of microstructures to be evaluated beyond the as-
received conditions.
The microstructure for the three coils of HSLA-Nb-Ti, 550 MPa grade are shown in figure 12.
The grains were finer than in the lower-strength grades, and the morphologies were not always polygonal
or equiaxed, which made the characterization of the structure difficult. The sample preparation for this
grade was crucial. We did some color etching, and it tended to define the grain boundaries better for
visual comparisons. After repeated examinations with both the light microscope and scanning electron
microscope (SEM) and with a variety of etchants, there was no clear advantage for either technique in
quantifying the grain size.
4.6.1 Grain-Size Measurements
Coil D2 that included head, middle, and tail sections was used for an interlaboratory comparison
between UBC and NIST for grain-size measurements. One half of the broken, longitudinal tensile sample
from the three positions (center location) was distributed to each laboratory. The undeformed grip area
was sectioned, polished, and etched according to the usual procedure in each laboratory and examined in
both the light microscope and SEM. The measurements for the grain sizes in the two laboratories are in-
cluded in table 17; the measurements from UBC are listed first; those from NIST are in parentheses. For
the head and tail center locations, there was excellent agreement: in the middle center location, staff at
NIST measured a larger grain size (4.2 x 10"^ mm) than that measured at UBC (3.4 x 10"^ mm). This 0.8
X 10~^mm difference in ferrite grain size amounts to about 30 MPa difference in the predicted strength,
depending upon which equation is used. The grain-size sensitivity of the strength prediction is a concern
for this high-strength grade in which the typical grain size is neither equiaxed nor polygonal.
30

Table 17. Summary of tensile tests on HSLA-Nb-Ti, 550 MPa grade steel.
Coil number
and conditionLocation^
Coiling temp.,°C
or aging condition
EQAD,mm
YS,
MPaUTS,
MPaRemarks
Dl
as received HC 648 2.9 X 10"^ 626 703 peak aged
as received TC 642 2.9 X 10"' 595 675 underaged
D2
as received HC 644 3.1 X 10⁻³
(3.3 X 10"^)
650 734 peak aged
as received HL 644 — 633 703 peak aged
as received MC 644 3.4 X 10⁻³
(4.2 X 10⁻³)
648 720 peak aged
as received ML 644 — 645 722 peak aged
as received TC 644 3.4 X 10⁻³
(3.6 X 10⁻³)
640 730 peak aged
as received TL 644 — 635 724 peak aged
D3
as received TL 612 2.0 X 10⁻³
(2.9 X 10⁻³)
587 644 underaged
as received MC 612 2.6 X 10⁻³
(3.2 X 10⁻³)
590 655 peak aged
aged TL 525 °C/30 min — 605 658 underaged
aged TL 650 °C/10min — 608 658 underaged
aged TL 650 °C/90 min 632 671 peak aged
Dl"
950 °C/60 min air-cooled from 950°C 5.5 X 10⁻³ 372 459 b
950 °C/60 min air-cooled from 790 °C 5.3 X 10⁻³ 349 449 b
950 °C/60 min air-cooled from 650 °C 6.8 X 10⁻³ 328 431 b
950°C/10min rC/min cooling 333 423 b
HC = head center; TC = tail center; HL = head left; MC = middle center; ML = middle left; TL = tail left
no precipitation strengthening, low reheat temperature did not dissolve niobium in austenite
heat-treated at NlST
4.6.2 Coil-to-Coil Variation
The differences in mechanical properties and microstructures for the three coils are shown in
table 17 and in figure 12. The third coil with the lowest strength had the finest measured grain size. The
chemical compositions reported for the three coils are very similar and cannot explain the variations in
properties.

(a) (b)
^-.-^#»sg
Figure 12. Microstructure for HSLA-Nb-Ti , 550 MPa grade steel. (1) coil Dl, nital etchant,
(b) coil D2, color etchant, and (c) coil D3, color etchant. Bar represents 5 x 10 ' mm.
32

4.6.3 Within-Coil Variations
The tail section from coil Dl had a lower strength than that of the head (about a 30 MPa differ-
ence). Coil D2 was checked in six locations, and the largest variations in strength were seen in the head
section where the YS variation was 17 MPa and the UTS variation was 31 MPa. The as-received tensile
properties of coil D3 were similar in the extreme tail and in the middle sections.
4.6.4 Aging of Coil Samples
Both hardness and tensile tests were done on aged coil samples. The tail section from coil Dl was
aged at 650 °C for up to 1000 min and at 550 °C for up to 10 000 min; the results are shown in figure 13.
At both temperatures, the peak hardness was the same, and the time it took to reach peak hardness was
consistent with literature values for niobium steel [18].
Coil D2 increased in hardness less than three Rockwell points (B scale) with aging. Since no
significance could be attached to this increase, no further experiments were performed on this material.
The middle section of coil D3 showed no increase in hardness with aging; the extreme tail section
exhibited some aging response in the hardness test. Therefore, additional tensile samples from the ex-
treme tail were machined and aged. The results of these tests are shown in table 18. The LYS increased
about 40 MPa and the UTS was 30 MPa higher after 90 min at 650 °C. The relative change in strength
was consistent with the increase in hardness observed in coil D2 after aging. These changes with aging
reflect the relative importance of location within the coil on the strength.
(D
oo
{/)
(1)
OJ
65
64
63
62
61
60
59
58
57 -
56 -
55
0.1
HSLA-Nb-TI 550 MPa grade
650.C
-X
' ' I I i II I 1 L-L.
550 °C
_l l_l_l LLl
1 10 100 1000
Time at temperature, min
10000
Figure 13. Hardness as a function of aging time for the HSLA-Nb-Ti, 550 MPa grade steel.
jj

583 583 650 2.6
594 591 637 3.1
608 606 666 2.6
608 604 651 3.9
642 610 659 3.4
636 606 657 3.6
650 630 669 4.1
656 635 673 3.6
Table 18. Tensile test results from aged samples of coil D3, extreme tail section.
Condition and YP, LYS, UTS, YP Uniform Total
sample number MPa MPa MPa elong., % elong., % elong., %
As received
1 583 583 650 2.6 10.6 19.4
2 594 591 637 3.1 12.0 22.8
525 °C for 30 min
1 608 606 666 2.6 10.4 19.4
2 608 604 651 3.9 12.0 21.8
650 °C for 10 min
1 642 610 659 3.4 11.1 20.0
2 636 606 657 3.6 11.8 20.9
650 °C for 90 min
1 650 630 669 4.1 10.8 19.0
2 656 635 673 3.6 10.6 20.0
4.6.5 Effect of Heat Treatment
Additional tests were performed on the HSLA-Nb-Ti, 550 MPa grade steel to confirm that, after
processing, its grain size was coarser and the effects of precipitation were gone. The heat treatment took
as-received sheets and reheated the material to 950 °C for 1 h and then cooled it at different rates. The
low reheat temperature of 950 °C ensures that little niobium and titanium will be dissolved in the aus-
tenite and that they will be available for subsequent precipitation in ferrite. The results are summarized
in table 17.
4.7 Nb-Ti and Niobium-Lean IF Grade Steel
The work on this grade for the structure-properties subtask was limited because no IF grade steel is
sold after hot-rolling. A summary of the tensile tests is shown in table 19. Only as-received coil samples
are included. The microstructures for the IF sheets were coarser than those of any of the other grades in-
cluded in the program, and the microstructures revealed some differences in grain size and shapes. Grain
shape is not considered to have a significant effect on the properties. The variation in the LYS for the tail
sections indicated that processing had some effect, but the UTS showed little effect, and we concluded
that the influence of processing is small and can be neglected.
The microstructure typically observed in the Nb-Ti and titanium IF grade is shown in figure 14.
The second phase observed in the other grades was absent because there was essentially no carbon in
these steel grades.
34

Table 19. Tensile test results from the IF steel coils.
Coil and YP, LYS, UTS, YP Uniform Total
location MPa MPa MPa elong., % elong., % elong., %
Nb-Ti, El 272 260 332 3.6 26.0 45
tail center 276 259 330 3.3 24.6 43
Nb-Ti, E2 261 251 329 3.5 25.4 42
head center 260 249 327 3.3 25.2 43
253 244 329 3.3 23.8 47
255 246 330 2.2 23.0 45
Nb^Ti, E2 296 296 334 3.3 21.9 42
tail center 292 281 333 3.3 21.4 40
283 265 333 3.6 22.4 41
263 249 327 3.3 25.5 45
Nb-Ti, E3 258 255 330 3.0 21.7 38
head center 259 248 327 2.7 22.4 38
258 253 332 2.4 21.4 40
262 254 333 2.4 22.4 41
Nb-lean, E4 237 231 310 3.3 23.6 41
head- 232 231 312 3.6 23.9 38
longitudinal 230 226 312 3.3 22.5 44
225 225 308 2.7 23.6 40
tail- 273 258 316 4.1 22.8 41
longitudinal 291 280 308 3.5 20.8 41
261 250 307 3.8 27.9 44
262 255 317 4.6 25.0 45
Nb-lean, E5 230 220 311 2.8 23.9 45
head- 227 217 301 2.4 24.3 45
longitudinal
tail- 264 256 316 3.3 23.0 45
longitudinal 267 258 323 3.6 22.8 45
head- 276 256 303 5.4 24.3 45
transverse 284 266 319 3.6 22.7 43
tail- 282 263 320 5.4 22.8 46
transverse 295 271 321 5.7 23.0 45
35

(a)
(b)
Figure 14. Typical microstructure observed in the (a) Nb-Ti and (b) Ti IF steel grades.
Bar respresents 10 x 10"'' mm.
36

4.8 Other HSLA-Nb Grade Steel
Samples from other HSLA-Nb grades (0.06 % carbon, 0.7 % manganese, 0.02 % to 0.03 % nio-
bium) were collected from three companies to supplement the data base available for the development of
property predictions. The coils from one company had been temper-rolled; the others, as-rolled. All the
chemical compositions were similar, but each had a different mill setup. The tensile test results are sum-
marized in table 20. A check of the microstructure revealed consistently polygonal and nearly equiaxed
grains. The temper-rolled samples (with different thicknesses) showed the effects of increasing hot
deformation: refining the austenite grain size reduced the final ferrite grain size (see fig. 15). Figure 16
shows the material's microstructure as well as the effects of color and nital etchants in preparing the
sample. Figure 17 shows the microstructure from onesample, which, again, was very similar to those
found in the other HSLA-Nb samples from other companies.
Table 20. Summary of tensile tests for HSLA-Nb coils from different mills.
Coil number
and location^
Coiling temp., °C
or aging conditionEQAD, mm YS, MPa UTS, MPa
Fl -TC 678 4.9 X 10"-'
(5.3 X 10"^)
436 509
F2''-HC 675 4.4 X 10"' 422 533
F2''-TC 675 3.9 X 10"' 418 527
F2 -TC 600 °C/100min 3.9 X 10' 469 530
F3^-HC 675 4.2 X 10"' 408 505
F3''-TC 675 5.0 X 10"' 405 495
fa'^-hc 550 4.8 X 10^' 427 525
F4''-TC 550 4.4 X 10"' 423 530
F5''-HC 550 4.7 X 10"' 426 527
F5^-TC 550 4.6 X 10"' 428 535
F5 -TC 600 °C/100min 4.6 X 10"' 481 545
F6^ - HC 600 5.9 X 10"' 405 512
F6^ - TC 600 5.6 X 10"' 406 515
F6 -TC 600 °C/100min 5.6 X 10"' 431 488
F7'' - HC 600 6.0 X 10"' 405 510
F7''-TC 600 5.0 X 10"' 393 515
F8 -MC 655 5.2 X 10' 386 468
TC = tail center; HC = head center; MC = middle center
temper-rolled
37

(a) (b)
(c)
Figure 1 5. Microstructure for the HSLA-Nb, 350 MPa steel with different thicknesses:
(a) 6 mm, (b) 4 mm, and (c) 1.8 mm. Bar represents 10 x lO'^mm.
38
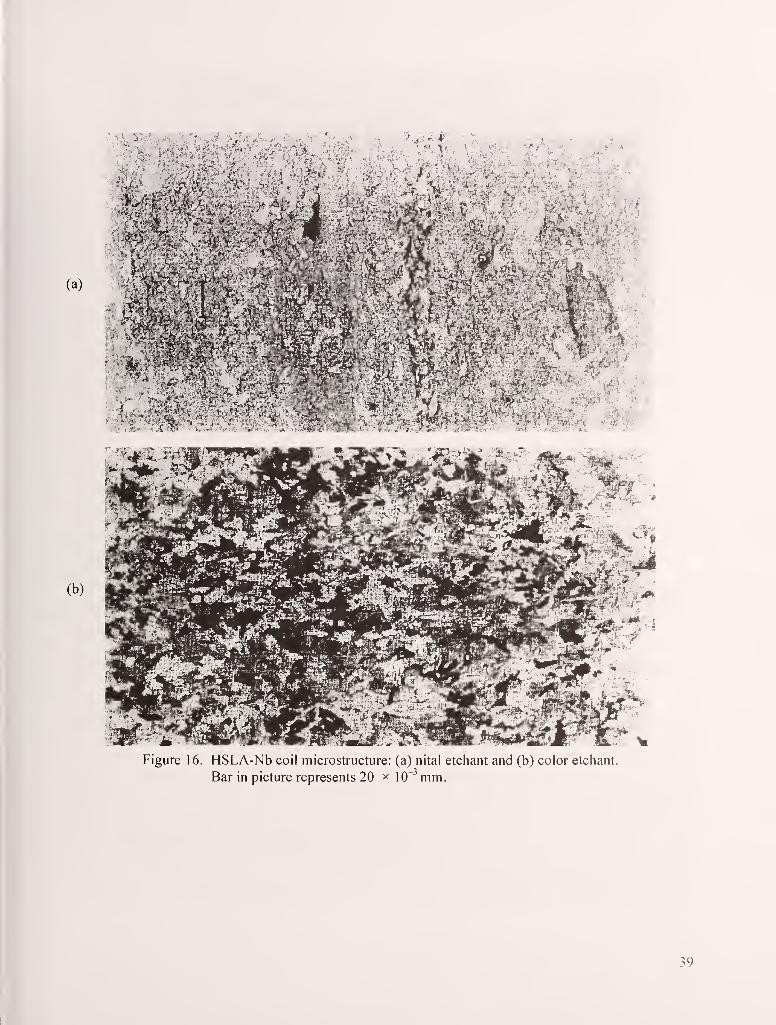
,' .,^^^^-
(a)
(b)
%V-i^H
Figure 16. HSLA-Nb coil microstructure: (a) nital etchant and (b) color etchant.
Bar in picture represents 20 x 10~ mm.
39

I
Figure 1 7. Typical microstructure for HSLA-Nb, 350 MPa grade steel, coil F8.
Bar represents 10 x 10"^ mm.
4.8.1 Within-Coil Variations
We received samples from nine locations for coil F8; head, middle, and tail sections were included
that spanned the full width of the coil. The results of the tensile tests are shown in table 21 . The largest
variation in the LYS was 21 MPa: the UTS variation was 19 MPa. The samples from other steel com-
panies did not allow for a significant comparison of within-coil variations.
4.8.2 Aging of Coil Samples
Both hardness and tensile tests were done on aged coil samples from coils F2, F5, and F6. The
as-received coils were aged at 600 °C for 100 min. Each showed some increase in hardness with aging,
between 2 and 3 points Rockwell B. To document the corresponding change in tensile properties, the
aging was repeated on samples large enough for tensile testing from three of the coils with different thick-
ness and coiling temperatures. The results are shown in table 22. In each case, the LYS increased with
aging, from 26 MPa to 54 MPa; the biggest increase was for the sheet coiled at 550 °C. For the UTS, only
the sheet coiled at 550 °C exhibited an increase; the UTS for the sheet coiled at 600 °C actually decreased
by 26 MPa. The temper-rolled condition of the as-received coils could account for at least a 20 MPa to
30 MPa difference in the LYS and no change in the UTS. In conclusion, it appears that the sheets coiled
at temperatures above 550 °C were at their maximum strength possible, given the ferrite grain size pro-
duced on the runout table. For the sheet coiled at 550 °C, the low coiling temperature resulted in a slightly
lower strength (<15 to 25 MPa) than possible.
40

Table 21. Tensile test results from coil F8.
LocationYP, LYS, UTS, YP Uniform Total
MPa MPa MPa elong., % elong., % elong., %
Head
left 399 393 474 2.0 19.5 31.2
center 383 380 462 — — 31.0
right 380 375 460 1.9 18.9 30.7
Middle*
left 404 401 474 3.3 19.2 30.4
center 392 386 468 2.7 18.6 31.0
right 398 395 467 3.1 20.3 31.0
Tail
left 400 387 455 4.1 19.7 30.4
center 403 397 455 4.7 21.4 34.0
right 398 392 456 3.3 19.2 31.0
Table 22. Tensile test results from niobium-treated coils F2, F5, and F6.
Coil number
and description
YP,
MPaLYS,
MPaUTS,
MPaYP,
%Uniform
elong., %Total
elong., %
Coil F2 - 1.9 mm thick; 675 °C coil-
ing; as-received; 600 °C/100 min
Coil F5 - 4.0 mm thick, 550 °C coil-
ing; as-received; 600 °C/100 min
Coil F6 - 6.2 mm thick, 600 °C coil-
ing; as-received; 600 °C/100 min
420 420 530 1.0 16 24.5
475 469 530 5.0 19.5 28.5
430 427 530 0.8 17.0 28
498 481 545 3.4 16.0 27.5
405 405 514 0.8 17.5 31
438 431 488 3.5 18.4 32.5
4.9 Ferrite Grain-Size Measurements—Round Robin
Because ferrite grain size is such a critical factor in the program, an interlaboratory round robin to
evaluate the measurement of ferrite grain size was initiated between the sponsor companies, UBC, and
NIST. UBC prepared five samples to be evaluated by each laboratory according to the procedures that
they currently use; one of the samples was from an A36 coil (number 1 ) and the other four were from
DQSK (number 2 was an actual coil sample; the other three were coil samples that were heat-treated to
increase the grain size). The results are summarized in table 23.
The results emphasize that the measurement of grain size is not as precise as, for example, the
measurement of mechanical properties like UTS. The grain size measurement typically averages
41

Table 23. Summary of ferrite grain size from round robin.
ID MethodSample number
1 2 3 4 5
UBC area 7.0 X 10"^ 10.0 X 10-' 20.0 X 10-' 25.0 X 10^ 47.0 X 10-'
NIST intercept 7.0 X 10"^ 10.9 X 10-^ 22.8 X 10-' 29.1 X 10' 69.7 X 10'
A intercept 6.8 X 10"-' 10.3 X 10-^ 22.1 X 10' 26.2 X 10-' 60.2 X 10-'
B intercept 8.9 X 10-' 11.9x 10-' 26.5 X 10-' 31.4 X 10-' 74.2 X 10-'
C intercept 9.6 X 10-' 11.9x 10-' 24.1 X 10-' 27.6 X 10-' 75.1 X 10-'
D area 12.5 X 10"^ 15.4 X 10-' 25.3 X 10-' 33.0 X 10' 76.5 X 10-'
E comparison 10.7 X 10"^ 15.1 X 10-' 25.3 X 10-' 35.8 X 10-' 101.3 X 10-'
F area 7.5 X 10"^ 11.2x 10^^ b 27.1 X 10-' 56.9 X 10-'
G area 5.1 X 10"^ 10.0 X 10-' b 29.6 X 10-' 56.4 X 10-'
Values reported are EQAD in millimeters
Not available; sample was repolished between measurements and fell out of the mount
500 grains in one cross section; a measured mechanical property like UTS is averaged over the entire
test section that includes several orders of magnitude more grains in the cross section. The agreement
in the measured values from UBC and NIST is important because there has to be consistency within the
program. The program will output a ferrite grain size, but it is the comparison between the property mea-
surement at each company and the computer prediction of the mechanical property that is the ultimate
standard by which the program is judged. Users of the program will have to judge how the grain size
output from the program is used in comparison with their own measured values.
5. Discussion
The discussion focuses on the two main contributions to strength: base strength (grain refinement
and solid-solution strengthening) and precipitation.
5.1 Equations to Predict Properties
5.1.1 Plain-Carbon Steel: Base Strength
The approach taken for the two plain-carbon steel grades considered in the program is that only
grain refinement and solid-solution strengthening contribute to strength in the as-rolled sheets produced
in the hot-strip mill.
42

5.1 .1.1 Review of Equations in the Literature
Five sets of equations found in the literature are relevant to the hot-strip mill model: the follow-
ing equations from Pickering [2, 1 1], Hodgson and Gibbs [7]. Choquet et al. (IRSID) [3], Tomota et al.
[8], and Campbell et al. [12].
Pickering:
Hodgson and Gibbs:
YS = 88 + 37[Mn] + 83[Si] + 291 8[Nf,ee] + IS.lfiT"'
UTS = 294 + 28[Mn] + 83[Si] + 3.S5[fp] + l.ld"-
YS = 62.2 + 26.1[Mn] + 60.2[Si] + 3286[Nfree] + 19.7^?-"'
UTS = 164.9 + 53.6[Mn] + 99.7[Si] + 634.7[C] + 11^"^
Choquet et al. (IRSID):
and
where
Tomota et al.:
where
so that
and
YS = 63 + YS,, + k,f^ d,-'" + (360 + 2600[C]-) (1 -/„),
UTS = 237 + UTS,, + k,f^ d^-'" + 500 (1 -/„),
YS,, = 23[Mn] + 53[Si] + 700[P] + 5000[Nf,ee],
k, = 15.4 - 30[C] + 6.094/(0.8 + [Mn]),
fa = ferrite fraction,
da = ferrite grain size (in millimeters),
UTS,3 = 29[Mn] + 79[Si] + 700[P] + 5369[Nfree],
k, = 7.24.
a =a(b + Spf
,
a =373+ 62.7[Mn] + 109[Si] + 10.8^„-°^
b = 0.002,
A^ = 5.35/(10 + cr°5)-0.024[Mn]-0.037[Si]- 0.12
YS = a at 8/,= 0.002
UTS = a\Nf.
(3)
(4)
(5)
(6)
(7)
(8)
(9)
(10)
(11)
43

Campbell et al.:
YS =/a (132 +11.8J„-"-) + (1 -/„)(408 + 92.2[Mn ]
+ 0.4005;,-"-) + 79.7[Si] (12)
UTS =fa (197+15.9J,-"^) + (l -/„)(592 + 0.7915/. ''-) + 500[Si], (13)
where
YS and UTS are in megapascals,
d is in millimeters,
elemental composition is in mass percent, and
Sp is the pearlite spacing in micrometers.
Tomota's equations are best applied to low-carbon steel with no appreciable free interstitial con-
tent; the YS cannot be considered for a typical hot-strip product where there is appreciable YPE. The
equations from Campbell et al. require additional information about the pearlite spacing that is not pre-
dicted from the transformation model. For comparison purposes, we assumed the spacing to be 0.4 |im;
serious considerations of these equations would require expansion of the transformation model to include
interstitial solute content and pearlite spacing. We include them here because they could be used for
future applications.
A consideration in choosing the equations to predict strength is the grain size dependence. Ferrite
grain sizes of plain-carbon steel typically vary from about 6 x lO"'' mm to 20 x 10"^ mm. However, weused the equations developed from plain-carbon steel also for microalloyed steel to evaluate the preci-
pitation-strengthening contribution. The ferrite grain sizes in microalloyed steel are typically finer than
those observed in plain-carbon steel; a ferrite grain size as small as 2.5 x 10~" mm has been observed in
a Nb-Ti steel [18]. Therefore, the equations must work for the smaller grain sizes as well.
A different, but important issue relates to the way in which the second phase affects the strength.
One approach for the prediction of YS, taken by Pickering and Hodgson and Gibbs, assumes that the
properties of ferrite control the YS until the volume fraction of second phase reaches 20 %, which is
sufficient for nearly all the conditions with which we are concerned. Campbell et al. and Choquet et al.
took a different approach, assuming a simple rule-of-mixtures equation to predict the LYS, but over a
wider range of^ than that is applicable in the previous approach.
For UTS, each of the four equations deals with variations mfa in a different fashion. The equation
of Choquet et al. assumes the rule-of-mixtures with a constant strength for the pearlite; the equation from
Campbell et al. has the same assumption, but with a dependence on pearlite spacing. Pickering limits the
equation to less than 20 % second phase with a linear dependence of UTS on the perlite volume fraction
fi> and not on composition or spacing. Hodgson and Gibbs assume the contribution offi> depends on the
carbon content and not on microstructural details, pearlite spacing, or volume fraction.
44

CD
Q-
400
375
350
O) 325C0)
BoCD
Q_
300
275
250
225
200
for DQSK composition with preferred equations
UTS
J I L
10 12 14 16 18
Ferrite grain size, pm
20 22
Figure 18. For DQSK, predicted YS and UTS from preferred set of equations as a function of grain size.
5.1.1.2 Application to the Hot-Strip Model
For the final hot-strip model released by UBC to AISI, the equations of Choquet et al. have been
adopted to describe the base LYS and UTS for several reasons: (1) The equations were developed for
a wider range of composition and/^than we need and, therefore, they should be adequate for all cases.
(2) Complication of the transformation model with the prediction of pearlite spacing is unnecessary.
(3) The equations predict a reasonable behavior for grain sizes between 20 mm and 8 mm (see fig. 18),
which is typical for plain-carbon steel.
An alternate set of equations to use for the prediction of strength in plain-carbon steel would be
the YS equation from Pickering and the UTS equation from Hodgson and Gibbs. A major reason to use
Pickering's YS and Hodgson and Gibbs's UTS equations together is that they give a consistent value for
the contribution of precipitation in HSLA steel.
5.1.2 HSLA Steel: Precipitation Strengthening
Precipitation strengthening is the result of the interaction between dislocations and the carboni-
trides containing vanadium, niobium, and/or titanium that form on cooling HSLA steel. The enhanced
strength is a strong function of composition (volume fraction) and the distribution of particle size and
spacing. Numerous approaches to predict the strengthening have been used; we review many of these
in the following subsections and then recommend how to implement the prediction.
45

5.1.2.1 Review of Equations in the Literature
We have compiled a list of physically based equations found in the literature [5, 7, 17, 19-26] that
relate to the strengthening increment due to precipitation; the proposed equations are shown in table 24.
In most cases, the strengthening is calculated from structural parameters measured on carbon extraction
Table 24. Equations found in the literature to describe precipitation strengthening.
Source Relationship
Gladman [19]
Melander [20]
Martin [21]
Gawne and Lewis [22]
Parilak et al. [23]
Hodgson and Gibbs [7]
Mitchell et al. [5]
Osterle [24]
Kwon et al. [25]
NIST[26]*
NIST [27]
(5.9x/'V)ln(x/Z))
0.7Gb
\niXlb) InIdnX
{dg + X)b_
[\n{Alb)]3/2
Ml
2GbX~
(8.9x/'^2r')ln(1630x)
38 + 76.8x10"^
2500 X Nbsoi
(MNeff- kiW
^.5\9GbX~^\r\{xlb)
373[l-exp(-6.33Nbsoi)]
kfc
0.426
Process dependent
/ = volume fraction of precipitates, subscript c for calculated;
otherwise measured from replica
b = Burgers vector, 0.25 nm
X = interparticle spacing
X = average particle diameter
dg = geometric mean-particle diameter from extraction replicas
Va = volume fraction of ferrite
k, k\, and ^2 "= fitting parameters
Neff = effective N content = (total N) - (1 % Ti)/3.42
assumes Poisson's ratio = 0.3
46

0.003
50 100 150 200 250 300
Strength increment due to precipitation, MPa
Figure 19. Calculated precipitation strengthening as a function of estimated volume fraction
of particles forNbC [18] anc VN [28].
replicas like the particle size x, average particle spacing A,, and/or the particle volume fraction/ How-
ever, there is no consistency among the equations. Some equations assume that only the average particle
spacing is important. Only Melander [20] takes into account the size distribution of particles. In other
approaches, the concentration of the metal species (either vanadium or niobium) is taken as an estimate
of the volume fraction/ The calculated/ based on the temperature history and chemical composition
[26], can be correlated to strength as a linear function, as NIST has done for the case of continuous cool-
ing, or taken as a function of the square root of the volume fraction estimated by Zajac et al. [28]. All
these approaches have been shown in the literature to work for a given set of data. Two complications for
the predictions that depend only on calculated/are (1) they cannot predict overaging (the case where the
volume fraction is a maximum and the particle sizes are coarse) and (2) the strengthening from a given/
ofNbC is different from that ofVN particles (see fig. 19).
A different approach to predicting variations in the precipitation strengthening in aluminum alloys
has been proposed by Shercliff and Ashby [29]. Their process model takes into account the particle
coarsening and changes to the solid-solution strengthening. The time constants for each process involved
are combined, and the effective activation energy for the system is measured so that the kinetics of aging
is characterized. This approach requires evaluating the kinetics through a series of experiments, but once
the activation energy for a particular system is measured, the aging kinetics for any time-temperature
history can be predicted.
5.1.2.2 Application to the Hot-Strip IVIodel
For the hot-strip model, we used the Shercliff-Ashby model; its application is summarized in ref-
erence [29]; this approach eliminates the need to characterize in detail the particle size and spacing in
HSLA steel. Such measurements are always time-consuming and subject to large experimental errors.
The experiments required to implement the Shercliff-Ashby model are simpler to perform and are readlK
integrated into the hot-strip model. The main problem associated with the Shercliff-Ashby model is
47

obtaining suitably underaged material on which to perform the required experiments. For the HSLA-Vgrade, the head and tail sections from the as-received coils were acceptable. Aging experiments at dif-
ferent temperatures were performed, and the sample hardnesses are shown in figure 20. The time it takes
to reach the peak hardness can be plotted against the aging temperature to calculate the effective activa-
tion energy Q; for the HSLA-V grade that value is 4 eV.
For the remaining HSLA (niobium-containing) steel grades, there is a fundamental problem to
obtain material that is underaged. The as-received coil samples were within 3 Rockwell B points of the
peak hardness that could be measured after aging experiments. In laboratory testing of crop samples, the
samples were reheated to 1200 °C, furnace-cooled to 950 °C, thermomechanically processed to refine the
austenite grain size, and then water-cooled. The resulting microstructures contained at least 50 % non-
polygonal constituents, and only a 3-point Rockwell B increase was found after aging the samples to the
peak hardness.
A paper by Vollrath et al. [17] contained aging curves performed on a 0.09 % carbon, 0.72 %manganese sheet steel with 0.046 % niobium that had been coiled at low temperatures to suppress pre-
cipitation during coiling (490 °C to 540 °C). The aging kinetics in VoUrath's work was similar to that
found in our aging experiments on as-received coil samples and the laboratory-processed crop samples
of niobium steel. Figure 21 compares the aging curves for one of the laboratory-processed crop samples
and one reported by Vollrath [17]. The absolute strengths were quite different, but the kinetics of pre-
cipitation appeared to be identical. Therefore, the value of ^ for the niobium-containing HSLA grades
(2.8 eV) is assumed to be the same as that determined from the literature data [17].
m
(0
85
80
0} 75
J^ooa: /O
OiO)<Dc7-1 65
60 -
55
0.1
\
\
700 C
I I 1 I I I
1 10 100 1000
Time at temperature, min
10000
Figure 20. Aging curves for HSLA-V, 350 MPa grade steel as a function of time and temperature.
48

95
90
OQ
0) R5$Jx:ooQ^ 80
toU)0)
75I—to
70
65
HSLA-Nb 350 MPa grade
- +
+ NIST lab
X ref . 1
7
,,,!
0.1 1 10 100 1000
Time at temperature, min
10000
Figure 2 1 . Aging curves for HSLA-Nb steel processing at NIST as a function of time
and data from literature [17].
5.2 Fine-Tuning of Equations
Fine-tuning of the structure-property equations goes along with validation of the model and was
done in this program so that the accuracy of the model predictions could be maximized. This can be
accomplished only when there are sufficient mill data along with metallographic samples to verify the
structure.
The best example of fine-tuning is probably the modifications made to the equations for A36.
which has a nonpolygonal microstructure. The results from the mill on the thick samples showed us that
the predicted UTS was too high compared with the values we measured. The literature data from the
ASM handbook of continuous-cooling diagrams [14] contained just enough data to enable a correction
for coiling.
A second example of fine-tuning is related to the total elongation in HSLA steel. Given the num-
erous tests (approximately 70) on the HSLA-Nb steel, we can make a better prediction of the total elonga-
tion in the tensile test by simply fitting the data we have rather than basing the prediction on results from
a wide variety of low-carbon steel grades. Figure 22 shows the measured total elongation plotted as a
function of the measured UTS. The two lines represent the predicted elongation for all steel grades and a
revised prediction that better fits the data. The suggested refinement to the prediction reduces the error
between prediction and measurement over the range of strengths observed in our tests. In either case,
there is a large scatter in the measured elongation for coil samples with UTS between 520 MPa and
560 MPa that no simple refinement in the prediction will resolve. We expect that the morphology of the
second phase plays an important role that is not included in the transformation model.
49

co
cp0)
"(0•*—
<
o
36
34
32
30
28
26
24
22
20
18
original
modified
-H-
-F"
+
++++ ^ + + +^
+-
+ ++ +
+
+
+ +
For HSLA-Nb 350 MPa grade
400 420 440 460 480 500 520 540 560 580 600
Measured UTS, MPa
Figure 22. Measured elongation in tensile test as a function of UTS for HSLA-Nb steel.
A third area for fine-tuning is the prediction of UTS for the HSLA-Nb-Ti, 550 MPa grade steel,
which has the finest grain size. The data from transformation experiments at UBC indicated that there
is a change in the grain-size dependence of hardness (estimated UTS) once the grain size gets below 3.5
X 10~" mm (see fig. 23). The change in the grain-size dependence for the samples reheated to 11 50 °C
could be related to the influence of a dislocation substructure, which we have no way to characterize at
this point. Therefore, a factor was introduced that adds to the predicted UTS in a linear fashion for grain
sizes below 3.5 x 10^ mm; the difference between the IRSID [3] and modified predictions is zero for a
grain size of 3.5 x 10^ mm and 50 MPa for a grain size of 2 x 10"^ mm.
5.3 Validation of Equations
5.3.1 Plain-Carbon Steel
For A36 and DQSK, we had 14 mill-coil samples or heat-treated samples with measured proper-
ties and microstructure (grain size and/a). A comparison of measured versus predicted properties is
shown in figure 24 for the preferred (IRSID) and our alternative choice for equations (Pickering's LYSand Hodgson and Gibbs's UTS). The preferred equations from IRSID showed better agreement with the
measured values than the predictions from the alternative equations: the average difference between
predicted and measured values was ±20 MPa for the preferred equations; the average difference was
±38 MPa for the alternative equations.
An additional data set supplied by one manufacturer [16] showed quite similar results (fig. 25).
The preferred equations from IRSID showed better agreement with the measured values (±15 MPa) than
the predictions from the alternative equations (±35 MPa). Therefore, the IRSID equations are preferred
to predict the strength properties of plain-carbon steel.
50

Q. 700
COwoc 650•g
(0
o 600 h«»—
9^ 560to(D
S 500*->
CO
EiE 450ID
o 950 °C
+ 1100°CX 1150 °C
modified
o o
o
preferred
j_^ l__i L. -L J-_L.
10 12 14 16
(Ferrite grain size, mm)
18 20 22 24
,-0.5
Figure 23 . Estimated UTS from transformation experiments conducted at UBCon the HSLA-Nb-Ti, 550 MPa grade steel.
03
550
500
CO-450
JZ
^ 400
"cO 350
D(D
"C 300
'o0)> 250
200
A36 and DQSKX
-^v: ^ /".^
+X X
1
X
X ^^x</
1 . 1
+ preferred
X alternate
1 1 1 1
200 250 300 350 400 450 500
Measured strengths, MPa550
Figure 24. Comparison between measured and predicted properties
from both the preferred and akernate equations.
51

05CL
0)
o
a.
550
500
450
400
350
300
250
200
-
-
.r/'
~ x>^„ +.
- XX * SL/
\x++ /-
XX ^^
X X + preferred
+— _L X X alternate
1 . 1 - 1 . 1J-- .
. -
200 250 300 350 400 450 500
Measured strengths, MPa550
Figure 25. Comparison between measured data from literature [16] and
properties predicted by the preferred and alternate equations.
5.3.2 HSLA Steel
The prediction of strength properties in HSLA steel is based on the IRSID equations with the
additional factor of precipitation. The precipitation increment is a function of chemical composition
and thermomechanical history. Under certain conditions for the niobium-containing HSLA steel grades,
strain-induced precipitation can occur in the austenite, which would reduce the niobium content available
to precipitate in ferrite where the strengthening occurs. Likewise, the coiling conditions and sample loca-
tion within the coil can have an influence on precipitation. Both of these factors could lead to a lower
precipitation-strengthening contribution. Temper-rolling will reduce the base strength for YS, but not
for UTS. All these factors lead to greater uncertainty in the prediction.
5.3.2.1 HSLA-V Grade Steel
For validation purposes, we have determined that the maximum precipitation strengthening for the
HSLA-V grade steel (considering the preferred base-strength equations from IRSID) to be 110 MPa for
YS and 150 MPa for UTS; for the alternate equations, the maximum strengthening is 100 MPa. The com-
parison between prediction and measured strength properties for the four coil samples available is shown
in figure 26. (The measured LYS of the three temper-rolled coils was increased by 50 MPa to account
for temper-rolling.) For the preferred base-strength equation, the prediction was always greater than the
measured values. For the alternate equation, there was slightly better agreement between measured and
predicted values, particularly for UTS, which is not corrected for temper-rolling.
52

540
5?n05Q- sno^w" 480<~
O) 460c
440*
^J(/)
420-DCD
400O-a 380<D^CL 360
340
For HSLA-V 350 MPa grade
XX X
y/
/ */
X preferred
+ alternate
//J ^ I ^ I , I I 1 ^
L J L.
340 360 380 400 420 440 460 480 500 520 540
Measured strengths, MPa
Figure 26. Comparison between HSLA-V, 350 MPa grade steel measured strengths
and strengths predicted by both the preferred and alternate equations.
5.3.2.2 HSLA-Nb Grade Steel without Excess Titanium
For validation purposes, we determined the maximum precipitation strengthening for the HSLA-Nbgrade steel without excess titanium (considering the preferred base-strength equations from IRSID) to be
150 MPa for coils with 0.04 % niobium and 1 15 MPa for the coils with 0.023 % niobium. A modification
was made to the YS equations so that the YS and UTS increments due to precipitation would be the same.
For the alternate equations, the maximum strengthening was assumed to be 100 MPa for the 0.04 % nio-
bium and 70 MPa for the lower niobium grade. The comparison between predicted and measured strength
properties for the five coil samples available is shown in figure 27. The agreement between measured and
predicted values is excellent for the preferred equations (average difference of 14 MPa) and slightly
worse for the alternate equations (average difference of 20 MPa).
5.3.2.3 HSLA-Nb-TI Grade Steel with Excess Titanium
For validation purposes, we determined that the maximum precipitation strengthening for the
HSLA-Nb grade steel (considering the preferred base-strength equations from IRSID) to be 180 MPa:
the titanium contribution was 2000 Ti^ where Ti^ is the excess titanium and is equal to the total [Ti]
- 3.42[N]. For the alternate equations, the maximum strengthening was assumed to be 1 50 MPa; the
excess titanium contribution was the same. The comparison between predicted and measured strength
properties for the three coil samples available is shown in figure 28. The preferred predictions w ere
comparable to the measured properties for all three coils; the alternate equations result in good predic-
tions for two of the three coils.
53

580
CD 560Q_
^ 540
</)
520 -
C 500CD
"OO 480
o0) 4604—'
OT3 440CDi_
Q- 420
400
For HSLA-Nb 350 and 360 MPa grades
^-
- "^0" /"
' " /+ + x^
+ + //
+ preferred
1
D alternate
1 , 1 , 1 > 1 1 1 , 11
400 420 440 460 480 500 520 540 560 580
Measured strengths, MPa
Figure 27. Comparison between measured and predicted properties
ofHSLA-Nb grade steel witiiout excess titanium.
740tuCL 720
_ 700COSI 680D)c 660CDu_
C/)640
D 620CD
O 600TD(D 580
Q.560
540
- HSLA-Nb-Ti 550 MPa grade
:X
X
X //-
X/ X
-
++ / X
X
*x+
+ X)-
+
++ preferred
1,1,1, 1,1.1X alternate
1,1,11 1
540 560 580 600 620 640 660 680 700 720 740 760
Measured strengths, MPa
Figure 28. Comparison between HSLA-Nb-Ti measured properties and
those predicted by the preferred and alternate equations.
54

For the HSLA-Nb-Ti, 550 MPa grade steel, we also had an extensive set of mill data (190 coils,
2.5 mm to 5 mm thick) that included processing temperatures, rolling schedule, roll forces, chemical
composition, and final properties (LYS, UTS, and total elongation). With no measured ferrite grain size,
we had to make some assumptions regarding the microstructure, but some trends were apparent. There
was no clear correlation between mechanical properties and coiling temperature (see fig. 29). Possible
reasons are (1) the sample for mechanical properties is usually taken at the tail end of the coil where
the strength can be reduced by about 30 MPa, depending on the exact position; (2) the variation in the
measurement can be ±10 MPa; and (3) chemical composition varies within this grade. The variations in
chemical composition were the only ones that we could examine in detail.
Figure 30 shows that the YS increased with higher excess titanium contents (similar to the trend
for UTS). The overall trend in the data (2400 MPa per mass percent of excess titanium) had a slightly
higher slope than that expected from the literature; that is, excess titanium increased the maximumstrength by 2000 MPa per mass percent. The effect of variations in the niobium content within this grade
can be considered only when the effect of excess titanium is first subtracted from the measured properties.
Figure 31 shows the corrected YS [measured YS - (2000 MPa x the excess titanium] versus niobium
content. The variation of niobium from 0.065 % to 0.09 % translates into an apparent increase of about
25 MPa.
After accounting for the composition factors, the scatter in data could still be as large as 100 MPa.
The variation due to grain size is the other significant factor that needs to be considered in the prediction.
Unfortunately, physical samples do not exist that would enable validation of the grain size in such detail.
For the limited coil samples that we received and from the testing of crop samples at UBC, we think that
740
« 720 -CO
^ 700 -
- 680 -c/)
^ 660 -
S 640 hn
^ 620
^ 600
3 580c/)
S 560
^ 540 -
520
X ^ XJ.
X '^ x^ ^ ''-^ ^
X ^X , X
vX X
X+ . ^t, >^#
X - \-^\ VX + M + +X * + ^ ++
.v<x
++ +
+
-H-
+++
fi + YS
X UTS
560 580 600 620 640 660 680 700
Coiling temperature, ^C
Figure 29. Measured YS and UTS as a function of coiling temperature
for the HSLA-Nb-Ti, 550 MPa grade steel.
2)5

680
660
03 640CL^ 620
sz
O) 600
c580
-«—
'
(/)
o 560
<u
> 540
520
500
0.005 0.01 0.015 0.02 0.025 0.03
Excess Ti, mass %0.035
OJDl
Figure 30. Measured YS as a function of excess titanium in the
HSLA-Nb-Ti, 550 MPa grade steel.
640
620
600
c580
(/)
560JO<u>, 540
"D
B 520O(D
t 500OO
480
HSLA-Nb-Ti 550 MPa grade
+ ++
* + T + +
+ " + t J* +J ,
^ I
;^t**.
+ +
linear
fit to
- overall trend
+ +
+
t
0.06 0.065 0.07 0.075 0.08 0.085 0.09 0.095
Nb content, mass %Figure 3 1 . Corrected YS [measured - (2000 MPa x the excess titanium)]
as a function of niobium content.
56

the range of grain sizes that will be produced under typical mill conditions is between 3.5 x 10 "* mm and
2 X 10"^ mm. The strengthening contribution predicted from the preferred equations due to grain refine-
ment from 3.5 x 10"^ mm to 2 x 10'' mm was about 75 MPa; the alternate equations predicted about
80 MPa; both values seem reasonable in light of the measured scatter in data.
In this way, the overall variations in strength can be explained on the basis of variations in chemical
composition (titanium, nitrogen, and niobium) and ferrite grain size (transformation characteristics). This
prediction scheme appears to be consistent with all the specific data available in the program.
5.3.3 Validation from the Steel Companies
The most thorough validation from a steel company has been the work of Nelson [30]. He studied
four grades produced at the mill with chemical compositions most similar to those of materials in our
program: A36, DQSK, HSLA-Nb, and HSLA-Nb-Ti, 550 MPa grade steels. In his initial evaluation, the
complete program was run on the four grades for various strip thicknesses and finishing and coiling tem-
peratures. A brief summary of the evaluation for the HSLA-Nb, 350 MPa grade steel is shown in table 25.
The predicted temperatures at an intermediate location (50 m from the last rolling stand) on the runout
table were generally within 50 °C of the measured values. The predicted temperatures at the end of the
runout table where the coil enters the downcoiler were often 50 °C to 100 °C lower than the measured
values. The YS and UTS predicted by the model were compared with the average values from the grades
obtained with similar processing. The agreement between predicted and measured values was typically
±35 MPa, with the predictions scattered equally on either side of the measured values. In general, the
model was deemed valuable for testing modifications of the current processing procedures.
From our perspective at NIST, the evaluation of the structure-property equations can be revisited
in three areas: (1) The actual chemical compositions for the different grades can be input manually to
accurately reflect the solid-solution strengthening in the base strength and the maximum precipitation
strengthening. (2) The predicted values of ferrite grain size need to be compared with the measured
values when possible. (3) The effect of coiling temperature must be evaluated. In the plain-carbon steels,
the coiling temperature affects the contribution from dissolved nitrogen on solid-solution strengthening;
for the microalloyed steels, the coiling conditions determine the percentage of precipitation strengthening
obtained.
Figure 32 shows the influence of niobium content on the predicted precipitation strengthening.
For the HSLA-Nb, 350 MPa grade steel, a range of niobium (about 0.015 % to 0.04 % ) can be used to
produce the required properties, which translates into a predicted precipitation strengthening of 50 MPa(alternate) or 60 MPa (preferred). The model evaluated by Nelson [30] uses 0.036 % niobium, but the
mill-produced samples had only 0.023 % niobium. In other words, if the model used the actual niobium
content of the samples instead of the 0.036 % niobium found in the grade used to set up the model, then
the predicted strengths would be about 25 MPa lower when the maximum precipitation is predicted from
the coiling model.
Figure 33 plots the measured ferrite grain sizes for the as-received samples of this grade as a
function of thickness along with the HSMM predictions. The interesting feature here is that the model
predicts a minimum ferrite grain size for the sheet at a thickness of about 3 mm. The measured grain sizes
seem to indicate that there is a gradual grain refinement with decreasing thickness—to the 1 .9 mm thick
sample we examined.
57

Table 25. Summary ofHSMM predictions for HSLA-Nb, 350 MPa grade steel.
IDThickness, Ferrite grain
faA(coiling temperature)^ -^CTpptn, A(UTS),'
mm size, mm °C MPa MPa
A 2.36 4.2 X 10"' 661/-53 128 —
B 6.49 4.6 X 10"-' 0.93 636/-32 144 +46
C 4.87 4.3 X 10"-' 0.92 657/+8 130 —D 3.13 3.6 X 10"-' — 598/+87 153
—
E 12.95 10.1 X 10"-' 0.98 755/-74 56 —F 1.92 5.1 X 10^^ 0.90 727/^7 74 —J 4.28 3.9 X 10"^ — 606/+48 153 +41
K 9.67 6.6 X 10"-' 0.94 641/-2 141 +36
L 3.10 3.4 X 10"-' 0.94 567/+87 143 +30
M 2.13 4.6 X 10"-' 0.93 694/-38 100 -3
N 4.77 4.4 X 10"^ — 443/+ 125 50 -58
5.31 4.1 X 10-'
0.94 430/+139 47 -56
P 12.77 7.7 X 10"-' 0.94 567/-1
1
143 +31
A(...) is defined as the difference between the measured value and the HSMM predicted value
CL200
^ 180
c IRQcu
£ 140cuu.o i?ncSI 100
mc 8UCD--' fiOC/3
D 400)
O 20o^
- HSLA steels _____ —- ,^ —
preferred , ^ -^- V ^"'^. ^- / ^'
^_ ^ <
^ \y alternate
. y_ /
-
/
-
. 1.1,1.1,1,1.1.1.1CL 0.01 0.02 0.03 0,04 0.05 0.06 0.07 0.08 0.09 0.1
Nb content, mass %
Figure 32. Maximum precipitation strengthening as a function of niobium content.
58

12
E 10n(DN
C03
O) 6
CD
(D 4 -
HSLA-Nb 350 MPa grade
- +
-^
•' +
measured \
predicted
1 , 1 , 1 11 < 1
2 4 6 8 10 12 14
Final strip thickness, mm
Figure 33. Measured and predicted ferrite grain size [30] versus thickness.
Figure 34 shows the model predictions for free nitrogen in plain-carbon steel and precipitation
strengthening in HSLA steel as a function of coiling temperature. The interesting features here are the
distinctive shape for each curve; in plain-carbon steel, the free nitrogen predicted from the model (fig.
34a) is a strong function of coiling temperature between about 550 °C and 660 °C. (The model pre-
dictions are considered valid for most of the length of the coil, but they may not be valid for the head and
tail as well as for the extreme edges.) For temperatures above and below this range, the prediction is not
a function of coiling temperature. For example, if the actual coiling temperature were 600 °C and the
model predicted a coiling temperature of 650 °C, the model performance would be considered good for
the temperature aspect; however, this predicted temperature would lead to a prediction of 10 % free nitro-
gen, whereas the actual value would be about 65 %. The 55 % difference in free nitrogen means that the
predicted strength of a steel containing 0.008 % nitrogen would be inaccurate by about 22 MPa.
A similar exercise can be performed for precipitation strengthening in HSLA steel containing nio-
bium. From figure 34b, the precipitation peaks at 600 °C and drops off to low values on either side of the
peak. If the actual coiling temperature were 650 °C, and if the model predicted a coiling temperature of
700 °C, the model performance would be considered good for the temperature aspect. However, a tem-
perature prediction of 700 °C would result in a prediction of 42 % precipitation strengthening, whereas
if the temperature prediction for coiling temperature were perfect, the precipitation would be 69 %. The
27 % difference in values would translate into a difference of 1 1 MPa in the predictions [41 MPa (pre-
ferred equation) or 30 MPa (alternate equation)] for a steel with a total of 0.036 % niobium.
59

(a)
350 400 450 500 550 600 650 700 750 800 850
Coiling temperature, °C
(b)
Co
'"4—
»
CD•*—
»
'q.q(Du-
o*-•—
»
oCD
LL
1.1
1.0
0.9 -
0.8
0.7
0.6
0.5
0.4
0.3
0.2
HSLA-Nb-Ti
550 MPagrade
HSLA-Nb 350 MPa grade
_L
400 450 500 550 600 650 700 750
Coiling temperature, °C
800
Figure 34. Microstructure predictions from HSMM [30]: (a) fraction of free nitrogen
versus coiling temperature; (b) fraction of maximum precipitation strength-
ening versus coiling temperature.
60

6. Additional Applications
The proposal anticipated that the model could be applied to a variety of applications other than the
hot-strip mill. The best example of this may be the prediction of properties for steel products made on a
Steckel mill where the chemical compositions for the steel and processing conditions, the temperature
variations, and the interpass times are quite different from those of the hot-strip mill. The preferred equa-
tions were used in the program, but they were not validated for Steckel mill products.
For plain-carbon steel in the Steckel mill, little will change in the structure-property equations as
long as the steel's matrix structure is predominantly polygonal ferrite. However, in the microalloyed
grades, the compositions are often designed to produce additional strength from transformation to acicu-
lar microstructures. Also, the maximum precipitation strengthening depends on the soluble microalloy
content in the austenite prior to the phase transformation, which varies along the length of the strip from
zero to the total microalloy content of the steel. The Sherd iff-Ashby process model can be used as in the
hot-strip model, except that the maximum strength must be modified to reflect the soluble microalloy
content.
7. Limitations
The major limitation in the preferred structure-property equations for general applications appears
to be the composition of the steel to be studied. The program has been set up to look at specific steel com-
positions, and the equations are valid in the range of microstructures typically produced. However, for
different combinations of composition and grain size, the equations may give unrealistic predictions.
An example can be shown with the HSLA-Nb composition: figure 35 shows the strength predicted by
the preferred equations for grain sizes between 2 x 10"^ mm and 14 x 10"^ mm. For grain sizes less than
550
03 500Q_
_ 450
-4—
»
C 4000)
3500)
D.O 300 -
Q_ 250
200
for HSLA-Nb composition with preferred equations
I I I
I , I I.
I
1 2 3 4 5 6 7 8 9 10 11 12 13 14 15
Ferrite grain size, ijm
Figure 35. Predicted YS and UTS of HSLA-Nb from the preferred set of equations
as a function of grain size.
61

3x10' mm. the predicted YS is greater than the predicted UTS, which is unrealistic. With the current
processing capability of a hot-strip mill, the grain size will probably be at least 3.5 x 10 mm. The pre-
dictions for base strength are okay. In the future, with improved equipment and better control of the
process, finer grain sizes may be achieved. In general, the preferred equation for YS seems to represent
a source of potential problems because grain-size dependence is a function of both carbon and manganese
content; this grain-size dependence is absent in the UTS equation.
8. Summat7 and Recommendations
Equations have been developed and validated for plain-carbon and HSLA steel produced on the
hot-strip mill. The lower yield strength, ultimate strength, and percent of total elongation are the main
outputs from the equations. For thicker, plate-type products, the DBTT can also be predicted. The accu-
racy of the HSMM predictions for YS and UTS are critically dependent upon the accuracy of the thermal
and transformation models' predictions, which is, at best, ±35 MPa. This is not as good as that reported
for a similar model [31], but the HSMM allows for more flexibility and detail in the setup for the hot-strip
mill.
Within the context of the goal for our program, the starting assumption was "The differences in
properties for a given steel grade can be correlated to microstructure." For the overall trends between
grades, there are clearly good correlations between microstructure and properties. On a finer scale,
regarding the question of how accurately the properties can be predicted from the microstructure, the
answer is less satisfactory. A good example is the HSLA-Nb-Ti, 550 MPa grade steel; figure 12 showed
the microstructure from the three different coils. The third coil with the finest measured grain size, which
would have the highest predicted strength, had a lower measured strength (about 50 MPa UTS) than the
other two. One factor that has not been considered in the prediction of strength is the misorientation
across the grain boundaries. All the equations described previously assume that the boundaries are high
angle (>20° misorientation).
To obtain a better understanding of misorientation, we did additional studies with a crystallographic
orientation mapping system in the SEM. The studies showed that there were several boundaries between
grains with nearly the same orientation, even in this equiaxed, polygonal structure. Unfortunately, the
technique did not work well with the higher strength HSLA steel.
The equations developed for the structure-property relationships are applicable to a wider range
of chemical composition than the eight grades in the program, but, in some cases, the alternate equations
(fig. 36) may give better predictions than the preferred equations (fig. 35). Base strength equations are
considered applicable to grades in which the microstructure is predominantly polygonal ferrite. Precipi-
tation strengthening can be predicted in steel containing 0.02 % to 0.09 % niobium, 0.08 % vanadium,
and excess titanium levels up to 0.025 %.
To improve the applicability of the model in its present form, two areas of additional work related
to this subtask appear to be needed. The first is related to the base strength: a systematic approach to cor-
relate base strength to retained austenite and acicular constituents in the microstructure. The second area
is related to the Shercliff-Ashby model and its application in the coiling module: more data on precipitate
coarsening (activation energy as a function of microalloy content) and measurements of the maximum
precipitation strengthening that can be achieved for a given microalloy content. With the additional work,
it should be possible to extend the model to predict the properties for all low-carbon steel grades. Future
work in this area should consider two additional experimental techniques. First, the use of hardness as a
measure of strength could be utilized more extensively than we did in this program. The correlation be-
tween hardness and tensile properties is well-known and reasonably accurate, albeit purely empirical. In
62

600
CD 550CL
^ 500
</)
JZ450
D)C0) 400
c/)
o 350CD
O 300T3<D
250
200 L
1 3 5 7 9 11 13
Ferrite grain size, um
15
Figure 36. Predicted YS and UTS of HSLA-Nb from the alternate set of equations
as a function of grain size.
this program, we developed equations that relate Rockwell B hardness Rb to tensile properties from data
supplied by one manufacturer for steel with less than 0.12 % carbon:
YS =386-3.23Rb + 0.104Rb'
UTS =586-11.3R„ + 0.1255R«
(14)
(15)
The equations were used to predict the strength of hot-rolled coils for automotive applications [32], which
was then compared with the measured properties; the results are shown in figure 37. Over the full range
of strength properties, the predicted and measured properties agree well.
The other area for refinement in any future test program is related to microstructure characteriza-
tion. Grain size is a critical factor in the model's predictions of properties. Much of our effort has been
in metallographic examination of ferrite grain size, and differences in the measurements made at NISTand at UBC remain, particularly for the HSLA-Nb-Ti, 550 MPa grade steel, which could account for
30 MPa in the prediction. An ultrasonic measurement should provide more consistent values within a
given grade. The other project in the Advanced Process Control Project, Online Mechanical Properties
Measurement [33], illustrates clearly what an ultrasonic measurement can contribute in the wa\ of
characterizing the microstructure. A complimentary magnetic-ultrasonic technique was explored b\
Igarashi et al. [34] to characterize precipitation in HSLA sheet steel.
63

CDa.
800
700
t= 600
c^ ^ 500
C/5
DCCD
D0)
O^ -D2^ 2? 400
(0CD
g 300
200
- for DQSK, HSLA 350 MPa and 550 MPa coils
- data points are measured
lines are predicted
++
UTS/X xx
y^ y^"^
^^^^^^^ /^YS
1
"^ j"-^^"''^
.1 . 1 , 1 . 1 1
40 50 60 70 80 90
Rockwell B scale hardness
100
Figure 37. Measured and predicted tensile properties as a function of hardness for DQSK; HSLA,350 MPa; and HSLA, 550 MPa grade sheet steel for automotive applications.
This work was supported by the American Iron and Steel Institute and performed at NIST under
the supervision of G. Alers and H.I. HcHenry. We acknowledge the help with the experimental work wereceived from R.P. Santoyo and D.P. Vigliotti of NIST. Our partners—P. Repas (U.S. Steel Technical
Center), Prof M. Militzer (University of British Columbia), D. Overby (Stelco), B. Nelson (Dofasco),
and W.P. Sun (National Steel)—contributed greatly to our work.
9. References
[1] Hombogen, E.; Staniek, G. J. Mater. Sci. 9: 879-886; 1974.
[2] Pickering, B.F., in Physical metallurgy and the design of steels. London: Applied Science Publishers; 1978.
[3] Choquet, P.; Fabregue, P.; Giusti, J.; Chamont, B., in Yue, S., ed., Proc. int. symp. on mathematical modeling
of hot-rolling of steel. Quebec: CIM; 1990. 34^3.
[4] Suehiro, M.; Sato, K.; Yada, H., Senuma, T.; Shigefuji, H.; Yamshita, Y., in Tamura, I., ed.. Int. conf on
physical metallurgy of thermomechanical processing of steels and other metals, THERMEC-88. Tokyo: Iron
and Steel Institute of Japan; 1988. 791-798.
[5] Mitchell, P.S.; Morrison, W.B; Crowder, S.N., in Asfahani, R.; Tither, G., eds.. Int. Symp. of low-carbon
steels for the 90s. Warrendale, PA: The Materials Society; 1993. 337-343.
[6] Kwon, O. Trans. Iron Steel Inst. Jap. 32(12): 350-358; 1992.
[7] Hodgson, RD.; Gibbs, R.K. Trans. Iron Steel Inst. Jap. 32(12): 1329-1338; 1992.
[8] Tomota, Y.; Umemoto, M.; Komatsubara, N.; Hiramatsu, A.; Nakajima, N.; Moriya, A.; Watanabe, T.;
Nanba, S.; Anan, G.; Kunishiga, K.; Higo, Y.; Miyahara, M. Trans. Iron Steel Inst. Jap. 32(12): 343-349;
1992.
[9] Mintz, B. Met. Technol. 1 1: 265-272; 1984.
64

[10
[11
[12
[13
[14
[15
[16
[17
[18
[19
[20
[21
[22
[23
[24
[25
[26
[27
[28
[29
[30
[31
[32
[33
[34
Gladman, T.; Pickering, F.B., in Baker, T.N., ed.. Yield, flow and fracture of polycrystals. London: Applied
Science Publishers; 1983.141-198.
Pickering, F.B., in Cahn, R.W.; Haasen, P.; Kramer, E.J., eds.. Materials science and technology—
A
comprehensive treatment. Vol. 7, Constitution and properties of steels. New York: Wiley-VCH; 1991. 41-94.
Campbell, P.C; Hawbolt, E.B.; Brimacombe, J.K. Metall. Trans. 22A: 2779-2790; 1991.
DeBray, B.; Teracher, P.; Jonas, J.J. Metall. Trans. 26A: 99-1 11; 1995.
Atkins, M., ed. Atlas of continuous cooling transformation diagrams for engineering steels. Metals Park, OH:
ASM Int.; 1980. 26.
Duit, G.A.; Hurkmans, A.; Scheffer, J.J.F.; Hoogendoom, T.M., in Tamura, I., ed.. Int. conf. on physical
metallurgy of thermomechanical processing of steels and other metals, THERMEC-88. Tokyo: Iron and Steel
Institute of Japan; 1988. 114-121.
Grozier, J.D., in Microalloying '75. New York: Union Carbide; 1977. 241-250.
Vollrath, L.G.E.; Hackl, R.; Schmitt-Thomas, K.G.; Daub, D., in Microalloying '88. Metals Park, OH: ASMInt.; 1988.353-358.
Repas, P.E., in Gray, J.M.; Ko, T.; Shoulhua, Z.; Baorong, W.; Xishan, X. eds., HSLA steels, metallurgy and
applications. Metals Park, OH: ASM Int.; 1986. 933-940.
Gladman, T.; Dulieu, D.; Mclvor, 1., in Microalloying '75. New York: Union Carbide; 1977. 32-54.
Melander, A. Scan. J. Met. 7: 109-1 13; 1978.
Martin, J.W. Micromechanisms in particle-hardened alloys. New York: Cambridge Solid State Science Series;
1980.61.
Gawne, D.T.; Lewis, G.M.H. Mater. Sci. Techol. 1: 183-191; 1985.
Parilak, L.; Slesar, M.; Stefan, B., in Microalloying '88, Metals Park, OH: ASM Int.; 1988.559-569.
Osterle, W., in Proc. HSLA steels conference. Beijing; 1995. 243-246.
Kwon, O., in Microalloying '95. Warrendale, PA: Iron and Steel Society; 1995. 251-262.
Purtscher, P.T.; Cheng, Y.; Kuziak, R.; Foley, R.P., in Proc, 37th MWSP conf., vol. XXXIII. Warrendale,
PA: Iron and Steel Society; 1996. 405-416.
AISI-UBC-NIST project "Microstructural engineering in hot-strip mills," Subtasks C2.5 and C2.6. Annual
progress report; May 1995 and 1996.
Zajac, S.; Siwecki, T.; Korchynsky, M., in Asfahani, R.; Tithere, G., eds., Proc, Int. symp. of low-carbon
steels for the 90s. Warrendale, PA: The Materials Society; 1993.139-149.
.
Shercliff, H.R.; Ashby, M.F. Acta Metall. Mater. 38(10): 1789-1812; 1990.
Nelson, B. Presentation at IISI TECHO-30, Washington, April 28, 1998.
Nanba, S. et al. Kobelco Technol. Rev., No. 21, April 1998. 3-6.
Mackie, T. Private communication: AISI Auto-Steel Partnership data.
Chase, V. R&D Magazine, pp. 39-43; May 1996.
Igarashi, B.; Alers, G.; Purtscher, P.T. 1997 ASNT spring conf./Sixth annual research symp., Houston, TX.Columbus, OH: American Society for Nondestructive Testing; 1997
65
U.S. GPO 1999-0-773-0 22/40 147


NIST Technical Publications
Periodical
Journal of Research of the National Institute of Standards and Technology—Reports NIST research
and development in those disciplines of the physical and engineering sciences in which the Institute is
active. These include physics, chemistry, engineering, mathematics, and computer sciences. Papers
cover a broad range of subjects, with major emphasis on measurement methodology and the basic
technology underlying standardization. Also included from time to time are survey articles on topics
closely related to the Institute's technical and scientific programs. Issued six times a year.
Nonperiodicals
Monographs—Major contributions to the technical literature on various subjects related to the Institute's
scientific and technical activities.
Handbooks—Recommended codes of engineering and industrial practice (including safety codes)
developed in cooperation with interested industries, professional organizations, and regulatory bodies.
Special Publications—Include proceedings of conferences sponsored by NIST, NIST annual reports, and
other special publications appropriate to this grouping such as wall charts, pocket cards, and
bibliographies.
Applied Mathematics Series—Mathematical tables, manuals, and studies of special interest to physicists,
engineers, chemists, biologists, mathematicians, computer programmers, and others engaged in scientific
and technical work.
National Standard Reference Data Series—Provides quantitative data on the physical and chemical
properties of materials, compiled from the world's literature and critically evaluated. Developed under a
worldwide program coordinated by NIST under the authority of the National Standard Data Act (Public
Law 90-396). NOTE: The Journal of Physical and Chemical Reference Data (JPCRD) is published bi-
monthly for NIST by the American Chemical Society (ACS) and the American Institute of Physics (AIP).
Subscriptions, reprints, and supplements are available from ACS, 1155 Sixteenth St., NW, Washington,
DC 20056.
Building Science Series—Disseminates technical information developed at the Institute on building
materials, components, systems, and whole structures. The series presents research results, test
methods, and performance criteria related to the structural and environmental functions and the durability
and safety characteristics of building elements and systems.
Technical Notes—Studies or reports which are complete in themselves but restrictive in their treatment
of a subject. Analogous to monographs but not so comprehensive in scope or definitive in treatment of
the subject area. Often serve as a vehicle for final reports of work performed at NIST under the
sponsorship of other government agencies.
Voluntary Product Standards—Developed under procedures published by the Department of Commercein Part 10, Title 15, of the Code of Federal Regulations. The standards establish nationally recognized
requirements for products, and provide all concerned interests with a basis for common understanding of
the characteristics of the products. NIST administers this program in support of the efforts of private-
sector standardizing organizations.
Consumer Information Series—Practical information, based on NIST research and experience, covering
areas of interest to the consumer. Easily understandable language and illustrations provide useful
background knowledge for shopping in today's technological marketplace.
Order the above NIST publications from: Superintendent of Documents, Government Printing Office,
Washington, DC 20402.
Order the following NIST publications—FIPS and NISTIRs—from the National Technical Information
Service, Springfield, VA 22161.
Federal Information Processing Standards Publications (FIPS PUB)—Publications in this series
collectively constitute the Federal Information Processing Standards Register. The Register serves as the
official source of information in the Federal Government regarding standards issued by NIST pursuant to
the Federal Property and Administrative Services Act of 1949 as amended. Public Law 89-306 (79 Stat.
1127), and as implemented by Executive Order 11717 (38 FR 12315, dated May 11, 1973) and Part 6 of
Title 15 CFR (Code of Federal Regulations).
NIST Interagency Reports (NISTIR)—A special series of interim or final reports on work performed by
NIST for outside sponsors (both government and non-government). In general, initial distribution is
handled by the sponsor; public distribution is by the National Technical Information Service, Springfield,
VA 22161, in paper copy or microfiche form.

U.S. Department of CommerceNational Institute of Standards and Technology325 BroadwayBoulder, Colorado 80303-3337
Official BusinessPenalty for Private Use, $300
Related Documents