Natixis International Funds (Lux) I SICAV Audited Annual Report As at December 31, 2014 No subscriptions should be made on the basis of the financial report alone. Subscriptions should only be made on the basis of the current Prospectus supplemented by the latest Annual Report and the latest Semi-Annual Report, if published thereafter. Performance data shown represents past performance and is not a guarantee of future results. More recent performance may be lower or higher. Principal value and returns fluctuate over time (including as a result of currency fluctuations) so that Shares, when redeemed, will be worth more or less than their original cost. Performance shown is net of all Fund expenses, but does not include the effect of sales charges or correspondent bank charges, and assumes reinvestment of distributions. If such charges were included, returns would have been lower. Performance for other Share classes will be more or less depending on differences in fees and sales charges. For periods when certain Share classes were unsubscribed or not yet created (the "inactive Share classes"), performance is imputed using the actual performance of the Fund's active Share class which has been determined by the management company as having the closest characteristics to such inactive Share class and adjusting it based on the difference in TERs and, where applicable, converting the net asset value of the active Share class into the currency of quotation of the inactive Share class. The quoted performance for such inactive Share class is the result of an indicative calculation. Unless otherwise indicated, all defined terms used herein shall have the same meaning as set out in the Prospectus of the Umbrella Fund. R.C.S. Luxembourg B 53023

Welcome message from author
This document is posted to help you gain knowledge. Please leave a comment to let me know what you think about it! Share it to your friends and learn new things together.
Transcript
Natixis International Funds (Lux) I
SICAV
Audited Annual Report
As at December 31, 2014
No subscriptions should be made on the basis of the financial report alone. Subscriptionsshould only be made on the basis of the current Prospectus supplemented by the latest AnnualReport and the latest Semi-Annual Report, if published thereafter.
Performance data shown represents past performance and is not a guarantee of future results. Morerecent performance may be lower or higher. Principal value and returns fluctuate over time (includingas a result of currency fluctuations) so that Shares, when redeemed, will be worth more or less thantheir original cost. Performance shown is net of all Fund expenses, but does not include the effect ofsales charges or correspondent bank charges, and assumes reinvestment of distributions. If suchcharges were included, returns would have been lower. Performance for other Share classes will bemore or less depending on differences in fees and sales charges. For periods when certain Shareclasses were unsubscribed or not yet created (the "inactive Share classes"), performance is imputedusing the actual performance of the Fund's active Share class which has been determined by themanagement company as having the closest characteristics to such inactive Share class andadjusting it based on the difference in TERs and, where applicable, converting the net asset value ofthe active Share class into the currency of quotation of the inactive Share class. The quoted performancefor such inactive Share class is the result of an indicative calculation.
Unless otherwise indicated, all defined terms used herein shall have the same meaning as set outin the Prospectus of the Umbrella Fund.
R.C.S. Luxembourg B 53023
Natixis International Funds (Lux) I
2
Table of contents
Management and Administration 5
Report to the Shareholders 7
Audit report 33
Statement of Net Assets 35
Statement of Changes in Net Assets 40
Absolute Asia AM Emerging Asia Fund
Changes in the number of Shares 46
Statistics 47
Statement of Investments 48
Absolute Asia AM Pacific Rim Equities Fund
Changes in the number of Shares 51
Statistics 52
Statement of Investments 53
Gateway U.S. Equities Fund (liquidated on October 15, 2014)
Changes in the number of Shares 55
Statistics 56
Harris Associates Concentrated U.S. Equity Fund
Changes in the number of Shares 57
Statistics 59
Statement of Investments 60
Harris Associates Global Equity Fund
Changes in the number of Shares 61
Statistics 64
Statement of Investments 65
Harris Associates U.S. Equity Fund
Changes in the number of Shares 67
Statistics 69
Statement of Investments 70
IDFC India Equities Fund
Changes in the number of Shares 72
Statistics 73
Statement of Investments 74
Loomis Sayles U.S. Research Fund
Changes in the number of Shares 75
Statistics 76
Statement of Investments 77
Natixis Emerging Europe Fund
Changes in the number of Shares 79
Statistics 80
Statement of Investments 81
Natixis Emerging Latin America Equity Fund (formerly Hansberger Emerging
Latin America Fund, change of name on April 10, 2014)
Changes in the number of Shares 84
Statistics 85
Statement of Investments 86
Natixis Europe Smaller Companies Fund
Changes in the number of Shares 88
Statistics 89
Statement of Investments 90
Natixis International Funds (Lux) I
3
Table of contents (continued)
Snyder U.S. Small Cap Equity Fund (launched on October 10, 2014)
Changes in the number of Shares 94
Statistics 95
Statement of Investments 96
Vaughan Nelson U.S. Small Cap Value Fund
Changes in the number of Shares 98
Statistics 99
Statement of Investments 100
Loomis Sayles Duration Hedged Global Corporate Bond Fund (launched
on February 4, 2014)
Changes in the number of Shares 102
Statistics 103
Statement of Investments 104
Loomis Sayles Emerging Debt and Currencies Fund
Changes in the number of Shares 115
Statistics 116
Statement of Investments 117
Loomis Sayles Global Credit Fund
Changes in the number of Shares 120
Statistics 122
Statement of Investments 123
Loomis Sayles Institutional Global Corporate Bond Fund
Changes in the number of Shares 132
Statistics 133
Statement of Investments 134
Loomis Sayles Institutional High Income Fund
Changes in the number of Shares 146
Statistics 147
Statement of Investments 148
Loomis Sayles Short Term Emerging Markets Bond Fund (formerly
Loomis Sayles Emerging Markets Corporate Bond Fund, change of name on
October 20, 2014)
Changes in the number of Shares 157
Statistics 158
Statement of Investments 159
Loomis Sayles Strategic Alpha Bond Fund
Changes in the number of Shares 165
Statistics 166
Statement of Investments 167
Loomis Sayles Sustainable Global Corporate Bond Fund
Changes in the number of Shares 178
Statistics 179
Statement of Investments 180
Natixis Euro Aggregate Plus Fund
Changes in the number of Shares 190
Statistics 191
Statement of Investments 192
Natixis Euro High Income Fund
Changes in the number of Shares 195
Statistics 196
Statement of Investments 197
Natixis International Funds (Lux) I
4
Table of contents (continued)
Natixis Global Inflation Fund
Changes in the number of Shares 201
Statistics 202
Statement of Investments 203
Natixis Short Term Global High Income Fund
Changes in the number of Shares 206
Statistics 207
Statement of Investments 208
Notes to the Financial Statements 212
Additional Information 237
Appendix A: Performance disclosure (unaudited) 240
Appendix B: Related parties (unaudited) 245
Appendix C: Soft commission arrangements (unaudited) 247
Appendix D: Annual financial statements, December 31, 2013 248
Natixis International Funds (Lux) I
5
Management and Administration
Chairman
Hervé GUINAMANTChief Executive Officer and PresidentNGAM International, L.L.C.a branch of NGAM S.A.Paris (France)
Directors
Patricia HORSFALLSenior Vice President, Chief Compliance OfficerNGAM UK LimitedLondon (UK)
Jason TREPANIERExecutive Vice President, Chief Operating OfficerNGAM Distribution,a branch of NGAM S.A.Paris (France)
Registered Office
2-8, avenue Charles de GaulleL-1653 Luxembourg(Grand Duchy of Luxembourg)R.C.S. B.53023
Management Company, Distributor and Promoter
NGAM S.A.2 rue Jean MonnetL-2180 Luxembourg(Grand Duchy of Luxembourg)
Custodian, Domiciliary and Corporate Agent, Administrative Agent, Paying Agent andRegistrar and Transfer Agent
Brown Brothers Harriman (Luxembourg) S.C.A.2-8, avenue Charles de Gaulle, B.P. 403L-2014 Luxembourg(Grand Duchy of Luxembourg)
Natixis International Funds (Lux) I
6
Management and Administration (continued)
Investment Managers
Absolute Asia Asset Management Ltd.1 Robinson Road#20-02 AIA TowerSingapore 048542(Singapore)
Gateway Investment Advisers, L.L.C.312 Walnut Street, 35th FloorCincinnati, Ohio 45202-9834(USA)
Harris Associates L.P.111 S. Wacker Drive, Suite 4600Chicago, Illinois 60606(USA)
Loomis, Sayles & Company, L.P.One Financial CenterBoston, Massachusetts 02111(USA)
Natixis Asset Management21, quai d’Austerlitz75013 Paris(France)
Snyder Capital Management, L.P.101 Mission Street, Suite 1400San Francisco, CA 94105(USA)
Vaughan Nelson Investment Management, L.P.600 Travis, Suite 6300Houston, Texas 77002-3071(USA)
Auditor
PricewaterhouseCoopers, Société coopérative2, rue Gerhard MercatorL-2182 Luxembourg(Grand Duchy of Luxembourg)
Legal Adviser
Arendt & Medernach14, rue ErasmeL-2082 Luxembourg(Grand Duchy of Luxembourg)
Hong Kong Representative
RBC Investor Services Trust Hong Kong Limited51st floor, Central Plaza18 Harbour RoadWanchaiHong Kong
Natixis International Funds (Lux) I
7
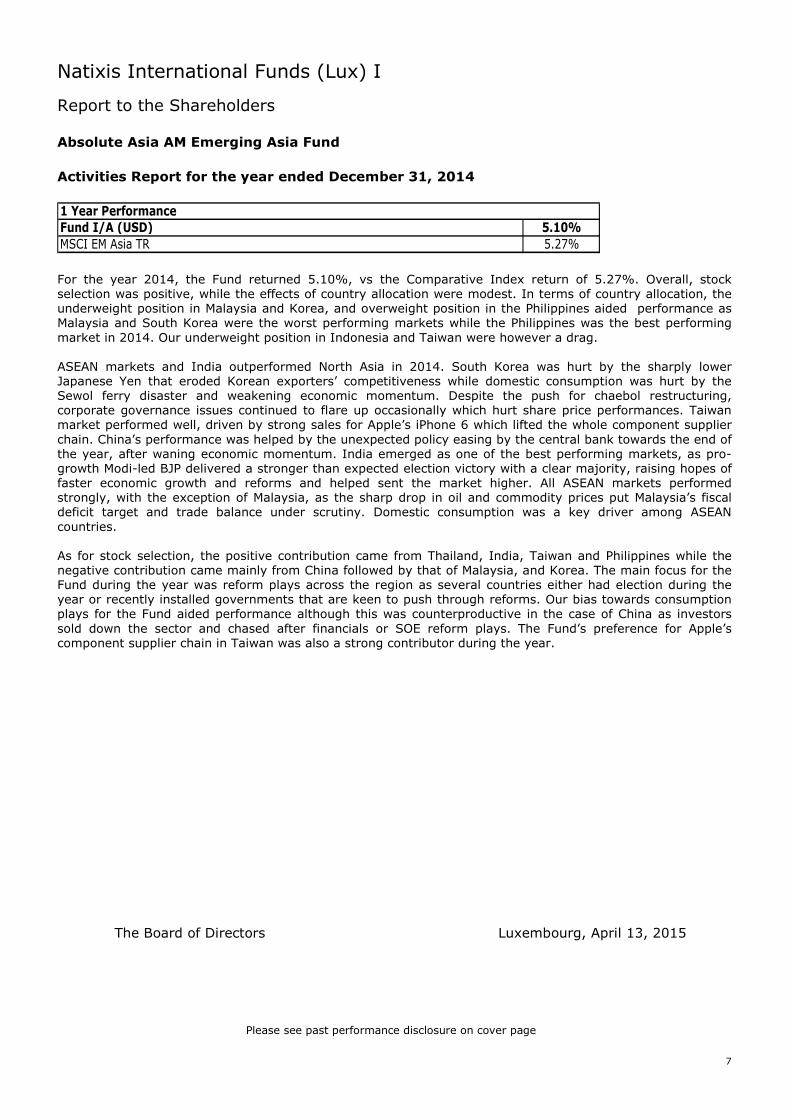
Report to the Shareholders
Absolute Asia AM Emerging Asia Fund
Activities Report for the year ended December 31, 2014
Fund I/A (USD) 5.10%
MSCI EM Asia TR 5.27%
1 Year Performance
For the year 2014, the Fund returned 5.10%, vs the Comparative Index return of 5.27%. Overall, stockselection was positive, while the effects of country allocation were modest. In terms of country allocation, theunderweight position in Malaysia and Korea, and overweight position in the Philippines aided performance asMalaysia and South Korea were the worst performing markets while the Philippines was the best performingmarket in 2014. Our underweight position in Indonesia and Taiwan were however a drag.
ASEAN markets and India outperformed North Asia in 2014. South Korea was hurt by the sharply lowerJapanese Yen that eroded Korean exporters’ competitiveness while domestic consumption was hurt by theSewol ferry disaster and weakening economic momentum. Despite the push for chaebol restructuring,corporate governance issues continued to flare up occasionally which hurt share price performances. Taiwanmarket performed well, driven by strong sales for Apple’s iPhone 6 which lifted the whole component supplierchain. China’s performance was helped by the unexpected policy easing by the central bank towards the end ofthe year, after waning economic momentum. India emerged as one of the best performing markets, as pro-growth Modi-led BJP delivered a stronger than expected election victory with a clear majority, raising hopes offaster economic growth and reforms and helped sent the market higher. All ASEAN markets performedstrongly, with the exception of Malaysia, as the sharp drop in oil and commodity prices put Malaysia’s fiscaldeficit target and trade balance under scrutiny. Domestic consumption was a key driver among ASEANcountries.
As for stock selection, the positive contribution came from Thailand, India, Taiwan and Philippines while thenegative contribution came mainly from China followed by that of Malaysia, and Korea. The main focus for theFund during the year was reform plays across the region as several countries either had election during theyear or recently installed governments that are keen to push through reforms. Our bias towards consumptionplays for the Fund aided performance although this was counterproductive in the case of China as investorssold down the sector and chased after financials or SOE reform plays. The Fund’s preference for Apple’scomponent supplier chain in Taiwan was also a strong contributor during the year.
Please see past performance disclosure on cover page
Luxembourg, April 13, 2015The Board of Directors
Natixis International Funds (Lux) I
8
Report to the Shareholders (continued)
Absolute Asia AM Pacific Rim Equities Fund
Activities Report for the year ended December 31, 2014
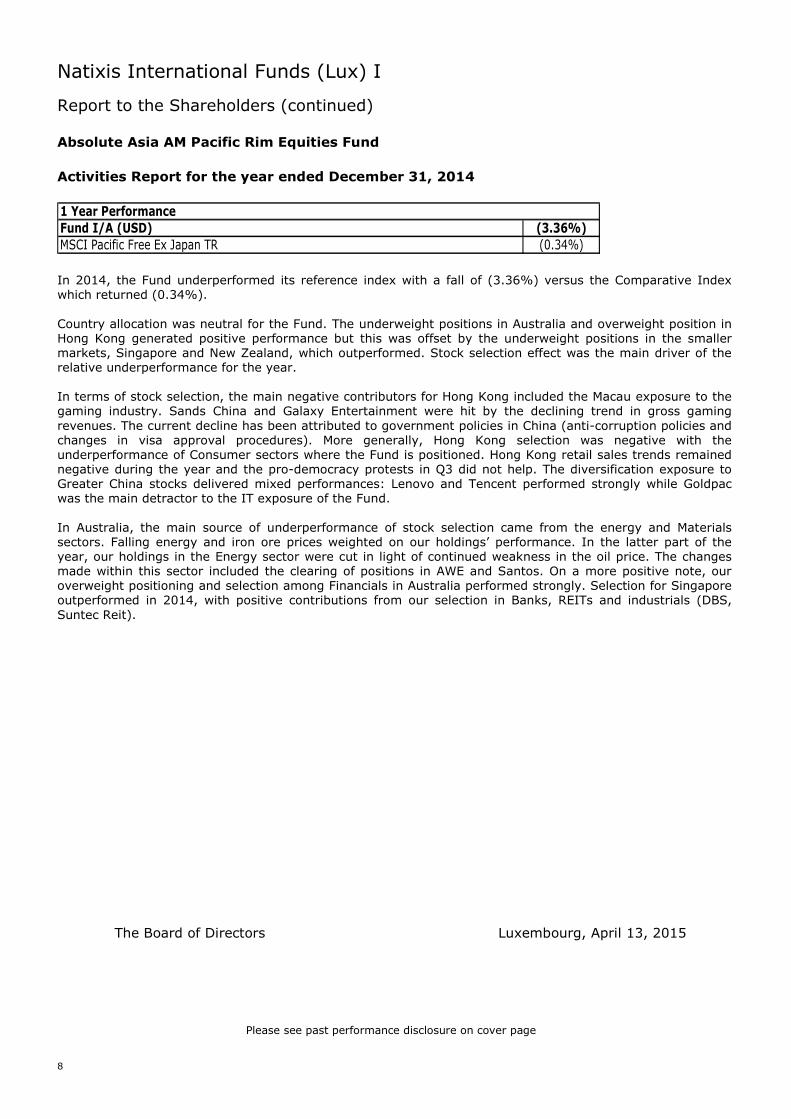
Fund I/A (USD) (3.36%)MSCI Pacific Free Ex Japan TR (0.34%)
1 Year Performance
In 2014, the Fund underperformed its reference index with a fall of (3.36%) versus the Comparative Indexwhich returned (0.34%).
Country allocation was neutral for the Fund. The underweight positions in Australia and overweight position inHong Kong generated positive performance but this was offset by the underweight positions in the smallermarkets, Singapore and New Zealand, which outperformed. Stock selection effect was the main driver of therelative underperformance for the year.
In terms of stock selection, the main negative contributors for Hong Kong included the Macau exposure to thegaming industry. Sands China and Galaxy Entertainment were hit by the declining trend in gross gamingrevenues. The current decline has been attributed to government policies in China (anti-corruption policies andchanges in visa approval procedures). More generally, Hong Kong selection was negative with theunderperformance of Consumer sectors where the Fund is positioned. Hong Kong retail sales trends remainednegative during the year and the pro-democracy protests in Q3 did not help. The diversification exposure toGreater China stocks delivered mixed performances: Lenovo and Tencent performed strongly while Goldpacwas the main detractor to the IT exposure of the Fund.
In Australia, the main source of underperformance of stock selection came from the energy and Materialssectors. Falling energy and iron ore prices weighted on our holdings’ performance. In the latter part of theyear, our holdings in the Energy sector were cut in light of continued weakness in the oil price. The changesmade within this sector included the clearing of positions in AWE and Santos. On a more positive note, ouroverweight positioning and selection among Financials in Australia performed strongly. Selection for Singaporeoutperformed in 2014, with positive contributions from our selection in Banks, REITs and industrials (DBS,Suntec Reit).
Please see past performance disclosure on cover page
Luxembourg, April 13, 2015The Board of Directors
Natixis International Funds (Lux) I
9
Report to the Shareholders (continued)
Gateway U.S. Equities Fund(1)
Activities Report for the period from January 1, 2014 to October 15, 2014
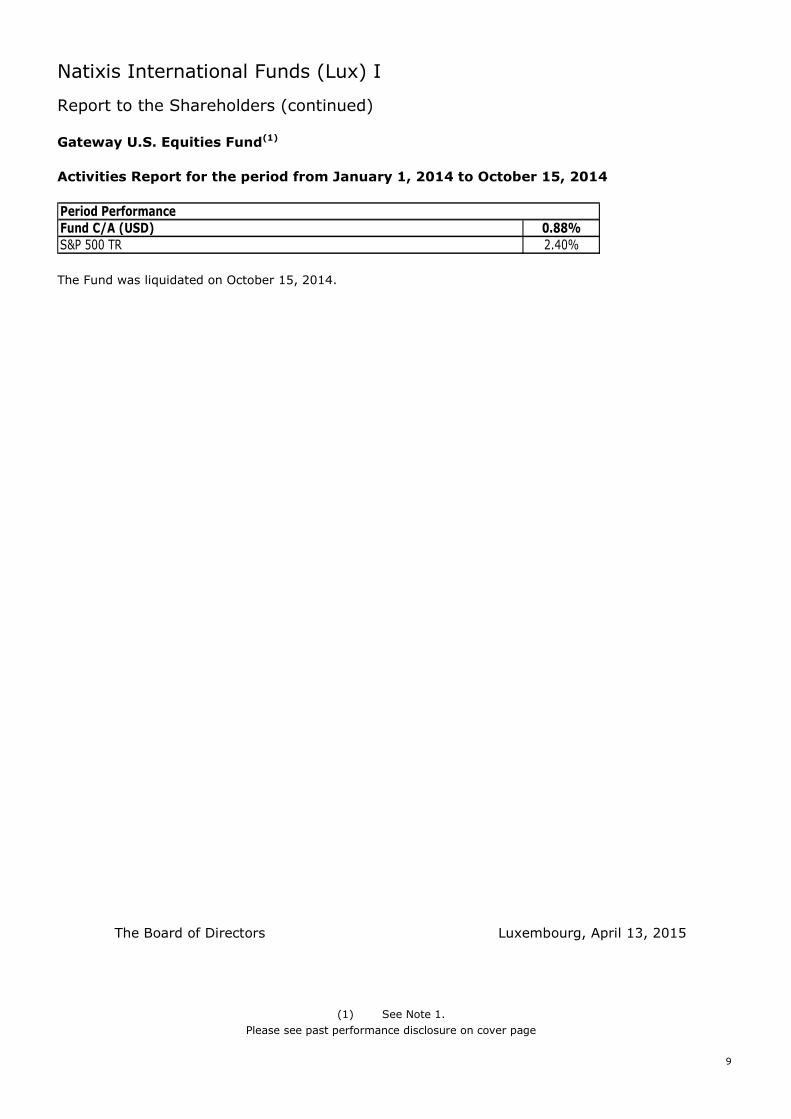
Fund C/A (USD) 0.88%S&P 500 TR 2.40%
Period Performance
The Fund was liquidated on October 15, 2014.
(1) See Note 1.
Please see past performance disclosure on cover page
Luxembourg, April 13, 2015The Board of Directors
Natixis International Funds (Lux) I
10
Report to the Shareholders (continued)
Harris Associates Concentrated U.S. Equity Fund
Activities Report for the year ended December 31, 2014
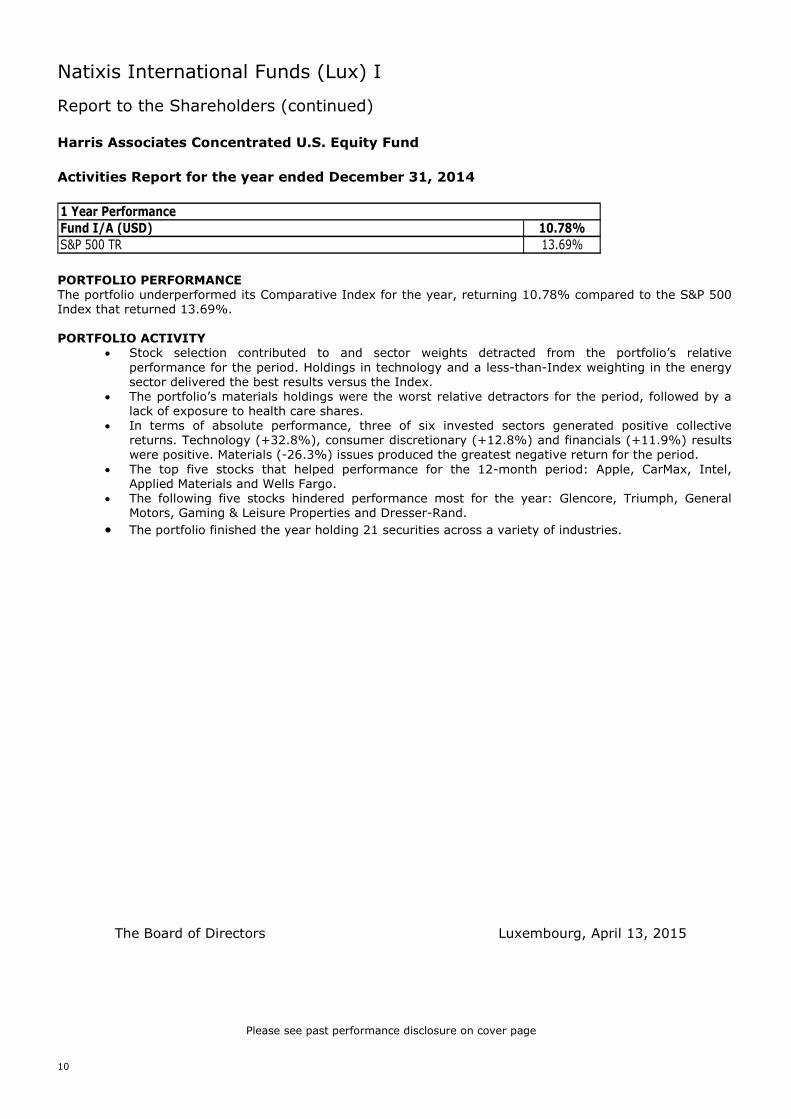
Fund I/A (USD) 10.78%S&P 500 TR 13.69%
1 Year Performance
PORTFOLIO PERFORMANCEThe portfolio underperformed its Comparative Index for the year, returning 10.78% compared to the S&P 500Index that returned 13.69%.
PORTFOLIO ACTIVITY Stock selection contributed to and sector weights detracted from the portfolio’s relative
performance for the period. Holdings in technology and a less-than-Index weighting in the energysector delivered the best results versus the Index.
The portfolio’s materials holdings were the worst relative detractors for the period, followed by alack of exposure to health care shares.
In terms of absolute performance, three of six invested sectors generated positive collectivereturns. Technology (+32.8%), consumer discretionary (+12.8%) and financials (+11.9%) resultswere positive. Materials (-26.3%) issues produced the greatest negative return for the period.
The top five stocks that helped performance for the 12-month period: Apple, CarMax, Intel,Applied Materials and Wells Fargo.
The following five stocks hindered performance most for the year: Glencore, Triumph, GeneralMotors, Gaming & Leisure Properties and Dresser-Rand.
The portfolio finished the year holding 21 securities across a variety of industries.
Please see past performance disclosure on cover page
Luxembourg, April 13, 2015The Board of Directors
Natixis International Funds (Lux) I
11
Report to the Shareholders (continued)
Harris Associates Global Equity Fund
Activities Report for the year ended December 31, 2014
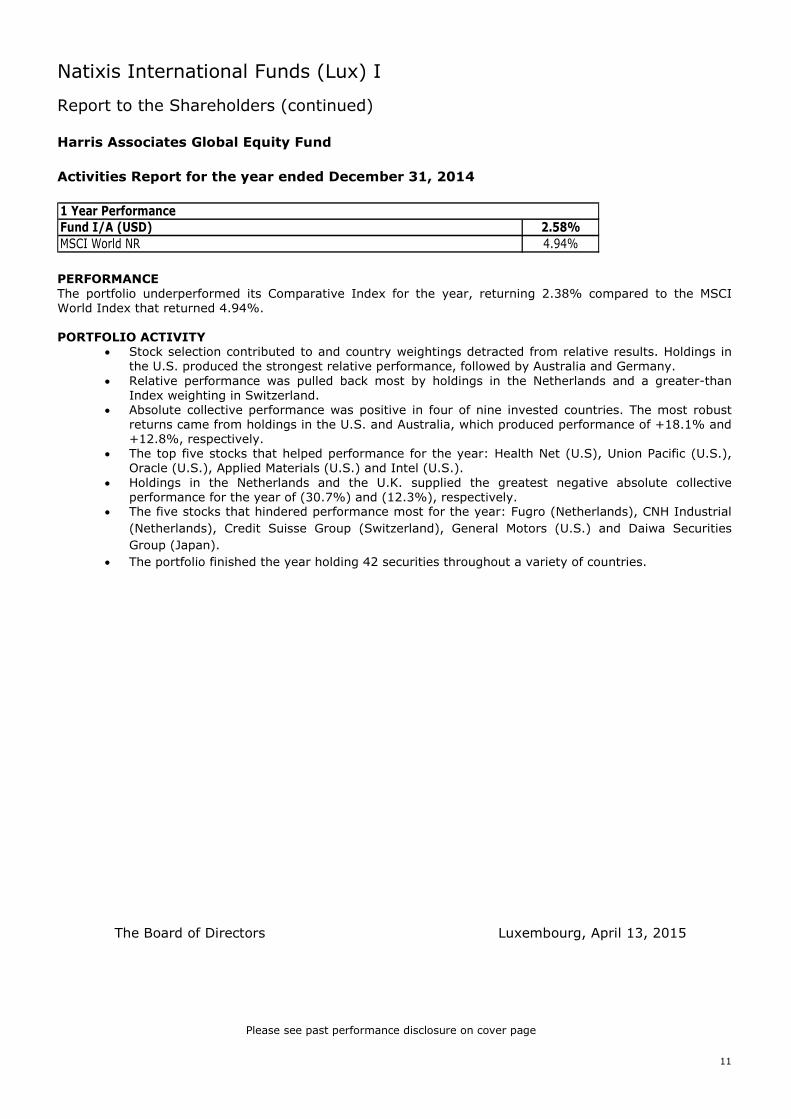
Fund I/A (USD) 2.58%MSCI World NR 4.94%
1 Year Performance
PERFORMANCEThe portfolio underperformed its Comparative Index for the year, returning 2.38% compared to the MSCIWorld Index that returned 4.94%.
PORTFOLIO ACTIVITY Stock selection contributed to and country weightings detracted from relative results. Holdings in
the U.S. produced the strongest relative performance, followed by Australia and Germany. Relative performance was pulled back most by holdings in the Netherlands and a greater-than
Index weighting in Switzerland. Absolute collective performance was positive in four of nine invested countries. The most robust
returns came from holdings in the U.S. and Australia, which produced performance of +18.1% and+12.8%, respectively.
The top five stocks that helped performance for the year: Health Net (U.S), Union Pacific (U.S.),Oracle (U.S.), Applied Materials (U.S.) and Intel (U.S.).
Holdings in the Netherlands and the U.K. supplied the greatest negative absolute collectiveperformance for the year of (30.7%) and (12.3%), respectively.
The five stocks that hindered performance most for the year: Fugro (Netherlands), CNH Industrial
(Netherlands), Credit Suisse Group (Switzerland), General Motors (U.S.) and Daiwa Securities
Group (Japan).
The portfolio finished the year holding 42 securities throughout a variety of countries.
Please see past performance disclosure on cover page
Luxembourg, April 13, 2015The Board of Directors
Natixis International Funds (Lux) I
12
Report to the Shareholders (continued)
Harris Associates U.S. Equity Fund
Activities Report for the year ended December 31, 2014
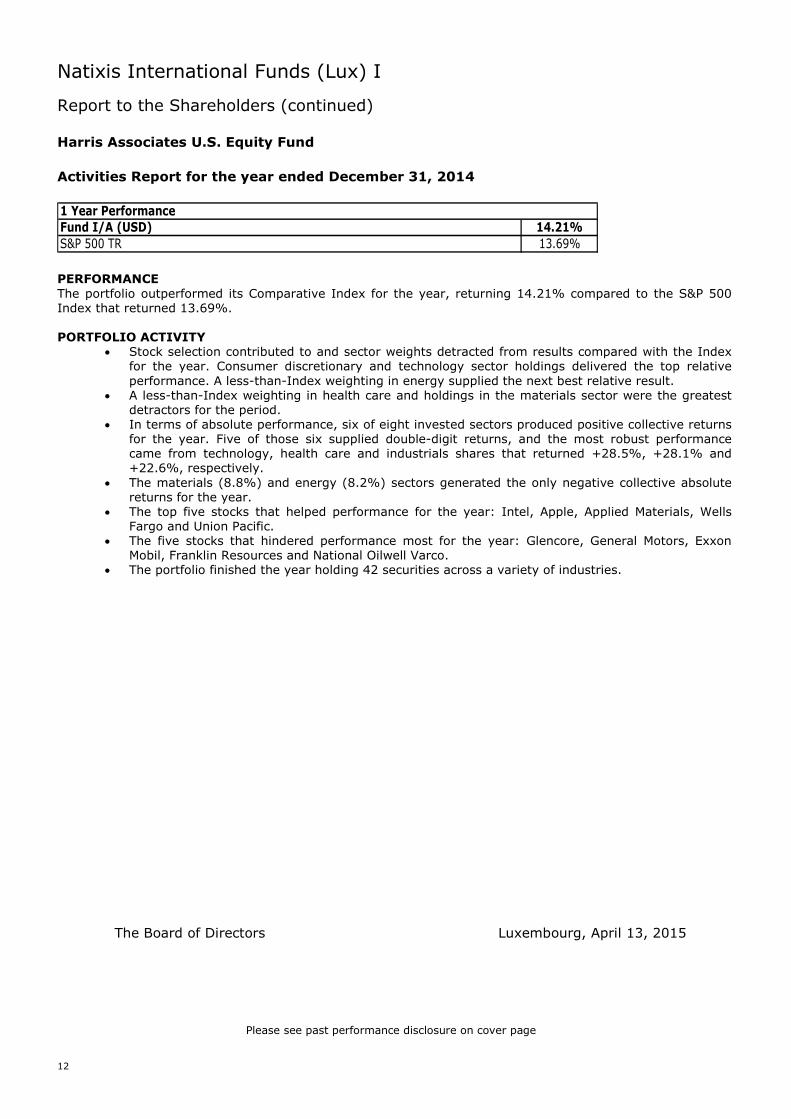
Fund I/A (USD) 14.21%S&P 500 TR 13.69%
1 Year Performance
PERFORMANCEThe portfolio outperformed its Comparative Index for the year, returning 14.21% compared to the S&P 500Index that returned 13.69%.
PORTFOLIO ACTIVITY Stock selection contributed to and sector weights detracted from results compared with the Index
for the year. Consumer discretionary and technology sector holdings delivered the top relativeperformance. A less-than-Index weighting in energy supplied the next best relative result.
A less-than-Index weighting in health care and holdings in the materials sector were the greatestdetractors for the period.
In terms of absolute performance, six of eight invested sectors produced positive collective returnsfor the year. Five of those six supplied double-digit returns, and the most robust performancecame from technology, health care and industrials shares that returned +28.5%, +28.1% and+22.6%, respectively.
The materials (8.8%) and energy (8.2%) sectors generated the only negative collective absolutereturns for the year.
The top five stocks that helped performance for the year: Intel, Apple, Applied Materials, WellsFargo and Union Pacific.
The five stocks that hindered performance most for the year: Glencore, General Motors, ExxonMobil, Franklin Resources and National Oilwell Varco.
The portfolio finished the year holding 42 securities across a variety of industries.
Please see past performance disclosure on cover page
Luxembourg, April 13, 2015The Board of Directors
Natixis International Funds (Lux) I
13
Report to the Shareholders (continued)
IDFC India Equities Fund
Activities Report for the year ended December 31, 2014
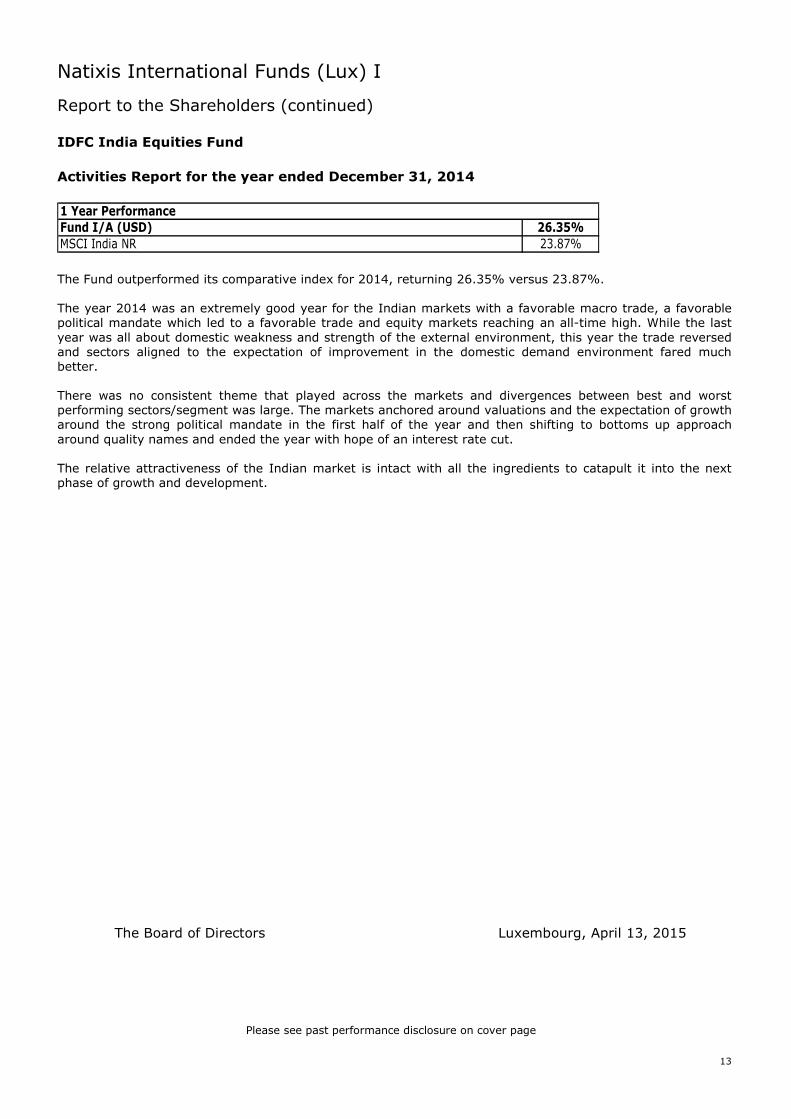
Fund I/A (USD) 26.35%MSCI India NR 23.87%
1 Year Performance
The Fund outperformed its comparative index for 2014, returning 26.35% versus 23.87%.
The year 2014 was an extremely good year for the Indian markets with a favorable macro trade, a favorablepolitical mandate which led to a favorable trade and equity markets reaching an all-time high. While the lastyear was all about domestic weakness and strength of the external environment, this year the trade reversedand sectors aligned to the expectation of improvement in the domestic demand environment fared muchbetter.
There was no consistent theme that played across the markets and divergences between best and worstperforming sectors/segment was large. The markets anchored around valuations and the expectation of growtharound the strong political mandate in the first half of the year and then shifting to bottoms up approacharound quality names and ended the year with hope of an interest rate cut.
The relative attractiveness of the Indian market is intact with all the ingredients to catapult it into the nextphase of growth and development.
Please see past performance disclosure on cover page
Luxembourg, April 13, 2015The Board of Directors
Natixis International Funds (Lux) I
14
Report to the Shareholders (continued)
Loomis Sayles U.S Research Fund
Activities Report for the year ended December 31, 2014
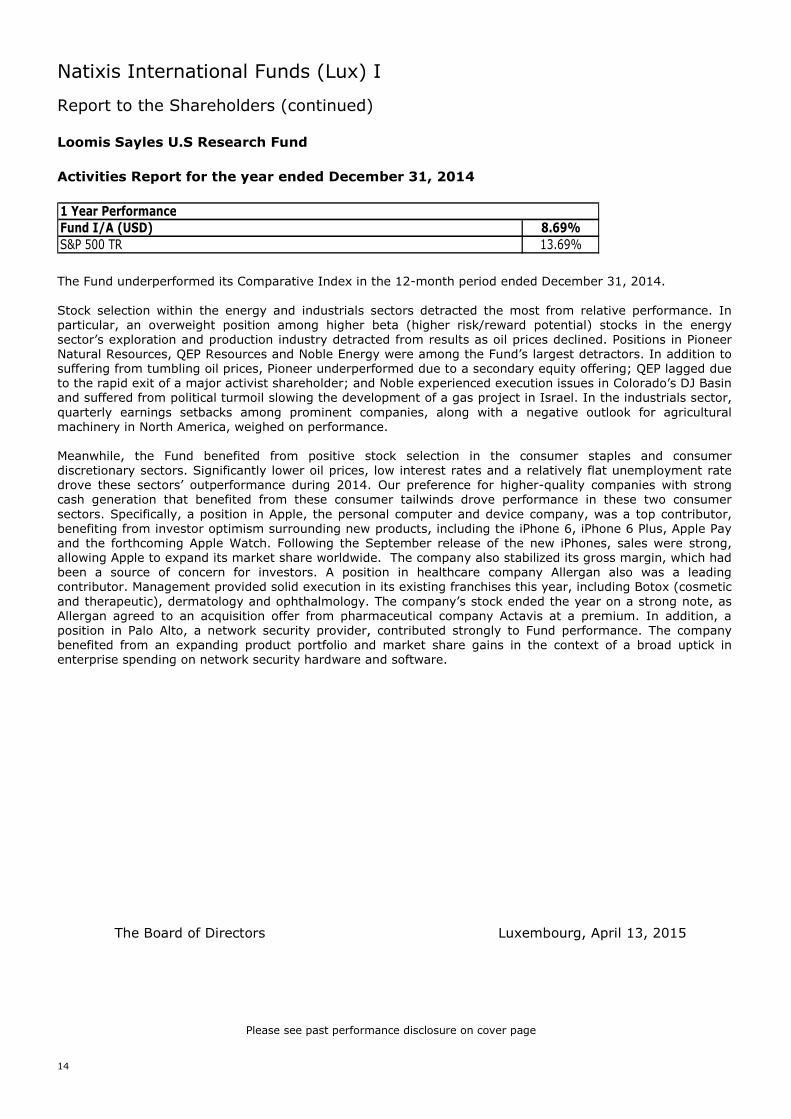
Fund I/A (USD) 8.69%S&P 500 TR 13.69%
1 Year Performance
The Fund underperformed its Comparative Index in the 12-month period ended December 31, 2014.
Stock selection within the energy and industrials sectors detracted the most from relative performance. Inparticular, an overweight position among higher beta (higher risk/reward potential) stocks in the energysector’s exploration and production industry detracted from results as oil prices declined. Positions in PioneerNatural Resources, QEP Resources and Noble Energy were among the Fund’s largest detractors. In addition tosuffering from tumbling oil prices, Pioneer underperformed due to a secondary equity offering; QEP lagged dueto the rapid exit of a major activist shareholder; and Noble experienced execution issues in Colorado’s DJ Basinand suffered from political turmoil slowing the development of a gas project in Israel. In the industrials sector,quarterly earnings setbacks among prominent companies, along with a negative outlook for agriculturalmachinery in North America, weighed on performance.
Meanwhile, the Fund benefited from positive stock selection in the consumer staples and consumerdiscretionary sectors. Significantly lower oil prices, low interest rates and a relatively flat unemployment ratedrove these sectors’ outperformance during 2014. Our preference for higher-quality companies with strongcash generation that benefited from these consumer tailwinds drove performance in these two consumersectors. Specifically, a position in Apple, the personal computer and device company, was a top contributor,benefiting from investor optimism surrounding new products, including the iPhone 6, iPhone 6 Plus, Apple Payand the forthcoming Apple Watch. Following the September release of the new iPhones, sales were strong,allowing Apple to expand its market share worldwide. The company also stabilized its gross margin, which hadbeen a source of concern for investors. A position in healthcare company Allergan also was a leadingcontributor. Management provided solid execution in its existing franchises this year, including Botox (cosmeticand therapeutic), dermatology and ophthalmology. The company’s stock ended the year on a strong note, asAllergan agreed to an acquisition offer from pharmaceutical company Actavis at a premium. In addition, aposition in Palo Alto, a network security provider, contributed strongly to Fund performance. The companybenefited from an expanding product portfolio and market share gains in the context of a broad uptick inenterprise spending on network security hardware and software.
Please see past performance disclosure on cover page
Luxembourg, April 13, 2015The Board of Directors
Natixis International Funds (Lux) I
15
Report to the Shareholders (continued)
Natixis Emerging Europe Fund
Activities Report for the year ended December 31, 2014
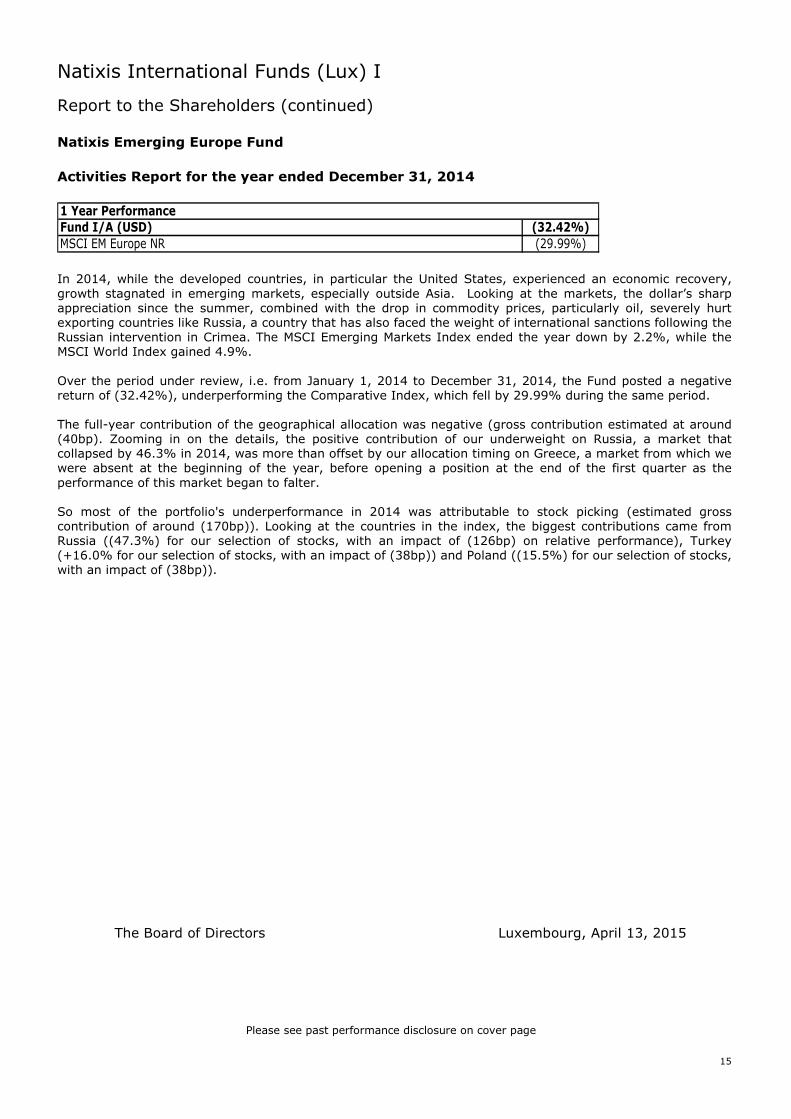
Fund I/A (USD) (32.42%)MSCI EM Europe NR (29.99%)
1 Year Performance
In 2014, while the developed countries, in particular the United States, experienced an economic recovery,growth stagnated in emerging markets, especially outside Asia. Looking at the markets, the dollar’s sharpappreciation since the summer, combined with the drop in commodity prices, particularly oil, severely hurtexporting countries like Russia, a country that has also faced the weight of international sanctions following theRussian intervention in Crimea. The MSCI Emerging Markets Index ended the year down by 2.2%, while theMSCI World Index gained 4.9%.
Over the period under review, i.e. from January 1, 2014 to December 31, 2014, the Fund posted a negativereturn of (32.42%), underperforming the Comparative Index, which fell by 29.99% during the same period.
The full-year contribution of the geographical allocation was negative (gross contribution estimated at around(40bp). Zooming in on the details, the positive contribution of our underweight on Russia, a market thatcollapsed by 46.3% in 2014, was more than offset by our allocation timing on Greece, a market from which wewere absent at the beginning of the year, before opening a position at the end of the first quarter as theperformance of this market began to falter.
So most of the portfolio's underperformance in 2014 was attributable to stock picking (estimated grosscontribution of around (170bp)). Looking at the countries in the index, the biggest contributions came fromRussia ((47.3%) for our selection of stocks, with an impact of (126bp) on relative performance), Turkey(+16.0% for our selection of stocks, with an impact of (38bp)) and Poland ((15.5%) for our selection of stocks,with an impact of (38bp)).
Please see past performance disclosure on cover page
Luxembourg, April 13, 2015The Board of Directors

Natixis International Funds (Lux) I
16
Report to the Shareholders (continued)
Natixis Emerging Latin America Equity Fund(1)
Activities Report for the period from April 10, 2014 to December 31, 2014
Fund I/A (USD) (13.32%)MSCI EM Latin America TR (15.08%)
Period Performance
In 2014, while the developed countries, in particular the United States, experienced an economic recovery,growth stagnated in emerging markets, especially outside Asia. Looking at the markets, the dollar’s sharpappreciation since the summer, combined with the drop in commodity prices, particularly oil, severely hurtexporting countries like Brazil, a country that is also suffering from the lack of structural reforms at a timewhen the Rousseff 2 administration is being set up. Within the region, Mexico and Colombia are also sufferingfrom this deflationary context related to the price of oil.
Over the period under review, i.e. from April 10 to December 31, 2014, the Fund posted a negative return of(13.32%), outperforming the Comparative Index, which fell by (15.08%) during the same period.
The full-year contribution of the geographical allocation was positive (gross contribution estimated at around+20bp). Looking at the details, the positive contribution of our overexposure to Peru, a market that rose by2.4% during the period, was combined with our underweight on Brazil, which shed 19.8% during the period.
So most of the portfolio's outperformance in 2014 was attributable to stock picking (estimated grosscontribution of around +215bp). Looking at the countries in the index, the biggest contributions came fromBrazil ((18.0%) for our selection of stocks, with an impact of +135bp on relative performance), Mexico (-3.6%for our selection of stocks, with an impact of +53bp) and Chile ((5.1%) for our selection of stocks, with animpact of +48bp).
(1) See Note 1.
Please see past performance disclosure on cover page
Luxembourg, April 13, 2015The Board of Directors
Natixis International Funds (Lux) I
17
Report to the Shareholders (continued)
Natixis Europe Smaller Companies Fund
Activities Report for the year ended December 31, 2014
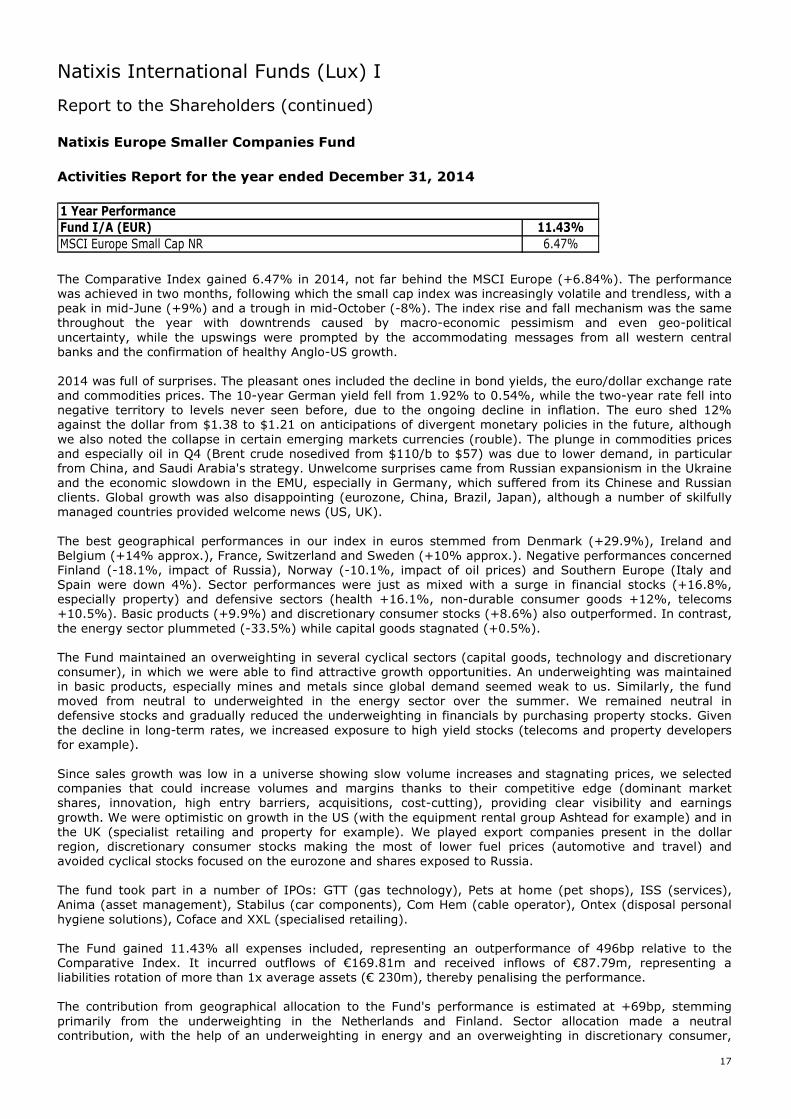
Fund I/A (EUR) 11.43%MSCI Europe Small Cap NR 6.47%
1 Year Performance
The Comparative Index gained 6.47% in 2014, not far behind the MSCI Europe (+6.84%). The performancewas achieved in two months, following which the small cap index was increasingly volatile and trendless, with apeak in mid-June (+9%) and a trough in mid-October (-8%). The index rise and fall mechanism was the samethroughout the year with downtrends caused by macro-economic pessimism and even geo-politicaluncertainty, while the upswings were prompted by the accommodating messages from all western centralbanks and the confirmation of healthy Anglo-US growth.
2014 was full of surprises. The pleasant ones included the decline in bond yields, the euro/dollar exchange rateand commodities prices. The 10-year German yield fell from 1.92% to 0.54%, while the two-year rate fell intonegative territory to levels never seen before, due to the ongoing decline in inflation. The euro shed 12%against the dollar from $1.38 to $1.21 on anticipations of divergent monetary policies in the future, althoughwe also noted the collapse in certain emerging markets currencies (rouble). The plunge in commodities pricesand especially oil in Q4 (Brent crude nosedived from $110/b to $57) was due to lower demand, in particularfrom China, and Saudi Arabia's strategy. Unwelcome surprises came from Russian expansionism in the Ukraineand the economic slowdown in the EMU, especially in Germany, which suffered from its Chinese and Russianclients. Global growth was also disappointing (eurozone, China, Brazil, Japan), although a number of skilfullymanaged countries provided welcome news (US, UK).
The best geographical performances in our index in euros stemmed from Denmark (+29.9%), Ireland andBelgium (+14% approx.), France, Switzerland and Sweden (+10% approx.). Negative performances concernedFinland (-18.1%, impact of Russia), Norway (-10.1%, impact of oil prices) and Southern Europe (Italy andSpain were down 4%). Sector performances were just as mixed with a surge in financial stocks (+16.8%,especially property) and defensive sectors (health +16.1%, non-durable consumer goods +12%, telecoms+10.5%). Basic products (+9.9%) and discretionary consumer stocks (+8.6%) also outperformed. In contrast,the energy sector plummeted (-33.5%) while capital goods stagnated (+0.5%).
The Fund maintained an overweighting in several cyclical sectors (capital goods, technology and discretionaryconsumer), in which we were able to find attractive growth opportunities. An underweighting was maintainedin basic products, especially mines and metals since global demand seemed weak to us. Similarly, the fundmoved from neutral to underweighted in the energy sector over the summer. We remained neutral indefensive stocks and gradually reduced the underweighting in financials by purchasing property stocks. Giventhe decline in long-term rates, we increased exposure to high yield stocks (telecoms and property developersfor example).
Since sales growth was low in a universe showing slow volume increases and stagnating prices, we selectedcompanies that could increase volumes and margins thanks to their competitive edge (dominant marketshares, innovation, high entry barriers, acquisitions, cost-cutting), providing clear visibility and earningsgrowth. We were optimistic on growth in the US (with the equipment rental group Ashtead for example) and inthe UK (specialist retailing and property for example). We played export companies present in the dollarregion, discretionary consumer stocks making the most of lower fuel prices (automotive and travel) andavoided cyclical stocks focused on the eurozone and shares exposed to Russia.
The fund took part in a number of IPOs: GTT (gas technology), Pets at home (pet shops), ISS (services),Anima (asset management), Stabilus (car components), Com Hem (cable operator), Ontex (disposal personalhygiene solutions), Coface and XXL (specialised retailing).
The Fund gained 11.43% all expenses included, representing an outperformance of 496bp relative to theComparative Index. It incurred outflows of €169.81m and received inflows of €87.79m, representing aliabilities rotation of more than 1x average assets (€ 230m), thereby penalising the performance.
The contribution from geographical allocation to the Fund's performance is estimated at +69bp, stemmingprimarily from the underweighting in the Netherlands and Finland. Sector allocation made a neutralcontribution, with the help of an underweighting in energy and an overweighting in discretionary consumer,
Natixis International Funds (Lux) I
18
Report to the Shareholders (continued)
Natixis Europe Smaller Companies Fund (continued)
Activities Report for the year ended December 31, 2014 (continued)
but a brake from the underweighting in financials and health stocks. As such, the majority of theoutperformance was driven by the choice of stocks. Our management philosophy, based above all on stockpicking, paid off in these troubled markets with no real trend. Furthermore, our style (quality and reasonablypriced growth) was profitable in view of high economic uncertainty.
The highest contributors stemmed from the capital goods sector, which was difficult in 2014, but was thesector where we best picked stocks, with a contribution of 440bp especially via: Imtech (-99%, non-owned,contribution of +71bp), Ashtead (+63.8%, +65bp), Kentz (+56.1% on a tender offer, +62bp), Go Ahead(+55.4%, +25bp) and Sanitec (+37% on a tender offer, +24bp). The selection of stocks in the technologysector contributed +250bp, mainly on the back of semi-conductors: Dialog (+87.8%, +85b), AMS (-71.9%,+61bp), ASMI (+46.7%, +24bp) as well as Ingenico (+49.5%, +45bp), Temenos (+43.6%, +22bp) andWirecard (+26.9%, +21bp). In other sectors, note the healthy contributions from Pandora (jewellery, +71.1%,contributing +58bp), sold in November since its capitalisation exceeded €8bn, Hikma (pharmacy, +78.5% and46bp), Gagfah (+50.2% and +40bp, sold after bid), WH Smith (book shops, +49.1%, +29bp), Ontex(+31.6%, +26bp), as well as all the UK property developers (Barratt, Taylor Wimpey, Bellway and CrestNicholson which provided +83bp).
In terms of underperformances, we would single out two oil stocks: Afren (-75.4%, -78bp) and Africa Oil(-44.8%, -34bp), although we cut our losses in time and had few E&P stocks. In internet stocks, Blinkx cost us34bp and Yoox 28bp, although we saved our gains in Asos by selling it at £7 in February whereas it ended theyear at £2.6. We managed to escape the large number of profit warnings.
Please see past performance disclosure on cover page
Luxembourg, April 13, 2015The Board of Directors
Natixis International Funds (Lux) I
19
Report to the Shareholders (continued)
Snyder U.S. Small Cap Equity Fund(1)
Activities Report for the period from October 10, 2014 to December 31, 2014
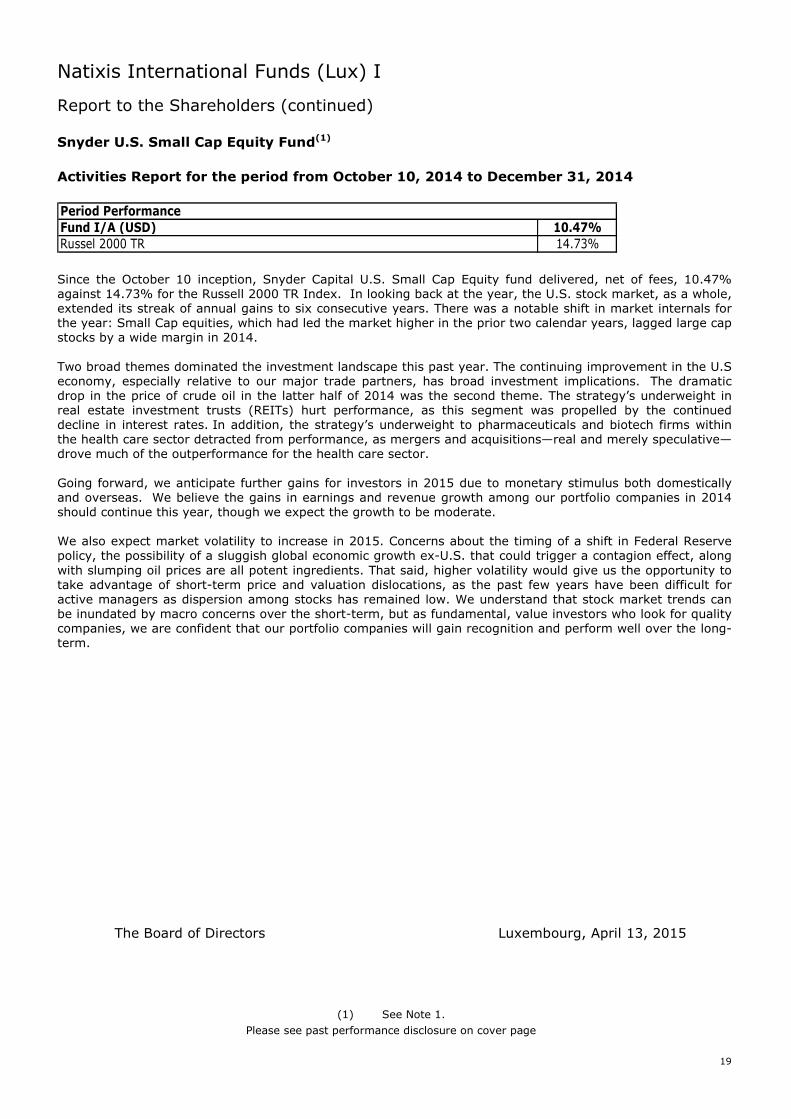
Fund I/A (USD) 10.47%Russel 2000 TR 14.73%
Period Performance
Since the October 10 inception, Snyder Capital U.S. Small Cap Equity fund delivered, net of fees, 10.47%against 14.73% for the Russell 2000 TR Index. In looking back at the year, the U.S. stock market, as a whole,extended its streak of annual gains to six consecutive years. There was a notable shift in market internals forthe year: Small Cap equities, which had led the market higher in the prior two calendar years, lagged large capstocks by a wide margin in 2014.
Two broad themes dominated the investment landscape this past year. The continuing improvement in the U.Seconomy, especially relative to our major trade partners, has broad investment implications. The dramaticdrop in the price of crude oil in the latter half of 2014 was the second theme. The strategy’s underweight inreal estate investment trusts (REITs) hurt performance, as this segment was propelled by the continueddecline in interest rates. In addition, the strategy’s underweight to pharmaceuticals and biotech firms withinthe health care sector detracted from performance, as mergers and acquisitions—real and merely speculative—drove much of the outperformance for the health care sector.
Going forward, we anticipate further gains for investors in 2015 due to monetary stimulus both domesticallyand overseas. We believe the gains in earnings and revenue growth among our portfolio companies in 2014should continue this year, though we expect the growth to be moderate.
We also expect market volatility to increase in 2015. Concerns about the timing of a shift in Federal Reservepolicy, the possibility of a sluggish global economic growth ex-U.S. that could trigger a contagion effect, alongwith slumping oil prices are all potent ingredients. That said, higher volatility would give us the opportunity totake advantage of short-term price and valuation dislocations, as the past few years have been difficult foractive managers as dispersion among stocks has remained low. We understand that stock market trends canbe inundated by macro concerns over the short-term, but as fundamental, value investors who look for qualitycompanies, we are confident that our portfolio companies will gain recognition and perform well over the long-term.
(1) See Note 1.
Please see past performance disclosure on cover page
Luxembourg, April 13, 2015The Board of Directors
Natixis International Funds (Lux) I
20
Report to the Shareholders (continued)
Vaughan Nelson U.S. Small Cap Value Fund
Activities Report for the year ended December 31, 2014
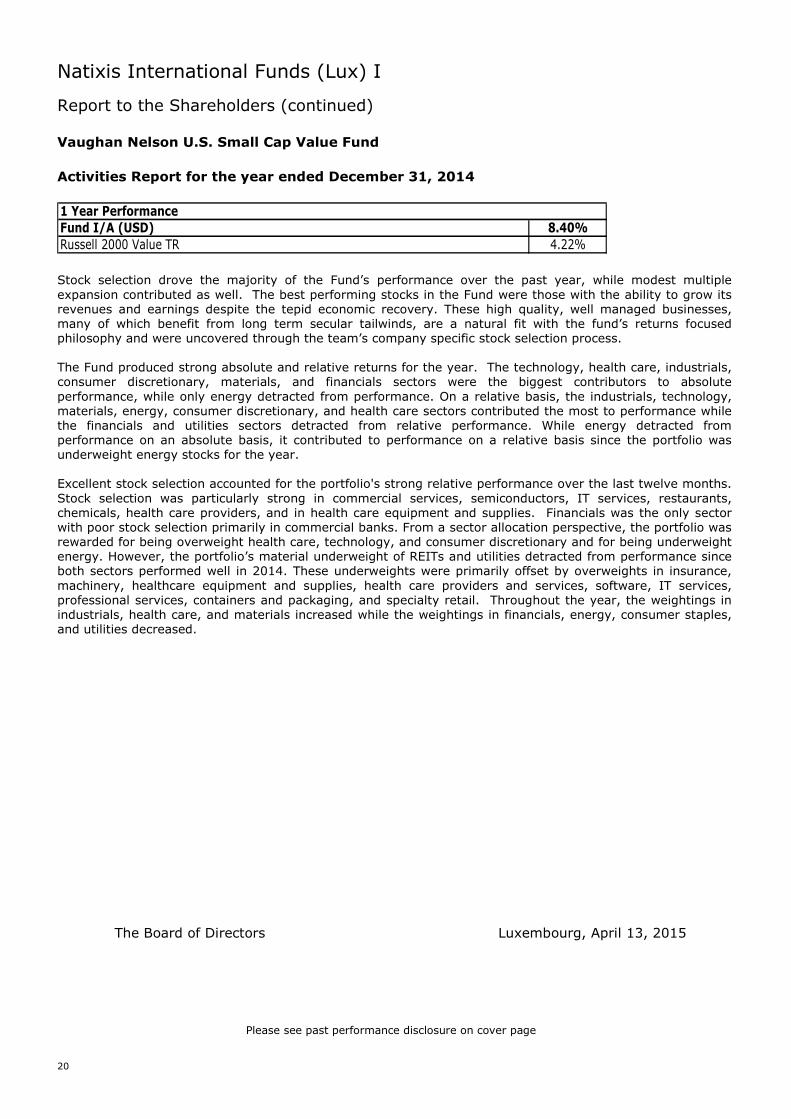
Fund I/A (USD) 8.40%Russell 2000 Value TR 4.22%
1 Year Performance
Stock selection drove the majority of the Fund’s performance over the past year, while modest multipleexpansion contributed as well. The best performing stocks in the Fund were those with the ability to grow itsrevenues and earnings despite the tepid economic recovery. These high quality, well managed businesses,many of which benefit from long term secular tailwinds, are a natural fit with the fund’s returns focusedphilosophy and were uncovered through the team’s company specific stock selection process.
The Fund produced strong absolute and relative returns for the year. The technology, health care, industrials,consumer discretionary, materials, and financials sectors were the biggest contributors to absoluteperformance, while only energy detracted from performance. On a relative basis, the industrials, technology,materials, energy, consumer discretionary, and health care sectors contributed the most to performance whilethe financials and utilities sectors detracted from relative performance. While energy detracted fromperformance on an absolute basis, it contributed to performance on a relative basis since the portfolio wasunderweight energy stocks for the year.
Excellent stock selection accounted for the portfolio's strong relative performance over the last twelve months.Stock selection was particularly strong in commercial services, semiconductors, IT services, restaurants,chemicals, health care providers, and in health care equipment and supplies. Financials was the only sectorwith poor stock selection primarily in commercial banks. From a sector allocation perspective, the portfolio wasrewarded for being overweight health care, technology, and consumer discretionary and for being underweightenergy. However, the portfolio’s material underweight of REITs and utilities detracted from performance sinceboth sectors performed well in 2014. These underweights were primarily offset by overweights in insurance,machinery, healthcare equipment and supplies, health care providers and services, software, IT services,professional services, containers and packaging, and specialty retail. Throughout the year, the weightings inindustrials, health care, and materials increased while the weightings in financials, energy, consumer staples,and utilities decreased.
Please see past performance disclosure on cover page
Luxembourg, April 13, 2015The Board of Directors

Natixis International Funds (Lux) I
21
Report to the Shareholders (continued)
Loomis Sayles Duration Hedged Global Corporate Bond Fund(1)
Activities Report for the period from February 4, 2014 to December 31, 2014
Fund I/A (USD) (3.45%)Period Performance
The Fund’s net underweight duration (price sensitivity to interest rate changes) stance weighed on resultsrelative to a neutral position. Global bond yields largely fell in 2014 as concerns over global growth and thecorresponding simulative actions taken by central banks gave way to yields reaching historically low levels.This theme was particularly true in the U.S. dollar market, where the Fund’s underweight lost value duringbouts of downward pressure on yields. While the relative position was modest, the movement in rates wasintense at times.
Our energy and insurance positions were under pressure. Within the energy sector, the Fund held a smallnumber of high yield issues that significantly underperformed their investment grade peers during the secondhalf of 2014, but they generally performed better than the broader high yield universe. Our holdings amongtechnology, electric, and banking companies were strong performers.
Our positioning in the local markets Europe were helpful as corporate bond spreads tightened with a resilienttone. Many have pegged the sector as a candidate for any upcoming European Central Bank (ECB) bond-buying, which supported the positive local returns. Allocations to the U.K. and U.S. corporate markets, whichweakened into the end of the year, underperformed the exposure to European markets. Limited exposure tothe energy sector was advantageous in what was a challenging business environment for the industry.Additionally, allocations to selected government-related, banking and communications issuers lifted returns.
An allocation to securitized bonds helped performance. Specifically, commercial mortgage backed securities(CMBS), home equity and car loans and asset-backed issues performed well relative to similar-duration andhigh-quality corporates.
(1) See Note 1.
Please see past performance disclosure on cover page
Luxembourg, April 13, 2015The Board of Directors
Natixis International Funds (Lux) I
22
Report to the Shareholders (continued)
Loomis Sayles Emerging Debt and Currencies Fund
Activities Report for the year ended December 31, 2014
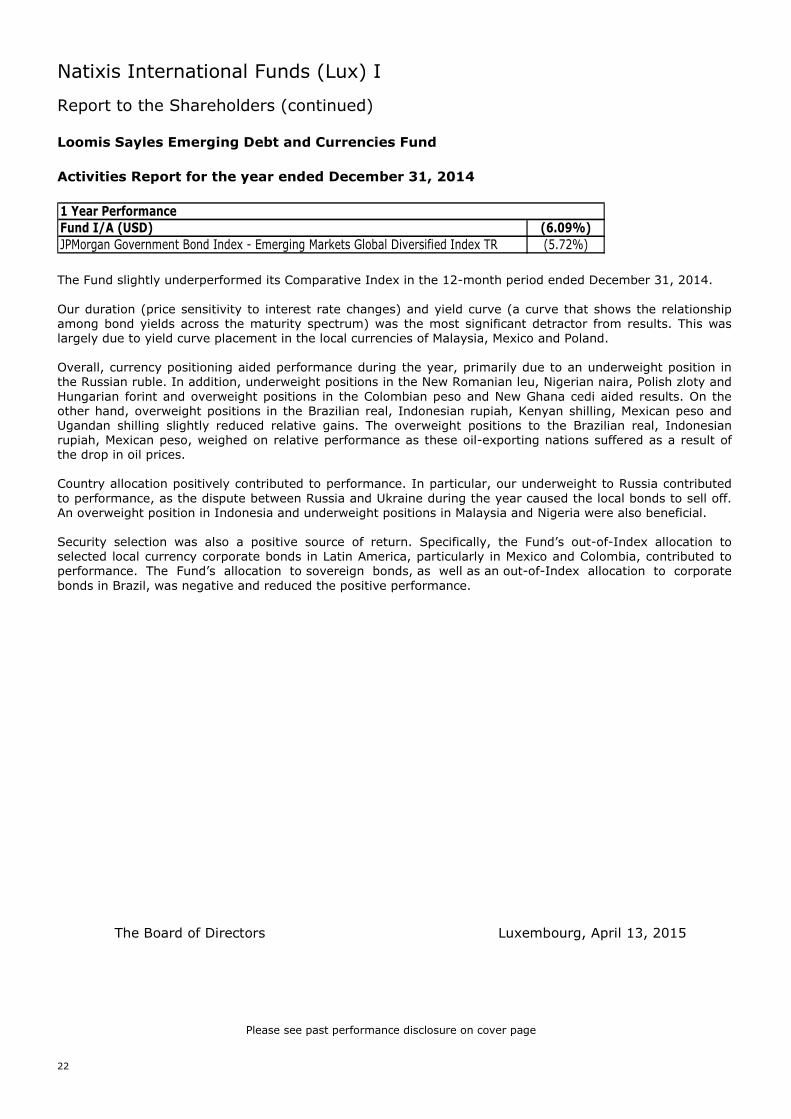
Fund I/A (USD) (6.09%)JPMorgan Government Bond Index - Emerging Markets Global Diversified Index TR (5.72%)
1 Year Performance
The Fund slightly underperformed its Comparative Index in the 12-month period ended December 31, 2014.
Our duration (price sensitivity to interest rate changes) and yield curve (a curve that shows the relationshipamong bond yields across the maturity spectrum) was the most significant detractor from results. This waslargely due to yield curve placement in the local currencies of Malaysia, Mexico and Poland.
Overall, currency positioning aided performance during the year, primarily due to an underweight position inthe Russian ruble. In addition, underweight positions in the New Romanian leu, Nigerian naira, Polish zloty andHungarian forint and overweight positions in the Colombian peso and New Ghana cedi aided results. On theother hand, overweight positions in the Brazilian real, Indonesian rupiah, Kenyan shilling, Mexican peso andUgandan shilling slightly reduced relative gains. The overweight positions to the Brazilian real, Indonesianrupiah, Mexican peso, weighed on relative performance as these oil-exporting nations suffered as a result ofthe drop in oil prices.
Country allocation positively contributed to performance. In particular, our underweight to Russia contributedto performance, as the dispute between Russia and Ukraine during the year caused the local bonds to sell off.An overweight position in Indonesia and underweight positions in Malaysia and Nigeria were also beneficial.
Security selection was also a positive source of return. Specifically, the Fund’s out-of-Index allocation toselected local currency corporate bonds in Latin America, particularly in Mexico and Colombia, contributed toperformance. The Fund’s allocation to sovereign bonds, as well as an out-of-Index allocation to corporatebonds in Brazil, was negative and reduced the positive performance.
Please see past performance disclosure on cover page
Luxembourg, April 13, 2015The Board of Directors

Natixis International Funds (Lux) I
23
Report to the Shareholders (continued)
Loomis Sayles Global Credit Fund
Activities Report for the year ended December 31, 2014
Fund I/A (USD) 1.93%Barclays Capital Global Aggregate Credit TR 2.94%
1 Year Performance
The Fund underperformed its Comparative Index in the 12-month period ended December 31, 2014.
Security selection within the corporate, securitized and government-related sectors was the main driver of theFund’s positive absolute performance during the year. In particular, selected corporate issues in the consumercyclical, electric, energy, insurance and transportation industries, along with specific government-relatedbonds, contributed favorably to performance.
Sector allocation also had a positive impact on results, mostly due to our underweight positions in selectedunderperforming sectors, including energy and consumer non-cyclicals. Holdings in out-of-Index sectors, suchas commercial mortgage-backed securities (CMBS) and government bonds, also aided performance. During2014, top-performing industries at the Index level included media-cable, building materials and insurance.
Duration (price sensitivity to interest rate changes) and yield curve (a curve that shows the relationship amongbond yields across the maturity spectrum) positioning had a negative effect on performance. Our shorter-than-Index duration in U.S.-dollar-denominated securities was the main driver of the underperformance. A longer-than-Index duration in euro-denominated bonds, was a positive contributor and slightly reduced the negativeeffect of our U.S. duration positioning. Country allocation was a positive contributor to performance, primarilydue to the Fund’s underweight position in Japan’s local markets. The Fund’s overweight position in Australiawas also a positive contributor.
Please see past performance disclosure on cover page
Luxembourg, April 13, 2015The Board of Directors
Natixis International Funds (Lux) I
24
Report to the Shareholders (continued)
Loomis Sayles Institutional Global Corporate Bond Fund
Activities Report for the year ended December 31, 2014
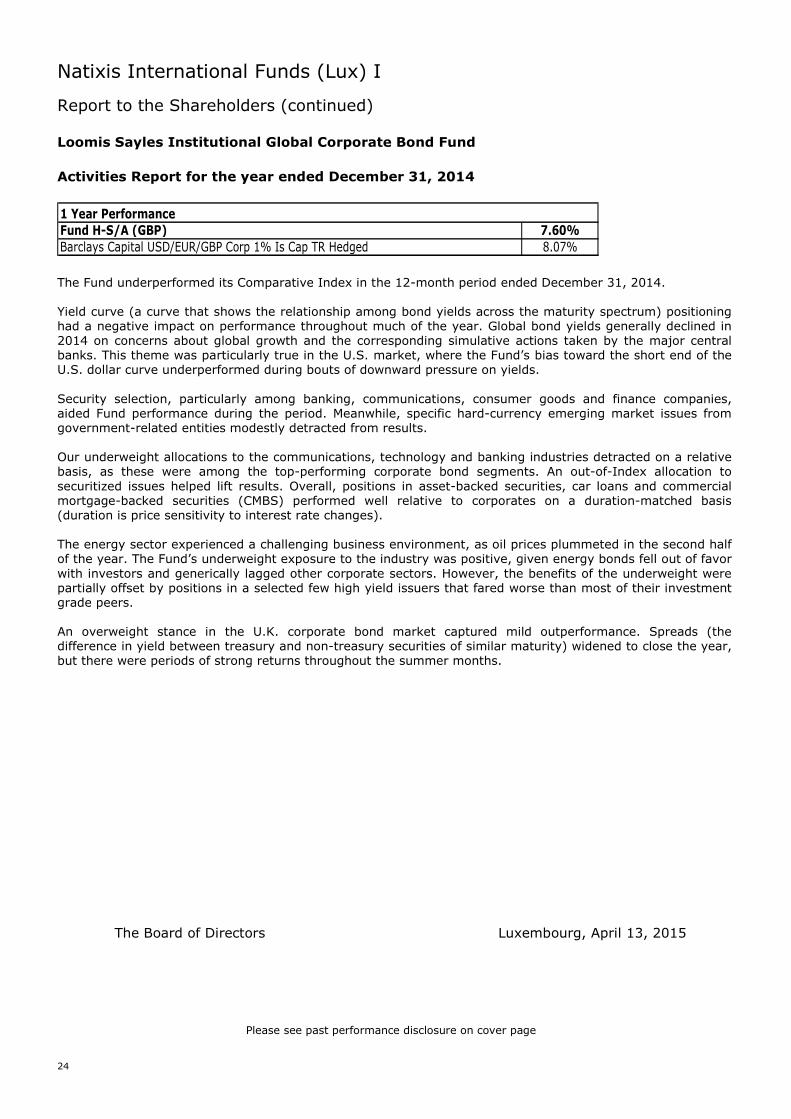
Fund H-S/A (GBP) 7.60%
Barclays Capital USD/EUR/GBP Corp 1% Is Cap TR Hedged 8.07%
1 Year Performance
The Fund underperformed its Comparative Index in the 12-month period ended December 31, 2014.
Yield curve (a curve that shows the relationship among bond yields across the maturity spectrum) positioninghad a negative impact on performance throughout much of the year. Global bond yields generally declined in2014 on concerns about global growth and the corresponding simulative actions taken by the major centralbanks. This theme was particularly true in the U.S. market, where the Fund’s bias toward the short end of theU.S. dollar curve underperformed during bouts of downward pressure on yields.
Security selection, particularly among banking, communications, consumer goods and finance companies,aided Fund performance during the period. Meanwhile, specific hard-currency emerging market issues fromgovernment-related entities modestly detracted from results.
Our underweight allocations to the communications, technology and banking industries detracted on a relativebasis, as these were among the top-performing corporate bond segments. An out-of-Index allocation tosecuritized issues helped lift results. Overall, positions in asset-backed securities, car loans and commercialmortgage-backed securities (CMBS) performed well relative to corporates on a duration-matched basis(duration is price sensitivity to interest rate changes).
The energy sector experienced a challenging business environment, as oil prices plummeted in the second halfof the year. The Fund’s underweight exposure to the industry was positive, given energy bonds fell out of favorwith investors and generically lagged other corporate sectors. However, the benefits of the underweight werepartially offset by positions in a selected few high yield issuers that fared worse than most of their investmentgrade peers.
An overweight stance in the U.K. corporate bond market captured mild outperformance. Spreads (thedifference in yield between treasury and non-treasury securities of similar maturity) widened to close the year,but there were periods of strong returns throughout the summer months.
Please see past performance disclosure on cover page
Luxembourg, April 13, 2015The Board of Directors
Natixis International Funds (Lux) I
25
Report to the Shareholders (continued)
Loomis Sayles Institutional High Income Fund
Activities Report for the year ended December 31, 2014
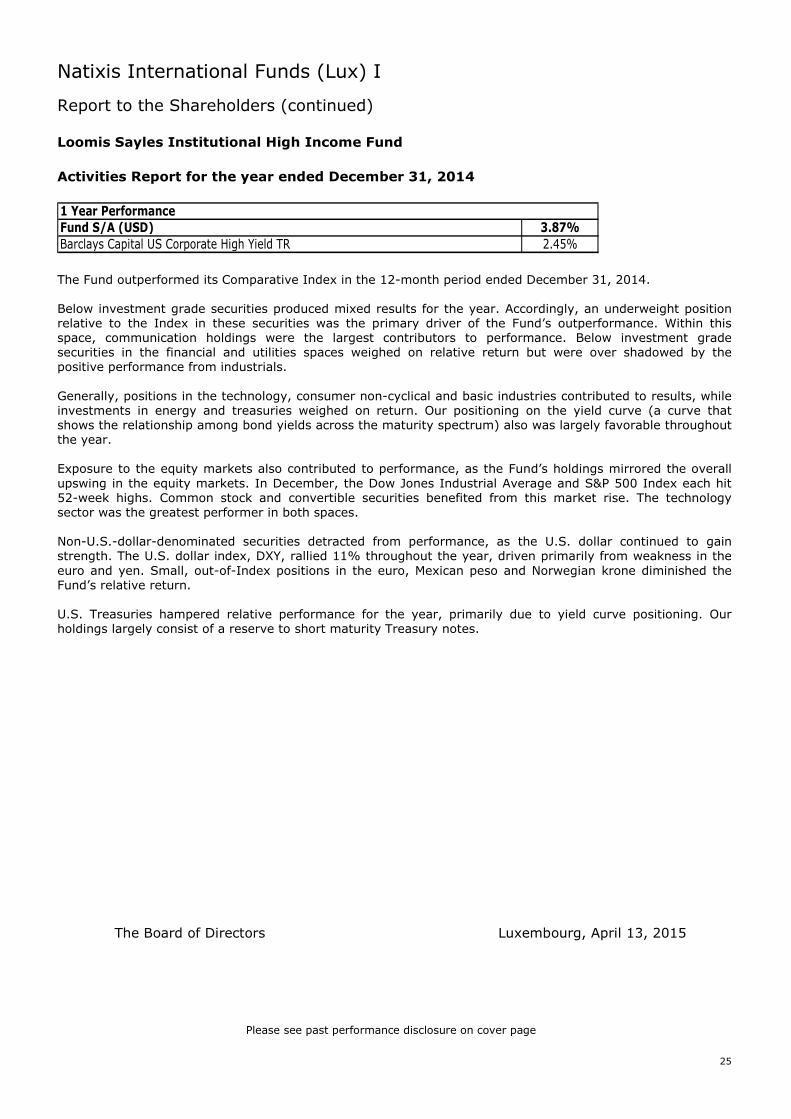
Fund S/A (USD) 3.87%
Barclays Capital US Corporate High Yield TR 2.45%
1 Year Performance
The Fund outperformed its Comparative Index in the 12-month period ended December 31, 2014.
Below investment grade securities produced mixed results for the year. Accordingly, an underweight positionrelative to the Index in these securities was the primary driver of the Fund’s outperformance. Within thisspace, communication holdings were the largest contributors to performance. Below investment gradesecurities in the financial and utilities spaces weighed on relative return but were over shadowed by thepositive performance from industrials.
Generally, positions in the technology, consumer non-cyclical and basic industries contributed to results, whileinvestments in energy and treasuries weighed on return. Our positioning on the yield curve (a curve thatshows the relationship among bond yields across the maturity spectrum) also was largely favorable throughoutthe year.
Exposure to the equity markets also contributed to performance, as the Fund’s holdings mirrored the overallupswing in the equity markets. In December, the Dow Jones Industrial Average and S&P 500 Index each hit52-week highs. Common stock and convertible securities benefited from this market rise. The technologysector was the greatest performer in both spaces.
Non-U.S.-dollar-denominated securities detracted from performance, as the U.S. dollar continued to gainstrength. The U.S. dollar index, DXY, rallied 11% throughout the year, driven primarily from weakness in theeuro and yen. Small, out-of-Index positions in the euro, Mexican peso and Norwegian krone diminished theFund’s relative return.
U.S. Treasuries hampered relative performance for the year, primarily due to yield curve positioning. Ourholdings largely consist of a reserve to short maturity Treasury notes.
Please see past performance disclosure on cover page
Luxembourg, April 13, 2015The Board of Directors

Natixis International Funds (Lux) I
26
Report to the Shareholders (continued)
Loomis Sayles Short Term Emerging Markets Bond Fund(1)
Activities Report for the year ended December 31, 2014
Fund I/A (USD) 3.30%1 Year Performance
The Fund posted a positive return for the 12-month period.
Selected U.S.-dollar-denominated corporate bonds contributed positively to the Fund’s performance,particularly in the banking, basic industry, consumer goods, retail and telecommunications sectors. Selectedforeign sovereigns also supported results.
Selections in the energy sector were the main detractors for the period, as oil prices continued to fall anduncertainty surrounding Russia’s border conflict and sanctions weighed on the sector. Concerns about globalgrowth led investors to U.S.-dollar-denominated assets, which pushed U.S. Treasury yields lower.
Currency and country allocation had a neutral effect on Fund performance during the year.
(1) See Note 1.
Please see past performance disclosure on cover page
Luxembourg, April 13, 2015The Board of Directors
Natixis International Funds (Lux) I
27
Report to the Shareholders (continued)
Loomis Sayles Strategic Alpha Bond Fund
Activities Report for the year ended December 31, 2014
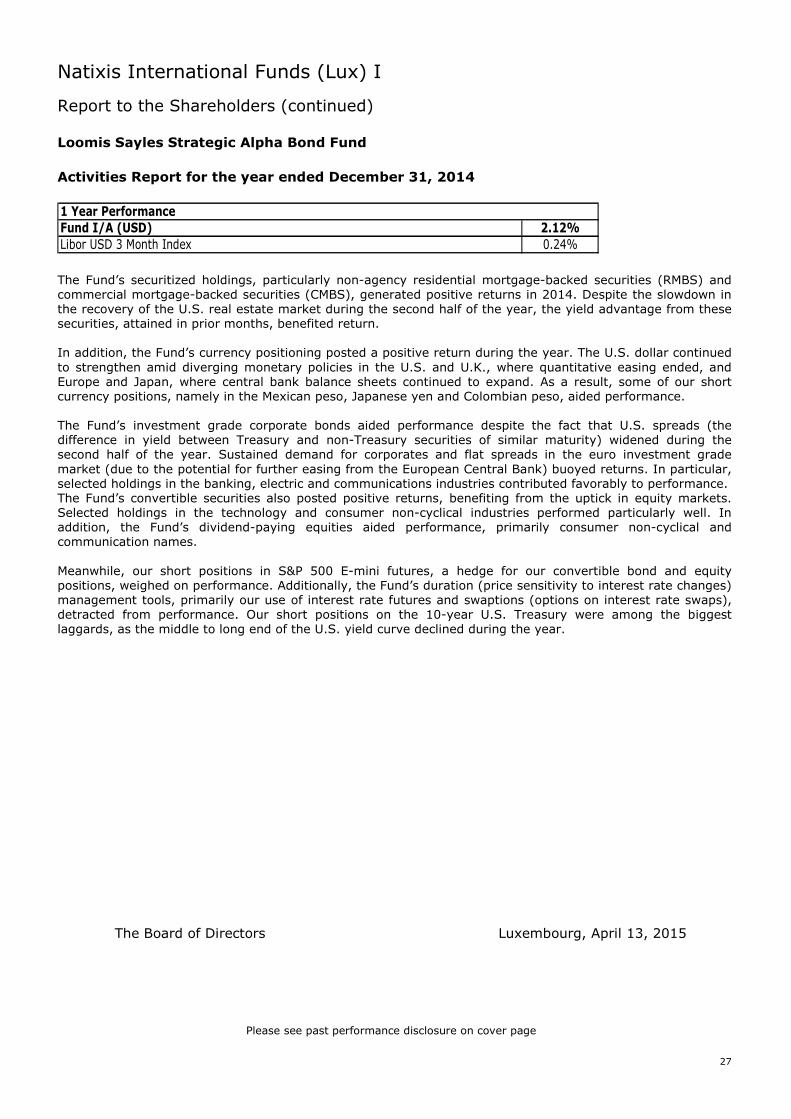
Fund I/A (USD) 2.12%
Libor USD 3 Month Index 0.24%
1 Year Performance
The Fund’s securitized holdings, particularly non-agency residential mortgage-backed securities (RMBS) andcommercial mortgage-backed securities (CMBS), generated positive returns in 2014. Despite the slowdown inthe recovery of the U.S. real estate market during the second half of the year, the yield advantage from thesesecurities, attained in prior months, benefited return.
In addition, the Fund’s currency positioning posted a positive return during the year. The U.S. dollar continuedto strengthen amid diverging monetary policies in the U.S. and U.K., where quantitative easing ended, andEurope and Japan, where central bank balance sheets continued to expand. As a result, some of our shortcurrency positions, namely in the Mexican peso, Japanese yen and Colombian peso, aided performance.
The Fund’s investment grade corporate bonds aided performance despite the fact that U.S. spreads (thedifference in yield between Treasury and non-Treasury securities of similar maturity) widened during thesecond half of the year. Sustained demand for corporates and flat spreads in the euro investment grademarket (due to the potential for further easing from the European Central Bank) buoyed returns. In particular,selected holdings in the banking, electric and communications industries contributed favorably to performance.The Fund’s convertible securities also posted positive returns, benefiting from the uptick in equity markets.Selected holdings in the technology and consumer non-cyclical industries performed particularly well. Inaddition, the Fund’s dividend-paying equities aided performance, primarily consumer non-cyclical andcommunication names.
Meanwhile, our short positions in S&P 500 E-mini futures, a hedge for our convertible bond and equitypositions, weighed on performance. Additionally, the Fund’s duration (price sensitivity to interest rate changes)management tools, primarily our use of interest rate futures and swaptions (options on interest rate swaps),detracted from performance. Our short positions on the 10-year U.S. Treasury were among the biggestlaggards, as the middle to long end of the U.S. yield curve declined during the year.
Please see past performance disclosure on cover page
Luxembourg, April 13, 2015The Board of Directors
Natixis International Funds (Lux) I
28
Report to the Shareholders (continued)
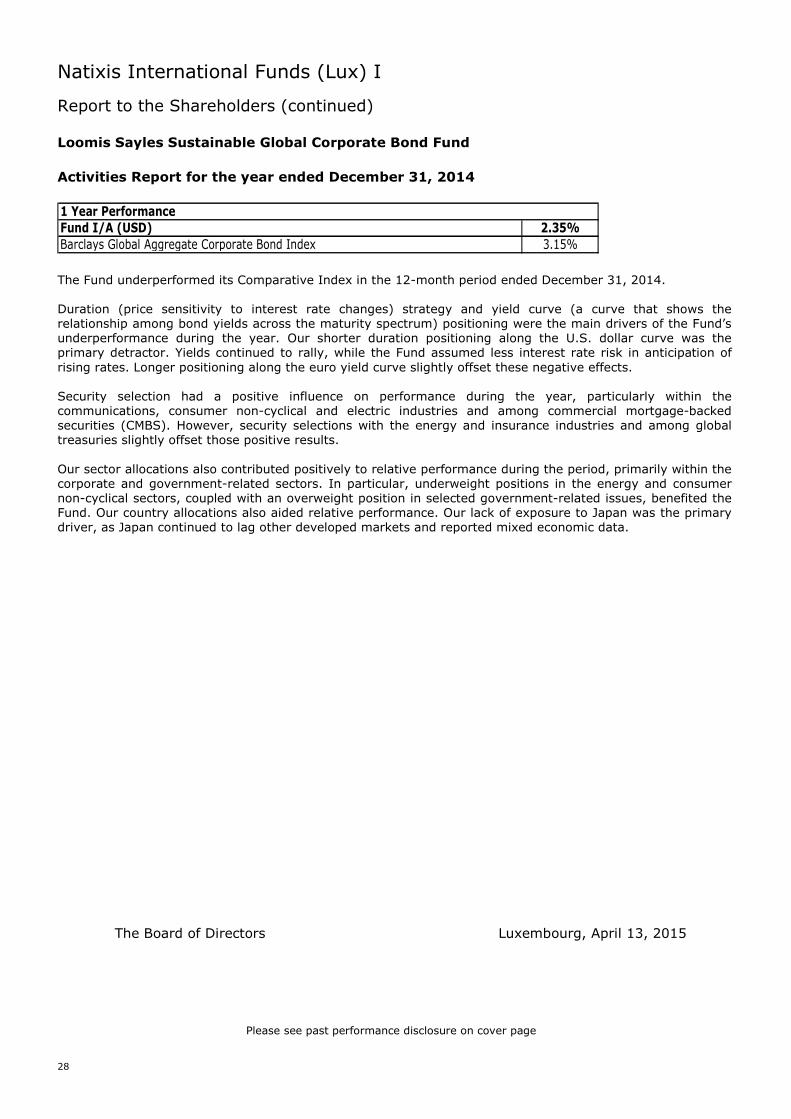
Loomis Sayles Sustainable Global Corporate Bond Fund
Activities Report for the year ended December 31, 2014
Fund I/A (USD) 2.35%
Barclays Global Aggregate Corporate Bond Index 3.15%
1 Year Performance
The Fund underperformed its Comparative Index in the 12-month period ended December 31, 2014.
Duration (price sensitivity to interest rate changes) strategy and yield curve (a curve that shows therelationship among bond yields across the maturity spectrum) positioning were the main drivers of the Fund’sunderperformance during the year. Our shorter duration positioning along the U.S. dollar curve was theprimary detractor. Yields continued to rally, while the Fund assumed less interest rate risk in anticipation ofrising rates. Longer positioning along the euro yield curve slightly offset these negative effects.
Security selection had a positive influence on performance during the year, particularly within thecommunications, consumer non-cyclical and electric industries and among commercial mortgage-backedsecurities (CMBS). However, security selections with the energy and insurance industries and among globaltreasuries slightly offset those positive results.
Our sector allocations also contributed positively to relative performance during the period, primarily within thecorporate and government-related sectors. In particular, underweight positions in the energy and consumernon-cyclical sectors, coupled with an overweight position in selected government-related issues, benefited theFund. Our country allocations also aided relative performance. Our lack of exposure to Japan was the primarydriver, as Japan continued to lag other developed markets and reported mixed economic data.
Please see past performance disclosure on cover page
Luxembourg, April 13, 2015The Board of Directors
Natixis International Funds (Lux) I
29
Report to the Shareholders (continued)
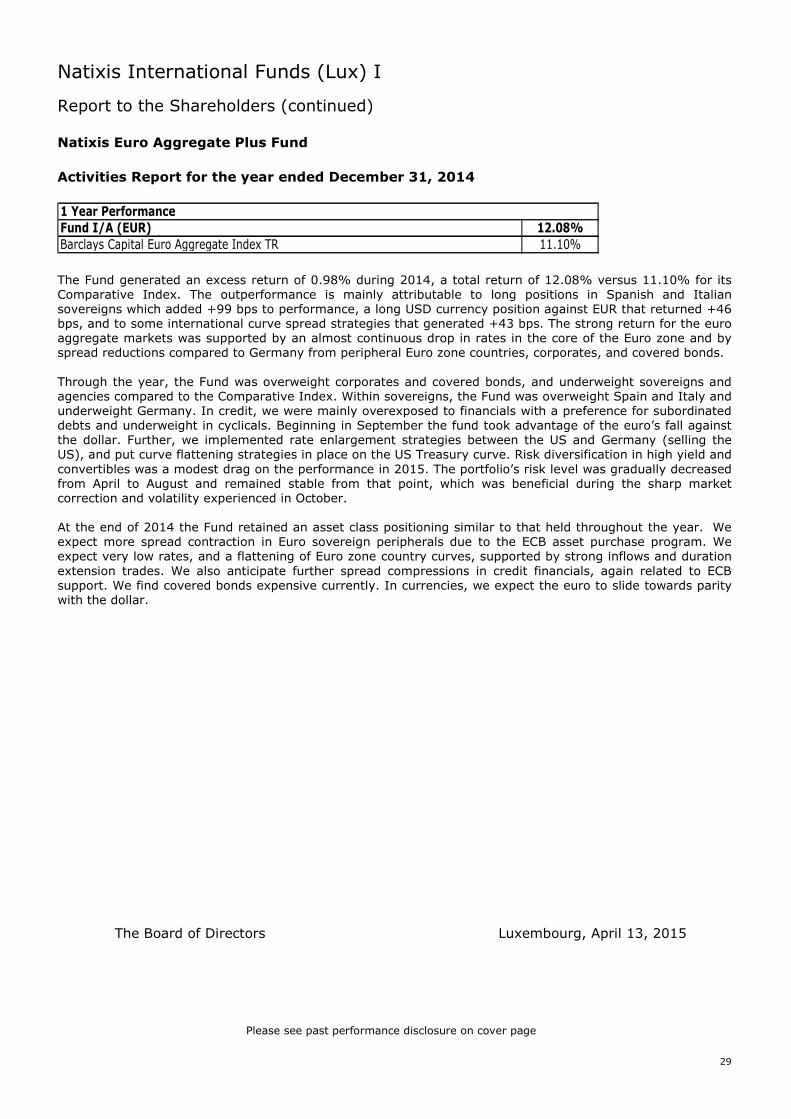
Natixis Euro Aggregate Plus Fund
Activities Report for the year ended December 31, 2014
Fund I/A (EUR) 12.08%
Barclays Capital Euro Aggregate Index TR 11.10%
1 Year Performance
The Fund generated an excess return of 0.98% during 2014, a total return of 12.08% versus 11.10% for itsComparative Index. The outperformance is mainly attributable to long positions in Spanish and Italiansovereigns which added +99 bps to performance, a long USD currency position against EUR that returned +46bps, and to some international curve spread strategies that generated +43 bps. The strong return for the euroaggregate markets was supported by an almost continuous drop in rates in the core of the Euro zone and byspread reductions compared to Germany from peripheral Euro zone countries, corporates, and covered bonds.
Through the year, the Fund was overweight corporates and covered bonds, and underweight sovereigns andagencies compared to the Comparative Index. Within sovereigns, the Fund was overweight Spain and Italy andunderweight Germany. In credit, we were mainly overexposed to financials with a preference for subordinateddebts and underweight in cyclicals. Beginning in September the fund took advantage of the euro’s fall againstthe dollar. Further, we implemented rate enlargement strategies between the US and Germany (selling theUS), and put curve flattening strategies in place on the US Treasury curve. Risk diversification in high yield andconvertibles was a modest drag on the performance in 2015. The portfolio’s risk level was gradually decreasedfrom April to August and remained stable from that point, which was beneficial during the sharp marketcorrection and volatility experienced in October.
At the end of 2014 the Fund retained an asset class positioning similar to that held throughout the year. Weexpect more spread contraction in Euro sovereign peripherals due to the ECB asset purchase program. Weexpect very low rates, and a flattening of Euro zone country curves, supported by strong inflows and durationextension trades. We also anticipate further spread compressions in credit financials, again related to ECBsupport. We find covered bonds expensive currently. In currencies, we expect the euro to slide towards paritywith the dollar.
Please see past performance disclosure on cover page
Luxembourg, April 13, 2015The Board of Directors
Natixis International Funds (Lux) I
30
Report to the Shareholders (continued)
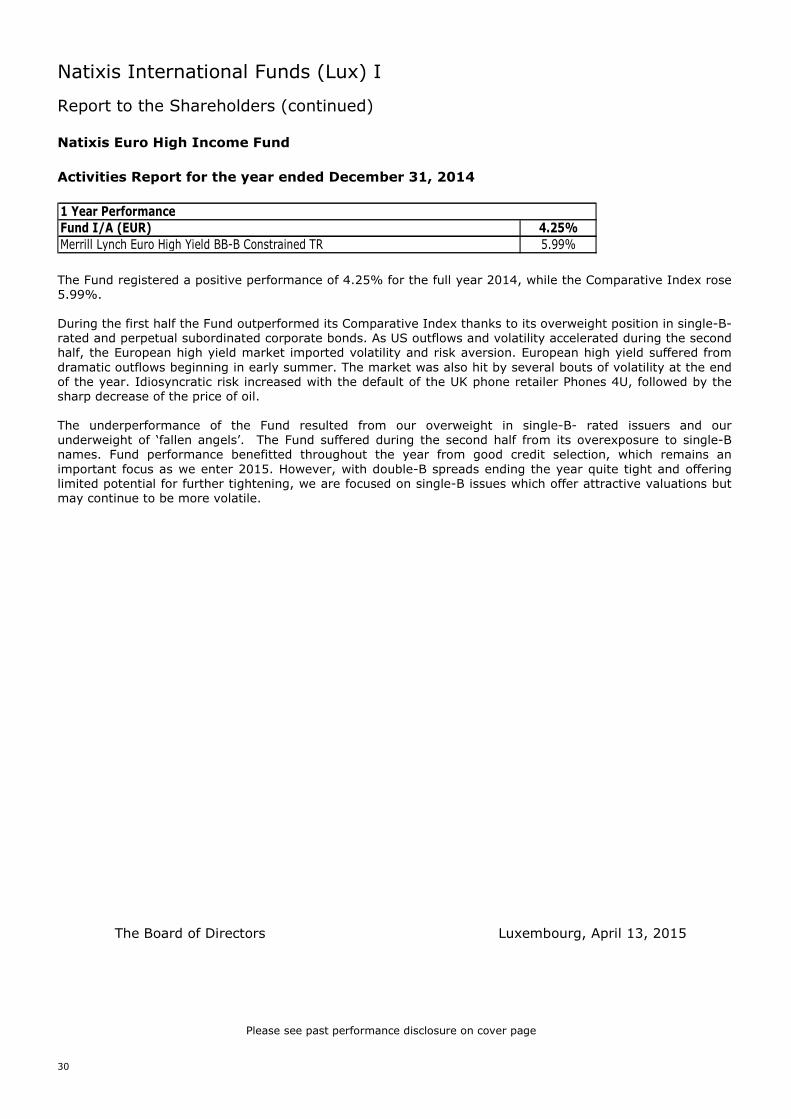
Natixis Euro High Income Fund
Activities Report for the year ended December 31, 2014
Fund I/A (EUR) 4.25%
Merrill Lynch Euro High Yield BB-B Constrained TR 5.99%
1 Year Performance
The Fund registered a positive performance of 4.25% for the full year 2014, while the Comparative Index rose5.99%.
During the first half the Fund outperformed its Comparative Index thanks to its overweight position in single-B-rated and perpetual subordinated corporate bonds. As US outflows and volatility accelerated during the secondhalf, the European high yield market imported volatility and risk aversion. European high yield suffered fromdramatic outflows beginning in early summer. The market was also hit by several bouts of volatility at the endof the year. Idiosyncratic risk increased with the default of the UK phone retailer Phones 4U, followed by thesharp decrease of the price of oil.
The underperformance of the Fund resulted from our overweight in single-B- rated issuers and ourunderweight of ‘fallen angels’. The Fund suffered during the second half from its overexposure to single-Bnames. Fund performance benefitted throughout the year from good credit selection, which remains animportant focus as we enter 2015. However, with double-B spreads ending the year quite tight and offeringlimited potential for further tightening, we are focused on single-B issues which offer attractive valuations butmay continue to be more volatile.
Please see past performance disclosure on cover page
Luxembourg, April 13, 2015The Board of Directors
Natixis International Funds (Lux) I
31
Report to the Shareholders (continued)
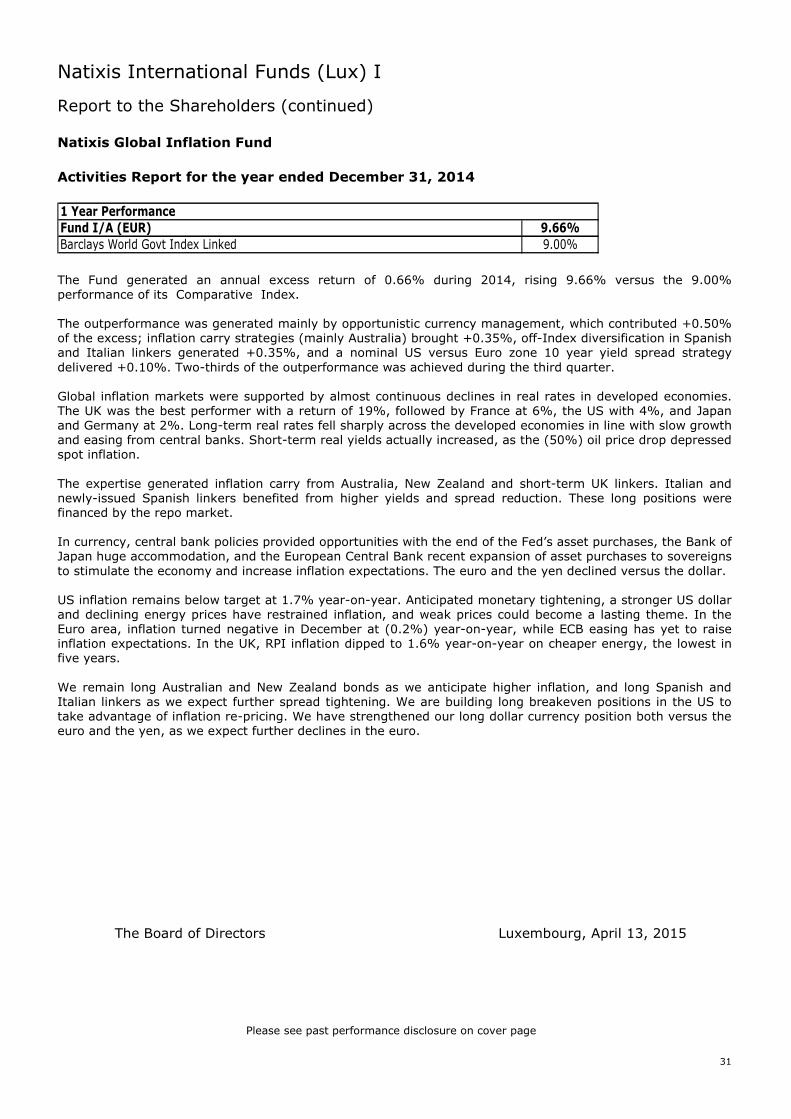
Natixis Global Inflation Fund
Activities Report for the year ended December 31, 2014
Fund I/A (EUR) 9.66%
Barclays World Govt Index Linked 9.00%
1 Year Performance
The Fund generated an annual excess return of 0.66% during 2014, rising 9.66% versus the 9.00%performance of its Comparative Index.
The outperformance was generated mainly by opportunistic currency management, which contributed +0.50%of the excess; inflation carry strategies (mainly Australia) brought +0.35%, off-Index diversification in Spanishand Italian linkers generated +0.35%, and a nominal US versus Euro zone 10 year yield spread strategydelivered +0.10%. Two-thirds of the outperformance was achieved during the third quarter.
Global inflation markets were supported by almost continuous declines in real rates in developed economies.The UK was the best performer with a return of 19%, followed by France at 6%, the US with 4%, and Japanand Germany at 2%. Long-term real rates fell sharply across the developed economies in line with slow growthand easing from central banks. Short-term real yields actually increased, as the (50%) oil price drop depressedspot inflation.
The expertise generated inflation carry from Australia, New Zealand and short-term UK linkers. Italian andnewly-issued Spanish linkers benefited from higher yields and spread reduction. These long positions werefinanced by the repo market.
In currency, central bank policies provided opportunities with the end of the Fed’s asset purchases, the Bank ofJapan huge accommodation, and the European Central Bank recent expansion of asset purchases to sovereignsto stimulate the economy and increase inflation expectations. The euro and the yen declined versus the dollar.
US inflation remains below target at 1.7% year-on-year. Anticipated monetary tightening, a stronger US dollarand declining energy prices have restrained inflation, and weak prices could become a lasting theme. In theEuro area, inflation turned negative in December at (0.2%) year-on-year, while ECB easing has yet to raiseinflation expectations. In the UK, RPI inflation dipped to 1.6% year-on-year on cheaper energy, the lowest infive years.
We remain long Australian and New Zealand bonds as we anticipate higher inflation, and long Spanish andItalian linkers as we expect further spread tightening. We are building long breakeven positions in the US totake advantage of inflation re-pricing. We have strengthened our long dollar currency position both versus theeuro and the yen, as we expect further declines in the euro.
Please see past performance disclosure on cover page
Luxembourg, April 13, 2015The Board of Directors
Natixis International Funds (Lux) I
32
Report to the Shareholders (continued)
Natixis Short Term Global High Income Fund
Activities Report for the year ended December 31, 2014
Fund I/A (USD) 1.85%1 Year Performance
The Fund registered a positive performance of 1.85% for the full year 2014.
All of the performance was achieved in the first half, with the second half down just 13 basis points. Therelative stability of the second half was achieved despite a high-single-digit drop in the US market during thesecond half of 2014. The Fund benefitted from a position of only 40% in the US market and from issuerselection. During the first half, the portfolio’s overweighting in single-B names benefitted performance, whilerestraining performance in the second half. For most of 2014, the best performers were fallen angels andDouble-B credits, two areas where the portfolio was less well-represented.
Globally, high yield markets have been and are likely to continue to be impacted by the low price of oil. Weexpect ongoing volatility, especially in the US but also elsewhere, from the low oil price and the resultantpressure on the shale gas industry, which is well-represented in the US high yield market. We had no shale oil-related debt in the global high yield portfolio during 2014. Credit selection has been central, especially giventhe volatility of 2014. Credit selection continues to be a prime focus of the portfolio into 2015, given ourexpectations of continued market volatility, focus on single-B names, and pressure on oil-related credits. Wedo not expect defaults to rise, and find double-B spreads tight, so we are focused on single-B names. With theUS and European cycles at different points and mergers and acquisition in the US accelerating in 2014, theportfolio remains underweight in the US. With respect to the higher yield currently available in the US, we willopportunistically rebalance the portfolio to modestly increase our position in US high yield names.
Please see past performance disclosure on cover page
Luxembourg, April 13, 2015The Board of Directors
Natixis International Funds (Lux) I
33
Audit report
To the Shareholders of
Natixis International Funds (Lux) I
We have audited the accompanying financial statements of Natixis International Funds (Lux) I and of
each of its sub-funds, which comprise the statement of net assets and the statement of investments
as at December 31, 2014 and the statement of changes in net assets for the year then ended, and a
summary of significant accounting policies and other explanatory notes to the financial statements.
Responsibility of the Board of Directors of the SICAV for the financial statements
The Board of Directors of the SICAV is responsible for the preparation and fair presentation of these
financial statements in accordance with Luxembourg legal and regulatory requirements relating to the
preparation of the financial statements and for such internal control as the Board of Directors of the
SICAV determines is necessary to enable the preparation of financial statements that are free from
material misstatement, whether due to fraud or error.
Responsibility of the “Réviseur d’entreprises agréé”
Our responsibility is to express an opinion on these financial statements based on our audit. We
conducted our audit in accordance with International Standards on Auditing as adopted for
Luxembourg by the “Commission de Surveillance du Secteur Financier”. Those standards require that
we comply with ethical requirements and plan and perform the audit to obtain reasonable assurance
about whether the financial statements are free from material misstatement.
An audit involves performing procedures to obtain audit evidence about the amounts and disclosures
in the financial statements. The procedures selected depend on the judgment of the
“Réviseur d’entreprises agréé”, including the assessment of the risks of material misstatement of the
financial statements, whether due to fraud or error. In making those risk assessments, the
“Réviseur d’entreprises agréé” considers internal control relevant to the entity’s preparation and fair
presentation of the financial statements in order to design audit procedures that are appropriate in the
circumstances, but not for the purpose of expressing an opinion on the effectiveness of the entity’s
internal control. An audit also includes evaluating the appropriateness of accounting policies used and
the reasonableness of accounting estimates made by the Board of Directors of the SICAV, as well as
evaluating the overall presentation of the financial statements.
PricewaterhouseCoopers, Société coopérative, 2 rue Gerhard Mercator, B.P. 1443, L-1014 LuxembourgT: +352 494848 1, F:+352 494848 2900, www.pwc.lu
Cabinet de révision agréé. Expert-comptable (autorisation gouvernementale n°10028256)R.C.S. Luxembourg B 65 477 - TVA LU25482518
Natixis International Funds (Lux) I
34
We believe that the audit evidence we have obtained is sufficient and appropriate to provide a basisfor our audit opinion.
Opinion
In our opinion, the financial statements give a true and fair view of the financial position of NatixisInternational Funds (Lux) I and of each of its sub-funds as of December 31, 2014 and of the results oftheir operations and changes in their net assets for the year then ended in accordance withLuxembourg legal and regulatory requirements relating to the preparation of the financial statements.
Other matters
Supplementary information included in the annual report has been reviewed in the context of ourmandate but has not been subject to specific audit procedures carried out in accordance with thestandards described above. Consequently, we express no opinion on such information. However, wehave no observation to make concerning such information in the context of the financial statementstaken as a whole.
PricewaterhouseCoopers, Société coopérative Luxembourg, April 13, 2015Represented by
Christophe Pittie
Natixis International Funds (Lux) I
Statement of Net Assets
As at December 31, 2014
35
Note
Absolute Asia AMEmerging Asia
Fund
USD
Absolute Asia AMPacific Rim
Equities Fund
USD
Harris AssociatesConcentrated U.S.
Equity Fund
USD
Harris AssociatesGlobal Equity Fund
USD
ASSETS
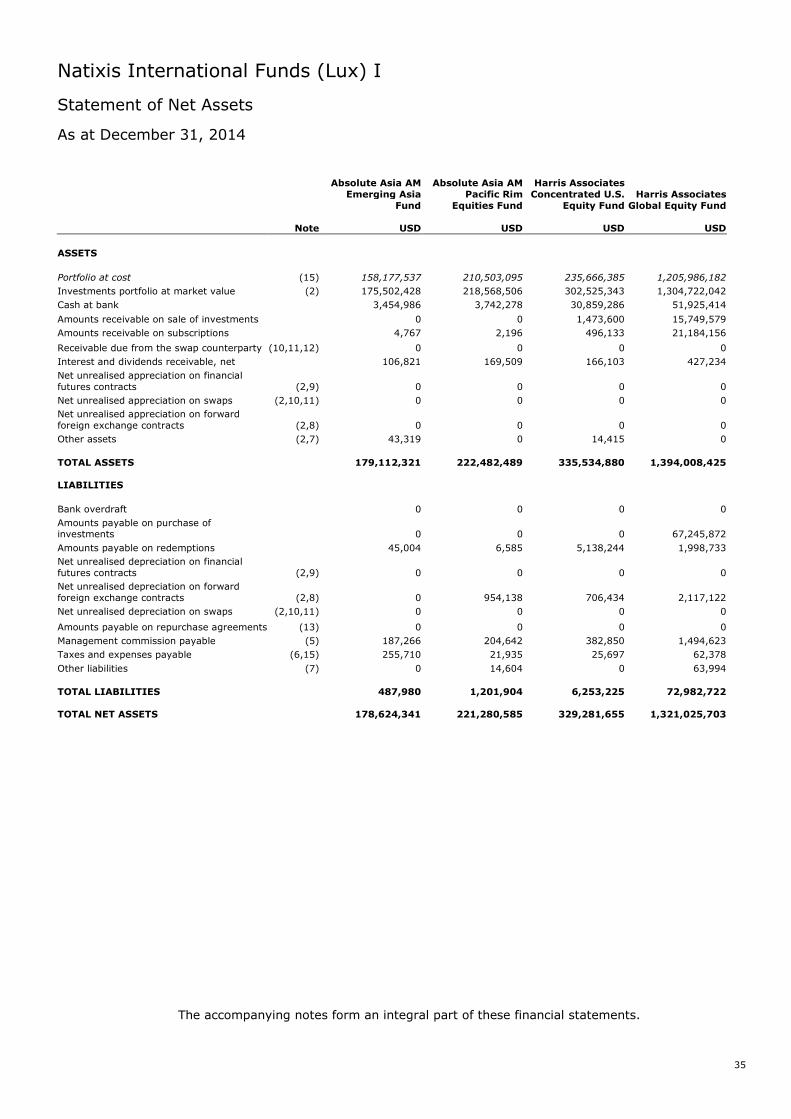
Portfolio at cost (15) 158,177,537 210,503,095 235,666,385 1,205,986,182
Investments portfolio at market value (2) 175,502,428 218,568,506 302,525,343 1,304,722,042
Cash at bank 3,454,986 3,742,278 30,859,286 51,925,414
Amounts receivable on sale of investments 0 0 1,473,600 15,749,579
Amounts receivable on subscriptions 4,767 2,196 496,133 21,184,156
Receivable due from the swap counterparty (10,11,12) 0 0 0 0
Interest and dividends receivable, net 106,821 169,509 166,103 427,234
Net unrealised appreciation on financialfutures contracts (2,9) 0 0 0 0
Net unrealised appreciation on swaps (2,10,11) 0 0 0 0
Net unrealised appreciation on forwardforeign exchange contracts (2,8) 0 0 0 0
Other assets (2,7) 43,319 0 14,415 0
TOTAL ASSETS 179,112,321 222,482,489 335,534,880 1,394,008,425
LIABILITIES
Bank overdraft 0 0 0 0
Amounts payable on purchase ofinvestments 0 0 0 67,245,872
Amounts payable on redemptions 45,004 6,585 5,138,244 1,998,733
Net unrealised depreciation on financialfutures contracts (2,9) 0 0 0 0
Net unrealised depreciation on forwardforeign exchange contracts (2,8) 0 954,138 706,434 2,117,122
Net unrealised depreciation on swaps (2,10,11) 0 0 0 0
Amounts payable on repurchase agreements (13) 0 0 0 0
Management commission payable (5) 187,266 204,642 382,850 1,494,623
Taxes and expenses payable (6,15) 255,710 21,935 25,697 62,378
Other liabilities (7) 0 14,604 0 63,994
TOTAL LIABILITIES 487,980 1,201,904 6,253,225 72,982,722
TOTAL NET ASSETS 178,624,341 221,280,585 329,281,655 1,321,025,703
The accompanying notes form an integral part of these financial statements.
Natixis International Funds (Lux) I
Statement of Net Assets (continued)
As at December 31, 2014
36
Harris AssociatesU.S. Equity Fund
USD
IDFC IndiaEquities Fund
USD
Loomis SaylesU.S. Research
Fund
USD
Natixis EmergingEurope Fund
USD
Natixis EmergingLatin AmericaEquity Fund(1)
USD
Natixis EuropeSmaller
Companies Fund
EUR
Snyder U.S. SmallCap Equity
Fund(1)
USD
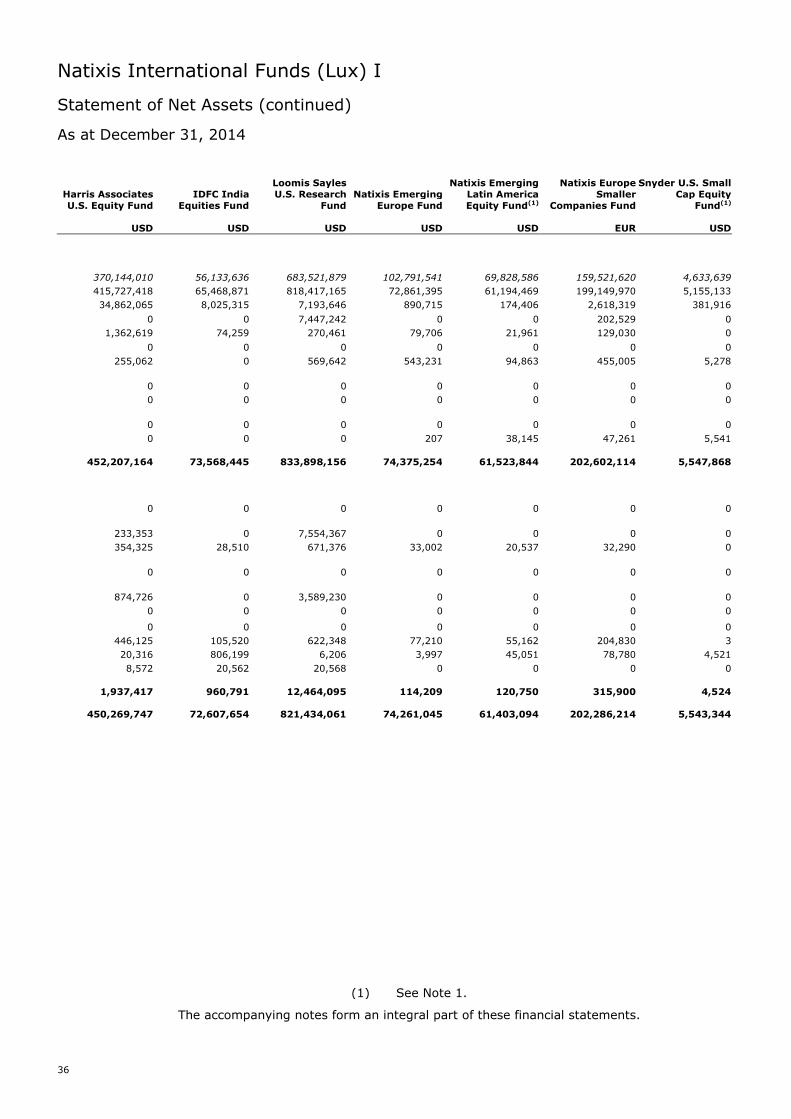
370,144,010 56,133,636 683,521,879 102,791,541 69,828,586 159,521,620 4,633,639
415,727,418 65,468,871 818,417,165 72,861,395 61,194,469 199,149,970 5,155,133
34,862,065 8,025,315 7,193,646 890,715 174,406 2,618,319 381,916
0 0 7,447,242 0 0 202,529 0
1,362,619 74,259 270,461 79,706 21,961 129,030 0
0 0 0 0 0 0 0
255,062 0 569,642 543,231 94,863 455,005 5,278
0 0 0 0 0 0 0
0 0 0 0 0 0 0
0 0 0 0 0 0 0
0 0 0 207 38,145 47,261 5,541
452,207,164 73,568,445 833,898,156 74,375,254 61,523,844 202,602,114 5,547,868
0 0 0 0 0 0 0
233,353 0 7,554,367 0 0 0 0
354,325 28,510 671,376 33,002 20,537 32,290 0
0 0 0 0 0 0 0
874,726 0 3,589,230 0 0 0 0
0 0 0 0 0 0 0
0 0 0 0 0 0 0
446,125 105,520 622,348 77,210 55,162 204,830 3
20,316 806,199 6,206 3,997 45,051 78,780 4,521
8,572 20,562 20,568 0 0 0 0
1,937,417 960,791 12,464,095 114,209 120,750 315,900 4,524
450,269,747 72,607,654 821,434,061 74,261,045 61,403,094 202,286,214 5,543,344
(1) See Note 1.
The accompanying notes form an integral part of these financial statements.
Natixis International Funds (Lux) I
Statement of Net Assets (continued)
As at December 31, 2014
37
Note
Vaughan NelsonU.S. Small Cap
Value Fund
USD
Loomis SaylesDuration HedgedGlobal Corporate
Bond Fund(1)
USD
Loomis SaylesEmerging Debt and
Currencies Fund
USD
Loomis SaylesGlobal Credit Fund
USD
ASSETS
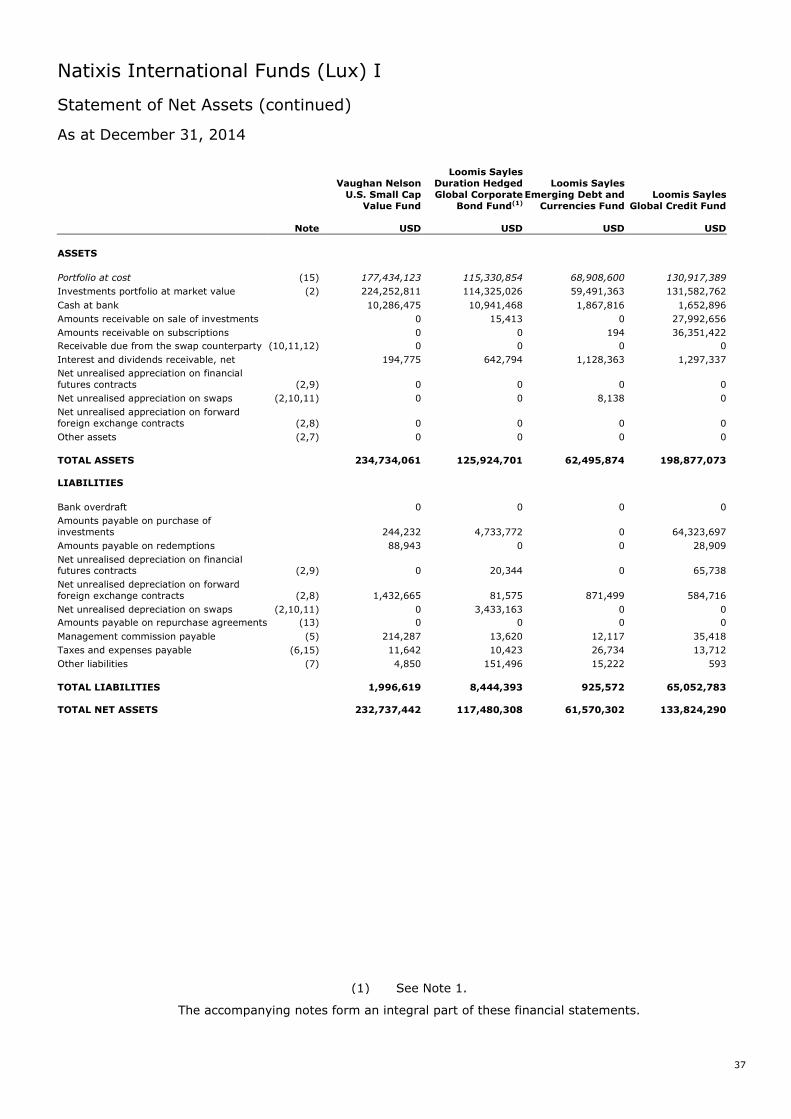
Portfolio at cost (15) 177,434,123 115,330,854 68,908,600 130,917,389
Investments portfolio at market value (2) 224,252,811 114,325,026 59,491,363 131,582,762
Cash at bank 10,286,475 10,941,468 1,867,816 1,652,896
Amounts receivable on sale of investments 0 15,413 0 27,992,656
Amounts receivable on subscriptions 0 0 194 36,351,422
Receivable due from the swap counterparty (10,11,12) 0 0 0 0
Interest and dividends receivable, net 194,775 642,794 1,128,363 1,297,337
Net unrealised appreciation on financialfutures contracts (2,9) 0 0 0 0
Net unrealised appreciation on swaps (2,10,11) 0 0 8,138 0
Net unrealised appreciation on forwardforeign exchange contracts (2,8) 0 0 0 0
Other assets (2,7) 0 0 0 0
TOTAL ASSETS 234,734,061 125,924,701 62,495,874 198,877,073
LIABILITIES
Bank overdraft 0 0 0 0
Amounts payable on purchase ofinvestments 244,232 4,733,772 0 64,323,697
Amounts payable on redemptions 88,943 0 0 28,909
Net unrealised depreciation on financialfutures contracts (2,9) 0 20,344 0 65,738
Net unrealised depreciation on forwardforeign exchange contracts (2,8) 1,432,665 81,575 871,499 584,716
Net unrealised depreciation on swaps (2,10,11) 0 3,433,163 0 0
Amounts payable on repurchase agreements (13) 0 0 0 0
Management commission payable (5) 214,287 13,620 12,117 35,418
Taxes and expenses payable (6,15) 11,642 10,423 26,734 13,712
Other liabilities (7) 4,850 151,496 15,222 593
TOTAL LIABILITIES 1,996,619 8,444,393 925,572 65,052,783
TOTAL NET ASSETS 232,737,442 117,480,308 61,570,302 133,824,290
(1) See Note 1.
The accompanying notes form an integral part of these financial statements.
Natixis International Funds (Lux) I
Statement of Net Assets (continued)
As at December 31, 2014
38
Loomis SaylesInstitutional
Global CorporateBond Fund
USD
Loomis SaylesInstitutional High
Income Fund
USD
Loomis SaylesShort Term
EmergingMarkets Bond
Fund(1)
USD
Loomis SaylesStrategic Alpha
Bond Fund
USD
Loomis SaylesSustainable
Global CorporateBond Fund
USD
Natixis EuroAggregate Plus
Fund
EUR
Natixis Euro HighIncome Fund
EUR
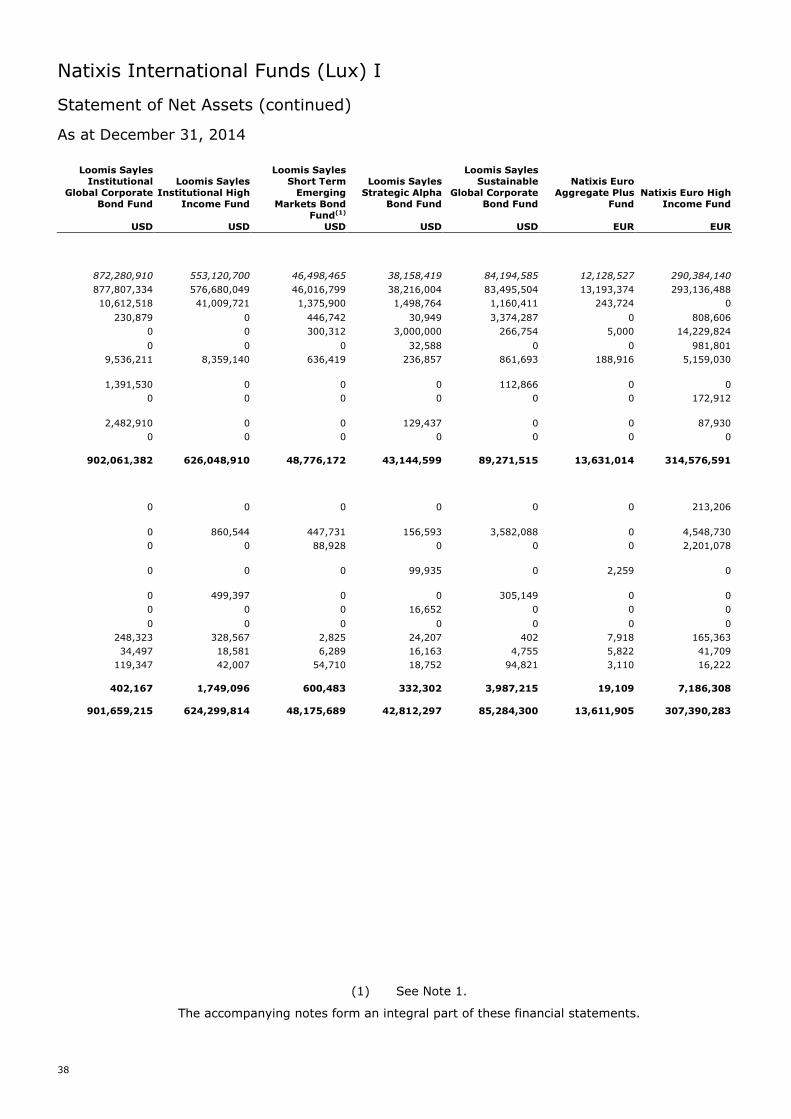
872,280,910 553,120,700 46,498,465 38,158,419 84,194,585 12,128,527 290,384,140
877,807,334 576,680,049 46,016,799 38,216,004 83,495,504 13,193,374 293,136,488
10,612,518 41,009,721 1,375,900 1,498,764 1,160,411 243,724 0
230,879 0 446,742 30,949 3,374,287 0 808,606
0 0 300,312 3,000,000 266,754 5,000 14,229,824
0 0 0 32,588 0 0 981,801
9,536,211 8,359,140 636,419 236,857 861,693 188,916 5,159,030
1,391,530 0 0 0 112,866 0 0
0 0 0 0 0 0 172,912
2,482,910 0 0 129,437 0 0 87,930
0 0 0 0 0 0 0
902,061,382 626,048,910 48,776,172 43,144,599 89,271,515 13,631,014 314,576,591
0 0 0 0 0 0 213,206
0 860,544 447,731 156,593 3,582,088 0 4,548,730
0 0 88,928 0 0 0 2,201,078
0 0 0 99,935 0 2,259 0
0 499,397 0 0 305,149 0 0
0 0 0 16,652 0 0 0
0 0 0 0 0 0 0
248,323 328,567 2,825 24,207 402 7,918 165,363
34,497 18,581 6,289 16,163 4,755 5,822 41,709
119,347 42,007 54,710 18,752 94,821 3,110 16,222
402,167 1,749,096 600,483 332,302 3,987,215 19,109 7,186,308
901,659,215 624,299,814 48,175,689 42,812,297 85,284,300 13,611,905 307,390,283
(1) See Note 1.
The accompanying notes form an integral part of these financial statements.
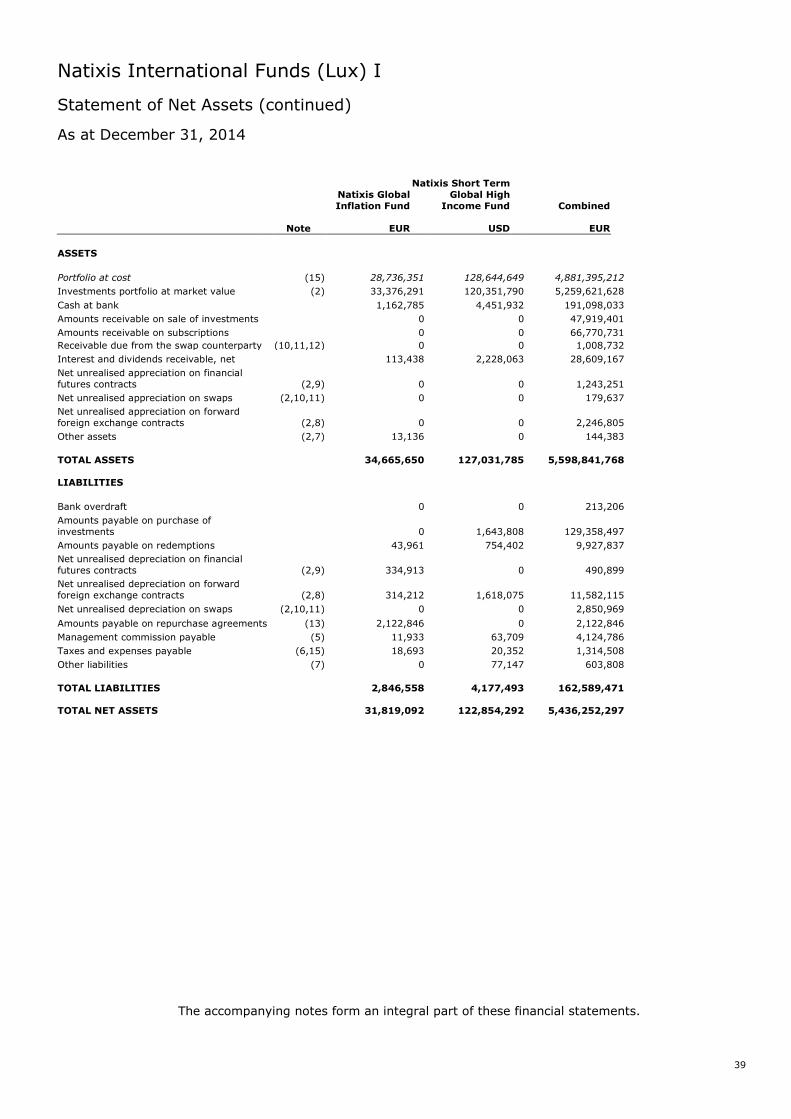
Natixis International Funds (Lux) I
Statement of Net Assets (continued)
As at December 31, 2014
39
Note
Natixis GlobalInflation Fund
EUR
Natixis Short TermGlobal High
Income Fund
USD
Combined
EUR
ASSETS
Portfolio at cost (15) 28,736,351 128,644,649 4,881,395,212
Investments portfolio at market value (2) 33,376,291 120,351,790 5,259,621,628
Cash at bank 1,162,785 4,451,932 191,098,033
Amounts receivable on sale of investments 0 0 47,919,401
Amounts receivable on subscriptions 0 0 66,770,731
Receivable due from the swap counterparty (10,11,12) 0 0 1,008,732
Interest and dividends receivable, net 113,438 2,228,063 28,609,167
Net unrealised appreciation on financialfutures contracts (2,9) 0 0 1,243,251
Net unrealised appreciation on swaps (2,10,11) 0 0 179,637
Net unrealised appreciation on forwardforeign exchange contracts (2,8) 0 0 2,246,805
Other assets (2,7) 13,136 0 144,383
TOTAL ASSETS 34,665,650 127,031,785 5,598,841,768
LIABILITIES
Bank overdraft 0 0 213,206
Amounts payable on purchase ofinvestments 0 1,643,808 129,358,497
Amounts payable on redemptions 43,961 754,402 9,927,837
Net unrealised depreciation on financialfutures contracts (2,9) 334,913 0 490,899
Net unrealised depreciation on forwardforeign exchange contracts (2,8) 314,212 1,618,075 11,582,115
Net unrealised depreciation on swaps (2,10,11) 0 0 2,850,969
Amounts payable on repurchase agreements (13) 2,122,846 0 2,122,846
Management commission payable (5) 11,933 63,709 4,124,786
Taxes and expenses payable (6,15) 18,693 20,352 1,314,508
Other liabilities (7) 0 77,147 603,808
TOTAL LIABILITIES 2,846,558 4,177,493 162,589,471
TOTAL NET ASSETS 31,819,092 122,854,292 5,436,252,297
The accompanying notes form an integral part of these financial statements.
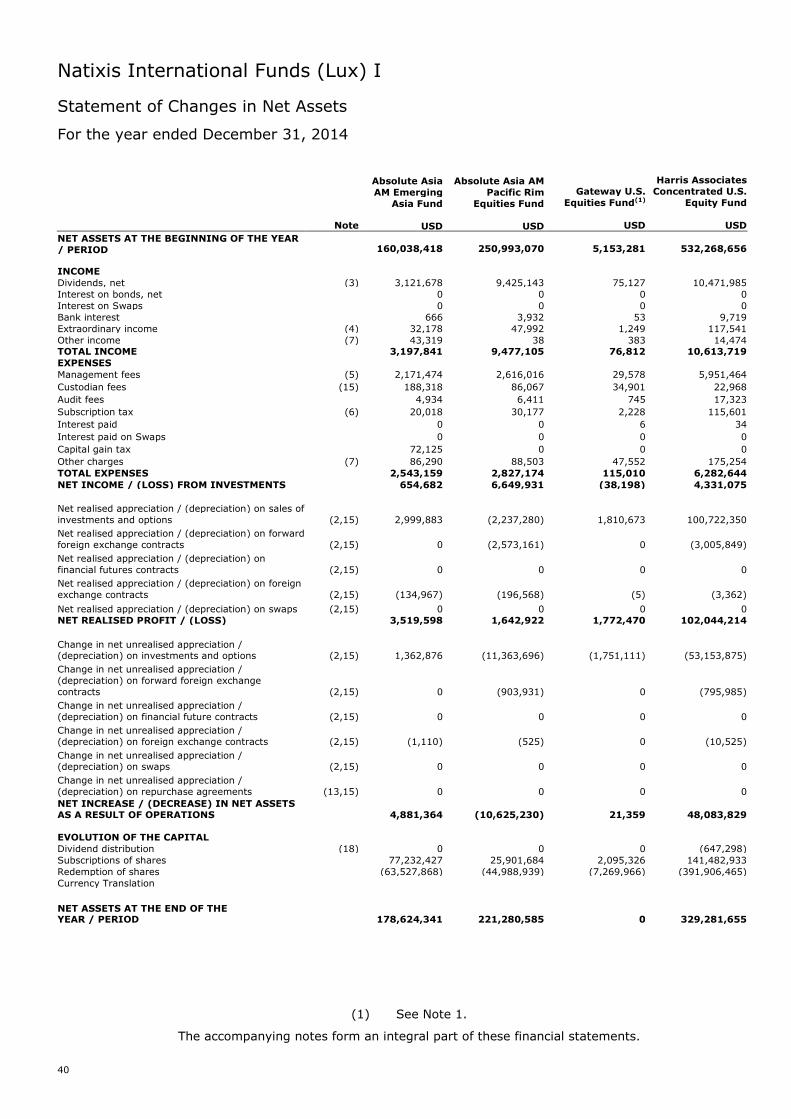
Natixis International Funds (Lux) I
Statement of Changes in Net Assets
For the year ended December 31, 2014
40
Note
Absolute AsiaAM Emerging
Asia Fund
USD
Absolute Asia AMPacific Rim
Equities Fund
USD
Gateway U.S.Equities Fund(1)
USD
Harris AssociatesConcentrated U.S.
Equity Fund
USD
NET ASSETS AT THE BEGINNING OF THE YEAR/ PERIOD 160,038,418 250,993,070 5,153,281 532,268,656
INCOMEDividends, net (3) 3,121,678 9,425,143 75,127 10,471,985Interest on bonds, net 0 0 0 0Interest on Swaps 0 0 0 0Bank interest 666 3,932 53 9,719Extraordinary income (4) 32,178 47,992 1,249 117,541Other income (7) 43,319 38 383 14,474TOTAL INCOME 3,197,841 9,477,105 76,812 10,613,719EXPENSES
Management fees (5) 2,171,474 2,616,016 29,578 5,951,464
Custodian fees (15) 188,318 86,067 34,901 22,968
Audit fees 4,934 6,411 745 17,323
Subscription tax (6) 20,018 30,177 2,228 115,601
Interest paid 0 0 6 34
Interest paid on Swaps 0 0 0 0
Capital gain tax 72,125 0 0 0
Other charges (7) 86,290 88,503 47,552 175,254
TOTAL EXPENSES 2,543,159 2,827,174 115,010 6,282,644
NET INCOME / (LOSS) FROM INVESTMENTS 654,682 6,649,931 (38,198) 4,331,075
Net realised appreciation / (depreciation) on sales ofinvestments and options (2,15) 2,999,883 (2,237,280) 1,810,673 100,722,350
Net realised appreciation / (depreciation) on forwardforeign exchange contracts (2,15) 0 (2,573,161) 0 (3,005,849)
Net realised appreciation / (depreciation) onfinancial futures contracts (2,15) 0 0 0 0
Net realised appreciation / (depreciation) on foreignexchange contracts (2,15) (134,967) (196,568) (5) (3,362)
Net realised appreciation / (depreciation) on swaps (2,15) 0 0 0 0NET REALISED PROFIT / (LOSS) 3,519,598 1,642,922 1,772,470 102,044,214
Change in net unrealised appreciation /(depreciation) on investments and options (2,15) 1,362,876 (11,363,696) (1,751,111) (53,153,875)
Change in net unrealised appreciation /(depreciation) on forward foreign exchangecontracts (2,15) 0 (903,931) 0 (795,985)
Change in net unrealised appreciation /(depreciation) on financial future contracts (2,15) 0 0 0 0
Change in net unrealised appreciation /(depreciation) on foreign exchange contracts (2,15) (1,110) (525) 0 (10,525)
Change in net unrealised appreciation /(depreciation) on swaps (2,15) 0 0 0 0
Change in net unrealised appreciation /(depreciation) on repurchase agreements (13,15) 0 0 0 0
NET INCREASE / (DECREASE) IN NET ASSETSAS A RESULT OF OPERATIONS 4,881,364 (10,625,230) 21,359 48,083,829
EVOLUTION OF THE CAPITALDividend distribution (18) 0 0 0 (647,298)Subscriptions of shares 77,232,427 25,901,684 2,095,326 141,482,933Redemption of shares (63,527,868) (44,988,939) (7,269,966) (391,906,465)Currency Translation
NET ASSETS AT THE END OF THEYEAR / PERIOD 178,624,341 221,280,585 0 329,281,655
(1) See Note 1.
The accompanying notes form an integral part of these financial statements.
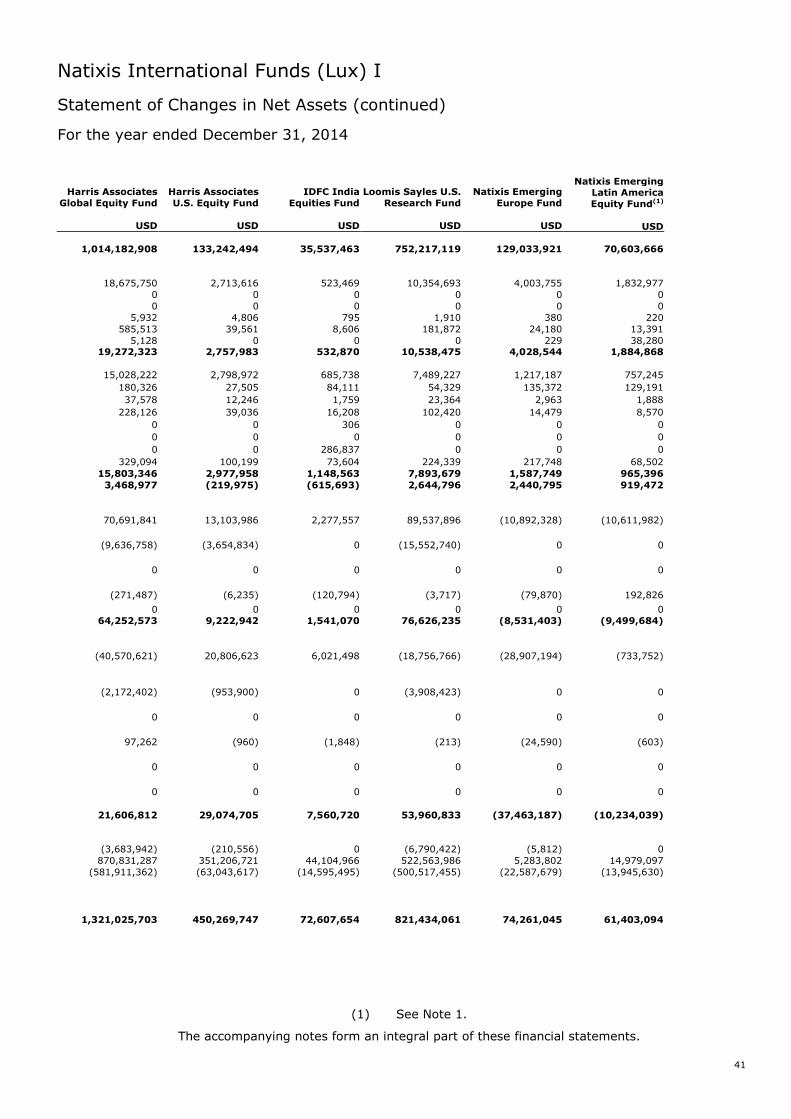
Natixis International Funds (Lux) I
Statement of Changes in Net Assets (continued)
For the year ended December 31, 2014
41
Harris AssociatesGlobal Equity Fund
USD
Harris AssociatesU.S. Equity Fund
USD
IDFC IndiaEquities Fund
USD
Loomis Sayles U.S.Research Fund
USD
Natixis EmergingEurope Fund
USD
Natixis EmergingLatin AmericaEquity Fund(1)
USD
1,014,182,908 133,242,494 35,537,463 752,217,119 129,033,921 70,603,666
18,675,750 2,713,616 523,469 10,354,693 4,003,755 1,832,9770 0 0 0 0 00 0 0 0 0 0
5,932 4,806 795 1,910 380 220585,513 39,561 8,606 181,872 24,180 13,391
5,128 0 0 0 229 38,28019,272,323 2,757,983 532,870 10,538,475 4,028,544 1,884,868
15,028,222 2,798,972 685,738 7,489,227 1,217,187 757,245
180,326 27,505 84,111 54,329 135,372 129,191
37,578 12,246 1,759 23,364 2,963 1,888
228,126 39,036 16,208 102,420 14,479 8,570
0 0 306 0 0 0
0 0 0 0 0 0
0 0 286,837 0 0 0
329,094 100,199 73,604 224,339 217,748 68,502
15,803,346 2,977,958 1,148,563 7,893,679 1,587,749 965,3963,468,977 (219,975) (615,693) 2,644,796 2,440,795 919,472
70,691,841 13,103,986 2,277,557 89,537,896 (10,892,328) (10,611,982)
(9,636,758) (3,654,834) 0 (15,552,740) 0 0
0 0 0 0 0 0
(271,487) (6,235) (120,794) (3,717) (79,870) 192,826
0 0 0 0 0 064,252,573 9,222,942 1,541,070 76,626,235 (8,531,403) (9,499,684)
(40,570,621) 20,806,623 6,021,498 (18,756,766) (28,907,194) (733,752)
(2,172,402) (953,900) 0 (3,908,423) 0 0
0 0 0 0 0 0
97,262 (960) (1,848) (213) (24,590) (603)
0 0 0 0 0 0
0 0 0 0 0 0
21,606,812 29,074,705 7,560,720 53,960,833 (37,463,187) (10,234,039)
(3,683,942) (210,556) 0 (6,790,422) (5,812) 0870,831,287 351,206,721 44,104,966 522,563,986 5,283,802 14,979,097
(581,911,362) (63,043,617) (14,595,495) (500,517,455) (22,587,679) (13,945,630)
1,321,025,703 450,269,747 72,607,654 821,434,061 74,261,045 61,403,094
(1) See Note 1.
The accompanying notes form an integral part of these financial statements.
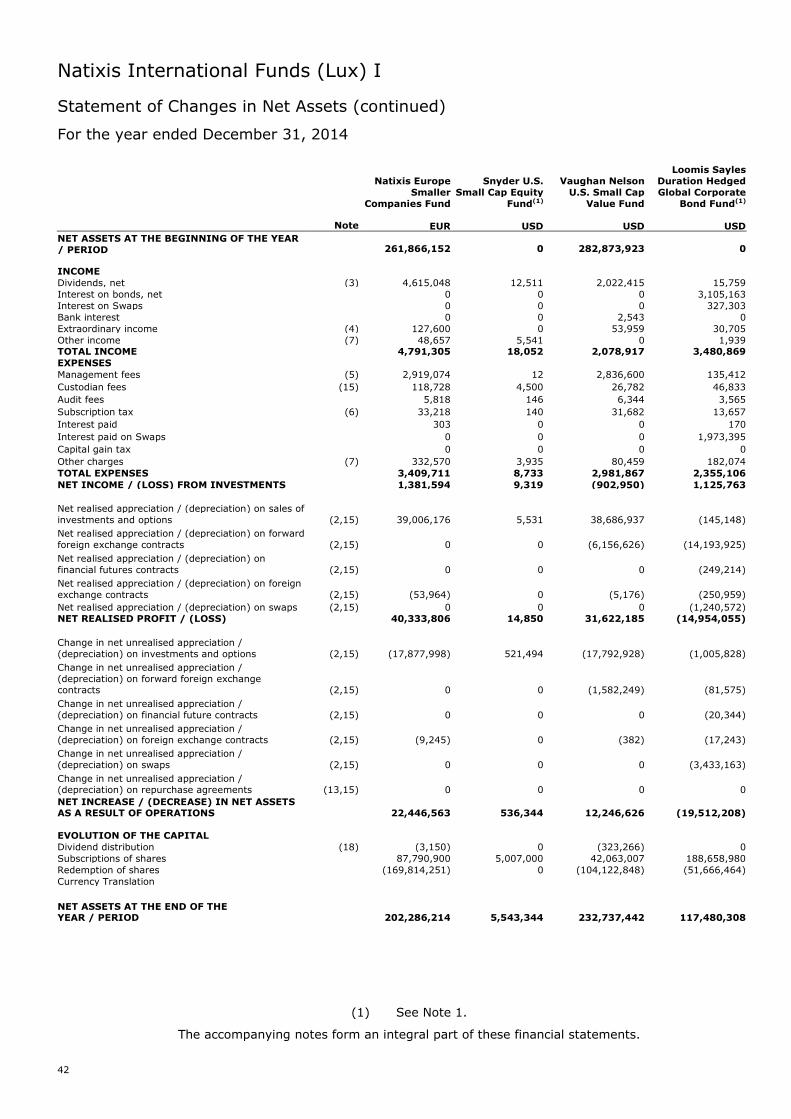
Natixis International Funds (Lux) I
Statement of Changes in Net Assets (continued)
For the year ended December 31, 2014
42
Note
Natixis EuropeSmaller
Companies Fund
EUR
Snyder U.S.Small Cap Equity
Fund(1)
USD
Vaughan NelsonU.S. Small Cap
Value Fund
USD
Loomis SaylesDuration HedgedGlobal Corporate
Bond Fund(1)
USD
NET ASSETS AT THE BEGINNING OF THE YEAR/ PERIOD 261,866,152 0 282,873,923 0
INCOMEDividends, net (3) 4,615,048 12,511 2,022,415 15,759Interest on bonds, net 0 0 0 3,105,163Interest on Swaps 0 0 0 327,303Bank interest 0 0 2,543 0Extraordinary income (4) 127,600 0 53,959 30,705Other income (7) 48,657 5,541 0 1,939TOTAL INCOME 4,791,305 18,052 2,078,917 3,480,869EXPENSES
Management fees (5) 2,919,074 12 2,836,600 135,412
Custodian fees (15) 118,728 4,500 26,782 46,833
Audit fees 5,818 146 6,344 3,565
Subscription tax (6) 33,218 140 31,682 13,657
Interest paid 303 0 0 170
Interest paid on Swaps 0 0 0 1,973,395
Capital gain tax 0 0 0 0
Other charges (7) 332,570 3,935 80,459 182,074
TOTAL EXPENSES 3,409,711 8,733 2,981,867 2,355,106
NET INCOME / (LOSS) FROM INVESTMENTS 1,381,594 9,319 (902,950) 1,125,763
Net realised appreciation / (depreciation) on sales ofinvestments and options (2,15) 39,006,176 5,531 38,686,937 (145,148)
Net realised appreciation / (depreciation) on forwardforeign exchange contracts (2,15) 0 0 (6,156,626) (14,193,925)
Net realised appreciation / (depreciation) onfinancial futures contracts (2,15) 0 0 0 (249,214)
Net realised appreciation / (depreciation) on foreignexchange contracts (2,15) (53,964) 0 (5,176) (250,959)
Net realised appreciation / (depreciation) on swaps (2,15) 0 0 0 (1,240,572)NET REALISED PROFIT / (LOSS) 40,333,806 14,850 31,622,185 (14,954,055)
Change in net unrealised appreciation /(depreciation) on investments and options (2,15) (17,877,998) 521,494 (17,792,928) (1,005,828)
Change in net unrealised appreciation /(depreciation) on forward foreign exchangecontracts (2,15) 0 0 (1,582,249) (81,575)
Change in net unrealised appreciation /(depreciation) on financial future contracts (2,15) 0 0 0 (20,344)
Change in net unrealised appreciation /(depreciation) on foreign exchange contracts (2,15) (9,245) 0 (382) (17,243)
Change in net unrealised appreciation /(depreciation) on swaps (2,15) 0 0 0 (3,433,163)
Change in net unrealised appreciation /(depreciation) on repurchase agreements (13,15) 0 0 0 0
NET INCREASE / (DECREASE) IN NET ASSETSAS A RESULT OF OPERATIONS 22,446,563 536,344 12,246,626 (19,512,208)
EVOLUTION OF THE CAPITALDividend distribution (18) (3,150) 0 (323,266) 0Subscriptions of shares 87,790,900 5,007,000 42,063,007 188,658,980Redemption of shares (169,814,251) 0 (104,122,848) (51,666,464)Currency Translation
NET ASSETS AT THE END OF THEYEAR / PERIOD 202,286,214 5,543,344 232,737,442 117,480,308
(1) See Note 1.
The accompanying notes form an integral part of these financial statements.
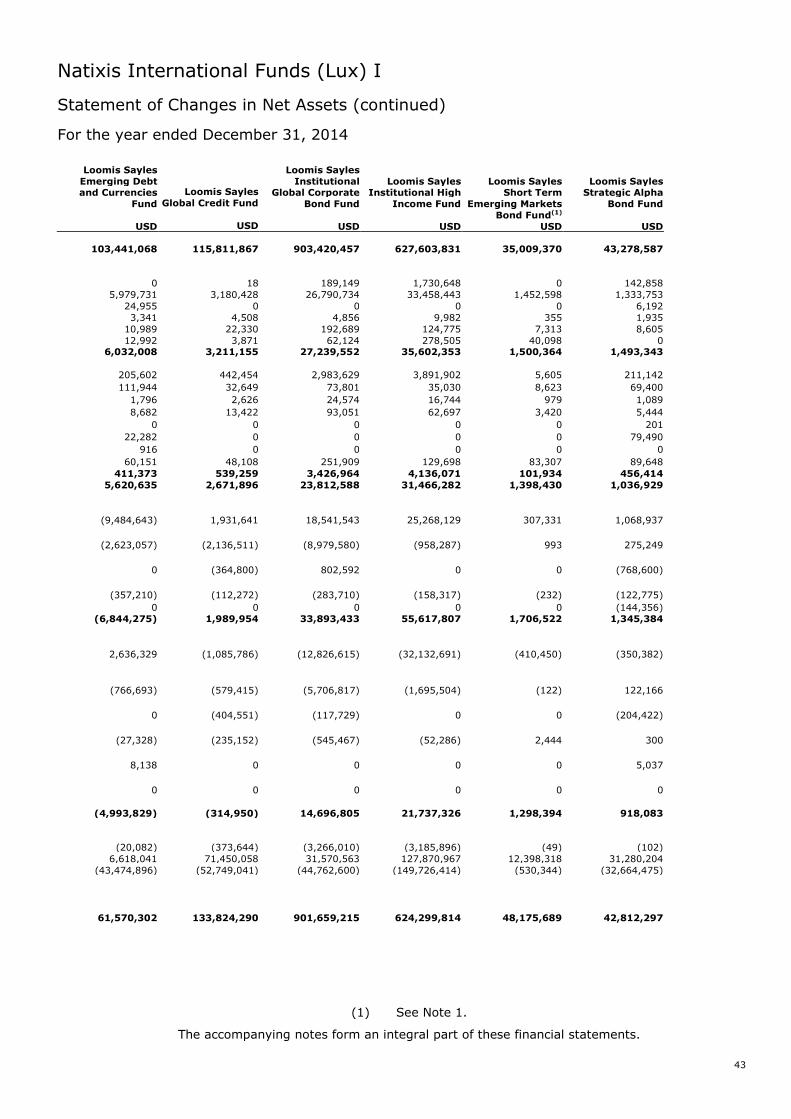
Natixis International Funds (Lux) I
Statement of Changes in Net Assets (continued)
For the year ended December 31, 2014
43
Loomis SaylesEmerging Debtand Currencies
Fund
USD
Loomis SaylesGlobal Credit Fund
USD
Loomis SaylesInstitutional
Global CorporateBond Fund
USD
Loomis SaylesInstitutional High
Income Fund
USD
Loomis SaylesShort Term
Emerging MarketsBond Fund(1)
USD
Loomis SaylesStrategic Alpha
Bond Fund
USD
103,441,068 115,811,867 903,420,457 627,603,831 35,009,370 43,278,587
0 18 189,149 1,730,648 0 142,8585,979,731 3,180,428 26,790,734 33,458,443 1,452,598 1,333,753
24,955 0 0 0 0 6,1923,341 4,508 4,856 9,982 355 1,935
10,989 22,330 192,689 124,775 7,313 8,60512,992 3,871 62,124 278,505 40,098 0
6,032,008 3,211,155 27,239,552 35,602,353 1,500,364 1,493,343
205,602 442,454 2,983,629 3,891,902 5,605 211,142
111,944 32,649 73,801 35,030 8,623 69,400
1,796 2,626 24,574 16,744 979 1,089
8,682 13,422 93,051 62,697 3,420 5,444
0 0 0 0 0 201
22,282 0 0 0 0 79,490
916 0 0 0 0 0
60,151 48,108 251,909 129,698 83,307 89,648
411,373 539,259 3,426,964 4,136,071 101,934 456,4145,620,635 2,671,896 23,812,588 31,466,282 1,398,430 1,036,929
(9,484,643) 1,931,641 18,541,543 25,268,129 307,331 1,068,937
(2,623,057) (2,136,511) (8,979,580) (958,287) 993 275,249
0 (364,800) 802,592 0 0 (768,600)
(357,210) (112,272) (283,710) (158,317) (232) (122,775)
0 0 0 0 0 (144,356)(6,844,275) 1,989,954 33,893,433 55,617,807 1,706,522 1,345,384
2,636,329 (1,085,786) (12,826,615) (32,132,691) (410,450) (350,382)
(766,693) (579,415) (5,706,817) (1,695,504) (122) 122,166
0 (404,551) (117,729) 0 0 (204,422)
(27,328) (235,152) (545,467) (52,286) 2,444 300
8,138 0 0 0 0 5,037
0 0 0 0 0 0
(4,993,829) (314,950) 14,696,805 21,737,326 1,298,394 918,083
(20,082) (373,644) (3,266,010) (3,185,896) (49) (102)6,618,041 71,450,058 31,570,563 127,870,967 12,398,318 31,280,204
(43,474,896) (52,749,041) (44,762,600) (149,726,414) (530,344) (32,664,475)
61,570,302 133,824,290 901,659,215 624,299,814 48,175,689 42,812,297
(1) See Note 1.
The accompanying notes form an integral part of these financial statements.
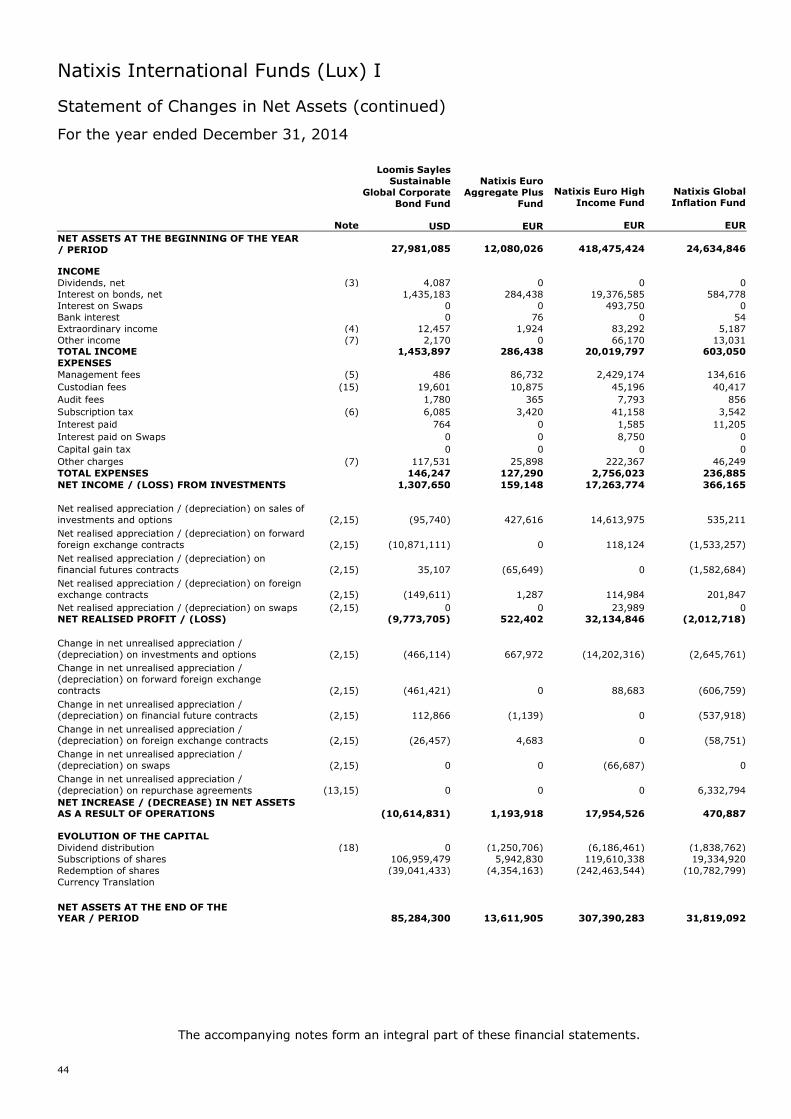
Natixis International Funds (Lux) I
Statement of Changes in Net Assets (continued)
For the year ended December 31, 2014
44
Note
Loomis SaylesSustainable
Global CorporateBond Fund
USD
Natixis EuroAggregate Plus
Fund
EUR
Natixis Euro HighIncome Fund
EUR
Natixis GlobalInflation Fund
EUR
NET ASSETS AT THE BEGINNING OF THE YEAR/ PERIOD 27,981,085 12,080,026 418,475,424 24,634,846
INCOMEDividends, net (3) 4,087 0 0 0Interest on bonds, net 1,435,183 284,438 19,376,585 584,778Interest on Swaps 0 0 493,750 0Bank interest 0 76 0 54Extraordinary income (4) 12,457 1,924 83,292 5,187Other income (7) 2,170 0 66,170 13,031TOTAL INCOME 1,453,897 286,438 20,019,797 603,050EXPENSES
Management fees (5) 486 86,732 2,429,174 134,616
Custodian fees (15) 19,601 10,875 45,196 40,417
Audit fees 1,780 365 7,793 856
Subscription tax (6) 6,085 3,420 41,158 3,542
Interest paid 764 0 1,585 11,205
Interest paid on Swaps 0 0 8,750 0
Capital gain tax 0 0 0 0
Other charges (7) 117,531 25,898 222,367 46,249
TOTAL EXPENSES 146,247 127,290 2,756,023 236,885
NET INCOME / (LOSS) FROM INVESTMENTS 1,307,650 159,148 17,263,774 366,165
Net realised appreciation / (depreciation) on sales ofinvestments and options (2,15) (95,740) 427,616 14,613,975 535,211
Net realised appreciation / (depreciation) on forwardforeign exchange contracts (2,15) (10,871,111) 0 118,124 (1,533,257)
Net realised appreciation / (depreciation) onfinancial futures contracts (2,15) 35,107 (65,649) 0 (1,582,684)
Net realised appreciation / (depreciation) on foreignexchange contracts (2,15) (149,611) 1,287 114,984 201,847
Net realised appreciation / (depreciation) on swaps (2,15) 0 0 23,989 0NET REALISED PROFIT / (LOSS) (9,773,705) 522,402 32,134,846 (2,012,718)
Change in net unrealised appreciation /(depreciation) on investments and options (2,15) (466,114) 667,972 (14,202,316) (2,645,761)
Change in net unrealised appreciation /(depreciation) on forward foreign exchangecontracts (2,15) (461,421) 0 88,683 (606,759)
Change in net unrealised appreciation /(depreciation) on financial future contracts (2,15) 112,866 (1,139) 0 (537,918)
Change in net unrealised appreciation /(depreciation) on foreign exchange contracts (2,15) (26,457) 4,683 0 (58,751)
Change in net unrealised appreciation /(depreciation) on swaps (2,15) 0 0 (66,687) 0
Change in net unrealised appreciation /(depreciation) on repurchase agreements (13,15) 0 0 0 6,332,794
NET INCREASE / (DECREASE) IN NET ASSETSAS A RESULT OF OPERATIONS (10,614,831) 1,193,918 17,954,526 470,887
EVOLUTION OF THE CAPITALDividend distribution (18) 0 (1,250,706) (6,186,461) (1,838,762)Subscriptions of shares 106,959,479 5,942,830 119,610,338 19,334,920Redemption of shares (39,041,433) (4,354,163) (242,463,544) (10,782,799)Currency Translation
NET ASSETS AT THE END OF THEYEAR / PERIOD 85,284,300 13,611,905 307,390,283 31,819,092
The accompanying notes form an integral part of these financial statements.
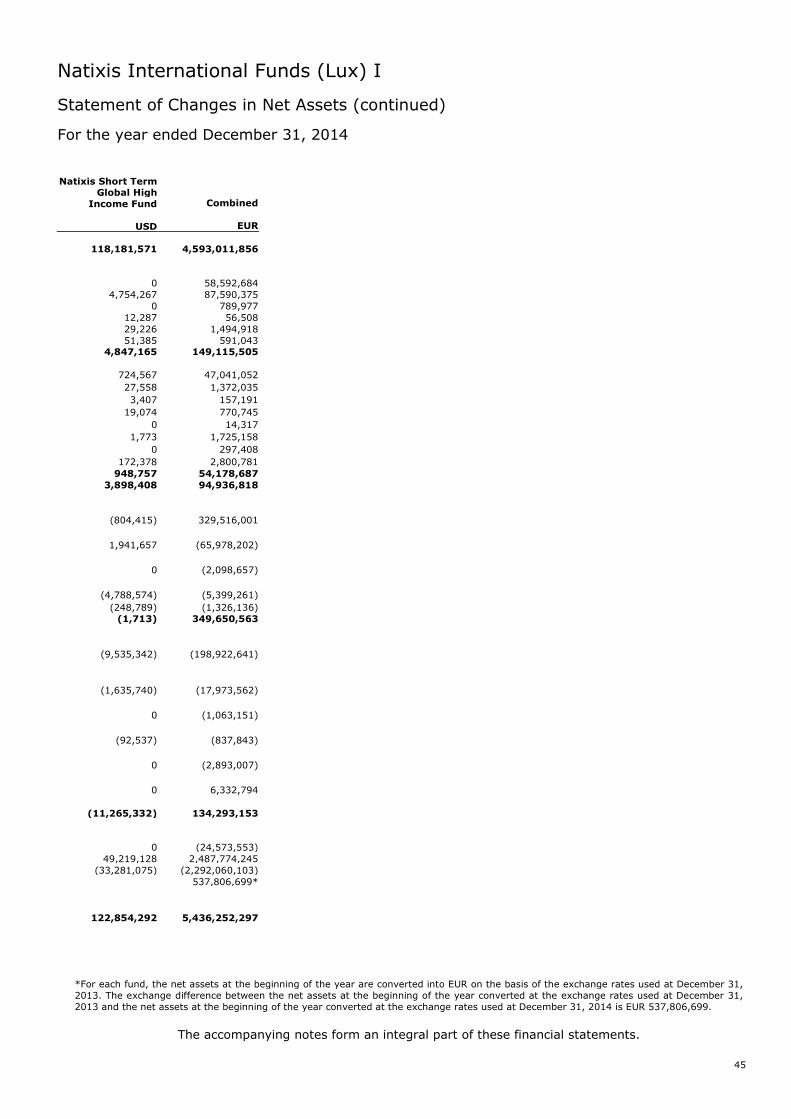
Natixis International Funds (Lux) I
Statement of Changes in Net Assets (continued)
For the year ended December 31, 2014
45
Natixis Short TermGlobal High
Income Fund
USD
Combined
EUR
118,181,571 4,593,011,856
0 58,592,6844,754,267 87,590,375
0 789,97712,287 56,50829,226 1,494,91851,385 591,043
4,847,165 149,115,505
724,567 47,041,052
27,558 1,372,035
3,407 157,191
19,074 770,745
0 14,317
1,773 1,725,158
0 297,408
172,378 2,800,781
948,757 54,178,6873,898,408 94,936,818
(804,415) 329,516,001
1,941,657 (65,978,202)
0 (2,098,657)
(4,788,574) (5,399,261)
(248,789) (1,326,136)(1,713) 349,650,563
(9,535,342) (198,922,641)
(1,635,740) (17,973,562)
0 (1,063,151)
(92,537) (837,843)
0 (2,893,007)
0 6,332,794
(11,265,332) 134,293,153
0 (24,573,553)49,219,128 2,487,774,245
(33,281,075) (2,292,060,103)537,806,699*
122,854,292 5,436,252,297
*For each fund, the net assets at the beginning of the year are converted into EUR on the basis of the exchange rates used at December 31,2013. The exchange difference between the net assets at the beginning of the year converted at the exchange rates used at December 31,2013 and the net assets at the beginning of the year converted at the exchange rates used at December 31, 2014 is EUR 537,806,699.
The accompanying notes form an integral part of these financial statements.
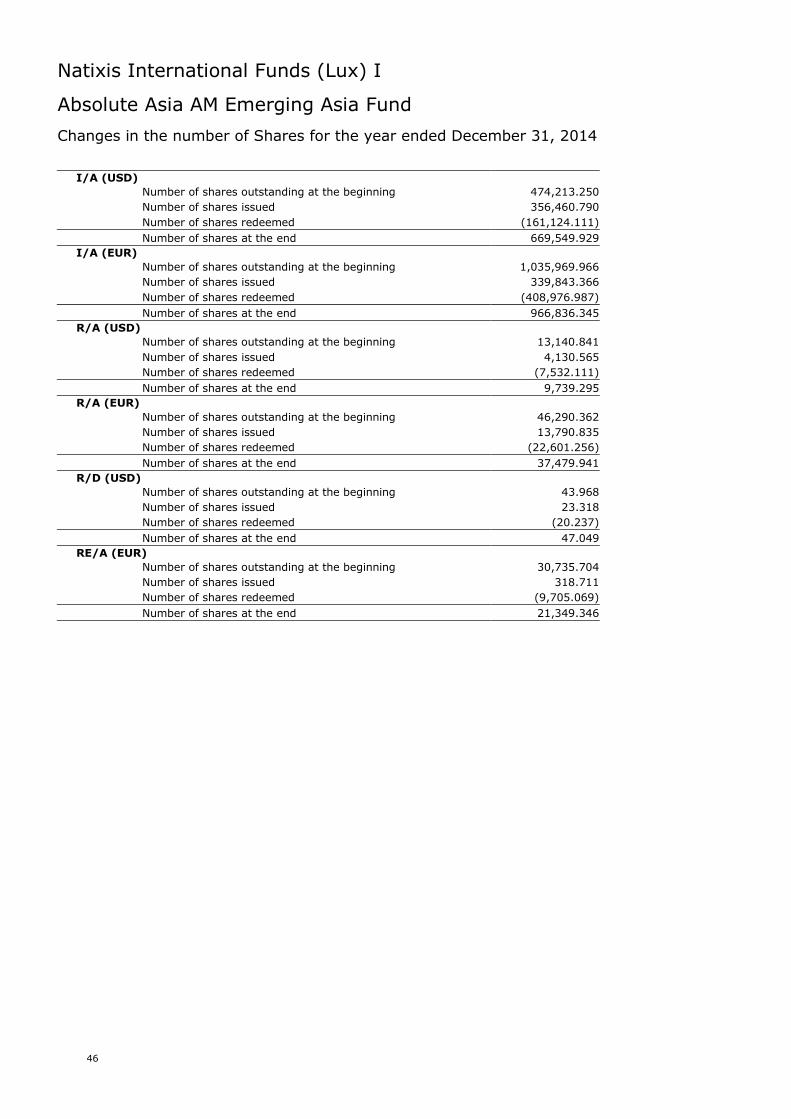
Natixis International Funds (Lux) I
46
Absolute Asia AM Emerging Asia Fund
Changes in the number of Shares for the year ended December 31, 2014
I/A (USD)
Number of shares outstanding at the beginning 474,213.250
Number of shares issued 356,460.790
Number of shares redeemed (161,124.111)
Number of shares at the end 669,549.929
I/A (EUR)
Number of shares outstanding at the beginning 1,035,969.966
Number of shares issued 339,843.366
Number of shares redeemed (408,976.987)
Number of shares at the end 966,836.345
R/A (USD)
Number of shares outstanding at the beginning 13,140.841
Number of shares issued 4,130.565
Number of shares redeemed (7,532.111)
Number of shares at the end 9,739.295
R/A (EUR)
Number of shares outstanding at the beginning 46,290.362
Number of shares issued 13,790.835
Number of shares redeemed (22,601.256)
Number of shares at the end 37,479.941
R/D (USD)
Number of shares outstanding at the beginning 43.968
Number of shares issued 23.318
Number of shares redeemed (20.237)
Number of shares at the end 47.049
RE/A (EUR)
Number of shares outstanding at the beginning 30,735.704
Number of shares issued 318.711
Number of shares redeemed (9,705.069)
Number of shares at the end 21,349.346
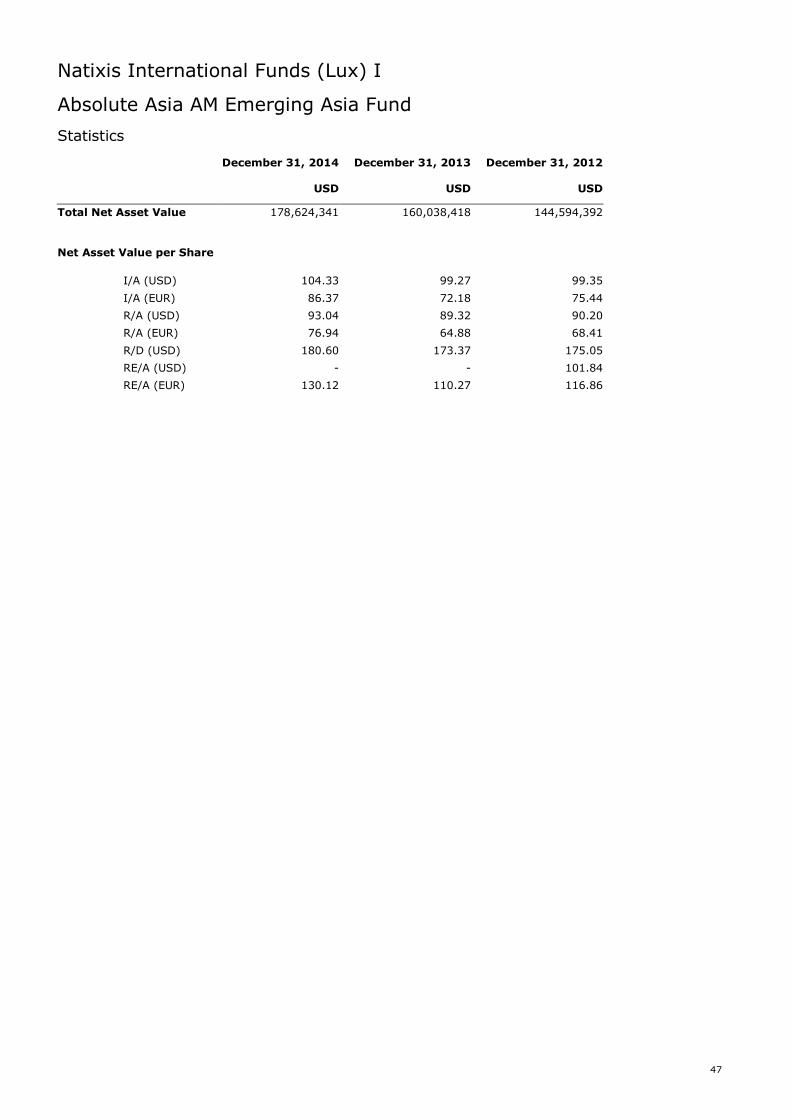
Natixis International Funds (Lux) I
47
Absolute Asia AM Emerging Asia Fund
Statistics
December 31, 2014 December 31, 2013 December 31, 2012
USD USD USD
Total Net Asset Value 178,624,341 160,038,418 144,594,392
Net Asset Value per Share
I/A (USD) 104.33 99.27 99.35
I/A (EUR) 86.37 72.18 75.44
R/A (USD) 93.04 89.32 90.20
R/A (EUR) 76.94 64.88 68.41
R/D (USD) 180.60 173.37 175.05
RE/A (USD) - - 101.84
RE/A (EUR) 130.12 110.27 116.86
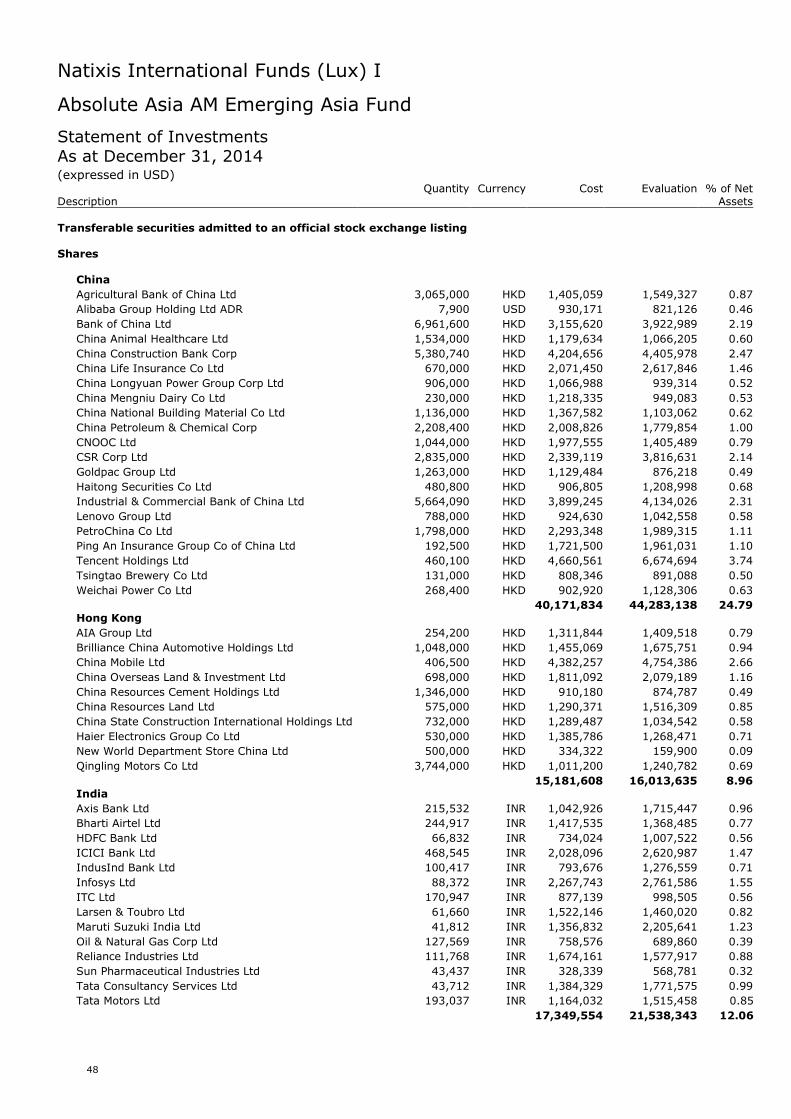
Natixis International Funds (Lux) I
48
Absolute Asia AM Emerging Asia Fund
Statement of InvestmentsAs at December 31, 2014(expressed in USD)
Quantity Currency Cost Evaluation % of NetDescription Assets
Transferable securities admitted to an official stock exchange listing
Shares
China
Agricultural Bank of China Ltd 3,065,000 HKD 1,405,059 1,549,327 0.87
Alibaba Group Holding Ltd ADR 7,900 USD 930,171 821,126 0.46
Bank of China Ltd 6,961,600 HKD 3,155,620 3,922,989 2.19
China Animal Healthcare Ltd 1,534,000 HKD 1,179,634 1,066,205 0.60
China Construction Bank Corp 5,380,740 HKD 4,204,656 4,405,978 2.47
China Life Insurance Co Ltd 670,000 HKD 2,071,450 2,617,846 1.46
China Longyuan Power Group Corp Ltd 906,000 HKD 1,066,988 939,314 0.52
China Mengniu Dairy Co Ltd 230,000 HKD 1,218,335 949,083 0.53
China National Building Material Co Ltd 1,136,000 HKD 1,367,582 1,103,062 0.62
China Petroleum & Chemical Corp 2,208,400 HKD 2,008,826 1,779,854 1.00
CNOOC Ltd 1,044,000 HKD 1,977,555 1,405,489 0.79
CSR Corp Ltd 2,835,000 HKD 2,339,119 3,816,631 2.14
Goldpac Group Ltd 1,263,000 HKD 1,129,484 876,218 0.49
Haitong Securities Co Ltd 480,800 HKD 906,805 1,208,998 0.68
Industrial & Commercial Bank of China Ltd 5,664,090 HKD 3,899,245 4,134,026 2.31
Lenovo Group Ltd 788,000 HKD 924,630 1,042,558 0.58
PetroChina Co Ltd 1,798,000 HKD 2,293,348 1,989,315 1.11
Ping An Insurance Group Co of China Ltd 192,500 HKD 1,721,500 1,961,031 1.10
Tencent Holdings Ltd 460,100 HKD 4,660,561 6,674,694 3.74
Tsingtao Brewery Co Ltd 131,000 HKD 808,346 891,088 0.50
Weichai Power Co Ltd 268,400 HKD 902,920 1,128,306 0.63
40,171,834 44,283,138 24.79Hong Kong
AIA Group Ltd 254,200 HKD 1,311,844 1,409,518 0.79
Brilliance China Automotive Holdings Ltd 1,048,000 HKD 1,455,069 1,675,751 0.94
China Mobile Ltd 406,500 HKD 4,382,257 4,754,386 2.66
China Overseas Land & Investment Ltd 698,000 HKD 1,811,092 2,079,189 1.16
China Resources Cement Holdings Ltd 1,346,000 HKD 910,180 874,787 0.49
China Resources Land Ltd 575,000 HKD 1,290,371 1,516,309 0.85
China State Construction International Holdings Ltd 732,000 HKD 1,289,487 1,034,542 0.58
Haier Electronics Group Co Ltd 530,000 HKD 1,385,786 1,268,471 0.71
New World Department Store China Ltd 500,000 HKD 334,322 159,900 0.09
Qingling Motors Co Ltd 3,744,000 HKD 1,011,200 1,240,782 0.69
15,181,608 16,013,635 8.96India
Axis Bank Ltd 215,532 INR 1,042,926 1,715,447 0.96
Bharti Airtel Ltd 244,917 INR 1,417,535 1,368,485 0.77
HDFC Bank Ltd 66,832 INR 734,024 1,007,522 0.56
ICICI Bank Ltd 468,545 INR 2,028,096 2,620,987 1.47
IndusInd Bank Ltd 100,417 INR 793,676 1,276,559 0.71
Infosys Ltd 88,372 INR 2,267,743 2,761,586 1.55
ITC Ltd 170,947 INR 877,139 998,505 0.56
Larsen & Toubro Ltd 61,660 INR 1,522,146 1,460,020 0.82
Maruti Suzuki India Ltd 41,812 INR 1,356,832 2,205,641 1.23
Oil & Natural Gas Corp Ltd 127,569 INR 758,576 689,860 0.39
Reliance Industries Ltd 111,768 INR 1,674,161 1,577,917 0.88
Sun Pharmaceutical Industries Ltd 43,437 INR 328,339 568,781 0.32
Tata Consultancy Services Ltd 43,712 INR 1,384,329 1,771,575 0.99
Tata Motors Ltd 193,037 INR 1,164,032 1,515,458 0.85
17,349,554 21,538,343 12.06
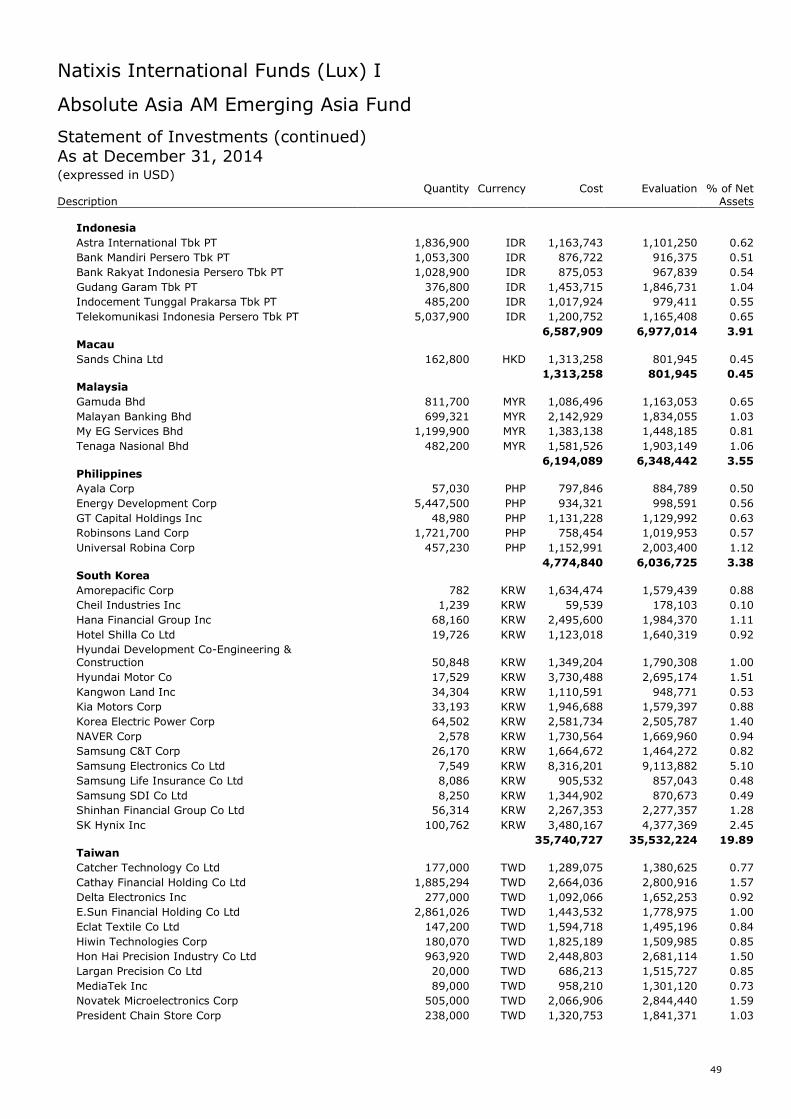
Natixis International Funds (Lux) I
49
Absolute Asia AM Emerging Asia Fund
Statement of Investments (continued)As at December 31, 2014(expressed in USD)
Quantity Currency Cost Evaluation % of NetDescription Assets
Indonesia
Astra International Tbk PT 1,836,900 IDR 1,163,743 1,101,250 0.62
Bank Mandiri Persero Tbk PT 1,053,300 IDR 876,722 916,375 0.51
Bank Rakyat Indonesia Persero Tbk PT 1,028,900 IDR 875,053 967,839 0.54
Gudang Garam Tbk PT 376,800 IDR 1,453,715 1,846,731 1.04
Indocement Tunggal Prakarsa Tbk PT 485,200 IDR 1,017,924 979,411 0.55
Telekomunikasi Indonesia Persero Tbk PT 5,037,900 IDR 1,200,752 1,165,408 0.65
6,587,909 6,977,014 3.91Macau
Sands China Ltd 162,800 HKD 1,313,258 801,945 0.45
1,313,258 801,945 0.45Malaysia
Gamuda Bhd 811,700 MYR 1,086,496 1,163,053 0.65
Malayan Banking Bhd 699,321 MYR 2,142,929 1,834,055 1.03
My EG Services Bhd 1,199,900 MYR 1,383,138 1,448,185 0.81
Tenaga Nasional Bhd 482,200 MYR 1,581,526 1,903,149 1.06
6,194,089 6,348,442 3.55Philippines
Ayala Corp 57,030 PHP 797,846 884,789 0.50
Energy Development Corp 5,447,500 PHP 934,321 998,591 0.56
GT Capital Holdings Inc 48,980 PHP 1,131,228 1,129,992 0.63
Robinsons Land Corp 1,721,700 PHP 758,454 1,019,953 0.57
Universal Robina Corp 457,230 PHP 1,152,991 2,003,400 1.12
4,774,840 6,036,725 3.38South Korea
Amorepacific Corp 782 KRW 1,634,474 1,579,439 0.88
Cheil Industries Inc 1,239 KRW 59,539 178,103 0.10
Hana Financial Group Inc 68,160 KRW 2,495,600 1,984,370 1.11
Hotel Shilla Co Ltd 19,726 KRW 1,123,018 1,640,319 0.92
Hyundai Development Co-Engineering &Construction 50,848 KRW 1,349,204 1,790,308 1.00
Hyundai Motor Co 17,529 KRW 3,730,488 2,695,174 1.51
Kangwon Land Inc 34,304 KRW 1,110,591 948,771 0.53
Kia Motors Corp 33,193 KRW 1,946,688 1,579,397 0.88
Korea Electric Power Corp 64,502 KRW 2,581,734 2,505,787 1.40
NAVER Corp 2,578 KRW 1,730,564 1,669,960 0.94
Samsung C&T Corp 26,170 KRW 1,664,672 1,464,272 0.82
Samsung Electronics Co Ltd 7,549 KRW 8,316,201 9,113,882 5.10
Samsung Life Insurance Co Ltd 8,086 KRW 905,532 857,043 0.48
Samsung SDI Co Ltd 8,250 KRW 1,344,902 870,673 0.49
Shinhan Financial Group Co Ltd 56,314 KRW 2,267,353 2,277,357 1.28
SK Hynix Inc 100,762 KRW 3,480,167 4,377,369 2.45
35,740,727 35,532,224 19.89Taiwan
Catcher Technology Co Ltd 177,000 TWD 1,289,075 1,380,625 0.77
Cathay Financial Holding Co Ltd 1,885,294 TWD 2,664,036 2,800,916 1.57
Delta Electronics Inc 277,000 TWD 1,092,066 1,652,253 0.92
E.Sun Financial Holding Co Ltd 2,861,026 TWD 1,443,532 1,778,975 1.00
Eclat Textile Co Ltd 147,200 TWD 1,594,718 1,495,196 0.84
Hiwin Technologies Corp 180,070 TWD 1,825,189 1,509,985 0.85
Hon Hai Precision Industry Co Ltd 963,920 TWD 2,448,803 2,681,114 1.50
Largan Precision Co Ltd 20,000 TWD 686,213 1,515,727 0.85
MediaTek Inc 89,000 TWD 958,210 1,301,120 0.73
Novatek Microelectronics Corp 505,000 TWD 2,066,906 2,844,440 1.59
President Chain Store Corp 238,000 TWD 1,320,753 1,841,371 1.03
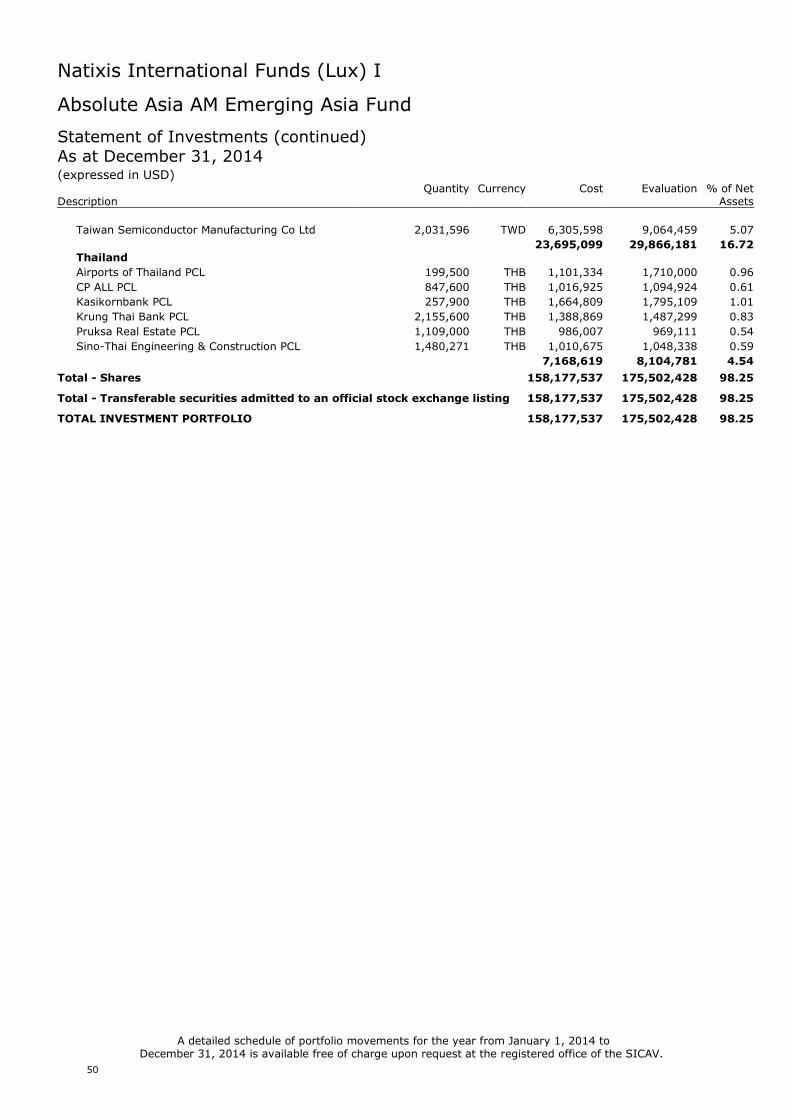
Natixis International Funds (Lux) I
50
Absolute Asia AM Emerging Asia Fund
Statement of Investments (continued)As at December 31, 2014(expressed in USD)
Quantity Currency Cost Evaluation % of NetDescription Assets
Taiwan Semiconductor Manufacturing Co Ltd 2,031,596 TWD 6,305,598 9,064,459 5.07
23,695,099 29,866,181 16.72Thailand
Airports of Thailand PCL 199,500 THB 1,101,334 1,710,000 0.96
CP ALL PCL 847,600 THB 1,016,925 1,094,924 0.61
Kasikornbank PCL 257,900 THB 1,664,809 1,795,109 1.01
Krung Thai Bank PCL 2,155,600 THB 1,388,869 1,487,299 0.83
Pruksa Real Estate PCL 1,109,000 THB 986,007 969,111 0.54
Sino-Thai Engineering & Construction PCL 1,480,271 THB 1,010,675 1,048,338 0.59
7,168,619 8,104,781 4.54
Total - Shares 158,177,537 175,502,428 98.25
Total - Transferable securities admitted to an official stock exchange listing 158,177,537 175,502,428 98.25
TOTAL INVESTMENT PORTFOLIO 158,177,537 175,502,428 98.25
A detailed schedule of portfolio movements for the year from January 1, 2014 toDecember 31, 2014 is available free of charge upon request at the registered office of the SICAV.

Natixis International Funds (Lux) I
51
Absolute Asia AM Pacific Rim Equities Fund
Changes in the number of Shares for the year ended December 31, 2014
H-I/A (EUR)
Number of shares outstanding at the beginning 340,990.838
Number of shares issued -
Number of shares redeemed -
Number of shares at the end 340,990.838
I/A (USD)
Number of shares outstanding at the beginning 113,534.829
Number of shares issued 56,261.772
Number of shares redeemed (86,436.959)
Number of shares at the end 83,359.642
I/A (EUR)
Number of shares outstanding at the beginning 714,804.233
Number of shares issued 205,558.427
Number of shares redeemed (195,137.510)
Number of shares at the end 725,225.150
R/A (USD)
Number of shares outstanding at the beginning 125,978.162
Number of shares issued 3,470.612
Number of shares redeemed (47,280.417)
Number of shares at the end 82,168.357
R/A (EUR)
Number of shares outstanding at the beginning 64,875.987
Number of shares issued 1,658.250
Number of shares redeemed (19,584.973)
Number of shares at the end 46,949.264
RE/A (USD)
Number of shares outstanding at the beginning 57,979.030
Number of shares issued 3,986.293
Number of shares redeemed (28,727.653)
Number of shares at the end 33,237.670
S/A (EUR)
Number of shares outstanding at the beginning 804,999.665
Number of shares issued -
Number of shares redeemed (65,000.000)
Number of shares at the end 739,999.665

Natixis International Funds (Lux) I
52
Absolute Asia AM Pacific Rim Equities Fund
Statistics
December 31, 2014 December 31, 2013 December 31, 2012
USD USD USD
Total Net Asset Value 221,280,585 250,993,070 434,318,240
Net Asset Value per Share
H-I/A (EUR) 91.07 90.22 89.54
I/A (USD) 89.19 92.29 97.44
I/A (EUR) 73.56 67.19 74.04
R/A (USD) 83.22 86.68 92.10
R/A (EUR) 68.68 63.13 70.01
RE/A (USD) 107.28 112.42 120.18
S/A (EUR) 107.85 98.32 108.13
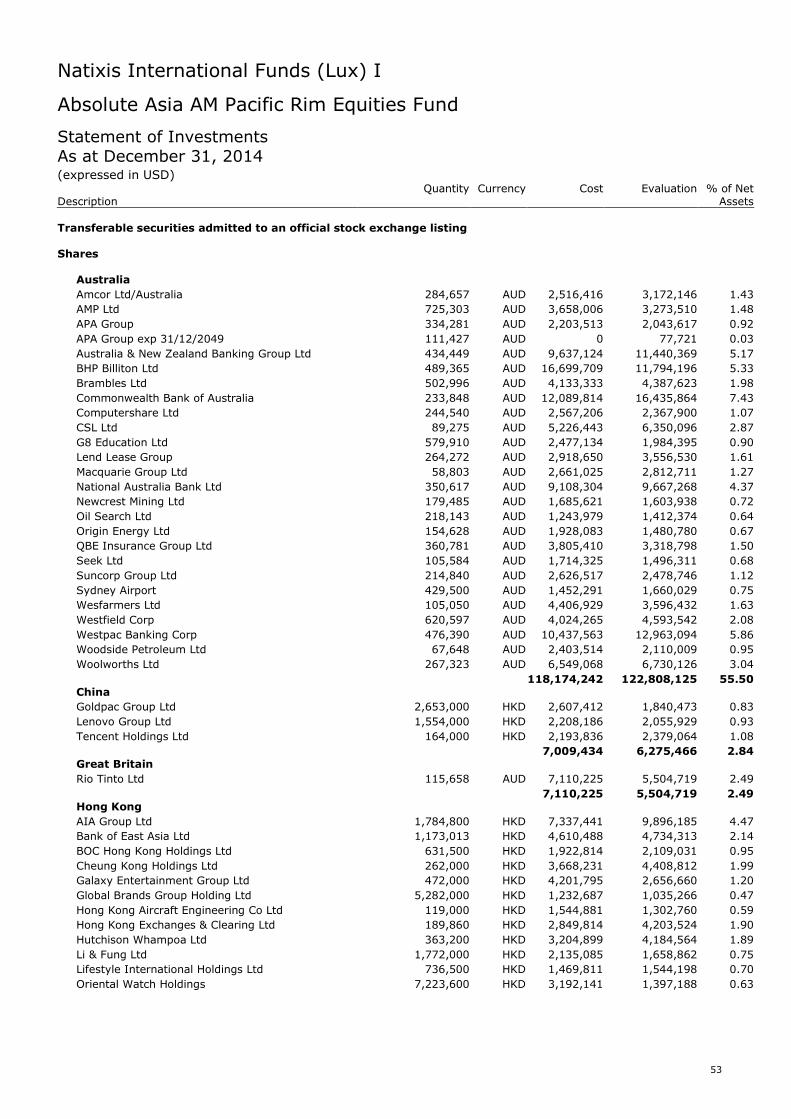
Natixis International Funds (Lux) I
53
Absolute Asia AM Pacific Rim Equities Fund
Statement of InvestmentsAs at December 31, 2014(expressed in USD)
Quantity Currency Cost Evaluation % of NetDescription Assets
Transferable securities admitted to an official stock exchange listing
Shares
Australia
Amcor Ltd/Australia 284,657 AUD 2,516,416 3,172,146 1.43
AMP Ltd 725,303 AUD 3,658,006 3,273,510 1.48
APA Group 334,281 AUD 2,203,513 2,043,617 0.92
APA Group exp 31/12/2049 111,427 AUD 0 77,721 0.03
Australia & New Zealand Banking Group Ltd 434,449 AUD 9,637,124 11,440,369 5.17
BHP Billiton Ltd 489,365 AUD 16,699,709 11,794,196 5.33
Brambles Ltd 502,996 AUD 4,133,333 4,387,623 1.98
Commonwealth Bank of Australia 233,848 AUD 12,089,814 16,435,864 7.43
Computershare Ltd 244,540 AUD 2,567,206 2,367,900 1.07
CSL Ltd 89,275 AUD 5,226,443 6,350,096 2.87
G8 Education Ltd 579,910 AUD 2,477,134 1,984,395 0.90
Lend Lease Group 264,272 AUD 2,918,650 3,556,530 1.61
Macquarie Group Ltd 58,803 AUD 2,661,025 2,812,711 1.27
National Australia Bank Ltd 350,617 AUD 9,108,304 9,667,268 4.37
Newcrest Mining Ltd 179,485 AUD 1,685,621 1,603,938 0.72
Oil Search Ltd 218,143 AUD 1,243,979 1,412,374 0.64
Origin Energy Ltd 154,628 AUD 1,928,083 1,480,780 0.67
QBE Insurance Group Ltd 360,781 AUD 3,805,410 3,318,798 1.50
Seek Ltd 105,584 AUD 1,714,325 1,496,311 0.68
Suncorp Group Ltd 214,840 AUD 2,626,517 2,478,746 1.12
Sydney Airport 429,500 AUD 1,452,291 1,660,029 0.75
Wesfarmers Ltd 105,050 AUD 4,406,929 3,596,432 1.63
Westfield Corp 620,597 AUD 4,024,265 4,593,542 2.08
Westpac Banking Corp 476,390 AUD 10,437,563 12,963,094 5.86
Woodside Petroleum Ltd 67,648 AUD 2,403,514 2,110,009 0.95
Woolworths Ltd 267,323 AUD 6,549,068 6,730,126 3.04
118,174,242 122,808,125 55.50China
Goldpac Group Ltd 2,653,000 HKD 2,607,412 1,840,473 0.83
Lenovo Group Ltd 1,554,000 HKD 2,208,186 2,055,929 0.93
Tencent Holdings Ltd 164,000 HKD 2,193,836 2,379,064 1.08
7,009,434 6,275,466 2.84Great Britain
Rio Tinto Ltd 115,658 AUD 7,110,225 5,504,719 2.49
7,110,225 5,504,719 2.49Hong Kong
AIA Group Ltd 1,784,800 HKD 7,337,441 9,896,185 4.47
Bank of East Asia Ltd 1,173,013 HKD 4,610,488 4,734,313 2.14
BOC Hong Kong Holdings Ltd 631,500 HKD 1,922,814 2,109,031 0.95
Cheung Kong Holdings Ltd 262,000 HKD 3,668,231 4,408,812 1.99
Galaxy Entertainment Group Ltd 472,000 HKD 4,201,795 2,656,660 1.20
Global Brands Group Holding Ltd 5,282,000 HKD 1,232,687 1,035,266 0.47
Hong Kong Aircraft Engineering Co Ltd 119,000 HKD 1,544,881 1,302,760 0.59
Hong Kong Exchanges & Clearing Ltd 189,860 HKD 2,849,814 4,203,524 1.90
Hutchison Whampoa Ltd 363,200 HKD 3,204,899 4,184,564 1.89
Li & Fung Ltd 1,772,000 HKD 2,135,085 1,658,862 0.75
Lifestyle International Holdings Ltd 736,500 HKD 1,469,811 1,544,198 0.70
Oriental Watch Holdings 7,223,600 HKD 3,192,141 1,397,188 0.63
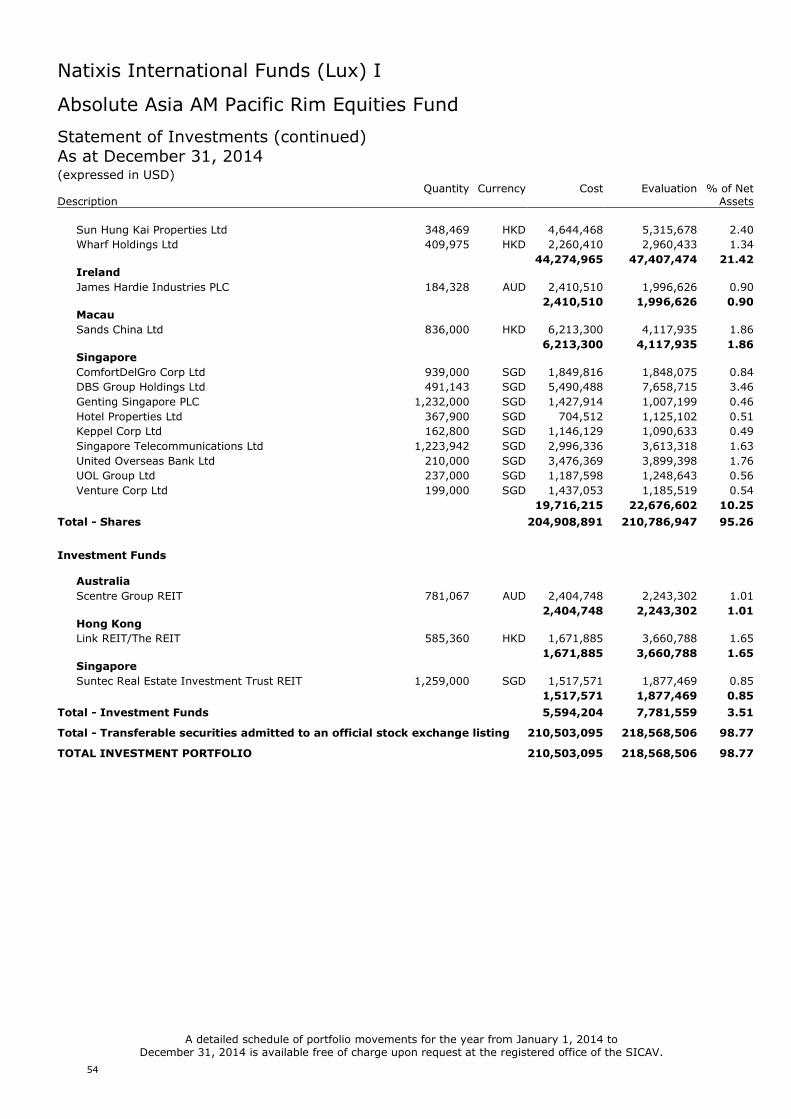
Natixis International Funds (Lux) I
54
Absolute Asia AM Pacific Rim Equities Fund
Statement of Investments (continued)As at December 31, 2014(expressed in USD)
Quantity Currency Cost Evaluation % of NetDescription Assets
Sun Hung Kai Properties Ltd 348,469 HKD 4,644,468 5,315,678 2.40
Wharf Holdings Ltd 409,975 HKD 2,260,410 2,960,433 1.34
44,274,965 47,407,474 21.42Ireland
James Hardie Industries PLC 184,328 AUD 2,410,510 1,996,626 0.90
2,410,510 1,996,626 0.90Macau
Sands China Ltd 836,000 HKD 6,213,300 4,117,935 1.86
6,213,300 4,117,935 1.86Singapore
ComfortDelGro Corp Ltd 939,000 SGD 1,849,816 1,848,075 0.84
DBS Group Holdings Ltd 491,143 SGD 5,490,488 7,658,715 3.46
Genting Singapore PLC 1,232,000 SGD 1,427,914 1,007,199 0.46
Hotel Properties Ltd 367,900 SGD 704,512 1,125,102 0.51
Keppel Corp Ltd 162,800 SGD 1,146,129 1,090,633 0.49
Singapore Telecommunications Ltd 1,223,942 SGD 2,996,336 3,613,318 1.63
United Overseas Bank Ltd 210,000 SGD 3,476,369 3,899,398 1.76
UOL Group Ltd 237,000 SGD 1,187,598 1,248,643 0.56
Venture Corp Ltd 199,000 SGD 1,437,053 1,185,519 0.54
19,716,215 22,676,602 10.25
Total - Shares 204,908,891 210,786,947 95.26
Investment Funds
Australia
Scentre Group REIT 781,067 AUD 2,404,748 2,243,302 1.01
2,404,748 2,243,302 1.01Hong Kong
Link REIT/The REIT 585,360 HKD 1,671,885 3,660,788 1.65
1,671,885 3,660,788 1.65Singapore
Suntec Real Estate Investment Trust REIT 1,259,000 SGD 1,517,571 1,877,469 0.85
1,517,571 1,877,469 0.85
Total - Investment Funds 5,594,204 7,781,559 3.51
Total - Transferable securities admitted to an official stock exchange listing 210,503,095 218,568,506 98.77
TOTAL INVESTMENT PORTFOLIO 210,503,095 218,568,506 98.77
A detailed schedule of portfolio movements for the year from January 1, 2014 toDecember 31, 2014 is available free of charge upon request at the registered office of the SICAV.
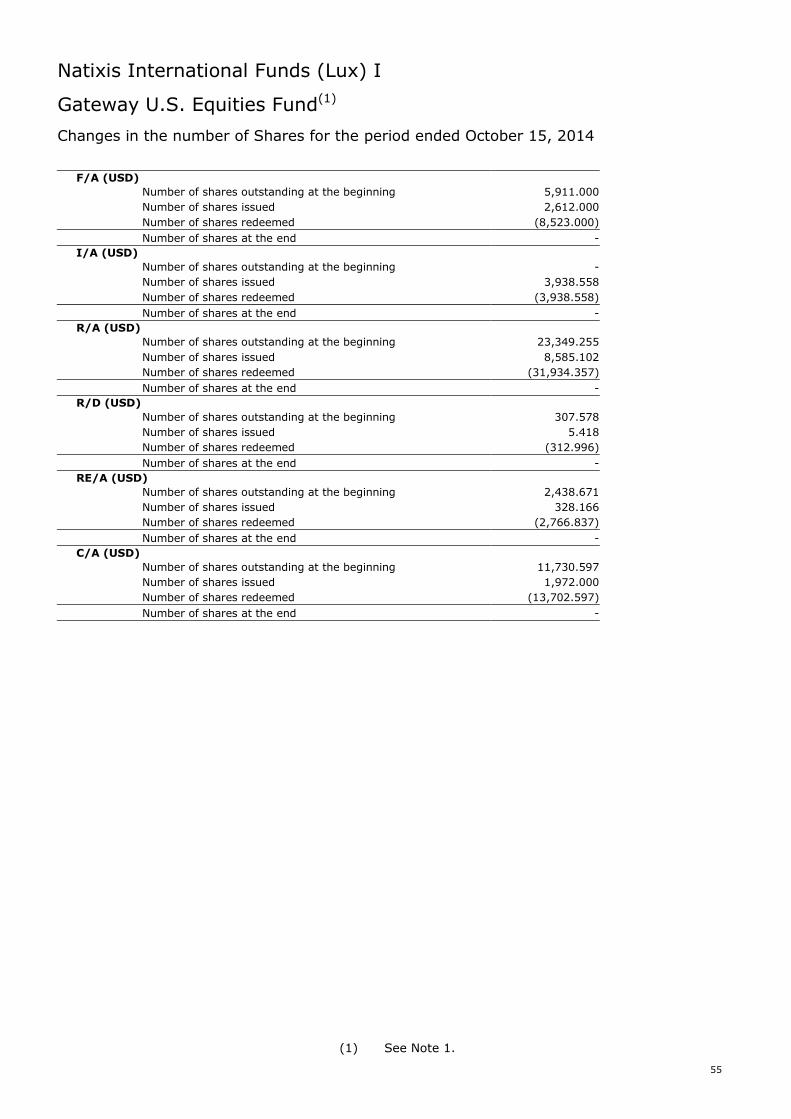
Natixis International Funds (Lux) I
55
Gateway U.S. Equities Fund(1)
Changes in the number of Shares for the period ended October 15, 2014
F/A (USD)
Number of shares outstanding at the beginning 5,911.000
Number of shares issued 2,612.000
Number of shares redeemed (8,523.000)
Number of shares at the end -
I/A (USD)
Number of shares outstanding at the beginning -
Number of shares issued 3,938.558
Number of shares redeemed (3,938.558)
Number of shares at the end -
R/A (USD)
Number of shares outstanding at the beginning 23,349.255
Number of shares issued 8,585.102
Number of shares redeemed (31,934.357)
Number of shares at the end -
R/D (USD)
Number of shares outstanding at the beginning 307.578
Number of shares issued 5.418
Number of shares redeemed (312.996)
Number of shares at the end -
RE/A (USD)
Number of shares outstanding at the beginning 2,438.671
Number of shares issued 328.166
Number of shares redeemed (2,766.837)
Number of shares at the end -
C/A (USD)
Number of shares outstanding at the beginning 11,730.597
Number of shares issued 1,972.000
Number of shares redeemed (13,702.597)
Number of shares at the end -
(1) See Note 1.
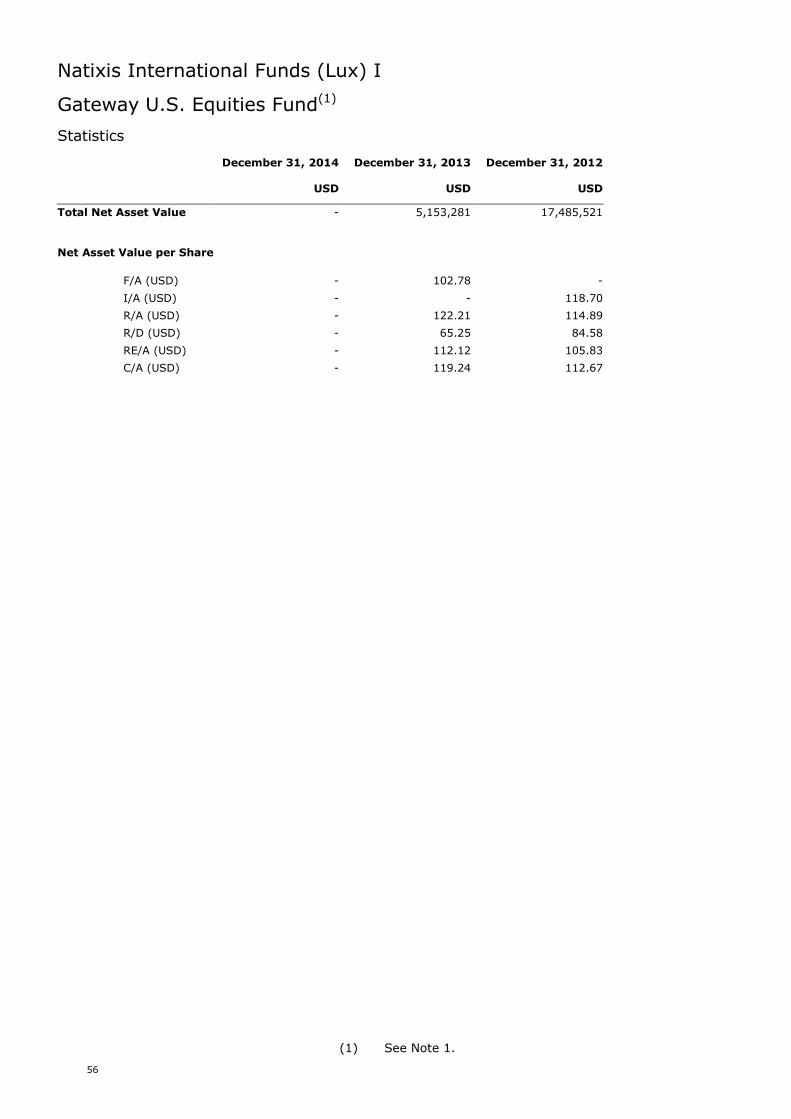
Natixis International Funds (Lux) I
56
Gateway U.S. Equities Fund(1)
Statistics
December 31, 2014 December 31, 2013 December 31, 2012
USD USD USD
Total Net Asset Value - 5,153,281 17,485,521
Net Asset Value per Share
F/A (USD) - 102.78 -
I/A (USD) - - 118.70
R/A (USD) - 122.21 114.89
R/D (USD) - 65.25 84.58
RE/A (USD) - 112.12 105.83
C/A (USD) - 119.24 112.67
(1) See Note 1.
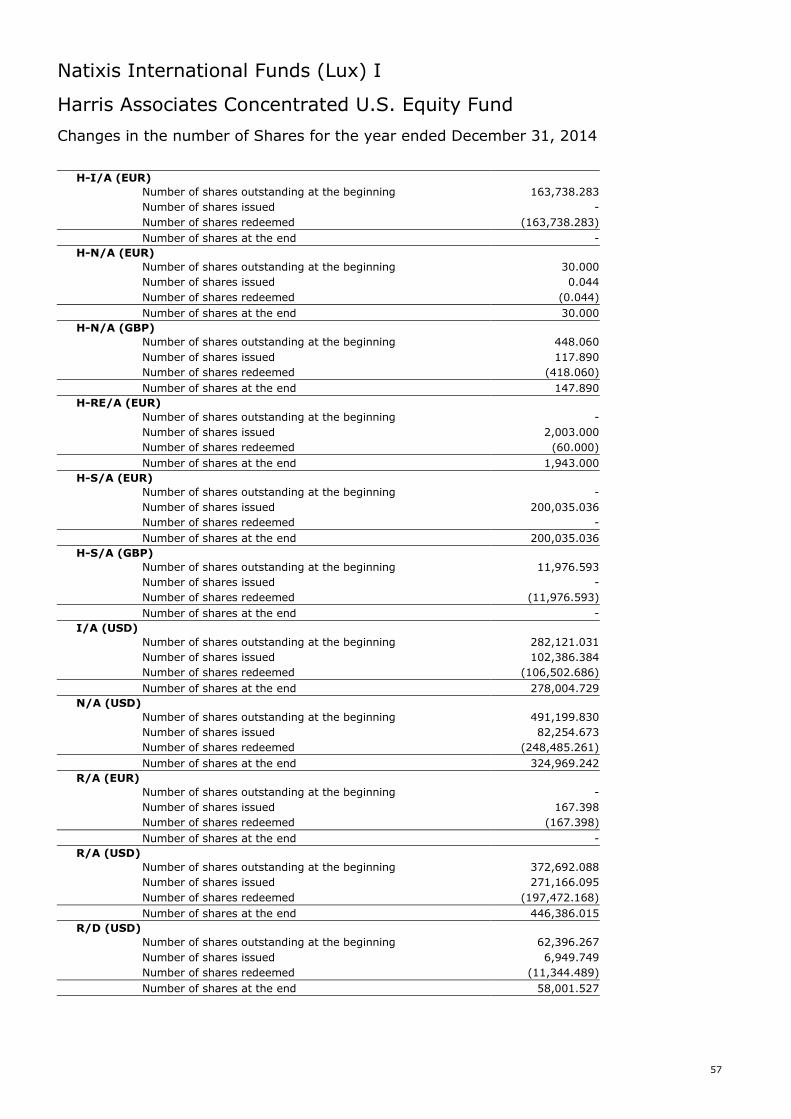
Natixis International Funds (Lux) I
57
Harris Associates Concentrated U.S. Equity Fund
Changes in the number of Shares for the year ended December 31, 2014
H-I/A (EUR)
Number of shares outstanding at the beginning 163,738.283
Number of shares issued -
Number of shares redeemed (163,738.283)
Number of shares at the end -
H-N/A (EUR)
Number of shares outstanding at the beginning 30.000
Number of shares issued 0.044
Number of shares redeemed (0.044)
Number of shares at the end 30.000
H-N/A (GBP)
Number of shares outstanding at the beginning 448.060
Number of shares issued 117.890
Number of shares redeemed (418.060)
Number of shares at the end 147.890
H-RE/A (EUR)
Number of shares outstanding at the beginning -
Number of shares issued 2,003.000
Number of shares redeemed (60.000)
Number of shares at the end 1,943.000
H-S/A (EUR)
Number of shares outstanding at the beginning -
Number of shares issued 200,035.036
Number of shares redeemed -
Number of shares at the end 200,035.036
H-S/A (GBP)
Number of shares outstanding at the beginning 11,976.593
Number of shares issued -
Number of shares redeemed (11,976.593)
Number of shares at the end -
I/A (USD)
Number of shares outstanding at the beginning 282,121.031
Number of shares issued 102,386.384
Number of shares redeemed (106,502.686)
Number of shares at the end 278,004.729
N/A (USD)
Number of shares outstanding at the beginning 491,199.830
Number of shares issued 82,254.673
Number of shares redeemed (248,485.261)
Number of shares at the end 324,969.242
R/A (EUR)
Number of shares outstanding at the beginning -
Number of shares issued 167.398
Number of shares redeemed (167.398)
Number of shares at the end -
R/A (USD)
Number of shares outstanding at the beginning 372,692.088
Number of shares issued 271,166.095
Number of shares redeemed (197,472.168)
Number of shares at the end 446,386.015
R/D (USD)
Number of shares outstanding at the beginning 62,396.267
Number of shares issued 6,949.749
Number of shares redeemed (11,344.489)
Number of shares at the end 58,001.527
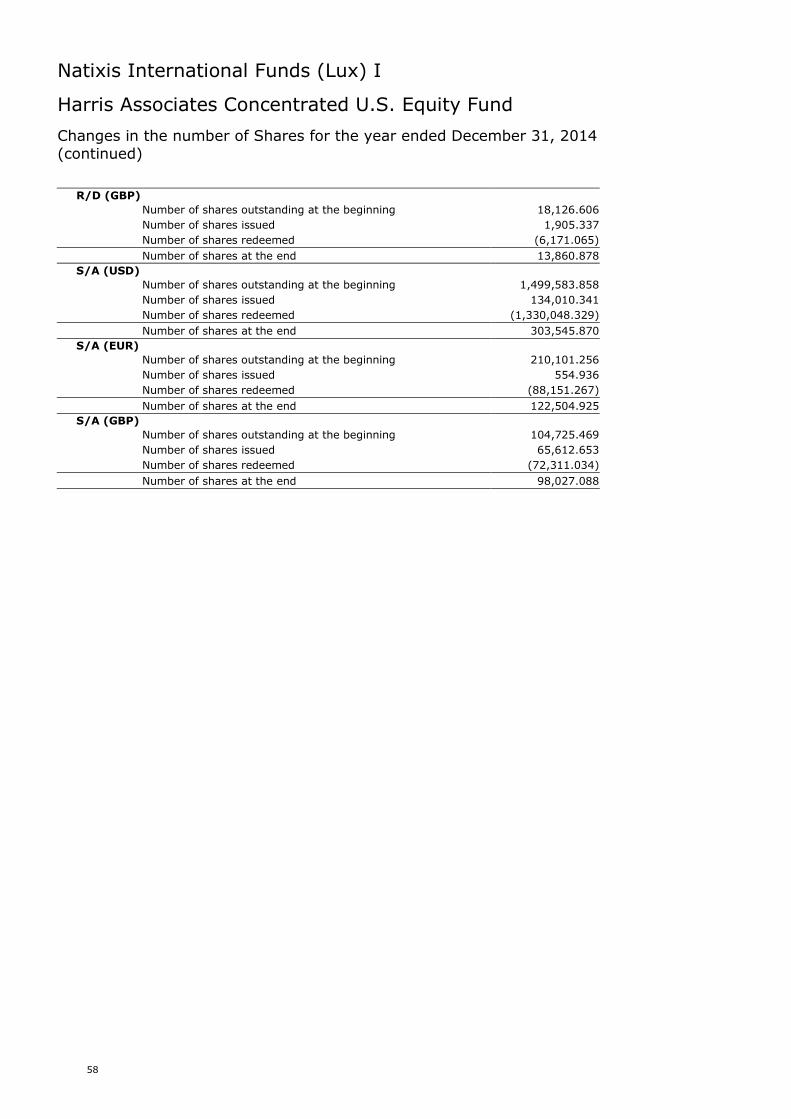
Natixis International Funds (Lux) I
58
Harris Associates Concentrated U.S. Equity Fund
Changes in the number of Shares for the year ended December 31, 2014(continued)
R/D (GBP)
Number of shares outstanding at the beginning 18,126.606
Number of shares issued 1,905.337
Number of shares redeemed (6,171.065)
Number of shares at the end 13,860.878
S/A (USD)
Number of shares outstanding at the beginning 1,499,583.858
Number of shares issued 134,010.341
Number of shares redeemed (1,330,048.329)
Number of shares at the end 303,545.870
S/A (EUR)
Number of shares outstanding at the beginning 210,101.256
Number of shares issued 554.936
Number of shares redeemed (88,151.267)
Number of shares at the end 122,504.925
S/A (GBP)
Number of shares outstanding at the beginning 104,725.469
Number of shares issued 65,612.653
Number of shares redeemed (72,311.034)
Number of shares at the end 98,027.088
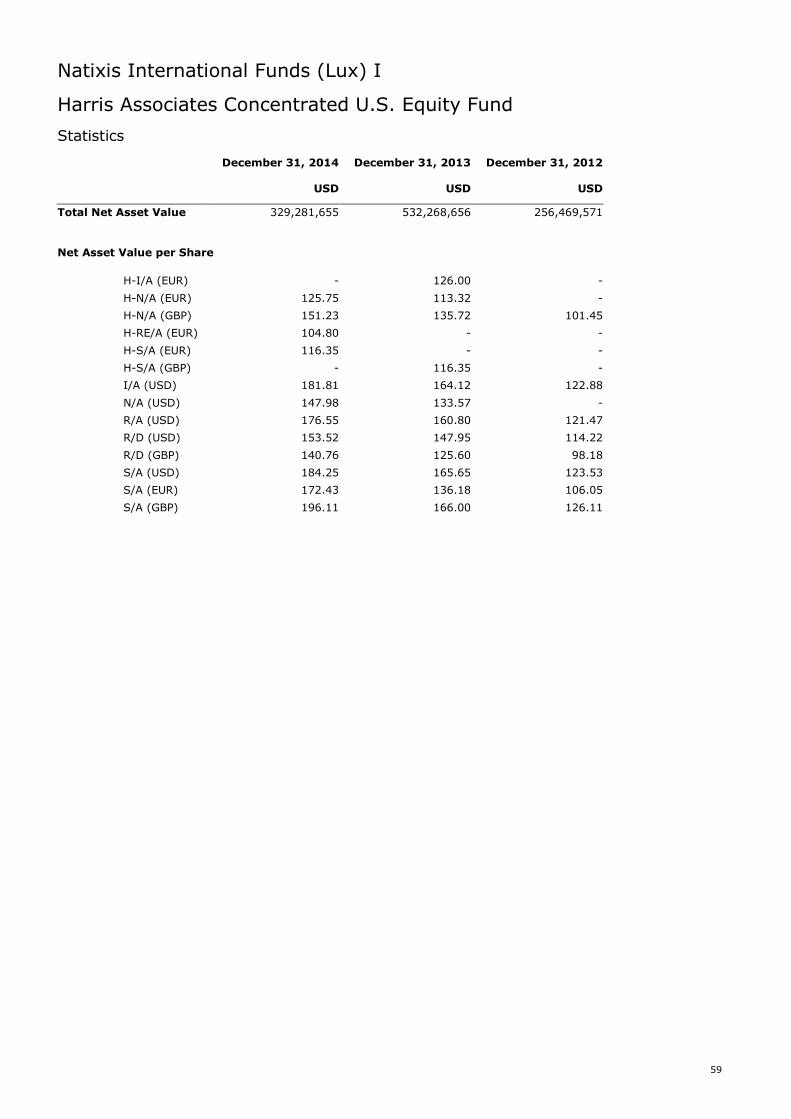
Natixis International Funds (Lux) I
59
Harris Associates Concentrated U.S. Equity Fund
Statistics
December 31, 2014 December 31, 2013 December 31, 2012
USD USD USD
Total Net Asset Value 329,281,655 532,268,656 256,469,571
Net Asset Value per Share
H-I/A (EUR) - 126.00 -
H-N/A (EUR) 125.75 113.32 -
H-N/A (GBP) 151.23 135.72 101.45
H-RE/A (EUR) 104.80 - -
H-S/A (EUR) 116.35 - -
H-S/A (GBP) - 116.35 -
I/A (USD) 181.81 164.12 122.88
N/A (USD) 147.98 133.57 -
R/A (USD) 176.55 160.80 121.47
R/D (USD) 153.52 147.95 114.22
R/D (GBP) 140.76 125.60 98.18
S/A (USD) 184.25 165.65 123.53
S/A (EUR) 172.43 136.18 106.05
S/A (GBP) 196.11 166.00 126.11
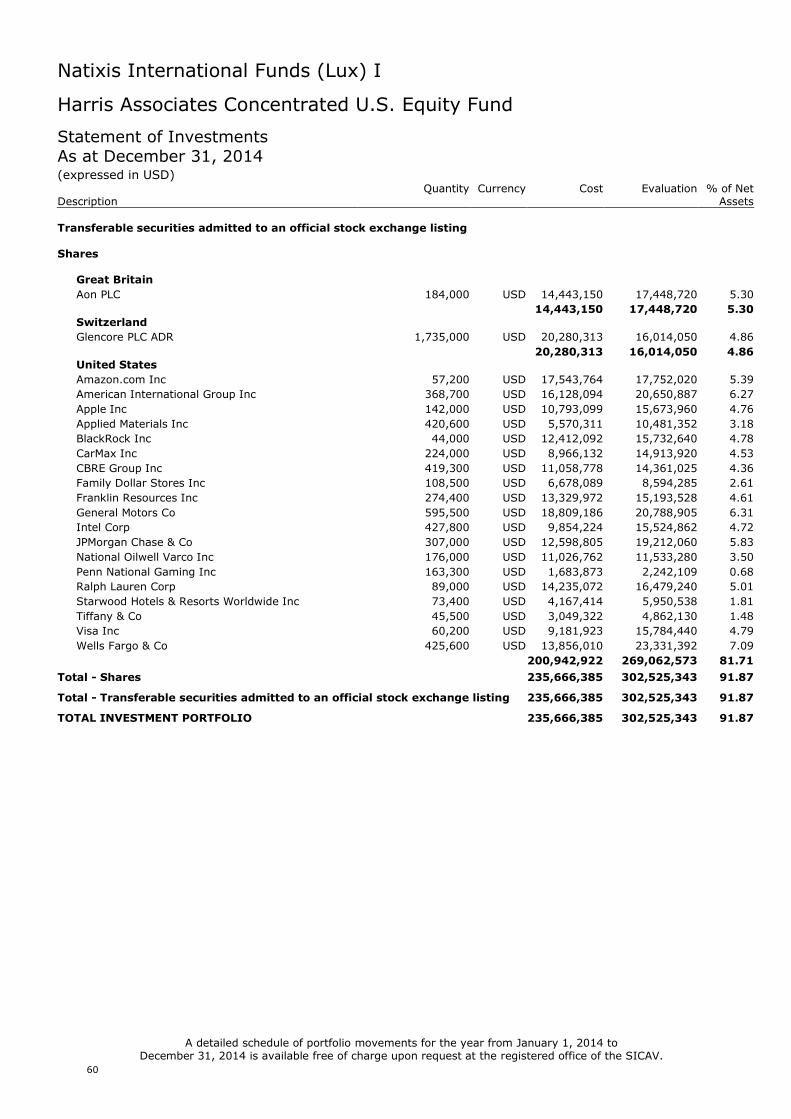
Natixis International Funds (Lux) I
60
Harris Associates Concentrated U.S. Equity Fund
Statement of InvestmentsAs at December 31, 2014(expressed in USD)
Quantity Currency Cost Evaluation % of NetDescription Assets
Transferable securities admitted to an official stock exchange listing
Shares
Great Britain
Aon PLC 184,000 USD 14,443,150 17,448,720 5.30
14,443,150 17,448,720 5.30Switzerland
Glencore PLC ADR 1,735,000 USD 20,280,313 16,014,050 4.86
20,280,313 16,014,050 4.86United States
Amazon.com Inc 57,200 USD 17,543,764 17,752,020 5.39
American International Group Inc 368,700 USD 16,128,094 20,650,887 6.27
Apple Inc 142,000 USD 10,793,099 15,673,960 4.76
Applied Materials Inc 420,600 USD 5,570,311 10,481,352 3.18
BlackRock Inc 44,000 USD 12,412,092 15,732,640 4.78
CarMax Inc 224,000 USD 8,966,132 14,913,920 4.53
CBRE Group Inc 419,300 USD 11,058,778 14,361,025 4.36
Family Dollar Stores Inc 108,500 USD 6,678,089 8,594,285 2.61
Franklin Resources Inc 274,400 USD 13,329,972 15,193,528 4.61
General Motors Co 595,500 USD 18,809,186 20,788,905 6.31
Intel Corp 427,800 USD 9,854,224 15,524,862 4.72
JPMorgan Chase & Co 307,000 USD 12,598,805 19,212,060 5.83
National Oilwell Varco Inc 176,000 USD 11,026,762 11,533,280 3.50
Penn National Gaming Inc 163,300 USD 1,683,873 2,242,109 0.68
Ralph Lauren Corp 89,000 USD 14,235,072 16,479,240 5.01
Starwood Hotels & Resorts Worldwide Inc 73,400 USD 4,167,414 5,950,538 1.81
Tiffany & Co 45,500 USD 3,049,322 4,862,130 1.48
Visa Inc 60,200 USD 9,181,923 15,784,440 4.79
Wells Fargo & Co 425,600 USD 13,856,010 23,331,392 7.09
200,942,922 269,062,573 81.71
Total - Shares 235,666,385 302,525,343 91.87
Total - Transferable securities admitted to an official stock exchange listing 235,666,385 302,525,343 91.87
TOTAL INVESTMENT PORTFOLIO 235,666,385 302,525,343 91.87
A detailed schedule of portfolio movements for the year from January 1, 2014 toDecember 31, 2014 is available free of charge upon request at the registered office of the SICAV.
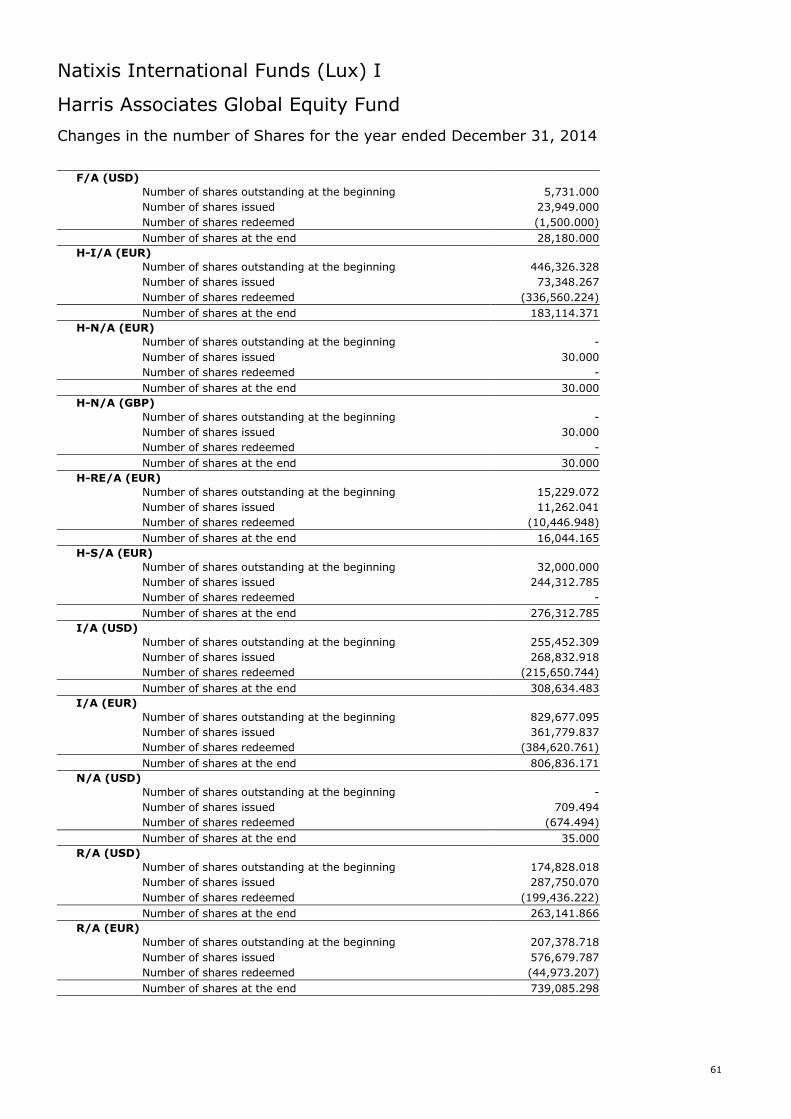
Natixis International Funds (Lux) I
61
Harris Associates Global Equity Fund
Changes in the number of Shares for the year ended December 31, 2014
F/A (USD)
Number of shares outstanding at the beginning 5,731.000
Number of shares issued 23,949.000
Number of shares redeemed (1,500.000)
Number of shares at the end 28,180.000
H-I/A (EUR)
Number of shares outstanding at the beginning 446,326.328
Number of shares issued 73,348.267
Number of shares redeemed (336,560.224)
Number of shares at the end 183,114.371
H-N/A (EUR)
Number of shares outstanding at the beginning -
Number of shares issued 30.000
Number of shares redeemed -
Number of shares at the end 30.000
H-N/A (GBP)
Number of shares outstanding at the beginning -
Number of shares issued 30.000
Number of shares redeemed -
Number of shares at the end 30.000
H-RE/A (EUR)
Number of shares outstanding at the beginning 15,229.072
Number of shares issued 11,262.041
Number of shares redeemed (10,446.948)
Number of shares at the end 16,044.165
H-S/A (EUR)
Number of shares outstanding at the beginning 32,000.000
Number of shares issued 244,312.785
Number of shares redeemed -
Number of shares at the end 276,312.785
I/A (USD)
Number of shares outstanding at the beginning 255,452.309
Number of shares issued 268,832.918
Number of shares redeemed (215,650.744)
Number of shares at the end 308,634.483
I/A (EUR)
Number of shares outstanding at the beginning 829,677.095
Number of shares issued 361,779.837
Number of shares redeemed (384,620.761)
Number of shares at the end 806,836.171
N/A (USD)
Number of shares outstanding at the beginning -
Number of shares issued 709.494
Number of shares redeemed (674.494)
Number of shares at the end 35.000
R/A (USD)
Number of shares outstanding at the beginning 174,828.018
Number of shares issued 287,750.070
Number of shares redeemed (199,436.222)
Number of shares at the end 263,141.866
R/A (EUR)
Number of shares outstanding at the beginning 207,378.718
Number of shares issued 576,679.787
Number of shares redeemed (44,973.207)
Number of shares at the end 739,085.298
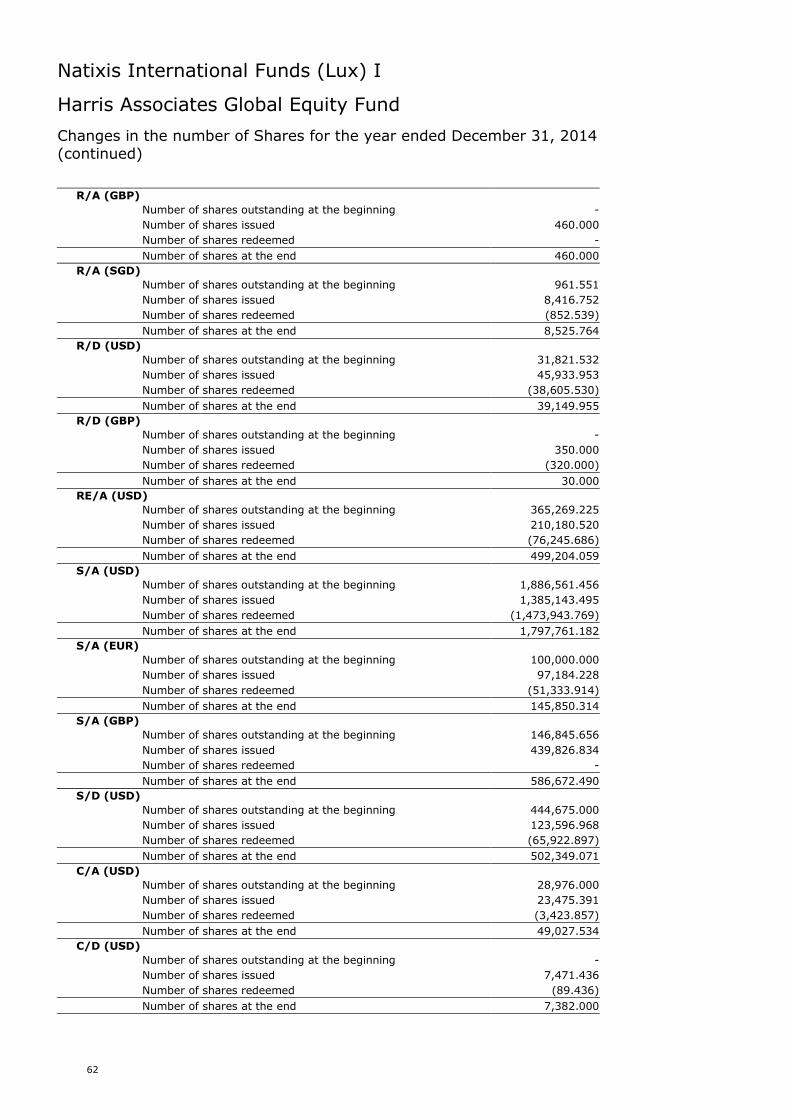
Natixis International Funds (Lux) I
62
Harris Associates Global Equity Fund
Changes in the number of Shares for the year ended December 31, 2014(continued)
R/A (GBP)
Number of shares outstanding at the beginning -
Number of shares issued 460.000
Number of shares redeemed -
Number of shares at the end 460.000
R/A (SGD)
Number of shares outstanding at the beginning 961.551
Number of shares issued 8,416.752
Number of shares redeemed (852.539)
Number of shares at the end 8,525.764
R/D (USD)
Number of shares outstanding at the beginning 31,821.532
Number of shares issued 45,933.953
Number of shares redeemed (38,605.530)
Number of shares at the end 39,149.955
R/D (GBP)
Number of shares outstanding at the beginning -
Number of shares issued 350.000
Number of shares redeemed (320.000)
Number of shares at the end 30.000
RE/A (USD)
Number of shares outstanding at the beginning 365,269.225
Number of shares issued 210,180.520
Number of shares redeemed (76,245.686)
Number of shares at the end 499,204.059
S/A (USD)
Number of shares outstanding at the beginning 1,886,561.456
Number of shares issued 1,385,143.495
Number of shares redeemed (1,473,943.769)
Number of shares at the end 1,797,761.182
S/A (EUR)
Number of shares outstanding at the beginning 100,000.000
Number of shares issued 97,184.228
Number of shares redeemed (51,333.914)
Number of shares at the end 145,850.314
S/A (GBP)
Number of shares outstanding at the beginning 146,845.656
Number of shares issued 439,826.834
Number of shares redeemed -
Number of shares at the end 586,672.490
S/D (USD)
Number of shares outstanding at the beginning 444,675.000
Number of shares issued 123,596.968
Number of shares redeemed (65,922.897)
Number of shares at the end 502,349.071
C/A (USD)
Number of shares outstanding at the beginning 28,976.000
Number of shares issued 23,475.391
Number of shares redeemed (3,423.857)
Number of shares at the end 49,027.534
C/D (USD)
Number of shares outstanding at the beginning -
Number of shares issued 7,471.436
Number of shares redeemed (89.436)
Number of shares at the end 7,382.000

Natixis International Funds (Lux) I
63
Harris Associates Global Equity Fund
Changes in the number of Shares for the year ended December 31, 2014(continued)
TH-S/A (SGD)
Number of shares outstanding at the beginning 213,437.850
Number of shares issued 15,933.610
Number of shares redeemed -
Number of shares at the end 229,371.460
RE/A (EUR)
Number of shares outstanding at the beginning -
Number of shares issued 5,107.418
Number of shares redeemed -
Number of shares at the end 5,107.418
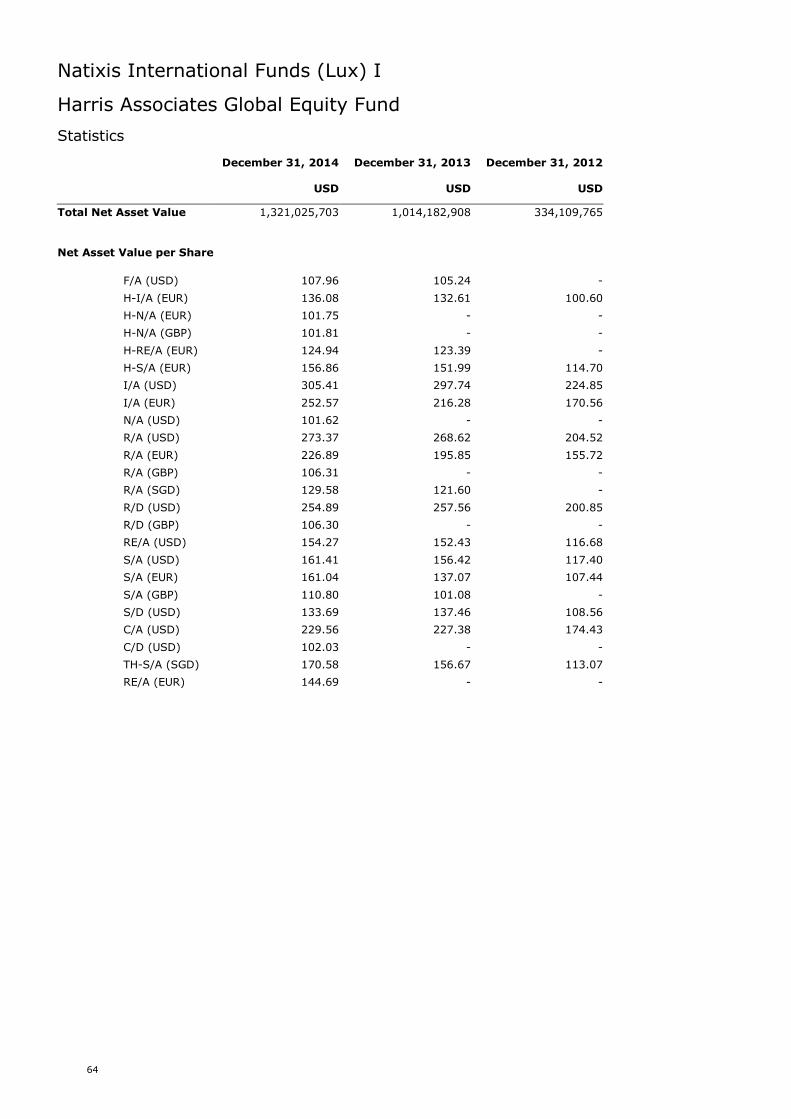
Natixis International Funds (Lux) I
64
Harris Associates Global Equity Fund
Statistics
December 31, 2014 December 31, 2013 December 31, 2012
USD USD USD
Total Net Asset Value 1,321,025,703 1,014,182,908 334,109,765
Net Asset Value per Share
F/A (USD) 107.96 105.24 -
H-I/A (EUR) 136.08 132.61 100.60
H-N/A (EUR) 101.75 - -
H-N/A (GBP) 101.81 - -
H-RE/A (EUR) 124.94 123.39 -
H-S/A (EUR) 156.86 151.99 114.70
I/A (USD) 305.41 297.74 224.85
I/A (EUR) 252.57 216.28 170.56
N/A (USD) 101.62 - -
R/A (USD) 273.37 268.62 204.52
R/A (EUR) 226.89 195.85 155.72
R/A (GBP) 106.31 - -
R/A (SGD) 129.58 121.60 -
R/D (USD) 254.89 257.56 200.85
R/D (GBP) 106.30 - -
RE/A (USD) 154.27 152.43 116.68
S/A (USD) 161.41 156.42 117.40
S/A (EUR) 161.04 137.07 107.44
S/A (GBP) 110.80 101.08 -
S/D (USD) 133.69 137.46 108.56
C/A (USD) 229.56 227.38 174.43
C/D (USD) 102.03 - -
TH-S/A (SGD) 170.58 156.67 113.07
RE/A (EUR) 144.69 - -
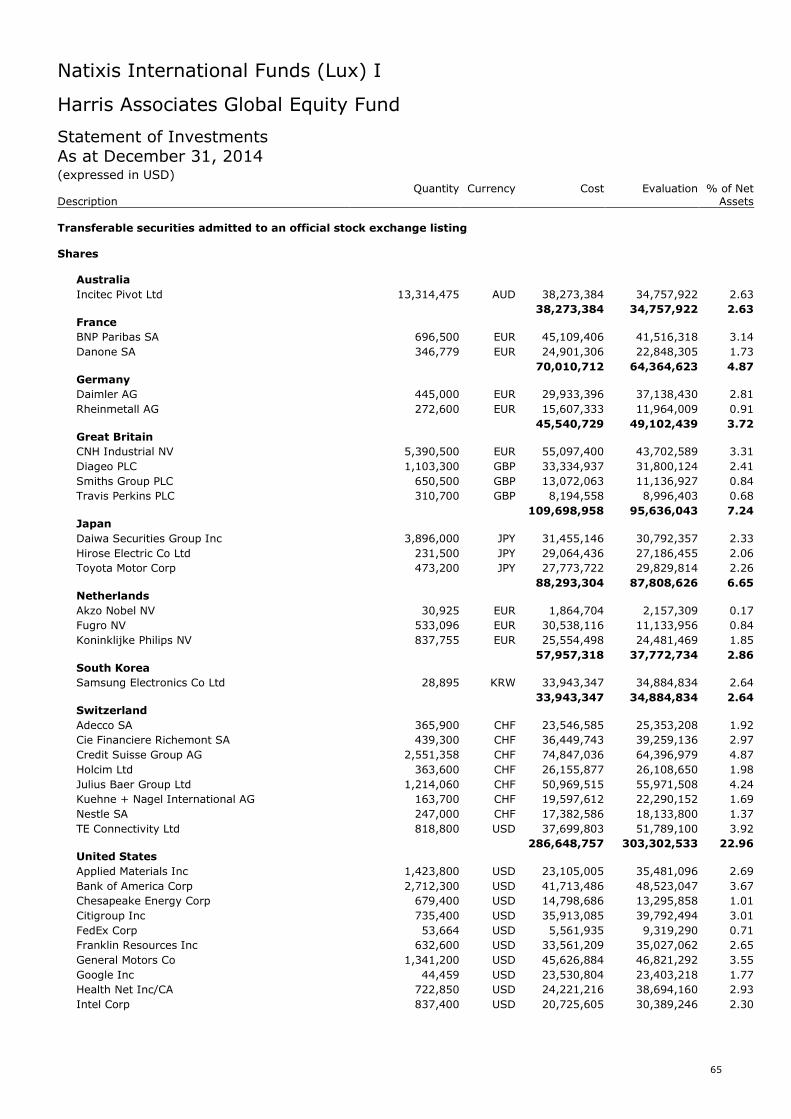
Natixis International Funds (Lux) I
65
Harris Associates Global Equity Fund
Statement of InvestmentsAs at December 31, 2014(expressed in USD)
Quantity Currency Cost Evaluation % of NetDescription Assets
Transferable securities admitted to an official stock exchange listing
Shares
Australia
Incitec Pivot Ltd 13,314,475 AUD 38,273,384 34,757,922 2.63
38,273,384 34,757,922 2.63France
BNP Paribas SA 696,500 EUR 45,109,406 41,516,318 3.14
Danone SA 346,779 EUR 24,901,306 22,848,305 1.73
70,010,712 64,364,623 4.87Germany
Daimler AG 445,000 EUR 29,933,396 37,138,430 2.81
Rheinmetall AG 272,600 EUR 15,607,333 11,964,009 0.91
45,540,729 49,102,439 3.72Great Britain
CNH Industrial NV 5,390,500 EUR 55,097,400 43,702,589 3.31
Diageo PLC 1,103,300 GBP 33,334,937 31,800,124 2.41
Smiths Group PLC 650,500 GBP 13,072,063 11,136,927 0.84
Travis Perkins PLC 310,700 GBP 8,194,558 8,996,403 0.68
109,698,958 95,636,043 7.24Japan
Daiwa Securities Group Inc 3,896,000 JPY 31,455,146 30,792,357 2.33
Hirose Electric Co Ltd 231,500 JPY 29,064,436 27,186,455 2.06
Toyota Motor Corp 473,200 JPY 27,773,722 29,829,814 2.26
88,293,304 87,808,626 6.65Netherlands
Akzo Nobel NV 30,925 EUR 1,864,704 2,157,309 0.17
Fugro NV 533,096 EUR 30,538,116 11,133,956 0.84
Koninklijke Philips NV 837,755 EUR 25,554,498 24,481,469 1.85
57,957,318 37,772,734 2.86South Korea
Samsung Electronics Co Ltd 28,895 KRW 33,943,347 34,884,834 2.64
33,943,347 34,884,834 2.64Switzerland
Adecco SA 365,900 CHF 23,546,585 25,353,208 1.92
Cie Financiere Richemont SA 439,300 CHF 36,449,743 39,259,136 2.97
Credit Suisse Group AG 2,551,358 CHF 74,847,036 64,396,979 4.87
Holcim Ltd 363,600 CHF 26,155,877 26,108,650 1.98
Julius Baer Group Ltd 1,214,060 CHF 50,969,515 55,971,508 4.24
Kuehne + Nagel International AG 163,700 CHF 19,597,612 22,290,152 1.69
Nestle SA 247,000 CHF 17,382,586 18,133,800 1.37
TE Connectivity Ltd 818,800 USD 37,699,803 51,789,100 3.92
286,648,757 303,302,533 22.96United States
Applied Materials Inc 1,423,800 USD 23,105,005 35,481,096 2.69
Bank of America Corp 2,712,300 USD 41,713,486 48,523,047 3.67
Chesapeake Energy Corp 679,400 USD 14,798,686 13,295,858 1.01
Citigroup Inc 735,400 USD 35,913,085 39,792,494 3.01
FedEx Corp 53,664 USD 5,561,935 9,319,290 0.71
Franklin Resources Inc 632,600 USD 33,561,209 35,027,062 2.65
General Motors Co 1,341,200 USD 45,626,884 46,821,292 3.55
Google Inc 44,459 USD 23,530,804 23,403,218 1.77
Health Net Inc/CA 722,850 USD 24,221,216 38,694,160 2.93
Intel Corp 837,400 USD 20,725,605 30,389,246 2.30

Natixis International Funds (Lux) I
66
Harris Associates Global Equity Fund
Statement of Investments (continued)As at December 31, 2014(expressed in USD)
Quantity Currency Cost Evaluation % of NetDescription Assets
Interpublic Group of Cos Inc/The 2,145,500 USD 40,753,861 44,562,035 3.37
Itron Inc 333,800 USD 13,333,350 14,116,402 1.07
Live Nation Entertainment Inc 606,800 USD 8,696,335 15,843,548 1.20
MasterCard Inc 529,400 USD 27,610,727 45,613,104 3.45
National Oilwell Varco Inc 452,500 USD 30,441,410 29,652,325 2.25
Oracle Corp 1,073,456 USD 34,652,207 48,273,316 3.65
Tenet Healthcare Corp 600,558 USD 21,434,300 30,430,274 2.30
Union Pacific Corp 401,700 USD 29,939,568 47,854,521 3.62
475,619,673 597,092,288 45.20
Total - Shares 1,205,986,182 1,304,722,042 98.77
Total - Transferable securities admitted to an official stock exchange listing 1,205,986,182 1,304,722,042 98.77
TOTAL INVESTMENT PORTFOLIO 1,205,986,182 1,304,722,042 98.77
A detailed schedule of portfolio movements for the year from January 1, 2014 toDecember 31, 2014 is available free of charge upon request at the registered office of the SICAV.
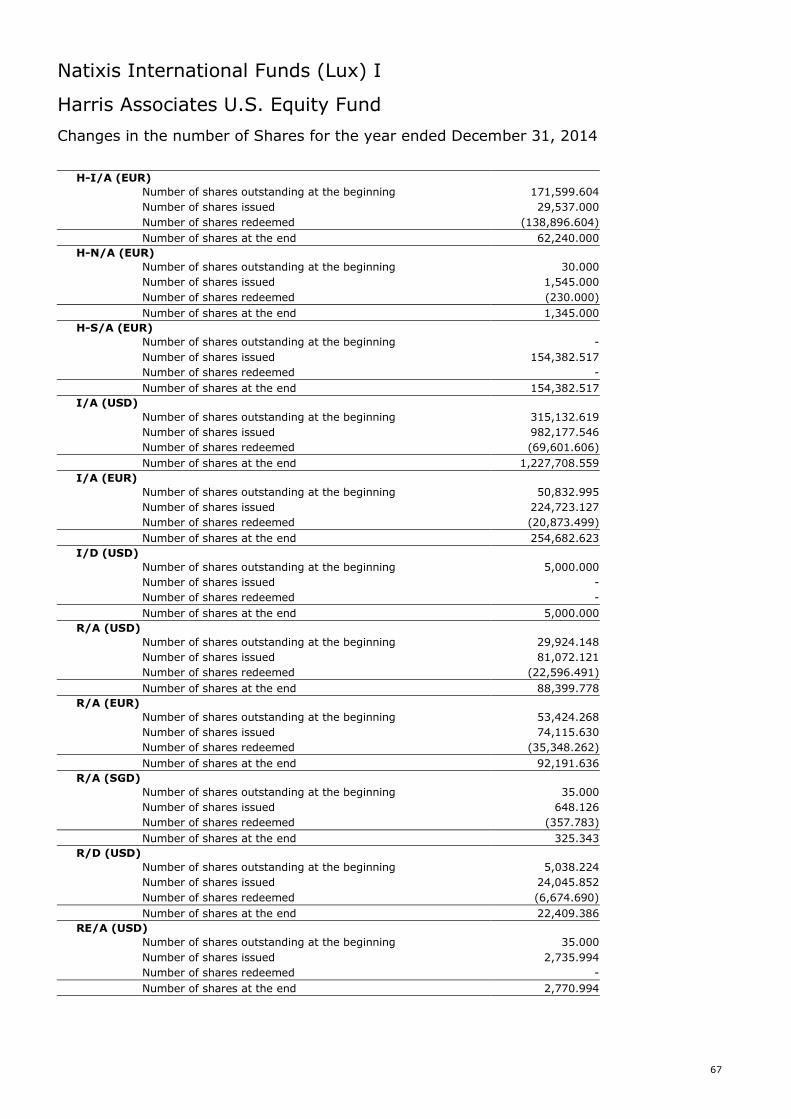
Natixis International Funds (Lux) I
67
Harris Associates U.S. Equity Fund
Changes in the number of Shares for the year ended December 31, 2014
H-I/A (EUR)
Number of shares outstanding at the beginning 171,599.604
Number of shares issued 29,537.000
Number of shares redeemed (138,896.604)
Number of shares at the end 62,240.000
H-N/A (EUR)
Number of shares outstanding at the beginning 30.000
Number of shares issued 1,545.000
Number of shares redeemed (230.000)
Number of shares at the end 1,345.000
H-S/A (EUR)
Number of shares outstanding at the beginning -
Number of shares issued 154,382.517
Number of shares redeemed -
Number of shares at the end 154,382.517
I/A (USD)
Number of shares outstanding at the beginning 315,132.619
Number of shares issued 982,177.546
Number of shares redeemed (69,601.606)
Number of shares at the end 1,227,708.559
I/A (EUR)
Number of shares outstanding at the beginning 50,832.995
Number of shares issued 224,723.127
Number of shares redeemed (20,873.499)
Number of shares at the end 254,682.623
I/D (USD)
Number of shares outstanding at the beginning 5,000.000
Number of shares issued -
Number of shares redeemed -
Number of shares at the end 5,000.000
R/A (USD)
Number of shares outstanding at the beginning 29,924.148
Number of shares issued 81,072.121
Number of shares redeemed (22,596.491)
Number of shares at the end 88,399.778
R/A (EUR)
Number of shares outstanding at the beginning 53,424.268
Number of shares issued 74,115.630
Number of shares redeemed (35,348.262)
Number of shares at the end 92,191.636
R/A (SGD)
Number of shares outstanding at the beginning 35.000
Number of shares issued 648.126
Number of shares redeemed (357.783)
Number of shares at the end 325.343
R/D (USD)
Number of shares outstanding at the beginning 5,038.224
Number of shares issued 24,045.852
Number of shares redeemed (6,674.690)
Number of shares at the end 22,409.386
RE/A (USD)
Number of shares outstanding at the beginning 35.000
Number of shares issued 2,735.994
Number of shares redeemed -
Number of shares at the end 2,770.994
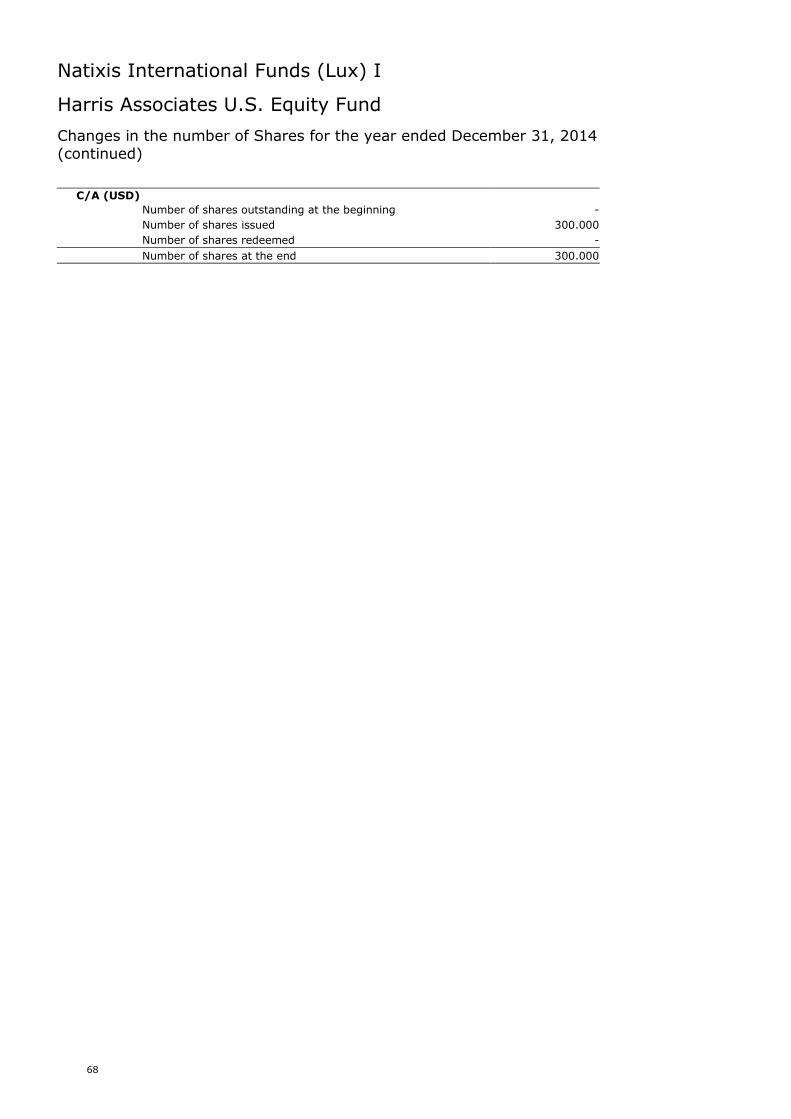
Natixis International Funds (Lux) I
68
Harris Associates U.S. Equity Fund
Changes in the number of Shares for the year ended December 31, 2014(continued)
C/A (USD)
Number of shares outstanding at the beginning -
Number of shares issued 300.000
Number of shares redeemed -
Number of shares at the end 300.000
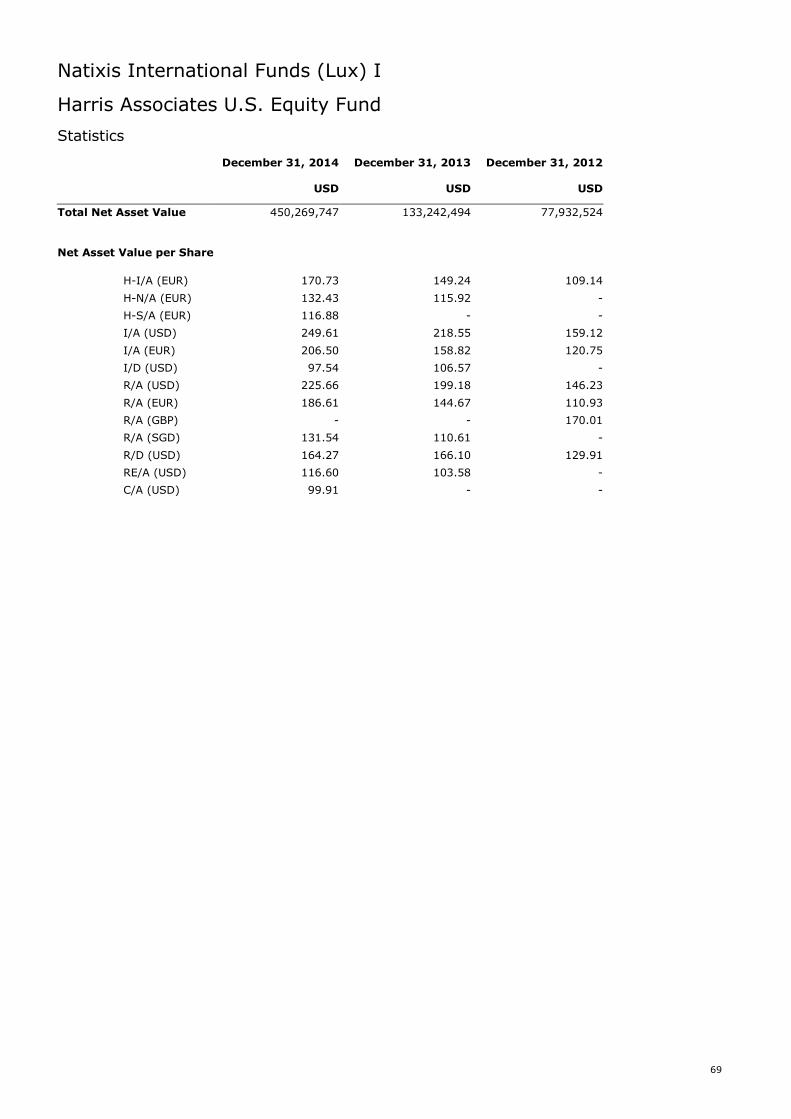
Natixis International Funds (Lux) I
69
Harris Associates U.S. Equity Fund
Statistics
December 31, 2014 December 31, 2013 December 31, 2012
USD USD USD
Total Net Asset Value 450,269,747 133,242,494 77,932,524
Net Asset Value per Share
H-I/A (EUR) 170.73 149.24 109.14
H-N/A (EUR) 132.43 115.92 -
H-S/A (EUR) 116.88 - -
I/A (USD) 249.61 218.55 159.12
I/A (EUR) 206.50 158.82 120.75
I/D (USD) 97.54 106.57 -
R/A (USD) 225.66 199.18 146.23
R/A (EUR) 186.61 144.67 110.93
R/A (GBP) - - 170.01
R/A (SGD) 131.54 110.61 -
R/D (USD) 164.27 166.10 129.91
RE/A (USD) 116.60 103.58 -
C/A (USD) 99.91 - -
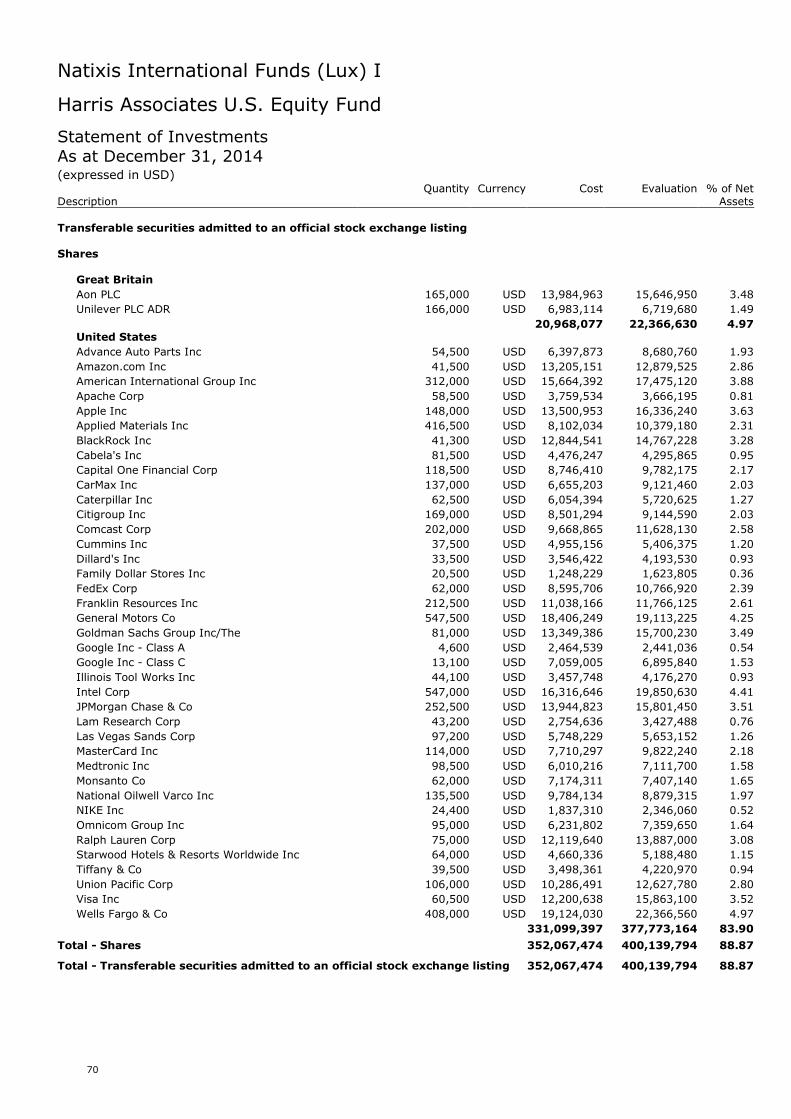
Natixis International Funds (Lux) I
70
Harris Associates U.S. Equity Fund
Statement of InvestmentsAs at December 31, 2014(expressed in USD)
Quantity Currency Cost Evaluation % of NetDescription Assets
Transferable securities admitted to an official stock exchange listing
Shares
Great Britain
Aon PLC 165,000 USD 13,984,963 15,646,950 3.48
Unilever PLC ADR 166,000 USD 6,983,114 6,719,680 1.49
20,968,077 22,366,630 4.97United States
Advance Auto Parts Inc 54,500 USD 6,397,873 8,680,760 1.93
Amazon.com Inc 41,500 USD 13,205,151 12,879,525 2.86
American International Group Inc 312,000 USD 15,664,392 17,475,120 3.88
Apache Corp 58,500 USD 3,759,534 3,666,195 0.81
Apple Inc 148,000 USD 13,500,953 16,336,240 3.63
Applied Materials Inc 416,500 USD 8,102,034 10,379,180 2.31
BlackRock Inc 41,300 USD 12,844,541 14,767,228 3.28
Cabela's Inc 81,500 USD 4,476,247 4,295,865 0.95
Capital One Financial Corp 118,500 USD 8,746,410 9,782,175 2.17
CarMax Inc 137,000 USD 6,655,203 9,121,460 2.03
Caterpillar Inc 62,500 USD 6,054,394 5,720,625 1.27
Citigroup Inc 169,000 USD 8,501,294 9,144,590 2.03
Comcast Corp 202,000 USD 9,668,865 11,628,130 2.58
Cummins Inc 37,500 USD 4,955,156 5,406,375 1.20
Dillard's Inc 33,500 USD 3,546,422 4,193,530 0.93
Family Dollar Stores Inc 20,500 USD 1,248,229 1,623,805 0.36
FedEx Corp 62,000 USD 8,595,706 10,766,920 2.39
Franklin Resources Inc 212,500 USD 11,038,166 11,766,125 2.61
General Motors Co 547,500 USD 18,406,249 19,113,225 4.25
Goldman Sachs Group Inc/The 81,000 USD 13,349,386 15,700,230 3.49
Google Inc - Class A 4,600 USD 2,464,539 2,441,036 0.54
Google Inc - Class C 13,100 USD 7,059,005 6,895,840 1.53
Illinois Tool Works Inc 44,100 USD 3,457,748 4,176,270 0.93
Intel Corp 547,000 USD 16,316,646 19,850,630 4.41
JPMorgan Chase & Co 252,500 USD 13,944,823 15,801,450 3.51
Lam Research Corp 43,200 USD 2,754,636 3,427,488 0.76
Las Vegas Sands Corp 97,200 USD 5,748,229 5,653,152 1.26
MasterCard Inc 114,000 USD 7,710,297 9,822,240 2.18
Medtronic Inc 98,500 USD 6,010,216 7,111,700 1.58
Monsanto Co 62,000 USD 7,174,311 7,407,140 1.65
National Oilwell Varco Inc 135,500 USD 9,784,134 8,879,315 1.97
NIKE Inc 24,400 USD 1,837,310 2,346,060 0.52
Omnicom Group Inc 95,000 USD 6,231,802 7,359,650 1.64
Ralph Lauren Corp 75,000 USD 12,119,640 13,887,000 3.08
Starwood Hotels & Resorts Worldwide Inc 64,000 USD 4,660,336 5,188,480 1.15
Tiffany & Co 39,500 USD 3,498,361 4,220,970 0.94
Union Pacific Corp 106,000 USD 10,286,491 12,627,780 2.80
Visa Inc 60,500 USD 12,200,638 15,863,100 3.52
Wells Fargo & Co 408,000 USD 19,124,030 22,366,560 4.97
331,099,397 377,773,164 83.90
Total - Shares 352,067,474 400,139,794 88.87
Total - Transferable securities admitted to an official stock exchange listing 352,067,474 400,139,794 88.87
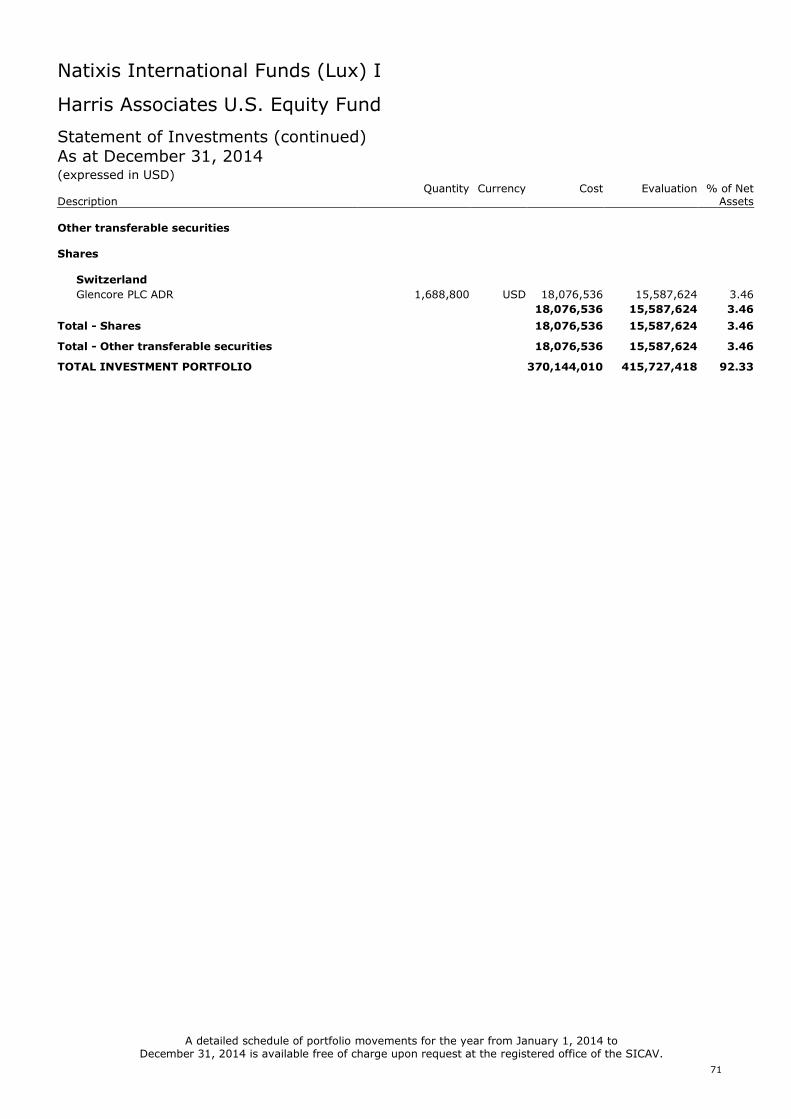
Natixis International Funds (Lux) I
71
Harris Associates U.S. Equity Fund
Statement of Investments (continued)As at December 31, 2014(expressed in USD)
Quantity Currency Cost Evaluation % of NetDescription Assets
Other transferable securities
Shares
Switzerland
Glencore PLC ADR 1,688,800 USD 18,076,536 15,587,624 3.46
18,076,536 15,587,624 3.46
Total - Shares 18,076,536 15,587,624 3.46
Total - Other transferable securities 18,076,536 15,587,624 3.46
TOTAL INVESTMENT PORTFOLIO 370,144,010 415,727,418 92.33
A detailed schedule of portfolio movements for the year from January 1, 2014 toDecember 31, 2014 is available free of charge upon request at the registered office of the SICAV.
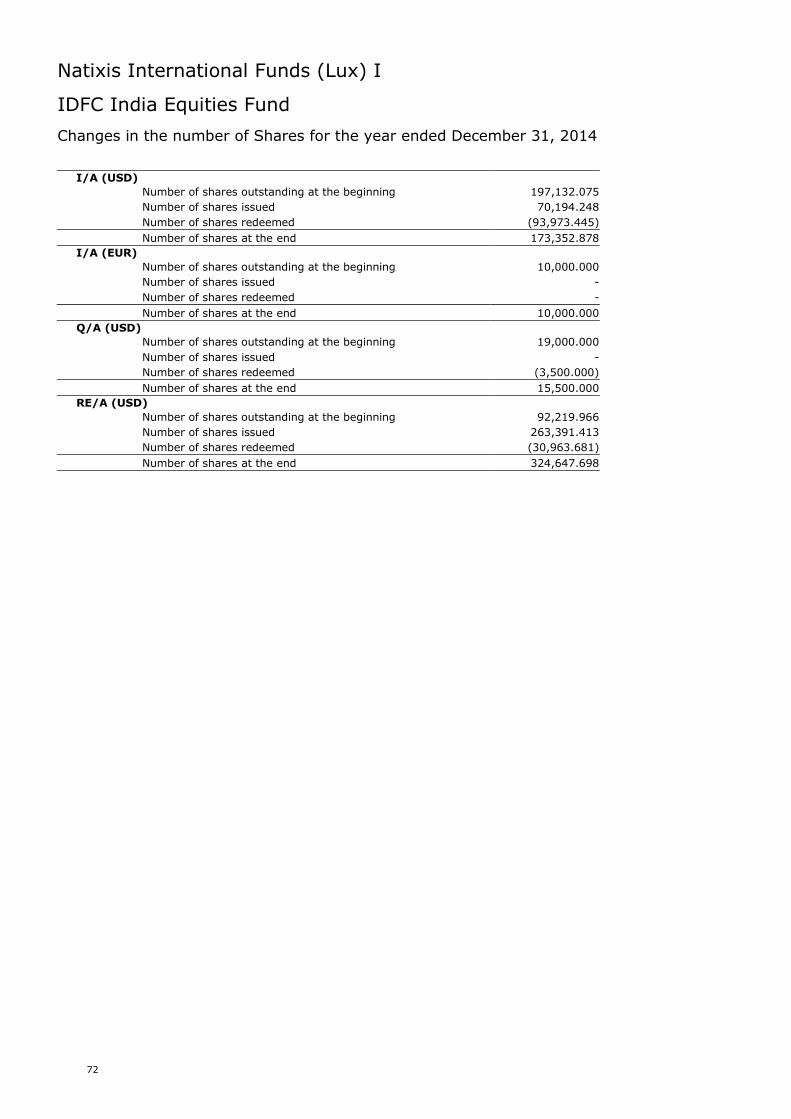
Natixis International Funds (Lux) I
72
IDFC India Equities Fund
Changes in the number of Shares for the year ended December 31, 2014
I/A (USD)
Number of shares outstanding at the beginning 197,132.075
Number of shares issued 70,194.248
Number of shares redeemed (93,973.445)
Number of shares at the end 173,352.878
I/A (EUR)
Number of shares outstanding at the beginning 10,000.000
Number of shares issued -
Number of shares redeemed -
Number of shares at the end 10,000.000
Q/A (USD)
Number of shares outstanding at the beginning 19,000.000
Number of shares issued -
Number of shares redeemed (3,500.000)
Number of shares at the end 15,500.000
RE/A (USD)
Number of shares outstanding at the beginning 92,219.966
Number of shares issued 263,391.413
Number of shares redeemed (30,963.681)
Number of shares at the end 324,647.698
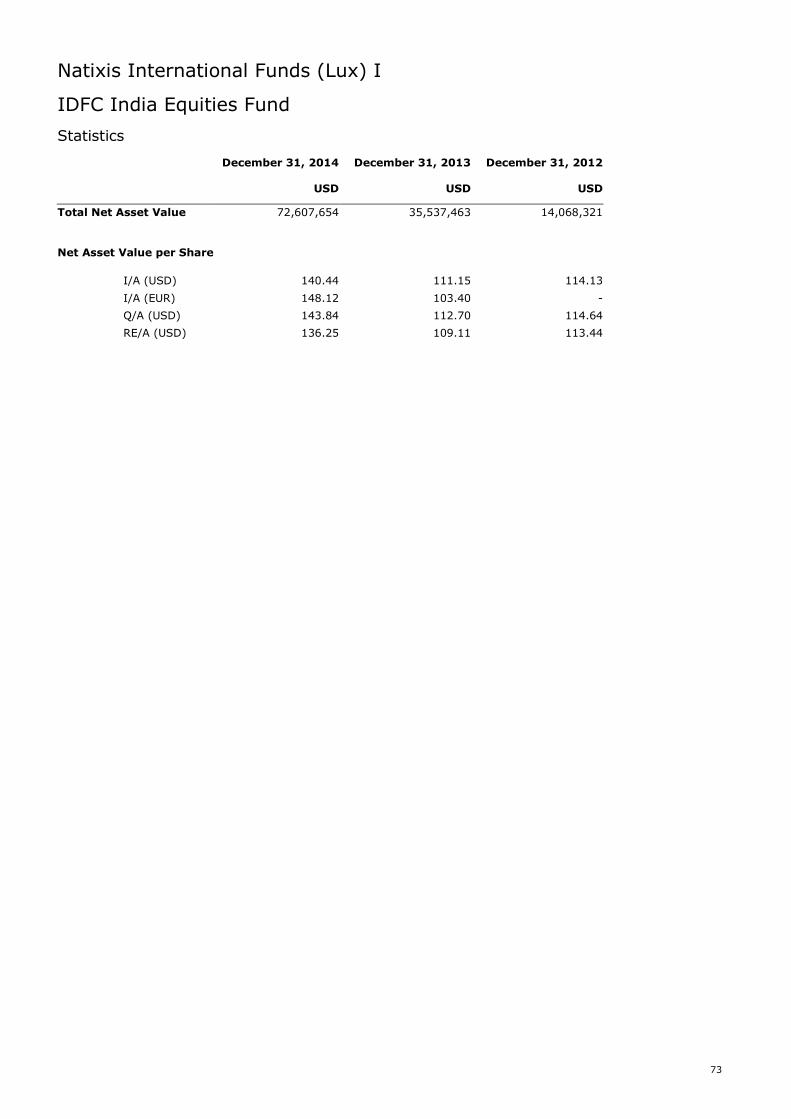
Natixis International Funds (Lux) I
73
IDFC India Equities Fund
Statistics
December 31, 2014 December 31, 2013 December 31, 2012
USD USD USD
Total Net Asset Value 72,607,654 35,537,463 14,068,321
Net Asset Value per Share
I/A (USD) 140.44 111.15 114.13
I/A (EUR) 148.12 103.40 -
Q/A (USD) 143.84 112.70 114.64
RE/A (USD) 136.25 109.11 113.44
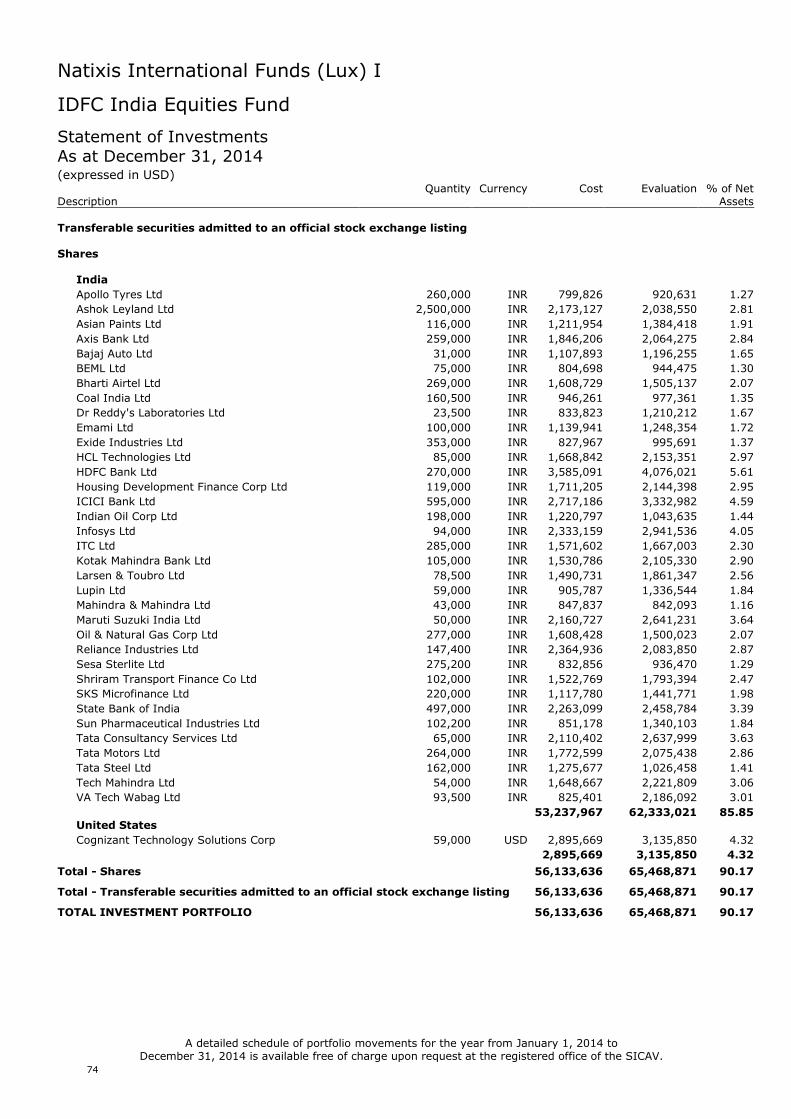
Natixis International Funds (Lux) I
74
IDFC India Equities Fund
Statement of InvestmentsAs at December 31, 2014(expressed in USD)
Quantity Currency Cost Evaluation % of NetDescription Assets
Transferable securities admitted to an official stock exchange listing
Shares
India
Apollo Tyres Ltd 260,000 INR 799,826 920,631 1.27
Ashok Leyland Ltd 2,500,000 INR 2,173,127 2,038,550 2.81
Asian Paints Ltd 116,000 INR 1,211,954 1,384,418 1.91
Axis Bank Ltd 259,000 INR 1,846,206 2,064,275 2.84
Bajaj Auto Ltd 31,000 INR 1,107,893 1,196,255 1.65
BEML Ltd 75,000 INR 804,698 944,475 1.30
Bharti Airtel Ltd 269,000 INR 1,608,729 1,505,137 2.07
Coal India Ltd 160,500 INR 946,261 977,361 1.35
Dr Reddy's Laboratories Ltd 23,500 INR 833,823 1,210,212 1.67
Emami Ltd 100,000 INR 1,139,941 1,248,354 1.72
Exide Industries Ltd 353,000 INR 827,967 995,691 1.37
HCL Technologies Ltd 85,000 INR 1,668,842 2,153,351 2.97
HDFC Bank Ltd 270,000 INR 3,585,091 4,076,021 5.61
Housing Development Finance Corp Ltd 119,000 INR 1,711,205 2,144,398 2.95
ICICI Bank Ltd 595,000 INR 2,717,186 3,332,982 4.59
Indian Oil Corp Ltd 198,000 INR 1,220,797 1,043,635 1.44
Infosys Ltd 94,000 INR 2,333,159 2,941,536 4.05
ITC Ltd 285,000 INR 1,571,602 1,667,003 2.30
Kotak Mahindra Bank Ltd 105,000 INR 1,530,786 2,105,330 2.90
Larsen & Toubro Ltd 78,500 INR 1,490,731 1,861,347 2.56
Lupin Ltd 59,000 INR 905,787 1,336,544 1.84
Mahindra & Mahindra Ltd 43,000 INR 847,837 842,093 1.16
Maruti Suzuki India Ltd 50,000 INR 2,160,727 2,641,231 3.64
Oil & Natural Gas Corp Ltd 277,000 INR 1,608,428 1,500,023 2.07
Reliance Industries Ltd 147,400 INR 2,364,936 2,083,850 2.87
Sesa Sterlite Ltd 275,200 INR 832,856 936,470 1.29
Shriram Transport Finance Co Ltd 102,000 INR 1,522,769 1,793,394 2.47
SKS Microfinance Ltd 220,000 INR 1,117,780 1,441,771 1.98
State Bank of India 497,000 INR 2,263,099 2,458,784 3.39
Sun Pharmaceutical Industries Ltd 102,200 INR 851,178 1,340,103 1.84
Tata Consultancy Services Ltd 65,000 INR 2,110,402 2,637,999 3.63
Tata Motors Ltd 264,000 INR 1,772,599 2,075,438 2.86
Tata Steel Ltd 162,000 INR 1,275,677 1,026,458 1.41
Tech Mahindra Ltd 54,000 INR 1,648,667 2,221,809 3.06
VA Tech Wabag Ltd 93,500 INR 825,401 2,186,092 3.01
53,237,967 62,333,021 85.85United States
Cognizant Technology Solutions Corp 59,000 USD 2,895,669 3,135,850 4.32
2,895,669 3,135,850 4.32
Total - Shares 56,133,636 65,468,871 90.17
Total - Transferable securities admitted to an official stock exchange listing 56,133,636 65,468,871 90.17
TOTAL INVESTMENT PORTFOLIO 56,133,636 65,468,871 90.17
A detailed schedule of portfolio movements for the year from January 1, 2014 toDecember 31, 2014 is available free of charge upon request at the registered office of the SICAV.
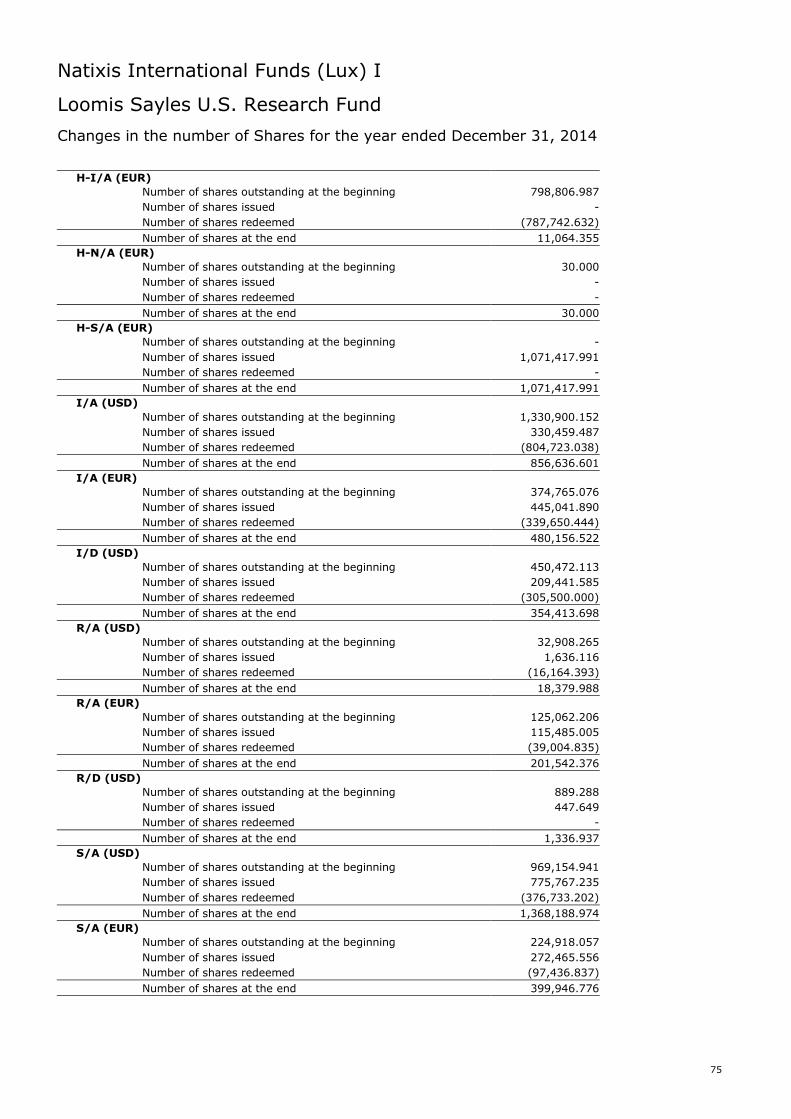
Natixis International Funds (Lux) I
75
Loomis Sayles U.S. Research Fund
Changes in the number of Shares for the year ended December 31, 2014
H-I/A (EUR)
Number of shares outstanding at the beginning 798,806.987
Number of shares issued -
Number of shares redeemed (787,742.632)
Number of shares at the end 11,064.355
H-N/A (EUR)
Number of shares outstanding at the beginning 30.000
Number of shares issued -
Number of shares redeemed -
Number of shares at the end 30.000
H-S/A (EUR)
Number of shares outstanding at the beginning -
Number of shares issued 1,071,417.991
Number of shares redeemed -
Number of shares at the end 1,071,417.991
I/A (USD)
Number of shares outstanding at the beginning 1,330,900.152
Number of shares issued 330,459.487
Number of shares redeemed (804,723.038)
Number of shares at the end 856,636.601
I/A (EUR)
Number of shares outstanding at the beginning 374,765.076
Number of shares issued 445,041.890
Number of shares redeemed (339,650.444)
Number of shares at the end 480,156.522
I/D (USD)
Number of shares outstanding at the beginning 450,472.113
Number of shares issued 209,441.585
Number of shares redeemed (305,500.000)
Number of shares at the end 354,413.698
R/A (USD)
Number of shares outstanding at the beginning 32,908.265
Number of shares issued 1,636.116
Number of shares redeemed (16,164.393)
Number of shares at the end 18,379.988
R/A (EUR)
Number of shares outstanding at the beginning 125,062.206
Number of shares issued 115,485.005
Number of shares redeemed (39,004.835)
Number of shares at the end 201,542.376
R/D (USD)
Number of shares outstanding at the beginning 889.288
Number of shares issued 447.649
Number of shares redeemed -
Number of shares at the end 1,336.937
S/A (USD)
Number of shares outstanding at the beginning 969,154.941
Number of shares issued 775,767.235
Number of shares redeemed (376,733.202)
Number of shares at the end 1,368,188.974
S/A (EUR)
Number of shares outstanding at the beginning 224,918.057
Number of shares issued 272,465.556
Number of shares redeemed (97,436.837)
Number of shares at the end 399,946.776
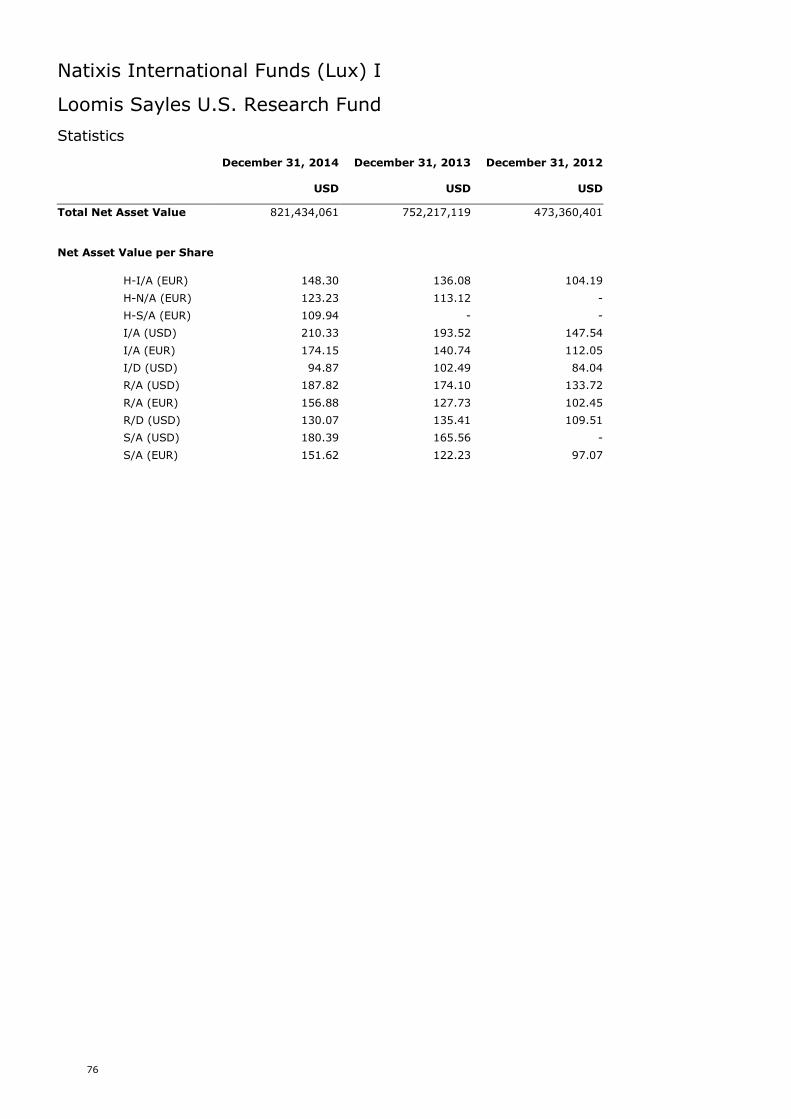
Natixis International Funds (Lux) I
76
Loomis Sayles U.S. Research Fund
Statistics
December 31, 2014 December 31, 2013 December 31, 2012
USD USD USD
Total Net Asset Value 821,434,061 752,217,119 473,360,401
Net Asset Value per Share
H-I/A (EUR) 148.30 136.08 104.19
H-N/A (EUR) 123.23 113.12 -
H-S/A (EUR) 109.94 - -
I/A (USD) 210.33 193.52 147.54
I/A (EUR) 174.15 140.74 112.05
I/D (USD) 94.87 102.49 84.04
R/A (USD) 187.82 174.10 133.72
R/A (EUR) 156.88 127.73 102.45
R/D (USD) 130.07 135.41 109.51
S/A (USD) 180.39 165.56 -
S/A (EUR) 151.62 122.23 97.07
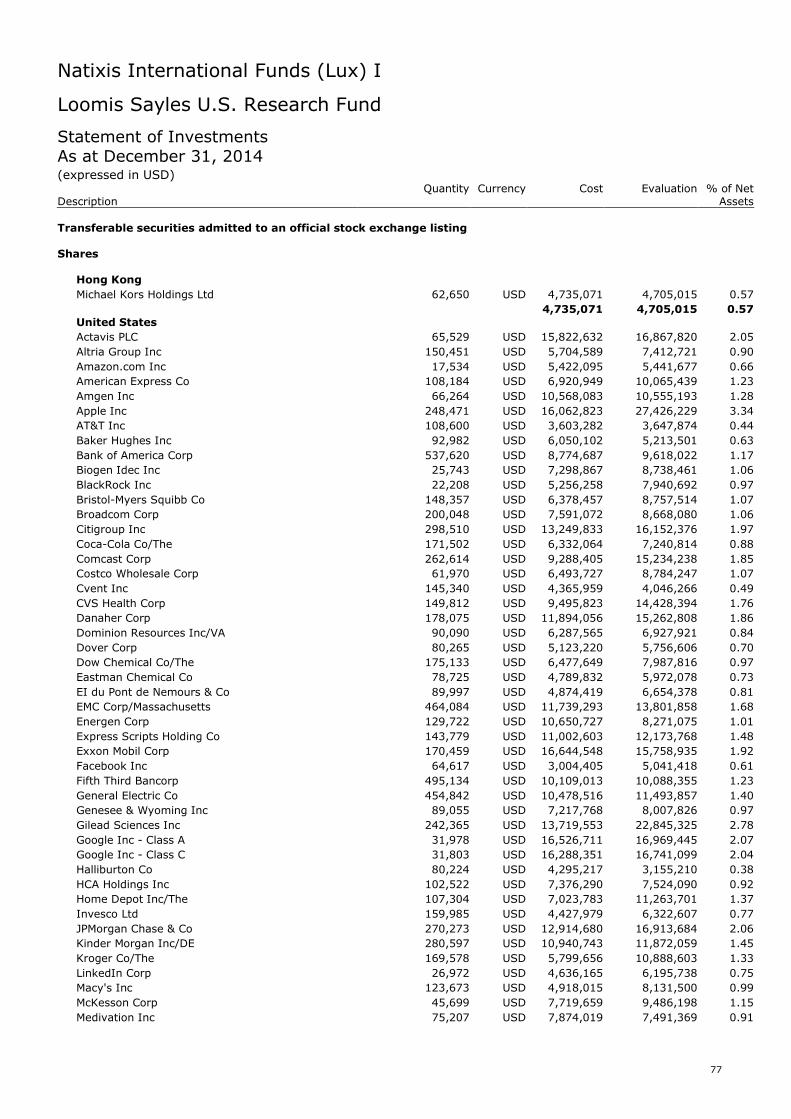
Natixis International Funds (Lux) I
77
Loomis Sayles U.S. Research Fund
Statement of InvestmentsAs at December 31, 2014(expressed in USD)
Quantity Currency Cost Evaluation % of NetDescription Assets
Transferable securities admitted to an official stock exchange listing
Shares
Hong Kong
Michael Kors Holdings Ltd 62,650 USD 4,735,071 4,705,015 0.57
4,735,071 4,705,015 0.57United States
Actavis PLC 65,529 USD 15,822,632 16,867,820 2.05
Altria Group Inc 150,451 USD 5,704,589 7,412,721 0.90
Amazon.com Inc 17,534 USD 5,422,095 5,441,677 0.66
American Express Co 108,184 USD 6,920,949 10,065,439 1.23
Amgen Inc 66,264 USD 10,568,083 10,555,193 1.28
Apple Inc 248,471 USD 16,062,823 27,426,229 3.34
AT&T Inc 108,600 USD 3,603,282 3,647,874 0.44
Baker Hughes Inc 92,982 USD 6,050,102 5,213,501 0.63
Bank of America Corp 537,620 USD 8,774,687 9,618,022 1.17
Biogen Idec Inc 25,743 USD 7,298,867 8,738,461 1.06
BlackRock Inc 22,208 USD 5,256,258 7,940,692 0.97
Bristol-Myers Squibb Co 148,357 USD 6,378,457 8,757,514 1.07
Broadcom Corp 200,048 USD 7,591,072 8,668,080 1.06
Citigroup Inc 298,510 USD 13,249,833 16,152,376 1.97
Coca-Cola Co/The 171,502 USD 6,332,064 7,240,814 0.88
Comcast Corp 262,614 USD 9,288,405 15,234,238 1.85
Costco Wholesale Corp 61,970 USD 6,493,727 8,784,247 1.07
Cvent Inc 145,340 USD 4,365,959 4,046,266 0.49
CVS Health Corp 149,812 USD 9,495,823 14,428,394 1.76
Danaher Corp 178,075 USD 11,894,056 15,262,808 1.86
Dominion Resources Inc/VA 90,090 USD 6,287,565 6,927,921 0.84
Dover Corp 80,265 USD 5,123,220 5,756,606 0.70
Dow Chemical Co/The 175,133 USD 6,477,649 7,987,816 0.97
Eastman Chemical Co 78,725 USD 4,789,832 5,972,078 0.73
EI du Pont de Nemours & Co 89,997 USD 4,874,419 6,654,378 0.81
EMC Corp/Massachusetts 464,084 USD 11,739,293 13,801,858 1.68
Energen Corp 129,722 USD 10,650,727 8,271,075 1.01
Express Scripts Holding Co 143,779 USD 11,002,603 12,173,768 1.48
Exxon Mobil Corp 170,459 USD 16,644,548 15,758,935 1.92
Facebook Inc 64,617 USD 3,004,405 5,041,418 0.61
Fifth Third Bancorp 495,134 USD 10,109,013 10,088,355 1.23
General Electric Co 454,842 USD 10,478,516 11,493,857 1.40
Genesee & Wyoming Inc 89,055 USD 7,217,768 8,007,826 0.97
Gilead Sciences Inc 242,365 USD 13,719,553 22,845,325 2.78
Google Inc - Class A 31,978 USD 16,526,711 16,969,445 2.07
Google Inc - Class C 31,803 USD 16,288,351 16,741,099 2.04
Halliburton Co 80,224 USD 4,295,217 3,155,210 0.38
HCA Holdings Inc 102,522 USD 7,376,290 7,524,090 0.92
Home Depot Inc/The 107,304 USD 7,023,783 11,263,701 1.37
Invesco Ltd 159,985 USD 4,427,979 6,322,607 0.77
JPMorgan Chase & Co 270,273 USD 12,914,680 16,913,684 2.06
Kinder Morgan Inc/DE 280,597 USD 10,940,743 11,872,059 1.45
Kroger Co/The 169,578 USD 5,799,656 10,888,603 1.33
LinkedIn Corp 26,972 USD 4,636,165 6,195,738 0.75
Macy's Inc 123,673 USD 4,918,015 8,131,500 0.99
McKesson Corp 45,699 USD 7,719,659 9,486,198 1.15
Medivation Inc 75,207 USD 7,874,019 7,491,369 0.91
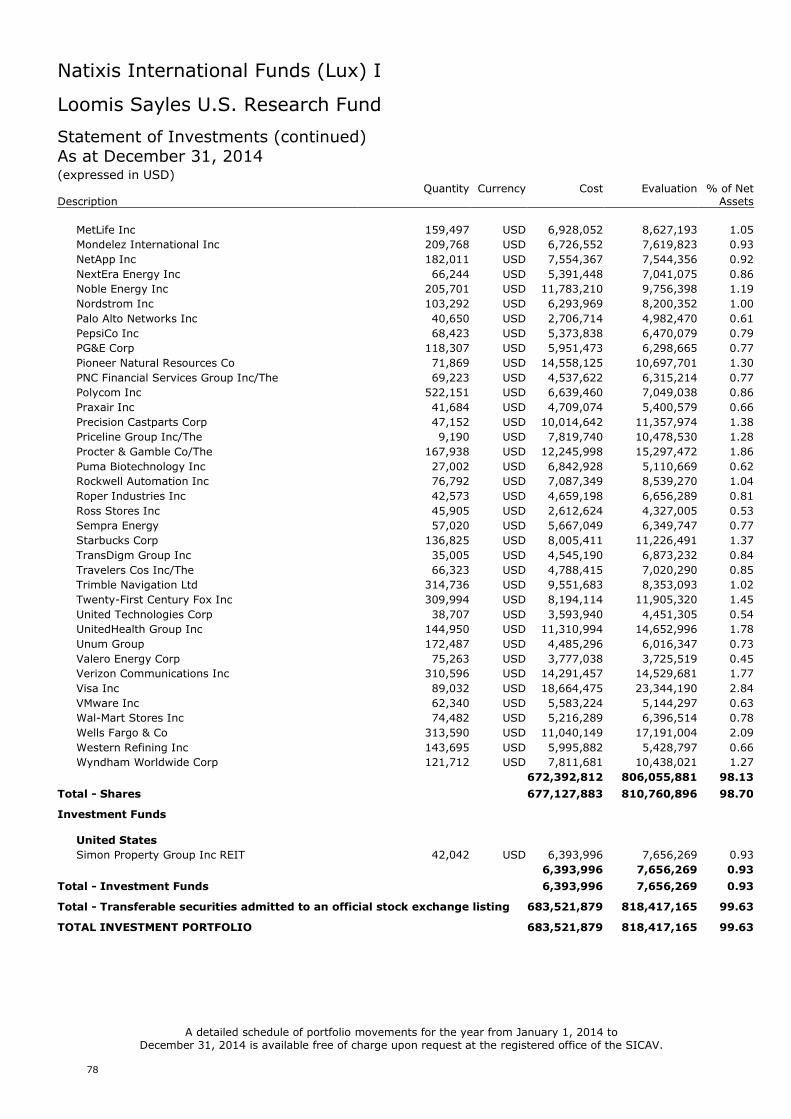
Natixis International Funds (Lux) I
78
Loomis Sayles U.S. Research Fund
Statement of Investments (continued)As at December 31, 2014(expressed in USD)
Quantity Currency Cost Evaluation % of NetDescription Assets
MetLife Inc 159,497 USD 6,928,052 8,627,193 1.05
Mondelez International Inc 209,768 USD 6,726,552 7,619,823 0.93
NetApp Inc 182,011 USD 7,554,367 7,544,356 0.92
NextEra Energy Inc 66,244 USD 5,391,448 7,041,075 0.86
Noble Energy Inc 205,701 USD 11,783,210 9,756,398 1.19
Nordstrom Inc 103,292 USD 6,293,969 8,200,352 1.00
Palo Alto Networks Inc 40,650 USD 2,706,714 4,982,470 0.61
PepsiCo Inc 68,423 USD 5,373,838 6,470,079 0.79
PG&E Corp 118,307 USD 5,951,473 6,298,665 0.77
Pioneer Natural Resources Co 71,869 USD 14,558,125 10,697,701 1.30
PNC Financial Services Group Inc/The 69,223 USD 4,537,622 6,315,214 0.77
Polycom Inc 522,151 USD 6,639,460 7,049,038 0.86
Praxair Inc 41,684 USD 4,709,074 5,400,579 0.66
Precision Castparts Corp 47,152 USD 10,014,642 11,357,974 1.38
Priceline Group Inc/The 9,190 USD 7,819,740 10,478,530 1.28
Procter & Gamble Co/The 167,938 USD 12,245,998 15,297,472 1.86
Puma Biotechnology Inc 27,002 USD 6,842,928 5,110,669 0.62
Rockwell Automation Inc 76,792 USD 7,087,349 8,539,270 1.04
Roper Industries Inc 42,573 USD 4,659,198 6,656,289 0.81
Ross Stores Inc 45,905 USD 2,612,624 4,327,005 0.53
Sempra Energy 57,020 USD 5,667,049 6,349,747 0.77
Starbucks Corp 136,825 USD 8,005,411 11,226,491 1.37
TransDigm Group Inc 35,005 USD 4,545,190 6,873,232 0.84
Travelers Cos Inc/The 66,323 USD 4,788,415 7,020,290 0.85
Trimble Navigation Ltd 314,736 USD 9,551,683 8,353,093 1.02
Twenty-First Century Fox Inc 309,994 USD 8,194,114 11,905,320 1.45
United Technologies Corp 38,707 USD 3,593,940 4,451,305 0.54
UnitedHealth Group Inc 144,950 USD 11,310,994 14,652,996 1.78
Unum Group 172,487 USD 4,485,296 6,016,347 0.73
Valero Energy Corp 75,263 USD 3,777,038 3,725,519 0.45
Verizon Communications Inc 310,596 USD 14,291,457 14,529,681 1.77
Visa Inc 89,032 USD 18,664,475 23,344,190 2.84
VMware Inc 62,340 USD 5,583,224 5,144,297 0.63
Wal-Mart Stores Inc 74,482 USD 5,216,289 6,396,514 0.78
Wells Fargo & Co 313,590 USD 11,040,149 17,191,004 2.09
Western Refining Inc 143,695 USD 5,995,882 5,428,797 0.66
Wyndham Worldwide Corp 121,712 USD 7,811,681 10,438,021 1.27
672,392,812 806,055,881 98.13
Total - Shares 677,127,883 810,760,896 98.70
Investment Funds
United States
Simon Property Group Inc REIT 42,042 USD 6,393,996 7,656,269 0.93
6,393,996 7,656,269 0.93
Total - Investment Funds 6,393,996 7,656,269 0.93
Total - Transferable securities admitted to an official stock exchange listing 683,521,879 818,417,165 99.63
TOTAL INVESTMENT PORTFOLIO 683,521,879 818,417,165 99.63
A detailed schedule of portfolio movements for the year from January 1, 2014 toDecember 31, 2014 is available free of charge upon request at the registered office of the SICAV.
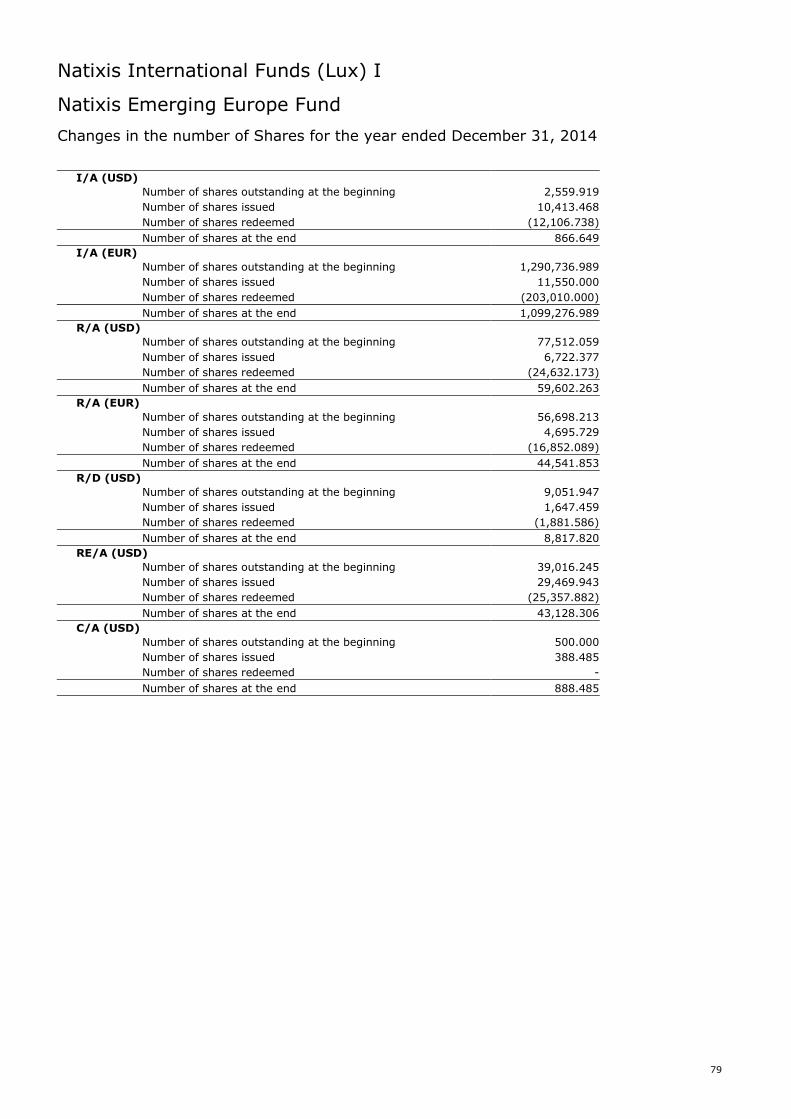
Natixis International Funds (Lux) I
79
Natixis Emerging Europe Fund
Changes in the number of Shares for the year ended December 31, 2014
I/A (USD)
Number of shares outstanding at the beginning 2,559.919
Number of shares issued 10,413.468
Number of shares redeemed (12,106.738)
Number of shares at the end 866.649
I/A (EUR)
Number of shares outstanding at the beginning 1,290,736.989
Number of shares issued 11,550.000
Number of shares redeemed (203,010.000)
Number of shares at the end 1,099,276.989
R/A (USD)
Number of shares outstanding at the beginning 77,512.059
Number of shares issued 6,722.377
Number of shares redeemed (24,632.173)
Number of shares at the end 59,602.263
R/A (EUR)
Number of shares outstanding at the beginning 56,698.213
Number of shares issued 4,695.729
Number of shares redeemed (16,852.089)
Number of shares at the end 44,541.853
R/D (USD)
Number of shares outstanding at the beginning 9,051.947
Number of shares issued 1,647.459
Number of shares redeemed (1,881.586)
Number of shares at the end 8,817.820
RE/A (USD)
Number of shares outstanding at the beginning 39,016.245
Number of shares issued 29,469.943
Number of shares redeemed (25,357.882)
Number of shares at the end 43,128.306
C/A (USD)
Number of shares outstanding at the beginning 500.000
Number of shares issued 388.485
Number of shares redeemed -
Number of shares at the end 888.485
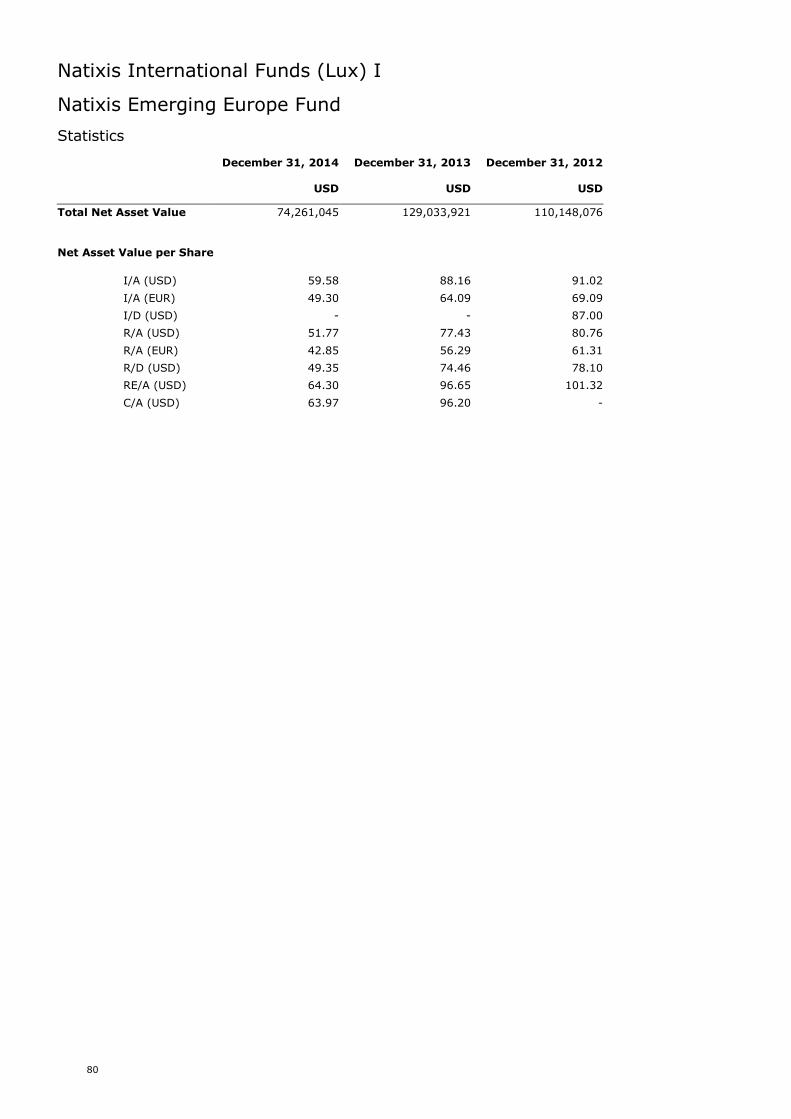
Natixis International Funds (Lux) I
80
Natixis Emerging Europe Fund
Statistics
December 31, 2014 December 31, 2013 December 31, 2012
USD USD USD
Total Net Asset Value 74,261,045 129,033,921 110,148,076
Net Asset Value per Share
I/A (USD) 59.58 88.16 91.02
I/A (EUR) 49.30 64.09 69.09
I/D (USD) - - 87.00
R/A (USD) 51.77 77.43 80.76
R/A (EUR) 42.85 56.29 61.31
R/D (USD) 49.35 74.46 78.10
RE/A (USD) 64.30 96.65 101.32
C/A (USD) 63.97 96.20 -
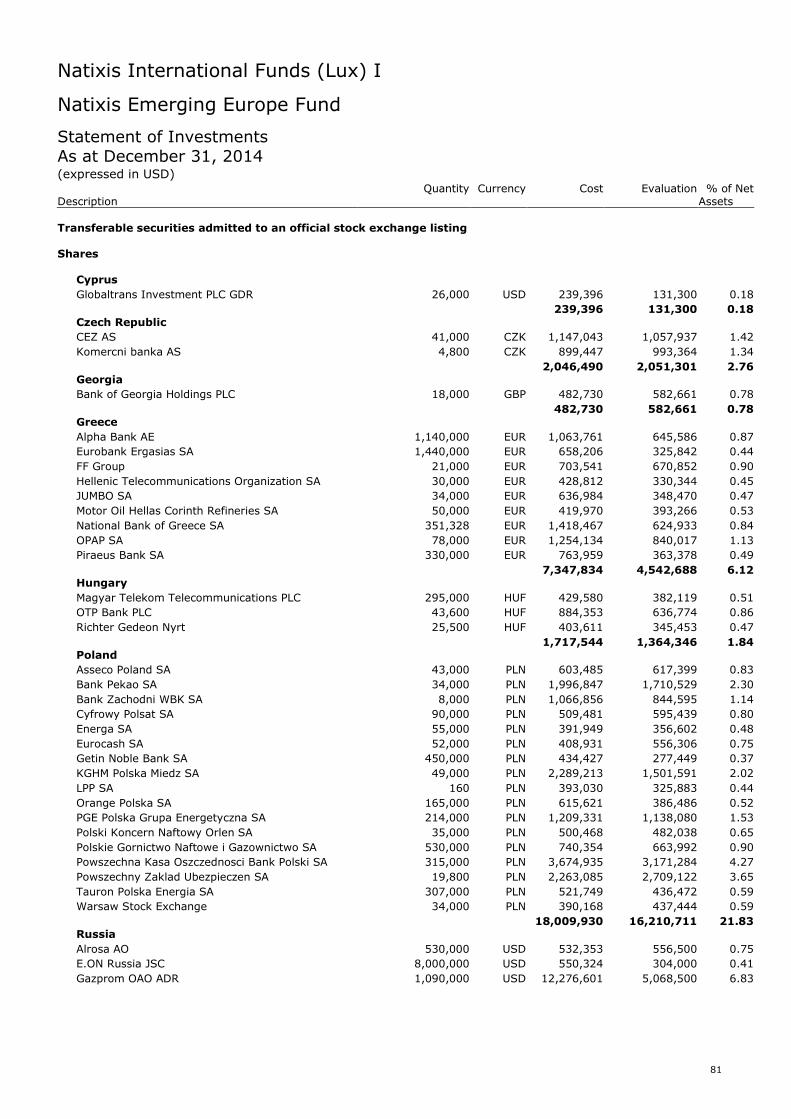
Natixis International Funds (Lux) I
81
Natixis Emerging Europe Fund
Statement of InvestmentsAs at December 31, 2014(expressed in USD)
Quantity Currency Cost Evaluation % of NetDescription Assets
Transferable securities admitted to an official stock exchange listing
Shares
Cyprus
Globaltrans Investment PLC GDR 26,000 USD 239,396 131,300 0.18
239,396 131,300 0.18Czech Republic
CEZ AS 41,000 CZK 1,147,043 1,057,937 1.42
Komercni banka AS 4,800 CZK 899,447 993,364 1.34
2,046,490 2,051,301 2.76Georgia
Bank of Georgia Holdings PLC 18,000 GBP 482,730 582,661 0.78
482,730 582,661 0.78Greece
Alpha Bank AE 1,140,000 EUR 1,063,761 645,586 0.87
Eurobank Ergasias SA 1,440,000 EUR 658,206 325,842 0.44
FF Group 21,000 EUR 703,541 670,852 0.90
Hellenic Telecommunications Organization SA 30,000 EUR 428,812 330,344 0.45
JUMBO SA 34,000 EUR 636,984 348,470 0.47
Motor Oil Hellas Corinth Refineries SA 50,000 EUR 419,970 393,266 0.53
National Bank of Greece SA 351,328 EUR 1,418,467 624,933 0.84
OPAP SA 78,000 EUR 1,254,134 840,017 1.13
Piraeus Bank SA 330,000 EUR 763,959 363,378 0.49
7,347,834 4,542,688 6.12Hungary
Magyar Telekom Telecommunications PLC 295,000 HUF 429,580 382,119 0.51
OTP Bank PLC 43,600 HUF 884,353 636,774 0.86
Richter Gedeon Nyrt 25,500 HUF 403,611 345,453 0.47
1,717,544 1,364,346 1.84Poland
Asseco Poland SA 43,000 PLN 603,485 617,399 0.83
Bank Pekao SA 34,000 PLN 1,996,847 1,710,529 2.30
Bank Zachodni WBK SA 8,000 PLN 1,066,856 844,595 1.14
Cyfrowy Polsat SA 90,000 PLN 509,481 595,439 0.80
Energa SA 55,000 PLN 391,949 356,602 0.48
Eurocash SA 52,000 PLN 408,931 556,306 0.75
Getin Noble Bank SA 450,000 PLN 434,427 277,449 0.37
KGHM Polska Miedz SA 49,000 PLN 2,289,213 1,501,591 2.02
LPP SA 160 PLN 393,030 325,883 0.44
Orange Polska SA 165,000 PLN 615,621 386,486 0.52
PGE Polska Grupa Energetyczna SA 214,000 PLN 1,209,331 1,138,080 1.53
Polski Koncern Naftowy Orlen SA 35,000 PLN 500,468 482,038 0.65
Polskie Gornictwo Naftowe i Gazownictwo SA 530,000 PLN 740,354 663,992 0.90
Powszechna Kasa Oszczednosci Bank Polski SA 315,000 PLN 3,674,935 3,171,284 4.27
Powszechny Zaklad Ubezpieczen SA 19,800 PLN 2,263,085 2,709,122 3.65
Tauron Polska Energia SA 307,000 PLN 521,749 436,472 0.59
Warsaw Stock Exchange 34,000 PLN 390,168 437,444 0.59
18,009,930 16,210,711 21.83Russia
Alrosa AO 530,000 USD 532,353 556,500 0.75
E.ON Russia JSC 8,000,000 USD 550,324 304,000 0.41
Gazprom OAO ADR 1,090,000 USD 12,276,601 5,068,500 6.83
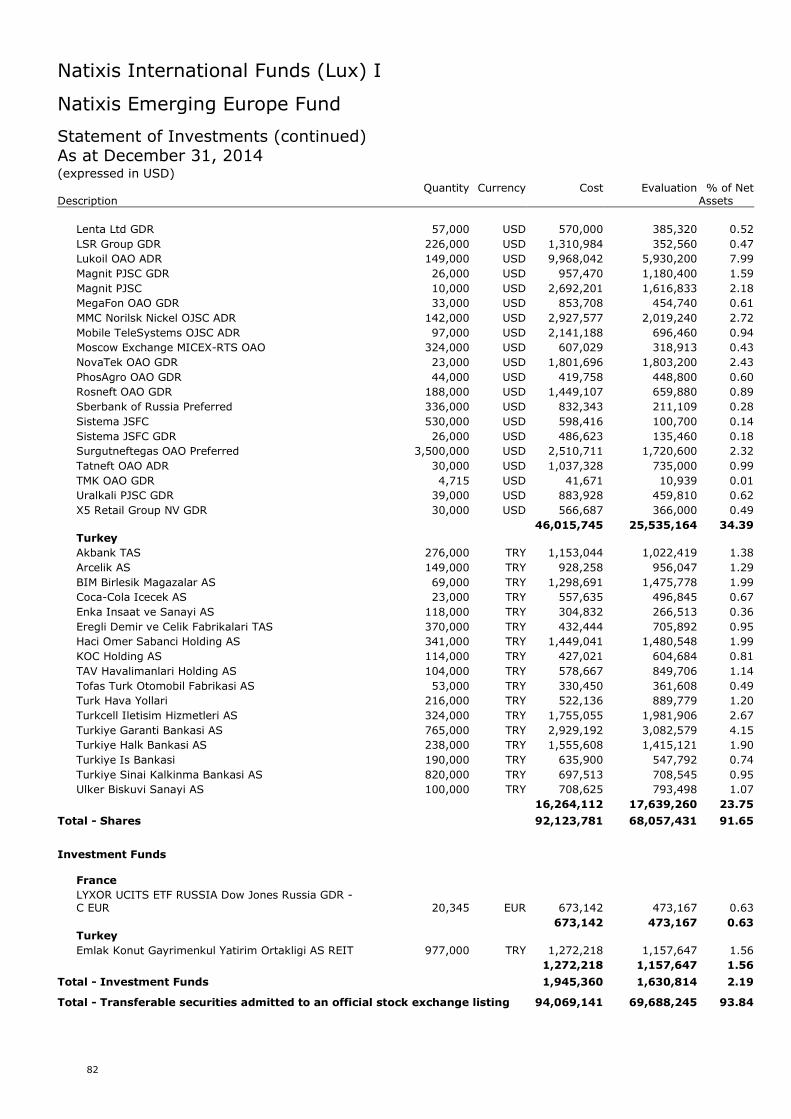
Natixis International Funds (Lux) I
82
Natixis Emerging Europe Fund
Statement of Investments (continued)As at December 31, 2014(expressed in USD)
Quantity Currency Cost Evaluation % of NetDescription Assets
Lenta Ltd GDR 57,000 USD 570,000 385,320 0.52
LSR Group GDR 226,000 USD 1,310,984 352,560 0.47
Lukoil OAO ADR 149,000 USD 9,968,042 5,930,200 7.99
Magnit PJSC GDR 26,000 USD 957,470 1,180,400 1.59
Magnit PJSC 10,000 USD 2,692,201 1,616,833 2.18
MegaFon OAO GDR 33,000 USD 853,708 454,740 0.61
MMC Norilsk Nickel OJSC ADR 142,000 USD 2,927,577 2,019,240 2.72
Mobile TeleSystems OJSC ADR 97,000 USD 2,141,188 696,460 0.94
Moscow Exchange MICEX-RTS OAO 324,000 USD 607,029 318,913 0.43
NovaTek OAO GDR 23,000 USD 1,801,696 1,803,200 2.43
PhosAgro OAO GDR 44,000 USD 419,758 448,800 0.60
Rosneft OAO GDR 188,000 USD 1,449,107 659,880 0.89
Sberbank of Russia Preferred 336,000 USD 832,343 211,109 0.28
Sistema JSFC 530,000 USD 598,416 100,700 0.14
Sistema JSFC GDR 26,000 USD 486,623 135,460 0.18
Surgutneftegas OAO Preferred 3,500,000 USD 2,510,711 1,720,600 2.32
Tatneft OAO ADR 30,000 USD 1,037,328 735,000 0.99
TMK OAO GDR 4,715 USD 41,671 10,939 0.01
Uralkali PJSC GDR 39,000 USD 883,928 459,810 0.62
X5 Retail Group NV GDR 30,000 USD 566,687 366,000 0.49
46,015,745 25,535,164 34.39Turkey
Akbank TAS 276,000 TRY 1,153,044 1,022,419 1.38
Arcelik AS 149,000 TRY 928,258 956,047 1.29
BIM Birlesik Magazalar AS 69,000 TRY 1,298,691 1,475,778 1.99
Coca-Cola Icecek AS 23,000 TRY 557,635 496,845 0.67
Enka Insaat ve Sanayi AS 118,000 TRY 304,832 266,513 0.36
Eregli Demir ve Celik Fabrikalari TAS 370,000 TRY 432,444 705,892 0.95
Haci Omer Sabanci Holding AS 341,000 TRY 1,449,041 1,480,548 1.99
KOC Holding AS 114,000 TRY 427,021 604,684 0.81
TAV Havalimanlari Holding AS 104,000 TRY 578,667 849,706 1.14
Tofas Turk Otomobil Fabrikasi AS 53,000 TRY 330,450 361,608 0.49
Turk Hava Yollari 216,000 TRY 522,136 889,779 1.20
Turkcell Iletisim Hizmetleri AS 324,000 TRY 1,755,055 1,981,906 2.67
Turkiye Garanti Bankasi AS 765,000 TRY 2,929,192 3,082,579 4.15
Turkiye Halk Bankasi AS 238,000 TRY 1,555,608 1,415,121 1.90
Turkiye Is Bankasi 190,000 TRY 635,900 547,792 0.74
Turkiye Sinai Kalkinma Bankasi AS 820,000 TRY 697,513 708,545 0.95
Ulker Biskuvi Sanayi AS 100,000 TRY 708,625 793,498 1.07
16,264,112 17,639,260 23.75
Total - Shares 92,123,781 68,057,431 91.65
Investment Funds
France
LYXOR UCITS ETF RUSSIA Dow Jones Russia GDR -C EUR 20,345 EUR 673,142 473,167 0.63
673,142 473,167 0.63Turkey
Emlak Konut Gayrimenkul Yatirim Ortakligi AS REIT 977,000 TRY 1,272,218 1,157,647 1.56
1,272,218 1,157,647 1.56
Total - Investment Funds 1,945,360 1,630,814 2.19
Total - Transferable securities admitted to an official stock exchange listing 94,069,141 69,688,245 93.84
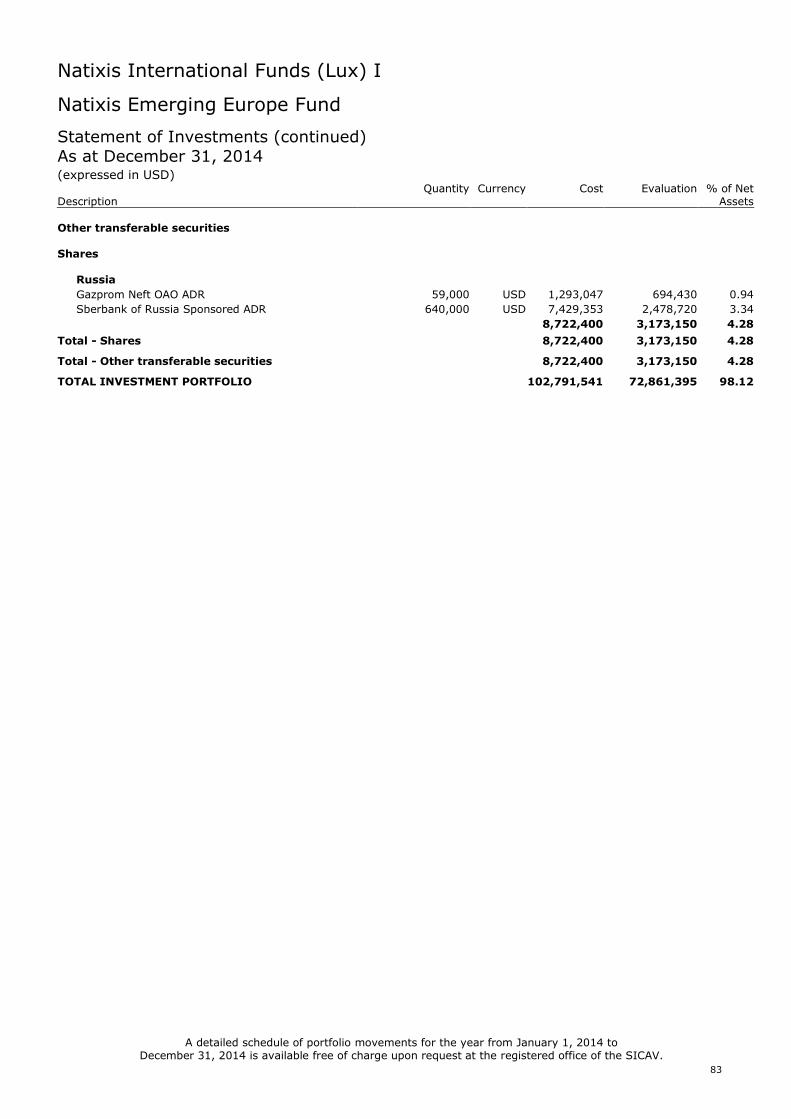
Natixis International Funds (Lux) I
83
Natixis Emerging Europe Fund
Statement of Investments (continued)As at December 31, 2014(expressed in USD)
Quantity Currency Cost Evaluation % of NetDescription Assets
Other transferable securities
Shares
Russia
Gazprom Neft OAO ADR 59,000 USD 1,293,047 694,430 0.94
Sberbank of Russia Sponsored ADR 640,000 USD 7,429,353 2,478,720 3.34
8,722,400 3,173,150 4.28
Total - Shares 8,722,400 3,173,150 4.28
Total - Other transferable securities 8,722,400 3,173,150 4.28
TOTAL INVESTMENT PORTFOLIO 102,791,541 72,861,395 98.12
A detailed schedule of portfolio movements for the year from January 1, 2014 toDecember 31, 2014 is available free of charge upon request at the registered office of the SICAV.
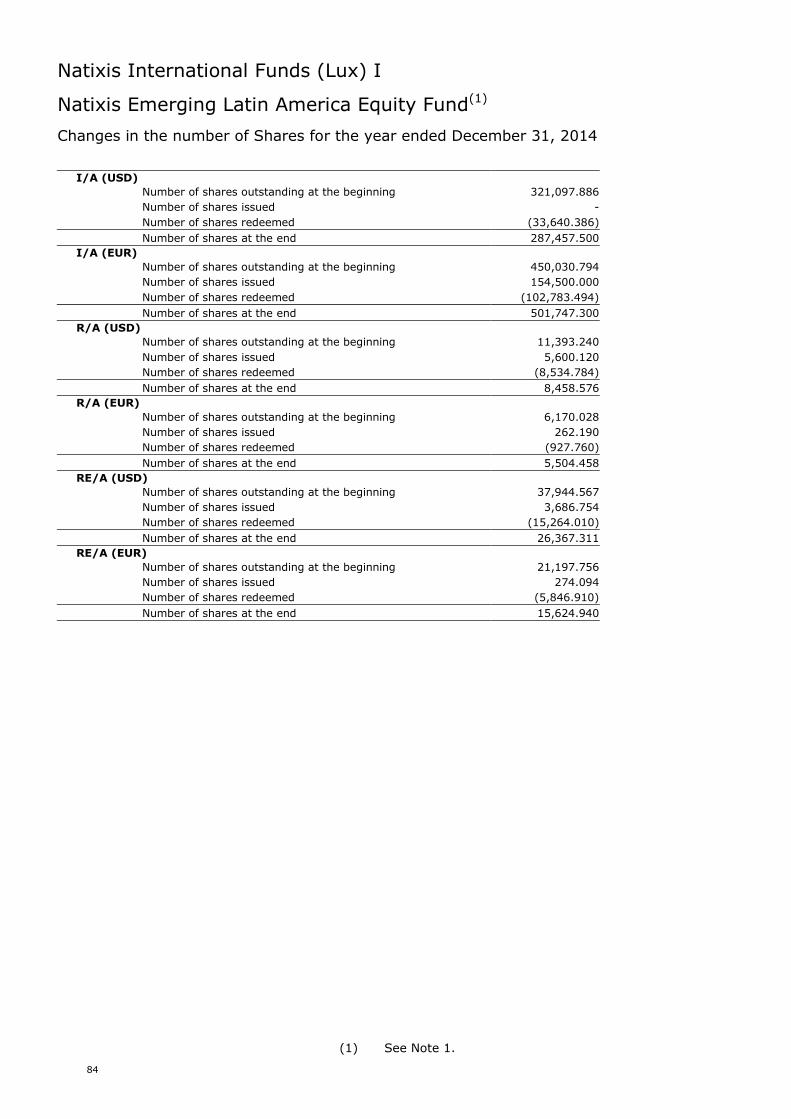
Natixis International Funds (Lux) I
84
Natixis Emerging Latin America Equity Fund(1)
Changes in the number of Shares for the year ended December 31, 2014
I/A (USD)
Number of shares outstanding at the beginning 321,097.886
Number of shares issued -
Number of shares redeemed (33,640.386)
Number of shares at the end 287,457.500
I/A (EUR)
Number of shares outstanding at the beginning 450,030.794
Number of shares issued 154,500.000
Number of shares redeemed (102,783.494)
Number of shares at the end 501,747.300
R/A (USD)
Number of shares outstanding at the beginning 11,393.240
Number of shares issued 5,600.120
Number of shares redeemed (8,534.784)
Number of shares at the end 8,458.576
R/A (EUR)
Number of shares outstanding at the beginning 6,170.028
Number of shares issued 262.190
Number of shares redeemed (927.760)
Number of shares at the end 5,504.458
RE/A (USD)
Number of shares outstanding at the beginning 37,944.567
Number of shares issued 3,686.754
Number of shares redeemed (15,264.010)
Number of shares at the end 26,367.311
RE/A (EUR)
Number of shares outstanding at the beginning 21,197.756
Number of shares issued 274.094
Number of shares redeemed (5,846.910)
Number of shares at the end 15,624.940
(1) See Note 1.
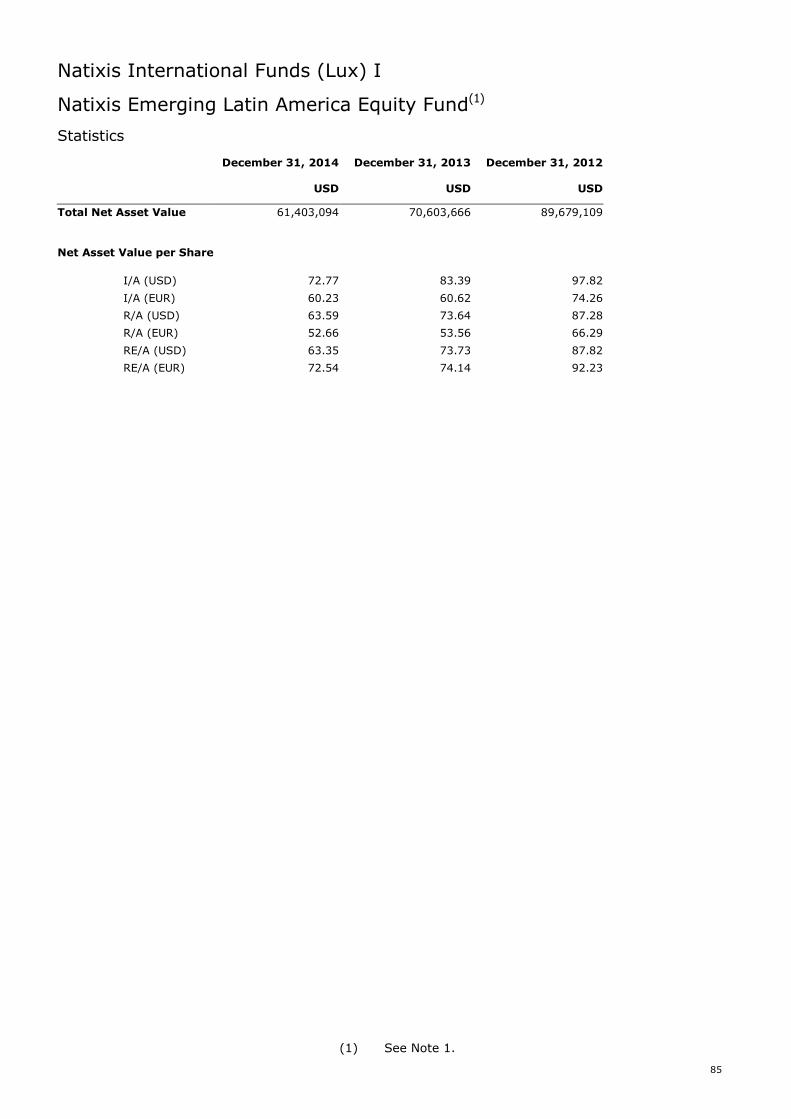
Natixis International Funds (Lux) I
85
Natixis Emerging Latin America Equity Fund(1)
Statistics
December 31, 2014 December 31, 2013 December 31, 2012
USD USD USD
Total Net Asset Value 61,403,094 70,603,666 89,679,109
Net Asset Value per Share
I/A (USD) 72.77 83.39 97.82
I/A (EUR) 60.23 60.62 74.26
R/A (USD) 63.59 73.64 87.28
R/A (EUR) 52.66 53.56 66.29
RE/A (USD) 63.35 73.73 87.82
RE/A (EUR) 72.54 74.14 92.23
(1) See Note 1.
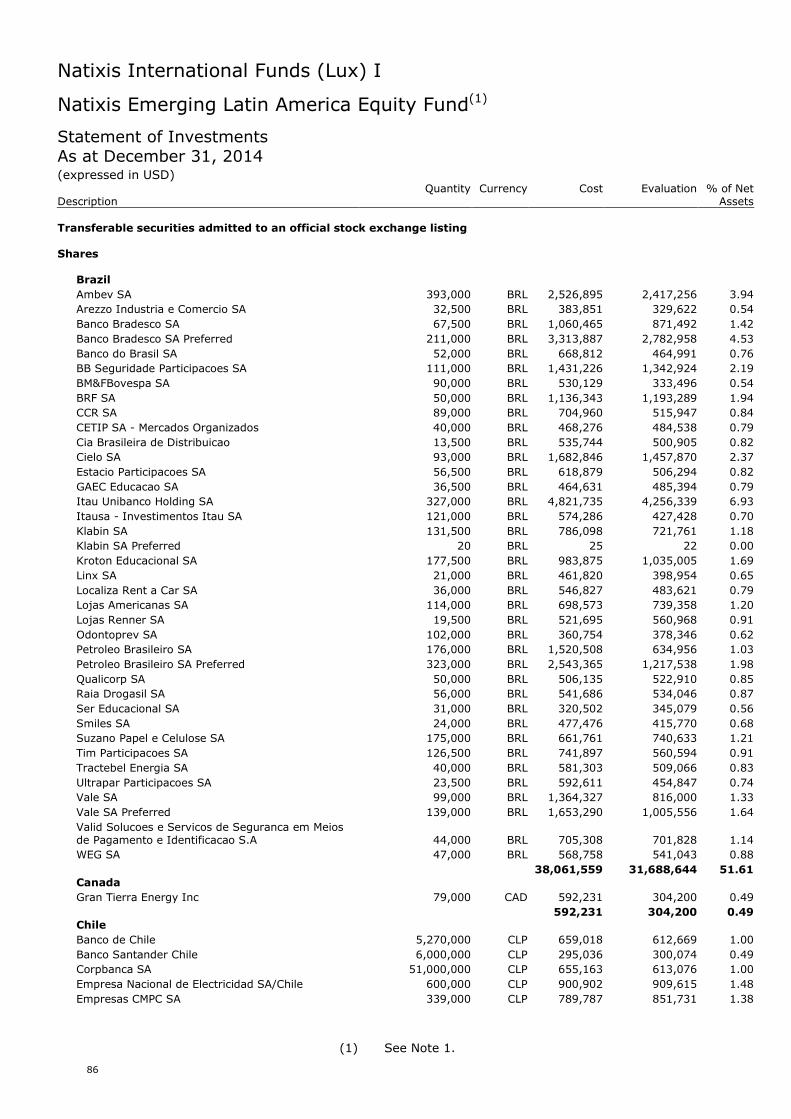
Natixis International Funds (Lux) I
86
Natixis Emerging Latin America Equity Fund(1)
Statement of InvestmentsAs at December 31, 2014(expressed in USD)
Quantity Currency Cost Evaluation % of NetDescription Assets
Transferable securities admitted to an official stock exchange listing
Shares
Brazil
Ambev SA 393,000 BRL 2,526,895 2,417,256 3.94
Arezzo Industria e Comercio SA 32,500 BRL 383,851 329,622 0.54
Banco Bradesco SA 67,500 BRL 1,060,465 871,492 1.42
Banco Bradesco SA Preferred 211,000 BRL 3,313,887 2,782,958 4.53
Banco do Brasil SA 52,000 BRL 668,812 464,991 0.76
BB Seguridade Participacoes SA 111,000 BRL 1,431,226 1,342,924 2.19
BM&FBovespa SA 90,000 BRL 530,129 333,496 0.54
BRF SA 50,000 BRL 1,136,343 1,193,289 1.94
CCR SA 89,000 BRL 704,960 515,947 0.84
CETIP SA - Mercados Organizados 40,000 BRL 468,276 484,538 0.79
Cia Brasileira de Distribuicao 13,500 BRL 535,744 500,905 0.82
Cielo SA 93,000 BRL 1,682,846 1,457,870 2.37
Estacio Participacoes SA 56,500 BRL 618,879 506,294 0.82
GAEC Educacao SA 36,500 BRL 464,631 485,394 0.79
Itau Unibanco Holding SA 327,000 BRL 4,821,735 4,256,339 6.93
Itausa - Investimentos Itau SA 121,000 BRL 574,286 427,428 0.70
Klabin SA 131,500 BRL 786,098 721,761 1.18
Klabin SA Preferred 20 BRL 25 22 0.00
Kroton Educacional SA 177,500 BRL 983,875 1,035,005 1.69
Linx SA 21,000 BRL 461,820 398,954 0.65
Localiza Rent a Car SA 36,000 BRL 546,827 483,621 0.79
Lojas Americanas SA 114,000 BRL 698,573 739,358 1.20
Lojas Renner SA 19,500 BRL 521,695 560,968 0.91
Odontoprev SA 102,000 BRL 360,754 378,346 0.62
Petroleo Brasileiro SA 176,000 BRL 1,520,508 634,956 1.03
Petroleo Brasileiro SA Preferred 323,000 BRL 2,543,365 1,217,538 1.98
Qualicorp SA 50,000 BRL 506,135 522,910 0.85
Raia Drogasil SA 56,000 BRL 541,686 534,046 0.87
Ser Educacional SA 31,000 BRL 320,502 345,079 0.56
Smiles SA 24,000 BRL 477,476 415,770 0.68
Suzano Papel e Celulose SA 175,000 BRL 661,761 740,633 1.21
Tim Participacoes SA 126,500 BRL 741,897 560,594 0.91
Tractebel Energia SA 40,000 BRL 581,303 509,066 0.83
Ultrapar Participacoes SA 23,500 BRL 592,611 454,847 0.74
Vale SA 99,000 BRL 1,364,327 816,000 1.33
Vale SA Preferred 139,000 BRL 1,653,290 1,005,556 1.64
Valid Solucoes e Servicos de Seguranca em Meiosde Pagamento e Identificacao S.A 44,000 BRL 705,308 701,828 1.14
WEG SA 47,000 BRL 568,758 541,043 0.88
38,061,559 31,688,644 51.61Canada
Gran Tierra Energy Inc 79,000 CAD 592,231 304,200 0.49
592,231 304,200 0.49Chile
Banco de Chile 5,270,000 CLP 659,018 612,669 1.00
Banco Santander Chile 6,000,000 CLP 295,036 300,074 0.49
Corpbanca SA 51,000,000 CLP 655,163 613,076 1.00
Empresa Nacional de Electricidad SA/Chile 600,000 CLP 900,902 909,615 1.48
Empresas CMPC SA 339,000 CLP 789,787 851,731 1.38
(1) See Note 1.
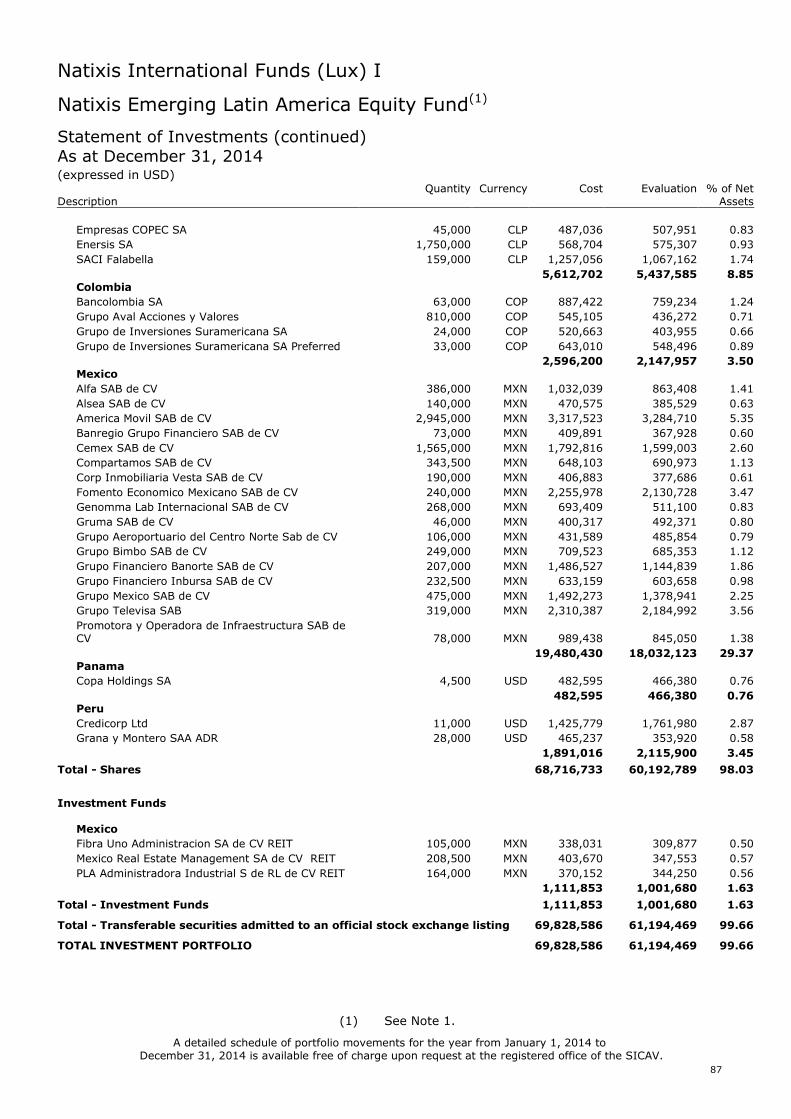
Natixis International Funds (Lux) I
87
Natixis Emerging Latin America Equity Fund(1)
Statement of Investments (continued)As at December 31, 2014(expressed in USD)
Quantity Currency Cost Evaluation % of NetDescription Assets
Empresas COPEC SA 45,000 CLP 487,036 507,951 0.83
Enersis SA 1,750,000 CLP 568,704 575,307 0.93
SACI Falabella 159,000 CLP 1,257,056 1,067,162 1.74
5,612,702 5,437,585 8.85Colombia
Bancolombia SA 63,000 COP 887,422 759,234 1.24
Grupo Aval Acciones y Valores 810,000 COP 545,105 436,272 0.71
Grupo de Inversiones Suramericana SA 24,000 COP 520,663 403,955 0.66
Grupo de Inversiones Suramericana SA Preferred 33,000 COP 643,010 548,496 0.89
2,596,200 2,147,957 3.50Mexico
Alfa SAB de CV 386,000 MXN 1,032,039 863,408 1.41
Alsea SAB de CV 140,000 MXN 470,575 385,529 0.63
America Movil SAB de CV 2,945,000 MXN 3,317,523 3,284,710 5.35
Banregio Grupo Financiero SAB de CV 73,000 MXN 409,891 367,928 0.60
Cemex SAB de CV 1,565,000 MXN 1,792,816 1,599,003 2.60
Compartamos SAB de CV 343,500 MXN 648,103 690,973 1.13
Corp Inmobiliaria Vesta SAB de CV 190,000 MXN 406,883 377,686 0.61
Fomento Economico Mexicano SAB de CV 240,000 MXN 2,255,978 2,130,728 3.47
Genomma Lab Internacional SAB de CV 268,000 MXN 693,409 511,100 0.83
Gruma SAB de CV 46,000 MXN 400,317 492,371 0.80
Grupo Aeroportuario del Centro Norte Sab de CV 106,000 MXN 431,589 485,854 0.79
Grupo Bimbo SAB de CV 249,000 MXN 709,523 685,353 1.12
Grupo Financiero Banorte SAB de CV 207,000 MXN 1,486,527 1,144,839 1.86
Grupo Financiero Inbursa SAB de CV 232,500 MXN 633,159 603,658 0.98
Grupo Mexico SAB de CV 475,000 MXN 1,492,273 1,378,941 2.25
Grupo Televisa SAB 319,000 MXN 2,310,387 2,184,992 3.56
Promotora y Operadora de Infraestructura SAB deCV 78,000 MXN 989,438 845,050 1.38
19,480,430 18,032,123 29.37Panama
Copa Holdings SA 4,500 USD 482,595 466,380 0.76
482,595 466,380 0.76Peru
Credicorp Ltd 11,000 USD 1,425,779 1,761,980 2.87
Grana y Montero SAA ADR 28,000 USD 465,237 353,920 0.58
1,891,016 2,115,900 3.45
Total - Shares 68,716,733 60,192,789 98.03
Investment Funds
Mexico
Fibra Uno Administracion SA de CV REIT 105,000 MXN 338,031 309,877 0.50
Mexico Real Estate Management SA de CV REIT 208,500 MXN 403,670 347,553 0.57
PLA Administradora Industrial S de RL de CV REIT 164,000 MXN 370,152 344,250 0.56
1,111,853 1,001,680 1.63
Total - Investment Funds 1,111,853 1,001,680 1.63
Total - Transferable securities admitted to an official stock exchange listing 69,828,586 61,194,469 99.66
TOTAL INVESTMENT PORTFOLIO 69,828,586 61,194,469 99.66
A detailed schedule of portfolio movements for the year from January 1, 2014 toDecember 31, 2014 is available free of charge upon request at the registered office of the SICAV.
(1) See Note 1.
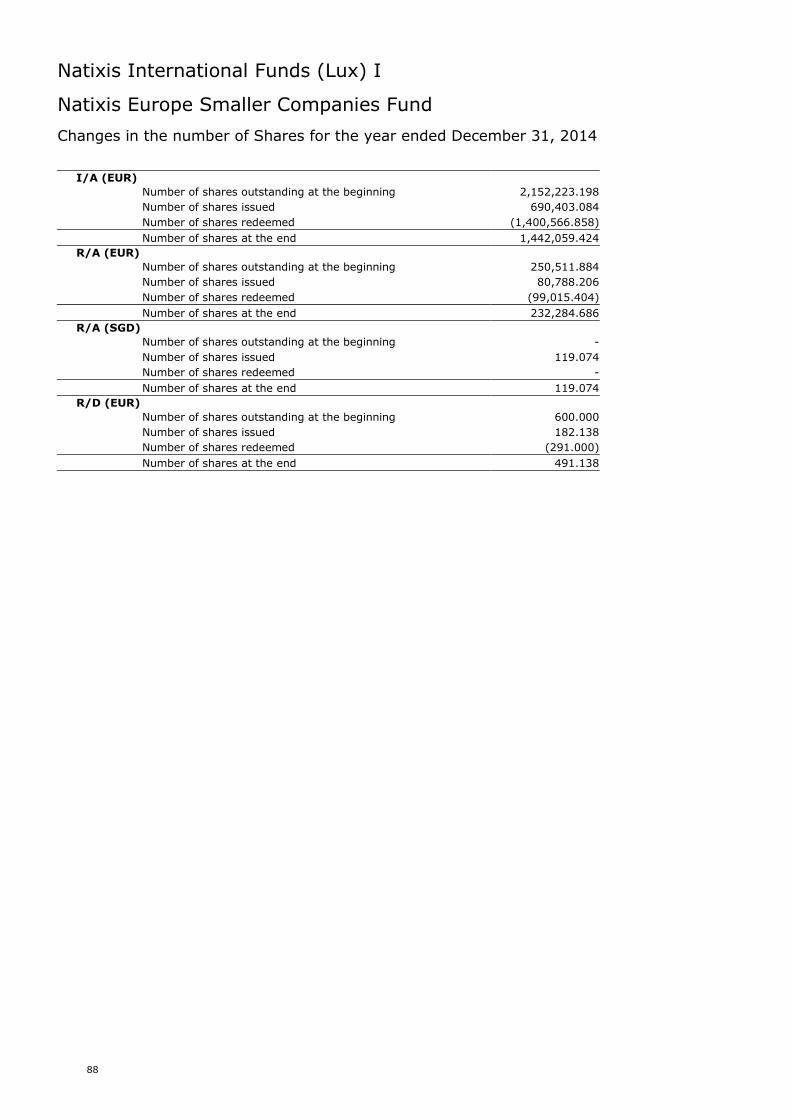
Natixis International Funds (Lux) I
88
Natixis Europe Smaller Companies Fund
Changes in the number of Shares for the year ended December 31, 2014
I/A (EUR)
Number of shares outstanding at the beginning 2,152,223.198
Number of shares issued 690,403.084
Number of shares redeemed (1,400,566.858)
Number of shares at the end 1,442,059.424
R/A (EUR)
Number of shares outstanding at the beginning 250,511.884
Number of shares issued 80,788.206
Number of shares redeemed (99,015.404)
Number of shares at the end 232,284.686
R/A (SGD)
Number of shares outstanding at the beginning -
Number of shares issued 119.074
Number of shares redeemed -
Number of shares at the end 119.074
R/D (EUR)
Number of shares outstanding at the beginning 600.000
Number of shares issued 182.138
Number of shares redeemed (291.000)
Number of shares at the end 491.138
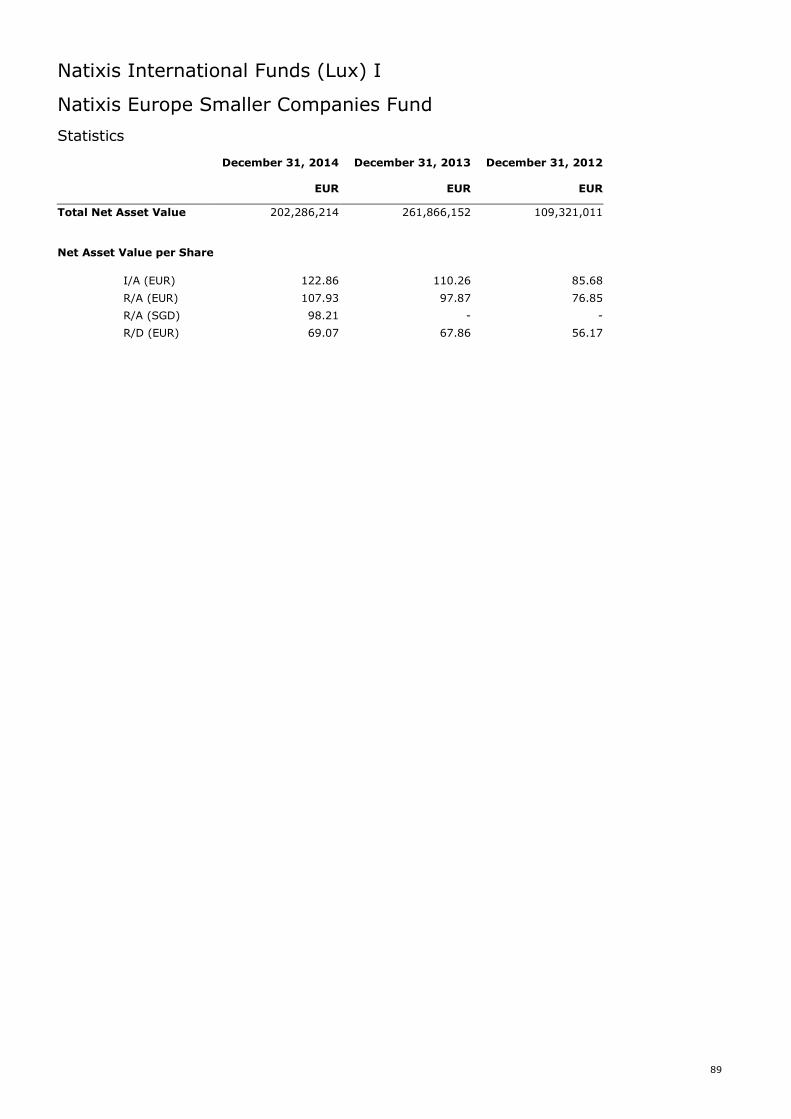
Natixis International Funds (Lux) I
89
Natixis Europe Smaller Companies Fund
Statistics
December 31, 2014 December 31, 2013 December 31, 2012
EUR EUR EUR
Total Net Asset Value 202,286,214 261,866,152 109,321,011
Net Asset Value per Share
I/A (EUR) 122.86 110.26 85.68
R/A (EUR) 107.93 97.87 76.85
R/A (SGD) 98.21 - -
R/D (EUR) 69.07 67.86 56.17
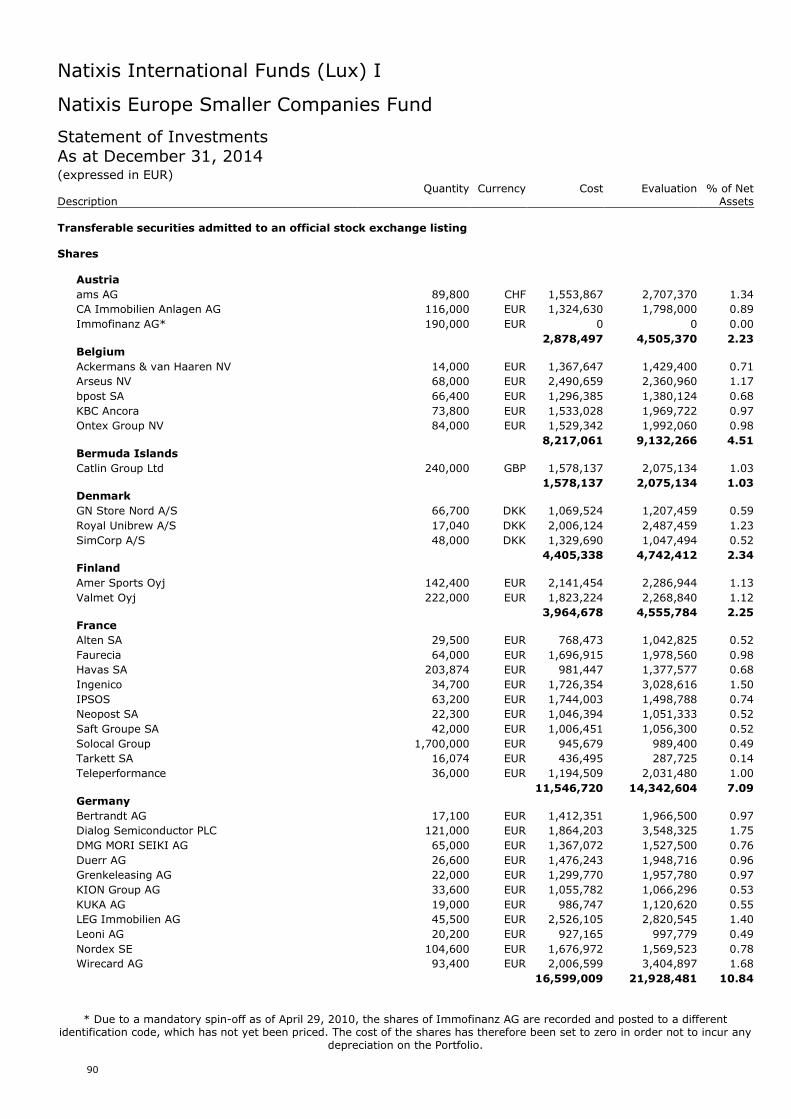
Natixis International Funds (Lux) I
90
Natixis Europe Smaller Companies Fund
Statement of InvestmentsAs at December 31, 2014(expressed in EUR)
Quantity Currency Cost Evaluation % of NetDescription Assets
Transferable securities admitted to an official stock exchange listing
Shares
Austria
ams AG 89,800 CHF 1,553,867 2,707,370 1.34
CA Immobilien Anlagen AG 116,000 EUR 1,324,630 1,798,000 0.89
Immofinanz AG* 190,000 EUR 0 0 0.00
2,878,497 4,505,370 2.23Belgium
Ackermans & van Haaren NV 14,000 EUR 1,367,647 1,429,400 0.71
Arseus NV 68,000 EUR 2,490,659 2,360,960 1.17
bpost SA 66,400 EUR 1,296,385 1,380,124 0.68
KBC Ancora 73,800 EUR 1,533,028 1,969,722 0.97
Ontex Group NV 84,000 EUR 1,529,342 1,992,060 0.98
8,217,061 9,132,266 4.51Bermuda Islands
Catlin Group Ltd 240,000 GBP 1,578,137 2,075,134 1.03
1,578,137 2,075,134 1.03Denmark
GN Store Nord A/S 66,700 DKK 1,069,524 1,207,459 0.59
Royal Unibrew A/S 17,040 DKK 2,006,124 2,487,459 1.23
SimCorp A/S 48,000 DKK 1,329,690 1,047,494 0.52
4,405,338 4,742,412 2.34Finland
Amer Sports Oyj 142,400 EUR 2,141,454 2,286,944 1.13
Valmet Oyj 222,000 EUR 1,823,224 2,268,840 1.12
3,964,678 4,555,784 2.25France
Alten SA 29,500 EUR 768,473 1,042,825 0.52
Faurecia 64,000 EUR 1,696,915 1,978,560 0.98
Havas SA 203,874 EUR 981,447 1,377,577 0.68
Ingenico 34,700 EUR 1,726,354 3,028,616 1.50
IPSOS 63,200 EUR 1,744,003 1,498,788 0.74
Neopost SA 22,300 EUR 1,046,394 1,051,333 0.52
Saft Groupe SA 42,000 EUR 1,006,451 1,056,300 0.52
Solocal Group 1,700,000 EUR 945,679 989,400 0.49
Tarkett SA 16,074 EUR 436,495 287,725 0.14
Teleperformance 36,000 EUR 1,194,509 2,031,480 1.00
11,546,720 14,342,604 7.09Germany
Bertrandt AG 17,100 EUR 1,412,351 1,966,500 0.97
Dialog Semiconductor PLC 121,000 EUR 1,864,203 3,548,325 1.75
DMG MORI SEIKI AG 65,000 EUR 1,367,072 1,527,500 0.76
Duerr AG 26,600 EUR 1,476,243 1,948,716 0.96
Grenkeleasing AG 22,000 EUR 1,299,770 1,957,780 0.97
KION Group AG 33,600 EUR 1,055,782 1,066,296 0.53
KUKA AG 19,000 EUR 986,747 1,120,620 0.55
LEG Immobilien AG 45,500 EUR 2,526,105 2,820,545 1.40
Leoni AG 20,200 EUR 927,165 997,779 0.49
Nordex SE 104,600 EUR 1,676,972 1,569,523 0.78
Wirecard AG 93,400 EUR 2,006,599 3,404,897 1.68
16,599,009 21,928,481 10.84
* Due to a mandatory spin-off as of April 29, 2010, the shares of Immofinanz AG are recorded and posted to a differentidentification code, which has not yet been priced. The cost of the shares has therefore been set to zero in order not to incur any
depreciation on the Portfolio.
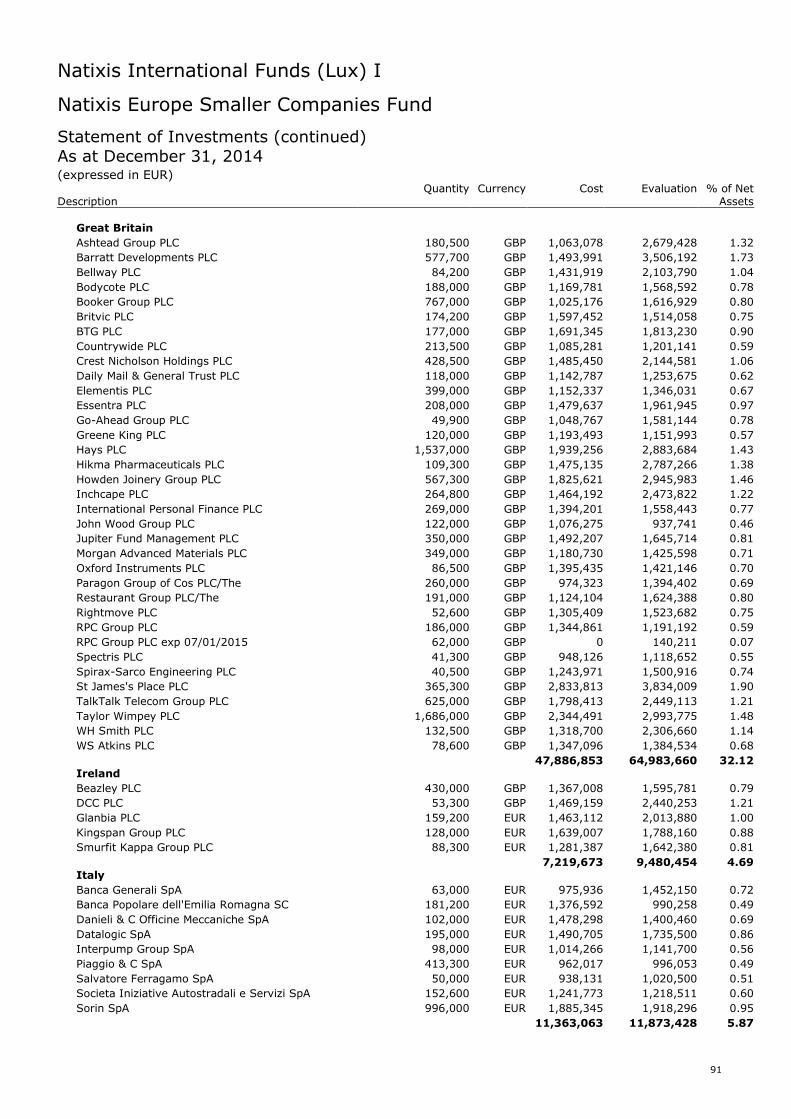
Natixis International Funds (Lux) I
91
Natixis Europe Smaller Companies Fund
Statement of Investments (continued)As at December 31, 2014(expressed in EUR)
Quantity Currency Cost Evaluation % of NetDescription Assets
Great Britain
Ashtead Group PLC 180,500 GBP 1,063,078 2,679,428 1.32
Barratt Developments PLC 577,700 GBP 1,493,991 3,506,192 1.73
Bellway PLC 84,200 GBP 1,431,919 2,103,790 1.04
Bodycote PLC 188,000 GBP 1,169,781 1,568,592 0.78
Booker Group PLC 767,000 GBP 1,025,176 1,616,929 0.80
Britvic PLC 174,200 GBP 1,597,452 1,514,058 0.75
BTG PLC 177,000 GBP 1,691,345 1,813,230 0.90
Countrywide PLC 213,500 GBP 1,085,281 1,201,141 0.59
Crest Nicholson Holdings PLC 428,500 GBP 1,485,450 2,144,581 1.06
Daily Mail & General Trust PLC 118,000 GBP 1,142,787 1,253,675 0.62
Elementis PLC 399,000 GBP 1,152,337 1,346,031 0.67
Essentra PLC 208,000 GBP 1,479,637 1,961,945 0.97
Go-Ahead Group PLC 49,900 GBP 1,048,767 1,581,144 0.78
Greene King PLC 120,000 GBP 1,193,493 1,151,993 0.57
Hays PLC 1,537,000 GBP 1,939,256 2,883,684 1.43
Hikma Pharmaceuticals PLC 109,300 GBP 1,475,135 2,787,266 1.38
Howden Joinery Group PLC 567,300 GBP 1,825,621 2,945,983 1.46
Inchcape PLC 264,800 GBP 1,464,192 2,473,822 1.22
International Personal Finance PLC 269,000 GBP 1,394,201 1,558,443 0.77
John Wood Group PLC 122,000 GBP 1,076,275 937,741 0.46
Jupiter Fund Management PLC 350,000 GBP 1,492,207 1,645,714 0.81
Morgan Advanced Materials PLC 349,000 GBP 1,180,730 1,425,598 0.71
Oxford Instruments PLC 86,500 GBP 1,395,435 1,421,146 0.70
Paragon Group of Cos PLC/The 260,000 GBP 974,323 1,394,402 0.69
Restaurant Group PLC/The 191,000 GBP 1,124,104 1,624,388 0.80
Rightmove PLC 52,600 GBP 1,305,409 1,523,682 0.75
RPC Group PLC 186,000 GBP 1,344,861 1,191,192 0.59
RPC Group PLC exp 07/01/2015 62,000 GBP 0 140,211 0.07
Spectris PLC 41,300 GBP 948,126 1,118,652 0.55
Spirax-Sarco Engineering PLC 40,500 GBP 1,243,971 1,500,916 0.74
St James's Place PLC 365,300 GBP 2,833,813 3,834,009 1.90
TalkTalk Telecom Group PLC 625,000 GBP 1,798,413 2,449,113 1.21
Taylor Wimpey PLC 1,686,000 GBP 2,344,491 2,993,775 1.48
WH Smith PLC 132,500 GBP 1,318,700 2,306,660 1.14
WS Atkins PLC 78,600 GBP 1,347,096 1,384,534 0.68
47,886,853 64,983,660 32.12Ireland
Beazley PLC 430,000 GBP 1,367,008 1,595,781 0.79
DCC PLC 53,300 GBP 1,469,159 2,440,253 1.21
Glanbia PLC 159,200 EUR 1,463,112 2,013,880 1.00
Kingspan Group PLC 128,000 EUR 1,639,007 1,788,160 0.88
Smurfit Kappa Group PLC 88,300 EUR 1,281,387 1,642,380 0.81
7,219,673 9,480,454 4.69Italy
Banca Generali SpA 63,000 EUR 975,936 1,452,150 0.72
Banca Popolare dell'Emilia Romagna SC 181,200 EUR 1,376,592 990,258 0.49
Danieli & C Officine Meccaniche SpA 102,000 EUR 1,478,298 1,400,460 0.69
Datalogic SpA 195,000 EUR 1,490,705 1,735,500 0.86
Interpump Group SpA 98,000 EUR 1,014,266 1,141,700 0.56
Piaggio & C SpA 413,300 EUR 962,017 996,053 0.49
Salvatore Ferragamo SpA 50,000 EUR 938,131 1,020,500 0.51
Societa Iniziative Autostradali e Servizi SpA 152,600 EUR 1,241,773 1,218,511 0.60
Sorin SpA 996,000 EUR 1,885,345 1,918,296 0.95
11,363,063 11,873,428 5.87
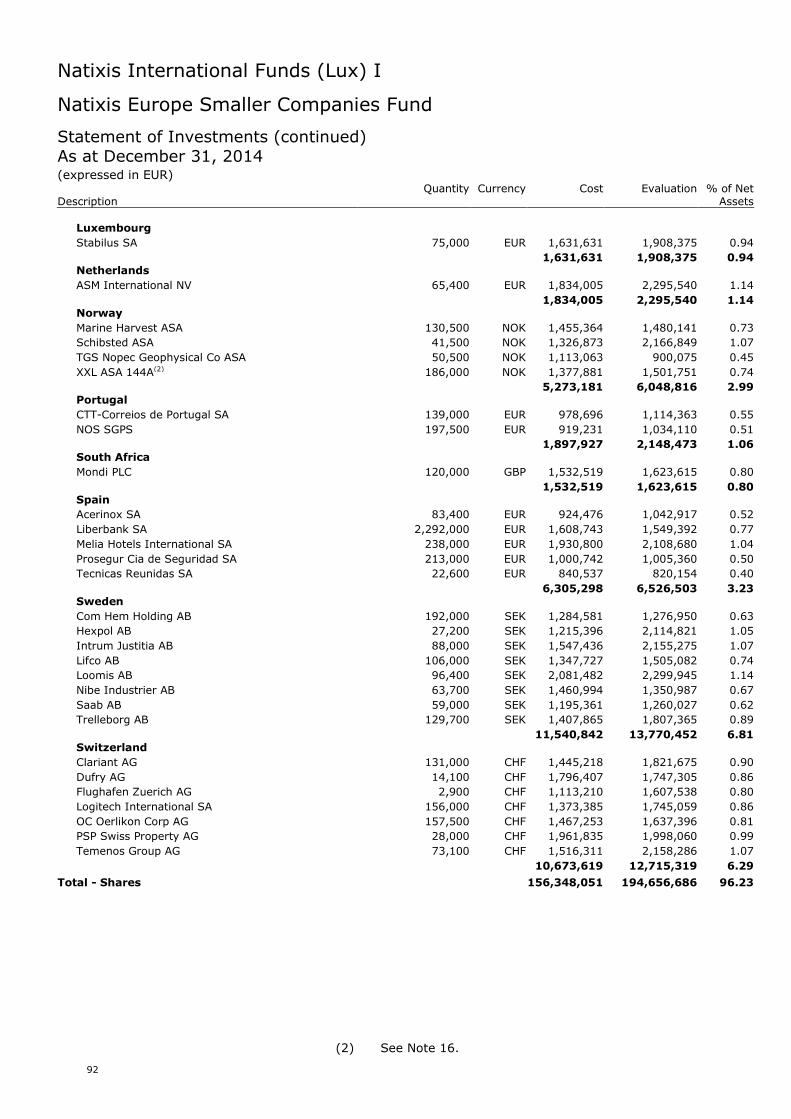
Natixis International Funds (Lux) I
92
Natixis Europe Smaller Companies Fund
Statement of Investments (continued)As at December 31, 2014(expressed in EUR)
Quantity Currency Cost Evaluation % of NetDescription Assets
Luxembourg
Stabilus SA 75,000 EUR 1,631,631 1,908,375 0.94
1,631,631 1,908,375 0.94Netherlands
ASM International NV 65,400 EUR 1,834,005 2,295,540 1.14
1,834,005 2,295,540 1.14Norway
Marine Harvest ASA 130,500 NOK 1,455,364 1,480,141 0.73
Schibsted ASA 41,500 NOK 1,326,873 2,166,849 1.07
TGS Nopec Geophysical Co ASA 50,500 NOK 1,113,063 900,075 0.45
XXL ASA 144A(2) 186,000 NOK 1,377,881 1,501,751 0.74
5,273,181 6,048,816 2.99Portugal
CTT-Correios de Portugal SA 139,000 EUR 978,696 1,114,363 0.55
NOS SGPS 197,500 EUR 919,231 1,034,110 0.51
1,897,927 2,148,473 1.06South Africa
Mondi PLC 120,000 GBP 1,532,519 1,623,615 0.80
1,532,519 1,623,615 0.80Spain
Acerinox SA 83,400 EUR 924,476 1,042,917 0.52
Liberbank SA 2,292,000 EUR 1,608,743 1,549,392 0.77
Melia Hotels International SA 238,000 EUR 1,930,800 2,108,680 1.04
Prosegur Cia de Seguridad SA 213,000 EUR 1,000,742 1,005,360 0.50
Tecnicas Reunidas SA 22,600 EUR 840,537 820,154 0.40
6,305,298 6,526,503 3.23Sweden
Com Hem Holding AB 192,000 SEK 1,284,581 1,276,950 0.63
Hexpol AB 27,200 SEK 1,215,396 2,114,821 1.05
Intrum Justitia AB 88,000 SEK 1,547,436 2,155,275 1.07
Lifco AB 106,000 SEK 1,347,727 1,505,082 0.74
Loomis AB 96,400 SEK 2,081,482 2,299,945 1.14
Nibe Industrier AB 63,700 SEK 1,460,994 1,350,987 0.67
Saab AB 59,000 SEK 1,195,361 1,260,027 0.62
Trelleborg AB 129,700 SEK 1,407,865 1,807,365 0.89
11,540,842 13,770,452 6.81Switzerland
Clariant AG 131,000 CHF 1,445,218 1,821,675 0.90
Dufry AG 14,100 CHF 1,796,407 1,747,305 0.86
Flughafen Zuerich AG 2,900 CHF 1,113,210 1,607,538 0.80
Logitech International SA 156,000 CHF 1,373,385 1,745,059 0.86
OC Oerlikon Corp AG 157,500 CHF 1,467,253 1,637,396 0.81
PSP Swiss Property AG 28,000 CHF 1,961,835 1,998,060 0.99
Temenos Group AG 73,100 CHF 1,516,311 2,158,286 1.07
10,673,619 12,715,319 6.29
Total - Shares 156,348,051 194,656,686 96.23
(2) See Note 16.
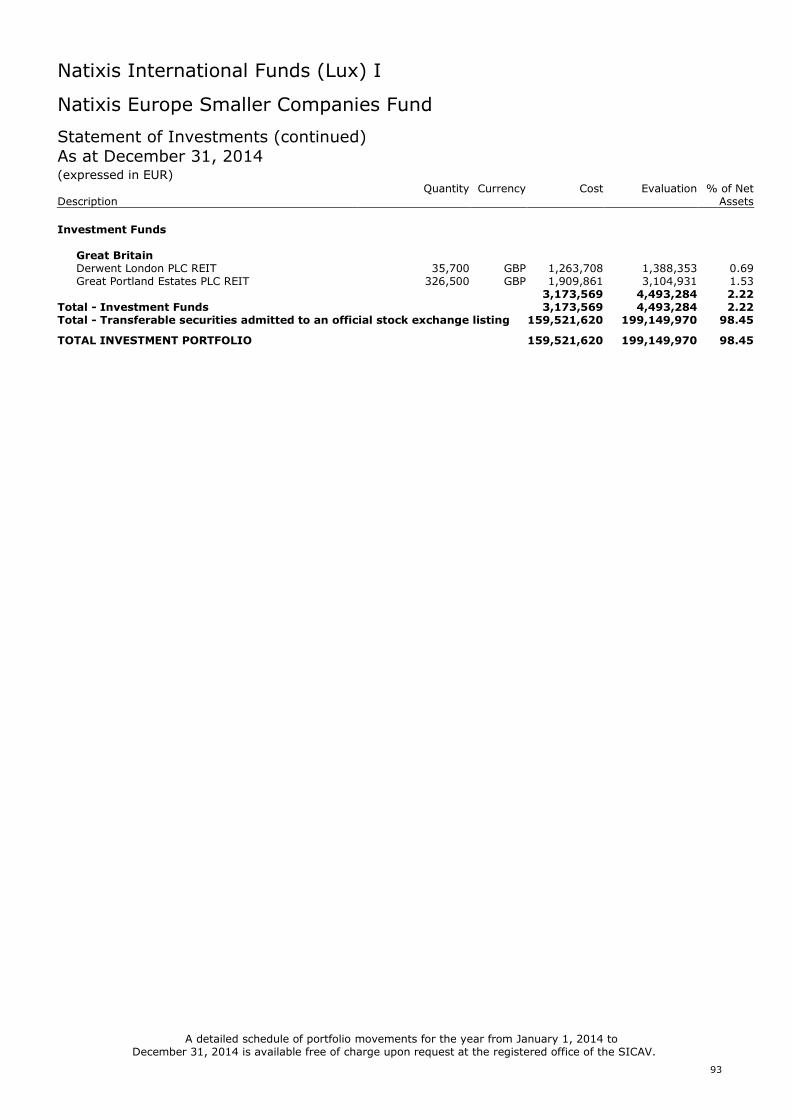
Natixis International Funds (Lux) I
93
Natixis Europe Smaller Companies Fund
Statement of Investments (continued)As at December 31, 2014(expressed in EUR)
Quantity Currency Cost Evaluation % of NetDescription Assets
Investment Funds
Great BritainDerwent London PLC REIT 35,700 GBP 1,263,708 1,388,353 0.69Great Portland Estates PLC REIT 326,500 GBP 1,909,861 3,104,931 1.53
3,173,569 4,493,284 2.22Total - Investment Funds 3,173,569 4,493,284 2.22Total - Transferable securities admitted to an official stock exchange listing 159,521,620 199,149,970 98.45
TOTAL INVESTMENT PORTFOLIO 159,521,620 199,149,970 98.45
A detailed schedule of portfolio movements for the year from January 1, 2014 toDecember 31, 2014 is available free of charge upon request at the registered office of the SICAV.
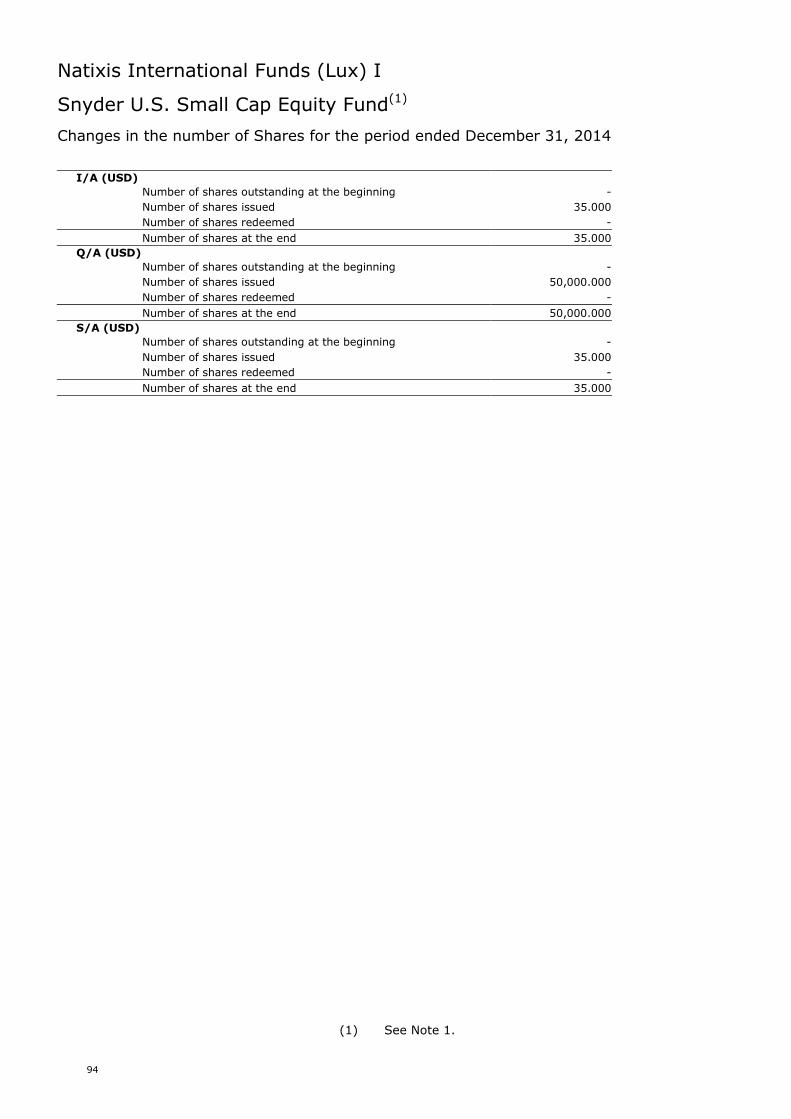
Natixis International Funds (Lux) I
94
Snyder U.S. Small Cap Equity Fund(1)
Changes in the number of Shares for the period ended December 31, 2014
I/A (USD)
Number of shares outstanding at the beginning -
Number of shares issued 35.000
Number of shares redeemed -
Number of shares at the end 35.000
Q/A (USD)
Number of shares outstanding at the beginning -
Number of shares issued 50,000.000
Number of shares redeemed -
Number of shares at the end 50,000.000
S/A (USD)
Number of shares outstanding at the beginning -
Number of shares issued 35.000
Number of shares redeemed -
Number of shares at the end 35.000
(1) See Note 1.
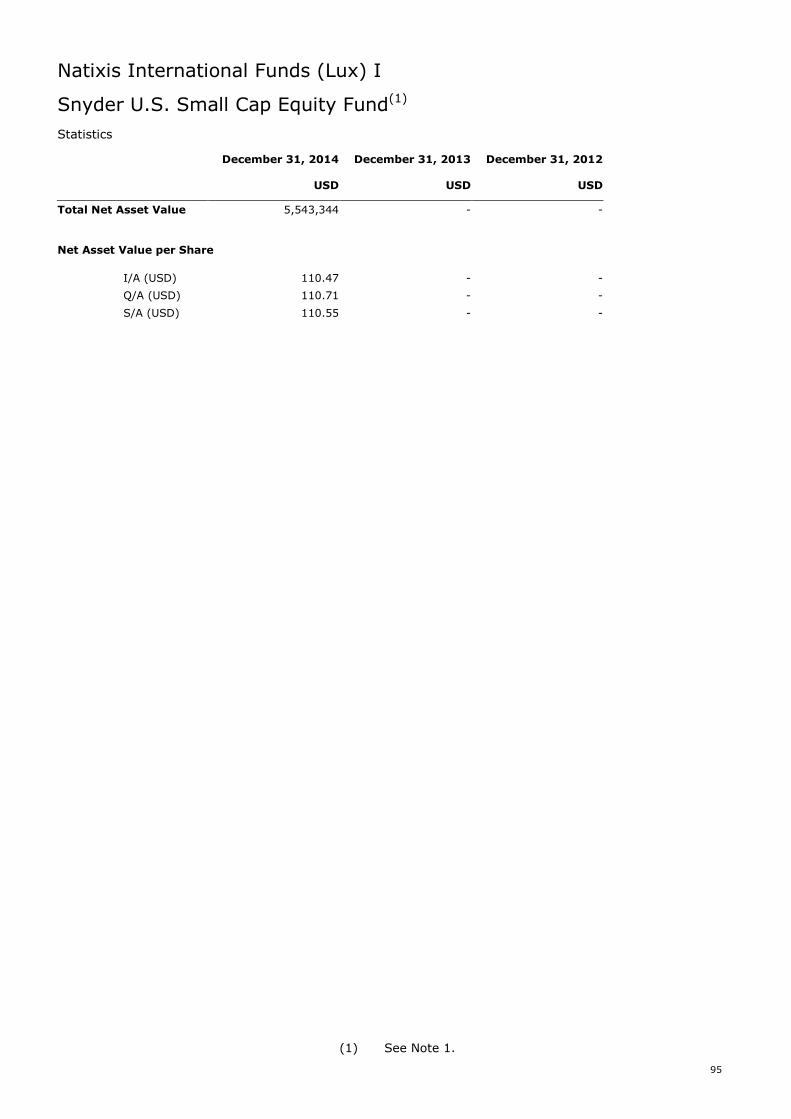
Natixis International Funds (Lux) I
95
Snyder U.S. Small Cap Equity Fund(1)
Statistics
December 31, 2014 December 31, 2013 December 31, 2012
USD USD USD
Total Net Asset Value 5,543,344 - -
Net Asset Value per Share
I/A (USD) 110.47 - -
Q/A (USD) 110.71 - -
S/A (USD) 110.55 - -
(1) See Note 1.
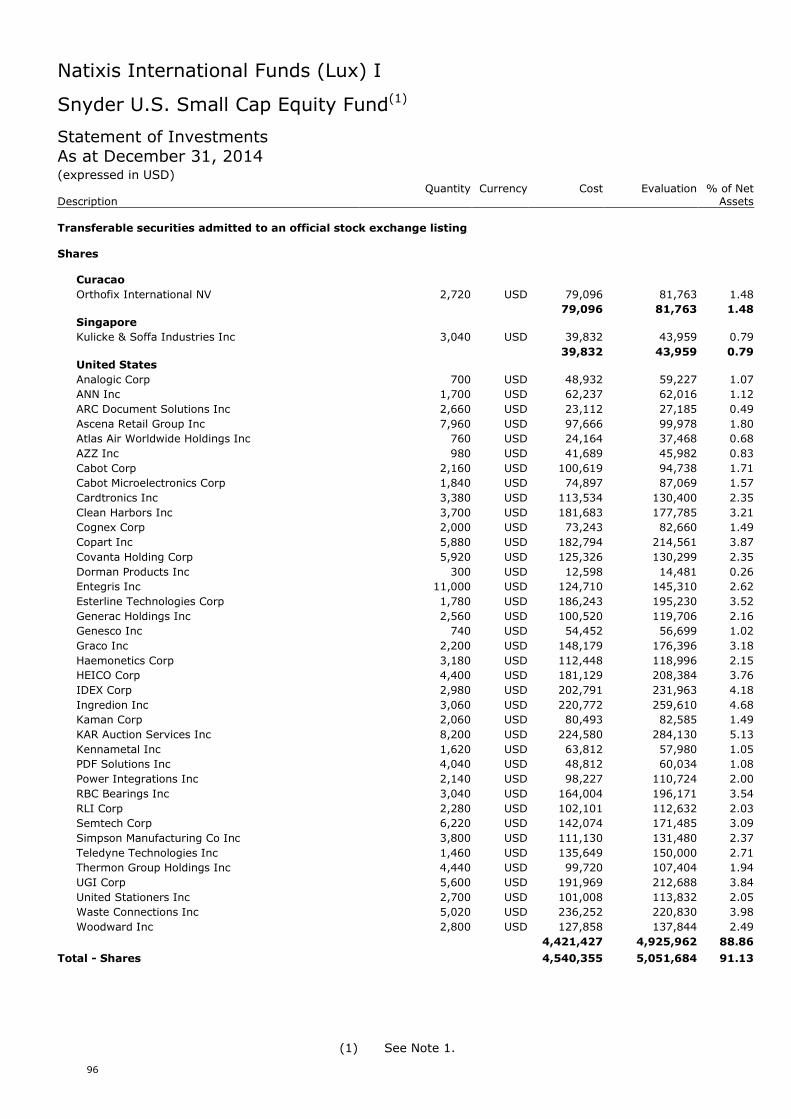
Natixis International Funds (Lux) I
96
Snyder U.S. Small Cap Equity Fund(1)
Statement of InvestmentsAs at December 31, 2014(expressed in USD)
Quantity Currency Cost Evaluation % of NetDescription Assets
Transferable securities admitted to an official stock exchange listing
Shares
Curacao
Orthofix International NV 2,720 USD 79,096 81,763 1.48
79,096 81,763 1.48Singapore
Kulicke & Soffa Industries Inc 3,040 USD 39,832 43,959 0.79
39,832 43,959 0.79United States
Analogic Corp 700 USD 48,932 59,227 1.07
ANN Inc 1,700 USD 62,237 62,016 1.12
ARC Document Solutions Inc 2,660 USD 23,112 27,185 0.49
Ascena Retail Group Inc 7,960 USD 97,666 99,978 1.80
Atlas Air Worldwide Holdings Inc 760 USD 24,164 37,468 0.68
AZZ Inc 980 USD 41,689 45,982 0.83
Cabot Corp 2,160 USD 100,619 94,738 1.71
Cabot Microelectronics Corp 1,840 USD 74,897 87,069 1.57
Cardtronics Inc 3,380 USD 113,534 130,400 2.35
Clean Harbors Inc 3,700 USD 181,683 177,785 3.21
Cognex Corp 2,000 USD 73,243 82,660 1.49
Copart Inc 5,880 USD 182,794 214,561 3.87
Covanta Holding Corp 5,920 USD 125,326 130,299 2.35
Dorman Products Inc 300 USD 12,598 14,481 0.26
Entegris Inc 11,000 USD 124,710 145,310 2.62
Esterline Technologies Corp 1,780 USD 186,243 195,230 3.52
Generac Holdings Inc 2,560 USD 100,520 119,706 2.16
Genesco Inc 740 USD 54,452 56,699 1.02
Graco Inc 2,200 USD 148,179 176,396 3.18
Haemonetics Corp 3,180 USD 112,448 118,996 2.15
HEICO Corp 4,400 USD 181,129 208,384 3.76
IDEX Corp 2,980 USD 202,791 231,963 4.18
Ingredion Inc 3,060 USD 220,772 259,610 4.68
Kaman Corp 2,060 USD 80,493 82,585 1.49
KAR Auction Services Inc 8,200 USD 224,580 284,130 5.13
Kennametal Inc 1,620 USD 63,812 57,980 1.05
PDF Solutions Inc 4,040 USD 48,812 60,034 1.08
Power Integrations Inc 2,140 USD 98,227 110,724 2.00
RBC Bearings Inc 3,040 USD 164,004 196,171 3.54
RLI Corp 2,280 USD 102,101 112,632 2.03
Semtech Corp 6,220 USD 142,074 171,485 3.09
Simpson Manufacturing Co Inc 3,800 USD 111,130 131,480 2.37
Teledyne Technologies Inc 1,460 USD 135,649 150,000 2.71
Thermon Group Holdings Inc 4,440 USD 99,720 107,404 1.94
UGI Corp 5,600 USD 191,969 212,688 3.84
United Stationers Inc 2,700 USD 101,008 113,832 2.05
Waste Connections Inc 5,020 USD 236,252 220,830 3.98
Woodward Inc 2,800 USD 127,858 137,844 2.49
4,421,427 4,925,962 88.86
Total - Shares 4,540,355 5,051,684 91.13
(1) See Note 1.
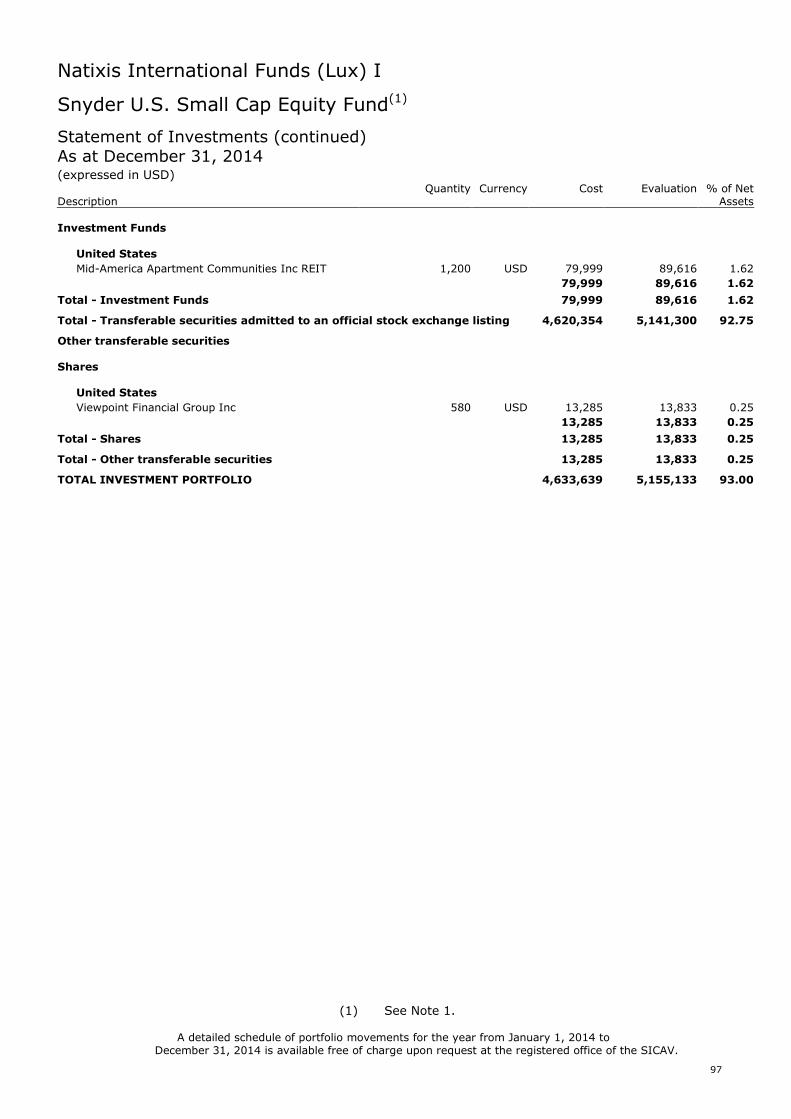
Natixis International Funds (Lux) I
97
Snyder U.S. Small Cap Equity Fund(1)
Statement of Investments (continued)As at December 31, 2014(expressed in USD)
Quantity Currency Cost Evaluation % of NetDescription Assets
Investment Funds
United States
Mid-America Apartment Communities Inc REIT 1,200 USD 79,999 89,616 1.62
79,999 89,616 1.62
Total - Investment Funds 79,999 89,616 1.62
Total - Transferable securities admitted to an official stock exchange listing 4,620,354 5,141,300 92.75
Other transferable securities
Shares
United States
Viewpoint Financial Group Inc 580 USD 13,285 13,833 0.25
13,285 13,833 0.25
Total - Shares 13,285 13,833 0.25
Total - Other transferable securities 13,285 13,833 0.25
TOTAL INVESTMENT PORTFOLIO 4,633,639 5,155,133 93.00
A detailed schedule of portfolio movements for the year from January 1, 2014 toDecember 31, 2014 is available free of charge upon request at the registered office of the SICAV.
(1) See Note 1.
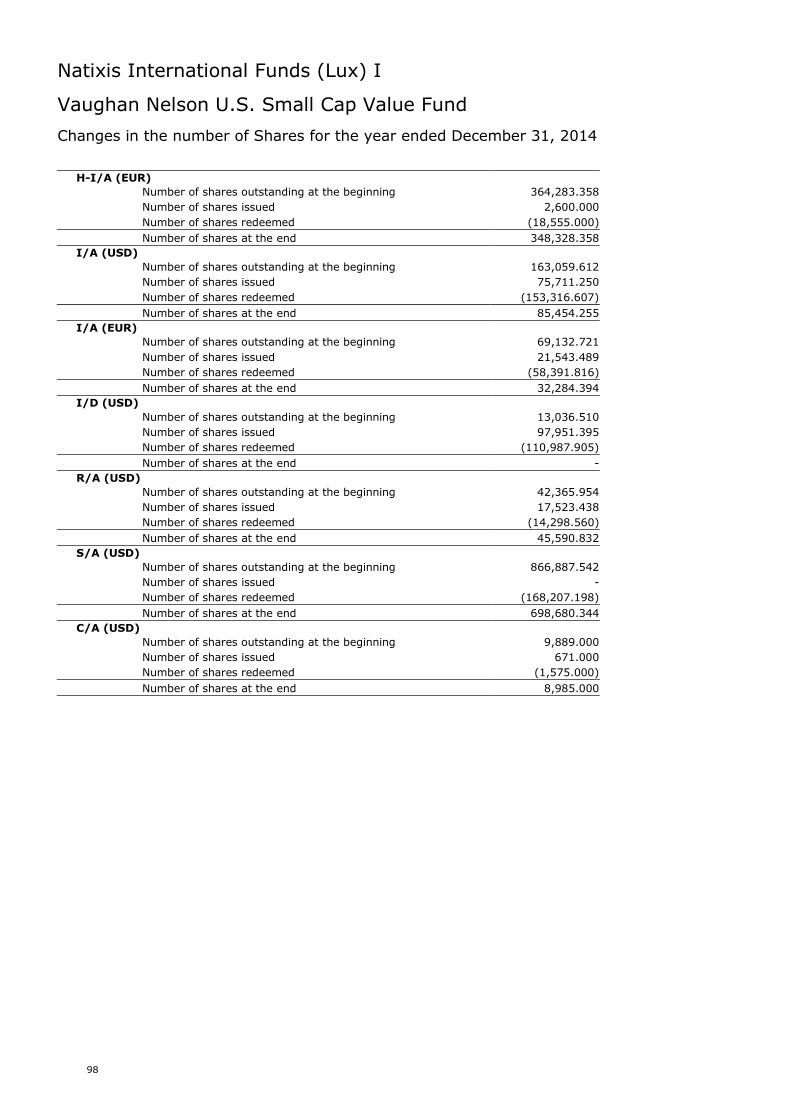
Natixis International Funds (Lux) I
98
Vaughan Nelson U.S. Small Cap Value Fund
Changes in the number of Shares for the year ended December 31, 2014
H-I/A (EUR)
Number of shares outstanding at the beginning 364,283.358
Number of shares issued 2,600.000
Number of shares redeemed (18,555.000)
Number of shares at the end 348,328.358
I/A (USD)
Number of shares outstanding at the beginning 163,059.612
Number of shares issued 75,711.250
Number of shares redeemed (153,316.607)
Number of shares at the end 85,454.255
I/A (EUR)
Number of shares outstanding at the beginning 69,132.721
Number of shares issued 21,543.489
Number of shares redeemed (58,391.816)
Number of shares at the end 32,284.394
I/D (USD)
Number of shares outstanding at the beginning 13,036.510
Number of shares issued 97,951.395
Number of shares redeemed (110,987.905)
Number of shares at the end -
R/A (USD)
Number of shares outstanding at the beginning 42,365.954
Number of shares issued 17,523.438
Number of shares redeemed (14,298.560)
Number of shares at the end 45,590.832
S/A (USD)
Number of shares outstanding at the beginning 866,887.542
Number of shares issued -
Number of shares redeemed (168,207.198)
Number of shares at the end 698,680.344
C/A (USD)
Number of shares outstanding at the beginning 9,889.000
Number of shares issued 671.000
Number of shares redeemed (1,575.000)
Number of shares at the end 8,985.000
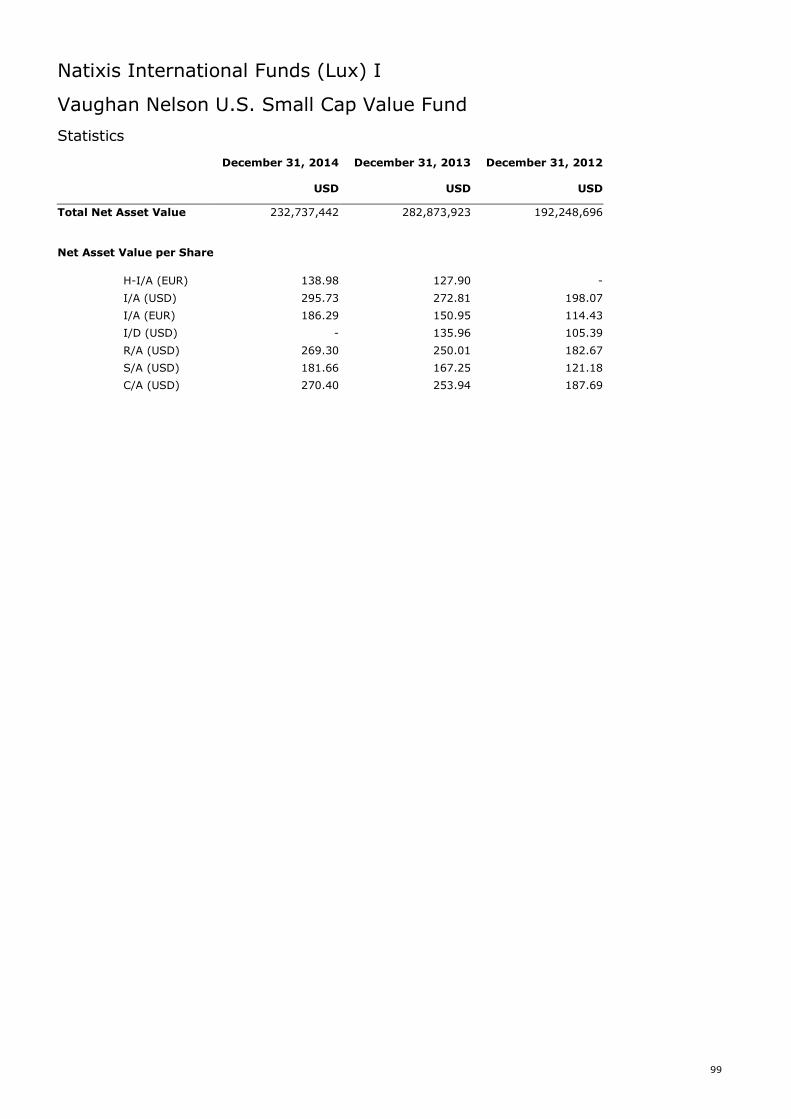
Natixis International Funds (Lux) I
99
Vaughan Nelson U.S. Small Cap Value Fund
Statistics
December 31, 2014 December 31, 2013 December 31, 2012
USD USD USD
Total Net Asset Value 232,737,442 282,873,923 192,248,696
Net Asset Value per Share
H-I/A (EUR) 138.98 127.90 -
I/A (USD) 295.73 272.81 198.07
I/A (EUR) 186.29 150.95 114.43
I/D (USD) - 135.96 105.39
R/A (USD) 269.30 250.01 182.67
S/A (USD) 181.66 167.25 121.18
C/A (USD) 270.40 253.94 187.69
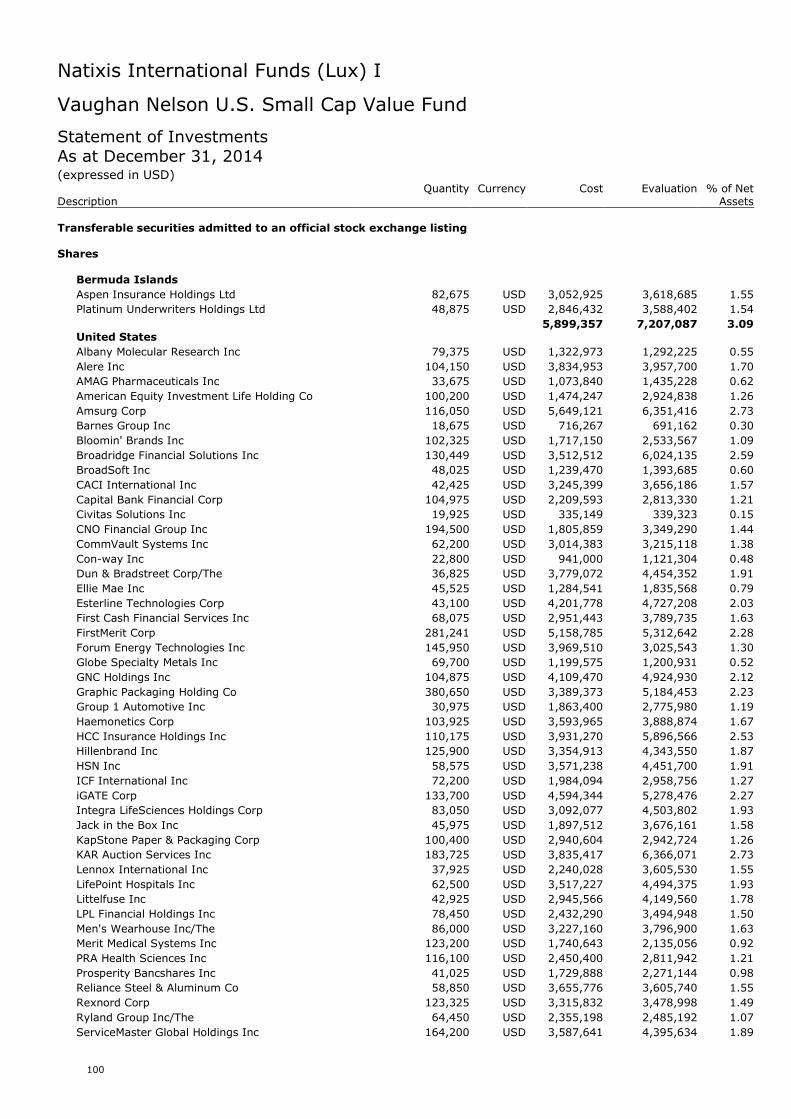
Natixis International Funds (Lux) I
100
Vaughan Nelson U.S. Small Cap Value Fund
Statement of InvestmentsAs at December 31, 2014(expressed in USD)
Quantity Currency Cost Evaluation % of NetDescription Assets
Transferable securities admitted to an official stock exchange listing
Shares
Bermuda Islands
Aspen Insurance Holdings Ltd 82,675 USD 3,052,925 3,618,685 1.55
Platinum Underwriters Holdings Ltd 48,875 USD 2,846,432 3,588,402 1.54
5,899,357 7,207,087 3.09United States
Albany Molecular Research Inc 79,375 USD 1,322,973 1,292,225 0.55
Alere Inc 104,150 USD 3,834,953 3,957,700 1.70
AMAG Pharmaceuticals Inc 33,675 USD 1,073,840 1,435,228 0.62
American Equity Investment Life Holding Co 100,200 USD 1,474,247 2,924,838 1.26
Amsurg Corp 116,050 USD 5,649,121 6,351,416 2.73
Barnes Group Inc 18,675 USD 716,267 691,162 0.30
Bloomin' Brands Inc 102,325 USD 1,717,150 2,533,567 1.09
Broadridge Financial Solutions Inc 130,449 USD 3,512,512 6,024,135 2.59
BroadSoft Inc 48,025 USD 1,239,470 1,393,685 0.60
CACI International Inc 42,425 USD 3,245,399 3,656,186 1.57
Capital Bank Financial Corp 104,975 USD 2,209,593 2,813,330 1.21
Civitas Solutions Inc 19,925 USD 335,149 339,323 0.15
CNO Financial Group Inc 194,500 USD 1,805,859 3,349,290 1.44
CommVault Systems Inc 62,200 USD 3,014,383 3,215,118 1.38
Con-way Inc 22,800 USD 941,000 1,121,304 0.48
Dun & Bradstreet Corp/The 36,825 USD 3,779,072 4,454,352 1.91
Ellie Mae Inc 45,525 USD 1,284,541 1,835,568 0.79
Esterline Technologies Corp 43,100 USD 4,201,778 4,727,208 2.03
First Cash Financial Services Inc 68,075 USD 2,951,443 3,789,735 1.63
FirstMerit Corp 281,241 USD 5,158,785 5,312,642 2.28
Forum Energy Technologies Inc 145,950 USD 3,969,510 3,025,543 1.30
Globe Specialty Metals Inc 69,700 USD 1,199,575 1,200,931 0.52
GNC Holdings Inc 104,875 USD 4,109,470 4,924,930 2.12
Graphic Packaging Holding Co 380,650 USD 3,389,373 5,184,453 2.23
Group 1 Automotive Inc 30,975 USD 1,863,400 2,775,980 1.19
Haemonetics Corp 103,925 USD 3,593,965 3,888,874 1.67
HCC Insurance Holdings Inc 110,175 USD 3,931,270 5,896,566 2.53
Hillenbrand Inc 125,900 USD 3,354,913 4,343,550 1.87
HSN Inc 58,575 USD 3,571,238 4,451,700 1.91
ICF International Inc 72,200 USD 1,984,094 2,958,756 1.27
iGATE Corp 133,700 USD 4,594,344 5,278,476 2.27
Integra LifeSciences Holdings Corp 83,050 USD 3,092,077 4,503,802 1.93
Jack in the Box Inc 45,975 USD 1,897,512 3,676,161 1.58
KapStone Paper & Packaging Corp 100,400 USD 2,940,604 2,942,724 1.26
KAR Auction Services Inc 183,725 USD 3,835,417 6,366,071 2.73
Lennox International Inc 37,925 USD 2,240,028 3,605,530 1.55
LifePoint Hospitals Inc 62,500 USD 3,517,227 4,494,375 1.93
Littelfuse Inc 42,925 USD 2,945,566 4,149,560 1.78
LPL Financial Holdings Inc 78,450 USD 2,432,290 3,494,948 1.50
Men's Wearhouse Inc/The 86,000 USD 3,227,160 3,796,900 1.63
Merit Medical Systems Inc 123,200 USD 1,740,643 2,135,056 0.92
PRA Health Sciences Inc 116,100 USD 2,450,400 2,811,942 1.21
Prosperity Bancshares Inc 41,025 USD 1,729,888 2,271,144 0.98
Reliance Steel & Aluminum Co 58,850 USD 3,655,776 3,605,740 1.55
Rexnord Corp 123,325 USD 3,315,832 3,478,998 1.49
Ryland Group Inc/The 64,450 USD 2,355,198 2,485,192 1.07
ServiceMaster Global Holdings Inc 164,200 USD 3,587,641 4,395,634 1.89
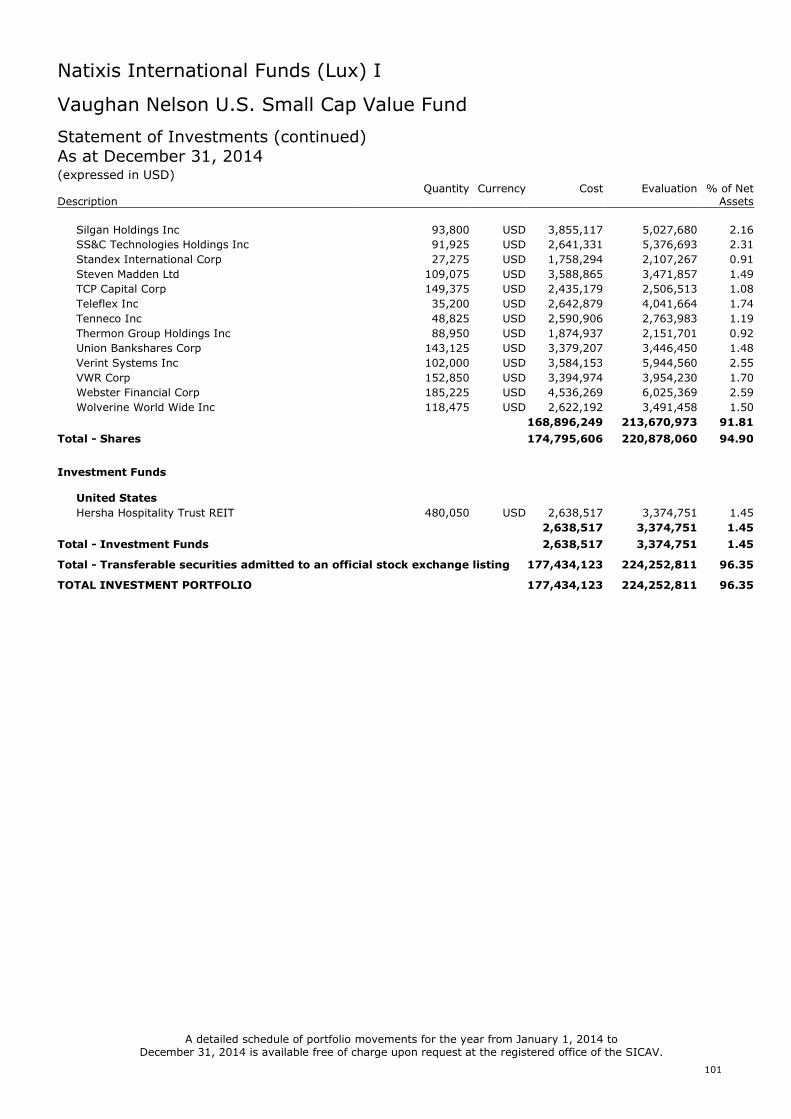
Natixis International Funds (Lux) I
101
Vaughan Nelson U.S. Small Cap Value Fund
Statement of Investments (continued)As at December 31, 2014(expressed in USD)
Quantity Currency Cost Evaluation % of NetDescription Assets
Silgan Holdings Inc 93,800 USD 3,855,117 5,027,680 2.16
SS&C Technologies Holdings Inc 91,925 USD 2,641,331 5,376,693 2.31
Standex International Corp 27,275 USD 1,758,294 2,107,267 0.91
Steven Madden Ltd 109,075 USD 3,588,865 3,471,857 1.49
TCP Capital Corp 149,375 USD 2,435,179 2,506,513 1.08
Teleflex Inc 35,200 USD 2,642,879 4,041,664 1.74
Tenneco Inc 48,825 USD 2,590,906 2,763,983 1.19
Thermon Group Holdings Inc 88,950 USD 1,874,937 2,151,701 0.92
Union Bankshares Corp 143,125 USD 3,379,207 3,446,450 1.48
Verint Systems Inc 102,000 USD 3,584,153 5,944,560 2.55
VWR Corp 152,850 USD 3,394,974 3,954,230 1.70
Webster Financial Corp 185,225 USD 4,536,269 6,025,369 2.59
Wolverine World Wide Inc 118,475 USD 2,622,192 3,491,458 1.50
168,896,249 213,670,973 91.81
Total - Shares 174,795,606 220,878,060 94.90
Investment Funds
United States
Hersha Hospitality Trust REIT 480,050 USD 2,638,517 3,374,751 1.45
2,638,517 3,374,751 1.45
Total - Investment Funds 2,638,517 3,374,751 1.45
Total - Transferable securities admitted to an official stock exchange listing 177,434,123 224,252,811 96.35
TOTAL INVESTMENT PORTFOLIO 177,434,123 224,252,811 96.35
A detailed schedule of portfolio movements for the year from January 1, 2014 toDecember 31, 2014 is available free of charge upon request at the registered office of the SICAV.
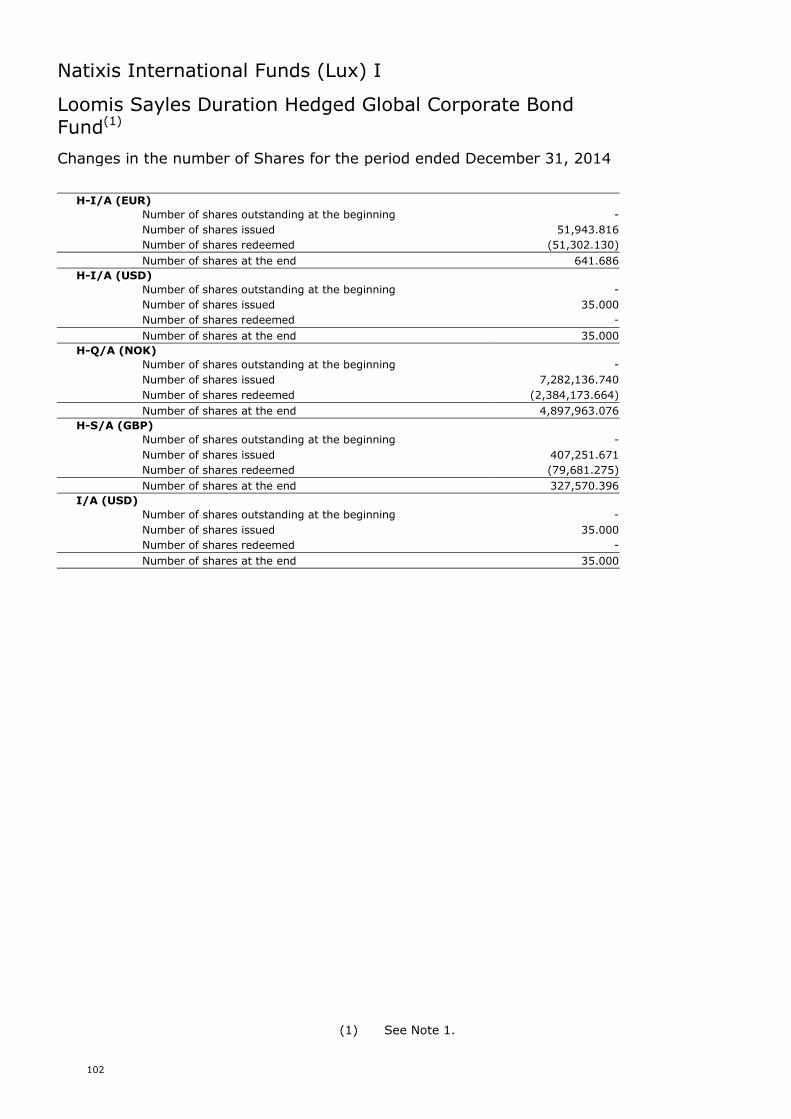
Natixis International Funds (Lux) I
102
Loomis Sayles Duration Hedged Global Corporate BondFund(1)
Changes in the number of Shares for the period ended December 31, 2014
H-I/A (EUR)
Number of shares outstanding at the beginning -
Number of shares issued 51,943.816
Number of shares redeemed (51,302.130)
Number of shares at the end 641.686
H-I/A (USD)
Number of shares outstanding at the beginning -
Number of shares issued 35.000
Number of shares redeemed -
Number of shares at the end 35.000
H-Q/A (NOK)
Number of shares outstanding at the beginning -
Number of shares issued 7,282,136.740
Number of shares redeemed (2,384,173.664)
Number of shares at the end 4,897,963.076
H-S/A (GBP)
Number of shares outstanding at the beginning -
Number of shares issued 407,251.671
Number of shares redeemed (79,681.275)
Number of shares at the end 327,570.396
I/A (USD)
Number of shares outstanding at the beginning -
Number of shares issued 35.000
Number of shares redeemed -
Number of shares at the end 35.000
(1) See Note 1.
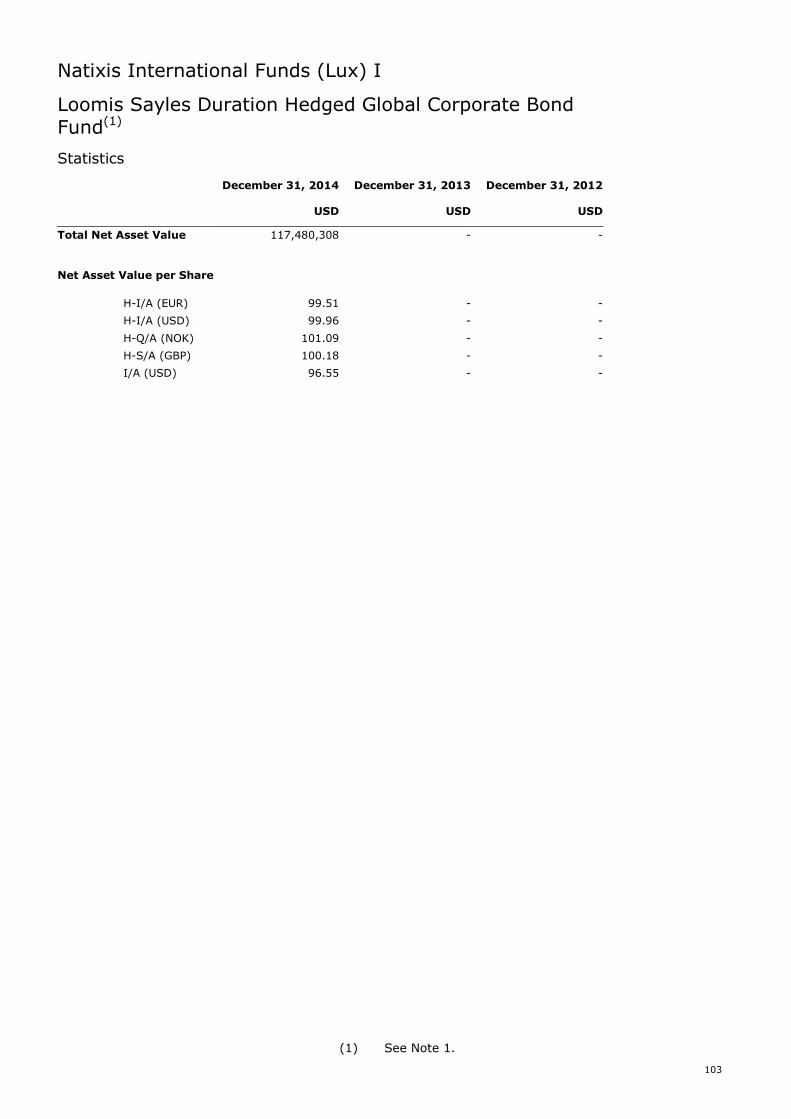
Natixis International Funds (Lux) I
103
Loomis Sayles Duration Hedged Global Corporate BondFund(1)
Statistics
December 31, 2014 December 31, 2013 December 31, 2012
USD USD USD
Total Net Asset Value 117,480,308 - -
Net Asset Value per Share
H-I/A (EUR) 99.51 - -
H-I/A (USD) 99.96 - -
H-Q/A (NOK) 101.09 - -
H-S/A (GBP) 100.18 - -
I/A (USD) 96.55 - -
(1) See Note 1.
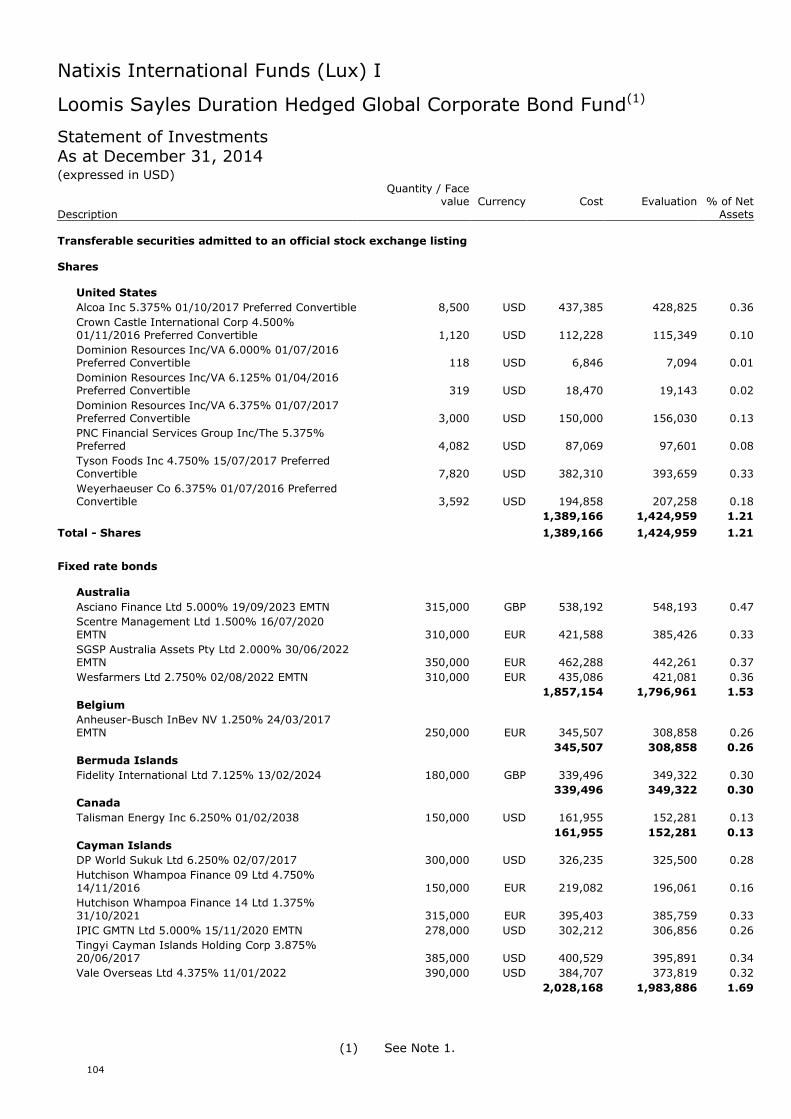
Natixis International Funds (Lux) I
104
Loomis Sayles Duration Hedged Global Corporate Bond Fund(1)
Statement of InvestmentsAs at December 31, 2014(expressed in USD)
Quantity / Facevalue Currency Cost Evaluation % of Net
Description Assets
Transferable securities admitted to an official stock exchange listing
Shares
United States
Alcoa Inc 5.375% 01/10/2017 Preferred Convertible 8,500 USD 437,385 428,825 0.36
Crown Castle International Corp 4.500%01/11/2016 Preferred Convertible 1,120 USD 112,228 115,349 0.10
Dominion Resources Inc/VA 6.000% 01/07/2016Preferred Convertible 118 USD 6,846 7,094 0.01
Dominion Resources Inc/VA 6.125% 01/04/2016Preferred Convertible 319 USD 18,470 19,143 0.02
Dominion Resources Inc/VA 6.375% 01/07/2017Preferred Convertible 3,000 USD 150,000 156,030 0.13
PNC Financial Services Group Inc/The 5.375%Preferred 4,082 USD 87,069 97,601 0.08
Tyson Foods Inc 4.750% 15/07/2017 PreferredConvertible 7,820 USD 382,310 393,659 0.33
Weyerhaeuser Co 6.375% 01/07/2016 PreferredConvertible 3,592 USD 194,858 207,258 0.18
1,389,166 1,424,959 1.21
Total - Shares 1,389,166 1,424,959 1.21
Fixed rate bonds
Australia
Asciano Finance Ltd 5.000% 19/09/2023 EMTN 315,000 GBP 538,192 548,193 0.47
Scentre Management Ltd 1.500% 16/07/2020EMTN 310,000 EUR 421,588 385,426 0.33
SGSP Australia Assets Pty Ltd 2.000% 30/06/2022EMTN 350,000 EUR 462,288 442,261 0.37
Wesfarmers Ltd 2.750% 02/08/2022 EMTN 310,000 EUR 435,086 421,081 0.36
1,857,154 1,796,961 1.53Belgium
Anheuser-Busch InBev NV 1.250% 24/03/2017EMTN 250,000 EUR 345,507 308,858 0.26
345,507 308,858 0.26Bermuda Islands
Fidelity International Ltd 7.125% 13/02/2024 180,000 GBP 339,496 349,322 0.30
339,496 349,322 0.30Canada
Talisman Energy Inc 6.250% 01/02/2038 150,000 USD 161,955 152,281 0.13
161,955 152,281 0.13Cayman Islands
DP World Sukuk Ltd 6.250% 02/07/2017 300,000 USD 326,235 325,500 0.28
Hutchison Whampoa Finance 09 Ltd 4.750%14/11/2016 150,000 EUR 219,082 196,061 0.16
Hutchison Whampoa Finance 14 Ltd 1.375%31/10/2021 315,000 EUR 395,403 385,759 0.33
IPIC GMTN Ltd 5.000% 15/11/2020 EMTN 278,000 USD 302,212 306,856 0.26
Tingyi Cayman Islands Holding Corp 3.875%20/06/2017 385,000 USD 400,529 395,891 0.34
Vale Overseas Ltd 4.375% 11/01/2022 390,000 USD 384,707 373,819 0.32
2,028,168 1,983,886 1.69
(1) See Note 1.
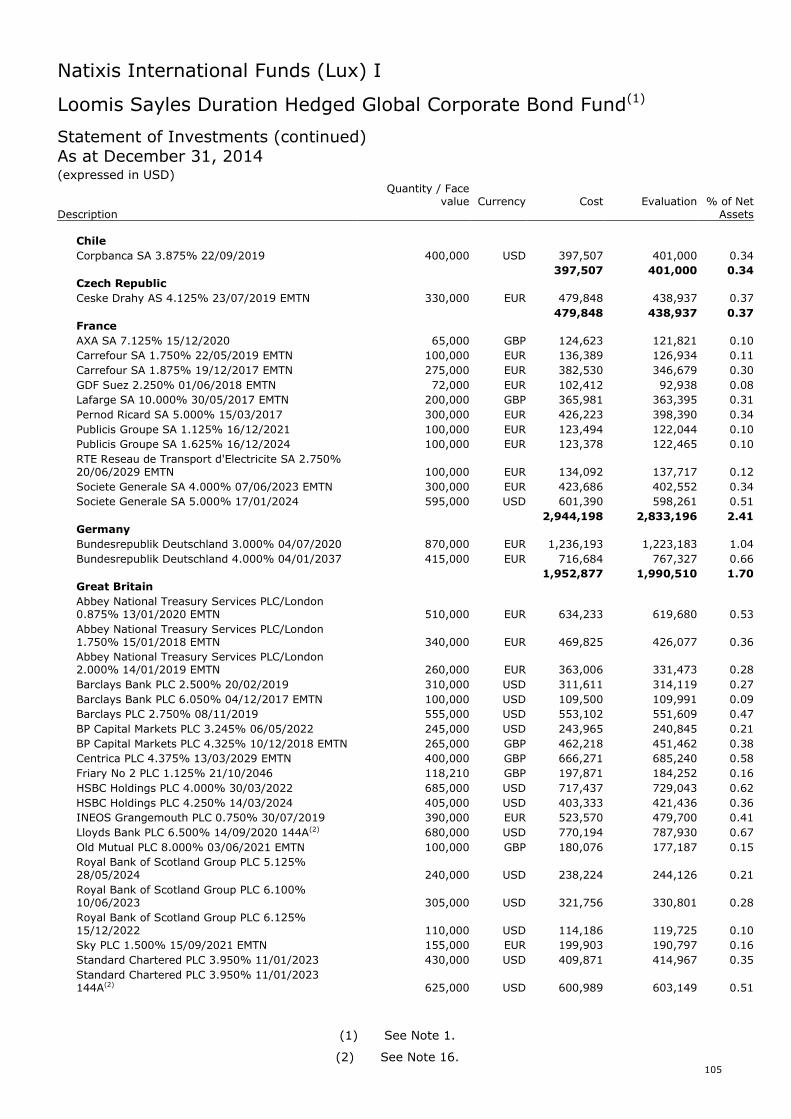
Natixis International Funds (Lux) I
105
Loomis Sayles Duration Hedged Global Corporate Bond Fund(1)
Statement of Investments (continued)As at December 31, 2014(expressed in USD)
Quantity / Facevalue Currency Cost Evaluation % of Net
Description Assets
Chile
Corpbanca SA 3.875% 22/09/2019 400,000 USD 397,507 401,000 0.34
397,507 401,000 0.34Czech Republic
Ceske Drahy AS 4.125% 23/07/2019 EMTN 330,000 EUR 479,848 438,937 0.37
479,848 438,937 0.37France
AXA SA 7.125% 15/12/2020 65,000 GBP 124,623 121,821 0.10
Carrefour SA 1.750% 22/05/2019 EMTN 100,000 EUR 136,389 126,934 0.11
Carrefour SA 1.875% 19/12/2017 EMTN 275,000 EUR 382,530 346,679 0.30
GDF Suez 2.250% 01/06/2018 EMTN 72,000 EUR 102,412 92,938 0.08
Lafarge SA 10.000% 30/05/2017 EMTN 200,000 GBP 365,981 363,395 0.31
Pernod Ricard SA 5.000% 15/03/2017 300,000 EUR 426,223 398,390 0.34
Publicis Groupe SA 1.125% 16/12/2021 100,000 EUR 123,494 122,044 0.10
Publicis Groupe SA 1.625% 16/12/2024 100,000 EUR 123,378 122,465 0.10
RTE Reseau de Transport d'Electricite SA 2.750%20/06/2029 EMTN 100,000 EUR 134,092 137,717 0.12
Societe Generale SA 4.000% 07/06/2023 EMTN 300,000 EUR 423,686 402,552 0.34
Societe Generale SA 5.000% 17/01/2024 595,000 USD 601,390 598,261 0.51
2,944,198 2,833,196 2.41Germany
Bundesrepublik Deutschland 3.000% 04/07/2020 870,000 EUR 1,236,193 1,223,183 1.04
Bundesrepublik Deutschland 4.000% 04/01/2037 415,000 EUR 716,684 767,327 0.66
1,952,877 1,990,510 1.70Great Britain
Abbey National Treasury Services PLC/London0.875% 13/01/2020 EMTN 510,000 EUR 634,233 619,680 0.53
Abbey National Treasury Services PLC/London1.750% 15/01/2018 EMTN 340,000 EUR 469,825 426,077 0.36
Abbey National Treasury Services PLC/London2.000% 14/01/2019 EMTN 260,000 EUR 363,006 331,473 0.28
Barclays Bank PLC 2.500% 20/02/2019 310,000 USD 311,611 314,119 0.27
Barclays Bank PLC 6.050% 04/12/2017 EMTN 100,000 USD 109,500 109,991 0.09
Barclays PLC 2.750% 08/11/2019 555,000 USD 553,102 551,609 0.47
BP Capital Markets PLC 3.245% 06/05/2022 245,000 USD 243,965 240,845 0.21
BP Capital Markets PLC 4.325% 10/12/2018 EMTN 265,000 GBP 462,218 451,462 0.38
Centrica PLC 4.375% 13/03/2029 EMTN 400,000 GBP 666,271 685,240 0.58
Friary No 2 PLC 1.125% 21/10/2046 118,210 GBP 197,871 184,252 0.16
HSBC Holdings PLC 4.000% 30/03/2022 685,000 USD 717,437 729,043 0.62
HSBC Holdings PLC 4.250% 14/03/2024 405,000 USD 403,333 421,436 0.36
INEOS Grangemouth PLC 0.750% 30/07/2019 390,000 EUR 523,570 479,700 0.41
Lloyds Bank PLC 6.500% 14/09/2020 144A(2) 680,000 USD 770,194 787,930 0.67
Old Mutual PLC 8.000% 03/06/2021 EMTN 100,000 GBP 180,076 177,187 0.15
Royal Bank of Scotland Group PLC 5.125%28/05/2024 240,000 USD 238,224 244,126 0.21
Royal Bank of Scotland Group PLC 6.100%10/06/2023 305,000 USD 321,756 330,801 0.28
Royal Bank of Scotland Group PLC 6.125%15/12/2022 110,000 USD 114,186 119,725 0.10
Sky PLC 1.500% 15/09/2021 EMTN 155,000 EUR 199,903 190,797 0.16
Standard Chartered PLC 3.950% 11/01/2023 430,000 USD 409,871 414,967 0.35
Standard Chartered PLC 3.950% 11/01/2023144A(2) 625,000 USD 600,989 603,149 0.51
(1) See Note 1.
(2) See Note 16.
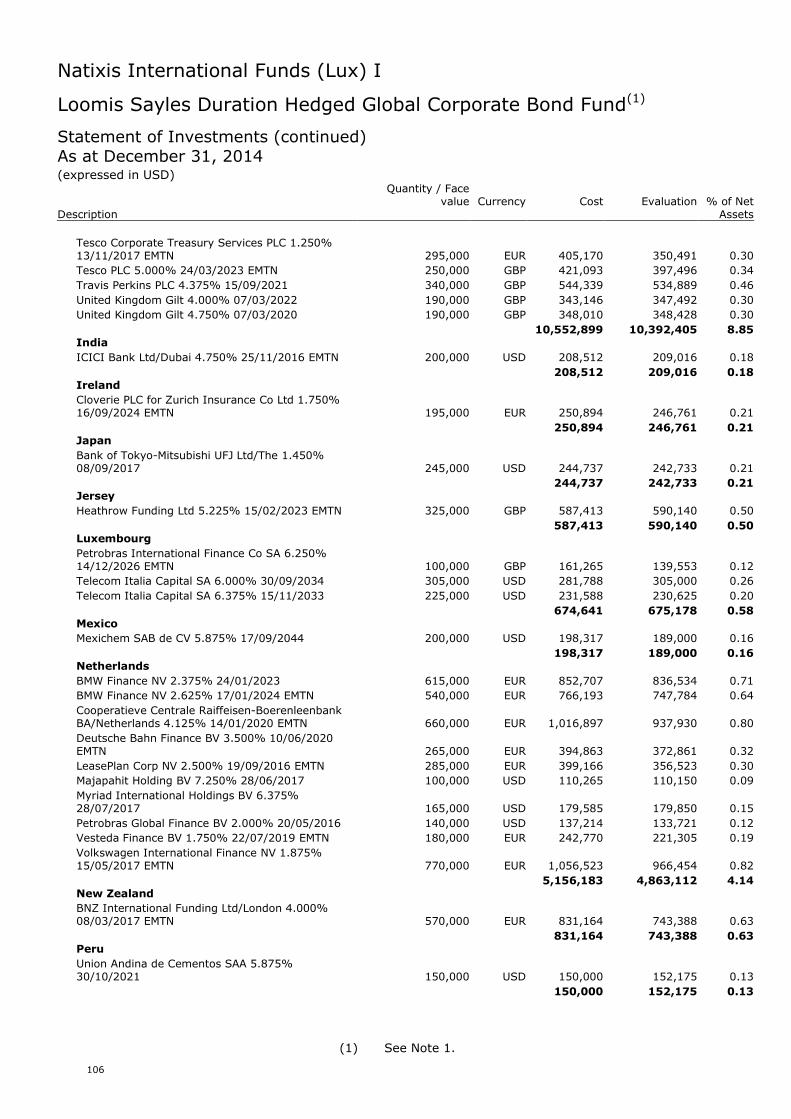
Natixis International Funds (Lux) I
106
Loomis Sayles Duration Hedged Global Corporate Bond Fund(1)
Statement of Investments (continued)As at December 31, 2014(expressed in USD)
Quantity / Facevalue Currency Cost Evaluation % of Net
Description Assets
Tesco Corporate Treasury Services PLC 1.250%13/11/2017 EMTN 295,000 EUR 405,170 350,491 0.30
Tesco PLC 5.000% 24/03/2023 EMTN 250,000 GBP 421,093 397,496 0.34
Travis Perkins PLC 4.375% 15/09/2021 340,000 GBP 544,339 534,889 0.46
United Kingdom Gilt 4.000% 07/03/2022 190,000 GBP 343,146 347,492 0.30
United Kingdom Gilt 4.750% 07/03/2020 190,000 GBP 348,010 348,428 0.30
10,552,899 10,392,405 8.85India
ICICI Bank Ltd/Dubai 4.750% 25/11/2016 EMTN 200,000 USD 208,512 209,016 0.18
208,512 209,016 0.18Ireland
Cloverie PLC for Zurich Insurance Co Ltd 1.750%16/09/2024 EMTN 195,000 EUR 250,894 246,761 0.21
250,894 246,761 0.21Japan
Bank of Tokyo-Mitsubishi UFJ Ltd/The 1.450%08/09/2017 245,000 USD 244,737 242,733 0.21
244,737 242,733 0.21Jersey
Heathrow Funding Ltd 5.225% 15/02/2023 EMTN 325,000 GBP 587,413 590,140 0.50
587,413 590,140 0.50Luxembourg
Petrobras International Finance Co SA 6.250%14/12/2026 EMTN 100,000 GBP 161,265 139,553 0.12
Telecom Italia Capital SA 6.000% 30/09/2034 305,000 USD 281,788 305,000 0.26
Telecom Italia Capital SA 6.375% 15/11/2033 225,000 USD 231,588 230,625 0.20
674,641 675,178 0.58Mexico
Mexichem SAB de CV 5.875% 17/09/2044 200,000 USD 198,317 189,000 0.16
198,317 189,000 0.16Netherlands
BMW Finance NV 2.375% 24/01/2023 615,000 EUR 852,707 836,534 0.71
BMW Finance NV 2.625% 17/01/2024 EMTN 540,000 EUR 766,193 747,784 0.64
Cooperatieve Centrale Raiffeisen-BoerenleenbankBA/Netherlands 4.125% 14/01/2020 EMTN 660,000 EUR 1,016,897 937,930 0.80
Deutsche Bahn Finance BV 3.500% 10/06/2020EMTN 265,000 EUR 394,863 372,861 0.32
LeasePlan Corp NV 2.500% 19/09/2016 EMTN 285,000 EUR 399,166 356,523 0.30
Majapahit Holding BV 7.250% 28/06/2017 100,000 USD 110,265 110,150 0.09
Myriad International Holdings BV 6.375%28/07/2017 165,000 USD 179,585 179,850 0.15
Petrobras Global Finance BV 2.000% 20/05/2016 140,000 USD 137,214 133,721 0.12
Vesteda Finance BV 1.750% 22/07/2019 EMTN 180,000 EUR 242,770 221,305 0.19
Volkswagen International Finance NV 1.875%15/05/2017 EMTN 770,000 EUR 1,056,523 966,454 0.82
5,156,183 4,863,112 4.14New Zealand
BNZ International Funding Ltd/London 4.000%08/03/2017 EMTN 570,000 EUR 831,164 743,388 0.63
831,164 743,388 0.63Peru
Union Andina de Cementos SAA 5.875%30/10/2021 150,000 USD 150,000 152,175 0.13
150,000 152,175 0.13
(1) See Note 1.
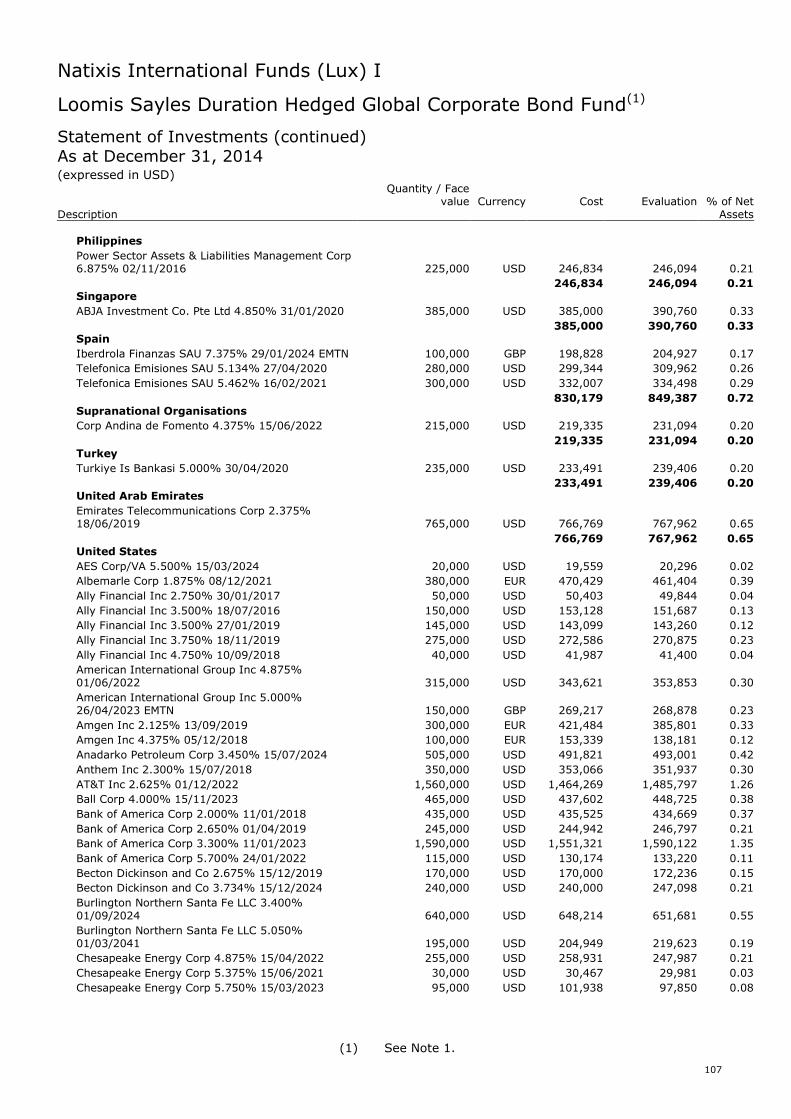
Natixis International Funds (Lux) I
107
Loomis Sayles Duration Hedged Global Corporate Bond Fund(1)
Statement of Investments (continued)As at December 31, 2014(expressed in USD)
Quantity / Facevalue Currency Cost Evaluation % of Net
Description Assets
Philippines
Power Sector Assets & Liabilities Management Corp6.875% 02/11/2016 225,000 USD 246,834 246,094 0.21
246,834 246,094 0.21Singapore
ABJA Investment Co. Pte Ltd 4.850% 31/01/2020 385,000 USD 385,000 390,760 0.33
385,000 390,760 0.33Spain
Iberdrola Finanzas SAU 7.375% 29/01/2024 EMTN 100,000 GBP 198,828 204,927 0.17
Telefonica Emisiones SAU 5.134% 27/04/2020 280,000 USD 299,344 309,962 0.26
Telefonica Emisiones SAU 5.462% 16/02/2021 300,000 USD 332,007 334,498 0.29
830,179 849,387 0.72Supranational Organisations
Corp Andina de Fomento 4.375% 15/06/2022 215,000 USD 219,335 231,094 0.20
219,335 231,094 0.20Turkey
Turkiye Is Bankasi 5.000% 30/04/2020 235,000 USD 233,491 239,406 0.20
233,491 239,406 0.20United Arab Emirates
Emirates Telecommunications Corp 2.375%18/06/2019 765,000 USD 766,769 767,962 0.65
766,769 767,962 0.65United States
AES Corp/VA 5.500% 15/03/2024 20,000 USD 19,559 20,296 0.02
Albemarle Corp 1.875% 08/12/2021 380,000 EUR 470,429 461,404 0.39
Ally Financial Inc 2.750% 30/01/2017 50,000 USD 50,403 49,844 0.04
Ally Financial Inc 3.500% 18/07/2016 150,000 USD 153,128 151,687 0.13
Ally Financial Inc 3.500% 27/01/2019 145,000 USD 143,099 143,260 0.12
Ally Financial Inc 3.750% 18/11/2019 275,000 USD 272,586 270,875 0.23
Ally Financial Inc 4.750% 10/09/2018 40,000 USD 41,987 41,400 0.04
American International Group Inc 4.875%01/06/2022 315,000 USD 343,621 353,853 0.30
American International Group Inc 5.000%26/04/2023 EMTN 150,000 GBP 269,217 268,878 0.23
Amgen Inc 2.125% 13/09/2019 300,000 EUR 421,484 385,801 0.33
Amgen Inc 4.375% 05/12/2018 100,000 EUR 153,339 138,181 0.12
Anadarko Petroleum Corp 3.450% 15/07/2024 505,000 USD 491,821 493,001 0.42
Anthem Inc 2.300% 15/07/2018 350,000 USD 353,066 351,937 0.30
AT&T Inc 2.625% 01/12/2022 1,560,000 USD 1,464,269 1,485,797 1.26
Ball Corp 4.000% 15/11/2023 465,000 USD 437,602 448,725 0.38
Bank of America Corp 2.000% 11/01/2018 435,000 USD 435,525 434,669 0.37
Bank of America Corp 2.650% 01/04/2019 245,000 USD 244,942 246,797 0.21
Bank of America Corp 3.300% 11/01/2023 1,590,000 USD 1,551,321 1,590,122 1.35
Bank of America Corp 5.700% 24/01/2022 115,000 USD 130,174 133,220 0.11
Becton Dickinson and Co 2.675% 15/12/2019 170,000 USD 170,000 172,236 0.15
Becton Dickinson and Co 3.734% 15/12/2024 240,000 USD 240,000 247,098 0.21
Burlington Northern Santa Fe LLC 3.400%01/09/2024 640,000 USD 648,214 651,681 0.55
Burlington Northern Santa Fe LLC 5.050%01/03/2041 195,000 USD 204,949 219,623 0.19
Chesapeake Energy Corp 4.875% 15/04/2022 255,000 USD 258,931 247,987 0.21
Chesapeake Energy Corp 5.375% 15/06/2021 30,000 USD 30,467 29,981 0.03
Chesapeake Energy Corp 5.750% 15/03/2023 95,000 USD 101,938 97,850 0.08
(1) See Note 1.
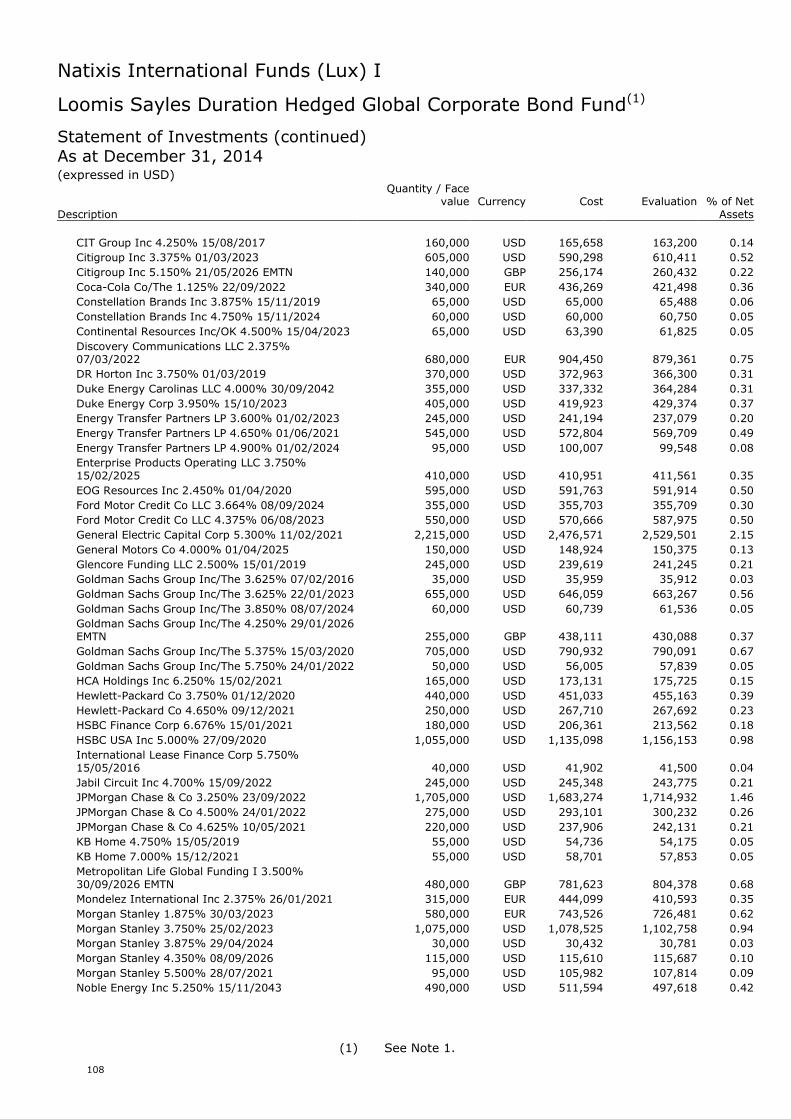
Natixis International Funds (Lux) I
108
Loomis Sayles Duration Hedged Global Corporate Bond Fund(1)
Statement of Investments (continued)As at December 31, 2014(expressed in USD)
Quantity / Facevalue Currency Cost Evaluation % of Net
Description Assets
CIT Group Inc 4.250% 15/08/2017 160,000 USD 165,658 163,200 0.14
Citigroup Inc 3.375% 01/03/2023 605,000 USD 590,298 610,411 0.52
Citigroup Inc 5.150% 21/05/2026 EMTN 140,000 GBP 256,174 260,432 0.22
Coca-Cola Co/The 1.125% 22/09/2022 340,000 EUR 436,269 421,498 0.36
Constellation Brands Inc 3.875% 15/11/2019 65,000 USD 65,000 65,488 0.06
Constellation Brands Inc 4.750% 15/11/2024 60,000 USD 60,000 60,750 0.05
Continental Resources Inc/OK 4.500% 15/04/2023 65,000 USD 63,390 61,825 0.05
Discovery Communications LLC 2.375%07/03/2022 680,000 EUR 904,450 879,361 0.75
DR Horton Inc 3.750% 01/03/2019 370,000 USD 372,963 366,300 0.31
Duke Energy Carolinas LLC 4.000% 30/09/2042 355,000 USD 337,332 364,284 0.31
Duke Energy Corp 3.950% 15/10/2023 405,000 USD 419,923 429,374 0.37
Energy Transfer Partners LP 3.600% 01/02/2023 245,000 USD 241,194 237,079 0.20
Energy Transfer Partners LP 4.650% 01/06/2021 545,000 USD 572,804 569,709 0.49
Energy Transfer Partners LP 4.900% 01/02/2024 95,000 USD 100,007 99,548 0.08
Enterprise Products Operating LLC 3.750%15/02/2025 410,000 USD 410,951 411,561 0.35
EOG Resources Inc 2.450% 01/04/2020 595,000 USD 591,763 591,914 0.50
Ford Motor Credit Co LLC 3.664% 08/09/2024 355,000 USD 355,703 355,709 0.30
Ford Motor Credit Co LLC 4.375% 06/08/2023 550,000 USD 570,666 587,975 0.50
General Electric Capital Corp 5.300% 11/02/2021 2,215,000 USD 2,476,571 2,529,501 2.15
General Motors Co 4.000% 01/04/2025 150,000 USD 148,924 150,375 0.13
Glencore Funding LLC 2.500% 15/01/2019 245,000 USD 239,619 241,245 0.21
Goldman Sachs Group Inc/The 3.625% 07/02/2016 35,000 USD 35,959 35,912 0.03
Goldman Sachs Group Inc/The 3.625% 22/01/2023 655,000 USD 646,059 663,267 0.56
Goldman Sachs Group Inc/The 3.850% 08/07/2024 60,000 USD 60,739 61,536 0.05
Goldman Sachs Group Inc/The 4.250% 29/01/2026EMTN 255,000 GBP 438,111 430,088 0.37
Goldman Sachs Group Inc/The 5.375% 15/03/2020 705,000 USD 790,932 790,091 0.67
Goldman Sachs Group Inc/The 5.750% 24/01/2022 50,000 USD 56,005 57,839 0.05
HCA Holdings Inc 6.250% 15/02/2021 165,000 USD 173,131 175,725 0.15
Hewlett-Packard Co 3.750% 01/12/2020 440,000 USD 451,033 455,163 0.39
Hewlett-Packard Co 4.650% 09/12/2021 250,000 USD 267,710 267,692 0.23
HSBC Finance Corp 6.676% 15/01/2021 180,000 USD 206,361 213,562 0.18
HSBC USA Inc 5.000% 27/09/2020 1,055,000 USD 1,135,098 1,156,153 0.98
International Lease Finance Corp 5.750%15/05/2016 40,000 USD 41,902 41,500 0.04
Jabil Circuit Inc 4.700% 15/09/2022 245,000 USD 245,348 243,775 0.21
JPMorgan Chase & Co 3.250% 23/09/2022 1,705,000 USD 1,683,274 1,714,932 1.46
JPMorgan Chase & Co 4.500% 24/01/2022 275,000 USD 293,101 300,232 0.26
JPMorgan Chase & Co 4.625% 10/05/2021 220,000 USD 237,906 242,131 0.21
KB Home 4.750% 15/05/2019 55,000 USD 54,736 54,175 0.05
KB Home 7.000% 15/12/2021 55,000 USD 58,701 57,853 0.05
Metropolitan Life Global Funding I 3.500%30/09/2026 EMTN 480,000 GBP 781,623 804,378 0.68
Mondelez International Inc 2.375% 26/01/2021 315,000 EUR 444,099 410,593 0.35
Morgan Stanley 1.875% 30/03/2023 580,000 EUR 743,526 726,481 0.62
Morgan Stanley 3.750% 25/02/2023 1,075,000 USD 1,078,525 1,102,758 0.94
Morgan Stanley 3.875% 29/04/2024 30,000 USD 30,432 30,781 0.03
Morgan Stanley 4.350% 08/09/2026 115,000 USD 115,610 115,687 0.10
Morgan Stanley 5.500% 28/07/2021 95,000 USD 105,982 107,814 0.09
Noble Energy Inc 5.250% 15/11/2043 490,000 USD 511,594 497,618 0.42
(1) See Note 1.
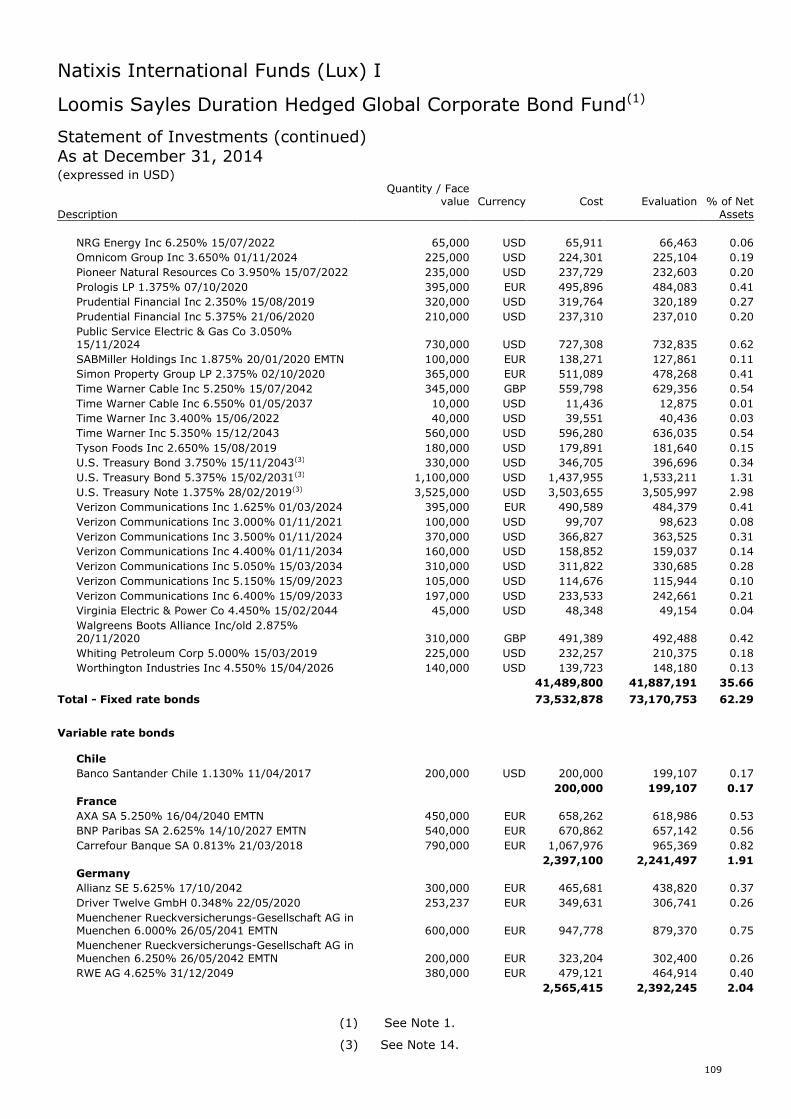
Natixis International Funds (Lux) I
109
Loomis Sayles Duration Hedged Global Corporate Bond Fund(1)
Statement of Investments (continued)As at December 31, 2014(expressed in USD)
Quantity / Facevalue Currency Cost Evaluation % of Net
Description Assets
NRG Energy Inc 6.250% 15/07/2022 65,000 USD 65,911 66,463 0.06
Omnicom Group Inc 3.650% 01/11/2024 225,000 USD 224,301 225,104 0.19
Pioneer Natural Resources Co 3.950% 15/07/2022 235,000 USD 237,729 232,603 0.20
Prologis LP 1.375% 07/10/2020 395,000 EUR 495,896 484,083 0.41
Prudential Financial Inc 2.350% 15/08/2019 320,000 USD 319,764 320,189 0.27
Prudential Financial Inc 5.375% 21/06/2020 210,000 USD 237,310 237,010 0.20
Public Service Electric & Gas Co 3.050%15/11/2024 730,000 USD 727,308 732,835 0.62
SABMiller Holdings Inc 1.875% 20/01/2020 EMTN 100,000 EUR 138,271 127,861 0.11
Simon Property Group LP 2.375% 02/10/2020 365,000 EUR 511,089 478,268 0.41
Time Warner Cable Inc 5.250% 15/07/2042 345,000 GBP 559,798 629,356 0.54
Time Warner Cable Inc 6.550% 01/05/2037 10,000 USD 11,436 12,875 0.01
Time Warner Inc 3.400% 15/06/2022 40,000 USD 39,551 40,436 0.03
Time Warner Inc 5.350% 15/12/2043 560,000 USD 596,280 636,035 0.54
Tyson Foods Inc 2.650% 15/08/2019 180,000 USD 179,891 181,640 0.15
U.S. Treasury Bond 3.750% 15/11/2043(3) 330,000 USD 346,705 396,696 0.34
U.S. Treasury Bond 5.375% 15/02/2031(3) 1,100,000 USD 1,437,955 1,533,211 1.31
U.S. Treasury Note 1.375% 28/02/2019(3) 3,525,000 USD 3,503,655 3,505,997 2.98
Verizon Communications Inc 1.625% 01/03/2024 395,000 EUR 490,589 484,379 0.41
Verizon Communications Inc 3.000% 01/11/2021 100,000 USD 99,707 98,623 0.08
Verizon Communications Inc 3.500% 01/11/2024 370,000 USD 366,827 363,525 0.31
Verizon Communications Inc 4.400% 01/11/2034 160,000 USD 158,852 159,037 0.14
Verizon Communications Inc 5.050% 15/03/2034 310,000 USD 311,822 330,685 0.28
Verizon Communications Inc 5.150% 15/09/2023 105,000 USD 114,676 115,944 0.10
Verizon Communications Inc 6.400% 15/09/2033 197,000 USD 233,533 242,661 0.21
Virginia Electric & Power Co 4.450% 15/02/2044 45,000 USD 48,348 49,154 0.04
Walgreens Boots Alliance Inc/old 2.875%20/11/2020 310,000 GBP 491,389 492,488 0.42
Whiting Petroleum Corp 5.000% 15/03/2019 225,000 USD 232,257 210,375 0.18
Worthington Industries Inc 4.550% 15/04/2026 140,000 USD 139,723 148,180 0.13
41,489,800 41,887,191 35.66
Total - Fixed rate bonds 73,532,878 73,170,753 62.29
Variable rate bonds
Chile
Banco Santander Chile 1.130% 11/04/2017 200,000 USD 200,000 199,107 0.17
200,000 199,107 0.17France
AXA SA 5.250% 16/04/2040 EMTN 450,000 EUR 658,262 618,986 0.53
BNP Paribas SA 2.625% 14/10/2027 EMTN 540,000 EUR 670,862 657,142 0.56
Carrefour Banque SA 0.813% 21/03/2018 790,000 EUR 1,067,976 965,369 0.82
2,397,100 2,241,497 1.91Germany
Allianz SE 5.625% 17/10/2042 300,000 EUR 465,681 438,820 0.37
Driver Twelve GmbH 0.348% 22/05/2020 253,237 EUR 349,631 306,741 0.26
Muenchener Rueckversicherungs-Gesellschaft AG inMuenchen 6.000% 26/05/2041 EMTN 600,000 EUR 947,778 879,370 0.75
Muenchener Rueckversicherungs-Gesellschaft AG inMuenchen 6.250% 26/05/2042 EMTN 200,000 EUR 323,204 302,400 0.26
RWE AG 4.625% 31/12/2049 380,000 EUR 479,121 464,914 0.40
2,565,415 2,392,245 2.04
(1) See Note 1.
(3) See Note 14.
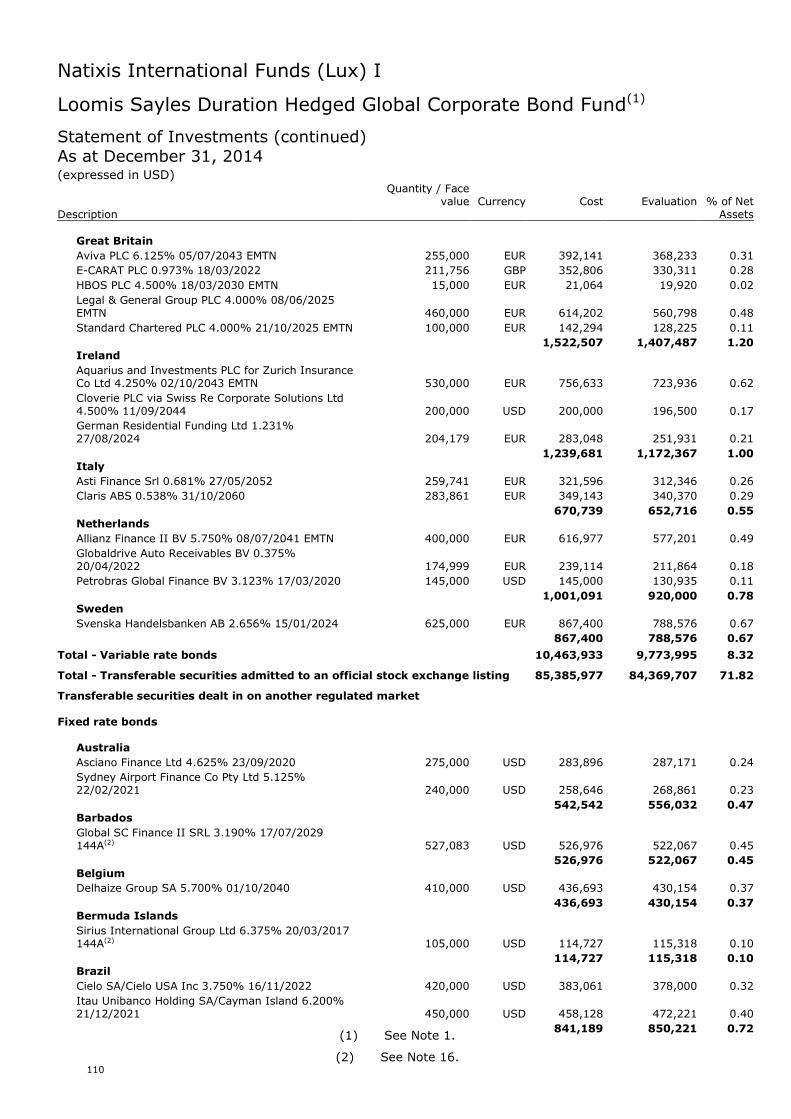
Natixis International Funds (Lux) I
110
Loomis Sayles Duration Hedged Global Corporate Bond Fund(1)
Statement of Investments (continued)As at December 31, 2014(expressed in USD)
Quantity / Facevalue Currency Cost Evaluation % of Net
Description Assets
Great Britain
Aviva PLC 6.125% 05/07/2043 EMTN 255,000 EUR 392,141 368,233 0.31
E-CARAT PLC 0.973% 18/03/2022 211,756 GBP 352,806 330,311 0.28
HBOS PLC 4.500% 18/03/2030 EMTN 15,000 EUR 21,064 19,920 0.02
Legal & General Group PLC 4.000% 08/06/2025EMTN 460,000 EUR 614,202 560,798 0.48
Standard Chartered PLC 4.000% 21/10/2025 EMTN 100,000 EUR 142,294 128,225 0.11
1,522,507 1,407,487 1.20Ireland
Aquarius and Investments PLC for Zurich InsuranceCo Ltd 4.250% 02/10/2043 EMTN 530,000 EUR 756,633 723,936 0.62
Cloverie PLC via Swiss Re Corporate Solutions Ltd4.500% 11/09/2044 200,000 USD 200,000 196,500 0.17
German Residential Funding Ltd 1.231%27/08/2024 204,179 EUR 283,048 251,931 0.21
1,239,681 1,172,367 1.00Italy
Asti Finance Srl 0.681% 27/05/2052 259,741 EUR 321,596 312,346 0.26
Claris ABS 0.538% 31/10/2060 283,861 EUR 349,143 340,370 0.29
670,739 652,716 0.55Netherlands
Allianz Finance II BV 5.750% 08/07/2041 EMTN 400,000 EUR 616,977 577,201 0.49
Globaldrive Auto Receivables BV 0.375%20/04/2022 174,999 EUR 239,114 211,864 0.18
Petrobras Global Finance BV 3.123% 17/03/2020 145,000 USD 145,000 130,935 0.11
1,001,091 920,000 0.78Sweden
Svenska Handelsbanken AB 2.656% 15/01/2024 625,000 EUR 867,400 788,576 0.67
867,400 788,576 0.67
Total - Variable rate bonds 10,463,933 9,773,995 8.32
Total - Transferable securities admitted to an official stock exchange listing 85,385,977 84,369,707 71.82
Transferable securities dealt in on another regulated market
Fixed rate bonds
Australia
Asciano Finance Ltd 4.625% 23/09/2020 275,000 USD 283,896 287,171 0.24
Sydney Airport Finance Co Pty Ltd 5.125%22/02/2021 240,000 USD 258,646 268,861 0.23
542,542 556,032 0.47Barbados
Global SC Finance II SRL 3.190% 17/07/2029144A(2) 527,083 USD 526,976 522,067 0.45
526,976 522,067 0.45Belgium
Delhaize Group SA 5.700% 01/10/2040 410,000 USD 436,693 430,154 0.37
436,693 430,154 0.37Bermuda Islands
Sirius International Group Ltd 6.375% 20/03/2017144A(2) 105,000 USD 114,727 115,318 0.10
114,727 115,318 0.10Brazil
Cielo SA/Cielo USA Inc 3.750% 16/11/2022 420,000 USD 383,061 378,000 0.32
Itau Unibanco Holding SA/Cayman Island 6.200%21/12/2021 450,000 USD 458,128 472,221 0.40
841,189 850,221 0.72(1) See Note 1.
(2) See Note 16.
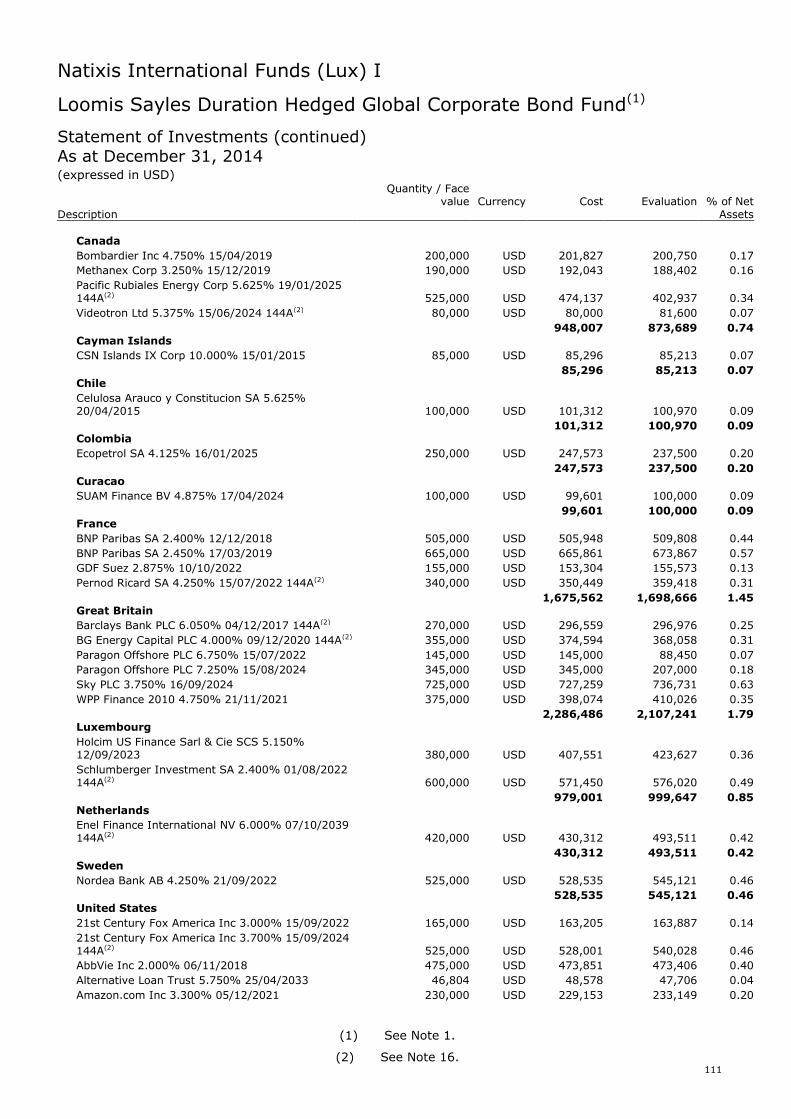
Natixis International Funds (Lux) I
111
Loomis Sayles Duration Hedged Global Corporate Bond Fund(1)
Statement of Investments (continued)As at December 31, 2014(expressed in USD)
Quantity / Facevalue Currency Cost Evaluation % of Net
Description Assets
Canada
Bombardier Inc 4.750% 15/04/2019 200,000 USD 201,827 200,750 0.17
Methanex Corp 3.250% 15/12/2019 190,000 USD 192,043 188,402 0.16
Pacific Rubiales Energy Corp 5.625% 19/01/2025144A(2) 525,000 USD 474,137 402,937 0.34
Videotron Ltd 5.375% 15/06/2024 144A(2) 80,000 USD 80,000 81,600 0.07
948,007 873,689 0.74Cayman Islands
CSN Islands IX Corp 10.000% 15/01/2015 85,000 USD 85,296 85,213 0.07
85,296 85,213 0.07Chile
Celulosa Arauco y Constitucion SA 5.625%20/04/2015 100,000 USD 101,312 100,970 0.09
101,312 100,970 0.09Colombia
Ecopetrol SA 4.125% 16/01/2025 250,000 USD 247,573 237,500 0.20
247,573 237,500 0.20Curacao
SUAM Finance BV 4.875% 17/04/2024 100,000 USD 99,601 100,000 0.09
99,601 100,000 0.09France
BNP Paribas SA 2.400% 12/12/2018 505,000 USD 505,948 509,808 0.44
BNP Paribas SA 2.450% 17/03/2019 665,000 USD 665,861 673,867 0.57
GDF Suez 2.875% 10/10/2022 155,000 USD 153,304 155,573 0.13
Pernod Ricard SA 4.250% 15/07/2022 144A(2) 340,000 USD 350,449 359,418 0.31
1,675,562 1,698,666 1.45Great Britain
Barclays Bank PLC 6.050% 04/12/2017 144A(2) 270,000 USD 296,559 296,976 0.25
BG Energy Capital PLC 4.000% 09/12/2020 144A(2) 355,000 USD 374,594 368,058 0.31
Paragon Offshore PLC 6.750% 15/07/2022 145,000 USD 145,000 88,450 0.07
Paragon Offshore PLC 7.250% 15/08/2024 345,000 USD 345,000 207,000 0.18
Sky PLC 3.750% 16/09/2024 725,000 USD 727,259 736,731 0.63
WPP Finance 2010 4.750% 21/11/2021 375,000 USD 398,074 410,026 0.35
2,286,486 2,107,241 1.79Luxembourg
Holcim US Finance Sarl & Cie SCS 5.150%12/09/2023 380,000 USD 407,551 423,627 0.36
Schlumberger Investment SA 2.400% 01/08/2022144A(2) 600,000 USD 571,450 576,020 0.49
979,001 999,647 0.85Netherlands
Enel Finance International NV 6.000% 07/10/2039144A(2) 420,000 USD 430,312 493,511 0.42
430,312 493,511 0.42Sweden
Nordea Bank AB 4.250% 21/09/2022 525,000 USD 528,535 545,121 0.46
528,535 545,121 0.46United States
21st Century Fox America Inc 3.000% 15/09/2022 165,000 USD 163,205 163,887 0.14
21st Century Fox America Inc 3.700% 15/09/2024144A(2) 525,000 USD 528,001 540,028 0.46
AbbVie Inc 2.000% 06/11/2018 475,000 USD 473,851 473,406 0.40
Alternative Loan Trust 5.750% 25/04/2033 46,804 USD 48,578 47,706 0.04
Amazon.com Inc 3.300% 05/12/2021 230,000 USD 229,153 233,149 0.20
(1) See Note 1.
(2) See Note 16.
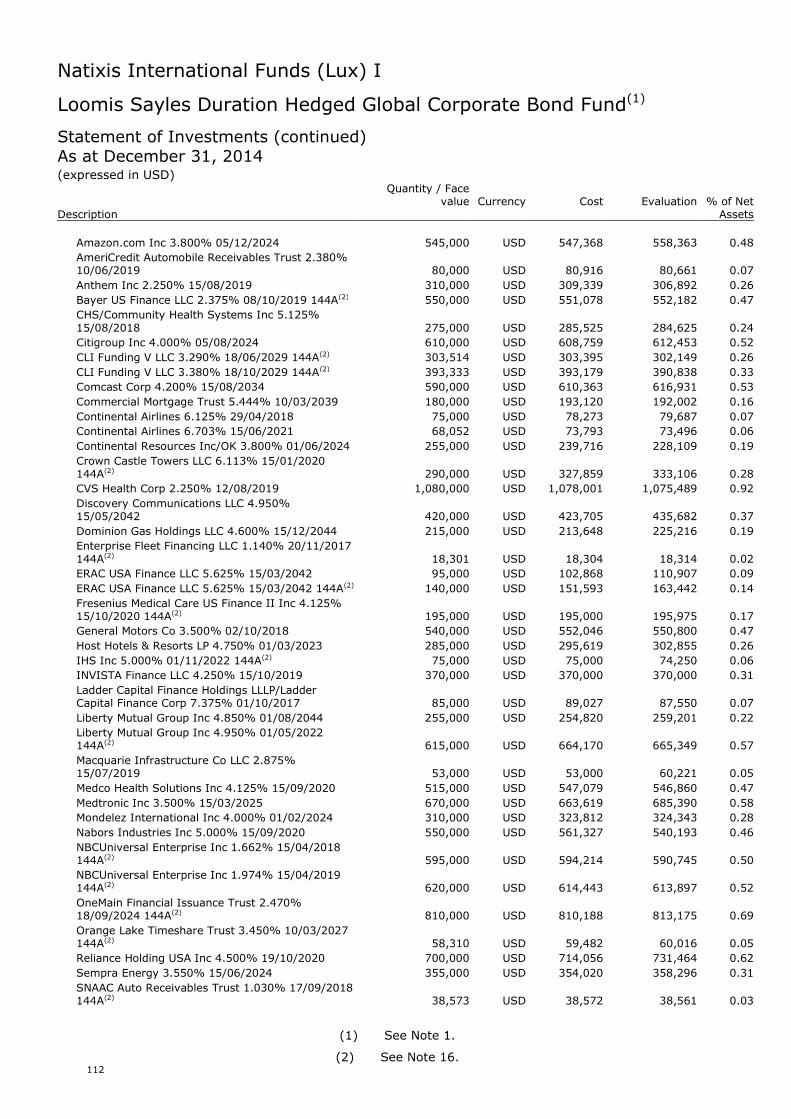
Natixis International Funds (Lux) I
112
Loomis Sayles Duration Hedged Global Corporate Bond Fund(1)
Statement of Investments (continued)As at December 31, 2014(expressed in USD)
Quantity / Facevalue Currency Cost Evaluation % of Net
Description Assets
Amazon.com Inc 3.800% 05/12/2024 545,000 USD 547,368 558,363 0.48
AmeriCredit Automobile Receivables Trust 2.380%10/06/2019 80,000 USD 80,916 80,661 0.07
Anthem Inc 2.250% 15/08/2019 310,000 USD 309,339 306,892 0.26
Bayer US Finance LLC 2.375% 08/10/2019 144A(2) 550,000 USD 551,078 552,182 0.47
CHS/Community Health Systems Inc 5.125%15/08/2018 275,000 USD 285,525 284,625 0.24
Citigroup Inc 4.000% 05/08/2024 610,000 USD 608,759 612,453 0.52
CLI Funding V LLC 3.290% 18/06/2029 144A(2) 303,514 USD 303,395 302,149 0.26
CLI Funding V LLC 3.380% 18/10/2029 144A(2) 393,333 USD 393,179 390,838 0.33
Comcast Corp 4.200% 15/08/2034 590,000 USD 610,363 616,931 0.53
Commercial Mortgage Trust 5.444% 10/03/2039 180,000 USD 193,120 192,002 0.16
Continental Airlines 6.125% 29/04/2018 75,000 USD 78,273 79,687 0.07
Continental Airlines 6.703% 15/06/2021 68,052 USD 73,793 73,496 0.06
Continental Resources Inc/OK 3.800% 01/06/2024 255,000 USD 239,716 228,109 0.19
Crown Castle Towers LLC 6.113% 15/01/2020144A(2) 290,000 USD 327,859 333,106 0.28
CVS Health Corp 2.250% 12/08/2019 1,080,000 USD 1,078,001 1,075,489 0.92
Discovery Communications LLC 4.950%15/05/2042 420,000 USD 423,705 435,682 0.37
Dominion Gas Holdings LLC 4.600% 15/12/2044 215,000 USD 213,648 225,216 0.19
Enterprise Fleet Financing LLC 1.140% 20/11/2017144A(2) 18,301 USD 18,304 18,314 0.02
ERAC USA Finance LLC 5.625% 15/03/2042 95,000 USD 102,868 110,907 0.09
ERAC USA Finance LLC 5.625% 15/03/2042 144A(2) 140,000 USD 151,593 163,442 0.14
Fresenius Medical Care US Finance II Inc 4.125%15/10/2020 144A(2) 195,000 USD 195,000 195,975 0.17
General Motors Co 3.500% 02/10/2018 540,000 USD 552,046 550,800 0.47
Host Hotels & Resorts LP 4.750% 01/03/2023 285,000 USD 295,619 302,855 0.26
IHS Inc 5.000% 01/11/2022 144A(2) 75,000 USD 75,000 74,250 0.06
INVISTA Finance LLC 4.250% 15/10/2019 370,000 USD 370,000 370,000 0.31
Ladder Capital Finance Holdings LLLP/LadderCapital Finance Corp 7.375% 01/10/2017 85,000 USD 89,027 87,550 0.07
Liberty Mutual Group Inc 4.850% 01/08/2044 255,000 USD 254,820 259,201 0.22
Liberty Mutual Group Inc 4.950% 01/05/2022144A(2) 615,000 USD 664,170 665,349 0.57
Macquarie Infrastructure Co LLC 2.875%15/07/2019 53,000 USD 53,000 60,221 0.05
Medco Health Solutions Inc 4.125% 15/09/2020 515,000 USD 547,079 546,860 0.47
Medtronic Inc 3.500% 15/03/2025 670,000 USD 663,619 685,390 0.58
Mondelez International Inc 4.000% 01/02/2024 310,000 USD 323,812 324,343 0.28
Nabors Industries Inc 5.000% 15/09/2020 550,000 USD 561,327 540,193 0.46
NBCUniversal Enterprise Inc 1.662% 15/04/2018144A(2) 595,000 USD 594,214 590,745 0.50
NBCUniversal Enterprise Inc 1.974% 15/04/2019144A(2) 620,000 USD 614,443 613,897 0.52
OneMain Financial Issuance Trust 2.470%18/09/2024 144A(2) 810,000 USD 810,188 813,175 0.69
Orange Lake Timeshare Trust 3.450% 10/03/2027144A(2) 58,310 USD 59,482 60,016 0.05
Reliance Holding USA Inc 4.500% 19/10/2020 700,000 USD 714,056 731,464 0.62
Sempra Energy 3.550% 15/06/2024 355,000 USD 354,020 358,296 0.31
SNAAC Auto Receivables Trust 1.030% 17/09/2018144A(2) 38,573 USD 38,572 38,561 0.03
(1) See Note 1.
(2) See Note 16.
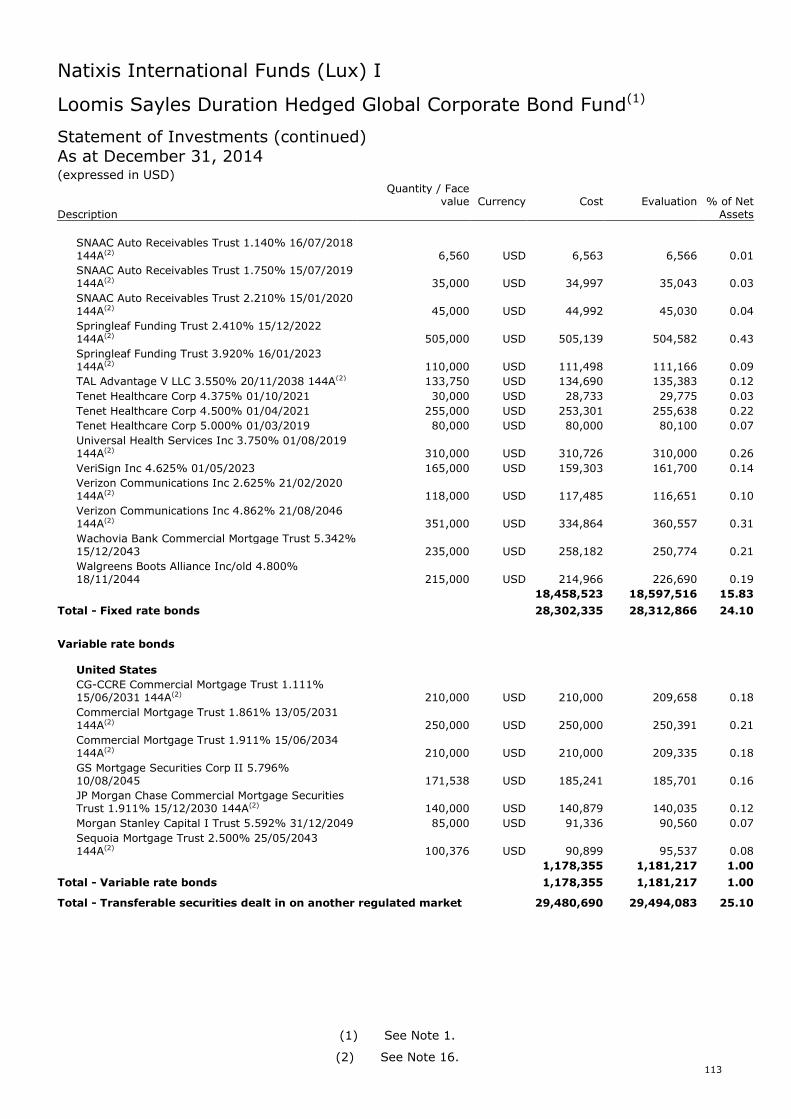
Natixis International Funds (Lux) I
113
Loomis Sayles Duration Hedged Global Corporate Bond Fund(1)
Statement of Investments (continued)As at December 31, 2014(expressed in USD)
Quantity / Facevalue Currency Cost Evaluation % of Net
Description Assets
SNAAC Auto Receivables Trust 1.140% 16/07/2018144A(2) 6,560 USD 6,563 6,566 0.01
SNAAC Auto Receivables Trust 1.750% 15/07/2019144A(2) 35,000 USD 34,997 35,043 0.03
SNAAC Auto Receivables Trust 2.210% 15/01/2020144A(2) 45,000 USD 44,992 45,030 0.04
Springleaf Funding Trust 2.410% 15/12/2022144A(2) 505,000 USD 505,139 504,582 0.43
Springleaf Funding Trust 3.920% 16/01/2023144A(2) 110,000 USD 111,498 111,166 0.09
TAL Advantage V LLC 3.550% 20/11/2038 144A(2) 133,750 USD 134,690 135,383 0.12
Tenet Healthcare Corp 4.375% 01/10/2021 30,000 USD 28,733 29,775 0.03
Tenet Healthcare Corp 4.500% 01/04/2021 255,000 USD 253,301 255,638 0.22
Tenet Healthcare Corp 5.000% 01/03/2019 80,000 USD 80,000 80,100 0.07
Universal Health Services Inc 3.750% 01/08/2019144A(2) 310,000 USD 310,726 310,000 0.26
VeriSign Inc 4.625% 01/05/2023 165,000 USD 159,303 161,700 0.14
Verizon Communications Inc 2.625% 21/02/2020144A(2) 118,000 USD 117,485 116,651 0.10
Verizon Communications Inc 4.862% 21/08/2046144A(2) 351,000 USD 334,864 360,557 0.31
Wachovia Bank Commercial Mortgage Trust 5.342%15/12/2043 235,000 USD 258,182 250,774 0.21
Walgreens Boots Alliance Inc/old 4.800%18/11/2044 215,000 USD 214,966 226,690 0.19
18,458,523 18,597,516 15.83
Total - Fixed rate bonds 28,302,335 28,312,866 24.10
Variable rate bonds
United States
CG-CCRE Commercial Mortgage Trust 1.111%15/06/2031 144A(2) 210,000 USD 210,000 209,658 0.18
Commercial Mortgage Trust 1.861% 13/05/2031144A(2) 250,000 USD 250,000 250,391 0.21
Commercial Mortgage Trust 1.911% 15/06/2034144A(2) 210,000 USD 210,000 209,335 0.18
GS Mortgage Securities Corp II 5.796%10/08/2045 171,538 USD 185,241 185,701 0.16
JP Morgan Chase Commercial Mortgage SecuritiesTrust 1.911% 15/12/2030 144A(2) 140,000 USD 140,879 140,035 0.12
Morgan Stanley Capital I Trust 5.592% 31/12/2049 85,000 USD 91,336 90,560 0.07
Sequoia Mortgage Trust 2.500% 25/05/2043144A(2) 100,376 USD 90,899 95,537 0.08
1,178,355 1,181,217 1.00
Total - Variable rate bonds 1,178,355 1,181,217 1.00
Total - Transferable securities dealt in on another regulated market 29,480,690 29,494,083 25.10
(1) See Note 1.
(2) See Note 16.

Natixis International Funds (Lux) I
114
Loomis Sayles Duration Hedged Global Corporate Bond Fund(1)
Statement of Investments (continued)As at December 31, 2014(expressed in USD)
Quantity / Facevalue Currency Cost Evaluation % of Net
Description Assets
Other transferable securities
Fixed rate bonds
Bermuda Islands
Global Container Assets Ltd 3.300% 05/11/2028144A(2) 250,000 USD 250,228 244,811 0.21
250,228 244,811 0.21United States
Walgreens Boots Alliance Inc/old 3.600%20/11/2025 135,000 GBP 213,959 216,425 0.18
213,959 216,425 0.18
Total - Fixed rate bonds 464,187 461,236 0.39
Total - Other transferable securities 464,187 461,236 0.39
TOTAL INVESTMENT PORTFOLIO 115,330,854 114,325,026 97.31
A detailed schedule of portfolio movements for the year from January 1, 2014 toDecember 31, 2014 is available free of charge upon request at the registered office of the SICAV.
(1) See Note 1.
(2) See Note 16.
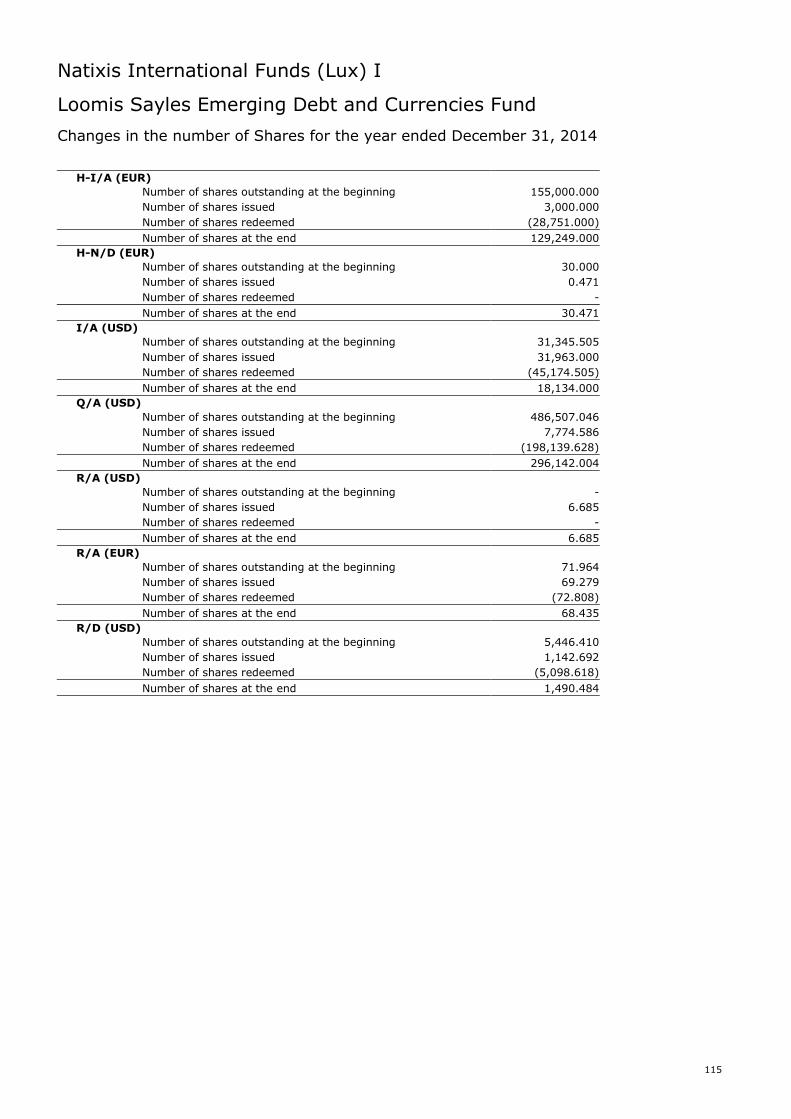
Natixis International Funds (Lux) I
115
Loomis Sayles Emerging Debt and Currencies Fund
Changes in the number of Shares for the year ended December 31, 2014
H-I/A (EUR)
Number of shares outstanding at the beginning 155,000.000
Number of shares issued 3,000.000
Number of shares redeemed (28,751.000)
Number of shares at the end 129,249.000
H-N/D (EUR)
Number of shares outstanding at the beginning 30.000
Number of shares issued 0.471
Number of shares redeemed -
Number of shares at the end 30.471
I/A (USD)
Number of shares outstanding at the beginning 31,345.505
Number of shares issued 31,963.000
Number of shares redeemed (45,174.505)
Number of shares at the end 18,134.000
Q/A (USD)
Number of shares outstanding at the beginning 486,507.046
Number of shares issued 7,774.586
Number of shares redeemed (198,139.628)
Number of shares at the end 296,142.004
R/A (USD)
Number of shares outstanding at the beginning -
Number of shares issued 6.685
Number of shares redeemed -
Number of shares at the end 6.685
R/A (EUR)
Number of shares outstanding at the beginning 71.964
Number of shares issued 69.279
Number of shares redeemed (72.808)
Number of shares at the end 68.435
R/D (USD)
Number of shares outstanding at the beginning 5,446.410
Number of shares issued 1,142.692
Number of shares redeemed (5,098.618)
Number of shares at the end 1,490.484
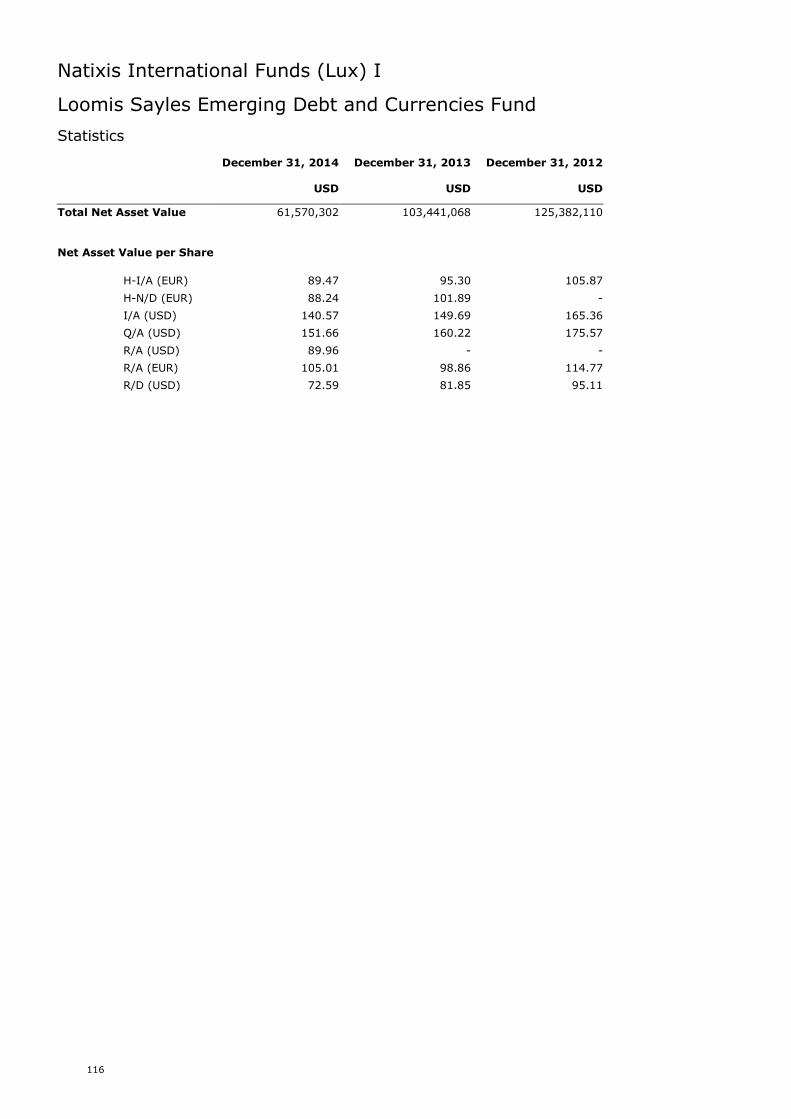
Natixis International Funds (Lux) I
116
Loomis Sayles Emerging Debt and Currencies Fund
Statistics
December 31, 2014 December 31, 2013 December 31, 2012
USD USD USD
Total Net Asset Value 61,570,302 103,441,068 125,382,110
Net Asset Value per Share
H-I/A (EUR) 89.47 95.30 105.87
H-N/D (EUR) 88.24 101.89 -
I/A (USD) 140.57 149.69 165.36
Q/A (USD) 151.66 160.22 175.57
R/A (USD) 89.96 - -
R/A (EUR) 105.01 98.86 114.77
R/D (USD) 72.59 81.85 95.11
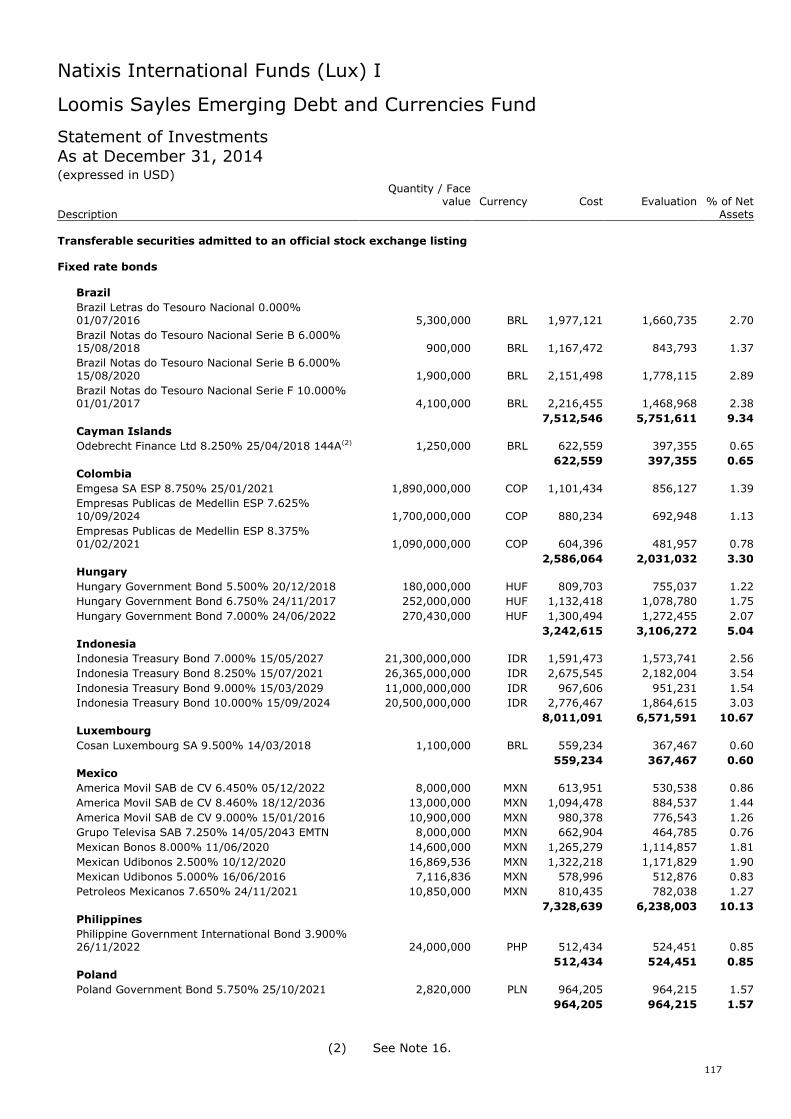
Natixis International Funds (Lux) I
117
Loomis Sayles Emerging Debt and Currencies Fund
Statement of InvestmentsAs at December 31, 2014(expressed in USD)
Quantity / Facevalue Currency Cost Evaluation % of Net
Description Assets
Transferable securities admitted to an official stock exchange listing
Fixed rate bonds
Brazil
Brazil Letras do Tesouro Nacional 0.000%01/07/2016 5,300,000 BRL 1,977,121 1,660,735 2.70
Brazil Notas do Tesouro Nacional Serie B 6.000%15/08/2018 900,000 BRL 1,167,472 843,793 1.37
Brazil Notas do Tesouro Nacional Serie B 6.000%15/08/2020 1,900,000 BRL 2,151,498 1,778,115 2.89
Brazil Notas do Tesouro Nacional Serie F 10.000%01/01/2017 4,100,000 BRL 2,216,455 1,468,968 2.38
7,512,546 5,751,611 9.34Cayman Islands
Odebrecht Finance Ltd 8.250% 25/04/2018 144A(2) 1,250,000 BRL 622,559 397,355 0.65
622,559 397,355 0.65Colombia
Emgesa SA ESP 8.750% 25/01/2021 1,890,000,000 COP 1,101,434 856,127 1.39
Empresas Publicas de Medellin ESP 7.625%10/09/2024 1,700,000,000 COP 880,234 692,948 1.13
Empresas Publicas de Medellin ESP 8.375%01/02/2021 1,090,000,000 COP 604,396 481,957 0.78
2,586,064 2,031,032 3.30Hungary
Hungary Government Bond 5.500% 20/12/2018 180,000,000 HUF 809,703 755,037 1.22
Hungary Government Bond 6.750% 24/11/2017 252,000,000 HUF 1,132,418 1,078,780 1.75
Hungary Government Bond 7.000% 24/06/2022 270,430,000 HUF 1,300,494 1,272,455 2.07
3,242,615 3,106,272 5.04Indonesia
Indonesia Treasury Bond 7.000% 15/05/2027 21,300,000,000 IDR 1,591,473 1,573,741 2.56
Indonesia Treasury Bond 8.250% 15/07/2021 26,365,000,000 IDR 2,675,545 2,182,004 3.54
Indonesia Treasury Bond 9.000% 15/03/2029 11,000,000,000 IDR 967,606 951,231 1.54
Indonesia Treasury Bond 10.000% 15/09/2024 20,500,000,000 IDR 2,776,467 1,864,615 3.03
8,011,091 6,571,591 10.67Luxembourg
Cosan Luxembourg SA 9.500% 14/03/2018 1,100,000 BRL 559,234 367,467 0.60
559,234 367,467 0.60Mexico
America Movil SAB de CV 6.450% 05/12/2022 8,000,000 MXN 613,951 530,538 0.86
America Movil SAB de CV 8.460% 18/12/2036 13,000,000 MXN 1,094,478 884,537 1.44
America Movil SAB de CV 9.000% 15/01/2016 10,900,000 MXN 980,378 776,543 1.26
Grupo Televisa SAB 7.250% 14/05/2043 EMTN 8,000,000 MXN 662,904 464,785 0.76
Mexican Bonos 8.000% 11/06/2020 14,600,000 MXN 1,265,279 1,114,857 1.81
Mexican Udibonos 2.500% 10/12/2020 16,869,536 MXN 1,322,218 1,171,829 1.90
Mexican Udibonos 5.000% 16/06/2016 7,116,836 MXN 578,996 512,876 0.83
Petroleos Mexicanos 7.650% 24/11/2021 10,850,000 MXN 810,435 782,038 1.27
7,328,639 6,238,003 10.13Philippines
Philippine Government International Bond 3.900%26/11/2022 24,000,000 PHP 512,434 524,451 0.85
512,434 524,451 0.85Poland
Poland Government Bond 5.750% 25/10/2021 2,820,000 PLN 964,205 964,215 1.57
964,205 964,215 1.57
(2) See Note 16.
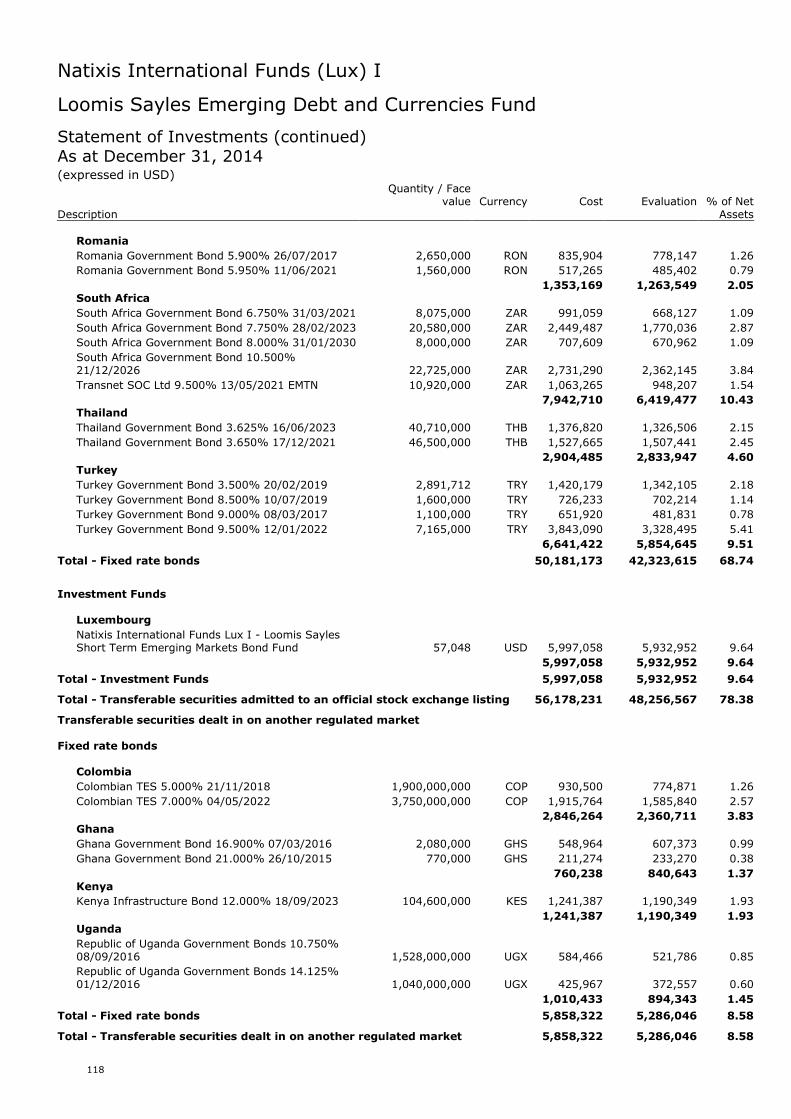
Natixis International Funds (Lux) I
118
Loomis Sayles Emerging Debt and Currencies Fund
Statement of Investments (continued)As at December 31, 2014(expressed in USD)
Quantity / Facevalue Currency Cost Evaluation % of Net
Description Assets
Romania
Romania Government Bond 5.900% 26/07/2017 2,650,000 RON 835,904 778,147 1.26
Romania Government Bond 5.950% 11/06/2021 1,560,000 RON 517,265 485,402 0.79
1,353,169 1,263,549 2.05South Africa
South Africa Government Bond 6.750% 31/03/2021 8,075,000 ZAR 991,059 668,127 1.09
South Africa Government Bond 7.750% 28/02/2023 20,580,000 ZAR 2,449,487 1,770,036 2.87
South Africa Government Bond 8.000% 31/01/2030 8,000,000 ZAR 707,609 670,962 1.09
South Africa Government Bond 10.500%21/12/2026 22,725,000 ZAR 2,731,290 2,362,145 3.84
Transnet SOC Ltd 9.500% 13/05/2021 EMTN 10,920,000 ZAR 1,063,265 948,207 1.54
7,942,710 6,419,477 10.43Thailand
Thailand Government Bond 3.625% 16/06/2023 40,710,000 THB 1,376,820 1,326,506 2.15
Thailand Government Bond 3.650% 17/12/2021 46,500,000 THB 1,527,665 1,507,441 2.45
2,904,485 2,833,947 4.60Turkey
Turkey Government Bond 3.500% 20/02/2019 2,891,712 TRY 1,420,179 1,342,105 2.18
Turkey Government Bond 8.500% 10/07/2019 1,600,000 TRY 726,233 702,214 1.14
Turkey Government Bond 9.000% 08/03/2017 1,100,000 TRY 651,920 481,831 0.78
Turkey Government Bond 9.500% 12/01/2022 7,165,000 TRY 3,843,090 3,328,495 5.41
6,641,422 5,854,645 9.51
Total - Fixed rate bonds 50,181,173 42,323,615 68.74
Investment Funds
Luxembourg
Natixis International Funds Lux I - Loomis SaylesShort Term Emerging Markets Bond Fund 57,048 USD 5,997,058 5,932,952 9.64
5,997,058 5,932,952 9.64
Total - Investment Funds 5,997,058 5,932,952 9.64
Total - Transferable securities admitted to an official stock exchange listing 56,178,231 48,256,567 78.38
Transferable securities dealt in on another regulated market
Fixed rate bonds
Colombia
Colombian TES 5.000% 21/11/2018 1,900,000,000 COP 930,500 774,871 1.26
Colombian TES 7.000% 04/05/2022 3,750,000,000 COP 1,915,764 1,585,840 2.57
2,846,264 2,360,711 3.83Ghana
Ghana Government Bond 16.900% 07/03/2016 2,080,000 GHS 548,964 607,373 0.99
Ghana Government Bond 21.000% 26/10/2015 770,000 GHS 211,274 233,270 0.38
760,238 840,643 1.37Kenya
Kenya Infrastructure Bond 12.000% 18/09/2023 104,600,000 KES 1,241,387 1,190,349 1.93
1,241,387 1,190,349 1.93Uganda
Republic of Uganda Government Bonds 10.750%08/09/2016 1,528,000,000 UGX 584,466 521,786 0.85
Republic of Uganda Government Bonds 14.125%01/12/2016 1,040,000,000 UGX 425,967 372,557 0.60
1,010,433 894,343 1.45
Total - Fixed rate bonds 5,858,322 5,286,046 8.58
Total - Transferable securities dealt in on another regulated market 5,858,322 5,286,046 8.58
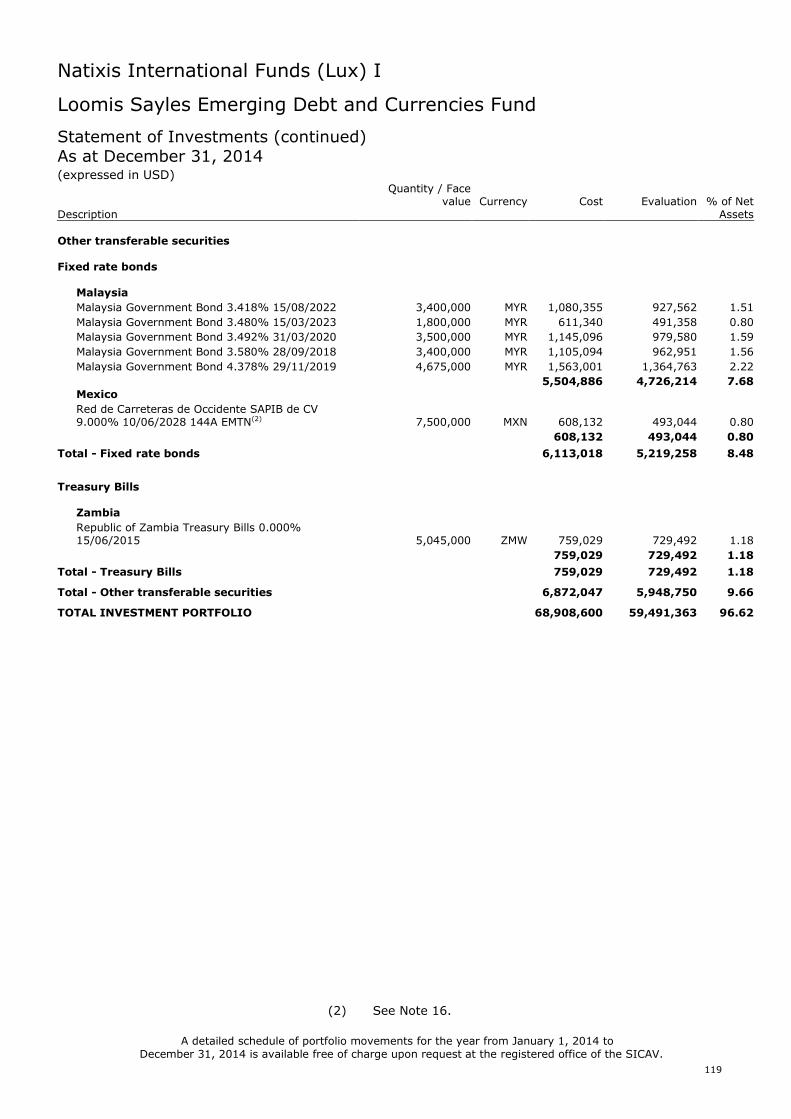
Natixis International Funds (Lux) I
119
Loomis Sayles Emerging Debt and Currencies Fund
Statement of Investments (continued)As at December 31, 2014(expressed in USD)
Quantity / Facevalue Currency Cost Evaluation % of Net
Description Assets
Other transferable securities
Fixed rate bonds
Malaysia
Malaysia Government Bond 3.418% 15/08/2022 3,400,000 MYR 1,080,355 927,562 1.51
Malaysia Government Bond 3.480% 15/03/2023 1,800,000 MYR 611,340 491,358 0.80
Malaysia Government Bond 3.492% 31/03/2020 3,500,000 MYR 1,145,096 979,580 1.59
Malaysia Government Bond 3.580% 28/09/2018 3,400,000 MYR 1,105,094 962,951 1.56
Malaysia Government Bond 4.378% 29/11/2019 4,675,000 MYR 1,563,001 1,364,763 2.22
5,504,886 4,726,214 7.68Mexico
Red de Carreteras de Occidente SAPIB de CV9.000% 10/06/2028 144A EMTN(2) 7,500,000 MXN 608,132 493,044 0.80
608,132 493,044 0.80
Total - Fixed rate bonds 6,113,018 5,219,258 8.48
Treasury Bills
Zambia
Republic of Zambia Treasury Bills 0.000%15/06/2015 5,045,000 ZMW 759,029 729,492 1.18
759,029 729,492 1.18
Total - Treasury Bills 759,029 729,492 1.18
Total - Other transferable securities 6,872,047 5,948,750 9.66
TOTAL INVESTMENT PORTFOLIO 68,908,600 59,491,363 96.62
A detailed schedule of portfolio movements for the year from January 1, 2014 toDecember 31, 2014 is available free of charge upon request at the registered office of the SICAV.
(2) See Note 16.
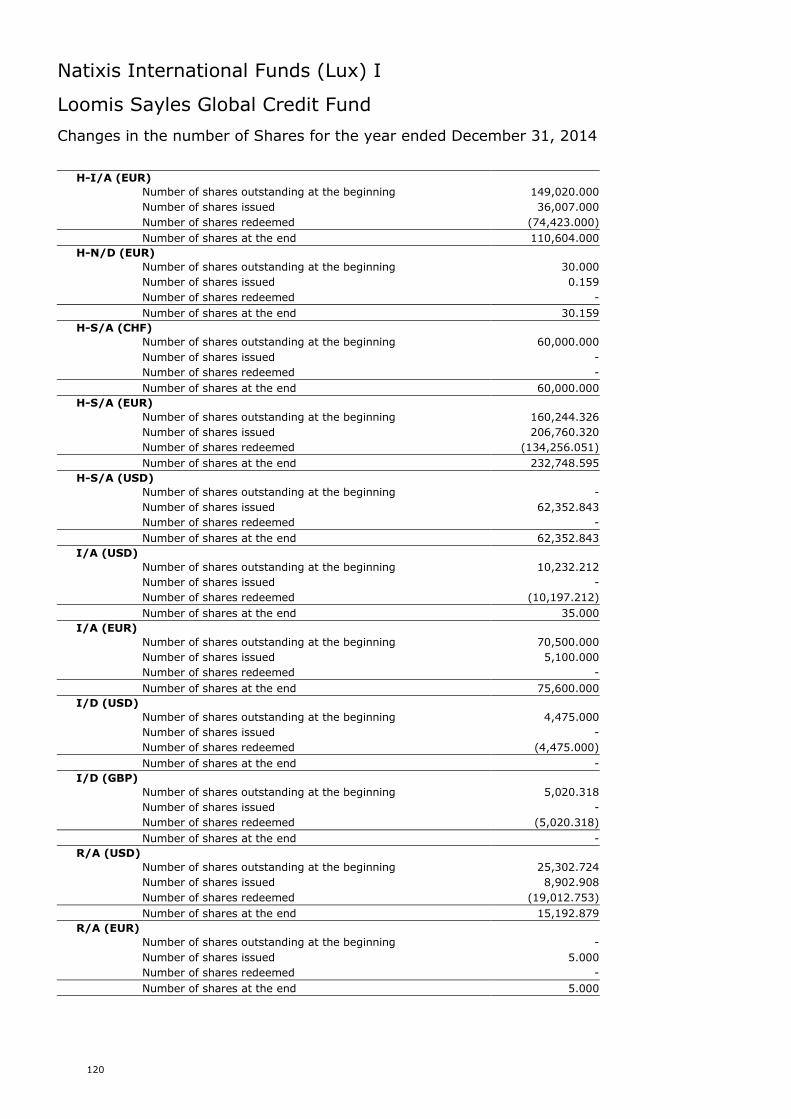
Natixis International Funds (Lux) I
120
Loomis Sayles Global Credit Fund
Changes in the number of Shares for the year ended December 31, 2014
H-I/A (EUR)
Number of shares outstanding at the beginning 149,020.000
Number of shares issued 36,007.000
Number of shares redeemed (74,423.000)
Number of shares at the end 110,604.000
H-N/D (EUR)
Number of shares outstanding at the beginning 30.000
Number of shares issued 0.159
Number of shares redeemed -
Number of shares at the end 30.159
H-S/A (CHF)
Number of shares outstanding at the beginning 60,000.000
Number of shares issued -
Number of shares redeemed -
Number of shares at the end 60,000.000
H-S/A (EUR)
Number of shares outstanding at the beginning 160,244.326
Number of shares issued 206,760.320
Number of shares redeemed (134,256.051)
Number of shares at the end 232,748.595
H-S/A (USD)
Number of shares outstanding at the beginning -
Number of shares issued 62,352.843
Number of shares redeemed -
Number of shares at the end 62,352.843
I/A (USD)
Number of shares outstanding at the beginning 10,232.212
Number of shares issued -
Number of shares redeemed (10,197.212)
Number of shares at the end 35.000
I/A (EUR)
Number of shares outstanding at the beginning 70,500.000
Number of shares issued 5,100.000
Number of shares redeemed -
Number of shares at the end 75,600.000
I/D (USD)
Number of shares outstanding at the beginning 4,475.000
Number of shares issued -
Number of shares redeemed (4,475.000)
Number of shares at the end -
I/D (GBP)
Number of shares outstanding at the beginning 5,020.318
Number of shares issued -
Number of shares redeemed (5,020.318)
Number of shares at the end -
R/A (USD)
Number of shares outstanding at the beginning 25,302.724
Number of shares issued 8,902.908
Number of shares redeemed (19,012.753)
Number of shares at the end 15,192.879
R/A (EUR)
Number of shares outstanding at the beginning -
Number of shares issued 5.000
Number of shares redeemed -
Number of shares at the end 5.000
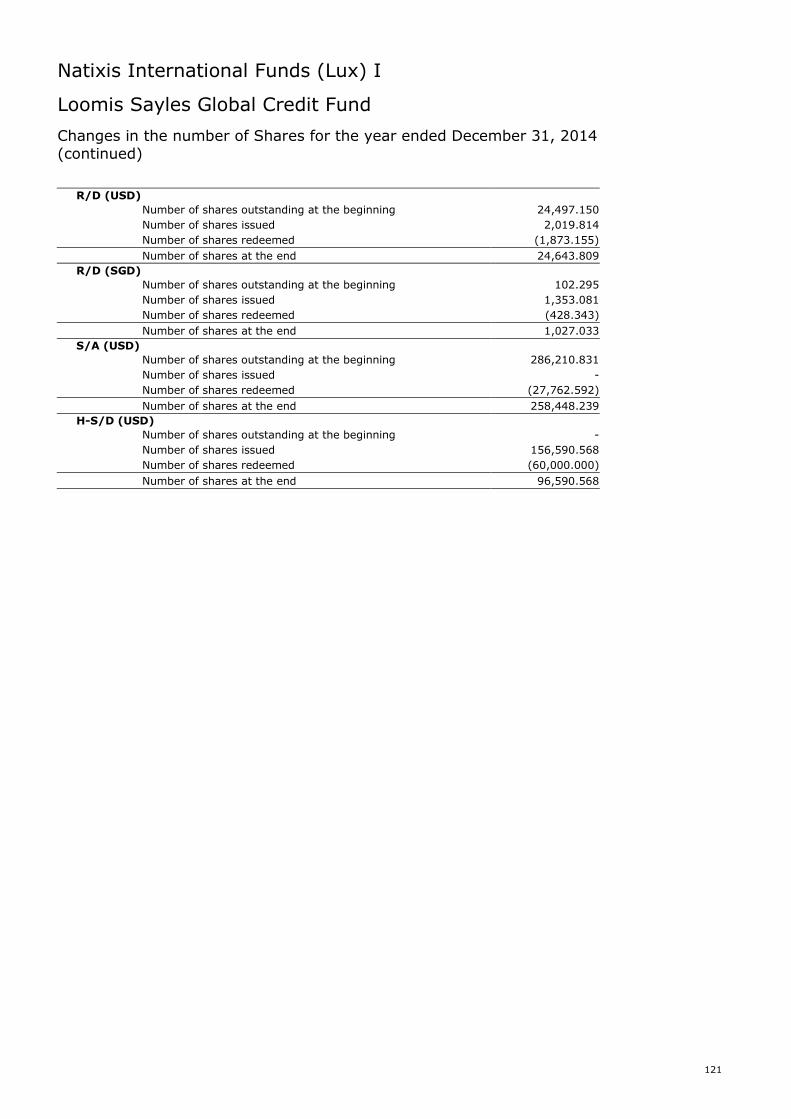
Natixis International Funds (Lux) I
121
Loomis Sayles Global Credit Fund
Changes in the number of Shares for the year ended December 31, 2014(continued)
R/D (USD)
Number of shares outstanding at the beginning 24,497.150
Number of shares issued 2,019.814
Number of shares redeemed (1,873.155)
Number of shares at the end 24,643.809
R/D (SGD)
Number of shares outstanding at the beginning 102.295
Number of shares issued 1,353.081
Number of shares redeemed (428.343)
Number of shares at the end 1,027.033
S/A (USD)
Number of shares outstanding at the beginning 286,210.831
Number of shares issued -
Number of shares redeemed (27,762.592)
Number of shares at the end 258,448.239
H-S/D (USD)
Number of shares outstanding at the beginning -
Number of shares issued 156,590.568
Number of shares redeemed (60,000.000)
Number of shares at the end 96,590.568
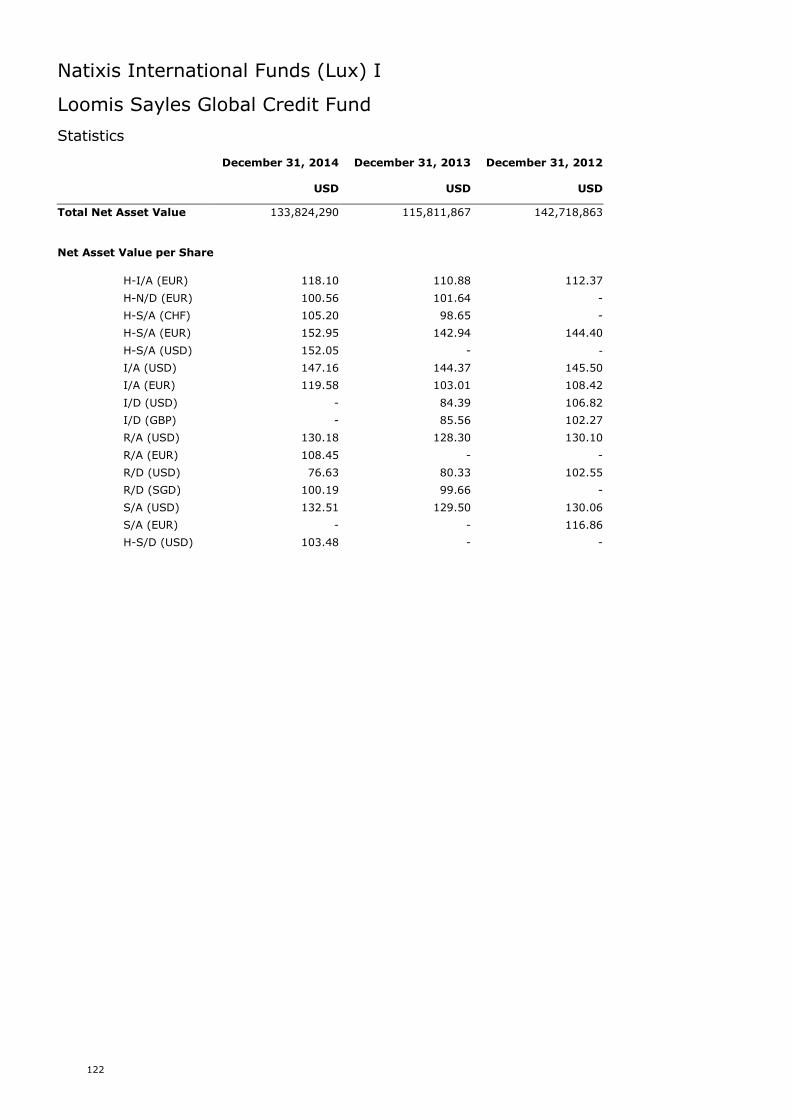
Natixis International Funds (Lux) I
122
Loomis Sayles Global Credit Fund
Statistics
December 31, 2014 December 31, 2013 December 31, 2012
USD USD USD
Total Net Asset Value 133,824,290 115,811,867 142,718,863
Net Asset Value per Share
H-I/A (EUR) 118.10 110.88 112.37
H-N/D (EUR) 100.56 101.64 -
H-S/A (CHF) 105.20 98.65 -
H-S/A (EUR) 152.95 142.94 144.40
H-S/A (USD) 152.05 - -
I/A (USD) 147.16 144.37 145.50
I/A (EUR) 119.58 103.01 108.42
I/D (USD) - 84.39 106.82
I/D (GBP) - 85.56 102.27
R/A (USD) 130.18 128.30 130.10
R/A (EUR) 108.45 - -
R/D (USD) 76.63 80.33 102.55
R/D (SGD) 100.19 99.66 -
S/A (USD) 132.51 129.50 130.06
S/A (EUR) - - 116.86
H-S/D (USD) 103.48 - -
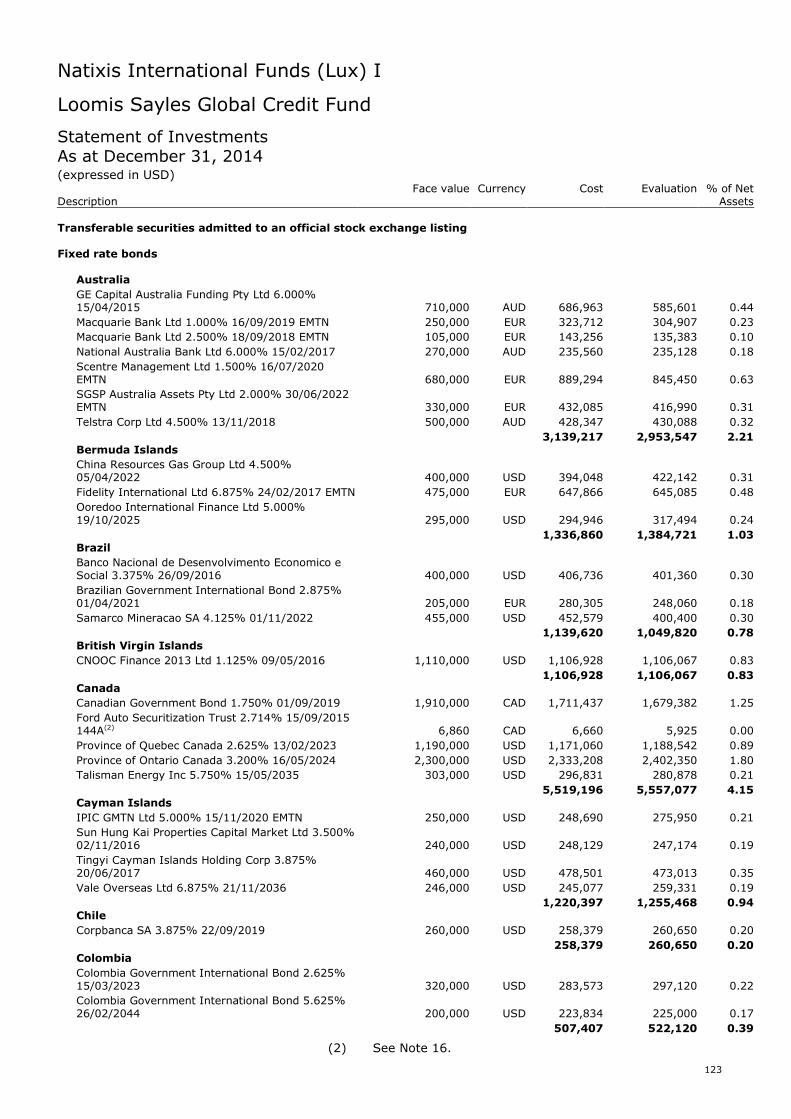
Natixis International Funds (Lux) I
123
Loomis Sayles Global Credit Fund
Statement of InvestmentsAs at December 31, 2014(expressed in USD)
Face value Currency Cost Evaluation % of NetDescription Assets
Transferable securities admitted to an official stock exchange listing
Fixed rate bonds
Australia
GE Capital Australia Funding Pty Ltd 6.000%15/04/2015 710,000 AUD 686,963 585,601 0.44
Macquarie Bank Ltd 1.000% 16/09/2019 EMTN 250,000 EUR 323,712 304,907 0.23
Macquarie Bank Ltd 2.500% 18/09/2018 EMTN 105,000 EUR 143,256 135,383 0.10
National Australia Bank Ltd 6.000% 15/02/2017 270,000 AUD 235,560 235,128 0.18
Scentre Management Ltd 1.500% 16/07/2020EMTN 680,000 EUR 889,294 845,450 0.63
SGSP Australia Assets Pty Ltd 2.000% 30/06/2022EMTN 330,000 EUR 432,085 416,990 0.31
Telstra Corp Ltd 4.500% 13/11/2018 500,000 AUD 428,347 430,088 0.32
3,139,217 2,953,547 2.21Bermuda Islands
China Resources Gas Group Ltd 4.500%05/04/2022 400,000 USD 394,048 422,142 0.31
Fidelity International Ltd 6.875% 24/02/2017 EMTN 475,000 EUR 647,866 645,085 0.48
Ooredoo International Finance Ltd 5.000%19/10/2025 295,000 USD 294,946 317,494 0.24
1,336,860 1,384,721 1.03Brazil
Banco Nacional de Desenvolvimento Economico eSocial 3.375% 26/09/2016 400,000 USD 406,736 401,360 0.30
Brazilian Government International Bond 2.875%01/04/2021 205,000 EUR 280,305 248,060 0.18
Samarco Mineracao SA 4.125% 01/11/2022 455,000 USD 452,579 400,400 0.30
1,139,620 1,049,820 0.78British Virgin Islands
CNOOC Finance 2013 Ltd 1.125% 09/05/2016 1,110,000 USD 1,106,928 1,106,067 0.83
1,106,928 1,106,067 0.83Canada
Canadian Government Bond 1.750% 01/09/2019 1,910,000 CAD 1,711,437 1,679,382 1.25
Ford Auto Securitization Trust 2.714% 15/09/2015144A(2) 6,860 CAD 6,660 5,925 0.00
Province of Quebec Canada 2.625% 13/02/2023 1,190,000 USD 1,171,060 1,188,542 0.89
Province of Ontario Canada 3.200% 16/05/2024 2,300,000 USD 2,333,208 2,402,350 1.80
Talisman Energy Inc 5.750% 15/05/2035 303,000 USD 296,831 280,878 0.21
5,519,196 5,557,077 4.15Cayman Islands
IPIC GMTN Ltd 5.000% 15/11/2020 EMTN 250,000 USD 248,690 275,950 0.21
Sun Hung Kai Properties Capital Market Ltd 3.500%02/11/2016 240,000 USD 248,129 247,174 0.19
Tingyi Cayman Islands Holding Corp 3.875%20/06/2017 460,000 USD 478,501 473,013 0.35
Vale Overseas Ltd 6.875% 21/11/2036 246,000 USD 245,077 259,331 0.19
1,220,397 1,255,468 0.94Chile
Corpbanca SA 3.875% 22/09/2019 260,000 USD 258,379 260,650 0.20
258,379 260,650 0.20Colombia
Colombia Government International Bond 2.625%15/03/2023 320,000 USD 283,573 297,120 0.22
Colombia Government International Bond 5.625%26/02/2044 200,000 USD 223,834 225,000 0.17
507,407 522,120 0.39
(2) See Note 16.
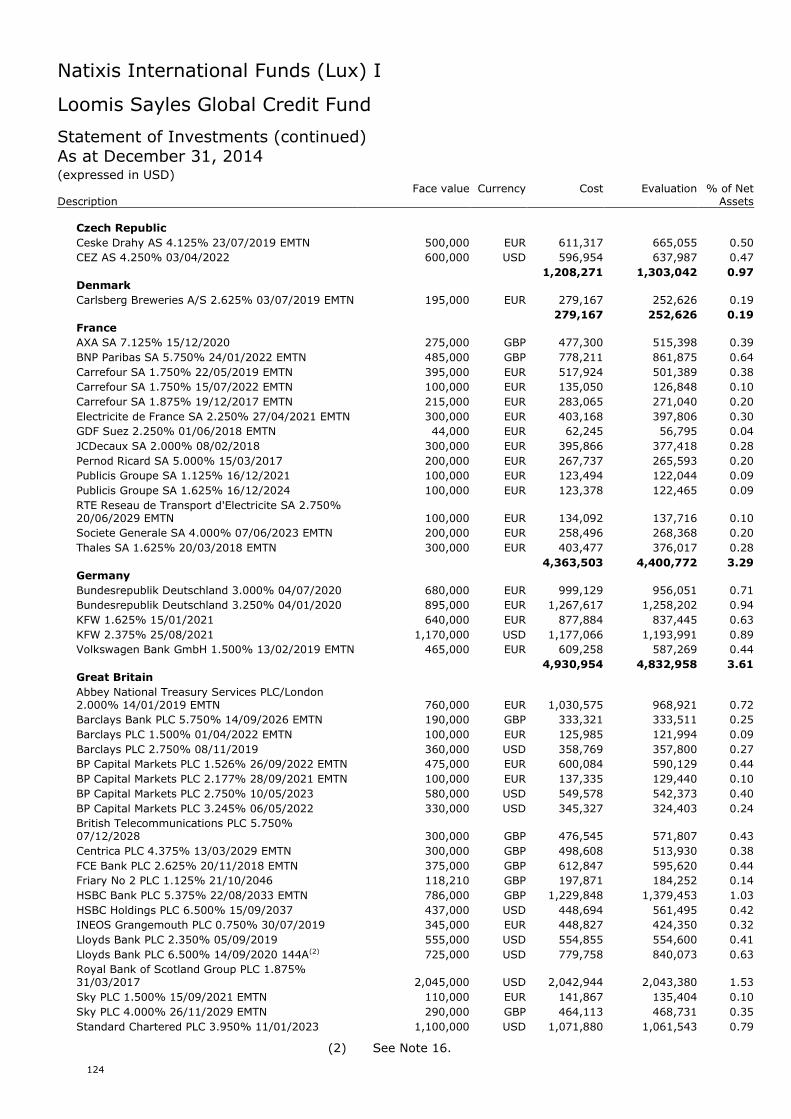
Natixis International Funds (Lux) I
124
Loomis Sayles Global Credit Fund
Statement of Investments (continued)As at December 31, 2014(expressed in USD)
Face value Currency Cost Evaluation % of NetDescription Assets
Czech Republic
Ceske Drahy AS 4.125% 23/07/2019 EMTN 500,000 EUR 611,317 665,055 0.50
CEZ AS 4.250% 03/04/2022 600,000 USD 596,954 637,987 0.47
1,208,271 1,303,042 0.97Denmark
Carlsberg Breweries A/S 2.625% 03/07/2019 EMTN 195,000 EUR 279,167 252,626 0.19
279,167 252,626 0.19France
AXA SA 7.125% 15/12/2020 275,000 GBP 477,300 515,398 0.39
BNP Paribas SA 5.750% 24/01/2022 EMTN 485,000 GBP 778,211 861,875 0.64
Carrefour SA 1.750% 22/05/2019 EMTN 395,000 EUR 517,924 501,389 0.38
Carrefour SA 1.750% 15/07/2022 EMTN 100,000 EUR 135,050 126,848 0.10
Carrefour SA 1.875% 19/12/2017 EMTN 215,000 EUR 283,065 271,040 0.20
Electricite de France SA 2.250% 27/04/2021 EMTN 300,000 EUR 403,168 397,806 0.30
GDF Suez 2.250% 01/06/2018 EMTN 44,000 EUR 62,245 56,795 0.04
JCDecaux SA 2.000% 08/02/2018 300,000 EUR 395,866 377,418 0.28
Pernod Ricard SA 5.000% 15/03/2017 200,000 EUR 267,737 265,593 0.20
Publicis Groupe SA 1.125% 16/12/2021 100,000 EUR 123,494 122,044 0.09
Publicis Groupe SA 1.625% 16/12/2024 100,000 EUR 123,378 122,465 0.09
RTE Reseau de Transport d'Electricite SA 2.750%20/06/2029 EMTN 100,000 EUR 134,092 137,716 0.10
Societe Generale SA 4.000% 07/06/2023 EMTN 200,000 EUR 258,496 268,368 0.20
Thales SA 1.625% 20/03/2018 EMTN 300,000 EUR 403,477 376,017 0.28
4,363,503 4,400,772 3.29Germany
Bundesrepublik Deutschland 3.000% 04/07/2020 680,000 EUR 999,129 956,051 0.71
Bundesrepublik Deutschland 3.250% 04/01/2020 895,000 EUR 1,267,617 1,258,202 0.94
KFW 1.625% 15/01/2021 640,000 EUR 877,884 837,445 0.63
KFW 2.375% 25/08/2021 1,170,000 USD 1,177,066 1,193,991 0.89
Volkswagen Bank GmbH 1.500% 13/02/2019 EMTN 465,000 EUR 609,258 587,269 0.44
4,930,954 4,832,958 3.61Great Britain
Abbey National Treasury Services PLC/London2.000% 14/01/2019 EMTN 760,000 EUR 1,030,575 968,921 0.72
Barclays Bank PLC 5.750% 14/09/2026 EMTN 190,000 GBP 333,321 333,511 0.25
Barclays PLC 1.500% 01/04/2022 EMTN 100,000 EUR 125,985 121,994 0.09
Barclays PLC 2.750% 08/11/2019 360,000 USD 358,769 357,800 0.27
BP Capital Markets PLC 1.526% 26/09/2022 EMTN 475,000 EUR 600,084 590,129 0.44
BP Capital Markets PLC 2.177% 28/09/2021 EMTN 100,000 EUR 137,335 129,440 0.10
BP Capital Markets PLC 2.750% 10/05/2023 580,000 USD 549,578 542,373 0.40
BP Capital Markets PLC 3.245% 06/05/2022 330,000 USD 345,327 324,403 0.24
British Telecommunications PLC 5.750%07/12/2028 300,000 GBP 476,545 571,807 0.43
Centrica PLC 4.375% 13/03/2029 EMTN 300,000 GBP 498,608 513,930 0.38
FCE Bank PLC 2.625% 20/11/2018 EMTN 375,000 GBP 612,847 595,620 0.44
Friary No 2 PLC 1.125% 21/10/2046 118,210 GBP 197,871 184,252 0.14
HSBC Bank PLC 5.375% 22/08/2033 EMTN 786,000 GBP 1,229,848 1,379,453 1.03
HSBC Holdings PLC 6.500% 15/09/2037 437,000 USD 448,694 561,495 0.42
INEOS Grangemouth PLC 0.750% 30/07/2019 345,000 EUR 448,827 424,350 0.32
Lloyds Bank PLC 2.350% 05/09/2019 555,000 USD 554,855 554,600 0.41
Lloyds Bank PLC 6.500% 14/09/2020 144A(2) 725,000 USD 779,758 840,073 0.63
Royal Bank of Scotland Group PLC 1.875%31/03/2017 2,045,000 USD 2,042,944 2,043,380 1.53
Sky PLC 1.500% 15/09/2021 EMTN 110,000 EUR 141,867 135,404 0.10
Sky PLC 4.000% 26/11/2029 EMTN 290,000 GBP 464,113 468,731 0.35
Standard Chartered PLC 3.950% 11/01/2023 1,100,000 USD 1,071,880 1,061,543 0.79
(2) See Note 16.
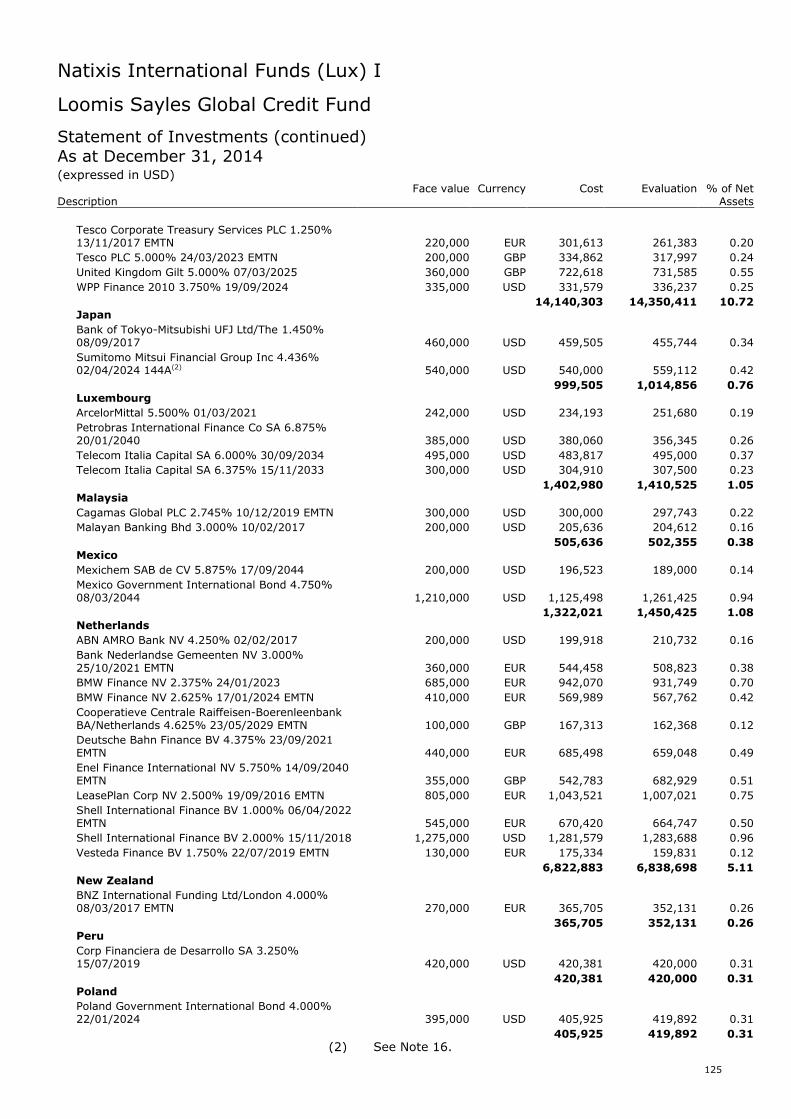
Natixis International Funds (Lux) I
125
Loomis Sayles Global Credit Fund
Statement of Investments (continued)As at December 31, 2014(expressed in USD)
Face value Currency Cost Evaluation % of NetDescription Assets
Tesco Corporate Treasury Services PLC 1.250%13/11/2017 EMTN 220,000 EUR 301,613 261,383 0.20
Tesco PLC 5.000% 24/03/2023 EMTN 200,000 GBP 334,862 317,997 0.24
United Kingdom Gilt 5.000% 07/03/2025 360,000 GBP 722,618 731,585 0.55
WPP Finance 2010 3.750% 19/09/2024 335,000 USD 331,579 336,237 0.25
14,140,303 14,350,411 10.72Japan
Bank of Tokyo-Mitsubishi UFJ Ltd/The 1.450%08/09/2017 460,000 USD 459,505 455,744 0.34
Sumitomo Mitsui Financial Group Inc 4.436%02/04/2024 144A(2) 540,000 USD 540,000 559,112 0.42
999,505 1,014,856 0.76Luxembourg
ArcelorMittal 5.500% 01/03/2021 242,000 USD 234,193 251,680 0.19
Petrobras International Finance Co SA 6.875%20/01/2040 385,000 USD 380,060 356,345 0.26
Telecom Italia Capital SA 6.000% 30/09/2034 495,000 USD 483,817 495,000 0.37
Telecom Italia Capital SA 6.375% 15/11/2033 300,000 USD 304,910 307,500 0.23
1,402,980 1,410,525 1.05Malaysia
Cagamas Global PLC 2.745% 10/12/2019 EMTN 300,000 USD 300,000 297,743 0.22
Malayan Banking Bhd 3.000% 10/02/2017 200,000 USD 205,636 204,612 0.16
505,636 502,355 0.38Mexico
Mexichem SAB de CV 5.875% 17/09/2044 200,000 USD 196,523 189,000 0.14
Mexico Government International Bond 4.750%08/03/2044 1,210,000 USD 1,125,498 1,261,425 0.94
1,322,021 1,450,425 1.08Netherlands
ABN AMRO Bank NV 4.250% 02/02/2017 200,000 USD 199,918 210,732 0.16
Bank Nederlandse Gemeenten NV 3.000%25/10/2021 EMTN 360,000 EUR 544,458 508,823 0.38
BMW Finance NV 2.375% 24/01/2023 685,000 EUR 942,070 931,749 0.70
BMW Finance NV 2.625% 17/01/2024 EMTN 410,000 EUR 569,989 567,762 0.42
Cooperatieve Centrale Raiffeisen-BoerenleenbankBA/Netherlands 4.625% 23/05/2029 EMTN 100,000 GBP 167,313 162,368 0.12
Deutsche Bahn Finance BV 4.375% 23/09/2021EMTN 440,000 EUR 685,498 659,048 0.49
Enel Finance International NV 5.750% 14/09/2040EMTN 355,000 GBP 542,783 682,929 0.51
LeasePlan Corp NV 2.500% 19/09/2016 EMTN 805,000 EUR 1,043,521 1,007,021 0.75
Shell International Finance BV 1.000% 06/04/2022EMTN 545,000 EUR 670,420 664,747 0.50
Shell International Finance BV 2.000% 15/11/2018 1,275,000 USD 1,281,579 1,283,688 0.96
Vesteda Finance BV 1.750% 22/07/2019 EMTN 130,000 EUR 175,334 159,831 0.12
6,822,883 6,838,698 5.11New Zealand
BNZ International Funding Ltd/London 4.000%08/03/2017 EMTN 270,000 EUR 365,705 352,131 0.26
365,705 352,131 0.26Peru
Corp Financiera de Desarrollo SA 3.250%15/07/2019 420,000 USD 420,381 420,000 0.31
420,381 420,000 0.31Poland
Poland Government International Bond 4.000%22/01/2024 395,000 USD 405,925 419,892 0.31
405,925 419,892 0.31
(2) See Note 16.
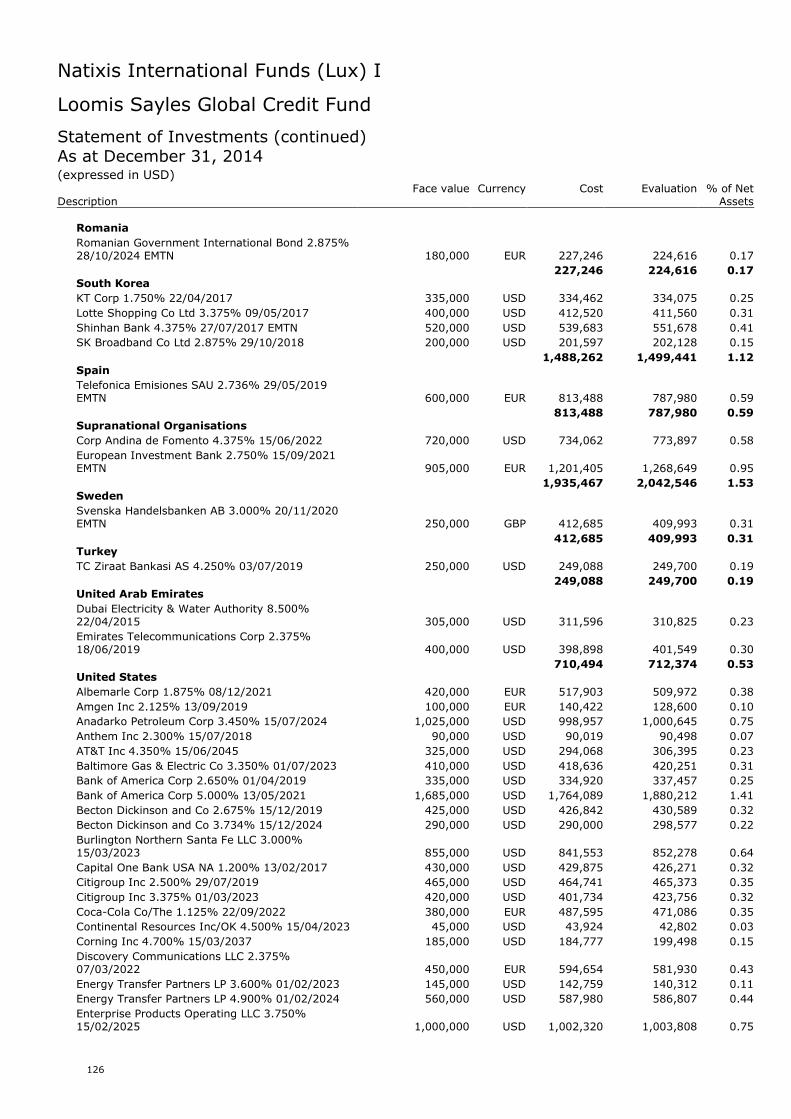
Natixis International Funds (Lux) I
126
Loomis Sayles Global Credit Fund
Statement of Investments (continued)As at December 31, 2014(expressed in USD)
Face value Currency Cost Evaluation % of NetDescription Assets
Romania
Romanian Government International Bond 2.875%28/10/2024 EMTN 180,000 EUR 227,246 224,616 0.17
227,246 224,616 0.17South Korea
KT Corp 1.750% 22/04/2017 335,000 USD 334,462 334,075 0.25
Lotte Shopping Co Ltd 3.375% 09/05/2017 400,000 USD 412,520 411,560 0.31
Shinhan Bank 4.375% 27/07/2017 EMTN 520,000 USD 539,683 551,678 0.41
SK Broadband Co Ltd 2.875% 29/10/2018 200,000 USD 201,597 202,128 0.15
1,488,262 1,499,441 1.12Spain
Telefonica Emisiones SAU 2.736% 29/05/2019EMTN 600,000 EUR 813,488 787,980 0.59
813,488 787,980 0.59Supranational Organisations
Corp Andina de Fomento 4.375% 15/06/2022 720,000 USD 734,062 773,897 0.58
European Investment Bank 2.750% 15/09/2021EMTN 905,000 EUR 1,201,405 1,268,649 0.95
1,935,467 2,042,546 1.53Sweden
Svenska Handelsbanken AB 3.000% 20/11/2020EMTN 250,000 GBP 412,685 409,993 0.31
412,685 409,993 0.31Turkey
TC Ziraat Bankasi AS 4.250% 03/07/2019 250,000 USD 249,088 249,700 0.19
249,088 249,700 0.19United Arab Emirates
Dubai Electricity & Water Authority 8.500%22/04/2015 305,000 USD 311,596 310,825 0.23
Emirates Telecommunications Corp 2.375%18/06/2019 400,000 USD 398,898 401,549 0.30
710,494 712,374 0.53United States
Albemarle Corp 1.875% 08/12/2021 420,000 EUR 517,903 509,972 0.38
Amgen Inc 2.125% 13/09/2019 100,000 EUR 140,422 128,600 0.10
Anadarko Petroleum Corp 3.450% 15/07/2024 1,025,000 USD 998,957 1,000,645 0.75
Anthem Inc 2.300% 15/07/2018 90,000 USD 90,019 90,498 0.07
AT&T Inc 4.350% 15/06/2045 325,000 USD 294,068 306,395 0.23
Baltimore Gas & Electric Co 3.350% 01/07/2023 410,000 USD 418,636 420,251 0.31
Bank of America Corp 2.650% 01/04/2019 335,000 USD 334,920 337,457 0.25
Bank of America Corp 5.000% 13/05/2021 1,685,000 USD 1,764,089 1,880,212 1.41
Becton Dickinson and Co 2.675% 15/12/2019 425,000 USD 426,842 430,589 0.32
Becton Dickinson and Co 3.734% 15/12/2024 290,000 USD 290,000 298,577 0.22
Burlington Northern Santa Fe LLC 3.000%15/03/2023 855,000 USD 841,553 852,278 0.64
Capital One Bank USA NA 1.200% 13/02/2017 430,000 USD 429,875 426,271 0.32
Citigroup Inc 2.500% 29/07/2019 465,000 USD 464,741 465,373 0.35
Citigroup Inc 3.375% 01/03/2023 420,000 USD 401,734 423,756 0.32
Coca-Cola Co/The 1.125% 22/09/2022 380,000 EUR 487,595 471,086 0.35
Continental Resources Inc/OK 4.500% 15/04/2023 45,000 USD 43,924 42,802 0.03
Corning Inc 4.700% 15/03/2037 185,000 USD 184,777 199,498 0.15
Discovery Communications LLC 2.375%07/03/2022 450,000 EUR 594,654 581,930 0.43
Energy Transfer Partners LP 3.600% 01/02/2023 145,000 USD 142,759 140,312 0.11
Energy Transfer Partners LP 4.900% 01/02/2024 560,000 USD 587,980 586,807 0.44
Enterprise Products Operating LLC 3.750%15/02/2025 1,000,000 USD 1,002,320 1,003,808 0.75
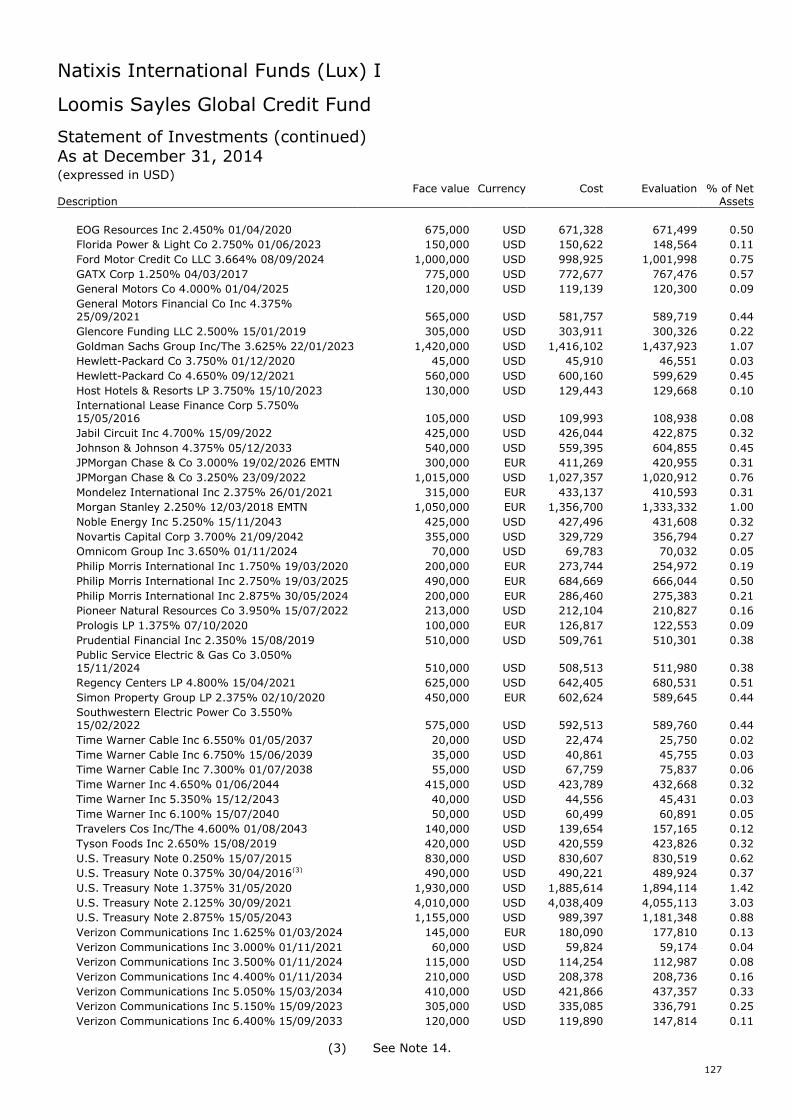
Natixis International Funds (Lux) I
127
Loomis Sayles Global Credit Fund
Statement of Investments (continued)As at December 31, 2014(expressed in USD)
Face value Currency Cost Evaluation % of NetDescription Assets
EOG Resources Inc 2.450% 01/04/2020 675,000 USD 671,328 671,499 0.50
Florida Power & Light Co 2.750% 01/06/2023 150,000 USD 150,622 148,564 0.11
Ford Motor Credit Co LLC 3.664% 08/09/2024 1,000,000 USD 998,925 1,001,998 0.75
GATX Corp 1.250% 04/03/2017 775,000 USD 772,677 767,476 0.57
General Motors Co 4.000% 01/04/2025 120,000 USD 119,139 120,300 0.09
General Motors Financial Co Inc 4.375%25/09/2021 565,000 USD 581,757 589,719 0.44
Glencore Funding LLC 2.500% 15/01/2019 305,000 USD 303,911 300,326 0.22
Goldman Sachs Group Inc/The 3.625% 22/01/2023 1,420,000 USD 1,416,102 1,437,923 1.07
Hewlett-Packard Co 3.750% 01/12/2020 45,000 USD 45,910 46,551 0.03
Hewlett-Packard Co 4.650% 09/12/2021 560,000 USD 600,160 599,629 0.45
Host Hotels & Resorts LP 3.750% 15/10/2023 130,000 USD 129,443 129,668 0.10
International Lease Finance Corp 5.750%15/05/2016 105,000 USD 109,993 108,938 0.08
Jabil Circuit Inc 4.700% 15/09/2022 425,000 USD 426,044 422,875 0.32
Johnson & Johnson 4.375% 05/12/2033 540,000 USD 559,395 604,855 0.45
JPMorgan Chase & Co 3.000% 19/02/2026 EMTN 300,000 EUR 411,269 420,955 0.31
JPMorgan Chase & Co 3.250% 23/09/2022 1,015,000 USD 1,027,357 1,020,912 0.76
Mondelez International Inc 2.375% 26/01/2021 315,000 EUR 433,137 410,593 0.31
Morgan Stanley 2.250% 12/03/2018 EMTN 1,050,000 EUR 1,356,700 1,333,332 1.00
Noble Energy Inc 5.250% 15/11/2043 425,000 USD 427,496 431,608 0.32
Novartis Capital Corp 3.700% 21/09/2042 355,000 USD 329,729 356,794 0.27
Omnicom Group Inc 3.650% 01/11/2024 70,000 USD 69,783 70,032 0.05
Philip Morris International Inc 1.750% 19/03/2020 200,000 EUR 273,744 254,972 0.19
Philip Morris International Inc 2.750% 19/03/2025 490,000 EUR 684,669 666,044 0.50
Philip Morris International Inc 2.875% 30/05/2024 200,000 EUR 286,460 275,383 0.21
Pioneer Natural Resources Co 3.950% 15/07/2022 213,000 USD 212,104 210,827 0.16
Prologis LP 1.375% 07/10/2020 100,000 EUR 126,817 122,553 0.09
Prudential Financial Inc 2.350% 15/08/2019 510,000 USD 509,761 510,301 0.38
Public Service Electric & Gas Co 3.050%15/11/2024 510,000 USD 508,513 511,980 0.38
Regency Centers LP 4.800% 15/04/2021 625,000 USD 642,405 680,531 0.51
Simon Property Group LP 2.375% 02/10/2020 450,000 EUR 602,624 589,645 0.44
Southwestern Electric Power Co 3.550%15/02/2022 575,000 USD 592,513 589,760 0.44
Time Warner Cable Inc 6.550% 01/05/2037 20,000 USD 22,474 25,750 0.02
Time Warner Cable Inc 6.750% 15/06/2039 35,000 USD 40,861 45,755 0.03
Time Warner Cable Inc 7.300% 01/07/2038 55,000 USD 67,759 75,837 0.06
Time Warner Inc 4.650% 01/06/2044 415,000 USD 423,789 432,668 0.32
Time Warner Inc 5.350% 15/12/2043 40,000 USD 44,556 45,431 0.03
Time Warner Inc 6.100% 15/07/2040 50,000 USD 60,499 60,891 0.05
Travelers Cos Inc/The 4.600% 01/08/2043 140,000 USD 139,654 157,165 0.12
Tyson Foods Inc 2.650% 15/08/2019 420,000 USD 420,559 423,826 0.32
U.S. Treasury Note 0.250% 15/07/2015 830,000 USD 830,607 830,519 0.62
U.S. Treasury Note 0.375% 30/04/2016(3) 490,000 USD 490,221 489,924 0.37
U.S. Treasury Note 1.375% 31/05/2020 1,930,000 USD 1,885,614 1,894,114 1.42
U.S. Treasury Note 2.125% 30/09/2021 4,010,000 USD 4,038,409 4,055,113 3.03
U.S. Treasury Note 2.875% 15/05/2043 1,155,000 USD 989,397 1,181,348 0.88
Verizon Communications Inc 1.625% 01/03/2024 145,000 EUR 180,090 177,810 0.13
Verizon Communications Inc 3.000% 01/11/2021 60,000 USD 59,824 59,174 0.04
Verizon Communications Inc 3.500% 01/11/2024 115,000 USD 114,254 112,987 0.08
Verizon Communications Inc 4.400% 01/11/2034 210,000 USD 208,378 208,736 0.16
Verizon Communications Inc 5.050% 15/03/2034 410,000 USD 421,866 437,357 0.33
Verizon Communications Inc 5.150% 15/09/2023 305,000 USD 335,085 336,791 0.25
Verizon Communications Inc 6.400% 15/09/2033 120,000 USD 119,890 147,814 0.11
(3) See Note 14.
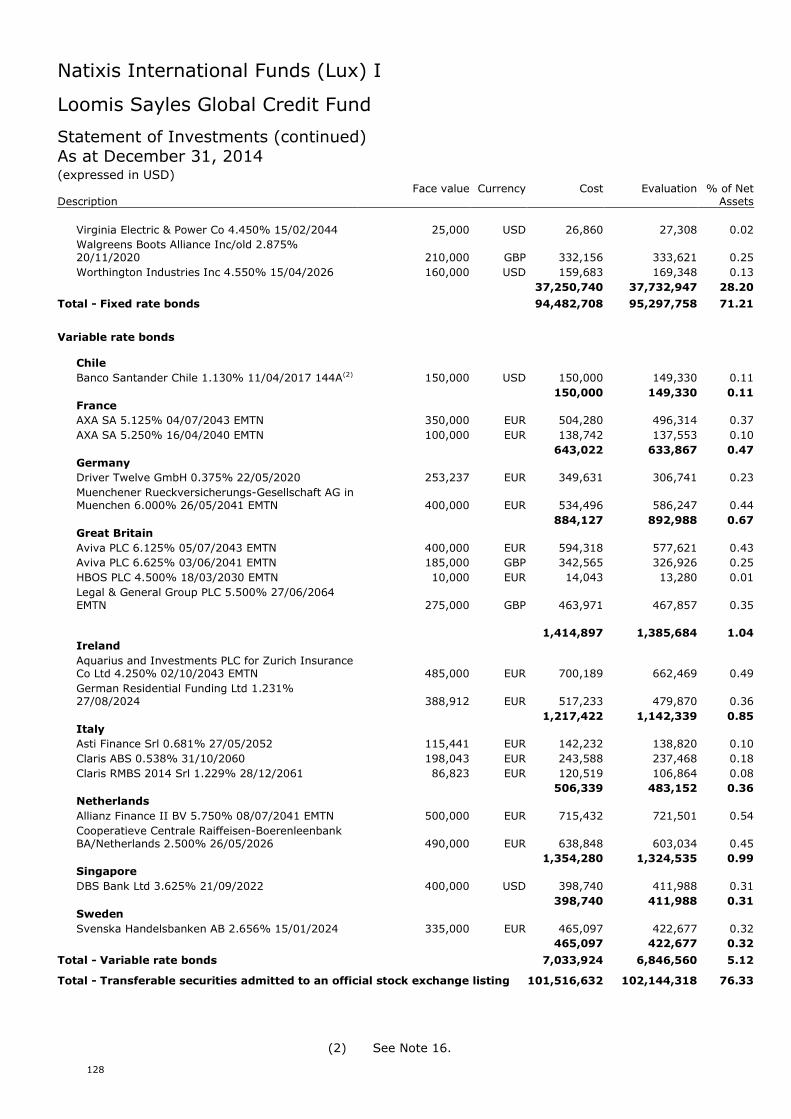
Natixis International Funds (Lux) I
128
Loomis Sayles Global Credit Fund
Statement of Investments (continued)As at December 31, 2014(expressed in USD)
Face value Currency Cost Evaluation % of NetDescription Assets
Virginia Electric & Power Co 4.450% 15/02/2044 25,000 USD 26,860 27,308 0.02
Walgreens Boots Alliance Inc/old 2.875%20/11/2020 210,000 GBP 332,156 333,621 0.25
Worthington Industries Inc 4.550% 15/04/2026 160,000 USD 159,683 169,348 0.13
37,250,740 37,732,947 28.20
Total - Fixed rate bonds 94,482,708 95,297,758 71.21
Variable rate bonds
Chile
Banco Santander Chile 1.130% 11/04/2017 144A(2) 150,000 USD 150,000 149,330 0.11
150,000 149,330 0.11France
AXA SA 5.125% 04/07/2043 EMTN 350,000 EUR 504,280 496,314 0.37
AXA SA 5.250% 16/04/2040 EMTN 100,000 EUR 138,742 137,553 0.10
643,022 633,867 0.47Germany
Driver Twelve GmbH 0.375% 22/05/2020 253,237 EUR 349,631 306,741 0.23
Muenchener Rueckversicherungs-Gesellschaft AG inMuenchen 6.000% 26/05/2041 EMTN 400,000 EUR 534,496 586,247 0.44
884,127 892,988 0.67Great Britain
Aviva PLC 6.125% 05/07/2043 EMTN 400,000 EUR 594,318 577,621 0.43
Aviva PLC 6.625% 03/06/2041 EMTN 185,000 GBP 342,565 326,926 0.25
HBOS PLC 4.500% 18/03/2030 EMTN 10,000 EUR 14,043 13,280 0.01
Legal & General Group PLC 5.500% 27/06/2064EMTN 275,000 GBP 463,971 467,857 0.35
1,414,897 1,385,684 1.04Ireland
Aquarius and Investments PLC for Zurich InsuranceCo Ltd 4.250% 02/10/2043 EMTN 485,000 EUR 700,189 662,469 0.49
German Residential Funding Ltd 1.231%27/08/2024 388,912 EUR 517,233 479,870 0.36
1,217,422 1,142,339 0.85Italy
Asti Finance Srl 0.681% 27/05/2052 115,441 EUR 142,232 138,820 0.10
Claris ABS 0.538% 31/10/2060 198,043 EUR 243,588 237,468 0.18
Claris RMBS 2014 Srl 1.229% 28/12/2061 86,823 EUR 120,519 106,864 0.08
506,339 483,152 0.36Netherlands
Allianz Finance II BV 5.750% 08/07/2041 EMTN 500,000 EUR 715,432 721,501 0.54
Cooperatieve Centrale Raiffeisen-BoerenleenbankBA/Netherlands 2.500% 26/05/2026 490,000 EUR 638,848 603,034 0.45
1,354,280 1,324,535 0.99Singapore
DBS Bank Ltd 3.625% 21/09/2022 400,000 USD 398,740 411,988 0.31
398,740 411,988 0.31Sweden
Svenska Handelsbanken AB 2.656% 15/01/2024 335,000 EUR 465,097 422,677 0.32
465,097 422,677 0.32
Total - Variable rate bonds 7,033,924 6,846,560 5.12
Total - Transferable securities admitted to an official stock exchange listing 101,516,632 102,144,318 76.33
(2) See Note 16.
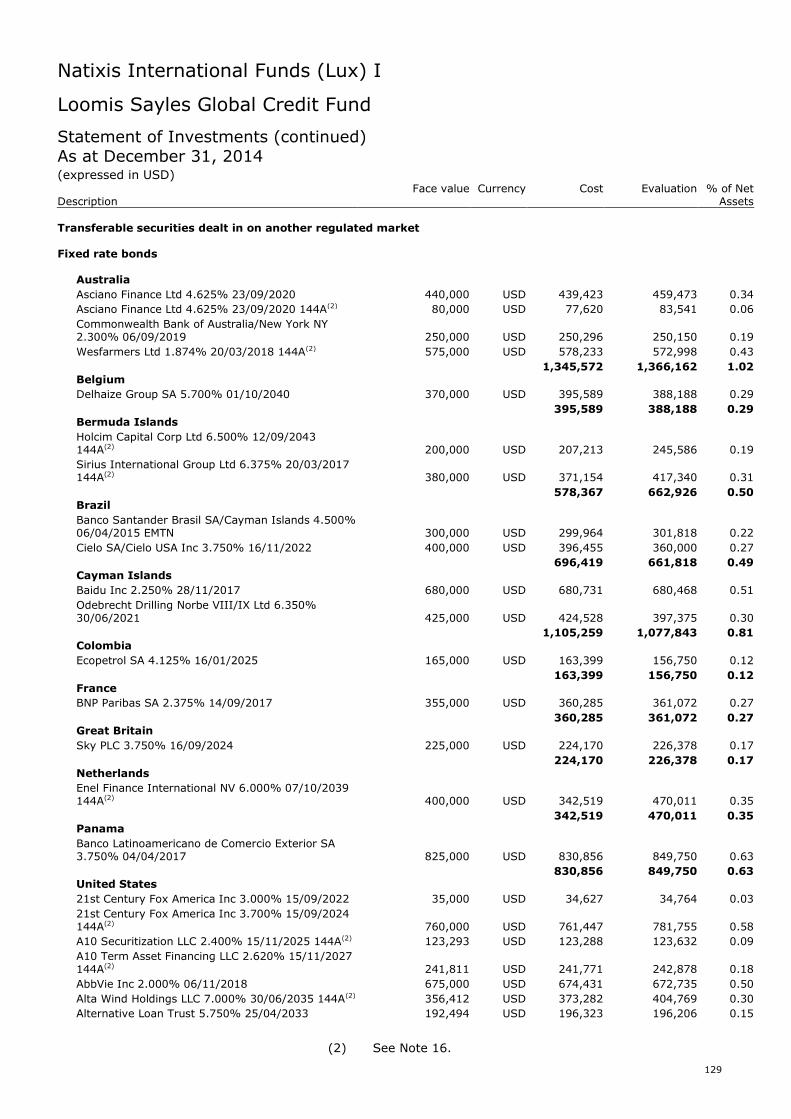
Natixis International Funds (Lux) I
129
Loomis Sayles Global Credit Fund
Statement of Investments (continued)As at December 31, 2014(expressed in USD)
Face value Currency Cost Evaluation % of NetDescription Assets
Transferable securities dealt in on another regulated market
Fixed rate bonds
Australia
Asciano Finance Ltd 4.625% 23/09/2020 440,000 USD 439,423 459,473 0.34
Asciano Finance Ltd 4.625% 23/09/2020 144A(2) 80,000 USD 77,620 83,541 0.06
Commonwealth Bank of Australia/New York NY2.300% 06/09/2019 250,000 USD 250,296 250,150 0.19
Wesfarmers Ltd 1.874% 20/03/2018 144A(2) 575,000 USD 578,233 572,998 0.43
1,345,572 1,366,162 1.02Belgium
Delhaize Group SA 5.700% 01/10/2040 370,000 USD 395,589 388,188 0.29
395,589 388,188 0.29Bermuda Islands
Holcim Capital Corp Ltd 6.500% 12/09/2043144A(2) 200,000 USD 207,213 245,586 0.19
Sirius International Group Ltd 6.375% 20/03/2017144A(2) 380,000 USD 371,154 417,340 0.31
578,367 662,926 0.50Brazil
Banco Santander Brasil SA/Cayman Islands 4.500%06/04/2015 EMTN 300,000 USD 299,964 301,818 0.22
Cielo SA/Cielo USA Inc 3.750% 16/11/2022 400,000 USD 396,455 360,000 0.27
696,419 661,818 0.49Cayman Islands
Baidu Inc 2.250% 28/11/2017 680,000 USD 680,731 680,468 0.51
Odebrecht Drilling Norbe VIII/IX Ltd 6.350%30/06/2021 425,000 USD 424,528 397,375 0.30
1,105,259 1,077,843 0.81Colombia
Ecopetrol SA 4.125% 16/01/2025 165,000 USD 163,399 156,750 0.12
163,399 156,750 0.12France
BNP Paribas SA 2.375% 14/09/2017 355,000 USD 360,285 361,072 0.27
360,285 361,072 0.27Great Britain
Sky PLC 3.750% 16/09/2024 225,000 USD 224,170 226,378 0.17
224,170 226,378 0.17Netherlands
Enel Finance International NV 6.000% 07/10/2039144A(2) 400,000 USD 342,519 470,011 0.35
342,519 470,011 0.35Panama
Banco Latinoamericano de Comercio Exterior SA3.750% 04/04/2017 825,000 USD 830,856 849,750 0.63
830,856 849,750 0.63United States
21st Century Fox America Inc 3.000% 15/09/2022 35,000 USD 34,627 34,764 0.03
21st Century Fox America Inc 3.700% 15/09/2024144A(2) 760,000 USD 761,447 781,755 0.58
A10 Securitization LLC 2.400% 15/11/2025 144A(2) 123,293 USD 123,288 123,632 0.09
A10 Term Asset Financing LLC 2.620% 15/11/2027144A(2) 241,811 USD 241,771 242,878 0.18
AbbVie Inc 2.000% 06/11/2018 675,000 USD 674,431 672,735 0.50
Alta Wind Holdings LLC 7.000% 30/06/2035 144A(2) 356,412 USD 373,282 404,769 0.30
Alternative Loan Trust 5.750% 25/04/2033 192,494 USD 196,323 196,206 0.15
(2) See Note 16.
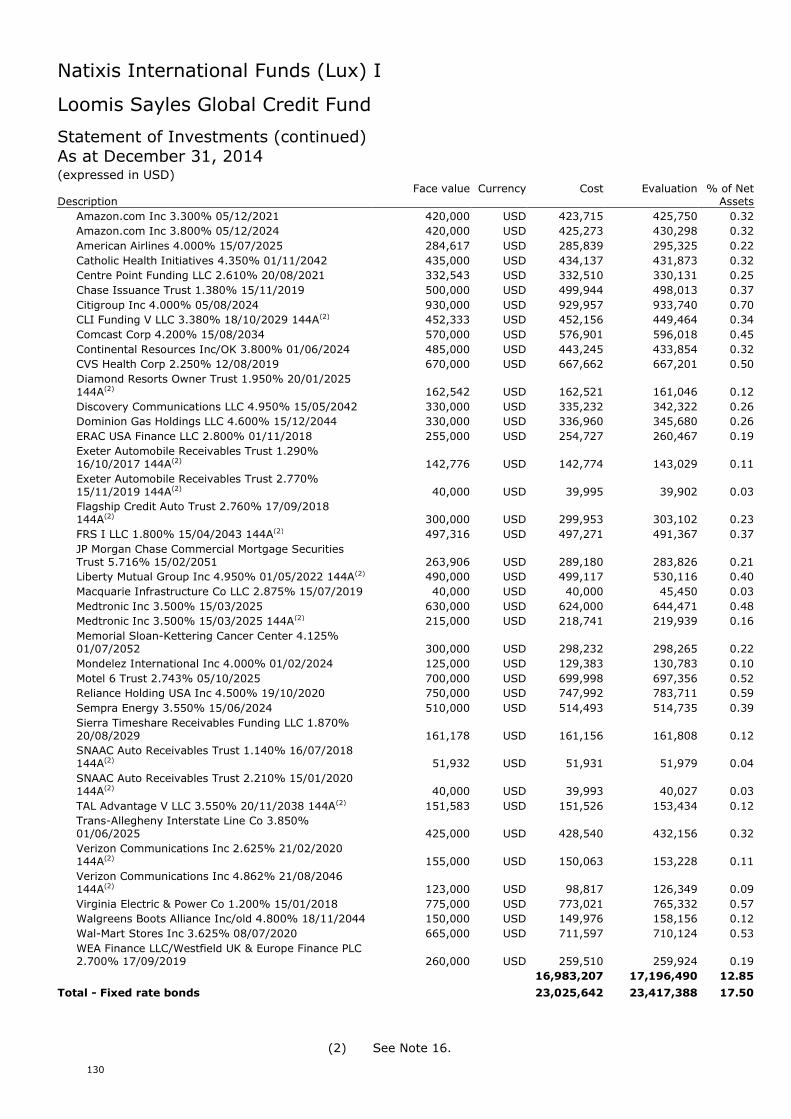
Natixis International Funds (Lux) I
130
Loomis Sayles Global Credit Fund
Statement of Investments (continued)As at December 31, 2014(expressed in USD)
Face value Currency Cost Evaluation % of NetDescription Assets
Amazon.com Inc 3.300% 05/12/2021 420,000 USD 423,715 425,750 0.32
Amazon.com Inc 3.800% 05/12/2024 420,000 USD 425,273 430,298 0.32
American Airlines 4.000% 15/07/2025 284,617 USD 285,839 295,325 0.22
Catholic Health Initiatives 4.350% 01/11/2042 435,000 USD 434,137 431,873 0.32
Centre Point Funding LLC 2.610% 20/08/2021 332,543 USD 332,510 330,131 0.25
Chase Issuance Trust 1.380% 15/11/2019 500,000 USD 499,944 498,013 0.37
Citigroup Inc 4.000% 05/08/2024 930,000 USD 929,957 933,740 0.70
CLI Funding V LLC 3.380% 18/10/2029 144A(2) 452,333 USD 452,156 449,464 0.34
Comcast Corp 4.200% 15/08/2034 570,000 USD 576,901 596,018 0.45
Continental Resources Inc/OK 3.800% 01/06/2024 485,000 USD 443,245 433,854 0.32
CVS Health Corp 2.250% 12/08/2019 670,000 USD 667,662 667,201 0.50
Diamond Resorts Owner Trust 1.950% 20/01/2025144A(2) 162,542 USD 162,521 161,046 0.12
Discovery Communications LLC 4.950% 15/05/2042 330,000 USD 335,232 342,322 0.26
Dominion Gas Holdings LLC 4.600% 15/12/2044 330,000 USD 336,960 345,680 0.26
ERAC USA Finance LLC 2.800% 01/11/2018 255,000 USD 254,727 260,467 0.19
Exeter Automobile Receivables Trust 1.290%16/10/2017 144A(2) 142,776 USD 142,774 143,029 0.11
Exeter Automobile Receivables Trust 2.770%15/11/2019 144A(2) 40,000 USD 39,995 39,902 0.03
Flagship Credit Auto Trust 2.760% 17/09/2018144A(2) 300,000 USD 299,953 303,102 0.23
FRS I LLC 1.800% 15/04/2043 144A(2) 497,316 USD 497,271 491,367 0.37
JP Morgan Chase Commercial Mortgage SecuritiesTrust 5.716% 15/02/2051 263,906 USD 289,180 283,826 0.21
Liberty Mutual Group Inc 4.950% 01/05/2022 144A(2) 490,000 USD 499,117 530,116 0.40
Macquarie Infrastructure Co LLC 2.875% 15/07/2019 40,000 USD 40,000 45,450 0.03
Medtronic Inc 3.500% 15/03/2025 630,000 USD 624,000 644,471 0.48
Medtronic Inc 3.500% 15/03/2025 144A(2) 215,000 USD 218,741 219,939 0.16
Memorial Sloan-Kettering Cancer Center 4.125%01/07/2052 300,000 USD 298,232 298,265 0.22
Mondelez International Inc 4.000% 01/02/2024 125,000 USD 129,383 130,783 0.10
Motel 6 Trust 2.743% 05/10/2025 700,000 USD 699,998 697,356 0.52
Reliance Holding USA Inc 4.500% 19/10/2020 750,000 USD 747,992 783,711 0.59
Sempra Energy 3.550% 15/06/2024 510,000 USD 514,493 514,735 0.39
Sierra Timeshare Receivables Funding LLC 1.870%20/08/2029 161,178 USD 161,156 161,808 0.12
SNAAC Auto Receivables Trust 1.140% 16/07/2018144A(2) 51,932 USD 51,931 51,979 0.04
SNAAC Auto Receivables Trust 2.210% 15/01/2020144A(2) 40,000 USD 39,993 40,027 0.03
TAL Advantage V LLC 3.550% 20/11/2038 144A(2) 151,583 USD 151,526 153,434 0.12
Trans-Allegheny Interstate Line Co 3.850%01/06/2025 425,000 USD 428,540 432,156 0.32
Verizon Communications Inc 2.625% 21/02/2020144A(2) 155,000 USD 150,063 153,228 0.11
Verizon Communications Inc 4.862% 21/08/2046144A(2) 123,000 USD 98,817 126,349 0.09
Virginia Electric & Power Co 1.200% 15/01/2018 775,000 USD 773,021 765,332 0.57
Walgreens Boots Alliance Inc/old 4.800% 18/11/2044 150,000 USD 149,976 158,156 0.12
Wal-Mart Stores Inc 3.625% 08/07/2020 665,000 USD 711,597 710,124 0.53
WEA Finance LLC/Westfield UK & Europe Finance PLC2.700% 17/09/2019 260,000 USD 259,510 259,924 0.19
16,983,207 17,196,490 12.85
Total - Fixed rate bonds 23,025,642 23,417,388 17.50
(2) See Note 16.
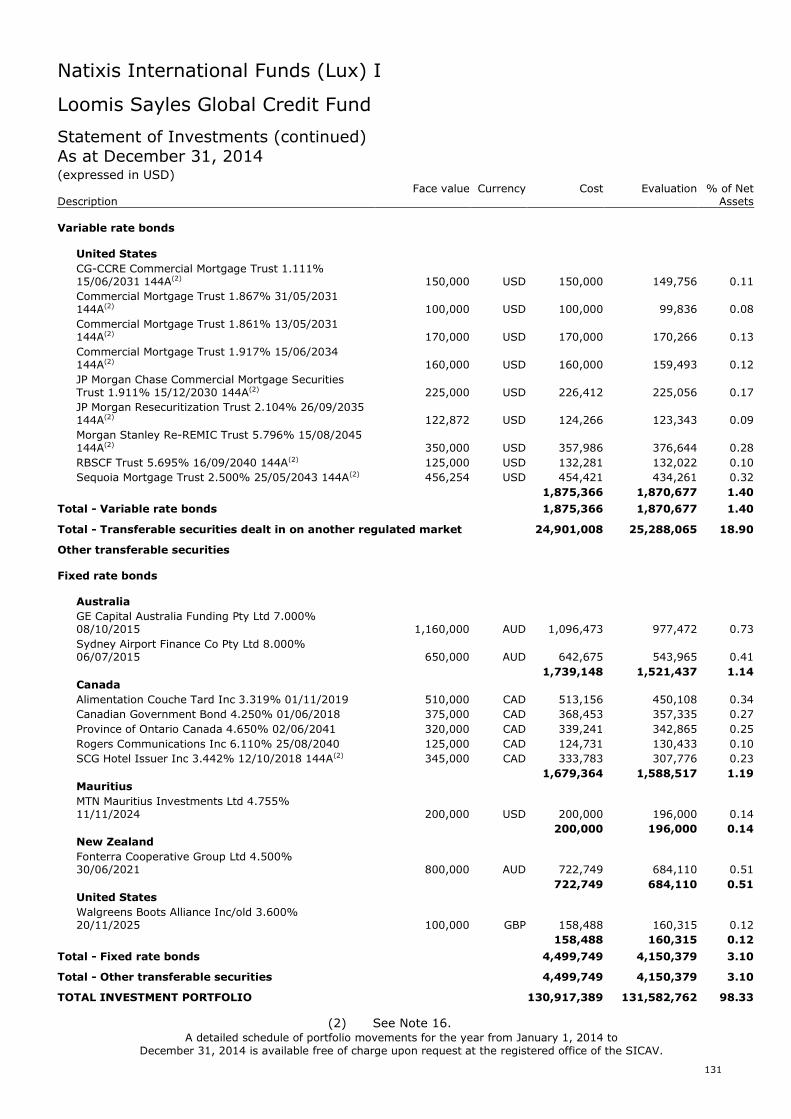
Natixis International Funds (Lux) I
131
Loomis Sayles Global Credit Fund
Statement of Investments (continued)As at December 31, 2014(expressed in USD)
Face value Currency Cost Evaluation % of NetDescription Assets
Variable rate bonds
United States
CG-CCRE Commercial Mortgage Trust 1.111%15/06/2031 144A(2) 150,000 USD 150,000 149,756 0.11
Commercial Mortgage Trust 1.867% 31/05/2031144A(2) 100,000 USD 100,000 99,836 0.08
Commercial Mortgage Trust 1.861% 13/05/2031144A(2) 170,000 USD 170,000 170,266 0.13
Commercial Mortgage Trust 1.917% 15/06/2034144A(2) 160,000 USD 160,000 159,493 0.12
JP Morgan Chase Commercial Mortgage SecuritiesTrust 1.911% 15/12/2030 144A(2) 225,000 USD 226,412 225,056 0.17
JP Morgan Resecuritization Trust 2.104% 26/09/2035144A(2) 122,872 USD 124,266 123,343 0.09
Morgan Stanley Re-REMIC Trust 5.796% 15/08/2045144A(2) 350,000 USD 357,986 376,644 0.28
RBSCF Trust 5.695% 16/09/2040 144A(2) 125,000 USD 132,281 132,022 0.10
Sequoia Mortgage Trust 2.500% 25/05/2043 144A(2) 456,254 USD 454,421 434,261 0.32
1,875,366 1,870,677 1.40
Total - Variable rate bonds 1,875,366 1,870,677 1.40
Total - Transferable securities dealt in on another regulated market 24,901,008 25,288,065 18.90
Other transferable securities
Fixed rate bonds
Australia
GE Capital Australia Funding Pty Ltd 7.000%08/10/2015 1,160,000 AUD 1,096,473 977,472 0.73
Sydney Airport Finance Co Pty Ltd 8.000%06/07/2015 650,000 AUD 642,675 543,965 0.41
1,739,148 1,521,437 1.14Canada
Alimentation Couche Tard Inc 3.319% 01/11/2019 510,000 CAD 513,156 450,108 0.34
Canadian Government Bond 4.250% 01/06/2018 375,000 CAD 368,453 357,335 0.27
Province of Ontario Canada 4.650% 02/06/2041 320,000 CAD 339,241 342,865 0.25
Rogers Communications Inc 6.110% 25/08/2040 125,000 CAD 124,731 130,433 0.10
SCG Hotel Issuer Inc 3.442% 12/10/2018 144A(2) 345,000 CAD 333,783 307,776 0.23
1,679,364 1,588,517 1.19Mauritius
MTN Mauritius Investments Ltd 4.755%11/11/2024 200,000 USD 200,000 196,000 0.14
200,000 196,000 0.14New Zealand
Fonterra Cooperative Group Ltd 4.500%30/06/2021 800,000 AUD 722,749 684,110 0.51
722,749 684,110 0.51United States
Walgreens Boots Alliance Inc/old 3.600%20/11/2025 100,000 GBP 158,488 160,315 0.12
158,488 160,315 0.12
Total - Fixed rate bonds 4,499,749 4,150,379 3.10
Total - Other transferable securities 4,499,749 4,150,379 3.10
TOTAL INVESTMENT PORTFOLIO 130,917,389 131,582,762 98.33
A detailed schedule of portfolio movements for the year from January 1, 2014 toDecember 31, 2014 is available free of charge upon request at the registered office of the SICAV.
(2) See Note 16.
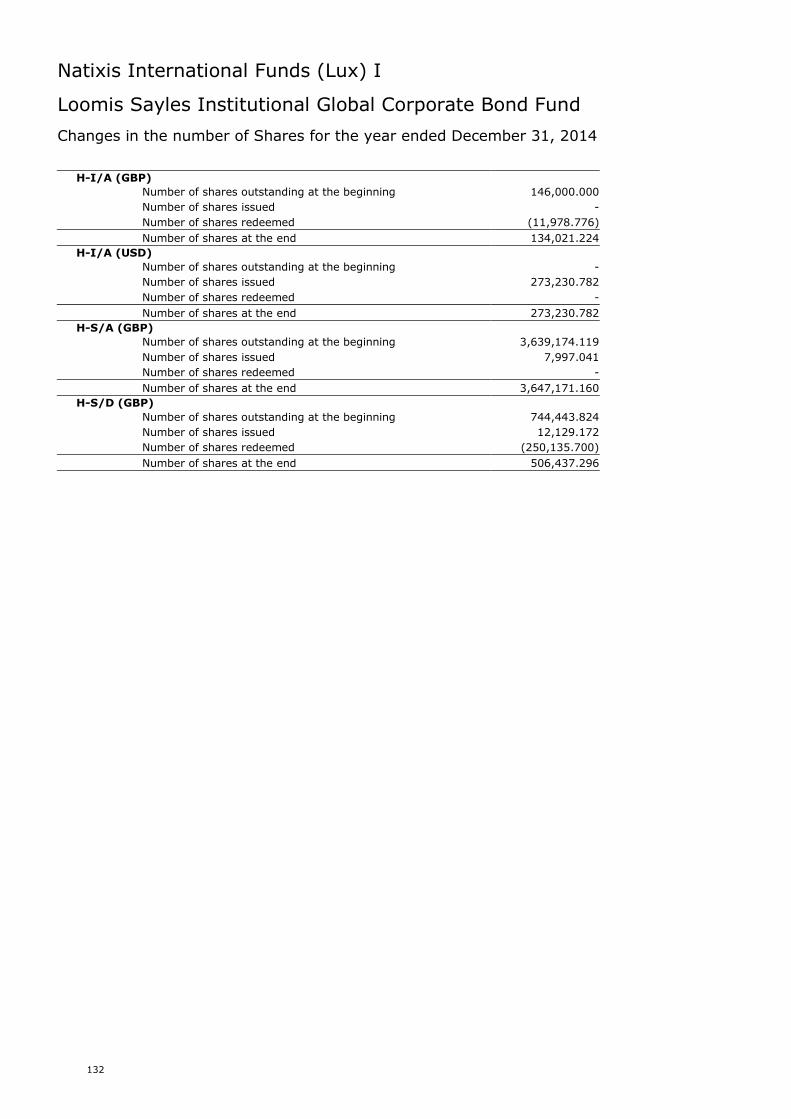
Natixis International Funds (Lux) I
132
Loomis Sayles Institutional Global Corporate Bond Fund
Changes in the number of Shares for the year ended December 31, 2014
H-I/A (GBP)
Number of shares outstanding at the beginning 146,000.000
Number of shares issued -
Number of shares redeemed (11,978.776)
Number of shares at the end 134,021.224
H-I/A (USD)
Number of shares outstanding at the beginning -
Number of shares issued 273,230.782
Number of shares redeemed -
Number of shares at the end 273,230.782
H-S/A (GBP)
Number of shares outstanding at the beginning 3,639,174.119
Number of shares issued 7,997.041
Number of shares redeemed -
Number of shares at the end 3,647,171.160
H-S/D (GBP)
Number of shares outstanding at the beginning 744,443.824
Number of shares issued 12,129.172
Number of shares redeemed (250,135.700)
Number of shares at the end 506,437.296
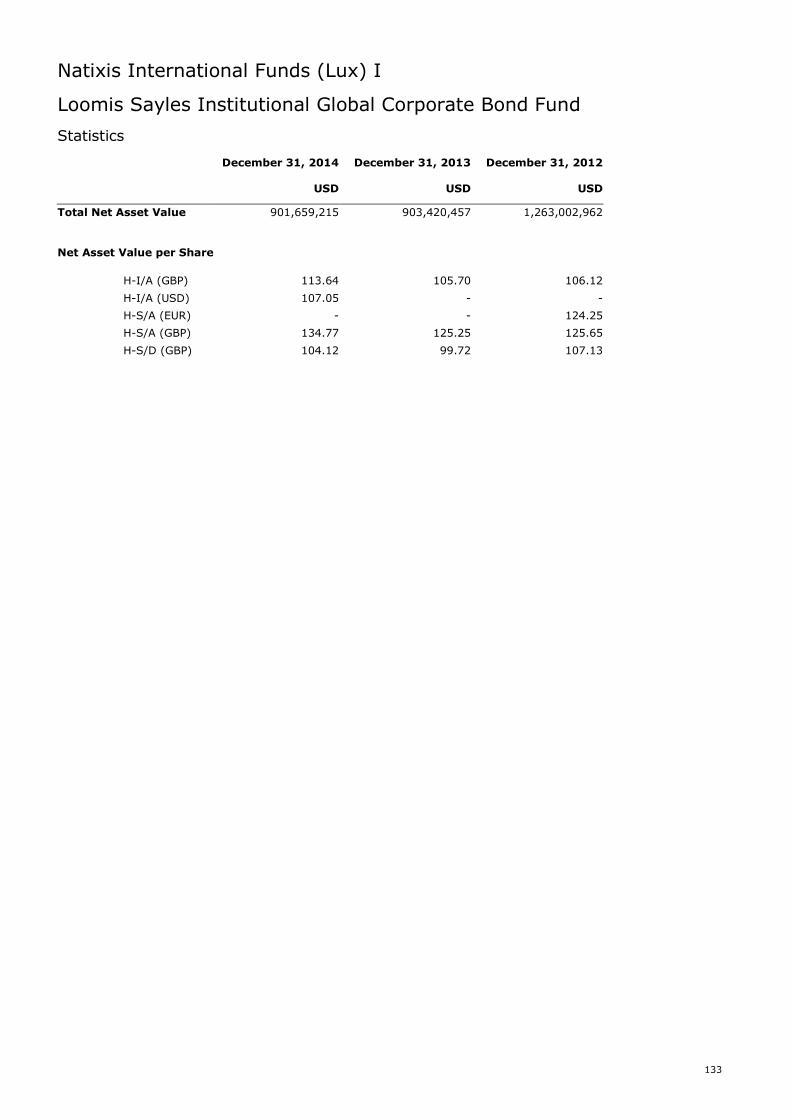
Natixis International Funds (Lux) I
133
Loomis Sayles Institutional Global Corporate Bond Fund
Statistics
December 31, 2014 December 31, 2013 December 31, 2012
USD USD USD
Total Net Asset Value 901,659,215 903,420,457 1,263,002,962
Net Asset Value per Share
H-I/A (GBP) 113.64 105.70 106.12
H-I/A (USD) 107.05 - -
H-S/A (EUR) - - 124.25
H-S/A (GBP) 134.77 125.25 125.65
H-S/D (GBP) 104.12 99.72 107.13
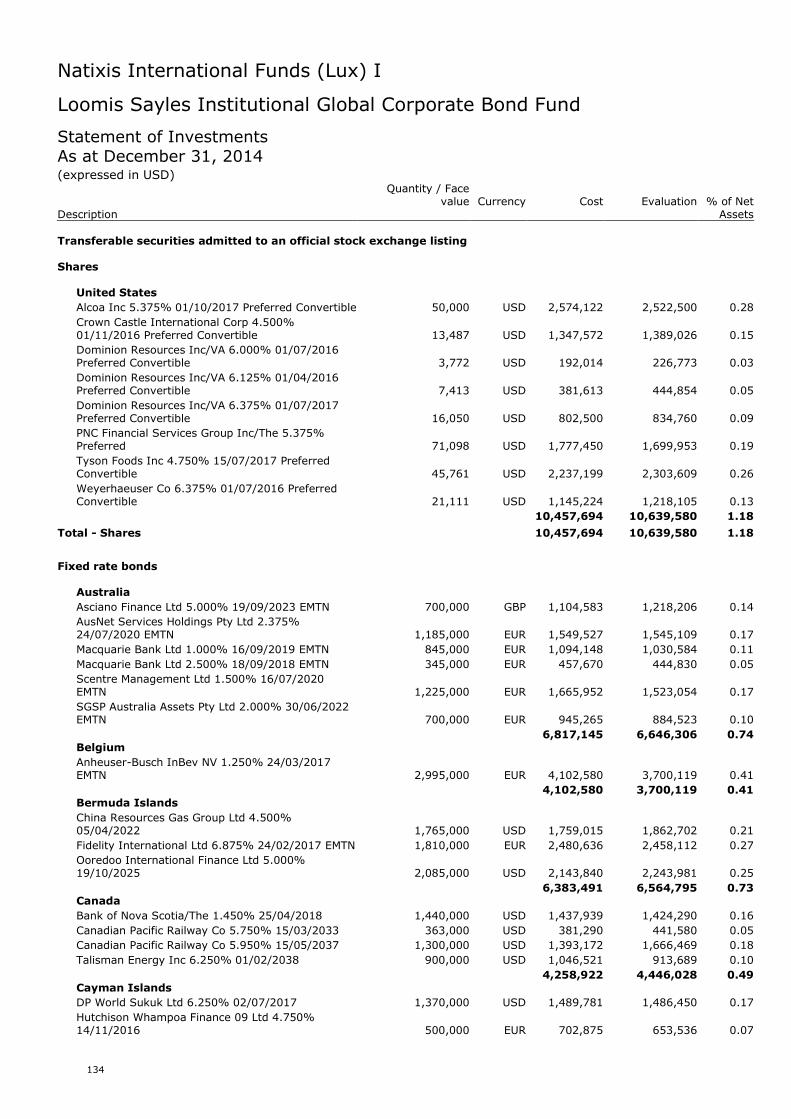
Natixis International Funds (Lux) I
134
Loomis Sayles Institutional Global Corporate Bond Fund
Statement of InvestmentsAs at December 31, 2014(expressed in USD)
Quantity / Facevalue Currency Cost Evaluation % of Net
Description Assets
Transferable securities admitted to an official stock exchange listing
Shares
United States
Alcoa Inc 5.375% 01/10/2017 Preferred Convertible 50,000 USD 2,574,122 2,522,500 0.28
Crown Castle International Corp 4.500%01/11/2016 Preferred Convertible 13,487 USD 1,347,572 1,389,026 0.15
Dominion Resources Inc/VA 6.000% 01/07/2016Preferred Convertible 3,772 USD 192,014 226,773 0.03
Dominion Resources Inc/VA 6.125% 01/04/2016Preferred Convertible 7,413 USD 381,613 444,854 0.05
Dominion Resources Inc/VA 6.375% 01/07/2017Preferred Convertible 16,050 USD 802,500 834,760 0.09
PNC Financial Services Group Inc/The 5.375%Preferred 71,098 USD 1,777,450 1,699,953 0.19
Tyson Foods Inc 4.750% 15/07/2017 PreferredConvertible 45,761 USD 2,237,199 2,303,609 0.26
Weyerhaeuser Co 6.375% 01/07/2016 PreferredConvertible 21,111 USD 1,145,224 1,218,105 0.13
10,457,694 10,639,580 1.18
Total - Shares 10,457,694 10,639,580 1.18
Fixed rate bonds
Australia
Asciano Finance Ltd 5.000% 19/09/2023 EMTN 700,000 GBP 1,104,583 1,218,206 0.14
AusNet Services Holdings Pty Ltd 2.375%24/07/2020 EMTN 1,185,000 EUR 1,549,527 1,545,109 0.17
Macquarie Bank Ltd 1.000% 16/09/2019 EMTN 845,000 EUR 1,094,148 1,030,584 0.11
Macquarie Bank Ltd 2.500% 18/09/2018 EMTN 345,000 EUR 457,670 444,830 0.05
Scentre Management Ltd 1.500% 16/07/2020EMTN 1,225,000 EUR 1,665,952 1,523,054 0.17
SGSP Australia Assets Pty Ltd 2.000% 30/06/2022EMTN 700,000 EUR 945,265 884,523 0.10
6,817,145 6,646,306 0.74Belgium
Anheuser-Busch InBev NV 1.250% 24/03/2017EMTN 2,995,000 EUR 4,102,580 3,700,119 0.41
4,102,580 3,700,119 0.41Bermuda Islands
China Resources Gas Group Ltd 4.500%05/04/2022 1,765,000 USD 1,759,015 1,862,702 0.21
Fidelity International Ltd 6.875% 24/02/2017 EMTN 1,810,000 EUR 2,480,636 2,458,112 0.27
Ooredoo International Finance Ltd 5.000%19/10/2025 2,085,000 USD 2,143,840 2,243,981 0.25
6,383,491 6,564,795 0.73Canada
Bank of Nova Scotia/The 1.450% 25/04/2018 1,440,000 USD 1,437,939 1,424,290 0.16
Canadian Pacific Railway Co 5.750% 15/03/2033 363,000 USD 381,290 441,580 0.05
Canadian Pacific Railway Co 5.950% 15/05/2037 1,300,000 USD 1,393,172 1,666,469 0.18
Talisman Energy Inc 6.250% 01/02/2038 900,000 USD 1,046,521 913,689 0.10
4,258,922 4,446,028 0.49Cayman Islands
DP World Sukuk Ltd 6.250% 02/07/2017 1,370,000 USD 1,489,781 1,486,450 0.17
Hutchison Whampoa Finance 09 Ltd 4.750%14/11/2016 500,000 EUR 702,875 653,536 0.07
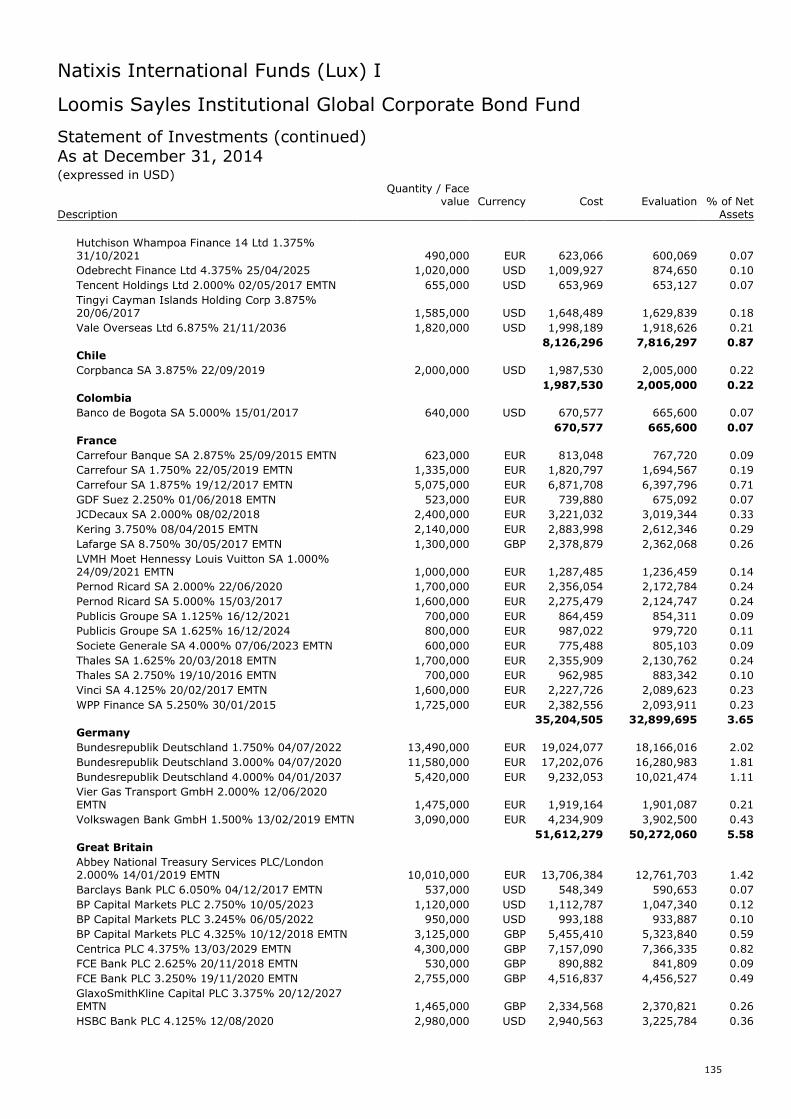
Natixis International Funds (Lux) I
135
Loomis Sayles Institutional Global Corporate Bond Fund
Statement of Investments (continued)As at December 31, 2014(expressed in USD)
Quantity / Facevalue Currency Cost Evaluation % of Net
Description Assets
Hutchison Whampoa Finance 14 Ltd 1.375%31/10/2021 490,000 EUR 623,066 600,069 0.07
Odebrecht Finance Ltd 4.375% 25/04/2025 1,020,000 USD 1,009,927 874,650 0.10
Tencent Holdings Ltd 2.000% 02/05/2017 EMTN 655,000 USD 653,969 653,127 0.07
Tingyi Cayman Islands Holding Corp 3.875%20/06/2017 1,585,000 USD 1,648,489 1,629,839 0.18
Vale Overseas Ltd 6.875% 21/11/2036 1,820,000 USD 1,998,189 1,918,626 0.21
8,126,296 7,816,297 0.87Chile
Corpbanca SA 3.875% 22/09/2019 2,000,000 USD 1,987,530 2,005,000 0.22
1,987,530 2,005,000 0.22Colombia
Banco de Bogota SA 5.000% 15/01/2017 640,000 USD 670,577 665,600 0.07
670,577 665,600 0.07France
Carrefour Banque SA 2.875% 25/09/2015 EMTN 623,000 EUR 813,048 767,720 0.09
Carrefour SA 1.750% 22/05/2019 EMTN 1,335,000 EUR 1,820,797 1,694,567 0.19
Carrefour SA 1.875% 19/12/2017 EMTN 5,075,000 EUR 6,871,708 6,397,796 0.71
GDF Suez 2.250% 01/06/2018 EMTN 523,000 EUR 739,880 675,092 0.07
JCDecaux SA 2.000% 08/02/2018 2,400,000 EUR 3,221,032 3,019,344 0.33
Kering 3.750% 08/04/2015 EMTN 2,140,000 EUR 2,883,998 2,612,346 0.29
Lafarge SA 8.750% 30/05/2017 EMTN 1,300,000 GBP 2,378,879 2,362,068 0.26
LVMH Moet Hennessy Louis Vuitton SA 1.000%24/09/2021 EMTN 1,000,000 EUR 1,287,485 1,236,459 0.14
Pernod Ricard SA 2.000% 22/06/2020 1,700,000 EUR 2,356,054 2,172,784 0.24
Pernod Ricard SA 5.000% 15/03/2017 1,600,000 EUR 2,275,479 2,124,747 0.24
Publicis Groupe SA 1.125% 16/12/2021 700,000 EUR 864,459 854,311 0.09
Publicis Groupe SA 1.625% 16/12/2024 800,000 EUR 987,022 979,720 0.11
Societe Generale SA 4.000% 07/06/2023 EMTN 600,000 EUR 775,488 805,103 0.09
Thales SA 1.625% 20/03/2018 EMTN 1,700,000 EUR 2,355,909 2,130,762 0.24
Thales SA 2.750% 19/10/2016 EMTN 700,000 EUR 962,985 883,342 0.10
Vinci SA 4.125% 20/02/2017 EMTN 1,600,000 EUR 2,227,726 2,089,623 0.23
WPP Finance SA 5.250% 30/01/2015 1,725,000 EUR 2,382,556 2,093,911 0.23
35,204,505 32,899,695 3.65Germany
Bundesrepublik Deutschland 1.750% 04/07/2022 13,490,000 EUR 19,024,077 18,166,016 2.02
Bundesrepublik Deutschland 3.000% 04/07/2020 11,580,000 EUR 17,202,076 16,280,983 1.81
Bundesrepublik Deutschland 4.000% 04/01/2037 5,420,000 EUR 9,232,053 10,021,474 1.11
Vier Gas Transport GmbH 2.000% 12/06/2020EMTN 1,475,000 EUR 1,919,164 1,901,087 0.21
Volkswagen Bank GmbH 1.500% 13/02/2019 EMTN 3,090,000 EUR 4,234,909 3,902,500 0.43
51,612,279 50,272,060 5.58Great Britain
Abbey National Treasury Services PLC/London2.000% 14/01/2019 EMTN 10,010,000 EUR 13,706,384 12,761,703 1.42
Barclays Bank PLC 6.050% 04/12/2017 EMTN 537,000 USD 548,349 590,653 0.07
BP Capital Markets PLC 2.750% 10/05/2023 1,120,000 USD 1,112,787 1,047,340 0.12
BP Capital Markets PLC 3.245% 06/05/2022 950,000 USD 993,188 933,887 0.10
BP Capital Markets PLC 4.325% 10/12/2018 EMTN 3,125,000 GBP 5,455,410 5,323,840 0.59
Centrica PLC 4.375% 13/03/2029 EMTN 4,300,000 GBP 7,157,090 7,366,335 0.82
FCE Bank PLC 2.625% 20/11/2018 EMTN 530,000 GBP 890,882 841,809 0.09
FCE Bank PLC 3.250% 19/11/2020 EMTN 2,755,000 GBP 4,516,837 4,456,527 0.49
GlaxoSmithKline Capital PLC 3.375% 20/12/2027EMTN 1,465,000 GBP 2,334,568 2,370,821 0.26
HSBC Bank PLC 4.125% 12/08/2020 2,980,000 USD 2,940,563 3,225,784 0.36
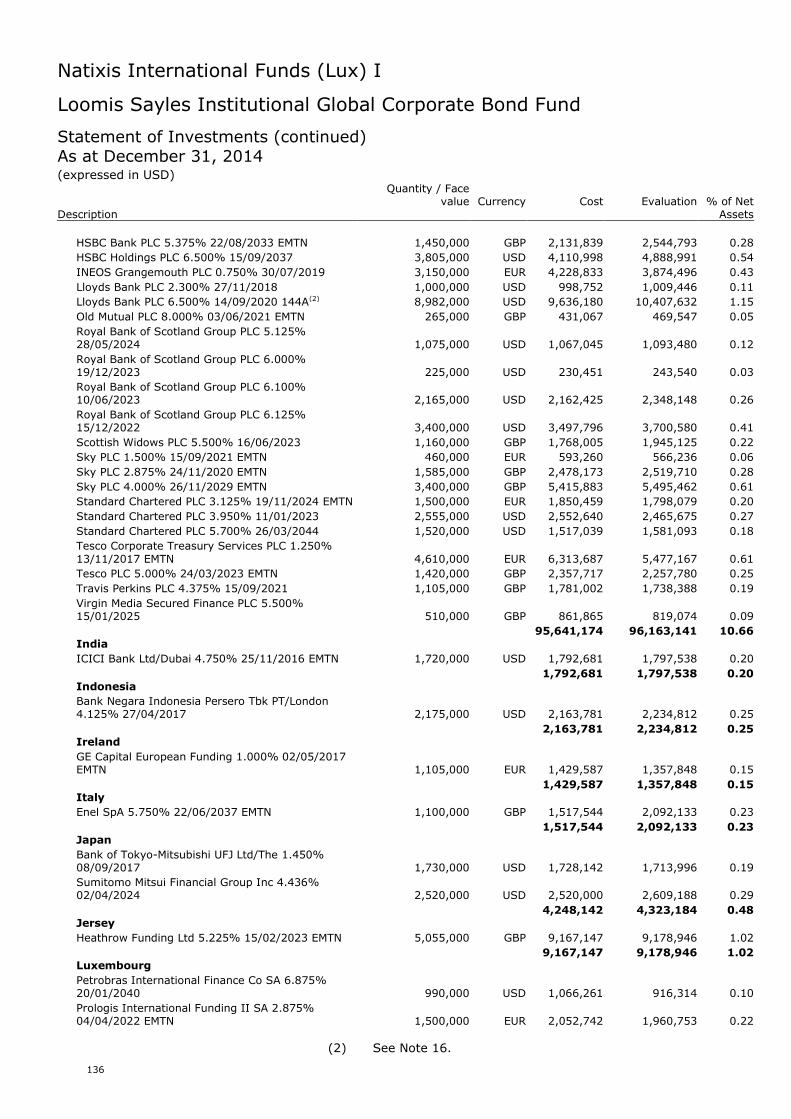
Natixis International Funds (Lux) I
136
Loomis Sayles Institutional Global Corporate Bond Fund
Statement of Investments (continued)As at December 31, 2014(expressed in USD)
Quantity / Facevalue Currency Cost Evaluation % of Net
Description Assets
HSBC Bank PLC 5.375% 22/08/2033 EMTN 1,450,000 GBP 2,131,839 2,544,793 0.28
HSBC Holdings PLC 6.500% 15/09/2037 3,805,000 USD 4,110,998 4,888,991 0.54
INEOS Grangemouth PLC 0.750% 30/07/2019 3,150,000 EUR 4,228,833 3,874,496 0.43
Lloyds Bank PLC 2.300% 27/11/2018 1,000,000 USD 998,752 1,009,446 0.11
Lloyds Bank PLC 6.500% 14/09/2020 144A(2) 8,982,000 USD 9,636,180 10,407,632 1.15
Old Mutual PLC 8.000% 03/06/2021 EMTN 265,000 GBP 431,067 469,547 0.05
Royal Bank of Scotland Group PLC 5.125%28/05/2024 1,075,000 USD 1,067,045 1,093,480 0.12
Royal Bank of Scotland Group PLC 6.000%19/12/2023 225,000 USD 230,451 243,540 0.03
Royal Bank of Scotland Group PLC 6.100%10/06/2023 2,165,000 USD 2,162,425 2,348,148 0.26
Royal Bank of Scotland Group PLC 6.125%15/12/2022 3,400,000 USD 3,497,796 3,700,580 0.41
Scottish Widows PLC 5.500% 16/06/2023 1,160,000 GBP 1,768,005 1,945,125 0.22
Sky PLC 1.500% 15/09/2021 EMTN 460,000 EUR 593,260 566,236 0.06
Sky PLC 2.875% 24/11/2020 EMTN 1,585,000 GBP 2,478,173 2,519,710 0.28
Sky PLC 4.000% 26/11/2029 EMTN 3,400,000 GBP 5,415,883 5,495,462 0.61
Standard Chartered PLC 3.125% 19/11/2024 EMTN 1,500,000 EUR 1,850,459 1,798,079 0.20
Standard Chartered PLC 3.950% 11/01/2023 2,555,000 USD 2,552,640 2,465,675 0.27
Standard Chartered PLC 5.700% 26/03/2044 1,520,000 USD 1,517,039 1,581,093 0.18
Tesco Corporate Treasury Services PLC 1.250%13/11/2017 EMTN 4,610,000 EUR 6,313,687 5,477,167 0.61
Tesco PLC 5.000% 24/03/2023 EMTN 1,420,000 GBP 2,357,717 2,257,780 0.25
Travis Perkins PLC 4.375% 15/09/2021 1,105,000 GBP 1,781,002 1,738,388 0.19
Virgin Media Secured Finance PLC 5.500%15/01/2025 510,000 GBP 861,865 819,074 0.09
95,641,174 96,163,141 10.66India
ICICI Bank Ltd/Dubai 4.750% 25/11/2016 EMTN 1,720,000 USD 1,792,681 1,797,538 0.20
1,792,681 1,797,538 0.20Indonesia
Bank Negara Indonesia Persero Tbk PT/London4.125% 27/04/2017 2,175,000 USD 2,163,781 2,234,812 0.25
2,163,781 2,234,812 0.25Ireland
GE Capital European Funding 1.000% 02/05/2017EMTN 1,105,000 EUR 1,429,587 1,357,848 0.15
1,429,587 1,357,848 0.15Italy
Enel SpA 5.750% 22/06/2037 EMTN 1,100,000 GBP 1,517,544 2,092,133 0.23
1,517,544 2,092,133 0.23Japan
Bank of Tokyo-Mitsubishi UFJ Ltd/The 1.450%08/09/2017 1,730,000 USD 1,728,142 1,713,996 0.19
Sumitomo Mitsui Financial Group Inc 4.436%02/04/2024 2,520,000 USD 2,520,000 2,609,188 0.29
4,248,142 4,323,184 0.48Jersey
Heathrow Funding Ltd 5.225% 15/02/2023 EMTN 5,055,000 GBP 9,167,147 9,178,946 1.02
9,167,147 9,178,946 1.02Luxembourg
Petrobras International Finance Co SA 6.875%20/01/2040 990,000 USD 1,066,261 916,314 0.10
Prologis International Funding II SA 2.875%04/04/2022 EMTN 1,500,000 EUR 2,052,742 1,960,753 0.22
(2) See Note 16.
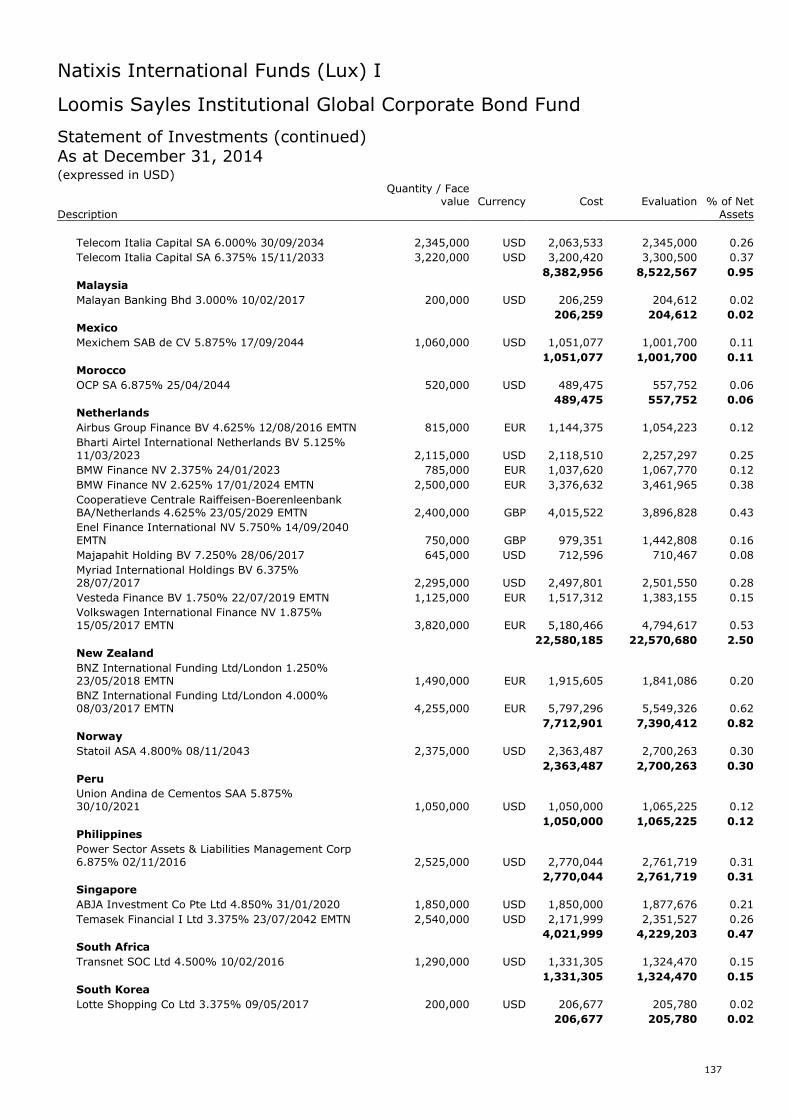
Natixis International Funds (Lux) I
137
Loomis Sayles Institutional Global Corporate Bond Fund
Statement of Investments (continued)As at December 31, 2014(expressed in USD)
Quantity / Facevalue Currency Cost Evaluation % of Net
Description Assets
Telecom Italia Capital SA 6.000% 30/09/2034 2,345,000 USD 2,063,533 2,345,000 0.26
Telecom Italia Capital SA 6.375% 15/11/2033 3,220,000 USD 3,200,420 3,300,500 0.37
8,382,956 8,522,567 0.95Malaysia
Malayan Banking Bhd 3.000% 10/02/2017 200,000 USD 206,259 204,612 0.02
206,259 204,612 0.02Mexico
Mexichem SAB de CV 5.875% 17/09/2044 1,060,000 USD 1,051,077 1,001,700 0.11
1,051,077 1,001,700 0.11Morocco
OCP SA 6.875% 25/04/2044 520,000 USD 489,475 557,752 0.06
489,475 557,752 0.06Netherlands
Airbus Group Finance BV 4.625% 12/08/2016 EMTN 815,000 EUR 1,144,375 1,054,223 0.12
Bharti Airtel International Netherlands BV 5.125%11/03/2023 2,115,000 USD 2,118,510 2,257,297 0.25
BMW Finance NV 2.375% 24/01/2023 785,000 EUR 1,037,620 1,067,770 0.12
BMW Finance NV 2.625% 17/01/2024 EMTN 2,500,000 EUR 3,376,632 3,461,965 0.38
Cooperatieve Centrale Raiffeisen-BoerenleenbankBA/Netherlands 4.625% 23/05/2029 EMTN 2,400,000 GBP 4,015,522 3,896,828 0.43
Enel Finance International NV 5.750% 14/09/2040EMTN 750,000 GBP 979,351 1,442,808 0.16
Majapahit Holding BV 7.250% 28/06/2017 645,000 USD 712,596 710,467 0.08
Myriad International Holdings BV 6.375%28/07/2017 2,295,000 USD 2,497,801 2,501,550 0.28
Vesteda Finance BV 1.750% 22/07/2019 EMTN 1,125,000 EUR 1,517,312 1,383,155 0.15
Volkswagen International Finance NV 1.875%15/05/2017 EMTN 3,820,000 EUR 5,180,466 4,794,617 0.53
22,580,185 22,570,680 2.50New Zealand
BNZ International Funding Ltd/London 1.250%23/05/2018 EMTN 1,490,000 EUR 1,915,605 1,841,086 0.20
BNZ International Funding Ltd/London 4.000%08/03/2017 EMTN 4,255,000 EUR 5,797,296 5,549,326 0.62
7,712,901 7,390,412 0.82Norway
Statoil ASA 4.800% 08/11/2043 2,375,000 USD 2,363,487 2,700,263 0.30
2,363,487 2,700,263 0.30Peru
Union Andina de Cementos SAA 5.875%30/10/2021 1,050,000 USD 1,050,000 1,065,225 0.12
1,050,000 1,065,225 0.12Philippines
Power Sector Assets & Liabilities Management Corp6.875% 02/11/2016 2,525,000 USD 2,770,044 2,761,719 0.31
2,770,044 2,761,719 0.31Singapore
ABJA Investment Co Pte Ltd 4.850% 31/01/2020 1,850,000 USD 1,850,000 1,877,676 0.21
Temasek Financial I Ltd 3.375% 23/07/2042 EMTN 2,540,000 USD 2,171,999 2,351,527 0.26
4,021,999 4,229,203 0.47South Africa
Transnet SOC Ltd 4.500% 10/02/2016 1,290,000 USD 1,331,305 1,324,470 0.15
1,331,305 1,324,470 0.15South Korea
Lotte Shopping Co Ltd 3.375% 09/05/2017 200,000 USD 206,677 205,780 0.02
206,677 205,780 0.02
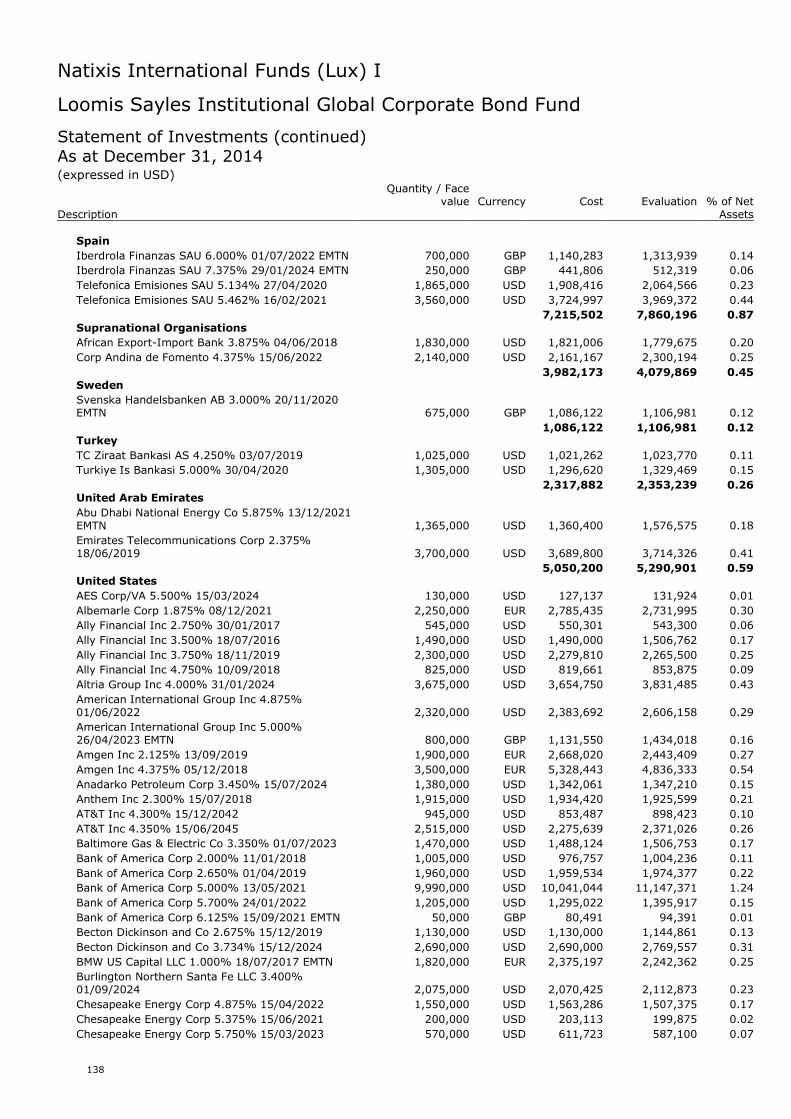
Natixis International Funds (Lux) I
138
Loomis Sayles Institutional Global Corporate Bond Fund
Statement of Investments (continued)As at December 31, 2014(expressed in USD)
Quantity / Facevalue Currency Cost Evaluation % of Net
Description Assets
Spain
Iberdrola Finanzas SAU 6.000% 01/07/2022 EMTN 700,000 GBP 1,140,283 1,313,939 0.14
Iberdrola Finanzas SAU 7.375% 29/01/2024 EMTN 250,000 GBP 441,806 512,319 0.06
Telefonica Emisiones SAU 5.134% 27/04/2020 1,865,000 USD 1,908,416 2,064,566 0.23
Telefonica Emisiones SAU 5.462% 16/02/2021 3,560,000 USD 3,724,997 3,969,372 0.44
7,215,502 7,860,196 0.87Supranational Organisations
African Export-Import Bank 3.875% 04/06/2018 1,830,000 USD 1,821,006 1,779,675 0.20
Corp Andina de Fomento 4.375% 15/06/2022 2,140,000 USD 2,161,167 2,300,194 0.25
3,982,173 4,079,869 0.45Sweden
Svenska Handelsbanken AB 3.000% 20/11/2020EMTN 675,000 GBP 1,086,122 1,106,981 0.12
1,086,122 1,106,981 0.12Turkey
TC Ziraat Bankasi AS 4.250% 03/07/2019 1,025,000 USD 1,021,262 1,023,770 0.11
Turkiye Is Bankasi 5.000% 30/04/2020 1,305,000 USD 1,296,620 1,329,469 0.15
2,317,882 2,353,239 0.26United Arab Emirates
Abu Dhabi National Energy Co 5.875% 13/12/2021EMTN 1,365,000 USD 1,360,400 1,576,575 0.18
Emirates Telecommunications Corp 2.375%18/06/2019 3,700,000 USD 3,689,800 3,714,326 0.41
5,050,200 5,290,901 0.59United States
AES Corp/VA 5.500% 15/03/2024 130,000 USD 127,137 131,924 0.01
Albemarle Corp 1.875% 08/12/2021 2,250,000 EUR 2,785,435 2,731,995 0.30
Ally Financial Inc 2.750% 30/01/2017 545,000 USD 550,301 543,300 0.06
Ally Financial Inc 3.500% 18/07/2016 1,490,000 USD 1,490,000 1,506,762 0.17
Ally Financial Inc 3.750% 18/11/2019 2,300,000 USD 2,279,810 2,265,500 0.25
Ally Financial Inc 4.750% 10/09/2018 825,000 USD 819,661 853,875 0.09
Altria Group Inc 4.000% 31/01/2024 3,675,000 USD 3,654,750 3,831,485 0.43
American International Group Inc 4.875%01/06/2022 2,320,000 USD 2,383,692 2,606,158 0.29
American International Group Inc 5.000%26/04/2023 EMTN 800,000 GBP 1,131,550 1,434,018 0.16
Amgen Inc 2.125% 13/09/2019 1,900,000 EUR 2,668,020 2,443,409 0.27
Amgen Inc 4.375% 05/12/2018 3,500,000 EUR 5,328,443 4,836,333 0.54
Anadarko Petroleum Corp 3.450% 15/07/2024 1,380,000 USD 1,342,061 1,347,210 0.15
Anthem Inc 2.300% 15/07/2018 1,915,000 USD 1,934,420 1,925,599 0.21
AT&T Inc 4.300% 15/12/2042 945,000 USD 853,487 898,423 0.10
AT&T Inc 4.350% 15/06/2045 2,515,000 USD 2,275,639 2,371,026 0.26
Baltimore Gas & Electric Co 3.350% 01/07/2023 1,470,000 USD 1,488,124 1,506,753 0.17
Bank of America Corp 2.000% 11/01/2018 1,005,000 USD 976,757 1,004,236 0.11
Bank of America Corp 2.650% 01/04/2019 1,960,000 USD 1,959,534 1,974,377 0.22
Bank of America Corp 5.000% 13/05/2021 9,990,000 USD 10,041,044 11,147,371 1.24
Bank of America Corp 5.700% 24/01/2022 1,205,000 USD 1,295,022 1,395,917 0.15
Bank of America Corp 6.125% 15/09/2021 EMTN 50,000 GBP 80,491 94,391 0.01
Becton Dickinson and Co 2.675% 15/12/2019 1,130,000 USD 1,130,000 1,144,861 0.13
Becton Dickinson and Co 3.734% 15/12/2024 2,690,000 USD 2,690,000 2,769,557 0.31
BMW US Capital LLC 1.000% 18/07/2017 EMTN 1,820,000 EUR 2,375,197 2,242,362 0.25
Burlington Northern Santa Fe LLC 3.400%01/09/2024 2,075,000 USD 2,070,425 2,112,873 0.23
Chesapeake Energy Corp 4.875% 15/04/2022 1,550,000 USD 1,563,286 1,507,375 0.17
Chesapeake Energy Corp 5.375% 15/06/2021 200,000 USD 203,113 199,875 0.02
Chesapeake Energy Corp 5.750% 15/03/2023 570,000 USD 611,723 587,100 0.07
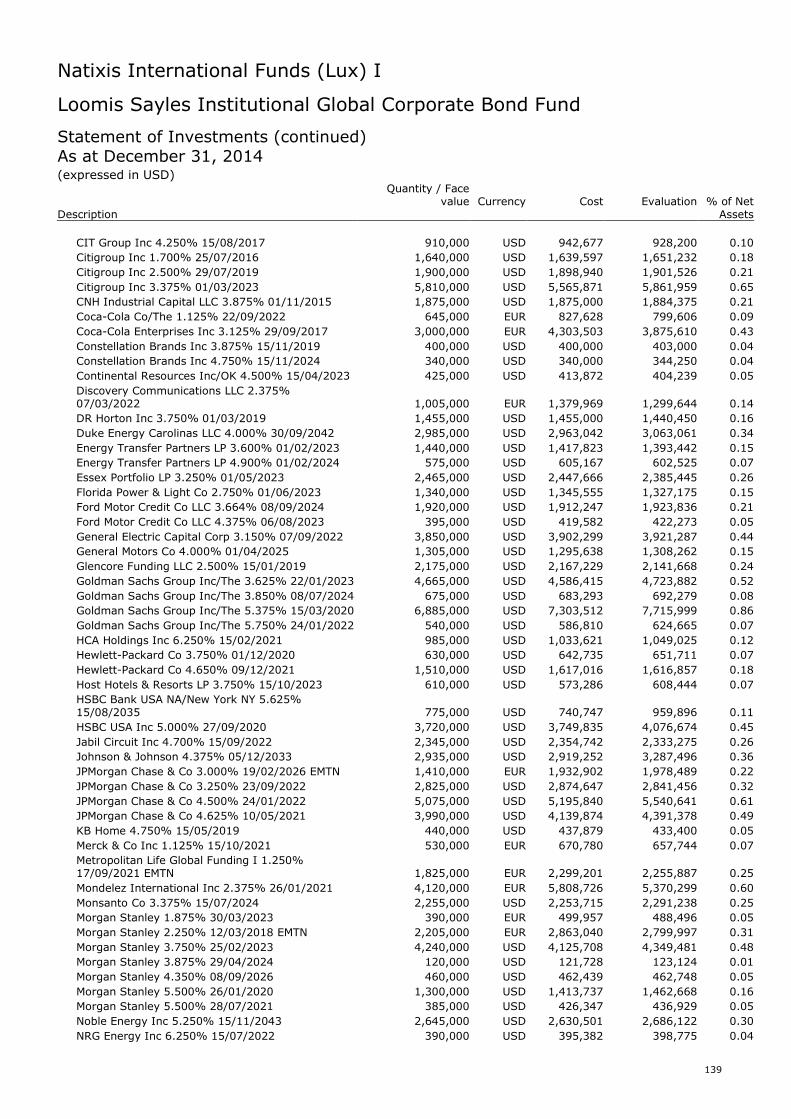
Natixis International Funds (Lux) I
139
Loomis Sayles Institutional Global Corporate Bond Fund
Statement of Investments (continued)As at December 31, 2014(expressed in USD)
Quantity / Facevalue Currency Cost Evaluation % of Net
Description Assets
CIT Group Inc 4.250% 15/08/2017 910,000 USD 942,677 928,200 0.10
Citigroup Inc 1.700% 25/07/2016 1,640,000 USD 1,639,597 1,651,232 0.18
Citigroup Inc 2.500% 29/07/2019 1,900,000 USD 1,898,940 1,901,526 0.21
Citigroup Inc 3.375% 01/03/2023 5,810,000 USD 5,565,871 5,861,959 0.65
CNH Industrial Capital LLC 3.875% 01/11/2015 1,875,000 USD 1,875,000 1,884,375 0.21
Coca-Cola Co/The 1.125% 22/09/2022 645,000 EUR 827,628 799,606 0.09
Coca-Cola Enterprises Inc 3.125% 29/09/2017 3,000,000 EUR 4,303,503 3,875,610 0.43
Constellation Brands Inc 3.875% 15/11/2019 400,000 USD 400,000 403,000 0.04
Constellation Brands Inc 4.750% 15/11/2024 340,000 USD 340,000 344,250 0.04
Continental Resources Inc/OK 4.500% 15/04/2023 425,000 USD 413,872 404,239 0.05
Discovery Communications LLC 2.375%07/03/2022 1,005,000 EUR 1,379,969 1,299,644 0.14
DR Horton Inc 3.750% 01/03/2019 1,455,000 USD 1,455,000 1,440,450 0.16
Duke Energy Carolinas LLC 4.000% 30/09/2042 2,985,000 USD 2,963,042 3,063,061 0.34
Energy Transfer Partners LP 3.600% 01/02/2023 1,440,000 USD 1,417,823 1,393,442 0.15
Energy Transfer Partners LP 4.900% 01/02/2024 575,000 USD 605,167 602,525 0.07
Essex Portfolio LP 3.250% 01/05/2023 2,465,000 USD 2,447,666 2,385,445 0.26
Florida Power & Light Co 2.750% 01/06/2023 1,340,000 USD 1,345,555 1,327,175 0.15
Ford Motor Credit Co LLC 3.664% 08/09/2024 1,920,000 USD 1,912,247 1,923,836 0.21
Ford Motor Credit Co LLC 4.375% 06/08/2023 395,000 USD 419,582 422,273 0.05
General Electric Capital Corp 3.150% 07/09/2022 3,850,000 USD 3,902,299 3,921,287 0.44
General Motors Co 4.000% 01/04/2025 1,305,000 USD 1,295,638 1,308,262 0.15
Glencore Funding LLC 2.500% 15/01/2019 2,175,000 USD 2,167,229 2,141,668 0.24
Goldman Sachs Group Inc/The 3.625% 22/01/2023 4,665,000 USD 4,586,415 4,723,882 0.52
Goldman Sachs Group Inc/The 3.850% 08/07/2024 675,000 USD 683,293 692,279 0.08
Goldman Sachs Group Inc/The 5.375% 15/03/2020 6,885,000 USD 7,303,512 7,715,999 0.86
Goldman Sachs Group Inc/The 5.750% 24/01/2022 540,000 USD 586,810 624,665 0.07
HCA Holdings Inc 6.250% 15/02/2021 985,000 USD 1,033,621 1,049,025 0.12
Hewlett-Packard Co 3.750% 01/12/2020 630,000 USD 642,735 651,711 0.07
Hewlett-Packard Co 4.650% 09/12/2021 1,510,000 USD 1,617,016 1,616,857 0.18
Host Hotels & Resorts LP 3.750% 15/10/2023 610,000 USD 573,286 608,444 0.07
HSBC Bank USA NA/New York NY 5.625%15/08/2035 775,000 USD 740,747 959,896 0.11
HSBC USA Inc 5.000% 27/09/2020 3,720,000 USD 3,749,835 4,076,674 0.45
Jabil Circuit Inc 4.700% 15/09/2022 2,345,000 USD 2,354,742 2,333,275 0.26
Johnson & Johnson 4.375% 05/12/2033 2,935,000 USD 2,919,252 3,287,496 0.36
JPMorgan Chase & Co 3.000% 19/02/2026 EMTN 1,410,000 EUR 1,932,902 1,978,489 0.22
JPMorgan Chase & Co 3.250% 23/09/2022 2,825,000 USD 2,874,647 2,841,456 0.32
JPMorgan Chase & Co 4.500% 24/01/2022 5,075,000 USD 5,195,840 5,540,641 0.61
JPMorgan Chase & Co 4.625% 10/05/2021 3,990,000 USD 4,139,874 4,391,378 0.49
KB Home 4.750% 15/05/2019 440,000 USD 437,879 433,400 0.05
Merck & Co Inc 1.125% 15/10/2021 530,000 EUR 670,780 657,744 0.07
Metropolitan Life Global Funding I 1.250%17/09/2021 EMTN 1,825,000 EUR 2,299,201 2,255,887 0.25
Mondelez International Inc 2.375% 26/01/2021 4,120,000 EUR 5,808,726 5,370,299 0.60
Monsanto Co 3.375% 15/07/2024 2,255,000 USD 2,253,715 2,291,238 0.25
Morgan Stanley 1.875% 30/03/2023 390,000 EUR 499,957 488,496 0.05
Morgan Stanley 2.250% 12/03/2018 EMTN 2,205,000 EUR 2,863,040 2,799,997 0.31
Morgan Stanley 3.750% 25/02/2023 4,240,000 USD 4,125,708 4,349,481 0.48
Morgan Stanley 3.875% 29/04/2024 120,000 USD 121,728 123,124 0.01
Morgan Stanley 4.350% 08/09/2026 460,000 USD 462,439 462,748 0.05
Morgan Stanley 5.500% 26/01/2020 1,300,000 USD 1,413,737 1,462,668 0.16
Morgan Stanley 5.500% 28/07/2021 385,000 USD 426,347 436,929 0.05
Noble Energy Inc 5.250% 15/11/2043 2,645,000 USD 2,630,501 2,686,122 0.30
NRG Energy Inc 6.250% 15/07/2022 390,000 USD 395,382 398,775 0.04
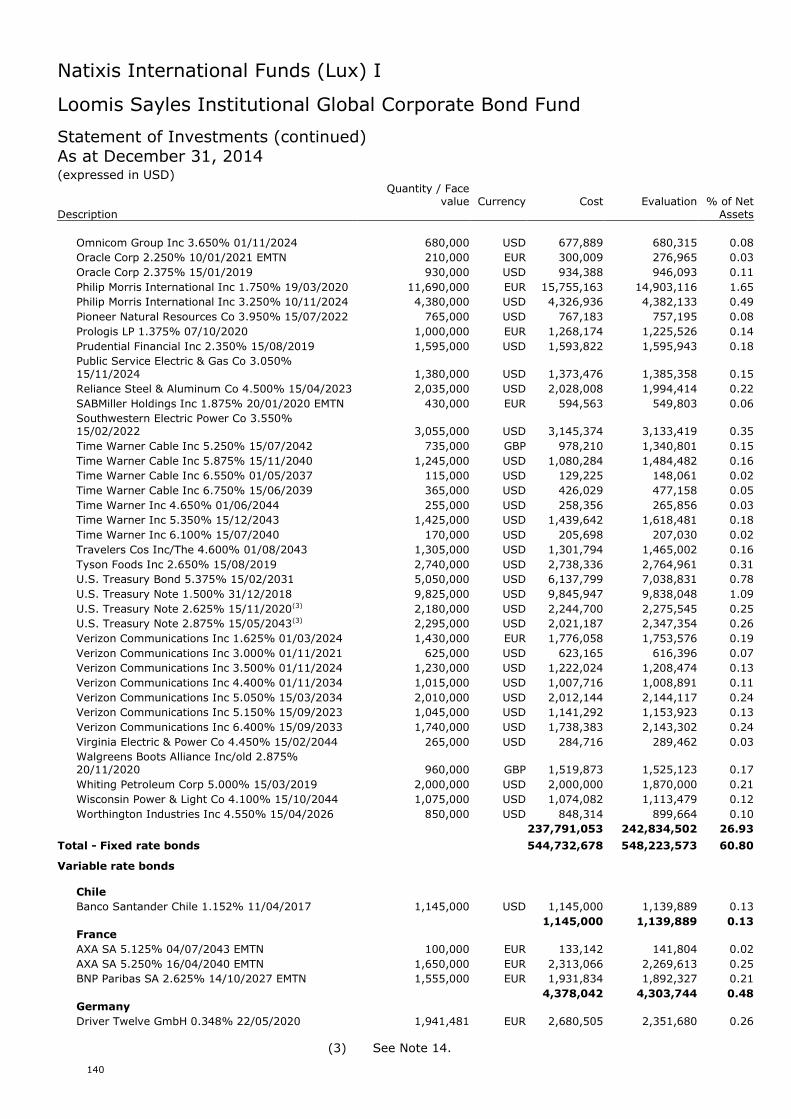
Natixis International Funds (Lux) I
140
Loomis Sayles Institutional Global Corporate Bond Fund
Statement of Investments (continued)As at December 31, 2014(expressed in USD)
Quantity / Facevalue Currency Cost Evaluation % of Net
Description Assets
Omnicom Group Inc 3.650% 01/11/2024 680,000 USD 677,889 680,315 0.08
Oracle Corp 2.250% 10/01/2021 EMTN 210,000 EUR 300,009 276,965 0.03
Oracle Corp 2.375% 15/01/2019 930,000 USD 934,388 946,093 0.11
Philip Morris International Inc 1.750% 19/03/2020 11,690,000 EUR 15,755,163 14,903,116 1.65
Philip Morris International Inc 3.250% 10/11/2024 4,380,000 USD 4,326,936 4,382,133 0.49
Pioneer Natural Resources Co 3.950% 15/07/2022 765,000 USD 767,183 757,195 0.08
Prologis LP 1.375% 07/10/2020 1,000,000 EUR 1,268,174 1,225,526 0.14
Prudential Financial Inc 2.350% 15/08/2019 1,595,000 USD 1,593,822 1,595,943 0.18
Public Service Electric & Gas Co 3.050%15/11/2024 1,380,000 USD 1,373,476 1,385,358 0.15
Reliance Steel & Aluminum Co 4.500% 15/04/2023 2,035,000 USD 2,028,008 1,994,414 0.22
SABMiller Holdings Inc 1.875% 20/01/2020 EMTN 430,000 EUR 594,563 549,803 0.06
Southwestern Electric Power Co 3.550%15/02/2022 3,055,000 USD 3,145,374 3,133,419 0.35
Time Warner Cable Inc 5.250% 15/07/2042 735,000 GBP 978,210 1,340,801 0.15
Time Warner Cable Inc 5.875% 15/11/2040 1,245,000 USD 1,080,284 1,484,482 0.16
Time Warner Cable Inc 6.550% 01/05/2037 115,000 USD 129,225 148,061 0.02
Time Warner Cable Inc 6.750% 15/06/2039 365,000 USD 426,029 477,158 0.05
Time Warner Inc 4.650% 01/06/2044 255,000 USD 258,356 265,856 0.03
Time Warner Inc 5.350% 15/12/2043 1,425,000 USD 1,439,642 1,618,481 0.18
Time Warner Inc 6.100% 15/07/2040 170,000 USD 205,698 207,030 0.02
Travelers Cos Inc/The 4.600% 01/08/2043 1,305,000 USD 1,301,794 1,465,002 0.16
Tyson Foods Inc 2.650% 15/08/2019 2,740,000 USD 2,738,336 2,764,961 0.31
U.S. Treasury Bond 5.375% 15/02/2031 5,050,000 USD 6,137,799 7,038,831 0.78
U.S. Treasury Note 1.500% 31/12/2018 9,825,000 USD 9,845,947 9,838,048 1.09
U.S. Treasury Note 2.625% 15/11/2020(3) 2,180,000 USD 2,244,700 2,275,545 0.25
U.S. Treasury Note 2.875% 15/05/2043(3) 2,295,000 USD 2,021,187 2,347,354 0.26
Verizon Communications Inc 1.625% 01/03/2024 1,430,000 EUR 1,776,058 1,753,576 0.19
Verizon Communications Inc 3.000% 01/11/2021 625,000 USD 623,165 616,396 0.07
Verizon Communications Inc 3.500% 01/11/2024 1,230,000 USD 1,222,024 1,208,474 0.13
Verizon Communications Inc 4.400% 01/11/2034 1,015,000 USD 1,007,716 1,008,891 0.11
Verizon Communications Inc 5.050% 15/03/2034 2,010,000 USD 2,012,144 2,144,117 0.24
Verizon Communications Inc 5.150% 15/09/2023 1,045,000 USD 1,141,292 1,153,923 0.13
Verizon Communications Inc 6.400% 15/09/2033 1,740,000 USD 1,738,383 2,143,302 0.24
Virginia Electric & Power Co 4.450% 15/02/2044 265,000 USD 284,716 289,462 0.03
Walgreens Boots Alliance Inc/old 2.875%20/11/2020 960,000 GBP 1,519,873 1,525,123 0.17
Whiting Petroleum Corp 5.000% 15/03/2019 2,000,000 USD 2,000,000 1,870,000 0.21
Wisconsin Power & Light Co 4.100% 15/10/2044 1,075,000 USD 1,074,082 1,113,479 0.12
Worthington Industries Inc 4.550% 15/04/2026 850,000 USD 848,314 899,664 0.10
237,791,053 242,834,502 26.93
Total - Fixed rate bonds 544,732,678 548,223,573 60.80
Variable rate bonds
Chile
Banco Santander Chile 1.152% 11/04/2017 1,145,000 USD 1,145,000 1,139,889 0.13
1,145,000 1,139,889 0.13France
AXA SA 5.125% 04/07/2043 EMTN 100,000 EUR 133,142 141,804 0.02
AXA SA 5.250% 16/04/2040 EMTN 1,650,000 EUR 2,313,066 2,269,613 0.25
BNP Paribas SA 2.625% 14/10/2027 EMTN 1,555,000 EUR 1,931,834 1,892,327 0.21
4,378,042 4,303,744 0.48Germany
Driver Twelve GmbH 0.348% 22/05/2020 1,941,481 EUR 2,680,505 2,351,680 0.26
(3) See Note 14.
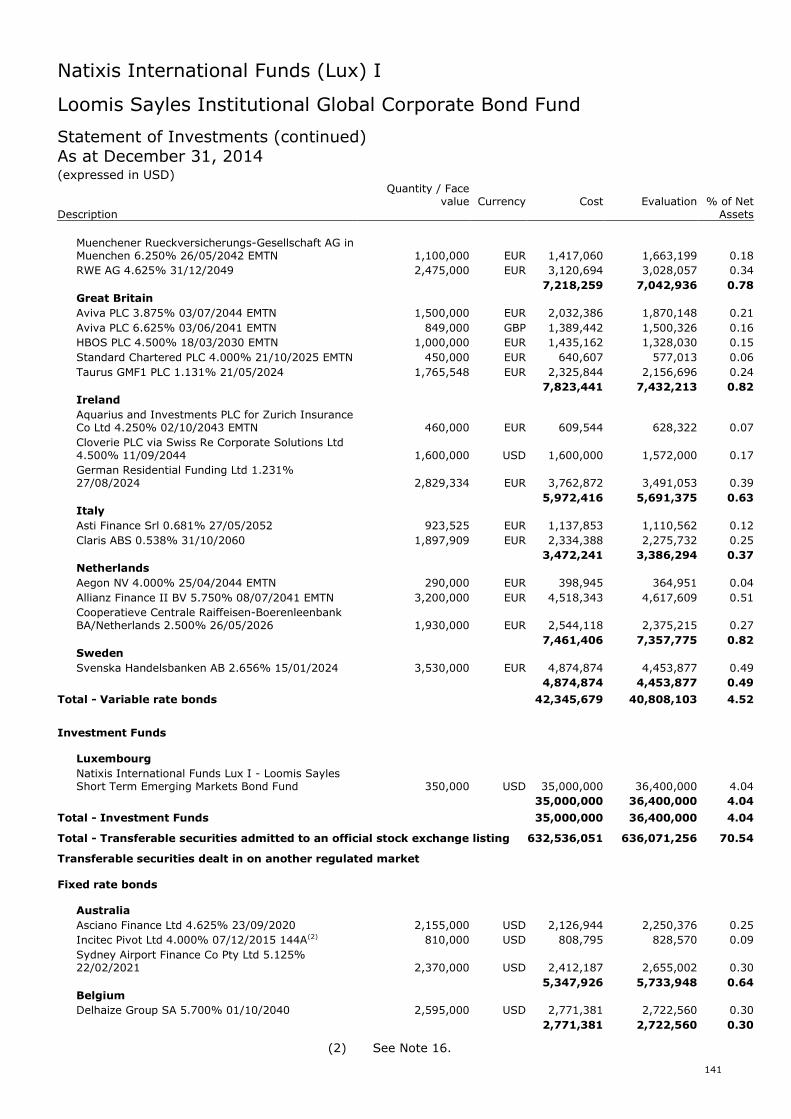
Natixis International Funds (Lux) I
141
Loomis Sayles Institutional Global Corporate Bond Fund
Statement of Investments (continued)As at December 31, 2014(expressed in USD)
Quantity / Facevalue Currency Cost Evaluation % of Net
Description Assets
Muenchener Rueckversicherungs-Gesellschaft AG inMuenchen 6.250% 26/05/2042 EMTN 1,100,000 EUR 1,417,060 1,663,199 0.18
RWE AG 4.625% 31/12/2049 2,475,000 EUR 3,120,694 3,028,057 0.34
7,218,259 7,042,936 0.78Great Britain
Aviva PLC 3.875% 03/07/2044 EMTN 1,500,000 EUR 2,032,386 1,870,148 0.21
Aviva PLC 6.625% 03/06/2041 EMTN 849,000 GBP 1,389,442 1,500,326 0.16
HBOS PLC 4.500% 18/03/2030 EMTN 1,000,000 EUR 1,435,162 1,328,030 0.15
Standard Chartered PLC 4.000% 21/10/2025 EMTN 450,000 EUR 640,607 577,013 0.06
Taurus GMF1 PLC 1.131% 21/05/2024 1,765,548 EUR 2,325,844 2,156,696 0.24
7,823,441 7,432,213 0.82Ireland
Aquarius and Investments PLC for Zurich InsuranceCo Ltd 4.250% 02/10/2043 EMTN 460,000 EUR 609,544 628,322 0.07
Cloverie PLC via Swiss Re Corporate Solutions Ltd4.500% 11/09/2044 1,600,000 USD 1,600,000 1,572,000 0.17
German Residential Funding Ltd 1.231%27/08/2024 2,829,334 EUR 3,762,872 3,491,053 0.39
5,972,416 5,691,375 0.63Italy
Asti Finance Srl 0.681% 27/05/2052 923,525 EUR 1,137,853 1,110,562 0.12
Claris ABS 0.538% 31/10/2060 1,897,909 EUR 2,334,388 2,275,732 0.25
3,472,241 3,386,294 0.37Netherlands
Aegon NV 4.000% 25/04/2044 EMTN 290,000 EUR 398,945 364,951 0.04
Allianz Finance II BV 5.750% 08/07/2041 EMTN 3,200,000 EUR 4,518,343 4,617,609 0.51
Cooperatieve Centrale Raiffeisen-BoerenleenbankBA/Netherlands 2.500% 26/05/2026 1,930,000 EUR 2,544,118 2,375,215 0.27
7,461,406 7,357,775 0.82Sweden
Svenska Handelsbanken AB 2.656% 15/01/2024 3,530,000 EUR 4,874,874 4,453,877 0.49
4,874,874 4,453,877 0.49
Total - Variable rate bonds 42,345,679 40,808,103 4.52
Investment Funds
Luxembourg
Natixis International Funds Lux I - Loomis SaylesShort Term Emerging Markets Bond Fund 350,000 USD 35,000,000 36,400,000 4.04
35,000,000 36,400,000 4.04
Total - Investment Funds 35,000,000 36,400,000 4.04
Total - Transferable securities admitted to an official stock exchange listing 632,536,051 636,071,256 70.54
Transferable securities dealt in on another regulated market
Fixed rate bonds
Australia
Asciano Finance Ltd 4.625% 23/09/2020 2,155,000 USD 2,126,944 2,250,376 0.25
Incitec Pivot Ltd 4.000% 07/12/2015 144A(2) 810,000 USD 808,795 828,570 0.09
Sydney Airport Finance Co Pty Ltd 5.125%22/02/2021 2,370,000 USD 2,412,187 2,655,002 0.30
5,347,926 5,733,948 0.64Belgium
Delhaize Group SA 5.700% 01/10/2040 2,595,000 USD 2,771,381 2,722,560 0.30
2,771,381 2,722,560 0.30
(2) See Note 16.
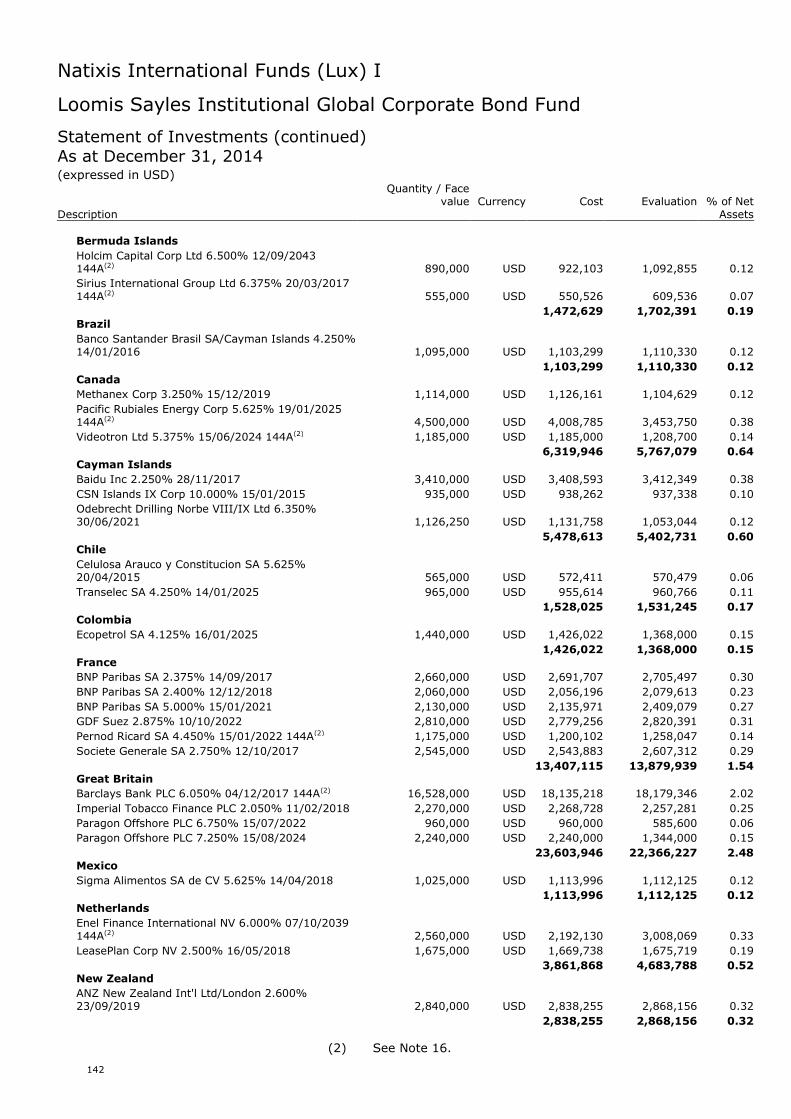
Natixis International Funds (Lux) I
142
Loomis Sayles Institutional Global Corporate Bond Fund
Statement of Investments (continued)As at December 31, 2014(expressed in USD)
Quantity / Facevalue Currency Cost Evaluation % of Net
Description Assets
Bermuda Islands
Holcim Capital Corp Ltd 6.500% 12/09/2043144A(2) 890,000 USD 922,103 1,092,855 0.12
Sirius International Group Ltd 6.375% 20/03/2017144A(2) 555,000 USD 550,526 609,536 0.07
1,472,629 1,702,391 0.19Brazil
Banco Santander Brasil SA/Cayman Islands 4.250%14/01/2016 1,095,000 USD 1,103,299 1,110,330 0.12
1,103,299 1,110,330 0.12Canada
Methanex Corp 3.250% 15/12/2019 1,114,000 USD 1,126,161 1,104,629 0.12
Pacific Rubiales Energy Corp 5.625% 19/01/2025144A(2) 4,500,000 USD 4,008,785 3,453,750 0.38
Videotron Ltd 5.375% 15/06/2024 144A(2) 1,185,000 USD 1,185,000 1,208,700 0.14
6,319,946 5,767,079 0.64Cayman Islands
Baidu Inc 2.250% 28/11/2017 3,410,000 USD 3,408,593 3,412,349 0.38
CSN Islands IX Corp 10.000% 15/01/2015 935,000 USD 938,262 937,338 0.10
Odebrecht Drilling Norbe VIII/IX Ltd 6.350%30/06/2021 1,126,250 USD 1,131,758 1,053,044 0.12
5,478,613 5,402,731 0.60Chile
Celulosa Arauco y Constitucion SA 5.625%20/04/2015 565,000 USD 572,411 570,479 0.06
Transelec SA 4.250% 14/01/2025 965,000 USD 955,614 960,766 0.11
1,528,025 1,531,245 0.17Colombia
Ecopetrol SA 4.125% 16/01/2025 1,440,000 USD 1,426,022 1,368,000 0.15
1,426,022 1,368,000 0.15France
BNP Paribas SA 2.375% 14/09/2017 2,660,000 USD 2,691,707 2,705,497 0.30
BNP Paribas SA 2.400% 12/12/2018 2,060,000 USD 2,056,196 2,079,613 0.23
BNP Paribas SA 5.000% 15/01/2021 2,130,000 USD 2,135,971 2,409,079 0.27
GDF Suez 2.875% 10/10/2022 2,810,000 USD 2,779,256 2,820,391 0.31
Pernod Ricard SA 4.450% 15/01/2022 144A(2) 1,175,000 USD 1,200,102 1,258,047 0.14
Societe Generale SA 2.750% 12/10/2017 2,545,000 USD 2,543,883 2,607,312 0.29
13,407,115 13,879,939 1.54Great Britain
Barclays Bank PLC 6.050% 04/12/2017 144A(2) 16,528,000 USD 18,135,218 18,179,346 2.02
Imperial Tobacco Finance PLC 2.050% 11/02/2018 2,270,000 USD 2,268,728 2,257,281 0.25
Paragon Offshore PLC 6.750% 15/07/2022 960,000 USD 960,000 585,600 0.06
Paragon Offshore PLC 7.250% 15/08/2024 2,240,000 USD 2,240,000 1,344,000 0.15
23,603,946 22,366,227 2.48Mexico
Sigma Alimentos SA de CV 5.625% 14/04/2018 1,025,000 USD 1,113,996 1,112,125 0.12
1,113,996 1,112,125 0.12Netherlands
Enel Finance International NV 6.000% 07/10/2039144A(2) 2,560,000 USD 2,192,130 3,008,069 0.33
LeasePlan Corp NV 2.500% 16/05/2018 1,675,000 USD 1,669,738 1,675,719 0.19
3,861,868 4,683,788 0.52New Zealand
ANZ New Zealand Int'l Ltd/London 2.600%23/09/2019 2,840,000 USD 2,838,255 2,868,156 0.32
2,838,255 2,868,156 0.32
(2) See Note 16.
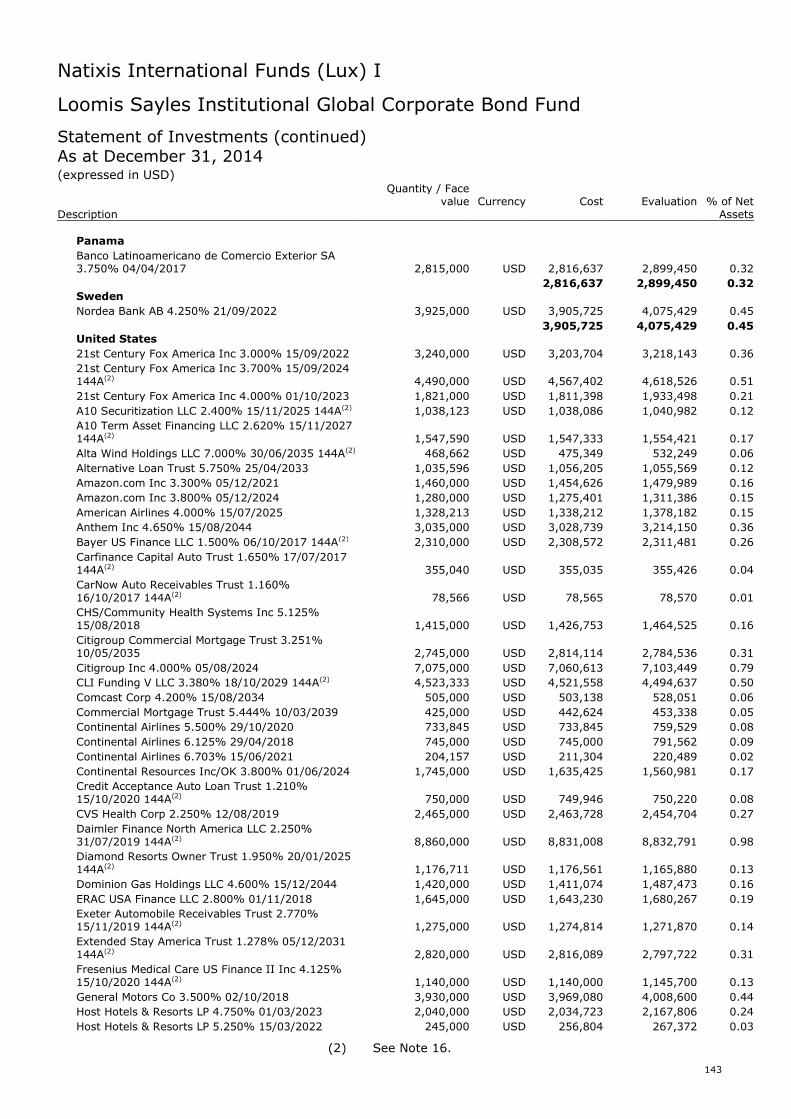
Natixis International Funds (Lux) I
143
Loomis Sayles Institutional Global Corporate Bond Fund
Statement of Investments (continued)As at December 31, 2014(expressed in USD)
Quantity / Facevalue Currency Cost Evaluation % of Net
Description Assets
Panama
Banco Latinoamericano de Comercio Exterior SA3.750% 04/04/2017 2,815,000 USD 2,816,637 2,899,450 0.32
2,816,637 2,899,450 0.32Sweden
Nordea Bank AB 4.250% 21/09/2022 3,925,000 USD 3,905,725 4,075,429 0.45
3,905,725 4,075,429 0.45United States
21st Century Fox America Inc 3.000% 15/09/2022 3,240,000 USD 3,203,704 3,218,143 0.36
21st Century Fox America Inc 3.700% 15/09/2024144A(2) 4,490,000 USD 4,567,402 4,618,526 0.51
21st Century Fox America Inc 4.000% 01/10/2023 1,821,000 USD 1,811,398 1,933,498 0.21
A10 Securitization LLC 2.400% 15/11/2025 144A(2) 1,038,123 USD 1,038,086 1,040,982 0.12
A10 Term Asset Financing LLC 2.620% 15/11/2027144A(2) 1,547,590 USD 1,547,333 1,554,421 0.17
Alta Wind Holdings LLC 7.000% 30/06/2035 144A(2) 468,662 USD 475,349 532,249 0.06
Alternative Loan Trust 5.750% 25/04/2033 1,035,596 USD 1,056,205 1,055,569 0.12
Amazon.com Inc 3.300% 05/12/2021 1,460,000 USD 1,454,626 1,479,989 0.16
Amazon.com Inc 3.800% 05/12/2024 1,280,000 USD 1,275,401 1,311,386 0.15
American Airlines 4.000% 15/07/2025 1,328,213 USD 1,338,212 1,378,182 0.15
Anthem Inc 4.650% 15/08/2044 3,035,000 USD 3,028,739 3,214,150 0.36
Bayer US Finance LLC 1.500% 06/10/2017 144A(2) 2,310,000 USD 2,308,572 2,311,481 0.26
Carfinance Capital Auto Trust 1.650% 17/07/2017144A(2) 355,040 USD 355,035 355,426 0.04
CarNow Auto Receivables Trust 1.160%16/10/2017 144A(2) 78,566 USD 78,565 78,570 0.01
CHS/Community Health Systems Inc 5.125%15/08/2018 1,415,000 USD 1,426,753 1,464,525 0.16
Citigroup Commercial Mortgage Trust 3.251%10/05/2035 2,745,000 USD 2,814,114 2,784,536 0.31
Citigroup Inc 4.000% 05/08/2024 7,075,000 USD 7,060,613 7,103,449 0.79
CLI Funding V LLC 3.380% 18/10/2029 144A(2) 4,523,333 USD 4,521,558 4,494,637 0.50
Comcast Corp 4.200% 15/08/2034 505,000 USD 503,138 528,051 0.06
Commercial Mortgage Trust 5.444% 10/03/2039 425,000 USD 442,624 453,338 0.05
Continental Airlines 5.500% 29/10/2020 733,845 USD 733,845 759,529 0.08
Continental Airlines 6.125% 29/04/2018 745,000 USD 745,000 791,562 0.09
Continental Airlines 6.703% 15/06/2021 204,157 USD 211,304 220,489 0.02
Continental Resources Inc/OK 3.800% 01/06/2024 1,745,000 USD 1,635,425 1,560,981 0.17
Credit Acceptance Auto Loan Trust 1.210%15/10/2020 144A(2) 750,000 USD 749,946 750,220 0.08
CVS Health Corp 2.250% 12/08/2019 2,465,000 USD 2,463,728 2,454,704 0.27
Daimler Finance North America LLC 2.250%31/07/2019 144A(2) 8,860,000 USD 8,831,008 8,832,791 0.98
Diamond Resorts Owner Trust 1.950% 20/01/2025144A(2) 1,176,711 USD 1,176,561 1,165,880 0.13
Dominion Gas Holdings LLC 4.600% 15/12/2044 1,420,000 USD 1,411,074 1,487,473 0.16
ERAC USA Finance LLC 2.800% 01/11/2018 1,645,000 USD 1,643,230 1,680,267 0.19
Exeter Automobile Receivables Trust 2.770%15/11/2019 144A(2) 1,275,000 USD 1,274,814 1,271,870 0.14
Extended Stay America Trust 1.278% 05/12/2031144A(2) 2,820,000 USD 2,816,089 2,797,722 0.31
Fresenius Medical Care US Finance II Inc 4.125%15/10/2020 144A(2) 1,140,000 USD 1,140,000 1,145,700 0.13
General Motors Co 3.500% 02/10/2018 3,930,000 USD 3,969,080 4,008,600 0.44
Host Hotels & Resorts LP 4.750% 01/03/2023 2,040,000 USD 2,034,723 2,167,806 0.24
Host Hotels & Resorts LP 5.250% 15/03/2022 245,000 USD 256,804 267,372 0.03
(2) See Note 16.
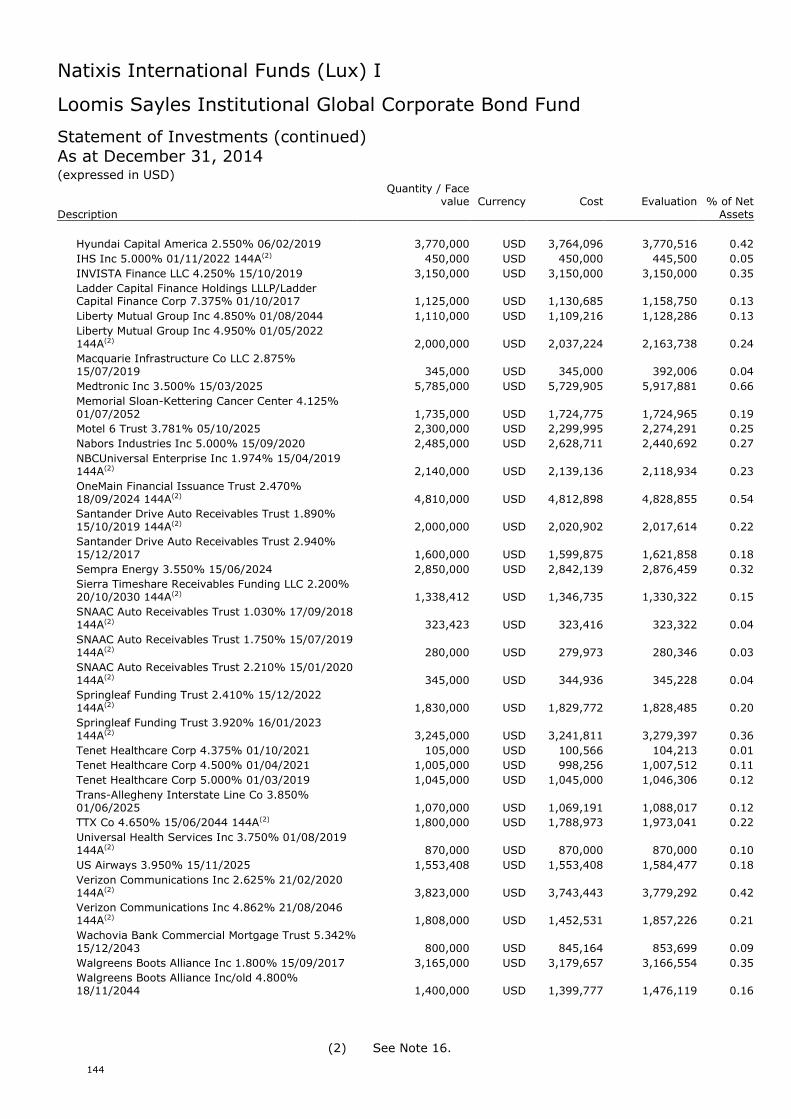
Natixis International Funds (Lux) I
144
Loomis Sayles Institutional Global Corporate Bond Fund
Statement of Investments (continued)As at December 31, 2014(expressed in USD)
Quantity / Facevalue Currency Cost Evaluation % of Net
Description Assets
Hyundai Capital America 2.550% 06/02/2019 3,770,000 USD 3,764,096 3,770,516 0.42
IHS Inc 5.000% 01/11/2022 144A(2) 450,000 USD 450,000 445,500 0.05
INVISTA Finance LLC 4.250% 15/10/2019 3,150,000 USD 3,150,000 3,150,000 0.35
Ladder Capital Finance Holdings LLLP/LadderCapital Finance Corp 7.375% 01/10/2017 1,125,000 USD 1,130,685 1,158,750 0.13
Liberty Mutual Group Inc 4.850% 01/08/2044 1,110,000 USD 1,109,216 1,128,286 0.13
Liberty Mutual Group Inc 4.950% 01/05/2022144A(2) 2,000,000 USD 2,037,224 2,163,738 0.24
Macquarie Infrastructure Co LLC 2.875%15/07/2019 345,000 USD 345,000 392,006 0.04
Medtronic Inc 3.500% 15/03/2025 5,785,000 USD 5,729,905 5,917,881 0.66
Memorial Sloan-Kettering Cancer Center 4.125%01/07/2052 1,735,000 USD 1,724,775 1,724,965 0.19
Motel 6 Trust 3.781% 05/10/2025 2,300,000 USD 2,299,995 2,274,291 0.25
Nabors Industries Inc 5.000% 15/09/2020 2,485,000 USD 2,628,711 2,440,692 0.27
NBCUniversal Enterprise Inc 1.974% 15/04/2019144A(2) 2,140,000 USD 2,139,136 2,118,934 0.23
OneMain Financial Issuance Trust 2.470%18/09/2024 144A(2) 4,810,000 USD 4,812,898 4,828,855 0.54
Santander Drive Auto Receivables Trust 1.890%15/10/2019 144A(2) 2,000,000 USD 2,020,902 2,017,614 0.22
Santander Drive Auto Receivables Trust 2.940%15/12/2017 1,600,000 USD 1,599,875 1,621,858 0.18
Sempra Energy 3.550% 15/06/2024 2,850,000 USD 2,842,139 2,876,459 0.32
Sierra Timeshare Receivables Funding LLC 2.200%20/10/2030 144A(2) 1,338,412 USD 1,346,735 1,330,322 0.15
SNAAC Auto Receivables Trust 1.030% 17/09/2018144A(2) 323,423 USD 323,416 323,322 0.04
SNAAC Auto Receivables Trust 1.750% 15/07/2019144A(2) 280,000 USD 279,973 280,346 0.03
SNAAC Auto Receivables Trust 2.210% 15/01/2020144A(2) 345,000 USD 344,936 345,228 0.04
Springleaf Funding Trust 2.410% 15/12/2022144A(2) 1,830,000 USD 1,829,772 1,828,485 0.20
Springleaf Funding Trust 3.920% 16/01/2023144A(2) 3,245,000 USD 3,241,811 3,279,397 0.36
Tenet Healthcare Corp 4.375% 01/10/2021 105,000 USD 100,566 104,213 0.01
Tenet Healthcare Corp 4.500% 01/04/2021 1,005,000 USD 998,256 1,007,512 0.11
Tenet Healthcare Corp 5.000% 01/03/2019 1,045,000 USD 1,045,000 1,046,306 0.12
Trans-Allegheny Interstate Line Co 3.850%01/06/2025 1,070,000 USD 1,069,191 1,088,017 0.12
TTX Co 4.650% 15/06/2044 144A(2) 1,800,000 USD 1,788,973 1,973,041 0.22
Universal Health Services Inc 3.750% 01/08/2019144A(2) 870,000 USD 870,000 870,000 0.10
US Airways 3.950% 15/11/2025 1,553,408 USD 1,553,408 1,584,477 0.18
Verizon Communications Inc 2.625% 21/02/2020144A(2) 3,823,000 USD 3,743,443 3,779,292 0.42
Verizon Communications Inc 4.862% 21/08/2046144A(2) 1,808,000 USD 1,452,531 1,857,226 0.21
Wachovia Bank Commercial Mortgage Trust 5.342%15/12/2043 800,000 USD 845,164 853,699 0.09
Walgreens Boots Alliance Inc 1.800% 15/09/2017 3,165,000 USD 3,179,657 3,166,554 0.35
Walgreens Boots Alliance Inc/old 4.800%18/11/2044 1,400,000 USD 1,399,777 1,476,119 0.16
(2) See Note 16.
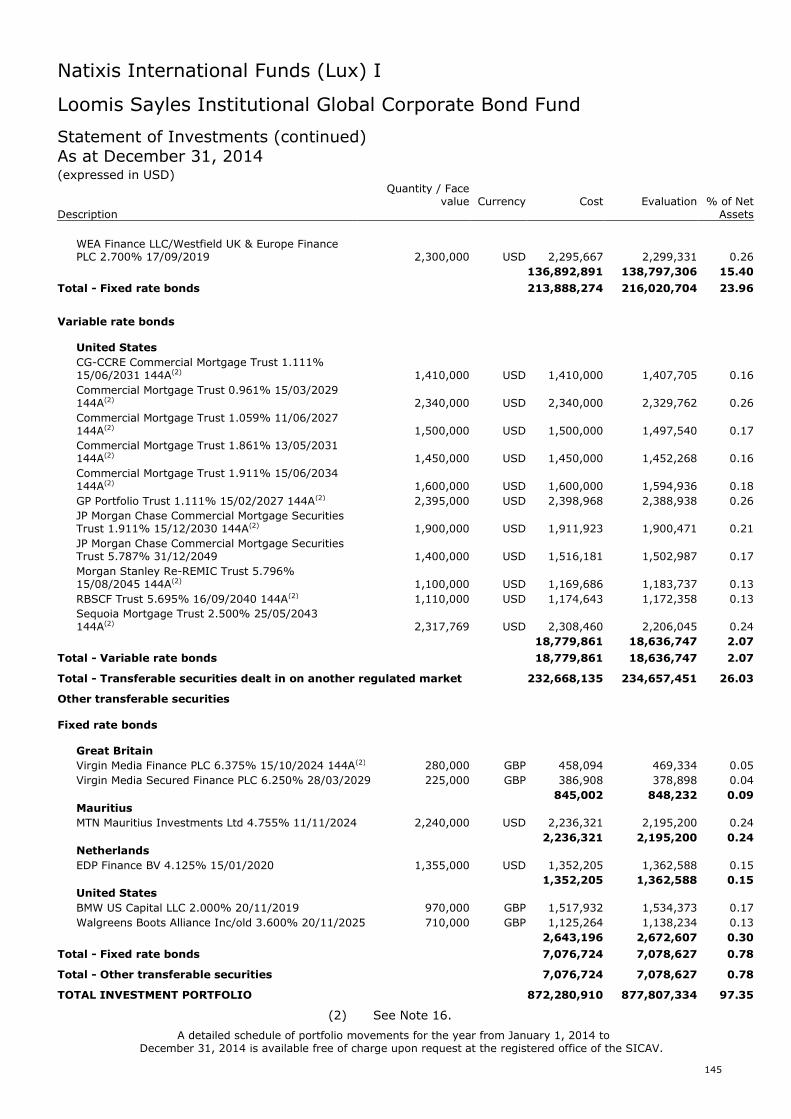
Natixis International Funds (Lux) I
145
Loomis Sayles Institutional Global Corporate Bond Fund
Statement of Investments (continued)As at December 31, 2014(expressed in USD)
Quantity / Facevalue Currency Cost Evaluation % of Net
Description Assets
WEA Finance LLC/Westfield UK & Europe FinancePLC 2.700% 17/09/2019 2,300,000 USD 2,295,667 2,299,331 0.26
136,892,891 138,797,306 15.40
Total - Fixed rate bonds 213,888,274 216,020,704 23.96
Variable rate bonds
United States
CG-CCRE Commercial Mortgage Trust 1.111%15/06/2031 144A(2) 1,410,000 USD 1,410,000 1,407,705 0.16
Commercial Mortgage Trust 0.961% 15/03/2029144A(2) 2,340,000 USD 2,340,000 2,329,762 0.26
Commercial Mortgage Trust 1.059% 11/06/2027144A(2) 1,500,000 USD 1,500,000 1,497,540 0.17
Commercial Mortgage Trust 1.861% 13/05/2031144A(2) 1,450,000 USD 1,450,000 1,452,268 0.16
Commercial Mortgage Trust 1.911% 15/06/2034144A(2) 1,600,000 USD 1,600,000 1,594,936 0.18
GP Portfolio Trust 1.111% 15/02/2027 144A(2) 2,395,000 USD 2,398,968 2,388,938 0.26
JP Morgan Chase Commercial Mortgage SecuritiesTrust 1.911% 15/12/2030 144A(2) 1,900,000 USD 1,911,923 1,900,471 0.21
JP Morgan Chase Commercial Mortgage SecuritiesTrust 5.787% 31/12/2049 1,400,000 USD 1,516,181 1,502,987 0.17
Morgan Stanley Re-REMIC Trust 5.796%15/08/2045 144A(2) 1,100,000 USD 1,169,686 1,183,737 0.13
RBSCF Trust 5.695% 16/09/2040 144A(2) 1,110,000 USD 1,174,643 1,172,358 0.13
Sequoia Mortgage Trust 2.500% 25/05/2043144A(2) 2,317,769 USD 2,308,460 2,206,045 0.24
18,779,861 18,636,747 2.07
Total - Variable rate bonds 18,779,861 18,636,747 2.07
Total - Transferable securities dealt in on another regulated market 232,668,135 234,657,451 26.03
Other transferable securities
Fixed rate bonds
Great Britain
Virgin Media Finance PLC 6.375% 15/10/2024 144A(2) 280,000 GBP 458,094 469,334 0.05
Virgin Media Secured Finance PLC 6.250% 28/03/2029 225,000 GBP 386,908 378,898 0.04
845,002 848,232 0.09Mauritius
MTN Mauritius Investments Ltd 4.755% 11/11/2024 2,240,000 USD 2,236,321 2,195,200 0.24
2,236,321 2,195,200 0.24Netherlands
EDP Finance BV 4.125% 15/01/2020 1,355,000 USD 1,352,205 1,362,588 0.15
1,352,205 1,362,588 0.15United States
BMW US Capital LLC 2.000% 20/11/2019 970,000 GBP 1,517,932 1,534,373 0.17
Walgreens Boots Alliance Inc/old 3.600% 20/11/2025 710,000 GBP 1,125,264 1,138,234 0.13
2,643,196 2,672,607 0.30
Total - Fixed rate bonds 7,076,724 7,078,627 0.78
Total - Other transferable securities 7,076,724 7,078,627 0.78
TOTAL INVESTMENT PORTFOLIO 872,280,910 877,807,334 97.35
A detailed schedule of portfolio movements for the year from January 1, 2014 toDecember 31, 2014 is available free of charge upon request at the registered office of the SICAV.
(2) See Note 16.
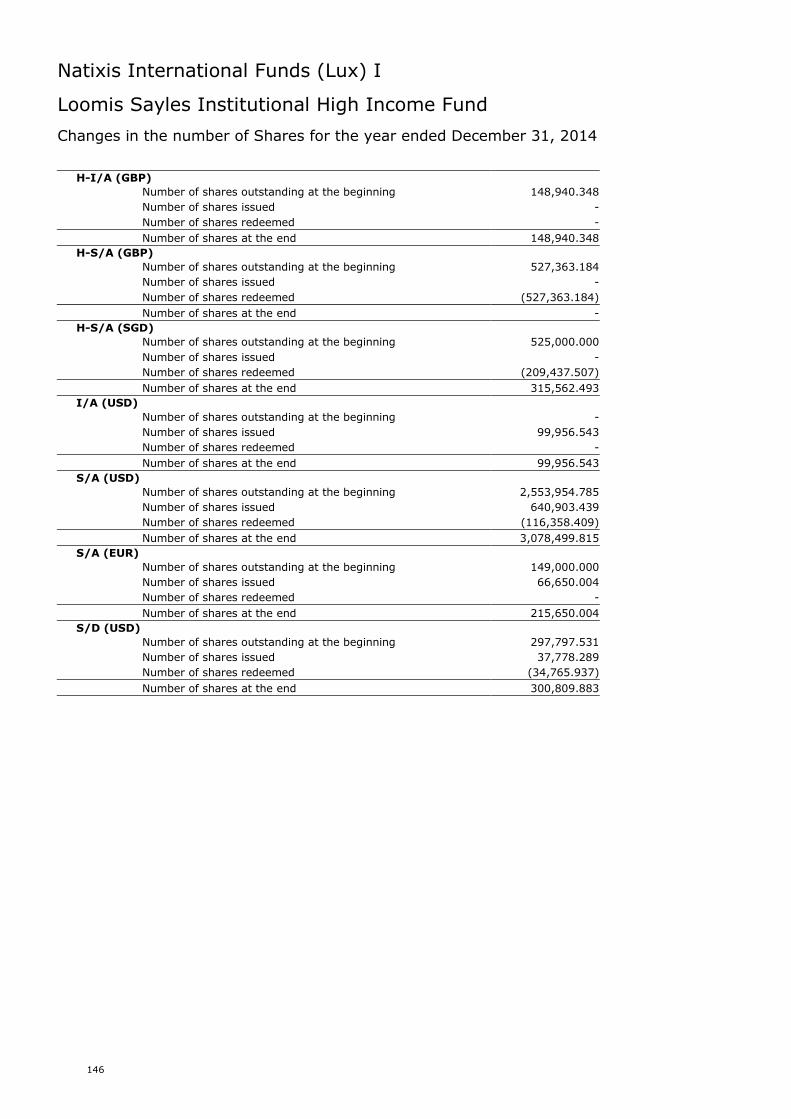
Natixis International Funds (Lux) I
146
Loomis Sayles Institutional High Income Fund
Changes in the number of Shares for the year ended December 31, 2014
H-I/A (GBP)
Number of shares outstanding at the beginning 148,940.348
Number of shares issued -
Number of shares redeemed -
Number of shares at the end 148,940.348
H-S/A (GBP)
Number of shares outstanding at the beginning 527,363.184
Number of shares issued -
Number of shares redeemed (527,363.184)
Number of shares at the end -
H-S/A (SGD)
Number of shares outstanding at the beginning 525,000.000
Number of shares issued -
Number of shares redeemed (209,437.507)
Number of shares at the end 315,562.493
I/A (USD)
Number of shares outstanding at the beginning -
Number of shares issued 99,956.543
Number of shares redeemed -
Number of shares at the end 99,956.543
S/A (USD)
Number of shares outstanding at the beginning 2,553,954.785
Number of shares issued 640,903.439
Number of shares redeemed (116,358.409)
Number of shares at the end 3,078,499.815
S/A (EUR)
Number of shares outstanding at the beginning 149,000.000
Number of shares issued 66,650.004
Number of shares redeemed -
Number of shares at the end 215,650.004
S/D (USD)
Number of shares outstanding at the beginning 297,797.531
Number of shares issued 37,778.289
Number of shares redeemed (34,765.937)
Number of shares at the end 300,809.883
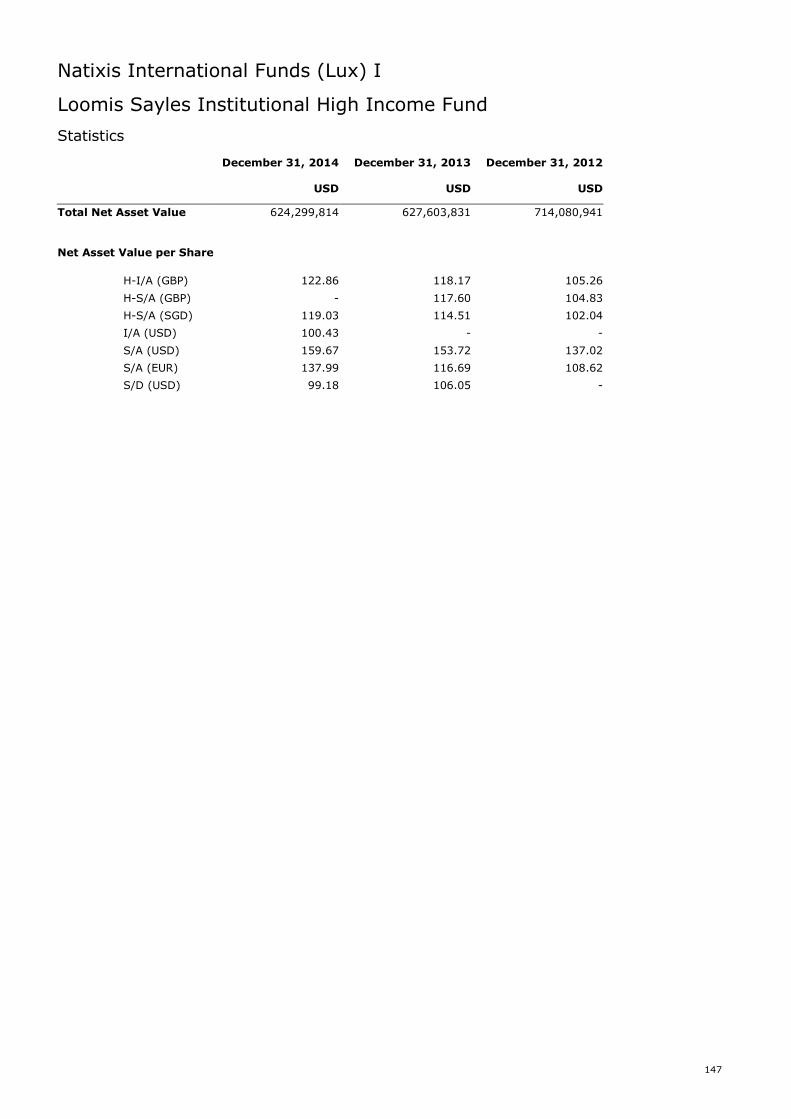
Natixis International Funds (Lux) I
147
Loomis Sayles Institutional High Income Fund
Statistics
December 31, 2014 December 31, 2013 December 31, 2012
USD USD USD
Total Net Asset Value 624,299,814 627,603,831 714,080,941
Net Asset Value per Share
H-I/A (GBP) 122.86 118.17 105.26
H-S/A (GBP) - 117.60 104.83
H-S/A (SGD) 119.03 114.51 102.04
I/A (USD) 100.43 - -
S/A (USD) 159.67 153.72 137.02
S/A (EUR) 137.99 116.69 108.62
S/D (USD) 99.18 106.05 -
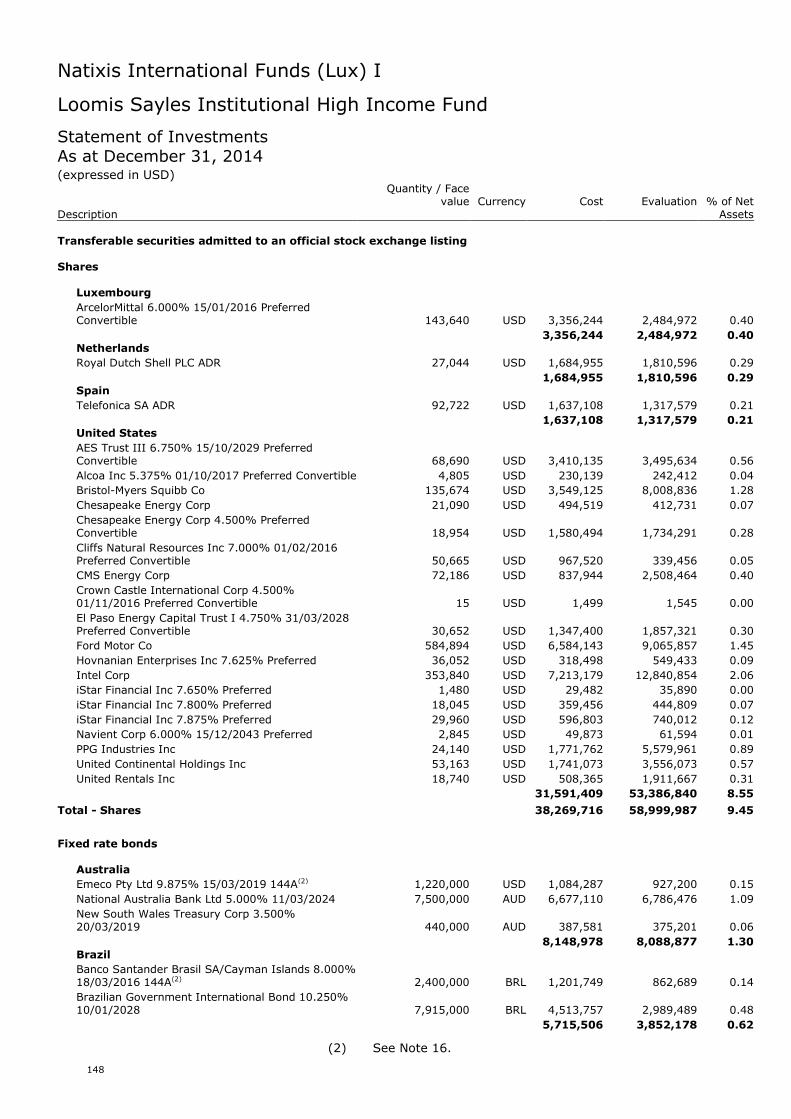
Natixis International Funds (Lux) I
148
Loomis Sayles Institutional High Income Fund
Statement of InvestmentsAs at December 31, 2014(expressed in USD)
Quantity / Facevalue Currency Cost Evaluation % of Net
Description Assets
Transferable securities admitted to an official stock exchange listing
Shares
Luxembourg
ArcelorMittal 6.000% 15/01/2016 PreferredConvertible 143,640 USD 3,356,244 2,484,972 0.40
3,356,244 2,484,972 0.40Netherlands
Royal Dutch Shell PLC ADR 27,044 USD 1,684,955 1,810,596 0.29
1,684,955 1,810,596 0.29Spain
Telefonica SA ADR 92,722 USD 1,637,108 1,317,579 0.21
1,637,108 1,317,579 0.21United States
AES Trust III 6.750% 15/10/2029 PreferredConvertible 68,690 USD 3,410,135 3,495,634 0.56
Alcoa Inc 5.375% 01/10/2017 Preferred Convertible 4,805 USD 230,139 242,412 0.04
Bristol-Myers Squibb Co 135,674 USD 3,549,125 8,008,836 1.28
Chesapeake Energy Corp 21,090 USD 494,519 412,731 0.07
Chesapeake Energy Corp 4.500% PreferredConvertible 18,954 USD 1,580,494 1,734,291 0.28
Cliffs Natural Resources Inc 7.000% 01/02/2016Preferred Convertible 50,665 USD 967,520 339,456 0.05
CMS Energy Corp 72,186 USD 837,944 2,508,464 0.40
Crown Castle International Corp 4.500%01/11/2016 Preferred Convertible 15 USD 1,499 1,545 0.00
El Paso Energy Capital Trust I 4.750% 31/03/2028Preferred Convertible 30,652 USD 1,347,400 1,857,321 0.30
Ford Motor Co 584,894 USD 6,584,143 9,065,857 1.45
Hovnanian Enterprises Inc 7.625% Preferred 36,052 USD 318,498 549,433 0.09
Intel Corp 353,840 USD 7,213,179 12,840,854 2.06
iStar Financial Inc 7.650% Preferred 1,480 USD 29,482 35,890 0.00
iStar Financial Inc 7.800% Preferred 18,045 USD 359,456 444,809 0.07
iStar Financial Inc 7.875% Preferred 29,960 USD 596,803 740,012 0.12
Navient Corp 6.000% 15/12/2043 Preferred 2,845 USD 49,873 61,594 0.01
PPG Industries Inc 24,140 USD 1,771,762 5,579,961 0.89
United Continental Holdings Inc 53,163 USD 1,741,073 3,556,073 0.57
United Rentals Inc 18,740 USD 508,365 1,911,667 0.31
31,591,409 53,386,840 8.55
Total - Shares 38,269,716 58,999,987 9.45
Fixed rate bonds
Australia
Emeco Pty Ltd 9.875% 15/03/2019 144A(2) 1,220,000 USD 1,084,287 927,200 0.15
National Australia Bank Ltd 5.000% 11/03/2024 7,500,000 AUD 6,677,110 6,786,476 1.09
New South Wales Treasury Corp 3.500%20/03/2019 440,000 AUD 387,581 375,201 0.06
8,148,978 8,088,877 1.30Brazil
Banco Santander Brasil SA/Cayman Islands 8.000%18/03/2016 144A(2) 2,400,000 BRL 1,201,749 862,689 0.14
Brazilian Government International Bond 10.250%10/01/2028 7,915,000 BRL 4,513,757 2,989,489 0.48
5,715,506 3,852,178 0.62
(2) See Note 16.
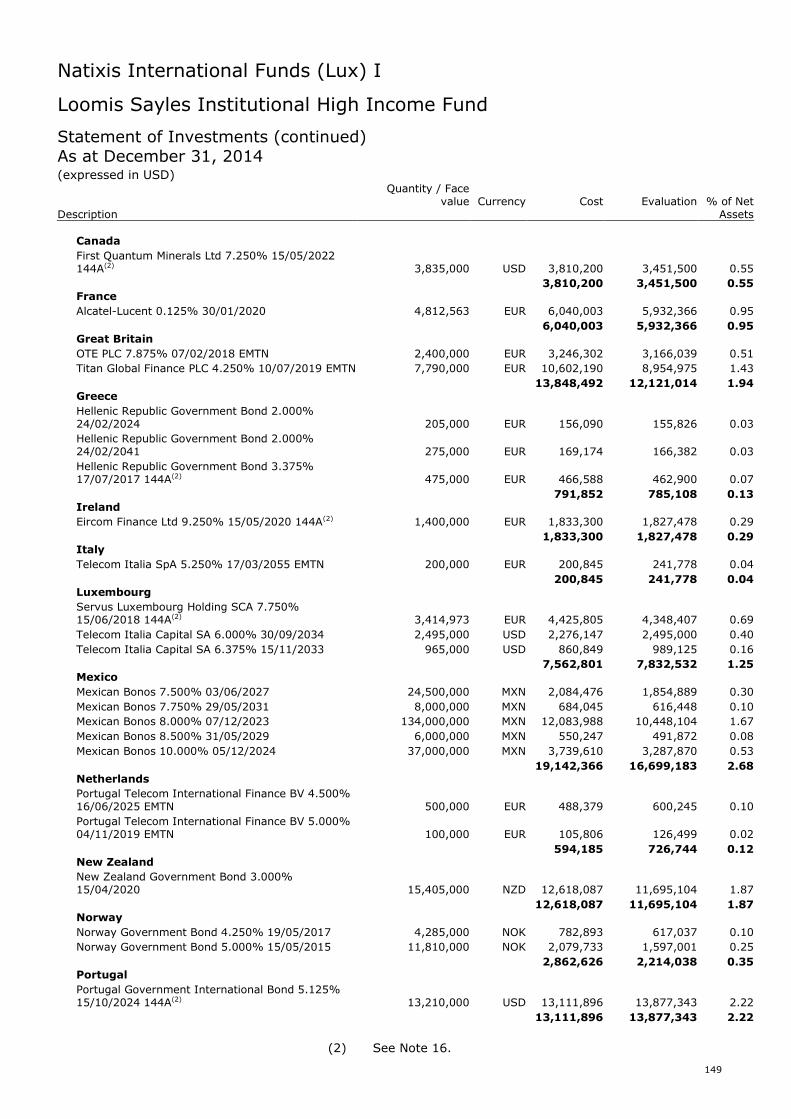
Natixis International Funds (Lux) I
149
Loomis Sayles Institutional High Income Fund
Statement of Investments (continued)As at December 31, 2014(expressed in USD)
Quantity / Facevalue Currency Cost Evaluation % of Net
Description Assets
Canada
First Quantum Minerals Ltd 7.250% 15/05/2022144A(2) 3,835,000 USD 3,810,200 3,451,500 0.55
3,810,200 3,451,500 0.55France
Alcatel-Lucent 0.125% 30/01/2020 4,812,563 EUR 6,040,003 5,932,366 0.95
6,040,003 5,932,366 0.95Great Britain
OTE PLC 7.875% 07/02/2018 EMTN 2,400,000 EUR 3,246,302 3,166,039 0.51
Titan Global Finance PLC 4.250% 10/07/2019 EMTN 7,790,000 EUR 10,602,190 8,954,975 1.43
13,848,492 12,121,014 1.94Greece
Hellenic Republic Government Bond 2.000%24/02/2024 205,000 EUR 156,090 155,826 0.03
Hellenic Republic Government Bond 2.000%24/02/2041 275,000 EUR 169,174 166,382 0.03
Hellenic Republic Government Bond 3.375%17/07/2017 144A(2) 475,000 EUR 466,588 462,900 0.07
791,852 785,108 0.13Ireland
Eircom Finance Ltd 9.250% 15/05/2020 144A(2) 1,400,000 EUR 1,833,300 1,827,478 0.29
1,833,300 1,827,478 0.29Italy
Telecom Italia SpA 5.250% 17/03/2055 EMTN 200,000 EUR 200,845 241,778 0.04
200,845 241,778 0.04Luxembourg
Servus Luxembourg Holding SCA 7.750%15/06/2018 144A(2) 3,414,973 EUR 4,425,805 4,348,407 0.69
Telecom Italia Capital SA 6.000% 30/09/2034 2,495,000 USD 2,276,147 2,495,000 0.40
Telecom Italia Capital SA 6.375% 15/11/2033 965,000 USD 860,849 989,125 0.16
7,562,801 7,832,532 1.25Mexico
Mexican Bonos 7.500% 03/06/2027 24,500,000 MXN 2,084,476 1,854,889 0.30
Mexican Bonos 7.750% 29/05/2031 8,000,000 MXN 684,045 616,448 0.10
Mexican Bonos 8.000% 07/12/2023 134,000,000 MXN 12,083,988 10,448,104 1.67
Mexican Bonos 8.500% 31/05/2029 6,000,000 MXN 550,247 491,872 0.08
Mexican Bonos 10.000% 05/12/2024 37,000,000 MXN 3,739,610 3,287,870 0.53
19,142,366 16,699,183 2.68Netherlands
Portugal Telecom International Finance BV 4.500%16/06/2025 EMTN 500,000 EUR 488,379 600,245 0.10
Portugal Telecom International Finance BV 5.000%04/11/2019 EMTN 100,000 EUR 105,806 126,499 0.02
594,185 726,744 0.12New Zealand
New Zealand Government Bond 3.000%15/04/2020 15,405,000 NZD 12,618,087 11,695,104 1.87
12,618,087 11,695,104 1.87Norway
Norway Government Bond 4.250% 19/05/2017 4,285,000 NOK 782,893 617,037 0.10
Norway Government Bond 5.000% 15/05/2015 11,810,000 NOK 2,079,733 1,597,001 0.25
2,862,626 2,214,038 0.35Portugal
Portugal Government International Bond 5.125%15/10/2024 144A(2) 13,210,000 USD 13,111,896 13,877,343 2.22
13,111,896 13,877,343 2.22
(2) See Note 16.
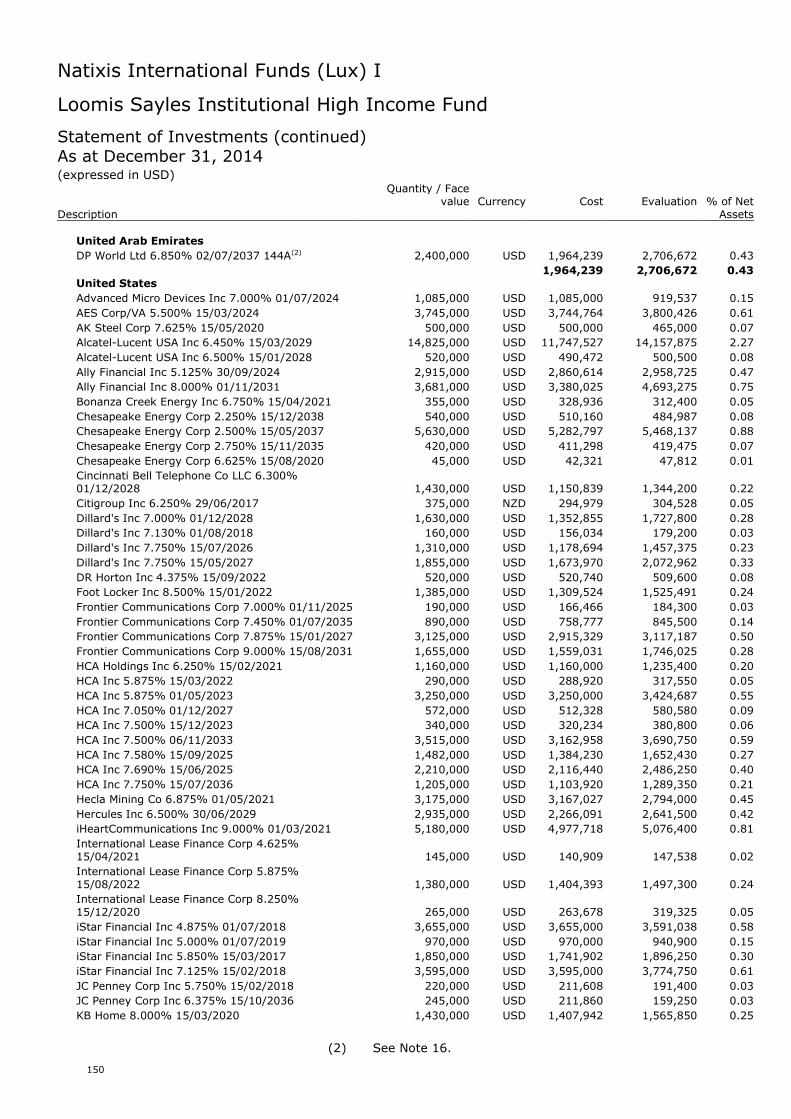
Natixis International Funds (Lux) I
150
Loomis Sayles Institutional High Income Fund
Statement of Investments (continued)As at December 31, 2014(expressed in USD)
Quantity / Facevalue Currency Cost Evaluation % of Net
Description Assets
United Arab Emirates
DP World Ltd 6.850% 02/07/2037 144A(2) 2,400,000 USD 1,964,239 2,706,672 0.43
1,964,239 2,706,672 0.43United States
Advanced Micro Devices Inc 7.000% 01/07/2024 1,085,000 USD 1,085,000 919,537 0.15
AES Corp/VA 5.500% 15/03/2024 3,745,000 USD 3,744,764 3,800,426 0.61
AK Steel Corp 7.625% 15/05/2020 500,000 USD 500,000 465,000 0.07
Alcatel-Lucent USA Inc 6.450% 15/03/2029 14,825,000 USD 11,747,527 14,157,875 2.27
Alcatel-Lucent USA Inc 6.500% 15/01/2028 520,000 USD 490,472 500,500 0.08
Ally Financial Inc 5.125% 30/09/2024 2,915,000 USD 2,860,614 2,958,725 0.47
Ally Financial Inc 8.000% 01/11/2031 3,681,000 USD 3,380,025 4,693,275 0.75
Bonanza Creek Energy Inc 6.750% 15/04/2021 355,000 USD 328,936 312,400 0.05
Chesapeake Energy Corp 2.250% 15/12/2038 540,000 USD 510,160 484,987 0.08
Chesapeake Energy Corp 2.500% 15/05/2037 5,630,000 USD 5,282,797 5,468,137 0.88
Chesapeake Energy Corp 2.750% 15/11/2035 420,000 USD 411,298 419,475 0.07
Chesapeake Energy Corp 6.625% 15/08/2020 45,000 USD 42,321 47,812 0.01
Cincinnati Bell Telephone Co LLC 6.300%01/12/2028 1,430,000 USD 1,150,839 1,344,200 0.22
Citigroup Inc 6.250% 29/06/2017 375,000 NZD 294,979 304,528 0.05
Dillard's Inc 7.000% 01/12/2028 1,630,000 USD 1,352,855 1,727,800 0.28
Dillard's Inc 7.130% 01/08/2018 160,000 USD 156,034 179,200 0.03
Dillard's Inc 7.750% 15/07/2026 1,310,000 USD 1,178,694 1,457,375 0.23
Dillard's Inc 7.750% 15/05/2027 1,855,000 USD 1,673,970 2,072,962 0.33
DR Horton Inc 4.375% 15/09/2022 520,000 USD 520,740 509,600 0.08
Foot Locker Inc 8.500% 15/01/2022 1,385,000 USD 1,309,524 1,525,491 0.24
Frontier Communications Corp 7.000% 01/11/2025 190,000 USD 166,466 184,300 0.03
Frontier Communications Corp 7.450% 01/07/2035 890,000 USD 758,777 845,500 0.14
Frontier Communications Corp 7.875% 15/01/2027 3,125,000 USD 2,915,329 3,117,187 0.50
Frontier Communications Corp 9.000% 15/08/2031 1,655,000 USD 1,559,031 1,746,025 0.28
HCA Holdings Inc 6.250% 15/02/2021 1,160,000 USD 1,160,000 1,235,400 0.20
HCA Inc 5.875% 15/03/2022 290,000 USD 288,920 317,550 0.05
HCA Inc 5.875% 01/05/2023 3,250,000 USD 3,250,000 3,424,687 0.55
HCA Inc 7.050% 01/12/2027 572,000 USD 512,328 580,580 0.09
HCA Inc 7.500% 15/12/2023 340,000 USD 320,234 380,800 0.06
HCA Inc 7.500% 06/11/2033 3,515,000 USD 3,162,958 3,690,750 0.59
HCA Inc 7.580% 15/09/2025 1,482,000 USD 1,384,230 1,652,430 0.27
HCA Inc 7.690% 15/06/2025 2,210,000 USD 2,116,440 2,486,250 0.40
HCA Inc 7.750% 15/07/2036 1,205,000 USD 1,103,920 1,289,350 0.21
Hecla Mining Co 6.875% 01/05/2021 3,175,000 USD 3,167,027 2,794,000 0.45
Hercules Inc 6.500% 30/06/2029 2,935,000 USD 2,266,091 2,641,500 0.42
iHeartCommunications Inc 9.000% 01/03/2021 5,180,000 USD 4,977,718 5,076,400 0.81
International Lease Finance Corp 4.625%15/04/2021 145,000 USD 140,909 147,538 0.02
International Lease Finance Corp 5.875%15/08/2022 1,380,000 USD 1,404,393 1,497,300 0.24
International Lease Finance Corp 8.250%15/12/2020 265,000 USD 263,678 319,325 0.05
iStar Financial Inc 4.875% 01/07/2018 3,655,000 USD 3,655,000 3,591,038 0.58
iStar Financial Inc 5.000% 01/07/2019 970,000 USD 970,000 940,900 0.15
iStar Financial Inc 5.850% 15/03/2017 1,850,000 USD 1,741,902 1,896,250 0.30
iStar Financial Inc 7.125% 15/02/2018 3,595,000 USD 3,595,000 3,774,750 0.61
JC Penney Corp Inc 5.750% 15/02/2018 220,000 USD 211,608 191,400 0.03
JC Penney Corp Inc 6.375% 15/10/2036 245,000 USD 211,860 159,250 0.03
KB Home 8.000% 15/03/2020 1,430,000 USD 1,407,942 1,565,850 0.25
(2) See Note 16.
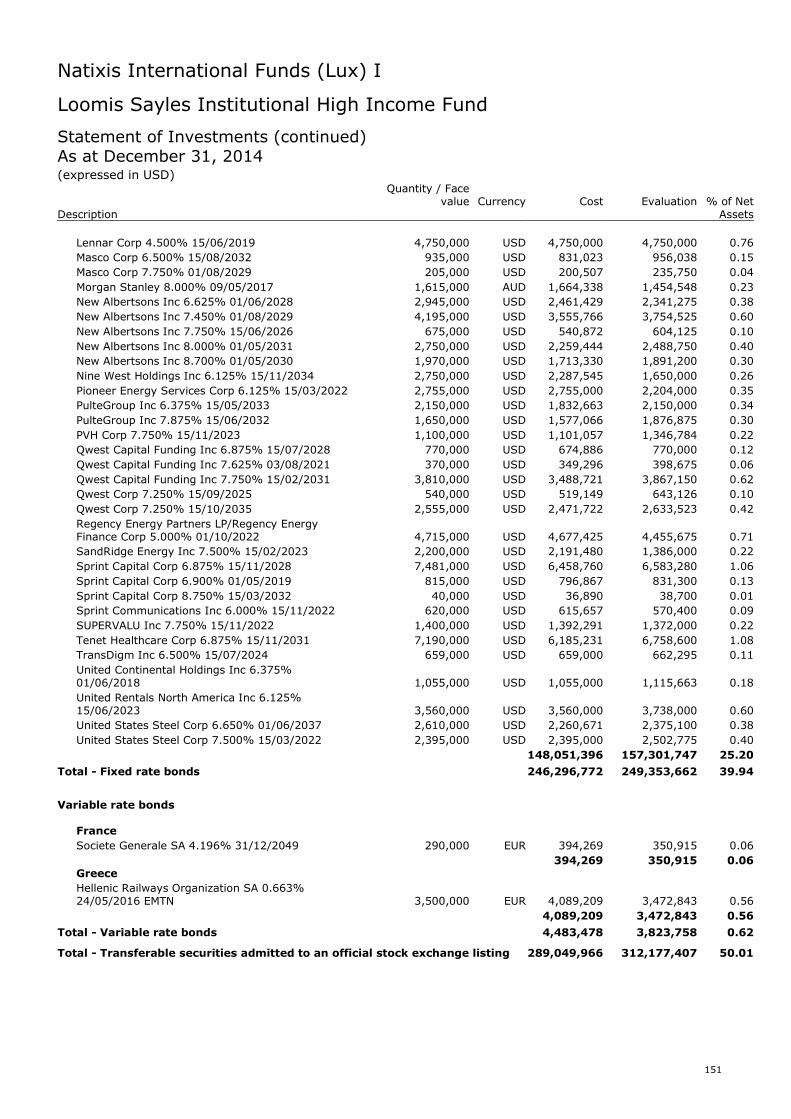
Natixis International Funds (Lux) I
151
Loomis Sayles Institutional High Income Fund
Statement of Investments (continued)As at December 31, 2014(expressed in USD)
Quantity / Facevalue Currency Cost Evaluation % of Net
Description Assets
Lennar Corp 4.500% 15/06/2019 4,750,000 USD 4,750,000 4,750,000 0.76
Masco Corp 6.500% 15/08/2032 935,000 USD 831,023 956,038 0.15
Masco Corp 7.750% 01/08/2029 205,000 USD 200,507 235,750 0.04
Morgan Stanley 8.000% 09/05/2017 1,615,000 AUD 1,664,338 1,454,548 0.23
New Albertsons Inc 6.625% 01/06/2028 2,945,000 USD 2,461,429 2,341,275 0.38
New Albertsons Inc 7.450% 01/08/2029 4,195,000 USD 3,555,766 3,754,525 0.60
New Albertsons Inc 7.750% 15/06/2026 675,000 USD 540,872 604,125 0.10
New Albertsons Inc 8.000% 01/05/2031 2,750,000 USD 2,259,444 2,488,750 0.40
New Albertsons Inc 8.700% 01/05/2030 1,970,000 USD 1,713,330 1,891,200 0.30
Nine West Holdings Inc 6.125% 15/11/2034 2,750,000 USD 2,287,545 1,650,000 0.26
Pioneer Energy Services Corp 6.125% 15/03/2022 2,755,000 USD 2,755,000 2,204,000 0.35
PulteGroup Inc 6.375% 15/05/2033 2,150,000 USD 1,832,663 2,150,000 0.34
PulteGroup Inc 7.875% 15/06/2032 1,650,000 USD 1,577,066 1,876,875 0.30
PVH Corp 7.750% 15/11/2023 1,100,000 USD 1,101,057 1,346,784 0.22
Qwest Capital Funding Inc 6.875% 15/07/2028 770,000 USD 674,886 770,000 0.12
Qwest Capital Funding Inc 7.625% 03/08/2021 370,000 USD 349,296 398,675 0.06
Qwest Capital Funding Inc 7.750% 15/02/2031 3,810,000 USD 3,488,721 3,867,150 0.62
Qwest Corp 7.250% 15/09/2025 540,000 USD 519,149 643,126 0.10
Qwest Corp 7.250% 15/10/2035 2,555,000 USD 2,471,722 2,633,523 0.42
Regency Energy Partners LP/Regency EnergyFinance Corp 5.000% 01/10/2022 4,715,000 USD 4,677,425 4,455,675 0.71
SandRidge Energy Inc 7.500% 15/02/2023 2,200,000 USD 2,191,480 1,386,000 0.22
Sprint Capital Corp 6.875% 15/11/2028 7,481,000 USD 6,458,760 6,583,280 1.06
Sprint Capital Corp 6.900% 01/05/2019 815,000 USD 796,867 831,300 0.13
Sprint Capital Corp 8.750% 15/03/2032 40,000 USD 36,890 38,700 0.01
Sprint Communications Inc 6.000% 15/11/2022 620,000 USD 615,657 570,400 0.09
SUPERVALU Inc 7.750% 15/11/2022 1,400,000 USD 1,392,291 1,372,000 0.22
Tenet Healthcare Corp 6.875% 15/11/2031 7,190,000 USD 6,185,231 6,758,600 1.08
TransDigm Inc 6.500% 15/07/2024 659,000 USD 659,000 662,295 0.11
United Continental Holdings Inc 6.375%01/06/2018 1,055,000 USD 1,055,000 1,115,663 0.18
United Rentals North America Inc 6.125%15/06/2023 3,560,000 USD 3,560,000 3,738,000 0.60
United States Steel Corp 6.650% 01/06/2037 2,610,000 USD 2,260,671 2,375,100 0.38
United States Steel Corp 7.500% 15/03/2022 2,395,000 USD 2,395,000 2,502,775 0.40
148,051,396 157,301,747 25.20
Total - Fixed rate bonds 246,296,772 249,353,662 39.94
Variable rate bonds
France
Societe Generale SA 4.196% 31/12/2049 290,000 EUR 394,269 350,915 0.06
394,269 350,915 0.06Greece
Hellenic Railways Organization SA 0.663%24/05/2016 EMTN 3,500,000 EUR 4,089,209 3,472,843 0.56
4,089,209 3,472,843 0.56
Total - Variable rate bonds 4,483,478 3,823,758 0.62
Total - Transferable securities admitted to an official stock exchange listing 289,049,966 312,177,407 50.01
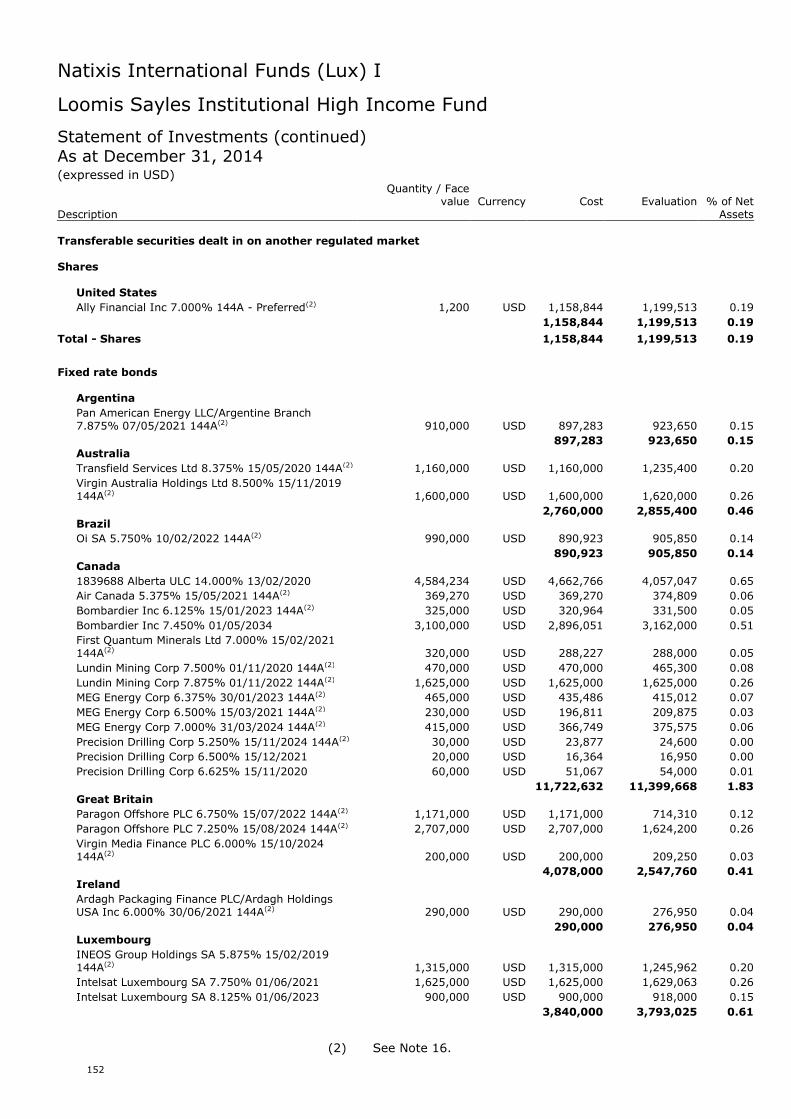
Natixis International Funds (Lux) I
152
Loomis Sayles Institutional High Income Fund
Statement of Investments (continued)As at December 31, 2014(expressed in USD)
Quantity / Facevalue Currency Cost Evaluation % of Net
Description Assets
Transferable securities dealt in on another regulated market
Shares
United States
Ally Financial Inc 7.000% 144A - Preferred(2) 1,200 USD 1,158,844 1,199,513 0.19
1,158,844 1,199,513 0.19
Total - Shares 1,158,844 1,199,513 0.19
Fixed rate bonds
Argentina
Pan American Energy LLC/Argentine Branch7.875% 07/05/2021 144A(2) 910,000 USD 897,283 923,650 0.15
897,283 923,650 0.15Australia
Transfield Services Ltd 8.375% 15/05/2020 144A(2) 1,160,000 USD 1,160,000 1,235,400 0.20
Virgin Australia Holdings Ltd 8.500% 15/11/2019144A(2) 1,600,000 USD 1,600,000 1,620,000 0.26
2,760,000 2,855,400 0.46Brazil
Oi SA 5.750% 10/02/2022 144A(2) 990,000 USD 890,923 905,850 0.14
890,923 905,850 0.14Canada
1839688 Alberta ULC 14.000% 13/02/2020 4,584,234 USD 4,662,766 4,057,047 0.65
Air Canada 5.375% 15/05/2021 144A(2) 369,270 USD 369,270 374,809 0.06
Bombardier Inc 6.125% 15/01/2023 144A(2) 325,000 USD 320,964 331,500 0.05
Bombardier Inc 7.450% 01/05/2034 3,100,000 USD 2,896,051 3,162,000 0.51
First Quantum Minerals Ltd 7.000% 15/02/2021144A(2) 320,000 USD 288,227 288,000 0.05
Lundin Mining Corp 7.500% 01/11/2020 144A(2) 470,000 USD 470,000 465,300 0.08
Lundin Mining Corp 7.875% 01/11/2022 144A(2) 1,625,000 USD 1,625,000 1,625,000 0.26
MEG Energy Corp 6.375% 30/01/2023 144A(2) 465,000 USD 435,486 415,012 0.07
MEG Energy Corp 6.500% 15/03/2021 144A(2) 230,000 USD 196,811 209,875 0.03
MEG Energy Corp 7.000% 31/03/2024 144A(2) 415,000 USD 366,749 375,575 0.06
Precision Drilling Corp 5.250% 15/11/2024 144A(2) 30,000 USD 23,877 24,600 0.00
Precision Drilling Corp 6.500% 15/12/2021 20,000 USD 16,364 16,950 0.00
Precision Drilling Corp 6.625% 15/11/2020 60,000 USD 51,067 54,000 0.01
11,722,632 11,399,668 1.83Great Britain
Paragon Offshore PLC 6.750% 15/07/2022 144A(2) 1,171,000 USD 1,171,000 714,310 0.12
Paragon Offshore PLC 7.250% 15/08/2024 144A(2) 2,707,000 USD 2,707,000 1,624,200 0.26
Virgin Media Finance PLC 6.000% 15/10/2024144A(2) 200,000 USD 200,000 209,250 0.03
4,078,000 2,547,760 0.41Ireland
Ardagh Packaging Finance PLC/Ardagh HoldingsUSA Inc 6.000% 30/06/2021 144A(2) 290,000 USD 290,000 276,950 0.04
290,000 276,950 0.04Luxembourg
INEOS Group Holdings SA 5.875% 15/02/2019144A(2) 1,315,000 USD 1,315,000 1,245,962 0.20
Intelsat Luxembourg SA 7.750% 01/06/2021 1,625,000 USD 1,625,000 1,629,063 0.26
Intelsat Luxembourg SA 8.125% 01/06/2023 900,000 USD 900,000 918,000 0.15
3,840,000 3,793,025 0.61
(2) See Note 16.
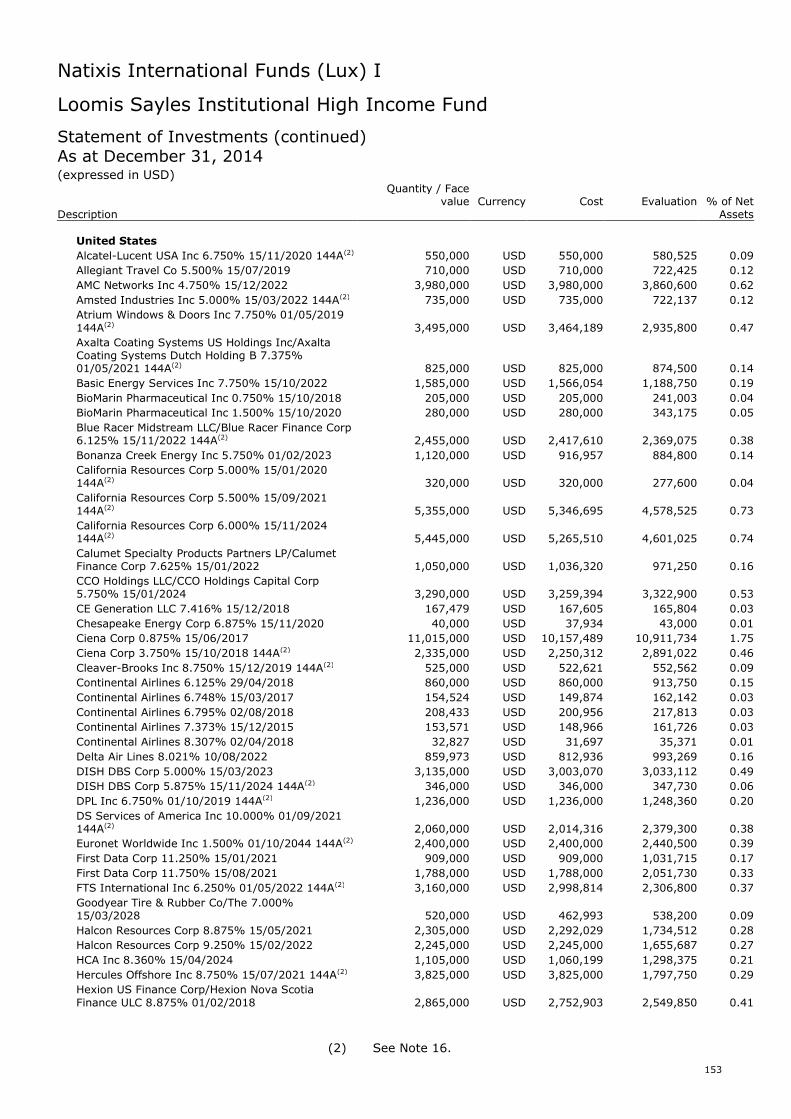
Natixis International Funds (Lux) I
153
Loomis Sayles Institutional High Income Fund
Statement of Investments (continued)As at December 31, 2014(expressed in USD)
Quantity / Facevalue Currency Cost Evaluation % of Net
Description Assets
United States
Alcatel-Lucent USA Inc 6.750% 15/11/2020 144A(2) 550,000 USD 550,000 580,525 0.09
Allegiant Travel Co 5.500% 15/07/2019 710,000 USD 710,000 722,425 0.12
AMC Networks Inc 4.750% 15/12/2022 3,980,000 USD 3,980,000 3,860,600 0.62
Amsted Industries Inc 5.000% 15/03/2022 144A(2) 735,000 USD 735,000 722,137 0.12
Atrium Windows & Doors Inc 7.750% 01/05/2019144A(2) 3,495,000 USD 3,464,189 2,935,800 0.47
Axalta Coating Systems US Holdings Inc/AxaltaCoating Systems Dutch Holding B 7.375%01/05/2021 144A(2) 825,000 USD 825,000 874,500 0.14
Basic Energy Services Inc 7.750% 15/10/2022 1,585,000 USD 1,566,054 1,188,750 0.19
BioMarin Pharmaceutical Inc 0.750% 15/10/2018 205,000 USD 205,000 241,003 0.04
BioMarin Pharmaceutical Inc 1.500% 15/10/2020 280,000 USD 280,000 343,175 0.05
Blue Racer Midstream LLC/Blue Racer Finance Corp6.125% 15/11/2022 144A(2) 2,455,000 USD 2,417,610 2,369,075 0.38
Bonanza Creek Energy Inc 5.750% 01/02/2023 1,120,000 USD 916,957 884,800 0.14
California Resources Corp 5.000% 15/01/2020144A(2) 320,000 USD 320,000 277,600 0.04
California Resources Corp 5.500% 15/09/2021144A(2) 5,355,000 USD 5,346,695 4,578,525 0.73
California Resources Corp 6.000% 15/11/2024144A(2) 5,445,000 USD 5,265,510 4,601,025 0.74
Calumet Specialty Products Partners LP/CalumetFinance Corp 7.625% 15/01/2022 1,050,000 USD 1,036,320 971,250 0.16
CCO Holdings LLC/CCO Holdings Capital Corp5.750% 15/01/2024 3,290,000 USD 3,259,394 3,322,900 0.53
CE Generation LLC 7.416% 15/12/2018 167,479 USD 167,605 165,804 0.03
Chesapeake Energy Corp 6.875% 15/11/2020 40,000 USD 37,934 43,000 0.01
Ciena Corp 0.875% 15/06/2017 11,015,000 USD 10,157,489 10,911,734 1.75
Ciena Corp 3.750% 15/10/2018 144A(2) 2,335,000 USD 2,250,312 2,891,022 0.46
Cleaver-Brooks Inc 8.750% 15/12/2019 144A(2) 525,000 USD 522,621 552,562 0.09
Continental Airlines 6.125% 29/04/2018 860,000 USD 860,000 913,750 0.15
Continental Airlines 6.748% 15/03/2017 154,524 USD 149,874 162,142 0.03
Continental Airlines 6.795% 02/08/2018 208,433 USD 200,956 217,813 0.03
Continental Airlines 7.373% 15/12/2015 153,571 USD 148,966 161,726 0.03
Continental Airlines 8.307% 02/04/2018 32,827 USD 31,697 35,371 0.01
Delta Air Lines 8.021% 10/08/2022 859,973 USD 812,936 993,269 0.16
DISH DBS Corp 5.000% 15/03/2023 3,135,000 USD 3,003,070 3,033,112 0.49
DISH DBS Corp 5.875% 15/11/2024 144A(2) 346,000 USD 346,000 347,730 0.06
DPL Inc 6.750% 01/10/2019 144A(2) 1,236,000 USD 1,236,000 1,248,360 0.20
DS Services of America Inc 10.000% 01/09/2021144A(2) 2,060,000 USD 2,014,316 2,379,300 0.38
Euronet Worldwide Inc 1.500% 01/10/2044 144A(2) 2,400,000 USD 2,400,000 2,440,500 0.39
First Data Corp 11.250% 15/01/2021 909,000 USD 909,000 1,031,715 0.17
First Data Corp 11.750% 15/08/2021 1,788,000 USD 1,788,000 2,051,730 0.33
FTS International Inc 6.250% 01/05/2022 144A(2) 3,160,000 USD 2,998,814 2,306,800 0.37
Goodyear Tire & Rubber Co/The 7.000%15/03/2028 520,000 USD 462,993 538,200 0.09
Halcon Resources Corp 8.875% 15/05/2021 2,305,000 USD 2,292,029 1,734,512 0.28
Halcon Resources Corp 9.250% 15/02/2022 2,245,000 USD 2,245,000 1,655,687 0.27
HCA Inc 8.360% 15/04/2024 1,105,000 USD 1,060,199 1,298,375 0.21
Hercules Offshore Inc 8.750% 15/07/2021 144A(2) 3,825,000 USD 3,825,000 1,797,750 0.29
Hexion US Finance Corp/Hexion Nova ScotiaFinance ULC 8.875% 01/02/2018 2,865,000 USD 2,752,903 2,549,850 0.41
(2) See Note 16.
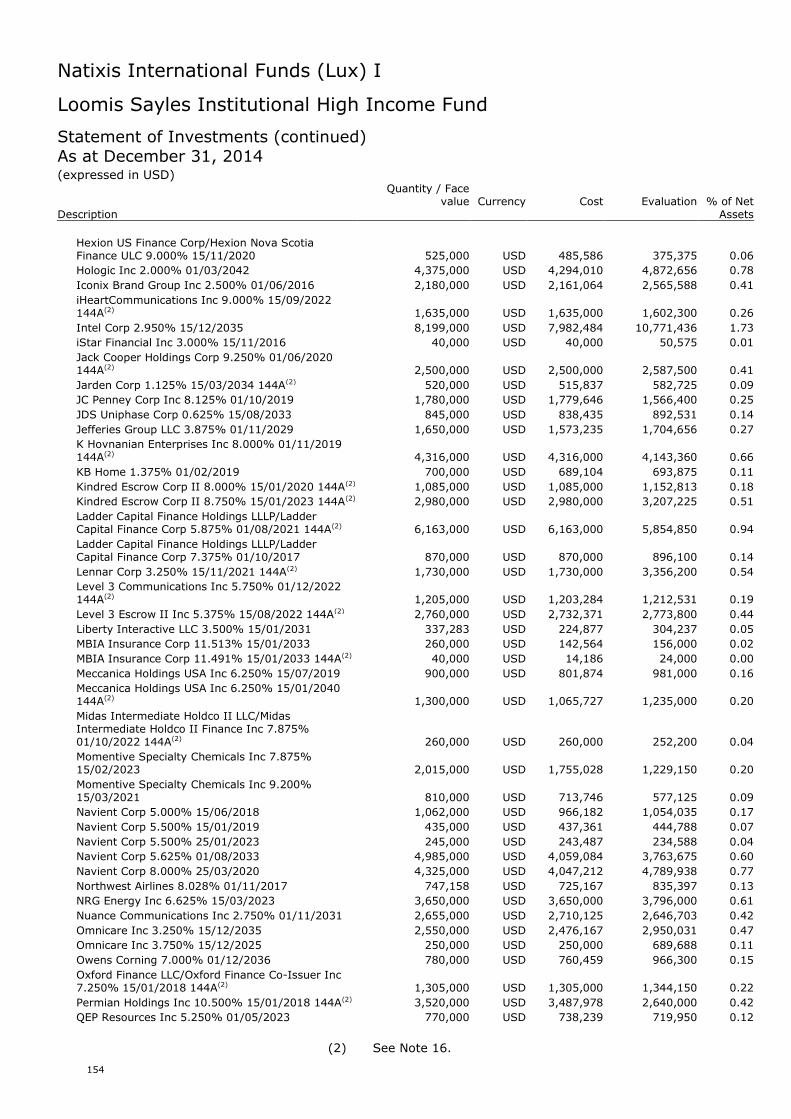
Natixis International Funds (Lux) I
154
Loomis Sayles Institutional High Income Fund
Statement of Investments (continued)As at December 31, 2014(expressed in USD)
Quantity / Facevalue Currency Cost Evaluation % of Net
Description Assets
Hexion US Finance Corp/Hexion Nova ScotiaFinance ULC 9.000% 15/11/2020 525,000 USD 485,586 375,375 0.06
Hologic Inc 2.000% 01/03/2042 4,375,000 USD 4,294,010 4,872,656 0.78
Iconix Brand Group Inc 2.500% 01/06/2016 2,180,000 USD 2,161,064 2,565,588 0.41
iHeartCommunications Inc 9.000% 15/09/2022144A(2) 1,635,000 USD 1,635,000 1,602,300 0.26
Intel Corp 2.950% 15/12/2035 8,199,000 USD 7,982,484 10,771,436 1.73
iStar Financial Inc 3.000% 15/11/2016 40,000 USD 40,000 50,575 0.01
Jack Cooper Holdings Corp 9.250% 01/06/2020144A(2) 2,500,000 USD 2,500,000 2,587,500 0.41
Jarden Corp 1.125% 15/03/2034 144A(2) 520,000 USD 515,837 582,725 0.09
JC Penney Corp Inc 8.125% 01/10/2019 1,780,000 USD 1,779,646 1,566,400 0.25
JDS Uniphase Corp 0.625% 15/08/2033 845,000 USD 838,435 892,531 0.14
Jefferies Group LLC 3.875% 01/11/2029 1,650,000 USD 1,573,235 1,704,656 0.27
K Hovnanian Enterprises Inc 8.000% 01/11/2019144A(2) 4,316,000 USD 4,316,000 4,143,360 0.66
KB Home 1.375% 01/02/2019 700,000 USD 689,104 693,875 0.11
Kindred Escrow Corp II 8.000% 15/01/2020 144A(2) 1,085,000 USD 1,085,000 1,152,813 0.18
Kindred Escrow Corp II 8.750% 15/01/2023 144A(2) 2,980,000 USD 2,980,000 3,207,225 0.51
Ladder Capital Finance Holdings LLLP/LadderCapital Finance Corp 5.875% 01/08/2021 144A(2) 6,163,000 USD 6,163,000 5,854,850 0.94
Ladder Capital Finance Holdings LLLP/LadderCapital Finance Corp 7.375% 01/10/2017 870,000 USD 870,000 896,100 0.14
Lennar Corp 3.250% 15/11/2021 144A(2) 1,730,000 USD 1,730,000 3,356,200 0.54
Level 3 Communications Inc 5.750% 01/12/2022144A(2) 1,205,000 USD 1,203,284 1,212,531 0.19
Level 3 Escrow II Inc 5.375% 15/08/2022 144A(2) 2,760,000 USD 2,732,371 2,773,800 0.44
Liberty Interactive LLC 3.500% 15/01/2031 337,283 USD 224,877 304,237 0.05
MBIA Insurance Corp 11.513% 15/01/2033 260,000 USD 142,564 156,000 0.02
MBIA Insurance Corp 11.491% 15/01/2033 144A(2) 40,000 USD 14,186 24,000 0.00
Meccanica Holdings USA Inc 6.250% 15/07/2019 900,000 USD 801,874 981,000 0.16
Meccanica Holdings USA Inc 6.250% 15/01/2040144A(2) 1,300,000 USD 1,065,727 1,235,000 0.20
Midas Intermediate Holdco II LLC/MidasIntermediate Holdco II Finance Inc 7.875%01/10/2022 144A(2) 260,000 USD 260,000 252,200 0.04
Momentive Specialty Chemicals Inc 7.875%15/02/2023 2,015,000 USD 1,755,028 1,229,150 0.20
Momentive Specialty Chemicals Inc 9.200%15/03/2021 810,000 USD 713,746 577,125 0.09
Navient Corp 5.000% 15/06/2018 1,062,000 USD 966,182 1,054,035 0.17
Navient Corp 5.500% 15/01/2019 435,000 USD 437,361 444,788 0.07
Navient Corp 5.500% 25/01/2023 245,000 USD 243,487 234,588 0.04
Navient Corp 5.625% 01/08/2033 4,985,000 USD 4,059,084 3,763,675 0.60
Navient Corp 8.000% 25/03/2020 4,325,000 USD 4,047,212 4,789,938 0.77
Northwest Airlines 8.028% 01/11/2017 747,158 USD 725,167 835,397 0.13
NRG Energy Inc 6.625% 15/03/2023 3,650,000 USD 3,650,000 3,796,000 0.61
Nuance Communications Inc 2.750% 01/11/2031 2,655,000 USD 2,710,125 2,646,703 0.42
Omnicare Inc 3.250% 15/12/2035 2,550,000 USD 2,476,167 2,950,031 0.47
Omnicare Inc 3.750% 15/12/2025 250,000 USD 250,000 689,688 0.11
Owens Corning 7.000% 01/12/2036 780,000 USD 760,459 966,300 0.15
Oxford Finance LLC/Oxford Finance Co-Issuer Inc7.250% 15/01/2018 144A(2) 1,305,000 USD 1,305,000 1,344,150 0.22
Permian Holdings Inc 10.500% 15/01/2018 144A(2) 3,520,000 USD 3,487,978 2,640,000 0.42
QEP Resources Inc 5.250% 01/05/2023 770,000 USD 738,239 719,950 0.12
(2) See Note 16.
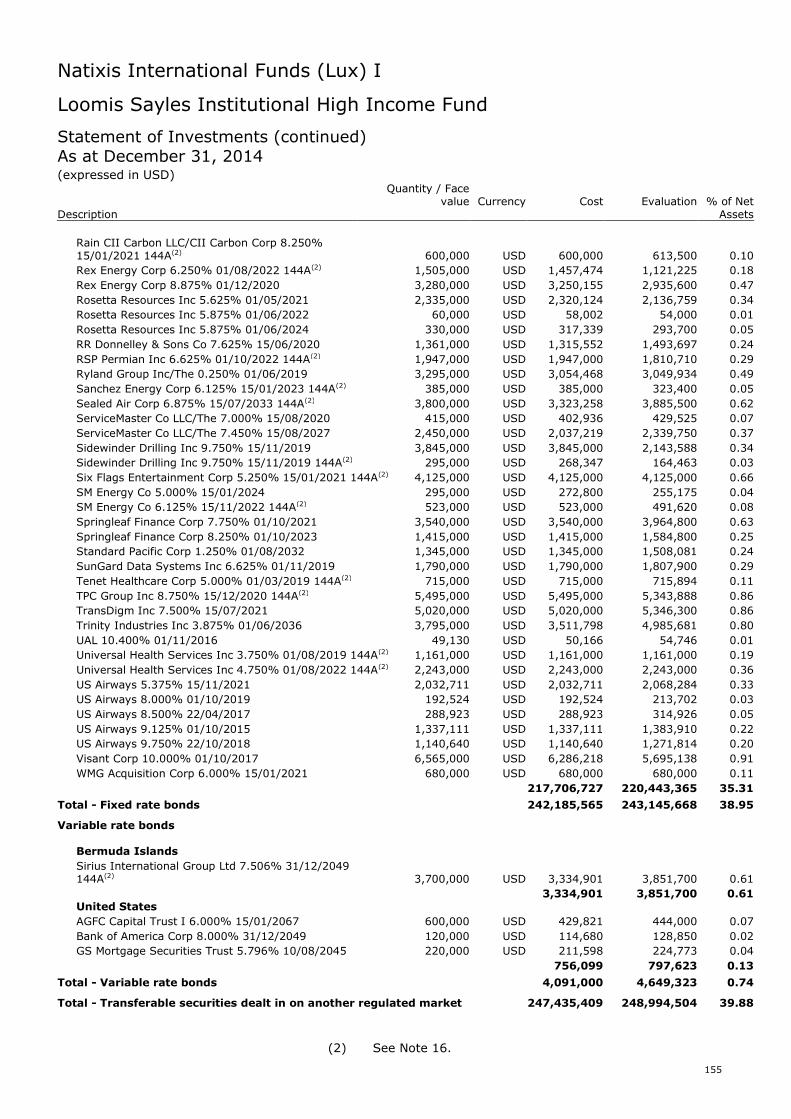
Natixis International Funds (Lux) I
155
Loomis Sayles Institutional High Income Fund
Statement of Investments (continued)As at December 31, 2014(expressed in USD)
Quantity / Facevalue Currency Cost Evaluation % of Net
Description Assets
Rain CII Carbon LLC/CII Carbon Corp 8.250%15/01/2021 144A(2) 600,000 USD 600,000 613,500 0.10
Rex Energy Corp 6.250% 01/08/2022 144A(2) 1,505,000 USD 1,457,474 1,121,225 0.18
Rex Energy Corp 8.875% 01/12/2020 3,280,000 USD 3,250,155 2,935,600 0.47
Rosetta Resources Inc 5.625% 01/05/2021 2,335,000 USD 2,320,124 2,136,759 0.34
Rosetta Resources Inc 5.875% 01/06/2022 60,000 USD 58,002 54,000 0.01
Rosetta Resources Inc 5.875% 01/06/2024 330,000 USD 317,339 293,700 0.05
RR Donnelley & Sons Co 7.625% 15/06/2020 1,361,000 USD 1,315,552 1,493,697 0.24
RSP Permian Inc 6.625% 01/10/2022 144A(2) 1,947,000 USD 1,947,000 1,810,710 0.29
Ryland Group Inc/The 0.250% 01/06/2019 3,295,000 USD 3,054,468 3,049,934 0.49
Sanchez Energy Corp 6.125% 15/01/2023 144A(2) 385,000 USD 385,000 323,400 0.05
Sealed Air Corp 6.875% 15/07/2033 144A(2) 3,800,000 USD 3,323,258 3,885,500 0.62
ServiceMaster Co LLC/The 7.000% 15/08/2020 415,000 USD 402,936 429,525 0.07
ServiceMaster Co LLC/The 7.450% 15/08/2027 2,450,000 USD 2,037,219 2,339,750 0.37
Sidewinder Drilling Inc 9.750% 15/11/2019 3,845,000 USD 3,845,000 2,143,588 0.34
Sidewinder Drilling Inc 9.750% 15/11/2019 144A(2) 295,000 USD 268,347 164,463 0.03
Six Flags Entertainment Corp 5.250% 15/01/2021 144A(2) 4,125,000 USD 4,125,000 4,125,000 0.66
SM Energy Co 5.000% 15/01/2024 295,000 USD 272,800 255,175 0.04
SM Energy Co 6.125% 15/11/2022 144A(2) 523,000 USD 523,000 491,620 0.08
Springleaf Finance Corp 7.750% 01/10/2021 3,540,000 USD 3,540,000 3,964,800 0.63
Springleaf Finance Corp 8.250% 01/10/2023 1,415,000 USD 1,415,000 1,584,800 0.25
Standard Pacific Corp 1.250% 01/08/2032 1,345,000 USD 1,345,000 1,508,081 0.24
SunGard Data Systems Inc 6.625% 01/11/2019 1,790,000 USD 1,790,000 1,807,900 0.29
Tenet Healthcare Corp 5.000% 01/03/2019 144A(2) 715,000 USD 715,000 715,894 0.11
TPC Group Inc 8.750% 15/12/2020 144A(2) 5,495,000 USD 5,495,000 5,343,888 0.86
TransDigm Inc 7.500% 15/07/2021 5,020,000 USD 5,020,000 5,346,300 0.86
Trinity Industries Inc 3.875% 01/06/2036 3,795,000 USD 3,511,798 4,985,681 0.80
UAL 10.400% 01/11/2016 49,130 USD 50,166 54,746 0.01
Universal Health Services Inc 3.750% 01/08/2019 144A(2) 1,161,000 USD 1,161,000 1,161,000 0.19
Universal Health Services Inc 4.750% 01/08/2022 144A(2) 2,243,000 USD 2,243,000 2,243,000 0.36
US Airways 5.375% 15/11/2021 2,032,711 USD 2,032,711 2,068,284 0.33
US Airways 8.000% 01/10/2019 192,524 USD 192,524 213,702 0.03
US Airways 8.500% 22/04/2017 288,923 USD 288,923 314,926 0.05
US Airways 9.125% 01/10/2015 1,337,111 USD 1,337,111 1,383,910 0.22
US Airways 9.750% 22/10/2018 1,140,640 USD 1,140,640 1,271,814 0.20
Visant Corp 10.000% 01/10/2017 6,565,000 USD 6,286,218 5,695,138 0.91
WMG Acquisition Corp 6.000% 15/01/2021 680,000 USD 680,000 680,000 0.11
217,706,727 220,443,365 35.31
Total - Fixed rate bonds 242,185,565 243,145,668 38.95
Variable rate bonds
Bermuda Islands
Sirius International Group Ltd 7.506% 31/12/2049144A(2) 3,700,000 USD 3,334,901 3,851,700 0.61
3,334,901 3,851,700 0.61United States
AGFC Capital Trust I 6.000% 15/01/2067 600,000 USD 429,821 444,000 0.07
Bank of America Corp 8.000% 31/12/2049 120,000 USD 114,680 128,850 0.02
GS Mortgage Securities Trust 5.796% 10/08/2045 220,000 USD 211,598 224,773 0.04
756,099 797,623 0.13
Total - Variable rate bonds 4,091,000 4,649,323 0.74
Total - Transferable securities dealt in on another regulated market 247,435,409 248,994,504 39.88
(2) See Note 16.
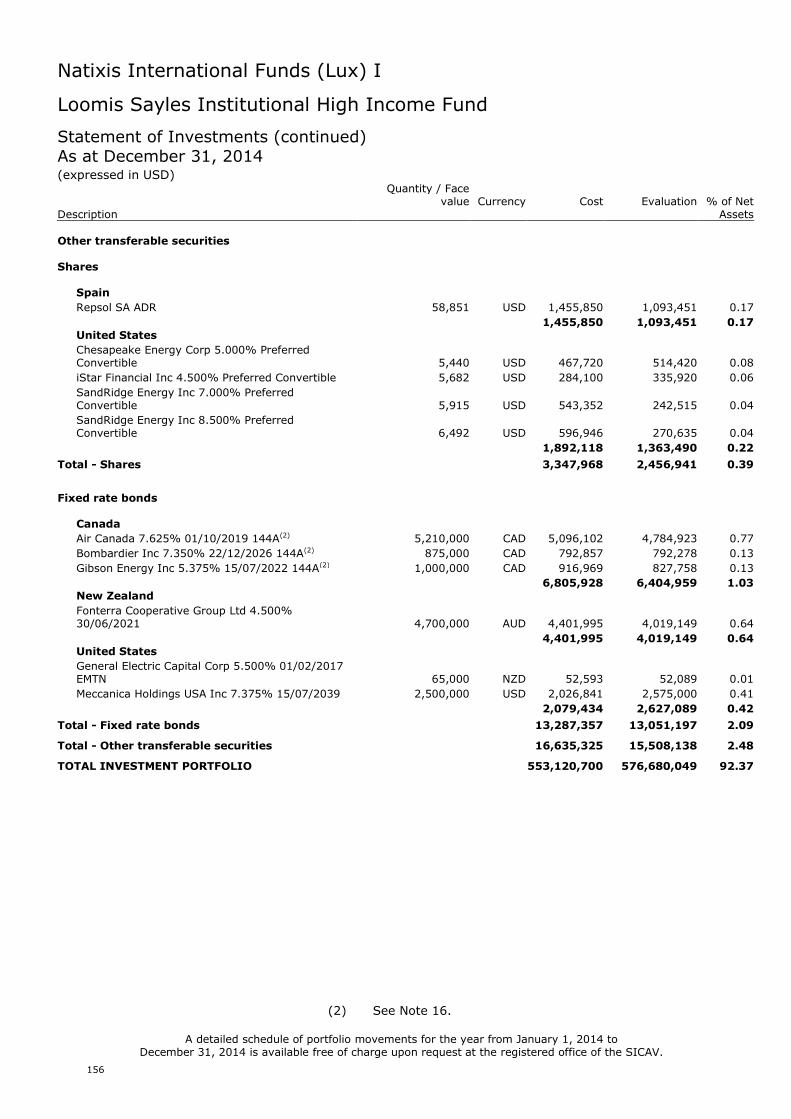
Natixis International Funds (Lux) I
156
Loomis Sayles Institutional High Income Fund
Statement of Investments (continued)As at December 31, 2014(expressed in USD)
Quantity / Facevalue Currency Cost Evaluation % of Net
Description Assets
Other transferable securities
Shares
Spain
Repsol SA ADR 58,851 USD 1,455,850 1,093,451 0.17
1,455,850 1,093,451 0.17United States
Chesapeake Energy Corp 5.000% PreferredConvertible 5,440 USD 467,720 514,420 0.08
iStar Financial Inc 4.500% Preferred Convertible 5,682 USD 284,100 335,920 0.06
SandRidge Energy Inc 7.000% PreferredConvertible 5,915 USD 543,352 242,515 0.04
SandRidge Energy Inc 8.500% PreferredConvertible 6,492 USD 596,946 270,635 0.04
1,892,118 1,363,490 0.22
Total - Shares 3,347,968 2,456,941 0.39
Fixed rate bonds
Canada
Air Canada 7.625% 01/10/2019 144A(2) 5,210,000 CAD 5,096,102 4,784,923 0.77
Bombardier Inc 7.350% 22/12/2026 144A(2) 875,000 CAD 792,857 792,278 0.13
Gibson Energy Inc 5.375% 15/07/2022 144A(2) 1,000,000 CAD 916,969 827,758 0.13
6,805,928 6,404,959 1.03New Zealand
Fonterra Cooperative Group Ltd 4.500%30/06/2021 4,700,000 AUD 4,401,995 4,019,149 0.64
4,401,995 4,019,149 0.64United States
General Electric Capital Corp 5.500% 01/02/2017EMTN 65,000 NZD 52,593 52,089 0.01
Meccanica Holdings USA Inc 7.375% 15/07/2039 2,500,000 USD 2,026,841 2,575,000 0.41
2,079,434 2,627,089 0.42
Total - Fixed rate bonds 13,287,357 13,051,197 2.09
Total - Other transferable securities 16,635,325 15,508,138 2.48
TOTAL INVESTMENT PORTFOLIO 553,120,700 576,680,049 92.37
A detailed schedule of portfolio movements for the year from January 1, 2014 toDecember 31, 2014 is available free of charge upon request at the registered office of the SICAV.
(2) See Note 16.
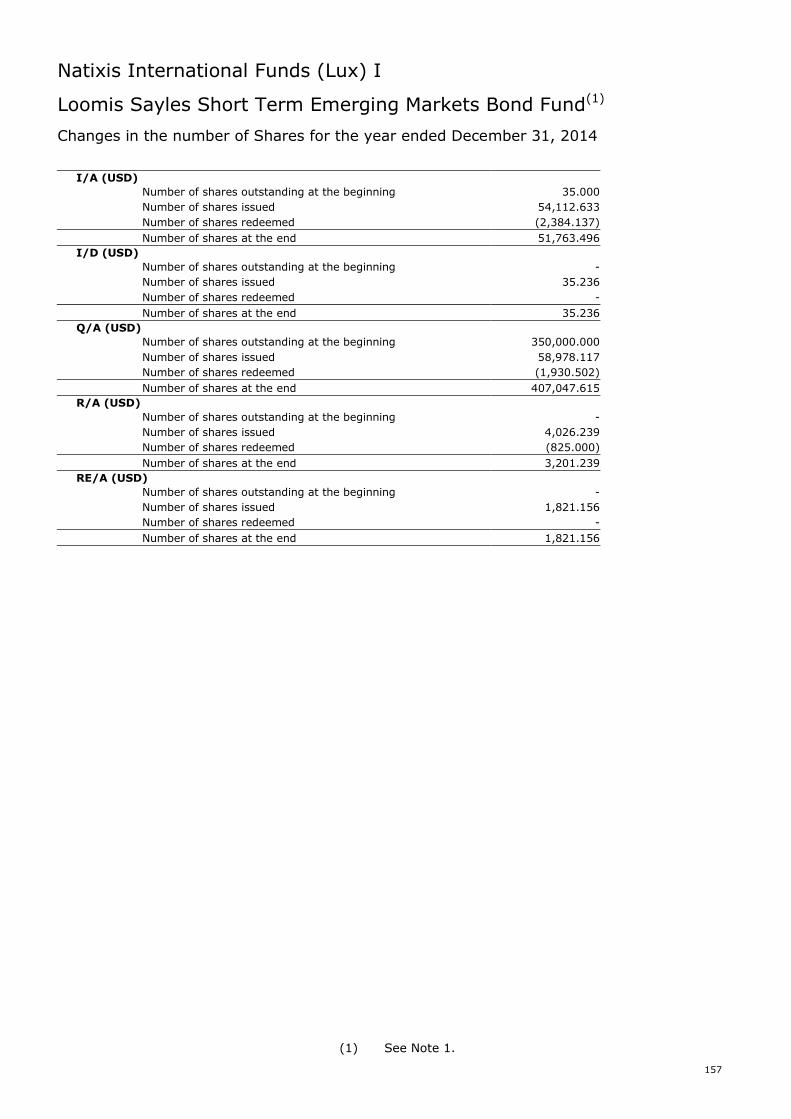
Natixis International Funds (Lux) I
157
Loomis Sayles Short Term Emerging Markets Bond Fund(1)
Changes in the number of Shares for the year ended December 31, 2014
I/A (USD)
Number of shares outstanding at the beginning 35.000
Number of shares issued 54,112.633
Number of shares redeemed (2,384.137)
Number of shares at the end 51,763.496
I/D (USD)
Number of shares outstanding at the beginning -
Number of shares issued 35.236
Number of shares redeemed -
Number of shares at the end 35.236
Q/A (USD)
Number of shares outstanding at the beginning 350,000.000
Number of shares issued 58,978.117
Number of shares redeemed (1,930.502)
Number of shares at the end 407,047.615
R/A (USD)
Number of shares outstanding at the beginning -
Number of shares issued 4,026.239
Number of shares redeemed (825.000)
Number of shares at the end 3,201.239
RE/A (USD)
Number of shares outstanding at the beginning -
Number of shares issued 1,821.156
Number of shares redeemed -
Number of shares at the end 1,821.156
(1) See Note 1.
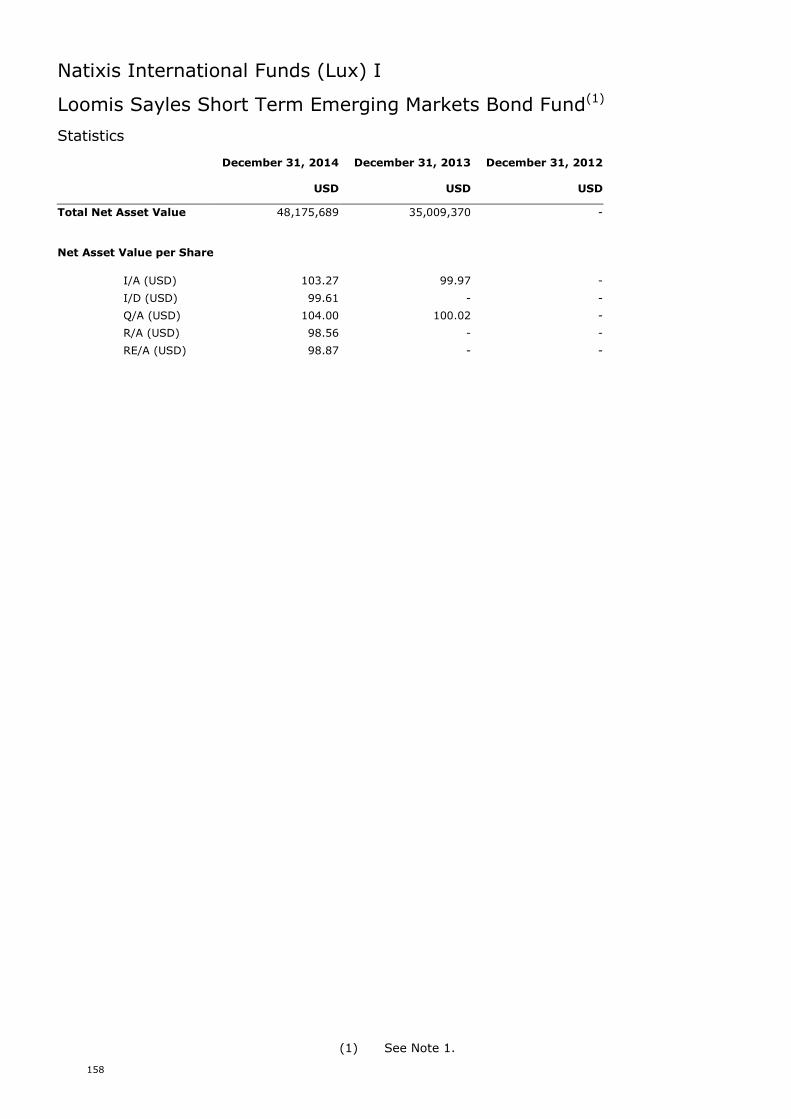
Natixis International Funds (Lux) I
158
Loomis Sayles Short Term Emerging Markets Bond Fund(1)
Statistics
December 31, 2014 December 31, 2013 December 31, 2012
USD USD USD
Total Net Asset Value 48,175,689 35,009,370 -
Net Asset Value per Share
I/A (USD) 103.27 99.97 -
I/D (USD) 99.61 - -
Q/A (USD) 104.00 100.02 -
R/A (USD) 98.56 - -
RE/A (USD) 98.87 - -
(1) See Note 1.
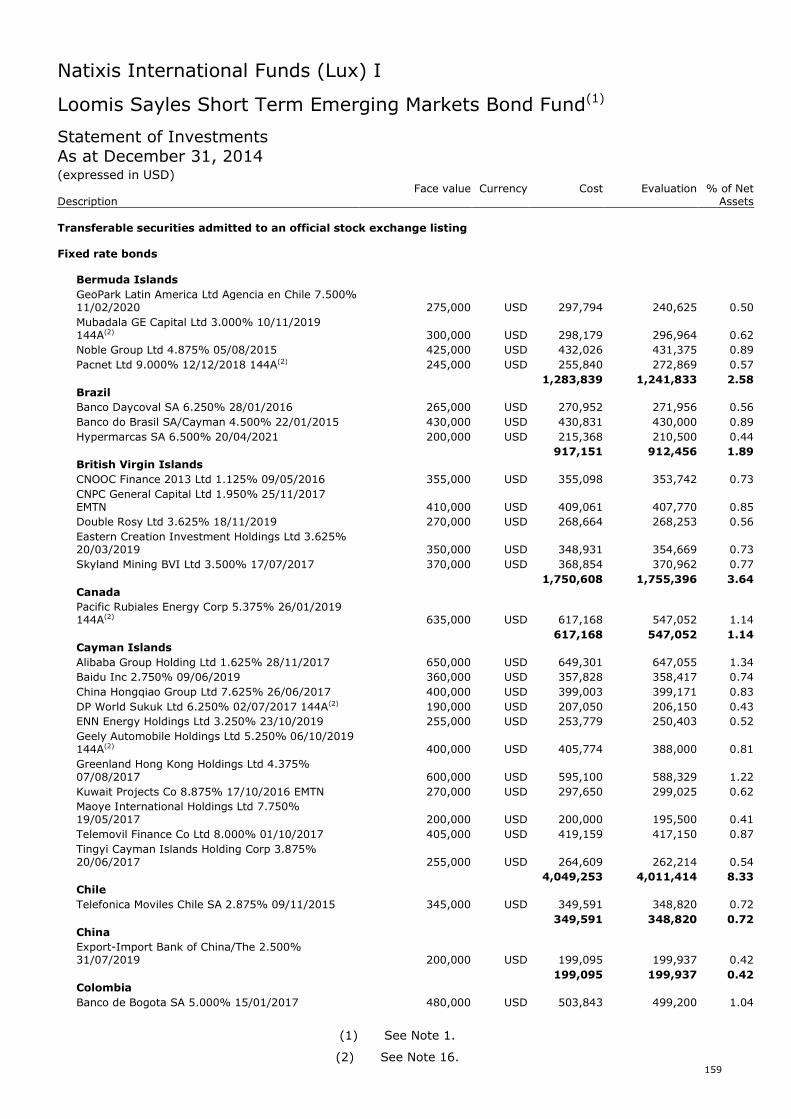
Natixis International Funds (Lux) I
159
Loomis Sayles Short Term Emerging Markets Bond Fund(1)
Statement of InvestmentsAs at December 31, 2014(expressed in USD)
Face value Currency Cost Evaluation % of NetDescription Assets
Transferable securities admitted to an official stock exchange listing
Fixed rate bonds
Bermuda Islands
GeoPark Latin America Ltd Agencia en Chile 7.500%11/02/2020 275,000 USD 297,794 240,625 0.50
Mubadala GE Capital Ltd 3.000% 10/11/2019144A(2) 300,000 USD 298,179 296,964 0.62
Noble Group Ltd 4.875% 05/08/2015 425,000 USD 432,026 431,375 0.89
Pacnet Ltd 9.000% 12/12/2018 144A(2) 245,000 USD 255,840 272,869 0.57
1,283,839 1,241,833 2.58Brazil
Banco Daycoval SA 6.250% 28/01/2016 265,000 USD 270,952 271,956 0.56
Banco do Brasil SA/Cayman 4.500% 22/01/2015 430,000 USD 430,831 430,000 0.89
Hypermarcas SA 6.500% 20/04/2021 200,000 USD 215,368 210,500 0.44
917,151 912,456 1.89British Virgin Islands
CNOOC Finance 2013 Ltd 1.125% 09/05/2016 355,000 USD 355,098 353,742 0.73
CNPC General Capital Ltd 1.950% 25/11/2017EMTN 410,000 USD 409,061 407,770 0.85
Double Rosy Ltd 3.625% 18/11/2019 270,000 USD 268,664 268,253 0.56
Eastern Creation Investment Holdings Ltd 3.625%20/03/2019 350,000 USD 348,931 354,669 0.73
Skyland Mining BVI Ltd 3.500% 17/07/2017 370,000 USD 368,854 370,962 0.77
1,750,608 1,755,396 3.64Canada
Pacific Rubiales Energy Corp 5.375% 26/01/2019144A(2) 635,000 USD 617,168 547,052 1.14
617,168 547,052 1.14Cayman Islands
Alibaba Group Holding Ltd 1.625% 28/11/2017 650,000 USD 649,301 647,055 1.34
Baidu Inc 2.750% 09/06/2019 360,000 USD 357,828 358,417 0.74
China Hongqiao Group Ltd 7.625% 26/06/2017 400,000 USD 399,003 399,171 0.83
DP World Sukuk Ltd 6.250% 02/07/2017 144A(2) 190,000 USD 207,050 206,150 0.43
ENN Energy Holdings Ltd 3.250% 23/10/2019 255,000 USD 253,779 250,403 0.52
Geely Automobile Holdings Ltd 5.250% 06/10/2019144A(2) 400,000 USD 405,774 388,000 0.81
Greenland Hong Kong Holdings Ltd 4.375%07/08/2017 600,000 USD 595,100 588,329 1.22
Kuwait Projects Co 8.875% 17/10/2016 EMTN 270,000 USD 297,650 299,025 0.62
Maoye International Holdings Ltd 7.750%19/05/2017 200,000 USD 200,000 195,500 0.41
Telemovil Finance Co Ltd 8.000% 01/10/2017 405,000 USD 419,159 417,150 0.87
Tingyi Cayman Islands Holding Corp 3.875%20/06/2017 255,000 USD 264,609 262,214 0.54
4,049,253 4,011,414 8.33Chile
Telefonica Moviles Chile SA 2.875% 09/11/2015 345,000 USD 349,591 348,820 0.72
349,591 348,820 0.72China
Export-Import Bank of China/The 2.500%31/07/2019 200,000 USD 199,095 199,937 0.42
199,095 199,937 0.42Colombia
Banco de Bogota SA 5.000% 15/01/2017 480,000 USD 503,843 499,200 1.04
(1) See Note 1.
(2) See Note 16.
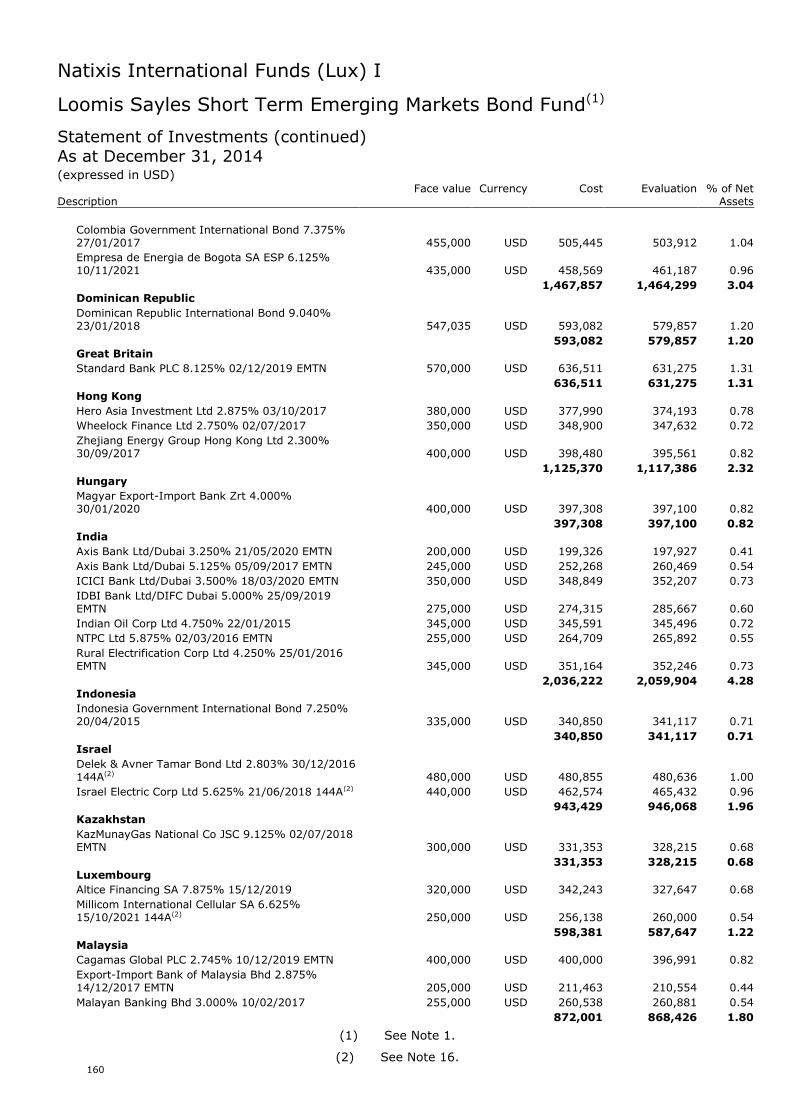
Natixis International Funds (Lux) I
160
Loomis Sayles Short Term Emerging Markets Bond Fund(1)
Statement of Investments (continued)As at December 31, 2014(expressed in USD)
Face value Currency Cost Evaluation % of NetDescription Assets
Colombia Government International Bond 7.375%27/01/2017 455,000 USD 505,445 503,912 1.04
Empresa de Energia de Bogota SA ESP 6.125%10/11/2021 435,000 USD 458,569 461,187 0.96
1,467,857 1,464,299 3.04Dominican Republic
Dominican Republic International Bond 9.040%23/01/2018 547,035 USD 593,082 579,857 1.20
593,082 579,857 1.20Great Britain
Standard Bank PLC 8.125% 02/12/2019 EMTN 570,000 USD 636,511 631,275 1.31
636,511 631,275 1.31Hong Kong
Hero Asia Investment Ltd 2.875% 03/10/2017 380,000 USD 377,990 374,193 0.78
Wheelock Finance Ltd 2.750% 02/07/2017 350,000 USD 348,900 347,632 0.72
Zhejiang Energy Group Hong Kong Ltd 2.300%30/09/2017 400,000 USD 398,480 395,561 0.82
1,125,370 1,117,386 2.32Hungary
Magyar Export-Import Bank Zrt 4.000%30/01/2020 400,000 USD 397,308 397,100 0.82
397,308 397,100 0.82India
Axis Bank Ltd/Dubai 3.250% 21/05/2020 EMTN 200,000 USD 199,326 197,927 0.41
Axis Bank Ltd/Dubai 5.125% 05/09/2017 EMTN 245,000 USD 252,268 260,469 0.54
ICICI Bank Ltd/Dubai 3.500% 18/03/2020 EMTN 350,000 USD 348,849 352,207 0.73
IDBI Bank Ltd/DIFC Dubai 5.000% 25/09/2019EMTN 275,000 USD 274,315 285,667 0.60
Indian Oil Corp Ltd 4.750% 22/01/2015 345,000 USD 345,591 345,496 0.72
NTPC Ltd 5.875% 02/03/2016 EMTN 255,000 USD 264,709 265,892 0.55
Rural Electrification Corp Ltd 4.250% 25/01/2016EMTN 345,000 USD 351,164 352,246 0.73
2,036,222 2,059,904 4.28Indonesia
Indonesia Government International Bond 7.250%20/04/2015 335,000 USD 340,850 341,117 0.71
340,850 341,117 0.71Israel
Delek & Avner Tamar Bond Ltd 2.803% 30/12/2016144A(2) 480,000 USD 480,855 480,636 1.00
Israel Electric Corp Ltd 5.625% 21/06/2018 144A(2) 440,000 USD 462,574 465,432 0.96
943,429 946,068 1.96Kazakhstan
KazMunayGas National Co JSC 9.125% 02/07/2018EMTN 300,000 USD 331,353 328,215 0.68
331,353 328,215 0.68Luxembourg
Altice Financing SA 7.875% 15/12/2019 320,000 USD 342,243 327,647 0.68
Millicom International Cellular SA 6.625%15/10/2021 144A(2) 250,000 USD 256,138 260,000 0.54
598,381 587,647 1.22Malaysia
Cagamas Global PLC 2.745% 10/12/2019 EMTN 400,000 USD 400,000 396,991 0.82
Export-Import Bank of Malaysia Bhd 2.875%14/12/2017 EMTN 205,000 USD 211,463 210,554 0.44
Malayan Banking Bhd 3.000% 10/02/2017 255,000 USD 260,538 260,881 0.54
872,001 868,426 1.80
(1) See Note 1.
(2) See Note 16.
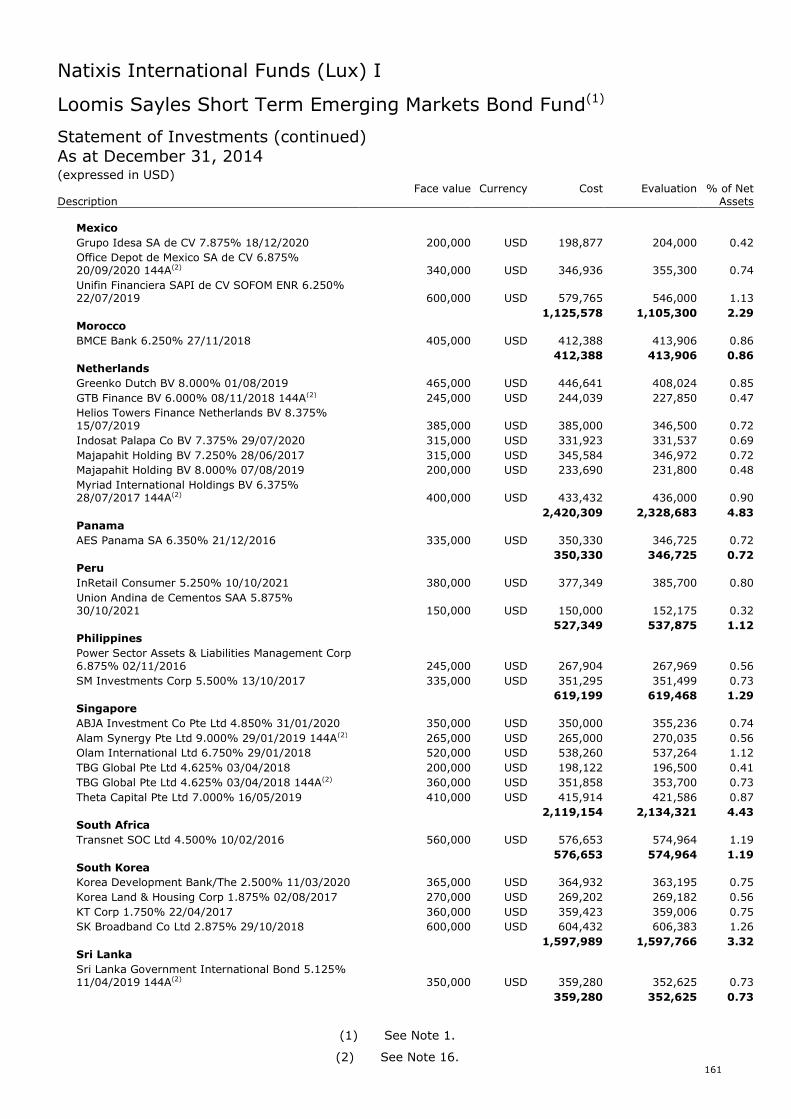
Natixis International Funds (Lux) I
161
Loomis Sayles Short Term Emerging Markets Bond Fund(1)
Statement of Investments (continued)As at December 31, 2014(expressed in USD)
Face value Currency Cost Evaluation % of NetDescription Assets
Mexico
Grupo Idesa SA de CV 7.875% 18/12/2020 200,000 USD 198,877 204,000 0.42
Office Depot de Mexico SA de CV 6.875%20/09/2020 144A(2) 340,000 USD 346,936 355,300 0.74
Unifin Financiera SAPI de CV SOFOM ENR 6.250%22/07/2019 600,000 USD 579,765 546,000 1.13
1,125,578 1,105,300 2.29Morocco
BMCE Bank 6.250% 27/11/2018 405,000 USD 412,388 413,906 0.86
412,388 413,906 0.86Netherlands
Greenko Dutch BV 8.000% 01/08/2019 465,000 USD 446,641 408,024 0.85
GTB Finance BV 6.000% 08/11/2018 144A(2) 245,000 USD 244,039 227,850 0.47
Helios Towers Finance Netherlands BV 8.375%15/07/2019 385,000 USD 385,000 346,500 0.72
Indosat Palapa Co BV 7.375% 29/07/2020 315,000 USD 331,923 331,537 0.69
Majapahit Holding BV 7.250% 28/06/2017 315,000 USD 345,584 346,972 0.72
Majapahit Holding BV 8.000% 07/08/2019 200,000 USD 233,690 231,800 0.48
Myriad International Holdings BV 6.375%28/07/2017 144A(2) 400,000 USD 433,432 436,000 0.90
2,420,309 2,328,683 4.83Panama
AES Panama SA 6.350% 21/12/2016 335,000 USD 350,330 346,725 0.72
350,330 346,725 0.72Peru
InRetail Consumer 5.250% 10/10/2021 380,000 USD 377,349 385,700 0.80
Union Andina de Cementos SAA 5.875%30/10/2021 150,000 USD 150,000 152,175 0.32
527,349 537,875 1.12Philippines
Power Sector Assets & Liabilities Management Corp6.875% 02/11/2016 245,000 USD 267,904 267,969 0.56
SM Investments Corp 5.500% 13/10/2017 335,000 USD 351,295 351,499 0.73
619,199 619,468 1.29Singapore
ABJA Investment Co Pte Ltd 4.850% 31/01/2020 350,000 USD 350,000 355,236 0.74
Alam Synergy Pte Ltd 9.000% 29/01/2019 144A(2) 265,000 USD 265,000 270,035 0.56
Olam International Ltd 6.750% 29/01/2018 520,000 USD 538,260 537,264 1.12
TBG Global Pte Ltd 4.625% 03/04/2018 200,000 USD 198,122 196,500 0.41
TBG Global Pte Ltd 4.625% 03/04/2018 144A(2) 360,000 USD 351,858 353,700 0.73
Theta Capital Pte Ltd 7.000% 16/05/2019 410,000 USD 415,914 421,586 0.87
2,119,154 2,134,321 4.43South Africa
Transnet SOC Ltd 4.500% 10/02/2016 560,000 USD 576,653 574,964 1.19
576,653 574,964 1.19South Korea
Korea Development Bank/The 2.500% 11/03/2020 365,000 USD 364,932 363,195 0.75
Korea Land & Housing Corp 1.875% 02/08/2017 270,000 USD 269,202 269,182 0.56
KT Corp 1.750% 22/04/2017 360,000 USD 359,423 359,006 0.75
SK Broadband Co Ltd 2.875% 29/10/2018 600,000 USD 604,432 606,383 1.26
1,597,989 1,597,766 3.32Sri Lanka
Sri Lanka Government International Bond 5.125%11/04/2019 144A(2) 350,000 USD 359,280 352,625 0.73
359,280 352,625 0.73
(1) See Note 1.
(2) See Note 16.
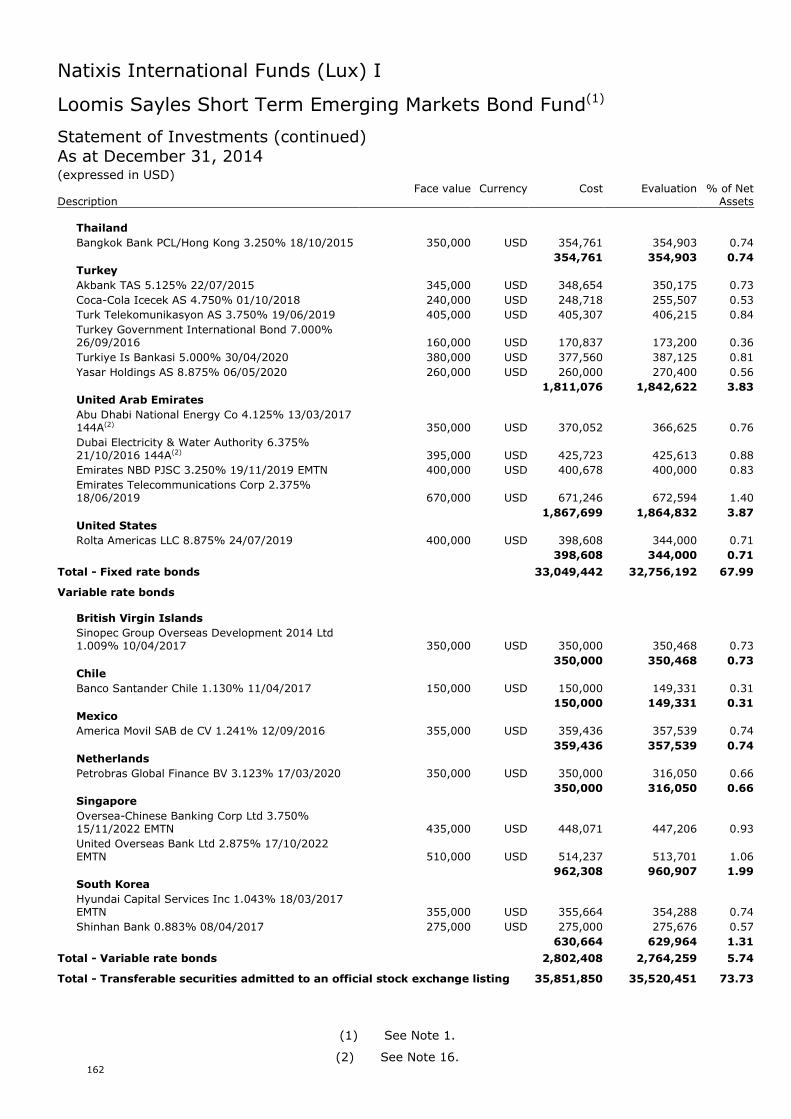
Natixis International Funds (Lux) I
162
Loomis Sayles Short Term Emerging Markets Bond Fund(1)
Statement of Investments (continued)As at December 31, 2014(expressed in USD)
Face value Currency Cost Evaluation % of NetDescription Assets
Thailand
Bangkok Bank PCL/Hong Kong 3.250% 18/10/2015 350,000 USD 354,761 354,903 0.74
354,761 354,903 0.74Turkey
Akbank TAS 5.125% 22/07/2015 345,000 USD 348,654 350,175 0.73
Coca-Cola Icecek AS 4.750% 01/10/2018 240,000 USD 248,718 255,507 0.53
Turk Telekomunikasyon AS 3.750% 19/06/2019 405,000 USD 405,307 406,215 0.84
Turkey Government International Bond 7.000%26/09/2016 160,000 USD 170,837 173,200 0.36
Turkiye Is Bankasi 5.000% 30/04/2020 380,000 USD 377,560 387,125 0.81
Yasar Holdings AS 8.875% 06/05/2020 260,000 USD 260,000 270,400 0.56
1,811,076 1,842,622 3.83United Arab Emirates
Abu Dhabi National Energy Co 4.125% 13/03/2017144A(2) 350,000 USD 370,052 366,625 0.76
Dubai Electricity & Water Authority 6.375%21/10/2016 144A(2) 395,000 USD 425,723 425,613 0.88
Emirates NBD PJSC 3.250% 19/11/2019 EMTN 400,000 USD 400,678 400,000 0.83
Emirates Telecommunications Corp 2.375%18/06/2019 670,000 USD 671,246 672,594 1.40
1,867,699 1,864,832 3.87United States
Rolta Americas LLC 8.875% 24/07/2019 400,000 USD 398,608 344,000 0.71
398,608 344,000 0.71
Total - Fixed rate bonds 33,049,442 32,756,192 67.99
Variable rate bonds
British Virgin Islands
Sinopec Group Overseas Development 2014 Ltd1.009% 10/04/2017 350,000 USD 350,000 350,468 0.73
350,000 350,468 0.73Chile
Banco Santander Chile 1.130% 11/04/2017 150,000 USD 150,000 149,331 0.31
150,000 149,331 0.31Mexico
America Movil SAB de CV 1.241% 12/09/2016 355,000 USD 359,436 357,539 0.74
359,436 357,539 0.74Netherlands
Petrobras Global Finance BV 3.123% 17/03/2020 350,000 USD 350,000 316,050 0.66
350,000 316,050 0.66Singapore
Oversea-Chinese Banking Corp Ltd 3.750%15/11/2022 EMTN 435,000 USD 448,071 447,206 0.93
United Overseas Bank Ltd 2.875% 17/10/2022EMTN 510,000 USD 514,237 513,701 1.06
962,308 960,907 1.99South Korea
Hyundai Capital Services Inc 1.043% 18/03/2017EMTN 355,000 USD 355,664 354,288 0.74
Shinhan Bank 0.883% 08/04/2017 275,000 USD 275,000 275,676 0.57
630,664 629,964 1.31
Total - Variable rate bonds 2,802,408 2,764,259 5.74
Total - Transferable securities admitted to an official stock exchange listing 35,851,850 35,520,451 73.73
(1) See Note 1.
(2) See Note 16.
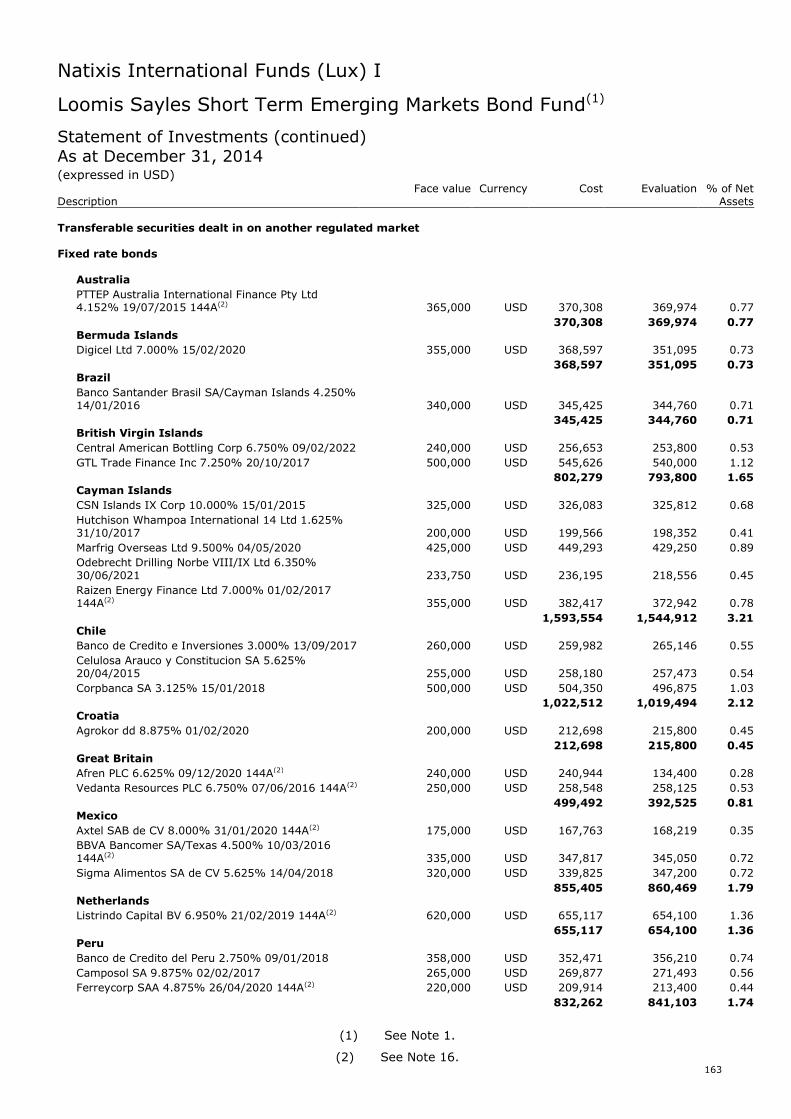
Natixis International Funds (Lux) I
163
Loomis Sayles Short Term Emerging Markets Bond Fund(1)
Statement of Investments (continued)As at December 31, 2014(expressed in USD)
Face value Currency Cost Evaluation % of NetDescription Assets
Transferable securities dealt in on another regulated market
Fixed rate bonds
Australia
PTTEP Australia International Finance Pty Ltd4.152% 19/07/2015 144A(2) 365,000 USD 370,308 369,974 0.77
370,308 369,974 0.77Bermuda Islands
Digicel Ltd 7.000% 15/02/2020 355,000 USD 368,597 351,095 0.73
368,597 351,095 0.73Brazil
Banco Santander Brasil SA/Cayman Islands 4.250%14/01/2016 340,000 USD 345,425 344,760 0.71
345,425 344,760 0.71British Virgin Islands
Central American Bottling Corp 6.750% 09/02/2022 240,000 USD 256,653 253,800 0.53
GTL Trade Finance Inc 7.250% 20/10/2017 500,000 USD 545,626 540,000 1.12
802,279 793,800 1.65Cayman Islands
CSN Islands IX Corp 10.000% 15/01/2015 325,000 USD 326,083 325,812 0.68
Hutchison Whampoa International 14 Ltd 1.625%31/10/2017 200,000 USD 199,566 198,352 0.41
Marfrig Overseas Ltd 9.500% 04/05/2020 425,000 USD 449,293 429,250 0.89
Odebrecht Drilling Norbe VIII/IX Ltd 6.350%30/06/2021 233,750 USD 236,195 218,556 0.45
Raizen Energy Finance Ltd 7.000% 01/02/2017144A(2) 355,000 USD 382,417 372,942 0.78
1,593,554 1,544,912 3.21Chile
Banco de Credito e Inversiones 3.000% 13/09/2017 260,000 USD 259,982 265,146 0.55
Celulosa Arauco y Constitucion SA 5.625%20/04/2015 255,000 USD 258,180 257,473 0.54
Corpbanca SA 3.125% 15/01/2018 500,000 USD 504,350 496,875 1.03
1,022,512 1,019,494 2.12Croatia
Agrokor dd 8.875% 01/02/2020 200,000 USD 212,698 215,800 0.45
212,698 215,800 0.45Great Britain
Afren PLC 6.625% 09/12/2020 144A(2) 240,000 USD 240,944 134,400 0.28
Vedanta Resources PLC 6.750% 07/06/2016 144A(2) 250,000 USD 258,548 258,125 0.53
499,492 392,525 0.81Mexico
Axtel SAB de CV 8.000% 31/01/2020 144A(2) 175,000 USD 167,763 168,219 0.35
BBVA Bancomer SA/Texas 4.500% 10/03/2016144A(2) 335,000 USD 347,817 345,050 0.72
Sigma Alimentos SA de CV 5.625% 14/04/2018 320,000 USD 339,825 347,200 0.72
855,405 860,469 1.79Netherlands
Listrindo Capital BV 6.950% 21/02/2019 144A(2) 620,000 USD 655,117 654,100 1.36
655,117 654,100 1.36Peru
Banco de Credito del Peru 2.750% 09/01/2018 358,000 USD 352,471 356,210 0.74
Camposol SA 9.875% 02/02/2017 265,000 USD 269,877 271,493 0.56
Ferreycorp SAA 4.875% 26/04/2020 144A(2) 220,000 USD 209,914 213,400 0.44
832,262 841,103 1.74
(1) See Note 1.
(2) See Note 16.
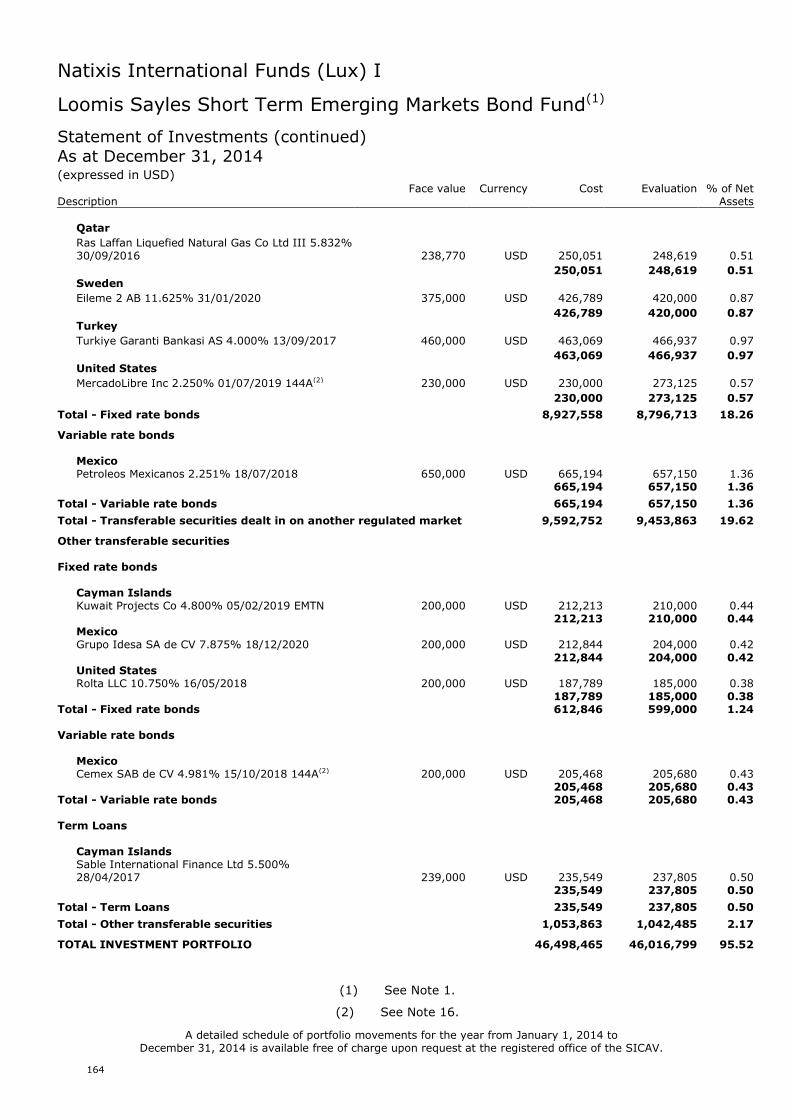
Natixis International Funds (Lux) I
164
Loomis Sayles Short Term Emerging Markets Bond Fund(1)
Statement of Investments (continued)As at December 31, 2014(expressed in USD)
Face value Currency Cost Evaluation % of NetDescription Assets
Qatar
Ras Laffan Liquefied Natural Gas Co Ltd III 5.832%30/09/2016 238,770 USD 250,051 248,619 0.51
250,051 248,619 0.51Sweden
Eileme 2 AB 11.625% 31/01/2020 375,000 USD 426,789 420,000 0.87
426,789 420,000 0.87Turkey
Turkiye Garanti Bankasi AS 4.000% 13/09/2017 460,000 USD 463,069 466,937 0.97
463,069 466,937 0.97United States
MercadoLibre Inc 2.250% 01/07/2019 144A(2) 230,000 USD 230,000 273,125 0.57
230,000 273,125 0.57
Total - Fixed rate bonds 8,927,558 8,796,713 18.26
Variable rate bonds
MexicoPetroleos Mexicanos 2.251% 18/07/2018 650,000 USD 665,194 657,150 1.36
665,194 657,150 1.36
Total - Variable rate bonds 665,194 657,150 1.36
Total - Transferable securities dealt in on another regulated market 9,592,752 9,453,863 19.62
Other transferable securities
Fixed rate bonds
Cayman IslandsKuwait Projects Co 4.800% 05/02/2019 EMTN 200,000 USD 212,213 210,000 0.44
212,213 210,000 0.44MexicoGrupo Idesa SA de CV 7.875% 18/12/2020 200,000 USD 212,844 204,000 0.42
212,844 204,000 0.42United StatesRolta LLC 10.750% 16/05/2018 200,000 USD 187,789 185,000 0.38
187,789 185,000 0.38Total - Fixed rate bonds 612,846 599,000 1.24
Variable rate bonds
MexicoCemex SAB de CV 4.981% 15/10/2018 144A(2) 200,000 USD 205,468 205,680 0.43
205,468 205,680 0.43Total - Variable rate bonds 205,468 205,680 0.43
Term Loans
Cayman IslandsSable International Finance Ltd 5.500%28/04/2017 239,000 USD 235,549 237,805 0.50
235,549 237,805 0.50
Total - Term Loans 235,549 237,805 0.50
Total - Other transferable securities 1,053,863 1,042,485 2.17
TOTAL INVESTMENT PORTFOLIO 46,498,465 46,016,799 95.52
A detailed schedule of portfolio movements for the year from January 1, 2014 toDecember 31, 2014 is available free of charge upon request at the registered office of the SICAV.
(1) See Note 1.
(2) See Note 16.
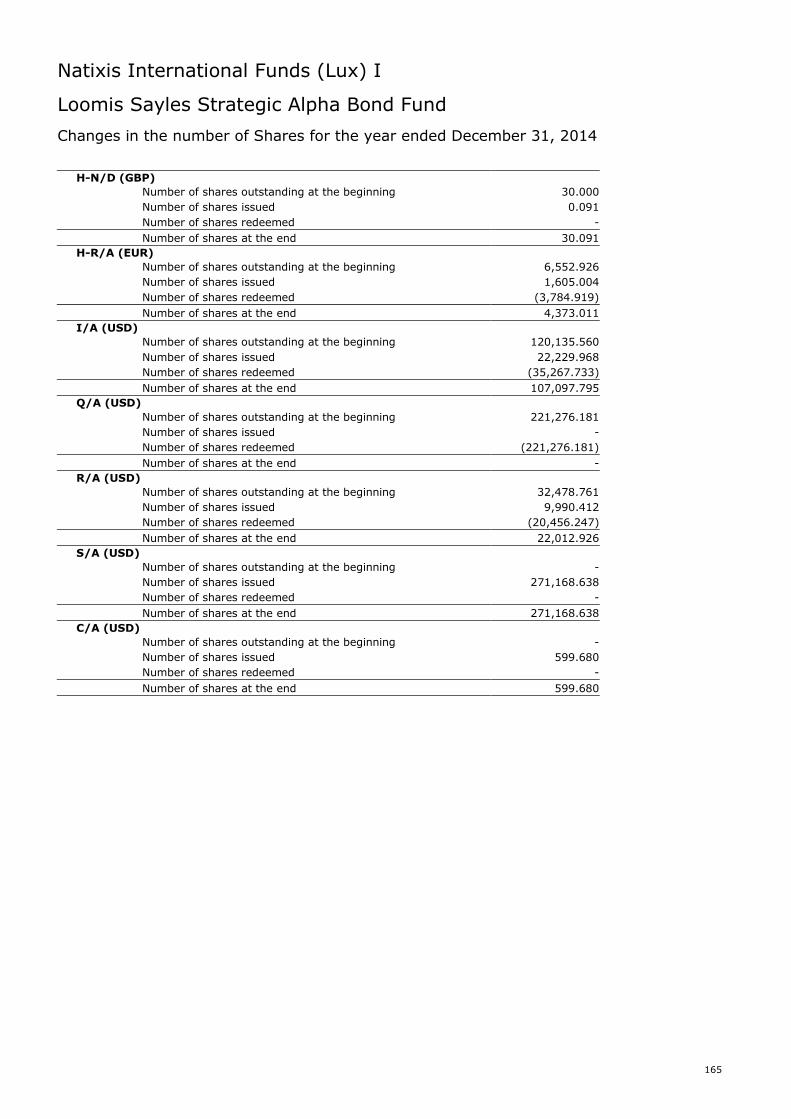
Natixis International Funds (Lux) I
165
Loomis Sayles Strategic Alpha Bond Fund
Changes in the number of Shares for the year ended December 31, 2014
H-N/D (GBP)
Number of shares outstanding at the beginning 30.000
Number of shares issued 0.091
Number of shares redeemed -
Number of shares at the end 30.091
H-R/A (EUR)
Number of shares outstanding at the beginning 6,552.926
Number of shares issued 1,605.004
Number of shares redeemed (3,784.919)
Number of shares at the end 4,373.011
I/A (USD)
Number of shares outstanding at the beginning 120,135.560
Number of shares issued 22,229.968
Number of shares redeemed (35,267.733)
Number of shares at the end 107,097.795
Q/A (USD)
Number of shares outstanding at the beginning 221,276.181
Number of shares issued -
Number of shares redeemed (221,276.181)
Number of shares at the end -
R/A (USD)
Number of shares outstanding at the beginning 32,478.761
Number of shares issued 9,990.412
Number of shares redeemed (20,456.247)
Number of shares at the end 22,012.926
S/A (USD)
Number of shares outstanding at the beginning -
Number of shares issued 271,168.638
Number of shares redeemed -
Number of shares at the end 271,168.638
C/A (USD)
Number of shares outstanding at the beginning -
Number of shares issued 599.680
Number of shares redeemed -
Number of shares at the end 599.680
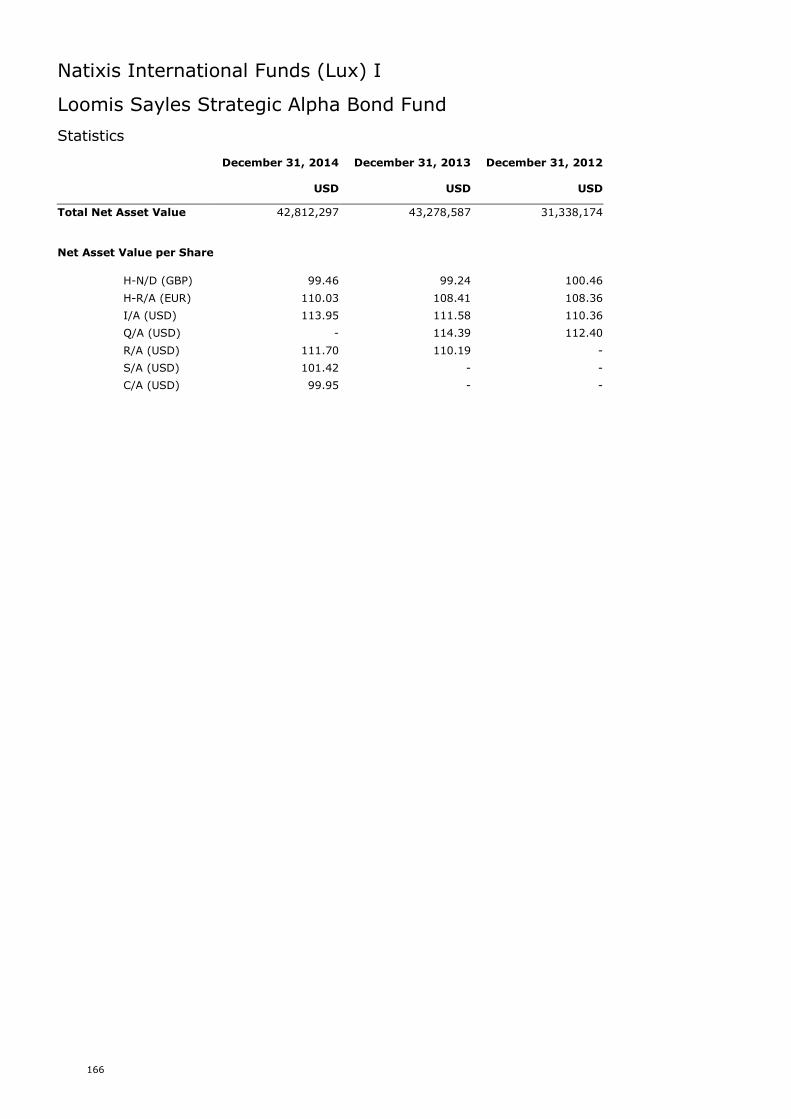
Natixis International Funds (Lux) I
166
Loomis Sayles Strategic Alpha Bond Fund
Statistics
December 31, 2014 December 31, 2013 December 31, 2012
USD USD USD
Total Net Asset Value 42,812,297 43,278,587 31,338,174
Net Asset Value per Share
H-N/D (GBP) 99.46 99.24 100.46
H-R/A (EUR) 110.03 108.41 108.36
I/A (USD) 113.95 111.58 110.36
Q/A (USD) - 114.39 112.40
R/A (USD) 111.70 110.19 -
S/A (USD) 101.42 - -
C/A (USD) 99.95 - -
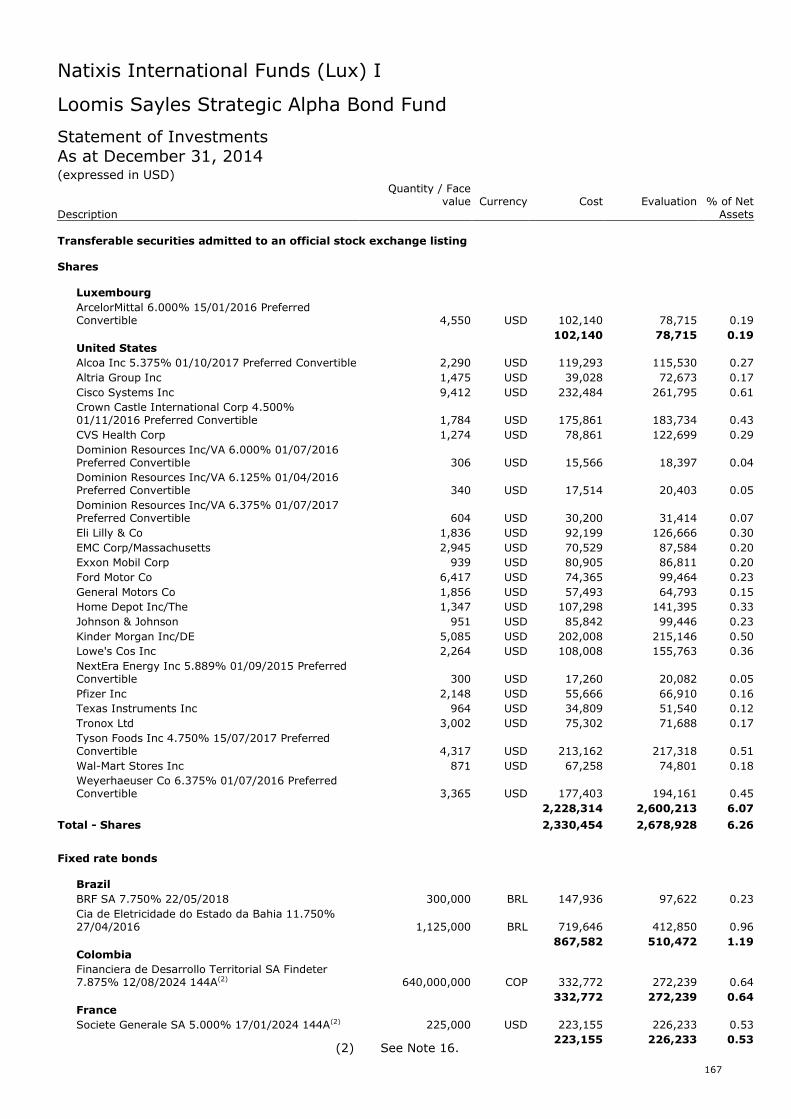
Natixis International Funds (Lux) I
167
Loomis Sayles Strategic Alpha Bond Fund
Statement of InvestmentsAs at December 31, 2014(expressed in USD)
Quantity / Facevalue Currency Cost Evaluation % of Net
Description Assets
Transferable securities admitted to an official stock exchange listing
Shares
Luxembourg
ArcelorMittal 6.000% 15/01/2016 PreferredConvertible 4,550 USD 102,140 78,715 0.19
102,140 78,715 0.19United States
Alcoa Inc 5.375% 01/10/2017 Preferred Convertible 2,290 USD 119,293 115,530 0.27
Altria Group Inc 1,475 USD 39,028 72,673 0.17
Cisco Systems Inc 9,412 USD 232,484 261,795 0.61
Crown Castle International Corp 4.500%01/11/2016 Preferred Convertible 1,784 USD 175,861 183,734 0.43
CVS Health Corp 1,274 USD 78,861 122,699 0.29
Dominion Resources Inc/VA 6.000% 01/07/2016Preferred Convertible 306 USD 15,566 18,397 0.04
Dominion Resources Inc/VA 6.125% 01/04/2016Preferred Convertible 340 USD 17,514 20,403 0.05
Dominion Resources Inc/VA 6.375% 01/07/2017Preferred Convertible 604 USD 30,200 31,414 0.07
Eli Lilly & Co 1,836 USD 92,199 126,666 0.30
EMC Corp/Massachusetts 2,945 USD 70,529 87,584 0.20
Exxon Mobil Corp 939 USD 80,905 86,811 0.20
Ford Motor Co 6,417 USD 74,365 99,464 0.23
General Motors Co 1,856 USD 57,493 64,793 0.15
Home Depot Inc/The 1,347 USD 107,298 141,395 0.33
Johnson & Johnson 951 USD 85,842 99,446 0.23
Kinder Morgan Inc/DE 5,085 USD 202,008 215,146 0.50
Lowe's Cos Inc 2,264 USD 108,008 155,763 0.36
NextEra Energy Inc 5.889% 01/09/2015 PreferredConvertible 300 USD 17,260 20,082 0.05
Pfizer Inc 2,148 USD 55,666 66,910 0.16
Texas Instruments Inc 964 USD 34,809 51,540 0.12
Tronox Ltd 3,002 USD 75,302 71,688 0.17
Tyson Foods Inc 4.750% 15/07/2017 PreferredConvertible 4,317 USD 213,162 217,318 0.51
Wal-Mart Stores Inc 871 USD 67,258 74,801 0.18
Weyerhaeuser Co 6.375% 01/07/2016 PreferredConvertible 3,365 USD 177,403 194,161 0.45
2,228,314 2,600,213 6.07
Total - Shares 2,330,454 2,678,928 6.26
Fixed rate bonds
Brazil
BRF SA 7.750% 22/05/2018 300,000 BRL 147,936 97,622 0.23
Cia de Eletricidade do Estado da Bahia 11.750%27/04/2016 1,125,000 BRL 719,646 412,850 0.96
867,582 510,472 1.19Colombia
Financiera de Desarrollo Territorial SA Findeter7.875% 12/08/2024 144A(2) 640,000,000 COP 332,772 272,239 0.64
332,772 272,239 0.64France
Societe Generale SA 5.000% 17/01/2024 144A(2) 225,000 USD 223,155 226,233 0.53
223,155 226,233 0.53(2) See Note 16.
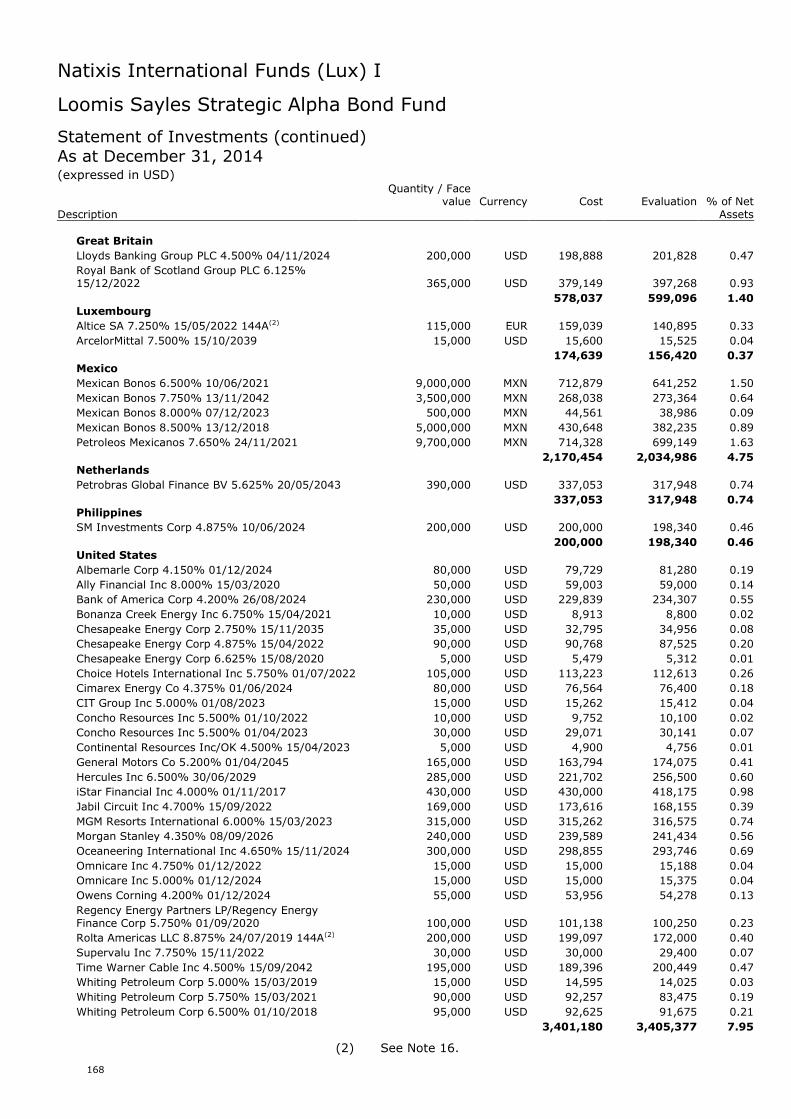
Natixis International Funds (Lux) I
168
Loomis Sayles Strategic Alpha Bond Fund
Statement of Investments (continued)As at December 31, 2014(expressed in USD)
Quantity / Facevalue Currency Cost Evaluation % of Net
Description Assets
Great Britain
Lloyds Banking Group PLC 4.500% 04/11/2024 200,000 USD 198,888 201,828 0.47
Royal Bank of Scotland Group PLC 6.125%15/12/2022 365,000 USD 379,149 397,268 0.93
578,037 599,096 1.40Luxembourg
Altice SA 7.250% 15/05/2022 144A(2) 115,000 EUR 159,039 140,895 0.33
ArcelorMittal 7.500% 15/10/2039 15,000 USD 15,600 15,525 0.04
174,639 156,420 0.37Mexico
Mexican Bonos 6.500% 10/06/2021 9,000,000 MXN 712,879 641,252 1.50
Mexican Bonos 7.750% 13/11/2042 3,500,000 MXN 268,038 273,364 0.64
Mexican Bonos 8.000% 07/12/2023 500,000 MXN 44,561 38,986 0.09
Mexican Bonos 8.500% 13/12/2018 5,000,000 MXN 430,648 382,235 0.89
Petroleos Mexicanos 7.650% 24/11/2021 9,700,000 MXN 714,328 699,149 1.63
2,170,454 2,034,986 4.75Netherlands
Petrobras Global Finance BV 5.625% 20/05/2043 390,000 USD 337,053 317,948 0.74
337,053 317,948 0.74Philippines
SM Investments Corp 4.875% 10/06/2024 200,000 USD 200,000 198,340 0.46
200,000 198,340 0.46United States
Albemarle Corp 4.150% 01/12/2024 80,000 USD 79,729 81,280 0.19
Ally Financial Inc 8.000% 15/03/2020 50,000 USD 59,003 59,000 0.14
Bank of America Corp 4.200% 26/08/2024 230,000 USD 229,839 234,307 0.55
Bonanza Creek Energy Inc 6.750% 15/04/2021 10,000 USD 8,913 8,800 0.02
Chesapeake Energy Corp 2.750% 15/11/2035 35,000 USD 32,795 34,956 0.08
Chesapeake Energy Corp 4.875% 15/04/2022 90,000 USD 90,768 87,525 0.20
Chesapeake Energy Corp 6.625% 15/08/2020 5,000 USD 5,479 5,312 0.01
Choice Hotels International Inc 5.750% 01/07/2022 105,000 USD 113,223 112,613 0.26
Cimarex Energy Co 4.375% 01/06/2024 80,000 USD 76,564 76,400 0.18
CIT Group Inc 5.000% 01/08/2023 15,000 USD 15,262 15,412 0.04
Concho Resources Inc 5.500% 01/10/2022 10,000 USD 9,752 10,100 0.02
Concho Resources Inc 5.500% 01/04/2023 30,000 USD 29,071 30,141 0.07
Continental Resources Inc/OK 4.500% 15/04/2023 5,000 USD 4,900 4,756 0.01
General Motors Co 5.200% 01/04/2045 165,000 USD 163,794 174,075 0.41
Hercules Inc 6.500% 30/06/2029 285,000 USD 221,702 256,500 0.60
iStar Financial Inc 4.000% 01/11/2017 430,000 USD 430,000 418,175 0.98
Jabil Circuit Inc 4.700% 15/09/2022 169,000 USD 173,616 168,155 0.39
MGM Resorts International 6.000% 15/03/2023 315,000 USD 315,262 316,575 0.74
Morgan Stanley 4.350% 08/09/2026 240,000 USD 239,589 241,434 0.56
Oceaneering International Inc 4.650% 15/11/2024 300,000 USD 298,855 293,746 0.69
Omnicare Inc 4.750% 01/12/2022 15,000 USD 15,000 15,188 0.04
Omnicare Inc 5.000% 01/12/2024 15,000 USD 15,000 15,375 0.04
Owens Corning 4.200% 01/12/2024 55,000 USD 53,956 54,278 0.13
Regency Energy Partners LP/Regency EnergyFinance Corp 5.750% 01/09/2020 100,000 USD 101,138 100,250 0.23
Rolta Americas LLC 8.875% 24/07/2019 144A(2) 200,000 USD 199,097 172,000 0.40
Supervalu Inc 7.750% 15/11/2022 30,000 USD 30,000 29,400 0.07
Time Warner Cable Inc 4.500% 15/09/2042 195,000 USD 189,396 200,449 0.47
Whiting Petroleum Corp 5.000% 15/03/2019 15,000 USD 14,595 14,025 0.03
Whiting Petroleum Corp 5.750% 15/03/2021 90,000 USD 92,257 83,475 0.19
Whiting Petroleum Corp 6.500% 01/10/2018 95,000 USD 92,625 91,675 0.21
3,401,180 3,405,377 7.95
(2) See Note 16.
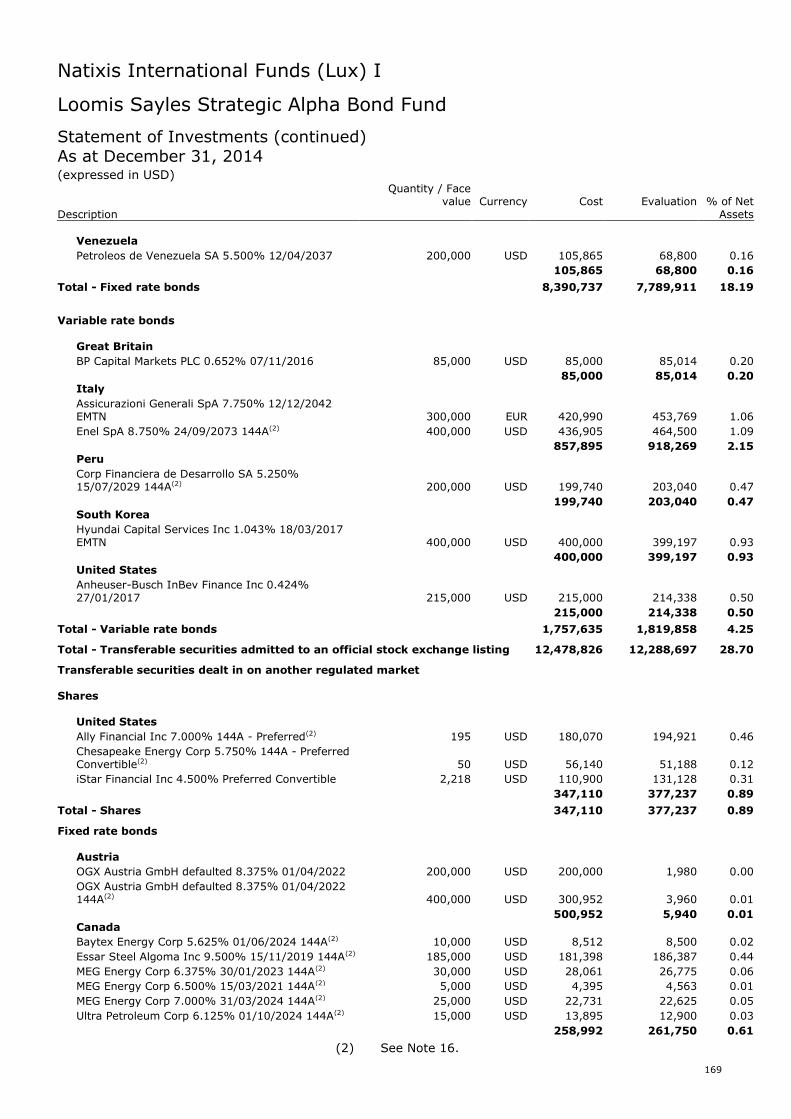
Natixis International Funds (Lux) I
169
Loomis Sayles Strategic Alpha Bond Fund
Statement of Investments (continued)As at December 31, 2014(expressed in USD)
Quantity / Facevalue Currency Cost Evaluation % of Net
Description Assets
Venezuela
Petroleos de Venezuela SA 5.500% 12/04/2037 200,000 USD 105,865 68,800 0.16
105,865 68,800 0.16
Total - Fixed rate bonds 8,390,737 7,789,911 18.19
Variable rate bonds
Great Britain
BP Capital Markets PLC 0.652% 07/11/2016 85,000 USD 85,000 85,014 0.20
85,000 85,014 0.20Italy
Assicurazioni Generali SpA 7.750% 12/12/2042EMTN 300,000 EUR 420,990 453,769 1.06
Enel SpA 8.750% 24/09/2073 144A(2) 400,000 USD 436,905 464,500 1.09
857,895 918,269 2.15Peru
Corp Financiera de Desarrollo SA 5.250%15/07/2029 144A(2) 200,000 USD 199,740 203,040 0.47
199,740 203,040 0.47South Korea
Hyundai Capital Services Inc 1.043% 18/03/2017EMTN 400,000 USD 400,000 399,197 0.93
400,000 399,197 0.93United States
Anheuser-Busch InBev Finance Inc 0.424%27/01/2017 215,000 USD 215,000 214,338 0.50
215,000 214,338 0.50
Total - Variable rate bonds 1,757,635 1,819,858 4.25
Total - Transferable securities admitted to an official stock exchange listing 12,478,826 12,288,697 28.70
Transferable securities dealt in on another regulated market
Shares
United States
Ally Financial Inc 7.000% 144A - Preferred(2) 195 USD 180,070 194,921 0.46
Chesapeake Energy Corp 5.750% 144A - PreferredConvertible(2) 50 USD 56,140 51,188 0.12
iStar Financial Inc 4.500% Preferred Convertible 2,218 USD 110,900 131,128 0.31
347,110 377,237 0.89
Total - Shares 347,110 377,237 0.89
Fixed rate bonds
Austria
OGX Austria GmbH defaulted 8.375% 01/04/2022 200,000 USD 200,000 1,980 0.00
OGX Austria GmbH defaulted 8.375% 01/04/2022144A(2) 400,000 USD 300,952 3,960 0.01
500,952 5,940 0.01Canada
Baytex Energy Corp 5.625% 01/06/2024 144A(2) 10,000 USD 8,512 8,500 0.02
Essar Steel Algoma Inc 9.500% 15/11/2019 144A(2) 185,000 USD 181,398 186,387 0.44
MEG Energy Corp 6.375% 30/01/2023 144A(2) 30,000 USD 28,061 26,775 0.06
MEG Energy Corp 6.500% 15/03/2021 144A(2) 5,000 USD 4,395 4,563 0.01
MEG Energy Corp 7.000% 31/03/2024 144A(2) 25,000 USD 22,731 22,625 0.05
Ultra Petroleum Corp 6.125% 01/10/2024 144A(2) 15,000 USD 13,895 12,900 0.03
258,992 261,750 0.61
(2) See Note 16.
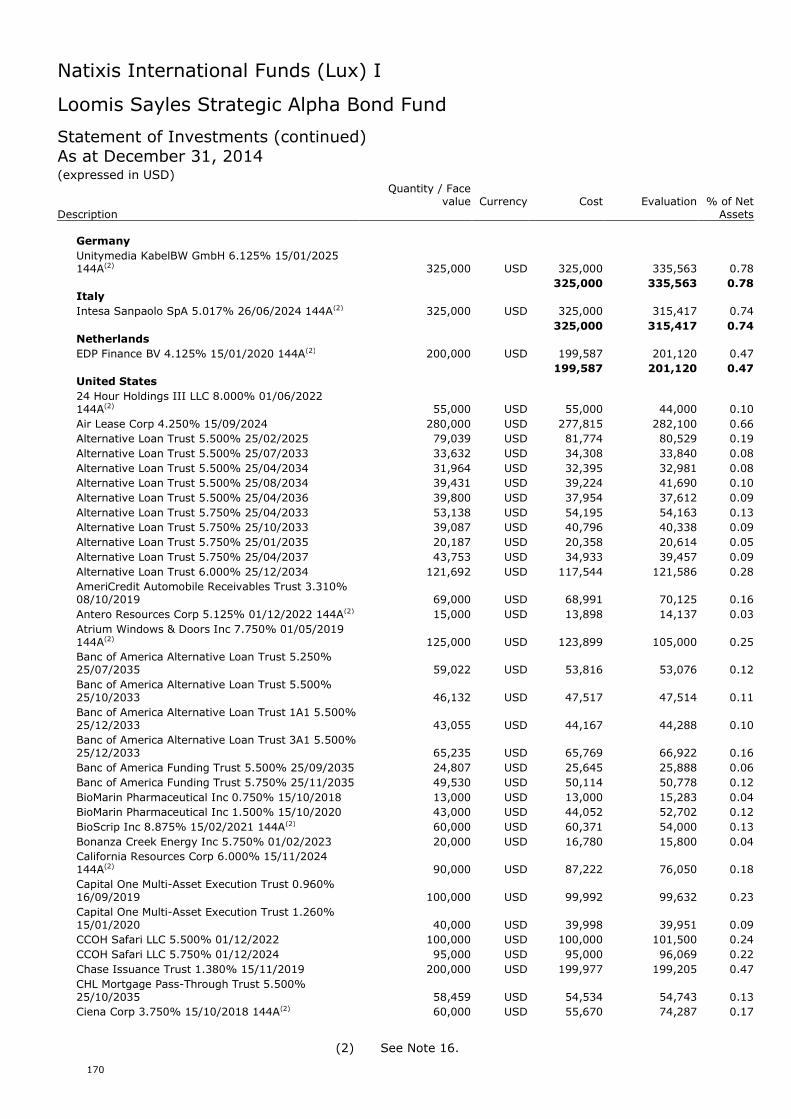
Natixis International Funds (Lux) I
170
Loomis Sayles Strategic Alpha Bond Fund
Statement of Investments (continued)As at December 31, 2014(expressed in USD)
Quantity / Facevalue Currency Cost Evaluation % of Net
Description Assets
Germany
Unitymedia KabelBW GmbH 6.125% 15/01/2025144A(2) 325,000 USD 325,000 335,563 0.78
325,000 335,563 0.78Italy
Intesa Sanpaolo SpA 5.017% 26/06/2024 144A(2) 325,000 USD 325,000 315,417 0.74
325,000 315,417 0.74Netherlands
EDP Finance BV 4.125% 15/01/2020 144A(2) 200,000 USD 199,587 201,120 0.47
199,587 201,120 0.47United States
24 Hour Holdings III LLC 8.000% 01/06/2022144A(2) 55,000 USD 55,000 44,000 0.10
Air Lease Corp 4.250% 15/09/2024 280,000 USD 277,815 282,100 0.66
Alternative Loan Trust 5.500% 25/02/2025 79,039 USD 81,774 80,529 0.19
Alternative Loan Trust 5.500% 25/07/2033 33,632 USD 34,308 33,840 0.08
Alternative Loan Trust 5.500% 25/04/2034 31,964 USD 32,395 32,981 0.08
Alternative Loan Trust 5.500% 25/08/2034 39,431 USD 39,224 41,690 0.10
Alternative Loan Trust 5.500% 25/04/2036 39,800 USD 37,954 37,612 0.09
Alternative Loan Trust 5.750% 25/04/2033 53,138 USD 54,195 54,163 0.13
Alternative Loan Trust 5.750% 25/10/2033 39,087 USD 40,796 40,338 0.09
Alternative Loan Trust 5.750% 25/01/2035 20,187 USD 20,358 20,614 0.05
Alternative Loan Trust 5.750% 25/04/2037 43,753 USD 34,933 39,457 0.09
Alternative Loan Trust 6.000% 25/12/2034 121,692 USD 117,544 121,586 0.28
AmeriCredit Automobile Receivables Trust 3.310%08/10/2019 69,000 USD 68,991 70,125 0.16
Antero Resources Corp 5.125% 01/12/2022 144A(2) 15,000 USD 13,898 14,137 0.03
Atrium Windows & Doors Inc 7.750% 01/05/2019144A(2) 125,000 USD 123,899 105,000 0.25
Banc of America Alternative Loan Trust 5.250%25/07/2035 59,022 USD 53,816 53,076 0.12
Banc of America Alternative Loan Trust 5.500%25/10/2033 46,132 USD 47,517 47,514 0.11
Banc of America Alternative Loan Trust 1A1 5.500%25/12/2033 43,055 USD 44,167 44,288 0.10
Banc of America Alternative Loan Trust 3A1 5.500%25/12/2033 65,235 USD 65,769 66,922 0.16
Banc of America Funding Trust 5.500% 25/09/2035 24,807 USD 25,645 25,888 0.06
Banc of America Funding Trust 5.750% 25/11/2035 49,530 USD 50,114 50,778 0.12
BioMarin Pharmaceutical Inc 0.750% 15/10/2018 13,000 USD 13,000 15,283 0.04
BioMarin Pharmaceutical Inc 1.500% 15/10/2020 43,000 USD 44,052 52,702 0.12
BioScrip Inc 8.875% 15/02/2021 144A(2) 60,000 USD 60,371 54,000 0.13
Bonanza Creek Energy Inc 5.750% 01/02/2023 20,000 USD 16,780 15,800 0.04
California Resources Corp 6.000% 15/11/2024144A(2) 90,000 USD 87,222 76,050 0.18
Capital One Multi-Asset Execution Trust 0.960%16/09/2019 100,000 USD 99,992 99,632 0.23
Capital One Multi-Asset Execution Trust 1.260%15/01/2020 40,000 USD 39,998 39,951 0.09
CCOH Safari LLC 5.500% 01/12/2022 100,000 USD 100,000 101,500 0.24
CCOH Safari LLC 5.750% 01/12/2024 95,000 USD 95,000 96,069 0.22
Chase Issuance Trust 1.380% 15/11/2019 200,000 USD 199,977 199,205 0.47
CHL Mortgage Pass-Through Trust 5.500%25/10/2035 58,459 USD 54,534 54,743 0.13
Ciena Corp 3.750% 15/10/2018 144A(2) 60,000 USD 55,670 74,287 0.17
(2) See Note 16.
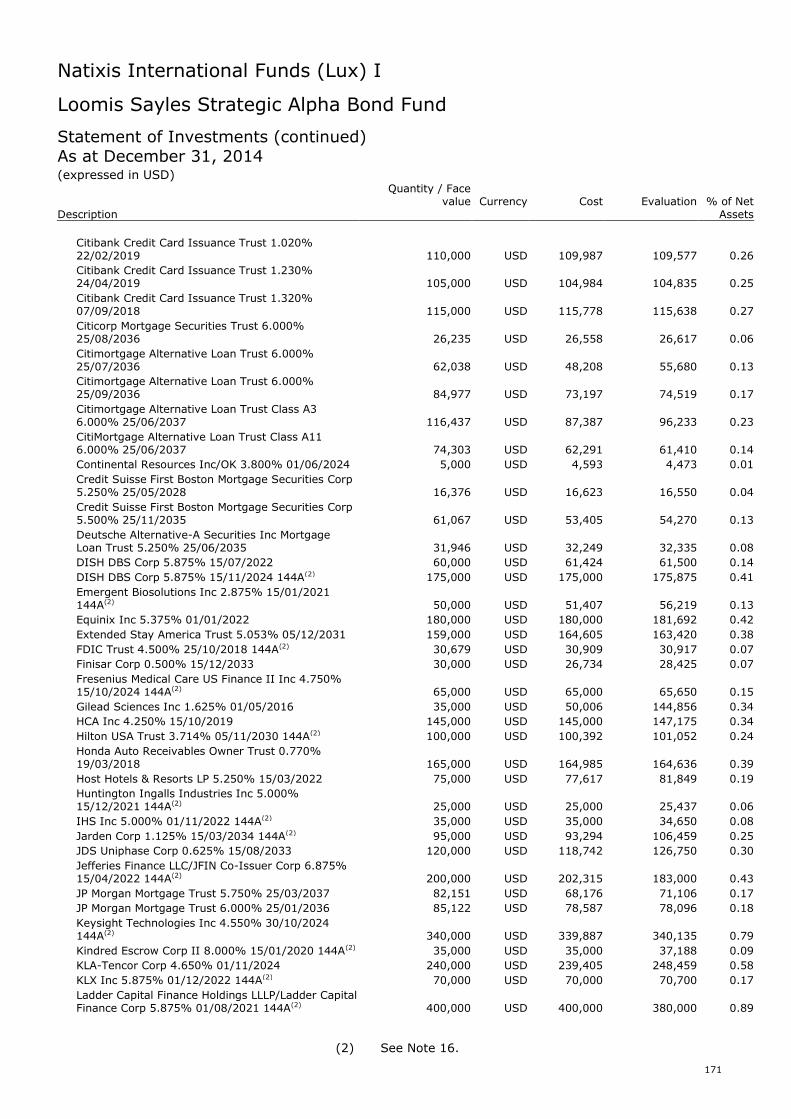
Natixis International Funds (Lux) I
171
Loomis Sayles Strategic Alpha Bond Fund
Statement of Investments (continued)As at December 31, 2014(expressed in USD)
Quantity / Facevalue Currency Cost Evaluation % of Net
Description Assets
Citibank Credit Card Issuance Trust 1.020%22/02/2019 110,000 USD 109,987 109,577 0.26
Citibank Credit Card Issuance Trust 1.230%24/04/2019 105,000 USD 104,984 104,835 0.25
Citibank Credit Card Issuance Trust 1.320%07/09/2018 115,000 USD 115,778 115,638 0.27
Citicorp Mortgage Securities Trust 6.000%25/08/2036 26,235 USD 26,558 26,617 0.06
Citimortgage Alternative Loan Trust 6.000%25/07/2036 62,038 USD 48,208 55,680 0.13
Citimortgage Alternative Loan Trust 6.000%25/09/2036 84,977 USD 73,197 74,519 0.17
Citimortgage Alternative Loan Trust Class A36.000% 25/06/2037 116,437 USD 87,387 96,233 0.23
CitiMortgage Alternative Loan Trust Class A116.000% 25/06/2037 74,303 USD 62,291 61,410 0.14
Continental Resources Inc/OK 3.800% 01/06/2024 5,000 USD 4,593 4,473 0.01
Credit Suisse First Boston Mortgage Securities Corp5.250% 25/05/2028 16,376 USD 16,623 16,550 0.04
Credit Suisse First Boston Mortgage Securities Corp5.500% 25/11/2035 61,067 USD 53,405 54,270 0.13
Deutsche Alternative-A Securities Inc MortgageLoan Trust 5.250% 25/06/2035 31,946 USD 32,249 32,335 0.08
DISH DBS Corp 5.875% 15/07/2022 60,000 USD 61,424 61,500 0.14
DISH DBS Corp 5.875% 15/11/2024 144A(2) 175,000 USD 175,000 175,875 0.41
Emergent Biosolutions Inc 2.875% 15/01/2021144A(2) 50,000 USD 51,407 56,219 0.13
Equinix Inc 5.375% 01/01/2022 180,000 USD 180,000 181,692 0.42
Extended Stay America Trust 5.053% 05/12/2031 159,000 USD 164,605 163,420 0.38
FDIC Trust 4.500% 25/10/2018 144A(2) 30,679 USD 30,909 30,917 0.07
Finisar Corp 0.500% 15/12/2033 30,000 USD 26,734 28,425 0.07
Fresenius Medical Care US Finance II Inc 4.750%15/10/2024 144A(2) 65,000 USD 65,000 65,650 0.15
Gilead Sciences Inc 1.625% 01/05/2016 35,000 USD 50,006 144,856 0.34
HCA Inc 4.250% 15/10/2019 145,000 USD 145,000 147,175 0.34
Hilton USA Trust 3.714% 05/11/2030 144A(2) 100,000 USD 100,392 101,052 0.24
Honda Auto Receivables Owner Trust 0.770%19/03/2018 165,000 USD 164,985 164,636 0.39
Host Hotels & Resorts LP 5.250% 15/03/2022 75,000 USD 77,617 81,849 0.19
Huntington Ingalls Industries Inc 5.000%15/12/2021 144A(2) 25,000 USD 25,000 25,437 0.06
IHS Inc 5.000% 01/11/2022 144A(2) 35,000 USD 35,000 34,650 0.08
Jarden Corp 1.125% 15/03/2034 144A(2) 95,000 USD 93,294 106,459 0.25
JDS Uniphase Corp 0.625% 15/08/2033 120,000 USD 118,742 126,750 0.30
Jefferies Finance LLC/JFIN Co-Issuer Corp 6.875%15/04/2022 144A(2) 200,000 USD 202,315 183,000 0.43
JP Morgan Mortgage Trust 5.750% 25/03/2037 82,151 USD 68,176 71,106 0.17
JP Morgan Mortgage Trust 6.000% 25/01/2036 85,122 USD 78,587 78,096 0.18
Keysight Technologies Inc 4.550% 30/10/2024144A(2) 340,000 USD 339,887 340,135 0.79
Kindred Escrow Corp II 8.000% 15/01/2020 144A(2) 35,000 USD 35,000 37,188 0.09
KLA-Tencor Corp 4.650% 01/11/2024 240,000 USD 239,405 248,459 0.58
KLX Inc 5.875% 01/12/2022 144A(2) 70,000 USD 70,000 70,700 0.17
Ladder Capital Finance Holdings LLLP/Ladder CapitalFinance Corp 5.875% 01/08/2021 144A(2) 400,000 USD 400,000 380,000 0.89
(2) See Note 16.
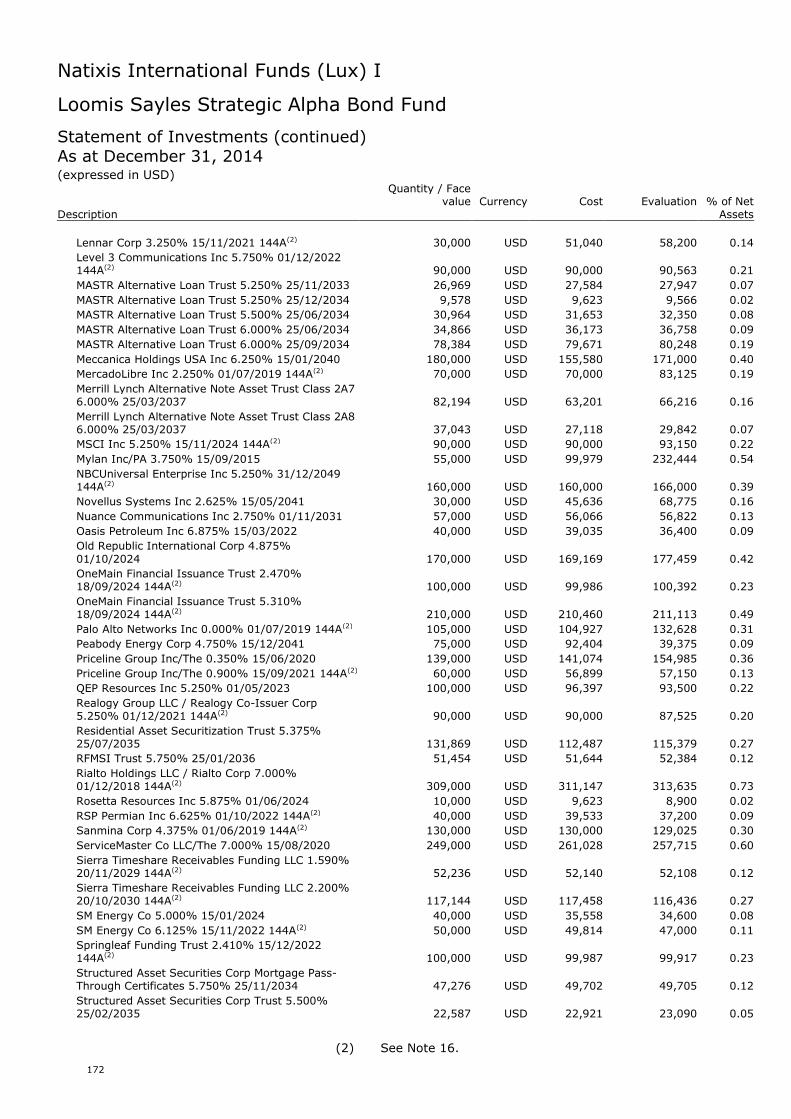
Natixis International Funds (Lux) I
172
Loomis Sayles Strategic Alpha Bond Fund
Statement of Investments (continued)As at December 31, 2014(expressed in USD)
Quantity / Facevalue Currency Cost Evaluation % of Net
Description Assets
Lennar Corp 3.250% 15/11/2021 144A(2) 30,000 USD 51,040 58,200 0.14
Level 3 Communications Inc 5.750% 01/12/2022144A(2) 90,000 USD 90,000 90,563 0.21
MASTR Alternative Loan Trust 5.250% 25/11/2033 26,969 USD 27,584 27,947 0.07
MASTR Alternative Loan Trust 5.250% 25/12/2034 9,578 USD 9,623 9,566 0.02
MASTR Alternative Loan Trust 5.500% 25/06/2034 30,964 USD 31,653 32,350 0.08
MASTR Alternative Loan Trust 6.000% 25/06/2034 34,866 USD 36,173 36,758 0.09
MASTR Alternative Loan Trust 6.000% 25/09/2034 78,384 USD 79,671 80,248 0.19
Meccanica Holdings USA Inc 6.250% 15/01/2040 180,000 USD 155,580 171,000 0.40
MercadoLibre Inc 2.250% 01/07/2019 144A(2) 70,000 USD 70,000 83,125 0.19
Merrill Lynch Alternative Note Asset Trust Class 2A76.000% 25/03/2037 82,194 USD 63,201 66,216 0.16
Merrill Lynch Alternative Note Asset Trust Class 2A86.000% 25/03/2037 37,043 USD 27,118 29,842 0.07
MSCI Inc 5.250% 15/11/2024 144A(2) 90,000 USD 90,000 93,150 0.22
Mylan Inc/PA 3.750% 15/09/2015 55,000 USD 99,979 232,444 0.54
NBCUniversal Enterprise Inc 5.250% 31/12/2049144A(2) 160,000 USD 160,000 166,000 0.39
Novellus Systems Inc 2.625% 15/05/2041 30,000 USD 45,636 68,775 0.16
Nuance Communications Inc 2.750% 01/11/2031 57,000 USD 56,066 56,822 0.13
Oasis Petroleum Inc 6.875% 15/03/2022 40,000 USD 39,035 36,400 0.09
Old Republic International Corp 4.875%01/10/2024 170,000 USD 169,169 177,459 0.42
OneMain Financial Issuance Trust 2.470%18/09/2024 144A(2) 100,000 USD 99,986 100,392 0.23
OneMain Financial Issuance Trust 5.310%18/09/2024 144A(2) 210,000 USD 210,460 211,113 0.49
Palo Alto Networks Inc 0.000% 01/07/2019 144A(2) 105,000 USD 104,927 132,628 0.31
Peabody Energy Corp 4.750% 15/12/2041 75,000 USD 92,404 39,375 0.09
Priceline Group Inc/The 0.350% 15/06/2020 139,000 USD 141,074 154,985 0.36
Priceline Group Inc/The 0.900% 15/09/2021 144A(2) 60,000 USD 56,899 57,150 0.13
QEP Resources Inc 5.250% 01/05/2023 100,000 USD 96,397 93,500 0.22
Realogy Group LLC / Realogy Co-Issuer Corp5.250% 01/12/2021 144A(2) 90,000 USD 90,000 87,525 0.20
Residential Asset Securitization Trust 5.375%25/07/2035 131,869 USD 112,487 115,379 0.27
RFMSI Trust 5.750% 25/01/2036 51,454 USD 51,644 52,384 0.12
Rialto Holdings LLC / Rialto Corp 7.000%01/12/2018 144A(2) 309,000 USD 311,147 313,635 0.73
Rosetta Resources Inc 5.875% 01/06/2024 10,000 USD 9,623 8,900 0.02
RSP Permian Inc 6.625% 01/10/2022 144A(2) 40,000 USD 39,533 37,200 0.09
Sanmina Corp 4.375% 01/06/2019 144A(2) 130,000 USD 130,000 129,025 0.30
ServiceMaster Co LLC/The 7.000% 15/08/2020 249,000 USD 261,028 257,715 0.60
Sierra Timeshare Receivables Funding LLC 1.590%20/11/2029 144A(2) 52,236 USD 52,140 52,108 0.12
Sierra Timeshare Receivables Funding LLC 2.200%20/10/2030 144A(2) 117,144 USD 117,458 116,436 0.27
SM Energy Co 5.000% 15/01/2024 40,000 USD 35,558 34,600 0.08
SM Energy Co 6.125% 15/11/2022 144A(2) 50,000 USD 49,814 47,000 0.11
Springleaf Funding Trust 2.410% 15/12/2022144A(2) 100,000 USD 99,987 99,917 0.23
Structured Asset Securities Corp Mortgage Pass-Through Certificates 5.750% 25/11/2034 47,276 USD 49,702 49,705 0.12
Structured Asset Securities Corp Trust 5.500%25/02/2035 22,587 USD 22,921 23,090 0.05
(2) See Note 16.
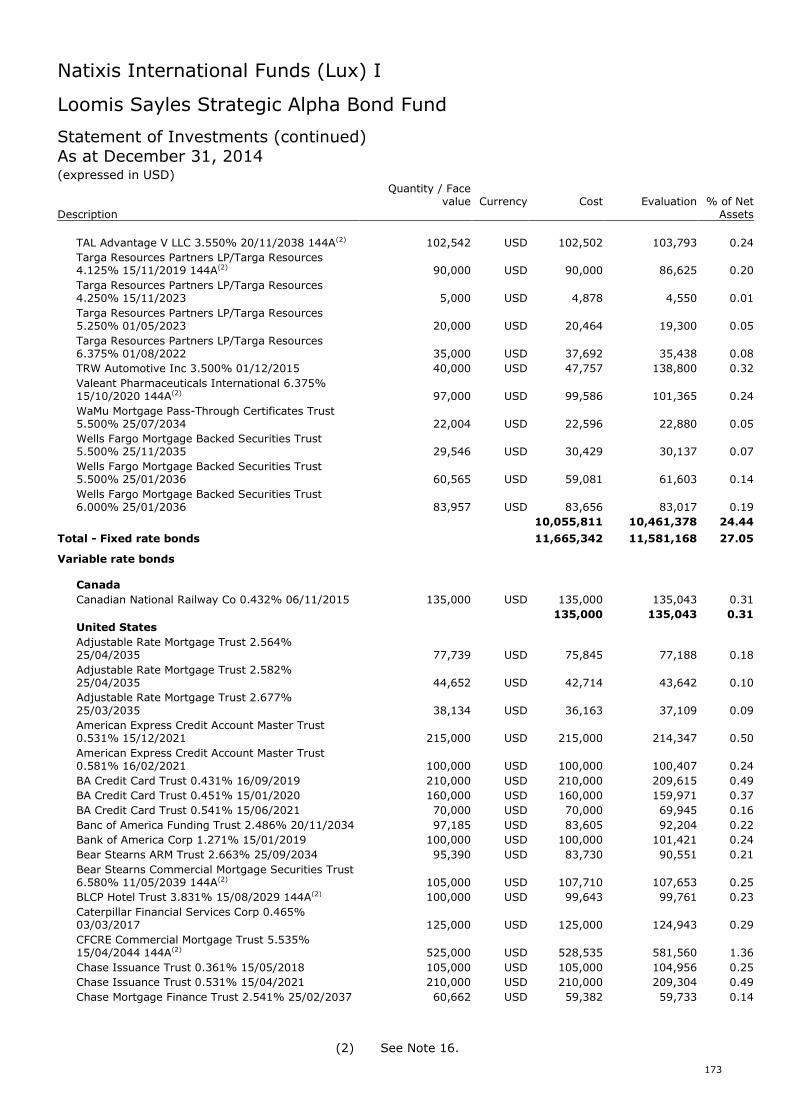
Natixis International Funds (Lux) I
173
Loomis Sayles Strategic Alpha Bond Fund
Statement of Investments (continued)As at December 31, 2014(expressed in USD)
Quantity / Facevalue Currency Cost Evaluation % of Net
Description Assets
TAL Advantage V LLC 3.550% 20/11/2038 144A(2) 102,542 USD 102,502 103,793 0.24
Targa Resources Partners LP/Targa Resources4.125% 15/11/2019 144A(2) 90,000 USD 90,000 86,625 0.20
Targa Resources Partners LP/Targa Resources4.250% 15/11/2023 5,000 USD 4,878 4,550 0.01
Targa Resources Partners LP/Targa Resources5.250% 01/05/2023 20,000 USD 20,464 19,300 0.05
Targa Resources Partners LP/Targa Resources6.375% 01/08/2022 35,000 USD 37,692 35,438 0.08
TRW Automotive Inc 3.500% 01/12/2015 40,000 USD 47,757 138,800 0.32
Valeant Pharmaceuticals International 6.375%15/10/2020 144A(2) 97,000 USD 99,586 101,365 0.24
WaMu Mortgage Pass-Through Certificates Trust5.500% 25/07/2034 22,004 USD 22,596 22,880 0.05
Wells Fargo Mortgage Backed Securities Trust5.500% 25/11/2035 29,546 USD 30,429 30,137 0.07
Wells Fargo Mortgage Backed Securities Trust5.500% 25/01/2036 60,565 USD 59,081 61,603 0.14
Wells Fargo Mortgage Backed Securities Trust6.000% 25/01/2036 83,957 USD 83,656 83,017 0.19
10,055,811 10,461,378 24.44
Total - Fixed rate bonds 11,665,342 11,581,168 27.05
Variable rate bonds
Canada
Canadian National Railway Co 0.432% 06/11/2015 135,000 USD 135,000 135,043 0.31
135,000 135,043 0.31United States
Adjustable Rate Mortgage Trust 2.564%25/04/2035 77,739 USD 75,845 77,188 0.18
Adjustable Rate Mortgage Trust 2.582%25/04/2035 44,652 USD 42,714 43,642 0.10
Adjustable Rate Mortgage Trust 2.677%25/03/2035 38,134 USD 36,163 37,109 0.09
American Express Credit Account Master Trust0.531% 15/12/2021 215,000 USD 215,000 214,347 0.50
American Express Credit Account Master Trust0.581% 16/02/2021 100,000 USD 100,000 100,407 0.24
BA Credit Card Trust 0.431% 16/09/2019 210,000 USD 210,000 209,615 0.49
BA Credit Card Trust 0.451% 15/01/2020 160,000 USD 160,000 159,971 0.37
BA Credit Card Trust 0.541% 15/06/2021 70,000 USD 70,000 69,945 0.16
Banc of America Funding Trust 2.486% 20/11/2034 97,185 USD 83,605 92,204 0.22
Bank of America Corp 1.271% 15/01/2019 100,000 USD 100,000 101,421 0.24
Bear Stearns ARM Trust 2.663% 25/09/2034 95,390 USD 83,730 90,551 0.21
Bear Stearns Commercial Mortgage Securities Trust6.580% 11/05/2039 144A(2) 105,000 USD 107,710 107,653 0.25
BLCP Hotel Trust 3.831% 15/08/2029 144A(2) 100,000 USD 99,643 99,761 0.23
Caterpillar Financial Services Corp 0.465%03/03/2017 125,000 USD 125,000 124,943 0.29
CFCRE Commercial Mortgage Trust 5.535%15/04/2044 144A(2) 525,000 USD 528,535 581,560 1.36
Chase Issuance Trust 0.361% 15/05/2018 105,000 USD 105,000 104,956 0.25
Chase Issuance Trust 0.531% 15/04/2021 210,000 USD 210,000 209,304 0.49
Chase Mortgage Finance Trust 2.541% 25/02/2037 60,662 USD 59,382 59,733 0.14
(2) See Note 16.
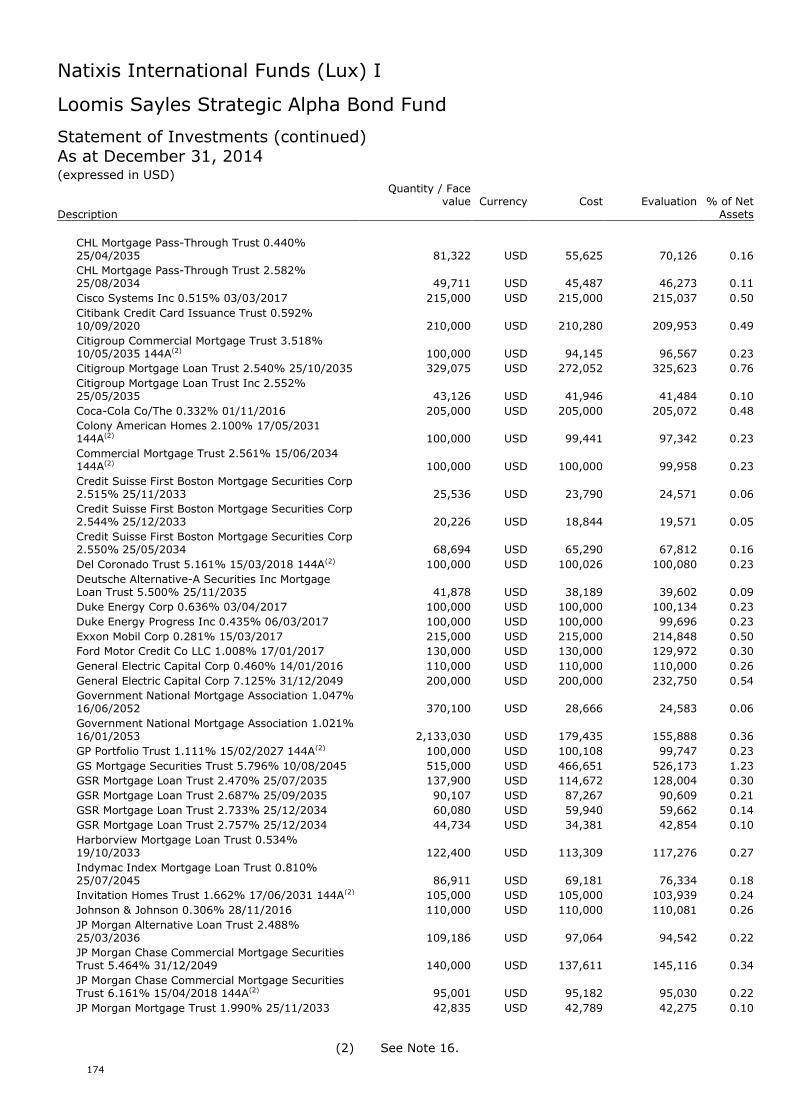
Natixis International Funds (Lux) I
174
Loomis Sayles Strategic Alpha Bond Fund
Statement of Investments (continued)As at December 31, 2014(expressed in USD)
Quantity / Facevalue Currency Cost Evaluation % of Net
Description Assets
CHL Mortgage Pass-Through Trust 0.440%25/04/2035 81,322 USD 55,625 70,126 0.16
CHL Mortgage Pass-Through Trust 2.582%25/08/2034 49,711 USD 45,487 46,273 0.11
Cisco Systems Inc 0.515% 03/03/2017 215,000 USD 215,000 215,037 0.50
Citibank Credit Card Issuance Trust 0.592%10/09/2020 210,000 USD 210,280 209,953 0.49
Citigroup Commercial Mortgage Trust 3.518%10/05/2035 144A(2) 100,000 USD 94,145 96,567 0.23
Citigroup Mortgage Loan Trust 2.540% 25/10/2035 329,075 USD 272,052 325,623 0.76
Citigroup Mortgage Loan Trust Inc 2.552%25/05/2035 43,126 USD 41,946 41,484 0.10
Coca-Cola Co/The 0.332% 01/11/2016 205,000 USD 205,000 205,072 0.48
Colony American Homes 2.100% 17/05/2031144A(2) 100,000 USD 99,441 97,342 0.23
Commercial Mortgage Trust 2.561% 15/06/2034144A(2) 100,000 USD 100,000 99,958 0.23
Credit Suisse First Boston Mortgage Securities Corp2.515% 25/11/2033 25,536 USD 23,790 24,571 0.06
Credit Suisse First Boston Mortgage Securities Corp2.544% 25/12/2033 20,226 USD 18,844 19,571 0.05
Credit Suisse First Boston Mortgage Securities Corp2.550% 25/05/2034 68,694 USD 65,290 67,812 0.16
Del Coronado Trust 5.161% 15/03/2018 144A(2) 100,000 USD 100,026 100,080 0.23
Deutsche Alternative-A Securities Inc MortgageLoan Trust 5.500% 25/11/2035 41,878 USD 38,189 39,602 0.09
Duke Energy Corp 0.636% 03/04/2017 100,000 USD 100,000 100,134 0.23
Duke Energy Progress Inc 0.435% 06/03/2017 100,000 USD 100,000 99,696 0.23
Exxon Mobil Corp 0.281% 15/03/2017 215,000 USD 215,000 214,848 0.50
Ford Motor Credit Co LLC 1.008% 17/01/2017 130,000 USD 130,000 129,972 0.30
General Electric Capital Corp 0.460% 14/01/2016 110,000 USD 110,000 110,000 0.26
General Electric Capital Corp 7.125% 31/12/2049 200,000 USD 200,000 232,750 0.54
Government National Mortgage Association 1.047%16/06/2052 370,100 USD 28,666 24,583 0.06
Government National Mortgage Association 1.021%16/01/2053 2,133,030 USD 179,435 155,888 0.36
GP Portfolio Trust 1.111% 15/02/2027 144A(2) 100,000 USD 100,108 99,747 0.23
GS Mortgage Securities Trust 5.796% 10/08/2045 515,000 USD 466,651 526,173 1.23
GSR Mortgage Loan Trust 2.470% 25/07/2035 137,900 USD 114,672 128,004 0.30
GSR Mortgage Loan Trust 2.687% 25/09/2035 90,107 USD 87,267 90,609 0.21
GSR Mortgage Loan Trust 2.733% 25/12/2034 60,080 USD 59,940 59,662 0.14
GSR Mortgage Loan Trust 2.757% 25/12/2034 44,734 USD 34,381 42,854 0.10
Harborview Mortgage Loan Trust 0.534%19/10/2033 122,400 USD 113,309 117,276 0.27
Indymac Index Mortgage Loan Trust 0.810%25/07/2045 86,911 USD 69,181 76,334 0.18
Invitation Homes Trust 1.662% 17/06/2031 144A(2) 105,000 USD 105,000 103,939 0.24
Johnson & Johnson 0.306% 28/11/2016 110,000 USD 110,000 110,081 0.26
JP Morgan Alternative Loan Trust 2.488%25/03/2036 109,186 USD 97,064 94,542 0.22
JP Morgan Chase Commercial Mortgage SecuritiesTrust 5.464% 31/12/2049 140,000 USD 137,611 145,116 0.34
JP Morgan Chase Commercial Mortgage SecuritiesTrust 6.161% 15/04/2018 144A(2) 95,001 USD 95,182 95,030 0.22
JP Morgan Mortgage Trust 1.990% 25/11/2033 42,835 USD 42,789 42,275 0.10
(2) See Note 16.
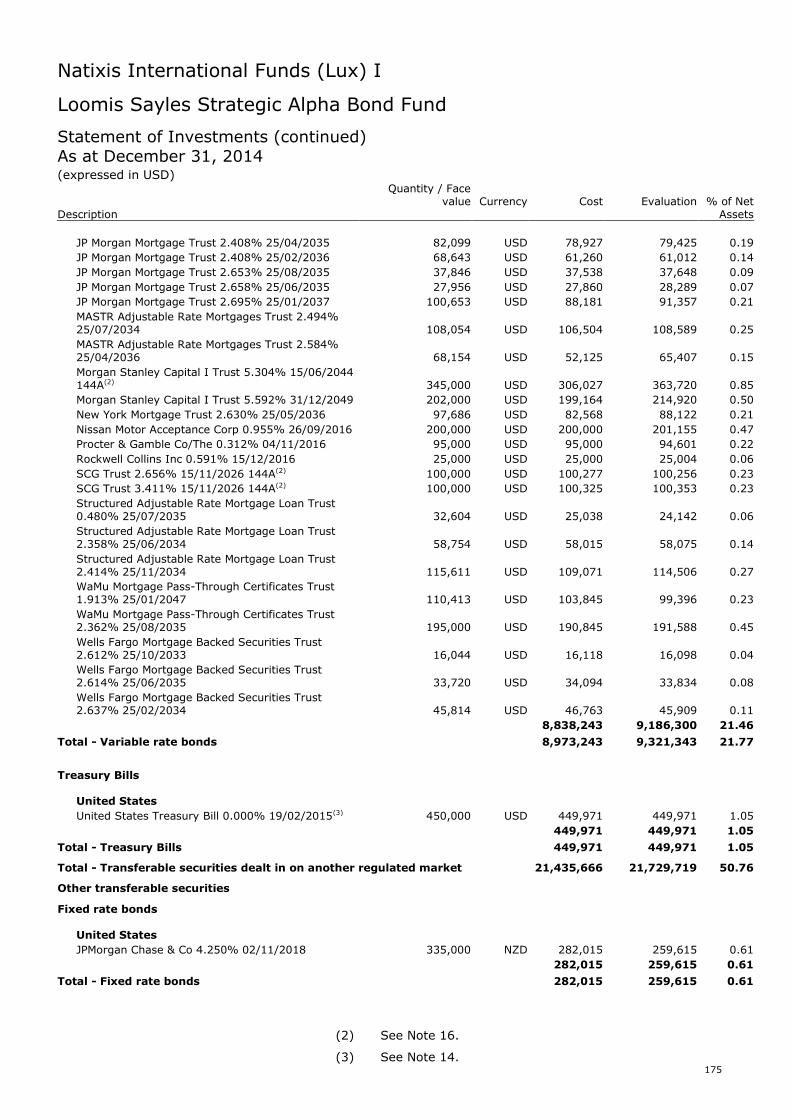
Natixis International Funds (Lux) I
175
Loomis Sayles Strategic Alpha Bond Fund
Statement of Investments (continued)As at December 31, 2014(expressed in USD)
Quantity / Facevalue Currency Cost Evaluation % of Net
Description Assets
JP Morgan Mortgage Trust 2.408% 25/04/2035 82,099 USD 78,927 79,425 0.19
JP Morgan Mortgage Trust 2.408% 25/02/2036 68,643 USD 61,260 61,012 0.14
JP Morgan Mortgage Trust 2.653% 25/08/2035 37,846 USD 37,538 37,648 0.09
JP Morgan Mortgage Trust 2.658% 25/06/2035 27,956 USD 27,860 28,289 0.07
JP Morgan Mortgage Trust 2.695% 25/01/2037 100,653 USD 88,181 91,357 0.21
MASTR Adjustable Rate Mortgages Trust 2.494%25/07/2034 108,054 USD 106,504 108,589 0.25
MASTR Adjustable Rate Mortgages Trust 2.584%25/04/2036 68,154 USD 52,125 65,407 0.15
Morgan Stanley Capital I Trust 5.304% 15/06/2044144A(2) 345,000 USD 306,027 363,720 0.85
Morgan Stanley Capital I Trust 5.592% 31/12/2049 202,000 USD 199,164 214,920 0.50
New York Mortgage Trust 2.630% 25/05/2036 97,686 USD 82,568 88,122 0.21
Nissan Motor Acceptance Corp 0.955% 26/09/2016 200,000 USD 200,000 201,155 0.47
Procter & Gamble Co/The 0.312% 04/11/2016 95,000 USD 95,000 94,601 0.22
Rockwell Collins Inc 0.591% 15/12/2016 25,000 USD 25,000 25,004 0.06
SCG Trust 2.656% 15/11/2026 144A(2) 100,000 USD 100,277 100,256 0.23
SCG Trust 3.411% 15/11/2026 144A(2) 100,000 USD 100,325 100,353 0.23
Structured Adjustable Rate Mortgage Loan Trust0.480% 25/07/2035 32,604 USD 25,038 24,142 0.06
Structured Adjustable Rate Mortgage Loan Trust2.358% 25/06/2034 58,754 USD 58,015 58,075 0.14
Structured Adjustable Rate Mortgage Loan Trust2.414% 25/11/2034 115,611 USD 109,071 114,506 0.27
WaMu Mortgage Pass-Through Certificates Trust1.913% 25/01/2047 110,413 USD 103,845 99,396 0.23
WaMu Mortgage Pass-Through Certificates Trust2.362% 25/08/2035 195,000 USD 190,845 191,588 0.45
Wells Fargo Mortgage Backed Securities Trust2.612% 25/10/2033 16,044 USD 16,118 16,098 0.04
Wells Fargo Mortgage Backed Securities Trust2.614% 25/06/2035 33,720 USD 34,094 33,834 0.08
Wells Fargo Mortgage Backed Securities Trust2.637% 25/02/2034 45,814 USD 46,763 45,909 0.11
8,838,243 9,186,300 21.46
Total - Variable rate bonds 8,973,243 9,321,343 21.77
Treasury Bills
United States
United States Treasury Bill 0.000% 19/02/2015(3) 450,000 USD 449,971 449,971 1.05
449,971 449,971 1.05
Total - Treasury Bills 449,971 449,971 1.05
Total - Transferable securities dealt in on another regulated market 21,435,666 21,729,719 50.76
Other transferable securities
Fixed rate bonds
United States
JPMorgan Chase & Co 4.250% 02/11/2018 335,000 NZD 282,015 259,615 0.61
282,015 259,615 0.61
Total - Fixed rate bonds 282,015 259,615 0.61
(2) See Note 16.
(3) See Note 14.
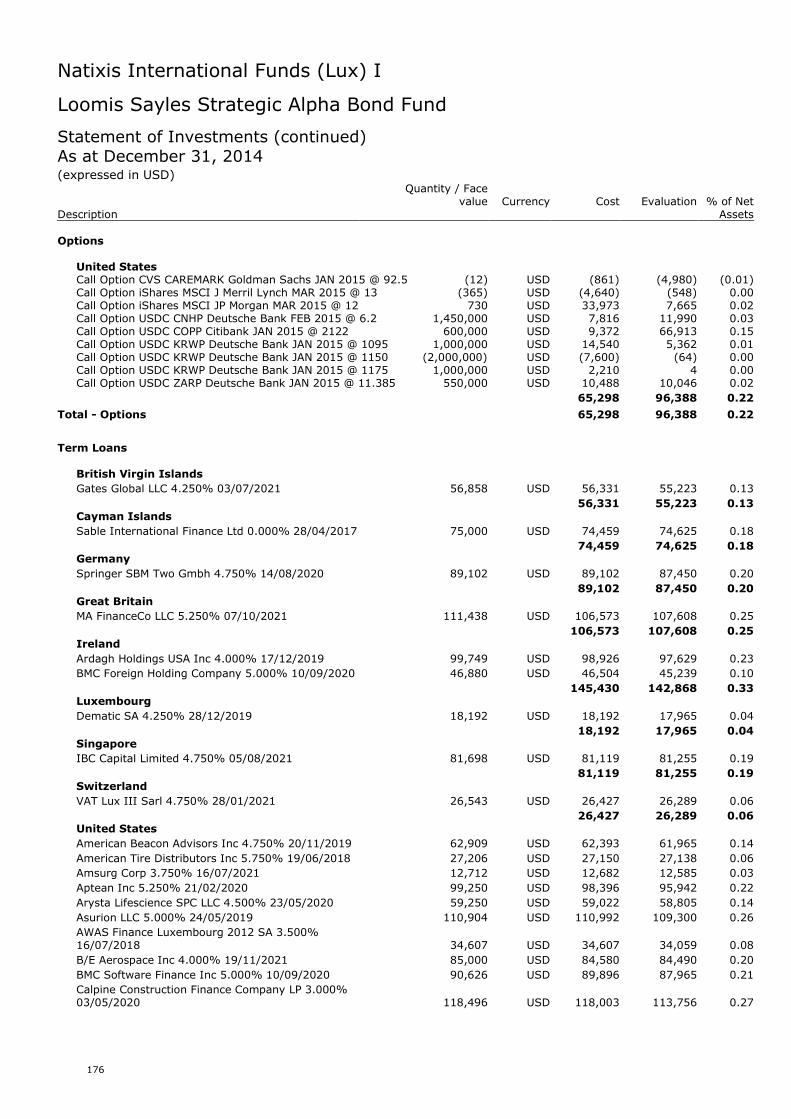
Natixis International Funds (Lux) I
176
Loomis Sayles Strategic Alpha Bond Fund
Statement of Investments (continued)As at December 31, 2014(expressed in USD)
Quantity / Facevalue Currency Cost Evaluation % of Net
Description Assets
Options
United StatesCall Option CVS CAREMARK Goldman Sachs JAN 2015 @ 92.5 (12) USD (861) (4,980) (0.01)Call Option iShares MSCI J Merril Lynch MAR 2015 @ 13 (365) USD (4,640) (548) 0.00Call Option iShares MSCI JP Morgan MAR 2015 @ 12 730 USD 33,973 7,665 0.02Call Option USDC CNHP Deutsche Bank FEB 2015 @ 6.2 1,450,000 USD 7,816 11,990 0.03Call Option USDC COPP Citibank JAN 2015 @ 2122 600,000 USD 9,372 66,913 0.15Call Option USDC KRWP Deutsche Bank JAN 2015 @ 1095 1,000,000 USD 14,540 5,362 0.01Call Option USDC KRWP Deutsche Bank JAN 2015 @ 1150 (2,000,000) USD (7,600) (64) 0.00Call Option USDC KRWP Deutsche Bank JAN 2015 @ 1175 1,000,000 USD 2,210 4 0.00Call Option USDC ZARP Deutsche Bank JAN 2015 @ 11.385 550,000 USD 10,488 10,046 0.02
65,298 96,388 0.22
Total - Options 65,298 96,388 0.22
Term Loans
British Virgin Islands
Gates Global LLC 4.250% 03/07/2021 56,858 USD 56,331 55,223 0.13
56,331 55,223 0.13Cayman Islands
Sable International Finance Ltd 0.000% 28/04/2017 75,000 USD 74,459 74,625 0.18
74,459 74,625 0.18Germany
Springer SBM Two Gmbh 4.750% 14/08/2020 89,102 USD 89,102 87,450 0.20
89,102 87,450 0.20Great Britain
MA FinanceCo LLC 5.250% 07/10/2021 111,438 USD 106,573 107,608 0.25
106,573 107,608 0.25Ireland
Ardagh Holdings USA Inc 4.000% 17/12/2019 99,749 USD 98,926 97,629 0.23
BMC Foreign Holding Company 5.000% 10/09/2020 46,880 USD 46,504 45,239 0.10
145,430 142,868 0.33Luxembourg
Dematic SA 4.250% 28/12/2019 18,192 USD 18,192 17,965 0.04
18,192 17,965 0.04Singapore
IBC Capital Limited 4.750% 05/08/2021 81,698 USD 81,119 81,255 0.19
81,119 81,255 0.19Switzerland
VAT Lux III Sarl 4.750% 28/01/2021 26,543 USD 26,427 26,289 0.06
26,427 26,289 0.06United States
American Beacon Advisors Inc 4.750% 20/11/2019 62,909 USD 62,393 61,965 0.14
American Tire Distributors Inc 5.750% 19/06/2018 27,206 USD 27,150 27,138 0.06
Amsurg Corp 3.750% 16/07/2021 12,712 USD 12,682 12,585 0.03
Aptean Inc 5.250% 21/02/2020 99,250 USD 98,396 95,942 0.22
Arysta Lifescience SPC LLC 4.500% 23/05/2020 59,250 USD 59,022 58,805 0.14
Asurion LLC 5.000% 24/05/2019 110,904 USD 110,992 109,300 0.26
AWAS Finance Luxembourg 2012 SA 3.500%16/07/2018 34,607 USD 34,607 34,059 0.08
B/E Aerospace Inc 4.000% 19/11/2021 85,000 USD 84,580 84,490 0.20
BMC Software Finance Inc 5.000% 10/09/2020 90,626 USD 89,896 87,965 0.21
Calpine Construction Finance Company LP 3.000%03/05/2020 118,496 USD 118,003 113,756 0.27
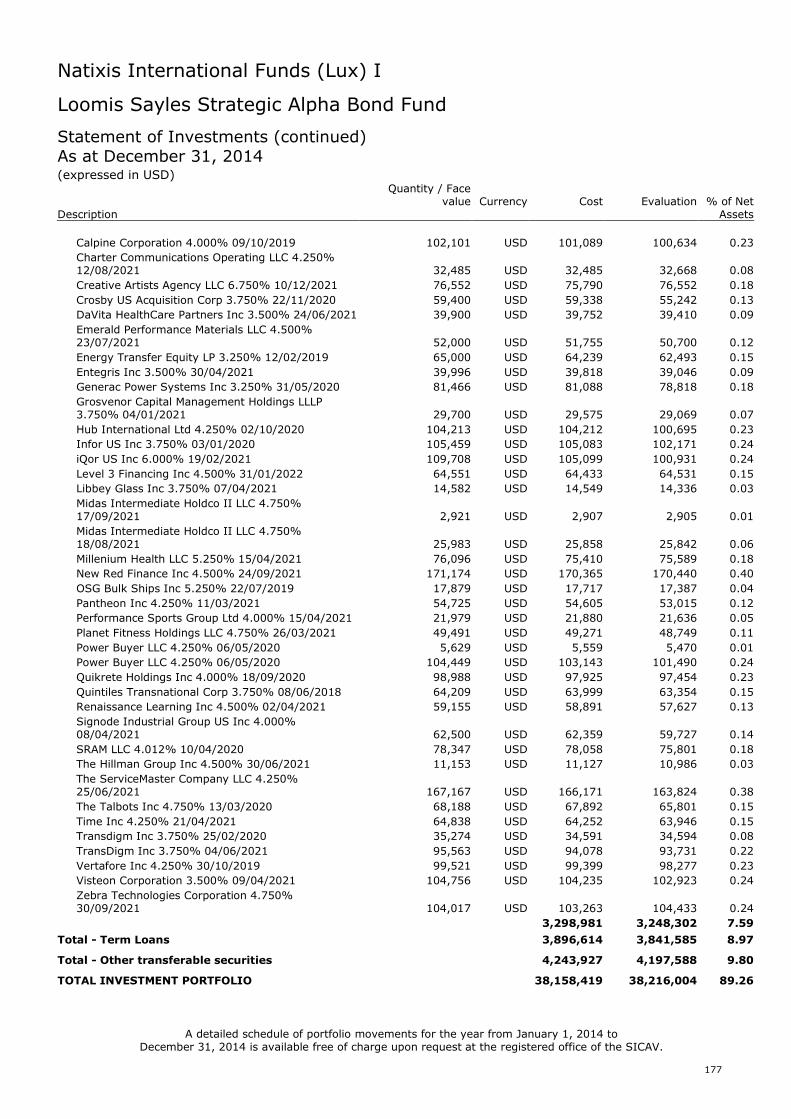
Natixis International Funds (Lux) I
177
Loomis Sayles Strategic Alpha Bond Fund
Statement of Investments (continued)As at December 31, 2014(expressed in USD)
Quantity / Facevalue Currency Cost Evaluation % of Net
Description Assets
Calpine Corporation 4.000% 09/10/2019 102,101 USD 101,089 100,634 0.23
Charter Communications Operating LLC 4.250%12/08/2021 32,485 USD 32,485 32,668 0.08
Creative Artists Agency LLC 6.750% 10/12/2021 76,552 USD 75,790 76,552 0.18
Crosby US Acquisition Corp 3.750% 22/11/2020 59,400 USD 59,338 55,242 0.13
DaVita HealthCare Partners Inc 3.500% 24/06/2021 39,900 USD 39,752 39,410 0.09
Emerald Performance Materials LLC 4.500%23/07/2021 52,000 USD 51,755 50,700 0.12
Energy Transfer Equity LP 3.250% 12/02/2019 65,000 USD 64,239 62,493 0.15
Entegris Inc 3.500% 30/04/2021 39,996 USD 39,818 39,046 0.09
Generac Power Systems Inc 3.250% 31/05/2020 81,466 USD 81,088 78,818 0.18
Grosvenor Capital Management Holdings LLLP3.750% 04/01/2021 29,700 USD 29,575 29,069 0.07
Hub International Ltd 4.250% 02/10/2020 104,213 USD 104,212 100,695 0.23
Infor US Inc 3.750% 03/01/2020 105,459 USD 105,083 102,171 0.24
iQor US Inc 6.000% 19/02/2021 109,708 USD 105,099 100,931 0.24
Level 3 Financing Inc 4.500% 31/01/2022 64,551 USD 64,433 64,531 0.15
Libbey Glass Inc 3.750% 07/04/2021 14,582 USD 14,549 14,336 0.03
Midas Intermediate Holdco II LLC 4.750%17/09/2021 2,921 USD 2,907 2,905 0.01
Midas Intermediate Holdco II LLC 4.750%18/08/2021 25,983 USD 25,858 25,842 0.06
Millenium Health LLC 5.250% 15/04/2021 76,096 USD 75,410 75,589 0.18
New Red Finance Inc 4.500% 24/09/2021 171,174 USD 170,365 170,440 0.40
OSG Bulk Ships Inc 5.250% 22/07/2019 17,879 USD 17,717 17,387 0.04
Pantheon Inc 4.250% 11/03/2021 54,725 USD 54,605 53,015 0.12
Performance Sports Group Ltd 4.000% 15/04/2021 21,979 USD 21,880 21,636 0.05
Planet Fitness Holdings LLC 4.750% 26/03/2021 49,491 USD 49,271 48,749 0.11
Power Buyer LLC 4.250% 06/05/2020 5,629 USD 5,559 5,470 0.01
Power Buyer LLC 4.250% 06/05/2020 104,449 USD 103,143 101,490 0.24
Quikrete Holdings Inc 4.000% 18/09/2020 98,988 USD 97,925 97,454 0.23
Quintiles Transnational Corp 3.750% 08/06/2018 64,209 USD 63,999 63,354 0.15
Renaissance Learning Inc 4.500% 02/04/2021 59,155 USD 58,891 57,627 0.13
Signode Industrial Group US Inc 4.000%08/04/2021 62,500 USD 62,359 59,727 0.14
SRAM LLC 4.012% 10/04/2020 78,347 USD 78,058 75,801 0.18
The Hillman Group Inc 4.500% 30/06/2021 11,153 USD 11,127 10,986 0.03
The ServiceMaster Company LLC 4.250%25/06/2021 167,167 USD 166,171 163,824 0.38
The Talbots Inc 4.750% 13/03/2020 68,188 USD 67,892 65,801 0.15
Time Inc 4.250% 21/04/2021 64,838 USD 64,252 63,946 0.15
Transdigm Inc 3.750% 25/02/2020 35,274 USD 34,591 34,594 0.08
TransDigm Inc 3.750% 04/06/2021 95,563 USD 94,078 93,731 0.22
Vertafore Inc 4.250% 30/10/2019 99,521 USD 99,399 98,277 0.23
Visteon Corporation 3.500% 09/04/2021 104,756 USD 104,235 102,923 0.24
Zebra Technologies Corporation 4.750%30/09/2021 104,017 USD 103,263 104,433 0.24
3,298,981 3,248,302 7.59
Total - Term Loans 3,896,614 3,841,585 8.97
Total - Other transferable securities 4,243,927 4,197,588 9.80
TOTAL INVESTMENT PORTFOLIO 38,158,419 38,216,004 89.26
A detailed schedule of portfolio movements for the year from January 1, 2014 toDecember 31, 2014 is available free of charge upon request at the registered office of the SICAV.
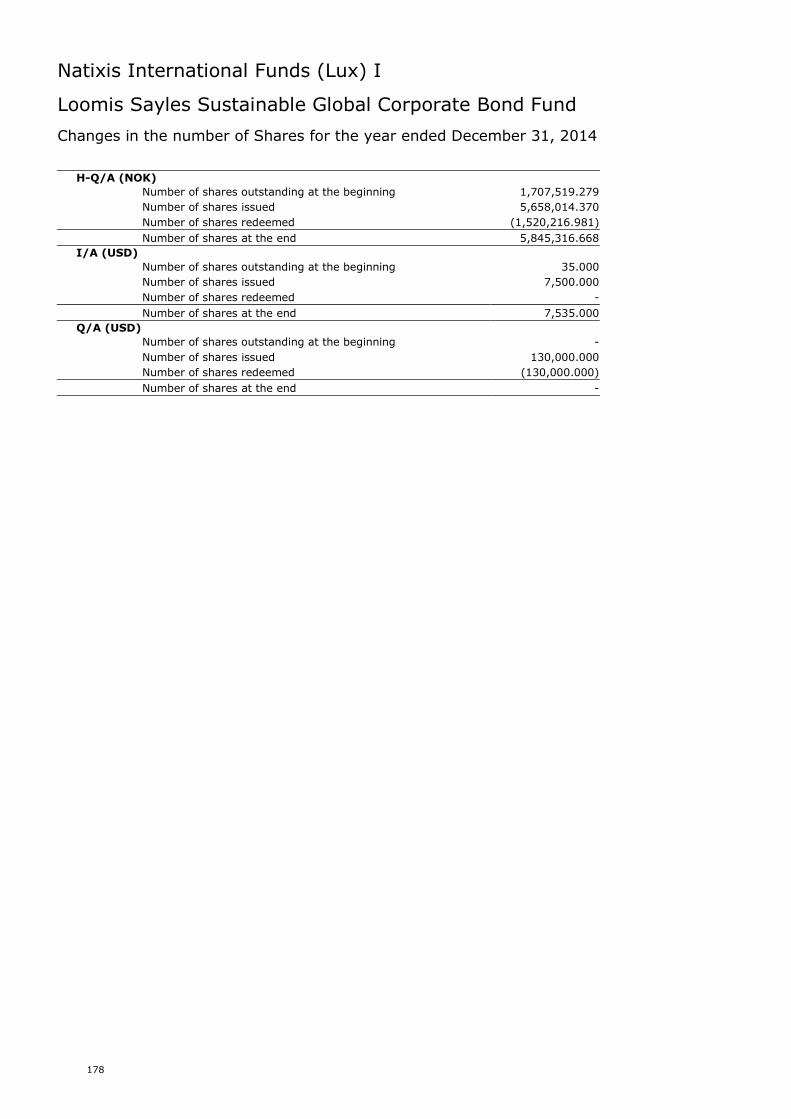
Natixis International Funds (Lux) I
178
Loomis Sayles Sustainable Global Corporate Bond Fund
Changes in the number of Shares for the year ended December 31, 2014
H-Q/A (NOK)
Number of shares outstanding at the beginning 1,707,519.279
Number of shares issued 5,658,014.370
Number of shares redeemed (1,520,216.981)
Number of shares at the end 5,845,316.668
I/A (USD)
Number of shares outstanding at the beginning 35.000
Number of shares issued 7,500.000
Number of shares redeemed -
Number of shares at the end 7,535.000
Q/A (USD)
Number of shares outstanding at the beginning -
Number of shares issued 130,000.000
Number of shares redeemed (130,000.000)
Number of shares at the end -
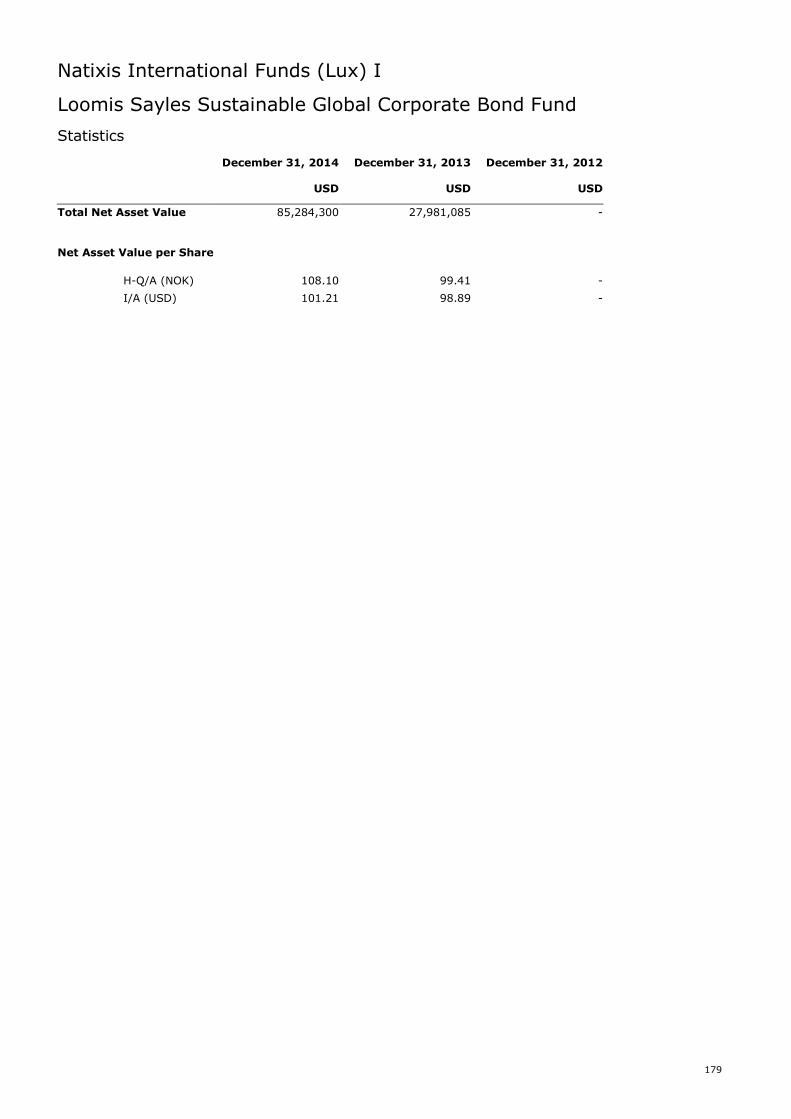
Natixis International Funds (Lux) I
179
Loomis Sayles Sustainable Global Corporate Bond Fund
Statistics
December 31, 2014 December 31, 2013 December 31, 2012
USD USD USD
Total Net Asset Value 85,284,300 27,981,085 -
Net Asset Value per Share
H-Q/A (NOK) 108.10 99.41 -
I/A (USD) 101.21 98.89 -
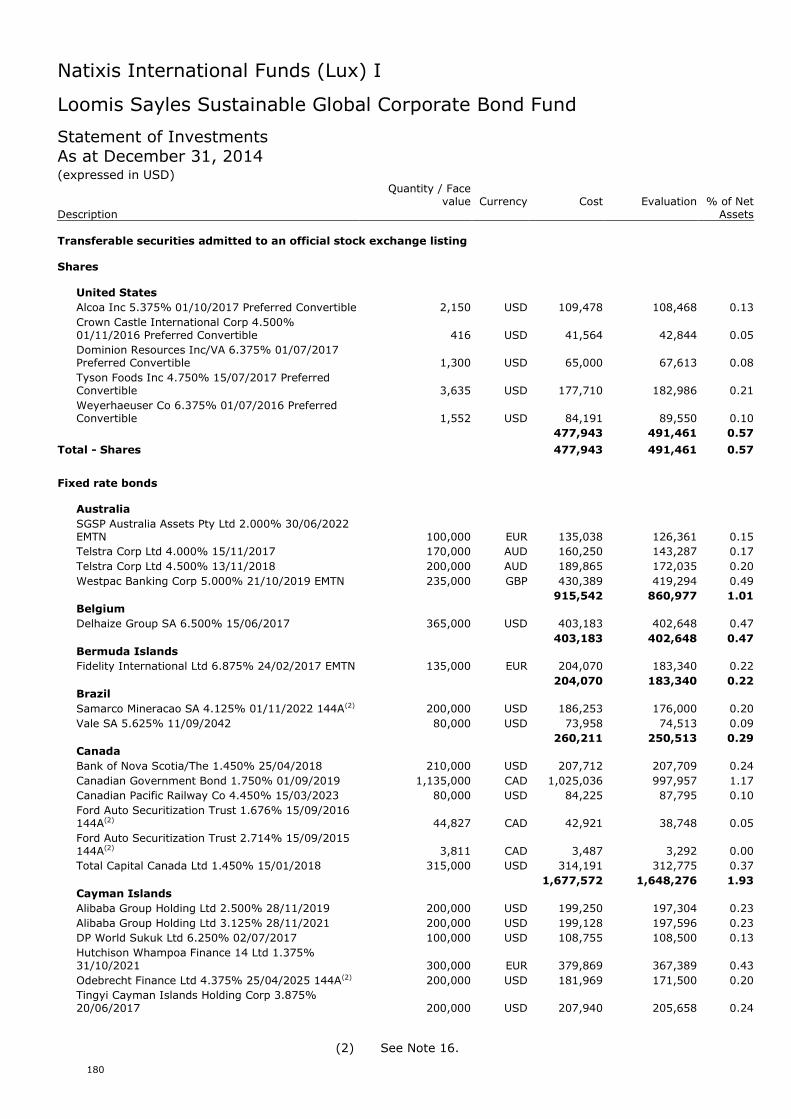
Natixis International Funds (Lux) I
180
Loomis Sayles Sustainable Global Corporate Bond Fund
Statement of InvestmentsAs at December 31, 2014(expressed in USD)
Quantity / Facevalue Currency Cost Evaluation % of Net
Description Assets
Transferable securities admitted to an official stock exchange listing
Shares
United States
Alcoa Inc 5.375% 01/10/2017 Preferred Convertible 2,150 USD 109,478 108,468 0.13
Crown Castle International Corp 4.500%01/11/2016 Preferred Convertible 416 USD 41,564 42,844 0.05
Dominion Resources Inc/VA 6.375% 01/07/2017Preferred Convertible 1,300 USD 65,000 67,613 0.08
Tyson Foods Inc 4.750% 15/07/2017 PreferredConvertible 3,635 USD 177,710 182,986 0.21
Weyerhaeuser Co 6.375% 01/07/2016 PreferredConvertible 1,552 USD 84,191 89,550 0.10
477,943 491,461 0.57
Total - Shares 477,943 491,461 0.57
Fixed rate bonds
Australia
SGSP Australia Assets Pty Ltd 2.000% 30/06/2022EMTN 100,000 EUR 135,038 126,361 0.15
Telstra Corp Ltd 4.000% 15/11/2017 170,000 AUD 160,250 143,287 0.17
Telstra Corp Ltd 4.500% 13/11/2018 200,000 AUD 189,865 172,035 0.20
Westpac Banking Corp 5.000% 21/10/2019 EMTN 235,000 GBP 430,389 419,294 0.49
915,542 860,977 1.01Belgium
Delhaize Group SA 6.500% 15/06/2017 365,000 USD 403,183 402,648 0.47
403,183 402,648 0.47Bermuda Islands
Fidelity International Ltd 6.875% 24/02/2017 EMTN 135,000 EUR 204,070 183,340 0.22
204,070 183,340 0.22Brazil
Samarco Mineracao SA 4.125% 01/11/2022 144A(2) 200,000 USD 186,253 176,000 0.20
Vale SA 5.625% 11/09/2042 80,000 USD 73,958 74,513 0.09
260,211 250,513 0.29Canada
Bank of Nova Scotia/The 1.450% 25/04/2018 210,000 USD 207,712 207,709 0.24
Canadian Government Bond 1.750% 01/09/2019 1,135,000 CAD 1,025,036 997,957 1.17
Canadian Pacific Railway Co 4.450% 15/03/2023 80,000 USD 84,225 87,795 0.10
Ford Auto Securitization Trust 1.676% 15/09/2016144A(2) 44,827 CAD 42,921 38,748 0.05
Ford Auto Securitization Trust 2.714% 15/09/2015144A(2) 3,811 CAD 3,487 3,292 0.00
Total Capital Canada Ltd 1.450% 15/01/2018 315,000 USD 314,191 312,775 0.37
1,677,572 1,648,276 1.93Cayman Islands
Alibaba Group Holding Ltd 2.500% 28/11/2019 200,000 USD 199,250 197,304 0.23
Alibaba Group Holding Ltd 3.125% 28/11/2021 200,000 USD 199,128 197,596 0.23
DP World Sukuk Ltd 6.250% 02/07/2017 100,000 USD 108,755 108,500 0.13
Hutchison Whampoa Finance 14 Ltd 1.375%31/10/2021 300,000 EUR 379,869 367,389 0.43
Odebrecht Finance Ltd 4.375% 25/04/2025 144A(2) 200,000 USD 181,969 171,500 0.20
Tingyi Cayman Islands Holding Corp 3.875%20/06/2017 200,000 USD 207,940 205,658 0.24
(2) See Note 16.
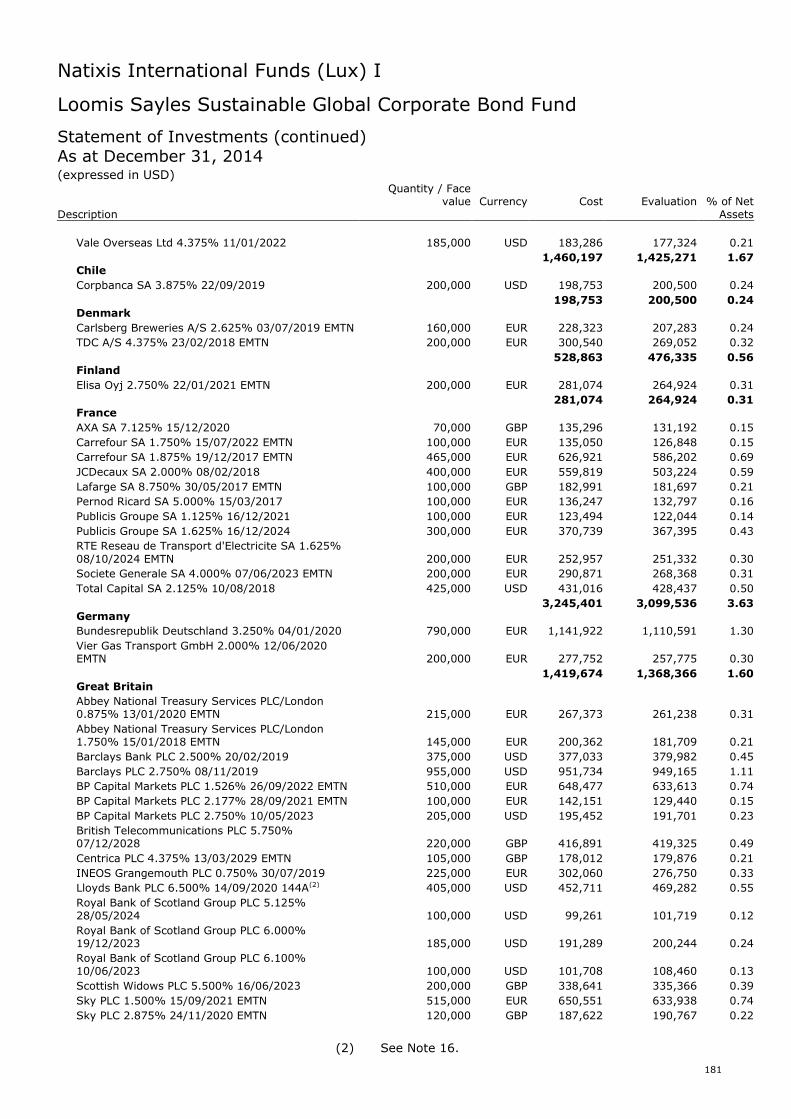
Natixis International Funds (Lux) I
181
Loomis Sayles Sustainable Global Corporate Bond Fund
Statement of Investments (continued)As at December 31, 2014(expressed in USD)
Quantity / Facevalue Currency Cost Evaluation % of Net
Description Assets
Vale Overseas Ltd 4.375% 11/01/2022 185,000 USD 183,286 177,324 0.21
1,460,197 1,425,271 1.67Chile
Corpbanca SA 3.875% 22/09/2019 200,000 USD 198,753 200,500 0.24
198,753 200,500 0.24Denmark
Carlsberg Breweries A/S 2.625% 03/07/2019 EMTN 160,000 EUR 228,323 207,283 0.24
TDC A/S 4.375% 23/02/2018 EMTN 200,000 EUR 300,540 269,052 0.32
528,863 476,335 0.56Finland
Elisa Oyj 2.750% 22/01/2021 EMTN 200,000 EUR 281,074 264,924 0.31
281,074 264,924 0.31France
AXA SA 7.125% 15/12/2020 70,000 GBP 135,296 131,192 0.15
Carrefour SA 1.750% 15/07/2022 EMTN 100,000 EUR 135,050 126,848 0.15
Carrefour SA 1.875% 19/12/2017 EMTN 465,000 EUR 626,921 586,202 0.69
JCDecaux SA 2.000% 08/02/2018 400,000 EUR 559,819 503,224 0.59
Lafarge SA 8.750% 30/05/2017 EMTN 100,000 GBP 182,991 181,697 0.21
Pernod Ricard SA 5.000% 15/03/2017 100,000 EUR 136,247 132,797 0.16
Publicis Groupe SA 1.125% 16/12/2021 100,000 EUR 123,494 122,044 0.14
Publicis Groupe SA 1.625% 16/12/2024 300,000 EUR 370,739 367,395 0.43
RTE Reseau de Transport d'Electricite SA 1.625%08/10/2024 EMTN 200,000 EUR 252,957 251,332 0.30
Societe Generale SA 4.000% 07/06/2023 EMTN 200,000 EUR 290,871 268,368 0.31
Total Capital SA 2.125% 10/08/2018 425,000 USD 431,016 428,437 0.50
3,245,401 3,099,536 3.63Germany
Bundesrepublik Deutschland 3.250% 04/01/2020 790,000 EUR 1,141,922 1,110,591 1.30
Vier Gas Transport GmbH 2.000% 12/06/2020EMTN 200,000 EUR 277,752 257,775 0.30
1,419,674 1,368,366 1.60Great Britain
Abbey National Treasury Services PLC/London0.875% 13/01/2020 EMTN 215,000 EUR 267,373 261,238 0.31
Abbey National Treasury Services PLC/London1.750% 15/01/2018 EMTN 145,000 EUR 200,362 181,709 0.21
Barclays Bank PLC 2.500% 20/02/2019 375,000 USD 377,033 379,982 0.45
Barclays PLC 2.750% 08/11/2019 955,000 USD 951,734 949,165 1.11
BP Capital Markets PLC 1.526% 26/09/2022 EMTN 510,000 EUR 648,477 633,613 0.74
BP Capital Markets PLC 2.177% 28/09/2021 EMTN 100,000 EUR 142,151 129,440 0.15
BP Capital Markets PLC 2.750% 10/05/2023 205,000 USD 195,452 191,701 0.23
British Telecommunications PLC 5.750%07/12/2028 220,000 GBP 416,891 419,325 0.49
Centrica PLC 4.375% 13/03/2029 EMTN 105,000 GBP 178,012 179,876 0.21
INEOS Grangemouth PLC 0.750% 30/07/2019 225,000 EUR 302,060 276,750 0.33
Lloyds Bank PLC 6.500% 14/09/2020 144A(2) 405,000 USD 452,711 469,282 0.55
Royal Bank of Scotland Group PLC 5.125%28/05/2024 100,000 USD 99,261 101,719 0.12
Royal Bank of Scotland Group PLC 6.000%19/12/2023 185,000 USD 191,289 200,244 0.24
Royal Bank of Scotland Group PLC 6.100%10/06/2023 100,000 USD 101,708 108,460 0.13
Scottish Widows PLC 5.500% 16/06/2023 200,000 GBP 338,641 335,366 0.39
Sky PLC 1.500% 15/09/2021 EMTN 515,000 EUR 650,551 633,938 0.74
Sky PLC 2.875% 24/11/2020 EMTN 120,000 GBP 187,622 190,767 0.22
(2) See Note 16.
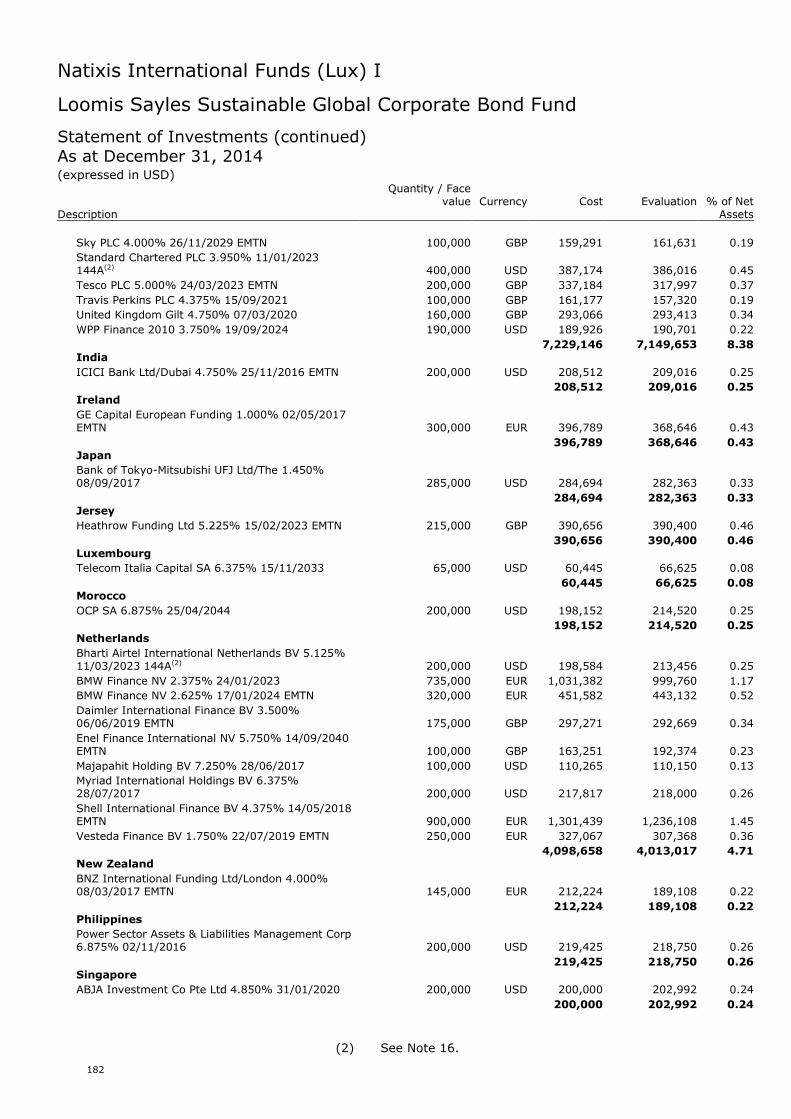
Natixis International Funds (Lux) I
182
Loomis Sayles Sustainable Global Corporate Bond Fund
Statement of Investments (continued)As at December 31, 2014(expressed in USD)
Quantity / Facevalue Currency Cost Evaluation % of Net
Description Assets
Sky PLC 4.000% 26/11/2029 EMTN 100,000 GBP 159,291 161,631 0.19
Standard Chartered PLC 3.950% 11/01/2023144A(2) 400,000 USD 387,174 386,016 0.45
Tesco PLC 5.000% 24/03/2023 EMTN 200,000 GBP 337,184 317,997 0.37
Travis Perkins PLC 4.375% 15/09/2021 100,000 GBP 161,177 157,320 0.19
United Kingdom Gilt 4.750% 07/03/2020 160,000 GBP 293,066 293,413 0.34
WPP Finance 2010 3.750% 19/09/2024 190,000 USD 189,926 190,701 0.22
7,229,146 7,149,653 8.38India
ICICI Bank Ltd/Dubai 4.750% 25/11/2016 EMTN 200,000 USD 208,512 209,016 0.25
208,512 209,016 0.25Ireland
GE Capital European Funding 1.000% 02/05/2017EMTN 300,000 EUR 396,789 368,646 0.43
396,789 368,646 0.43Japan
Bank of Tokyo-Mitsubishi UFJ Ltd/The 1.450%08/09/2017 285,000 USD 284,694 282,363 0.33
284,694 282,363 0.33Jersey
Heathrow Funding Ltd 5.225% 15/02/2023 EMTN 215,000 GBP 390,656 390,400 0.46
390,656 390,400 0.46Luxembourg
Telecom Italia Capital SA 6.375% 15/11/2033 65,000 USD 60,445 66,625 0.08
60,445 66,625 0.08Morocco
OCP SA 6.875% 25/04/2044 200,000 USD 198,152 214,520 0.25
198,152 214,520 0.25Netherlands
Bharti Airtel International Netherlands BV 5.125%11/03/2023 144A(2) 200,000 USD 198,584 213,456 0.25
BMW Finance NV 2.375% 24/01/2023 735,000 EUR 1,031,382 999,760 1.17
BMW Finance NV 2.625% 17/01/2024 EMTN 320,000 EUR 451,582 443,132 0.52
Daimler International Finance BV 3.500%06/06/2019 EMTN 175,000 GBP 297,271 292,669 0.34
Enel Finance International NV 5.750% 14/09/2040EMTN 100,000 GBP 163,251 192,374 0.23
Majapahit Holding BV 7.250% 28/06/2017 100,000 USD 110,265 110,150 0.13
Myriad International Holdings BV 6.375%28/07/2017 200,000 USD 217,817 218,000 0.26
Shell International Finance BV 4.375% 14/05/2018EMTN 900,000 EUR 1,301,439 1,236,108 1.45
Vesteda Finance BV 1.750% 22/07/2019 EMTN 250,000 EUR 327,067 307,368 0.36
4,098,658 4,013,017 4.71New Zealand
BNZ International Funding Ltd/London 4.000%08/03/2017 EMTN 145,000 EUR 212,224 189,108 0.22
212,224 189,108 0.22Philippines
Power Sector Assets & Liabilities Management Corp6.875% 02/11/2016 200,000 USD 219,425 218,750 0.26
219,425 218,750 0.26Singapore
ABJA Investment Co Pte Ltd 4.850% 31/01/2020 200,000 USD 200,000 202,992 0.24
200,000 202,992 0.24
(2) See Note 16.
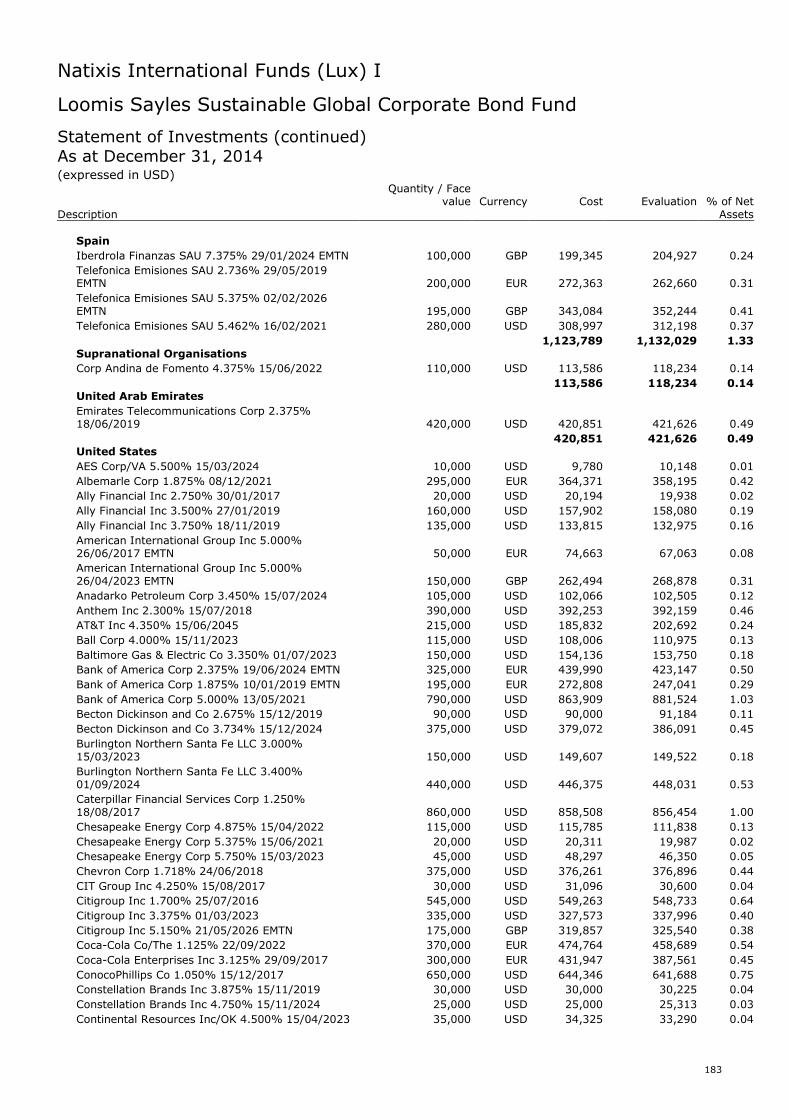
Natixis International Funds (Lux) I
183
Loomis Sayles Sustainable Global Corporate Bond Fund
Statement of Investments (continued)As at December 31, 2014(expressed in USD)
Quantity / Facevalue Currency Cost Evaluation % of Net
Description Assets
Spain
Iberdrola Finanzas SAU 7.375% 29/01/2024 EMTN 100,000 GBP 199,345 204,927 0.24
Telefonica Emisiones SAU 2.736% 29/05/2019EMTN 200,000 EUR 272,363 262,660 0.31
Telefonica Emisiones SAU 5.375% 02/02/2026EMTN 195,000 GBP 343,084 352,244 0.41
Telefonica Emisiones SAU 5.462% 16/02/2021 280,000 USD 308,997 312,198 0.37
1,123,789 1,132,029 1.33Supranational Organisations
Corp Andina de Fomento 4.375% 15/06/2022 110,000 USD 113,586 118,234 0.14
113,586 118,234 0.14United Arab Emirates
Emirates Telecommunications Corp 2.375%18/06/2019 420,000 USD 420,851 421,626 0.49
420,851 421,626 0.49United States
AES Corp/VA 5.500% 15/03/2024 10,000 USD 9,780 10,148 0.01
Albemarle Corp 1.875% 08/12/2021 295,000 EUR 364,371 358,195 0.42
Ally Financial Inc 2.750% 30/01/2017 20,000 USD 20,194 19,938 0.02
Ally Financial Inc 3.500% 27/01/2019 160,000 USD 157,902 158,080 0.19
Ally Financial Inc 3.750% 18/11/2019 135,000 USD 133,815 132,975 0.16
American International Group Inc 5.000%26/06/2017 EMTN 50,000 EUR 74,663 67,063 0.08
American International Group Inc 5.000%26/04/2023 EMTN 150,000 GBP 262,494 268,878 0.31
Anadarko Petroleum Corp 3.450% 15/07/2024 105,000 USD 102,066 102,505 0.12
Anthem Inc 2.300% 15/07/2018 390,000 USD 392,253 392,159 0.46
AT&T Inc 4.350% 15/06/2045 215,000 USD 185,832 202,692 0.24
Ball Corp 4.000% 15/11/2023 115,000 USD 108,006 110,975 0.13
Baltimore Gas & Electric Co 3.350% 01/07/2023 150,000 USD 154,136 153,750 0.18
Bank of America Corp 2.375% 19/06/2024 EMTN 325,000 EUR 439,990 423,147 0.50
Bank of America Corp 1.875% 10/01/2019 EMTN 195,000 EUR 272,808 247,041 0.29
Bank of America Corp 5.000% 13/05/2021 790,000 USD 863,909 881,524 1.03
Becton Dickinson and Co 2.675% 15/12/2019 90,000 USD 90,000 91,184 0.11
Becton Dickinson and Co 3.734% 15/12/2024 375,000 USD 379,072 386,091 0.45
Burlington Northern Santa Fe LLC 3.000%15/03/2023 150,000 USD 149,607 149,522 0.18
Burlington Northern Santa Fe LLC 3.400%01/09/2024 440,000 USD 446,375 448,031 0.53
Caterpillar Financial Services Corp 1.250%18/08/2017 860,000 USD 858,508 856,454 1.00
Chesapeake Energy Corp 4.875% 15/04/2022 115,000 USD 115,785 111,838 0.13
Chesapeake Energy Corp 5.375% 15/06/2021 20,000 USD 20,311 19,987 0.02
Chesapeake Energy Corp 5.750% 15/03/2023 45,000 USD 48,297 46,350 0.05
Chevron Corp 1.718% 24/06/2018 375,000 USD 376,261 376,896 0.44
CIT Group Inc 4.250% 15/08/2017 30,000 USD 31,096 30,600 0.04
Citigroup Inc 1.700% 25/07/2016 545,000 USD 549,263 548,733 0.64
Citigroup Inc 3.375% 01/03/2023 335,000 USD 327,573 337,996 0.40
Citigroup Inc 5.150% 21/05/2026 EMTN 175,000 GBP 319,857 325,540 0.38
Coca-Cola Co/The 1.125% 22/09/2022 370,000 EUR 474,764 458,689 0.54
Coca-Cola Enterprises Inc 3.125% 29/09/2017 300,000 EUR 431,947 387,561 0.45
ConocoPhillips Co 1.050% 15/12/2017 650,000 USD 644,346 641,688 0.75
Constellation Brands Inc 3.875% 15/11/2019 30,000 USD 30,000 30,225 0.04
Constellation Brands Inc 4.750% 15/11/2024 25,000 USD 25,000 25,313 0.03
Continental Resources Inc/OK 4.500% 15/04/2023 35,000 USD 34,325 33,290 0.04
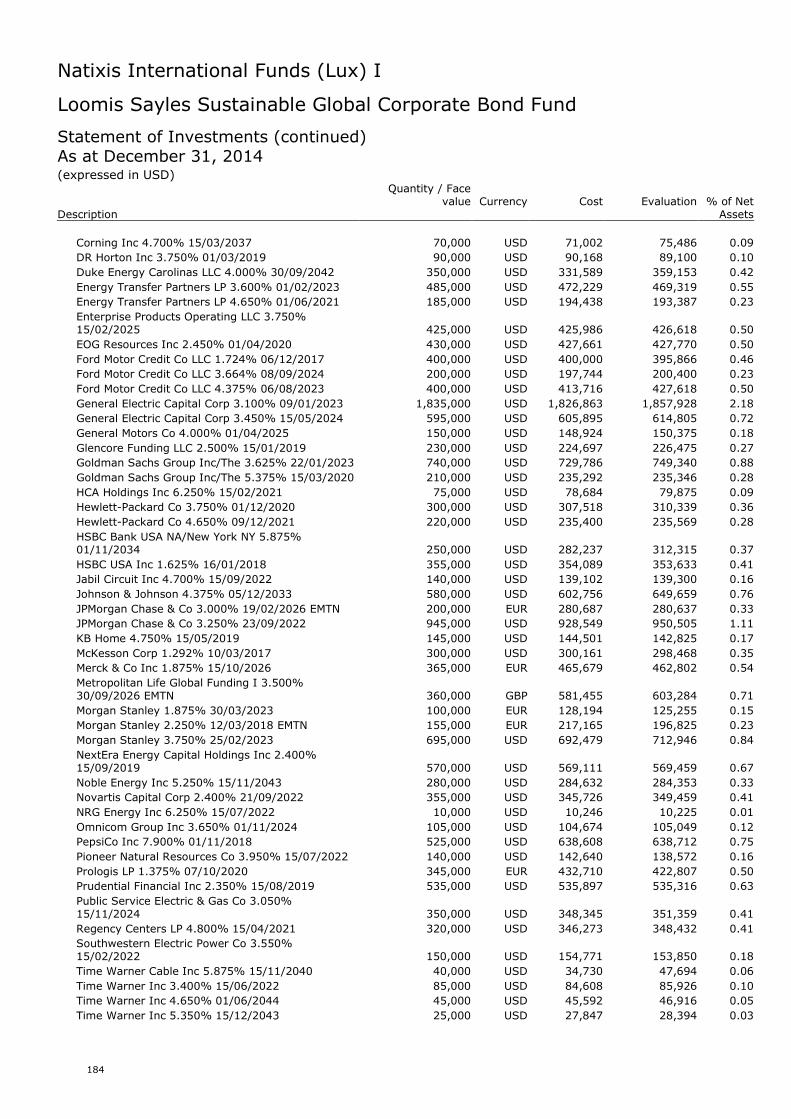
Natixis International Funds (Lux) I
184
Loomis Sayles Sustainable Global Corporate Bond Fund
Statement of Investments (continued)As at December 31, 2014(expressed in USD)
Quantity / Facevalue Currency Cost Evaluation % of Net
Description Assets
Corning Inc 4.700% 15/03/2037 70,000 USD 71,002 75,486 0.09
DR Horton Inc 3.750% 01/03/2019 90,000 USD 90,168 89,100 0.10
Duke Energy Carolinas LLC 4.000% 30/09/2042 350,000 USD 331,589 359,153 0.42
Energy Transfer Partners LP 3.600% 01/02/2023 485,000 USD 472,229 469,319 0.55
Energy Transfer Partners LP 4.650% 01/06/2021 185,000 USD 194,438 193,387 0.23
Enterprise Products Operating LLC 3.750%15/02/2025 425,000 USD 425,986 426,618 0.50
EOG Resources Inc 2.450% 01/04/2020 430,000 USD 427,661 427,770 0.50
Ford Motor Credit Co LLC 1.724% 06/12/2017 400,000 USD 400,000 395,866 0.46
Ford Motor Credit Co LLC 3.664% 08/09/2024 200,000 USD 197,744 200,400 0.23
Ford Motor Credit Co LLC 4.375% 06/08/2023 400,000 USD 413,716 427,618 0.50
General Electric Capital Corp 3.100% 09/01/2023 1,835,000 USD 1,826,863 1,857,928 2.18
General Electric Capital Corp 3.450% 15/05/2024 595,000 USD 605,895 614,805 0.72
General Motors Co 4.000% 01/04/2025 150,000 USD 148,924 150,375 0.18
Glencore Funding LLC 2.500% 15/01/2019 230,000 USD 224,697 226,475 0.27
Goldman Sachs Group Inc/The 3.625% 22/01/2023 740,000 USD 729,786 749,340 0.88
Goldman Sachs Group Inc/The 5.375% 15/03/2020 210,000 USD 235,292 235,346 0.28
HCA Holdings Inc 6.250% 15/02/2021 75,000 USD 78,684 79,875 0.09
Hewlett-Packard Co 3.750% 01/12/2020 300,000 USD 307,518 310,339 0.36
Hewlett-Packard Co 4.650% 09/12/2021 220,000 USD 235,400 235,569 0.28
HSBC Bank USA NA/New York NY 5.875%01/11/2034 250,000 USD 282,237 312,315 0.37
HSBC USA Inc 1.625% 16/01/2018 355,000 USD 354,089 353,633 0.41
Jabil Circuit Inc 4.700% 15/09/2022 140,000 USD 139,102 139,300 0.16
Johnson & Johnson 4.375% 05/12/2033 580,000 USD 602,756 649,659 0.76
JPMorgan Chase & Co 3.000% 19/02/2026 EMTN 200,000 EUR 280,687 280,637 0.33
JPMorgan Chase & Co 3.250% 23/09/2022 945,000 USD 928,549 950,505 1.11
KB Home 4.750% 15/05/2019 145,000 USD 144,501 142,825 0.17
McKesson Corp 1.292% 10/03/2017 300,000 USD 300,161 298,468 0.35
Merck & Co Inc 1.875% 15/10/2026 365,000 EUR 465,679 462,802 0.54
Metropolitan Life Global Funding I 3.500%30/09/2026 EMTN 360,000 GBP 581,455 603,284 0.71
Morgan Stanley 1.875% 30/03/2023 100,000 EUR 128,194 125,255 0.15
Morgan Stanley 2.250% 12/03/2018 EMTN 155,000 EUR 217,165 196,825 0.23
Morgan Stanley 3.750% 25/02/2023 695,000 USD 692,479 712,946 0.84
NextEra Energy Capital Holdings Inc 2.400%15/09/2019 570,000 USD 569,111 569,459 0.67
Noble Energy Inc 5.250% 15/11/2043 280,000 USD 284,632 284,353 0.33
Novartis Capital Corp 2.400% 21/09/2022 355,000 USD 345,726 349,459 0.41
NRG Energy Inc 6.250% 15/07/2022 10,000 USD 10,246 10,225 0.01
Omnicom Group Inc 3.650% 01/11/2024 105,000 USD 104,674 105,049 0.12
PepsiCo Inc 7.900% 01/11/2018 525,000 USD 638,608 638,712 0.75
Pioneer Natural Resources Co 3.950% 15/07/2022 140,000 USD 142,640 138,572 0.16
Prologis LP 1.375% 07/10/2020 345,000 EUR 432,710 422,807 0.50
Prudential Financial Inc 2.350% 15/08/2019 535,000 USD 535,897 535,316 0.63
Public Service Electric & Gas Co 3.050%15/11/2024 350,000 USD 348,345 351,359 0.41
Regency Centers LP 4.800% 15/04/2021 320,000 USD 346,273 348,432 0.41
Southwestern Electric Power Co 3.550%15/02/2022 150,000 USD 154,771 153,850 0.18
Time Warner Cable Inc 5.875% 15/11/2040 40,000 USD 34,730 47,694 0.06
Time Warner Inc 3.400% 15/06/2022 85,000 USD 84,608 85,926 0.10
Time Warner Inc 4.650% 01/06/2044 45,000 USD 45,592 46,916 0.05
Time Warner Inc 5.350% 15/12/2043 25,000 USD 27,847 28,394 0.03
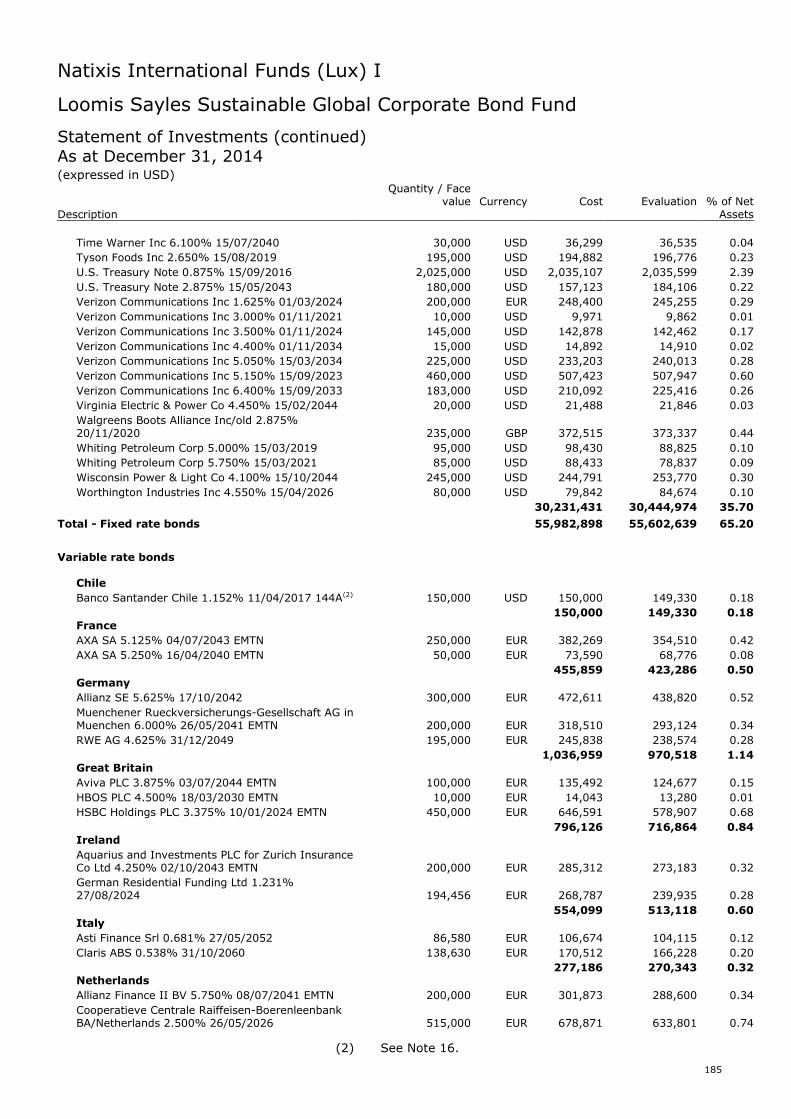
Natixis International Funds (Lux) I
185
Loomis Sayles Sustainable Global Corporate Bond Fund
Statement of Investments (continued)As at December 31, 2014(expressed in USD)
Quantity / Facevalue Currency Cost Evaluation % of Net
Description Assets
Time Warner Inc 6.100% 15/07/2040 30,000 USD 36,299 36,535 0.04
Tyson Foods Inc 2.650% 15/08/2019 195,000 USD 194,882 196,776 0.23
U.S. Treasury Note 0.875% 15/09/2016 2,025,000 USD 2,035,107 2,035,599 2.39
U.S. Treasury Note 2.875% 15/05/2043 180,000 USD 157,123 184,106 0.22
Verizon Communications Inc 1.625% 01/03/2024 200,000 EUR 248,400 245,255 0.29
Verizon Communications Inc 3.000% 01/11/2021 10,000 USD 9,971 9,862 0.01
Verizon Communications Inc 3.500% 01/11/2024 145,000 USD 142,878 142,462 0.17
Verizon Communications Inc 4.400% 01/11/2034 15,000 USD 14,892 14,910 0.02
Verizon Communications Inc 5.050% 15/03/2034 225,000 USD 233,203 240,013 0.28
Verizon Communications Inc 5.150% 15/09/2023 460,000 USD 507,423 507,947 0.60
Verizon Communications Inc 6.400% 15/09/2033 183,000 USD 210,092 225,416 0.26
Virginia Electric & Power Co 4.450% 15/02/2044 20,000 USD 21,488 21,846 0.03
Walgreens Boots Alliance Inc/old 2.875%20/11/2020 235,000 GBP 372,515 373,337 0.44
Whiting Petroleum Corp 5.000% 15/03/2019 95,000 USD 98,430 88,825 0.10
Whiting Petroleum Corp 5.750% 15/03/2021 85,000 USD 88,433 78,837 0.09
Wisconsin Power & Light Co 4.100% 15/10/2044 245,000 USD 244,791 253,770 0.30
Worthington Industries Inc 4.550% 15/04/2026 80,000 USD 79,842 84,674 0.10
30,231,431 30,444,974 35.70
Total - Fixed rate bonds 55,982,898 55,602,639 65.20
Variable rate bonds
Chile
Banco Santander Chile 1.152% 11/04/2017 144A(2) 150,000 USD 150,000 149,330 0.18
150,000 149,330 0.18France
AXA SA 5.125% 04/07/2043 EMTN 250,000 EUR 382,269 354,510 0.42
AXA SA 5.250% 16/04/2040 EMTN 50,000 EUR 73,590 68,776 0.08
455,859 423,286 0.50Germany
Allianz SE 5.625% 17/10/2042 300,000 EUR 472,611 438,820 0.52
Muenchener Rueckversicherungs-Gesellschaft AG inMuenchen 6.000% 26/05/2041 EMTN 200,000 EUR 318,510 293,124 0.34
RWE AG 4.625% 31/12/2049 195,000 EUR 245,838 238,574 0.28
1,036,959 970,518 1.14Great Britain
Aviva PLC 3.875% 03/07/2044 EMTN 100,000 EUR 135,492 124,677 0.15
HBOS PLC 4.500% 18/03/2030 EMTN 10,000 EUR 14,043 13,280 0.01
HSBC Holdings PLC 3.375% 10/01/2024 EMTN 450,000 EUR 646,591 578,907 0.68
796,126 716,864 0.84Ireland
Aquarius and Investments PLC for Zurich InsuranceCo Ltd 4.250% 02/10/2043 EMTN 200,000 EUR 285,312 273,183 0.32
German Residential Funding Ltd 1.231%27/08/2024 194,456 EUR 268,787 239,935 0.28
554,099 513,118 0.60Italy
Asti Finance Srl 0.681% 27/05/2052 86,580 EUR 106,674 104,115 0.12
Claris ABS 0.538% 31/10/2060 138,630 EUR 170,512 166,228 0.20
277,186 270,343 0.32Netherlands
Allianz Finance II BV 5.750% 08/07/2041 EMTN 200,000 EUR 301,873 288,600 0.34
Cooperatieve Centrale Raiffeisen-BoerenleenbankBA/Netherlands 2.500% 26/05/2026 515,000 EUR 678,871 633,801 0.74
(2) See Note 16.
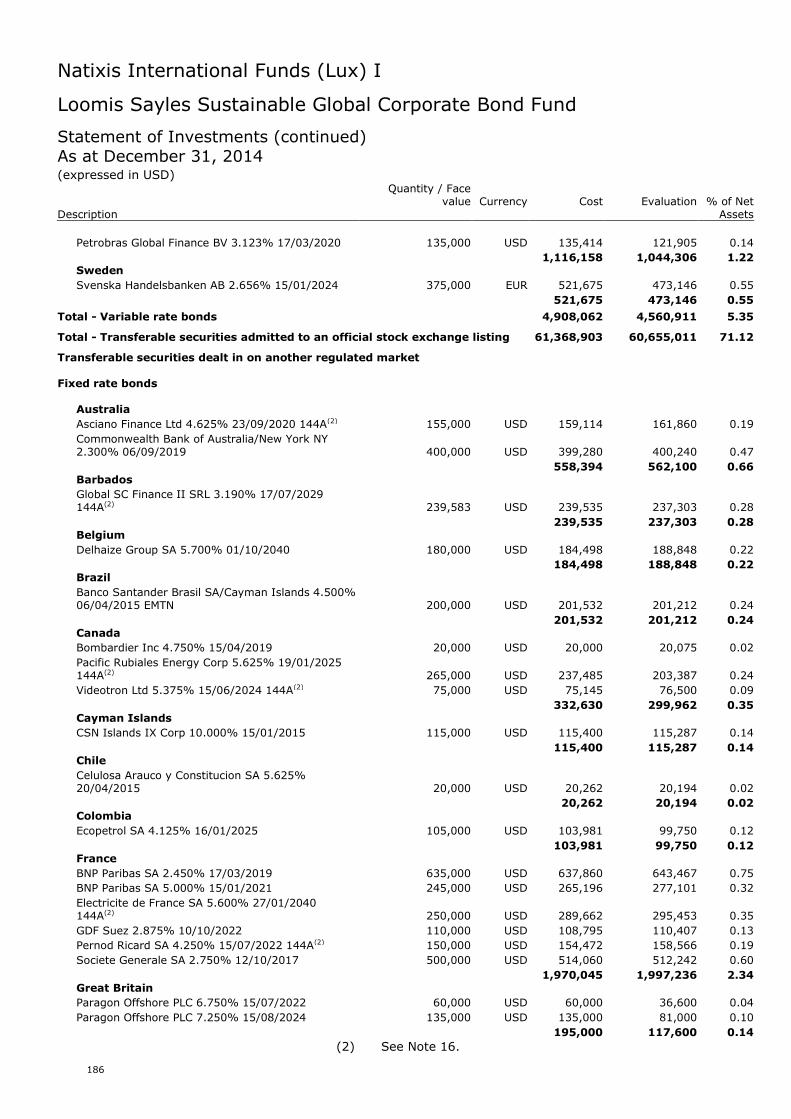
Natixis International Funds (Lux) I
186
Loomis Sayles Sustainable Global Corporate Bond Fund
Statement of Investments (continued)As at December 31, 2014(expressed in USD)
Quantity / Facevalue Currency Cost Evaluation % of Net
Description Assets
Petrobras Global Finance BV 3.123% 17/03/2020 135,000 USD 135,414 121,905 0.14
1,116,158 1,044,306 1.22Sweden
Svenska Handelsbanken AB 2.656% 15/01/2024 375,000 EUR 521,675 473,146 0.55
521,675 473,146 0.55
Total - Variable rate bonds 4,908,062 4,560,911 5.35
Total - Transferable securities admitted to an official stock exchange listing 61,368,903 60,655,011 71.12
Transferable securities dealt in on another regulated market
Fixed rate bonds
Australia
Asciano Finance Ltd 4.625% 23/09/2020 144A(2) 155,000 USD 159,114 161,860 0.19
Commonwealth Bank of Australia/New York NY2.300% 06/09/2019 400,000 USD 399,280 400,240 0.47
558,394 562,100 0.66Barbados
Global SC Finance II SRL 3.190% 17/07/2029144A(2) 239,583 USD 239,535 237,303 0.28
239,535 237,303 0.28Belgium
Delhaize Group SA 5.700% 01/10/2040 180,000 USD 184,498 188,848 0.22
184,498 188,848 0.22Brazil
Banco Santander Brasil SA/Cayman Islands 4.500%06/04/2015 EMTN 200,000 USD 201,532 201,212 0.24
201,532 201,212 0.24Canada
Bombardier Inc 4.750% 15/04/2019 20,000 USD 20,000 20,075 0.02
Pacific Rubiales Energy Corp 5.625% 19/01/2025144A(2) 265,000 USD 237,485 203,387 0.24
Videotron Ltd 5.375% 15/06/2024 144A(2) 75,000 USD 75,145 76,500 0.09
332,630 299,962 0.35Cayman Islands
CSN Islands IX Corp 10.000% 15/01/2015 115,000 USD 115,400 115,287 0.14
115,400 115,287 0.14Chile
Celulosa Arauco y Constitucion SA 5.625%20/04/2015 20,000 USD 20,262 20,194 0.02
20,262 20,194 0.02Colombia
Ecopetrol SA 4.125% 16/01/2025 105,000 USD 103,981 99,750 0.12
103,981 99,750 0.12France
BNP Paribas SA 2.450% 17/03/2019 635,000 USD 637,860 643,467 0.75
BNP Paribas SA 5.000% 15/01/2021 245,000 USD 265,196 277,101 0.32
Electricite de France SA 5.600% 27/01/2040144A(2) 250,000 USD 289,662 295,453 0.35
GDF Suez 2.875% 10/10/2022 110,000 USD 108,795 110,407 0.13
Pernod Ricard SA 4.250% 15/07/2022 144A(2) 150,000 USD 154,472 158,566 0.19
Societe Generale SA 2.750% 12/10/2017 500,000 USD 514,060 512,242 0.60
1,970,045 1,997,236 2.34Great Britain
Paragon Offshore PLC 6.750% 15/07/2022 60,000 USD 60,000 36,600 0.04
Paragon Offshore PLC 7.250% 15/08/2024 135,000 USD 135,000 81,000 0.10
195,000 117,600 0.14
(2) See Note 16.
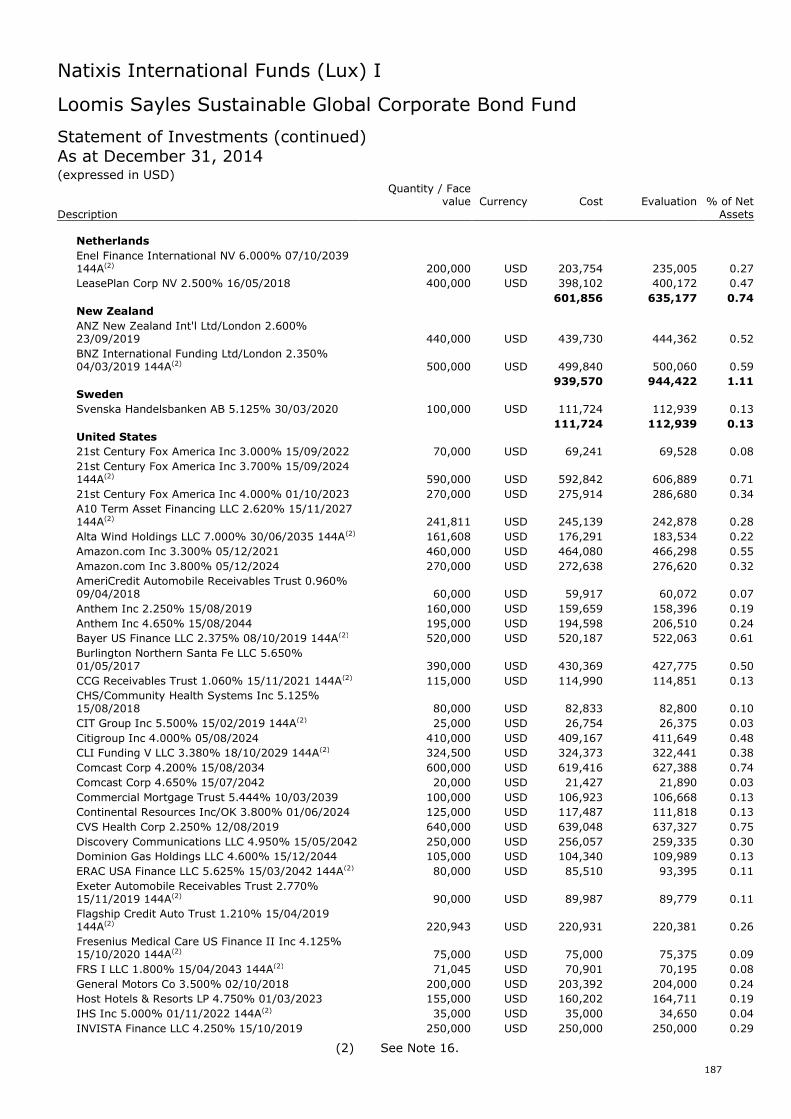
Natixis International Funds (Lux) I
187
Loomis Sayles Sustainable Global Corporate Bond Fund
Statement of Investments (continued)As at December 31, 2014(expressed in USD)
Quantity / Facevalue Currency Cost Evaluation % of Net
Description Assets
Netherlands
Enel Finance International NV 6.000% 07/10/2039144A(2) 200,000 USD 203,754 235,005 0.27
LeasePlan Corp NV 2.500% 16/05/2018 400,000 USD 398,102 400,172 0.47
601,856 635,177 0.74New Zealand
ANZ New Zealand Int'l Ltd/London 2.600%23/09/2019 440,000 USD 439,730 444,362 0.52
BNZ International Funding Ltd/London 2.350%04/03/2019 144A(2) 500,000 USD 499,840 500,060 0.59
939,570 944,422 1.11Sweden
Svenska Handelsbanken AB 5.125% 30/03/2020 100,000 USD 111,724 112,939 0.13
111,724 112,939 0.13United States
21st Century Fox America Inc 3.000% 15/09/2022 70,000 USD 69,241 69,528 0.08
21st Century Fox America Inc 3.700% 15/09/2024144A(2) 590,000 USD 592,842 606,889 0.71
21st Century Fox America Inc 4.000% 01/10/2023 270,000 USD 275,914 286,680 0.34
A10 Term Asset Financing LLC 2.620% 15/11/2027144A(2) 241,811 USD 245,139 242,878 0.28
Alta Wind Holdings LLC 7.000% 30/06/2035 144A(2) 161,608 USD 176,291 183,534 0.22
Amazon.com Inc 3.300% 05/12/2021 460,000 USD 464,080 466,298 0.55
Amazon.com Inc 3.800% 05/12/2024 270,000 USD 272,638 276,620 0.32
AmeriCredit Automobile Receivables Trust 0.960%09/04/2018 60,000 USD 59,917 60,072 0.07
Anthem Inc 2.250% 15/08/2019 160,000 USD 159,659 158,396 0.19
Anthem Inc 4.650% 15/08/2044 195,000 USD 194,598 206,510 0.24
Bayer US Finance LLC 2.375% 08/10/2019 144A(2) 520,000 USD 520,187 522,063 0.61
Burlington Northern Santa Fe LLC 5.650%01/05/2017 390,000 USD 430,369 427,775 0.50
CCG Receivables Trust 1.060% 15/11/2021 144A(2) 115,000 USD 114,990 114,851 0.13
CHS/Community Health Systems Inc 5.125%15/08/2018 80,000 USD 82,833 82,800 0.10
CIT Group Inc 5.500% 15/02/2019 144A(2) 25,000 USD 26,754 26,375 0.03
Citigroup Inc 4.000% 05/08/2024 410,000 USD 409,167 411,649 0.48
CLI Funding V LLC 3.380% 18/10/2029 144A(2) 324,500 USD 324,373 322,441 0.38
Comcast Corp 4.200% 15/08/2034 600,000 USD 619,416 627,388 0.74
Comcast Corp 4.650% 15/07/2042 20,000 USD 21,427 21,890 0.03
Commercial Mortgage Trust 5.444% 10/03/2039 100,000 USD 106,923 106,668 0.13
Continental Resources Inc/OK 3.800% 01/06/2024 125,000 USD 117,487 111,818 0.13
CVS Health Corp 2.250% 12/08/2019 640,000 USD 639,048 637,327 0.75
Discovery Communications LLC 4.950% 15/05/2042 250,000 USD 256,057 259,335 0.30
Dominion Gas Holdings LLC 4.600% 15/12/2044 105,000 USD 104,340 109,989 0.13
ERAC USA Finance LLC 5.625% 15/03/2042 144A(2) 80,000 USD 85,510 93,395 0.11
Exeter Automobile Receivables Trust 2.770%15/11/2019 144A(2) 90,000 USD 89,987 89,779 0.11
Flagship Credit Auto Trust 1.210% 15/04/2019144A(2) 220,943 USD 220,931 220,381 0.26
Fresenius Medical Care US Finance II Inc 4.125%15/10/2020 144A(2) 75,000 USD 75,000 75,375 0.09
FRS I LLC 1.800% 15/04/2043 144A(2) 71,045 USD 70,901 70,195 0.08
General Motors Co 3.500% 02/10/2018 200,000 USD 203,392 204,000 0.24
Host Hotels & Resorts LP 4.750% 01/03/2023 155,000 USD 160,202 164,711 0.19
IHS Inc 5.000% 01/11/2022 144A(2) 35,000 USD 35,000 34,650 0.04
INVISTA Finance LLC 4.250% 15/10/2019 250,000 USD 250,000 250,000 0.29
(2) See Note 16.
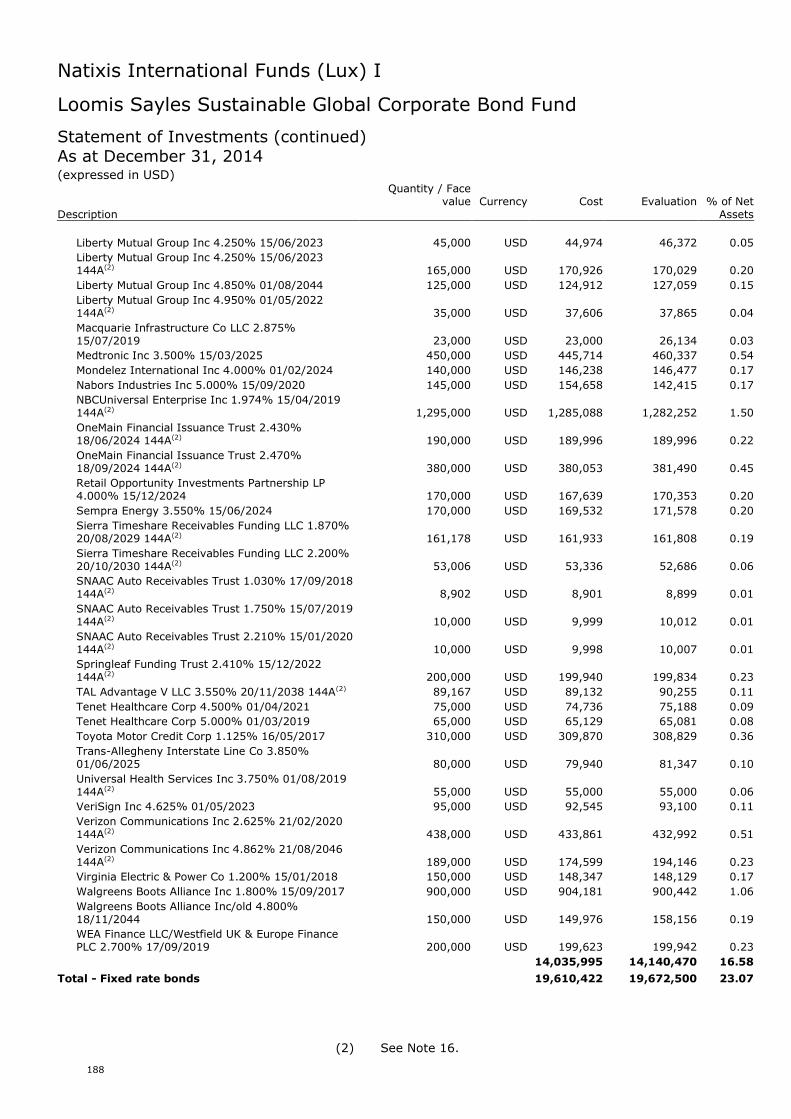
Natixis International Funds (Lux) I
188
Loomis Sayles Sustainable Global Corporate Bond Fund
Statement of Investments (continued)As at December 31, 2014(expressed in USD)
Quantity / Facevalue Currency Cost Evaluation % of Net
Description Assets
Liberty Mutual Group Inc 4.250% 15/06/2023 45,000 USD 44,974 46,372 0.05
Liberty Mutual Group Inc 4.250% 15/06/2023144A(2) 165,000 USD 170,926 170,029 0.20
Liberty Mutual Group Inc 4.850% 01/08/2044 125,000 USD 124,912 127,059 0.15
Liberty Mutual Group Inc 4.950% 01/05/2022144A(2) 35,000 USD 37,606 37,865 0.04
Macquarie Infrastructure Co LLC 2.875%15/07/2019 23,000 USD 23,000 26,134 0.03
Medtronic Inc 3.500% 15/03/2025 450,000 USD 445,714 460,337 0.54
Mondelez International Inc 4.000% 01/02/2024 140,000 USD 146,238 146,477 0.17
Nabors Industries Inc 5.000% 15/09/2020 145,000 USD 154,658 142,415 0.17
NBCUniversal Enterprise Inc 1.974% 15/04/2019144A(2) 1,295,000 USD 1,285,088 1,282,252 1.50
OneMain Financial Issuance Trust 2.430%18/06/2024 144A(2) 190,000 USD 189,996 189,996 0.22
OneMain Financial Issuance Trust 2.470%18/09/2024 144A(2) 380,000 USD 380,053 381,490 0.45
Retail Opportunity Investments Partnership LP4.000% 15/12/2024 170,000 USD 167,639 170,353 0.20
Sempra Energy 3.550% 15/06/2024 170,000 USD 169,532 171,578 0.20
Sierra Timeshare Receivables Funding LLC 1.870%20/08/2029 144A(2) 161,178 USD 161,933 161,808 0.19
Sierra Timeshare Receivables Funding LLC 2.200%20/10/2030 144A(2) 53,006 USD 53,336 52,686 0.06
SNAAC Auto Receivables Trust 1.030% 17/09/2018144A(2) 8,902 USD 8,901 8,899 0.01
SNAAC Auto Receivables Trust 1.750% 15/07/2019144A(2) 10,000 USD 9,999 10,012 0.01
SNAAC Auto Receivables Trust 2.210% 15/01/2020144A(2) 10,000 USD 9,998 10,007 0.01
Springleaf Funding Trust 2.410% 15/12/2022144A(2) 200,000 USD 199,940 199,834 0.23
TAL Advantage V LLC 3.550% 20/11/2038 144A(2) 89,167 USD 89,132 90,255 0.11
Tenet Healthcare Corp 4.500% 01/04/2021 75,000 USD 74,736 75,188 0.09
Tenet Healthcare Corp 5.000% 01/03/2019 65,000 USD 65,129 65,081 0.08
Toyota Motor Credit Corp 1.125% 16/05/2017 310,000 USD 309,870 308,829 0.36
Trans-Allegheny Interstate Line Co 3.850%01/06/2025 80,000 USD 79,940 81,347 0.10
Universal Health Services Inc 3.750% 01/08/2019144A(2) 55,000 USD 55,000 55,000 0.06
VeriSign Inc 4.625% 01/05/2023 95,000 USD 92,545 93,100 0.11
Verizon Communications Inc 2.625% 21/02/2020144A(2) 438,000 USD 433,861 432,992 0.51
Verizon Communications Inc 4.862% 21/08/2046144A(2) 189,000 USD 174,599 194,146 0.23
Virginia Electric & Power Co 1.200% 15/01/2018 150,000 USD 148,347 148,129 0.17
Walgreens Boots Alliance Inc 1.800% 15/09/2017 900,000 USD 904,181 900,442 1.06
Walgreens Boots Alliance Inc/old 4.800%18/11/2044 150,000 USD 149,976 158,156 0.19
WEA Finance LLC/Westfield UK & Europe FinancePLC 2.700% 17/09/2019 200,000 USD 199,623 199,942 0.23
14,035,995 14,140,470 16.58
Total - Fixed rate bonds 19,610,422 19,672,500 23.07
(2) See Note 16.
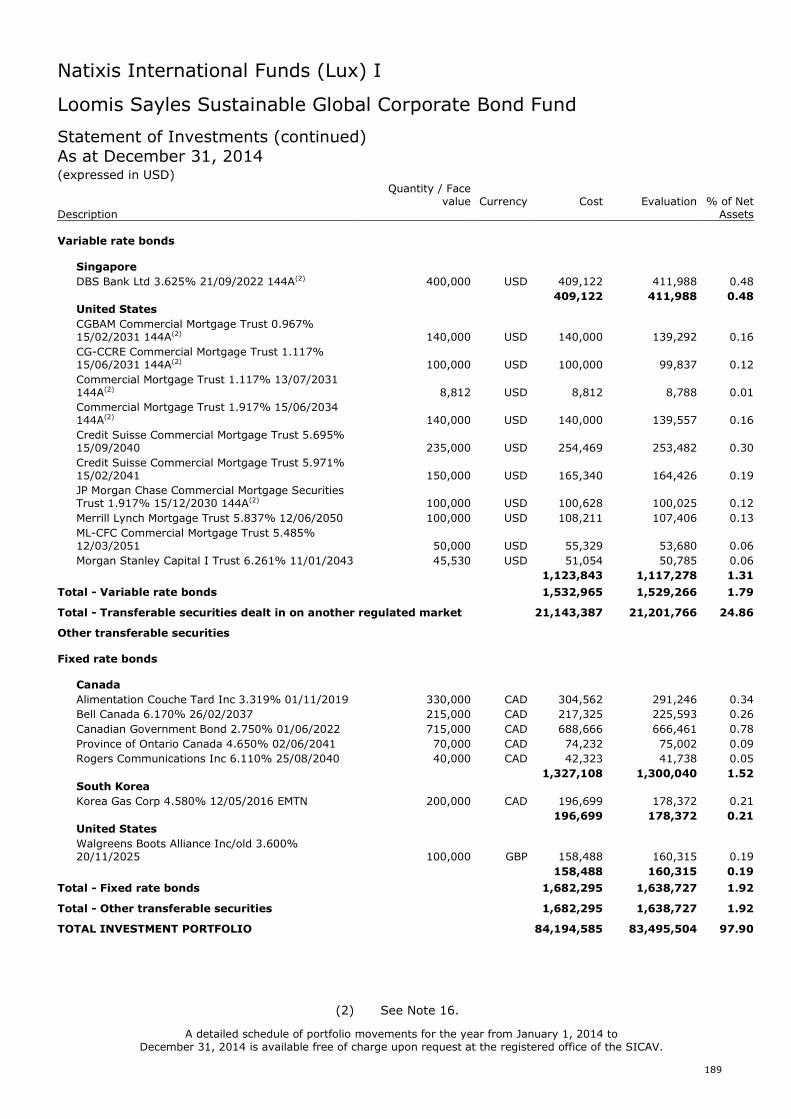
Natixis International Funds (Lux) I
189
Loomis Sayles Sustainable Global Corporate Bond Fund
Statement of Investments (continued)As at December 31, 2014(expressed in USD)
Quantity / Facevalue Currency Cost Evaluation % of Net
Description Assets
Variable rate bonds
Singapore
DBS Bank Ltd 3.625% 21/09/2022 144A(2) 400,000 USD 409,122 411,988 0.48
409,122 411,988 0.48United States
CGBAM Commercial Mortgage Trust 0.967%15/02/2031 144A(2) 140,000 USD 140,000 139,292 0.16
CG-CCRE Commercial Mortgage Trust 1.117%15/06/2031 144A(2) 100,000 USD 100,000 99,837 0.12
Commercial Mortgage Trust 1.117% 13/07/2031144A(2) 8,812 USD 8,812 8,788 0.01
Commercial Mortgage Trust 1.917% 15/06/2034144A(2) 140,000 USD 140,000 139,557 0.16
Credit Suisse Commercial Mortgage Trust 5.695%15/09/2040 235,000 USD 254,469 253,482 0.30
Credit Suisse Commercial Mortgage Trust 5.971%15/02/2041 150,000 USD 165,340 164,426 0.19
JP Morgan Chase Commercial Mortgage SecuritiesTrust 1.917% 15/12/2030 144A(2) 100,000 USD 100,628 100,025 0.12
Merrill Lynch Mortgage Trust 5.837% 12/06/2050 100,000 USD 108,211 107,406 0.13
ML-CFC Commercial Mortgage Trust 5.485%12/03/2051 50,000 USD 55,329 53,680 0.06
Morgan Stanley Capital I Trust 6.261% 11/01/2043 45,530 USD 51,054 50,785 0.06
1,123,843 1,117,278 1.31
Total - Variable rate bonds 1,532,965 1,529,266 1.79
Total - Transferable securities dealt in on another regulated market 21,143,387 21,201,766 24.86
Other transferable securities
Fixed rate bonds
Canada
Alimentation Couche Tard Inc 3.319% 01/11/2019 330,000 CAD 304,562 291,246 0.34
Bell Canada 6.170% 26/02/2037 215,000 CAD 217,325 225,593 0.26
Canadian Government Bond 2.750% 01/06/2022 715,000 CAD 688,666 666,461 0.78
Province of Ontario Canada 4.650% 02/06/2041 70,000 CAD 74,232 75,002 0.09
Rogers Communications Inc 6.110% 25/08/2040 40,000 CAD 42,323 41,738 0.05
1,327,108 1,300,040 1.52South Korea
Korea Gas Corp 4.580% 12/05/2016 EMTN 200,000 CAD 196,699 178,372 0.21
196,699 178,372 0.21United States
Walgreens Boots Alliance Inc/old 3.600%20/11/2025 100,000 GBP 158,488 160,315 0.19
158,488 160,315 0.19
Total - Fixed rate bonds 1,682,295 1,638,727 1.92
Total - Other transferable securities 1,682,295 1,638,727 1.92
TOTAL INVESTMENT PORTFOLIO 84,194,585 83,495,504 97.90
A detailed schedule of portfolio movements for the year from January 1, 2014 toDecember 31, 2014 is available free of charge upon request at the registered office of the SICAV.
(2) See Note 16.
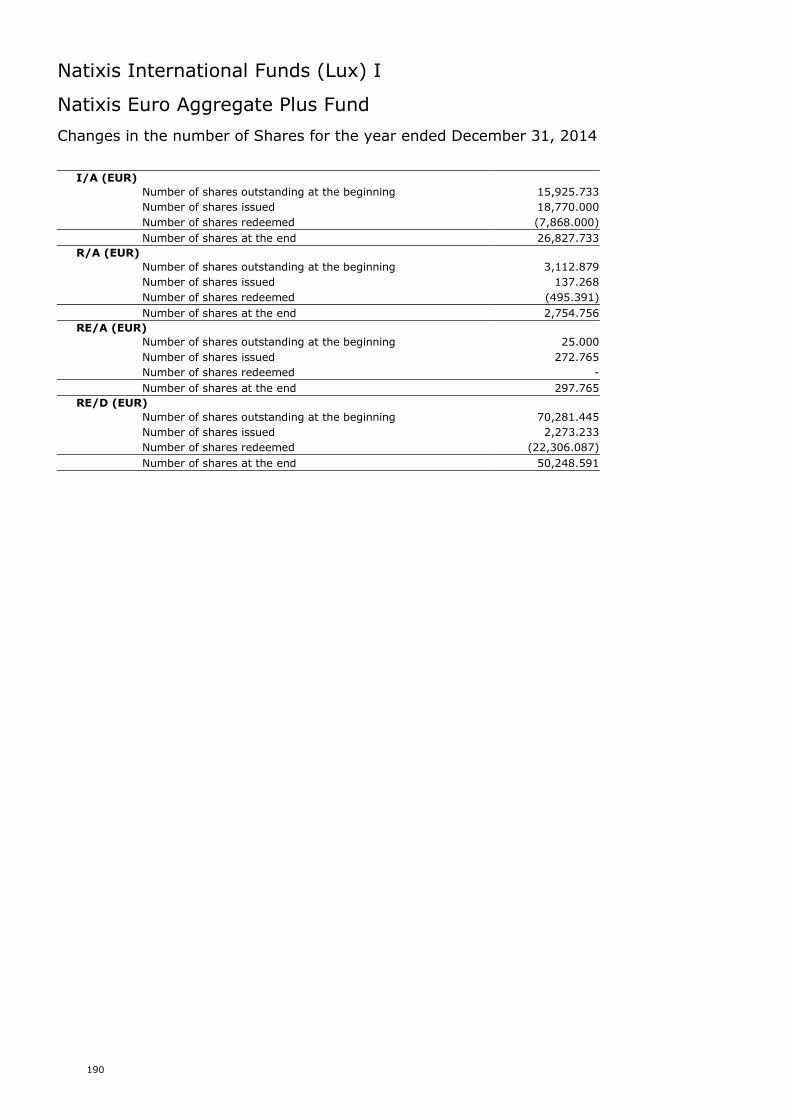
Natixis International Funds (Lux) I
190
Natixis Euro Aggregate Plus Fund
Changes in the number of Shares for the year ended December 31, 2014
I/A (EUR)
Number of shares outstanding at the beginning 15,925.733
Number of shares issued 18,770.000
Number of shares redeemed (7,868.000)
Number of shares at the end 26,827.733
R/A (EUR)
Number of shares outstanding at the beginning 3,112.879
Number of shares issued 137.268
Number of shares redeemed (495.391)
Number of shares at the end 2,754.756
RE/A (EUR)
Number of shares outstanding at the beginning 25.000
Number of shares issued 272.765
Number of shares redeemed -
Number of shares at the end 297.765
RE/D (EUR)
Number of shares outstanding at the beginning 70,281.445
Number of shares issued 2,273.233
Number of shares redeemed (22,306.087)
Number of shares at the end 50,248.591
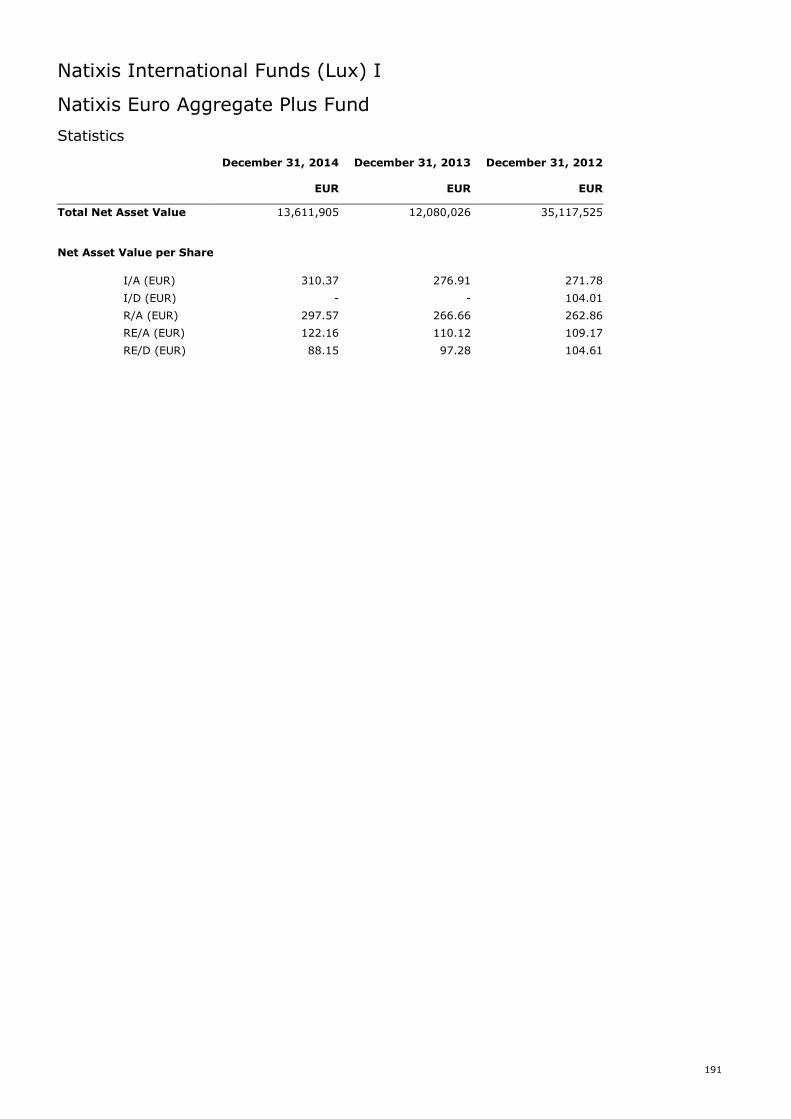
Natixis International Funds (Lux) I
191
Natixis Euro Aggregate Plus Fund
Statistics
December 31, 2014 December 31, 2013 December 31, 2012
EUR EUR EUR
Total Net Asset Value 13,611,905 12,080,026 35,117,525
Net Asset Value per Share
I/A (EUR) 310.37 276.91 271.78
I/D (EUR) - - 104.01
R/A (EUR) 297.57 266.66 262.86
RE/A (EUR) 122.16 110.12 109.17
RE/D (EUR) 88.15 97.28 104.61
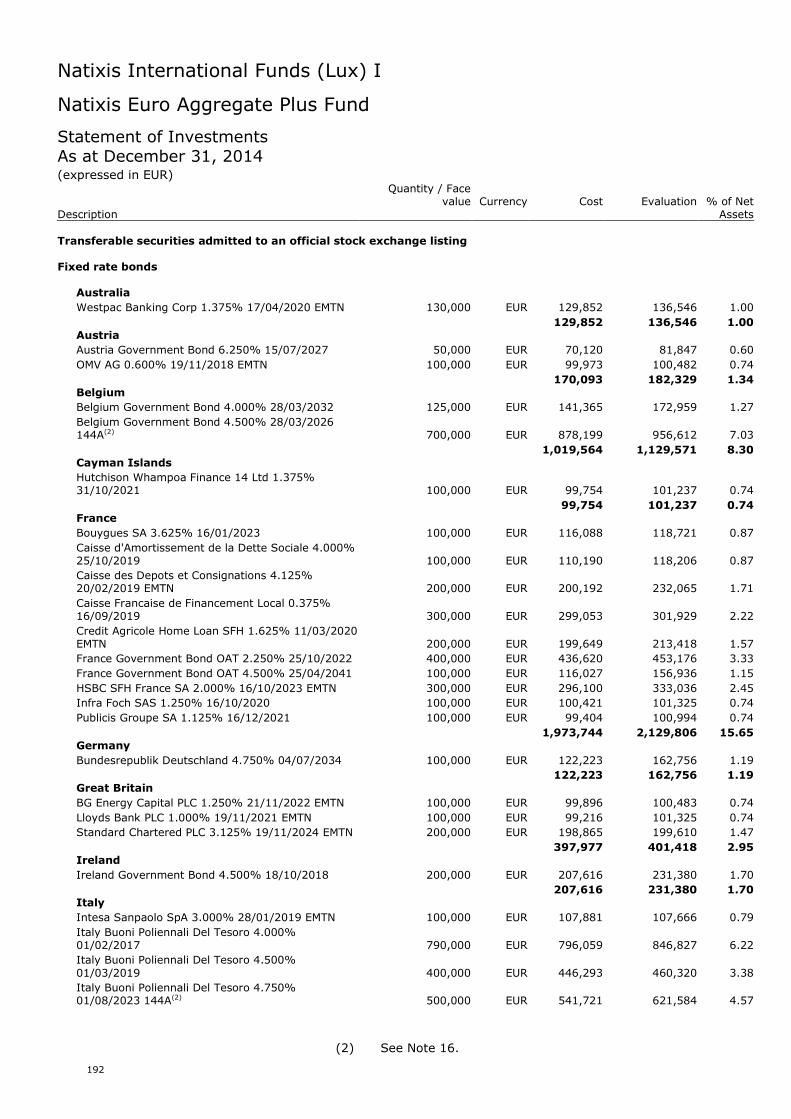
Natixis International Funds (Lux) I
192
Natixis Euro Aggregate Plus Fund
Statement of InvestmentsAs at December 31, 2014(expressed in EUR)
Quantity / Facevalue Currency Cost Evaluation % of Net
Description Assets
Transferable securities admitted to an official stock exchange listing
Fixed rate bonds
Australia
Westpac Banking Corp 1.375% 17/04/2020 EMTN 130,000 EUR 129,852 136,546 1.00
129,852 136,546 1.00Austria
Austria Government Bond 6.250% 15/07/2027 50,000 EUR 70,120 81,847 0.60
OMV AG 0.600% 19/11/2018 EMTN 100,000 EUR 99,973 100,482 0.74
170,093 182,329 1.34Belgium
Belgium Government Bond 4.000% 28/03/2032 125,000 EUR 141,365 172,959 1.27
Belgium Government Bond 4.500% 28/03/2026144A(2) 700,000 EUR 878,199 956,612 7.03
1,019,564 1,129,571 8.30Cayman Islands
Hutchison Whampoa Finance 14 Ltd 1.375%31/10/2021 100,000 EUR 99,754 101,237 0.74
99,754 101,237 0.74France
Bouygues SA 3.625% 16/01/2023 100,000 EUR 116,088 118,721 0.87
Caisse d'Amortissement de la Dette Sociale 4.000%25/10/2019 100,000 EUR 110,190 118,206 0.87
Caisse des Depots et Consignations 4.125%20/02/2019 EMTN 200,000 EUR 200,192 232,065 1.71
Caisse Francaise de Financement Local 0.375%16/09/2019 300,000 EUR 299,053 301,929 2.22
Credit Agricole Home Loan SFH 1.625% 11/03/2020EMTN 200,000 EUR 199,649 213,418 1.57
France Government Bond OAT 2.250% 25/10/2022 400,000 EUR 436,620 453,176 3.33
France Government Bond OAT 4.500% 25/04/2041 100,000 EUR 116,027 156,936 1.15
HSBC SFH France SA 2.000% 16/10/2023 EMTN 300,000 EUR 296,100 333,036 2.45
Infra Foch SAS 1.250% 16/10/2020 100,000 EUR 100,421 101,325 0.74
Publicis Groupe SA 1.125% 16/12/2021 100,000 EUR 99,404 100,994 0.74
1,973,744 2,129,806 15.65Germany
Bundesrepublik Deutschland 4.750% 04/07/2034 100,000 EUR 122,223 162,756 1.19
122,223 162,756 1.19Great Britain
BG Energy Capital PLC 1.250% 21/11/2022 EMTN 100,000 EUR 99,896 100,483 0.74
Lloyds Bank PLC 1.000% 19/11/2021 EMTN 100,000 EUR 99,216 101,325 0.74
Standard Chartered PLC 3.125% 19/11/2024 EMTN 200,000 EUR 198,865 199,610 1.47
397,977 401,418 2.95Ireland
Ireland Government Bond 4.500% 18/10/2018 200,000 EUR 207,616 231,380 1.70
207,616 231,380 1.70Italy
Intesa Sanpaolo SpA 3.000% 28/01/2019 EMTN 100,000 EUR 107,881 107,666 0.79
Italy Buoni Poliennali Del Tesoro 4.000%01/02/2017 790,000 EUR 796,059 846,827 6.22
Italy Buoni Poliennali Del Tesoro 4.500%01/03/2019 400,000 EUR 446,293 460,320 3.38
Italy Buoni Poliennali Del Tesoro 4.750%01/08/2023 144A(2) 500,000 EUR 541,721 621,584 4.57
(2) See Note 16.
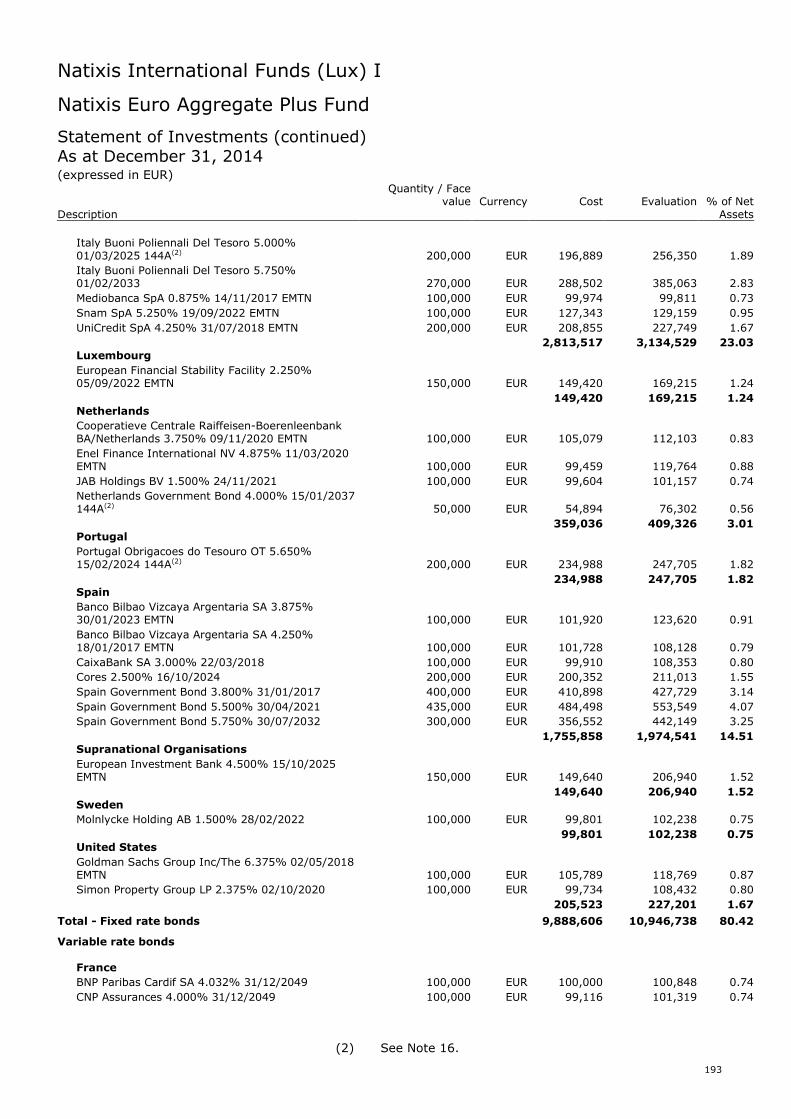
Natixis International Funds (Lux) I
193
Natixis Euro Aggregate Plus Fund
Statement of Investments (continued)As at December 31, 2014(expressed in EUR)
Quantity / Facevalue Currency Cost Evaluation % of Net
Description Assets
Italy Buoni Poliennali Del Tesoro 5.000%01/03/2025 144A(2) 200,000 EUR 196,889 256,350 1.89
Italy Buoni Poliennali Del Tesoro 5.750%01/02/2033 270,000 EUR 288,502 385,063 2.83
Mediobanca SpA 0.875% 14/11/2017 EMTN 100,000 EUR 99,974 99,811 0.73
Snam SpA 5.250% 19/09/2022 EMTN 100,000 EUR 127,343 129,159 0.95
UniCredit SpA 4.250% 31/07/2018 EMTN 200,000 EUR 208,855 227,749 1.67
2,813,517 3,134,529 23.03Luxembourg
European Financial Stability Facility 2.250%05/09/2022 EMTN 150,000 EUR 149,420 169,215 1.24
149,420 169,215 1.24Netherlands
Cooperatieve Centrale Raiffeisen-BoerenleenbankBA/Netherlands 3.750% 09/11/2020 EMTN 100,000 EUR 105,079 112,103 0.83
Enel Finance International NV 4.875% 11/03/2020EMTN 100,000 EUR 99,459 119,764 0.88
JAB Holdings BV 1.500% 24/11/2021 100,000 EUR 99,604 101,157 0.74
Netherlands Government Bond 4.000% 15/01/2037144A(2) 50,000 EUR 54,894 76,302 0.56
359,036 409,326 3.01Portugal
Portugal Obrigacoes do Tesouro OT 5.650%15/02/2024 144A(2) 200,000 EUR 234,988 247,705 1.82
234,988 247,705 1.82Spain
Banco Bilbao Vizcaya Argentaria SA 3.875%30/01/2023 EMTN 100,000 EUR 101,920 123,620 0.91
Banco Bilbao Vizcaya Argentaria SA 4.250%18/01/2017 EMTN 100,000 EUR 101,728 108,128 0.79
CaixaBank SA 3.000% 22/03/2018 100,000 EUR 99,910 108,353 0.80
Cores 2.500% 16/10/2024 200,000 EUR 200,352 211,013 1.55
Spain Government Bond 3.800% 31/01/2017 400,000 EUR 410,898 427,729 3.14
Spain Government Bond 5.500% 30/04/2021 435,000 EUR 484,498 553,549 4.07
Spain Government Bond 5.750% 30/07/2032 300,000 EUR 356,552 442,149 3.25
1,755,858 1,974,541 14.51Supranational Organisations
European Investment Bank 4.500% 15/10/2025EMTN 150,000 EUR 149,640 206,940 1.52
149,640 206,940 1.52Sweden
Molnlycke Holding AB 1.500% 28/02/2022 100,000 EUR 99,801 102,238 0.75
99,801 102,238 0.75United States
Goldman Sachs Group Inc/The 6.375% 02/05/2018EMTN 100,000 EUR 105,789 118,769 0.87
Simon Property Group LP 2.375% 02/10/2020 100,000 EUR 99,734 108,432 0.80
205,523 227,201 1.67
Total - Fixed rate bonds 9,888,606 10,946,738 80.42
Variable rate bonds
France
BNP Paribas Cardif SA 4.032% 31/12/2049 100,000 EUR 100,000 100,848 0.74
CNP Assurances 4.000% 31/12/2049 100,000 EUR 99,116 101,319 0.74
(2) See Note 16.
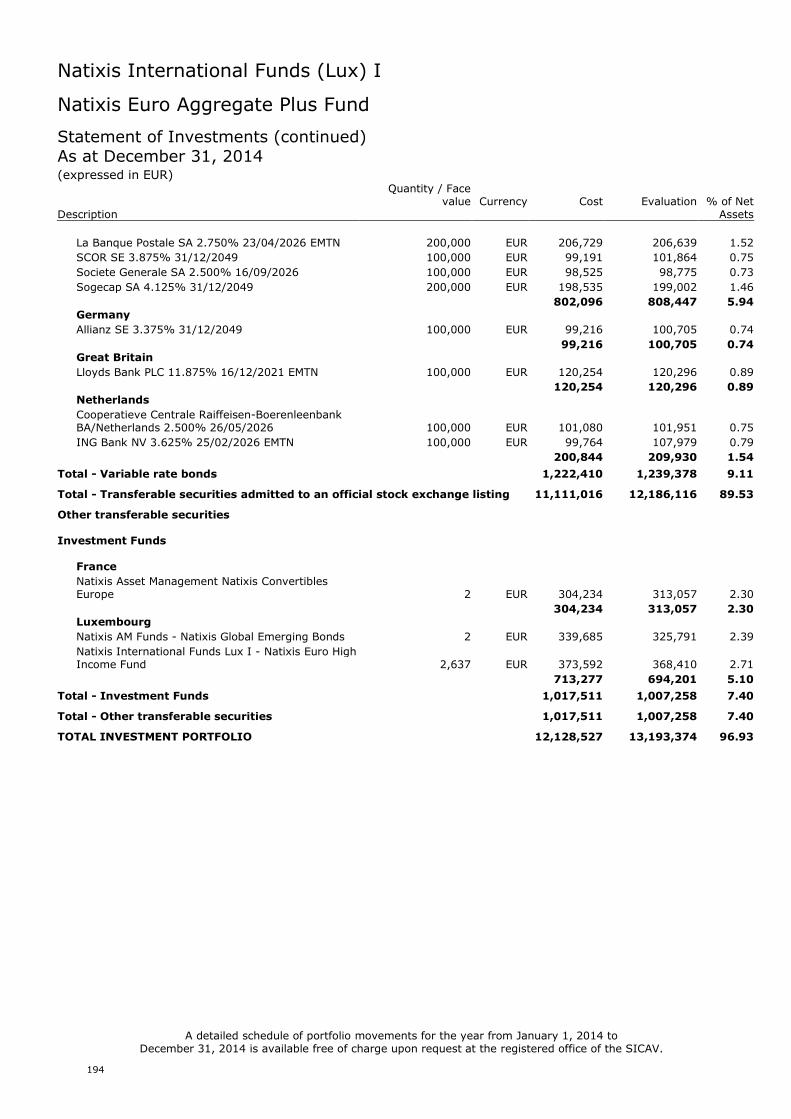
Natixis International Funds (Lux) I
194
Natixis Euro Aggregate Plus Fund
Statement of Investments (continued)As at December 31, 2014(expressed in EUR)
Quantity / Facevalue Currency Cost Evaluation % of Net
Description Assets
La Banque Postale SA 2.750% 23/04/2026 EMTN 200,000 EUR 206,729 206,639 1.52
SCOR SE 3.875% 31/12/2049 100,000 EUR 99,191 101,864 0.75
Societe Generale SA 2.500% 16/09/2026 100,000 EUR 98,525 98,775 0.73
Sogecap SA 4.125% 31/12/2049 200,000 EUR 198,535 199,002 1.46
802,096 808,447 5.94Germany
Allianz SE 3.375% 31/12/2049 100,000 EUR 99,216 100,705 0.74
99,216 100,705 0.74Great Britain
Lloyds Bank PLC 11.875% 16/12/2021 EMTN 100,000 EUR 120,254 120,296 0.89
120,254 120,296 0.89Netherlands
Cooperatieve Centrale Raiffeisen-BoerenleenbankBA/Netherlands 2.500% 26/05/2026 100,000 EUR 101,080 101,951 0.75
ING Bank NV 3.625% 25/02/2026 EMTN 100,000 EUR 99,764 107,979 0.79
200,844 209,930 1.54
Total - Variable rate bonds 1,222,410 1,239,378 9.11
Total - Transferable securities admitted to an official stock exchange listing 11,111,016 12,186,116 89.53
Other transferable securities
Investment Funds
France
Natixis Asset Management Natixis ConvertiblesEurope 2 EUR 304,234 313,057 2.30
304,234 313,057 2.30Luxembourg
Natixis AM Funds - Natixis Global Emerging Bonds 2 EUR 339,685 325,791 2.39
Natixis International Funds Lux I - Natixis Euro HighIncome Fund 2,637 EUR 373,592 368,410 2.71
713,277 694,201 5.10
Total - Investment Funds 1,017,511 1,007,258 7.40
Total - Other transferable securities 1,017,511 1,007,258 7.40
TOTAL INVESTMENT PORTFOLIO 12,128,527 13,193,374 96.93
A detailed schedule of portfolio movements for the year from January 1, 2014 toDecember 31, 2014 is available free of charge upon request at the registered office of the SICAV.
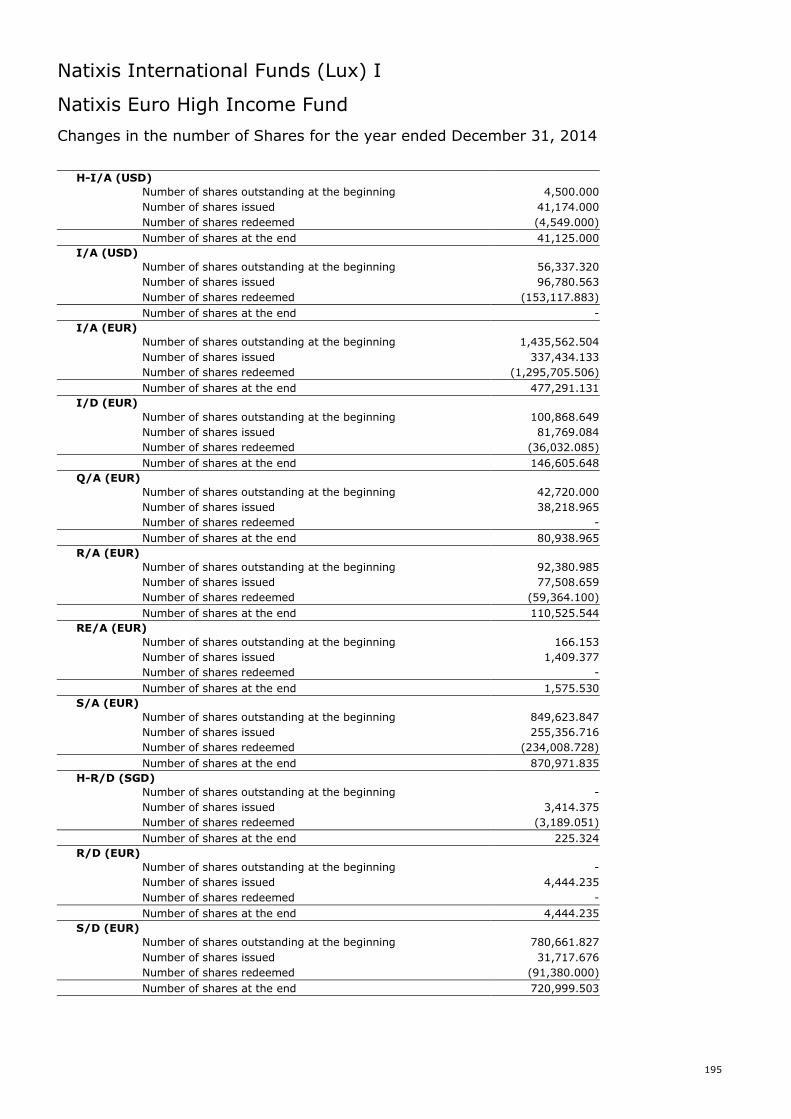
Natixis International Funds (Lux) I
195
Natixis Euro High Income Fund
Changes in the number of Shares for the year ended December 31, 2014
H-I/A (USD)
Number of shares outstanding at the beginning 4,500.000
Number of shares issued 41,174.000
Number of shares redeemed (4,549.000)
Number of shares at the end 41,125.000
I/A (USD)
Number of shares outstanding at the beginning 56,337.320
Number of shares issued 96,780.563
Number of shares redeemed (153,117.883)
Number of shares at the end -
I/A (EUR)
Number of shares outstanding at the beginning 1,435,562.504
Number of shares issued 337,434.133
Number of shares redeemed (1,295,705.506)
Number of shares at the end 477,291.131
I/D (EUR)
Number of shares outstanding at the beginning 100,868.649
Number of shares issued 81,769.084
Number of shares redeemed (36,032.085)
Number of shares at the end 146,605.648
Q/A (EUR)
Number of shares outstanding at the beginning 42,720.000
Number of shares issued 38,218.965
Number of shares redeemed -
Number of shares at the end 80,938.965
R/A (EUR)
Number of shares outstanding at the beginning 92,380.985
Number of shares issued 77,508.659
Number of shares redeemed (59,364.100)
Number of shares at the end 110,525.544
RE/A (EUR)
Number of shares outstanding at the beginning 166.153
Number of shares issued 1,409.377
Number of shares redeemed -
Number of shares at the end 1,575.530
S/A (EUR)
Number of shares outstanding at the beginning 849,623.847
Number of shares issued 255,356.716
Number of shares redeemed (234,008.728)
Number of shares at the end 870,971.835
H-R/D (SGD)
Number of shares outstanding at the beginning -
Number of shares issued 3,414.375
Number of shares redeemed (3,189.051)
Number of shares at the end 225.324
R/D (EUR)
Number of shares outstanding at the beginning -
Number of shares issued 4,444.235
Number of shares redeemed -
Number of shares at the end 4,444.235
S/D (EUR)
Number of shares outstanding at the beginning 780,661.827
Number of shares issued 31,717.676
Number of shares redeemed (91,380.000)
Number of shares at the end 720,999.503
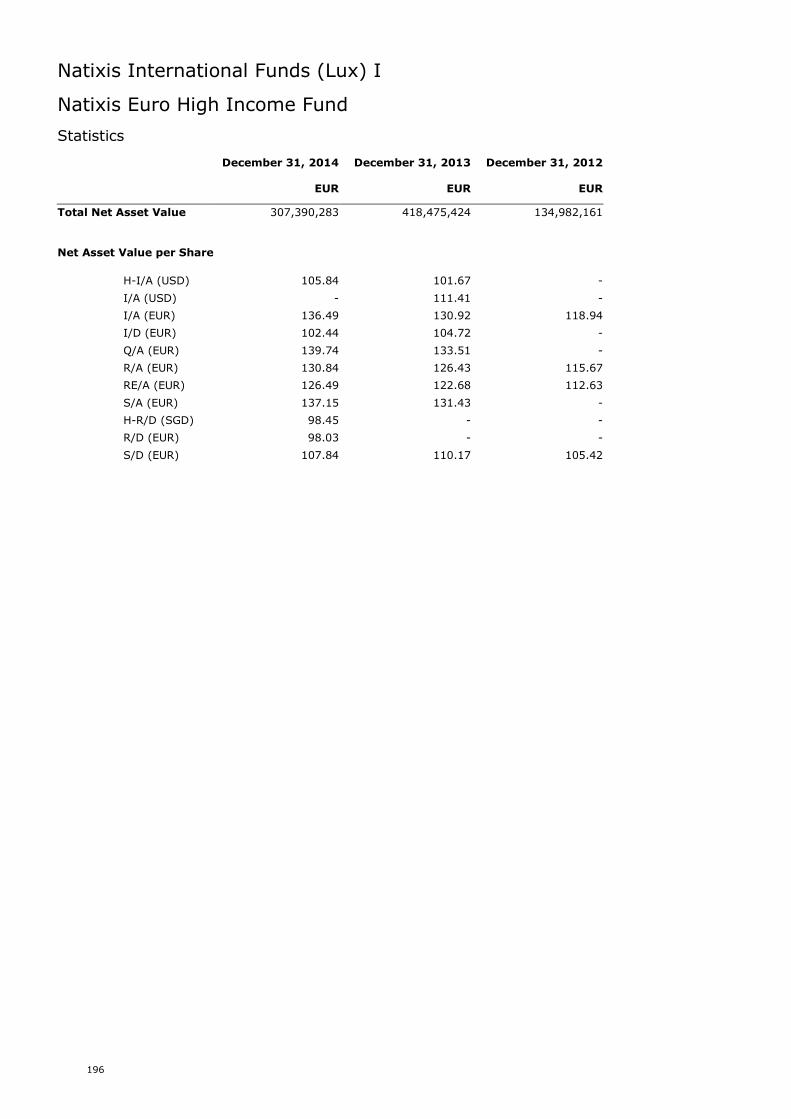
Natixis International Funds (Lux) I
196
Natixis Euro High Income Fund
Statistics
December 31, 2014 December 31, 2013 December 31, 2012
EUR EUR EUR
Total Net Asset Value 307,390,283 418,475,424 134,982,161
Net Asset Value per Share
H-I/A (USD) 105.84 101.67 -
I/A (USD) - 111.41 -
I/A (EUR) 136.49 130.92 118.94
I/D (EUR) 102.44 104.72 -
Q/A (EUR) 139.74 133.51 -
R/A (EUR) 130.84 126.43 115.67
RE/A (EUR) 126.49 122.68 112.63
S/A (EUR) 137.15 131.43 -
H-R/D (SGD) 98.45 - -
R/D (EUR) 98.03 - -
S/D (EUR) 107.84 110.17 105.42
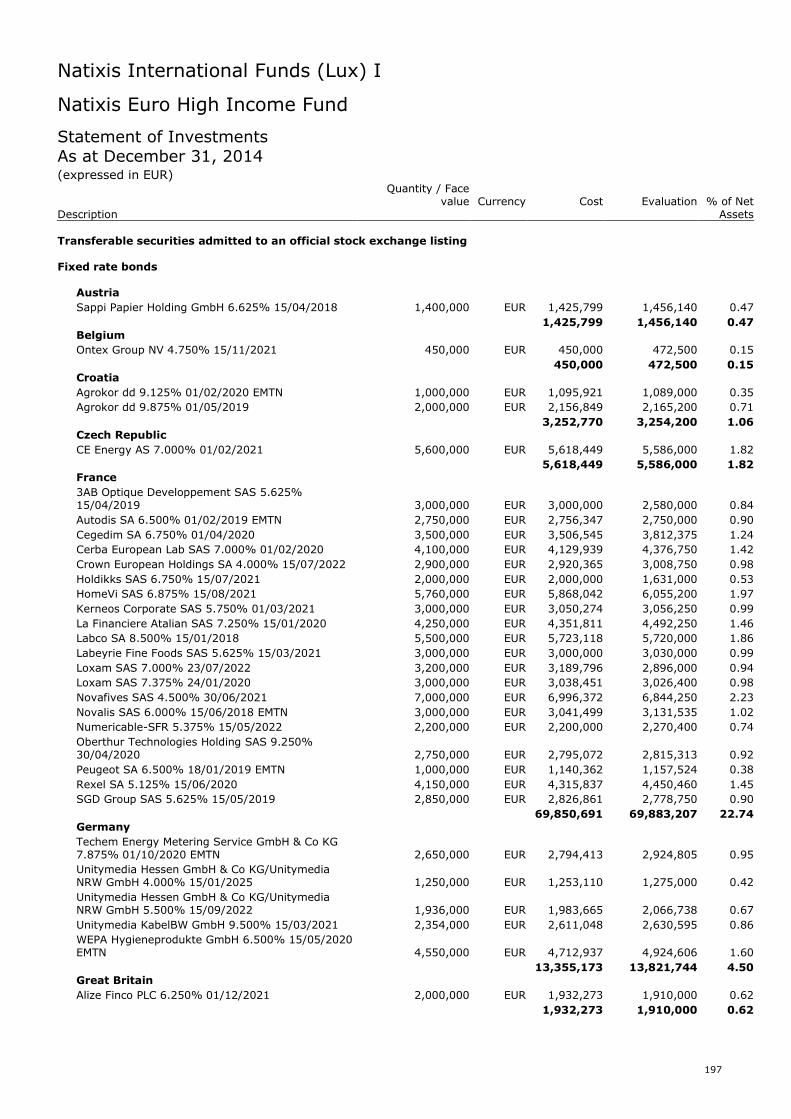
Natixis International Funds (Lux) I
197
Natixis Euro High Income Fund
Statement of InvestmentsAs at December 31, 2014(expressed in EUR)
Quantity / Facevalue Currency Cost Evaluation % of Net
Description Assets
Transferable securities admitted to an official stock exchange listing
Fixed rate bonds
Austria
Sappi Papier Holding GmbH 6.625% 15/04/2018 1,400,000 EUR 1,425,799 1,456,140 0.47
1,425,799 1,456,140 0.47Belgium
Ontex Group NV 4.750% 15/11/2021 450,000 EUR 450,000 472,500 0.15
450,000 472,500 0.15Croatia
Agrokor dd 9.125% 01/02/2020 EMTN 1,000,000 EUR 1,095,921 1,089,000 0.35
Agrokor dd 9.875% 01/05/2019 2,000,000 EUR 2,156,849 2,165,200 0.71
3,252,770 3,254,200 1.06Czech Republic
CE Energy AS 7.000% 01/02/2021 5,600,000 EUR 5,618,449 5,586,000 1.82
5,618,449 5,586,000 1.82France
3AB Optique Developpement SAS 5.625%15/04/2019 3,000,000 EUR 3,000,000 2,580,000 0.84
Autodis SA 6.500% 01/02/2019 EMTN 2,750,000 EUR 2,756,347 2,750,000 0.90
Cegedim SA 6.750% 01/04/2020 3,500,000 EUR 3,506,545 3,812,375 1.24
Cerba European Lab SAS 7.000% 01/02/2020 4,100,000 EUR 4,129,939 4,376,750 1.42
Crown European Holdings SA 4.000% 15/07/2022 2,900,000 EUR 2,920,365 3,008,750 0.98
Holdikks SAS 6.750% 15/07/2021 2,000,000 EUR 2,000,000 1,631,000 0.53
HomeVi SAS 6.875% 15/08/2021 5,760,000 EUR 5,868,042 6,055,200 1.97
Kerneos Corporate SAS 5.750% 01/03/2021 3,000,000 EUR 3,050,274 3,056,250 0.99
La Financiere Atalian SAS 7.250% 15/01/2020 4,250,000 EUR 4,351,811 4,492,250 1.46
Labco SA 8.500% 15/01/2018 5,500,000 EUR 5,723,118 5,720,000 1.86
Labeyrie Fine Foods SAS 5.625% 15/03/2021 3,000,000 EUR 3,000,000 3,030,000 0.99
Loxam SAS 7.000% 23/07/2022 3,200,000 EUR 3,189,796 2,896,000 0.94
Loxam SAS 7.375% 24/01/2020 3,000,000 EUR 3,038,451 3,026,400 0.98
Novafives SAS 4.500% 30/06/2021 7,000,000 EUR 6,996,372 6,844,250 2.23
Novalis SAS 6.000% 15/06/2018 EMTN 3,000,000 EUR 3,041,499 3,131,535 1.02
Numericable-SFR 5.375% 15/05/2022 2,200,000 EUR 2,200,000 2,270,400 0.74
Oberthur Technologies Holding SAS 9.250%30/04/2020 2,750,000 EUR 2,795,072 2,815,313 0.92
Peugeot SA 6.500% 18/01/2019 EMTN 1,000,000 EUR 1,140,362 1,157,524 0.38
Rexel SA 5.125% 15/06/2020 4,150,000 EUR 4,315,837 4,450,460 1.45
SGD Group SAS 5.625% 15/05/2019 2,850,000 EUR 2,826,861 2,778,750 0.90
69,850,691 69,883,207 22.74Germany
Techem Energy Metering Service GmbH & Co KG7.875% 01/10/2020 EMTN 2,650,000 EUR 2,794,413 2,924,805 0.95
Unitymedia Hessen GmbH & Co KG/UnitymediaNRW GmbH 4.000% 15/01/2025 1,250,000 EUR 1,253,110 1,275,000 0.42
Unitymedia Hessen GmbH & Co KG/UnitymediaNRW GmbH 5.500% 15/09/2022 1,936,000 EUR 1,983,665 2,066,738 0.67
Unitymedia KabelBW GmbH 9.500% 15/03/2021 2,354,000 EUR 2,611,048 2,630,595 0.86
WEPA Hygieneprodukte GmbH 6.500% 15/05/2020EMTN 4,550,000 EUR 4,712,937 4,924,606 1.60
13,355,173 13,821,744 4.50Great Britain
Alize Finco PLC 6.250% 01/12/2021 2,000,000 EUR 1,932,273 1,910,000 0.62
1,932,273 1,910,000 0.62
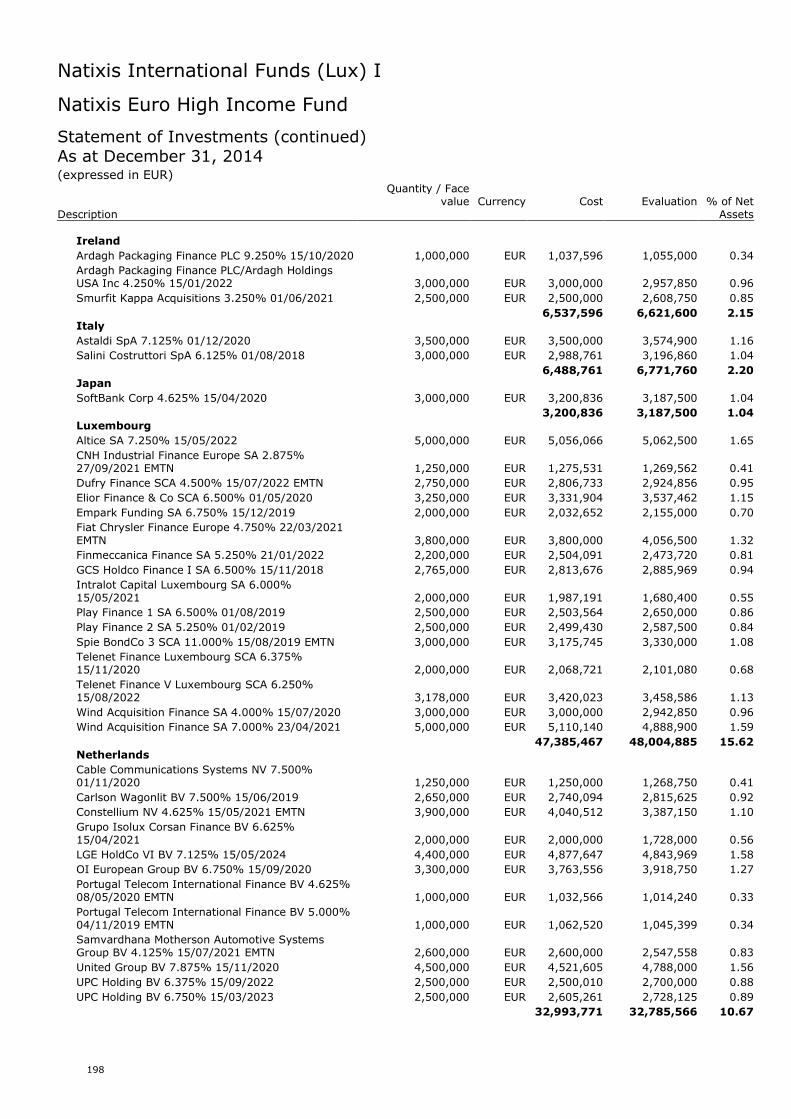
Natixis International Funds (Lux) I
198
Natixis Euro High Income Fund
Statement of Investments (continued)As at December 31, 2014(expressed in EUR)
Quantity / Facevalue Currency Cost Evaluation % of Net
Description Assets
Ireland
Ardagh Packaging Finance PLC 9.250% 15/10/2020 1,000,000 EUR 1,037,596 1,055,000 0.34
Ardagh Packaging Finance PLC/Ardagh HoldingsUSA Inc 4.250% 15/01/2022 3,000,000 EUR 3,000,000 2,957,850 0.96
Smurfit Kappa Acquisitions 3.250% 01/06/2021 2,500,000 EUR 2,500,000 2,608,750 0.85
6,537,596 6,621,600 2.15Italy
Astaldi SpA 7.125% 01/12/2020 3,500,000 EUR 3,500,000 3,574,900 1.16
Salini Costruttori SpA 6.125% 01/08/2018 3,000,000 EUR 2,988,761 3,196,860 1.04
6,488,761 6,771,760 2.20Japan
SoftBank Corp 4.625% 15/04/2020 3,000,000 EUR 3,200,836 3,187,500 1.04
3,200,836 3,187,500 1.04Luxembourg
Altice SA 7.250% 15/05/2022 5,000,000 EUR 5,056,066 5,062,500 1.65
CNH Industrial Finance Europe SA 2.875%27/09/2021 EMTN 1,250,000 EUR 1,275,531 1,269,562 0.41
Dufry Finance SCA 4.500% 15/07/2022 EMTN 2,750,000 EUR 2,806,733 2,924,856 0.95
Elior Finance & Co SCA 6.500% 01/05/2020 3,250,000 EUR 3,331,904 3,537,462 1.15
Empark Funding SA 6.750% 15/12/2019 2,000,000 EUR 2,032,652 2,155,000 0.70
Fiat Chrysler Finance Europe 4.750% 22/03/2021EMTN 3,800,000 EUR 3,800,000 4,056,500 1.32
Finmeccanica Finance SA 5.250% 21/01/2022 2,200,000 EUR 2,504,091 2,473,720 0.81
GCS Holdco Finance I SA 6.500% 15/11/2018 2,765,000 EUR 2,813,676 2,885,969 0.94
Intralot Capital Luxembourg SA 6.000%15/05/2021 2,000,000 EUR 1,987,191 1,680,400 0.55
Play Finance 1 SA 6.500% 01/08/2019 2,500,000 EUR 2,503,564 2,650,000 0.86
Play Finance 2 SA 5.250% 01/02/2019 2,500,000 EUR 2,499,430 2,587,500 0.84
Spie BondCo 3 SCA 11.000% 15/08/2019 EMTN 3,000,000 EUR 3,175,745 3,330,000 1.08
Telenet Finance Luxembourg SCA 6.375%15/11/2020 2,000,000 EUR 2,068,721 2,101,080 0.68
Telenet Finance V Luxembourg SCA 6.250%15/08/2022 3,178,000 EUR 3,420,023 3,458,586 1.13
Wind Acquisition Finance SA 4.000% 15/07/2020 3,000,000 EUR 3,000,000 2,942,850 0.96
Wind Acquisition Finance SA 7.000% 23/04/2021 5,000,000 EUR 5,110,140 4,888,900 1.59
47,385,467 48,004,885 15.62Netherlands
Cable Communications Systems NV 7.500%01/11/2020 1,250,000 EUR 1,250,000 1,268,750 0.41
Carlson Wagonlit BV 7.500% 15/06/2019 2,650,000 EUR 2,740,094 2,815,625 0.92
Constellium NV 4.625% 15/05/2021 EMTN 3,900,000 EUR 4,040,512 3,387,150 1.10
Grupo Isolux Corsan Finance BV 6.625%15/04/2021 2,000,000 EUR 2,000,000 1,728,000 0.56
LGE HoldCo VI BV 7.125% 15/05/2024 4,400,000 EUR 4,877,647 4,843,969 1.58
OI European Group BV 6.750% 15/09/2020 3,300,000 EUR 3,763,556 3,918,750 1.27
Portugal Telecom International Finance BV 4.625%08/05/2020 EMTN 1,000,000 EUR 1,032,566 1,014,240 0.33
Portugal Telecom International Finance BV 5.000%04/11/2019 EMTN 1,000,000 EUR 1,062,520 1,045,399 0.34
Samvardhana Motherson Automotive SystemsGroup BV 4.125% 15/07/2021 EMTN 2,600,000 EUR 2,600,000 2,547,558 0.83
United Group BV 7.875% 15/11/2020 4,500,000 EUR 4,521,605 4,788,000 1.56
UPC Holding BV 6.375% 15/09/2022 2,500,000 EUR 2,500,010 2,700,000 0.88
UPC Holding BV 6.750% 15/03/2023 2,500,000 EUR 2,605,261 2,728,125 0.89
32,993,771 32,785,566 10.67
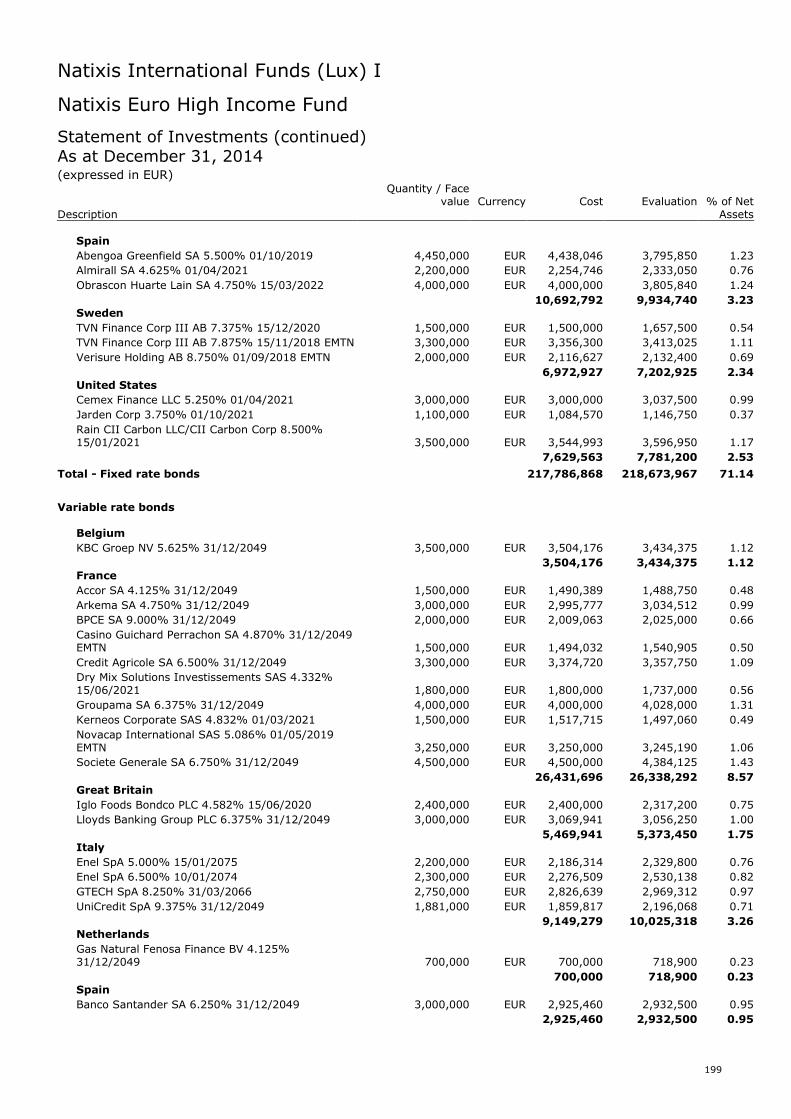
Natixis International Funds (Lux) I
199
Natixis Euro High Income Fund
Statement of Investments (continued)As at December 31, 2014(expressed in EUR)
Quantity / Facevalue Currency Cost Evaluation % of Net
Description Assets
Spain
Abengoa Greenfield SA 5.500% 01/10/2019 4,450,000 EUR 4,438,046 3,795,850 1.23
Almirall SA 4.625% 01/04/2021 2,200,000 EUR 2,254,746 2,333,050 0.76
Obrascon Huarte Lain SA 4.750% 15/03/2022 4,000,000 EUR 4,000,000 3,805,840 1.24
10,692,792 9,934,740 3.23Sweden
TVN Finance Corp III AB 7.375% 15/12/2020 1,500,000 EUR 1,500,000 1,657,500 0.54
TVN Finance Corp III AB 7.875% 15/11/2018 EMTN 3,300,000 EUR 3,356,300 3,413,025 1.11
Verisure Holding AB 8.750% 01/09/2018 EMTN 2,000,000 EUR 2,116,627 2,132,400 0.69
6,972,927 7,202,925 2.34United States
Cemex Finance LLC 5.250% 01/04/2021 3,000,000 EUR 3,000,000 3,037,500 0.99
Jarden Corp 3.750% 01/10/2021 1,100,000 EUR 1,084,570 1,146,750 0.37
Rain CII Carbon LLC/CII Carbon Corp 8.500%15/01/2021 3,500,000 EUR 3,544,993 3,596,950 1.17
7,629,563 7,781,200 2.53
Total - Fixed rate bonds 217,786,868 218,673,967 71.14
Variable rate bonds
Belgium
KBC Groep NV 5.625% 31/12/2049 3,500,000 EUR 3,504,176 3,434,375 1.12
3,504,176 3,434,375 1.12France
Accor SA 4.125% 31/12/2049 1,500,000 EUR 1,490,389 1,488,750 0.48
Arkema SA 4.750% 31/12/2049 3,000,000 EUR 2,995,777 3,034,512 0.99
BPCE SA 9.000% 31/12/2049 2,000,000 EUR 2,009,063 2,025,000 0.66
Casino Guichard Perrachon SA 4.870% 31/12/2049EMTN 1,500,000 EUR 1,494,032 1,540,905 0.50
Credit Agricole SA 6.500% 31/12/2049 3,300,000 EUR 3,374,720 3,357,750 1.09
Dry Mix Solutions Investissements SAS 4.332%15/06/2021 1,800,000 EUR 1,800,000 1,737,000 0.56
Groupama SA 6.375% 31/12/2049 4,000,000 EUR 4,000,000 4,028,000 1.31
Kerneos Corporate SAS 4.832% 01/03/2021 1,500,000 EUR 1,517,715 1,497,060 0.49
Novacap International SAS 5.086% 01/05/2019EMTN 3,250,000 EUR 3,250,000 3,245,190 1.06
Societe Generale SA 6.750% 31/12/2049 4,500,000 EUR 4,500,000 4,384,125 1.43
26,431,696 26,338,292 8.57Great Britain
Iglo Foods Bondco PLC 4.582% 15/06/2020 2,400,000 EUR 2,400,000 2,317,200 0.75
Lloyds Banking Group PLC 6.375% 31/12/2049 3,000,000 EUR 3,069,941 3,056,250 1.00
5,469,941 5,373,450 1.75Italy
Enel SpA 5.000% 15/01/2075 2,200,000 EUR 2,186,314 2,329,800 0.76
Enel SpA 6.500% 10/01/2074 2,300,000 EUR 2,276,509 2,530,138 0.82
GTECH SpA 8.250% 31/03/2066 2,750,000 EUR 2,826,639 2,969,312 0.97
UniCredit SpA 9.375% 31/12/2049 1,881,000 EUR 1,859,817 2,196,068 0.71
9,149,279 10,025,318 3.26Netherlands
Gas Natural Fenosa Finance BV 4.125%31/12/2049 700,000 EUR 700,000 718,900 0.23
700,000 718,900 0.23Spain
Banco Santander SA 6.250% 31/12/2049 3,000,000 EUR 2,925,460 2,932,500 0.95
2,925,460 2,932,500 0.95
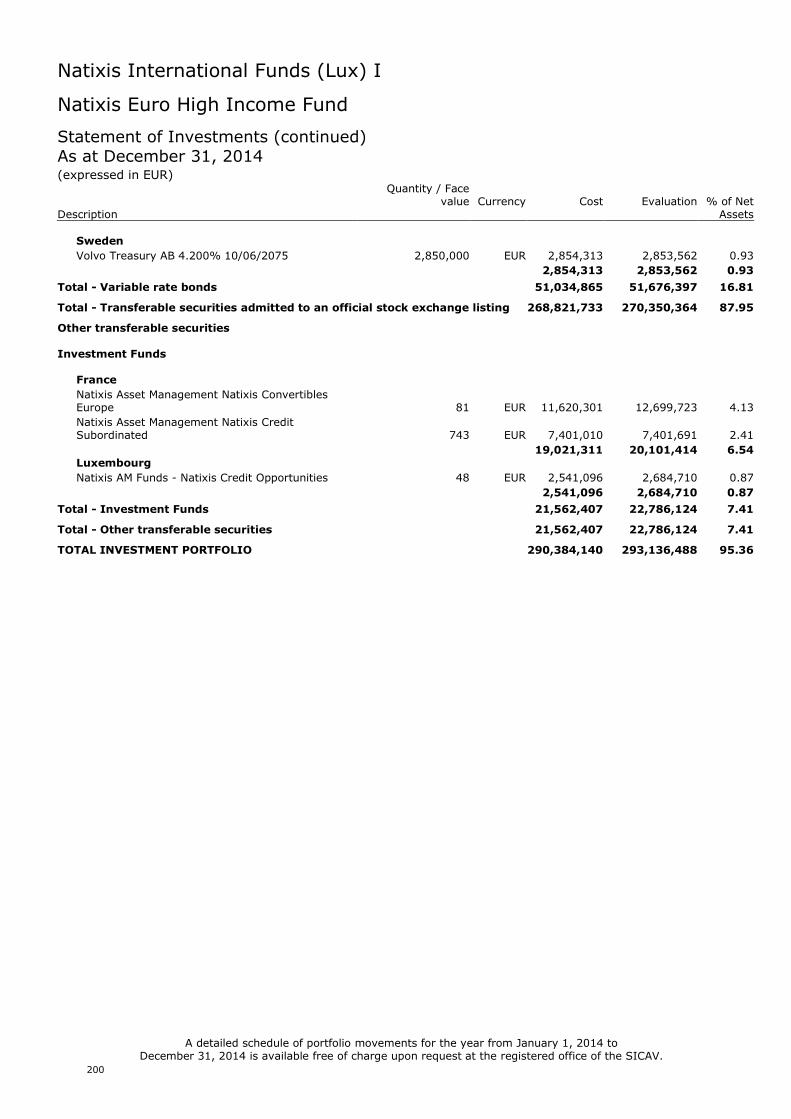
Natixis International Funds (Lux) I
200
Natixis Euro High Income Fund
Statement of Investments (continued)As at December 31, 2014(expressed in EUR)
Quantity / Facevalue Currency Cost Evaluation % of Net
Description Assets
Sweden
Volvo Treasury AB 4.200% 10/06/2075 2,850,000 EUR 2,854,313 2,853,562 0.93
2,854,313 2,853,562 0.93
Total - Variable rate bonds 51,034,865 51,676,397 16.81
Total - Transferable securities admitted to an official stock exchange listing 268,821,733 270,350,364 87.95
Other transferable securities
Investment Funds
France
Natixis Asset Management Natixis ConvertiblesEurope 81 EUR 11,620,301 12,699,723 4.13
Natixis Asset Management Natixis CreditSubordinated 743 EUR 7,401,010 7,401,691 2.41
19,021,311 20,101,414 6.54Luxembourg
Natixis AM Funds - Natixis Credit Opportunities 48 EUR 2,541,096 2,684,710 0.87
2,541,096 2,684,710 0.87
Total - Investment Funds 21,562,407 22,786,124 7.41
Total - Other transferable securities 21,562,407 22,786,124 7.41
TOTAL INVESTMENT PORTFOLIO 290,384,140 293,136,488 95.36
A detailed schedule of portfolio movements for the year from January 1, 2014 toDecember 31, 2014 is available free of charge upon request at the registered office of the SICAV.
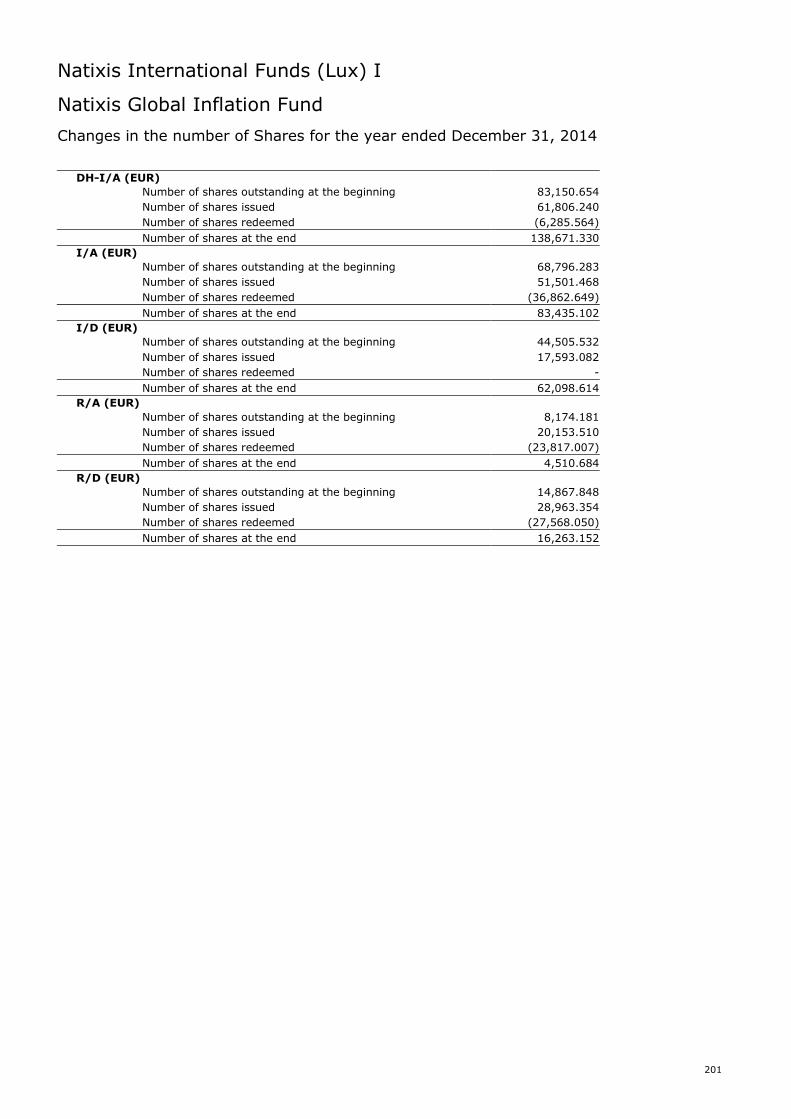
Natixis International Funds (Lux) I
201
Natixis Global Inflation Fund
Changes in the number of Shares for the year ended December 31, 2014
DH-I/A (EUR)
Number of shares outstanding at the beginning 83,150.654
Number of shares issued 61,806.240
Number of shares redeemed (6,285.564)
Number of shares at the end 138,671.330
I/A (EUR)
Number of shares outstanding at the beginning 68,796.283
Number of shares issued 51,501.468
Number of shares redeemed (36,862.649)
Number of shares at the end 83,435.102
I/D (EUR)
Number of shares outstanding at the beginning 44,505.532
Number of shares issued 17,593.082
Number of shares redeemed -
Number of shares at the end 62,098.614
R/A (EUR)
Number of shares outstanding at the beginning 8,174.181
Number of shares issued 20,153.510
Number of shares redeemed (23,817.007)
Number of shares at the end 4,510.684
R/D (EUR)
Number of shares outstanding at the beginning 14,867.848
Number of shares issued 28,963.354
Number of shares redeemed (27,568.050)
Number of shares at the end 16,263.152
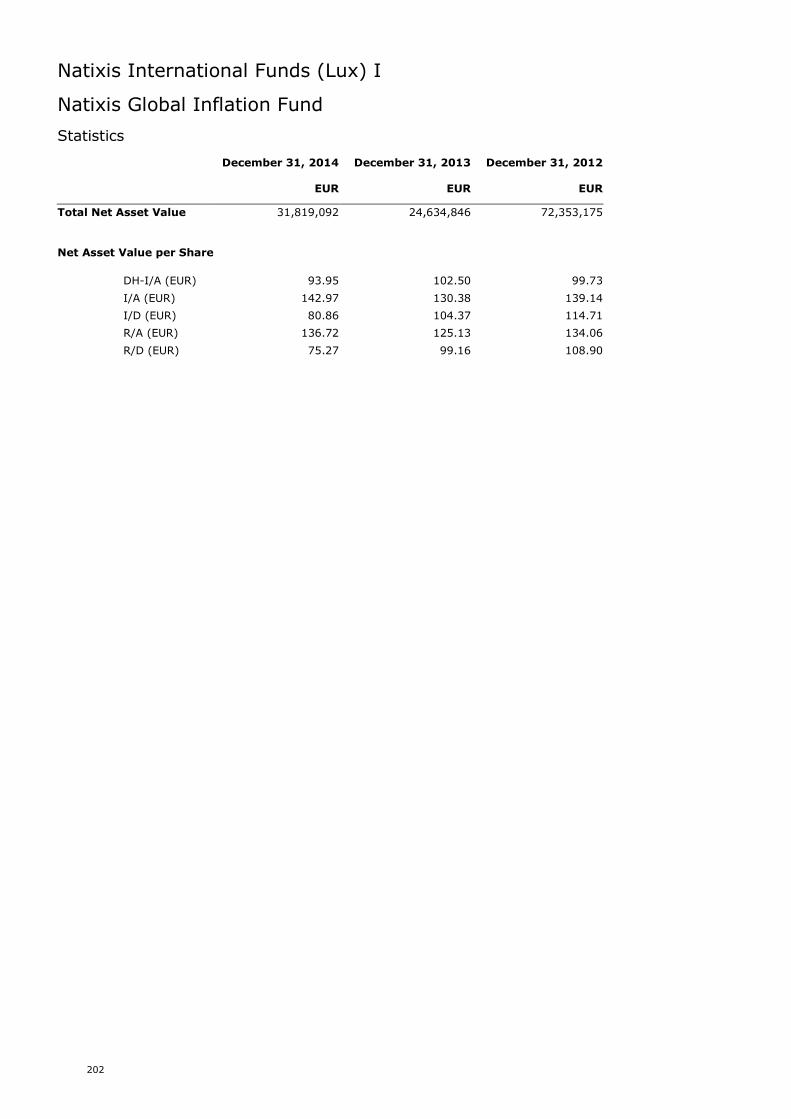
Natixis International Funds (Lux) I
202
Natixis Global Inflation Fund
Statistics
December 31, 2014 December 31, 2013 December 31, 2012
EUR EUR EUR
Total Net Asset Value 31,819,092 24,634,846 72,353,175
Net Asset Value per Share
DH-I/A (EUR) 93.95 102.50 99.73
I/A (EUR) 142.97 130.38 139.14
I/D (EUR) 80.86 104.37 114.71
R/A (EUR) 136.72 125.13 134.06
R/D (EUR) 75.27 99.16 108.90
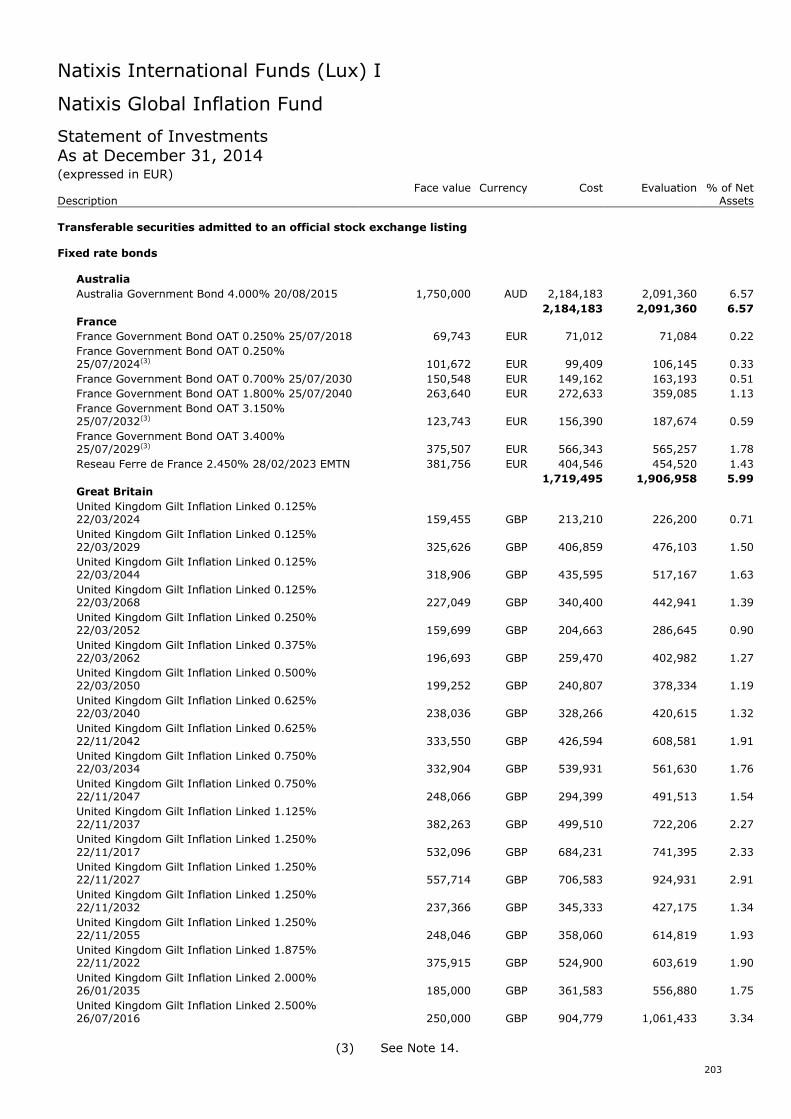
Natixis International Funds (Lux) I
203
Natixis Global Inflation Fund
Statement of InvestmentsAs at December 31, 2014(expressed in EUR)
Face value Currency Cost Evaluation % of NetDescription Assets
Transferable securities admitted to an official stock exchange listing
Fixed rate bonds
Australia
Australia Government Bond 4.000% 20/08/2015 1,750,000 AUD 2,184,183 2,091,360 6.57
2,184,183 2,091,360 6.57France
France Government Bond OAT 0.250% 25/07/2018 69,743 EUR 71,012 71,084 0.22
France Government Bond OAT 0.250%25/07/2024(3) 101,672 EUR 99,409 106,145 0.33
France Government Bond OAT 0.700% 25/07/2030 150,548 EUR 149,162 163,193 0.51
France Government Bond OAT 1.800% 25/07/2040 263,640 EUR 272,633 359,085 1.13
France Government Bond OAT 3.150%25/07/2032(3) 123,743 EUR 156,390 187,674 0.59
France Government Bond OAT 3.400%25/07/2029(3) 375,507 EUR 566,343 565,257 1.78
Reseau Ferre de France 2.450% 28/02/2023 EMTN 381,756 EUR 404,546 454,520 1.43
1,719,495 1,906,958 5.99Great Britain
United Kingdom Gilt Inflation Linked 0.125%22/03/2024 159,455 GBP 213,210 226,200 0.71
United Kingdom Gilt Inflation Linked 0.125%22/03/2029 325,626 GBP 406,859 476,103 1.50
United Kingdom Gilt Inflation Linked 0.125%22/03/2044 318,906 GBP 435,595 517,167 1.63
United Kingdom Gilt Inflation Linked 0.125%22/03/2068 227,049 GBP 340,400 442,941 1.39
United Kingdom Gilt Inflation Linked 0.250%22/03/2052 159,699 GBP 204,663 286,645 0.90
United Kingdom Gilt Inflation Linked 0.375%22/03/2062 196,693 GBP 259,470 402,982 1.27
United Kingdom Gilt Inflation Linked 0.500%22/03/2050 199,252 GBP 240,807 378,334 1.19
United Kingdom Gilt Inflation Linked 0.625%22/03/2040 238,036 GBP 328,266 420,615 1.32
United Kingdom Gilt Inflation Linked 0.625%22/11/2042 333,550 GBP 426,594 608,581 1.91
United Kingdom Gilt Inflation Linked 0.750%22/03/2034 332,904 GBP 539,931 561,630 1.76
United Kingdom Gilt Inflation Linked 0.750%22/11/2047 248,066 GBP 294,399 491,513 1.54
United Kingdom Gilt Inflation Linked 1.125%22/11/2037 382,263 GBP 499,510 722,206 2.27
United Kingdom Gilt Inflation Linked 1.250%22/11/2017 532,096 GBP 684,231 741,395 2.33
United Kingdom Gilt Inflation Linked 1.250%22/11/2027 557,714 GBP 706,583 924,931 2.91
United Kingdom Gilt Inflation Linked 1.250%22/11/2032 237,366 GBP 345,333 427,175 1.34
United Kingdom Gilt Inflation Linked 1.250%22/11/2055 248,046 GBP 358,060 614,819 1.93
United Kingdom Gilt Inflation Linked 1.875%22/11/2022 375,915 GBP 524,900 603,619 1.90
United Kingdom Gilt Inflation Linked 2.000%26/01/2035 185,000 GBP 361,583 556,880 1.75
United Kingdom Gilt Inflation Linked 2.500%26/07/2016 250,000 GBP 904,779 1,061,433 3.34
(3) See Note 14.
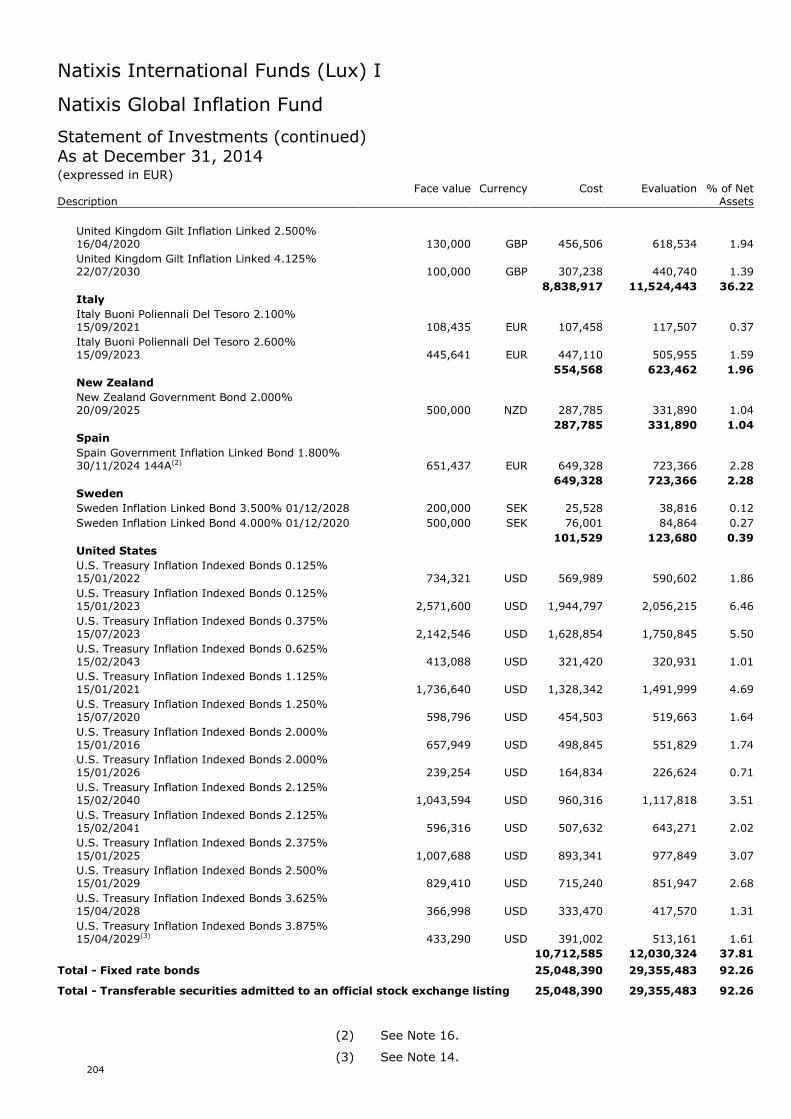
Natixis International Funds (Lux) I
204
Natixis Global Inflation Fund
Statement of Investments (continued)As at December 31, 2014(expressed in EUR)
Face value Currency Cost Evaluation % of NetDescription Assets
United Kingdom Gilt Inflation Linked 2.500%16/04/2020 130,000 GBP 456,506 618,534 1.94
United Kingdom Gilt Inflation Linked 4.125%22/07/2030 100,000 GBP 307,238 440,740 1.39
8,838,917 11,524,443 36.22Italy
Italy Buoni Poliennali Del Tesoro 2.100%15/09/2021 108,435 EUR 107,458 117,507 0.37
Italy Buoni Poliennali Del Tesoro 2.600%15/09/2023 445,641 EUR 447,110 505,955 1.59
554,568 623,462 1.96New Zealand
New Zealand Government Bond 2.000%20/09/2025 500,000 NZD 287,785 331,890 1.04
287,785 331,890 1.04Spain
Spain Government Inflation Linked Bond 1.800%30/11/2024 144A(2) 651,437 EUR 649,328 723,366 2.28
649,328 723,366 2.28Sweden
Sweden Inflation Linked Bond 3.500% 01/12/2028 200,000 SEK 25,528 38,816 0.12
Sweden Inflation Linked Bond 4.000% 01/12/2020 500,000 SEK 76,001 84,864 0.27
101,529 123,680 0.39United States
U.S. Treasury Inflation Indexed Bonds 0.125%15/01/2022 734,321 USD 569,989 590,602 1.86
U.S. Treasury Inflation Indexed Bonds 0.125%15/01/2023 2,571,600 USD 1,944,797 2,056,215 6.46
U.S. Treasury Inflation Indexed Bonds 0.375%15/07/2023 2,142,546 USD 1,628,854 1,750,845 5.50
U.S. Treasury Inflation Indexed Bonds 0.625%15/02/2043 413,088 USD 321,420 320,931 1.01
U.S. Treasury Inflation Indexed Bonds 1.125%15/01/2021 1,736,640 USD 1,328,342 1,491,999 4.69
U.S. Treasury Inflation Indexed Bonds 1.250%15/07/2020 598,796 USD 454,503 519,663 1.64
U.S. Treasury Inflation Indexed Bonds 2.000%15/01/2016 657,949 USD 498,845 551,829 1.74
U.S. Treasury Inflation Indexed Bonds 2.000%15/01/2026 239,254 USD 164,834 226,624 0.71
U.S. Treasury Inflation Indexed Bonds 2.125%15/02/2040 1,043,594 USD 960,316 1,117,818 3.51
U.S. Treasury Inflation Indexed Bonds 2.125%15/02/2041 596,316 USD 507,632 643,271 2.02
U.S. Treasury Inflation Indexed Bonds 2.375%15/01/2025 1,007,688 USD 893,341 977,849 3.07
U.S. Treasury Inflation Indexed Bonds 2.500%15/01/2029 829,410 USD 715,240 851,947 2.68
U.S. Treasury Inflation Indexed Bonds 3.625%15/04/2028 366,998 USD 333,470 417,570 1.31
U.S. Treasury Inflation Indexed Bonds 3.875%15/04/2029(3) 433,290 USD 391,002 513,161 1.61
10,712,585 12,030,324 37.81
Total - Fixed rate bonds 25,048,390 29,355,483 92.26
Total - Transferable securities admitted to an official stock exchange listing 25,048,390 29,355,483 92.26
(2) See Note 16.
(3) See Note 14.
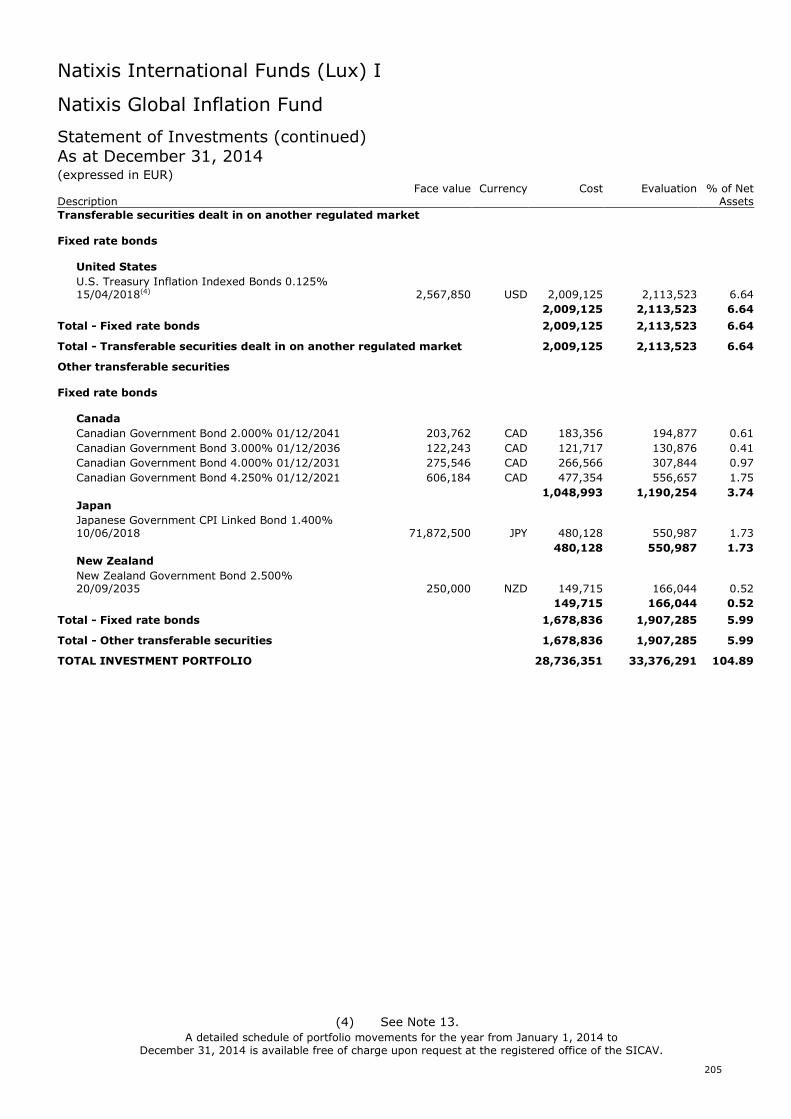
Natixis International Funds (Lux) I
205
Natixis Global Inflation Fund
Statement of Investments (continued)As at December 31, 2014(expressed in EUR)
Face value Currency Cost Evaluation % of NetDescription Assets
Transferable securities dealt in on another regulated market
Fixed rate bonds
United States
U.S. Treasury Inflation Indexed Bonds 0.125%15/04/2018(4) 2,567,850 USD 2,009,125 2,113,523 6.64
2,009,125 2,113,523 6.64
Total - Fixed rate bonds 2,009,125 2,113,523 6.64
Total - Transferable securities dealt in on another regulated market 2,009,125 2,113,523 6.64
Other transferable securities
Fixed rate bonds
Canada
Canadian Government Bond 2.000% 01/12/2041 203,762 CAD 183,356 194,877 0.61
Canadian Government Bond 3.000% 01/12/2036 122,243 CAD 121,717 130,876 0.41
Canadian Government Bond 4.000% 01/12/2031 275,546 CAD 266,566 307,844 0.97
Canadian Government Bond 4.250% 01/12/2021 606,184 CAD 477,354 556,657 1.75
1,048,993 1,190,254 3.74Japan
Japanese Government CPI Linked Bond 1.400%10/06/2018 71,872,500 JPY 480,128 550,987 1.73
480,128 550,987 1.73New Zealand
New Zealand Government Bond 2.500%20/09/2035 250,000 NZD 149,715 166,044 0.52
149,715 166,044 0.52
Total - Fixed rate bonds 1,678,836 1,907,285 5.99
Total - Other transferable securities 1,678,836 1,907,285 5.99
TOTAL INVESTMENT PORTFOLIO 28,736,351 33,376,291 104.89
A detailed schedule of portfolio movements for the year from January 1, 2014 toDecember 31, 2014 is available free of charge upon request at the registered office of the SICAV.
(4) See Note 13.
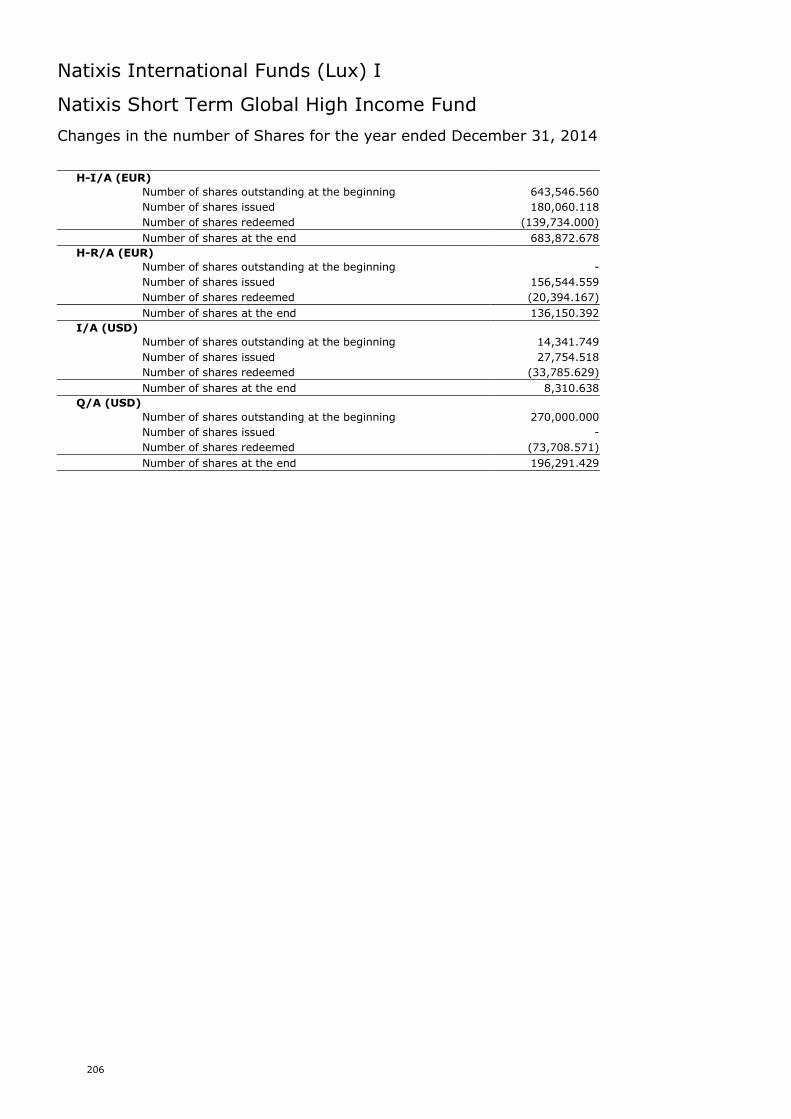
Natixis International Funds (Lux) I
206
Natixis Short Term Global High Income Fund
Changes in the number of Shares for the year ended December 31, 2014
H-I/A (EUR)
Number of shares outstanding at the beginning 643,546.560
Number of shares issued 180,060.118
Number of shares redeemed (139,734.000)
Number of shares at the end 683,872.678
H-R/A (EUR)
Number of shares outstanding at the beginning -
Number of shares issued 156,544.559
Number of shares redeemed (20,394.167)
Number of shares at the end 136,150.392
I/A (USD)
Number of shares outstanding at the beginning 14,341.749
Number of shares issued 27,754.518
Number of shares redeemed (33,785.629)
Number of shares at the end 8,310.638
Q/A (USD)
Number of shares outstanding at the beginning 270,000.000
Number of shares issued -
Number of shares redeemed (73,708.571)
Number of shares at the end 196,291.429

Natixis International Funds (Lux) I
207
Natixis Short Term Global High Income Fund
Statistics
December 31, 2014 December 31, 2013 December 31, 2012
USD USD USD
Total Net Asset Value 122,854,292 118,181,571 -
Net Asset Value per Share
H-I/A (EUR) 102.99 100.98 -
H-R/A (EUR) 100.65 - -
I/A (USD) 102.70 100.83 -
Q/A (USD) 103.07 100.89 -
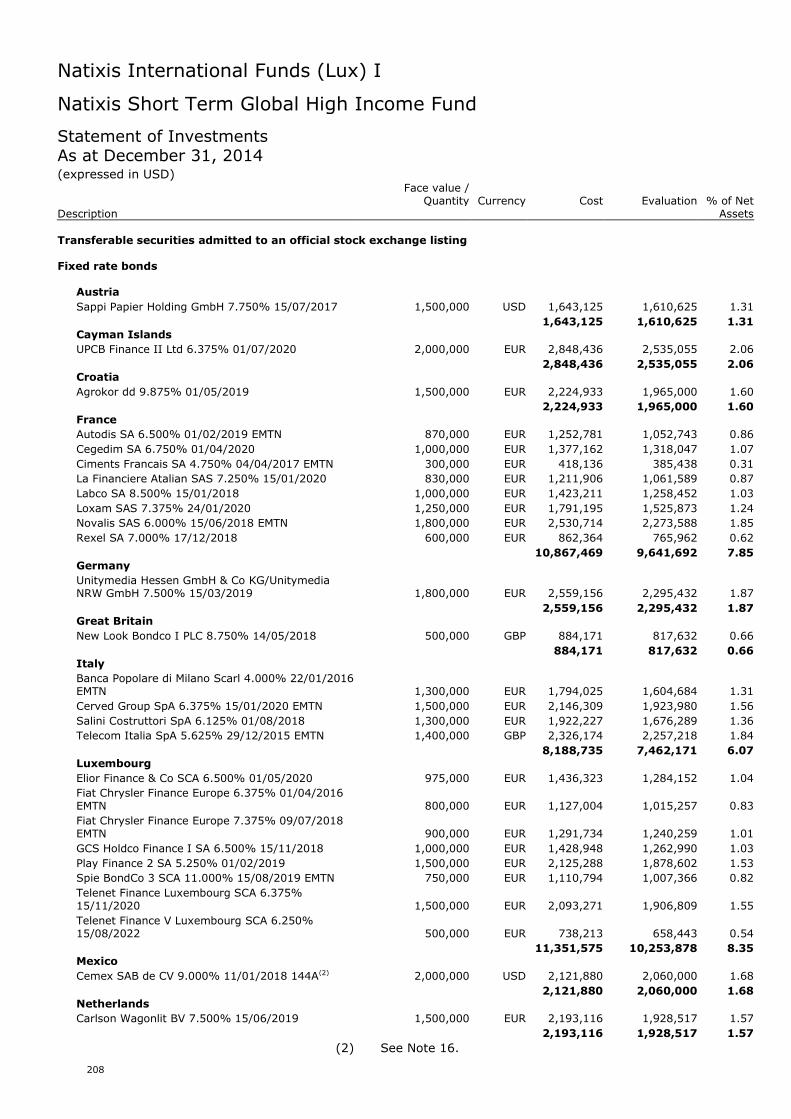
Natixis International Funds (Lux) I
208
Natixis Short Term Global High Income Fund
Statement of InvestmentsAs at December 31, 2014(expressed in USD)
Face value /Quantity Currency Cost Evaluation % of Net
Description Assets
Transferable securities admitted to an official stock exchange listing
Fixed rate bonds
Austria
Sappi Papier Holding GmbH 7.750% 15/07/2017 1,500,000 USD 1,643,125 1,610,625 1.31
1,643,125 1,610,625 1.31Cayman Islands
UPCB Finance II Ltd 6.375% 01/07/2020 2,000,000 EUR 2,848,436 2,535,055 2.06
2,848,436 2,535,055 2.06Croatia
Agrokor dd 9.875% 01/05/2019 1,500,000 EUR 2,224,933 1,965,000 1.60
2,224,933 1,965,000 1.60France
Autodis SA 6.500% 01/02/2019 EMTN 870,000 EUR 1,252,781 1,052,743 0.86
Cegedim SA 6.750% 01/04/2020 1,000,000 EUR 1,377,162 1,318,047 1.07
Ciments Francais SA 4.750% 04/04/2017 EMTN 300,000 EUR 418,136 385,438 0.31
La Financiere Atalian SAS 7.250% 15/01/2020 830,000 EUR 1,211,906 1,061,589 0.87
Labco SA 8.500% 15/01/2018 1,000,000 EUR 1,423,211 1,258,452 1.03
Loxam SAS 7.375% 24/01/2020 1,250,000 EUR 1,791,195 1,525,873 1.24
Novalis SAS 6.000% 15/06/2018 EMTN 1,800,000 EUR 2,530,714 2,273,588 1.85
Rexel SA 7.000% 17/12/2018 600,000 EUR 862,364 765,962 0.62
10,867,469 9,641,692 7.85Germany
Unitymedia Hessen GmbH & Co KG/UnitymediaNRW GmbH 7.500% 15/03/2019 1,800,000 EUR 2,559,156 2,295,432 1.87
2,559,156 2,295,432 1.87Great Britain
New Look Bondco I PLC 8.750% 14/05/2018 500,000 GBP 884,171 817,632 0.66
884,171 817,632 0.66Italy
Banca Popolare di Milano Scarl 4.000% 22/01/2016EMTN 1,300,000 EUR 1,794,025 1,604,684 1.31
Cerved Group SpA 6.375% 15/01/2020 EMTN 1,500,000 EUR 2,146,309 1,923,980 1.56
Salini Costruttori SpA 6.125% 01/08/2018 1,300,000 EUR 1,922,227 1,676,289 1.36
Telecom Italia SpA 5.625% 29/12/2015 EMTN 1,400,000 GBP 2,326,174 2,257,218 1.84
8,188,735 7,462,171 6.07Luxembourg
Elior Finance & Co SCA 6.500% 01/05/2020 975,000 EUR 1,436,323 1,284,152 1.04
Fiat Chrysler Finance Europe 6.375% 01/04/2016EMTN 800,000 EUR 1,127,004 1,015,257 0.83
Fiat Chrysler Finance Europe 7.375% 09/07/2018EMTN 900,000 EUR 1,291,734 1,240,259 1.01
GCS Holdco Finance I SA 6.500% 15/11/2018 1,000,000 EUR 1,428,948 1,262,990 1.03
Play Finance 2 SA 5.250% 01/02/2019 1,500,000 EUR 2,125,288 1,878,602 1.53
Spie BondCo 3 SCA 11.000% 15/08/2019 EMTN 750,000 EUR 1,110,794 1,007,366 0.82
Telenet Finance Luxembourg SCA 6.375%15/11/2020 1,500,000 EUR 2,093,271 1,906,809 1.55
Telenet Finance V Luxembourg SCA 6.250%15/08/2022 500,000 EUR 738,213 658,443 0.54
11,351,575 10,253,878 8.35Mexico
Cemex SAB de CV 9.000% 11/01/2018 144A(2) 2,000,000 USD 2,121,880 2,060,000 1.68
2,121,880 2,060,000 1.68Netherlands
Carlson Wagonlit BV 7.500% 15/06/2019 1,500,000 EUR 2,193,116 1,928,517 1.57
2,193,116 1,928,517 1.57
(2) See Note 16.
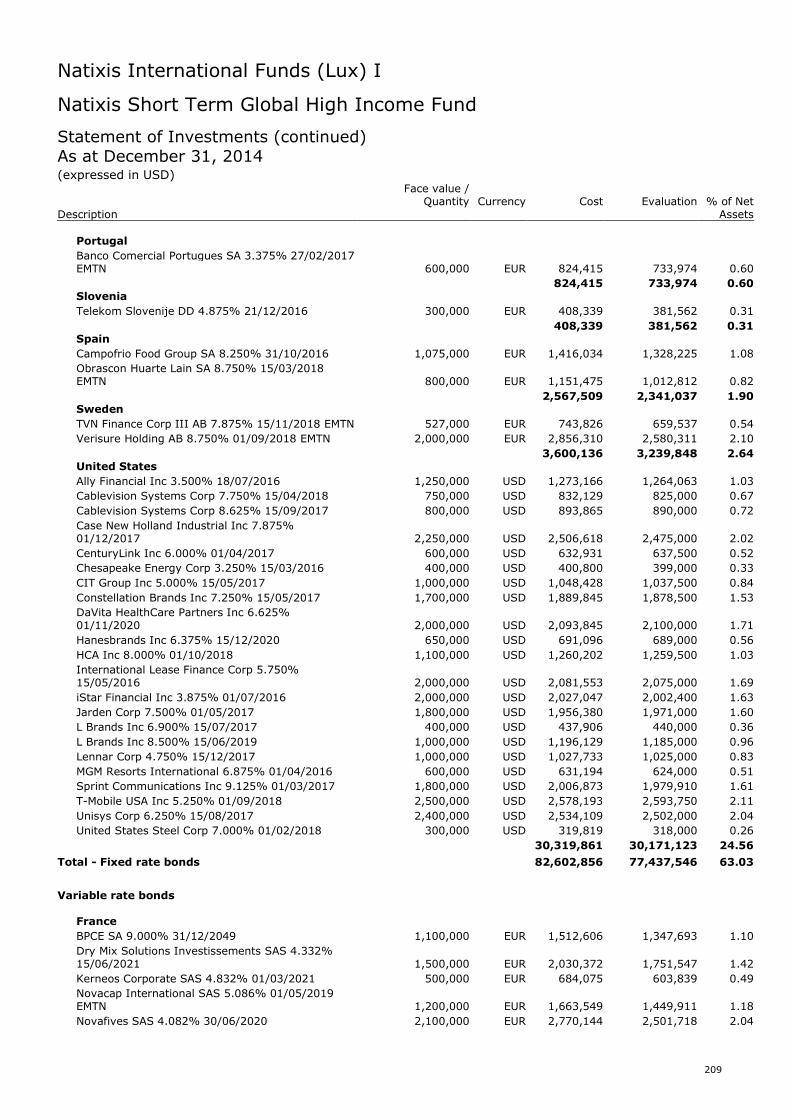
Natixis International Funds (Lux) I
209
Natixis Short Term Global High Income Fund
Statement of Investments (continued)As at December 31, 2014(expressed in USD)
Face value /Quantity Currency Cost Evaluation % of Net
Description Assets
Portugal
Banco Comercial Portugues SA 3.375% 27/02/2017EMTN 600,000 EUR 824,415 733,974 0.60
824,415 733,974 0.60Slovenia
Telekom Slovenije DD 4.875% 21/12/2016 300,000 EUR 408,339 381,562 0.31
408,339 381,562 0.31Spain
Campofrio Food Group SA 8.250% 31/10/2016 1,075,000 EUR 1,416,034 1,328,225 1.08
Obrascon Huarte Lain SA 8.750% 15/03/2018EMTN 800,000 EUR 1,151,475 1,012,812 0.82
2,567,509 2,341,037 1.90Sweden
TVN Finance Corp III AB 7.875% 15/11/2018 EMTN 527,000 EUR 743,826 659,537 0.54
Verisure Holding AB 8.750% 01/09/2018 EMTN 2,000,000 EUR 2,856,310 2,580,311 2.10
3,600,136 3,239,848 2.64United States
Ally Financial Inc 3.500% 18/07/2016 1,250,000 USD 1,273,166 1,264,063 1.03
Cablevision Systems Corp 7.750% 15/04/2018 750,000 USD 832,129 825,000 0.67
Cablevision Systems Corp 8.625% 15/09/2017 800,000 USD 893,865 890,000 0.72
Case New Holland Industrial Inc 7.875%01/12/2017 2,250,000 USD 2,506,618 2,475,000 2.02
CenturyLink Inc 6.000% 01/04/2017 600,000 USD 632,931 637,500 0.52
Chesapeake Energy Corp 3.250% 15/03/2016 400,000 USD 400,800 399,000 0.33
CIT Group Inc 5.000% 15/05/2017 1,000,000 USD 1,048,428 1,037,500 0.84
Constellation Brands Inc 7.250% 15/05/2017 1,700,000 USD 1,889,845 1,878,500 1.53
DaVita HealthCare Partners Inc 6.625%01/11/2020 2,000,000 USD 2,093,845 2,100,000 1.71
Hanesbrands Inc 6.375% 15/12/2020 650,000 USD 691,096 689,000 0.56
HCA Inc 8.000% 01/10/2018 1,100,000 USD 1,260,202 1,259,500 1.03
International Lease Finance Corp 5.750%15/05/2016 2,000,000 USD 2,081,553 2,075,000 1.69
iStar Financial Inc 3.875% 01/07/2016 2,000,000 USD 2,027,047 2,002,400 1.63
Jarden Corp 7.500% 01/05/2017 1,800,000 USD 1,956,380 1,971,000 1.60
L Brands Inc 6.900% 15/07/2017 400,000 USD 437,906 440,000 0.36
L Brands Inc 8.500% 15/06/2019 1,000,000 USD 1,196,129 1,185,000 0.96
Lennar Corp 4.750% 15/12/2017 1,000,000 USD 1,027,733 1,025,000 0.83
MGM Resorts International 6.875% 01/04/2016 600,000 USD 631,194 624,000 0.51
Sprint Communications Inc 9.125% 01/03/2017 1,800,000 USD 2,006,873 1,979,910 1.61
T-Mobile USA Inc 5.250% 01/09/2018 2,500,000 USD 2,578,193 2,593,750 2.11
Unisys Corp 6.250% 15/08/2017 2,400,000 USD 2,534,109 2,502,000 2.04
United States Steel Corp 7.000% 01/02/2018 300,000 USD 319,819 318,000 0.26
30,319,861 30,171,123 24.56
Total - Fixed rate bonds 82,602,856 77,437,546 63.03
Variable rate bonds
France
BPCE SA 9.000% 31/12/2049 1,100,000 EUR 1,512,606 1,347,693 1.10
Dry Mix Solutions Investissements SAS 4.332%15/06/2021 1,500,000 EUR 2,030,372 1,751,547 1.42
Kerneos Corporate SAS 4.832% 01/03/2021 500,000 EUR 684,075 603,839 0.49
Novacap International SAS 5.086% 01/05/2019EMTN 1,200,000 EUR 1,663,549 1,449,911 1.18
Novafives SAS 4.082% 30/06/2020 2,100,000 EUR 2,770,144 2,501,718 2.04
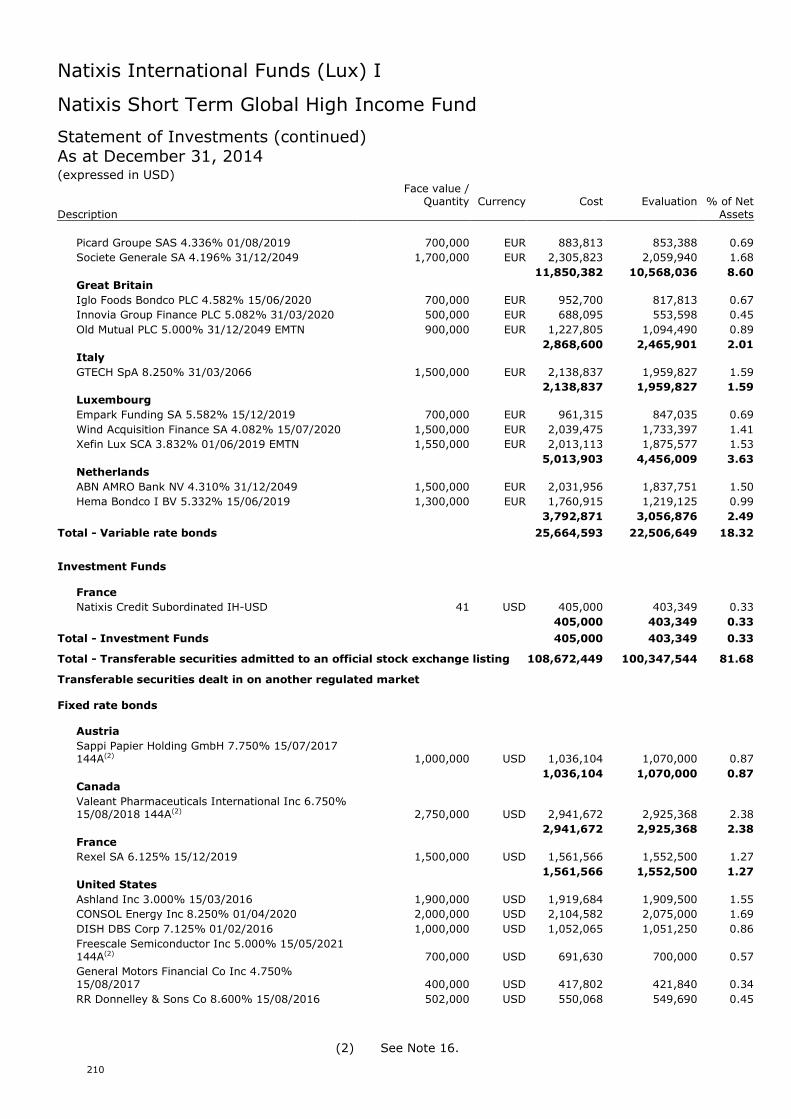
Natixis International Funds (Lux) I
210
Natixis Short Term Global High Income Fund
Statement of Investments (continued)As at December 31, 2014(expressed in USD)
Face value /Quantity Currency Cost Evaluation % of Net
Description Assets
Picard Groupe SAS 4.336% 01/08/2019 700,000 EUR 883,813 853,388 0.69
Societe Generale SA 4.196% 31/12/2049 1,700,000 EUR 2,305,823 2,059,940 1.68
11,850,382 10,568,036 8.60Great Britain
Iglo Foods Bondco PLC 4.582% 15/06/2020 700,000 EUR 952,700 817,813 0.67
Innovia Group Finance PLC 5.082% 31/03/2020 500,000 EUR 688,095 553,598 0.45
Old Mutual PLC 5.000% 31/12/2049 EMTN 900,000 EUR 1,227,805 1,094,490 0.89
2,868,600 2,465,901 2.01Italy
GTECH SpA 8.250% 31/03/2066 1,500,000 EUR 2,138,837 1,959,827 1.59
2,138,837 1,959,827 1.59Luxembourg
Empark Funding SA 5.582% 15/12/2019 700,000 EUR 961,315 847,035 0.69
Wind Acquisition Finance SA 4.082% 15/07/2020 1,500,000 EUR 2,039,475 1,733,397 1.41
Xefin Lux SCA 3.832% 01/06/2019 EMTN 1,550,000 EUR 2,013,113 1,875,577 1.53
5,013,903 4,456,009 3.63Netherlands
ABN AMRO Bank NV 4.310% 31/12/2049 1,500,000 EUR 2,031,956 1,837,751 1.50
Hema Bondco I BV 5.332% 15/06/2019 1,300,000 EUR 1,760,915 1,219,125 0.99
3,792,871 3,056,876 2.49
Total - Variable rate bonds 25,664,593 22,506,649 18.32
Investment Funds
France
Natixis Credit Subordinated IH-USD 41 USD 405,000 403,349 0.33
405,000 403,349 0.33
Total - Investment Funds 405,000 403,349 0.33
Total - Transferable securities admitted to an official stock exchange listing 108,672,449 100,347,544 81.68
Transferable securities dealt in on another regulated market
Fixed rate bonds
Austria
Sappi Papier Holding GmbH 7.750% 15/07/2017144A(2) 1,000,000 USD 1,036,104 1,070,000 0.87
1,036,104 1,070,000 0.87Canada
Valeant Pharmaceuticals International Inc 6.750%15/08/2018 144A(2) 2,750,000 USD 2,941,672 2,925,368 2.38
2,941,672 2,925,368 2.38France
Rexel SA 6.125% 15/12/2019 1,500,000 USD 1,561,566 1,552,500 1.27
1,561,566 1,552,500 1.27United States
Ashland Inc 3.000% 15/03/2016 1,900,000 USD 1,919,684 1,909,500 1.55
CONSOL Energy Inc 8.250% 01/04/2020 2,000,000 USD 2,104,582 2,075,000 1.69
DISH DBS Corp 7.125% 01/02/2016 1,000,000 USD 1,052,065 1,051,250 0.86
Freescale Semiconductor Inc 5.000% 15/05/2021144A(2) 700,000 USD 691,630 700,000 0.57
General Motors Financial Co Inc 4.750%15/08/2017 400,000 USD 417,802 421,840 0.34
RR Donnelley & Sons Co 8.600% 15/08/2016 502,000 USD 550,068 549,690 0.45
(2) See Note 16.
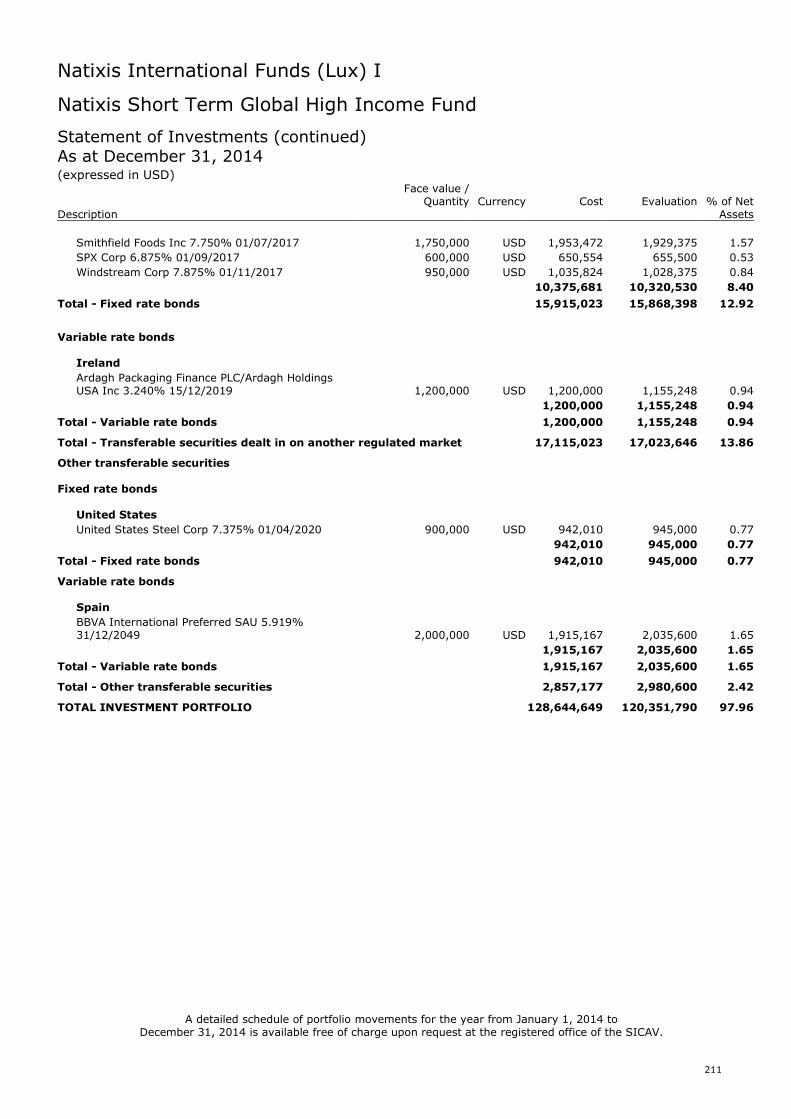
Natixis International Funds (Lux) I
211
Natixis Short Term Global High Income Fund
Statement of Investments (continued)As at December 31, 2014(expressed in USD)
Face value /Quantity Currency Cost Evaluation % of Net
Description Assets
Smithfield Foods Inc 7.750% 01/07/2017 1,750,000 USD 1,953,472 1,929,375 1.57
SPX Corp 6.875% 01/09/2017 600,000 USD 650,554 655,500 0.53
Windstream Corp 7.875% 01/11/2017 950,000 USD 1,035,824 1,028,375 0.84
10,375,681 10,320,530 8.40
Total - Fixed rate bonds 15,915,023 15,868,398 12.92
Variable rate bonds
Ireland
Ardagh Packaging Finance PLC/Ardagh HoldingsUSA Inc 3.240% 15/12/2019 1,200,000 USD 1,200,000 1,155,248 0.94
1,200,000 1,155,248 0.94
Total - Variable rate bonds 1,200,000 1,155,248 0.94
Total - Transferable securities dealt in on another regulated market 17,115,023 17,023,646 13.86
Other transferable securities
Fixed rate bonds
United States
United States Steel Corp 7.375% 01/04/2020 900,000 USD 942,010 945,000 0.77
942,010 945,000 0.77
Total - Fixed rate bonds 942,010 945,000 0.77
Variable rate bonds
Spain
BBVA International Preferred SAU 5.919%31/12/2049 2,000,000 USD 1,915,167 2,035,600 1.65
1,915,167 2,035,600 1.65
Total - Variable rate bonds 1,915,167 2,035,600 1.65
Total - Other transferable securities 2,857,177 2,980,600 2.42
TOTAL INVESTMENT PORTFOLIO 128,644,649 120,351,790 97.96
A detailed schedule of portfolio movements for the year from January 1, 2014 toDecember 31, 2014 is available free of charge upon request at the registered office of the SICAV.
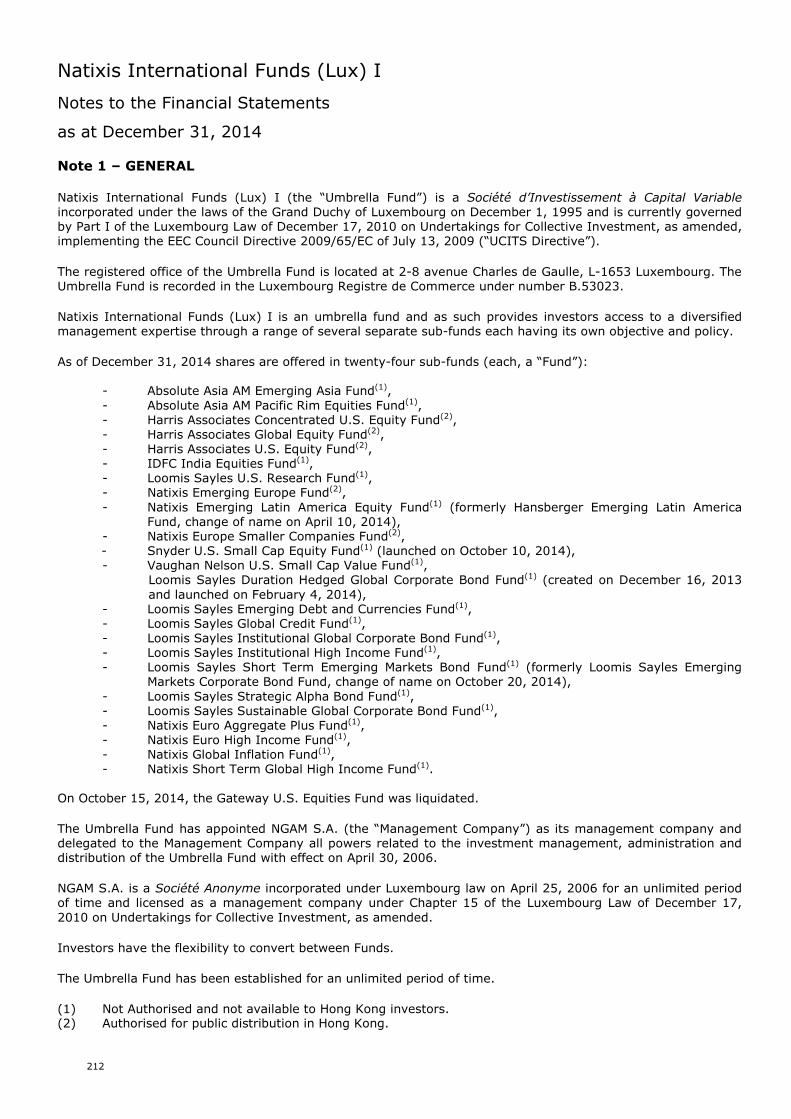
Natixis International Funds (Lux) I
Notes to the Financial Statements
as at December 31, 2014
212
Note 1 – GENERAL
Natixis International Funds (Lux) I (the “Umbrella Fund”) is a Société d’Investissement à Capital Variableincorporated under the laws of the Grand Duchy of Luxembourg on December 1, 1995 and is currently governedby Part I of the Luxembourg Law of December 17, 2010 on Undertakings for Collective Investment, as amended,implementing the EEC Council Directive 2009/65/EC of July 13, 2009 (“UCITS Directive”).
The registered office of the Umbrella Fund is located at 2-8 avenue Charles de Gaulle, L-1653 Luxembourg. TheUmbrella Fund is recorded in the Luxembourg Registre de Commerce under number B.53023.
Natixis International Funds (Lux) I is an umbrella fund and as such provides investors access to a diversifiedmanagement expertise through a range of several separate sub-funds each having its own objective and policy.
As of December 31, 2014 shares are offered in twenty-four sub-funds (each, a “Fund”):
- Absolute Asia AM Emerging Asia Fund(1),- Absolute Asia AM Pacific Rim Equities Fund(1),- Harris Associates Concentrated U.S. Equity Fund(2),- Harris Associates Global Equity Fund(2),- Harris Associates U.S. Equity Fund(2),- IDFC India Equities Fund(1),- Loomis Sayles U.S. Research Fund(1),- Natixis Emerging Europe Fund(2),- Natixis Emerging Latin America Equity Fund(1) (formerly Hansberger Emerging Latin America
Fund, change of name on April 10, 2014),- Natixis Europe Smaller Companies Fund(2),- Snyder U.S. Small Cap Equity Fund(1) (launched on October 10, 2014),- Vaughan Nelson U.S. Small Cap Value Fund(1),
Loomis Sayles Duration Hedged Global Corporate Bond Fund(1) (created on December 16, 2013and launched on February 4, 2014),
- Loomis Sayles Emerging Debt and Currencies Fund(1),- Loomis Sayles Global Credit Fund(1),- Loomis Sayles Institutional Global Corporate Bond Fund(1),- Loomis Sayles Institutional High Income Fund(1),- Loomis Sayles Short Term Emerging Markets Bond Fund(1) (formerly Loomis Sayles Emerging
Markets Corporate Bond Fund, change of name on October 20, 2014),- Loomis Sayles Strategic Alpha Bond Fund(1),- Loomis Sayles Sustainable Global Corporate Bond Fund(1),- Natixis Euro Aggregate Plus Fund(1),- Natixis Euro High Income Fund(1),- Natixis Global Inflation Fund(1),- Natixis Short Term Global High Income Fund(1).
On October 15, 2014, the Gateway U.S. Equities Fund was liquidated.
The Umbrella Fund has appointed NGAM S.A. (the “Management Company”) as its management company anddelegated to the Management Company all powers related to the investment management, administration anddistribution of the Umbrella Fund with effect on April 30, 2006.
NGAM S.A. is a Société Anonyme incorporated under Luxembourg law on April 25, 2006 for an unlimited periodof time and licensed as a management company under Chapter 15 of the Luxembourg Law of December 17,2010 on Undertakings for Collective Investment, as amended.
Investors have the flexibility to convert between Funds.
The Umbrella Fund has been established for an unlimited period of time.
(1) Not Authorised and not available to Hong Kong investors.(2) Authorised for public distribution in Hong Kong.
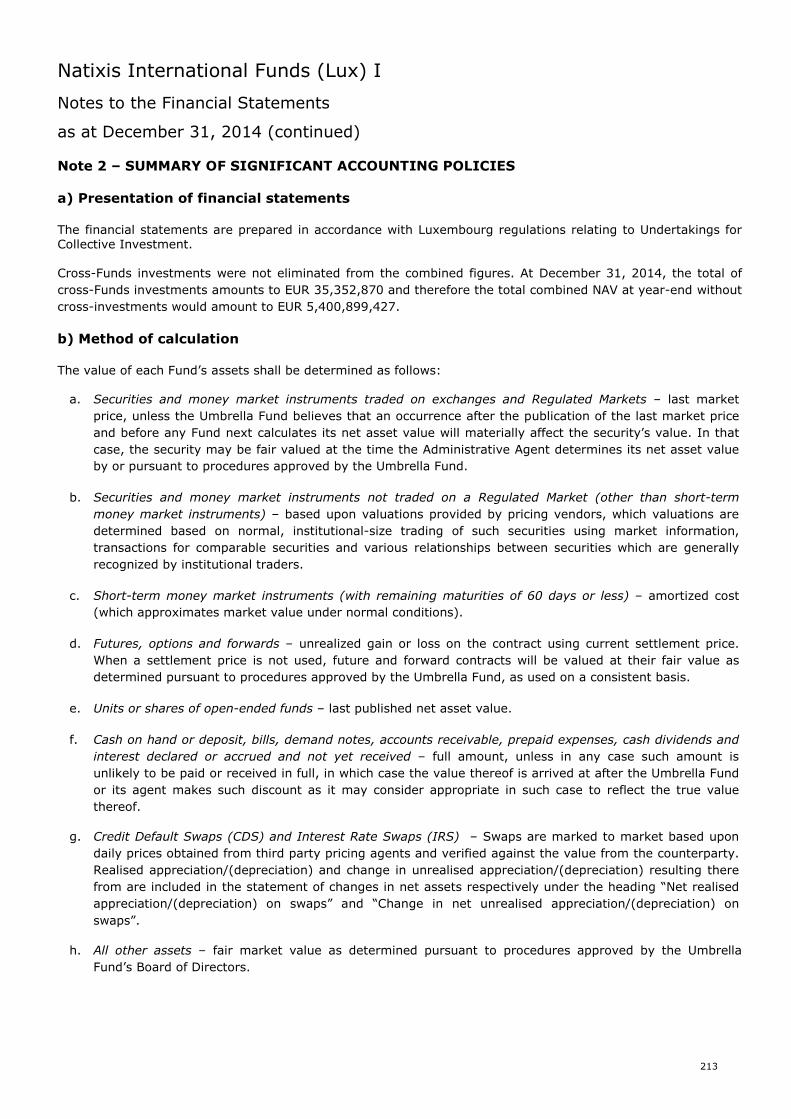
Natixis International Funds (Lux) I
Notes to the Financial Statements
as at December 31, 2014 (continued)
213
Note 2 – SUMMARY OF SIGNIFICANT ACCOUNTING POLICIES
a) Presentation of financial statements
The financial statements are prepared in accordance with Luxembourg regulations relating to Undertakings forCollective Investment.
Cross-Funds investments were not eliminated from the combined figures. At December 31, 2014, the total of
cross-Funds investments amounts to EUR 35,352,870 and therefore the total combined NAV at year-end without
cross-investments would amount to EUR 5,400,899,427.
b) Method of calculation
The value of each Fund’s assets shall be determined as follows:
a. Securities and money market instruments traded on exchanges and Regulated Markets – last market
price, unless the Umbrella Fund believes that an occurrence after the publication of the last market price
and before any Fund next calculates its net asset value will materially affect the security’s value. In that
case, the security may be fair valued at the time the Administrative Agent determines its net asset value
by or pursuant to procedures approved by the Umbrella Fund.
b. Securities and money market instruments not traded on a Regulated Market (other than short-term
money market instruments) – based upon valuations provided by pricing vendors, which valuations are
determined based on normal, institutional-size trading of such securities using market information,
transactions for comparable securities and various relationships between securities which are generally
recognized by institutional traders.
c. Short-term money market instruments (with remaining maturities of 60 days or less) – amortized cost
(which approximates market value under normal conditions).
d. Futures, options and forwards – unrealized gain or loss on the contract using current settlement price.
When a settlement price is not used, future and forward contracts will be valued at their fair value as
determined pursuant to procedures approved by the Umbrella Fund, as used on a consistent basis.
e. Units or shares of open-ended funds – last published net asset value.
f. Cash on hand or deposit, bills, demand notes, accounts receivable, prepaid expenses, cash dividends and
interest declared or accrued and not yet received – full amount, unless in any case such amount is
unlikely to be paid or received in full, in which case the value thereof is arrived at after the Umbrella Fund
or its agent makes such discount as it may consider appropriate in such case to reflect the true value
thereof.
g. Credit Default Swaps (CDS) and Interest Rate Swaps (IRS) – Swaps are marked to market based upon
daily prices obtained from third party pricing agents and verified against the value from the counterparty.
Realised appreciation/(depreciation) and change in unrealised appreciation/(depreciation) resulting there
from are included in the statement of changes in net assets respectively under the heading “Net realised
appreciation/(depreciation) on swaps” and “Change in net unrealised appreciation/(depreciation) on
swaps”.
h. All other assets – fair market value as determined pursuant to procedures approved by the Umbrella
Fund’s Board of Directors.
Natixis International Funds (Lux) I
Notes to the Financial Statements
as at December 31, 2014 (continued)
214
Note 2 – SUMMARY OF SIGNIFICANT ACCOUNTING POLICIES (continued)
b) Method of calculation (continued)
i. Swaptions - when the Fund writes a swaption, an amount equal to the premium received by the Fund isrecorded as a liability and is subsequently adjusted to the current fair value of the swaption written.Premiums received from the written swaptions which expire unexercised are treated by the Fund on theexpiration dates as realised gains.
j. Term loans – the Fund may invest in fixed and floating rate loans from one or more financial institutionsby way of an assignment/transfer or for a participation in the whole or part of the loan amountoutstanding. The Fund will invest only in loans that qualify as money market instruments. Whenpurchasing loan participations, a Fund assumes the economic risk associated with the corporate borrowerand the credit risk associated with an interposed bank or other financial intermediary. The loanparticipations or assignments in which a Fund intends to invest may not be rated by any internationallyrecognised rating service. When purchasing loan assignments, a Fund assumes the credit risk associatedwith the corporate borrower only. The value of a term loan is determined prudently and in good faith bythe Board of Directors on the basis of foreseeable purchase and sales prices. Realisedappreciation/(depreciation) and changes in unrealised appreciation/(depreciation) as a result thereof areincluded in the Combined Statement of Changes in Net Assets respectively under “Net realisedappreciation/(depreciation) on sales of investments” and “Change in net unrealisedappreciation/(depreciation) on investments”.
c) Foreign exchange translation
The value of all assets and liabilities not expressed in the Reference Currency of a Fund will be converted intothe Reference Currency of such Fund at rates last quoted by any major bank.
The exchange rate used as at December 31, 2014:
1 EUR = 1.2101 USD
Note 3 – DIVIDEND AND INTEREST INCOME
Dividend income is recorded on the ex-dividend date. Interest income (including amortization of premium anddiscount) is accrued daily.
Note 4 – EXTRAORDINARY INCOME
In recent years, the European Court of Justice, through rulings on a number of cases brought before it (FokusBank, Aberdeen, Denkavit, Santander) has upheld the contention that the imposition of withholding taxes by anEU member state on dividends earned by that of another EU member state is discriminatory and impedes thefree flow of capital within the European Union. As a result, some of those EU members, have begun to refundhistorical withholding taxes (and in addition, some have revised their respective tax treaties) in response toclaims filed against them by the taxpayers. Natixis International Funds (Lux) I is among those taxpayers thathave filed claims for a refund of historical withholding taxes suffered against a number of EU countries. As aresult, extraordinary income refers to the refund from the European tax authorities.
Note 5 – FEES PAID TO THE MANAGEMENT COMPANY
The Management Company is entitled to receive from the Funds a Management Fee calculated and payablemonthly in arrears. The Management Fee due to each Share class and for each month shall be calculated asfollows:
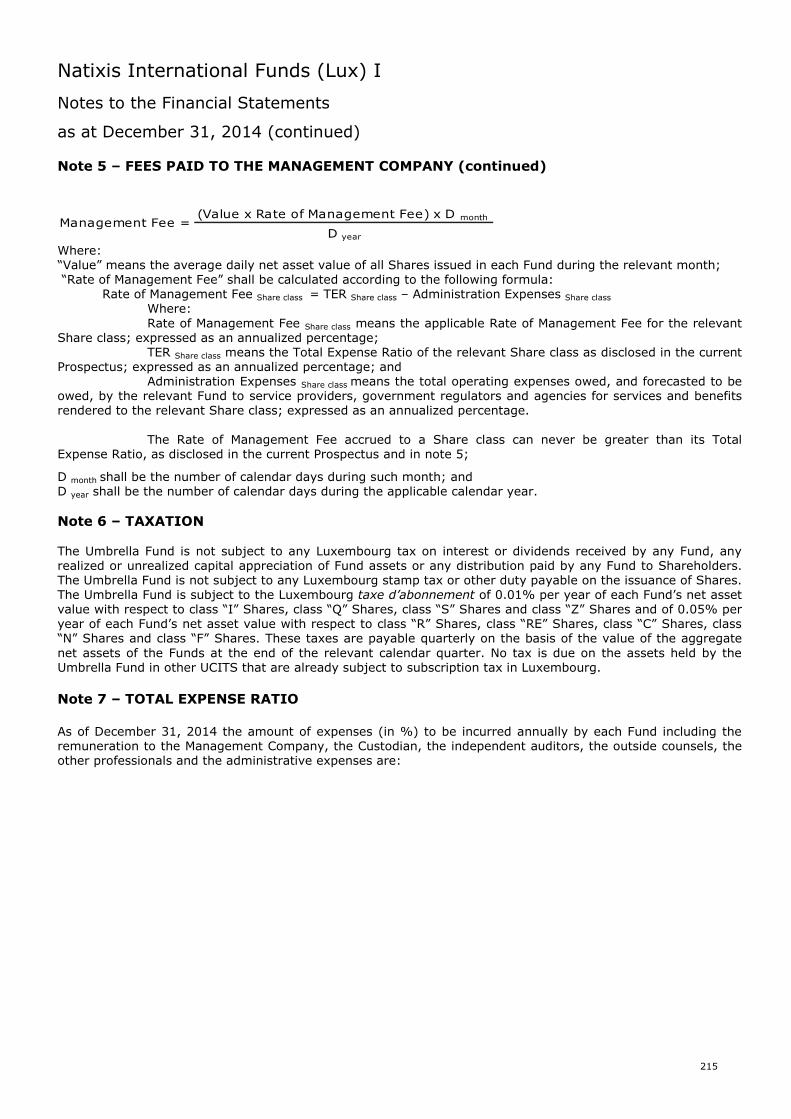
Natixis International Funds (Lux) I
Notes to the Financial Statements
as at December 31, 2014 (continued)
215
Note 5 – FEES PAID TO THE MANAGEMENT COMPANY (continued)
(Value x Rate of Management Fee) x D month
D year
Management Fee =
Where:“Value” means the average daily net asset value of all Shares issued in each Fund during the relevant month;“Rate of Management Fee” shall be calculated according to the following formula:
Rate of Management Fee Share class = TER Share class – Administration Expenses Share class
Where:Rate of Management Fee Share class means the applicable Rate of Management Fee for the relevant
Share class; expressed as an annualized percentage;TER Share class means the Total Expense Ratio of the relevant Share class as disclosed in the current
Prospectus; expressed as an annualized percentage; andAdministration Expenses Share class means the total operating expenses owed, and forecasted to be
owed, by the relevant Fund to service providers, government regulators and agencies for services and benefitsrendered to the relevant Share class; expressed as an annualized percentage.
The Rate of Management Fee accrued to a Share class can never be greater than its TotalExpense Ratio, as disclosed in the current Prospectus and in note 5;
D month shall be the number of calendar days during such month; andD year shall be the number of calendar days during the applicable calendar year.
Note 6 – TAXATION
The Umbrella Fund is not subject to any Luxembourg tax on interest or dividends received by any Fund, anyrealized or unrealized capital appreciation of Fund assets or any distribution paid by any Fund to Shareholders.The Umbrella Fund is not subject to any Luxembourg stamp tax or other duty payable on the issuance of Shares.The Umbrella Fund is subject to the Luxembourg taxe d’abonnement of 0.01% per year of each Fund’s net assetvalue with respect to class “I” Shares, class “Q” Shares, class “S” Shares and class “Z” Shares and of 0.05% peryear of each Fund’s net asset value with respect to class “R” Shares, class “RE” Shares, class “C” Shares, class“N” Shares and class “F” Shares. These taxes are payable quarterly on the basis of the value of the aggregatenet assets of the Funds at the end of the relevant calendar quarter. No tax is due on the assets held by theUmbrella Fund in other UCITS that are already subject to subscription tax in Luxembourg.
Note 7 – TOTAL EXPENSE RATIO
As of December 31, 2014 the amount of expenses (in %) to be incurred annually by each Fund including theremuneration to the Management Company, the Custodian, the independent auditors, the outside counsels, theother professionals and the administrative expenses are:
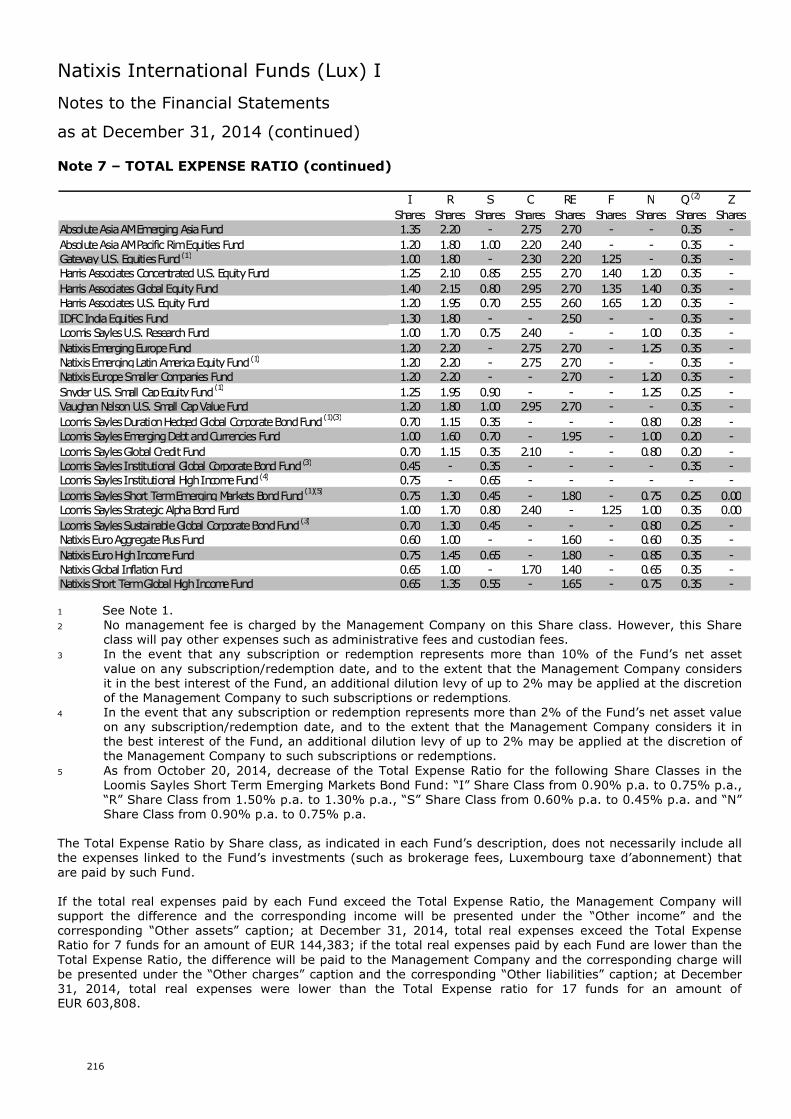
Natixis International Funds (Lux) I
Notes to the Financial Statements
as at December 31, 2014 (continued)
216
Note 7 – TOTAL EXPENSE RATIO (continued)
I R S C RE F N Q(2) Z
Shares Shares Shares Shares Shares Shares Shares Shares SharesAbsoluteAsiaAMEmergingAsiaFund 1.35 2.20 - 2.75 2.70 - - 0.35 -
AbsoluteAsiaAMPacificRimEquities Fund 1.20 1.80 1.00 2.20 2.40 - - 0.35 -GatewayU.S.EquitiesFund(1) 1.00 1.80 - 2.30 2.20 1.25 - 0.35 -HarrisAssociatesConcentratedU.S.EquityFund 1.25 2.10 0.85 2.55 2.70 1.40 1.20 0.35 -
HarrisAssociatesGlobalEquityFund 1.40 2.15 0.80 2.95 2.70 1.35 1.40 0.35 -HarrisAssociatesU.S.Equity Fund 1.20 1.95 0.70 2.55 2.60 1.65 1.20 0.35 -
IDFCIndiaEquities Fund 1.30 1.80 - - 2.50 - - 0.35 -LoomisSaylesU.S.ResearchFund 1.00 1.70 0.75 2.40 - - 1.00 0.35 -
NatixisEmergingEuropeFund 1.20 2.20 - 2.75 2.70 - 1.25 0.35 -NatixisEmergingLatinAmericaEquityFund(1) 1.20 2.20 - 2.75 2.70 - - 0.35 -NatixisEuropeSmaller CompaniesFund 1.20 2.20 - - 2.70 - 1.20 0.35 -
Snyder U.S.Small CapEquityFund(1)
1.25 1.95 0.90 - - - 1.25 0.25 -VaughanNelsonU.S.Small CapValueFund 1.20 1.80 1.00 2.95 2.70 - - 0.35 -
LoomisSaylesDurationHedgedGlobal CorporateBondFund(1)(3)
0.70 1.15 0.35 - - - 0.80 0.28 -LoomisSaylesEmergingDebtandCurrencies Fund 1.00 1.60 0.70 - 1.95 - 1.00 0.20 -
LoomisSaylesGlobalCreditFund 0.70 1.15 0.35 2.10 - - 0.80 0.20 -LoomisSaylesInstitutional Global CorporateBondFund(3) 0.45 - 0.35 - - - - 0.35 -LoomisSaylesInstitutional HighIncomeFund(4) 0.75 - 0.65 - - - - - -
LoomisSaylesShort TermEmergingMarketsBondFund(1)(5)
0.75 1.30 0.45 - 1.80 - 0.75 0.25 0.00LoomisSaylesStrategicAlphaBondFund 1.00 1.70 0.80 2.40 - 1.25 1.00 0.35 0.00
LoomisSaylesSustainableGlobal CorporateBondFund(3)
0.70 1.30 0.45 - - - 0.80 0.25 -NatixisEuroAggregatePlusFund 0.60 1.00 - - 1.60 - 0.60 0.35 -
NatixisEuroHighIncomeFund 0.75 1.45 0.65 - 1.80 - 0.85 0.35 -NatixisGlobal InflationFund 0.65 1.00 - 1.70 1.40 - 0.65 0.35 -NatixisShort TermGlobalHighIncomeFund 0.65 1.35 0.55 - 1.65 - 0.75 0.35 -
1 See Note 1.2 No management fee is charged by the Management Company on this Share class. However, this Share
class will pay other expenses such as administrative fees and custodian fees.3 In the event that any subscription or redemption represents more than 10% of the Fund’s net asset
value on any subscription/redemption date, and to the extent that the Management Company considersit in the best interest of the Fund, an additional dilution levy of up to 2% may be applied at the discretionof the Management Company to such subscriptions or redemptions.
4 In the event that any subscription or redemption represents more than 2% of the Fund’s net asset valueon any subscription/redemption date, and to the extent that the Management Company considers it inthe best interest of the Fund, an additional dilution levy of up to 2% may be applied at the discretion ofthe Management Company to such subscriptions or redemptions.
5 As from October 20, 2014, decrease of the Total Expense Ratio for the following Share Classes in theLoomis Sayles Short Term Emerging Markets Bond Fund: “I” Share Class from 0.90% p.a. to 0.75% p.a.,“R” Share Class from 1.50% p.a. to 1.30% p.a., “S” Share Class from 0.60% p.a. to 0.45% p.a. and “N”Share Class from 0.90% p.a. to 0.75% p.a.
The Total Expense Ratio by Share class, as indicated in each Fund’s description, does not necessarily include allthe expenses linked to the Fund’s investments (such as brokerage fees, Luxembourg taxe d’abonnement) thatare paid by such Fund.
If the total real expenses paid by each Fund exceed the Total Expense Ratio, the Management Company willsupport the difference and the corresponding income will be presented under the “Other income” and thecorresponding “Other assets” caption; at December 31, 2014, total real expenses exceed the Total ExpenseRatio for 7 funds for an amount of EUR 144,383; if the total real expenses paid by each Fund are lower than theTotal Expense Ratio, the difference will be paid to the Management Company and the corresponding charge willbe presented under the “Other charges” caption and the corresponding “Other liabilities” caption; at December31, 2014, total real expenses were lower than the Total Expense ratio for 17 funds for an amount ofEUR 603,808.
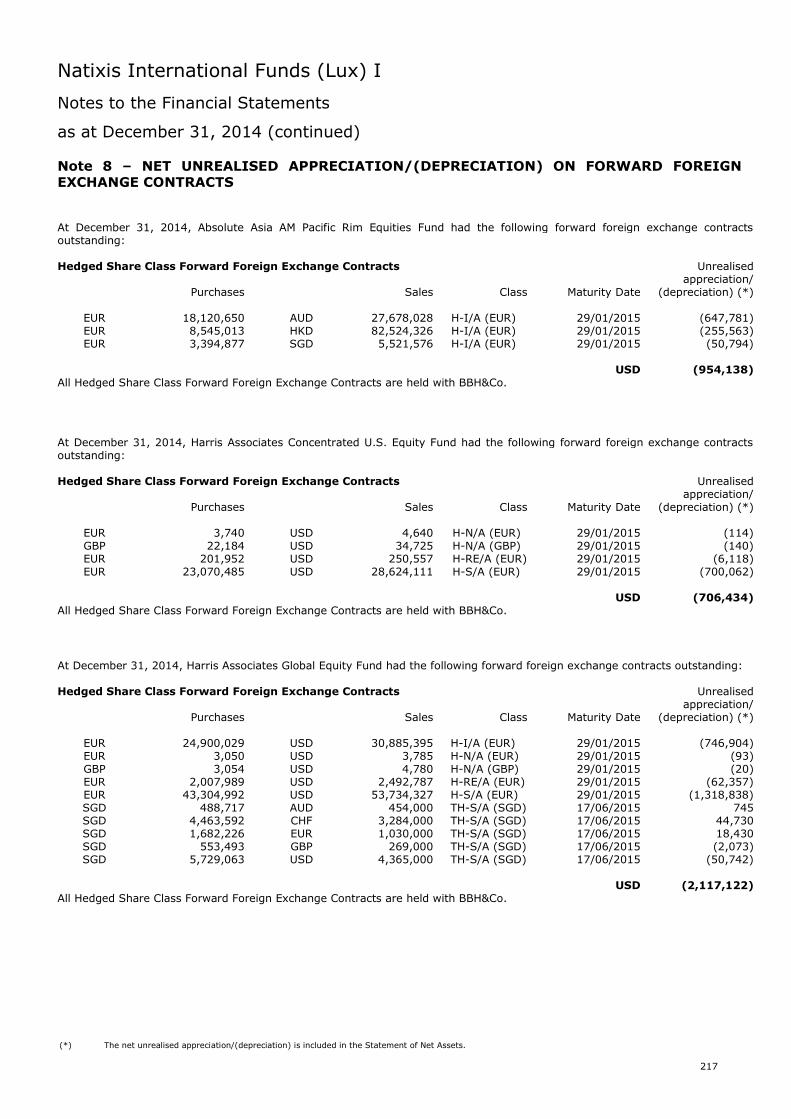
Natixis International Funds (Lux) I
Notes to the Financial Statements
as at December 31, 2014 (continued)
217
Note 8 – NET UNREALISED APPRECIATION/(DEPRECIATION) ON FORWARD FOREIGNEXCHANGE CONTRACTS
At December 31, 2014, Absolute Asia AM Pacific Rim Equities Fund had the following forward foreign exchange contractsoutstanding:
Hedged Share Class Forward Foreign Exchange Contracts Unrealisedappreciation/
Purchases Sales Class Maturity Date (depreciation) (*)
EUR 18,120,650 AUD 27,678,028 H-I/A (EUR) 29/01/2015 (647,781)EUR 8,545,013 HKD 82,524,326 H-I/A (EUR) 29/01/2015 (255,563)EUR 3,394,877 SGD 5,521,576 H-I/A (EUR) 29/01/2015 (50,794)
USD (954,138)All Hedged Share Class Forward Foreign Exchange Contracts are held with BBH&Co.
At December 31, 2014, Harris Associates Concentrated U.S. Equity Fund had the following forward foreign exchange contractsoutstanding:
Hedged Share Class Forward Foreign Exchange Contracts Unrealisedappreciation/
Purchases Sales Class Maturity Date (depreciation) (*)
EUR 3,740 USD 4,640 H-N/A (EUR) 29/01/2015 (114)GBP 22,184 USD 34,725 H-N/A (GBP) 29/01/2015 (140)EUR 201,952 USD 250,557 H-RE/A (EUR) 29/01/2015 (6,118)EUR 23,070,485 USD 28,624,111 H-S/A (EUR) 29/01/2015 (700,062)
USD (706,434)All Hedged Share Class Forward Foreign Exchange Contracts are held with BBH&Co.
At December 31, 2014, Harris Associates Global Equity Fund had the following forward foreign exchange contracts outstanding:
Hedged Share Class Forward Foreign Exchange Contracts Unrealisedappreciation/
Purchases Sales Class Maturity Date (depreciation) (*)
EUR 24,900,029 USD 30,885,395 H-I/A (EUR) 29/01/2015 (746,904)EUR 3,050 USD 3,785 H-N/A (EUR) 29/01/2015 (93)GBP 3,054 USD 4,780 H-N/A (GBP) 29/01/2015 (20)EUR 2,007,989 USD 2,492,787 H-RE/A (EUR) 29/01/2015 (62,357)EUR 43,304,992 USD 53,734,327 H-S/A (EUR) 29/01/2015 (1,318,838)SGD 488,717 AUD 454,000 TH-S/A (SGD) 17/06/2015 745SGD 4,463,592 CHF 3,284,000 TH-S/A (SGD) 17/06/2015 44,730SGD 1,682,226 EUR 1,030,000 TH-S/A (SGD) 17/06/2015 18,430SGD 553,493 GBP 269,000 TH-S/A (SGD) 17/06/2015 (2,073)SGD 5,729,063 USD 4,365,000 TH-S/A (SGD) 17/06/2015 (50,742)
USD (2,117,122)All Hedged Share Class Forward Foreign Exchange Contracts are held with BBH&Co.
(*) The net unrealised appreciation/(depreciation) is included in the Statement of Net Assets.
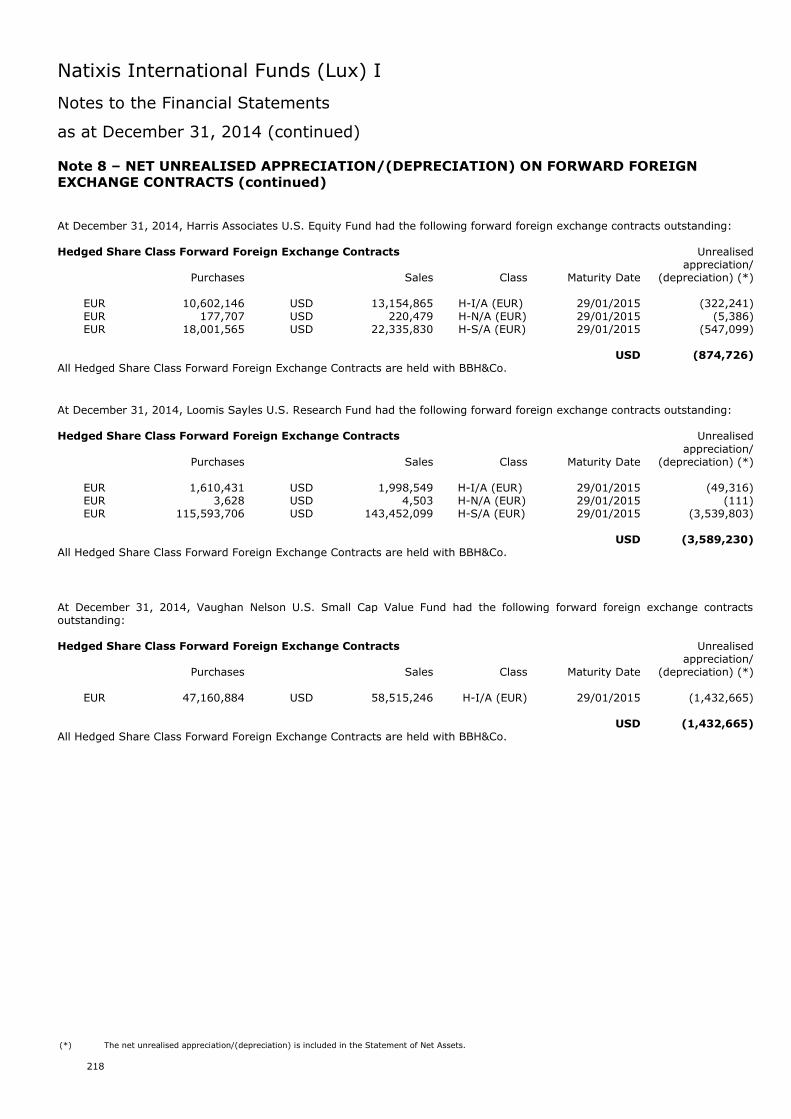
Natixis International Funds (Lux) I
Notes to the Financial Statements
as at December 31, 2014 (continued)
218
Note 8 – NET UNREALISED APPRECIATION/(DEPRECIATION) ON FORWARD FOREIGNEXCHANGE CONTRACTS (continued)
At December 31, 2014, Harris Associates U.S. Equity Fund had the following forward foreign exchange contracts outstanding:
Hedged Share Class Forward Foreign Exchange Contracts Unrealisedappreciation/
Purchases Sales Class Maturity Date (depreciation) (*)
EUR 10,602,146 USD 13,154,865 H-I/A (EUR) 29/01/2015 (322,241)EUR 177,707 USD 220,479 H-N/A (EUR) 29/01/2015 (5,386)EUR 18,001,565 USD 22,335,830 H-S/A (EUR) 29/01/2015 (547,099)
USD (874,726)All Hedged Share Class Forward Foreign Exchange Contracts are held with BBH&Co.
At December 31, 2014, Loomis Sayles U.S. Research Fund had the following forward foreign exchange contracts outstanding:
Hedged Share Class Forward Foreign Exchange Contracts Unrealisedappreciation/
Purchases Sales Class Maturity Date (depreciation) (*)
EUR 1,610,431 USD 1,998,549 H-I/A (EUR) 29/01/2015 (49,316)EUR 3,628 USD 4,503 H-N/A (EUR) 29/01/2015 (111)EUR 115,593,706 USD 143,452,099 H-S/A (EUR) 29/01/2015 (3,539,803)
USD (3,589,230)All Hedged Share Class Forward Foreign Exchange Contracts are held with BBH&Co.
At December 31, 2014, Vaughan Nelson U.S. Small Cap Value Fund had the following forward foreign exchange contractsoutstanding:
Hedged Share Class Forward Foreign Exchange Contracts Unrealisedappreciation/
Purchases Sales Class Maturity Date (depreciation) (*)
EUR 47,160,884 USD 58,515,246 H-I/A (EUR) 29/01/2015 (1,432,665)
USD (1,432,665)All Hedged Share Class Forward Foreign Exchange Contracts are held with BBH&Co.
(*) The net unrealised appreciation/(depreciation) is included in the Statement of Net Assets.
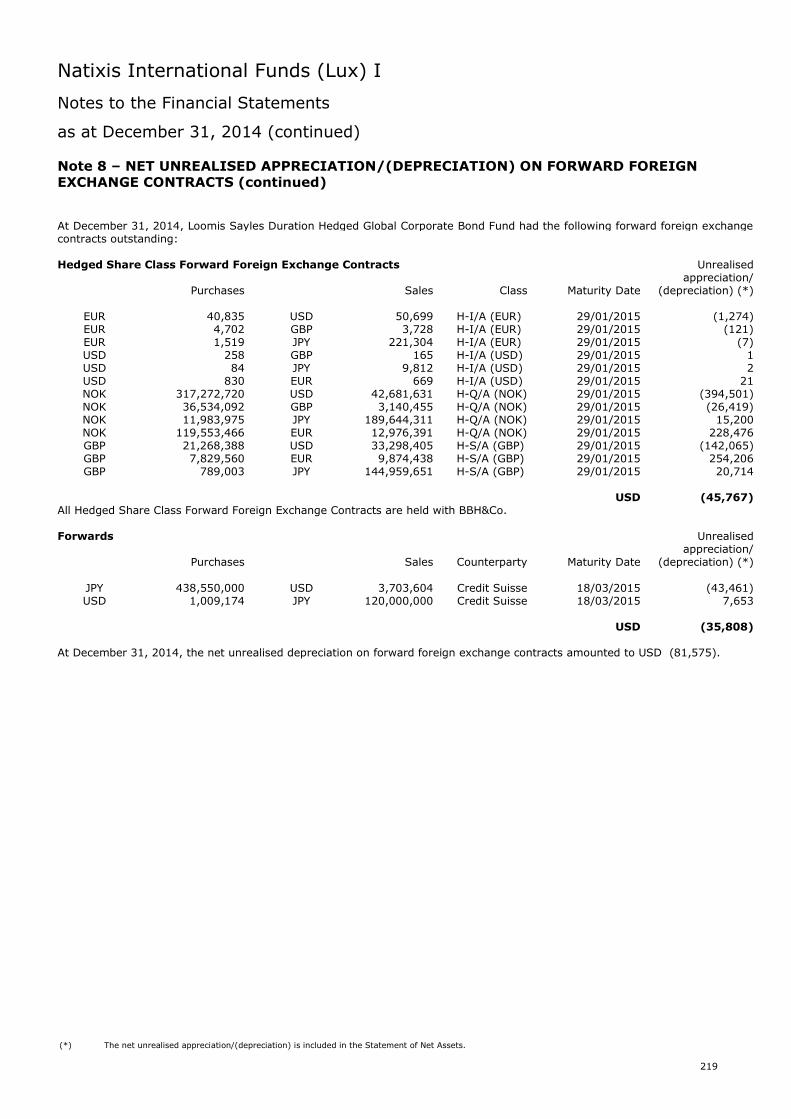
Natixis International Funds (Lux) I
Notes to the Financial Statements
as at December 31, 2014 (continued)
219
Note 8 – NET UNREALISED APPRECIATION/(DEPRECIATION) ON FORWARD FOREIGNEXCHANGE CONTRACTS (continued)
At December 31, 2014, Loomis Sayles Duration Hedged Global Corporate Bond Fund had the following forward foreign exchangecontracts outstanding:
Hedged Share Class Forward Foreign Exchange Contracts Unrealisedappreciation/
Purchases Sales Class Maturity Date (depreciation) (*)
EUR 40,835 USD 50,699 H-I/A (EUR) 29/01/2015 (1,274)EUR 4,702 GBP 3,728 H-I/A (EUR) 29/01/2015 (121)EUR 1,519 JPY 221,304 H-I/A (EUR) 29/01/2015 (7)USD 258 GBP 165 H-I/A (USD) 29/01/2015 1USD 84 JPY 9,812 H-I/A (USD) 29/01/2015 2USD 830 EUR 669 H-I/A (USD) 29/01/2015 21NOK 317,272,720 USD 42,681,631 H-Q/A (NOK) 29/01/2015 (394,501)NOK 36,534,092 GBP 3,140,455 H-Q/A (NOK) 29/01/2015 (26,419)NOK 11,983,975 JPY 189,644,311 H-Q/A (NOK) 29/01/2015 15,200NOK 119,553,466 EUR 12,976,391 H-Q/A (NOK) 29/01/2015 228,476GBP 21,268,388 USD 33,298,405 H-S/A (GBP) 29/01/2015 (142,065)GBP 7,829,560 EUR 9,874,438 H-S/A (GBP) 29/01/2015 254,206GBP 789,003 JPY 144,959,651 H-S/A (GBP) 29/01/2015 20,714
USD (45,767)All Hedged Share Class Forward Foreign Exchange Contracts are held with BBH&Co.
Forwards Unrealisedappreciation/
Purchases Sales Counterparty Maturity Date (depreciation) (*)
JPY 438,550,000 USD 3,703,604 Credit Suisse 18/03/2015 (43,461)USD 1,009,174 JPY 120,000,000 Credit Suisse 18/03/2015 7,653
USD (35,808)
At December 31, 2014, the net unrealised depreciation on forward foreign exchange contracts amounted to USD (81,575).
(*) The net unrealised appreciation/(depreciation) is included in the Statement of Net Assets.
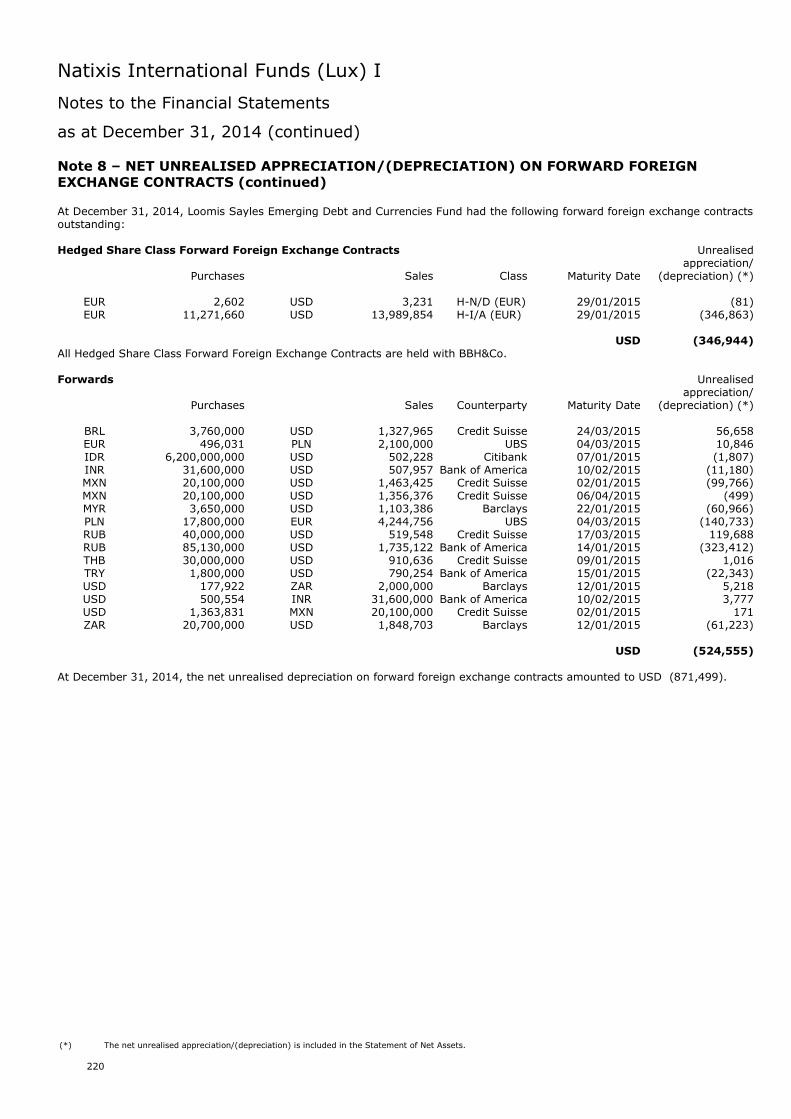
Natixis International Funds (Lux) I
Notes to the Financial Statements
as at December 31, 2014 (continued)
220
Note 8 – NET UNREALISED APPRECIATION/(DEPRECIATION) ON FORWARD FOREIGNEXCHANGE CONTRACTS (continued)
At December 31, 2014, Loomis Sayles Emerging Debt and Currencies Fund had the following forward foreign exchange contractsoutstanding:
Hedged Share Class Forward Foreign Exchange Contracts Unrealisedappreciation/
Purchases Sales Class Maturity Date (depreciation) (*)
EUR 2,602 USD 3,231 H-N/D (EUR) 29/01/2015 (81)EUR 11,271,660 USD 13,989,854 H-I/A (EUR) 29/01/2015 (346,863)
USD (346,944)All Hedged Share Class Forward Foreign Exchange Contracts are held with BBH&Co.
Forwards Unrealisedappreciation/
Purchases Sales Counterparty Maturity Date (depreciation) (*)
BRL 3,760,000 USD 1,327,965 Credit Suisse 24/03/2015 56,658EUR 496,031 PLN 2,100,000 UBS 04/03/2015 10,846IDR 6,200,000,000 USD 502,228 Citibank 07/01/2015 (1,807)INR 31,600,000 USD 507,957 Bank of America 10/02/2015 (11,180)MXN 20,100,000 USD 1,463,425 Credit Suisse 02/01/2015 (99,766)MXN 20,100,000 USD 1,356,376 Credit Suisse 06/04/2015 (499)MYR 3,650,000 USD 1,103,386 Barclays 22/01/2015 (60,966)PLN 17,800,000 EUR 4,244,756 UBS 04/03/2015 (140,733)RUB 40,000,000 USD 519,548 Credit Suisse 17/03/2015 119,688RUB 85,130,000 USD 1,735,122 Bank of America 14/01/2015 (323,412)THB 30,000,000 USD 910,636 Credit Suisse 09/01/2015 1,016TRY 1,800,000 USD 790,254 Bank of America 15/01/2015 (22,343)USD 177,922 ZAR 2,000,000 Barclays 12/01/2015 5,218USD 500,554 INR 31,600,000 Bank of America 10/02/2015 3,777USD 1,363,831 MXN 20,100,000 Credit Suisse 02/01/2015 171ZAR 20,700,000 USD 1,848,703 Barclays 12/01/2015 (61,223)
USD (524,555)
At December 31, 2014, the net unrealised depreciation on forward foreign exchange contracts amounted to USD (871,499).
(*) The net unrealised appreciation/(depreciation) is included in the Statement of Net Assets.
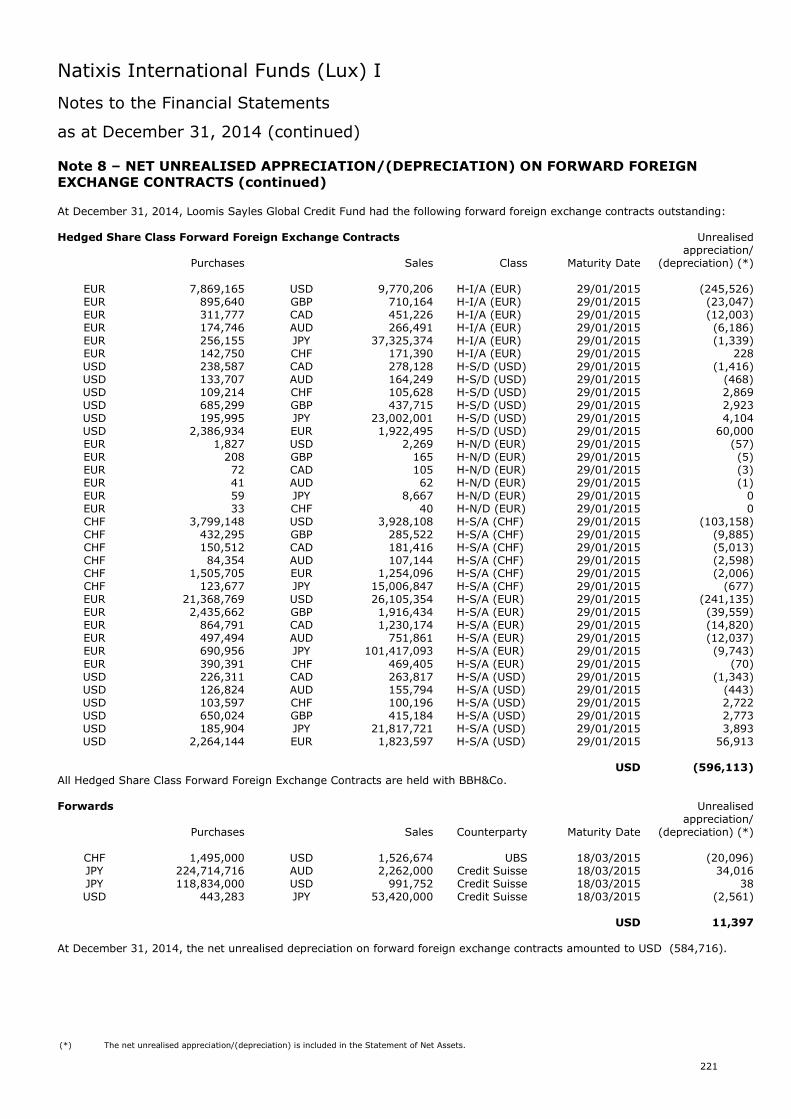
Natixis International Funds (Lux) I
Notes to the Financial Statements
as at December 31, 2014 (continued)
221
Note 8 – NET UNREALISED APPRECIATION/(DEPRECIATION) ON FORWARD FOREIGNEXCHANGE CONTRACTS (continued)
At December 31, 2014, Loomis Sayles Global Credit Fund had the following forward foreign exchange contracts outstanding:
Hedged Share Class Forward Foreign Exchange Contracts Unrealisedappreciation/
Purchases Sales Class Maturity Date (depreciation) (*)
EUR 7,869,165 USD 9,770,206 H-I/A (EUR) 29/01/2015 (245,526)EUR 895,640 GBP 710,164 H-I/A (EUR) 29/01/2015 (23,047)EUR 311,777 CAD 451,226 H-I/A (EUR) 29/01/2015 (12,003)EUR 174,746 AUD 266,491 H-I/A (EUR) 29/01/2015 (6,186)EUR 256,155 JPY 37,325,374 H-I/A (EUR) 29/01/2015 (1,339)EUR 142,750 CHF 171,390 H-I/A (EUR) 29/01/2015 228USD 238,587 CAD 278,128 H-S/D (USD) 29/01/2015 (1,416)USD 133,707 AUD 164,249 H-S/D (USD) 29/01/2015 (468)USD 109,214 CHF 105,628 H-S/D (USD) 29/01/2015 2,869USD 685,299 GBP 437,715 H-S/D (USD) 29/01/2015 2,923USD 195,995 JPY 23,002,001 H-S/D (USD) 29/01/2015 4,104USD 2,386,934 EUR 1,922,495 H-S/D (USD) 29/01/2015 60,000EUR 1,827 USD 2,269 H-N/D (EUR) 29/01/2015 (57)EUR 208 GBP 165 H-N/D (EUR) 29/01/2015 (5)EUR 72 CAD 105 H-N/D (EUR) 29/01/2015 (3)EUR 41 AUD 62 H-N/D (EUR) 29/01/2015 (1)EUR 59 JPY 8,667 H-N/D (EUR) 29/01/2015 0EUR 33 CHF 40 H-N/D (EUR) 29/01/2015 0CHF 3,799,148 USD 3,928,108 H-S/A (CHF) 29/01/2015 (103,158)CHF 432,295 GBP 285,522 H-S/A (CHF) 29/01/2015 (9,885)CHF 150,512 CAD 181,416 H-S/A (CHF) 29/01/2015 (5,013)CHF 84,354 AUD 107,144 H-S/A (CHF) 29/01/2015 (2,598)CHF 1,505,705 EUR 1,254,096 H-S/A (CHF) 29/01/2015 (2,006)CHF 123,677 JPY 15,006,847 H-S/A (CHF) 29/01/2015 (677)EUR 21,368,769 USD 26,105,354 H-S/A (EUR) 29/01/2015 (241,135)EUR 2,435,662 GBP 1,916,434 H-S/A (EUR) 29/01/2015 (39,559)EUR 864,791 CAD 1,230,174 H-S/A (EUR) 29/01/2015 (14,820)EUR 497,494 AUD 751,861 H-S/A (EUR) 29/01/2015 (12,037)EUR 690,956 JPY 101,417,093 H-S/A (EUR) 29/01/2015 (9,743)EUR 390,391 CHF 469,405 H-S/A (EUR) 29/01/2015 (70)USD 226,311 CAD 263,817 H-S/A (USD) 29/01/2015 (1,343)USD 126,824 AUD 155,794 H-S/A (USD) 29/01/2015 (443)USD 103,597 CHF 100,196 H-S/A (USD) 29/01/2015 2,722USD 650,024 GBP 415,184 H-S/A (USD) 29/01/2015 2,773USD 185,904 JPY 21,817,721 H-S/A (USD) 29/01/2015 3,893USD 2,264,144 EUR 1,823,597 H-S/A (USD) 29/01/2015 56,913
USD (596,113)All Hedged Share Class Forward Foreign Exchange Contracts are held with BBH&Co.
Forwards Unrealisedappreciation/
Purchases Sales Counterparty Maturity Date (depreciation) (*)
CHF 1,495,000 USD 1,526,674 UBS 18/03/2015 (20,096)JPY 224,714,716 AUD 2,262,000 Credit Suisse 18/03/2015 34,016JPY 118,834,000 USD 991,752 Credit Suisse 18/03/2015 38USD 443,283 JPY 53,420,000 Credit Suisse 18/03/2015 (2,561)
USD 11,397
At December 31, 2014, the net unrealised depreciation on forward foreign exchange contracts amounted to USD (584,716).
(*) The net unrealised appreciation/(depreciation) is included in the Statement of Net Assets.
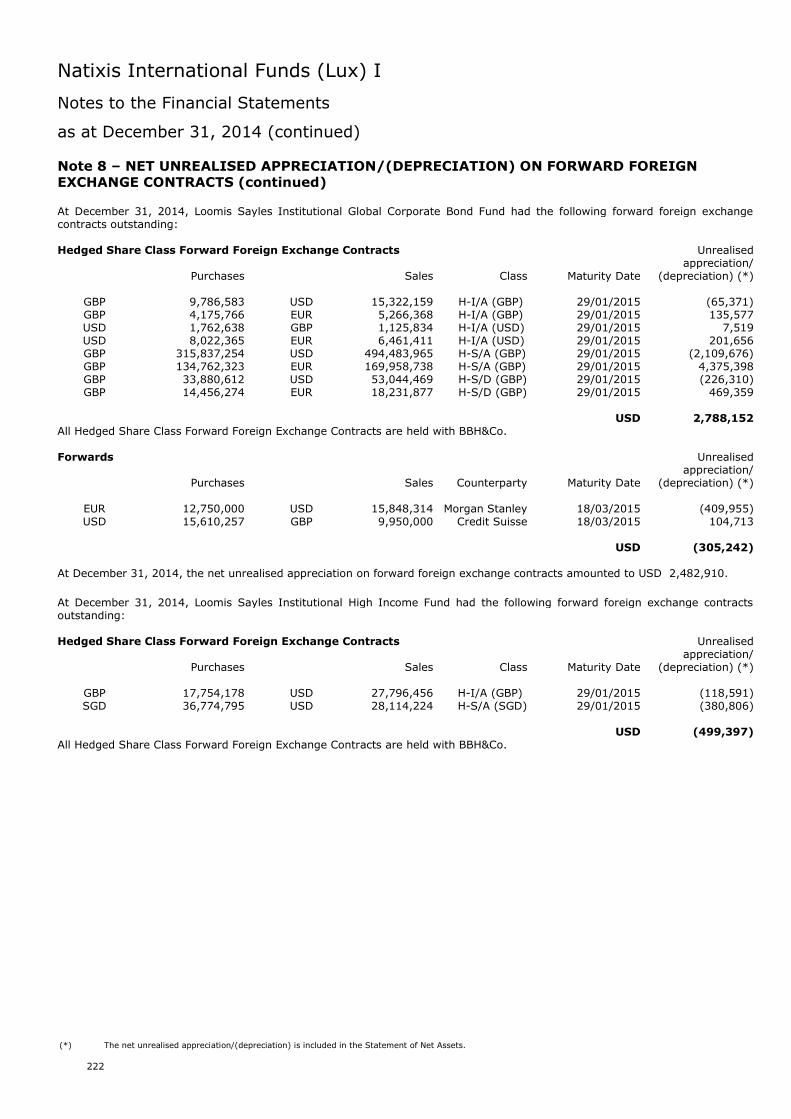
Natixis International Funds (Lux) I
Notes to the Financial Statements
as at December 31, 2014 (continued)
222
Note 8 – NET UNREALISED APPRECIATION/(DEPRECIATION) ON FORWARD FOREIGNEXCHANGE CONTRACTS (continued)
At December 31, 2014, Loomis Sayles Institutional Global Corporate Bond Fund had the following forward foreign exchangecontracts outstanding:
Hedged Share Class Forward Foreign Exchange Contracts Unrealisedappreciation/
Purchases Sales Class Maturity Date (depreciation) (*)
GBP 9,786,583 USD 15,322,159 H-I/A (GBP) 29/01/2015 (65,371)GBP 4,175,766 EUR 5,266,368 H-I/A (GBP) 29/01/2015 135,577USD 1,762,638 GBP 1,125,834 H-I/A (USD) 29/01/2015 7,519USD 8,022,365 EUR 6,461,411 H-I/A (USD) 29/01/2015 201,656GBP 315,837,254 USD 494,483,965 H-S/A (GBP) 29/01/2015 (2,109,676)GBP 134,762,323 EUR 169,958,738 H-S/A (GBP) 29/01/2015 4,375,398GBP 33,880,612 USD 53,044,469 H-S/D (GBP) 29/01/2015 (226,310)GBP 14,456,274 EUR 18,231,877 H-S/D (GBP) 29/01/2015 469,359
USD 2,788,152All Hedged Share Class Forward Foreign Exchange Contracts are held with BBH&Co.
Forwards Unrealisedappreciation/
Purchases Sales Counterparty Maturity Date (depreciation) (*)
EUR 12,750,000 USD 15,848,314 Morgan Stanley 18/03/2015 (409,955)USD 15,610,257 GBP 9,950,000 Credit Suisse 18/03/2015 104,713
USD (305,242)
At December 31, 2014, the net unrealised appreciation on forward foreign exchange contracts amounted to USD 2,482,910.
At December 31, 2014, Loomis Sayles Institutional High Income Fund had the following forward foreign exchange contractsoutstanding:
Hedged Share Class Forward Foreign Exchange Contracts Unrealisedappreciation/
Purchases Sales Class Maturity Date (depreciation) (*)
GBP 17,754,178 USD 27,796,456 H-I/A (GBP) 29/01/2015 (118,591)SGD 36,774,795 USD 28,114,224 H-S/A (SGD) 29/01/2015 (380,806)
USD (499,397)All Hedged Share Class Forward Foreign Exchange Contracts are held with BBH&Co.
(*) The net unrealised appreciation/(depreciation) is included in the Statement of Net Assets.
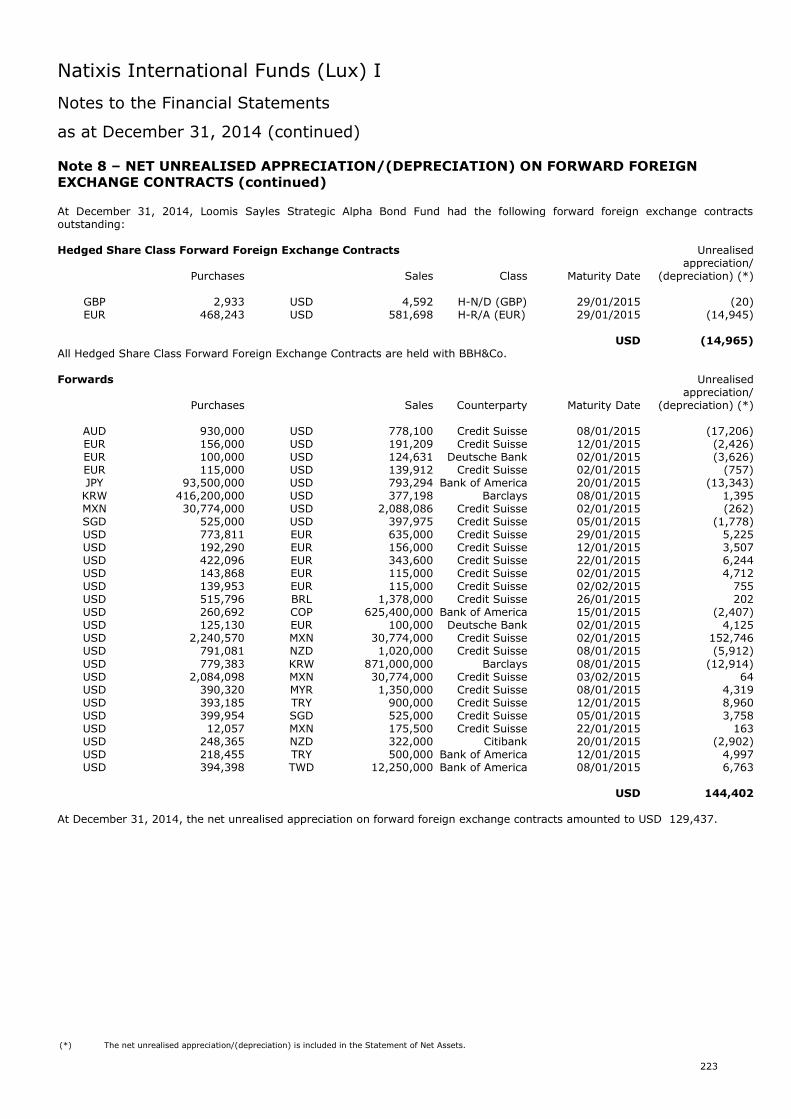
Natixis International Funds (Lux) I
Notes to the Financial Statements
as at December 31, 2014 (continued)
223
Note 8 – NET UNREALISED APPRECIATION/(DEPRECIATION) ON FORWARD FOREIGNEXCHANGE CONTRACTS (continued)
At December 31, 2014, Loomis Sayles Strategic Alpha Bond Fund had the following forward foreign exchange contractsoutstanding:
Hedged Share Class Forward Foreign Exchange Contracts Unrealisedappreciation/
Purchases Sales Class Maturity Date (depreciation) (*)
GBP 2,933 USD 4,592 H-N/D (GBP) 29/01/2015 (20)EUR 468,243 USD 581,698 H-R/A (EUR) 29/01/2015 (14,945)
USD (14,965)All Hedged Share Class Forward Foreign Exchange Contracts are held with BBH&Co.
Forwards Unrealisedappreciation/
Purchases Sales Counterparty Maturity Date (depreciation) (*)
AUD 930,000 USD 778,100 Credit Suisse 08/01/2015 (17,206)EUR 156,000 USD 191,209 Credit Suisse 12/01/2015 (2,426)EUR 100,000 USD 124,631 Deutsche Bank 02/01/2015 (3,626)EUR 115,000 USD 139,912 Credit Suisse 02/01/2015 (757)JPY 93,500,000 USD 793,294 Bank of America 20/01/2015 (13,343)KRW 416,200,000 USD 377,198 Barclays 08/01/2015 1,395MXN 30,774,000 USD 2,088,086 Credit Suisse 02/01/2015 (262)SGD 525,000 USD 397,975 Credit Suisse 05/01/2015 (1,778)USD 773,811 EUR 635,000 Credit Suisse 29/01/2015 5,225USD 192,290 EUR 156,000 Credit Suisse 12/01/2015 3,507USD 422,096 EUR 343,600 Credit Suisse 22/01/2015 6,244USD 143,868 EUR 115,000 Credit Suisse 02/01/2015 4,712USD 139,953 EUR 115,000 Credit Suisse 02/02/2015 755USD 515,796 BRL 1,378,000 Credit Suisse 26/01/2015 202USD 260,692 COP 625,400,000 Bank of America 15/01/2015 (2,407)USD 125,130 EUR 100,000 Deutsche Bank 02/01/2015 4,125USD 2,240,570 MXN 30,774,000 Credit Suisse 02/01/2015 152,746USD 791,081 NZD 1,020,000 Credit Suisse 08/01/2015 (5,912)USD 779,383 KRW 871,000,000 Barclays 08/01/2015 (12,914)USD 2,084,098 MXN 30,774,000 Credit Suisse 03/02/2015 64USD 390,320 MYR 1,350,000 Credit Suisse 08/01/2015 4,319USD 393,185 TRY 900,000 Credit Suisse 12/01/2015 8,960USD 399,954 SGD 525,000 Credit Suisse 05/01/2015 3,758USD 12,057 MXN 175,500 Credit Suisse 22/01/2015 163USD 248,365 NZD 322,000 Citibank 20/01/2015 (2,902)USD 218,455 TRY 500,000 Bank of America 12/01/2015 4,997USD 394,398 TWD 12,250,000 Bank of America 08/01/2015 6,763
USD 144,402
At December 31, 2014, the net unrealised appreciation on forward foreign exchange contracts amounted to USD 129,437.
(*) The net unrealised appreciation/(depreciation) is included in the Statement of Net Assets.
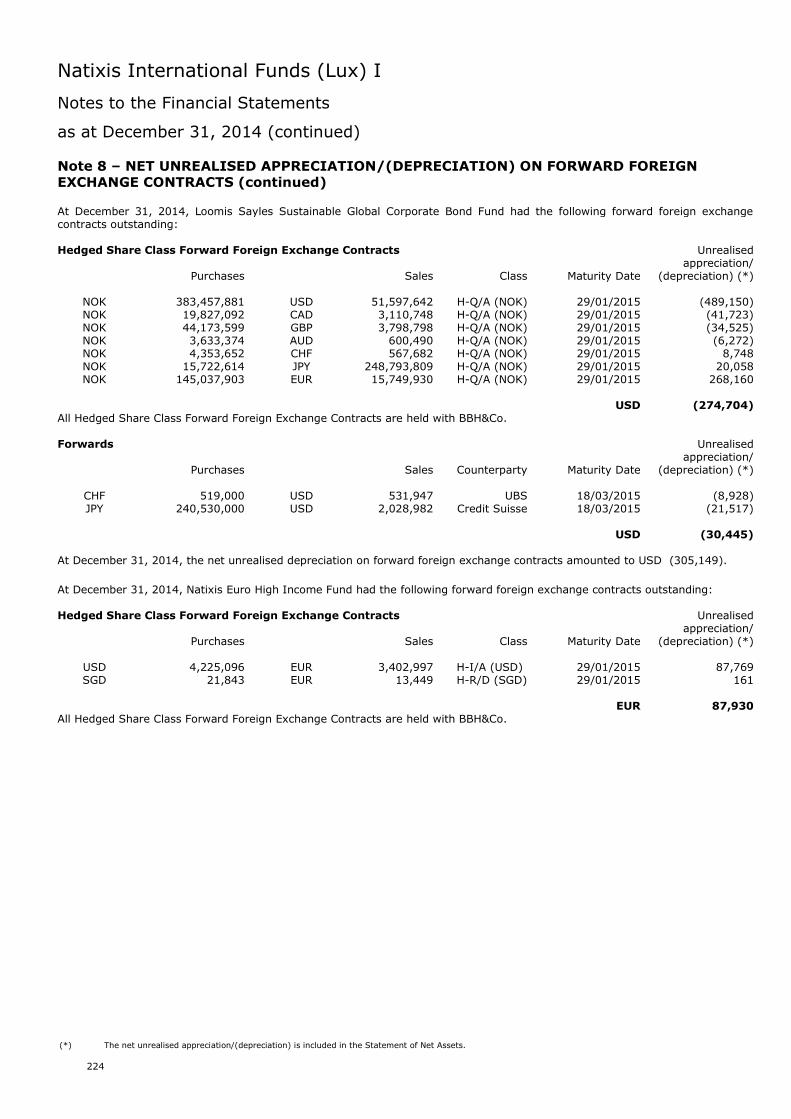
Natixis International Funds (Lux) I
Notes to the Financial Statements
as at December 31, 2014 (continued)
224
Note 8 – NET UNREALISED APPRECIATION/(DEPRECIATION) ON FORWARD FOREIGNEXCHANGE CONTRACTS (continued)
At December 31, 2014, Loomis Sayles Sustainable Global Corporate Bond Fund had the following forward foreign exchangecontracts outstanding:
Hedged Share Class Forward Foreign Exchange Contracts Unrealisedappreciation/
Purchases Sales Class Maturity Date (depreciation) (*)
NOK 383,457,881 USD 51,597,642 H-Q/A (NOK) 29/01/2015 (489,150)NOK 19,827,092 CAD 3,110,748 H-Q/A (NOK) 29/01/2015 (41,723)NOK 44,173,599 GBP 3,798,798 H-Q/A (NOK) 29/01/2015 (34,525)NOK 3,633,374 AUD 600,490 H-Q/A (NOK) 29/01/2015 (6,272)NOK 4,353,652 CHF 567,682 H-Q/A (NOK) 29/01/2015 8,748NOK 15,722,614 JPY 248,793,809 H-Q/A (NOK) 29/01/2015 20,058NOK 145,037,903 EUR 15,749,930 H-Q/A (NOK) 29/01/2015 268,160
USD (274,704)All Hedged Share Class Forward Foreign Exchange Contracts are held with BBH&Co.
Forwards Unrealisedappreciation/
Purchases Sales Counterparty Maturity Date (depreciation) (*)
CHF 519,000 USD 531,947 UBS 18/03/2015 (8,928)JPY 240,530,000 USD 2,028,982 Credit Suisse 18/03/2015 (21,517)
USD (30,445)
At December 31, 2014, the net unrealised depreciation on forward foreign exchange contracts amounted to USD (305,149).
At December 31, 2014, Natixis Euro High Income Fund had the following forward foreign exchange contracts outstanding:
Hedged Share Class Forward Foreign Exchange Contracts Unrealisedappreciation/
Purchases Sales Class Maturity Date (depreciation) (*)
USD 4,225,096 EUR 3,402,997 H-I/A (USD) 29/01/2015 87,769SGD 21,843 EUR 13,449 H-R/D (SGD) 29/01/2015 161
EUR 87,930All Hedged Share Class Forward Foreign Exchange Contracts are held with BBH&Co.
(*) The net unrealised appreciation/(depreciation) is included in the Statement of Net Assets.
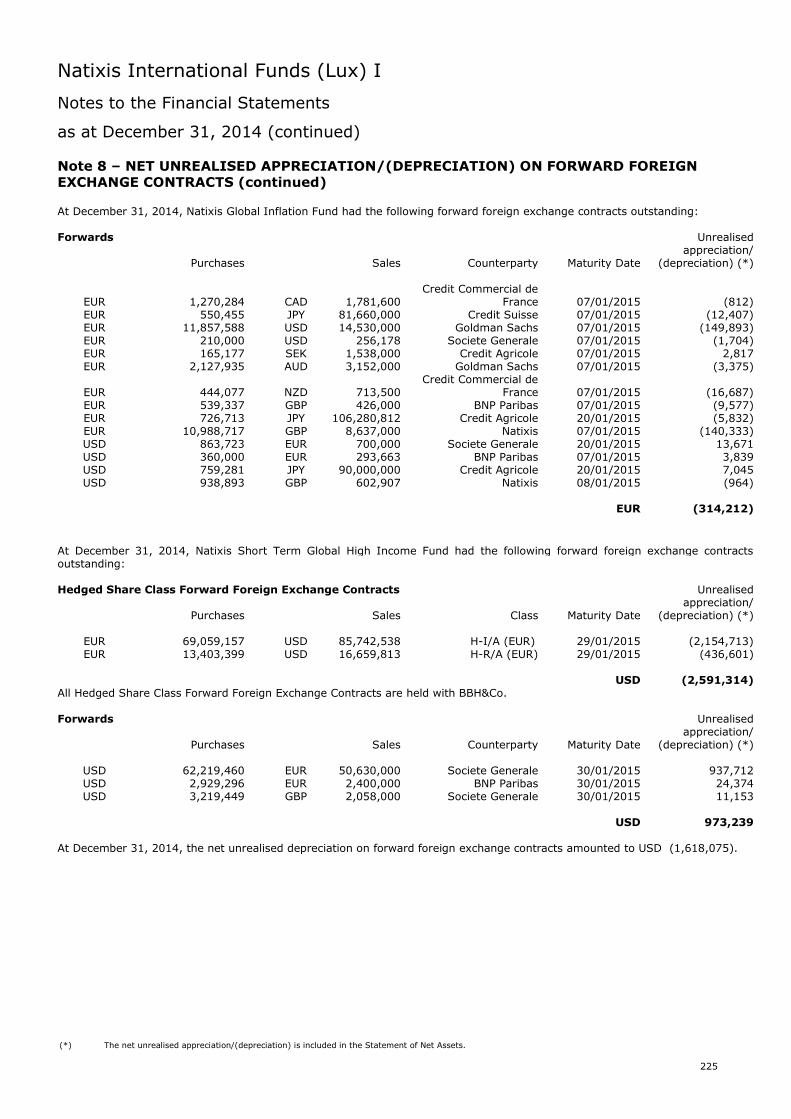
Natixis International Funds (Lux) I
Notes to the Financial Statements
as at December 31, 2014 (continued)
225
Note 8 – NET UNREALISED APPRECIATION/(DEPRECIATION) ON FORWARD FOREIGNEXCHANGE CONTRACTS (continued)
At December 31, 2014, Natixis Global Inflation Fund had the following forward foreign exchange contracts outstanding:
Forwards Unrealisedappreciation/
Purchases Sales Counterparty Maturity Date (depreciation) (*)
EUR 1,270,284 CAD 1,781,600Credit Commercial de
France 07/01/2015 (812)EUR 550,455 JPY 81,660,000 Credit Suisse 07/01/2015 (12,407)EUR 11,857,588 USD 14,530,000 Goldman Sachs 07/01/2015 (149,893)EUR 210,000 USD 256,178 Societe Generale 07/01/2015 (1,704)EUR 165,177 SEK 1,538,000 Credit Agricole 07/01/2015 2,817EUR 2,127,935 AUD 3,152,000 Goldman Sachs 07/01/2015 (3,375)
EUR 444,077 NZD 713,500Credit Commercial de
France 07/01/2015 (16,687)EUR 539,337 GBP 426,000 BNP Paribas 07/01/2015 (9,577)EUR 726,713 JPY 106,280,812 Credit Agricole 20/01/2015 (5,832)EUR 10,988,717 GBP 8,637,000 Natixis 07/01/2015 (140,333)USD 863,723 EUR 700,000 Societe Generale 20/01/2015 13,671USD 360,000 EUR 293,663 BNP Paribas 07/01/2015 3,839USD 759,281 JPY 90,000,000 Credit Agricole 20/01/2015 7,045USD 938,893 GBP 602,907 Natixis 08/01/2015 (964)
EUR (314,212)
At December 31, 2014, Natixis Short Term Global High Income Fund had the following forward foreign exchange contractsoutstanding:
Hedged Share Class Forward Foreign Exchange Contracts Unrealisedappreciation/
Purchases Sales Class Maturity Date (depreciation) (*)
EUR 69,059,157 USD 85,742,538 H-I/A (EUR) 29/01/2015 (2,154,713)EUR 13,403,399 USD 16,659,813 H-R/A (EUR) 29/01/2015 (436,601)
USD (2,591,314)All Hedged Share Class Forward Foreign Exchange Contracts are held with BBH&Co.
Forwards Unrealisedappreciation/
Purchases Sales Counterparty Maturity Date (depreciation) (*)
USD 62,219,460 EUR 50,630,000 Societe Generale 30/01/2015 937,712USD 2,929,296 EUR 2,400,000 BNP Paribas 30/01/2015 24,374USD 3,219,449 GBP 2,058,000 Societe Generale 30/01/2015 11,153
USD 973,239
At December 31, 2014, the net unrealised depreciation on forward foreign exchange contracts amounted to USD (1,618,075).
(*) The net unrealised appreciation/(depreciation) is included in the Statement of Net Assets.
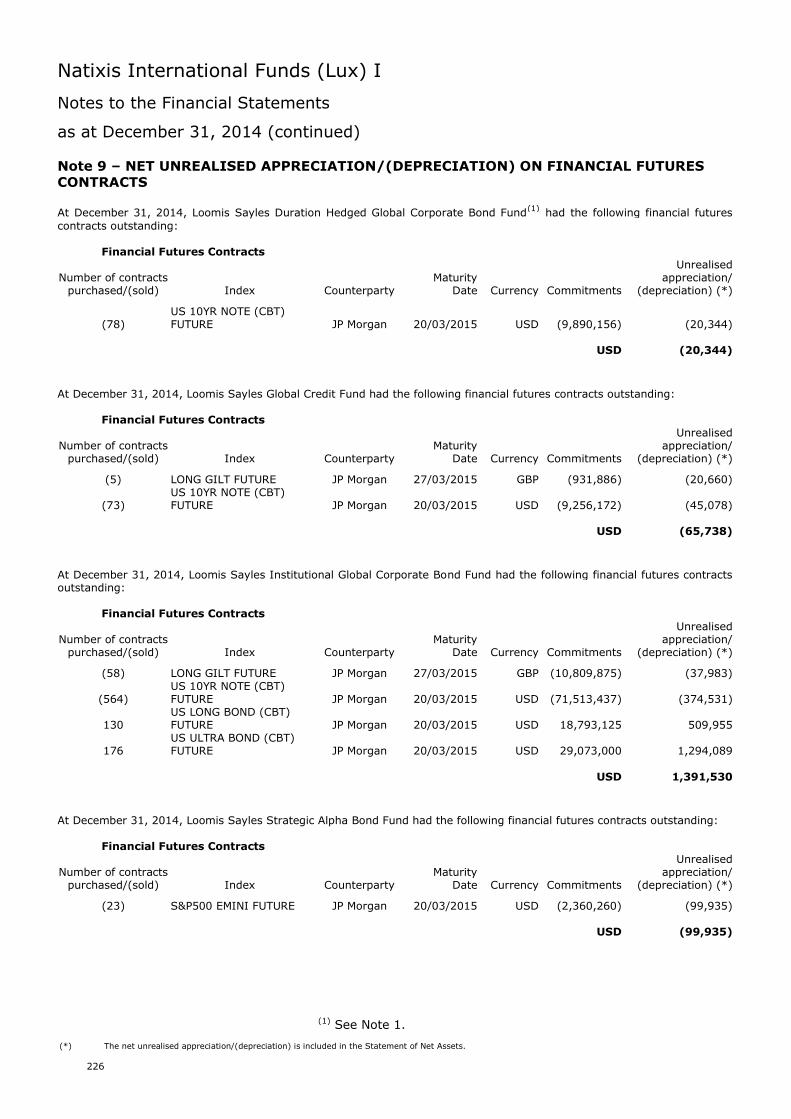
Natixis International Funds (Lux) I
Notes to the Financial Statements
as at December 31, 2014 (continued)
226
Note 9 – NET UNREALISED APPRECIATION/(DEPRECIATION) ON FINANCIAL FUTURESCONTRACTS
At December 31, 2014, Loomis Sayles Duration Hedged Global Corporate Bond Fund(1) had the following financial futurescontracts outstanding:
Financial Futures ContractsUnrealised
Number of contracts Maturity appreciation/purchased/(sold) Index Counterparty Date Currency Commitments (depreciation) (*)
(78)US 10YR NOTE (CBT)FUTURE JP Morgan 20/03/2015 USD (9,890,156) (20,344)
USD (20,344)
At December 31, 2014, Loomis Sayles Global Credit Fund had the following financial futures contracts outstanding:
Financial Futures ContractsUnrealised
Number of contracts Maturity appreciation/purchased/(sold) Index Counterparty Date Currency Commitments (depreciation) (*)
(5) LONG GILT FUTURE JP Morgan 27/03/2015 GBP (931,886) (20,660)
(73)US 10YR NOTE (CBT)FUTURE JP Morgan 20/03/2015 USD (9,256,172) (45,078)
USD (65,738)
At December 31, 2014, Loomis Sayles Institutional Global Corporate Bond Fund had the following financial futures contractsoutstanding:
Financial Futures ContractsUnrealised
Number of contracts Maturity appreciation/purchased/(sold) Index Counterparty Date Currency Commitments (depreciation) (*)
(58) LONG GILT FUTURE JP Morgan 27/03/2015 GBP (10,809,875) (37,983)
(564)US 10YR NOTE (CBT)FUTURE JP Morgan 20/03/2015 USD (71,513,437) (374,531)
130US LONG BOND (CBT)FUTURE JP Morgan 20/03/2015 USD 18,793,125 509,955
176US ULTRA BOND (CBT)FUTURE JP Morgan 20/03/2015 USD 29,073,000 1,294,089
USD 1,391,530
At December 31, 2014, Loomis Sayles Strategic Alpha Bond Fund had the following financial futures contracts outstanding:
Financial Futures ContractsUnrealised
Number of contracts Maturity appreciation/purchased/(sold) Index Counterparty Date Currency Commitments (depreciation) (*)
(23) S&P500 EMINI FUTURE JP Morgan 20/03/2015 USD (2,360,260) (99,935)
USD (99,935)
(1) See Note 1.
(*) The net unrealised appreciation/(depreciation) is included in the Statement of Net Assets.
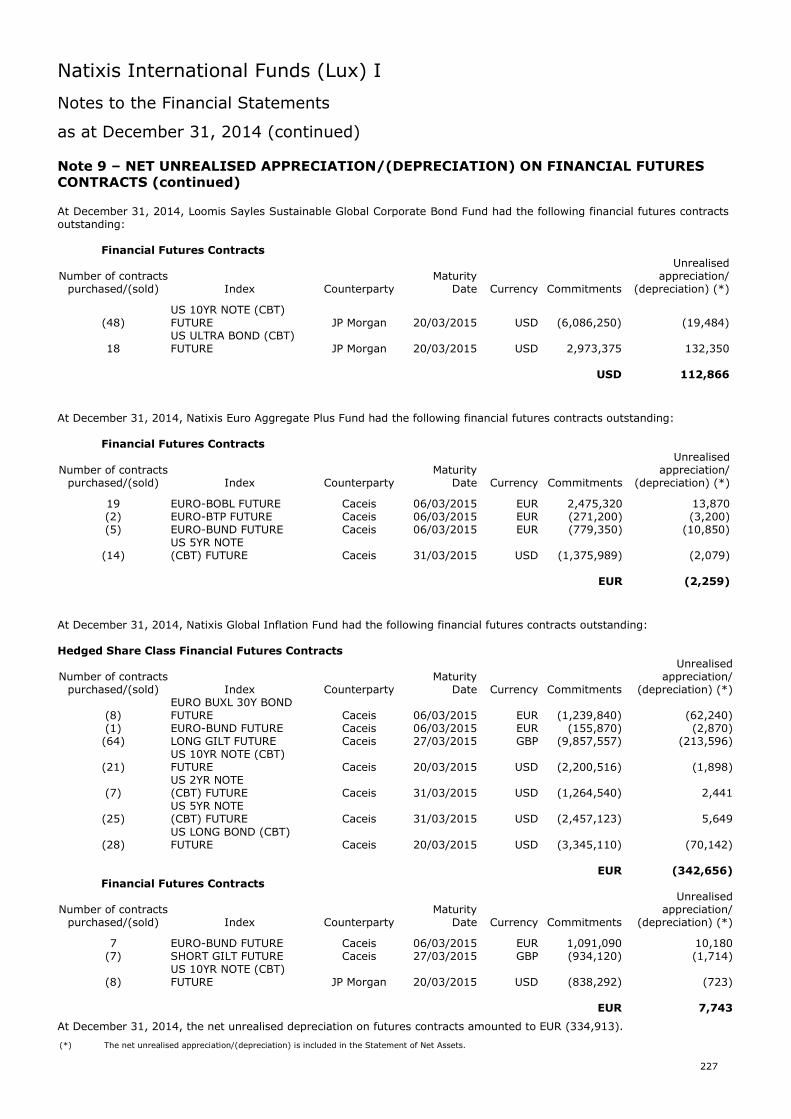
Natixis International Funds (Lux) I
Notes to the Financial Statements
as at December 31, 2014 (continued)
227
Note 9 – NET UNREALISED APPRECIATION/(DEPRECIATION) ON FINANCIAL FUTURESCONTRACTS (continued)
At December 31, 2014, Loomis Sayles Sustainable Global Corporate Bond Fund had the following financial futures contractsoutstanding:
Financial Futures ContractsUnrealised
Number of contracts Maturity appreciation/purchased/(sold) Index Counterparty Date Currency Commitments (depreciation) (*)
(48)US 10YR NOTE (CBT)FUTURE JP Morgan 20/03/2015 USD (6,086,250) (19,484)
18US ULTRA BOND (CBT)FUTURE JP Morgan 20/03/2015 USD 2,973,375 132,350
USD 112,866
At December 31, 2014, Natixis Euro Aggregate Plus Fund had the following financial futures contracts outstanding:
Financial Futures ContractsUnrealised
Number of contracts Maturity appreciation/purchased/(sold) Index Counterparty Date Currency Commitments (depreciation) (*)
19 EURO-BOBL FUTURE Caceis 06/03/2015 EUR 2,475,320 13,870(2) EURO-BTP FUTURE Caceis 06/03/2015 EUR (271,200) (3,200)(5) EURO-BUND FUTURE Caceis 06/03/2015 EUR (779,350) (10,850)
(14)US 5YR NOTE(CBT) FUTURE Caceis 31/03/2015 USD (1,375,989) (2,079)
EUR (2,259)
At December 31, 2014, Natixis Global Inflation Fund had the following financial futures contracts outstanding:
Hedged Share Class Financial Futures ContractsUnrealised
Number of contracts Maturity appreciation/purchased/(sold) Index Counterparty Date Currency Commitments (depreciation) (*)
(8)EURO BUXL 30Y BONDFUTURE Caceis 06/03/2015 EUR (1,239,840) (62,240)
(1) EURO-BUND FUTURE Caceis 06/03/2015 EUR (155,870) (2,870)(64) LONG GILT FUTURE Caceis 27/03/2015 GBP (9,857,557) (213,596)
(21)US 10YR NOTE (CBT)FUTURE Caceis 20/03/2015 USD (2,200,516) (1,898)
(7)US 2YR NOTE(CBT) FUTURE Caceis 31/03/2015 USD (1,264,540) 2,441
(25)US 5YR NOTE(CBT) FUTURE Caceis 31/03/2015 USD (2,457,123) 5,649
(28)US LONG BOND (CBT)FUTURE Caceis 20/03/2015 USD (3,345,110) (70,142)
EUR (342,656)Financial Futures Contracts
UnrealisedNumber of contracts Maturity appreciation/
purchased/(sold) Index Counterparty Date Currency Commitments (depreciation) (*)
7 EURO-BUND FUTURE Caceis 06/03/2015 EUR 1,091,090 10,180(7) SHORT GILT FUTURE Caceis 27/03/2015 GBP (934,120) (1,714)
(8)US 10YR NOTE (CBT)FUTURE JP Morgan 20/03/2015 USD (838,292) (723)
EUR 7,743
At December 31, 2014, the net unrealised depreciation on futures contracts amounted to EUR (334,913).
(*) The net unrealised appreciation/(depreciation) is included in the Statement of Net Assets.
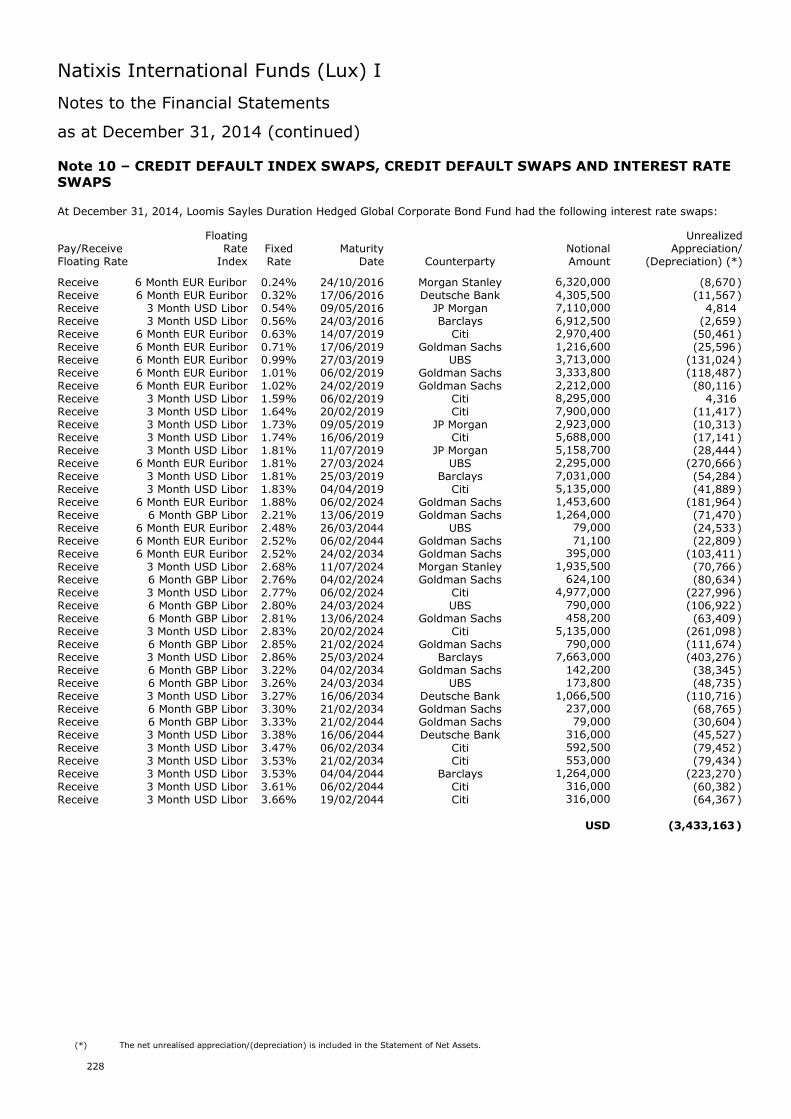
Natixis International Funds (Lux) I
Notes to the Financial Statements
as at December 31, 2014 (continued)
228
Note 10 – CREDIT DEFAULT INDEX SWAPS, CREDIT DEFAULT SWAPS AND INTEREST RATESWAPS
At December 31, 2014, Loomis Sayles Duration Hedged Global Corporate Bond Fund had the following interest rate swaps:
Floating UnrealizedPay/Receive Rate Fixed Maturity Notional Appreciation/Floating Rate Index Rate Date Counterparty Amount (Depreciation) (*)
Receive 6 Month EUR Euribor 0.24% 24/10/2016 Morgan Stanley 6,320,000 (8,670)Receive 6 Month EUR Euribor 0.32% 17/06/2016 Deutsche Bank 4,305,500 (11,567)Receive 3 Month USD Libor 0.54% 09/05/2016 JP Morgan 7,110,000 4,814Receive 3 Month USD Libor 0.56% 24/03/2016 Barclays 6,912,500 (2,659)Receive 6 Month EUR Euribor 0.63% 14/07/2019 Citi 2,970,400 (50,461)Receive 6 Month EUR Euribor 0.71% 17/06/2019 Goldman Sachs 1,216,600 (25,596)Receive 6 Month EUR Euribor 0.99% 27/03/2019 UBS 3,713,000 (131,024)Receive 6 Month EUR Euribor 1.01% 06/02/2019 Goldman Sachs 3,333,800 (118,487)Receive 6 Month EUR Euribor 1.02% 24/02/2019 Goldman Sachs 2,212,000 (80,116)Receive 3 Month USD Libor 1.59% 06/02/2019 Citi 8,295,000 4,316Receive 3 Month USD Libor 1.64% 20/02/2019 Citi 7,900,000 (11,417)Receive 3 Month USD Libor 1.73% 09/05/2019 JP Morgan 2,923,000 (10,313)Receive 3 Month USD Libor 1.74% 16/06/2019 Citi 5,688,000 (17,141)Receive 3 Month USD Libor 1.81% 11/07/2019 JP Morgan 5,158,700 (28,444)Receive 6 Month EUR Euribor 1.81% 27/03/2024 UBS 2,295,000 (270,666)Receive 3 Month USD Libor 1.81% 25/03/2019 Barclays 7,031,000 (54,284)Receive 3 Month USD Libor 1.83% 04/04/2019 Citi 5,135,000 (41,889)Receive 6 Month EUR Euribor 1.88% 06/02/2024 Goldman Sachs 1,453,600 (181,964)Receive 6 Month GBP Libor 2.21% 13/06/2019 Goldman Sachs 1,264,000 (71,470)Receive 6 Month EUR Euribor 2.48% 26/03/2044 UBS 79,000 (24,533)Receive 6 Month EUR Euribor 2.52% 06/02/2044 Goldman Sachs 71,100 (22,809)Receive 6 Month EUR Euribor 2.52% 24/02/2034 Goldman Sachs 395,000 (103,411)Receive 3 Month USD Libor 2.68% 11/07/2024 Morgan Stanley 1,935,500 (70,766)Receive 6 Month GBP Libor 2.76% 04/02/2024 Goldman Sachs 624,100 (80,634)Receive 3 Month USD Libor 2.77% 06/02/2024 Citi 4,977,000 (227,996)Receive 6 Month GBP Libor 2.80% 24/03/2024 UBS 790,000 (106,922)Receive 6 Month GBP Libor 2.81% 13/06/2024 Goldman Sachs 458,200 (63,409)Receive 3 Month USD Libor 2.83% 20/02/2024 Citi 5,135,000 (261,098)Receive 6 Month GBP Libor 2.85% 21/02/2024 Goldman Sachs 790,000 (111,674)Receive 3 Month USD Libor 2.86% 25/03/2024 Barclays 7,663,000 (403,276)Receive 6 Month GBP Libor 3.22% 04/02/2034 Goldman Sachs 142,200 (38,345)Receive 6 Month GBP Libor 3.26% 24/03/2034 UBS 173,800 (48,735)Receive 3 Month USD Libor 3.27% 16/06/2034 Deutsche Bank 1,066,500 (110,716)Receive 6 Month GBP Libor 3.30% 21/02/2034 Goldman Sachs 237,000 (68,765)Receive 6 Month GBP Libor 3.33% 21/02/2044 Goldman Sachs 79,000 (30,604)Receive 3 Month USD Libor 3.38% 16/06/2044 Deutsche Bank 316,000 (45,527)Receive 3 Month USD Libor 3.47% 06/02/2034 Citi 592,500 (79,452)Receive 3 Month USD Libor 3.53% 21/02/2034 Citi 553,000 (79,434)Receive 3 Month USD Libor 3.53% 04/04/2044 Barclays 1,264,000 (223,270)Receive 3 Month USD Libor 3.61% 06/02/2044 Citi 316,000 (60,382)Receive 3 Month USD Libor 3.66% 19/02/2044 Citi 316,000 (64,367)
USD (3,433,163)
(*) The net unrealised appreciation/(depreciation) is included in the Statement of Net Assets.
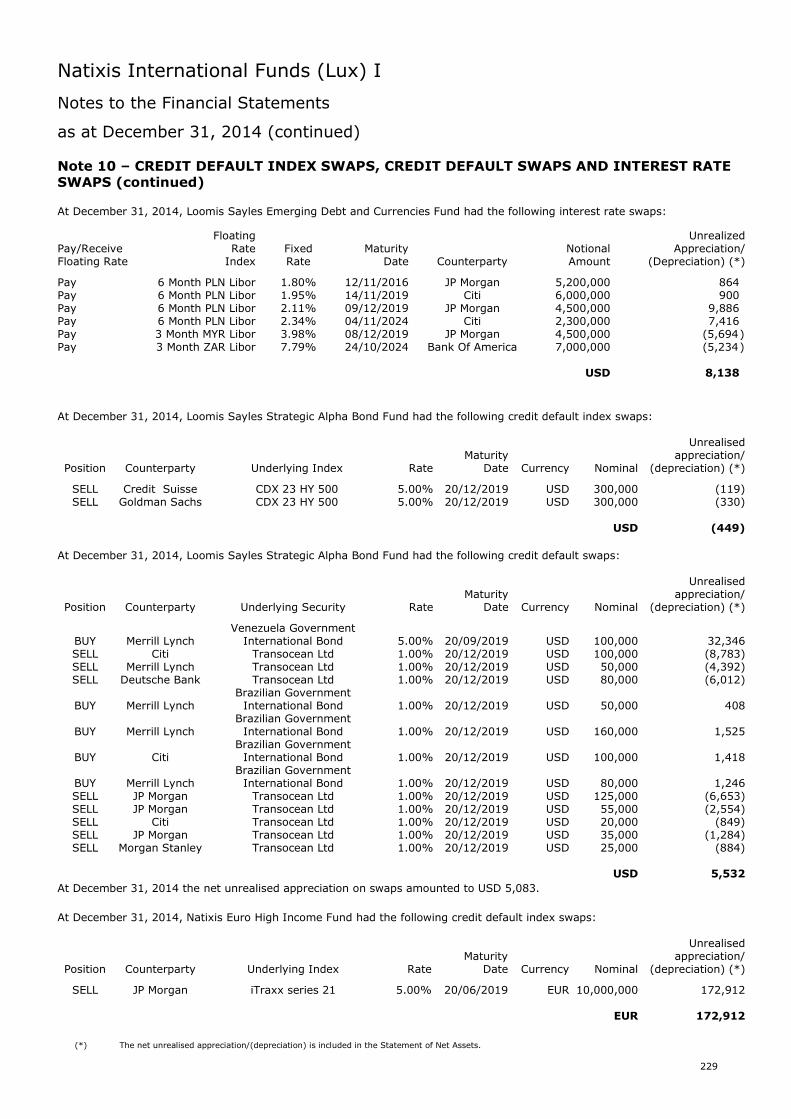
Natixis International Funds (Lux) I
Notes to the Financial Statements
as at December 31, 2014 (continued)
229
Note 10 – CREDIT DEFAULT INDEX SWAPS, CREDIT DEFAULT SWAPS AND INTEREST RATESWAPS (continued)
At December 31, 2014, Loomis Sayles Emerging Debt and Currencies Fund had the following interest rate swaps:
Floating UnrealizedPay/Receive Rate Fixed Maturity Notional Appreciation/Floating Rate Index Rate Date Counterparty Amount (Depreciation) (*)
Pay 6 Month PLN Libor 1.80% 12/11/2016 JP Morgan 5,200,000 864Pay 6 Month PLN Libor 1.95% 14/11/2019 Citi 6,000,000 900Pay 6 Month PLN Libor 2.11% 09/12/2019 JP Morgan 4,500,000 9,886Pay 6 Month PLN Libor 2.34% 04/11/2024 Citi 2,300,000 7,416Pay 3 Month MYR Libor 3.98% 08/12/2019 JP Morgan 4,500,000 (5,694)Pay 3 Month ZAR Libor 7.79% 24/10/2024 Bank Of America 7,000,000 (5,234)
USD 8,138
At December 31, 2014, Loomis Sayles Strategic Alpha Bond Fund had the following credit default index swaps:
UnrealisedMaturity appreciation/
Position Counterparty Underlying Index Rate Date Currency Nominal (depreciation) (*)
SELL Credit Suisse CDX 23 HY 500 5.00% 20/12/2019 USD 300,000 (119)SELL Goldman Sachs CDX 23 HY 500 5.00% 20/12/2019 USD 300,000 (330)
USD (449)
At December 31, 2014, Loomis Sayles Strategic Alpha Bond Fund had the following credit default swaps:
UnrealisedMaturity appreciation/
Position Counterparty Underlying Security Rate Date Currency Nominal (depreciation) (*)
BUY Merrill LynchVenezuela Government
International Bond 5.00% 20/09/2019 USD 100,000 32,346SELL Citi Transocean Ltd 1.00% 20/12/2019 USD 100,000 (8,783)SELL Merrill Lynch Transocean Ltd 1.00% 20/12/2019 USD 50,000 (4,392)SELL Deutsche Bank Transocean Ltd 1.00% 20/12/2019 USD 80,000 (6,012)
BUY Merrill LynchBrazilian Government
International Bond 1.00% 20/12/2019 USD 50,000 408
BUY Merrill LynchBrazilian Government
International Bond 1.00% 20/12/2019 USD 160,000 1,525
BUY CitiBrazilian Government
International Bond 1.00% 20/12/2019 USD 100,000 1,418
BUY Merrill LynchBrazilian Government
International Bond 1.00% 20/12/2019 USD 80,000 1,246SELL JP Morgan Transocean Ltd 1.00% 20/12/2019 USD 125,000 (6,653)SELL JP Morgan Transocean Ltd 1.00% 20/12/2019 USD 55,000 (2,554)SELL Citi Transocean Ltd 1.00% 20/12/2019 USD 20,000 (849)SELL JP Morgan Transocean Ltd 1.00% 20/12/2019 USD 35,000 (1,284)SELL Morgan Stanley Transocean Ltd 1.00% 20/12/2019 USD 25,000 (884)
USD 5,532
At December 31, 2014 the net unrealised appreciation on swaps amounted to USD 5,083.
At December 31, 2014, Natixis Euro High Income Fund had the following credit default index swaps:
UnrealisedMaturity appreciation/
Position Counterparty Underlying Index Rate Date Currency Nominal (depreciation) (*)
SELL JP Morgan iTraxx series 21 5.00% 20/06/2019 EUR 10,000,000 172,912
EUR 172,912
(*) The net unrealised appreciation/(depreciation) is included in the Statement of Net Assets.
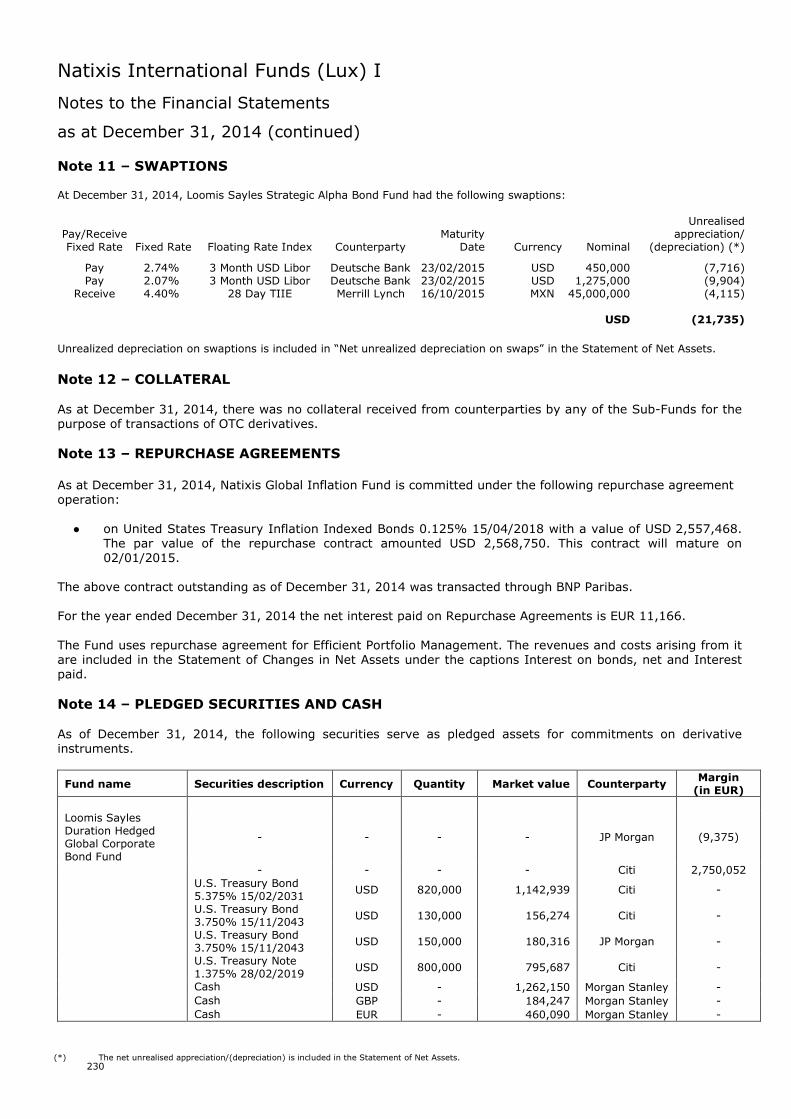
Natixis International Funds (Lux) I
Notes to the Financial Statements
as at December 31, 2014 (continued)
230
Note 11 – SWAPTIONS
At December 31, 2014, Loomis Sayles Strategic Alpha Bond Fund had the following swaptions:
UnrealisedPay/Receive Maturity appreciation/Fixed Rate Fixed Rate Floating Rate Index Counterparty Date Currency Nominal (depreciation) (*)
Pay 2.74% 3 Month USD Libor Deutsche Bank 23/02/2015 USD 450,000 (7,716)Pay 2.07% 3 Month USD Libor Deutsche Bank 23/02/2015 USD 1,275,000 (9,904)
Receive 4.40% 28 Day TIIE Merrill Lynch 16/10/2015 MXN 45,000,000 (4,115)
USD (21,735)
Unrealized depreciation on swaptions is included in “Net unrealized depreciation on swaps” in the Statement of Net Assets.
Note 12 – COLLATERAL
As at December 31, 2014, there was no collateral received from counterparties by any of the Sub-Funds for thepurpose of transactions of OTC derivatives.
Note 13 – REPURCHASE AGREEMENTS
As at December 31, 2014, Natixis Global Inflation Fund is committed under the following repurchase agreementoperation:
● on United States Treasury Inflation Indexed Bonds 0.125% 15/04/2018 with a value of USD 2,557,468. The par value of the repurchase contract amounted USD 2,568,750. This contract will mature on02/01/2015.
The above contract outstanding as of December 31, 2014 was transacted through BNP Paribas.
For the year ended December 31, 2014 the net interest paid on Repurchase Agreements is EUR 11,166.
The Fund uses repurchase agreement for Efficient Portfolio Management. The revenues and costs arising from itare included in the Statement of Changes in Net Assets under the captions Interest on bonds, net and Interestpaid.
Note 14 – PLEDGED SECURITIES AND CASH
As of December 31, 2014, the following securities serve as pledged assets for commitments on derivativeinstruments.
Fund name Securities description Currency Quantity Market value CounterpartyMargin
(in EUR)
Loomis SaylesDuration HedgedGlobal CorporateBond Fund
- - - - JP Morgan (9,375)
- - - - Citi 2,750,052U.S. Treasury Bond5.375% 15/02/2031
USD 820,000 1,142,939 Citi -
U.S. Treasury Bond3.750% 15/11/2043
USD 130,000 156,274 Citi -
U.S. Treasury Bond3.750% 15/11/2043
USD 150,000 180,316 JP Morgan -
U.S. Treasury Note1.375% 28/02/2019
USD 800,000 795,687 Citi -
Cash USD - 1,262,150 Morgan Stanley -
Cash GBP - 184,247 Morgan Stanley -
Cash EUR - 460,090 Morgan Stanley -
(*) The net unrealised appreciation/(depreciation) is included in the Statement of Net Assets.
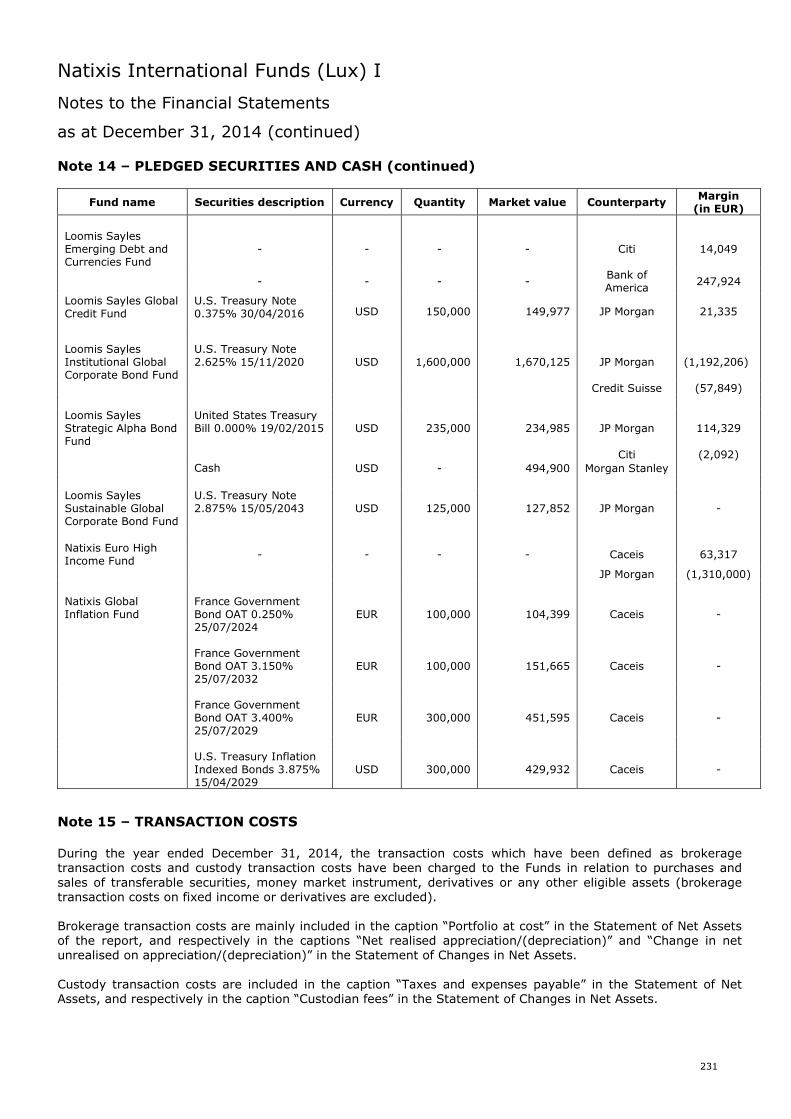
Natixis International Funds (Lux) I
Notes to the Financial Statements
as at December 31, 2014 (continued)
231
Note 14 – PLEDGED SECURITIES AND CASH (continued)
Fund name Securities description Currency Quantity Market value CounterpartyMargin
(in EUR)
Loomis SaylesEmerging Debt andCurrencies Fund
- - - - Citi 14,049
- - - -Bank ofAmerica
247,924
Loomis Sayles GlobalCredit Fund
U.S. Treasury Note0.375% 30/04/2016 USD 150,000 149,977 JP Morgan 21,335
Loomis SaylesInstitutional GlobalCorporate Bond Fund
U.S. Treasury Note2.625% 15/11/2020 USD 1,600,000 1,670,125 JP Morgan (1,192,206)
Credit Suisse (57,849)
Loomis SaylesStrategic Alpha BondFund
United States TreasuryBill 0.000% 19/02/2015 USD 235,000 234,985 JP Morgan 114,329
Citi (2,092)
Cash USD - 494,900 Morgan Stanley
Loomis SaylesSustainable GlobalCorporate Bond Fund
U.S. Treasury Note2.875% 15/05/2043 USD 125,000 127,852 JP Morgan -
Natixis Euro HighIncome Fund
- - - - Caceis 63,317
JP Morgan (1,310,000)
Natixis GlobalInflation Fund
France GovernmentBond OAT 0.250%25/07/2024
EUR 100,000 104,399 Caceis -
France GovernmentBond OAT 3.150%25/07/2032
EUR 100,000 151,665 Caceis -
France GovernmentBond OAT 3.400%25/07/2029
EUR 300,000 451,595 Caceis -
U.S. Treasury InflationIndexed Bonds 3.875%15/04/2029
USD 300,000 429,932 Caceis -
Note 15 – TRANSACTION COSTS
During the year ended December 31, 2014, the transaction costs which have been defined as brokeragetransaction costs and custody transaction costs have been charged to the Funds in relation to purchases andsales of transferable securities, money market instrument, derivatives or any other eligible assets (brokeragetransaction costs on fixed income or derivatives are excluded).
Brokerage transaction costs are mainly included in the caption “Portfolio at cost” in the Statement of Net Assetsof the report, and respectively in the captions “Net realised appreciation/(depreciation)” and “Change in netunrealised on appreciation/(depreciation)” in the Statement of Changes in Net Assets.
Custody transaction costs are included in the caption “Taxes and expenses payable” in the Statement of NetAssets, and respectively in the caption “Custodian fees” in the Statement of Changes in Net Assets.
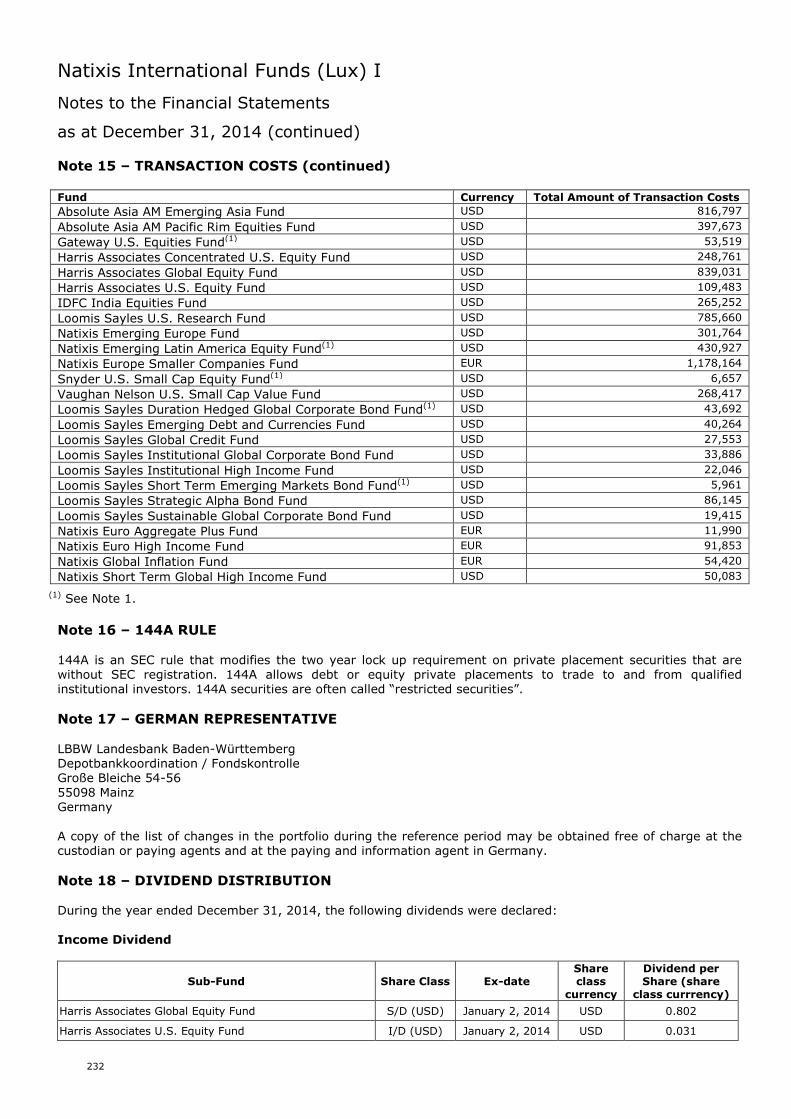
Natixis International Funds (Lux) I
Notes to the Financial Statements
as at December 31, 2014 (continued)
232
Note 15 – TRANSACTION COSTS (continued)
Fund Currency Total Amount of Transaction Costs
Absolute Asia AM Emerging Asia Fund USD 816,797
Absolute Asia AM Pacific Rim Equities Fund USD 397,673
Gateway U.S. Equities Fund(1) USD 53,519
Harris Associates Concentrated U.S. Equity Fund USD 248,761
Harris Associates Global Equity Fund USD 839,031
Harris Associates U.S. Equity Fund USD 109,483
IDFC India Equities Fund USD 265,252
Loomis Sayles U.S. Research Fund USD 785,660
Natixis Emerging Europe Fund USD 301,764
Natixis Emerging Latin America Equity Fund(1) USD 430,927
Natixis Europe Smaller Companies Fund EUR 1,178,164
Snyder U.S. Small Cap Equity Fund(1) USD 6,657
Vaughan Nelson U.S. Small Cap Value Fund USD 268,417
Loomis Sayles Duration Hedged Global Corporate Bond Fund(1) USD 43,692
Loomis Sayles Emerging Debt and Currencies Fund USD 40,264
Loomis Sayles Global Credit Fund USD 27,553
Loomis Sayles Institutional Global Corporate Bond Fund USD 33,886
Loomis Sayles Institutional High Income Fund USD 22,046
Loomis Sayles Short Term Emerging Markets Bond Fund(1) USD 5,961
Loomis Sayles Strategic Alpha Bond Fund USD 86,145
Loomis Sayles Sustainable Global Corporate Bond Fund USD 19,415
Natixis Euro Aggregate Plus Fund EUR 11,990
Natixis Euro High Income Fund EUR 91,853
Natixis Global Inflation Fund EUR 54,420
Natixis Short Term Global High Income Fund USD 50,083
(1) See Note 1.
Note 16 – 144A RULE
144A is an SEC rule that modifies the two year lock up requirement on private placement securities that arewithout SEC registration. 144A allows debt or equity private placements to trade to and from qualifiedinstitutional investors. 144A securities are often called “restricted securities”.
Note 17 – GERMAN REPRESENTATIVE
LBBW Landesbank Baden-WürttembergDepotbankkoordination / FondskontrolleGroße Bleiche 54-5655098 MainzGermany
A copy of the list of changes in the portfolio during the reference period may be obtained free of charge at thecustodian or paying agents and at the paying and information agent in Germany.
Note 18 – DIVIDEND DISTRIBUTION
During the year ended December 31, 2014, the following dividends were declared:
Income Dividend
Sub-Fund Share Class Ex-dateShareclass
currency
Dividend perShare (share
class currrency)
Harris Associates Global Equity Fund S/D (USD) January 2, 2014 USD 0.802
Harris Associates U.S. Equity Fund I/D (USD) January 2, 2014 USD 0.031
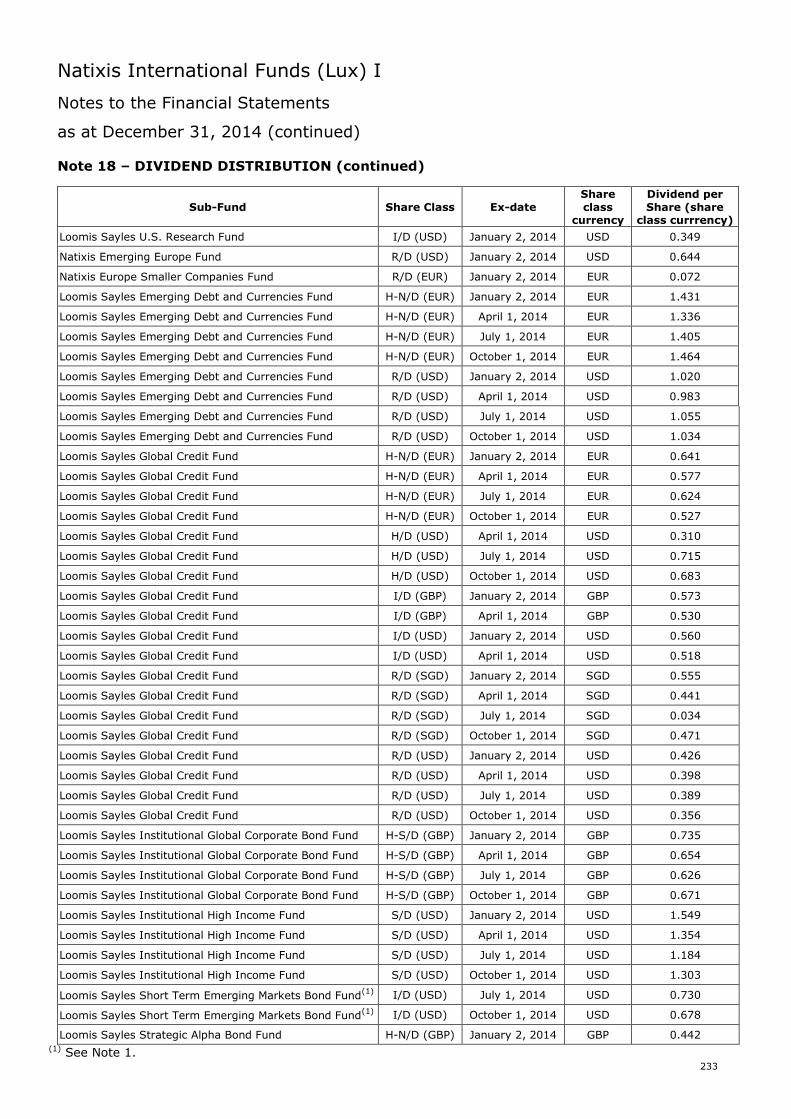
Natixis International Funds (Lux) I
Notes to the Financial Statements
as at December 31, 2014 (continued)
233
Note 18 – DIVIDEND DISTRIBUTION (continued)
Sub-Fund Share Class Ex-dateShareclass
currency
Dividend perShare (share
class currrency)
Loomis Sayles U.S. Research Fund I/D (USD) January 2, 2014 USD 0.349
Natixis Emerging Europe Fund R/D (USD) January 2, 2014 USD 0.644
Natixis Europe Smaller Companies Fund R/D (EUR) January 2, 2014 EUR 0.072
Loomis Sayles Emerging Debt and Currencies Fund H-N/D (EUR) January 2, 2014 EUR 1.431
Loomis Sayles Emerging Debt and Currencies Fund H-N/D (EUR) April 1, 2014 EUR 1.336
Loomis Sayles Emerging Debt and Currencies Fund H-N/D (EUR) July 1, 2014 EUR 1.405
Loomis Sayles Emerging Debt and Currencies Fund H-N/D (EUR) October 1, 2014 EUR 1.464
Loomis Sayles Emerging Debt and Currencies Fund R/D (USD) January 2, 2014 USD 1.020
Loomis Sayles Emerging Debt and Currencies Fund R/D (USD) April 1, 2014 USD 0.983
Loomis Sayles Emerging Debt and Currencies Fund R/D (USD) July 1, 2014 USD 1.055
Loomis Sayles Emerging Debt and Currencies Fund R/D (USD) October 1, 2014 USD 1.034
Loomis Sayles Global Credit Fund H-N/D (EUR) January 2, 2014 EUR 0.641
Loomis Sayles Global Credit Fund H-N/D (EUR) April 1, 2014 EUR 0.577
Loomis Sayles Global Credit Fund H-N/D (EUR) July 1, 2014 EUR 0.624
Loomis Sayles Global Credit Fund H-N/D (EUR) October 1, 2014 EUR 0.527
Loomis Sayles Global Credit Fund H/D (USD) April 1, 2014 USD 0.310
Loomis Sayles Global Credit Fund H/D (USD) July 1, 2014 USD 0.715
Loomis Sayles Global Credit Fund H/D (USD) October 1, 2014 USD 0.683
Loomis Sayles Global Credit Fund I/D (GBP) January 2, 2014 GBP 0.573
Loomis Sayles Global Credit Fund I/D (GBP) April 1, 2014 GBP 0.530
Loomis Sayles Global Credit Fund I/D (USD) January 2, 2014 USD 0.560
Loomis Sayles Global Credit Fund I/D (USD) April 1, 2014 USD 0.518
Loomis Sayles Global Credit Fund R/D (SGD) January 2, 2014 SGD 0.555
Loomis Sayles Global Credit Fund R/D (SGD) April 1, 2014 SGD 0.441
Loomis Sayles Global Credit Fund R/D (SGD) July 1, 2014 SGD 0.034
Loomis Sayles Global Credit Fund R/D (SGD) October 1, 2014 SGD 0.471
Loomis Sayles Global Credit Fund R/D (USD) January 2, 2014 USD 0.426
Loomis Sayles Global Credit Fund R/D (USD) April 1, 2014 USD 0.398
Loomis Sayles Global Credit Fund R/D (USD) July 1, 2014 USD 0.389
Loomis Sayles Global Credit Fund R/D (USD) October 1, 2014 USD 0.356
Loomis Sayles Institutional Global Corporate Bond Fund H-S/D (GBP) January 2, 2014 GBP 0.735
Loomis Sayles Institutional Global Corporate Bond Fund H-S/D (GBP) April 1, 2014 GBP 0.654
Loomis Sayles Institutional Global Corporate Bond Fund H-S/D (GBP) July 1, 2014 GBP 0.626
Loomis Sayles Institutional Global Corporate Bond Fund H-S/D (GBP) October 1, 2014 GBP 0.671
Loomis Sayles Institutional High Income Fund S/D (USD) January 2, 2014 USD 1.549
Loomis Sayles Institutional High Income Fund S/D (USD) April 1, 2014 USD 1.354
Loomis Sayles Institutional High Income Fund S/D (USD) July 1, 2014 USD 1.184
Loomis Sayles Institutional High Income Fund S/D (USD) October 1, 2014 USD 1.303
Loomis Sayles Short Term Emerging Markets Bond Fund(1) I/D (USD) July 1, 2014 USD 0.730
Loomis Sayles Short Term Emerging Markets Bond Fund(1) I/D (USD) October 1, 2014 USD 0.678
Loomis Sayles Strategic Alpha Bond Fund H-N/D (GBP) January 2, 2014 GBP 0.442(1) See Note 1.
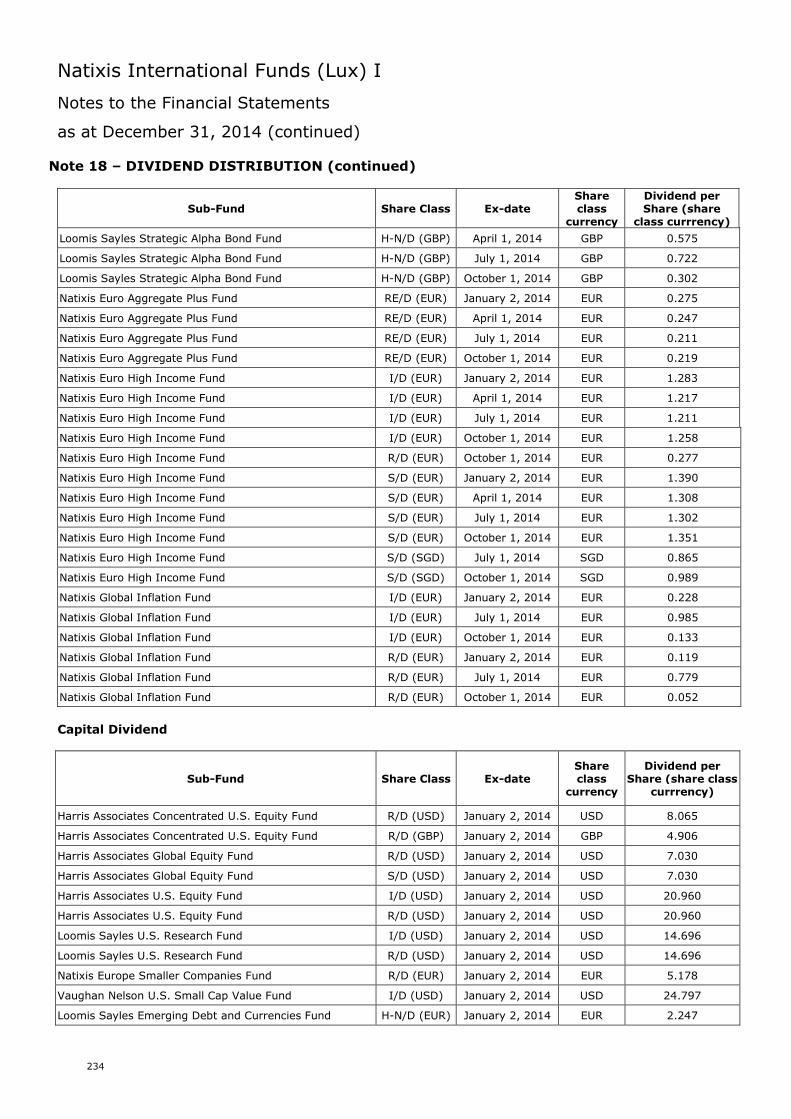
Natixis International Funds (Lux) I
Notes to the Financial Statements
as at December 31, 2014 (continued)
234
Note 18 – DIVIDEND DISTRIBUTION (continued)
Sub-Fund Share Class Ex-dateShareclass
currency
Dividend perShare (share
class currrency)
Loomis Sayles Strategic Alpha Bond Fund H-N/D (GBP) April 1, 2014 GBP 0.575
Loomis Sayles Strategic Alpha Bond Fund H-N/D (GBP) July 1, 2014 GBP 0.722
Loomis Sayles Strategic Alpha Bond Fund H-N/D (GBP) October 1, 2014 GBP 0.302
Natixis Euro Aggregate Plus Fund RE/D (EUR) January 2, 2014 EUR 0.275
Natixis Euro Aggregate Plus Fund RE/D (EUR) April 1, 2014 EUR 0.247
Natixis Euro Aggregate Plus Fund RE/D (EUR) July 1, 2014 EUR 0.211
Natixis Euro Aggregate Plus Fund RE/D (EUR) October 1, 2014 EUR 0.219
Natixis Euro High Income Fund I/D (EUR) January 2, 2014 EUR 1.283
Natixis Euro High Income Fund I/D (EUR) April 1, 2014 EUR 1.217
Natixis Euro High Income Fund I/D (EUR) July 1, 2014 EUR 1.211
Natixis Euro High Income Fund I/D (EUR) October 1, 2014 EUR 1.258
Natixis Euro High Income Fund R/D (EUR) October 1, 2014 EUR 0.277
Natixis Euro High Income Fund S/D (EUR) January 2, 2014 EUR 1.390
Natixis Euro High Income Fund S/D (EUR) April 1, 2014 EUR 1.308
Natixis Euro High Income Fund S/D (EUR) July 1, 2014 EUR 1.302
Natixis Euro High Income Fund S/D (EUR) October 1, 2014 EUR 1.351
Natixis Euro High Income Fund S/D (SGD) July 1, 2014 SGD 0.865
Natixis Euro High Income Fund S/D (SGD) October 1, 2014 SGD 0.989
Natixis Global Inflation Fund I/D (EUR) January 2, 2014 EUR 0.228
Natixis Global Inflation Fund I/D (EUR) July 1, 2014 EUR 0.985
Natixis Global Inflation Fund I/D (EUR) October 1, 2014 EUR 0.133
Natixis Global Inflation Fund R/D (EUR) January 2, 2014 EUR 0.119
Natixis Global Inflation Fund R/D (EUR) July 1, 2014 EUR 0.779
Natixis Global Inflation Fund R/D (EUR) October 1, 2014 EUR 0.052
Capital Dividend
Sub-Fund Share Class Ex-dateShareclass
currency
Dividend perShare (share class
currrency)
Harris Associates Concentrated U.S. Equity Fund R/D (USD) January 2, 2014 USD 8.065
Harris Associates Concentrated U.S. Equity Fund R/D (GBP) January 2, 2014 GBP 4.906
Harris Associates Global Equity Fund R/D (USD) January 2, 2014 USD 7.030
Harris Associates Global Equity Fund S/D (USD) January 2, 2014 USD 7.030
Harris Associates U.S. Equity Fund I/D (USD) January 2, 2014 USD 20.960
Harris Associates U.S. Equity Fund R/D (USD) January 2, 2014 USD 20.960
Loomis Sayles U.S. Research Fund I/D (USD) January 2, 2014 USD 14.696
Loomis Sayles U.S. Research Fund R/D (USD) January 2, 2014 USD 14.696
Natixis Europe Smaller Companies Fund R/D (EUR) January 2, 2014 EUR 5.178
Vaughan Nelson U.S. Small Cap Value Fund I/D (USD) January 2, 2014 USD 24.797
Loomis Sayles Emerging Debt and Currencies Fund H-N/D (EUR) January 2, 2014 EUR 2.247
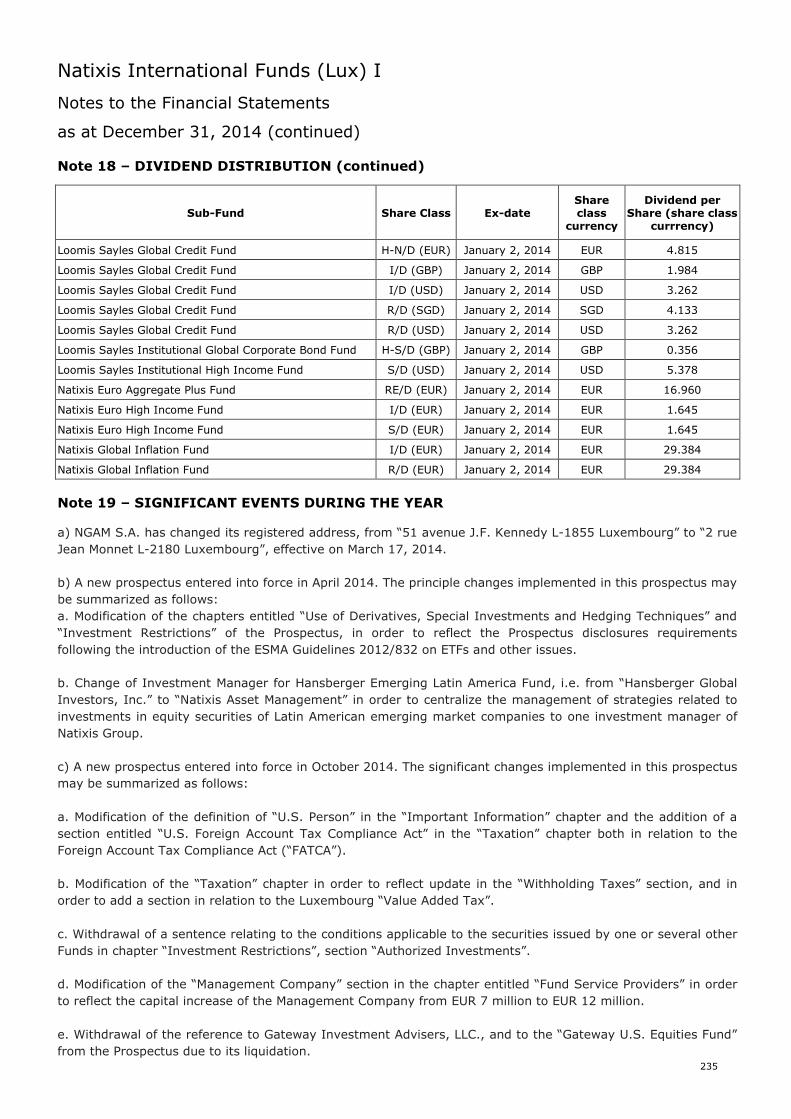
Natixis International Funds (Lux) I
Notes to the Financial Statements
as at December 31, 2014 (continued)
235
Note 18 – DIVIDEND DISTRIBUTION (continued)
Sub-Fund Share Class Ex-dateShareclass
currency
Dividend perShare (share class
currrency)
Loomis Sayles Global Credit Fund H-N/D (EUR) January 2, 2014 EUR 4.815
Loomis Sayles Global Credit Fund I/D (GBP) January 2, 2014 GBP 1.984
Loomis Sayles Global Credit Fund I/D (USD) January 2, 2014 USD 3.262
Loomis Sayles Global Credit Fund R/D (SGD) January 2, 2014 SGD 4.133
Loomis Sayles Global Credit Fund R/D (USD) January 2, 2014 USD 3.262
Loomis Sayles Institutional Global Corporate Bond Fund H-S/D (GBP) January 2, 2014 GBP 0.356
Loomis Sayles Institutional High Income Fund S/D (USD) January 2, 2014 USD 5.378
Natixis Euro Aggregate Plus Fund RE/D (EUR) January 2, 2014 EUR 16.960
Natixis Euro High Income Fund I/D (EUR) January 2, 2014 EUR 1.645
Natixis Euro High Income Fund S/D (EUR) January 2, 2014 EUR 1.645
Natixis Global Inflation Fund I/D (EUR) January 2, 2014 EUR 29.384
Natixis Global Inflation Fund R/D (EUR) January 2, 2014 EUR 29.384
Note 19 – SIGNIFICANT EVENTS DURING THE YEAR
a) NGAM S.A. has changed its registered address, from “51 avenue J.F. Kennedy L-1855 Luxembourg” to “2 rue
Jean Monnet L-2180 Luxembourg”, effective on March 17, 2014.
b) A new prospectus entered into force in April 2014. The principle changes implemented in this prospectus may
be summarized as follows:
a. Modification of the chapters entitled “Use of Derivatives, Special Investments and Hedging Techniques” and
“Investment Restrictions” of the Prospectus, in order to reflect the Prospectus disclosures requirements
following the introduction of the ESMA Guidelines 2012/832 on ETFs and other issues.
b. Change of Investment Manager for Hansberger Emerging Latin America Fund, i.e. from “Hansberger Global
Investors, Inc.” to “Natixis Asset Management” in order to centralize the management of strategies related to
investments in equity securities of Latin American emerging market companies to one investment manager of
Natixis Group.
c) A new prospectus entered into force in October 2014. The significant changes implemented in this prospectus
may be summarized as follows:
a. Modification of the definition of “U.S. Person” in the “Important Information” chapter and the addition of a
section entitled “U.S. Foreign Account Tax Compliance Act” in the “Taxation” chapter both in relation to the
Foreign Account Tax Compliance Act (“FATCA”).
b. Modification of the “Taxation” chapter in order to reflect update in the “Withholding Taxes” section, and in
order to add a section in relation to the Luxembourg “Value Added Tax”.
c. Withdrawal of a sentence relating to the conditions applicable to the securities issued by one or several other
Funds in chapter “Investment Restrictions”, section “Authorized Investments”.
d. Modification of the “Management Company” section in the chapter entitled “Fund Service Providers” in order
to reflect the capital increase of the Management Company from EUR 7 million to EUR 12 million.
e. Withdrawal of the reference to Gateway Investment Advisers, LLC., and to the “Gateway U.S. Equities Fund”
from the Prospectus due to its liquidation.
Natixis International Funds (Lux) I
Notes to the Financial Statements
as at December 31, 2014 (continued)
236
Note 19 – SIGNIFICANT EVENTS DURING THE YEAR (continued)
f. Modification of the investment policy of the Natixis Emerging Latin America Equity Fund and Loomis Sayles
Institutional High Income Fund regarding the amount of its total assets being invested in particular instruments.
g. Modification of the investment objective and policy and name of the Loomis Sayles Emerging Markets
Corporate Bond Fund.
h. Addition of a provision related to an anti-dilution levy for Loomis Sayles Duration Hedged Global Corporate
Bond Fund and Loomis Sayles Sustainable Global Corporate Bond Fund as from October 20, 2014, in order to
protect existing shareholders from the possible impact of trading activities associated with large institutional
flows.
There have been no other significant events affecting the Fund during the year ended December 31, 2014.
Note 20 – SUBSEQUENT EVENTS
A new prospectus entered into force in March 2015. The principle changes implemented in this prospectus may
be summarized as follows:
Creation of a new Fund denominated “Vaughan Nelson U.S. Mid Cap Equity Fund” (created on February
27, 2015, and launched on March 17, 2015).
As from March 31, 2015, modification of the characteristics of the “R” and “RE” Share classes for each
Fund offering such Share classes (mainly, addition of a minimum initial investment and minimum
holding for the “R” share classes. Addition of a maximum sales charge up to 2.00% for the “RE” share
classes, and removal of the minimum initial investment and minimum holding from these RE Share
classes).
Change of name of Absolute Asia Asset Management Limited into “Natixis Asset Management Asia
Limited” (with effect on January 1, 2015).
Apart from the above, there are no other subsequent events to be disclosed as at December 31, 2014.
Natixis International Funds (Lux) I
Additional Information
237
SAVINGS DIRECTIVE (unaudited)
The Law of June 21, 2005, (the “Law”) has implemented into Luxembourg law the Council Directive 2003/48/ECon the taxation of savings income in the form of interest payments (the “Savings Directive”). It seeks to ensurethat individuals residents in an EU Member State who receive interest payments from another Member State aretaxed in the Member State in which they are resident for the tax purposes.
The Savings Directive targets payments in the form of interest payments from debt claims (“Taxable Income”)made in a member state of the European Union (a “Member State”) to individuals (“Beneficiaries”) residing inanother Member State. Under the Savings Directive Member States are required to provide the tax authorities ofthe Beneficiary’s Member State with details on payments of Taxable Income made and the identity of therespective Beneficiaries (“Exchange of Information”). For a transitional period some countries (amongst whichLuxembourg) shall however apply a withholding tax system instead of an exchange of information. Although theterritorial scope of the Directive is limited to the EU arrangements and agreements have been concluded with 10dependent or associated territories – Jersey, Guernsey, Isle of Man, Anguilla, BVI, Cayman Islands, Turk &Caicos Islands, Montserrat, Netherlands Antilles and Aruba – and 5 third countries – Switzerland, Liechtenstein,San Marino, Monaco and Andorra – to ensure a level playing field.
As the date of this Prospectus, the rate of such withholding tax is 35%.
Article 9 of the Law provides however that no withholding tax will be withheld if the Beneficiary explicitlyauthorizes the paying agent in writing to proceed to an Exchange of Information.
On March 20, 2014, the European Council decided to pass the revised EU Savings Directive, which will amendand broaden the scope of the EU Savings Directive. On the same European Council meeting, Luxembourgconfirmed that they will endorse the amendment to the EU Savings Directive and will replace the withholdingsystem by the automatic exchange of information system as of January 1, 2015. On March 24, 2014 the Councilof the European Union passed the proposed amendment of the EU Savings Directive.
Dividends distributed by the Umbrella Fund will fall into the scope of the Savings Directive if more than 15% ofthe relevant portfolio’s assets are invested in debt claims (as defined in the Law). Redemption proceeds realisedby shareholders on the disposal of shares will fall into the Scope of the Savings Directive if more than 40% of therelevant fund assets are invested in debt claims.
The Umbrella Fund is authorised to reject any application for shares if the applying investor does not provide theUmbrella Fund with complete and satisfactory information required by the Law.
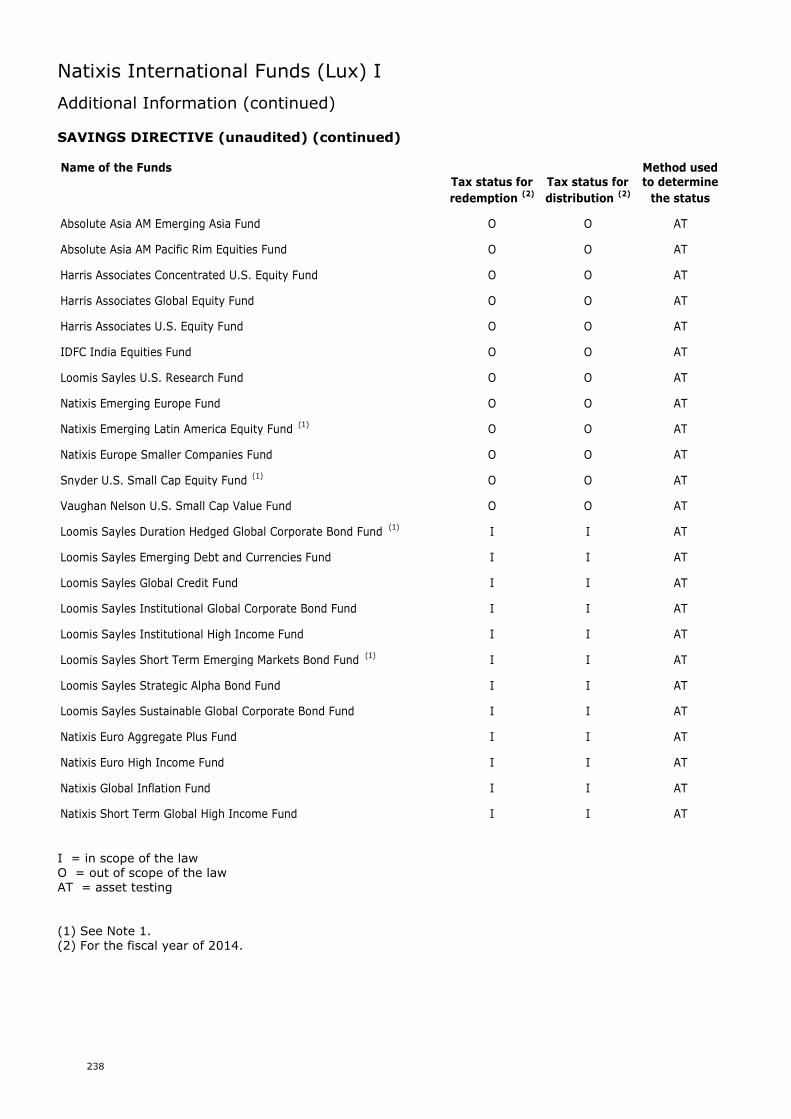
Natixis International Funds (Lux) I
Additional Information (continued)
238
SAVINGS DIRECTIVE (unaudited) (continued)
Name of the Funds Method usedTax status for Tax status for to determine
redemption (2) distribution (2) the status
Absolute Asia AM Emerging Asia Fund O O AT
Absolute Asia AM Pacific Rim Equities Fund O O AT
Harris Associates Concentrated U.S. Equity Fund O O AT
Harris Associates Global Equity Fund O O AT
Harris Associates U.S. Equity Fund O O AT
IDFC India Equities Fund O O AT
Loomis Sayles U.S. Research Fund O O AT
Natixis Emerging Europe Fund O O AT
Natixis Emerging Latin America Equity Fund (1) O O AT
Natixis Europe Smaller Companies Fund O O AT
Snyder U.S. Small Cap Equity Fund (1) O O AT
Vaughan Nelson U.S. Small Cap Value Fund O O AT
Loomis Sayles Duration Hedged Global Corporate Bond Fund (1) I I AT
Loomis Sayles Emerging Debt and Currencies Fund I I AT
Loomis Sayles Global Credit Fund I I AT
Loomis Sayles Institutional Global Corporate Bond Fund I I AT
Loomis Sayles Institutional High Income Fund I I AT
Loomis Sayles Short Term Emerging Markets Bond Fund (1) I I AT
Loomis Sayles Strategic Alpha Bond Fund I I AT
Loomis Sayles Sustainable Global Corporate Bond Fund I I AT
Natixis Euro Aggregate Plus Fund I I AT
Natixis Euro High Income Fund I I AT
Natixis Global Inflation Fund I I AT
Natixis Short Term Global High Income Fund I I AT
I = in scope of the lawO = out of scope of the lawAT = asset testing
(1) See Note 1.(2) For the fiscal year of 2014.
Natixis International Funds (Lux) I
Additional Information (continued)
239
INFORMATION ON GLOBAL MARKET RISK EXPOSURE (unaudited)
The Management Company monitored the global market risk exposure of the Funds for the year ended December31, 2014 utilizing the commitment approach.
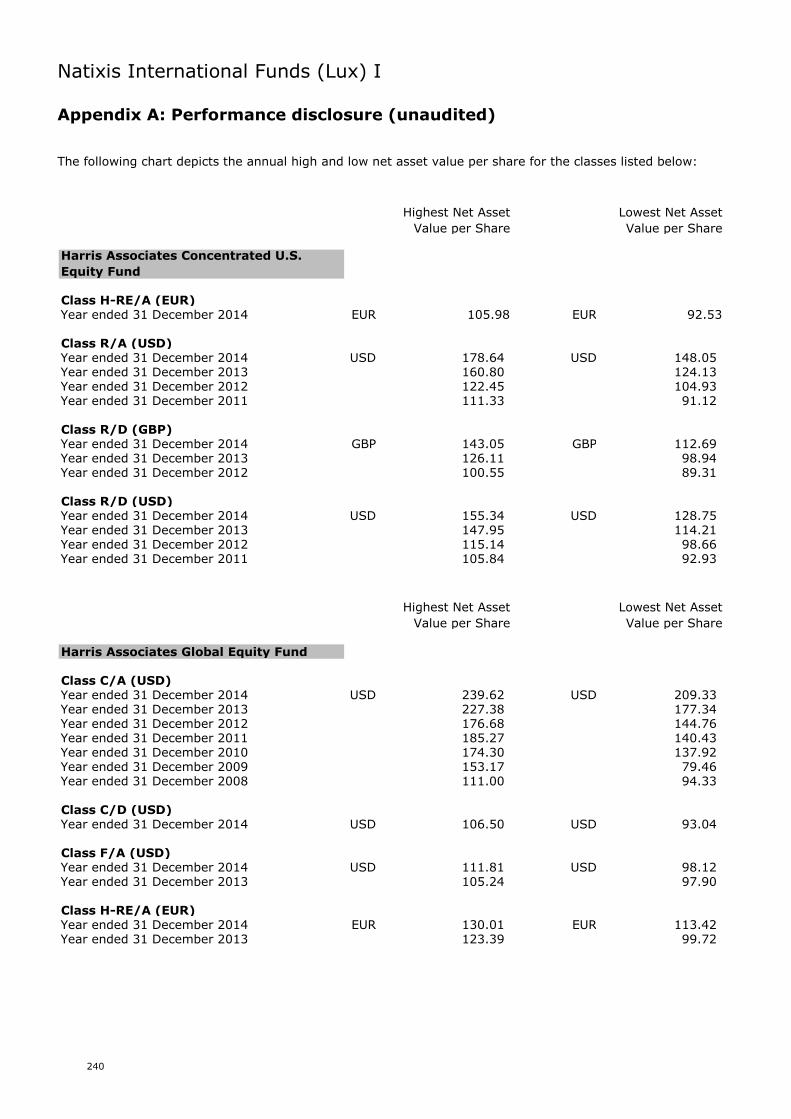
Natixis International Funds (Lux) I
Appendix A: Performance disclosure (unaudited)
240
The following chart depicts the annual high and low net asset value per share for the classes listed below:
Highest Net Asset
Value per Share
Lowest Net Asset
Value per Share
Harris Associates Concentrated U.S.
Equity Fund
Class H-RE/A (EUR)Year ended 31 December 2014 EUR 105.98 EUR 92.53
Class R/A (USD)Year ended 31 December 2014 USD 178.64 USD 148.05Year ended 31 December 2013 160.80 124.13Year ended 31 December 2012 122.45 104.93Year ended 31 December 2011 111.33 91.12
Class R/D (GBP)Year ended 31 December 2014 GBP 143.05 GBP 112.69Year ended 31 December 2013 126.11 98.94Year ended 31 December 2012 100.55 89.31
Class R/D (USD)Year ended 31 December 2014 USD 155.34 USD 128.75Year ended 31 December 2013 147.95 114.21Year ended 31 December 2012 115.14 98.66Year ended 31 December 2011 105.84 92.93
Highest Net Asset
Value per Share
Lowest Net Asset
Value per Share
Harris Associates Global Equity Fund
Class C/A (USD)Year ended 31 December 2014 USD 239.62 USD 209.33Year ended 31 December 2013 227.38 177.34Year ended 31 December 2012 176.68 144.76Year ended 31 December 2011 185.27 140.43Year ended 31 December 2010 174.30 137.92Year ended 31 December 2009 153.17 79.46Year ended 31 December 2008 111.00 94.33
Class C/D (USD)Year ended 31 December 2014 USD 106.50 USD 93.04
Class F/A (USD)Year ended 31 December 2014 USD 111.81 USD 98.12Year ended 31 December 2013 105.24 97.90
Class H-RE/A (EUR)Year ended 31 December 2014 EUR 130.01 EUR 113.42Year ended 31 December 2013 123.39 99.72
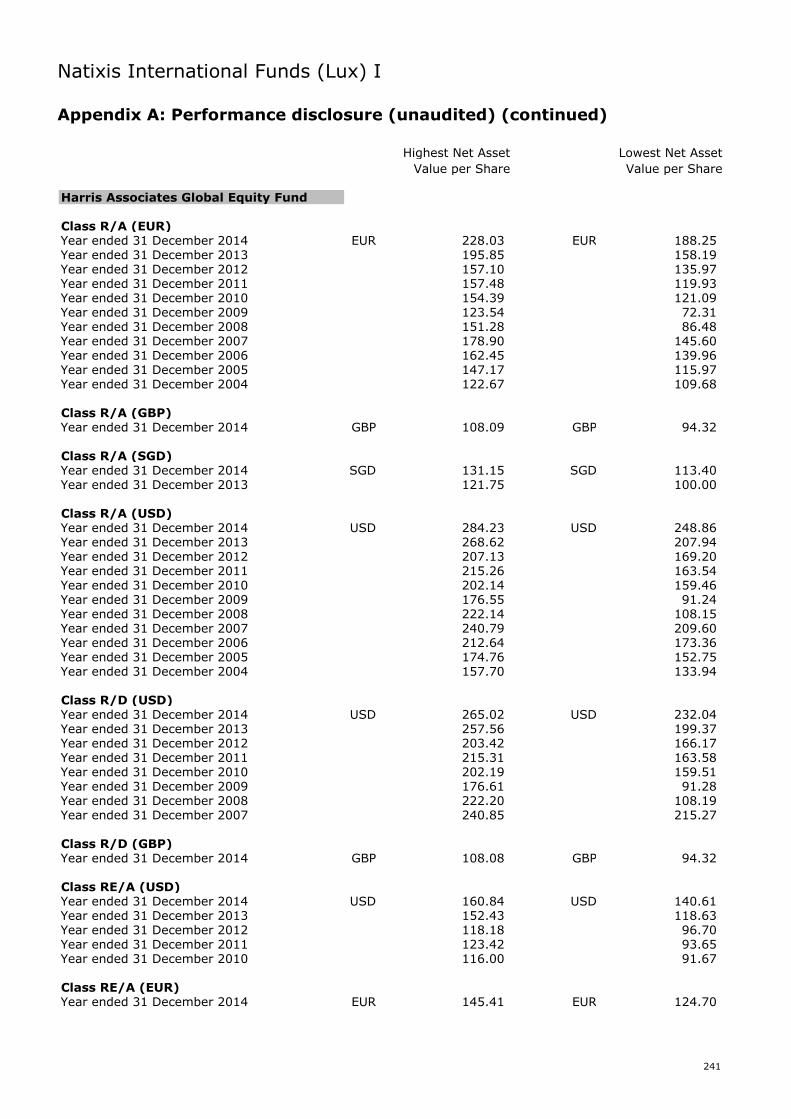
Natixis International Funds (Lux) I
Appendix A: Performance disclosure (unaudited) (continued)
241
Highest Net Asset
Value per Share
Lowest Net Asset
Value per Share
Harris Associates Global Equity Fund
Class R/A (EUR)Year ended 31 December 2014 EUR 228.03 EUR 188.25Year ended 31 December 2013 195.85 158.19Year ended 31 December 2012 157.10 135.97Year ended 31 December 2011 157.48 119.93Year ended 31 December 2010 154.39 121.09Year ended 31 December 2009 123.54 72.31Year ended 31 December 2008 151.28 86.48Year ended 31 December 2007 178.90 145.60Year ended 31 December 2006 162.45 139.96Year ended 31 December 2005 147.17 115.97Year ended 31 December 2004 122.67 109.68
Class R/A (GBP)Year ended 31 December 2014 GBP 108.09 GBP 94.32
Class R/A (SGD)Year ended 31 December 2014 SGD 131.15 SGD 113.40Year ended 31 December 2013 121.75 100.00
Class R/A (USD)Year ended 31 December 2014 USD 284.23 USD 248.86Year ended 31 December 2013 268.62 207.94Year ended 31 December 2012 207.13 169.20Year ended 31 December 2011 215.26 163.54Year ended 31 December 2010 202.14 159.46Year ended 31 December 2009 176.55 91.24Year ended 31 December 2008 222.14 108.15Year ended 31 December 2007 240.79 209.60Year ended 31 December 2006 212.64 173.36Year ended 31 December 2005 174.76 152.75Year ended 31 December 2004 157.70 133.94
Class R/D (USD)Year ended 31 December 2014 USD 265.02 USD 232.04Year ended 31 December 2013 257.56 199.37Year ended 31 December 2012 203.42 166.17Year ended 31 December 2011 215.31 163.58Year ended 31 December 2010 202.19 159.51Year ended 31 December 2009 176.61 91.28Year ended 31 December 2008 222.20 108.19Year ended 31 December 2007 240.85 215.27
Class R/D (GBP)Year ended 31 December 2014 GBP 108.08 GBP 94.32
Class RE/A (USD)Year ended 31 December 2014 USD 160.84 USD 140.61Year ended 31 December 2013 152.43 118.63Year ended 31 December 2012 118.18 96.70Year ended 31 December 2011 123.42 93.65Year ended 31 December 2010 116.00 91.67
Class RE/A (EUR)Year ended 31 December 2014 EUR 145.41 EUR 124.70
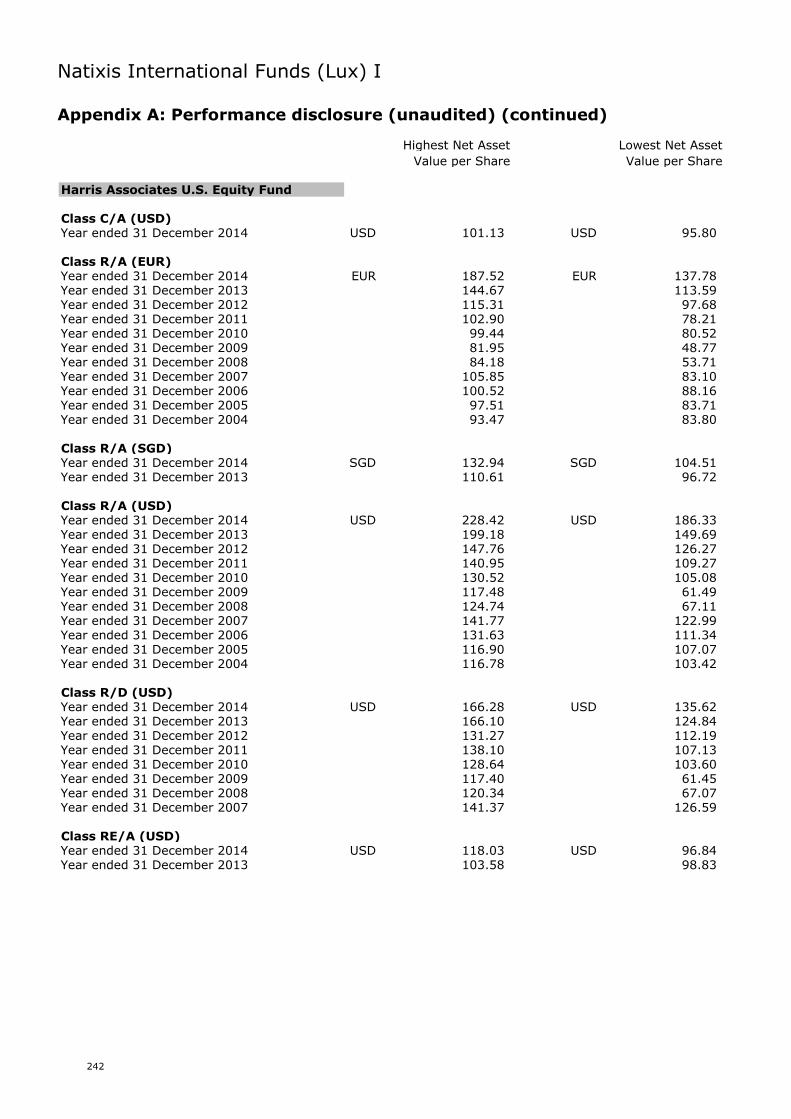
Natixis International Funds (Lux) I
Appendix A: Performance disclosure (unaudited) (continued)
242
Highest Net Asset
Value per Share
Lowest Net Asset
Value per Share
Harris Associates U.S. Equity Fund
Class C/A (USD)Year ended 31 December 2014 USD 101.13 USD 95.80
Class R/A (EUR)Year ended 31 December 2014 EUR 187.52 EUR 137.78Year ended 31 December 2013 144.67 113.59Year ended 31 December 2012 115.31 97.68Year ended 31 December 2011 102.90 78.21Year ended 31 December 2010 99.44 80.52Year ended 31 December 2009 81.95 48.77Year ended 31 December 2008 84.18 53.71Year ended 31 December 2007 105.85 83.10Year ended 31 December 2006 100.52 88.16Year ended 31 December 2005 97.51 83.71Year ended 31 December 2004 93.47 83.80
Class R/A (SGD)Year ended 31 December 2014 SGD 132.94 SGD 104.51Year ended 31 December 2013 110.61 96.72
Class R/A (USD)Year ended 31 December 2014 USD 228.42 USD 186.33Year ended 31 December 2013 199.18 149.69Year ended 31 December 2012 147.76 126.27Year ended 31 December 2011 140.95 109.27Year ended 31 December 2010 130.52 105.08Year ended 31 December 2009 117.48 61.49Year ended 31 December 2008 124.74 67.11Year ended 31 December 2007 141.77 122.99Year ended 31 December 2006 131.63 111.34Year ended 31 December 2005 116.90 107.07Year ended 31 December 2004 116.78 103.42
Class R/D (USD)Year ended 31 December 2014 USD 166.28 USD 135.62Year ended 31 December 2013 166.10 124.84Year ended 31 December 2012 131.27 112.19Year ended 31 December 2011 138.10 107.13Year ended 31 December 2010 128.64 103.60Year ended 31 December 2009 117.40 61.45Year ended 31 December 2008 120.34 67.07Year ended 31 December 2007 141.37 126.59
Class RE/A (USD)Year ended 31 December 2014 USD 118.03 USD 96.84Year ended 31 December 2013 103.58 98.83
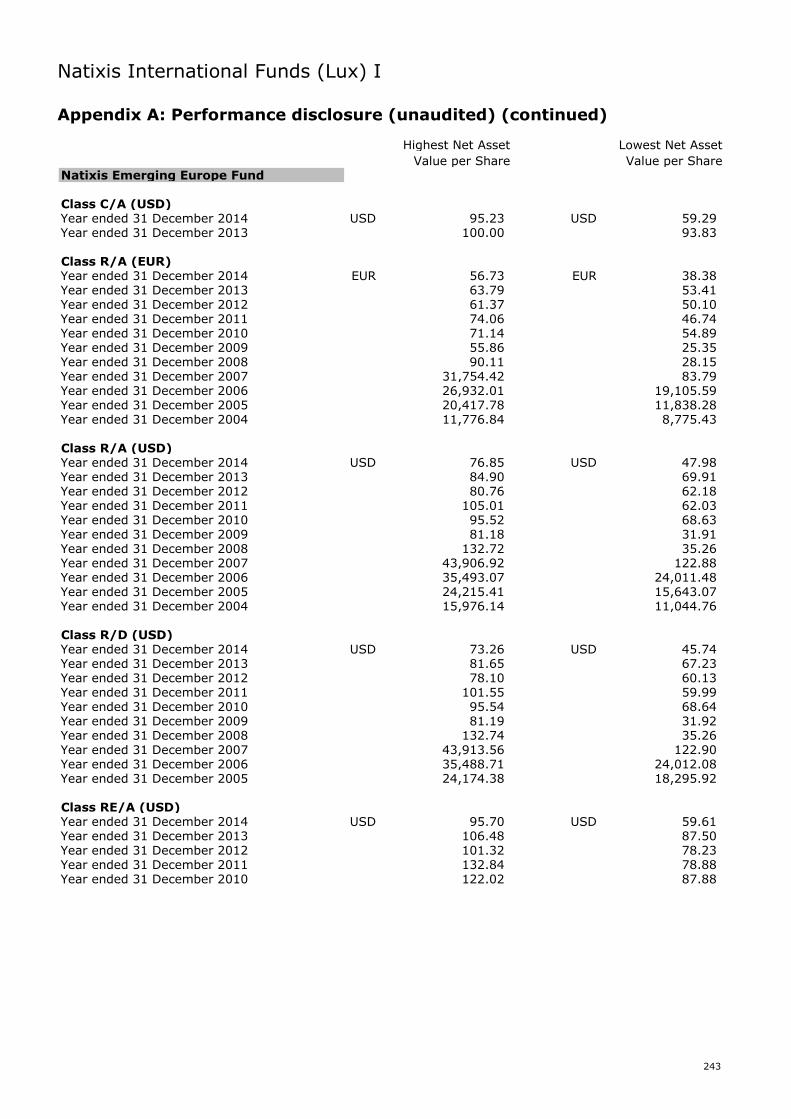
Natixis International Funds (Lux) I
Appendix A: Performance disclosure (unaudited) (continued)
243
Highest Net Asset
Value per Share
Lowest Net Asset
Value per ShareNatixis Emerging Europe Fund
Class C/A (USD)Year ended 31 December 2014 USD 95.23 USD 59.29Year ended 31 December 2013 100.00 93.83
Class R/A (EUR)Year ended 31 December 2014 EUR 56.73 EUR 38.38Year ended 31 December 2013 63.79 53.41Year ended 31 December 2012 61.37 50.10Year ended 31 December 2011 74.06 46.74Year ended 31 December 2010 71.14 54.89Year ended 31 December 2009 55.86 25.35Year ended 31 December 2008 90.11 28.15Year ended 31 December 2007 31,754.42 83.79Year ended 31 December 2006 26,932.01 19,105.59Year ended 31 December 2005 20,417.78 11,838.28Year ended 31 December 2004 11,776.84 8,775.43
Class R/A (USD)Year ended 31 December 2014 USD 76.85 USD 47.98Year ended 31 December 2013 84.90 69.91Year ended 31 December 2012 80.76 62.18Year ended 31 December 2011 105.01 62.03Year ended 31 December 2010 95.52 68.63Year ended 31 December 2009 81.18 31.91Year ended 31 December 2008 132.72 35.26Year ended 31 December 2007 43,906.92 122.88Year ended 31 December 2006 35,493.07 24,011.48Year ended 31 December 2005 24,215.41 15,643.07Year ended 31 December 2004 15,976.14 11,044.76
Class R/D (USD)Year ended 31 December 2014 USD 73.26 USD 45.74Year ended 31 December 2013 81.65 67.23Year ended 31 December 2012 78.10 60.13Year ended 31 December 2011 101.55 59.99Year ended 31 December 2010 95.54 68.64Year ended 31 December 2009 81.19 31.92Year ended 31 December 2008 132.74 35.26Year ended 31 December 2007 43,913.56 122.90Year ended 31 December 2006 35,488.71 24,012.08Year ended 31 December 2005 24,174.38 18,295.92
Class RE/A (USD)Year ended 31 December 2014 USD 95.70 USD 59.61Year ended 31 December 2013 106.48 87.50Year ended 31 December 2012 101.32 78.23Year ended 31 December 2011 132.84 78.88Year ended 31 December 2010 122.02 87.88
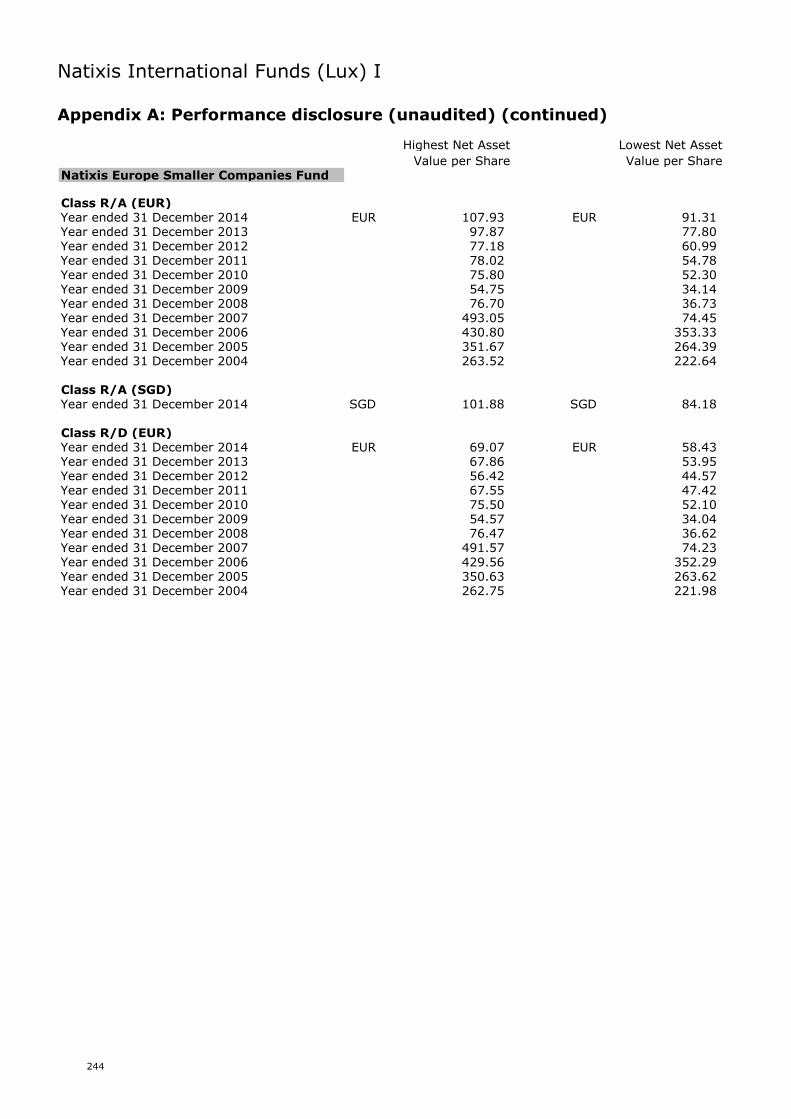
Natixis International Funds (Lux) I
Appendix A: Performance disclosure (unaudited) (continued)
244
Highest Net Asset
Value per Share
Lowest Net Asset
Value per ShareNatixis Europe Smaller Companies Fund
Class R/A (EUR)Year ended 31 December 2014 EUR 107.93 EUR 91.31Year ended 31 December 2013 97.87 77.80Year ended 31 December 2012 77.18 60.99Year ended 31 December 2011 78.02 54.78Year ended 31 December 2010 75.80 52.30Year ended 31 December 2009 54.75 34.14Year ended 31 December 2008 76.70 36.73Year ended 31 December 2007 493.05 74.45Year ended 31 December 2006 430.80 353.33Year ended 31 December 2005 351.67 264.39Year ended 31 December 2004 263.52 222.64
Class R/A (SGD)Year ended 31 December 2014 SGD 101.88 SGD 84.18
Class R/D (EUR)Year ended 31 December 2014 EUR 69.07 EUR 58.43Year ended 31 December 2013 67.86 53.95Year ended 31 December 2012 56.42 44.57Year ended 31 December 2011 67.55 47.42Year ended 31 December 2010 75.50 52.10Year ended 31 December 2009 54.57 34.04Year ended 31 December 2008 76.47 36.62Year ended 31 December 2007 491.57 74.23Year ended 31 December 2006 429.56 352.29Year ended 31 December 2005 350.63 263.62Year ended 31 December 2004 262.75 221.98
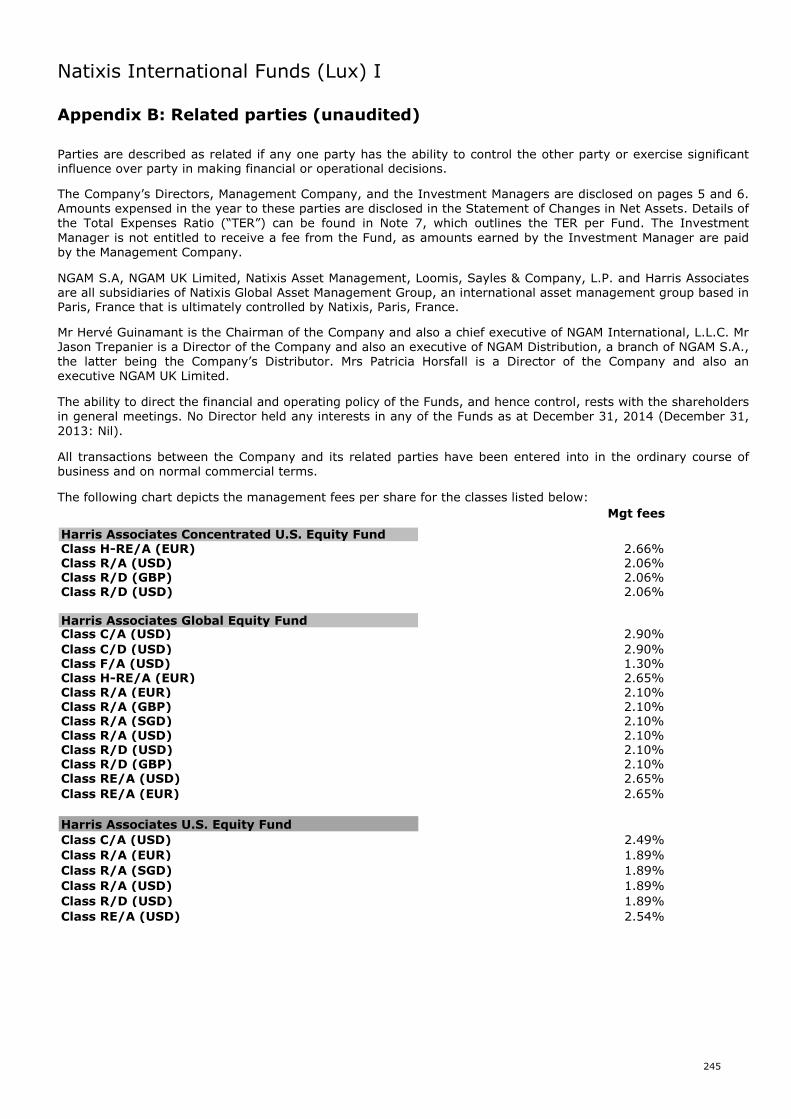
Natixis International Funds (Lux) I
Appendix B: Related parties (unaudited)
245
Parties are described as related if any one party has the ability to control the other party or exercise significantinfluence over party in making financial or operational decisions.
The Company’s Directors, Management Company, and the Investment Managers are disclosed on pages 5 and 6.Amounts expensed in the year to these parties are disclosed in the Statement of Changes in Net Assets. Details ofthe Total Expenses Ratio (“TER”) can be found in Note 7, which outlines the TER per Fund. The InvestmentManager is not entitled to receive a fee from the Fund, as amounts earned by the Investment Manager are paidby the Management Company.
NGAM S.A, NGAM UK Limited, Natixis Asset Management, Loomis, Sayles & Company, L.P. and Harris Associatesare all subsidiaries of Natixis Global Asset Management Group, an international asset management group based inParis, France that is ultimately controlled by Natixis, Paris, France.
Mr Hervé Guinamant is the Chairman of the Company and also a chief executive of NGAM International, L.L.C. MrJason Trepanier is a Director of the Company and also an executive of NGAM Distribution, a branch of NGAM S.A.,the latter being the Company’s Distributor. Mrs Patricia Horsfall is a Director of the Company and also anexecutive NGAM UK Limited.
The ability to direct the financial and operating policy of the Funds, and hence control, rests with the shareholdersin general meetings. No Director held any interests in any of the Funds as at December 31, 2014 (December 31,2013: Nil).
All transactions between the Company and its related parties have been entered into in the ordinary course ofbusiness and on normal commercial terms.
The following chart depicts the management fees per share for the classes listed below:
2.66%2.06%2.06%
Harris Associates Concentrated U.S. Equity Fund Class H-RE/A (EUR)Class R/A (USD)Class R/D (GBP)Class R/D (USD) 2.06%
Harris Associates Global Equity FundClass C/A (USD) 2.90%
Class C/D (USD) 2.90%Class F/A (USD) 1.30%Class H-RE/A (EUR) 2.65%Class R/A (EUR) 2.10%Class R/A (GBP) 2.10%Class R/A (SGD) 2.10%Class R/A (USD) 2.10%Class R/D (USD) 2.10%Class R/D (GBP) 2.10%Class RE/A (USD) 2.65%
Class RE/A (EUR) 2.65%
Harris Associates U.S. Equity Fund
Class C/A (USD) 2.49%
Class R/A (EUR) 1.89%
Class R/A (SGD) 1.89%
Class R/A (USD) 1.89%
Class R/D (USD) 1.89%
Class RE/A (USD) 2.54%
Mgt fees
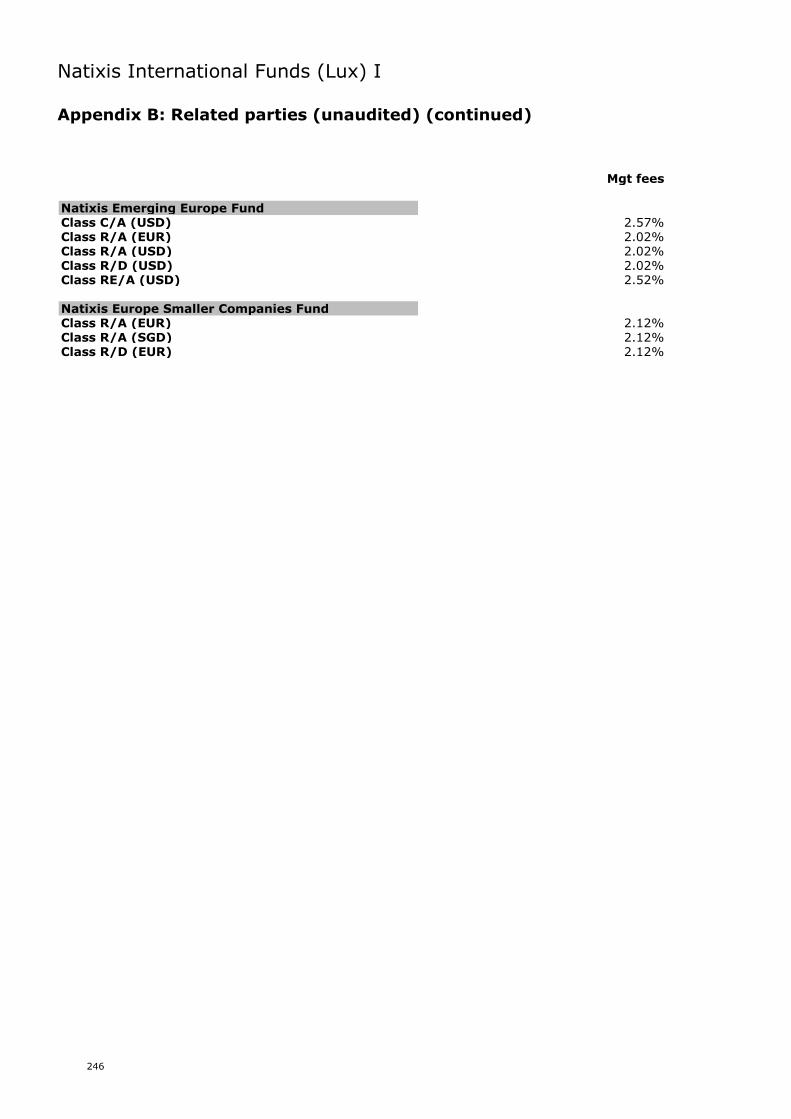
Natixis International Funds (Lux) I
Appendix B: Related parties (unaudited) (continued)
246
Mgt fees
Natixis Emerging Europe FundClass C/A (USD) 2.57%Class R/A (EUR) 2.02%Class R/A (USD) 2.02%Class R/D (USD) 2.02%Class RE/A (USD) 2.52%
Natixis Europe Smaller Companies FundClass R/A (EUR) 2.12%Class R/A (SGD) 2.12%Class R/D (EUR) 2.12%
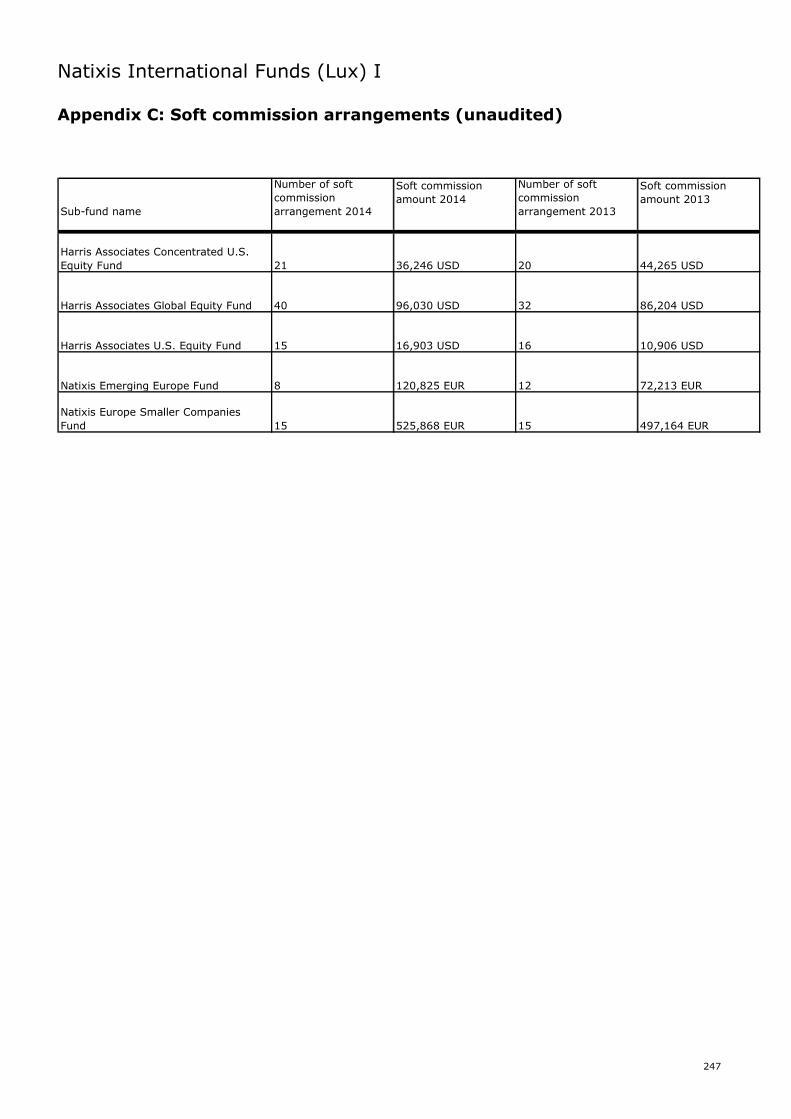
Natixis International Funds (Lux) I
Appendix C: Soft commission arrangements (unaudited)
247
Sub-fund name
Number of soft
commission
arrangement 2014
Soft commission
amount 2014
Number of soft
commission
arrangement 2013
Soft commission
amount 2013
Harris Associates Concentrated U.S.
Equity Fund 21 36,246 USD 20 44,265 USD
Harris Associates Global Equity Fund 40 96,030 USD 32 86,204 USD
Harris Associates U.S. Equity Fund 15 16,903 USD 16 10,906 USD
Natixis Emerging Europe Fund 8 120,825 EUR 12 72,213 EUR
Natixis Europe Smaller Companies
Fund 15 525,868 EUR 15 497,164 EUR
Natixis International Funds (Lux) I
Appendix D: Annual financial statements, December 31, 2013
248
Natixis International Funds (Lux) I
SICAV
Audited Annual Report
As at December 31, 2013
No subscriptions should be made on the basis of the financial report alone. Subscriptions should only be made on the basis of the current Prospectus supplemented by the latest Annual Report and the latest Semi-Annual Report, if published thereafter.
Performance data shown represents past performance and is not a guarantee of future results. More recent performance may be lower or higher. Principal value and returns fluctuate over time (including as a result of currency fluctuations) so that Shares, when redeemed, will be worth more or less than their original cost. Performance shown is net of all Fund expenses, but does not include the effect of sales charges or correspondent bank charges, and assumes reinvestment of distributions. If such charges were included, returns would have been lower. Performance for other Share classes will be more or less depending on differences in fees and sales charges. For periods when certain Share classes were unsubscribed or not yet created (the "inactive Share classes"), performance is imputed using the actual performance of the Fund's active Share class which has been determined by the management company as having the closest characteristics to such inactive Share class and adjusting it based on the difference in TERs and, where applicable, converting the net asset value of the active Share class into the currency of quotation of the inactive Share class. The quoted performance for such inactive Share class is the result of an indicative calculation.
Unless otherwise indicated, all defined terms used herein shall have the same meaning as set out in the Prospectus of the Umbrella Fund.
R.C.S. Luxembourg B 53023
249

250
Natixis International Funds (Lux) I
Table of contents
Management and Administration 5
Report to the Shareholders 7
Audit report 32
Statement of Net Assets 34
Statement of Changes in Net Assets 40
Absolute Asia AM Emerging Asia Fund Changes in the number of Shares 46 Statistics 47 Statement of Investments 48 Absolute Asia AM Pacific Rim Equities Fund Changes in the number of Shares 51 Statistics 52 Statement of Investments 53 Gateway U.S. Equities Fund Changes in the number of Shares 55 Statistics 56 Statement of Investments 57 Hansberger Emerging Latin America Fund Changes in the number of Shares 64 Statistics 65 Statement of Investments 66 Harris Associates Concentrated U.S. Equity Fund Changes in the number of Shares 68 Statistics 70 Statement of Investments 71 Harris Associates Global Equity Fund Changes in the number of Shares 72 Statistics 74 Statement of Investments 75 Harris Associates U.S. Equity Fund Changes in the number of Shares 77 Statistics 78 Statement of Investments 79 IDFC India Equities Fund Changes in the number of Shares 81 Statistics 82 Statement of Investments 83 Loomis Sayles Global Equity Opportunities Fund (liquidated on December 31, 2013) Changes in the number of Shares 84 Statistics 85 Loomis Sayles U.S. Research Fund Changes in the number of Shares 86 Statistics 87 Statement of Investments 88
251
Natixis International Funds (Lux) I
Table of contents (continued) Natixis Emerging Europe Fund Changes in the number of Shares 91 Statistics 92 Statement of Investments 93 Natixis Europe Smaller Companies Fund Changes in the number of Shares 96 Statistics 97 Statement of Investments 98 Vaughan Nelson U.S. Small Cap Value Fund Changes in the number of Shares 102 Statistics 103 Statement of Investments 104 Loomis Sayles Emerging Debt and Currencies Fund Changes in the number of Shares 106 Statistics 107 Statement of Investments 108 Loomis Sayles Emerging Markets Corporate Bond Fund (launched on December 4, 2013) Changes in the number of Shares 111 Statistics 112 Statement of Investments 113 Loomis Sayles Global Credit Fund Changes in the number of Shares 119 Statistics 121 Statement of Investments 122 Loomis Sayles Institutional Global Corporate Bond Fund Changes in the number of Shares 131 Statistics 132 Statement of Investments 133 Loomis Sayles Institutional High Income Fund Changes in the number of Shares 145 Statistics 146 Statement of Investments 147 Loomis Sayles Strategic Alpha Bond Fund Changes in the number of Shares 157 Statistics 158 Statement of Investments 159 Loomis Sayles Sustainable Global Corporate Bond Fund (launched on October 25, 2013) Changes in the number of Shares 170 Statistics 171 Statement of Investments 172 Natixis Euro Aggregate Plus Fund Changes in the number of Shares 180 Statistics 181 Statement of Investments 182 Natixis Euro High Income Fund Changes in the number of Shares 185 Statistics 186 Statement of Investments 187
252
Natixis International Funds (Lux) I
Table of contents (continued)
Natixis Global Inflation Fund Changes in the number of Shares 192 Statistics 193 Statement of Investments 194 Natixis Short Term Global High Income Fund (launched on October 9, 2013) Changes in the number of Shares 197 Statistics 198 Statement of Investments 199
Notes to the Financial Statements 203
Additional Information 224
253
Natixis International Funds (Lux) I
Management and Administration Chairman Hervé GUINAMANT Chief Executive Officer and President NGAM International, L.L.C. a branch of NGAM S.A. Paris (France) Directors Patricia HORSFALL Senior Vice President, Chief Compliance Officer NGAM UK Limited London (UK) Jason TREPANIER Executive Vice President, Chief Operating Officer NGAM Distribution, a branch of NGAM S.A. Paris (France) Registered Office 2-8, avenue Charles de Gaulle L-1653 Luxembourg (Grand Duchy of Luxembourg) R.C.S. B.53023 Management Company, Distributor and Promoter NGAM S.A. 51, avenue J.F. Kennedy L-1855 Luxembourg (Grand Duchy of Luxembourg) Custodian, Domiciliary and Corporate Agent, Administrative Agent, Paying Agent and Registrar and Transfer Agent Brown Brothers Harriman (Luxembourg) S.C.A. 2-8, avenue Charles de Gaulle, B.P. 403 L-2014 Luxembourg (Grand Duchy of Luxembourg)
254
Natixis International Funds (Lux) I
Management and Administration (continued) Investment Managers Absolute Asia Asset Management Ltd. 1 Robinson Road #20-02 AIA Tower Singapore 048542 (Singapore) Gateway Investment Advisers, L.L.C. 312 Walnut Street, 35th Floor Cincinnati, Ohio 45202-9834 (USA) Hansberger Global Investors, Inc. 401 East Las Olas Boulevard, Suite 1700 Fort Lauderdale, Florida 33301 (USA) Harris Associates L.P. Two North LaSalle Street Chicago, Illinois 60602 (USA) Loomis, Sayles & Company, L.P. One Financial Center Boston, Massachusetts 02111 (USA) Natixis Asset Management 21, quai d’Austerlitz 75013 Paris (France) Vaughan Nelson Investment Management, L.P. 600 Travis, Suite 6300 Houston, Texas 77002-3071 (USA) Auditor PricewaterhouseCoopers, Société coopérative 400, route d’Esch B.P. 1443 L-1014 Luxembourg (Grand Duchy of Luxembourg) Legal Adviser Arendt & Medernach 14, rue Erasme L-2082 Luxembourg (Grand Duchy of Luxembourg)
255
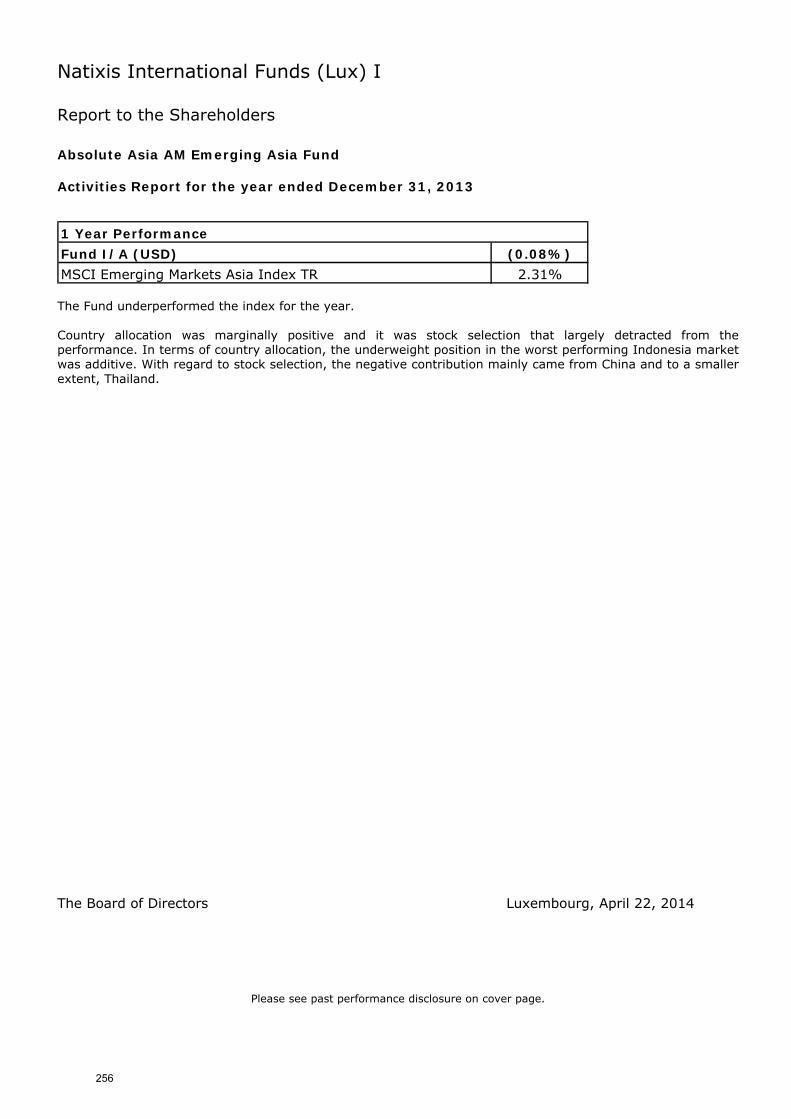
Natixis International Funds (Lux) I
Report to the Shareholders Absolute Asia AM Emerging Asia Fund
Activities Report for the year ended December 31, 2013
Fund I/A (USD) (0.08%)
MSCI Emerging Markets Asia Index TR 2.31%
1 Year Performance
The Fund underperformed the index for the year. Country allocation was marginally positive and it was stock selection that largely detracted from the performance. In terms of country allocation, the underweight position in the worst performing Indonesia market was additive. With regard to stock selection, the negative contribution mainly came from China and to a smaller extent, Thailand.
The Board of Directors Luxembourg, April 22, 2014
Please see past performance disclosure on cover page.
256
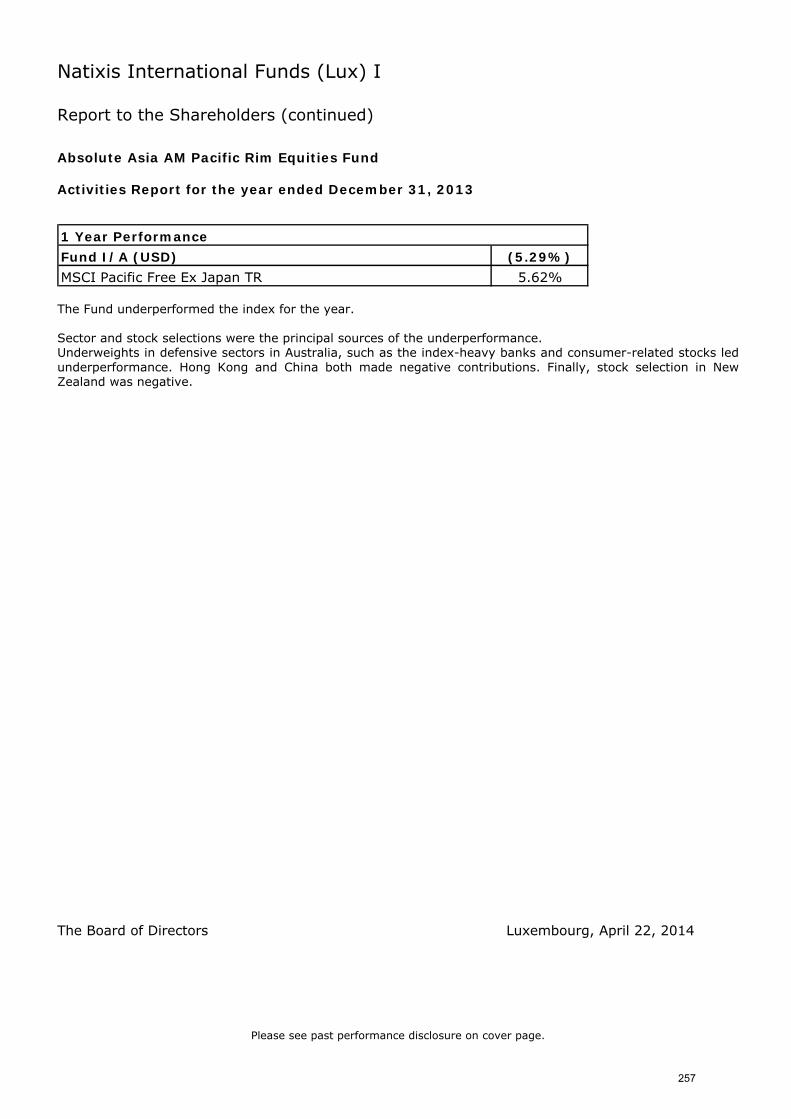
Natixis International Funds (Lux) I
Report to the Shareholders (continued) Absolute Asia AM Pacific Rim Equities Fund
Activities Report for the year ended December 31, 2013
Fund I/A (USD) (5.29%)
MSCI Pacific Free Ex Japan TR 5.62%
1 Year Performance
The Fund underperformed the index for the year. Sector and stock selections were the principal sources of the underperformance. Underweights in defensive sectors in Australia, such as the index-heavy banks and consumer-related stocks led underperformance. Hong Kong and China both made negative contributions. Finally, stock selection in New Zealand was negative.
The Board of Directors Luxembourg, April 22, 2014
Please see past performance disclosure on cover page.
257
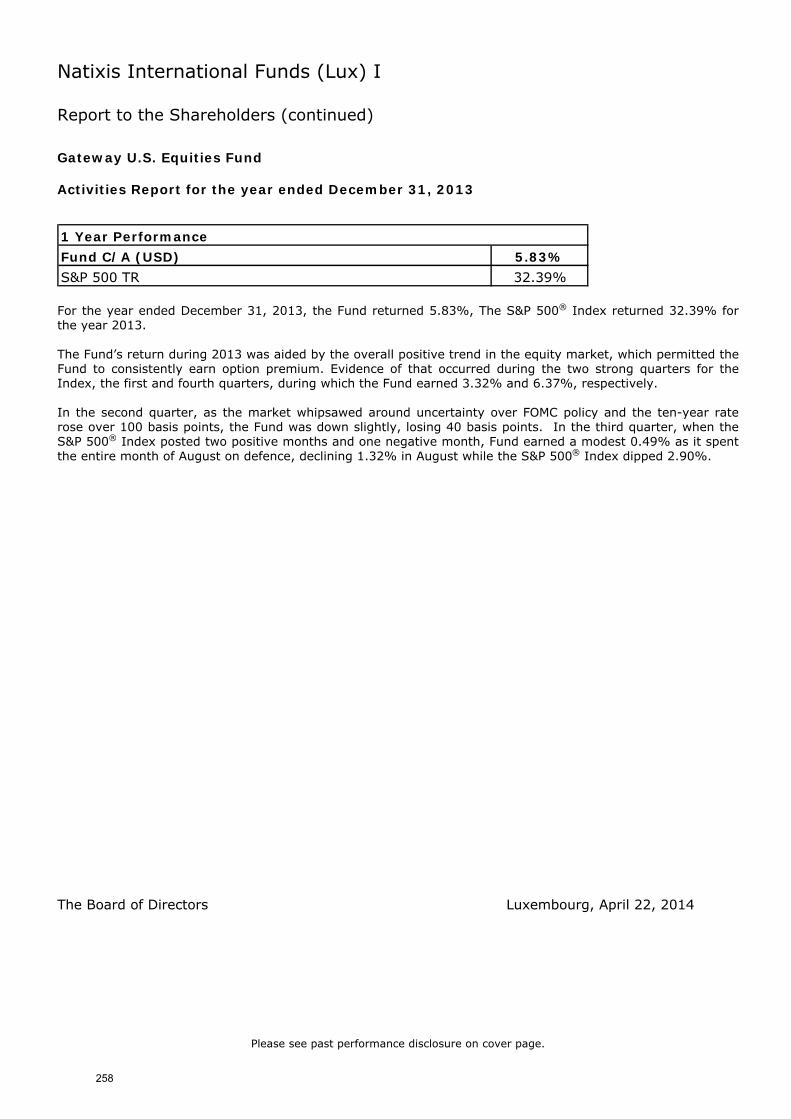
Natixis International Funds (Lux) I
Report to the Shareholders (continued) Gateway U.S. Equities Fund
Activities Report for the year ended December 31, 2013
Fund C/A (USD) 5.83%
S&P 500 TR 32.39%
1 Year Performance
For the year ended December 31, 2013, the Fund returned 5.83%, The S&P 500® Index returned 32.39% for the year 2013. The Fund’s return during 2013 was aided by the overall positive trend in the equity market, which permitted the Fund to consistently earn option premium. Evidence of that occurred during the two strong quarters for the Index, the first and fourth quarters, during which the Fund earned 3.32% and 6.37%, respectively. In the second quarter, as the market whipsawed around uncertainty over FOMC policy and the ten-year rate rose over 100 basis points, the Fund was down slightly, losing 40 basis points. In the third quarter, when the S&P 500® Index posted two positive months and one negative month, Fund earned a modest 0.49% as it spent the entire month of August on defence, declining 1.32% in August while the S&P 500® Index dipped 2.90%.
The Board of Directors Luxembourg, April 22, 2014
Please see past performance disclosure on cover page.
258
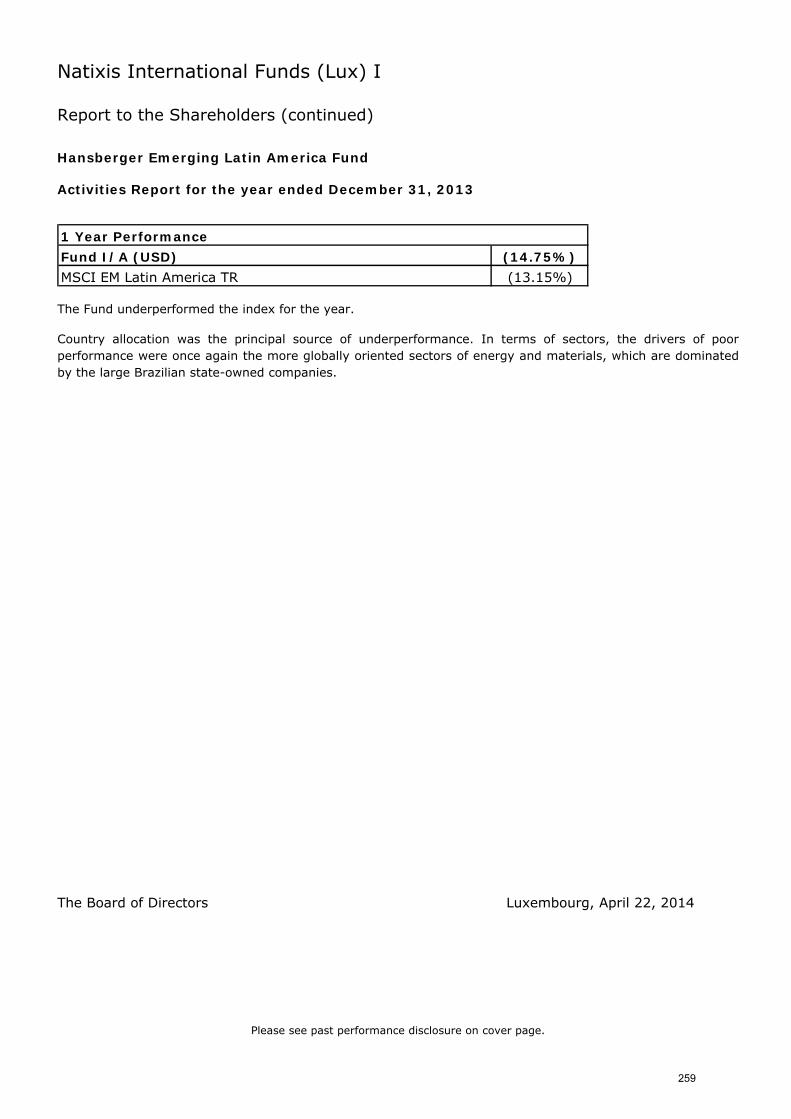
Natixis International Funds (Lux) I
Report to the Shareholders (continued) Hansberger Emerging Latin America Fund
Activities Report for the year ended December 31, 2013
Fund I/A (USD) (14.75%)
MSCI EM Latin America TR (13.15%)
1 Year Performance
The Fund underperformed the index for the year.
Country allocation was the principal source of underperformance. In terms of sectors, the drivers of poor performance were once again the more globally oriented sectors of energy and materials, which are dominated by the large Brazilian state-owned companies.
The Board of Directors Luxembourg, April 22, 2014
Please see past performance disclosure on cover page.
259
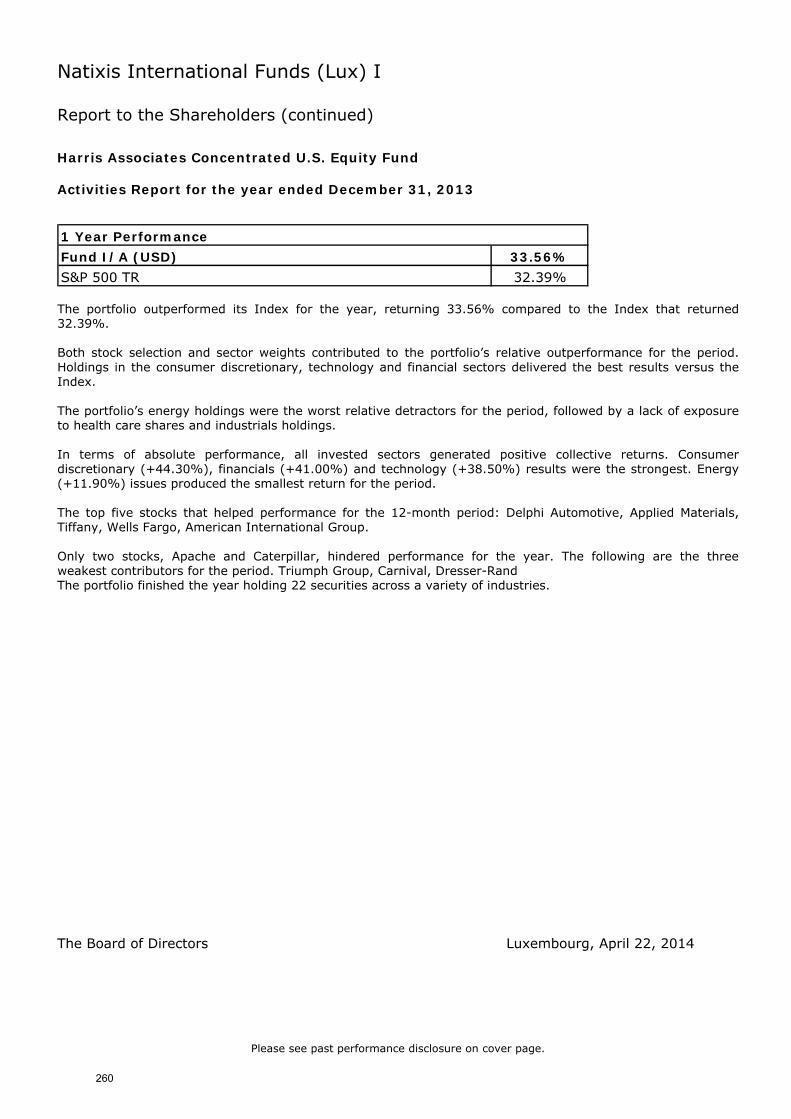
Natixis International Funds (Lux) I
Report to the Shareholders (continued) Harris Associates Concentrated U.S. Equity Fund
Activities Report for the year ended December 31, 2013
Fund I/A (USD) 33.56%
S&P 500 TR 32.39%
1 Year Performance
The portfolio outperformed its Index for the year, returning 33.56% compared to the Index that returned 32.39%. Both stock selection and sector weights contributed to the portfolio’s relative outperformance for the period. Holdings in the consumer discretionary, technology and financial sectors delivered the best results versus the Index. The portfolio’s energy holdings were the worst relative detractors for the period, followed by a lack of exposure to health care shares and industrials holdings. In terms of absolute performance, all invested sectors generated positive collective returns. Consumer discretionary (+44.30%), financials (+41.00%) and technology (+38.50%) results were the strongest. Energy (+11.90%) issues produced the smallest return for the period. The top five stocks that helped performance for the 12-month period: Delphi Automotive, Applied Materials, Tiffany, Wells Fargo, American International Group. Only two stocks, Apache and Caterpillar, hindered performance for the year. The following are the three weakest contributors for the period. Triumph Group, Carnival, Dresser-Rand The portfolio finished the year holding 22 securities across a variety of industries.
The Board of Directors Luxembourg, April 22, 2014
Please see past performance disclosure on cover page.
260
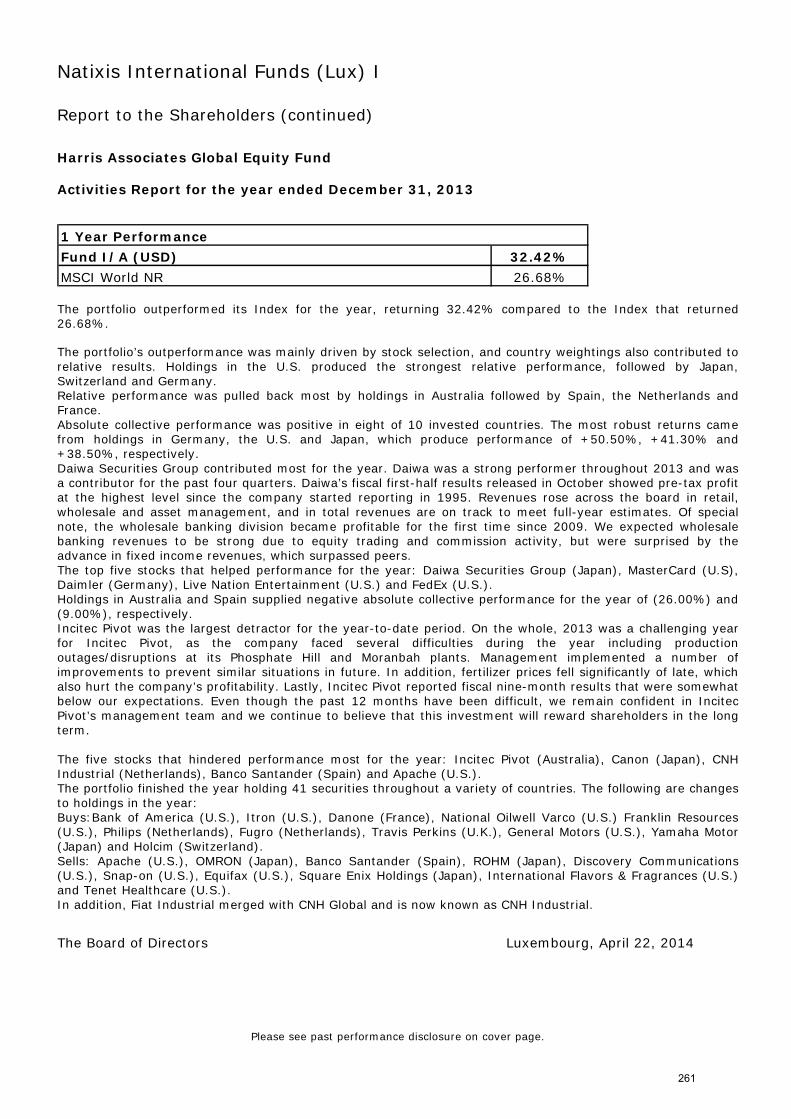
Natixis International Funds (Lux) I
Report to the Shareholders (continued) Harris Associates Global Equity Fund
Activities Report for the year ended December 31, 2013
Fund I/A (USD) 32.42%
MSCI World NR 26.68%
1 Year Performance
The portfolio outperformed its Index for the year, returning 32.42% compared to the Index that returned 26.68%. The portfolio’s outperformance was mainly driven by stock selection, and country weightings also contributed to relative results. Holdings in the U.S. produced the strongest relative performance, followed by Japan, Switzerland and Germany. Relative performance was pulled back most by holdings in Australia followed by Spain, the Netherlands and France. Absolute collective performance was positive in eight of 10 invested countries. The most robust returns came from holdings in Germany, the U.S. and Japan, which produce performance of +50.50%, +41.30% and +38.50%, respectively. Daiwa Securities Group contributed most for the year. Daiwa was a strong performer throughout 2013 and was a contributor for the past four quarters. Daiwa’s fiscal first-half results released in October showed pre-tax profit at the highest level since the company started reporting in 1995. Revenues rose across the board in retail, wholesale and asset management, and in total revenues are on track to meet full-year estimates. Of special note, the wholesale banking division became profitable for the first time since 2009. We expected wholesale banking revenues to be strong due to equity trading and commission activity, but were surprised by the advance in fixed income revenues, which surpassed peers. The top five stocks that helped performance for the year: Daiwa Securities Group (Japan), MasterCard (U.S), Daimler (Germany), Live Nation Entertainment (U.S.) and FedEx (U.S.). Holdings in Australia and Spain supplied negative absolute collective performance for the year of (26.00%) and (9.00%), respectively. Incitec Pivot was the largest detractor for the year-to-date period. On the whole, 2013 was a challenging year for Incitec Pivot, as the company faced several difficulties during the year including production outages/disruptions at its Phosphate Hill and Moranbah plants. Management implemented a number of improvements to prevent similar situations in future. In addition, fertilizer prices fell significantly of late, which also hurt the company’s profitability. Lastly, Incitec Pivot reported fiscal nine-month results that were somewhat below our expectations. Even though the past 12 months have been difficult, we remain confident in Incitec Pivot’s management team and we continue to believe that this investment will reward shareholders in the long term. The five stocks that hindered performance most for the year: Incitec Pivot (Australia), Canon (Japan), CNH Industrial (Netherlands), Banco Santander (Spain) and Apache (U.S.). The portfolio finished the year holding 41 securities throughout a variety of countries. The following are changes to holdings in the year: Buys:Bank of America (U.S.), Itron (U.S.), Danone (France), National Oilwell Varco (U.S.) Franklin Resources (U.S.), Philips (Netherlands), Fugro (Netherlands), Travis Perkins (U.K.), General Motors (U.S.), Yamaha Motor (Japan) and Holcim (Switzerland). Sells: Apache (U.S.), OMRON (Japan), Banco Santander (Spain), ROHM (Japan), Discovery Communications (U.S.), Snap-on (U.S.), Equifax (U.S.), Square Enix Holdings (Japan), International Flavors & Fragrances (U.S.) and Tenet Healthcare (U.S.). In addition, Fiat Industrial merged with CNH Global and is now known as CNH Industrial.
The Board of Directors Luxembourg, April 22, 2014
Please see past performance disclosure on cover page.
261
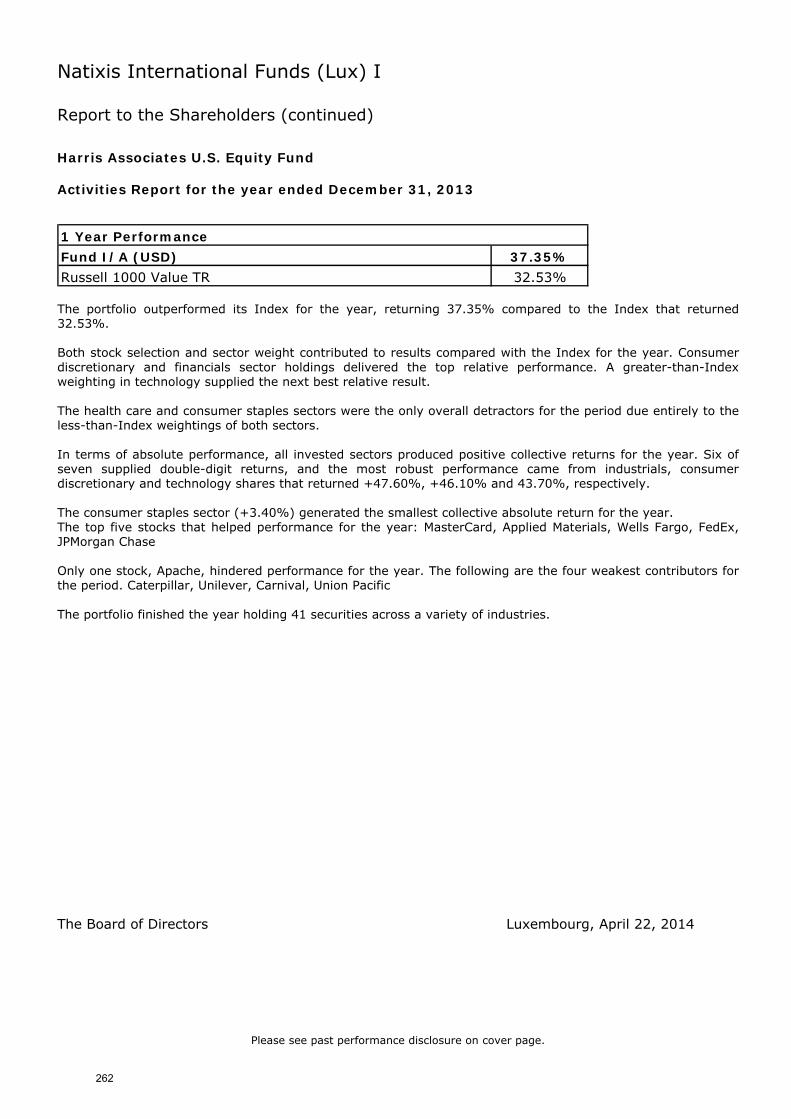
Natixis International Funds (Lux) I
Report to the Shareholders (continued) Harris Associates U.S. Equity Fund
Activities Report for the year ended December 31, 2013
Fund I/A (USD) 37.35%
Russell 1000 Value TR 32.53%
1 Year Performance
The portfolio outperformed its Index for the year, returning 37.35% compared to the Index that returned 32.53%. Both stock selection and sector weight contributed to results compared with the Index for the year. Consumer discretionary and financials sector holdings delivered the top relative performance. A greater-than-Index weighting in technology supplied the next best relative result. The health care and consumer staples sectors were the only overall detractors for the period due entirely to the less-than-Index weightings of both sectors. In terms of absolute performance, all invested sectors produced positive collective returns for the year. Six of seven supplied double-digit returns, and the most robust performance came from industrials, consumer discretionary and technology shares that returned +47.60%, +46.10% and 43.70%, respectively. The consumer staples sector (+3.40%) generated the smallest collective absolute return for the year. The top five stocks that helped performance for the year: MasterCard, Applied Materials, Wells Fargo, FedEx, JPMorgan Chase Only one stock, Apache, hindered performance for the year. The following are the four weakest contributors for the period. Caterpillar, Unilever, Carnival, Union Pacific The portfolio finished the year holding 41 securities across a variety of industries.
The Board of Directors Luxembourg, April 22, 2014
Please see past performance disclosure on cover page.
262
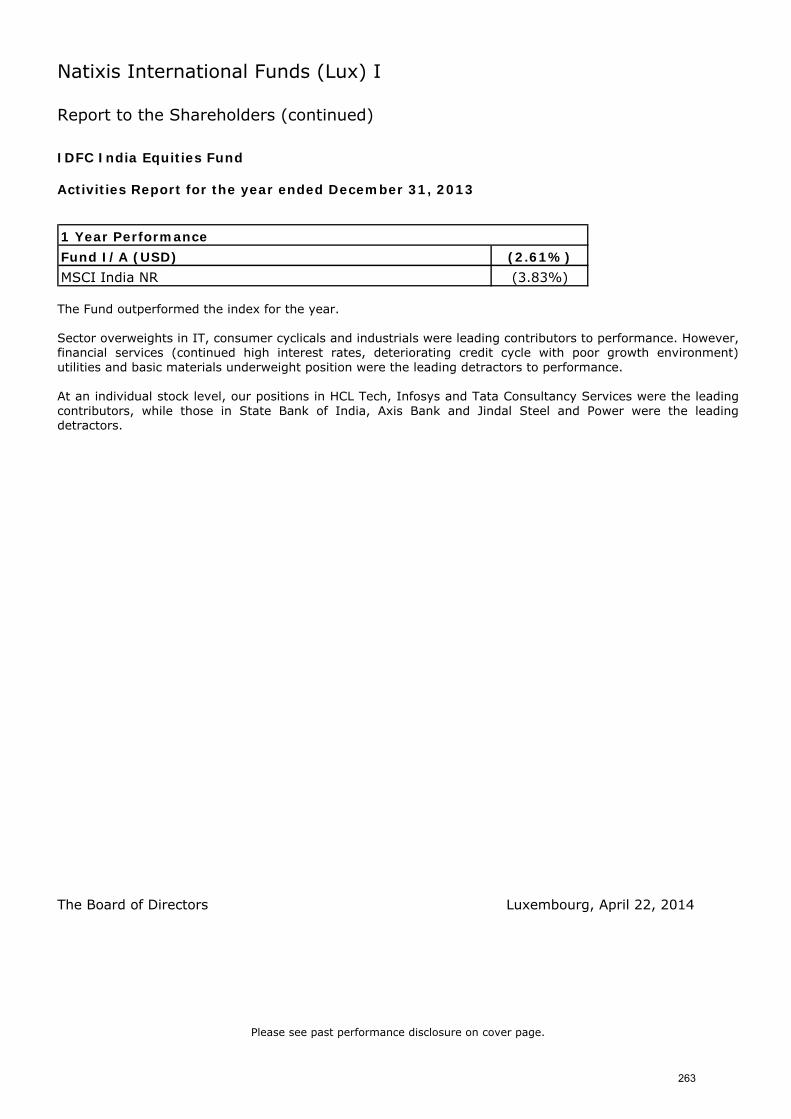
Natixis International Funds (Lux) I
Report to the Shareholders (continued) IDFC India Equities Fund
Activities Report for the year ended December 31, 2013
Fund I/A (USD) (2.61%)
MSCI India NR (3.83%)
1 Year Performance
The Fund outperformed the index for the year. Sector overweights in IT, consumer cyclicals and industrials were leading contributors to performance. However, financial services (continued high interest rates, deteriorating credit cycle with poor growth environment) utilities and basic materials underweight position were the leading detractors to performance. At an individual stock level, our positions in HCL Tech, Infosys and Tata Consultancy Services were the leading contributors, while those in State Bank of India, Axis Bank and Jindal Steel and Power were the leading detractors.
The Board of Directors Luxembourg, April 22, 2014
Please see past performance disclosure on cover page.
263
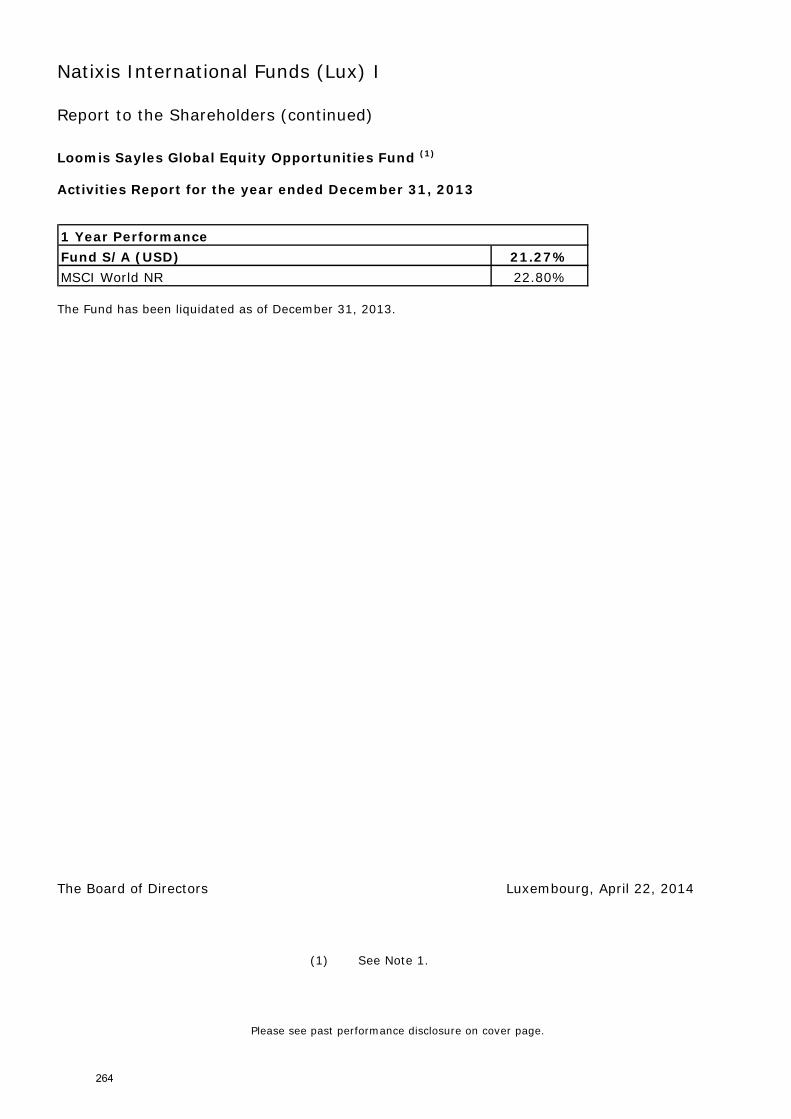
Natixis International Funds (Lux) I
Report to the Shareholders (continued) Loomis Sayles Global Equity Opportunities Fund (1)
Activities Report for the year ended December 31, 2013
Fund S/A (USD) 21.27%
MSCI World NR 22.80%
1 Year Performance
The Fund has been liquidated as of December 31, 2013.
The Board of Directors Luxembourg, April 22, 2014
(1) See Note 1.
Please see past performance disclosure on cover page.
264
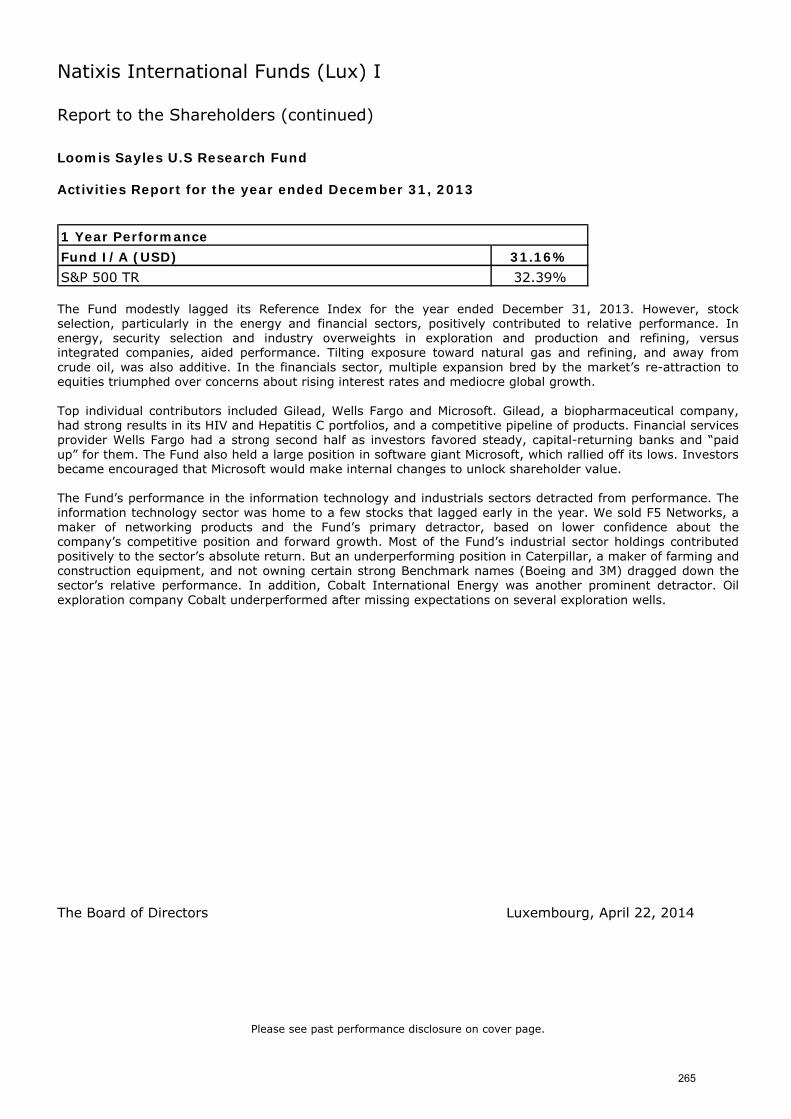
Natixis International Funds (Lux) I
Report to the Shareholders (continued) Loomis Sayles U.S Research Fund
Activities Report for the year ended December 31, 2013
Fund I/A (USD) 31.16%
S&P 500 TR 32.39%
1 Year Performance
The Fund modestly lagged its Reference Index for the year ended December 31, 2013. However, stock selection, particularly in the energy and financial sectors, positively contributed to relative performance. In energy, security selection and industry overweights in exploration and production and refining, versus integrated companies, aided performance. Tilting exposure toward natural gas and refining, and away from crude oil, was also additive. In the financials sector, multiple expansion bred by the market’s re-attraction to equities triumphed over concerns about rising interest rates and mediocre global growth.
Top individual contributors included Gilead, Wells Fargo and Microsoft. Gilead, a biopharmaceutical company, had strong results in its HIV and Hepatitis C portfolios, and a competitive pipeline of products. Financial services provider Wells Fargo had a strong second half as investors favored steady, capital-returning banks and “paid up” for them. The Fund also held a large position in software giant Microsoft, which rallied off its lows. Investors became encouraged that Microsoft would make internal changes to unlock shareholder value.
The Fund’s performance in the information technology and industrials sectors detracted from performance. The information technology sector was home to a few stocks that lagged early in the year. We sold F5 Networks, a maker of networking products and the Fund’s primary detractor, based on lower confidence about the company’s competitive position and forward growth. Most of the Fund’s industrial sector holdings contributed positively to the sector’s absolute return. But an underperforming position in Caterpillar, a maker of farming and construction equipment, and not owning certain strong Benchmark names (Boeing and 3M) dragged down the sector’s relative performance. In addition, Cobalt International Energy was another prominent detractor. Oil exploration company Cobalt underperformed after missing expectations on several exploration wells.
The Board of Directors Luxembourg, April 22, 2014
Please see past performance disclosure on cover page.
265
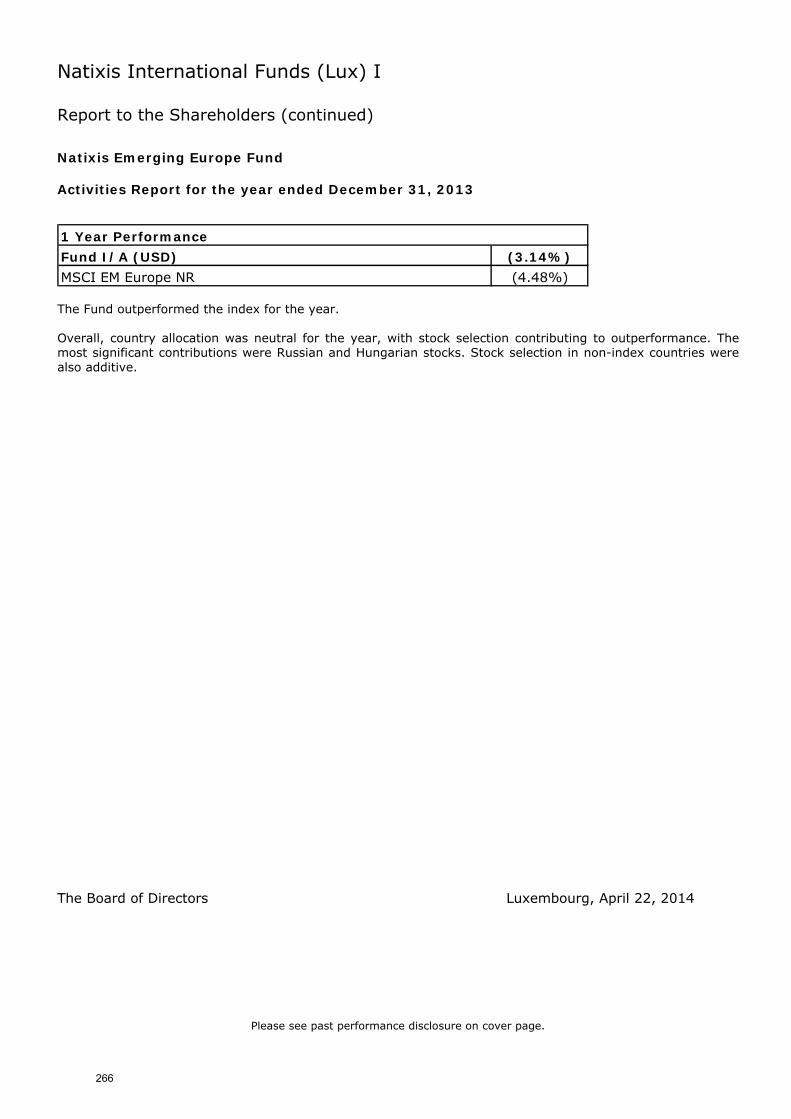
Natixis International Funds (Lux) I
Report to the Shareholders (continued) Natixis Emerging Europe Fund
Activities Report for the year ended December 31, 2013
Fund I/A (USD) (3.14%)
MSCI EM Europe NR (4.48%)
1 Year Performance
The Fund outperformed the index for the year. Overall, country allocation was neutral for the year, with stock selection contributing to outperformance. The most significant contributions were Russian and Hungarian stocks. Stock selection in non-index countries were also additive.
The Board of Directors Luxembourg, April 22, 2014
Please see past performance disclosure on cover page.
266
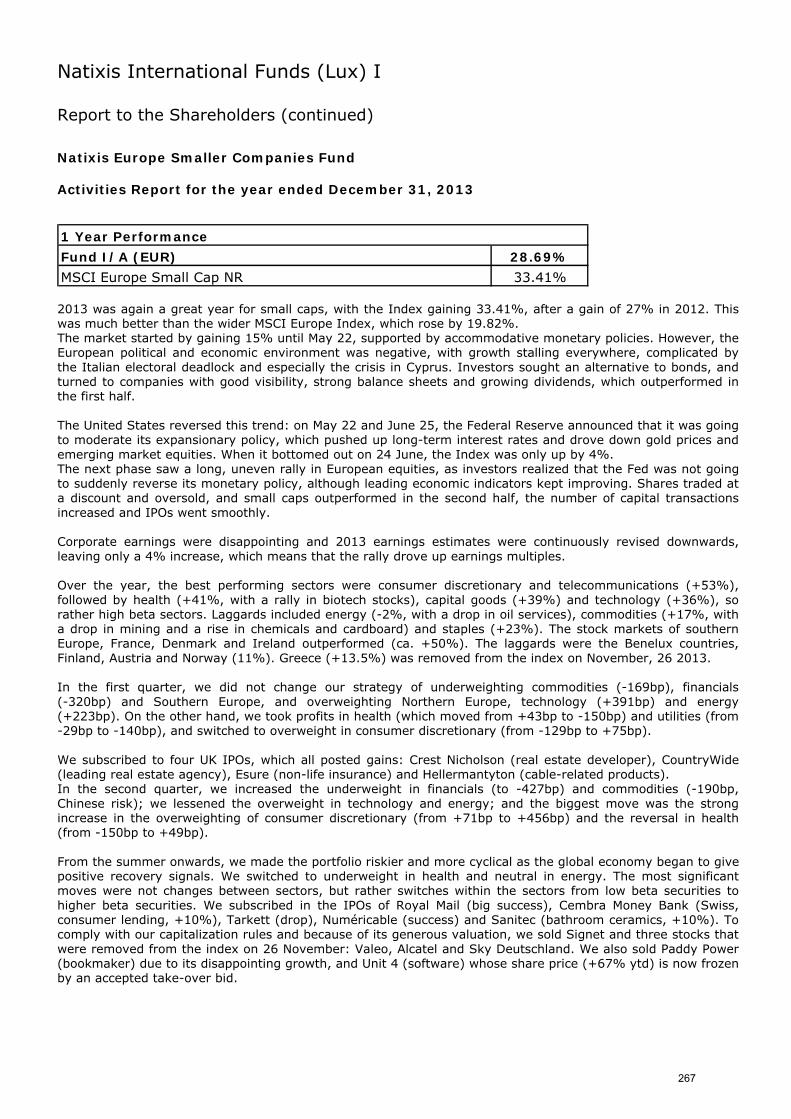
Natixis International Funds (Lux) I
Report to the Shareholders (continued) Natixis Europe Smaller Companies Fund
Activities Report for the year ended December 31, 2013
Fund I/A (EUR) 28.69%
MSCI Europe Small Cap NR 33.41%
1 Year Performance
2013 was again a great year for small caps, with the Index gaining 33.41%, after a gain of 27% in 2012. This was much better than the wider MSCI Europe Index, which rose by 19.82%. The market started by gaining 15% until May 22, supported by accommodative monetary policies. However, the European political and economic environment was negative, with growth stalling everywhere, complicated by the Italian electoral deadlock and especially the crisis in Cyprus. Investors sought an alternative to bonds, and turned to companies with good visibility, strong balance sheets and growing dividends, which outperformed in the first half. The United States reversed this trend: on May 22 and June 25, the Federal Reserve announced that it was going to moderate its expansionary policy, which pushed up long-term interest rates and drove down gold prices and emerging market equities. When it bottomed out on 24 June, the Index was only up by 4%. The next phase saw a long, uneven rally in European equities, as investors realized that the Fed was not going to suddenly reverse its monetary policy, although leading economic indicators kept improving. Shares traded at a discount and oversold, and small caps outperformed in the second half, the number of capital transactions increased and IPOs went smoothly. Corporate earnings were disappointing and 2013 earnings estimates were continuously revised downwards, leaving only a 4% increase, which means that the rally drove up earnings multiples. Over the year, the best performing sectors were consumer discretionary and telecommunications (+53%), followed by health (+41%, with a rally in biotech stocks), capital goods (+39%) and technology (+36%), so rather high beta sectors. Laggards included energy (-2%, with a drop in oil services), commodities (+17%, with a drop in mining and a rise in chemicals and cardboard) and staples (+23%). The stock markets of southern Europe, France, Denmark and Ireland outperformed (ca. +50%). The laggards were the Benelux countries, Finland, Austria and Norway (11%). Greece (+13.5%) was removed from the index on November, 26 2013. In the first quarter, we did not change our strategy of underweighting commodities (-169bp), financials (-320bp) and Southern Europe, and overweighting Northern Europe, technology (+391bp) and energy (+223bp). On the other hand, we took profits in health (which moved from +43bp to -150bp) and utilities (from -29bp to -140bp), and switched to overweight in consumer discretionary (from -129bp to +75bp). We subscribed to four UK IPOs, which all posted gains: Crest Nicholson (real estate developer), CountryWide (leading real estate agency), Esure (non-life insurance) and Hellermantyton (cable-related products). In the second quarter, we increased the underweight in financials (to -427bp) and commodities (-190bp, Chinese risk); we lessened the overweight in technology and energy; and the biggest move was the strong increase in the overweighting of consumer discretionary (from +71bp to +456bp) and the reversal in health (from -150bp to +49bp). From the summer onwards, we made the portfolio riskier and more cyclical as the global economy began to give positive recovery signals. We switched to underweight in health and neutral in energy. The most significant moves were not changes between sectors, but rather switches within the sectors from low beta securities to higher beta securities. We subscribed in the IPOs of Royal Mail (big success), Cembra Money Bank (Swiss, consumer lending, +10%), Tarkett (drop), Numéricable (success) and Sanitec (bathroom ceramics, +10%). To comply with our capitalization rules and because of its generous valuation, we sold Signet and three stocks that were removed from the index on 26 November: Valeo, Alcatel and Sky Deutschland. We also sold Paddy Power (bookmaker) due to its disappointing growth, and Unit 4 (software) whose share price (+67% ytd) is now frozen by an accepted take-over bid.
267
Natixis International Funds (Lux) I
Report to the Shareholders (continued) Natixis Europe Smaller Companies Fund
Activities Report for the year ended December 31, 2013 (continued)
The Fund gained 28.69% i.e. -472bp vs. the Index. The first quarter (+41bp relative to the Index) and the second quarter (+159bp) were good for the portfolio because our growth style at a reasonable price and with quality stocks was popular among investors. We rightly underweighted Southern Europe and financials. The third quarter (-414bp) was very bad because we underweighted the discounted and oversold stocks, e.g. Southern European banks. In the fourth quarter (+272bp) good stock picking enabled us to recover some of the lost ground. The contribution of the geographical allocation to the annual performance of the portfolio was neutral (gains from overweighting the UK and Ireland and underweighting Finland and Greece, losses on the rest). The contribution of sector allocation is estimated at -29bp, in particular because we overweighted energy for too long. Stock selection generally detracted from performance, particularly in energy, health and technology. It was better in commodities and financials. Movements on the liabilities side (subscriptions of €141m, redemptions of €47m) were significant when related to net assets of €109m as of December 31, 2012 and €262m as of December 31, 2013. Transaction costs had a rather significant negative impact on performance.
The Board of Directors Luxembourg, April 22, 2014
Please see past performance disclosure on cover page.
268
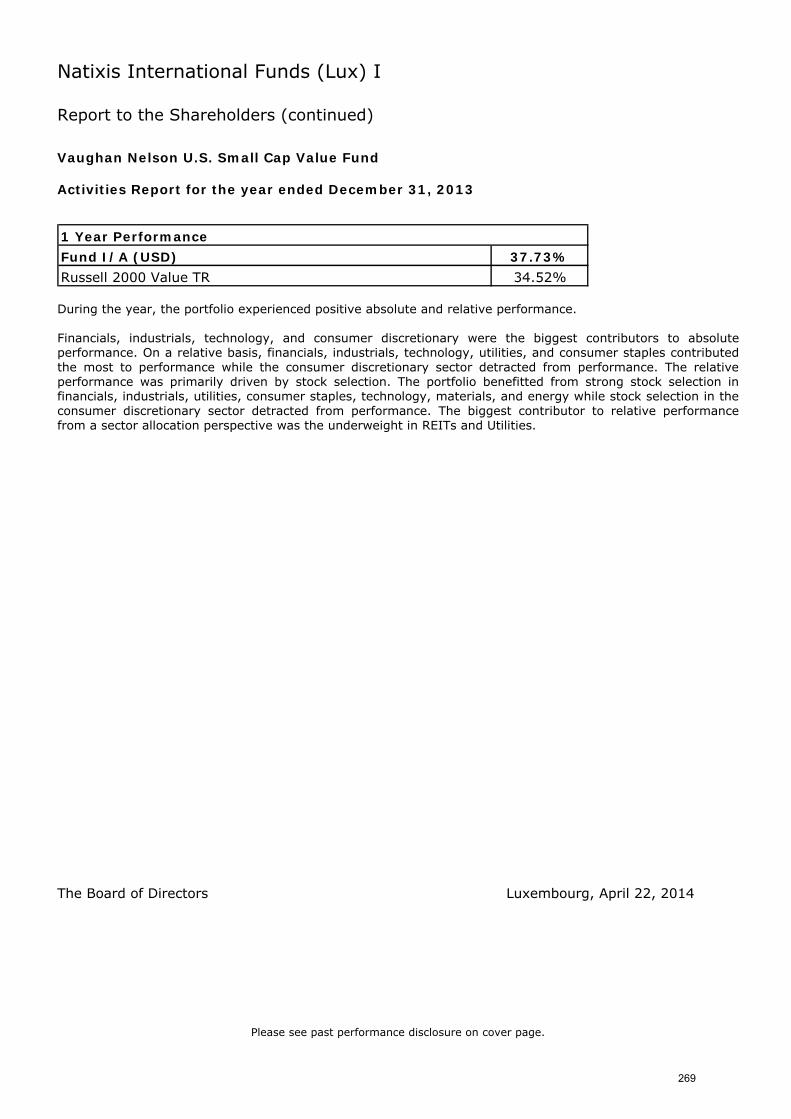
Natixis International Funds (Lux) I
Report to the Shareholders (continued) Vaughan Nelson U.S. Small Cap Value Fund
Activities Report for the year ended December 31, 2013
Fund I/A (USD) 37.73%
Russell 2000 Value TR 34.52%
1 Year Performance
During the year, the portfolio experienced positive absolute and relative performance. Financials, industrials, technology, and consumer discretionary were the biggest contributors to absolute performance. On a relative basis, financials, industrials, technology, utilities, and consumer staples contributed the most to performance while the consumer discretionary sector detracted from performance. The relative performance was primarily driven by stock selection. The portfolio benefitted from strong stock selection in financials, industrials, utilities, consumer staples, technology, materials, and energy while stock selection in the consumer discretionary sector detracted from performance. The biggest contributor to relative performance from a sector allocation perspective was the underweight in REITs and Utilities.
The Board of Directors Luxembourg, April 22, 2014
Please see past performance disclosure on cover page.
269
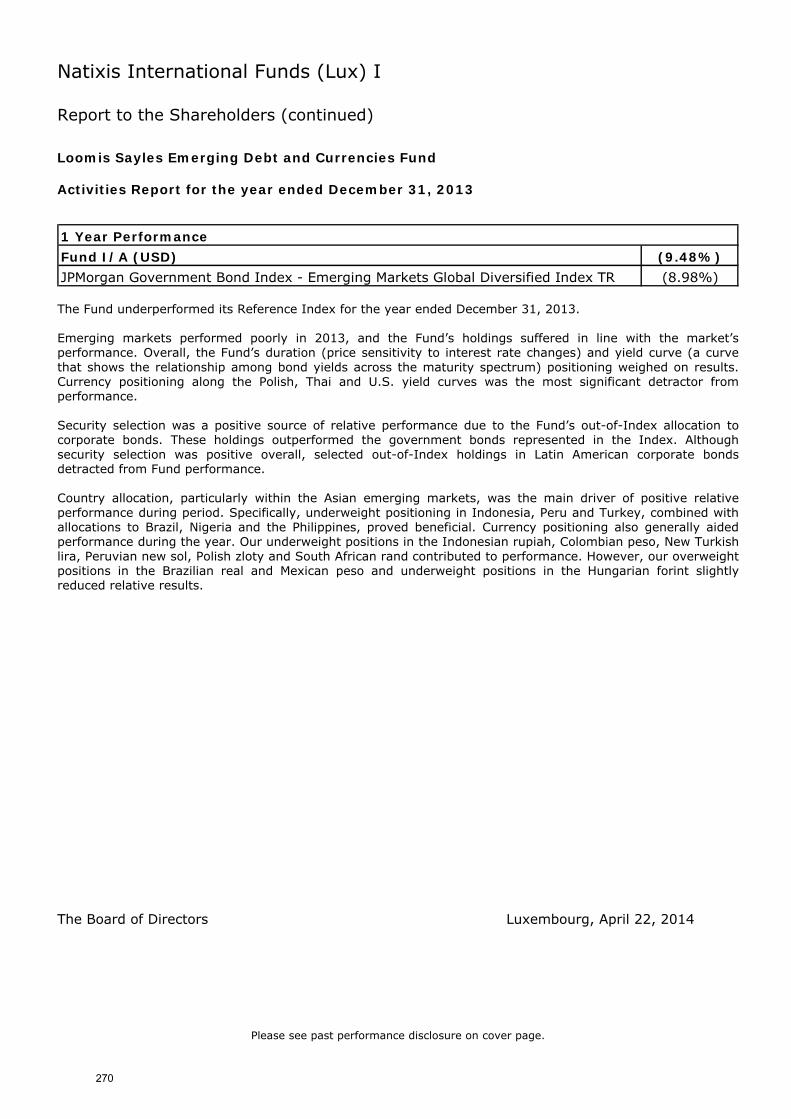
Natixis International Funds (Lux) I
Report to the Shareholders (continued) Loomis Sayles Emerging Debt and Currencies Fund
Activities Report for the year ended December 31, 2013
Fund I/A (USD) (9.48%)
JPMorgan Government Bond Index - Emerging Markets Global Diversified Index TR (8.98%)
1 Year Performance
The Fund underperformed its Reference Index for the year ended December 31, 2013. Emerging markets performed poorly in 2013, and the Fund’s holdings suffered in line with the market’s performance. Overall, the Fund’s duration (price sensitivity to interest rate changes) and yield curve (a curve that shows the relationship among bond yields across the maturity spectrum) positioning weighed on results. Currency positioning along the Polish, Thai and U.S. yield curves was the most significant detractor from performance. Security selection was a positive source of relative performance due to the Fund’s out-of-Index allocation to corporate bonds. These holdings outperformed the government bonds represented in the Index. Although security selection was positive overall, selected out-of-Index holdings in Latin American corporate bonds detracted from Fund performance. Country allocation, particularly within the Asian emerging markets, was the main driver of positive relative performance during period. Specifically, underweight positioning in Indonesia, Peru and Turkey, combined with allocations to Brazil, Nigeria and the Philippines, proved beneficial. Currency positioning also generally aided performance during the year. Our underweight positions in the Indonesian rupiah, Colombian peso, New Turkish lira, Peruvian new sol, Polish zloty and South African rand contributed to performance. However, our overweight positions in the Brazilian real and Mexican peso and underweight positions in the Hungarian forint slightly reduced relative results.
The Board of Directors Luxembourg, April 22, 2014
Please see past performance disclosure on cover page.
270
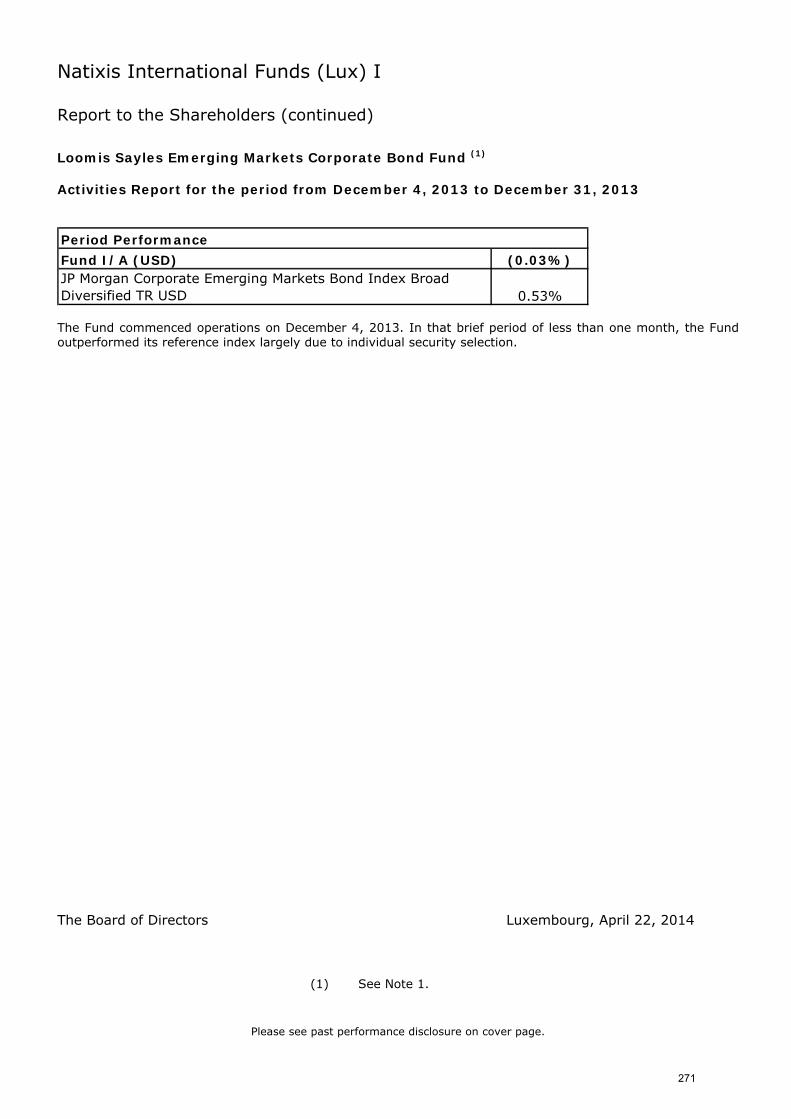
Natixis International Funds (Lux) I
Report to the Shareholders (continued) Loomis Sayles Emerging Markets Corporate Bond Fund (1)
Activities Report for the period from December 4, 2013 to December 31, 2013
Fund I/A (USD) (0.03%)JP Morgan Corporate Emerging Markets Bond Index Broad Diversified TR USD 0.53%
Period Performance
The Fund commenced operations on December 4, 2013. In that brief period of less than one month, the Fund outperformed its reference index largely due to individual security selection.
The Board of Directors Luxembourg, April 22, 2014
(1) See Note 1.
Please see past performance disclosure on cover page.
271
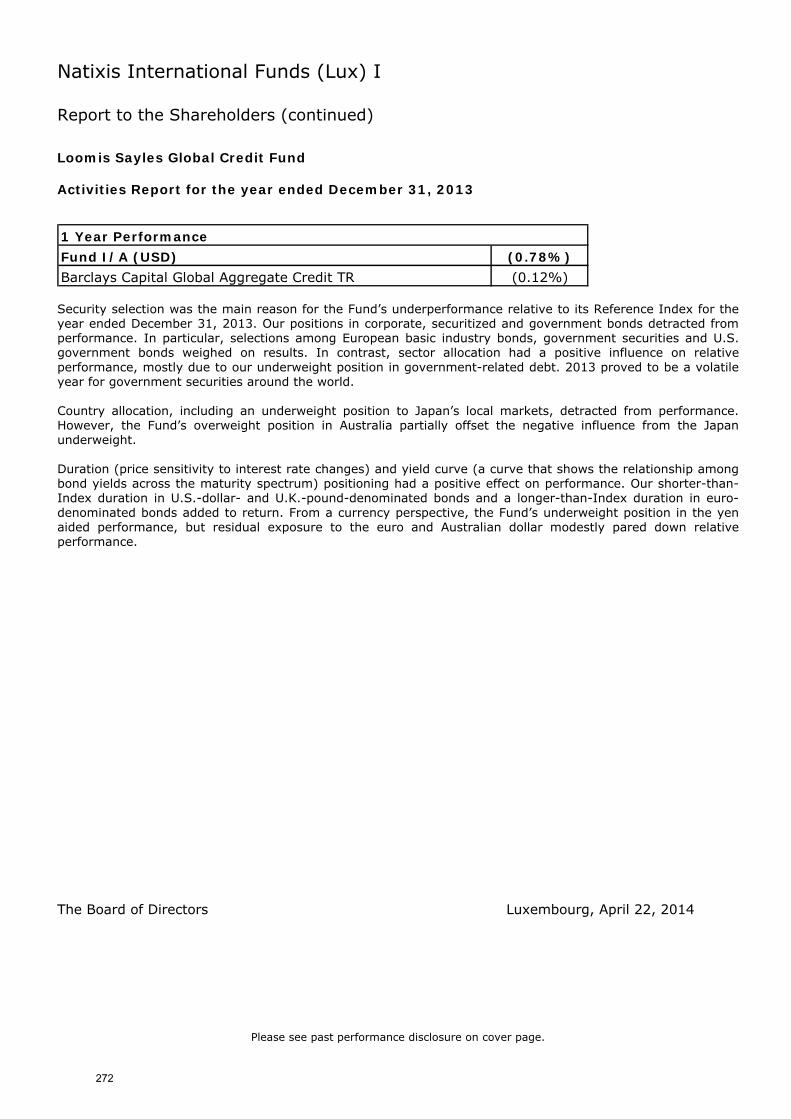
Natixis International Funds (Lux) I
Report to the Shareholders (continued) Loomis Sayles Global Credit Fund
Activities Report for the year ended December 31, 2013
Fund I/A (USD) (0.78%)
Barclays Capital Global Aggregate Credit TR (0.12%)
1 Year Performance
Security selection was the main reason for the Fund’s underperformance relative to its Reference Index for the year ended December 31, 2013. Our positions in corporate, securitized and government bonds detracted from performance. In particular, selections among European basic industry bonds, government securities and U.S. government bonds weighed on results. In contrast, sector allocation had a positive influence on relative performance, mostly due to our underweight position in government-related debt. 2013 proved to be a volatile year for government securities around the world. Country allocation, including an underweight position to Japan’s local markets, detracted from performance. However, the Fund’s overweight position in Australia partially offset the negative influence from the Japan underweight. Duration (price sensitivity to interest rate changes) and yield curve (a curve that shows the relationship among bond yields across the maturity spectrum) positioning had a positive effect on performance. Our shorter-than-Index duration in U.S.-dollar- and U.K.-pound-denominated bonds and a longer-than-Index duration in euro-denominated bonds added to return. From a currency perspective, the Fund’s underweight position in the yen aided performance, but residual exposure to the euro and Australian dollar modestly pared down relative performance.
The Board of Directors Luxembourg, April 22, 2014
Please see past performance disclosure on cover page.
272
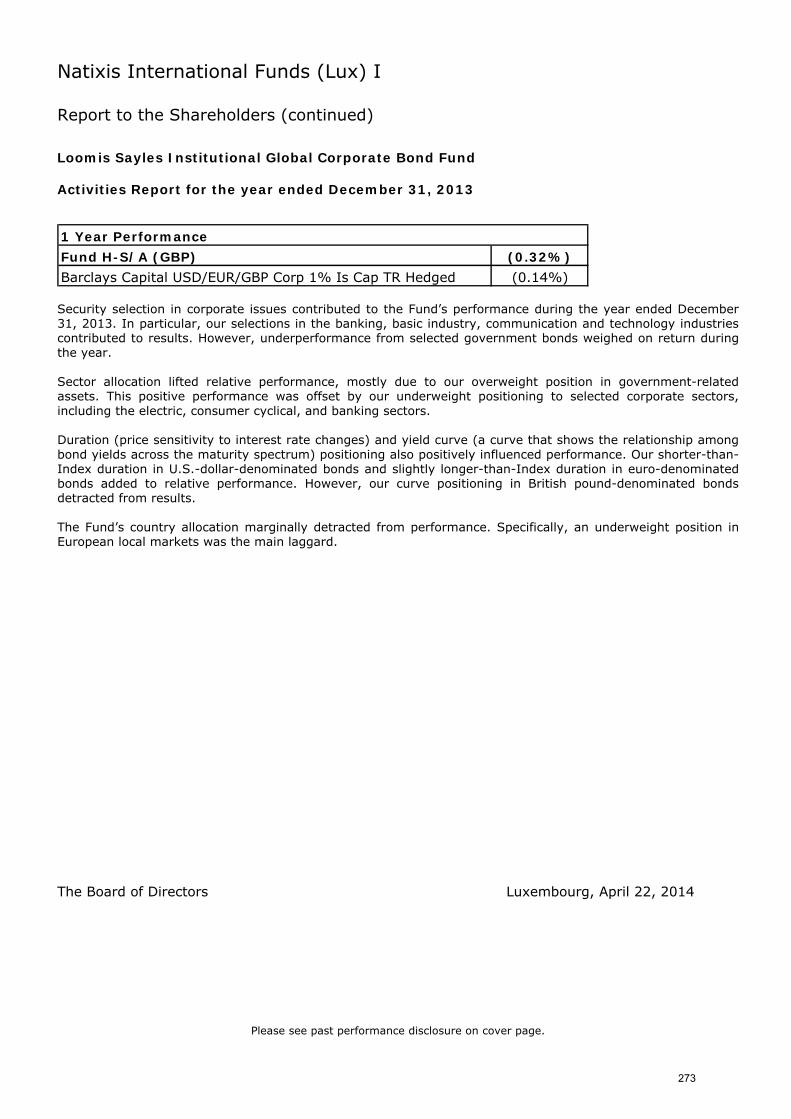
Natixis International Funds (Lux) I
Report to the Shareholders (continued) Loomis Sayles Institutional Global Corporate Bond Fund
Activities Report for the year ended December 31, 2013
Fund H-S/A (GBP) (0.32%)
Barclays Capital USD/EUR/GBP Corp 1% Is Cap TR Hedged (0.14%)
1 Year Performance
Security selection in corporate issues contributed to the Fund’s performance during the year ended December 31, 2013. In particular, our selections in the banking, basic industry, communication and technology industries contributed to results. However, underperformance from selected government bonds weighed on return during the year. Sector allocation lifted relative performance, mostly due to our overweight position in government-related assets. This positive performance was offset by our underweight positioning to selected corporate sectors, including the electric, consumer cyclical, and banking sectors. Duration (price sensitivity to interest rate changes) and yield curve (a curve that shows the relationship among bond yields across the maturity spectrum) positioning also positively influenced performance. Our shorter-than-Index duration in U.S.-dollar-denominated bonds and slightly longer-than-Index duration in euro-denominated bonds added to relative performance. However, our curve positioning in British pound-denominated bonds detracted from results. The Fund’s country allocation marginally detracted from performance. Specifically, an underweight position in European local markets was the main laggard.
The Board of Directors Luxembourg, April 22, 2014
Please see past performance disclosure on cover page.
273
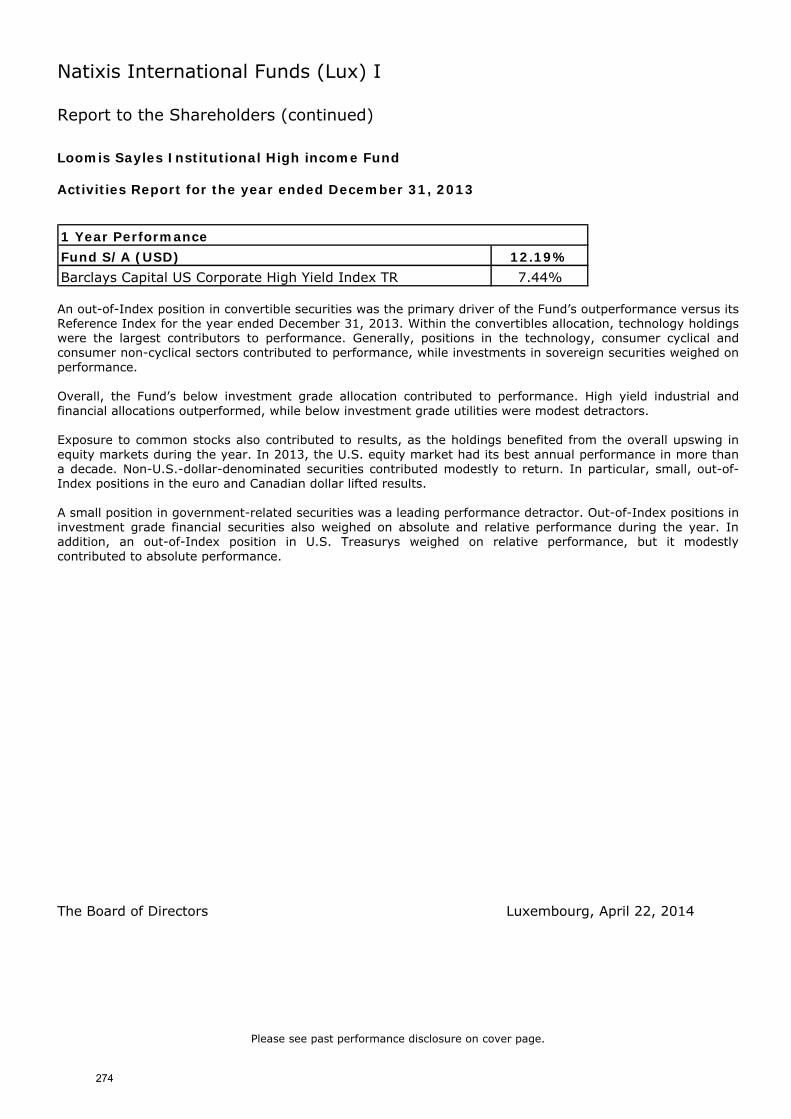
Natixis International Funds (Lux) I
Report to the Shareholders (continued) Loomis Sayles Institutional High income Fund
Activities Report for the year ended December 31, 2013
Fund S/A (USD) 12.19%
Barclays Capital US Corporate High Yield Index TR 7.44%
1 Year Performance
An out-of-Index position in convertible securities was the primary driver of the Fund’s outperformance versus its Reference Index for the year ended December 31, 2013. Within the convertibles allocation, technology holdings were the largest contributors to performance. Generally, positions in the technology, consumer cyclical and consumer non-cyclical sectors contributed to performance, while investments in sovereign securities weighed on performance. Overall, the Fund’s below investment grade allocation contributed to performance. High yield industrial and financial allocations outperformed, while below investment grade utilities were modest detractors. Exposure to common stocks also contributed to results, as the holdings benefited from the overall upswing in equity markets during the year. In 2013, the U.S. equity market had its best annual performance in more than a decade. Non-U.S.-dollar-denominated securities contributed modestly to return. In particular, small, out-of-Index positions in the euro and Canadian dollar lifted results. A small position in government-related securities was a leading performance detractor. Out-of-Index positions in investment grade financial securities also weighed on absolute and relative performance during the year. In addition, an out-of-Index position in U.S. Treasurys weighed on relative performance, but it modestly contributed to absolute performance.
The Board of Directors Luxembourg, April 22, 2014
Please see past performance disclosure on cover page.
274
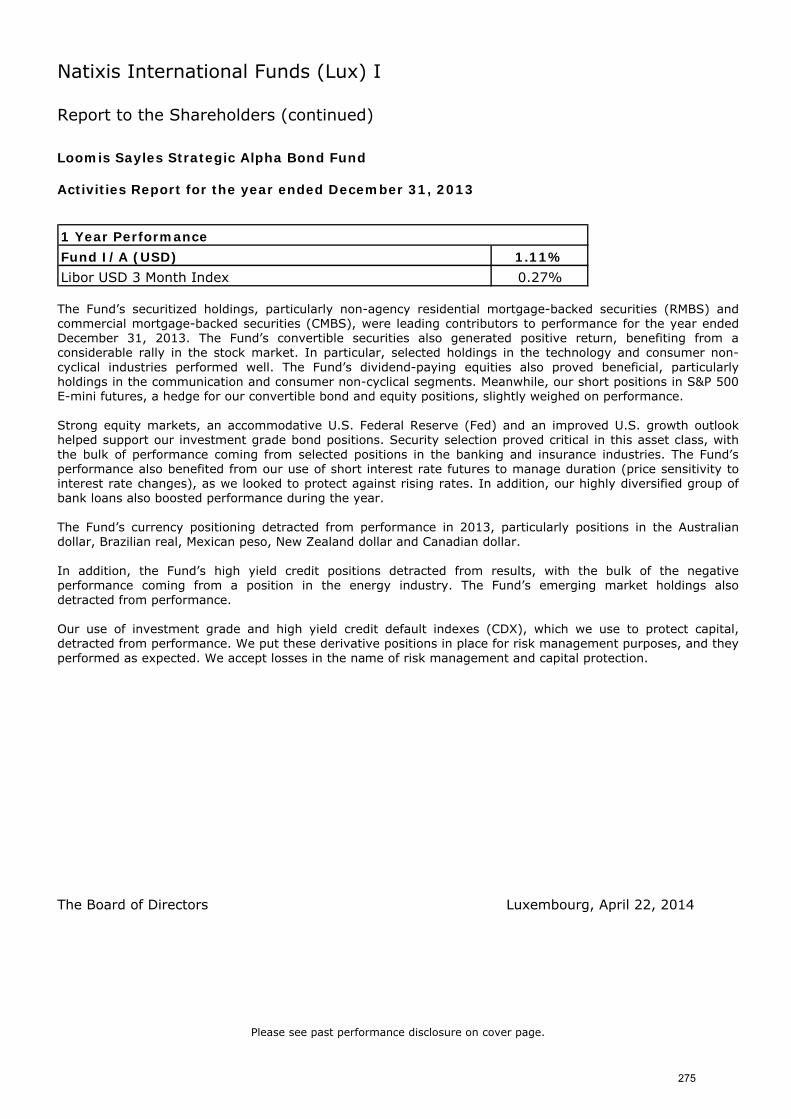
Natixis International Funds (Lux) I
Report to the Shareholders (continued) Loomis Sayles Strategic Alpha Bond Fund
Activities Report for the year ended December 31, 2013
Fund I/A (USD) 1.11%
Libor USD 3 Month Index 0.27%
1 Year Performance
The Fund’s securitized holdings, particularly non-agency residential mortgage-backed securities (RMBS) and commercial mortgage-backed securities (CMBS), were leading contributors to performance for the year ended December 31, 2013. The Fund’s convertible securities also generated positive return, benefiting from a considerable rally in the stock market. In particular, selected holdings in the technology and consumer non-cyclical industries performed well. The Fund’s dividend-paying equities also proved beneficial, particularly holdings in the communication and consumer non-cyclical segments. Meanwhile, our short positions in S&P 500 E-mini futures, a hedge for our convertible bond and equity positions, slightly weighed on performance. Strong equity markets, an accommodative U.S. Federal Reserve (Fed) and an improved U.S. growth outlook helped support our investment grade bond positions. Security selection proved critical in this asset class, with the bulk of performance coming from selected positions in the banking and insurance industries. The Fund’s performance also benefited from our use of short interest rate futures to manage duration (price sensitivity to interest rate changes), as we looked to protect against rising rates. In addition, our highly diversified group of bank loans also boosted performance during the year. The Fund’s currency positioning detracted from performance in 2013, particularly positions in the Australian dollar, Brazilian real, Mexican peso, New Zealand dollar and Canadian dollar. In addition, the Fund’s high yield credit positions detracted from results, with the bulk of the negative performance coming from a position in the energy industry. The Fund’s emerging market holdings also detracted from performance. Our use of investment grade and high yield credit default indexes (CDX), which we use to protect capital, detracted from performance. We put these derivative positions in place for risk management purposes, and they performed as expected. We accept losses in the name of risk management and capital protection.
The Board of Directors Luxembourg, April 22, 2014
Please see past performance disclosure on cover page.
275
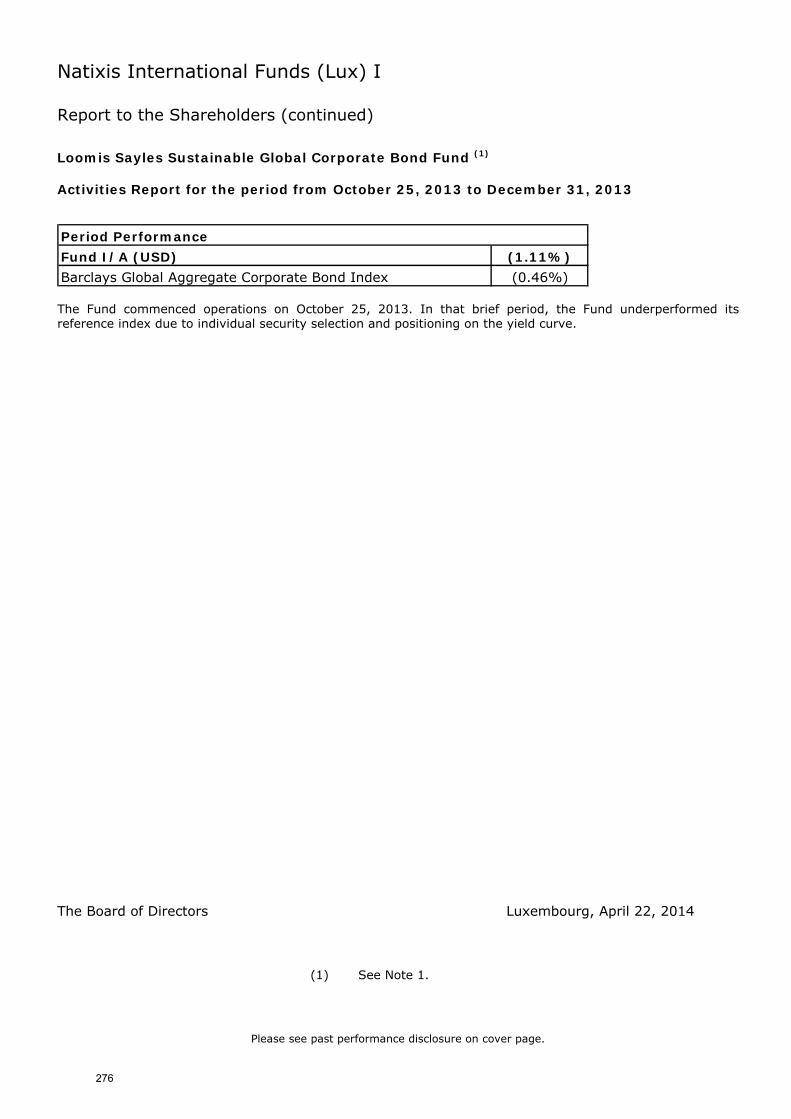
Natixis International Funds (Lux) I
Report to the Shareholders (continued) Loomis Sayles Sustainable Global Corporate Bond Fund (1)
Activities Report for the period from October 25, 2013 to December 31, 2013
Fund I/A (USD) (1.11%)
Barclays Global Aggregate Corporate Bond Index (0.46%)
Period Performance
The Fund commenced operations on October 25, 2013. In that brief period, the Fund underperformed its reference index due to individual security selection and positioning on the yield curve.
The Board of Directors Luxembourg, April 22, 2014
(1) See Note 1.
Please see past performance disclosure on cover page.
276
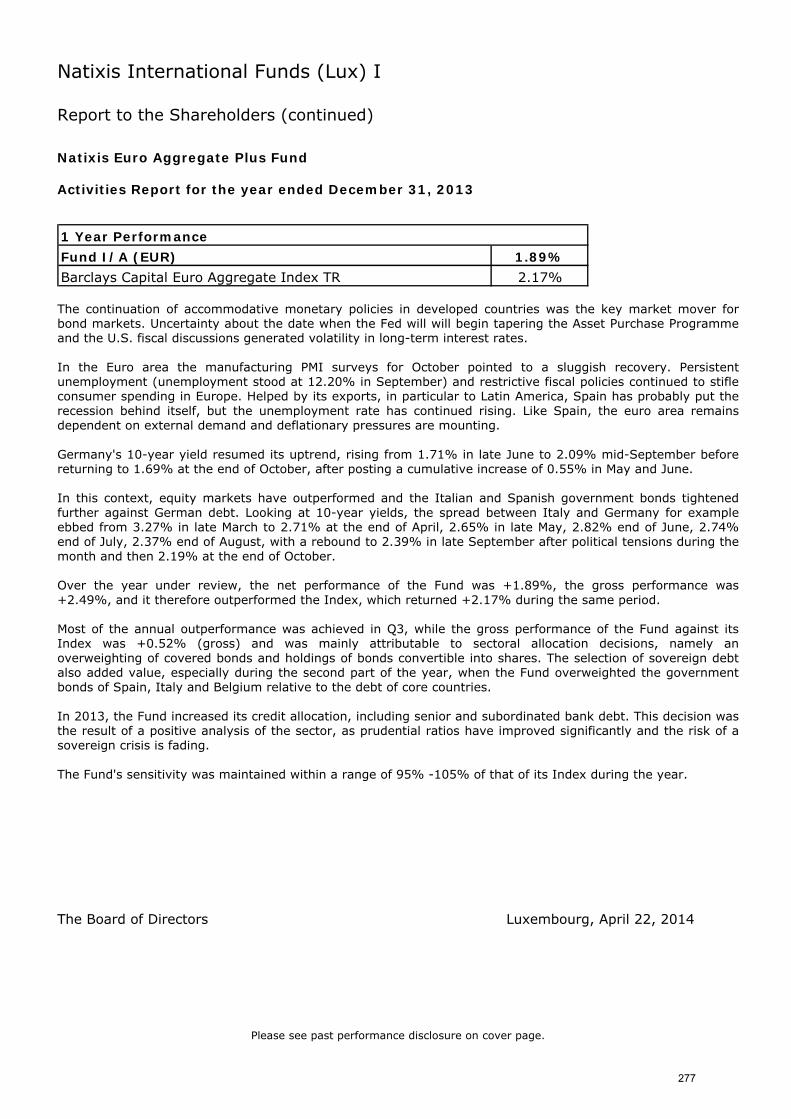
Natixis International Funds (Lux) I
Report to the Shareholders (continued) Natixis Euro Aggregate Plus Fund
Activities Report for the year ended December 31, 2013
Fund I/A (EUR) 1.89%
Barclays Capital Euro Aggregate Index TR 2.17%
1 Year Performance
The continuation of accommodative monetary policies in developed countries was the key market mover for bond markets. Uncertainty about the date when the Fed will will begin tapering the Asset Purchase Programme and the U.S. fiscal discussions generated volatility in long-term interest rates. In the Euro area the manufacturing PMI surveys for October pointed to a sluggish recovery. Persistent unemployment (unemployment stood at 12.20% in September) and restrictive fiscal policies continued to stifle consumer spending in Europe. Helped by its exports, in particular to Latin America, Spain has probably put the recession behind itself, but the unemployment rate has continued rising. Like Spain, the euro area remains dependent on external demand and deflationary pressures are mounting. Germany's 10-year yield resumed its uptrend, rising from 1.71% in late June to 2.09% mid-September before returning to 1.69% at the end of October, after posting a cumulative increase of 0.55% in May and June. In this context, equity markets have outperformed and the Italian and Spanish government bonds tightened further against German debt. Looking at 10-year yields, the spread between Italy and Germany for example ebbed from 3.27% in late March to 2.71% at the end of April, 2.65% in late May, 2.82% end of June, 2.74% end of July, 2.37% end of August, with a rebound to 2.39% in late September after political tensions during the month and then 2.19% at the end of October. Over the year under review, the net performance of the Fund was +1.89%, the gross performance was +2.49%, and it therefore outperformed the Index, which returned +2.17% during the same period. Most of the annual outperformance was achieved in Q3, while the gross performance of the Fund against its Index was +0.52% (gross) and was mainly attributable to sectoral allocation decisions, namely an overweighting of covered bonds and holdings of bonds convertible into shares. The selection of sovereign debt also added value, especially during the second part of the year, when the Fund overweighted the government bonds of Spain, Italy and Belgium relative to the debt of core countries. In 2013, the Fund increased its credit allocation, including senior and subordinated bank debt. This decision was the result of a positive analysis of the sector, as prudential ratios have improved significantly and the risk of a sovereign crisis is fading. The Fund's sensitivity was maintained within a range of 95% -105% of that of its Index during the year.
The Board of Directors Luxembourg, April 22, 2014
Please see past performance disclosure on cover page.
277
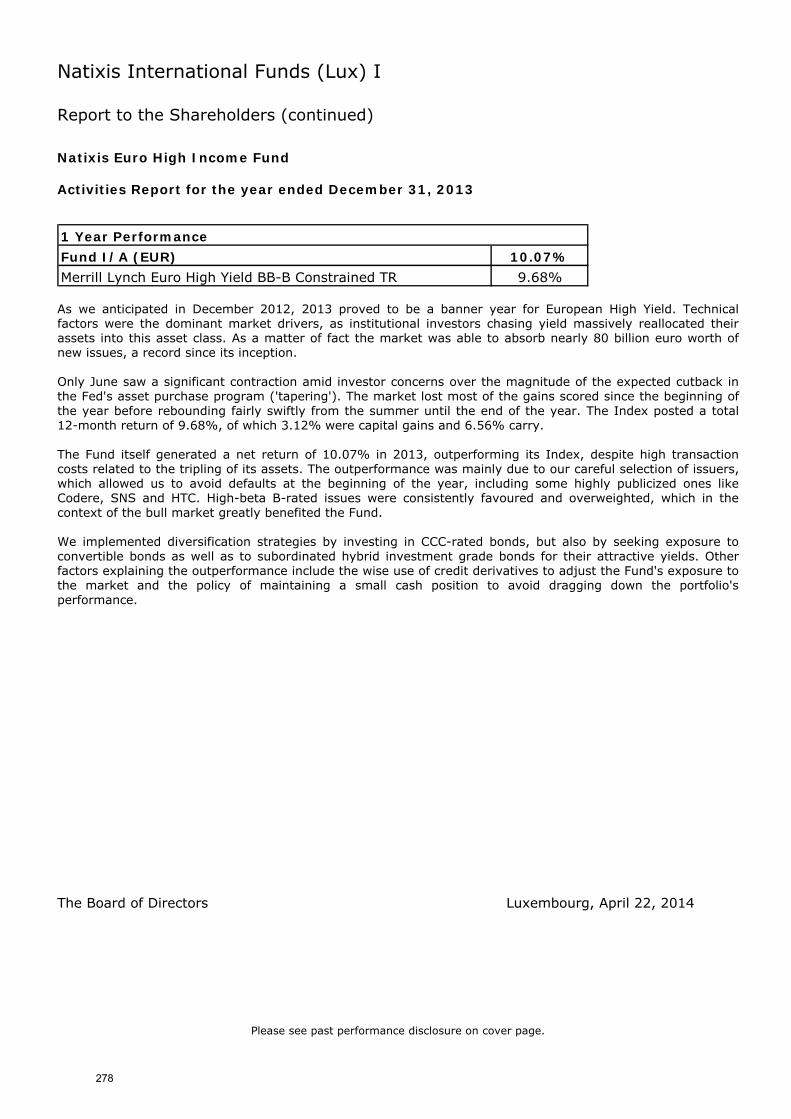
Natixis International Funds (Lux) I
Report to the Shareholders (continued) Natixis Euro High Income Fund
Activities Report for the year ended December 31, 2013
Fund I/A (EUR) 10.07%
Merrill Lynch Euro High Yield BB-B Constrained TR 9.68%
1 Year Performance
As we anticipated in December 2012, 2013 proved to be a banner year for European High Yield. Technical factors were the dominant market drivers, as institutional investors chasing yield massively reallocated their assets into this asset class. As a matter of fact the market was able to absorb nearly 80 billion euro worth of new issues, a record since its inception. Only June saw a significant contraction amid investor concerns over the magnitude of the expected cutback in the Fed's asset purchase program ('tapering'). The market lost most of the gains scored since the beginning of the year before rebounding fairly swiftly from the summer until the end of the year. The Index posted a total 12-month return of 9.68%, of which 3.12% were capital gains and 6.56% carry. The Fund itself generated a net return of 10.07% in 2013, outperforming its Index, despite high transaction costs related to the tripling of its assets. The outperformance was mainly due to our careful selection of issuers, which allowed us to avoid defaults at the beginning of the year, including some highly publicized ones like Codere, SNS and HTC. High-beta B-rated issues were consistently favoured and overweighted, which in the context of the bull market greatly benefited the Fund. We implemented diversification strategies by investing in CCC-rated bonds, but also by seeking exposure to convertible bonds as well as to subordinated hybrid investment grade bonds for their attractive yields. Other factors explaining the outperformance include the wise use of credit derivatives to adjust the Fund's exposure to the market and the policy of maintaining a small cash position to avoid dragging down the portfolio's performance. The Board of Directors Luxembourg, April 22, 2014
Please see past performance disclosure on cover page.
278
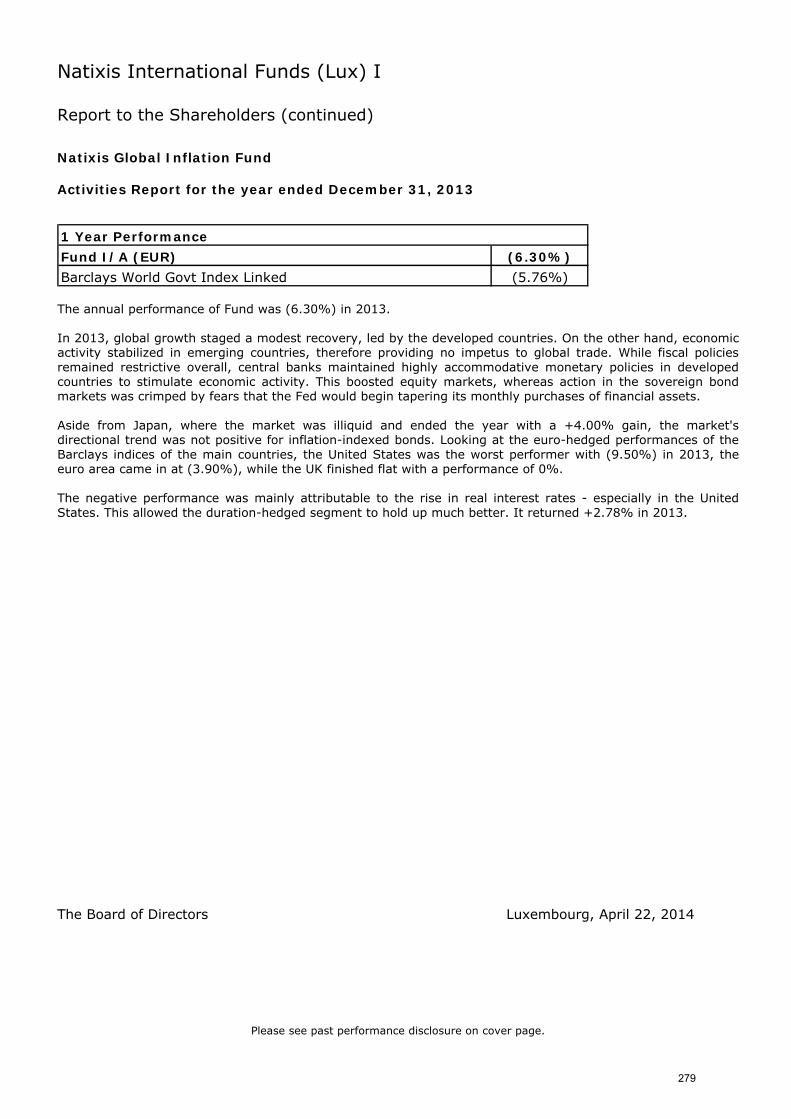
Natixis International Funds (Lux) I
Report to the Shareholders (continued) Natixis Global Inflation Fund
Activities Report for the year ended December 31, 2013
Fund I/A (EUR) (6.30%)
Barclays World Govt Index Linked (5.76%)
1 Year Performance
The annual performance of Fund was (6.30%) in 2013. In 2013, global growth staged a modest recovery, led by the developed countries. On the other hand, economic activity stabilized in emerging countries, therefore providing no impetus to global trade. While fiscal policies remained restrictive overall, central banks maintained highly accommodative monetary policies in developed countries to stimulate economic activity. This boosted equity markets, whereas action in the sovereign bond markets was crimped by fears that the Fed would begin tapering its monthly purchases of financial assets. Aside from Japan, where the market was illiquid and ended the year with a +4.00% gain, the market's directional trend was not positive for inflation-indexed bonds. Looking at the euro-hedged performances of the Barclays indices of the main countries, the United States was the worst performer with (9.50%) in 2013, the euro area came in at (3.90%), while the UK finished flat with a performance of 0%. The negative performance was mainly attributable to the rise in real interest rates - especially in the United States. This allowed the duration-hedged segment to hold up much better. It returned +2.78% in 2013.
The Board of Directors Luxembourg, April 22, 2014
Please see past performance disclosure on cover page.
279
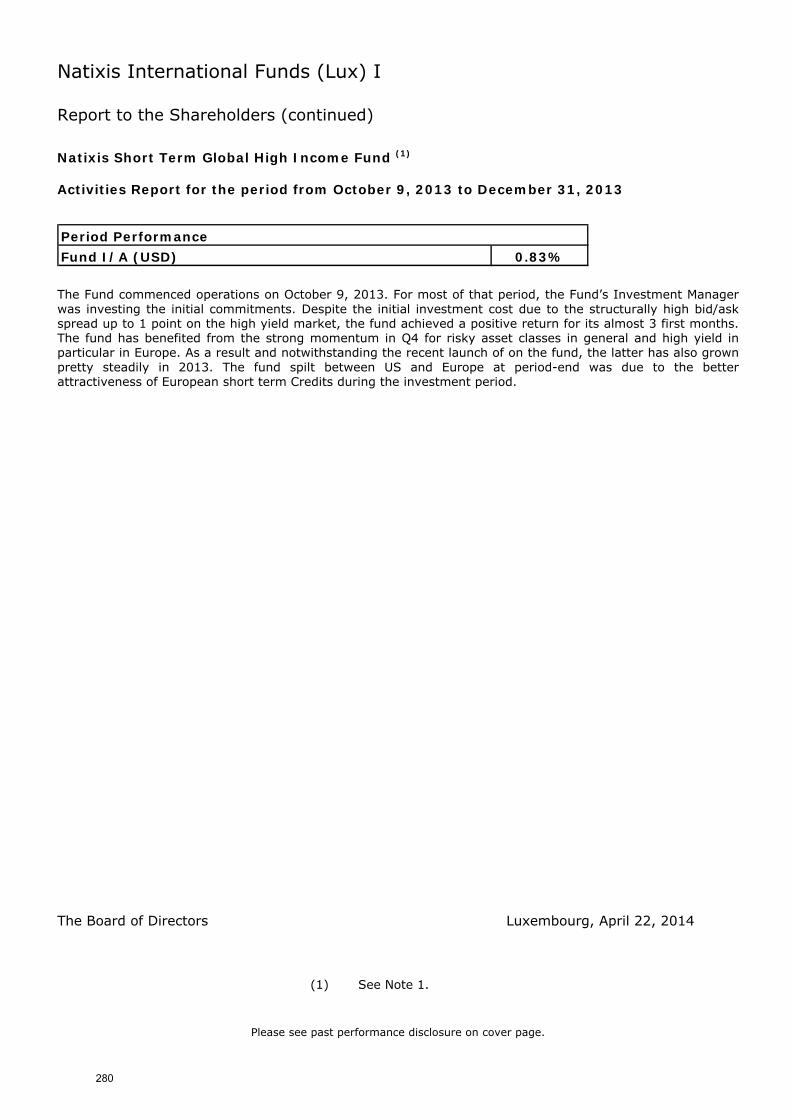
Natixis International Funds (Lux) I
Report to the Shareholders (continued) Natixis Short Term Global High Income Fund (1)
Activities Report for the period from October 9, 2013 to December 31, 2013
Fund I/A (USD) 0.83%
Period Performance
The Fund commenced operations on October 9, 2013. For most of that period, the Fund’s Investment Manager was investing the initial commitments. Despite the initial investment cost due to the structurally high bid/ask spread up to 1 point on the high yield market, the fund achieved a positive return for its almost 3 first months. The fund has benefited from the strong momentum in Q4 for risky asset classes in general and high yield in particular in Europe. As a result and notwithstanding the recent launch of on the fund, the latter has also grown pretty steadily in 2013. The fund spilt between US and Europe at period-end was due to the better attractiveness of European short term Credits during the investment period.
The Board of Directors Luxembourg, April 22, 2014
(1) See Note 1.
Please see past performance disclosure on cover page.
280
Natixis International Funds (Lux) I
Audit report To the Shareholders of Natixis International Funds (Lux) I We have audited the accompanying financial statements of Natixis International Funds (Lux) I and of each of its sub-funds, which comprise the statement of net assets and the statement of investments as at December 31, 2013 and the statement of changes in net assets for the year then ended, and a summary of significant accounting policies and other explanatory notes to the financial statements. Responsibility of the Board of Directors of the SICAV for the financial statements The Board of Directors of the SICAV is responsible for the preparation and fair presentation of these financial statements in accordance with Luxembourg legal and regulatory requirements relating to the preparation of the financial statements and for such internal control as the Board of Directors of the SICAV determines is necessary to enable the preparation of financial statements that are free from material misstatement, whether due to fraud or error. Responsibility of the “Réviseur d’entreprises agréé” Our responsibility is to express an opinion on these financial statements based on our audit. We conducted our audit in accordance with International Standards on Auditing as adopted for Luxembourg by the “Commission de Surveillance du Secteur Financier”. Those standards require that we comply with ethical requirements and plan and perform the audit to obtain reasonable assurance about whether the financial statements are free from material misstatement. An audit involves performing procedures to obtain audit evidence about the amounts and disclosures in the financial statements. The procedures selected depend on the judgment of the “Réviseur d’entreprises agréé”, including the assessment of the risks of material misstatement of the financial statements, whether due to fraud or error. In making those risk assessments, the “Réviseur d’entreprises agréé” considers internal control relevant to the entity’s preparation and fair presentation of the financial statements in order to design audit procedures that are appropriate in the circumstances, but not for the purpose of expressing an opinion on the effectiveness of the entity’s internal control. An audit also includes evaluating the appropriateness of accounting policies used and the reasonableness of accounting estimates made by the Board of Directors of the SICAV, as well as evaluating the overall presentation of the financial statements.
PricewaterhouseCoopers, Société coopérative, 400 Route d’Esch, B.P. 1443, L-1014 Luxembourg T: +352 494848 1, F:+352 494848 2900, www.pwc.lu
Cabinet de révision agréé. Expert-comptable (autorisation gouvernementale n°10028256) R.C.S. Luxembourg B 65 477 - TVA LU25482518
281
Natixis International Funds (Lux) I
We believe that the audit evidence we have obtained is sufficient and appropriate to provide a basis for our audit opinion. Opinion In our opinion, the financial statements give a true and fair view of the financial position of Natixis International Funds (Lux) I and of each of its sub-funds as of December 31, 2013, and of the results of their operations and changes in their net assets for the year then ended in accordance with Luxembourg legal and regulatory requirements relating to the preparation of the financial statements. Other matters Supplementary information included in the annual report has been reviewed in the context of our mandate but has not been subject to specific audit procedures carried out in accordance with the standards described above. Consequently, we express no opinion on such information. However, we have no observation to make concerning such information in the context of the financial statements taken as a whole. PricewaterhouseCoopers, Société coopérative Luxembourg, April 22, 2014 Represented by Christophe Pittie
282
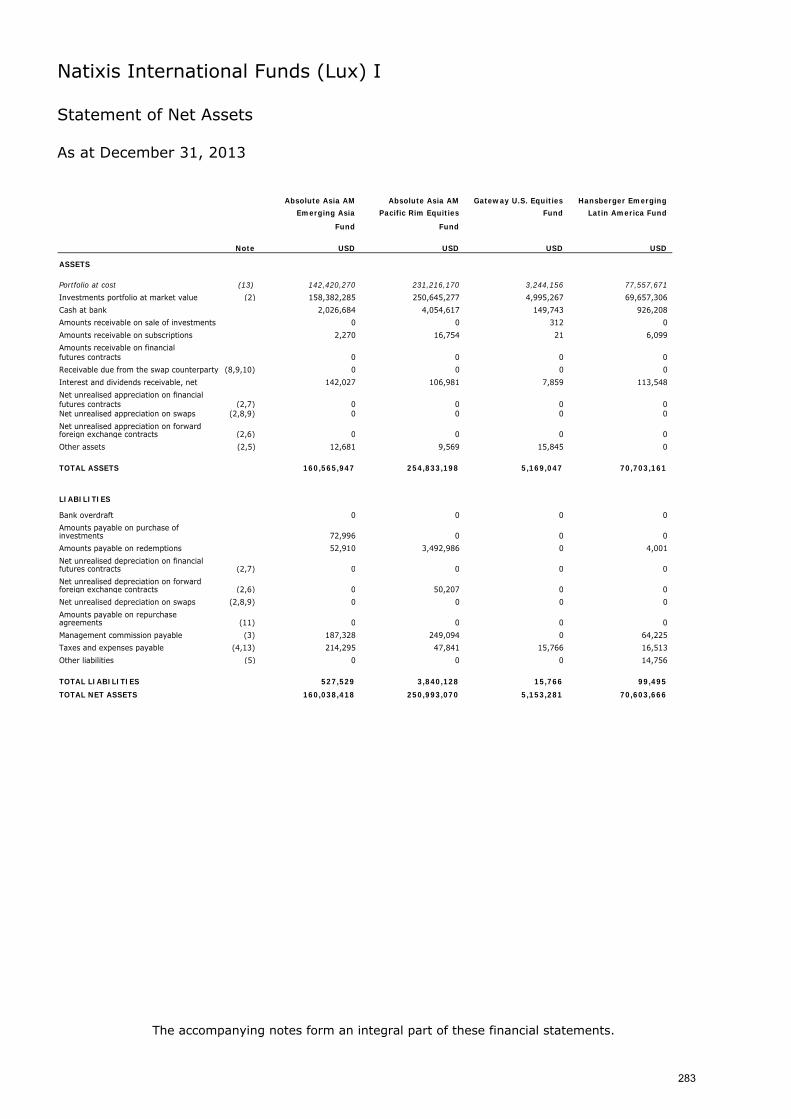
Natixis International Funds (Lux) I
Statement of Net Assets As at December 31, 2013
The accompanying notes form an integral part of these financial statements.
Absolute Asia AM Absolute Asia AM Gateway U.S. Equities Hansberger Emerging
Emerging Asia Pacific Rim Equities Fund Latin America Fund
Fund Fund
Note USD USD USD USD
ASSETS
Portfolio at cost (13) 142,420,270 231,216,170 3,244,156 77,557,671
Investments portfolio at market value (2) 158,382,285 250,645,277 4,995,267 69,657,306
Cash at bank 2,026,684 4,054,617 149,743 926,208
Amounts receivable on sale of investments 0 0 312 0
Amounts receivable on subscriptions 2,270 16,754 21 6,099
Amounts receivable on financialfutures contracts 0 0 0 0
Receivable due from the swap counterparty (8,9,10) 0 0 0 0
Interest and dividends receivable, net 142,027 106,981 7,859 113,548
Net unrealised appreciation on financial futures contracts (2,7) 0 0 0 0 Net unrealised appreciation on swaps (2,8,9) 0 0 0 0
Net unrealised appreciation on forward foreign exchange contracts (2,6) 0 0 0 0
Other assets (2,5) 12,681 9,569 15,845 0
TOTAL ASSETS 160,565,947 254,833,198 5,169,047 70,703,161
LIABILITIES
Bank overdraft 0 0 0 0
Amounts payable on purchase of investments 72,996 0 0 0
Amounts payable on redemptions 52,910 3,492,986 0 4,001
Net unrealised depreciation on financial futures contracts (2,7) 0 0 0 0
Net unrealised depreciation on forward foreign exchange contracts (2,6) 0 50,207 0 0
Net unrealised depreciation on swaps (2,8,9) 0 0 0 0
Amounts payable on repurchase agreements (11) 0 0 0 0
Management commission payable (3) 187,328 249,094 0 64,225
Taxes and expenses payable (4,13) 214,295 47,841 15,766 16,513
Other liabilities (5) 0 0 0 14,756
TOTAL LIABILITIES 527,529 3,840,128 15,766 99,495
TOTAL NET ASSETS 160,038,418 250,993,070 5,153,281 70,603,666
283
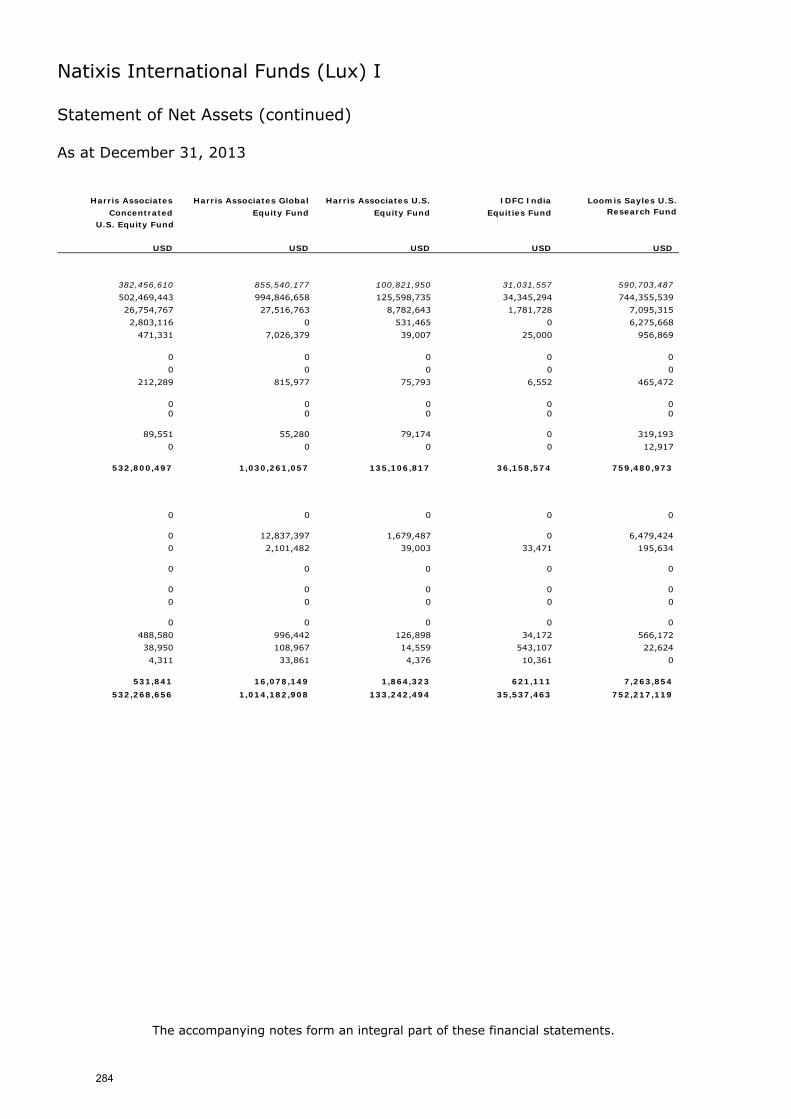
Natixis International Funds (Lux) I
Statement of Net Assets (continued) As at December 31, 2013
The accompanying notes form an integral part of these financial statements.
Harris Associates Harris Associates Global Harris Associates U.S. IDFC India Loomis Sayles U.S.
Concentrated Equity Fund Equity Fund Equities Fund Research Fund
U.S. Equity Fund
USD USD USD USD USD
382,456,610 855,540,177 100,821,950 31,031,557 590,703,487
502,469,443 994,846,658 125,598,735 34,345,294 744,355,539
26,754,767 27,516,763 8,782,643 1,781,728 7,095,315
2,803,116 0 531,465 0 6,275,668
471,331 7,026,379 39,007 25,000 956,869
0 0 0 0 0
0 0 0 0 0
212,289 815,977 75,793 6,552 465,472
0 0 0 0 0 0 0 0 0 0
89,551 55,280 79,174 0 319,193
0 0 0 0 12,917
532,800,497 1,030,261,057 135,106,817 36,158,574 759,480,973
0 0 0 0 0
0 12,837,397 1,679,487 0 6,479,424
0 2,101,482 39,003 33,471 195,634
0 0 0 0 0
0 0 0 0 0
0 0 0 0 0
0 0 0 0 0
488,580 996,442 126,898 34,172 566,172
38,950 108,967 14,559 543,107 22,624
4,311 33,861 4,376 10,361 0
531,841 16,078,149 1,864,323 621,111 7,263,854
532,268,656 1,014,182,908 133,242,494 35,537,463 752,217,119
284
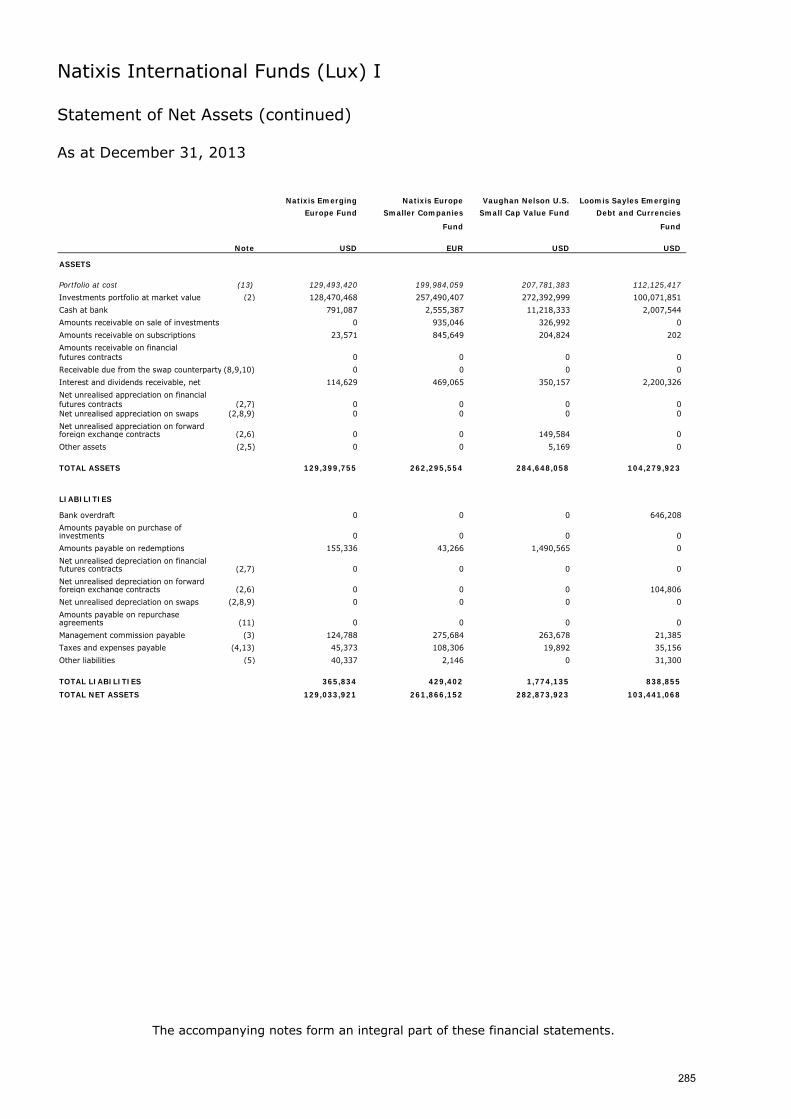
Natixis International Funds (Lux) I
Statement of Net Assets (continued) As at December 31, 2013
The accompanying notes form an integral part of these financial statements.
Natixis Emerging Natixis Europe Vaughan Nelson U.S. Loomis Sayles Emerging
Europe Fund Smaller Companies Small Cap Value Fund Debt and Currencies
Fund Fund
Note USD EUR USD USD
ASSETS
Portfolio at cost (13) 129,493,420 199,984,059 207,781,383 112,125,417
Investments portfolio at market value (2) 128,470,468 257,490,407 272,392,999 100,071,851
Cash at bank 791,087 2,555,387 11,218,333 2,007,544
Amounts receivable on sale of investments 0 935,046 326,992 0
Amounts receivable on subscriptions 23,571 845,649 204,824 202
Amounts receivable on financialfutures contracts 0 0 0 0
Receivable due from the swap counterparty (8,9,10) 0 0 0 0
Interest and dividends receivable, net 114,629 469,065 350,157 2,200,326
Net unrealised appreciation on financial futures contracts (2,7) 0 0 0 0 Net unrealised appreciation on swaps (2,8,9) 0 0 0 0
Net unrealised appreciation on forward foreign exchange contracts (2,6) 0 0 149,584 0
Other assets (2,5) 0 0 5,169 0
TOTAL ASSETS 129,399,755 262,295,554 284,648,058 104,279,923
LIABILITIES
Bank overdraft 0 0 0 646,208
Amounts payable on purchase of investments 0 0 0 0
Amounts payable on redemptions 155,336 43,266 1,490,565 0
Net unrealised depreciation on financial futures contracts (2,7) 0 0 0 0
Net unrealised depreciation on forward foreign exchange contracts (2,6) 0 0 0 104,806
Net unrealised depreciation on swaps (2,8,9) 0 0 0 0
Amounts payable on repurchase agreements (11) 0 0 0 0
Management commission payable (3) 124,788 275,684 263,678 21,385
Taxes and expenses payable (4,13) 45,373 108,306 19,892 35,156
Other liabilities (5) 40,337 2,146 0 31,300
TOTAL LIABILITIES 365,834 429,402 1,774,135 838,855
TOTAL NET ASSETS 129,033,921 261,866,152 282,873,923 103,441,068
285
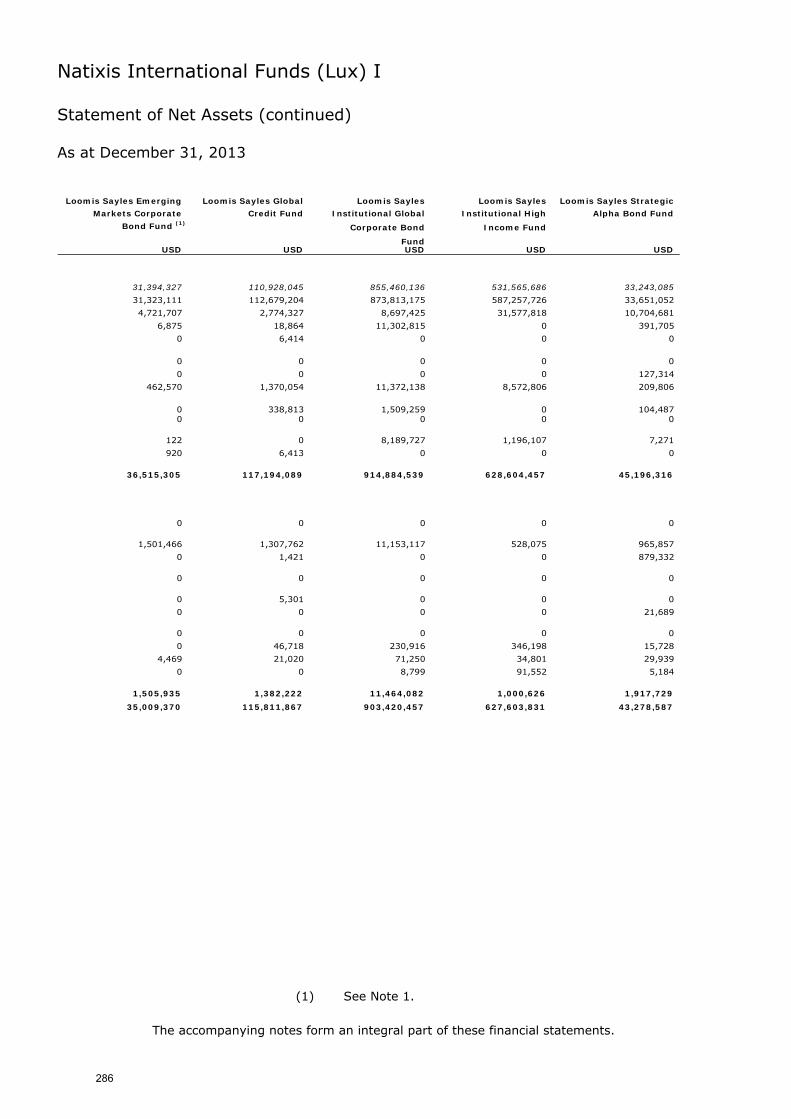
Natixis International Funds (Lux) I
Statement of Net Assets (continued) As at December 31, 2013
The accompanying notes form an integral part of these financial statements.
Loomis Sayles Emerging Loomis Sayles Global Loomis Sayles Loomis Sayles Loomis Sayles Strategic
Markets Corporate Credit Fund Institutional Global Institutional High Alpha Bond Fund
Bond Fund (1)Corporate Bond Income Fund
FundUSD USD USD USD USD
31,394,327 110,928,045 855,460,136 531,565,686 33,243,085
31,323,111 112,679,204 873,813,175 587,257,726 33,651,052
4,721,707 2,774,327 8,697,425 31,577,818 10,704,681
6,875 18,864 11,302,815 0 391,705
0 6,414 0 0 0
0 0 0 0 0
0 0 0 0 127,314
462,570 1,370,054 11,372,138 8,572,806 209,806
0 338,813 1,509,259 0 104,487 0 0 0 0 0
122 0 8,189,727 1,196,107 7,271
920 6,413 0 0 0
36,515,305 117,194,089 914,884,539 628,604,457 45,196,316
0 0 0 0 0
1,501,466 1,307,762 11,153,117 528,075 965,857
0 1,421 0 0 879,332
0 0 0 0 0
0 5,301 0 0 0
0 0 0 0 21,689
0 0 0 0 0
0 46,718 230,916 346,198 15,728
4,469 21,020 71,250 34,801 29,939
0 0 8,799 91,552 5,184
1,505,935 1,382,222 11,464,082 1,000,626 1,917,729
35,009,370 115,811,867 903,420,457 627,603,831 43,278,587
(1) See Note 1.
286
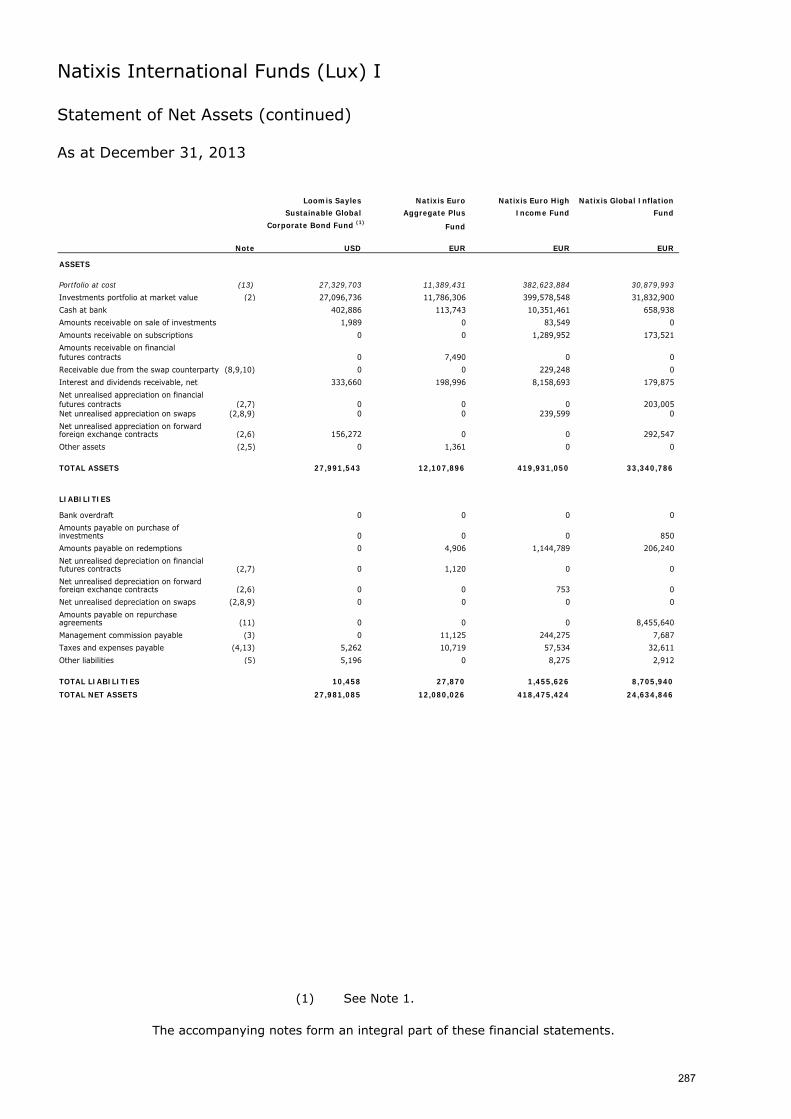
Natixis International Funds (Lux) I
Statement of Net Assets (continued) As at December 31, 2013
The accompanying notes form an integral part of these financial statements.
Loomis Sayles Natixis Euro Natixis Euro High Natixis Global Inflation
Sustainable Global Aggregate Plus Income Fund Fund
Corporate Bond Fund (1)Fund
Note USD EUR EUR EUR
ASSETS
Portfolio at cost (13) 27,329,703 11,389,431 382,623,884 30,879,993
Investments portfolio at market value (2) 27,096,736 11,786,306 399,578,548 31,832,900
Cash at bank 402,886 113,743 10,351,461 658,938
Amounts receivable on sale of investments 1,989 0 83,549 0
Amounts receivable on subscriptions 0 0 1,289,952 173,521
Amounts receivable on financialfutures contracts 0 7,490 0 0
Receivable due from the swap counterparty (8,9,10) 0 0 229,248 0
Interest and dividends receivable, net 333,660 198,996 8,158,693 179,875
Net unrealised appreciation on financial futures contracts (2,7) 0 0 0 203,005 Net unrealised appreciation on swaps (2,8,9) 0 0 239,599 0
Net unrealised appreciation on forward foreign exchange contracts (2,6) 156,272 0 0 292,547
Other assets (2,5) 0 1,361 0 0
TOTAL ASSETS 27,991,543 12,107,896 419,931,050 33,340,786
LIABILITIES
Bank overdraft 0 0 0 0
Amounts payable on purchase of investments 0 0 0 850
Amounts payable on redemptions 0 4,906 1,144,789 206,240
Net unrealised depreciation on financial futures contracts (2,7) 0 1,120 0 0
Net unrealised depreciation on forward foreign exchange contracts (2,6) 0 0 753 0
Net unrealised depreciation on swaps (2,8,9) 0 0 0 0
Amounts payable on repurchase agreements (11) 0 0 0 8,455,640
Management commission payable (3) 0 11,125 244,275 7,687
Taxes and expenses payable (4,13) 5,262 10,719 57,534 32,611
Other liabilities (5) 5,196 0 8,275 2,912
TOTAL LIABILITIES 10,458 27,870 1,455,626 8,705,940
TOTAL NET ASSETS 27,981,085 12,080,026 418,475,424 24,634,846
(1) See Note 1.
287
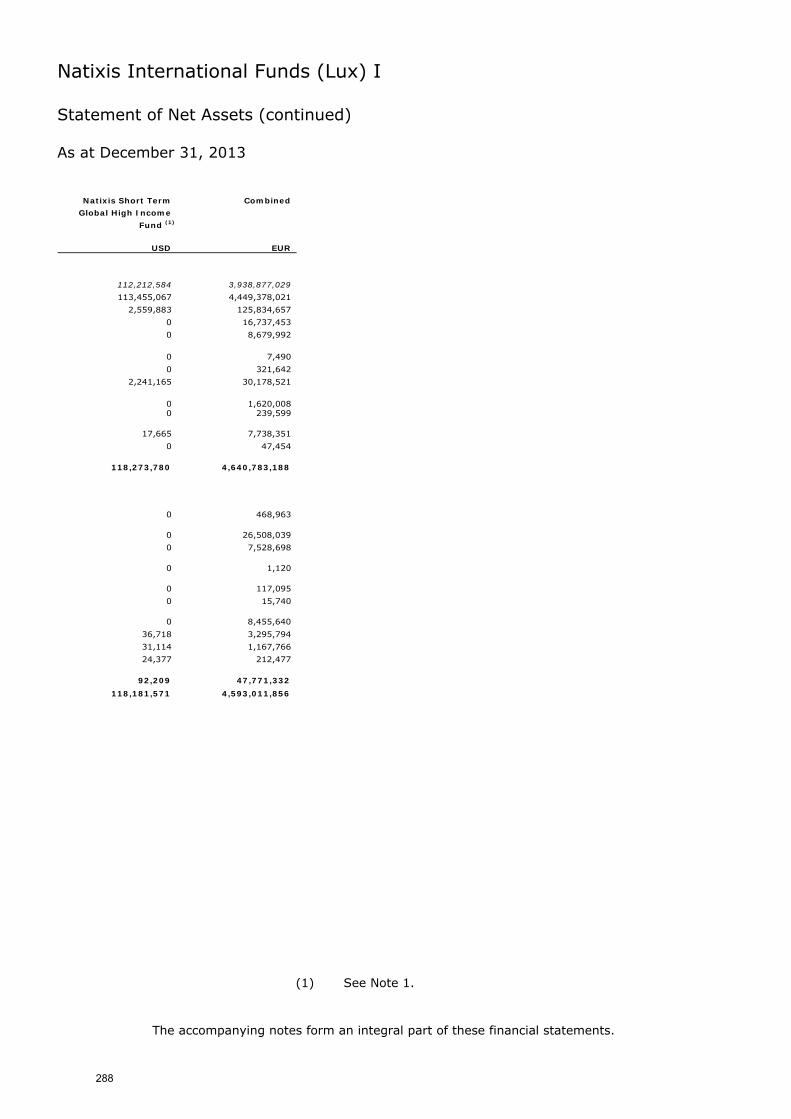
Natixis International Funds (Lux) I
Statement of Net Assets (continued) As at December 31, 2013
The accompanying notes form an integral part of these financial statements.
Natixis Short Term Combined
Global High Income
Fund (1)
USD EUR
112,212,584 3,938,877,029
113,455,067 4,449,378,021
2,559,883 125,834,657
0 16,737,453
0 8,679,992
0 7,490
0 321,642
2,241,165 30,178,521
0 1,620,008 0 239,599
17,665 7,738,351
0 47,454
118,273,780 4,640,783,188
0 468,963
0 26,508,039
0 7,528,698
0 1,120
0 117,095
0 15,740
0 8,455,640
36,718 3,295,794
31,114 1,167,766
24,377 212,477
92,209 47,771,332
118,181,571 4,593,011,856
(1) See Note 1.
288
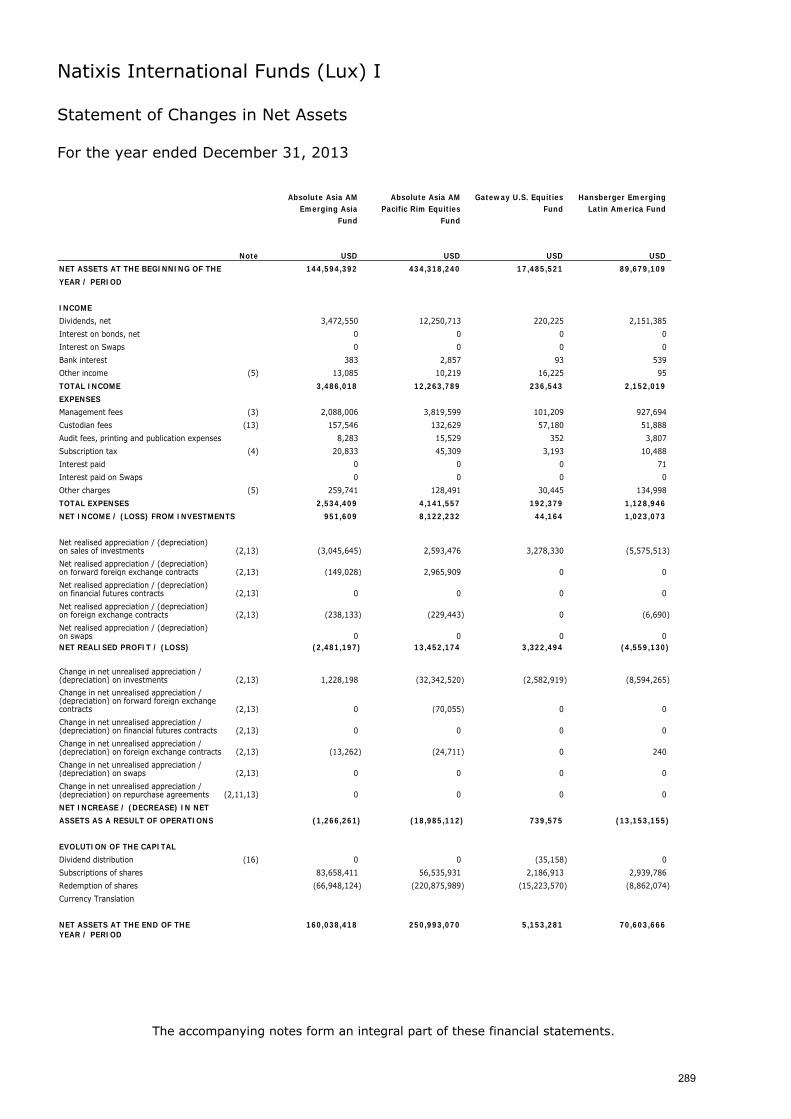
Natixis International Funds (Lux) I
Statement of Changes in Net Assets For the year ended December 31, 2013
The accompanying notes form an integral part of these financial statements.
Absolute Asia AM Absolute Asia AM Gateway U.S. Equities Hansberger EmergingEmerging Asia Pacific Rim Equities Fund Latin America Fund
Fund Fund
Note USD USD USD USD
NET ASSETS AT THE BEGINNING OF THE 144,594,392 434,318,240 17,485,521 89,679,109
YEAR / PERIOD
INCOME
Dividends, net 3,472,550 12,250,713 220,225 2,151,385
Interest on bonds, net 0 0 0 0
Interest on Swaps 0 0 0 0
Bank interest 383 2,857 93 539
Other income (5) 13,085 10,219 16,225 95
TOTAL INCOME 3,486,018 12,263,789 236,543 2,152,019
EXPENSES
Management fees (3) 2,088,006 3,819,599 101,209 927,694
Custodian fees (13) 157,546 132,629 57,180 51,888
Audit fees, printing and publication expenses 8,283 15,529 352 3,807
Subscription tax (4) 20,833 45,309 3,193 10,488
Interest paid 0 0 0 71
Interest paid on Swaps 0 0 0 0
Other charges (5) 259,741 128,491 30,445 134,998
TOTAL EXPENSES 2,534,409 4,141,557 192,379 1,128,946
NET INCOME / (LOSS) FROM INVESTMENTS 951,609 8,122,232 44,164 1,023,073
Net realised appreciation / (depreciation)on sales of investments (2,13) (3,045,645) 2,593,476 3,278,330 (5,575,513)
Net realised appreciation / (depreciation)on forward foreign exchange contracts (2,13) (149,028) 2,965,909 0 0
Net realised appreciation / (depreciation)on financial futures contracts (2,13) 0 0 0 0
Net realised appreciation / (depreciation)on foreign exchange contracts (2,13) (238,133) (229,443) 0 (6,690)
Net realised appreciation / (depreciation)on swaps 0 0 0 0 NET REALISED PROFIT / (LOSS) (2,481,197) 13,452,174 3,322,494 (4,559,130)
Change in net unrealised appreciation / (depreciation) on investments (2,13) 1,228,198 (32,342,520) (2,582,919) (8,594,265)
Change in net unrealised appreciation / (depreciation) on forward foreign exchange contracts (2,13) 0 (70,055) 0 0
Change in net unrealised appreciation / (depreciation) on financial futures contracts (2,13) 0 0 0 0
Change in net unrealised appreciation /(depreciation) on foreign exchange contracts (2,13) (13,262) (24,711) 0 240
Change in net unrealised appreciation / (depreciation) on swaps (2,13) 0 0 0 0
Change in net unrealised appreciation / (depreciation) on repurchase agreements (2,11,13) 0 0 0 0
NET INCREASE / (DECREASE) IN NET
ASSETS AS A RESULT OF OPERATIONS (1,266,261) (18,985,112) 739,575 (13,153,155)
EVOLUTION OF THE CAPITAL
Dividend distribution (16) 0 0 (35,158) 0
Subscriptions of shares 83,658,411 56,535,931 2,186,913 2,939,786
Redemption of shares (66,948,124) (220,875,989) (15,223,570) (8,862,074)
Currency Translation
NET ASSETS AT THE END OF THE 160,038,418 250,993,070 5,153,281 70,603,666 YEAR / PERIOD
289
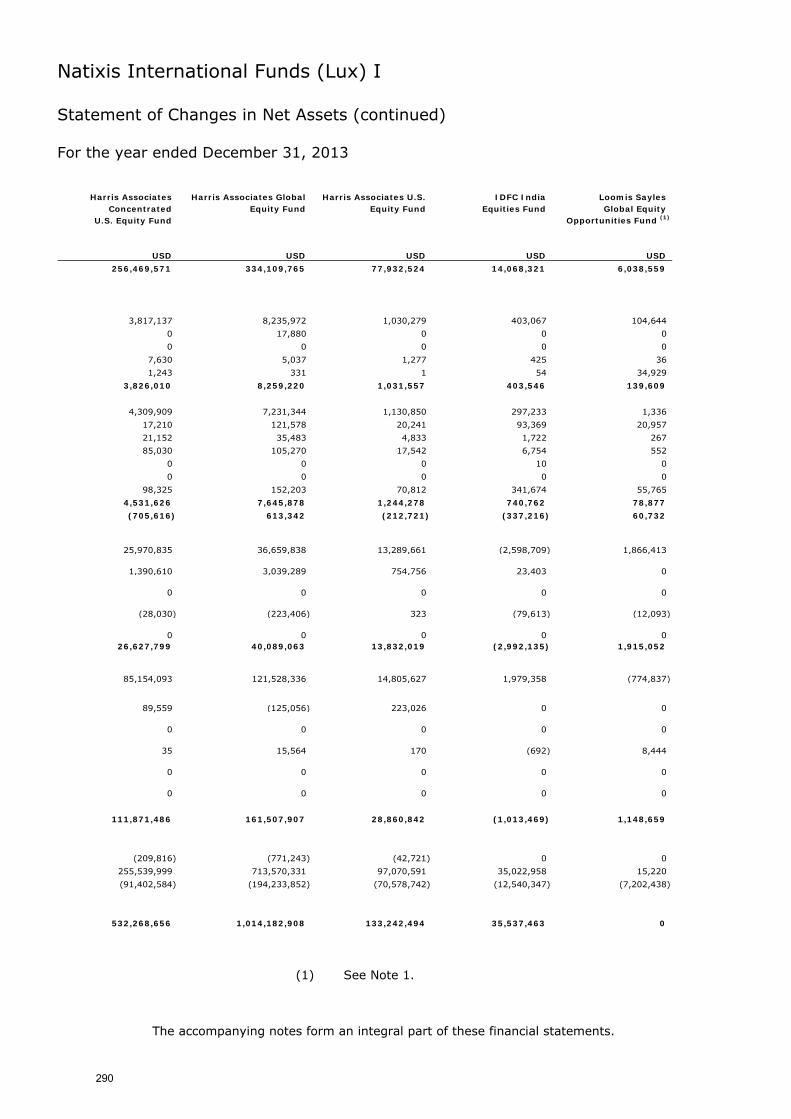
Natixis International Funds (Lux) I
Statement of Changes in Net Assets (continued) For the year ended December 31, 2013
The accompanying notes form an integral part of these financial statements.
Harris Associates Harris Associates Global Harris Associates U.S. IDFC India Loomis SaylesConcentrated Equity Fund Equity Fund Equities Fund Global Equity
U.S. Equity Fund Opportunities Fund (1)
USD USD USD USD USD
256,469,571 334,109,765 77,932,524 14,068,321 6,038,559
3,817,137 8,235,972 1,030,279 403,067 104,644
0 17,880 0 0 0
0 0 0 0 0
7,630 5,037 1,277 425 36
1,243 331 1 54 34,929
3,826,010 8,259,220 1,031,557 403,546 139,609
4,309,909 7,231,344 1,130,850 297,233 1,336
17,210 121,578 20,241 93,369 20,957
21,152 35,483 4,833 1,722 267
85,030 105,270 17,542 6,754 552
0 0 0 10 0
0 0 0 0 0
98,325 152,203 70,812 341,674 55,765
4,531,626 7,645,878 1,244,278 740,762 78,877
(705,616) 613,342 (212,721) (337,216) 60,732
25,970,835 36,659,838 13,289,661 (2,598,709) 1,866,413
1,390,610 3,039,289 754,756 23,403 0
0 0 0 0 0
(28,030) (223,406) 323 (79,613) (12,093)
0 0 0 0 0 26,627,799 40,089,063 13,832,019 (2,992,135) 1,915,052
85,154,093 121,528,336 14,805,627 1,979,358 (774,837)
89,559 (125,056) 223,026 0 0
0 0 0 0 0
35 15,564 170 (692) 8,444
0 0 0 0 0
0 0 0 0 0
111,871,486 161,507,907 28,860,842 (1,013,469) 1,148,659
(209,816) (771,243) (42,721) 0 0
255,539,999 713,570,331 97,070,591 35,022,958 15,220
(91,402,584) (194,233,852) (70,578,742) (12,540,347) (7,202,438)
532,268,656 1,014,182,908 133,242,494 35,537,463 0
(1) See Note 1.
290
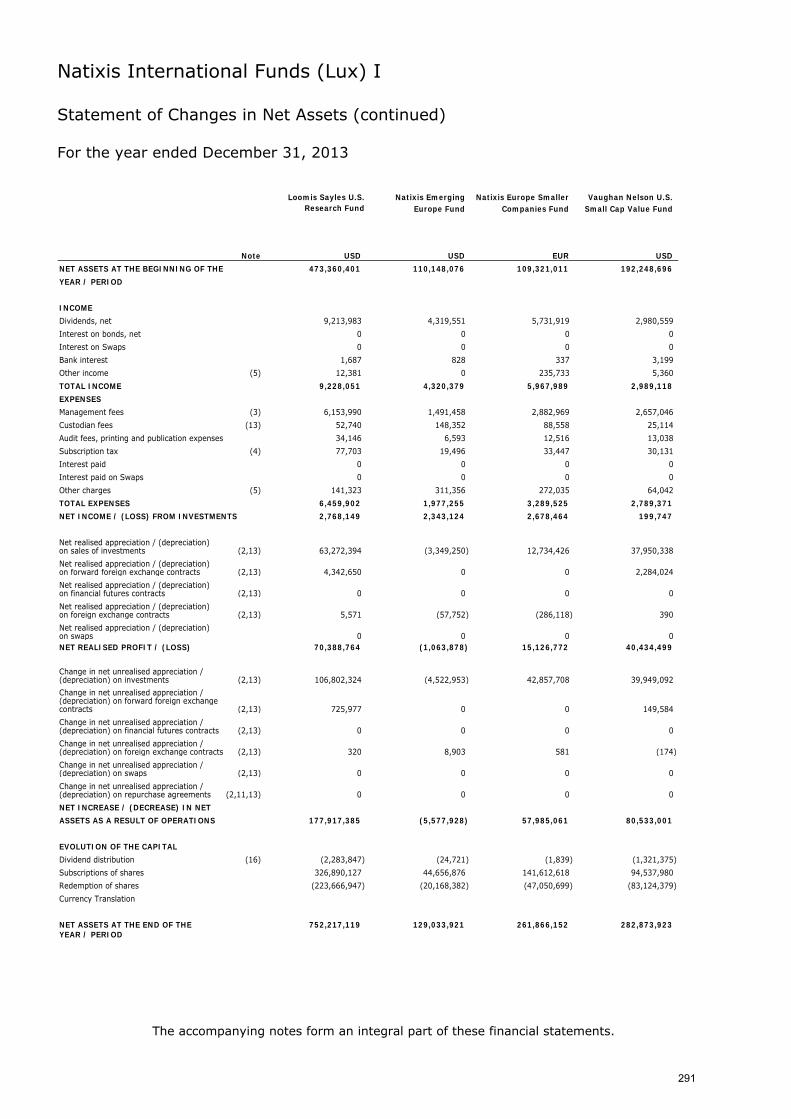
Natixis International Funds (Lux) I
Statement of Changes in Net Assets (continued) For the year ended December 31, 2013
The accompanying notes form an integral part of these financial statements.
Loomis Sayles U.S. Natixis Emerging Natixis Europe Smaller Vaughan Nelson U.S.Research Fund Europe Fund Companies Fund Small Cap Value Fund
Note USD USD EUR USD
NET ASSETS AT THE BEGINNING OF THE 473,360,401 110,148,076 109,321,011 192,248,696
YEAR / PERIOD
INCOME
Dividends, net 9,213,983 4,319,551 5,731,919 2,980,559
Interest on bonds, net 0 0 0 0
Interest on Swaps 0 0 0 0
Bank interest 1,687 828 337 3,199
Other income (5) 12,381 0 235,733 5,360
TOTAL INCOME 9,228,051 4,320,379 5,967,989 2,989,118
EXPENSES
Management fees (3) 6,153,990 1,491,458 2,882,969 2,657,046
Custodian fees (13) 52,740 148,352 88,558 25,114
Audit fees, printing and publication expenses 34,146 6,593 12,516 13,038
Subscription tax (4) 77,703 19,496 33,447 30,131
Interest paid 0 0 0 0
Interest paid on Swaps 0 0 0 0
Other charges (5) 141,323 311,356 272,035 64,042
TOTAL EXPENSES 6,459,902 1,977,255 3,289,525 2,789,371
NET INCOME / (LOSS) FROM INVESTMENTS 2,768,149 2,343,124 2,678,464 199,747
Net realised appreciation / (depreciation)on sales of investments (2,13) 63,272,394 (3,349,250) 12,734,426 37,950,338
Net realised appreciation / (depreciation)on forward foreign exchange contracts (2,13) 4,342,650 0 0 2,284,024
Net realised appreciation / (depreciation)on financial futures contracts (2,13) 0 0 0 0
Net realised appreciation / (depreciation)on foreign exchange contracts (2,13) 5,571 (57,752) (286,118) 390
Net realised appreciation / (depreciation)on swaps 0 0 0 0 NET REALISED PROFIT / (LOSS) 70,388,764 (1,063,878) 15,126,772 40,434,499
Change in net unrealised appreciation / (depreciation) on investments (2,13) 106,802,324 (4,522,953) 42,857,708 39,949,092
Change in net unrealised appreciation / (depreciation) on forward foreign exchange contracts (2,13) 725,977 0 0 149,584
Change in net unrealised appreciation / (depreciation) on financial futures contracts (2,13) 0 0 0 0
Change in net unrealised appreciation /(depreciation) on foreign exchange contracts (2,13) 320 8,903 581 (174)
Change in net unrealised appreciation / (depreciation) on swaps (2,13) 0 0 0 0
Change in net unrealised appreciation / (depreciation) on repurchase agreements (2,11,13) 0 0 0 0
NET INCREASE / (DECREASE) IN NET
ASSETS AS A RESULT OF OPERATIONS 177,917,385 (5,577,928) 57,985,061 80,533,001
EVOLUTION OF THE CAPITAL
Dividend distribution (16) (2,283,847) (24,721) (1,839) (1,321,375)
Subscriptions of shares 326,890,127 44,656,876 141,612,618 94,537,980
Redemption of shares (223,666,947) (20,168,382) (47,050,699) (83,124,379)
Currency Translation
NET ASSETS AT THE END OF THE 752,217,119 129,033,921 261,866,152 282,873,923 YEAR / PERIOD
291
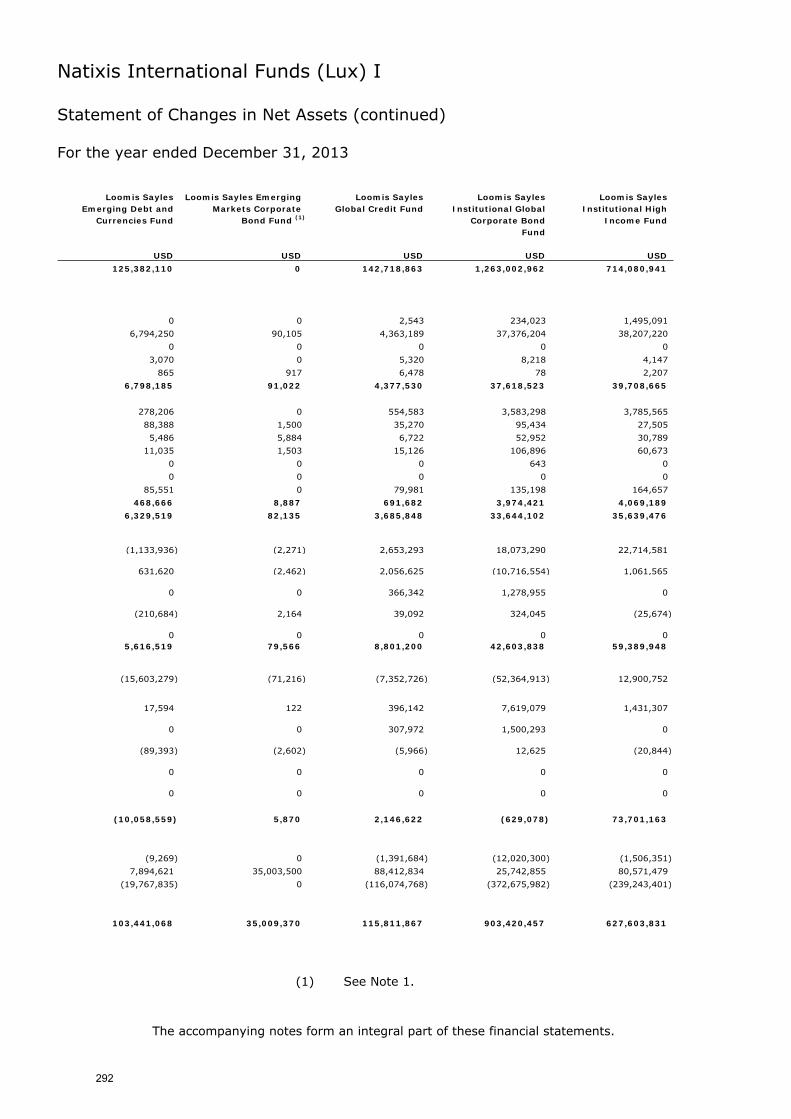
Natixis International Funds (Lux) I
Statement of Changes in Net Assets (continued) For the year ended December 31, 2013
The accompanying notes form an integral part of these financial statements.
Loomis Sayles Loomis Sayles Emerging Loomis Sayles Loomis Sayles Loomis SaylesEmerging Debt and Markets Corporate Global Credit Fund Institutional Global Institutional High
Currencies Fund Bond Fund (1) Corporate Bond Income Fund Fund
USD USD USD USD USD
125,382,110 0 142,718,863 1,263,002,962 714,080,941
0 0 2,543 234,023 1,495,091
6,794,250 90,105 4,363,189 37,376,204 38,207,220
0 0 0 0 0
3,070 0 5,320 8,218 4,147
865 917 6,478 78 2,207
6,798,185 91,022 4,377,530 37,618,523 39,708,665
278,206 0 554,583 3,583,298 3,785,565
88,388 1,500 35,270 95,434 27,505
5,486 5,884 6,722 52,952 30,789
11,035 1,503 15,126 106,896 60,673
0 0 0 643 0
0 0 0 0 0
85,551 0 79,981 135,198 164,657
468,666 8,887 691,682 3,974,421 4,069,189
6,329,519 82,135 3,685,848 33,644,102 35,639,476
(1,133,936) (2,271) 2,653,293 18,073,290 22,714,581
631,620 (2,462) 2,056,625 (10,716,554) 1,061,565
0 0 366,342 1,278,955 0
(210,684) 2,164 39,092 324,045 (25,674)
0 0 0 0 0 5,616,519 79,566 8,801,200 42,603,838 59,389,948
(15,603,279) (71,216) (7,352,726) (52,364,913) 12,900,752
17,594 122 396,142 7,619,079 1,431,307
0 0 307,972 1,500,293 0
(89,393) (2,602) (5,966) 12,625 (20,844)
0 0 0 0 0
0 0 0 0 0
(10,058,559) 5,870 2,146,622 (629,078) 73,701,163
(9,269) 0 (1,391,684) (12,020,300) (1,506,351)
7,894,621 35,003,500 88,412,834 25,742,855 80,571,479
(19,767,835) 0 (116,074,768) (372,675,982) (239,243,401)
103,441,068 35,009,370 115,811,867 903,420,457 627,603,831
(1) See Note 1.
292
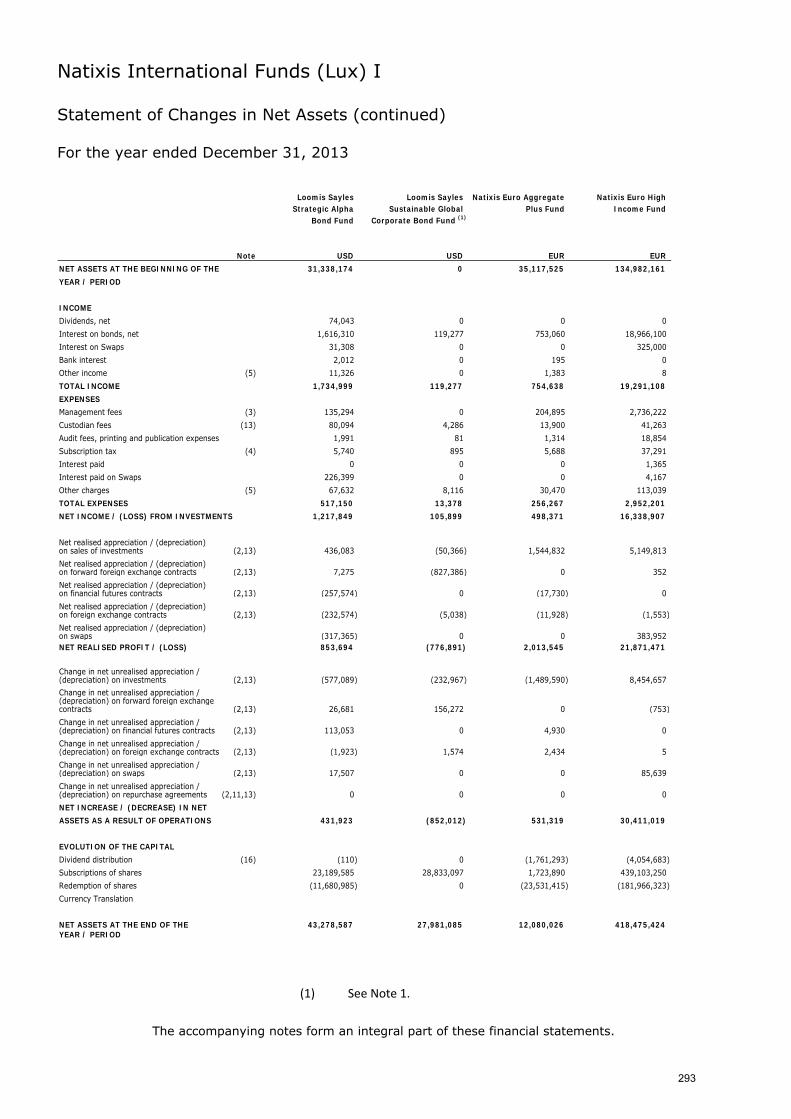
Natixis International Funds (Lux) I
Statement of Changes in Net Assets (continued) For the year ended December 31, 2013
The accompanying notes form an integral part of these financial statements.
Loomis Sayles Loomis Sayles Natixis Euro Aggregate Natixis Euro HighStrategic Alpha Sustainable Global Plus Fund Income Fund
Bond Fund Corporate Bond Fund (1)
Note USD USD EUR EUR
NET ASSETS AT THE BEGINNING OF THE 31,338,174 0 35,117,525 134,982,161
YEAR / PERIOD
INCOME
Dividends, net 74,043 0 0 0
Interest on bonds, net 1,616,310 119,277 753,060 18,966,100
Interest on Swaps 31,308 0 0 325,000
Bank interest 2,012 0 195 0
Other income (5) 11,326 0 1,383 8
TOTAL INCOME 1,734,999 119,277 754,638 19,291,108
EXPENSES
Management fees (3) 135,294 0 204,895 2,736,222
Custodian fees (13) 80,094 4,286 13,900 41,263
Audit fees, printing and publication expenses 1,991 81 1,314 18,854
Subscription tax (4) 5,740 895 5,688 37,291
Interest paid 0 0 0 1,365
Interest paid on Swaps 226,399 0 0 4,167
Other charges (5) 67,632 8,116 30,470 113,039
TOTAL EXPENSES 517,150 13,378 256,267 2,952,201
NET INCOME / (LOSS) FROM INVESTMENTS 1,217,849 105,899 498,371 16,338,907
Net realised appreciation / (depreciation)on sales of investments (2,13) 436,083 (50,366) 1,544,832 5,149,813
Net realised appreciation / (depreciation)on forward foreign exchange contracts (2,13) 7,275 (827,386) 0 352
Net realised appreciation / (depreciation)on financial futures contracts (2,13) (257,574) 0 (17,730) 0
Net realised appreciation / (depreciation)on foreign exchange contracts (2,13) (232,574) (5,038) (11,928) (1,553)
Net realised appreciation / (depreciation)on swaps (317,365) 0 0 383,952 NET REALISED PROFIT / (LOSS) 853,694 (776,891) 2,013,545 21,871,471
Change in net unrealised appreciation / (depreciation) on investments (2,13) (577,089) (232,967) (1,489,590) 8,454,657
Change in net unrealised appreciation / (depreciation) on forward foreign exchange contracts (2,13) 26,681 156,272 0 (753)
Change in net unrealised appreciation / (depreciation) on financial futures contracts (2,13) 113,053 0 4,930 0
Change in net unrealised appreciation /(depreciation) on foreign exchange contracts (2,13) (1,923) 1,574 2,434 5
Change in net unrealised appreciation / (depreciation) on swaps (2,13) 17,507 0 0 85,639
Change in net unrealised appreciation / (depreciation) on repurchase agreements (2,11,13) 0 0 0 0
NET INCREASE / (DECREASE) IN NET
ASSETS AS A RESULT OF OPERATIONS 431,923 (852,012) 531,319 30,411,019
EVOLUTION OF THE CAPITAL
Dividend distribution (16) (110) 0 (1,761,293) (4,054,683)
Subscriptions of shares 23,189,585 28,833,097 1,723,890 439,103,250
Redemption of shares (11,680,985) 0 (23,531,415) (181,966,323)
Currency Translation
NET ASSETS AT THE END OF THE 43,278,587 27,981,085 12,080,026 418,475,424 YEAR / PERIOD
(1) See Note 1.
293
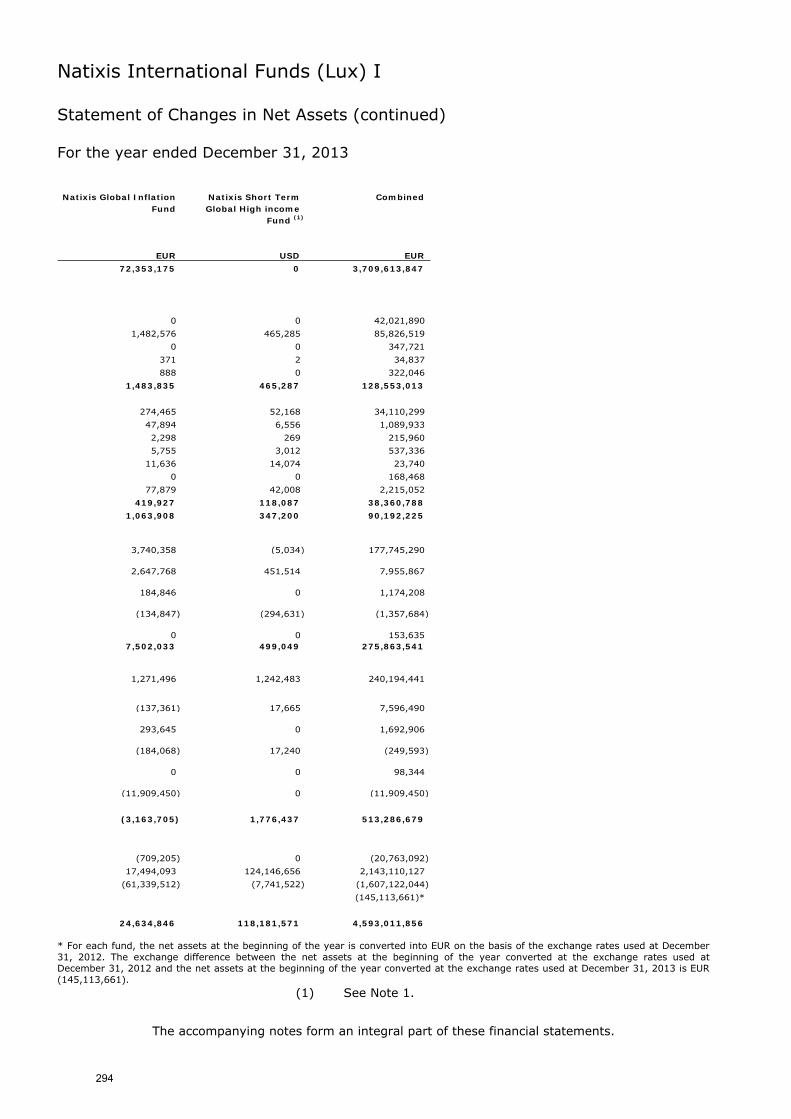
Natixis International Funds (Lux) I
Statement of Changes in Net Assets (continued) For the year ended December 31, 2013
The accompanying notes form an integral part of these financial statements.
Natixis Global Inflation Natixis Short Term CombinedFund Global High income
Fund (1)
EUR USD EUR
72,353,175 0 3,709,613,847
0 0 42,021,890
1,482,576 465,285 85,826,519
0 0 347,721
371 2 34,837
888 0 322,046
1,483,835 465,287 128,553,013
274,465 52,168 34,110,299
47,894 6,556 1,089,933
2,298 269 215,960
5,755 3,012 537,336
11,636 14,074 23,740
0 0 168,468
77,879 42,008 2,215,052
419,927 118,087 38,360,788
1,063,908 347,200 90,192,225
3,740,358 (5,034) 177,745,290
2,647,768 451,514 7,955,867
184,846 0 1,174,208
(134,847) (294,631) (1,357,684)
0 0 153,635 7,502,033 499,049 275,863,541
1,271,496 1,242,483 240,194,441
(137,361) 17,665 7,596,490
293,645 0 1,692,906
(184,068) 17,240 (249,593)
0 0 98,344
(11,909,450) 0 (11,909,450)
(3,163,705) 1,776,437 513,286,679
(709,205) 0 (20,763,092)
17,494,093 124,146,656 2,143,110,127
(61,339,512) (7,741,522) (1,607,122,044)
(145,113,661)*
24,634,846 118,181,571 4,593,011,856 * For each fund, the net assets at the beginning of the year is converted into EUR on the basis of the exchange rates used at December 31, 2012. The exchange difference between the net assets at the beginning of the year converted at the exchange rates used at December 31, 2012 and the net assets at the beginning of the year converted at the exchange rates used at December 31, 2013 is EUR (145,113,661).
(1) See Note 1.
294
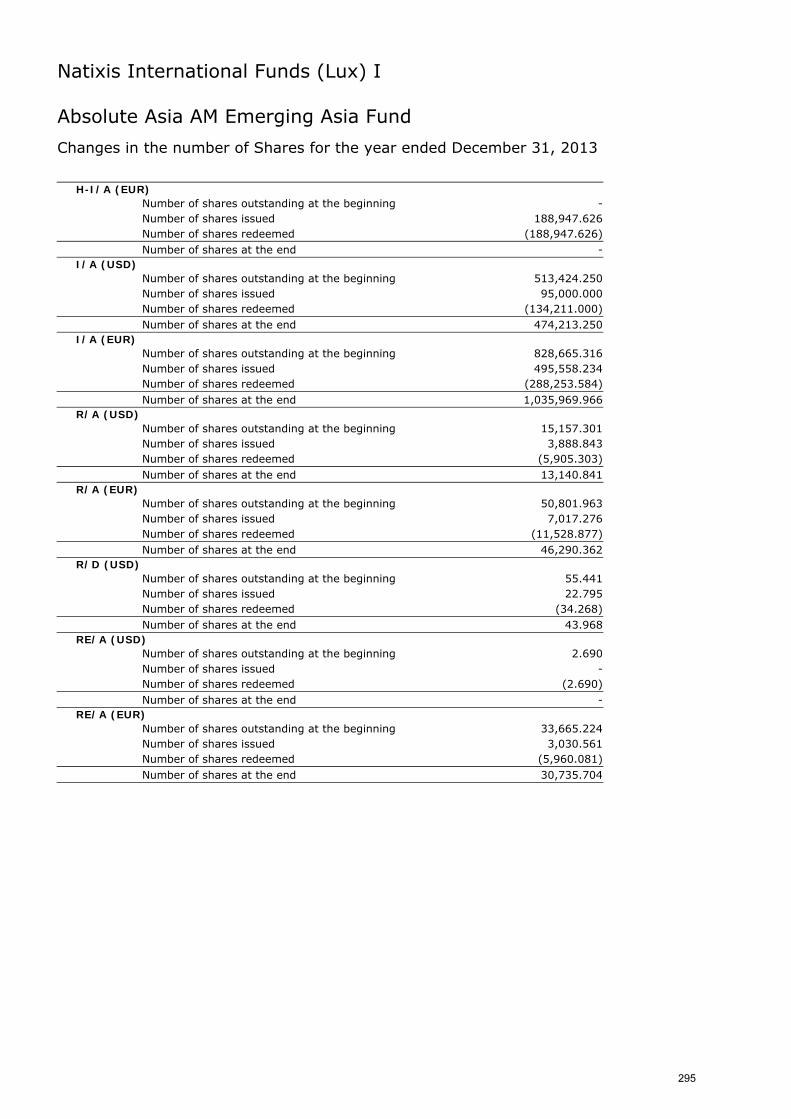
Natixis International Funds (Lux) I
Absolute Asia AM Emerging Asia Fund
Changes in the number of Shares for the year ended December 31, 2013
H-I/A (EUR) Number of shares outstanding at the beginning - Number of shares issued 188,947.626
Number of shares redeemed (188,947.626) Number of shares at the end -
I/A (USD) Number of shares outstanding at the beginning 513,424.250
Number of shares issued 95,000.000
Number of shares redeemed (134,211.000) Number of shares at the end 474,213.250
I/A (EUR) Number of shares outstanding at the beginning 828,665.316
Number of shares issued 495,558.234
Number of shares redeemed (288,253.584) Number of shares at the end 1,035,969.966
R/A (USD) Number of shares outstanding at the beginning 15,157.301
Number of shares issued 3,888.843
Number of shares redeemed (5,905.303) Number of shares at the end 13,140.841
R/A (EUR) Number of shares outstanding at the beginning 50,801.963
Number of shares issued 7,017.276
Number of shares redeemed (11,528.877) Number of shares at the end 46,290.362
R/D (USD) Number of shares outstanding at the beginning 55.441
Number of shares issued 22.795
Number of shares redeemed (34.268) Number of shares at the end 43.968
RE/A (USD) Number of shares outstanding at the beginning 2.690
Number of shares issued - Number of shares redeemed (2.690) Number of shares at the end -
RE/A (EUR) Number of shares outstanding at the beginning 33,665.224
Number of shares issued 3,030.561
Number of shares redeemed (5,960.081) Number of shares at the end 30,735.704
295
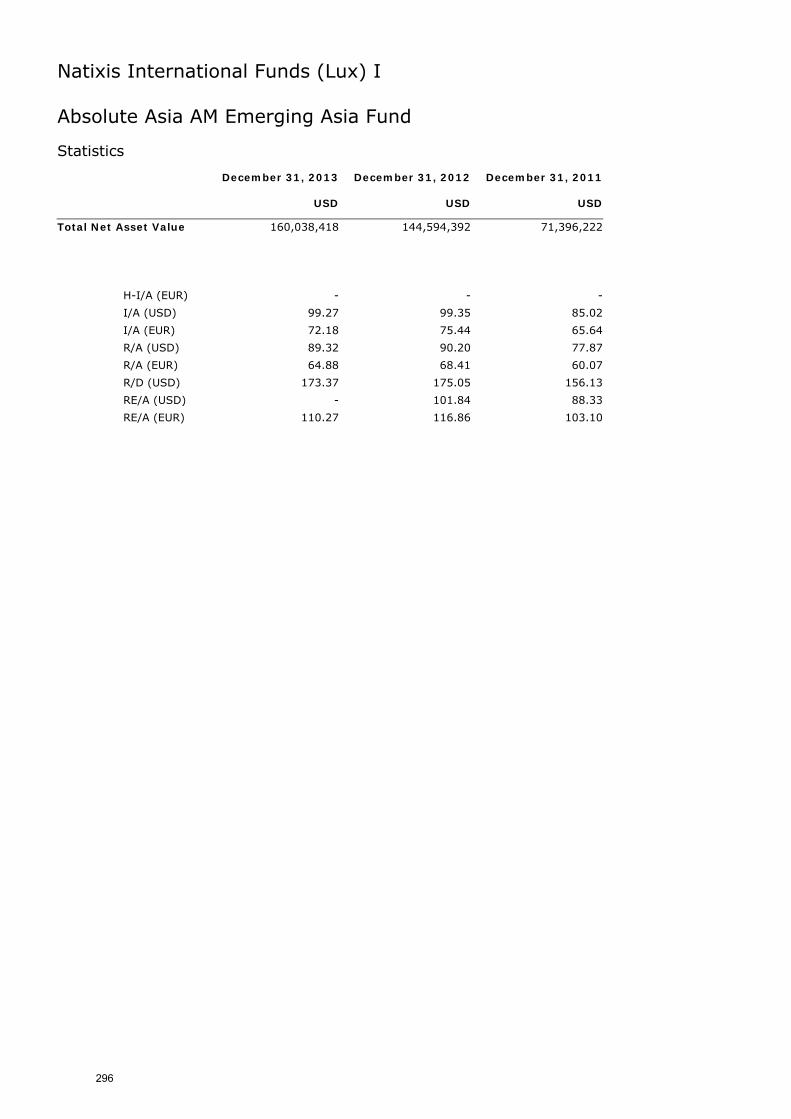
Natixis International Funds (Lux) I
Absolute Asia AM Emerging Asia Fund Statistics December 31, 2013 December 31, 2012 December 31, 2011 USD USD USD
Total Net Asset Value 160,038,418 144,594,392 71,396,222
H-I/A (EUR) - - -
I/A (USD) 99.27 99.35 85.02
I/A (EUR) 72.18 75.44 65.64
R/A (USD) 89.32 90.20 77.87
R/A (EUR) 64.88 68.41 60.07
R/D (USD) 173.37 175.05 156.13
RE/A (USD) - 101.84 88.33
RE/A (EUR) 110.27 116.86 103.10
296
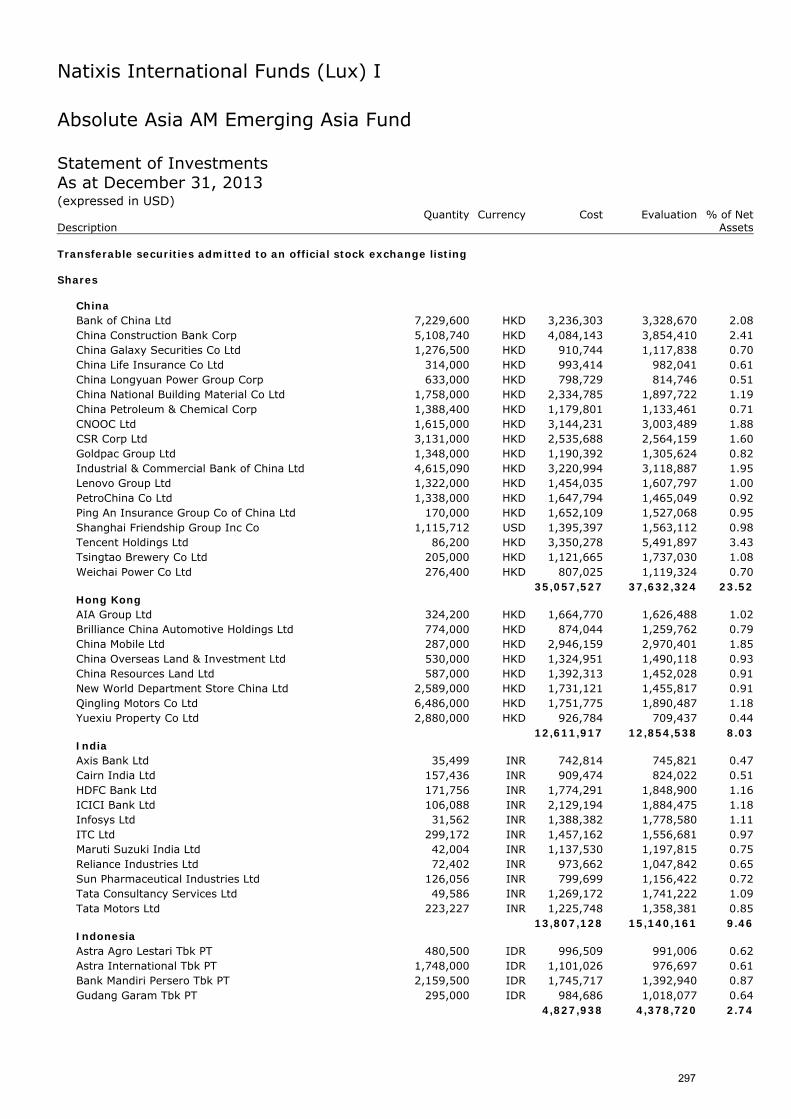
Natixis International Funds (Lux) I
Absolute Asia AM Emerging Asia Fund Statement of Investments As at December 31, 2013 (expressed in USD) Quantity Currency Cost Evaluation % of Net Description Assets Transferable securities admitted to an official stock exchange listing Shares
China Bank of China Ltd 7,229,600 HKD 3,236,303 3,328,670 2.08 China Construction Bank Corp 5,108,740 HKD 4,084,143 3,854,410 2.41 China Galaxy Securities Co Ltd 1,276,500 HKD 910,744 1,117,838 0.70 China Life Insurance Co Ltd 314,000 HKD 993,414 982,041 0.61 China Longyuan Power Group Corp 633,000 HKD 798,729 814,746 0.51 China National Building Material Co Ltd 1,758,000 HKD 2,334,785 1,897,722 1.19 China Petroleum & Chemical Corp 1,388,400 HKD 1,179,801 1,133,461 0.71 CNOOC Ltd 1,615,000 HKD 3,144,231 3,003,489 1.88 CSR Corp Ltd 3,131,000 HKD 2,535,688 2,564,159 1.60 Goldpac Group Ltd 1,348,000 HKD 1,190,392 1,305,624 0.82 Industrial & Commercial Bank of China Ltd 4,615,090 HKD 3,220,994 3,118,887 1.95 Lenovo Group Ltd 1,322,000 HKD 1,454,035 1,607,797 1.00 PetroChina Co Ltd 1,338,000 HKD 1,647,794 1,465,049 0.92 Ping An Insurance Group Co of China Ltd 170,000 HKD 1,652,109 1,527,068 0.95 Shanghai Friendship Group Inc Co 1,115,712 USD 1,395,397 1,563,112 0.98 Tencent Holdings Ltd 86,200 HKD 3,350,278 5,491,897 3.43 Tsingtao Brewery Co Ltd 205,000 HKD 1,121,665 1,737,030 1.08 Weichai Power Co Ltd 276,400 HKD 807,025 1,119,324 0.70
35,057,527 37,632,324 23.52 Hong Kong AIA Group Ltd 324,200 HKD 1,664,770 1,626,488 1.02 Brilliance China Automotive Holdings Ltd 774,000 HKD 874,044 1,259,762 0.79 China Mobile Ltd 287,000 HKD 2,946,159 2,970,401 1.85 China Overseas Land & Investment Ltd 530,000 HKD 1,324,951 1,490,118 0.93 China Resources Land Ltd 587,000 HKD 1,392,313 1,452,028 0.91 New World Department Store China Ltd 2,589,000 HKD 1,731,121 1,455,817 0.91 Qingling Motors Co Ltd 6,486,000 HKD 1,751,775 1,890,487 1.18 Yuexiu Property Co Ltd 2,880,000 HKD 926,784 709,437 0.44
12,611,917 12,854,538 8.03 India Axis Bank Ltd 35,499 INR 742,814 745,821 0.47 Cairn India Ltd 157,436 INR 909,474 824,022 0.51 HDFC Bank Ltd 171,756 INR 1,774,291 1,848,900 1.16 ICICI Bank Ltd 106,088 INR 2,129,194 1,884,475 1.18 Infosys Ltd 31,562 INR 1,388,382 1,778,580 1.11 ITC Ltd 299,172 INR 1,457,162 1,556,681 0.97 Maruti Suzuki India Ltd 42,004 INR 1,137,530 1,197,815 0.75 Reliance Industries Ltd 72,402 INR 973,662 1,047,842 0.65 Sun Pharmaceutical Industries Ltd 126,056 INR 799,699 1,156,422 0.72 Tata Consultancy Services Ltd 49,586 INR 1,269,172 1,741,222 1.09 Tata Motors Ltd 223,227 INR 1,225,748 1,358,381 0.85
13,807,128 15,140,161 9.46 Indonesia Astra Agro Lestari Tbk PT 480,500 IDR 996,509 991,006 0.62 Astra International Tbk PT 1,748,000 IDR 1,101,026 976,697 0.61 Bank Mandiri Persero Tbk PT 2,159,500 IDR 1,745,717 1,392,940 0.87 Gudang Garam Tbk PT 295,000 IDR 984,686 1,018,077 0.64
4,827,938 4,378,720 2.74
297
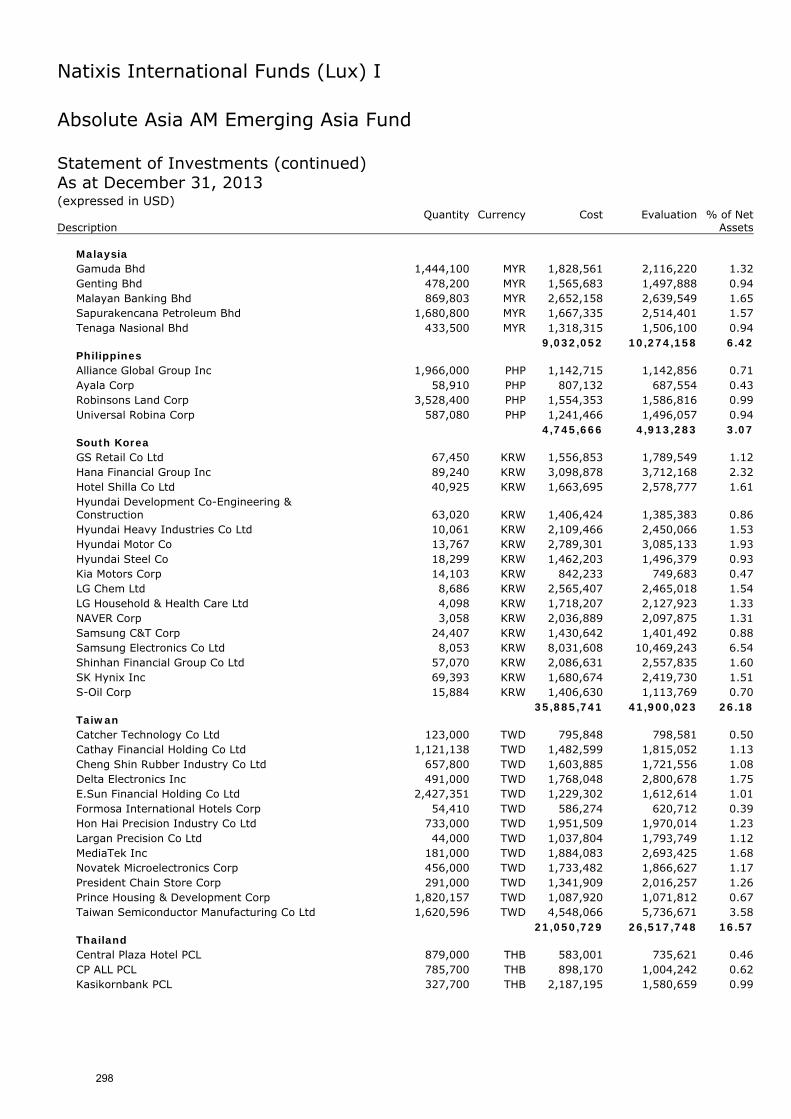
Natixis International Funds (Lux) I
Absolute Asia AM Emerging Asia Fund Statement of Investments (continued) As at December 31, 2013 (expressed in USD) Quantity Currency Cost Evaluation % of Net Description Assets
Malaysia Gamuda Bhd 1,444,100 MYR 1,828,561 2,116,220 1.32 Genting Bhd 478,200 MYR 1,565,683 1,497,888 0.94 Malayan Banking Bhd 869,803 MYR 2,652,158 2,639,549 1.65 Sapurakencana Petroleum Bhd 1,680,800 MYR 1,667,335 2,514,401 1.57 Tenaga Nasional Bhd 433,500 MYR 1,318,315 1,506,100 0.94
9,032,052 10,274,158 6.42 Philippines Alliance Global Group Inc 1,966,000 PHP 1,142,715 1,142,856 0.71 Ayala Corp 58,910 PHP 807,132 687,554 0.43 Robinsons Land Corp 3,528,400 PHP 1,554,353 1,586,816 0.99 Universal Robina Corp 587,080 PHP 1,241,466 1,496,057 0.94
4,745,666 4,913,283 3.07 South Korea GS Retail Co Ltd 67,450 KRW 1,556,853 1,789,549 1.12 Hana Financial Group Inc 89,240 KRW 3,098,878 3,712,168 2.32 Hotel Shilla Co Ltd 40,925 KRW 1,663,695 2,578,777 1.61 Hyundai Development Co-Engineering & Construction 63,020 KRW 1,406,424 1,385,383 0.86 Hyundai Heavy Industries Co Ltd 10,061 KRW 2,109,466 2,450,066 1.53 Hyundai Motor Co 13,767 KRW 2,789,301 3,085,133 1.93 Hyundai Steel Co 18,299 KRW 1,462,203 1,496,379 0.93 Kia Motors Corp 14,103 KRW 842,233 749,683 0.47 LG Chem Ltd 8,686 KRW 2,565,407 2,465,018 1.54 LG Household & Health Care Ltd 4,098 KRW 1,718,207 2,127,923 1.33 NAVER Corp 3,058 KRW 2,036,889 2,097,875 1.31 Samsung C&T Corp 24,407 KRW 1,430,642 1,401,492 0.88 Samsung Electronics Co Ltd 8,053 KRW 8,031,608 10,469,243 6.54 Shinhan Financial Group Co Ltd 57,070 KRW 2,086,631 2,557,835 1.60 SK Hynix Inc 69,393 KRW 1,680,674 2,419,730 1.51 S-Oil Corp 15,884 KRW 1,406,630 1,113,769 0.70
35,885,741 41,900,023 26.18 Taiwan Catcher Technology Co Ltd 123,000 TWD 795,848 798,581 0.50 Cathay Financial Holding Co Ltd 1,121,138 TWD 1,482,599 1,815,052 1.13 Cheng Shin Rubber Industry Co Ltd 657,800 TWD 1,603,885 1,721,556 1.08 Delta Electronics Inc 491,000 TWD 1,768,048 2,800,678 1.75 E.Sun Financial Holding Co Ltd 2,427,351 TWD 1,229,302 1,612,614 1.01 Formosa International Hotels Corp 54,410 TWD 586,274 620,712 0.39 Hon Hai Precision Industry Co Ltd 733,000 TWD 1,951,509 1,970,014 1.23 Largan Precision Co Ltd 44,000 TWD 1,037,804 1,793,749 1.12 MediaTek Inc 181,000 TWD 1,884,083 2,693,425 1.68 Novatek Microelectronics Corp 456,000 TWD 1,733,482 1,866,627 1.17 President Chain Store Corp 291,000 TWD 1,341,909 2,016,257 1.26 Prince Housing & Development Corp 1,820,157 TWD 1,087,920 1,071,812 0.67 Taiwan Semiconductor Manufacturing Co Ltd 1,620,596 TWD 4,548,066 5,736,671 3.58
21,050,729 26,517,748 16.57 Thailand Central Plaza Hotel PCL 879,000 THB 583,001 735,621 0.46 CP ALL PCL 785,700 THB 898,170 1,004,242 0.62 Kasikornbank PCL 327,700 THB 2,187,195 1,580,659 0.99
298
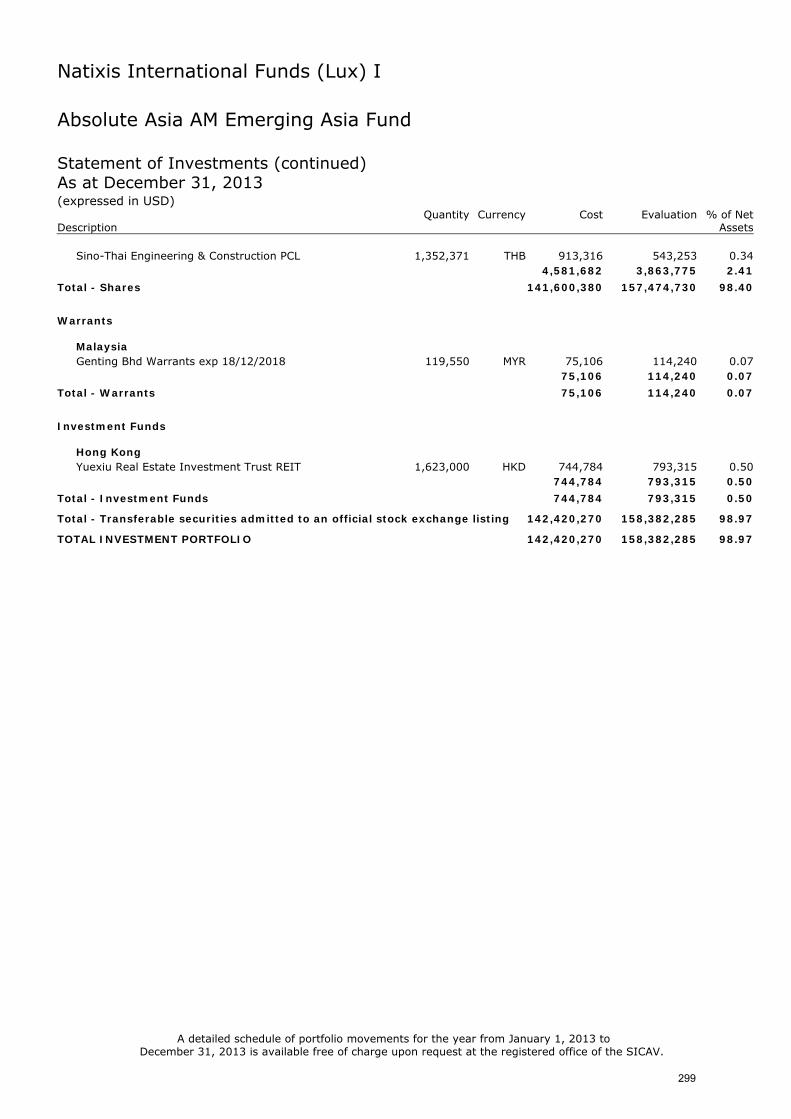
Natixis International Funds (Lux) I
Absolute Asia AM Emerging Asia Fund Statement of Investments (continued) As at December 31, 2013 (expressed in USD) Quantity Currency Cost Evaluation % of Net Description Assets
Sino-Thai Engineering & Construction PCL 1,352,371 THB 913,316 543,253 0.34 4,581,682 3,863,775 2.41
Total - Shares 141,600,380 157,474,730 98.40
Warrants
Malaysia Genting Bhd Warrants exp 18/12/2018 119,550 MYR 75,106 114,240 0.07
75,106 114,240 0.07
Total - Warrants 75,106 114,240 0.07
Investment Funds
Hong Kong Yuexiu Real Estate Investment Trust REIT 1,623,000 HKD 744,784 793,315 0.50
744,784 793,315 0.50
Total - Investment Funds 744,784 793,315 0.50
Total - Transferable securities admitted to an official stock exchange listing 142,420,270 158,382,285 98.97
TOTAL INVESTMENT PORTFOLIO 142,420,270 158,382,285 98.97 A detailed schedule of portfolio movements for the year from January 1, 2013 to
December 31, 2013 is available free of charge upon request at the registered office of the SICAV.
299
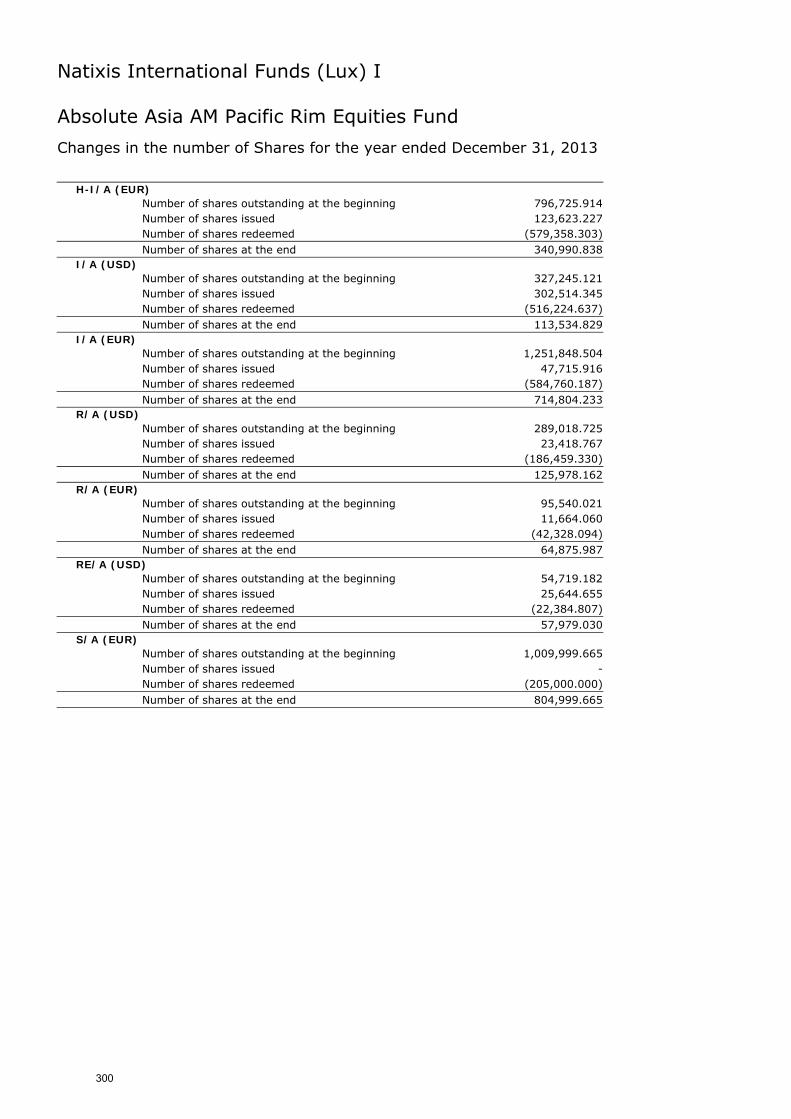
Natixis International Funds (Lux) I
Absolute Asia AM Pacific Rim Equities Fund
Changes in the number of Shares for the year ended December 31, 2013
H-I/A (EUR) Number of shares outstanding at the beginning 796,725.914
Number of shares issued 123,623.227
Number of shares redeemed (579,358.303) Number of shares at the end 340,990.838
I/A (USD) Number of shares outstanding at the beginning 327,245.121
Number of shares issued 302,514.345
Number of shares redeemed (516,224.637) Number of shares at the end 113,534.829
I/A (EUR) Number of shares outstanding at the beginning 1,251,848.504
Number of shares issued 47,715.916
Number of shares redeemed (584,760.187) Number of shares at the end 714,804.233
R/A (USD) Number of shares outstanding at the beginning 289,018.725
Number of shares issued 23,418.767
Number of shares redeemed (186,459.330) Number of shares at the end 125,978.162
R/A (EUR) Number of shares outstanding at the beginning 95,540.021
Number of shares issued 11,664.060
Number of shares redeemed (42,328.094) Number of shares at the end 64,875.987
RE/A (USD) Number of shares outstanding at the beginning 54,719.182
Number of shares issued 25,644.655
Number of shares redeemed (22,384.807) Number of shares at the end 57,979.030
S/A (EUR) Number of shares outstanding at the beginning 1,009,999.665
Number of shares issued - Number of shares redeemed (205,000.000) Number of shares at the end 804,999.665
300
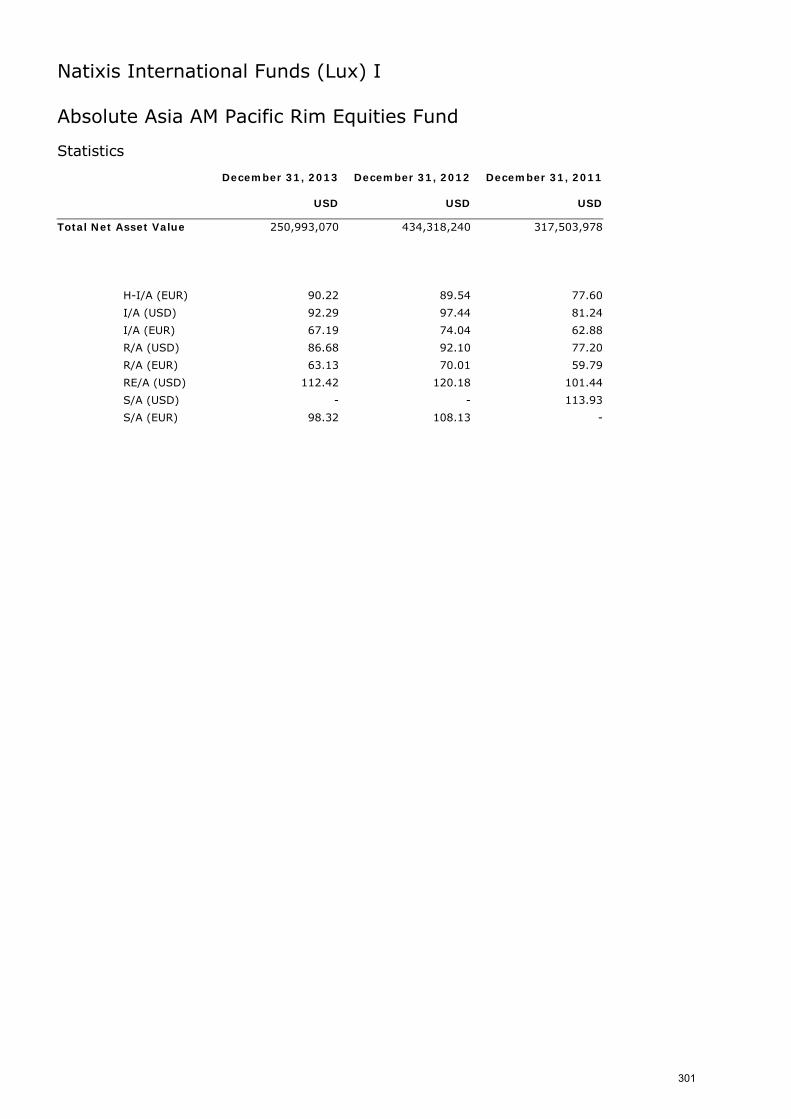
Natixis International Funds (Lux) I
Absolute Asia AM Pacific Rim Equities Fund Statistics December 31, 2013 December 31, 2012 December 31, 2011 USD USD USD
Total Net Asset Value 250,993,070 434,318,240 317,503,978
H-I/A (EUR) 90.22 89.54 77.60
I/A (USD) 92.29 97.44 81.24
I/A (EUR) 67.19 74.04 62.88
R/A (USD) 86.68 92.10 77.20
R/A (EUR) 63.13 70.01 59.79
RE/A (USD) 112.42 120.18 101.44
S/A (USD) - - 113.93
S/A (EUR) 98.32 108.13 -
301
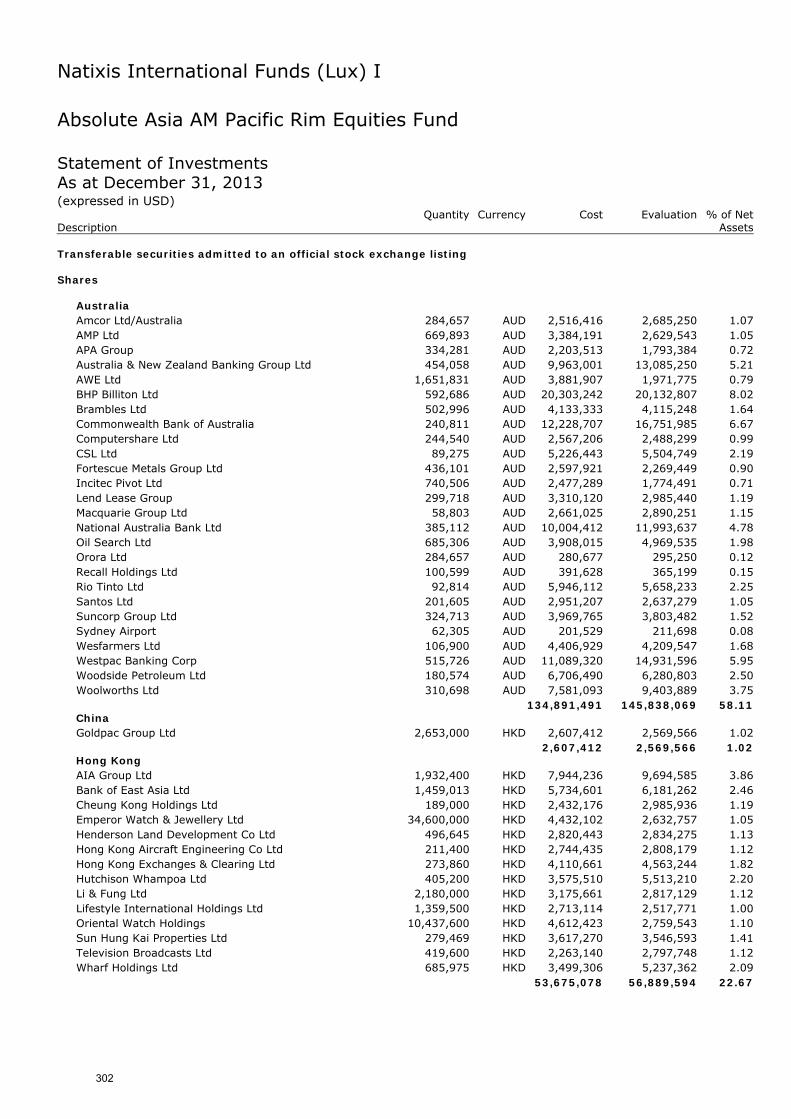
Natixis International Funds (Lux) I
Absolute Asia AM Pacific Rim Equities Fund Statement of Investments As at December 31, 2013 (expressed in USD) Quantity Currency Cost Evaluation % of Net Description Assets Transferable securities admitted to an official stock exchange listing Shares
Australia Amcor Ltd/Australia 284,657 AUD 2,516,416 2,685,250 1.07 AMP Ltd 669,893 AUD 3,384,191 2,629,543 1.05 APA Group 334,281 AUD 2,203,513 1,793,384 0.72 Australia & New Zealand Banking Group Ltd 454,058 AUD 9,963,001 13,085,250 5.21 AWE Ltd 1,651,831 AUD 3,881,907 1,971,775 0.79 BHP Billiton Ltd 592,686 AUD 20,303,242 20,132,807 8.02 Brambles Ltd 502,996 AUD 4,133,333 4,115,248 1.64 Commonwealth Bank of Australia 240,811 AUD 12,228,707 16,751,985 6.67 Computershare Ltd 244,540 AUD 2,567,206 2,488,299 0.99 CSL Ltd 89,275 AUD 5,226,443 5,504,749 2.19 Fortescue Metals Group Ltd 436,101 AUD 2,597,921 2,269,449 0.90 Incitec Pivot Ltd 740,506 AUD 2,477,289 1,774,491 0.71 Lend Lease Group 299,718 AUD 3,310,120 2,985,440 1.19 Macquarie Group Ltd 58,803 AUD 2,661,025 2,890,251 1.15 National Australia Bank Ltd 385,112 AUD 10,004,412 11,993,637 4.78 Oil Search Ltd 685,306 AUD 3,908,015 4,969,535 1.98 Orora Ltd 284,657 AUD 280,677 295,250 0.12 Recall Holdings Ltd 100,599 AUD 391,628 365,199 0.15 Rio Tinto Ltd 92,814 AUD 5,946,112 5,658,233 2.25 Santos Ltd 201,605 AUD 2,951,207 2,637,279 1.05 Suncorp Group Ltd 324,713 AUD 3,969,765 3,803,482 1.52 Sydney Airport 62,305 AUD 201,529 211,698 0.08 Wesfarmers Ltd 106,900 AUD 4,406,929 4,209,547 1.68 Westpac Banking Corp 515,726 AUD 11,089,320 14,931,596 5.95 Woodside Petroleum Ltd 180,574 AUD 6,706,490 6,280,803 2.50 Woolworths Ltd 310,698 AUD 7,581,093 9,403,889 3.75
134,891,491 145,838,069 58.11 China Goldpac Group Ltd 2,653,000 HKD 2,607,412 2,569,566 1.02
2,607,412 2,569,566 1.02 Hong Kong AIA Group Ltd 1,932,400 HKD 7,944,236 9,694,585 3.86 Bank of East Asia Ltd 1,459,013 HKD 5,734,601 6,181,262 2.46 Cheung Kong Holdings Ltd 189,000 HKD 2,432,176 2,985,936 1.19 Emperor Watch & Jewellery Ltd 34,600,000 HKD 4,432,102 2,632,757 1.05 Henderson Land Development Co Ltd 496,645 HKD 2,820,443 2,834,275 1.13 Hong Kong Aircraft Engineering Co Ltd 211,400 HKD 2,744,435 2,808,179 1.12 Hong Kong Exchanges & Clearing Ltd 273,860 HKD 4,110,661 4,563,244 1.82 Hutchison Whampoa Ltd 405,200 HKD 3,575,510 5,513,210 2.20 Li & Fung Ltd 2,180,000 HKD 3,175,661 2,817,129 1.12 Lifestyle International Holdings Ltd 1,359,500 HKD 2,713,114 2,517,771 1.00 Oriental Watch Holdings 10,437,600 HKD 4,612,423 2,759,543 1.10 Sun Hung Kai Properties Ltd 279,469 HKD 3,617,270 3,546,593 1.41 Television Broadcasts Ltd 419,600 HKD 2,263,140 2,797,748 1.12 Wharf Holdings Ltd 685,975 HKD 3,499,306 5,237,362 2.09
53,675,078 56,889,594 22.67
302
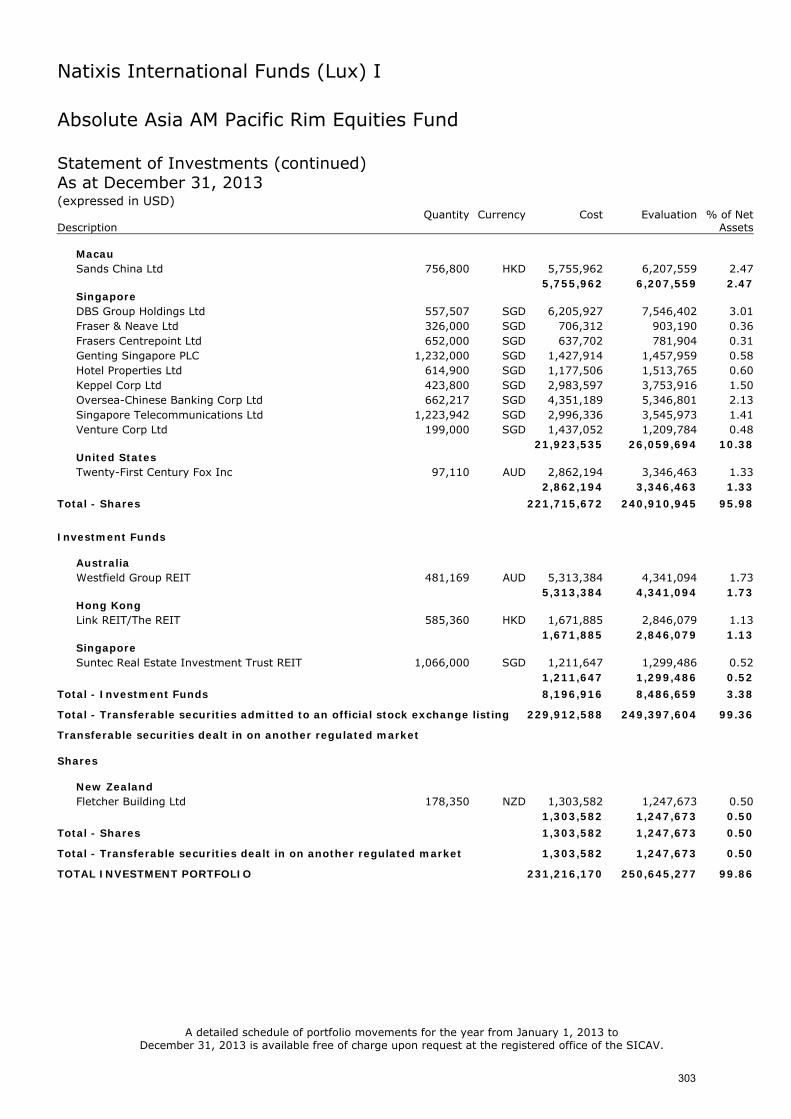
Natixis International Funds (Lux) I
Absolute Asia AM Pacific Rim Equities Fund Statement of Investments (continued) As at December 31, 2013 (expressed in USD) Quantity Currency Cost Evaluation % of Net Description Assets
Macau Sands China Ltd 756,800 HKD 5,755,962 6,207,559 2.47
5,755,962 6,207,559 2.47 Singapore DBS Group Holdings Ltd 557,507 SGD 6,205,927 7,546,402 3.01 Fraser & Neave Ltd 326,000 SGD 706,312 903,190 0.36 Frasers Centrepoint Ltd 652,000 SGD 637,702 781,904 0.31 Genting Singapore PLC 1,232,000 SGD 1,427,914 1,457,959 0.58 Hotel Properties Ltd 614,900 SGD 1,177,506 1,513,765 0.60 Keppel Corp Ltd 423,800 SGD 2,983,597 3,753,916 1.50 Oversea-Chinese Banking Corp Ltd 662,217 SGD 4,351,189 5,346,801 2.13 Singapore Telecommunications Ltd 1,223,942 SGD 2,996,336 3,545,973 1.41 Venture Corp Ltd 199,000 SGD 1,437,052 1,209,784 0.48
21,923,535 26,059,694 10.38 United States Twenty-First Century Fox Inc 97,110 AUD 2,862,194 3,346,463 1.33
2,862,194 3,346,463 1.33
Total - Shares 221,715,672 240,910,945 95.98
Investment Funds
Australia Westfield Group REIT 481,169 AUD 5,313,384 4,341,094 1.73
5,313,384 4,341,094 1.73 Hong Kong Link REIT/The REIT 585,360 HKD 1,671,885 2,846,079 1.13
1,671,885 2,846,079 1.13 Singapore Suntec Real Estate Investment Trust REIT 1,066,000 SGD 1,211,647 1,299,486 0.52
1,211,647 1,299,486 0.52
Total - Investment Funds 8,196,916 8,486,659 3.38
Total - Transferable securities admitted to an official stock exchange listing 229,912,588 249,397,604 99.36
Transferable securities dealt in on another regulated market Shares
New Zealand Fletcher Building Ltd 178,350 NZD 1,303,582 1,247,673 0.50
1,303,582 1,247,673 0.50
Total - Shares 1,303,582 1,247,673 0.50
Total - Transferable securities dealt in on another regulated market 1,303,582 1,247,673 0.50
TOTAL INVESTMENT PORTFOLIO 231,216,170 250,645,277 99.86
A detailed schedule of portfolio movements for the year from January 1, 2013 to December 31, 2013 is available free of charge upon request at the registered office of the SICAV.
303
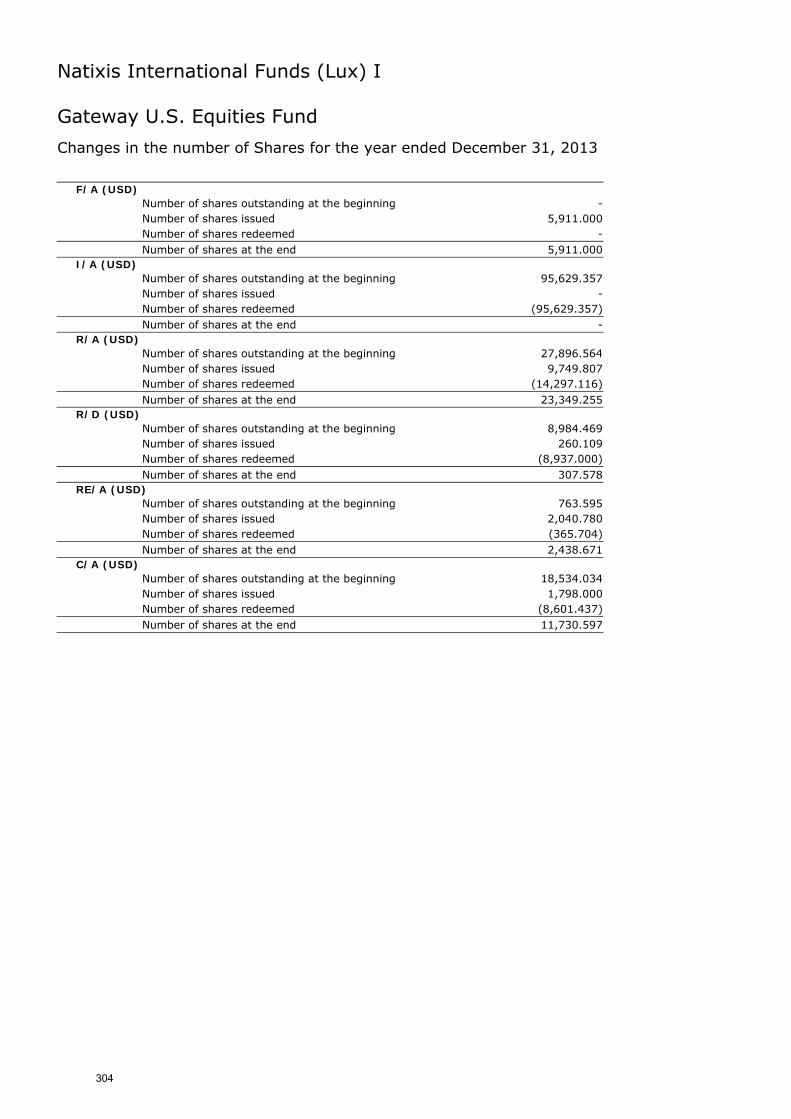
Natixis International Funds (Lux) I
Gateway U.S. Equities Fund
Changes in the number of Shares for the year ended December 31, 2013
F/A (USD) Number of shares outstanding at the beginning - Number of shares issued 5,911.000
Number of shares redeemed - Number of shares at the end 5,911.000
I/A (USD) Number of shares outstanding at the beginning 95,629.357
Number of shares issued - Number of shares redeemed (95,629.357) Number of shares at the end -
R/A (USD) Number of shares outstanding at the beginning 27,896.564
Number of shares issued 9,749.807
Number of shares redeemed (14,297.116) Number of shares at the end 23,349.255
R/D (USD) Number of shares outstanding at the beginning 8,984.469
Number of shares issued 260.109
Number of shares redeemed (8,937.000) Number of shares at the end 307.578
RE/A (USD) Number of shares outstanding at the beginning 763.595
Number of shares issued 2,040.780
Number of shares redeemed (365.704) Number of shares at the end 2,438.671
C/A (USD) Number of shares outstanding at the beginning 18,534.034
Number of shares issued 1,798.000
Number of shares redeemed (8,601.437) Number of shares at the end 11,730.597
304
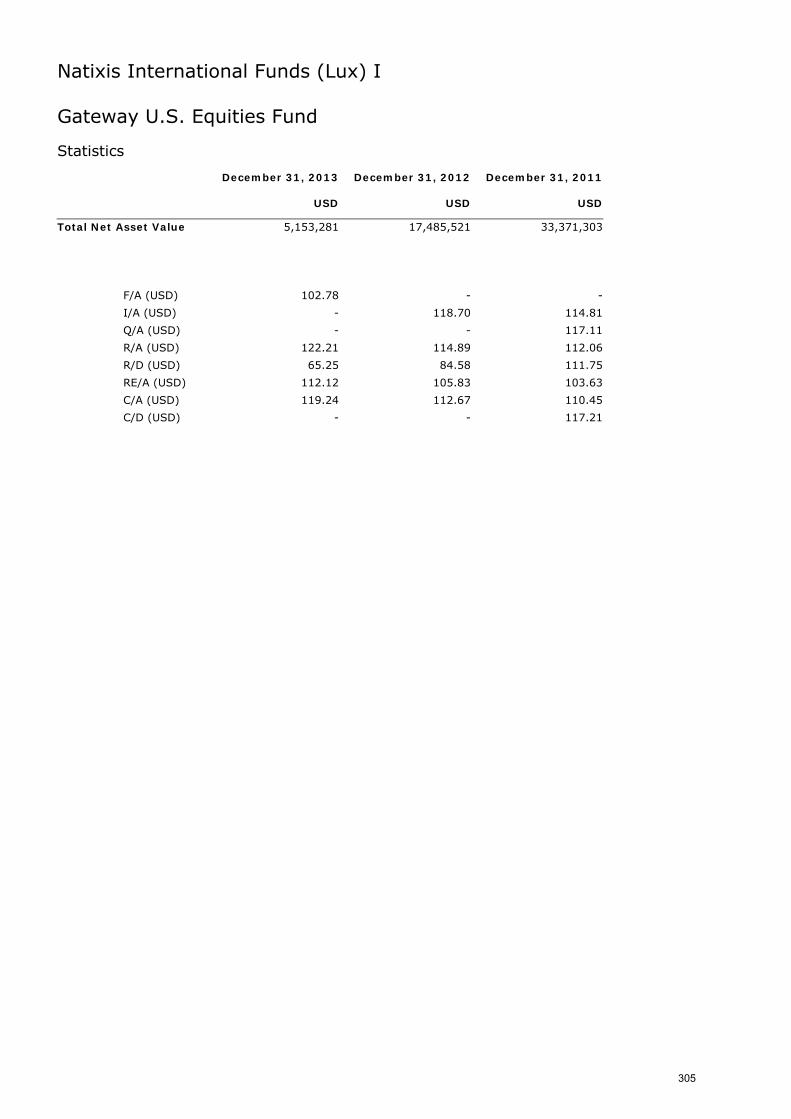
Natixis International Funds (Lux) I
Gateway U.S. Equities Fund Statistics December 31, 2013 December 31, 2012 December 31, 2011 USD USD USD
Total Net Asset Value 5,153,281 17,485,521 33,371,303
F/A (USD) 102.78 - -
I/A (USD) - 118.70 114.81
Q/A (USD) - - 117.11
R/A (USD) 122.21 114.89 112.06
R/D (USD) 65.25 84.58 111.75
RE/A (USD) 112.12 105.83 103.63
C/A (USD) 119.24 112.67 110.45
C/D (USD) - - 117.21
305
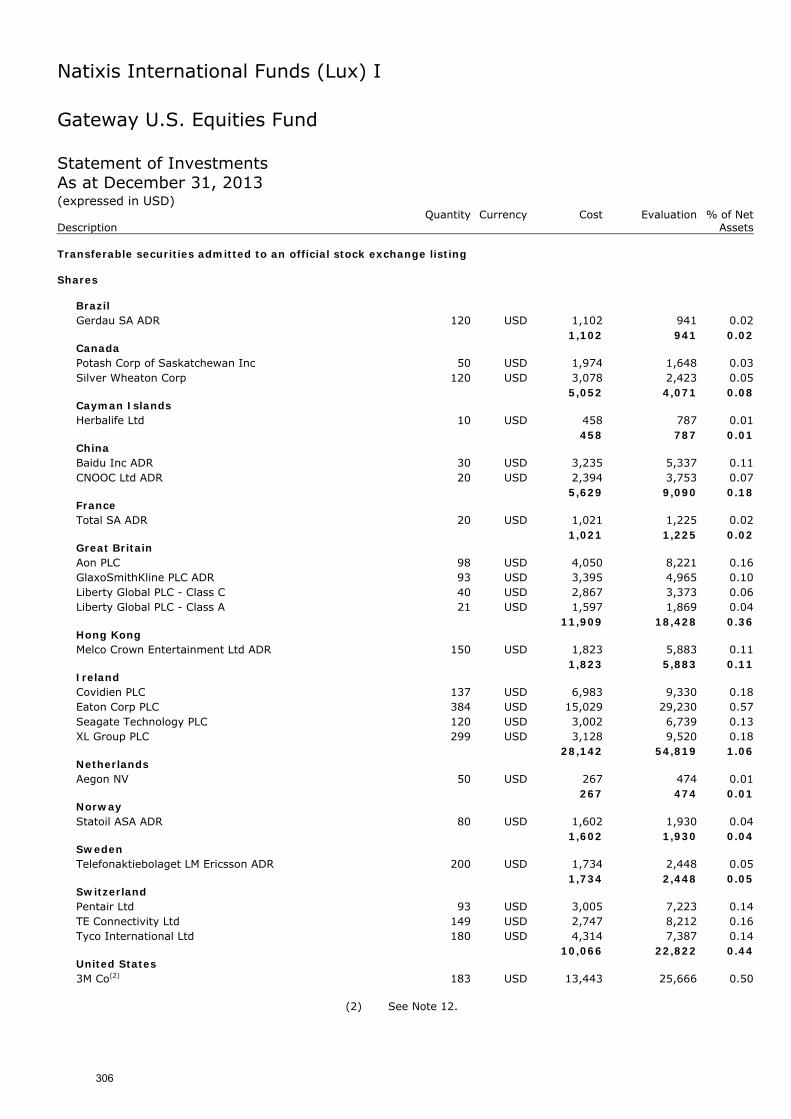
Natixis International Funds (Lux) I
Gateway U.S. Equities Fund Statement of Investments As at December 31, 2013 (expressed in USD) Quantity Currency Cost Evaluation % of Net Description Assets Transferable securities admitted to an official stock exchange listing Shares
Brazil Gerdau SA ADR 120 USD 1,102 941 0.02
1,102 941 0.02 Canada Potash Corp of Saskatchewan Inc 50 USD 1,974 1,648 0.03 Silver Wheaton Corp 120 USD 3,078 2,423 0.05
5,052 4,071 0.08 Cayman Islands Herbalife Ltd 10 USD 458 787 0.01
458 787 0.01 China Baidu Inc ADR 30 USD 3,235 5,337 0.11 CNOOC Ltd ADR 20 USD 2,394 3,753 0.07
5,629 9,090 0.18 France Total SA ADR 20 USD 1,021 1,225 0.02
1,021 1,225 0.02 Great Britain Aon PLC 98 USD 4,050 8,221 0.16 GlaxoSmithKline PLC ADR 93 USD 3,395 4,965 0.10 Liberty Global PLC - Class C 40 USD 2,867 3,373 0.06 Liberty Global PLC - Class A 21 USD 1,597 1,869 0.04
11,909 18,428 0.36 Hong Kong Melco Crown Entertainment Ltd ADR 150 USD 1,823 5,883 0.11
1,823 5,883 0.11 Ireland Covidien PLC 137 USD 6,983 9,330 0.18 Eaton Corp PLC 384 USD 15,029 29,230 0.57 Seagate Technology PLC 120 USD 3,002 6,739 0.13 XL Group PLC 299 USD 3,128 9,520 0.18
28,142 54,819 1.06 Netherlands Aegon NV 50 USD 267 474 0.01
267 474 0.01 Norway Statoil ASA ADR 80 USD 1,602 1,930 0.04
1,602 1,930 0.04 Sweden Telefonaktiebolaget LM Ericsson ADR 200 USD 1,734 2,448 0.05
1,734 2,448 0.05 Switzerland Pentair Ltd 93 USD 3,005 7,223 0.14 TE Connectivity Ltd 149 USD 2,747 8,212 0.16 Tyco International Ltd 180 USD 4,314 7,387 0.14
10,066 22,822 0.44 United States 3M Co(2) 183 USD 13,443 25,666 0.50
(2) See Note 12.
306
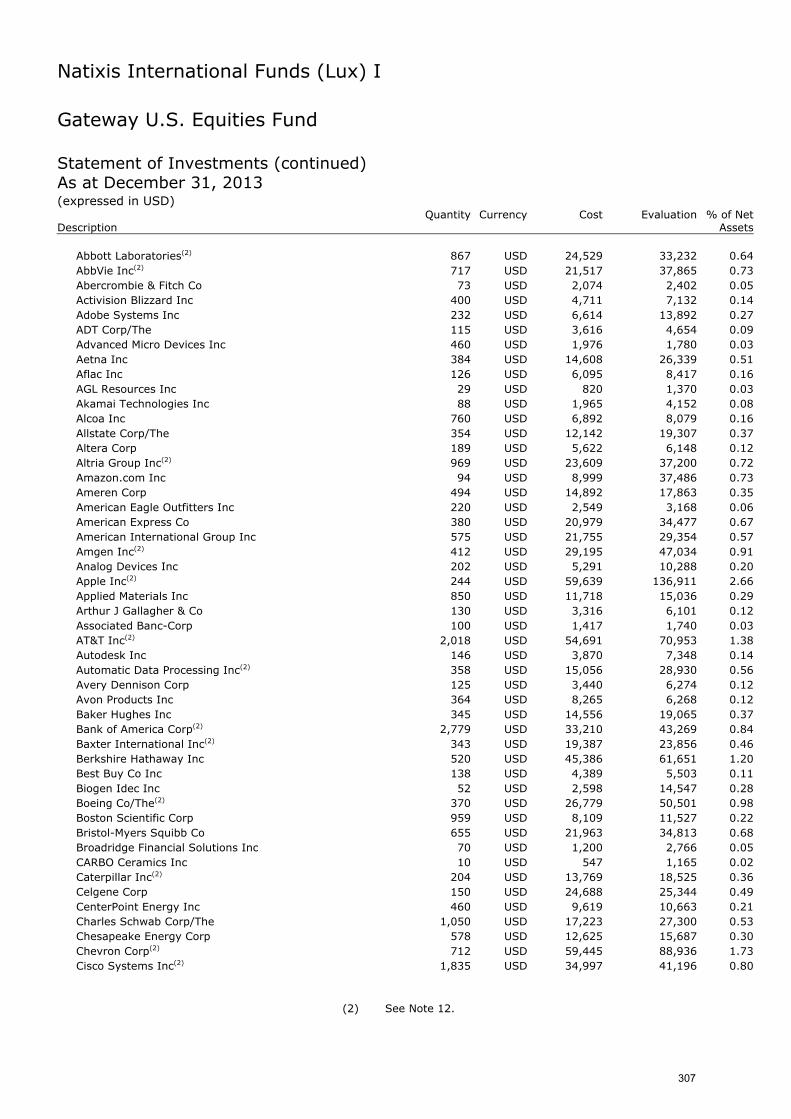
Natixis International Funds (Lux) I
Gateway U.S. Equities Fund Statement of Investments (continued) As at December 31, 2013 (expressed in USD) Quantity Currency Cost Evaluation % of Net Description Assets
Abbott Laboratories(2) 867 USD 24,529 33,232 0.64 AbbVie Inc(2) 717 USD 21,517 37,865 0.73 Abercrombie & Fitch Co 73 USD 2,074 2,402 0.05 Activision Blizzard Inc 400 USD 4,711 7,132 0.14 Adobe Systems Inc 232 USD 6,614 13,892 0.27 ADT Corp/The 115 USD 3,616 4,654 0.09 Advanced Micro Devices Inc 460 USD 1,976 1,780 0.03 Aetna Inc 384 USD 14,608 26,339 0.51 Aflac Inc 126 USD 6,095 8,417 0.16 AGL Resources Inc 29 USD 820 1,370 0.03 Akamai Technologies Inc 88 USD 1,965 4,152 0.08 Alcoa Inc 760 USD 6,892 8,079 0.16 Allstate Corp/The 354 USD 12,142 19,307 0.37 Altera Corp 189 USD 5,622 6,148 0.12 Altria Group Inc(2) 969 USD 23,609 37,200 0.72 Amazon.com Inc 94 USD 8,999 37,486 0.73 Ameren Corp 494 USD 14,892 17,863 0.35 American Eagle Outfitters Inc 220 USD 2,549 3,168 0.06 American Express Co 380 USD 20,979 34,477 0.67 American International Group Inc 575 USD 21,755 29,354 0.57 Amgen Inc(2) 412 USD 29,195 47,034 0.91 Analog Devices Inc 202 USD 5,291 10,288 0.20 Apple Inc(2) 244 USD 59,639 136,911 2.66 Applied Materials Inc 850 USD 11,718 15,036 0.29 Arthur J Gallagher & Co 130 USD 3,316 6,101 0.12 Associated Banc-Corp 100 USD 1,417 1,740 0.03 AT&T Inc(2) 2,018 USD 54,691 70,953 1.38 Autodesk Inc 146 USD 3,870 7,348 0.14 Automatic Data Processing Inc(2) 358 USD 15,056 28,930 0.56 Avery Dennison Corp 125 USD 3,440 6,274 0.12 Avon Products Inc 364 USD 8,265 6,268 0.12 Baker Hughes Inc 345 USD 14,556 19,065 0.37 Bank of America Corp(2) 2,779 USD 33,210 43,269 0.84 Baxter International Inc(2) 343 USD 19,387 23,856 0.46 Berkshire Hathaway Inc 520 USD 45,386 61,651 1.20 Best Buy Co Inc 138 USD 4,389 5,503 0.11 Biogen Idec Inc 52 USD 2,598 14,547 0.28 Boeing Co/The(2) 370 USD 26,779 50,501 0.98 Boston Scientific Corp 959 USD 8,109 11,527 0.22 Bristol-Myers Squibb Co 655 USD 21,963 34,813 0.68 Broadridge Financial Solutions Inc 70 USD 1,200 2,766 0.05 CARBO Ceramics Inc 10 USD 547 1,165 0.02 Caterpillar Inc(2) 204 USD 13,769 18,525 0.36 Celgene Corp 150 USD 24,688 25,344 0.49 CenterPoint Energy Inc 460 USD 9,619 10,663 0.21 Charles Schwab Corp/The 1,050 USD 17,223 27,300 0.53 Chesapeake Energy Corp 578 USD 12,625 15,687 0.30 Chevron Corp(2) 712 USD 59,445 88,936 1.73 Cisco Systems Inc(2) 1,835 USD 34,997 41,196 0.80
(2) See Note 12.
307
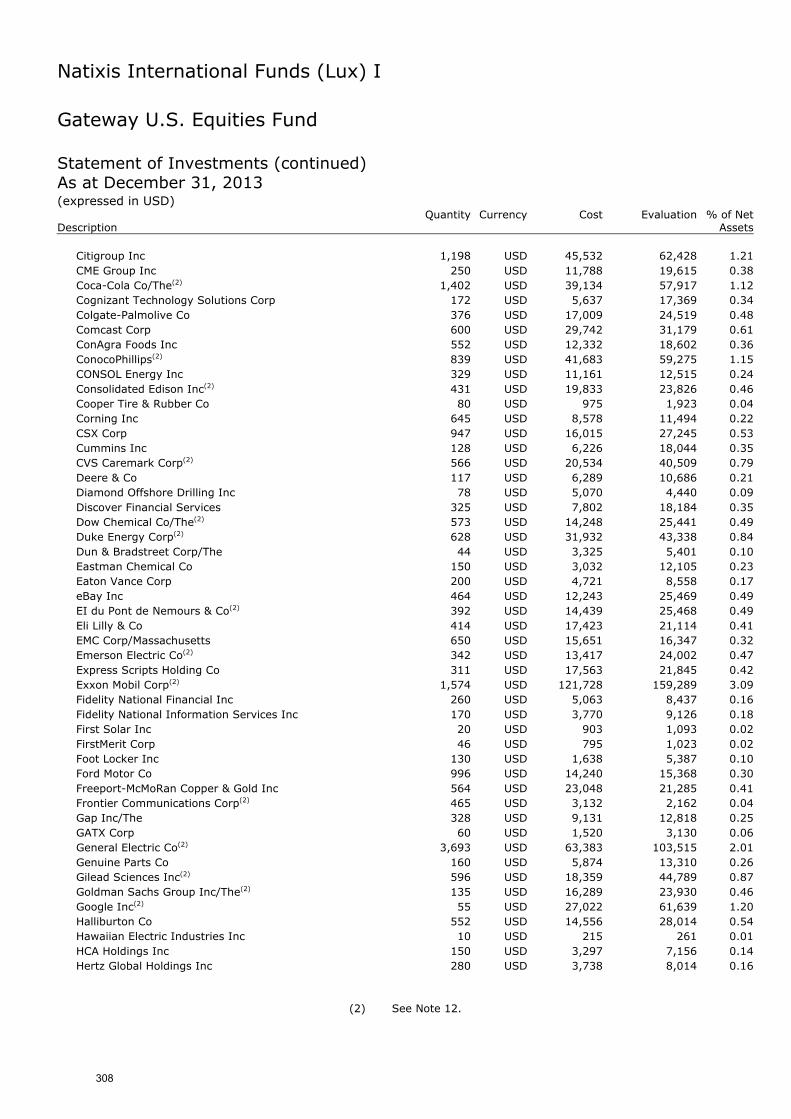
Natixis International Funds (Lux) I
Gateway U.S. Equities Fund Statement of Investments (continued) As at December 31, 2013 (expressed in USD) Quantity Currency Cost Evaluation % of Net Description Assets
Citigroup Inc 1,198 USD 45,532 62,428 1.21 CME Group Inc 250 USD 11,788 19,615 0.38 Coca-Cola Co/The(2) 1,402 USD 39,134 57,917 1.12 Cognizant Technology Solutions Corp 172 USD 5,637 17,369 0.34 Colgate-Palmolive Co 376 USD 17,009 24,519 0.48 Comcast Corp 600 USD 29,742 31,179 0.61 ConAgra Foods Inc 552 USD 12,332 18,602 0.36 ConocoPhillips(2) 839 USD 41,683 59,275 1.15 CONSOL Energy Inc 329 USD 11,161 12,515 0.24 Consolidated Edison Inc(2) 431 USD 19,833 23,826 0.46 Cooper Tire & Rubber Co 80 USD 975 1,923 0.04 Corning Inc 645 USD 8,578 11,494 0.22 CSX Corp 947 USD 16,015 27,245 0.53 Cummins Inc 128 USD 6,226 18,044 0.35 CVS Caremark Corp(2) 566 USD 20,534 40,509 0.79 Deere & Co 117 USD 6,289 10,686 0.21 Diamond Offshore Drilling Inc 78 USD 5,070 4,440 0.09 Discover Financial Services 325 USD 7,802 18,184 0.35 Dow Chemical Co/The(2) 573 USD 14,248 25,441 0.49 Duke Energy Corp(2) 628 USD 31,932 43,338 0.84 Dun & Bradstreet Corp/The 44 USD 3,325 5,401 0.10 Eastman Chemical Co 150 USD 3,032 12,105 0.23 Eaton Vance Corp 200 USD 4,721 8,558 0.17 eBay Inc 464 USD 12,243 25,469 0.49 EI du Pont de Nemours & Co(2) 392 USD 14,439 25,468 0.49 Eli Lilly & Co 414 USD 17,423 21,114 0.41 EMC Corp/Massachusetts 650 USD 15,651 16,347 0.32 Emerson Electric Co(2) 342 USD 13,417 24,002 0.47 Express Scripts Holding Co 311 USD 17,563 21,845 0.42 Exxon Mobil Corp(2) 1,574 USD 121,728 159,289 3.09 Fidelity National Financial Inc 260 USD 5,063 8,437 0.16 Fidelity National Information Services Inc 170 USD 3,770 9,126 0.18 First Solar Inc 20 USD 903 1,093 0.02 FirstMerit Corp 46 USD 795 1,023 0.02 Foot Locker Inc 130 USD 1,638 5,387 0.10 Ford Motor Co 996 USD 14,240 15,368 0.30 Freeport-McMoRan Copper & Gold Inc 564 USD 23,048 21,285 0.41 Frontier Communications Corp(2) 465 USD 3,132 2,162 0.04 Gap Inc/The 328 USD 9,131 12,818 0.25 GATX Corp 60 USD 1,520 3,130 0.06 General Electric Co(2) 3,693 USD 63,383 103,515 2.01 Genuine Parts Co 160 USD 5,874 13,310 0.26 Gilead Sciences Inc(2) 596 USD 18,359 44,789 0.87 Goldman Sachs Group Inc/The(2) 135 USD 16,289 23,930 0.46 Google Inc(2) 55 USD 27,022 61,639 1.20 Halliburton Co 552 USD 14,556 28,014 0.54 Hawaiian Electric Industries Inc 10 USD 215 261 0.01 HCA Holdings Inc 150 USD 3,297 7,156 0.14 Hertz Global Holdings Inc 280 USD 3,738 8,014 0.16
(2) See Note 12.
308
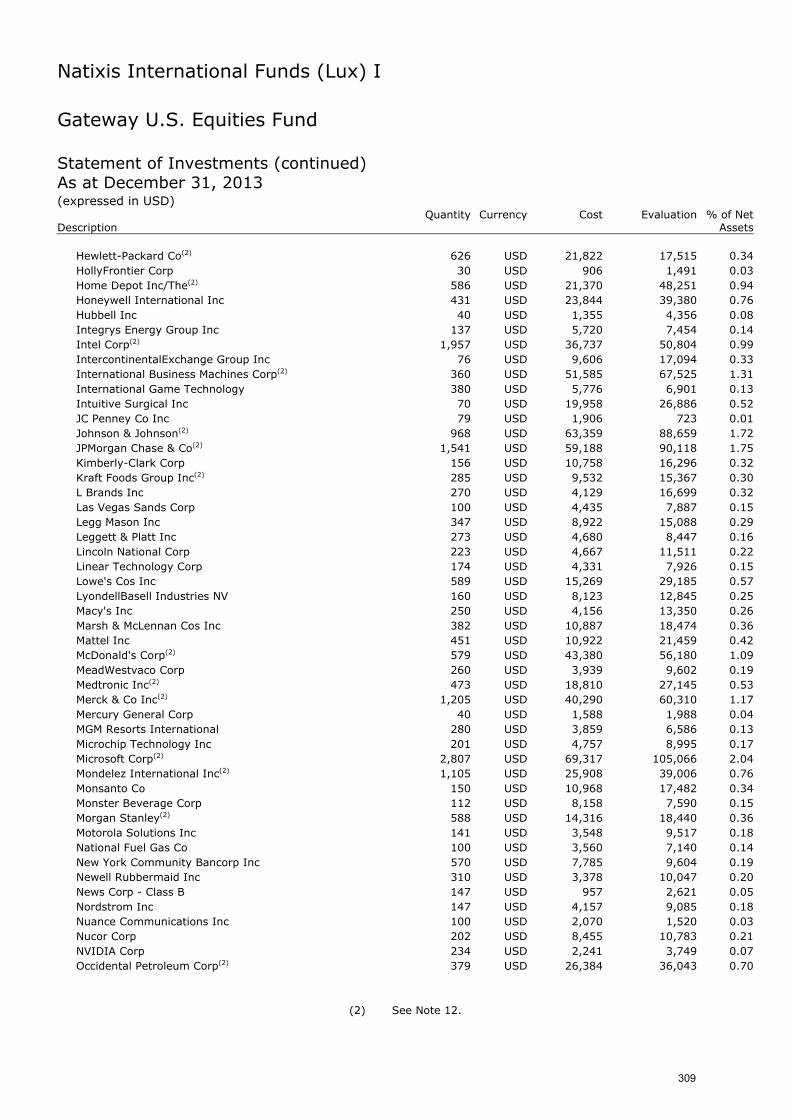
Natixis International Funds (Lux) I
Gateway U.S. Equities Fund Statement of Investments (continued) As at December 31, 2013 (expressed in USD) Quantity Currency Cost Evaluation % of Net Description Assets
Hewlett-Packard Co(2) 626 USD 21,822 17,515 0.34 HollyFrontier Corp 30 USD 906 1,491 0.03 Home Depot Inc/The(2) 586 USD 21,370 48,251 0.94 Honeywell International Inc 431 USD 23,844 39,380 0.76 Hubbell Inc 40 USD 1,355 4,356 0.08 Integrys Energy Group Inc 137 USD 5,720 7,454 0.14 Intel Corp(2) 1,957 USD 36,737 50,804 0.99 IntercontinentalExchange Group Inc 76 USD 9,606 17,094 0.33 International Business Machines Corp(2) 360 USD 51,585 67,525 1.31 International Game Technology 380 USD 5,776 6,901 0.13 Intuitive Surgical Inc 70 USD 19,958 26,886 0.52 JC Penney Co Inc 79 USD 1,906 723 0.01 Johnson & Johnson(2) 968 USD 63,359 88,659 1.72 JPMorgan Chase & Co(2) 1,541 USD 59,188 90,118 1.75 Kimberly-Clark Corp 156 USD 10,758 16,296 0.32 Kraft Foods Group Inc(2) 285 USD 9,532 15,367 0.30 L Brands Inc 270 USD 4,129 16,699 0.32 Las Vegas Sands Corp 100 USD 4,435 7,887 0.15 Legg Mason Inc 347 USD 8,922 15,088 0.29 Leggett & Platt Inc 273 USD 4,680 8,447 0.16 Lincoln National Corp 223 USD 4,667 11,511 0.22 Linear Technology Corp 174 USD 4,331 7,926 0.15 Lowe's Cos Inc 589 USD 15,269 29,185 0.57 LyondellBasell Industries NV 160 USD 8,123 12,845 0.25 Macy's Inc 250 USD 4,156 13,350 0.26 Marsh & McLennan Cos Inc 382 USD 10,887 18,474 0.36 Mattel Inc 451 USD 10,922 21,459 0.42 McDonald's Corp(2) 579 USD 43,380 56,180 1.09 MeadWestvaco Corp 260 USD 3,939 9,602 0.19 Medtronic Inc(2) 473 USD 18,810 27,145 0.53 Merck & Co Inc(2) 1,205 USD 40,290 60,310 1.17 Mercury General Corp 40 USD 1,588 1,988 0.04 MGM Resorts International 280 USD 3,859 6,586 0.13 Microchip Technology Inc 201 USD 4,757 8,995 0.17 Microsoft Corp(2) 2,807 USD 69,317 105,066 2.04 Mondelez International Inc(2) 1,105 USD 25,908 39,006 0.76 Monsanto Co 150 USD 10,968 17,482 0.34 Monster Beverage Corp 112 USD 8,158 7,590 0.15 Morgan Stanley(2) 588 USD 14,316 18,440 0.36 Motorola Solutions Inc 141 USD 3,548 9,517 0.18 National Fuel Gas Co 100 USD 3,560 7,140 0.14 New York Community Bancorp Inc 570 USD 7,785 9,604 0.19 Newell Rubbermaid Inc 310 USD 3,378 10,047 0.20 News Corp - Class B 147 USD 957 2,621 0.05 Nordstrom Inc 147 USD 4,157 9,085 0.18 Nuance Communications Inc 100 USD 2,070 1,520 0.03 Nucor Corp 202 USD 8,455 10,783 0.21 NVIDIA Corp 234 USD 2,241 3,749 0.07 Occidental Petroleum Corp(2) 379 USD 26,384 36,043 0.70
(2) See Note 12.
309
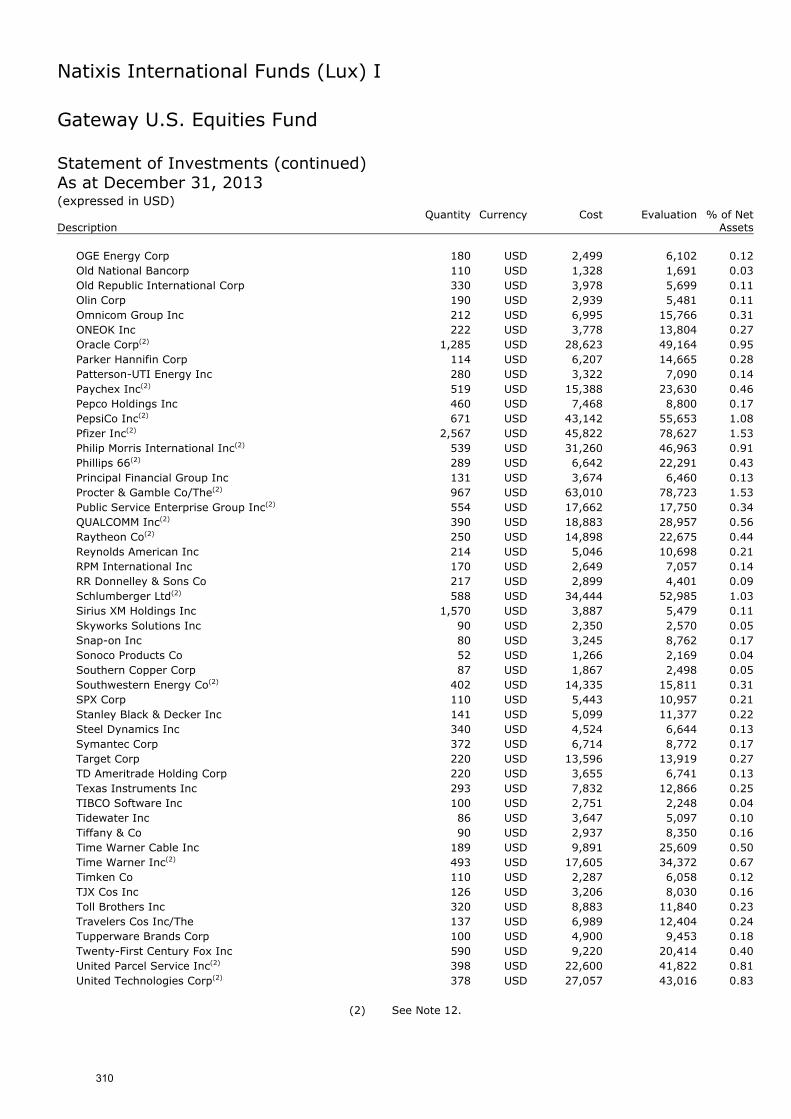
Natixis International Funds (Lux) I
Gateway U.S. Equities Fund Statement of Investments (continued) As at December 31, 2013 (expressed in USD) Quantity Currency Cost Evaluation % of Net Description Assets
OGE Energy Corp 180 USD 2,499 6,102 0.12 Old National Bancorp 110 USD 1,328 1,691 0.03 Old Republic International Corp 330 USD 3,978 5,699 0.11 Olin Corp 190 USD 2,939 5,481 0.11 Omnicom Group Inc 212 USD 6,995 15,766 0.31 ONEOK Inc 222 USD 3,778 13,804 0.27 Oracle Corp(2) 1,285 USD 28,623 49,164 0.95 Parker Hannifin Corp 114 USD 6,207 14,665 0.28 Patterson-UTI Energy Inc 280 USD 3,322 7,090 0.14 Paychex Inc(2) 519 USD 15,388 23,630 0.46 Pepco Holdings Inc 460 USD 7,468 8,800 0.17 PepsiCo Inc(2) 671 USD 43,142 55,653 1.08 Pfizer Inc(2) 2,567 USD 45,822 78,627 1.53 Philip Morris International Inc(2) 539 USD 31,260 46,963 0.91 Phillips 66(2) 289 USD 6,642 22,291 0.43 Principal Financial Group Inc 131 USD 3,674 6,460 0.13 Procter & Gamble Co/The(2) 967 USD 63,010 78,723 1.53 Public Service Enterprise Group Inc(2) 554 USD 17,662 17,750 0.34 QUALCOMM Inc(2) 390 USD 18,883 28,957 0.56 Raytheon Co(2) 250 USD 14,898 22,675 0.44 Reynolds American Inc 214 USD 5,046 10,698 0.21 RPM International Inc 170 USD 2,649 7,057 0.14 RR Donnelley & Sons Co 217 USD 2,899 4,401 0.09 Schlumberger Ltd(2) 588 USD 34,444 52,985 1.03 Sirius XM Holdings Inc 1,570 USD 3,887 5,479 0.11 Skyworks Solutions Inc 90 USD 2,350 2,570 0.05 Snap-on Inc 80 USD 3,245 8,762 0.17 Sonoco Products Co 52 USD 1,266 2,169 0.04 Southern Copper Corp 87 USD 1,867 2,498 0.05 Southwestern Energy Co(2) 402 USD 14,335 15,811 0.31 SPX Corp 110 USD 5,443 10,957 0.21 Stanley Black & Decker Inc 141 USD 5,099 11,377 0.22 Steel Dynamics Inc 340 USD 4,524 6,644 0.13 Symantec Corp 372 USD 6,714 8,772 0.17 Target Corp 220 USD 13,596 13,919 0.27 TD Ameritrade Holding Corp 220 USD 3,655 6,741 0.13 Texas Instruments Inc 293 USD 7,832 12,866 0.25 TIBCO Software Inc 100 USD 2,751 2,248 0.04 Tidewater Inc 86 USD 3,647 5,097 0.10 Tiffany & Co 90 USD 2,937 8,350 0.16 Time Warner Cable Inc 189 USD 9,891 25,609 0.50 Time Warner Inc(2) 493 USD 17,605 34,372 0.67 Timken Co 110 USD 2,287 6,058 0.12 TJX Cos Inc 126 USD 3,206 8,030 0.16 Toll Brothers Inc 320 USD 8,883 11,840 0.23 Travelers Cos Inc/The 137 USD 6,989 12,404 0.24 Tupperware Brands Corp 100 USD 4,900 9,453 0.18 Twenty-First Century Fox Inc 590 USD 9,220 20,414 0.40 United Parcel Service Inc(2) 398 USD 22,600 41,822 0.81 United Technologies Corp(2) 378 USD 27,057 43,016 0.83
(2) See Note 12.
310
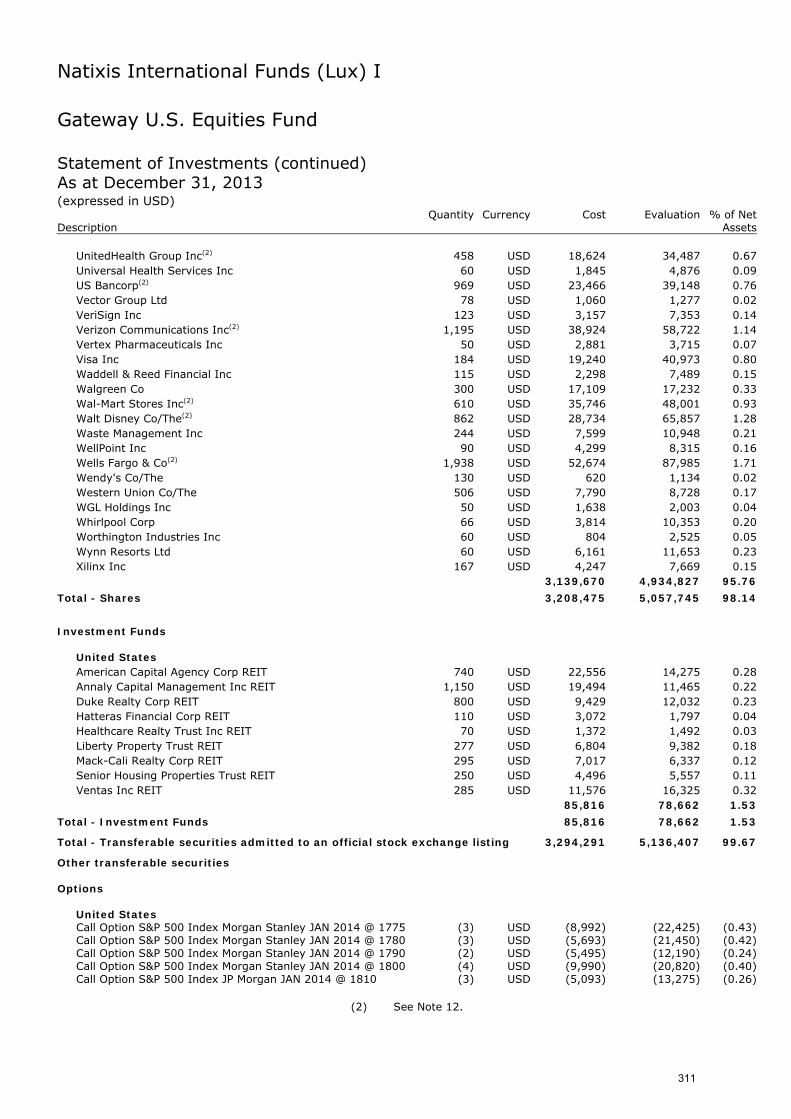
Natixis International Funds (Lux) I
Gateway U.S. Equities Fund Statement of Investments (continued) As at December 31, 2013 (expressed in USD) Quantity Currency Cost Evaluation % of Net Description Assets
UnitedHealth Group Inc(2) 458 USD 18,624 34,487 0.67 Universal Health Services Inc 60 USD 1,845 4,876 0.09 US Bancorp(2) 969 USD 23,466 39,148 0.76 Vector Group Ltd 78 USD 1,060 1,277 0.02 VeriSign Inc 123 USD 3,157 7,353 0.14 Verizon Communications Inc(2) 1,195 USD 38,924 58,722 1.14 Vertex Pharmaceuticals Inc 50 USD 2,881 3,715 0.07 Visa Inc 184 USD 19,240 40,973 0.80 Waddell & Reed Financial Inc 115 USD 2,298 7,489 0.15 Walgreen Co 300 USD 17,109 17,232 0.33 Wal-Mart Stores Inc(2) 610 USD 35,746 48,001 0.93 Walt Disney Co/The(2) 862 USD 28,734 65,857 1.28 Waste Management Inc 244 USD 7,599 10,948 0.21 WellPoint Inc 90 USD 4,299 8,315 0.16 Wells Fargo & Co(2) 1,938 USD 52,674 87,985 1.71 Wendy's Co/The 130 USD 620 1,134 0.02 Western Union Co/The 506 USD 7,790 8,728 0.17 WGL Holdings Inc 50 USD 1,638 2,003 0.04 Whirlpool Corp 66 USD 3,814 10,353 0.20 Worthington Industries Inc 60 USD 804 2,525 0.05 Wynn Resorts Ltd 60 USD 6,161 11,653 0.23 Xilinx Inc 167 USD 4,247 7,669 0.15
3,139,670 4,934,827 95.76
Total - Shares 3,208,475 5,057,745 98.14
Investment Funds
United States American Capital Agency Corp REIT 740 USD 22,556 14,275 0.28 Annaly Capital Management Inc REIT 1,150 USD 19,494 11,465 0.22 Duke Realty Corp REIT 800 USD 9,429 12,032 0.23 Hatteras Financial Corp REIT 110 USD 3,072 1,797 0.04 Healthcare Realty Trust Inc REIT 70 USD 1,372 1,492 0.03 Liberty Property Trust REIT 277 USD 6,804 9,382 0.18 Mack-Cali Realty Corp REIT 295 USD 7,017 6,337 0.12 Senior Housing Properties Trust REIT 250 USD 4,496 5,557 0.11 Ventas Inc REIT 285 USD 11,576 16,325 0.32
85,816 78,662 1.53
Total - Investment Funds 85,816 78,662 1.53
Total - Transferable securities admitted to an official stock exchange listing 3,294,291 5,136,407 99.67
Other transferable securities Options
United States Call Option S&P 500 Index Morgan Stanley JAN 2014 @ 1775 (3) USD (8,992) (22,425) (0.43) Call Option S&P 500 Index Morgan Stanley JAN 2014 @ 1780 (3) USD (5,693) (21,450) (0.42) Call Option S&P 500 Index Morgan Stanley JAN 2014 @ 1790 (2) USD (5,495) (12,190) (0.24) Call Option S&P 500 Index Morgan Stanley JAN 2014 @ 1800 (4) USD (9,990) (20,820) (0.40) Call Option S&P 500 Index JP Morgan JAN 2014 @ 1810 (3) USD (5,093) (13,275) (0.26)
(2) See Note 12.
311
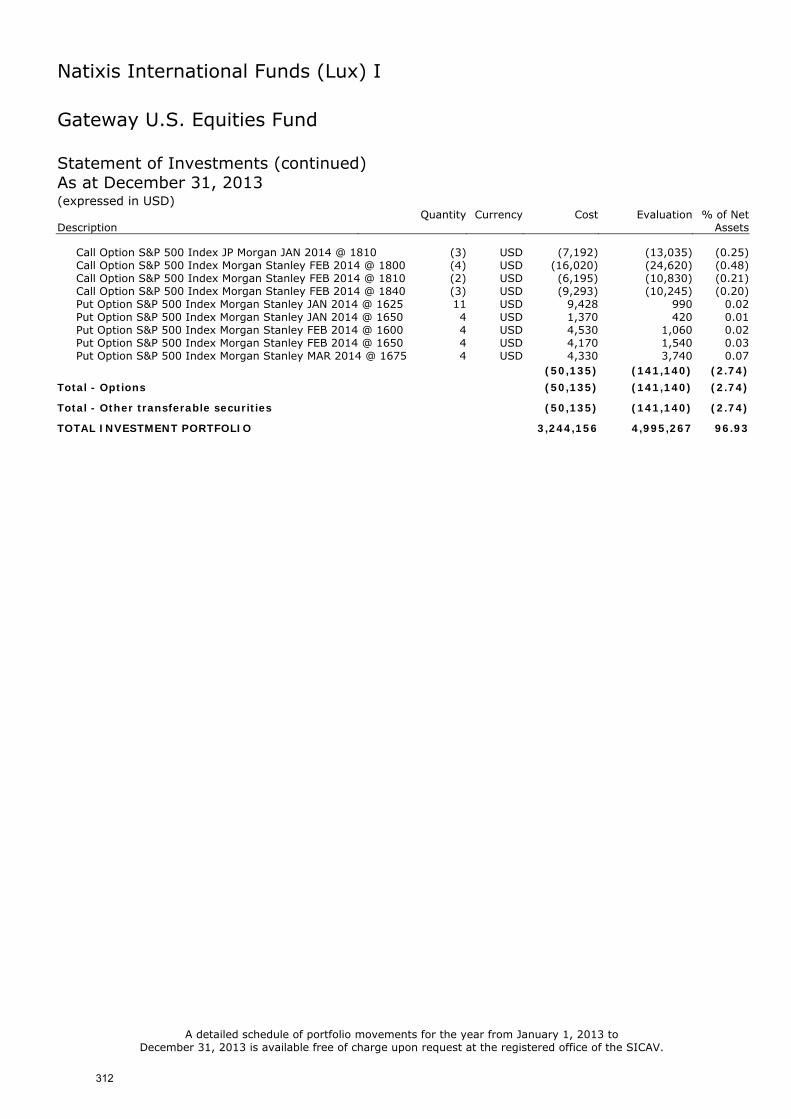
Natixis International Funds (Lux) I
Gateway U.S. Equities Fund Statement of Investments (continued) As at December 31, 2013 (expressed in USD) Quantity Currency Cost Evaluation % of Net Description Assets
Call Option S&P 500 Index JP Morgan JAN 2014 @ 1810 (3) USD (7,192) (13,035) (0.25) Call Option S&P 500 Index Morgan Stanley FEB 2014 @ 1800 (4) USD (16,020) (24,620) (0.48) Call Option S&P 500 Index Morgan Stanley FEB 2014 @ 1810 (2) USD (6,195) (10,830) (0.21) Call Option S&P 500 Index Morgan Stanley FEB 2014 @ 1840 (3) USD (9,293) (10,245) (0.20) Put Option S&P 500 Index Morgan Stanley JAN 2014 @ 1625 11 USD 9,428 990 0.02 Put Option S&P 500 Index Morgan Stanley JAN 2014 @ 1650 4 USD 1,370 420 0.01 Put Option S&P 500 Index Morgan Stanley FEB 2014 @ 1600 4 USD 4,530 1,060 0.02 Put Option S&P 500 Index Morgan Stanley FEB 2014 @ 1650 4 USD 4,170 1,540 0.03 Put Option S&P 500 Index Morgan Stanley MAR 2014 @ 1675 4 USD 4,330 3,740 0.07
(50,135) (141,140) (2.74)
Total - Options (50,135) (141,140) (2.74)
Total - Other transferable securities (50,135) (141,140) (2.74)
TOTAL INVESTMENT PORTFOLIO 3,244,156 4,995,267 96.93
A detailed schedule of portfolio movements for the year from January 1, 2013 to December 31, 2013 is available free of charge upon request at the registered office of the SICAV.
312
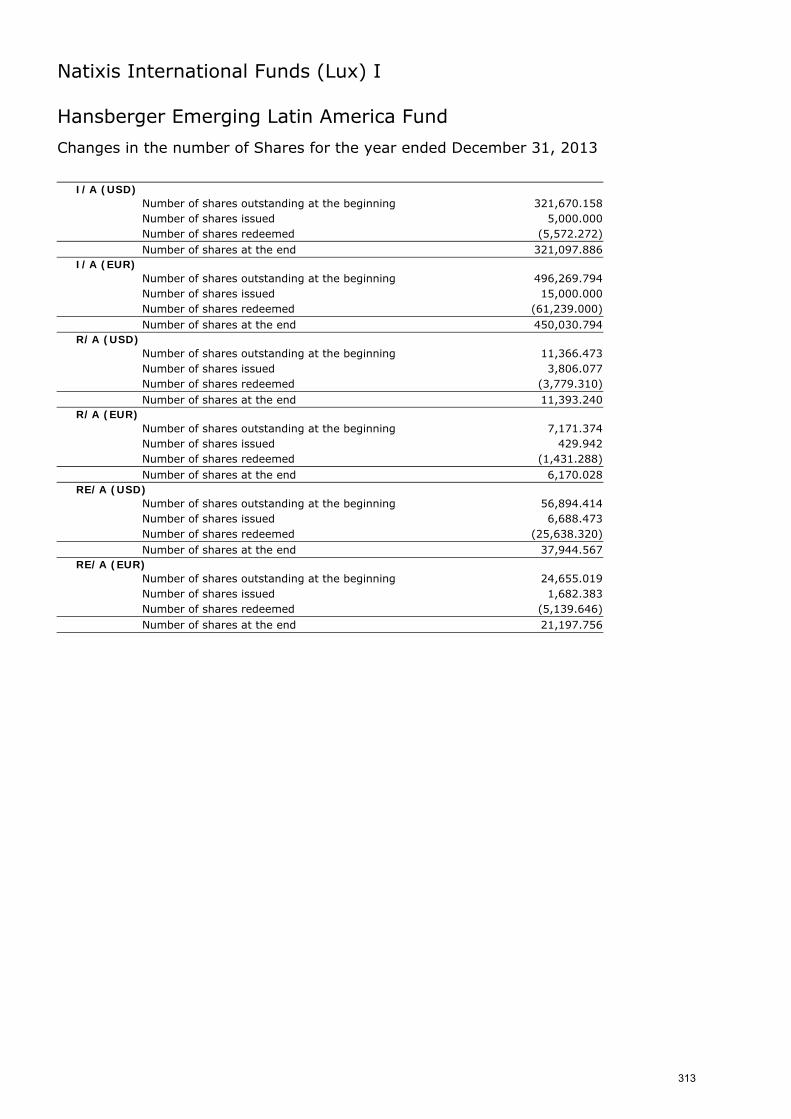
Natixis International Funds (Lux) I
Hansberger Emerging Latin America Fund
Changes in the number of Shares for the year ended December 31, 2013
I/A (USD) Number of shares outstanding at the beginning 321,670.158
Number of shares issued 5,000.000
Number of shares redeemed (5,572.272) Number of shares at the end 321,097.886
I/A (EUR) Number of shares outstanding at the beginning 496,269.794
Number of shares issued 15,000.000
Number of shares redeemed (61,239.000) Number of shares at the end 450,030.794
R/A (USD) Number of shares outstanding at the beginning 11,366.473
Number of shares issued 3,806.077
Number of shares redeemed (3,779.310) Number of shares at the end 11,393.240
R/A (EUR) Number of shares outstanding at the beginning 7,171.374
Number of shares issued 429.942
Number of shares redeemed (1,431.288) Number of shares at the end 6,170.028
RE/A (USD) Number of shares outstanding at the beginning 56,894.414
Number of shares issued 6,688.473
Number of shares redeemed (25,638.320) Number of shares at the end 37,944.567
RE/A (EUR) Number of shares outstanding at the beginning 24,655.019
Number of shares issued 1,682.383
Number of shares redeemed (5,139.646) Number of shares at the end 21,197.756
313
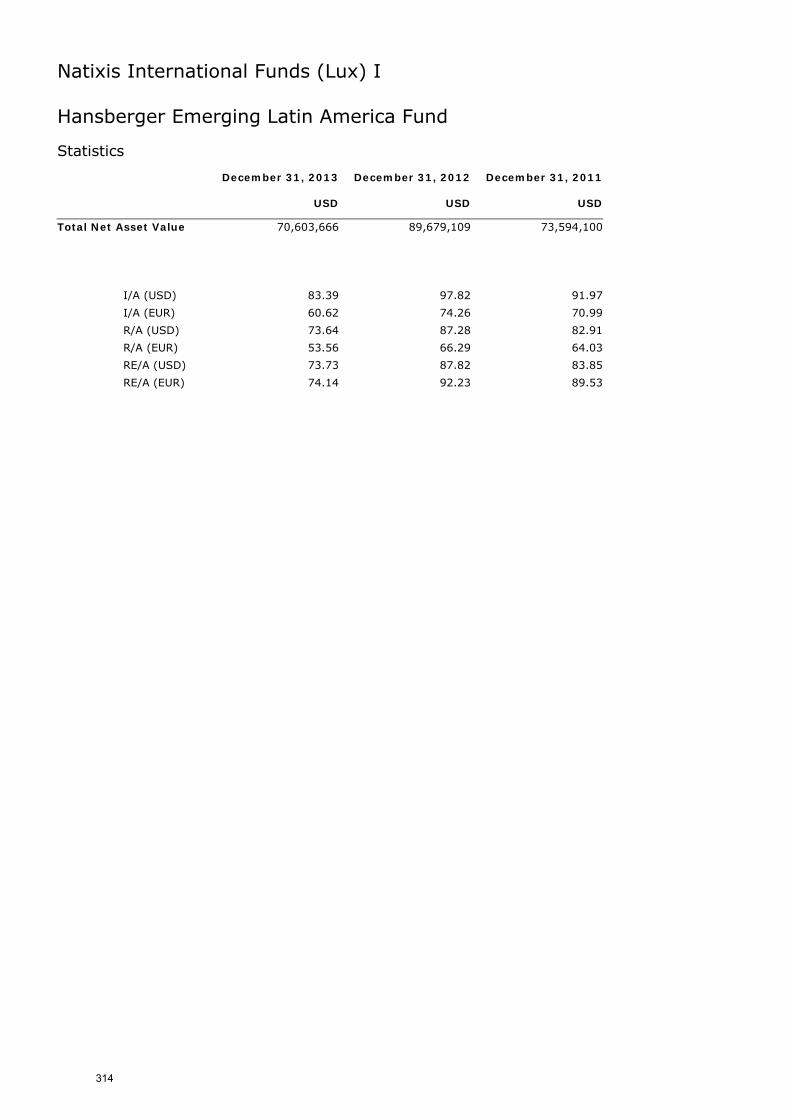
Natixis International Funds (Lux) I
Hansberger Emerging Latin America Fund Statistics December 31, 2013 December 31, 2012 December 31, 2011 USD USD USD
Total Net Asset Value 70,603,666 89,679,109 73,594,100
I/A (USD) 83.39 97.82 91.97
I/A (EUR) 60.62 74.26 70.99
R/A (USD) 73.64 87.28 82.91
R/A (EUR) 53.56 66.29 64.03
RE/A (USD) 73.73 87.82 83.85
RE/A (EUR) 74.14 92.23 89.53
314
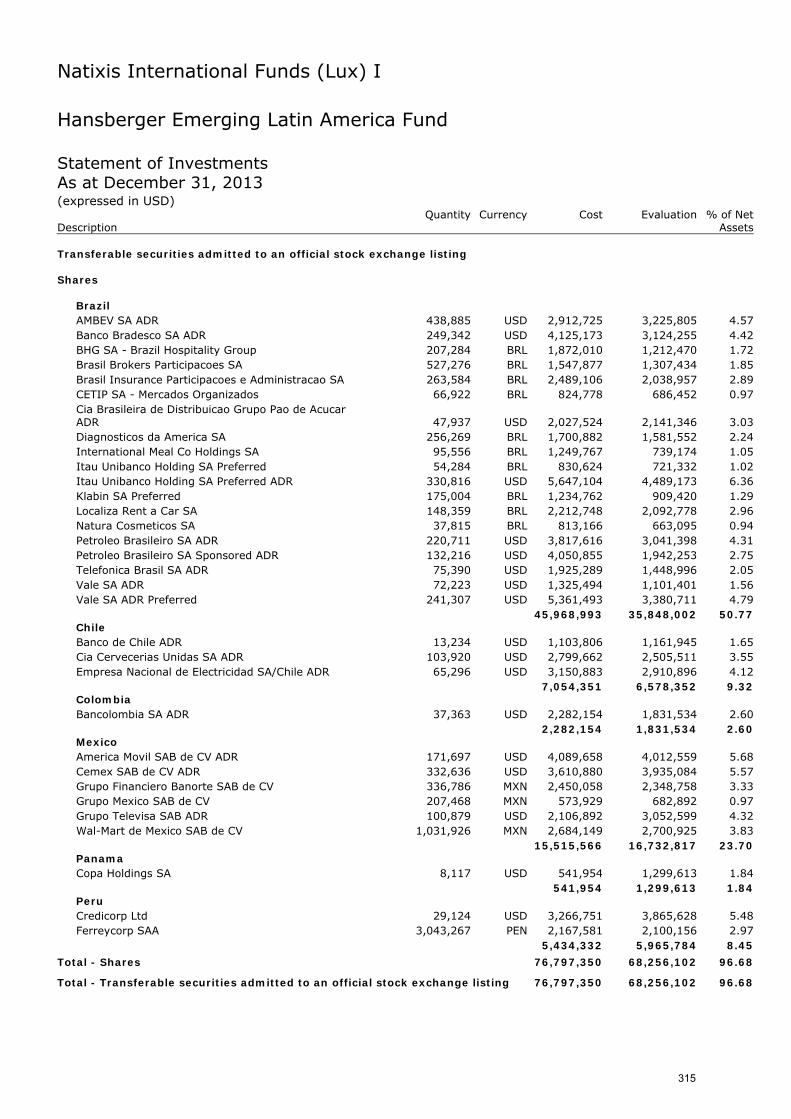
Natixis International Funds (Lux) I
Hansberger Emerging Latin America Fund Statement of Investments As at December 31, 2013 (expressed in USD) Quantity Currency Cost Evaluation % of Net Description Assets Transferable securities admitted to an official stock exchange listing Shares
Brazil AMBEV SA ADR 438,885 USD 2,912,725 3,225,805 4.57 Banco Bradesco SA ADR 249,342 USD 4,125,173 3,124,255 4.42 BHG SA - Brazil Hospitality Group 207,284 BRL 1,872,010 1,212,470 1.72 Brasil Brokers Participacoes SA 527,276 BRL 1,547,877 1,307,434 1.85 Brasil Insurance Participacoes e Administracao SA 263,584 BRL 2,489,106 2,038,957 2.89 CETIP SA - Mercados Organizados 66,922 BRL 824,778 686,452 0.97 Cia Brasileira de Distribuicao Grupo Pao de Acucar ADR 47,937 USD 2,027,524 2,141,346 3.03 Diagnosticos da America SA 256,269 BRL 1,700,882 1,581,552 2.24 International Meal Co Holdings SA 95,556 BRL 1,249,767 739,174 1.05 Itau Unibanco Holding SA Preferred 54,284 BRL 830,624 721,332 1.02 Itau Unibanco Holding SA Preferred ADR 330,816 USD 5,647,104 4,489,173 6.36 Klabin SA Preferred 175,004 BRL 1,234,762 909,420 1.29 Localiza Rent a Car SA 148,359 BRL 2,212,748 2,092,778 2.96 Natura Cosmeticos SA 37,815 BRL 813,166 663,095 0.94 Petroleo Brasileiro SA ADR 220,711 USD 3,817,616 3,041,398 4.31 Petroleo Brasileiro SA Sponsored ADR 132,216 USD 4,050,855 1,942,253 2.75 Telefonica Brasil SA ADR 75,390 USD 1,925,289 1,448,996 2.05 Vale SA ADR 72,223 USD 1,325,494 1,101,401 1.56 Vale SA ADR Preferred 241,307 USD 5,361,493 3,380,711 4.79
45,968,993 35,848,002 50.77 Chile Banco de Chile ADR 13,234 USD 1,103,806 1,161,945 1.65 Cia Cervecerias Unidas SA ADR 103,920 USD 2,799,662 2,505,511 3.55 Empresa Nacional de Electricidad SA/Chile ADR 65,296 USD 3,150,883 2,910,896 4.12
7,054,351 6,578,352 9.32 Colombia Bancolombia SA ADR 37,363 USD 2,282,154 1,831,534 2.60
2,282,154 1,831,534 2.60 Mexico America Movil SAB de CV ADR 171,697 USD 4,089,658 4,012,559 5.68 Cemex SAB de CV ADR 332,636 USD 3,610,880 3,935,084 5.57 Grupo Financiero Banorte SAB de CV 336,786 MXN 2,450,058 2,348,758 3.33 Grupo Mexico SAB de CV 207,468 MXN 573,929 682,892 0.97 Grupo Televisa SAB ADR 100,879 USD 2,106,892 3,052,599 4.32 Wal-Mart de Mexico SAB de CV 1,031,926 MXN 2,684,149 2,700,925 3.83
15,515,566 16,732,817 23.70 Panama Copa Holdings SA 8,117 USD 541,954 1,299,613 1.84
541,954 1,299,613 1.84 Peru Credicorp Ltd 29,124 USD 3,266,751 3,865,628 5.48 Ferreycorp SAA 3,043,267 PEN 2,167,581 2,100,156 2.97
5,434,332 5,965,784 8.45
Total - Shares 76,797,350 68,256,102 96.68
Total - Transferable securities admitted to an official stock exchange listing 76,797,350 68,256,102 96.68
315
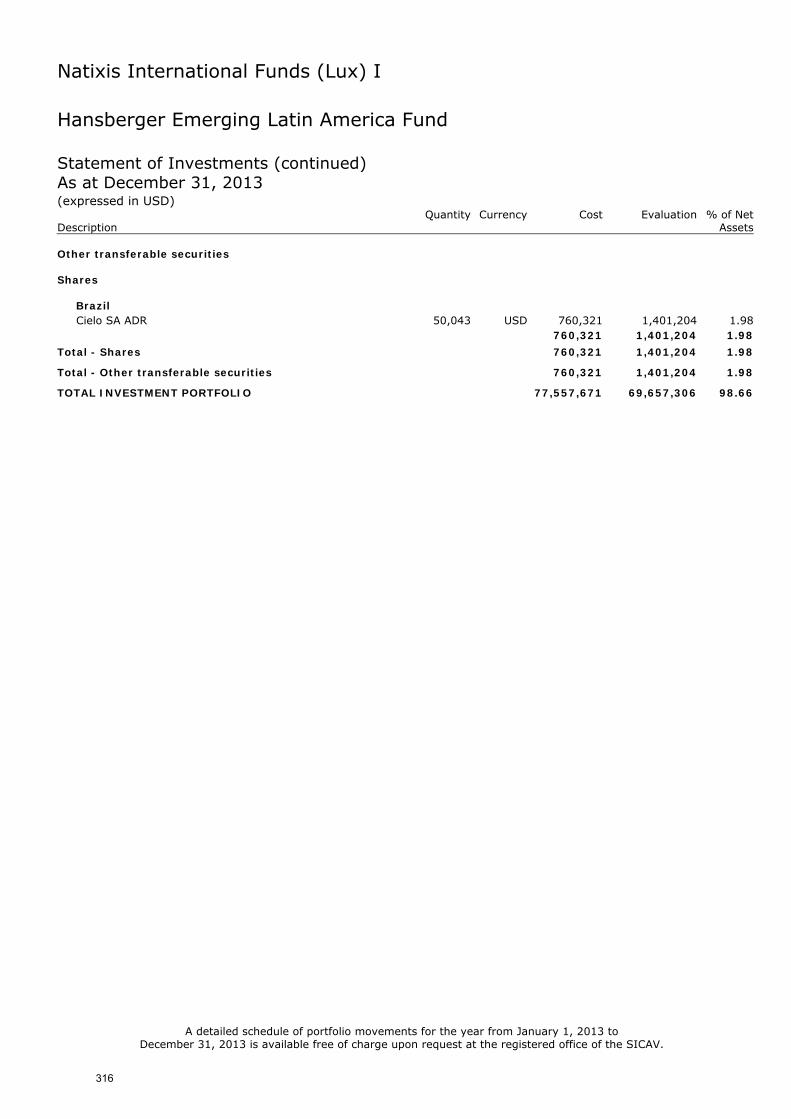
Natixis International Funds (Lux) I
Hansberger Emerging Latin America Fund Statement of Investments (continued) As at December 31, 2013 (expressed in USD) Quantity Currency Cost Evaluation % of Net Description Assets Other transferable securities Shares
Brazil Cielo SA ADR 50,043 USD 760,321 1,401,204 1.98
760,321 1,401,204 1.98
Total - Shares 760,321 1,401,204 1.98
Total - Other transferable securities 760,321 1,401,204 1.98
TOTAL INVESTMENT PORTFOLIO 77,557,671 69,657,306 98.66
A detailed schedule of portfolio movements for the year from January 1, 2013 to December 31, 2013 is available free of charge upon request at the registered office of the SICAV.
316
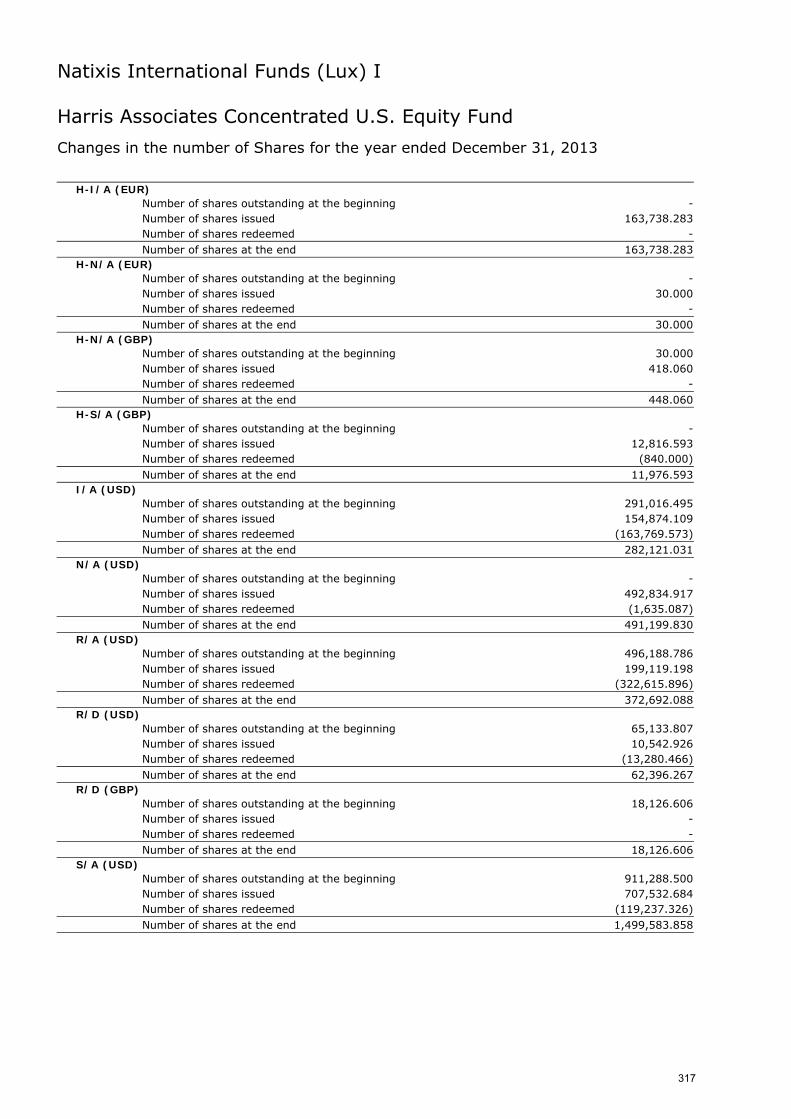
Natixis International Funds (Lux) I
Harris Associates Concentrated U.S. Equity Fund
Changes in the number of Shares for the year ended December 31, 2013
H-I/A (EUR) Number of shares outstanding at the beginning - Number of shares issued 163,738.283
Number of shares redeemed - Number of shares at the end 163,738.283
H-N/A (EUR) Number of shares outstanding at the beginning - Number of shares issued 30.000
Number of shares redeemed - Number of shares at the end 30.000
H-N/A (GBP) Number of shares outstanding at the beginning 30.000
Number of shares issued 418.060
Number of shares redeemed - Number of shares at the end 448.060
H-S/A (GBP) Number of shares outstanding at the beginning - Number of shares issued 12,816.593
Number of shares redeemed (840.000) Number of shares at the end 11,976.593
I/A (USD) Number of shares outstanding at the beginning 291,016.495
Number of shares issued 154,874.109
Number of shares redeemed (163,769.573) Number of shares at the end 282,121.031
N/A (USD) Number of shares outstanding at the beginning - Number of shares issued 492,834.917
Number of shares redeemed (1,635.087) Number of shares at the end 491,199.830
R/A (USD) Number of shares outstanding at the beginning 496,188.786
Number of shares issued 199,119.198
Number of shares redeemed (322,615.896) Number of shares at the end 372,692.088
R/D (USD) Number of shares outstanding at the beginning 65,133.807
Number of shares issued 10,542.926
Number of shares redeemed (13,280.466) Number of shares at the end 62,396.267
R/D (GBP) Number of shares outstanding at the beginning 18,126.606
Number of shares issued - Number of shares redeemed - Number of shares at the end 18,126.606
S/A (USD) Number of shares outstanding at the beginning 911,288.500
Number of shares issued 707,532.684
Number of shares redeemed (119,237.326) Number of shares at the end 1,499,583.858
317
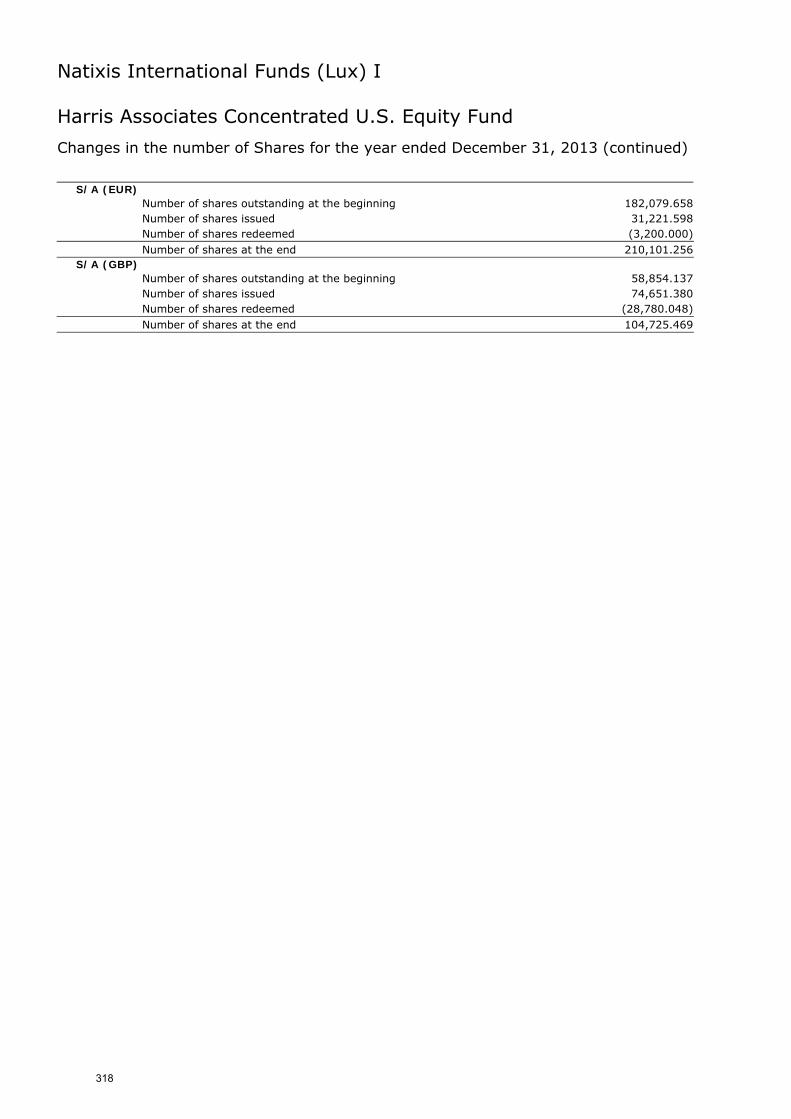
Natixis International Funds (Lux) I
Harris Associates Concentrated U.S. Equity Fund
Changes in the number of Shares for the year ended December 31, 2013 (continued) S/A (EUR)
Number of shares outstanding at the beginning 182,079.658
Number of shares issued 31,221.598
Number of shares redeemed (3,200.000) Number of shares at the end 210,101.256
S/A (GBP) Number of shares outstanding at the beginning 58,854.137
Number of shares issued 74,651.380
Number of shares redeemed (28,780.048) Number of shares at the end 104,725.469
318
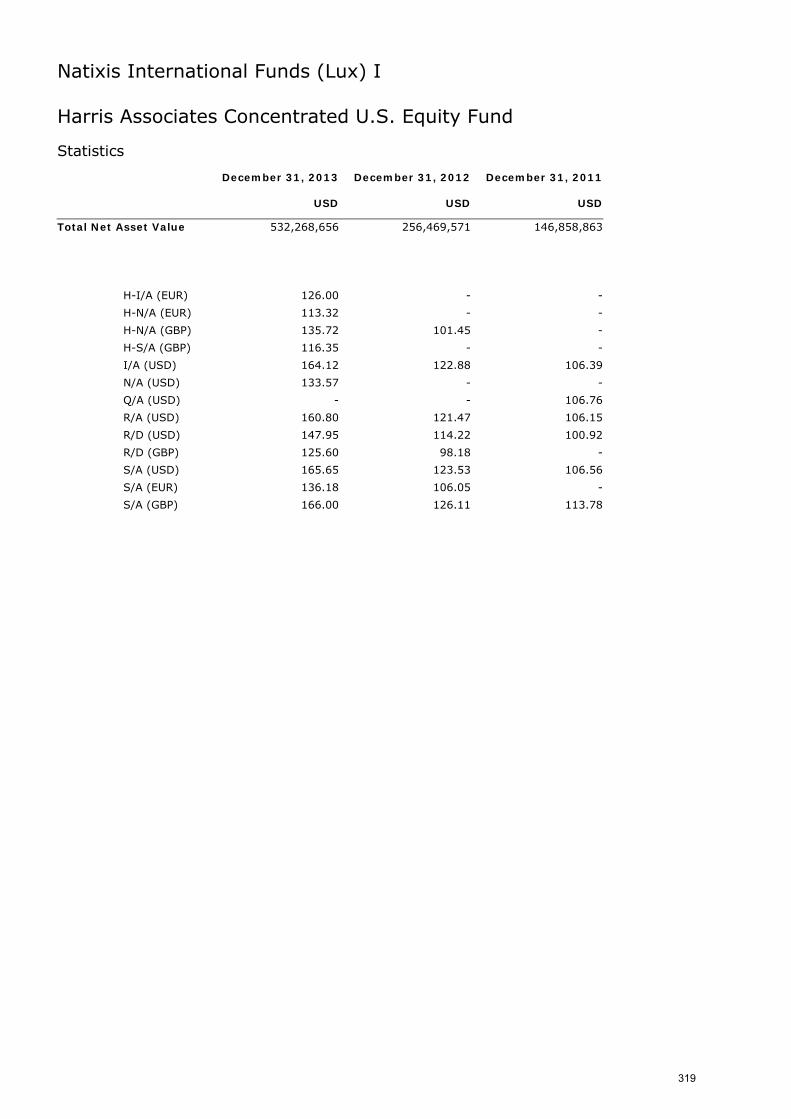
Natixis International Funds (Lux) I
Harris Associates Concentrated U.S. Equity Fund Statistics December 31, 2013 December 31, 2012 December 31, 2011 USD USD USD
Total Net Asset Value 532,268,656 256,469,571 146,858,863
H-I/A (EUR) 126.00 - -
H-N/A (EUR) 113.32 - -
H-N/A (GBP) 135.72 101.45 -
H-S/A (GBP) 116.35 - -
I/A (USD) 164.12 122.88 106.39
N/A (USD) 133.57 - -
Q/A (USD) - - 106.76
R/A (USD) 160.80 121.47 106.15
R/D (USD) 147.95 114.22 100.92
R/D (GBP) 125.60 98.18 -
S/A (USD) 165.65 123.53 106.56
S/A (EUR) 136.18 106.05 -
S/A (GBP) 166.00 126.11 113.78
319
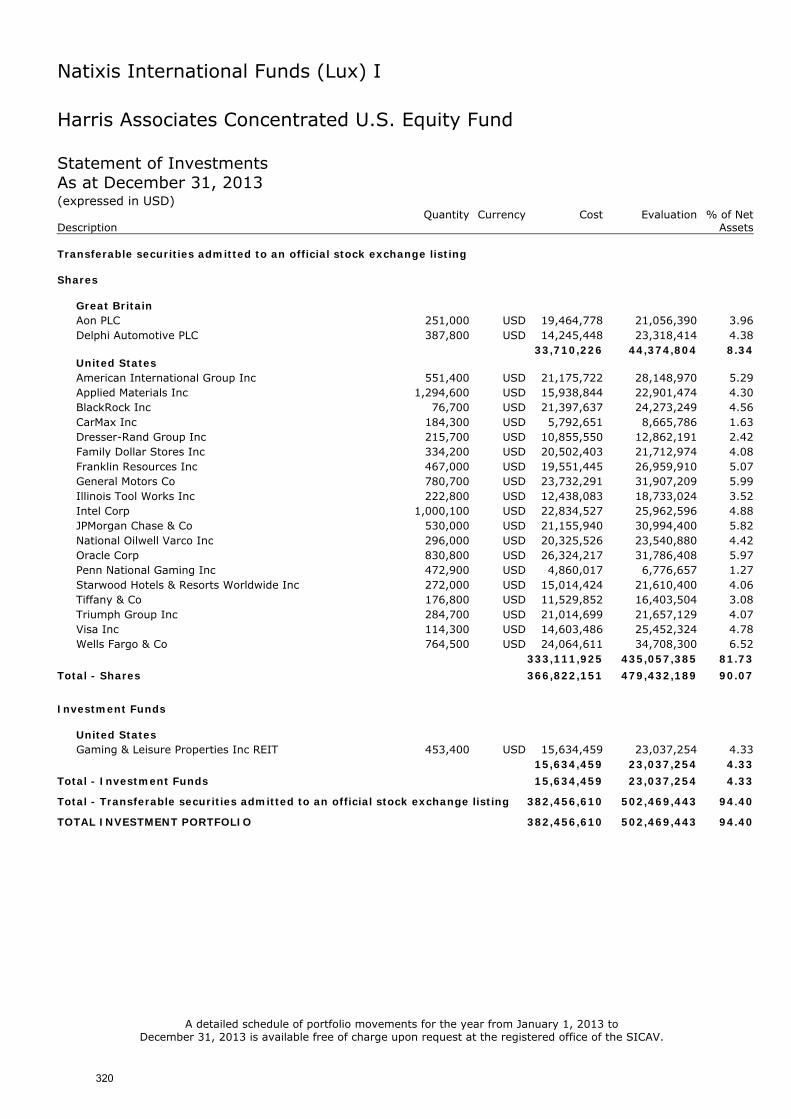
Natixis International Funds (Lux) I
Harris Associates Concentrated U.S. Equity Fund Statement of Investments As at December 31, 2013 (expressed in USD) Quantity Currency Cost Evaluation % of Net Description Assets Transferable securities admitted to an official stock exchange listing Shares
Great Britain Aon PLC 251,000 USD 19,464,778 21,056,390 3.96 Delphi Automotive PLC 387,800 USD 14,245,448 23,318,414 4.38
33,710,226 44,374,804 8.34 United States American International Group Inc 551,400 USD 21,175,722 28,148,970 5.29 Applied Materials Inc 1,294,600 USD 15,938,844 22,901,474 4.30 BlackRock Inc 76,700 USD 21,397,637 24,273,249 4.56 CarMax Inc 184,300 USD 5,792,651 8,665,786 1.63 Dresser-Rand Group Inc 215,700 USD 10,855,550 12,862,191 2.42 Family Dollar Stores Inc 334,200 USD 20,502,403 21,712,974 4.08 Franklin Resources Inc 467,000 USD 19,551,445 26,959,910 5.07 General Motors Co 780,700 USD 23,732,291 31,907,209 5.99 Illinois Tool Works Inc 222,800 USD 12,438,083 18,733,024 3.52 Intel Corp 1,000,100 USD 22,834,527 25,962,596 4.88 JPMorgan Chase & Co 530,000 USD 21,155,940 30,994,400 5.82 National Oilwell Varco Inc 296,000 USD 20,325,526 23,540,880 4.42 Oracle Corp 830,800 USD 26,324,217 31,786,408 5.97 Penn National Gaming Inc 472,900 USD 4,860,017 6,776,657 1.27 Starwood Hotels & Resorts Worldwide Inc 272,000 USD 15,014,424 21,610,400 4.06 Tiffany & Co 176,800 USD 11,529,852 16,403,504 3.08 Triumph Group Inc 284,700 USD 21,014,699 21,657,129 4.07 Visa Inc 114,300 USD 14,603,486 25,452,324 4.78 Wells Fargo & Co 764,500 USD 24,064,611 34,708,300 6.52
333,111,925 435,057,385 81.73
Total - Shares 366,822,151 479,432,189 90.07
Investment Funds
United States Gaming & Leisure Properties Inc REIT 453,400 USD 15,634,459 23,037,254 4.33
15,634,459 23,037,254 4.33
Total - Investment Funds 15,634,459 23,037,254 4.33
Total - Transferable securities admitted to an official stock exchange listing 382,456,610 502,469,443 94.40
TOTAL INVESTMENT PORTFOLIO 382,456,610 502,469,443 94.40
A detailed schedule of portfolio movements for the year from January 1, 2013 to December 31, 2013 is available free of charge upon request at the registered office of the SICAV.
320
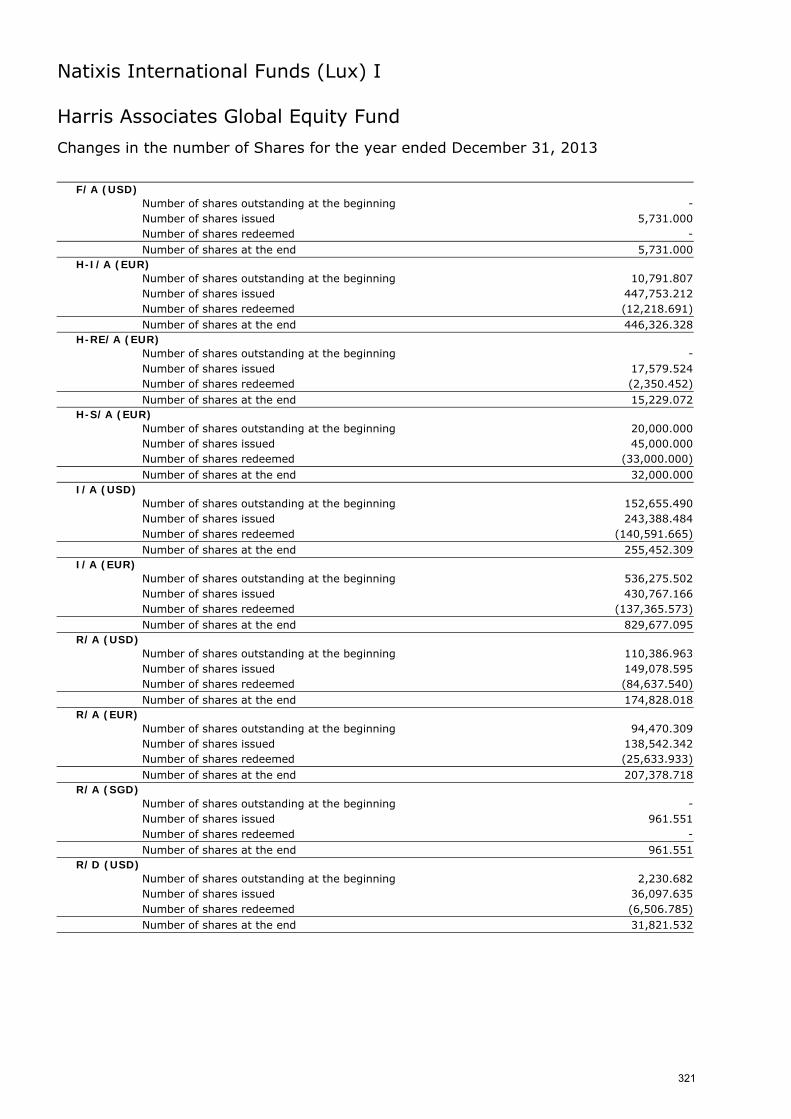
Natixis International Funds (Lux) I
Harris Associates Global Equity Fund
Changes in the number of Shares for the year ended December 31, 2013
F/A (USD) Number of shares outstanding at the beginning - Number of shares issued 5,731.000 Number of shares redeemed - Number of shares at the end 5,731.000
H-I/A (EUR) Number of shares outstanding at the beginning 10,791.807
Number of shares issued 447,753.212
Number of shares redeemed (12,218.691) Number of shares at the end 446,326.328
H-RE/A (EUR) Number of shares outstanding at the beginning - Number of shares issued 17,579.524
Number of shares redeemed (2,350.452) Number of shares at the end 15,229.072
H-S/A (EUR) Number of shares outstanding at the beginning 20,000.000
Number of shares issued 45,000.000
Number of shares redeemed (33,000.000) Number of shares at the end 32,000.000
I/A (USD) Number of shares outstanding at the beginning 152,655.490
Number of shares issued 243,388.484
Number of shares redeemed (140,591.665) Number of shares at the end 255,452.309
I/A (EUR) Number of shares outstanding at the beginning 536,275.502
Number of shares issued 430,767.166
Number of shares redeemed (137,365.573) Number of shares at the end 829,677.095
R/A (USD) Number of shares outstanding at the beginning 110,386.963
Number of shares issued 149,078.595
Number of shares redeemed (84,637.540) Number of shares at the end 174,828.018
R/A (EUR) Number of shares outstanding at the beginning 94,470.309
Number of shares issued 138,542.342
Number of shares redeemed (25,633.933) Number of shares at the end 207,378.718
R/A (SGD) Number of shares outstanding at the beginning - Number of shares issued 961.551
Number of shares redeemed - Number of shares at the end 961.551
R/D (USD) Number of shares outstanding at the beginning 2,230.682
Number of shares issued 36,097.635
Number of shares redeemed (6,506.785) Number of shares at the end 31,821.532
321
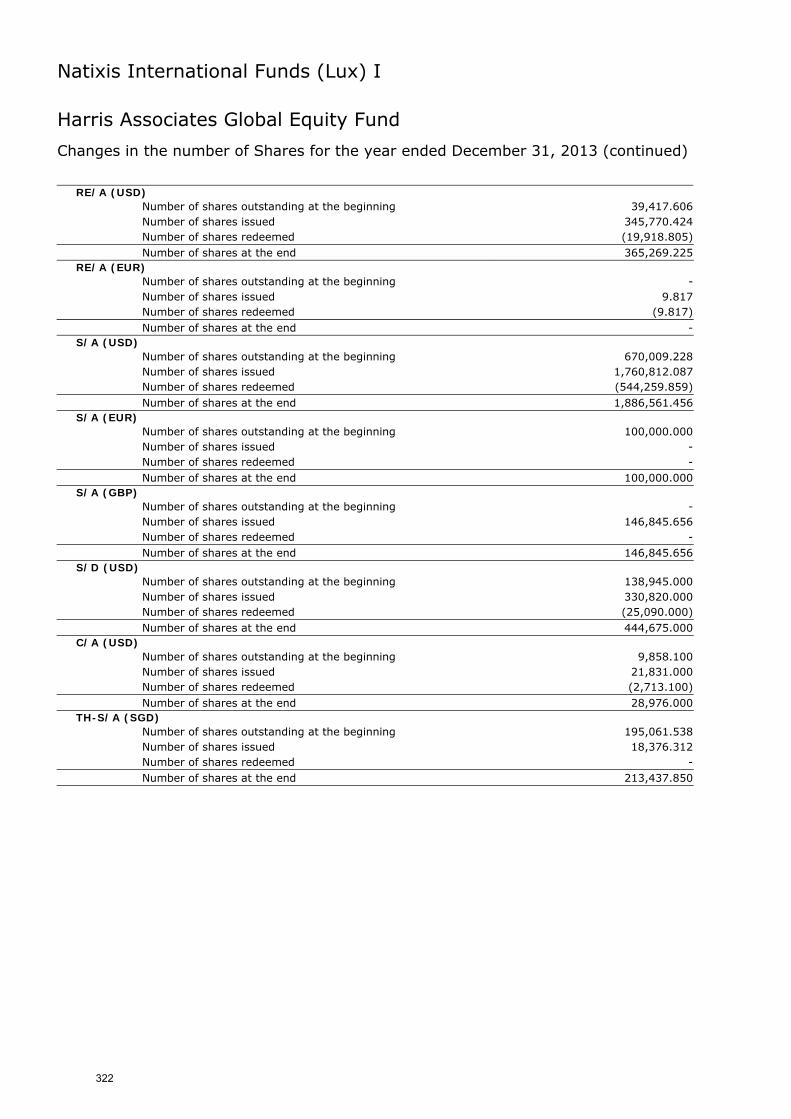
Natixis International Funds (Lux) I
Harris Associates Global Equity Fund
Changes in the number of Shares for the year ended December 31, 2013 (continued) RE/A (USD)
Number of shares outstanding at the beginning 39,417.606
Number of shares issued 345,770.424
Number of shares redeemed (19,918.805) Number of shares at the end 365,269.225
RE/A (EUR) Number of shares outstanding at the beginning - Number of shares issued 9.817
Number of shares redeemed (9.817) Number of shares at the end -
S/A (USD) Number of shares outstanding at the beginning 670,009.228
Number of shares issued 1,760,812.087
Number of shares redeemed (544,259.859) Number of shares at the end 1,886,561.456
S/A (EUR) Number of shares outstanding at the beginning 100,000.000
Number of shares issued - Number of shares redeemed - Number of shares at the end 100,000.000
S/A (GBP) Number of shares outstanding at the beginning - Number of shares issued 146,845.656
Number of shares redeemed - Number of shares at the end 146,845.656
S/D (USD) Number of shares outstanding at the beginning 138,945.000
Number of shares issued 330,820.000
Number of shares redeemed (25,090.000) Number of shares at the end 444,675.000
C/A (USD) Number of shares outstanding at the beginning 9,858.100
Number of shares issued 21,831.000
Number of shares redeemed (2,713.100) Number of shares at the end 28,976.000
TH-S/A (SGD) Number of shares outstanding at the beginning 195,061.538
Number of shares issued 18,376.312
Number of shares redeemed - Number of shares at the end 213,437.850
322
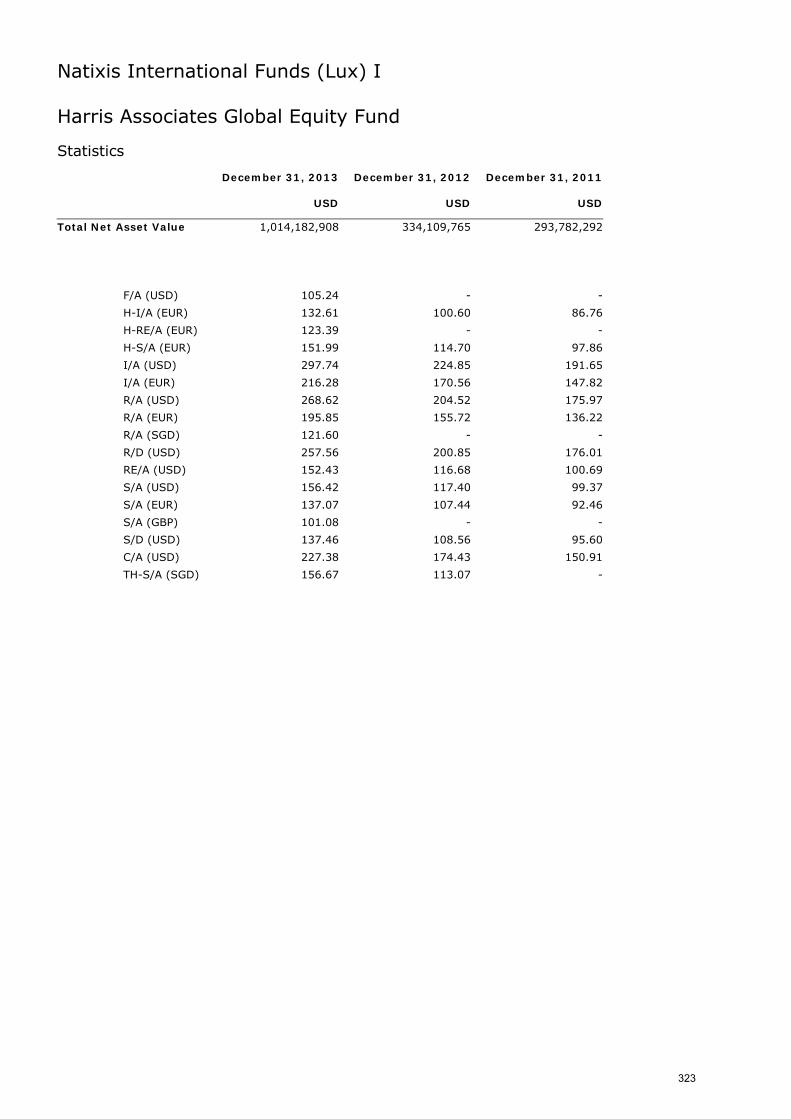
Natixis International Funds (Lux) I
Harris Associates Global Equity Fund Statistics December 31, 2013 December 31, 2012 December 31, 2011 USD USD USD
Total Net Asset Value 1,014,182,908 334,109,765 293,782,292
F/A (USD) 105.24 - -
H-I/A (EUR) 132.61 100.60 86.76
H-RE/A (EUR) 123.39 - -
H-S/A (EUR) 151.99 114.70 97.86
I/A (USD) 297.74 224.85 191.65
I/A (EUR) 216.28 170.56 147.82
R/A (USD) 268.62 204.52 175.97
R/A (EUR) 195.85 155.72 136.22
R/A (SGD) 121.60 - -
R/D (USD) 257.56 200.85 176.01
RE/A (USD) 152.43 116.68 100.69
S/A (USD) 156.42 117.40 99.37
S/A (EUR) 137.07 107.44 92.46
S/A (GBP) 101.08 - -
S/D (USD) 137.46 108.56 95.60
C/A (USD) 227.38 174.43 150.91
TH-S/A (SGD) 156.67 113.07 -
323
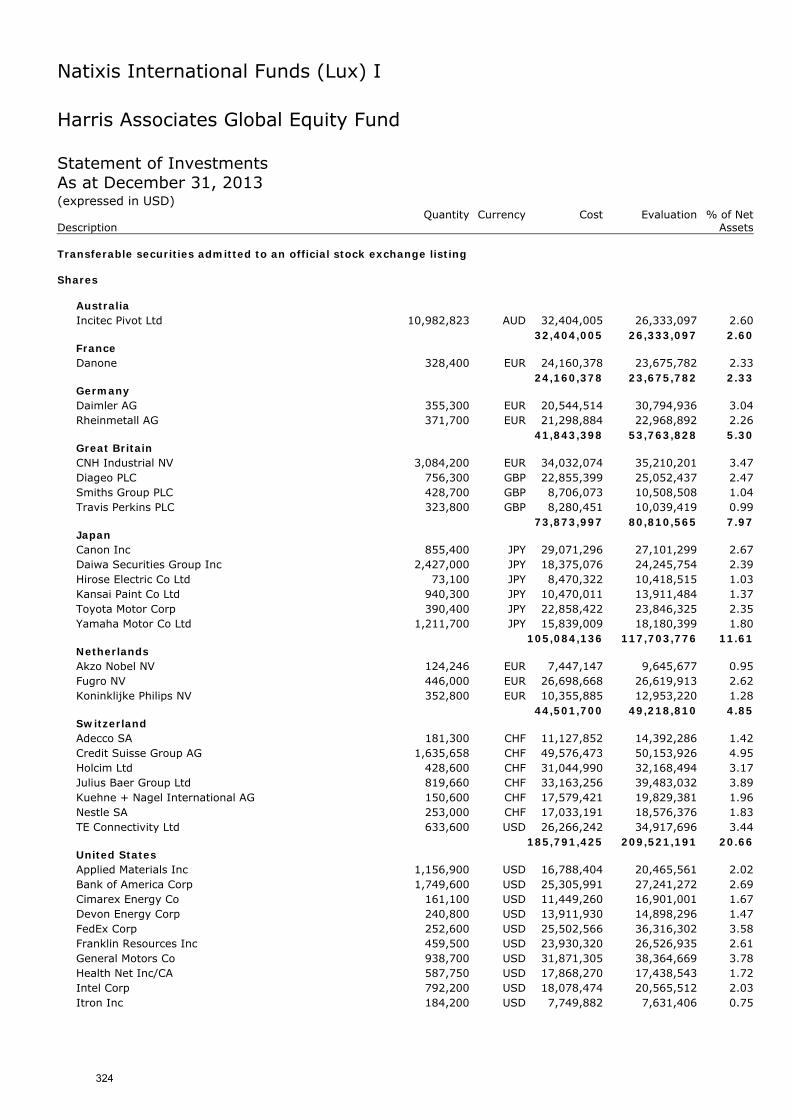
Natixis International Funds (Lux) I
Harris Associates Global Equity Fund Statement of Investments As at December 31, 2013 (expressed in USD) Quantity Currency Cost Evaluation % of Net Description Assets Transferable securities admitted to an official stock exchange listing Shares
Australia Incitec Pivot Ltd 10,982,823 AUD 32,404,005 26,333,097 2.60
32,404,005 26,333,097 2.60 France Danone 328,400 EUR 24,160,378 23,675,782 2.33
24,160,378 23,675,782 2.33 Germany Daimler AG 355,300 EUR 20,544,514 30,794,936 3.04 Rheinmetall AG 371,700 EUR 21,298,884 22,968,892 2.26
41,843,398 53,763,828 5.30 Great Britain CNH Industrial NV 3,084,200 EUR 34,032,074 35,210,201 3.47 Diageo PLC 756,300 GBP 22,855,399 25,052,437 2.47 Smiths Group PLC 428,700 GBP 8,706,073 10,508,508 1.04 Travis Perkins PLC 323,800 GBP 8,280,451 10,039,419 0.99
73,873,997 80,810,565 7.97 Japan Canon Inc 855,400 JPY 29,071,296 27,101,299 2.67 Daiwa Securities Group Inc 2,427,000 JPY 18,375,076 24,245,754 2.39 Hirose Electric Co Ltd 73,100 JPY 8,470,322 10,418,515 1.03 Kansai Paint Co Ltd 940,300 JPY 10,470,011 13,911,484 1.37 Toyota Motor Corp 390,400 JPY 22,858,422 23,846,325 2.35 Yamaha Motor Co Ltd 1,211,700 JPY 15,839,009 18,180,399 1.80
105,084,136 117,703,776 11.61 Netherlands Akzo Nobel NV 124,246 EUR 7,447,147 9,645,677 0.95 Fugro NV 446,000 EUR 26,698,668 26,619,913 2.62 Koninklijke Philips NV 352,800 EUR 10,355,885 12,953,220 1.28
44,501,700 49,218,810 4.85 Switzerland Adecco SA 181,300 CHF 11,127,852 14,392,286 1.42 Credit Suisse Group AG 1,635,658 CHF 49,576,473 50,153,926 4.95 Holcim Ltd 428,600 CHF 31,044,990 32,168,494 3.17 Julius Baer Group Ltd 819,660 CHF 33,163,256 39,483,032 3.89 Kuehne + Nagel International AG 150,600 CHF 17,579,421 19,829,381 1.96 Nestle SA 253,000 CHF 17,033,191 18,576,376 1.83 TE Connectivity Ltd 633,600 USD 26,266,242 34,917,696 3.44
185,791,425 209,521,191 20.66 United States Applied Materials Inc 1,156,900 USD 16,788,404 20,465,561 2.02 Bank of America Corp 1,749,600 USD 25,305,991 27,241,272 2.69 Cimarex Energy Co 161,100 USD 11,449,260 16,901,001 1.67 Devon Energy Corp 240,800 USD 13,911,930 14,898,296 1.47 FedEx Corp 252,600 USD 25,502,566 36,316,302 3.58 Franklin Resources Inc 459,500 USD 23,930,320 26,526,935 2.61 General Motors Co 938,700 USD 31,871,305 38,364,669 3.78 Health Net Inc/CA 587,750 USD 17,868,270 17,438,543 1.72 Intel Corp 792,200 USD 18,078,474 20,565,512 2.03 Itron Inc 184,200 USD 7,749,882 7,631,406 0.75
324
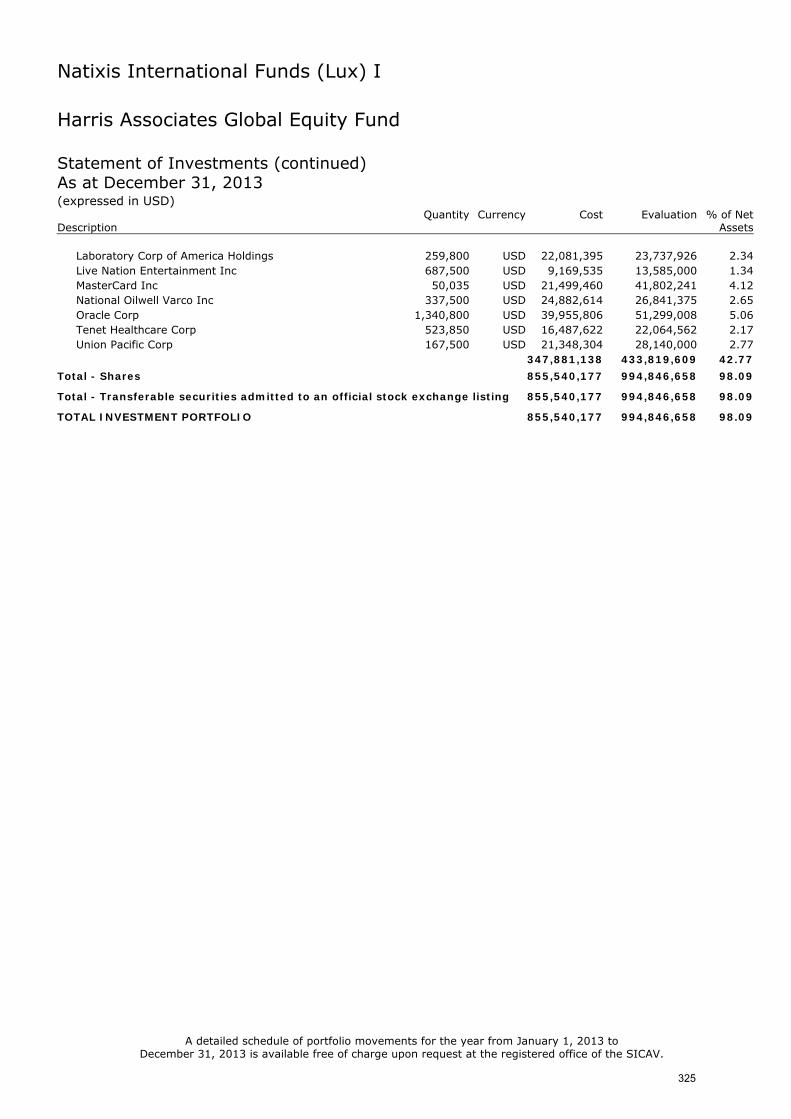
Natixis International Funds (Lux) I
Harris Associates Global Equity Fund Statement of Investments (continued) As at December 31, 2013 (expressed in USD) Quantity Currency Cost Evaluation % of Net Description Assets
Laboratory Corp of America Holdings 259,800 USD 22,081,395 23,737,926 2.34 Live Nation Entertainment Inc 687,500 USD 9,169,535 13,585,000 1.34 MasterCard Inc 50,035 USD 21,499,460 41,802,241 4.12 National Oilwell Varco Inc 337,500 USD 24,882,614 26,841,375 2.65 Oracle Corp 1,340,800 USD 39,955,806 51,299,008 5.06 Tenet Healthcare Corp 523,850 USD 16,487,622 22,064,562 2.17 Union Pacific Corp 167,500 USD 21,348,304 28,140,000 2.77
347,881,138 433,819,609 42.77
Total - Shares 855,540,177 994,846,658 98.09
Total - Transferable securities admitted to an official stock exchange listing 855,540,177 994,846,658 98.09
TOTAL INVESTMENT PORTFOLIO 855,540,177 994,846,658 98.09
A detailed schedule of portfolio movements for the year from January 1, 2013 to December 31, 2013 is available free of charge upon request at the registered office of the SICAV.
325
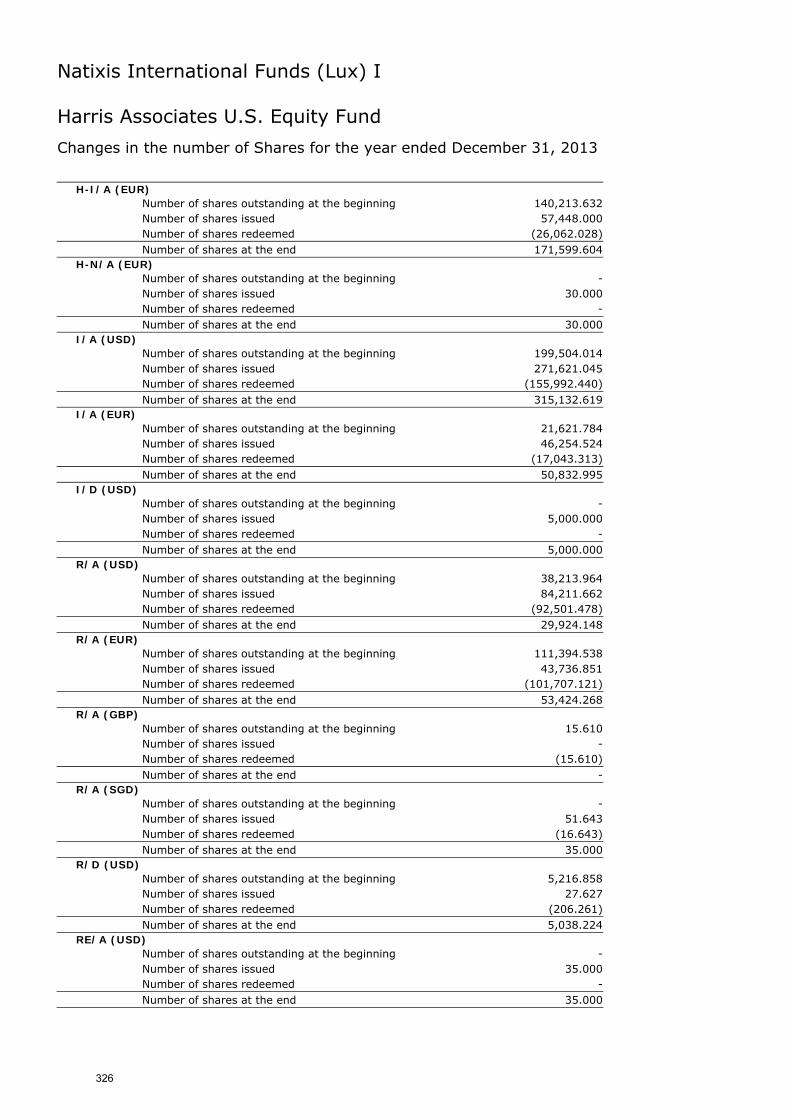
Natixis International Funds (Lux) I
Harris Associates U.S. Equity Fund
Changes in the number of Shares for the year ended December 31, 2013
H-I/A (EUR) Number of shares outstanding at the beginning 140,213.632
Number of shares issued 57,448.000
Number of shares redeemed (26,062.028) Number of shares at the end 171,599.604
H-N/A (EUR) Number of shares outstanding at the beginning - Number of shares issued 30.000
Number of shares redeemed - Number of shares at the end 30.000
I/A (USD) Number of shares outstanding at the beginning 199,504.014
Number of shares issued 271,621.045
Number of shares redeemed (155,992.440) Number of shares at the end 315,132.619
I/A (EUR) Number of shares outstanding at the beginning 21,621.784
Number of shares issued 46,254.524
Number of shares redeemed (17,043.313) Number of shares at the end 50,832.995
I/D (USD) Number of shares outstanding at the beginning - Number of shares issued 5,000.000
Number of shares redeemed - Number of shares at the end 5,000.000
R/A (USD) Number of shares outstanding at the beginning 38,213.964
Number of shares issued 84,211.662
Number of shares redeemed (92,501.478) Number of shares at the end 29,924.148
R/A (EUR) Number of shares outstanding at the beginning 111,394.538
Number of shares issued 43,736.851
Number of shares redeemed (101,707.121) Number of shares at the end 53,424.268
R/A (GBP) Number of shares outstanding at the beginning 15.610
Number of shares issued - Number of shares redeemed (15.610) Number of shares at the end -
R/A (SGD) Number of shares outstanding at the beginning - Number of shares issued 51.643
Number of shares redeemed (16.643) Number of shares at the end 35.000
R/D (USD) Number of shares outstanding at the beginning 5,216.858
Number of shares issued 27.627
Number of shares redeemed (206.261) Number of shares at the end 5,038.224
RE/A (USD) Number of shares outstanding at the beginning - Number of shares issued 35.000
Number of shares redeemed - Number of shares at the end 35.000
326
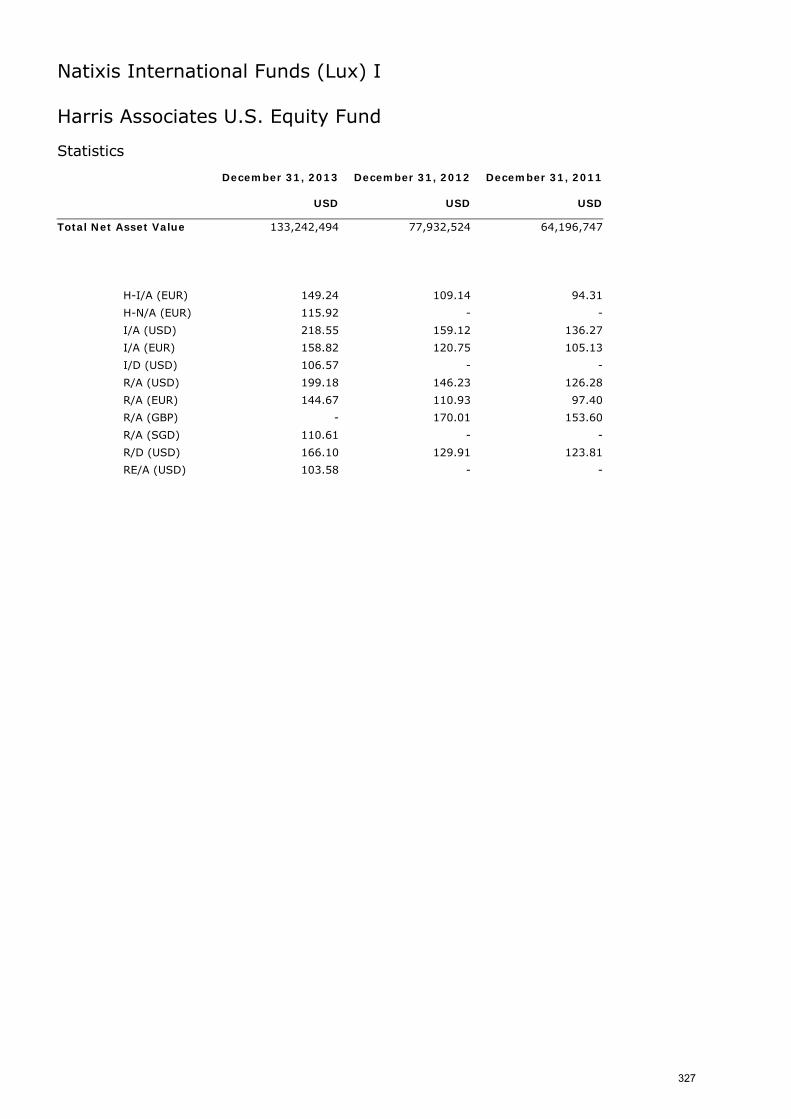
Natixis International Funds (Lux) I
Harris Associates U.S. Equity Fund Statistics December 31, 2013 December 31, 2012 December 31, 2011 USD USD USD
Total Net Asset Value 133,242,494 77,932,524 64,196,747
H-I/A (EUR) 149.24 109.14 94.31
H-N/A (EUR) 115.92 - -
I/A (USD) 218.55 159.12 136.27
I/A (EUR) 158.82 120.75 105.13
I/D (USD) 106.57 - -
R/A (USD) 199.18 146.23 126.28
R/A (EUR) 144.67 110.93 97.40
R/A (GBP) - 170.01 153.60
R/A (SGD) 110.61 - -
R/D (USD) 166.10 129.91 123.81
RE/A (USD) 103.58 - -
327
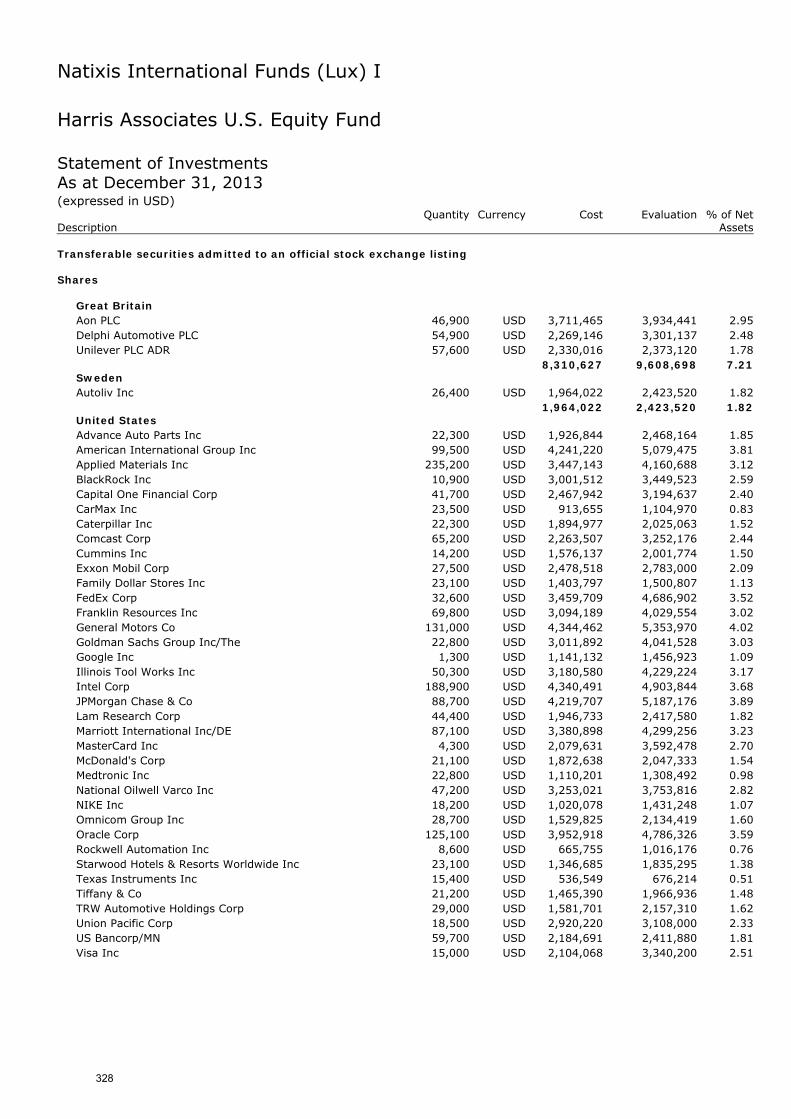
Natixis International Funds (Lux) I
Harris Associates U.S. Equity Fund Statement of Investments As at December 31, 2013 (expressed in USD) Quantity Currency Cost Evaluation % of Net Description Assets Transferable securities admitted to an official stock exchange listing Shares
Great Britain Aon PLC 46,900 USD 3,711,465 3,934,441 2.95 Delphi Automotive PLC 54,900 USD 2,269,146 3,301,137 2.48 Unilever PLC ADR 57,600 USD 2,330,016 2,373,120 1.78
8,310,627 9,608,698 7.21 Sweden Autoliv Inc 26,400 USD 1,964,022 2,423,520 1.82
1,964,022 2,423,520 1.82 United States Advance Auto Parts Inc 22,300 USD 1,926,844 2,468,164 1.85 American International Group Inc 99,500 USD 4,241,220 5,079,475 3.81 Applied Materials Inc 235,200 USD 3,447,143 4,160,688 3.12 BlackRock Inc 10,900 USD 3,001,512 3,449,523 2.59 Capital One Financial Corp 41,700 USD 2,467,942 3,194,637 2.40 CarMax Inc 23,500 USD 913,655 1,104,970 0.83 Caterpillar Inc 22,300 USD 1,894,977 2,025,063 1.52 Comcast Corp 65,200 USD 2,263,507 3,252,176 2.44 Cummins Inc 14,200 USD 1,576,137 2,001,774 1.50 Exxon Mobil Corp 27,500 USD 2,478,518 2,783,000 2.09 Family Dollar Stores Inc 23,100 USD 1,403,797 1,500,807 1.13 FedEx Corp 32,600 USD 3,459,709 4,686,902 3.52 Franklin Resources Inc 69,800 USD 3,094,189 4,029,554 3.02 General Motors Co 131,000 USD 4,344,462 5,353,970 4.02 Goldman Sachs Group Inc/The 22,800 USD 3,011,892 4,041,528 3.03 Google Inc 1,300 USD 1,141,132 1,456,923 1.09 Illinois Tool Works Inc 50,300 USD 3,180,580 4,229,224 3.17 Intel Corp 188,900 USD 4,340,491 4,903,844 3.68 JPMorgan Chase & Co 88,700 USD 4,219,707 5,187,176 3.89 Lam Research Corp 44,400 USD 1,946,733 2,417,580 1.82 Marriott International Inc/DE 87,100 USD 3,380,898 4,299,256 3.23 MasterCard Inc 4,300 USD 2,079,631 3,592,478 2.70 McDonald's Corp 21,100 USD 1,872,638 2,047,333 1.54 Medtronic Inc 22,800 USD 1,110,201 1,308,492 0.98 National Oilwell Varco Inc 47,200 USD 3,253,021 3,753,816 2.82 NIKE Inc 18,200 USD 1,020,078 1,431,248 1.07 Omnicom Group Inc 28,700 USD 1,529,825 2,134,419 1.60 Oracle Corp 125,100 USD 3,952,918 4,786,326 3.59 Rockwell Automation Inc 8,600 USD 665,755 1,016,176 0.76 Starwood Hotels & Resorts Worldwide Inc 23,100 USD 1,346,685 1,835,295 1.38 Texas Instruments Inc 15,400 USD 536,549 676,214 0.51 Tiffany & Co 21,200 USD 1,465,390 1,966,936 1.48 TRW Automotive Holdings Corp 29,000 USD 1,581,701 2,157,310 1.62 Union Pacific Corp 18,500 USD 2,920,220 3,108,000 2.33 US Bancorp/MN 59,700 USD 2,184,691 2,411,880 1.81 Visa Inc 15,000 USD 2,104,068 3,340,200 2.51
328
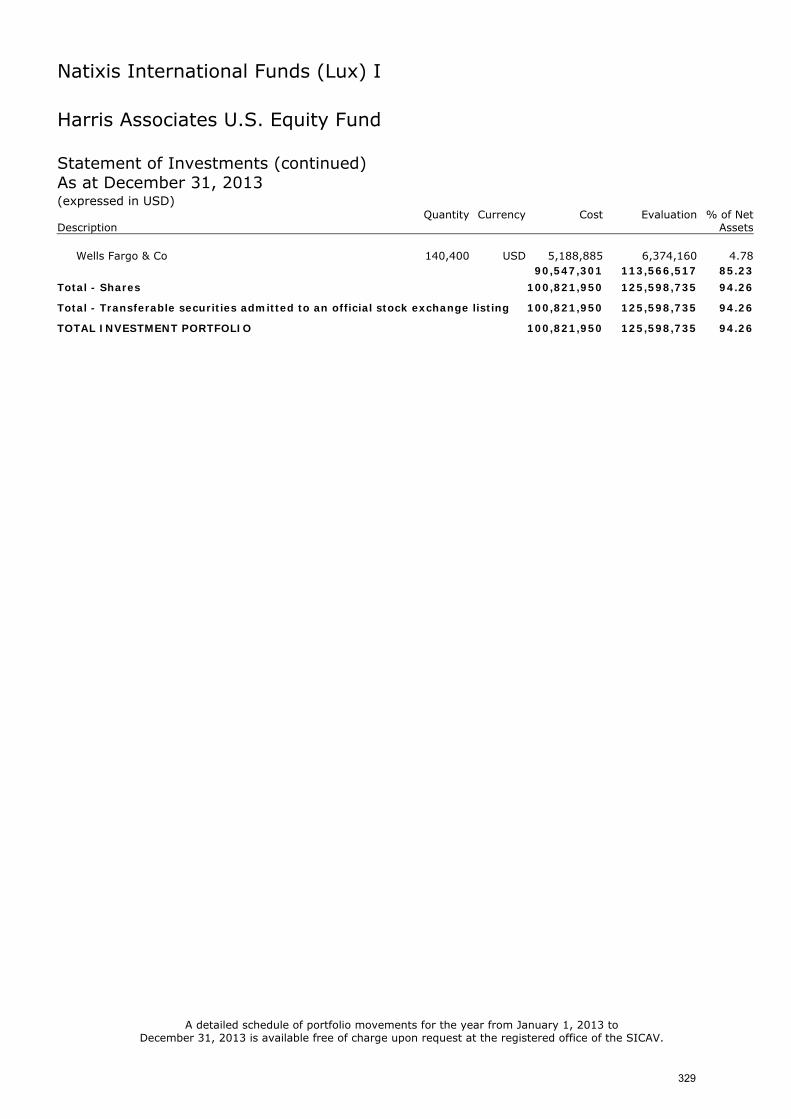
Natixis International Funds (Lux) I
Harris Associates U.S. Equity Fund Statement of Investments (continued) As at December 31, 2013 (expressed in USD) Quantity Currency Cost Evaluation % of Net Description Assets
Wells Fargo & Co 140,400 USD 5,188,885 6,374,160 4.78 90,547,301 113,566,517 85.23
Total - Shares 100,821,950 125,598,735 94.26
Total - Transferable securities admitted to an official stock exchange listing 100,821,950 125,598,735 94.26
TOTAL INVESTMENT PORTFOLIO 100,821,950 125,598,735 94.26
A detailed schedule of portfolio movements for the year from January 1, 2013 to December 31, 2013 is available free of charge upon request at the registered office of the SICAV.
329
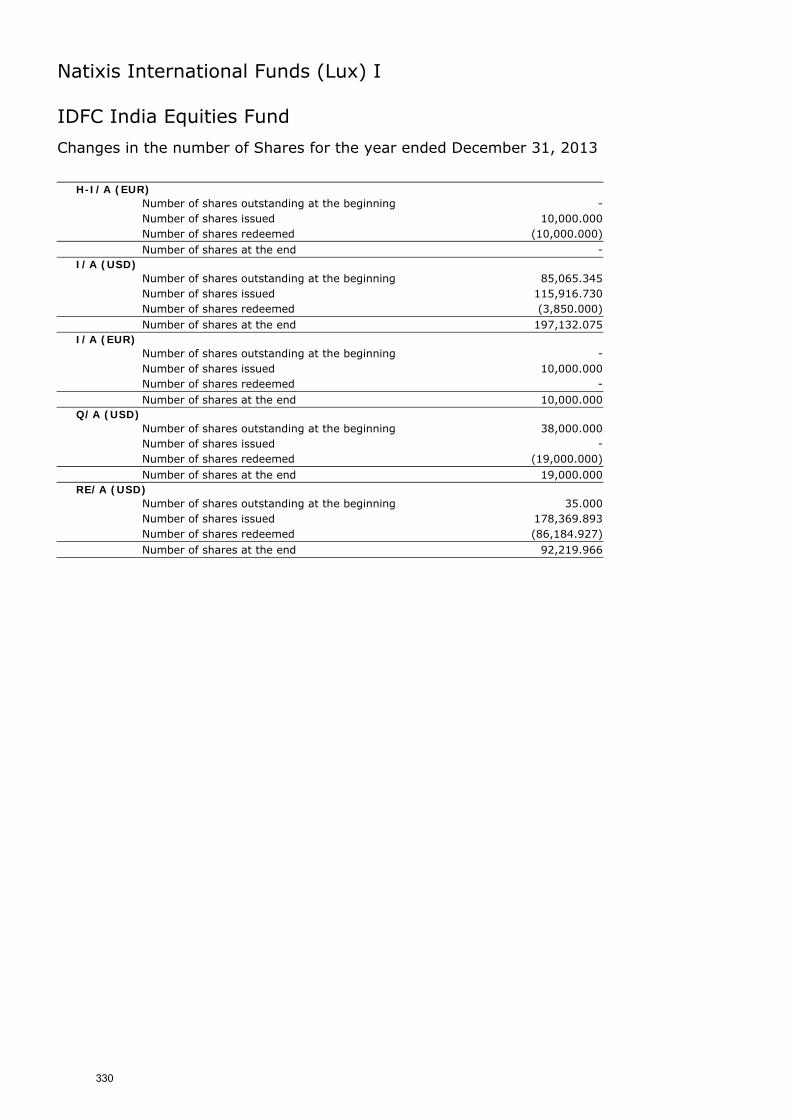
Natixis International Funds (Lux) I
IDFC India Equities Fund
Changes in the number of Shares for the year ended December 31, 2013
H-I/A (EUR) Number of shares outstanding at the beginning - Number of shares issued 10,000.000
Number of shares redeemed (10,000.000) Number of shares at the end -
I/A (USD) Number of shares outstanding at the beginning 85,065.345
Number of shares issued 115,916.730
Number of shares redeemed (3,850.000) Number of shares at the end 197,132.075
I/A (EUR) Number of shares outstanding at the beginning - Number of shares issued 10,000.000
Number of shares redeemed - Number of shares at the end 10,000.000
Q/A (USD) Number of shares outstanding at the beginning 38,000.000
Number of shares issued - Number of shares redeemed (19,000.000) Number of shares at the end 19,000.000
RE/A (USD) Number of shares outstanding at the beginning 35.000
Number of shares issued 178,369.893
Number of shares redeemed (86,184.927) Number of shares at the end 92,219.966
330
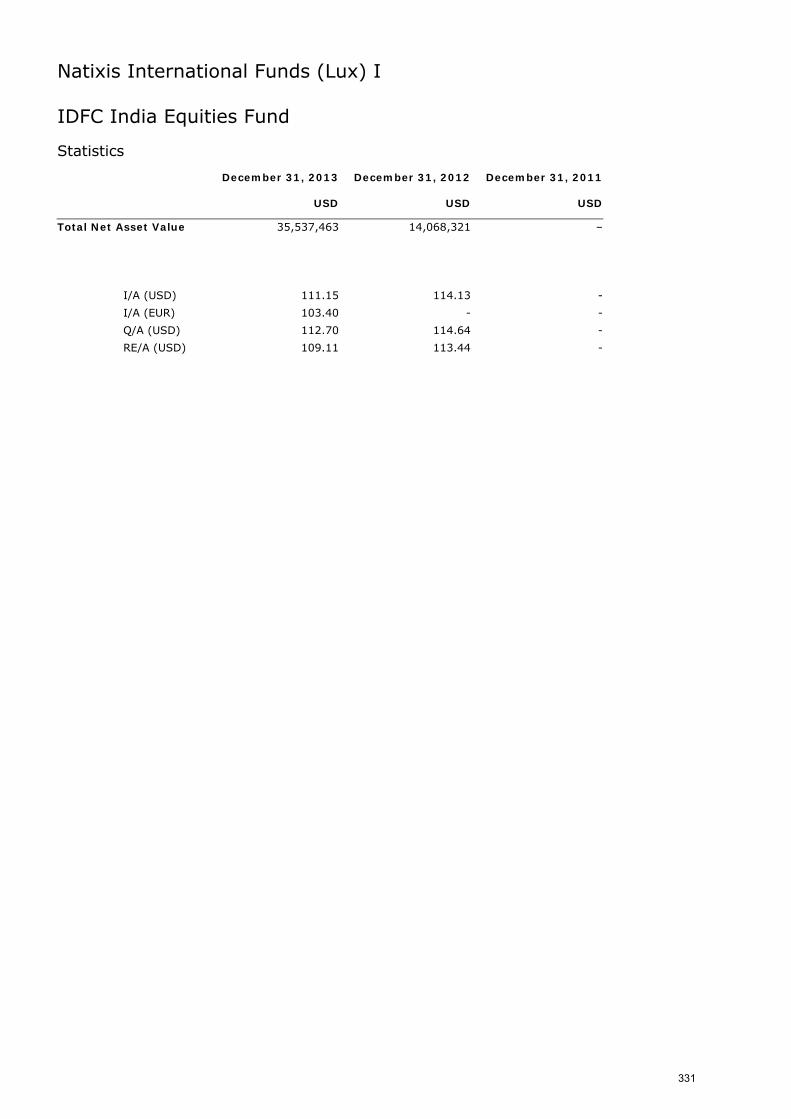
Natixis International Funds (Lux) I
IDFC India Equities Fund Statistics December 31, 2013 December 31, 2012 December 31, 2011 USD USD USD
Total Net Asset Value 35,537,463 14,068,321 –
I/A (USD) 111.15 114.13 -
I/A (EUR) 103.40 - -
Q/A (USD) 112.70 114.64 -
RE/A (USD) 109.11 113.44 -
331
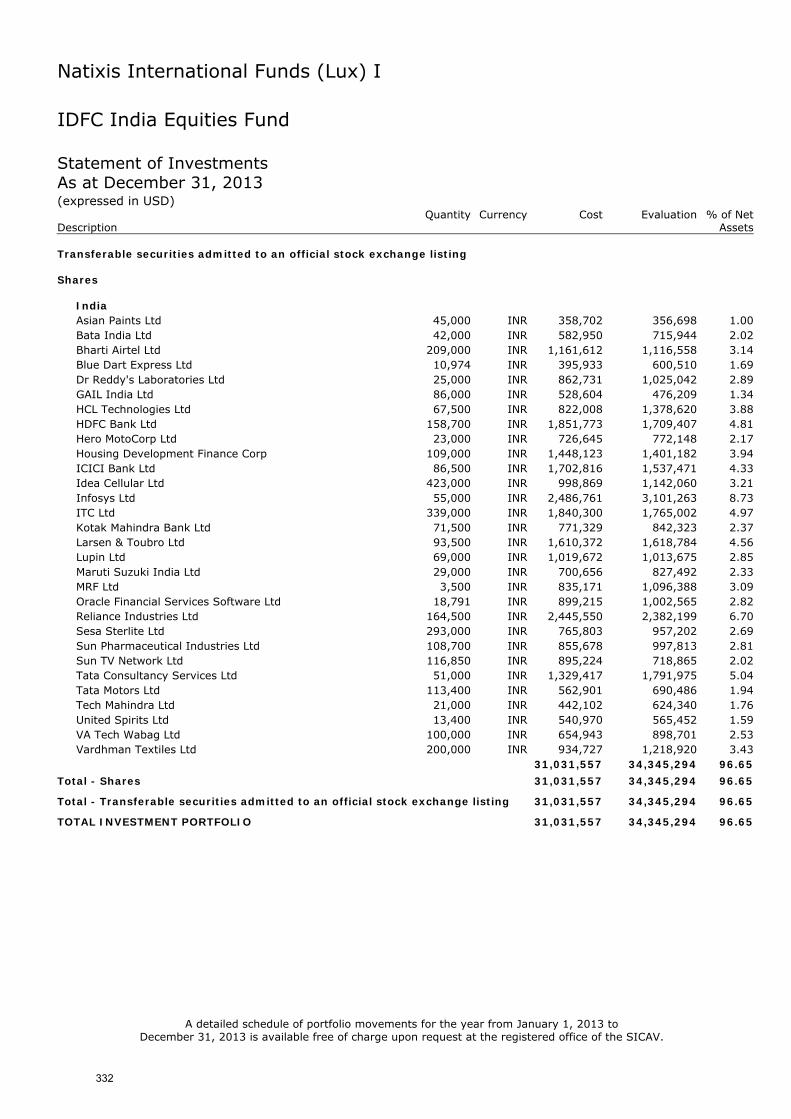
Natixis International Funds (Lux) I
IDFC India Equities Fund Statement of Investments As at December 31, 2013 (expressed in USD) Quantity Currency Cost Evaluation % of Net Description Assets Transferable securities admitted to an official stock exchange listing Shares
India Asian Paints Ltd 45,000 INR 358,702 356,698 1.00 Bata India Ltd 42,000 INR 582,950 715,944 2.02 Bharti Airtel Ltd 209,000 INR 1,161,612 1,116,558 3.14 Blue Dart Express Ltd 10,974 INR 395,933 600,510 1.69 Dr Reddy's Laboratories Ltd 25,000 INR 862,731 1,025,042 2.89 GAIL India Ltd 86,000 INR 528,604 476,209 1.34 HCL Technologies Ltd 67,500 INR 822,008 1,378,620 3.88 HDFC Bank Ltd 158,700 INR 1,851,773 1,709,407 4.81 Hero MotoCorp Ltd 23,000 INR 726,645 772,148 2.17 Housing Development Finance Corp 109,000 INR 1,448,123 1,401,182 3.94 ICICI Bank Ltd 86,500 INR 1,702,816 1,537,471 4.33 Idea Cellular Ltd 423,000 INR 998,869 1,142,060 3.21 Infosys Ltd 55,000 INR 2,486,761 3,101,263 8.73 ITC Ltd 339,000 INR 1,840,300 1,765,002 4.97 Kotak Mahindra Bank Ltd 71,500 INR 771,329 842,323 2.37 Larsen & Toubro Ltd 93,500 INR 1,610,372 1,618,784 4.56 Lupin Ltd 69,000 INR 1,019,672 1,013,675 2.85 Maruti Suzuki India Ltd 29,000 INR 700,656 827,492 2.33 MRF Ltd 3,500 INR 835,171 1,096,388 3.09 Oracle Financial Services Software Ltd 18,791 INR 899,215 1,002,565 2.82 Reliance Industries Ltd 164,500 INR 2,445,550 2,382,199 6.70 Sesa Sterlite Ltd 293,000 INR 765,803 957,202 2.69 Sun Pharmaceutical Industries Ltd 108,700 INR 855,678 997,813 2.81 Sun TV Network Ltd 116,850 INR 895,224 718,865 2.02 Tata Consultancy Services Ltd 51,000 INR 1,329,417 1,791,975 5.04 Tata Motors Ltd 113,400 INR 562,901 690,486 1.94 Tech Mahindra Ltd 21,000 INR 442,102 624,340 1.76 United Spirits Ltd 13,400 INR 540,970 565,452 1.59 VA Tech Wabag Ltd 100,000 INR 654,943 898,701 2.53 Vardhman Textiles Ltd 200,000 INR 934,727 1,218,920 3.43
31,031,557 34,345,294 96.65
Total - Shares 31,031,557 34,345,294 96.65
Total - Transferable securities admitted to an official stock exchange listing 31,031,557 34,345,294 96.65
TOTAL INVESTMENT PORTFOLIO 31,031,557 34,345,294 96.65
A detailed schedule of portfolio movements for the year from January 1, 2013 to December 31, 2013 is available free of charge upon request at the registered office of the SICAV.
332
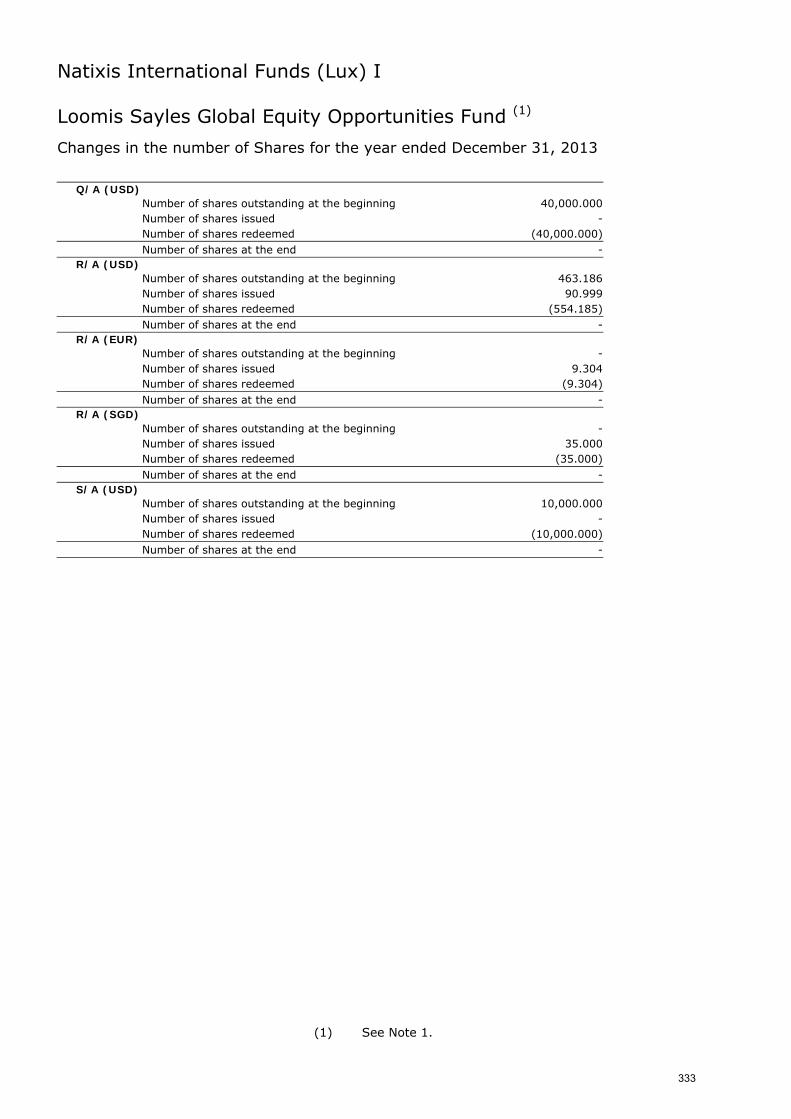
Natixis International Funds (Lux) I
Loomis Sayles Global Equity Opportunities Fund (1)
Changes in the number of Shares for the year ended December 31, 2013
Q/A (USD) Number of shares outstanding at the beginning 40,000.000
Number of shares issued - Number of shares redeemed (40,000.000) Number of shares at the end -
R/A (USD) Number of shares outstanding at the beginning 463.186
Number of shares issued 90.999
Number of shares redeemed (554.185) Number of shares at the end -
R/A (EUR) Number of shares outstanding at the beginning - Number of shares issued 9.304
Number of shares redeemed (9.304) Number of shares at the end -
R/A (SGD) Number of shares outstanding at the beginning - Number of shares issued 35.000
Number of shares redeemed (35.000) Number of shares at the end -
S/A (USD) Number of shares outstanding at the beginning 10,000.000
Number of shares issued - Number of shares redeemed (10,000.000) Number of shares at the end -
(1) See Note 1.
333
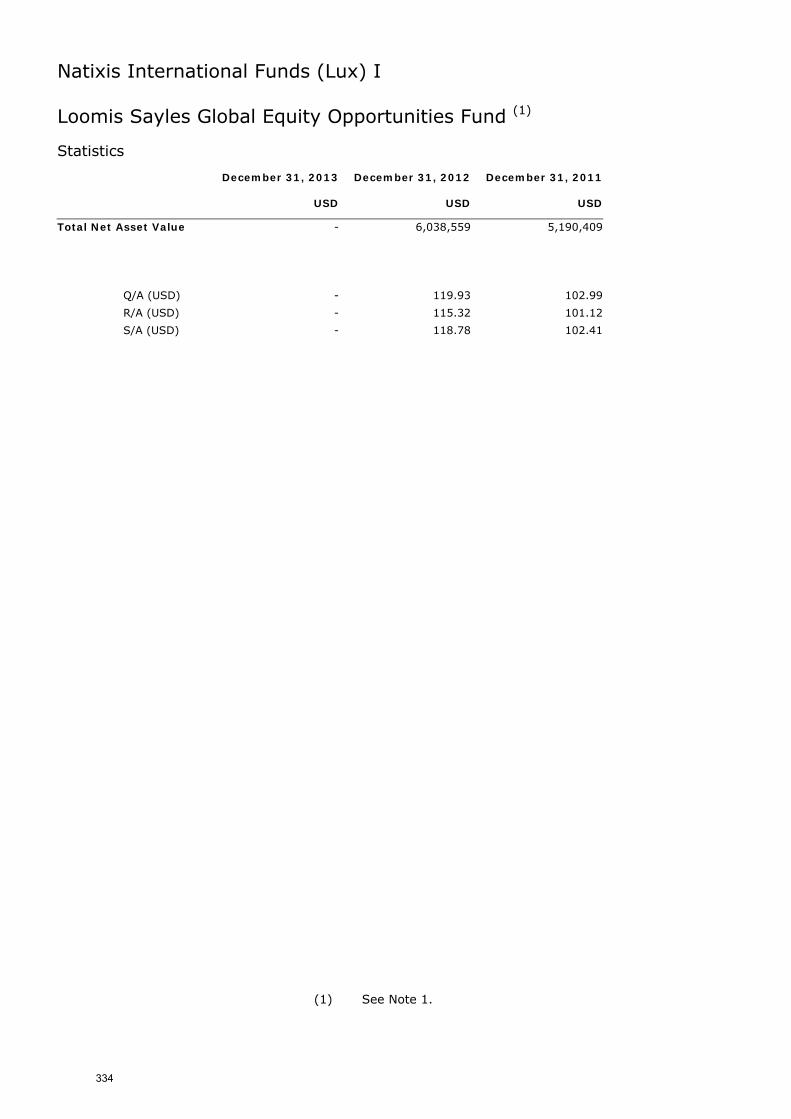
Natixis International Funds (Lux) I
Loomis Sayles Global Equity Opportunities Fund (1) Statistics December 31, 2013 December 31, 2012 December 31, 2011 USD USD USD
Total Net Asset Value - 6,038,559 5,190,409
Q/A (USD) - 119.93 102.99
R/A (USD) - 115.32 101.12
S/A (USD) - 118.78 102.41
(1) See Note 1.
334
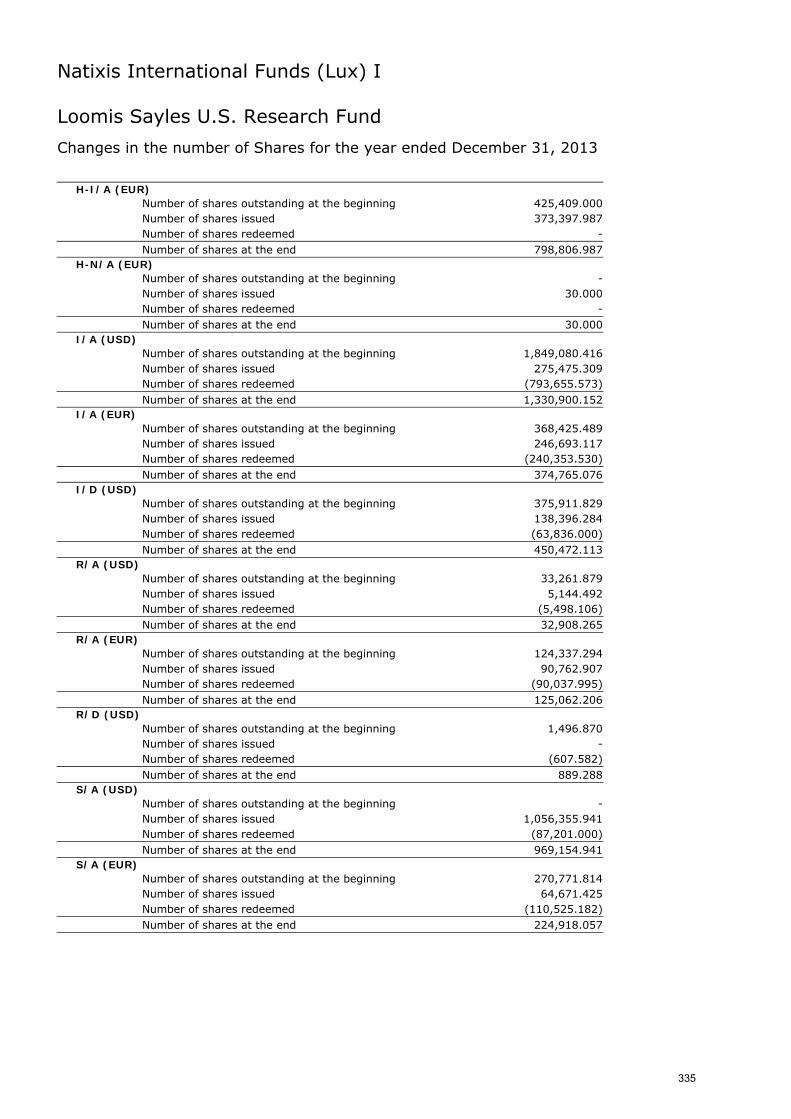
Natixis International Funds (Lux) I
Loomis Sayles U.S. Research Fund
Changes in the number of Shares for the year ended December 31, 2013
H-I/A (EUR) Number of shares outstanding at the beginning 425,409.000
Number of shares issued 373,397.987
Number of shares redeemed - Number of shares at the end 798,806.987
H-N/A (EUR) Number of shares outstanding at the beginning - Number of shares issued 30.000
Number of shares redeemed - Number of shares at the end 30.000
I/A (USD) Number of shares outstanding at the beginning 1,849,080.416
Number of shares issued 275,475.309
Number of shares redeemed (793,655.573) Number of shares at the end 1,330,900.152
I/A (EUR) Number of shares outstanding at the beginning 368,425.489
Number of shares issued 246,693.117
Number of shares redeemed (240,353.530) Number of shares at the end 374,765.076
I/D (USD) Number of shares outstanding at the beginning 375,911.829
Number of shares issued 138,396.284
Number of shares redeemed (63,836.000) Number of shares at the end 450,472.113
R/A (USD) Number of shares outstanding at the beginning 33,261.879
Number of shares issued 5,144.492
Number of shares redeemed (5,498.106) Number of shares at the end 32,908.265
R/A (EUR) Number of shares outstanding at the beginning 124,337.294
Number of shares issued 90,762.907
Number of shares redeemed (90,037.995) Number of shares at the end 125,062.206
R/D (USD) Number of shares outstanding at the beginning 1,496.870
Number of shares issued - Number of shares redeemed (607.582) Number of shares at the end 889.288
S/A (USD) Number of shares outstanding at the beginning - Number of shares issued 1,056,355.941
Number of shares redeemed (87,201.000) Number of shares at the end 969,154.941
S/A (EUR) Number of shares outstanding at the beginning 270,771.814
Number of shares issued 64,671.425
Number of shares redeemed (110,525.182) Number of shares at the end 224,918.057
335
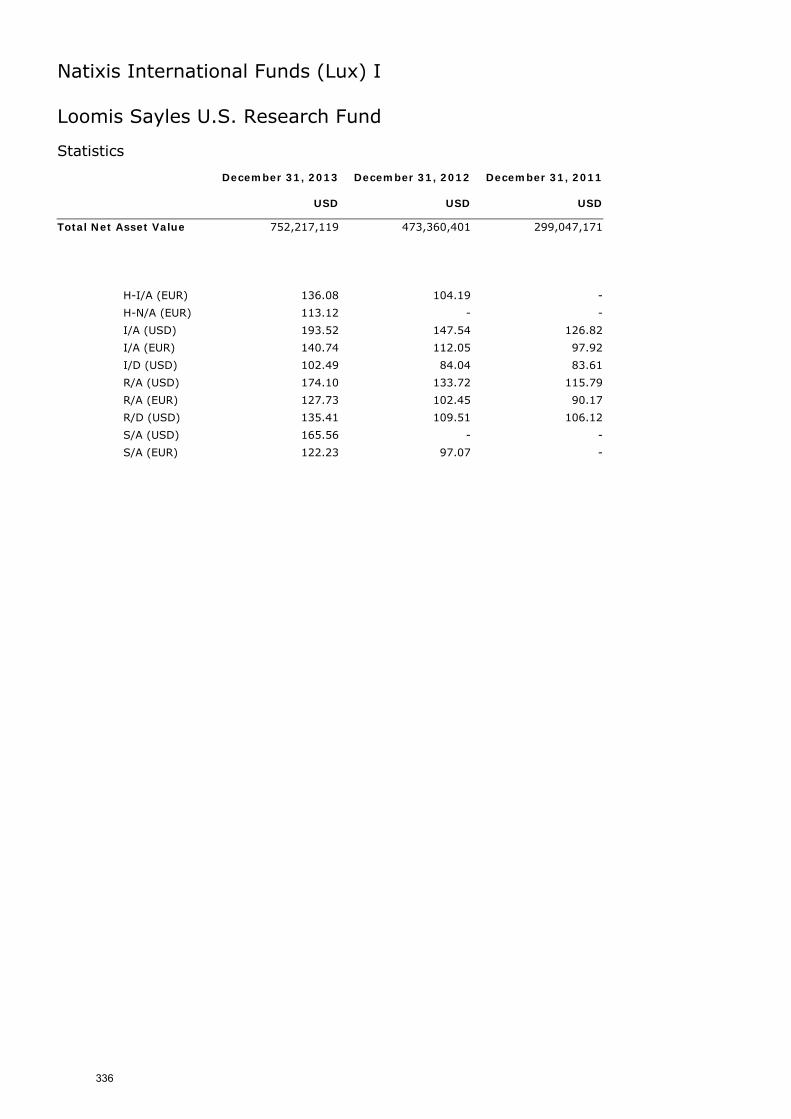
Natixis International Funds (Lux) I
Loomis Sayles U.S. Research Fund Statistics December 31, 2013 December 31, 2012 December 31, 2011 USD USD USD
Total Net Asset Value 752,217,119 473,360,401 299,047,171
H-I/A (EUR) 136.08 104.19 -
H-N/A (EUR) 113.12 - -
I/A (USD) 193.52 147.54 126.82
I/A (EUR) 140.74 112.05 97.92
I/D (USD) 102.49 84.04 83.61
R/A (USD) 174.10 133.72 115.79
R/A (EUR) 127.73 102.45 90.17
R/D (USD) 135.41 109.51 106.12
S/A (USD) 165.56 - -
S/A (EUR) 122.23 97.07 -
336
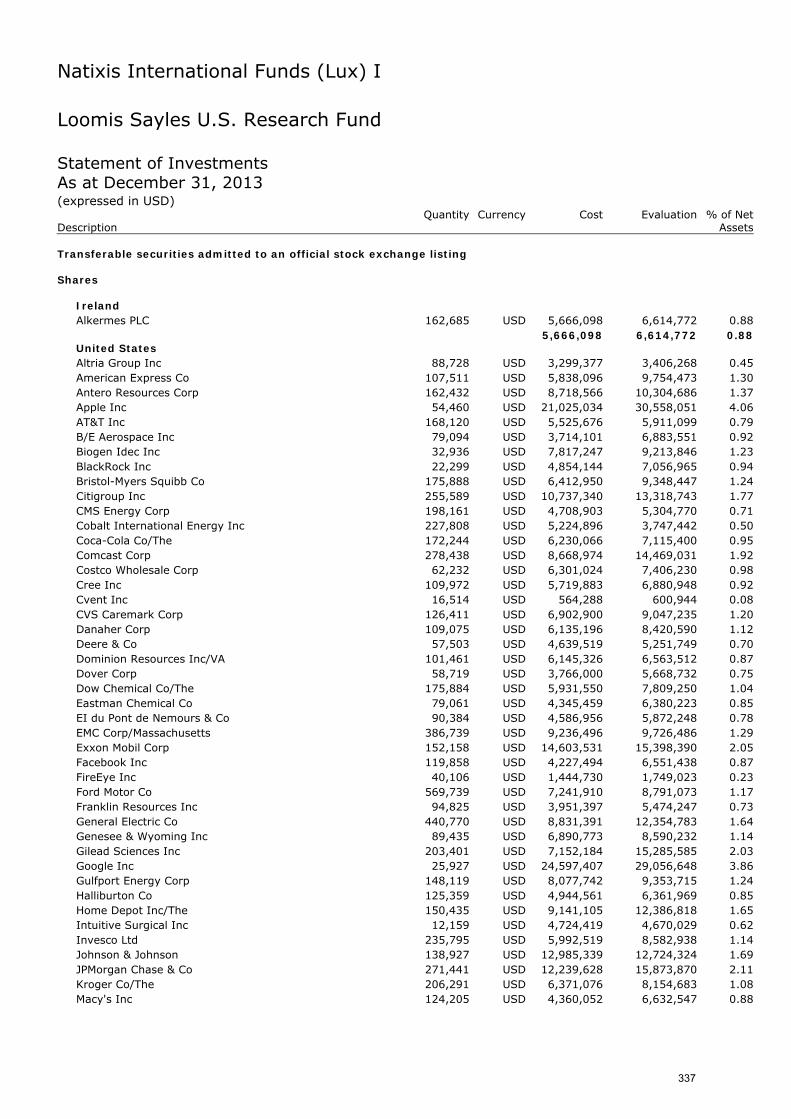
Natixis International Funds (Lux) I
Loomis Sayles U.S. Research Fund Statement of Investments As at December 31, 2013 (expressed in USD) Quantity Currency Cost Evaluation % of Net Description Assets Transferable securities admitted to an official stock exchange listing Shares
Ireland Alkermes PLC 162,685 USD 5,666,098 6,614,772 0.88
5,666,098 6,614,772 0.88 United States Altria Group Inc 88,728 USD 3,299,377 3,406,268 0.45 American Express Co 107,511 USD 5,838,096 9,754,473 1.30 Antero Resources Corp 162,432 USD 8,718,566 10,304,686 1.37 Apple Inc 54,460 USD 21,025,034 30,558,051 4.06 AT&T Inc 168,120 USD 5,525,676 5,911,099 0.79 B/E Aerospace Inc 79,094 USD 3,714,101 6,883,551 0.92 Biogen Idec Inc 32,936 USD 7,817,247 9,213,846 1.23 BlackRock Inc 22,299 USD 4,854,144 7,056,965 0.94 Bristol-Myers Squibb Co 175,888 USD 6,412,950 9,348,447 1.24 Citigroup Inc 255,589 USD 10,737,340 13,318,743 1.77 CMS Energy Corp 198,161 USD 4,708,903 5,304,770 0.71 Cobalt International Energy Inc 227,808 USD 5,224,896 3,747,442 0.50 Coca-Cola Co/The 172,244 USD 6,230,066 7,115,400 0.95 Comcast Corp 278,438 USD 8,668,974 14,469,031 1.92 Costco Wholesale Corp 62,232 USD 6,301,024 7,406,230 0.98 Cree Inc 109,972 USD 5,719,883 6,880,948 0.92 Cvent Inc 16,514 USD 564,288 600,944 0.08 CVS Caremark Corp 126,411 USD 6,902,900 9,047,235 1.20 Danaher Corp 109,075 USD 6,135,196 8,420,590 1.12 Deere & Co 57,503 USD 4,639,519 5,251,749 0.70 Dominion Resources Inc/VA 101,461 USD 6,145,326 6,563,512 0.87 Dover Corp 58,719 USD 3,766,000 5,668,732 0.75 Dow Chemical Co/The 175,884 USD 5,931,550 7,809,250 1.04 Eastman Chemical Co 79,061 USD 4,345,459 6,380,223 0.85 EI du Pont de Nemours & Co 90,384 USD 4,586,956 5,872,248 0.78 EMC Corp/Massachusetts 386,739 USD 9,236,496 9,726,486 1.29 Exxon Mobil Corp 152,158 USD 14,603,531 15,398,390 2.05 Facebook Inc 119,858 USD 4,227,494 6,551,438 0.87 FireEye Inc 40,106 USD 1,444,730 1,749,023 0.23 Ford Motor Co 569,739 USD 7,241,910 8,791,073 1.17 Franklin Resources Inc 94,825 USD 3,951,397 5,474,247 0.73 General Electric Co 440,770 USD 8,831,391 12,354,783 1.64 Genesee & Wyoming Inc 89,435 USD 6,890,773 8,590,232 1.14 Gilead Sciences Inc 203,401 USD 7,152,184 15,285,585 2.03 Google Inc 25,927 USD 24,597,407 29,056,648 3.86 Gulfport Energy Corp 148,119 USD 8,077,742 9,353,715 1.24 Halliburton Co 125,359 USD 4,944,561 6,361,969 0.85 Home Depot Inc/The 150,435 USD 9,141,105 12,386,818 1.65 Intuitive Surgical Inc 12,159 USD 4,724,419 4,670,029 0.62 Invesco Ltd 235,795 USD 5,992,519 8,582,938 1.14 Johnson & Johnson 138,927 USD 12,985,339 12,724,324 1.69 JPMorgan Chase & Co 271,441 USD 12,239,628 15,873,870 2.11 Kroger Co/The 206,291 USD 6,371,076 8,154,683 1.08 Macy's Inc 124,205 USD 4,360,052 6,632,547 0.88
337
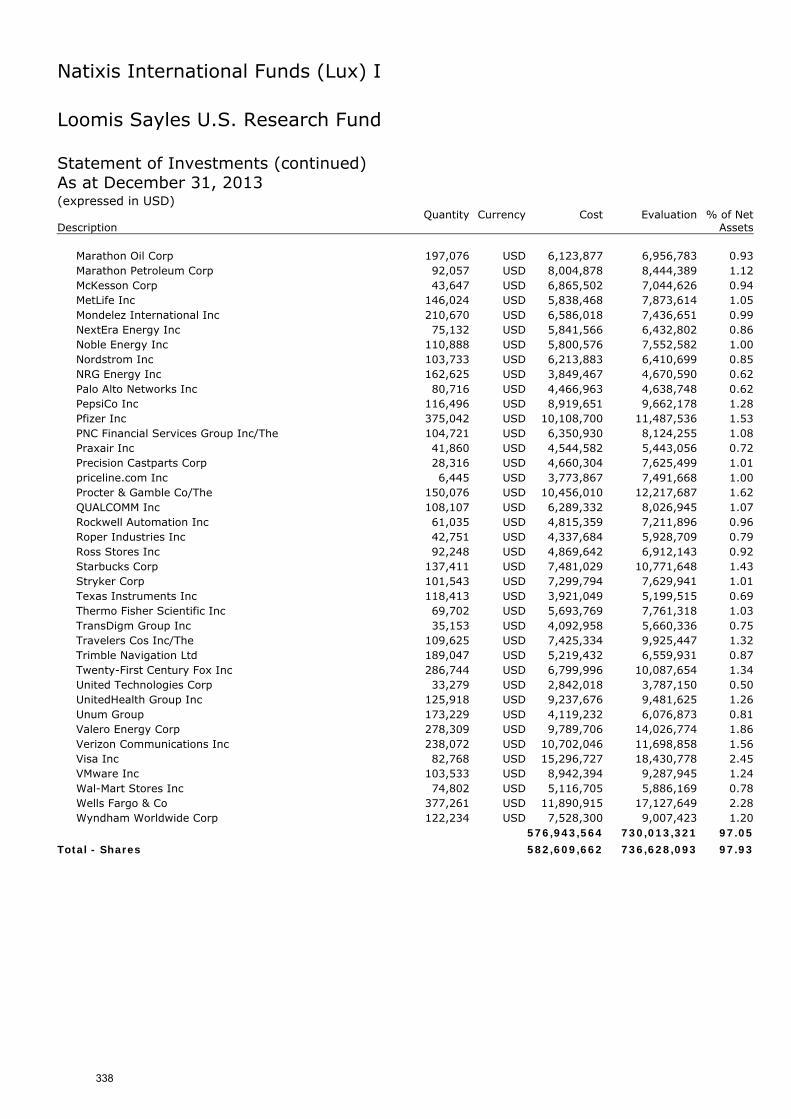
Natixis International Funds (Lux) I
Loomis Sayles U.S. Research Fund Statement of Investments (continued) As at December 31, 2013 (expressed in USD) Quantity Currency Cost Evaluation % of Net Description Assets
Marathon Oil Corp 197,076 USD 6,123,877 6,956,783 0.93 Marathon Petroleum Corp 92,057 USD 8,004,878 8,444,389 1.12 McKesson Corp 43,647 USD 6,865,502 7,044,626 0.94 MetLife Inc 146,024 USD 5,838,468 7,873,614 1.05 Mondelez International Inc 210,670 USD 6,586,018 7,436,651 0.99 NextEra Energy Inc 75,132 USD 5,841,566 6,432,802 0.86 Noble Energy Inc 110,888 USD 5,800,576 7,552,582 1.00 Nordstrom Inc 103,733 USD 6,213,883 6,410,699 0.85 NRG Energy Inc 162,625 USD 3,849,467 4,670,590 0.62 Palo Alto Networks Inc 80,716 USD 4,466,963 4,638,748 0.62 PepsiCo Inc 116,496 USD 8,919,651 9,662,178 1.28 Pfizer Inc 375,042 USD 10,108,700 11,487,536 1.53 PNC Financial Services Group Inc/The 104,721 USD 6,350,930 8,124,255 1.08 Praxair Inc 41,860 USD 4,544,582 5,443,056 0.72 Precision Castparts Corp 28,316 USD 4,660,304 7,625,499 1.01 priceline.com Inc 6,445 USD 3,773,867 7,491,668 1.00 Procter & Gamble Co/The 150,076 USD 10,456,010 12,217,687 1.62 QUALCOMM Inc 108,107 USD 6,289,332 8,026,945 1.07 Rockwell Automation Inc 61,035 USD 4,815,359 7,211,896 0.96 Roper Industries Inc 42,751 USD 4,337,684 5,928,709 0.79 Ross Stores Inc 92,248 USD 4,869,642 6,912,143 0.92 Starbucks Corp 137,411 USD 7,481,029 10,771,648 1.43 Stryker Corp 101,543 USD 7,299,794 7,629,941 1.01 Texas Instruments Inc 118,413 USD 3,921,049 5,199,515 0.69 Thermo Fisher Scientific Inc 69,702 USD 5,693,769 7,761,318 1.03 TransDigm Group Inc 35,153 USD 4,092,958 5,660,336 0.75 Travelers Cos Inc/The 109,625 USD 7,425,334 9,925,447 1.32 Trimble Navigation Ltd 189,047 USD 5,219,432 6,559,931 0.87 Twenty-First Century Fox Inc 286,744 USD 6,799,996 10,087,654 1.34 United Technologies Corp 33,279 USD 2,842,018 3,787,150 0.50 UnitedHealth Group Inc 125,918 USD 9,237,676 9,481,625 1.26 Unum Group 173,229 USD 4,119,232 6,076,873 0.81 Valero Energy Corp 278,309 USD 9,789,706 14,026,774 1.86 Verizon Communications Inc 238,072 USD 10,702,046 11,698,858 1.56 Visa Inc 82,768 USD 15,296,727 18,430,778 2.45 VMware Inc 103,533 USD 8,942,394 9,287,945 1.24 Wal-Mart Stores Inc 74,802 USD 5,116,705 5,886,169 0.78 Wells Fargo & Co 377,261 USD 11,890,915 17,127,649 2.28 Wyndham Worldwide Corp 122,234 USD 7,528,300 9,007,423 1.20
576,943,564 730,013,321 97.05
Total - Shares 582,609,662 736,628,093 97.93
338
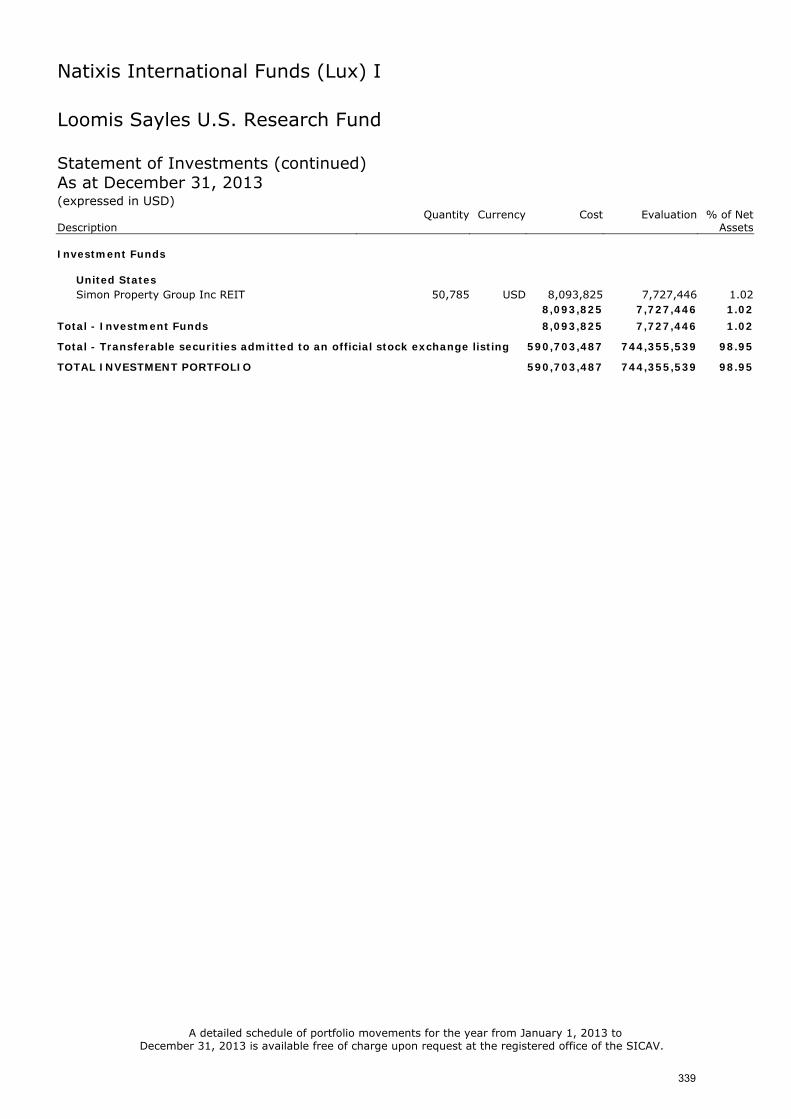
Natixis International Funds (Lux) I
Loomis Sayles U.S. Research Fund Statement of Investments (continued) As at December 31, 2013 (expressed in USD) Quantity Currency Cost Evaluation % of Net Description Assets Investment Funds
United States Simon Property Group Inc REIT 50,785 USD 8,093,825 7,727,446 1.02
8,093,825 7,727,446 1.02
Total - Investment Funds 8,093,825 7,727,446 1.02
Total - Transferable securities admitted to an official stock exchange listing 590,703,487 744,355,539 98.95
TOTAL INVESTMENT PORTFOLIO 590,703,487 744,355,539 98.95
A detailed schedule of portfolio movements for the year from January 1, 2013 to December 31, 2013 is available free of charge upon request at the registered office of the SICAV.
339
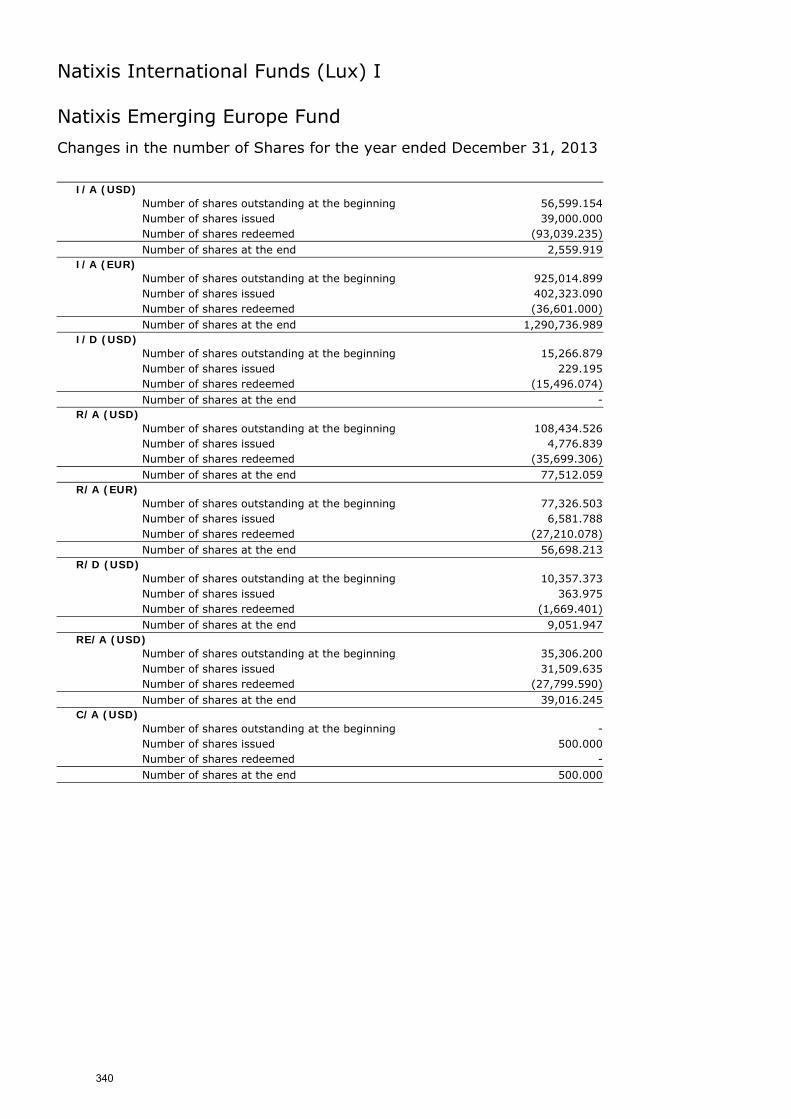
Natixis International Funds (Lux) I
Natixis Emerging Europe Fund
Changes in the number of Shares for the year ended December 31, 2013
I/A (USD) Number of shares outstanding at the beginning 56,599.154
Number of shares issued 39,000.000
Number of shares redeemed (93,039.235) Number of shares at the end 2,559.919
I/A (EUR) Number of shares outstanding at the beginning 925,014.899
Number of shares issued 402,323.090
Number of shares redeemed (36,601.000) Number of shares at the end 1,290,736.989
I/D (USD) Number of shares outstanding at the beginning 15,266.879
Number of shares issued 229.195
Number of shares redeemed (15,496.074) Number of shares at the end -
R/A (USD) Number of shares outstanding at the beginning 108,434.526
Number of shares issued 4,776.839
Number of shares redeemed (35,699.306) Number of shares at the end 77,512.059
R/A (EUR) Number of shares outstanding at the beginning 77,326.503
Number of shares issued 6,581.788
Number of shares redeemed (27,210.078) Number of shares at the end 56,698.213
R/D (USD) Number of shares outstanding at the beginning 10,357.373
Number of shares issued 363.975
Number of shares redeemed (1,669.401) Number of shares at the end 9,051.947
RE/A (USD) Number of shares outstanding at the beginning 35,306.200
Number of shares issued 31,509.635
Number of shares redeemed (27,799.590) Number of shares at the end 39,016.245
C/A (USD) Number of shares outstanding at the beginning - Number of shares issued 500.000
Number of shares redeemed - Number of shares at the end 500.000
340
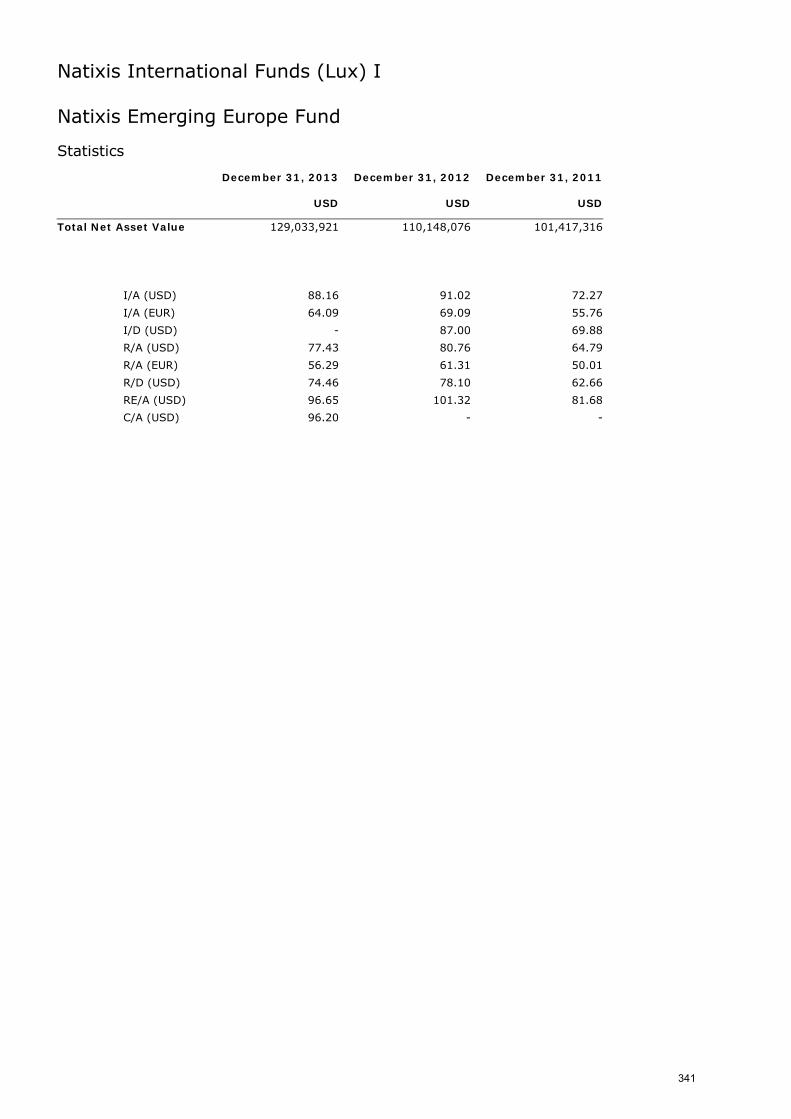
Natixis International Funds (Lux) I
Natixis Emerging Europe Fund Statistics December 31, 2013 December 31, 2012 December 31, 2011 USD USD USD
Total Net Asset Value 129,033,921 110,148,076 101,417,316
I/A (USD) 88.16 91.02 72.27
I/A (EUR) 64.09 69.09 55.76
I/D (USD) - 87.00 69.88
R/A (USD) 77.43 80.76 64.79
R/A (EUR) 56.29 61.31 50.01
R/D (USD) 74.46 78.10 62.66
RE/A (USD) 96.65 101.32 81.68
C/A (USD) 96.20 - -
341
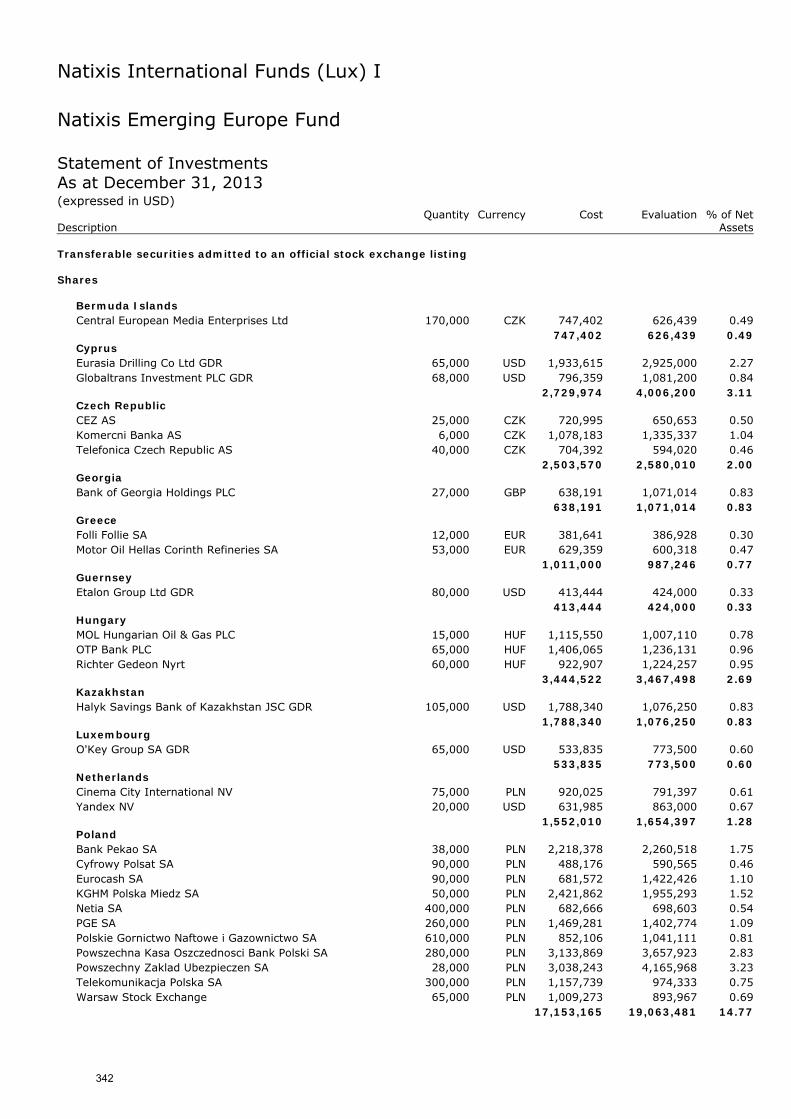
Natixis International Funds (Lux) I
Natixis Emerging Europe Fund Statement of Investments As at December 31, 2013 (expressed in USD) Quantity Currency Cost Evaluation % of Net Description Assets Transferable securities admitted to an official stock exchange listing Shares
Bermuda Islands Central European Media Enterprises Ltd 170,000 CZK 747,402 626,439 0.49
747,402 626,439 0.49 Cyprus Eurasia Drilling Co Ltd GDR 65,000 USD 1,933,615 2,925,000 2.27 Globaltrans Investment PLC GDR 68,000 USD 796,359 1,081,200 0.84
2,729,974 4,006,200 3.11 Czech Republic CEZ AS 25,000 CZK 720,995 650,653 0.50 Komercni Banka AS 6,000 CZK 1,078,183 1,335,337 1.04 Telefonica Czech Republic AS 40,000 CZK 704,392 594,020 0.46
2,503,570 2,580,010 2.00 Georgia Bank of Georgia Holdings PLC 27,000 GBP 638,191 1,071,014 0.83
638,191 1,071,014 0.83 Greece Folli Follie SA 12,000 EUR 381,641 386,928 0.30 Motor Oil Hellas Corinth Refineries SA 53,000 EUR 629,359 600,318 0.47
1,011,000 987,246 0.77 Guernsey Etalon Group Ltd GDR 80,000 USD 413,444 424,000 0.33
413,444 424,000 0.33 Hungary MOL Hungarian Oil & Gas PLC 15,000 HUF 1,115,550 1,007,110 0.78 OTP Bank PLC 65,000 HUF 1,406,065 1,236,131 0.96 Richter Gedeon Nyrt 60,000 HUF 922,907 1,224,257 0.95
3,444,522 3,467,498 2.69 Kazakhstan Halyk Savings Bank of Kazakhstan JSC GDR 105,000 USD 1,788,340 1,076,250 0.83
1,788,340 1,076,250 0.83 Luxembourg O'Key Group SA GDR 65,000 USD 533,835 773,500 0.60
533,835 773,500 0.60 Netherlands Cinema City International NV 75,000 PLN 920,025 791,397 0.61 Yandex NV 20,000 USD 631,985 863,000 0.67
1,552,010 1,654,397 1.28 Poland Bank Pekao SA 38,000 PLN 2,218,378 2,260,518 1.75 Cyfrowy Polsat SA 90,000 PLN 488,176 590,565 0.46 Eurocash SA 90,000 PLN 681,572 1,422,426 1.10 KGHM Polska Miedz SA 50,000 PLN 2,421,862 1,955,293 1.52 Netia SA 400,000 PLN 682,666 698,603 0.54 PGE SA 260,000 PLN 1,469,281 1,402,774 1.09 Polskie Gornictwo Naftowe i Gazownictwo SA 610,000 PLN 852,106 1,041,111 0.81 Powszechna Kasa Oszczednosci Bank Polski SA 280,000 PLN 3,133,869 3,657,923 2.83 Powszechny Zaklad Ubezpieczen SA 28,000 PLN 3,038,243 4,165,968 3.23 Telekomunikacja Polska SA 300,000 PLN 1,157,739 974,333 0.75 Warsaw Stock Exchange 65,000 PLN 1,009,273 893,967 0.69 17,153,165 19,063,481 14.77
342
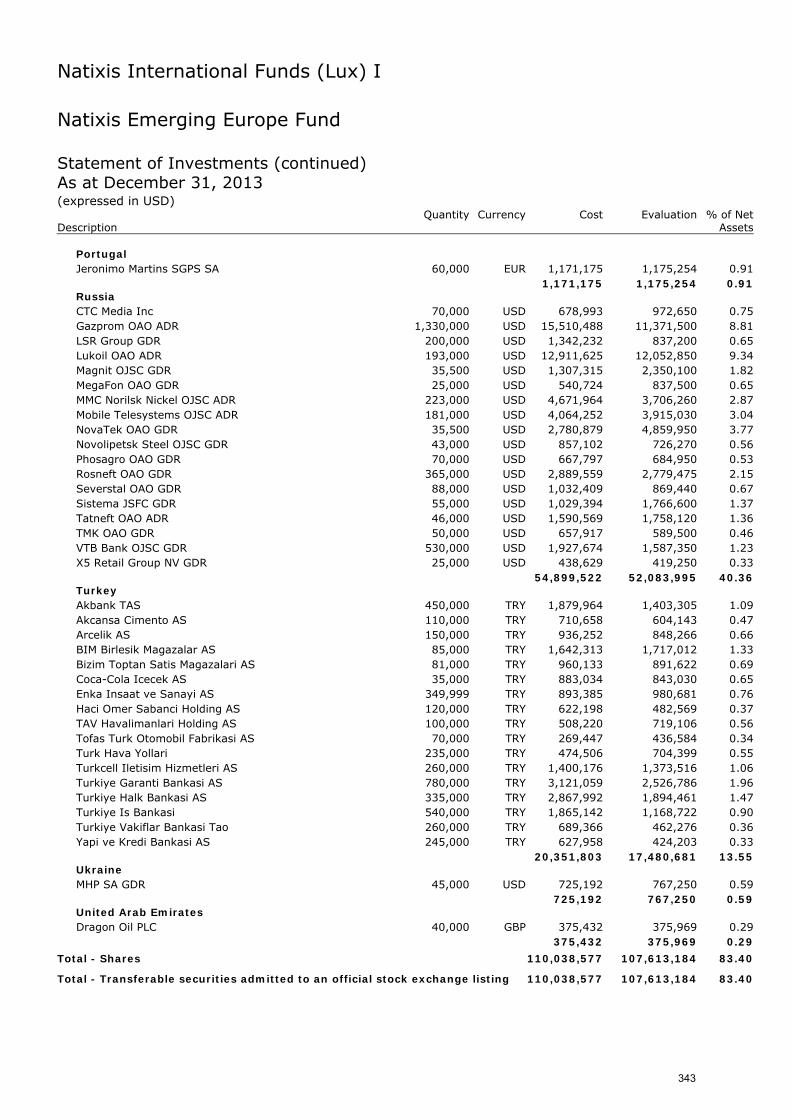
Natixis International Funds (Lux) I
Natixis Emerging Europe Fund Statement of Investments (continued) As at December 31, 2013 (expressed in USD) Quantity Currency Cost Evaluation % of Net Description Assets
Portugal Jeronimo Martins SGPS SA 60,000 EUR 1,171,175 1,175,254 0.91
1,171,175 1,175,254 0.91 Russia CTC Media Inc 70,000 USD 678,993 972,650 0.75 Gazprom OAO ADR 1,330,000 USD 15,510,488 11,371,500 8.81 LSR Group GDR 200,000 USD 1,342,232 837,200 0.65 Lukoil OAO ADR 193,000 USD 12,911,625 12,052,850 9.34 Magnit OJSC GDR 35,500 USD 1,307,315 2,350,100 1.82 MegaFon OAO GDR 25,000 USD 540,724 837,500 0.65 MMC Norilsk Nickel OJSC ADR 223,000 USD 4,671,964 3,706,260 2.87 Mobile Telesystems OJSC ADR 181,000 USD 4,064,252 3,915,030 3.04 NovaTek OAO GDR 35,500 USD 2,780,879 4,859,950 3.77 Novolipetsk Steel OJSC GDR 43,000 USD 857,102 726,270 0.56 Phosagro OAO GDR 70,000 USD 667,797 684,950 0.53 Rosneft OAO GDR 365,000 USD 2,889,559 2,779,475 2.15 Severstal OAO GDR 88,000 USD 1,032,409 869,440 0.67 Sistema JSFC GDR 55,000 USD 1,029,394 1,766,600 1.37 Tatneft OAO ADR 46,000 USD 1,590,569 1,758,120 1.36 TMK OAO GDR 50,000 USD 657,917 589,500 0.46 VTB Bank OJSC GDR 530,000 USD 1,927,674 1,587,350 1.23 X5 Retail Group NV GDR 25,000 USD 438,629 419,250 0.33
54,899,522 52,083,995 40.36 Turkey Akbank TAS 450,000 TRY 1,879,964 1,403,305 1.09 Akcansa Cimento AS 110,000 TRY 710,658 604,143 0.47 Arcelik AS 150,000 TRY 936,252 848,266 0.66 BIM Birlesik Magazalar AS 85,000 TRY 1,642,313 1,717,012 1.33 Bizim Toptan Satis Magazalari AS 81,000 TRY 960,133 891,622 0.69 Coca-Cola Icecek AS 35,000 TRY 883,034 843,030 0.65 Enka Insaat ve Sanayi AS 349,999 TRY 893,385 980,681 0.76 Haci Omer Sabanci Holding AS 120,000 TRY 622,198 482,569 0.37 TAV Havalimanlari Holding AS 100,000 TRY 508,220 719,106 0.56 Tofas Turk Otomobil Fabrikasi AS 70,000 TRY 269,447 436,584 0.34 Turk Hava Yollari 235,000 TRY 474,506 704,399 0.55 Turkcell Iletisim Hizmetleri AS 260,000 TRY 1,400,176 1,373,516 1.06 Turkiye Garanti Bankasi AS 780,000 TRY 3,121,059 2,526,786 1.96 Turkiye Halk Bankasi AS 335,000 TRY 2,867,992 1,894,461 1.47 Turkiye Is Bankasi 540,000 TRY 1,865,142 1,168,722 0.90 Turkiye Vakiflar Bankasi Tao 260,000 TRY 689,366 462,276 0.36 Yapi ve Kredi Bankasi AS 245,000 TRY 627,958 424,203 0.33
20,351,803 17,480,681 13.55 Ukraine MHP SA GDR 45,000 USD 725,192 767,250 0.59
725,192 767,250 0.59 United Arab Emirates Dragon Oil PLC 40,000 GBP 375,432 375,969 0.29
375,432 375,969 0.29
Total - Shares 110,038,577 107,613,184 83.40
Total - Transferable securities admitted to an official stock exchange listing 110,038,577 107,613,184 83.40
343
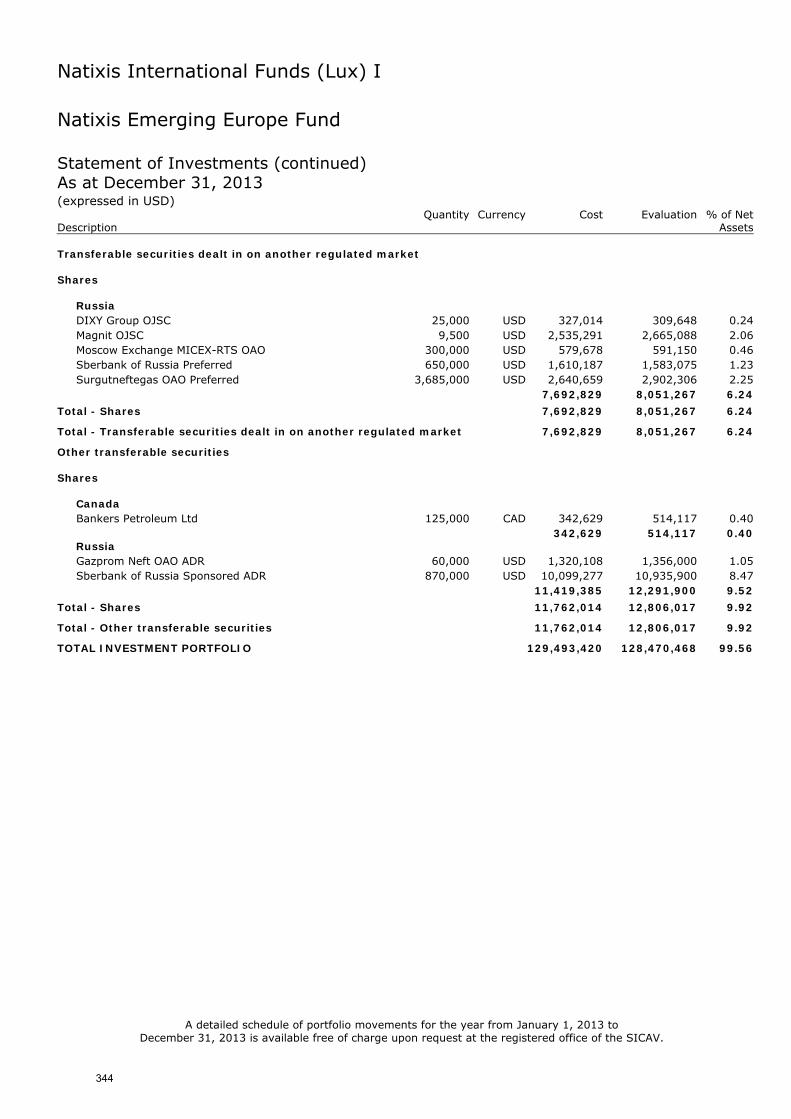
Natixis International Funds (Lux) I
Natixis Emerging Europe Fund Statement of Investments (continued) As at December 31, 2013 (expressed in USD) Quantity Currency Cost Evaluation % of Net Description Assets Transferable securities dealt in on another regulated market Shares
Russia DIXY Group OJSC 25,000 USD 327,014 309,648 0.24 Magnit OJSC 9,500 USD 2,535,291 2,665,088 2.06 Moscow Exchange MICEX-RTS OAO 300,000 USD 579,678 591,150 0.46 Sberbank of Russia Preferred 650,000 USD 1,610,187 1,583,075 1.23 Surgutneftegas OAO Preferred 3,685,000 USD 2,640,659 2,902,306 2.25
7,692,829 8,051,267 6.24
Total - Shares 7,692,829 8,051,267 6.24
Total - Transferable securities dealt in on another regulated market 7,692,829 8,051,267 6.24
Other transferable securities Shares
Canada Bankers Petroleum Ltd 125,000 CAD 342,629 514,117 0.40
342,629 514,117 0.40 Russia Gazprom Neft OAO ADR 60,000 USD 1,320,108 1,356,000 1.05 Sberbank of Russia Sponsored ADR 870,000 USD 10,099,277 10,935,900 8.47
11,419,385 12,291,900 9.52
Total - Shares 11,762,014 12,806,017 9.92
Total - Other transferable securities 11,762,014 12,806,017 9.92
TOTAL INVESTMENT PORTFOLIO 129,493,420 128,470,468 99.56
A detailed schedule of portfolio movements for the year from January 1, 2013 to December 31, 2013 is available free of charge upon request at the registered office of the SICAV.
344
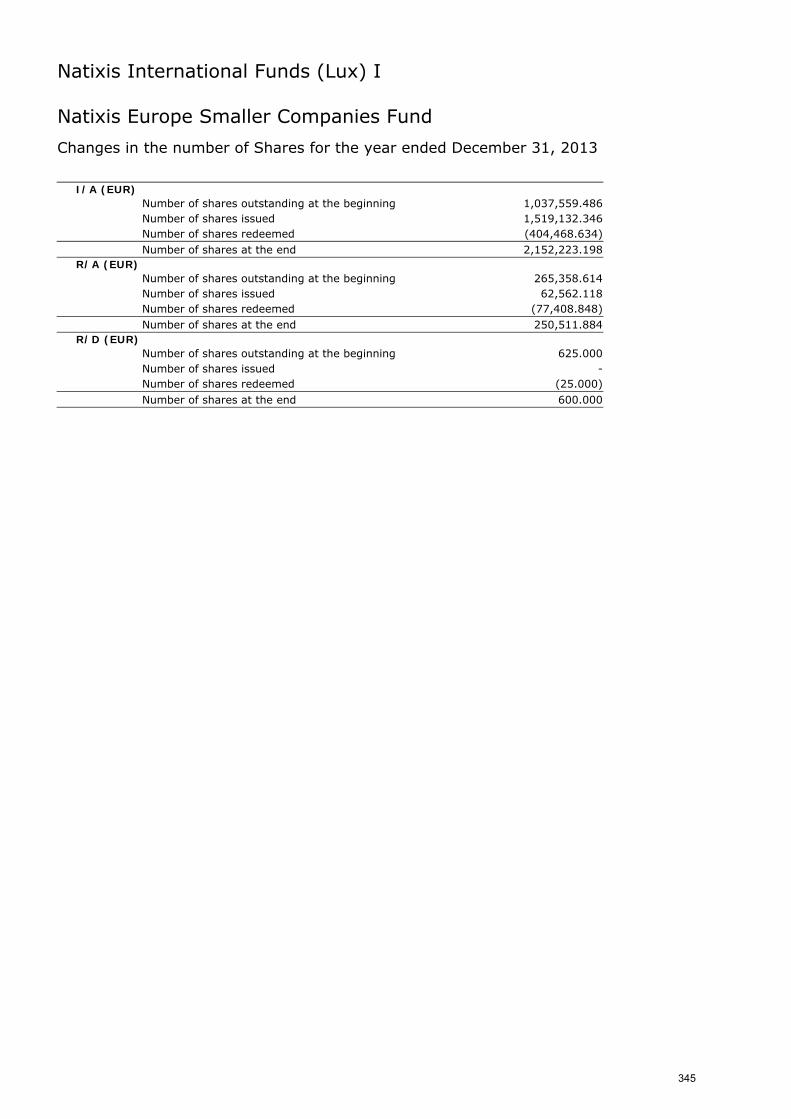
Natixis International Funds (Lux) I
Natixis Europe Smaller Companies Fund
Changes in the number of Shares for the year ended December 31, 2013
I/A (EUR) Number of shares outstanding at the beginning 1,037,559.486
Number of shares issued 1,519,132.346
Number of shares redeemed (404,468.634) Number of shares at the end 2,152,223.198
R/A (EUR) Number of shares outstanding at the beginning 265,358.614
Number of shares issued 62,562.118
Number of shares redeemed (77,408.848) Number of shares at the end 250,511.884
R/D (EUR) Number of shares outstanding at the beginning 625.000
Number of shares issued - Number of shares redeemed (25.000) Number of shares at the end 600.000
345
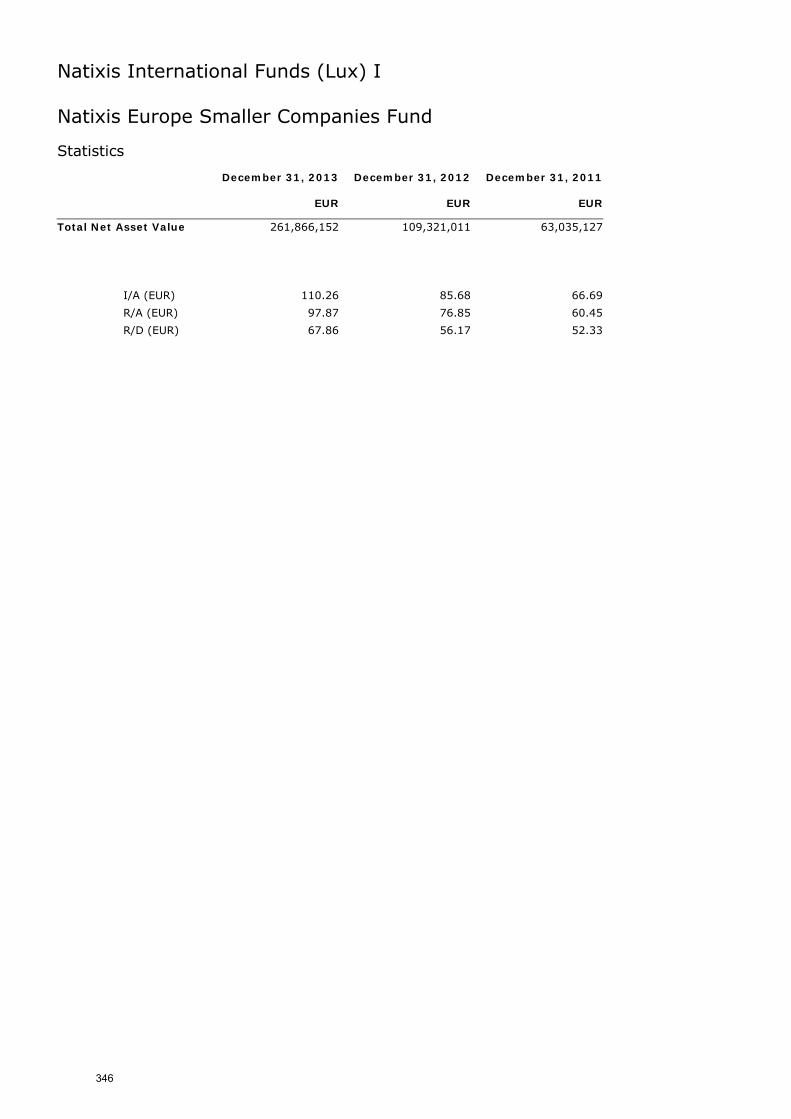
Natixis International Funds (Lux) I
Natixis Europe Smaller Companies Fund Statistics December 31, 2013 December 31, 2012 December 31, 2011 EUR EUR EUR
Total Net Asset Value 261,866,152 109,321,011 63,035,127
I/A (EUR) 110.26 85.68 66.69
R/A (EUR) 97.87 76.85 60.45
R/D (EUR) 67.86 56.17 52.33
346
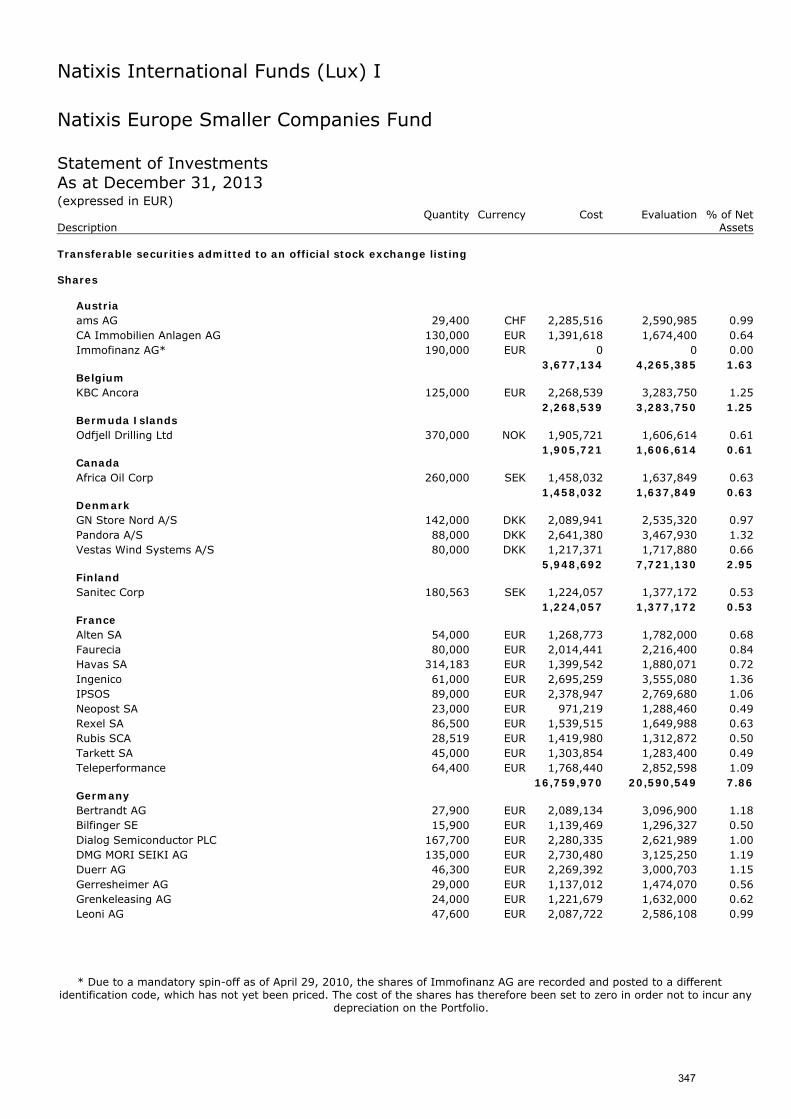
Natixis International Funds (Lux) I
Natixis Europe Smaller Companies Fund Statement of Investments As at December 31, 2013 (expressed in EUR) Quantity Currency Cost Evaluation % of Net Description Assets Transferable securities admitted to an official stock exchange listing Shares
Austria ams AG 29,400 CHF 2,285,516 2,590,985 0.99 CA Immobilien Anlagen AG 130,000 EUR 1,391,618 1,674,400 0.64 Immofinanz AG* 190,000 EUR 0 0 0.00
3,677,134 4,265,385 1.63 Belgium KBC Ancora 125,000 EUR 2,268,539 3,283,750 1.25
2,268,539 3,283,750 1.25 Bermuda Islands Odfjell Drilling Ltd 370,000 NOK 1,905,721 1,606,614 0.61
1,905,721 1,606,614 0.61 Canada Africa Oil Corp 260,000 SEK 1,458,032 1,637,849 0.63
1,458,032 1,637,849 0.63 Denmark GN Store Nord A/S 142,000 DKK 2,089,941 2,535,320 0.97 Pandora A/S 88,000 DKK 2,641,380 3,467,930 1.32 Vestas Wind Systems A/S 80,000 DKK 1,217,371 1,717,880 0.66
5,948,692 7,721,130 2.95 Finland Sanitec Corp 180,563 SEK 1,224,057 1,377,172 0.53
1,224,057 1,377,172 0.53 France Alten SA 54,000 EUR 1,268,773 1,782,000 0.68 Faurecia 80,000 EUR 2,014,441 2,216,400 0.84 Havas SA 314,183 EUR 1,399,542 1,880,071 0.72 Ingenico 61,000 EUR 2,695,259 3,555,080 1.36 IPSOS 89,000 EUR 2,378,947 2,769,680 1.06 Neopost SA 23,000 EUR 971,219 1,288,460 0.49 Rexel SA 86,500 EUR 1,539,515 1,649,988 0.63 Rubis SCA 28,519 EUR 1,419,980 1,312,872 0.50 Tarkett SA 45,000 EUR 1,303,854 1,283,400 0.49 Teleperformance 64,400 EUR 1,768,440 2,852,598 1.09
16,759,970 20,590,549 7.86 Germany Bertrandt AG 27,900 EUR 2,089,134 3,096,900 1.18 Bilfinger SE 15,900 EUR 1,139,469 1,296,327 0.50 Dialog Semiconductor PLC 167,700 EUR 2,280,335 2,621,989 1.00 DMG MORI SEIKI AG 135,000 EUR 2,730,480 3,125,250 1.19 Duerr AG 46,300 EUR 2,269,392 3,000,703 1.15 Gerresheimer AG 29,000 EUR 1,137,012 1,474,070 0.56 Grenkeleasing AG 24,000 EUR 1,221,679 1,632,000 0.62 Leoni AG 47,600 EUR 2,087,722 2,586,108 0.99
* Due to a mandatory spin-off as of April 29, 2010, the shares of Immofinanz AG are recorded and posted to a different identification code, which has not yet been priced. The cost of the shares has therefore been set to zero in order not to incur any
depreciation on the Portfolio.
347
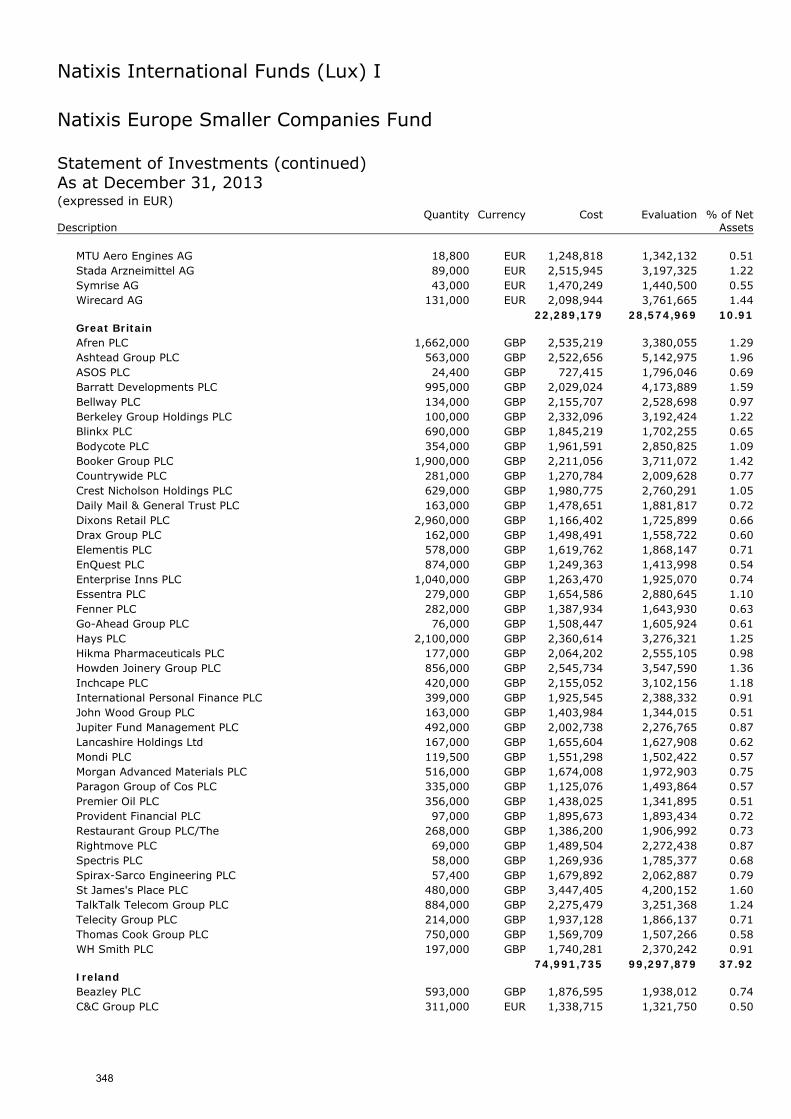
Natixis International Funds (Lux) I
Natixis Europe Smaller Companies Fund Statement of Investments (continued) As at December 31, 2013 (expressed in EUR) Quantity Currency Cost Evaluation % of Net Description Assets
MTU Aero Engines AG 18,800 EUR 1,248,818 1,342,132 0.51 Stada Arzneimittel AG 89,000 EUR 2,515,945 3,197,325 1.22 Symrise AG 43,000 EUR 1,470,249 1,440,500 0.55 Wirecard AG 131,000 EUR 2,098,944 3,761,665 1.44
22,289,179 28,574,969 10.91 Great Britain Afren PLC 1,662,000 GBP 2,535,219 3,380,055 1.29 Ashtead Group PLC 563,000 GBP 2,522,656 5,142,975 1.96 ASOS PLC 24,400 GBP 727,415 1,796,046 0.69 Barratt Developments PLC 995,000 GBP 2,029,024 4,173,889 1.59 Bellway PLC 134,000 GBP 2,155,707 2,528,698 0.97 Berkeley Group Holdings PLC 100,000 GBP 2,332,096 3,192,424 1.22 Blinkx PLC 690,000 GBP 1,845,219 1,702,255 0.65 Bodycote PLC 354,000 GBP 1,961,591 2,850,825 1.09 Booker Group PLC 1,900,000 GBP 2,211,056 3,711,072 1.42 Countrywide PLC 281,000 GBP 1,270,784 2,009,628 0.77 Crest Nicholson Holdings PLC 629,000 GBP 1,980,775 2,760,291 1.05 Daily Mail & General Trust PLC 163,000 GBP 1,478,651 1,881,817 0.72 Dixons Retail PLC 2,960,000 GBP 1,166,402 1,725,899 0.66 Drax Group PLC 162,000 GBP 1,498,491 1,558,722 0.60 Elementis PLC 578,000 GBP 1,619,762 1,868,147 0.71 EnQuest PLC 874,000 GBP 1,249,363 1,413,998 0.54 Enterprise Inns PLC 1,040,000 GBP 1,263,470 1,925,070 0.74 Essentra PLC 279,000 GBP 1,654,586 2,880,645 1.10 Fenner PLC 282,000 GBP 1,387,934 1,643,930 0.63 Go-Ahead Group PLC 76,000 GBP 1,508,447 1,605,924 0.61 Hays PLC 2,100,000 GBP 2,360,614 3,276,321 1.25 Hikma Pharmaceuticals PLC 177,000 GBP 2,064,202 2,555,105 0.98 Howden Joinery Group PLC 856,000 GBP 2,545,734 3,547,590 1.36 Inchcape PLC 420,000 GBP 2,155,052 3,102,156 1.18 International Personal Finance PLC 399,000 GBP 1,925,545 2,388,332 0.91 John Wood Group PLC 163,000 GBP 1,403,984 1,344,015 0.51 Jupiter Fund Management PLC 492,000 GBP 2,002,738 2,276,765 0.87 Lancashire Holdings Ltd 167,000 GBP 1,655,604 1,627,908 0.62 Mondi PLC 119,500 GBP 1,551,298 1,502,422 0.57 Morgan Advanced Materials PLC 516,000 GBP 1,674,008 1,972,903 0.75 Paragon Group of Cos PLC 335,000 GBP 1,125,076 1,493,864 0.57 Premier Oil PLC 356,000 GBP 1,438,025 1,341,895 0.51 Provident Financial PLC 97,000 GBP 1,895,673 1,893,434 0.72 Restaurant Group PLC/The 268,000 GBP 1,386,200 1,906,992 0.73 Rightmove PLC 69,000 GBP 1,489,504 2,272,438 0.87 Spectris PLC 58,000 GBP 1,269,936 1,785,377 0.68 Spirax-Sarco Engineering PLC 57,400 GBP 1,679,892 2,062,887 0.79 St James's Place PLC 480,000 GBP 3,447,405 4,200,152 1.60 TalkTalk Telecom Group PLC 884,000 GBP 2,275,479 3,251,368 1.24 Telecity Group PLC 214,000 GBP 1,937,128 1,866,137 0.71 Thomas Cook Group PLC 750,000 GBP 1,569,709 1,507,266 0.58 WH Smith PLC 197,000 GBP 1,740,281 2,370,242 0.91
74,991,735 99,297,879 37.92 Ireland Beazley PLC 593,000 GBP 1,876,595 1,938,012 0.74 C&C Group PLC 311,000 EUR 1,338,715 1,321,750 0.50
348
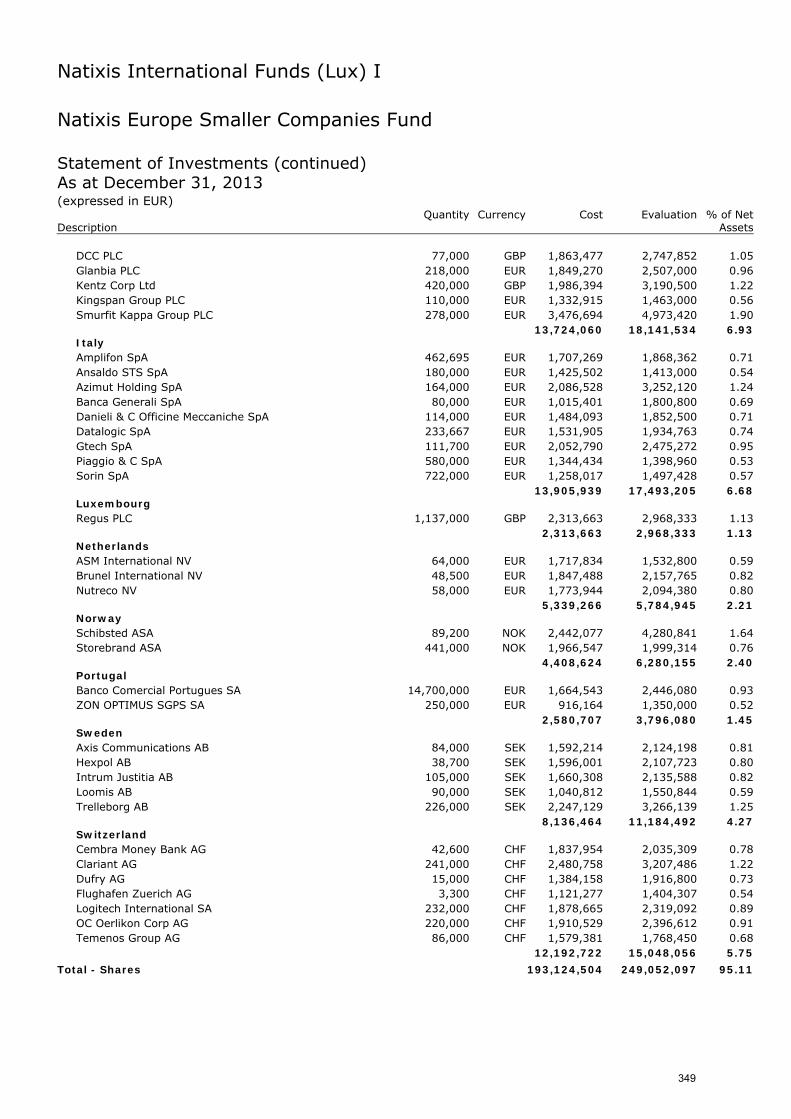
Natixis International Funds (Lux) I
Natixis Europe Smaller Companies Fund Statement of Investments (continued) As at December 31, 2013 (expressed in EUR) Quantity Currency Cost Evaluation % of Net Description Assets
DCC PLC 77,000 GBP 1,863,477 2,747,852 1.05 Glanbia PLC 218,000 EUR 1,849,270 2,507,000 0.96 Kentz Corp Ltd 420,000 GBP 1,986,394 3,190,500 1.22 Kingspan Group PLC 110,000 EUR 1,332,915 1,463,000 0.56 Smurfit Kappa Group PLC 278,000 EUR 3,476,694 4,973,420 1.90
13,724,060 18,141,534 6.93 Italy Amplifon SpA 462,695 EUR 1,707,269 1,868,362 0.71 Ansaldo STS SpA 180,000 EUR 1,425,502 1,413,000 0.54 Azimut Holding SpA 164,000 EUR 2,086,528 3,252,120 1.24 Banca Generali SpA 80,000 EUR 1,015,401 1,800,800 0.69 Danieli & C Officine Meccaniche SpA 114,000 EUR 1,484,093 1,852,500 0.71 Datalogic SpA 233,667 EUR 1,531,905 1,934,763 0.74 Gtech SpA 111,700 EUR 2,052,790 2,475,272 0.95 Piaggio & C SpA 580,000 EUR 1,344,434 1,398,960 0.53 Sorin SpA 722,000 EUR 1,258,017 1,497,428 0.57
13,905,939 17,493,205 6.68 Luxembourg Regus PLC 1,137,000 GBP 2,313,663 2,968,333 1.13
2,313,663 2,968,333 1.13 Netherlands ASM International NV 64,000 EUR 1,717,834 1,532,800 0.59 Brunel International NV 48,500 EUR 1,847,488 2,157,765 0.82 Nutreco NV 58,000 EUR 1,773,944 2,094,380 0.80
5,339,266 5,784,945 2.21 Norway Schibsted ASA 89,200 NOK 2,442,077 4,280,841 1.64 Storebrand ASA 441,000 NOK 1,966,547 1,999,314 0.76
4,408,624 6,280,155 2.40 Portugal Banco Comercial Portugues SA 14,700,000 EUR 1,664,543 2,446,080 0.93 ZON OPTIMUS SGPS SA 250,000 EUR 916,164 1,350,000 0.52
2,580,707 3,796,080 1.45 Sweden Axis Communications AB 84,000 SEK 1,592,214 2,124,198 0.81 Hexpol AB 38,700 SEK 1,596,001 2,107,723 0.80 Intrum Justitia AB 105,000 SEK 1,660,308 2,135,588 0.82 Loomis AB 90,000 SEK 1,040,812 1,550,844 0.59 Trelleborg AB 226,000 SEK 2,247,129 3,266,139 1.25
8,136,464 11,184,492 4.27 Switzerland Cembra Money Bank AG 42,600 CHF 1,837,954 2,035,309 0.78 Clariant AG 241,000 CHF 2,480,758 3,207,486 1.22 Dufry AG 15,000 CHF 1,384,158 1,916,800 0.73 Flughafen Zuerich AG 3,300 CHF 1,121,277 1,404,307 0.54 Logitech International SA 232,000 CHF 1,878,665 2,319,092 0.89 OC Oerlikon Corp AG 220,000 CHF 1,910,529 2,396,612 0.91 Temenos Group AG 86,000 CHF 1,579,381 1,768,450 0.68
12,192,722 15,048,056 5.75
Total - Shares 193,124,504 249,052,097 95.11
349
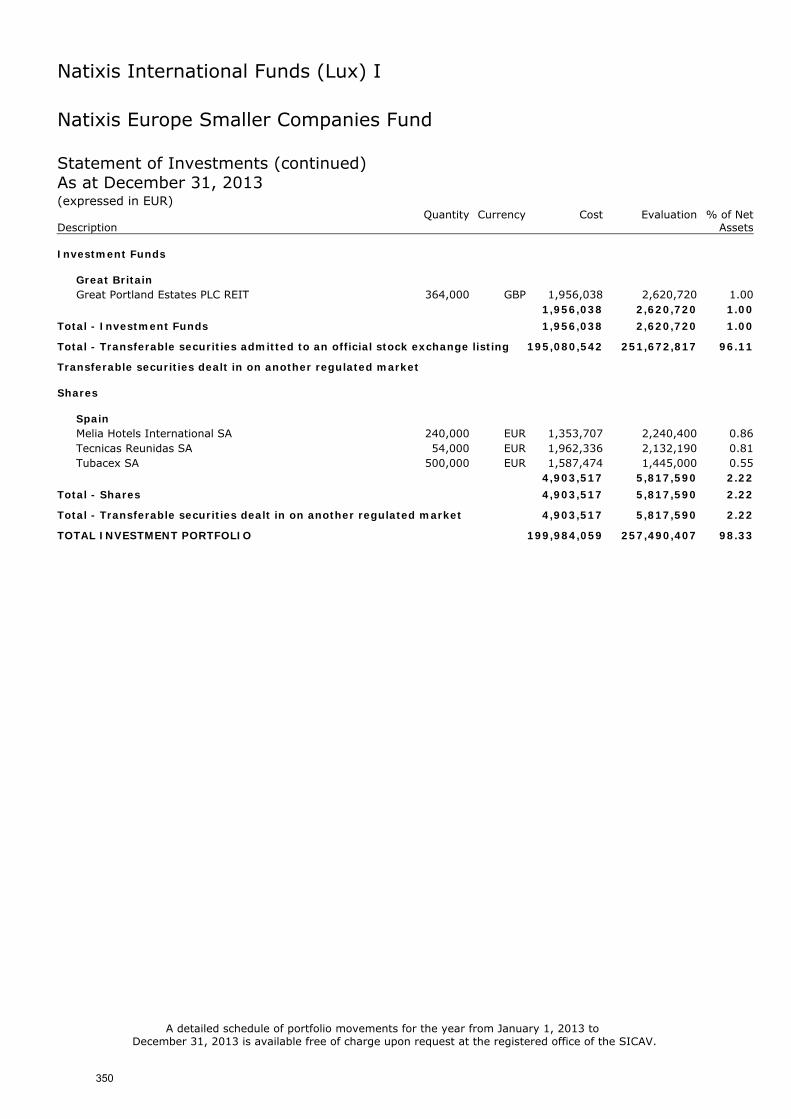
Natixis International Funds (Lux) I
Natixis Europe Smaller Companies Fund Statement of Investments (continued) As at December 31, 2013 (expressed in EUR) Quantity Currency Cost Evaluation % of Net Description Assets Investment Funds
Great Britain Great Portland Estates PLC REIT 364,000 GBP 1,956,038 2,620,720 1.00
1,956,038 2,620,720 1.00
Total - Investment Funds 1,956,038 2,620,720 1.00
Total - Transferable securities admitted to an official stock exchange listing 195,080,542 251,672,817 96.11
Transferable securities dealt in on another regulated market Shares
Spain Melia Hotels International SA 240,000 EUR 1,353,707 2,240,400 0.86 Tecnicas Reunidas SA 54,000 EUR 1,962,336 2,132,190 0.81 Tubacex SA 500,000 EUR 1,587,474 1,445,000 0.55
4,903,517 5,817,590 2.22
Total - Shares 4,903,517 5,817,590 2.22
Total - Transferable securities dealt in on another regulated market 4,903,517 5,817,590 2.22
TOTAL INVESTMENT PORTFOLIO 199,984,059 257,490,407 98.33 A detailed schedule of portfolio movements for the year from January 1, 2013 to
December 31, 2013 is available free of charge upon request at the registered office of the SICAV.
350

Natixis International Funds (Lux) I
Vaughan Nelson U.S. Small Cap Value Fund
Changes in the number of Shares for the year ended December 31, 2013
H-I/A (EUR) Number of shares outstanding at the beginning - Number of shares issued 366,883.358
Number of shares redeemed (2,600.000) Number of shares at the end 364,283.358
I/A (USD) Number of shares outstanding at the beginning 223,661.830
Number of shares issued 83,150.640
Number of shares redeemed (143,752.858) Number of shares at the end 163,059.612
I/A (EUR) Number of shares outstanding at the beginning 21,029.481
Number of shares issued 71,614.140
Number of shares redeemed (23,510.900) Number of shares at the end 69,132.721
I/D (USD) Number of shares outstanding at the beginning 193,750.052
Number of shares issued 13,036.458
Number of shares redeemed (193,750.000) Number of shares at the end 13,036.510
R/A (USD) Number of shares outstanding at the beginning 15,178.159
Number of shares issued 47,660.618
Number of shares redeemed (20,472.823) Number of shares at the end 42,365.954
S/A (USD) Number of shares outstanding at the beginning 987,709.129
Number of shares issued - Number of shares redeemed (120,821.587) Number of shares at the end 866,887.542
C/A (USD) Number of shares outstanding at the beginning 10,107.231
Number of shares issued 2,748.000
Number of shares redeemed (2,966.231) Number of shares at the end 9,889.000
351
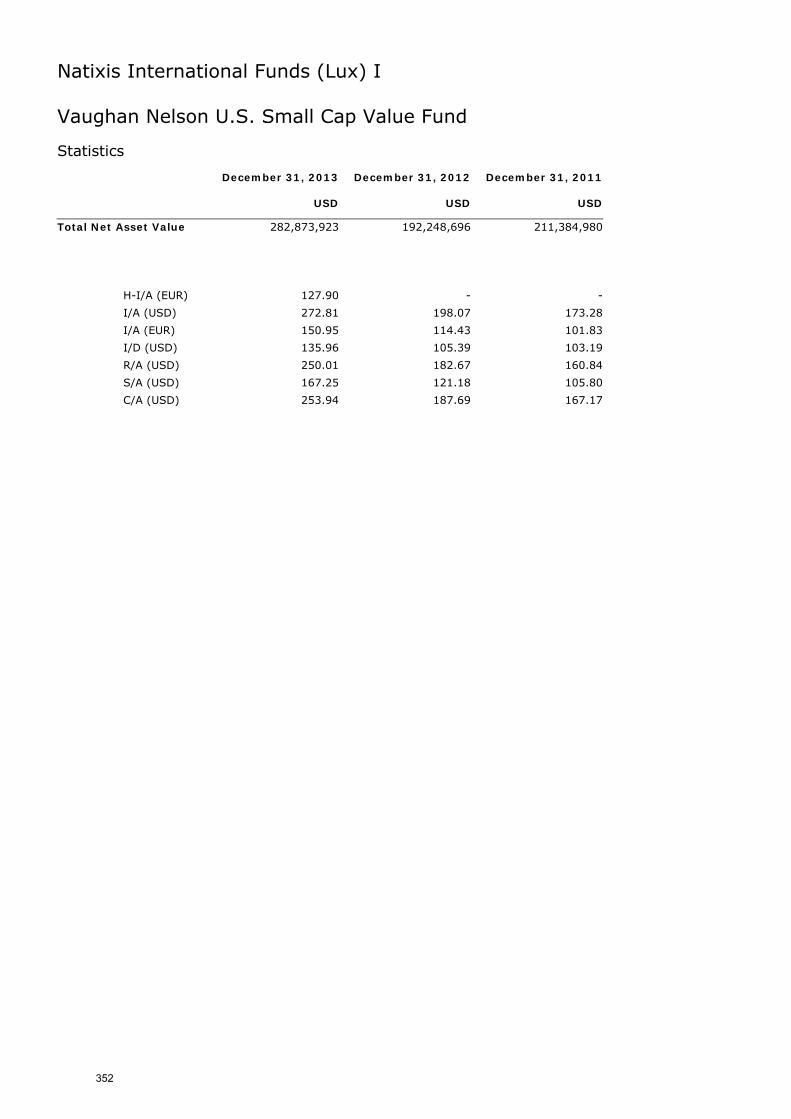
Natixis International Funds (Lux) I
Vaughan Nelson U.S. Small Cap Value Fund Statistics December 31, 2013 December 31, 2012 December 31, 2011 USD USD USD
Total Net Asset Value 282,873,923 192,248,696 211,384,980
H-I/A (EUR) 127.90 - -
I/A (USD) 272.81 198.07 173.28
I/A (EUR) 150.95 114.43 101.83
I/D (USD) 135.96 105.39 103.19
R/A (USD) 250.01 182.67 160.84
S/A (USD) 167.25 121.18 105.80
C/A (USD) 253.94 187.69 167.17
352
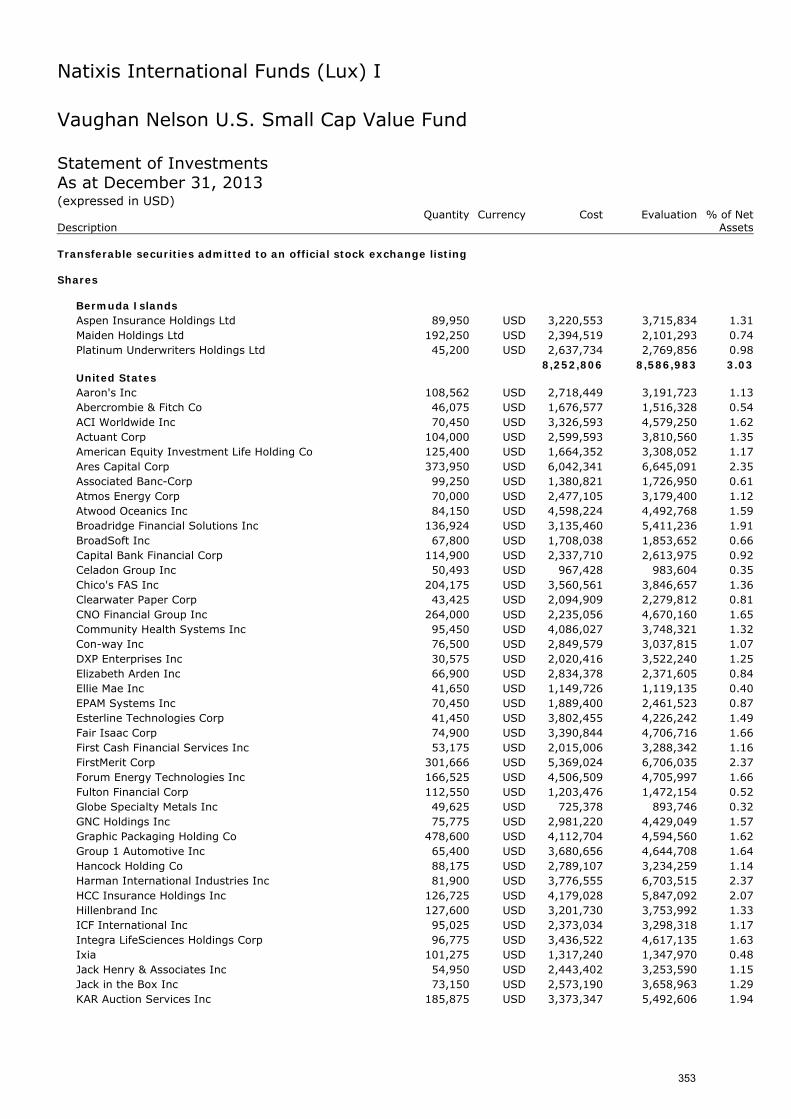
Natixis International Funds (Lux) I
Vaughan Nelson U.S. Small Cap Value Fund Statement of Investments As at December 31, 2013 (expressed in USD) Quantity Currency Cost Evaluation % of Net Description Assets Transferable securities admitted to an official stock exchange listing Shares
Bermuda Islands Aspen Insurance Holdings Ltd 89,950 USD 3,220,553 3,715,834 1.31 Maiden Holdings Ltd 192,250 USD 2,394,519 2,101,293 0.74 Platinum Underwriters Holdings Ltd 45,200 USD 2,637,734 2,769,856 0.98
8,252,806 8,586,983 3.03 United States Aaron's Inc 108,562 USD 2,718,449 3,191,723 1.13 Abercrombie & Fitch Co 46,075 USD 1,676,577 1,516,328 0.54 ACI Worldwide Inc 70,450 USD 3,326,593 4,579,250 1.62 Actuant Corp 104,000 USD 2,599,593 3,810,560 1.35 American Equity Investment Life Holding Co 125,400 USD 1,664,352 3,308,052 1.17 Ares Capital Corp 373,950 USD 6,042,341 6,645,091 2.35 Associated Banc-Corp 99,250 USD 1,380,821 1,726,950 0.61 Atmos Energy Corp 70,000 USD 2,477,105 3,179,400 1.12 Atwood Oceanics Inc 84,150 USD 4,598,224 4,492,768 1.59 Broadridge Financial Solutions Inc 136,924 USD 3,135,460 5,411,236 1.91 BroadSoft Inc 67,800 USD 1,708,038 1,853,652 0.66 Capital Bank Financial Corp 114,900 USD 2,337,710 2,613,975 0.92 Celadon Group Inc 50,493 USD 967,428 983,604 0.35 Chico's FAS Inc 204,175 USD 3,560,561 3,846,657 1.36 Clearwater Paper Corp 43,425 USD 2,094,909 2,279,812 0.81 CNO Financial Group Inc 264,000 USD 2,235,056 4,670,160 1.65 Community Health Systems Inc 95,450 USD 4,086,027 3,748,321 1.32 Con-way Inc 76,500 USD 2,849,579 3,037,815 1.07 DXP Enterprises Inc 30,575 USD 2,020,416 3,522,240 1.25 Elizabeth Arden Inc 66,900 USD 2,834,378 2,371,605 0.84 Ellie Mae Inc 41,650 USD 1,149,726 1,119,135 0.40 EPAM Systems Inc 70,450 USD 1,889,400 2,461,523 0.87 Esterline Technologies Corp 41,450 USD 3,802,455 4,226,242 1.49 Fair Isaac Corp 74,900 USD 3,390,844 4,706,716 1.66 First Cash Financial Services Inc 53,175 USD 2,015,006 3,288,342 1.16 FirstMerit Corp 301,666 USD 5,369,024 6,706,035 2.37 Forum Energy Technologies Inc 166,525 USD 4,506,509 4,705,997 1.66 Fulton Financial Corp 112,550 USD 1,203,476 1,472,154 0.52 Globe Specialty Metals Inc 49,625 USD 725,378 893,746 0.32 GNC Holdings Inc 75,775 USD 2,981,220 4,429,049 1.57 Graphic Packaging Holding Co 478,600 USD 4,112,704 4,594,560 1.62 Group 1 Automotive Inc 65,400 USD 3,680,656 4,644,708 1.64 Hancock Holding Co 88,175 USD 2,789,107 3,234,259 1.14 Harman International Industries Inc 81,900 USD 3,776,555 6,703,515 2.37 HCC Insurance Holdings Inc 126,725 USD 4,179,028 5,847,092 2.07 Hillenbrand Inc 127,600 USD 3,201,730 3,753,992 1.33 ICF International Inc 95,025 USD 2,373,034 3,298,318 1.17 Integra LifeSciences Holdings Corp 96,775 USD 3,436,522 4,617,135 1.63 Ixia 101,275 USD 1,317,240 1,347,970 0.48 Jack Henry & Associates Inc 54,950 USD 2,443,402 3,253,590 1.15 Jack in the Box Inc 73,150 USD 2,573,190 3,658,963 1.29 KAR Auction Services Inc 185,875 USD 3,373,347 5,492,606 1.94
353
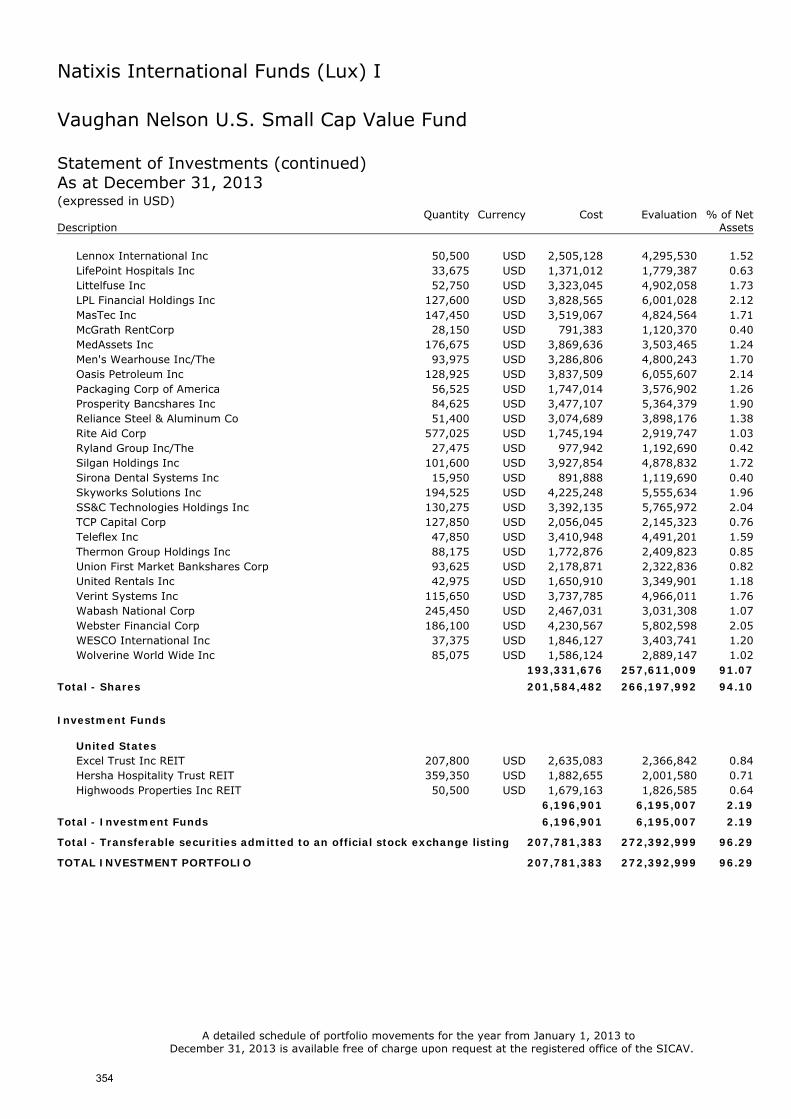
Natixis International Funds (Lux) I
Vaughan Nelson U.S. Small Cap Value Fund Statement of Investments (continued) As at December 31, 2013 (expressed in USD) Quantity Currency Cost Evaluation % of Net Description Assets
Lennox International Inc 50,500 USD 2,505,128 4,295,530 1.52 LifePoint Hospitals Inc 33,675 USD 1,371,012 1,779,387 0.63 Littelfuse Inc 52,750 USD 3,323,045 4,902,058 1.73 LPL Financial Holdings Inc 127,600 USD 3,828,565 6,001,028 2.12 MasTec Inc 147,450 USD 3,519,067 4,824,564 1.71 McGrath RentCorp 28,150 USD 791,383 1,120,370 0.40 MedAssets Inc 176,675 USD 3,869,636 3,503,465 1.24 Men's Wearhouse Inc/The 93,975 USD 3,286,806 4,800,243 1.70 Oasis Petroleum Inc 128,925 USD 3,837,509 6,055,607 2.14 Packaging Corp of America 56,525 USD 1,747,014 3,576,902 1.26 Prosperity Bancshares Inc 84,625 USD 3,477,107 5,364,379 1.90 Reliance Steel & Aluminum Co 51,400 USD 3,074,689 3,898,176 1.38 Rite Aid Corp 577,025 USD 1,745,194 2,919,747 1.03 Ryland Group Inc/The 27,475 USD 977,942 1,192,690 0.42 Silgan Holdings Inc 101,600 USD 3,927,854 4,878,832 1.72 Sirona Dental Systems Inc 15,950 USD 891,888 1,119,690 0.40 Skyworks Solutions Inc 194,525 USD 4,225,248 5,555,634 1.96 SS&C Technologies Holdings Inc 130,275 USD 3,392,135 5,765,972 2.04 TCP Capital Corp 127,850 USD 2,056,045 2,145,323 0.76 Teleflex Inc 47,850 USD 3,410,948 4,491,201 1.59 Thermon Group Holdings Inc 88,175 USD 1,772,876 2,409,823 0.85 Union First Market Bankshares Corp 93,625 USD 2,178,871 2,322,836 0.82 United Rentals Inc 42,975 USD 1,650,910 3,349,901 1.18 Verint Systems Inc 115,650 USD 3,737,785 4,966,011 1.76 Wabash National Corp 245,450 USD 2,467,031 3,031,308 1.07 Webster Financial Corp 186,100 USD 4,230,567 5,802,598 2.05 WESCO International Inc 37,375 USD 1,846,127 3,403,741 1.20 Wolverine World Wide Inc 85,075 USD 1,586,124 2,889,147 1.02
193,331,676 257,611,009 91.07
Total - Shares 201,584,482 266,197,992 94.10
Investment Funds
United States Excel Trust Inc REIT 207,800 USD 2,635,083 2,366,842 0.84 Hersha Hospitality Trust REIT 359,350 USD 1,882,655 2,001,580 0.71 Highwoods Properties Inc REIT 50,500 USD 1,679,163 1,826,585 0.64
6,196,901 6,195,007 2.19
Total - Investment Funds 6,196,901 6,195,007 2.19
Total - Transferable securities admitted to an official stock exchange listing 207,781,383 272,392,999 96.29
TOTAL INVESTMENT PORTFOLIO 207,781,383 272,392,999 96.29
A detailed schedule of portfolio movements for the year from January 1, 2013 to December 31, 2013 is available free of charge upon request at the registered office of the SICAV.
354
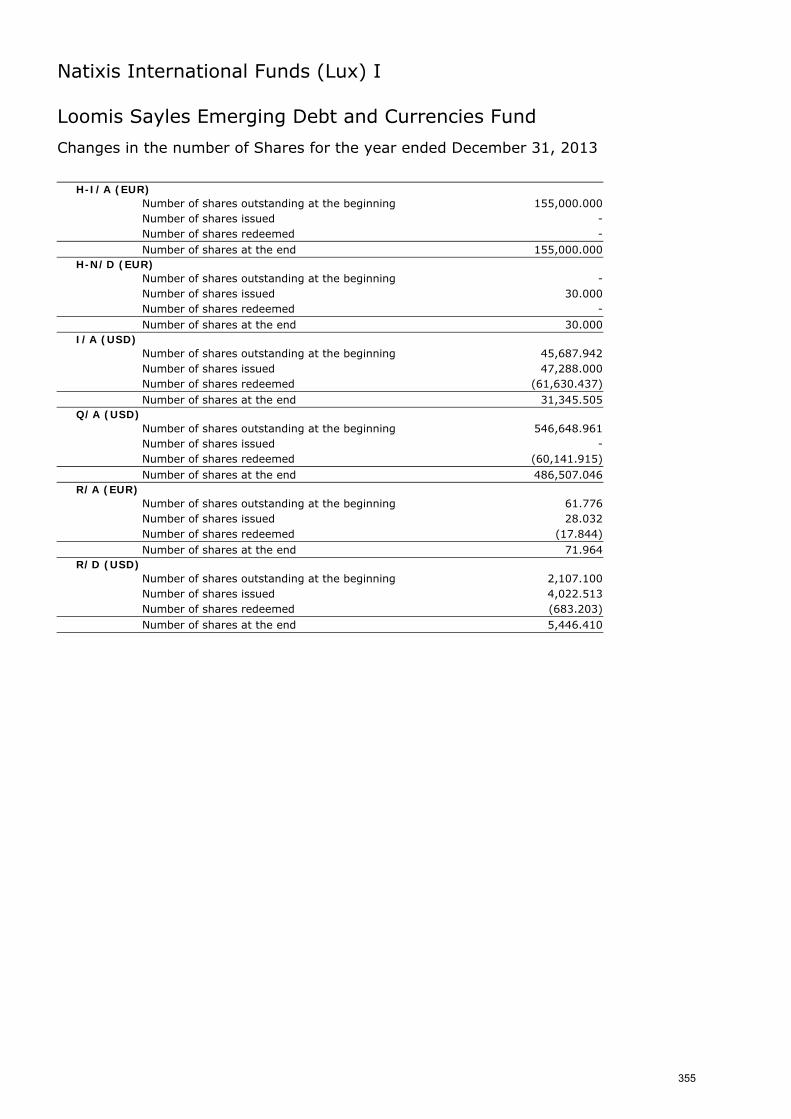
Natixis International Funds (Lux) I
Loomis Sayles Emerging Debt and Currencies Fund
Changes in the number of Shares for the year ended December 31, 2013
H-I/A (EUR) Number of shares outstanding at the beginning 155,000.000
Number of shares issued - Number of shares redeemed - Number of shares at the end 155,000.000
H-N/D (EUR) Number of shares outstanding at the beginning - Number of shares issued 30.000
Number of shares redeemed - Number of shares at the end 30.000
I/A (USD) Number of shares outstanding at the beginning 45,687.942
Number of shares issued 47,288.000
Number of shares redeemed (61,630.437) Number of shares at the end 31,345.505
Q/A (USD) Number of shares outstanding at the beginning 546,648.961
Number of shares issued - Number of shares redeemed (60,141.915) Number of shares at the end 486,507.046
R/A (EUR) Number of shares outstanding at the beginning 61.776
Number of shares issued 28.032
Number of shares redeemed (17.844) Number of shares at the end 71.964
R/D (USD) Number of shares outstanding at the beginning 2,107.100
Number of shares issued 4,022.513
Number of shares redeemed (683.203) Number of shares at the end 5,446.410
355
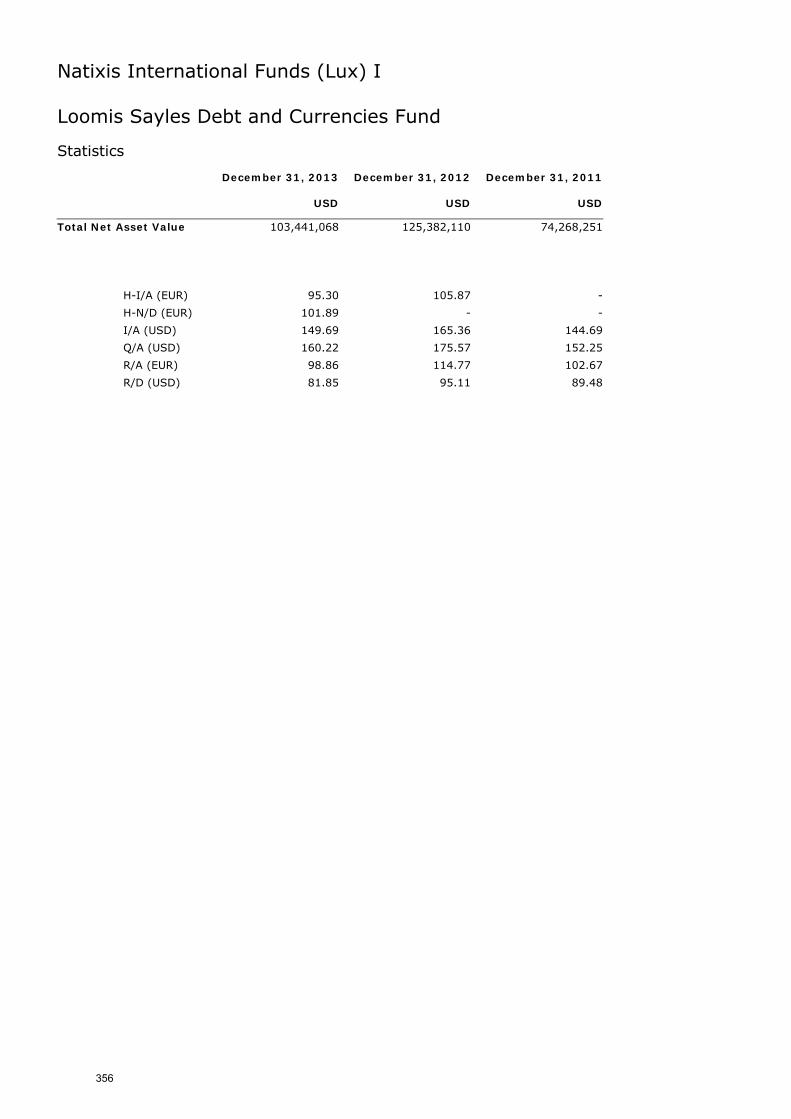
Natixis International Funds (Lux) I
Loomis Sayles Debt and Currencies Fund Statistics December 31, 2013 December 31, 2012 December 31, 2011 USD USD USD
Total Net Asset Value 103,441,068 125,382,110 74,268,251
H-I/A (EUR) 95.30 105.87 -
H-N/D (EUR) 101.89 - -
I/A (USD) 149.69 165.36 144.69
Q/A (USD) 160.22 175.57 152.25
R/A (EUR) 98.86 114.77 102.67
R/D (USD) 81.85 95.11 89.48
356
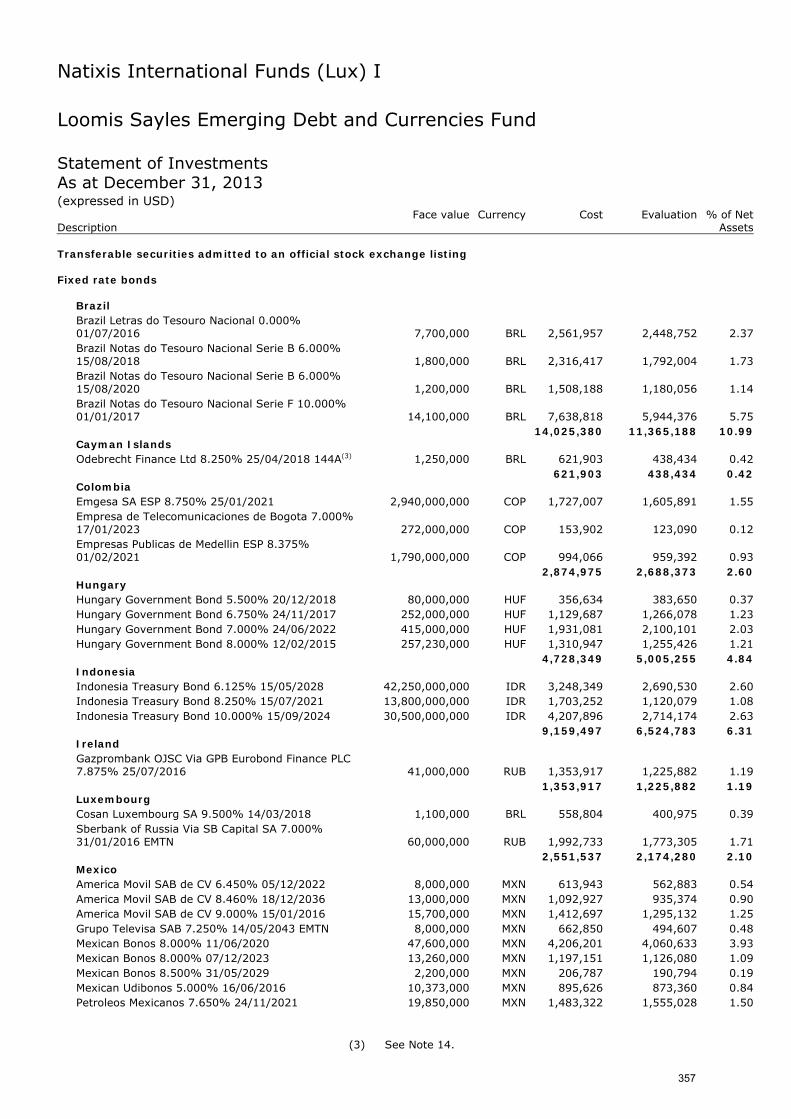
Natixis International Funds (Lux) I
Loomis Sayles Emerging Debt and Currencies Fund Statement of Investments As at December 31, 2013 (expressed in USD) Face value Currency Cost Evaluation % of Net Description Assets Transferable securities admitted to an official stock exchange listing Fixed rate bonds
Brazil Brazil Letras do Tesouro Nacional 0.000% 01/07/2016 7,700,000 BRL 2,561,957 2,448,752 2.37 Brazil Notas do Tesouro Nacional Serie B 6.000% 15/08/2018 1,800,000 BRL 2,316,417 1,792,004 1.73 Brazil Notas do Tesouro Nacional Serie B 6.000% 15/08/2020 1,200,000 BRL 1,508,188 1,180,056 1.14 Brazil Notas do Tesouro Nacional Serie F 10.000% 01/01/2017 14,100,000 BRL 7,638,818 5,944,376 5.75
14,025,380 11,365,188 10.99 Cayman Islands Odebrecht Finance Ltd 8.250% 25/04/2018 144A(3) 1,250,000 BRL 621,903 438,434 0.42
621,903 438,434 0.42 Colombia Emgesa SA ESP 8.750% 25/01/2021 2,940,000,000 COP 1,727,007 1,605,891 1.55 Empresa de Telecomunicaciones de Bogota 7.000% 17/01/2023 272,000,000 COP 153,902 123,090 0.12 Empresas Publicas de Medellin ESP 8.375% 01/02/2021 1,790,000,000 COP 994,066 959,392 0.93
2,874,975 2,688,373 2.60 Hungary Hungary Government Bond 5.500% 20/12/2018 80,000,000 HUF 356,634 383,650 0.37 Hungary Government Bond 6.750% 24/11/2017 252,000,000 HUF 1,129,687 1,266,078 1.23 Hungary Government Bond 7.000% 24/06/2022 415,000,000 HUF 1,931,081 2,100,101 2.03 Hungary Government Bond 8.000% 12/02/2015 257,230,000 HUF 1,310,947 1,255,426 1.21
4,728,349 5,005,255 4.84 Indonesia Indonesia Treasury Bond 6.125% 15/05/2028 42,250,000,000 IDR 3,248,349 2,690,530 2.60 Indonesia Treasury Bond 8.250% 15/07/2021 13,800,000,000 IDR 1,703,252 1,120,079 1.08 Indonesia Treasury Bond 10.000% 15/09/2024 30,500,000,000 IDR 4,207,896 2,714,174 2.63
9,159,497 6,524,783 6.31 Ireland Gazprombank OJSC Via GPB Eurobond Finance PLC 7.875% 25/07/2016 41,000,000 RUB 1,353,917 1,225,882 1.19
1,353,917 1,225,882 1.19 Luxembourg Cosan Luxembourg SA 9.500% 14/03/2018 1,100,000 BRL 558,804 400,975 0.39 Sberbank of Russia Via SB Capital SA 7.000% 31/01/2016 EMTN 60,000,000 RUB 1,992,733 1,773,305 1.71
2,551,537 2,174,280 2.10 Mexico America Movil SAB de CV 6.450% 05/12/2022 8,000,000 MXN 613,943 562,883 0.54 America Movil SAB de CV 8.460% 18/12/2036 13,000,000 MXN 1,092,927 935,374 0.90 America Movil SAB de CV 9.000% 15/01/2016 15,700,000 MXN 1,412,697 1,295,132 1.25 Grupo Televisa SAB 7.250% 14/05/2043 EMTN 8,000,000 MXN 662,850 494,607 0.48 Mexican Bonos 8.000% 11/06/2020 47,600,000 MXN 4,206,201 4,060,633 3.93 Mexican Bonos 8.000% 07/12/2023 13,260,000 MXN 1,197,151 1,126,080 1.09 Mexican Bonos 8.500% 31/05/2029 2,200,000 MXN 206,787 190,794 0.19 Mexican Udibonos 5.000% 16/06/2016 10,373,000 MXN 895,626 873,360 0.84 Petroleos Mexicanos 7.650% 24/11/2021 19,850,000 MXN 1,483,322 1,555,028 1.50
(3) See Note 14.
357
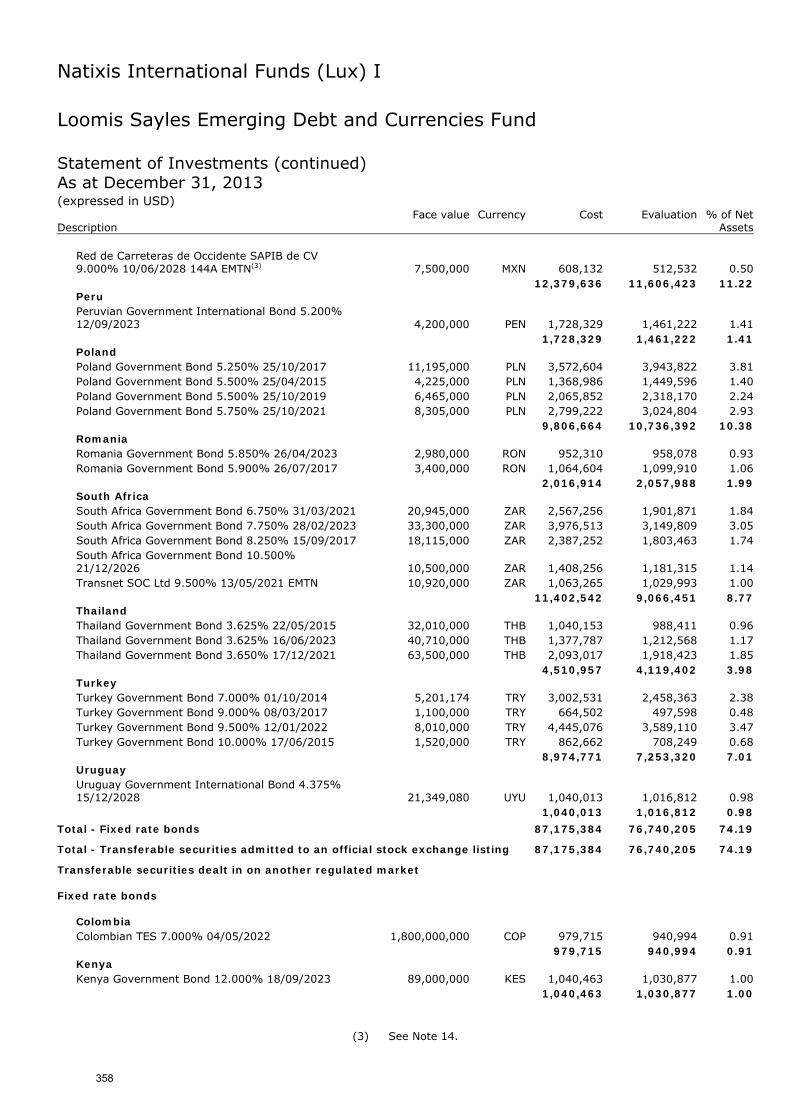
Natixis International Funds (Lux) I
Loomis Sayles Emerging Debt and Currencies Fund Statement of Investments (continued) As at December 31, 2013 (expressed in USD) Face value Currency Cost Evaluation % of Net Description Assets
Red de Carreteras de Occidente SAPIB de CV 9.000% 10/06/2028 144A EMTN(3) 7,500,000 MXN 608,132 512,532 0.50
12,379,636 11,606,423 11.22 Peru Peruvian Government International Bond 5.200% 12/09/2023 4,200,000 PEN 1,728,329 1,461,222 1.41
1,728,329 1,461,222 1.41 Poland Poland Government Bond 5.250% 25/10/2017 11,195,000 PLN 3,572,604 3,943,822 3.81 Poland Government Bond 5.500% 25/04/2015 4,225,000 PLN 1,368,986 1,449,596 1.40 Poland Government Bond 5.500% 25/10/2019 6,465,000 PLN 2,065,852 2,318,170 2.24 Poland Government Bond 5.750% 25/10/2021 8,305,000 PLN 2,799,222 3,024,804 2.93
9,806,664 10,736,392 10.38 Romania Romania Government Bond 5.850% 26/04/2023 2,980,000 RON 952,310 958,078 0.93 Romania Government Bond 5.900% 26/07/2017 3,400,000 RON 1,064,604 1,099,910 1.06
2,016,914 2,057,988 1.99 South Africa South Africa Government Bond 6.750% 31/03/2021 20,945,000 ZAR 2,567,256 1,901,871 1.84 South Africa Government Bond 7.750% 28/02/2023 33,300,000 ZAR 3,976,513 3,149,809 3.05 South Africa Government Bond 8.250% 15/09/2017 18,115,000 ZAR 2,387,252 1,803,463 1.74 South Africa Government Bond 10.500% 21/12/2026 10,500,000 ZAR 1,408,256 1,181,315 1.14 Transnet SOC Ltd 9.500% 13/05/2021 EMTN 10,920,000 ZAR 1,063,265 1,029,993 1.00
11,402,542 9,066,451 8.77 Thailand Thailand Government Bond 3.625% 22/05/2015 32,010,000 THB 1,040,153 988,411 0.96 Thailand Government Bond 3.625% 16/06/2023 40,710,000 THB 1,377,787 1,212,568 1.17 Thailand Government Bond 3.650% 17/12/2021 63,500,000 THB 2,093,017 1,918,423 1.85
4,510,957 4,119,402 3.98 Turkey Turkey Government Bond 7.000% 01/10/2014 5,201,174 TRY 3,002,531 2,458,363 2.38 Turkey Government Bond 9.000% 08/03/2017 1,100,000 TRY 664,502 497,598 0.48 Turkey Government Bond 9.500% 12/01/2022 8,010,000 TRY 4,445,076 3,589,110 3.47 Turkey Government Bond 10.000% 17/06/2015 1,520,000 TRY 862,662 708,249 0.68
8,974,771 7,253,320 7.01 Uruguay Uruguay Government International Bond 4.375% 15/12/2028 21,349,080 UYU 1,040,013 1,016,812 0.98
1,040,013 1,016,812 0.98
Total - Fixed rate bonds 87,175,384 76,740,205 74.19
Total - Transferable securities admitted to an official stock exchange listing 87,175,384 76,740,205 74.19
Transferable securities dealt in on another regulated market Fixed rate bonds
Colombia Colombian TES 7.000% 04/05/2022 1,800,000,000 COP 979,715 940,994 0.91
979,715 940,994 0.91 Kenya Kenya Government Bond 12.000% 18/09/2023 89,000,000 KES 1,040,463 1,030,877 1.00
1,040,463 1,030,877 1.00
(3) See Note 14.
358
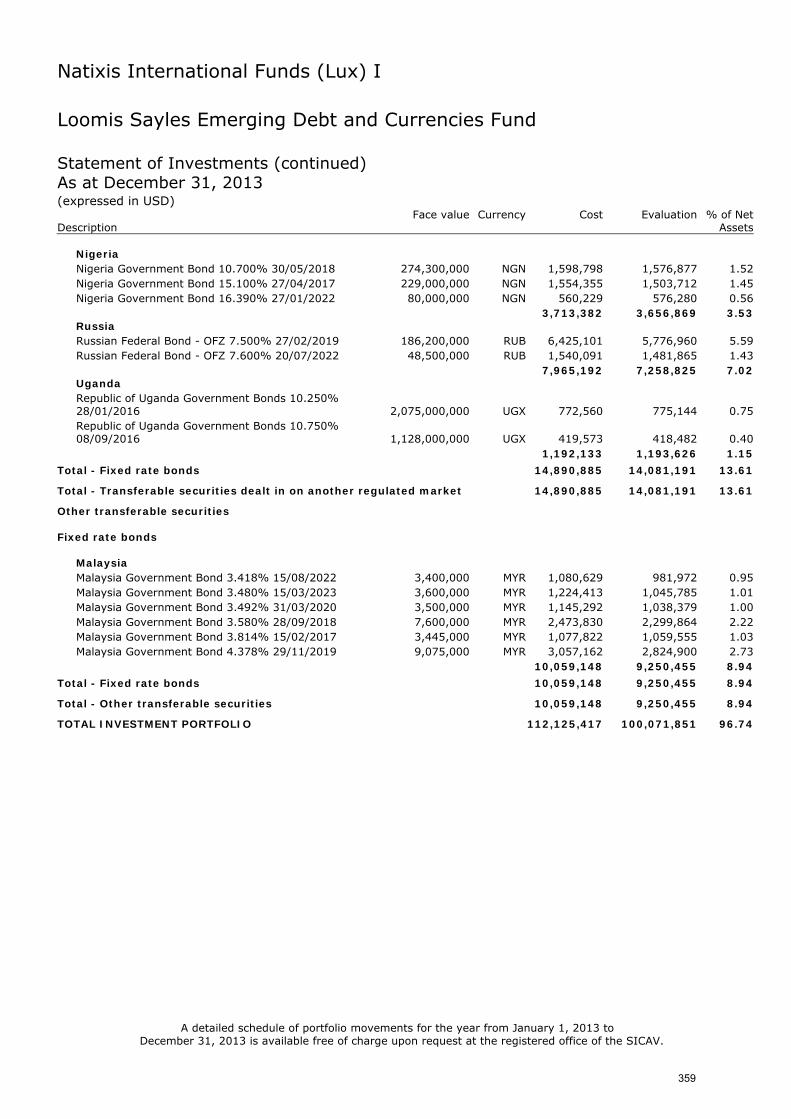
Natixis International Funds (Lux) I
Loomis Sayles Emerging Debt and Currencies Fund Statement of Investments (continued) As at December 31, 2013 (expressed in USD) Face value Currency Cost Evaluation % of Net Description Assets
Nigeria Nigeria Government Bond 10.700% 30/05/2018 274,300,000 NGN 1,598,798 1,576,877 1.52 Nigeria Government Bond 15.100% 27/04/2017 229,000,000 NGN 1,554,355 1,503,712 1.45 Nigeria Government Bond 16.390% 27/01/2022 80,000,000 NGN 560,229 576,280 0.56
3,713,382 3,656,869 3.53 Russia Russian Federal Bond - OFZ 7.500% 27/02/2019 186,200,000 RUB 6,425,101 5,776,960 5.59 Russian Federal Bond - OFZ 7.600% 20/07/2022 48,500,000 RUB 1,540,091 1,481,865 1.43
7,965,192 7,258,825 7.02 Uganda Republic of Uganda Government Bonds 10.250% 28/01/2016 2,075,000,000 UGX 772,560 775,144 0.75 Republic of Uganda Government Bonds 10.750% 08/09/2016 1,128,000,000 UGX 419,573 418,482 0.40
1,192,133 1,193,626 1.15
Total - Fixed rate bonds 14,890,885 14,081,191 13.61
Total - Transferable securities dealt in on another regulated market 14,890,885 14,081,191 13.61
Other transferable securities Fixed rate bonds
Malaysia Malaysia Government Bond 3.418% 15/08/2022 3,400,000 MYR 1,080,629 981,972 0.95 Malaysia Government Bond 3.480% 15/03/2023 3,600,000 MYR 1,224,413 1,045,785 1.01 Malaysia Government Bond 3.492% 31/03/2020 3,500,000 MYR 1,145,292 1,038,379 1.00 Malaysia Government Bond 3.580% 28/09/2018 7,600,000 MYR 2,473,830 2,299,864 2.22 Malaysia Government Bond 3.814% 15/02/2017 3,445,000 MYR 1,077,822 1,059,555 1.03 Malaysia Government Bond 4.378% 29/11/2019 9,075,000 MYR 3,057,162 2,824,900 2.73
10,059,148 9,250,455 8.94
Total - Fixed rate bonds 10,059,148 9,250,455 8.94
Total - Other transferable securities 10,059,148 9,250,455 8.94
TOTAL INVESTMENT PORTFOLIO 112,125,417 100,071,851 96.74 A detailed schedule of portfolio movements for the year from January 1, 2013 to
December 31, 2013 is available free of charge upon request at the registered office of the SICAV.
359
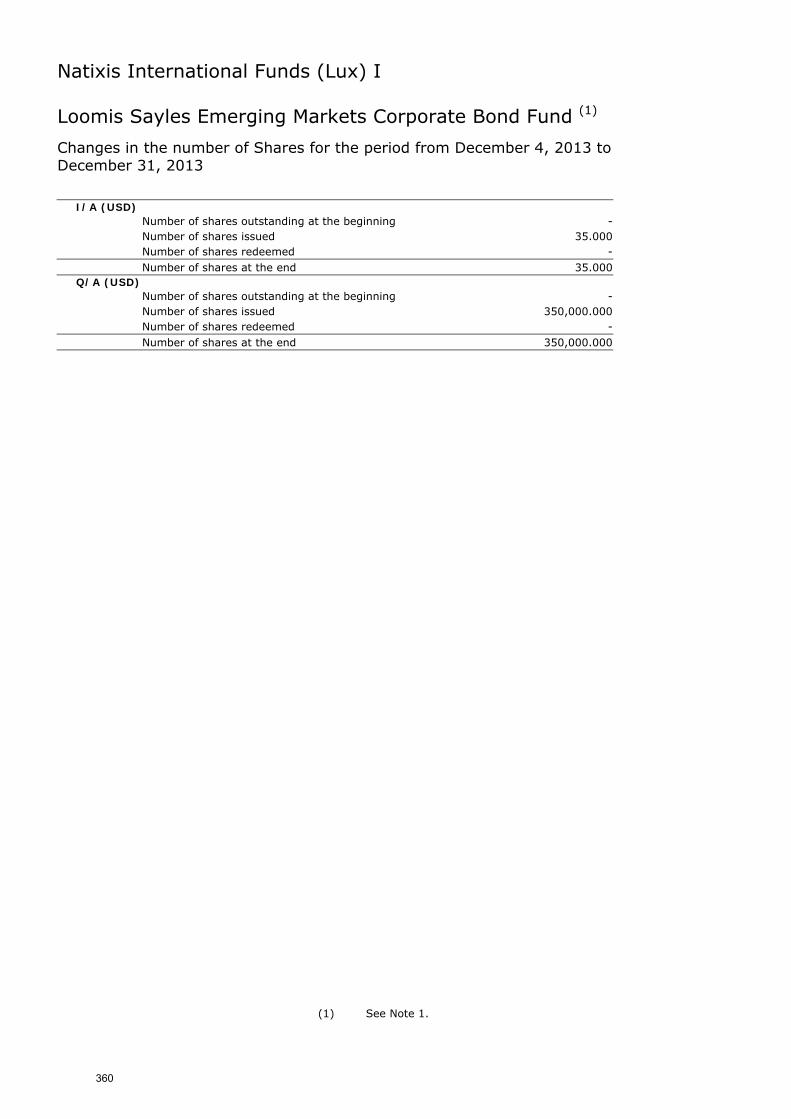
Natixis International Funds (Lux) I
Loomis Sayles Emerging Markets Corporate Bond Fund (1)
Changes in the number of Shares for the period from December 4, 2013 to December 31, 2013
I/A (USD) Number of shares outstanding at the beginning - Number of shares issued 35.000
Number of shares redeemed - Number of shares at the end 35.000
Q/A (USD) Number of shares outstanding at the beginning - Number of shares issued 350,000.000
Number of shares redeemed - Number of shares at the end 350,000.000
(1) See Note 1.
360
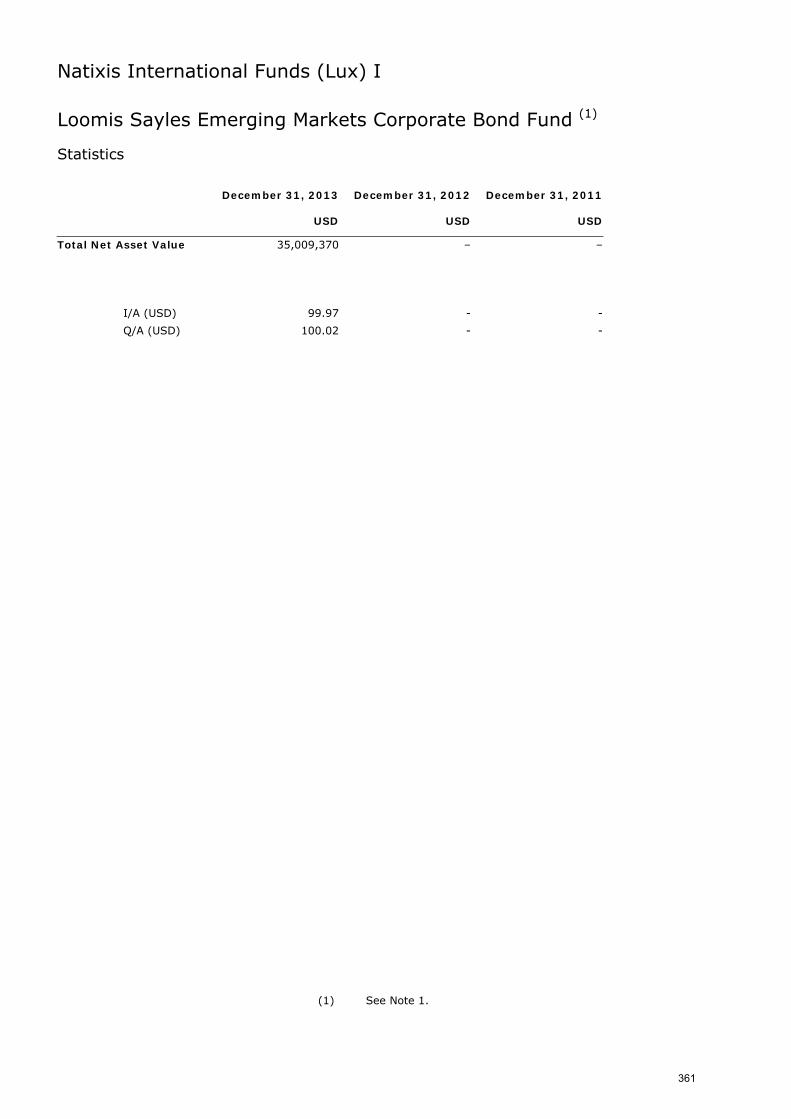
Natixis International Funds (Lux) I
Loomis Sayles Emerging Markets Corporate Bond Fund (1) Statistics December 31, 2013 December 31, 2012 December 31, 2011 USD USD USD
Total Net Asset Value 35,009,370 – –
I/A (USD) 99.97 - -
Q/A (USD) 100.02 - -
(1) See Note 1.
361
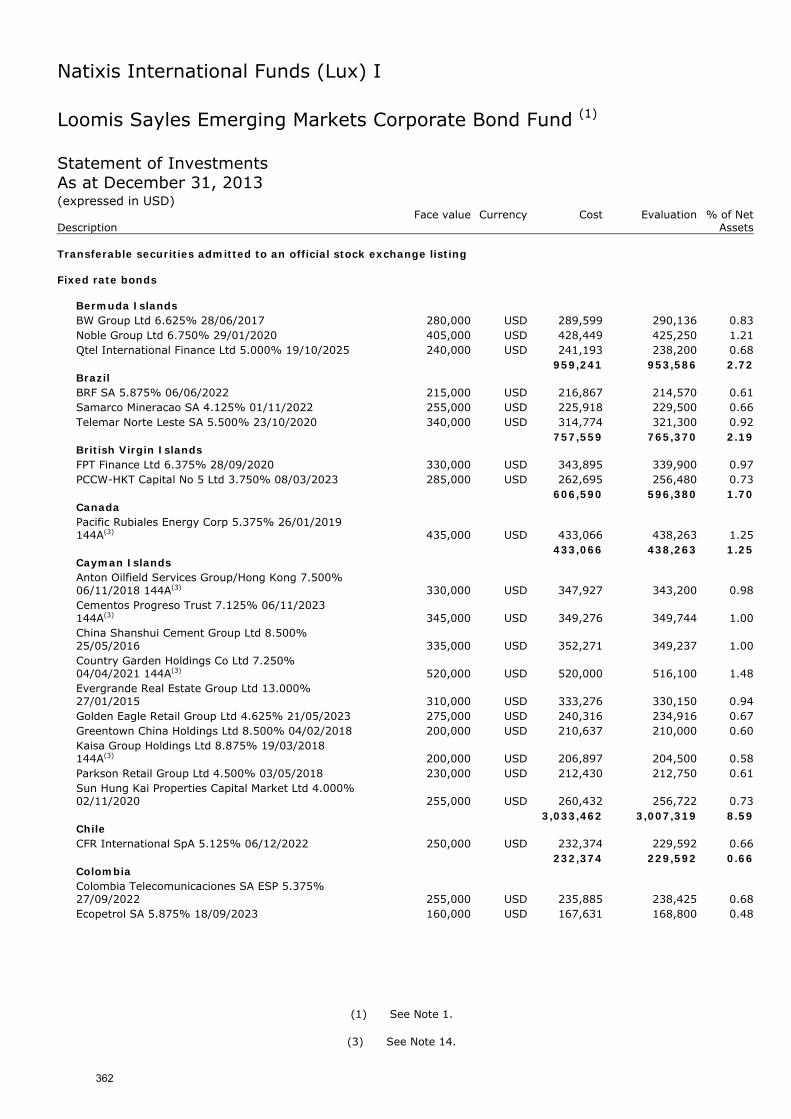
Natixis International Funds (Lux) I
Loomis Sayles Emerging Markets Corporate Bond Fund (1) Statement of Investments As at December 31, 2013 (expressed in USD) Face value Currency Cost Evaluation % of Net Description Assets Transferable securities admitted to an official stock exchange listing Fixed rate bonds
Bermuda Islands BW Group Ltd 6.625% 28/06/2017 280,000 USD 289,599 290,136 0.83 Noble Group Ltd 6.750% 29/01/2020 405,000 USD 428,449 425,250 1.21 Qtel International Finance Ltd 5.000% 19/10/2025 240,000 USD 241,193 238,200 0.68
959,241 953,586 2.72 Brazil BRF SA 5.875% 06/06/2022 215,000 USD 216,867 214,570 0.61 Samarco Mineracao SA 4.125% 01/11/2022 255,000 USD 225,918 229,500 0.66 Telemar Norte Leste SA 5.500% 23/10/2020 340,000 USD 314,774 321,300 0.92
757,559 765,370 2.19 British Virgin Islands FPT Finance Ltd 6.375% 28/09/2020 330,000 USD 343,895 339,900 0.97 PCCW-HKT Capital No 5 Ltd 3.750% 08/03/2023 285,000 USD 262,695 256,480 0.73
606,590 596,380 1.70 Canada Pacific Rubiales Energy Corp 5.375% 26/01/2019 144A(3) 435,000 USD 433,066 438,263 1.25
433,066 438,263 1.25 Cayman Islands Anton Oilfield Services Group/Hong Kong 7.500% 06/11/2018 144A(3) 330,000 USD 347,927 343,200 0.98 Cementos Progreso Trust 7.125% 06/11/2023 144A(3) 345,000 USD 349,276 349,744 1.00 China Shanshui Cement Group Ltd 8.500% 25/05/2016 335,000 USD 352,271 349,237 1.00 Country Garden Holdings Co Ltd 7.250% 04/04/2021 144A(3) 520,000 USD 520,000 516,100 1.48 Evergrande Real Estate Group Ltd 13.000% 27/01/2015 310,000 USD 333,276 330,150 0.94 Golden Eagle Retail Group Ltd 4.625% 21/05/2023 275,000 USD 240,316 234,916 0.67 Greentown China Holdings Ltd 8.500% 04/02/2018 200,000 USD 210,637 210,000 0.60 Kaisa Group Holdings Ltd 8.875% 19/03/2018 144A(3) 200,000 USD 206,897 204,500 0.58 Parkson Retail Group Ltd 4.500% 03/05/2018 230,000 USD 212,430 212,750 0.61 Sun Hung Kai Properties Capital Market Ltd 4.000% 02/11/2020 255,000 USD 260,432 256,722 0.73
3,033,462 3,007,319 8.59 Chile CFR International SpA 5.125% 06/12/2022 250,000 USD 232,374 229,592 0.66
232,374 229,592 0.66 Colombia Colombia Telecomunicaciones SA ESP 5.375% 27/09/2022 255,000 USD 235,885 238,425 0.68 Ecopetrol SA 5.875% 18/09/2023 160,000 USD 167,631 168,800 0.48
(1) See Note 1.
(3) See Note 14.
362
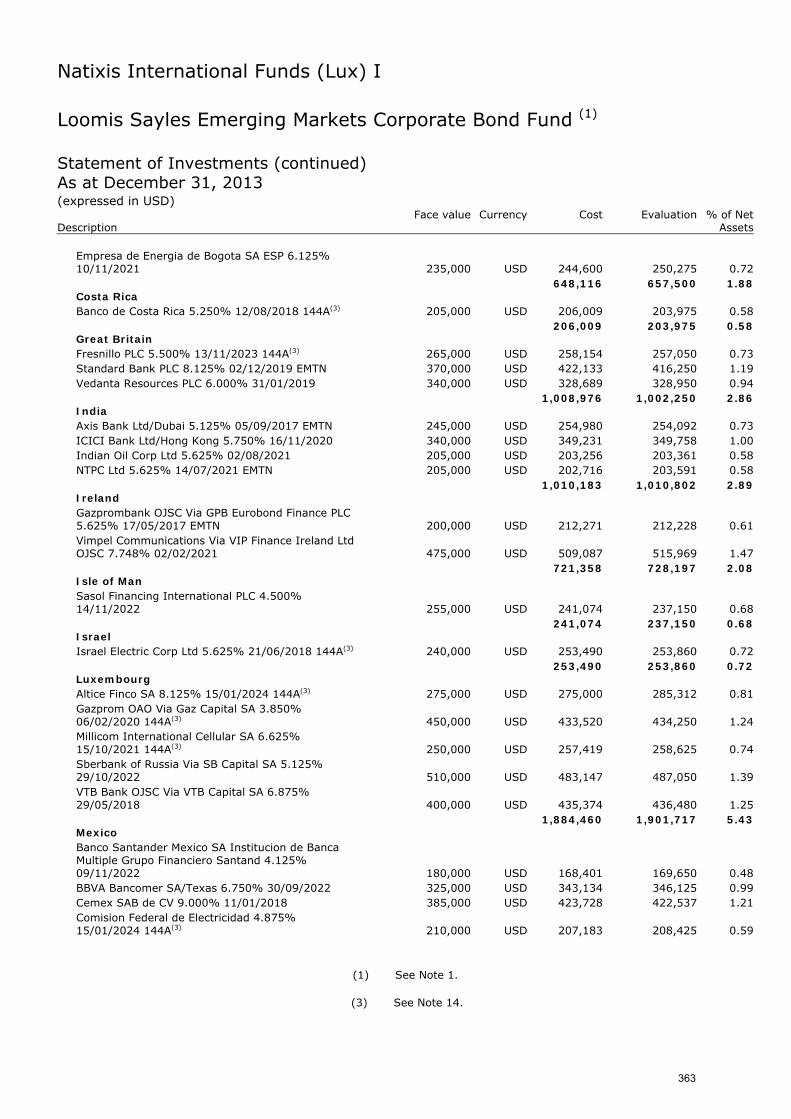
Natixis International Funds (Lux) I
Loomis Sayles Emerging Markets Corporate Bond Fund (1) Statement of Investments (continued) As at December 31, 2013 (expressed in USD) Face value Currency Cost Evaluation % of Net Description Assets
Empresa de Energia de Bogota SA ESP 6.125% 10/11/2021 235,000 USD 244,600 250,275 0.72
648,116 657,500 1.88 Costa Rica Banco de Costa Rica 5.250% 12/08/2018 144A(3) 205,000 USD 206,009 203,975 0.58
206,009 203,975 0.58 Great Britain Fresnillo PLC 5.500% 13/11/2023 144A(3) 265,000 USD 258,154 257,050 0.73 Standard Bank PLC 8.125% 02/12/2019 EMTN 370,000 USD 422,133 416,250 1.19 Vedanta Resources PLC 6.000% 31/01/2019 340,000 USD 328,689 328,950 0.94
1,008,976 1,002,250 2.86 India Axis Bank Ltd/Dubai 5.125% 05/09/2017 EMTN 245,000 USD 254,980 254,092 0.73 ICICI Bank Ltd/Hong Kong 5.750% 16/11/2020 340,000 USD 349,231 349,758 1.00 Indian Oil Corp Ltd 5.625% 02/08/2021 205,000 USD 203,256 203,361 0.58 NTPC Ltd 5.625% 14/07/2021 EMTN 205,000 USD 202,716 203,591 0.58
1,010,183 1,010,802 2.89 Ireland Gazprombank OJSC Via GPB Eurobond Finance PLC 5.625% 17/05/2017 EMTN 200,000 USD 212,271 212,228 0.61 Vimpel Communications Via VIP Finance Ireland Ltd OJSC 7.748% 02/02/2021 475,000 USD 509,087 515,969 1.47
721,358 728,197 2.08 Isle of Man Sasol Financing International PLC 4.500% 14/11/2022 255,000 USD 241,074 237,150 0.68
241,074 237,150 0.68 Israel Israel Electric Corp Ltd 5.625% 21/06/2018 144A(3) 240,000 USD 253,490 253,860 0.72
253,490 253,860 0.72 Luxembourg Altice Finco SA 8.125% 15/01/2024 144A(3) 275,000 USD 275,000 285,312 0.81 Gazprom OAO Via Gaz Capital SA 3.850% 06/02/2020 144A(3) 450,000 USD 433,520 434,250 1.24 Millicom International Cellular SA 6.625% 15/10/2021 144A(3) 250,000 USD 257,419 258,625 0.74 Sberbank of Russia Via SB Capital SA 5.125% 29/10/2022 510,000 USD 483,147 487,050 1.39 VTB Bank OJSC Via VTB Capital SA 6.875% 29/05/2018 400,000 USD 435,374 436,480 1.25
1,884,460 1,901,717 5.43 Mexico Banco Santander Mexico SA Institucion de Banca Multiple Grupo Financiero Santand 4.125% 09/11/2022 180,000 USD 168,401 169,650 0.48 BBVA Bancomer SA/Texas 6.750% 30/09/2022 325,000 USD 343,134 346,125 0.99 Cemex SAB de CV 9.000% 11/01/2018 385,000 USD 423,728 422,537 1.21 Comision Federal de Electricidad 4.875% 15/01/2024 144A(3) 210,000 USD 207,183 208,425 0.59
(1) See Note 1.
(3) See Note 14.
363
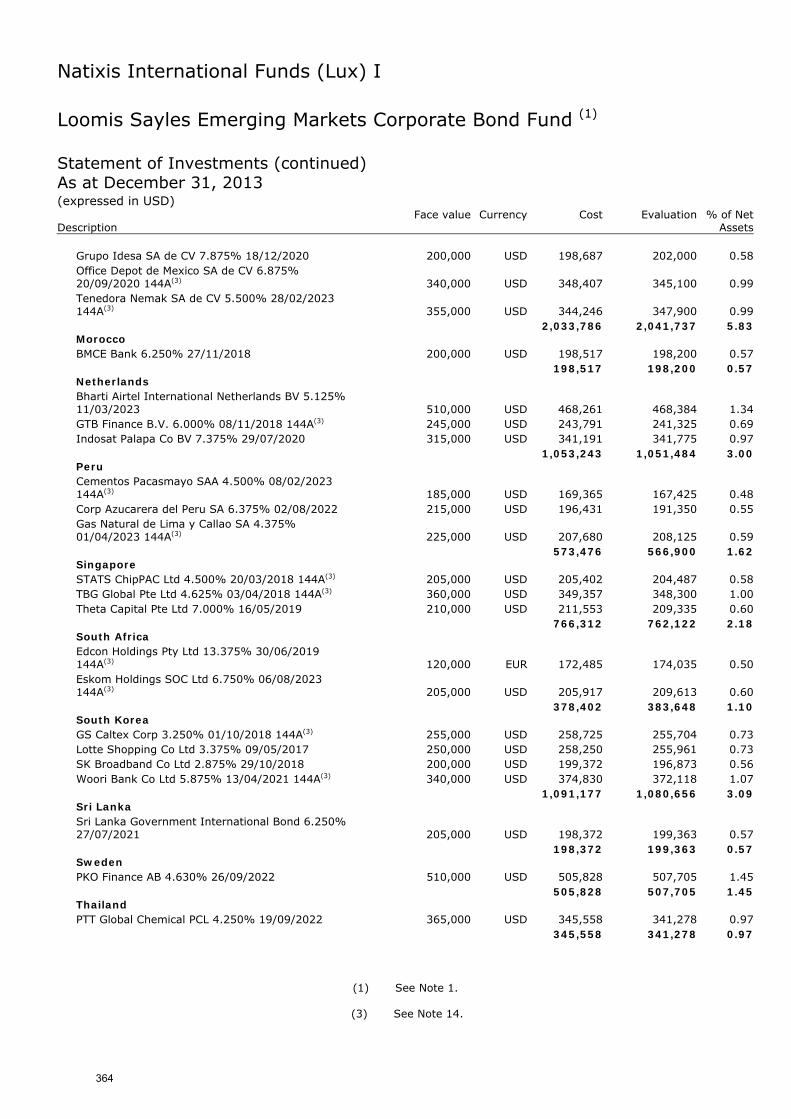
Natixis International Funds (Lux) I
Loomis Sayles Emerging Markets Corporate Bond Fund (1) Statement of Investments (continued) As at December 31, 2013 (expressed in USD) Face value Currency Cost Evaluation % of Net Description Assets
Grupo Idesa SA de CV 7.875% 18/12/2020 200,000 USD 198,687 202,000 0.58 Office Depot de Mexico SA de CV 6.875% 20/09/2020 144A(3) 340,000 USD 348,407 345,100 0.99 Tenedora Nemak SA de CV 5.500% 28/02/2023 144A(3) 355,000 USD 344,246 347,900 0.99
2,033,786 2,041,737 5.83 Morocco BMCE Bank 6.250% 27/11/2018 200,000 USD 198,517 198,200 0.57
198,517 198,200 0.57 Netherlands Bharti Airtel International Netherlands BV 5.125% 11/03/2023 510,000 USD 468,261 468,384 1.34 GTB Finance B.V. 6.000% 08/11/2018 144A(3) 245,000 USD 243,791 241,325 0.69 Indosat Palapa Co BV 7.375% 29/07/2020 315,000 USD 341,191 341,775 0.97
1,053,243 1,051,484 3.00 Peru Cementos Pacasmayo SAA 4.500% 08/02/2023 144A(3) 185,000 USD 169,365 167,425 0.48 Corp Azucarera del Peru SA 6.375% 02/08/2022 215,000 USD 196,431 191,350 0.55 Gas Natural de Lima y Callao SA 4.375% 01/04/2023 144A(3) 225,000 USD 207,680 208,125 0.59
573,476 566,900 1.62 Singapore STATS ChipPAC Ltd 4.500% 20/03/2018 144A(3) 205,000 USD 205,402 204,487 0.58 TBG Global Pte Ltd 4.625% 03/04/2018 144A(3) 360,000 USD 349,357 348,300 1.00 Theta Capital Pte Ltd 7.000% 16/05/2019 210,000 USD 211,553 209,335 0.60
766,312 762,122 2.18 South Africa Edcon Holdings Pty Ltd 13.375% 30/06/2019 144A(3) 120,000 EUR 172,485 174,035 0.50 Eskom Holdings SOC Ltd 6.750% 06/08/2023 144A(3) 205,000 USD 205,917 209,613 0.60
378,402 383,648 1.10 South Korea GS Caltex Corp 3.250% 01/10/2018 144A(3) 255,000 USD 258,725 255,704 0.73 Lotte Shopping Co Ltd 3.375% 09/05/2017 250,000 USD 258,250 255,961 0.73 SK Broadband Co Ltd 2.875% 29/10/2018 200,000 USD 199,372 196,873 0.56 Woori Bank Co Ltd 5.875% 13/04/2021 144A(3) 340,000 USD 374,830 372,118 1.07
1,091,177 1,080,656 3.09 Sri Lanka Sri Lanka Government International Bond 6.250% 27/07/2021 205,000 USD 198,372 199,363 0.57
198,372 199,363 0.57 Sweden PKO Finance AB 4.630% 26/09/2022 510,000 USD 505,828 507,705 1.45
505,828 507,705 1.45 Thailand PTT Global Chemical PCL 4.250% 19/09/2022 365,000 USD 345,558 341,278 0.97
345,558 341,278 0.97
(1) See Note 1.
(3) See Note 14.
364
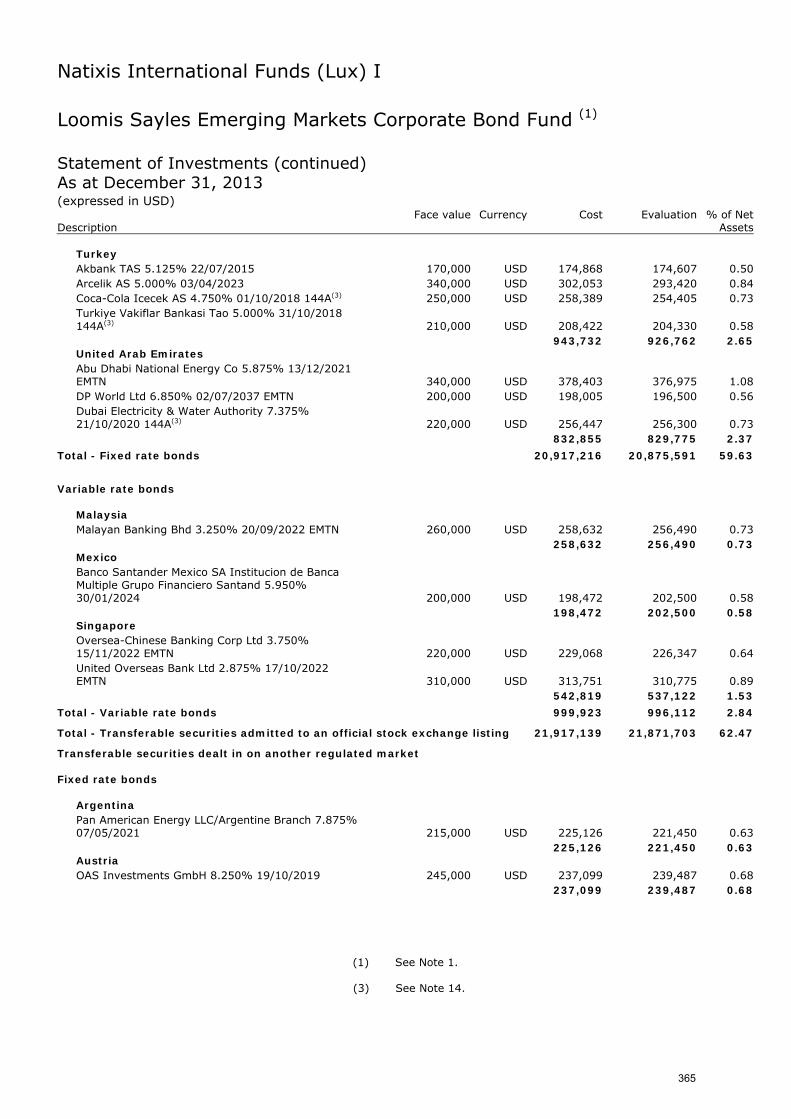
Natixis International Funds (Lux) I
Loomis Sayles Emerging Markets Corporate Bond Fund (1) Statement of Investments (continued) As at December 31, 2013 (expressed in USD) Face value Currency Cost Evaluation % of Net Description Assets
Turkey Akbank TAS 5.125% 22/07/2015 170,000 USD 174,868 174,607 0.50 Arcelik AS 5.000% 03/04/2023 340,000 USD 302,053 293,420 0.84 Coca-Cola Icecek AS 4.750% 01/10/2018 144A(3) 250,000 USD 258,389 254,405 0.73 Turkiye Vakiflar Bankasi Tao 5.000% 31/10/2018 144A(3) 210,000 USD 208,422 204,330 0.58
943,732 926,762 2.65 United Arab Emirates Abu Dhabi National Energy Co 5.875% 13/12/2021 EMTN 340,000 USD 378,403 376,975 1.08 DP World Ltd 6.850% 02/07/2037 EMTN 200,000 USD 198,005 196,500 0.56 Dubai Electricity & Water Authority 7.375% 21/10/2020 144A(3) 220,000 USD 256,447 256,300 0.73
832,855 829,775 2.37
Total - Fixed rate bonds 20,917,216 20,875,591 59.63
Variable rate bonds
Malaysia Malayan Banking Bhd 3.250% 20/09/2022 EMTN 260,000 USD 258,632 256,490 0.73
258,632 256,490 0.73 Mexico Banco Santander Mexico SA Institucion de Banca Multiple Grupo Financiero Santand 5.950% 30/01/2024 200,000 USD 198,472 202,500 0.58
198,472 202,500 0.58 Singapore Oversea-Chinese Banking Corp Ltd 3.750% 15/11/2022 EMTN 220,000 USD 229,068 226,347 0.64 United Overseas Bank Ltd 2.875% 17/10/2022 EMTN 310,000 USD 313,751 310,775 0.89
542,819 537,122 1.53
Total - Variable rate bonds 999,923 996,112 2.84
Total - Transferable securities admitted to an official stock exchange listing 21,917,139 21,871,703 62.47
Transferable securities dealt in on another regulated market Fixed rate bonds
Argentina Pan American Energy LLC/Argentine Branch 7.875% 07/05/2021 215,000 USD 225,126 221,450 0.63
225,126 221,450 0.63 Austria OAS Investments GmbH 8.250% 19/10/2019 245,000 USD 237,099 239,487 0.68
237,099 239,487 0.68
(1) See Note 1.
(3) See Note 14.
365
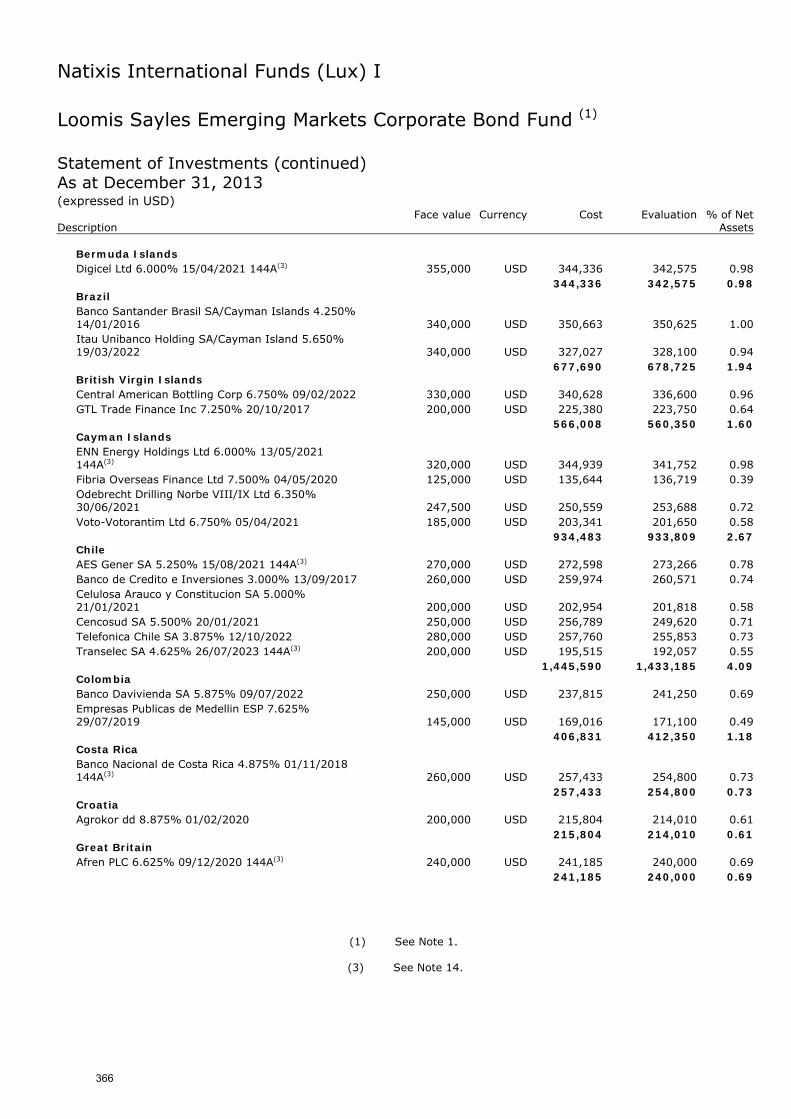
Natixis International Funds (Lux) I
Loomis Sayles Emerging Markets Corporate Bond Fund (1) Statement of Investments (continued) As at December 31, 2013 (expressed in USD) Face value Currency Cost Evaluation % of Net Description Assets
Bermuda Islands Digicel Ltd 6.000% 15/04/2021 144A(3) 355,000 USD 344,336 342,575 0.98
344,336 342,575 0.98 Brazil Banco Santander Brasil SA/Cayman Islands 4.250% 14/01/2016 340,000 USD 350,663 350,625 1.00 Itau Unibanco Holding SA/Cayman Island 5.650% 19/03/2022 340,000 USD 327,027 328,100 0.94
677,690 678,725 1.94 British Virgin Islands Central American Bottling Corp 6.750% 09/02/2022 330,000 USD 340,628 336,600 0.96 GTL Trade Finance Inc 7.250% 20/10/2017 200,000 USD 225,380 223,750 0.64
566,008 560,350 1.60 Cayman Islands ENN Energy Holdings Ltd 6.000% 13/05/2021 144A(3) 320,000 USD 344,939 341,752 0.98 Fibria Overseas Finance Ltd 7.500% 04/05/2020 125,000 USD 135,644 136,719 0.39 Odebrecht Drilling Norbe VIII/IX Ltd 6.350% 30/06/2021 247,500 USD 250,559 253,688 0.72 Voto-Votorantim Ltd 6.750% 05/04/2021 185,000 USD 203,341 201,650 0.58
934,483 933,809 2.67 Chile AES Gener SA 5.250% 15/08/2021 144A(3) 270,000 USD 272,598 273,266 0.78 Banco de Credito e Inversiones 3.000% 13/09/2017 260,000 USD 259,974 260,571 0.74 Celulosa Arauco y Constitucion SA 5.000% 21/01/2021 200,000 USD 202,954 201,818 0.58 Cencosud SA 5.500% 20/01/2021 250,000 USD 256,789 249,620 0.71 Telefonica Chile SA 3.875% 12/10/2022 280,000 USD 257,760 255,853 0.73 Transelec SA 4.625% 26/07/2023 144A(3) 200,000 USD 195,515 192,057 0.55
1,445,590 1,433,185 4.09 Colombia Banco Davivienda SA 5.875% 09/07/2022 250,000 USD 237,815 241,250 0.69 Empresas Publicas de Medellin ESP 7.625% 29/07/2019 145,000 USD 169,016 171,100 0.49
406,831 412,350 1.18 Costa Rica Banco Nacional de Costa Rica 4.875% 01/11/2018 144A(3) 260,000 USD 257,433 254,800 0.73
257,433 254,800 0.73 Croatia Agrokor dd 8.875% 01/02/2020 200,000 USD 215,804 214,010 0.61
215,804 214,010 0.61 Great Britain Afren PLC 6.625% 09/12/2020 144A(3) 240,000 USD 241,185 240,000 0.69
241,185 240,000 0.69
(1) See Note 1.
(3) See Note 14.
366
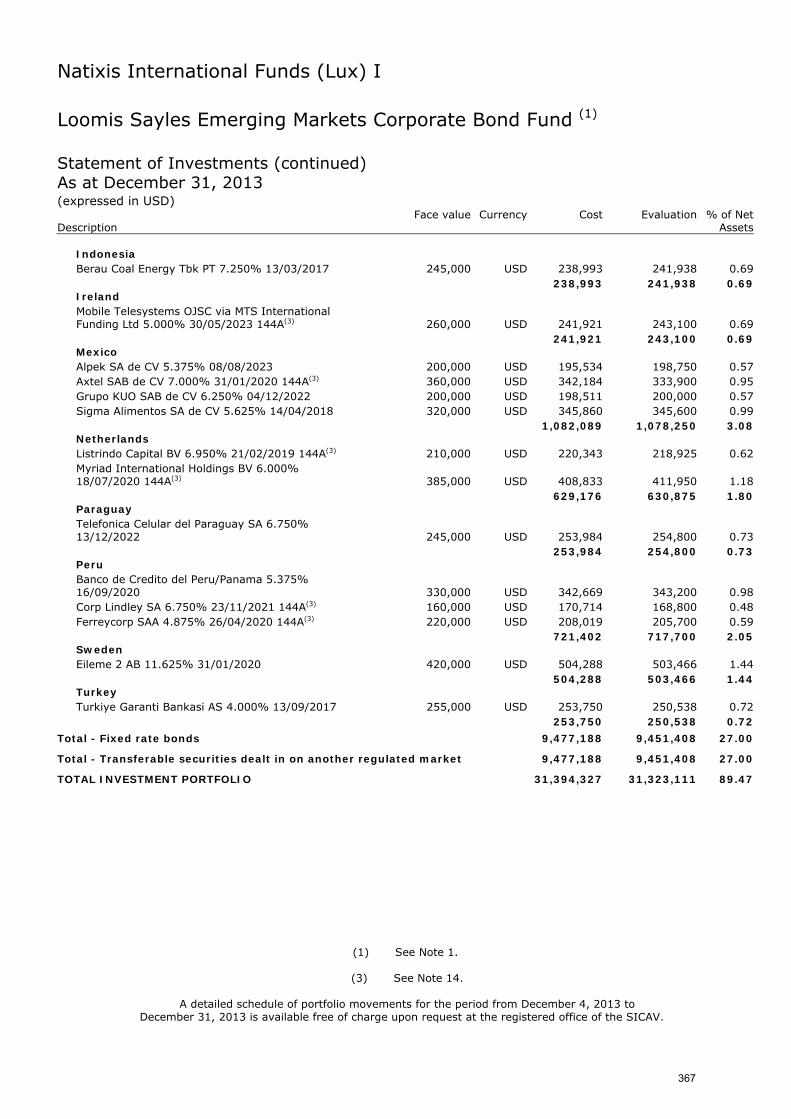
Natixis International Funds (Lux) I
Loomis Sayles Emerging Markets Corporate Bond Fund (1) Statement of Investments (continued) As at December 31, 2013 (expressed in USD) Face value Currency Cost Evaluation % of Net Description Assets
Indonesia Berau Coal Energy Tbk PT 7.250% 13/03/2017 245,000 USD 238,993 241,938 0.69
238,993 241,938 0.69 Ireland Mobile Telesystems OJSC via MTS International Funding Ltd 5.000% 30/05/2023 144A(3) 260,000 USD 241,921 243,100 0.69
241,921 243,100 0.69 Mexico Alpek SA de CV 5.375% 08/08/2023 200,000 USD 195,534 198,750 0.57 Axtel SAB de CV 7.000% 31/01/2020 144A(3) 360,000 USD 342,184 333,900 0.95 Grupo KUO SAB de CV 6.250% 04/12/2022 200,000 USD 198,511 200,000 0.57 Sigma Alimentos SA de CV 5.625% 14/04/2018 320,000 USD 345,860 345,600 0.99
1,082,089 1,078,250 3.08 Netherlands Listrindo Capital BV 6.950% 21/02/2019 144A(3) 210,000 USD 220,343 218,925 0.62 Myriad International Holdings BV 6.000% 18/07/2020 144A(3) 385,000 USD 408,833 411,950 1.18
629,176 630,875 1.80 Paraguay Telefonica Celular del Paraguay SA 6.750% 13/12/2022 245,000 USD 253,984 254,800 0.73
253,984 254,800 0.73 Peru Banco de Credito del Peru/Panama 5.375% 16/09/2020 330,000 USD 342,669 343,200 0.98 Corp Lindley SA 6.750% 23/11/2021 144A(3) 160,000 USD 170,714 168,800 0.48 Ferreycorp SAA 4.875% 26/04/2020 144A(3) 220,000 USD 208,019 205,700 0.59
721,402 717,700 2.05 Sweden Eileme 2 AB 11.625% 31/01/2020 420,000 USD 504,288 503,466 1.44
504,288 503,466 1.44 Turkey Turkiye Garanti Bankasi AS 4.000% 13/09/2017 255,000 USD 253,750 250,538 0.72
253,750 250,538 0.72
Total - Fixed rate bonds 9,477,188 9,451,408 27.00
Total - Transferable securities dealt in on another regulated market 9,477,188 9,451,408 27.00
TOTAL INVESTMENT PORTFOLIO 31,394,327 31,323,111 89.47
(1) See Note 1.
(3) See Note 14.
A detailed schedule of portfolio movements for the period from December 4, 2013 to December 31, 2013 is available free of charge upon request at the registered office of the SICAV.
367
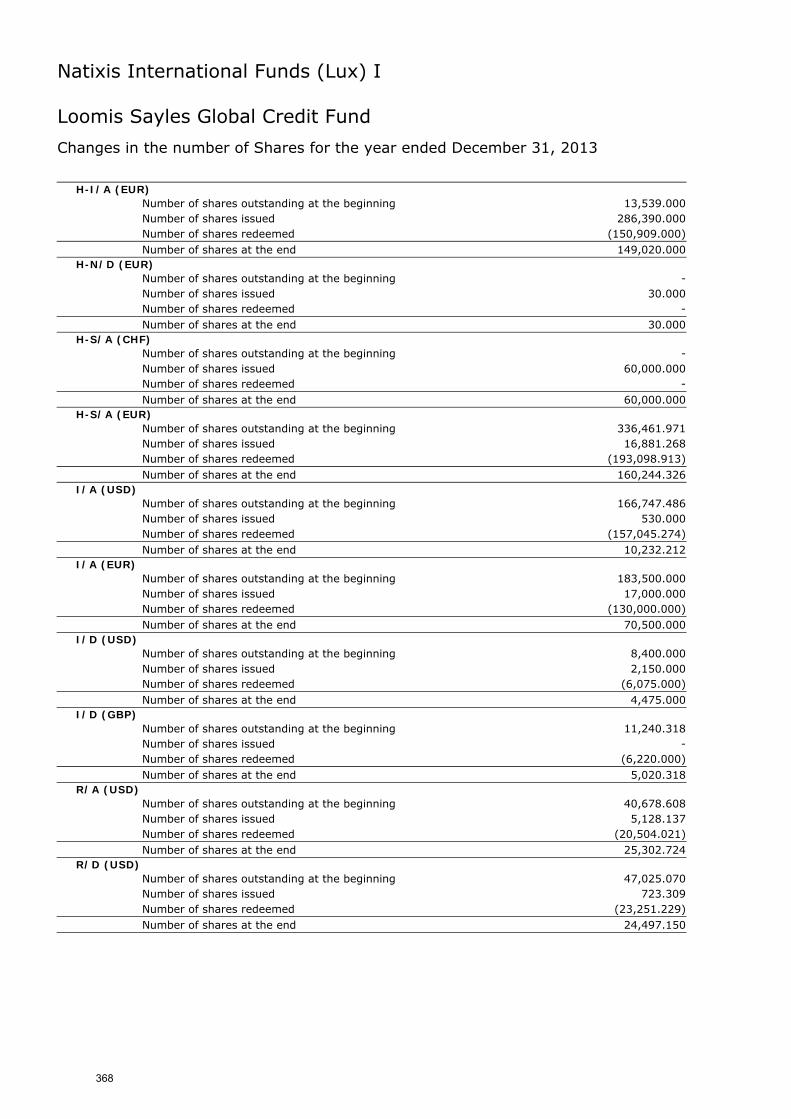
Natixis International Funds (Lux) I
Loomis Sayles Global Credit Fund
Changes in the number of Shares for the year ended December 31, 2013
H-I/A (EUR) Number of shares outstanding at the beginning 13,539.000
Number of shares issued 286,390.000
Number of shares redeemed (150,909.000) Number of shares at the end 149,020.000
H-N/D (EUR) Number of shares outstanding at the beginning - Number of shares issued 30.000
Number of shares redeemed - Number of shares at the end 30.000
H-S/A (CHF) Number of shares outstanding at the beginning - Number of shares issued 60,000.000
Number of shares redeemed - Number of shares at the end 60,000.000
H-S/A (EUR) Number of shares outstanding at the beginning 336,461.971
Number of shares issued 16,881.268
Number of shares redeemed (193,098.913) Number of shares at the end 160,244.326
I/A (USD) Number of shares outstanding at the beginning 166,747.486
Number of shares issued 530.000
Number of shares redeemed (157,045.274) Number of shares at the end 10,232.212
I/A (EUR) Number of shares outstanding at the beginning 183,500.000
Number of shares issued 17,000.000
Number of shares redeemed (130,000.000) Number of shares at the end 70,500.000
I/D (USD) Number of shares outstanding at the beginning 8,400.000
Number of shares issued 2,150.000
Number of shares redeemed (6,075.000) Number of shares at the end 4,475.000
I/D (GBP) Number of shares outstanding at the beginning 11,240.318
Number of shares issued - Number of shares redeemed (6,220.000) Number of shares at the end 5,020.318
R/A (USD) Number of shares outstanding at the beginning 40,678.608
Number of shares issued 5,128.137
Number of shares redeemed (20,504.021) Number of shares at the end 25,302.724
R/D (USD) Number of shares outstanding at the beginning 47,025.070
Number of shares issued 723.309
Number of shares redeemed (23,251.229) Number of shares at the end 24,497.150
368
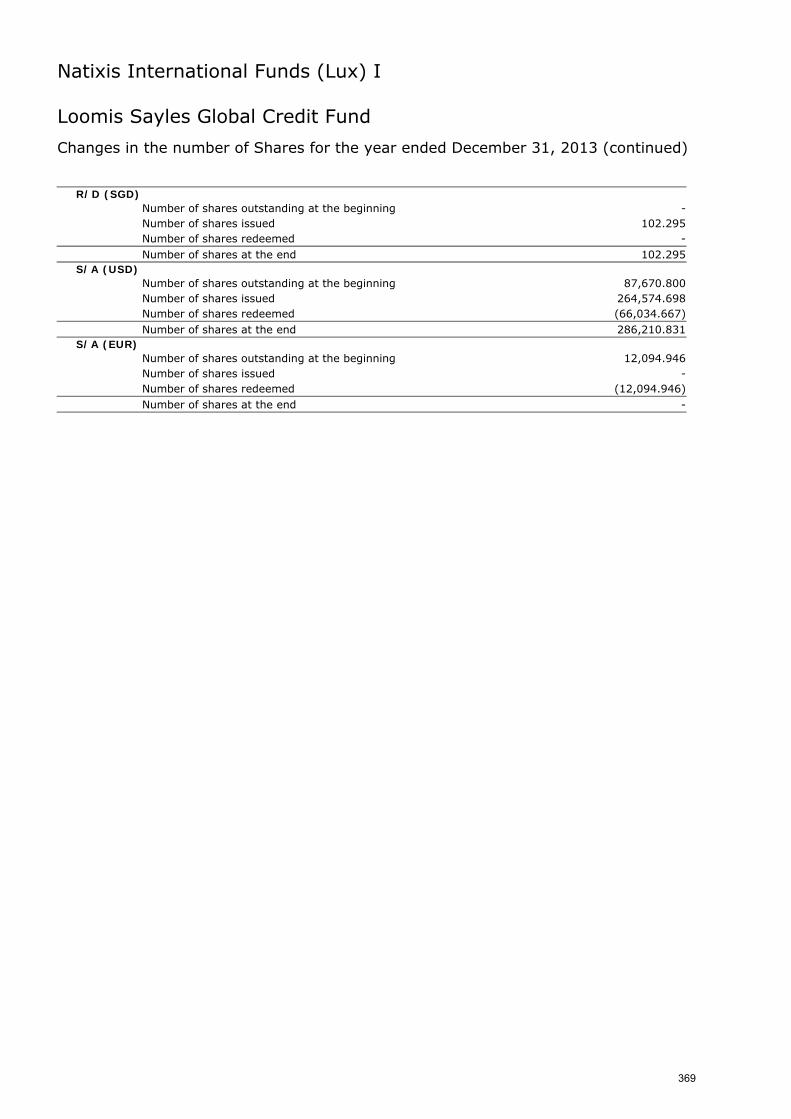
Natixis International Funds (Lux) I
Loomis Sayles Global Credit Fund
Changes in the number of Shares for the year ended December 31, 2013 (continued)
R/D (SGD) Number of shares outstanding at the beginning - Number of shares issued 102.295
Number of shares redeemed - Number of shares at the end 102.295
S/A (USD) Number of shares outstanding at the beginning 87,670.800
Number of shares issued 264,574.698
Number of shares redeemed (66,034.667) Number of shares at the end 286,210.831
S/A (EUR) Number of shares outstanding at the beginning 12,094.946
Number of shares issued - Number of shares redeemed (12,094.946) Number of shares at the end -
369
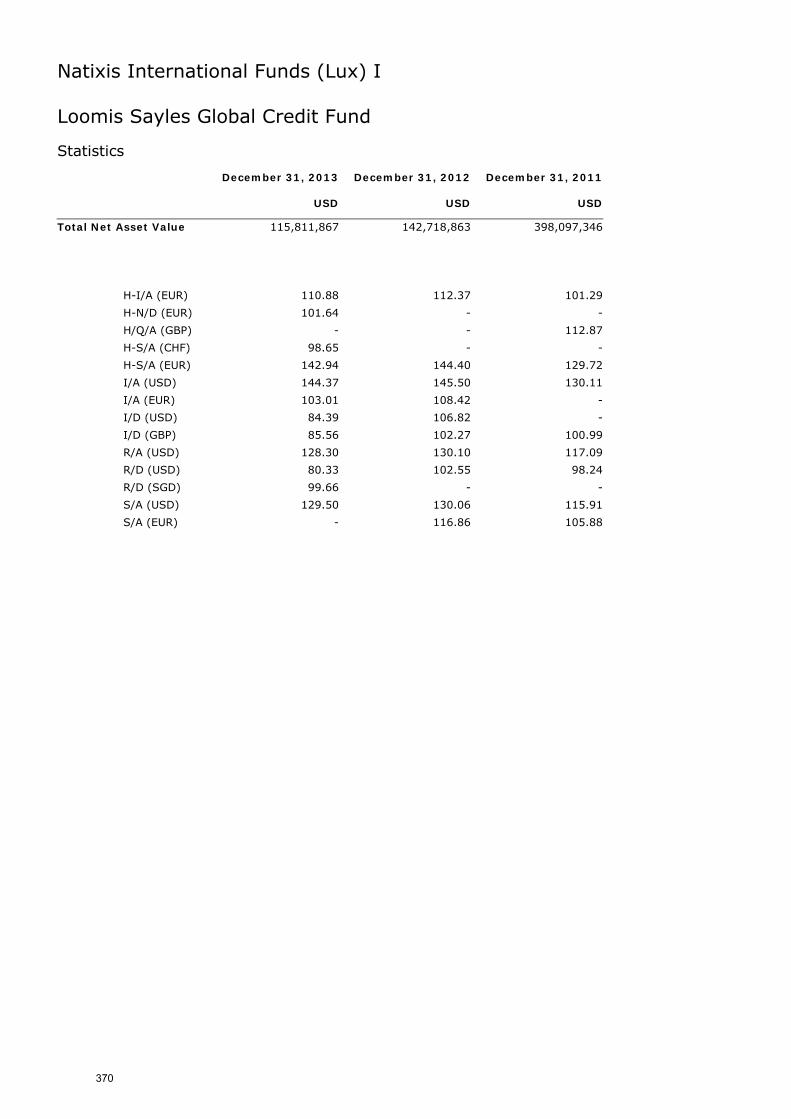
Natixis International Funds (Lux) I
Loomis Sayles Global Credit Fund Statistics December 31, 2013 December 31, 2012 December 31, 2011 USD USD USD
Total Net Asset Value 115,811,867 142,718,863 398,097,346
H-I/A (EUR) 110.88 112.37 101.29
H-N/D (EUR) 101.64 - -
H/Q/A (GBP) - - 112.87
H-S/A (CHF) 98.65 - -
H-S/A (EUR) 142.94 144.40 129.72
I/A (USD) 144.37 145.50 130.11
I/A (EUR) 103.01 108.42 -
I/D (USD) 84.39 106.82 -
I/D (GBP) 85.56 102.27 100.99
R/A (USD) 128.30 130.10 117.09
R/D (USD) 80.33 102.55 98.24
R/D (SGD) 99.66 - -
S/A (USD) 129.50 130.06 115.91
S/A (EUR) - 116.86 105.88
370
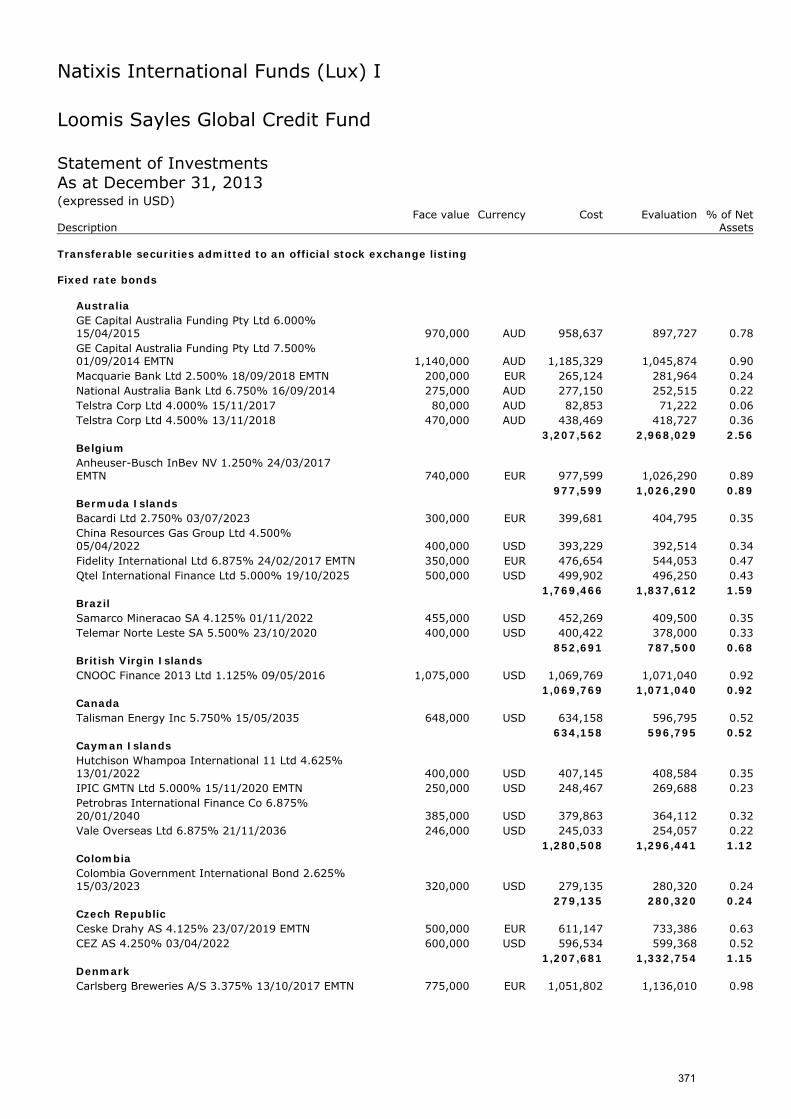
Natixis International Funds (Lux) I
Loomis Sayles Global Credit Fund Statement of Investments As at December 31, 2013 (expressed in USD) Face value Currency Cost Evaluation % of Net Description Assets Transferable securities admitted to an official stock exchange listing Fixed rate bonds
Australia GE Capital Australia Funding Pty Ltd 6.000% 15/04/2015 970,000 AUD 958,637 897,727 0.78 GE Capital Australia Funding Pty Ltd 7.500% 01/09/2014 EMTN 1,140,000 AUD 1,185,329 1,045,874 0.90 Macquarie Bank Ltd 2.500% 18/09/2018 EMTN 200,000 EUR 265,124 281,964 0.24 National Australia Bank Ltd 6.750% 16/09/2014 275,000 AUD 277,150 252,515 0.22 Telstra Corp Ltd 4.000% 15/11/2017 80,000 AUD 82,853 71,222 0.06 Telstra Corp Ltd 4.500% 13/11/2018 470,000 AUD 438,469 418,727 0.36
3,207,562 2,968,029 2.56 Belgium Anheuser-Busch InBev NV 1.250% 24/03/2017 EMTN 740,000 EUR 977,599 1,026,290 0.89
977,599 1,026,290 0.89 Bermuda Islands Bacardi Ltd 2.750% 03/07/2023 300,000 EUR 399,681 404,795 0.35 China Resources Gas Group Ltd 4.500% 05/04/2022 400,000 USD 393,229 392,514 0.34 Fidelity International Ltd 6.875% 24/02/2017 EMTN 350,000 EUR 476,654 544,053 0.47 Qtel International Finance Ltd 5.000% 19/10/2025 500,000 USD 499,902 496,250 0.43
1,769,466 1,837,612 1.59 Brazil Samarco Mineracao SA 4.125% 01/11/2022 455,000 USD 452,269 409,500 0.35 Telemar Norte Leste SA 5.500% 23/10/2020 400,000 USD 400,422 378,000 0.33
852,691 787,500 0.68 British Virgin Islands CNOOC Finance 2013 Ltd 1.125% 09/05/2016 1,075,000 USD 1,069,769 1,071,040 0.92
1,069,769 1,071,040 0.92 Canada Talisman Energy Inc 5.750% 15/05/2035 648,000 USD 634,158 596,795 0.52
634,158 596,795 0.52 Cayman Islands Hutchison Whampoa International 11 Ltd 4.625% 13/01/2022 400,000 USD 407,145 408,584 0.35 IPIC GMTN Ltd 5.000% 15/11/2020 EMTN 250,000 USD 248,467 269,688 0.23 Petrobras International Finance Co 6.875% 20/01/2040 385,000 USD 379,863 364,112 0.32 Vale Overseas Ltd 6.875% 21/11/2036 246,000 USD 245,033 254,057 0.22
1,280,508 1,296,441 1.12 Colombia Colombia Government International Bond 2.625% 15/03/2023 320,000 USD 279,135 280,320 0.24
279,135 280,320 0.24 Czech Republic Ceske Drahy AS 4.125% 23/07/2019 EMTN 500,000 EUR 611,147 733,386 0.63 CEZ AS 4.250% 03/04/2022 600,000 USD 596,534 599,368 0.52
1,207,681 1,332,754 1.15 Denmark Carlsberg Breweries A/S 3.375% 13/10/2017 EMTN 775,000 EUR 1,051,802 1,136,010 0.98
371
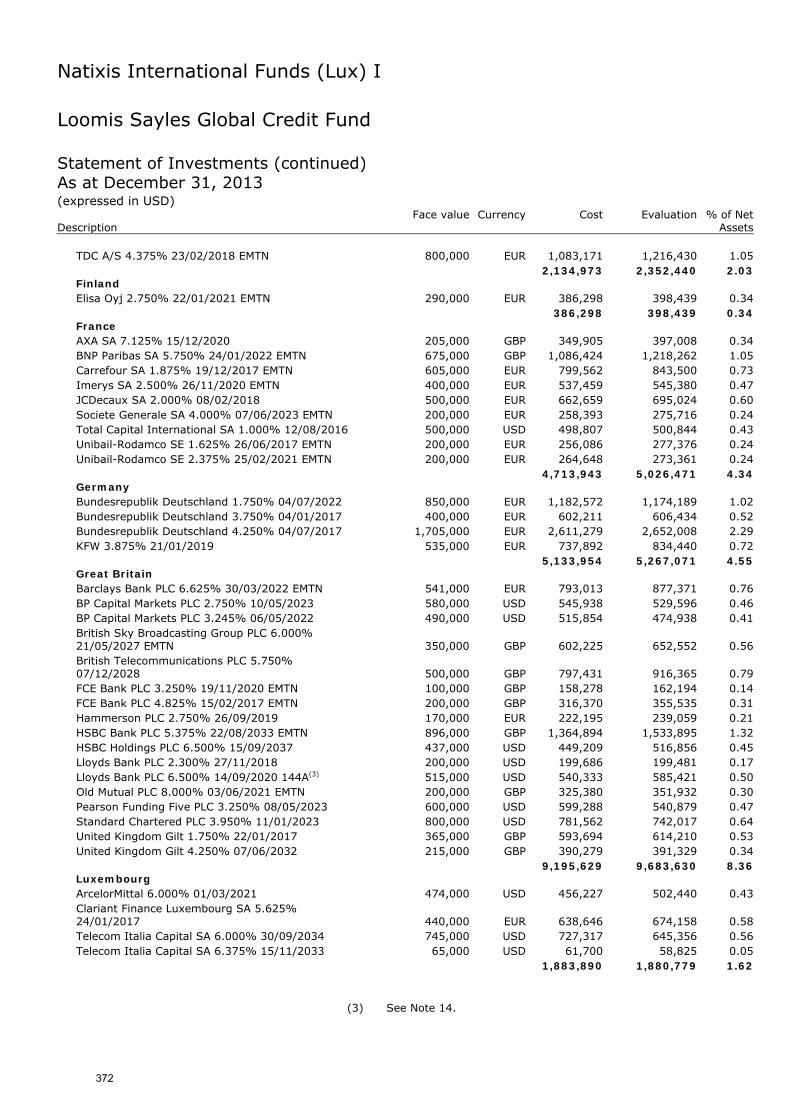
Natixis International Funds (Lux) I
Loomis Sayles Global Credit Fund Statement of Investments (continued) As at December 31, 2013 (expressed in USD) Face value Currency Cost Evaluation % of Net Description Assets
TDC A/S 4.375% 23/02/2018 EMTN 800,000 EUR 1,083,171 1,216,430 1.05 2,134,973 2,352,440 2.03
Finland Elisa Oyj 2.750% 22/01/2021 EMTN 290,000 EUR 386,298 398,439 0.34
386,298 398,439 0.34 France AXA SA 7.125% 15/12/2020 205,000 GBP 349,905 397,008 0.34 BNP Paribas SA 5.750% 24/01/2022 EMTN 675,000 GBP 1,086,424 1,218,262 1.05 Carrefour SA 1.875% 19/12/2017 EMTN 605,000 EUR 799,562 843,500 0.73 Imerys SA 2.500% 26/11/2020 EMTN 400,000 EUR 537,459 545,380 0.47 JCDecaux SA 2.000% 08/02/2018 500,000 EUR 662,659 695,024 0.60 Societe Generale SA 4.000% 07/06/2023 EMTN 200,000 EUR 258,393 275,716 0.24 Total Capital International SA 1.000% 12/08/2016 500,000 USD 498,807 500,844 0.43 Unibail-Rodamco SE 1.625% 26/06/2017 EMTN 200,000 EUR 256,086 277,376 0.24 Unibail-Rodamco SE 2.375% 25/02/2021 EMTN 200,000 EUR 264,648 273,361 0.24
4,713,943 5,026,471 4.34 Germany Bundesrepublik Deutschland 1.750% 04/07/2022 850,000 EUR 1,182,572 1,174,189 1.02 Bundesrepublik Deutschland 3.750% 04/01/2017 400,000 EUR 602,211 606,434 0.52 Bundesrepublik Deutschland 4.250% 04/07/2017 1,705,000 EUR 2,611,279 2,652,008 2.29 KFW 3.875% 21/01/2019 535,000 EUR 737,892 834,440 0.72
5,133,954 5,267,071 4.55 Great Britain Barclays Bank PLC 6.625% 30/03/2022 EMTN 541,000 EUR 793,013 877,371 0.76 BP Capital Markets PLC 2.750% 10/05/2023 580,000 USD 545,938 529,596 0.46 BP Capital Markets PLC 3.245% 06/05/2022 490,000 USD 515,854 474,938 0.41 British Sky Broadcasting Group PLC 6.000% 21/05/2027 EMTN 350,000 GBP 602,225 652,552 0.56 British Telecommunications PLC 5.750% 07/12/2028 500,000 GBP 797,431 916,365 0.79 FCE Bank PLC 3.250% 19/11/2020 EMTN 100,000 GBP 158,278 162,194 0.14 FCE Bank PLC 4.825% 15/02/2017 EMTN 200,000 GBP 316,370 355,535 0.31 Hammerson PLC 2.750% 26/09/2019 170,000 EUR 222,195 239,059 0.21 HSBC Bank PLC 5.375% 22/08/2033 EMTN 896,000 GBP 1,364,894 1,533,895 1.32 HSBC Holdings PLC 6.500% 15/09/2037 437,000 USD 449,209 516,856 0.45 Lloyds Bank PLC 2.300% 27/11/2018 200,000 USD 199,686 199,481 0.17 Lloyds Bank PLC 6.500% 14/09/2020 144A(3) 515,000 USD 540,333 585,421 0.50 Old Mutual PLC 8.000% 03/06/2021 EMTN 200,000 GBP 325,380 351,932 0.30 Pearson Funding Five PLC 3.250% 08/05/2023 600,000 USD 599,288 540,879 0.47 Standard Chartered PLC 3.950% 11/01/2023 800,000 USD 781,562 742,017 0.64 United Kingdom Gilt 1.750% 22/01/2017 365,000 GBP 593,694 614,210 0.53 United Kingdom Gilt 4.250% 07/06/2032 215,000 GBP 390,279 391,329 0.34
9,195,629 9,683,630 8.36 Luxembourg ArcelorMittal 6.000% 01/03/2021 474,000 USD 456,227 502,440 0.43 Clariant Finance Luxembourg SA 5.625% 24/01/2017 440,000 EUR 638,646 674,158 0.58 Telecom Italia Capital SA 6.000% 30/09/2034 745,000 USD 727,317 645,356 0.56 Telecom Italia Capital SA 6.375% 15/11/2033 65,000 USD 61,700 58,825 0.05 1,883,890 1,880,779 1.62
(3) See Note 14.
372
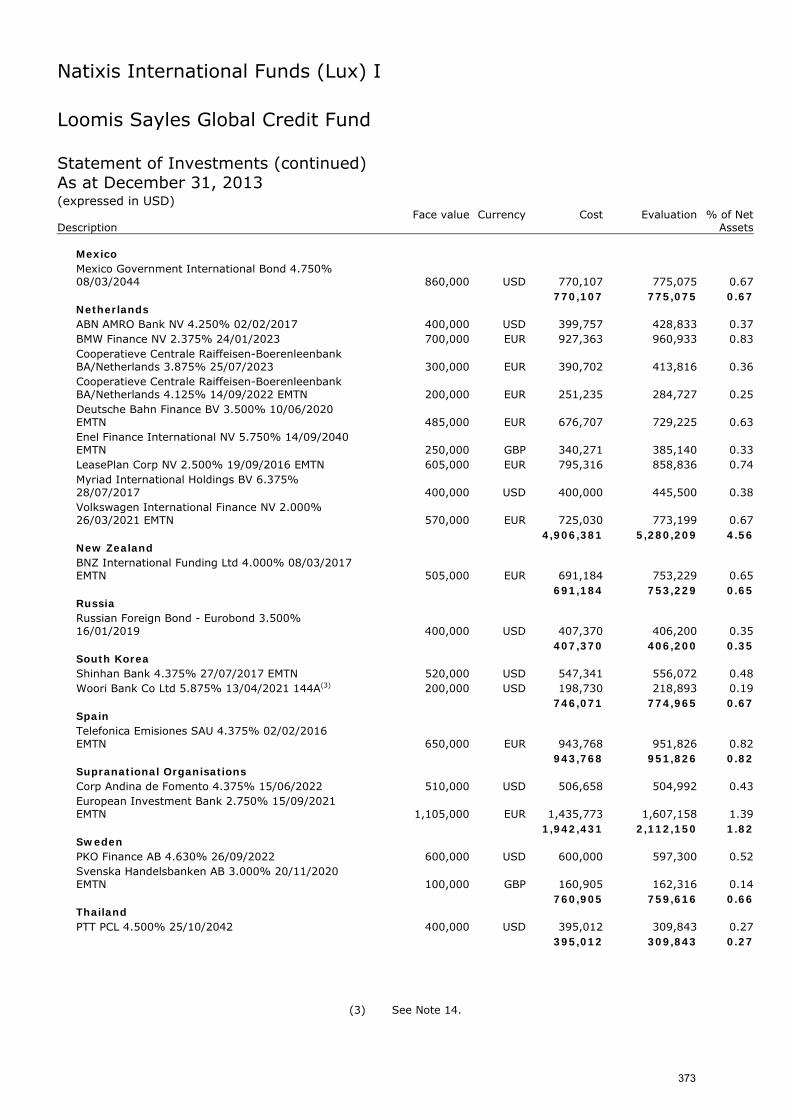
Natixis International Funds (Lux) I
Loomis Sayles Global Credit Fund Statement of Investments (continued) As at December 31, 2013 (expressed in USD) Face value Currency Cost Evaluation % of Net Description Assets
Mexico Mexico Government International Bond 4.750% 08/03/2044 860,000 USD 770,107 775,075 0.67
770,107 775,075 0.67 Netherlands ABN AMRO Bank NV 4.250% 02/02/2017 400,000 USD 399,757 428,833 0.37 BMW Finance NV 2.375% 24/01/2023 700,000 EUR 927,363 960,933 0.83 Cooperatieve Centrale Raiffeisen-Boerenleenbank BA/Netherlands 3.875% 25/07/2023 300,000 EUR 390,702 413,816 0.36 Cooperatieve Centrale Raiffeisen-Boerenleenbank BA/Netherlands 4.125% 14/09/2022 EMTN 200,000 EUR 251,235 284,727 0.25 Deutsche Bahn Finance BV 3.500% 10/06/2020 EMTN 485,000 EUR 676,707 729,225 0.63 Enel Finance International NV 5.750% 14/09/2040 EMTN 250,000 GBP 340,271 385,140 0.33 LeasePlan Corp NV 2.500% 19/09/2016 EMTN 605,000 EUR 795,316 858,836 0.74 Myriad International Holdings BV 6.375% 28/07/2017 400,000 USD 400,000 445,500 0.38 Volkswagen International Finance NV 2.000% 26/03/2021 EMTN 570,000 EUR 725,030 773,199 0.67
4,906,381 5,280,209 4.56 New Zealand BNZ International Funding Ltd 4.000% 08/03/2017 EMTN 505,000 EUR 691,184 753,229 0.65
691,184 753,229 0.65 Russia Russian Foreign Bond - Eurobond 3.500% 16/01/2019 400,000 USD 407,370 406,200 0.35
407,370 406,200 0.35 South Korea Shinhan Bank 4.375% 27/07/2017 EMTN 520,000 USD 547,341 556,072 0.48 Woori Bank Co Ltd 5.875% 13/04/2021 144A(3) 200,000 USD 198,730 218,893 0.19
746,071 774,965 0.67 Spain Telefonica Emisiones SAU 4.375% 02/02/2016 EMTN 650,000 EUR 943,768 951,826 0.82
943,768 951,826 0.82 Supranational Organisations Corp Andina de Fomento 4.375% 15/06/2022 510,000 USD 506,658 504,992 0.43 European Investment Bank 2.750% 15/09/2021 EMTN 1,105,000 EUR 1,435,773 1,607,158 1.39
1,942,431 2,112,150 1.82 Sweden PKO Finance AB 4.630% 26/09/2022 600,000 USD 600,000 597,300 0.52 Svenska Handelsbanken AB 3.000% 20/11/2020 EMTN 100,000 GBP 160,905 162,316 0.14
760,905 759,616 0.66 Thailand PTT PCL 4.500% 25/10/2042 400,000 USD 395,012 309,843 0.27
395,012 309,843 0.27
(3) See Note 14.
373
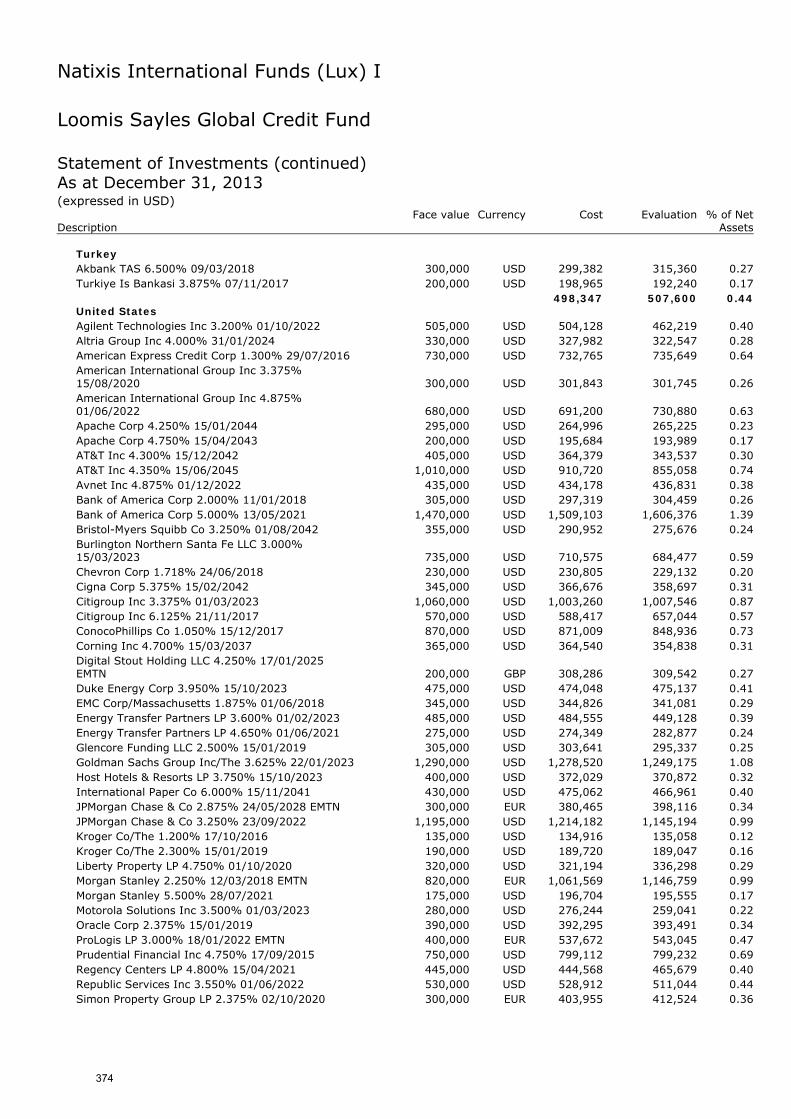
Natixis International Funds (Lux) I
Loomis Sayles Global Credit Fund Statement of Investments (continued) As at December 31, 2013 (expressed in USD) Face value Currency Cost Evaluation % of Net Description Assets
Turkey Akbank TAS 6.500% 09/03/2018 300,000 USD 299,382 315,360 0.27 Turkiye Is Bankasi 3.875% 07/11/2017 200,000 USD 198,965 192,240 0.17
498,347 507,600 0.44 United States Agilent Technologies Inc 3.200% 01/10/2022 505,000 USD 504,128 462,219 0.40 Altria Group Inc 4.000% 31/01/2024 330,000 USD 327,982 322,547 0.28 American Express Credit Corp 1.300% 29/07/2016 730,000 USD 732,765 735,649 0.64 American International Group Inc 3.375% 15/08/2020 300,000 USD 301,843 301,745 0.26 American International Group Inc 4.875% 01/06/2022 680,000 USD 691,200 730,880 0.63 Apache Corp 4.250% 15/01/2044 295,000 USD 264,996 265,225 0.23 Apache Corp 4.750% 15/04/2043 200,000 USD 195,684 193,989 0.17 AT&T Inc 4.300% 15/12/2042 405,000 USD 364,379 343,537 0.30 AT&T Inc 4.350% 15/06/2045 1,010,000 USD 910,720 855,058 0.74 Avnet Inc 4.875% 01/12/2022 435,000 USD 434,178 436,831 0.38 Bank of America Corp 2.000% 11/01/2018 305,000 USD 297,319 304,459 0.26 Bank of America Corp 5.000% 13/05/2021 1,470,000 USD 1,509,103 1,606,376 1.39 Bristol-Myers Squibb Co 3.250% 01/08/2042 355,000 USD 290,952 275,676 0.24 Burlington Northern Santa Fe LLC 3.000% 15/03/2023 735,000 USD 710,575 684,477 0.59 Chevron Corp 1.718% 24/06/2018 230,000 USD 230,805 229,132 0.20 Cigna Corp 5.375% 15/02/2042 345,000 USD 366,676 358,697 0.31 Citigroup Inc 3.375% 01/03/2023 1,060,000 USD 1,003,260 1,007,546 0.87 Citigroup Inc 6.125% 21/11/2017 570,000 USD 588,417 657,044 0.57 ConocoPhillips Co 1.050% 15/12/2017 870,000 USD 871,009 848,936 0.73 Corning Inc 4.700% 15/03/2037 365,000 USD 364,540 354,838 0.31 Digital Stout Holding LLC 4.250% 17/01/2025 EMTN 200,000 GBP 308,286 309,542 0.27 Duke Energy Corp 3.950% 15/10/2023 475,000 USD 474,048 475,137 0.41 EMC Corp/Massachusetts 1.875% 01/06/2018 345,000 USD 344,826 341,081 0.29 Energy Transfer Partners LP 3.600% 01/02/2023 485,000 USD 484,555 449,128 0.39 Energy Transfer Partners LP 4.650% 01/06/2021 275,000 USD 274,349 282,877 0.24 Glencore Funding LLC 2.500% 15/01/2019 305,000 USD 303,641 295,337 0.25 Goldman Sachs Group Inc/The 3.625% 22/01/2023 1,290,000 USD 1,278,520 1,249,175 1.08 Host Hotels & Resorts LP 3.750% 15/10/2023 400,000 USD 372,029 370,872 0.32 International Paper Co 6.000% 15/11/2041 430,000 USD 475,062 466,961 0.40 JPMorgan Chase & Co 2.875% 24/05/2028 EMTN 300,000 EUR 380,465 398,116 0.34 JPMorgan Chase & Co 3.250% 23/09/2022 1,195,000 USD 1,214,182 1,145,194 0.99 Kroger Co/The 1.200% 17/10/2016 135,000 USD 134,916 135,058 0.12 Kroger Co/The 2.300% 15/01/2019 190,000 USD 189,720 189,047 0.16 Liberty Property LP 4.750% 01/10/2020 320,000 USD 321,194 336,298 0.29 Morgan Stanley 2.250% 12/03/2018 EMTN 820,000 EUR 1,061,569 1,146,759 0.99 Morgan Stanley 5.500% 28/07/2021 175,000 USD 196,704 195,555 0.17 Motorola Solutions Inc 3.500% 01/03/2023 280,000 USD 276,244 259,041 0.22 Oracle Corp 2.375% 15/01/2019 390,000 USD 392,295 393,491 0.34 ProLogis LP 3.000% 18/01/2022 EMTN 400,000 EUR 537,672 543,045 0.47 Prudential Financial Inc 4.750% 17/09/2015 750,000 USD 799,112 799,232 0.69 Regency Centers LP 4.800% 15/04/2021 445,000 USD 444,568 465,679 0.40 Republic Services Inc 3.550% 01/06/2022 530,000 USD 528,912 511,044 0.44 Simon Property Group LP 2.375% 02/10/2020 300,000 EUR 403,955 412,524 0.36
374
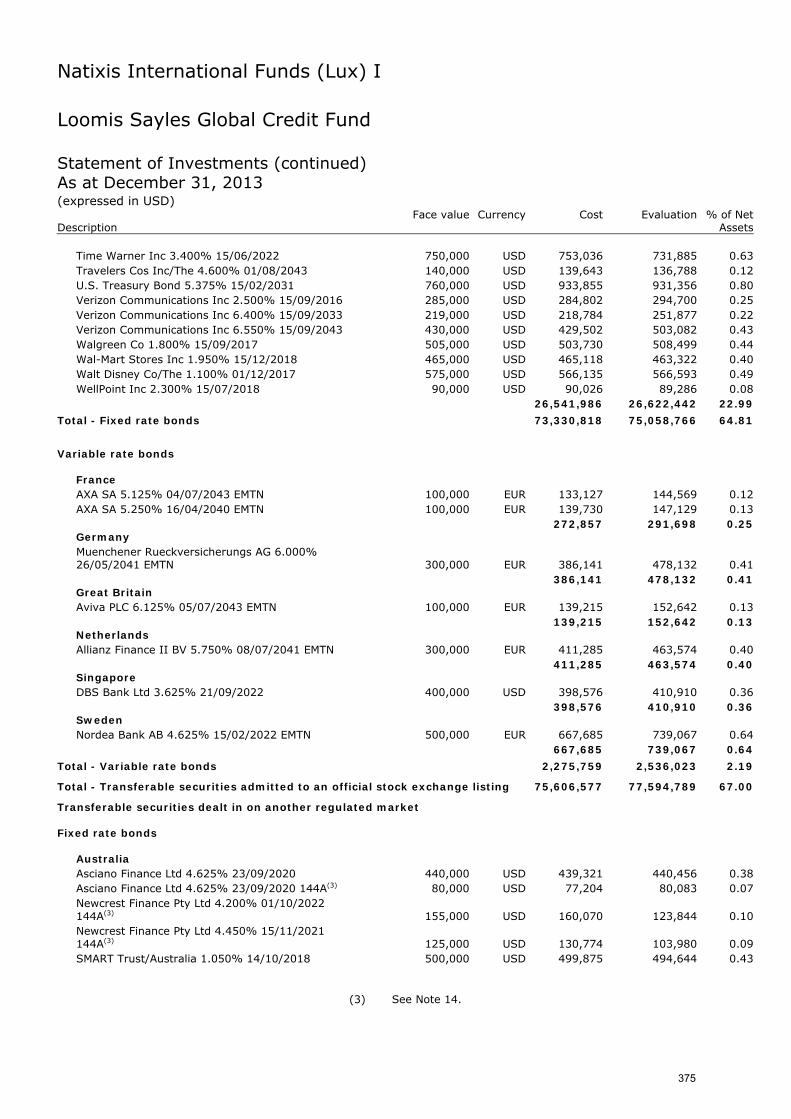
Natixis International Funds (Lux) I
Loomis Sayles Global Credit Fund Statement of Investments (continued) As at December 31, 2013 (expressed in USD) Face value Currency Cost Evaluation % of Net Description Assets
Time Warner Inc 3.400% 15/06/2022 750,000 USD 753,036 731,885 0.63 Travelers Cos Inc/The 4.600% 01/08/2043 140,000 USD 139,643 136,788 0.12 U.S. Treasury Bond 5.375% 15/02/2031 760,000 USD 933,855 931,356 0.80 Verizon Communications Inc 2.500% 15/09/2016 285,000 USD 284,802 294,700 0.25 Verizon Communications Inc 6.400% 15/09/2033 219,000 USD 218,784 251,877 0.22 Verizon Communications Inc 6.550% 15/09/2043 430,000 USD 429,502 503,082 0.43 Walgreen Co 1.800% 15/09/2017 505,000 USD 503,730 508,499 0.44 Wal-Mart Stores Inc 1.950% 15/12/2018 465,000 USD 465,118 463,322 0.40 Walt Disney Co/The 1.100% 01/12/2017 575,000 USD 566,135 566,593 0.49 WellPoint Inc 2.300% 15/07/2018 90,000 USD 90,026 89,286 0.08
26,541,986 26,622,442 22.99
Total - Fixed rate bonds 73,330,818 75,058,766 64.81
Variable rate bonds
France AXA SA 5.125% 04/07/2043 EMTN 100,000 EUR 133,127 144,569 0.12 AXA SA 5.250% 16/04/2040 EMTN 100,000 EUR 139,730 147,129 0.13
272,857 291,698 0.25 Germany Muenchener Rueckversicherungs AG 6.000% 26/05/2041 EMTN 300,000 EUR 386,141 478,132 0.41
386,141 478,132 0.41 Great Britain Aviva PLC 6.125% 05/07/2043 EMTN 100,000 EUR 139,215 152,642 0.13
139,215 152,642 0.13 Netherlands Allianz Finance II BV 5.750% 08/07/2041 EMTN 300,000 EUR 411,285 463,574 0.40
411,285 463,574 0.40 Singapore DBS Bank Ltd 3.625% 21/09/2022 400,000 USD 398,576 410,910 0.36
398,576 410,910 0.36 Sweden Nordea Bank AB 4.625% 15/02/2022 EMTN 500,000 EUR 667,685 739,067 0.64
667,685 739,067 0.64
Total - Variable rate bonds 2,275,759 2,536,023 2.19
Total - Transferable securities admitted to an official stock exchange listing 75,606,577 77,594,789 67.00
Transferable securities dealt in on another regulated market Fixed rate bonds
Australia Asciano Finance Ltd 4.625% 23/09/2020 440,000 USD 439,321 440,456 0.38 Asciano Finance Ltd 4.625% 23/09/2020 144A(3) 80,000 USD 77,204 80,083 0.07 Newcrest Finance Pty Ltd 4.200% 01/10/2022 144A(3) 155,000 USD 160,070 123,844 0.10 Newcrest Finance Pty Ltd 4.450% 15/11/2021 144A(3) 125,000 USD 130,774 103,980 0.09 SMART Trust/Australia 1.050% 14/10/2018 500,000 USD 499,875 494,644 0.43
(3) See Note 14.
375
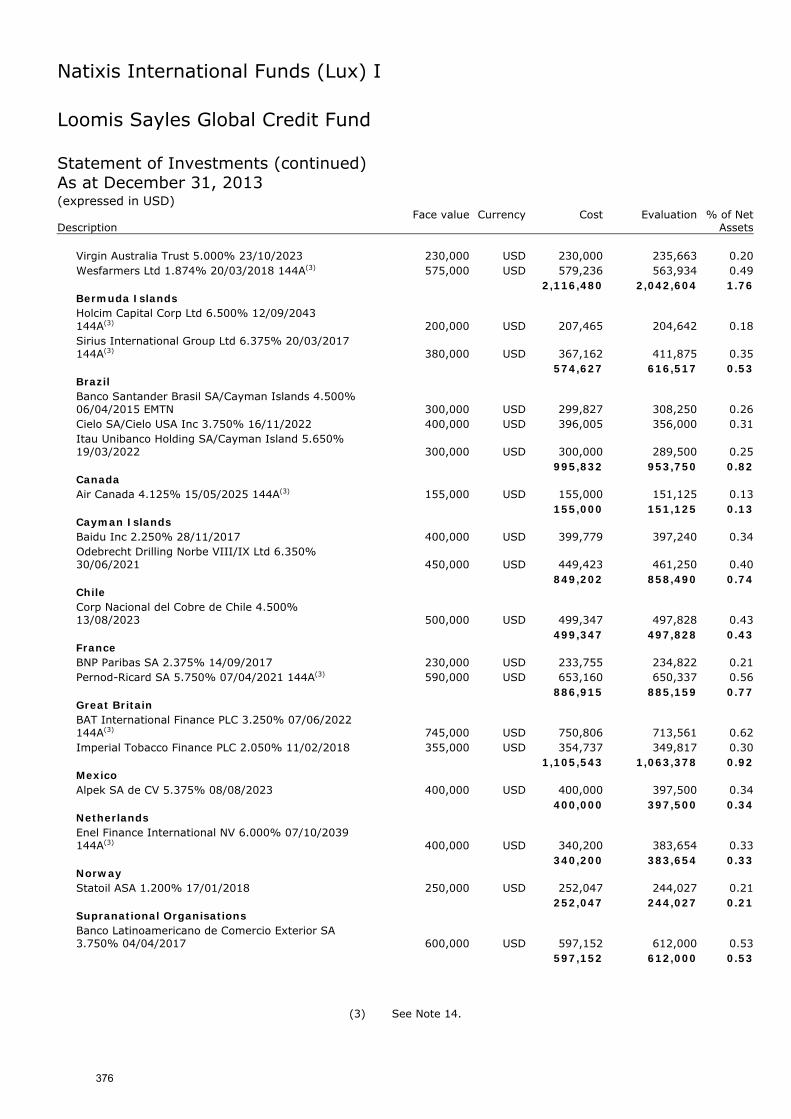
Natixis International Funds (Lux) I
Loomis Sayles Global Credit Fund Statement of Investments (continued) As at December 31, 2013 (expressed in USD) Face value Currency Cost Evaluation % of Net Description Assets
Virgin Australia Trust 5.000% 23/10/2023 230,000 USD 230,000 235,663 0.20 Wesfarmers Ltd 1.874% 20/03/2018 144A(3) 575,000 USD 579,236 563,934 0.49
2,116,480 2,042,604 1.76 Bermuda Islands Holcim Capital Corp Ltd 6.500% 12/09/2043 144A(3) 200,000 USD 207,465 204,642 0.18 Sirius International Group Ltd 6.375% 20/03/2017 144A(3) 380,000 USD 367,162 411,875 0.35
574,627 616,517 0.53 Brazil Banco Santander Brasil SA/Cayman Islands 4.500% 06/04/2015 EMTN 300,000 USD 299,827 308,250 0.26 Cielo SA/Cielo USA Inc 3.750% 16/11/2022 400,000 USD 396,005 356,000 0.31 Itau Unibanco Holding SA/Cayman Island 5.650% 19/03/2022 300,000 USD 300,000 289,500 0.25
995,832 953,750 0.82 Canada Air Canada 4.125% 15/05/2025 144A(3) 155,000 USD 155,000 151,125 0.13
155,000 151,125 0.13 Cayman Islands Baidu Inc 2.250% 28/11/2017 400,000 USD 399,779 397,240 0.34 Odebrecht Drilling Norbe VIII/IX Ltd 6.350% 30/06/2021 450,000 USD 449,423 461,250 0.40
849,202 858,490 0.74 Chile Corp Nacional del Cobre de Chile 4.500% 13/08/2023 500,000 USD 499,347 497,828 0.43
499,347 497,828 0.43 France BNP Paribas SA 2.375% 14/09/2017 230,000 USD 233,755 234,822 0.21 Pernod-Ricard SA 5.750% 07/04/2021 144A(3) 590,000 USD 653,160 650,337 0.56
886,915 885,159 0.77 Great Britain BAT International Finance PLC 3.250% 07/06/2022 144A(3) 745,000 USD 750,806 713,561 0.62 Imperial Tobacco Finance PLC 2.050% 11/02/2018 355,000 USD 354,737 349,817 0.30
1,105,543 1,063,378 0.92 Mexico Alpek SA de CV 5.375% 08/08/2023 400,000 USD 400,000 397,500 0.34
400,000 397,500 0.34 Netherlands Enel Finance International NV 6.000% 07/10/2039 144A(3) 400,000 USD 340,200 383,654 0.33
340,200 383,654 0.33 Norway Statoil ASA 1.200% 17/01/2018 250,000 USD 252,047 244,027 0.21
252,047 244,027 0.21 Supranational Organisations Banco Latinoamericano de Comercio Exterior SA 3.750% 04/04/2017 600,000 USD 597,152 612,000 0.53
597,152 612,000 0.53
(3) See Note 14.
376
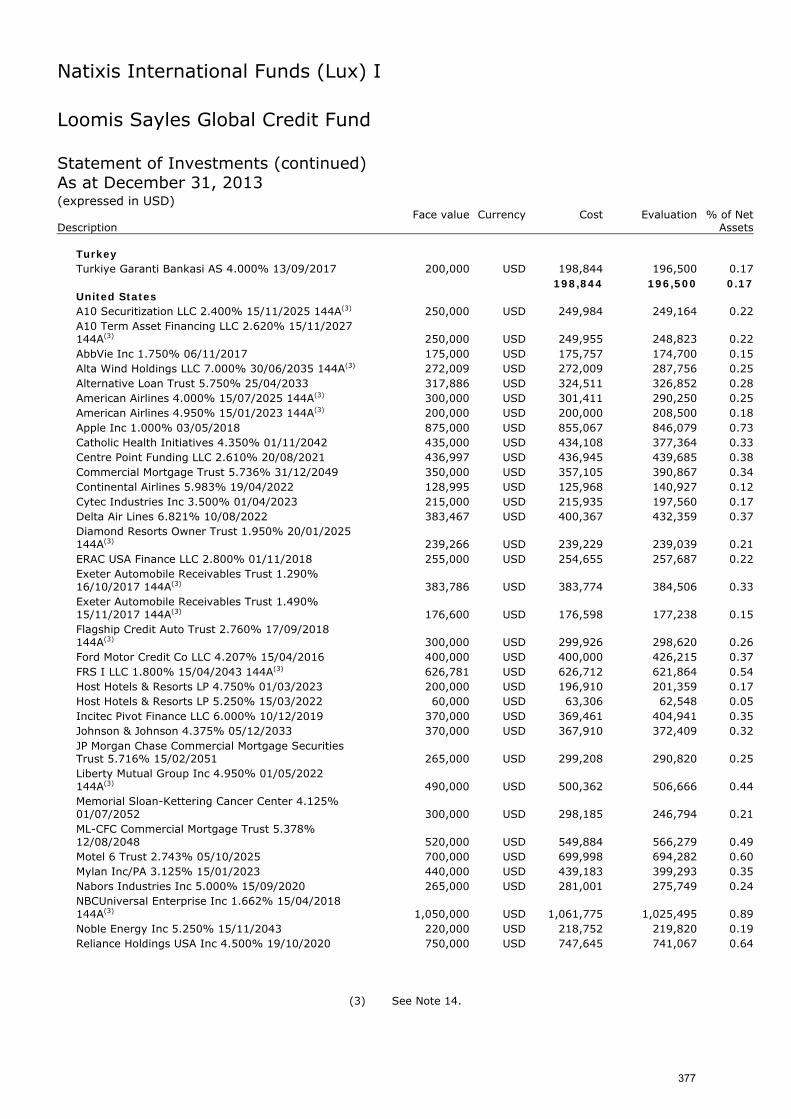
Natixis International Funds (Lux) I
Loomis Sayles Global Credit Fund Statement of Investments (continued) As at December 31, 2013 (expressed in USD) Face value Currency Cost Evaluation % of Net Description Assets
Turkey Turkiye Garanti Bankasi AS 4.000% 13/09/2017 200,000 USD 198,844 196,500 0.17
198,844 196,500 0.17 United States A10 Securitization LLC 2.400% 15/11/2025 144A(3) 250,000 USD 249,984 249,164 0.22 A10 Term Asset Financing LLC 2.620% 15/11/2027 144A(3) 250,000 USD 249,955 248,823 0.22 AbbVie Inc 1.750% 06/11/2017 175,000 USD 175,757 174,700 0.15 Alta Wind Holdings LLC 7.000% 30/06/2035 144A(3) 272,009 USD 272,009 287,756 0.25 Alternative Loan Trust 5.750% 25/04/2033 317,886 USD 324,511 326,852 0.28 American Airlines 4.000% 15/07/2025 144A(3) 300,000 USD 301,411 290,250 0.25 American Airlines 4.950% 15/01/2023 144A(3) 200,000 USD 200,000 208,500 0.18 Apple Inc 1.000% 03/05/2018 875,000 USD 855,067 846,079 0.73 Catholic Health Initiatives 4.350% 01/11/2042 435,000 USD 434,108 377,364 0.33 Centre Point Funding LLC 2.610% 20/08/2021 436,997 USD 436,945 439,685 0.38 Commercial Mortgage Trust 5.736% 31/12/2049 350,000 USD 357,105 390,867 0.34 Continental Airlines 5.983% 19/04/2022 128,995 USD 125,968 140,927 0.12 Cytec Industries Inc 3.500% 01/04/2023 215,000 USD 215,935 197,560 0.17 Delta Air Lines 6.821% 10/08/2022 383,467 USD 400,367 432,359 0.37 Diamond Resorts Owner Trust 1.950% 20/01/2025 144A(3) 239,266 USD 239,229 239,039 0.21 ERAC USA Finance LLC 2.800% 01/11/2018 255,000 USD 254,655 257,687 0.22 Exeter Automobile Receivables Trust 1.290% 16/10/2017 144A(3) 383,786 USD 383,774 384,506 0.33 Exeter Automobile Receivables Trust 1.490% 15/11/2017 144A(3) 176,600 USD 176,598 177,238 0.15 Flagship Credit Auto Trust 2.760% 17/09/2018 144A(3) 300,000 USD 299,926 298,620 0.26 Ford Motor Credit Co LLC 4.207% 15/04/2016 400,000 USD 400,000 426,215 0.37 FRS I LLC 1.800% 15/04/2043 144A(3) 626,781 USD 626,712 621,864 0.54 Host Hotels & Resorts LP 4.750% 01/03/2023 200,000 USD 196,910 201,359 0.17 Host Hotels & Resorts LP 5.250% 15/03/2022 60,000 USD 63,306 62,548 0.05 Incitec Pivot Finance LLC 6.000% 10/12/2019 370,000 USD 369,461 404,941 0.35 Johnson & Johnson 4.375% 05/12/2033 370,000 USD 367,910 372,409 0.32 JP Morgan Chase Commercial Mortgage Securities Trust 5.716% 15/02/2051 265,000 USD 299,208 290,820 0.25 Liberty Mutual Group Inc 4.950% 01/05/2022 144A(3) 490,000 USD 500,362 506,666 0.44 Memorial Sloan-Kettering Cancer Center 4.125% 01/07/2052 300,000 USD 298,185 246,794 0.21 ML-CFC Commercial Mortgage Trust 5.378% 12/08/2048 520,000 USD 549,884 566,279 0.49 Motel 6 Trust 2.743% 05/10/2025 700,000 USD 699,998 694,282 0.60 Mylan Inc/PA 3.125% 15/01/2023 440,000 USD 439,183 399,293 0.35 Nabors Industries Inc 5.000% 15/09/2020 265,000 USD 281,001 275,749 0.24 NBCUniversal Enterprise Inc 1.662% 15/04/2018 144A(3) 1,050,000 USD 1,061,775 1,025,495 0.89 Noble Energy Inc 5.250% 15/11/2043 220,000 USD 218,752 219,820 0.19 Reliance Holdings USA Inc 4.500% 19/10/2020 750,000 USD 747,645 741,067 0.64
(3) See Note 14.
377
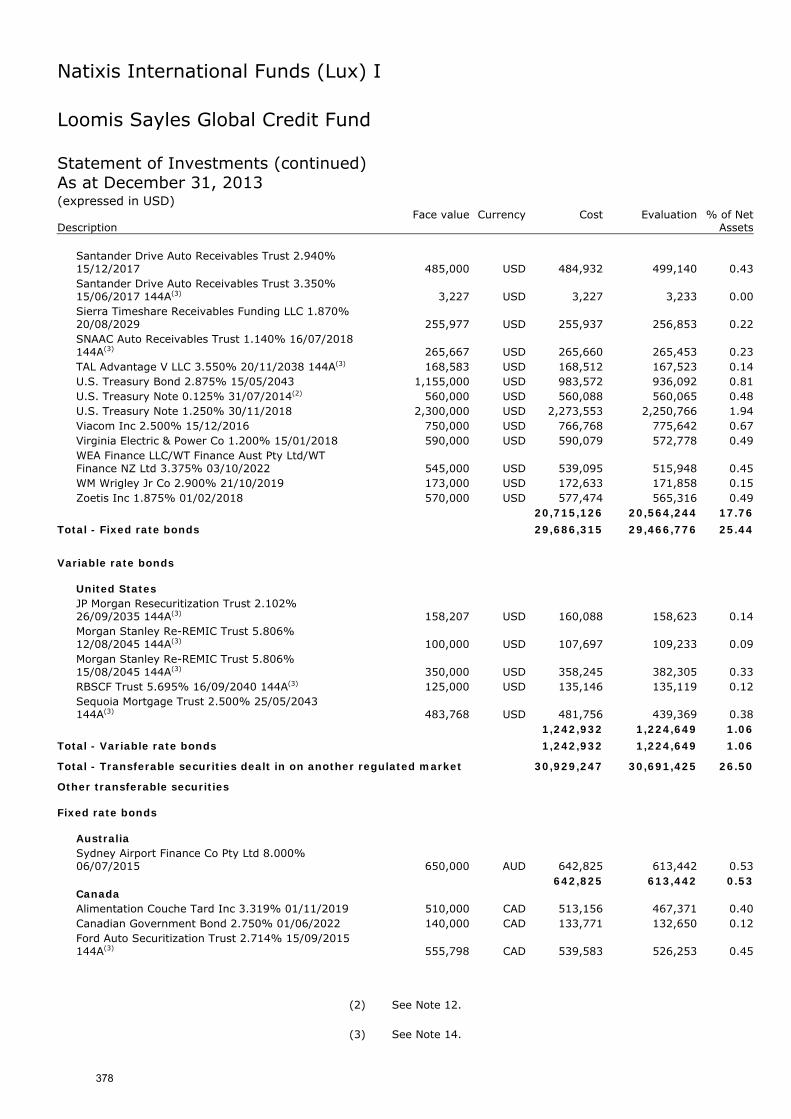
Natixis International Funds (Lux) I
Loomis Sayles Global Credit Fund Statement of Investments (continued) As at December 31, 2013 (expressed in USD) Face value Currency Cost Evaluation % of Net Description Assets
Santander Drive Auto Receivables Trust 2.940% 15/12/2017 485,000 USD 484,932 499,140 0.43 Santander Drive Auto Receivables Trust 3.350% 15/06/2017 144A(3) 3,227 USD 3,227 3,233 0.00 Sierra Timeshare Receivables Funding LLC 1.870% 20/08/2029 255,977 USD 255,937 256,853 0.22 SNAAC Auto Receivables Trust 1.140% 16/07/2018 144A(3) 265,667 USD 265,660 265,453 0.23 TAL Advantage V LLC 3.550% 20/11/2038 144A(3) 168,583 USD 168,512 167,523 0.14 U.S. Treasury Bond 2.875% 15/05/2043 1,155,000 USD 983,572 936,092 0.81 U.S. Treasury Note 0.125% 31/07/2014(2) 560,000 USD 560,088 560,065 0.48 U.S. Treasury Note 1.250% 30/11/2018 2,300,000 USD 2,273,553 2,250,766 1.94 Viacom Inc 2.500% 15/12/2016 750,000 USD 766,768 775,642 0.67 Virginia Electric & Power Co 1.200% 15/01/2018 590,000 USD 590,079 572,778 0.49 WEA Finance LLC/WT Finance Aust Pty Ltd/WT Finance NZ Ltd 3.375% 03/10/2022 545,000 USD 539,095 515,948 0.45 WM Wrigley Jr Co 2.900% 21/10/2019 173,000 USD 172,633 171,858 0.15 Zoetis Inc 1.875% 01/02/2018 570,000 USD 577,474 565,316 0.49
20,715,126 20,564,244 17.76
Total - Fixed rate bonds 29,686,315 29,466,776 25.44
Variable rate bonds
United States JP Morgan Resecuritization Trust 2.102% 26/09/2035 144A(3) 158,207 USD 160,088 158,623 0.14 Morgan Stanley Re-REMIC Trust 5.806% 12/08/2045 144A(3) 100,000 USD 107,697 109,233 0.09 Morgan Stanley Re-REMIC Trust 5.806% 15/08/2045 144A(3) 350,000 USD 358,245 382,305 0.33 RBSCF Trust 5.695% 16/09/2040 144A(3) 125,000 USD 135,146 135,119 0.12 Sequoia Mortgage Trust 2.500% 25/05/2043 144A(3) 483,768 USD 481,756 439,369 0.38
1,242,932 1,224,649 1.06
Total - Variable rate bonds 1,242,932 1,224,649 1.06
Total - Transferable securities dealt in on another regulated market 30,929,247 30,691,425 26.50
Other transferable securities Fixed rate bonds
Australia Sydney Airport Finance Co Pty Ltd 8.000% 06/07/2015 650,000 AUD 642,825 613,442 0.53
642,825 613,442 0.53 Canada Alimentation Couche Tard Inc 3.319% 01/11/2019 510,000 CAD 513,156 467,371 0.40 Canadian Government Bond 2.750% 01/06/2022 140,000 CAD 133,771 132,650 0.12 Ford Auto Securitization Trust 2.714% 15/09/2015 144A(3) 555,798 CAD 539,583 526,253 0.45
(2) See Note 12.
(3) See Note 14.
378
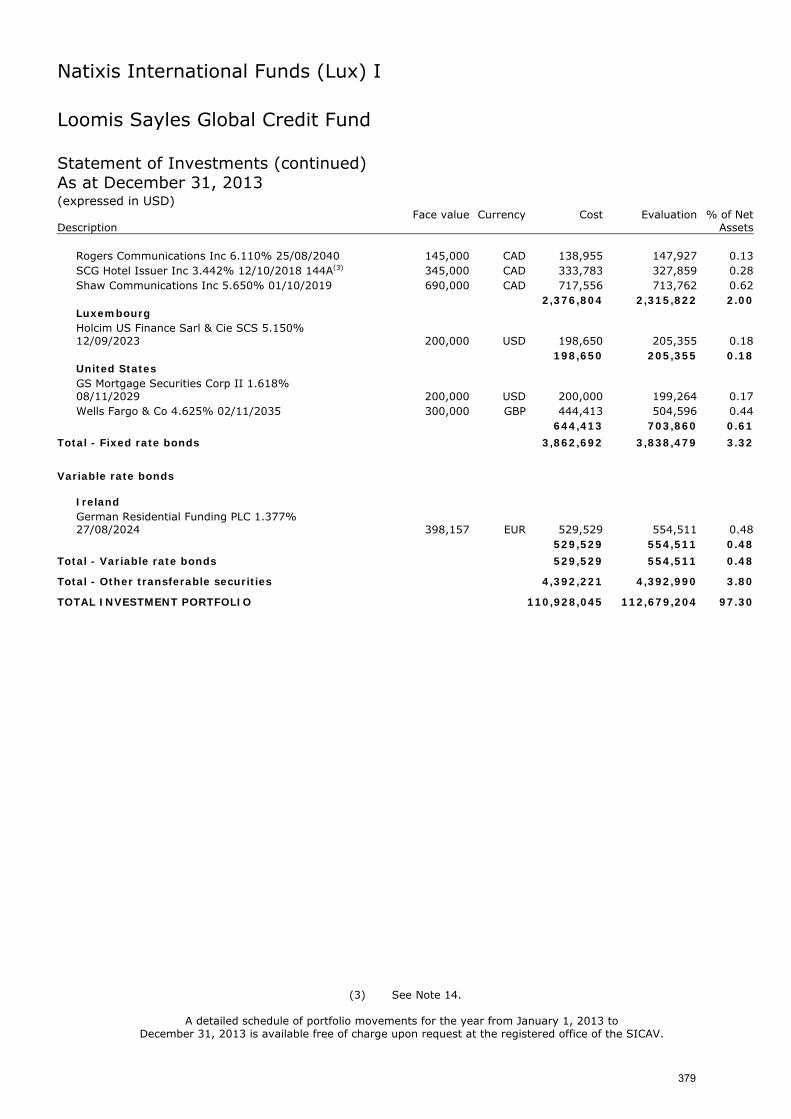
Natixis International Funds (Lux) I
Loomis Sayles Global Credit Fund Statement of Investments (continued) As at December 31, 2013 (expressed in USD) Face value Currency Cost Evaluation % of Net Description Assets
Rogers Communications Inc 6.110% 25/08/2040 145,000 CAD 138,955 147,927 0.13 SCG Hotel Issuer Inc 3.442% 12/10/2018 144A(3) 345,000 CAD 333,783 327,859 0.28 Shaw Communications Inc 5.650% 01/10/2019 690,000 CAD 717,556 713,762 0.62
2,376,804 2,315,822 2.00 Luxembourg Holcim US Finance Sarl & Cie SCS 5.150% 12/09/2023 200,000 USD 198,650 205,355 0.18
198,650 205,355 0.18 United States GS Mortgage Securities Corp II 1.618% 08/11/2029 200,000 USD 200,000 199,264 0.17 Wells Fargo & Co 4.625% 02/11/2035 300,000 GBP 444,413 504,596 0.44
644,413 703,860 0.61
Total - Fixed rate bonds 3,862,692 3,838,479 3.32
Variable rate bonds
Ireland German Residential Funding PLC 1.377% 27/08/2024 398,157 EUR 529,529 554,511 0.48
529,529 554,511 0.48
Total - Variable rate bonds 529,529 554,511 0.48
Total - Other transferable securities 4,392,221 4,392,990 3.80
TOTAL INVESTMENT PORTFOLIO 110,928,045 112,679,204 97.30
(3) See Note 14.
A detailed schedule of portfolio movements for the year from January 1, 2013 to December 31, 2013 is available free of charge upon request at the registered office of the SICAV.
379
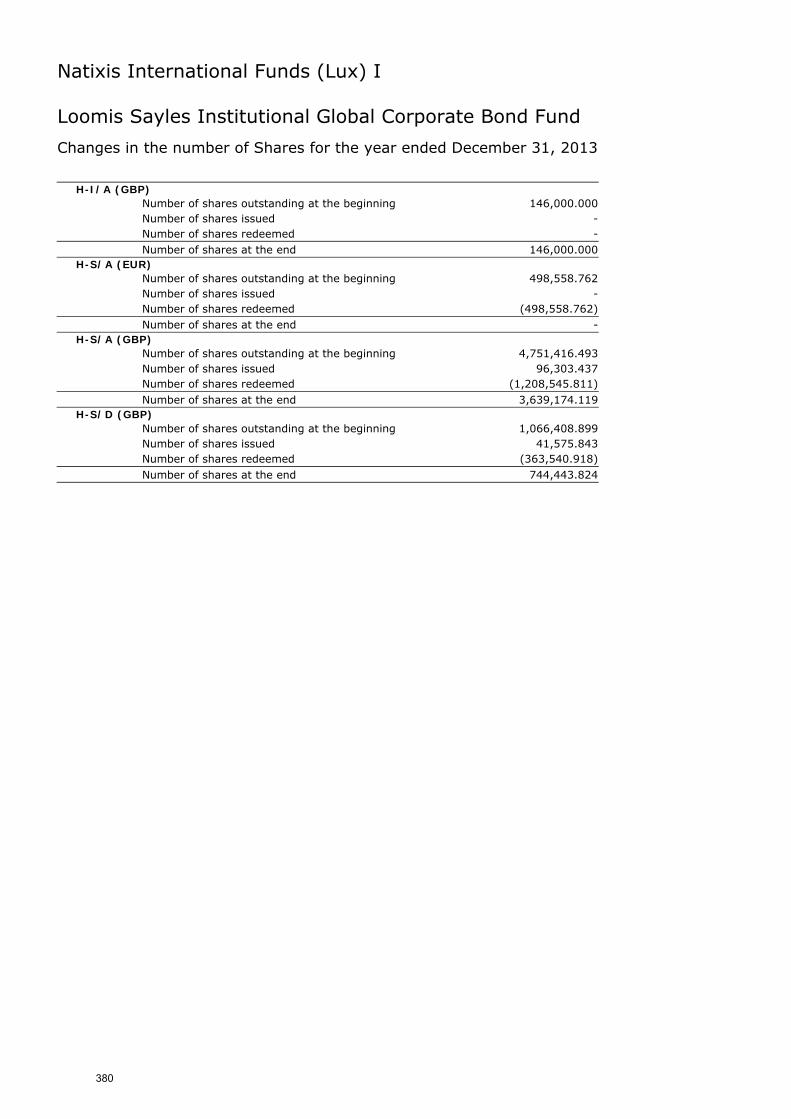
Natixis International Funds (Lux) I
Loomis Sayles Institutional Global Corporate Bond Fund
Changes in the number of Shares for the year ended December 31, 2013
H-I/A (GBP) Number of shares outstanding at the beginning 146,000.000
Number of shares issued - Number of shares redeemed - Number of shares at the end 146,000.000
H-S/A (EUR) Number of shares outstanding at the beginning 498,558.762
Number of shares issued - Number of shares redeemed (498,558.762) Number of shares at the end -
H-S/A (GBP) Number of shares outstanding at the beginning 4,751,416.493
Number of shares issued 96,303.437
Number of shares redeemed (1,208,545.811) Number of shares at the end 3,639,174.119
H-S/D (GBP) Number of shares outstanding at the beginning 1,066,408.899
Number of shares issued 41,575.843
Number of shares redeemed (363,540.918) Number of shares at the end 744,443.824
380
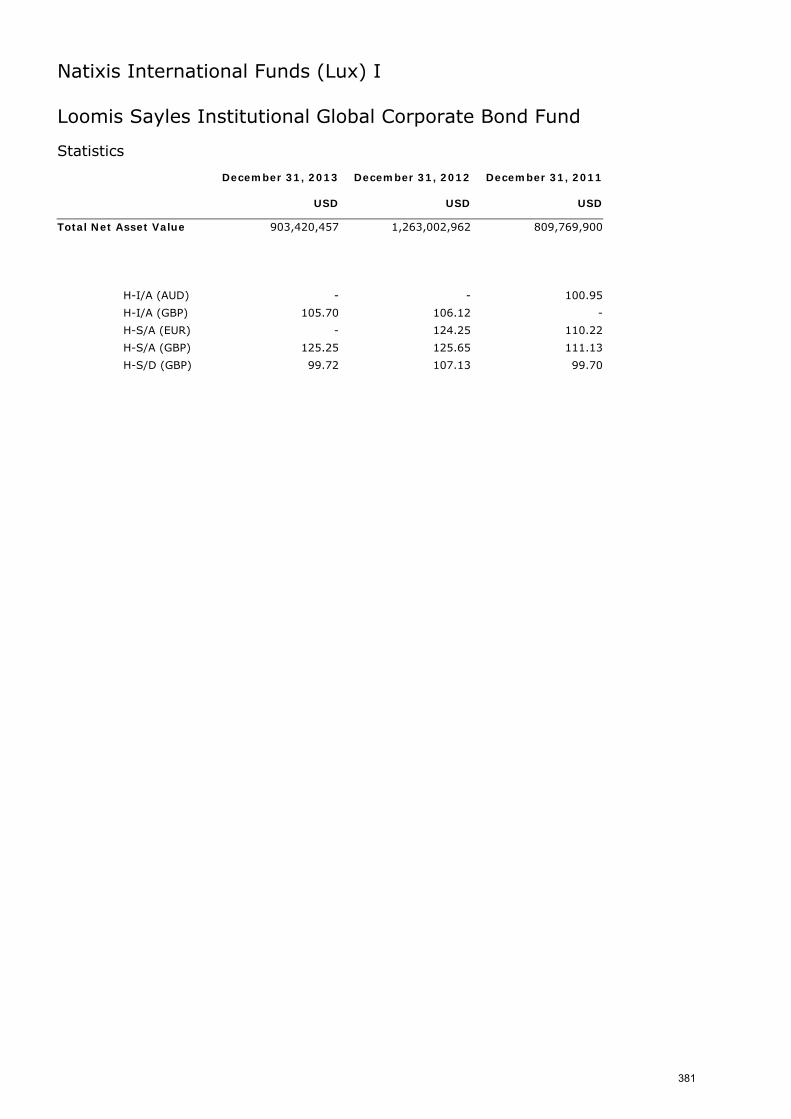
Natixis International Funds (Lux) I
Loomis Sayles Institutional Global Corporate Bond Fund Statistics December 31, 2013 December 31, 2012 December 31, 2011 USD USD USD
Total Net Asset Value 903,420,457 1,263,002,962 809,769,900
H-I/A (AUD) - - 100.95
H-I/A (GBP) 105.70 106.12 -
H-S/A (EUR) - 124.25 110.22
H-S/A (GBP) 125.25 125.65 111.13
H-S/D (GBP) 99.72 107.13 99.70
381
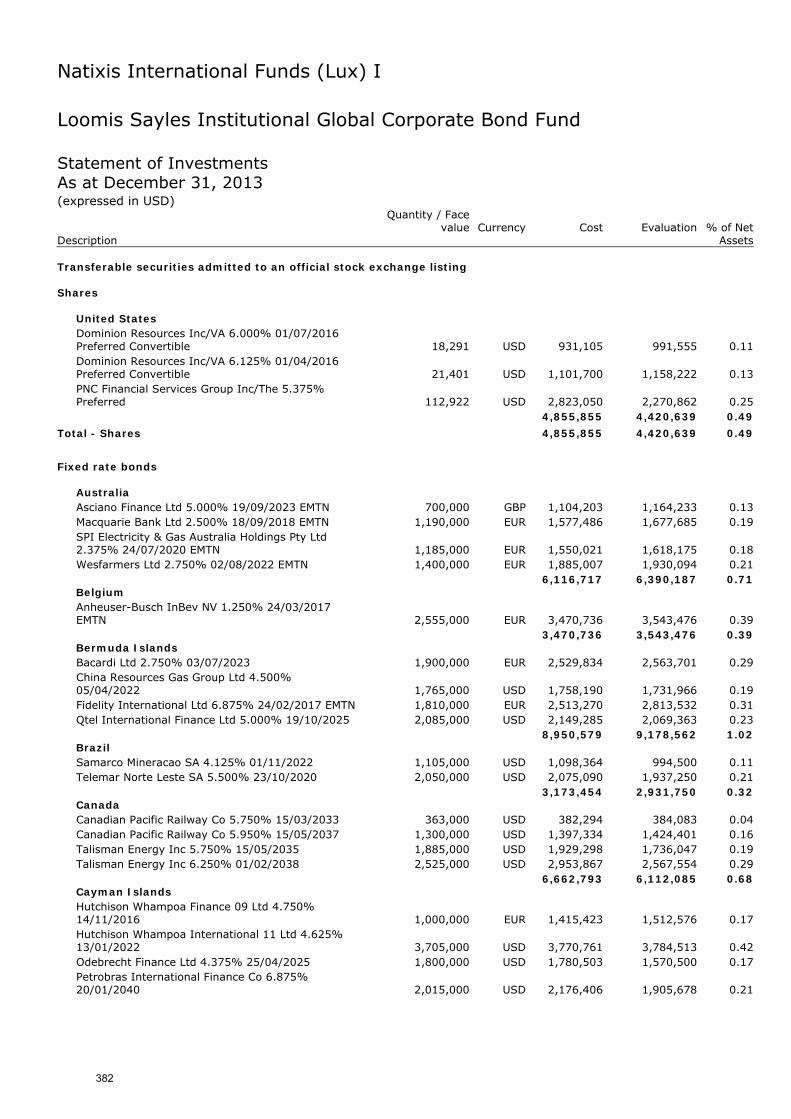
Natixis International Funds (Lux) I
Loomis Sayles Institutional Global Corporate Bond Fund Statement of Investments As at December 31, 2013 (expressed in USD)
Quantity / Face
value Currency Cost Evaluation % of Net Description Assets Transferable securities admitted to an official stock exchange listing Shares
United States Dominion Resources Inc/VA 6.000% 01/07/2016 Preferred Convertible 18,291 USD 931,105 991,555 0.11 Dominion Resources Inc/VA 6.125% 01/04/2016 Preferred Convertible 21,401 USD 1,101,700 1,158,222 0.13 PNC Financial Services Group Inc/The 5.375% Preferred 112,922 USD 2,823,050 2,270,862 0.25
4,855,855 4,420,639 0.49
Total - Shares 4,855,855 4,420,639 0.49
Fixed rate bonds
Australia Asciano Finance Ltd 5.000% 19/09/2023 EMTN 700,000 GBP 1,104,203 1,164,233 0.13 Macquarie Bank Ltd 2.500% 18/09/2018 EMTN 1,190,000 EUR 1,577,486 1,677,685 0.19 SPI Electricity & Gas Australia Holdings Pty Ltd 2.375% 24/07/2020 EMTN 1,185,000 EUR 1,550,021 1,618,175 0.18 Wesfarmers Ltd 2.750% 02/08/2022 EMTN 1,400,000 EUR 1,885,007 1,930,094 0.21
6,116,717 6,390,187 0.71 Belgium Anheuser-Busch InBev NV 1.250% 24/03/2017 EMTN 2,555,000 EUR 3,470,736 3,543,476 0.39
3,470,736 3,543,476 0.39 Bermuda Islands Bacardi Ltd 2.750% 03/07/2023 1,900,000 EUR 2,529,834 2,563,701 0.29 China Resources Gas Group Ltd 4.500% 05/04/2022 1,765,000 USD 1,758,190 1,731,966 0.19 Fidelity International Ltd 6.875% 24/02/2017 EMTN 1,810,000 EUR 2,513,270 2,813,532 0.31 Qtel International Finance Ltd 5.000% 19/10/2025 2,085,000 USD 2,149,285 2,069,363 0.23
8,950,579 9,178,562 1.02 Brazil Samarco Mineracao SA 4.125% 01/11/2022 1,105,000 USD 1,098,364 994,500 0.11 Telemar Norte Leste SA 5.500% 23/10/2020 2,050,000 USD 2,075,090 1,937,250 0.21
3,173,454 2,931,750 0.32 Canada Canadian Pacific Railway Co 5.750% 15/03/2033 363,000 USD 382,294 384,083 0.04 Canadian Pacific Railway Co 5.950% 15/05/2037 1,300,000 USD 1,397,334 1,424,401 0.16 Talisman Energy Inc 5.750% 15/05/2035 1,885,000 USD 1,929,298 1,736,047 0.19 Talisman Energy Inc 6.250% 01/02/2038 2,525,000 USD 2,953,867 2,567,554 0.29
6,662,793 6,112,085 0.68 Cayman Islands Hutchison Whampoa Finance 09 Ltd 4.750% 14/11/2016 1,000,000 EUR 1,415,423 1,512,576 0.17 Hutchison Whampoa International 11 Ltd 4.625% 13/01/2022 3,705,000 USD 3,770,761 3,784,513 0.42 Odebrecht Finance Ltd 4.375% 25/04/2025 1,800,000 USD 1,780,503 1,570,500 0.17 Petrobras International Finance Co 6.875% 20/01/2040 2,015,000 USD 2,176,406 1,905,678 0.21
382
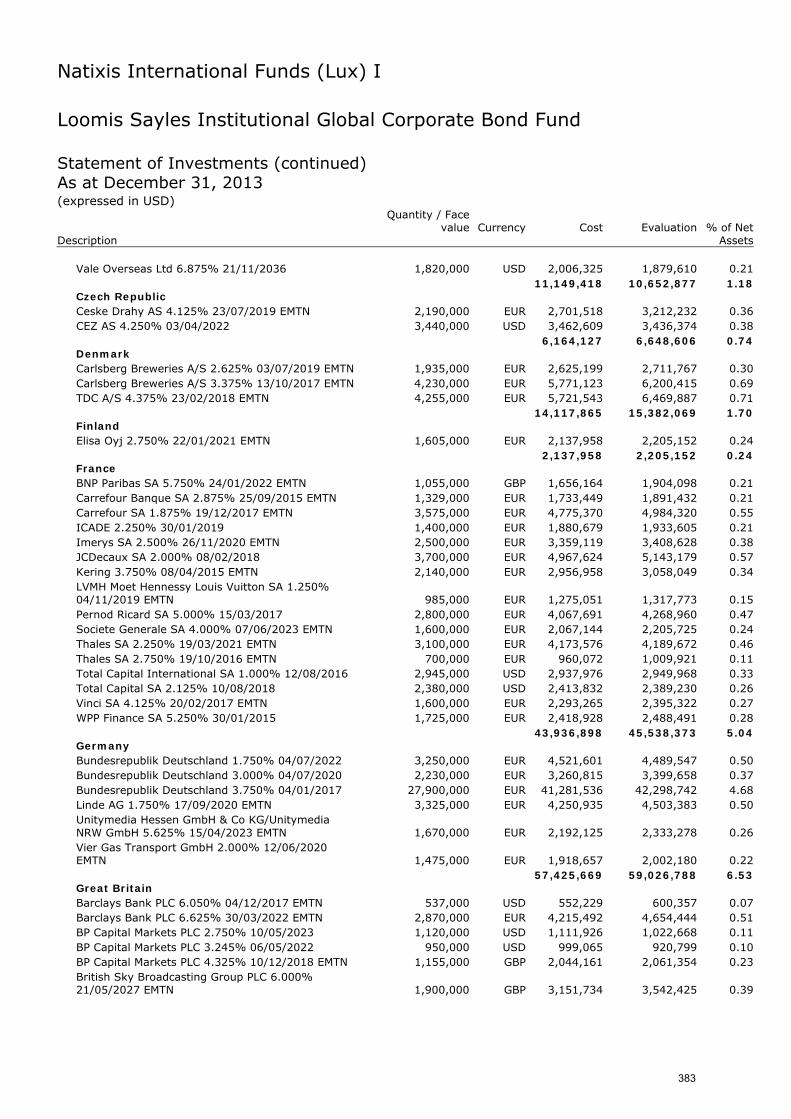
Natixis International Funds (Lux) I
Loomis Sayles Institutional Global Corporate Bond Fund Statement of Investments (continued) As at December 31, 2013 (expressed in USD)
Quantity / Face
value Currency Cost Evaluation % of Net Description Assets
Vale Overseas Ltd 6.875% 21/11/2036 1,820,000 USD 2,006,325 1,879,610 0.21 11,149,418 10,652,877 1.18
Czech Republic Ceske Drahy AS 4.125% 23/07/2019 EMTN 2,190,000 EUR 2,701,518 3,212,232 0.36 CEZ AS 4.250% 03/04/2022 3,440,000 USD 3,462,609 3,436,374 0.38
6,164,127 6,648,606 0.74 Denmark Carlsberg Breweries A/S 2.625% 03/07/2019 EMTN 1,935,000 EUR 2,625,199 2,711,767 0.30 Carlsberg Breweries A/S 3.375% 13/10/2017 EMTN 4,230,000 EUR 5,771,123 6,200,415 0.69 TDC A/S 4.375% 23/02/2018 EMTN 4,255,000 EUR 5,721,543 6,469,887 0.71
14,117,865 15,382,069 1.70 Finland Elisa Oyj 2.750% 22/01/2021 EMTN 1,605,000 EUR 2,137,958 2,205,152 0.24
2,137,958 2,205,152 0.24 France BNP Paribas SA 5.750% 24/01/2022 EMTN 1,055,000 GBP 1,656,164 1,904,098 0.21 Carrefour Banque SA 2.875% 25/09/2015 EMTN 1,329,000 EUR 1,733,449 1,891,432 0.21 Carrefour SA 1.875% 19/12/2017 EMTN 3,575,000 EUR 4,775,370 4,984,320 0.55 ICADE 2.250% 30/01/2019 1,400,000 EUR 1,880,679 1,933,605 0.21 Imerys SA 2.500% 26/11/2020 EMTN 2,500,000 EUR 3,359,119 3,408,628 0.38 JCDecaux SA 2.000% 08/02/2018 3,700,000 EUR 4,967,624 5,143,179 0.57 Kering 3.750% 08/04/2015 EMTN 2,140,000 EUR 2,956,958 3,058,049 0.34 LVMH Moet Hennessy Louis Vuitton SA 1.250% 04/11/2019 EMTN 985,000 EUR 1,275,051 1,317,773 0.15 Pernod Ricard SA 5.000% 15/03/2017 2,800,000 EUR 4,067,691 4,268,960 0.47 Societe Generale SA 4.000% 07/06/2023 EMTN 1,600,000 EUR 2,067,144 2,205,725 0.24 Thales SA 2.250% 19/03/2021 EMTN 3,100,000 EUR 4,173,576 4,189,672 0.46 Thales SA 2.750% 19/10/2016 EMTN 700,000 EUR 960,072 1,009,921 0.11 Total Capital International SA 1.000% 12/08/2016 2,945,000 USD 2,937,976 2,949,968 0.33 Total Capital SA 2.125% 10/08/2018 2,380,000 USD 2,413,832 2,389,230 0.26 Vinci SA 4.125% 20/02/2017 EMTN 1,600,000 EUR 2,293,265 2,395,322 0.27 WPP Finance SA 5.250% 30/01/2015 1,725,000 EUR 2,418,928 2,488,491 0.28
43,936,898 45,538,373 5.04 Germany Bundesrepublik Deutschland 1.750% 04/07/2022 3,250,000 EUR 4,521,601 4,489,547 0.50 Bundesrepublik Deutschland 3.000% 04/07/2020 2,230,000 EUR 3,260,815 3,399,658 0.37 Bundesrepublik Deutschland 3.750% 04/01/2017 27,900,000 EUR 41,281,536 42,298,742 4.68 Linde AG 1.750% 17/09/2020 EMTN 3,325,000 EUR 4,250,935 4,503,383 0.50 Unitymedia Hessen GmbH & Co KG/Unitymedia NRW GmbH 5.625% 15/04/2023 EMTN 1,670,000 EUR 2,192,125 2,333,278 0.26 Vier Gas Transport GmbH 2.000% 12/06/2020 EMTN 1,475,000 EUR 1,918,657 2,002,180 0.22
57,425,669 59,026,788 6.53 Great Britain Barclays Bank PLC 6.050% 04/12/2017 EMTN 537,000 USD 552,229 600,357 0.07 Barclays Bank PLC 6.625% 30/03/2022 EMTN 2,870,000 EUR 4,215,492 4,654,444 0.51 BP Capital Markets PLC 2.750% 10/05/2023 1,120,000 USD 1,111,926 1,022,668 0.11 BP Capital Markets PLC 3.245% 06/05/2022 950,000 USD 999,065 920,799 0.10 BP Capital Markets PLC 4.325% 10/12/2018 EMTN 1,155,000 GBP 2,044,161 2,061,354 0.23 British Sky Broadcasting Group PLC 6.000% 21/05/2027 EMTN 1,900,000 GBP 3,151,734 3,542,425 0.39
383
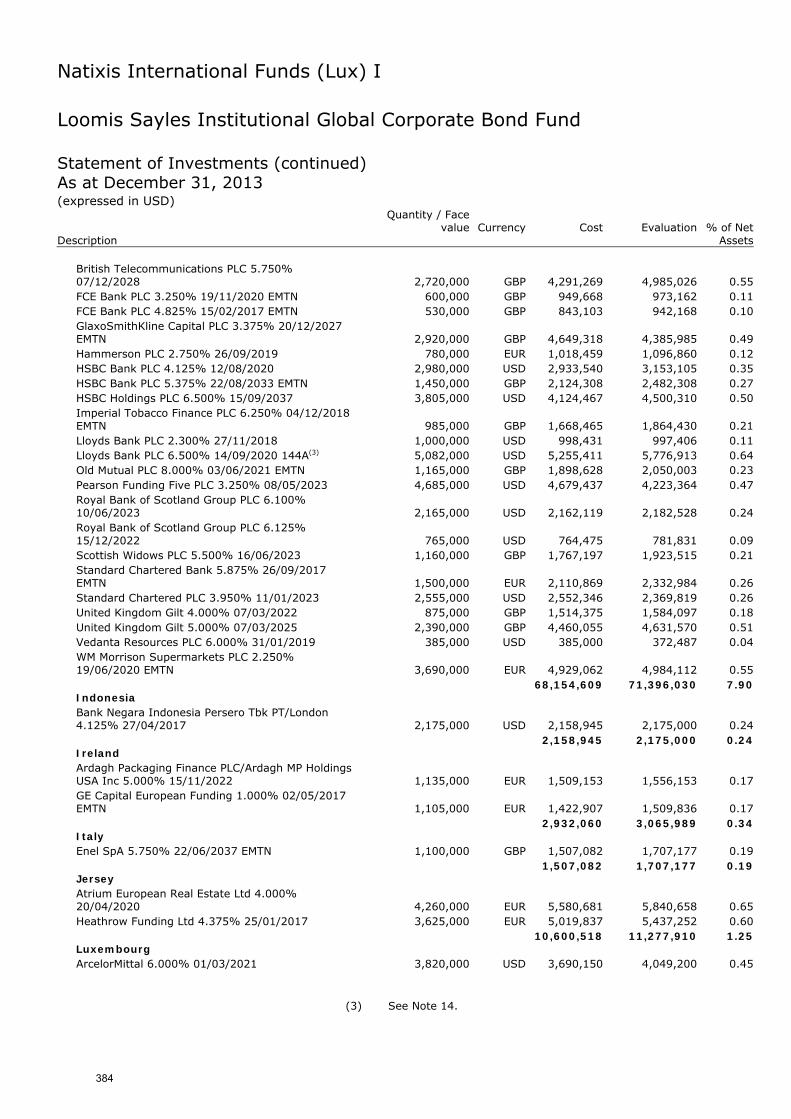
Natixis International Funds (Lux) I
Loomis Sayles Institutional Global Corporate Bond Fund Statement of Investments (continued) As at December 31, 2013 (expressed in USD)
Quantity / Face
value Currency Cost Evaluation % of Net Description Assets
British Telecommunications PLC 5.750% 07/12/2028 2,720,000 GBP 4,291,269 4,985,026 0.55 FCE Bank PLC 3.250% 19/11/2020 EMTN 600,000 GBP 949,668 973,162 0.11 FCE Bank PLC 4.825% 15/02/2017 EMTN 530,000 GBP 843,103 942,168 0.10 GlaxoSmithKline Capital PLC 3.375% 20/12/2027 EMTN 2,920,000 GBP 4,649,318 4,385,985 0.49 Hammerson PLC 2.750% 26/09/2019 780,000 EUR 1,018,459 1,096,860 0.12 HSBC Bank PLC 4.125% 12/08/2020 2,980,000 USD 2,933,540 3,153,105 0.35 HSBC Bank PLC 5.375% 22/08/2033 EMTN 1,450,000 GBP 2,124,308 2,482,308 0.27 HSBC Holdings PLC 6.500% 15/09/2037 3,805,000 USD 4,124,467 4,500,310 0.50 Imperial Tobacco Finance PLC 6.250% 04/12/2018 EMTN 985,000 GBP 1,668,465 1,864,430 0.21 Lloyds Bank PLC 2.300% 27/11/2018 1,000,000 USD 998,431 997,406 0.11 Lloyds Bank PLC 6.500% 14/09/2020 144A(3) 5,082,000 USD 5,255,411 5,776,913 0.64 Old Mutual PLC 8.000% 03/06/2021 EMTN 1,165,000 GBP 1,898,628 2,050,003 0.23 Pearson Funding Five PLC 3.250% 08/05/2023 4,685,000 USD 4,679,437 4,223,364 0.47 Royal Bank of Scotland Group PLC 6.100% 10/06/2023 2,165,000 USD 2,162,119 2,182,528 0.24 Royal Bank of Scotland Group PLC 6.125% 15/12/2022 765,000 USD 764,475 781,831 0.09 Scottish Widows PLC 5.500% 16/06/2023 1,160,000 GBP 1,767,197 1,923,515 0.21 Standard Chartered Bank 5.875% 26/09/2017 EMTN 1,500,000 EUR 2,110,869 2,332,984 0.26 Standard Chartered PLC 3.950% 11/01/2023 2,555,000 USD 2,552,346 2,369,819 0.26 United Kingdom Gilt 4.000% 07/03/2022 875,000 GBP 1,514,375 1,584,097 0.18 United Kingdom Gilt 5.000% 07/03/2025 2,390,000 GBP 4,460,055 4,631,570 0.51 Vedanta Resources PLC 6.000% 31/01/2019 385,000 USD 385,000 372,487 0.04 WM Morrison Supermarkets PLC 2.250% 19/06/2020 EMTN 3,690,000 EUR 4,929,062 4,984,112 0.55
68,154,609 71,396,030 7.90 Indonesia Bank Negara Indonesia Persero Tbk PT/London 4.125% 27/04/2017 2,175,000 USD 2,158,945 2,175,000 0.24
2,158,945 2,175,000 0.24 Ireland Ardagh Packaging Finance PLC/Ardagh MP Holdings USA Inc 5.000% 15/11/2022 1,135,000 EUR 1,509,153 1,556,153 0.17 GE Capital European Funding 1.000% 02/05/2017 EMTN 1,105,000 EUR 1,422,907 1,509,836 0.17
2,932,060 3,065,989 0.34 Italy Enel SpA 5.750% 22/06/2037 EMTN 1,100,000 GBP 1,507,082 1,707,177 0.19
1,507,082 1,707,177 0.19 Jersey Atrium European Real Estate Ltd 4.000% 20/04/2020 4,260,000 EUR 5,580,681 5,840,658 0.65 Heathrow Funding Ltd 4.375% 25/01/2017 3,625,000 EUR 5,019,837 5,437,252 0.60
10,600,518 11,277,910 1.25 Luxembourg ArcelorMittal 6.000% 01/03/2021 3,820,000 USD 3,690,150 4,049,200 0.45
(3) See Note 14.
384
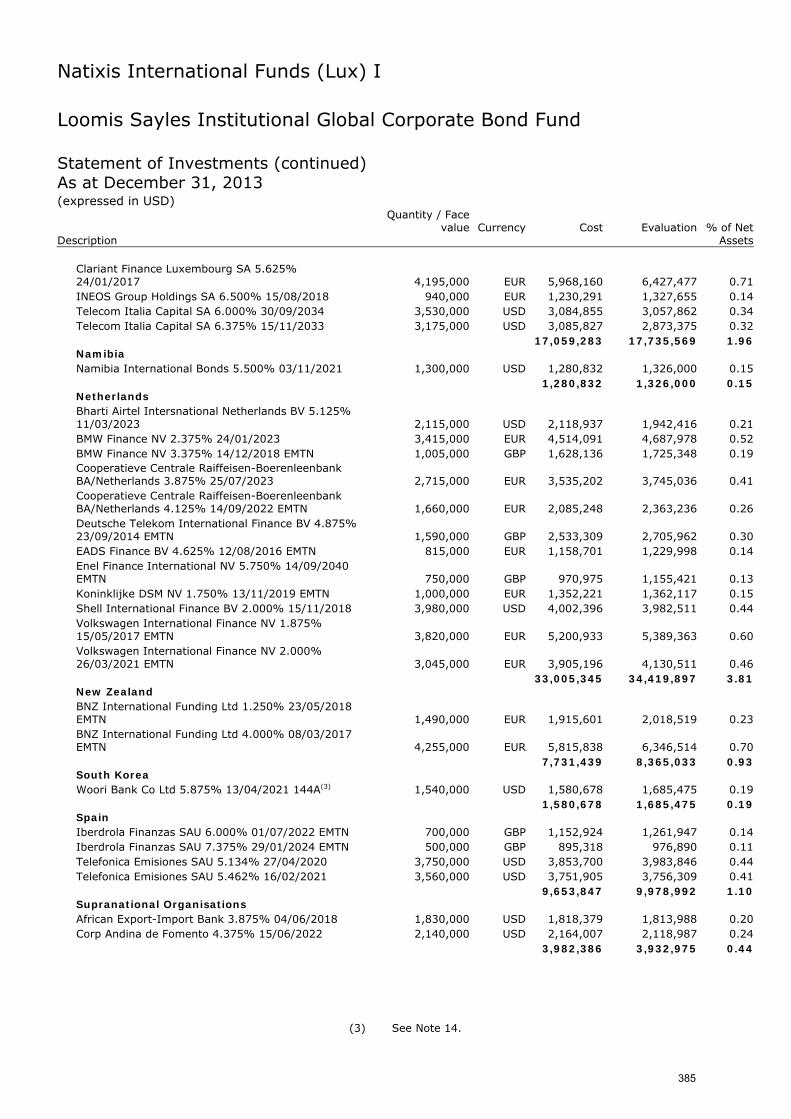
Natixis International Funds (Lux) I
Loomis Sayles Institutional Global Corporate Bond Fund Statement of Investments (continued) As at December 31, 2013 (expressed in USD)
Quantity / Face
value Currency Cost Evaluation % of Net Description Assets
Clariant Finance Luxembourg SA 5.625% 24/01/2017 4,195,000 EUR 5,968,160 6,427,477 0.71 INEOS Group Holdings SA 6.500% 15/08/2018 940,000 EUR 1,230,291 1,327,655 0.14 Telecom Italia Capital SA 6.000% 30/09/2034 3,530,000 USD 3,084,855 3,057,862 0.34 Telecom Italia Capital SA 6.375% 15/11/2033 3,175,000 USD 3,085,827 2,873,375 0.32
17,059,283 17,735,569 1.96 Namibia Namibia International Bonds 5.500% 03/11/2021 1,300,000 USD 1,280,832 1,326,000 0.15
1,280,832 1,326,000 0.15 Netherlands Bharti Airtel Intersnational Netherlands BV 5.125% 11/03/2023 2,115,000 USD 2,118,937 1,942,416 0.21 BMW Finance NV 2.375% 24/01/2023 3,415,000 EUR 4,514,091 4,687,978 0.52 BMW Finance NV 3.375% 14/12/2018 EMTN 1,005,000 GBP 1,628,136 1,725,348 0.19 Cooperatieve Centrale Raiffeisen-Boerenleenbank BA/Netherlands 3.875% 25/07/2023 2,715,000 EUR 3,535,202 3,745,036 0.41 Cooperatieve Centrale Raiffeisen-Boerenleenbank BA/Netherlands 4.125% 14/09/2022 EMTN 1,660,000 EUR 2,085,248 2,363,236 0.26 Deutsche Telekom International Finance BV 4.875% 23/09/2014 EMTN 1,590,000 GBP 2,533,309 2,705,962 0.30 EADS Finance BV 4.625% 12/08/2016 EMTN 815,000 EUR 1,158,701 1,229,998 0.14 Enel Finance International NV 5.750% 14/09/2040 EMTN 750,000 GBP 970,975 1,155,421 0.13 Koninklijke DSM NV 1.750% 13/11/2019 EMTN 1,000,000 EUR 1,352,221 1,362,117 0.15 Shell International Finance BV 2.000% 15/11/2018 3,980,000 USD 4,002,396 3,982,511 0.44 Volkswagen International Finance NV 1.875% 15/05/2017 EMTN 3,820,000 EUR 5,200,933 5,389,363 0.60 Volkswagen International Finance NV 2.000% 26/03/2021 EMTN 3,045,000 EUR 3,905,196 4,130,511 0.46
33,005,345 34,419,897 3.81 New Zealand BNZ International Funding Ltd 1.250% 23/05/2018 EMTN 1,490,000 EUR 1,915,601 2,018,519 0.23 BNZ International Funding Ltd 4.000% 08/03/2017 EMTN 4,255,000 EUR 5,815,838 6,346,514 0.70
7,731,439 8,365,033 0.93 South Korea Woori Bank Co Ltd 5.875% 13/04/2021 144A(3) 1,540,000 USD 1,580,678 1,685,475 0.19
1,580,678 1,685,475 0.19 Spain Iberdrola Finanzas SAU 6.000% 01/07/2022 EMTN 700,000 GBP 1,152,924 1,261,947 0.14 Iberdrola Finanzas SAU 7.375% 29/01/2024 EMTN 500,000 GBP 895,318 976,890 0.11 Telefonica Emisiones SAU 5.134% 27/04/2020 3,750,000 USD 3,853,700 3,983,846 0.44 Telefonica Emisiones SAU 5.462% 16/02/2021 3,560,000 USD 3,751,905 3,756,309 0.41
9,653,847 9,978,992 1.10 Supranational Organisations African Export-Import Bank 3.875% 04/06/2018 1,830,000 USD 1,818,379 1,813,988 0.20 Corp Andina de Fomento 4.375% 15/06/2022 2,140,000 USD 2,164,007 2,118,987 0.24
3,982,386 3,932,975 0.44
(3) See Note 14.
385
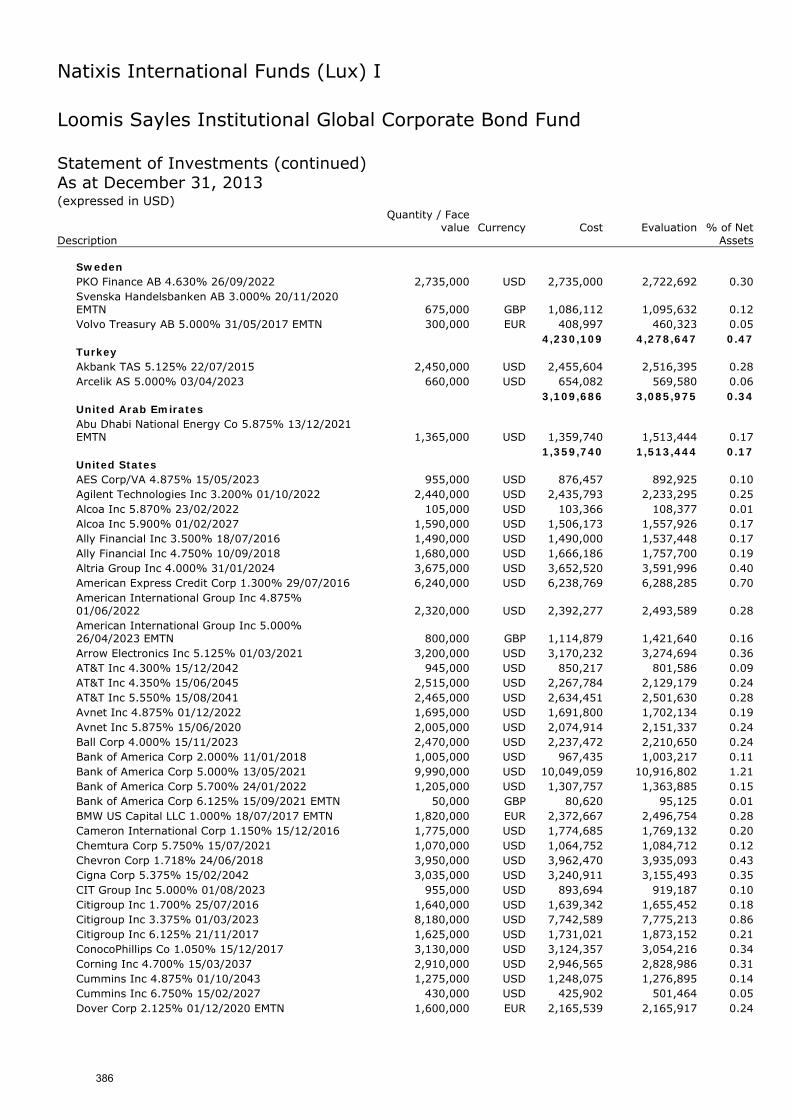
Natixis International Funds (Lux) I
Loomis Sayles Institutional Global Corporate Bond Fund Statement of Investments (continued) As at December 31, 2013 (expressed in USD)
Quantity / Face
value Currency Cost Evaluation % of Net Description Assets
Sweden PKO Finance AB 4.630% 26/09/2022 2,735,000 USD 2,735,000 2,722,692 0.30 Svenska Handelsbanken AB 3.000% 20/11/2020 EMTN 675,000 GBP 1,086,112 1,095,632 0.12 Volvo Treasury AB 5.000% 31/05/2017 EMTN 300,000 EUR 408,997 460,323 0.05
4,230,109 4,278,647 0.47 Turkey Akbank TAS 5.125% 22/07/2015 2,450,000 USD 2,455,604 2,516,395 0.28 Arcelik AS 5.000% 03/04/2023 660,000 USD 654,082 569,580 0.06
3,109,686 3,085,975 0.34 United Arab Emirates Abu Dhabi National Energy Co 5.875% 13/12/2021 EMTN 1,365,000 USD 1,359,740 1,513,444 0.17
1,359,740 1,513,444 0.17 United States AES Corp/VA 4.875% 15/05/2023 955,000 USD 876,457 892,925 0.10 Agilent Technologies Inc 3.200% 01/10/2022 2,440,000 USD 2,435,793 2,233,295 0.25 Alcoa Inc 5.870% 23/02/2022 105,000 USD 103,366 108,377 0.01 Alcoa Inc 5.900% 01/02/2027 1,590,000 USD 1,506,173 1,557,926 0.17 Ally Financial Inc 3.500% 18/07/2016 1,490,000 USD 1,490,000 1,537,448 0.17 Ally Financial Inc 4.750% 10/09/2018 1,680,000 USD 1,666,186 1,757,700 0.19 Altria Group Inc 4.000% 31/01/2024 3,675,000 USD 3,652,520 3,591,996 0.40 American Express Credit Corp 1.300% 29/07/2016 6,240,000 USD 6,238,769 6,288,285 0.70 American International Group Inc 4.875% 01/06/2022 2,320,000 USD 2,392,277 2,493,589 0.28 American International Group Inc 5.000% 26/04/2023 EMTN 800,000 GBP 1,114,879 1,421,640 0.16 Arrow Electronics Inc 5.125% 01/03/2021 3,200,000 USD 3,170,232 3,274,694 0.36 AT&T Inc 4.300% 15/12/2042 945,000 USD 850,217 801,586 0.09 AT&T Inc 4.350% 15/06/2045 2,515,000 USD 2,267,784 2,129,179 0.24 AT&T Inc 5.550% 15/08/2041 2,465,000 USD 2,634,451 2,501,630 0.28 Avnet Inc 4.875% 01/12/2022 1,695,000 USD 1,691,800 1,702,134 0.19 Avnet Inc 5.875% 15/06/2020 2,005,000 USD 2,074,914 2,151,337 0.24 Ball Corp 4.000% 15/11/2023 2,470,000 USD 2,237,472 2,210,650 0.24 Bank of America Corp 2.000% 11/01/2018 1,005,000 USD 967,435 1,003,217 0.11 Bank of America Corp 5.000% 13/05/2021 9,990,000 USD 10,049,059 10,916,802 1.21 Bank of America Corp 5.700% 24/01/2022 1,205,000 USD 1,307,757 1,363,885 0.15 Bank of America Corp 6.125% 15/09/2021 EMTN 50,000 GBP 80,620 95,125 0.01 BMW US Capital LLC 1.000% 18/07/2017 EMTN 1,820,000 EUR 2,372,667 2,496,754 0.28 Cameron International Corp 1.150% 15/12/2016 1,775,000 USD 1,774,685 1,769,132 0.20 Chemtura Corp 5.750% 15/07/2021 1,070,000 USD 1,064,752 1,084,712 0.12 Chevron Corp 1.718% 24/06/2018 3,950,000 USD 3,962,470 3,935,093 0.43 Cigna Corp 5.375% 15/02/2042 3,035,000 USD 3,240,911 3,155,493 0.35 CIT Group Inc 5.000% 01/08/2023 955,000 USD 893,694 919,187 0.10 Citigroup Inc 1.700% 25/07/2016 1,640,000 USD 1,639,342 1,655,452 0.18 Citigroup Inc 3.375% 01/03/2023 8,180,000 USD 7,742,589 7,775,213 0.86 Citigroup Inc 6.125% 21/11/2017 1,625,000 USD 1,731,021 1,873,152 0.21 ConocoPhillips Co 1.050% 15/12/2017 3,130,000 USD 3,124,357 3,054,216 0.34 Corning Inc 4.700% 15/03/2037 2,910,000 USD 2,946,565 2,828,986 0.31 Cummins Inc 4.875% 01/10/2043 1,275,000 USD 1,248,075 1,276,895 0.14 Cummins Inc 6.750% 15/02/2027 430,000 USD 425,902 501,464 0.05 Dover Corp 2.125% 01/12/2020 EMTN 1,600,000 EUR 2,165,539 2,165,917 0.24
386
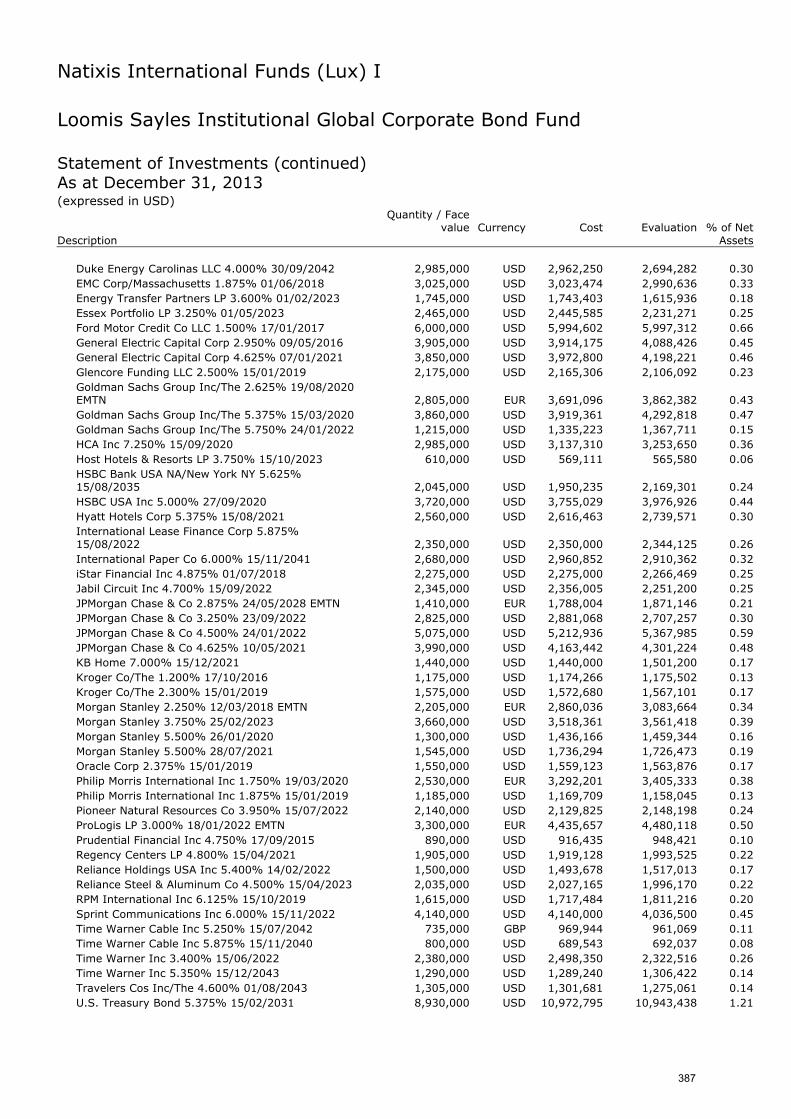
Natixis International Funds (Lux) I
Loomis Sayles Institutional Global Corporate Bond Fund Statement of Investments (continued) As at December 31, 2013 (expressed in USD)
Quantity / Face
value Currency Cost Evaluation % of Net Description Assets
Duke Energy Carolinas LLC 4.000% 30/09/2042 2,985,000 USD 2,962,250 2,694,282 0.30 EMC Corp/Massachusetts 1.875% 01/06/2018 3,025,000 USD 3,023,474 2,990,636 0.33 Energy Transfer Partners LP 3.600% 01/02/2023 1,745,000 USD 1,743,403 1,615,936 0.18 Essex Portfolio LP 3.250% 01/05/2023 2,465,000 USD 2,445,585 2,231,271 0.25 Ford Motor Credit Co LLC 1.500% 17/01/2017 6,000,000 USD 5,994,602 5,997,312 0.66 General Electric Capital Corp 2.950% 09/05/2016 3,905,000 USD 3,914,175 4,088,426 0.45 General Electric Capital Corp 4.625% 07/01/2021 3,850,000 USD 3,972,800 4,198,221 0.46 Glencore Funding LLC 2.500% 15/01/2019 2,175,000 USD 2,165,306 2,106,092 0.23 Goldman Sachs Group Inc/The 2.625% 19/08/2020 EMTN 2,805,000 EUR 3,691,096 3,862,382 0.43 Goldman Sachs Group Inc/The 5.375% 15/03/2020 3,860,000 USD 3,919,361 4,292,818 0.47 Goldman Sachs Group Inc/The 5.750% 24/01/2022 1,215,000 USD 1,335,223 1,367,711 0.15 HCA Inc 7.250% 15/09/2020 2,985,000 USD 3,137,310 3,253,650 0.36 Host Hotels & Resorts LP 3.750% 15/10/2023 610,000 USD 569,111 565,580 0.06 HSBC Bank USA NA/New York NY 5.625% 15/08/2035 2,045,000 USD 1,950,235 2,169,301 0.24 HSBC USA Inc 5.000% 27/09/2020 3,720,000 USD 3,755,029 3,976,926 0.44 Hyatt Hotels Corp 5.375% 15/08/2021 2,560,000 USD 2,616,463 2,739,571 0.30 International Lease Finance Corp 5.875% 15/08/2022 2,350,000 USD 2,350,000 2,344,125 0.26 International Paper Co 6.000% 15/11/2041 2,680,000 USD 2,960,852 2,910,362 0.32 iStar Financial Inc 4.875% 01/07/2018 2,275,000 USD 2,275,000 2,266,469 0.25 Jabil Circuit Inc 4.700% 15/09/2022 2,345,000 USD 2,356,005 2,251,200 0.25 JPMorgan Chase & Co 2.875% 24/05/2028 EMTN 1,410,000 EUR 1,788,004 1,871,146 0.21 JPMorgan Chase & Co 3.250% 23/09/2022 2,825,000 USD 2,881,068 2,707,257 0.30 JPMorgan Chase & Co 4.500% 24/01/2022 5,075,000 USD 5,212,936 5,367,985 0.59 JPMorgan Chase & Co 4.625% 10/05/2021 3,990,000 USD 4,163,442 4,301,224 0.48 KB Home 7.000% 15/12/2021 1,440,000 USD 1,440,000 1,501,200 0.17 Kroger Co/The 1.200% 17/10/2016 1,175,000 USD 1,174,266 1,175,502 0.13 Kroger Co/The 2.300% 15/01/2019 1,575,000 USD 1,572,680 1,567,101 0.17 Morgan Stanley 2.250% 12/03/2018 EMTN 2,205,000 EUR 2,860,036 3,083,664 0.34 Morgan Stanley 3.750% 25/02/2023 3,660,000 USD 3,518,361 3,561,418 0.39 Morgan Stanley 5.500% 26/01/2020 1,300,000 USD 1,436,166 1,459,344 0.16 Morgan Stanley 5.500% 28/07/2021 1,545,000 USD 1,736,294 1,726,473 0.19 Oracle Corp 2.375% 15/01/2019 1,550,000 USD 1,559,123 1,563,876 0.17 Philip Morris International Inc 1.750% 19/03/2020 2,530,000 EUR 3,292,201 3,405,333 0.38 Philip Morris International Inc 1.875% 15/01/2019 1,185,000 USD 1,169,709 1,158,045 0.13 Pioneer Natural Resources Co 3.950% 15/07/2022 2,140,000 USD 2,129,825 2,148,198 0.24 ProLogis LP 3.000% 18/01/2022 EMTN 3,300,000 EUR 4,435,657 4,480,118 0.50 Prudential Financial Inc 4.750% 17/09/2015 890,000 USD 916,435 948,421 0.10 Regency Centers LP 4.800% 15/04/2021 1,905,000 USD 1,919,128 1,993,525 0.22 Reliance Holdings USA Inc 5.400% 14/02/2022 1,500,000 USD 1,493,678 1,517,013 0.17 Reliance Steel & Aluminum Co 4.500% 15/04/2023 2,035,000 USD 2,027,165 1,996,170 0.22 RPM International Inc 6.125% 15/10/2019 1,615,000 USD 1,717,484 1,811,216 0.20 Sprint Communications Inc 6.000% 15/11/2022 4,140,000 USD 4,140,000 4,036,500 0.45 Time Warner Cable Inc 5.250% 15/07/2042 735,000 GBP 969,944 961,069 0.11 Time Warner Cable Inc 5.875% 15/11/2040 800,000 USD 689,543 692,037 0.08 Time Warner Inc 3.400% 15/06/2022 2,380,000 USD 2,498,350 2,322,516 0.26 Time Warner Inc 5.350% 15/12/2043 1,290,000 USD 1,289,240 1,306,422 0.14 Travelers Cos Inc/The 4.600% 01/08/2043 1,305,000 USD 1,301,681 1,275,061 0.14 U.S. Treasury Bond 5.375% 15/02/2031 8,930,000 USD 10,972,795 10,943,438 1.21
387
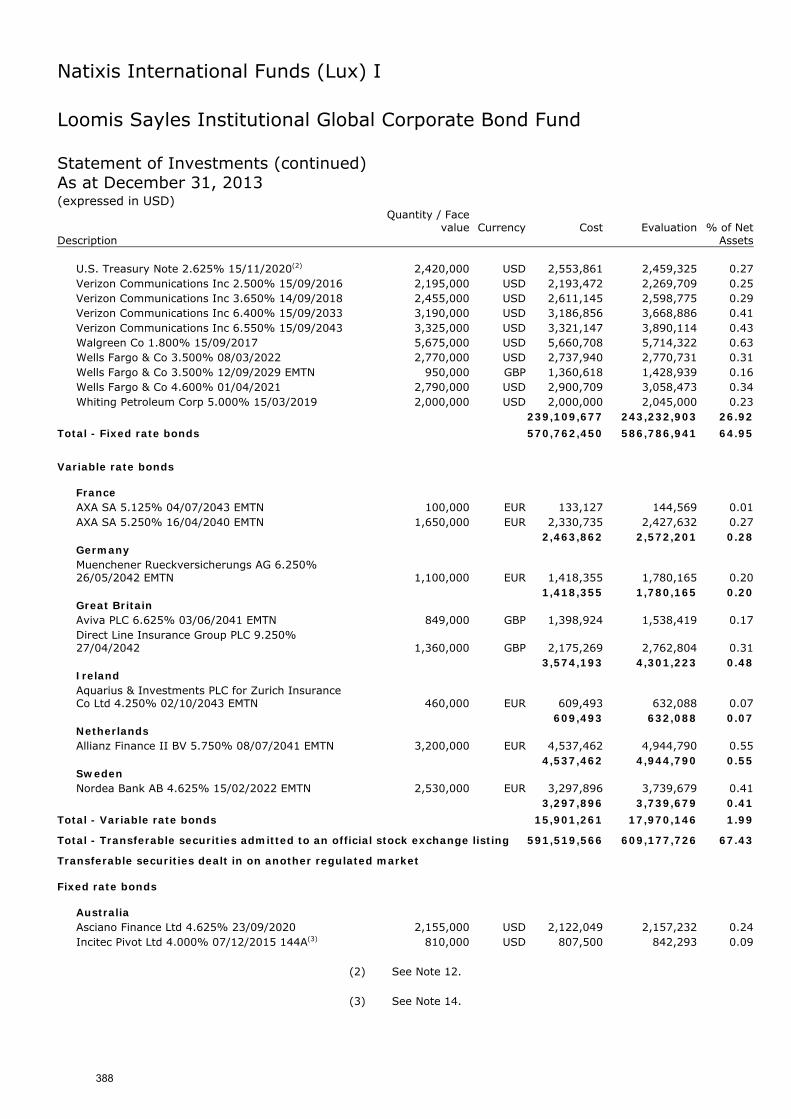
Natixis International Funds (Lux) I
Loomis Sayles Institutional Global Corporate Bond Fund Statement of Investments (continued) As at December 31, 2013 (expressed in USD)
Quantity / Face
value Currency Cost Evaluation % of Net Description Assets
U.S. Treasury Note 2.625% 15/11/2020(2) 2,420,000 USD 2,553,861 2,459,325 0.27 Verizon Communications Inc 2.500% 15/09/2016 2,195,000 USD 2,193,472 2,269,709 0.25 Verizon Communications Inc 3.650% 14/09/2018 2,455,000 USD 2,611,145 2,598,775 0.29 Verizon Communications Inc 6.400% 15/09/2033 3,190,000 USD 3,186,856 3,668,886 0.41 Verizon Communications Inc 6.550% 15/09/2043 3,325,000 USD 3,321,147 3,890,114 0.43 Walgreen Co 1.800% 15/09/2017 5,675,000 USD 5,660,708 5,714,322 0.63 Wells Fargo & Co 3.500% 08/03/2022 2,770,000 USD 2,737,940 2,770,731 0.31 Wells Fargo & Co 3.500% 12/09/2029 EMTN 950,000 GBP 1,360,618 1,428,939 0.16 Wells Fargo & Co 4.600% 01/04/2021 2,790,000 USD 2,900,709 3,058,473 0.34 Whiting Petroleum Corp 5.000% 15/03/2019 2,000,000 USD 2,000,000 2,045,000 0.23
239,109,677 243,232,903 26.92
Total - Fixed rate bonds 570,762,450 586,786,941 64.95
Variable rate bonds
France AXA SA 5.125% 04/07/2043 EMTN 100,000 EUR 133,127 144,569 0.01 AXA SA 5.250% 16/04/2040 EMTN 1,650,000 EUR 2,330,735 2,427,632 0.27
2,463,862 2,572,201 0.28 Germany Muenchener Rueckversicherungs AG 6.250% 26/05/2042 EMTN 1,100,000 EUR 1,418,355 1,780,165 0.20
1,418,355 1,780,165 0.20 Great Britain Aviva PLC 6.625% 03/06/2041 EMTN 849,000 GBP 1,398,924 1,538,419 0.17 Direct Line Insurance Group PLC 9.250% 27/04/2042 1,360,000 GBP 2,175,269 2,762,804 0.31
3,574,193 4,301,223 0.48 Ireland Aquarius & Investments PLC for Zurich Insurance Co Ltd 4.250% 02/10/2043 EMTN 460,000 EUR 609,493 632,088 0.07
609,493 632,088 0.07 Netherlands Allianz Finance II BV 5.750% 08/07/2041 EMTN 3,200,000 EUR 4,537,462 4,944,790 0.55
4,537,462 4,944,790 0.55 Sweden Nordea Bank AB 4.625% 15/02/2022 EMTN 2,530,000 EUR 3,297,896 3,739,679 0.41
3,297,896 3,739,679 0.41
Total - Variable rate bonds 15,901,261 17,970,146 1.99
Total - Transferable securities admitted to an official stock exchange listing 591,519,566 609,177,726 67.43
Transferable securities dealt in on another regulated market Fixed rate bonds
Australia Asciano Finance Ltd 4.625% 23/09/2020 2,155,000 USD 2,122,049 2,157,232 0.24 Incitec Pivot Ltd 4.000% 07/12/2015 144A(3) 810,000 USD 807,500 842,293 0.09
(2) See Note 12.
(3) See Note 14.
388
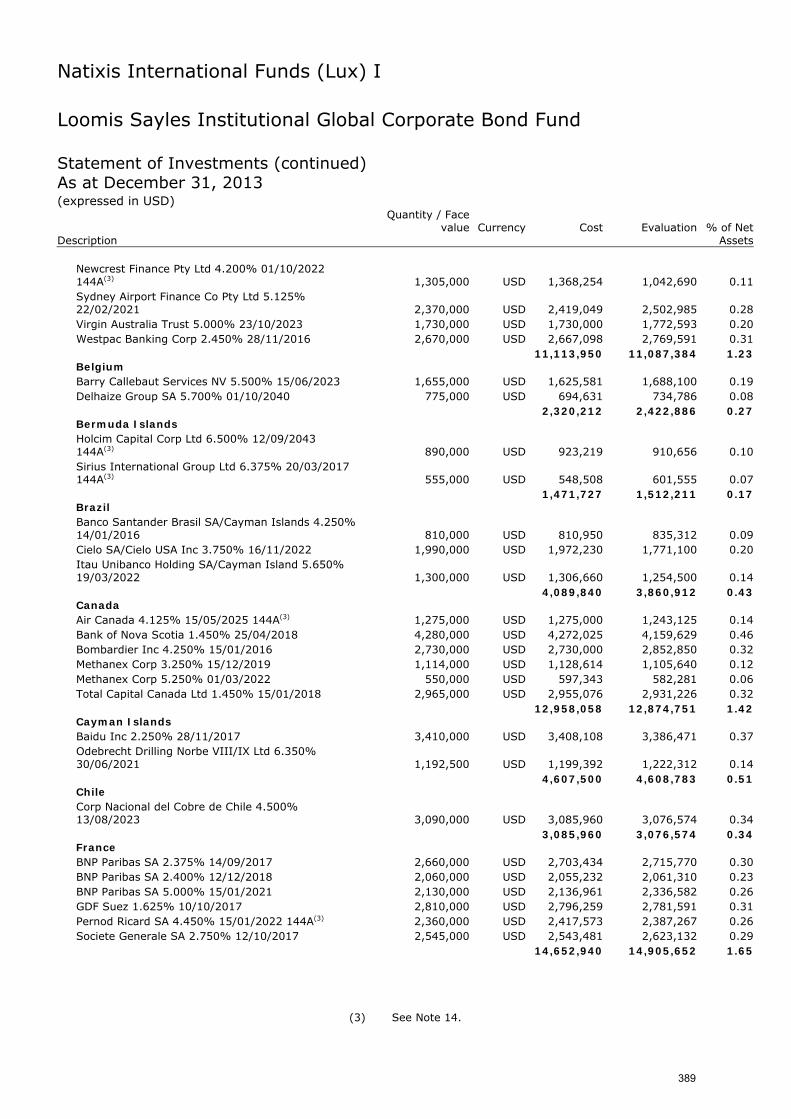
Natixis International Funds (Lux) I
Loomis Sayles Institutional Global Corporate Bond Fund Statement of Investments (continued) As at December 31, 2013 (expressed in USD)
Quantity / Face
value Currency Cost Evaluation % of Net Description Assets
Newcrest Finance Pty Ltd 4.200% 01/10/2022 144A(3) 1,305,000 USD 1,368,254 1,042,690 0.11 Sydney Airport Finance Co Pty Ltd 5.125% 22/02/2021 2,370,000 USD 2,419,049 2,502,985 0.28 Virgin Australia Trust 5.000% 23/10/2023 1,730,000 USD 1,730,000 1,772,593 0.20 Westpac Banking Corp 2.450% 28/11/2016 2,670,000 USD 2,667,098 2,769,591 0.31
11,113,950 11,087,384 1.23 Belgium Barry Callebaut Services NV 5.500% 15/06/2023 1,655,000 USD 1,625,581 1,688,100 0.19 Delhaize Group SA 5.700% 01/10/2040 775,000 USD 694,631 734,786 0.08
2,320,212 2,422,886 0.27 Bermuda Islands Holcim Capital Corp Ltd 6.500% 12/09/2043 144A(3) 890,000 USD 923,219 910,656 0.10 Sirius International Group Ltd 6.375% 20/03/2017 144A(3) 555,000 USD 548,508 601,555 0.07
1,471,727 1,512,211 0.17 Brazil Banco Santander Brasil SA/Cayman Islands 4.250% 14/01/2016 810,000 USD 810,950 835,312 0.09 Cielo SA/Cielo USA Inc 3.750% 16/11/2022 1,990,000 USD 1,972,230 1,771,100 0.20 Itau Unibanco Holding SA/Cayman Island 5.650% 19/03/2022 1,300,000 USD 1,306,660 1,254,500 0.14
4,089,840 3,860,912 0.43 Canada Air Canada 4.125% 15/05/2025 144A(3) 1,275,000 USD 1,275,000 1,243,125 0.14 Bank of Nova Scotia 1.450% 25/04/2018 4,280,000 USD 4,272,025 4,159,629 0.46 Bombardier Inc 4.250% 15/01/2016 2,730,000 USD 2,730,000 2,852,850 0.32 Methanex Corp 3.250% 15/12/2019 1,114,000 USD 1,128,614 1,105,640 0.12 Methanex Corp 5.250% 01/03/2022 550,000 USD 597,343 582,281 0.06 Total Capital Canada Ltd 1.450% 15/01/2018 2,965,000 USD 2,955,076 2,931,226 0.32
12,958,058 12,874,751 1.42 Cayman Islands Baidu Inc 2.250% 28/11/2017 3,410,000 USD 3,408,108 3,386,471 0.37 Odebrecht Drilling Norbe VIII/IX Ltd 6.350% 30/06/2021 1,192,500 USD 1,199,392 1,222,312 0.14
4,607,500 4,608,783 0.51 Chile Corp Nacional del Cobre de Chile 4.500% 13/08/2023 3,090,000 USD 3,085,960 3,076,574 0.34
3,085,960 3,076,574 0.34 France BNP Paribas SA 2.375% 14/09/2017 2,660,000 USD 2,703,434 2,715,770 0.30 BNP Paribas SA 2.400% 12/12/2018 2,060,000 USD 2,055,232 2,061,310 0.23 BNP Paribas SA 5.000% 15/01/2021 2,130,000 USD 2,136,961 2,336,582 0.26 GDF Suez 1.625% 10/10/2017 2,810,000 USD 2,796,259 2,781,591 0.31 Pernod Ricard SA 4.450% 15/01/2022 144A(3) 2,360,000 USD 2,417,573 2,387,267 0.26 Societe Generale SA 2.750% 12/10/2017 2,545,000 USD 2,543,481 2,623,132 0.29
14,652,940 14,905,652 1.65
(3) See Note 14.
389
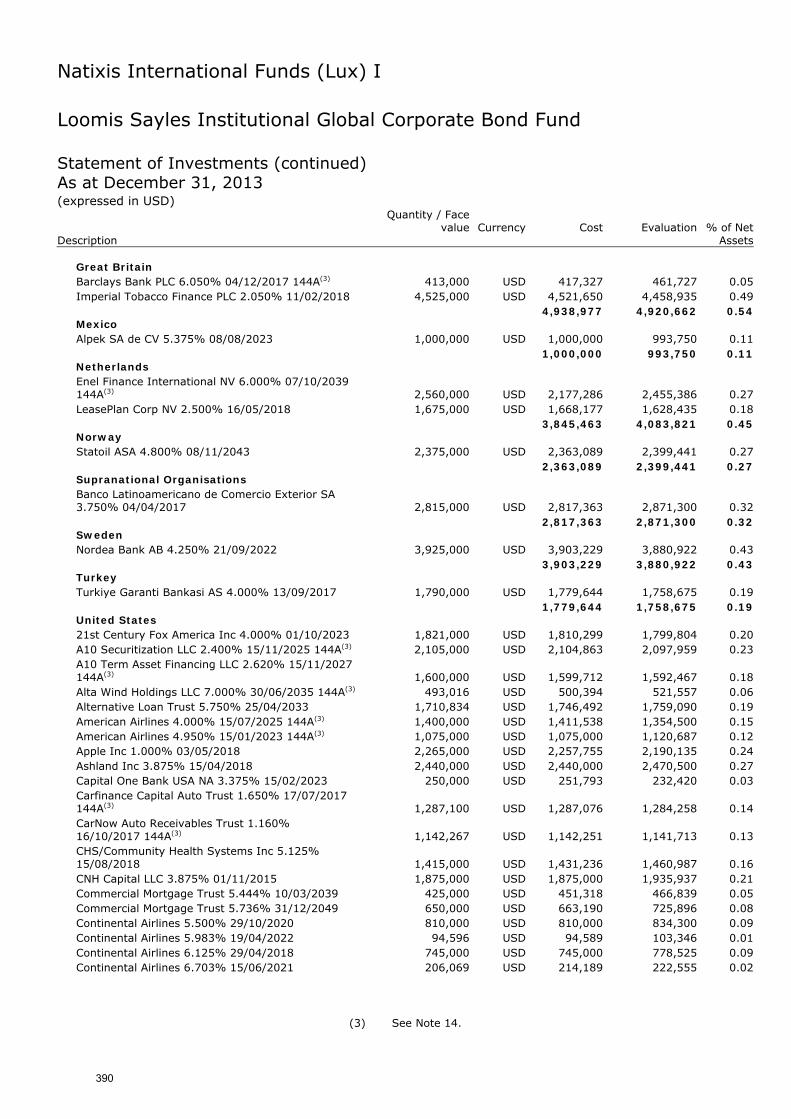
Natixis International Funds (Lux) I
Loomis Sayles Institutional Global Corporate Bond Fund Statement of Investments (continued) As at December 31, 2013 (expressed in USD)
Quantity / Face
value Currency Cost Evaluation % of Net Description Assets
Great Britain Barclays Bank PLC 6.050% 04/12/2017 144A(3) 413,000 USD 417,327 461,727 0.05 Imperial Tobacco Finance PLC 2.050% 11/02/2018 4,525,000 USD 4,521,650 4,458,935 0.49
4,938,977 4,920,662 0.54 Mexico Alpek SA de CV 5.375% 08/08/2023 1,000,000 USD 1,000,000 993,750 0.11
1,000,000 993,750 0.11 Netherlands Enel Finance International NV 6.000% 07/10/2039 144A(3) 2,560,000 USD 2,177,286 2,455,386 0.27 LeasePlan Corp NV 2.500% 16/05/2018 1,675,000 USD 1,668,177 1,628,435 0.18
3,845,463 4,083,821 0.45 Norway Statoil ASA 4.800% 08/11/2043 2,375,000 USD 2,363,089 2,399,441 0.27
2,363,089 2,399,441 0.27 Supranational Organisations Banco Latinoamericano de Comercio Exterior SA 3.750% 04/04/2017 2,815,000 USD 2,817,363 2,871,300 0.32
2,817,363 2,871,300 0.32 Sweden Nordea Bank AB 4.250% 21/09/2022 3,925,000 USD 3,903,229 3,880,922 0.43
3,903,229 3,880,922 0.43 Turkey Turkiye Garanti Bankasi AS 4.000% 13/09/2017 1,790,000 USD 1,779,644 1,758,675 0.19
1,779,644 1,758,675 0.19 United States 21st Century Fox America Inc 4.000% 01/10/2023 1,821,000 USD 1,810,299 1,799,804 0.20 A10 Securitization LLC 2.400% 15/11/2025 144A(3) 2,105,000 USD 2,104,863 2,097,959 0.23 A10 Term Asset Financing LLC 2.620% 15/11/2027 144A(3) 1,600,000 USD 1,599,712 1,592,467 0.18 Alta Wind Holdings LLC 7.000% 30/06/2035 144A(3) 493,016 USD 500,394 521,557 0.06 Alternative Loan Trust 5.750% 25/04/2033 1,710,834 USD 1,746,492 1,759,090 0.19 American Airlines 4.000% 15/07/2025 144A(3) 1,400,000 USD 1,411,538 1,354,500 0.15 American Airlines 4.950% 15/01/2023 144A(3) 1,075,000 USD 1,075,000 1,120,687 0.12 Apple Inc 1.000% 03/05/2018 2,265,000 USD 2,257,755 2,190,135 0.24 Ashland Inc 3.875% 15/04/2018 2,440,000 USD 2,440,000 2,470,500 0.27 Capital One Bank USA NA 3.375% 15/02/2023 250,000 USD 251,793 232,420 0.03 Carfinance Capital Auto Trust 1.650% 17/07/2017 144A(3) 1,287,100 USD 1,287,076 1,284,258 0.14 CarNow Auto Receivables Trust 1.160% 16/10/2017 144A(3) 1,142,267 USD 1,142,251 1,141,713 0.13 CHS/Community Health Systems Inc 5.125% 15/08/2018 1,415,000 USD 1,431,236 1,460,987 0.16 CNH Capital LLC 3.875% 01/11/2015 1,875,000 USD 1,875,000 1,935,937 0.21 Commercial Mortgage Trust 5.444% 10/03/2039 425,000 USD 451,318 466,839 0.05 Commercial Mortgage Trust 5.736% 31/12/2049 650,000 USD 663,190 725,896 0.08 Continental Airlines 5.500% 29/10/2020 810,000 USD 810,000 834,300 0.09 Continental Airlines 5.983% 19/04/2022 94,596 USD 94,589 103,346 0.01 Continental Airlines 6.125% 29/04/2018 745,000 USD 745,000 778,525 0.09 Continental Airlines 6.703% 15/06/2021 206,069 USD 214,189 222,555 0.02
(3) See Note 14.
390
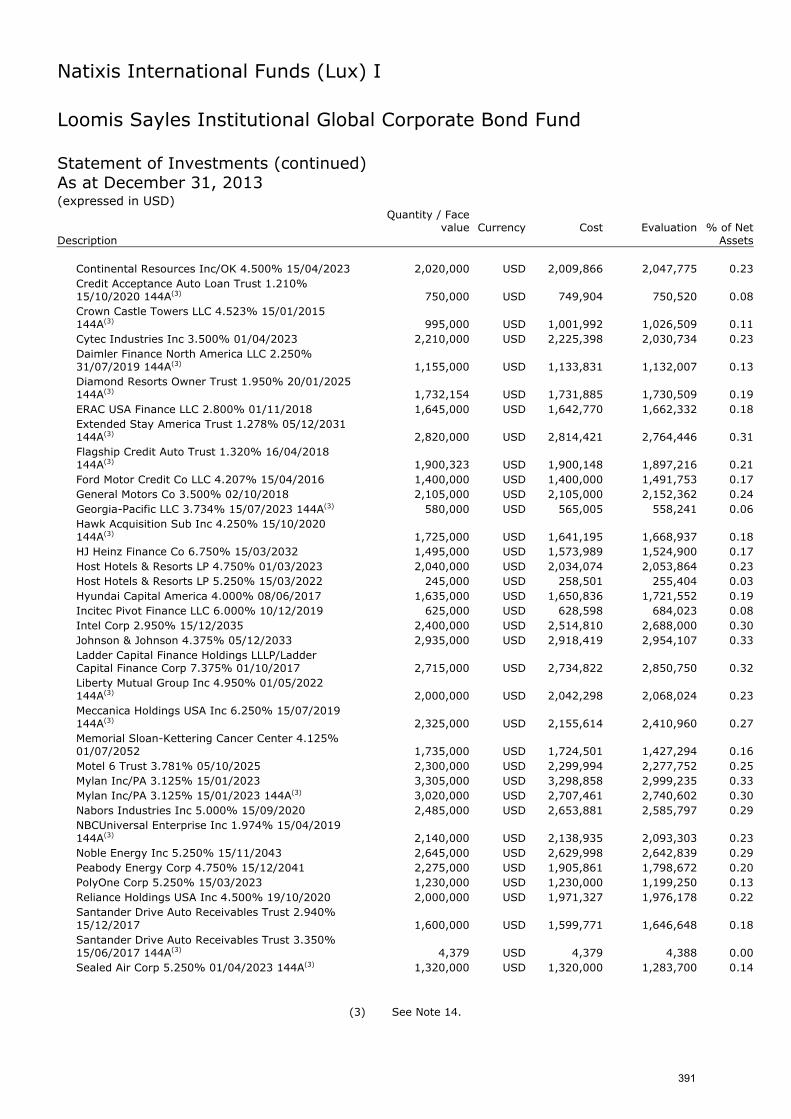
Natixis International Funds (Lux) I
Loomis Sayles Institutional Global Corporate Bond Fund Statement of Investments (continued) As at December 31, 2013 (expressed in USD)
Quantity / Face
value Currency Cost Evaluation % of Net Description Assets
Continental Resources Inc/OK 4.500% 15/04/2023 2,020,000 USD 2,009,866 2,047,775 0.23 Credit Acceptance Auto Loan Trust 1.210% 15/10/2020 144A(3) 750,000 USD 749,904 750,520 0.08 Crown Castle Towers LLC 4.523% 15/01/2015 144A(3) 995,000 USD 1,001,992 1,026,509 0.11 Cytec Industries Inc 3.500% 01/04/2023 2,210,000 USD 2,225,398 2,030,734 0.23 Daimler Finance North America LLC 2.250% 31/07/2019 144A(3) 1,155,000 USD 1,133,831 1,132,007 0.13 Diamond Resorts Owner Trust 1.950% 20/01/2025 144A(3) 1,732,154 USD 1,731,885 1,730,509 0.19 ERAC USA Finance LLC 2.800% 01/11/2018 1,645,000 USD 1,642,770 1,662,332 0.18 Extended Stay America Trust 1.278% 05/12/2031 144A(3) 2,820,000 USD 2,814,421 2,764,446 0.31 Flagship Credit Auto Trust 1.320% 16/04/2018 144A(3) 1,900,323 USD 1,900,148 1,897,216 0.21 Ford Motor Credit Co LLC 4.207% 15/04/2016 1,400,000 USD 1,400,000 1,491,753 0.17 General Motors Co 3.500% 02/10/2018 2,105,000 USD 2,105,000 2,152,362 0.24 Georgia-Pacific LLC 3.734% 15/07/2023 144A(3) 580,000 USD 565,005 558,241 0.06 Hawk Acquisition Sub Inc 4.250% 15/10/2020 144A(3) 1,725,000 USD 1,641,195 1,668,937 0.18 HJ Heinz Finance Co 6.750% 15/03/2032 1,495,000 USD 1,573,989 1,524,900 0.17 Host Hotels & Resorts LP 4.750% 01/03/2023 2,040,000 USD 2,034,074 2,053,864 0.23 Host Hotels & Resorts LP 5.250% 15/03/2022 245,000 USD 258,501 255,404 0.03 Hyundai Capital America 4.000% 08/06/2017 1,635,000 USD 1,650,836 1,721,552 0.19 Incitec Pivot Finance LLC 6.000% 10/12/2019 625,000 USD 628,598 684,023 0.08 Intel Corp 2.950% 15/12/2035 2,400,000 USD 2,514,810 2,688,000 0.30 Johnson & Johnson 4.375% 05/12/2033 2,935,000 USD 2,918,419 2,954,107 0.33 Ladder Capital Finance Holdings LLLP/Ladder Capital Finance Corp 7.375% 01/10/2017 2,715,000 USD 2,734,822 2,850,750 0.32 Liberty Mutual Group Inc 4.950% 01/05/2022 144A(3) 2,000,000 USD 2,042,298 2,068,024 0.23 Meccanica Holdings USA Inc 6.250% 15/07/2019 144A(3) 2,325,000 USD 2,155,614 2,410,960 0.27 Memorial Sloan-Kettering Cancer Center 4.125% 01/07/2052 1,735,000 USD 1,724,501 1,427,294 0.16 Motel 6 Trust 3.781% 05/10/2025 2,300,000 USD 2,299,994 2,277,752 0.25 Mylan Inc/PA 3.125% 15/01/2023 3,305,000 USD 3,298,858 2,999,235 0.33 Mylan Inc/PA 3.125% 15/01/2023 144A(3) 3,020,000 USD 2,707,461 2,740,602 0.30 Nabors Industries Inc 5.000% 15/09/2020 2,485,000 USD 2,653,881 2,585,797 0.29 NBCUniversal Enterprise Inc 1.974% 15/04/2019 144A(3) 2,140,000 USD 2,138,935 2,093,303 0.23 Noble Energy Inc 5.250% 15/11/2043 2,645,000 USD 2,629,998 2,642,839 0.29 Peabody Energy Corp 4.750% 15/12/2041 2,275,000 USD 1,905,861 1,798,672 0.20 PolyOne Corp 5.250% 15/03/2023 1,230,000 USD 1,230,000 1,199,250 0.13 Reliance Holdings USA Inc 4.500% 19/10/2020 2,000,000 USD 1,971,327 1,976,178 0.22 Santander Drive Auto Receivables Trust 2.940% 15/12/2017 1,600,000 USD 1,599,771 1,646,648 0.18 Santander Drive Auto Receivables Trust 3.350% 15/06/2017 144A(3) 4,379 USD 4,379 4,388 0.00 Sealed Air Corp 5.250% 01/04/2023 144A(3) 1,320,000 USD 1,320,000 1,283,700 0.14
(3) See Note 14.
391
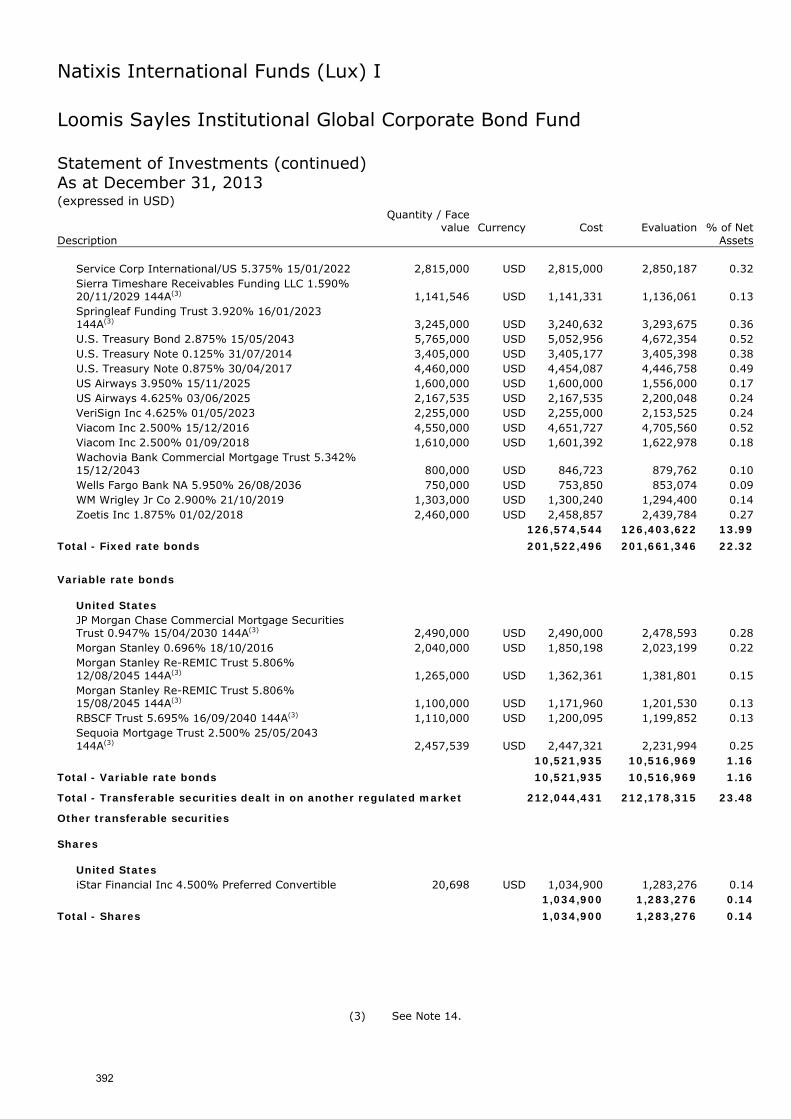
Natixis International Funds (Lux) I
Loomis Sayles Institutional Global Corporate Bond Fund Statement of Investments (continued) As at December 31, 2013 (expressed in USD)
Quantity / Face
value Currency Cost Evaluation % of Net Description Assets
Service Corp International/US 5.375% 15/01/2022 2,815,000 USD 2,815,000 2,850,187 0.32 Sierra Timeshare Receivables Funding LLC 1.590% 20/11/2029 144A(3) 1,141,546 USD 1,141,331 1,136,061 0.13 Springleaf Funding Trust 3.920% 16/01/2023 144A(3) 3,245,000 USD 3,240,632 3,293,675 0.36 U.S. Treasury Bond 2.875% 15/05/2043 5,765,000 USD 5,052,956 4,672,354 0.52 U.S. Treasury Note 0.125% 31/07/2014 3,405,000 USD 3,405,177 3,405,398 0.38 U.S. Treasury Note 0.875% 30/04/2017 4,460,000 USD 4,454,087 4,446,758 0.49 US Airways 3.950% 15/11/2025 1,600,000 USD 1,600,000 1,556,000 0.17 US Airways 4.625% 03/06/2025 2,167,535 USD 2,167,535 2,200,048 0.24 VeriSign Inc 4.625% 01/05/2023 2,255,000 USD 2,255,000 2,153,525 0.24 Viacom Inc 2.500% 15/12/2016 4,550,000 USD 4,651,727 4,705,560 0.52 Viacom Inc 2.500% 01/09/2018 1,610,000 USD 1,601,392 1,622,978 0.18 Wachovia Bank Commercial Mortgage Trust 5.342% 15/12/2043 800,000 USD 846,723 879,762 0.10 Wells Fargo Bank NA 5.950% 26/08/2036 750,000 USD 753,850 853,074 0.09 WM Wrigley Jr Co 2.900% 21/10/2019 1,303,000 USD 1,300,240 1,294,400 0.14 Zoetis Inc 1.875% 01/02/2018 2,460,000 USD 2,458,857 2,439,784 0.27
126,574,544 126,403,622 13.99
Total - Fixed rate bonds 201,522,496 201,661,346 22.32
Variable rate bonds
United States JP Morgan Chase Commercial Mortgage Securities Trust 0.947% 15/04/2030 144A(3) 2,490,000 USD 2,490,000 2,478,593 0.28 Morgan Stanley 0.696% 18/10/2016 2,040,000 USD 1,850,198 2,023,199 0.22 Morgan Stanley Re-REMIC Trust 5.806% 12/08/2045 144A(3) 1,265,000 USD 1,362,361 1,381,801 0.15 Morgan Stanley Re-REMIC Trust 5.806% 15/08/2045 144A(3) 1,100,000 USD 1,171,960 1,201,530 0.13 RBSCF Trust 5.695% 16/09/2040 144A(3) 1,110,000 USD 1,200,095 1,199,852 0.13 Sequoia Mortgage Trust 2.500% 25/05/2043 144A(3) 2,457,539 USD 2,447,321 2,231,994 0.25
10,521,935 10,516,969 1.16
Total - Variable rate bonds 10,521,935 10,516,969 1.16
Total - Transferable securities dealt in on another regulated market 212,044,431 212,178,315 23.48
Other transferable securities Shares
United States iStar Financial Inc 4.500% Preferred Convertible 20,698 USD 1,034,900 1,283,276 0.14
1,034,900 1,283,276 0.14
Total - Shares 1,034,900 1,283,276 0.14
(3) See Note 14.
392
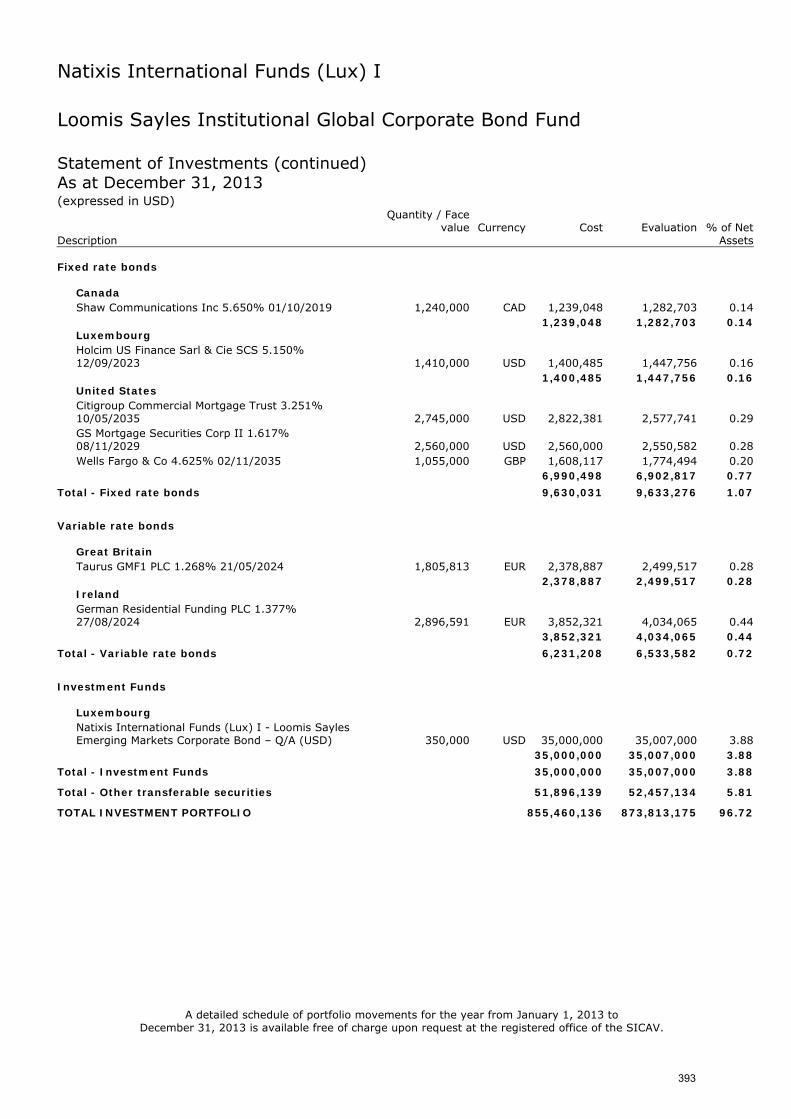
Natixis International Funds (Lux) I
Loomis Sayles Institutional Global Corporate Bond Fund Statement of Investments (continued) As at December 31, 2013 (expressed in USD)
Quantity / Face
value Currency Cost Evaluation % of Net Description Assets Fixed rate bonds
Canada Shaw Communications Inc 5.650% 01/10/2019 1,240,000 CAD 1,239,048 1,282,703 0.14
1,239,048 1,282,703 0.14 Luxembourg Holcim US Finance Sarl & Cie SCS 5.150% 12/09/2023 1,410,000 USD 1,400,485 1,447,756 0.16
1,400,485 1,447,756 0.16 United States Citigroup Commercial Mortgage Trust 3.251% 10/05/2035 2,745,000 USD 2,822,381 2,577,741 0.29 GS Mortgage Securities Corp II 1.617% 08/11/2029 2,560,000 USD 2,560,000 2,550,582 0.28 Wells Fargo & Co 4.625% 02/11/2035 1,055,000 GBP 1,608,117 1,774,494 0.20
6,990,498 6,902,817 0.77
Total - Fixed rate bonds 9,630,031 9,633,276 1.07
Variable rate bonds
Great Britain Taurus GMF1 PLC 1.268% 21/05/2024 1,805,813 EUR 2,378,887 2,499,517 0.28
2,378,887 2,499,517 0.28 Ireland German Residential Funding PLC 1.377% 27/08/2024 2,896,591 EUR 3,852,321 4,034,065 0.44
3,852,321 4,034,065 0.44
Total - Variable rate bonds 6,231,208 6,533,582 0.72
Investment Funds
Luxembourg Natixis International Funds (Lux) I - Loomis Sayles Emerging Markets Corporate Bond – Q/A (USD) 350,000 USD 35,000,000 35,007,000 3.88
35,000,000 35,007,000 3.88
Total - Investment Funds 35,000,000 35,007,000 3.88
Total - Other transferable securities 51,896,139 52,457,134 5.81
TOTAL INVESTMENT PORTFOLIO 855,460,136 873,813,175 96.72
A detailed schedule of portfolio movements for the year from January 1, 2013 to December 31, 2013 is available free of charge upon request at the registered office of the SICAV.
393
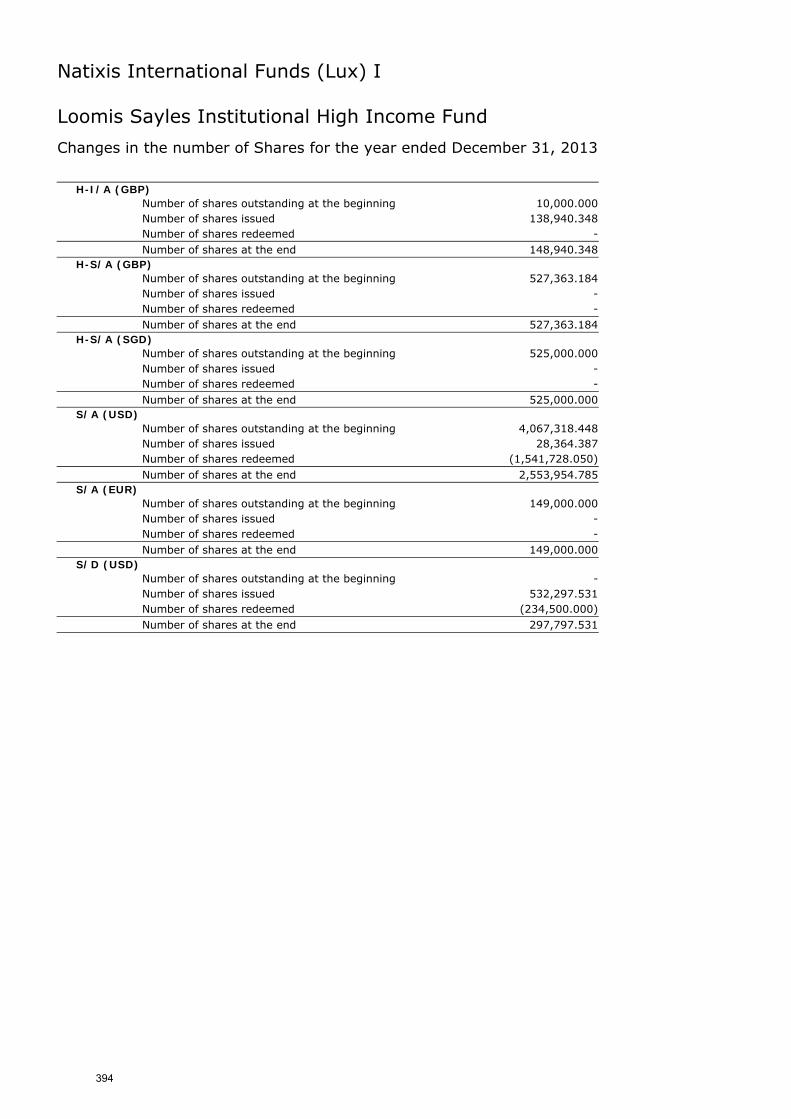
Natixis International Funds (Lux) I
Loomis Sayles Institutional High Income Fund
Changes in the number of Shares for the year ended December 31, 2013
H-I/A (GBP) Number of shares outstanding at the beginning 10,000.000
Number of shares issued 138,940.348
Number of shares redeemed - Number of shares at the end 148,940.348
H-S/A (GBP) Number of shares outstanding at the beginning 527,363.184
Number of shares issued - Number of shares redeemed - Number of shares at the end 527,363.184
H-S/A (SGD) Number of shares outstanding at the beginning 525,000.000
Number of shares issued - Number of shares redeemed - Number of shares at the end 525,000.000
S/A (USD) Number of shares outstanding at the beginning 4,067,318.448
Number of shares issued 28,364.387
Number of shares redeemed (1,541,728.050) Number of shares at the end 2,553,954.785
S/A (EUR) Number of shares outstanding at the beginning 149,000.000
Number of shares issued - Number of shares redeemed - Number of shares at the end 149,000.000
S/D (USD) Number of shares outstanding at the beginning - Number of shares issued 532,297.531
Number of shares redeemed (234,500.000) Number of shares at the end 297,797.531
394
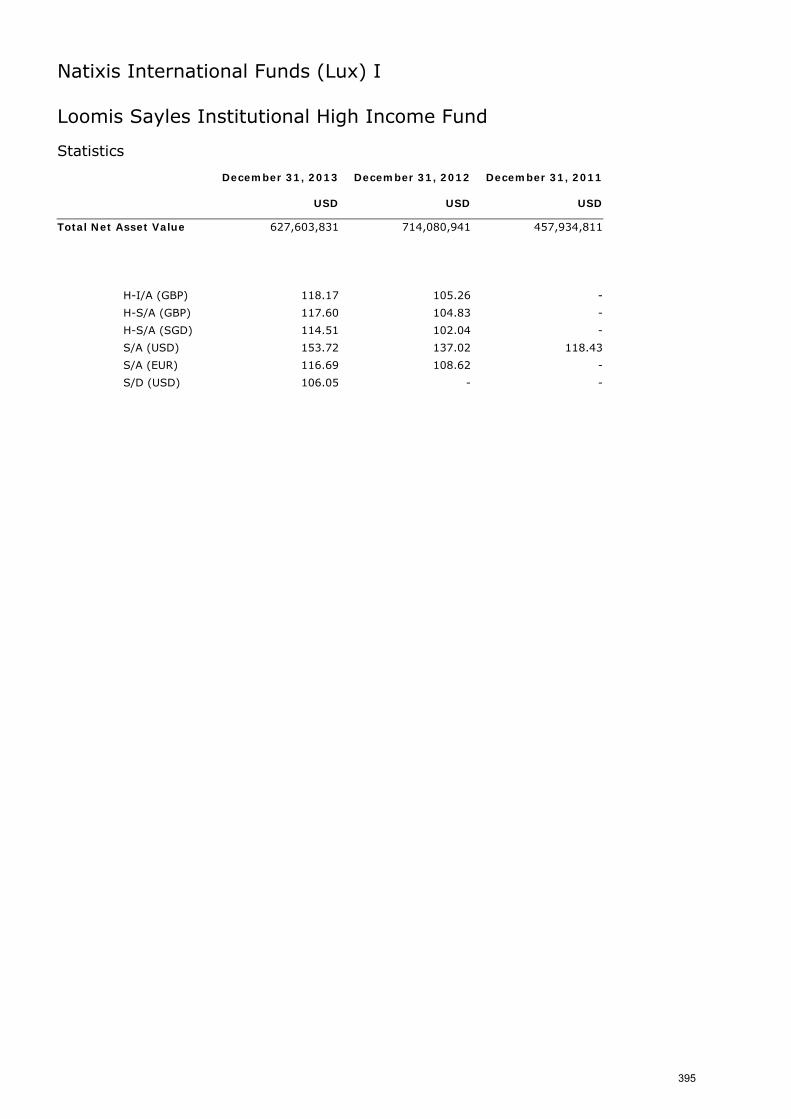
Natixis International Funds (Lux) I
Loomis Sayles Institutional High Income Fund Statistics December 31, 2013 December 31, 2012 December 31, 2011 USD USD USD
Total Net Asset Value 627,603,831 714,080,941 457,934,811
H-I/A (GBP) 118.17 105.26 -
H-S/A (GBP) 117.60 104.83 -
H-S/A (SGD) 114.51 102.04 -
S/A (USD) 153.72 137.02 118.43
S/A (EUR) 116.69 108.62 -
S/D (USD) 106.05 - -
395
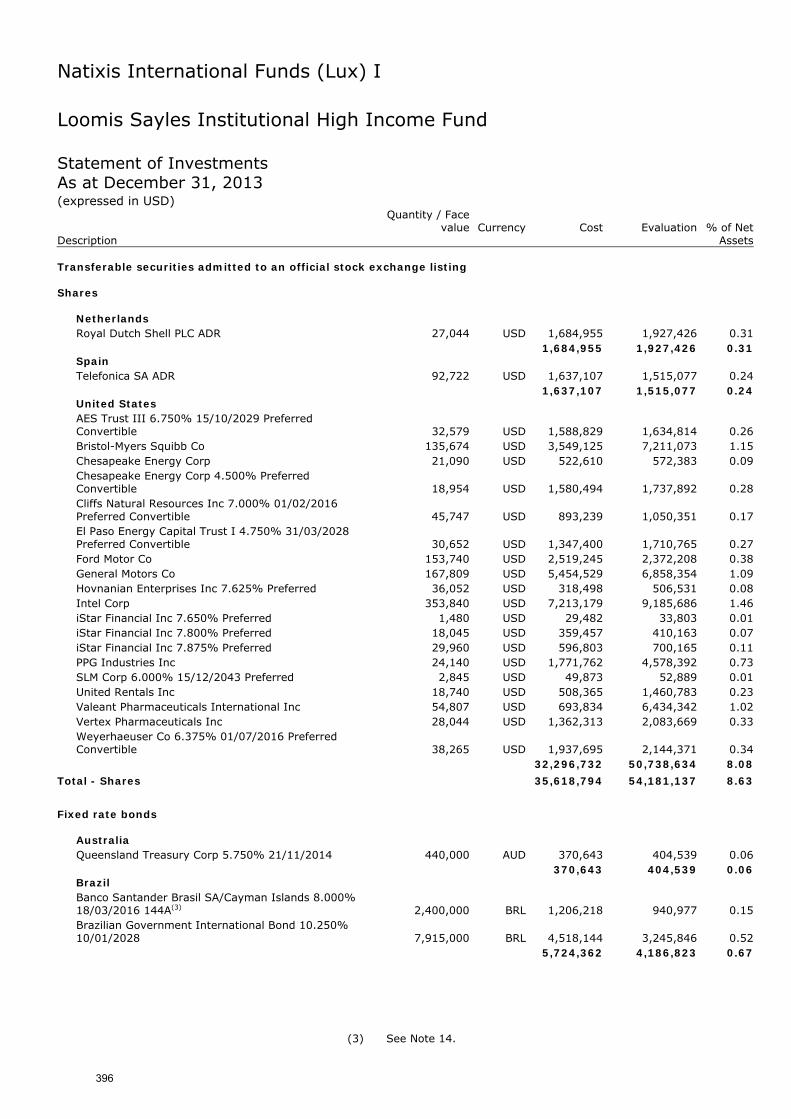
Natixis International Funds (Lux) I
Loomis Sayles Institutional High Income Fund Statement of Investments As at December 31, 2013 (expressed in USD)
Quantity / Face
value Currency Cost Evaluation % of Net Description Assets Transferable securities admitted to an official stock exchange listing Shares
Netherlands Royal Dutch Shell PLC ADR 27,044 USD 1,684,955 1,927,426 0.31
1,684,955 1,927,426 0.31 Spain Telefonica SA ADR 92,722 USD 1,637,107 1,515,077 0.24
1,637,107 1,515,077 0.24 United States AES Trust III 6.750% 15/10/2029 Preferred Convertible 32,579 USD 1,588,829 1,634,814 0.26 Bristol-Myers Squibb Co 135,674 USD 3,549,125 7,211,073 1.15 Chesapeake Energy Corp 21,090 USD 522,610 572,383 0.09 Chesapeake Energy Corp 4.500% Preferred Convertible 18,954 USD 1,580,494 1,737,892 0.28 Cliffs Natural Resources Inc 7.000% 01/02/2016 Preferred Convertible 45,747 USD 893,239 1,050,351 0.17 El Paso Energy Capital Trust I 4.750% 31/03/2028 Preferred Convertible 30,652 USD 1,347,400 1,710,765 0.27 Ford Motor Co 153,740 USD 2,519,245 2,372,208 0.38 General Motors Co 167,809 USD 5,454,529 6,858,354 1.09 Hovnanian Enterprises Inc 7.625% Preferred 36,052 USD 318,498 506,531 0.08 Intel Corp 353,840 USD 7,213,179 9,185,686 1.46 iStar Financial Inc 7.650% Preferred 1,480 USD 29,482 33,803 0.01 iStar Financial Inc 7.800% Preferred 18,045 USD 359,457 410,163 0.07 iStar Financial Inc 7.875% Preferred 29,960 USD 596,803 700,165 0.11 PPG Industries Inc 24,140 USD 1,771,762 4,578,392 0.73 SLM Corp 6.000% 15/12/2043 Preferred 2,845 USD 49,873 52,889 0.01 United Rentals Inc 18,740 USD 508,365 1,460,783 0.23 Valeant Pharmaceuticals International Inc 54,807 USD 693,834 6,434,342 1.02 Vertex Pharmaceuticals Inc 28,044 USD 1,362,313 2,083,669 0.33 Weyerhaeuser Co 6.375% 01/07/2016 Preferred Convertible 38,265 USD 1,937,695 2,144,371 0.34
32,296,732 50,738,634 8.08
Total - Shares 35,618,794 54,181,137 8.63
Fixed rate bonds
Australia Queensland Treasury Corp 5.750% 21/11/2014 440,000 AUD 370,643 404,539 0.06
370,643 404,539 0.06 Brazil Banco Santander Brasil SA/Cayman Islands 8.000% 18/03/2016 144A(3) 2,400,000 BRL 1,206,218 940,977 0.15 Brazilian Government International Bond 10.250% 10/01/2028 7,915,000 BRL 4,518,144 3,245,846 0.52
5,724,362 4,186,823 0.67
(3) See Note 14.
396
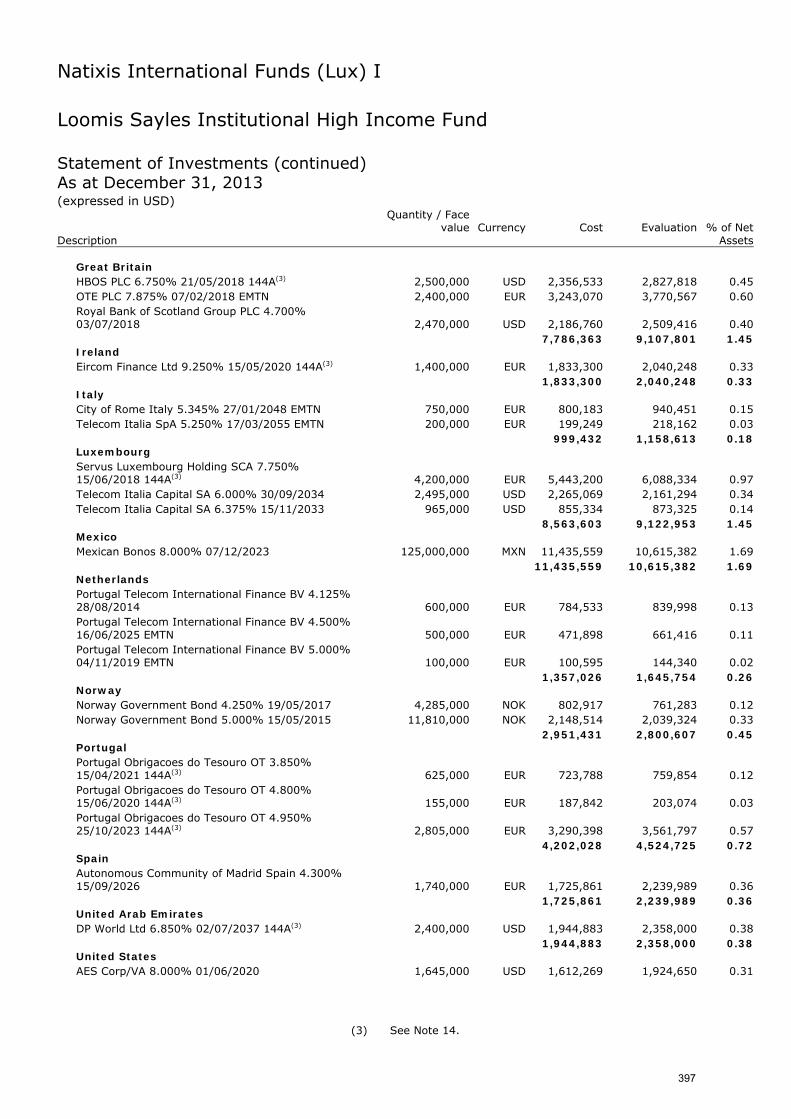
Natixis International Funds (Lux) I
Loomis Sayles Institutional High Income Fund Statement of Investments (continued) As at December 31, 2013 (expressed in USD)
Quantity / Face
value Currency Cost Evaluation % of Net Description Assets
Great Britain HBOS PLC 6.750% 21/05/2018 144A(3) 2,500,000 USD 2,356,533 2,827,818 0.45 OTE PLC 7.875% 07/02/2018 EMTN 2,400,000 EUR 3,243,070 3,770,567 0.60 Royal Bank of Scotland Group PLC 4.700% 03/07/2018 2,470,000 USD 2,186,760 2,509,416 0.40
7,786,363 9,107,801 1.45 Ireland Eircom Finance Ltd 9.250% 15/05/2020 144A(3) 1,400,000 EUR 1,833,300 2,040,248 0.33
1,833,300 2,040,248 0.33 Italy City of Rome Italy 5.345% 27/01/2048 EMTN 750,000 EUR 800,183 940,451 0.15 Telecom Italia SpA 5.250% 17/03/2055 EMTN 200,000 EUR 199,249 218,162 0.03
999,432 1,158,613 0.18 Luxembourg Servus Luxembourg Holding SCA 7.750% 15/06/2018 144A(3) 4,200,000 EUR 5,443,200 6,088,334 0.97 Telecom Italia Capital SA 6.000% 30/09/2034 2,495,000 USD 2,265,069 2,161,294 0.34 Telecom Italia Capital SA 6.375% 15/11/2033 965,000 USD 855,334 873,325 0.14
8,563,603 9,122,953 1.45 Mexico Mexican Bonos 8.000% 07/12/2023 125,000,000 MXN 11,435,559 10,615,382 1.69
11,435,559 10,615,382 1.69 Netherlands Portugal Telecom International Finance BV 4.125% 28/08/2014 600,000 EUR 784,533 839,998 0.13 Portugal Telecom International Finance BV 4.500% 16/06/2025 EMTN 500,000 EUR 471,898 661,416 0.11 Portugal Telecom International Finance BV 5.000% 04/11/2019 EMTN 100,000 EUR 100,595 144,340 0.02
1,357,026 1,645,754 0.26 Norway Norway Government Bond 4.250% 19/05/2017 4,285,000 NOK 802,917 761,283 0.12 Norway Government Bond 5.000% 15/05/2015 11,810,000 NOK 2,148,514 2,039,324 0.33
2,951,431 2,800,607 0.45 Portugal Portugal Obrigacoes do Tesouro OT 3.850% 15/04/2021 144A(3) 625,000 EUR 723,788 759,854 0.12 Portugal Obrigacoes do Tesouro OT 4.800% 15/06/2020 144A(3) 155,000 EUR 187,842 203,074 0.03 Portugal Obrigacoes do Tesouro OT 4.950% 25/10/2023 144A(3) 2,805,000 EUR 3,290,398 3,561,797 0.57
4,202,028 4,524,725 0.72 Spain Autonomous Community of Madrid Spain 4.300% 15/09/2026 1,740,000 EUR 1,725,861 2,239,989 0.36
1,725,861 2,239,989 0.36 United Arab Emirates DP World Ltd 6.850% 02/07/2037 144A(3) 2,400,000 USD 1,944,883 2,358,000 0.38
1,944,883 2,358,000 0.38 United States AES Corp/VA 8.000% 01/06/2020 1,645,000 USD 1,612,269 1,924,650 0.31
(3) See Note 14.
397
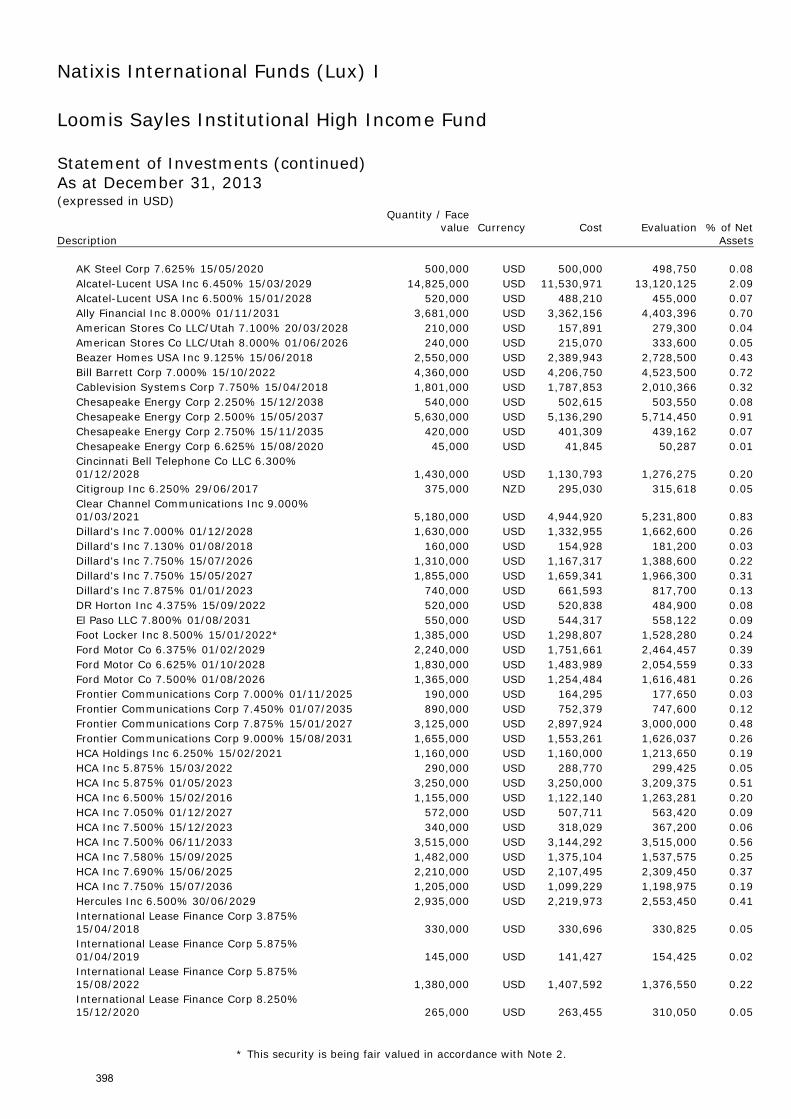
Natixis International Funds (Lux) I
Loomis Sayles Institutional High Income Fund Statement of Investments (continued) As at December 31, 2013 (expressed in USD)
Quantity / Face
value Currency Cost Evaluation % of Net Description Assets
AK Steel Corp 7.625% 15/05/2020 500,000 USD 500,000 498,750 0.08 Alcatel-Lucent USA Inc 6.450% 15/03/2029 14,825,000 USD 11,530,971 13,120,125 2.09 Alcatel-Lucent USA Inc 6.500% 15/01/2028 520,000 USD 488,210 455,000 0.07 Ally Financial Inc 8.000% 01/11/2031 3,681,000 USD 3,362,156 4,403,396 0.70 American Stores Co LLC/Utah 7.100% 20/03/2028 210,000 USD 157,891 279,300 0.04 American Stores Co LLC/Utah 8.000% 01/06/2026 240,000 USD 215,070 333,600 0.05 Beazer Homes USA Inc 9.125% 15/06/2018 2,550,000 USD 2,389,943 2,728,500 0.43 Bill Barrett Corp 7.000% 15/10/2022 4,360,000 USD 4,206,750 4,523,500 0.72 Cablevision Systems Corp 7.750% 15/04/2018 1,801,000 USD 1,787,853 2,010,366 0.32 Chesapeake Energy Corp 2.250% 15/12/2038 540,000 USD 502,615 503,550 0.08 Chesapeake Energy Corp 2.500% 15/05/2037 5,630,000 USD 5,136,290 5,714,450 0.91 Chesapeake Energy Corp 2.750% 15/11/2035 420,000 USD 401,309 439,162 0.07 Chesapeake Energy Corp 6.625% 15/08/2020 45,000 USD 41,845 50,287 0.01 Cincinnati Bell Telephone Co LLC 6.300% 01/12/2028 1,430,000 USD 1,130,793 1,276,275 0.20 Citigroup Inc 6.250% 29/06/2017 375,000 NZD 295,030 315,618 0.05 Clear Channel Communications Inc 9.000% 01/03/2021 5,180,000 USD 4,944,920 5,231,800 0.83 Dillard's Inc 7.000% 01/12/2028 1,630,000 USD 1,332,955 1,662,600 0.26 Dillard's Inc 7.130% 01/08/2018 160,000 USD 154,928 181,200 0.03 Dillard's Inc 7.750% 15/07/2026 1,310,000 USD 1,167,317 1,388,600 0.22 Dillard's Inc 7.750% 15/05/2027 1,855,000 USD 1,659,341 1,966,300 0.31 Dillard's Inc 7.875% 01/01/2023 740,000 USD 661,593 817,700 0.13 DR Horton Inc 4.375% 15/09/2022 520,000 USD 520,838 484,900 0.08 El Paso LLC 7.800% 01/08/2031 550,000 USD 544,317 558,122 0.09 Foot Locker Inc 8.500% 15/01/2022* 1,385,000 USD 1,298,807 1,528,280 0.24 Ford Motor Co 6.375% 01/02/2029 2,240,000 USD 1,751,661 2,464,457 0.39 Ford Motor Co 6.625% 01/10/2028 1,830,000 USD 1,483,989 2,054,559 0.33 Ford Motor Co 7.500% 01/08/2026 1,365,000 USD 1,254,484 1,616,481 0.26 Frontier Communications Corp 7.000% 01/11/2025 190,000 USD 164,295 177,650 0.03 Frontier Communications Corp 7.450% 01/07/2035 890,000 USD 752,379 747,600 0.12 Frontier Communications Corp 7.875% 15/01/2027 3,125,000 USD 2,897,924 3,000,000 0.48 Frontier Communications Corp 9.000% 15/08/2031 1,655,000 USD 1,553,261 1,626,037 0.26 HCA Holdings Inc 6.250% 15/02/2021 1,160,000 USD 1,160,000 1,213,650 0.19 HCA Inc 5.875% 15/03/2022 290,000 USD 288,770 299,425 0.05 HCA Inc 5.875% 01/05/2023 3,250,000 USD 3,250,000 3,209,375 0.51 HCA Inc 6.500% 15/02/2016 1,155,000 USD 1,122,140 1,263,281 0.20 HCA Inc 7.050% 01/12/2027 572,000 USD 507,711 563,420 0.09 HCA Inc 7.500% 15/12/2023 340,000 USD 318,029 367,200 0.06 HCA Inc 7.500% 06/11/2033 3,515,000 USD 3,144,292 3,515,000 0.56 HCA Inc 7.580% 15/09/2025 1,482,000 USD 1,375,104 1,537,575 0.25 HCA Inc 7.690% 15/06/2025 2,210,000 USD 2,107,495 2,309,450 0.37 HCA Inc 7.750% 15/07/2036 1,205,000 USD 1,099,229 1,198,975 0.19 Hercules Inc 6.500% 30/06/2029 2,935,000 USD 2,219,973 2,553,450 0.41 International Lease Finance Corp 3.875% 15/04/2018 330,000 USD 330,696 330,825 0.05 International Lease Finance Corp 5.875% 01/04/2019 145,000 USD 141,427 154,425 0.02 International Lease Finance Corp 5.875% 15/08/2022 1,380,000 USD 1,407,592 1,376,550 0.22 International Lease Finance Corp 8.250% 15/12/2020 265,000 USD 263,455 310,050 0.05
* This security is being fair valued in accordance with Note 2.
398
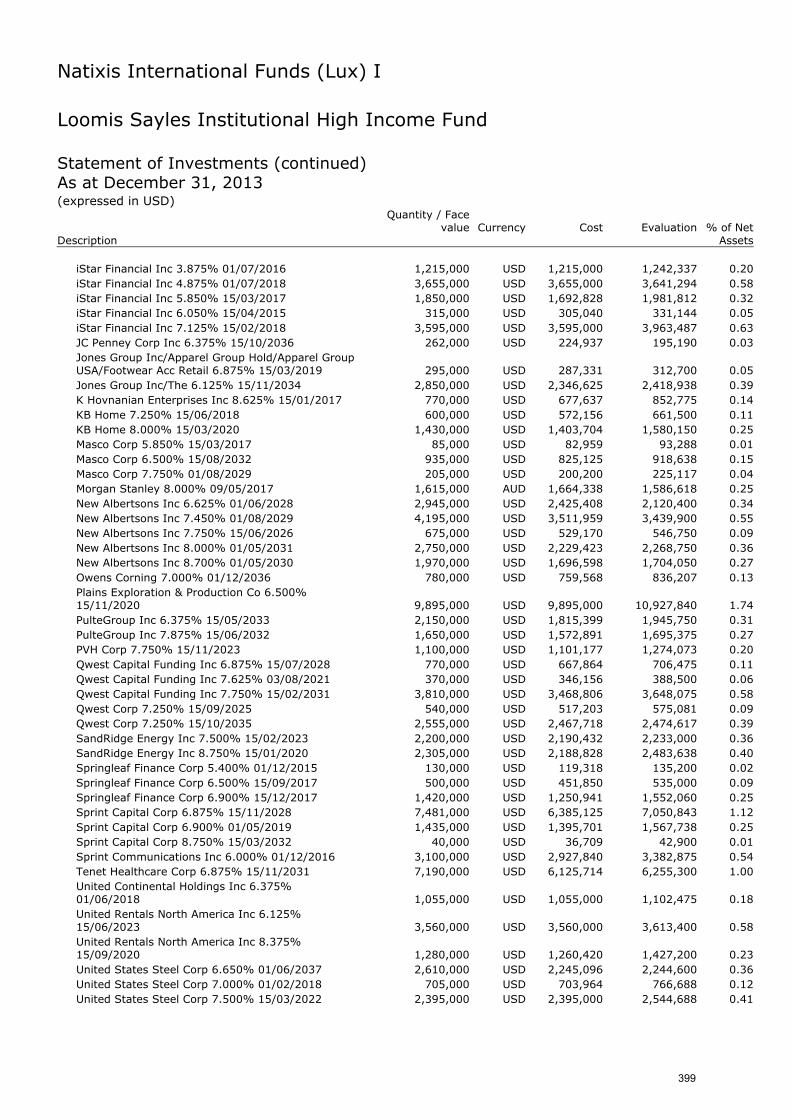
Natixis International Funds (Lux) I
Loomis Sayles Institutional High Income Fund Statement of Investments (continued) As at December 31, 2013 (expressed in USD)
Quantity / Face
value Currency Cost Evaluation % of Net Description Assets
iStar Financial Inc 3.875% 01/07/2016 1,215,000 USD 1,215,000 1,242,337 0.20 iStar Financial Inc 4.875% 01/07/2018 3,655,000 USD 3,655,000 3,641,294 0.58 iStar Financial Inc 5.850% 15/03/2017 1,850,000 USD 1,692,828 1,981,812 0.32 iStar Financial Inc 6.050% 15/04/2015 315,000 USD 305,040 331,144 0.05 iStar Financial Inc 7.125% 15/02/2018 3,595,000 USD 3,595,000 3,963,487 0.63 JC Penney Corp Inc 6.375% 15/10/2036 262,000 USD 224,937 195,190 0.03 Jones Group Inc/Apparel Group Hold/Apparel Group USA/Footwear Acc Retail 6.875% 15/03/2019 295,000 USD 287,331 312,700 0.05 Jones Group Inc/The 6.125% 15/11/2034 2,850,000 USD 2,346,625 2,418,938 0.39 K Hovnanian Enterprises Inc 8.625% 15/01/2017 770,000 USD 677,637 852,775 0.14 KB Home 7.250% 15/06/2018 600,000 USD 572,156 661,500 0.11 KB Home 8.000% 15/03/2020 1,430,000 USD 1,403,704 1,580,150 0.25 Masco Corp 5.850% 15/03/2017 85,000 USD 82,959 93,288 0.01 Masco Corp 6.500% 15/08/2032 935,000 USD 825,125 918,638 0.15 Masco Corp 7.750% 01/08/2029 205,000 USD 200,200 225,117 0.04 Morgan Stanley 8.000% 09/05/2017 1,615,000 AUD 1,664,338 1,586,618 0.25 New Albertsons Inc 6.625% 01/06/2028 2,945,000 USD 2,425,408 2,120,400 0.34 New Albertsons Inc 7.450% 01/08/2029 4,195,000 USD 3,511,959 3,439,900 0.55 New Albertsons Inc 7.750% 15/06/2026 675,000 USD 529,170 546,750 0.09 New Albertsons Inc 8.000% 01/05/2031 2,750,000 USD 2,229,423 2,268,750 0.36 New Albertsons Inc 8.700% 01/05/2030 1,970,000 USD 1,696,598 1,704,050 0.27 Owens Corning 7.000% 01/12/2036 780,000 USD 759,568 836,207 0.13 Plains Exploration & Production Co 6.500% 15/11/2020 9,895,000 USD 9,895,000 10,927,840 1.74 PulteGroup Inc 6.375% 15/05/2033 2,150,000 USD 1,815,399 1,945,750 0.31 PulteGroup Inc 7.875% 15/06/2032 1,650,000 USD 1,572,891 1,695,375 0.27 PVH Corp 7.750% 15/11/2023 1,100,000 USD 1,101,177 1,274,073 0.20 Qwest Capital Funding Inc 6.875% 15/07/2028 770,000 USD 667,864 706,475 0.11 Qwest Capital Funding Inc 7.625% 03/08/2021 370,000 USD 346,156 388,500 0.06 Qwest Capital Funding Inc 7.750% 15/02/2031 3,810,000 USD 3,468,806 3,648,075 0.58 Qwest Corp 7.250% 15/09/2025 540,000 USD 517,203 575,081 0.09 Qwest Corp 7.250% 15/10/2035 2,555,000 USD 2,467,718 2,474,617 0.39 SandRidge Energy Inc 7.500% 15/02/2023 2,200,000 USD 2,190,432 2,233,000 0.36 SandRidge Energy Inc 8.750% 15/01/2020 2,305,000 USD 2,188,828 2,483,638 0.40 Springleaf Finance Corp 5.400% 01/12/2015 130,000 USD 119,318 135,200 0.02 Springleaf Finance Corp 6.500% 15/09/2017 500,000 USD 451,850 535,000 0.09 Springleaf Finance Corp 6.900% 15/12/2017 1,420,000 USD 1,250,941 1,552,060 0.25 Sprint Capital Corp 6.875% 15/11/2028 7,481,000 USD 6,385,125 7,050,843 1.12 Sprint Capital Corp 6.900% 01/05/2019 1,435,000 USD 1,395,701 1,567,738 0.25 Sprint Capital Corp 8.750% 15/03/2032 40,000 USD 36,709 42,900 0.01 Sprint Communications Inc 6.000% 01/12/2016 3,100,000 USD 2,927,840 3,382,875 0.54 Tenet Healthcare Corp 6.875% 15/11/2031 7,190,000 USD 6,125,714 6,255,300 1.00 United Continental Holdings Inc 6.375% 01/06/2018 1,055,000 USD 1,055,000 1,102,475 0.18 United Rentals North America Inc 6.125% 15/06/2023 3,560,000 USD 3,560,000 3,613,400 0.58 United Rentals North America Inc 8.375% 15/09/2020 1,280,000 USD 1,260,420 1,427,200 0.23 United States Steel Corp 6.650% 01/06/2037 2,610,000 USD 2,245,096 2,244,600 0.36 United States Steel Corp 7.000% 01/02/2018 705,000 USD 703,964 766,688 0.12 United States Steel Corp 7.500% 15/03/2022 2,395,000 USD 2,395,000 2,544,688 0.41
399
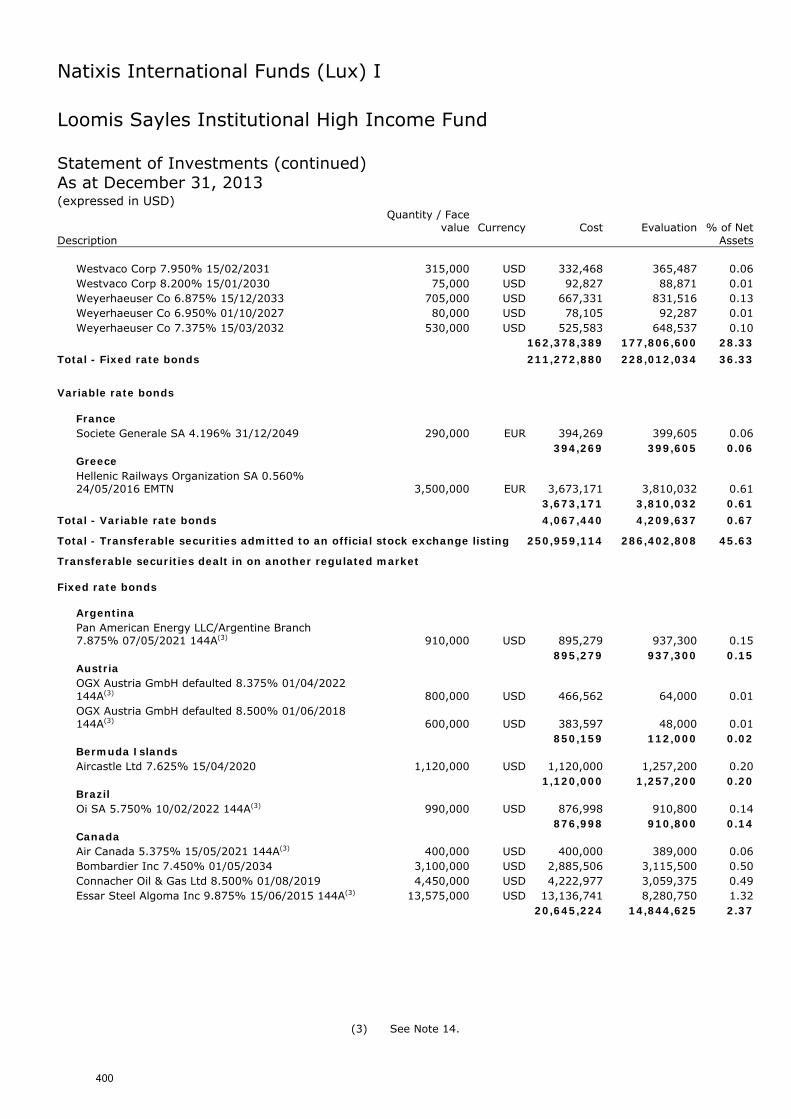
Natixis International Funds (Lux) I
Loomis Sayles Institutional High Income Fund Statement of Investments (continued) As at December 31, 2013 (expressed in USD)
Quantity / Face
value Currency Cost Evaluation % of Net Description Assets
Westvaco Corp 7.950% 15/02/2031 315,000 USD 332,468 365,487 0.06 Westvaco Corp 8.200% 15/01/2030 75,000 USD 92,827 88,871 0.01 Weyerhaeuser Co 6.875% 15/12/2033 705,000 USD 667,331 831,516 0.13 Weyerhaeuser Co 6.950% 01/10/2027 80,000 USD 78,105 92,287 0.01 Weyerhaeuser Co 7.375% 15/03/2032 530,000 USD 525,583 648,537 0.10
162,378,389 177,806,600 28.33
Total - Fixed rate bonds 211,272,880 228,012,034 36.33
Variable rate bonds
France Societe Generale SA 4.196% 31/12/2049 290,000 EUR 394,269 399,605 0.06
394,269 399,605 0.06 Greece Hellenic Railways Organization SA 0.560% 24/05/2016 EMTN 3,500,000 EUR 3,673,171 3,810,032 0.61
3,673,171 3,810,032 0.61
Total - Variable rate bonds 4,067,440 4,209,637 0.67
Total - Transferable securities admitted to an official stock exchange listing 250,959,114 286,402,808 45.63
Transferable securities dealt in on another regulated market Fixed rate bonds
Argentina Pan American Energy LLC/Argentine Branch 7.875% 07/05/2021 144A(3) 910,000 USD 895,279 937,300 0.15
895,279 937,300 0.15 Austria OGX Austria GmbH defaulted 8.375% 01/04/2022 144A(3) 800,000 USD 466,562 64,000 0.01 OGX Austria GmbH defaulted 8.500% 01/06/2018 144A(3) 600,000 USD 383,597 48,000 0.01
850,159 112,000 0.02 Bermuda Islands Aircastle Ltd 7.625% 15/04/2020 1,120,000 USD 1,120,000 1,257,200 0.20
1,120,000 1,257,200 0.20 Brazil Oi SA 5.750% 10/02/2022 144A(3) 990,000 USD 876,998 910,800 0.14
876,998 910,800 0.14 Canada Air Canada 5.375% 15/05/2021 144A(3) 400,000 USD 400,000 389,000 0.06 Bombardier Inc 7.450% 01/05/2034 3,100,000 USD 2,885,506 3,115,500 0.50 Connacher Oil & Gas Ltd 8.500% 01/08/2019 4,450,000 USD 4,222,977 3,059,375 0.49 Essar Steel Algoma Inc 9.875% 15/06/2015 144A(3) 13,575,000 USD 13,136,741 8,280,750 1.32
20,645,224 14,844,625 2.37
(3) See Note 14.
400
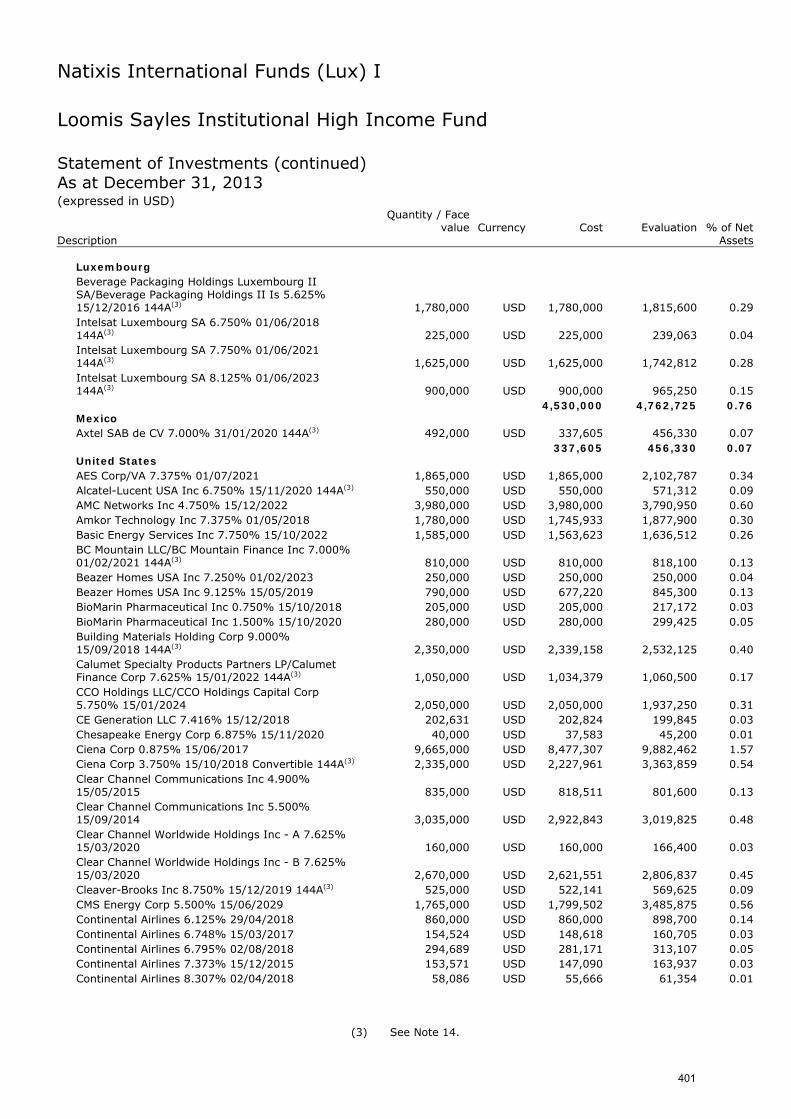
Natixis International Funds (Lux) I
Loomis Sayles Institutional High Income Fund Statement of Investments (continued) As at December 31, 2013 (expressed in USD)
Quantity / Face
value Currency Cost Evaluation % of Net Description Assets
Luxembourg Beverage Packaging Holdings Luxembourg II SA/Beverage Packaging Holdings II Is 5.625% 15/12/2016 144A(3) 1,780,000 USD 1,780,000 1,815,600 0.29 Intelsat Luxembourg SA 6.750% 01/06/2018 144A(3) 225,000 USD 225,000 239,063 0.04 Intelsat Luxembourg SA 7.750% 01/06/2021 144A(3) 1,625,000 USD 1,625,000 1,742,812 0.28 Intelsat Luxembourg SA 8.125% 01/06/2023 144A(3) 900,000 USD 900,000 965,250 0.15
4,530,000 4,762,725 0.76 Mexico Axtel SAB de CV 7.000% 31/01/2020 144A(3) 492,000 USD 337,605 456,330 0.07
337,605 456,330 0.07 United States AES Corp/VA 7.375% 01/07/2021 1,865,000 USD 1,865,000 2,102,787 0.34 Alcatel-Lucent USA Inc 6.750% 15/11/2020 144A(3) 550,000 USD 550,000 571,312 0.09 AMC Networks Inc 4.750% 15/12/2022 3,980,000 USD 3,980,000 3,790,950 0.60 Amkor Technology Inc 7.375% 01/05/2018 1,780,000 USD 1,745,933 1,877,900 0.30 Basic Energy Services Inc 7.750% 15/10/2022 1,585,000 USD 1,563,623 1,636,512 0.26 BC Mountain LLC/BC Mountain Finance Inc 7.000% 01/02/2021 144A(3) 810,000 USD 810,000 818,100 0.13 Beazer Homes USA Inc 7.250% 01/02/2023 250,000 USD 250,000 250,000 0.04 Beazer Homes USA Inc 9.125% 15/05/2019 790,000 USD 677,220 845,300 0.13 BioMarin Pharmaceutical Inc 0.750% 15/10/2018 205,000 USD 205,000 217,172 0.03 BioMarin Pharmaceutical Inc 1.500% 15/10/2020 280,000 USD 280,000 299,425 0.05 Building Materials Holding Corp 9.000% 15/09/2018 144A(3) 2,350,000 USD 2,339,158 2,532,125 0.40 Calumet Specialty Products Partners LP/Calumet Finance Corp 7.625% 15/01/2022 144A(3) 1,050,000 USD 1,034,379 1,060,500 0.17 CCO Holdings LLC/CCO Holdings Capital Corp 5.750% 15/01/2024 2,050,000 USD 2,050,000 1,937,250 0.31 CE Generation LLC 7.416% 15/12/2018 202,631 USD 202,824 199,845 0.03 Chesapeake Energy Corp 6.875% 15/11/2020 40,000 USD 37,583 45,200 0.01 Ciena Corp 0.875% 15/06/2017 9,665,000 USD 8,477,307 9,882,462 1.57 Ciena Corp 3.750% 15/10/2018 Convertible 144A(3) 2,335,000 USD 2,227,961 3,363,859 0.54 Clear Channel Communications Inc 4.900% 15/05/2015 835,000 USD 818,511 801,600 0.13 Clear Channel Communications Inc 5.500% 15/09/2014 3,035,000 USD 2,922,843 3,019,825 0.48 Clear Channel Worldwide Holdings Inc - A 7.625% 15/03/2020 160,000 USD 160,000 166,400 0.03 Clear Channel Worldwide Holdings Inc - B 7.625% 15/03/2020 2,670,000 USD 2,621,551 2,806,837 0.45 Cleaver-Brooks Inc 8.750% 15/12/2019 144A(3) 525,000 USD 522,141 569,625 0.09 CMS Energy Corp 5.500% 15/06/2029 1,765,000 USD 1,799,502 3,485,875 0.56 Continental Airlines 6.125% 29/04/2018 860,000 USD 860,000 898,700 0.14 Continental Airlines 6.748% 15/03/2017 154,524 USD 148,618 160,705 0.03 Continental Airlines 6.795% 02/08/2018 294,689 USD 281,171 313,107 0.05 Continental Airlines 7.373% 15/12/2015 153,571 USD 147,090 163,937 0.03 Continental Airlines 8.307% 02/04/2018 58,086 USD 55,666 61,354 0.01
(3) See Note 14.
401
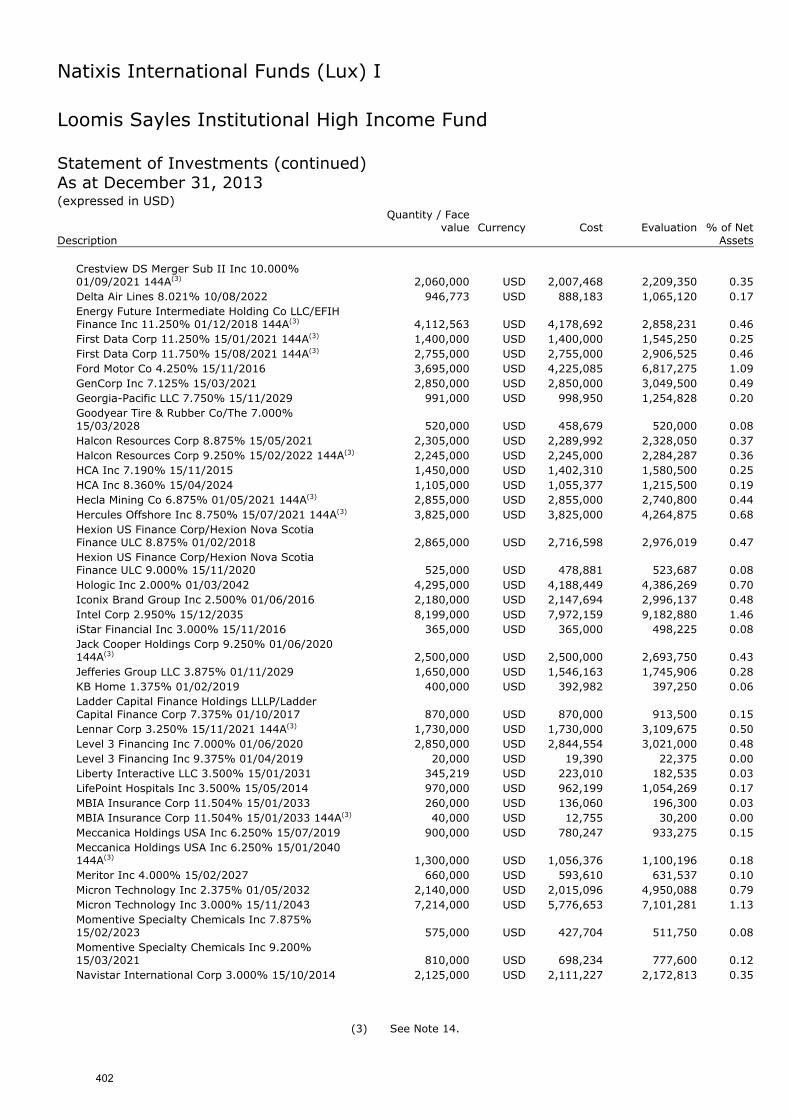
Natixis International Funds (Lux) I
Loomis Sayles Institutional High Income Fund Statement of Investments (continued) As at December 31, 2013 (expressed in USD)
Quantity / Face
value Currency Cost Evaluation % of Net Description Assets
Crestview DS Merger Sub II Inc 10.000% 01/09/2021 144A(3) 2,060,000 USD 2,007,468 2,209,350 0.35 Delta Air Lines 8.021% 10/08/2022 946,773 USD 888,183 1,065,120 0.17 Energy Future Intermediate Holding Co LLC/EFIH Finance Inc 11.250% 01/12/2018 144A(3) 4,112,563 USD 4,178,692 2,858,231 0.46 First Data Corp 11.250% 15/01/2021 144A(3) 1,400,000 USD 1,400,000 1,545,250 0.25 First Data Corp 11.750% 15/08/2021 144A(3) 2,755,000 USD 2,755,000 2,906,525 0.46 Ford Motor Co 4.250% 15/11/2016 3,695,000 USD 4,225,085 6,817,275 1.09 GenCorp Inc 7.125% 15/03/2021 2,850,000 USD 2,850,000 3,049,500 0.49 Georgia-Pacific LLC 7.750% 15/11/2029 991,000 USD 998,950 1,254,828 0.20 Goodyear Tire & Rubber Co/The 7.000% 15/03/2028 520,000 USD 458,679 520,000 0.08 Halcon Resources Corp 8.875% 15/05/2021 2,305,000 USD 2,289,992 2,328,050 0.37 Halcon Resources Corp 9.250% 15/02/2022 144A(3) 2,245,000 USD 2,245,000 2,284,287 0.36 HCA Inc 7.190% 15/11/2015 1,450,000 USD 1,402,310 1,580,500 0.25 HCA Inc 8.360% 15/04/2024 1,105,000 USD 1,055,377 1,215,500 0.19 Hecla Mining Co 6.875% 01/05/2021 144A(3) 2,855,000 USD 2,855,000 2,740,800 0.44 Hercules Offshore Inc 8.750% 15/07/2021 144A(3) 3,825,000 USD 3,825,000 4,264,875 0.68 Hexion US Finance Corp/Hexion Nova Scotia Finance ULC 8.875% 01/02/2018 2,865,000 USD 2,716,598 2,976,019 0.47 Hexion US Finance Corp/Hexion Nova Scotia Finance ULC 9.000% 15/11/2020 525,000 USD 478,881 523,687 0.08 Hologic Inc 2.000% 01/03/2042 4,295,000 USD 4,188,449 4,386,269 0.70 Iconix Brand Group Inc 2.500% 01/06/2016 2,180,000 USD 2,147,694 2,996,137 0.48 Intel Corp 2.950% 15/12/2035 8,199,000 USD 7,972,159 9,182,880 1.46 iStar Financial Inc 3.000% 15/11/2016 365,000 USD 365,000 498,225 0.08 Jack Cooper Holdings Corp 9.250% 01/06/2020 144A(3) 2,500,000 USD 2,500,000 2,693,750 0.43 Jefferies Group LLC 3.875% 01/11/2029 1,650,000 USD 1,546,163 1,745,906 0.28 KB Home 1.375% 01/02/2019 400,000 USD 392,982 397,250 0.06 Ladder Capital Finance Holdings LLLP/Ladder Capital Finance Corp 7.375% 01/10/2017 870,000 USD 870,000 913,500 0.15 Lennar Corp 3.250% 15/11/2021 144A(3) 1,730,000 USD 1,730,000 3,109,675 0.50 Level 3 Financing Inc 7.000% 01/06/2020 2,850,000 USD 2,844,554 3,021,000 0.48 Level 3 Financing Inc 9.375% 01/04/2019 20,000 USD 19,390 22,375 0.00 Liberty Interactive LLC 3.500% 15/01/2031 345,219 USD 223,010 182,535 0.03 LifePoint Hospitals Inc 3.500% 15/05/2014 970,000 USD 962,199 1,054,269 0.17 MBIA Insurance Corp 11.504% 15/01/2033 260,000 USD 136,060 196,300 0.03 MBIA Insurance Corp 11.504% 15/01/2033 144A(3) 40,000 USD 12,755 30,200 0.00 Meccanica Holdings USA Inc 6.250% 15/07/2019 900,000 USD 780,247 933,275 0.15 Meccanica Holdings USA Inc 6.250% 15/01/2040 144A(3) 1,300,000 USD 1,056,376 1,100,196 0.18 Meritor Inc 4.000% 15/02/2027 660,000 USD 593,610 631,537 0.10 Micron Technology Inc 2.375% 01/05/2032 2,140,000 USD 2,015,096 4,950,088 0.79 Micron Technology Inc 3.000% 15/11/2043 7,214,000 USD 5,776,653 7,101,281 1.13 Momentive Specialty Chemicals Inc 7.875% 15/02/2023 575,000 USD 427,704 511,750 0.08 Momentive Specialty Chemicals Inc 9.200% 15/03/2021 810,000 USD 698,234 777,600 0.12 Navistar International Corp 3.000% 15/10/2014 2,125,000 USD 2,111,227 2,172,813 0.35
(3) See Note 14.
402
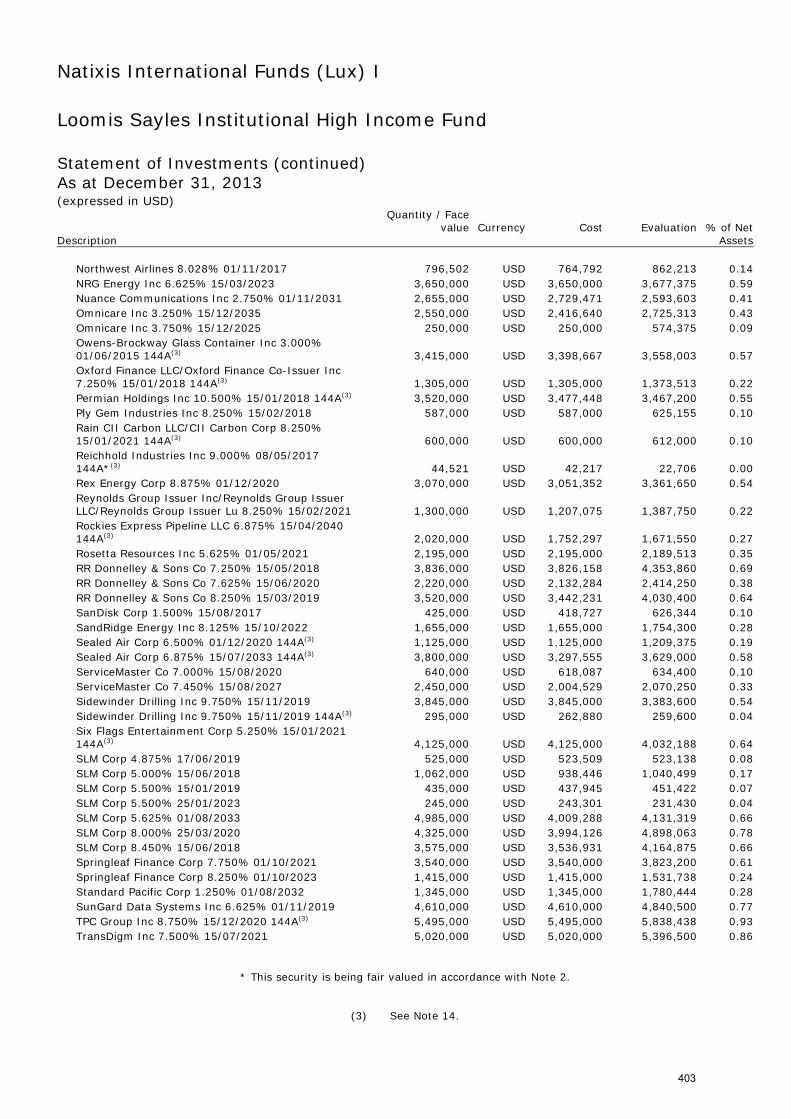
Natixis International Funds (Lux) I
Loomis Sayles Institutional High Income Fund Statement of Investments (continued) As at December 31, 2013 (expressed in USD)
Quantity / Face
value Currency Cost Evaluation % of Net Description Assets
Northwest Airlines 8.028% 01/11/2017 796,502 USD 764,792 862,213 0.14 NRG Energy Inc 6.625% 15/03/2023 3,650,000 USD 3,650,000 3,677,375 0.59 Nuance Communications Inc 2.750% 01/11/2031 2,655,000 USD 2,729,471 2,593,603 0.41 Omnicare Inc 3.250% 15/12/2035 2,550,000 USD 2,416,640 2,725,313 0.43 Omnicare Inc 3.750% 15/12/2025 250,000 USD 250,000 574,375 0.09 Owens-Brockway Glass Container Inc 3.000% 01/06/2015 144A(3) 3,415,000 USD 3,398,667 3,558,003 0.57 Oxford Finance LLC/Oxford Finance Co-Issuer Inc 7.250% 15/01/2018 144A(3) 1,305,000 USD 1,305,000 1,373,513 0.22 Permian Holdings Inc 10.500% 15/01/2018 144A(3) 3,520,000 USD 3,477,448 3,467,200 0.55 Ply Gem Industries Inc 8.250% 15/02/2018 587,000 USD 587,000 625,155 0.10 Rain CII Carbon LLC/CII Carbon Corp 8.250% 15/01/2021 144A(3) 600,000 USD 600,000 612,000 0.10 Reichhold Industries Inc 9.000% 08/05/2017 144A*(3) 44,521 USD 42,217 22,706 0.00 Rex Energy Corp 8.875% 01/12/2020 3,070,000 USD 3,051,352 3,361,650 0.54 Reynolds Group Issuer Inc/Reynolds Group Issuer LLC/Reynolds Group Issuer Lu 8.250% 15/02/2021 1,300,000 USD 1,207,075 1,387,750 0.22 Rockies Express Pipeline LLC 6.875% 15/04/2040 144A(3) 2,020,000 USD 1,752,297 1,671,550 0.27 Rosetta Resources Inc 5.625% 01/05/2021 2,195,000 USD 2,195,000 2,189,513 0.35 RR Donnelley & Sons Co 7.250% 15/05/2018 3,836,000 USD 3,826,158 4,353,860 0.69 RR Donnelley & Sons Co 7.625% 15/06/2020 2,220,000 USD 2,132,284 2,414,250 0.38 RR Donnelley & Sons Co 8.250% 15/03/2019 3,520,000 USD 3,442,231 4,030,400 0.64 SanDisk Corp 1.500% 15/08/2017 425,000 USD 418,727 626,344 0.10 SandRidge Energy Inc 8.125% 15/10/2022 1,655,000 USD 1,655,000 1,754,300 0.28 Sealed Air Corp 6.500% 01/12/2020 144A(3) 1,125,000 USD 1,125,000 1,209,375 0.19 Sealed Air Corp 6.875% 15/07/2033 144A(3) 3,800,000 USD 3,297,555 3,629,000 0.58 ServiceMaster Co 7.000% 15/08/2020 640,000 USD 618,087 634,400 0.10 ServiceMaster Co 7.450% 15/08/2027 2,450,000 USD 2,004,529 2,070,250 0.33 Sidewinder Drilling Inc 9.750% 15/11/2019 3,845,000 USD 3,845,000 3,383,600 0.54 Sidewinder Drilling Inc 9.750% 15/11/2019 144A(3) 295,000 USD 262,880 259,600 0.04 Six Flags Entertainment Corp 5.250% 15/01/2021 144A(3) 4,125,000 USD 4,125,000 4,032,188 0.64 SLM Corp 4.875% 17/06/2019 525,000 USD 523,509 523,138 0.08 SLM Corp 5.000% 15/06/2018 1,062,000 USD 938,446 1,040,499 0.17 SLM Corp 5.500% 15/01/2019 435,000 USD 437,945 451,422 0.07 SLM Corp 5.500% 25/01/2023 245,000 USD 243,301 231,430 0.04 SLM Corp 5.625% 01/08/2033 4,985,000 USD 4,009,288 4,131,319 0.66 SLM Corp 8.000% 25/03/2020 4,325,000 USD 3,994,126 4,898,063 0.78 SLM Corp 8.450% 15/06/2018 3,575,000 USD 3,536,931 4,164,875 0.66 Springleaf Finance Corp 7.750% 01/10/2021 3,540,000 USD 3,540,000 3,823,200 0.61 Springleaf Finance Corp 8.250% 01/10/2023 1,415,000 USD 1,415,000 1,531,738 0.24 Standard Pacific Corp 1.250% 01/08/2032 1,345,000 USD 1,345,000 1,780,444 0.28 SunGard Data Systems Inc 6.625% 01/11/2019 4,610,000 USD 4,610,000 4,840,500 0.77 TPC Group Inc 8.750% 15/12/2020 144A(3) 5,495,000 USD 5,495,000 5,838,438 0.93 TransDigm Inc 7.500% 15/07/2021 5,020,000 USD 5,020,000 5,396,500 0.86
* This security is being fair valued in accordance with Note 2.
(3) See Note 14.
403
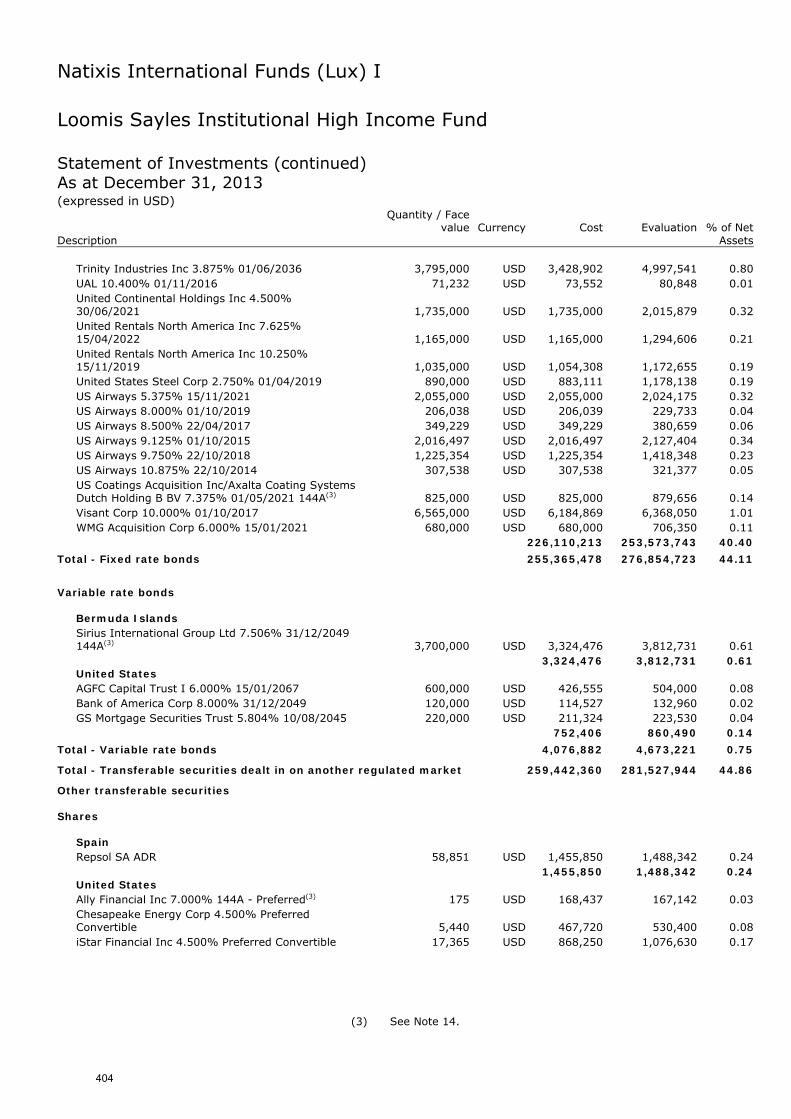
Natixis International Funds (Lux) I
Loomis Sayles Institutional High Income Fund Statement of Investments (continued) As at December 31, 2013 (expressed in USD)
Quantity / Face
value Currency Cost Evaluation % of Net Description Assets
Trinity Industries Inc 3.875% 01/06/2036 3,795,000 USD 3,428,902 4,997,541 0.80 UAL 10.400% 01/11/2016 71,232 USD 73,552 80,848 0.01 United Continental Holdings Inc 4.500% 30/06/2021 1,735,000 USD 1,735,000 2,015,879 0.32 United Rentals North America Inc 7.625% 15/04/2022 1,165,000 USD 1,165,000 1,294,606 0.21 United Rentals North America Inc 10.250% 15/11/2019 1,035,000 USD 1,054,308 1,172,655 0.19 United States Steel Corp 2.750% 01/04/2019 890,000 USD 883,111 1,178,138 0.19 US Airways 5.375% 15/11/2021 2,055,000 USD 2,055,000 2,024,175 0.32 US Airways 8.000% 01/10/2019 206,038 USD 206,039 229,733 0.04 US Airways 8.500% 22/04/2017 349,229 USD 349,229 380,659 0.06 US Airways 9.125% 01/10/2015 2,016,497 USD 2,016,497 2,127,404 0.34 US Airways 9.750% 22/10/2018 1,225,354 USD 1,225,354 1,418,348 0.23 US Airways 10.875% 22/10/2014 307,538 USD 307,538 321,377 0.05 US Coatings Acquisition Inc/Axalta Coating Systems Dutch Holding B BV 7.375% 01/05/2021 144A(3) 825,000 USD 825,000 879,656 0.14 Visant Corp 10.000% 01/10/2017 6,565,000 USD 6,184,869 6,368,050 1.01 WMG Acquisition Corp 6.000% 15/01/2021 680,000 USD 680,000 706,350 0.11
226,110,213 253,573,743 40.40
Total - Fixed rate bonds 255,365,478 276,854,723 44.11
Variable rate bonds
Bermuda Islands Sirius International Group Ltd 7.506% 31/12/2049 144A(3) 3,700,000 USD 3,324,476 3,812,731 0.61
3,324,476 3,812,731 0.61 United States AGFC Capital Trust I 6.000% 15/01/2067 600,000 USD 426,555 504,000 0.08 Bank of America Corp 8.000% 31/12/2049 120,000 USD 114,527 132,960 0.02 GS Mortgage Securities Trust 5.804% 10/08/2045 220,000 USD 211,324 223,530 0.04
752,406 860,490 0.14
Total - Variable rate bonds 4,076,882 4,673,221 0.75
Total - Transferable securities dealt in on another regulated market 259,442,360 281,527,944 44.86
Other transferable securities Shares
Spain Repsol SA ADR 58,851 USD 1,455,850 1,488,342 0.24
1,455,850 1,488,342 0.24 United States Ally Financial Inc 7.000% 144A - Preferred(3) 175 USD 168,437 167,142 0.03 Chesapeake Energy Corp 4.500% Preferred Convertible 5,440 USD 467,720 530,400 0.08 iStar Financial Inc 4.500% Preferred Convertible 17,365 USD 868,250 1,076,630 0.17
(3) See Note 14.
404
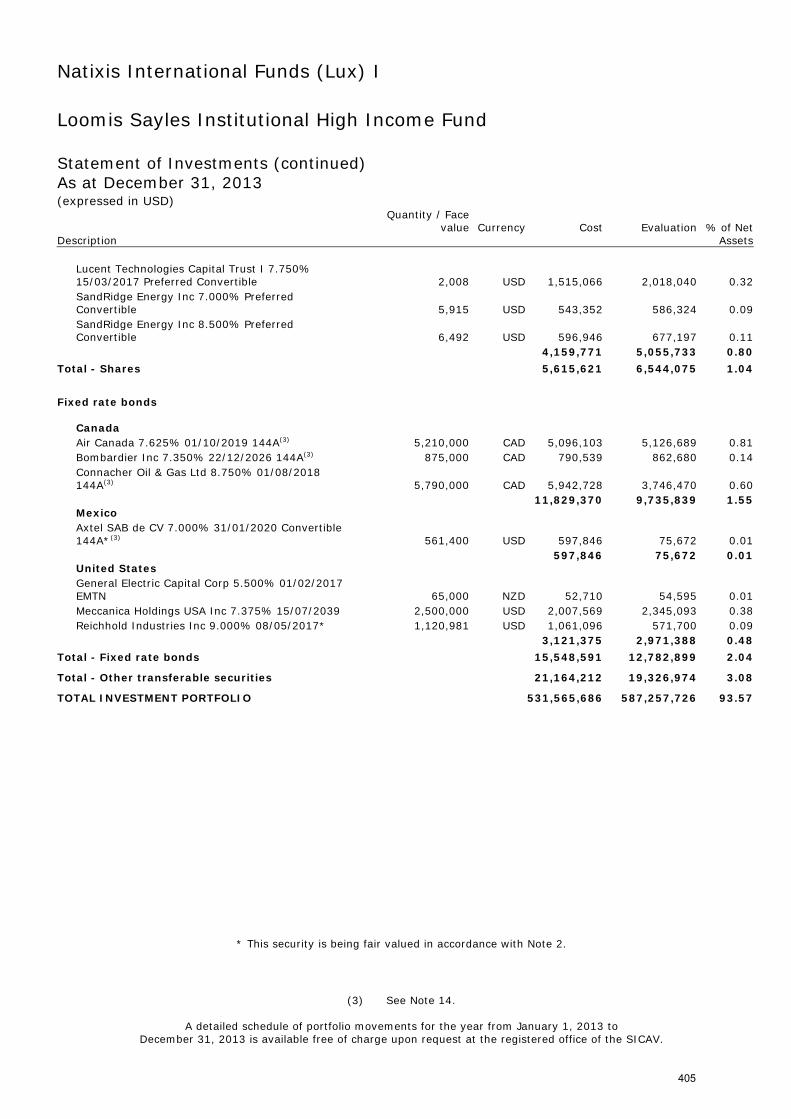
Natixis International Funds (Lux) I
Loomis Sayles Institutional High Income Fund Statement of Investments (continued) As at December 31, 2013 (expressed in USD)
Quantity / Face
value Currency Cost Evaluation % of Net Description Assets
Lucent Technologies Capital Trust I 7.750% 15/03/2017 Preferred Convertible 2,008 USD 1,515,066 2,018,040 0.32 SandRidge Energy Inc 7.000% Preferred Convertible 5,915 USD 543,352 586,324 0.09 SandRidge Energy Inc 8.500% Preferred Convertible 6,492 USD 596,946 677,197 0.11
4,159,771 5,055,733 0.80
Total - Shares 5,615,621 6,544,075 1.04
Fixed rate bonds
Canada Air Canada 7.625% 01/10/2019 144A(3) 5,210,000 CAD 5,096,103 5,126,689 0.81 Bombardier Inc 7.350% 22/12/2026 144A(3) 875,000 CAD 790,539 862,680 0.14 Connacher Oil & Gas Ltd 8.750% 01/08/2018 144A(3) 5,790,000 CAD 5,942,728 3,746,470 0.60
11,829,370 9,735,839 1.55 Mexico Axtel SAB de CV 7.000% 31/01/2020 Convertible 144A*(3) 561,400 USD 597,846 75,672 0.01
597,846 75,672 0.01 United States General Electric Capital Corp 5.500% 01/02/2017 EMTN 65,000 NZD 52,710 54,595 0.01 Meccanica Holdings USA Inc 7.375% 15/07/2039 2,500,000 USD 2,007,569 2,345,093 0.38 Reichhold Industries Inc 9.000% 08/05/2017* 1,120,981 USD 1,061,096 571,700 0.09
3,121,375 2,971,388 0.48
Total - Fixed rate bonds 15,548,591 12,782,899 2.04
Total - Other transferable securities 21,164,212 19,326,974 3.08
TOTAL INVESTMENT PORTFOLIO 531,565,686 587,257,726 93.57
* This security is being fair valued in accordance with Note 2.
(3) See Note 14.
A detailed schedule of portfolio movements for the year from January 1, 2013 to December 31, 2013 is available free of charge upon request at the registered office of the SICAV.
405
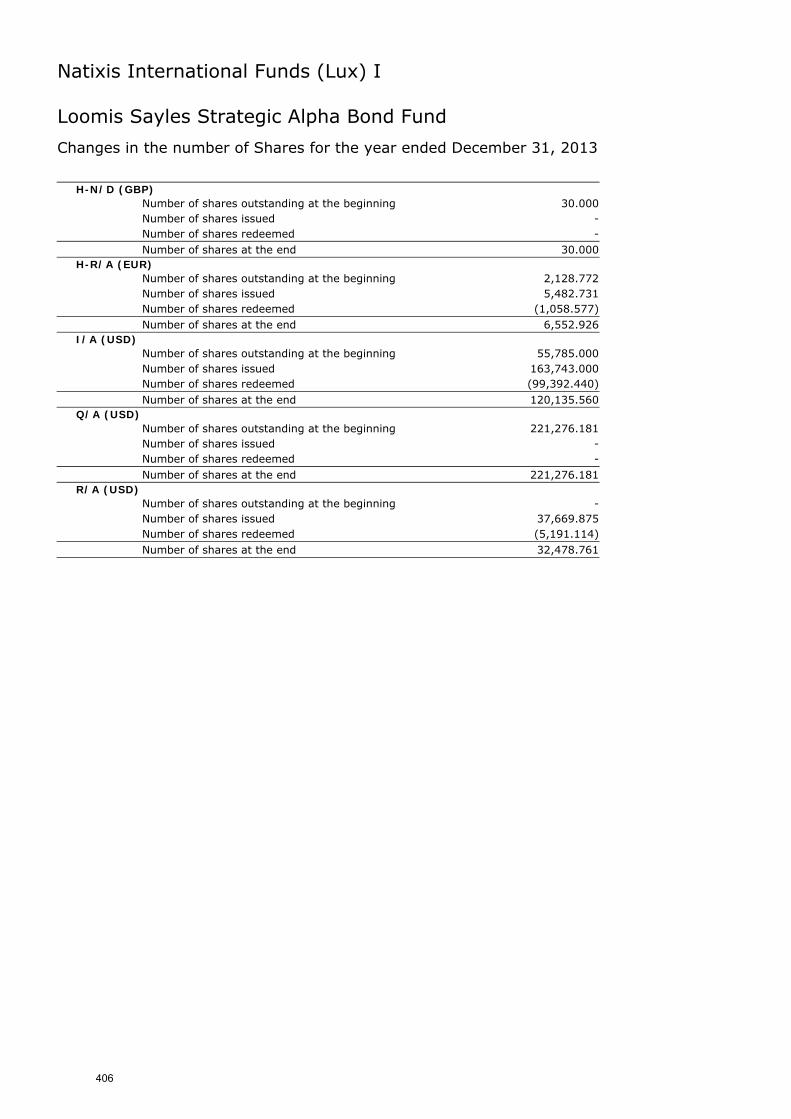
Natixis International Funds (Lux) I
Loomis Sayles Strategic Alpha Bond Fund
Changes in the number of Shares for the year ended December 31, 2013
H-N/D (GBP) Number of shares outstanding at the beginning 30.000
Number of shares issued - Number of shares redeemed - Number of shares at the end 30.000
H-R/A (EUR) Number of shares outstanding at the beginning 2,128.772
Number of shares issued 5,482.731
Number of shares redeemed (1,058.577) Number of shares at the end 6,552.926
I/A (USD) Number of shares outstanding at the beginning 55,785.000
Number of shares issued 163,743.000
Number of shares redeemed (99,392.440) Number of shares at the end 120,135.560
Q/A (USD) Number of shares outstanding at the beginning 221,276.181
Number of shares issued - Number of shares redeemed - Number of shares at the end 221,276.181
R/A (USD) Number of shares outstanding at the beginning - Number of shares issued 37,669.875
Number of shares redeemed (5,191.114) Number of shares at the end 32,478.761
406
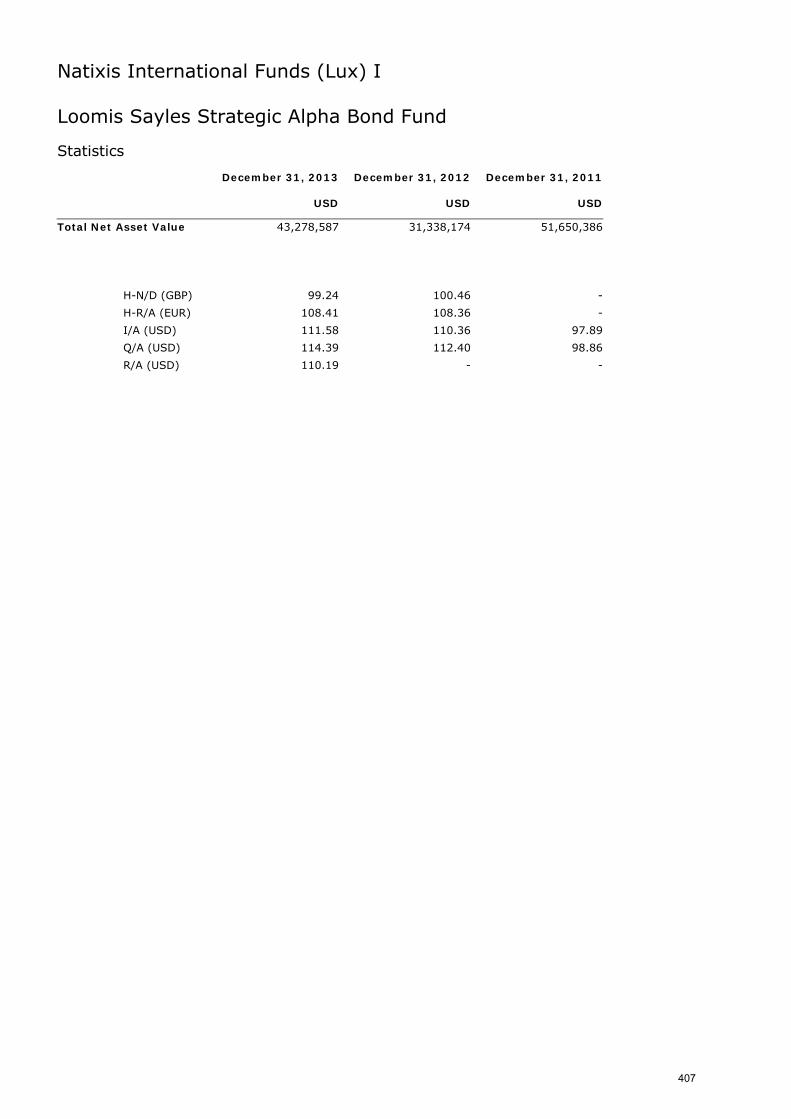
Natixis International Funds (Lux) I
Loomis Sayles Strategic Alpha Bond Fund Statistics December 31, 2013 December 31, 2012 December 31, 2011 USD USD USD
Total Net Asset Value 43,278,587 31,338,174 51,650,386
H-N/D (GBP) 99.24 100.46 -
H-R/A (EUR) 108.41 108.36 -
I/A (USD) 111.58 110.36 97.89
Q/A (USD) 114.39 112.40 98.86
R/A (USD) 110.19 - -
407
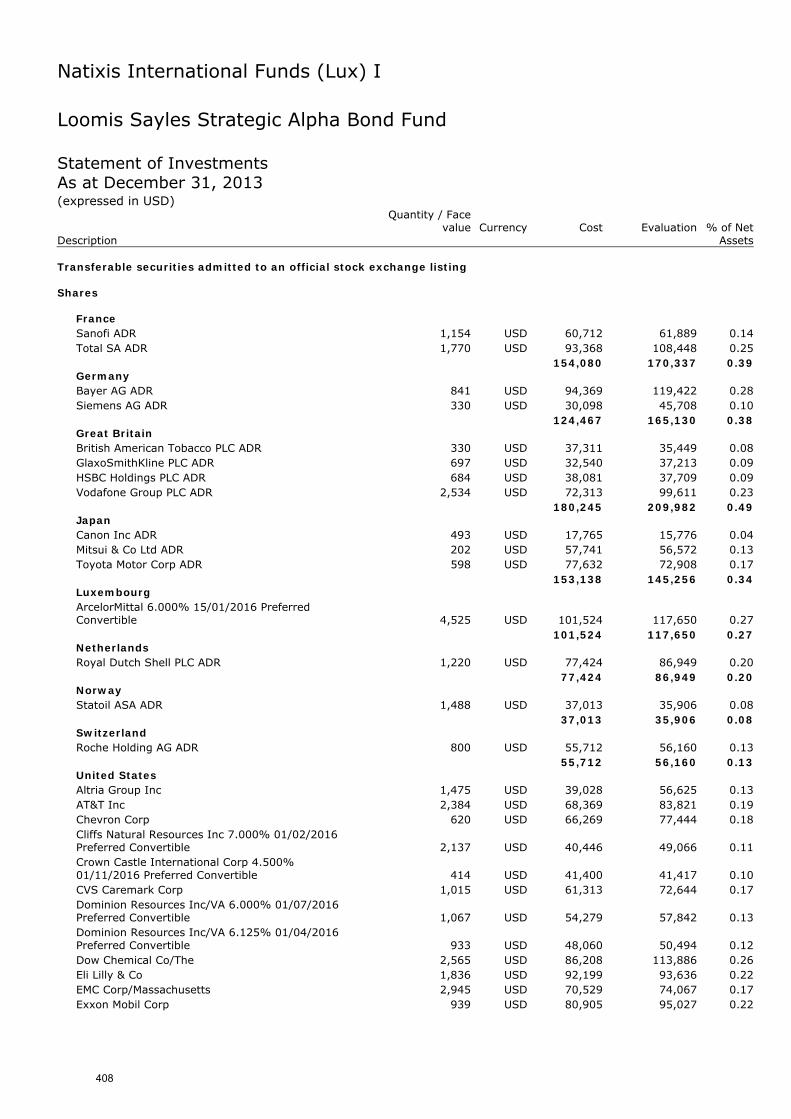
Natixis International Funds (Lux) I
Loomis Sayles Strategic Alpha Bond Fund Statement of Investments As at December 31, 2013 (expressed in USD)
Quantity / Face
value Currency Cost Evaluation % of Net Description Assets Transferable securities admitted to an official stock exchange listing Shares
France Sanofi ADR 1,154 USD 60,712 61,889 0.14 Total SA ADR 1,770 USD 93,368 108,448 0.25
154,080 170,337 0.39 Germany Bayer AG ADR 841 USD 94,369 119,422 0.28 Siemens AG ADR 330 USD 30,098 45,708 0.10
124,467 165,130 0.38 Great Britain British American Tobacco PLC ADR 330 USD 37,311 35,449 0.08 GlaxoSmithKline PLC ADR 697 USD 32,540 37,213 0.09 HSBC Holdings PLC ADR 684 USD 38,081 37,709 0.09 Vodafone Group PLC ADR 2,534 USD 72,313 99,611 0.23
180,245 209,982 0.49 Japan Canon Inc ADR 493 USD 17,765 15,776 0.04 Mitsui & Co Ltd ADR 202 USD 57,741 56,572 0.13 Toyota Motor Corp ADR 598 USD 77,632 72,908 0.17
153,138 145,256 0.34 Luxembourg ArcelorMittal 6.000% 15/01/2016 Preferred Convertible 4,525 USD 101,524 117,650 0.27
101,524 117,650 0.27 Netherlands Royal Dutch Shell PLC ADR 1,220 USD 77,424 86,949 0.20
77,424 86,949 0.20 Norway Statoil ASA ADR 1,488 USD 37,013 35,906 0.08
37,013 35,906 0.08 Switzerland Roche Holding AG ADR 800 USD 55,712 56,160 0.13
55,712 56,160 0.13 United States Altria Group Inc 1,475 USD 39,028 56,625 0.13 AT&T Inc 2,384 USD 68,369 83,821 0.19 Chevron Corp 620 USD 66,269 77,444 0.18 Cliffs Natural Resources Inc 7.000% 01/02/2016 Preferred Convertible 2,137 USD 40,446 49,066 0.11 Crown Castle International Corp 4.500% 01/11/2016 Preferred Convertible 414 USD 41,400 41,417 0.10 CVS Caremark Corp 1,015 USD 61,313 72,644 0.17 Dominion Resources Inc/VA 6.000% 01/07/2016 Preferred Convertible 1,067 USD 54,279 57,842 0.13 Dominion Resources Inc/VA 6.125% 01/04/2016 Preferred Convertible 933 USD 48,060 50,494 0.12 Dow Chemical Co/The 2,565 USD 86,208 113,886 0.26 Eli Lilly & Co 1,836 USD 92,199 93,636 0.22 EMC Corp/Massachusetts 2,945 USD 70,529 74,067 0.17 Exxon Mobil Corp 939 USD 80,905 95,027 0.22
408
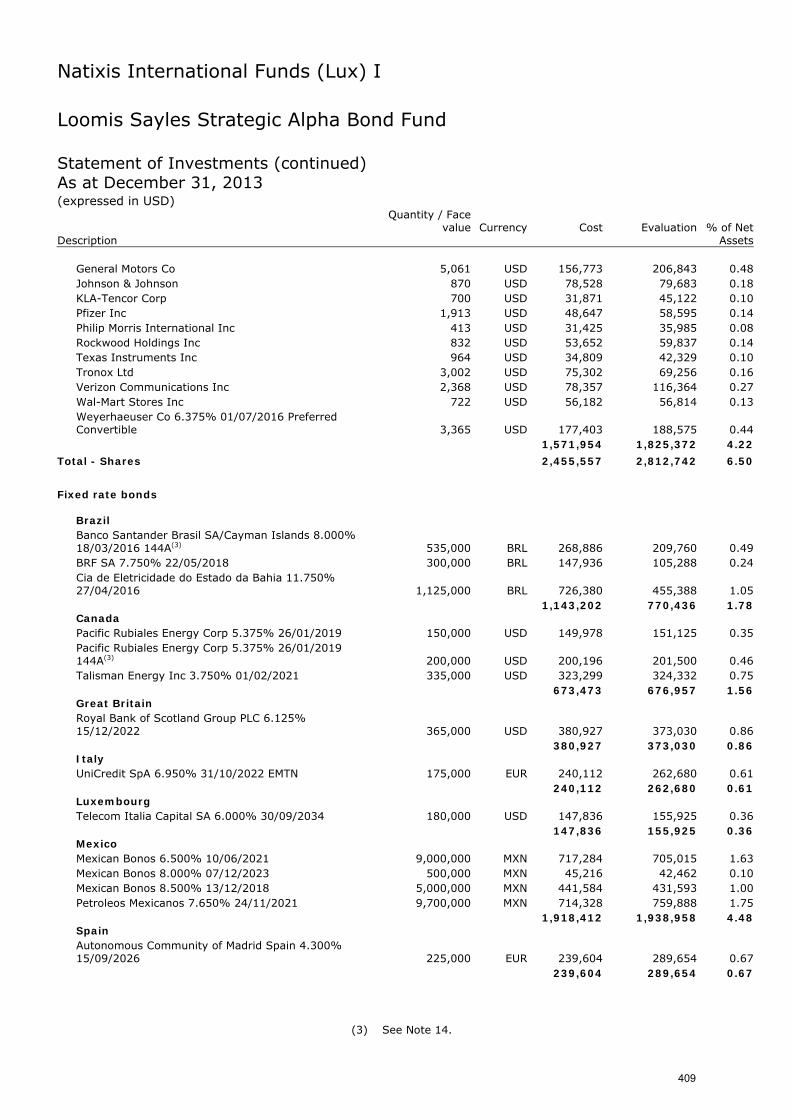
Natixis International Funds (Lux) I
Loomis Sayles Strategic Alpha Bond Fund Statement of Investments (continued) As at December 31, 2013 (expressed in USD)
Quantity / Face
value Currency Cost Evaluation % of Net Description Assets
General Motors Co 5,061 USD 156,773 206,843 0.48 Johnson & Johnson 870 USD 78,528 79,683 0.18 KLA-Tencor Corp 700 USD 31,871 45,122 0.10 Pfizer Inc 1,913 USD 48,647 58,595 0.14 Philip Morris International Inc 413 USD 31,425 35,985 0.08 Rockwood Holdings Inc 832 USD 53,652 59,837 0.14 Texas Instruments Inc 964 USD 34,809 42,329 0.10 Tronox Ltd 3,002 USD 75,302 69,256 0.16 Verizon Communications Inc 2,368 USD 78,357 116,364 0.27 Wal-Mart Stores Inc 722 USD 56,182 56,814 0.13 Weyerhaeuser Co 6.375% 01/07/2016 Preferred Convertible 3,365 USD 177,403 188,575 0.44
1,571,954 1,825,372 4.22
Total - Shares 2,455,557 2,812,742 6.50
Fixed rate bonds
Brazil Banco Santander Brasil SA/Cayman Islands 8.000% 18/03/2016 144A(3) 535,000 BRL 268,886 209,760 0.49 BRF SA 7.750% 22/05/2018 300,000 BRL 147,936 105,288 0.24 Cia de Eletricidade do Estado da Bahia 11.750% 27/04/2016 1,125,000 BRL 726,380 455,388 1.05
1,143,202 770,436 1.78 Canada Pacific Rubiales Energy Corp 5.375% 26/01/2019 150,000 USD 149,978 151,125 0.35 Pacific Rubiales Energy Corp 5.375% 26/01/2019 144A(3) 200,000 USD 200,196 201,500 0.46 Talisman Energy Inc 3.750% 01/02/2021 335,000 USD 323,299 324,332 0.75
673,473 676,957 1.56 Great Britain Royal Bank of Scotland Group PLC 6.125% 15/12/2022 365,000 USD 380,927 373,030 0.86
380,927 373,030 0.86 Italy UniCredit SpA 6.950% 31/10/2022 EMTN 175,000 EUR 240,112 262,680 0.61
240,112 262,680 0.61 Luxembourg Telecom Italia Capital SA 6.000% 30/09/2034 180,000 USD 147,836 155,925 0.36
147,836 155,925 0.36 Mexico Mexican Bonos 6.500% 10/06/2021 9,000,000 MXN 717,284 705,015 1.63 Mexican Bonos 8.000% 07/12/2023 500,000 MXN 45,216 42,462 0.10 Mexican Bonos 8.500% 13/12/2018 5,000,000 MXN 441,584 431,593 1.00 Petroleos Mexicanos 7.650% 24/11/2021 9,700,000 MXN 714,328 759,888 1.75
1,918,412 1,938,958 4.48 Spain Autonomous Community of Madrid Spain 4.300% 15/09/2026 225,000 EUR 239,604 289,654 0.67
239,604 289,654 0.67
(3) See Note 14.
409
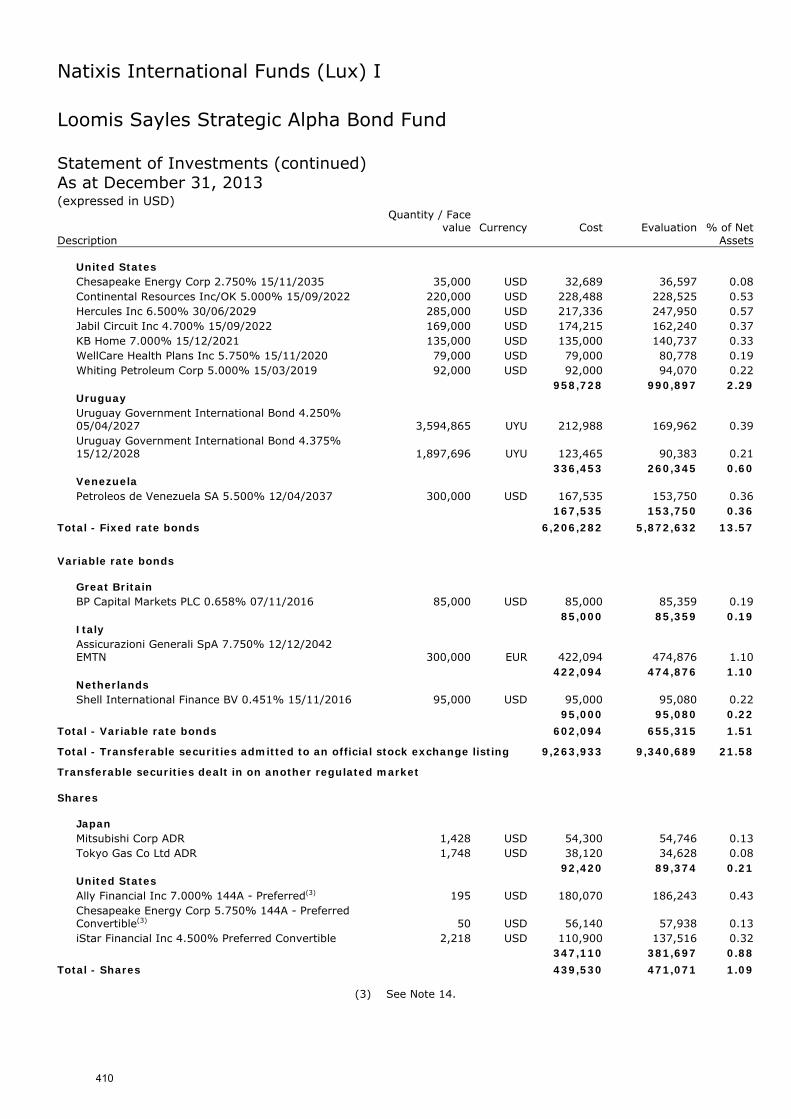
Natixis International Funds (Lux) I
Loomis Sayles Strategic Alpha Bond Fund Statement of Investments (continued) As at December 31, 2013 (expressed in USD)
Quantity / Face
value Currency Cost Evaluation % of Net Description Assets
United States Chesapeake Energy Corp 2.750% 15/11/2035 35,000 USD 32,689 36,597 0.08 Continental Resources Inc/OK 5.000% 15/09/2022 220,000 USD 228,488 228,525 0.53 Hercules Inc 6.500% 30/06/2029 285,000 USD 217,336 247,950 0.57 Jabil Circuit Inc 4.700% 15/09/2022 169,000 USD 174,215 162,240 0.37 KB Home 7.000% 15/12/2021 135,000 USD 135,000 140,737 0.33 WellCare Health Plans Inc 5.750% 15/11/2020 79,000 USD 79,000 80,778 0.19 Whiting Petroleum Corp 5.000% 15/03/2019 92,000 USD 92,000 94,070 0.22
958,728 990,897 2.29 Uruguay Uruguay Government International Bond 4.250% 05/04/2027 3,594,865 UYU 212,988 169,962 0.39 Uruguay Government International Bond 4.375% 15/12/2028 1,897,696 UYU 123,465 90,383 0.21
336,453 260,345 0.60 Venezuela Petroleos de Venezuela SA 5.500% 12/04/2037 300,000 USD 167,535 153,750 0.36
167,535 153,750 0.36
Total - Fixed rate bonds 6,206,282 5,872,632 13.57
Variable rate bonds
Great Britain BP Capital Markets PLC 0.658% 07/11/2016 85,000 USD 85,000 85,359 0.19
85,000 85,359 0.19 Italy Assicurazioni Generali SpA 7.750% 12/12/2042 EMTN 300,000 EUR 422,094 474,876 1.10
422,094 474,876 1.10 Netherlands Shell International Finance BV 0.451% 15/11/2016 95,000 USD 95,000 95,080 0.22
95,000 95,080 0.22
Total - Variable rate bonds 602,094 655,315 1.51
Total - Transferable securities admitted to an official stock exchange listing 9,263,933 9,340,689 21.58
Transferable securities dealt in on another regulated market Shares
Japan Mitsubishi Corp ADR 1,428 USD 54,300 54,746 0.13 Tokyo Gas Co Ltd ADR 1,748 USD 38,120 34,628 0.08
92,420 89,374 0.21 United States Ally Financial Inc 7.000% 144A - Preferred(3) 195 USD 180,070 186,243 0.43 Chesapeake Energy Corp 5.750% 144A - Preferred Convertible(3) 50 USD 56,140 57,938 0.13 iStar Financial Inc 4.500% Preferred Convertible 2,218 USD 110,900 137,516 0.32
347,110 381,697 0.88
Total - Shares 439,530 471,071 1.09
(3) See Note 14.
410
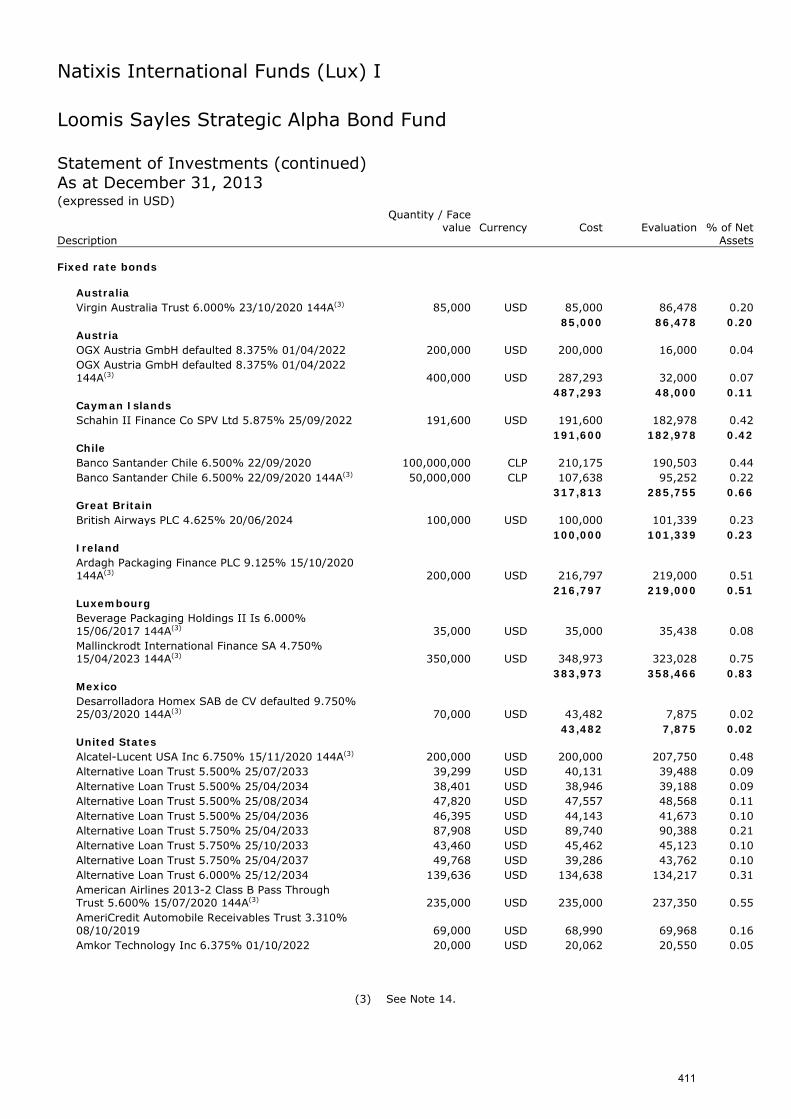
Natixis International Funds (Lux) I
Loomis Sayles Strategic Alpha Bond Fund Statement of Investments (continued) As at December 31, 2013 (expressed in USD)
Quantity / Face
value Currency Cost Evaluation % of Net Description Assets Fixed rate bonds
Australia Virgin Australia Trust 6.000% 23/10/2020 144A(3) 85,000 USD 85,000 86,478 0.20
85,000 86,478 0.20 Austria OGX Austria GmbH defaulted 8.375% 01/04/2022 200,000 USD 200,000 16,000 0.04 OGX Austria GmbH defaulted 8.375% 01/04/2022 144A(3) 400,000 USD 287,293 32,000 0.07
487,293 48,000 0.11 Cayman Islands Schahin II Finance Co SPV Ltd 5.875% 25/09/2022 191,600 USD 191,600 182,978 0.42
191,600 182,978 0.42 Chile Banco Santander Chile 6.500% 22/09/2020 100,000,000 CLP 210,175 190,503 0.44 Banco Santander Chile 6.500% 22/09/2020 144A(3) 50,000,000 CLP 107,638 95,252 0.22
317,813 285,755 0.66 Great Britain British Airways PLC 4.625% 20/06/2024 100,000 USD 100,000 101,339 0.23
100,000 101,339 0.23 Ireland Ardagh Packaging Finance PLC 9.125% 15/10/2020 144A(3) 200,000 USD 216,797 219,000 0.51
216,797 219,000 0.51 Luxembourg Beverage Packaging Holdings II Is 6.000% 15/06/2017 144A(3) 35,000 USD 35,000 35,438 0.08 Mallinckrodt International Finance SA 4.750% 15/04/2023 144A(3) 350,000 USD 348,973 323,028 0.75
383,973 358,466 0.83 Mexico Desarrolladora Homex SAB de CV defaulted 9.750% 25/03/2020 144A(3) 70,000 USD 43,482 7,875 0.02
43,482 7,875 0.02 United States Alcatel-Lucent USA Inc 6.750% 15/11/2020 144A(3) 200,000 USD 200,000 207,750 0.48 Alternative Loan Trust 5.500% 25/07/2033 39,299 USD 40,131 39,488 0.09 Alternative Loan Trust 5.500% 25/04/2034 38,401 USD 38,946 39,188 0.09 Alternative Loan Trust 5.500% 25/08/2034 47,820 USD 47,557 48,568 0.11 Alternative Loan Trust 5.500% 25/04/2036 46,395 USD 44,143 41,673 0.10 Alternative Loan Trust 5.750% 25/04/2033 87,908 USD 89,740 90,388 0.21 Alternative Loan Trust 5.750% 25/10/2033 43,460 USD 45,462 45,123 0.10 Alternative Loan Trust 5.750% 25/04/2037 49,768 USD 39,286 43,762 0.10 Alternative Loan Trust 6.000% 25/12/2034 139,636 USD 134,638 134,217 0.31 American Airlines 2013-2 Class B Pass Through Trust 5.600% 15/07/2020 144A(3) 235,000 USD 235,000 237,350 0.55 AmeriCredit Automobile Receivables Trust 3.310% 08/10/2019 69,000 USD 68,990 69,968 0.16 Amkor Technology Inc 6.375% 01/10/2022 20,000 USD 20,062 20,550 0.05
(3) See Note 14.
411
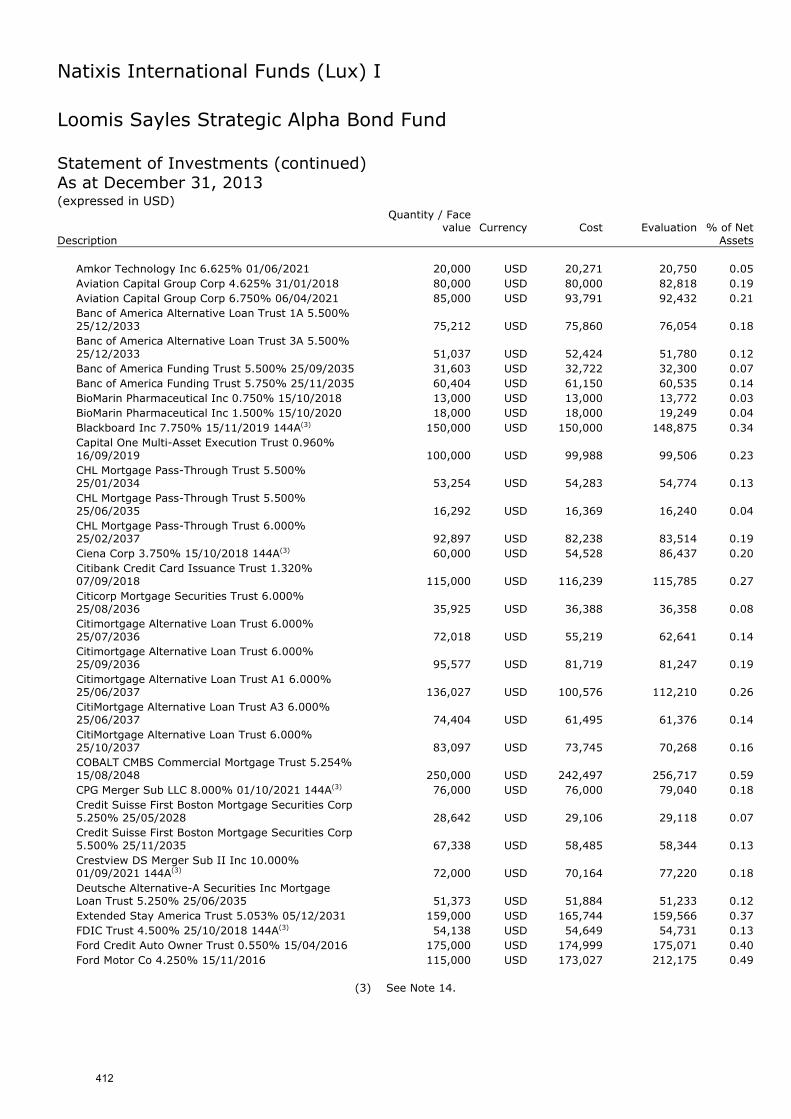
Natixis International Funds (Lux) I
Loomis Sayles Strategic Alpha Bond Fund Statement of Investments (continued) As at December 31, 2013 (expressed in USD)
Quantity / Face
value Currency Cost Evaluation % of Net Description Assets
Amkor Technology Inc 6.625% 01/06/2021 20,000 USD 20,271 20,750 0.05 Aviation Capital Group Corp 4.625% 31/01/2018 80,000 USD 80,000 82,818 0.19 Aviation Capital Group Corp 6.750% 06/04/2021 85,000 USD 93,791 92,432 0.21 Banc of America Alternative Loan Trust 1A 5.500% 25/12/2033 75,212 USD 75,860 76,054 0.18 Banc of America Alternative Loan Trust 3A 5.500% 25/12/2033 51,037 USD 52,424 51,780 0.12 Banc of America Funding Trust 5.500% 25/09/2035 31,603 USD 32,722 32,300 0.07 Banc of America Funding Trust 5.750% 25/11/2035 60,404 USD 61,150 60,535 0.14 BioMarin Pharmaceutical Inc 0.750% 15/10/2018 13,000 USD 13,000 13,772 0.03 BioMarin Pharmaceutical Inc 1.500% 15/10/2020 18,000 USD 18,000 19,249 0.04 Blackboard Inc 7.750% 15/11/2019 144A(3) 150,000 USD 150,000 148,875 0.34 Capital One Multi-Asset Execution Trust 0.960% 16/09/2019 100,000 USD 99,988 99,506 0.23 CHL Mortgage Pass-Through Trust 5.500% 25/01/2034 53,254 USD 54,283 54,774 0.13 CHL Mortgage Pass-Through Trust 5.500% 25/06/2035 16,292 USD 16,369 16,240 0.04 CHL Mortgage Pass-Through Trust 6.000% 25/02/2037 92,897 USD 82,238 83,514 0.19 Ciena Corp 3.750% 15/10/2018 144A(3) 60,000 USD 54,528 86,437 0.20 Citibank Credit Card Issuance Trust 1.320% 07/09/2018 115,000 USD 116,239 115,785 0.27 Citicorp Mortgage Securities Trust 6.000% 25/08/2036 35,925 USD 36,388 36,358 0.08 Citimortgage Alternative Loan Trust 6.000% 25/07/2036 72,018 USD 55,219 62,641 0.14 Citimortgage Alternative Loan Trust 6.000% 25/09/2036 95,577 USD 81,719 81,247 0.19 Citimortgage Alternative Loan Trust A1 6.000% 25/06/2037 136,027 USD 100,576 112,210 0.26 CitiMortgage Alternative Loan Trust A3 6.000% 25/06/2037 74,404 USD 61,495 61,376 0.14 CitiMortgage Alternative Loan Trust 6.000% 25/10/2037 83,097 USD 73,745 70,268 0.16 COBALT CMBS Commercial Mortgage Trust 5.254% 15/08/2048 250,000 USD 242,497 256,717 0.59 CPG Merger Sub LLC 8.000% 01/10/2021 144A(3) 76,000 USD 76,000 79,040 0.18 Credit Suisse First Boston Mortgage Securities Corp 5.250% 25/05/2028 28,642 USD 29,106 29,118 0.07 Credit Suisse First Boston Mortgage Securities Corp 5.500% 25/11/2035 67,338 USD 58,485 58,344 0.13 Crestview DS Merger Sub II Inc 10.000% 01/09/2021 144A(3) 72,000 USD 70,164 77,220 0.18 Deutsche Alternative-A Securities Inc Mortgage Loan Trust 5.250% 25/06/2035 51,373 USD 51,884 51,233 0.12 Extended Stay America Trust 5.053% 05/12/2031 159,000 USD 165,744 159,566 0.37 FDIC Trust 4.500% 25/10/2018 144A(3) 54,138 USD 54,649 54,731 0.13 Ford Credit Auto Owner Trust 0.550% 15/04/2016 175,000 USD 174,999 175,071 0.40 Ford Motor Co 4.250% 15/11/2016 115,000 USD 173,027 212,175 0.49
(3) See Note 14.
412
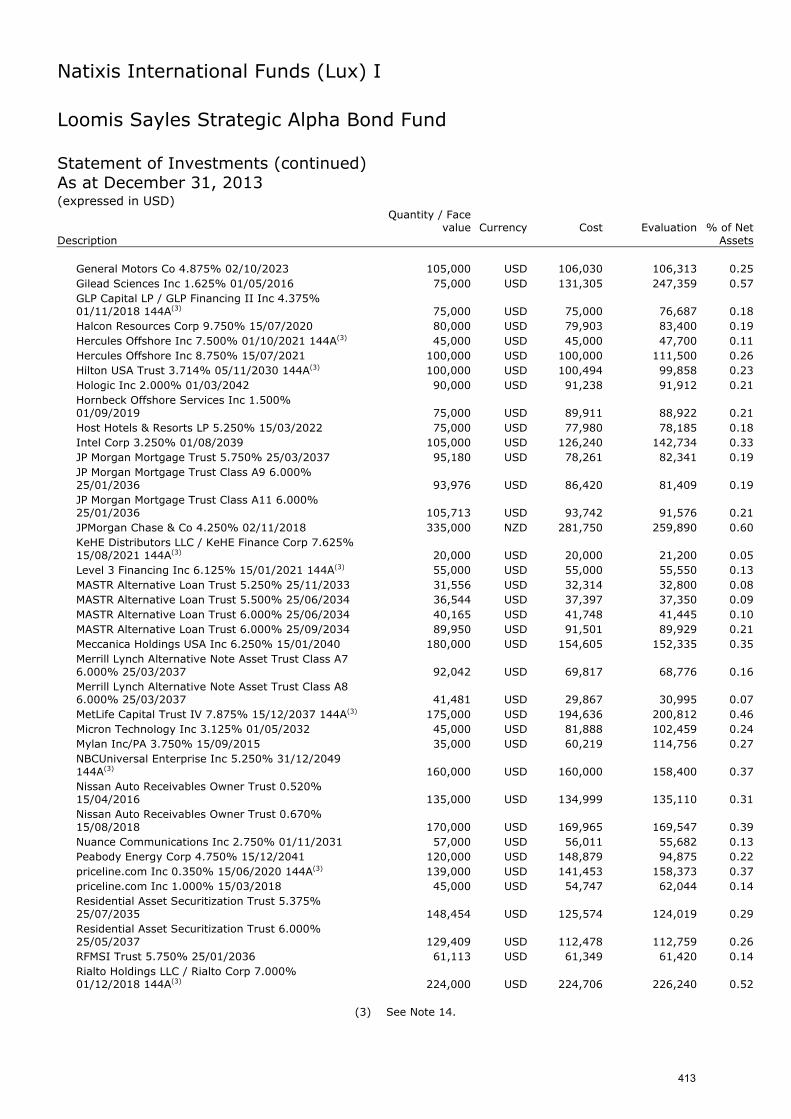
Natixis International Funds (Lux) I
Loomis Sayles Strategic Alpha Bond Fund Statement of Investments (continued) As at December 31, 2013 (expressed in USD)
Quantity / Face
value Currency Cost Evaluation % of Net Description Assets
General Motors Co 4.875% 02/10/2023 105,000 USD 106,030 106,313 0.25 Gilead Sciences Inc 1.625% 01/05/2016 75,000 USD 131,305 247,359 0.57 GLP Capital LP / GLP Financing II Inc 4.375% 01/11/2018 144A(3) 75,000 USD 75,000 76,687 0.18 Halcon Resources Corp 9.750% 15/07/2020 80,000 USD 79,903 83,400 0.19 Hercules Offshore Inc 7.500% 01/10/2021 144A(3) 45,000 USD 45,000 47,700 0.11 Hercules Offshore Inc 8.750% 15/07/2021 100,000 USD 100,000 111,500 0.26 Hilton USA Trust 3.714% 05/11/2030 144A(3) 100,000 USD 100,494 99,858 0.23 Hologic Inc 2.000% 01/03/2042 90,000 USD 91,238 91,912 0.21 Hornbeck Offshore Services Inc 1.500% 01/09/2019 75,000 USD 89,911 88,922 0.21 Host Hotels & Resorts LP 5.250% 15/03/2022 75,000 USD 77,980 78,185 0.18 Intel Corp 3.250% 01/08/2039 105,000 USD 126,240 142,734 0.33 JP Morgan Mortgage Trust 5.750% 25/03/2037 95,180 USD 78,261 82,341 0.19 JP Morgan Mortgage Trust Class A9 6.000% 25/01/2036 93,976 USD 86,420 81,409 0.19 JP Morgan Mortgage Trust Class A11 6.000% 25/01/2036 105,713 USD 93,742 91,576 0.21 JPMorgan Chase & Co 4.250% 02/11/2018 335,000 NZD 281,750 259,890 0.60 KeHE Distributors LLC / KeHE Finance Corp 7.625% 15/08/2021 144A(3) 20,000 USD 20,000 21,200 0.05 Level 3 Financing Inc 6.125% 15/01/2021 144A(3) 55,000 USD 55,000 55,550 0.13 MASTR Alternative Loan Trust 5.250% 25/11/2033 31,556 USD 32,314 32,800 0.08 MASTR Alternative Loan Trust 5.500% 25/06/2034 36,544 USD 37,397 37,350 0.09 MASTR Alternative Loan Trust 6.000% 25/06/2034 40,165 USD 41,748 41,445 0.10 MASTR Alternative Loan Trust 6.000% 25/09/2034 89,950 USD 91,501 89,929 0.21 Meccanica Holdings USA Inc 6.250% 15/01/2040 180,000 USD 154,605 152,335 0.35 Merrill Lynch Alternative Note Asset Trust Class A7 6.000% 25/03/2037 92,042 USD 69,817 68,776 0.16 Merrill Lynch Alternative Note Asset Trust Class A8 6.000% 25/03/2037 41,481 USD 29,867 30,995 0.07 MetLife Capital Trust IV 7.875% 15/12/2037 144A(3) 175,000 USD 194,636 200,812 0.46 Micron Technology Inc 3.125% 01/05/2032 45,000 USD 81,888 102,459 0.24 Mylan Inc/PA 3.750% 15/09/2015 35,000 USD 60,219 114,756 0.27 NBCUniversal Enterprise Inc 5.250% 31/12/2049 144A(3) 160,000 USD 160,000 158,400 0.37 Nissan Auto Receivables Owner Trust 0.520% 15/04/2016 135,000 USD 134,999 135,110 0.31 Nissan Auto Receivables Owner Trust 0.670% 15/08/2018 170,000 USD 169,965 169,547 0.39 Nuance Communications Inc 2.750% 01/11/2031 57,000 USD 56,011 55,682 0.13 Peabody Energy Corp 4.750% 15/12/2041 120,000 USD 148,879 94,875 0.22 priceline.com Inc 0.350% 15/06/2020 144A(3) 139,000 USD 141,453 158,373 0.37 priceline.com Inc 1.000% 15/03/2018 45,000 USD 54,747 62,044 0.14 Residential Asset Securitization Trust 5.375% 25/07/2035 148,454 USD 125,574 124,019 0.29 Residential Asset Securitization Trust 6.000% 25/05/2037 129,409 USD 112,478 112,759 0.26 RFMSI Trust 5.750% 25/01/2036 61,113 USD 61,349 61,420 0.14 Rialto Holdings LLC / Rialto Corp 7.000% 01/12/2018 144A(3) 224,000 USD 224,706 226,240 0.52
(3) See Note 14.
413
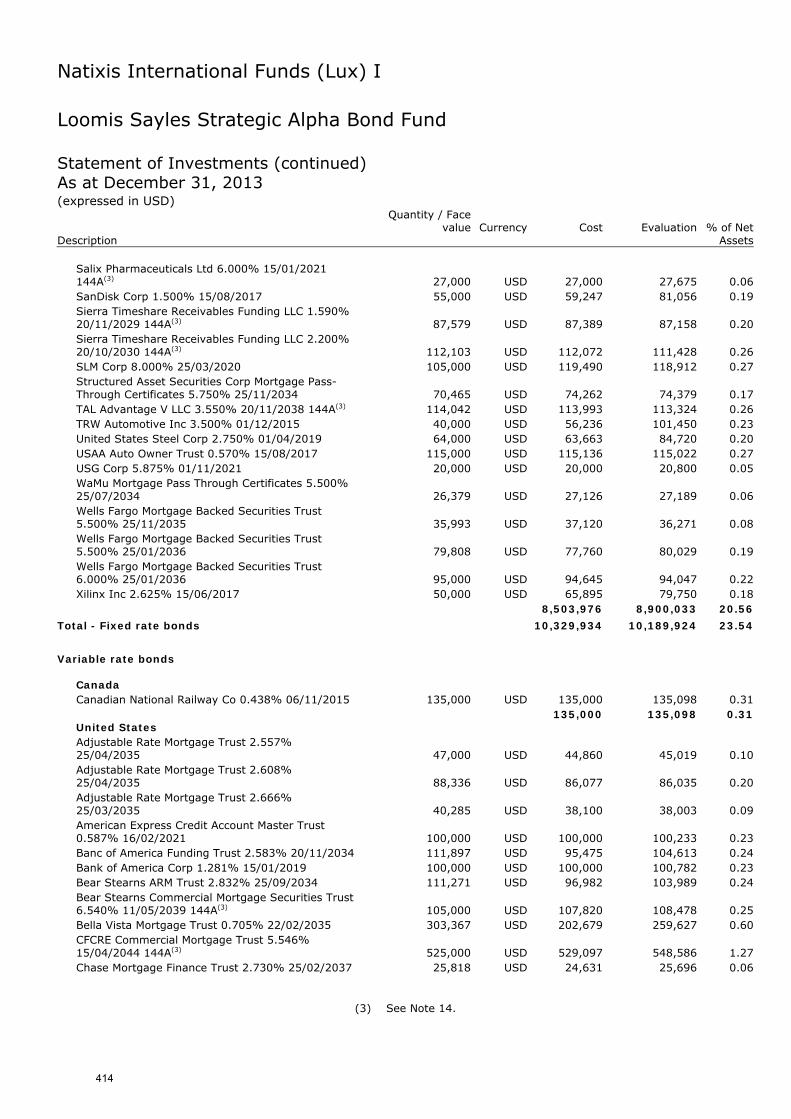
Natixis International Funds (Lux) I
Loomis Sayles Strategic Alpha Bond Fund Statement of Investments (continued) As at December 31, 2013 (expressed in USD)
Quantity / Face
value Currency Cost Evaluation % of Net Description Assets
Salix Pharmaceuticals Ltd 6.000% 15/01/2021 144A(3) 27,000 USD 27,000 27,675 0.06 SanDisk Corp 1.500% 15/08/2017 55,000 USD 59,247 81,056 0.19 Sierra Timeshare Receivables Funding LLC 1.590% 20/11/2029 144A(3) 87,579 USD 87,389 87,158 0.20 Sierra Timeshare Receivables Funding LLC 2.200% 20/10/2030 144A(3) 112,103 USD 112,072 111,428 0.26 SLM Corp 8.000% 25/03/2020 105,000 USD 119,490 118,912 0.27 Structured Asset Securities Corp Mortgage Pass-Through Certificates 5.750% 25/11/2034 70,465 USD 74,262 74,379 0.17 TAL Advantage V LLC 3.550% 20/11/2038 144A(3) 114,042 USD 113,993 113,324 0.26 TRW Automotive Inc 3.500% 01/12/2015 40,000 USD 56,236 101,450 0.23 United States Steel Corp 2.750% 01/04/2019 64,000 USD 63,663 84,720 0.20 USAA Auto Owner Trust 0.570% 15/08/2017 115,000 USD 115,136 115,022 0.27 USG Corp 5.875% 01/11/2021 20,000 USD 20,000 20,800 0.05 WaMu Mortgage Pass Through Certificates 5.500% 25/07/2034 26,379 USD 27,126 27,189 0.06 Wells Fargo Mortgage Backed Securities Trust 5.500% 25/11/2035 35,993 USD 37,120 36,271 0.08 Wells Fargo Mortgage Backed Securities Trust 5.500% 25/01/2036 79,808 USD 77,760 80,029 0.19 Wells Fargo Mortgage Backed Securities Trust 6.000% 25/01/2036 95,000 USD 94,645 94,047 0.22 Xilinx Inc 2.625% 15/06/2017 50,000 USD 65,895 79,750 0.18
8,503,976 8,900,033 20.56
Total - Fixed rate bonds 10,329,934 10,189,924 23.54
Variable rate bonds
Canada Canadian National Railway Co 0.438% 06/11/2015 135,000 USD 135,000 135,098 0.31
135,000 135,098 0.31 United States Adjustable Rate Mortgage Trust 2.557% 25/04/2035 47,000 USD 44,860 45,019 0.10 Adjustable Rate Mortgage Trust 2.608% 25/04/2035 88,336 USD 86,077 86,035 0.20 Adjustable Rate Mortgage Trust 2.666% 25/03/2035 40,285 USD 38,100 38,003 0.09 American Express Credit Account Master Trust 0.587% 16/02/2021 100,000 USD 100,000 100,233 0.23 Banc of America Funding Trust 2.583% 20/11/2034 111,897 USD 95,475 104,613 0.24 Bank of America Corp 1.281% 15/01/2019 100,000 USD 100,000 100,782 0.23 Bear Stearns ARM Trust 2.832% 25/09/2034 111,271 USD 96,982 103,989 0.24 Bear Stearns Commercial Mortgage Securities Trust 6.540% 11/05/2039 144A(3) 105,000 USD 107,820 108,478 0.25 Bella Vista Mortgage Trust 0.705% 22/02/2035 303,367 USD 202,679 259,627 0.60 CFCRE Commercial Mortgage Trust 5.546% 15/04/2044 144A(3) 525,000 USD 529,097 548,586 1.27 Chase Mortgage Finance Trust 2.730% 25/02/2037 25,818 USD 24,631 25,696 0.06
(3) See Note 14.
414
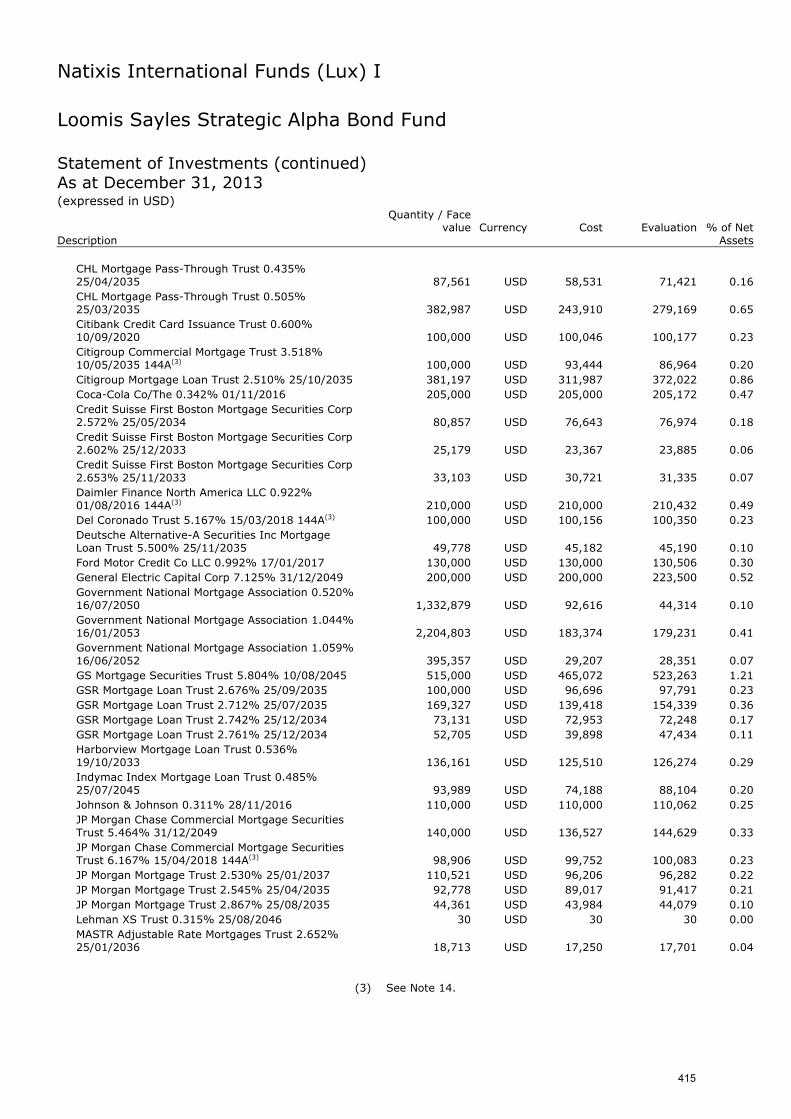
Natixis International Funds (Lux) I
Loomis Sayles Strategic Alpha Bond Fund Statement of Investments (continued) As at December 31, 2013 (expressed in USD)
Quantity / Face
value Currency Cost Evaluation % of Net Description Assets
CHL Mortgage Pass-Through Trust 0.435% 25/04/2035 87,561 USD 58,531 71,421 0.16 CHL Mortgage Pass-Through Trust 0.505% 25/03/2035 382,987 USD 243,910 279,169 0.65 Citibank Credit Card Issuance Trust 0.600% 10/09/2020 100,000 USD 100,046 100,177 0.23 Citigroup Commercial Mortgage Trust 3.518% 10/05/2035 144A(3) 100,000 USD 93,444 86,964 0.20 Citigroup Mortgage Loan Trust 2.510% 25/10/2035 381,197 USD 311,987 372,022 0.86 Coca-Cola Co/The 0.342% 01/11/2016 205,000 USD 205,000 205,172 0.47 Credit Suisse First Boston Mortgage Securities Corp 2.572% 25/05/2034 80,857 USD 76,643 76,974 0.18 Credit Suisse First Boston Mortgage Securities Corp 2.602% 25/12/2033 25,179 USD 23,367 23,885 0.06 Credit Suisse First Boston Mortgage Securities Corp 2.653% 25/11/2033 33,103 USD 30,721 31,335 0.07 Daimler Finance North America LLC 0.922% 01/08/2016 144A(3) 210,000 USD 210,000 210,432 0.49 Del Coronado Trust 5.167% 15/03/2018 144A(3) 100,000 USD 100,156 100,350 0.23 Deutsche Alternative-A Securities Inc Mortgage Loan Trust 5.500% 25/11/2035 49,778 USD 45,182 45,190 0.10 Ford Motor Credit Co LLC 0.992% 17/01/2017 130,000 USD 130,000 130,506 0.30 General Electric Capital Corp 7.125% 31/12/2049 200,000 USD 200,000 223,500 0.52 Government National Mortgage Association 0.520% 16/07/2050 1,332,879 USD 92,616 44,314 0.10 Government National Mortgage Association 1.044% 16/01/2053 2,204,803 USD 183,374 179,231 0.41 Government National Mortgage Association 1.059% 16/06/2052 395,357 USD 29,207 28,351 0.07 GS Mortgage Securities Trust 5.804% 10/08/2045 515,000 USD 465,072 523,263 1.21 GSR Mortgage Loan Trust 2.676% 25/09/2035 100,000 USD 96,696 97,791 0.23 GSR Mortgage Loan Trust 2.712% 25/07/2035 169,327 USD 139,418 154,339 0.36 GSR Mortgage Loan Trust 2.742% 25/12/2034 73,131 USD 72,953 72,248 0.17 GSR Mortgage Loan Trust 2.761% 25/12/2034 52,705 USD 39,898 47,434 0.11 Harborview Mortgage Loan Trust 0.536% 19/10/2033 136,161 USD 125,510 126,274 0.29 Indymac Index Mortgage Loan Trust 0.485% 25/07/2045 93,989 USD 74,188 88,104 0.20 Johnson & Johnson 0.311% 28/11/2016 110,000 USD 110,000 110,062 0.25 JP Morgan Chase Commercial Mortgage Securities Trust 5.464% 31/12/2049 140,000 USD 136,527 144,629 0.33 JP Morgan Chase Commercial Mortgage Securities Trust 6.167% 15/04/2018 144A(3) 98,906 USD 99,752 100,083 0.23 JP Morgan Mortgage Trust 2.530% 25/01/2037 110,521 USD 96,206 96,282 0.22 JP Morgan Mortgage Trust 2.545% 25/04/2035 92,778 USD 89,017 91,417 0.21 JP Morgan Mortgage Trust 2.867% 25/08/2035 44,361 USD 43,984 44,079 0.10 Lehman XS Trust 0.315% 25/08/2046 30 USD 30 30 0.00 MASTR Adjustable Rate Mortgages Trust 2.652% 25/01/2036 18,713 USD 17,250 17,701 0.04
(3) See Note 14.
415
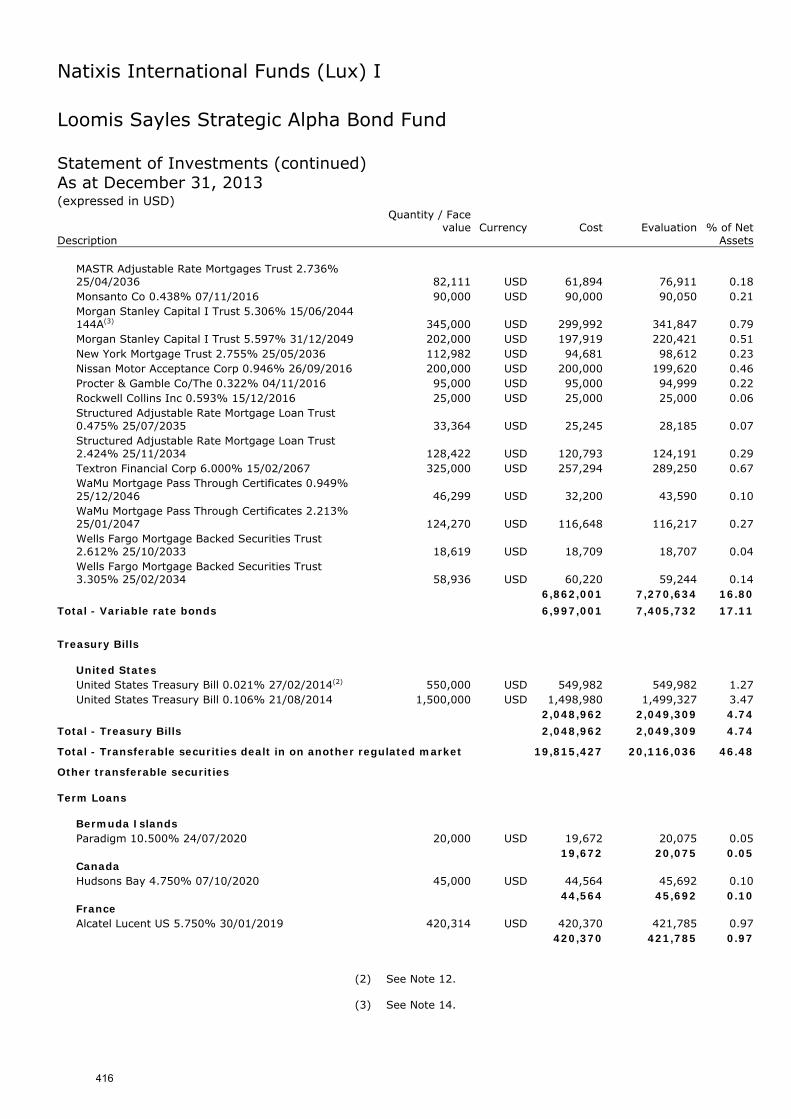
Natixis International Funds (Lux) I
Loomis Sayles Strategic Alpha Bond Fund Statement of Investments (continued) As at December 31, 2013 (expressed in USD)
Quantity / Face
value Currency Cost Evaluation % of Net Description Assets
MASTR Adjustable Rate Mortgages Trust 2.736% 25/04/2036 82,111 USD 61,894 76,911 0.18 Monsanto Co 0.438% 07/11/2016 90,000 USD 90,000 90,050 0.21 Morgan Stanley Capital I Trust 5.306% 15/06/2044 144A(3) 345,000 USD 299,992 341,847 0.79 Morgan Stanley Capital I Trust 5.597% 31/12/2049 202,000 USD 197,919 220,421 0.51 New York Mortgage Trust 2.755% 25/05/2036 112,982 USD 94,681 98,612 0.23 Nissan Motor Acceptance Corp 0.946% 26/09/2016 200,000 USD 200,000 199,620 0.46 Procter & Gamble Co/The 0.322% 04/11/2016 95,000 USD 95,000 94,999 0.22 Rockwell Collins Inc 0.593% 15/12/2016 25,000 USD 25,000 25,000 0.06 Structured Adjustable Rate Mortgage Loan Trust 0.475% 25/07/2035 33,364 USD 25,245 28,185 0.07 Structured Adjustable Rate Mortgage Loan Trust 2.424% 25/11/2034 128,422 USD 120,793 124,191 0.29 Textron Financial Corp 6.000% 15/02/2067 325,000 USD 257,294 289,250 0.67 WaMu Mortgage Pass Through Certificates 0.949% 25/12/2046 46,299 USD 32,200 43,590 0.10 WaMu Mortgage Pass Through Certificates 2.213% 25/01/2047 124,270 USD 116,648 116,217 0.27 Wells Fargo Mortgage Backed Securities Trust 2.612% 25/10/2033 18,619 USD 18,709 18,707 0.04 Wells Fargo Mortgage Backed Securities Trust 3.305% 25/02/2034 58,936 USD 60,220 59,244 0.14
6,862,001 7,270,634 16.80
Total - Variable rate bonds 6,997,001 7,405,732 17.11
Treasury Bills
United States United States Treasury Bill 0.021% 27/02/2014(2) 550,000 USD 549,982 549,982 1.27 United States Treasury Bill 0.106% 21/08/2014 1,500,000 USD 1,498,980 1,499,327 3.47
2,048,962 2,049,309 4.74
Total - Treasury Bills 2,048,962 2,049,309 4.74
Total - Transferable securities dealt in on another regulated market 19,815,427 20,116,036 46.48
Other transferable securities Term Loans
Bermuda Islands Paradigm 10.500% 24/07/2020 20,000 USD 19,672 20,075 0.05
19,672 20,075 0.05 Canada Hudsons Bay 4.750% 07/10/2020 45,000 USD 44,564 45,692 0.10
44,564 45,692 0.10 France Alcatel Lucent US 5.750% 30/01/2019 420,314 USD 420,370 421,785 0.97
420,370 421,785 0.97
(2) See Note 12.
(3) See Note 14.
416
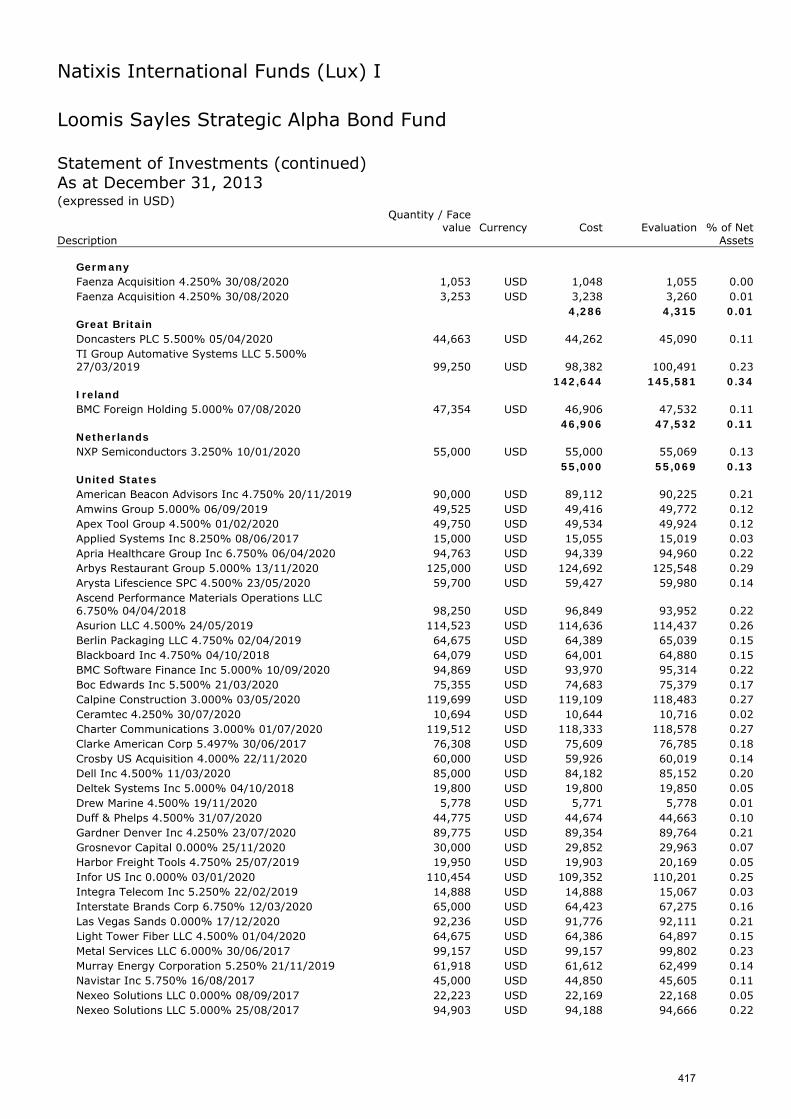
Natixis International Funds (Lux) I
Loomis Sayles Strategic Alpha Bond Fund Statement of Investments (continued) As at December 31, 2013 (expressed in USD)
Quantity / Face
value Currency Cost Evaluation % of Net Description Assets
Germany Faenza Acquisition 4.250% 30/08/2020 1,053 USD 1,048 1,055 0.00 Faenza Acquisition 4.250% 30/08/2020 3,253 USD 3,238 3,260 0.01
4,286 4,315 0.01 Great Britain Doncasters PLC 5.500% 05/04/2020 44,663 USD 44,262 45,090 0.11 TI Group Automative Systems LLC 5.500% 27/03/2019 99,250 USD 98,382 100,491 0.23
142,644 145,581 0.34 Ireland BMC Foreign Holding 5.000% 07/08/2020 47,354 USD 46,906 47,532 0.11
46,906 47,532 0.11 Netherlands NXP Semiconductors 3.250% 10/01/2020 55,000 USD 55,000 55,069 0.13
55,000 55,069 0.13 United States American Beacon Advisors Inc 4.750% 20/11/2019 90,000 USD 89,112 90,225 0.21 Amwins Group 5.000% 06/09/2019 49,525 USD 49,416 49,772 0.12 Apex Tool Group 4.500% 01/02/2020 49,750 USD 49,534 49,924 0.12 Applied Systems Inc 8.250% 08/06/2017 15,000 USD 15,055 15,019 0.03 Apria Healthcare Group Inc 6.750% 06/04/2020 94,763 USD 94,339 94,960 0.22 Arbys Restaurant Group 5.000% 13/11/2020 125,000 USD 124,692 125,548 0.29 Arysta Lifescience SPC 4.500% 23/05/2020 59,700 USD 59,427 59,980 0.14 Ascend Performance Materials Operations LLC 6.750% 04/04/2018 98,250 USD 96,849 93,952 0.22 Asurion LLC 4.500% 24/05/2019 114,523 USD 114,636 114,437 0.26 Berlin Packaging LLC 4.750% 02/04/2019 64,675 USD 64,389 65,039 0.15 Blackboard Inc 4.750% 04/10/2018 64,079 USD 64,001 64,880 0.15 BMC Software Finance Inc 5.000% 10/09/2020 94,869 USD 93,970 95,314 0.22 Boc Edwards Inc 5.500% 21/03/2020 75,355 USD 74,683 75,379 0.17 Calpine Construction 3.000% 03/05/2020 119,699 USD 119,109 118,483 0.27 Ceramtec 4.250% 30/07/2020 10,694 USD 10,644 10,716 0.02 Charter Communications 3.000% 01/07/2020 119,512 USD 118,333 118,578 0.27 Clarke American Corp 5.497% 30/06/2017 76,308 USD 75,609 76,785 0.18 Crosby US Acquisition 4.000% 22/11/2020 60,000 USD 59,926 60,019 0.14 Dell Inc 4.500% 11/03/2020 85,000 USD 84,182 85,152 0.20 Deltek Systems Inc 5.000% 04/10/2018 19,800 USD 19,800 19,850 0.05 Drew Marine 4.500% 19/11/2020 5,778 USD 5,771 5,778 0.01 Duff & Phelps 4.500% 31/07/2020 44,775 USD 44,674 44,663 0.10 Gardner Denver Inc 4.250% 23/07/2020 89,775 USD 89,354 89,764 0.21 Grosnevor Capital 0.000% 25/11/2020 30,000 USD 29,852 29,963 0.07 Harbor Freight Tools 4.750% 25/07/2019 19,950 USD 19,903 20,169 0.05 Infor US Inc 0.000% 03/01/2020 110,454 USD 109,352 110,201 0.25 Integra Telecom Inc 5.250% 22/02/2019 14,888 USD 14,888 15,067 0.03 Interstate Brands Corp 6.750% 12/03/2020 65,000 USD 64,423 67,275 0.16 Las Vegas Sands 0.000% 17/12/2020 92,236 USD 91,776 92,111 0.21 Light Tower Fiber LLC 4.500% 01/04/2020 64,675 USD 64,386 64,897 0.15 Metal Services LLC 6.000% 30/06/2017 99,157 USD 99,157 99,802 0.23 Murray Energy Corporation 5.250% 21/11/2019 61,918 USD 61,612 62,499 0.14 Navistar Inc 5.750% 16/08/2017 45,000 USD 44,850 45,605 0.11 Nexeo Solutions LLC 0.000% 08/09/2017 22,223 USD 22,169 22,168 0.05 Nexeo Solutions LLC 5.000% 25/08/2017 94,903 USD 94,188 94,666 0.22
417
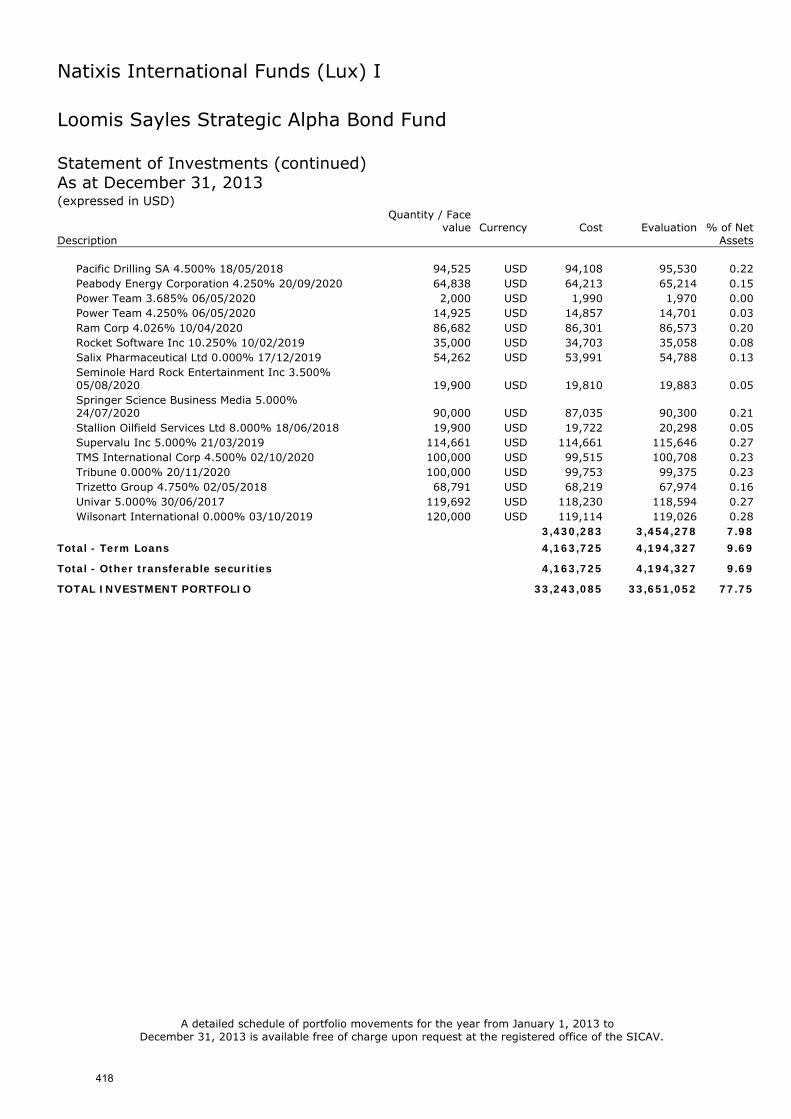
Natixis International Funds (Lux) I
Loomis Sayles Strategic Alpha Bond Fund Statement of Investments (continued) As at December 31, 2013 (expressed in USD)
Quantity / Face
value Currency Cost Evaluation % of Net Description Assets
Pacific Drilling SA 4.500% 18/05/2018 94,525 USD 94,108 95,530 0.22 Peabody Energy Corporation 4.250% 20/09/2020 64,838 USD 64,213 65,214 0.15 Power Team 3.685% 06/05/2020 2,000 USD 1,990 1,970 0.00 Power Team 4.250% 06/05/2020 14,925 USD 14,857 14,701 0.03 Ram Corp 4.026% 10/04/2020 86,682 USD 86,301 86,573 0.20 Rocket Software Inc 10.250% 10/02/2019 35,000 USD 34,703 35,058 0.08 Salix Pharmaceutical Ltd 0.000% 17/12/2019 54,262 USD 53,991 54,788 0.13 Seminole Hard Rock Entertainment Inc 3.500% 05/08/2020 19,900 USD 19,810 19,883 0.05 Springer Science Business Media 5.000% 24/07/2020 90,000 USD 87,035 90,300 0.21 Stallion Oilfield Services Ltd 8.000% 18/06/2018 19,900 USD 19,722 20,298 0.05 Supervalu Inc 5.000% 21/03/2019 114,661 USD 114,661 115,646 0.27 TMS International Corp 4.500% 02/10/2020 100,000 USD 99,515 100,708 0.23 Tribune 0.000% 20/11/2020 100,000 USD 99,753 99,375 0.23 Trizetto Group 4.750% 02/05/2018 68,791 USD 68,219 67,974 0.16 Univar 5.000% 30/06/2017 119,692 USD 118,230 118,594 0.27 Wilsonart International 0.000% 03/10/2019 120,000 USD 119,114 119,026 0.28
3,430,283 3,454,278 7.98
Total - Term Loans 4,163,725 4,194,327 9.69
Total - Other transferable securities 4,163,725 4,194,327 9.69
TOTAL INVESTMENT PORTFOLIO 33,243,085 33,651,052 77.75 A detailed schedule of portfolio movements for the year from January 1, 2013 to
December 31, 2013 is available free of charge upon request at the registered office of the SICAV.
418
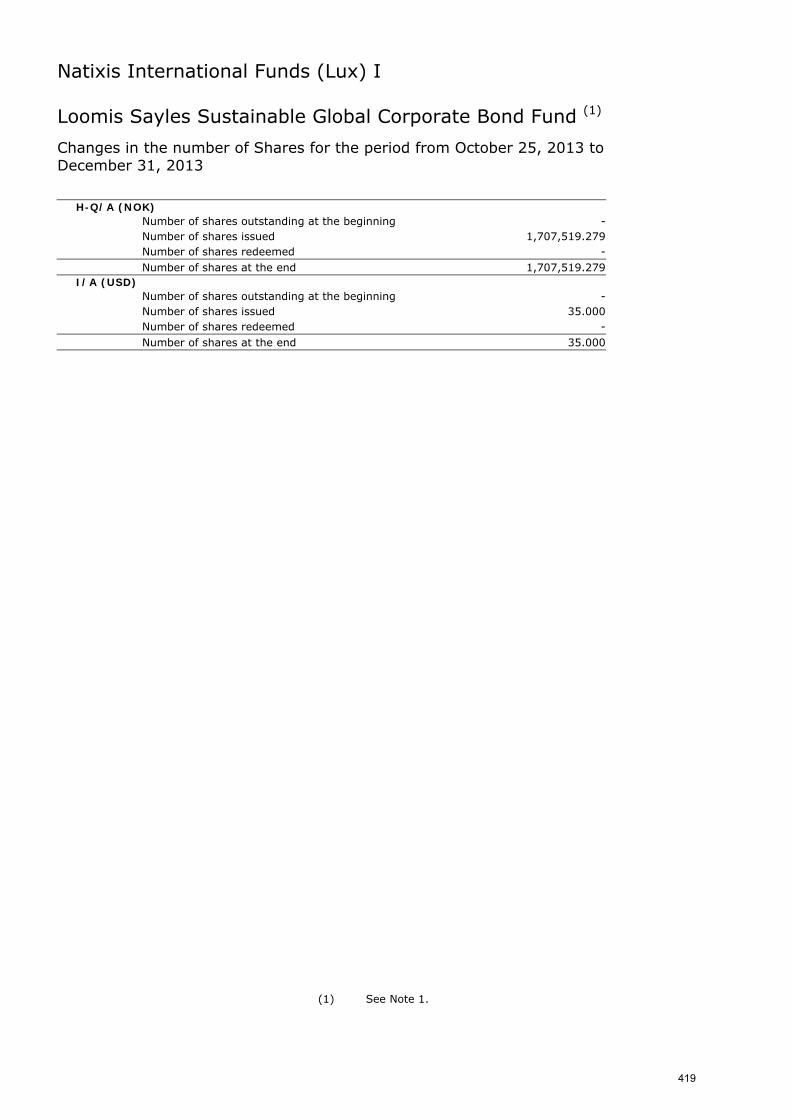
Natixis International Funds (Lux) I
Loomis Sayles Sustainable Global Corporate Bond Fund (1)
Changes in the number of Shares for the period from October 25, 2013 to December 31, 2013
H-Q/A (NOK) Number of shares outstanding at the beginning - Number of shares issued 1,707,519.279 Number of shares redeemed - Number of shares at the end 1,707,519.279
I/A (USD) Number of shares outstanding at the beginning - Number of shares issued 35.000
Number of shares redeemed - Number of shares at the end 35.000
(1) See Note 1.
419
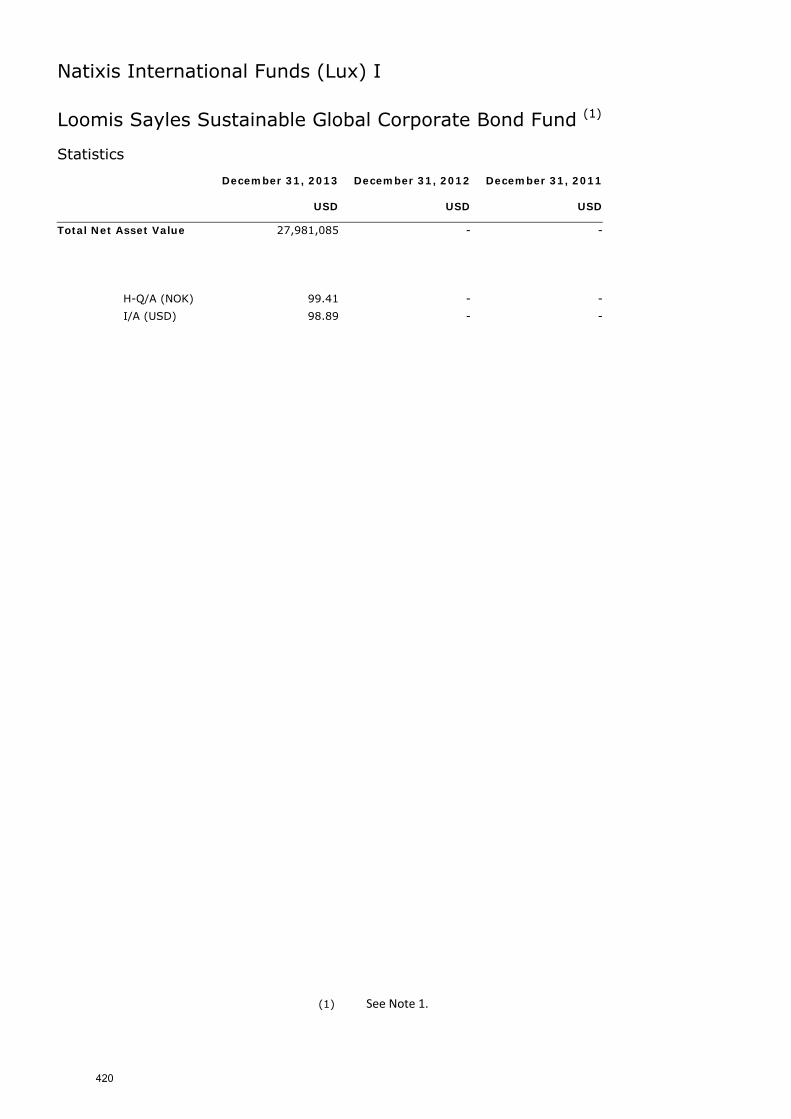
Natixis International Funds (Lux) I
Loomis Sayles Sustainable Global Corporate Bond Fund (1)
Statistics December 31, 2013 December 31, 2012 December 31, 2011 USD USD USD
Total Net Asset Value 27,981,085 - -
H-Q/A (NOK) 99.41 - -
I/A (USD) 98.89 - -
(1) See Note 1.
420
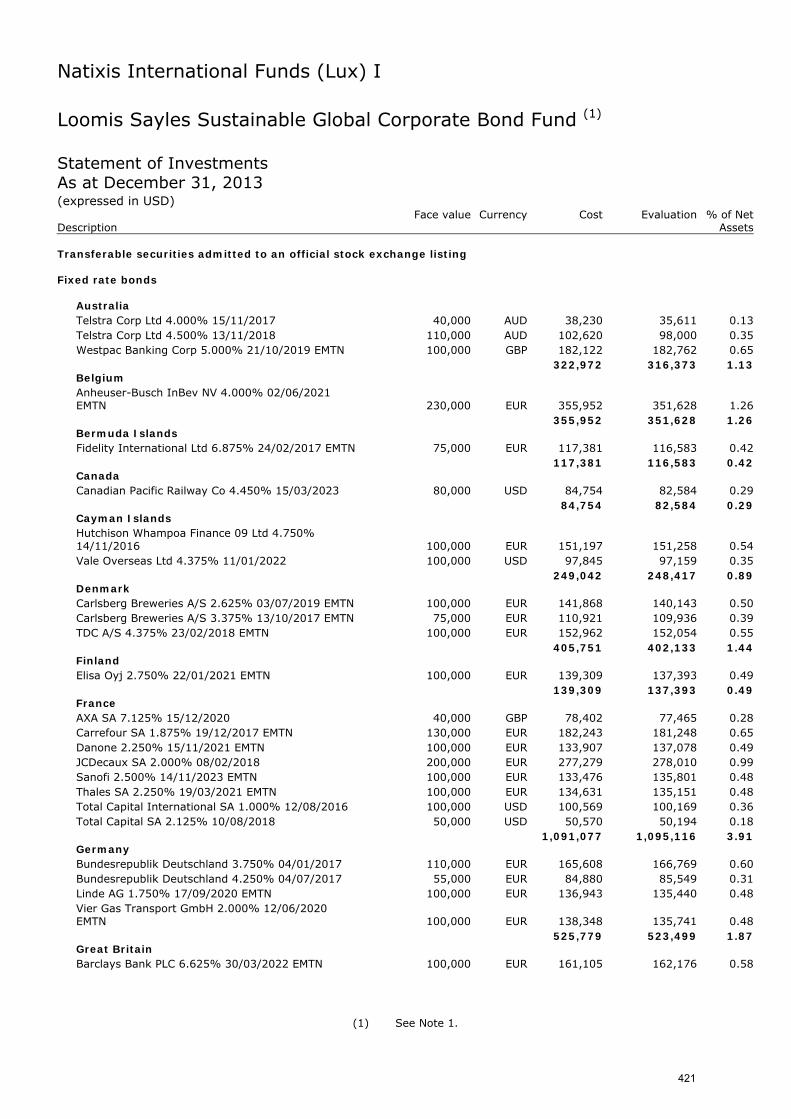
Natixis International Funds (Lux) I
Loomis Sayles Sustainable Global Corporate Bond Fund (1) Statement of Investments As at December 31, 2013 (expressed in USD) Face value Currency Cost Evaluation % of Net Description Assets Transferable securities admitted to an official stock exchange listing Fixed rate bonds
Australia Telstra Corp Ltd 4.000% 15/11/2017 40,000 AUD 38,230 35,611 0.13 Telstra Corp Ltd 4.500% 13/11/2018 110,000 AUD 102,620 98,000 0.35 Westpac Banking Corp 5.000% 21/10/2019 EMTN 100,000 GBP 182,122 182,762 0.65
322,972 316,373 1.13 Belgium Anheuser-Busch InBev NV 4.000% 02/06/2021 EMTN 230,000 EUR 355,952 351,628 1.26
355,952 351,628 1.26 Bermuda Islands Fidelity International Ltd 6.875% 24/02/2017 EMTN 75,000 EUR 117,381 116,583 0.42
117,381 116,583 0.42 Canada Canadian Pacific Railway Co 4.450% 15/03/2023 80,000 USD 84,754 82,584 0.29
84,754 82,584 0.29 Cayman Islands Hutchison Whampoa Finance 09 Ltd 4.750% 14/11/2016 100,000 EUR 151,197 151,258 0.54 Vale Overseas Ltd 4.375% 11/01/2022 100,000 USD 97,845 97,159 0.35
249,042 248,417 0.89 Denmark Carlsberg Breweries A/S 2.625% 03/07/2019 EMTN 100,000 EUR 141,868 140,143 0.50 Carlsberg Breweries A/S 3.375% 13/10/2017 EMTN 75,000 EUR 110,921 109,936 0.39 TDC A/S 4.375% 23/02/2018 EMTN 100,000 EUR 152,962 152,054 0.55
405,751 402,133 1.44 Finland Elisa Oyj 2.750% 22/01/2021 EMTN 100,000 EUR 139,309 137,393 0.49
139,309 137,393 0.49 France AXA SA 7.125% 15/12/2020 40,000 GBP 78,402 77,465 0.28 Carrefour SA 1.875% 19/12/2017 EMTN 130,000 EUR 182,243 181,248 0.65 Danone 2.250% 15/11/2021 EMTN 100,000 EUR 133,907 137,078 0.49 JCDecaux SA 2.000% 08/02/2018 200,000 EUR 277,279 278,010 0.99 Sanofi 2.500% 14/11/2023 EMTN 100,000 EUR 133,476 135,801 0.48 Thales SA 2.250% 19/03/2021 EMTN 100,000 EUR 134,631 135,151 0.48 Total Capital International SA 1.000% 12/08/2016 100,000 USD 100,569 100,169 0.36 Total Capital SA 2.125% 10/08/2018 50,000 USD 50,570 50,194 0.18
1,091,077 1,095,116 3.91 Germany Bundesrepublik Deutschland 3.750% 04/01/2017 110,000 EUR 165,608 166,769 0.60 Bundesrepublik Deutschland 4.250% 04/07/2017 55,000 EUR 84,880 85,549 0.31 Linde AG 1.750% 17/09/2020 EMTN 100,000 EUR 136,943 135,440 0.48 Vier Gas Transport GmbH 2.000% 12/06/2020 EMTN 100,000 EUR 138,348 135,741 0.48
525,779 523,499 1.87 Great Britain Barclays Bank PLC 6.625% 30/03/2022 EMTN 100,000 EUR 161,105 162,176 0.58
(1) See Note 1.
421
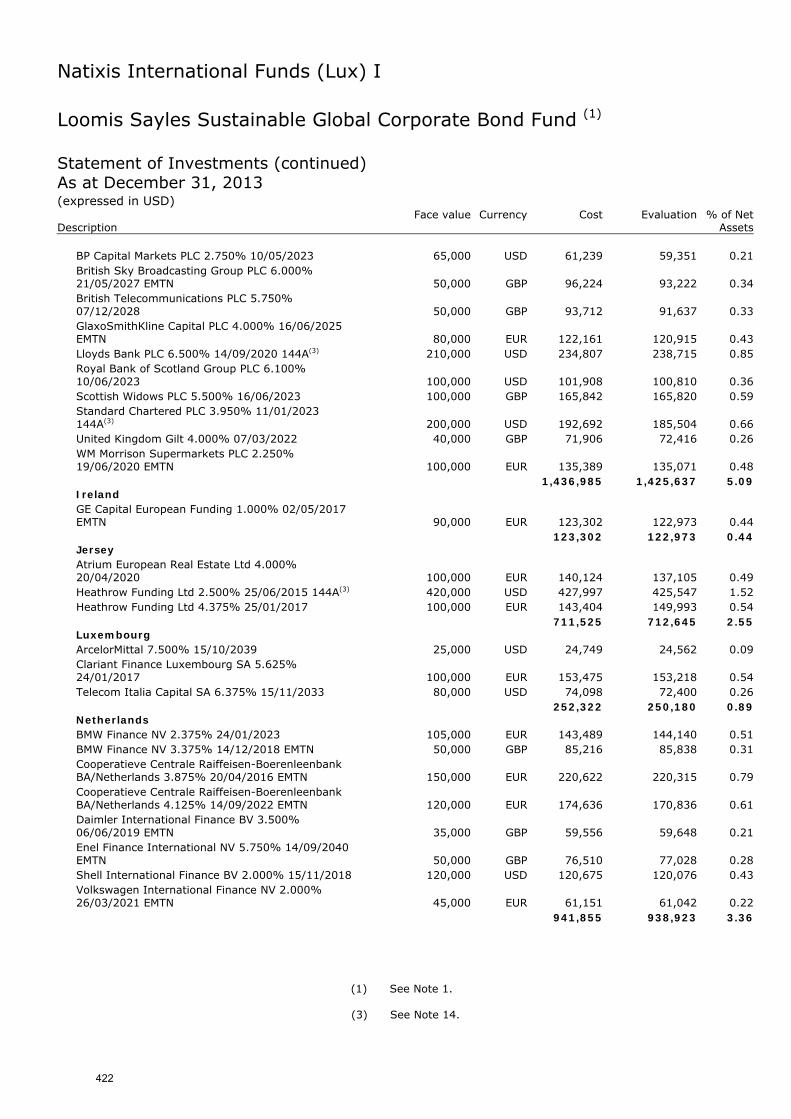
Natixis International Funds (Lux) I
Loomis Sayles Sustainable Global Corporate Bond Fund (1) Statement of Investments (continued) As at December 31, 2013 (expressed in USD) Face value Currency Cost Evaluation % of Net Description Assets
BP Capital Markets PLC 2.750% 10/05/2023 65,000 USD 61,239 59,351 0.21 British Sky Broadcasting Group PLC 6.000% 21/05/2027 EMTN 50,000 GBP 96,224 93,222 0.34 British Telecommunications PLC 5.750% 07/12/2028 50,000 GBP 93,712 91,637 0.33 GlaxoSmithKline Capital PLC 4.000% 16/06/2025 EMTN 80,000 EUR 122,161 120,915 0.43 Lloyds Bank PLC 6.500% 14/09/2020 144A(3) 210,000 USD 234,807 238,715 0.85 Royal Bank of Scotland Group PLC 6.100% 10/06/2023 100,000 USD 101,908 100,810 0.36 Scottish Widows PLC 5.500% 16/06/2023 100,000 GBP 165,842 165,820 0.59 Standard Chartered PLC 3.950% 11/01/2023 144A(3) 200,000 USD 192,692 185,504 0.66 United Kingdom Gilt 4.000% 07/03/2022 40,000 GBP 71,906 72,416 0.26 WM Morrison Supermarkets PLC 2.250% 19/06/2020 EMTN 100,000 EUR 135,389 135,071 0.48
1,436,985 1,425,637 5.09 Ireland GE Capital European Funding 1.000% 02/05/2017 EMTN 90,000 EUR 123,302 122,973 0.44
123,302 122,973 0.44 Jersey Atrium European Real Estate Ltd 4.000% 20/04/2020 100,000 EUR 140,124 137,105 0.49 Heathrow Funding Ltd 2.500% 25/06/2015 144A(3) 420,000 USD 427,997 425,547 1.52 Heathrow Funding Ltd 4.375% 25/01/2017 100,000 EUR 143,404 149,993 0.54
711,525 712,645 2.55 Luxembourg ArcelorMittal 7.500% 15/10/2039 25,000 USD 24,749 24,562 0.09 Clariant Finance Luxembourg SA 5.625% 24/01/2017 100,000 EUR 153,475 153,218 0.54 Telecom Italia Capital SA 6.375% 15/11/2033 80,000 USD 74,098 72,400 0.26
252,322 250,180 0.89 Netherlands BMW Finance NV 2.375% 24/01/2023 105,000 EUR 143,489 144,140 0.51 BMW Finance NV 3.375% 14/12/2018 EMTN 50,000 GBP 85,216 85,838 0.31 Cooperatieve Centrale Raiffeisen-Boerenleenbank BA/Netherlands 3.875% 20/04/2016 EMTN 150,000 EUR 220,622 220,315 0.79 Cooperatieve Centrale Raiffeisen-Boerenleenbank BA/Netherlands 4.125% 14/09/2022 EMTN 120,000 EUR 174,636 170,836 0.61 Daimler International Finance BV 3.500% 06/06/2019 EMTN 35,000 GBP 59,556 59,648 0.21 Enel Finance International NV 5.750% 14/09/2040 EMTN 50,000 GBP 76,510 77,028 0.28 Shell International Finance BV 2.000% 15/11/2018 120,000 USD 120,675 120,076 0.43 Volkswagen International Finance NV 2.000% 26/03/2021 EMTN 45,000 EUR 61,151 61,042 0.22
941,855 938,923 3.36
(1) See Note 1.
(3) See Note 14.
422
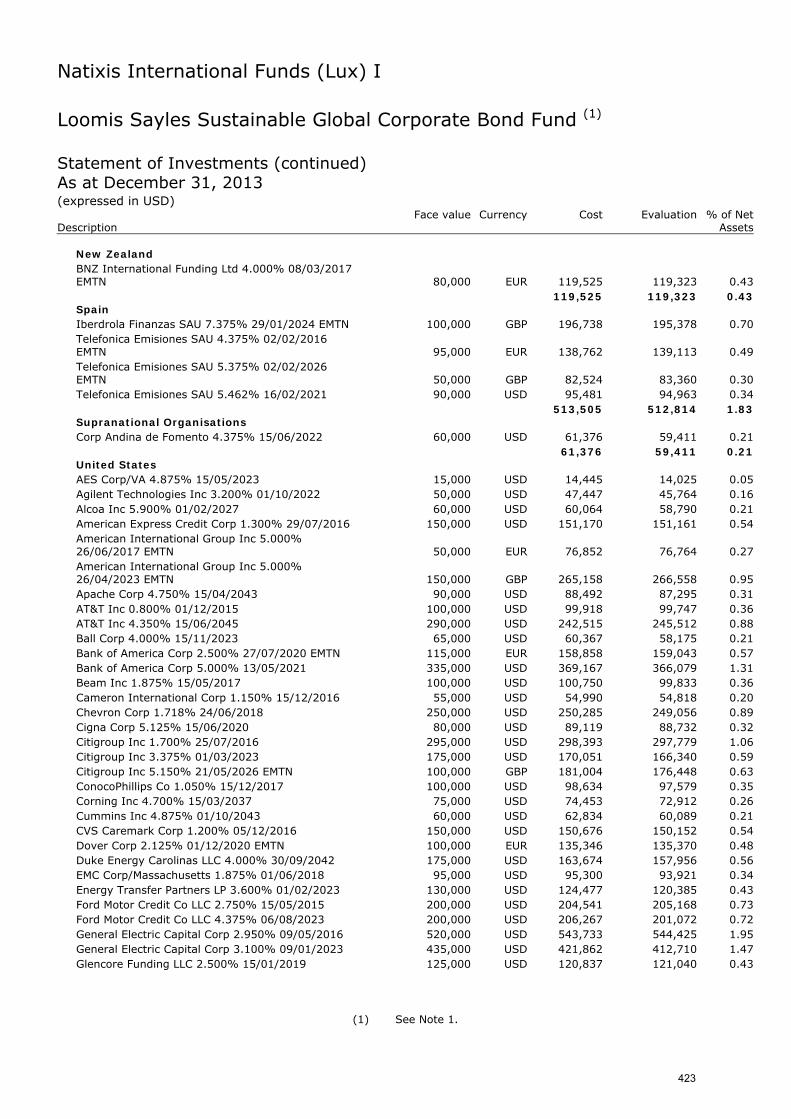
Natixis International Funds (Lux) I
Loomis Sayles Sustainable Global Corporate Bond Fund (1) Statement of Investments (continued) As at December 31, 2013 (expressed in USD) Face value Currency Cost Evaluation % of Net Description Assets
New Zealand BNZ International Funding Ltd 4.000% 08/03/2017 EMTN 80,000 EUR 119,525 119,323 0.43
119,525 119,323 0.43 Spain Iberdrola Finanzas SAU 7.375% 29/01/2024 EMTN 100,000 GBP 196,738 195,378 0.70 Telefonica Emisiones SAU 4.375% 02/02/2016 EMTN 95,000 EUR 138,762 139,113 0.49 Telefonica Emisiones SAU 5.375% 02/02/2026 EMTN 50,000 GBP 82,524 83,360 0.30 Telefonica Emisiones SAU 5.462% 16/02/2021 90,000 USD 95,481 94,963 0.34
513,505 512,814 1.83 Supranational Organisations Corp Andina de Fomento 4.375% 15/06/2022 60,000 USD 61,376 59,411 0.21
61,376 59,411 0.21 United States AES Corp/VA 4.875% 15/05/2023 15,000 USD 14,445 14,025 0.05 Agilent Technologies Inc 3.200% 01/10/2022 50,000 USD 47,447 45,764 0.16 Alcoa Inc 5.900% 01/02/2027 60,000 USD 60,064 58,790 0.21 American Express Credit Corp 1.300% 29/07/2016 150,000 USD 151,170 151,161 0.54 American International Group Inc 5.000% 26/06/2017 EMTN 50,000 EUR 76,852 76,764 0.27 American International Group Inc 5.000% 26/04/2023 EMTN 150,000 GBP 265,158 266,558 0.95 Apache Corp 4.750% 15/04/2043 90,000 USD 88,492 87,295 0.31 AT&T Inc 0.800% 01/12/2015 100,000 USD 99,918 99,747 0.36 AT&T Inc 4.350% 15/06/2045 290,000 USD 242,515 245,512 0.88 Ball Corp 4.000% 15/11/2023 65,000 USD 60,367 58,175 0.21 Bank of America Corp 2.500% 27/07/2020 EMTN 115,000 EUR 158,858 159,043 0.57 Bank of America Corp 5.000% 13/05/2021 335,000 USD 369,167 366,079 1.31 Beam Inc 1.875% 15/05/2017 100,000 USD 100,750 99,833 0.36 Cameron International Corp 1.150% 15/12/2016 55,000 USD 54,990 54,818 0.20 Chevron Corp 1.718% 24/06/2018 250,000 USD 250,285 249,056 0.89 Cigna Corp 5.125% 15/06/2020 80,000 USD 89,119 88,732 0.32 Citigroup Inc 1.700% 25/07/2016 295,000 USD 298,393 297,779 1.06 Citigroup Inc 3.375% 01/03/2023 175,000 USD 170,051 166,340 0.59 Citigroup Inc 5.150% 21/05/2026 EMTN 100,000 GBP 181,004 176,448 0.63 ConocoPhillips Co 1.050% 15/12/2017 100,000 USD 98,634 97,579 0.35 Corning Inc 4.700% 15/03/2037 75,000 USD 74,453 72,912 0.26 Cummins Inc 4.875% 01/10/2043 60,000 USD 62,834 60,089 0.21 CVS Caremark Corp 1.200% 05/12/2016 150,000 USD 150,676 150,152 0.54 Dover Corp 2.125% 01/12/2020 EMTN 100,000 EUR 135,346 135,370 0.48 Duke Energy Carolinas LLC 4.000% 30/09/2042 175,000 USD 163,674 157,956 0.56 EMC Corp/Massachusetts 1.875% 01/06/2018 95,000 USD 95,300 93,921 0.34 Energy Transfer Partners LP 3.600% 01/02/2023 130,000 USD 124,477 120,385 0.43 Ford Motor Credit Co LLC 2.750% 15/05/2015 200,000 USD 204,541 205,168 0.73 Ford Motor Credit Co LLC 4.375% 06/08/2023 200,000 USD 206,267 201,072 0.72 General Electric Capital Corp 2.950% 09/05/2016 520,000 USD 543,733 544,425 1.95 General Electric Capital Corp 3.100% 09/01/2023 435,000 USD 421,862 412,710 1.47 Glencore Funding LLC 2.500% 15/01/2019 125,000 USD 120,837 121,040 0.43
(1) See Note 1.
423
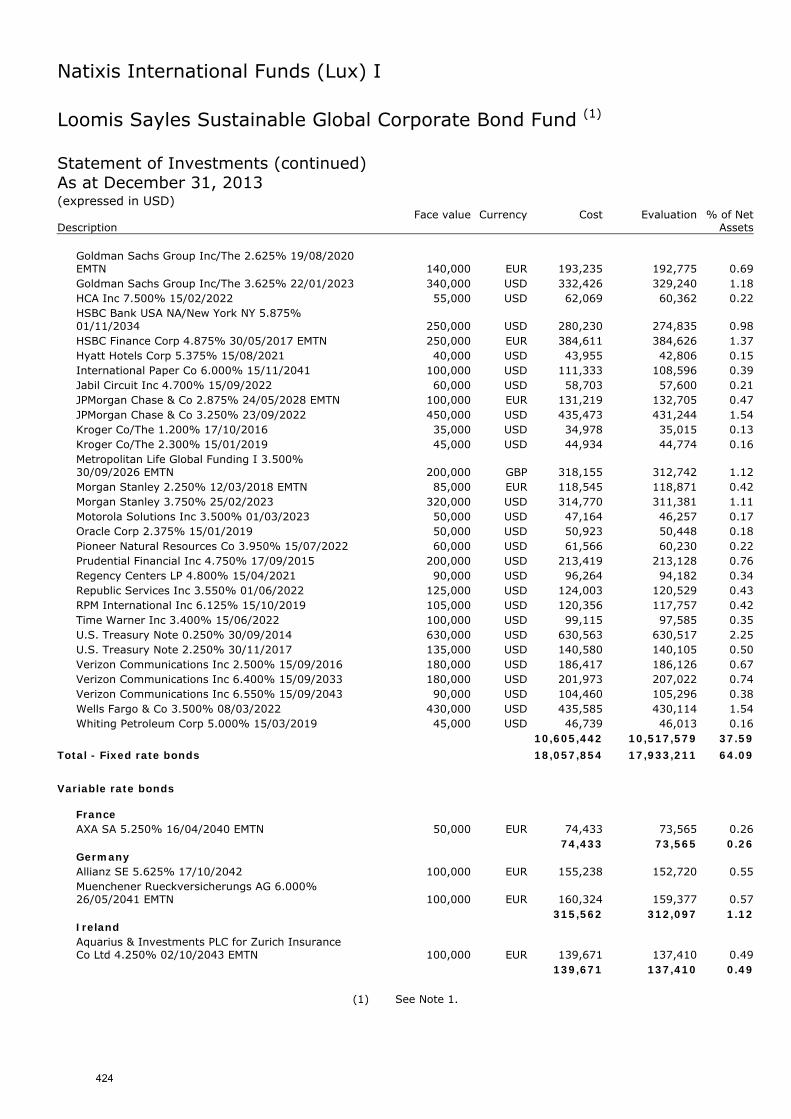
Natixis International Funds (Lux) I
Loomis Sayles Sustainable Global Corporate Bond Fund (1) Statement of Investments (continued) As at December 31, 2013 (expressed in USD) Face value Currency Cost Evaluation % of Net Description Assets
Goldman Sachs Group Inc/The 2.625% 19/08/2020 EMTN 140,000 EUR 193,235 192,775 0.69 Goldman Sachs Group Inc/The 3.625% 22/01/2023 340,000 USD 332,426 329,240 1.18 HCA Inc 7.500% 15/02/2022 55,000 USD 62,069 60,362 0.22 HSBC Bank USA NA/New York NY 5.875% 01/11/2034 250,000 USD 280,230 274,835 0.98 HSBC Finance Corp 4.875% 30/05/2017 EMTN 250,000 EUR 384,611 384,626 1.37 Hyatt Hotels Corp 5.375% 15/08/2021 40,000 USD 43,955 42,806 0.15 International Paper Co 6.000% 15/11/2041 100,000 USD 111,333 108,596 0.39 Jabil Circuit Inc 4.700% 15/09/2022 60,000 USD 58,703 57,600 0.21 JPMorgan Chase & Co 2.875% 24/05/2028 EMTN 100,000 EUR 131,219 132,705 0.47 JPMorgan Chase & Co 3.250% 23/09/2022 450,000 USD 435,473 431,244 1.54 Kroger Co/The 1.200% 17/10/2016 35,000 USD 34,978 35,015 0.13 Kroger Co/The 2.300% 15/01/2019 45,000 USD 44,934 44,774 0.16 Metropolitan Life Global Funding I 3.500% 30/09/2026 EMTN 200,000 GBP 318,155 312,742 1.12 Morgan Stanley 2.250% 12/03/2018 EMTN 85,000 EUR 118,545 118,871 0.42 Morgan Stanley 3.750% 25/02/2023 320,000 USD 314,770 311,381 1.11 Motorola Solutions Inc 3.500% 01/03/2023 50,000 USD 47,164 46,257 0.17 Oracle Corp 2.375% 15/01/2019 50,000 USD 50,923 50,448 0.18 Pioneer Natural Resources Co 3.950% 15/07/2022 60,000 USD 61,566 60,230 0.22 Prudential Financial Inc 4.750% 17/09/2015 200,000 USD 213,419 213,128 0.76 Regency Centers LP 4.800% 15/04/2021 90,000 USD 96,264 94,182 0.34 Republic Services Inc 3.550% 01/06/2022 125,000 USD 124,003 120,529 0.43 RPM International Inc 6.125% 15/10/2019 105,000 USD 120,356 117,757 0.42 Time Warner Inc 3.400% 15/06/2022 100,000 USD 99,115 97,585 0.35 U.S. Treasury Note 0.250% 30/09/2014 630,000 USD 630,563 630,517 2.25 U.S. Treasury Note 2.250% 30/11/2017 135,000 USD 140,580 140,105 0.50 Verizon Communications Inc 2.500% 15/09/2016 180,000 USD 186,417 186,126 0.67 Verizon Communications Inc 6.400% 15/09/2033 180,000 USD 201,973 207,022 0.74 Verizon Communications Inc 6.550% 15/09/2043 90,000 USD 104,460 105,296 0.38 Wells Fargo & Co 3.500% 08/03/2022 430,000 USD 435,585 430,114 1.54 Whiting Petroleum Corp 5.000% 15/03/2019 45,000 USD 46,739 46,013 0.16
10,605,442 10,517,579 37.59
Total - Fixed rate bonds 18,057,854 17,933,211 64.09
Variable rate bonds
France AXA SA 5.250% 16/04/2040 EMTN 50,000 EUR 74,433 73,565 0.26
74,433 73,565 0.26 Germany Allianz SE 5.625% 17/10/2042 100,000 EUR 155,238 152,720 0.55 Muenchener Rueckversicherungs AG 6.000% 26/05/2041 EMTN 100,000 EUR 160,324 159,377 0.57
315,562 312,097 1.12 Ireland Aquarius & Investments PLC for Zurich Insurance Co Ltd 4.250% 02/10/2043 EMTN 100,000 EUR 139,671 137,410 0.49
139,671 137,410 0.49
(1) See Note 1.
424
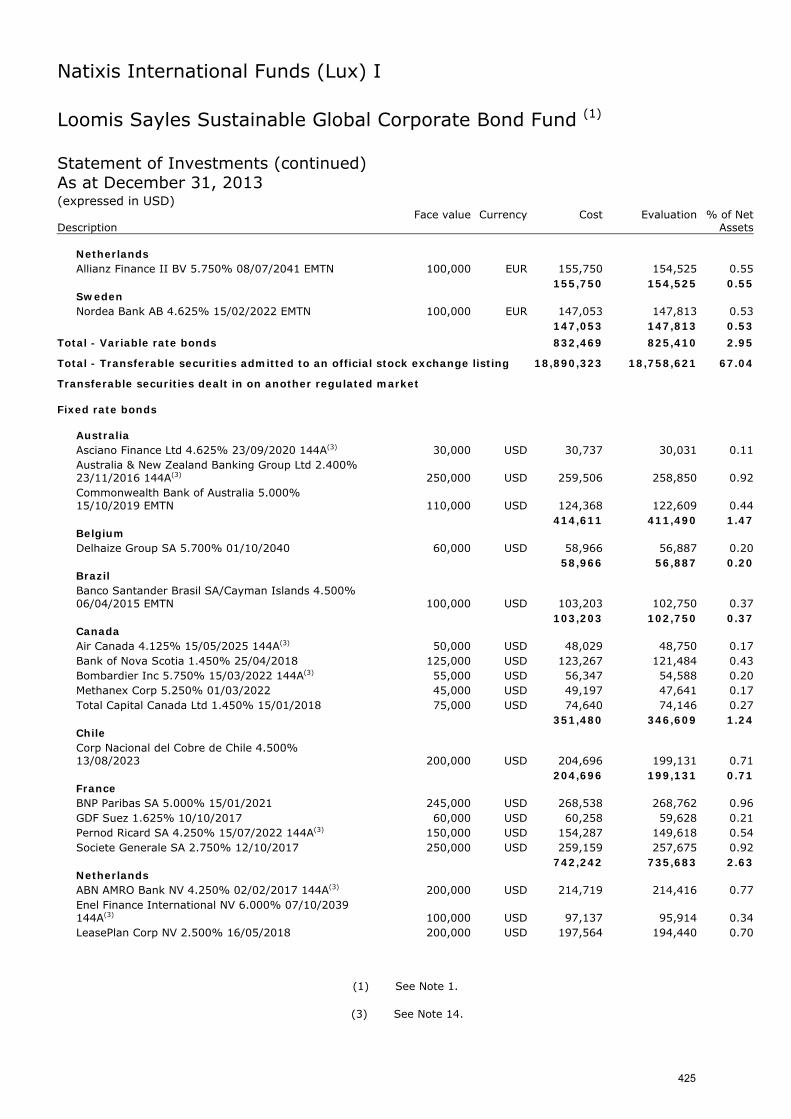
Natixis International Funds (Lux) I
Loomis Sayles Sustainable Global Corporate Bond Fund (1) Statement of Investments (continued) As at December 31, 2013 (expressed in USD) Face value Currency Cost Evaluation % of Net Description Assets
Netherlands Allianz Finance II BV 5.750% 08/07/2041 EMTN 100,000 EUR 155,750 154,525 0.55
155,750 154,525 0.55 Sweden Nordea Bank AB 4.625% 15/02/2022 EMTN 100,000 EUR 147,053 147,813 0.53
147,053 147,813 0.53
Total - Variable rate bonds 832,469 825,410 2.95
Total - Transferable securities admitted to an official stock exchange listing 18,890,323 18,758,621 67.04
Transferable securities dealt in on another regulated market Fixed rate bonds
Australia Asciano Finance Ltd 4.625% 23/09/2020 144A(3) 30,000 USD 30,737 30,031 0.11 Australia & New Zealand Banking Group Ltd 2.400% 23/11/2016 144A(3) 250,000 USD 259,506 258,850 0.92 Commonwealth Bank of Australia 5.000% 15/10/2019 EMTN 110,000 USD 124,368 122,609 0.44
414,611 411,490 1.47 Belgium Delhaize Group SA 5.700% 01/10/2040 60,000 USD 58,966 56,887 0.20
58,966 56,887 0.20 Brazil Banco Santander Brasil SA/Cayman Islands 4.500% 06/04/2015 EMTN 100,000 USD 103,203 102,750 0.37
103,203 102,750 0.37 Canada Air Canada 4.125% 15/05/2025 144A(3) 50,000 USD 48,029 48,750 0.17 Bank of Nova Scotia 1.450% 25/04/2018 125,000 USD 123,267 121,484 0.43 Bombardier Inc 5.750% 15/03/2022 144A(3) 55,000 USD 56,347 54,588 0.20 Methanex Corp 5.250% 01/03/2022 45,000 USD 49,197 47,641 0.17 Total Capital Canada Ltd 1.450% 15/01/2018 75,000 USD 74,640 74,146 0.27
351,480 346,609 1.24 Chile Corp Nacional del Cobre de Chile 4.500% 13/08/2023 200,000 USD 204,696 199,131 0.71
204,696 199,131 0.71 France BNP Paribas SA 5.000% 15/01/2021 245,000 USD 268,538 268,762 0.96 GDF Suez 1.625% 10/10/2017 60,000 USD 60,258 59,628 0.21 Pernod Ricard SA 4.250% 15/07/2022 144A(3) 150,000 USD 154,287 149,618 0.54 Societe Generale SA 2.750% 12/10/2017 250,000 USD 259,159 257,675 0.92
742,242 735,683 2.63 Netherlands ABN AMRO Bank NV 4.250% 02/02/2017 144A(3) 200,000 USD 214,719 214,416 0.77 Enel Finance International NV 6.000% 07/10/2039 144A(3) 100,000 USD 97,137 95,914 0.34 LeasePlan Corp NV 2.500% 16/05/2018 200,000 USD 197,564 194,440 0.70
(1) See Note 1.
(3) See Note 14.
425
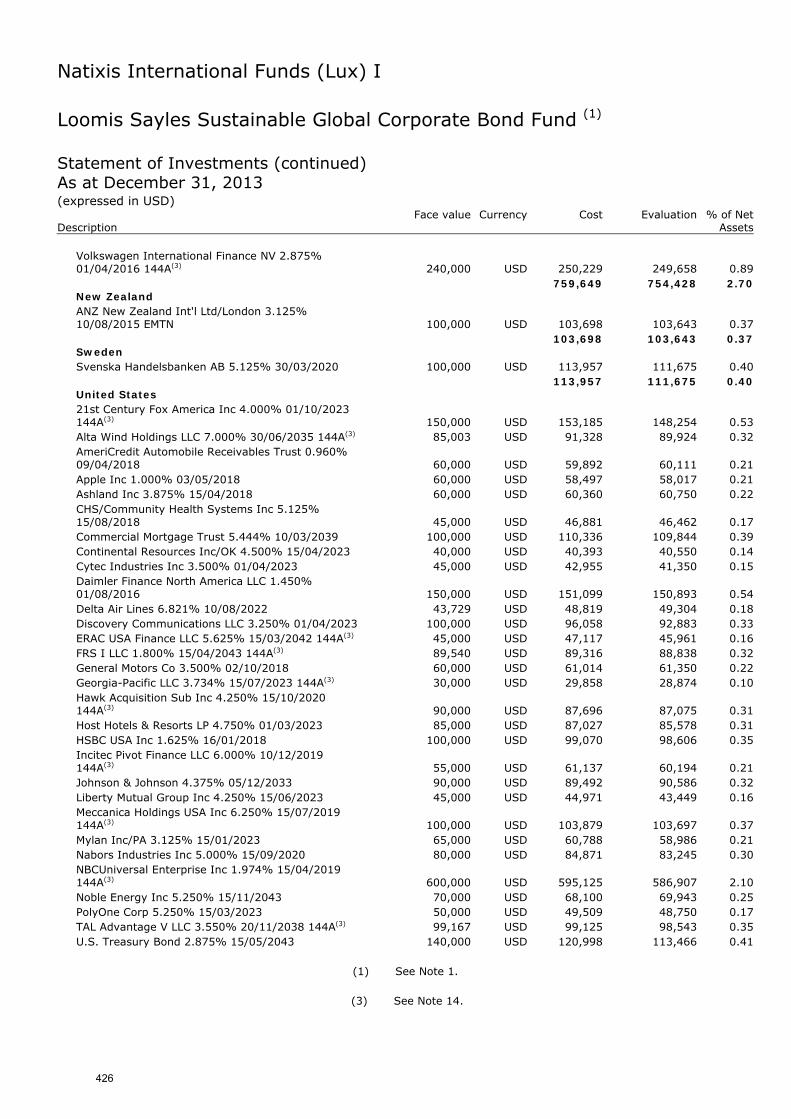
Natixis International Funds (Lux) I
Loomis Sayles Sustainable Global Corporate Bond Fund (1) Statement of Investments (continued) As at December 31, 2013 (expressed in USD) Face value Currency Cost Evaluation % of Net Description Assets
Volkswagen International Finance NV 2.875% 01/04/2016 144A(3) 240,000 USD 250,229 249,658 0.89
759,649 754,428 2.70 New Zealand ANZ New Zealand Int'l Ltd/London 3.125% 10/08/2015 EMTN 100,000 USD 103,698 103,643 0.37
103,698 103,643 0.37 Sweden Svenska Handelsbanken AB 5.125% 30/03/2020 100,000 USD 113,957 111,675 0.40
113,957 111,675 0.40 United States 21st Century Fox America Inc 4.000% 01/10/2023 144A(3) 150,000 USD 153,185 148,254 0.53 Alta Wind Holdings LLC 7.000% 30/06/2035 144A(3) 85,003 USD 91,328 89,924 0.32 AmeriCredit Automobile Receivables Trust 0.960% 09/04/2018 60,000 USD 59,892 60,111 0.21 Apple Inc 1.000% 03/05/2018 60,000 USD 58,497 58,017 0.21 Ashland Inc 3.875% 15/04/2018 60,000 USD 60,360 60,750 0.22 CHS/Community Health Systems Inc 5.125% 15/08/2018 45,000 USD 46,881 46,462 0.17 Commercial Mortgage Trust 5.444% 10/03/2039 100,000 USD 110,336 109,844 0.39 Continental Resources Inc/OK 4.500% 15/04/2023 40,000 USD 40,393 40,550 0.14 Cytec Industries Inc 3.500% 01/04/2023 45,000 USD 42,955 41,350 0.15 Daimler Finance North America LLC 1.450% 01/08/2016 150,000 USD 151,099 150,893 0.54 Delta Air Lines 6.821% 10/08/2022 43,729 USD 48,819 49,304 0.18 Discovery Communications LLC 3.250% 01/04/2023 100,000 USD 96,058 92,883 0.33 ERAC USA Finance LLC 5.625% 15/03/2042 144A(3) 45,000 USD 47,117 45,961 0.16 FRS I LLC 1.800% 15/04/2043 144A(3) 89,540 USD 89,316 88,838 0.32 General Motors Co 3.500% 02/10/2018 60,000 USD 61,014 61,350 0.22 Georgia-Pacific LLC 3.734% 15/07/2023 144A(3) 30,000 USD 29,858 28,874 0.10 Hawk Acquisition Sub Inc 4.250% 15/10/2020 144A(3) 90,000 USD 87,696 87,075 0.31 Host Hotels & Resorts LP 4.750% 01/03/2023 85,000 USD 87,027 85,578 0.31 HSBC USA Inc 1.625% 16/01/2018 100,000 USD 99,070 98,606 0.35 Incitec Pivot Finance LLC 6.000% 10/12/2019 144A(3) 55,000 USD 61,137 60,194 0.21 Johnson & Johnson 4.375% 05/12/2033 90,000 USD 89,492 90,586 0.32 Liberty Mutual Group Inc 4.250% 15/06/2023 45,000 USD 44,971 43,449 0.16 Meccanica Holdings USA Inc 6.250% 15/07/2019 144A(3) 100,000 USD 103,879 103,697 0.37 Mylan Inc/PA 3.125% 15/01/2023 65,000 USD 60,788 58,986 0.21 Nabors Industries Inc 5.000% 15/09/2020 80,000 USD 84,871 83,245 0.30 NBCUniversal Enterprise Inc 1.974% 15/04/2019 144A(3) 600,000 USD 595,125 586,907 2.10 Noble Energy Inc 5.250% 15/11/2043 70,000 USD 68,100 69,943 0.25 PolyOne Corp 5.250% 15/03/2023 50,000 USD 49,509 48,750 0.17 TAL Advantage V LLC 3.550% 20/11/2038 144A(3) 99,167 USD 99,125 98,543 0.35 U.S. Treasury Bond 2.875% 15/05/2043 140,000 USD 120,998 113,466 0.41
(1) See Note 1.
(3) See Note 14.
426
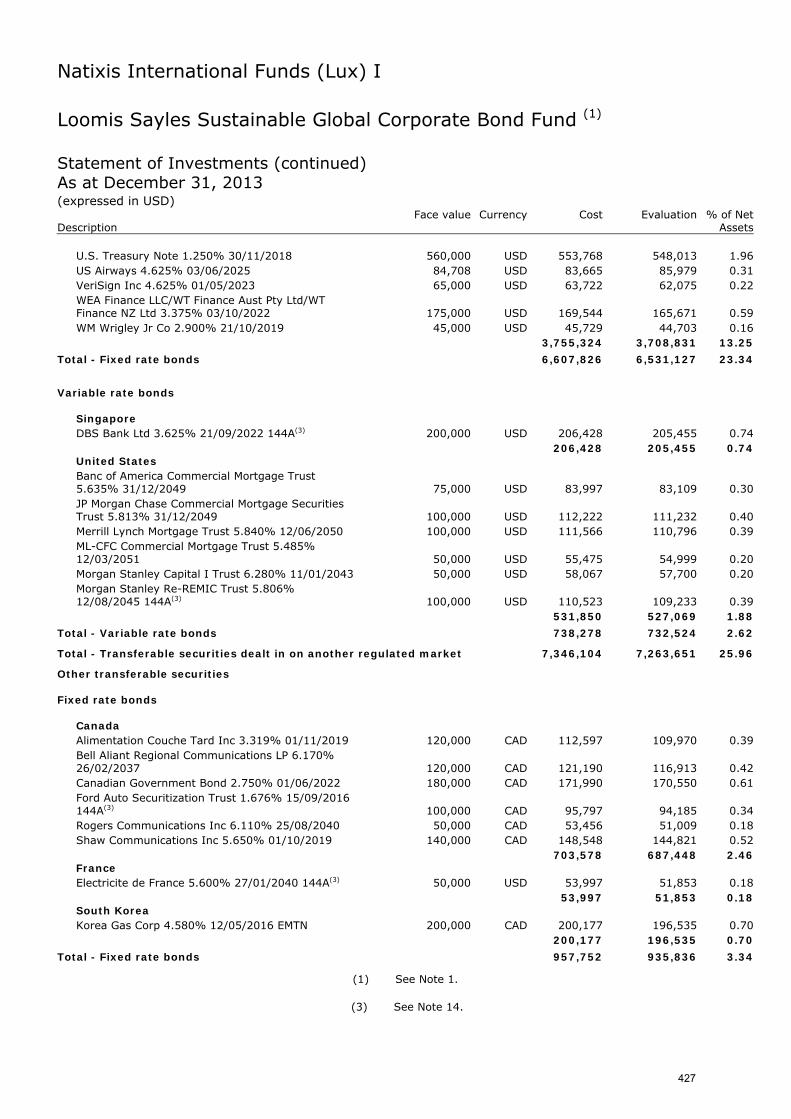
Natixis International Funds (Lux) I
Loomis Sayles Sustainable Global Corporate Bond Fund (1) Statement of Investments (continued) As at December 31, 2013 (expressed in USD) Face value Currency Cost Evaluation % of Net Description Assets
U.S. Treasury Note 1.250% 30/11/2018 560,000 USD 553,768 548,013 1.96 US Airways 4.625% 03/06/2025 84,708 USD 83,665 85,979 0.31 VeriSign Inc 4.625% 01/05/2023 65,000 USD 63,722 62,075 0.22 WEA Finance LLC/WT Finance Aust Pty Ltd/WT Finance NZ Ltd 3.375% 03/10/2022 175,000 USD 169,544 165,671 0.59 WM Wrigley Jr Co 2.900% 21/10/2019 45,000 USD 45,729 44,703 0.16
3,755,324 3,708,831 13.25
Total - Fixed rate bonds 6,607,826 6,531,127 23.34
Variable rate bonds
Singapore DBS Bank Ltd 3.625% 21/09/2022 144A(3) 200,000 USD 206,428 205,455 0.74
206,428 205,455 0.74 United States Banc of America Commercial Mortgage Trust 5.635% 31/12/2049 75,000 USD 83,997 83,109 0.30 JP Morgan Chase Commercial Mortgage Securities Trust 5.813% 31/12/2049 100,000 USD 112,222 111,232 0.40 Merrill Lynch Mortgage Trust 5.840% 12/06/2050 100,000 USD 111,566 110,796 0.39 ML-CFC Commercial Mortgage Trust 5.485% 12/03/2051 50,000 USD 55,475 54,999 0.20 Morgan Stanley Capital I Trust 6.280% 11/01/2043 50,000 USD 58,067 57,700 0.20 Morgan Stanley Re-REMIC Trust 5.806% 12/08/2045 144A(3) 100,000 USD 110,523 109,233 0.39
531,850 527,069 1.88
Total - Variable rate bonds 738,278 732,524 2.62
Total - Transferable securities dealt in on another regulated market 7,346,104 7,263,651 25.96
Other transferable securities Fixed rate bonds
Canada Alimentation Couche Tard Inc 3.319% 01/11/2019 120,000 CAD 112,597 109,970 0.39 Bell Aliant Regional Communications LP 6.170% 26/02/2037 120,000 CAD 121,190 116,913 0.42 Canadian Government Bond 2.750% 01/06/2022 180,000 CAD 171,990 170,550 0.61 Ford Auto Securitization Trust 1.676% 15/09/2016 144A(3) 100,000 CAD 95,797 94,185 0.34 Rogers Communications Inc 6.110% 25/08/2040 50,000 CAD 53,456 51,009 0.18 Shaw Communications Inc 5.650% 01/10/2019 140,000 CAD 148,548 144,821 0.52
703,578 687,448 2.46 France Electricite de France 5.600% 27/01/2040 144A(3) 50,000 USD 53,997 51,853 0.18
53,997 51,853 0.18 South Korea Korea Gas Corp 4.580% 12/05/2016 EMTN 200,000 CAD 200,177 196,535 0.70
200,177 196,535 0.70
Total - Fixed rate bonds 957,752 935,836 3.34
(1) See Note 1.
(3) See Note 14.
427
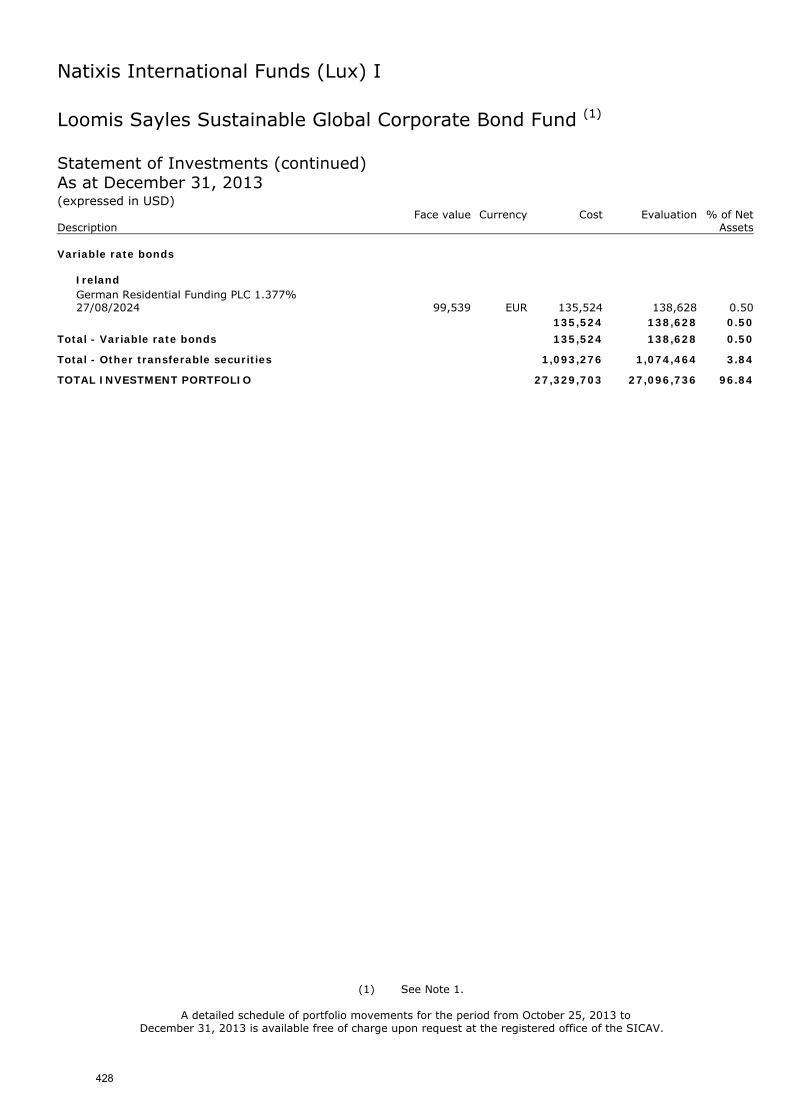
Natixis International Funds (Lux) I
Loomis Sayles Sustainable Global Corporate Bond Fund (1) Statement of Investments (continued) As at December 31, 2013 (expressed in USD) Face value Currency Cost Evaluation % of Net Description Assets Variable rate bonds
Ireland German Residential Funding PLC 1.377% 27/08/2024 99,539 EUR 135,524 138,628 0.50
135,524 138,628 0.50
Total - Variable rate bonds 135,524 138,628 0.50
Total - Other transferable securities 1,093,276 1,074,464 3.84
TOTAL INVESTMENT PORTFOLIO 27,329,703 27,096,736 96.84
(1) See Note 1. A detailed schedule of portfolio movements for the period from October 25, 2013 to
December 31, 2013 is available free of charge upon request at the registered office of the SICAV.
428
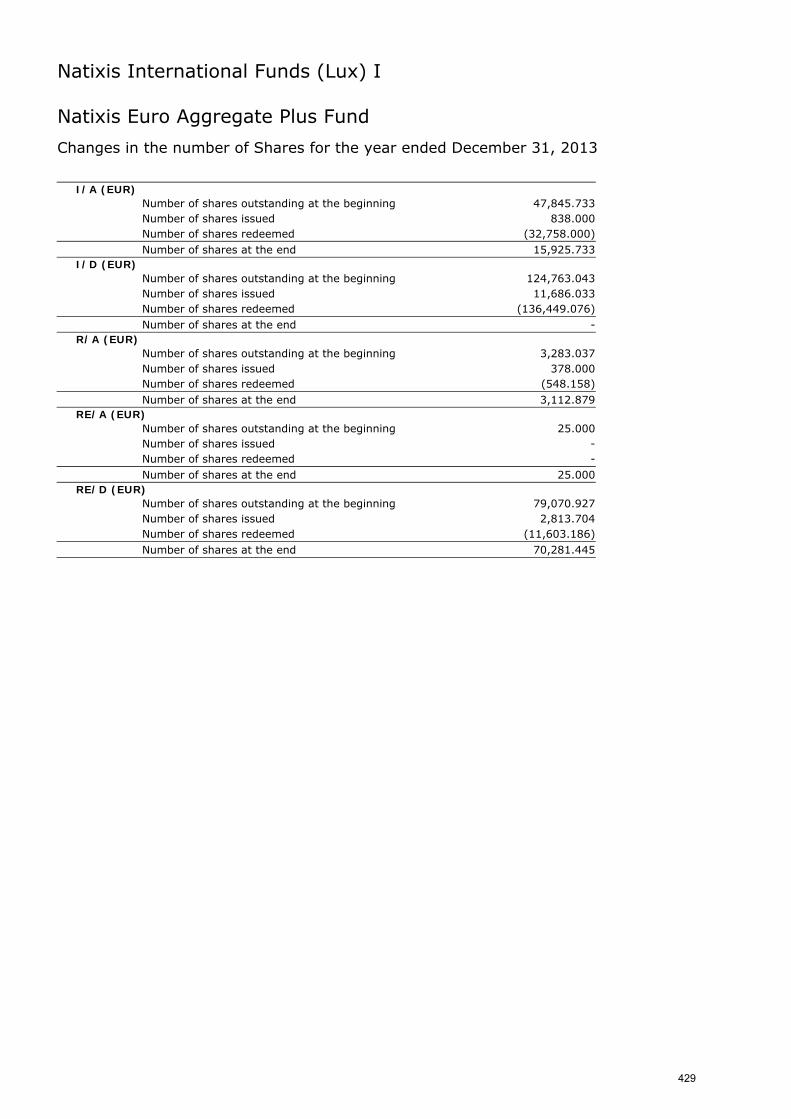
Natixis International Funds (Lux) I
Natixis Euro Aggregate Plus Fund
Changes in the number of Shares for the year ended December 31, 2013
I/A (EUR) Number of shares outstanding at the beginning 47,845.733
Number of shares issued 838.000
Number of shares redeemed (32,758.000) Number of shares at the end 15,925.733
I/D (EUR) Number of shares outstanding at the beginning 124,763.043
Number of shares issued 11,686.033
Number of shares redeemed (136,449.076) Number of shares at the end -
R/A (EUR) Number of shares outstanding at the beginning 3,283.037
Number of shares issued 378.000
Number of shares redeemed (548.158) Number of shares at the end 3,112.879
RE/A (EUR) Number of shares outstanding at the beginning 25.000
Number of shares issued - Number of shares redeemed - Number of shares at the end 25.000
RE/D (EUR) Number of shares outstanding at the beginning 79,070.927
Number of shares issued 2,813.704
Number of shares redeemed (11,603.186) Number of shares at the end 70,281.445
429
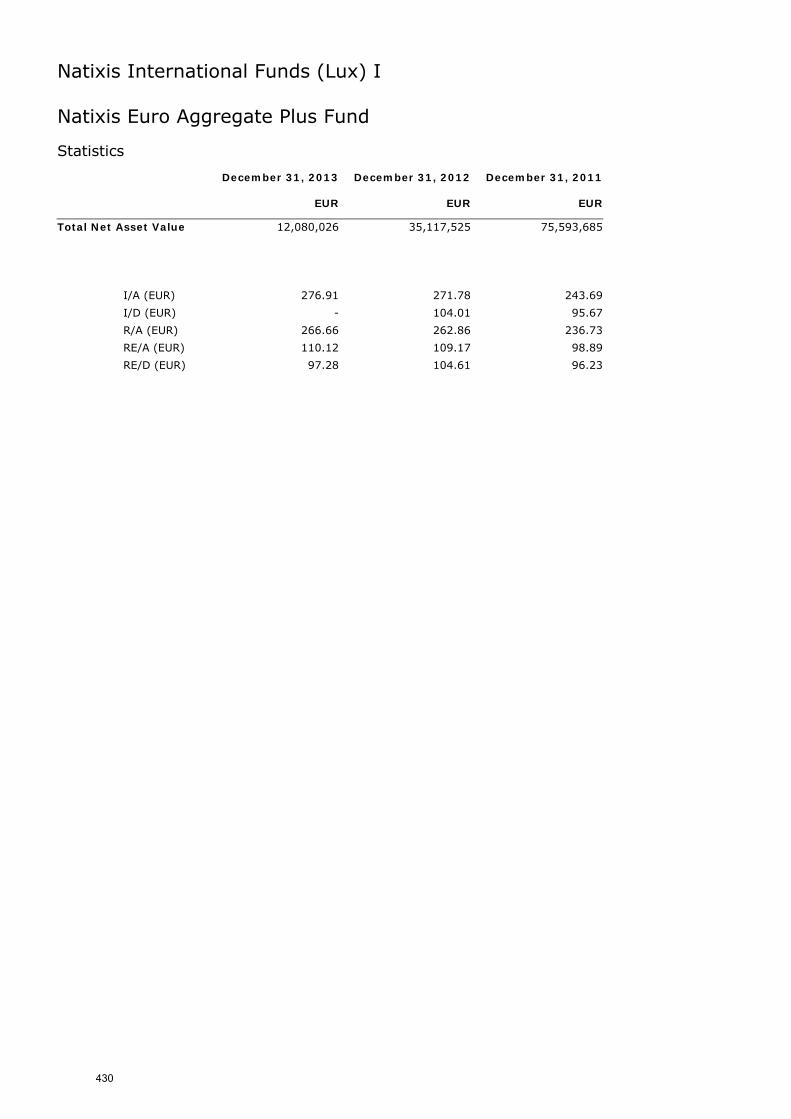
Natixis International Funds (Lux) I
Natixis Euro Aggregate Plus Fund Statistics December 31, 2013 December 31, 2012 December 31, 2011 EUR EUR EUR
Total Net Asset Value 12,080,026 35,117,525 75,593,685
I/A (EUR) 276.91 271.78 243.69
I/D (EUR) - 104.01 95.67
R/A (EUR) 266.66 262.86 236.73
RE/A (EUR) 110.12 109.17 98.89
RE/D (EUR) 97.28 104.61 96.23
430
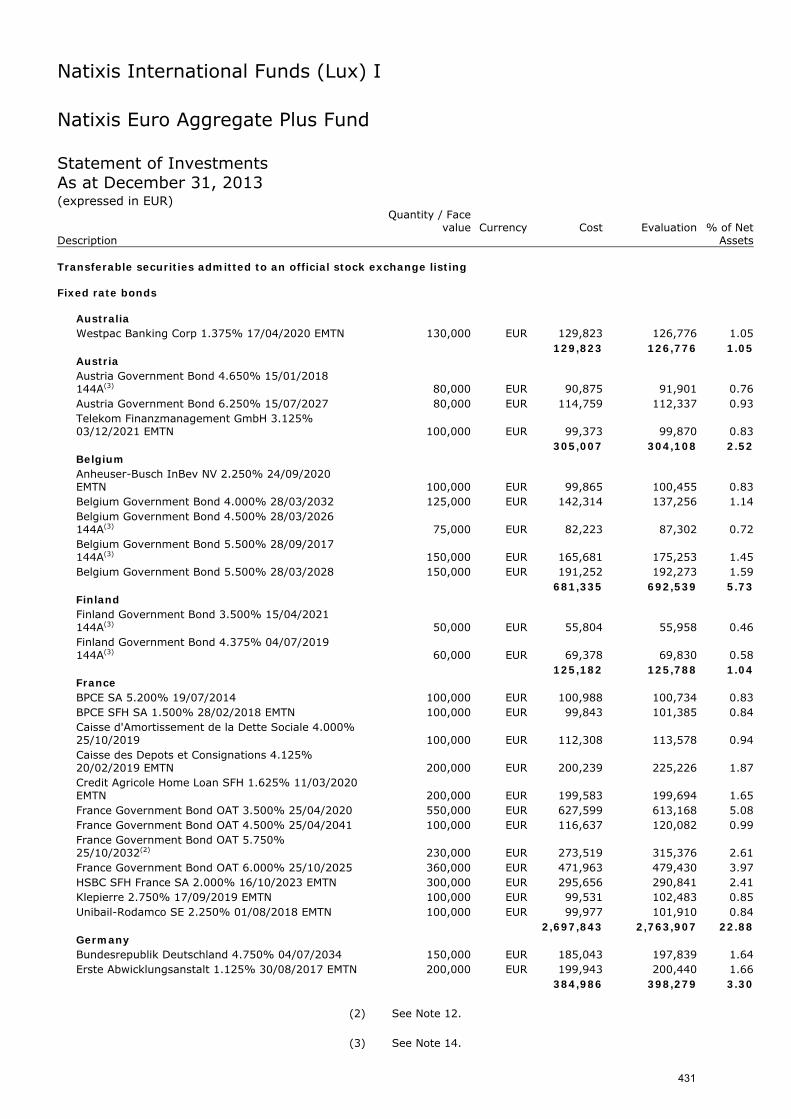
Natixis International Funds (Lux) I
Natixis Euro Aggregate Plus Fund Statement of Investments As at December 31, 2013 (expressed in EUR)
Quantity / Face
value Currency Cost Evaluation % of Net Description Assets Transferable securities admitted to an official stock exchange listing Fixed rate bonds
Australia Westpac Banking Corp 1.375% 17/04/2020 EMTN 130,000 EUR 129,823 126,776 1.05
129,823 126,776 1.05 Austria Austria Government Bond 4.650% 15/01/2018 144A(3) 80,000 EUR 90,875 91,901 0.76 Austria Government Bond 6.250% 15/07/2027 80,000 EUR 114,759 112,337 0.93 Telekom Finanzmanagement GmbH 3.125% 03/12/2021 EMTN 100,000 EUR 99,373 99,870 0.83
305,007 304,108 2.52 Belgium Anheuser-Busch InBev NV 2.250% 24/09/2020 EMTN 100,000 EUR 99,865 100,455 0.83 Belgium Government Bond 4.000% 28/03/2032 125,000 EUR 142,314 137,256 1.14 Belgium Government Bond 4.500% 28/03/2026 144A(3) 75,000 EUR 82,223 87,302 0.72 Belgium Government Bond 5.500% 28/09/2017 144A(3) 150,000 EUR 165,681 175,253 1.45 Belgium Government Bond 5.500% 28/03/2028 150,000 EUR 191,252 192,273 1.59
681,335 692,539 5.73 Finland Finland Government Bond 3.500% 15/04/2021 144A(3) 50,000 EUR 55,804 55,958 0.46 Finland Government Bond 4.375% 04/07/2019 144A(3) 60,000 EUR 69,378 69,830 0.58
125,182 125,788 1.04 France BPCE SA 5.200% 19/07/2014 100,000 EUR 100,988 100,734 0.83 BPCE SFH SA 1.500% 28/02/2018 EMTN 100,000 EUR 99,843 101,385 0.84 Caisse d'Amortissement de la Dette Sociale 4.000% 25/10/2019 100,000 EUR 112,308 113,578 0.94 Caisse des Depots et Consignations 4.125% 20/02/2019 EMTN 200,000 EUR 200,239 225,226 1.87 Credit Agricole Home Loan SFH 1.625% 11/03/2020 EMTN 200,000 EUR 199,583 199,694 1.65 France Government Bond OAT 3.500% 25/04/2020 550,000 EUR 627,599 613,168 5.08 France Government Bond OAT 4.500% 25/04/2041 100,000 EUR 116,637 120,082 0.99 France Government Bond OAT 5.750% 25/10/2032(2) 230,000 EUR 273,519 315,376 2.61 France Government Bond OAT 6.000% 25/10/2025 360,000 EUR 471,963 479,430 3.97 HSBC SFH France SA 2.000% 16/10/2023 EMTN 300,000 EUR 295,656 290,841 2.41 Klepierre 2.750% 17/09/2019 EMTN 100,000 EUR 99,531 102,483 0.85 Unibail-Rodamco SE 2.250% 01/08/2018 EMTN 100,000 EUR 99,977 101,910 0.84
2,697,843 2,763,907 22.88 Germany Bundesrepublik Deutschland 4.750% 04/07/2034 150,000 EUR 185,043 197,839 1.64 Erste Abwicklungsanstalt 1.125% 30/08/2017 EMTN 200,000 EUR 199,943 200,440 1.66
384,986 398,279 3.30
(2) See Note 12.
(3) See Note 14.
431
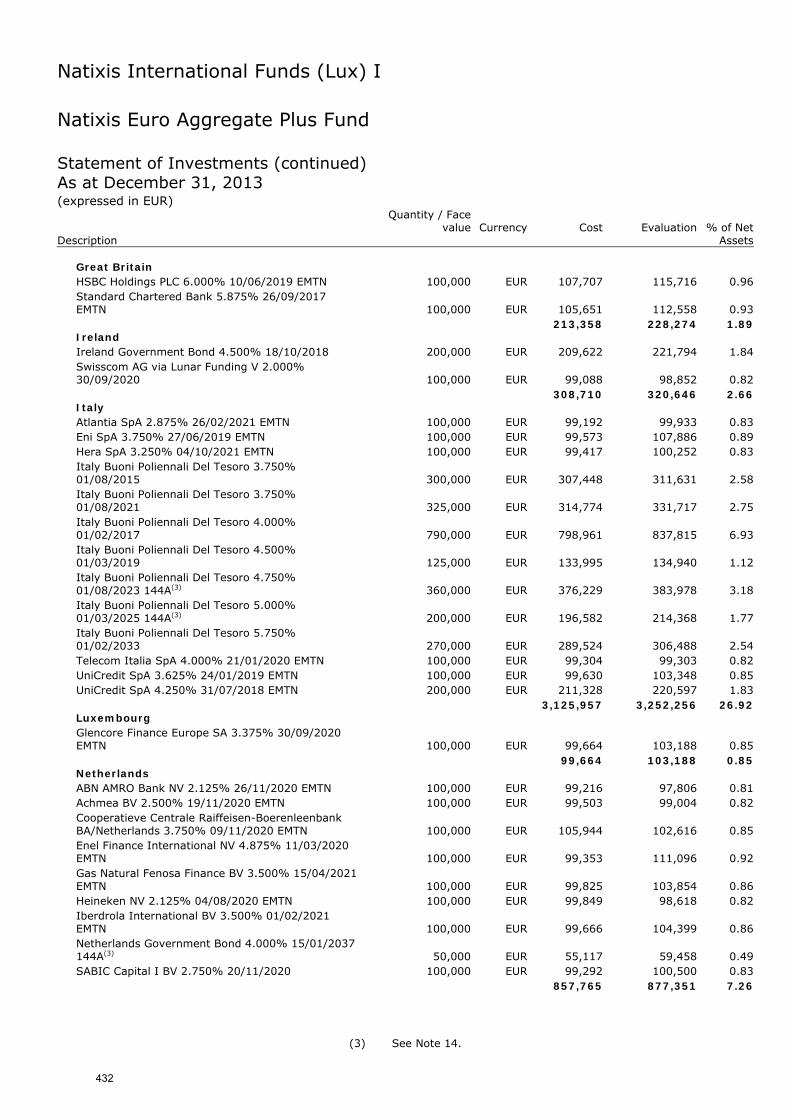
Natixis International Funds (Lux) I
Natixis Euro Aggregate Plus Fund Statement of Investments (continued) As at December 31, 2013 (expressed in EUR)
Quantity / Face
value Currency Cost Evaluation % of Net Description Assets
Great Britain HSBC Holdings PLC 6.000% 10/06/2019 EMTN 100,000 EUR 107,707 115,716 0.96 Standard Chartered Bank 5.875% 26/09/2017 EMTN 100,000 EUR 105,651 112,558 0.93
213,358 228,274 1.89 Ireland Ireland Government Bond 4.500% 18/10/2018 200,000 EUR 209,622 221,794 1.84 Swisscom AG via Lunar Funding V 2.000% 30/09/2020 100,000 EUR 99,088 98,852 0.82
308,710 320,646 2.66 Italy Atlantia SpA 2.875% 26/02/2021 EMTN 100,000 EUR 99,192 99,933 0.83 Eni SpA 3.750% 27/06/2019 EMTN 100,000 EUR 99,573 107,886 0.89 Hera SpA 3.250% 04/10/2021 EMTN 100,000 EUR 99,417 100,252 0.83 Italy Buoni Poliennali Del Tesoro 3.750% 01/08/2015 300,000 EUR 307,448 311,631 2.58 Italy Buoni Poliennali Del Tesoro 3.750% 01/08/2021 325,000 EUR 314,774 331,717 2.75 Italy Buoni Poliennali Del Tesoro 4.000% 01/02/2017 790,000 EUR 798,961 837,815 6.93 Italy Buoni Poliennali Del Tesoro 4.500% 01/03/2019 125,000 EUR 133,995 134,940 1.12 Italy Buoni Poliennali Del Tesoro 4.750% 01/08/2023 144A(3) 360,000 EUR 376,229 383,978 3.18 Italy Buoni Poliennali Del Tesoro 5.000% 01/03/2025 144A(3) 200,000 EUR 196,582 214,368 1.77 Italy Buoni Poliennali Del Tesoro 5.750% 01/02/2033 270,000 EUR 289,524 306,488 2.54 Telecom Italia SpA 4.000% 21/01/2020 EMTN 100,000 EUR 99,304 99,303 0.82 UniCredit SpA 3.625% 24/01/2019 EMTN 100,000 EUR 99,630 103,348 0.85 UniCredit SpA 4.250% 31/07/2018 EMTN 200,000 EUR 211,328 220,597 1.83
3,125,957 3,252,256 26.92 Luxembourg Glencore Finance Europe SA 3.375% 30/09/2020 EMTN 100,000 EUR 99,664 103,188 0.85
99,664 103,188 0.85 Netherlands ABN AMRO Bank NV 2.125% 26/11/2020 EMTN 100,000 EUR 99,216 97,806 0.81 Achmea BV 2.500% 19/11/2020 EMTN 100,000 EUR 99,503 99,004 0.82 Cooperatieve Centrale Raiffeisen-Boerenleenbank BA/Netherlands 3.750% 09/11/2020 EMTN 100,000 EUR 105,944 102,616 0.85 Enel Finance International NV 4.875% 11/03/2020 EMTN 100,000 EUR 99,353 111,096 0.92 Gas Natural Fenosa Finance BV 3.500% 15/04/2021 EMTN 100,000 EUR 99,825 103,854 0.86 Heineken NV 2.125% 04/08/2020 EMTN 100,000 EUR 99,849 98,618 0.82 Iberdrola International BV 3.500% 01/02/2021 EMTN 100,000 EUR 99,666 104,399 0.86 Netherlands Government Bond 4.000% 15/01/2037 144A(3) 50,000 EUR 55,117 59,458 0.49 SABIC Capital I BV 2.750% 20/11/2020 100,000 EUR 99,292 100,500 0.83
857,765 877,351 7.26
(3) See Note 14.
432
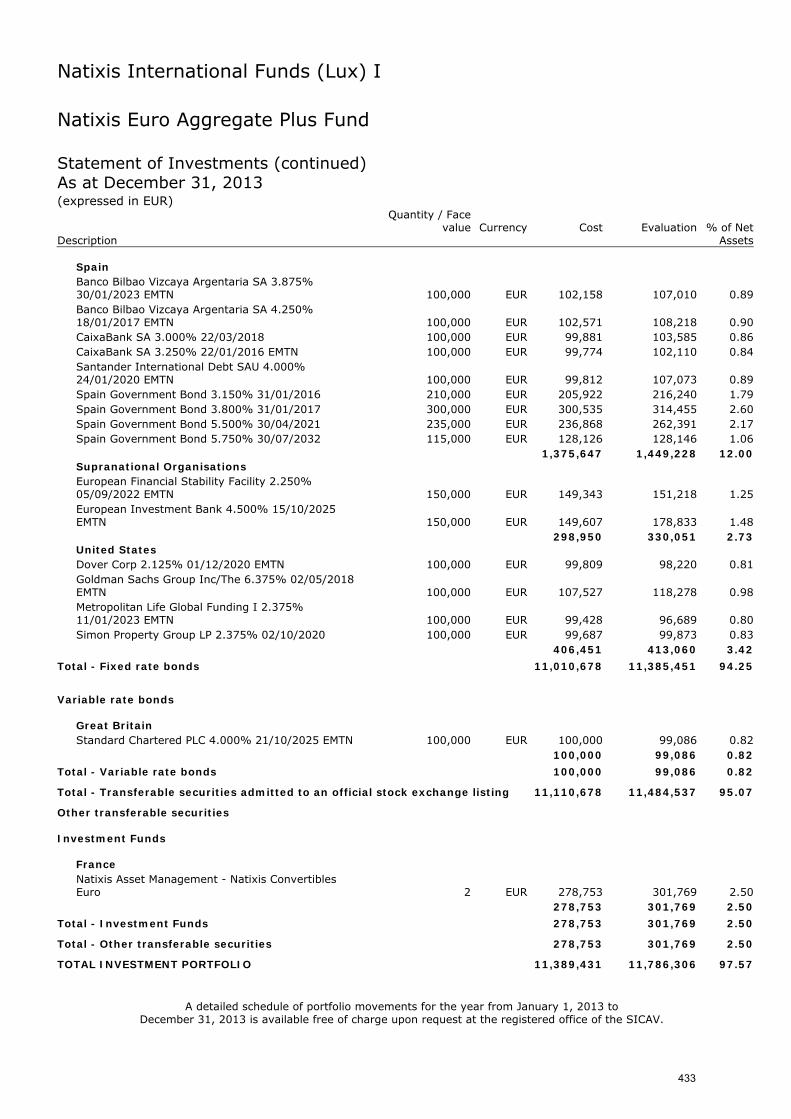
Natixis International Funds (Lux) I
Natixis Euro Aggregate Plus Fund Statement of Investments (continued) As at December 31, 2013 (expressed in EUR)
Quantity / Face
value Currency Cost Evaluation % of Net Description Assets
Spain Banco Bilbao Vizcaya Argentaria SA 3.875% 30/01/2023 EMTN 100,000 EUR 102,158 107,010 0.89 Banco Bilbao Vizcaya Argentaria SA 4.250% 18/01/2017 EMTN 100,000 EUR 102,571 108,218 0.90 CaixaBank SA 3.000% 22/03/2018 100,000 EUR 99,881 103,585 0.86 CaixaBank SA 3.250% 22/01/2016 EMTN 100,000 EUR 99,774 102,110 0.84 Santander International Debt SAU 4.000% 24/01/2020 EMTN 100,000 EUR 99,812 107,073 0.89 Spain Government Bond 3.150% 31/01/2016 210,000 EUR 205,922 216,240 1.79 Spain Government Bond 3.800% 31/01/2017 300,000 EUR 300,535 314,455 2.60 Spain Government Bond 5.500% 30/04/2021 235,000 EUR 236,868 262,391 2.17 Spain Government Bond 5.750% 30/07/2032 115,000 EUR 128,126 128,146 1.06
1,375,647 1,449,228 12.00 Supranational Organisations European Financial Stability Facility 2.250% 05/09/2022 EMTN 150,000 EUR 149,343 151,218 1.25 European Investment Bank 4.500% 15/10/2025 EMTN 150,000 EUR 149,607 178,833 1.48
298,950 330,051 2.73 United States Dover Corp 2.125% 01/12/2020 EMTN 100,000 EUR 99,809 98,220 0.81 Goldman Sachs Group Inc/The 6.375% 02/05/2018 EMTN 100,000 EUR 107,527 118,278 0.98 Metropolitan Life Global Funding I 2.375% 11/01/2023 EMTN 100,000 EUR 99,428 96,689 0.80 Simon Property Group LP 2.375% 02/10/2020 100,000 EUR 99,687 99,873 0.83
406,451 413,060 3.42
Total - Fixed rate bonds 11,010,678 11,385,451 94.25
Variable rate bonds
Great Britain Standard Chartered PLC 4.000% 21/10/2025 EMTN 100,000 EUR 100,000 99,086 0.82
100,000 99,086 0.82
Total - Variable rate bonds 100,000 99,086 0.82
Total - Transferable securities admitted to an official stock exchange listing 11,110,678 11,484,537 95.07
Other transferable securities Investment Funds
France Natixis Asset Management - Natixis Convertibles Euro 2 EUR 278,753 301,769 2.50
278,753 301,769 2.50
Total - Investment Funds 278,753 301,769 2.50
Total - Other transferable securities 278,753 301,769 2.50
TOTAL INVESTMENT PORTFOLIO 11,389,431 11,786,306 97.57
A detailed schedule of portfolio movements for the year from January 1, 2013 to December 31, 2013 is available free of charge upon request at the registered office of the SICAV.
433
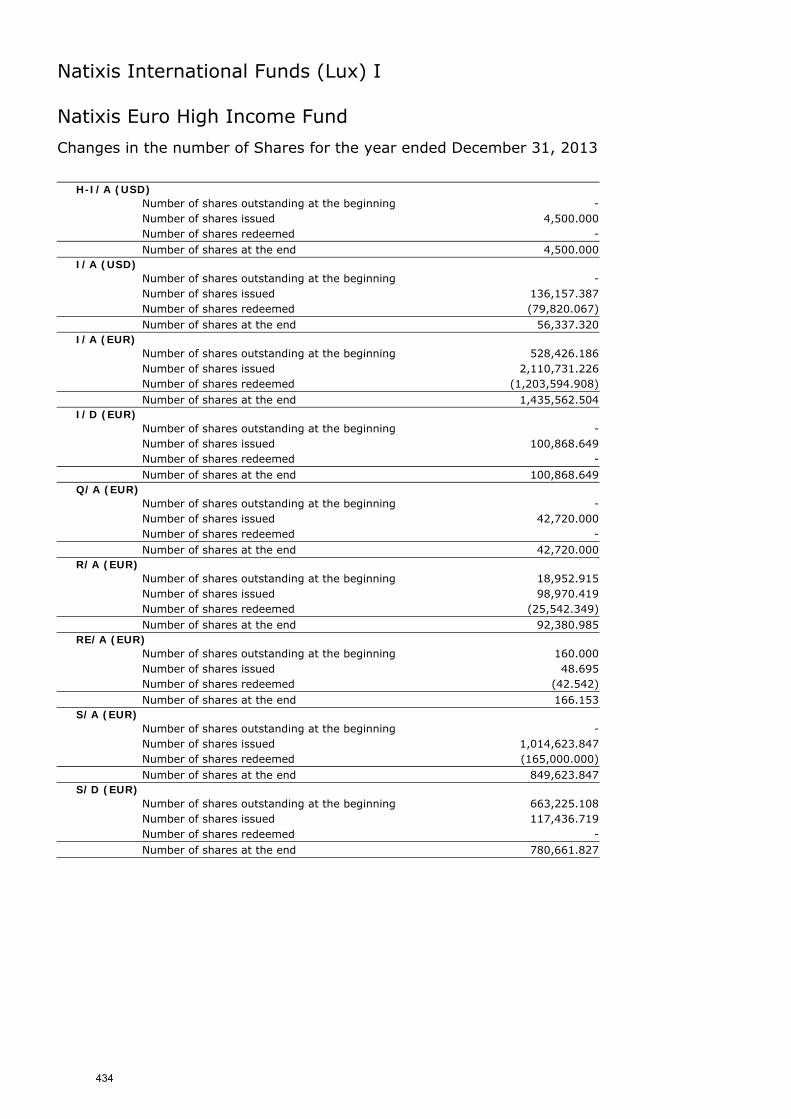
Natixis International Funds (Lux) I
Natixis Euro High Income Fund
Changes in the number of Shares for the year ended December 31, 2013
H-I/A (USD) Number of shares outstanding at the beginning - Number of shares issued 4,500.000
Number of shares redeemed - Number of shares at the end 4,500.000
I/A (USD) Number of shares outstanding at the beginning - Number of shares issued 136,157.387
Number of shares redeemed (79,820.067) Number of shares at the end 56,337.320
I/A (EUR) Number of shares outstanding at the beginning 528,426.186
Number of shares issued 2,110,731.226
Number of shares redeemed (1,203,594.908) Number of shares at the end 1,435,562.504
I/D (EUR) Number of shares outstanding at the beginning - Number of shares issued 100,868.649
Number of shares redeemed - Number of shares at the end 100,868.649
Q/A (EUR) Number of shares outstanding at the beginning - Number of shares issued 42,720.000
Number of shares redeemed - Number of shares at the end 42,720.000
R/A (EUR) Number of shares outstanding at the beginning 18,952.915
Number of shares issued 98,970.419
Number of shares redeemed (25,542.349) Number of shares at the end 92,380.985
RE/A (EUR) Number of shares outstanding at the beginning 160.000
Number of shares issued 48.695
Number of shares redeemed (42.542) Number of shares at the end 166.153
S/A (EUR) Number of shares outstanding at the beginning - Number of shares issued 1,014,623.847
Number of shares redeemed (165,000.000) Number of shares at the end 849,623.847
S/D (EUR) Number of shares outstanding at the beginning 663,225.108
Number of shares issued 117,436.719
Number of shares redeemed - Number of shares at the end 780,661.827
434
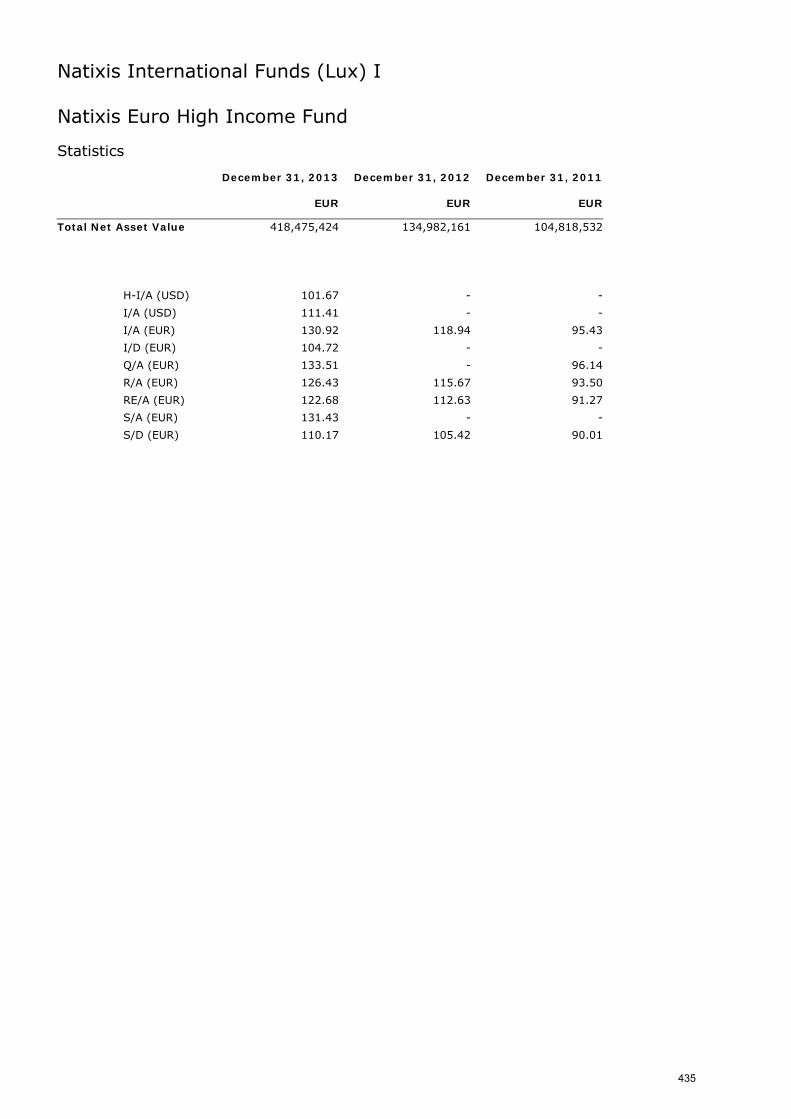
Natixis International Funds (Lux) I
Natixis Euro High Income Fund Statistics December 31, 2013 December 31, 2012 December 31, 2011 EUR EUR EUR
Total Net Asset Value 418,475,424 134,982,161 104,818,532
H-I/A (USD) 101.67 - -
I/A (USD) 111.41 - -
I/A (EUR) 130.92 118.94 95.43
I/D (EUR) 104.72 - -
Q/A (EUR) 133.51 - 96.14
R/A (EUR) 126.43 115.67 93.50
RE/A (EUR) 122.68 112.63 91.27
S/A (EUR) 131.43 - -
S/D (EUR) 110.17 105.42 90.01
435
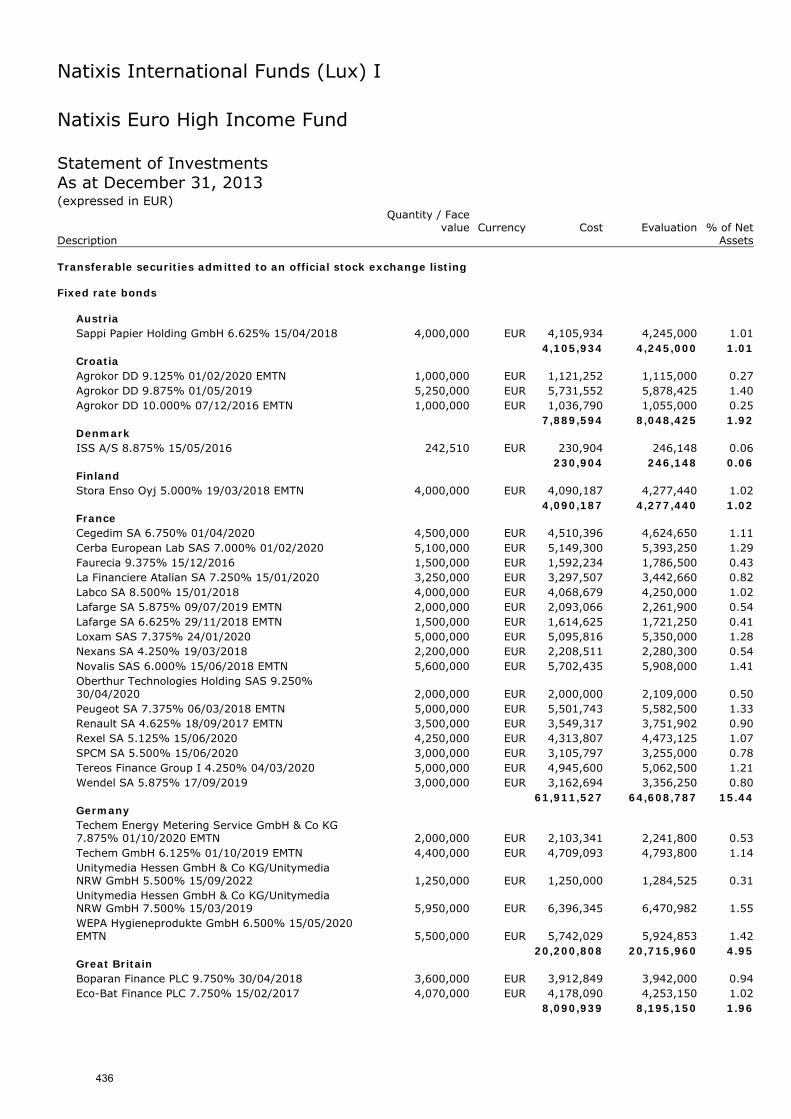
Natixis International Funds (Lux) I
Natixis Euro High Income Fund Statement of Investments As at December 31, 2013 (expressed in EUR)
Quantity / Face
value Currency Cost Evaluation % of Net Description Assets Transferable securities admitted to an official stock exchange listing Fixed rate bonds
Austria Sappi Papier Holding GmbH 6.625% 15/04/2018 4,000,000 EUR 4,105,934 4,245,000 1.01
4,105,934 4,245,000 1.01 Croatia Agrokor DD 9.125% 01/02/2020 EMTN 1,000,000 EUR 1,121,252 1,115,000 0.27 Agrokor DD 9.875% 01/05/2019 5,250,000 EUR 5,731,552 5,878,425 1.40 Agrokor DD 10.000% 07/12/2016 EMTN 1,000,000 EUR 1,036,790 1,055,000 0.25
7,889,594 8,048,425 1.92 Denmark ISS A/S 8.875% 15/05/2016 242,510 EUR 230,904 246,148 0.06
230,904 246,148 0.06 Finland Stora Enso Oyj 5.000% 19/03/2018 EMTN 4,000,000 EUR 4,090,187 4,277,440 1.02
4,090,187 4,277,440 1.02 France Cegedim SA 6.750% 01/04/2020 4,500,000 EUR 4,510,396 4,624,650 1.11 Cerba European Lab SAS 7.000% 01/02/2020 5,100,000 EUR 5,149,300 5,393,250 1.29 Faurecia 9.375% 15/12/2016 1,500,000 EUR 1,592,234 1,786,500 0.43 La Financiere Atalian SA 7.250% 15/01/2020 3,250,000 EUR 3,297,507 3,442,660 0.82 Labco SA 8.500% 15/01/2018 4,000,000 EUR 4,068,679 4,250,000 1.02 Lafarge SA 5.875% 09/07/2019 EMTN 2,000,000 EUR 2,093,066 2,261,900 0.54 Lafarge SA 6.625% 29/11/2018 EMTN 1,500,000 EUR 1,614,625 1,721,250 0.41 Loxam SAS 7.375% 24/01/2020 5,000,000 EUR 5,095,816 5,350,000 1.28 Nexans SA 4.250% 19/03/2018 2,200,000 EUR 2,208,511 2,280,300 0.54 Novalis SAS 6.000% 15/06/2018 EMTN 5,600,000 EUR 5,702,435 5,908,000 1.41 Oberthur Technologies Holding SAS 9.250% 30/04/2020 2,000,000 EUR 2,000,000 2,109,000 0.50 Peugeot SA 7.375% 06/03/2018 EMTN 5,000,000 EUR 5,501,743 5,582,500 1.33 Renault SA 4.625% 18/09/2017 EMTN 3,500,000 EUR 3,549,317 3,751,902 0.90 Rexel SA 5.125% 15/06/2020 4,250,000 EUR 4,313,807 4,473,125 1.07 SPCM SA 5.500% 15/06/2020 3,000,000 EUR 3,105,797 3,255,000 0.78 Tereos Finance Group I 4.250% 04/03/2020 5,000,000 EUR 4,945,600 5,062,500 1.21 Wendel SA 5.875% 17/09/2019 3,000,000 EUR 3,162,694 3,356,250 0.80
61,911,527 64,608,787 15.44 Germany Techem Energy Metering Service GmbH & Co KG 7.875% 01/10/2020 EMTN 2,000,000 EUR 2,103,341 2,241,800 0.53 Techem GmbH 6.125% 01/10/2019 EMTN 4,400,000 EUR 4,709,093 4,793,800 1.14 Unitymedia Hessen GmbH & Co KG/Unitymedia NRW GmbH 5.500% 15/09/2022 1,250,000 EUR 1,250,000 1,284,525 0.31 Unitymedia Hessen GmbH & Co KG/Unitymedia NRW GmbH 7.500% 15/03/2019 5,950,000 EUR 6,396,345 6,470,982 1.55 WEPA Hygieneprodukte GmbH 6.500% 15/05/2020 EMTN 5,500,000 EUR 5,742,029 5,924,853 1.42
20,200,808 20,715,960 4.95 Great Britain Boparan Finance PLC 9.750% 30/04/2018 3,600,000 EUR 3,912,849 3,942,000 0.94 Eco-Bat Finance PLC 7.750% 15/02/2017 4,070,000 EUR 4,178,090 4,253,150 1.02
8,090,939 8,195,150 1.96
436
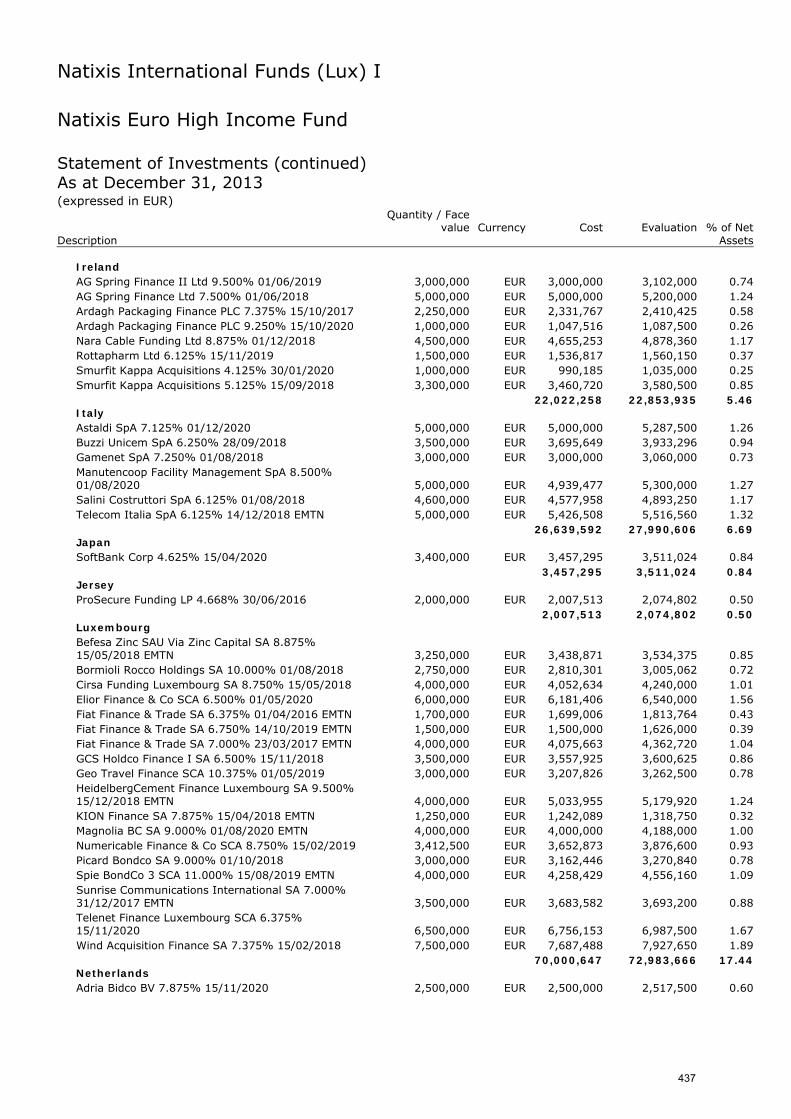
Natixis International Funds (Lux) I
Natixis Euro High Income Fund Statement of Investments (continued) As at December 31, 2013 (expressed in EUR)
Quantity / Face
value Currency Cost Evaluation % of Net Description Assets
Ireland AG Spring Finance II Ltd 9.500% 01/06/2019 3,000,000 EUR 3,000,000 3,102,000 0.74 AG Spring Finance Ltd 7.500% 01/06/2018 5,000,000 EUR 5,000,000 5,200,000 1.24 Ardagh Packaging Finance PLC 7.375% 15/10/2017 2,250,000 EUR 2,331,767 2,410,425 0.58 Ardagh Packaging Finance PLC 9.250% 15/10/2020 1,000,000 EUR 1,047,516 1,087,500 0.26 Nara Cable Funding Ltd 8.875% 01/12/2018 4,500,000 EUR 4,655,253 4,878,360 1.17 Rottapharm Ltd 6.125% 15/11/2019 1,500,000 EUR 1,536,817 1,560,150 0.37 Smurfit Kappa Acquisitions 4.125% 30/01/2020 1,000,000 EUR 990,185 1,035,000 0.25 Smurfit Kappa Acquisitions 5.125% 15/09/2018 3,300,000 EUR 3,460,720 3,580,500 0.85
22,022,258 22,853,935 5.46 Italy Astaldi SpA 7.125% 01/12/2020 5,000,000 EUR 5,000,000 5,287,500 1.26 Buzzi Unicem SpA 6.250% 28/09/2018 3,500,000 EUR 3,695,649 3,933,296 0.94 Gamenet SpA 7.250% 01/08/2018 3,000,000 EUR 3,000,000 3,060,000 0.73 Manutencoop Facility Management SpA 8.500% 01/08/2020 5,000,000 EUR 4,939,477 5,300,000 1.27 Salini Costruttori SpA 6.125% 01/08/2018 4,600,000 EUR 4,577,958 4,893,250 1.17 Telecom Italia SpA 6.125% 14/12/2018 EMTN 5,000,000 EUR 5,426,508 5,516,560 1.32
26,639,592 27,990,606 6.69 Japan SoftBank Corp 4.625% 15/04/2020 3,400,000 EUR 3,457,295 3,511,024 0.84
3,457,295 3,511,024 0.84 Jersey ProSecure Funding LP 4.668% 30/06/2016 2,000,000 EUR 2,007,513 2,074,802 0.50
2,007,513 2,074,802 0.50 Luxembourg Befesa Zinc SAU Via Zinc Capital SA 8.875% 15/05/2018 EMTN 3,250,000 EUR 3,438,871 3,534,375 0.85 Bormioli Rocco Holdings SA 10.000% 01/08/2018 2,750,000 EUR 2,810,301 3,005,062 0.72 Cirsa Funding Luxembourg SA 8.750% 15/05/2018 4,000,000 EUR 4,052,634 4,240,000 1.01 Elior Finance & Co SCA 6.500% 01/05/2020 6,000,000 EUR 6,181,406 6,540,000 1.56 Fiat Finance & Trade SA 6.375% 01/04/2016 EMTN 1,700,000 EUR 1,699,006 1,813,764 0.43 Fiat Finance & Trade SA 6.750% 14/10/2019 EMTN 1,500,000 EUR 1,500,000 1,626,000 0.39 Fiat Finance & Trade SA 7.000% 23/03/2017 EMTN 4,000,000 EUR 4,075,663 4,362,720 1.04 GCS Holdco Finance I SA 6.500% 15/11/2018 3,500,000 EUR 3,557,925 3,600,625 0.86 Geo Travel Finance SCA 10.375% 01/05/2019 3,000,000 EUR 3,207,826 3,262,500 0.78 HeidelbergCement Finance Luxembourg SA 9.500% 15/12/2018 EMTN 4,000,000 EUR 5,033,955 5,179,920 1.24 KION Finance SA 7.875% 15/04/2018 EMTN 1,250,000 EUR 1,242,089 1,318,750 0.32 Magnolia BC SA 9.000% 01/08/2020 EMTN 4,000,000 EUR 4,000,000 4,188,000 1.00 Numericable Finance & Co SCA 8.750% 15/02/2019 3,412,500 EUR 3,652,873 3,876,600 0.93 Picard Bondco SA 9.000% 01/10/2018 3,000,000 EUR 3,162,446 3,270,840 0.78 Spie BondCo 3 SCA 11.000% 15/08/2019 EMTN 4,000,000 EUR 4,258,429 4,556,160 1.09 Sunrise Communications International SA 7.000% 31/12/2017 EMTN 3,500,000 EUR 3,683,582 3,693,200 0.88 Telenet Finance Luxembourg SCA 6.375% 15/11/2020 6,500,000 EUR 6,756,153 6,987,500 1.67 Wind Acquisition Finance SA 7.375% 15/02/2018 7,500,000 EUR 7,687,488 7,927,650 1.89
70,000,647 72,983,666 17.44 Netherlands Adria Bidco BV 7.875% 15/11/2020 2,500,000 EUR 2,500,000 2,517,500 0.60
437
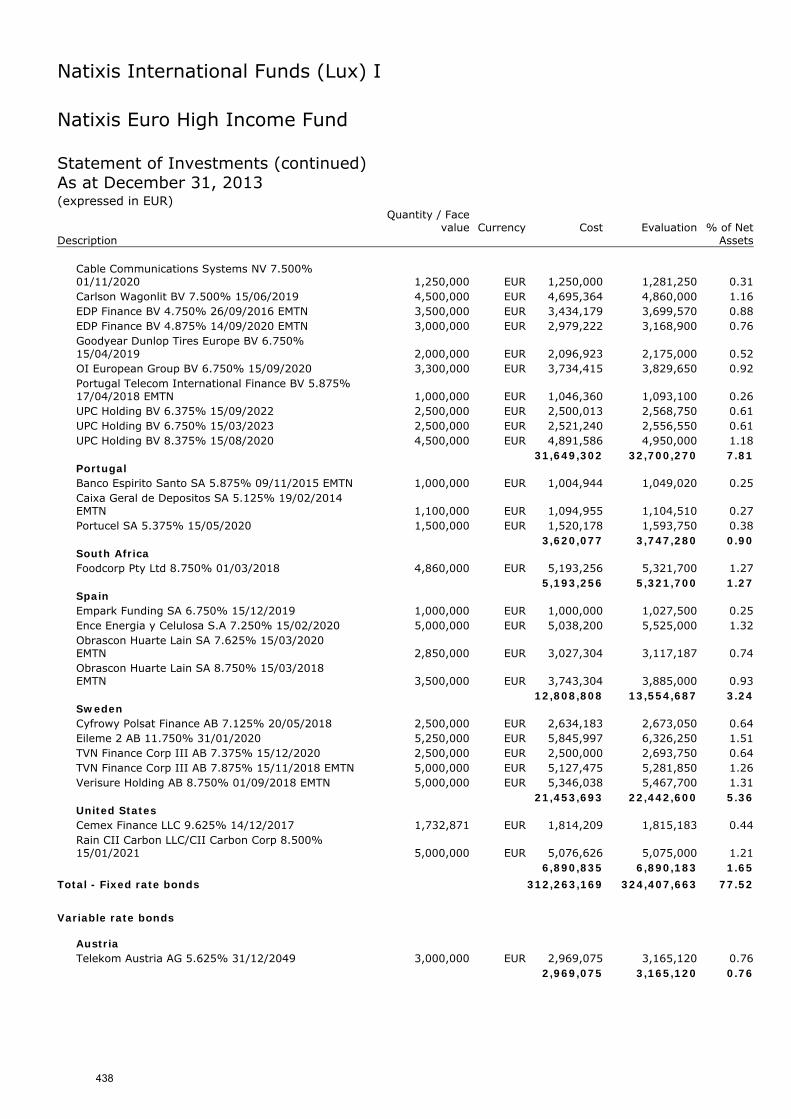
Natixis International Funds (Lux) I
Natixis Euro High Income Fund Statement of Investments (continued) As at December 31, 2013 (expressed in EUR)
Quantity / Face
value Currency Cost Evaluation % of Net Description Assets
Cable Communications Systems NV 7.500% 01/11/2020 1,250,000 EUR 1,250,000 1,281,250 0.31 Carlson Wagonlit BV 7.500% 15/06/2019 4,500,000 EUR 4,695,364 4,860,000 1.16 EDP Finance BV 4.750% 26/09/2016 EMTN 3,500,000 EUR 3,434,179 3,699,570 0.88 EDP Finance BV 4.875% 14/09/2020 EMTN 3,000,000 EUR 2,979,222 3,168,900 0.76 Goodyear Dunlop Tires Europe BV 6.750% 15/04/2019 2,000,000 EUR 2,096,923 2,175,000 0.52 OI European Group BV 6.750% 15/09/2020 3,300,000 EUR 3,734,415 3,829,650 0.92 Portugal Telecom International Finance BV 5.875% 17/04/2018 EMTN 1,000,000 EUR 1,046,360 1,093,100 0.26 UPC Holding BV 6.375% 15/09/2022 2,500,000 EUR 2,500,013 2,568,750 0.61 UPC Holding BV 6.750% 15/03/2023 2,500,000 EUR 2,521,240 2,556,550 0.61 UPC Holding BV 8.375% 15/08/2020 4,500,000 EUR 4,891,586 4,950,000 1.18
31,649,302 32,700,270 7.81 Portugal Banco Espirito Santo SA 5.875% 09/11/2015 EMTN 1,000,000 EUR 1,004,944 1,049,020 0.25 Caixa Geral de Depositos SA 5.125% 19/02/2014 EMTN 1,100,000 EUR 1,094,955 1,104,510 0.27 Portucel SA 5.375% 15/05/2020 1,500,000 EUR 1,520,178 1,593,750 0.38
3,620,077 3,747,280 0.90 South Africa Foodcorp Pty Ltd 8.750% 01/03/2018 4,860,000 EUR 5,193,256 5,321,700 1.27
5,193,256 5,321,700 1.27 Spain Empark Funding SA 6.750% 15/12/2019 1,000,000 EUR 1,000,000 1,027,500 0.25 Ence Energia y Celulosa S.A 7.250% 15/02/2020 5,000,000 EUR 5,038,200 5,525,000 1.32 Obrascon Huarte Lain SA 7.625% 15/03/2020 EMTN 2,850,000 EUR 3,027,304 3,117,187 0.74 Obrascon Huarte Lain SA 8.750% 15/03/2018 EMTN 3,500,000 EUR 3,743,304 3,885,000 0.93
12,808,808 13,554,687 3.24 Sweden Cyfrowy Polsat Finance AB 7.125% 20/05/2018 2,500,000 EUR 2,634,183 2,673,050 0.64 Eileme 2 AB 11.750% 31/01/2020 5,250,000 EUR 5,845,997 6,326,250 1.51 TVN Finance Corp III AB 7.375% 15/12/2020 2,500,000 EUR 2,500,000 2,693,750 0.64 TVN Finance Corp III AB 7.875% 15/11/2018 EMTN 5,000,000 EUR 5,127,475 5,281,850 1.26 Verisure Holding AB 8.750% 01/09/2018 EMTN 5,000,000 EUR 5,346,038 5,467,700 1.31
21,453,693 22,442,600 5.36 United States Cemex Finance LLC 9.625% 14/12/2017 1,732,871 EUR 1,814,209 1,815,183 0.44 Rain CII Carbon LLC/CII Carbon Corp 8.500% 15/01/2021 5,000,000 EUR 5,076,626 5,075,000 1.21
6,890,835 6,890,183 1.65
Total - Fixed rate bonds 312,263,169 324,407,663 77.52
Variable rate bonds
Austria Telekom Austria AG 5.625% 31/12/2049 3,000,000 EUR 2,969,075 3,165,120 0.76
2,969,075 3,165,120 0.76
438
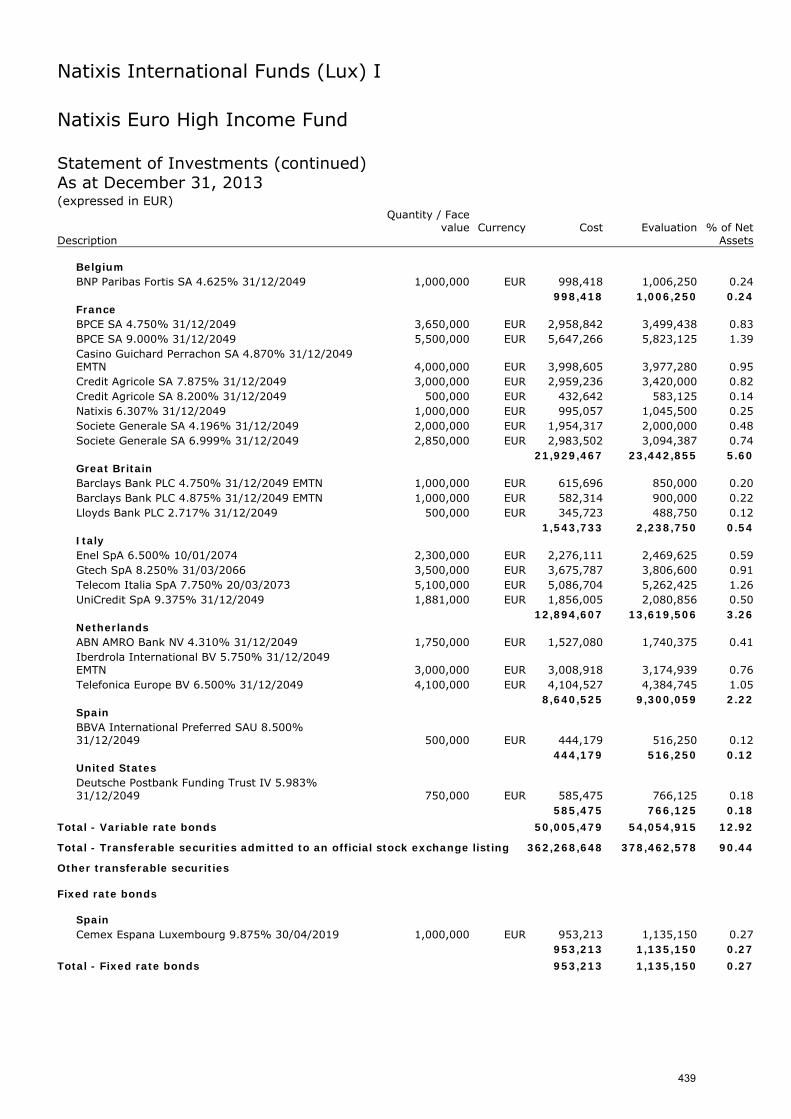
Natixis International Funds (Lux) I
Natixis Euro High Income Fund Statement of Investments (continued) As at December 31, 2013 (expressed in EUR)
Quantity / Face
value Currency Cost Evaluation % of Net Description Assets
Belgium BNP Paribas Fortis SA 4.625% 31/12/2049 1,000,000 EUR 998,418 1,006,250 0.24
998,418 1,006,250 0.24 France BPCE SA 4.750% 31/12/2049 3,650,000 EUR 2,958,842 3,499,438 0.83 BPCE SA 9.000% 31/12/2049 5,500,000 EUR 5,647,266 5,823,125 1.39 Casino Guichard Perrachon SA 4.870% 31/12/2049 EMTN 4,000,000 EUR 3,998,605 3,977,280 0.95 Credit Agricole SA 7.875% 31/12/2049 3,000,000 EUR 2,959,236 3,420,000 0.82 Credit Agricole SA 8.200% 31/12/2049 500,000 EUR 432,642 583,125 0.14 Natixis 6.307% 31/12/2049 1,000,000 EUR 995,057 1,045,500 0.25 Societe Generale SA 4.196% 31/12/2049 2,000,000 EUR 1,954,317 2,000,000 0.48 Societe Generale SA 6.999% 31/12/2049 2,850,000 EUR 2,983,502 3,094,387 0.74
21,929,467 23,442,855 5.60 Great Britain Barclays Bank PLC 4.750% 31/12/2049 EMTN 1,000,000 EUR 615,696 850,000 0.20 Barclays Bank PLC 4.875% 31/12/2049 EMTN 1,000,000 EUR 582,314 900,000 0.22 Lloyds Bank PLC 2.717% 31/12/2049 500,000 EUR 345,723 488,750 0.12
1,543,733 2,238,750 0.54 Italy Enel SpA 6.500% 10/01/2074 2,300,000 EUR 2,276,111 2,469,625 0.59 Gtech SpA 8.250% 31/03/2066 3,500,000 EUR 3,675,787 3,806,600 0.91 Telecom Italia SpA 7.750% 20/03/2073 5,100,000 EUR 5,086,704 5,262,425 1.26 UniCredit SpA 9.375% 31/12/2049 1,881,000 EUR 1,856,005 2,080,856 0.50
12,894,607 13,619,506 3.26 Netherlands ABN AMRO Bank NV 4.310% 31/12/2049 1,750,000 EUR 1,527,080 1,740,375 0.41 Iberdrola International BV 5.750% 31/12/2049 EMTN 3,000,000 EUR 3,008,918 3,174,939 0.76 Telefonica Europe BV 6.500% 31/12/2049 4,100,000 EUR 4,104,527 4,384,745 1.05
8,640,525 9,300,059 2.22 Spain BBVA International Preferred SAU 8.500% 31/12/2049 500,000 EUR 444,179 516,250 0.12
444,179 516,250 0.12 United States Deutsche Postbank Funding Trust IV 5.983% 31/12/2049 750,000 EUR 585,475 766,125 0.18
585,475 766,125 0.18
Total - Variable rate bonds 50,005,479 54,054,915 12.92
Total - Transferable securities admitted to an official stock exchange listing 362,268,648 378,462,578 90.44
Other transferable securities Fixed rate bonds
Spain Cemex Espana Luxembourg 9.875% 30/04/2019 1,000,000 EUR 953,213 1,135,150 0.27
953,213 1,135,150 0.27
Total - Fixed rate bonds 953,213 1,135,150 0.27
439
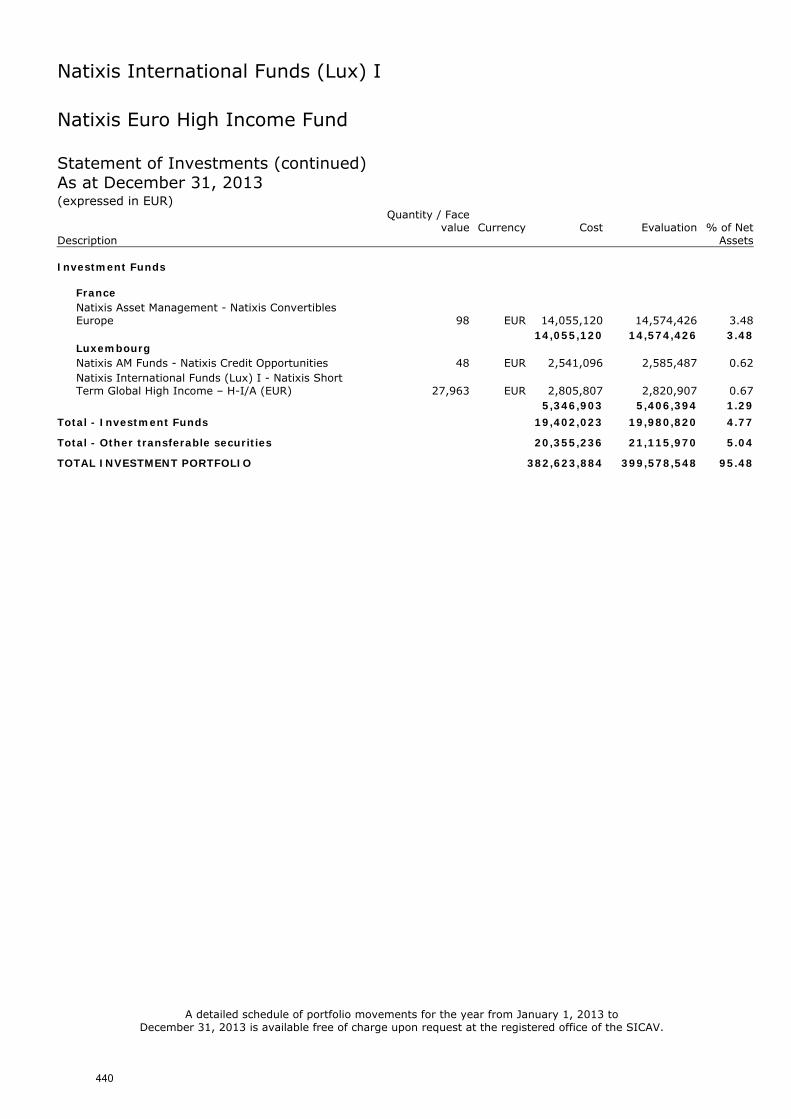
Natixis International Funds (Lux) I
Natixis Euro High Income Fund Statement of Investments (continued) As at December 31, 2013 (expressed in EUR)
Quantity / Face
value Currency Cost Evaluation % of Net Description Assets Investment Funds
France Natixis Asset Management - Natixis Convertibles Europe 98 EUR 14,055,120 14,574,426 3.48
14,055,120 14,574,426 3.48 Luxembourg Natixis AM Funds - Natixis Credit Opportunities 48 EUR 2,541,096 2,585,487 0.62 Natixis International Funds (Lux) I - Natixis Short Term Global High Income – H-I/A (EUR) 27,963 EUR 2,805,807 2,820,907 0.67
5,346,903 5,406,394 1.29
Total - Investment Funds 19,402,023 19,980,820 4.77
Total - Other transferable securities 20,355,236 21,115,970 5.04
TOTAL INVESTMENT PORTFOLIO 382,623,884 399,578,548 95.48
A detailed schedule of portfolio movements for the year from January 1, 2013 to December 31, 2013 is available free of charge upon request at the registered office of the SICAV.
440
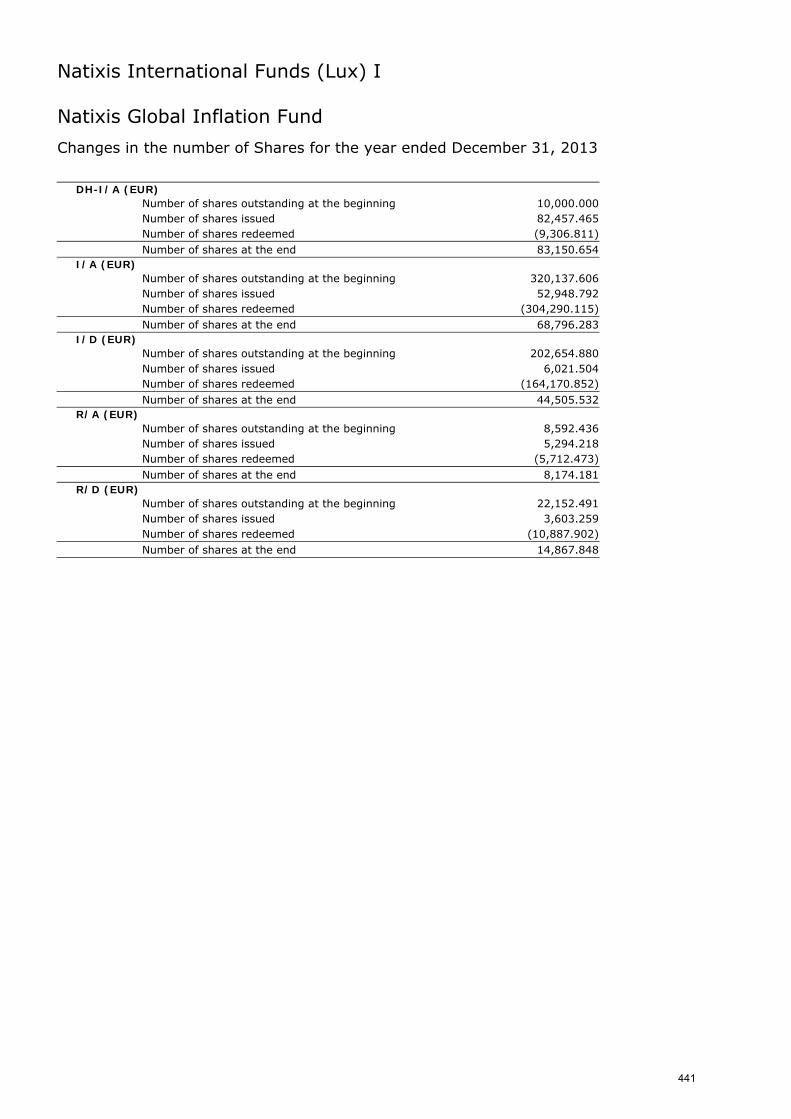
Natixis International Funds (Lux) I
Natixis Global Inflation Fund
Changes in the number of Shares for the year ended December 31, 2013
DH-I/A (EUR) Number of shares outstanding at the beginning 10,000.000
Number of shares issued 82,457.465
Number of shares redeemed (9,306.811) Number of shares at the end 83,150.654
I/A (EUR) Number of shares outstanding at the beginning 320,137.606
Number of shares issued 52,948.792
Number of shares redeemed (304,290.115) Number of shares at the end 68,796.283
I/D (EUR) Number of shares outstanding at the beginning 202,654.880
Number of shares issued 6,021.504
Number of shares redeemed (164,170.852) Number of shares at the end 44,505.532
R/A (EUR) Number of shares outstanding at the beginning 8,592.436
Number of shares issued 5,294.218
Number of shares redeemed (5,712.473) Number of shares at the end 8,174.181
R/D (EUR) Number of shares outstanding at the beginning 22,152.491
Number of shares issued 3,603.259
Number of shares redeemed (10,887.902) Number of shares at the end 14,867.848
441
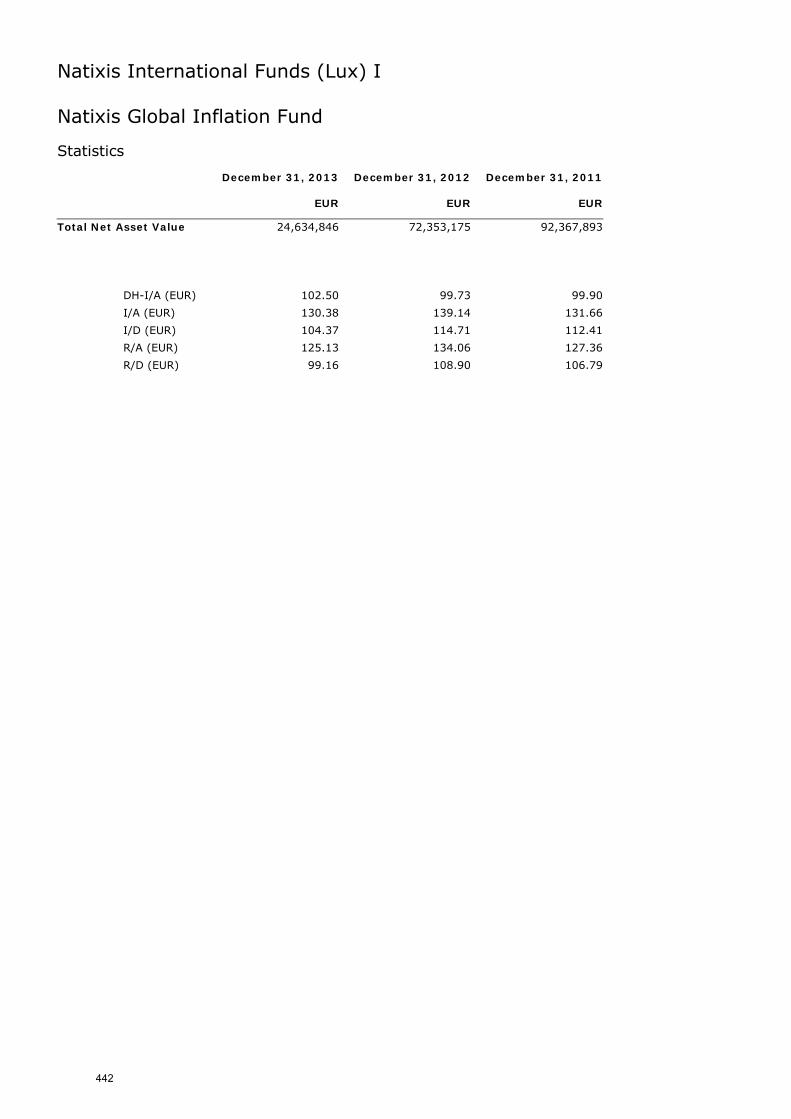
Natixis International Funds (Lux) I
Natixis Global Inflation Fund Statistics December 31, 2013 December 31, 2012 December 31, 2011 EUR EUR EUR
Total Net Asset Value 24,634,846 72,353,175 92,367,893
DH-I/A (EUR) 102.50 99.73 99.90
I/A (EUR) 130.38 139.14 131.66
I/D (EUR) 104.37 114.71 112.41
R/A (EUR) 125.13 134.06 127.36
R/D (EUR) 99.16 108.90 106.79
442
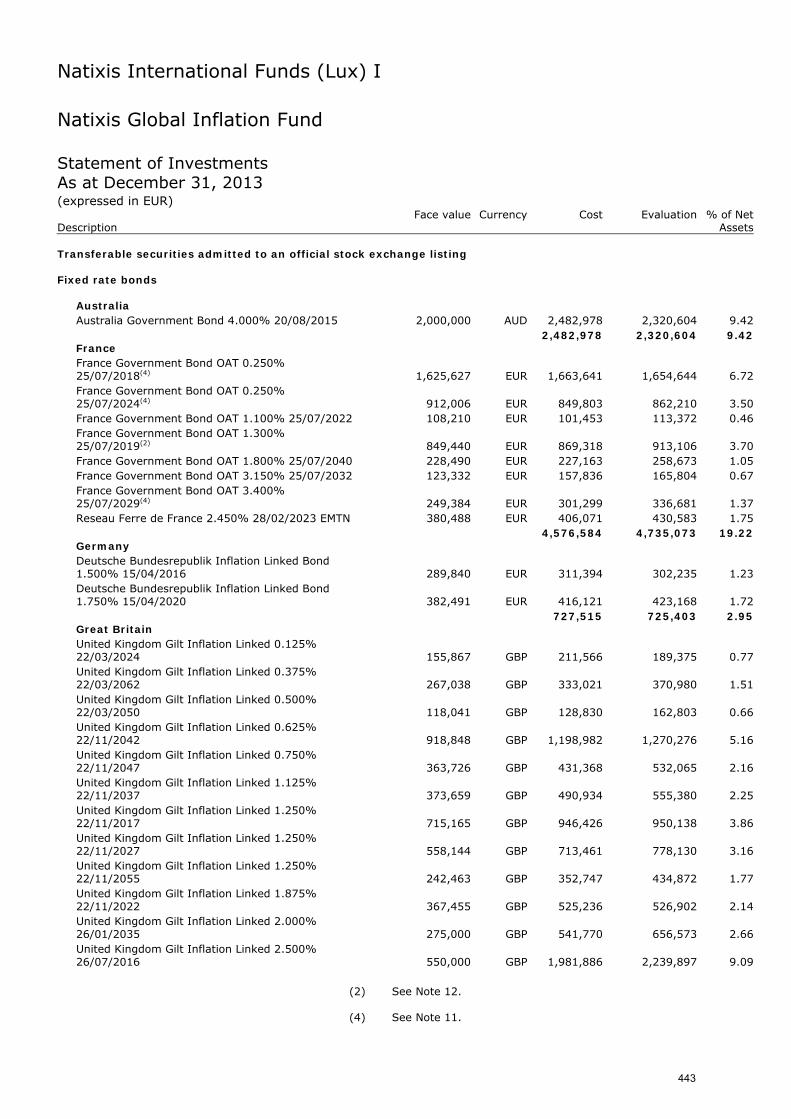
Natixis International Funds (Lux) I
Natixis Global Inflation Fund Statement of Investments As at December 31, 2013 (expressed in EUR) Face value Currency Cost Evaluation % of Net Description Assets Transferable securities admitted to an official stock exchange listing Fixed rate bonds
Australia Australia Government Bond 4.000% 20/08/2015 2,000,000 AUD 2,482,978 2,320,604 9.42
2,482,978 2,320,604 9.42 France France Government Bond OAT 0.250% 25/07/2018(4) 1,625,627 EUR 1,663,641 1,654,644 6.72 France Government Bond OAT 0.250% 25/07/2024(4) 912,006 EUR 849,803 862,210 3.50 France Government Bond OAT 1.100% 25/07/2022 108,210 EUR 101,453 113,372 0.46 France Government Bond OAT 1.300% 25/07/2019(2) 849,440 EUR 869,318 913,106 3.70 France Government Bond OAT 1.800% 25/07/2040 228,490 EUR 227,163 258,673 1.05 France Government Bond OAT 3.150% 25/07/2032 123,332 EUR 157,836 165,804 0.67 France Government Bond OAT 3.400% 25/07/2029(4) 249,384 EUR 301,299 336,681 1.37 Reseau Ferre de France 2.450% 28/02/2023 EMTN 380,488 EUR 406,071 430,583 1.75
4,576,584 4,735,073 19.22 Germany Deutsche Bundesrepublik Inflation Linked Bond 1.500% 15/04/2016 289,840 EUR 311,394 302,235 1.23 Deutsche Bundesrepublik Inflation Linked Bond 1.750% 15/04/2020 382,491 EUR 416,121 423,168 1.72
727,515 725,403 2.95 Great Britain United Kingdom Gilt Inflation Linked 0.125% 22/03/2024 155,867 GBP 211,566 189,375 0.77 United Kingdom Gilt Inflation Linked 0.375% 22/03/2062 267,038 GBP 333,021 370,980 1.51 United Kingdom Gilt Inflation Linked 0.500% 22/03/2050 118,041 GBP 128,830 162,803 0.66 United Kingdom Gilt Inflation Linked 0.625% 22/11/2042 918,848 GBP 1,198,982 1,270,276 5.16 United Kingdom Gilt Inflation Linked 0.750% 22/11/2047 363,726 GBP 431,368 532,065 2.16 United Kingdom Gilt Inflation Linked 1.125% 22/11/2037 373,659 GBP 490,934 555,380 2.25 United Kingdom Gilt Inflation Linked 1.250% 22/11/2017 715,165 GBP 946,426 950,138 3.86 United Kingdom Gilt Inflation Linked 1.250% 22/11/2027 558,144 GBP 713,461 778,130 3.16 United Kingdom Gilt Inflation Linked 1.250% 22/11/2055 242,463 GBP 352,747 434,872 1.77 United Kingdom Gilt Inflation Linked 1.875% 22/11/2022 367,455 GBP 525,236 526,902 2.14 United Kingdom Gilt Inflation Linked 2.000% 26/01/2035 275,000 GBP 541,770 656,573 2.66 United Kingdom Gilt Inflation Linked 2.500% 26/07/2016 550,000 GBP 1,981,886 2,239,897 9.09
(2) See Note 12.
(4) See Note 11.
443
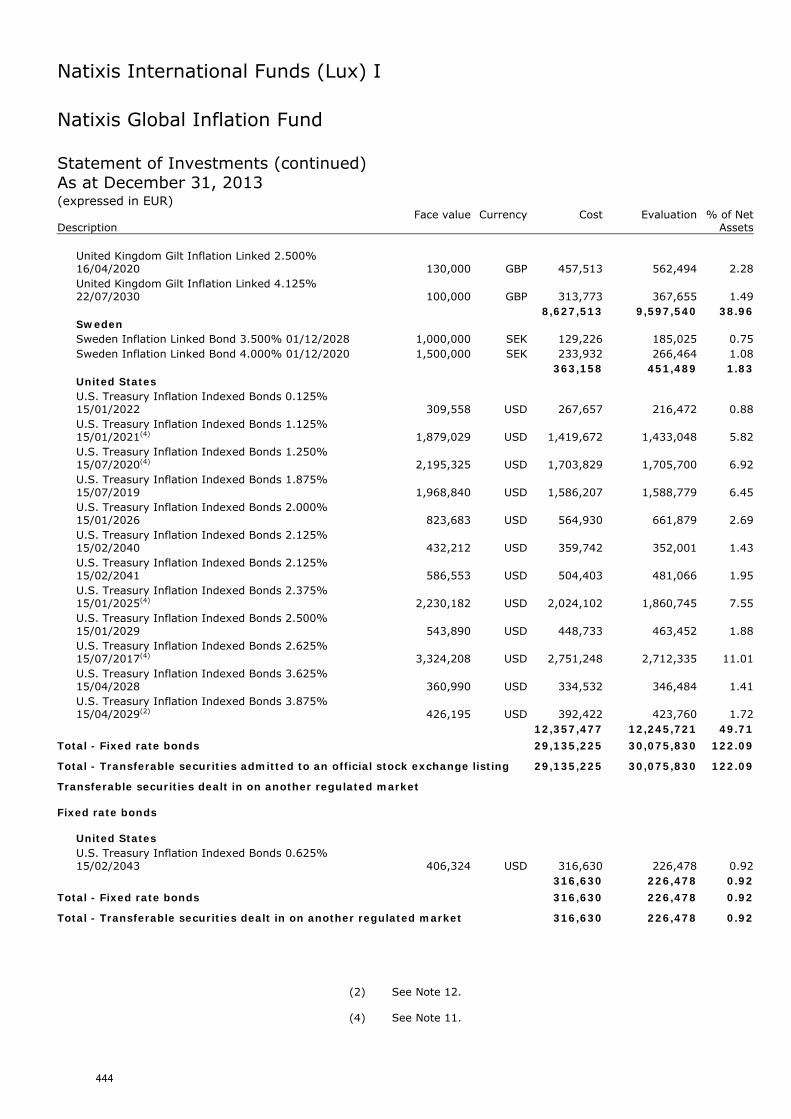
Natixis International Funds (Lux) I
Natixis Global Inflation Fund Statement of Investments (continued) As at December 31, 2013 (expressed in EUR) Face value Currency Cost Evaluation % of Net Description Assets
United Kingdom Gilt Inflation Linked 2.500% 16/04/2020 130,000 GBP 457,513 562,494 2.28 United Kingdom Gilt Inflation Linked 4.125% 22/07/2030 100,000 GBP 313,773 367,655 1.49
8,627,513 9,597,540 38.96 Sweden Sweden Inflation Linked Bond 3.500% 01/12/2028 1,000,000 SEK 129,226 185,025 0.75 Sweden Inflation Linked Bond 4.000% 01/12/2020 1,500,000 SEK 233,932 266,464 1.08
363,158 451,489 1.83 United States U.S. Treasury Inflation Indexed Bonds 0.125% 15/01/2022 309,558 USD 267,657 216,472 0.88 U.S. Treasury Inflation Indexed Bonds 1.125% 15/01/2021(4) 1,879,029 USD 1,419,672 1,433,048 5.82 U.S. Treasury Inflation Indexed Bonds 1.250% 15/07/2020(4) 2,195,325 USD 1,703,829 1,705,700 6.92 U.S. Treasury Inflation Indexed Bonds 1.875% 15/07/2019 1,968,840 USD 1,586,207 1,588,779 6.45 U.S. Treasury Inflation Indexed Bonds 2.000% 15/01/2026 823,683 USD 564,930 661,879 2.69 U.S. Treasury Inflation Indexed Bonds 2.125% 15/02/2040 432,212 USD 359,742 352,001 1.43 U.S. Treasury Inflation Indexed Bonds 2.125% 15/02/2041 586,553 USD 504,403 481,066 1.95 U.S. Treasury Inflation Indexed Bonds 2.375% 15/01/2025(4) 2,230,182 USD 2,024,102 1,860,745 7.55 U.S. Treasury Inflation Indexed Bonds 2.500% 15/01/2029 543,890 USD 448,733 463,452 1.88 U.S. Treasury Inflation Indexed Bonds 2.625% 15/07/2017(4) 3,324,208 USD 2,751,248 2,712,335 11.01 U.S. Treasury Inflation Indexed Bonds 3.625% 15/04/2028 360,990 USD 334,532 346,484 1.41 U.S. Treasury Inflation Indexed Bonds 3.875% 15/04/2029(2) 426,195 USD 392,422 423,760 1.72
12,357,477 12,245,721 49.71
Total - Fixed rate bonds 29,135,225 30,075,830 122.09
Total - Transferable securities admitted to an official stock exchange listing 29,135,225 30,075,830 122.09
Transferable securities dealt in on another regulated market Fixed rate bonds
United States U.S. Treasury Inflation Indexed Bonds 0.625% 15/02/2043 406,324 USD 316,630 226,478 0.92
316,630 226,478 0.92
Total - Fixed rate bonds 316,630 226,478 0.92
Total - Transferable securities dealt in on another regulated market 316,630 226,478 0.92
(2) See Note 12.
(4) See Note 11.
444
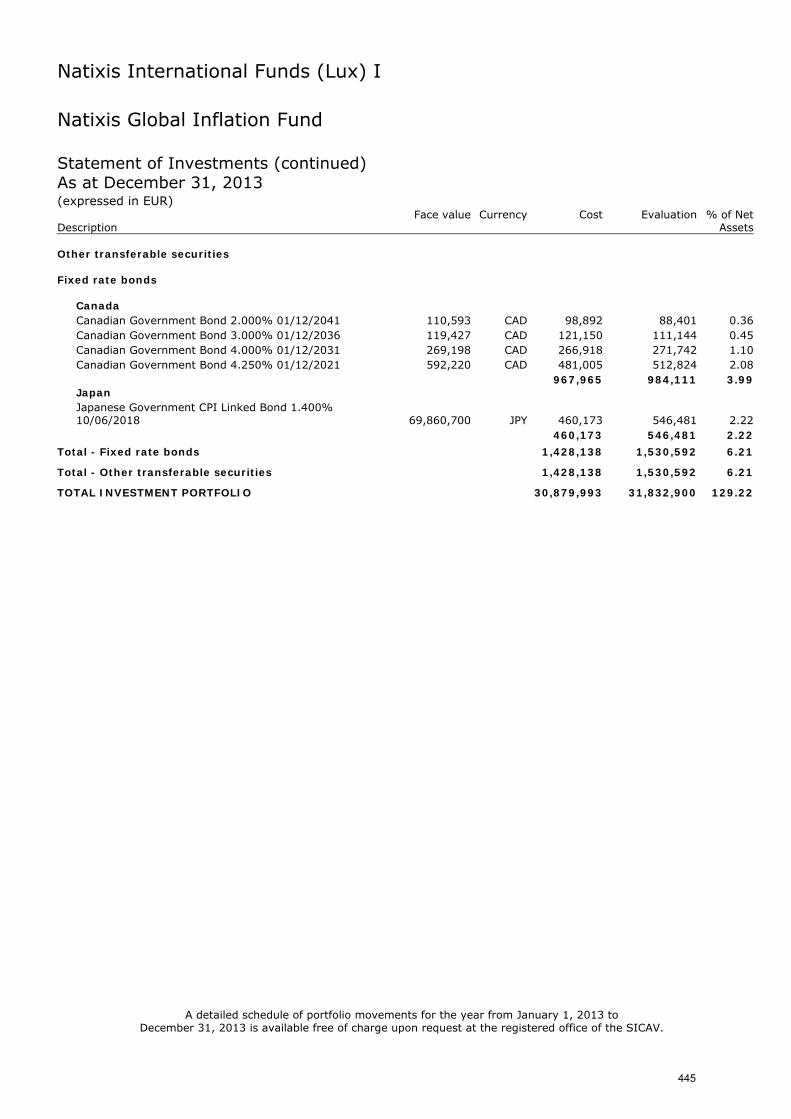
Natixis International Funds (Lux) I
Natixis Global Inflation Fund Statement of Investments (continued) As at December 31, 2013 (expressed in EUR) Face value Currency Cost Evaluation % of Net Description Assets Other transferable securities Fixed rate bonds
Canada Canadian Government Bond 2.000% 01/12/2041 110,593 CAD 98,892 88,401 0.36 Canadian Government Bond 3.000% 01/12/2036 119,427 CAD 121,150 111,144 0.45 Canadian Government Bond 4.000% 01/12/2031 269,198 CAD 266,918 271,742 1.10 Canadian Government Bond 4.250% 01/12/2021 592,220 CAD 481,005 512,824 2.08
967,965 984,111 3.99 Japan Japanese Government CPI Linked Bond 1.400% 10/06/2018 69,860,700 JPY 460,173 546,481 2.22
460,173 546,481 2.22
Total - Fixed rate bonds 1,428,138 1,530,592 6.21
Total - Other transferable securities 1,428,138 1,530,592 6.21
TOTAL INVESTMENT PORTFOLIO 30,879,993 31,832,900 129.22
A detailed schedule of portfolio movements for the year from January 1, 2013 to December 31, 2013 is available free of charge upon request at the registered office of the SICAV.
445
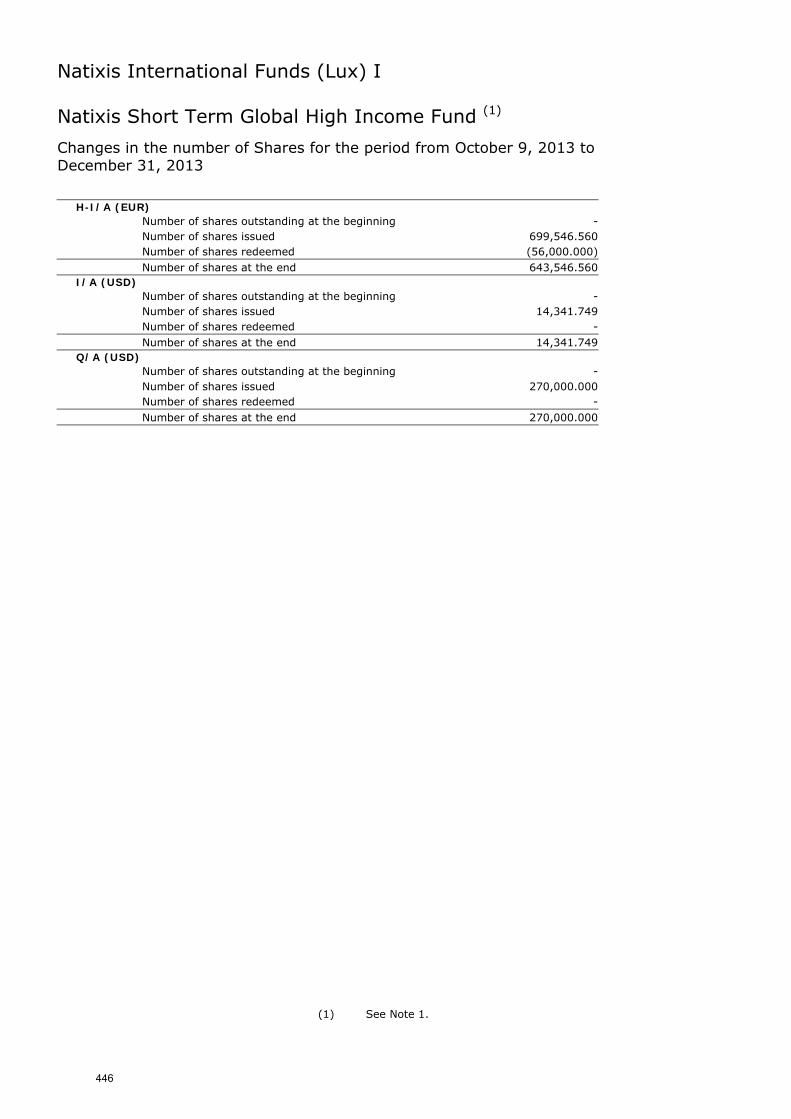
Natixis International Funds (Lux) I
Natixis Short Term Global High Income Fund (1)
Changes in the number of Shares for the period from October 9, 2013 to December 31, 2013
H-I/A (EUR) Number of shares outstanding at the beginning - Number of shares issued 699,546.560
Number of shares redeemed (56,000.000) Number of shares at the end 643,546.560
I/A (USD) Number of shares outstanding at the beginning - Number of shares issued 14,341.749
Number of shares redeemed - Number of shares at the end 14,341.749
Q/A (USD) Number of shares outstanding at the beginning - Number of shares issued 270,000.000
Number of shares redeemed - Number of shares at the end 270,000.000
(1) See Note 1.
446
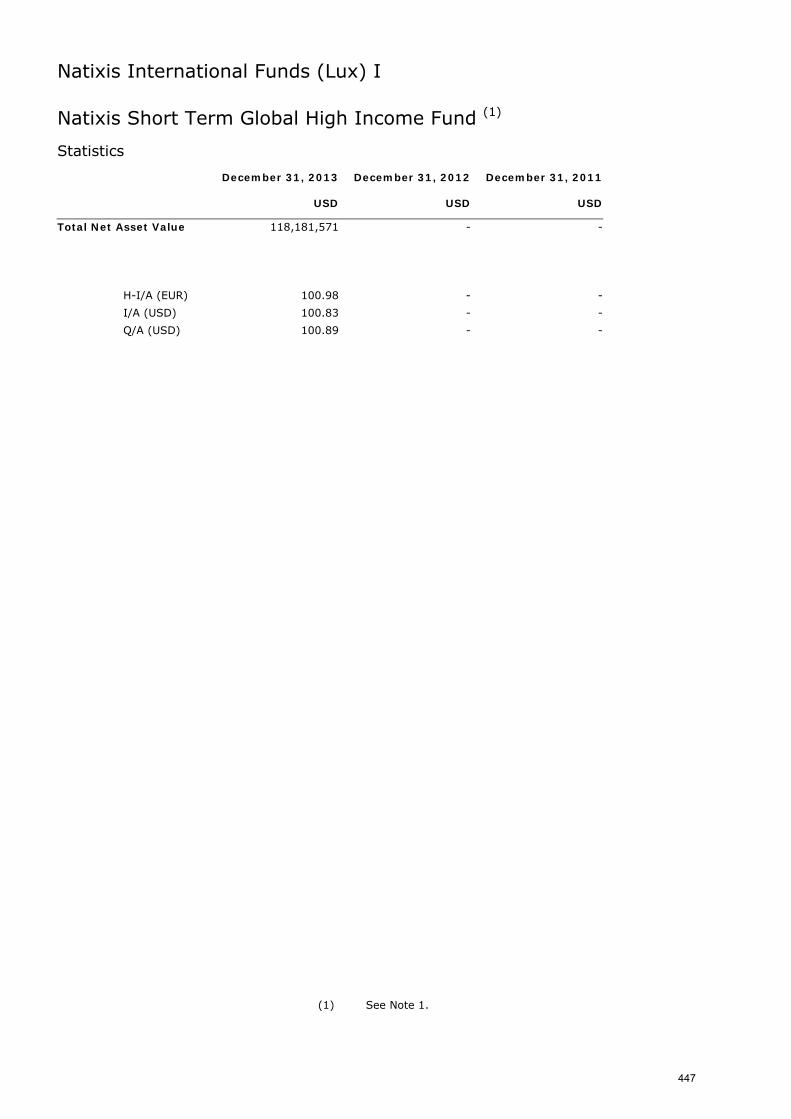
Natixis International Funds (Lux) I
Natixis Short Term Global High Income Fund (1)
Statistics December 31, 2013 December 31, 2012 December 31, 2011 USD USD USD
Total Net Asset Value 118,181,571 - -
H-I/A (EUR) 100.98 - -
I/A (USD) 100.83 - -
Q/A (USD) 100.89 - -
(1) See Note 1.
447
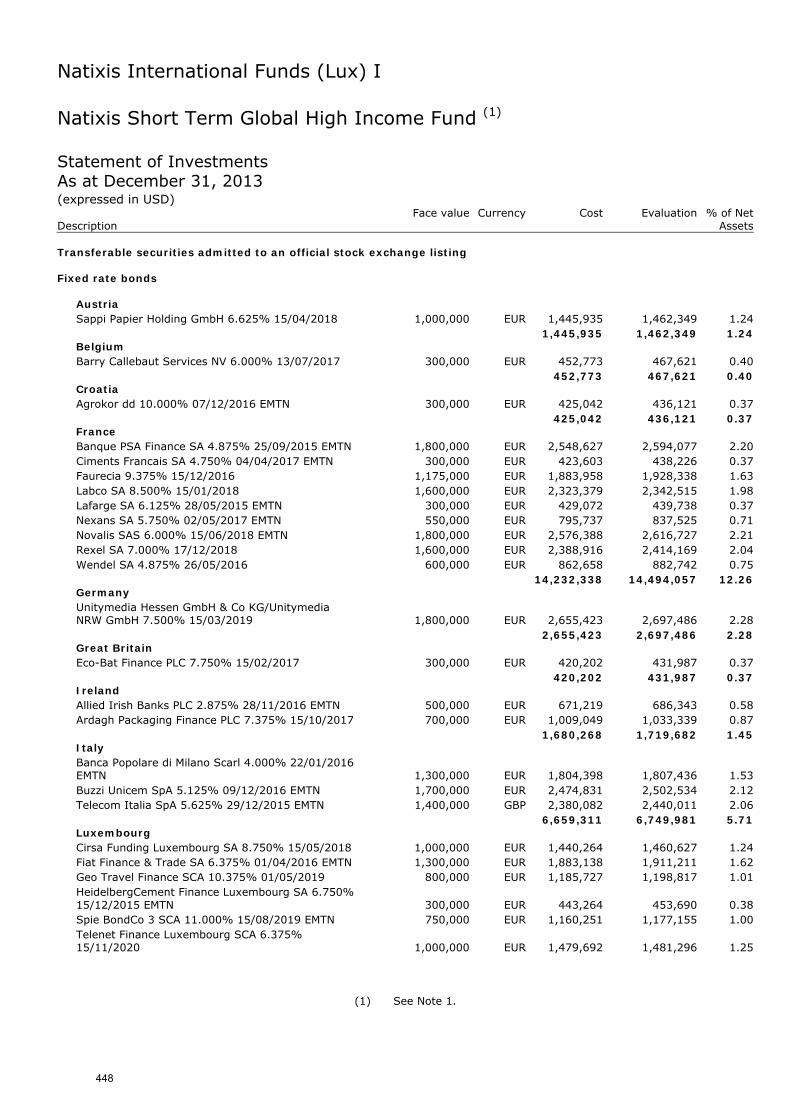
Natixis International Funds (Lux) I
Natixis Short Term Global High Income Fund (1) Statement of Investments As at December 31, 2013 (expressed in USD) Face value Currency Cost Evaluation % of Net Description Assets Transferable securities admitted to an official stock exchange listing Fixed rate bonds
Austria Sappi Papier Holding GmbH 6.625% 15/04/2018 1,000,000 EUR 1,445,935 1,462,349 1.24
1,445,935 1,462,349 1.24 Belgium Barry Callebaut Services NV 6.000% 13/07/2017 300,000 EUR 452,773 467,621 0.40
452,773 467,621 0.40 Croatia Agrokor dd 10.000% 07/12/2016 EMTN 300,000 EUR 425,042 436,121 0.37
425,042 436,121 0.37 France Banque PSA Finance SA 4.875% 25/09/2015 EMTN 1,800,000 EUR 2,548,627 2,594,077 2.20 Ciments Francais SA 4.750% 04/04/2017 EMTN 300,000 EUR 423,603 438,226 0.37 Faurecia 9.375% 15/12/2016 1,175,000 EUR 1,883,958 1,928,338 1.63 Labco SA 8.500% 15/01/2018 1,600,000 EUR 2,323,379 2,342,515 1.98 Lafarge SA 6.125% 28/05/2015 EMTN 300,000 EUR 429,072 439,738 0.37 Nexans SA 5.750% 02/05/2017 EMTN 550,000 EUR 795,737 837,525 0.71 Novalis SAS 6.000% 15/06/2018 EMTN 1,800,000 EUR 2,576,388 2,616,727 2.21 Rexel SA 7.000% 17/12/2018 1,600,000 EUR 2,388,916 2,414,169 2.04 Wendel SA 4.875% 26/05/2016 600,000 EUR 862,658 882,742 0.75
14,232,338 14,494,057 12.26 Germany Unitymedia Hessen GmbH & Co KG/Unitymedia NRW GmbH 7.500% 15/03/2019 1,800,000 EUR 2,655,423 2,697,486 2.28
2,655,423 2,697,486 2.28 Great Britain Eco-Bat Finance PLC 7.750% 15/02/2017 300,000 EUR 420,202 431,987 0.37
420,202 431,987 0.37 Ireland Allied Irish Banks PLC 2.875% 28/11/2016 EMTN 500,000 EUR 671,219 686,343 0.58 Ardagh Packaging Finance PLC 7.375% 15/10/2017 700,000 EUR 1,009,049 1,033,339 0.87
1,680,268 1,719,682 1.45 Italy Banca Popolare di Milano Scarl 4.000% 22/01/2016 EMTN 1,300,000 EUR 1,804,398 1,807,436 1.53 Buzzi Unicem SpA 5.125% 09/12/2016 EMTN 1,700,000 EUR 2,474,831 2,502,534 2.12 Telecom Italia SpA 5.625% 29/12/2015 EMTN 1,400,000 GBP 2,380,082 2,440,011 2.06
6,659,311 6,749,981 5.71 Luxembourg Cirsa Funding Luxembourg SA 8.750% 15/05/2018 1,000,000 EUR 1,440,264 1,460,627 1.24 Fiat Finance & Trade SA 6.375% 01/04/2016 EMTN 1,300,000 EUR 1,883,138 1,911,211 1.62 Geo Travel Finance SCA 10.375% 01/05/2019 800,000 EUR 1,185,727 1,198,817 1.01 HeidelbergCement Finance Luxembourg SA 6.750% 15/12/2015 EMTN 300,000 EUR 443,264 453,690 0.38 Spie BondCo 3 SCA 11.000% 15/08/2019 EMTN 750,000 EUR 1,160,251 1,177,155 1.00 Telenet Finance Luxembourg SCA 6.375% 15/11/2020 1,000,000 EUR 1,479,692 1,481,296 1.25
(1) See Note 1.
448
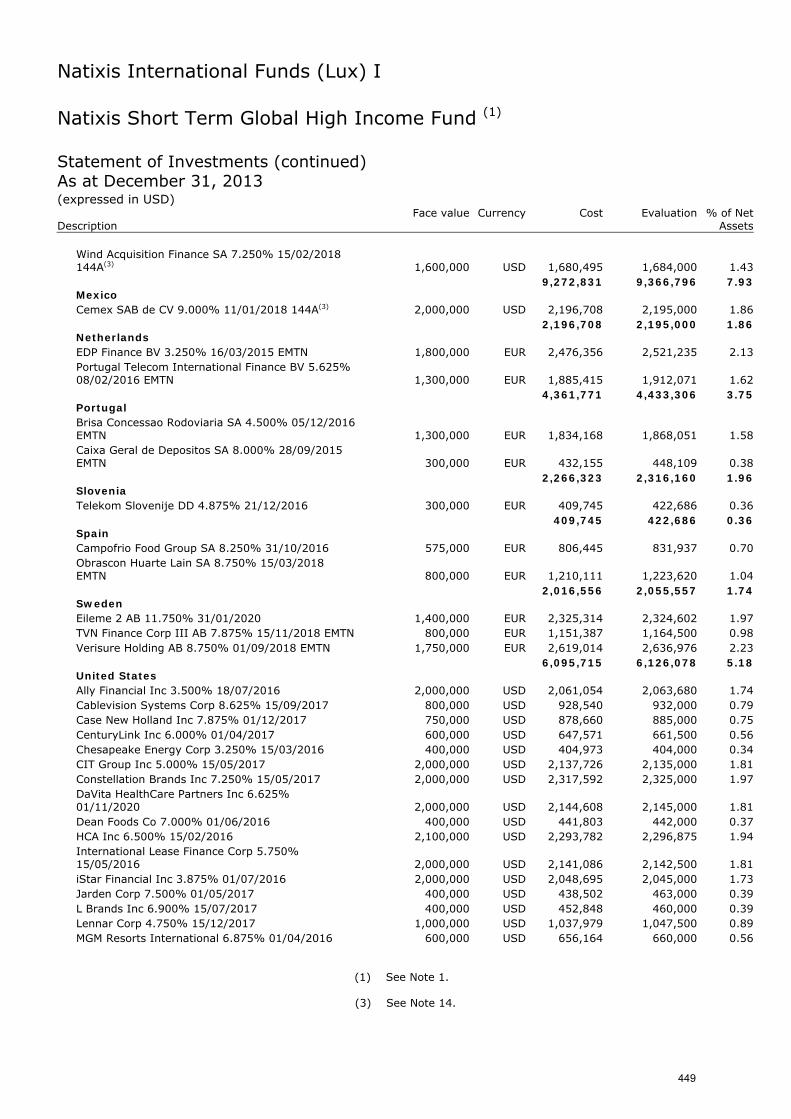
Natixis International Funds (Lux) I
Natixis Short Term Global High Income Fund (1) Statement of Investments (continued) As at December 31, 2013 (expressed in USD) Face value Currency Cost Evaluation % of Net Description Assets
Wind Acquisition Finance SA 7.250% 15/02/2018 144A(3) 1,600,000 USD 1,680,495 1,684,000 1.43
9,272,831 9,366,796 7.93 Mexico Cemex SAB de CV 9.000% 11/01/2018 144A(3) 2,000,000 USD 2,196,708 2,195,000 1.86
2,196,708 2,195,000 1.86 Netherlands EDP Finance BV 3.250% 16/03/2015 EMTN 1,800,000 EUR 2,476,356 2,521,235 2.13 Portugal Telecom International Finance BV 5.625% 08/02/2016 EMTN 1,300,000 EUR 1,885,415 1,912,071 1.62
4,361,771 4,433,306 3.75 Portugal Brisa Concessao Rodoviaria SA 4.500% 05/12/2016 EMTN 1,300,000 EUR 1,834,168 1,868,051 1.58 Caixa Geral de Depositos SA 8.000% 28/09/2015 EMTN 300,000 EUR 432,155 448,109 0.38
2,266,323 2,316,160 1.96 Slovenia Telekom Slovenije DD 4.875% 21/12/2016 300,000 EUR 409,745 422,686 0.36
409,745 422,686 0.36 Spain Campofrio Food Group SA 8.250% 31/10/2016 575,000 EUR 806,445 831,937 0.70 Obrascon Huarte Lain SA 8.750% 15/03/2018 EMTN 800,000 EUR 1,210,111 1,223,620 1.04
2,016,556 2,055,557 1.74 Sweden Eileme 2 AB 11.750% 31/01/2020 1,400,000 EUR 2,325,314 2,324,602 1.97 TVN Finance Corp III AB 7.875% 15/11/2018 EMTN 800,000 EUR 1,151,387 1,164,500 0.98 Verisure Holding AB 8.750% 01/09/2018 EMTN 1,750,000 EUR 2,619,014 2,636,976 2.23
6,095,715 6,126,078 5.18 United States Ally Financial Inc 3.500% 18/07/2016 2,000,000 USD 2,061,054 2,063,680 1.74 Cablevision Systems Corp 8.625% 15/09/2017 800,000 USD 928,540 932,000 0.79 Case New Holland Inc 7.875% 01/12/2017 750,000 USD 878,660 885,000 0.75 CenturyLink Inc 6.000% 01/04/2017 600,000 USD 647,571 661,500 0.56 Chesapeake Energy Corp 3.250% 15/03/2016 400,000 USD 404,973 404,000 0.34 CIT Group Inc 5.000% 15/05/2017 2,000,000 USD 2,137,726 2,135,000 1.81 Constellation Brands Inc 7.250% 15/05/2017 2,000,000 USD 2,317,592 2,325,000 1.97 DaVita HealthCare Partners Inc 6.625% 01/11/2020 2,000,000 USD 2,144,608 2,145,000 1.81 Dean Foods Co 7.000% 01/06/2016 400,000 USD 441,803 442,000 0.37 HCA Inc 6.500% 15/02/2016 2,100,000 USD 2,293,782 2,296,875 1.94 International Lease Finance Corp 5.750% 15/05/2016 2,000,000 USD 2,141,086 2,142,500 1.81 iStar Financial Inc 3.875% 01/07/2016 2,000,000 USD 2,048,695 2,045,000 1.73 Jarden Corp 7.500% 01/05/2017 400,000 USD 438,502 463,000 0.39 L Brands Inc 6.900% 15/07/2017 400,000 USD 452,848 460,000 0.39 Lennar Corp 4.750% 15/12/2017 1,000,000 USD 1,037,979 1,047,500 0.89 MGM Resorts International 6.875% 01/04/2016 600,000 USD 656,164 660,000 0.56
(1) See Note 1.
(3) See Note 14.
449
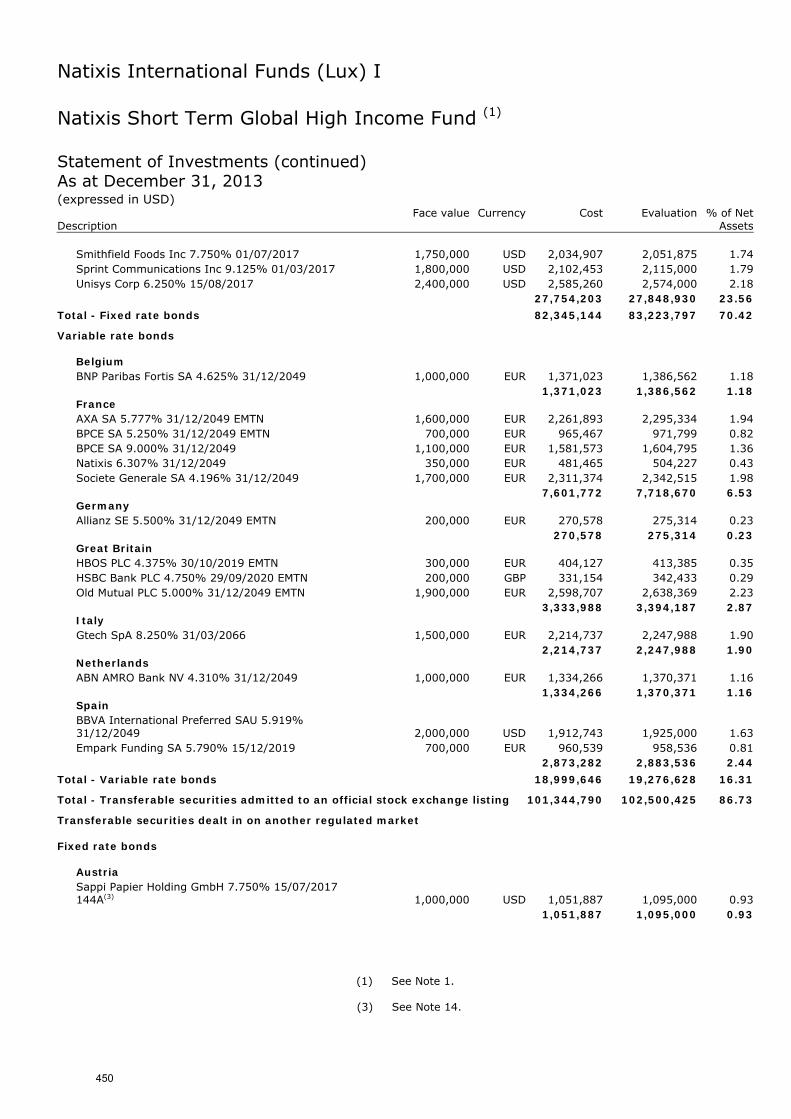
Natixis International Funds (Lux) I
Natixis Short Term Global High Income Fund (1) Statement of Investments (continued) As at December 31, 2013 (expressed in USD) Face value Currency Cost Evaluation % of Net Description Assets
Smithfield Foods Inc 7.750% 01/07/2017 1,750,000 USD 2,034,907 2,051,875 1.74 Sprint Communications Inc 9.125% 01/03/2017 1,800,000 USD 2,102,453 2,115,000 1.79 Unisys Corp 6.250% 15/08/2017 2,400,000 USD 2,585,260 2,574,000 2.18
27,754,203 27,848,930 23.56
Total - Fixed rate bonds 82,345,144 83,223,797 70.42
Variable rate bonds
Belgium BNP Paribas Fortis SA 4.625% 31/12/2049 1,000,000 EUR 1,371,023 1,386,562 1.18
1,371,023 1,386,562 1.18 France AXA SA 5.777% 31/12/2049 EMTN 1,600,000 EUR 2,261,893 2,295,334 1.94 BPCE SA 5.250% 31/12/2049 EMTN 700,000 EUR 965,467 971,799 0.82 BPCE SA 9.000% 31/12/2049 1,100,000 EUR 1,581,573 1,604,795 1.36 Natixis 6.307% 31/12/2049 350,000 EUR 481,465 504,227 0.43 Societe Generale SA 4.196% 31/12/2049 1,700,000 EUR 2,311,374 2,342,515 1.98
7,601,772 7,718,670 6.53 Germany Allianz SE 5.500% 31/12/2049 EMTN 200,000 EUR 270,578 275,314 0.23
270,578 275,314 0.23 Great Britain HBOS PLC 4.375% 30/10/2019 EMTN 300,000 EUR 404,127 413,385 0.35 HSBC Bank PLC 4.750% 29/09/2020 EMTN 200,000 GBP 331,154 342,433 0.29 Old Mutual PLC 5.000% 31/12/2049 EMTN 1,900,000 EUR 2,598,707 2,638,369 2.23
3,333,988 3,394,187 2.87 Italy Gtech SpA 8.250% 31/03/2066 1,500,000 EUR 2,214,737 2,247,988 1.90
2,214,737 2,247,988 1.90 Netherlands ABN AMRO Bank NV 4.310% 31/12/2049 1,000,000 EUR 1,334,266 1,370,371 1.16
1,334,266 1,370,371 1.16 Spain BBVA International Preferred SAU 5.919% 31/12/2049 2,000,000 USD 1,912,743 1,925,000 1.63 Empark Funding SA 5.790% 15/12/2019 700,000 EUR 960,539 958,536 0.81
2,873,282 2,883,536 2.44
Total - Variable rate bonds 18,999,646 19,276,628 16.31
Total - Transferable securities admitted to an official stock exchange listing 101,344,790 102,500,425 86.73
Transferable securities dealt in on another regulated market Fixed rate bonds
Austria Sappi Papier Holding GmbH 7.750% 15/07/2017 144A(3) 1,000,000 USD 1,051,887 1,095,000 0.93
1,051,887 1,095,000 0.93
(1) See Note 1.
(3) See Note 14.
450
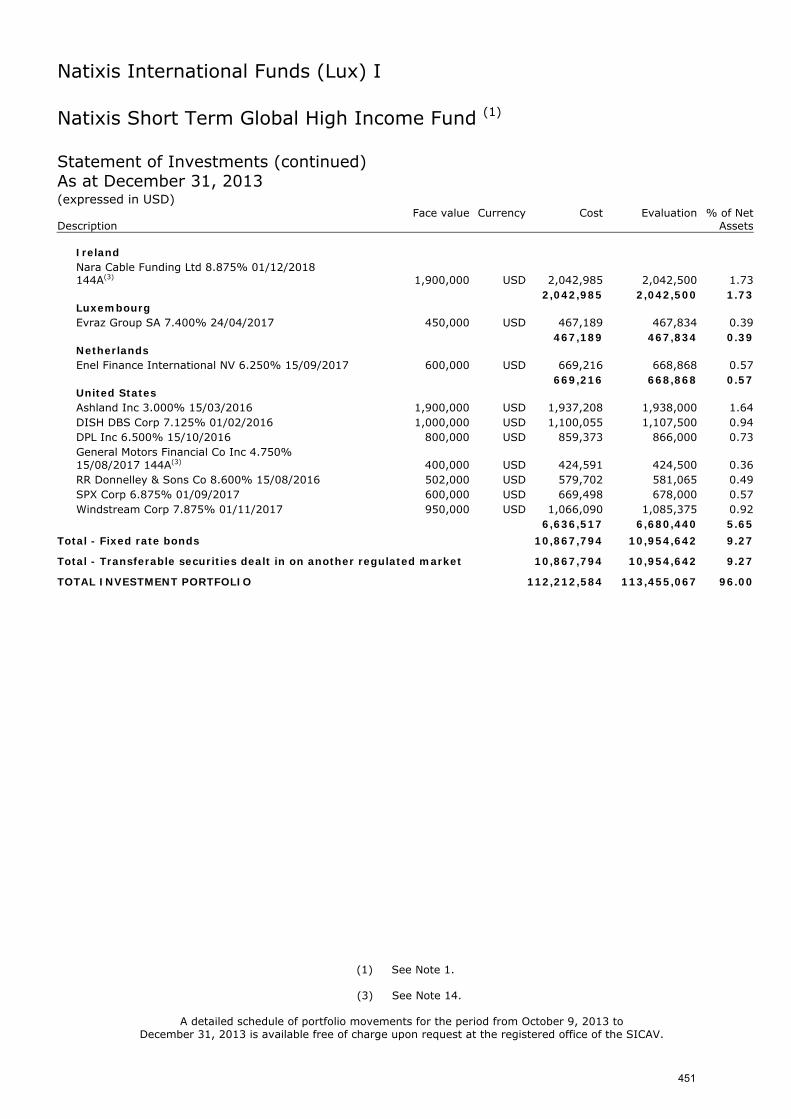
Natixis International Funds (Lux) I
Natixis Short Term Global High Income Fund (1) Statement of Investments (continued) As at December 31, 2013 (expressed in USD) Face value Currency Cost Evaluation % of Net Description Assets
Ireland Nara Cable Funding Ltd 8.875% 01/12/2018 144A(3) 1,900,000 USD 2,042,985 2,042,500 1.73
2,042,985 2,042,500 1.73 Luxembourg Evraz Group SA 7.400% 24/04/2017 450,000 USD 467,189 467,834 0.39
467,189 467,834 0.39 Netherlands Enel Finance International NV 6.250% 15/09/2017 600,000 USD 669,216 668,868 0.57
669,216 668,868 0.57 United States Ashland Inc 3.000% 15/03/2016 1,900,000 USD 1,937,208 1,938,000 1.64 DISH DBS Corp 7.125% 01/02/2016 1,000,000 USD 1,100,055 1,107,500 0.94 DPL Inc 6.500% 15/10/2016 800,000 USD 859,373 866,000 0.73 General Motors Financial Co Inc 4.750% 15/08/2017 144A(3) 400,000 USD 424,591 424,500 0.36 RR Donnelley & Sons Co 8.600% 15/08/2016 502,000 USD 579,702 581,065 0.49 SPX Corp 6.875% 01/09/2017 600,000 USD 669,498 678,000 0.57 Windstream Corp 7.875% 01/11/2017 950,000 USD 1,066,090 1,085,375 0.92
6,636,517 6,680,440 5.65
Total - Fixed rate bonds 10,867,794 10,954,642 9.27
Total - Transferable securities dealt in on another regulated market 10,867,794 10,954,642 9.27
TOTAL INVESTMENT PORTFOLIO 112,212,584 113,455,067 96.00
(1) See Note 1.
(3) See Note 14.
A detailed schedule of portfolio movements for the period from October 9, 2013 to December 31, 2013 is available free of charge upon request at the registered office of the SICAV.
451
Natixis International Funds (Lux) I Notes to the Financial Statements
as at December 31, 2013
Note 1 – GENERAL
Natixis International Funds (Lux) I (the “Umbrella Fund”) is a Société d’Investissement à Capital Variable incorporated under the laws of the Grand Duchy of Luxembourg on December 1, 1995 and is currently governed by Part I of the Luxembourg Law of December 17, 2010 on undertakings for collective investment as amended, implementing the EEC Council Directive 2009/65/EC of July 13, 2009 (“UCITS Directive”).
The registered office of the Umbrella Fund is located at 2-8 avenue Charles de Gaulle, L-1653 Luxembourg. The Umbrella Fund is recorded in the Luxembourg Registre de Commerce under number B.53023.
Natixis International Funds (Lux) I is an umbrella fund and as such provides investors access to a diversified management expertise through a range of several separate sub-funds each having its own objective and policy.
As of December 31, 2013 shares are offered in twenty-four sub-funds (each, a “Fund”): - Absolute Asia AM Emerging Asia Fund, - Absolute Asia AM Pacific Rim Equities Fund, - Gateway U.S. Equities Fund, - Hansberger Emerging Latin America Fund, - Harris Associates Concentrated U.S. Equity Fund, - Harris Associates Global Equity Fund, - Harris Associates U.S. Equity Fund, - IDFC India Equities Fund, - Loomis Sayles U.S. Research Fund, - Natixis Emerging Europe Fund, - Natixis Europe Smaller Companies Fund, - Vaughan Nelson U.S. Small Cap Value Fund, - Loomis Sayles Duration Hedged Corporate Bond Fund (created on December 16, 2013 and launched on February 4, 2014), - Loomis Sayles Emerging Debt and Currencies Fund, - Loomis Sayles Emerging Markets Corporate Bond Fund (created on September 30, 2013 and launched on December 4, 2013), - Loomis Sayles Global Credit Fund, - Loomis Sayles Institutional Global Corporate Bond Fund, - Loomis Sayles Institutional High Income Fund, - Loomis Sayles Strategic Alpha Bond Fund, - Loomis Sayles Sustainable Global Corporate Bond Fund (created on September 30, 2013 and launched on October 25, 2013), - Natixis Euro Aggregate Plus Fund, - Natixis Euro High Income Fund, - Natixis Global Inflation Fund, - Natixis Short Term Global High Income Fund (created on September 30, 2013 and launched on October 9, 2013).
The Umbrella Fund has appointed NGAM S.A. (the “Management Company”) as its management company and delegated to the Management Company all powers related to the investment management, administration and distribution of the Umbrella Fund with effect on April 30, 2006.
NGAM S.A. is a Société Anonyme incorporated under Luxembourg law on April 25, 2006 for an unlimited period of time and licensed as a management company under Chapter 15 of the Luxembourg Law of December 17, 2010 on undertakings for collective investment, as amended.
Investors have the flexibility to convert between Funds.
The Umbrella Fund has been established for an unlimited period of time.
On December 31, 2013, the Loomis Sayles Global Equity Opportunities Fund was liquidated.
452
Natixis International Funds (Lux) I Notes to the Financial Statements
as at December 31, 2013 (continued)
Note 2 – SUMMARY OF SIGNIFICANT ACCOUNTING POLICIES a) Presentation of financial statements The financial statements are prepared in accordance with Luxembourg regulations relating to undertakings for collective investment. Cross-Funds investments were not eliminated from the combined figures. At December 31, 2013, the total of cross-Funds investments amounts to EUR 28,226,047 and therefore the total combined NAV at year-end without cross-investments would amount to EUR 4,564,785,809. b) Method of calculation The value of each Fund’s assets shall be determined as follows:
a. Securities and money market instruments traded on exchanges and Regulated Markets – last market price, unless the Umbrella Fund believes that an occurrence after the publication of the last market price and before any Fund next calculates its net asset value will materially affect the security’s value. In that case, the security may be fair valued at the time the Administrative Agent determines its net asset value by or pursuant to procedures approved by the Umbrella Fund.
b. Securities and money market instruments not traded on a Regulated Market (other than short-term money
market instruments) – based upon valuations provided by pricing vendors, which valuations are determined based on normal, institutional-size trading of such securities using market information, transactions for comparable securities and various relationships between securities which are generally recognized by institutional traders.
c. Short-term money market instruments (with remaining maturities of 60 days or less) – amortized cost
(which approximates market value under normal conditions). d. Futures, options and forwards – unrealized gain or loss on the contract using current settlement price.
When a settlement price is not used, future and forward contracts will be valued at their fair value as determined pursuant to procedures approved by the Umbrella Fund, as used on a consistent basis.
e. Units or shares of open-ended funds – last published net asset value. f. Cash on hand or deposit, bills, demand notes, accounts receivable, prepaid expenses, cash dividends and
interest declared or accrued and not yet received – full amount, unless in any case such amount is unlikely to be paid or received in full, in which case the value thereof is arrived at after the Umbrella Fund or its agent makes such discount as it may consider appropriate in such case to reflect the true value thereof.
g. Credit Default Swap (CDS) – CDS are marked to market based upon daily prices obtained from third party pricing agents and verified against the value from the counterparty. Realised appreciation/(depreciation) and change in unrealised appreciation/(depreciation) resulting there from are included in the statement of changes in net assets respectively under the heading “Net realised appreciation/(depreciation) on swaps” and “Change in net unrealised appreciation/(depreciation) on swaps”.
h. All other assets – fair market value as determined pursuant to procedures approved by the Umbrella Fund’s Board of Directors.
i. Swaptions – when the Fund writes a swaption, an amount equal to the premium received by the Fund is recorded as a liability and is subsequently adjusted to the current fair value of the swaption written. Premiums received from the written swaptions which expire unexercised are treated by the Fund on the expiration dates as realised gains.
453
Natixis International Funds (Lux) I Notes to the Financial Statements
as at December 31, 2013 (continued)
Note 2 – SUMMARY OF SIGNIFICANT ACCOUNTING POLICIES (continued) b) Method of calculation (continued)
j. Term loans – the Fund may invest in fixed and floating rate loans from one or more financial institutions by
way of an assignment/transfer or for a participation in the whole or part of the loan amount outstanding. The Fund will invest only in loans that qualify as money market instruments. When purchasing loan participations, a Fund assumes the economic risk associated with the corporate borrower and the credit risk associated with an interposed bank or other financial intermediary. The loan participations or assignments in which a Fund intends to invest may not be rated by any internationally recognised rating service. When purchasing loan assignments, a Fund assumes the credit risk associated with the corporate borrower only. The value of a term loan is determined prudently and in good faith by the Board of Directors on the basis of foreseeable purchase and sales prices. Realised appreciation/(depreciation) and changes in unrealised appreciation/(depreciation) as a result thereof are included in the Combined Statement of Changes in Net Assets respectively under “Net realised appreciation/(depreciation) on sales of investments” and “Change in net unrealised appreciation/(depreciation) on investments”.
c) Foreign exchange translation
The value of all assets and liabilities not expressed in the Reference Currency of a Fund will be converted into the Reference Currency of such Fund at rates last quoted by any major bank.
The exchange rate used as at December 31, 2013:
1 EUR = 1.37795 USD Note 3 – FEES PAID TO THE MANAGEMENT COMPANY
The Management Company is entitled to receive from the Funds a Management Fee calculated and payable monthly in arrears. The Management Fee due to each Share class and for each month shall be calculated as follows:
(Value x Rate of Management Fee) x D month
D year
Management Fee =
Where: “Value” means the average daily net asset value of all Shares issued in each Fund during the relevant month; “Rate of Management Fee” shall be calculated according to the following formula: Rate of Management Fee Share class = TER Share class – Administration Expenses Share class
Where: Rate of Management Fee Share class means the applicable Rate of Management Fee for the relevant Share class; expressed as an annualized percentage; TER Share class means the Total Expense Ratio of the relevant Share class as disclosed in the current Prospectus; expressed as an annualized percentage; and Administration Expenses Share class means the total operating expenses owed, and forecasted to be owed, by the relevant Fund to service providers, government regulators and agencies for services and benefits rendered to the relevant Share class; expressed as an annualized percentage. The Rate of Management Fee accrued to a Share class can never be greater than its Total Expense Ratio, as disclosed in the current Prospectus and in note 5;
D month shall be the number of calendar days during such month; and D year shall be the number of calendar days during the applicable calendar year.
454
Natixis International Funds (Lux) I Notes to the Financial Statements
as at December 31, 2013 (continued)
Note 4 – TAXATION
The Umbrella Fund is not subject to any Luxembourg tax on interest or dividends received by any Fund, any realized or unrealized capital appreciation of Fund assets or any distribution paid by any Fund to Shareholders. The Umbrella Fund is not subject to any Luxembourg stamp tax or other duty payable on the issuance of Shares. The Umbrella Fund is subject to the Luxembourg taxe d’abonnement of 0.01% per year of each Fund’s net asset value with respect to class “I” Shares, class “Q” Shares and class “S” Shares and of 0.05% per year of each Fund’s net asset value with respect to class “R” Shares, class “RE” Shares, class “C” Shares, class “N” Shares, class “F” Shares and class “Z” Shares. These taxes are payable quarterly on the basis of the value of the aggregate net assets of the Funds at the end of the relevant calendar quarter. No tax is due on the assets held by the Umbrella Fund in other UCITS that are already subject to subscription tax in Luxembourg. Note 5 – TOTAL EXPENSE RATIO
As of December 31, 2013 the amount of expenses (in %) to be incurred annually by each Fund including the remuneration to the Management Company, the Custodian, the independent auditors, the outside counsels, the other professionals and the administrative expenses are:
I R S C RE F N Q (2) ZShares Shares Shares Shares Shares Shares Shares Shares Shares
Absolute Asia AM Emerging Asia Fund 1.35 2.20 - 2.75 2.70 - - 0.35 -Absolute Asia AM Pacific Rim Equities Fund (5) 1.20 1.80 1.00 2.20 2.40 - - 0.35 -Gateway U.S. Equities Fund 1.00 1.80 - 2.30 2.20 1.25 - 0.35 -Hansberger Emerging Latin America Fund 1.20 2.20 - 2.75 2.70 - - 0.35 -Harris Associates Concentrated U.S. Equity Fund 1.25 2.10 0.85 2.55 2.70 1.40 1.20 0.35 -Harris Associates Global Equity Fund (3) (6) (9) 1.40 2.15 0.80 2.95 2.70 1.35 - 0.35 -Harris Associates U.S. Equity Fund (10) 1.20 1.95 0.70 2.55 2.60 1.65 1.20 0.35 -IDFC India Equities Fund 1.30 1.80 - - 2.50 - - 0.35 -Loomis Sayles Global Equity Opportunities Fund (1) 1.30 2.40 0.75 2.95 - - - 0.35 -Loomis Sayles U.S. Research Fund 1.00 1.70 0.75 2.40 - - 1.00 0.35 -Natixis Emerging Europe Fund 1.20 2.20 - 2.75 2.70 - - 0.35 -Natixis Europe Smaller Companies Fund 1.20 2.20 - - 2.70 - 1.20 0.35 -Vaughan Nelson U.S. Small Cap Value Fund 1.20 1.80 1.00 2.95 2.70 - - 0.35 -Loomis Sayles Emerging Debt and Currencies Fund (4) (6) 1.00 1.60 0.70 - 1.95 - 1.00 0.2 -Loomis Sayles Emerging Markets Corporate Bond Fund (1) 0.90 1.50 0.60 - 1.80 - 0.90 0.25 0.00Loomis Sayles Global Credit Fund (10) 0.70 1.15 0.35 2.10 - - 0.80 0.2 -Loomis Sayles Institutional Global Corporate Bond Fund (13) 0.45 - 0.35 - - - - 0.35 -Loomis Sayles Institutional High Income Fund (14) 0.75 - 0.65 - - - - - -Loomis Sayles Strategic Alpha Bond Fund (4) 1.00 1.70 0.80 2.40 - 1.25 1.00 0.35 0.00Loomis Sayles Sustainable Global Corporate Bond Fund (1) (7) 0.70 1.30 0.45 - - - 0.80 0.25 -Natixis Euro Aggregate Plus Fund 0.60 1.00 - - 1.60 - 0.60 0.35 -Natixis Euro High Income Fund (8) (10) (11) (12) 0.75 1.45 0.65 - 1.80 - - 0.35 -Natixis Global Inflation Fund 0.65 1.00 - 1.70 1.40 - 0.65 0.35 -Natixis Short Term Global High Income Fund (1) 0.65 1.35 0.55 - 1.65 - 0.75 0.35 -
1 See Note 1.
2 No management fee is charged by the Management Company on this Share class. However, this Share
class will pay other expenses such as administrative fees and custodian fees. 3 As of February 28, 2013, the decrease of the Total Expense ratio of the “I” Share class of the Harris
Associates Global Equity Fund from 1.50% p.a. to 1.40% p.a. 4 As of January 7, 2013, the decrease of the Total Expense ratio of the “I” Share class of the Loomis Sayles
Emerging Debt and Currencies Fund from 1.10% p.a. to 1.00% p.a., the Loomis Sayles Strategic Alpha Bond Fund from 1.20% p.a. to 1.00% p.a.
5 As of January 7, 2013, the increase of the Total Expense ratio of the “R” Share class of the Absolute Asia AM Pacific Rim Equities Fund from 1.70% p.a. to 1.80% p.a.
6 As of January 7, 2013, the increase of the Total Expense ratio of the “RE” Share class of the Harris Associates Global Equity Fund from 2.70% p.a. to 2.95% p.a., the Loomis Sayles Emerging Debt and Currencies Fund from 1.90% p.a. to 1.95% p.a.
7 As of January 7, 2013, the decrease of the Total Expense ratio of the “S” Share class of the Loomis Sayles Institutional Global Corporate Bond Fund from 0.40% p.a. to 0.35% p.a.
8 As of October 31, 2013, the decrease of the Total Expense ratio of the “I” Share class of the Natixis Euro High Income Fund from 1.00% p.a. to 0.75% p.a.
455
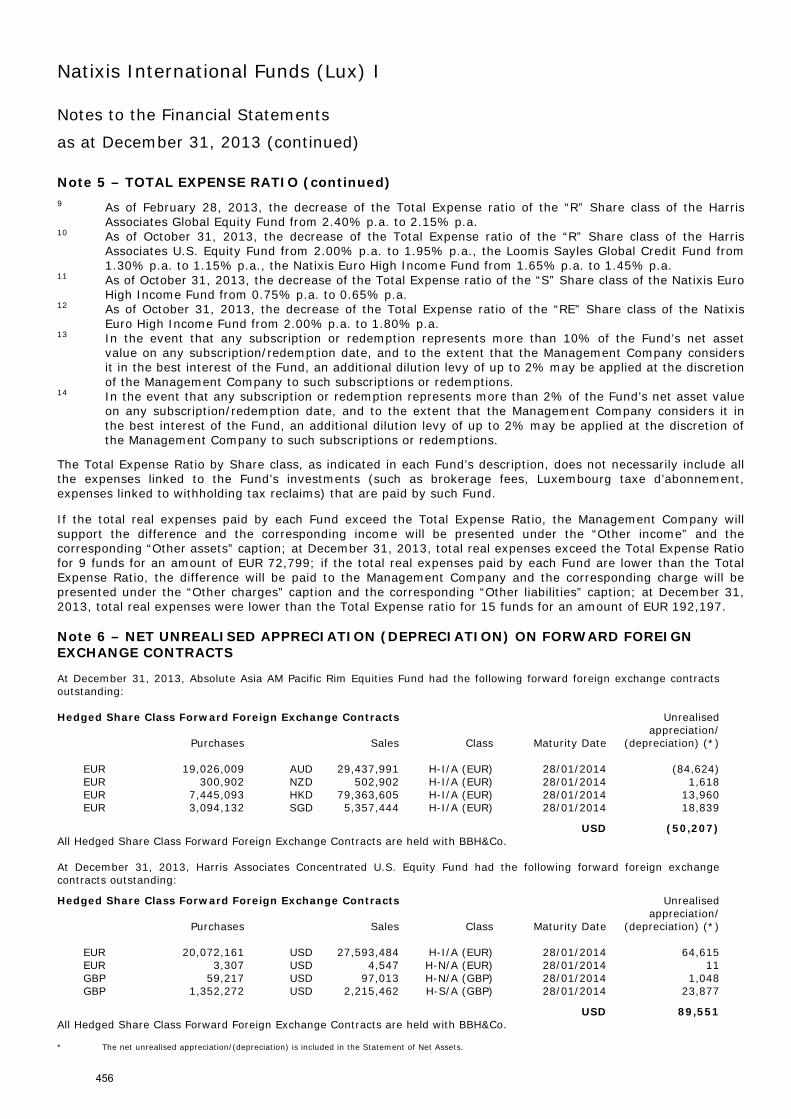
Natixis International Funds (Lux) I Notes to the Financial Statements
as at December 31, 2013 (continued)
Note 5 – TOTAL EXPENSE RATIO (continued) 9 As of February 28, 2013, the decrease of the Total Expense ratio of the “R” Share class of the Harris
Associates Global Equity Fund from 2.40% p.a. to 2.15% p.a. 10 As of October 31, 2013, the decrease of the Total Expense ratio of the “R” Share class of the Harris
Associates U.S. Equity Fund from 2.00% p.a. to 1.95% p.a., the Loomis Sayles Global Credit Fund from 1.30% p.a. to 1.15% p.a., the Natixis Euro High Income Fund from 1.65% p.a. to 1.45% p.a.
11 As of October 31, 2013, the decrease of the Total Expense ratio of the “S” Share class of the Natixis Euro High Income Fund from 0.75% p.a. to 0.65% p.a.
12 As of October 31, 2013, the decrease of the Total Expense ratio of the “RE” Share class of the Natixis Euro High Income Fund from 2.00% p.a. to 1.80% p.a.
13 In the event that any subscription or redemption represents more than 10% of the Fund’s net asset value on any subscription/redemption date, and to the extent that the Management Company considers it in the best interest of the Fund, an additional dilution levy of up to 2% may be applied at the discretion of the Management Company to such subscriptions or redemptions.
14 In the event that any subscription or redemption represents more than 2% of the Fund’s net asset value on any subscription/redemption date, and to the extent that the Management Company considers it in the best interest of the Fund, an additional dilution levy of up to 2% may be applied at the discretion of the Management Company to such subscriptions or redemptions.
The Total Expense Ratio by Share class, as indicated in each Fund’s description, does not necessarily include all the expenses linked to the Fund’s investments (such as brokerage fees, Luxembourg taxe d’abonnement, expenses linked to withholding tax reclaims) that are paid by such Fund. If the total real expenses paid by each Fund exceed the Total Expense Ratio, the Management Company will support the difference and the corresponding income will be presented under the “Other income” and the corresponding “Other assets” caption; at December 31, 2013, total real expenses exceed the Total Expense Ratio for 9 funds for an amount of EUR 72,799; if the total real expenses paid by each Fund are lower than the Total Expense Ratio, the difference will be paid to the Management Company and the corresponding charge will be presented under the “Other charges” caption and the corresponding “Other liabilities” caption; at December 31, 2013, total real expenses were lower than the Total Expense ratio for 15 funds for an amount of EUR 192,197. Note 6 – NET UNREALISED APPRECIATION (DEPRECIATION) ON FORWARD FOREIGN EXCHANGE CONTRACTS At December 31, 2013, Absolute Asia AM Pacific Rim Equities Fund had the following forward foreign exchange contracts outstanding: Hedged Share Class Forward Foreign Exchange Contracts Unrealised appreciation/ Purchases Sales Class Maturity Date (depreciation) (*)
EUR 19,026,009 AUD 29,437,991 H-I/A (EUR) 28/01/2014 (84,624) EUR 300,902 NZD 502,902 H-I/A (EUR) 28/01/2014 1,618 EUR 7,445,093 HKD 79,363,605 H-I/A (EUR) 28/01/2014 13,960 EUR 3,094,132 SGD 5,357,444 H-I/A (EUR) 28/01/2014 18,839
USD (50,207) All Hedged Share Class Forward Foreign Exchange Contracts are held with BBH&Co.
At December 31, 2013, Harris Associates Concentrated U.S. Equity Fund had the following forward foreign exchange contracts outstanding: Hedged Share Class Forward Foreign Exchange Contracts Unrealised appreciation/ Purchases Sales Class Maturity Date (depreciation) (*)
EUR 20,072,161 USD 27,593,484 H-I/A (EUR) 28/01/2014 64,615 EUR 3,307 USD 4,547 H-N/A (EUR) 28/01/2014 11 GBP 59,217 USD 97,013 H-N/A (GBP) 28/01/2014 1,048 GBP 1,352,272 USD 2,215,462 H-S/A (GBP) 28/01/2014 23,877
USD 89,551 All Hedged Share Class Forward Foreign Exchange Contracts are held with BBH&Co.
* The net unrealised appreciation/(depreciation) is included in the Statement of Net Assets.
456
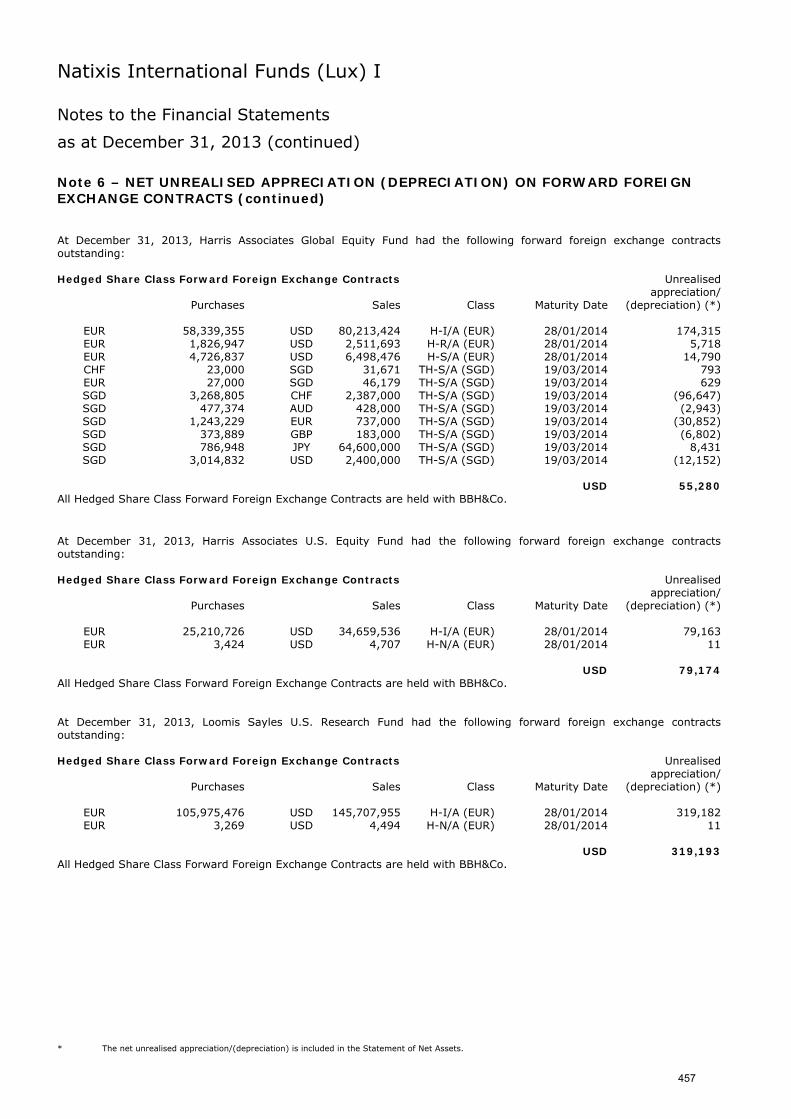
Natixis International Funds (Lux) I Notes to the Financial Statements
as at December 31, 2013 (continued)
Note 6 – NET UNREALISED APPRECIATION (DEPRECIATION) ON FORWARD FOREIGN EXCHANGE CONTRACTS (continued) At December 31, 2013, Harris Associates Global Equity Fund had the following forward foreign exchange contracts outstanding: Hedged Share Class Forward Foreign Exchange Contracts Unrealised appreciation/ Purchases Sales Class Maturity Date (depreciation) (*)
EUR 58,339,355 USD 80,213,424 H-I/A (EUR) 28/01/2014 174,315 EUR 1,826,947 USD 2,511,693 H-R/A (EUR) 28/01/2014 5,718 EUR 4,726,837 USD 6,498,476 H-S/A (EUR) 28/01/2014 14,790 CHF 23,000 SGD 31,671 TH-S/A (SGD) 19/03/2014 793 EUR 27,000 SGD 46,179 TH-S/A (SGD) 19/03/2014 629 SGD 3,268,805 CHF 2,387,000 TH-S/A (SGD) 19/03/2014 (96,647) SGD 477,374 AUD 428,000 TH-S/A (SGD) 19/03/2014 (2,943) SGD 1,243,229 EUR 737,000 TH-S/A (SGD) 19/03/2014 (30,852) SGD 373,889 GBP 183,000 TH-S/A (SGD) 19/03/2014 (6,802) SGD 786,948 JPY 64,600,000 TH-S/A (SGD) 19/03/2014 8,431 SGD 3,014,832 USD 2,400,000 TH-S/A (SGD) 19/03/2014 (12,152)
USD 55,280 All Hedged Share Class Forward Foreign Exchange Contracts are held with BBH&Co.
At December 31, 2013, Harris Associates U.S. Equity Fund had the following forward foreign exchange contracts outstanding: Hedged Share Class Forward Foreign Exchange Contracts Unrealised appreciation/ Purchases Sales Class Maturity Date (depreciation) (*)
EUR 25,210,726 USD 34,659,536 H-I/A (EUR) 28/01/2014 79,163 EUR 3,424 USD 4,707 H-N/A (EUR) 28/01/2014 11
USD 79,174 All Hedged Share Class Forward Foreign Exchange Contracts are held with BBH&Co.
At December 31, 2013, Loomis Sayles U.S. Research Fund had the following forward foreign exchange contracts outstanding: Hedged Share Class Forward Foreign Exchange Contracts Unrealised appreciation/ Purchases Sales Class Maturity Date (depreciation) (*)
EUR 105,975,476 USD 145,707,955 H-I/A (EUR) 28/01/2014 319,182 EUR 3,269 USD 4,494 H-N/A (EUR) 28/01/2014 11
USD 319,193 All Hedged Share Class Forward Foreign Exchange Contracts are held with BBH&Co.
* The net unrealised appreciation/(depreciation) is included in the Statement of Net Assets.
457
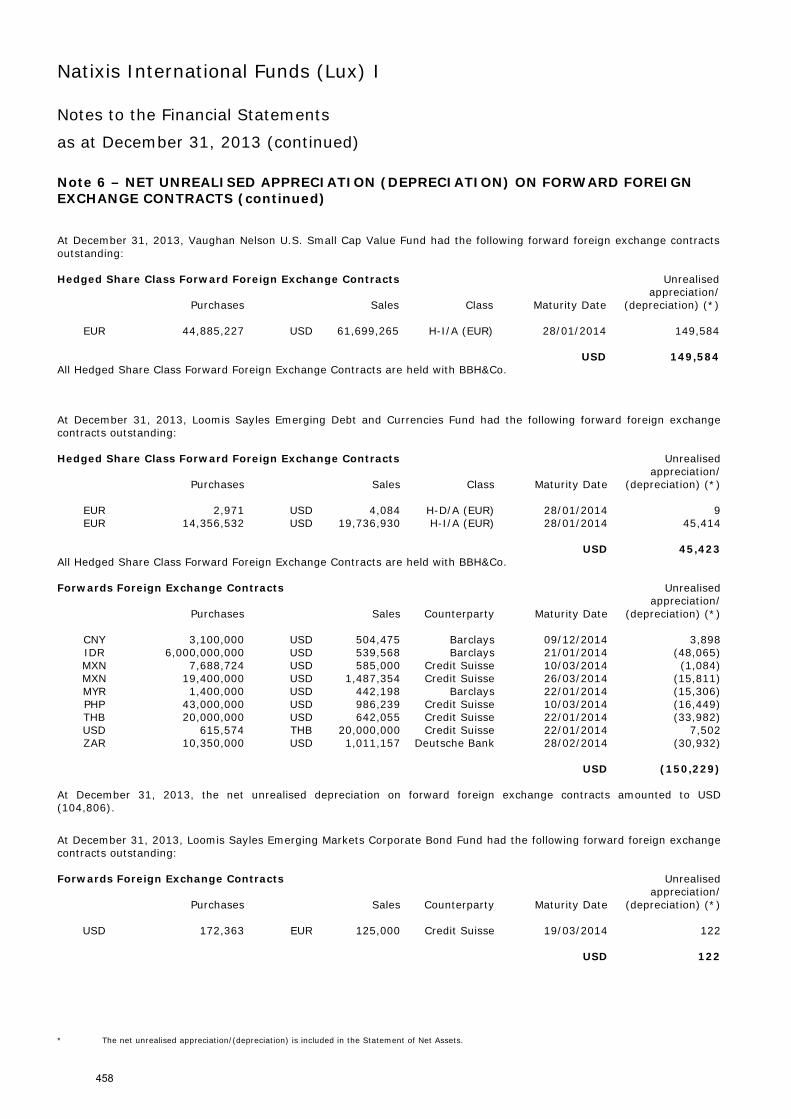
Natixis International Funds (Lux) I Notes to the Financial Statements
as at December 31, 2013 (continued)
Note 6 – NET UNREALISED APPRECIATION (DEPRECIATION) ON FORWARD FOREIGN EXCHANGE CONTRACTS (continued) At December 31, 2013, Vaughan Nelson U.S. Small Cap Value Fund had the following forward foreign exchange contracts outstanding: Hedged Share Class Forward Foreign Exchange Contracts Unrealised appreciation/ Purchases Sales Class Maturity Date (depreciation) (*)
EUR 44,885,227 USD 61,699,265 H-I/A (EUR) 28/01/2014 149,584 USD 149,584All Hedged Share Class Forward Foreign Exchange Contracts are held with BBH&Co.
At December 31, 2013, Loomis Sayles Emerging Debt and Currencies Fund had the following forward foreign exchange contracts outstanding: Hedged Share Class Forward Foreign Exchange Contracts Unrealised appreciation/ Purchases Sales Class Maturity Date (depreciation) (*)
EUR 2,971 USD 4,084 H-D/A (EUR) 28/01/2014 9EUR 14,356,532 USD 19,736,930 H-I/A (EUR) 28/01/2014 45,414
USD 45,423All Hedged Share Class Forward Foreign Exchange Contracts are held with BBH&Co. Forwards Foreign Exchange Contracts Unrealised appreciation/ Purchases Sales Counterparty Maturity Date (depreciation) (*)
CNY 3,100,000 USD 504,475 Barclays 09/12/2014 3,898IDR 6,000,000,000 USD 539,568 Barclays 21/01/2014 (48,065)MXN 7,688,724 USD 585,000 Credit Suisse 10/03/2014 (1,084)MXN 19,400,000 USD 1,487,354 Credit Suisse 26/03/2014 (15,811)MYR 1,400,000 USD 442,198 Barclays 22/01/2014 (15,306)PHP 43,000,000 USD 986,239 Credit Suisse 10/03/2014 (16,449)THB 20,000,000 USD 642,055 Credit Suisse 22/01/2014 (33,982)USD 615,574 THB 20,000,000 Credit Suisse 22/01/2014 7,502ZAR 10,350,000 USD 1,011,157 Deutsche Bank 28/02/2014 (30,932)
USD (150,229) At December 31, 2013, the net unrealised depreciation on forward foreign exchange contracts amounted to USD (104,806).
At December 31, 2013, Loomis Sayles Emerging Markets Corporate Bond Fund had the following forward foreign exchange contracts outstanding: Forwards Foreign Exchange Contracts Unrealised appreciation/ Purchases Sales Counterparty Maturity Date (depreciation) (*)
USD 172,363 EUR 125,000 Credit Suisse 19/03/2014 122 USD 122
* The net unrealised appreciation/(depreciation) is included in the Statement of Net Assets.
458
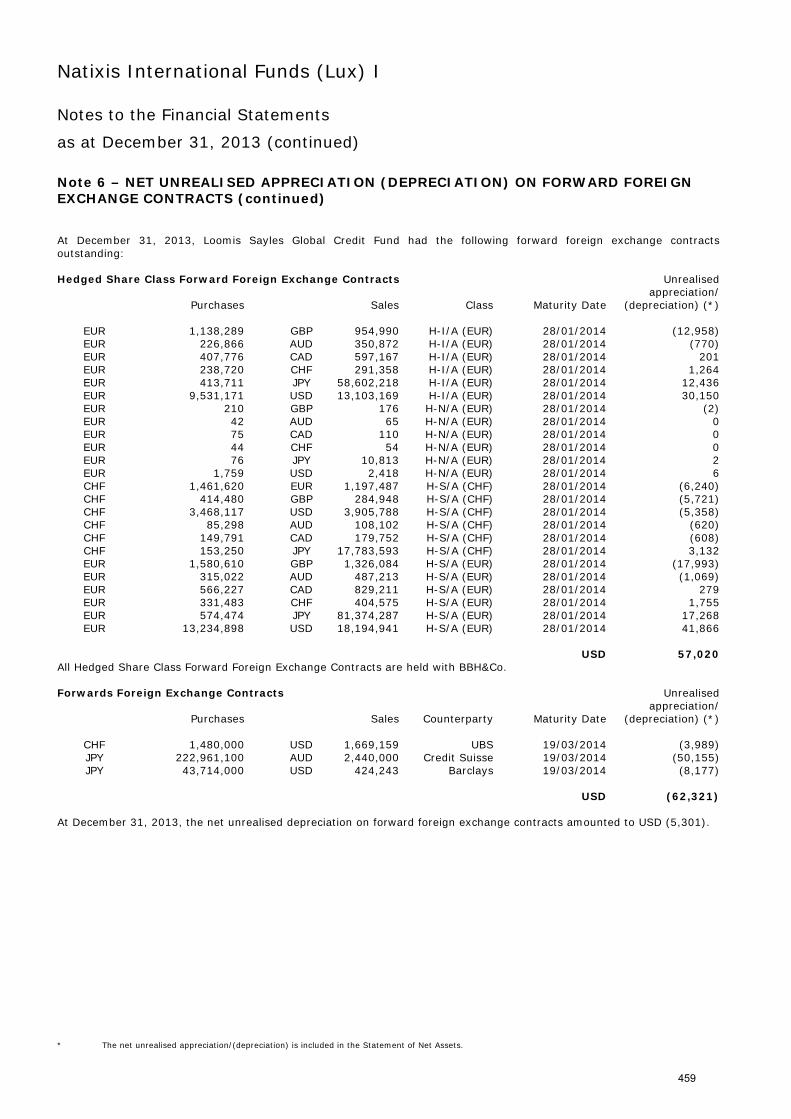
Natixis International Funds (Lux) I Notes to the Financial Statements
as at December 31, 2013 (continued)
Note 6 – NET UNREALISED APPRECIATION (DEPRECIATION) ON FORWARD FOREIGN EXCHANGE CONTRACTS (continued) At December 31, 2013, Loomis Sayles Global Credit Fund had the following forward foreign exchange contracts outstanding: Hedged Share Class Forward Foreign Exchange Contracts Unrealised appreciation/ Purchases Sales Class Maturity Date (depreciation) (*)
EUR 1,138,289 GBP 954,990 H-I/A (EUR) 28/01/2014 (12,958)EUR 226,866 AUD 350,872 H-I/A (EUR) 28/01/2014 (770)EUR 407,776 CAD 597,167 H-I/A (EUR) 28/01/2014 201EUR 238,720 CHF 291,358 H-I/A (EUR) 28/01/2014 1,264EUR 413,711 JPY 58,602,218 H-I/A (EUR) 28/01/2014 12,436EUR 9,531,171 USD 13,103,169 H-I/A (EUR) 28/01/2014 30,150EUR 210 GBP 176 H-N/A (EUR) 28/01/2014 (2)EUR 42 AUD 65 H-N/A (EUR) 28/01/2014 0EUR 75 CAD 110 H-N/A (EUR) 28/01/2014 0EUR 44 CHF 54 H-N/A (EUR) 28/01/2014 0EUR 76 JPY 10,813 H-N/A (EUR) 28/01/2014 2EUR 1,759 USD 2,418 H-N/A (EUR) 28/01/2014 6CHF 1,461,620 EUR 1,197,487 H-S/A (CHF) 28/01/2014 (6,240)CHF 414,480 GBP 284,948 H-S/A (CHF) 28/01/2014 (5,721)CHF 3,468,117 USD 3,905,788 H-S/A (CHF) 28/01/2014 (5,358)CHF 85,298 AUD 108,102 H-S/A (CHF) 28/01/2014 (620)CHF 149,791 CAD 179,752 H-S/A (CHF) 28/01/2014 (608)CHF 153,250 JPY 17,783,593 H-S/A (CHF) 28/01/2014 3,132EUR 1,580,610 GBP 1,326,084 H-S/A (EUR) 28/01/2014 (17,993)EUR 315,022 AUD 487,213 H-S/A (EUR) 28/01/2014 (1,069)EUR 566,227 CAD 829,211 H-S/A (EUR) 28/01/2014 279EUR 331,483 CHF 404,575 H-S/A (EUR) 28/01/2014 1,755EUR 574,474 JPY 81,374,287 H-S/A (EUR) 28/01/2014 17,268EUR 13,234,898 USD 18,194,941 H-S/A (EUR) 28/01/2014 41,866
USD 57,020All Hedged Share Class Forward Foreign Exchange Contracts are held with BBH&Co. Forwards Foreign Exchange Contracts Unrealised appreciation/ Purchases Sales Counterparty Maturity Date (depreciation) (*)
CHF 1,480,000 USD 1,669,159 UBS 19/03/2014 (3,989)JPY 222,961,100 AUD 2,440,000 Credit Suisse 19/03/2014 (50,155)JPY 43,714,000 USD 424,243 Barclays 19/03/2014 (8,177)
USD (62,321) At December 31, 2013, the net unrealised depreciation on forward foreign exchange contracts amounted to USD (5,301).
* The net unrealised appreciation/(depreciation) is included in the Statement of Net Assets.
459
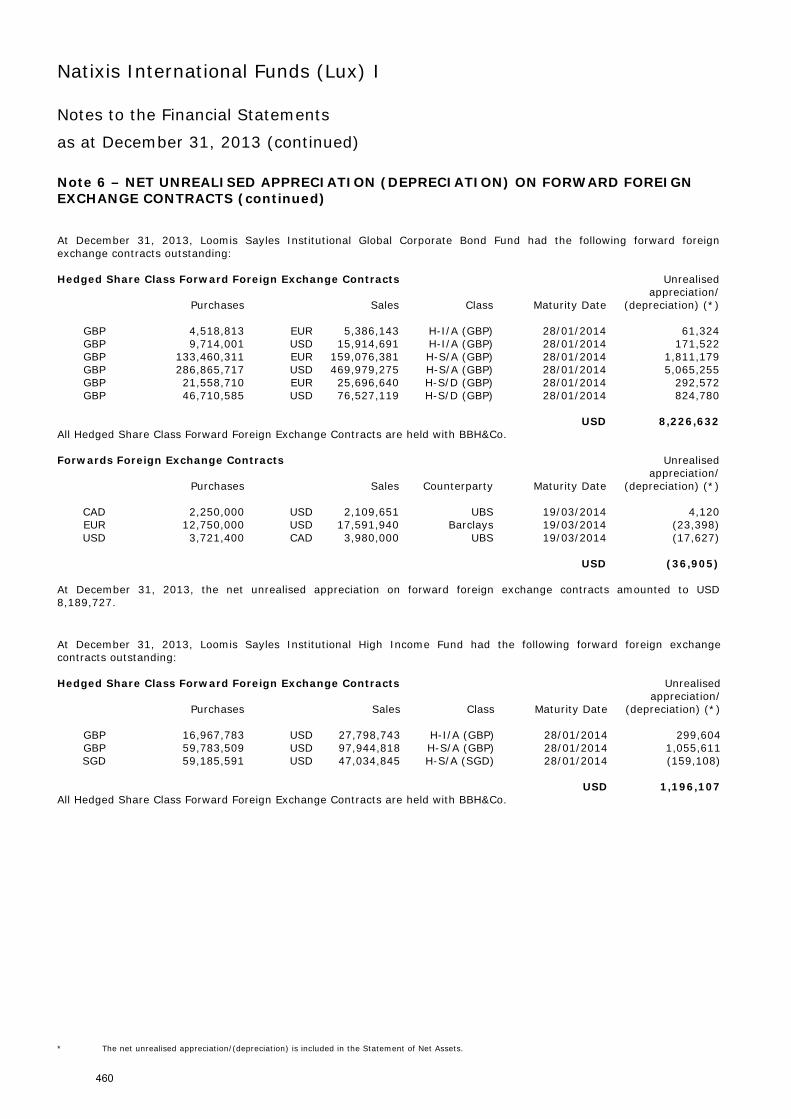
Natixis International Funds (Lux) I Notes to the Financial Statements
as at December 31, 2013 (continued)
Note 6 – NET UNREALISED APPRECIATION (DEPRECIATION) ON FORWARD FOREIGN EXCHANGE CONTRACTS (continued) At December 31, 2013, Loomis Sayles Institutional Global Corporate Bond Fund had the following forward foreign exchange contracts outstanding: Hedged Share Class Forward Foreign Exchange Contracts Unrealised appreciation/ Purchases Sales Class Maturity Date (depreciation) (*)
GBP 4,518,813 EUR 5,386,143 H-I/A (GBP) 28/01/2014 61,324GBP 9,714,001 USD 15,914,691 H-I/A (GBP) 28/01/2014 171,522GBP 133,460,311 EUR 159,076,381 H-S/A (GBP) 28/01/2014 1,811,179GBP 286,865,717 USD 469,979,275 H-S/A (GBP) 28/01/2014 5,065,255GBP 21,558,710 EUR 25,696,640 H-S/D (GBP) 28/01/2014 292,572GBP 46,710,585 USD 76,527,119 H-S/D (GBP) 28/01/2014 824,780
USD 8,226,632All Hedged Share Class Forward Foreign Exchange Contracts are held with BBH&Co. Forwards Foreign Exchange Contracts Unrealised appreciation/ Purchases Sales Counterparty Maturity Date (depreciation) (*)
CAD 2,250,000 USD 2,109,651 UBS 19/03/2014 4,120EUR 12,750,000 USD 17,591,940 Barclays 19/03/2014 (23,398)USD 3,721,400 CAD 3,980,000 UBS 19/03/2014 (17,627)
USD (36,905) At December 31, 2013, the net unrealised appreciation on forward foreign exchange contracts amounted to USD 8,189,727.
At December 31, 2013, Loomis Sayles Institutional High Income Fund had the following forward foreign exchange contracts outstanding: Hedged Share Class Forward Foreign Exchange Contracts Unrealised appreciation/ Purchases Sales Class Maturity Date (depreciation) (*)
GBP 16,967,783 USD 27,798,743 H-I/A (GBP) 28/01/2014 299,604GBP 59,783,509 USD 97,944,818 H-S/A (GBP) 28/01/2014 1,055,611SGD 59,185,591 USD 47,034,845 H-S/A (SGD) 28/01/2014 (159,108)
USD 1,196,107All Hedged Share Class Forward Foreign Exchange Contracts are held with BBH&Co.
* The net unrealised appreciation/(depreciation) is included in the Statement of Net Assets.
460
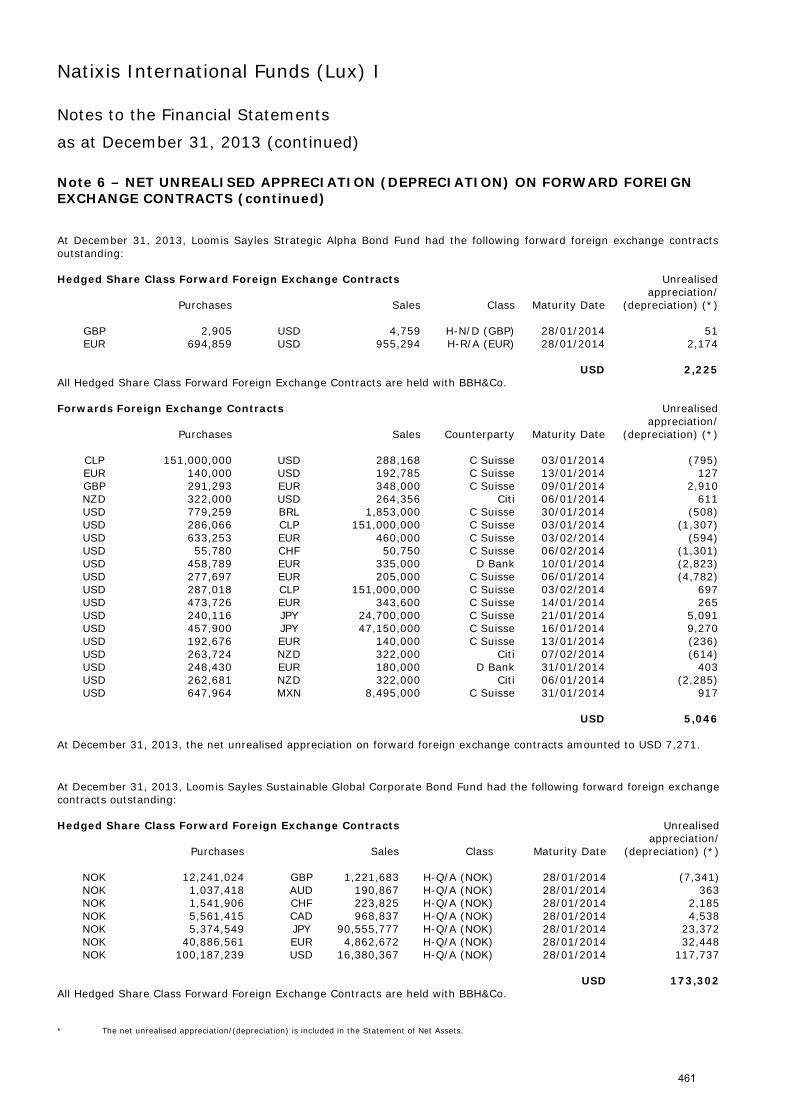
Natixis International Funds (Lux) I Notes to the Financial Statements
as at December 31, 2013 (continued)
Note 6 – NET UNREALISED APPRECIATION (DEPRECIATION) ON FORWARD FOREIGN EXCHANGE CONTRACTS (continued) At December 31, 2013, Loomis Sayles Strategic Alpha Bond Fund had the following forward foreign exchange contracts outstanding: Hedged Share Class Forward Foreign Exchange Contracts Unrealised appreciation/ Purchases Sales Class Maturity Date (depreciation) (*)
GBP 2,905 USD 4,759 H-N/D (GBP) 28/01/2014 51EUR 694,859 USD 955,294 H-R/A (EUR) 28/01/2014 2,174
USD 2,225All Hedged Share Class Forward Foreign Exchange Contracts are held with BBH&Co. Forwards Foreign Exchange Contracts Unrealised appreciation/ Purchases Sales Counterparty Maturity Date (depreciation) (*)
CLP 151,000,000 USD 288,168 C Suisse 03/01/2014 (795)EUR 140,000 USD 192,785 C Suisse 13/01/2014 127GBP 291,293 EUR 348,000 C Suisse 09/01/2014 2,910NZD 322,000 USD 264,356 Citi 06/01/2014 611USD 779,259 BRL 1,853,000 C Suisse 30/01/2014 (508)USD 286,066 CLP 151,000,000 C Suisse 03/01/2014 (1,307)USD 633,253 EUR 460,000 C Suisse 03/02/2014 (594)USD 55,780 CHF 50,750 C Suisse 06/02/2014 (1,301)USD 458,789 EUR 335,000 D Bank 10/01/2014 (2,823)USD 277,697 EUR 205,000 C Suisse 06/01/2014 (4,782)USD 287,018 CLP 151,000,000 C Suisse 03/02/2014 697USD 473,726 EUR 343,600 C Suisse 14/01/2014 265USD 240,116 JPY 24,700,000 C Suisse 21/01/2014 5,091USD 457,900 JPY 47,150,000 C Suisse 16/01/2014 9,270USD 192,676 EUR 140,000 C Suisse 13/01/2014 (236)USD 263,724 NZD 322,000 Citi 07/02/2014 (614)USD 248,430 EUR 180,000 D Bank 31/01/2014 403USD 262,681 NZD 322,000 Citi 06/01/2014 (2,285)USD 647,964 MXN 8,495,000 C Suisse 31/01/2014 917
USD 5,046 At December 31, 2013, the net unrealised appreciation on forward foreign exchange contracts amounted to USD 7,271.
At December 31, 2013, Loomis Sayles Sustainable Global Corporate Bond Fund had the following forward foreign exchange contracts outstanding: Hedged Share Class Forward Foreign Exchange Contracts Unrealised appreciation/ Purchases Sales Class Maturity Date (depreciation) (*)
NOK 12,241,024 GBP 1,221,683 H-Q/A (NOK) 28/01/2014 (7,341)NOK 1,037,418 AUD 190,867 H-Q/A (NOK) 28/01/2014 363NOK 1,541,906 CHF 223,825 H-Q/A (NOK) 28/01/2014 2,185NOK 5,561,415 CAD 968,837 H-Q/A (NOK) 28/01/2014 4,538NOK 5,374,549 JPY 90,555,777 H-Q/A (NOK) 28/01/2014 23,372NOK 40,886,561 EUR 4,862,672 H-Q/A (NOK) 28/01/2014 32,448NOK 100,187,239 USD 16,380,367 H-Q/A (NOK) 28/01/2014 117,737
USD 173,302All Hedged Share Class Forward Foreign Exchange Contracts are held with BBH&Co. * The net unrealised appreciation/(depreciation) is included in the Statement of Net Assets.
461
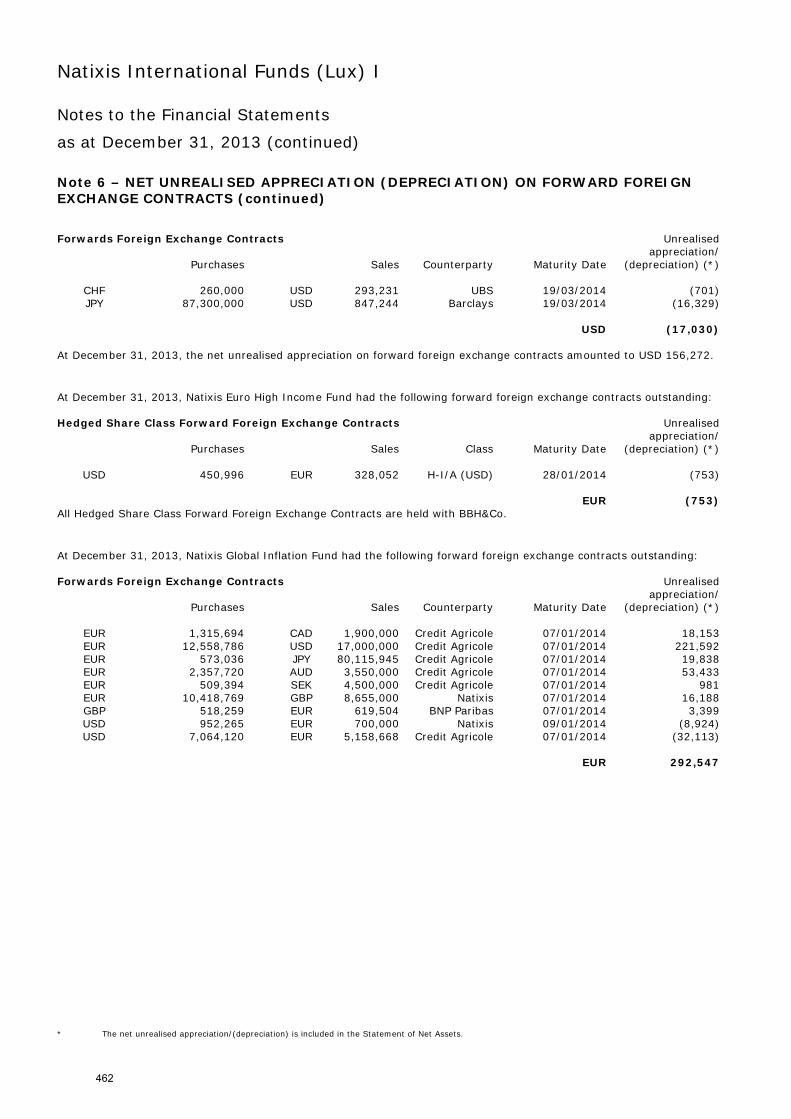
Natixis International Funds (Lux) I Notes to the Financial Statements
as at December 31, 2013 (continued)
Note 6 – NET UNREALISED APPRECIATION (DEPRECIATION) ON FORWARD FOREIGN EXCHANGE CONTRACTS (continued) Forwards Foreign Exchange Contracts Unrealised appreciation/ Purchases Sales Counterparty Maturity Date (depreciation) (*)
CHF 260,000 USD 293,231 UBS 19/03/2014 (701)JPY 87,300,000 USD 847,244 Barclays 19/03/2014 (16,329)
USD (17,030) At December 31, 2013, the net unrealised appreciation on forward foreign exchange contracts amounted to USD 156,272.
At December 31, 2013, Natixis Euro High Income Fund had the following forward foreign exchange contracts outstanding: Hedged Share Class Forward Foreign Exchange Contracts Unrealised appreciation/ Purchases Sales Class Maturity Date (depreciation) (*)
USD 450,996 EUR 328,052 H-I/A (USD) 28/01/2014 (753) EUR (753)All Hedged Share Class Forward Foreign Exchange Contracts are held with BBH&Co.
At December 31, 2013, Natixis Global Inflation Fund had the following forward foreign exchange contracts outstanding: Forwards Foreign Exchange Contracts Unrealised appreciation/ Purchases Sales Counterparty Maturity Date (depreciation) (*)
EUR 1,315,694 CAD 1,900,000 Credit Agricole 07/01/2014 18,153EUR 12,558,786 USD 17,000,000 Credit Agricole 07/01/2014 221,592EUR 573,036 JPY 80,115,945 Credit Agricole 07/01/2014 19,838EUR 2,357,720 AUD 3,550,000 Credit Agricole 07/01/2014 53,433EUR 509,394 SEK 4,500,000 Credit Agricole 07/01/2014 981EUR 10,418,769 GBP 8,655,000 Natixis 07/01/2014 16,188GBP 518,259 EUR 619,504 BNP Paribas 07/01/2014 3,399USD 952,265 EUR 700,000 Natixis 09/01/2014 (8,924)USD 7,064,120 EUR 5,158,668 Credit Agricole 07/01/2014 (32,113)
EUR 292,547
* The net unrealised appreciation/(depreciation) is included in the Statement of Net Assets.
462
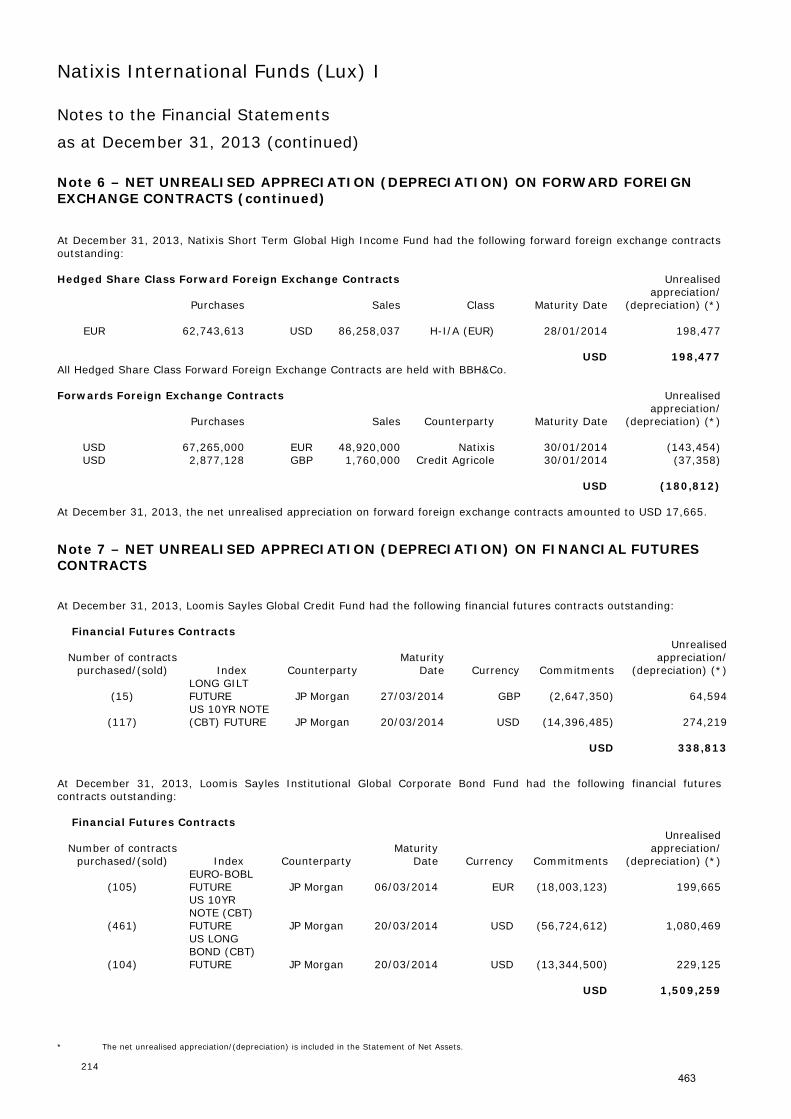
Natixis International Funds (Lux) I Notes to the Financial Statements
as at December 31, 2013 (continued)
214
Note 6 – NET UNREALISED APPRECIATION (DEPRECIATION) ON FORWARD FOREIGN EXCHANGE CONTRACTS (continued) At December 31, 2013, Natixis Short Term Global High Income Fund had the following forward foreign exchange contracts outstanding: Hedged Share Class Forward Foreign Exchange Contracts Unrealised appreciation/ Purchases Sales Class Maturity Date (depreciation) (*)
EUR 62,743,613 USD 86,258,037 H-I/A (EUR) 28/01/2014 198,477 USD 198,477All Hedged Share Class Forward Foreign Exchange Contracts are held with BBH&Co. Forwards Foreign Exchange Contracts Unrealised appreciation/ Purchases Sales Counterparty Maturity Date (depreciation) (*)
USD 67,265,000 EUR 48,920,000 Natixis 30/01/2014 (143,454)USD 2,877,128 GBP 1,760,000 Credit Agricole 30/01/2014 (37,358)
USD (180,812) At December 31, 2013, the net unrealised appreciation on forward foreign exchange contracts amounted to USD 17,665.
Note 7 – NET UNREALISED APPRECIATION (DEPRECIATION) ON FINANCIAL FUTURES CONTRACTS At December 31, 2013, Loomis Sayles Global Credit Fund had the following financial futures contracts outstanding:
Financial Futures Contracts
UnrealisedNumber of contracts Maturity appreciation/
purchased/(sold) Index Counterparty Date Currency Commitments (depreciation) (*)
(15) LONG GILT FUTURE JP Morgan 27/03/2014 GBP (2,647,350) 64,594
(117) US 10YR NOTE (CBT) FUTURE JP Morgan 20/03/2014 USD (14,396,485) 274,219
USD 338,813
At December 31, 2013, Loomis Sayles Institutional Global Corporate Bond Fund had the following financial futures contracts outstanding:
Financial Futures Contracts
UnrealisedNumber of contracts Maturity appreciation/
purchased/(sold) Index Counterparty Date Currency Commitments (depreciation) (*)
(105) EURO-BOBL FUTURE JP Morgan 06/03/2014 EUR (18,003,123) 199,665
(461)
US 10YR NOTE (CBT) FUTURE JP Morgan 20/03/2014 USD (56,724,612) 1,080,469
(104)
US LONG BOND (CBT) FUTURE JP Morgan 20/03/2014 USD (13,344,500) 229,125
USD 1,509,259
* The net unrealised appreciation/(depreciation) is included in the Statement of Net Assets.
463
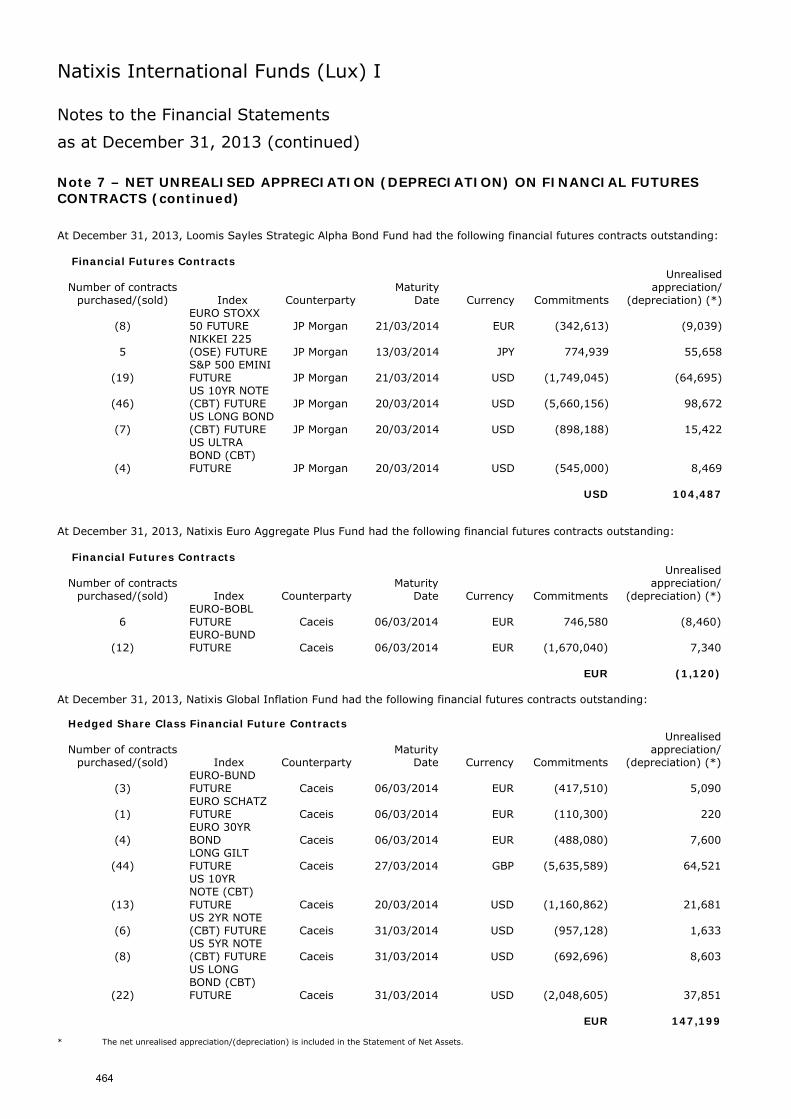
Natixis International Funds (Lux) I Notes to the Financial Statements
as at December 31, 2013 (continued)
Note 7 – NET UNREALISED APPRECIATION (DEPRECIATION) ON FINANCIAL FUTURES CONTRACTS (continued) At December 31, 2013, Loomis Sayles Strategic Alpha Bond Fund had the following financial futures contracts outstanding:
Financial Futures Contracts
Unrealised Number of contracts Maturity appreciation/
purchased/(sold) Index Counterparty Date Currency Commitments (depreciation) (*)
(8) EURO STOXX 50 FUTURE JP Morgan 21/03/2014 EUR (342,613) (9,039)
5 NIKKEI 225 (OSE) FUTURE JP Morgan 13/03/2014 JPY 774,939 55,658
(19) S&P 500 EMINI FUTURE JP Morgan 21/03/2014 USD (1,749,045) (64,695)
(46) US 10YR NOTE (CBT) FUTURE JP Morgan 20/03/2014 USD (5,660,156) 98,672
(7) US LONG BOND (CBT) FUTURE JP Morgan 20/03/2014 USD (898,188) 15,422
(4)
US ULTRA BOND (CBT) FUTURE JP Morgan 20/03/2014 USD (545,000) 8,469
USD 104,487
At December 31, 2013, Natixis Euro Aggregate Plus Fund had the following financial futures contracts outstanding:
Financial Futures Contracts
Unrealised Number of contracts Maturity appreciation/
purchased/(sold) Index Counterparty Date Currency Commitments (depreciation) (*)
6 EURO-BOBL FUTURE Caceis 06/03/2014 EUR 746,580 (8,460)
(12) EURO-BUND FUTURE Caceis 06/03/2014 EUR (1,670,040) 7,340
EUR (1,120)
At December 31, 2013, Natixis Global Inflation Fund had the following financial futures contracts outstanding: Hedged Share Class Financial Future Contracts
Unrealised Number of contracts Maturity appreciation/
purchased/(sold) Index Counterparty Date Currency Commitments (depreciation) (*)
(3) EURO-BUND FUTURE Caceis 06/03/2014 EUR (417,510) 5,090
(1) EURO SCHATZ FUTURE Caceis 06/03/2014 EUR (110,300) 220
(4) EURO 30YR BOND Caceis 06/03/2014 EUR (488,080) 7,600
(44) LONG GILT FUTURE Caceis 27/03/2014 GBP (5,635,589) 64,521
(13)
US 10YR NOTE (CBT) FUTURE Caceis 20/03/2014 USD (1,160,862) 21,681
(6) US 2YR NOTE (CBT) FUTURE Caceis 31/03/2014 USD (957,128) 1,633
(8) US 5YR NOTE (CBT) FUTURE Caceis 31/03/2014 USD (692,696) 8,603
(22)
US LONG BOND (CBT) FUTURE Caceis 31/03/2014 USD (2,048,605) 37,851
EUR 147,199 * The net unrealised appreciation/(depreciation) is included in the Statement of Net Assets.
464
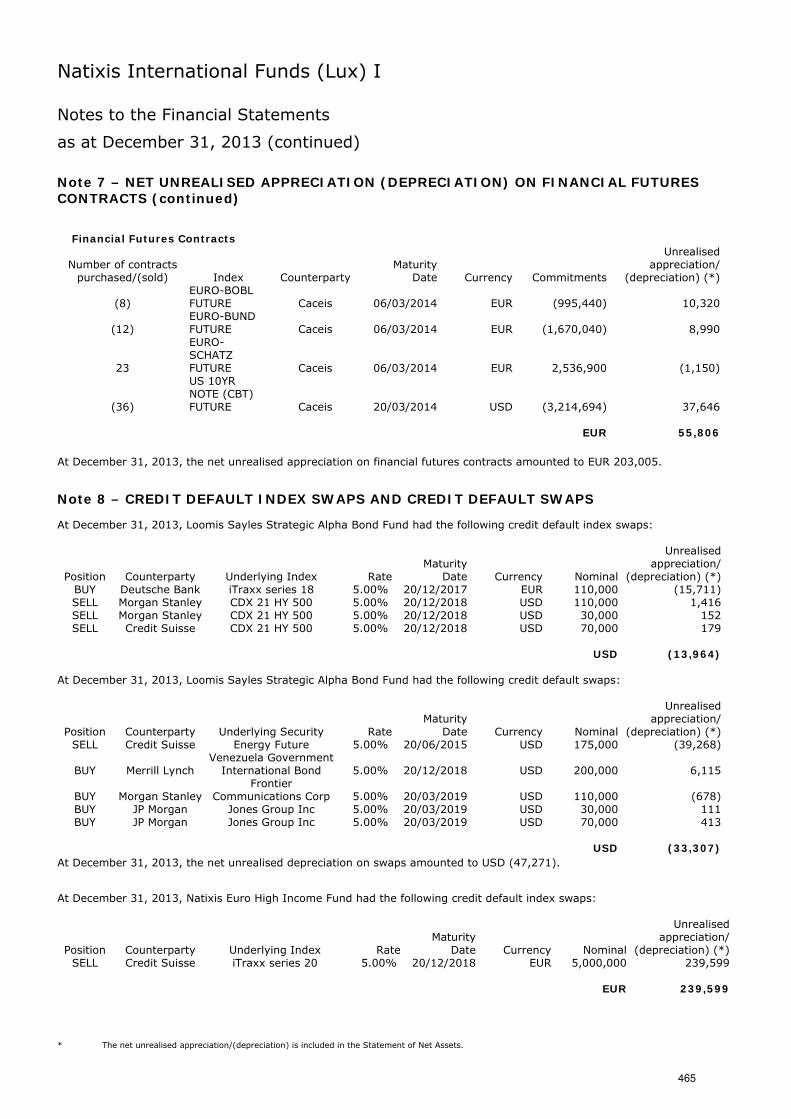
Natixis International Funds (Lux) I Notes to the Financial Statements
as at December 31, 2013 (continued)
Note 7 – NET UNREALISED APPRECIATION (DEPRECIATION) ON FINANCIAL FUTURES CONTRACTS (continued)
Financial Futures Contracts Unrealised
Number of contracts Maturity appreciation/ purchased/(sold) Index Counterparty Date Currency Commitments (depreciation) (*)
(8) EURO-BOBL FUTURE Caceis 06/03/2014 EUR (995,440) 10,320
(12) EURO-BUND FUTURE Caceis 06/03/2014 EUR (1,670,040) 8,990
23
EURO-SCHATZ FUTURE Caceis 06/03/2014 EUR 2,536,900 (1,150)
(36)
US 10YR NOTE (CBT) FUTURE Caceis 20/03/2014 USD (3,214,694) 37,646
EUR 55,806
At December 31, 2013, the net unrealised appreciation on financial futures contracts amounted to EUR 203,005.
Note 8 – CREDIT DEFAULT INDEX SWAPS AND CREDIT DEFAULT SWAPS At December 31, 2013, Loomis Sayles Strategic Alpha Bond Fund had the following credit default index swaps:
Unrealised Maturity appreciation/
Position Counterparty Underlying Index Rate Date Currency Nominal (depreciation) (*) BUY Deutsche Bank iTraxx series 18 5.00% 20/12/2017 EUR 110,000 (15,711) SELL Morgan Stanley CDX 21 HY 500 5.00% 20/12/2018 USD 110,000 1,416 SELL Morgan Stanley CDX 21 HY 500 5.00% 20/12/2018 USD 30,000 152 SELL Credit Suisse CDX 21 HY 500 5.00% 20/12/2018 USD 70,000 179
USD (13,964) At December 31, 2013, Loomis Sayles Strategic Alpha Bond Fund had the following credit default swaps:
Unrealised Maturity appreciation/
Position Counterparty Underlying Security Rate Date Currency Nominal (depreciation) (*) SELL Credit Suisse Energy Future 5.00% 20/06/2015 USD 175,000 (39,268)
BUY Merrill Lynch Venezuela Government
International Bond 5.00% 20/12/2018 USD 200,000 6,115
BUY Morgan Stanley Frontier
Communications Corp 5.00% 20/03/2019 USD 110,000 (678) BUY JP Morgan Jones Group Inc 5.00% 20/03/2019 USD 30,000 111 BUY JP Morgan Jones Group Inc 5.00% 20/03/2019 USD 70,000 413
USD (33,307)
At December 31, 2013, the net unrealised depreciation on swaps amounted to USD (47,271). At December 31, 2013, Natixis Euro High Income Fund had the following credit default index swaps:
Unrealised Maturity appreciation/
Position Counterparty Underlying Index Rate Date Currency Nominal (depreciation) (*) SELL Credit Suisse iTraxx series 20 5.00% 20/12/2018 EUR 5,000,000 239,599
EUR 239,599
* The net unrealised appreciation/(depreciation) is included in the Statement of Net Assets.
465
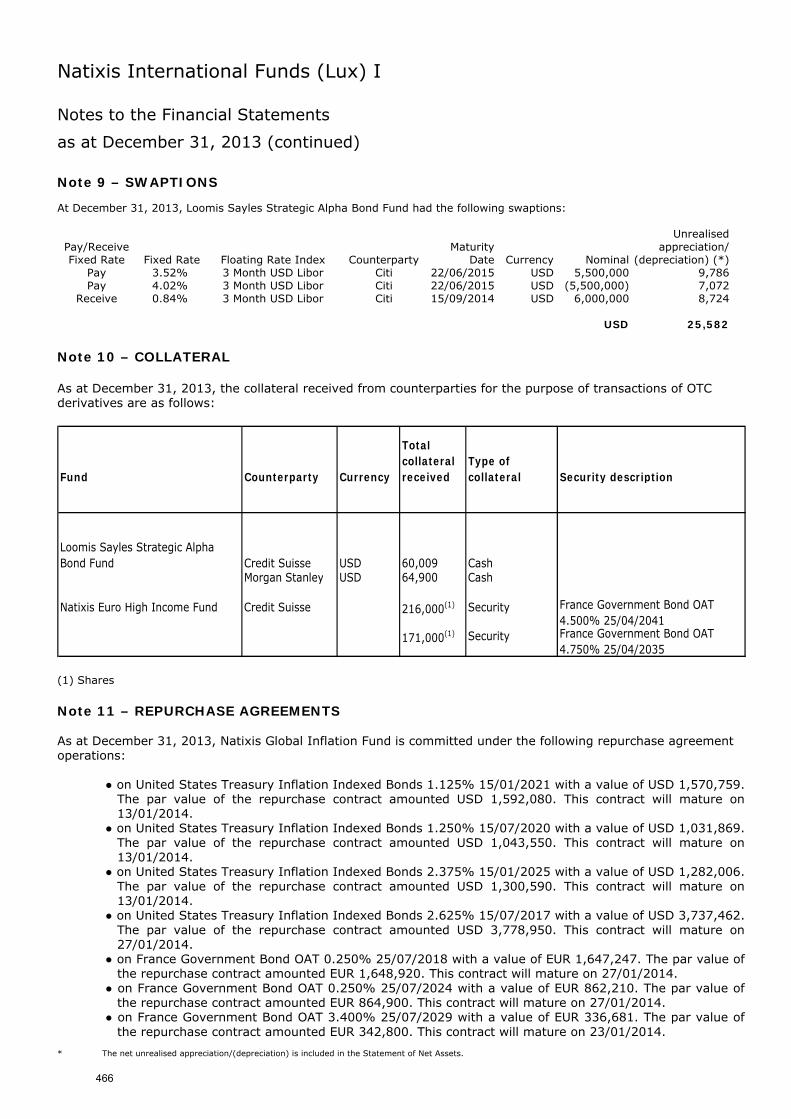
Natixis International Funds (Lux) I Notes to the Financial Statements
as at December 31, 2013 (continued)
Note 9 – SWAPTIONS At December 31, 2013, Loomis Sayles Strategic Alpha Bond Fund had the following swaptions:
Unrealised
Pay/Receive Maturity appreciation/Fixed Rate Fixed Rate Floating Rate Index Counterparty Date Currency Nominal (depreciation) (*)
Pay 3.52% 3 Month USD Libor Citi 22/06/2015 USD 5,500,000 9,786Pay 4.02% 3 Month USD Libor Citi 22/06/2015 USD (5,500,000) 7,072
Receive 0.84% 3 Month USD Libor Citi 15/09/2014 USD 6,000,000 8,724 USD 25,582
Note 10 – COLLATERAL As at December 31, 2013, the collateral received from counterparties for the purpose of transactions of OTC derivatives are as follows:
Fund Counterparty Currency
Total collateral received
Type of collateral Security description
Loomis Sayles Strategic Alpha Bond Fund Credit Suisse USD 60,009 Cash
Morgan Stanley USD 64,900 Cash
Natixis Euro High Income Fund Credit Suisse 216,000(1) Security France Government Bond OAT 4.500% 25/04/2041
171,000(1) Security France Government Bond OAT 4.750% 25/04/2035
(1) Shares Note 11 – REPURCHASE AGREEMENTS As at December 31, 2013, Natixis Global Inflation Fund is committed under the following repurchase agreement operations: ● on United States Treasury Inflation Indexed Bonds 1.125% 15/01/2021 with a value of USD 1,570,759.
The par value of the repurchase contract amounted USD 1,592,080. This contract will mature on 13/01/2014.
● on United States Treasury Inflation Indexed Bonds 1.250% 15/07/2020 with a value of USD 1,031,869. The par value of the repurchase contract amounted USD 1,043,550. This contract will mature on 13/01/2014.
● on United States Treasury Inflation Indexed Bonds 2.375% 15/01/2025 with a value of USD 1,282,006. The par value of the repurchase contract amounted USD 1,300,590. This contract will mature on 13/01/2014.
● on United States Treasury Inflation Indexed Bonds 2.625% 15/07/2017 with a value of USD 3,737,462. The par value of the repurchase contract amounted USD 3,778,950. This contract will mature on 27/01/2014.
● on France Government Bond OAT 0.250% 25/07/2018 with a value of EUR 1,647,247. The par value of the repurchase contract amounted EUR 1,648,920. This contract will mature on 27/01/2014.
● on France Government Bond OAT 0.250% 25/07/2024 with a value of EUR 862,210. The par value of the repurchase contract amounted EUR 864,900. This contract will mature on 27/01/2014.
● on France Government Bond OAT 3.400% 25/07/2029 with a value of EUR 336,681. The par value of the repurchase contract amounted EUR 342,800. This contract will mature on 23/01/2014.
* The net unrealised appreciation/(depreciation) is included in the Statement of Net Assets.
466
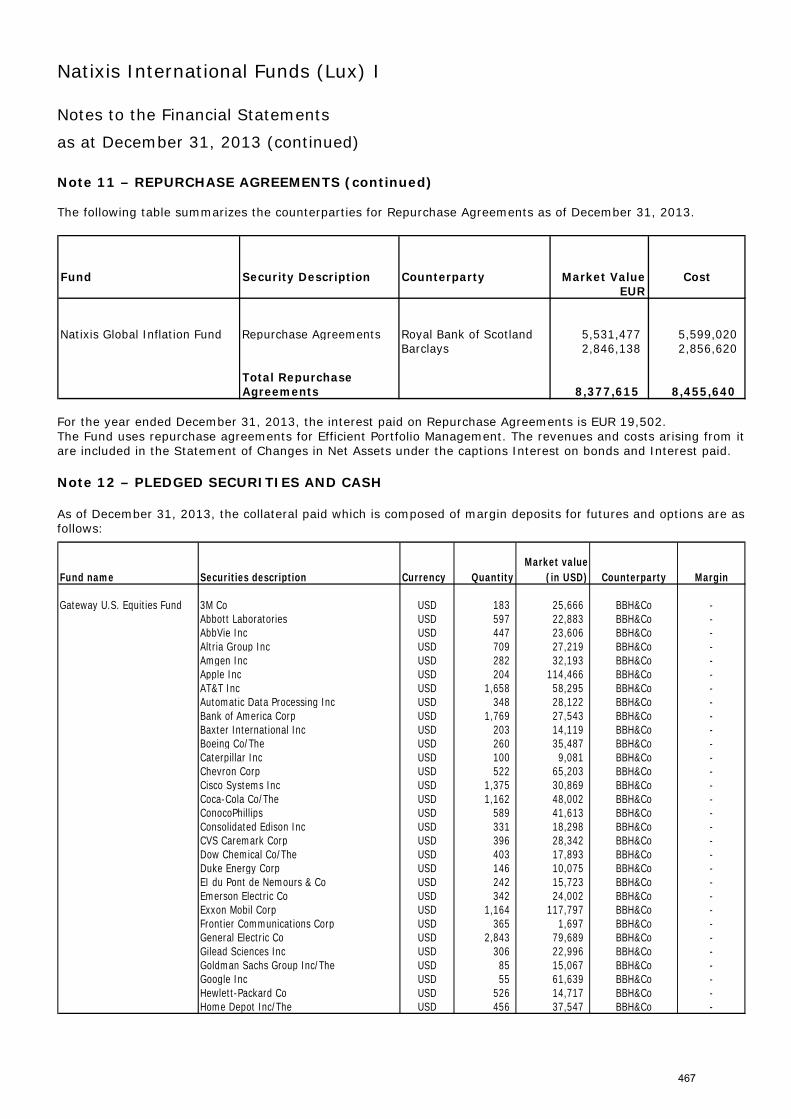
Natixis International Funds (Lux) I Notes to the Financial Statements
as at December 31, 2013 (continued)
Note 11 – REPURCHASE AGREEMENTS (continued) The following table summarizes the counterparties for Repurchase Agreements as of December 31, 2013.
Fund Security Description Counterparty Market Value CostEUR
Natixis Global Inflation Fund Repurchase Agreements Royal Bank of Scotland 5,531,477 5,599,020 Barclays 2,846,138 2,856,620
Total RepurchaseAgreements 8,377,615 8,455,640
For the year ended December 31, 2013, the interest paid on Repurchase Agreements is EUR 19,502. The Fund uses repurchase agreements for Efficient Portfolio Management. The revenues and costs arising from it are included in the Statement of Changes in Net Assets under the captions Interest on bonds and Interest paid. Note 12 – PLEDGED SECURITIES AND CASH As of December 31, 2013, the collateral paid which is composed of margin deposits for futures and options are as follows:
Fund name Securities description Currency QuantityMarket value
(in USD) Counterparty Margin
Gateway U.S. Equities Fund 3M Co USD 183 25,666 BBH&Co -Abbott Laboratories USD 597 22,883 BBH&Co -AbbVie Inc USD 447 23,606 BBH&Co -Altria Group Inc USD 709 27,219 BBH&Co -Amgen Inc USD 282 32,193 BBH&Co -Apple Inc USD 204 114,466 BBH&Co -AT&T Inc USD 1,658 58,295 BBH&Co -Automatic Data Processing Inc USD 348 28,122 BBH&Co -Bank of America Corp USD 1,769 27,543 BBH&Co -Baxter International Inc USD 203 14,119 BBH&Co -Boeing Co/The USD 260 35,487 BBH&Co -Caterpillar Inc USD 100 9,081 BBH&Co -Chevron Corp USD 522 65,203 BBH&Co -Cisco Systems Inc USD 1,375 30,869 BBH&Co -Coca-Cola Co/The USD 1,162 48,002 BBH&Co -ConocoPhillips USD 589 41,613 BBH&Co -Consolidated Edison Inc USD 331 18,298 BBH&Co -CVS Caremark Corp USD 396 28,342 BBH&Co -Dow Chemical Co/The USD 403 17,893 BBH&Co -Duke Energy Corp USD 146 10,075 BBH&Co -EI du Pont de Nemours & Co USD 242 15,723 BBH&Co -Emerson Electric Co USD 342 24,002 BBH&Co -Exxon Mobil Corp USD 1,164 117,797 BBH&Co -Frontier Communications Corp USD 365 1,697 BBH&Co -General Electric Co USD 2,843 79,689 BBH&Co -Gilead Sciences Inc USD 306 22,996 BBH&Co -Goldman Sachs Group Inc/The USD 85 15,067 BBH&Co -Google Inc USD 55 61,639 BBH&Co -Hewlett-Packard Co USD 526 14,717 BBH&Co -Home Depot Inc/The USD 456 37,547 BBH&Co -
467
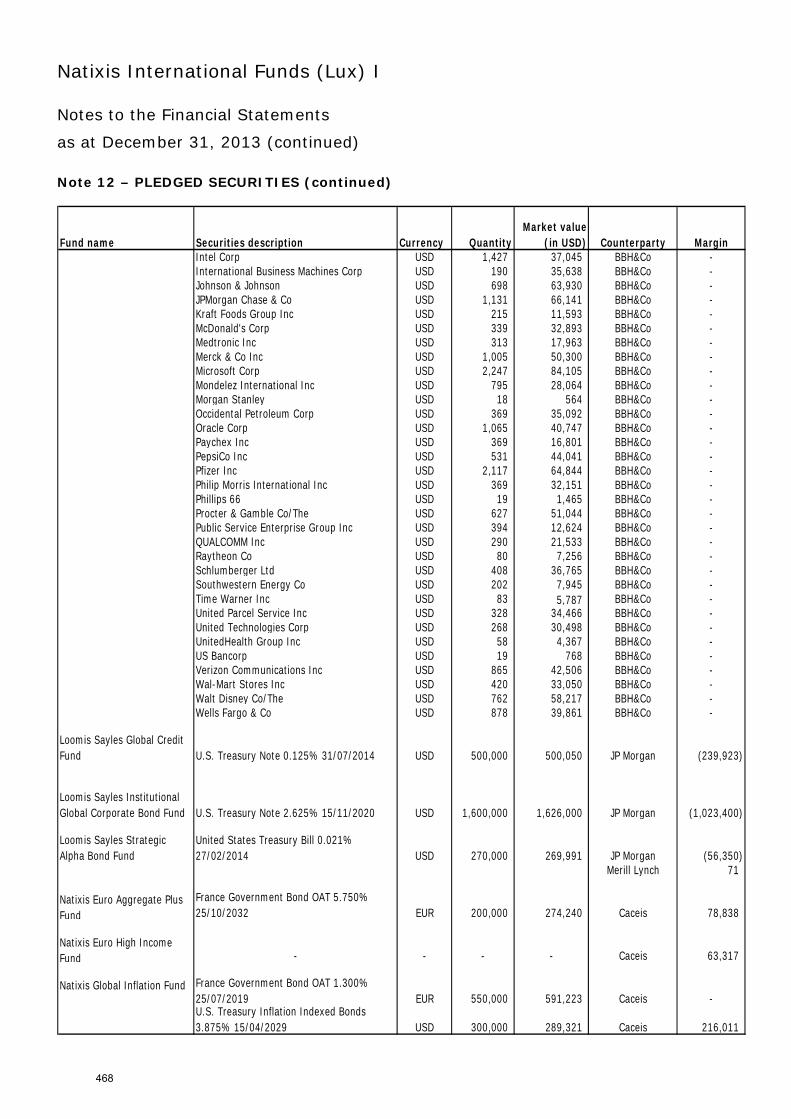
Natixis International Funds (Lux) I Notes to the Financial Statements
as at December 31, 2013 (continued)
Note 12 – PLEDGED SECURITIES (continued)
Fund name Securities description Currency QuantityMarket value
(in USD) Counterparty MarginIntel Corp USD 1,427 37,045 BBH&Co -International Business Machines Corp USD 190 35,638 BBH&Co -Johnson & Johnson USD 698 63,930 BBH&Co -JPMorgan Chase & Co USD 1,131 66,141 BBH&Co -Kraft Foods Group Inc USD 215 11,593 BBH&Co -McDonald's Corp USD 339 32,893 BBH&Co -Medtronic Inc USD 313 17,963 BBH&Co -Merck & Co Inc USD 1,005 50,300 BBH&Co -Microsoft Corp USD 2,247 84,105 BBH&Co -Mondelez International Inc USD 795 28,064 BBH&Co -Morgan Stanley USD 18 564 BBH&Co -Occidental Petroleum Corp USD 369 35,092 BBH&Co -Oracle Corp USD 1,065 40,747 BBH&Co -Paychex Inc USD 369 16,801 BBH&Co -PepsiCo Inc USD 531 44,041 BBH&Co -Pfizer Inc USD 2,117 64,844 BBH&Co -Philip Morris International Inc USD 369 32,151 BBH&Co -Phillips 66 USD 19 1,465 BBH&Co -Procter & Gamble Co/The USD 627 51,044 BBH&Co -Public Service Enterprise Group Inc USD 394 12,624 BBH&Co -QUALCOMM Inc USD 290 21,533 BBH&Co -Raytheon Co USD 80 7,256 BBH&Co -Schlumberger Ltd USD 408 36,765 BBH&Co -Southwestern Energy Co USD 202 7,945 BBH&Co -Time Warner Inc USD 83 5,787 BBH&Co -United Parcel Service Inc USD 328 34,466 BBH&Co -United Technologies Corp USD 268 30,498 BBH&Co -UnitedHealth Group Inc USD 58 4,367 BBH&Co -US Bancorp USD 19 768 BBH&Co -Verizon Communications Inc USD 865 42,506 BBH&Co -Wal-Mart Stores Inc USD 420 33,050 BBH&Co -Walt Disney Co/The USD 762 58,217 BBH&Co -Wells Fargo & Co USD 878 39,861 BBH&Co -
Loomis Sayles Global Credit Fund U.S. Treasury Note 0.125% 31/07/2014 USD 500,000 500,050 JP Morgan (239,923)
Loomis Sayles Institutional Global Corporate Bond Fund U.S. Treasury Note 2.625% 15/11/2020 USD 1,600,000 1,626,000 JP Morgan (1,023,400)
Loomis Sayles Strategic Alpha Bond Fund
United States Treasury Bill 0.021% 27/02/2014 USD 270,000 269,991 JP Morgan (56,350)
Merill Lynch 71
Natixis Euro Aggregate Plus Fund
France Government Bond OAT 5.750% 25/10/2032 EUR 200,000 274,240 Caceis 78,838
Natixis Euro High Income Fund - - - - Caceis 63,317
Natixis Global Inflation Fund France Government Bond OAT 1.300% 25/07/2019 EUR 550,000 591,223 Caceis -U.S. Treasury Inflation Indexed Bonds 3.875% 15/04/2029 USD 300,000 289,321 Caceis 216,011
468
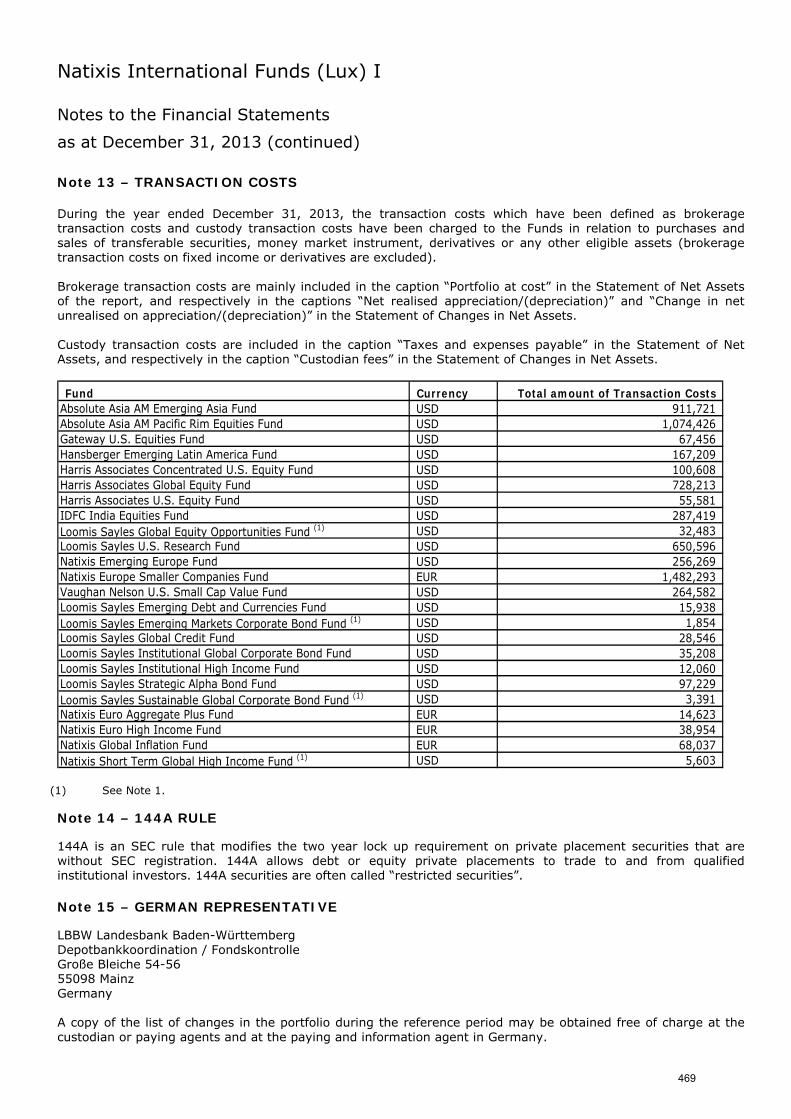
Natixis International Funds (Lux) I Notes to the Financial Statements
as at December 31, 2013 (continued)
Note 13 – TRANSACTION COSTS During the year ended December 31, 2013, the transaction costs which have been defined as brokerage transaction costs and custody transaction costs have been charged to the Funds in relation to purchases and sales of transferable securities, money market instrument, derivatives or any other eligible assets (brokerage transaction costs on fixed income or derivatives are excluded). Brokerage transaction costs are mainly included in the caption “Portfolio at cost” in the Statement of Net Assets of the report, and respectively in the captions “Net realised appreciation/(depreciation)” and “Change in net unrealised on appreciation/(depreciation)” in the Statement of Changes in Net Assets. Custody transaction costs are included in the caption “Taxes and expenses payable” in the Statement of Net Assets, and respectively in the caption “Custodian fees” in the Statement of Changes in Net Assets.
Fund Currency Total amount of Transaction Costs Absolute Asia AM Emerging Asia Fund USD 911,721 Absolute Asia AM Pacific Rim Equities Fund USD 1,074,426 Gateway U.S. Equities Fund USD 67,456 Hansberger Emerging Latin America Fund USD 167,209 Harris Associates Concentrated U.S. Equity Fund USD 100,608 Harris Associates Global Equity Fund USD 728,213 Harris Associates U.S. Equity Fund USD 55,581 IDFC India Equities Fund USD 287,419 Loomis Sayles Global Equity Opportunities Fund (1) USD 32,483 Loomis Sayles U.S. Research Fund USD 650,596 Natixis Emerging Europe Fund USD 256,269 Natixis Europe Smaller Companies Fund EUR 1,482,293 Vaughan Nelson U.S. Small Cap Value Fund USD 264,582 Loomis Sayles Emerging Debt and Currencies Fund USD 15,938 Loomis Sayles Emerging Markets Corporate Bond Fund (1) USD 1,854 Loomis Sayles Global Credit Fund USD 28,546 Loomis Sayles Institutional Global Corporate Bond Fund USD 35,208 Loomis Sayles Institutional High Income Fund USD 12,060 Loomis Sayles Strategic Alpha Bond Fund USD 97,229 Loomis Sayles Sustainable Global Corporate Bond Fund (1) USD 3,391 Natixis Euro Aggregate Plus Fund EUR 14,623 Natixis Euro High Income Fund EUR 38,954 Natixis Global Inflation Fund EUR 68,037 Natixis Short Term Global High Income Fund (1) USD 5,603
(1) See Note 1.
Note 14 – 144A RULE 144A is an SEC rule that modifies the two year lock up requirement on private placement securities that are without SEC registration. 144A allows debt or equity private placements to trade to and from qualified institutional investors. 144A securities are often called “restricted securities”. Note 15 – GERMAN REPRESENTATIVE LBBW Landesbank Baden-Württemberg Depotbankkoordination / Fondskontrolle Große Bleiche 54-56 55098 Mainz Germany A copy of the list of changes in the portfolio during the reference period may be obtained free of charge at the custodian or paying agents and at the paying and information agent in Germany.
469
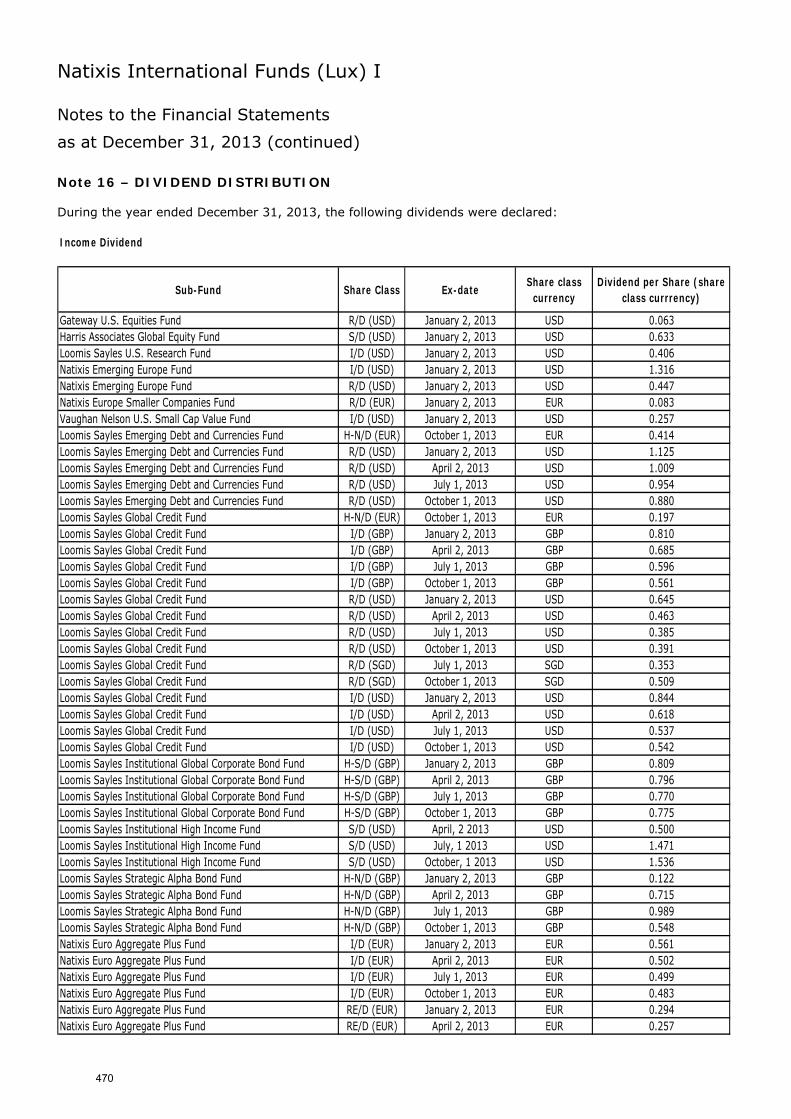
Natixis International Funds (Lux) I Notes to the Financial Statements
as at December 31, 2013 (continued)
Note 16 – DIVIDEND DISTRIBUTION During the year ended December 31, 2013, the following dividends were declared: Income Dividend
Sub-Fund Share Class Ex-dateShare class
currencyDividend per Share (share
class currrency)
Gateway U.S. Equities Fund R/D (USD) January 2, 2013 USD 0.063Harris Associates Global Equity Fund S/D (USD) January 2, 2013 USD 0.633Loomis Sayles U.S. Research Fund I/D (USD) January 2, 2013 USD 0.406Natixis Emerging Europe Fund I/D (USD) January 2, 2013 USD 1.316Natixis Emerging Europe Fund R/D (USD) January 2, 2013 USD 0.447Natixis Europe Smaller Companies Fund R/D (EUR) January 2, 2013 EUR 0.083Vaughan Nelson U.S. Small Cap Value Fund I/D (USD) January 2, 2013 USD 0.257Loomis Sayles Emerging Debt and Currencies Fund H-N/D (EUR) October 1, 2013 EUR 0.414Loomis Sayles Emerging Debt and Currencies Fund R/D (USD) January 2, 2013 USD 1.125Loomis Sayles Emerging Debt and Currencies Fund R/D (USD) April 2, 2013 USD 1.009Loomis Sayles Emerging Debt and Currencies Fund R/D (USD) July 1, 2013 USD 0.954Loomis Sayles Emerging Debt and Currencies Fund R/D (USD) October 1, 2013 USD 0.880Loomis Sayles Global Credit Fund H-N/D (EUR) October 1, 2013 EUR 0.197Loomis Sayles Global Credit Fund I/D (GBP) January 2, 2013 GBP 0.810Loomis Sayles Global Credit Fund I/D (GBP) April 2, 2013 GBP 0.685Loomis Sayles Global Credit Fund I/D (GBP) July 1, 2013 GBP 0.596Loomis Sayles Global Credit Fund I/D (GBP) October 1, 2013 GBP 0.561Loomis Sayles Global Credit Fund R/D (USD) January 2, 2013 USD 0.645Loomis Sayles Global Credit Fund R/D (USD) April 2, 2013 USD 0.463Loomis Sayles Global Credit Fund R/D (USD) July 1, 2013 USD 0.385Loomis Sayles Global Credit Fund R/D (USD) October 1, 2013 USD 0.391Loomis Sayles Global Credit Fund R/D (SGD) July 1, 2013 SGD 0.353Loomis Sayles Global Credit Fund R/D (SGD) October 1, 2013 SGD 0.509Loomis Sayles Global Credit Fund I/D (USD) January 2, 2013 USD 0.844Loomis Sayles Global Credit Fund I/D (USD) April 2, 2013 USD 0.618Loomis Sayles Global Credit Fund I/D (USD) July 1, 2013 USD 0.537Loomis Sayles Global Credit Fund I/D (USD) October 1, 2013 USD 0.542Loomis Sayles Institutional Global Corporate Bond Fund H-S/D (GBP) January 2, 2013 GBP 0.809Loomis Sayles Institutional Global Corporate Bond Fund H-S/D (GBP) April 2, 2013 GBP 0.796Loomis Sayles Institutional Global Corporate Bond Fund H-S/D (GBP) July 1, 2013 GBP 0.770Loomis Sayles Institutional Global Corporate Bond Fund H-S/D (GBP) October 1, 2013 GBP 0.775Loomis Sayles Institutional High Income Fund S/D (USD) April, 2 2013 USD 0.500Loomis Sayles Institutional High Income Fund S/D (USD) July, 1 2013 USD 1.471Loomis Sayles Institutional High Income Fund S/D (USD) October, 1 2013 USD 1.536Loomis Sayles Strategic Alpha Bond Fund H-N/D (GBP) January 2, 2013 GBP 0.122Loomis Sayles Strategic Alpha Bond Fund H-N/D (GBP) April 2, 2013 GBP 0.715Loomis Sayles Strategic Alpha Bond Fund H-N/D (GBP) July 1, 2013 GBP 0.989Loomis Sayles Strategic Alpha Bond Fund H-N/D (GBP) October 1, 2013 GBP 0.548Natixis Euro Aggregate Plus Fund I/D (EUR) January 2, 2013 EUR 0.561Natixis Euro Aggregate Plus Fund I/D (EUR) April 2, 2013 EUR 0.502Natixis Euro Aggregate Plus Fund I/D (EUR) July 1, 2013 EUR 0.499Natixis Euro Aggregate Plus Fund I/D (EUR) October 1, 2013 EUR 0.483Natixis Euro Aggregate Plus Fund RE/D (EUR) January 2, 2013 EUR 0.294Natixis Euro Aggregate Plus Fund RE/D (EUR) April 2, 2013 EUR 0.257
470
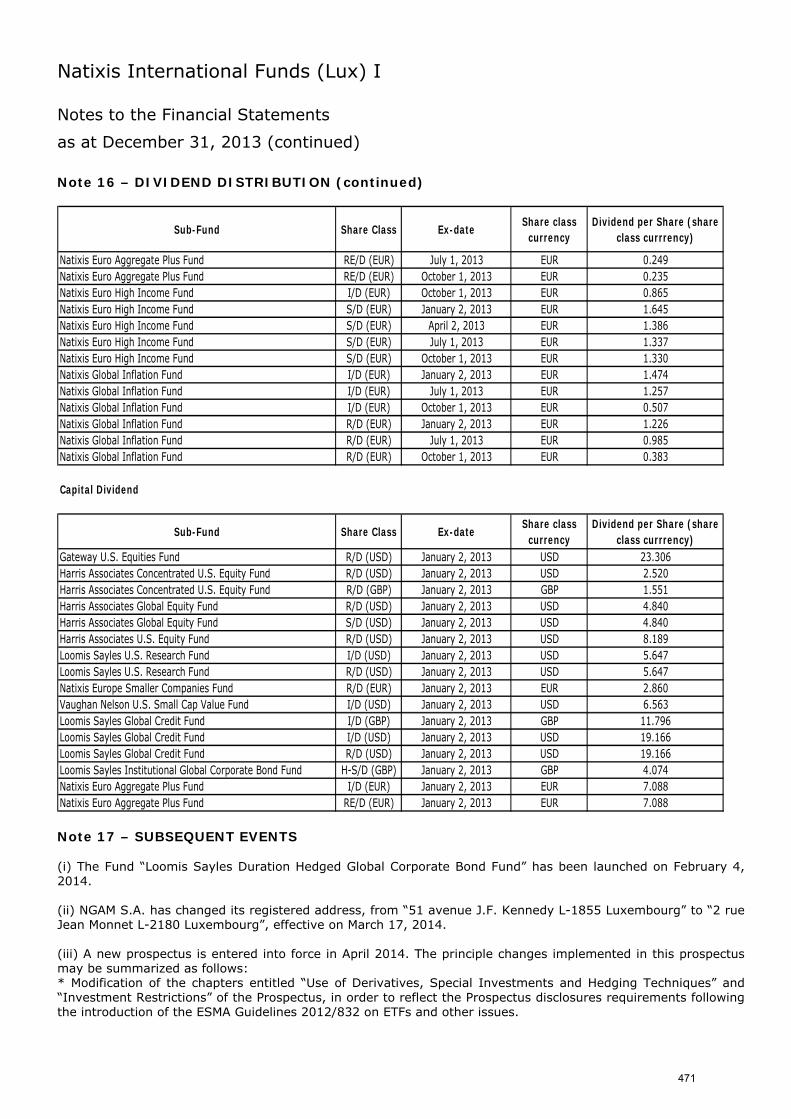
Natixis International Funds (Lux) I Notes to the Financial Statements
as at December 31, 2013 (continued)
Note 16 – DIVIDEND DISTRIBUTION (continued)
Sub-Fund Share Class Ex-dateShare class
currencyDividend per Share (share
class currrency)
Natixis Euro Aggregate Plus Fund RE/D (EUR) July 1, 2013 EUR 0.249Natixis Euro Aggregate Plus Fund RE/D (EUR) October 1, 2013 EUR 0.235Natixis Euro High Income Fund I/D (EUR) October 1, 2013 EUR 0.865Natixis Euro High Income Fund S/D (EUR) January 2, 2013 EUR 1.645Natixis Euro High Income Fund S/D (EUR) April 2, 2013 EUR 1.386Natixis Euro High Income Fund S/D (EUR) July 1, 2013 EUR 1.337Natixis Euro High Income Fund S/D (EUR) October 1, 2013 EUR 1.330Natixis Global Inflation Fund I/D (EUR) January 2, 2013 EUR 1.474Natixis Global Inflation Fund I/D (EUR) July 1, 2013 EUR 1.257Natixis Global Inflation Fund I/D (EUR) October 1, 2013 EUR 0.507Natixis Global Inflation Fund R/D (EUR) January 2, 2013 EUR 1.226Natixis Global Inflation Fund R/D (EUR) July 1, 2013 EUR 0.985Natixis Global Inflation Fund R/D (EUR) October 1, 2013 EUR 0.383
Capital Dividend
Sub-Fund Share Class Ex-dateShare class
currencyDividend per Share (share
class currrency)Gateway U.S. Equities Fund R/D (USD) January 2, 2013 USD 23.306Harris Associates Concentrated U.S. Equity Fund R/D (USD) January 2, 2013 USD 2.520Harris Associates Concentrated U.S. Equity Fund R/D (GBP) January 2, 2013 GBP 1.551Harris Associates Global Equity Fund R/D (USD) January 2, 2013 USD 4.840Harris Associates Global Equity Fund S/D (USD) January 2, 2013 USD 4.840Harris Associates U.S. Equity Fund R/D (USD) January 2, 2013 USD 8.189Loomis Sayles U.S. Research Fund I/D (USD) January 2, 2013 USD 5.647Loomis Sayles U.S. Research Fund R/D (USD) January 2, 2013 USD 5.647Natixis Europe Smaller Companies Fund R/D (EUR) January 2, 2013 EUR 2.860Vaughan Nelson U.S. Small Cap Value Fund I/D (USD) January 2, 2013 USD 6.563Loomis Sayles Global Credit Fund I/D (GBP) January 2, 2013 GBP 11.796Loomis Sayles Global Credit Fund I/D (USD) January 2, 2013 USD 19.166Loomis Sayles Global Credit Fund R/D (USD) January 2, 2013 USD 19.166Loomis Sayles Institutional Global Corporate Bond Fund H-S/D (GBP) January 2, 2013 GBP 4.074Natixis Euro Aggregate Plus Fund I/D (EUR) January 2, 2013 EUR 7.088Natixis Euro Aggregate Plus Fund RE/D (EUR) January 2, 2013 EUR 7.088 Note 17 – SUBSEQUENT EVENTS (i) The Fund “Loomis Sayles Duration Hedged Global Corporate Bond Fund” has been launched on February 4, 2014. (ii) NGAM S.A. has changed its registered address, from “51 avenue J.F. Kennedy L-1855 Luxembourg” to “2 rue Jean Monnet L-2180 Luxembourg”, effective on March 17, 2014. (iii) A new prospectus is entered into force in April 2014. The principle changes implemented in this prospectus may be summarized as follows: * Modification of the chapters entitled “Use of Derivatives, Special Investments and Hedging Techniques” and “Investment Restrictions” of the Prospectus, in order to reflect the Prospectus disclosures requirements following the introduction of the ESMA Guidelines 2012/832 on ETFs and other issues.
471
Natixis International Funds (Lux) I Notes to the Financial Statements
as at December 31, 2013 (continued)
Note 17 – SUBSEQUENT EVENTS (continued) * Change of Investment Manager for Hansberger Emerging Latin America Fund, i.e. from “Hansberger Global Investors, Inc.” to “Natixis Asset Management” in order to centralize the management of strategies related to investments in equity securities of Latin American emerging market companies to one investment manager of Natixis Group. * Change of name of the Fund “Hansberger Emerging Latin America Fund” to “Natixis Emerging Latin America Equity Fund”. Apart from the above, there are no other subsequent events to be disclosed as at December 31, 2013.
472
Natixis International Funds (Lux) I Additional information
SAVINGS DIRECTIVE (unaudited)
The law of June 21, 2005, (the “Law”) has implemented into Luxembourg law the Council Directive 2003/48/EC on the taxation of savings income in the form of interest payments (the “Savings Directive”). It seeks to ensure that individuals residents in an EU Member State who receive interest payments from another Member State are taxed in the Member State in which they are resident for the tax purposes. The Savings Directive targets payments in the form of interest payments from debt claims (“Taxable Income”) made in a member state of the European Union (a “Member State”) to individuals (“Beneficiaries”) residing in another Member State. Under the Savings Directive Member States are required to provide the tax authorities of the Beneficiary's Member State with details on payments of Taxable Income made and the identity of the respective Beneficiaries (“Exchange of Information”). For a transitional period some countries (amongst which Luxembourg) shall however apply a withholding tax system instead of an exchange of information. Although the territorial scope of the Directive is limited to the EU arrangements and agreements have been concluded with 10 dependent or associated territories –Jersey, Guernsey, Isle of Man, Anguilla, BVI, Cayman Islands, Turk & Caicos Islands, Montserrat, Netherlands Antilles and Aruba- and 5 third countries –Switzerland, Liechtenstein, San Marino, Monaco and Andorra- to ensure a level playing field. As at the date of this Prospectus, the rate of such withholding tax is 35%. Article 9 of the Law provides however that no withholding tax will be withheld if the Beneficiary explicitly authorizes the paying agent in writing to proceed to an Exchange of Information. Dividends distributed by the Umbrella Fund will fall into the scope of the Savings Directive if more than 15% of the relevant portfolio's assets are invested in debt claims (as defined in the Law). Redemption proceeds realised by shareholders on the disposal of shares will fall into the Scope of the Savings Directive if more than 40% of the relevant fund assets are invested in debt claims. The Umbrella Fund is authorised to reject any application for shares if the applying investor does not provide the Umbrella Fund with complete and satisfactory information as required by the Law.
473
Natixis International Funds (Lux) I Additional information (continued)
SAVINGS DIRECTIVE (unaudited) (continued)
Name of the Funds Method used
Tax status for Tax status for to determineredemption (2) distribution (2) the status
Absolute Asia AM Emerging Asia Fund O O AT
Absolute Asia AM Pacific Rim Equities Fund O O AT
Gateway U.S. Equities Fund O O AT
Hansberger Emerging Latin America Fund O O AT
Harris Associates Concentrated U.S. Equity Fund O O AT
Harris Associates Global Equity Fund O O AT
Harris Associates U.S. Equity Fund O O AT
IDFC India Equities Fund O O AT
Loomis Sayles Global Equity Opportunities Fund (1) O O AT
Loomis Sayles U.S. Research Fund O O AT
Natixis Emerging Europe Fund O O AT
Natixis Europe Smaller Companies Fund O O AT
Vaughan Nelson U.S. Small Cap Value Fund O O AT
Loomis Sayles Emerging Debt and Currencies Fund I I AT
Loomis Sayles Emerging Markets Corporate Bond Fund (1) I I AT
Loomis Sayles Global Credit Fund I I AT
Loomis Sayles Institutional Global Corporate Bond Fund I I AT
Loomis Sayles Institutional High Income Fund I I AT
Loomis Sayles Strategic Alpha Bond Fund I I AT
Loomis Sayles Sustainable Global Corporate Bond Fund (1) I I AT
Natixis Euro Aggregate Plus Fund I I AT
Natixis Euro High Income Fund I I AT
Natixis Global Inflation Fund I I AT
Natixis Short Term Global High Income Fund (1) I I AT
I = in scope of the law O = out of acope of the law AT = asset testing (1) See Note 1. (2) For the fiscal year of 2013.
474
Natixis International Funds (Lux) I Additional information (continued)
INFORMATION ON GLOBAL MARKET RISK EXPOSURE (unaudited) The Management Company monitored the global market risk exposure of the Funds for the year ended December 31, 2013 utilizing the commitment approach.
475
Related Documents