National Tracking Poll #2107125 July 28-29, 2021 Crosstabulation Results Methodology: is poll was conducted between July 28-July 29, 2021 among a sample of 2000 Registered Voters. e interviews were conducted online and the data were weighted to approximate a target sample of Registered Voters based on age, gender, race, educational attainment, marital status, home owner- ship, 2020 presidential vote choice, and region. Results from the full survey have a margin of error of plus or minus 2 percentage points.

Welcome message from author
This document is posted to help you gain knowledge. Please leave a comment to let me know what you think about it! Share it to your friends and learn new things together.
Transcript

National Tracking Poll #2107125July 28-29, 2021
Crosstabulation Results
Methodology:This poll was conducted between July 28-July 29, 2021 among a sample of 2000 Registered Voters.The interviews were conducted online and the data were weighted to approximate a target sample ofRegistered Voters based on age, gender, race, educational attainment, marital status, home owner-ship, 2020 presidential vote choice, and region. Results from the full survey have a margin of errorof plus or minus 2 percentage points.

Table Index
1 Table P1: Now, generally speaking, would you say that things in the country are going in theright direction, or have they pretty seriously gotten off on the wrong track? . . . . . . . . . . 6
2 Table nr2b: Do you approve or disapprove of the job Joe Biden is doing as President? . . . . 10
3 Table nr2bNET: Do you approve or disapprove of the job Joe Biden is doing as President? . . 13
4 Table P3: Now, thinking about your vote, what would you say is the top set of issues on yourmind when you cast your vote for federal offices such as U.S. Senate or Congress? . . . . . . . 16
5 Table POL1_1: Do you have a favorable or unfavorable view of each of the following? Antifa 20
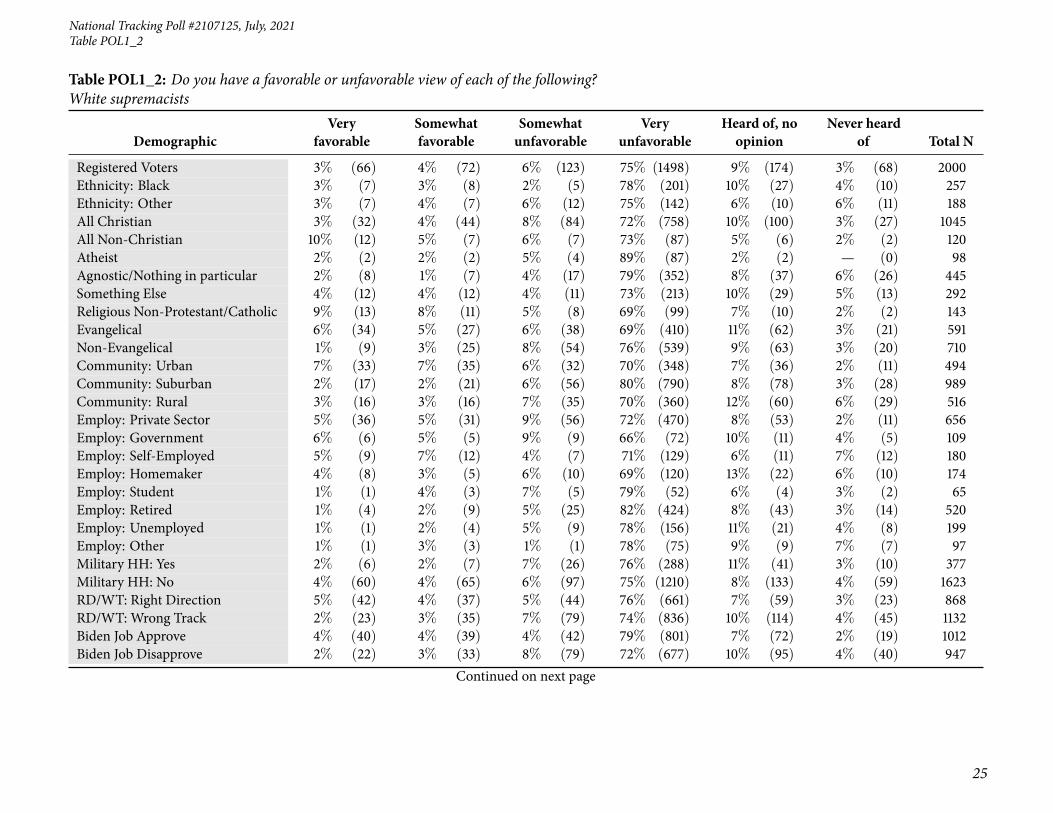
6 Table POL1_2: Do you have a favorable or unfavorable view of each of the following? Whitesupremacists . . . . . . . . . . . . . . . . . . . . . . . . . . . . . . . . . . . . . . . . . . 24
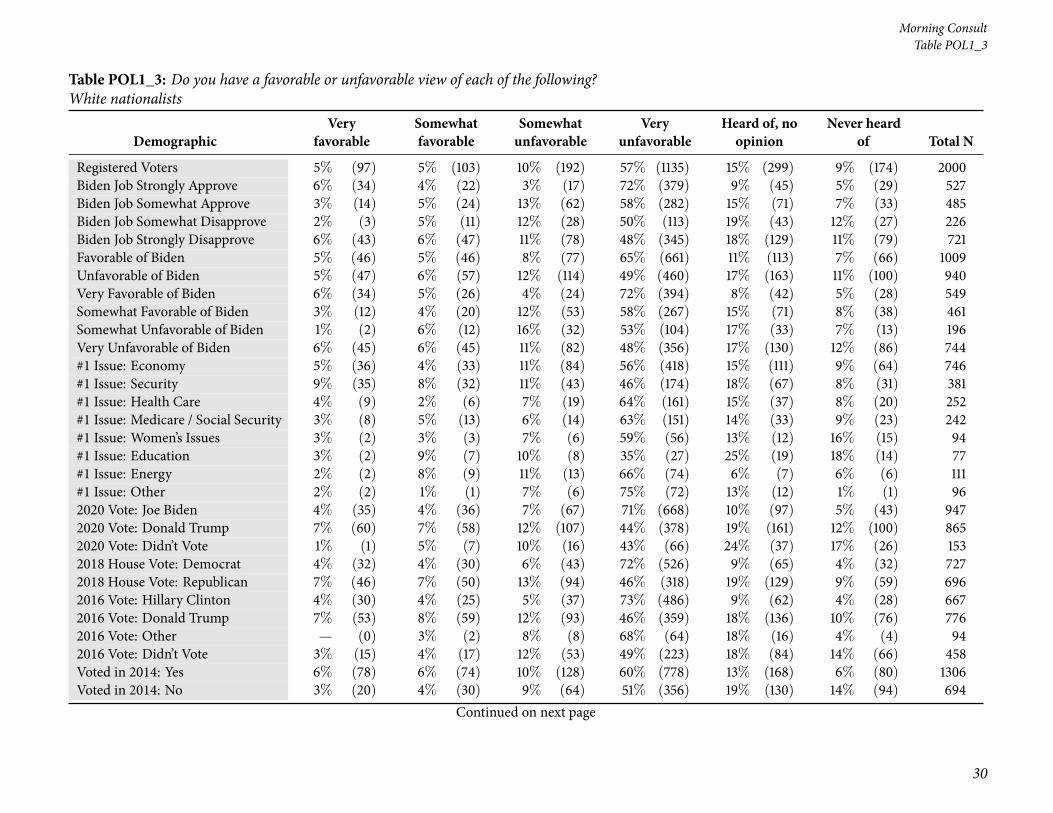
7 Table POL1_3: Do you have a favorable or unfavorable view of each of the following? Whitenationalists . . . . . . . . . . . . . . . . . . . . . . . . . . . . . . . . . . . . . . . . . . . 28
8 Table POL1_4: Do you have a favorable or unfavorable view of each of the following? ProudBoys . . . . . . . . . . . . . . . . . . . . . . . . . . . . . . . . . . . . . . . . . . . . . . . 32
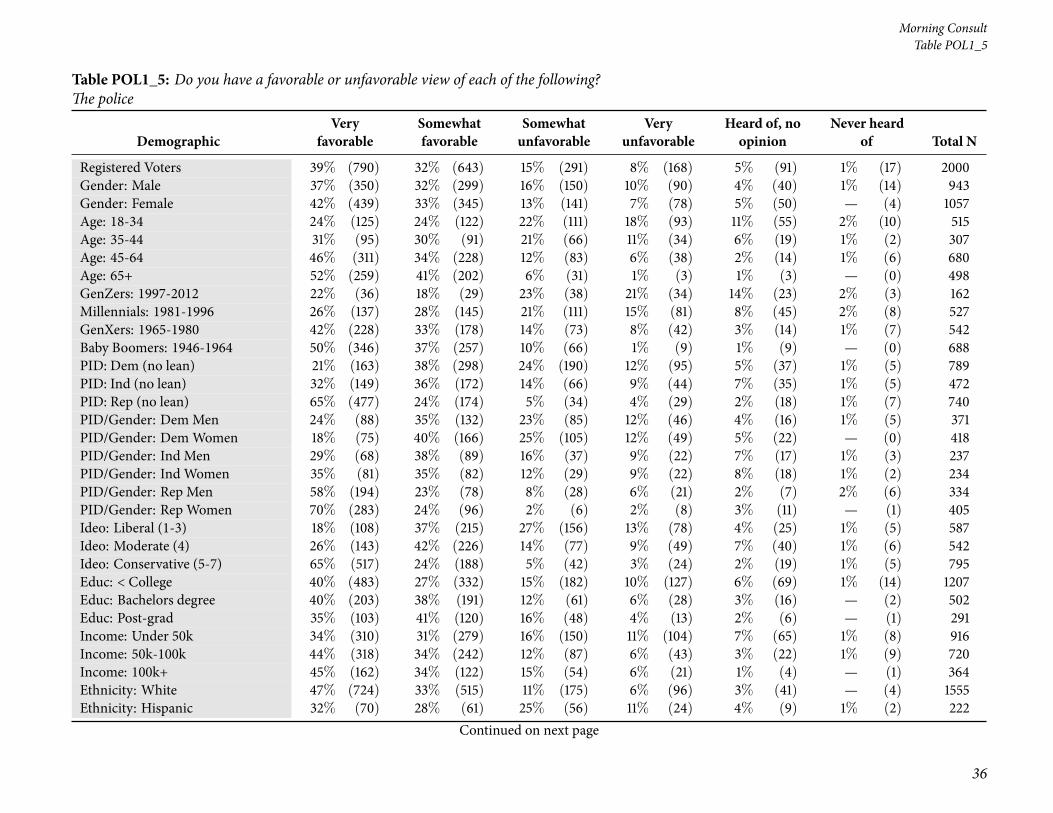
9 Table POL1_5: Do you have a favorable or unfavorable view of each of the following? Thepolice . . . . . . . . . . . . . . . . . . . . . . . . . . . . . . . . . . . . . . . . . . . . . . 36
10 Table POL1_6: Do you have a favorable or unfavorable view of each of the following? Trumpsupporters . . . . . . . . . . . . . . . . . . . . . . . . . . . . . . . . . . . . . . . . . . . . 40
11 Table POL1_7: Do you have a favorable or unfavorable view of each of the following? Bidensupporters . . . . . . . . . . . . . . . . . . . . . . . . . . . . . . . . . . . . . . . . . . . . 44
12 TablePOL1_8: Do you have a favorable or unfavorable view of each of the following? Democrats 48
13 Table POL1_9: Do you have a favorable or unfavorable view of each of the following? Re-publicans . . . . . . . . . . . . . . . . . . . . . . . . . . . . . . . . . . . . . . . . . . . . 52
14 Table POL2: Do you believe the people who broke into the U.S. Capitol in Washington, D.C.,as Congress was certifying Electoral College votes for Joe Biden are: . . . . . . . . . . . . . . 56
15 Table POL3: And do you believe the people who broke into the U.S. Capitol in Washington,D.C., as Congress was certifying Electoral College votes for Joe Biden should be viewed asdomestic terrorists, or not? . . . . . . . . . . . . . . . . . . . . . . . . . . . . . . . . . . . 60
16 Table POL4_1: How responsible do you believe each of the following are for the events thatled to a group of people attacking police and breaking into the U.S. Capitol in Washington,D.C.? Democrats in Congress . . . . . . . . . . . . . . . . . . . . . . . . . . . . . . . . . . 64
17 Table POL4_2: How responsible do you believe each of the following are for the events thatled to a group of people attacking police and breaking into the U.S. Capitol in Washington,D.C.? Republicans in Congress . . . . . . . . . . . . . . . . . . . . . . . . . . . . . . . . . 68
2
National Tracking Poll #2107125, July, 2021
18 Table POL4_3: How responsible do you believe each of the following are for the events thatled to a group of people attacking police and breaking into the U.S. Capitol in Washington,D.C.? Sen. Ted Cruz . . . . . . . . . . . . . . . . . . . . . . . . . . . . . . . . . . . . . . 72
19 Table POL4_4: How responsible do you believe each of the following are for the events thatled to a group of people attacking police and breaking into the U.S. Capitol in Washington,D.C.? Sen. Josh Hawley . . . . . . . . . . . . . . . . . . . . . . . . . . . . . . . . . . . . . 76
20 Table POL4_5: How responsible do you believe each of the following are for the events thatled to a group of people attacking police and breaking into the U.S. Capitol in Washington,D.C.? Local law enforcement . . . . . . . . . . . . . . . . . . . . . . . . . . . . . . . . . . 80
21 Table POL4_6: How responsible do you believe each of the following are for the events thatled to a group of people attacking police and breaking into the U.S. Capitol in Washington,D.C.? Defense Department . . . . . . . . . . . . . . . . . . . . . . . . . . . . . . . . . . . 84
22 Table POL4_7: How responsible do you believe each of the following are for the events thatled to a group of people attacking police and breaking into the U.S. Capitol in Washington,D.C.? Donald Trump . . . . . . . . . . . . . . . . . . . . . . . . . . . . . . . . . . . . . . 88
23 Table POL4_8: How responsible do you believe each of the following are for the events thatled to a group of people attacking police and breaking into the U.S. Capitol in Washington,D.C.? Mike Pence . . . . . . . . . . . . . . . . . . . . . . . . . . . . . . . . . . . . . . . . 92
24 Table POL4_9: How responsible do you believe each of the following are for the events thatled to a group of people attacking police and breaking into the U.S. Capitol in Washington,D.C.? President Joe Biden . . . . . . . . . . . . . . . . . . . . . . . . . . . . . . . . . . . . 96
25 Table POL4_10: How responsible do you believe each of the following are for the events thatled to a group of people attacking police and breaking into the U.S. Capitol in Washington,D.C.? The people who broke into the U.S. Capitol . . . . . . . . . . . . . . . . . . . . . . . 100
26 Table POL4_11: How responsible do you believe each of the following are for the events thatled to a group of people attacking police and breaking into the U.S. Capitol in Washington,D.C.? State elections officials . . . . . . . . . . . . . . . . . . . . . . . . . . . . . . . . . . 104
27 Table POL4_12: How responsible do you believe each of the following are for the events thatled to a group of people attacking police and breaking into the U.S. Capitol in Washington,D.C.? State legislators . . . . . . . . . . . . . . . . . . . . . . . . . . . . . . . . . . . . . . 108
28 Table POL4_13: How responsible do you believe each of the following are for the events thatled to a group of people attacking police and breaking into the U.S. Capitol in Washington,D.C.? News media . . . . . . . . . . . . . . . . . . . . . . . . . . . . . . . . . . . . . . . 112
29 Table POL4_14: How responsible do you believe each of the following are for the events thatled to a group of people attacking police and breaking into the U.S. Capitol in Washington,D.C.? Social media companies . . . . . . . . . . . . . . . . . . . . . . . . . . . . . . . . . 116
30 Table POL4_15: How responsible do you believe each of the following are for the events thatled to a group of people attacking police and breaking into the U.S. Capitol in Washington,D.C.? Speaker of the House Nancy Pelosi . . . . . . . . . . . . . . . . . . . . . . . . . . . . 120
3
Morning Consult
31 Table POL5_1: Thinking about the events that occurred at the U.S. Capitol on Jan. 6, howwell does each of the following describe how you feel? Surprised . . . . . . . . . . . . . . . . 124
32 Table POL5_2: Thinking about the events that occurred at the U.S. Capitol on Jan. 6, howwell does each of the following describe how you feel? Worried . . . . . . . . . . . . . . . . 128
33 Table POL5_3: Thinking about the events that occurred at the U.S. Capitol on Jan. 6, howwell does each of the following describe how you feel? Indifferent . . . . . . . . . . . . . . . 132
34 Table POL5_4: Thinking about the events that occurred at the U.S. Capitol on Jan. 6, howwell does each of the following describe how you feel? Sad . . . . . . . . . . . . . . . . . . . 136
35 Table POL5_5: Thinking about the events that occurred at the U.S. Capitol on Jan. 6, howwell does each of the following describe how you feel? Frustrated . . . . . . . . . . . . . . . 140
36 Table POL5_6: Thinking about the events that occurred at the U.S. Capitol on Jan. 6, howwell does each of the following describe how you feel? Nervous . . . . . . . . . . . . . . . . 144
37 Table POL5_7: Thinking about the events that occurred at the U.S. Capitol on Jan. 6, howwell does each of the following describe how you feel? Upset . . . . . . . . . . . . . . . . . . 148
38 Table POL5_8: Thinking about the events that occurred at the U.S. Capitol on Jan. 6, howwell does each of the following describe how you feel? Confident . . . . . . . . . . . . . . . . 152
39 Table POL5_9: Thinking about the events that occurred at the U.S. Capitol on Jan. 6, howwell does each of the following describe how you feel? Scared . . . . . . . . . . . . . . . . . 156
40 Table POL5_10: Thinking about the events that occurred at the U.S. Capitol on Jan. 6, howwell does each of the following describe how you feel? Angry . . . . . . . . . . . . . . . . . . 160
41 Table POL5_11: Thinking about the events that occurred at the U.S. Capitol on Jan. 6, howwell does each of the following describe how you feel? Happy . . . . . . . . . . . . . . . . . 164
42 Table POL5_12: Thinking about the events that occurred at the U.S. Capitol on Jan. 6, howwell does each of the following describe how you feel? Depressed . . . . . . . . . . . . . . . 168
43 Table POL5_13: Thinking about the events that occurred at the U.S. Capitol on Jan. 6, howwell does each of the following describe how you feel? Excited . . . . . . . . . . . . . . . . . 172
44 Table POL5_14: Thinking about the events that occurred at the U.S. Capitol on Jan. 6, howwell does each of the following describe how you feel? Embarrassed . . . . . . . . . . . . . . 176
45 Table POL5_15: Thinking about the events that occurred at the U.S. Capitol on Jan. 6, howwell does each of the following describe how you feel? Ashamed . . . . . . . . . . . . . . . . 180
46 Table POL6: As you may know, House Speaker Nancy Pelosi (D-Calif.) appointed sevenDemocrats and two Republicans to serve on a special congressional committee to investigatethe events that occurred at the U.S. Capitol on January 6th.Based on what you know, do youapprove or disapprove of the special congressional committee investigating the events that oc-curred at the U.S. Capitol on January 6th? . . . . . . . . . . . . . . . . . . . . . . . . . . . 184
4

National Tracking Poll #2107125, July, 2021
47 Table POL7: And specifically, how important is it for the federal government to continue toinvestigate the events that occurred in the U.S. Capitol in Washington, D.C. on January 6th? . 188
48 Table POL8_1: Do you agree or disagree with the following statements? The people who brokeinto the U.S. Capitol are representative of the Republican Party . . . . . . . . . . . . . . . . 192
49 Table POL8_2: Do you agree or disagree with the following statements? The people who brokeinto the U.S. Capitol are representative of Donald Trump, but not the Republican Party . . . 196
50 Table POL8_3: Do you agree or disagree with the following statements? There has been toomuch focus on the January 6th events at the U.S. Capitol . . . . . . . . . . . . . . . . . . . 200
51 Table POL8_4: Do you agree or disagree with the following statements? There has not beenenough focus on the January 6th events at the U.S. Capitol . . . . . . . . . . . . . . . . . . 204
52 TablePOL9_1: Howmuch have you seen, read or heard about each of the following? GymnastSimone Biles pulling out of Team USA’s team gymnastics competition on Tuesday, July 27th . 208
53 Table POL9_2: How much have you seen, read or heard about each of the following? Thespecial congressional committee investigating the January 6th U.S. Capitol riot holding its firsthearing on Tuesday, July 27th . . . . . . . . . . . . . . . . . . . . . . . . . . . . . . . . . . 211
54 Table POL9_3: How much have you seen, read or heard about each of the following? Policeofficers who defended theU.S. Capitol on January 6th testifying before the special congressionalcommittee investigating the Capitol riot . . . . . . . . . . . . . . . . . . . . . . . . . . . . 214
55 Table POL10: And did you watch or listen to the police officers who defended the U.S. Capitolon January 6th testify before the special congressional committee on Tuesday, July 27th, liveon air, either in part or in full? . . . . . . . . . . . . . . . . . . . . . . . . . . . . . . . . . 217
56 Summary Statistics of Survey Respondent Demographics . . . . . . . . . . . . . . . . . 220
5
6
Morning ConsultTable P1
Crosstabulation Results by Respondent Demographics
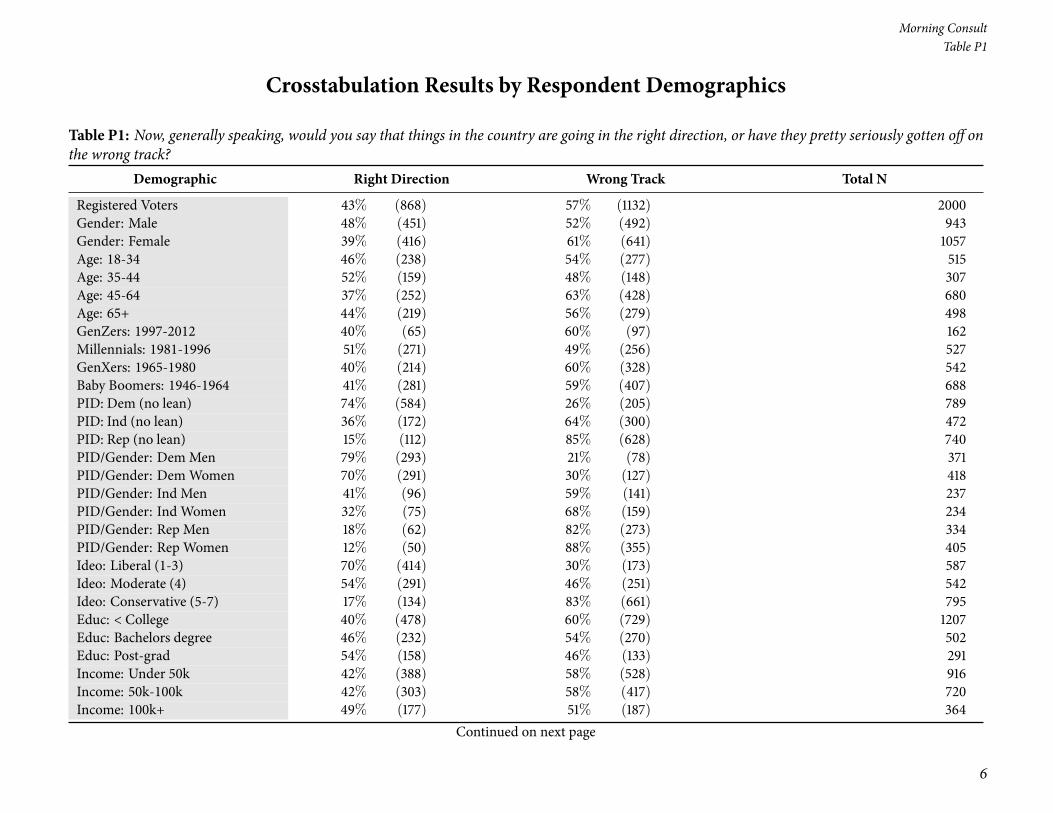
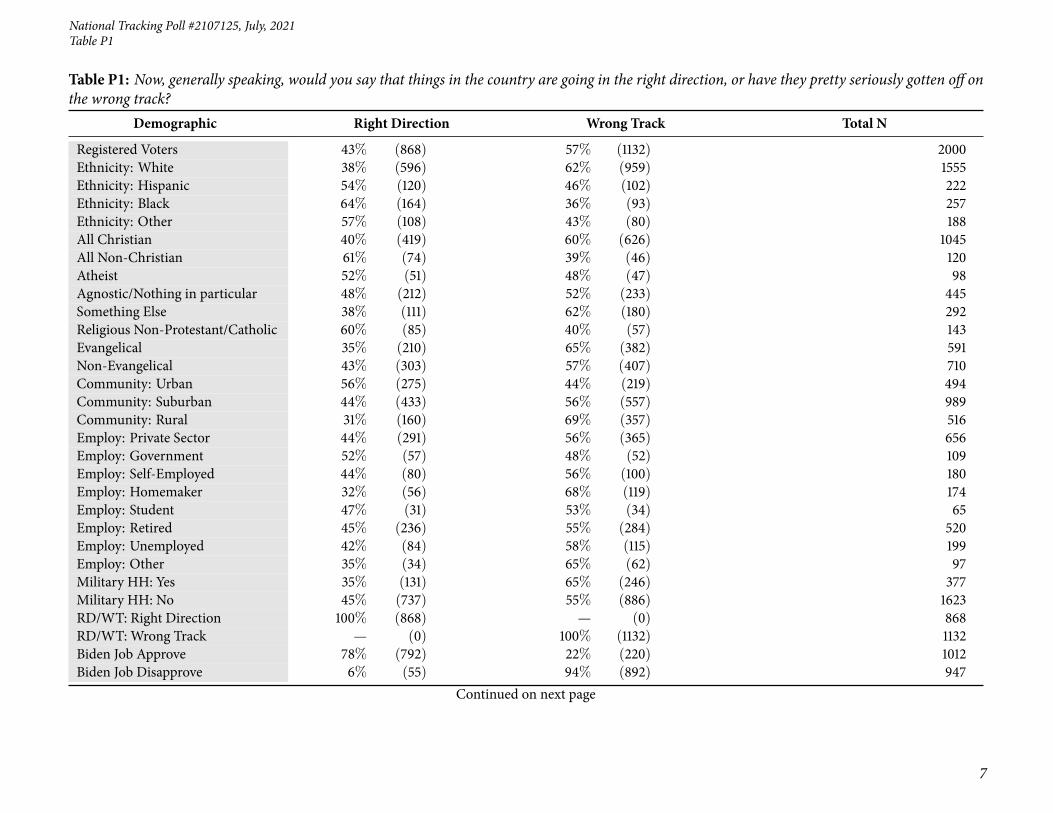
Table P1: Now, generally speaking, would you say that things in the country are going in the right direction, or have they pretty seriously gotten off onthe wrong track?
Demographic Right Direction Wrong Track Total N
Registered Voters 43% (868) 57% (1132) 2000Gender: Male 48% (451) 52% (492) 943Gender: Female 39% (416) 61% (641) 1057Age: 18-34 46% (238) 54% (277) 515Age: 35-44 52% (159) 48% (148) 307Age: 45-64 37% (252) 63% (428) 680Age: 65+ 44% (219) 56% (279) 498GenZers: 1997-2012 40% (65) 60% (97) 162Millennials: 1981-1996 51% (271) 49% (256) 527GenXers: 1965-1980 40% (214) 60% (328) 542Baby Boomers: 1946-1964 41% (281) 59% (407) 688PID: Dem (no lean) 74% (584) 26% (205) 789PID: Ind (no lean) 36% (172) 64% (300) 472PID: Rep (no lean) 15% (112) 85% (628) 740PID/Gender: DemMen 79% (293) 21% (78) 371PID/Gender: DemWomen 70% (291) 30% (127) 418PID/Gender: Ind Men 41% (96) 59% (141) 237PID/Gender: Ind Women 32% (75) 68% (159) 234PID/Gender: Rep Men 18% (62) 82% (273) 334PID/Gender: Rep Women 12% (50) 88% (355) 405Ideo: Liberal (1-3) 70% (414) 30% (173) 587Ideo: Moderate (4) 54% (291) 46% (251) 542Ideo: Conservative (5-7) 17% (134) 83% (661) 795Educ: < College 40% (478) 60% (729) 1207Educ: Bachelors degree 46% (232) 54% (270) 502Educ: Post-grad 54% (158) 46% (133) 291Income: Under 50k 42% (388) 58% (528) 916Income: 50k-100k 42% (303) 58% (417) 720Income: 100k+ 49% (177) 51% (187) 364
Continued on next page
National Tracking Poll #2107125, July, 2021
7
Table P1
Table P1: Now, generally speaking, would you say that things in the country are going in the right direction, or have they pretty seriously gotten off onthe wrong track?
Demographic Right Direction Wrong Track Total N
Registered Voters 43% (868) 57% (1132) 2000Ethnicity: White 38% (596) 62% (959) 1555Ethnicity: Hispanic 54% (120) 46% (102) 222Ethnicity: Black 64% (164) 36% (93) 257Ethnicity: Other 57% (108) 43% (80) 188All Christian 40% (419) 60% (626) 1045All Non-Christian 61% (74) 39% (46) 120Atheist 52% (51) 48% (47) 98Agnostic/Nothing in particular 48% (212) 52% (233) 445Something Else 38% (111) 62% (180) 292Religious Non-Protestant/Catholic 60% (85) 40% (57) 143Evangelical 35% (210) 65% (382) 591Non-Evangelical 43% (303) 57% (407) 710Community: Urban 56% (275) 44% (219) 494Community: Suburban 44% (433) 56% (557) 989Community: Rural 31% (160) 69% (357) 516Employ: Private Sector 44% (291) 56% (365) 656Employ: Government 52% (57) 48% (52) 109Employ: Self-Employed 44% (80) 56% (100) 180Employ: Homemaker 32% (56) 68% (119) 174Employ: Student 47% (31) 53% (34) 65Employ: Retired 45% (236) 55% (284) 520Employ: Unemployed 42% (84) 58% (115) 199Employ: Other 35% (34) 65% (62) 97Military HH: Yes 35% (131) 65% (246) 377Military HH: No 45% (737) 55% (886) 1623RD/WT: Right Direction 100% (868) — (0) 868RD/WT: Wrong Track — (0) 100% (1132) 1132Biden Job Approve 78% (792) 22% (220) 1012Biden Job Disapprove 6% (55) 94% (892) 947
Continued on next page

8
Morning ConsultTable P1
Table P1: Now, generally speaking, would you say that things in the country are going in the right direction, or have they pretty seriously gotten off onthe wrong track?
Demographic Right Direction Wrong Track Total N
Registered Voters 43% (868) 57% (1132) 2000Biden Job Strongly Approve 89% (470) 11% (58) 527Biden Job Somewhat Approve 66% (322) 34% (162) 485Biden Job Somewhat Disapprove 13% (29) 87% (197) 226Biden Job Strongly Disapprove 4% (26) 96% (694) 721Favorable of Biden 78% (784) 22% (225) 1009Unfavorable of Biden 6% (59) 94% (881) 940Very Favorable of Biden 88% (484) 12% (65) 549Somewhat Favorable of Biden 65% (300) 35% (160) 461Somewhat Unfavorable of Biden 18% (35) 82% (161) 196Very Unfavorable of Biden 3% (24) 97% (720) 744#1 Issue: Economy 41% (303) 59% (443) 746#1 Issue: Security 18% (69) 82% (312) 381#1 Issue: Health Care 68% (170) 32% (82) 252#1 Issue: Medicare / Social Security 57% (137) 43% (105) 242#1 Issue: Women’s Issues 51% (48) 49% (46) 94#1 Issue: Education 40% (31) 60% (46) 77#1 Issue: Energy 63% (70) 37% (41) 111#1 Issue: Other 40% (39) 60% (57) 962020 Vote: Joe Biden 75% (710) 25% (237) 9472020 Vote: Donald Trump 11% (98) 89% (767) 8652020 Vote: Didn’t Vote 34% (51) 66% (102) 1532018 House Vote: Democrat 75% (543) 25% (184) 7272018 House Vote: Republican 13% (90) 87% (606) 6962016 Vote: Hillary Clinton 76% (510) 24% (158) 6672016 Vote: Donald Trump 14% (105) 86% (670) 7762016 Vote: Other 38% (35) 62% (59) 942016 Vote: Didn’t Vote 47% (215) 53% (243) 458Voted in 2014: Yes 44% (572) 56% (734) 1306Voted in 2014: No 43% (296) 57% (398) 694
Continued on next page

National Tracking Poll #2107125, July, 2021
9
Table P1
Table P1: Now, generally speaking, would you say that things in the country are going in the right direction, or have they pretty seriously gotten off onthe wrong track?
Demographic Right Direction Wrong Track Total N
Registered Voters 43% (868) 57% (1132) 20004-Region: Northeast 48% (168) 52% (185) 3534-Region: Midwest 43% (189) 57% (256) 4454-Region: South 41% (308) 59% (438) 7464-Region: West 44% (202) 56% (254) 456Note: Row proportions may total to larger than one-hundred percent due to rounding. For more information visit MorningConsultIntelligence.com.

10
Morning ConsultTable nr2b
Table nr2b: Do you approve or disapprove of the job Joe Biden is doing as President?
DemographicStronglyApprove
SomewhatApprove
SomewhatDisapprove
StronglyDisapprove
Don’t Know /No Opinion Total N
Registered Voters 26% (527) 24% (485) 11% (226) 36% (721) 2% (41) 2000Gender: Male 29% (271) 23% (220) 10% (92) 37% (345) 2% (15) 943Gender: Female 24% (256) 25% (264) 13% (134) 36% (376) 2% (26) 1057Age: 18-34 23% (120) 35% (178) 16% (82) 23% (116) 4% (19) 515Age: 35-44 28% (85) 26% (79) 14% (44) 30% (93) 2% (7) 307Age: 45-64 24% (160) 21% (146) 9% (61) 45% (305) 1% (8) 680Age: 65+ 33% (162) 16% (82) 8% (40) 42% (207) 1% (7) 498GenZers: 1997-2012 21% (34) 38% (61) 16% (26) 20% (33) 5% (8) 162Millennials: 1981-1996 25% (133) 32% (170) 15% (79) 24% (128) 3% (16) 527GenXers: 1965-1980 24% (133) 21% (114) 11% (60) 43% (232) 1% (4) 542Baby Boomers: 1946-1964 29% (200) 19% (131) 8% (55) 43% (293) 1% (9) 688PID: Dem (no lean) 54% (423) 35% (274) 6% (45) 4% (33) 2% (13) 789PID: Ind (no lean) 14% (68) 29% (139) 17% (79) 34% (163) 5% (23) 472PID: Rep (no lean) 5% (36) 10% (72) 14% (102) 71% (525) 1% (5) 740PID/Gender: DemMen 57% (212) 30% (111) 5% (20) 6% (23) 1% (5) 371PID/Gender: DemWomen 51% (212) 39% (163) 6% (25) 2% (10) 2% (8) 418PID/Gender: Ind Men 18% (43) 31% (73) 14% (33) 35% (83) 3% (6) 237PID/Gender: Ind Women 11% (25) 28% (66) 20% (47) 34% (79) 7% (16) 234PID/Gender: Rep Men 5% (17) 11% (36) 12% (40) 71% (238) 1% (4) 334PID/Gender: Rep Women 5% (19) 9% (36) 15% (62) 71% (287) — (2) 405Ideo: Liberal (1-3) 49% (290) 39% (228) 6% (36) 5% (29) 1% (3) 587Ideo: Moderate (4) 30% (162) 30% (160) 14% (73) 23% (127) 4% (20) 542Ideo: Conservative (5-7) 8% (67) 9% (69) 14% (110) 68% (545) 1% (5) 795Educ: < College 23% (278) 24% (287) 12% (143) 39% (469) 3% (32) 1207Educ: Bachelors degree 28% (141) 25% (124) 13% (64) 33% (167) 1% (6) 502Educ: Post-grad 37% (109) 26% (75) 7% (19) 29% (84) 1% (4) 291Income: Under 50k 25% (228) 26% (234) 13% (119) 33% (306) 3% (28) 916Income: 50k-100k 26% (188) 21% (154) 11% (79) 40% (287) 2% (12) 720Income: 100k+ 31% (111) 27% (97) 8% (28) 35% (127) — (1) 364Ethnicity: White 23% (364) 22% (335) 12% (183) 42% (650) 2% (24) 1555Ethnicity: Hispanic 31% (69) 34% (76) 8% (18) 23% (51) 4% (8) 222Ethnicity: Black 47% (119) 31% (79) 10% (26) 10% (27) 2% (6) 257
Continued on next page

National Tracking Poll #2107125, July, 2021
11
Table nr2b
Table nr2b: Do you approve or disapprove of the job Joe Biden is doing as President?
DemographicStronglyApprove
SomewhatApprove
SomewhatDisapprove
StronglyDisapprove
Don’t Know /No Opinion Total N
Registered Voters 26% (527) 24% (485) 11% (226) 36% (721) 2% (41) 2000Ethnicity: Other 23% (44) 38% (71) 10% (18) 24% (44) 6% (11) 188All Christian 23% (245) 20% (211) 11% (111) 44% (465) 1% (13) 1045All Non-Christian 46% (55) 21% (25) 10% (12) 23% (28) — (1) 120Atheist 31% (31) 36% (36) 14% (14) 16% (16) 2% (2) 98Agnostic/Nothing in particular 28% (123) 32% (143) 11% (51) 25% (112) 4% (16) 445Something Else 25% (73) 24% (70) 13% (39) 34% (100) 3% (10) 292Religious Non-Protestant/Catholic 41% (59) 24% (34) 9% (13) 25% (36) — (1) 143Evangelical 20% (119) 19% (114) 12% (70) 46% (275) 2% (13) 591Non-Evangelical 27% (194) 22% (154) 10% (74) 39% (279) 1% (9) 710Community: Urban 34% (167) 29% (143) 13% (64) 22% (109) 2% (10) 494Community: Suburban 26% (256) 25% (250) 10% (103) 37% (364) 2% (16) 989Community: Rural 20% (105) 18% (91) 11% (59) 48% (247) 3% (14) 516Employ: Private Sector 26% (167) 26% (170) 13% (86) 35% (227) 1% (6) 656Employ: Government 33% (36) 24% (26) 15% (16) 23% (25) 5% (6) 109Employ: Self-Employed 28% (51) 22% (39) 14% (26) 34% (62) 1% (2) 180Employ: Homemaker 16% (28) 24% (43) 10% (18) 49% (85) 1% (1) 174Employ: Student 19% (12) 49% (32) 13% (9) 14% (9) 5% (3) 65Employ: Retired 31% (164) 18% (95) 8% (41) 41% (212) 2% (8) 520Employ: Unemployed 22% (44) 31% (62) 10% (19) 33% (65) 5% (9) 199Employ: Other 27% (26) 19% (18) 12% (12) 37% (36) 5% (5) 97Military HH: Yes 20% (77) 18% (66) 10% (37) 50% (190) 2% (7) 377Military HH: No 28% (450) 26% (418) 12% (189) 33% (530) 2% (34) 1623RD/WT: Right Direction 54% (470) 37% (322) 3% (29) 3% (26) 2% (20) 868RD/WT: Wrong Track 5% (58) 14% (162) 17% (197) 61% (694) 2% (21) 1132Biden Job Approve 52% (527) 48% (485) — (0) — (0) — (0) 1012Biden Job Disapprove — (0) — (0) 24% (226) 76% (721) — (0) 947Biden Job Strongly Approve 100% (527) — (0) — (0) — (0) — (0) 527Biden Job Somewhat Approve — (0) 100% (485) — (0) — (0) — (0) 485Biden Job Somewhat Disapprove — (0) — (0) 100% (226) — (0) — (0) 226Biden Job Strongly Disapprove — (0) — (0) — (0) 100% (721) — (0) 721
Continued on next page

12
Morning ConsultTable nr2b
Table nr2b: Do you approve or disapprove of the job Joe Biden is doing as President?
DemographicStronglyApprove
SomewhatApprove
SomewhatDisapprove
StronglyDisapprove
Don’t Know /No Opinion Total N
Registered Voters 26% (527) 24% (485) 11% (226) 36% (721) 2% (41) 2000Favorable of Biden 51% (514) 44% (449) 3% (25) 1% (12) 1% (9) 1009Unfavorable of Biden 1% (11) 3% (28) 21% (194) 74% (697) 1% (11) 940Very Favorable of Biden 86% (471) 12% (64) — (1) 2% (10) — (2) 549Somewhat Favorable of Biden 9% (43) 84% (385) 5% (24) — (2) 2% (7) 461Somewhat Unfavorable of Biden 2% (4) 12% (24) 72% (142) 8% (16) 5% (9) 196Very Unfavorable of Biden 1% (7) — (4) 7% (52) 91% (680) — (1) 744#1 Issue: Economy 21% (157) 27% (204) 13% (99) 36% (270) 2% (16) 746#1 Issue: Security 13% (48) 6% (24) 11% (41) 70% (265) 1% (3) 381#1 Issue: Health Care 46% (116) 31% (78) 8% (20) 13% (33) 2% (5) 252#1 Issue: Medicare / Social Security 38% (92) 21% (50) 10% (25) 29% (70) 2% (5) 242#1 Issue: Women’s Issues 26% (25) 37% (35) 18% (17) 14% (13) 5% (4) 94#1 Issue: Education 24% (18) 29% (23) 12% (9) 31% (24) 4% (3) 77#1 Issue: Energy 35% (39) 45% (50) 7% (8) 10% (11) 3% (4) 111#1 Issue: Other 32% (31) 22% (22) 8% (8) 35% (34) 2% (2) 962020 Vote: Joe Biden 51% (482) 40% (381) 5% (48) 3% (26) 1% (10) 9472020 Vote: Donald Trump 2% (21) 6% (54) 15% (127) 76% (653) 1% (10) 8652020 Vote: Didn’t Vote 15% (23) 26% (40) 26% (40) 22% (33) 11% (17) 1532018 House Vote: Democrat 53% (387) 35% (251) 7% (51) 4% (29) 1% (10) 7272018 House Vote: Republican 4% (27) 9% (64) 12% (81) 74% (515) 1% (9) 6962016 Vote: Hillary Clinton 55% (369) 35% (236) 4% (27) 4% (25) 1% (9) 6672016 Vote: Donald Trump 4% (28) 8% (65) 14% (106) 73% (567) 1% (10) 7762016 Vote: Other 17% (16) 37% (35) 21% (20) 22% (20) 3% (3) 942016 Vote: Didn’t Vote 25% (114) 32% (146) 16% (73) 23% (106) 4% (19) 458Voted in 2014: Yes 29% (373) 22% (286) 9% (115) 39% (513) 1% (18) 1306Voted in 2014: No 22% (154) 29% (198) 16% (111) 30% (207) 3% (23) 6944-Region: Northeast 27% (97) 27% (95) 12% (43) 31% (108) 3% (10) 3534-Region: Midwest 25% (109) 26% (115) 12% (55) 36% (158) 1% (7) 4454-Region: South 27% (201) 22% (161) 8% (61) 42% (311) 2% (12) 7464-Region: West 26% (120) 25% (113) 15% (67) 32% (144) 3% (12) 456Note: Row proportions may total to larger than one-hundred percent due to rounding. For more information visit MorningConsultIntelligence.com.

National Tracking Poll #2107125, July, 2021
13
Table nr2bNET
Table nr2bNET: Do you approve or disapprove of the job Joe Biden is doing as President?
Demographic Total Approve Total DisapproveDon’t Know / No
Opinion Total N
Registered Voters 51% (1012) 47% (947) 2% (41) 2000Gender: Male 52% (491) 46% (437) 2% (15) 943Gender: Female 49% (521) 48% (510) 2% (26) 1057Age: 18-34 58% (298) 38% (198) 4% (19) 515Age: 35-44 53% (164) 44% (136) 2% (7) 307Age: 45-64 45% (306) 54% (366) 1% (8) 680Age: 65+ 49% (244) 50% (246) 1% (7) 498GenZers: 1997-2012 59% (95) 36% (59) 5% (8) 162Millennials: 1981-1996 58% (304) 39% (207) 3% (16) 527GenXers: 1965-1980 46% (247) 54% (291) 1% (4) 542Baby Boomers: 1946-1964 48% (331) 51% (348) 1% (9) 688PID: Dem (no lean) 88% (698) 10% (78) 2% (13) 789PID: Ind (no lean) 44% (207) 51% (242) 5% (23) 472PID: Rep (no lean) 15% (108) 85% (627) 1% (5) 740PID/Gender: DemMen 87% (323) 12% (43) 1% (5) 371PID/Gender: DemWomen 90% (374) 8% (35) 2% (8) 418PID/Gender: Ind Men 49% (115) 49% (116) 3% (6) 237PID/Gender: Ind Women 39% (92) 54% (126) 7% (16) 234PID/Gender: Rep Men 16% (53) 83% (278) 1% (4) 334PID/Gender: Rep Women 13% (55) 86% (349) — (2) 405Ideo: Liberal (1-3) 88% (518) 11% (65) 1% (3) 587Ideo: Moderate (4) 59% (322) 37% (200) 4% (20) 542Ideo: Conservative (5-7) 17% (136) 82% (655) 1% (5) 795Educ: < College 47% (564) 51% (612) 3% (32) 1207Educ: Bachelors degree 53% (264) 46% (232) 1% (6) 502Educ: Post-grad 63% (183) 36% (104) 1% (4) 291Income: Under 50k 50% (462) 46% (425) 3% (28) 916Income: 50k-100k 47% (342) 51% (366) 2% (12) 720Income: 100k+ 57% (208) 43% (155) — (1) 364Ethnicity: White 45% (699) 54% (832) 2% (24) 1555Ethnicity: Hispanic 65% (145) 31% (69) 4% (8) 222Ethnicity: Black 77% (198) 20% (52) 2% (6) 257
Continued on next page

14
Morning ConsultTable nr2bNET
Table nr2bNET: Do you approve or disapprove of the job Joe Biden is doing as President?
Demographic Total Approve Total DisapproveDon’t Know / No
Opinion Total N
Registered Voters 51% (1012) 47% (947) 2% (41) 2000Ethnicity: Other 61% (115) 33% (62) 6% (11) 188All Christian 44% (456) 55% (576) 1% (13) 1045All Non-Christian 67% (80) 33% (40) — (1) 120Atheist 68% (66) 30% (30) 2% (2) 98Agnostic/Nothing in particular 60% (266) 37% (163) 4% (16) 445Something Else 49% (143) 48% (139) 3% (10) 292Religious Non-Protestant/Catholic 65% (93) 34% (49) — (1) 143Evangelical 40% (234) 58% (344) 2% (13) 591Non-Evangelical 49% (348) 50% (353) 1% (9) 710Community: Urban 63% (310) 35% (174) 2% (10) 494Community: Suburban 51% (506) 47% (467) 2% (16) 989Community: Rural 38% (196) 59% (306) 3% (14) 516Employ: Private Sector 51% (337) 48% (313) 1% (6) 656Employ: Government 57% (62) 38% (41) 5% (6) 109Employ: Self-Employed 50% (90) 49% (88) 1% (2) 180Employ: Homemaker 40% (70) 59% (103) 1% (1) 174Employ: Student 68% (44) 27% (18) 5% (3) 65Employ: Retired 50% (259) 49% (253) 2% (8) 520Employ: Unemployed 53% (105) 42% (84) 5% (9) 199Employ: Other 46% (44) 49% (48) 5% (5) 97Military HH: Yes 38% (143) 60% (227) 2% (7) 377Military HH: No 54% (869) 44% (720) 2% (34) 1623RD/WT: Right Direction 91% (792) 6% (55) 2% (20) 868RD/WT: Wrong Track 19% (220) 79% (892) 2% (21) 1132Biden Job Approve 100% (1012) — (0) — (0) 1012Biden Job Disapprove — (0) 100% (947) — (0) 947Biden Job Strongly Approve 100% (527) — (0) — (0) 527Biden Job Somewhat Approve 100% (485) — (0) — (0) 485Biden Job Somewhat Disapprove — (0) 100% (226) — (0) 226Biden Job Strongly Disapprove — (0) 100% (721) — (0) 721
Continued on next page
National Tracking Poll #2107125, July, 2021
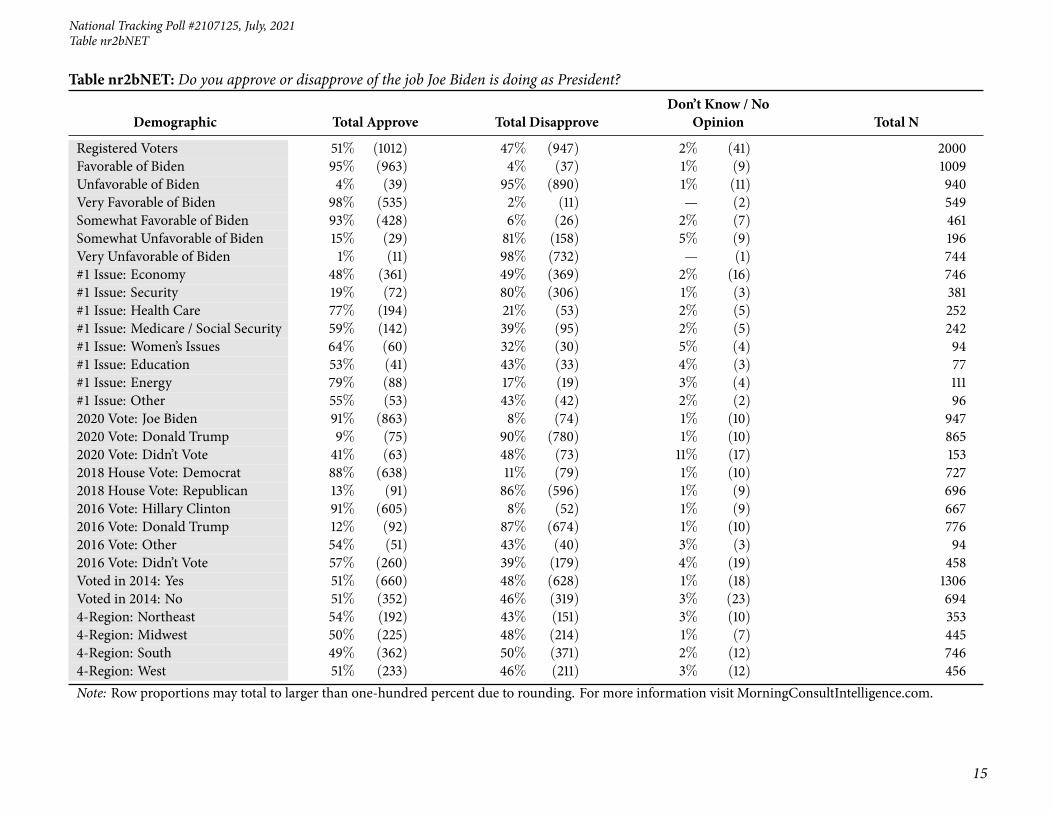
15
Table nr2bNET
Table nr2bNET: Do you approve or disapprove of the job Joe Biden is doing as President?
Demographic Total Approve Total DisapproveDon’t Know / No
Opinion Total N
Registered Voters 51% (1012) 47% (947) 2% (41) 2000Favorable of Biden 95% (963) 4% (37) 1% (9) 1009Unfavorable of Biden 4% (39) 95% (890) 1% (11) 940Very Favorable of Biden 98% (535) 2% (11) — (2) 549Somewhat Favorable of Biden 93% (428) 6% (26) 2% (7) 461Somewhat Unfavorable of Biden 15% (29) 81% (158) 5% (9) 196Very Unfavorable of Biden 1% (11) 98% (732) — (1) 744#1 Issue: Economy 48% (361) 49% (369) 2% (16) 746#1 Issue: Security 19% (72) 80% (306) 1% (3) 381#1 Issue: Health Care 77% (194) 21% (53) 2% (5) 252#1 Issue: Medicare / Social Security 59% (142) 39% (95) 2% (5) 242#1 Issue: Women’s Issues 64% (60) 32% (30) 5% (4) 94#1 Issue: Education 53% (41) 43% (33) 4% (3) 77#1 Issue: Energy 79% (88) 17% (19) 3% (4) 111#1 Issue: Other 55% (53) 43% (42) 2% (2) 962020 Vote: Joe Biden 91% (863) 8% (74) 1% (10) 9472020 Vote: Donald Trump 9% (75) 90% (780) 1% (10) 8652020 Vote: Didn’t Vote 41% (63) 48% (73) 11% (17) 1532018 House Vote: Democrat 88% (638) 11% (79) 1% (10) 7272018 House Vote: Republican 13% (91) 86% (596) 1% (9) 6962016 Vote: Hillary Clinton 91% (605) 8% (52) 1% (9) 6672016 Vote: Donald Trump 12% (92) 87% (674) 1% (10) 7762016 Vote: Other 54% (51) 43% (40) 3% (3) 942016 Vote: Didn’t Vote 57% (260) 39% (179) 4% (19) 458Voted in 2014: Yes 51% (660) 48% (628) 1% (18) 1306Voted in 2014: No 51% (352) 46% (319) 3% (23) 6944-Region: Northeast 54% (192) 43% (151) 3% (10) 3534-Region: Midwest 50% (225) 48% (214) 1% (7) 4454-Region: South 49% (362) 50% (371) 2% (12) 7464-Region: West 51% (233) 46% (211) 3% (12) 456Note: Row proportions may total to larger than one-hundred percent due to rounding. For more information visit MorningConsultIntelligence.com.

16
Morning ConsultTable P3
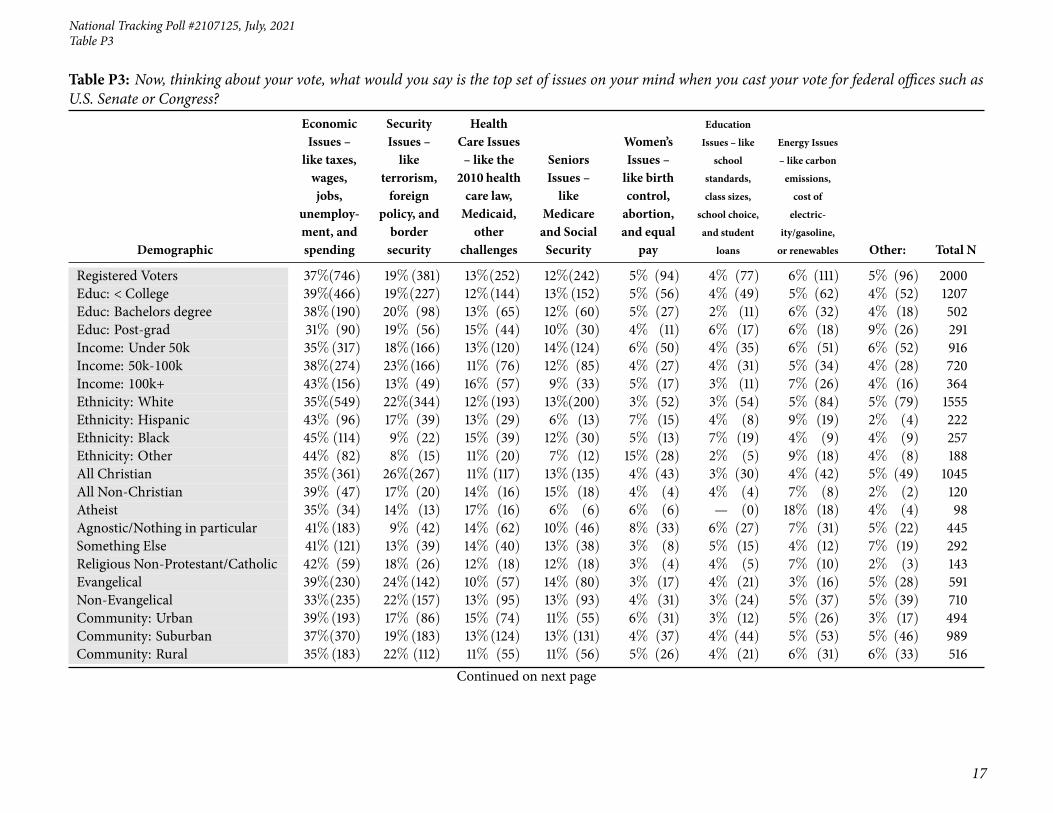
Table P3: Now, thinking about your vote, what would you say is the top set of issues on your mind when you cast your vote for federal offices such asU.S. Senate or Congress?
Demographic
EconomicIssues –like taxes,wages,jobs,
unemploy-ment, andspending
SecurityIssues –like
terrorism,foreign
policy, andbordersecurity
HealthCare Issues– like the2010 healthcare law,Medicaid,other
challenges
SeniorsIssues –like
Medicareand SocialSecurity
Women’sIssues –like birthcontrol,abortion,and equal
pay
EducationIssues – like
schoolstandards,class sizes,
school choice,and student
loans
Energy Issues– like carbonemissions,cost ofelectric-
ity/gasoline,or renewables Other: Total N
Registered Voters 37%(746) 19%(381) 13%(252) 12%(242) 5% (94) 4% (77) 6% (111) 5% (96) 2000Gender: Male 38%(359) 19%(176) 14%(128) 11%(103) 1% (14) 5% (47) 7% (68) 5% (48) 943Gender: Female 37%(387) 19%(205) 12%(124) 13%(139) 8% (81) 3% (30) 4% (43) 5% (48) 1057Age: 18-34 43%(223) 11% (57) 14% (72) 2% (10) 11% (57) 7% (35) 9% (48) 3% (13) 515Age: 35-44 48%(147) 16% (48) 13% (41) 3% (9) 5% (16) 6% (18) 5% (16) 4% (13) 307Age: 45-64 39%(263) 21%(143) 14% (95) 12% (79) 3% (18) 3% (20) 4% (25) 5% (37) 680Age: 65+ 23% (113) 27%(133) 9% (44) 29%(144) 1% (3) 1% (4) 5% (23) 7% (34) 498GenZers: 1997-2012 31% (50) 14% (23) 15% (25) 1% (2) 17% (27) 8% (14) 11% (18) 2% (4) 162Millennials: 1981-1996 49%(257) 11% (61) 12% (66) 2% (13) 7% (38) 7% (35) 7% (38) 4% (19) 527GenXers: 1965-1980 43%(235) 19%(104) 15% (83) 6% (33) 4% (22) 4% (20) 4% (24) 4% (19) 542Baby Boomers: 1946-1964 27%(185) 25% (171) 11% (75) 24%(166) 1% (7) 1% (7) 4% (28) 7% (50) 688PID: Dem (no lean) 34%(265) 8% (60) 19%(148) 15% (121) 8% (60) 3% (25) 9% (71) 5% (38) 789PID: Ind (no lean) 42%(198) 14% (68) 14% (68) 10% (46) 3% (15) 4% (18) 5% (23) 7% (35) 472PID: Rep (no lean) 38%(283) 34%(253) 5% (36) 10% (75) 3% (19) 5% (34) 2% (17) 3% (23) 740PID/Gender: DemMen 36%(133) 9% (35) 21% (78) 13% (48) 2% (8) 4% (15) 11% (40) 4% (13) 371PID/Gender: DemWomen 32%(132) 6% (26) 17% (70) 18% (73) 12% (52) 2% (9) 7% (31) 6% (25) 418PID/Gender: Ind Men 42%(100) 12% (28) 14% (34) 10% (24) — (0) 4% (9) 6% (15) 12% (27) 237PID/Gender: Ind Women 42% (98) 17% (40) 14% (34) 10% (23) 6% (15) 4% (9) 3% (8) 3% (8) 234PID/Gender: Rep Men 38%(126) 34% (114) 5% (15) 9% (32) 2% (5) 7% (22) 4% (13) 2% (8) 334PID/Gender: Rep Women 39%(157) 34%(139) 5% (21) 11% (43) 3% (14) 3% (12) 1% (4) 4% (15) 405Ideo: Liberal (1-3) 33%(192) 5% (27) 19% (111) 15% (85) 8% (47) 4% (25) 11% (64) 6% (35) 587Ideo: Moderate (4) 40%(217) 13% (70) 16% (85) 12% (66) 5% (25) 4% (23) 6% (30) 5% (26) 542Ideo: Conservative (5-7) 39% (311) 34%(273) 6% (46) 10% (82) 2% (19) 3% (26) 1% (10) 4% (29) 795
Continued on next page
National Tracking Poll #2107125, July, 2021
17
Table P3
Table P3: Now, thinking about your vote, what would you say is the top set of issues on your mind when you cast your vote for federal offices such asU.S. Senate or Congress?
Demographic
EconomicIssues –like taxes,wages,jobs,
unemploy-ment, andspending
SecurityIssues –like
terrorism,foreign
policy, andbordersecurity
HealthCare Issues– like the2010 healthcare law,Medicaid,other
challenges
SeniorsIssues –like
Medicareand SocialSecurity
Women’sIssues –like birthcontrol,abortion,and equal
pay
EducationIssues – like
schoolstandards,class sizes,
school choice,and student
loans
Energy Issues– like carbonemissions,cost ofelectric-
ity/gasoline,or renewables Other: Total N
Registered Voters 37%(746) 19%(381) 13%(252) 12%(242) 5% (94) 4% (77) 6% (111) 5% (96) 2000Educ: < College 39%(466) 19%(227) 12%(144) 13%(152) 5% (56) 4% (49) 5% (62) 4% (52) 1207Educ: Bachelors degree 38%(190) 20% (98) 13% (65) 12% (60) 5% (27) 2% (11) 6% (32) 4% (18) 502Educ: Post-grad 31% (90) 19% (56) 15% (44) 10% (30) 4% (11) 6% (17) 6% (18) 9% (26) 291Income: Under 50k 35%(317) 18%(166) 13%(120) 14%(124) 6% (50) 4% (35) 6% (51) 6% (52) 916Income: 50k-100k 38%(274) 23%(166) 11% (76) 12% (85) 4% (27) 4% (31) 5% (34) 4% (28) 720Income: 100k+ 43%(156) 13% (49) 16% (57) 9% (33) 5% (17) 3% (11) 7% (26) 4% (16) 364Ethnicity: White 35%(549) 22%(344) 12%(193) 13%(200) 3% (52) 3% (54) 5% (84) 5% (79) 1555Ethnicity: Hispanic 43% (96) 17% (39) 13% (29) 6% (13) 7% (15) 4% (8) 9% (19) 2% (4) 222Ethnicity: Black 45% (114) 9% (22) 15% (39) 12% (30) 5% (13) 7% (19) 4% (9) 4% (9) 257Ethnicity: Other 44% (82) 8% (15) 11% (20) 7% (12) 15% (28) 2% (5) 9% (18) 4% (8) 188All Christian 35%(361) 26%(267) 11% (117) 13%(135) 4% (43) 3% (30) 4% (42) 5% (49) 1045All Non-Christian 39% (47) 17% (20) 14% (16) 15% (18) 4% (4) 4% (4) 7% (8) 2% (2) 120Atheist 35% (34) 14% (13) 17% (16) 6% (6) 6% (6) — (0) 18% (18) 4% (4) 98Agnostic/Nothing in particular 41%(183) 9% (42) 14% (62) 10% (46) 8% (33) 6% (27) 7% (31) 5% (22) 445Something Else 41% (121) 13% (39) 14% (40) 13% (38) 3% (8) 5% (15) 4% (12) 7% (19) 292Religious Non-Protestant/Catholic 42% (59) 18% (26) 12% (18) 12% (18) 3% (4) 4% (5) 7% (10) 2% (3) 143Evangelical 39%(230) 24%(142) 10% (57) 14% (80) 3% (17) 4% (21) 3% (16) 5% (28) 591Non-Evangelical 33%(235) 22%(157) 13% (95) 13% (93) 4% (31) 3% (24) 5% (37) 5% (39) 710Community: Urban 39%(193) 17% (86) 15% (74) 11% (55) 6% (31) 3% (12) 5% (26) 3% (17) 494Community: Suburban 37%(370) 19%(183) 13%(124) 13% (131) 4% (37) 4% (44) 5% (53) 5% (46) 989Community: Rural 35%(183) 22% (112) 11% (55) 11% (56) 5% (26) 4% (21) 6% (31) 6% (33) 516
Continued on next page

18
Morning ConsultTable P3
Table P3: Now, thinking about your vote, what would you say is the top set of issues on your mind when you cast your vote for federal offices such asU.S. Senate or Congress?
Demographic
EconomicIssues –like taxes,wages,jobs,
unemploy-ment, andspending
SecurityIssues –like
terrorism,foreign
policy, andbordersecurity
HealthCare Issues– like the2010 healthcare law,Medicaid,other
challenges
SeniorsIssues –like
Medicareand SocialSecurity
Women’sIssues –like birthcontrol,abortion,and equal
pay
EducationIssues – like
schoolstandards,class sizes,
school choice,and student
loans
Energy Issues– like carbonemissions,cost ofelectric-
ity/gasoline,or renewables Other: Total N
Registered Voters 37%(746) 19%(381) 13%(252) 12%(242) 5% (94) 4% (77) 6% (111) 5% (96) 2000Employ: Private Sector 47%(307) 15% (101) 16%(102) 5% (31) 4% (29) 5% (32) 5% (33) 3% (21) 656Employ: Government 43% (47) 11% (12) 16% (18) 1% (1) 4% (5) 11% (12) 10% (11) 3% (4) 109Employ: Self-Employed 41% (74) 17% (30) 14% (25) 5% (9) 7% (12) 5% (9) 9% (17) 2% (4) 180Employ: Homemaker 39% (68) 24% (43) 10% (17) 11% (19) 7% (12) 2% (4) 2% (3) 5% (9) 174Employ: Student 26% (17) 12% (8) 13% (8) — (0) 21% (14) 14% (9) 10% (6) 4% (3) 65Employ: Retired 23% (117) 26%(134) 9% (47) 29%(153) 1% (6) 1% (4) 5% (25) 7% (34) 520Employ: Unemployed 43% (85) 18% (37) 11% (22) 10% (19) 7% (14) 1% (2) 4% (8) 6% (12) 199Employ: Other 32% (31) 17% (16) 13% (13) 10% (10) 3% (3) 6% (6) 8% (8) 12% (11) 97Military HH: Yes 32% (121) 27%(103) 7% (27) 16% (62) 4% (15) 2% (7) 4% (15) 7% (27) 377Military HH: No 39%(625) 17%(278) 14%(225) 11%(180) 5% (79) 4% (70) 6% (96) 4% (69) 1623RD/WT: Right Direction 35%(303) 8% (69) 20%(170) 16%(137) 6% (48) 4% (31) 8% (70) 4% (39) 868RD/WT: Wrong Track 39%(443) 28%(312) 7% (82) 9%(105) 4% (46) 4% (46) 4% (41) 5% (57) 1132Biden Job Approve 36%(361) 7% (72) 19%(194) 14%(142) 6% (60) 4% (41) 9% (88) 5% (53) 1012Biden Job Disapprove 39%(369) 32%(306) 6% (53) 10% (95) 3% (30) 4% (33) 2% (19) 4% (42) 947Biden Job Strongly Approve 30%(157) 9% (48) 22% (116) 17% (92) 5% (25) 3% (18) 7% (39) 6% (31) 527Biden Job Somewhat Approve 42%(204) 5% (24) 16% (78) 10% (50) 7% (35) 5% (23) 10% (50) 4% (22) 485Biden Job Somewhat Disapprove 44% (99) 18% (41) 9% (20) 11% (25) 7% (17) 4% (9) 4% (8) 3% (8) 226Biden Job Strongly Disapprove 37%(270) 37%(265) 5% (33) 10% (70) 2% (13) 3% (24) 2% (11) 5% (34) 721Favorable of Biden 36%(363) 7% (72) 19%(192) 15%(149) 6% (62) 4% (36) 8% (85) 5% (51) 1009Unfavorable of Biden 39%(369) 32%(302) 6% (54) 10% (91) 3% (26) 4% (35) 2% (22) 4% (41) 940Very Favorable of Biden 31%(170) 9% (47) 23%(124) 17% (93) 4% (25) 3% (17) 8% (41) 6% (31) 549Somewhat Favorable of Biden 42%(193) 5% (25) 15% (67) 12% (56) 8% (37) 4% (19) 10% (44) 4% (20) 461Somewhat Unfavorable of Biden 48% (94) 15% (30) 10% (19) 9% (18) 4% (8) 5% (11) 4% (8) 4% (8) 196Very Unfavorable of Biden 37%(275) 37%(272) 5% (35) 10% (73) 2% (18) 3% (24) 2% (14) 4% (33) 744
Continued on next page

National Tracking Poll #2107125, July, 2021
19
Table P3
Table P3: Now, thinking about your vote, what would you say is the top set of issues on your mind when you cast your vote for federal offices such asU.S. Senate or Congress?
Demographic
EconomicIssues –like taxes,wages,jobs,
unemploy-ment, andspending
SecurityIssues –like
terrorism,foreign
policy, andbordersecurity
HealthCare Issues– like the2010 healthcare law,Medicaid,other
challenges
SeniorsIssues –like
Medicareand SocialSecurity
Women’sIssues –like birthcontrol,abortion,and equal
pay
EducationIssues – like
schoolstandards,class sizes,
school choice,and student
loans
Energy Issues– like carbonemissions,cost ofelectric-
ity/gasoline,or renewables Other: Total N
Registered Voters 37%(746) 19%(381) 13%(252) 12%(242) 5% (94) 4% (77) 6% (111) 5% (96) 2000#1 Issue: Economy 100%(746) — (0) — (0) — (0) — (0) — (0) — (0) — (0) 746#1 Issue: Security — (0) 100%(381) — (0) — (0) — (0) — (0) — (0) — (0) 381#1 Issue: Health Care — (0) — (0) 100%(252) — (0) — (0) — (0) — (0) — (0) 252#1 Issue: Medicare / Social Security — (0) — (0) — (0) 100%(242) — (0) — (0) — (0) — (0) 242#1 Issue: Women’s Issues — (0) — (0) — (0) — (0) 100% (94) — (0) — (0) — (0) 94#1 Issue: Education — (0) — (0) — (0) — (0) — (0) 100% (77) — (0) — (0) 77#1 Issue: Energy — (0) — (0) — (0) — (0) — (0) — (0) 100% (111) — (0) 111#1 Issue: Other — (0) — (0) — (0) — (0) — (0) — (0) — (0) 100% (96) 962020 Vote: Joe Biden 35%(328) 7% (70) 20%(185) 15%(145) 6% (61) 3% (27) 9% (81) 5% (49) 9472020 Vote: Donald Trump 39%(339) 35%(299) 5% (42) 9% (81) 2% (20) 4% (37) 2% (15) 4% (32) 8652020 Vote: Didn’t Vote 43% (66) 6% (9) 13% (19) 9% (14) 6% (10) 5% (8) 9% (14) 8% (13) 1532018 House Vote: Democrat 32%(236) 8% (56) 21%(149) 17%(126) 4% (31) 3% (21) 9% (62) 6% (46) 7272018 House Vote: Republican 38%(265) 37%(255) 5% (33) 9% (62) 2% (10) 4% (25) 2% (13) 5% (32) 6962016 Vote: Hillary Clinton 34%(229) 7% (45) 20%(136) 17% (115) 4% (24) 3% (19) 8% (54) 7% (45) 6672016 Vote: Donald Trump 38%(293) 37%(287) 5% (39) 9% (71) 1% (10) 3% (24) 2% (17) 4% (35) 7762016 Vote: Other 44% (42) 3% (3) 13% (13) 16% (15) 4% (3) 9% (9) 7% (6) 4% (4) 942016 Vote: Didn’t Vote 39%(180) 10% (44) 14% (63) 9% (41) 12% (57) 6% (26) 8% (35) 3% (12) 458Voted in 2014: Yes 35%(463) 22%(287) 12%(159) 14%(182) 2% (31) 3% (44) 5% (62) 6% (78) 1306Voted in 2014: No 41%(283) 13% (94) 13% (93) 9% (60) 9% (63) 5% (33) 7% (49) 3% (18) 6944-Region: Northeast 38%(133) 18% (65) 12% (42) 12% (41) 5% (17) 3% (11) 7% (23) 6% (21) 3534-Region: Midwest 39%(175) 16% (70) 15% (67) 12% (54) 4% (19) 3% (13) 5% (24) 5% (23) 4454-Region: South 37%(274) 19%(138) 12% (93) 13% (97) 4% (33) 5% (37) 5% (39) 5% (36) 7464-Region: West 36%(164) 24%(108) 11% (50) 11% (50) 6% (26) 4% (16) 6% (25) 4% (17) 456Note: Row proportions may total to larger than one-hundred percent due to rounding. For more information visit MorningConsultIntelligence.com.

20
Morning ConsultTable POL1_1
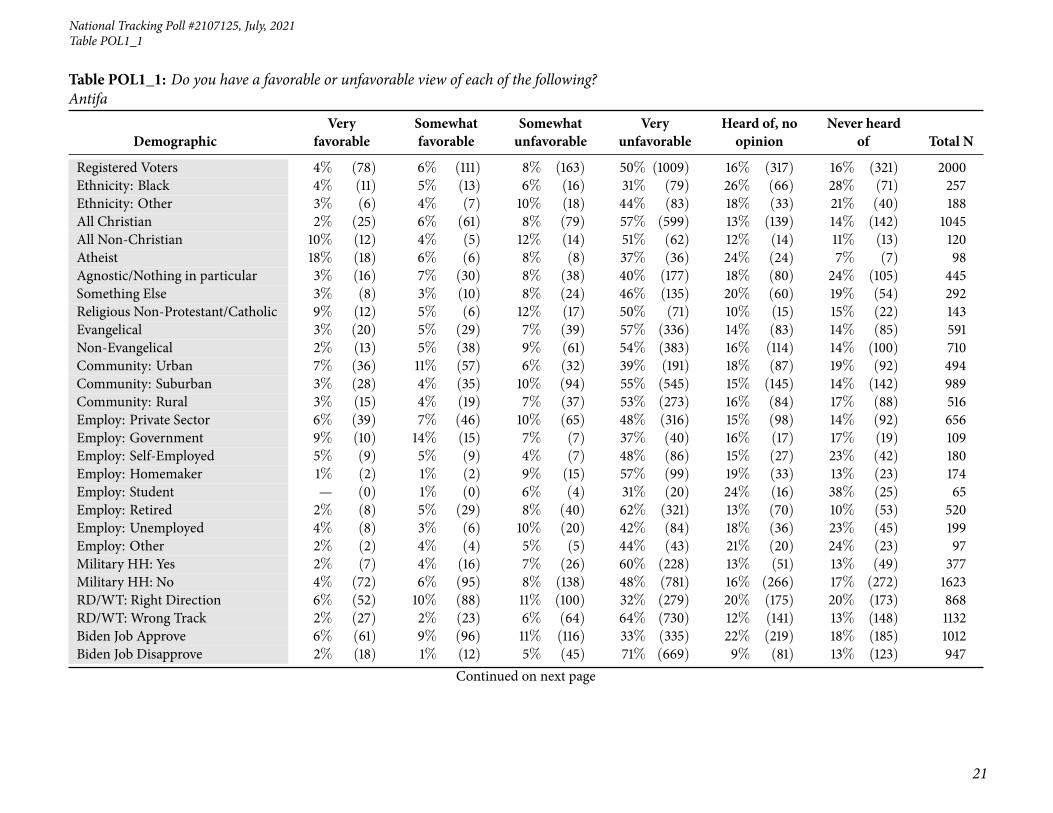
Table POL1_1: Do you have a favorable or unfavorable view of each of the following?Antifa
DemographicVery
favorableSomewhatfavorable
Somewhatunfavorable
Veryunfavorable
Heard of, noopinion
Never heardof Total N
Registered Voters 4% (78) 6% (111) 8% (163) 50% (1009) 16% (317) 16% (321) 2000Gender: Male 5% (46) 7% (70) 10% (95) 51% (484) 14% (135) 12% (112) 943Gender: Female 3% (32) 4% (41) 6% (68) 50% (525) 17% (181) 20% (209) 1057Age: 18-34 6% (32) 7% (37) 8% (39) 31% (162) 22% (113) 26% (133) 515Age: 35-44 6% (17) 8% (24) 9% (29) 44% (134) 15% (45) 19% (58) 307Age: 45-64 3% (23) 3% (23) 8% (57) 59% (398) 13% (92) 13% (86) 680Age: 65+ 1% (6) 5% (27) 8% (38) 63% (315) 13% (67) 9% (43) 498GenZers: 1997-2012 5% (8) 5% (9) 4% (7) 27% (44) 21% (34) 37% (60) 162Millennials: 1981-1996 6% (33) 8% (41) 10% (51) 35% (186) 20% (107) 21% (109) 527GenXers: 1965-1980 4% (23) 4% (22) 8% (46) 55% (300) 13% (72) 15% (79) 542Baby Boomers: 1946-1964 2% (12) 5% (35) 8% (52) 63% (430) 14% (96) 9% (62) 688PID: Dem (no lean) 6% (45) 10% (77) 10% (77) 33% (264) 23% (180) 19% (146) 789PID: Ind (no lean) 3% (15) 4% (17) 10% (45) 51% (241) 16% (74) 17% (80) 472PID: Rep (no lean) 3% (19) 2% (18) 6% (41) 68% (504) 9% (63) 13% (95) 740PID/Gender: DemMen 8% (29) 13% (47) 13% (49) 33% (124) 21% (79) 12% (43) 371PID/Gender: DemWomen 4% (16) 7% (30) 7% (28) 33% (140) 24% (101) 25% (103) 418PID/Gender: Ind Men 2% (5) 4% (9) 12% (28) 55% (130) 12% (29) 15% (36) 237PID/Gender: Ind Women 4% (9) 3% (7) 7% (17) 47% (111) 19% (45) 19% (44) 234PID/Gender: Rep Men 4% (12) 4% (14) 5% (18) 69% (230) 8% (27) 10% (33) 334PID/Gender: Rep Women 2% (6) 1% (4) 6% (23) 68% (275) 9% (36) 15% (62) 405Ideo: Liberal (1-3) 9% (51) 10% (60) 11% (62) 34% (202) 23% (136) 13% (76) 587Ideo: Moderate (4) 2% (9) 4% (23) 9% (50) 44% (238) 18% (99) 23% (123) 542Ideo: Conservative (5-7) 2% (17) 3% (28) 5% (43) 70% (554) 8% (63) 11% (91) 795Educ: < College 3% (34) 4% (51) 7% (80) 49% (593) 17% (206) 20% (244) 1207Educ: Bachelors degree 6% (29) 6% (31) 10% (48) 53% (267) 15% (78) 10% (49) 502Educ: Post-grad 5% (15) 10% (29) 12% (36) 51% (149) 11% (33) 10% (28) 291Income: Under 50k 3% (30) 6% (51) 6% (55) 44% (402) 19% (173) 22% (206) 916Income: 50k-100k 2% (18) 6% (42) 10% (68) 58% (416) 13% (93) 12% (83) 720Income: 100k+ 8% (31) 5% (19) 11% (40) 52% (191) 14% (51) 9% (32) 364Ethnicity: White 4% (62) 6% (91) 8% (129) 54% (847) 14% (217) 13% (209) 1555Ethnicity: Hispanic 6% (12) 9% (19) 5% (12) 42% (94) 17% (37) 21% (47) 222
Continued on next page
National Tracking Poll #2107125, July, 2021
21
Table POL1_1
Table POL1_1: Do you have a favorable or unfavorable view of each of the following?Antifa
DemographicVery
favorableSomewhatfavorable
Somewhatunfavorable
Veryunfavorable
Heard of, noopinion
Never heardof Total N
Registered Voters 4% (78) 6% (111) 8% (163) 50% (1009) 16% (317) 16% (321) 2000Ethnicity: Black 4% (11) 5% (13) 6% (16) 31% (79) 26% (66) 28% (71) 257Ethnicity: Other 3% (6) 4% (7) 10% (18) 44% (83) 18% (33) 21% (40) 188All Christian 2% (25) 6% (61) 8% (79) 57% (599) 13% (139) 14% (142) 1045All Non-Christian 10% (12) 4% (5) 12% (14) 51% (62) 12% (14) 11% (13) 120Atheist 18% (18) 6% (6) 8% (8) 37% (36) 24% (24) 7% (7) 98Agnostic/Nothing in particular 3% (16) 7% (30) 8% (38) 40% (177) 18% (80) 24% (105) 445Something Else 3% (8) 3% (10) 8% (24) 46% (135) 20% (60) 19% (54) 292Religious Non-Protestant/Catholic 9% (12) 5% (6) 12% (17) 50% (71) 10% (15) 15% (22) 143Evangelical 3% (20) 5% (29) 7% (39) 57% (336) 14% (83) 14% (85) 591Non-Evangelical 2% (13) 5% (38) 9% (61) 54% (383) 16% (114) 14% (100) 710Community: Urban 7% (36) 11% (57) 6% (32) 39% (191) 18% (87) 19% (92) 494Community: Suburban 3% (28) 4% (35) 10% (94) 55% (545) 15% (145) 14% (142) 989Community: Rural 3% (15) 4% (19) 7% (37) 53% (273) 16% (84) 17% (88) 516Employ: Private Sector 6% (39) 7% (46) 10% (65) 48% (316) 15% (98) 14% (92) 656Employ: Government 9% (10) 14% (15) 7% (7) 37% (40) 16% (17) 17% (19) 109Employ: Self-Employed 5% (9) 5% (9) 4% (7) 48% (86) 15% (27) 23% (42) 180Employ: Homemaker 1% (2) 1% (2) 9% (15) 57% (99) 19% (33) 13% (23) 174Employ: Student — (0) 1% (0) 6% (4) 31% (20) 24% (16) 38% (25) 65Employ: Retired 2% (8) 5% (29) 8% (40) 62% (321) 13% (70) 10% (53) 520Employ: Unemployed 4% (8) 3% (6) 10% (20) 42% (84) 18% (36) 23% (45) 199Employ: Other 2% (2) 4% (4) 5% (5) 44% (43) 21% (20) 24% (23) 97Military HH: Yes 2% (7) 4% (16) 7% (26) 60% (228) 13% (51) 13% (49) 377Military HH: No 4% (72) 6% (95) 8% (138) 48% (781) 16% (266) 17% (272) 1623RD/WT: Right Direction 6% (52) 10% (88) 11% (100) 32% (279) 20% (175) 20% (173) 868RD/WT: Wrong Track 2% (27) 2% (23) 6% (64) 64% (730) 12% (141) 13% (148) 1132Biden Job Approve 6% (61) 9% (96) 11% (116) 33% (335) 22% (219) 18% (185) 1012Biden Job Disapprove 2% (18) 1% (12) 5% (45) 71% (669) 9% (81) 13% (123) 947
Continued on next page

22
Morning ConsultTable POL1_1
Table POL1_1: Do you have a favorable or unfavorable view of each of the following?Antifa
DemographicVery
favorableSomewhatfavorable
Somewhatunfavorable
Veryunfavorable
Heard of, noopinion
Never heardof Total N
Registered Voters 4% (78) 6% (111) 8% (163) 50% (1009) 16% (317) 16% (321) 2000Biden Job Strongly Approve 8% (41) 11% (59) 9% (48) 35% (185) 20% (105) 17% (89) 527Biden Job Somewhat Approve 4% (19) 8% (37) 14% (68) 31% (150) 24% (114) 20% (96) 485Biden Job Somewhat Disapprove 5% (10) 1% (3) 13% (28) 47% (107) 12% (26) 23% (51) 226Biden Job Strongly Disapprove 1% (7) 1% (8) 2% (16) 78% (562) 8% (55) 10% (72) 721Favorable of Biden 6% (60) 9% (90) 12% (117) 32% (327) 22% (226) 19% (190) 1009Unfavorable of Biden 2% (17) 2% (17) 5% (46) 71% (670) 8% (78) 12% (113) 940Very Favorable of Biden 7% (41) 11% (59) 9% (50) 34% (188) 20% (108) 19% (103) 549Somewhat Favorable of Biden 4% (19) 7% (31) 15% (67) 30% (139) 26% (118) 19% (87) 461Somewhat Unfavorable of Biden 5% (10) 6% (12) 12% (24) 50% (98) 12% (23) 15% (30) 196Very Unfavorable of Biden 1% (7) 1% (5) 3% (22) 77% (572) 7% (55) 11% (83) 744#1 Issue: Economy 3% (25) 4% (32) 9% (67) 51% (382) 16% (120) 16% (119) 746#1 Issue: Security 3% (13) 4% (15) 5% (20) 70% (266) 6% (21) 12% (46) 381#1 Issue: Health Care 9% (22) 8% (21) 11% (29) 35% (87) 23% (58) 14% (36) 252#1 Issue: Medicare / Social Security 1% (3) 5% (11) 9% (21) 49% (118) 20% (47) 17% (41) 242#1 Issue: Women’s Issues 2% (2) 7% (6) 6% (6) 37% (35) 20% (19) 29% (27) 94#1 Issue: Education 1% (1) 6% (5) 4% (3) 41% (31) 19% (15) 29% (22) 77#1 Issue: Energy 6% (7) 12% (13) 8% (9) 37% (41) 20% (22) 17% (19) 111#1 Issue: Other 6% (6) 7% (7) 9% (8) 51% (49) 15% (15) 11% (11) 962020 Vote: Joe Biden 7% (63) 9% (87) 11% (106) 34% (325) 22% (209) 17% (156) 9472020 Vote: Donald Trump 2% (13) 2% (16) 5% (46) 72% (621) 7% (60) 13% (108) 8652020 Vote: Didn’t Vote 1% (2) 5% (7) 6% (9) 29% (44) 27% (41) 33% (50) 1532018 House Vote: Democrat 7% (53) 11% (77) 12% (85) 37% (267) 20% (144) 14% (102) 7272018 House Vote: Republican 2% (13) 2% (13) 6% (45) 72% (504) 7% (46) 11% (75) 6962016 Vote: Hillary Clinton 6% (41) 11% (72) 12% (77) 36% (239) 21% (139) 15% (99) 6672016 Vote: Donald Trump 2% (15) 2% (15) 6% (49) 72% (560) 7% (56) 10% (80) 7762016 Vote: Other 9% (8) 1% (1) 12% (11) 50% (47) 15% (14) 12% (12) 942016 Vote: Didn’t Vote 3% (13) 5% (21) 6% (26) 35% (162) 23% (106) 28% (130) 458Voted in 2014: Yes 4% (57) 6% (84) 9% (120) 55% (720) 13% (169) 12% (156) 1306Voted in 2014: No 3% (22) 4% (27) 6% (43) 42% (289) 21% (148) 24% (165) 694
Continued on next page
National Tracking Poll #2107125, July, 2021
23
Table POL1_1
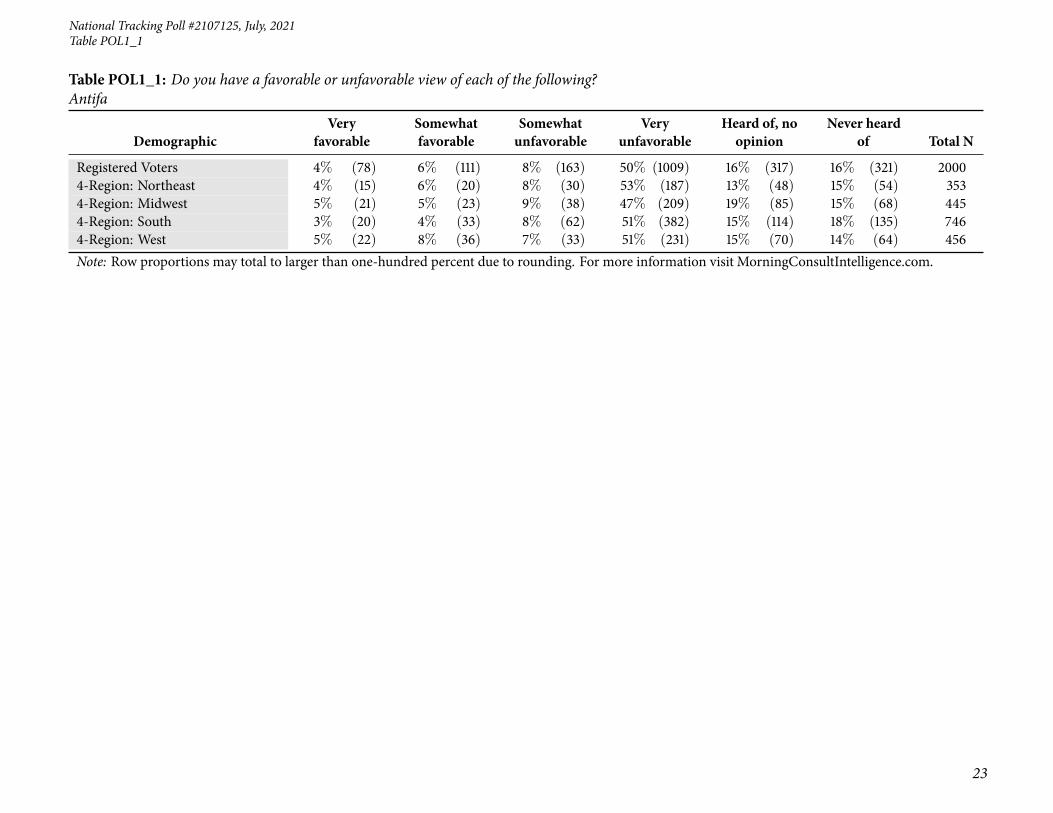
Table POL1_1: Do you have a favorable or unfavorable view of each of the following?Antifa
DemographicVery
favorableSomewhatfavorable
Somewhatunfavorable
Veryunfavorable
Heard of, noopinion
Never heardof Total N
Registered Voters 4% (78) 6% (111) 8% (163) 50% (1009) 16% (317) 16% (321) 20004-Region: Northeast 4% (15) 6% (20) 8% (30) 53% (187) 13% (48) 15% (54) 3534-Region: Midwest 5% (21) 5% (23) 9% (38) 47% (209) 19% (85) 15% (68) 4454-Region: South 3% (20) 4% (33) 8% (62) 51% (382) 15% (114) 18% (135) 7464-Region: West 5% (22) 8% (36) 7% (33) 51% (231) 15% (70) 14% (64) 456Note: Row proportions may total to larger than one-hundred percent due to rounding. For more information visit MorningConsultIntelligence.com.

24
Morning ConsultTable POL1_2
Table POL1_2: Do you have a favorable or unfavorable view of each of the following?White supremacists
DemographicVery
favorableSomewhatfavorable
Somewhatunfavorable
Veryunfavorable
Heard of, noopinion
Never heardof Total N
Registered Voters 3% (66) 4% (72) 6% (123) 75% (1498) 9% (174) 3% (68) 2000Gender: Male 5% (51) 5% (48) 6% (60) 74% (694) 8% (73) 2% (17) 943Gender: Female 1% (14) 2% (24) 6% (62) 76% (804) 10% (100) 5% (52) 1057Age: 18-34 6% (30) 5% (27) 6% (29) 69% (354) 10% (50) 5% (25) 515Age: 35-44 6% (18) 5% (15) 7% (22) 71% (217) 8% (26) 3% (10) 307Age: 45-64 2% (14) 3% (18) 7% (46) 77% (523) 8% (52) 4% (27) 680Age: 65+ 1% (4) 2% (12) 5% (27) 81% (404) 9% (45) 1% (6) 498GenZers: 1997-2012 4% (6) 4% (7) 5% (8) 73% (118) 9% (15) 4% (7) 162Millennials: 1981-1996 7% (37) 6% (31) 6% (34) 67% (351) 10% (50) 5% (25) 527GenXers: 1965-1980 2% (12) 3% (17) 7% (36) 76% (413) 9% (46) 3% (18) 542Baby Boomers: 1946-1964 2% (11) 2% (16) 6% (39) 81% (554) 7% (50) 3% (18) 688PID: Dem (no lean) 4% (31) 4% (28) 3% (27) 81% (637) 6% (46) 3% (20) 789PID: Ind (no lean) — (1) 2% (8) 6% (29) 76% (359) 11% (50) 5% (24) 472PID: Rep (no lean) 4% (33) 5% (36) 9% (67) 68% (502) 10% (78) 3% (25) 740PID/Gender: DemMen 7% (26) 6% (22) 4% (14) 75% (278) 7% (25) 2% (6) 371PID/Gender: DemWomen 1% (5) 1% (6) 3% (13) 86% (358) 5% (21) 3% (14) 418PID/Gender: Ind Men — (1) 2% (6) 6% (14) 79% (188) 9% (21) 3% (8) 237PID/Gender: Ind Women — (0) 1% (2) 6% (15) 73% (171) 13% (29) 7% (16) 234PID/Gender: Rep Men 7% (24) 6% (20) 10% (33) 68% (227) 8% (28) 1% (3) 334PID/Gender: Rep Women 2% (9) 4% (16) 8% (34) 68% (275) 12% (50) 5% (22) 405Ideo: Liberal (1-3) 5% (27) 3% (15) 2% (14) 85% (497) 4% (25) 2% (9) 587Ideo: Moderate (4) 2% (13) 1% (6) 9% (46) 74% (400) 10% (56) 4% (21) 542Ideo: Conservative (5-7) 3% (26) 6% (46) 7% (59) 70% (560) 9% (75) 4% (29) 795Educ: < College 3% (34) 3% (38) 6% (69) 73% (877) 11% (136) 5% (55) 1207Educ: Bachelors degree 4% (20) 3% (16) 6% (31) 80% (399) 6% (28) 1% (7) 502Educ: Post-grad 4% (12) 6% (18) 8% (23) 76% (221) 3% (10) 2% (6) 291Income: Under 50k 3% (26) 4% (34) 5% (50) 72% (660) 11% (104) 5% (42) 916Income: 50k-100k 3% (19) 2% (18) 7% (51) 76% (549) 8% (58) 3% (25) 720Income: 100k+ 6% (20) 5% (20) 6% (22) 79% (289) 3% (11) 1% (2) 364Ethnicity: White 3% (53) 4% (57) 7% (107) 74% (1155) 9% (137) 3% (48) 1555Ethnicity: Hispanic 7% (17) 6% (13) 5% (11) 68% (152) 9% (19) 5% (11) 222
Continued on next page
National Tracking Poll #2107125, July, 2021
25
Table POL1_2
Table POL1_2: Do you have a favorable or unfavorable view of each of the following?White supremacists
DemographicVery
favorableSomewhatfavorable
Somewhatunfavorable
Veryunfavorable
Heard of, noopinion
Never heardof Total N
Registered Voters 3% (66) 4% (72) 6% (123) 75% (1498) 9% (174) 3% (68) 2000Ethnicity: Black 3% (7) 3% (8) 2% (5) 78% (201) 10% (27) 4% (10) 257Ethnicity: Other 3% (7) 4% (7) 6% (12) 75% (142) 6% (10) 6% (11) 188All Christian 3% (32) 4% (44) 8% (84) 72% (758) 10% (100) 3% (27) 1045All Non-Christian 10% (12) 5% (7) 6% (7) 73% (87) 5% (6) 2% (2) 120Atheist 2% (2) 2% (2) 5% (4) 89% (87) 2% (2) — (0) 98Agnostic/Nothing in particular 2% (8) 1% (7) 4% (17) 79% (352) 8% (37) 6% (26) 445Something Else 4% (12) 4% (12) 4% (11) 73% (213) 10% (29) 5% (13) 292Religious Non-Protestant/Catholic 9% (13) 8% (11) 5% (8) 69% (99) 7% (10) 2% (2) 143Evangelical 6% (34) 5% (27) 6% (38) 69% (410) 11% (62) 3% (21) 591Non-Evangelical 1% (9) 3% (25) 8% (54) 76% (539) 9% (63) 3% (20) 710Community: Urban 7% (33) 7% (35) 6% (32) 70% (348) 7% (36) 2% (11) 494Community: Suburban 2% (17) 2% (21) 6% (56) 80% (790) 8% (78) 3% (28) 989Community: Rural 3% (16) 3% (16) 7% (35) 70% (360) 12% (60) 6% (29) 516Employ: Private Sector 5% (36) 5% (31) 9% (56) 72% (470) 8% (53) 2% (11) 656Employ: Government 6% (6) 5% (5) 9% (9) 66% (72) 10% (11) 4% (5) 109Employ: Self-Employed 5% (9) 7% (12) 4% (7) 71% (129) 6% (11) 7% (12) 180Employ: Homemaker 4% (8) 3% (5) 6% (10) 69% (120) 13% (22) 6% (10) 174Employ: Student 1% (1) 4% (3) 7% (5) 79% (52) 6% (4) 3% (2) 65Employ: Retired 1% (4) 2% (9) 5% (25) 82% (424) 8% (43) 3% (14) 520Employ: Unemployed 1% (1) 2% (4) 5% (9) 78% (156) 11% (21) 4% (8) 199Employ: Other 1% (1) 3% (3) 1% (1) 78% (75) 9% (9) 7% (7) 97Military HH: Yes 2% (6) 2% (7) 7% (26) 76% (288) 11% (41) 3% (10) 377Military HH: No 4% (60) 4% (65) 6% (97) 75% (1210) 8% (133) 4% (59) 1623RD/WT: Right Direction 5% (42) 4% (37) 5% (44) 76% (661) 7% (59) 3% (23) 868RD/WT: Wrong Track 2% (23) 3% (35) 7% (79) 74% (836) 10% (114) 4% (45) 1132Biden Job Approve 4% (40) 4% (39) 4% (42) 79% (801) 7% (72) 2% (19) 1012Biden Job Disapprove 2% (22) 3% (33) 8% (79) 72% (677) 10% (95) 4% (40) 947
Continued on next page

26
Morning ConsultTable POL1_2
Table POL1_2: Do you have a favorable or unfavorable view of each of the following?White supremacists
DemographicVery
favorableSomewhatfavorable
Somewhatunfavorable
Veryunfavorable
Heard of, noopinion
Never heardof Total N
Registered Voters 3% (66) 4% (72) 6% (123) 75% (1498) 9% (174) 3% (68) 2000Biden Job Strongly Approve 6% (30) 4% (19) 2% (11) 81% (425) 6% (32) 2% (10) 527Biden Job Somewhat Approve 2% (10) 4% (20) 6% (31) 78% (376) 8% (40) 2% (9) 485Biden Job Somewhat Disapprove 2% (4) 2% (4) 12% (26) 73% (165) 8% (18) 4% (9) 226Biden Job Strongly Disapprove 3% (18) 4% (29) 7% (53) 71% (512) 11% (77) 4% (31) 721Favorable of Biden 4% (38) 4% (40) 4% (38) 80% (807) 7% (67) 2% (20) 1009Unfavorable of Biden 2% (23) 3% (32) 9% (85) 71% (669) 9% (89) 5% (42) 940Very Favorable of Biden 4% (24) 4% (20) 1% (8) 83% (455) 6% (31) 2% (10) 549Somewhat Favorable of Biden 3% (14) 4% (19) 7% (30) 76% (352) 8% (36) 2% (10) 461Somewhat Unfavorable of Biden 2% (3) 2% (5) 12% (23) 70% (138) 7% (13) 7% (14) 196Very Unfavorable of Biden 3% (20) 4% (27) 8% (62) 71% (531) 10% (76) 4% (29) 744#1 Issue: Economy 3% (24) 2% (16) 8% (59) 75% (558) 9% (64) 4% (26) 746#1 Issue: Security 6% (23) 6% (24) 5% (20) 66% (253) 13% (50) 3% (12) 381#1 Issue: Health Care 4% (9) 3% (8) 5% (12) 78% (196) 8% (21) 3% (7) 252#1 Issue: Medicare / Social Security 2% (5) 3% (6) 6% (14) 77% (186) 7% (18) 5% (12) 242#1 Issue: Women’s Issues 2% (2) 2% (1) 3% (3) 85% (80) 2% (2) 7% (6) 94#1 Issue: Education 2% (2) 3% (2) 15% (11) 63% (48) 15% (12) 2% (1) 77#1 Issue: Energy 1% (1) 10% (11) 3% (3) 83% (92) 1% (2) 2% (2) 111#1 Issue: Other — (0) 3% (3) 1% (1) 87% (84) 6% (6) 1% (1) 962020 Vote: Joe Biden 3% (30) 3% (29) 3% (32) 83% (783) 6% (61) 1% (11) 9472020 Vote: Donald Trump 4% (33) 4% (37) 10% (83) 68% (588) 10% (87) 4% (37) 8652020 Vote: Didn’t Vote 1% (2) 3% (5) 3% (5) 65% (99) 16% (24) 12% (18) 1532018 House Vote: Democrat 3% (24) 3% (24) 4% (26) 83% (607) 5% (35) 2% (12) 7272018 House Vote: Republican 4% (30) 4% (27) 10% (68) 68% (472) 11% (75) 3% (24) 6962016 Vote: Hillary Clinton 4% (25) 3% (21) 3% (19) 83% (556) 5% (37) 1% (10) 6672016 Vote: Donald Trump 4% (30) 4% (34) 8% (66) 69% (534) 10% (77) 5% (35) 7762016 Vote: Other — (0) 1% (1) 5% (5) 84% (79) 9% (8) 1% (1) 942016 Vote: Didn’t Vote 2% (10) 4% (17) 7% (31) 71% (326) 11% (51) 5% (23) 458Voted in 2014: Yes 4% (47) 4% (49) 6% (77) 77% (1001) 8% (100) 2% (31) 1306Voted in 2014: No 3% (19) 3% (23) 7% (46) 72% (496) 11% (73) 5% (37) 694
Continued on next page

National Tracking Poll #2107125, July, 2021
27
Table POL1_2
Table POL1_2: Do you have a favorable or unfavorable view of each of the following?White supremacists
DemographicVery
favorableSomewhatfavorable
Somewhatunfavorable
Veryunfavorable
Heard of, noopinion
Never heardof Total N
Registered Voters 3% (66) 4% (72) 6% (123) 75% (1498) 9% (174) 3% (68) 20004-Region: Northeast 5% (18) 2% (7) 10% (34) 74% (260) 6% (22) 3% (11) 3534-Region: Midwest 2% (9) 2% (10) 6% (25) 76% (339) 9% (42) 5% (21) 4454-Region: South 3% (21) 5% (34) 6% (44) 74% (549) 10% (72) 4% (26) 7464-Region: West 4% (18) 5% (21) 5% (21) 77% (350) 8% (37) 2% (10) 456Note: Row proportions may total to larger than one-hundred percent due to rounding. For more information visit MorningConsultIntelligence.com.

28
Morning ConsultTable POL1_3
Table POL1_3: Do you have a favorable or unfavorable view of each of the following?White nationalists
DemographicVery
favorableSomewhatfavorable
Somewhatunfavorable
Veryunfavorable
Heard of, noopinion
Never heardof Total N
Registered Voters 5% (97) 5% (103) 10% (192) 57% (1135) 15% (299) 9% (174) 2000Gender: Male 7% (70) 8% (78) 10% (92) 58% (551) 11% (103) 5% (49) 943Gender: Female 3% (28) 2% (25) 9% (100) 55% (584) 19% (196) 12% (125) 1057Age: 18-34 6% (32) 6% (31) 10% (51) 49% (254) 18% (90) 11% (57) 515Age: 35-44 8% (26) 5% (14) 7% (23) 49% (152) 17% (51) 13% (41) 307Age: 45-64 5% (32) 5% (31) 11% (72) 58% (397) 14% (92) 8% (55) 680Age: 65+ 1% (7) 5% (27) 9% (46) 67% (332) 13% (65) 4% (21) 498GenZers: 1997-2012 2% (4) 5% (8) 11% (18) 51% (82) 20% (32) 11% (18) 162Millennials: 1981-1996 9% (46) 6% (32) 9% (47) 47% (247) 17% (89) 12% (66) 527GenXers: 1965-1980 5% (28) 5% (29) 8% (44) 58% (314) 14% (78) 9% (49) 542Baby Boomers: 1946-1964 3% (18) 5% (32) 11% (74) 65% (445) 12% (84) 5% (36) 688PID: Dem (no lean) 5% (38) 4% (35) 8% (63) 67% (531) 10% (81) 5% (41) 789PID: Ind (no lean) 2% (7) 2% (8) 10% (46) 60% (282) 17% (78) 11% (50) 472PID: Rep (no lean) 7% (52) 8% (61) 11% (84) 43% (322) 19% (140) 11% (82) 740PID/Gender: DemMen 8% (29) 9% (32) 7% (26) 64% (239) 9% (34) 3% (12) 371PID/Gender: DemWomen 2% (9) 1% (2) 9% (37) 70% (293) 11% (47) 7% (30) 418PID/Gender: Ind Men 2% (5) 3% (6) 10% (24) 68% (161) 10% (24) 7% (16) 237PID/Gender: Ind Women 1% (2) 1% (2) 9% (22) 51% (120) 23% (54) 15% (34) 234PID/Gender: Rep Men 11% (35) 12% (39) 13% (43) 45% (151) 13% (45) 6% (21) 334PID/Gender: Rep Women 4% (17) 5% (21) 10% (41) 42% (171) 23% (95) 15% (61) 405Ideo: Liberal (1-3) 5% (31) 3% (16) 6% (35) 73% (427) 9% (54) 4% (23) 587Ideo: Moderate (4) 3% (15) 3% (14) 10% (56) 57% (310) 18% (96) 9% (51) 542Ideo: Conservative (5-7) 6% (47) 9% (69) 12% (95) 47% (374) 16% (126) 11% (84) 795Educ: < College 4% (54) 4% (53) 10% (121) 51% (616) 19% (232) 11% (131) 1207Educ: Bachelors degree 4% (22) 6% (29) 8% (42) 66% (333) 10% (50) 5% (25) 502Educ: Post-grad 7% (21) 7% (21) 10% (29) 64% (185) 6% (17) 6% (18) 291Income: Under 50k 5% (43) 4% (38) 9% (84) 53% (488) 18% (163) 11% (100) 916Income: 50k-100k 4% (26) 5% (38) 10% (76) 59% (427) 14% (99) 8% (54) 720Income: 100k+ 8% (28) 7% (27) 9% (32) 60% (220) 10% (37) 5% (20) 364Ethnicity: White 5% (76) 6% (95) 10% (153) 56% (865) 15% (230) 9% (138) 1555Ethnicity: Hispanic 8% (17) 4% (9) 13% (28) 57% (127) 10% (23) 8% (19) 222
Continued on next page

National Tracking Poll #2107125, July, 2021
29
Table POL1_3
Table POL1_3: Do you have a favorable or unfavorable view of each of the following?White nationalists
DemographicVery
favorableSomewhatfavorable
Somewhatunfavorable
Veryunfavorable
Heard of, noopinion
Never heardof Total N
Registered Voters 5% (97) 5% (103) 10% (192) 57% (1135) 15% (299) 9% (174) 2000Ethnicity: Black 5% (12) 2% (6) 6% (14) 64% (165) 15% (40) 8% (20) 257Ethnicity: Other 5% (10) 1% (3) 13% (25) 56% (105) 15% (29) 9% (17) 188All Christian 6% (61) 6% (62) 12% (122) 54% (569) 15% (152) 8% (79) 1045All Non-Christian 8% (9) 9% (11) 11% (13) 61% (73) 10% (12) 1% (2) 120Atheist — (0) 5% (5) 9% (9) 76% (75) 4% (4) 6% (6) 98Agnostic/Nothing in particular 2% (9) 4% (16) 7% (31) 59% (261) 18% (80) 11% (47) 445Something Else 6% (18) 3% (10) 6% (17) 54% (156) 17% (51) 14% (40) 292Religious Non-Protestant/Catholic 6% (9) 10% (15) 12% (17) 57% (81) 12% (17) 2% (3) 143Evangelical 9% (53) 6% (34) 9% (56) 51% (300) 15% (91) 10% (58) 591Non-Evangelical 4% (26) 5% (33) 11% (77) 57% (408) 15% (107) 8% (59) 710Community: Urban 8% (42) 9% (43) 8% (41) 52% (258) 15% (74) 7% (36) 494Community: Suburban 2% (25) 3% (34) 11% (108) 62% (615) 14% (135) 7% (72) 989Community: Rural 6% (31) 5% (26) 8% (43) 51% (261) 17% (89) 13% (65) 516Employ: Private Sector 8% (51) 6% (42) 10% (65) 54% (357) 14% (95) 7% (46) 656Employ: Government 6% (7) 5% (5) 11% (12) 57% (62) 12% (13) 10% (11) 109Employ: Self-Employed 7% (12) 10% (18) 6% (11) 56% (100) 9% (17) 12% (22) 180Employ: Homemaker 6% (10) 4% (7) 10% (17) 40% (71) 24% (43) 15% (26) 174Employ: Student 1% (1) 7% (4) 10% (6) 54% (35) 23% (15) 6% (4) 65Employ: Retired 2% (9) 4% (23) 10% (50) 66% (341) 14% (73) 4% (23) 520Employ: Unemployed 2% (4) 1% (2) 12% (24) 56% (111) 15% (29) 14% (28) 199Employ: Other 4% (4) 1% (1) 6% (6) 59% (57) 14% (14) 14% (14) 97Military HH: Yes 3% (10) 4% (14) 11% (42) 58% (219) 17% (62) 8% (30) 377Military HH: No 5% (87) 5% (89) 9% (150) 56% (916) 15% (236) 9% (144) 1623RD/WT: Right Direction 5% (45) 6% (49) 8% (68) 62% (539) 12% (105) 7% (62) 868RD/WT: Wrong Track 5% (53) 5% (55) 11% (124) 53% (595) 17% (194) 10% (112) 1132Biden Job Approve 5% (48) 5% (46) 8% (79) 65% (662) 11% (116) 6% (61) 1012Biden Job Disapprove 5% (46) 6% (57) 11% (107) 48% (458) 18% (173) 11% (106) 947
Continued on next page
30
Morning ConsultTable POL1_3
Table POL1_3: Do you have a favorable or unfavorable view of each of the following?White nationalists
DemographicVery
favorableSomewhatfavorable
Somewhatunfavorable
Veryunfavorable
Heard of, noopinion
Never heardof Total N
Registered Voters 5% (97) 5% (103) 10% (192) 57% (1135) 15% (299) 9% (174) 2000Biden Job Strongly Approve 6% (34) 4% (22) 3% (17) 72% (379) 9% (45) 5% (29) 527Biden Job Somewhat Approve 3% (14) 5% (24) 13% (62) 58% (282) 15% (71) 7% (33) 485Biden Job Somewhat Disapprove 2% (3) 5% (11) 12% (28) 50% (113) 19% (43) 12% (27) 226Biden Job Strongly Disapprove 6% (43) 6% (47) 11% (78) 48% (345) 18% (129) 11% (79) 721Favorable of Biden 5% (46) 5% (46) 8% (77) 65% (661) 11% (113) 7% (66) 1009Unfavorable of Biden 5% (47) 6% (57) 12% (114) 49% (460) 17% (163) 11% (100) 940Very Favorable of Biden 6% (34) 5% (26) 4% (24) 72% (394) 8% (42) 5% (28) 549Somewhat Favorable of Biden 3% (12) 4% (20) 12% (53) 58% (267) 15% (71) 8% (38) 461Somewhat Unfavorable of Biden 1% (2) 6% (12) 16% (32) 53% (104) 17% (33) 7% (13) 196Very Unfavorable of Biden 6% (45) 6% (45) 11% (82) 48% (356) 17% (130) 12% (86) 744#1 Issue: Economy 5% (36) 4% (33) 11% (84) 56% (418) 15% (111) 9% (64) 746#1 Issue: Security 9% (35) 8% (32) 11% (43) 46% (174) 18% (67) 8% (31) 381#1 Issue: Health Care 4% (9) 2% (6) 7% (19) 64% (161) 15% (37) 8% (20) 252#1 Issue: Medicare / Social Security 3% (8) 5% (13) 6% (14) 63% (151) 14% (33) 9% (23) 242#1 Issue: Women’s Issues 3% (2) 3% (3) 7% (6) 59% (56) 13% (12) 16% (15) 94#1 Issue: Education 3% (2) 9% (7) 10% (8) 35% (27) 25% (19) 18% (14) 77#1 Issue: Energy 2% (2) 8% (9) 11% (13) 66% (74) 6% (7) 6% (6) 111#1 Issue: Other 2% (2) 1% (1) 7% (6) 75% (72) 13% (12) 1% (1) 962020 Vote: Joe Biden 4% (35) 4% (36) 7% (67) 71% (668) 10% (97) 5% (43) 9472020 Vote: Donald Trump 7% (60) 7% (58) 12% (107) 44% (378) 19% (161) 12% (100) 8652020 Vote: Didn’t Vote 1% (1) 5% (7) 10% (16) 43% (66) 24% (37) 17% (26) 1532018 House Vote: Democrat 4% (32) 4% (30) 6% (43) 72% (526) 9% (65) 4% (32) 7272018 House Vote: Republican 7% (46) 7% (50) 13% (94) 46% (318) 19% (129) 9% (59) 6962016 Vote: Hillary Clinton 4% (30) 4% (25) 5% (37) 73% (486) 9% (62) 4% (28) 6672016 Vote: Donald Trump 7% (53) 8% (59) 12% (93) 46% (359) 18% (136) 10% (76) 7762016 Vote: Other — (0) 3% (2) 8% (8) 68% (64) 18% (16) 4% (4) 942016 Vote: Didn’t Vote 3% (15) 4% (17) 12% (53) 49% (223) 18% (84) 14% (66) 458Voted in 2014: Yes 6% (78) 6% (74) 10% (128) 60% (778) 13% (168) 6% (80) 1306Voted in 2014: No 3% (20) 4% (30) 9% (64) 51% (356) 19% (130) 14% (94) 694
Continued on next page

National Tracking Poll #2107125, July, 2021
31
Table POL1_3
Table POL1_3: Do you have a favorable or unfavorable view of each of the following?White nationalists
DemographicVery
favorableSomewhatfavorable
Somewhatunfavorable
Veryunfavorable
Heard of, noopinion
Never heardof Total N
Registered Voters 5% (97) 5% (103) 10% (192) 57% (1135) 15% (299) 9% (174) 20004-Region: Northeast 7% (26) 3% (11) 12% (43) 58% (204) 14% (50) 6% (20) 3534-Region: Midwest 4% (20) 3% (15) 11% (49) 56% (248) 17% (78) 8% (37) 4454-Region: South 5% (36) 6% (47) 9% (67) 55% (411) 15% (109) 10% (76) 7464-Region: West 4% (16) 7% (31) 7% (34) 60% (272) 14% (62) 9% (41) 456Note: Row proportions may total to larger than one-hundred percent due to rounding. For more information visit MorningConsultIntelligence.com.

32
Morning ConsultTable POL1_4
Table POL1_4: Do you have a favorable or unfavorable view of each of the following?Proud Boys
DemographicVery
favorableSomewhatfavorable
Somewhatunfavorable
Veryunfavorable
Heard of, noopinion
Never heardof Total N
Registered Voters 4% (83) 5% (100) 9% (173) 45% (894) 14% (277) 24% (474) 2000Gender: Male 7% (65) 6% (57) 11% (100) 48% (450) 12% (110) 17% (160) 943Gender: Female 2% (17) 4% (43) 7% (72) 42% (444) 16% (168) 30% (314) 1057Age: 18-34 6% (29) 6% (29) 9% (47) 34% (174) 13% (66) 33% (170) 515Age: 35-44 8% (24) 8% (24) 6% (19) 36% (109) 13% (39) 30% (91) 307Age: 45-64 2% (15) 5% (36) 9% (64) 45% (307) 16% (109) 22% (149) 680Age: 65+ 3% (14) 2% (11) 9% (43) 61% (304) 13% (63) 13% (64) 498GenZers: 1997-2012 5% (9) 5% (8) 9% (14) 28% (45) 17% (27) 36% (59) 162Millennials: 1981-1996 7% (36) 8% (41) 8% (42) 34% (181) 12% (63) 31% (163) 527GenXers: 1965-1980 4% (20) 5% (28) 9% (49) 43% (231) 15% (82) 24% (132) 542Baby Boomers: 1946-1964 2% (17) 3% (22) 9% (61) 56% (388) 13% (91) 16% (109) 688PID: Dem (no lean) 4% (33) 5% (36) 6% (45) 60% (473) 7% (57) 18% (144) 789PID: Ind (no lean) 2% (9) 3% (14) 10% (45) 43% (204) 18% (87) 24% (112) 472PID: Rep (no lean) 5% (40) 7% (49) 11% (82) 29% (217) 18% (134) 29% (217) 740PID/Gender: DemMen 7% (25) 6% (24) 8% (31) 59% (220) 6% (23) 13% (49) 371PID/Gender: DemWomen 2% (8) 3% (13) 3% (14) 61% (254) 8% (34) 23% (95) 418PID/Gender: Ind Men 3% (8) 4% (9) 11% (25) 51% (120) 14% (33) 18% (43) 237PID/Gender: Ind Women 1% (2) 2% (5) 9% (20) 36% (84) 23% (53) 30% (70) 234PID/Gender: Rep Men 10% (33) 7% (25) 13% (45) 33% (111) 16% (54) 20% (68) 334PID/Gender: Rep Women 2% (7) 6% (25) 9% (38) 26% (106) 20% (80) 37% (149) 405Ideo: Liberal (1-3) 4% (25) 4% (21) 4% (26) 67% (396) 7% (39) 14% (80) 587Ideo: Moderate (4) 3% (18) 3% (17) 10% (54) 42% (227) 16% (85) 26% (141) 542Ideo: Conservative (5-7) 5% (39) 7% (59) 11% (86) 32% (253) 17% (137) 28% (221) 795Educ: < College 4% (49) 4% (54) 9% (111) 38% (455) 16% (193) 29% (346) 1207Educ: Bachelors degree 4% (21) 5% (23) 9% (47) 52% (262) 11% (56) 18% (93) 502Educ: Post-grad 4% (13) 8% (23) 5% (14) 61% (176) 10% (29) 12% (35) 291Income: Under 50k 4% (37) 5% (48) 7% (68) 39% (361) 14% (133) 29% (269) 916Income: 50k-100k 4% (26) 4% (27) 10% (71) 48% (347) 15% (109) 19% (140) 720Income: 100k+ 5% (20) 7% (24) 9% (34) 51% (186) 10% (35) 18% (65) 364Ethnicity: White 4% (62) 5% (84) 9% (142) 44% (687) 13% (210) 24% (370) 1555Ethnicity: Hispanic 6% (14) 7% (16) 10% (21) 37% (81) 15% (34) 25% (55) 222
Continued on next page

National Tracking Poll #2107125, July, 2021
33
Table POL1_4
Table POL1_4: Do you have a favorable or unfavorable view of each of the following?Proud Boys
DemographicVery
favorableSomewhatfavorable
Somewhatunfavorable
Veryunfavorable
Heard of, noopinion
Never heardof Total N
Registered Voters 4% (83) 5% (100) 9% (173) 45% (894) 14% (277) 24% (474) 2000Ethnicity: Black 5% (13) 3% (7) 7% (18) 46% (119) 16% (40) 23% (59) 257Ethnicity: Other 4% (8) 4% (8) 6% (12) 47% (88) 14% (27) 24% (45) 188All Christian 4% (38) 7% (68) 10% (101) 43% (451) 15% (161) 22% (226) 1045All Non-Christian 8% (10) 4% (5) 9% (10) 52% (63) 10% (12) 17% (20) 120Atheist 4% (4) 1% (1) 12% (12) 68% (66) 5% (5) 11% (11) 98Agnostic/Nothing in particular 3% (15) 3% (13) 6% (27) 48% (212) 12% (52) 28% (126) 445Something Else 6% (17) 4% (12) 8% (22) 35% (103) 16% (47) 31% (91) 292Religious Non-Protestant/Catholic 8% (12) 4% (6) 10% (14) 46% (66) 10% (15) 20% (29) 143Evangelical 6% (38) 7% (40) 8% (46) 35% (208) 17% (103) 27% (157) 591Non-Evangelical 2% (14) 5% (39) 10% (72) 48% (338) 14% (101) 21% (147) 710Community: Urban 10% (47) 7% (34) 6% (31) 40% (197) 13% (65) 24% (119) 494Community: Suburban 2% (15) 5% (49) 11% (108) 48% (471) 14% (140) 21% (206) 989Community: Rural 4% (20) 3% (16) 7% (34) 44% (226) 14% (72) 29% (149) 516Employ: Private Sector 7% (49) 7% (48) 10% (64) 42% (275) 13% (87) 20% (133) 656Employ: Government 5% (5) 2% (2) 13% (14) 36% (39) 15% (16) 30% (32) 109Employ: Self-Employed 5% (9) 7% (12) 10% (18) 42% (76) 13% (24) 23% (42) 180Employ: Homemaker 2% (4) 3% (4) 9% (16) 33% (57) 20% (35) 33% (57) 174Employ: Student 2% (1) 9% (6) 7% (4) 32% (21) 7% (4) 43% (28) 65Employ: Retired 2% (12) 2% (10) 8% (39) 59% (308) 14% (75) 14% (75) 520Employ: Unemployed 1% (2) 4% (9) 6% (13) 40% (79) 11% (21) 38% (75) 199Employ: Other — (0) 8% (7) 5% (5) 41% (40) 14% (14) 32% (31) 97Military HH: Yes 2% (9) 3% (12) 10% (39) 49% (184) 15% (56) 21% (78) 377Military HH: No 5% (74) 5% (87) 8% (134) 44% (710) 14% (222) 24% (396) 1623RD/WT: Right Direction 5% (43) 5% (43) 6% (55) 57% (491) 8% (69) 19% (166) 868RD/WT: Wrong Track 3% (39) 5% (56) 10% (118) 36% (403) 18% (208) 27% (308) 1132Biden Job Approve 4% (45) 4% (39) 6% (61) 60% (602) 8% (79) 18% (186) 1012Biden Job Disapprove 4% (35) 6% (58) 12% (111) 30% (286) 20% (187) 28% (270) 947
Continued on next page

34
Morning ConsultTable POL1_4
Table POL1_4: Do you have a favorable or unfavorable view of each of the following?Proud Boys
DemographicVery
favorableSomewhatfavorable
Somewhatunfavorable
Veryunfavorable
Heard of, noopinion
Never heardof Total N
Registered Voters 4% (83) 5% (100) 9% (173) 45% (894) 14% (277) 24% (474) 2000Biden Job Strongly Approve 6% (34) 4% (22) 4% (19) 65% (342) 6% (34) 15% (77) 527Biden Job Somewhat Approve 2% (11) 3% (17) 9% (42) 54% (261) 9% (45) 22% (109) 485Biden Job Somewhat Disapprove 2% (4) 4% (8) 11% (26) 35% (78) 15% (34) 34% (76) 226Biden Job Strongly Disapprove 4% (31) 7% (50) 12% (85) 29% (208) 21% (153) 27% (193) 721Favorable of Biden 4% (45) 4% (41) 5% (51) 60% (602) 8% (82) 19% (189) 1009Unfavorable of Biden 4% (35) 6% (56) 13% (120) 30% (286) 19% (181) 28% (263) 940Very Favorable of Biden 6% (32) 5% (27) 2% (13) 65% (356) 7% (40) 15% (81) 549Somewhat Favorable of Biden 3% (13) 3% (14) 8% (38) 53% (246) 9% (43) 23% (108) 461Somewhat Unfavorable of Biden — (0) 3% (7) 17% (33) 35% (69) 18% (35) 26% (52) 196Very Unfavorable of Biden 5% (34) 7% (49) 12% (87) 29% (217) 20% (146) 28% (211) 744#1 Issue: Economy 5% (34) 6% (43) 10% (77) 41% (305) 14% (105) 24% (182) 746#1 Issue: Security 6% (24) 7% (28) 9% (35) 32% (122) 20% (76) 25% (96) 381#1 Issue: Health Care 3% (9) 4% (9) 5% (13) 56% (142) 11% (27) 21% (52) 252#1 Issue: Medicare / Social Security 2% (4) 3% (6) 7% (18) 54% (131) 11% (26) 24% (57) 242#1 Issue: Women’s Issues — (0) 2% (2) 2% (2) 54% (51) 10% (9) 32% (30) 94#1 Issue: Education 3% (3) 1% (1) 12% (10) 27% (21) 25% (19) 31% (24) 77#1 Issue: Energy 4% (4) 5% (5) 13% (14) 60% (67) 6% (7) 13% (14) 111#1 Issue: Other 5% (5) 5% (5) 4% (4) 58% (56) 8% (7) 19% (18) 962020 Vote: Joe Biden 4% (36) 4% (34) 6% (58) 63% (598) 7% (70) 16% (151) 9472020 Vote: Donald Trump 5% (42) 7% (61) 11% (97) 29% (248) 19% (167) 29% (250) 8652020 Vote: Didn’t Vote 3% (5) 3% (4) 10% (16) 23% (36) 21% (32) 39% (60) 1532018 House Vote: Democrat 4% (28) 5% (33) 5% (38) 66% (483) 6% (47) 14% (99) 7272018 House Vote: Republican 5% (35) 6% (45) 13% (89) 32% (221) 19% (132) 25% (174) 6962016 Vote: Hillary Clinton 4% (30) 4% (24) 5% (35) 67% (446) 6% (41) 14% (92) 6672016 Vote: Donald Trump 5% (38) 7% (54) 12% (94) 31% (243) 19% (148) 26% (198) 7762016 Vote: Other 1% (1) — (0) 3% (3) 53% (49) 20% (18) 23% (22) 942016 Vote: Didn’t Vote 3% (14) 5% (21) 9% (41) 33% (153) 15% (67) 35% (162) 458Voted in 2014: Yes 4% (57) 5% (63) 9% (121) 51% (661) 13% (164) 18% (240) 1306Voted in 2014: No 4% (26) 5% (36) 7% (52) 34% (233) 16% (114) 34% (234) 694
Continued on next page

National Tracking Poll #2107125, July, 2021
35
Table POL1_4
Table POL1_4: Do you have a favorable or unfavorable view of each of the following?Proud Boys
DemographicVery
favorableSomewhatfavorable
Somewhatunfavorable
Veryunfavorable
Heard of, noopinion
Never heardof Total N
Registered Voters 4% (83) 5% (100) 9% (173) 45% (894) 14% (277) 24% (474) 20004-Region: Northeast 5% (16) 5% (16) 11% (38) 46% (162) 13% (47) 21% (74) 3534-Region: Midwest 3% (15) 3% (14) 7% (31) 50% (224) 15% (66) 21% (95) 4454-Region: South 3% (23) 7% (49) 8% (62) 41% (304) 14% (102) 28% (206) 7464-Region: West 6% (28) 4% (20) 9% (41) 45% (204) 14% (63) 22% (100) 456Note: Row proportions may total to larger than one-hundred percent due to rounding. For more information visit MorningConsultIntelligence.com.
36
Morning ConsultTable POL1_5
Table POL1_5: Do you have a favorable or unfavorable view of each of the following?The police
DemographicVery
favorableSomewhatfavorable
Somewhatunfavorable
Veryunfavorable
Heard of, noopinion
Never heardof Total N
Registered Voters 39% (790) 32% (643) 15% (291) 8% (168) 5% (91) 1% (17) 2000Gender: Male 37% (350) 32% (299) 16% (150) 10% (90) 4% (40) 1% (14) 943Gender: Female 42% (439) 33% (345) 13% (141) 7% (78) 5% (50) — (4) 1057Age: 18-34 24% (125) 24% (122) 22% (111) 18% (93) 11% (55) 2% (10) 515Age: 35-44 31% (95) 30% (91) 21% (66) 11% (34) 6% (19) 1% (2) 307Age: 45-64 46% (311) 34% (228) 12% (83) 6% (38) 2% (14) 1% (6) 680Age: 65+ 52% (259) 41% (202) 6% (31) 1% (3) 1% (3) — (0) 498GenZers: 1997-2012 22% (36) 18% (29) 23% (38) 21% (34) 14% (23) 2% (3) 162Millennials: 1981-1996 26% (137) 28% (145) 21% (111) 15% (81) 8% (45) 2% (8) 527GenXers: 1965-1980 42% (228) 33% (178) 14% (73) 8% (42) 3% (14) 1% (7) 542Baby Boomers: 1946-1964 50% (346) 37% (257) 10% (66) 1% (9) 1% (9) — (0) 688PID: Dem (no lean) 21% (163) 38% (298) 24% (190) 12% (95) 5% (37) 1% (5) 789PID: Ind (no lean) 32% (149) 36% (172) 14% (66) 9% (44) 7% (35) 1% (5) 472PID: Rep (no lean) 65% (477) 24% (174) 5% (34) 4% (29) 2% (18) 1% (7) 740PID/Gender: DemMen 24% (88) 35% (132) 23% (85) 12% (46) 4% (16) 1% (5) 371PID/Gender: DemWomen 18% (75) 40% (166) 25% (105) 12% (49) 5% (22) — (0) 418PID/Gender: Ind Men 29% (68) 38% (89) 16% (37) 9% (22) 7% (17) 1% (3) 237PID/Gender: Ind Women 35% (81) 35% (82) 12% (29) 9% (22) 8% (18) 1% (2) 234PID/Gender: Rep Men 58% (194) 23% (78) 8% (28) 6% (21) 2% (7) 2% (6) 334PID/Gender: Rep Women 70% (283) 24% (96) 2% (6) 2% (8) 3% (11) — (1) 405Ideo: Liberal (1-3) 18% (108) 37% (215) 27% (156) 13% (78) 4% (25) 1% (5) 587Ideo: Moderate (4) 26% (143) 42% (226) 14% (77) 9% (49) 7% (40) 1% (6) 542Ideo: Conservative (5-7) 65% (517) 24% (188) 5% (42) 3% (24) 2% (19) 1% (5) 795Educ: < College 40% (483) 27% (332) 15% (182) 10% (127) 6% (69) 1% (14) 1207Educ: Bachelors degree 40% (203) 38% (191) 12% (61) 6% (28) 3% (16) — (2) 502Educ: Post-grad 35% (103) 41% (120) 16% (48) 4% (13) 2% (6) — (1) 291Income: Under 50k 34% (310) 31% (279) 16% (150) 11% (104) 7% (65) 1% (8) 916Income: 50k-100k 44% (318) 34% (242) 12% (87) 6% (43) 3% (22) 1% (9) 720Income: 100k+ 45% (162) 34% (122) 15% (54) 6% (21) 1% (4) — (1) 364Ethnicity: White 47% (724) 33% (515) 11% (175) 6% (96) 3% (41) — (4) 1555Ethnicity: Hispanic 32% (70) 28% (61) 25% (56) 11% (24) 4% (9) 1% (2) 222
Continued on next page
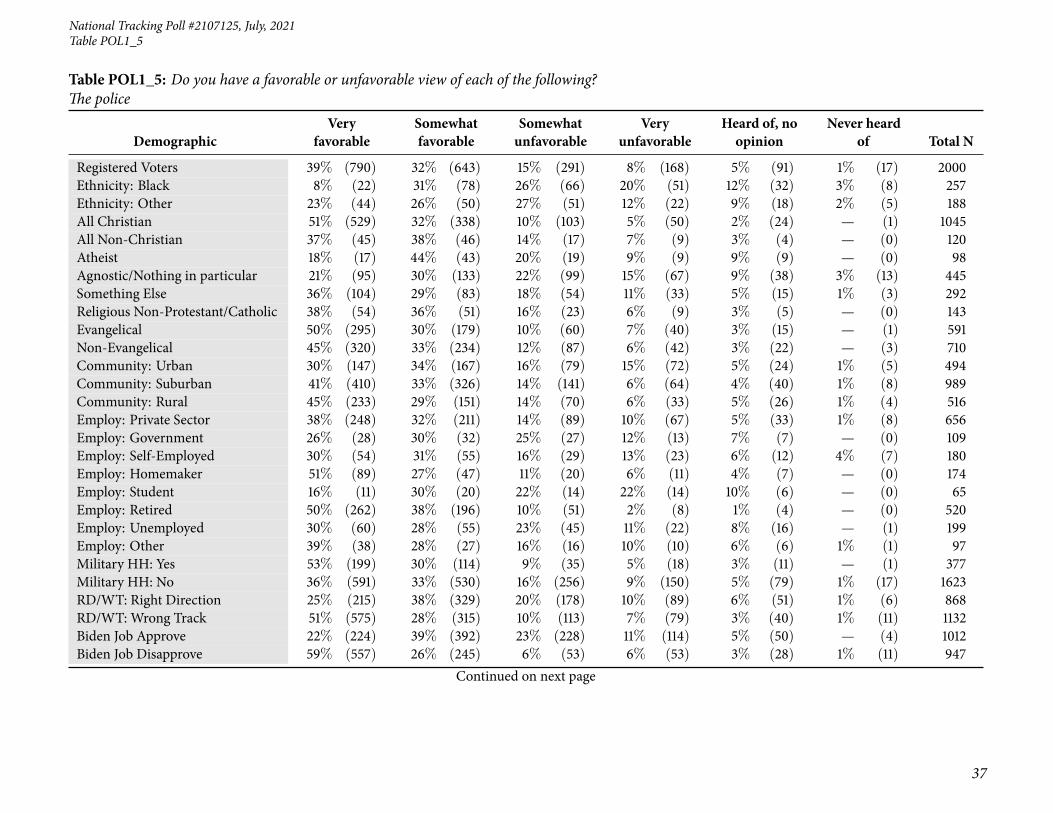
National Tracking Poll #2107125, July, 2021
37
Table POL1_5
Table POL1_5: Do you have a favorable or unfavorable view of each of the following?The police
DemographicVery
favorableSomewhatfavorable
Somewhatunfavorable
Veryunfavorable
Heard of, noopinion
Never heardof Total N
Registered Voters 39% (790) 32% (643) 15% (291) 8% (168) 5% (91) 1% (17) 2000Ethnicity: Black 8% (22) 31% (78) 26% (66) 20% (51) 12% (32) 3% (8) 257Ethnicity: Other 23% (44) 26% (50) 27% (51) 12% (22) 9% (18) 2% (5) 188All Christian 51% (529) 32% (338) 10% (103) 5% (50) 2% (24) — (1) 1045All Non-Christian 37% (45) 38% (46) 14% (17) 7% (9) 3% (4) — (0) 120Atheist 18% (17) 44% (43) 20% (19) 9% (9) 9% (9) — (0) 98Agnostic/Nothing in particular 21% (95) 30% (133) 22% (99) 15% (67) 9% (38) 3% (13) 445Something Else 36% (104) 29% (83) 18% (54) 11% (33) 5% (15) 1% (3) 292Religious Non-Protestant/Catholic 38% (54) 36% (51) 16% (23) 6% (9) 3% (5) — (0) 143Evangelical 50% (295) 30% (179) 10% (60) 7% (40) 3% (15) — (1) 591Non-Evangelical 45% (320) 33% (234) 12% (87) 6% (42) 3% (22) — (3) 710Community: Urban 30% (147) 34% (167) 16% (79) 15% (72) 5% (24) 1% (5) 494Community: Suburban 41% (410) 33% (326) 14% (141) 6% (64) 4% (40) 1% (8) 989Community: Rural 45% (233) 29% (151) 14% (70) 6% (33) 5% (26) 1% (4) 516Employ: Private Sector 38% (248) 32% (211) 14% (89) 10% (67) 5% (33) 1% (8) 656Employ: Government 26% (28) 30% (32) 25% (27) 12% (13) 7% (7) — (0) 109Employ: Self-Employed 30% (54) 31% (55) 16% (29) 13% (23) 6% (12) 4% (7) 180Employ: Homemaker 51% (89) 27% (47) 11% (20) 6% (11) 4% (7) — (0) 174Employ: Student 16% (11) 30% (20) 22% (14) 22% (14) 10% (6) — (0) 65Employ: Retired 50% (262) 38% (196) 10% (51) 2% (8) 1% (4) — (0) 520Employ: Unemployed 30% (60) 28% (55) 23% (45) 11% (22) 8% (16) — (1) 199Employ: Other 39% (38) 28% (27) 16% (16) 10% (10) 6% (6) 1% (1) 97Military HH: Yes 53% (199) 30% (114) 9% (35) 5% (18) 3% (11) — (1) 377Military HH: No 36% (591) 33% (530) 16% (256) 9% (150) 5% (79) 1% (17) 1623RD/WT: Right Direction 25% (215) 38% (329) 20% (178) 10% (89) 6% (51) 1% (6) 868RD/WT: Wrong Track 51% (575) 28% (315) 10% (113) 7% (79) 3% (40) 1% (11) 1132Biden Job Approve 22% (224) 39% (392) 23% (228) 11% (114) 5% (50) — (4) 1012Biden Job Disapprove 59% (557) 26% (245) 6% (53) 6% (53) 3% (28) 1% (11) 947
Continued on next page

38
Morning ConsultTable POL1_5
Table POL1_5: Do you have a favorable or unfavorable view of each of the following?The police
DemographicVery
favorableSomewhatfavorable
Somewhatunfavorable
Veryunfavorable
Heard of, noopinion
Never heardof Total N
Registered Voters 39% (790) 32% (643) 15% (291) 8% (168) 5% (91) 1% (17) 2000Biden Job Strongly Approve 26% (139) 38% (201) 18% (95) 11% (60) 6% (30) — (2) 527Biden Job Somewhat Approve 18% (85) 39% (191) 28% (133) 11% (54) 4% (20) — (2) 485Biden Job Somewhat Disapprove 28% (64) 42% (96) 11% (26) 11% (26) 5% (11) 2% (4) 226Biden Job Strongly Disapprove 68% (493) 21% (149) 4% (27) 4% (27) 2% (17) 1% (7) 721Favorable of Biden 22% (227) 39% (397) 22% (225) 11% (110) 4% (45) — (5) 1009Unfavorable of Biden 59% (553) 26% (240) 7% (62) 6% (55) 3% (27) — (3) 940Very Favorable of Biden 25% (140) 37% (204) 19% (106) 12% (66) 5% (30) 1% (3) 549Somewhat Favorable of Biden 19% (87) 42% (193) 26% (119) 10% (45) 3% (15) — (2) 461Somewhat Unfavorable of Biden 28% (54) 36% (71) 16% (31) 14% (28) 6% (13) — (0) 196Very Unfavorable of Biden 67% (499) 23% (169) 4% (31) 4% (28) 2% (14) — (3) 744#1 Issue: Economy 36% (265) 34% (251) 14% (105) 10% (76) 6% (46) — (2) 746#1 Issue: Security 65% (249) 24% (92) 5% (20) 2% (9) 2% (9) — (2) 381#1 Issue: Health Care 25% (64) 32% (82) 23% (59) 12% (30) 5% (14) 1% (3) 252#1 Issue: Medicare / Social Security 43% (104) 44% (106) 9% (23) 3% (7) — (1) 1% (1) 242#1 Issue: Women’s Issues 24% (23) 16% (15) 30% (28) 22% (21) 3% (3) 4% (4) 94#1 Issue: Education 32% (25) 31% (24) 13% (10) 7% (5) 11% (8) 7% (5) 77#1 Issue: Energy 25% (28) 38% (42) 23% (26) 11% (12) 3% (3) — (0) 111#1 Issue: Other 33% (32) 33% (32) 21% (20) 7% (7) 5% (5) — (0) 962020 Vote: Joe Biden 21% (195) 39% (367) 23% (222) 11% (108) 5% (50) — (4) 9472020 Vote: Donald Trump 63% (548) 25% (215) 5% (39) 4% (36) 2% (21) 1% (5) 8652020 Vote: Didn’t Vote 26% (39) 30% (46) 16% (24) 14% (21) 11% (17) 4% (5) 1532018 House Vote: Democrat 21% (156) 42% (307) 23% (170) 9% (66) 4% (27) — (2) 7272018 House Vote: Republican 65% (451) 26% (179) 4% (26) 3% (23) 2% (17) — (1) 6962016 Vote: Hillary Clinton 22% (144) 43% (290) 21% (143) 9% (60) 4% (29) — (1) 6672016 Vote: Donald Trump 63% (491) 25% (193) 5% (40) 4% (30) 3% (21) — (1) 7762016 Vote: Other 27% (25) 39% (36) 18% (17) 6% (6) 4% (4) 6% (5) 942016 Vote: Didn’t Vote 28% (128) 26% (121) 20% (91) 16% (72) 8% (37) 2% (10) 458Voted in 2014: Yes 43% (560) 35% (457) 13% (175) 6% (74) 3% (33) 1% (8) 1306Voted in 2014: No 33% (230) 27% (187) 17% (116) 14% (94) 8% (57) 1% (10) 694
Continued on next page

National Tracking Poll #2107125, July, 2021
39
Table POL1_5
Table POL1_5: Do you have a favorable or unfavorable view of each of the following?The police
DemographicVery
favorableSomewhatfavorable
Somewhatunfavorable
Veryunfavorable
Heard of, noopinion
Never heardof Total N
Registered Voters 39% (790) 32% (643) 15% (291) 8% (168) 5% (91) 1% (17) 20004-Region: Northeast 35% (123) 38% (133) 15% (54) 8% (29) 3% (11) 1% (3) 3534-Region: Midwest 39% (173) 33% (147) 16% (69) 7% (33) 5% (22) — (1) 4454-Region: South 43% (323) 29% (213) 12% (90) 9% (65) 6% (43) 2% (12) 7464-Region: West 37% (171) 33% (151) 17% (77) 9% (41) 3% (14) — (1) 456Note: Row proportions may total to larger than one-hundred percent due to rounding. For more information visit MorningConsultIntelligence.com.

40
Morning ConsultTable POL1_6
Table POL1_6: Do you have a favorable or unfavorable view of each of the following?Trump supporters
DemographicVery
favorableSomewhatfavorable
Somewhatunfavorable
Veryunfavorable
Heard of, noopinion
Never heardof Total N
Registered Voters 23% (463) 19% (376) 11% (211) 41% (829) 5% (108) 1% (14) 2000Gender: Male 25% (233) 19% (176) 10% (96) 41% (390) 4% (41) 1% (7) 943Gender: Female 22% (230) 19% (200) 11% (115) 41% (439) 6% (67) 1% (7) 1057Age: 18-34 16% (84) 16% (84) 12% (64) 46% (236) 8% (40) 2% (8) 515Age: 35-44 25% (76) 15% (45) 15% (45) 39% (121) 6% (19) 1% (2) 307Age: 45-64 27% (186) 20% (138) 9% (64) 38% (255) 5% (34) — (3) 680Age: 65+ 24% (117) 22% (109) 8% (39) 44% (217) 3% (15) — (1) 498GenZers: 1997-2012 17% (28) 13% (21) 12% (19) 51% (82) 6% (9) 2% (3) 162Millennials: 1981-1996 19% (100) 16% (86) 14% (73) 42% (219) 8% (41) 1% (8) 527GenXers: 1965-1980 26% (142) 18% (100) 11% (58) 38% (208) 6% (32) 1% (3) 542Baby Boomers: 1946-1964 26% (179) 21% (145) 8% (58) 41% (284) 3% (22) — (0) 688PID: Dem (no lean) 4% (32) 5% (38) 12% (93) 73% (580) 5% (39) 1% (7) 789PID: Ind (no lean) 16% (77) 21% (98) 13% (60) 40% (188) 10% (46) 1% (3) 472PID: Rep (no lean) 48% (354) 32% (240) 8% (58) 8% (61) 3% (23) — (3) 740PID/Gender: DemMen 7% (24) 7% (27) 11% (41) 70% (262) 3% (12) 1% (5) 371PID/Gender: DemWomen 2% (8) 3% (11) 13% (52) 76% (318) 6% (27) — (1) 418PID/Gender: Ind Men 17% (41) 20% (47) 10% (23) 43% (103) 10% (23) — (1) 237PID/Gender: Ind Women 16% (36) 22% (51) 16% (37) 36% (85) 10% (23) 1% (2) 234PID/Gender: Rep Men 50% (168) 30% (102) 10% (33) 8% (26) 2% (6) — (0) 334PID/Gender: Rep Women 46% (186) 34% (138) 6% (26) 9% (36) 4% (17) 1% (3) 405Ideo: Liberal (1-3) 5% (31) 5% (27) 10% (57) 77% (450) 3% (20) — (3) 587Ideo: Moderate (4) 13% (70) 16% (88) 12% (65) 49% (266) 9% (51) — (2) 542Ideo: Conservative (5-7) 44% (350) 32% (254) 10% (79) 11% (86) 2% (19) 1% (7) 795Educ: < College 27% (330) 18% (213) 10% (115) 39% (469) 6% (73) 1% (8) 1207Educ: Bachelors degree 19% (95) 21% (105) 12% (60) 43% (214) 5% (23) 1% (4) 502Educ: Post-grad 13% (38) 20% (58) 12% (36) 50% (146) 4% (12) 1% (2) 291Income: Under 50k 23% (215) 15% (139) 11% (98) 43% (390) 7% (66) 1% (8) 916Income: 50k-100k 23% (163) 23% (165) 10% (69) 40% (287) 4% (31) 1% (4) 720Income: 100k+ 23% (85) 20% (72) 12% (44) 42% (152) 3% (10) — (1) 364Ethnicity: White 27% (417) 21% (328) 11% (178) 36% (555) 4% (67) 1% (10) 1555Ethnicity: Hispanic 16% (37) 12% (28) 12% (27) 51% (113) 8% (18) — (1) 222
Continued on next page

National Tracking Poll #2107125, July, 2021
41
Table POL1_6
Table POL1_6: Do you have a favorable or unfavorable view of each of the following?Trump supporters
DemographicVery
favorableSomewhatfavorable
Somewhatunfavorable
Veryunfavorable
Heard of, noopinion
Never heardof Total N
Registered Voters 23% (463) 19% (376) 11% (211) 41% (829) 5% (108) 1% (14) 2000Ethnicity: Black 7% (19) 10% (24) 8% (21) 65% (168) 9% (24) — (1) 257Ethnicity: Other 14% (27) 12% (23) 7% (12) 56% (105) 9% (17) 2% (3) 188All Christian 28% (296) 23% (235) 12% (128) 32% (338) 4% (43) — (5) 1045All Non-Christian 21% (25) 14% (17) 8% (9) 52% (62) 5% (6) — (0) 120Atheist 4% (4) 14% (13) 11% (10) 66% (65) 5% (5) — (0) 98Agnostic/Nothing in particular 13% (60) 13% (58) 9% (42) 56% (249) 6% (28) 2% (8) 445Something Else 27% (78) 18% (51) 7% (22) 39% (115) 9% (26) — (1) 292Religious Non-Protestant/Catholic 20% (29) 16% (24) 9% (13) 47% (68) 7% (9) — (0) 143Evangelical 34% (200) 22% (128) 10% (59) 28% (167) 6% (35) — (2) 591Non-Evangelical 24% (168) 21% (148) 12% (85) 39% (275) 4% (30) 1% (4) 710Community: Urban 17% (84) 17% (82) 12% (62) 47% (235) 5% (26) 1% (6) 494Community: Suburban 22% (219) 19% (192) 10% (99) 43% (429) 5% (46) 1% (5) 989Community: Rural 31% (160) 20% (103) 10% (51) 32% (165) 7% (35) 1% (3) 516Employ: Private Sector 21% (136) 22% (146) 13% (87) 38% (250) 5% (34) — (3) 656Employ: Government 12% (13) 20% (22) 13% (14) 43% (47) 10% (11) 2% (3) 109Employ: Self-Employed 28% (51) 17% (30) 13% (24) 34% (62) 5% (9) 2% (4) 180Employ: Homemaker 34% (59) 21% (36) 8% (14) 29% (50) 7% (13) 1% (2) 174Employ: Student 6% (4) 13% (9) 13% (8) 64% (42) 3% (2) 1% (0) 65Employ: Retired 26% (134) 18% (96) 8% (40) 44% (228) 4% (21) — (1) 520Employ: Unemployed 19% (37) 14% (28) 9% (18) 53% (105) 6% (11) — (0) 199Employ: Other 30% (29) 10% (9) 7% (7) 47% (45) 7% (7) 1% (1) 97Military HH: Yes 32% (119) 22% (81) 10% (39) 31% (118) 5% (20) — (0) 377Military HH: No 21% (344) 18% (294) 11% (173) 44% (711) 5% (88) 1% (14) 1623RD/WT: Right Direction 6% (49) 7% (65) 14% (118) 66% (574) 7% (57) 1% (5) 868RD/WT: Wrong Track 37% (415) 27% (311) 8% (93) 22% (254) 4% (51) 1% (8) 1132Biden Job Approve 4% (40) 7% (67) 12% (119) 72% (725) 5% (55) — (5) 1012Biden Job Disapprove 44% (418) 32% (302) 9% (88) 9% (89) 4% (41) 1% (8) 947
Continued on next page
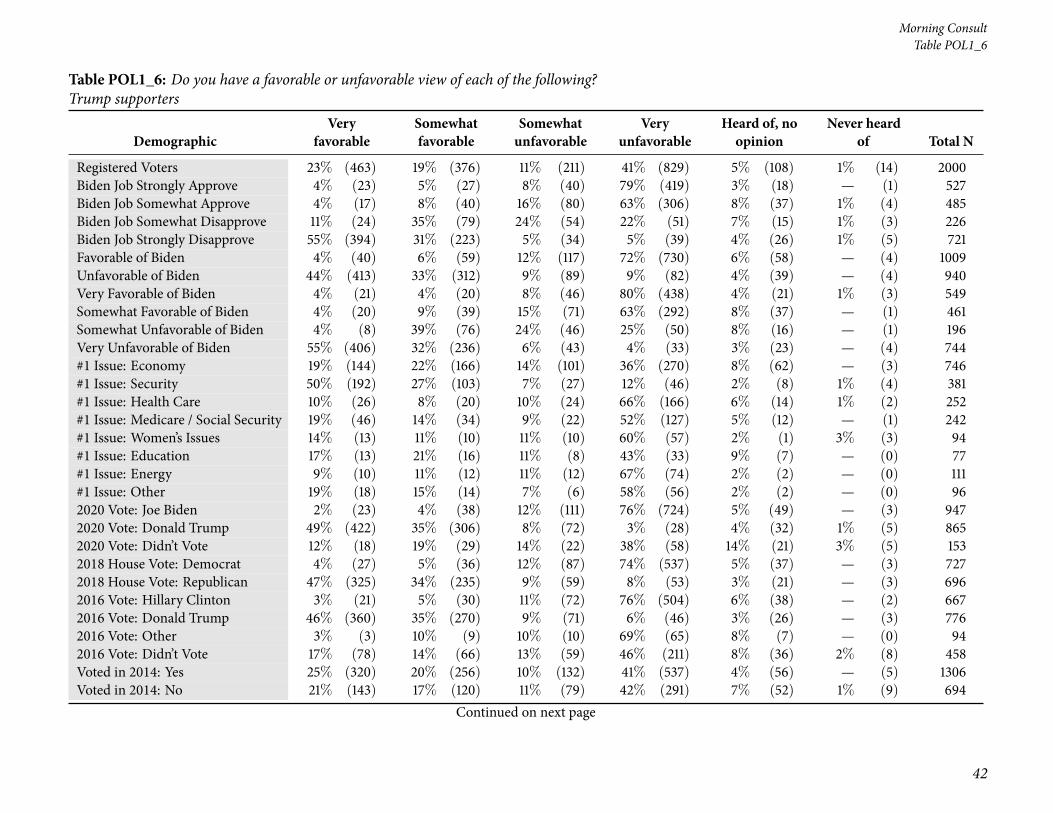
42
Morning ConsultTable POL1_6
Table POL1_6: Do you have a favorable or unfavorable view of each of the following?Trump supporters
DemographicVery
favorableSomewhatfavorable
Somewhatunfavorable
Veryunfavorable
Heard of, noopinion
Never heardof Total N
Registered Voters 23% (463) 19% (376) 11% (211) 41% (829) 5% (108) 1% (14) 2000Biden Job Strongly Approve 4% (23) 5% (27) 8% (40) 79% (419) 3% (18) — (1) 527Biden Job Somewhat Approve 4% (17) 8% (40) 16% (80) 63% (306) 8% (37) 1% (4) 485Biden Job Somewhat Disapprove 11% (24) 35% (79) 24% (54) 22% (51) 7% (15) 1% (3) 226Biden Job Strongly Disapprove 55% (394) 31% (223) 5% (34) 5% (39) 4% (26) 1% (5) 721Favorable of Biden 4% (40) 6% (59) 12% (117) 72% (730) 6% (58) — (4) 1009Unfavorable of Biden 44% (413) 33% (312) 9% (89) 9% (82) 4% (39) — (4) 940Very Favorable of Biden 4% (21) 4% (20) 8% (46) 80% (438) 4% (21) 1% (3) 549Somewhat Favorable of Biden 4% (20) 9% (39) 15% (71) 63% (292) 8% (37) — (1) 461Somewhat Unfavorable of Biden 4% (8) 39% (76) 24% (46) 25% (50) 8% (16) — (1) 196Very Unfavorable of Biden 55% (406) 32% (236) 6% (43) 4% (33) 3% (23) — (4) 744#1 Issue: Economy 19% (144) 22% (166) 14% (101) 36% (270) 8% (62) — (3) 746#1 Issue: Security 50% (192) 27% (103) 7% (27) 12% (46) 2% (8) 1% (4) 381#1 Issue: Health Care 10% (26) 8% (20) 10% (24) 66% (166) 6% (14) 1% (2) 252#1 Issue: Medicare / Social Security 19% (46) 14% (34) 9% (22) 52% (127) 5% (12) — (1) 242#1 Issue: Women’s Issues 14% (13) 11% (10) 11% (10) 60% (57) 2% (1) 3% (3) 94#1 Issue: Education 17% (13) 21% (16) 11% (8) 43% (33) 9% (7) — (0) 77#1 Issue: Energy 9% (10) 11% (12) 11% (12) 67% (74) 2% (2) — (0) 111#1 Issue: Other 19% (18) 15% (14) 7% (6) 58% (56) 2% (2) — (0) 962020 Vote: Joe Biden 2% (23) 4% (38) 12% (111) 76% (724) 5% (49) — (3) 9472020 Vote: Donald Trump 49% (422) 35% (306) 8% (72) 3% (28) 4% (32) 1% (5) 8652020 Vote: Didn’t Vote 12% (18) 19% (29) 14% (22) 38% (58) 14% (21) 3% (5) 1532018 House Vote: Democrat 4% (27) 5% (36) 12% (87) 74% (537) 5% (37) — (3) 7272018 House Vote: Republican 47% (325) 34% (235) 9% (59) 8% (53) 3% (21) — (3) 6962016 Vote: Hillary Clinton 3% (21) 5% (30) 11% (72) 76% (504) 6% (38) — (2) 6672016 Vote: Donald Trump 46% (360) 35% (270) 9% (71) 6% (46) 3% (26) — (3) 7762016 Vote: Other 3% (3) 10% (9) 10% (10) 69% (65) 8% (7) — (0) 942016 Vote: Didn’t Vote 17% (78) 14% (66) 13% (59) 46% (211) 8% (36) 2% (8) 458Voted in 2014: Yes 25% (320) 20% (256) 10% (132) 41% (537) 4% (56) — (5) 1306Voted in 2014: No 21% (143) 17% (120) 11% (79) 42% (291) 7% (52) 1% (9) 694
Continued on next page

National Tracking Poll #2107125, July, 2021
43
Table POL1_6
Table POL1_6: Do you have a favorable or unfavorable view of each of the following?Trump supporters
DemographicVery
favorableSomewhatfavorable
Somewhatunfavorable
Veryunfavorable
Heard of, noopinion
Never heardof Total N
Registered Voters 23% (463) 19% (376) 11% (211) 41% (829) 5% (108) 1% (14) 20004-Region: Northeast 21% (73) 15% (53) 13% (46) 46% (162) 4% (16) 1% (4) 3534-Region: Midwest 23% (101) 18% (82) 10% (46) 42% (187) 6% (26) 1% (3) 4454-Region: South 27% (200) 20% (150) 10% (76) 37% (273) 6% (44) — (3) 7464-Region: West 19% (88) 20% (91) 10% (43) 45% (206) 5% (22) 1% (4) 456Note: Row proportions may total to larger than one-hundred percent due to rounding. For more information visit MorningConsultIntelligence.com.

44
Morning ConsultTable POL1_7
Table POL1_7: Do you have a favorable or unfavorable view of each of the following?Biden supporters
DemographicVery
favorableSomewhatfavorable
Somewhatunfavorable
Veryunfavorable
Heard of, noopinion
Never heardof Total N
Registered Voters 25% (496) 23% (457) 15% (290) 30% (593) 7% (143) 1% (20) 2000Gender: Male 26% (246) 23% (219) 12% (113) 31% (296) 6% (55) 1% (14) 943Gender: Female 24% (250) 23% (238) 17% (177) 28% (297) 8% (89) 1% (6) 1057Age: 18-34 23% (120) 30% (153) 14% (73) 20% (105) 11% (57) 1% (7) 515Age: 35-44 25% (76) 21% (64) 18% (55) 27% (82) 8% (26) 2% (5) 307Age: 45-64 23% (153) 19% (131) 13% (89) 37% (253) 7% (46) 1% (7) 680Age: 65+ 29% (146) 22% (108) 15% (73) 31% (154) 3% (15) — (2) 498GenZers: 1997-2012 24% (39) 27% (44) 16% (27) 19% (31) 11% (19) 2% (3) 162Millennials: 1981-1996 24% (125) 28% (149) 15% (77) 22% (114) 10% (53) 2% (8) 527GenXers: 1965-1980 22% (121) 20% (106) 14% (76) 35% (192) 7% (40) 1% (7) 542Baby Boomers: 1946-1964 28% (194) 20% (136) 14% (100) 33% (227) 4% (30) — (1) 688PID: Dem (no lean) 51% (402) 36% (281) 4% (31) 4% (34) 4% (32) 1% (8) 789PID: Ind (no lean) 13% (63) 24% (113) 21% (99) 26% (122) 15% (69) 1% (5) 472PID: Rep (no lean) 4% (30) 9% (63) 22% (160) 59% (437) 6% (42) 1% (7) 740PID/Gender: DemMen 54% (199) 33% (122) 3% (10) 6% (23) 3% (11) 2% (6) 371PID/Gender: DemWomen 49% (203) 38% (159) 5% (21) 3% (11) 5% (22) — (2) 418PID/Gender: Ind Men 13% (32) 28% (66) 18% (43) 28% (67) 12% (29) 1% (2) 237PID/Gender: Ind Women 14% (32) 20% (47) 24% (57) 24% (55) 17% (40) 1% (3) 234PID/Gender: Rep Men 4% (15) 9% (31) 18% (61) 62% (207) 5% (15) 2% (6) 334PID/Gender: Rep Women 4% (15) 8% (32) 24% (99) 57% (230) 7% (27) — (1) 405Ideo: Liberal (1-3) 48% (282) 38% (220) 5% (31) 4% (24) 4% (22) 1% (8) 587Ideo: Moderate (4) 25% (138) 28% (152) 14% (73) 20% (109) 12% (65) 1% (5) 542Ideo: Conservative (5-7) 8% (63) 9% (71) 21% (170) 56% (444) 5% (40) 1% (7) 795Educ: < College 23% (274) 21% (248) 15% (178) 32% (392) 8% (100) 1% (15) 1207Educ: Bachelors degree 27% (135) 25% (127) 14% (71) 27% (134) 6% (31) — (2) 502Educ: Post-grad 30% (86) 28% (81) 14% (41) 23% (67) 4% (12) 1% (3) 291Income: Under 50k 24% (218) 23% (211) 14% (125) 30% (275) 8% (76) 1% (11) 916Income: 50k-100k 23% (167) 21% (150) 17% (126) 31% (222) 7% (48) 1% (7) 720Income: 100k+ 30% (111) 26% (96) 11% (40) 26% (96) 5% (19) 1% (3) 364Ethnicity: White 22% (339) 21% (323) 16% (252) 34% (537) 6% (96) 1% (9) 1555Ethnicity: Hispanic 30% (67) 32% (72) 8% (18) 21% (46) 8% (18) 1% (2) 222
Continued on next page
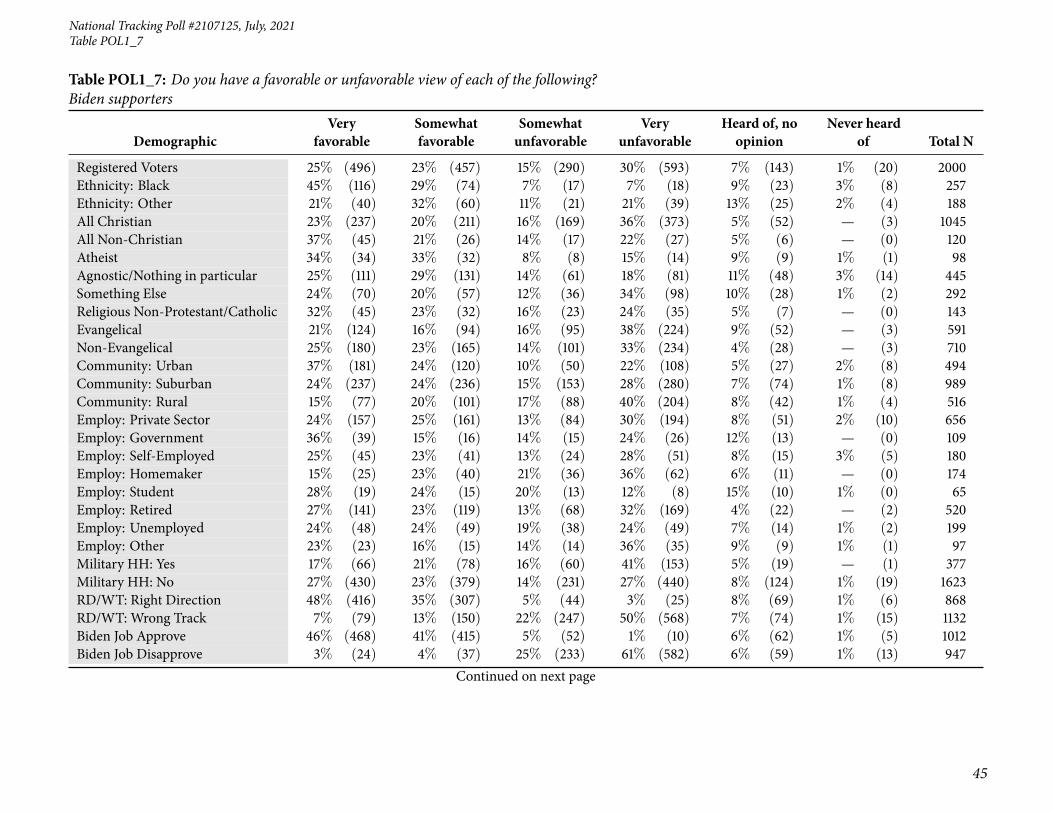
National Tracking Poll #2107125, July, 2021
45
Table POL1_7
Table POL1_7: Do you have a favorable or unfavorable view of each of the following?Biden supporters
DemographicVery
favorableSomewhatfavorable
Somewhatunfavorable
Veryunfavorable
Heard of, noopinion
Never heardof Total N
Registered Voters 25% (496) 23% (457) 15% (290) 30% (593) 7% (143) 1% (20) 2000Ethnicity: Black 45% (116) 29% (74) 7% (17) 7% (18) 9% (23) 3% (8) 257Ethnicity: Other 21% (40) 32% (60) 11% (21) 21% (39) 13% (25) 2% (4) 188All Christian 23% (237) 20% (211) 16% (169) 36% (373) 5% (52) — (3) 1045All Non-Christian 37% (45) 21% (26) 14% (17) 22% (27) 5% (6) — (0) 120Atheist 34% (34) 33% (32) 8% (8) 15% (14) 9% (9) 1% (1) 98Agnostic/Nothing in particular 25% (111) 29% (131) 14% (61) 18% (81) 11% (48) 3% (14) 445Something Else 24% (70) 20% (57) 12% (36) 34% (98) 10% (28) 1% (2) 292Religious Non-Protestant/Catholic 32% (45) 23% (32) 16% (23) 24% (35) 5% (7) — (0) 143Evangelical 21% (124) 16% (94) 16% (95) 38% (224) 9% (52) — (3) 591Non-Evangelical 25% (180) 23% (165) 14% (101) 33% (234) 4% (28) — (3) 710Community: Urban 37% (181) 24% (120) 10% (50) 22% (108) 5% (27) 2% (8) 494Community: Suburban 24% (237) 24% (236) 15% (153) 28% (280) 7% (74) 1% (8) 989Community: Rural 15% (77) 20% (101) 17% (88) 40% (204) 8% (42) 1% (4) 516Employ: Private Sector 24% (157) 25% (161) 13% (84) 30% (194) 8% (51) 2% (10) 656Employ: Government 36% (39) 15% (16) 14% (15) 24% (26) 12% (13) — (0) 109Employ: Self-Employed 25% (45) 23% (41) 13% (24) 28% (51) 8% (15) 3% (5) 180Employ: Homemaker 15% (25) 23% (40) 21% (36) 36% (62) 6% (11) — (0) 174Employ: Student 28% (19) 24% (15) 20% (13) 12% (8) 15% (10) 1% (0) 65Employ: Retired 27% (141) 23% (119) 13% (68) 32% (169) 4% (22) — (2) 520Employ: Unemployed 24% (48) 24% (49) 19% (38) 24% (49) 7% (14) 1% (2) 199Employ: Other 23% (23) 16% (15) 14% (14) 36% (35) 9% (9) 1% (1) 97Military HH: Yes 17% (66) 21% (78) 16% (60) 41% (153) 5% (19) — (1) 377Military HH: No 27% (430) 23% (379) 14% (231) 27% (440) 8% (124) 1% (19) 1623RD/WT: Right Direction 48% (416) 35% (307) 5% (44) 3% (25) 8% (69) 1% (6) 868RD/WT: Wrong Track 7% (79) 13% (150) 22% (247) 50% (568) 7% (74) 1% (15) 1132Biden Job Approve 46% (468) 41% (415) 5% (52) 1% (10) 6% (62) 1% (5) 1012Biden Job Disapprove 3% (24) 4% (37) 25% (233) 61% (582) 6% (59) 1% (13) 947
Continued on next page

46
Morning ConsultTable POL1_7
Table POL1_7: Do you have a favorable or unfavorable view of each of the following?Biden supporters
DemographicVery
favorableSomewhatfavorable
Somewhatunfavorable
Veryunfavorable
Heard of, noopinion
Never heardof Total N
Registered Voters 25% (496) 23% (457) 15% (290) 30% (593) 7% (143) 1% (20) 2000Biden Job Strongly Approve 73% (384) 22% (114) 2% (11) 1% (4) 2% (11) 1% (3) 527Biden Job Somewhat Approve 17% (84) 62% (301) 8% (40) 1% (6) 11% (51) — (2) 485Biden Job Somewhat Disapprove 4% (8) 12% (27) 48% (109) 23% (52) 11% (24) 3% (6) 226Biden Job Strongly Disapprove 2% (15) 1% (11) 17% (124) 73% (529) 5% (35) 1% (7) 721Favorable of Biden 47% (475) 42% (424) 4% (40) 1% (9) 6% (56) 1% (5) 1009Unfavorable of Biden 2% (18) 3% (30) 26% (247) 61% (576) 7% (64) 1% (5) 940Very Favorable of Biden 75% (409) 21% (118) 1% (6) 1% (4) 2% (10) — (3) 549Somewhat Favorable of Biden 14% (65) 66% (306) 8% (35) 1% (6) 10% (46) 1% (3) 461Somewhat Unfavorable of Biden 5% (10) 11% (21) 55% (108) 12% (23) 17% (33) — (1) 196Very Unfavorable of Biden 1% (8) 1% (9) 19% (139) 74% (553) 4% (31) 1% (4) 744#1 Issue: Economy 18% (137) 26% (190) 18% (132) 29% (213) 10% (71) — (3) 746#1 Issue: Security 10% (38) 9% (35) 19% (72) 58% (222) 3% (11) 1% (3) 381#1 Issue: Health Care 46% (115) 27% (68) 7% (18) 13% (33) 6% (16) 1% (2) 252#1 Issue: Medicare / Social Security 38% (91) 22% (52) 10% (24) 22% (53) 9% (21) — (0) 242#1 Issue: Women’s Issues 31% (29) 36% (34) 7% (7) 18% (17) 4% (4) 4% (4) 94#1 Issue: Education 20% (15) 16% (12) 14% (11) 28% (21) 16% (12) 7% (5) 77#1 Issue: Energy 41% (45) 36% (40) 10% (11) 7% (8) 4% (4) 2% (2) 111#1 Issue: Other 27% (26) 26% (25) 17% (16) 26% (25) 3% (3) 1% (1) 962020 Vote: Joe Biden 48% (454) 39% (373) 6% (55) 2% (18) 4% (42) — (5) 9472020 Vote: Donald Trump 2% (19) 5% (47) 22% (187) 63% (541) 7% (63) 1% (8) 8652020 Vote: Didn’t Vote 12% (19) 22% (33) 24% (37) 17% (26) 21% (31) 4% (6) 1532018 House Vote: Democrat 50% (365) 37% (271) 5% (37) 3% (25) 4% (27) — (3) 7272018 House Vote: Republican 2% (12) 8% (55) 24% (164) 60% (421) 6% (39) 1% (5) 6962016 Vote: Hillary Clinton 52% (346) 38% (252) 5% (31) 2% (11) 4% (25) — (2) 6672016 Vote: Donald Trump 3% (22) 7% (56) 22% (168) 61% (472) 7% (52) 1% (6) 7762016 Vote: Other 10% (10) 38% (36) 24% (22) 16% (15) 8% (7) 4% (4) 942016 Vote: Didn’t Vote 25% (117) 24% (112) 15% (69) 20% (93) 13% (59) 2% (9) 458Voted in 2014: Yes 26% (345) 23% (295) 14% (178) 31% (411) 5% (66) 1% (11) 1306Voted in 2014: No 22% (151) 23% (162) 16% (112) 26% (182) 11% (78) 1% (9) 694
Continued on next page

National Tracking Poll #2107125, July, 2021
47
Table POL1_7
Table POL1_7: Do you have a favorable or unfavorable view of each of the following?Biden supporters
DemographicVery
favorableSomewhatfavorable
Somewhatunfavorable
Veryunfavorable
Heard of, noopinion
Never heardof Total N
Registered Voters 25% (496) 23% (457) 15% (290) 30% (593) 7% (143) 1% (20) 20004-Region: Northeast 28% (100) 24% (85) 14% (48) 25% (89) 8% (27) 1% (5) 3534-Region: Midwest 20% (90) 25% (109) 20% (89) 27% (121) 8% (35) — (1) 4454-Region: South 25% (184) 20% (150) 14% (102) 33% (248) 7% (50) 1% (11) 7464-Region: West 27% (121) 25% (113) 11% (51) 30% (135) 7% (32) 1% (3) 456Note: Row proportions may total to larger than one-hundred percent due to rounding. For more information visit MorningConsultIntelligence.com.
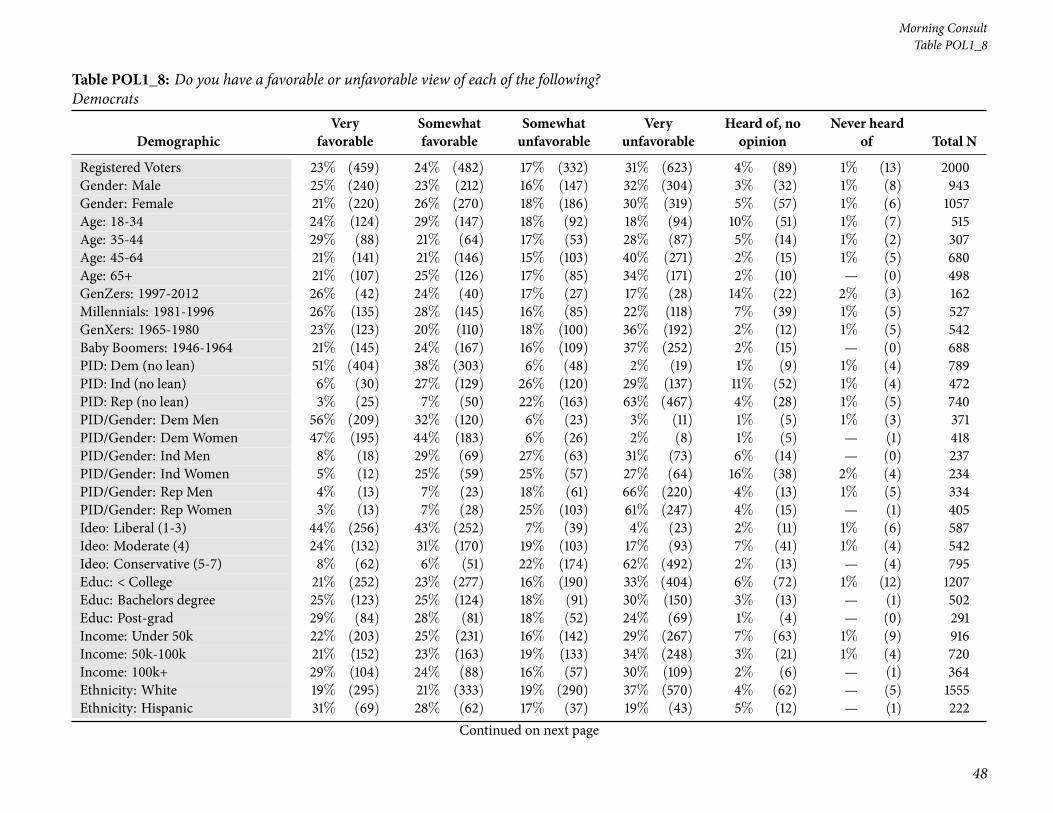
48
Morning ConsultTable POL1_8
Table POL1_8: Do you have a favorable or unfavorable view of each of the following?Democrats
DemographicVery
favorableSomewhatfavorable
Somewhatunfavorable
Veryunfavorable
Heard of, noopinion
Never heardof Total N
Registered Voters 23% (459) 24% (482) 17% (332) 31% (623) 4% (89) 1% (13) 2000Gender: Male 25% (240) 23% (212) 16% (147) 32% (304) 3% (32) 1% (8) 943Gender: Female 21% (220) 26% (270) 18% (186) 30% (319) 5% (57) 1% (6) 1057Age: 18-34 24% (124) 29% (147) 18% (92) 18% (94) 10% (51) 1% (7) 515Age: 35-44 29% (88) 21% (64) 17% (53) 28% (87) 5% (14) 1% (2) 307Age: 45-64 21% (141) 21% (146) 15% (103) 40% (271) 2% (15) 1% (5) 680Age: 65+ 21% (107) 25% (126) 17% (85) 34% (171) 2% (10) — (0) 498GenZers: 1997-2012 26% (42) 24% (40) 17% (27) 17% (28) 14% (22) 2% (3) 162Millennials: 1981-1996 26% (135) 28% (145) 16% (85) 22% (118) 7% (39) 1% (5) 527GenXers: 1965-1980 23% (123) 20% (110) 18% (100) 36% (192) 2% (12) 1% (5) 542Baby Boomers: 1946-1964 21% (145) 24% (167) 16% (109) 37% (252) 2% (15) — (0) 688PID: Dem (no lean) 51% (404) 38% (303) 6% (48) 2% (19) 1% (9) 1% (4) 789PID: Ind (no lean) 6% (30) 27% (129) 26% (120) 29% (137) 11% (52) 1% (4) 472PID: Rep (no lean) 3% (25) 7% (50) 22% (163) 63% (467) 4% (28) 1% (5) 740PID/Gender: DemMen 56% (209) 32% (120) 6% (23) 3% (11) 1% (5) 1% (3) 371PID/Gender: DemWomen 47% (195) 44% (183) 6% (26) 2% (8) 1% (5) — (1) 418PID/Gender: Ind Men 8% (18) 29% (69) 27% (63) 31% (73) 6% (14) — (0) 237PID/Gender: Ind Women 5% (12) 25% (59) 25% (57) 27% (64) 16% (38) 2% (4) 234PID/Gender: Rep Men 4% (13) 7% (23) 18% (61) 66% (220) 4% (13) 1% (5) 334PID/Gender: Rep Women 3% (13) 7% (28) 25% (103) 61% (247) 4% (15) — (1) 405Ideo: Liberal (1-3) 44% (256) 43% (252) 7% (39) 4% (23) 2% (11) 1% (6) 587Ideo: Moderate (4) 24% (132) 31% (170) 19% (103) 17% (93) 7% (41) 1% (4) 542Ideo: Conservative (5-7) 8% (62) 6% (51) 22% (174) 62% (492) 2% (13) — (4) 795Educ: < College 21% (252) 23% (277) 16% (190) 33% (404) 6% (72) 1% (12) 1207Educ: Bachelors degree 25% (123) 25% (124) 18% (91) 30% (150) 3% (13) — (1) 502Educ: Post-grad 29% (84) 28% (81) 18% (52) 24% (69) 1% (4) — (0) 291Income: Under 50k 22% (203) 25% (231) 16% (142) 29% (267) 7% (63) 1% (9) 916Income: 50k-100k 21% (152) 23% (163) 19% (133) 34% (248) 3% (21) 1% (4) 720Income: 100k+ 29% (104) 24% (88) 16% (57) 30% (109) 2% (6) — (1) 364Ethnicity: White 19% (295) 21% (333) 19% (290) 37% (570) 4% (62) — (5) 1555Ethnicity: Hispanic 31% (69) 28% (62) 17% (37) 19% (43) 5% (12) — (1) 222
Continued on next page
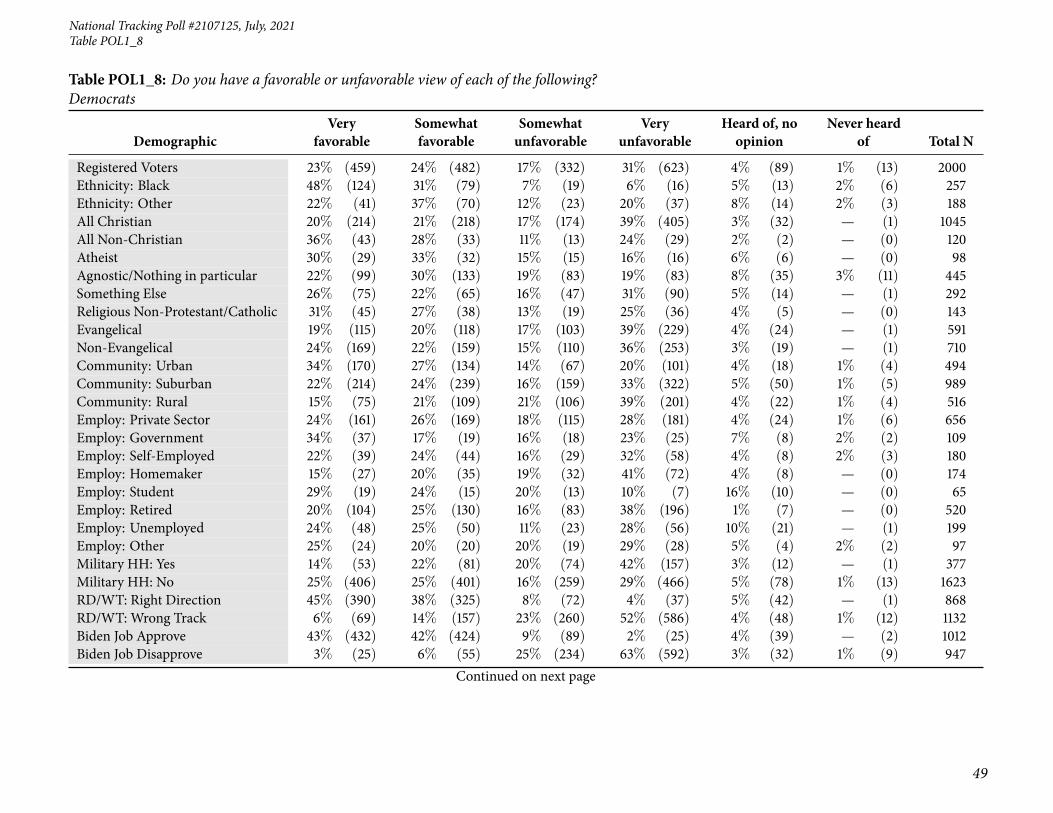
National Tracking Poll #2107125, July, 2021
49
Table POL1_8
Table POL1_8: Do you have a favorable or unfavorable view of each of the following?Democrats
DemographicVery
favorableSomewhatfavorable
Somewhatunfavorable
Veryunfavorable
Heard of, noopinion
Never heardof Total N
Registered Voters 23% (459) 24% (482) 17% (332) 31% (623) 4% (89) 1% (13) 2000Ethnicity: Black 48% (124) 31% (79) 7% (19) 6% (16) 5% (13) 2% (6) 257Ethnicity: Other 22% (41) 37% (70) 12% (23) 20% (37) 8% (14) 2% (3) 188All Christian 20% (214) 21% (218) 17% (174) 39% (405) 3% (32) — (1) 1045All Non-Christian 36% (43) 28% (33) 11% (13) 24% (29) 2% (2) — (0) 120Atheist 30% (29) 33% (32) 15% (15) 16% (16) 6% (6) — (0) 98Agnostic/Nothing in particular 22% (99) 30% (133) 19% (83) 19% (83) 8% (35) 3% (11) 445Something Else 26% (75) 22% (65) 16% (47) 31% (90) 5% (14) — (1) 292Religious Non-Protestant/Catholic 31% (45) 27% (38) 13% (19) 25% (36) 4% (5) — (0) 143Evangelical 19% (115) 20% (118) 17% (103) 39% (229) 4% (24) — (1) 591Non-Evangelical 24% (169) 22% (159) 15% (110) 36% (253) 3% (19) — (1) 710Community: Urban 34% (170) 27% (134) 14% (67) 20% (101) 4% (18) 1% (4) 494Community: Suburban 22% (214) 24% (239) 16% (159) 33% (322) 5% (50) 1% (5) 989Community: Rural 15% (75) 21% (109) 21% (106) 39% (201) 4% (22) 1% (4) 516Employ: Private Sector 24% (161) 26% (169) 18% (115) 28% (181) 4% (24) 1% (6) 656Employ: Government 34% (37) 17% (19) 16% (18) 23% (25) 7% (8) 2% (2) 109Employ: Self-Employed 22% (39) 24% (44) 16% (29) 32% (58) 4% (8) 2% (3) 180Employ: Homemaker 15% (27) 20% (35) 19% (32) 41% (72) 4% (8) — (0) 174Employ: Student 29% (19) 24% (15) 20% (13) 10% (7) 16% (10) — (0) 65Employ: Retired 20% (104) 25% (130) 16% (83) 38% (196) 1% (7) — (0) 520Employ: Unemployed 24% (48) 25% (50) 11% (23) 28% (56) 10% (21) — (1) 199Employ: Other 25% (24) 20% (20) 20% (19) 29% (28) 5% (4) 2% (2) 97Military HH: Yes 14% (53) 22% (81) 20% (74) 42% (157) 3% (12) — (1) 377Military HH: No 25% (406) 25% (401) 16% (259) 29% (466) 5% (78) 1% (13) 1623RD/WT: Right Direction 45% (390) 38% (325) 8% (72) 4% (37) 5% (42) — (1) 868RD/WT: Wrong Track 6% (69) 14% (157) 23% (260) 52% (586) 4% (48) 1% (12) 1132Biden Job Approve 43% (432) 42% (424) 9% (89) 2% (25) 4% (39) — (2) 1012Biden Job Disapprove 3% (25) 6% (55) 25% (234) 63% (592) 3% (32) 1% (9) 947
Continued on next page

50
Morning ConsultTable POL1_8
Table POL1_8: Do you have a favorable or unfavorable view of each of the following?Democrats
DemographicVery
favorableSomewhatfavorable
Somewhatunfavorable
Veryunfavorable
Heard of, noopinion
Never heardof Total N
Registered Voters 23% (459) 24% (482) 17% (332) 31% (623) 4% (89) 1% (13) 2000Biden Job Strongly Approve 66% (350) 28% (148) 3% (14) 1% (5) 2% (8) — (1) 527Biden Job Somewhat Approve 17% (82) 57% (276) 15% (74) 4% (20) 6% (30) — (2) 485Biden Job Somewhat Disapprove 3% (6) 20% (45) 47% (107) 21% (48) 8% (18) 1% (3) 226Biden Job Strongly Disapprove 3% (19) 1% (10) 18% (127) 76% (545) 2% (14) 1% (6) 721Favorable of Biden 43% (436) 44% (440) 8% (77) 3% (25) 3% (28) — (3) 1009Unfavorable of Biden 2% (17) 4% (40) 27% (254) 63% (589) 4% (38) — (2) 940Very Favorable of Biden 68% (375) 28% (151) 2% (11) 1% (6) 1% (6) — (1) 549Somewhat Favorable of Biden 13% (62) 63% (289) 14% (66) 4% (20) 5% (22) 1% (2) 461Somewhat Unfavorable of Biden 4% (7) 15% (29) 56% (109) 16% (32) 10% (19) — (0) 196Very Unfavorable of Biden 1% (10) 2% (12) 19% (144) 75% (557) 3% (19) — (2) 744#1 Issue: Economy 20% (146) 25% (189) 18% (135) 32% (237) 5% (37) — (2) 746#1 Issue: Security 11% (42) 9% (34) 17% (65) 61% (234) 2% (6) — (0) 381#1 Issue: Health Care 35% (88) 32% (80) 14% (36) 11% (27) 7% (18) 1% (3) 252#1 Issue: Medicare / Social Security 31% (74) 27% (66) 15% (35) 26% (62) 2% (5) — (0) 242#1 Issue: Women’s Issues 29% (28) 33% (31) 11% (11) 14% (13) 9% (9) 4% (4) 94#1 Issue: Education 22% (17) 15% (12) 20% (16) 25% (19) 11% (9) 6% (4) 77#1 Issue: Energy 39% (43) 40% (45) 14% (15) 5% (6) 2% (2) — (0) 111#1 Issue: Other 22% (21) 27% (26) 20% (19) 26% (26) 5% (4) — (0) 962020 Vote: Joe Biden 44% (418) 41% (393) 10% (92) 2% (18) 3% (24) — (1) 9472020 Vote: Donald Trump 2% (19) 6% (50) 23% (201) 65% (564) 3% (24) 1% (7) 8652020 Vote: Didn’t Vote 13% (19) 24% (36) 19% (30) 19% (30) 22% (33) 3% (5) 1532018 House Vote: Democrat 47% (343) 41% (296) 9% (66) 2% (16) 1% (5) — (1) 7272018 House Vote: Republican 3% (19) 6% (45) 24% (164) 65% (451) 2% (17) — (1) 6962016 Vote: Hillary Clinton 49% (329) 40% (265) 8% (50) 2% (15) 1% (8) — (1) 6672016 Vote: Donald Trump 3% (26) 7% (56) 23% (181) 64% (495) 2% (17) — (1) 7762016 Vote: Other 5% (5) 31% (30) 29% (27) 21% (19) 9% (8) 5% (5) 942016 Vote: Didn’t Vote 22% (99) 29% (131) 16% (74) 20% (90) 12% (56) 2% (7) 458Voted in 2014: Yes 25% (323) 23% (300) 16% (209) 34% (439) 2% (29) — (6) 1306Voted in 2014: No 20% (136) 26% (182) 18% (123) 27% (184) 9% (60) 1% (8) 694
Continued on next page

National Tracking Poll #2107125, July, 2021
51
Table POL1_8
Table POL1_8: Do you have a favorable or unfavorable view of each of the following?Democrats
DemographicVery
favorableSomewhatfavorable
Somewhatunfavorable
Veryunfavorable
Heard of, noopinion
Never heardof Total N
Registered Voters 23% (459) 24% (482) 17% (332) 31% (623) 4% (89) 1% (13) 20004-Region: Northeast 25% (87) 27% (95) 16% (57) 28% (97) 4% (14) 1% (3) 3534-Region: Midwest 18% (80) 28% (125) 16% (71) 32% (140) 6% (27) 1% (2) 4454-Region: South 24% (180) 21% (160) 15% (116) 34% (256) 4% (28) 1% (8) 7464-Region: West 25% (113) 23% (103) 20% (89) 28% (130) 5% (21) — (0) 456Note: Row proportions may total to larger than one-hundred percent due to rounding. For more information visit MorningConsultIntelligence.com.

52
Morning ConsultTable POL1_9
Table POL1_9: Do you have a favorable or unfavorable view of each of the following?Republicans
DemographicVery
favorableSomewhatfavorable
Somewhatunfavorable
Veryunfavorable
Heard of, noopinion
Never heardof Total N
Registered Voters 19% (377) 25% (508) 20% (399) 30% (600) 5% (98) 1% (18) 2000Gender: Male 19% (178) 24% (227) 21% (194) 31% (295) 4% (37) 1% (12) 943Gender: Female 19% (199) 27% (281) 19% (205) 29% (305) 6% (61) 1% (6) 1057Age: 18-34 17% (87) 20% (103) 20% (102) 31% (161) 11% (55) 1% (8) 515Age: 35-44 20% (62) 22% (67) 23% (71) 28% (87) 5% (16) 1% (4) 307Age: 45-64 22% (148) 29% (196) 18% (120) 28% (192) 3% (18) 1% (6) 680Age: 65+ 16% (81) 28% (141) 21% (106) 32% (160) 2% (10) — (1) 498GenZers: 1997-2012 17% (28) 16% (27) 17% (28) 30% (48) 18% (28) 2% (3) 162Millennials: 1981-1996 17% (88) 22% (117) 23% (119) 30% (160) 7% (37) 1% (5) 527GenXers: 1965-1980 23% (124) 25% (136) 20% (106) 28% (152) 3% (14) 2% (9) 542Baby Boomers: 1946-1964 18% (127) 29% (197) 19% (131) 31% (215) 3% (18) — (0) 688PID: Dem (no lean) 4% (29) 8% (65) 26% (202) 56% (446) 5% (37) 1% (10) 789PID: Ind (no lean) 7% (32) 29% (134) 25% (119) 28% (131) 11% (52) 1% (3) 472PID: Rep (no lean) 43% (317) 42% (308) 10% (77) 3% (23) 1% (9) 1% (6) 740PID/Gender: DemMen 6% (22) 8% (30) 25% (94) 55% (204) 4% (15) 2% (6) 371PID/Gender: DemWomen 2% (6) 8% (35) 26% (108) 58% (242) 5% (22) 1% (4) 418PID/Gender: Ind Men 4% (9) 28% (67) 25% (59) 35% (84) 8% (18) — (0) 237PID/Gender: Ind Women 10% (23) 29% (67) 26% (60) 20% (47) 15% (34) 1% (3) 234PID/Gender: Rep Men 44% (147) 39% (130) 12% (41) 2% (8) 1% (4) 2% (6) 334PID/Gender: Rep Women 42% (170) 44% (178) 9% (37) 4% (15) 1% (5) — (0) 405Ideo: Liberal (1-3) 6% (33) 9% (51) 24% (143) 56% (329) 4% (21) 2% (10) 587Ideo: Moderate (4) 10% (53) 23% (122) 25% (136) 35% (188) 7% (40) — (2) 542Ideo: Conservative (5-7) 35% (279) 41% (330) 14% (109) 7% (58) 2% (14) 1% (6) 795Educ: < College 22% (266) 24% (293) 19% (228) 28% (332) 6% (75) 1% (13) 1207Educ: Bachelors degree 16% (79) 29% (144) 22% (111) 29% (146) 4% (18) 1% (4) 502Educ: Post-grad 11% (32) 24% (70) 21% (61) 42% (121) 2% (5) 1% (2) 291Income: Under 50k 19% (173) 22% (202) 20% (185) 30% (275) 8% (71) 1% (10) 916Income: 50k-100k 19% (135) 28% (205) 19% (138) 30% (217) 2% (17) 1% (7) 720Income: 100k+ 19% (70) 28% (100) 21% (76) 30% (108) 3% (10) — (1) 364Ethnicity: White 22% (348) 29% (445) 19% (300) 26% (401) 4% (59) — (3) 1555Ethnicity: Hispanic 18% (40) 17% (39) 26% (58) 27% (60) 11% (24) — (1) 222
Continued on next page
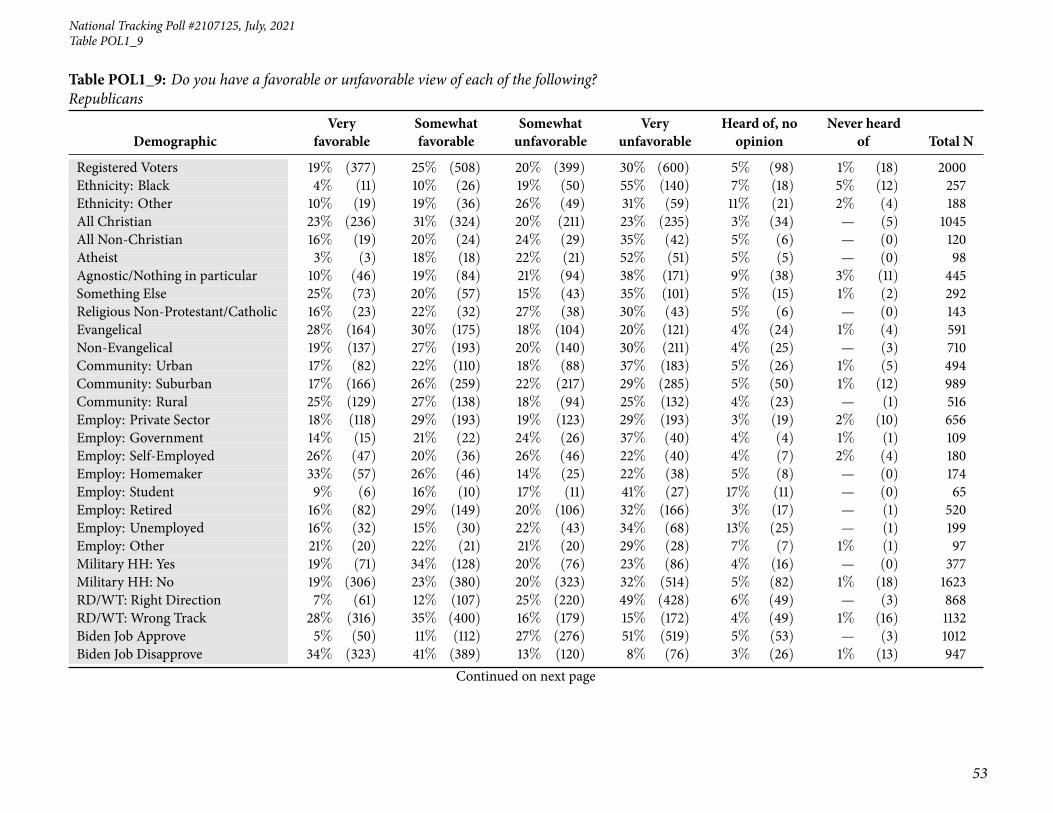
National Tracking Poll #2107125, July, 2021
53
Table POL1_9
Table POL1_9: Do you have a favorable or unfavorable view of each of the following?Republicans
DemographicVery
favorableSomewhatfavorable
Somewhatunfavorable
Veryunfavorable
Heard of, noopinion
Never heardof Total N
Registered Voters 19% (377) 25% (508) 20% (399) 30% (600) 5% (98) 1% (18) 2000Ethnicity: Black 4% (11) 10% (26) 19% (50) 55% (140) 7% (18) 5% (12) 257Ethnicity: Other 10% (19) 19% (36) 26% (49) 31% (59) 11% (21) 2% (4) 188All Christian 23% (236) 31% (324) 20% (211) 23% (235) 3% (34) — (5) 1045All Non-Christian 16% (19) 20% (24) 24% (29) 35% (42) 5% (6) — (0) 120Atheist 3% (3) 18% (18) 22% (21) 52% (51) 5% (5) — (0) 98Agnostic/Nothing in particular 10% (46) 19% (84) 21% (94) 38% (171) 9% (38) 3% (11) 445Something Else 25% (73) 20% (57) 15% (43) 35% (101) 5% (15) 1% (2) 292Religious Non-Protestant/Catholic 16% (23) 22% (32) 27% (38) 30% (43) 5% (6) — (0) 143Evangelical 28% (164) 30% (175) 18% (104) 20% (121) 4% (24) 1% (4) 591Non-Evangelical 19% (137) 27% (193) 20% (140) 30% (211) 4% (25) — (3) 710Community: Urban 17% (82) 22% (110) 18% (88) 37% (183) 5% (26) 1% (5) 494Community: Suburban 17% (166) 26% (259) 22% (217) 29% (285) 5% (50) 1% (12) 989Community: Rural 25% (129) 27% (138) 18% (94) 25% (132) 4% (23) — (1) 516Employ: Private Sector 18% (118) 29% (193) 19% (123) 29% (193) 3% (19) 2% (10) 656Employ: Government 14% (15) 21% (22) 24% (26) 37% (40) 4% (4) 1% (1) 109Employ: Self-Employed 26% (47) 20% (36) 26% (46) 22% (40) 4% (7) 2% (4) 180Employ: Homemaker 33% (57) 26% (46) 14% (25) 22% (38) 5% (8) — (0) 174Employ: Student 9% (6) 16% (10) 17% (11) 41% (27) 17% (11) — (0) 65Employ: Retired 16% (82) 29% (149) 20% (106) 32% (166) 3% (17) — (1) 520Employ: Unemployed 16% (32) 15% (30) 22% (43) 34% (68) 13% (25) — (1) 199Employ: Other 21% (20) 22% (21) 21% (20) 29% (28) 7% (7) 1% (1) 97Military HH: Yes 19% (71) 34% (128) 20% (76) 23% (86) 4% (16) — (0) 377Military HH: No 19% (306) 23% (380) 20% (323) 32% (514) 5% (82) 1% (18) 1623RD/WT: Right Direction 7% (61) 12% (107) 25% (220) 49% (428) 6% (49) — (3) 868RD/WT: Wrong Track 28% (316) 35% (400) 16% (179) 15% (172) 4% (49) 1% (16) 1132Biden Job Approve 5% (50) 11% (112) 27% (276) 51% (519) 5% (53) — (3) 1012Biden Job Disapprove 34% (323) 41% (389) 13% (120) 8% (76) 3% (26) 1% (13) 947
Continued on next page

54
Morning ConsultTable POL1_9
Table POL1_9: Do you have a favorable or unfavorable view of each of the following?Republicans
DemographicVery
favorableSomewhatfavorable
Somewhatunfavorable
Veryunfavorable
Heard of, noopinion
Never heardof Total N
Registered Voters 19% (377) 25% (508) 20% (399) 30% (600) 5% (98) 1% (18) 2000Biden Job Strongly Approve 6% (29) 7% (38) 21% (110) 63% (330) 4% (20) — (1) 527Biden Job Somewhat Approve 4% (20) 15% (75) 34% (166) 39% (189) 7% (33) — (2) 485Biden Job Somewhat Disapprove 12% (26) 46% (105) 18% (40) 17% (38) 5% (12) 3% (6) 226Biden Job Strongly Disapprove 41% (296) 39% (284) 11% (80) 5% (39) 2% (14) 1% (7) 721Favorable of Biden 5% (51) 11% (112) 26% (267) 52% (526) 5% (50) — (4) 1009Unfavorable of Biden 34% (317) 42% (392) 14% (130) 7% (68) 3% (29) 1% (6) 940Very Favorable of Biden 5% (25) 6% (31) 21% (117) 64% (350) 4% (22) 1% (3) 549Somewhat Favorable of Biden 6% (26) 18% (81) 32% (150) 38% (176) 6% (28) — (1) 461Somewhat Unfavorable of Biden 8% (16) 41% (81) 24% (47) 17% (34) 8% (16) 2% (3) 196Very Unfavorable of Biden 40% (301) 42% (310) 11% (83) 5% (34) 2% (13) — (3) 744#1 Issue: Economy 16% (122) 28% (209) 24% (178) 25% (186) 6% (44) 1% (7) 746#1 Issue: Security 39% (147) 39% (147) 11% (43) 10% (37) 1% (5) — (2) 381#1 Issue: Health Care 13% (32) 10% (25) 22% (54) 48% (121) 8% (19) — (1) 252#1 Issue: Medicare / Social Security 15% (37) 23% (55) 17% (41) 41% (99) 4% (9) — (0) 242#1 Issue: Women’s Issues 14% (13) 14% (13) 21% (20) 42% (40) 4% (4) 4% (4) 94#1 Issue: Education 14% (11) 23% (18) 22% (17) 26% (20) 8% (7) 7% (5) 77#1 Issue: Energy 7% (7) 16% (18) 28% (31) 45% (50) 4% (5) — (0) 111#1 Issue: Other 8% (8) 22% (21) 16% (16) 48% (47) 5% (5) — (0) 962020 Vote: Joe Biden 3% (25) 8% (79) 27% (257) 57% (536) 4% (41) 1% (8) 9472020 Vote: Donald Trump 38% (332) 45% (386) 12% (106) 3% (24) 1% (13) — (4) 8652020 Vote: Didn’t Vote 12% (18) 24% (37) 17% (25) 19% (29) 25% (39) 3% (4) 1532018 House Vote: Democrat 3% (24) 8% (62) 26% (188) 58% (424) 3% (24) 1% (6) 7272018 House Vote: Republican 37% (258) 43% (301) 14% (97) 4% (29) 1% (9) — (1) 6962016 Vote: Hillary Clinton 3% (19) 9% (60) 24% (163) 60% (398) 3% (22) 1% (5) 6672016 Vote: Donald Trump 37% (290) 42% (328) 13% (104) 5% (39) 2% (15) — (0) 7762016 Vote: Other 4% (4) 15% (15) 36% (34) 34% (32) 5% (5) 6% (6) 942016 Vote: Didn’t Vote 14% (64) 23% (104) 21% (98) 28% (128) 12% (57) 1% (7) 458Voted in 2014: Yes 19% (253) 26% (334) 20% (263) 32% (413) 2% (32) 1% (11) 1306Voted in 2014: No 18% (124) 25% (173) 20% (136) 27% (187) 10% (67) 1% (8) 694
Continued on next page

National Tracking Poll #2107125, July, 2021
55
Table POL1_9
Table POL1_9: Do you have a favorable or unfavorable view of each of the following?Republicans
DemographicVery
favorableSomewhatfavorable
Somewhatunfavorable
Veryunfavorable
Heard of, noopinion
Never heardof Total N
Registered Voters 19% (377) 25% (508) 20% (399) 30% (600) 5% (98) 1% (18) 20004-Region: Northeast 18% (65) 22% (77) 21% (73) 34% (119) 5% (16) 1% (3) 3534-Region: Midwest 17% (77) 27% (120) 22% (98) 28% (125) 5% (21) 1% (4) 4454-Region: South 21% (159) 27% (200) 17% (127) 29% (215) 5% (34) 1% (10) 7464-Region: West 17% (76) 24% (111) 22% (100) 31% (141) 6% (26) — (2) 456Note: Row proportions may total to larger than one-hundred percent due to rounding. For more information visit MorningConsultIntelligence.com.
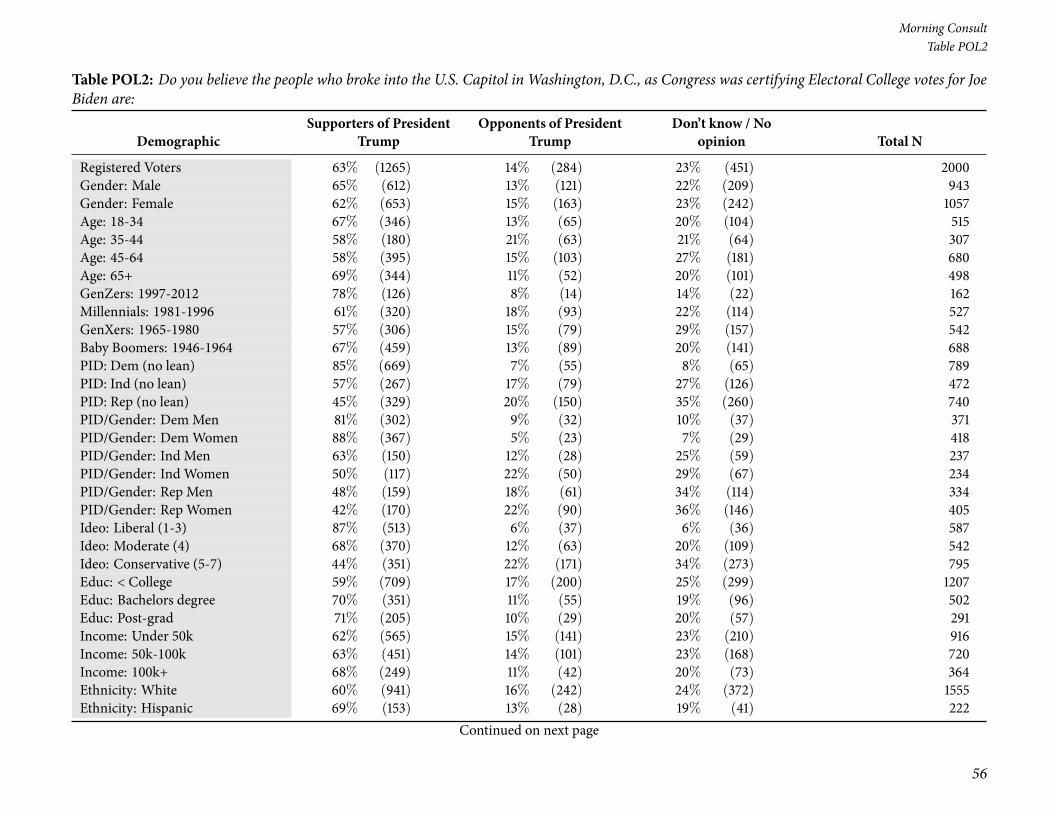
56
Morning ConsultTable POL2
Table POL2: Do you believe the people who broke into the U.S. Capitol in Washington, D.C., as Congress was certifying Electoral College votes for JoeBiden are:
DemographicSupporters of President
TrumpOpponents of President
TrumpDon’t know / No
opinion Total N
Registered Voters 63% (1265) 14% (284) 23% (451) 2000Gender: Male 65% (612) 13% (121) 22% (209) 943Gender: Female 62% (653) 15% (163) 23% (242) 1057Age: 18-34 67% (346) 13% (65) 20% (104) 515Age: 35-44 58% (180) 21% (63) 21% (64) 307Age: 45-64 58% (395) 15% (103) 27% (181) 680Age: 65+ 69% (344) 11% (52) 20% (101) 498GenZers: 1997-2012 78% (126) 8% (14) 14% (22) 162Millennials: 1981-1996 61% (320) 18% (93) 22% (114) 527GenXers: 1965-1980 57% (306) 15% (79) 29% (157) 542Baby Boomers: 1946-1964 67% (459) 13% (89) 20% (141) 688PID: Dem (no lean) 85% (669) 7% (55) 8% (65) 789PID: Ind (no lean) 57% (267) 17% (79) 27% (126) 472PID: Rep (no lean) 45% (329) 20% (150) 35% (260) 740PID/Gender: DemMen 81% (302) 9% (32) 10% (37) 371PID/Gender: DemWomen 88% (367) 5% (23) 7% (29) 418PID/Gender: Ind Men 63% (150) 12% (28) 25% (59) 237PID/Gender: Ind Women 50% (117) 22% (50) 29% (67) 234PID/Gender: Rep Men 48% (159) 18% (61) 34% (114) 334PID/Gender: Rep Women 42% (170) 22% (90) 36% (146) 405Ideo: Liberal (1-3) 87% (513) 6% (37) 6% (36) 587Ideo: Moderate (4) 68% (370) 12% (63) 20% (109) 542Ideo: Conservative (5-7) 44% (351) 22% (171) 34% (273) 795Educ: < College 59% (709) 17% (200) 25% (299) 1207Educ: Bachelors degree 70% (351) 11% (55) 19% (96) 502Educ: Post-grad 71% (205) 10% (29) 20% (57) 291Income: Under 50k 62% (565) 15% (141) 23% (210) 916Income: 50k-100k 63% (451) 14% (101) 23% (168) 720Income: 100k+ 68% (249) 11% (42) 20% (73) 364Ethnicity: White 60% (941) 16% (242) 24% (372) 1555Ethnicity: Hispanic 69% (153) 13% (28) 19% (41) 222
Continued on next page

National Tracking Poll #2107125, July, 2021
57
Table POL2
Table POL2: Do you believe the people who broke into the U.S. Capitol in Washington, D.C., as Congress was certifying Electoral College votes for JoeBiden are:
DemographicSupporters of President
TrumpOpponents of President
TrumpDon’t know / No
opinion Total N
Registered Voters 63% (1265) 14% (284) 23% (451) 2000Ethnicity: Black 72% (184) 11% (28) 17% (44) 257Ethnicity: Other 74% (140) 7% (14) 18% (35) 188All Christian 58% (605) 16% (170) 26% (269) 1045All Non-Christian 74% (89) 16% (19) 10% (12) 120Atheist 88% (86) 5% (5) 7% (7) 98Agnostic/Nothing in particular 70% (311) 7% (33) 23% (101) 445Something Else 60% (174) 19% (57) 21% (61) 292Religious Non-Protestant/Catholic 71% (101) 17% (24) 12% (18) 143Evangelical 54% (320) 19% (111) 27% (161) 591Non-Evangelical 62% (441) 15% (109) 23% (160) 710Community: Urban 68% (337) 15% (75) 17% (83) 494Community: Suburban 64% (633) 12% (122) 24% (235) 989Community: Rural 57% (296) 17% (87) 26% (133) 516Employ: Private Sector 63% (415) 15% (97) 22% (144) 656Employ: Government 65% (70) 14% (15) 22% (24) 109Employ: Self-Employed 55% (99) 13% (24) 32% (58) 180Employ: Homemaker 49% (86) 20% (35) 31% (53) 174Employ: Student 84% (55) 8% (5) 7% (5) 65Employ: Retired 69% (359) 13% (66) 18% (95) 520Employ: Unemployed 66% (132) 10% (19) 24% (47) 199Employ: Other 51% (49) 24% (23) 26% (25) 97Military HH: Yes 59% (221) 16% (60) 26% (96) 377Military HH: No 64% (1044) 14% (224) 22% (355) 1623RD/WT: Right Direction 80% (697) 9% (76) 11% (94) 868RD/WT: Wrong Track 50% (568) 18% (208) 32% (357) 1132Biden Job Approve 84% (845) 7% (72) 9% (95) 1012Biden Job Disapprove 42% (401) 22% (211) 35% (335) 947
Continued on next page
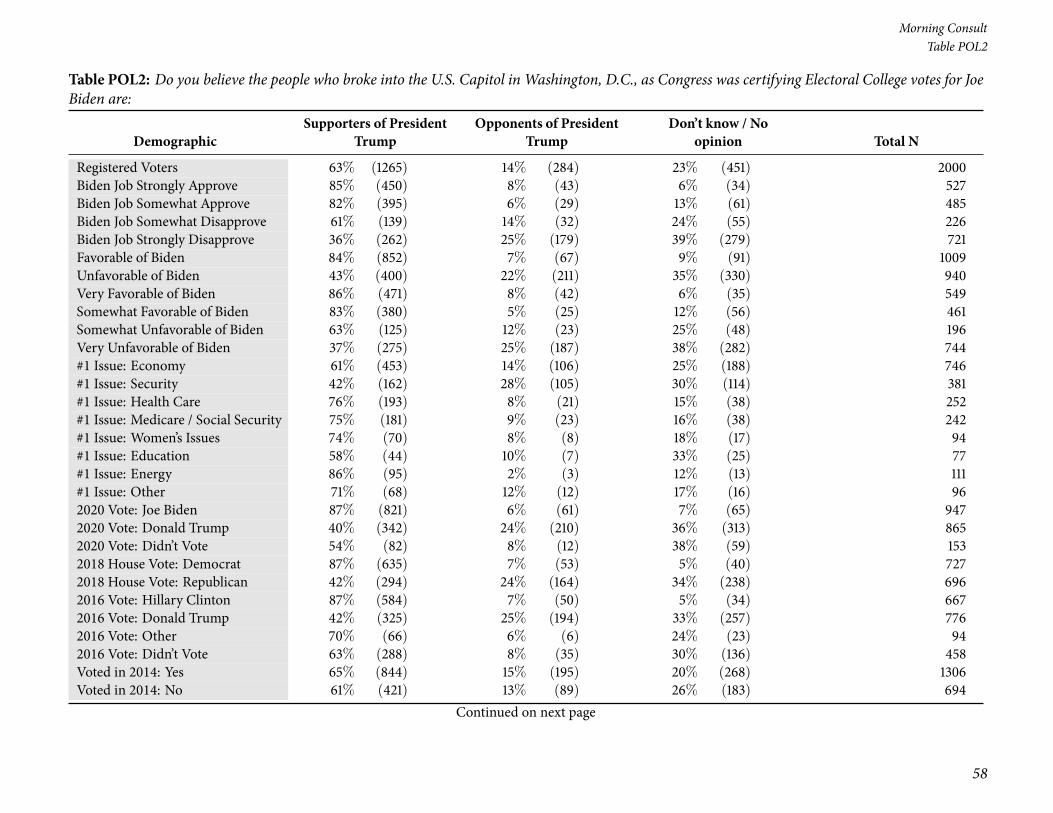
58
Morning ConsultTable POL2
Table POL2: Do you believe the people who broke into the U.S. Capitol in Washington, D.C., as Congress was certifying Electoral College votes for JoeBiden are:
DemographicSupporters of President
TrumpOpponents of President
TrumpDon’t know / No
opinion Total N
Registered Voters 63% (1265) 14% (284) 23% (451) 2000Biden Job Strongly Approve 85% (450) 8% (43) 6% (34) 527Biden Job Somewhat Approve 82% (395) 6% (29) 13% (61) 485Biden Job Somewhat Disapprove 61% (139) 14% (32) 24% (55) 226Biden Job Strongly Disapprove 36% (262) 25% (179) 39% (279) 721Favorable of Biden 84% (852) 7% (67) 9% (91) 1009Unfavorable of Biden 43% (400) 22% (211) 35% (330) 940Very Favorable of Biden 86% (471) 8% (42) 6% (35) 549Somewhat Favorable of Biden 83% (380) 5% (25) 12% (56) 461Somewhat Unfavorable of Biden 63% (125) 12% (23) 25% (48) 196Very Unfavorable of Biden 37% (275) 25% (187) 38% (282) 744#1 Issue: Economy 61% (453) 14% (106) 25% (188) 746#1 Issue: Security 42% (162) 28% (105) 30% (114) 381#1 Issue: Health Care 76% (193) 8% (21) 15% (38) 252#1 Issue: Medicare / Social Security 75% (181) 9% (23) 16% (38) 242#1 Issue: Women’s Issues 74% (70) 8% (8) 18% (17) 94#1 Issue: Education 58% (44) 10% (7) 33% (25) 77#1 Issue: Energy 86% (95) 2% (3) 12% (13) 111#1 Issue: Other 71% (68) 12% (12) 17% (16) 962020 Vote: Joe Biden 87% (821) 6% (61) 7% (65) 9472020 Vote: Donald Trump 40% (342) 24% (210) 36% (313) 8652020 Vote: Didn’t Vote 54% (82) 8% (12) 38% (59) 1532018 House Vote: Democrat 87% (635) 7% (53) 5% (40) 7272018 House Vote: Republican 42% (294) 24% (164) 34% (238) 6962016 Vote: Hillary Clinton 87% (584) 7% (50) 5% (34) 6672016 Vote: Donald Trump 42% (325) 25% (194) 33% (257) 7762016 Vote: Other 70% (66) 6% (6) 24% (23) 942016 Vote: Didn’t Vote 63% (288) 8% (35) 30% (136) 458Voted in 2014: Yes 65% (844) 15% (195) 20% (268) 1306Voted in 2014: No 61% (421) 13% (89) 26% (183) 694
Continued on next page

National Tracking Poll #2107125, July, 2021
59
Table POL2
Table POL2: Do you believe the people who broke into the U.S. Capitol in Washington, D.C., as Congress was certifying Electoral College votes for JoeBiden are:
DemographicSupporters of President
TrumpOpponents of President
TrumpDon’t know / No
opinion Total N
Registered Voters 63% (1265) 14% (284) 23% (451) 20004-Region: Northeast 66% (234) 12% (43) 22% (77) 3534-Region: Midwest 66% (294) 13% (57) 21% (94) 4454-Region: South 58% (431) 15% (109) 28% (205) 7464-Region: West 67% (306) 16% (74) 16% (75) 456Note: Row proportions may total to larger than one-hundred percent due to rounding. For more information visit MorningConsultIntelligence.com.
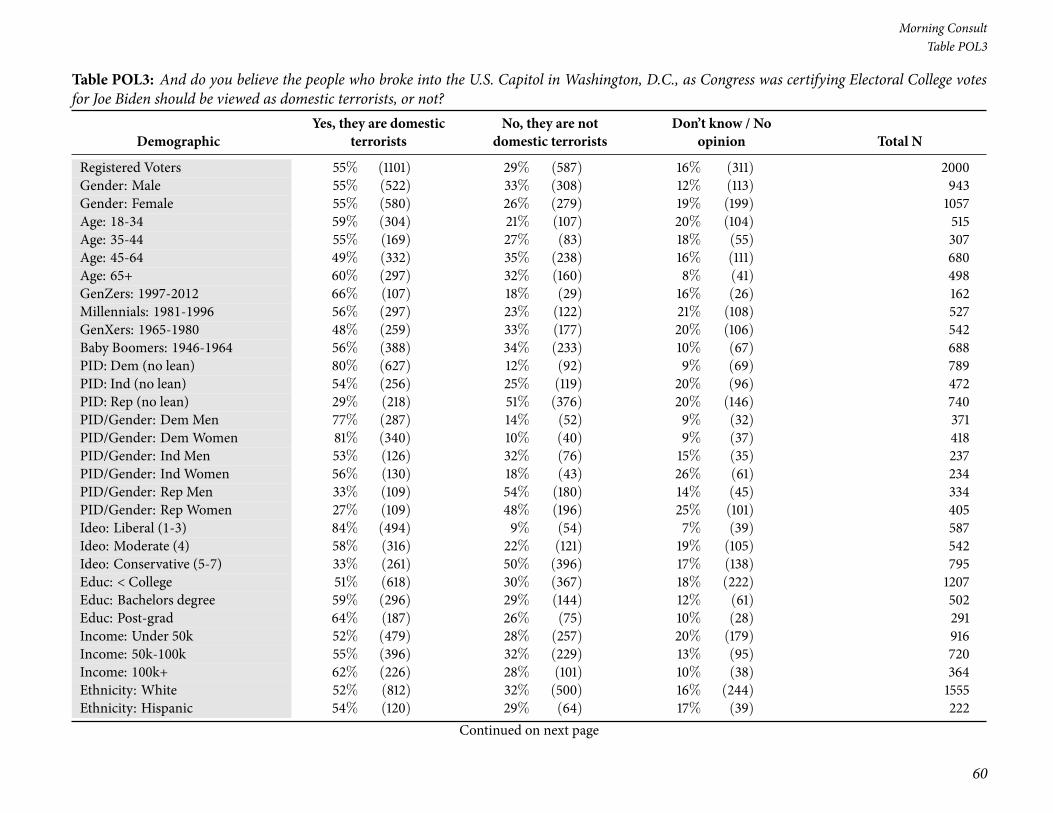
60
Morning ConsultTable POL3
Table POL3: And do you believe the people who broke into the U.S. Capitol in Washington, D.C., as Congress was certifying Electoral College votesfor Joe Biden should be viewed as domestic terrorists, or not?
DemographicYes, they are domestic
terroristsNo, they are not
domestic terroristsDon’t know / No
opinion Total N
Registered Voters 55% (1101) 29% (587) 16% (311) 2000Gender: Male 55% (522) 33% (308) 12% (113) 943Gender: Female 55% (580) 26% (279) 19% (199) 1057Age: 18-34 59% (304) 21% (107) 20% (104) 515Age: 35-44 55% (169) 27% (83) 18% (55) 307Age: 45-64 49% (332) 35% (238) 16% (111) 680Age: 65+ 60% (297) 32% (160) 8% (41) 498GenZers: 1997-2012 66% (107) 18% (29) 16% (26) 162Millennials: 1981-1996 56% (297) 23% (122) 21% (108) 527GenXers: 1965-1980 48% (259) 33% (177) 20% (106) 542Baby Boomers: 1946-1964 56% (388) 34% (233) 10% (67) 688PID: Dem (no lean) 80% (627) 12% (92) 9% (69) 789PID: Ind (no lean) 54% (256) 25% (119) 20% (96) 472PID: Rep (no lean) 29% (218) 51% (376) 20% (146) 740PID/Gender: DemMen 77% (287) 14% (52) 9% (32) 371PID/Gender: DemWomen 81% (340) 10% (40) 9% (37) 418PID/Gender: Ind Men 53% (126) 32% (76) 15% (35) 237PID/Gender: Ind Women 56% (130) 18% (43) 26% (61) 234PID/Gender: Rep Men 33% (109) 54% (180) 14% (45) 334PID/Gender: Rep Women 27% (109) 48% (196) 25% (101) 405Ideo: Liberal (1-3) 84% (494) 9% (54) 7% (39) 587Ideo: Moderate (4) 58% (316) 22% (121) 19% (105) 542Ideo: Conservative (5-7) 33% (261) 50% (396) 17% (138) 795Educ: < College 51% (618) 30% (367) 18% (222) 1207Educ: Bachelors degree 59% (296) 29% (144) 12% (61) 502Educ: Post-grad 64% (187) 26% (75) 10% (28) 291Income: Under 50k 52% (479) 28% (257) 20% (179) 916Income: 50k-100k 55% (396) 32% (229) 13% (95) 720Income: 100k+ 62% (226) 28% (101) 10% (38) 364Ethnicity: White 52% (812) 32% (500) 16% (244) 1555Ethnicity: Hispanic 54% (120) 29% (64) 17% (39) 222
Continued on next page

National Tracking Poll #2107125, July, 2021
61
Table POL3
Table POL3: And do you believe the people who broke into the U.S. Capitol in Washington, D.C., as Congress was certifying Electoral College votesfor Joe Biden should be viewed as domestic terrorists, or not?
DemographicYes, they are domestic
terroristsNo, they are not
domestic terroristsDon’t know / No
opinion Total N
Registered Voters 55% (1101) 29% (587) 16% (311) 2000Ethnicity: Black 66% (171) 18% (47) 15% (39) 257Ethnicity: Other 63% (119) 21% (40) 15% (29) 188All Christian 50% (525) 35% (361) 15% (159) 1045All Non-Christian 68% (82) 25% (30) 6% (8) 120Atheist 79% (78) 16% (16) 4% (4) 98Agnostic/Nothing in particular 61% (270) 21% (92) 19% (83) 445Something Else 50% (147) 30% (88) 20% (57) 292Religious Non-Protestant/Catholic 66% (94) 25% (36) 9% (13) 143Evangelical 45% (266) 36% (213) 19% (113) 591Non-Evangelical 55% (388) 32% (225) 14% (97) 710Community: Urban 64% (314) 23% (112) 14% (68) 494Community: Suburban 55% (544) 30% (295) 15% (150) 989Community: Rural 47% (243) 35% (180) 18% (93) 516Employ: Private Sector 54% (354) 33% (214) 13% (88) 656Employ: Government 63% (68) 21% (23) 16% (17) 109Employ: Self-Employed 46% (82) 30% (53) 25% (45) 180Employ: Homemaker 45% (78) 32% (56) 23% (40) 174Employ: Student 70% (45) 22% (14) 8% (5) 65Employ: Retired 60% (312) 30% (159) 9% (49) 520Employ: Unemployed 52% (104) 25% (49) 23% (46) 199Employ: Other 59% (57) 20% (19) 21% (20) 97Military HH: Yes 54% (205) 32% (122) 13% (50) 377Military HH: No 55% (897) 29% (465) 16% (261) 1623RD/WT: Right Direction 76% (659) 14% (117) 10% (91) 868RD/WT: Wrong Track 39% (442) 41% (470) 19% (220) 1132Biden Job Approve 80% (809) 11% (107) 9% (96) 1012Biden Job Disapprove 29% (273) 50% (476) 21% (198) 947
Continued on next page

62
Morning ConsultTable POL3
Table POL3: And do you believe the people who broke into the U.S. Capitol in Washington, D.C., as Congress was certifying Electoral College votesfor Joe Biden should be viewed as domestic terrorists, or not?
DemographicYes, they are domestic
terroristsNo, they are not
domestic terroristsDon’t know / No
opinion Total N
Registered Voters 55% (1101) 29% (587) 16% (311) 2000Biden Job Strongly Approve 82% (434) 11% (57) 7% (37) 527Biden Job Somewhat Approve 77% (375) 10% (50) 12% (59) 485Biden Job Somewhat Disapprove 45% (102) 30% (68) 25% (56) 226Biden Job Strongly Disapprove 24% (171) 57% (408) 20% (142) 721Favorable of Biden 80% (805) 11% (109) 9% (95) 1009Unfavorable of Biden 30% (278) 50% (474) 20% (188) 940Very Favorable of Biden 80% (439) 12% (63) 8% (47) 549Somewhat Favorable of Biden 80% (366) 10% (46) 10% (48) 461Somewhat Unfavorable of Biden 52% (102) 29% (57) 19% (37) 196Very Unfavorable of Biden 24% (175) 56% (418) 20% (151) 744#1 Issue: Economy 50% (374) 32% (238) 18% (134) 746#1 Issue: Security 35% (135) 47% (180) 17% (67) 381#1 Issue: Health Care 73% (183) 16% (39) 12% (30) 252#1 Issue: Medicare / Social Security 68% (163) 21% (51) 12% (28) 242#1 Issue: Women’s Issues 70% (66) 12% (11) 18% (17) 94#1 Issue: Education 44% (34) 29% (23) 26% (20) 77#1 Issue: Energy 78% (87) 17% (19) 4% (5) 111#1 Issue: Other 62% (60) 27% (26) 11% (10) 962020 Vote: Joe Biden 82% (778) 10% (94) 8% (75) 9472020 Vote: Donald Trump 27% (238) 53% (460) 19% (167) 8652020 Vote: Didn’t Vote 44% (68) 18% (28) 38% (57) 1532018 House Vote: Democrat 83% (606) 11% (82) 5% (39) 7272018 House Vote: Republican 29% (203) 53% (372) 17% (121) 6962016 Vote: Hillary Clinton 83% (553) 11% (73) 6% (41) 6672016 Vote: Donald Trump 30% (234) 53% (409) 17% (133) 7762016 Vote: Other 67% (63) 12% (11) 22% (20) 942016 Vote: Didn’t Vote 54% (249) 20% (93) 25% (117) 458Voted in 2014: Yes 56% (731) 31% (410) 13% (165) 1306Voted in 2014: No 53% (371) 26% (177) 21% (146) 694
Continued on next page

National Tracking Poll #2107125, July, 2021
63
Table POL3
Table POL3: And do you believe the people who broke into the U.S. Capitol in Washington, D.C., as Congress was certifying Electoral College votesfor Joe Biden should be viewed as domestic terrorists, or not?
DemographicYes, they are domestic
terroristsNo, they are not
domestic terroristsDon’t know / No
opinion Total N
Registered Voters 55% (1101) 29% (587) 16% (311) 20004-Region: Northeast 61% (215) 25% (87) 14% (51) 3534-Region: Midwest 56% (247) 30% (133) 14% (64) 4454-Region: South 51% (378) 32% (236) 18% (132) 7464-Region: West 57% (261) 29% (131) 14% (64) 456Note: Row proportions may total to larger than one-hundred percent due to rounding. For more information visit MorningConsultIntelligence.com.

64
Morning ConsultTable POL4_1
Table POL4_1: How responsible do you believe each of the following are for the events that led to a group of people attacking police and breaking intothe U.S. Capitol in Washington, D.C.?Democrats in Congress
DemographicVery
responsibleSomewhatresponsible
Not tooresponsible
Not responsibleat all
Don’t know /No opinion Total N
Registered Voters 18% (365) 16% (314) 13% (265) 40% (793) 13% (262) 2000Gender: Male 20% (190) 16% (154) 14% (132) 42% (392) 8% (75) 943Gender: Female 17% (175) 15% (160) 13% (133) 38% (401) 18% (187) 1057Age: 18-34 17% (86) 12% (64) 19% (100) 33% (168) 19% (97) 515Age: 35-44 22% (67) 13% (41) 11% (34) 37% (115) 16% (50) 307Age: 45-64 19% (128) 19% (131) 10% (65) 40% (274) 12% (81) 680Age: 65+ 17% (84) 16% (78) 13% (66) 47% (236) 7% (34) 498GenZers: 1997-2012 11% (18) 12% (20) 28% (46) 32% (51) 17% (27) 162Millennials: 1981-1996 21% (108) 13% (70) 15% (77) 34% (179) 18% (93) 527GenXers: 1965-1980 19% (105) 16% (85) 10% (56) 41% (221) 14% (75) 542Baby Boomers: 1946-1964 17% (118) 18% (125) 11% (74) 45% (310) 9% (61) 688PID: Dem (no lean) 9% (68) 7% (55) 15% (116) 61% (479) 9% (71) 789PID: Ind (no lean) 16% (75) 17% (81) 13% (62) 33% (156) 21% (97) 472PID: Rep (no lean) 30% (222) 24% (178) 12% (87) 21% (158) 13% (94) 740PID/Gender: DemMen 13% (49) 9% (34) 16% (60) 57% (210) 5% (18) 371PID/Gender: DemWomen 5% (20) 5% (21) 14% (56) 64% (268) 13% (53) 418PID/Gender: Ind Men 15% (36) 17% (41) 13% (32) 43% (101) 11% (27) 237PID/Gender: Ind Women 16% (38) 17% (40) 13% (31) 24% (55) 30% (70) 234PID/Gender: Rep Men 31% (105) 24% (79) 12% (40) 24% (80) 9% (29) 334PID/Gender: Rep Women 29% (117) 25% (99) 11% (46) 19% (78) 16% (64) 405Ideo: Liberal (1-3) 7% (39) 6% (35) 17% (97) 65% (383) 5% (32) 587Ideo: Moderate (4) 13% (68) 15% (82) 15% (80) 39% (209) 19% (103) 542Ideo: Conservative (5-7) 31% (246) 24% (191) 10% (77) 24% (187) 12% (95) 795Educ: < College 20% (247) 15% (186) 13% (158) 35% (423) 16% (195) 1207Educ: Bachelors degree 16% (78) 18% (90) 15% (74) 42% (209) 10% (50) 502Educ: Post-grad 14% (41) 13% (38) 11% (33) 56% (161) 6% (17) 291Income: Under 50k 19% (174) 13% (122) 13% (123) 37% (335) 18% (161) 916Income: 50k-100k 15% (107) 19% (134) 14% (101) 42% (304) 10% (74) 720Income: 100k+ 23% (84) 16% (59) 11% (41) 42% (154) 7% (26) 364Ethnicity: White 20% (313) 18% (277) 12% (192) 37% (575) 13% (198) 1555
Continued on next page

National Tracking Poll #2107125, July, 2021
65
Table POL4_1
Table POL4_1: How responsible do you believe each of the following are for the events that led to a group of people attacking police and breaking intothe U.S. Capitol in Washington, D.C.?Democrats in Congress
DemographicVery
responsibleSomewhatresponsible
Not tooresponsible
Not responsibleat all
Don’t know /No opinion Total N
Registered Voters 18% (365) 16% (314) 13% (265) 40% (793) 13% (262) 2000Ethnicity: Hispanic 14% (32) 13% (29) 20% (43) 42% (94) 11% (24) 222Ethnicity: Black 12% (30) 4% (10) 15% (40) 57% (145) 13% (32) 257Ethnicity: Other 12% (23) 14% (27) 18% (33) 39% (74) 17% (31) 188All Christian 22% (228) 19% (201) 12% (128) 37% (383) 10% (105) 1045All Non-Christian 22% (26) 15% (18) 14% (17) 38% (45) 12% (15) 120Atheist 3% (3) 7% (7) 12% (11) 69% (68) 9% (9) 98Agnostic/Nothing in particular 12% (52) 11% (48) 17% (75) 44% (197) 16% (73) 445Something Else 19% (56) 14% (41) 12% (34) 34% (100) 21% (61) 292Religious Non-Protestant/Catholic 20% (28) 17% (24) 16% (23) 35% (49) 13% (19) 143Evangelical 25% (151) 19% (110) 10% (61) 33% (193) 13% (77) 591Non-Evangelical 19% (132) 18% (125) 13% (90) 40% (282) 11% (81) 710Community: Urban 19% (92) 13% (62) 14% (69) 43% (211) 12% (61) 494Community: Suburban 15% (151) 18% (177) 15% (146) 40% (400) 12% (115) 989Community: Rural 24% (122) 15% (75) 10% (51) 35% (182) 17% (86) 516Employ: Private Sector 20% (131) 17% (111) 13% (86) 40% (260) 10% (68) 656Employ: Government 16% (17) 20% (22) 13% (14) 39% (42) 12% (13) 109Employ: Self-Employed 22% (40) 17% (31) 14% (25) 33% (60) 14% (25) 180Employ: Homemaker 23% (40) 18% (31) 11% (18) 29% (50) 20% (35) 174Employ: Student 6% (4) 13% (8) 24% (15) 35% (23) 22% (15) 65Employ: Retired 17% (89) 14% (75) 13% (69) 47% (245) 8% (42) 520Employ: Unemployed 12% (25) 16% (31) 11% (23) 40% (80) 20% (40) 199Employ: Other 21% (21) 5% (5) 15% (14) 33% (32) 26% (25) 97Military HH: Yes 22% (84) 18% (68) 14% (53) 38% (143) 8% (30) 377Military HH: No 17% (282) 15% (246) 13% (212) 40% (651) 14% (232) 1623RD/WT: Right Direction 8% (73) 8% (72) 16% (137) 57% (498) 10% (87) 868RD/WT: Wrong Track 26% (293) 21% (242) 11% (128) 26% (295) 15% (175) 1132Biden Job Approve 7% (75) 8% (83) 16% (158) 59% (599) 10% (97) 1012Biden Job Disapprove 30% (285) 24% (228) 11% (105) 20% (186) 15% (142) 947
Continued on next page

66
Morning ConsultTable POL4_1
Table POL4_1: How responsible do you believe each of the following are for the events that led to a group of people attacking police and breaking intothe U.S. Capitol in Washington, D.C.?Democrats in Congress
DemographicVery
responsibleSomewhatresponsible
Not tooresponsible
Not responsibleat all
Don’t know /No opinion Total N
Registered Voters 18% (365) 16% (314) 13% (265) 40% (793) 13% (262) 2000Biden Job Strongly Approve 10% (54) 4% (23) 11% (60) 70% (367) 4% (23) 527Biden Job Somewhat Approve 4% (21) 12% (60) 20% (98) 48% (233) 15% (73) 485Biden Job Somewhat Disapprove 10% (22) 28% (63) 18% (41) 25% (56) 20% (45) 226Biden Job Strongly Disapprove 37% (263) 23% (165) 9% (64) 18% (131) 14% (98) 721Favorable of Biden 7% (71) 8% (84) 16% (159) 60% (604) 9% (91) 1009Unfavorable of Biden 31% (288) 24% (227) 10% (98) 20% (187) 15% (141) 940Very Favorable of Biden 10% (54) 5% (27) 11% (59) 69% (381) 5% (28) 549Somewhat Favorable of Biden 4% (16) 13% (58) 22% (100) 48% (223) 14% (63) 461Somewhat Unfavorable of Biden 10% (19) 26% (52) 17% (34) 25% (49) 21% (42) 196Very Unfavorable of Biden 36% (269) 23% (175) 9% (64) 18% (137) 13% (99) 744#1 Issue: Economy 16% (116) 17% (124) 14% (102) 39% (291) 15% (113) 746#1 Issue: Security 37% (141) 26% (98) 7% (28) 20% (75) 10% (38) 381#1 Issue: Health Care 10% (26) 10% (26) 19% (49) 52% (131) 8% (20) 252#1 Issue: Medicare / Social Security 16% (40) 13% (31) 11% (27) 49% (119) 10% (24) 242#1 Issue: Women’s Issues 9% (9) 7% (7) 18% (17) 44% (41) 22% (21) 94#1 Issue: Education 13% (10) 15% (11) 11% (9) 34% (27) 26% (20) 77#1 Issue: Energy 6% (7) 6% (6) 22% (25) 55% (61) 11% (12) 111#1 Issue: Other 18% (17) 10% (10) 8% (8) 50% (49) 13% (13) 962020 Vote: Joe Biden 6% (61) 8% (72) 16% (154) 62% (583) 8% (76) 9472020 Vote: Donald Trump 32% (280) 25% (220) 10% (84) 19% (161) 14% (119) 8652020 Vote: Didn’t Vote 13% (20) 10% (16) 15% (23) 25% (38) 36% (55) 1532018 House Vote: Democrat 7% (54) 7% (53) 14% (104) 66% (482) 5% (33) 7272018 House Vote: Republican 34% (233) 25% (174) 9% (65) 19% (131) 13% (92) 6962016 Vote: Hillary Clinton 7% (48) 6% (41) 13% (85) 69% (459) 5% (34) 6672016 Vote: Donald Trump 34% (266) 24% (189) 10% (74) 20% (152) 12% (95) 7762016 Vote: Other 4% (4) 9% (8) 25% (24) 42% (39) 20% (19) 942016 Vote: Didn’t Vote 10% (47) 16% (74) 18% (81) 31% (142) 25% (114) 458Voted in 2014: Yes 20% (262) 16% (212) 12% (154) 43% (564) 9% (114) 1306Voted in 2014: No 15% (103) 15% (102) 16% (111) 33% (230) 21% (148) 694
Continued on next page

National Tracking Poll #2107125, July, 2021
67
Table POL4_1
Table POL4_1: How responsible do you believe each of the following are for the events that led to a group of people attacking police and breaking intothe U.S. Capitol in Washington, D.C.?Democrats in Congress
DemographicVery
responsibleSomewhatresponsible
Not tooresponsible
Not responsibleat all
Don’t know /No opinion Total N
Registered Voters 18% (365) 16% (314) 13% (265) 40% (793) 13% (262) 20004-Region: Northeast 19% (66) 14% (48) 13% (44) 42% (148) 13% (48) 3534-Region: Midwest 20% (87) 13% (60) 13% (59) 40% (179) 14% (60) 4454-Region: South 19% (138) 18% (132) 12% (93) 39% (292) 12% (91) 7464-Region: West 16% (75) 16% (74) 15% (69) 38% (175) 14% (63) 456Note: Row proportions may total to larger than one-hundred percent due to rounding. For more information visit MorningConsultIntelligence.com.

68
Morning ConsultTable POL4_2
Table POL4_2: How responsible do you believe each of the following are for the events that led to a group of people attacking police and breaking intothe U.S. Capitol in Washington, D.C.?Republicans in Congress
DemographicVery
responsibleSomewhatresponsible
Not tooresponsible
Not responsibleat all
Don’t know /No opinion Total N
Registered Voters 23% (462) 24% (482) 13% (256) 28% (564) 12% (236) 2000Gender: Male 26% (241) 23% (219) 13% (124) 30% (282) 8% (77) 943Gender: Female 21% (221) 25% (263) 12% (132) 27% (281) 15% (159) 1057Age: 18-34 29% (148) 21% (110) 11% (58) 18% (92) 21% (106) 515Age: 35-44 22% (68) 27% (82) 10% (30) 28% (85) 14% (42) 307Age: 45-64 21% (143) 22% (150) 13% (91) 33% (227) 10% (69) 680Age: 65+ 21% (103) 28% (139) 16% (78) 32% (159) 4% (19) 498GenZers: 1997-2012 35% (57) 25% (41) 9% (15) 13% (21) 17% (28) 162Millennials: 1981-1996 25% (133) 22% (115) 12% (64) 22% (114) 19% (102) 527GenXers: 1965-1980 19% (103) 23% (125) 13% (72) 33% (179) 12% (63) 542Baby Boomers: 1946-1964 22% (154) 26% (179) 14% (93) 32% (222) 6% (39) 688PID: Dem (no lean) 40% (314) 33% (257) 8% (62) 11% (86) 9% (70) 789PID: Ind (no lean) 19% (91) 23% (109) 17% (79) 22% (105) 18% (87) 472PID: Rep (no lean) 8% (57) 16% (116) 16% (115) 50% (373) 11% (79) 740PID/Gender: DemMen 42% (157) 30% (113) 10% (37) 10% (39) 7% (25) 371PID/Gender: DemWomen 37% (157) 34% (144) 6% (25) 11% (47) 11% (45) 418PID/Gender: Ind Men 22% (52) 23% (55) 17% (41) 26% (61) 12% (28) 237PID/Gender: Ind Women 17% (40) 23% (54) 16% (38) 19% (44) 25% (59) 234PID/Gender: Rep Men 10% (32) 15% (50) 14% (46) 55% (182) 7% (24) 334PID/Gender: Rep Women 6% (25) 16% (65) 17% (69) 47% (191) 14% (55) 405Ideo: Liberal (1-3) 42% (248) 35% (205) 9% (52) 9% (55) 5% (28) 587Ideo: Moderate (4) 23% (127) 26% (142) 11% (61) 21% (112) 18% (100) 542Ideo: Conservative (5-7) 9% (70) 16% (124) 17% (138) 48% (380) 11% (84) 795Educ: < College 22% (264) 21% (254) 13% (153) 30% (365) 14% (172) 1207Educ: Bachelors degree 22% (110) 28% (143) 14% (71) 26% (128) 10% (49) 502Educ: Post-grad 30% (87) 29% (86) 11% (32) 24% (70) 5% (15) 291Income: Under 50k 22% (203) 23% (210) 13% (115) 26% (241) 16% (147) 916Income: 50k-100k 22% (158) 26% (190) 14% (98) 30% (214) 8% (60) 720Income: 100k+ 28% (101) 23% (83) 12% (43) 30% (109) 8% (29) 364Ethnicity: White 21% (325) 24% (367) 13% (202) 31% (485) 11% (176) 1555
Continued on next page

National Tracking Poll #2107125, July, 2021
69
Table POL4_2
Table POL4_2: How responsible do you believe each of the following are for the events that led to a group of people attacking police and breaking intothe U.S. Capitol in Washington, D.C.?Republicans in Congress
DemographicVery
responsibleSomewhatresponsible
Not tooresponsible
Not responsibleat all
Don’t know /No opinion Total N
Registered Voters 23% (462) 24% (482) 13% (256) 28% (564) 12% (236) 2000Ethnicity: Hispanic 29% (65) 24% (54) 10% (21) 25% (55) 12% (27) 222Ethnicity: Black 38% (96) 21% (55) 11% (29) 16% (42) 13% (34) 257Ethnicity: Other 21% (40) 32% (60) 13% (25) 19% (37) 14% (26) 188All Christian 19% (203) 24% (253) 14% (141) 35% (363) 8% (84) 1045All Non-Christian 29% (35) 30% (37) 6% (7) 27% (32) 8% (9) 120Atheist 35% (34) 24% (23) 12% (12) 12% (12) 17% (17) 98Agnostic/Nothing in particular 26% (117) 25% (110) 13% (57) 20% (87) 17% (74) 445Something Else 25% (73) 20% (59) 13% (39) 24% (69) 18% (51) 292Religious Non-Protestant/Catholic 27% (38) 28% (40) 8% (12) 27% (39) 9% (13) 143Evangelical 19% (110) 21% (126) 13% (76) 37% (220) 10% (60) 591Non-Evangelical 22% (159) 25% (181) 14% (96) 29% (204) 10% (70) 710Community: Urban 30% (150) 25% (125) 9% (43) 24% (119) 12% (57) 494Community: Suburban 23% (229) 24% (238) 15% (147) 27% (269) 11% (106) 989Community: Rural 16% (83) 23% (119) 13% (66) 34% (175) 14% (73) 516Employ: Private Sector 23% (153) 23% (154) 12% (80) 30% (200) 11% (70) 656Employ: Government 28% (31) 22% (24) 15% (16) 22% (24) 12% (13) 109Employ: Self-Employed 25% (45) 23% (41) 13% (24) 27% (48) 12% (22) 180Employ: Homemaker 10% (17) 16% (28) 22% (39) 39% (67) 13% (23) 174Employ: Student 31% (20) 30% (20) 11% (7) 6% (4) 21% (14) 65Employ: Retired 21% (110) 29% (149) 13% (67) 32% (167) 5% (27) 520Employ: Unemployed 30% (59) 23% (45) 10% (20) 16% (32) 22% (43) 199Employ: Other 28% (27) 22% (21) 3% (3) 22% (21) 24% (23) 97Military HH: Yes 18% (69) 25% (94) 15% (55) 35% (132) 7% (27) 377Military HH: No 24% (393) 24% (388) 12% (201) 27% (431) 13% (209) 1623RD/WT: Right Direction 37% (318) 33% (283) 10% (83) 11% (98) 10% (86) 868RD/WT: Wrong Track 13% (144) 18% (199) 15% (173) 41% (466) 13% (150) 1132Biden Job Approve 38% (385) 33% (332) 9% (94) 10% (100) 10% (100) 1012Biden Job Disapprove 8% (73) 15% (143) 17% (161) 48% (454) 12% (116) 947
Continued on next page

70
Morning ConsultTable POL4_2
Table POL4_2: How responsible do you believe each of the following are for the events that led to a group of people attacking police and breaking intothe U.S. Capitol in Washington, D.C.?Republicans in Congress
DemographicVery
responsibleSomewhatresponsible
Not tooresponsible
Not responsibleat all
Don’t know /No opinion Total N
Registered Voters 23% (462) 24% (482) 13% (256) 28% (564) 12% (236) 2000Biden Job Strongly Approve 46% (245) 31% (166) 6% (31) 10% (54) 6% (31) 527Biden Job Somewhat Approve 29% (140) 34% (166) 13% (64) 9% (46) 14% (69) 485Biden Job Somewhat Disapprove 12% (26) 26% (58) 17% (39) 28% (63) 18% (40) 226Biden Job Strongly Disapprove 7% (47) 12% (85) 17% (122) 54% (390) 11% (76) 721Favorable of Biden 39% (389) 34% (342) 10% (97) 9% (93) 9% (89) 1009Unfavorable of Biden 7% (67) 15% (138) 17% (158) 49% (459) 13% (118) 940Very Favorable of Biden 48% (261) 30% (163) 7% (40) 10% (56) 5% (29) 549Somewhat Favorable of Biden 28% (128) 39% (178) 12% (57) 8% (37) 13% (60) 461Somewhat Unfavorable of Biden 11% (22) 27% (52) 15% (29) 28% (56) 19% (38) 196Very Unfavorable of Biden 6% (45) 12% (86) 17% (130) 54% (404) 11% (80) 744#1 Issue: Economy 19% (145) 25% (188) 15% (114) 28% (206) 12% (93) 746#1 Issue: Security 9% (36) 17% (65) 15% (57) 49% (187) 9% (36) 381#1 Issue: Health Care 39% (97) 21% (54) 12% (30) 18% (45) 11% (27) 252#1 Issue: Medicare / Social Security 27% (65) 28% (67) 12% (29) 24% (57) 10% (23) 242#1 Issue: Women’s Issues 33% (31) 26% (25) 6% (6) 14% (14) 20% (19) 94#1 Issue: Education 23% (18) 22% (17) 7% (5) 21% (16) 27% (21) 77#1 Issue: Energy 33% (36) 37% (41) 8% (9) 16% (18) 5% (6) 111#1 Issue: Other 36% (35) 25% (24) 5% (5) 22% (21) 12% (11) 962020 Vote: Joe Biden 41% (385) 33% (313) 8% (78) 10% (96) 8% (75) 9472020 Vote: Donald Trump 6% (50) 14% (125) 18% (155) 51% (439) 11% (96) 8652020 Vote: Didn’t Vote 15% (23) 22% (33) 14% (21) 15% (22) 34% (53) 1532018 House Vote: Democrat 41% (300) 34% (247) 9% (64) 11% (81) 5% (36) 7272018 House Vote: Republican 7% (47) 17% (118) 16% (109) 50% (351) 10% (71) 6962016 Vote: Hillary Clinton 42% (279) 34% (228) 8% (52) 10% (69) 6% (40) 6672016 Vote: Donald Trump 7% (51) 16% (121) 17% (134) 51% (393) 10% (76) 7762016 Vote: Other 24% (23) 28% (26) 10% (9) 21% (20) 17% (16) 942016 Vote: Didn’t Vote 23% (106) 23% (107) 13% (61) 17% (80) 23% (104) 458Voted in 2014: Yes 24% (308) 25% (323) 12% (162) 31% (407) 8% (107) 1306Voted in 2014: No 22% (154) 23% (159) 14% (94) 23% (157) 19% (129) 694
Continued on next page

National Tracking Poll #2107125, July, 2021
71
Table POL4_2
Table POL4_2: How responsible do you believe each of the following are for the events that led to a group of people attacking police and breaking intothe U.S. Capitol in Washington, D.C.?Republicans in Congress
DemographicVery
responsibleSomewhatresponsible
Not tooresponsible
Not responsibleat all
Don’t know /No opinion Total N
Registered Voters 23% (462) 24% (482) 13% (256) 28% (564) 12% (236) 20004-Region: Northeast 25% (88) 25% (89) 12% (42) 25% (89) 13% (45) 3534-Region: Midwest 22% (100) 24% (108) 17% (75) 24% (106) 13% (56) 4454-Region: South 23% (172) 23% (175) 12% (88) 31% (228) 11% (83) 7464-Region: West 22% (102) 24% (110) 11% (51) 31% (140) 11% (52) 456Note: Row proportions may total to larger than one-hundred percent due to rounding. For more information visit MorningConsultIntelligence.com.
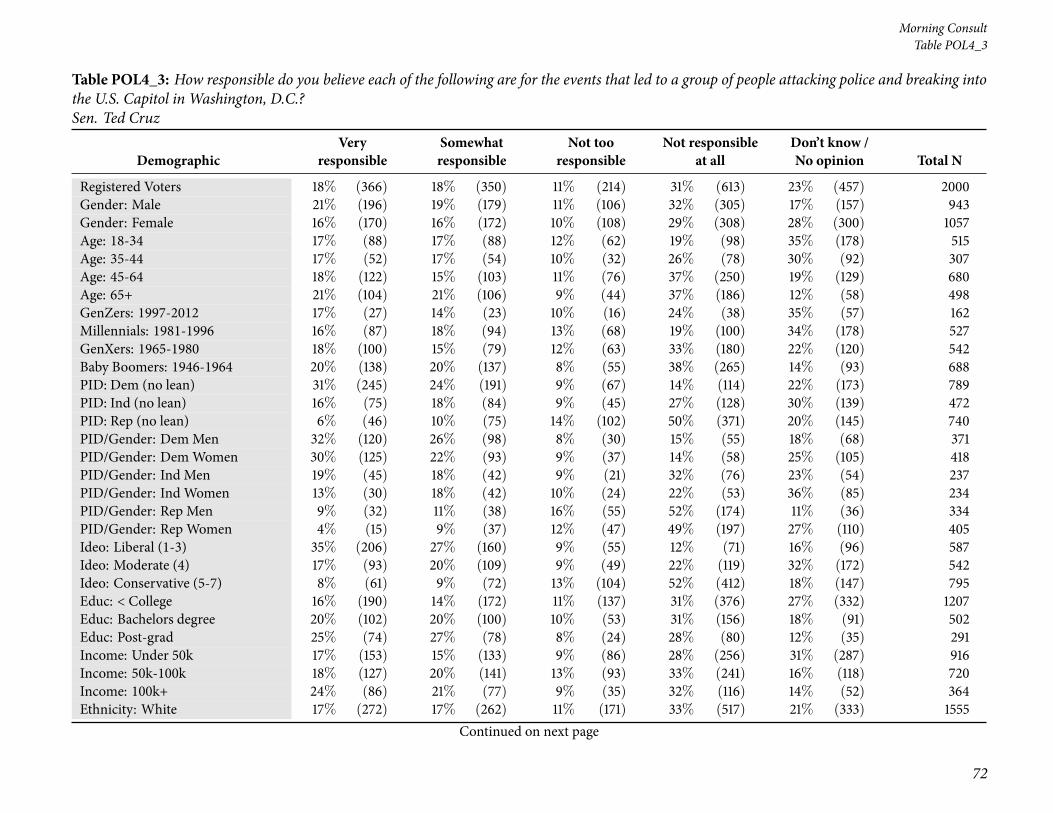
72
Morning ConsultTable POL4_3
Table POL4_3: How responsible do you believe each of the following are for the events that led to a group of people attacking police and breaking intothe U.S. Capitol in Washington, D.C.?Sen. Ted Cruz
DemographicVery
responsibleSomewhatresponsible
Not tooresponsible
Not responsibleat all
Don’t know /No opinion Total N
Registered Voters 18% (366) 18% (350) 11% (214) 31% (613) 23% (457) 2000Gender: Male 21% (196) 19% (179) 11% (106) 32% (305) 17% (157) 943Gender: Female 16% (170) 16% (172) 10% (108) 29% (308) 28% (300) 1057Age: 18-34 17% (88) 17% (88) 12% (62) 19% (98) 35% (178) 515Age: 35-44 17% (52) 17% (54) 10% (32) 26% (78) 30% (92) 307Age: 45-64 18% (122) 15% (103) 11% (76) 37% (250) 19% (129) 680Age: 65+ 21% (104) 21% (106) 9% (44) 37% (186) 12% (58) 498GenZers: 1997-2012 17% (27) 14% (23) 10% (16) 24% (38) 35% (57) 162Millennials: 1981-1996 16% (87) 18% (94) 13% (68) 19% (100) 34% (178) 527GenXers: 1965-1980 18% (100) 15% (79) 12% (63) 33% (180) 22% (120) 542Baby Boomers: 1946-1964 20% (138) 20% (137) 8% (55) 38% (265) 14% (93) 688PID: Dem (no lean) 31% (245) 24% (191) 9% (67) 14% (114) 22% (173) 789PID: Ind (no lean) 16% (75) 18% (84) 9% (45) 27% (128) 30% (139) 472PID: Rep (no lean) 6% (46) 10% (75) 14% (102) 50% (371) 20% (145) 740PID/Gender: DemMen 32% (120) 26% (98) 8% (30) 15% (55) 18% (68) 371PID/Gender: DemWomen 30% (125) 22% (93) 9% (37) 14% (58) 25% (105) 418PID/Gender: Ind Men 19% (45) 18% (42) 9% (21) 32% (76) 23% (54) 237PID/Gender: Ind Women 13% (30) 18% (42) 10% (24) 22% (53) 36% (85) 234PID/Gender: Rep Men 9% (32) 11% (38) 16% (55) 52% (174) 11% (36) 334PID/Gender: Rep Women 4% (15) 9% (37) 12% (47) 49% (197) 27% (110) 405Ideo: Liberal (1-3) 35% (206) 27% (160) 9% (55) 12% (71) 16% (96) 587Ideo: Moderate (4) 17% (93) 20% (109) 9% (49) 22% (119) 32% (172) 542Ideo: Conservative (5-7) 8% (61) 9% (72) 13% (104) 52% (412) 18% (147) 795Educ: < College 16% (190) 14% (172) 11% (137) 31% (376) 27% (332) 1207Educ: Bachelors degree 20% (102) 20% (100) 10% (53) 31% (156) 18% (91) 502Educ: Post-grad 25% (74) 27% (78) 8% (24) 28% (80) 12% (35) 291Income: Under 50k 17% (153) 15% (133) 9% (86) 28% (256) 31% (287) 916Income: 50k-100k 18% (127) 20% (141) 13% (93) 33% (241) 16% (118) 720Income: 100k+ 24% (86) 21% (77) 9% (35) 32% (116) 14% (52) 364Ethnicity: White 17% (272) 17% (262) 11% (171) 33% (517) 21% (333) 1555
Continued on next page

National Tracking Poll #2107125, July, 2021
73
Table POL4_3
Table POL4_3: How responsible do you believe each of the following are for the events that led to a group of people attacking police and breaking intothe U.S. Capitol in Washington, D.C.?Sen. Ted Cruz
DemographicVery
responsibleSomewhatresponsible
Not tooresponsible
Not responsibleat all
Don’t know /No opinion Total N
Registered Voters 18% (366) 18% (350) 11% (214) 31% (613) 23% (457) 2000Ethnicity: Hispanic 22% (48) 16% (36) 13% (28) 30% (66) 20% (44) 222Ethnicity: Black 24% (63) 18% (47) 11% (29) 16% (42) 30% (76) 257Ethnicity: Other 16% (31) 22% (42) 7% (14) 28% (53) 26% (48) 188All Christian 16% (163) 18% (184) 12% (127) 38% (396) 17% (175) 1045All Non-Christian 24% (29) 27% (32) 7% (8) 26% (31) 16% (19) 120Atheist 32% (31) 25% (25) 6% (6) 14% (14) 23% (23) 98Agnostic/Nothing in particular 21% (94) 17% (76) 10% (45) 21% (91) 31% (138) 445Something Else 16% (48) 11% (33) 10% (28) 28% (81) 35% (103) 292Religious Non-Protestant/Catholic 23% (33) 26% (37) 8% (12) 24% (35) 18% (26) 143Evangelical 12% (74) 16% (94) 9% (52) 39% (231) 24% (141) 591Non-Evangelical 19% (134) 16% (114) 14% (97) 33% (238) 18% (127) 710Community: Urban 22% (110) 19% (96) 9% (43) 23% (113) 27% (133) 494Community: Suburban 18% (178) 18% (174) 12% (121) 34% (333) 19% (184) 989Community: Rural 15% (78) 16% (80) 10% (50) 32% (167) 27% (141) 516Employ: Private Sector 19% (125) 20% (128) 12% (81) 30% (196) 19% (126) 656Employ: Government 20% (22) 16% (17) 15% (16) 28% (30) 21% (23) 109Employ: Self-Employed 17% (31) 16% (29) 9% (16) 26% (48) 31% (56) 180Employ: Homemaker 10% (17) 11% (19) 13% (23) 37% (65) 29% (50) 174Employ: Student 11% (7) 18% (12) 5% (3) 18% (11) 48% (31) 65Employ: Retired 21% (111) 21% (112) 9% (46) 37% (191) 12% (61) 520Employ: Unemployed 18% (36) 12% (23) 11% (22) 23% (46) 36% (72) 199Employ: Other 17% (17) 10% (10) 7% (7) 26% (25) 40% (38) 97Military HH: Yes 13% (48) 19% (70) 11% (42) 42% (157) 16% (60) 377Military HH: No 20% (318) 17% (280) 11% (172) 28% (456) 24% (397) 1623RD/WT: Right Direction 30% (257) 27% (233) 9% (80) 14% (124) 20% (174) 868RD/WT: Wrong Track 10% (109) 10% (117) 12% (134) 43% (489) 25% (284) 1132Biden Job Approve 30% (304) 26% (266) 9% (88) 14% (142) 21% (212) 1012Biden Job Disapprove 6% (59) 9% (83) 13% (126) 49% (461) 23% (218) 947
Continued on next page

74
Morning ConsultTable POL4_3
Table POL4_3: How responsible do you believe each of the following are for the events that led to a group of people attacking police and breaking intothe U.S. Capitol in Washington, D.C.?Sen. Ted Cruz
DemographicVery
responsibleSomewhatresponsible
Not tooresponsible
Not responsibleat all
Don’t know /No opinion Total N
Registered Voters 18% (366) 18% (350) 11% (214) 31% (613) 23% (457) 2000Biden Job Strongly Approve 39% (206) 25% (130) 6% (32) 14% (76) 16% (83) 527Biden Job Somewhat Approve 20% (97) 28% (136) 11% (56) 14% (66) 27% (129) 485Biden Job Somewhat Disapprove 10% (22) 17% (39) 18% (40) 24% (55) 31% (70) 226Biden Job Strongly Disapprove 5% (36) 6% (44) 12% (86) 56% (406) 21% (148) 721Favorable of Biden 31% (308) 27% (270) 9% (89) 13% (133) 21% (209) 1009Unfavorable of Biden 6% (55) 8% (79) 13% (121) 50% (470) 23% (216) 940Very Favorable of Biden 38% (208) 24% (134) 6% (35) 14% (80) 17% (92) 549Somewhat Favorable of Biden 22% (100) 30% (136) 12% (54) 12% (54) 25% (117) 461Somewhat Unfavorable of Biden 10% (20) 17% (34) 14% (28) 27% (53) 31% (61) 196Very Unfavorable of Biden 5% (35) 6% (45) 12% (93) 56% (417) 21% (155) 744#1 Issue: Economy 13% (97) 19% (139) 14% (101) 30% (225) 25% (184) 746#1 Issue: Security 8% (32) 9% (33) 10% (38) 57% (217) 16% (61) 381#1 Issue: Health Care 33% (84) 17% (43) 9% (22) 19% (48) 22% (55) 252#1 Issue: Medicare / Social Security 25% (61) 17% (41) 11% (27) 22% (54) 24% (58) 242#1 Issue: Women’s Issues 19% (18) 31% (29) 9% (8) 9% (9) 32% (30) 94#1 Issue: Education 16% (12) 22% (17) 13% (10) 13% (10) 36% (28) 77#1 Issue: Energy 32% (36) 23% (26) 5% (6) 19% (21) 20% (23) 111#1 Issue: Other 27% (26) 22% (21) 3% (2) 30% (28) 19% (18) 962020 Vote: Joe Biden 33% (309) 27% (252) 8% (77) 14% (129) 19% (180) 9472020 Vote: Donald Trump 4% (34) 9% (79) 13% (116) 52% (449) 22% (187) 8652020 Vote: Didn’t Vote 12% (19) 9% (14) 12% (18) 18% (28) 48% (73) 1532018 House Vote: Democrat 35% (254) 27% (200) 9% (64) 15% (107) 14% (102) 7272018 House Vote: Republican 7% (46) 10% (70) 13% (93) 52% (360) 18% (126) 6962016 Vote: Hillary Clinton 36% (237) 27% (179) 8% (56) 14% (94) 15% (100) 6672016 Vote: Donald Trump 6% (45) 10% (76) 12% (95) 54% (416) 18% (143) 7762016 Vote: Other 27% (26) 21% (20) 16% (15) 12% (12) 23% (21) 942016 Vote: Didn’t Vote 12% (56) 16% (73) 10% (47) 19% (89) 42% (193) 458Voted in 2014: Yes 21% (273) 18% (234) 12% (153) 33% (425) 17% (221) 1306Voted in 2014: No 13% (92) 17% (116) 9% (61) 27% (187) 34% (237) 694
Continued on next page

National Tracking Poll #2107125, July, 2021
75
Table POL4_3
Table POL4_3: How responsible do you believe each of the following are for the events that led to a group of people attacking police and breaking intothe U.S. Capitol in Washington, D.C.?Sen. Ted Cruz
DemographicVery
responsibleSomewhatresponsible
Not tooresponsible
Not responsibleat all
Don’t know /No opinion Total N
Registered Voters 18% (366) 18% (350) 11% (214) 31% (613) 23% (457) 20004-Region: Northeast 22% (76) 16% (57) 9% (32) 30% (106) 23% (82) 3534-Region: Midwest 18% (79) 18% (80) 12% (55) 29% (127) 23% (104) 4454-Region: South 17% (124) 17% (127) 11% (82) 32% (242) 23% (171) 7464-Region: West 19% (86) 19% (87) 10% (45) 30% (138) 22% (99) 456Note: Row proportions may total to larger than one-hundred percent due to rounding. For more information visit MorningConsultIntelligence.com.
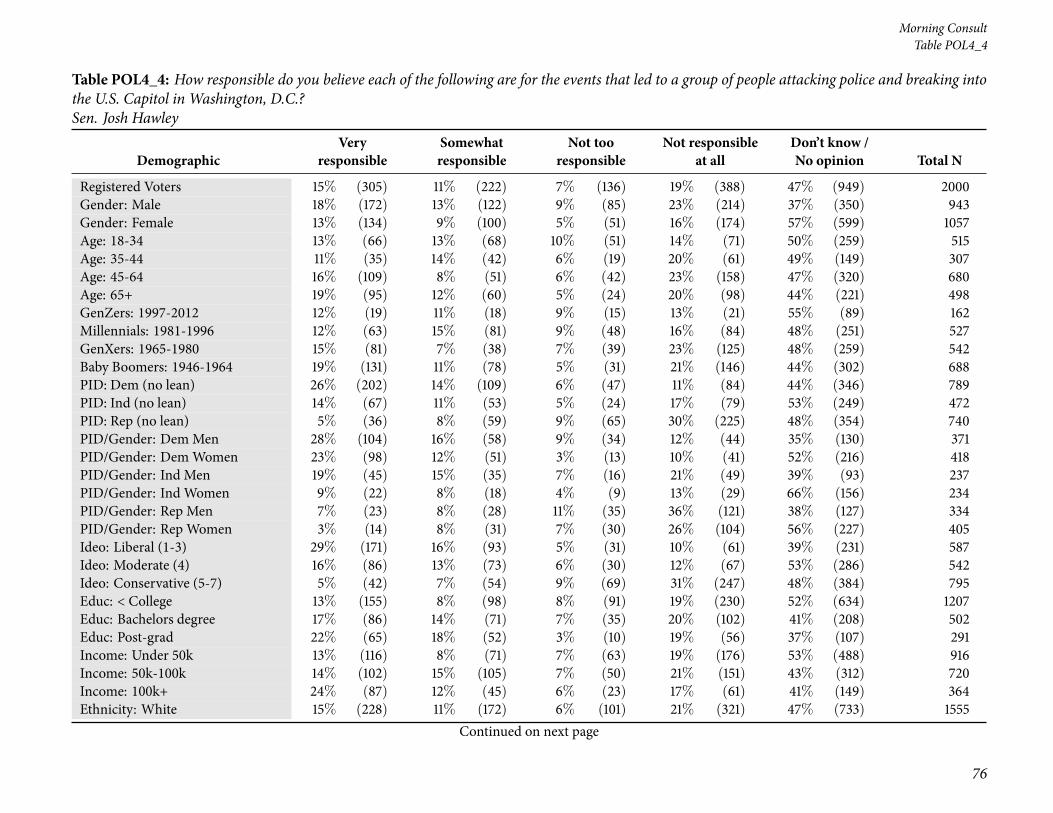
76
Morning ConsultTable POL4_4
Table POL4_4: How responsible do you believe each of the following are for the events that led to a group of people attacking police and breaking intothe U.S. Capitol in Washington, D.C.?Sen. Josh Hawley
DemographicVery
responsibleSomewhatresponsible
Not tooresponsible
Not responsibleat all
Don’t know /No opinion Total N
Registered Voters 15% (305) 11% (222) 7% (136) 19% (388) 47% (949) 2000Gender: Male 18% (172) 13% (122) 9% (85) 23% (214) 37% (350) 943Gender: Female 13% (134) 9% (100) 5% (51) 16% (174) 57% (599) 1057Age: 18-34 13% (66) 13% (68) 10% (51) 14% (71) 50% (259) 515Age: 35-44 11% (35) 14% (42) 6% (19) 20% (61) 49% (149) 307Age: 45-64 16% (109) 8% (51) 6% (42) 23% (158) 47% (320) 680Age: 65+ 19% (95) 12% (60) 5% (24) 20% (98) 44% (221) 498GenZers: 1997-2012 12% (19) 11% (18) 9% (15) 13% (21) 55% (89) 162Millennials: 1981-1996 12% (63) 15% (81) 9% (48) 16% (84) 48% (251) 527GenXers: 1965-1980 15% (81) 7% (38) 7% (39) 23% (125) 48% (259) 542Baby Boomers: 1946-1964 19% (131) 11% (78) 5% (31) 21% (146) 44% (302) 688PID: Dem (no lean) 26% (202) 14% (109) 6% (47) 11% (84) 44% (346) 789PID: Ind (no lean) 14% (67) 11% (53) 5% (24) 17% (79) 53% (249) 472PID: Rep (no lean) 5% (36) 8% (59) 9% (65) 30% (225) 48% (354) 740PID/Gender: DemMen 28% (104) 16% (58) 9% (34) 12% (44) 35% (130) 371PID/Gender: DemWomen 23% (98) 12% (51) 3% (13) 10% (41) 52% (216) 418PID/Gender: Ind Men 19% (45) 15% (35) 7% (16) 21% (49) 39% (93) 237PID/Gender: Ind Women 9% (22) 8% (18) 4% (9) 13% (29) 66% (156) 234PID/Gender: Rep Men 7% (23) 8% (28) 11% (35) 36% (121) 38% (127) 334PID/Gender: Rep Women 3% (14) 8% (31) 7% (30) 26% (104) 56% (227) 405Ideo: Liberal (1-3) 29% (171) 16% (93) 5% (31) 10% (61) 39% (231) 587Ideo: Moderate (4) 16% (86) 13% (73) 6% (30) 12% (67) 53% (286) 542Ideo: Conservative (5-7) 5% (42) 7% (54) 9% (69) 31% (247) 48% (384) 795Educ: < College 13% (155) 8% (98) 8% (91) 19% (230) 52% (634) 1207Educ: Bachelors degree 17% (86) 14% (71) 7% (35) 20% (102) 41% (208) 502Educ: Post-grad 22% (65) 18% (52) 3% (10) 19% (56) 37% (107) 291Income: Under 50k 13% (116) 8% (71) 7% (63) 19% (176) 53% (488) 916Income: 50k-100k 14% (102) 15% (105) 7% (50) 21% (151) 43% (312) 720Income: 100k+ 24% (87) 12% (45) 6% (23) 17% (61) 41% (149) 364Ethnicity: White 15% (228) 11% (172) 6% (101) 21% (321) 47% (733) 1555
Continued on next page

National Tracking Poll #2107125, July, 2021
77
Table POL4_4
Table POL4_4: How responsible do you believe each of the following are for the events that led to a group of people attacking police and breaking intothe U.S. Capitol in Washington, D.C.?Sen. Josh Hawley
DemographicVery
responsibleSomewhatresponsible
Not tooresponsible
Not responsibleat all
Don’t know /No opinion Total N
Registered Voters 15% (305) 11% (222) 7% (136) 19% (388) 47% (949) 2000Ethnicity: Hispanic 14% (31) 12% (27) 9% (19) 17% (37) 48% (108) 222Ethnicity: Black 18% (47) 11% (27) 8% (21) 14% (36) 49% (126) 257Ethnicity: Other 16% (30) 12% (23) 7% (14) 17% (31) 48% (90) 188All Christian 13% (138) 12% (125) 7% (72) 22% (233) 46% (476) 1045All Non-Christian 24% (29) 13% (16) 7% (8) 17% (20) 39% (47) 120Atheist 25% (24) 15% (15) 9% (8) 14% (14) 37% (36) 98Agnostic/Nothing in particular 19% (86) 9% (42) 6% (25) 16% (73) 49% (219) 445Something Else 9% (27) 8% (24) 8% (23) 16% (48) 58% (170) 292Religious Non-Protestant/Catholic 21% (29) 14% (20) 9% (14) 16% (23) 40% (58) 143Evangelical 9% (53) 12% (73) 8% (46) 20% (120) 51% (299) 591Non-Evangelical 16% (111) 10% (71) 6% (43) 22% (153) 47% (331) 710Community: Urban 17% (83) 13% (66) 6% (32) 17% (85) 46% (228) 494Community: Suburban 17% (164) 9% (94) 6% (64) 22% (214) 46% (453) 989Community: Rural 11% (58) 12% (61) 8% (40) 17% (88) 52% (269) 516Employ: Private Sector 15% (102) 15% (96) 9% (62) 22% (142) 39% (255) 656Employ: Government 12% (13) 21% (22) 13% (14) 15% (17) 39% (42) 109Employ: Self-Employed 15% (26) 8% (14) 7% (13) 19% (34) 51% (92) 180Employ: Homemaker 9% (16) 6% (10) 5% (9) 21% (36) 59% (103) 174Employ: Student 5% (3) 6% (4) 4% (3) 11% (7) 74% (48) 65Employ: Retired 20% (105) 11% (59) 4% (23) 20% (105) 44% (228) 520Employ: Unemployed 16% (32) 5% (10) 4% (8) 16% (31) 59% (117) 199Employ: Other 10% (10) 6% (6) 4% (4) 15% (15) 65% (63) 97Military HH: Yes 11% (41) 12% (44) 7% (26) 21% (78) 50% (188) 377Military HH: No 16% (265) 11% (178) 7% (110) 19% (309) 47% (761) 1623RD/WT: Right Direction 25% (216) 17% (145) 7% (60) 10% (91) 41% (356) 868RD/WT: Wrong Track 8% (89) 7% (76) 7% (76) 26% (297) 52% (593) 1132Biden Job Approve 25% (251) 16% (161) 6% (62) 10% (100) 43% (438) 1012Biden Job Disapprove 6% (53) 6% (60) 8% (74) 30% (280) 51% (480) 947
Continued on next page
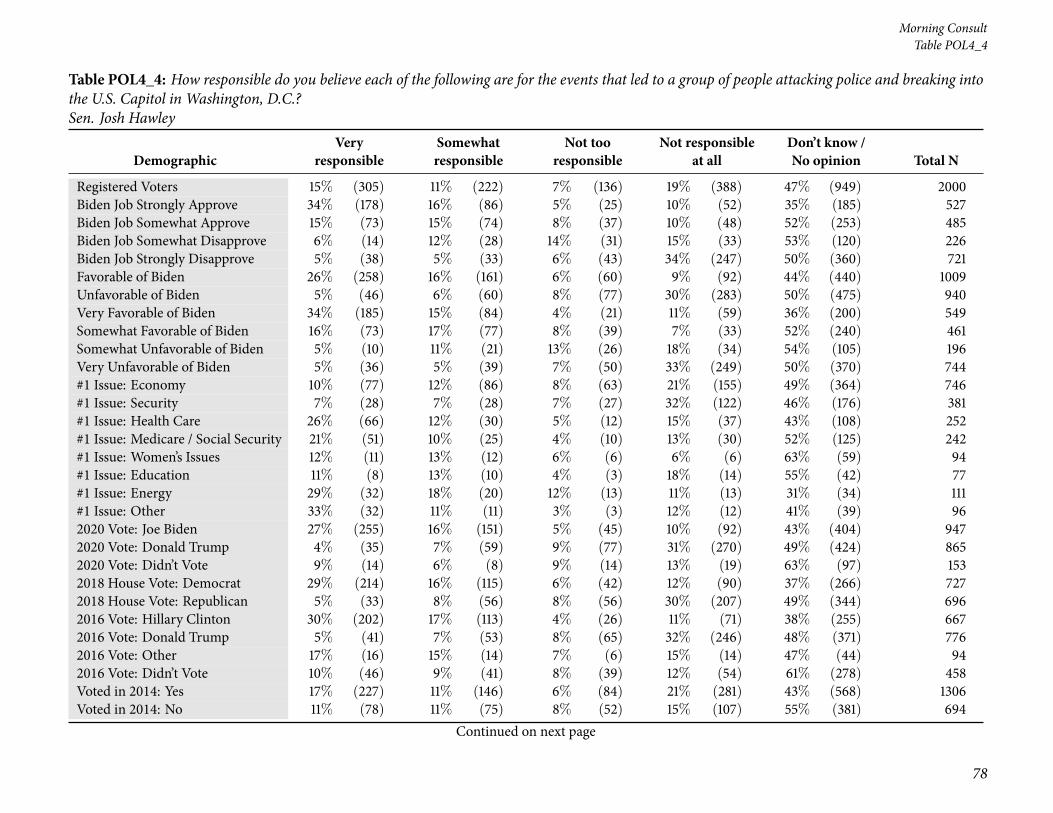
78
Morning ConsultTable POL4_4
Table POL4_4: How responsible do you believe each of the following are for the events that led to a group of people attacking police and breaking intothe U.S. Capitol in Washington, D.C.?Sen. Josh Hawley
DemographicVery
responsibleSomewhatresponsible
Not tooresponsible
Not responsibleat all
Don’t know /No opinion Total N
Registered Voters 15% (305) 11% (222) 7% (136) 19% (388) 47% (949) 2000Biden Job Strongly Approve 34% (178) 16% (86) 5% (25) 10% (52) 35% (185) 527Biden Job Somewhat Approve 15% (73) 15% (74) 8% (37) 10% (48) 52% (253) 485Biden Job Somewhat Disapprove 6% (14) 12% (28) 14% (31) 15% (33) 53% (120) 226Biden Job Strongly Disapprove 5% (38) 5% (33) 6% (43) 34% (247) 50% (360) 721Favorable of Biden 26% (258) 16% (161) 6% (60) 9% (92) 44% (440) 1009Unfavorable of Biden 5% (46) 6% (60) 8% (77) 30% (283) 50% (475) 940Very Favorable of Biden 34% (185) 15% (84) 4% (21) 11% (59) 36% (200) 549Somewhat Favorable of Biden 16% (73) 17% (77) 8% (39) 7% (33) 52% (240) 461Somewhat Unfavorable of Biden 5% (10) 11% (21) 13% (26) 18% (34) 54% (105) 196Very Unfavorable of Biden 5% (36) 5% (39) 7% (50) 33% (249) 50% (370) 744#1 Issue: Economy 10% (77) 12% (86) 8% (63) 21% (155) 49% (364) 746#1 Issue: Security 7% (28) 7% (28) 7% (27) 32% (122) 46% (176) 381#1 Issue: Health Care 26% (66) 12% (30) 5% (12) 15% (37) 43% (108) 252#1 Issue: Medicare / Social Security 21% (51) 10% (25) 4% (10) 13% (30) 52% (125) 242#1 Issue: Women’s Issues 12% (11) 13% (12) 6% (6) 6% (6) 63% (59) 94#1 Issue: Education 11% (8) 13% (10) 4% (3) 18% (14) 55% (42) 77#1 Issue: Energy 29% (32) 18% (20) 12% (13) 11% (13) 31% (34) 111#1 Issue: Other 33% (32) 11% (11) 3% (3) 12% (12) 41% (39) 962020 Vote: Joe Biden 27% (255) 16% (151) 5% (45) 10% (92) 43% (404) 9472020 Vote: Donald Trump 4% (35) 7% (59) 9% (77) 31% (270) 49% (424) 8652020 Vote: Didn’t Vote 9% (14) 6% (8) 9% (14) 13% (19) 63% (97) 1532018 House Vote: Democrat 29% (214) 16% (115) 6% (42) 12% (90) 37% (266) 7272018 House Vote: Republican 5% (33) 8% (56) 8% (56) 30% (207) 49% (344) 6962016 Vote: Hillary Clinton 30% (202) 17% (113) 4% (26) 11% (71) 38% (255) 6672016 Vote: Donald Trump 5% (41) 7% (53) 8% (65) 32% (246) 48% (371) 7762016 Vote: Other 17% (16) 15% (14) 7% (6) 15% (14) 47% (44) 942016 Vote: Didn’t Vote 10% (46) 9% (41) 8% (39) 12% (54) 61% (278) 458Voted in 2014: Yes 17% (227) 11% (146) 6% (84) 21% (281) 43% (568) 1306Voted in 2014: No 11% (78) 11% (75) 8% (52) 15% (107) 55% (381) 694
Continued on next page

National Tracking Poll #2107125, July, 2021
79
Table POL4_4
Table POL4_4: How responsible do you believe each of the following are for the events that led to a group of people attacking police and breaking intothe U.S. Capitol in Washington, D.C.?Sen. Josh Hawley
DemographicVery
responsibleSomewhatresponsible
Not tooresponsible
Not responsibleat all
Don’t know /No opinion Total N
Registered Voters 15% (305) 11% (222) 7% (136) 19% (388) 47% (949) 20004-Region: Northeast 18% (63) 11% (40) 5% (18) 19% (68) 47% (164) 3534-Region: Midwest 15% (65) 11% (49) 6% (29) 18% (82) 49% (220) 4454-Region: South 14% (106) 11% (83) 7% (53) 20% (148) 48% (356) 7464-Region: West 16% (71) 11% (50) 8% (37) 20% (90) 46% (208) 456Note: Row proportions may total to larger than one-hundred percent due to rounding. For more information visit MorningConsultIntelligence.com.

80
Morning ConsultTable POL4_5
Table POL4_5: How responsible do you believe each of the following are for the events that led to a group of people attacking police and breaking intothe U.S. Capitol in Washington, D.C.?Local law enforcement
DemographicVery
responsibleSomewhatresponsible
Not tooresponsible
Not responsibleat all
Don’t know /No opinion Total N
Registered Voters 11% (226) 21% (422) 16% (327) 39% (781) 12% (244) 2000Gender: Male 13% (125) 24% (230) 16% (152) 38% (358) 8% (78) 943Gender: Female 10% (101) 18% (192) 17% (175) 40% (423) 16% (166) 1057Age: 18-34 17% (85) 27% (138) 15% (75) 24% (125) 18% (92) 515Age: 35-44 18% (54) 22% (68) 14% (42) 32% (99) 15% (45) 307Age: 45-64 9% (58) 21% (141) 16% (110) 44% (300) 11% (72) 680Age: 65+ 6% (29) 15% (74) 20% (101) 52% (258) 7% (36) 498GenZers: 1997-2012 19% (31) 29% (47) 13% (21) 25% (40) 14% (23) 162Millennials: 1981-1996 16% (85) 26% (135) 16% (86) 25% (131) 17% (90) 527GenXers: 1965-1980 11% (62) 20% (109) 15% (81) 41% (224) 12% (66) 542Baby Boomers: 1946-1964 6% (43) 17% (117) 16% (112) 52% (359) 8% (57) 688PID: Dem (no lean) 13% (99) 22% (173) 16% (129) 38% (299) 11% (88) 789PID: Ind (no lean) 8% (38) 19% (92) 19% (89) 37% (172) 17% (80) 472PID: Rep (no lean) 12% (89) 21% (157) 15% (109) 42% (310) 10% (75) 740PID/Gender: DemMen 15% (54) 25% (93) 16% (61) 36% (134) 8% (28) 371PID/Gender: DemWomen 11% (45) 19% (80) 16% (68) 39% (165) 14% (60) 418PID/Gender: Ind Men 6% (15) 24% (57) 20% (47) 39% (92) 11% (26) 237PID/Gender: Ind Women 10% (23) 15% (34) 18% (42) 34% (81) 23% (55) 234PID/Gender: Rep Men 17% (55) 24% (79) 13% (44) 39% (132) 7% (24) 334PID/Gender: Rep Women 8% (34) 19% (77) 16% (65) 44% (178) 13% (51) 405Ideo: Liberal (1-3) 11% (65) 22% (130) 18% (103) 42% (246) 7% (42) 587Ideo: Moderate (4) 9% (50) 23% (123) 16% (87) 35% (191) 17% (90) 542Ideo: Conservative (5-7) 13% (103) 20% (161) 15% (121) 41% (326) 11% (85) 795Educ: < College 12% (148) 20% (241) 14% (171) 39% (466) 15% (181) 1207Educ: Bachelors degree 10% (49) 24% (123) 17% (88) 39% (195) 9% (47) 502Educ: Post-grad 10% (29) 20% (58) 23% (68) 42% (121) 5% (15) 291Income: Under 50k 13% (121) 20% (186) 14% (131) 35% (318) 18% (161) 916Income: 50k-100k 10% (69) 21% (151) 18% (132) 42% (305) 9% (62) 720Income: 100k+ 10% (36) 23% (85) 17% (64) 43% (158) 6% (22) 364Ethnicity: White 11% (171) 20% (309) 16% (257) 42% (650) 11% (168) 1555
Continued on next page

National Tracking Poll #2107125, July, 2021
81
Table POL4_5
Table POL4_5: How responsible do you believe each of the following are for the events that led to a group of people attacking police and breaking intothe U.S. Capitol in Washington, D.C.?Local law enforcement
DemographicVery
responsibleSomewhatresponsible
Not tooresponsible
Not responsibleat all
Don’t know /No opinion Total N
Registered Voters 11% (226) 21% (422) 16% (327) 39% (781) 12% (244) 2000Ethnicity: Hispanic 15% (34) 32% (71) 11% (25) 29% (64) 13% (28) 222Ethnicity: Black 16% (41) 22% (57) 17% (44) 27% (70) 17% (45) 257Ethnicity: Other 7% (13) 30% (57) 14% (26) 32% (61) 17% (31) 188All Christian 10% (107) 22% (225) 17% (180) 41% (432) 10% (101) 1045All Non-Christian 19% (23) 18% (21) 15% (18) 41% (49) 7% (9) 120Atheist 8% (8) 20% (20) 12% (12) 51% (50) 9% (9) 98Agnostic/Nothing in particular 12% (55) 25% (111) 17% (77) 31% (136) 15% (66) 445Something Else 11% (32) 15% (45) 14% (41) 39% (114) 20% (59) 292Religious Non-Protestant/Catholic 17% (25) 18% (26) 15% (21) 41% (58) 9% (13) 143Evangelical 13% (78) 21% (122) 14% (85) 37% (220) 15% (86) 591Non-Evangelical 8% (60) 20% (142) 18% (129) 44% (312) 9% (67) 710Community: Urban 16% (79) 26% (127) 16% (80) 30% (150) 12% (58) 494Community: Suburban 10% (102) 20% (200) 18% (176) 41% (404) 11% (107) 989Community: Rural 9% (45) 18% (94) 14% (71) 44% (228) 15% (79) 516Employ: Private Sector 15% (98) 26% (173) 15% (98) 34% (226) 9% (62) 656Employ: Government 5% (6) 23% (25) 19% (21) 40% (44) 13% (14) 109Employ: Self-Employed 14% (26) 20% (37) 19% (34) 33% (59) 14% (24) 180Employ: Homemaker 5% (9) 16% (28) 20% (34) 45% (78) 15% (26) 174Employ: Student 21% (14) 26% (17) 14% (9) 20% (13) 18% (12) 65Employ: Retired 6% (30) 16% (81) 18% (94) 52% (271) 8% (44) 520Employ: Unemployed 14% (28) 22% (44) 12% (25) 30% (59) 22% (43) 199Employ: Other 16% (16) 17% (16) 14% (13) 32% (31) 21% (20) 97Military HH: Yes 10% (39) 18% (68) 17% (64) 48% (180) 7% (26) 377Military HH: No 12% (187) 22% (354) 16% (263) 37% (601) 13% (218) 1623RD/WT: Right Direction 11% (96) 22% (190) 17% (146) 39% (339) 11% (97) 868RD/WT: Wrong Track 11% (130) 21% (232) 16% (181) 39% (442) 13% (146) 1132Biden Job Approve 10% (100) 22% (226) 18% (181) 39% (392) 11% (113) 1012Biden Job Disapprove 13% (121) 20% (193) 15% (145) 40% (376) 12% (112) 947
Continued on next page

82
Morning ConsultTable POL4_5
Table POL4_5: How responsible do you believe each of the following are for the events that led to a group of people attacking police and breaking intothe U.S. Capitol in Washington, D.C.?Local law enforcement
DemographicVery
responsibleSomewhatresponsible
Not tooresponsible
Not responsibleat all
Don’t know /No opinion Total N
Registered Voters 11% (226) 21% (422) 16% (327) 39% (781) 12% (244) 2000Biden Job Strongly Approve 14% (72) 18% (96) 17% (89) 43% (229) 8% (40) 527Biden Job Somewhat Approve 6% (28) 27% (130) 19% (91) 34% (163) 15% (73) 485Biden Job Somewhat Disapprove 10% (22) 24% (54) 19% (42) 36% (81) 12% (27) 226Biden Job Strongly Disapprove 14% (99) 19% (139) 14% (103) 41% (295) 12% (85) 721Favorable of Biden 11% (106) 21% (216) 18% (186) 39% (397) 10% (104) 1009Unfavorable of Biden 12% (113) 21% (200) 15% (140) 40% (378) 12% (110) 940Very Favorable of Biden 12% (68) 18% (99) 19% (103) 43% (234) 8% (45) 549Somewhat Favorable of Biden 8% (38) 25% (117) 18% (84) 35% (163) 13% (59) 461Somewhat Unfavorable of Biden 8% (16) 24% (47) 16% (32) 35% (68) 17% (32) 196Very Unfavorable of Biden 13% (97) 21% (153) 15% (108) 42% (309) 10% (77) 744#1 Issue: Economy 12% (87) 23% (171) 16% (123) 37% (272) 12% (92) 746#1 Issue: Security 13% (51) 20% (76) 16% (62) 41% (157) 9% (35) 381#1 Issue: Health Care 10% (25) 23% (58) 21% (52) 36% (91) 10% (26) 252#1 Issue: Medicare / Social Security 6% (13) 13% (33) 16% (38) 53% (129) 12% (30) 242#1 Issue: Women’s Issues 17% (16) 28% (26) 12% (11) 21% (20) 22% (21) 94#1 Issue: Education 17% (13) 20% (15) 10% (8) 25% (19) 28% (22) 77#1 Issue: Energy 8% (9) 22% (25) 18% (20) 45% (50) 7% (8) 111#1 Issue: Other 12% (12) 19% (19) 13% (13) 44% (43) 11% (10) 962020 Vote: Joe Biden 11% (102) 21% (203) 18% (172) 40% (378) 10% (92) 9472020 Vote: Donald Trump 12% (102) 21% (178) 15% (129) 42% (360) 11% (96) 8652020 Vote: Didn’t Vote 12% (19) 24% (37) 13% (20) 22% (34) 28% (43) 1532018 House Vote: Democrat 10% (74) 19% (141) 19% (136) 45% (324) 7% (52) 7272018 House Vote: Republican 12% (84) 20% (141) 17% (119) 39% (274) 11% (77) 6962016 Vote: Hillary Clinton 9% (63) 19% (129) 18% (121) 46% (305) 7% (49) 6672016 Vote: Donald Trump 12% (95) 20% (157) 16% (125) 42% (322) 10% (78) 7762016 Vote: Other 6% (6) 13% (12) 27% (25) 35% (33) 19% (18) 942016 Vote: Didn’t Vote 14% (63) 27% (122) 12% (55) 26% (121) 21% (98) 458Voted in 2014: Yes 10% (137) 19% (251) 18% (236) 43% (558) 10% (124) 1306Voted in 2014: No 13% (89) 25% (171) 13% (91) 32% (224) 17% (120) 694
Continued on next page

National Tracking Poll #2107125, July, 2021
83
Table POL4_5
Table POL4_5: How responsible do you believe each of the following are for the events that led to a group of people attacking police and breaking intothe U.S. Capitol in Washington, D.C.?Local law enforcement
DemographicVery
responsibleSomewhatresponsible
Not tooresponsible
Not responsibleat all
Don’t know /No opinion Total N
Registered Voters 11% (226) 21% (422) 16% (327) 39% (781) 12% (244) 20004-Region: Northeast 11% (40) 20% (70) 21% (73) 36% (127) 12% (43) 3534-Region: Midwest 11% (48) 20% (89) 15% (66) 44% (195) 11% (47) 4454-Region: South 13% (94) 20% (148) 15% (111) 40% (298) 13% (95) 7464-Region: West 10% (43) 25% (115) 17% (76) 35% (161) 13% (59) 456Note: Row proportions may total to larger than one-hundred percent due to rounding. For more information visit MorningConsultIntelligence.com.

84
Morning ConsultTable POL4_6
Table POL4_6: How responsible do you believe each of the following are for the events that led to a group of people attacking police and breaking intothe U.S. Capitol in Washington, D.C.?Defense Department
DemographicVery
responsibleSomewhatresponsible
Not tooresponsible
Not responsibleat all
Don’t know /No opinion Total N
Registered Voters 11% (222) 20% (393) 16% (315) 32% (633) 22% (437) 2000Gender: Male 13% (122) 21% (195) 18% (166) 34% (319) 15% (142) 943Gender: Female 9% (100) 19% (198) 14% (149) 30% (314) 28% (296) 1057Age: 18-34 17% (86) 23% (117) 17% (85) 14% (75) 29% (152) 515Age: 35-44 15% (45) 20% (62) 14% (43) 24% (73) 27% (84) 307Age: 45-64 9% (64) 20% (136) 16% (110) 35% (235) 20% (134) 680Age: 65+ 5% (27) 16% (77) 15% (76) 50% (250) 14% (68) 498GenZers: 1997-2012 20% (32) 20% (32) 18% (29) 14% (23) 28% (45) 162Millennials: 1981-1996 15% (81) 24% (124) 16% (85) 16% (85) 29% (151) 527GenXers: 1965-1980 10% (56) 20% (110) 14% (78) 33% (180) 22% (119) 542Baby Boomers: 1946-1964 7% (51) 16% (110) 16% (113) 44% (304) 16% (109) 688PID: Dem (no lean) 12% (93) 18% (146) 15% (115) 35% (274) 20% (161) 789PID: Ind (no lean) 9% (42) 21% (98) 17% (81) 29% (137) 24% (114) 472PID: Rep (no lean) 12% (86) 20% (149) 16% (119) 30% (223) 22% (163) 740PID/Gender: DemMen 14% (51) 20% (75) 17% (63) 35% (130) 14% (51) 371PID/Gender: DemWomen 10% (42) 17% (71) 12% (52) 34% (143) 26% (110) 418PID/Gender: Ind Men 10% (23) 22% (53) 19% (46) 31% (73) 18% (42) 237PID/Gender: Ind Women 8% (19) 19% (46) 15% (35) 27% (63) 31% (72) 234PID/Gender: Rep Men 14% (47) 20% (67) 17% (57) 34% (115) 14% (48) 334PID/Gender: Rep Women 10% (39) 20% (81) 15% (62) 27% (108) 28% (115) 405Ideo: Liberal (1-3) 11% (63) 20% (116) 17% (100) 36% (211) 17% (97) 587Ideo: Moderate (4) 10% (56) 22% (120) 17% (92) 27% (148) 23% (125) 542Ideo: Conservative (5-7) 12% (95) 18% (144) 15% (119) 33% (261) 22% (176) 795Educ: < College 12% (150) 18% (219) 15% (184) 29% (347) 25% (307) 1207Educ: Bachelors degree 10% (48) 19% (97) 18% (92) 35% (175) 18% (89) 502Educ: Post-grad 8% (24) 26% (77) 13% (39) 38% (110) 14% (41) 291Income: Under 50k 13% (117) 18% (164) 15% (133) 27% (245) 28% (256) 916Income: 50k-100k 8% (57) 20% (144) 19% (137) 36% (260) 17% (121) 720Income: 100k+ 13% (48) 23% (85) 12% (44) 35% (128) 16% (60) 364Ethnicity: White 11% (169) 19% (296) 16% (251) 33% (513) 21% (326) 1555
Continued on next page

National Tracking Poll #2107125, July, 2021
85
Table POL4_6
Table POL4_6: How responsible do you believe each of the following are for the events that led to a group of people attacking police and breaking intothe U.S. Capitol in Washington, D.C.?Defense Department
DemographicVery
responsibleSomewhatresponsible
Not tooresponsible
Not responsibleat all
Don’t know /No opinion Total N
Registered Voters 11% (222) 20% (393) 16% (315) 32% (633) 22% (437) 2000Ethnicity: Hispanic 20% (44) 20% (44) 18% (40) 25% (56) 17% (37) 222Ethnicity: Black 15% (38) 16% (41) 13% (34) 30% (76) 26% (67) 257Ethnicity: Other 8% (15) 29% (55) 16% (30) 23% (44) 24% (45) 188All Christian 11% (112) 18% (192) 17% (181) 34% (357) 19% (204) 1045All Non-Christian 18% (21) 23% (27) 14% (17) 29% (35) 17% (20) 120Atheist 8% (8) 20% (20) 9% (9) 42% (41) 21% (21) 98Agnostic/Nothing in particular 11% (50) 20% (90) 17% (76) 27% (119) 25% (109) 445Something Else 10% (31) 22% (63) 11% (33) 28% (81) 29% (83) 292Religious Non-Protestant/Catholic 15% (22) 23% (33) 13% (18) 30% (43) 19% (27) 143Evangelical 15% (88) 19% (112) 13% (76) 29% (169) 25% (147) 591Non-Evangelical 8% (54) 19% (134) 19% (134) 36% (257) 18% (131) 710Community: Urban 17% (85) 22% (107) 14% (68) 26% (128) 21% (106) 494Community: Suburban 9% (93) 20% (199) 17% (172) 33% (326) 20% (199) 989Community: Rural 8% (43) 17% (87) 15% (75) 35% (179) 26% (132) 516Employ: Private Sector 14% (89) 25% (166) 16% (103) 27% (177) 18% (121) 656Employ: Government 10% (11) 15% (17) 20% (22) 33% (36) 21% (22) 109Employ: Self-Employed 16% (28) 19% (33) 18% (32) 28% (51) 20% (36) 180Employ: Homemaker 7% (12) 21% (36) 11% (20) 29% (50) 32% (56) 174Employ: Student 14% (9) 20% (13) 17% (11) 7% (4) 43% (28) 65Employ: Retired 6% (29) 16% (82) 14% (74) 48% (249) 17% (86) 520Employ: Unemployed 14% (27) 16% (31) 17% (33) 22% (44) 32% (64) 199Employ: Other 17% (16) 15% (15) 21% (20) 22% (21) 25% (24) 97Military HH: Yes 7% (27) 17% (64) 17% (64) 40% (152) 18% (70) 377Military HH: No 12% (194) 20% (329) 15% (251) 30% (481) 23% (368) 1623RD/WT: Right Direction 10% (91) 20% (170) 17% (147) 34% (295) 19% (165) 868RD/WT: Wrong Track 12% (131) 20% (223) 15% (168) 30% (338) 24% (273) 1132Biden Job Approve 10% (105) 21% (212) 17% (170) 33% (335) 19% (190) 1012Biden Job Disapprove 12% (114) 19% (175) 15% (144) 30% (288) 24% (225) 947
Continued on next page

86
Morning ConsultTable POL4_6
Table POL4_6: How responsible do you believe each of the following are for the events that led to a group of people attacking police and breaking intothe U.S. Capitol in Washington, D.C.?Defense Department
DemographicVery
responsibleSomewhatresponsible
Not tooresponsible
Not responsibleat all
Don’t know /No opinion Total N
Registered Voters 11% (222) 20% (393) 16% (315) 32% (633) 22% (437) 2000Biden Job Strongly Approve 15% (78) 16% (86) 16% (82) 39% (208) 14% (74) 527Biden Job Somewhat Approve 6% (28) 26% (126) 18% (88) 26% (127) 24% (116) 485Biden Job Somewhat Disapprove 9% (21) 21% (47) 19% (42) 26% (60) 25% (56) 226Biden Job Strongly Disapprove 13% (94) 18% (128) 14% (101) 32% (228) 23% (169) 721Favorable of Biden 11% (109) 20% (200) 17% (173) 34% (341) 19% (187) 1009Unfavorable of Biden 12% (109) 20% (186) 15% (137) 30% (286) 24% (223) 940Very Favorable of Biden 15% (80) 17% (93) 15% (81) 40% (221) 14% (74) 549Somewhat Favorable of Biden 6% (29) 23% (107) 20% (92) 26% (120) 24% (113) 461Somewhat Unfavorable of Biden 7% (14) 28% (54) 15% (29) 25% (49) 25% (50) 196Very Unfavorable of Biden 13% (95) 18% (131) 14% (107) 32% (237) 23% (173) 744#1 Issue: Economy 10% (73) 22% (167) 16% (117) 30% (224) 22% (165) 746#1 Issue: Security 15% (56) 16% (63) 16% (61) 32% (120) 21% (81) 381#1 Issue: Health Care 13% (32) 16% (41) 16% (41) 37% (94) 18% (45) 252#1 Issue: Medicare / Social Security 8% (19) 13% (31) 15% (36) 44% (107) 20% (48) 242#1 Issue: Women’s Issues 18% (17) 14% (13) 12% (11) 18% (17) 37% (35) 94#1 Issue: Education 12% (9) 24% (18) 19% (15) 15% (11) 31% (24) 77#1 Issue: Energy 7% (7) 31% (34) 16% (18) 31% (34) 16% (18) 111#1 Issue: Other 8% (7) 27% (26) 17% (17) 26% (25) 22% (21) 962020 Vote: Joe Biden 11% (102) 20% (191) 16% (152) 35% (331) 18% (171) 9472020 Vote: Donald Trump 11% (99) 18% (158) 16% (141) 31% (270) 23% (197) 8652020 Vote: Didn’t Vote 11% (18) 25% (39) 13% (19) 15% (23) 36% (54) 1532018 House Vote: Democrat 9% (69) 20% (146) 18% (130) 38% (276) 15% (105) 7272018 House Vote: Republican 12% (82) 19% (130) 16% (109) 32% (225) 22% (151) 6962016 Vote: Hillary Clinton 9% (63) 20% (132) 15% (97) 40% (270) 16% (105) 6672016 Vote: Donald Trump 12% (89) 18% (141) 16% (123) 34% (260) 21% (162) 7762016 Vote: Other 6% (6) 16% (15) 27% (26) 30% (28) 20% (19) 942016 Vote: Didn’t Vote 14% (64) 23% (104) 15% (69) 16% (72) 33% (149) 458Voted in 2014: Yes 10% (131) 18% (238) 17% (217) 37% (483) 18% (237) 1306Voted in 2014: No 13% (91) 22% (154) 14% (98) 22% (150) 29% (201) 694
Continued on next page
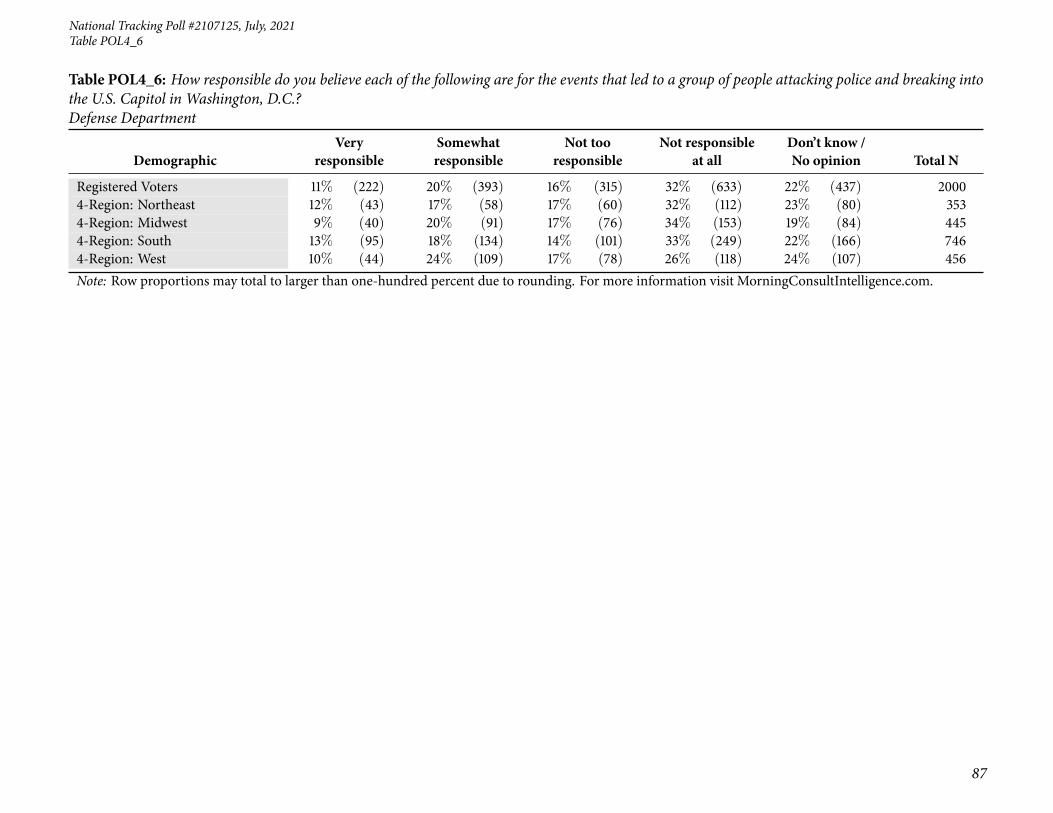
National Tracking Poll #2107125, July, 2021
87
Table POL4_6
Table POL4_6: How responsible do you believe each of the following are for the events that led to a group of people attacking police and breaking intothe U.S. Capitol in Washington, D.C.?Defense Department
DemographicVery
responsibleSomewhatresponsible
Not tooresponsible
Not responsibleat all
Don’t know /No opinion Total N
Registered Voters 11% (222) 20% (393) 16% (315) 32% (633) 22% (437) 20004-Region: Northeast 12% (43) 17% (58) 17% (60) 32% (112) 23% (80) 3534-Region: Midwest 9% (40) 20% (91) 17% (76) 34% (153) 19% (84) 4454-Region: South 13% (95) 18% (134) 14% (101) 33% (249) 22% (166) 7464-Region: West 10% (44) 24% (109) 17% (78) 26% (118) 24% (107) 456Note: Row proportions may total to larger than one-hundred percent due to rounding. For more information visit MorningConsultIntelligence.com.

88
Morning ConsultTable POL4_7
Table POL4_7: How responsible do you believe each of the following are for the events that led to a group of people attacking police and breaking intothe U.S. Capitol in Washington, D.C.?Donald Trump
DemographicVery
responsibleSomewhatresponsible
Not tooresponsible
Not responsibleat all
Don’t know /No opinion Total N
Registered Voters 44% (883) 12% (247) 10% (201) 27% (532) 7% (136) 2000Gender: Male 43% (406) 13% (119) 11% (107) 27% (254) 6% (57) 943Gender: Female 45% (477) 12% (128) 9% (94) 26% (279) 7% (79) 1057Age: 18-34 46% (238) 17% (86) 8% (42) 16% (85) 13% (65) 515Age: 35-44 41% (126) 16% (48) 7% (23) 29% (88) 7% (22) 307Age: 45-64 40% (269) 9% (62) 12% (83) 34% (228) 6% (38) 680Age: 65+ 50% (250) 10% (52) 11% (54) 26% (131) 2% (11) 498GenZers: 1997-2012 50% (81) 17% (28) 8% (12) 18% (29) 7% (12) 162Millennials: 1981-1996 43% (225) 18% (93) 8% (41) 19% (100) 13% (67) 527GenXers: 1965-1980 40% (215) 10% (52) 11% (62) 34% (183) 6% (31) 542Baby Boomers: 1946-1964 48% (327) 9% (65) 11% (73) 29% (201) 3% (23) 688PID: Dem (no lean) 76% (600) 8% (66) 4% (30) 7% (58) 4% (35) 789PID: Ind (no lean) 41% (192) 15% (69) 11% (52) 23% (111) 10% (48) 472PID: Rep (no lean) 12% (91) 15% (113) 16% (120) 49% (363) 7% (53) 740PID/Gender: DemMen 71% (265) 9% (34) 6% (22) 8% (30) 5% (19) 371PID/Gender: DemWomen 80% (335) 7% (31) 2% (7) 7% (28) 4% (16) 418PID/Gender: Ind Men 42% (100) 15% (36) 10% (23) 24% (58) 9% (21) 237PID/Gender: Ind Women 39% (91) 14% (34) 12% (29) 23% (53) 12% (28) 234PID/Gender: Rep Men 12% (41) 15% (49) 18% (61) 49% (165) 5% (18) 334PID/Gender: Rep Women 12% (50) 16% (64) 14% (58) 49% (198) 9% (35) 405Ideo: Liberal (1-3) 80% (467) 9% (55) 3% (18) 6% (35) 2% (12) 587Ideo: Moderate (4) 49% (264) 16% (84) 9% (49) 17% (92) 10% (53) 542Ideo: Conservative (5-7) 16% (127) 12% (99) 16% (125) 49% (389) 7% (55) 795Educ: < College 41% (496) 11% (132) 10% (120) 29% (356) 9% (103) 1207Educ: Bachelors degree 45% (228) 16% (82) 10% (50) 24% (119) 5% (23) 502Educ: Post-grad 55% (159) 11% (33) 11% (31) 20% (57) 3% (10) 291Income: Under 50k 45% (409) 11% (97) 9% (84) 26% (243) 9% (83) 916Income: 50k-100k 42% (302) 15% (106) 11% (79) 27% (194) 5% (39) 720Income: 100k+ 47% (172) 12% (45) 10% (37) 26% (96) 4% (14) 364Ethnicity: White 40% (615) 13% (200) 11% (169) 30% (474) 6% (97) 1555
Continued on next page

National Tracking Poll #2107125, July, 2021
89
Table POL4_7
Table POL4_7: How responsible do you believe each of the following are for the events that led to a group of people attacking police and breaking intothe U.S. Capitol in Washington, D.C.?Donald Trump
DemographicVery
responsibleSomewhatresponsible
Not tooresponsible
Not responsibleat all
Don’t know /No opinion Total N
Registered Voters 44% (883) 12% (247) 10% (201) 27% (532) 7% (136) 2000Ethnicity: Hispanic 53% (118) 11% (23) 9% (21) 22% (48) 6% (12) 222Ethnicity: Black 64% (165) 11% (29) 7% (18) 10% (25) 8% (20) 257Ethnicity: Other 55% (103) 10% (18) 7% (14) 18% (34) 10% (19) 188All Christian 37% (388) 13% (141) 11% (118) 33% (349) 5% (49) 1045All Non-Christian 56% (68) 17% (21) 6% (7) 17% (20) 4% (5) 120Atheist 65% (64) 8% (8) 5% (5) 16% (15) 6% (6) 98Agnostic/Nothing in particular 54% (242) 10% (46) 9% (38) 17% (73) 10% (45) 445Something Else 42% (121) 11% (32) 11% (32) 26% (75) 11% (32) 292Religious Non-Protestant/Catholic 51% (73) 19% (26) 7% (10) 19% (28) 4% (6) 143Evangelical 32% (191) 15% (87) 10% (62) 36% (210) 7% (41) 591Non-Evangelical 44% (310) 11% (79) 12% (82) 28% (201) 5% (37) 710Community: Urban 51% (253) 14% (71) 10% (50) 17% (86) 7% (34) 494Community: Suburban 45% (450) 12% (123) 11% (107) 26% (256) 5% (54) 989Community: Rural 35% (180) 10% (53) 9% (44) 37% (190) 9% (49) 516Employ: Private Sector 40% (263) 15% (99) 12% (79) 27% (175) 6% (40) 656Employ: Government 43% (46) 17% (19) 10% (11) 21% (23) 9% (10) 109Employ: Self-Employed 43% (77) 13% (23) 11% (19) 23% (41) 11% (19) 180Employ: Homemaker 29% (51) 8% (14) 10% (18) 47% (81) 6% (11) 174Employ: Student 57% (37) 24% (15) 1% (1) 10% (6) 8% (5) 65Employ: Retired 51% (264) 9% (45) 10% (53) 27% (141) 3% (16) 520Employ: Unemployed 50% (99) 12% (23) 8% (16) 19% (38) 11% (23) 199Employ: Other 46% (45) 9% (9) 4% (4) 28% (27) 13% (12) 97Military HH: Yes 38% (143) 11% (43) 11% (40) 37% (140) 3% (12) 377Military HH: No 46% (740) 13% (204) 10% (161) 24% (393) 8% (125) 1623RD/WT: Right Direction 70% (607) 12% (106) 5% (41) 8% (65) 6% (48) 868RD/WT: Wrong Track 24% (276) 13% (142) 14% (160) 41% (467) 8% (88) 1132Biden Job Approve 75% (755) 11% (110) 4% (36) 6% (65) 5% (46) 1012Biden Job Disapprove 13% (119) 14% (130) 17% (164) 48% (457) 8% (77) 947
Continued on next page

90
Morning ConsultTable POL4_7
Table POL4_7: How responsible do you believe each of the following are for the events that led to a group of people attacking police and breaking intothe U.S. Capitol in Washington, D.C.?Donald Trump
DemographicVery
responsibleSomewhatresponsible
Not tooresponsible
Not responsibleat all
Don’t know /No opinion Total N
Registered Voters 44% (883) 12% (247) 10% (201) 27% (532) 7% (136) 2000Biden Job Strongly Approve 82% (432) 6% (33) 3% (17) 6% (30) 3% (15) 527Biden Job Somewhat Approve 67% (323) 16% (77) 4% (20) 7% (35) 6% (30) 485Biden Job Somewhat Disapprove 28% (63) 26% (58) 19% (43) 18% (40) 10% (22) 226Biden Job Strongly Disapprove 8% (56) 10% (72) 17% (121) 58% (417) 8% (55) 721Favorable of Biden 76% (771) 11% (110) 3% (31) 6% (56) 4% (42) 1009Unfavorable of Biden 11% (100) 14% (133) 18% (165) 50% (469) 8% (74) 940Very Favorable of Biden 82% (451) 5% (26) 4% (20) 6% (36) 3% (17) 549Somewhat Favorable of Biden 69% (319) 18% (85) 2% (11) 4% (20) 5% (25) 461Somewhat Unfavorable of Biden 27% (54) 26% (50) 18% (35) 21% (42) 8% (15) 196Very Unfavorable of Biden 6% (46) 11% (83) 17% (129) 57% (427) 8% (59) 744#1 Issue: Economy 40% (298) 18% (132) 10% (72) 26% (190) 7% (53) 746#1 Issue: Security 17% (64) 10% (39) 15% (58) 53% (201) 5% (18) 381#1 Issue: Health Care 66% (167) 9% (22) 4% (11) 14% (36) 6% (16) 252#1 Issue: Medicare / Social Security 56% (136) 8% (18) 12% (30) 19% (46) 5% (11) 242#1 Issue: Women’s Issues 67% (63) 7% (7) 7% (6) 8% (8) 11% (11) 94#1 Issue: Education 38% (29) 14% (11) 16% (12) 15% (11) 18% (14) 77#1 Issue: Energy 61% (68) 15% (17) 6% (6) 12% (14) 5% (6) 111#1 Issue: Other 59% (57) 2% (2) 5% (5) 27% (26) 7% (7) 962020 Vote: Joe Biden 79% (749) 9% (85) 3% (27) 5% (49) 4% (37) 9472020 Vote: Donald Trump 8% (67) 15% (128) 19% (162) 52% (449) 7% (59) 8652020 Vote: Didn’t Vote 35% (53) 19% (30) 6% (10) 18% (28) 21% (33) 1532018 House Vote: Democrat 79% (571) 9% (67) 4% (30) 6% (46) 2% (13) 7272018 House Vote: Republican 12% (85) 14% (100) 15% (107) 52% (359) 7% (45) 6962016 Vote: Hillary Clinton 80% (536) 8% (55) 3% (19) 6% (42) 2% (17) 6672016 Vote: Donald Trump 11% (87) 15% (115) 17% (132) 50% (390) 7% (51) 7762016 Vote: Other 60% (57) 9% (9) 7% (6) 16% (15) 7% (7) 942016 Vote: Didn’t Vote 44% (202) 15% (69) 10% (44) 18% (82) 14% (62) 458Voted in 2014: Yes 45% (589) 11% (147) 10% (126) 29% (385) 5% (59) 1306Voted in 2014: No 42% (294) 15% (101) 11% (75) 21% (148) 11% (77) 694
Continued on next page

National Tracking Poll #2107125, July, 2021
91
Table POL4_7
Table POL4_7: How responsible do you believe each of the following are for the events that led to a group of people attacking police and breaking intothe U.S. Capitol in Washington, D.C.?Donald Trump
DemographicVery
responsibleSomewhatresponsible
Not tooresponsible
Not responsibleat all
Don’t know /No opinion Total N
Registered Voters 44% (883) 12% (247) 10% (201) 27% (532) 7% (136) 20004-Region: Northeast 47% (165) 14% (50) 9% (32) 23% (80) 7% (26) 3534-Region: Midwest 45% (202) 13% (58) 8% (37) 26% (117) 7% (31) 4454-Region: South 41% (309) 12% (89) 11% (83) 28% (209) 8% (56) 7464-Region: West 45% (207) 11% (51) 11% (49) 28% (126) 5% (23) 456Note: Row proportions may total to larger than one-hundred percent due to rounding. For more information visit MorningConsultIntelligence.com.
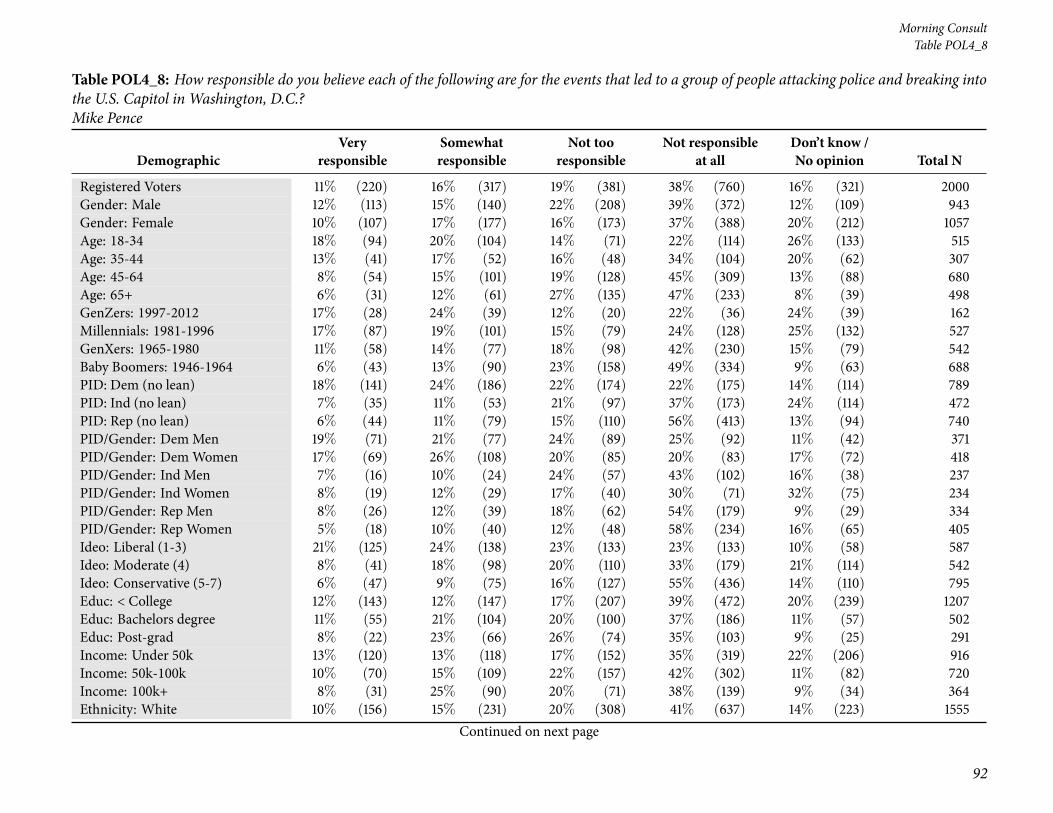
92
Morning ConsultTable POL4_8
Table POL4_8: How responsible do you believe each of the following are for the events that led to a group of people attacking police and breaking intothe U.S. Capitol in Washington, D.C.?Mike Pence
DemographicVery
responsibleSomewhatresponsible
Not tooresponsible
Not responsibleat all
Don’t know /No opinion Total N
Registered Voters 11% (220) 16% (317) 19% (381) 38% (760) 16% (321) 2000Gender: Male 12% (113) 15% (140) 22% (208) 39% (372) 12% (109) 943Gender: Female 10% (107) 17% (177) 16% (173) 37% (388) 20% (212) 1057Age: 18-34 18% (94) 20% (104) 14% (71) 22% (114) 26% (133) 515Age: 35-44 13% (41) 17% (52) 16% (48) 34% (104) 20% (62) 307Age: 45-64 8% (54) 15% (101) 19% (128) 45% (309) 13% (88) 680Age: 65+ 6% (31) 12% (61) 27% (135) 47% (233) 8% (39) 498GenZers: 1997-2012 17% (28) 24% (39) 12% (20) 22% (36) 24% (39) 162Millennials: 1981-1996 17% (87) 19% (101) 15% (79) 24% (128) 25% (132) 527GenXers: 1965-1980 11% (58) 14% (77) 18% (98) 42% (230) 15% (79) 542Baby Boomers: 1946-1964 6% (43) 13% (90) 23% (158) 49% (334) 9% (63) 688PID: Dem (no lean) 18% (141) 24% (186) 22% (174) 22% (175) 14% (114) 789PID: Ind (no lean) 7% (35) 11% (53) 21% (97) 37% (173) 24% (114) 472PID: Rep (no lean) 6% (44) 11% (79) 15% (110) 56% (413) 13% (94) 740PID/Gender: DemMen 19% (71) 21% (77) 24% (89) 25% (92) 11% (42) 371PID/Gender: DemWomen 17% (69) 26% (108) 20% (85) 20% (83) 17% (72) 418PID/Gender: Ind Men 7% (16) 10% (24) 24% (57) 43% (102) 16% (38) 237PID/Gender: Ind Women 8% (19) 12% (29) 17% (40) 30% (71) 32% (75) 234PID/Gender: Rep Men 8% (26) 12% (39) 18% (62) 54% (179) 9% (29) 334PID/Gender: Rep Women 5% (18) 10% (40) 12% (48) 58% (234) 16% (65) 405Ideo: Liberal (1-3) 21% (125) 24% (138) 23% (133) 23% (133) 10% (58) 587Ideo: Moderate (4) 8% (41) 18% (98) 20% (110) 33% (179) 21% (114) 542Ideo: Conservative (5-7) 6% (47) 9% (75) 16% (127) 55% (436) 14% (110) 795Educ: < College 12% (143) 12% (147) 17% (207) 39% (472) 20% (239) 1207Educ: Bachelors degree 11% (55) 21% (104) 20% (100) 37% (186) 11% (57) 502Educ: Post-grad 8% (22) 23% (66) 26% (74) 35% (103) 9% (25) 291Income: Under 50k 13% (120) 13% (118) 17% (152) 35% (319) 22% (206) 916Income: 50k-100k 10% (70) 15% (109) 22% (157) 42% (302) 11% (82) 720Income: 100k+ 8% (31) 25% (90) 20% (71) 38% (139) 9% (34) 364Ethnicity: White 10% (156) 15% (231) 20% (308) 41% (637) 14% (223) 1555
Continued on next page

National Tracking Poll #2107125, July, 2021
93
Table POL4_8
Table POL4_8: How responsible do you believe each of the following are for the events that led to a group of people attacking police and breaking intothe U.S. Capitol in Washington, D.C.?Mike Pence
DemographicVery
responsibleSomewhatresponsible
Not tooresponsible
Not responsibleat all
Don’t know /No opinion Total N
Registered Voters 11% (220) 16% (317) 19% (381) 38% (760) 16% (321) 2000Ethnicity: Hispanic 17% (38) 17% (37) 17% (38) 34% (75) 15% (34) 222Ethnicity: Black 17% (43) 17% (44) 17% (44) 27% (70) 22% (56) 257Ethnicity: Other 11% (21) 22% (42) 15% (29) 28% (53) 23% (43) 188All Christian 8% (87) 16% (164) 19% (197) 47% (487) 10% (109) 1045All Non-Christian 21% (25) 14% (17) 18% (22) 34% (41) 13% (16) 120Atheist 12% (12) 25% (25) 12% (12) 35% (34) 16% (15) 98Agnostic/Nothing in particular 15% (68) 16% (72) 22% (96) 25% (113) 22% (96) 445Something Else 10% (28) 13% (39) 19% (54) 29% (85) 29% (86) 292Religious Non-Protestant/Catholic 18% (25) 14% (20) 21% (30) 32% (46) 15% (22) 143Evangelical 10% (57) 15% (87) 15% (90) 43% (255) 17% (102) 591Non-Evangelical 8% (57) 16% (110) 21% (151) 43% (307) 12% (85) 710Community: Urban 16% (78) 21% (106) 15% (75) 29% (142) 19% (93) 494Community: Suburban 9% (88) 15% (145) 22% (216) 40% (400) 14% (140) 989Community: Rural 11% (54) 13% (66) 17% (90) 42% (218) 17% (88) 516Employ: Private Sector 12% (77) 18% (120) 19% (127) 37% (241) 14% (92) 656Employ: Government 7% (7) 20% (22) 16% (17) 38% (41) 19% (21) 109Employ: Self-Employed 18% (33) 16% (28) 16% (30) 34% (60) 16% (29) 180Employ: Homemaker 8% (14) 10% (18) 19% (33) 45% (78) 18% (32) 174Employ: Student 10% (7) 30% (19) 8% (5) 22% (15) 30% (20) 65Employ: Retired 7% (36) 15% (76) 25% (128) 45% (231) 9% (48) 520Employ: Unemployed 18% (35) 10% (20) 16% (33) 28% (56) 27% (55) 199Employ: Other 11% (11) 15% (14) 9% (9) 39% (37) 26% (25) 97Military HH: Yes 8% (31) 13% (48) 20% (74) 47% (178) 12% (45) 377Military HH: No 12% (189) 17% (269) 19% (307) 36% (582) 17% (276) 1623RD/WT: Right Direction 15% (133) 22% (193) 25% (214) 24% (205) 14% (122) 868RD/WT: Wrong Track 8% (88) 11% (124) 15% (166) 49% (555) 18% (199) 1132Biden Job Approve 16% (163) 22% (220) 25% (249) 23% (233) 14% (147) 1012Biden Job Disapprove 6% (55) 10% (95) 14% (130) 54% (516) 16% (152) 947
Continued on next page

94
Morning ConsultTable POL4_8
Table POL4_8: How responsible do you believe each of the following are for the events that led to a group of people attacking police and breaking intothe U.S. Capitol in Washington, D.C.?Mike Pence
DemographicVery
responsibleSomewhatresponsible
Not tooresponsible
Not responsibleat all
Don’t know /No opinion Total N
Registered Voters 11% (220) 16% (317) 19% (381) 38% (760) 16% (321) 2000Biden Job Strongly Approve 19% (100) 23% (122) 24% (126) 24% (128) 10% (52) 527Biden Job Somewhat Approve 13% (64) 20% (98) 25% (123) 22% (105) 20% (95) 485Biden Job Somewhat Disapprove 6% (15) 20% (46) 16% (36) 37% (84) 20% (45) 226Biden Job Strongly Disapprove 6% (40) 7% (49) 13% (94) 60% (432) 15% (106) 721Favorable of Biden 17% (169) 22% (220) 25% (251) 23% (229) 14% (140) 1009Unfavorable of Biden 5% (50) 10% (95) 14% (129) 55% (516) 16% (151) 940Very Favorable of Biden 18% (101) 24% (133) 26% (140) 22% (121) 10% (54) 549Somewhat Favorable of Biden 15% (67) 19% (88) 24% (111) 24% (109) 19% (86) 461Somewhat Unfavorable of Biden 6% (12) 19% (37) 14% (28) 37% (73) 23% (46) 196Very Unfavorable of Biden 5% (38) 8% (57) 14% (101) 60% (443) 14% (105) 744#1 Issue: Economy 10% (74) 15% (110) 19% (140) 38% (283) 19% (139) 746#1 Issue: Security 7% (27) 12% (46) 13% (49) 56% (213) 12% (46) 381#1 Issue: Health Care 16% (39) 15% (37) 27% (67) 30% (75) 13% (34) 252#1 Issue: Medicare / Social Security 11% (27) 15% (37) 27% (66) 33% (80) 13% (31) 242#1 Issue: Women’s Issues 19% (18) 30% (28) 10% (10) 19% (18) 22% (21) 94#1 Issue: Education 15% (12) 13% (10) 13% (10) 31% (24) 28% (22) 77#1 Issue: Energy 14% (15) 26% (29) 20% (22) 29% (32) 12% (13) 111#1 Issue: Other 8% (8) 20% (19) 18% (17) 36% (35) 18% (17) 962020 Vote: Joe Biden 17% (156) 22% (211) 25% (236) 23% (218) 13% (124) 9472020 Vote: Donald Trump 6% (48) 9% (79) 15% (126) 57% (489) 14% (123) 8652020 Vote: Didn’t Vote 9% (13) 15% (23) 10% (16) 27% (42) 39% (60) 1532018 House Vote: Democrat 17% (123) 24% (171) 25% (184) 26% (186) 9% (62) 7272018 House Vote: Republican 5% (38) 10% (71) 14% (94) 58% (404) 13% (89) 6962016 Vote: Hillary Clinton 17% (114) 24% (159) 26% (173) 23% (152) 10% (69) 6672016 Vote: Donald Trump 6% (45) 9% (71) 15% (115) 58% (449) 12% (97) 7762016 Vote: Other 6% (6) 15% (14) 25% (24) 37% (35) 17% (16) 942016 Vote: Didn’t Vote 12% (56) 16% (71) 15% (70) 26% (121) 31% (141) 458Voted in 2014: Yes 11% (142) 16% (203) 20% (263) 42% (550) 11% (148) 1306Voted in 2014: No 11% (79) 16% (114) 17% (118) 30% (210) 25% (173) 694
Continued on next page

National Tracking Poll #2107125, July, 2021
95
Table POL4_8
Table POL4_8: How responsible do you believe each of the following are for the events that led to a group of people attacking police and breaking intothe U.S. Capitol in Washington, D.C.?Mike Pence
DemographicVery
responsibleSomewhatresponsible
Not tooresponsible
Not responsibleat all
Don’t know /No opinion Total N
Registered Voters 11% (220) 16% (317) 19% (381) 38% (760) 16% (321) 20004-Region: Northeast 13% (45) 16% (58) 15% (53) 41% (146) 14% (51) 3534-Region: Midwest 10% (46) 13% (56) 20% (88) 39% (174) 18% (81) 4454-Region: South 12% (93) 15% (114) 19% (140) 38% (280) 16% (119) 7464-Region: West 8% (37) 20% (89) 22% (99) 35% (160) 15% (70) 456Note: Row proportions may total to larger than one-hundred percent due to rounding. For more information visit MorningConsultIntelligence.com.

96
Morning ConsultTable POL4_9
Table POL4_9: How responsible do you believe each of the following are for the events that led to a group of people attacking police and breaking intothe U.S. Capitol in Washington, D.C.?President Joe Biden
DemographicVery
responsibleSomewhatresponsible
Not tooresponsible
Not responsibleat all
Don’t know /No opinion Total N
Registered Voters 15% (300) 14% (278) 11% (219) 49% (989) 11% (215) 2000Gender: Male 16% (154) 14% (132) 11% (105) 52% (487) 7% (64) 943Gender: Female 14% (145) 14% (146) 11% (113) 47% (502) 14% (151) 1057Age: 18-34 14% (74) 16% (81) 12% (62) 42% (216) 16% (82) 515Age: 35-44 23% (70) 12% (37) 15% (45) 37% (114) 13% (41) 307Age: 45-64 14% (93) 14% (97) 10% (70) 52% (356) 9% (65) 680Age: 65+ 13% (62) 13% (64) 8% (42) 61% (303) 6% (28) 498GenZers: 1997-2012 13% (20) 16% (27) 11% (18) 44% (72) 15% (25) 162Millennials: 1981-1996 18% (94) 14% (76) 14% (72) 39% (207) 15% (78) 527GenXers: 1965-1980 17% (90) 12% (64) 11% (61) 50% (269) 11% (58) 542Baby Boomers: 1946-1964 12% (85) 14% (98) 8% (54) 58% (401) 7% (50) 688PID: Dem (no lean) 8% (66) 6% (49) 8% (62) 71% (556) 7% (55) 789PID: Ind (no lean) 11% (52) 14% (68) 14% (67) 44% (210) 16% (75) 472PID: Rep (no lean) 25% (181) 22% (161) 12% (90) 30% (223) 12% (85) 740PID/Gender: DemMen 12% (44) 8% (30) 8% (30) 66% (246) 6% (21) 371PID/Gender: DemWomen 5% (22) 4% (19) 8% (32) 74% (311) 8% (34) 418PID/Gender: Ind Men 12% (27) 16% (37) 14% (34) 49% (116) 10% (23) 237PID/Gender: Ind Women 10% (25) 13% (31) 14% (32) 40% (94) 22% (52) 234PID/Gender: Rep Men 25% (83) 19% (65) 12% (41) 37% (125) 6% (21) 334PID/Gender: Rep Women 24% (99) 24% (96) 12% (49) 24% (98) 16% (64) 405Ideo: Liberal (1-3) 7% (42) 5% (29) 9% (54) 75% (441) 3% (20) 587Ideo: Moderate (4) 12% (66) 13% (70) 10% (56) 50% (269) 15% (81) 542Ideo: Conservative (5-7) 23% (182) 21% (165) 13% (100) 33% (260) 11% (88) 795Educ: < College 17% (202) 14% (169) 12% (140) 44% (536) 13% (160) 1207Educ: Bachelors degree 12% (61) 14% (70) 12% (61) 54% (269) 8% (41) 502Educ: Post-grad 12% (36) 13% (39) 6% (17) 63% (184) 5% (14) 291Income: Under 50k 15% (137) 13% (115) 13% (117) 45% (413) 14% (132) 916Income: 50k-100k 13% (97) 15% (108) 11% (76) 52% (377) 9% (63) 720Income: 100k+ 18% (65) 15% (55) 7% (26) 54% (199) 5% (20) 364Ethnicity: White 17% (264) 15% (232) 11% (165) 47% (738) 10% (157) 1555
Continued on next page

National Tracking Poll #2107125, July, 2021
97
Table POL4_9
Table POL4_9: How responsible do you believe each of the following are for the events that led to a group of people attacking police and breaking intothe U.S. Capitol in Washington, D.C.?President Joe Biden
DemographicVery
responsibleSomewhatresponsible
Not tooresponsible
Not responsibleat all
Don’t know /No opinion Total N
Registered Voters 15% (300) 14% (278) 11% (219) 49% (989) 11% (215) 2000Ethnicity: Hispanic 10% (23) 14% (32) 14% (32) 52% (117) 9% (19) 222Ethnicity: Black 10% (25) 4% (11) 11% (28) 63% (161) 12% (32) 257Ethnicity: Other 6% (10) 18% (35) 14% (26) 48% (91) 14% (27) 188All Christian 18% (190) 16% (167) 10% (106) 47% (494) 8% (89) 1045All Non-Christian 22% (27) 9% (10) 13% (16) 49% (59) 7% (8) 120Atheist 4% (4) 5% (5) 8% (8) 72% (71) 11% (11) 98Agnostic/Nothing in particular 9% (38) 13% (56) 13% (59) 52% (233) 13% (59) 445Something Else 14% (42) 14% (40) 10% (30) 45% (131) 17% (48) 292Religious Non-Protestant/Catholic 21% (30) 12% (18) 13% (19) 47% (66) 7% (10) 143Evangelical 21% (125) 14% (84) 9% (56) 43% (252) 13% (75) 591Non-Evangelical 14% (102) 16% (113) 11% (76) 51% (361) 8% (58) 710Community: Urban 16% (79) 11% (55) 11% (56) 50% (245) 12% (59) 494Community: Suburban 12% (119) 14% (137) 12% (118) 53% (525) 9% (90) 989Community: Rural 20% (101) 17% (86) 9% (45) 42% (219) 13% (66) 516Employ: Private Sector 16% (106) 15% (98) 12% (81) 47% (311) 9% (61) 656Employ: Government 14% (16) 16% (18) 8% (9) 48% (52) 14% (15) 109Employ: Self-Employed 22% (40) 14% (25) 15% (27) 41% (74) 8% (15) 180Employ: Homemaker 17% (29) 17% (29) 13% (22) 37% (65) 16% (28) 174Employ: Student 6% (4) 17% (11) 9% (6) 54% (35) 15% (10) 65Employ: Retired 13% (70) 12% (62) 7% (39) 61% (315) 7% (34) 520Employ: Unemployed 9% (17) 11% (23) 14% (27) 46% (92) 20% (39) 199Employ: Other 18% (18) 13% (13) 9% (9) 46% (44) 14% (13) 97Military HH: Yes 17% (64) 15% (55) 12% (44) 50% (188) 7% (26) 377Military HH: No 15% (236) 14% (223) 11% (174) 49% (800) 12% (189) 1623RD/WT: Right Direction 9% (82) 8% (66) 8% (73) 67% (582) 7% (65) 868RD/WT: Wrong Track 19% (218) 19% (212) 13% (146) 36% (407) 13% (151) 1132Biden Job Approve 8% (81) 7% (74) 8% (85) 69% (703) 7% (70) 1012Biden Job Disapprove 23% (214) 21% (199) 14% (133) 29% (275) 13% (126) 947
Continued on next page

98
Morning ConsultTable POL4_9
Table POL4_9: How responsible do you believe each of the following are for the events that led to a group of people attacking police and breaking intothe U.S. Capitol in Washington, D.C.?President Joe Biden
DemographicVery
responsibleSomewhatresponsible
Not tooresponsible
Not responsibleat all
Don’t know /No opinion Total N
Registered Voters 15% (300) 14% (278) 11% (219) 49% (989) 11% (215) 2000Biden Job Strongly Approve 12% (63) 4% (19) 6% (32) 75% (394) 4% (19) 527Biden Job Somewhat Approve 4% (17) 11% (55) 11% (52) 64% (309) 10% (51) 485Biden Job Somewhat Disapprove 7% (17) 20% (44) 20% (46) 36% (82) 17% (38) 226Biden Job Strongly Disapprove 27% (198) 21% (154) 12% (87) 27% (192) 12% (89) 721Favorable of Biden 8% (80) 6% (63) 9% (87) 71% (718) 6% (61) 1009Unfavorable of Biden 23% (213) 23% (213) 14% (130) 27% (258) 13% (126) 940Very Favorable of Biden 12% (64) 4% (23) 4% (24) 77% (421) 3% (17) 549Somewhat Favorable of Biden 4% (16) 9% (40) 14% (64) 64% (297) 9% (43) 461Somewhat Unfavorable of Biden 4% (7) 25% (49) 19% (37) 33% (65) 19% (38) 196Very Unfavorable of Biden 28% (206) 22% (164) 13% (93) 26% (193) 12% (88) 744#1 Issue: Economy 12% (93) 16% (119) 13% (98) 47% (353) 11% (83) 746#1 Issue: Security 29% (110) 22% (82) 13% (48) 28% (108) 8% (32) 381#1 Issue: Health Care 11% (28) 5% (13) 5% (14) 69% (175) 9% (22) 252#1 Issue: Medicare / Social Security 13% (31) 9% (21) 8% (21) 61% (148) 9% (21) 242#1 Issue: Women’s Issues 12% (11) 7% (7) 9% (9) 51% (48) 21% (20) 94#1 Issue: Education 13% (10) 16% (12) 8% (6) 37% (29) 26% (20) 77#1 Issue: Energy 3% (4) 13% (15) 12% (14) 66% (73) 6% (6) 111#1 Issue: Other 13% (12) 9% (9) 10% (10) 57% (55) 10% (10) 962020 Vote: Joe Biden 6% (61) 6% (60) 8% (77) 73% (694) 6% (54) 9472020 Vote: Donald Trump 25% (220) 22% (191) 13% (112) 27% (236) 12% (105) 8652020 Vote: Didn’t Vote 11% (17) 15% (23) 16% (25) 29% (45) 28% (43) 1532018 House Vote: Democrat 8% (57) 5% (38) 8% (55) 76% (553) 3% (25) 7272018 House Vote: Republican 24% (168) 22% (151) 14% (96) 29% (203) 11% (78) 6962016 Vote: Hillary Clinton 7% (49) 5% (33) 6% (43) 78% (519) 4% (24) 6672016 Vote: Donald Trump 25% (191) 22% (169) 13% (100) 29% (226) 12% (89) 7762016 Vote: Other 3% (2) 5% (5) 15% (14) 62% (58) 16% (15) 942016 Vote: Didn’t Vote 12% (57) 15% (71) 13% (61) 40% (182) 19% (87) 458Voted in 2014: Yes 16% (207) 13% (169) 10% (129) 53% (696) 8% (104) 1306Voted in 2014: No 13% (92) 16% (109) 13% (89) 42% (292) 16% (111) 694
Continued on next page

National Tracking Poll #2107125, July, 2021
99
Table POL4_9
Table POL4_9: How responsible do you believe each of the following are for the events that led to a group of people attacking police and breaking intothe U.S. Capitol in Washington, D.C.?President Joe Biden
DemographicVery
responsibleSomewhatresponsible
Not tooresponsible
Not responsibleat all
Don’t know /No opinion Total N
Registered Voters 15% (300) 14% (278) 11% (219) 49% (989) 11% (215) 20004-Region: Northeast 15% (52) 15% (54) 9% (33) 50% (176) 11% (38) 3534-Region: Midwest 14% (63) 15% (66) 12% (52) 50% (224) 9% (39) 4454-Region: South 17% (128) 12% (88) 11% (80) 50% (370) 11% (80) 7464-Region: West 12% (56) 15% (69) 12% (54) 48% (218) 13% (58) 456Note: Row proportions may total to larger than one-hundred percent due to rounding. For more information visit MorningConsultIntelligence.com.

100
Morning ConsultTable POL4_10
Table POL4_10: How responsible do you believe each of the following are for the events that led to a group of people attacking police and breakinginto the U.S. Capitol in Washington, D.C.?The people who broke into the U.S. Capitol
DemographicVery
responsibleSomewhatresponsible
Not tooresponsible
Not responsibleat all
Don’t know /No opinion Total N
Registered Voters 71% (1427) 13% (256) 3% (62) 7% (131) 6% (124) 2000Gender: Male 72% (674) 13% (123) 4% (35) 7% (62) 5% (49) 943Gender: Female 71% (753) 13% (133) 3% (27) 6% (69) 7% (75) 1057Age: 18-34 65% (335) 12% (64) 4% (23) 8% (40) 10% (53) 515Age: 35-44 69% (213) 10% (31) 3% (10) 7% (22) 10% (32) 307Age: 45-64 71% (485) 13% (90) 3% (22) 8% (52) 5% (32) 680Age: 65+ 79% (394) 15% (72) 2% (8) 3% (16) 1% (7) 498GenZers: 1997-2012 68% (111) 10% (16) 4% (7) 8% (13) 10% (16) 162Millennials: 1981-1996 63% (334) 13% (67) 4% (21) 9% (46) 11% (59) 527GenXers: 1965-1980 71% (386) 12% (66) 3% (18) 7% (38) 6% (33) 542Baby Boomers: 1946-1964 77% (533) 14% (95) 2% (15) 4% (30) 2% (14) 688PID: Dem (no lean) 79% (623) 7% (53) 2% (14) 7% (57) 5% (42) 789PID: Ind (no lean) 74% (351) 13% (62) 1% (5) 4% (17) 8% (37) 472PID: Rep (no lean) 61% (454) 19% (141) 6% (44) 8% (57) 6% (45) 740PID/Gender: DemMen 77% (285) 10% (36) 2% (9) 6% (23) 5% (18) 371PID/Gender: DemWomen 81% (338) 4% (18) 1% (5) 8% (34) 6% (24) 418PID/Gender: Ind Men 77% (183) 12% (28) — (0) 4% (11) 7% (16) 237PID/Gender: Ind Women 72% (168) 15% (34) 2% (4) 3% (6) 9% (22) 234PID/Gender: Rep Men 62% (206) 18% (59) 8% (25) 8% (28) 5% (15) 334PID/Gender: Rep Women 61% (248) 20% (81) 5% (19) 7% (29) 7% (29) 405Ideo: Liberal (1-3) 85% (501) 6% (34) 2% (11) 5% (32) 1% (9) 587Ideo: Moderate (4) 67% (364) 14% (78) 2% (9) 7% (37) 10% (53) 542Ideo: Conservative (5-7) 66% (526) 17% (135) 5% (38) 7% (54) 5% (41) 795Educ: < College 68% (826) 13% (162) 4% (44) 7% (81) 8% (94) 1207Educ: Bachelors degree 75% (378) 10% (51) 2% (10) 8% (40) 5% (23) 502Educ: Post-grad 76% (222) 15% (44) 3% (7) 3% (10) 2% (7) 291Income: Under 50k 68% (620) 12% (112) 4% (34) 6% (59) 10% (90) 916Income: 50k-100k 75% (540) 13% (94) 2% (15) 6% (45) 4% (26) 720Income: 100k+ 73% (267) 14% (50) 4% (13) 7% (27) 2% (8) 364Ethnicity: White 71% (1097) 14% (222) 3% (53) 6% (100) 5% (84) 1555
Continued on next page
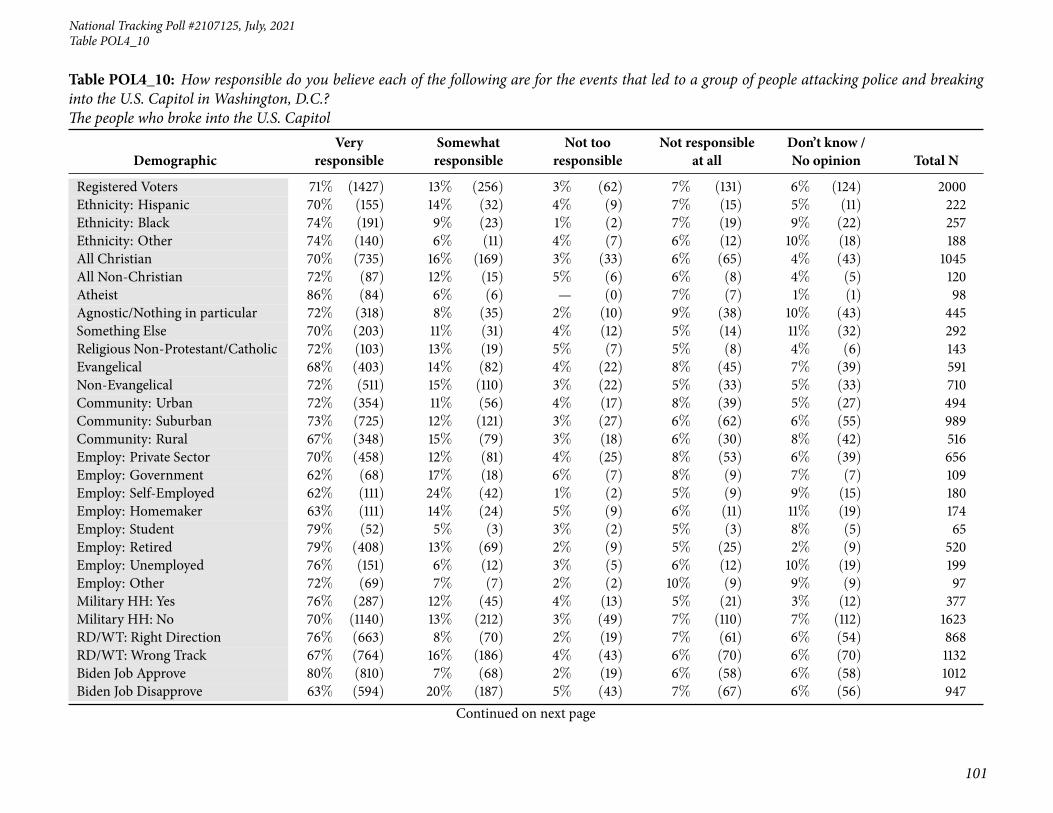
National Tracking Poll #2107125, July, 2021
101
Table POL4_10
Table POL4_10: How responsible do you believe each of the following are for the events that led to a group of people attacking police and breakinginto the U.S. Capitol in Washington, D.C.?The people who broke into the U.S. Capitol
DemographicVery
responsibleSomewhatresponsible
Not tooresponsible
Not responsibleat all
Don’t know /No opinion Total N
Registered Voters 71% (1427) 13% (256) 3% (62) 7% (131) 6% (124) 2000Ethnicity: Hispanic 70% (155) 14% (32) 4% (9) 7% (15) 5% (11) 222Ethnicity: Black 74% (191) 9% (23) 1% (2) 7% (19) 9% (22) 257Ethnicity: Other 74% (140) 6% (11) 4% (7) 6% (12) 10% (18) 188All Christian 70% (735) 16% (169) 3% (33) 6% (65) 4% (43) 1045All Non-Christian 72% (87) 12% (15) 5% (6) 6% (8) 4% (5) 120Atheist 86% (84) 6% (6) — (0) 7% (7) 1% (1) 98Agnostic/Nothing in particular 72% (318) 8% (35) 2% (10) 9% (38) 10% (43) 445Something Else 70% (203) 11% (31) 4% (12) 5% (14) 11% (32) 292Religious Non-Protestant/Catholic 72% (103) 13% (19) 5% (7) 5% (8) 4% (6) 143Evangelical 68% (403) 14% (82) 4% (22) 8% (45) 7% (39) 591Non-Evangelical 72% (511) 15% (110) 3% (22) 5% (33) 5% (33) 710Community: Urban 72% (354) 11% (56) 4% (17) 8% (39) 5% (27) 494Community: Suburban 73% (725) 12% (121) 3% (27) 6% (62) 6% (55) 989Community: Rural 67% (348) 15% (79) 3% (18) 6% (30) 8% (42) 516Employ: Private Sector 70% (458) 12% (81) 4% (25) 8% (53) 6% (39) 656Employ: Government 62% (68) 17% (18) 6% (7) 8% (9) 7% (7) 109Employ: Self-Employed 62% (111) 24% (42) 1% (2) 5% (9) 9% (15) 180Employ: Homemaker 63% (111) 14% (24) 5% (9) 6% (11) 11% (19) 174Employ: Student 79% (52) 5% (3) 3% (2) 5% (3) 8% (5) 65Employ: Retired 79% (408) 13% (69) 2% (9) 5% (25) 2% (9) 520Employ: Unemployed 76% (151) 6% (12) 3% (5) 6% (12) 10% (19) 199Employ: Other 72% (69) 7% (7) 2% (2) 10% (9) 9% (9) 97Military HH: Yes 76% (287) 12% (45) 4% (13) 5% (21) 3% (12) 377Military HH: No 70% (1140) 13% (212) 3% (49) 7% (110) 7% (112) 1623RD/WT: Right Direction 76% (663) 8% (70) 2% (19) 7% (61) 6% (54) 868RD/WT: Wrong Track 67% (764) 16% (186) 4% (43) 6% (70) 6% (70) 1132Biden Job Approve 80% (810) 7% (68) 2% (19) 6% (58) 6% (58) 1012Biden Job Disapprove 63% (594) 20% (187) 5% (43) 7% (67) 6% (56) 947
Continued on next page

102
Morning ConsultTable POL4_10
Table POL4_10: How responsible do you believe each of the following are for the events that led to a group of people attacking police and breakinginto the U.S. Capitol in Washington, D.C.?The people who broke into the U.S. Capitol
DemographicVery
responsibleSomewhatresponsible
Not tooresponsible
Not responsibleat all
Don’t know /No opinion Total N
Registered Voters 71% (1427) 13% (256) 3% (62) 7% (131) 6% (124) 2000Biden Job Strongly Approve 82% (434) 6% (30) 1% (5) 8% (40) 4% (19) 527Biden Job Somewhat Approve 78% (376) 8% (38) 3% (14) 4% (18) 8% (39) 485Biden Job Somewhat Disapprove 68% (153) 17% (39) 3% (8) 5% (11) 7% (16) 226Biden Job Strongly Disapprove 61% (441) 21% (148) 5% (35) 8% (57) 6% (40) 721Favorable of Biden 82% (823) 7% (69) 1% (11) 6% (56) 5% (50) 1009Unfavorable of Biden 62% (584) 20% (185) 5% (51) 7% (68) 6% (53) 940Very Favorable of Biden 80% (439) 8% (42) 1% (7) 7% (41) 4% (20) 549Somewhat Favorable of Biden 83% (384) 6% (27) 1% (4) 3% (16) 6% (30) 461Somewhat Unfavorable of Biden 66% (130) 13% (26) 7% (14) 7% (14) 6% (12) 196Very Unfavorable of Biden 61% (454) 21% (159) 5% (36) 7% (54) 6% (41) 744#1 Issue: Economy 72% (537) 14% (104) 2% (18) 5% (38) 6% (48) 746#1 Issue: Security 57% (217) 22% (84) 4% (17) 11% (41) 6% (22) 381#1 Issue: Health Care 80% (203) 7% (18) 1% (4) 6% (15) 5% (12) 252#1 Issue: Medicare / Social Security 79% (190) 7% (18) 4% (9) 5% (13) 5% (12) 242#1 Issue: Women’s Issues 70% (66) 8% (8) 2% (2) 10% (9) 9% (9) 94#1 Issue: Education 58% (45) 8% (6) 9% (7) 8% (6) 17% (13) 77#1 Issue: Energy 79% (88) 11% (13) 3% (4) 6% (7) — (0) 111#1 Issue: Other 84% (81) 6% (6) 1% (1) — (0) 9% (9) 962020 Vote: Joe Biden 83% (784) 6% (58) 1% (10) 5% (52) 5% (44) 9472020 Vote: Donald Trump 61% (528) 21% (179) 6% (51) 7% (63) 5% (43) 8652020 Vote: Didn’t Vote 60% (91) 10% (16) — (1) 9% (14) 20% (31) 1532018 House Vote: Democrat 83% (601) 8% (55) 1% (10) 6% (45) 2% (17) 7272018 House Vote: Republican 65% (451) 20% (138) 5% (32) 6% (45) 4% (29) 6962016 Vote: Hillary Clinton 84% (560) 6% (41) 1% (4) 6% (43) 3% (20) 6672016 Vote: Donald Trump 63% (486) 20% (156) 5% (42) 7% (53) 5% (39) 7762016 Vote: Other 83% (78) 6% (5) 1% (1) 5% (5) 5% (4) 942016 Vote: Didn’t Vote 65% (300) 11% (52) 3% (15) 7% (31) 13% (60) 458Voted in 2014: Yes 73% (959) 13% (171) 3% (44) 6% (84) 4% (49) 1306Voted in 2014: No 68% (469) 12% (85) 3% (18) 7% (47) 11% (75) 694
Continued on next page

National Tracking Poll #2107125, July, 2021
103
Table POL4_10
Table POL4_10: How responsible do you believe each of the following are for the events that led to a group of people attacking police and breakinginto the U.S. Capitol in Washington, D.C.?The people who broke into the U.S. Capitol
DemographicVery
responsibleSomewhatresponsible
Not tooresponsible
Not responsibleat all
Don’t know /No opinion Total N
Registered Voters 71% (1427) 13% (256) 3% (62) 7% (131) 6% (124) 20004-Region: Northeast 73% (258) 13% (45) 3% (11) 5% (17) 6% (21) 3534-Region: Midwest 72% (321) 11% (50) 5% (22) 4% (20) 7% (32) 4454-Region: South 69% (516) 13% (99) 2% (16) 8% (61) 7% (54) 7464-Region: West 73% (332) 14% (62) 3% (12) 7% (33) 4% (17) 456Note: Row proportions may total to larger than one-hundred percent due to rounding. For more information visit MorningConsultIntelligence.com.

104
Morning ConsultTable POL4_11
Table POL4_11: How responsible do you believe each of the following are for the events that led to a group of people attacking police and breakinginto the U.S. Capitol in Washington, D.C.?State elections officials
DemographicVery
responsibleSomewhatresponsible
Not tooresponsible
Not responsibleat all
Don’t know /No opinion Total N
Registered Voters 12% (240) 21% (426) 15% (304) 30% (597) 22% (433) 2000Gender: Male 14% (131) 22% (206) 17% (156) 32% (301) 16% (149) 943Gender: Female 10% (109) 21% (220) 14% (148) 28% (296) 27% (284) 1057Age: 18-34 15% (79) 19% (97) 16% (81) 19% (100) 31% (158) 515Age: 35-44 13% (41) 28% (85) 13% (41) 21% (63) 25% (77) 307Age: 45-64 12% (79) 21% (142) 14% (98) 34% (231) 19% (129) 680Age: 65+ 8% (41) 20% (102) 17% (83) 41% (203) 14% (69) 498GenZers: 1997-2012 14% (23) 20% (32) 18% (29) 15% (24) 34% (54) 162Millennials: 1981-1996 15% (78) 22% (116) 15% (81) 19% (103) 28% (150) 527GenXers: 1965-1980 13% (68) 20% (108) 15% (79) 32% (173) 21% (114) 542Baby Boomers: 1946-1964 10% (70) 21% (147) 15% (100) 39% (270) 15% (101) 688PID: Dem (no lean) 10% (77) 21% (165) 17% (135) 33% (259) 19% (154) 789PID: Ind (no lean) 10% (46) 23% (108) 15% (72) 27% (126) 25% (119) 472PID: Rep (no lean) 16% (117) 21% (153) 13% (97) 29% (213) 22% (160) 740PID/Gender: DemMen 12% (44) 20% (75) 18% (68) 34% (126) 16% (58) 371PID/Gender: DemWomen 8% (33) 21% (90) 16% (67) 32% (132) 23% (96) 418PID/Gender: Ind Men 9% (22) 27% (65) 15% (37) 30% (72) 18% (43) 237PID/Gender: Ind Women 10% (25) 18% (43) 15% (35) 23% (54) 33% (77) 234PID/Gender: Rep Men 20% (66) 20% (66) 15% (52) 31% (103) 14% (48) 334PID/Gender: Rep Women 13% (51) 22% (87) 11% (45) 27% (110) 28% (112) 405Ideo: Liberal (1-3) 11% (65) 21% (123) 17% (102) 34% (202) 16% (95) 587Ideo: Moderate (4) 10% (52) 20% (109) 19% (100) 28% (149) 24% (131) 542Ideo: Conservative (5-7) 15% (119) 22% (179) 12% (96) 29% (233) 21% (169) 795Educ: < College 14% (166) 19% (233) 14% (169) 28% (332) 25% (306) 1207Educ: Bachelors degree 10% (51) 25% (127) 17% (86) 31% (154) 17% (83) 502Educ: Post-grad 8% (23) 22% (65) 17% (48) 38% (111) 15% (43) 291Income: Under 50k 15% (133) 17% (159) 15% (136) 27% (246) 26% (242) 916Income: 50k-100k 9% (66) 24% (174) 16% (113) 34% (242) 17% (125) 720Income: 100k+ 11% (41) 26% (93) 15% (55) 30% (109) 18% (66) 364Ethnicity: White 12% (192) 22% (336) 15% (236) 30% (460) 21% (331) 1555
Continued on next page

National Tracking Poll #2107125, July, 2021
105
Table POL4_11
Table POL4_11: How responsible do you believe each of the following are for the events that led to a group of people attacking police and breakinginto the U.S. Capitol in Washington, D.C.?State elections officials
DemographicVery
responsibleSomewhatresponsible
Not tooresponsible
Not responsibleat all
Don’t know /No opinion Total N
Registered Voters 12% (240) 21% (426) 15% (304) 30% (597) 22% (433) 2000Ethnicity: Hispanic 15% (34) 22% (48) 17% (39) 22% (49) 23% (52) 222Ethnicity: Black 11% (27) 19% (49) 12% (32) 36% (91) 22% (58) 257Ethnicity: Other 11% (21) 22% (41) 19% (36) 25% (46) 24% (44) 188All Christian 12% (128) 24% (254) 17% (174) 29% (307) 18% (183) 1045All Non-Christian 21% (25) 24% (29) 15% (19) 26% (31) 14% (16) 120Atheist 8% (8) 16% (16) 16% (16) 43% (42) 17% (17) 98Agnostic/Nothing in particular 11% (49) 18% (82) 13% (58) 30% (133) 28% (123) 445Something Else 10% (30) 15% (45) 13% (38) 29% (85) 32% (94) 292Religious Non-Protestant/Catholic 20% (29) 23% (32) 15% (21) 27% (38) 15% (22) 143Evangelical 13% (78) 21% (123) 13% (80) 30% (175) 23% (136) 591Non-Evangelical 11% (75) 24% (172) 18% (125) 29% (207) 19% (132) 710Community: Urban 13% (66) 25% (121) 17% (86) 25% (123) 20% (98) 494Community: Suburban 11% (107) 22% (219) 15% (146) 31% (310) 21% (207) 989Community: Rural 13% (66) 16% (85) 14% (71) 32% (165) 25% (129) 516Employ: Private Sector 14% (91) 27% (175) 15% (95) 25% (166) 20% (129) 656Employ: Government 12% (12) 22% (24) 24% (26) 23% (25) 20% (21) 109Employ: Self-Employed 21% (38) 16% (29) 16% (28) 26% (47) 21% (37) 180Employ: Homemaker 8% (14) 17% (29) 9% (16) 32% (55) 34% (60) 174Employ: Student 15% (10) 17% (11) 14% (9) 15% (10) 39% (25) 65Employ: Retired 8% (40) 20% (104) 17% (87) 42% (219) 13% (70) 520Employ: Unemployed 11% (21) 18% (35) 14% (29) 28% (55) 29% (58) 199Employ: Other 13% (13) 19% (18) 14% (13) 21% (21) 33% (32) 97Military HH: Yes 12% (45) 22% (81) 18% (67) 33% (125) 16% (59) 377Military HH: No 12% (195) 21% (344) 15% (236) 29% (473) 23% (374) 1623RD/WT: Right Direction 10% (84) 22% (190) 19% (162) 32% (274) 18% (158) 868RD/WT: Wrong Track 14% (157) 21% (236) 13% (142) 29% (323) 24% (275) 1132Biden Job Approve 8% (84) 22% (225) 18% (178) 33% (332) 19% (193) 1012Biden Job Disapprove 16% (151) 21% (197) 13% (121) 28% (260) 23% (217) 947
Continued on next page

106
Morning ConsultTable POL4_11
Table POL4_11: How responsible do you believe each of the following are for the events that led to a group of people attacking police and breakinginto the U.S. Capitol in Washington, D.C.?State elections officials
DemographicVery
responsibleSomewhatresponsible
Not tooresponsible
Not responsibleat all
Don’t know /No opinion Total N
Registered Voters 12% (240) 21% (426) 15% (304) 30% (597) 22% (433) 2000Biden Job Strongly Approve 11% (56) 22% (118) 15% (82) 38% (200) 14% (72) 527Biden Job Somewhat Approve 6% (28) 22% (107) 20% (96) 27% (132) 25% (121) 485Biden Job Somewhat Disapprove 9% (20) 18% (41) 15% (35) 32% (73) 25% (57) 226Biden Job Strongly Disapprove 18% (131) 22% (156) 12% (86) 26% (188) 22% (159) 721Favorable of Biden 8% (84) 22% (225) 18% (181) 33% (333) 18% (186) 1009Unfavorable of Biden 16% (151) 21% (196) 13% (120) 27% (257) 23% (217) 940Very Favorable of Biden 9% (51) 23% (124) 16% (90) 37% (204) 15% (81) 549Somewhat Favorable of Biden 7% (33) 22% (101) 20% (91) 28% (129) 23% (105) 461Somewhat Unfavorable of Biden 10% (20) 16% (32) 15% (30) 32% (63) 26% (51) 196Very Unfavorable of Biden 18% (130) 22% (164) 12% (90) 26% (194) 22% (166) 744#1 Issue: Economy 10% (76) 23% (175) 15% (114) 29% (216) 22% (165) 746#1 Issue: Security 17% (63) 22% (83) 14% (52) 28% (108) 20% (76) 381#1 Issue: Health Care 12% (30) 22% (56) 12% (31) 32% (81) 21% (54) 252#1 Issue: Medicare / Social Security 10% (23) 18% (45) 19% (46) 34% (83) 19% (45) 242#1 Issue: Women’s Issues 15% (14) 11% (10) 22% (20) 23% (22) 30% (28) 94#1 Issue: Education 15% (12) 17% (13) 11% (8) 28% (22) 29% (22) 77#1 Issue: Energy 7% (8) 21% (23) 22% (24) 32% (35) 19% (21) 111#1 Issue: Other 14% (14) 21% (20) 8% (8) 33% (32) 23% (22) 962020 Vote: Joe Biden 8% (80) 23% (217) 17% (164) 34% (318) 18% (168) 9472020 Vote: Donald Trump 17% (145) 21% (183) 13% (115) 27% (235) 22% (187) 8652020 Vote: Didn’t Vote 8% (12) 15% (23) 13% (20) 23% (35) 41% (63) 1532018 House Vote: Democrat 8% (60) 23% (165) 19% (138) 37% (269) 13% (95) 7272018 House Vote: Republican 17% (117) 23% (160) 13% (89) 26% (182) 21% (148) 6962016 Vote: Hillary Clinton 7% (48) 23% (153) 18% (122) 37% (244) 15% (100) 6672016 Vote: Donald Trump 17% (130) 22% (169) 13% (104) 28% (218) 20% (155) 7762016 Vote: Other 9% (9) 16% (15) 17% (16) 35% (33) 24% (22) 942016 Vote: Didn’t Vote 12% (54) 19% (87) 13% (61) 23% (103) 33% (153) 458Voted in 2014: Yes 12% (156) 23% (295) 16% (208) 32% (420) 17% (227) 1306Voted in 2014: No 12% (84) 19% (131) 14% (96) 26% (177) 30% (206) 694
Continued on next page

National Tracking Poll #2107125, July, 2021
107
Table POL4_11
Table POL4_11: How responsible do you believe each of the following are for the events that led to a group of people attacking police and breakinginto the U.S. Capitol in Washington, D.C.?State elections officials
DemographicVery
responsibleSomewhatresponsible
Not tooresponsible
Not responsibleat all
Don’t know /No opinion Total N
Registered Voters 12% (240) 21% (426) 15% (304) 30% (597) 22% (433) 20004-Region: Northeast 17% (59) 21% (75) 19% (69) 24% (84) 19% (67) 3534-Region: Midwest 8% (36) 23% (101) 13% (58) 34% (152) 22% (98) 4454-Region: South 14% (103) 20% (152) 13% (99) 31% (234) 21% (159) 7464-Region: West 9% (43) 21% (97) 17% (79) 28% (128) 24% (109) 456Note: Row proportions may total to larger than one-hundred percent due to rounding. For more information visit MorningConsultIntelligence.com.

108
Morning ConsultTable POL4_12
Table POL4_12: How responsible do you believe each of the following are for the events that led to a group of people attacking police and breakinginto the U.S. Capitol in Washington, D.C.?State legislators
DemographicVery
responsibleSomewhatresponsible
Not tooresponsible
Not responsibleat all
Don’t know /No opinion Total N
Registered Voters 10% (204) 22% (450) 18% (367) 26% (516) 23% (463) 2000Gender: Male 12% (112) 22% (212) 20% (186) 29% (274) 17% (160) 943Gender: Female 9% (92) 23% (238) 17% (181) 23% (242) 29% (304) 1057Age: 18-34 14% (70) 22% (112) 17% (89) 18% (93) 29% (151) 515Age: 35-44 14% (43) 24% (73) 14% (44) 19% (59) 29% (89) 307Age: 45-64 10% (68) 24% (163) 16% (107) 29% (195) 22% (147) 680Age: 65+ 5% (23) 21% (102) 26% (127) 34% (168) 15% (77) 498GenZers: 1997-2012 10% (16) 25% (40) 15% (25) 18% (30) 32% (52) 162Millennials: 1981-1996 15% (78) 22% (118) 17% (91) 18% (97) 27% (144) 527GenXers: 1965-1980 12% (64) 20% (107) 15% (82) 29% (157) 24% (132) 542Baby Boomers: 1946-1964 7% (46) 24% (167) 20% (139) 31% (215) 18% (121) 688PID: Dem (no lean) 9% (75) 27% (212) 20% (157) 23% (184) 20% (161) 789PID: Ind (no lean) 10% (47) 19% (90) 18% (86) 24% (114) 29% (135) 472PID: Rep (no lean) 11% (82) 20% (147) 17% (124) 30% (219) 23% (167) 740PID/Gender: DemMen 11% (40) 27% (101) 22% (80) 25% (93) 15% (57) 371PID/Gender: DemWomen 8% (35) 27% (112) 18% (77) 22% (91) 25% (104) 418PID/Gender: Ind Men 10% (24) 18% (44) 20% (49) 31% (75) 20% (47) 237PID/Gender: Ind Women 10% (23) 20% (46) 16% (38) 17% (39) 38% (88) 234PID/Gender: Rep Men 14% (48) 20% (67) 17% (57) 32% (106) 17% (56) 334PID/Gender: Rep Women 9% (35) 20% (80) 17% (67) 28% (112) 27% (111) 405Ideo: Liberal (1-3) 12% (71) 26% (154) 22% (127) 22% (127) 18% (108) 587Ideo: Moderate (4) 9% (47) 21% (115) 18% (98) 25% (136) 27% (146) 542Ideo: Conservative (5-7) 10% (80) 21% (164) 17% (134) 31% (247) 21% (170) 795Educ: < College 12% (140) 21% (254) 17% (206) 24% (293) 26% (314) 1207Educ: Bachelors degree 9% (43) 25% (125) 22% (109) 26% (130) 19% (95) 502Educ: Post-grad 7% (21) 24% (71) 18% (52) 32% (93) 19% (54) 291Income: Under 50k 12% (107) 20% (185) 18% (165) 22% (204) 28% (254) 916Income: 50k-100k 8% (57) 24% (172) 19% (138) 29% (207) 20% (145) 720Income: 100k+ 11% (39) 25% (92) 18% (64) 29% (104) 18% (64) 364Ethnicity: White 10% (160) 23% (357) 19% (297) 26% (399) 22% (342) 1555
Continued on next page
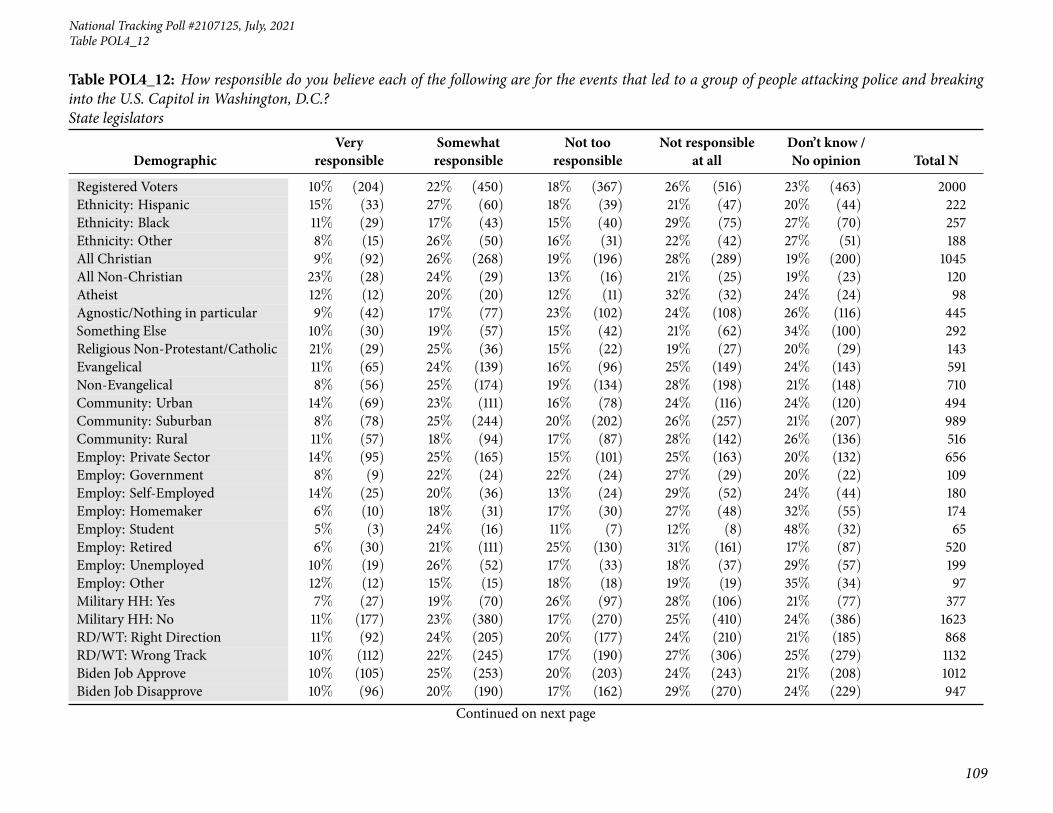
National Tracking Poll #2107125, July, 2021
109
Table POL4_12
Table POL4_12: How responsible do you believe each of the following are for the events that led to a group of people attacking police and breakinginto the U.S. Capitol in Washington, D.C.?State legislators
DemographicVery
responsibleSomewhatresponsible
Not tooresponsible
Not responsibleat all
Don’t know /No opinion Total N
Registered Voters 10% (204) 22% (450) 18% (367) 26% (516) 23% (463) 2000Ethnicity: Hispanic 15% (33) 27% (60) 18% (39) 21% (47) 20% (44) 222Ethnicity: Black 11% (29) 17% (43) 15% (40) 29% (75) 27% (70) 257Ethnicity: Other 8% (15) 26% (50) 16% (31) 22% (42) 27% (51) 188All Christian 9% (92) 26% (268) 19% (196) 28% (289) 19% (200) 1045All Non-Christian 23% (28) 24% (29) 13% (16) 21% (25) 19% (23) 120Atheist 12% (12) 20% (20) 12% (11) 32% (32) 24% (24) 98Agnostic/Nothing in particular 9% (42) 17% (77) 23% (102) 24% (108) 26% (116) 445Something Else 10% (30) 19% (57) 15% (42) 21% (62) 34% (100) 292Religious Non-Protestant/Catholic 21% (29) 25% (36) 15% (22) 19% (27) 20% (29) 143Evangelical 11% (65) 24% (139) 16% (96) 25% (149) 24% (143) 591Non-Evangelical 8% (56) 25% (174) 19% (134) 28% (198) 21% (148) 710Community: Urban 14% (69) 23% (111) 16% (78) 24% (116) 24% (120) 494Community: Suburban 8% (78) 25% (244) 20% (202) 26% (257) 21% (207) 989Community: Rural 11% (57) 18% (94) 17% (87) 28% (142) 26% (136) 516Employ: Private Sector 14% (95) 25% (165) 15% (101) 25% (163) 20% (132) 656Employ: Government 8% (9) 22% (24) 22% (24) 27% (29) 20% (22) 109Employ: Self-Employed 14% (25) 20% (36) 13% (24) 29% (52) 24% (44) 180Employ: Homemaker 6% (10) 18% (31) 17% (30) 27% (48) 32% (55) 174Employ: Student 5% (3) 24% (16) 11% (7) 12% (8) 48% (32) 65Employ: Retired 6% (30) 21% (111) 25% (130) 31% (161) 17% (87) 520Employ: Unemployed 10% (19) 26% (52) 17% (33) 18% (37) 29% (57) 199Employ: Other 12% (12) 15% (15) 18% (18) 19% (19) 35% (34) 97Military HH: Yes 7% (27) 19% (70) 26% (97) 28% (106) 21% (77) 377Military HH: No 11% (177) 23% (380) 17% (270) 25% (410) 24% (386) 1623RD/WT: Right Direction 11% (92) 24% (205) 20% (177) 24% (210) 21% (185) 868RD/WT: Wrong Track 10% (112) 22% (245) 17% (190) 27% (306) 25% (279) 1132Biden Job Approve 10% (105) 25% (253) 20% (203) 24% (243) 21% (208) 1012Biden Job Disapprove 10% (96) 20% (190) 17% (162) 29% (270) 24% (229) 947
Continued on next page
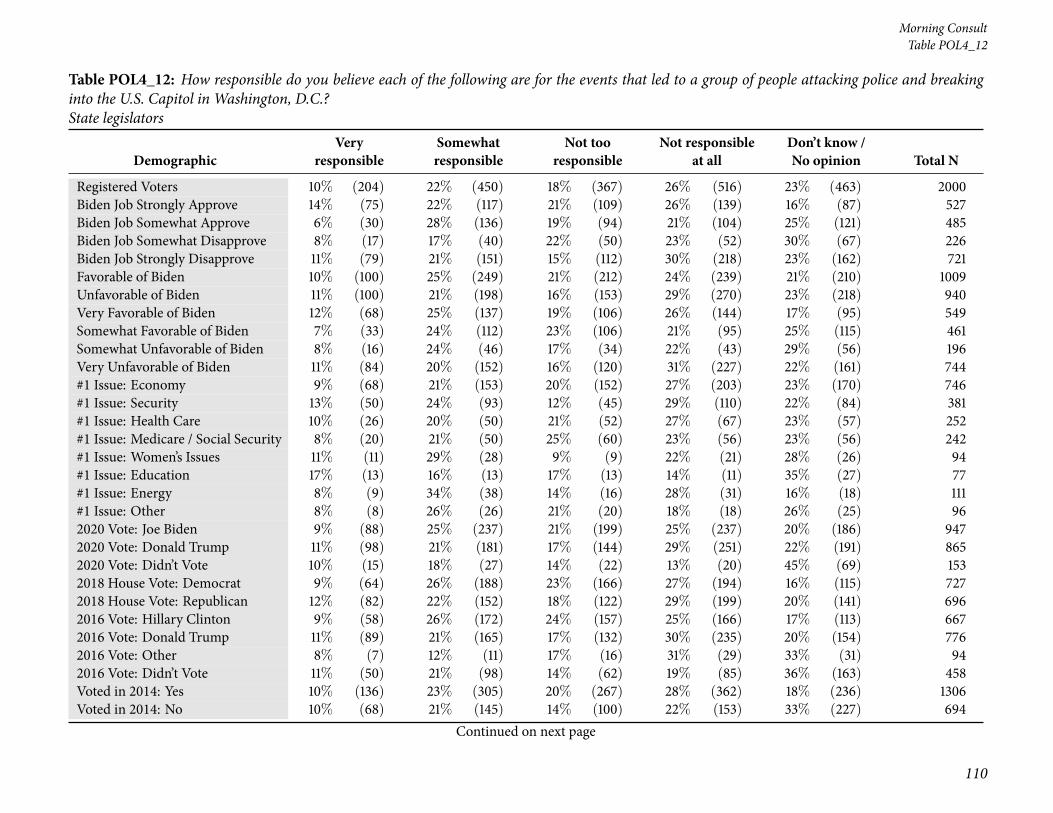
110
Morning ConsultTable POL4_12
Table POL4_12: How responsible do you believe each of the following are for the events that led to a group of people attacking police and breakinginto the U.S. Capitol in Washington, D.C.?State legislators
DemographicVery
responsibleSomewhatresponsible
Not tooresponsible
Not responsibleat all
Don’t know /No opinion Total N
Registered Voters 10% (204) 22% (450) 18% (367) 26% (516) 23% (463) 2000Biden Job Strongly Approve 14% (75) 22% (117) 21% (109) 26% (139) 16% (87) 527Biden Job Somewhat Approve 6% (30) 28% (136) 19% (94) 21% (104) 25% (121) 485Biden Job Somewhat Disapprove 8% (17) 17% (40) 22% (50) 23% (52) 30% (67) 226Biden Job Strongly Disapprove 11% (79) 21% (151) 15% (112) 30% (218) 23% (162) 721Favorable of Biden 10% (100) 25% (249) 21% (212) 24% (239) 21% (210) 1009Unfavorable of Biden 11% (100) 21% (198) 16% (153) 29% (270) 23% (218) 940Very Favorable of Biden 12% (68) 25% (137) 19% (106) 26% (144) 17% (95) 549Somewhat Favorable of Biden 7% (33) 24% (112) 23% (106) 21% (95) 25% (115) 461Somewhat Unfavorable of Biden 8% (16) 24% (46) 17% (34) 22% (43) 29% (56) 196Very Unfavorable of Biden 11% (84) 20% (152) 16% (120) 31% (227) 22% (161) 744#1 Issue: Economy 9% (68) 21% (153) 20% (152) 27% (203) 23% (170) 746#1 Issue: Security 13% (50) 24% (93) 12% (45) 29% (110) 22% (84) 381#1 Issue: Health Care 10% (26) 20% (50) 21% (52) 27% (67) 23% (57) 252#1 Issue: Medicare / Social Security 8% (20) 21% (50) 25% (60) 23% (56) 23% (56) 242#1 Issue: Women’s Issues 11% (11) 29% (28) 9% (9) 22% (21) 28% (26) 94#1 Issue: Education 17% (13) 16% (13) 17% (13) 14% (11) 35% (27) 77#1 Issue: Energy 8% (9) 34% (38) 14% (16) 28% (31) 16% (18) 111#1 Issue: Other 8% (8) 26% (26) 21% (20) 18% (18) 26% (25) 962020 Vote: Joe Biden 9% (88) 25% (237) 21% (199) 25% (237) 20% (186) 9472020 Vote: Donald Trump 11% (98) 21% (181) 17% (144) 29% (251) 22% (191) 8652020 Vote: Didn’t Vote 10% (15) 18% (27) 14% (22) 13% (20) 45% (69) 1532018 House Vote: Democrat 9% (64) 26% (188) 23% (166) 27% (194) 16% (115) 7272018 House Vote: Republican 12% (82) 22% (152) 18% (122) 29% (199) 20% (141) 6962016 Vote: Hillary Clinton 9% (58) 26% (172) 24% (157) 25% (166) 17% (113) 6672016 Vote: Donald Trump 11% (89) 21% (165) 17% (132) 30% (235) 20% (154) 7762016 Vote: Other 8% (7) 12% (11) 17% (16) 31% (29) 33% (31) 942016 Vote: Didn’t Vote 11% (50) 21% (98) 14% (62) 19% (85) 36% (163) 458Voted in 2014: Yes 10% (136) 23% (305) 20% (267) 28% (362) 18% (236) 1306Voted in 2014: No 10% (68) 21% (145) 14% (100) 22% (153) 33% (227) 694
Continued on next page

National Tracking Poll #2107125, July, 2021
111
Table POL4_12
Table POL4_12: How responsible do you believe each of the following are for the events that led to a group of people attacking police and breakinginto the U.S. Capitol in Washington, D.C.?State legislators
DemographicVery
responsibleSomewhatresponsible
Not tooresponsible
Not responsibleat all
Don’t know /No opinion Total N
Registered Voters 10% (204) 22% (450) 18% (367) 26% (516) 23% (463) 20004-Region: Northeast 11% (38) 22% (78) 19% (68) 25% (89) 23% (80) 3534-Region: Midwest 8% (35) 21% (93) 18% (82) 30% (132) 23% (103) 4454-Region: South 11% (85) 22% (161) 18% (135) 26% (197) 23% (169) 7464-Region: West 10% (46) 26% (118) 18% (82) 22% (98) 25% (112) 456Note: Row proportions may total to larger than one-hundred percent due to rounding. For more information visit MorningConsultIntelligence.com.

112
Morning ConsultTable POL4_13
Table POL4_13: How responsible do you believe each of the following are for the events that led to a group of people attacking police and breakinginto the U.S. Capitol in Washington, D.C.?News media
DemographicVery
responsibleSomewhatresponsible
Not tooresponsible
Not responsibleat all
Don’t know /No opinion Total N
Registered Voters 28% (559) 31% (612) 14% (270) 18% (350) 10% (209) 2000Gender: Male 28% (260) 30% (286) 15% (139) 19% (177) 9% (81) 943Gender: Female 28% (299) 31% (326) 12% (131) 16% (173) 12% (128) 1057Age: 18-34 28% (146) 29% (147) 11% (59) 13% (67) 19% (96) 515Age: 35-44 30% (93) 33% (102) 7% (22) 19% (59) 10% (31) 307Age: 45-64 26% (179) 30% (207) 15% (103) 20% (134) 8% (56) 680Age: 65+ 28% (141) 31% (155) 17% (86) 18% (90) 5% (26) 498GenZers: 1997-2012 29% (47) 30% (48) 10% (16) 13% (21) 18% (30) 162Millennials: 1981-1996 29% (150) 30% (158) 11% (57) 15% (77) 16% (84) 527GenXers: 1965-1980 27% (144) 31% (170) 13% (68) 20% (109) 9% (50) 542Baby Boomers: 1946-1964 28% (193) 31% (210) 16% (110) 19% (134) 6% (41) 688PID: Dem (no lean) 15% (115) 32% (255) 17% (136) 24% (193) 12% (91) 789PID: Ind (no lean) 28% (130) 29% (137) 15% (70) 14% (64) 15% (70) 472PID: Rep (no lean) 43% (314) 30% (220) 9% (64) 13% (93) 6% (48) 740PID/Gender: DemMen 18% (66) 29% (109) 18% (68) 25% (93) 9% (35) 371PID/Gender: DemWomen 12% (48) 35% (146) 16% (68) 24% (100) 13% (56) 418PID/Gender: Ind Men 27% (63) 29% (70) 18% (43) 15% (36) 11% (26) 237PID/Gender: Ind Women 28% (67) 28% (67) 12% (28) 12% (29) 19% (44) 234PID/Gender: Rep Men 39% (131) 32% (107) 8% (28) 14% (48) 6% (20) 334PID/Gender: Rep Women 45% (184) 28% (113) 9% (36) 11% (45) 7% (28) 405Ideo: Liberal (1-3) 17% (97) 32% (185) 19% (109) 25% (146) 8% (50) 587Ideo: Moderate (4) 18% (97) 35% (188) 17% (90) 17% (91) 14% (76) 542Ideo: Conservative (5-7) 44% (350) 28% (220) 8% (66) 13% (101) 7% (58) 795Educ: < College 30% (362) 28% (339) 11% (138) 18% (214) 13% (154) 1207Educ: Bachelors degree 27% (134) 34% (170) 16% (79) 16% (81) 8% (38) 502Educ: Post-grad 22% (63) 36% (103) 18% (53) 19% (54) 6% (17) 291Income: Under 50k 29% (263) 25% (231) 12% (107) 20% (179) 15% (136) 916Income: 50k-100k 27% (196) 34% (247) 16% (117) 15% (109) 7% (50) 720Income: 100k+ 27% (100) 36% (133) 13% (46) 17% (62) 6% (24) 364Ethnicity: White 31% (478) 31% (476) 14% (219) 16% (250) 9% (133) 1555
Continued on next page

National Tracking Poll #2107125, July, 2021
113
Table POL4_13
Table POL4_13: How responsible do you believe each of the following are for the events that led to a group of people attacking police and breakinginto the U.S. Capitol in Washington, D.C.?News media
DemographicVery
responsibleSomewhatresponsible
Not tooresponsible
Not responsibleat all
Don’t know /No opinion Total N
Registered Voters 28% (559) 31% (612) 14% (270) 18% (350) 10% (209) 2000Ethnicity: Hispanic 26% (59) 33% (73) 10% (21) 19% (41) 12% (28) 222Ethnicity: Black 18% (47) 25% (63) 12% (31) 27% (69) 18% (47) 257Ethnicity: Other 19% (35) 38% (72) 11% (21) 16% (31) 15% (29) 188All Christian 32% (330) 32% (334) 13% (138) 15% (161) 8% (82) 1045All Non-Christian 28% (34) 32% (38) 22% (26) 12% (14) 6% (7) 120Atheist 15% (14) 29% (29) 14% (14) 30% (29) 12% (11) 98Agnostic/Nothing in particular 21% (93) 31% (136) 13% (56) 21% (93) 15% (66) 445Something Else 30% (88) 26% (75) 12% (35) 18% (52) 14% (42) 292Religious Non-Protestant/Catholic 28% (39) 31% (44) 22% (31) 13% (18) 7% (10) 143Evangelical 34% (202) 27% (162) 13% (76) 15% (91) 10% (60) 591Non-Evangelical 29% (205) 33% (236) 13% (90) 17% (119) 8% (60) 710Community: Urban 27% (132) 29% (145) 13% (66) 20% (101) 10% (51) 494Community: Suburban 27% (269) 33% (323) 13% (133) 16% (163) 10% (102) 989Community: Rural 31% (158) 28% (144) 14% (72) 17% (86) 11% (57) 516Employ: Private Sector 31% (201) 32% (208) 13% (86) 17% (109) 8% (52) 656Employ: Government 17% (18) 33% (36) 15% (17) 25% (27) 10% (11) 109Employ: Self-Employed 26% (47) 32% (58) 14% (25) 17% (30) 11% (19) 180Employ: Homemaker 33% (58) 30% (53) 13% (22) 14% (24) 10% (17) 174Employ: Student 22% (14) 31% (20) 10% (6) 12% (8) 25% (17) 65Employ: Retired 26% (135) 32% (164) 17% (88) 20% (103) 6% (30) 520Employ: Unemployed 23% (45) 24% (48) 11% (21) 19% (38) 24% (47) 199Employ: Other 40% (39) 25% (24) 5% (5) 13% (12) 16% (16) 97Military HH: Yes 36% (134) 30% (113) 12% (45) 18% (67) 5% (18) 377Military HH: No 26% (425) 31% (499) 14% (226) 17% (283) 12% (191) 1623RD/WT: Right Direction 13% (112) 34% (292) 19% (167) 23% (201) 11% (96) 868RD/WT: Wrong Track 39% (447) 28% (320) 9% (104) 13% (149) 10% (113) 1132Biden Job Approve 13% (132) 33% (338) 20% (200) 23% (230) 11% (113) 1012Biden Job Disapprove 44% (421) 28% (264) 7% (69) 12% (113) 8% (80) 947
Continued on next page

114
Morning ConsultTable POL4_13
Table POL4_13: How responsible do you believe each of the following are for the events that led to a group of people attacking police and breakinginto the U.S. Capitol in Washington, D.C.?News media
DemographicVery
responsibleSomewhatresponsible
Not tooresponsible
Not responsibleat all
Don’t know /No opinion Total N
Registered Voters 28% (559) 31% (612) 14% (270) 18% (350) 10% (209) 2000Biden Job Strongly Approve 13% (71) 31% (166) 20% (105) 27% (141) 8% (45) 527Biden Job Somewhat Approve 13% (61) 35% (172) 19% (94) 18% (89) 14% (68) 485Biden Job Somewhat Disapprove 30% (67) 36% (82) 11% (24) 15% (35) 8% (18) 226Biden Job Strongly Disapprove 49% (353) 25% (182) 6% (45) 11% (78) 9% (62) 721Favorable of Biden 13% (134) 34% (348) 19% (196) 23% (230) 10% (102) 1009Unfavorable of Biden 44% (418) 27% (258) 8% (73) 12% (116) 8% (76) 940Very Favorable of Biden 14% (75) 31% (173) 21% (113) 25% (139) 9% (49) 549Somewhat Favorable of Biden 13% (60) 38% (175) 18% (83) 20% (90) 11% (53) 461Somewhat Unfavorable of Biden 27% (52) 34% (67) 12% (23) 16% (31) 11% (22) 196Very Unfavorable of Biden 49% (366) 26% (191) 7% (50) 11% (84) 7% (53) 744#1 Issue: Economy 26% (196) 34% (256) 12% (92) 16% (120) 11% (81) 746#1 Issue: Security 47% (181) 25% (94) 9% (36) 11% (44) 7% (28) 381#1 Issue: Health Care 19% (48) 33% (82) 19% (48) 22% (56) 7% (18) 252#1 Issue: Medicare / Social Security 25% (60) 26% (63) 18% (44) 20% (49) 11% (26) 242#1 Issue: Women’s Issues 16% (15) 36% (34) 9% (8) 20% (18) 19% (18) 94#1 Issue: Education 26% (20) 26% (20) 6% (5) 12% (9) 29% (22) 77#1 Issue: Energy 9% (10) 34% (38) 23% (26) 28% (31) 6% (7) 111#1 Issue: Other 30% (29) 26% (25) 12% (12) 23% (22) 9% (9) 962020 Vote: Joe Biden 13% (119) 34% (319) 20% (190) 23% (222) 10% (97) 9472020 Vote: Donald Trump 45% (386) 29% (250) 7% (64) 12% (103) 7% (61) 8652020 Vote: Didn’t Vote 29% (44) 22% (33) 8% (12) 14% (22) 27% (42) 1532018 House Vote: Democrat 12% (85) 35% (257) 20% (142) 27% (196) 6% (46) 7272018 House Vote: Republican 46% (320) 27% (191) 9% (63) 11% (74) 7% (47) 6962016 Vote: Hillary Clinton 12% (81) 34% (230) 20% (131) 27% (179) 7% (46) 6672016 Vote: Donald Trump 45% (346) 29% (225) 8% (63) 12% (93) 6% (50) 7762016 Vote: Other 23% (21) 25% (23) 27% (26) 10% (10) 15% (14) 942016 Vote: Didn’t Vote 24% (110) 29% (132) 11% (49) 15% (68) 22% (100) 458Voted in 2014: Yes 29% (378) 31% (401) 14% (187) 19% (245) 7% (95) 1306Voted in 2014: No 26% (181) 30% (210) 12% (83) 15% (105) 16% (114) 694
Continued on next page

National Tracking Poll #2107125, July, 2021
115
Table POL4_13
Table POL4_13: How responsible do you believe each of the following are for the events that led to a group of people attacking police and breakinginto the U.S. Capitol in Washington, D.C.?News media
DemographicVery
responsibleSomewhatresponsible
Not tooresponsible
Not responsibleat all
Don’t know /No opinion Total N
Registered Voters 28% (559) 31% (612) 14% (270) 18% (350) 10% (209) 20004-Region: Northeast 26% (91) 31% (111) 15% (54) 16% (56) 12% (42) 3534-Region: Midwest 28% (125) 33% (145) 13% (59) 17% (77) 9% (40) 4454-Region: South 28% (208) 30% (222) 13% (100) 18% (132) 11% (85) 7464-Region: West 30% (135) 30% (134) 13% (57) 19% (86) 9% (43) 456Note: Row proportions may total to larger than one-hundred percent due to rounding. For more information visit MorningConsultIntelligence.com.

116
Morning ConsultTable POL4_14
Table POL4_14: How responsible do you believe each of the following are for the events that led to a group of people attacking police and breakinginto the U.S. Capitol in Washington, D.C.?Social media companies
DemographicVery
responsibleSomewhatresponsible
Not tooresponsible
Not responsibleat all
Don’t know /No opinion Total N
Registered Voters 28% (553) 34% (676) 13% (261) 13% (264) 12% (247) 2000Gender: Male 27% (256) 35% (332) 15% (141) 13% (127) 9% (87) 943Gender: Female 28% (297) 32% (343) 11% (121) 13% (137) 15% (159) 1057Age: 18-34 25% (129) 30% (154) 13% (69) 15% (78) 16% (85) 515Age: 35-44 27% (82) 26% (80) 14% (44) 15% (45) 18% (55) 307Age: 45-64 26% (178) 36% (244) 13% (91) 14% (95) 11% (72) 680Age: 65+ 33% (164) 39% (196) 12% (58) 9% (45) 7% (35) 498GenZers: 1997-2012 24% (39) 27% (45) 12% (19) 20% (32) 16% (27) 162Millennials: 1981-1996 26% (138) 30% (158) 14% (75) 13% (67) 17% (89) 527GenXers: 1965-1980 25% (136) 32% (172) 15% (81) 16% (86) 12% (67) 542Baby Boomers: 1946-1964 32% (219) 38% (265) 11% (73) 11% (73) 9% (59) 688PID: Dem (no lean) 20% (156) 35% (279) 15% (117) 17% (132) 13% (103) 789PID: Ind (no lean) 28% (131) 35% (165) 12% (55) 11% (50) 15% (71) 472PID: Rep (no lean) 36% (266) 31% (231) 12% (89) 11% (82) 10% (72) 740PID/Gender: DemMen 21% (78) 35% (129) 15% (54) 19% (69) 11% (41) 371PID/Gender: DemWomen 19% (78) 36% (151) 15% (63) 15% (63) 15% (62) 418PID/Gender: Ind Men 28% (67) 35% (84) 17% (40) 10% (25) 9% (22) 237PID/Gender: Ind Women 27% (64) 35% (81) 6% (14) 11% (25) 21% (49) 234PID/Gender: Rep Men 33% (111) 36% (120) 14% (46) 10% (33) 7% (24) 334PID/Gender: Rep Women 38% (155) 28% (112) 11% (43) 12% (48) 12% (48) 405Ideo: Liberal (1-3) 22% (131) 37% (219) 15% (91) 16% (93) 9% (54) 587Ideo: Moderate (4) 18% (99) 39% (209) 15% (81) 14% (75) 14% (78) 542Ideo: Conservative (5-7) 39% (307) 29% (231) 11% (86) 11% (88) 10% (83) 795Educ: < College 28% (332) 31% (369) 13% (155) 14% (171) 15% (181) 1207Educ: Bachelors degree 30% (149) 35% (175) 14% (72) 12% (60) 9% (45) 502Educ: Post-grad 25% (71) 45% (131) 12% (35) 11% (33) 7% (20) 291Income: Under 50k 28% (253) 28% (261) 14% (126) 14% (132) 16% (144) 916Income: 50k-100k 25% (182) 38% (277) 13% (93) 13% (95) 10% (73) 720Income: 100k+ 32% (117) 38% (138) 12% (43) 10% (37) 8% (30) 364Ethnicity: White 30% (465) 34% (535) 13% (202) 12% (183) 11% (171) 1555
Continued on next page

National Tracking Poll #2107125, July, 2021
117
Table POL4_14
Table POL4_14: How responsible do you believe each of the following are for the events that led to a group of people attacking police and breakinginto the U.S. Capitol in Washington, D.C.?Social media companies
DemographicVery
responsibleSomewhatresponsible
Not tooresponsible
Not responsibleat all
Don’t know /No opinion Total N
Registered Voters 28% (553) 34% (676) 13% (261) 13% (264) 12% (247) 2000Ethnicity: Hispanic 28% (63) 32% (72) 11% (24) 18% (39) 11% (24) 222Ethnicity: Black 16% (41) 30% (78) 12% (31) 22% (57) 19% (50) 257Ethnicity: Other 25% (47) 33% (63) 15% (29) 13% (24) 13% (25) 188All Christian 30% (312) 37% (382) 12% (130) 13% (131) 9% (90) 1045All Non-Christian 34% (41) 33% (39) 18% (21) 6% (7) 10% (12) 120Atheist 23% (22) 31% (30) 15% (15) 13% (13) 18% (18) 98Agnostic/Nothing in particular 24% (105) 32% (141) 12% (52) 16% (70) 17% (77) 445Something Else 25% (73) 29% (83) 15% (44) 14% (42) 17% (50) 292Religious Non-Protestant/Catholic 31% (45) 33% (47) 18% (25) 7% (10) 11% (16) 143Evangelical 30% (176) 30% (178) 15% (89) 13% (74) 12% (73) 591Non-Evangelical 28% (200) 39% (276) 11% (77) 13% (95) 9% (62) 710Community: Urban 26% (126) 30% (149) 15% (74) 18% (89) 11% (56) 494Community: Suburban 27% (271) 37% (370) 12% (115) 11% (110) 13% (124) 989Community: Rural 30% (155) 30% (157) 14% (72) 13% (65) 13% (67) 516Employ: Private Sector 27% (174) 34% (221) 16% (104) 15% (98) 9% (60) 656Employ: Government 21% (23) 27% (29) 18% (19) 22% (24) 12% (13) 109Employ: Self-Employed 29% (53) 35% (63) 14% (25) 10% (18) 12% (22) 180Employ: Homemaker 27% (46) 30% (52) 12% (22) 13% (23) 18% (31) 174Employ: Student 23% (15) 31% (20) 5% (3) 15% (10) 26% (17) 65Employ: Retired 29% (153) 41% (216) 11% (58) 9% (49) 9% (44) 520Employ: Unemployed 24% (49) 27% (54) 13% (26) 14% (29) 21% (42) 199Employ: Other 41% (40) 22% (22) 4% (4) 13% (13) 19% (18) 97Military HH: Yes 32% (120) 34% (129) 11% (42) 14% (52) 9% (35) 377Military HH: No 27% (432) 34% (547) 14% (219) 13% (212) 13% (212) 1623RD/WT: Right Direction 18% (159) 38% (333) 15% (134) 15% (130) 13% (111) 868RD/WT: Wrong Track 35% (394) 30% (343) 11% (127) 12% (133) 12% (136) 1132Biden Job Approve 18% (187) 38% (388) 15% (154) 15% (156) 13% (127) 1012Biden Job Disapprove 38% (362) 29% (273) 11% (106) 11% (104) 11% (101) 947
Continued on next page

118
Morning ConsultTable POL4_14
Table POL4_14: How responsible do you believe each of the following are for the events that led to a group of people attacking police and breakinginto the U.S. Capitol in Washington, D.C.?Social media companies
DemographicVery
responsibleSomewhatresponsible
Not tooresponsible
Not responsibleat all
Don’t know /No opinion Total N
Registered Voters 28% (553) 34% (676) 13% (261) 13% (264) 12% (247) 2000Biden Job Strongly Approve 19% (101) 37% (196) 15% (81) 19% (101) 9% (49) 527Biden Job Somewhat Approve 18% (86) 40% (192) 15% (73) 11% (55) 16% (79) 485Biden Job Somewhat Disapprove 26% (58) 35% (78) 17% (39) 12% (26) 11% (25) 226Biden Job Strongly Disapprove 42% (303) 27% (195) 9% (68) 11% (78) 11% (76) 721Favorable of Biden 19% (192) 38% (388) 16% (157) 15% (151) 12% (121) 1009Unfavorable of Biden 38% (354) 30% (281) 11% (103) 12% (108) 10% (94) 940Very Favorable of Biden 20% (112) 37% (201) 16% (85) 17% (96) 10% (54) 549Somewhat Favorable of Biden 17% (80) 41% (187) 16% (71) 12% (56) 14% (66) 461Somewhat Unfavorable of Biden 25% (49) 37% (72) 14% (28) 14% (28) 10% (19) 196Very Unfavorable of Biden 41% (306) 28% (208) 10% (75) 11% (80) 10% (75) 744#1 Issue: Economy 22% (166) 35% (263) 16% (119) 14% (103) 13% (95) 746#1 Issue: Security 40% (151) 35% (133) 5% (19) 12% (45) 9% (33) 381#1 Issue: Health Care 25% (63) 34% (86) 16% (41) 15% (38) 10% (24) 252#1 Issue: Medicare / Social Security 27% (65) 35% (84) 16% (38) 11% (26) 12% (29) 242#1 Issue: Women’s Issues 18% (17) 30% (28) 10% (9) 19% (18) 23% (22) 94#1 Issue: Education 26% (20) 22% (17) 13% (10) 14% (11) 25% (19) 77#1 Issue: Energy 30% (34) 30% (33) 13% (14) 16% (18) 11% (12) 111#1 Issue: Other 38% (36) 34% (32) 10% (9) 7% (6) 13% (12) 962020 Vote: Joe Biden 20% (188) 39% (366) 15% (140) 15% (145) 11% (107) 9472020 Vote: Donald Trump 37% (322) 30% (261) 12% (101) 12% (99) 9% (81) 8652020 Vote: Didn’t Vote 23% (34) 26% (40) 11% (17) 10% (15) 30% (46) 1532018 House Vote: Democrat 19% (138) 39% (286) 16% (117) 16% (120) 9% (67) 7272018 House Vote: Republican 39% (273) 31% (217) 10% (68) 10% (72) 10% (67) 6962016 Vote: Hillary Clinton 19% (127) 41% (271) 16% (108) 15% (99) 9% (62) 6672016 Vote: Donald Trump 38% (293) 31% (240) 11% (85) 11% (87) 9% (71) 7762016 Vote: Other 27% (26) 26% (24) 22% (21) 4% (4) 20% (19) 942016 Vote: Didn’t Vote 23% (106) 30% (139) 10% (48) 16% (72) 20% (94) 458Voted in 2014: Yes 29% (381) 35% (459) 13% (170) 12% (162) 10% (133) 1306Voted in 2014: No 25% (172) 31% (217) 13% (91) 15% (101) 16% (113) 694
Continued on next page

National Tracking Poll #2107125, July, 2021
119
Table POL4_14
Table POL4_14: How responsible do you believe each of the following are for the events that led to a group of people attacking police and breakinginto the U.S. Capitol in Washington, D.C.?Social media companies
DemographicVery
responsibleSomewhatresponsible
Not tooresponsible
Not responsibleat all
Don’t know /No opinion Total N
Registered Voters 28% (553) 34% (676) 13% (261) 13% (264) 12% (247) 20004-Region: Northeast 30% (104) 34% (120) 12% (41) 13% (44) 12% (44) 3534-Region: Midwest 28% (126) 35% (154) 15% (65) 12% (52) 11% (48) 4454-Region: South 26% (195) 31% (234) 12% (89) 16% (119) 15% (110) 7464-Region: West 28% (127) 37% (168) 15% (67) 11% (49) 10% (44) 456Note: Row proportions may total to larger than one-hundred percent due to rounding. For more information visit MorningConsultIntelligence.com.
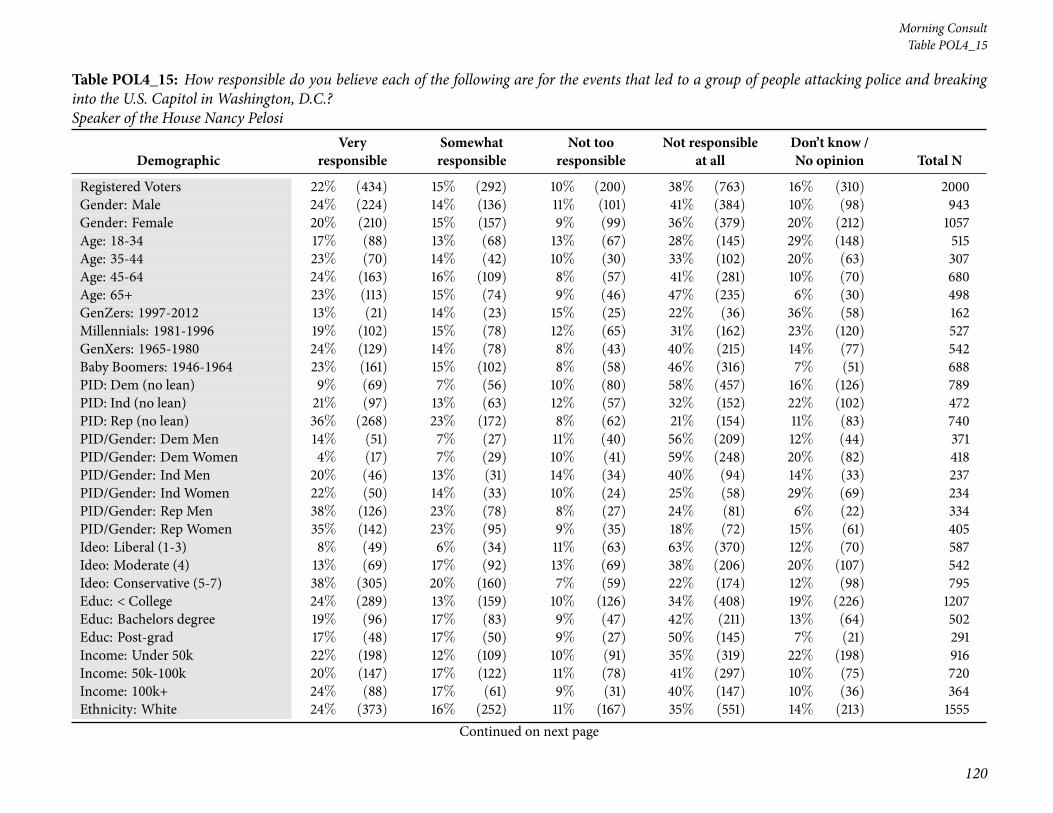
120
Morning ConsultTable POL4_15
Table POL4_15: How responsible do you believe each of the following are for the events that led to a group of people attacking police and breakinginto the U.S. Capitol in Washington, D.C.?Speaker of the House Nancy Pelosi
DemographicVery
responsibleSomewhatresponsible
Not tooresponsible
Not responsibleat all
Don’t know /No opinion Total N
Registered Voters 22% (434) 15% (292) 10% (200) 38% (763) 16% (310) 2000Gender: Male 24% (224) 14% (136) 11% (101) 41% (384) 10% (98) 943Gender: Female 20% (210) 15% (157) 9% (99) 36% (379) 20% (212) 1057Age: 18-34 17% (88) 13% (68) 13% (67) 28% (145) 29% (148) 515Age: 35-44 23% (70) 14% (42) 10% (30) 33% (102) 20% (63) 307Age: 45-64 24% (163) 16% (109) 8% (57) 41% (281) 10% (70) 680Age: 65+ 23% (113) 15% (74) 9% (46) 47% (235) 6% (30) 498GenZers: 1997-2012 13% (21) 14% (23) 15% (25) 22% (36) 36% (58) 162Millennials: 1981-1996 19% (102) 15% (78) 12% (65) 31% (162) 23% (120) 527GenXers: 1965-1980 24% (129) 14% (78) 8% (43) 40% (215) 14% (77) 542Baby Boomers: 1946-1964 23% (161) 15% (102) 8% (58) 46% (316) 7% (51) 688PID: Dem (no lean) 9% (69) 7% (56) 10% (80) 58% (457) 16% (126) 789PID: Ind (no lean) 21% (97) 13% (63) 12% (57) 32% (152) 22% (102) 472PID: Rep (no lean) 36% (268) 23% (172) 8% (62) 21% (154) 11% (83) 740PID/Gender: DemMen 14% (51) 7% (27) 11% (40) 56% (209) 12% (44) 371PID/Gender: DemWomen 4% (17) 7% (29) 10% (41) 59% (248) 20% (82) 418PID/Gender: Ind Men 20% (46) 13% (31) 14% (34) 40% (94) 14% (33) 237PID/Gender: Ind Women 22% (50) 14% (33) 10% (24) 25% (58) 29% (69) 234PID/Gender: Rep Men 38% (126) 23% (78) 8% (27) 24% (81) 6% (22) 334PID/Gender: Rep Women 35% (142) 23% (95) 9% (35) 18% (72) 15% (61) 405Ideo: Liberal (1-3) 8% (49) 6% (34) 11% (63) 63% (370) 12% (70) 587Ideo: Moderate (4) 13% (69) 17% (92) 13% (69) 38% (206) 20% (107) 542Ideo: Conservative (5-7) 38% (305) 20% (160) 7% (59) 22% (174) 12% (98) 795Educ: < College 24% (289) 13% (159) 10% (126) 34% (408) 19% (226) 1207Educ: Bachelors degree 19% (96) 17% (83) 9% (47) 42% (211) 13% (64) 502Educ: Post-grad 17% (48) 17% (50) 9% (27) 50% (145) 7% (21) 291Income: Under 50k 22% (198) 12% (109) 10% (91) 35% (319) 22% (198) 916Income: 50k-100k 20% (147) 17% (122) 11% (78) 41% (297) 10% (75) 720Income: 100k+ 24% (88) 17% (61) 9% (31) 40% (147) 10% (36) 364Ethnicity: White 24% (373) 16% (252) 11% (167) 35% (551) 14% (213) 1555
Continued on next page

National Tracking Poll #2107125, July, 2021
121
Table POL4_15
Table POL4_15: How responsible do you believe each of the following are for the events that led to a group of people attacking police and breakinginto the U.S. Capitol in Washington, D.C.?Speaker of the House Nancy Pelosi
DemographicVery
responsibleSomewhatresponsible
Not tooresponsible
Not responsibleat all
Don’t know /No opinion Total N
Registered Voters 22% (434) 15% (292) 10% (200) 38% (763) 16% (310) 2000Ethnicity: Hispanic 19% (43) 12% (27) 13% (29) 37% (83) 18% (40) 222Ethnicity: Black 10% (26) 9% (23) 9% (24) 52% (132) 20% (51) 257Ethnicity: Other 19% (35) 9% (17) 5% (9) 42% (80) 25% (47) 188All Christian 26% (277) 17% (180) 11% (111) 35% (364) 11% (113) 1045All Non-Christian 29% (35) 11% (13) 10% (12) 39% (47) 12% (14) 120Atheist 4% (4) 7% (7) 6% (6) 66% (64) 17% (17) 98Agnostic/Nothing in particular 13% (57) 12% (52) 11% (47) 42% (188) 23% (102) 445Something Else 21% (61) 14% (41) 8% (24) 34% (100) 22% (65) 292Religious Non-Protestant/Catholic 29% (41) 13% (18) 10% (14) 37% (53) 11% (16) 143Evangelical 26% (155) 17% (102) 11% (64) 31% (184) 15% (86) 591Non-Evangelical 25% (174) 16% (113) 9% (66) 38% (270) 12% (86) 710Community: Urban 19% (92) 11% (56) 11% (52) 40% (199) 19% (94) 494Community: Suburban 19% (191) 17% (165) 10% (95) 40% (400) 14% (138) 989Community: Rural 29% (150) 14% (71) 10% (53) 32% (164) 15% (78) 516Employ: Private Sector 24% (156) 15% (96) 11% (70) 38% (248) 13% (87) 656Employ: Government 8% (9) 23% (25) 14% (15) 39% (42) 17% (18) 109Employ: Self-Employed 25% (45) 20% (37) 11% (21) 29% (51) 15% (27) 180Employ: Homemaker 24% (42) 17% (29) 9% (15) 31% (54) 19% (34) 174Employ: Student 8% (5) 6% (4) 9% (6) 24% (16) 53% (35) 65Employ: Retired 23% (121) 13% (67) 10% (51) 48% (247) 7% (34) 520Employ: Unemployed 18% (35) 11% (21) 8% (16) 38% (75) 26% (51) 199Employ: Other 22% (22) 14% (13) 8% (7) 30% (29) 26% (25) 97Military HH: Yes 29% (108) 15% (55) 10% (38) 38% (144) 9% (32) 377Military HH: No 20% (326) 15% (237) 10% (162) 38% (620) 17% (278) 1623RD/WT: Right Direction 7% (64) 9% (78) 12% (102) 57% (495) 15% (128) 868RD/WT: Wrong Track 33% (370) 19% (214) 9% (98) 24% (268) 16% (182) 1132Biden Job Approve 7% (69) 8% (84) 11% (114) 58% (587) 16% (158) 1012Biden Job Disapprove 38% (362) 21% (202) 9% (84) 18% (167) 14% (131) 947
Continued on next page
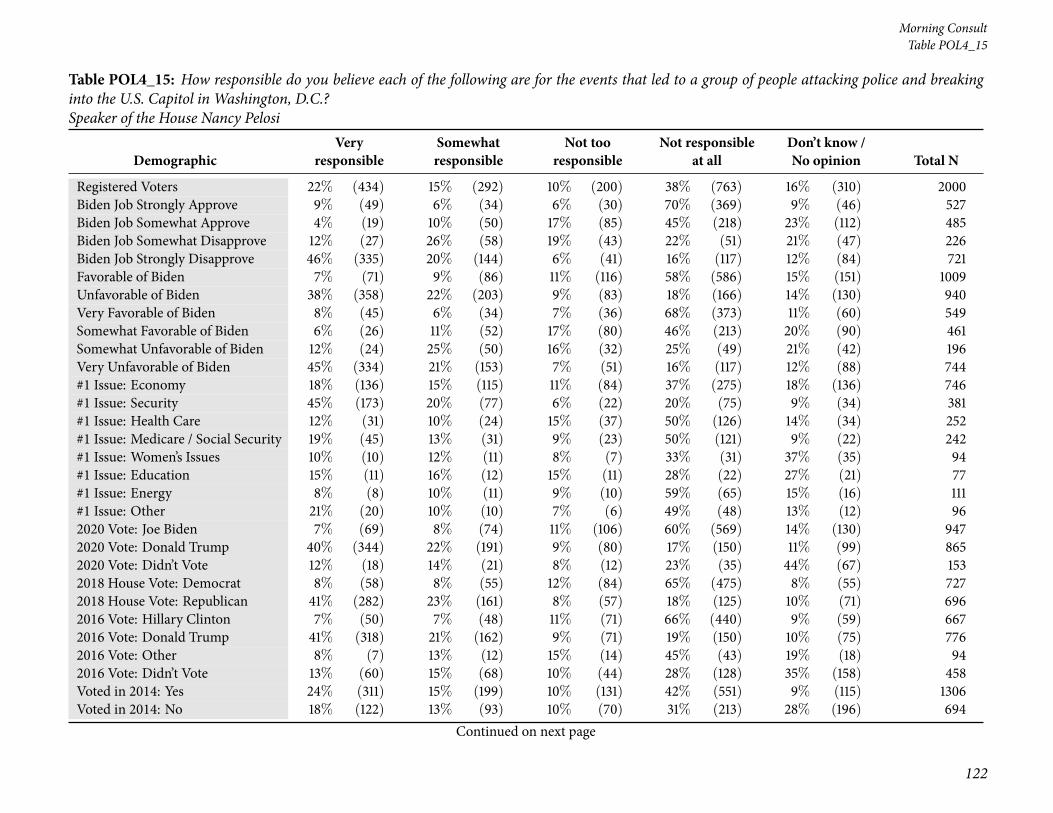
122
Morning ConsultTable POL4_15
Table POL4_15: How responsible do you believe each of the following are for the events that led to a group of people attacking police and breakinginto the U.S. Capitol in Washington, D.C.?Speaker of the House Nancy Pelosi
DemographicVery
responsibleSomewhatresponsible
Not tooresponsible
Not responsibleat all
Don’t know /No opinion Total N
Registered Voters 22% (434) 15% (292) 10% (200) 38% (763) 16% (310) 2000Biden Job Strongly Approve 9% (49) 6% (34) 6% (30) 70% (369) 9% (46) 527Biden Job Somewhat Approve 4% (19) 10% (50) 17% (85) 45% (218) 23% (112) 485Biden Job Somewhat Disapprove 12% (27) 26% (58) 19% (43) 22% (51) 21% (47) 226Biden Job Strongly Disapprove 46% (335) 20% (144) 6% (41) 16% (117) 12% (84) 721Favorable of Biden 7% (71) 9% (86) 11% (116) 58% (586) 15% (151) 1009Unfavorable of Biden 38% (358) 22% (203) 9% (83) 18% (166) 14% (130) 940Very Favorable of Biden 8% (45) 6% (34) 7% (36) 68% (373) 11% (60) 549Somewhat Favorable of Biden 6% (26) 11% (52) 17% (80) 46% (213) 20% (90) 461Somewhat Unfavorable of Biden 12% (24) 25% (50) 16% (32) 25% (49) 21% (42) 196Very Unfavorable of Biden 45% (334) 21% (153) 7% (51) 16% (117) 12% (88) 744#1 Issue: Economy 18% (136) 15% (115) 11% (84) 37% (275) 18% (136) 746#1 Issue: Security 45% (173) 20% (77) 6% (22) 20% (75) 9% (34) 381#1 Issue: Health Care 12% (31) 10% (24) 15% (37) 50% (126) 14% (34) 252#1 Issue: Medicare / Social Security 19% (45) 13% (31) 9% (23) 50% (121) 9% (22) 242#1 Issue: Women’s Issues 10% (10) 12% (11) 8% (7) 33% (31) 37% (35) 94#1 Issue: Education 15% (11) 16% (12) 15% (11) 28% (22) 27% (21) 77#1 Issue: Energy 8% (8) 10% (11) 9% (10) 59% (65) 15% (16) 111#1 Issue: Other 21% (20) 10% (10) 7% (6) 49% (48) 13% (12) 962020 Vote: Joe Biden 7% (69) 8% (74) 11% (106) 60% (569) 14% (130) 9472020 Vote: Donald Trump 40% (344) 22% (191) 9% (80) 17% (150) 11% (99) 8652020 Vote: Didn’t Vote 12% (18) 14% (21) 8% (12) 23% (35) 44% (67) 1532018 House Vote: Democrat 8% (58) 8% (55) 12% (84) 65% (475) 8% (55) 7272018 House Vote: Republican 41% (282) 23% (161) 8% (57) 18% (125) 10% (71) 6962016 Vote: Hillary Clinton 7% (50) 7% (48) 11% (71) 66% (440) 9% (59) 6672016 Vote: Donald Trump 41% (318) 21% (162) 9% (71) 19% (150) 10% (75) 7762016 Vote: Other 8% (7) 13% (12) 15% (14) 45% (43) 19% (18) 942016 Vote: Didn’t Vote 13% (60) 15% (68) 10% (44) 28% (128) 35% (158) 458Voted in 2014: Yes 24% (311) 15% (199) 10% (131) 42% (551) 9% (115) 1306Voted in 2014: No 18% (122) 13% (93) 10% (70) 31% (213) 28% (196) 694
Continued on next page

National Tracking Poll #2107125, July, 2021
123
Table POL4_15
Table POL4_15: How responsible do you believe each of the following are for the events that led to a group of people attacking police and breakinginto the U.S. Capitol in Washington, D.C.?Speaker of the House Nancy Pelosi
DemographicVery
responsibleSomewhatresponsible
Not tooresponsible
Not responsibleat all
Don’t know /No opinion Total N
Registered Voters 22% (434) 15% (292) 10% (200) 38% (763) 16% (310) 20004-Region: Northeast 22% (78) 15% (54) 10% (34) 37% (129) 16% (58) 3534-Region: Midwest 22% (99) 13% (57) 11% (51) 39% (171) 15% (67) 4454-Region: South 23% (175) 14% (105) 9% (69) 37% (277) 16% (120) 7464-Region: West 18% (83) 17% (77) 10% (46) 41% (185) 14% (65) 456Note: Row proportions may total to larger than one-hundred percent due to rounding. For more information visit MorningConsultIntelligence.com.

124
Morning ConsultTable POL5_1
Table POL5_1: Thinking about the events that occurred at the U.S. Capitol on Jan. 6, how well does each of the following describe how you feel?Surprised
Demographic Very well Somewhat well Not very well Not well at allDon’t know /No opinion Total N
Registered Voters 25% (510) 30% (606) 16% (328) 18% (364) 10% (192) 2000Gender: Male 26% (242) 32% (304) 16% (151) 18% (170) 8% (76) 943Gender: Female 25% (268) 29% (302) 17% (177) 18% (194) 11% (116) 1057Age: 18-34 23% (120) 30% (155) 20% (102) 17% (87) 10% (51) 515Age: 35-44 24% (74) 24% (74) 12% (37) 22% (69) 17% (54) 307Age: 45-64 27% (183) 32% (215) 17% (114) 16% (111) 8% (58) 680Age: 65+ 27% (134) 33% (163) 15% (74) 20% (97) 6% (30) 498GenZers: 1997-2012 24% (40) 28% (45) 24% (39) 15% (24) 9% (15) 162Millennials: 1981-1996 23% (121) 30% (158) 16% (83) 19% (102) 12% (63) 527GenXers: 1965-1980 25% (136) 29% (157) 16% (84) 19% (101) 12% (63) 542Baby Boomers: 1946-1964 28% (193) 32% (217) 16% (109) 18% (123) 7% (47) 688PID: Dem (no lean) 31% (243) 27% (211) 17% (133) 18% (139) 8% (63) 789PID: Ind (no lean) 22% (102) 34% (160) 17% (78) 17% (78) 11% (54) 472PID: Rep (no lean) 22% (165) 32% (236) 16% (116) 20% (147) 10% (76) 740PID/Gender: DemMen 31% (114) 28% (104) 17% (62) 17% (64) 7% (27) 371PID/Gender: DemWomen 31% (129) 26% (107) 17% (72) 18% (75) 9% (36) 418PID/Gender: Ind Men 23% (55) 34% (81) 16% (37) 17% (40) 10% (25) 237PID/Gender: Ind Women 20% (47) 34% (79) 18% (41) 16% (38) 12% (29) 234PID/Gender: Rep Men 22% (73) 36% (119) 16% (52) 20% (65) 7% (24) 334PID/Gender: Rep Women 23% (92) 29% (116) 16% (64) 20% (81) 13% (52) 405Ideo: Liberal (1-3) 27% (160) 28% (163) 18% (105) 22% (128) 5% (31) 587Ideo: Moderate (4) 24% (130) 31% (168) 18% (98) 17% (90) 10% (55) 542Ideo: Conservative (5-7) 26% (204) 32% (253) 14% (113) 17% (134) 12% (92) 795Educ: < College 27% (321) 27% (321) 17% (210) 18% (213) 12% (143) 1207Educ: Bachelors degree 24% (121) 35% (178) 15% (74) 19% (94) 7% (35) 502Educ: Post-grad 24% (69) 37% (107) 15% (44) 20% (57) 5% (14) 291Income: Under 50k 26% (236) 26% (240) 16% (148) 19% (176) 13% (115) 916Income: 50k-100k 24% (172) 35% (254) 17% (125) 17% (122) 7% (48) 720Income: 100k+ 28% (102) 31% (113) 15% (54) 18% (66) 8% (29) 364Ethnicity: White 25% (390) 32% (494) 17% (263) 18% (284) 8% (125) 1555Ethnicity: Hispanic 27% (60) 28% (62) 20% (45) 13% (30) 12% (26) 222
Continued on next page

National Tracking Poll #2107125, July, 2021
125
Table POL5_1
Table POL5_1: Thinking about the events that occurred at the U.S. Capitol on Jan. 6, how well does each of the following describe how you feel?Surprised
Demographic Very well Somewhat well Not very well Not well at allDon’t know /No opinion Total N
Registered Voters 25% (510) 30% (606) 16% (328) 18% (364) 10% (192) 2000Ethnicity: Black 33% (85) 24% (63) 11% (29) 16% (41) 15% (39) 257Ethnicity: Other 19% (35) 26% (49) 19% (36) 21% (39) 15% (28) 188All Christian 26% (267) 31% (324) 16% (165) 19% (199) 9% (90) 1045All Non-Christian 28% (34) 36% (44) 14% (16) 14% (17) 8% (9) 120Atheist 24% (24) 28% (27) 21% (21) 23% (23) 4% (4) 98Agnostic/Nothing in particular 23% (102) 30% (134) 19% (84) 17% (76) 11% (48) 445Something Else 28% (83) 26% (77) 14% (42) 17% (48) 14% (42) 292Religious Non-Protestant/Catholic 26% (37) 37% (53) 16% (22) 14% (20) 7% (10) 143Evangelical 29% (172) 28% (165) 14% (81) 19% (114) 10% (59) 591Non-Evangelical 24% (173) 31% (223) 17% (117) 18% (127) 10% (70) 710Community: Urban 32% (158) 30% (149) 14% (70) 15% (75) 9% (43) 494Community: Suburban 25% (244) 31% (303) 17% (169) 17% (173) 10% (101) 989Community: Rural 21% (108) 30% (155) 17% (89) 22% (116) 9% (49) 516Employ: Private Sector 26% (168) 33% (219) 15% (95) 20% (132) 7% (43) 656Employ: Government 30% (32) 25% (27) 22% (24) 14% (15) 9% (10) 109Employ: Self-Employed 31% (55) 32% (57) 15% (27) 13% (23) 10% (17) 180Employ: Homemaker 13% (23) 33% (58) 19% (34) 17% (29) 17% (30) 174Employ: Student 32% (21) 20% (13) 23% (15) 13% (9) 12% (8) 65Employ: Retired 25% (130) 32% (167) 16% (83) 20% (104) 7% (36) 520Employ: Unemployed 28% (57) 25% (51) 15% (31) 19% (37) 12% (24) 199Employ: Other 25% (25) 14% (14) 20% (20) 15% (14) 25% (24) 97Military HH: Yes 29% (111) 29% (109) 17% (62) 19% (73) 6% (22) 377Military HH: No 25% (399) 31% (497) 16% (265) 18% (291) 10% (170) 1623RD/WT: Right Direction 31% (268) 29% (255) 15% (132) 16% (142) 8% (71) 868RD/WT: Wrong Track 21% (242) 31% (351) 17% (196) 20% (222) 11% (122) 1132Biden Job Approve 30% (299) 29% (295) 16% (160) 18% (182) 7% (76) 1012Biden Job Disapprove 21% (200) 32% (301) 17% (166) 18% (175) 11% (106) 947
Continued on next page

126
Morning ConsultTable POL5_1
Table POL5_1: Thinking about the events that occurred at the U.S. Capitol on Jan. 6, how well does each of the following describe how you feel?Surprised
Demographic Very well Somewhat well Not very well Not well at allDon’t know /No opinion Total N
Registered Voters 25% (510) 30% (606) 16% (328) 18% (364) 10% (192) 2000Biden Job Strongly Approve 36% (192) 25% (131) 13% (71) 18% (97) 7% (37) 527Biden Job Somewhat Approve 22% (106) 34% (165) 18% (89) 18% (86) 8% (39) 485Biden Job Somewhat Disapprove 25% (56) 35% (80) 17% (39) 14% (32) 9% (20) 226Biden Job Strongly Disapprove 20% (144) 31% (221) 18% (127) 20% (143) 12% (86) 721Favorable of Biden 31% (311) 29% (296) 15% (152) 18% (181) 7% (69) 1009Unfavorable of Biden 20% (191) 32% (302) 18% (168) 19% (177) 11% (102) 940Very Favorable of Biden 35% (192) 25% (136) 15% (80) 18% (101) 7% (39) 549Somewhat Favorable of Biden 26% (119) 35% (161) 16% (72) 17% (79) 7% (30) 461Somewhat Unfavorable of Biden 25% (48) 38% (74) 15% (29) 15% (29) 8% (17) 196Very Unfavorable of Biden 19% (143) 31% (228) 19% (139) 20% (148) 12% (86) 744#1 Issue: Economy 26% (193) 33% (249) 15% (108) 18% (132) 8% (63) 746#1 Issue: Security 26% (98) 30% (115) 15% (58) 17% (64) 12% (46) 381#1 Issue: Health Care 31% (79) 24% (61) 16% (42) 21% (52) 7% (19) 252#1 Issue: Medicare / Social Security 24% (59) 31% (75) 17% (41) 18% (43) 10% (24) 242#1 Issue: Women’s Issues 16% (15) 32% (30) 20% (19) 16% (15) 16% (15) 94#1 Issue: Education 18% (13) 32% (24) 18% (14) 19% (15) 14% (11) 77#1 Issue: Energy 27% (30) 29% (32) 24% (27) 18% (20) 2% (2) 111#1 Issue: Other 23% (22) 20% (19) 20% (19) 24% (23) 13% (12) 962020 Vote: Joe Biden 29% (279) 28% (269) 16% (152) 19% (182) 7% (65) 9472020 Vote: Donald Trump 23% (196) 33% (284) 17% (144) 18% (153) 10% (87) 8652020 Vote: Didn’t Vote 18% (28) 29% (44) 17% (26) 14% (22) 22% (34) 1532018 House Vote: Democrat 29% (214) 29% (211) 15% (110) 20% (148) 6% (44) 7272018 House Vote: Republican 23% (162) 33% (231) 15% (105) 19% (133) 9% (65) 6962016 Vote: Hillary Clinton 30% (203) 29% (191) 14% (95) 21% (137) 6% (41) 6672016 Vote: Donald Trump 24% (185) 32% (249) 15% (120) 19% (146) 10% (76) 7762016 Vote: Other 15% (14) 31% (29) 28% (26) 20% (19) 6% (5) 942016 Vote: Didn’t Vote 23% (107) 30% (135) 19% (86) 13% (60) 15% (70) 458Voted in 2014: Yes 26% (345) 31% (403) 15% (201) 19% (252) 8% (105) 1306Voted in 2014: No 24% (165) 29% (203) 18% (127) 16% (112) 13% (87) 694
Continued on next page

National Tracking Poll #2107125, July, 2021
127
Table POL5_1
Table POL5_1: Thinking about the events that occurred at the U.S. Capitol on Jan. 6, how well does each of the following describe how you feel?Surprised
Demographic Very well Somewhat well Not very well Not well at allDon’t know /No opinion Total N
Registered Voters 25% (510) 30% (606) 16% (328) 18% (364) 10% (192) 20004-Region: Northeast 26% (90) 31% (109) 14% (48) 18% (64) 12% (41) 3534-Region: Midwest 27% (121) 30% (134) 17% (77) 20% (88) 5% (24) 4454-Region: South 27% (201) 30% (226) 16% (119) 16% (122) 11% (79) 7464-Region: West 21% (98) 30% (137) 18% (84) 20% (90) 10% (48) 456Note: Row proportions may total to larger than one-hundred percent due to rounding. For more information visit MorningConsultIntelligence.com.

128
Morning ConsultTable POL5_2
Table POL5_2: Thinking about the events that occurred at the U.S. Capitol on Jan. 6, how well does each of the following describe how you feel?Worried
Demographic Very well Somewhat well Not very well Not well at allDon’t know /No opinion Total N
Registered Voters 31% (619) 28% (562) 14% (288) 18% (363) 8% (168) 2000Gender: Male 28% (262) 29% (273) 16% (152) 20% (187) 7% (69) 943Gender: Female 34% (357) 27% (290) 13% (136) 17% (175) 9% (100) 1057Age: 18-34 34% (174) 26% (134) 13% (66) 17% (88) 10% (54) 515Age: 35-44 31% (94) 24% (73) 10% (30) 21% (66) 15% (45) 307Age: 45-64 28% (191) 28% (194) 18% (123) 19% (128) 6% (44) 680Age: 65+ 32% (160) 32% (162) 14% (69) 16% (81) 5% (26) 498GenZers: 1997-2012 38% (61) 25% (40) 15% (24) 14% (23) 9% (14) 162Millennials: 1981-1996 32% (167) 25% (134) 12% (62) 19% (100) 12% (65) 527GenXers: 1965-1980 28% (153) 25% (137) 17% (90) 21% (116) 8% (46) 542Baby Boomers: 1946-1964 31% (214) 32% (223) 14% (98) 17% (114) 6% (39) 688PID: Dem (no lean) 47% (368) 26% (208) 9% (74) 11% (84) 7% (54) 789PID: Ind (no lean) 28% (130) 31% (147) 14% (65) 18% (85) 9% (44) 472PID: Rep (no lean) 16% (120) 28% (207) 20% (149) 26% (193) 9% (70) 740PID/Gender: DemMen 45% (166) 25% (95) 11% (42) 12% (44) 7% (25) 371PID/Gender: DemWomen 48% (202) 27% (114) 8% (33) 10% (41) 7% (29) 418PID/Gender: Ind Men 22% (53) 34% (80) 17% (41) 19% (45) 8% (19) 237PID/Gender: Ind Women 33% (77) 29% (67) 10% (24) 17% (40) 11% (26) 234PID/Gender: Rep Men 13% (42) 29% (98) 21% (70) 30% (99) 7% (25) 334PID/Gender: Rep Women 19% (78) 27% (108) 20% (79) 23% (95) 11% (45) 405Ideo: Liberal (1-3) 51% (298) 28% (162) 7% (39) 12% (69) 3% (19) 587Ideo: Moderate (4) 32% (174) 28% (154) 15% (81) 17% (91) 8% (42) 542Ideo: Conservative (5-7) 16% (124) 29% (234) 19% (153) 25% (197) 11% (87) 795Educ: < College 28% (344) 27% (321) 15% (179) 19% (231) 11% (132) 1207Educ: Bachelors degree 33% (167) 29% (145) 14% (70) 19% (95) 5% (25) 502Educ: Post-grad 37% (108) 33% (96) 14% (39) 12% (36) 4% (11) 291Income: Under 50k 30% (277) 27% (246) 13% (117) 19% (172) 11% (103) 916Income: 50k-100k 31% (225) 29% (206) 15% (105) 19% (139) 6% (44) 720Income: 100k+ 32% (117) 30% (109) 18% (66) 14% (52) 6% (21) 364Ethnicity: White 30% (473) 30% (459) 14% (214) 19% (292) 8% (117) 1555Ethnicity: Hispanic 34% (76) 29% (64) 17% (37) 13% (29) 8% (17) 222
Continued on next page

National Tracking Poll #2107125, July, 2021
129
Table POL5_2
Table POL5_2: Thinking about the events that occurred at the U.S. Capitol on Jan. 6, how well does each of the following describe how you feel?Worried
Demographic Very well Somewhat well Not very well Not well at allDon’t know /No opinion Total N
Registered Voters 31% (619) 28% (562) 14% (288) 18% (363) 8% (168) 2000Ethnicity: Black 34% (89) 22% (57) 14% (37) 17% (43) 12% (32) 257Ethnicity: Other 30% (57) 25% (46) 20% (37) 15% (28) 11% (20) 188All Christian 28% (298) 29% (307) 16% (163) 20% (206) 7% (71) 1045All Non-Christian 43% (52) 26% (31) 14% (17) 10% (12) 7% (9) 120Atheist 53% (52) 24% (24) 8% (8) 11% (11) 4% (4) 98Agnostic/Nothing in particular 32% (144) 26% (117) 15% (67) 17% (76) 9% (41) 445Something Else 25% (74) 28% (83) 11% (33) 20% (59) 15% (44) 292Religious Non-Protestant/Catholic 40% (57) 26% (37) 18% (25) 10% (15) 6% (9) 143Evangelical 25% (148) 30% (175) 13% (74) 23% (134) 10% (60) 591Non-Evangelical 30% (214) 29% (208) 15% (109) 18% (126) 7% (52) 710Community: Urban 33% (165) 28% (138) 13% (64) 17% (86) 8% (41) 494Community: Suburban 31% (308) 30% (293) 14% (139) 17% (168) 8% (81) 989Community: Rural 28% (146) 25% (131) 16% (85) 21% (109) 9% (47) 516Employ: Private Sector 31% (201) 28% (182) 16% (108) 21% (137) 4% (28) 656Employ: Government 35% (38) 30% (33) 8% (9) 16% (18) 10% (10) 109Employ: Self-Employed 28% (51) 32% (57) 12% (21) 19% (34) 9% (16) 180Employ: Homemaker 23% (40) 25% (44) 15% (27) 19% (33) 18% (31) 174Employ: Student 38% (25) 19% (12) 17% (11) 10% (7) 16% (10) 65Employ: Retired 32% (165) 31% (163) 14% (72) 17% (87) 6% (33) 520Employ: Unemployed 36% (72) 26% (51) 13% (26) 16% (31) 9% (18) 199Employ: Other 28% (27) 21% (20) 15% (14) 16% (15) 21% (21) 97Military HH: Yes 27% (103) 29% (110) 15% (55) 23% (88) 6% (22) 377Military HH: No 32% (516) 28% (452) 14% (233) 17% (275) 9% (147) 1623RD/WT: Right Direction 42% (367) 29% (250) 11% (94) 11% (96) 7% (61) 868RD/WT: Wrong Track 22% (252) 28% (313) 17% (194) 24% (266) 10% (108) 1132Biden Job Approve 44% (442) 30% (303) 10% (102) 10% (105) 6% (60) 1012Biden Job Disapprove 18% (169) 26% (251) 19% (181) 26% (251) 10% (96) 947
Continued on next page

130
Morning ConsultTable POL5_2
Table POL5_2: Thinking about the events that occurred at the U.S. Capitol on Jan. 6, how well does each of the following describe how you feel?Worried
Demographic Very well Somewhat well Not very well Not well at allDon’t know /No opinion Total N
Registered Voters 31% (619) 28% (562) 14% (288) 18% (363) 8% (168) 2000Biden Job Strongly Approve 50% (263) 25% (134) 9% (49) 11% (55) 5% (26) 527Biden Job Somewhat Approve 37% (179) 35% (169) 11% (53) 10% (50) 7% (35) 485Biden Job Somewhat Disapprove 26% (59) 29% (67) 17% (38) 21% (48) 7% (15) 226Biden Job Strongly Disapprove 15% (110) 26% (184) 20% (143) 28% (203) 11% (81) 721Favorable of Biden 45% (455) 30% (301) 10% (97) 11% (106) 5% (50) 1009Unfavorable of Biden 17% (157) 27% (254) 20% (184) 26% (249) 10% (96) 940Very Favorable of Biden 51% (279) 25% (137) 9% (47) 10% (56) 5% (28) 549Somewhat Favorable of Biden 38% (176) 36% (164) 11% (49) 11% (50) 5% (22) 461Somewhat Unfavorable of Biden 23% (45) 30% (58) 20% (40) 19% (38) 7% (14) 196Very Unfavorable of Biden 15% (112) 26% (195) 19% (144) 28% (211) 11% (82) 744#1 Issue: Economy 25% (185) 32% (236) 15% (115) 20% (149) 8% (61) 746#1 Issue: Security 19% (73) 24% (92) 19% (73) 26% (101) 11% (41) 381#1 Issue: Health Care 44% (111) 27% (69) 9% (24) 14% (36) 5% (12) 252#1 Issue: Medicare / Social Security 38% (92) 30% (73) 11% (27) 13% (32) 8% (19) 242#1 Issue: Women’s Issues 46% (43) 24% (22) 7% (7) 14% (13) 10% (9) 94#1 Issue: Education 28% (22) 30% (23) 23% (17) 7% (5) 12% (9) 77#1 Issue: Energy 52% (58) 25% (28) 9% (10) 10% (11) 3% (3) 111#1 Issue: Other 37% (35) 19% (18) 15% (14) 16% (16) 13% (13) 962020 Vote: Joe Biden 46% (438) 30% (283) 8% (79) 10% (98) 5% (49) 9472020 Vote: Donald Trump 16% (134) 28% (241) 20% (176) 27% (233) 9% (80) 8652020 Vote: Didn’t Vote 25% (39) 21% (32) 20% (30) 13% (20) 21% (32) 1532018 House Vote: Democrat 45% (325) 30% (215) 9% (69) 12% (85) 5% (33) 7272018 House Vote: Republican 17% (119) 30% (209) 18% (123) 26% (180) 9% (65) 6962016 Vote: Hillary Clinton 45% (298) 31% (208) 9% (59) 11% (71) 5% (31) 6672016 Vote: Donald Trump 17% (133) 28% (214) 18% (142) 28% (214) 9% (72) 7762016 Vote: Other 33% (31) 32% (30) 15% (14) 11% (11) 9% (8) 942016 Vote: Didn’t Vote 33% (153) 24% (110) 16% (73) 14% (65) 12% (57) 458Voted in 2014: Yes 31% (406) 29% (385) 14% (179) 18% (235) 8% (101) 1306Voted in 2014: No 31% (212) 26% (177) 16% (109) 18% (128) 10% (68) 694
Continued on next page
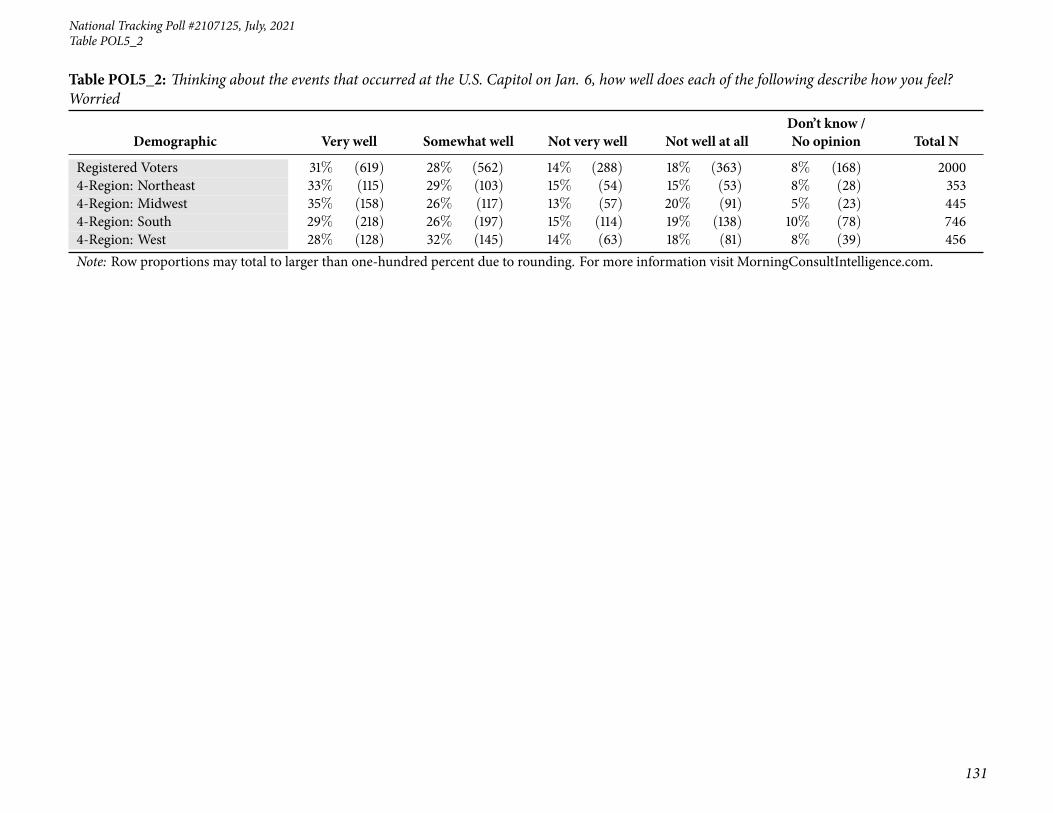
National Tracking Poll #2107125, July, 2021
131
Table POL5_2
Table POL5_2: Thinking about the events that occurred at the U.S. Capitol on Jan. 6, how well does each of the following describe how you feel?Worried
Demographic Very well Somewhat well Not very well Not well at allDon’t know /No opinion Total N
Registered Voters 31% (619) 28% (562) 14% (288) 18% (363) 8% (168) 20004-Region: Northeast 33% (115) 29% (103) 15% (54) 15% (53) 8% (28) 3534-Region: Midwest 35% (158) 26% (117) 13% (57) 20% (91) 5% (23) 4454-Region: South 29% (218) 26% (197) 15% (114) 19% (138) 10% (78) 7464-Region: West 28% (128) 32% (145) 14% (63) 18% (81) 8% (39) 456Note: Row proportions may total to larger than one-hundred percent due to rounding. For more information visit MorningConsultIntelligence.com.
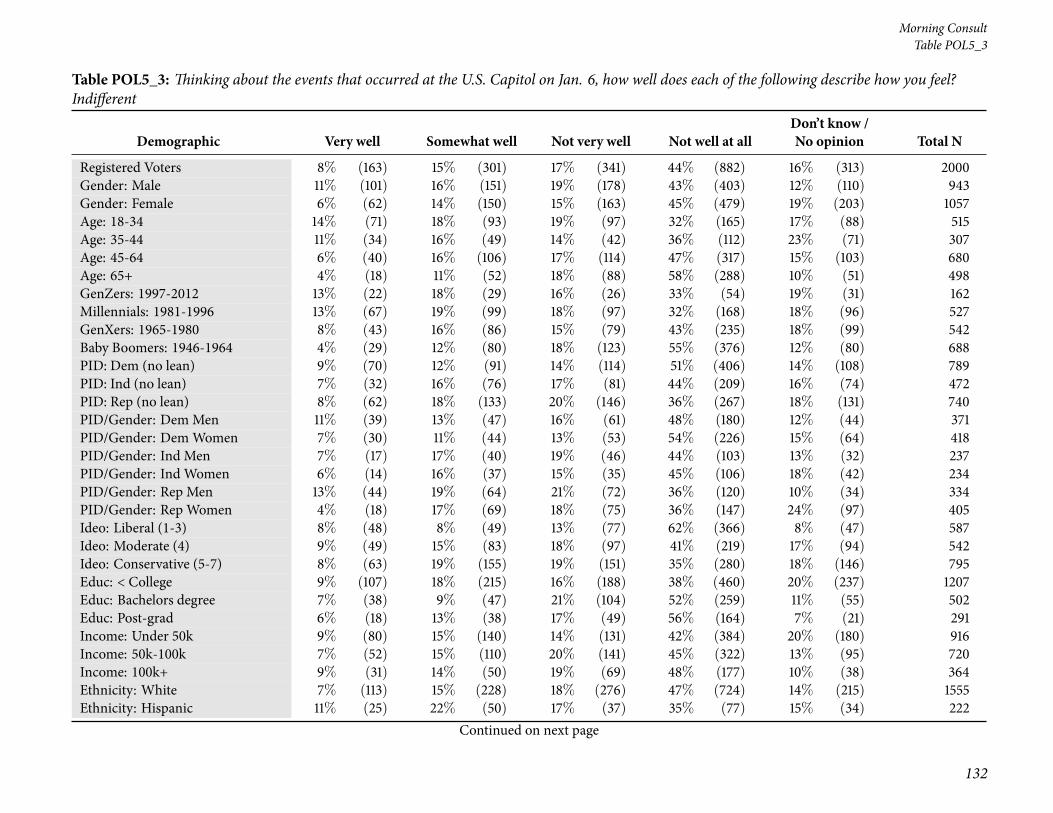
132
Morning ConsultTable POL5_3
Table POL5_3: Thinking about the events that occurred at the U.S. Capitol on Jan. 6, how well does each of the following describe how you feel?Indifferent
Demographic Very well Somewhat well Not very well Not well at allDon’t know /No opinion Total N
Registered Voters 8% (163) 15% (301) 17% (341) 44% (882) 16% (313) 2000Gender: Male 11% (101) 16% (151) 19% (178) 43% (403) 12% (110) 943Gender: Female 6% (62) 14% (150) 15% (163) 45% (479) 19% (203) 1057Age: 18-34 14% (71) 18% (93) 19% (97) 32% (165) 17% (88) 515Age: 35-44 11% (34) 16% (49) 14% (42) 36% (112) 23% (71) 307Age: 45-64 6% (40) 16% (106) 17% (114) 47% (317) 15% (103) 680Age: 65+ 4% (18) 11% (52) 18% (88) 58% (288) 10% (51) 498GenZers: 1997-2012 13% (22) 18% (29) 16% (26) 33% (54) 19% (31) 162Millennials: 1981-1996 13% (67) 19% (99) 18% (97) 32% (168) 18% (96) 527GenXers: 1965-1980 8% (43) 16% (86) 15% (79) 43% (235) 18% (99) 542Baby Boomers: 1946-1964 4% (29) 12% (80) 18% (123) 55% (376) 12% (80) 688PID: Dem (no lean) 9% (70) 12% (91) 14% (114) 51% (406) 14% (108) 789PID: Ind (no lean) 7% (32) 16% (76) 17% (81) 44% (209) 16% (74) 472PID: Rep (no lean) 8% (62) 18% (133) 20% (146) 36% (267) 18% (131) 740PID/Gender: DemMen 11% (39) 13% (47) 16% (61) 48% (180) 12% (44) 371PID/Gender: DemWomen 7% (30) 11% (44) 13% (53) 54% (226) 15% (64) 418PID/Gender: Ind Men 7% (17) 17% (40) 19% (46) 44% (103) 13% (32) 237PID/Gender: Ind Women 6% (14) 16% (37) 15% (35) 45% (106) 18% (42) 234PID/Gender: Rep Men 13% (44) 19% (64) 21% (72) 36% (120) 10% (34) 334PID/Gender: Rep Women 4% (18) 17% (69) 18% (75) 36% (147) 24% (97) 405Ideo: Liberal (1-3) 8% (48) 8% (49) 13% (77) 62% (366) 8% (47) 587Ideo: Moderate (4) 9% (49) 15% (83) 18% (97) 41% (219) 17% (94) 542Ideo: Conservative (5-7) 8% (63) 19% (155) 19% (151) 35% (280) 18% (146) 795Educ: < College 9% (107) 18% (215) 16% (188) 38% (460) 20% (237) 1207Educ: Bachelors degree 7% (38) 9% (47) 21% (104) 52% (259) 11% (55) 502Educ: Post-grad 6% (18) 13% (38) 17% (49) 56% (164) 7% (21) 291Income: Under 50k 9% (80) 15% (140) 14% (131) 42% (384) 20% (180) 916Income: 50k-100k 7% (52) 15% (110) 20% (141) 45% (322) 13% (95) 720Income: 100k+ 9% (31) 14% (50) 19% (69) 48% (177) 10% (38) 364Ethnicity: White 7% (113) 15% (228) 18% (276) 47% (724) 14% (215) 1555Ethnicity: Hispanic 11% (25) 22% (50) 17% (37) 35% (77) 15% (34) 222
Continued on next page
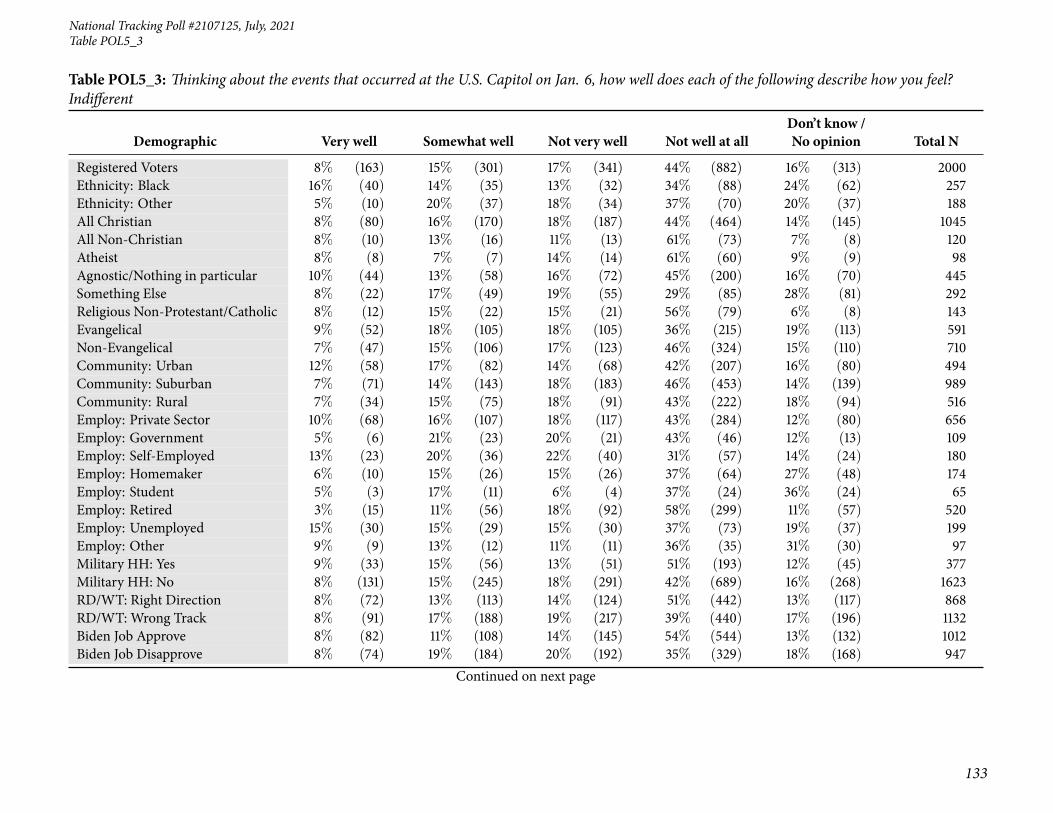
National Tracking Poll #2107125, July, 2021
133
Table POL5_3
Table POL5_3: Thinking about the events that occurred at the U.S. Capitol on Jan. 6, how well does each of the following describe how you feel?Indifferent
Demographic Very well Somewhat well Not very well Not well at allDon’t know /No opinion Total N
Registered Voters 8% (163) 15% (301) 17% (341) 44% (882) 16% (313) 2000Ethnicity: Black 16% (40) 14% (35) 13% (32) 34% (88) 24% (62) 257Ethnicity: Other 5% (10) 20% (37) 18% (34) 37% (70) 20% (37) 188All Christian 8% (80) 16% (170) 18% (187) 44% (464) 14% (145) 1045All Non-Christian 8% (10) 13% (16) 11% (13) 61% (73) 7% (8) 120Atheist 8% (8) 7% (7) 14% (14) 61% (60) 9% (9) 98Agnostic/Nothing in particular 10% (44) 13% (58) 16% (72) 45% (200) 16% (70) 445Something Else 8% (22) 17% (49) 19% (55) 29% (85) 28% (81) 292Religious Non-Protestant/Catholic 8% (12) 15% (22) 15% (21) 56% (79) 6% (8) 143Evangelical 9% (52) 18% (105) 18% (105) 36% (215) 19% (113) 591Non-Evangelical 7% (47) 15% (106) 17% (123) 46% (324) 15% (110) 710Community: Urban 12% (58) 17% (82) 14% (68) 42% (207) 16% (80) 494Community: Suburban 7% (71) 14% (143) 18% (183) 46% (453) 14% (139) 989Community: Rural 7% (34) 15% (75) 18% (91) 43% (222) 18% (94) 516Employ: Private Sector 10% (68) 16% (107) 18% (117) 43% (284) 12% (80) 656Employ: Government 5% (6) 21% (23) 20% (21) 43% (46) 12% (13) 109Employ: Self-Employed 13% (23) 20% (36) 22% (40) 31% (57) 14% (24) 180Employ: Homemaker 6% (10) 15% (26) 15% (26) 37% (64) 27% (48) 174Employ: Student 5% (3) 17% (11) 6% (4) 37% (24) 36% (24) 65Employ: Retired 3% (15) 11% (56) 18% (92) 58% (299) 11% (57) 520Employ: Unemployed 15% (30) 15% (29) 15% (30) 37% (73) 19% (37) 199Employ: Other 9% (9) 13% (12) 11% (11) 36% (35) 31% (30) 97Military HH: Yes 9% (33) 15% (56) 13% (51) 51% (193) 12% (45) 377Military HH: No 8% (131) 15% (245) 18% (291) 42% (689) 16% (268) 1623RD/WT: Right Direction 8% (72) 13% (113) 14% (124) 51% (442) 13% (117) 868RD/WT: Wrong Track 8% (91) 17% (188) 19% (217) 39% (440) 17% (196) 1132Biden Job Approve 8% (82) 11% (108) 14% (145) 54% (544) 13% (132) 1012Biden Job Disapprove 8% (74) 19% (184) 20% (192) 35% (329) 18% (168) 947
Continued on next page

134
Morning ConsultTable POL5_3
Table POL5_3: Thinking about the events that occurred at the U.S. Capitol on Jan. 6, how well does each of the following describe how you feel?Indifferent
Demographic Very well Somewhat well Not very well Not well at allDon’t know /No opinion Total N
Registered Voters 8% (163) 15% (301) 17% (341) 44% (882) 16% (313) 2000Biden Job Strongly Approve 9% (49) 10% (51) 11% (60) 58% (307) 12% (61) 527Biden Job Somewhat Approve 7% (33) 12% (57) 18% (86) 49% (237) 15% (71) 485Biden Job Somewhat Disapprove 8% (18) 25% (57) 25% (57) 31% (69) 11% (25) 226Biden Job Strongly Disapprove 8% (56) 18% (127) 19% (135) 36% (260) 20% (142) 721Favorable of Biden 8% (81) 11% (111) 14% (144) 54% (546) 13% (128) 1009Unfavorable of Biden 8% (77) 20% (185) 20% (191) 34% (324) 17% (164) 940Very Favorable of Biden 8% (45) 9% (52) 14% (79) 56% (308) 12% (65) 549Somewhat Favorable of Biden 8% (35) 13% (60) 14% (65) 51% (237) 14% (63) 461Somewhat Unfavorable of Biden 10% (19) 26% (51) 21% (42) 32% (62) 11% (21) 196Very Unfavorable of Biden 8% (58) 18% (133) 20% (149) 35% (262) 19% (142) 744#1 Issue: Economy 10% (73) 17% (123) 17% (128) 40% (295) 17% (127) 746#1 Issue: Security 8% (30) 17% (65) 21% (79) 35% (134) 19% (74) 381#1 Issue: Health Care 7% (19) 11% (28) 18% (45) 52% (131) 12% (30) 252#1 Issue: Medicare / Social Security 3% (8) 16% (38) 13% (32) 54% (131) 14% (33) 242#1 Issue: Women’s Issues 7% (7) 10% (10) 20% (19) 44% (42) 18% (17) 94#1 Issue: Education 12% (10) 20% (16) 17% (13) 39% (30) 11% (8) 77#1 Issue: Energy 10% (11) 13% (15) 15% (17) 56% (63) 5% (6) 111#1 Issue: Other 7% (7) 7% (7) 10% (9) 58% (56) 18% (17) 962020 Vote: Joe Biden 8% (72) 10% (93) 14% (132) 56% (528) 13% (122) 9472020 Vote: Donald Trump 8% (66) 19% (167) 21% (182) 36% (311) 16% (139) 8652020 Vote: Didn’t Vote 13% (20) 22% (34) 14% (21) 21% (31) 30% (46) 1532018 House Vote: Democrat 7% (48) 12% (85) 14% (104) 56% (406) 11% (83) 7272018 House Vote: Republican 8% (53) 17% (118) 19% (133) 39% (274) 17% (117) 6962016 Vote: Hillary Clinton 7% (43) 10% (68) 13% (89) 59% (393) 11% (74) 6672016 Vote: Donald Trump 7% (56) 19% (146) 20% (152) 37% (290) 17% (133) 7762016 Vote: Other 8% (7) 12% (11) 18% (17) 49% (46) 13% (12) 942016 Vote: Didn’t Vote 12% (57) 16% (73) 18% (84) 33% (150) 21% (94) 458Voted in 2014: Yes 7% (87) 14% (188) 17% (221) 48% (629) 14% (181) 1306Voted in 2014: No 11% (76) 16% (113) 17% (120) 36% (253) 19% (132) 694
Continued on next page

National Tracking Poll #2107125, July, 2021
135
Table POL5_3
Table POL5_3: Thinking about the events that occurred at the U.S. Capitol on Jan. 6, how well does each of the following describe how you feel?Indifferent
Demographic Very well Somewhat well Not very well Not well at allDon’t know /No opinion Total N
Registered Voters 8% (163) 15% (301) 17% (341) 44% (882) 16% (313) 20004-Region: Northeast 7% (24) 16% (57) 15% (52) 46% (164) 16% (57) 3534-Region: Midwest 6% (27) 13% (56) 17% (74) 52% (231) 13% (58) 4454-Region: South 9% (64) 17% (123) 18% (132) 39% (291) 18% (136) 7464-Region: West 11% (48) 14% (65) 18% (84) 43% (197) 14% (62) 456Note: Row proportions may total to larger than one-hundred percent due to rounding. For more information visit MorningConsultIntelligence.com.

136
Morning ConsultTable POL5_4
Table POL5_4: Thinking about the events that occurred at the U.S. Capitol on Jan. 6, how well does each of the following describe how you feel?Sad
Demographic Very well Somewhat well Not very well Not well at allDon’t know /No opinion Total N
Registered Voters 37% (739) 28% (552) 12% (233) 15% (303) 9% (173) 2000Gender: Male 32% (305) 28% (265) 14% (131) 18% (168) 8% (74) 943Gender: Female 41% (434) 27% (287) 10% (102) 13% (134) 9% (99) 1057Age: 18-34 26% (135) 28% (146) 16% (85) 18% (92) 11% (57) 515Age: 35-44 32% (98) 28% (87) 12% (37) 14% (44) 14% (42) 307Age: 45-64 39% (267) 24% (165) 11% (77) 18% (119) 8% (52) 680Age: 65+ 48% (239) 31% (154) 7% (35) 9% (47) 5% (23) 498GenZers: 1997-2012 23% (37) 30% (48) 12% (20) 25% (41) 9% (15) 162Millennials: 1981-1996 29% (153) 26% (137) 18% (93) 14% (76) 13% (67) 527GenXers: 1965-1980 36% (193) 25% (137) 11% (59) 18% (99) 10% (54) 542Baby Boomers: 1946-1964 46% (313) 30% (204) 8% (55) 12% (81) 5% (35) 688PID: Dem (no lean) 46% (360) 27% (211) 11% (89) 10% (78) 6% (51) 789PID: Ind (no lean) 37% (175) 28% (133) 12% (57) 14% (64) 9% (42) 472PID: Rep (no lean) 28% (204) 28% (208) 12% (87) 22% (161) 11% (80) 740PID/Gender: DemMen 42% (157) 24% (90) 14% (53) 11% (43) 8% (28) 371PID/Gender: DemWomen 48% (203) 29% (121) 9% (36) 8% (35) 6% (23) 418PID/Gender: Ind Men 30% (72) 32% (77) 13% (32) 16% (39) 7% (18) 237PID/Gender: Ind Women 44% (103) 24% (57) 11% (25) 11% (25) 10% (24) 234PID/Gender: Rep Men 23% (76) 29% (98) 14% (46) 26% (87) 8% (28) 334PID/Gender: Rep Women 32% (128) 27% (110) 10% (41) 18% (74) 13% (52) 405Ideo: Liberal (1-3) 51% (302) 25% (146) 11% (65) 10% (57) 3% (17) 587Ideo: Moderate (4) 36% (193) 29% (159) 12% (64) 14% (77) 9% (49) 542Ideo: Conservative (5-7) 28% (223) 28% (225) 12% (98) 20% (159) 11% (91) 795Educ: < College 33% (401) 27% (327) 13% (152) 16% (196) 11% (131) 1207Educ: Bachelors degree 43% (214) 29% (144) 10% (50) 13% (66) 5% (27) 502Educ: Post-grad 43% (125) 28% (81) 11% (31) 14% (41) 5% (14) 291Income: Under 50k 35% (317) 26% (241) 11% (97) 18% (160) 11% (100) 916Income: 50k-100k 37% (268) 28% (205) 13% (95) 14% (100) 7% (53) 720Income: 100k+ 42% (155) 29% (107) 11% (41) 12% (42) 6% (20) 364Ethnicity: White 38% (592) 28% (434) 11% (174) 15% (236) 8% (120) 1555Ethnicity: Hispanic 33% (74) 30% (66) 13% (28) 14% (31) 10% (22) 222
Continued on next page

National Tracking Poll #2107125, July, 2021
137
Table POL5_4
Table POL5_4: Thinking about the events that occurred at the U.S. Capitol on Jan. 6, how well does each of the following describe how you feel?Sad
Demographic Very well Somewhat well Not very well Not well at allDon’t know /No opinion Total N
Registered Voters 37% (739) 28% (552) 12% (233) 15% (303) 9% (173) 2000Ethnicity: Black 35% (91) 24% (63) 12% (32) 16% (42) 11% (29) 257Ethnicity: Other 30% (57) 30% (56) 14% (27) 13% (25) 13% (24) 188All Christian 39% (408) 26% (275) 11% (117) 16% (168) 7% (77) 1045All Non-Christian 43% (52) 28% (34) 11% (14) 10% (12) 7% (9) 120Atheist 54% (53) 29% (29) 11% (11) 2% (2) 3% (3) 98Agnostic/Nothing in particular 32% (142) 29% (131) 13% (57) 16% (71) 10% (44) 445Something Else 29% (85) 29% (84) 12% (34) 17% (50) 14% (40) 292Religious Non-Protestant/Catholic 42% (60) 28% (39) 13% (18) 11% (15) 6% (9) 143Evangelical 36% (212) 27% (157) 11% (65) 17% (98) 10% (59) 591Non-Evangelical 38% (270) 27% (194) 11% (78) 16% (113) 8% (56) 710Community: Urban 38% (186) 26% (129) 12% (61) 15% (76) 9% (43) 494Community: Suburban 37% (367) 28% (278) 12% (123) 14% (135) 9% (86) 989Community: Rural 36% (186) 28% (146) 9% (49) 18% (92) 9% (44) 516Employ: Private Sector 35% (229) 27% (175) 15% (96) 19% (123) 5% (34) 656Employ: Government 26% (29) 27% (29) 19% (21) 19% (21) 9% (9) 109Employ: Self-Employed 33% (59) 25% (44) 18% (33) 10% (18) 14% (26) 180Employ: Homemaker 31% (54) 30% (53) 9% (16) 15% (26) 15% (26) 174Employ: Student 22% (15) 29% (19) 10% (6) 26% (17) 13% (9) 65Employ: Retired 47% (242) 31% (162) 7% (35) 10% (51) 6% (30) 520Employ: Unemployed 35% (70) 26% (52) 10% (19) 19% (38) 10% (20) 199Employ: Other 43% (42) 19% (18) 7% (7) 10% (10) 20% (20) 97Military HH: Yes 37% (140) 28% (105) 12% (46) 18% (66) 5% (20) 377Military HH: No 37% (599) 28% (447) 12% (188) 15% (236) 9% (152) 1623RD/WT: Right Direction 46% (396) 26% (225) 10% (90) 10% (90) 8% (67) 868RD/WT: Wrong Track 30% (343) 29% (327) 13% (144) 19% (212) 9% (106) 1132Biden Job Approve 48% (483) 27% (275) 9% (89) 10% (103) 6% (62) 1012Biden Job Disapprove 26% (250) 29% (270) 15% (141) 20% (191) 10% (96) 947
Continued on next page

138
Morning ConsultTable POL5_4
Table POL5_4: Thinking about the events that occurred at the U.S. Capitol on Jan. 6, how well does each of the following describe how you feel?Sad
Demographic Very well Somewhat well Not very well Not well at allDon’t know /No opinion Total N
Registered Voters 37% (739) 28% (552) 12% (233) 15% (303) 9% (173) 2000Biden Job Strongly Approve 55% (290) 21% (113) 8% (41) 10% (54) 6% (30) 527Biden Job Somewhat Approve 40% (193) 33% (162) 10% (48) 10% (49) 7% (32) 485Biden Job Somewhat Disapprove 27% (60) 35% (78) 18% (40) 15% (35) 6% (13) 226Biden Job Strongly Disapprove 26% (189) 27% (192) 14% (100) 22% (156) 12% (83) 721Favorable of Biden 48% (488) 27% (276) 9% (91) 10% (98) 6% (56) 1009Unfavorable of Biden 26% (245) 29% (274) 14% (133) 21% (195) 10% (94) 940Very Favorable of Biden 55% (300) 22% (119) 8% (42) 10% (56) 6% (33) 549Somewhat Favorable of Biden 41% (188) 34% (158) 11% (49) 9% (42) 5% (23) 461Somewhat Unfavorable of Biden 30% (58) 32% (63) 16% (31) 17% (33) 5% (11) 196Very Unfavorable of Biden 25% (186) 28% (210) 14% (103) 22% (162) 11% (83) 744#1 Issue: Economy 35% (264) 29% (219) 13% (96) 15% (110) 8% (57) 746#1 Issue: Security 26% (98) 28% (106) 13% (49) 21% (80) 12% (47) 381#1 Issue: Health Care 43% (110) 24% (61) 10% (24) 16% (40) 7% (17) 252#1 Issue: Medicare / Social Security 45% (110) 28% (68) 9% (22) 10% (24) 7% (18) 242#1 Issue: Women’s Issues 38% (36) 31% (29) 10% (10) 9% (9) 11% (11) 94#1 Issue: Education 20% (16) 32% (24) 20% (16) 18% (14) 10% (8) 77#1 Issue: Energy 55% (61) 23% (25) 8% (9) 10% (11) 4% (4) 111#1 Issue: Other 46% (45) 19% (18) 7% (7) 16% (16) 12% (11) 962020 Vote: Joe Biden 49% (466) 27% (255) 9% (90) 9% (86) 5% (51) 9472020 Vote: Donald Trump 26% (228) 29% (249) 14% (117) 22% (186) 10% (84) 8652020 Vote: Didn’t Vote 22% (34) 26% (40) 14% (21) 16% (24) 22% (34) 1532018 House Vote: Democrat 51% (369) 25% (182) 11% (79) 9% (65) 4% (32) 7272018 House Vote: Republican 30% (211) 28% (194) 11% (74) 21% (145) 10% (72) 6962016 Vote: Hillary Clinton 52% (347) 26% (173) 10% (64) 7% (49) 5% (34) 6672016 Vote: Donald Trump 29% (225) 28% (214) 13% (97) 21% (164) 10% (75) 7762016 Vote: Other 43% (40) 26% (24) 15% (14) 12% (11) 4% (4) 942016 Vote: Didn’t Vote 27% (126) 30% (139) 13% (57) 17% (77) 13% (60) 458Voted in 2014: Yes 40% (525) 27% (356) 10% (133) 15% (191) 8% (101) 1306Voted in 2014: No 31% (214) 28% (196) 15% (101) 16% (112) 10% (71) 694
Continued on next page

National Tracking Poll #2107125, July, 2021
139
Table POL5_4
Table POL5_4: Thinking about the events that occurred at the U.S. Capitol on Jan. 6, how well does each of the following describe how you feel?Sad
Demographic Very well Somewhat well Not very well Not well at allDon’t know /No opinion Total N
Registered Voters 37% (739) 28% (552) 12% (233) 15% (303) 9% (173) 20004-Region: Northeast 43% (151) 25% (87) 12% (42) 12% (43) 9% (30) 3534-Region: Midwest 38% (171) 29% (130) 10% (44) 17% (77) 5% (23) 4454-Region: South 35% (260) 27% (202) 12% (87) 16% (118) 11% (80) 7464-Region: West 35% (157) 29% (134) 13% (60) 14% (65) 9% (39) 456Note: Row proportions may total to larger than one-hundred percent due to rounding. For more information visit MorningConsultIntelligence.com.

140
Morning ConsultTable POL5_5
Table POL5_5: Thinking about the events that occurred at the U.S. Capitol on Jan. 6, how well does each of the following describe how you feel?Frustrated
Demographic Very well Somewhat well Not very well Not well at allDon’t know /No opinion Total N
Registered Voters 37% (749) 29% (589) 11% (226) 13% (252) 9% (184) 2000Gender: Male 36% (336) 29% (272) 14% (127) 15% (138) 7% (70) 943Gender: Female 39% (414) 30% (317) 9% (99) 11% (114) 11% (113) 1057Age: 18-34 35% (182) 28% (144) 12% (64) 13% (68) 11% (57) 515Age: 35-44 37% (114) 23% (72) 11% (32) 13% (39) 16% (50) 307Age: 45-64 40% (270) 28% (188) 12% (83) 13% (86) 8% (53) 680Age: 65+ 37% (183) 37% (185) 9% (47) 12% (59) 5% (24) 498GenZers: 1997-2012 36% (58) 30% (49) 9% (14) 16% (25) 9% (15) 162Millennials: 1981-1996 36% (189) 25% (133) 14% (72) 12% (62) 13% (71) 527GenXers: 1965-1980 40% (218) 25% (134) 12% (64) 13% (73) 10% (52) 542Baby Boomers: 1946-1964 38% (259) 35% (241) 10% (66) 12% (81) 6% (41) 688PID: Dem (no lean) 49% (390) 27% (210) 9% (68) 8% (64) 7% (58) 789PID: Ind (no lean) 37% (175) 31% (145) 12% (55) 9% (44) 11% (53) 472PID: Rep (no lean) 25% (184) 32% (235) 14% (103) 20% (144) 10% (73) 740PID/Gender: DemMen 48% (178) 25% (94) 10% (37) 10% (37) 7% (25) 371PID/Gender: DemWomen 51% (213) 28% (116) 7% (31) 6% (27) 8% (32) 418PID/Gender: Ind Men 36% (86) 29% (68) 14% (33) 12% (28) 10% (23) 237PID/Gender: Ind Women 38% (89) 33% (77) 10% (22) 7% (17) 13% (30) 234PID/Gender: Rep Men 21% (72) 33% (110) 17% (58) 22% (73) 7% (22) 334PID/Gender: Rep Women 28% (112) 31% (125) 11% (46) 18% (71) 13% (51) 405Ideo: Liberal (1-3) 54% (318) 25% (147) 8% (46) 9% (54) 4% (22) 587Ideo: Moderate (4) 36% (193) 34% (185) 10% (53) 12% (65) 9% (46) 542Ideo: Conservative (5-7) 25% (203) 31% (246) 15% (117) 16% (130) 12% (99) 795Educ: < College 35% (420) 29% (355) 11% (131) 13% (161) 12% (141) 1207Educ: Bachelors degree 39% (194) 32% (161) 12% (59) 12% (59) 6% (28) 502Educ: Post-grad 47% (135) 25% (73) 12% (36) 11% (32) 5% (15) 291Income: Under 50k 36% (328) 28% (252) 10% (89) 15% (135) 12% (111) 916Income: 50k-100k 37% (269) 31% (222) 13% (95) 11% (82) 7% (52) 720Income: 100k+ 42% (152) 32% (116) 11% (42) 10% (35) 6% (20) 364Ethnicity: White 36% (563) 31% (482) 11% (176) 13% (206) 8% (128) 1555Ethnicity: Hispanic 35% (78) 28% (63) 11% (24) 14% (31) 12% (26) 222
Continued on next page

National Tracking Poll #2107125, July, 2021
141
Table POL5_5
Table POL5_5: Thinking about the events that occurred at the U.S. Capitol on Jan. 6, how well does each of the following describe how you feel?Frustrated
Demographic Very well Somewhat well Not very well Not well at allDon’t know /No opinion Total N
Registered Voters 37% (749) 29% (589) 11% (226) 13% (252) 9% (184) 2000Ethnicity: Black 44% (113) 21% (54) 11% (28) 10% (26) 14% (35) 257Ethnicity: Other 39% (73) 28% (52) 12% (22) 10% (19) 11% (21) 188All Christian 35% (361) 32% (335) 12% (128) 13% (137) 8% (85) 1045All Non-Christian 45% (55) 27% (32) 11% (13) 10% (12) 7% (9) 120Atheist 48% (47) 31% (30) 5% (5) 10% (10) 6% (6) 98Agnostic/Nothing in particular 41% (183) 26% (116) 12% (52) 12% (55) 9% (39) 445Something Else 36% (104) 26% (76) 10% (28) 13% (38) 16% (45) 292Religious Non-Protestant/Catholic 43% (61) 26% (38) 14% (19) 11% (16) 6% (9) 143Evangelical 31% (181) 30% (178) 13% (75) 15% (89) 11% (68) 591Non-Evangelical 39% (275) 31% (223) 10% (72) 11% (79) 8% (60) 710Community: Urban 38% (189) 28% (141) 11% (55) 14% (67) 9% (43) 494Community: Suburban 37% (364) 31% (307) 12% (120) 11% (107) 9% (91) 989Community: Rural 38% (196) 27% (142) 10% (51) 15% (78) 10% (50) 516Employ: Private Sector 40% (260) 27% (179) 12% (81) 15% (96) 6% (40) 656Employ: Government 35% (38) 29% (31) 14% (15) 13% (14) 10% (10) 109Employ: Self-Employed 38% (68) 31% (56) 9% (16) 12% (21) 10% (18) 180Employ: Homemaker 31% (54) 27% (46) 13% (23) 13% (22) 16% (28) 174Employ: Student 40% (26) 38% (24) 2% (1) 8% (5) 13% (8) 65Employ: Retired 37% (195) 35% (181) 10% (52) 12% (61) 6% (31) 520Employ: Unemployed 33% (65) 27% (55) 14% (28) 13% (25) 13% (26) 199Employ: Other 44% (42) 17% (16) 10% (9) 8% (8) 22% (22) 97Military HH: Yes 36% (134) 34% (128) 9% (35) 16% (61) 5% (19) 377Military HH: No 38% (615) 28% (461) 12% (191) 12% (191) 10% (164) 1623RD/WT: Right Direction 45% (393) 28% (247) 10% (90) 8% (70) 8% (67) 868RD/WT: Wrong Track 31% (357) 30% (342) 12% (136) 16% (182) 10% (116) 1132Biden Job Approve 48% (485) 28% (287) 9% (95) 7% (74) 7% (71) 1012Biden Job Disapprove 27% (253) 31% (295) 13% (128) 18% (171) 11% (100) 947
Continued on next page

142
Morning ConsultTable POL5_5
Table POL5_5: Thinking about the events that occurred at the U.S. Capitol on Jan. 6, how well does each of the following describe how you feel?Frustrated
Demographic Very well Somewhat well Not very well Not well at allDon’t know /No opinion Total N
Registered Voters 37% (749) 29% (589) 11% (226) 13% (252) 9% (184) 2000Biden Job Strongly Approve 53% (279) 26% (137) 7% (38) 8% (41) 6% (32) 527Biden Job Somewhat Approve 43% (206) 31% (149) 12% (57) 7% (33) 8% (39) 485Biden Job Somewhat Disapprove 30% (68) 41% (92) 11% (25) 11% (25) 8% (17) 226Biden Job Strongly Disapprove 26% (185) 28% (203) 14% (103) 20% (146) 12% (83) 721Favorable of Biden 49% (495) 28% (283) 9% (96) 7% (74) 6% (62) 1009Unfavorable of Biden 26% (249) 32% (299) 13% (122) 18% (171) 11% (101) 940Very Favorable of Biden 53% (288) 26% (140) 8% (45) 7% (38) 7% (37) 549Somewhat Favorable of Biden 45% (207) 31% (143) 11% (50) 8% (36) 5% (24) 461Somewhat Unfavorable of Biden 34% (66) 45% (88) 9% (18) 7% (14) 5% (11) 196Very Unfavorable of Biden 25% (182) 28% (211) 14% (104) 21% (157) 12% (90) 744#1 Issue: Economy 35% (260) 31% (229) 11% (82) 14% (107) 9% (68) 746#1 Issue: Security 28% (108) 29% (109) 16% (60) 15% (58) 12% (46) 381#1 Issue: Health Care 48% (121) 30% (75) 7% (16) 10% (25) 6% (14) 252#1 Issue: Medicare / Social Security 34% (83) 37% (89) 10% (25) 11% (25) 8% (20) 242#1 Issue: Women’s Issues 43% (40) 24% (23) 8% (8) 12% (12) 12% (12) 94#1 Issue: Education 41% (32) 20% (15) 21% (16) 7% (5) 12% (9) 77#1 Issue: Energy 53% (59) 24% (27) 10% (11) 9% (10) 3% (4) 111#1 Issue: Other 48% (46) 23% (23) 8% (7) 10% (9) 12% (11) 962020 Vote: Joe Biden 51% (485) 28% (261) 9% (81) 7% (63) 6% (57) 9472020 Vote: Donald Trump 24% (210) 33% (282) 14% (120) 19% (167) 10% (86) 8652020 Vote: Didn’t Vote 29% (45) 25% (38) 13% (21) 10% (15) 23% (35) 1532018 House Vote: Democrat 52% (381) 25% (185) 9% (62) 8% (57) 6% (43) 7272018 House Vote: Republican 27% (186) 33% (226) 12% (83) 19% (135) 9% (65) 6962016 Vote: Hillary Clinton 52% (348) 27% (178) 8% (56) 7% (45) 6% (40) 6672016 Vote: Donald Trump 26% (204) 32% (250) 12% (93) 20% (153) 10% (75) 7762016 Vote: Other 45% (42) 22% (20) 17% (16) 7% (7) 10% (9) 942016 Vote: Didn’t Vote 34% (154) 31% (140) 13% (61) 10% (45) 13% (59) 458Voted in 2014: Yes 40% (517) 28% (371) 11% (140) 13% (174) 8% (105) 1306Voted in 2014: No 33% (232) 31% (218) 12% (86) 11% (79) 11% (79) 694
Continued on next page

National Tracking Poll #2107125, July, 2021
143
Table POL5_5
Table POL5_5: Thinking about the events that occurred at the U.S. Capitol on Jan. 6, how well does each of the following describe how you feel?Frustrated
Demographic Very well Somewhat well Not very well Not well at allDon’t know /No opinion Total N
Registered Voters 37% (749) 29% (589) 11% (226) 13% (252) 9% (184) 20004-Region: Northeast 44% (157) 25% (87) 11% (39) 10% (36) 10% (34) 3534-Region: Midwest 37% (165) 34% (153) 9% (41) 13% (59) 6% (27) 4454-Region: South 37% (276) 27% (199) 12% (93) 13% (96) 11% (82) 7464-Region: West 33% (151) 33% (151) 11% (52) 13% (60) 9% (41) 456Note: Row proportions may total to larger than one-hundred percent due to rounding. For more information visit MorningConsultIntelligence.com.

144
Morning ConsultTable POL5_6
Table POL5_6: Thinking about the events that occurred at the U.S. Capitol on Jan. 6, how well does each of the following describe how you feel?Nervous
Demographic Very well Somewhat well Not very well Not well at allDon’t know /No opinion Total N
Registered Voters 20% (402) 28% (564) 17% (339) 25% (499) 10% (196) 2000Gender: Male 17% (164) 28% (263) 19% (176) 28% (260) 9% (80) 943Gender: Female 23% (238) 28% (301) 15% (163) 23% (239) 11% (116) 1057Age: 18-34 22% (115) 29% (150) 18% (94) 19% (98) 11% (58) 515Age: 35-44 23% (70) 25% (76) 9% (28) 29% (88) 14% (44) 307Age: 45-64 18% (120) 29% (197) 17% (119) 27% (184) 9% (60) 680Age: 65+ 19% (97) 28% (141) 20% (98) 26% (128) 7% (33) 498GenZers: 1997-2012 21% (33) 32% (52) 16% (27) 19% (31) 12% (19) 162Millennials: 1981-1996 24% (124) 26% (137) 15% (81) 22% (117) 13% (68) 527GenXers: 1965-1980 19% (105) 25% (138) 18% (96) 27% (149) 10% (55) 542Baby Boomers: 1946-1964 18% (122) 32% (220) 17% (115) 27% (183) 7% (48) 688PID: Dem (no lean) 29% (227) 33% (264) 12% (98) 17% (131) 9% (69) 789PID: Ind (no lean) 19% (91) 28% (131) 17% (82) 25% (119) 10% (48) 472PID: Rep (no lean) 11% (85) 23% (169) 22% (159) 34% (248) 11% (79) 740PID/Gender: DemMen 25% (93) 33% (124) 15% (57) 18% (68) 8% (30) 371PID/Gender: DemWomen 32% (134) 34% (141) 10% (40) 15% (63) 10% (40) 418PID/Gender: Ind Men 16% (38) 27% (65) 21% (50) 26% (63) 10% (23) 237PID/Gender: Ind Women 23% (53) 28% (67) 14% (32) 24% (57) 11% (25) 234PID/Gender: Rep Men 10% (33) 22% (75) 21% (69) 39% (129) 8% (28) 334PID/Gender: Rep Women 13% (51) 23% (94) 22% (90) 29% (119) 13% (51) 405Ideo: Liberal (1-3) 32% (186) 35% (205) 11% (67) 18% (104) 4% (26) 587Ideo: Moderate (4) 21% (112) 31% (167) 16% (86) 22% (121) 10% (56) 542Ideo: Conservative (5-7) 12% (92) 22% (172) 22% (173) 33% (260) 12% (98) 795Educ: < College 18% (217) 27% (321) 17% (201) 27% (321) 12% (148) 1207Educ: Bachelors degree 23% (117) 28% (138) 20% (100) 22% (112) 7% (34) 502Educ: Post-grad 24% (69) 36% (105) 13% (38) 23% (65) 5% (14) 291Income: Under 50k 21% (191) 25% (230) 15% (134) 26% (241) 13% (120) 916Income: 50k-100k 18% (133) 31% (226) 18% (132) 24% (172) 8% (56) 720Income: 100k+ 21% (78) 30% (108) 20% (73) 23% (85) 6% (20) 364Ethnicity: White 21% (324) 29% (451) 17% (265) 25% (390) 8% (126) 1555Ethnicity: Hispanic 25% (56) 31% (68) 17% (38) 19% (43) 7% (16) 222
Continued on next page
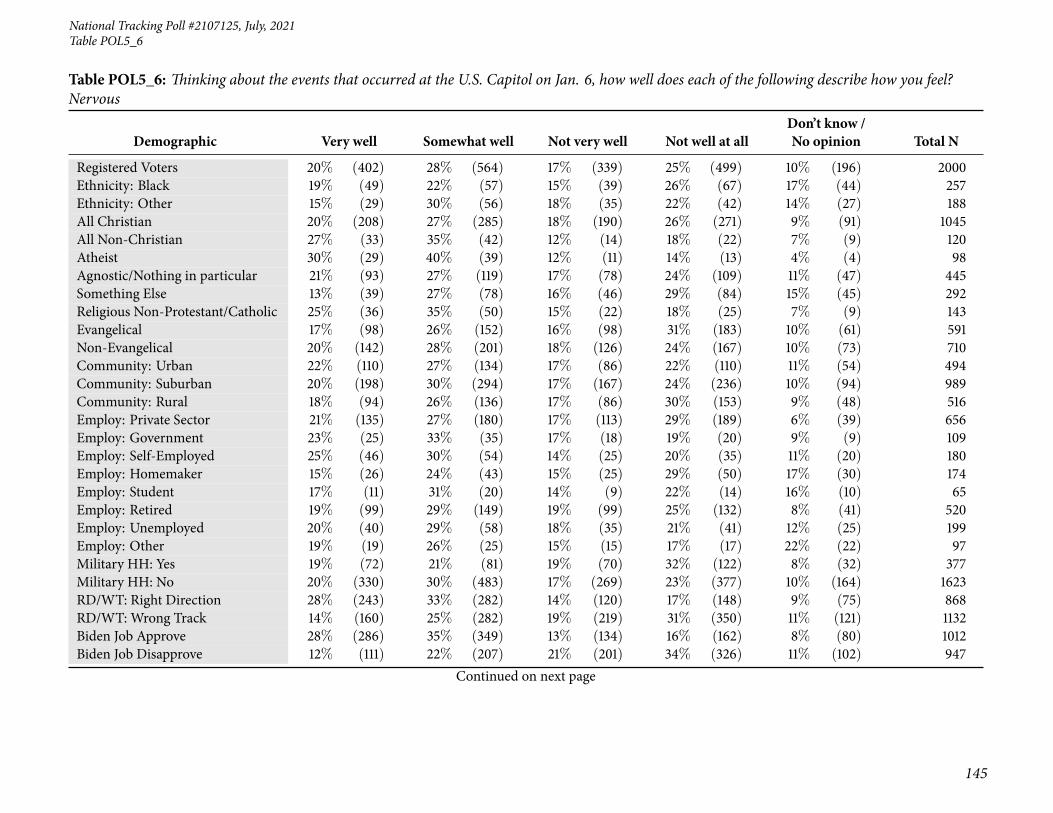
National Tracking Poll #2107125, July, 2021
145
Table POL5_6
Table POL5_6: Thinking about the events that occurred at the U.S. Capitol on Jan. 6, how well does each of the following describe how you feel?Nervous
Demographic Very well Somewhat well Not very well Not well at allDon’t know /No opinion Total N
Registered Voters 20% (402) 28% (564) 17% (339) 25% (499) 10% (196) 2000Ethnicity: Black 19% (49) 22% (57) 15% (39) 26% (67) 17% (44) 257Ethnicity: Other 15% (29) 30% (56) 18% (35) 22% (42) 14% (27) 188All Christian 20% (208) 27% (285) 18% (190) 26% (271) 9% (91) 1045All Non-Christian 27% (33) 35% (42) 12% (14) 18% (22) 7% (9) 120Atheist 30% (29) 40% (39) 12% (11) 14% (13) 4% (4) 98Agnostic/Nothing in particular 21% (93) 27% (119) 17% (78) 24% (109) 11% (47) 445Something Else 13% (39) 27% (78) 16% (46) 29% (84) 15% (45) 292Religious Non-Protestant/Catholic 25% (36) 35% (50) 15% (22) 18% (25) 7% (9) 143Evangelical 17% (98) 26% (152) 16% (98) 31% (183) 10% (61) 591Non-Evangelical 20% (142) 28% (201) 18% (126) 24% (167) 10% (73) 710Community: Urban 22% (110) 27% (134) 17% (86) 22% (110) 11% (54) 494Community: Suburban 20% (198) 30% (294) 17% (167) 24% (236) 10% (94) 989Community: Rural 18% (94) 26% (136) 17% (86) 30% (153) 9% (48) 516Employ: Private Sector 21% (135) 27% (180) 17% (113) 29% (189) 6% (39) 656Employ: Government 23% (25) 33% (35) 17% (18) 19% (20) 9% (9) 109Employ: Self-Employed 25% (46) 30% (54) 14% (25) 20% (35) 11% (20) 180Employ: Homemaker 15% (26) 24% (43) 15% (25) 29% (50) 17% (30) 174Employ: Student 17% (11) 31% (20) 14% (9) 22% (14) 16% (10) 65Employ: Retired 19% (99) 29% (149) 19% (99) 25% (132) 8% (41) 520Employ: Unemployed 20% (40) 29% (58) 18% (35) 21% (41) 12% (25) 199Employ: Other 19% (19) 26% (25) 15% (15) 17% (17) 22% (22) 97Military HH: Yes 19% (72) 21% (81) 19% (70) 32% (122) 8% (32) 377Military HH: No 20% (330) 30% (483) 17% (269) 23% (377) 10% (164) 1623RD/WT: Right Direction 28% (243) 33% (282) 14% (120) 17% (148) 9% (75) 868RD/WT: Wrong Track 14% (160) 25% (282) 19% (219) 31% (350) 11% (121) 1132Biden Job Approve 28% (286) 35% (349) 13% (134) 16% (162) 8% (80) 1012Biden Job Disapprove 12% (111) 22% (207) 21% (201) 34% (326) 11% (102) 947
Continued on next page

146
Morning ConsultTable POL5_6
Table POL5_6: Thinking about the events that occurred at the U.S. Capitol on Jan. 6, how well does each of the following describe how you feel?Nervous
Demographic Very well Somewhat well Not very well Not well at allDon’t know /No opinion Total N
Registered Voters 20% (402) 28% (564) 17% (339) 25% (499) 10% (196) 2000Biden Job Strongly Approve 35% (184) 29% (155) 13% (67) 17% (89) 6% (33) 527Biden Job Somewhat Approve 21% (102) 40% (194) 14% (67) 15% (73) 10% (48) 485Biden Job Somewhat Disapprove 18% (42) 33% (74) 18% (41) 23% (53) 7% (17) 226Biden Job Strongly Disapprove 10% (69) 18% (133) 22% (160) 38% (273) 12% (85) 721Favorable of Biden 29% (291) 35% (351) 13% (131) 16% (162) 7% (75) 1009Unfavorable of Biden 11% (105) 22% (209) 22% (203) 34% (323) 11% (101) 940Very Favorable of Biden 34% (188) 30% (163) 11% (63) 17% (92) 8% (42) 549Somewhat Favorable of Biden 22% (102) 41% (188) 15% (68) 15% (70) 7% (33) 461Somewhat Unfavorable of Biden 20% (40) 30% (60) 18% (35) 25% (49) 6% (12) 196Very Unfavorable of Biden 9% (65) 20% (150) 22% (167) 37% (274) 12% (89) 744#1 Issue: Economy 17% (124) 29% (214) 19% (143) 26% (197) 9% (67) 746#1 Issue: Security 14% (53) 19% (74) 19% (71) 34% (129) 14% (54) 381#1 Issue: Health Care 28% (70) 35% (89) 11% (27) 20% (51) 6% (16) 252#1 Issue: Medicare / Social Security 22% (53) 28% (67) 16% (39) 23% (56) 11% (26) 242#1 Issue: Women’s Issues 27% (25) 35% (33) 11% (10) 16% (15) 11% (10) 94#1 Issue: Education 15% (12) 29% (22) 19% (15) 24% (18) 13% (10) 77#1 Issue: Energy 37% (41) 31% (34) 16% (18) 14% (15) 3% (3) 111#1 Issue: Other 25% (24) 31% (30) 16% (16) 17% (17) 11% (10) 962020 Vote: Joe Biden 29% (275) 35% (334) 12% (115) 16% (150) 8% (73) 9472020 Vote: Donald Trump 11% (97) 22% (191) 22% (189) 35% (306) 9% (82) 8652020 Vote: Didn’t Vote 15% (24) 22% (33) 21% (32) 20% (30) 22% (34) 1532018 House Vote: Democrat 28% (207) 35% (251) 13% (97) 17% (125) 7% (47) 7272018 House Vote: Republican 13% (91) 22% (151) 21% (146) 34% (240) 10% (68) 6962016 Vote: Hillary Clinton 28% (187) 34% (228) 13% (89) 18% (117) 7% (46) 6672016 Vote: Donald Trump 14% (107) 21% (161) 22% (168) 34% (264) 10% (76) 7762016 Vote: Other 18% (17) 36% (34) 11% (10) 24% (23) 11% (10) 942016 Vote: Didn’t Vote 19% (88) 31% (141) 16% (72) 20% (93) 14% (64) 458Voted in 2014: Yes 21% (268) 28% (368) 17% (222) 25% (331) 9% (117) 1306Voted in 2014: No 19% (134) 28% (196) 17% (117) 24% (167) 12% (80) 694
Continued on next page

National Tracking Poll #2107125, July, 2021
147
Table POL5_6
Table POL5_6: Thinking about the events that occurred at the U.S. Capitol on Jan. 6, how well does each of the following describe how you feel?Nervous
Demographic Very well Somewhat well Not very well Not well at allDon’t know /No opinion Total N
Registered Voters 20% (402) 28% (564) 17% (339) 25% (499) 10% (196) 20004-Region: Northeast 21% (76) 34% (119) 15% (52) 21% (76) 9% (31) 3534-Region: Midwest 23% (103) 29% (129) 17% (74) 23% (104) 8% (36) 4454-Region: South 19% (140) 25% (189) 19% (140) 26% (193) 11% (84) 7464-Region: West 18% (83) 28% (126) 16% (74) 28% (126) 10% (46) 456Note: Row proportions may total to larger than one-hundred percent due to rounding. For more information visit MorningConsultIntelligence.com.

148
Morning ConsultTable POL5_7
Table POL5_7: Thinking about the events that occurred at the U.S. Capitol on Jan. 6, how well does each of the following describe how you feel?Upset
Demographic Very well Somewhat well Not very well Not well at allDon’t know /No opinion Total N
Registered Voters 42% (832) 27% (534) 10% (194) 13% (267) 9% (173) 2000Gender: Male 40% (379) 27% (254) 10% (98) 15% (137) 8% (74) 943Gender: Female 43% (452) 26% (280) 9% (95) 12% (131) 9% (99) 1057Age: 18-34 36% (185) 25% (130) 14% (70) 15% (79) 10% (51) 515Age: 35-44 39% (121) 26% (80) 8% (24) 13% (40) 14% (43) 307Age: 45-64 44% (300) 25% (167) 9% (63) 14% (95) 8% (55) 680Age: 65+ 46% (227) 31% (157) 7% (37) 11% (54) 5% (23) 498GenZers: 1997-2012 37% (60) 26% (43) 10% (17) 17% (27) 9% (15) 162Millennials: 1981-1996 36% (189) 26% (137) 12% (65) 14% (75) 12% (61) 527GenXers: 1965-1980 41% (224) 23% (126) 10% (52) 16% (85) 10% (54) 542Baby Boomers: 1946-1964 47% (326) 29% (199) 8% (52) 11% (73) 5% (37) 688PID: Dem (no lean) 57% (451) 22% (176) 6% (45) 9% (67) 6% (49) 789PID: Ind (no lean) 39% (186) 30% (140) 12% (56) 10% (46) 9% (44) 472PID: Rep (no lean) 26% (194) 29% (217) 13% (93) 21% (154) 11% (80) 740PID/Gender: DemMen 56% (208) 21% (78) 6% (21) 11% (40) 6% (24) 371PID/Gender: DemWomen 58% (243) 23% (98) 6% (23) 7% (28) 6% (25) 418PID/Gender: Ind Men 37% (88) 32% (75) 13% (31) 9% (22) 9% (21) 237PID/Gender: Ind Women 42% (98) 28% (65) 11% (25) 10% (24) 10% (23) 234PID/Gender: Rep Men 25% (83) 30% (100) 14% (46) 22% (75) 9% (29) 334PID/Gender: Rep Women 27% (111) 29% (117) 12% (47) 20% (79) 13% (51) 405Ideo: Liberal (1-3) 62% (363) 21% (121) 6% (32) 9% (53) 3% (18) 587Ideo: Moderate (4) 41% (225) 30% (161) 9% (47) 11% (60) 9% (49) 542Ideo: Conservative (5-7) 26% (209) 30% (239) 13% (107) 19% (147) 12% (93) 795Educ: < College 39% (467) 26% (317) 10% (123) 14% (167) 11% (133) 1207Educ: Bachelors degree 44% (219) 29% (147) 9% (45) 13% (64) 5% (27) 502Educ: Post-grad 50% (146) 24% (70) 9% (25) 13% (37) 4% (13) 291Income: Under 50k 41% (371) 25% (226) 9% (84) 14% (132) 11% (103) 916Income: 50k-100k 43% (311) 27% (195) 10% (74) 12% (88) 7% (53) 720Income: 100k+ 41% (150) 31% (113) 10% (36) 13% (48) 5% (17) 364Ethnicity: White 41% (644) 27% (420) 10% (158) 14% (212) 8% (121) 1555Ethnicity: Hispanic 45% (100) 22% (48) 10% (22) 13% (29) 10% (23) 222
Continued on next page

National Tracking Poll #2107125, July, 2021
149
Table POL5_7
Table POL5_7: Thinking about the events that occurred at the U.S. Capitol on Jan. 6, how well does each of the following describe how you feel?Upset
Demographic Very well Somewhat well Not very well Not well at allDon’t know /No opinion Total N
Registered Voters 42% (832) 27% (534) 10% (194) 13% (267) 9% (173) 2000Ethnicity: Black 44% (112) 27% (69) 6% (16) 12% (30) 12% (30) 257Ethnicity: Other 40% (76) 24% (45) 11% (20) 13% (25) 11% (22) 188All Christian 39% (410) 27% (283) 11% (112) 15% (160) 8% (79) 1045All Non-Christian 56% (68) 24% (28) 8% (9) 5% (6) 7% (8) 120Atheist 59% (57) 30% (30) 6% (6) 2% (2) 3% (3) 98Agnostic/Nothing in particular 41% (185) 26% (116) 9% (39) 14% (64) 9% (41) 445Something Else 38% (112) 26% (76) 9% (27) 12% (36) 14% (41) 292Religious Non-Protestant/Catholic 51% (72) 24% (34) 12% (17) 8% (11) 6% (8) 143Evangelical 36% (213) 28% (164) 10% (58) 15% (89) 11% (66) 591Non-Evangelical 43% (302) 26% (187) 10% (71) 14% (97) 7% (53) 710Community: Urban 44% (218) 24% (117) 9% (45) 15% (74) 8% (41) 494Community: Suburban 42% (411) 27% (270) 10% (100) 12% (119) 9% (90) 989Community: Rural 39% (203) 28% (147) 9% (48) 15% (75) 8% (43) 516Employ: Private Sector 39% (258) 27% (179) 11% (70) 17% (113) 6% (38) 656Employ: Government 41% (44) 23% (25) 13% (14) 15% (16) 8% (8) 109Employ: Self-Employed 40% (72) 29% (53) 11% (20) 10% (17) 9% (17) 180Employ: Homemaker 32% (56) 27% (48) 15% (26) 10% (18) 15% (27) 174Employ: Student 43% (28) 23% (15) 5% (3) 17% (11) 12% (8) 65Employ: Retired 47% (247) 29% (152) 6% (31) 11% (58) 6% (33) 520Employ: Unemployed 43% (86) 22% (44) 9% (18) 15% (29) 11% (22) 199Employ: Other 43% (41) 20% (19) 11% (11) 6% (5) 21% (20) 97Military HH: Yes 43% (161) 25% (93) 12% (45) 16% (59) 5% (20) 377Military HH: No 41% (671) 27% (441) 9% (149) 13% (208) 9% (153) 1623RD/WT: Right Direction 55% (475) 24% (207) 6% (56) 8% (73) 7% (58) 868RD/WT: Wrong Track 32% (357) 29% (326) 12% (138) 17% (195) 10% (116) 1132Biden Job Approve 57% (576) 24% (239) 6% (58) 8% (83) 5% (55) 1012Biden Job Disapprove 26% (245) 30% (285) 14% (132) 19% (180) 11% (105) 947
Continued on next page

150
Morning ConsultTable POL5_7
Table POL5_7: Thinking about the events that occurred at the U.S. Capitol on Jan. 6, how well does each of the following describe how you feel?Upset
Demographic Very well Somewhat well Not very well Not well at allDon’t know /No opinion Total N
Registered Voters 42% (832) 27% (534) 10% (194) 13% (267) 9% (173) 2000Biden Job Strongly Approve 64% (339) 17% (90) 4% (22) 10% (53) 4% (24) 527Biden Job Somewhat Approve 49% (237) 31% (150) 7% (36) 6% (30) 6% (31) 485Biden Job Somewhat Disapprove 31% (70) 35% (80) 14% (31) 12% (27) 8% (18) 226Biden Job Strongly Disapprove 24% (175) 28% (205) 14% (101) 21% (153) 12% (87) 721Favorable of Biden 57% (579) 24% (246) 5% (54) 8% (80) 5% (50) 1009Unfavorable of Biden 26% (245) 30% (282) 14% (134) 19% (178) 11% (101) 940Very Favorable of Biden 64% (350) 18% (98) 5% (28) 9% (48) 4% (24) 549Somewhat Favorable of Biden 50% (229) 32% (148) 6% (26) 7% (32) 6% (26) 461Somewhat Unfavorable of Biden 35% (69) 34% (66) 14% (28) 12% (24) 5% (9) 196Very Unfavorable of Biden 24% (176) 29% (216) 14% (106) 21% (154) 12% (92) 744#1 Issue: Economy 38% (282) 28% (209) 12% (88) 14% (107) 8% (61) 746#1 Issue: Security 27% (101) 30% (115) 12% (44) 17% (66) 14% (54) 381#1 Issue: Health Care 54% (137) 23% (58) 7% (19) 11% (27) 4% (11) 252#1 Issue: Medicare / Social Security 52% (126) 23% (55) 8% (18) 11% (27) 6% (15) 242#1 Issue: Women’s Issues 47% (44) 20% (19) 7% (7) 14% (13) 13% (12) 94#1 Issue: Education 39% (30) 23% (18) 12% (9) 17% (13) 9% (7) 77#1 Issue: Energy 57% (63) 33% (37) 3% (4) 5% (5) 2% (2) 111#1 Issue: Other 50% (48) 24% (23) 6% (5) 10% (9) 11% (10) 962020 Vote: Joe Biden 59% (560) 23% (215) 6% (55) 8% (71) 5% (45) 9472020 Vote: Donald Trump 25% (212) 32% (273) 14% (119) 20% (173) 10% (88) 8652020 Vote: Didn’t Vote 32% (48) 23% (35) 11% (16) 13% (20) 22% (33) 1532018 House Vote: Democrat 59% (427) 22% (162) 7% (52) 8% (57) 4% (29) 7272018 House Vote: Republican 28% (198) 32% (221) 10% (71) 19% (133) 10% (72) 6962016 Vote: Hillary Clinton 61% (405) 23% (155) 5% (36) 6% (43) 4% (29) 6672016 Vote: Donald Trump 26% (205) 31% (238) 12% (96) 20% (159) 10% (79) 7762016 Vote: Other 45% (42) 26% (24) 10% (9) 9% (9) 10% (9) 942016 Vote: Didn’t Vote 39% (179) 25% (116) 12% (53) 12% (55) 12% (56) 458Voted in 2014: Yes 43% (561) 27% (351) 9% (117) 13% (174) 8% (104) 1306Voted in 2014: No 39% (271) 26% (183) 11% (77) 13% (93) 10% (70) 694
Continued on next page
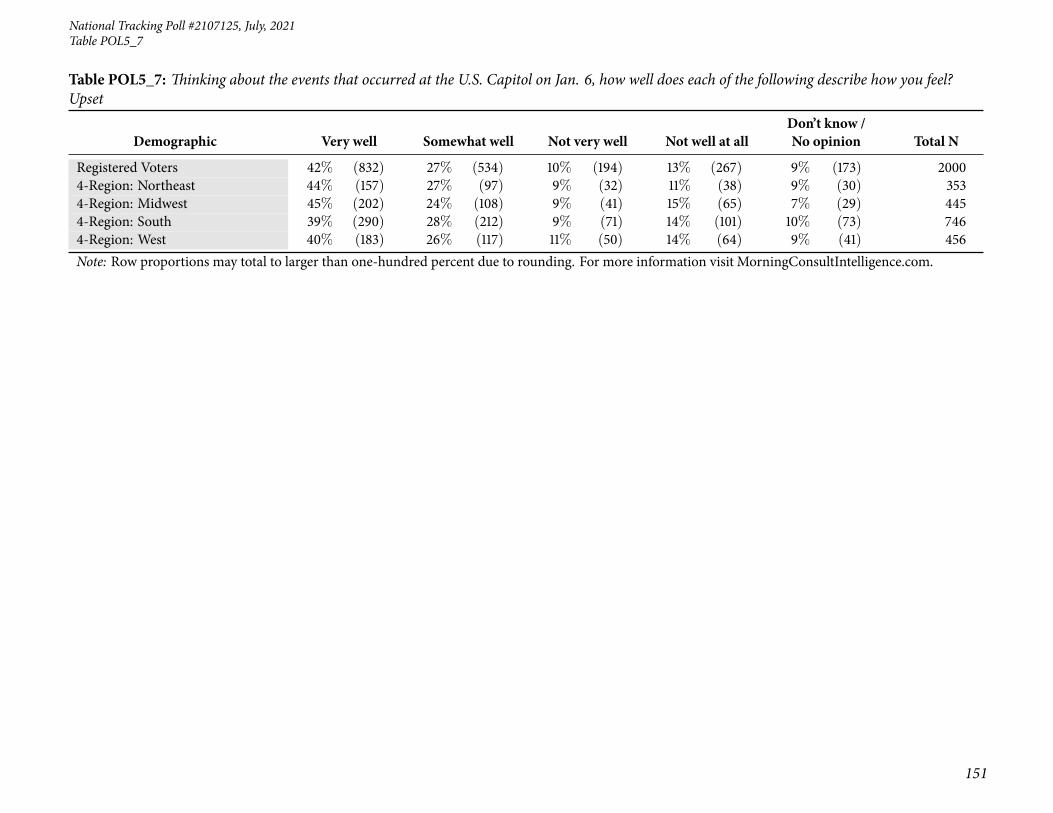
National Tracking Poll #2107125, July, 2021
151
Table POL5_7
Table POL5_7: Thinking about the events that occurred at the U.S. Capitol on Jan. 6, how well does each of the following describe how you feel?Upset
Demographic Very well Somewhat well Not very well Not well at allDon’t know /No opinion Total N
Registered Voters 42% (832) 27% (534) 10% (194) 13% (267) 9% (173) 20004-Region: Northeast 44% (157) 27% (97) 9% (32) 11% (38) 9% (30) 3534-Region: Midwest 45% (202) 24% (108) 9% (41) 15% (65) 7% (29) 4454-Region: South 39% (290) 28% (212) 9% (71) 14% (101) 10% (73) 7464-Region: West 40% (183) 26% (117) 11% (50) 14% (64) 9% (41) 456Note: Row proportions may total to larger than one-hundred percent due to rounding. For more information visit MorningConsultIntelligence.com.

152
Morning ConsultTable POL5_8
Table POL5_8: Thinking about the events that occurred at the U.S. Capitol on Jan. 6, how well does each of the following describe how you feel?Confident
Demographic Very well Somewhat well Not very well Not well at allDon’t know /No opinion Total N
Registered Voters 7% (139) 8% (167) 20% (400) 52% (1040) 13% (254) 2000Gender: Male 11% (103) 12% (110) 22% (209) 45% (421) 11% (100) 943Gender: Female 3% (36) 5% (57) 18% (191) 59% (619) 15% (154) 1057Age: 18-34 11% (54) 9% (44) 19% (100) 48% (245) 14% (71) 515Age: 35-44 10% (30) 10% (32) 15% (46) 47% (146) 18% (55) 307Age: 45-64 6% (41) 9% (60) 19% (130) 55% (371) 11% (78) 680Age: 65+ 3% (14) 6% (31) 25% (125) 56% (279) 10% (50) 498GenZers: 1997-2012 11% (18) 9% (14) 14% (23) 54% (88) 12% (19) 162Millennials: 1981-1996 11% (56) 10% (55) 20% (103) 44% (229) 16% (85) 527GenXers: 1965-1980 7% (39) 8% (45) 18% (100) 52% (284) 13% (73) 542Baby Boomers: 1946-1964 3% (23) 6% (44) 23% (155) 58% (401) 10% (65) 688PID: Dem (no lean) 8% (60) 9% (72) 16% (125) 58% (458) 9% (74) 789PID: Ind (no lean) 4% (21) 6% (28) 22% (104) 54% (253) 14% (65) 472PID: Rep (no lean) 8% (59) 9% (67) 23% (171) 44% (329) 16% (115) 740PID/Gender: DemMen 11% (41) 13% (50) 18% (66) 50% (185) 8% (29) 371PID/Gender: DemWomen 5% (19) 5% (22) 14% (60) 65% (272) 11% (45) 418PID/Gender: Ind Men 7% (18) 8% (20) 25% (59) 46% (110) 13% (32) 237PID/Gender: Ind Women 1% (3) 4% (8) 20% (46) 61% (143) 14% (33) 234PID/Gender: Rep Men 13% (45) 12% (41) 25% (85) 37% (125) 12% (39) 334PID/Gender: Rep Women 3% (14) 6% (26) 21% (86) 50% (204) 19% (76) 405Ideo: Liberal (1-3) 7% (42) 7% (39) 19% (109) 62% (361) 6% (35) 587Ideo: Moderate (4) 6% (33) 9% (51) 18% (99) 55% (297) 11% (62) 542Ideo: Conservative (5-7) 8% (60) 9% (75) 22% (178) 44% (348) 17% (134) 795Educ: < College 7% (81) 9% (105) 19% (232) 50% (603) 15% (187) 1207Educ: Bachelors degree 7% (33) 8% (39) 22% (111) 55% (274) 9% (44) 502Educ: Post-grad 9% (25) 8% (23) 20% (57) 56% (163) 8% (23) 291Income: Under 50k 8% (72) 8% (74) 19% (175) 50% (454) 15% (141) 916Income: 50k-100k 6% (42) 7% (49) 23% (163) 54% (385) 11% (81) 720Income: 100k+ 7% (25) 12% (44) 17% (63) 55% (201) 9% (31) 364Ethnicity: White 7% (105) 7% (116) 20% (308) 54% (840) 12% (186) 1555Ethnicity: Hispanic 9% (21) 9% (21) 22% (49) 48% (108) 11% (24) 222
Continued on next page

National Tracking Poll #2107125, July, 2021
153
Table POL5_8
Table POL5_8: Thinking about the events that occurred at the U.S. Capitol on Jan. 6, how well does each of the following describe how you feel?Confident
Demographic Very well Somewhat well Not very well Not well at allDon’t know /No opinion Total N
Registered Voters 7% (139) 8% (167) 20% (400) 52% (1040) 13% (254) 2000Ethnicity: Black 10% (27) 12% (30) 19% (48) 43% (111) 16% (40) 257Ethnicity: Other 4% (8) 11% (21) 23% (44) 47% (89) 14% (27) 188All Christian 8% (79) 9% (91) 21% (217) 51% (535) 12% (122) 1045All Non-Christian 14% (17) 11% (13) 14% (17) 49% (59) 12% (14) 120Atheist 2% (2) 6% (6) 14% (14) 72% (70) 6% (6) 98Agnostic/Nothing in particular 5% (24) 7% (33) 21% (93) 54% (241) 12% (53) 445Something Else 6% (17) 8% (24) 20% (60) 46% (134) 20% (57) 292Religious Non-Protestant/Catholic 14% (19) 10% (14) 17% (24) 49% (69) 11% (15) 143Evangelical 8% (50) 9% (55) 19% (110) 49% (288) 15% (89) 591Non-Evangelical 6% (40) 8% (57) 22% (159) 52% (368) 12% (86) 710Community: Urban 14% (71) 9% (43) 17% (86) 45% (224) 14% (71) 494Community: Suburban 4% (37) 8% (83) 21% (204) 55% (545) 12% (120) 989Community: Rural 6% (32) 8% (41) 21% (110) 53% (271) 12% (62) 516Employ: Private Sector 9% (62) 10% (64) 20% (132) 51% (337) 9% (62) 656Employ: Government 10% (10) 15% (16) 20% (22) 45% (49) 10% (11) 109Employ: Self-Employed 15% (26) 15% (27) 16% (29) 43% (78) 12% (21) 180Employ: Homemaker 3% (5) 3% (5) 17% (29) 53% (92) 25% (43) 174Employ: Student 2% (2) 11% (7) 7% (5) 63% (41) 16% (11) 65Employ: Retired 4% (20) 7% (34) 22% (115) 56% (293) 11% (57) 520Employ: Unemployed 5% (11) 5% (10) 23% (46) 52% (104) 14% (28) 199Employ: Other 4% (4) 4% (4) 24% (23) 46% (45) 21% (21) 97Military HH: Yes 5% (19) 7% (28) 22% (84) 54% (204) 11% (43) 377Military HH: No 7% (121) 9% (139) 19% (316) 52% (836) 13% (211) 1623RD/WT: Right Direction 9% (77) 10% (86) 19% (168) 52% (454) 10% (83) 868RD/WT: Wrong Track 6% (63) 7% (81) 21% (232) 52% (586) 15% (170) 1132Biden Job Approve 8% (78) 8% (83) 19% (189) 56% (569) 9% (93) 1012Biden Job Disapprove 6% (57) 9% (82) 22% (204) 48% (457) 16% (147) 947
Continued on next page

154
Morning ConsultTable POL5_8
Table POL5_8: Thinking about the events that occurred at the U.S. Capitol on Jan. 6, how well does each of the following describe how you feel?Confident
Demographic Very well Somewhat well Not very well Not well at allDon’t know /No opinion Total N
Registered Voters 7% (139) 8% (167) 20% (400) 52% (1040) 13% (254) 2000Biden Job Strongly Approve 12% (62) 9% (48) 16% (83) 56% (293) 8% (41) 527Biden Job Somewhat Approve 3% (16) 7% (35) 22% (106) 57% (275) 11% (52) 485Biden Job Somewhat Disapprove 8% (19) 9% (20) 23% (51) 51% (116) 9% (20) 226Biden Job Strongly Disapprove 5% (38) 9% (62) 21% (153) 47% (340) 18% (127) 721Favorable of Biden 8% (78) 8% (84) 19% (190) 57% (573) 8% (86) 1009Unfavorable of Biden 6% (57) 9% (81) 22% (206) 48% (449) 16% (146) 940Very Favorable of Biden 12% (63) 8% (46) 17% (95) 55% (302) 8% (42) 549Somewhat Favorable of Biden 3% (14) 8% (38) 21% (95) 59% (270) 9% (43) 461Somewhat Unfavorable of Biden 4% (9) 8% (17) 22% (44) 54% (106) 11% (21) 196Very Unfavorable of Biden 7% (49) 9% (65) 22% (163) 46% (343) 17% (125) 744#1 Issue: Economy 6% (45) 9% (64) 21% (157) 52% (390) 12% (90) 746#1 Issue: Security 11% (40) 9% (35) 21% (81) 40% (154) 19% (71) 381#1 Issue: Health Care 8% (19) 9% (21) 15% (39) 61% (154) 8% (19) 252#1 Issue: Medicare / Social Security 3% (8) 9% (22) 17% (41) 56% (136) 14% (35) 242#1 Issue: Women’s Issues 9% (9) 2% (2) 15% (14) 66% (62) 8% (8) 94#1 Issue: Education 8% (7) 11% (9) 22% (17) 46% (35) 13% (10) 77#1 Issue: Energy 10% (11) 12% (13) 27% (30) 45% (50) 5% (6) 111#1 Issue: Other 1% (1) 2% (2) 22% (22) 60% (58) 15% (14) 962020 Vote: Joe Biden 7% (66) 8% (75) 18% (171) 58% (548) 9% (86) 9472020 Vote: Donald Trump 7% (61) 10% (83) 22% (194) 46% (400) 15% (126) 8652020 Vote: Didn’t Vote 7% (11) 6% (9) 20% (30) 45% (69) 23% (34) 1532018 House Vote: Democrat 7% (54) 9% (67) 18% (128) 59% (426) 7% (52) 7272018 House Vote: Republican 7% (46) 9% (66) 21% (149) 47% (327) 16% (108) 6962016 Vote: Hillary Clinton 7% (49) 9% (59) 17% (115) 59% (391) 8% (53) 6672016 Vote: Donald Trump 7% (53) 8% (66) 22% (171) 48% (369) 15% (117) 7762016 Vote: Other 1% (1) 2% (2) 19% (18) 66% (62) 12% (11) 942016 Vote: Didn’t Vote 8% (36) 8% (38) 21% (96) 47% (215) 16% (72) 458Voted in 2014: Yes 7% (91) 9% (119) 20% (261) 52% (684) 12% (151) 1306Voted in 2014: No 7% (49) 7% (48) 20% (139) 51% (356) 15% (102) 694
Continued on next page

National Tracking Poll #2107125, July, 2021
155
Table POL5_8
Table POL5_8: Thinking about the events that occurred at the U.S. Capitol on Jan. 6, how well does each of the following describe how you feel?Confident
Demographic Very well Somewhat well Not very well Not well at allDon’t know /No opinion Total N
Registered Voters 7% (139) 8% (167) 20% (400) 52% (1040) 13% (254) 20004-Region: Northeast 7% (23) 10% (35) 19% (68) 53% (187) 12% (41) 3534-Region: Midwest 5% (20) 7% (30) 20% (89) 60% (265) 9% (41) 4454-Region: South 9% (63) 10% (71) 21% (155) 46% (345) 15% (112) 7464-Region: West 7% (33) 7% (31) 19% (88) 53% (243) 13% (60) 456Note: Row proportions may total to larger than one-hundred percent due to rounding. For more information visit MorningConsultIntelligence.com.

156
Morning ConsultTable POL5_9
Table POL5_9: Thinking about the events that occurred at the U.S. Capitol on Jan. 6, how well does each of the following describe how you feel?Scared
Demographic Very well Somewhat well Not very well Not well at allDon’t know /No opinion Total N
Registered Voters 20% (408) 25% (495) 18% (361) 27% (540) 10% (195) 2000Gender: Male 15% (138) 24% (224) 21% (199) 32% (299) 9% (83) 943Gender: Female 26% (270) 26% (271) 15% (162) 23% (241) 11% (112) 1057Age: 18-34 19% (98) 27% (139) 19% (97) 24% (125) 11% (56) 515Age: 35-44 24% (73) 21% (66) 11% (34) 28% (87) 15% (47) 307Age: 45-64 21% (141) 22% (150) 18% (126) 29% (200) 9% (63) 680Age: 65+ 19% (96) 28% (140) 21% (104) 26% (128) 6% (30) 498GenZers: 1997-2012 21% (34) 27% (44) 17% (28) 24% (40) 10% (17) 162Millennials: 1981-1996 20% (108) 25% (130) 17% (92) 25% (130) 13% (68) 527GenXers: 1965-1980 21% (114) 21% (113) 17% (91) 31% (165) 11% (59) 542Baby Boomers: 1946-1964 19% (134) 27% (184) 20% (137) 27% (187) 7% (46) 688PID: Dem (no lean) 31% (243) 30% (234) 15% (115) 17% (135) 8% (62) 789PID: Ind (no lean) 19% (88) 26% (123) 20% (94) 26% (121) 10% (46) 472PID: Rep (no lean) 10% (77) 19% (138) 21% (153) 38% (284) 12% (88) 740PID/Gender: DemMen 24% (88) 27% (101) 19% (71) 22% (80) 8% (31) 371PID/Gender: DemWomen 37% (155) 32% (134) 10% (44) 13% (55) 7% (30) 418PID/Gender: Ind Men 11% (26) 26% (61) 23% (54) 33% (78) 8% (19) 237PID/Gender: Ind Women 27% (63) 26% (61) 17% (40) 19% (44) 11% (26) 234PID/Gender: Rep Men 7% (24) 19% (62) 22% (74) 42% (141) 10% (33) 334PID/Gender: Rep Women 13% (53) 19% (76) 19% (78) 35% (143) 14% (55) 405Ideo: Liberal (1-3) 34% (197) 32% (186) 15% (86) 17% (101) 3% (17) 587Ideo: Moderate (4) 21% (114) 27% (144) 16% (85) 26% (142) 11% (57) 542Ideo: Conservative (5-7) 10% (81) 19% (152) 21% (170) 36% (287) 13% (106) 795Educ: < College 18% (218) 23% (278) 19% (227) 28% (337) 12% (147) 1207Educ: Bachelors degree 24% (122) 25% (126) 16% (82) 27% (136) 7% (36) 502Educ: Post-grad 23% (68) 31% (91) 18% (52) 23% (67) 4% (12) 291Income: Under 50k 22% (201) 21% (190) 16% (147) 28% (259) 13% (119) 916Income: 50k-100k 17% (125) 28% (203) 21% (154) 26% (190) 7% (47) 720Income: 100k+ 23% (82) 28% (102) 17% (60) 25% (91) 8% (29) 364Ethnicity: White 20% (315) 26% (397) 18% (284) 27% (424) 9% (135) 1555Ethnicity: Hispanic 25% (56) 23% (51) 21% (46) 24% (54) 7% (16) 222
Continued on next page

National Tracking Poll #2107125, July, 2021
157
Table POL5_9
Table POL5_9: Thinking about the events that occurred at the U.S. Capitol on Jan. 6, how well does each of the following describe how you feel?Scared
Demographic Very well Somewhat well Not very well Not well at allDon’t know /No opinion Total N
Registered Voters 20% (408) 25% (495) 18% (361) 27% (540) 10% (195) 2000Ethnicity: Black 22% (57) 20% (53) 13% (35) 29% (76) 15% (37) 257Ethnicity: Other 19% (36) 24% (45) 23% (43) 21% (40) 12% (23) 188All Christian 19% (201) 24% (254) 19% (201) 29% (307) 8% (82) 1045All Non-Christian 31% (38) 25% (30) 12% (15) 23% (28) 8% (10) 120Atheist 27% (26) 38% (37) 14% (13) 17% (16) 5% (5) 98Agnostic/Nothing in particular 23% (103) 23% (103) 19% (83) 25% (111) 10% (45) 445Something Else 14% (40) 25% (72) 17% (50) 26% (77) 18% (54) 292Religious Non-Protestant/Catholic 30% (43) 24% (34) 16% (23) 22% (32) 7% (10) 143Evangelical 17% (101) 21% (123) 17% (103) 31% (186) 13% (79) 591Non-Evangelical 19% (133) 27% (195) 19% (135) 27% (192) 8% (55) 710Community: Urban 21% (103) 26% (128) 19% (94) 25% (124) 9% (45) 494Community: Suburban 22% (214) 26% (257) 16% (157) 27% (272) 9% (91) 989Community: Rural 18% (91) 21% (110) 21% (111) 28% (144) 12% (60) 516Employ: Private Sector 19% (126) 25% (164) 18% (115) 32% (208) 6% (43) 656Employ: Government 19% (21) 29% (32) 18% (20) 24% (26) 9% (10) 109Employ: Self-Employed 22% (40) 24% (42) 18% (32) 26% (48) 10% (18) 180Employ: Homemaker 20% (35) 16% (28) 20% (34) 26% (45) 18% (31) 174Employ: Student 24% (16) 24% (16) 13% (8) 24% (16) 15% (10) 65Employ: Retired 20% (103) 29% (149) 19% (98) 25% (132) 7% (38) 520Employ: Unemployed 24% (47) 21% (42) 21% (42) 22% (44) 12% (24) 199Employ: Other 21% (21) 22% (22) 12% (11) 22% (21) 22% (21) 97Military HH: Yes 16% (61) 20% (76) 22% (82) 35% (131) 7% (27) 377Military HH: No 21% (347) 26% (419) 17% (280) 25% (409) 10% (168) 1623RD/WT: Right Direction 29% (253) 31% (269) 14% (126) 18% (158) 7% (63) 868RD/WT: Wrong Track 14% (155) 20% (226) 21% (236) 34% (382) 12% (133) 1132Biden Job Approve 29% (297) 32% (327) 15% (147) 17% (174) 7% (67) 1012Biden Job Disapprove 11% (104) 17% (162) 22% (207) 38% (358) 12% (116) 947
Continued on next page
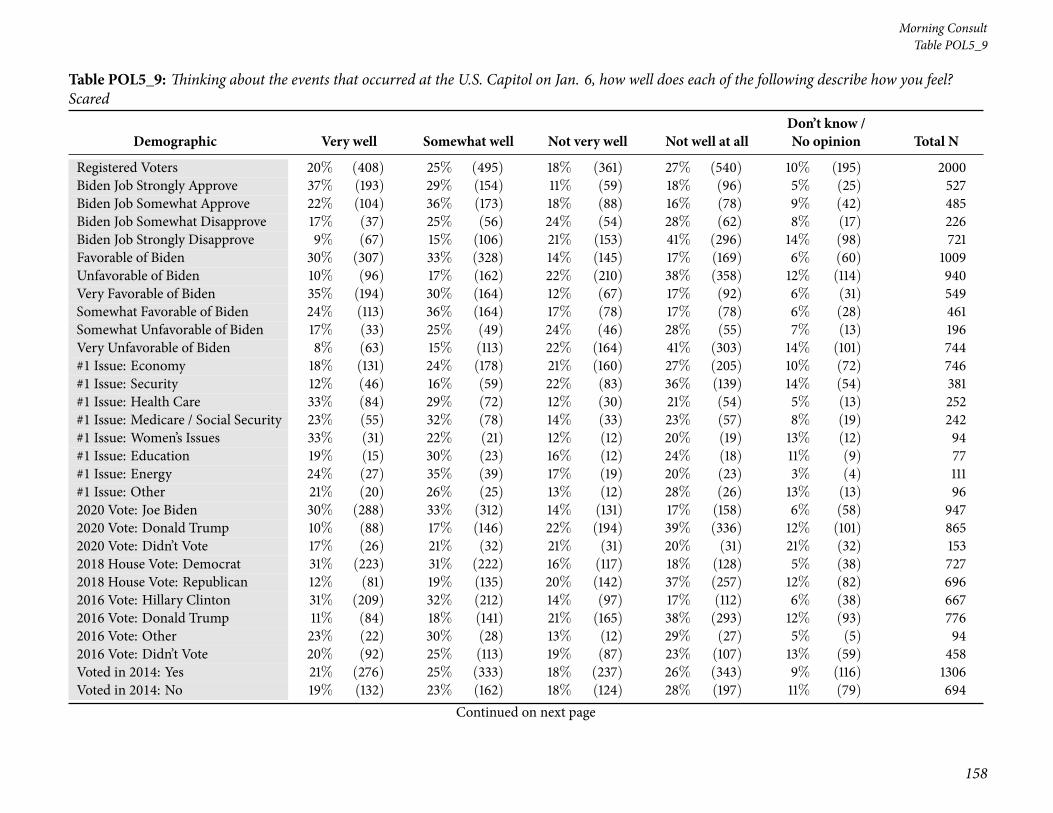
158
Morning ConsultTable POL5_9
Table POL5_9: Thinking about the events that occurred at the U.S. Capitol on Jan. 6, how well does each of the following describe how you feel?Scared
Demographic Very well Somewhat well Not very well Not well at allDon’t know /No opinion Total N
Registered Voters 20% (408) 25% (495) 18% (361) 27% (540) 10% (195) 2000Biden Job Strongly Approve 37% (193) 29% (154) 11% (59) 18% (96) 5% (25) 527Biden Job Somewhat Approve 22% (104) 36% (173) 18% (88) 16% (78) 9% (42) 485Biden Job Somewhat Disapprove 17% (37) 25% (56) 24% (54) 28% (62) 8% (17) 226Biden Job Strongly Disapprove 9% (67) 15% (106) 21% (153) 41% (296) 14% (98) 721Favorable of Biden 30% (307) 33% (328) 14% (145) 17% (169) 6% (60) 1009Unfavorable of Biden 10% (96) 17% (162) 22% (210) 38% (358) 12% (114) 940Very Favorable of Biden 35% (194) 30% (164) 12% (67) 17% (92) 6% (31) 549Somewhat Favorable of Biden 24% (113) 36% (164) 17% (78) 17% (78) 6% (28) 461Somewhat Unfavorable of Biden 17% (33) 25% (49) 24% (46) 28% (55) 7% (13) 196Very Unfavorable of Biden 8% (63) 15% (113) 22% (164) 41% (303) 14% (101) 744#1 Issue: Economy 18% (131) 24% (178) 21% (160) 27% (205) 10% (72) 746#1 Issue: Security 12% (46) 16% (59) 22% (83) 36% (139) 14% (54) 381#1 Issue: Health Care 33% (84) 29% (72) 12% (30) 21% (54) 5% (13) 252#1 Issue: Medicare / Social Security 23% (55) 32% (78) 14% (33) 23% (57) 8% (19) 242#1 Issue: Women’s Issues 33% (31) 22% (21) 12% (12) 20% (19) 13% (12) 94#1 Issue: Education 19% (15) 30% (23) 16% (12) 24% (18) 11% (9) 77#1 Issue: Energy 24% (27) 35% (39) 17% (19) 20% (23) 3% (4) 111#1 Issue: Other 21% (20) 26% (25) 13% (12) 28% (26) 13% (13) 962020 Vote: Joe Biden 30% (288) 33% (312) 14% (131) 17% (158) 6% (58) 9472020 Vote: Donald Trump 10% (88) 17% (146) 22% (194) 39% (336) 12% (101) 8652020 Vote: Didn’t Vote 17% (26) 21% (32) 21% (31) 20% (31) 21% (32) 1532018 House Vote: Democrat 31% (223) 31% (222) 16% (117) 18% (128) 5% (38) 7272018 House Vote: Republican 12% (81) 19% (135) 20% (142) 37% (257) 12% (82) 6962016 Vote: Hillary Clinton 31% (209) 32% (212) 14% (97) 17% (112) 6% (38) 6672016 Vote: Donald Trump 11% (84) 18% (141) 21% (165) 38% (293) 12% (93) 7762016 Vote: Other 23% (22) 30% (28) 13% (12) 29% (27) 5% (5) 942016 Vote: Didn’t Vote 20% (92) 25% (113) 19% (87) 23% (107) 13% (59) 458Voted in 2014: Yes 21% (276) 25% (333) 18% (237) 26% (343) 9% (116) 1306Voted in 2014: No 19% (132) 23% (162) 18% (124) 28% (197) 11% (79) 694
Continued on next page

National Tracking Poll #2107125, July, 2021
159
Table POL5_9
Table POL5_9: Thinking about the events that occurred at the U.S. Capitol on Jan. 6, how well does each of the following describe how you feel?Scared
Demographic Very well Somewhat well Not very well Not well at allDon’t know /No opinion Total N
Registered Voters 20% (408) 25% (495) 18% (361) 27% (540) 10% (195) 20004-Region: Northeast 25% (88) 25% (90) 16% (56) 24% (83) 10% (36) 3534-Region: Midwest 20% (91) 30% (135) 18% (79) 26% (114) 6% (27) 4454-Region: South 19% (141) 22% (165) 18% (133) 30% (225) 11% (82) 7464-Region: West 19% (88) 23% (105) 21% (93) 26% (118) 11% (51) 456Note: Row proportions may total to larger than one-hundred percent due to rounding. For more information visit MorningConsultIntelligence.com.

160
Morning ConsultTable POL5_10
Table POL5_10: Thinking about the events that occurred at the U.S. Capitol on Jan. 6, how well does each of the following describe how you feel?Angry
Demographic Very well Somewhat well Not very well Not well at allDon’t know /No opinion Total N
Registered Voters 42% (830) 24% (479) 11% (224) 14% (289) 9% (178) 2000Gender: Male 40% (374) 24% (228) 12% (116) 16% (155) 7% (69) 943Gender: Female 43% (456) 24% (251) 10% (108) 13% (134) 10% (108) 1057Age: 18-34 36% (183) 24% (126) 14% (72) 15% (77) 11% (56) 515Age: 35-44 39% (119) 23% (71) 9% (26) 14% (44) 15% (46) 307Age: 45-64 44% (298) 23% (154) 13% (86) 13% (91) 8% (52) 680Age: 65+ 46% (229) 26% (128) 8% (39) 16% (77) 5% (24) 498GenZers: 1997-2012 35% (57) 21% (34) 18% (30) 16% (25) 10% (17) 162Millennials: 1981-1996 36% (190) 26% (137) 11% (59) 15% (77) 12% (64) 527GenXers: 1965-1980 41% (221) 22% (121) 11% (61) 16% (85) 10% (54) 542Baby Boomers: 1946-1964 47% (327) 24% (166) 9% (65) 13% (92) 6% (38) 688PID: Dem (no lean) 56% (444) 21% (168) 6% (51) 9% (73) 7% (53) 789PID: Ind (no lean) 40% (187) 25% (119) 13% (62) 13% (59) 10% (45) 472PID: Rep (no lean) 27% (199) 26% (192) 15% (111) 21% (158) 11% (80) 740PID/Gender: DemMen 52% (192) 21% (79) 8% (31) 11% (42) 7% (27) 371PID/Gender: DemWomen 60% (252) 21% (89) 5% (20) 7% (30) 6% (26) 418PID/Gender: Ind Men 39% (93) 26% (63) 13% (31) 13% (32) 8% (18) 237PID/Gender: Ind Women 40% (94) 24% (56) 13% (31) 12% (27) 11% (27) 234PID/Gender: Rep Men 27% (89) 26% (86) 16% (54) 24% (81) 7% (24) 334PID/Gender: Rep Women 27% (110) 26% (106) 14% (57) 19% (77) 14% (56) 405Ideo: Liberal (1-3) 60% (350) 21% (123) 6% (33) 11% (62) 3% (19) 587Ideo: Moderate (4) 42% (226) 26% (143) 11% (58) 12% (64) 9% (51) 542Ideo: Conservative (5-7) 28% (220) 25% (202) 16% (126) 20% (155) 12% (93) 795Educ: < College 38% (458) 25% (301) 11% (131) 15% (182) 11% (136) 1207Educ: Bachelors degree 45% (224) 24% (120) 12% (58) 14% (70) 6% (30) 502Educ: Post-grad 51% (148) 20% (58) 12% (35) 13% (37) 4% (12) 291Income: Under 50k 39% (360) 24% (217) 10% (93) 16% (142) 11% (103) 916Income: 50k-100k 42% (300) 25% (181) 11% (80) 15% (107) 7% (52) 720Income: 100k+ 47% (170) 22% (80) 14% (50) 11% (41) 6% (23) 364Ethnicity: White 42% (649) 25% (385) 11% (174) 14% (222) 8% (126) 1555Ethnicity: Hispanic 40% (89) 22% (48) 14% (31) 14% (32) 10% (23) 222
Continued on next page

National Tracking Poll #2107125, July, 2021
161
Table POL5_10
Table POL5_10: Thinking about the events that occurred at the U.S. Capitol on Jan. 6, how well does each of the following describe how you feel?Angry
Demographic Very well Somewhat well Not very well Not well at allDon’t know /No opinion Total N
Registered Voters 42% (830) 24% (479) 11% (224) 14% (289) 9% (178) 2000Ethnicity: Black 45% (116) 22% (57) 8% (21) 13% (34) 11% (28) 257Ethnicity: Other 35% (65) 20% (38) 15% (28) 18% (33) 13% (24) 188All Christian 40% (418) 24% (255) 12% (130) 16% (167) 7% (75) 1045All Non-Christian 45% (55) 25% (31) 9% (11) 10% (12) 10% (12) 120Atheist 62% (60) 25% (24) 6% (5) 5% (5) 3% (3) 98Agnostic/Nothing in particular 42% (185) 25% (110) 10% (44) 14% (64) 9% (41) 445Something Else 38% (112) 20% (59) 11% (33) 14% (42) 16% (47) 292Religious Non-Protestant/Catholic 44% (63) 25% (36) 10% (15) 11% (16) 9% (13) 143Evangelical 36% (211) 22% (131) 14% (82) 17% (98) 12% (69) 591Non-Evangelical 43% (309) 25% (175) 10% (74) 14% (102) 7% (50) 710Community: Urban 43% (212) 23% (113) 11% (55) 13% (66) 10% (48) 494Community: Suburban 42% (416) 25% (244) 11% (106) 14% (139) 9% (84) 989Community: Rural 39% (202) 24% (122) 12% (63) 16% (85) 9% (46) 516Employ: Private Sector 40% (264) 26% (169) 11% (71) 17% (112) 6% (41) 656Employ: Government 48% (52) 14% (15) 14% (15) 17% (18) 8% (9) 109Employ: Self-Employed 33% (59) 31% (56) 17% (31) 10% (18) 9% (16) 180Employ: Homemaker 32% (55) 23% (39) 13% (23) 16% (28) 17% (29) 174Employ: Student 37% (24) 20% (13) 15% (10) 11% (7) 17% (11) 65Employ: Retired 48% (248) 25% (128) 7% (37) 14% (75) 6% (31) 520Employ: Unemployed 42% (84) 21% (41) 14% (28) 13% (27) 10% (19) 199Employ: Other 46% (44) 17% (16) 10% (10) 5% (5) 22% (21) 97Military HH: Yes 37% (140) 27% (103) 9% (33) 21% (79) 6% (23) 377Military HH: No 43% (690) 23% (376) 12% (191) 13% (211) 10% (155) 1623RD/WT: Right Direction 54% (466) 22% (188) 8% (70) 10% (89) 6% (55) 868RD/WT: Wrong Track 32% (364) 26% (291) 14% (154) 18% (201) 11% (122) 1132Biden Job Approve 57% (576) 22% (219) 7% (70) 9% (89) 6% (58) 1012Biden Job Disapprove 26% (243) 27% (252) 16% (150) 21% (194) 11% (107) 947
Continued on next page
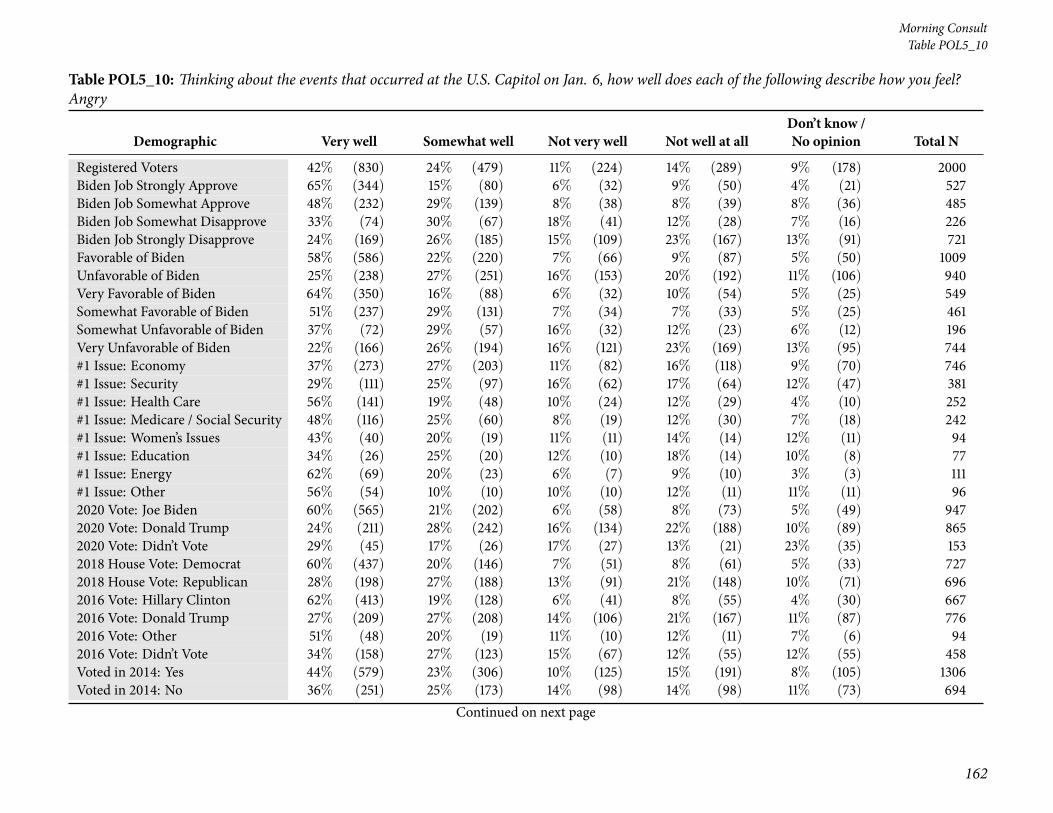
162
Morning ConsultTable POL5_10
Table POL5_10: Thinking about the events that occurred at the U.S. Capitol on Jan. 6, how well does each of the following describe how you feel?Angry
Demographic Very well Somewhat well Not very well Not well at allDon’t know /No opinion Total N
Registered Voters 42% (830) 24% (479) 11% (224) 14% (289) 9% (178) 2000Biden Job Strongly Approve 65% (344) 15% (80) 6% (32) 9% (50) 4% (21) 527Biden Job Somewhat Approve 48% (232) 29% (139) 8% (38) 8% (39) 8% (36) 485Biden Job Somewhat Disapprove 33% (74) 30% (67) 18% (41) 12% (28) 7% (16) 226Biden Job Strongly Disapprove 24% (169) 26% (185) 15% (109) 23% (167) 13% (91) 721Favorable of Biden 58% (586) 22% (220) 7% (66) 9% (87) 5% (50) 1009Unfavorable of Biden 25% (238) 27% (251) 16% (153) 20% (192) 11% (106) 940Very Favorable of Biden 64% (350) 16% (88) 6% (32) 10% (54) 5% (25) 549Somewhat Favorable of Biden 51% (237) 29% (131) 7% (34) 7% (33) 5% (25) 461Somewhat Unfavorable of Biden 37% (72) 29% (57) 16% (32) 12% (23) 6% (12) 196Very Unfavorable of Biden 22% (166) 26% (194) 16% (121) 23% (169) 13% (95) 744#1 Issue: Economy 37% (273) 27% (203) 11% (82) 16% (118) 9% (70) 746#1 Issue: Security 29% (111) 25% (97) 16% (62) 17% (64) 12% (47) 381#1 Issue: Health Care 56% (141) 19% (48) 10% (24) 12% (29) 4% (10) 252#1 Issue: Medicare / Social Security 48% (116) 25% (60) 8% (19) 12% (30) 7% (18) 242#1 Issue: Women’s Issues 43% (40) 20% (19) 11% (11) 14% (14) 12% (11) 94#1 Issue: Education 34% (26) 25% (20) 12% (10) 18% (14) 10% (8) 77#1 Issue: Energy 62% (69) 20% (23) 6% (7) 9% (10) 3% (3) 111#1 Issue: Other 56% (54) 10% (10) 10% (10) 12% (11) 11% (11) 962020 Vote: Joe Biden 60% (565) 21% (202) 6% (58) 8% (73) 5% (49) 9472020 Vote: Donald Trump 24% (211) 28% (242) 16% (134) 22% (188) 10% (89) 8652020 Vote: Didn’t Vote 29% (45) 17% (26) 17% (27) 13% (21) 23% (35) 1532018 House Vote: Democrat 60% (437) 20% (146) 7% (51) 8% (61) 5% (33) 7272018 House Vote: Republican 28% (198) 27% (188) 13% (91) 21% (148) 10% (71) 6962016 Vote: Hillary Clinton 62% (413) 19% (128) 6% (41) 8% (55) 4% (30) 6672016 Vote: Donald Trump 27% (209) 27% (208) 14% (106) 21% (167) 11% (87) 7762016 Vote: Other 51% (48) 20% (19) 11% (10) 12% (11) 7% (6) 942016 Vote: Didn’t Vote 34% (158) 27% (123) 15% (67) 12% (55) 12% (55) 458Voted in 2014: Yes 44% (579) 23% (306) 10% (125) 15% (191) 8% (105) 1306Voted in 2014: No 36% (251) 25% (173) 14% (98) 14% (98) 11% (73) 694
Continued on next page

National Tracking Poll #2107125, July, 2021
163
Table POL5_10
Table POL5_10: Thinking about the events that occurred at the U.S. Capitol on Jan. 6, how well does each of the following describe how you feel?Angry
Demographic Very well Somewhat well Not very well Not well at allDon’t know /No opinion Total N
Registered Voters 42% (830) 24% (479) 11% (224) 14% (289) 9% (178) 20004-Region: Northeast 49% (172) 25% (89) 9% (30) 9% (32) 8% (30) 3534-Region: Midwest 44% (197) 23% (100) 10% (46) 17% (74) 6% (27) 4454-Region: South 37% (275) 25% (185) 12% (89) 16% (118) 11% (79) 7464-Region: West 41% (186) 23% (104) 13% (58) 14% (65) 9% (42) 456Note: Row proportions may total to larger than one-hundred percent due to rounding. For more information visit MorningConsultIntelligence.com.

164
Morning ConsultTable POL5_11
Table POL5_11: Thinking about the events that occurred at the U.S. Capitol on Jan. 6, how well does each of the following describe how you feel?Happy
Demographic Very well Somewhat well Not very well Not well at allDon’t know /No opinion Total N
Registered Voters 6% (114) 6% (111) 11% (226) 67% (1348) 10% (201) 2000Gender: Male 9% (82) 6% (56) 14% (136) 62% (581) 9% (88) 943Gender: Female 3% (32) 5% (55) 9% (91) 73% (767) 11% (113) 1057Age: 18-34 9% (45) 8% (43) 13% (66) 57% (293) 13% (68) 515Age: 35-44 9% (29) 8% (25) 11% (34) 56% (172) 15% (46) 307Age: 45-64 4% (30) 5% (34) 13% (86) 70% (473) 8% (57) 680Age: 65+ 2% (10) 2% (8) 8% (40) 82% (410) 6% (30) 498GenZers: 1997-2012 5% (7) 9% (14) 10% (16) 64% (104) 13% (20) 162Millennials: 1981-1996 10% (55) 9% (50) 12% (65) 53% (279) 15% (78) 527GenXers: 1965-1980 7% (37) 5% (28) 13% (72) 65% (351) 10% (54) 542Baby Boomers: 1946-1964 2% (14) 3% (17) 10% (67) 80% (548) 6% (42) 688PID: Dem (no lean) 8% (60) 4% (31) 8% (62) 72% (572) 8% (64) 789PID: Ind (no lean) 3% (13) 4% (20) 11% (53) 71% (335) 11% (50) 472PID: Rep (no lean) 5% (40) 8% (60) 15% (111) 60% (442) 12% (87) 740PID/Gender: DemMen 12% (44) 4% (14) 9% (32) 66% (247) 9% (35) 371PID/Gender: DemWomen 4% (16) 4% (17) 7% (31) 78% (325) 7% (29) 418PID/Gender: Ind Men 3% (8) 5% (11) 14% (34) 68% (161) 10% (24) 237PID/Gender: Ind Women 2% (5) 4% (9) 8% (19) 74% (174) 11% (26) 234PID/Gender: Rep Men 9% (30) 9% (31) 21% (70) 52% (174) 9% (30) 334PID/Gender: Rep Women 3% (11) 7% (29) 10% (40) 66% (268) 14% (57) 405Ideo: Liberal (1-3) 7% (40) 5% (28) 8% (45) 77% (452) 4% (21) 587Ideo: Moderate (4) 5% (27) 5% (25) 9% (49) 70% (379) 11% (62) 542Ideo: Conservative (5-7) 6% (44) 7% (53) 15% (123) 60% (476) 12% (99) 795Educ: < College 5% (55) 7% (79) 12% (149) 64% (775) 12% (149) 1207Educ: Bachelors degree 6% (30) 4% (22) 11% (56) 71% (357) 7% (36) 502Educ: Post-grad 10% (28) 3% (10) 7% (21) 75% (217) 5% (15) 291Income: Under 50k 6% (55) 6% (58) 11% (100) 63% (580) 13% (124) 916Income: 50k-100k 5% (35) 5% (33) 13% (94) 70% (504) 8% (54) 720Income: 100k+ 7% (24) 6% (20) 9% (32) 73% (265) 6% (23) 364Ethnicity: White 6% (87) 5% (81) 10% (161) 70% (1094) 8% (132) 1555Ethnicity: Hispanic 10% (23) 8% (19) 13% (28) 58% (129) 10% (23) 222
Continued on next page

National Tracking Poll #2107125, July, 2021
165
Table POL5_11
Table POL5_11: Thinking about the events that occurred at the U.S. Capitol on Jan. 6, how well does each of the following describe how you feel?Happy
Demographic Very well Somewhat well Not very well Not well at allDon’t know /No opinion Total N
Registered Voters 6% (114) 6% (111) 11% (226) 67% (1348) 10% (201) 2000Ethnicity: Black 6% (16) 7% (18) 14% (36) 56% (144) 17% (43) 257Ethnicity: Other 6% (11) 7% (12) 16% (29) 59% (110) 13% (25) 188All Christian 5% (57) 7% (68) 11% (114) 69% (722) 8% (84) 1045All Non-Christian 15% (18) 3% (4) 7% (9) 66% (79) 9% (11) 120Atheist 2% (2) — (0) 13% (13) 81% (80) 3% (3) 98Agnostic/Nothing in particular 4% (17) 4% (19) 12% (52) 68% (303) 12% (54) 445Something Else 7% (20) 7% (20) 13% (38) 57% (165) 17% (48) 292Religious Non-Protestant/Catholic 13% (18) 6% (8) 11% (15) 63% (89) 8% (12) 143Evangelical 7% (42) 7% (43) 11% (65) 63% (375) 11% (67) 591Non-Evangelical 5% (32) 6% (40) 11% (79) 70% (497) 9% (62) 710Community: Urban 12% (57) 6% (28) 12% (58) 61% (301) 10% (50) 494Community: Suburban 3% (27) 5% (52) 11% (113) 71% (700) 10% (97) 989Community: Rural 6% (29) 6% (31) 11% (56) 67% (347) 10% (54) 516Employ: Private Sector 8% (51) 8% (52) 14% (89) 64% (422) 6% (42) 656Employ: Government 13% (14) 8% (9) 19% (21) 51% (56) 8% (9) 109Employ: Self-Employed 11% (20) 9% (15) 10% (18) 56% (100) 15% (26) 180Employ: Homemaker 2% (4) 3% (5) 12% (20) 65% (114) 18% (31) 174Employ: Student 2% (1) 7% (4) 8% (5) 67% (44) 16% (11) 65Employ: Retired 2% (12) 2% (11) 9% (45) 80% (417) 7% (35) 520Employ: Unemployed 4% (8) 5% (9) 10% (19) 70% (140) 11% (22) 199Employ: Other 3% (3) 4% (4) 9% (9) 58% (56) 26% (25) 97Military HH: Yes 4% (17) 4% (14) 12% (46) 73% (274) 7% (26) 377Military HH: No 6% (97) 6% (97) 11% (180) 66% (1075) 11% (174) 1623RD/WT: Right Direction 8% (70) 6% (50) 8% (70) 70% (607) 8% (71) 868RD/WT: Wrong Track 4% (44) 5% (61) 14% (156) 65% (741) 11% (130) 1132Biden Job Approve 7% (68) 5% (50) 8% (83) 73% (737) 7% (74) 1012Biden Job Disapprove 5% (44) 6% (60) 15% (140) 62% (591) 12% (112) 947
Continued on next page

166
Morning ConsultTable POL5_11
Table POL5_11: Thinking about the events that occurred at the U.S. Capitol on Jan. 6, how well does each of the following describe how you feel?Happy
Demographic Very well Somewhat well Not very well Not well at allDon’t know /No opinion Total N
Registered Voters 6% (114) 6% (111) 11% (226) 67% (1348) 10% (201) 2000Biden Job Strongly Approve 11% (57) 4% (20) 6% (31) 74% (389) 6% (31) 527Biden Job Somewhat Approve 2% (10) 6% (30) 11% (52) 72% (348) 9% (44) 485Biden Job Somewhat Disapprove 5% (12) 7% (15) 16% (36) 64% (144) 8% (19) 226Biden Job Strongly Disapprove 4% (31) 6% (45) 14% (104) 62% (446) 13% (94) 721Favorable of Biden 6% (64) 5% (46) 8% (82) 75% (753) 6% (65) 1009Unfavorable of Biden 5% (47) 7% (64) 14% (134) 62% (582) 12% (115) 940Very Favorable of Biden 9% (49) 4% (20) 6% (34) 74% (409) 7% (36) 549Somewhat Favorable of Biden 3% (14) 6% (25) 10% (48) 75% (344) 6% (28) 461Somewhat Unfavorable of Biden 6% (11) 9% (17) 14% (28) 64% (125) 8% (15) 196Very Unfavorable of Biden 5% (35) 6% (47) 14% (106) 61% (457) 13% (100) 744#1 Issue: Economy 5% (39) 5% (39) 13% (96) 67% (501) 10% (71) 746#1 Issue: Security 6% (23) 8% (30) 12% (46) 59% (227) 14% (55) 381#1 Issue: Health Care 7% (18) 4% (10) 9% (24) 73% (185) 6% (15) 252#1 Issue: Medicare / Social Security 5% (12) 5% (13) 10% (24) 72% (175) 8% (19) 242#1 Issue: Women’s Issues 7% (7) 4% (3) 9% (9) 67% (63) 13% (12) 94#1 Issue: Education 7% (5) 12% (9) 16% (12) 50% (38) 15% (12) 77#1 Issue: Energy 9% (10) 4% (5) 8% (9) 76% (84) 3% (3) 111#1 Issue: Other — (0) 2% (2) 7% (6) 78% (75) 13% (13) 962020 Vote: Joe Biden 6% (58) 4% (37) 9% (81) 75% (709) 7% (62) 9472020 Vote: Donald Trump 6% (50) 7% (61) 15% (129) 61% (529) 11% (96) 8652020 Vote: Didn’t Vote 4% (6) 8% (12) 8% (13) 56% (86) 24% (36) 1532018 House Vote: Democrat 7% (54) 4% (30) 8% (59) 75% (546) 5% (38) 7272018 House Vote: Republican 6% (38) 6% (41) 14% (97) 63% (442) 11% (78) 6962016 Vote: Hillary Clinton 6% (41) 4% (28) 7% (45) 77% (516) 5% (36) 6672016 Vote: Donald Trump 6% (45) 6% (45) 14% (112) 62% (484) 11% (89) 7762016 Vote: Other — (0) 1% (1) 12% (11) 77% (72) 10% (9) 942016 Vote: Didn’t Vote 6% (27) 8% (34) 13% (58) 59% (273) 15% (67) 458Voted in 2014: Yes 6% (81) 4% (58) 10% (136) 70% (914) 9% (118) 1306Voted in 2014: No 5% (33) 8% (53) 13% (91) 63% (435) 12% (83) 694
Continued on next page

National Tracking Poll #2107125, July, 2021
167
Table POL5_11
Table POL5_11: Thinking about the events that occurred at the U.S. Capitol on Jan. 6, how well does each of the following describe how you feel?Happy
Demographic Very well Somewhat well Not very well Not well at allDon’t know /No opinion Total N
Registered Voters 6% (114) 6% (111) 11% (226) 67% (1348) 10% (201) 20004-Region: Northeast 5% (19) 6% (20) 10% (35) 69% (244) 10% (35) 3534-Region: Midwest 6% (26) 4% (18) 11% (47) 73% (323) 7% (30) 4454-Region: South 6% (42) 7% (52) 12% (92) 63% (471) 12% (89) 7464-Region: West 6% (26) 5% (21) 11% (52) 68% (310) 10% (46) 456Note: Row proportions may total to larger than one-hundred percent due to rounding. For more information visit MorningConsultIntelligence.com.

168
Morning ConsultTable POL5_12
Table POL5_12: Thinking about the events that occurred at the U.S. Capitol on Jan. 6, how well does each of the following describe how you feel?Depressed
Demographic Very well Somewhat well Not very well Not well at allDon’t know /No opinion Total N
Registered Voters 17% (338) 22% (442) 19% (378) 30% (598) 12% (245) 2000Gender: Male 17% (158) 22% (204) 23% (212) 30% (284) 9% (84) 943Gender: Female 17% (179) 23% (238) 16% (166) 30% (314) 15% (161) 1057Age: 18-34 16% (80) 21% (110) 19% (100) 32% (163) 12% (62) 515Age: 35-44 18% (56) 19% (57) 17% (51) 27% (83) 20% (60) 307Age: 45-64 16% (111) 24% (162) 19% (127) 29% (198) 12% (82) 680Age: 65+ 18% (91) 23% (113) 20% (100) 31% (154) 8% (40) 498GenZers: 1997-2012 15% (24) 18% (29) 20% (33) 36% (58) 11% (18) 162Millennials: 1981-1996 16% (86) 22% (115) 19% (99) 28% (150) 15% (77) 527GenXers: 1965-1980 16% (87) 23% (123) 17% (92) 29% (160) 15% (79) 542Baby Boomers: 1946-1964 18% (122) 23% (157) 19% (134) 31% (211) 9% (65) 688PID: Dem (no lean) 24% (190) 25% (201) 17% (132) 24% (192) 10% (75) 789PID: Ind (no lean) 15% (69) 23% (109) 22% (105) 26% (124) 14% (65) 472PID: Rep (no lean) 11% (79) 18% (132) 19% (141) 38% (282) 14% (105) 740PID/Gender: DemMen 24% (89) 26% (96) 19% (70) 24% (88) 8% (28) 371PID/Gender: DemWomen 24% (101) 25% (105) 15% (62) 25% (103) 11% (47) 418PID/Gender: Ind Men 14% (34) 21% (49) 28% (67) 28% (67) 9% (20) 237PID/Gender: Ind Women 15% (35) 26% (61) 16% (37) 24% (57) 19% (44) 234PID/Gender: Rep Men 11% (35) 18% (60) 22% (75) 39% (129) 11% (35) 334PID/Gender: Rep Women 11% (44) 18% (72) 16% (66) 38% (153) 17% (69) 405Ideo: Liberal (1-3) 27% (160) 28% (166) 17% (101) 20% (119) 7% (40) 587Ideo: Moderate (4) 16% (87) 22% (121) 19% (101) 32% (171) 12% (63) 542Ideo: Conservative (5-7) 10% (81) 18% (142) 21% (167) 36% (289) 15% (117) 795Educ: < College 14% (173) 21% (253) 19% (225) 31% (371) 15% (184) 1207Educ: Bachelors degree 18% (92) 24% (121) 20% (100) 29% (145) 9% (43) 502Educ: Post-grad 25% (72) 23% (68) 18% (52) 28% (82) 6% (17) 291Income: Under 50k 17% (159) 21% (196) 16% (146) 29% (268) 16% (147) 916Income: 50k-100k 14% (104) 24% (172) 23% (163) 30% (218) 9% (64) 720Income: 100k+ 20% (74) 20% (74) 19% (70) 31% (113) 9% (34) 364Ethnicity: White 17% (266) 23% (357) 18% (284) 30% (469) 12% (179) 1555Ethnicity: Hispanic 21% (47) 25% (55) 17% (38) 25% (56) 12% (26) 222
Continued on next page

National Tracking Poll #2107125, July, 2021
169
Table POL5_12
Table POL5_12: Thinking about the events that occurred at the U.S. Capitol on Jan. 6, how well does each of the following describe how you feel?Depressed
Demographic Very well Somewhat well Not very well Not well at allDon’t know /No opinion Total N
Registered Voters 17% (338) 22% (442) 19% (378) 30% (598) 12% (245) 2000Ethnicity: Black 13% (34) 20% (51) 21% (53) 32% (83) 14% (35) 257Ethnicity: Other 20% (37) 18% (34) 22% (41) 25% (47) 16% (30) 188All Christian 17% (173) 22% (231) 19% (201) 32% (331) 10% (108) 1045All Non-Christian 24% (29) 23% (28) 17% (20) 21% (26) 15% (19) 120Atheist 26% (26) 30% (30) 16% (16) 23% (22) 5% (5) 98Agnostic/Nothing in particular 18% (82) 21% (94) 20% (87) 30% (132) 11% (50) 445Something Else 10% (29) 20% (60) 18% (53) 30% (87) 21% (63) 292Religious Non-Protestant/Catholic 22% (31) 23% (33) 18% (25) 24% (34) 13% (19) 143Evangelical 13% (78) 21% (124) 17% (103) 34% (199) 15% (89) 591Non-Evangelical 17% (120) 22% (159) 20% (144) 29% (207) 11% (80) 710Community: Urban 19% (96) 21% (103) 19% (91) 27% (135) 14% (69) 494Community: Suburban 15% (153) 23% (230) 19% (191) 31% (307) 11% (109) 989Community: Rural 17% (88) 21% (110) 18% (95) 30% (157) 13% (66) 516Employ: Private Sector 16% (107) 22% (144) 19% (127) 33% (217) 9% (62) 656Employ: Government 19% (20) 20% (22) 20% (22) 32% (35) 9% (10) 109Employ: Self-Employed 18% (33) 27% (49) 21% (37) 22% (39) 12% (22) 180Employ: Homemaker 10% (17) 15% (27) 18% (31) 35% (61) 22% (39) 174Employ: Student 8% (5) 20% (13) 14% (9) 41% (27) 17% (11) 65Employ: Retired 19% (99) 24% (127) 19% (101) 28% (145) 9% (49) 520Employ: Unemployed 22% (44) 19% (38) 18% (35) 27% (54) 14% (28) 199Employ: Other 12% (12) 24% (23) 16% (16) 22% (21) 25% (25) 97Military HH: Yes 15% (55) 19% (71) 19% (72) 38% (145) 9% (34) 377Military HH: No 17% (283) 23% (370) 19% (306) 28% (453) 13% (211) 1623RD/WT: Right Direction 22% (194) 25% (216) 18% (156) 25% (214) 10% (88) 868RD/WT: Wrong Track 13% (144) 20% (226) 20% (222) 34% (385) 14% (156) 1132Biden Job Approve 23% (235) 26% (262) 17% (172) 24% (246) 10% (97) 1012Biden Job Disapprove 10% (95) 19% (179) 21% (201) 36% (341) 14% (130) 947
Continued on next page

170
Morning ConsultTable POL5_12
Table POL5_12: Thinking about the events that occurred at the U.S. Capitol on Jan. 6, how well does each of the following describe how you feel?Depressed
Demographic Very well Somewhat well Not very well Not well at allDon’t know /No opinion Total N
Registered Voters 17% (338) 22% (442) 19% (378) 30% (598) 12% (245) 2000Biden Job Strongly Approve 30% (157) 24% (126) 16% (85) 22% (118) 8% (42) 527Biden Job Somewhat Approve 16% (79) 28% (136) 18% (87) 26% (128) 11% (55) 485Biden Job Somewhat Disapprove 12% (27) 28% (64) 25% (56) 25% (57) 10% (22) 226Biden Job Strongly Disapprove 9% (68) 16% (114) 20% (145) 39% (284) 15% (109) 721Favorable of Biden 24% (239) 26% (264) 17% (176) 24% (239) 9% (91) 1009Unfavorable of Biden 10% (95) 19% (175) 21% (193) 37% (346) 14% (131) 940Very Favorable of Biden 29% (159) 25% (139) 15% (81) 22% (121) 9% (49) 549Somewhat Favorable of Biden 17% (80) 27% (125) 21% (95) 26% (118) 9% (42) 461Somewhat Unfavorable of Biden 14% (28) 24% (47) 25% (48) 28% (54) 9% (18) 196Very Unfavorable of Biden 9% (67) 17% (128) 19% (145) 39% (292) 15% (113) 744#1 Issue: Economy 13% (99) 22% (162) 20% (150) 31% (233) 14% (101) 746#1 Issue: Security 11% (42) 18% (70) 21% (80) 35% (133) 15% (56) 381#1 Issue: Health Care 22% (55) 29% (72) 12% (30) 29% (74) 8% (21) 252#1 Issue: Medicare / Social Security 21% (51) 23% (55) 17% (41) 28% (68) 11% (27) 242#1 Issue: Women’s Issues 27% (25) 22% (21) 15% (15) 22% (21) 13% (13) 94#1 Issue: Education 13% (10) 15% (12) 25% (19) 33% (25) 14% (11) 77#1 Issue: Energy 25% (28) 34% (37) 19% (21) 19% (21) 3% (3) 111#1 Issue: Other 28% (27) 14% (13) 22% (21) 24% (23) 13% (12) 962020 Vote: Joe Biden 24% (226) 26% (249) 18% (168) 23% (218) 9% (84) 9472020 Vote: Donald Trump 10% (85) 19% (162) 21% (179) 37% (321) 14% (117) 8652020 Vote: Didn’t Vote 15% (23) 16% (25) 17% (26) 27% (41) 24% (37) 1532018 House Vote: Democrat 26% (187) 26% (186) 18% (127) 24% (172) 8% (55) 7272018 House Vote: Republican 11% (76) 20% (141) 19% (132) 36% (251) 14% (96) 6962016 Vote: Hillary Clinton 26% (172) 26% (175) 18% (120) 22% (148) 8% (52) 6672016 Vote: Donald Trump 10% (80) 19% (151) 19% (149) 37% (288) 14% (108) 7762016 Vote: Other 15% (14) 29% (27) 17% (16) 27% (25) 12% (11) 942016 Vote: Didn’t Vote 16% (72) 19% (86) 20% (92) 29% (135) 16% (73) 458Voted in 2014: Yes 18% (235) 23% (297) 19% (249) 29% (375) 11% (150) 1306Voted in 2014: No 15% (102) 21% (145) 19% (128) 32% (224) 14% (95) 694
Continued on next page

National Tracking Poll #2107125, July, 2021
171
Table POL5_12
Table POL5_12: Thinking about the events that occurred at the U.S. Capitol on Jan. 6, how well does each of the following describe how you feel?Depressed
Demographic Very well Somewhat well Not very well Not well at allDon’t know /No opinion Total N
Registered Voters 17% (338) 22% (442) 19% (378) 30% (598) 12% (245) 20004-Region: Northeast 19% (68) 24% (84) 20% (70) 26% (92) 11% (40) 3534-Region: Midwest 15% (66) 26% (115) 17% (75) 33% (145) 10% (45) 4454-Region: South 16% (118) 19% (144) 19% (144) 32% (239) 14% (102) 7464-Region: West 19% (86) 22% (100) 20% (89) 27% (122) 13% (58) 456Note: Row proportions may total to larger than one-hundred percent due to rounding. For more information visit MorningConsultIntelligence.com.

172
Morning ConsultTable POL5_13
Table POL5_13: Thinking about the events that occurred at the U.S. Capitol on Jan. 6, how well does each of the following describe how you feel?Excited
Demographic Very well Somewhat well Not very well Not well at allDon’t know /No opinion Total N
Registered Voters 5% (102) 6% (130) 14% (279) 64% (1272) 11% (217) 2000Gender: Male 8% (75) 8% (72) 17% (160) 57% (541) 10% (96) 943Gender: Female 3% (28) 6% (58) 11% (119) 69% (731) 11% (121) 1057Age: 18-34 8% (41) 9% (48) 17% (86) 54% (278) 12% (62) 515Age: 35-44 8% (26) 8% (24) 13% (39) 53% (164) 18% (54) 307Age: 45-64 3% (24) 6% (40) 14% (96) 67% (457) 9% (64) 680Age: 65+ 2% (12) 3% (17) 12% (58) 75% (373) 8% (38) 498GenZers: 1997-2012 6% (10) 9% (14) 16% (25) 57% (93) 12% (19) 162Millennials: 1981-1996 10% (51) 10% (52) 16% (83) 51% (268) 14% (73) 527GenXers: 1965-1980 4% (24) 6% (34) 13% (71) 64% (348) 12% (66) 542Baby Boomers: 1946-1964 2% (16) 4% (28) 13% (89) 73% (503) 8% (53) 688PID: Dem (no lean) 8% (61) 5% (41) 11% (90) 67% (529) 9% (67) 789PID: Ind (no lean) 2% (11) 4% (20) 16% (74) 66% (311) 12% (55) 472PID: Rep (no lean) 4% (30) 9% (69) 16% (115) 58% (431) 13% (95) 740PID/Gender: DemMen 13% (46) 6% (22) 13% (49) 60% (223) 8% (30) 371PID/Gender: DemWomen 4% (15) 4% (18) 10% (41) 73% (306) 9% (37) 418PID/Gender: Ind Men 2% (6) 6% (14) 18% (42) 63% (149) 11% (26) 237PID/Gender: Ind Women 2% (6) 2% (6) 14% (32) 69% (162) 12% (29) 234PID/Gender: Rep Men 7% (23) 10% (35) 21% (69) 50% (168) 12% (39) 334PID/Gender: Rep Women 2% (7) 8% (34) 11% (46) 65% (263) 14% (55) 405Ideo: Liberal (1-3) 7% (38) 3% (19) 11% (66) 75% (441) 4% (22) 587Ideo: Moderate (4) 5% (28) 6% (35) 13% (69) 64% (345) 12% (64) 542Ideo: Conservative (5-7) 4% (33) 9% (69) 17% (132) 56% (448) 14% (114) 795Educ: < College 5% (58) 7% (87) 15% (177) 60% (728) 13% (158) 1207Educ: Bachelors degree 4% (21) 5% (26) 14% (68) 68% (344) 9% (43) 502Educ: Post-grad 8% (23) 6% (17) 12% (33) 69% (200) 6% (17) 291Income: Under 50k 6% (56) 7% (66) 14% (124) 59% (537) 15% (134) 916Income: 50k-100k 4% (28) 6% (42) 15% (106) 68% (489) 8% (55) 720Income: 100k+ 5% (19) 6% (22) 14% (50) 67% (246) 8% (28) 364Ethnicity: White 5% (79) 6% (96) 13% (205) 66% (1028) 10% (148) 1555Ethnicity: Hispanic 8% (19) 10% (23) 16% (36) 53% (119) 12% (26) 222
Continued on next page

National Tracking Poll #2107125, July, 2021
173
Table POL5_13
Table POL5_13: Thinking about the events that occurred at the U.S. Capitol on Jan. 6, how well does each of the following describe how you feel?Excited
Demographic Very well Somewhat well Not very well Not well at allDon’t know /No opinion Total N
Registered Voters 5% (102) 6% (130) 14% (279) 64% (1272) 11% (217) 2000Ethnicity: Black 7% (18) 6% (15) 17% (44) 52% (134) 18% (46) 257Ethnicity: Other 3% (6) 10% (19) 16% (30) 58% (110) 12% (23) 188All Christian 5% (55) 7% (75) 14% (142) 65% (675) 9% (98) 1045All Non-Christian 8% (10) 7% (8) 12% (14) 63% (76) 10% (12) 120Atheist 2% (2) — (0) 16% (16) 78% (76) 4% (4) 98Agnostic/Nothing in particular 5% (22) 5% (23) 13% (60) 65% (287) 12% (53) 445Something Else 5% (14) 8% (23) 16% (47) 54% (157) 17% (51) 292Religious Non-Protestant/Catholic 9% (13) 8% (11) 15% (22) 59% (84) 9% (13) 143Evangelical 6% (33) 9% (54) 14% (82) 59% (348) 13% (74) 591Non-Evangelical 5% (32) 5% (38) 14% (97) 66% (471) 10% (71) 710Community: Urban 11% (54) 8% (41) 12% (58) 57% (284) 12% (58) 494Community: Suburban 3% (25) 5% (54) 15% (145) 67% (660) 11% (105) 989Community: Rural 4% (23) 7% (35) 15% (76) 63% (328) 11% (55) 516Employ: Private Sector 7% (46) 8% (53) 16% (104) 62% (407) 7% (46) 656Employ: Government 11% (12) 12% (13) 15% (16) 52% (56) 10% (11) 109Employ: Self-Employed 11% (20) 10% (19) 11% (20) 53% (96) 14% (26) 180Employ: Homemaker 2% (4) 2% (4) 15% (25) 64% (111) 18% (31) 174Employ: Student 2% (1) 10% (6) 12% (8) 60% (39) 16% (11) 65Employ: Retired 2% (12) 4% (20) 12% (64) 73% (381) 8% (42) 520Employ: Unemployed 2% (4) 4% (9) 14% (28) 65% (129) 14% (29) 199Employ: Other 3% (3) 6% (6) 13% (13) 55% (53) 23% (22) 97Military HH: Yes 4% (15) 6% (23) 13% (50) 69% (261) 7% (28) 377Military HH: No 5% (87) 7% (107) 14% (229) 62% (1010) 12% (190) 1623RD/WT: Right Direction 8% (72) 7% (61) 12% (101) 64% (559) 9% (74) 868RD/WT: Wrong Track 3% (30) 6% (68) 16% (178) 63% (712) 13% (143) 1132Biden Job Approve 7% (67) 6% (59) 11% (112) 68% (693) 8% (81) 1012Biden Job Disapprove 3% (33) 7% (67) 17% (158) 60% (567) 13% (122) 947
Continued on next page

174
Morning ConsultTable POL5_13
Table POL5_13: Thinking about the events that occurred at the U.S. Capitol on Jan. 6, how well does each of the following describe how you feel?Excited
Demographic Very well Somewhat well Not very well Not well at allDon’t know /No opinion Total N
Registered Voters 5% (102) 6% (130) 14% (279) 64% (1272) 11% (217) 2000Biden Job Strongly Approve 10% (54) 6% (29) 10% (53) 69% (364) 5% (27) 527Biden Job Somewhat Approve 3% (13) 6% (29) 12% (59) 68% (329) 11% (54) 485Biden Job Somewhat Disapprove 4% (9) 8% (19) 22% (49) 58% (130) 9% (20) 226Biden Job Strongly Disapprove 3% (24) 7% (49) 15% (110) 61% (436) 14% (102) 721Favorable of Biden 6% (64) 6% (58) 11% (113) 69% (699) 7% (75) 1009Unfavorable of Biden 4% (33) 7% (69) 17% (161) 59% (555) 13% (122) 940Very Favorable of Biden 10% (54) 6% (32) 9% (52) 68% (375) 6% (35) 549Somewhat Favorable of Biden 2% (10) 6% (26) 13% (61) 70% (324) 9% (40) 461Somewhat Unfavorable of Biden 5% (10) 8% (15) 23% (45) 55% (108) 9% (17) 196Very Unfavorable of Biden 3% (23) 7% (54) 16% (116) 60% (447) 14% (105) 744#1 Issue: Economy 4% (33) 7% (54) 16% (117) 62% (462) 11% (80) 746#1 Issue: Security 7% (27) 8% (29) 15% (57) 55% (210) 15% (58) 381#1 Issue: Health Care 8% (21) 5% (12) 9% (24) 71% (179) 7% (17) 252#1 Issue: Medicare / Social Security 2% (4) 5% (12) 14% (35) 69% (167) 10% (24) 242#1 Issue: Women’s Issues 3% (3) 6% (6) 7% (7) 71% (67) 12% (11) 94#1 Issue: Education 7% (5) 13% (10) 16% (13) 50% (38) 14% (11) 77#1 Issue: Energy 6% (7) 4% (5) 18% (20) 68% (76) 3% (3) 111#1 Issue: Other 3% (2) 3% (3) 6% (6) 75% (72) 13% (13) 962020 Vote: Joe Biden 6% (61) 4% (42) 11% (106) 71% (668) 7% (70) 9472020 Vote: Donald Trump 4% (35) 9% (74) 17% (146) 59% (506) 12% (104) 8652020 Vote: Didn’t Vote 4% (6) 8% (12) 17% (25) 47% (72) 25% (38) 1532018 House Vote: Democrat 7% (50) 5% (39) 12% (86) 70% (509) 6% (44) 7272018 House Vote: Republican 4% (26) 9% (61) 15% (103) 60% (419) 13% (87) 6962016 Vote: Hillary Clinton 7% (43) 5% (33) 11% (77) 70% (470) 7% (45) 6672016 Vote: Donald Trump 4% (30) 7% (57) 16% (127) 60% (464) 13% (98) 7762016 Vote: Other 1% (1) 5% (5) 9% (8) 76% (72) 9% (8) 942016 Vote: Didn’t Vote 6% (28) 7% (34) 15% (67) 58% (264) 14% (66) 458Voted in 2014: Yes 5% (69) 6% (83) 14% (179) 65% (847) 10% (129) 1306Voted in 2014: No 5% (33) 7% (47) 14% (100) 61% (425) 13% (89) 694
Continued on next page

National Tracking Poll #2107125, July, 2021
175
Table POL5_13
Table POL5_13: Thinking about the events that occurred at the U.S. Capitol on Jan. 6, how well does each of the following describe how you feel?Excited
Demographic Very well Somewhat well Not very well Not well at allDon’t know /No opinion Total N
Registered Voters 5% (102) 6% (130) 14% (279) 64% (1272) 11% (217) 20004-Region: Northeast 7% (24) 6% (22) 13% (45) 63% (223) 11% (39) 3534-Region: Midwest 4% (16) 6% (29) 12% (52) 71% (314) 8% (34) 4454-Region: South 5% (39) 7% (50) 15% (116) 60% (447) 13% (95) 7464-Region: West 5% (23) 6% (29) 15% (67) 63% (288) 11% (48) 456Note: Row proportions may total to larger than one-hundred percent due to rounding. For more information visit MorningConsultIntelligence.com.

176
Morning ConsultTable POL5_14
Table POL5_14: Thinking about the events that occurred at the U.S. Capitol on Jan. 6, how well does each of the following describe how you feel?Embarrassed
Demographic Very well Somewhat well Not very well Not well at allDon’t know /No opinion Total N
Registered Voters 35% (694) 25% (498) 10% (210) 20% (408) 10% (190) 2000Gender: Male 33% (312) 25% (235) 13% (120) 22% (208) 7% (67) 943Gender: Female 36% (381) 25% (263) 8% (89) 19% (200) 12% (124) 1057Age: 18-34 35% (181) 21% (110) 13% (66) 20% (103) 11% (55) 515Age: 35-44 34% (105) 24% (73) 7% (20) 20% (62) 15% (46) 307Age: 45-64 36% (247) 24% (165) 9% (63) 21% (143) 9% (62) 680Age: 65+ 32% (160) 30% (150) 12% (60) 20% (101) 5% (27) 498GenZers: 1997-2012 34% (55) 20% (33) 12% (20) 25% (40) 9% (14) 162Millennials: 1981-1996 34% (180) 23% (120) 12% (64) 18% (97) 13% (66) 527GenXers: 1965-1980 36% (195) 24% (132) 8% (42) 20% (111) 11% (62) 542Baby Boomers: 1946-1964 35% (242) 27% (187) 10% (71) 21% (145) 6% (43) 688PID: Dem (no lean) 48% (378) 23% (178) 9% (70) 13% (102) 8% (62) 789PID: Ind (no lean) 31% (148) 27% (127) 11% (51) 21% (100) 10% (45) 472PID: Rep (no lean) 23% (169) 26% (193) 12% (88) 28% (206) 11% (84) 740PID/Gender: DemMen 46% (172) 22% (82) 10% (38) 14% (53) 7% (26) 371PID/Gender: DemWomen 49% (206) 23% (96) 8% (32) 12% (48) 8% (35) 418PID/Gender: Ind Men 30% (71) 27% (65) 13% (32) 23% (54) 7% (16) 237PID/Gender: Ind Women 33% (77) 27% (62) 8% (19) 20% (46) 12% (29) 234PID/Gender: Rep Men 21% (70) 27% (89) 15% (50) 30% (101) 7% (24) 334PID/Gender: Rep Women 24% (99) 26% (104) 9% (38) 26% (105) 15% (59) 405Ideo: Liberal (1-3) 50% (293) 23% (135) 8% (50) 14% (81) 5% (28) 587Ideo: Moderate (4) 36% (193) 26% (142) 8% (43) 21% (114) 9% (50) 542Ideo: Conservative (5-7) 23% (180) 26% (208) 14% (109) 25% (202) 12% (96) 795Educ: < College 32% (381) 25% (300) 10% (124) 21% (252) 12% (150) 1207Educ: Bachelors degree 39% (196) 26% (131) 10% (51) 19% (94) 6% (30) 502Educ: Post-grad 40% (117) 23% (68) 12% (34) 21% (62) 3% (10) 291Income: Under 50k 33% (302) 22% (203) 9% (78) 23% (211) 13% (120) 916Income: 50k-100k 36% (256) 27% (197) 12% (84) 19% (136) 7% (47) 720Income: 100k+ 37% (136) 27% (97) 13% (47) 17% (61) 6% (23) 364Ethnicity: White 35% (543) 25% (395) 10% (161) 21% (323) 9% (133) 1555Ethnicity: Hispanic 43% (95) 20% (44) 11% (24) 15% (33) 12% (27) 222
Continued on next page

National Tracking Poll #2107125, July, 2021
177
Table POL5_14
Table POL5_14: Thinking about the events that occurred at the U.S. Capitol on Jan. 6, how well does each of the following describe how you feel?Embarrassed
Demographic Very well Somewhat well Not very well Not well at allDon’t know /No opinion Total N
Registered Voters 35% (694) 25% (498) 10% (210) 20% (408) 10% (190) 2000Ethnicity: Black 32% (83) 23% (60) 12% (31) 19% (50) 13% (33) 257Ethnicity: Other 36% (68) 23% (43) 10% (18) 19% (35) 13% (24) 188All Christian 32% (334) 25% (263) 12% (130) 23% (235) 8% (83) 1045All Non-Christian 42% (51) 27% (32) 8% (9) 15% (18) 8% (10) 120Atheist 53% (52) 24% (23) 5% (5) 13% (13) 5% (5) 98Agnostic/Nothing in particular 38% (168) 25% (113) 9% (42) 17% (77) 10% (44) 445Something Else 30% (89) 23% (66) 8% (23) 22% (65) 17% (49) 292Religious Non-Protestant/Catholic 39% (56) 27% (38) 12% (17) 15% (22) 7% (10) 143Evangelical 30% (176) 24% (144) 10% (61) 23% (138) 12% (72) 591Non-Evangelical 34% (240) 25% (175) 12% (82) 22% (155) 8% (58) 710Community: Urban 35% (171) 25% (123) 11% (52) 21% (102) 9% (47) 494Community: Suburban 36% (351) 26% (258) 11% (113) 18% (179) 9% (88) 989Community: Rural 33% (172) 23% (118) 9% (44) 25% (127) 11% (56) 516Employ: Private Sector 39% (256) 23% (153) 11% (70) 21% (140) 6% (37) 656Employ: Government 37% (40) 22% (24) 11% (11) 21% (22) 9% (10) 109Employ: Self-Employed 28% (51) 30% (54) 12% (21) 20% (36) 10% (18) 180Employ: Homemaker 27% (46) 24% (41) 9% (16) 22% (38) 19% (33) 174Employ: Student 38% (25) 17% (11) 13% (9) 16% (10) 16% (10) 65Employ: Retired 33% (170) 30% (157) 12% (62) 19% (97) 7% (35) 520Employ: Unemployed 39% (77) 18% (37) 6% (13) 24% (47) 13% (26) 199Employ: Other 30% (29) 22% (21) 8% (8) 17% (17) 23% (22) 97Military HH: Yes 32% (120) 30% (113) 10% (37) 23% (86) 5% (21) 377Military HH: No 35% (574) 24% (385) 11% (173) 20% (322) 10% (170) 1623RD/WT: Right Direction 44% (381) 25% (216) 9% (80) 14% (125) 7% (65) 868RD/WT: Wrong Track 28% (313) 25% (282) 11% (130) 25% (283) 11% (126) 1132Biden Job Approve 47% (471) 25% (257) 8% (80) 13% (135) 7% (69) 1012Biden Job Disapprove 23% (213) 25% (239) 13% (128) 28% (261) 11% (106) 947
Continued on next page
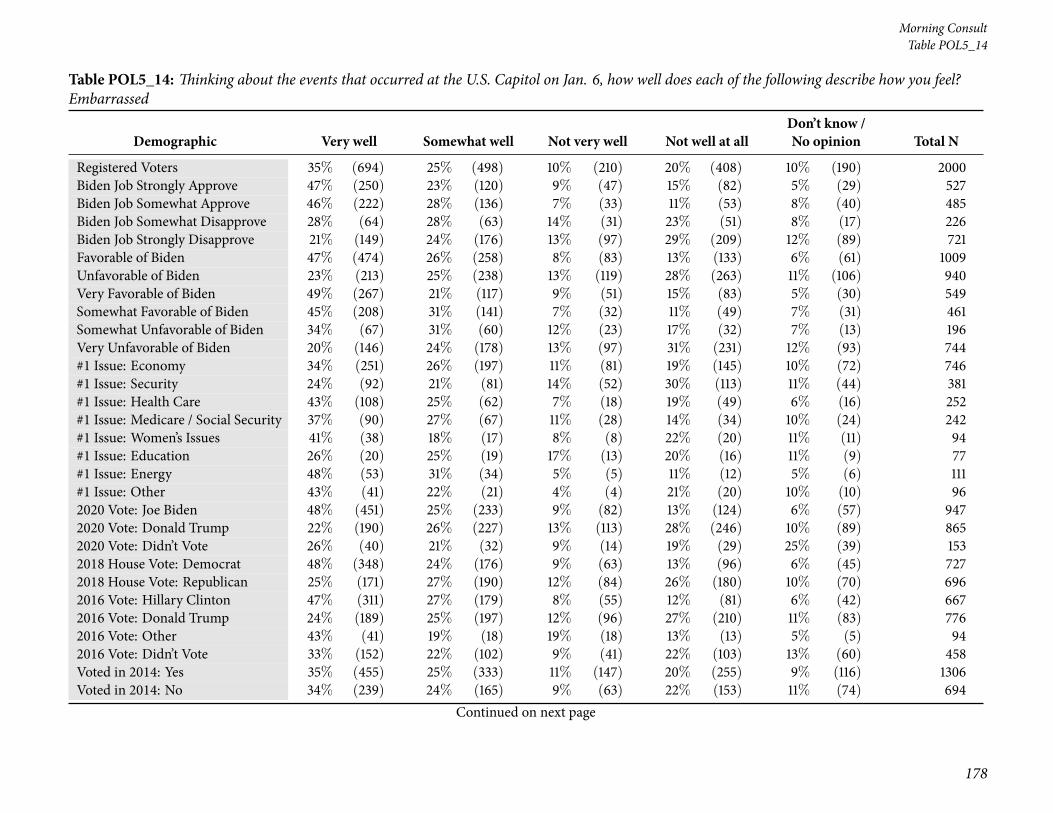
178
Morning ConsultTable POL5_14
Table POL5_14: Thinking about the events that occurred at the U.S. Capitol on Jan. 6, how well does each of the following describe how you feel?Embarrassed
Demographic Very well Somewhat well Not very well Not well at allDon’t know /No opinion Total N
Registered Voters 35% (694) 25% (498) 10% (210) 20% (408) 10% (190) 2000Biden Job Strongly Approve 47% (250) 23% (120) 9% (47) 15% (82) 5% (29) 527Biden Job Somewhat Approve 46% (222) 28% (136) 7% (33) 11% (53) 8% (40) 485Biden Job Somewhat Disapprove 28% (64) 28% (63) 14% (31) 23% (51) 8% (17) 226Biden Job Strongly Disapprove 21% (149) 24% (176) 13% (97) 29% (209) 12% (89) 721Favorable of Biden 47% (474) 26% (258) 8% (83) 13% (133) 6% (61) 1009Unfavorable of Biden 23% (213) 25% (238) 13% (119) 28% (263) 11% (106) 940Very Favorable of Biden 49% (267) 21% (117) 9% (51) 15% (83) 5% (30) 549Somewhat Favorable of Biden 45% (208) 31% (141) 7% (32) 11% (49) 7% (31) 461Somewhat Unfavorable of Biden 34% (67) 31% (60) 12% (23) 17% (32) 7% (13) 196Very Unfavorable of Biden 20% (146) 24% (178) 13% (97) 31% (231) 12% (93) 744#1 Issue: Economy 34% (251) 26% (197) 11% (81) 19% (145) 10% (72) 746#1 Issue: Security 24% (92) 21% (81) 14% (52) 30% (113) 11% (44) 381#1 Issue: Health Care 43% (108) 25% (62) 7% (18) 19% (49) 6% (16) 252#1 Issue: Medicare / Social Security 37% (90) 27% (67) 11% (28) 14% (34) 10% (24) 242#1 Issue: Women’s Issues 41% (38) 18% (17) 8% (8) 22% (20) 11% (11) 94#1 Issue: Education 26% (20) 25% (19) 17% (13) 20% (16) 11% (9) 77#1 Issue: Energy 48% (53) 31% (34) 5% (5) 11% (12) 5% (6) 111#1 Issue: Other 43% (41) 22% (21) 4% (4) 21% (20) 10% (10) 962020 Vote: Joe Biden 48% (451) 25% (233) 9% (82) 13% (124) 6% (57) 9472020 Vote: Donald Trump 22% (190) 26% (227) 13% (113) 28% (246) 10% (89) 8652020 Vote: Didn’t Vote 26% (40) 21% (32) 9% (14) 19% (29) 25% (39) 1532018 House Vote: Democrat 48% (348) 24% (176) 9% (63) 13% (96) 6% (45) 7272018 House Vote: Republican 25% (171) 27% (190) 12% (84) 26% (180) 10% (70) 6962016 Vote: Hillary Clinton 47% (311) 27% (179) 8% (55) 12% (81) 6% (42) 6672016 Vote: Donald Trump 24% (189) 25% (197) 12% (96) 27% (210) 11% (83) 7762016 Vote: Other 43% (41) 19% (18) 19% (18) 13% (13) 5% (5) 942016 Vote: Didn’t Vote 33% (152) 22% (102) 9% (41) 22% (103) 13% (60) 458Voted in 2014: Yes 35% (455) 25% (333) 11% (147) 20% (255) 9% (116) 1306Voted in 2014: No 34% (239) 24% (165) 9% (63) 22% (153) 11% (74) 694
Continued on next page

National Tracking Poll #2107125, July, 2021
179
Table POL5_14
Table POL5_14: Thinking about the events that occurred at the U.S. Capitol on Jan. 6, how well does each of the following describe how you feel?Embarrassed
Demographic Very well Somewhat well Not very well Not well at allDon’t know /No opinion Total N
Registered Voters 35% (694) 25% (498) 10% (210) 20% (408) 10% (190) 20004-Region: Northeast 39% (138) 23% (82) 10% (36) 18% (62) 10% (36) 3534-Region: Midwest 39% (176) 23% (101) 10% (43) 22% (97) 6% (29) 4454-Region: South 32% (236) 26% (198) 12% (86) 20% (150) 10% (77) 7464-Region: West 32% (145) 26% (118) 10% (45) 22% (99) 11% (49) 456Note: Row proportions may total to larger than one-hundred percent due to rounding. For more information visit MorningConsultIntelligence.com.

180
Morning ConsultTable POL5_15
Table POL5_15: Thinking about the events that occurred at the U.S. Capitol on Jan. 6, how well does each of the following describe how you feel?Ashamed
Demographic Very well Somewhat well Not very well Not well at allDon’t know /No opinion Total N
Registered Voters 37% (743) 23% (450) 12% (231) 19% (384) 10% (191) 2000Gender: Male 37% (346) 23% (217) 13% (124) 20% (186) 7% (71) 943Gender: Female 38% (398) 22% (234) 10% (108) 19% (198) 11% (120) 1057Age: 18-34 40% (204) 19% (96) 13% (64) 19% (98) 10% (53) 515Age: 35-44 33% (101) 25% (77) 11% (35) 13% (41) 17% (53) 307Age: 45-64 37% (250) 22% (150) 10% (71) 22% (148) 9% (61) 680Age: 65+ 38% (188) 26% (128) 12% (61) 19% (97) 5% (24) 498GenZers: 1997-2012 36% (58) 21% (33) 11% (19) 22% (36) 10% (16) 162Millennials: 1981-1996 37% (195) 21% (109) 13% (68) 16% (86) 13% (68) 527GenXers: 1965-1980 37% (199) 22% (119) 10% (53) 21% (112) 11% (59) 542Baby Boomers: 1946-1964 37% (257) 24% (162) 12% (85) 20% (139) 7% (45) 688PID: Dem (no lean) 52% (408) 20% (159) 9% (67) 12% (98) 7% (56) 789PID: Ind (no lean) 36% (169) 23% (110) 12% (58) 18% (83) 11% (52) 472PID: Rep (no lean) 23% (167) 24% (181) 14% (106) 27% (203) 11% (83) 740PID/Gender: DemMen 51% (191) 19% (71) 9% (33) 14% (51) 7% (25) 371PID/Gender: DemWomen 52% (217) 21% (88) 8% (34) 11% (47) 8% (32) 418PID/Gender: Ind Men 33% (77) 27% (64) 14% (34) 17% (41) 9% (21) 237PID/Gender: Ind Women 39% (91) 19% (46) 10% (24) 18% (42) 13% (31) 234PID/Gender: Rep Men 23% (78) 24% (82) 17% (56) 28% (94) 8% (25) 334PID/Gender: Rep Women 22% (89) 25% (100) 12% (50) 27% (109) 14% (57) 405Ideo: Liberal (1-3) 54% (317) 21% (124) 8% (47) 13% (77) 4% (21) 587Ideo: Moderate (4) 39% (209) 24% (129) 12% (63) 16% (87) 10% (54) 542Ideo: Conservative (5-7) 24% (189) 23% (185) 14% (112) 26% (209) 13% (100) 795Educ: < College 35% (426) 22% (268) 11% (136) 19% (233) 12% (145) 1207Educ: Bachelors degree 40% (202) 23% (113) 13% (64) 18% (92) 6% (30) 502Educ: Post-grad 40% (115) 24% (69) 11% (31) 20% (59) 6% (16) 291Income: Under 50k 36% (334) 21% (195) 11% (102) 19% (175) 12% (109) 916Income: 50k-100k 36% (260) 25% (179) 13% (90) 18% (131) 8% (59) 720Income: 100k+ 41% (150) 21% (76) 11% (39) 21% (77) 6% (22) 364Ethnicity: White 37% (574) 23% (364) 12% (183) 20% (304) 8% (130) 1555Ethnicity: Hispanic 44% (98) 17% (38) 12% (27) 17% (38) 10% (21) 222
Continued on next page

National Tracking Poll #2107125, July, 2021
181
Table POL5_15
Table POL5_15: Thinking about the events that occurred at the U.S. Capitol on Jan. 6, how well does each of the following describe how you feel?Ashamed
Demographic Very well Somewhat well Not very well Not well at allDon’t know /No opinion Total N
Registered Voters 37% (743) 23% (450) 12% (231) 19% (384) 10% (191) 2000Ethnicity: Black 38% (98) 22% (55) 8% (20) 18% (47) 14% (36) 257Ethnicity: Other 38% (71) 16% (31) 15% (28) 18% (33) 13% (25) 188All Christian 34% (352) 25% (258) 13% (134) 21% (215) 8% (86) 1045All Non-Christian 46% (55) 22% (27) 10% (12) 15% (18) 6% (8) 120Atheist 54% (53) 27% (26) 6% (6) 9% (9) 4% (4) 98Agnostic/Nothing in particular 41% (182) 19% (85) 10% (46) 19% (86) 10% (45) 445Something Else 34% (100) 18% (54) 11% (33) 19% (56) 17% (48) 292Religious Non-Protestant/Catholic 44% (63) 22% (32) 11% (15) 17% (24) 6% (8) 143Evangelical 32% (188) 24% (144) 10% (58) 22% (128) 12% (73) 591Non-Evangelical 36% (254) 23% (161) 14% (100) 19% (135) 8% (60) 710Community: Urban 36% (179) 25% (121) 11% (52) 20% (99) 9% (42) 494Community: Suburban 39% (384) 21% (208) 13% (127) 18% (178) 9% (93) 989Community: Rural 35% (180) 23% (121) 10% (53) 21% (106) 11% (56) 516Employ: Private Sector 40% (264) 21% (140) 12% (81) 20% (133) 6% (38) 656Employ: Government 39% (43) 24% (26) 14% (15) 12% (13) 10% (11) 109Employ: Self-Employed 34% (61) 21% (37) 15% (27) 18% (33) 12% (22) 180Employ: Homemaker 25% (44) 19% (34) 9% (15) 29% (51) 17% (30) 174Employ: Student 36% (24) 20% (13) 9% (6) 22% (15) 12% (8) 65Employ: Retired 37% (194) 27% (142) 10% (53) 18% (94) 7% (36) 520Employ: Unemployed 39% (77) 19% (38) 12% (24) 17% (34) 13% (27) 199Employ: Other 38% (37) 20% (20) 10% (10) 12% (11) 20% (19) 97Military HH: Yes 34% (130) 23% (88) 11% (40) 25% (96) 6% (23) 377Military HH: No 38% (613) 22% (362) 12% (192) 18% (288) 10% (168) 1623RD/WT: Right Direction 48% (416) 23% (198) 8% (70) 13% (116) 8% (69) 868RD/WT: Wrong Track 29% (328) 22% (253) 14% (162) 24% (268) 11% (122) 1132Biden Job Approve 51% (512) 22% (219) 8% (80) 13% (132) 7% (68) 1012Biden Job Disapprove 23% (220) 23% (220) 16% (151) 26% (248) 11% (107) 947
Continued on next page
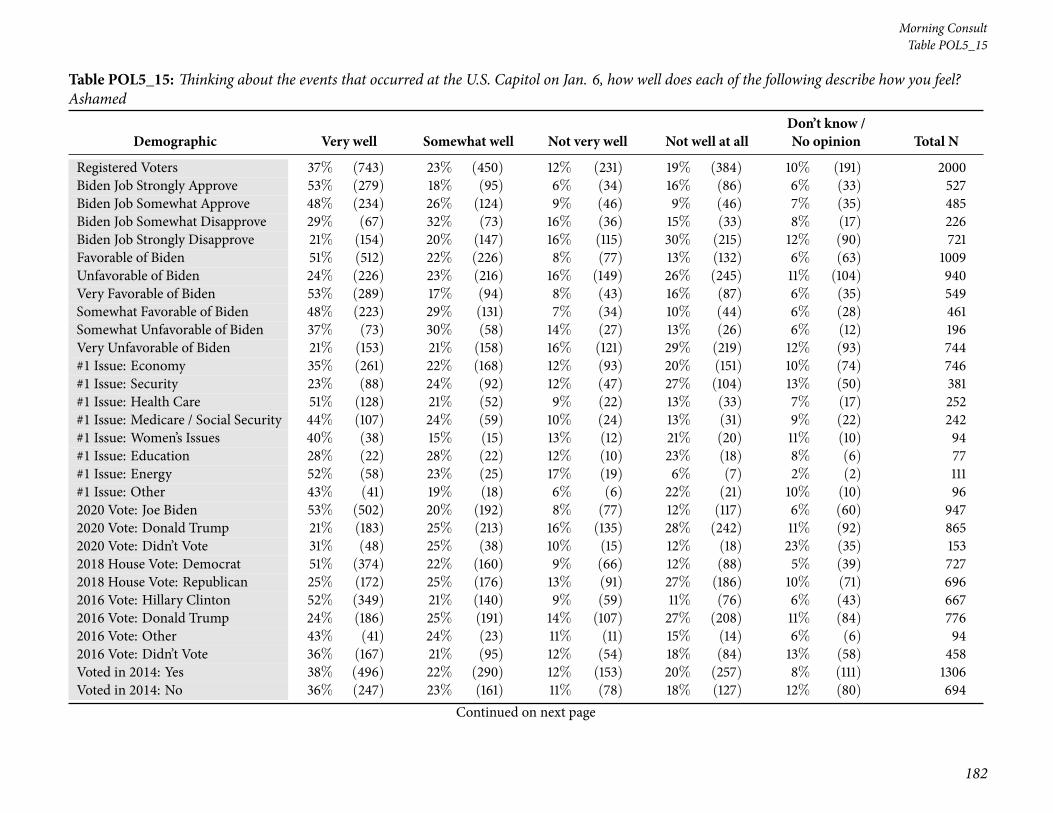
182
Morning ConsultTable POL5_15
Table POL5_15: Thinking about the events that occurred at the U.S. Capitol on Jan. 6, how well does each of the following describe how you feel?Ashamed
Demographic Very well Somewhat well Not very well Not well at allDon’t know /No opinion Total N
Registered Voters 37% (743) 23% (450) 12% (231) 19% (384) 10% (191) 2000Biden Job Strongly Approve 53% (279) 18% (95) 6% (34) 16% (86) 6% (33) 527Biden Job Somewhat Approve 48% (234) 26% (124) 9% (46) 9% (46) 7% (35) 485Biden Job Somewhat Disapprove 29% (67) 32% (73) 16% (36) 15% (33) 8% (17) 226Biden Job Strongly Disapprove 21% (154) 20% (147) 16% (115) 30% (215) 12% (90) 721Favorable of Biden 51% (512) 22% (226) 8% (77) 13% (132) 6% (63) 1009Unfavorable of Biden 24% (226) 23% (216) 16% (149) 26% (245) 11% (104) 940Very Favorable of Biden 53% (289) 17% (94) 8% (43) 16% (87) 6% (35) 549Somewhat Favorable of Biden 48% (223) 29% (131) 7% (34) 10% (44) 6% (28) 461Somewhat Unfavorable of Biden 37% (73) 30% (58) 14% (27) 13% (26) 6% (12) 196Very Unfavorable of Biden 21% (153) 21% (158) 16% (121) 29% (219) 12% (93) 744#1 Issue: Economy 35% (261) 22% (168) 12% (93) 20% (151) 10% (74) 746#1 Issue: Security 23% (88) 24% (92) 12% (47) 27% (104) 13% (50) 381#1 Issue: Health Care 51% (128) 21% (52) 9% (22) 13% (33) 7% (17) 252#1 Issue: Medicare / Social Security 44% (107) 24% (59) 10% (24) 13% (31) 9% (22) 242#1 Issue: Women’s Issues 40% (38) 15% (15) 13% (12) 21% (20) 11% (10) 94#1 Issue: Education 28% (22) 28% (22) 12% (10) 23% (18) 8% (6) 77#1 Issue: Energy 52% (58) 23% (25) 17% (19) 6% (7) 2% (2) 111#1 Issue: Other 43% (41) 19% (18) 6% (6) 22% (21) 10% (10) 962020 Vote: Joe Biden 53% (502) 20% (192) 8% (77) 12% (117) 6% (60) 9472020 Vote: Donald Trump 21% (183) 25% (213) 16% (135) 28% (242) 11% (92) 8652020 Vote: Didn’t Vote 31% (48) 25% (38) 10% (15) 12% (18) 23% (35) 1532018 House Vote: Democrat 51% (374) 22% (160) 9% (66) 12% (88) 5% (39) 7272018 House Vote: Republican 25% (172) 25% (176) 13% (91) 27% (186) 10% (71) 6962016 Vote: Hillary Clinton 52% (349) 21% (140) 9% (59) 11% (76) 6% (43) 6672016 Vote: Donald Trump 24% (186) 25% (191) 14% (107) 27% (208) 11% (84) 7762016 Vote: Other 43% (41) 24% (23) 11% (11) 15% (14) 6% (6) 942016 Vote: Didn’t Vote 36% (167) 21% (95) 12% (54) 18% (84) 13% (58) 458Voted in 2014: Yes 38% (496) 22% (290) 12% (153) 20% (257) 8% (111) 1306Voted in 2014: No 36% (247) 23% (161) 11% (78) 18% (127) 12% (80) 694
Continued on next page
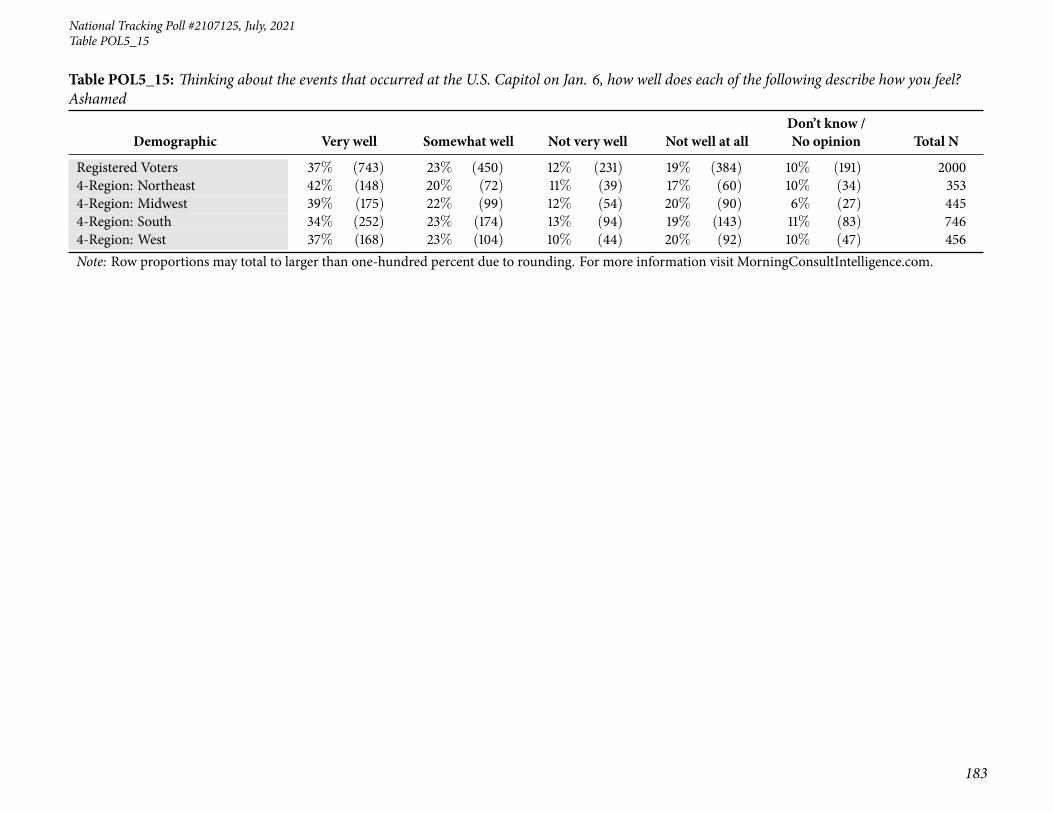
National Tracking Poll #2107125, July, 2021
183
Table POL5_15
Table POL5_15: Thinking about the events that occurred at the U.S. Capitol on Jan. 6, how well does each of the following describe how you feel?Ashamed
Demographic Very well Somewhat well Not very well Not well at allDon’t know /No opinion Total N
Registered Voters 37% (743) 23% (450) 12% (231) 19% (384) 10% (191) 20004-Region: Northeast 42% (148) 20% (72) 11% (39) 17% (60) 10% (34) 3534-Region: Midwest 39% (175) 22% (99) 12% (54) 20% (90) 6% (27) 4454-Region: South 34% (252) 23% (174) 13% (94) 19% (143) 11% (83) 7464-Region: West 37% (168) 23% (104) 10% (44) 20% (92) 10% (47) 456Note: Row proportions may total to larger than one-hundred percent due to rounding. For more information visit MorningConsultIntelligence.com.

184
Morning ConsultTable POL6
Table POL6: As you may know, House Speaker Nancy Pelosi (D-Calif.) appointed seven Democrats and two Republicans to serve on a special con-gressional committee to investigate the events that occurred at the U.S. Capitol on January 6th.Based on what you know, do you approve or disapproveof the special congressional committee investigating the events that occurred at the U.S. Capitol on January 6th?
DemographicStronglyapprove
Somewhatapprove
Somewhatdisapprove
Stronglydisapprove
Don’t know /No opinion Total N
Registered Voters 36% (716) 17% (331) 11% (211) 26% (522) 11% (219) 2000Gender: Male 40% (377) 18% (167) 9% (82) 26% (244) 8% (72) 943Gender: Female 32% (339) 16% (164) 12% (129) 26% (278) 14% (147) 1057Age: 18-34 31% (161) 23% (117) 10% (53) 15% (76) 21% (108) 515Age: 35-44 33% (101) 20% (63) 8% (24) 25% (78) 13% (41) 307Age: 45-64 34% (233) 14% (97) 12% (80) 31% (214) 8% (57) 680Age: 65+ 44% (221) 11% (55) 11% (54) 31% (155) 2% (12) 498GenZers: 1997-2012 27% (43) 23% (38) 14% (23) 18% (29) 18% (29) 162Millennials: 1981-1996 34% (178) 23% (119) 8% (44) 16% (86) 19% (100) 527GenXers: 1965-1980 32% (173) 14% (76) 13% (69) 30% (163) 11% (60) 542Baby Boomers: 1946-1964 42% (287) 14% (94) 10% (69) 31% (212) 4% (26) 688PID: Dem (no lean) 61% (480) 19% (151) 5% (36) 6% (43) 10% (79) 789PID: Ind (no lean) 31% (148) 18% (83) 12% (59) 24% (115) 14% (66) 472PID: Rep (no lean) 12% (88) 13% (97) 16% (116) 49% (364) 10% (74) 740PID/Gender: DemMen 65% (240) 20% (75) 4% (16) 4% (17) 6% (24) 371PID/Gender: DemWomen 57% (240) 18% (76) 5% (20) 6% (27) 13% (55) 418PID/Gender: Ind Men 35% (84) 20% (48) 8% (20) 26% (62) 10% (24) 237PID/Gender: Ind Women 28% (65) 15% (36) 16% (39) 23% (53) 18% (43) 234PID/Gender: Rep Men 16% (53) 13% (45) 14% (46) 49% (165) 7% (25) 334PID/Gender: Rep Women 9% (35) 13% (53) 17% (70) 49% (199) 12% (50) 405Ideo: Liberal (1-3) 65% (382) 18% (104) 5% (28) 6% (33) 7% (40) 587Ideo: Moderate (4) 38% (204) 21% (114) 13% (70) 15% (79) 14% (75) 542Ideo: Conservative (5-7) 14% (114) 13% (104) 13% (104) 50% (394) 10% (79) 795Educ: < College 31% (370) 17% (210) 10% (121) 28% (339) 14% (166) 1207Educ: Bachelors degree 39% (197) 17% (84) 13% (64) 24% (119) 8% (38) 502Educ: Post-grad 51% (149) 13% (37) 9% (26) 22% (64) 5% (15) 291Income: Under 50k 33% (299) 18% (164) 10% (87) 24% (219) 16% (146) 916Income: 50k-100k 36% (262) 15% (111) 12% (87) 29% (211) 7% (49) 720Income: 100k+ 43% (155) 15% (56) 10% (36) 26% (93) 7% (24) 364Ethnicity: White 34% (525) 16% (246) 11% (178) 30% (462) 9% (143) 1555
Continued on next page
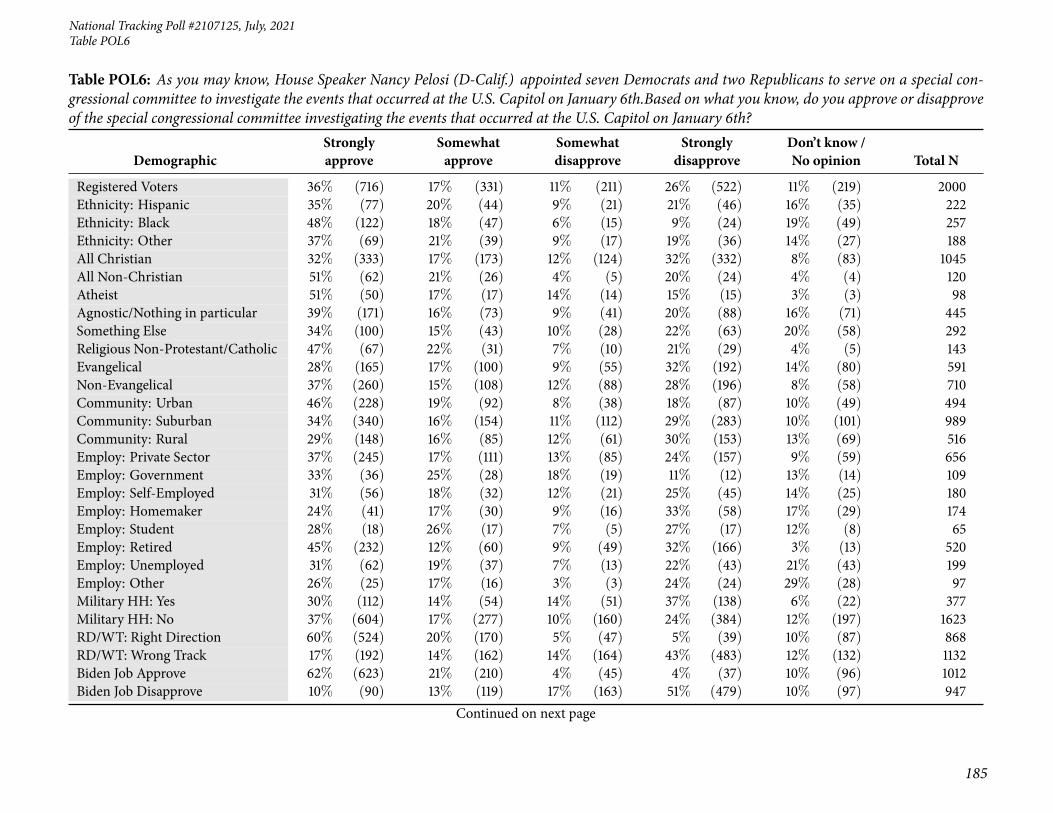
National Tracking Poll #2107125, July, 2021
185
Table POL6
Table POL6: As you may know, House Speaker Nancy Pelosi (D-Calif.) appointed seven Democrats and two Republicans to serve on a special con-gressional committee to investigate the events that occurred at the U.S. Capitol on January 6th.Based on what you know, do you approve or disapproveof the special congressional committee investigating the events that occurred at the U.S. Capitol on January 6th?
DemographicStronglyapprove
Somewhatapprove
Somewhatdisapprove
Stronglydisapprove
Don’t know /No opinion Total N
Registered Voters 36% (716) 17% (331) 11% (211) 26% (522) 11% (219) 2000Ethnicity: Hispanic 35% (77) 20% (44) 9% (21) 21% (46) 16% (35) 222Ethnicity: Black 48% (122) 18% (47) 6% (15) 9% (24) 19% (49) 257Ethnicity: Other 37% (69) 21% (39) 9% (17) 19% (36) 14% (27) 188All Christian 32% (333) 17% (173) 12% (124) 32% (332) 8% (83) 1045All Non-Christian 51% (62) 21% (26) 4% (5) 20% (24) 4% (4) 120Atheist 51% (50) 17% (17) 14% (14) 15% (15) 3% (3) 98Agnostic/Nothing in particular 39% (171) 16% (73) 9% (41) 20% (88) 16% (71) 445Something Else 34% (100) 15% (43) 10% (28) 22% (63) 20% (58) 292Religious Non-Protestant/Catholic 47% (67) 22% (31) 7% (10) 21% (29) 4% (5) 143Evangelical 28% (165) 17% (100) 9% (55) 32% (192) 14% (80) 591Non-Evangelical 37% (260) 15% (108) 12% (88) 28% (196) 8% (58) 710Community: Urban 46% (228) 19% (92) 8% (38) 18% (87) 10% (49) 494Community: Suburban 34% (340) 16% (154) 11% (112) 29% (283) 10% (101) 989Community: Rural 29% (148) 16% (85) 12% (61) 30% (153) 13% (69) 516Employ: Private Sector 37% (245) 17% (111) 13% (85) 24% (157) 9% (59) 656Employ: Government 33% (36) 25% (28) 18% (19) 11% (12) 13% (14) 109Employ: Self-Employed 31% (56) 18% (32) 12% (21) 25% (45) 14% (25) 180Employ: Homemaker 24% (41) 17% (30) 9% (16) 33% (58) 17% (29) 174Employ: Student 28% (18) 26% (17) 7% (5) 27% (17) 12% (8) 65Employ: Retired 45% (232) 12% (60) 9% (49) 32% (166) 3% (13) 520Employ: Unemployed 31% (62) 19% (37) 7% (13) 22% (43) 21% (43) 199Employ: Other 26% (25) 17% (16) 3% (3) 24% (24) 29% (28) 97Military HH: Yes 30% (112) 14% (54) 14% (51) 37% (138) 6% (22) 377Military HH: No 37% (604) 17% (277) 10% (160) 24% (384) 12% (197) 1623RD/WT: Right Direction 60% (524) 20% (170) 5% (47) 5% (39) 10% (87) 868RD/WT: Wrong Track 17% (192) 14% (162) 14% (164) 43% (483) 12% (132) 1132Biden Job Approve 62% (623) 21% (210) 4% (45) 4% (37) 10% (96) 1012Biden Job Disapprove 10% (90) 13% (119) 17% (163) 51% (479) 10% (97) 947
Continued on next page
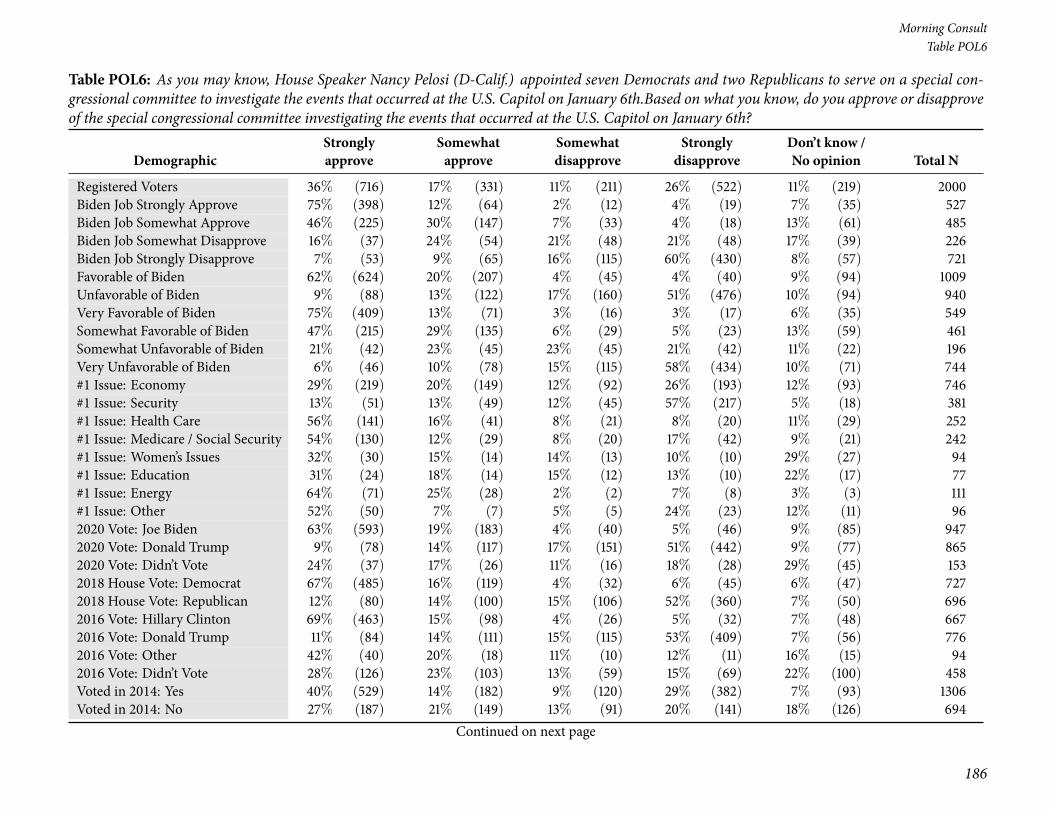
186
Morning ConsultTable POL6
Table POL6: As you may know, House Speaker Nancy Pelosi (D-Calif.) appointed seven Democrats and two Republicans to serve on a special con-gressional committee to investigate the events that occurred at the U.S. Capitol on January 6th.Based on what you know, do you approve or disapproveof the special congressional committee investigating the events that occurred at the U.S. Capitol on January 6th?
DemographicStronglyapprove
Somewhatapprove
Somewhatdisapprove
Stronglydisapprove
Don’t know /No opinion Total N
Registered Voters 36% (716) 17% (331) 11% (211) 26% (522) 11% (219) 2000Biden Job Strongly Approve 75% (398) 12% (64) 2% (12) 4% (19) 7% (35) 527Biden Job Somewhat Approve 46% (225) 30% (147) 7% (33) 4% (18) 13% (61) 485Biden Job Somewhat Disapprove 16% (37) 24% (54) 21% (48) 21% (48) 17% (39) 226Biden Job Strongly Disapprove 7% (53) 9% (65) 16% (115) 60% (430) 8% (57) 721Favorable of Biden 62% (624) 20% (207) 4% (45) 4% (40) 9% (94) 1009Unfavorable of Biden 9% (88) 13% (122) 17% (160) 51% (476) 10% (94) 940Very Favorable of Biden 75% (409) 13% (71) 3% (16) 3% (17) 6% (35) 549Somewhat Favorable of Biden 47% (215) 29% (135) 6% (29) 5% (23) 13% (59) 461Somewhat Unfavorable of Biden 21% (42) 23% (45) 23% (45) 21% (42) 11% (22) 196Very Unfavorable of Biden 6% (46) 10% (78) 15% (115) 58% (434) 10% (71) 744#1 Issue: Economy 29% (219) 20% (149) 12% (92) 26% (193) 12% (93) 746#1 Issue: Security 13% (51) 13% (49) 12% (45) 57% (217) 5% (18) 381#1 Issue: Health Care 56% (141) 16% (41) 8% (21) 8% (20) 11% (29) 252#1 Issue: Medicare / Social Security 54% (130) 12% (29) 8% (20) 17% (42) 9% (21) 242#1 Issue: Women’s Issues 32% (30) 15% (14) 14% (13) 10% (10) 29% (27) 94#1 Issue: Education 31% (24) 18% (14) 15% (12) 13% (10) 22% (17) 77#1 Issue: Energy 64% (71) 25% (28) 2% (2) 7% (8) 3% (3) 111#1 Issue: Other 52% (50) 7% (7) 5% (5) 24% (23) 12% (11) 962020 Vote: Joe Biden 63% (593) 19% (183) 4% (40) 5% (46) 9% (85) 9472020 Vote: Donald Trump 9% (78) 14% (117) 17% (151) 51% (442) 9% (77) 8652020 Vote: Didn’t Vote 24% (37) 17% (26) 11% (16) 18% (28) 29% (45) 1532018 House Vote: Democrat 67% (485) 16% (119) 4% (32) 6% (45) 6% (47) 7272018 House Vote: Republican 12% (80) 14% (100) 15% (106) 52% (360) 7% (50) 6962016 Vote: Hillary Clinton 69% (463) 15% (98) 4% (26) 5% (32) 7% (48) 6672016 Vote: Donald Trump 11% (84) 14% (111) 15% (115) 53% (409) 7% (56) 7762016 Vote: Other 42% (40) 20% (18) 11% (10) 12% (11) 16% (15) 942016 Vote: Didn’t Vote 28% (126) 23% (103) 13% (59) 15% (69) 22% (100) 458Voted in 2014: Yes 40% (529) 14% (182) 9% (120) 29% (382) 7% (93) 1306Voted in 2014: No 27% (187) 21% (149) 13% (91) 20% (141) 18% (126) 694
Continued on next page

National Tracking Poll #2107125, July, 2021
187
Table POL6
Table POL6: As you may know, House Speaker Nancy Pelosi (D-Calif.) appointed seven Democrats and two Republicans to serve on a special con-gressional committee to investigate the events that occurred at the U.S. Capitol on January 6th.Based on what you know, do you approve or disapproveof the special congressional committee investigating the events that occurred at the U.S. Capitol on January 6th?
DemographicStronglyapprove
Somewhatapprove
Somewhatdisapprove
Stronglydisapprove
Don’t know /No opinion Total N
Registered Voters 36% (716) 17% (331) 11% (211) 26% (522) 11% (219) 20004-Region: Northeast 39% (138) 17% (61) 11% (39) 24% (83) 9% (32) 3534-Region: Midwest 38% (167) 17% (75) 12% (54) 24% (105) 10% (43) 4454-Region: South 32% (237) 17% (124) 10% (77) 29% (214) 13% (94) 7464-Region: West 38% (174) 16% (71) 9% (41) 26% (120) 11% (50) 456Note: Row proportions may total to larger than one-hundred percent due to rounding. For more information visit MorningConsultIntelligence.com.
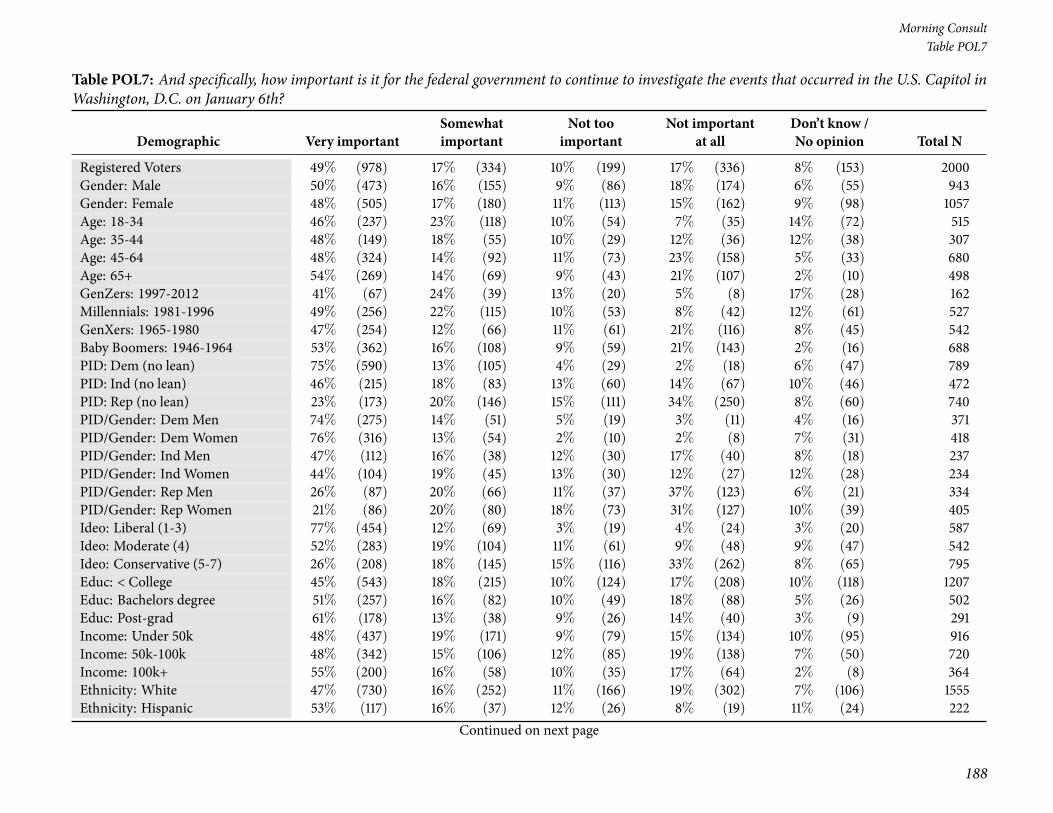
188
Morning ConsultTable POL7
Table POL7: And specifically, how important is it for the federal government to continue to investigate the events that occurred in the U.S. Capitol inWashington, D.C. on January 6th?
Demographic Very importantSomewhatimportant
Not tooimportant
Not importantat all
Don’t know /No opinion Total N
Registered Voters 49% (978) 17% (334) 10% (199) 17% (336) 8% (153) 2000Gender: Male 50% (473) 16% (155) 9% (86) 18% (174) 6% (55) 943Gender: Female 48% (505) 17% (180) 11% (113) 15% (162) 9% (98) 1057Age: 18-34 46% (237) 23% (118) 10% (54) 7% (35) 14% (72) 515Age: 35-44 48% (149) 18% (55) 10% (29) 12% (36) 12% (38) 307Age: 45-64 48% (324) 14% (92) 11% (73) 23% (158) 5% (33) 680Age: 65+ 54% (269) 14% (69) 9% (43) 21% (107) 2% (10) 498GenZers: 1997-2012 41% (67) 24% (39) 13% (20) 5% (8) 17% (28) 162Millennials: 1981-1996 49% (256) 22% (115) 10% (53) 8% (42) 12% (61) 527GenXers: 1965-1980 47% (254) 12% (66) 11% (61) 21% (116) 8% (45) 542Baby Boomers: 1946-1964 53% (362) 16% (108) 9% (59) 21% (143) 2% (16) 688PID: Dem (no lean) 75% (590) 13% (105) 4% (29) 2% (18) 6% (47) 789PID: Ind (no lean) 46% (215) 18% (83) 13% (60) 14% (67) 10% (46) 472PID: Rep (no lean) 23% (173) 20% (146) 15% (111) 34% (250) 8% (60) 740PID/Gender: DemMen 74% (275) 14% (51) 5% (19) 3% (11) 4% (16) 371PID/Gender: DemWomen 76% (316) 13% (54) 2% (10) 2% (8) 7% (31) 418PID/Gender: Ind Men 47% (112) 16% (38) 12% (30) 17% (40) 8% (18) 237PID/Gender: Ind Women 44% (104) 19% (45) 13% (30) 12% (27) 12% (28) 234PID/Gender: Rep Men 26% (87) 20% (66) 11% (37) 37% (123) 6% (21) 334PID/Gender: Rep Women 21% (86) 20% (80) 18% (73) 31% (127) 10% (39) 405Ideo: Liberal (1-3) 77% (454) 12% (69) 3% (19) 4% (24) 3% (20) 587Ideo: Moderate (4) 52% (283) 19% (104) 11% (61) 9% (48) 9% (47) 542Ideo: Conservative (5-7) 26% (208) 18% (145) 15% (116) 33% (262) 8% (65) 795Educ: < College 45% (543) 18% (215) 10% (124) 17% (208) 10% (118) 1207Educ: Bachelors degree 51% (257) 16% (82) 10% (49) 18% (88) 5% (26) 502Educ: Post-grad 61% (178) 13% (38) 9% (26) 14% (40) 3% (9) 291Income: Under 50k 48% (437) 19% (171) 9% (79) 15% (134) 10% (95) 916Income: 50k-100k 48% (342) 15% (106) 12% (85) 19% (138) 7% (50) 720Income: 100k+ 55% (200) 16% (58) 10% (35) 17% (64) 2% (8) 364Ethnicity: White 47% (730) 16% (252) 11% (166) 19% (302) 7% (106) 1555Ethnicity: Hispanic 53% (117) 16% (37) 12% (26) 8% (19) 11% (24) 222
Continued on next page
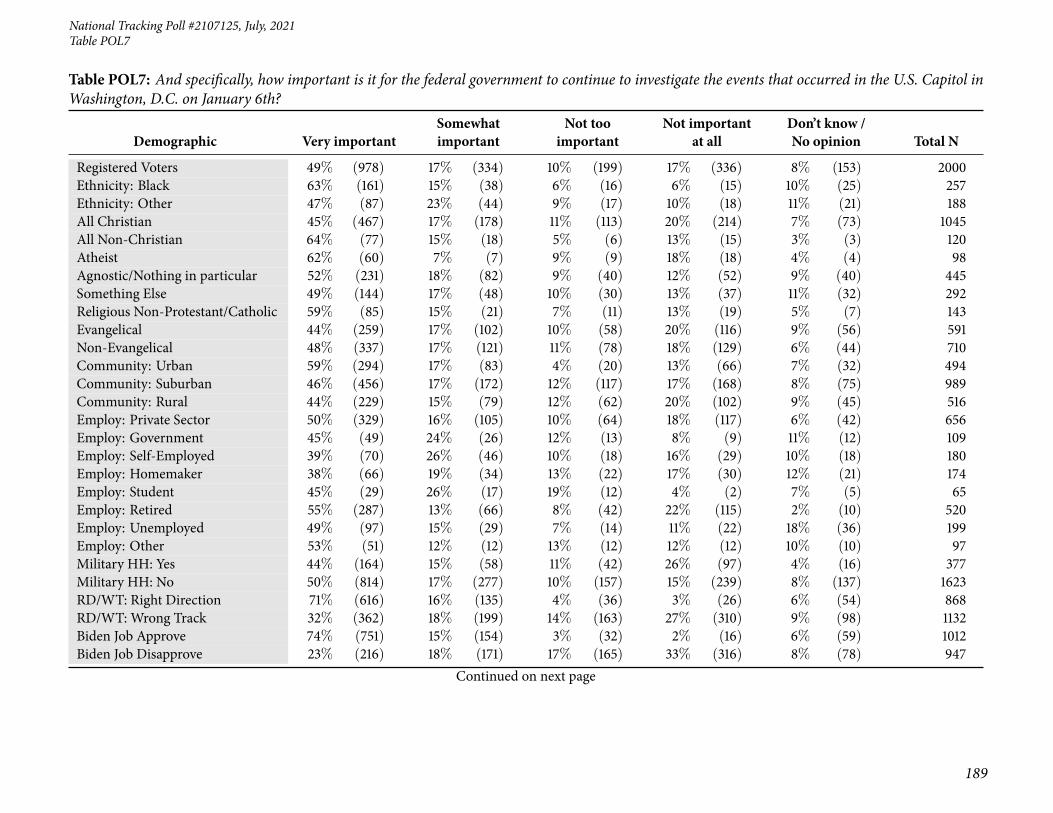
National Tracking Poll #2107125, July, 2021
189
Table POL7
Table POL7: And specifically, how important is it for the federal government to continue to investigate the events that occurred in the U.S. Capitol inWashington, D.C. on January 6th?
Demographic Very importantSomewhatimportant
Not tooimportant
Not importantat all
Don’t know /No opinion Total N
Registered Voters 49% (978) 17% (334) 10% (199) 17% (336) 8% (153) 2000Ethnicity: Black 63% (161) 15% (38) 6% (16) 6% (15) 10% (25) 257Ethnicity: Other 47% (87) 23% (44) 9% (17) 10% (18) 11% (21) 188All Christian 45% (467) 17% (178) 11% (113) 20% (214) 7% (73) 1045All Non-Christian 64% (77) 15% (18) 5% (6) 13% (15) 3% (3) 120Atheist 62% (60) 7% (7) 9% (9) 18% (18) 4% (4) 98Agnostic/Nothing in particular 52% (231) 18% (82) 9% (40) 12% (52) 9% (40) 445Something Else 49% (144) 17% (48) 10% (30) 13% (37) 11% (32) 292Religious Non-Protestant/Catholic 59% (85) 15% (21) 7% (11) 13% (19) 5% (7) 143Evangelical 44% (259) 17% (102) 10% (58) 20% (116) 9% (56) 591Non-Evangelical 48% (337) 17% (121) 11% (78) 18% (129) 6% (44) 710Community: Urban 59% (294) 17% (83) 4% (20) 13% (66) 7% (32) 494Community: Suburban 46% (456) 17% (172) 12% (117) 17% (168) 8% (75) 989Community: Rural 44% (229) 15% (79) 12% (62) 20% (102) 9% (45) 516Employ: Private Sector 50% (329) 16% (105) 10% (64) 18% (117) 6% (42) 656Employ: Government 45% (49) 24% (26) 12% (13) 8% (9) 11% (12) 109Employ: Self-Employed 39% (70) 26% (46) 10% (18) 16% (29) 10% (18) 180Employ: Homemaker 38% (66) 19% (34) 13% (22) 17% (30) 12% (21) 174Employ: Student 45% (29) 26% (17) 19% (12) 4% (2) 7% (5) 65Employ: Retired 55% (287) 13% (66) 8% (42) 22% (115) 2% (10) 520Employ: Unemployed 49% (97) 15% (29) 7% (14) 11% (22) 18% (36) 199Employ: Other 53% (51) 12% (12) 13% (12) 12% (12) 10% (10) 97Military HH: Yes 44% (164) 15% (58) 11% (42) 26% (97) 4% (16) 377Military HH: No 50% (814) 17% (277) 10% (157) 15% (239) 8% (137) 1623RD/WT: Right Direction 71% (616) 16% (135) 4% (36) 3% (26) 6% (54) 868RD/WT: Wrong Track 32% (362) 18% (199) 14% (163) 27% (310) 9% (98) 1132Biden Job Approve 74% (751) 15% (154) 3% (32) 2% (16) 6% (59) 1012Biden Job Disapprove 23% (216) 18% (171) 17% (165) 33% (316) 8% (78) 947
Continued on next page

190
Morning ConsultTable POL7
Table POL7: And specifically, how important is it for the federal government to continue to investigate the events that occurred in the U.S. Capitol inWashington, D.C. on January 6th?
Demographic Very importantSomewhatimportant
Not tooimportant
Not importantat all
Don’t know /No opinion Total N
Registered Voters 49% (978) 17% (334) 10% (199) 17% (336) 8% (153) 2000Biden Job Strongly Approve 83% (437) 8% (43) 2% (11) 2% (10) 5% (26) 527Biden Job Somewhat Approve 65% (314) 23% (112) 4% (21) 1% (6) 7% (33) 485Biden Job Somewhat Disapprove 35% (78) 27% (61) 21% (47) 10% (22) 8% (19) 226Biden Job Strongly Disapprove 19% (138) 15% (110) 16% (119) 41% (295) 8% (59) 721Favorable of Biden 75% (756) 16% (158) 3% (28) 2% (18) 5% (49) 1009Unfavorable of Biden 23% (213) 18% (171) 18% (169) 33% (309) 8% (79) 940Very Favorable of Biden 82% (451) 10% (52) 2% (9) 2% (10) 5% (27) 549Somewhat Favorable of Biden 66% (305) 23% (105) 4% (20) 2% (8) 5% (22) 461Somewhat Unfavorable of Biden 40% (78) 25% (49) 19% (38) 8% (16) 8% (15) 196Very Unfavorable of Biden 18% (135) 16% (123) 18% (131) 39% (293) 8% (63) 744#1 Issue: Economy 42% (310) 21% (155) 13% (94) 16% (117) 9% (69) 746#1 Issue: Security 32% (122) 14% (55) 10% (39) 36% (137) 7% (28) 381#1 Issue: Health Care 70% (177) 13% (33) 6% (14) 6% (14) 5% (13) 252#1 Issue: Medicare / Social Security 62% (150) 9% (22) 9% (22) 14% (34) 6% (14) 242#1 Issue: Women’s Issues 53% (50) 22% (21) 5% (5) 6% (6) 14% (13) 94#1 Issue: Education 38% (29) 22% (17) 17% (13) 10% (7) 13% (10) 77#1 Issue: Energy 71% (79) 21% (24) 3% (4) 4% (5) — (0) 111#1 Issue: Other 63% (61) 7% (7) 9% (8) 16% (16) 5% (5) 962020 Vote: Joe Biden 76% (722) 13% (125) 3% (31) 2% (19) 5% (49) 9472020 Vote: Donald Trump 21% (183) 19% (168) 18% (152) 34% (298) 7% (64) 8652020 Vote: Didn’t Vote 38% (59) 23% (35) 9% (13) 8% (12) 22% (34) 1532018 House Vote: Democrat 77% (557) 12% (86) 6% (42) 2% (18) 3% (23) 7272018 House Vote: Republican 24% (170) 18% (126) 14% (100) 35% (243) 8% (57) 6962016 Vote: Hillary Clinton 80% (532) 11% (74) 3% (21) 2% (15) 4% (26) 6672016 Vote: Donald Trump 24% (184) 18% (142) 16% (123) 35% (272) 7% (54) 7762016 Vote: Other 57% (54) 17% (16) 5% (4) 15% (14) 5% (5) 942016 Vote: Didn’t Vote 45% (205) 22% (102) 11% (50) 7% (33) 15% (68) 458Voted in 2014: Yes 51% (668) 15% (193) 10% (128) 19% (245) 5% (72) 1306Voted in 2014: No 45% (310) 20% (141) 10% (71) 13% (91) 12% (81) 694
Continued on next page

National Tracking Poll #2107125, July, 2021
191
Table POL7
Table POL7: And specifically, how important is it for the federal government to continue to investigate the events that occurred in the U.S. Capitol inWashington, D.C. on January 6th?
Demographic Very importantSomewhatimportant
Not tooimportant
Not importantat all
Don’t know /No opinion Total N
Registered Voters 49% (978) 17% (334) 10% (199) 17% (336) 8% (153) 20004-Region: Northeast 50% (177) 14% (48) 15% (53) 14% (50) 7% (25) 3534-Region: Midwest 51% (225) 18% (81) 9% (41) 16% (70) 6% (28) 4454-Region: South 46% (345) 17% (126) 10% (73) 19% (142) 8% (60) 7464-Region: West 51% (231) 17% (79) 7% (32) 16% (73) 9% (40) 456Note: Row proportions may total to larger than one-hundred percent due to rounding. For more information visit MorningConsultIntelligence.com.
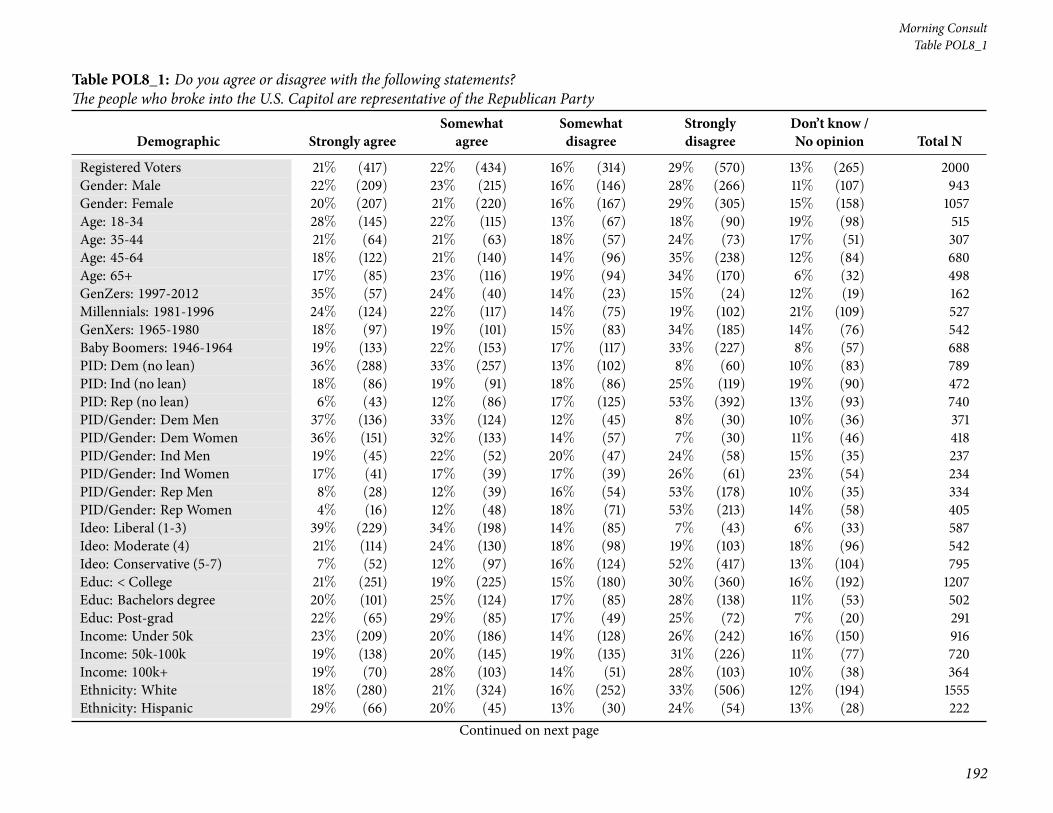
192
Morning ConsultTable POL8_1
Table POL8_1: Do you agree or disagree with the following statements?The people who broke into the U.S. Capitol are representative of the Republican Party
Demographic Strongly agreeSomewhatagree
Somewhatdisagree
Stronglydisagree
Don’t know /No opinion Total N
Registered Voters 21% (417) 22% (434) 16% (314) 29% (570) 13% (265) 2000Gender: Male 22% (209) 23% (215) 16% (146) 28% (266) 11% (107) 943Gender: Female 20% (207) 21% (220) 16% (167) 29% (305) 15% (158) 1057Age: 18-34 28% (145) 22% (115) 13% (67) 18% (90) 19% (98) 515Age: 35-44 21% (64) 21% (63) 18% (57) 24% (73) 17% (51) 307Age: 45-64 18% (122) 21% (140) 14% (96) 35% (238) 12% (84) 680Age: 65+ 17% (85) 23% (116) 19% (94) 34% (170) 6% (32) 498GenZers: 1997-2012 35% (57) 24% (40) 14% (23) 15% (24) 12% (19) 162Millennials: 1981-1996 24% (124) 22% (117) 14% (75) 19% (102) 21% (109) 527GenXers: 1965-1980 18% (97) 19% (101) 15% (83) 34% (185) 14% (76) 542Baby Boomers: 1946-1964 19% (133) 22% (153) 17% (117) 33% (227) 8% (57) 688PID: Dem (no lean) 36% (288) 33% (257) 13% (102) 8% (60) 10% (83) 789PID: Ind (no lean) 18% (86) 19% (91) 18% (86) 25% (119) 19% (90) 472PID: Rep (no lean) 6% (43) 12% (86) 17% (125) 53% (392) 13% (93) 740PID/Gender: DemMen 37% (136) 33% (124) 12% (45) 8% (30) 10% (36) 371PID/Gender: DemWomen 36% (151) 32% (133) 14% (57) 7% (30) 11% (46) 418PID/Gender: Ind Men 19% (45) 22% (52) 20% (47) 24% (58) 15% (35) 237PID/Gender: Ind Women 17% (41) 17% (39) 17% (39) 26% (61) 23% (54) 234PID/Gender: Rep Men 8% (28) 12% (39) 16% (54) 53% (178) 10% (35) 334PID/Gender: Rep Women 4% (16) 12% (48) 18% (71) 53% (213) 14% (58) 405Ideo: Liberal (1-3) 39% (229) 34% (198) 14% (85) 7% (43) 6% (33) 587Ideo: Moderate (4) 21% (114) 24% (130) 18% (98) 19% (103) 18% (96) 542Ideo: Conservative (5-7) 7% (52) 12% (97) 16% (124) 52% (417) 13% (104) 795Educ: < College 21% (251) 19% (225) 15% (180) 30% (360) 16% (192) 1207Educ: Bachelors degree 20% (101) 25% (124) 17% (85) 28% (138) 11% (53) 502Educ: Post-grad 22% (65) 29% (85) 17% (49) 25% (72) 7% (20) 291Income: Under 50k 23% (209) 20% (186) 14% (128) 26% (242) 16% (150) 916Income: 50k-100k 19% (138) 20% (145) 19% (135) 31% (226) 11% (77) 720Income: 100k+ 19% (70) 28% (103) 14% (51) 28% (103) 10% (38) 364Ethnicity: White 18% (280) 21% (324) 16% (252) 33% (506) 12% (194) 1555Ethnicity: Hispanic 29% (66) 20% (45) 13% (30) 24% (54) 13% (28) 222
Continued on next page

National Tracking Poll #2107125, July, 2021
193
Table POL8_1
Table POL8_1: Do you agree or disagree with the following statements?The people who broke into the U.S. Capitol are representative of the Republican Party
Demographic Strongly agreeSomewhatagree
Somewhatdisagree
Stronglydisagree
Don’t know /No opinion Total N
Registered Voters 21% (417) 22% (434) 16% (314) 29% (570) 13% (265) 2000Ethnicity: Black 36% (93) 27% (70) 9% (22) 14% (35) 14% (36) 257Ethnicity: Other 23% (44) 21% (40) 21% (39) 16% (30) 19% (35) 188All Christian 16% (167) 20% (206) 17% (173) 37% (387) 11% (112) 1045All Non-Christian 29% (35) 27% (33) 19% (23) 17% (20) 7% (9) 120Atheist 31% (30) 22% (22) 22% (21) 13% (13) 12% (11) 98Agnostic/Nothing in particular 25% (110) 27% (119) 13% (59) 18% (80) 17% (77) 445Something Else 25% (74) 18% (54) 13% (37) 24% (70) 19% (57) 292Religious Non-Protestant/Catholic 26% (37) 26% (36) 20% (28) 20% (28) 9% (13) 143Evangelical 16% (93) 17% (103) 16% (96) 36% (213) 15% (86) 591Non-Evangelical 21% (147) 21% (151) 15% (105) 33% (231) 11% (77) 710Community: Urban 28% (139) 22% (110) 15% (74) 22% (108) 13% (64) 494Community: Suburban 21% (205) 22% (217) 16% (156) 29% (288) 12% (123) 989Community: Rural 14% (73) 21% (107) 16% (84) 34% (175) 15% (77) 516Employ: Private Sector 21% (138) 22% (147) 15% (97) 29% (187) 13% (86) 656Employ: Government 27% (30) 18% (19) 15% (16) 25% (27) 15% (17) 109Employ: Self-Employed 24% (42) 20% (37) 18% (33) 21% (38) 17% (30) 180Employ: Homemaker 9% (16) 24% (42) 18% (31) 33% (57) 16% (28) 174Employ: Student 31% (20) 27% (17) 19% (12) 10% (6) 14% (9) 65Employ: Retired 18% (94) 23% (120) 17% (88) 36% (185) 6% (33) 520Employ: Unemployed 25% (49) 22% (44) 12% (24) 23% (46) 18% (36) 199Employ: Other 27% (26) 8% (7) 13% (13) 26% (25) 26% (25) 97Military HH: Yes 16% (59) 20% (75) 18% (67) 37% (141) 10% (36) 377Military HH: No 22% (358) 22% (359) 15% (247) 26% (429) 14% (229) 1623RD/WT: Right Direction 33% (290) 32% (278) 14% (121) 9% (77) 12% (101) 868RD/WT: Wrong Track 11% (126) 14% (156) 17% (193) 44% (494) 14% (164) 1132Biden Job Approve 35% (355) 33% (339) 13% (133) 8% (79) 10% (106) 1012Biden Job Disapprove 6% (55) 10% (90) 19% (178) 51% (485) 15% (140) 947
Continued on next page
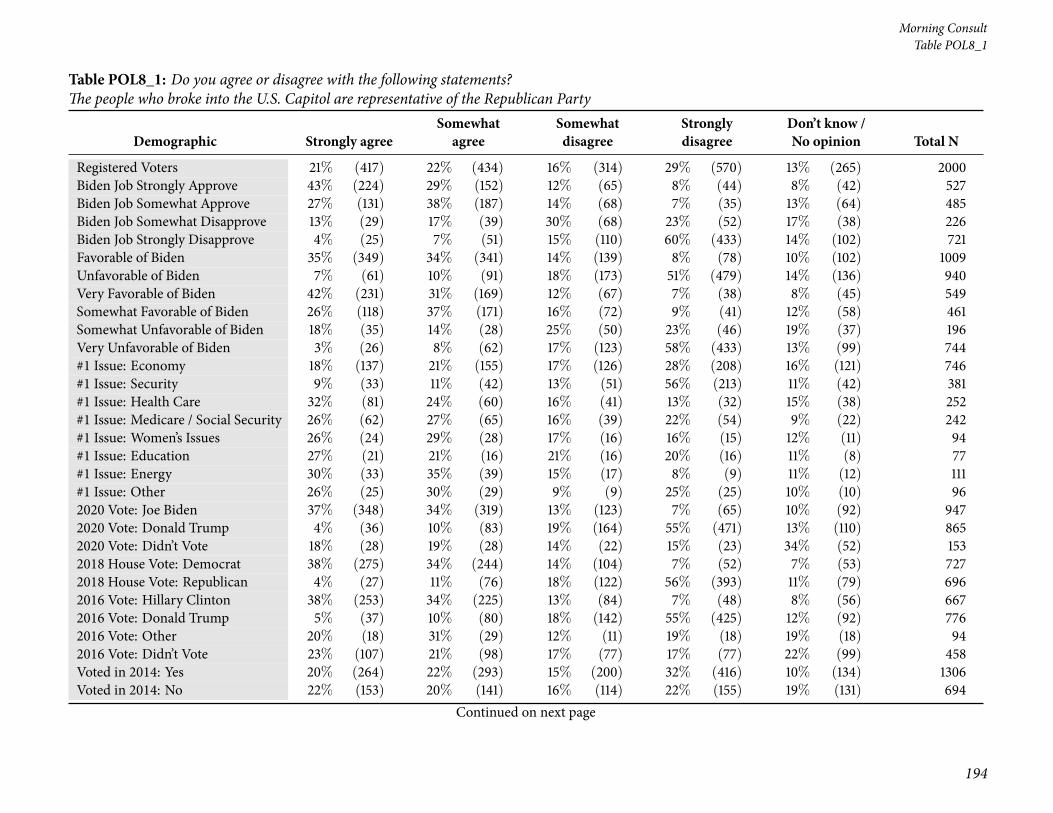
194
Morning ConsultTable POL8_1
Table POL8_1: Do you agree or disagree with the following statements?The people who broke into the U.S. Capitol are representative of the Republican Party
Demographic Strongly agreeSomewhatagree
Somewhatdisagree
Stronglydisagree
Don’t know /No opinion Total N
Registered Voters 21% (417) 22% (434) 16% (314) 29% (570) 13% (265) 2000Biden Job Strongly Approve 43% (224) 29% (152) 12% (65) 8% (44) 8% (42) 527Biden Job Somewhat Approve 27% (131) 38% (187) 14% (68) 7% (35) 13% (64) 485Biden Job Somewhat Disapprove 13% (29) 17% (39) 30% (68) 23% (52) 17% (38) 226Biden Job Strongly Disapprove 4% (25) 7% (51) 15% (110) 60% (433) 14% (102) 721Favorable of Biden 35% (349) 34% (341) 14% (139) 8% (78) 10% (102) 1009Unfavorable of Biden 7% (61) 10% (91) 18% (173) 51% (479) 14% (136) 940Very Favorable of Biden 42% (231) 31% (169) 12% (67) 7% (38) 8% (45) 549Somewhat Favorable of Biden 26% (118) 37% (171) 16% (72) 9% (41) 12% (58) 461Somewhat Unfavorable of Biden 18% (35) 14% (28) 25% (50) 23% (46) 19% (37) 196Very Unfavorable of Biden 3% (26) 8% (62) 17% (123) 58% (433) 13% (99) 744#1 Issue: Economy 18% (137) 21% (155) 17% (126) 28% (208) 16% (121) 746#1 Issue: Security 9% (33) 11% (42) 13% (51) 56% (213) 11% (42) 381#1 Issue: Health Care 32% (81) 24% (60) 16% (41) 13% (32) 15% (38) 252#1 Issue: Medicare / Social Security 26% (62) 27% (65) 16% (39) 22% (54) 9% (22) 242#1 Issue: Women’s Issues 26% (24) 29% (28) 17% (16) 16% (15) 12% (11) 94#1 Issue: Education 27% (21) 21% (16) 21% (16) 20% (16) 11% (8) 77#1 Issue: Energy 30% (33) 35% (39) 15% (17) 8% (9) 11% (12) 111#1 Issue: Other 26% (25) 30% (29) 9% (9) 25% (25) 10% (10) 962020 Vote: Joe Biden 37% (348) 34% (319) 13% (123) 7% (65) 10% (92) 9472020 Vote: Donald Trump 4% (36) 10% (83) 19% (164) 55% (471) 13% (110) 8652020 Vote: Didn’t Vote 18% (28) 19% (28) 14% (22) 15% (23) 34% (52) 1532018 House Vote: Democrat 38% (275) 34% (244) 14% (104) 7% (52) 7% (53) 7272018 House Vote: Republican 4% (27) 11% (76) 18% (122) 56% (393) 11% (79) 6962016 Vote: Hillary Clinton 38% (253) 34% (225) 13% (84) 7% (48) 8% (56) 6672016 Vote: Donald Trump 5% (37) 10% (80) 18% (142) 55% (425) 12% (92) 7762016 Vote: Other 20% (18) 31% (29) 12% (11) 19% (18) 19% (18) 942016 Vote: Didn’t Vote 23% (107) 21% (98) 17% (77) 17% (77) 22% (99) 458Voted in 2014: Yes 20% (264) 22% (293) 15% (200) 32% (416) 10% (134) 1306Voted in 2014: No 22% (153) 20% (141) 16% (114) 22% (155) 19% (131) 694
Continued on next page

National Tracking Poll #2107125, July, 2021
195
Table POL8_1
Table POL8_1: Do you agree or disagree with the following statements?The people who broke into the U.S. Capitol are representative of the Republican Party
Demographic Strongly agreeSomewhatagree
Somewhatdisagree
Stronglydisagree
Don’t know /No opinion Total N
Registered Voters 21% (417) 22% (434) 16% (314) 29% (570) 13% (265) 20004-Region: Northeast 24% (85) 23% (82) 15% (52) 27% (95) 11% (39) 3534-Region: Midwest 18% (80) 23% (104) 17% (76) 25% (111) 17% (74) 4454-Region: South 19% (140) 20% (149) 14% (106) 32% (242) 15% (110) 7464-Region: West 24% (111) 22% (99) 18% (81) 27% (122) 9% (43) 456Note: Row proportions may total to larger than one-hundred percent due to rounding. For more information visit MorningConsultIntelligence.com.

196
Morning ConsultTable POL8_2
Table POL8_2: Do you agree or disagree with the following statements?The people who broke into the U.S. Capitol are representative of Donald Trump, but not the Republican Party
Demographic Strongly agreeSomewhatagree
Somewhatdisagree
Stronglydisagree
Don’t know /No opinion Total N
Registered Voters 19% (389) 23% (457) 16% (327) 29% (587) 12% (239) 2000Gender: Male 21% (194) 23% (219) 17% (162) 28% (266) 11% (102) 943Gender: Female 18% (195) 23% (238) 16% (165) 30% (321) 13% (138) 1057Age: 18-34 24% (126) 26% (131) 14% (75) 19% (96) 17% (87) 515Age: 35-44 22% (68) 21% (64) 15% (47) 28% (86) 14% (43) 307Age: 45-64 15% (104) 20% (138) 16% (111) 36% (248) 12% (79) 680Age: 65+ 18% (91) 25% (124) 19% (95) 32% (157) 6% (30) 498GenZers: 1997-2012 34% (56) 19% (31) 20% (32) 14% (22) 13% (20) 162Millennials: 1981-1996 21% (109) 27% (143) 13% (68) 22% (116) 17% (90) 527GenXers: 1965-1980 16% (87) 19% (102) 17% (90) 37% (200) 12% (63) 542Baby Boomers: 1946-1964 17% (119) 23% (161) 18% (124) 32% (221) 9% (63) 688PID: Dem (no lean) 29% (232) 29% (230) 17% (137) 15% (121) 9% (69) 789PID: Ind (no lean) 16% (76) 26% (122) 14% (67) 27% (129) 17% (78) 472PID: Rep (no lean) 11% (81) 14% (105) 17% (124) 46% (338) 12% (92) 740PID/Gender: DemMen 28% (103) 28% (104) 19% (71) 17% (65) 8% (29) 371PID/Gender: DemWomen 31% (129) 30% (126) 16% (66) 13% (56) 10% (40) 418PID/Gender: Ind Men 20% (47) 25% (60) 18% (42) 22% (52) 15% (35) 237PID/Gender: Ind Women 12% (29) 26% (62) 10% (24) 33% (76) 18% (43) 234PID/Gender: Rep Men 13% (44) 16% (55) 15% (49) 45% (149) 11% (38) 334PID/Gender: Rep Women 9% (37) 12% (51) 18% (75) 47% (189) 13% (54) 405Ideo: Liberal (1-3) 29% (171) 30% (179) 18% (107) 17% (100) 5% (30) 587Ideo: Moderate (4) 21% (112) 26% (142) 17% (93) 21% (111) 15% (83) 542Ideo: Conservative (5-7) 12% (93) 15% (123) 15% (122) 45% (356) 13% (102) 795Educ: < College 18% (222) 20% (244) 15% (183) 32% (389) 14% (170) 1207Educ: Bachelors degree 19% (97) 29% (145) 16% (82) 26% (130) 9% (48) 502Educ: Post-grad 24% (70) 24% (69) 21% (63) 23% (68) 7% (22) 291Income: Under 50k 20% (179) 22% (199) 14% (130) 30% (274) 15% (134) 916Income: 50k-100k 18% (131) 23% (168) 19% (137) 30% (216) 9% (68) 720Income: 100k+ 22% (79) 25% (90) 17% (60) 27% (97) 10% (38) 364Ethnicity: White 18% (273) 22% (345) 17% (263) 31% (490) 12% (185) 1555Ethnicity: Hispanic 23% (52) 24% (53) 18% (39) 24% (52) 11% (26) 222
Continued on next page

National Tracking Poll #2107125, July, 2021
197
Table POL8_2
Table POL8_2: Do you agree or disagree with the following statements?The people who broke into the U.S. Capitol are representative of Donald Trump, but not the Republican Party
Demographic Strongly agreeSomewhatagree
Somewhatdisagree
Stronglydisagree
Don’t know /No opinion Total N
Registered Voters 19% (389) 23% (457) 16% (327) 29% (587) 12% (239) 2000Ethnicity: Black 28% (71) 23% (60) 12% (31) 25% (64) 12% (31) 257Ethnicity: Other 24% (45) 28% (52) 18% (33) 18% (34) 13% (24) 188All Christian 18% (185) 22% (232) 15% (162) 34% (352) 11% (115) 1045All Non-Christian 31% (37) 26% (32) 21% (26) 15% (18) 6% (8) 120Atheist 24% (24) 28% (28) 15% (14) 24% (23) 9% (9) 98Agnostic/Nothing in particular 20% (88) 25% (110) 18% (80) 24% (109) 13% (58) 445Something Else 19% (55) 19% (56) 16% (45) 29% (85) 17% (51) 292Religious Non-Protestant/Catholic 31% (44) 27% (39) 18% (26) 16% (23) 8% (11) 143Evangelical 18% (105) 19% (111) 14% (85) 36% (210) 14% (80) 591Non-Evangelical 18% (127) 23% (167) 17% (118) 31% (218) 11% (80) 710Community: Urban 24% (117) 27% (131) 14% (71) 24% (121) 11% (54) 494Community: Suburban 19% (188) 22% (222) 18% (178) 29% (285) 12% (116) 989Community: Rural 16% (84) 20% (104) 15% (79) 35% (181) 13% (69) 516Employ: Private Sector 20% (131) 26% (171) 17% (110) 27% (176) 11% (69) 656Employ: Government 22% (24) 21% (23) 19% (21) 24% (26) 13% (15) 109Employ: Self-Employed 21% (38) 23% (41) 18% (32) 23% (42) 16% (28) 180Employ: Homemaker 9% (15) 17% (30) 10% (18) 46% (80) 18% (31) 174Employ: Student 36% (23) 26% (17) 15% (10) 6% (4) 17% (11) 65Employ: Retired 18% (95) 24% (126) 18% (92) 33% (172) 7% (34) 520Employ: Unemployed 20% (39) 18% (36) 18% (36) 27% (54) 17% (34) 199Employ: Other 24% (23) 15% (15) 9% (9) 34% (33) 18% (17) 97Military HH: Yes 18% (68) 20% (76) 17% (62) 39% (147) 6% (24) 377Military HH: No 20% (321) 24% (381) 16% (265) 27% (441) 13% (215) 1623RD/WT: Right Direction 28% (246) 31% (273) 15% (134) 15% (127) 10% (87) 868RD/WT: Wrong Track 13% (142) 16% (184) 17% (193) 41% (460) 13% (153) 1132Biden Job Approve 28% (287) 32% (323) 16% (166) 14% (143) 9% (93) 1012Biden Job Disapprove 10% (93) 14% (129) 17% (161) 46% (435) 14% (129) 947
Continued on next page
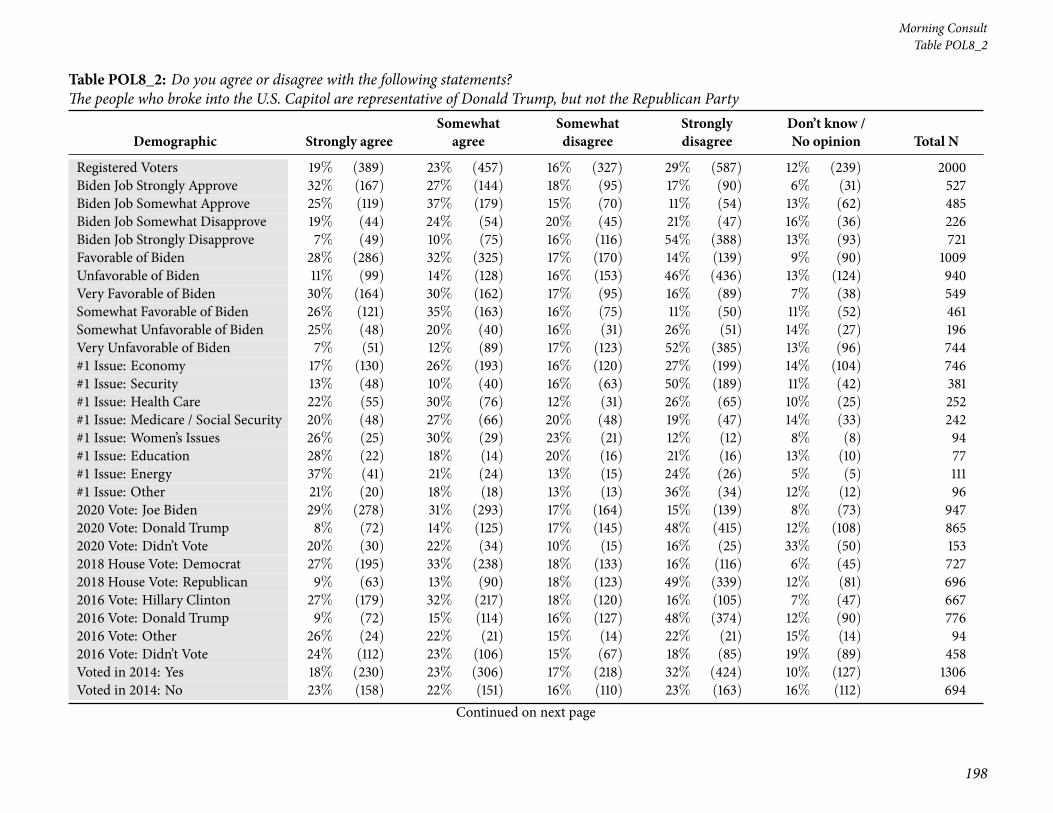
198
Morning ConsultTable POL8_2
Table POL8_2: Do you agree or disagree with the following statements?The people who broke into the U.S. Capitol are representative of Donald Trump, but not the Republican Party
Demographic Strongly agreeSomewhatagree
Somewhatdisagree
Stronglydisagree
Don’t know /No opinion Total N
Registered Voters 19% (389) 23% (457) 16% (327) 29% (587) 12% (239) 2000Biden Job Strongly Approve 32% (167) 27% (144) 18% (95) 17% (90) 6% (31) 527Biden Job Somewhat Approve 25% (119) 37% (179) 15% (70) 11% (54) 13% (62) 485Biden Job Somewhat Disapprove 19% (44) 24% (54) 20% (45) 21% (47) 16% (36) 226Biden Job Strongly Disapprove 7% (49) 10% (75) 16% (116) 54% (388) 13% (93) 721Favorable of Biden 28% (286) 32% (325) 17% (170) 14% (139) 9% (90) 1009Unfavorable of Biden 11% (99) 14% (128) 16% (153) 46% (436) 13% (124) 940Very Favorable of Biden 30% (164) 30% (162) 17% (95) 16% (89) 7% (38) 549Somewhat Favorable of Biden 26% (121) 35% (163) 16% (75) 11% (50) 11% (52) 461Somewhat Unfavorable of Biden 25% (48) 20% (40) 16% (31) 26% (51) 14% (27) 196Very Unfavorable of Biden 7% (51) 12% (89) 17% (123) 52% (385) 13% (96) 744#1 Issue: Economy 17% (130) 26% (193) 16% (120) 27% (199) 14% (104) 746#1 Issue: Security 13% (48) 10% (40) 16% (63) 50% (189) 11% (42) 381#1 Issue: Health Care 22% (55) 30% (76) 12% (31) 26% (65) 10% (25) 252#1 Issue: Medicare / Social Security 20% (48) 27% (66) 20% (48) 19% (47) 14% (33) 242#1 Issue: Women’s Issues 26% (25) 30% (29) 23% (21) 12% (12) 8% (8) 94#1 Issue: Education 28% (22) 18% (14) 20% (16) 21% (16) 13% (10) 77#1 Issue: Energy 37% (41) 21% (24) 13% (15) 24% (26) 5% (5) 111#1 Issue: Other 21% (20) 18% (18) 13% (13) 36% (34) 12% (12) 962020 Vote: Joe Biden 29% (278) 31% (293) 17% (164) 15% (139) 8% (73) 9472020 Vote: Donald Trump 8% (72) 14% (125) 17% (145) 48% (415) 12% (108) 8652020 Vote: Didn’t Vote 20% (30) 22% (34) 10% (15) 16% (25) 33% (50) 1532018 House Vote: Democrat 27% (195) 33% (238) 18% (133) 16% (116) 6% (45) 7272018 House Vote: Republican 9% (63) 13% (90) 18% (123) 49% (339) 12% (81) 6962016 Vote: Hillary Clinton 27% (179) 32% (217) 18% (120) 16% (105) 7% (47) 6672016 Vote: Donald Trump 9% (72) 15% (114) 16% (127) 48% (374) 12% (90) 7762016 Vote: Other 26% (24) 22% (21) 15% (14) 22% (21) 15% (14) 942016 Vote: Didn’t Vote 24% (112) 23% (106) 15% (67) 18% (85) 19% (89) 458Voted in 2014: Yes 18% (230) 23% (306) 17% (218) 32% (424) 10% (127) 1306Voted in 2014: No 23% (158) 22% (151) 16% (110) 23% (163) 16% (112) 694
Continued on next page

National Tracking Poll #2107125, July, 2021
199
Table POL8_2
Table POL8_2: Do you agree or disagree with the following statements?The people who broke into the U.S. Capitol are representative of Donald Trump, but not the Republican Party
Demographic Strongly agreeSomewhatagree
Somewhatdisagree
Stronglydisagree
Don’t know /No opinion Total N
Registered Voters 19% (389) 23% (457) 16% (327) 29% (587) 12% (239) 20004-Region: Northeast 19% (67) 24% (85) 16% (57) 26% (91) 15% (53) 3534-Region: Midwest 17% (76) 24% (109) 17% (74) 30% (132) 12% (54) 4454-Region: South 20% (151) 20% (150) 14% (107) 32% (241) 13% (97) 7464-Region: West 21% (94) 25% (114) 20% (89) 27% (123) 8% (36) 456Note: Row proportions may total to larger than one-hundred percent due to rounding. For more information visit MorningConsultIntelligence.com.

200
Morning ConsultTable POL8_3
Table POL8_3: Do you agree or disagree with the following statements?There has been too much focus on the January 6th events at the U.S. Capitol
Demographic Strongly agreeSomewhatagree
Somewhatdisagree
Stronglydisagree
Don’t know /No opinion Total N
Registered Voters 25% (507) 17% (343) 16% (320) 33% (664) 8% (167) 2000Gender: Male 28% (265) 16% (154) 16% (153) 32% (305) 7% (66) 943Gender: Female 23% (242) 18% (189) 16% (167) 34% (358) 9% (100) 1057Age: 18-34 19% (100) 20% (105) 21% (107) 27% (140) 12% (64) 515Age: 35-44 20% (62) 20% (61) 18% (55) 29% (90) 13% (39) 307Age: 45-64 31% (211) 14% (98) 15% (99) 33% (227) 7% (45) 680Age: 65+ 27% (133) 16% (79) 12% (60) 42% (207) 4% (18) 498GenZers: 1997-2012 19% (30) 19% (31) 23% (37) 28% (45) 12% (19) 162Millennials: 1981-1996 19% (99) 20% (108) 22% (116) 25% (134) 13% (70) 527GenXers: 1965-1980 30% (161) 16% (89) 14% (73) 32% (172) 9% (47) 542Baby Boomers: 1946-1964 28% (192) 15% (102) 12% (81) 41% (284) 4% (29) 688PID: Dem (no lean) 10% (78) 10% (82) 17% (136) 56% (443) 6% (49) 789PID: Ind (no lean) 22% (103) 16% (77) 19% (89) 32% (150) 11% (52) 472PID: Rep (no lean) 44% (325) 25% (184) 13% (94) 10% (70) 9% (66) 740PID/Gender: DemMen 13% (50) 12% (45) 19% (70) 51% (187) 5% (19) 371PID/Gender: DemWomen 7% (28) 9% (38) 16% (66) 61% (256) 7% (30) 418PID/Gender: Ind Men 24% (57) 15% (37) 18% (44) 33% (78) 9% (22) 237PID/Gender: Ind Women 20% (47) 17% (40) 20% (46) 31% (72) 12% (29) 234PID/Gender: Rep Men 47% (159) 22% (72) 12% (39) 12% (40) 7% (25) 334PID/Gender: Rep Women 41% (167) 28% (112) 14% (55) 8% (31) 10% (41) 405Ideo: Liberal (1-3) 9% (54) 8% (47) 14% (84) 64% (377) 4% (26) 587Ideo: Moderate (4) 16% (84) 21% (113) 23% (122) 32% (175) 9% (47) 542Ideo: Conservative (5-7) 45% (362) 22% (173) 12% (94) 12% (94) 9% (72) 795Educ: < College 24% (295) 17% (211) 18% (212) 29% (354) 11% (136) 1207Educ: Bachelors degree 28% (140) 17% (87) 16% (79) 35% (176) 4% (19) 502Educ: Post-grad 25% (72) 15% (45) 10% (29) 46% (133) 4% (12) 291Income: Under 50k 21% (191) 17% (157) 18% (167) 31% (285) 13% (115) 916Income: 50k-100k 29% (208) 18% (128) 14% (101) 34% (243) 6% (41) 720Income: 100k+ 30% (108) 16% (58) 14% (53) 37% (135) 3% (11) 364Ethnicity: White 29% (444) 18% (286) 15% (232) 31% (478) 7% (116) 1555Ethnicity: Hispanic 21% (47) 14% (30) 22% (49) 34% (76) 9% (20) 222
Continued on next page

National Tracking Poll #2107125, July, 2021
201
Table POL8_3
Table POL8_3: Do you agree or disagree with the following statements?There has been too much focus on the January 6th events at the U.S. Capitol
Demographic Strongly agreeSomewhatagree
Somewhatdisagree
Stronglydisagree
Don’t know /No opinion Total N
Registered Voters 25% (507) 17% (343) 16% (320) 33% (664) 8% (167) 2000Ethnicity: Black 13% (33) 12% (32) 21% (53) 42% (108) 12% (30) 257Ethnicity: Other 16% (29) 13% (25) 19% (36) 41% (77) 11% (21) 188All Christian 30% (312) 21% (220) 16% (171) 26% (276) 6% (66) 1045All Non-Christian 27% (32) 11% (13) 13% (16) 46% (55) 3% (4) 120Atheist 13% (13) 11% (11) 18% (17) 54% (53) 4% (4) 98Agnostic/Nothing in particular 19% (83) 14% (61) 17% (77) 38% (170) 12% (53) 445Something Else 23% (66) 13% (39) 13% (38) 37% (109) 13% (39) 292Religious Non-Protestant/Catholic 26% (37) 14% (20) 16% (23) 40% (57) 4% (5) 143Evangelical 29% (174) 20% (120) 18% (104) 23% (134) 10% (60) 591Non-Evangelical 27% (195) 18% (130) 14% (97) 35% (246) 6% (43) 710Community: Urban 26% (128) 14% (69) 17% (85) 34% (169) 9% (43) 494Community: Suburban 25% (244) 18% (176) 16% (157) 34% (336) 8% (76) 989Community: Rural 26% (135) 19% (98) 15% (78) 31% (158) 9% (47) 516Employ: Private Sector 28% (186) 20% (134) 15% (97) 30% (198) 6% (41) 656Employ: Government 24% (27) 16% (17) 22% (24) 27% (29) 11% (12) 109Employ: Self-Employed 24% (42) 15% (27) 26% (46) 26% (47) 10% (18) 180Employ: Homemaker 23% (40) 23% (40) 15% (26) 23% (41) 15% (27) 174Employ: Student 15% (10) 20% (13) 20% (13) 33% (22) 12% (8) 65Employ: Retired 26% (135) 16% (81) 10% (55) 44% (227) 4% (23) 520Employ: Unemployed 19% (38) 13% (26) 19% (39) 35% (70) 13% (26) 199Employ: Other 29% (28) 5% (5) 20% (20) 32% (31) 14% (13) 97Military HH: Yes 34% (128) 16% (60) 16% (60) 29% (110) 5% (19) 377Military HH: No 23% (378) 17% (283) 16% (261) 34% (553) 9% (148) 1623RD/WT: Right Direction 9% (82) 13% (114) 18% (158) 51% (447) 8% (67) 868RD/WT: Wrong Track 37% (424) 20% (229) 14% (162) 19% (217) 9% (99) 1132Biden Job Approve 8% (81) 12% (121) 19% (194) 54% (549) 7% (68) 1012Biden Job Disapprove 44% (419) 23% (218) 13% (122) 11% (106) 9% (82) 947
Continued on next page

202
Morning ConsultTable POL8_3
Table POL8_3: Do you agree or disagree with the following statements?There has been too much focus on the January 6th events at the U.S. Capitol
Demographic Strongly agreeSomewhatagree
Somewhatdisagree
Stronglydisagree
Don’t know /No opinion Total N
Registered Voters 25% (507) 17% (343) 16% (320) 33% (664) 8% (167) 2000Biden Job Strongly Approve 11% (60) 10% (50) 12% (63) 62% (325) 5% (28) 527Biden Job Somewhat Approve 4% (20) 14% (70) 27% (131) 46% (223) 8% (40) 485Biden Job Somewhat Disapprove 21% (47) 31% (69) 20% (45) 19% (43) 10% (22) 226Biden Job Strongly Disapprove 52% (372) 21% (149) 11% (77) 9% (63) 8% (60) 721Favorable of Biden 8% (80) 12% (118) 19% (191) 55% (559) 6% (62) 1009Unfavorable of Biden 44% (417) 23% (221) 14% (127) 11% (100) 8% (76) 940Very Favorable of Biden 11% (59) 9% (52) 13% (69) 62% (340) 5% (30) 549Somewhat Favorable of Biden 5% (21) 14% (66) 26% (122) 48% (219) 7% (32) 461Somewhat Unfavorable of Biden 22% (44) 25% (50) 24% (47) 22% (43) 7% (13) 196Very Unfavorable of Biden 50% (373) 23% (171) 11% (80) 8% (57) 8% (63) 744#1 Issue: Economy 25% (190) 18% (137) 21% (153) 25% (190) 10% (76) 746#1 Issue: Security 49% (186) 22% (83) 9% (36) 14% (52) 6% (24) 381#1 Issue: Health Care 12% (31) 11% (27) 19% (49) 51% (128) 6% (16) 252#1 Issue: Medicare / Social Security 18% (44) 13% (31) 13% (32) 50% (122) 6% (14) 242#1 Issue: Women’s Issues 14% (13) 19% (18) 11% (10) 46% (44) 10% (10) 94#1 Issue: Education 19% (15) 24% (19) 14% (10) 21% (16) 21% (16) 77#1 Issue: Energy 10% (11) 14% (15) 19% (21) 56% (62) 1% (2) 111#1 Issue: Other 18% (18) 13% (13) 8% (8) 51% (49) 9% (9) 962020 Vote: Joe Biden 8% (73) 10% (95) 18% (166) 59% (560) 6% (53) 9472020 Vote: Donald Trump 46% (398) 25% (220) 13% (112) 8% (67) 8% (68) 8652020 Vote: Didn’t Vote 20% (30) 14% (21) 23% (36) 19% (29) 24% (36) 1532018 House Vote: Democrat 9% (66) 12% (85) 16% (115) 60% (437) 4% (26) 7272018 House Vote: Republican 47% (325) 23% (157) 13% (91) 11% (77) 7% (46) 6962016 Vote: Hillary Clinton 8% (56) 9% (62) 17% (112) 61% (410) 4% (28) 6672016 Vote: Donald Trump 46% (359) 24% (185) 13% (99) 10% (79) 7% (54) 7762016 Vote: Other 10% (9) 13% (13) 14% (13) 49% (46) 14% (13) 942016 Vote: Didn’t Vote 18% (81) 18% (84) 21% (97) 27% (125) 15% (71) 458Voted in 2014: Yes 27% (356) 16% (212) 14% (179) 36% (473) 7% (86) 1306Voted in 2014: No 22% (151) 19% (131) 20% (141) 27% (190) 12% (80) 694
Continued on next page

National Tracking Poll #2107125, July, 2021
203
Table POL8_3
Table POL8_3: Do you agree or disagree with the following statements?There has been too much focus on the January 6th events at the U.S. Capitol
Demographic Strongly agreeSomewhatagree
Somewhatdisagree
Stronglydisagree
Don’t know /No opinion Total N
Registered Voters 25% (507) 17% (343) 16% (320) 33% (664) 8% (167) 20004-Region: Northeast 25% (88) 15% (55) 14% (50) 38% (135) 7% (26) 3534-Region: Midwest 20% (89) 20% (87) 17% (74) 36% (161) 7% (33) 4454-Region: South 29% (213) 16% (122) 16% (119) 29% (216) 10% (76) 7464-Region: West 26% (117) 17% (79) 17% (77) 33% (151) 7% (32) 456Note: Row proportions may total to larger than one-hundred percent due to rounding. For more information visit MorningConsultIntelligence.com.
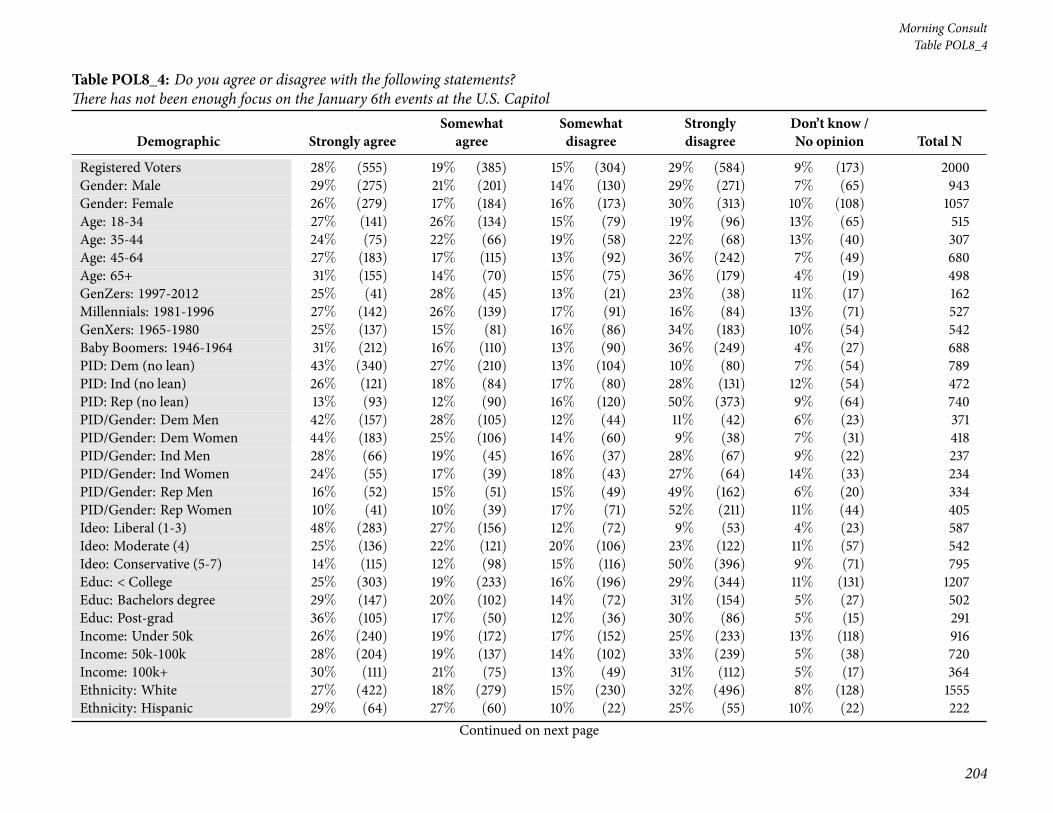
204
Morning ConsultTable POL8_4
Table POL8_4: Do you agree or disagree with the following statements?There has not been enough focus on the January 6th events at the U.S. Capitol
Demographic Strongly agreeSomewhatagree
Somewhatdisagree
Stronglydisagree
Don’t know /No opinion Total N
Registered Voters 28% (555) 19% (385) 15% (304) 29% (584) 9% (173) 2000Gender: Male 29% (275) 21% (201) 14% (130) 29% (271) 7% (65) 943Gender: Female 26% (279) 17% (184) 16% (173) 30% (313) 10% (108) 1057Age: 18-34 27% (141) 26% (134) 15% (79) 19% (96) 13% (65) 515Age: 35-44 24% (75) 22% (66) 19% (58) 22% (68) 13% (40) 307Age: 45-64 27% (183) 17% (115) 13% (92) 36% (242) 7% (49) 680Age: 65+ 31% (155) 14% (70) 15% (75) 36% (179) 4% (19) 498GenZers: 1997-2012 25% (41) 28% (45) 13% (21) 23% (38) 11% (17) 162Millennials: 1981-1996 27% (142) 26% (139) 17% (91) 16% (84) 13% (71) 527GenXers: 1965-1980 25% (137) 15% (81) 16% (86) 34% (183) 10% (54) 542Baby Boomers: 1946-1964 31% (212) 16% (110) 13% (90) 36% (249) 4% (27) 688PID: Dem (no lean) 43% (340) 27% (210) 13% (104) 10% (80) 7% (54) 789PID: Ind (no lean) 26% (121) 18% (84) 17% (80) 28% (131) 12% (54) 472PID: Rep (no lean) 13% (93) 12% (90) 16% (120) 50% (373) 9% (64) 740PID/Gender: DemMen 42% (157) 28% (105) 12% (44) 11% (42) 6% (23) 371PID/Gender: DemWomen 44% (183) 25% (106) 14% (60) 9% (38) 7% (31) 418PID/Gender: Ind Men 28% (66) 19% (45) 16% (37) 28% (67) 9% (22) 237PID/Gender: Ind Women 24% (55) 17% (39) 18% (43) 27% (64) 14% (33) 234PID/Gender: Rep Men 16% (52) 15% (51) 15% (49) 49% (162) 6% (20) 334PID/Gender: Rep Women 10% (41) 10% (39) 17% (71) 52% (211) 11% (44) 405Ideo: Liberal (1-3) 48% (283) 27% (156) 12% (72) 9% (53) 4% (23) 587Ideo: Moderate (4) 25% (136) 22% (121) 20% (106) 23% (122) 11% (57) 542Ideo: Conservative (5-7) 14% (115) 12% (98) 15% (116) 50% (396) 9% (71) 795Educ: < College 25% (303) 19% (233) 16% (196) 29% (344) 11% (131) 1207Educ: Bachelors degree 29% (147) 20% (102) 14% (72) 31% (154) 5% (27) 502Educ: Post-grad 36% (105) 17% (50) 12% (36) 30% (86) 5% (15) 291Income: Under 50k 26% (240) 19% (172) 17% (152) 25% (233) 13% (118) 916Income: 50k-100k 28% (204) 19% (137) 14% (102) 33% (239) 5% (38) 720Income: 100k+ 30% (111) 21% (75) 13% (49) 31% (112) 5% (17) 364Ethnicity: White 27% (422) 18% (279) 15% (230) 32% (496) 8% (128) 1555Ethnicity: Hispanic 29% (64) 27% (60) 10% (22) 25% (55) 10% (22) 222
Continued on next page

National Tracking Poll #2107125, July, 2021
205
Table POL8_4
Table POL8_4: Do you agree or disagree with the following statements?There has not been enough focus on the January 6th events at the U.S. Capitol
Demographic Strongly agreeSomewhatagree
Somewhatdisagree
Stronglydisagree
Don’t know /No opinion Total N
Registered Voters 28% (555) 19% (385) 15% (304) 29% (584) 9% (173) 2000Ethnicity: Black 34% (87) 26% (67) 14% (37) 16% (42) 9% (24) 257Ethnicity: Other 24% (46) 21% (39) 19% (36) 24% (46) 11% (21) 188All Christian 24% (255) 17% (180) 16% (162) 36% (374) 7% (74) 1045All Non-Christian 39% (47) 20% (24) 20% (24) 17% (21) 4% (4) 120Atheist 44% (43) 21% (21) 12% (12) 19% (18) 4% (4) 98Agnostic/Nothing in particular 32% (140) 22% (96) 15% (69) 21% (93) 11% (48) 445Something Else 24% (69) 22% (65) 13% (37) 27% (79) 14% (42) 292Religious Non-Protestant/Catholic 36% (51) 21% (30) 21% (30) 17% (25) 5% (7) 143Evangelical 20% (116) 21% (124) 14% (84) 35% (206) 10% (62) 591Non-Evangelical 29% (203) 16% (111) 15% (108) 34% (238) 7% (51) 710Community: Urban 34% (168) 24% (117) 13% (66) 20% (98) 9% (45) 494Community: Suburban 26% (260) 18% (180) 16% (155) 32% (317) 8% (76) 989Community: Rural 24% (126) 17% (87) 16% (83) 33% (169) 10% (51) 516Employ: Private Sector 26% (173) 23% (150) 15% (95) 30% (200) 6% (38) 656Employ: Government 26% (29) 20% (22) 13% (14) 23% (25) 17% (19) 109Employ: Self-Employed 29% (52) 24% (42) 14% (26) 24% (43) 9% (17) 180Employ: Homemaker 19% (33) 13% (23) 23% (40) 29% (51) 16% (27) 174Employ: Student 28% (18) 17% (11) 19% (12) 25% (16) 12% (8) 65Employ: Retired 33% (172) 14% (73) 13% (67) 36% (187) 4% (22) 520Employ: Unemployed 24% (48) 21% (41) 20% (40) 20% (40) 15% (31) 199Employ: Other 31% (30) 23% (22) 11% (10) 22% (22) 13% (12) 97Military HH: Yes 28% (105) 14% (52) 14% (54) 39% (147) 5% (20) 377Military HH: No 28% (449) 21% (333) 15% (250) 27% (438) 9% (153) 1623RD/WT: Right Direction 40% (347) 25% (221) 14% (123) 12% (103) 9% (74) 868RD/WT: Wrong Track 18% (208) 14% (164) 16% (181) 42% (481) 9% (99) 1132Biden Job Approve 41% (418) 26% (261) 15% (148) 11% (106) 8% (78) 1012Biden Job Disapprove 13% (127) 13% (120) 16% (152) 50% (469) 8% (79) 947
Continued on next page
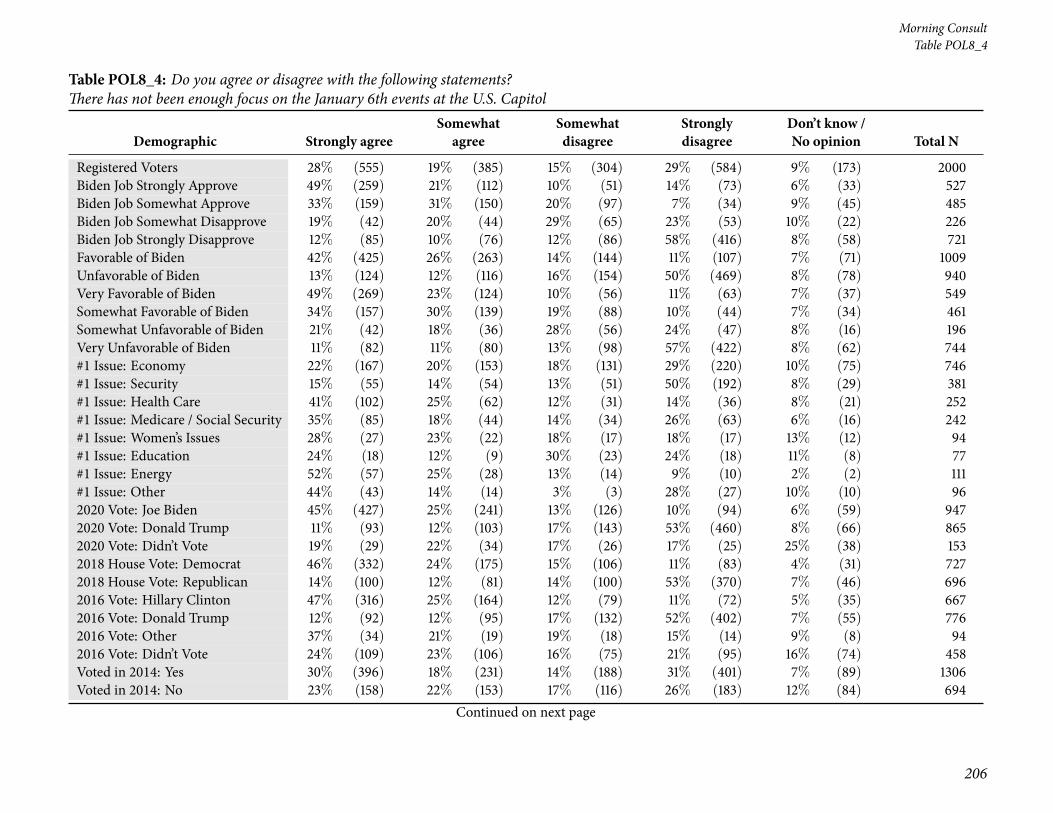
206
Morning ConsultTable POL8_4
Table POL8_4: Do you agree or disagree with the following statements?There has not been enough focus on the January 6th events at the U.S. Capitol
Demographic Strongly agreeSomewhatagree
Somewhatdisagree
Stronglydisagree
Don’t know /No opinion Total N
Registered Voters 28% (555) 19% (385) 15% (304) 29% (584) 9% (173) 2000Biden Job Strongly Approve 49% (259) 21% (112) 10% (51) 14% (73) 6% (33) 527Biden Job Somewhat Approve 33% (159) 31% (150) 20% (97) 7% (34) 9% (45) 485Biden Job Somewhat Disapprove 19% (42) 20% (44) 29% (65) 23% (53) 10% (22) 226Biden Job Strongly Disapprove 12% (85) 10% (76) 12% (86) 58% (416) 8% (58) 721Favorable of Biden 42% (425) 26% (263) 14% (144) 11% (107) 7% (71) 1009Unfavorable of Biden 13% (124) 12% (116) 16% (154) 50% (469) 8% (78) 940Very Favorable of Biden 49% (269) 23% (124) 10% (56) 11% (63) 7% (37) 549Somewhat Favorable of Biden 34% (157) 30% (139) 19% (88) 10% (44) 7% (34) 461Somewhat Unfavorable of Biden 21% (42) 18% (36) 28% (56) 24% (47) 8% (16) 196Very Unfavorable of Biden 11% (82) 11% (80) 13% (98) 57% (422) 8% (62) 744#1 Issue: Economy 22% (167) 20% (153) 18% (131) 29% (220) 10% (75) 746#1 Issue: Security 15% (55) 14% (54) 13% (51) 50% (192) 8% (29) 381#1 Issue: Health Care 41% (102) 25% (62) 12% (31) 14% (36) 8% (21) 252#1 Issue: Medicare / Social Security 35% (85) 18% (44) 14% (34) 26% (63) 6% (16) 242#1 Issue: Women’s Issues 28% (27) 23% (22) 18% (17) 18% (17) 13% (12) 94#1 Issue: Education 24% (18) 12% (9) 30% (23) 24% (18) 11% (8) 77#1 Issue: Energy 52% (57) 25% (28) 13% (14) 9% (10) 2% (2) 111#1 Issue: Other 44% (43) 14% (14) 3% (3) 28% (27) 10% (10) 962020 Vote: Joe Biden 45% (427) 25% (241) 13% (126) 10% (94) 6% (59) 9472020 Vote: Donald Trump 11% (93) 12% (103) 17% (143) 53% (460) 8% (66) 8652020 Vote: Didn’t Vote 19% (29) 22% (34) 17% (26) 17% (25) 25% (38) 1532018 House Vote: Democrat 46% (332) 24% (175) 15% (106) 11% (83) 4% (31) 7272018 House Vote: Republican 14% (100) 12% (81) 14% (100) 53% (370) 7% (46) 6962016 Vote: Hillary Clinton 47% (316) 25% (164) 12% (79) 11% (72) 5% (35) 6672016 Vote: Donald Trump 12% (92) 12% (95) 17% (132) 52% (402) 7% (55) 7762016 Vote: Other 37% (34) 21% (19) 19% (18) 15% (14) 9% (8) 942016 Vote: Didn’t Vote 24% (109) 23% (106) 16% (75) 21% (95) 16% (74) 458Voted in 2014: Yes 30% (396) 18% (231) 14% (188) 31% (401) 7% (89) 1306Voted in 2014: No 23% (158) 22% (153) 17% (116) 26% (183) 12% (84) 694
Continued on next page
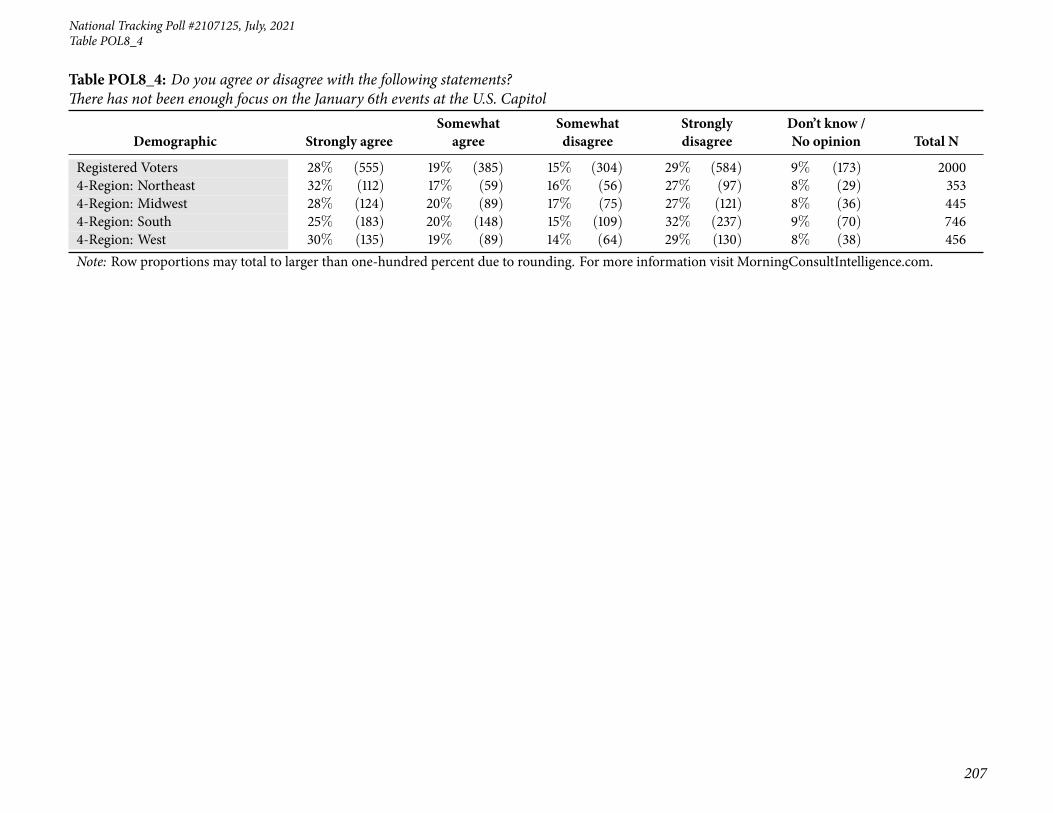
National Tracking Poll #2107125, July, 2021
207
Table POL8_4
Table POL8_4: Do you agree or disagree with the following statements?There has not been enough focus on the January 6th events at the U.S. Capitol
Demographic Strongly agreeSomewhatagree
Somewhatdisagree
Stronglydisagree
Don’t know /No opinion Total N
Registered Voters 28% (555) 19% (385) 15% (304) 29% (584) 9% (173) 20004-Region: Northeast 32% (112) 17% (59) 16% (56) 27% (97) 8% (29) 3534-Region: Midwest 28% (124) 20% (89) 17% (75) 27% (121) 8% (36) 4454-Region: South 25% (183) 20% (148) 15% (109) 32% (237) 9% (70) 7464-Region: West 30% (135) 19% (89) 14% (64) 29% (130) 8% (38) 456Note: Row proportions may total to larger than one-hundred percent due to rounding. For more information visit MorningConsultIntelligence.com.
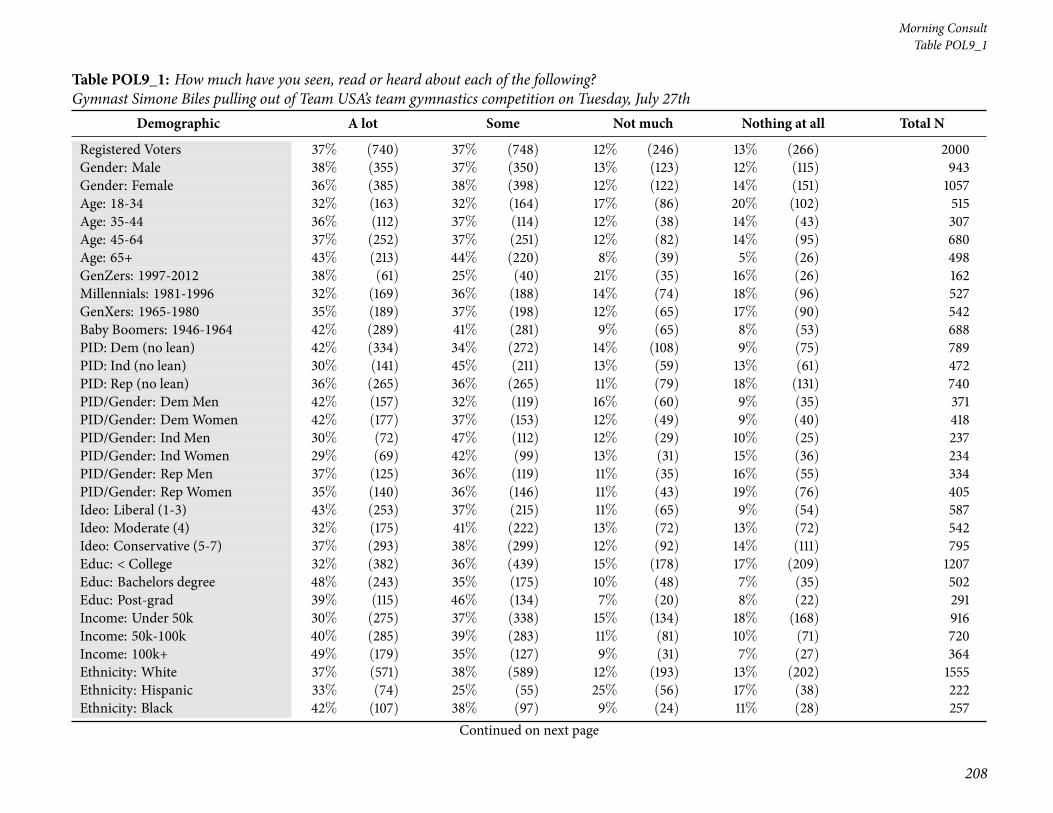
208
Morning ConsultTable POL9_1
Table POL9_1: How much have you seen, read or heard about each of the following?Gymnast Simone Biles pulling out of Team USA’s team gymnastics competition on Tuesday, July 27th
Demographic A lot Some Not much Nothing at all Total N
Registered Voters 37% (740) 37% (748) 12% (246) 13% (266) 2000Gender: Male 38% (355) 37% (350) 13% (123) 12% (115) 943Gender: Female 36% (385) 38% (398) 12% (122) 14% (151) 1057Age: 18-34 32% (163) 32% (164) 17% (86) 20% (102) 515Age: 35-44 36% (112) 37% (114) 12% (38) 14% (43) 307Age: 45-64 37% (252) 37% (251) 12% (82) 14% (95) 680Age: 65+ 43% (213) 44% (220) 8% (39) 5% (26) 498GenZers: 1997-2012 38% (61) 25% (40) 21% (35) 16% (26) 162Millennials: 1981-1996 32% (169) 36% (188) 14% (74) 18% (96) 527GenXers: 1965-1980 35% (189) 37% (198) 12% (65) 17% (90) 542Baby Boomers: 1946-1964 42% (289) 41% (281) 9% (65) 8% (53) 688PID: Dem (no lean) 42% (334) 34% (272) 14% (108) 9% (75) 789PID: Ind (no lean) 30% (141) 45% (211) 13% (59) 13% (61) 472PID: Rep (no lean) 36% (265) 36% (265) 11% (79) 18% (131) 740PID/Gender: DemMen 42% (157) 32% (119) 16% (60) 9% (35) 371PID/Gender: DemWomen 42% (177) 37% (153) 12% (49) 9% (40) 418PID/Gender: Ind Men 30% (72) 47% (112) 12% (29) 10% (25) 237PID/Gender: Ind Women 29% (69) 42% (99) 13% (31) 15% (36) 234PID/Gender: Rep Men 37% (125) 36% (119) 11% (35) 16% (55) 334PID/Gender: Rep Women 35% (140) 36% (146) 11% (43) 19% (76) 405Ideo: Liberal (1-3) 43% (253) 37% (215) 11% (65) 9% (54) 587Ideo: Moderate (4) 32% (175) 41% (222) 13% (72) 13% (72) 542Ideo: Conservative (5-7) 37% (293) 38% (299) 12% (92) 14% (111) 795Educ: < College 32% (382) 36% (439) 15% (178) 17% (209) 1207Educ: Bachelors degree 48% (243) 35% (175) 10% (48) 7% (35) 502Educ: Post-grad 39% (115) 46% (134) 7% (20) 8% (22) 291Income: Under 50k 30% (275) 37% (338) 15% (134) 18% (168) 916Income: 50k-100k 40% (285) 39% (283) 11% (81) 10% (71) 720Income: 100k+ 49% (179) 35% (127) 9% (31) 7% (27) 364Ethnicity: White 37% (571) 38% (589) 12% (193) 13% (202) 1555Ethnicity: Hispanic 33% (74) 25% (55) 25% (56) 17% (38) 222Ethnicity: Black 42% (107) 38% (97) 9% (24) 11% (28) 257
Continued on next page

National Tracking Poll #2107125, July, 2021
209
Table POL9_1
Table POL9_1: How much have you seen, read or heard about each of the following?Gymnast Simone Biles pulling out of Team USA’s team gymnastics competition on Tuesday, July 27th
Demographic A lot Some Not much Nothing at all Total N
Registered Voters 37% (740) 37% (748) 12% (246) 13% (266) 2000Ethnicity: Other 33% (62) 33% (62) 15% (29) 19% (35) 188All Christian 39% (406) 39% (409) 11% (116) 11% (113) 1045All Non-Christian 44% (53) 37% (44) 11% (13) 9% (11) 120Atheist 49% (48) 34% (34) 10% (10) 7% (7) 98Agnostic/Nothing in particular 29% (131) 37% (164) 16% (70) 18% (80) 445Something Else 35% (102) 33% (97) 13% (37) 19% (56) 292Religious Non-Protestant/Catholic 38% (54) 38% (54) 11% (15) 13% (19) 143Evangelical 38% (224) 37% (220) 11% (62) 15% (86) 591Non-Evangelical 39% (279) 38% (273) 12% (86) 10% (72) 710Community: Urban 36% (179) 36% (180) 14% (69) 13% (66) 494Community: Suburban 42% (417) 36% (353) 11% (110) 11% (109) 989Community: Rural 28% (143) 42% (214) 13% (68) 18% (91) 516Employ: Private Sector 40% (266) 35% (231) 13% (87) 11% (73) 656Employ: Government 36% (39) 38% (41) 10% (11) 16% (17) 109Employ: Self-Employed 32% (58) 37% (66) 14% (26) 17% (31) 180Employ: Homemaker 29% (51) 37% (64) 12% (21) 22% (38) 174Employ: Student 43% (28) 21% (14) 19% (12) 17% (11) 65Employ: Retired 40% (209) 44% (227) 11% (58) 5% (26) 520Employ: Unemployed 27% (53) 38% (75) 13% (25) 23% (45) 199Employ: Other 38% (37) 30% (29) 6% (5) 26% (25) 97Military HH: Yes 37% (140) 41% (155) 14% (52) 8% (30) 377Military HH: No 37% (600) 37% (593) 12% (194) 15% (236) 1623RD/WT: Right Direction 39% (336) 38% (326) 13% (110) 11% (95) 868RD/WT: Wrong Track 36% (404) 37% (422) 12% (136) 15% (171) 1132Biden Job Approve 39% (398) 38% (389) 12% (124) 10% (101) 1012Biden Job Disapprove 35% (331) 37% (350) 12% (113) 16% (153) 947Biden Job Strongly Approve 44% (232) 37% (194) 10% (52) 9% (49) 527Biden Job Somewhat Approve 34% (166) 40% (195) 15% (72) 11% (52) 485Biden Job Somewhat Disapprove 30% (68) 43% (98) 14% (32) 13% (28) 226Biden Job Strongly Disapprove 37% (263) 35% (252) 11% (81) 17% (124) 721
Continued on next page
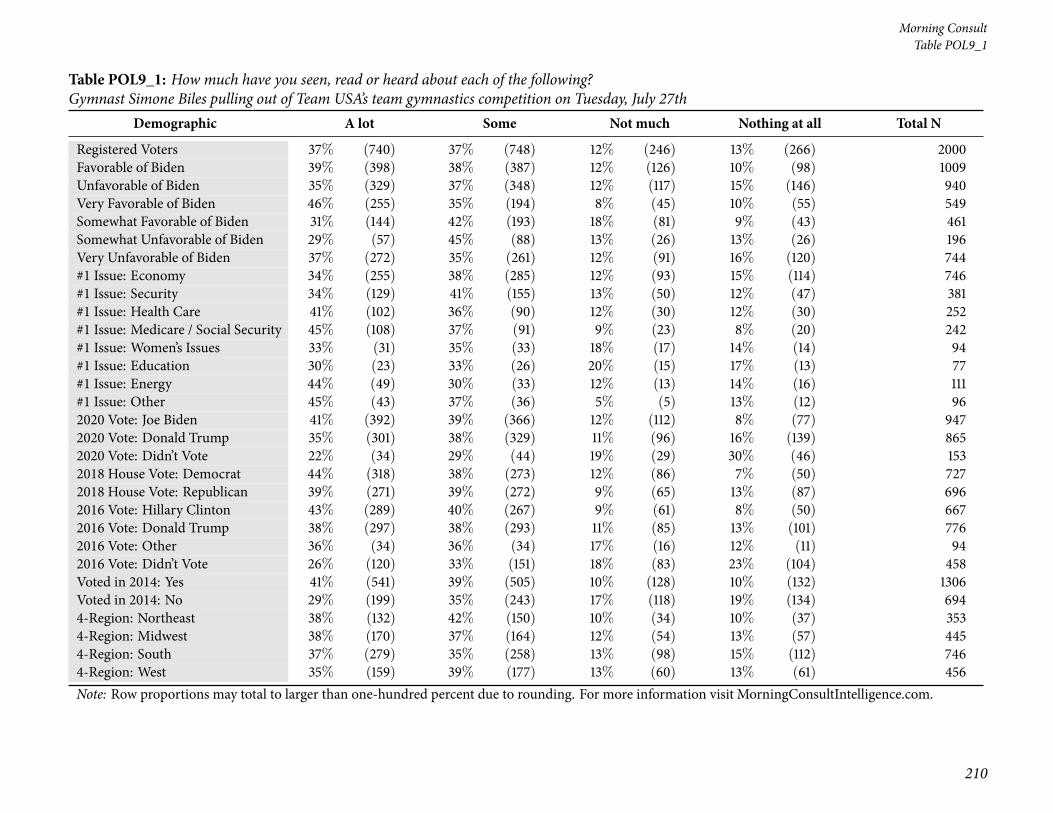
210
Morning ConsultTable POL9_1
Table POL9_1: How much have you seen, read or heard about each of the following?Gymnast Simone Biles pulling out of Team USA’s team gymnastics competition on Tuesday, July 27th
Demographic A lot Some Not much Nothing at all Total N
Registered Voters 37% (740) 37% (748) 12% (246) 13% (266) 2000Favorable of Biden 39% (398) 38% (387) 12% (126) 10% (98) 1009Unfavorable of Biden 35% (329) 37% (348) 12% (117) 15% (146) 940Very Favorable of Biden 46% (255) 35% (194) 8% (45) 10% (55) 549Somewhat Favorable of Biden 31% (144) 42% (193) 18% (81) 9% (43) 461Somewhat Unfavorable of Biden 29% (57) 45% (88) 13% (26) 13% (26) 196Very Unfavorable of Biden 37% (272) 35% (261) 12% (91) 16% (120) 744#1 Issue: Economy 34% (255) 38% (285) 12% (93) 15% (114) 746#1 Issue: Security 34% (129) 41% (155) 13% (50) 12% (47) 381#1 Issue: Health Care 41% (102) 36% (90) 12% (30) 12% (30) 252#1 Issue: Medicare / Social Security 45% (108) 37% (91) 9% (23) 8% (20) 242#1 Issue: Women’s Issues 33% (31) 35% (33) 18% (17) 14% (14) 94#1 Issue: Education 30% (23) 33% (26) 20% (15) 17% (13) 77#1 Issue: Energy 44% (49) 30% (33) 12% (13) 14% (16) 111#1 Issue: Other 45% (43) 37% (36) 5% (5) 13% (12) 962020 Vote: Joe Biden 41% (392) 39% (366) 12% (112) 8% (77) 9472020 Vote: Donald Trump 35% (301) 38% (329) 11% (96) 16% (139) 8652020 Vote: Didn’t Vote 22% (34) 29% (44) 19% (29) 30% (46) 1532018 House Vote: Democrat 44% (318) 38% (273) 12% (86) 7% (50) 7272018 House Vote: Republican 39% (271) 39% (272) 9% (65) 13% (87) 6962016 Vote: Hillary Clinton 43% (289) 40% (267) 9% (61) 8% (50) 6672016 Vote: Donald Trump 38% (297) 38% (293) 11% (85) 13% (101) 7762016 Vote: Other 36% (34) 36% (34) 17% (16) 12% (11) 942016 Vote: Didn’t Vote 26% (120) 33% (151) 18% (83) 23% (104) 458Voted in 2014: Yes 41% (541) 39% (505) 10% (128) 10% (132) 1306Voted in 2014: No 29% (199) 35% (243) 17% (118) 19% (134) 6944-Region: Northeast 38% (132) 42% (150) 10% (34) 10% (37) 3534-Region: Midwest 38% (170) 37% (164) 12% (54) 13% (57) 4454-Region: South 37% (279) 35% (258) 13% (98) 15% (112) 7464-Region: West 35% (159) 39% (177) 13% (60) 13% (61) 456Note: Row proportions may total to larger than one-hundred percent due to rounding. For more information visit MorningConsultIntelligence.com.

National Tracking Poll #2107125, July, 2021
211
Table POL9_2
Table POL9_2: How much have you seen, read or heard about each of the following?The special congressional committee investigating the January 6th U.S. Capitol riot holding its first hearing on Tuesday, July 27th
Demographic A lot Some Not much Nothing at all Total N
Registered Voters 22% (432) 36% (730) 24% (474) 18% (364) 2000Gender: Male 26% (241) 41% (382) 21% (202) 12% (117) 943Gender: Female 18% (191) 33% (348) 26% (272) 23% (246) 1057Age: 18-34 12% (63) 30% (153) 31% (157) 28% (142) 515Age: 35-44 15% (46) 39% (120) 24% (73) 22% (67) 307Age: 45-64 22% (149) 39% (267) 24% (160) 15% (103) 680Age: 65+ 35% (174) 38% (189) 17% (83) 10% (51) 498GenZers: 1997-2012 14% (22) 24% (39) 36% (58) 27% (43) 162Millennials: 1981-1996 14% (71) 36% (188) 26% (138) 24% (129) 527GenXers: 1965-1980 17% (91) 38% (205) 26% (139) 20% (108) 542Baby Boomers: 1946-1964 32% (219) 39% (269) 18% (123) 11% (77) 688PID: Dem (no lean) 27% (211) 37% (295) 24% (190) 12% (93) 789PID: Ind (no lean) 20% (94) 40% (188) 19% (89) 21% (100) 472PID: Rep (no lean) 17% (128) 33% (247) 26% (194) 23% (171) 740PID/Gender: DemMen 30% (111) 39% (145) 23% (85) 8% (30) 371PID/Gender: DemWomen 24% (100) 36% (150) 25% (105) 15% (62) 418PID/Gender: Ind Men 24% (57) 44% (106) 18% (43) 14% (32) 237PID/Gender: Ind Women 16% (37) 35% (83) 20% (46) 29% (68) 234PID/Gender: Rep Men 22% (73) 40% (132) 22% (74) 16% (55) 334PID/Gender: Rep Women 13% (54) 28% (115) 30% (121) 29% (116) 405Ideo: Liberal (1-3) 27% (161) 38% (223) 23% (138) 11% (66) 587Ideo: Moderate (4) 17% (93) 40% (219) 24% (128) 19% (102) 542Ideo: Conservative (5-7) 22% (172) 34% (271) 24% (190) 20% (162) 795Educ: < College 18% (219) 32% (389) 27% (332) 22% (268) 1207Educ: Bachelors degree 26% (131) 42% (211) 20% (102) 12% (58) 502Educ: Post-grad 29% (83) 45% (130) 14% (40) 13% (37) 291Income: Under 50k 17% (159) 34% (311) 28% (256) 21% (189) 916Income: 50k-100k 23% (166) 39% (282) 20% (144) 18% (128) 720Income: 100k+ 29% (107) 38% (137) 20% (74) 13% (46) 364Ethnicity: White 22% (339) 37% (568) 24% (367) 18% (281) 1555Ethnicity: Hispanic 18% (40) 34% (76) 27% (60) 21% (46) 222Ethnicity: Black 25% (65) 38% (98) 21% (55) 15% (39) 257
Continued on next page
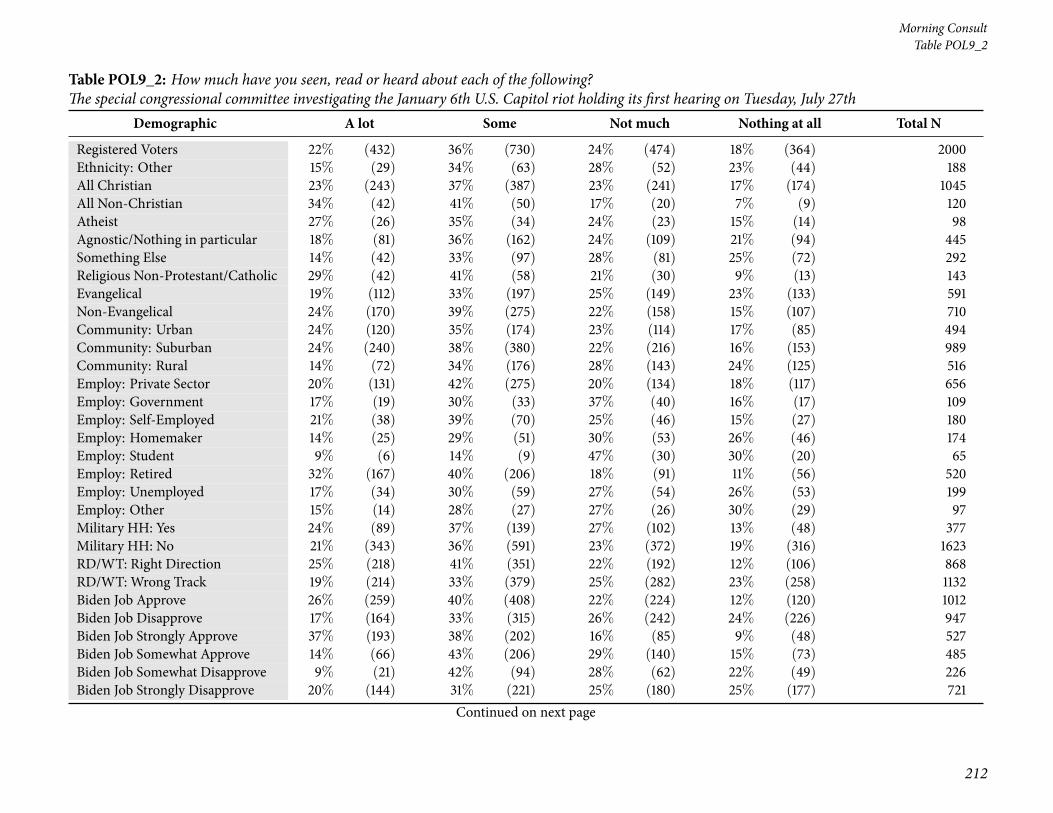
212
Morning ConsultTable POL9_2
Table POL9_2: How much have you seen, read or heard about each of the following?The special congressional committee investigating the January 6th U.S. Capitol riot holding its first hearing on Tuesday, July 27th
Demographic A lot Some Not much Nothing at all Total N
Registered Voters 22% (432) 36% (730) 24% (474) 18% (364) 2000Ethnicity: Other 15% (29) 34% (63) 28% (52) 23% (44) 188All Christian 23% (243) 37% (387) 23% (241) 17% (174) 1045All Non-Christian 34% (42) 41% (50) 17% (20) 7% (9) 120Atheist 27% (26) 35% (34) 24% (23) 15% (14) 98Agnostic/Nothing in particular 18% (81) 36% (162) 24% (109) 21% (94) 445Something Else 14% (42) 33% (97) 28% (81) 25% (72) 292Religious Non-Protestant/Catholic 29% (42) 41% (58) 21% (30) 9% (13) 143Evangelical 19% (112) 33% (197) 25% (149) 23% (133) 591Non-Evangelical 24% (170) 39% (275) 22% (158) 15% (107) 710Community: Urban 24% (120) 35% (174) 23% (114) 17% (85) 494Community: Suburban 24% (240) 38% (380) 22% (216) 16% (153) 989Community: Rural 14% (72) 34% (176) 28% (143) 24% (125) 516Employ: Private Sector 20% (131) 42% (275) 20% (134) 18% (117) 656Employ: Government 17% (19) 30% (33) 37% (40) 16% (17) 109Employ: Self-Employed 21% (38) 39% (70) 25% (46) 15% (27) 180Employ: Homemaker 14% (25) 29% (51) 30% (53) 26% (46) 174Employ: Student 9% (6) 14% (9) 47% (30) 30% (20) 65Employ: Retired 32% (167) 40% (206) 18% (91) 11% (56) 520Employ: Unemployed 17% (34) 30% (59) 27% (54) 26% (53) 199Employ: Other 15% (14) 28% (27) 27% (26) 30% (29) 97Military HH: Yes 24% (89) 37% (139) 27% (102) 13% (48) 377Military HH: No 21% (343) 36% (591) 23% (372) 19% (316) 1623RD/WT: Right Direction 25% (218) 41% (351) 22% (192) 12% (106) 868RD/WT: Wrong Track 19% (214) 33% (379) 25% (282) 23% (258) 1132Biden Job Approve 26% (259) 40% (408) 22% (224) 12% (120) 1012Biden Job Disapprove 17% (164) 33% (315) 26% (242) 24% (226) 947Biden Job Strongly Approve 37% (193) 38% (202) 16% (85) 9% (48) 527Biden Job Somewhat Approve 14% (66) 43% (206) 29% (140) 15% (73) 485Biden Job Somewhat Disapprove 9% (21) 42% (94) 28% (62) 22% (49) 226Biden Job Strongly Disapprove 20% (144) 31% (221) 25% (180) 25% (177) 721
Continued on next page

National Tracking Poll #2107125, July, 2021
213
Table POL9_2
Table POL9_2: How much have you seen, read or heard about each of the following?The special congressional committee investigating the January 6th U.S. Capitol riot holding its first hearing on Tuesday, July 27th
Demographic A lot Some Not much Nothing at all Total N
Registered Voters 22% (432) 36% (730) 24% (474) 18% (364) 2000Favorable of Biden 26% (263) 40% (399) 23% (228) 12% (120) 1009Unfavorable of Biden 17% (162) 35% (325) 25% (240) 23% (214) 940Very Favorable of Biden 36% (195) 38% (206) 17% (94) 10% (53) 549Somewhat Favorable of Biden 15% (68) 42% (193) 29% (134) 14% (66) 461Somewhat Unfavorable of Biden 10% (19) 43% (85) 25% (50) 22% (42) 196Very Unfavorable of Biden 19% (143) 32% (240) 25% (190) 23% (171) 744#1 Issue: Economy 18% (133) 37% (274) 26% (191) 20% (148) 746#1 Issue: Security 21% (80) 38% (145) 21% (81) 20% (75) 381#1 Issue: Health Care 23% (57) 38% (97) 25% (62) 15% (37) 252#1 Issue: Medicare / Social Security 30% (73) 35% (85) 22% (52) 13% (31) 242#1 Issue: Women’s Issues 8% (7) 28% (26) 39% (37) 25% (24) 94#1 Issue: Education 21% (16) 28% (22) 29% (22) 22% (17) 77#1 Issue: Energy 27% (30) 40% (45) 20% (22) 13% (14) 111#1 Issue: Other 37% (36) 38% (37) 6% (6) 19% (18) 962020 Vote: Joe Biden 26% (245) 40% (383) 23% (217) 11% (102) 9472020 Vote: Donald Trump 19% (162) 34% (294) 25% (215) 22% (193) 8652020 Vote: Didn’t Vote 13% (21) 27% (42) 22% (33) 38% (58) 1532018 House Vote: Democrat 31% (225) 39% (287) 20% (147) 10% (69) 7272018 House Vote: Republican 22% (150) 38% (262) 22% (155) 19% (129) 6962016 Vote: Hillary Clinton 31% (207) 41% (271) 18% (118) 11% (71) 6672016 Vote: Donald Trump 20% (157) 36% (280) 24% (190) 19% (149) 7762016 Vote: Other 24% (23) 39% (37) 18% (17) 19% (18) 942016 Vote: Didn’t Vote 9% (43) 31% (140) 33% (150) 27% (126) 458Voted in 2014: Yes 27% (353) 39% (509) 20% (258) 14% (186) 1306Voted in 2014: No 11% (80) 32% (221) 31% (216) 26% (178) 6944-Region: Northeast 25% (90) 39% (138) 19% (66) 17% (59) 3534-Region: Midwest 20% (89) 35% (155) 28% (124) 17% (76) 4454-Region: South 20% (147) 37% (277) 23% (174) 20% (148) 7464-Region: West 23% (106) 35% (160) 24% (109) 18% (80) 456Note: Row proportions may total to larger than one-hundred percent due to rounding. For more information visit MorningConsultIntelligence.com.
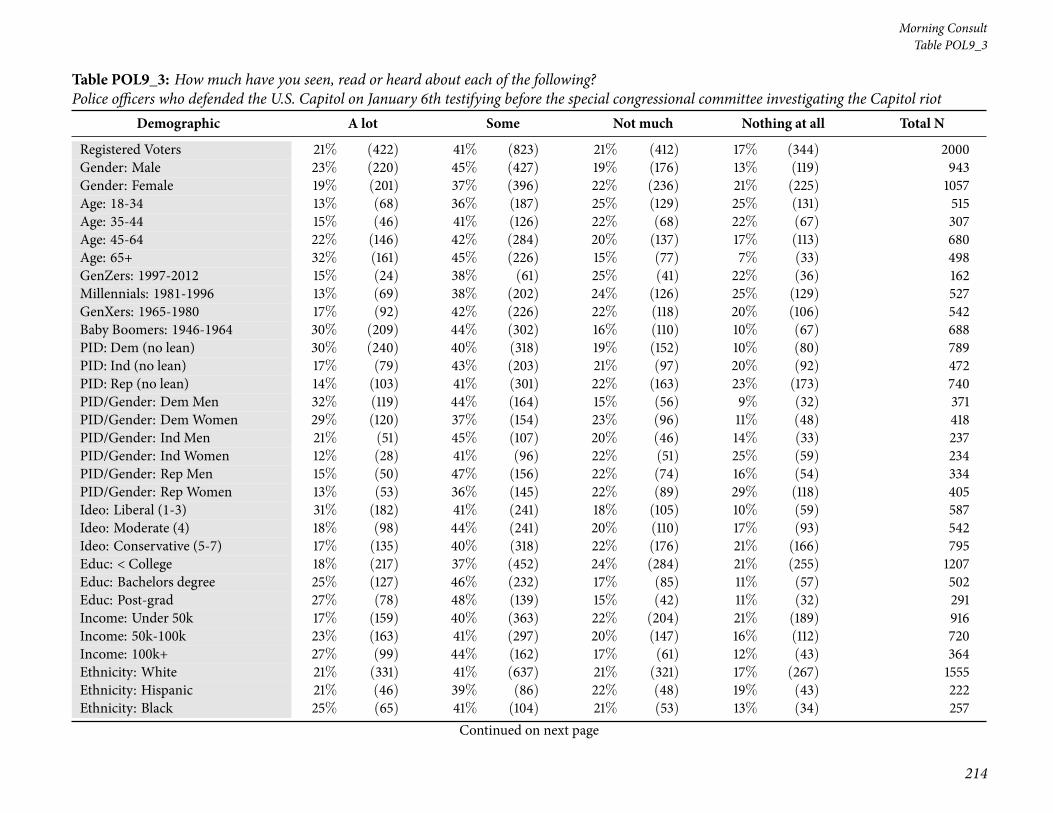
214
Morning ConsultTable POL9_3
Table POL9_3: How much have you seen, read or heard about each of the following?Police officers who defended the U.S. Capitol on January 6th testifying before the special congressional committee investigating the Capitol riot
Demographic A lot Some Not much Nothing at all Total N
Registered Voters 21% (422) 41% (823) 21% (412) 17% (344) 2000Gender: Male 23% (220) 45% (427) 19% (176) 13% (119) 943Gender: Female 19% (201) 37% (396) 22% (236) 21% (225) 1057Age: 18-34 13% (68) 36% (187) 25% (129) 25% (131) 515Age: 35-44 15% (46) 41% (126) 22% (68) 22% (67) 307Age: 45-64 22% (146) 42% (284) 20% (137) 17% (113) 680Age: 65+ 32% (161) 45% (226) 15% (77) 7% (33) 498GenZers: 1997-2012 15% (24) 38% (61) 25% (41) 22% (36) 162Millennials: 1981-1996 13% (69) 38% (202) 24% (126) 25% (129) 527GenXers: 1965-1980 17% (92) 42% (226) 22% (118) 20% (106) 542Baby Boomers: 1946-1964 30% (209) 44% (302) 16% (110) 10% (67) 688PID: Dem (no lean) 30% (240) 40% (318) 19% (152) 10% (80) 789PID: Ind (no lean) 17% (79) 43% (203) 21% (97) 20% (92) 472PID: Rep (no lean) 14% (103) 41% (301) 22% (163) 23% (173) 740PID/Gender: DemMen 32% (119) 44% (164) 15% (56) 9% (32) 371PID/Gender: DemWomen 29% (120) 37% (154) 23% (96) 11% (48) 418PID/Gender: Ind Men 21% (51) 45% (107) 20% (46) 14% (33) 237PID/Gender: Ind Women 12% (28) 41% (96) 22% (51) 25% (59) 234PID/Gender: Rep Men 15% (50) 47% (156) 22% (74) 16% (54) 334PID/Gender: Rep Women 13% (53) 36% (145) 22% (89) 29% (118) 405Ideo: Liberal (1-3) 31% (182) 41% (241) 18% (105) 10% (59) 587Ideo: Moderate (4) 18% (98) 44% (241) 20% (110) 17% (93) 542Ideo: Conservative (5-7) 17% (135) 40% (318) 22% (176) 21% (166) 795Educ: < College 18% (217) 37% (452) 24% (284) 21% (255) 1207Educ: Bachelors degree 25% (127) 46% (232) 17% (85) 11% (57) 502Educ: Post-grad 27% (78) 48% (139) 15% (42) 11% (32) 291Income: Under 50k 17% (159) 40% (363) 22% (204) 21% (189) 916Income: 50k-100k 23% (163) 41% (297) 20% (147) 16% (112) 720Income: 100k+ 27% (99) 44% (162) 17% (61) 12% (43) 364Ethnicity: White 21% (331) 41% (637) 21% (321) 17% (267) 1555Ethnicity: Hispanic 21% (46) 39% (86) 22% (48) 19% (43) 222Ethnicity: Black 25% (65) 41% (104) 21% (53) 13% (34) 257
Continued on next page
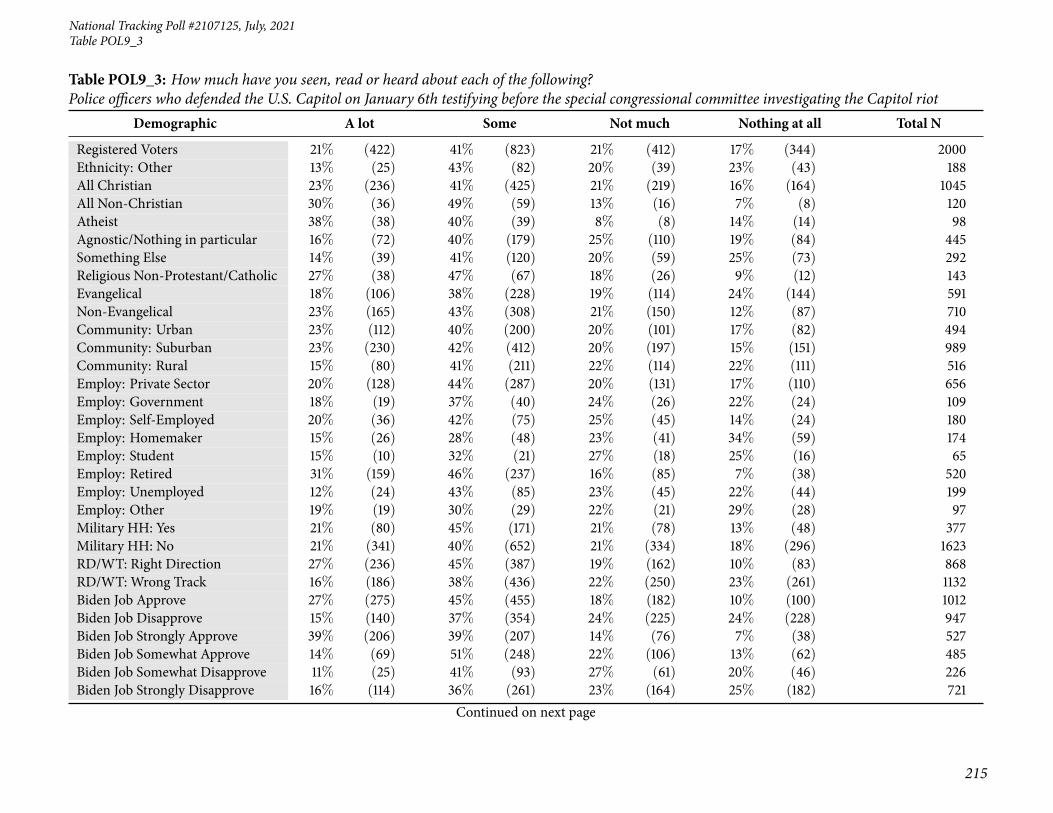
National Tracking Poll #2107125, July, 2021
215
Table POL9_3
Table POL9_3: How much have you seen, read or heard about each of the following?Police officers who defended the U.S. Capitol on January 6th testifying before the special congressional committee investigating the Capitol riot
Demographic A lot Some Not much Nothing at all Total N
Registered Voters 21% (422) 41% (823) 21% (412) 17% (344) 2000Ethnicity: Other 13% (25) 43% (82) 20% (39) 23% (43) 188All Christian 23% (236) 41% (425) 21% (219) 16% (164) 1045All Non-Christian 30% (36) 49% (59) 13% (16) 7% (8) 120Atheist 38% (38) 40% (39) 8% (8) 14% (14) 98Agnostic/Nothing in particular 16% (72) 40% (179) 25% (110) 19% (84) 445Something Else 14% (39) 41% (120) 20% (59) 25% (73) 292Religious Non-Protestant/Catholic 27% (38) 47% (67) 18% (26) 9% (12) 143Evangelical 18% (106) 38% (228) 19% (114) 24% (144) 591Non-Evangelical 23% (165) 43% (308) 21% (150) 12% (87) 710Community: Urban 23% (112) 40% (200) 20% (101) 17% (82) 494Community: Suburban 23% (230) 42% (412) 20% (197) 15% (151) 989Community: Rural 15% (80) 41% (211) 22% (114) 22% (111) 516Employ: Private Sector 20% (128) 44% (287) 20% (131) 17% (110) 656Employ: Government 18% (19) 37% (40) 24% (26) 22% (24) 109Employ: Self-Employed 20% (36) 42% (75) 25% (45) 14% (24) 180Employ: Homemaker 15% (26) 28% (48) 23% (41) 34% (59) 174Employ: Student 15% (10) 32% (21) 27% (18) 25% (16) 65Employ: Retired 31% (159) 46% (237) 16% (85) 7% (38) 520Employ: Unemployed 12% (24) 43% (85) 23% (45) 22% (44) 199Employ: Other 19% (19) 30% (29) 22% (21) 29% (28) 97Military HH: Yes 21% (80) 45% (171) 21% (78) 13% (48) 377Military HH: No 21% (341) 40% (652) 21% (334) 18% (296) 1623RD/WT: Right Direction 27% (236) 45% (387) 19% (162) 10% (83) 868RD/WT: Wrong Track 16% (186) 38% (436) 22% (250) 23% (261) 1132Biden Job Approve 27% (275) 45% (455) 18% (182) 10% (100) 1012Biden Job Disapprove 15% (140) 37% (354) 24% (225) 24% (228) 947Biden Job Strongly Approve 39% (206) 39% (207) 14% (76) 7% (38) 527Biden Job Somewhat Approve 14% (69) 51% (248) 22% (106) 13% (62) 485Biden Job Somewhat Disapprove 11% (25) 41% (93) 27% (61) 20% (46) 226Biden Job Strongly Disapprove 16% (114) 36% (261) 23% (164) 25% (182) 721
Continued on next page
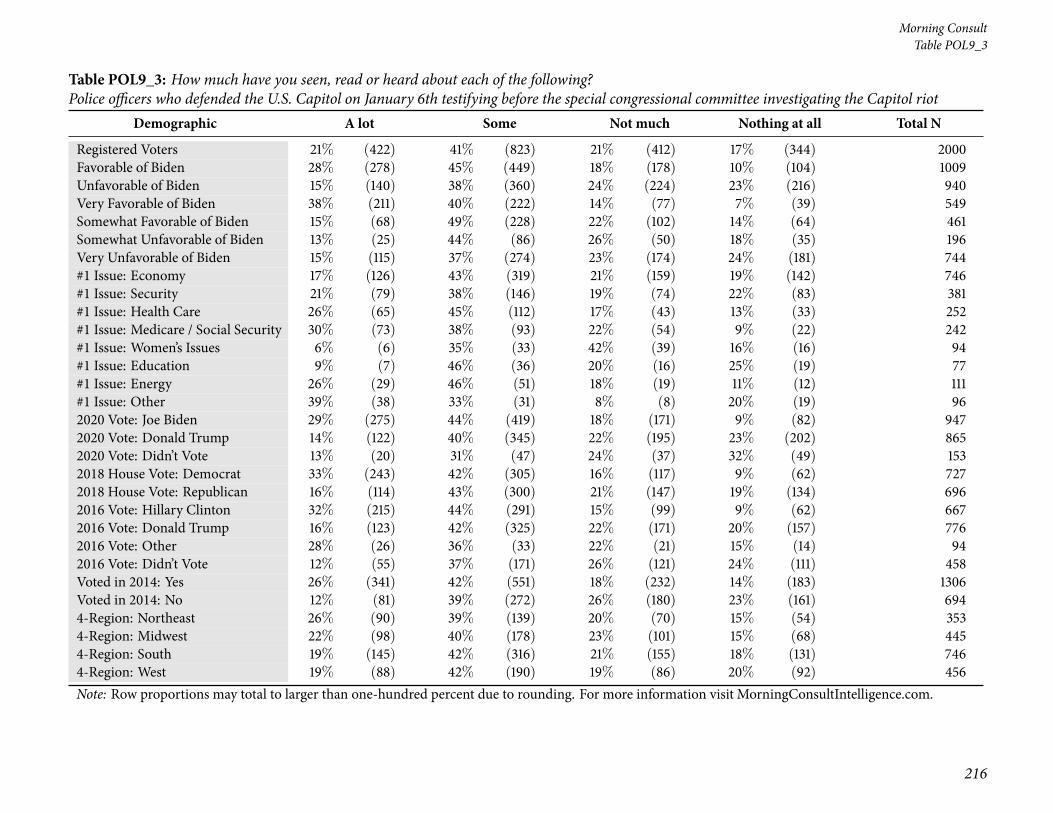
216
Morning ConsultTable POL9_3
Table POL9_3: How much have you seen, read or heard about each of the following?Police officers who defended the U.S. Capitol on January 6th testifying before the special congressional committee investigating the Capitol riot
Demographic A lot Some Not much Nothing at all Total N
Registered Voters 21% (422) 41% (823) 21% (412) 17% (344) 2000Favorable of Biden 28% (278) 45% (449) 18% (178) 10% (104) 1009Unfavorable of Biden 15% (140) 38% (360) 24% (224) 23% (216) 940Very Favorable of Biden 38% (211) 40% (222) 14% (77) 7% (39) 549Somewhat Favorable of Biden 15% (68) 49% (228) 22% (102) 14% (64) 461Somewhat Unfavorable of Biden 13% (25) 44% (86) 26% (50) 18% (35) 196Very Unfavorable of Biden 15% (115) 37% (274) 23% (174) 24% (181) 744#1 Issue: Economy 17% (126) 43% (319) 21% (159) 19% (142) 746#1 Issue: Security 21% (79) 38% (146) 19% (74) 22% (83) 381#1 Issue: Health Care 26% (65) 45% (112) 17% (43) 13% (33) 252#1 Issue: Medicare / Social Security 30% (73) 38% (93) 22% (54) 9% (22) 242#1 Issue: Women’s Issues 6% (6) 35% (33) 42% (39) 16% (16) 94#1 Issue: Education 9% (7) 46% (36) 20% (16) 25% (19) 77#1 Issue: Energy 26% (29) 46% (51) 18% (19) 11% (12) 111#1 Issue: Other 39% (38) 33% (31) 8% (8) 20% (19) 962020 Vote: Joe Biden 29% (275) 44% (419) 18% (171) 9% (82) 9472020 Vote: Donald Trump 14% (122) 40% (345) 22% (195) 23% (202) 8652020 Vote: Didn’t Vote 13% (20) 31% (47) 24% (37) 32% (49) 1532018 House Vote: Democrat 33% (243) 42% (305) 16% (117) 9% (62) 7272018 House Vote: Republican 16% (114) 43% (300) 21% (147) 19% (134) 6962016 Vote: Hillary Clinton 32% (215) 44% (291) 15% (99) 9% (62) 6672016 Vote: Donald Trump 16% (123) 42% (325) 22% (171) 20% (157) 7762016 Vote: Other 28% (26) 36% (33) 22% (21) 15% (14) 942016 Vote: Didn’t Vote 12% (55) 37% (171) 26% (121) 24% (111) 458Voted in 2014: Yes 26% (341) 42% (551) 18% (232) 14% (183) 1306Voted in 2014: No 12% (81) 39% (272) 26% (180) 23% (161) 6944-Region: Northeast 26% (90) 39% (139) 20% (70) 15% (54) 3534-Region: Midwest 22% (98) 40% (178) 23% (101) 15% (68) 4454-Region: South 19% (145) 42% (316) 21% (155) 18% (131) 7464-Region: West 19% (88) 42% (190) 19% (86) 20% (92) 456Note: Row proportions may total to larger than one-hundred percent due to rounding. For more information visit MorningConsultIntelligence.com.

National Tracking Poll #2107125, July, 2021
217
Table POL10
Table POL10: And did you watch or listen to the police officers who defended the U.S. Capitol on January 6th testify before the special congressionalcommittee on Tuesday, July 27th, live on air, either in part or in full?
Demographic Yes, in full Yes, in part No Total N
Registered Voters 10% (209) 39% (778) 51% (1013) 2000Gender: Male 13% (120) 43% (404) 44% (419) 943Gender: Female 8% (90) 35% (374) 56% (594) 1057Age: 18-34 13% (65) 32% (167) 55% (283) 515Age: 35-44 14% (42) 30% (91) 57% (174) 307Age: 45-64 8% (56) 37% (252) 55% (372) 680Age: 65+ 9% (46) 54% (269) 37% (183) 498GenZers: 1997-2012 9% (15) 35% (57) 55% (90) 162Millennials: 1981-1996 15% (81) 31% (162) 54% (285) 527GenXers: 1965-1980 8% (42) 34% (183) 59% (317) 542Baby Boomers: 1946-1964 9% (62) 48% (329) 43% (298) 688PID: Dem (no lean) 15% (122) 46% (364) 38% (304) 789PID: Ind (no lean) 7% (32) 39% (182) 55% (257) 472PID: Rep (no lean) 8% (55) 31% (232) 61% (452) 740PID/Gender: DemMen 17% (61) 51% (188) 33% (122) 371PID/Gender: DemWomen 14% (60) 42% (176) 43% (181) 418PID/Gender: Ind Men 8% (19) 40% (94) 52% (125) 237PID/Gender: Ind Women 6% (14) 38% (88) 57% (133) 234PID/Gender: Rep Men 12% (40) 37% (122) 51% (172) 334PID/Gender: Rep Women 4% (16) 27% (110) 69% (280) 405Ideo: Liberal (1-3) 16% (96) 47% (276) 37% (215) 587Ideo: Moderate (4) 9% (47) 40% (218) 51% (276) 542Ideo: Conservative (5-7) 8% (65) 34% (268) 58% (463) 795Educ: < College 8% (101) 36% (433) 56% (673) 1207Educ: Bachelors degree 16% (80) 43% (216) 41% (206) 502Educ: Post-grad 10% (28) 44% (129) 46% (134) 291Income: Under 50k 10% (89) 37% (336) 54% (490) 916Income: 50k-100k 10% (74) 41% (294) 49% (352) 720Income: 100k+ 13% (46) 41% (148) 47% (170) 364Ethnicity: White 10% (159) 39% (604) 51% (793) 1555Ethnicity: Hispanic 16% (34) 38% (84) 47% (104) 222Ethnicity: Black 13% (33) 40% (104) 47% (119) 257
Continued on next page

218
Morning ConsultTable POL10
Table POL10: And did you watch or listen to the police officers who defended the U.S. Capitol on January 6th testify before the special congressionalcommittee on Tuesday, July 27th, live on air, either in part or in full?
Demographic Yes, in full Yes, in part No Total N
Registered Voters 10% (209) 39% (778) 51% (1013) 2000Ethnicity: Other 9% (17) 37% (70) 53% (100) 188All Christian 10% (109) 40% (418) 50% (517) 1045All Non-Christian 20% (24) 45% (55) 35% (42) 120Atheist 12% (12) 48% (47) 40% (39) 98Agnostic/Nothing in particular 9% (40) 34% (153) 56% (251) 445Something Else 8% (24) 36% (105) 56% (162) 292Religious Non-Protestant/Catholic 18% (25) 43% (61) 39% (56) 143Evangelical 10% (59) 37% (219) 53% (313) 591Non-Evangelical 10% (70) 42% (295) 49% (345) 710Community: Urban 16% (79) 39% (192) 45% (223) 494Community: Suburban 9% (91) 41% (402) 50% (496) 989Community: Rural 7% (39) 36% (184) 57% (294) 516Employ: Private Sector 14% (95) 36% (235) 50% (327) 656Employ: Government 14% (15) 35% (38) 51% (55) 109Employ: Self-Employed 12% (21) 37% (67) 51% (92) 180Employ: Homemaker 5% (9) 23% (40) 72% (125) 174Employ: Student 2% (1) 42% (27) 56% (37) 65Employ: Retired 10% (50) 53% (276) 37% (193) 520Employ: Unemployed 6% (12) 33% (65) 62% (122) 199Employ: Other 7% (6) 30% (29) 63% (61) 97Military HH: Yes 9% (33) 43% (163) 48% (181) 377Military HH: No 11% (177) 38% (615) 51% (831) 1623RD/WT: Right Direction 16% (139) 44% (385) 40% (344) 868RD/WT: Wrong Track 6% (71) 35% (393) 59% (668) 1132Biden Job Approve 15% (156) 45% (459) 39% (397) 1012Biden Job Disapprove 5% (50) 33% (312) 62% (585) 947Biden Job Strongly Approve 22% (115) 45% (239) 33% (173) 527Biden Job Somewhat Approve 8% (41) 45% (220) 46% (224) 485Biden Job Somewhat Disapprove 5% (10) 39% (87) 57% (129) 226Biden Job Strongly Disapprove 6% (40) 31% (225) 63% (456) 721
Continued on next page

National Tracking Poll #2107125, July, 2021
219
Table POL10
Table POL10: And did you watch or listen to the police officers who defended the U.S. Capitol on January 6th testify before the special congressionalcommittee on Tuesday, July 27th, live on air, either in part or in full?
Demographic Yes, in full Yes, in part No Total N
Registered Voters 10% (209) 39% (778) 51% (1013) 2000Favorable of Biden 15% (155) 45% (458) 39% (397) 1009Unfavorable of Biden 5% (48) 33% (314) 61% (578) 940Very Favorable of Biden 21% (115) 46% (250) 33% (184) 549Somewhat Favorable of Biden 9% (39) 45% (208) 46% (213) 461Somewhat Unfavorable of Biden 5% (10) 41% (80) 54% (106) 196Very Unfavorable of Biden 5% (38) 31% (234) 63% (471) 744#1 Issue: Economy 8% (63) 36% (269) 55% (414) 746#1 Issue: Security 8% (32) 38% (145) 54% (204) 381#1 Issue: Health Care 12% (30) 46% (115) 42% (106) 252#1 Issue: Medicare / Social Security 13% (31) 47% (113) 41% (98) 242#1 Issue: Women’s Issues 8% (7) 23% (21) 70% (66) 94#1 Issue: Education 17% (13) 28% (22) 55% (42) 77#1 Issue: Energy 15% (17) 53% (59) 32% (35) 111#1 Issue: Other 17% (16) 35% (33) 48% (47) 962020 Vote: Joe Biden 15% (140) 48% (453) 37% (354) 9472020 Vote: Donald Trump 6% (54) 33% (284) 61% (527) 8652020 Vote: Didn’t Vote 8% (13) 22% (33) 70% (107) 1532018 House Vote: Democrat 18% (129) 50% (360) 33% (238) 7272018 House Vote: Republican 7% (51) 36% (252) 56% (393) 6962016 Vote: Hillary Clinton 16% (108) 50% (333) 34% (225) 6672016 Vote: Donald Trump 7% (56) 37% (285) 56% (435) 7762016 Vote: Other 12% (11) 38% (36) 50% (47) 942016 Vote: Didn’t Vote 7% (32) 27% (123) 66% (303) 458Voted in 2014: Yes 13% (165) 43% (565) 44% (576) 1306Voted in 2014: No 6% (44) 31% (213) 63% (436) 6944-Region: Northeast 12% (42) 44% (157) 44% (154) 3534-Region: Midwest 11% (50) 36% (159) 53% (236) 4454-Region: South 10% (74) 39% (289) 51% (384) 7464-Region: West 10% (44) 38% (173) 52% (239) 456Note: Row proportions may total to larger than one-hundred percent due to rounding. For more information visit MorningConsultIntelligence.com.
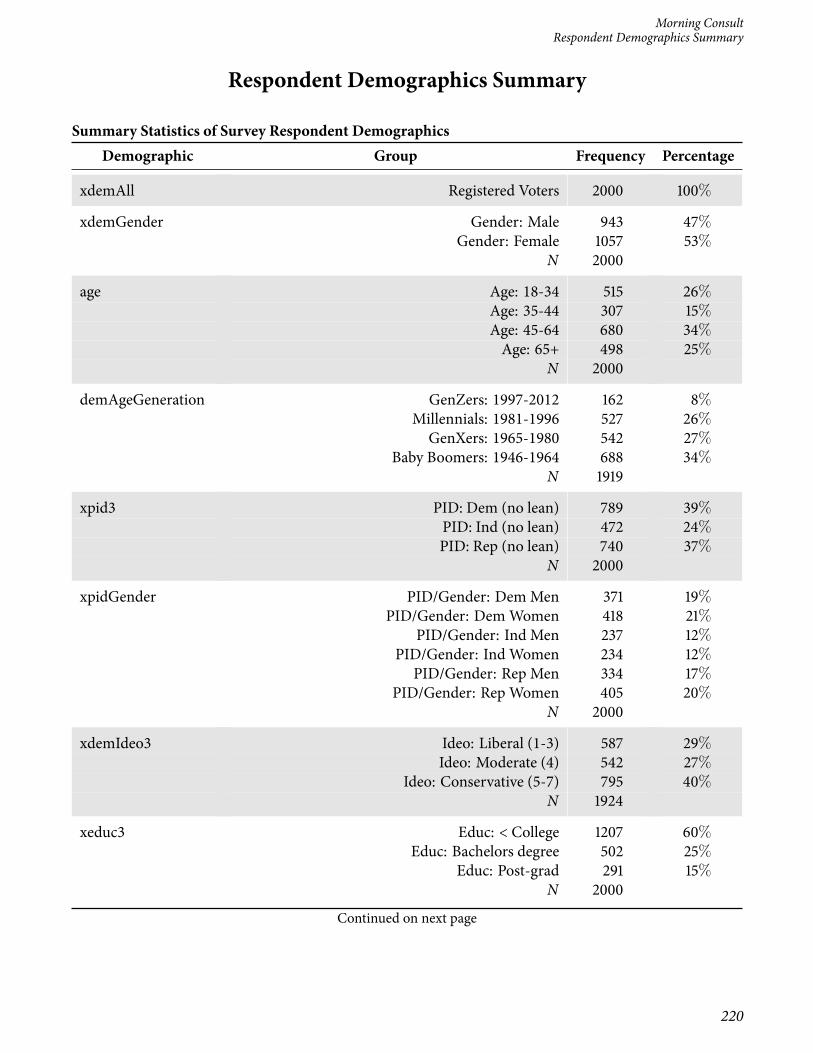
Morning ConsultRespondent Demographics Summary
Respondent Demographics Summary
Summary Statistics of Survey Respondent DemographicsDemographic Group Frequency Percentage
xdemAll Registered Voters 2000 100%
xdemGender Gender: Male 943 47%Gender: Female 1057 53%
N 2000
age Age: 18-34 515 26%Age: 35-44 307 15%Age: 45-64 680 34%Age: 65+ 498 25%
N 2000
demAgeGeneration GenZers: 1997-2012 162 8%Millennials: 1981-1996 527 26%GenXers: 1965-1980 542 27%
Baby Boomers: 1946-1964 688 34%N 1919
xpid3 PID: Dem (no lean) 789 39%PID: Ind (no lean) 472 24%PID: Rep (no lean) 740 37%
N 2000
xpidGender PID/Gender: DemMen 371 19%PID/Gender: DemWomen 418 21%
PID/Gender: Ind Men 237 12%PID/Gender: Ind Women 234 12%
PID/Gender: Rep Men 334 17%PID/Gender: Rep Women 405 20%
N 2000
xdemIdeo3 Ideo: Liberal (1-3) 587 29%Ideo: Moderate (4) 542 27%
Ideo: Conservative (5-7) 795 40%N 1924
xeduc3 Educ: < College 1207 60%Educ: Bachelors degree 502 25%
Educ: Post-grad 291 15%N 2000
Continued on next page
220

National Tracking Poll #2107125, July, 2021Respondent Demographics Summary
Summary Statistics of Survey Respondent DemographicsDemographic Group Frequency Percentage
xdemInc3 Income: Under 50k 916 46%Income: 50k-100k 720 36%
Income: 100k+ 364 18%N 2000
xdemWhite Ethnicity: White 1555 78%
xdemHispBin Ethnicity: Hispanic 222 11%
demBlackBin Ethnicity: Black 257 13%
demRaceOther Ethnicity: Other 188 9%
xdemReligion All Christian 1045 52%All Non-Christian 120 6%
Atheist 98 5%Agnostic/Nothing in particular 445 22%
Something Else 292 15%N 2000
xdemReligOther Religious Non-Protestant/Catholic 143 7%
xdemEvang Evangelical 591 30%Non-Evangelical 710 36%
N 1301
xdemUsr Community: Urban 494 25%Community: Suburban 989 49%
Community: Rural 516 26%N 2000
xdemEmploy Employ: Private Sector 656 33%Employ: Government 109 5%
Employ: Self-Employed 180 9%Employ: Homemaker 174 9%
Employ: Student 65 3%Employ: Retired 520 26%
Employ: Unemployed 199 10%Employ: Other 97 5%
N 2000
xdemMilHH1 Military HH: Yes 377 19%Military HH: No 1623 81%
N 2000
Continued on next page
221

Morning ConsultRespondent Demographics Summary
Summary Statistics of Survey Respondent DemographicsDemographic Group Frequency Percentage
xnr1 RD/WT: Right Direction 868 43%RD/WT: Wrong Track 1132 57%
N 2000
xdemBidenApprove Biden Job Approve 1012 51%Biden Job Disapprove 947 47%
N 1959
xdemBidenApprove2 Biden Job Strongly Approve 527 26%Biden Job Somewhat Approve 485 24%
Biden Job Somewhat Disapprove 226 11%Biden Job Strongly Disapprove 721 36%
N 1959
xdemBidenFav Favorable of Biden 1009 50%Unfavorable of Biden 940 47%
N 1950
xdemBidenFavFull Very Favorable of Biden 549 27%Somewhat Favorable of Biden 461 23%
Somewhat Unfavorable of Biden 196 10%Very Unfavorable of Biden 744 37%
N 1950
xnr3 #1 Issue: Economy 746 37%#1 Issue: Security 381 19%
#1 Issue: Health Care 252 13%#1 Issue: Medicare / Social Security 242 12%
#1 Issue: Women’s Issues 94 5%#1 Issue: Education 77 4%
#1 Issue: Energy 111 6%#1 Issue: Other 96 5%
N 2000
xsubVote20O 2020 Vote: Joe Biden 947 47%2020 Vote: Donald Trump 865 43%
2020 Vote: Other 35 2%2020 Vote: Didn’t Vote 153 8%
N 2000
xsubVote18O 2018 House Vote: Democrat 727 36%2018 House Vote: Republican 696 35%
2018 House Vote: Someone else 38 2%N 1461
Continued on next page
222

National Tracking Poll #2107125, July, 2021Respondent Demographics Summary
Summary Statistics of Survey Respondent DemographicsDemographic Group Frequency Percentage
xsubVote16O 2016 Vote: Hillary Clinton 667 33%2016 Vote: Donald Trump 776 39%
2016 Vote: Other 94 5%2016 Vote: Didn’t Vote 458 23%
N 1995
xsubVote14O Voted in 2014: Yes 1306 65%Voted in 2014: No 694 35%
N 2000
xreg4 4-Region: Northeast 353 18%4-Region: Midwest 445 22%
4-Region: South 746 37%4-Region: West 456 23%
N 2000
Note: Group proportions may total to larger than one-hundred percent due to rounding. All statistics are calcu-lated with demographic post-stratification weights applied.
223

224 Morning Consult
Related Documents


