National Vegetable IPM Coordinator Lauren Thompson Scholefield Robinson Horticultural Services Pty Ltd Project Number: VG09191

Welcome message from author
This document is posted to help you gain knowledge. Please leave a comment to let me know what you think about it! Share it to your friends and learn new things together.
Transcript

National Vegetable IPM Coordinator
Lauren Thompson
Scholefield Robinson Horticultural Services Pty Ltd
Project Number: VG09191

VG09191
This report is published by Horticulture Australia Ltd to pass on information concerning horticultural research and development undertaken for the vegetables industry.
The research contained in this report was funded by Horticulture Australia Ltd with the financial support of the vegetables industry.
All expressions of opinion are not to be regarded as expressing the opinion of Horticulture Australia Ltd or any authority of the Australian Government. The Company and the Australian Government accept no responsibility for any of the opinions or the accuracy of the information contained in this report and readers should rely upon their own enquiries in making decisions concerning their own interests.
ISBN 0 7341 2674 3 Published and distributed by: Horticulture Australia Ltd Level 7 179 Elizabeth Street Sydney NSW 2000 Telephone: (02) 8295 2300 Fax: (02) 8295 2399 © Copyright 2011

Prepared for : Horticulture Australia Ltd (HAL)
HAL Project No. : VG09191
Authors : Lauren Thompson, Scholefield Robinson Horticultural Services (Lead Agency) and Sandra McDougall, NSW Dept of Primary Industries (Subcontracted Agency)
Completion Date : 13 May 2011
FINAL REPORT National Vegetable IPM Coordinator
VG09191

Scholefield Robinson Horticultural Services Pty Ltd
Final Report : National Vegetable IPM Coordinator (Project VG09191), May 2011 Page i
HAL Project No. VG09191 May 2011 PROJECT LEADER Lauren Thompson Senior Consultant, Scholefield Robinson Horticultural Services Pty Ltd PO Box 650, FULLARTON SA 5063 Phone: (08) 8373 2488 OTHER KEY PERSONNEL Dr Sandra McDougall Industry Leader (Vegetables), NSW Department of Primary Industries (NSW DPI) Vegetable Industry Centre, Yanco, PMB, YANCO NSW 2703 Phone: (02) 6951 2728
Gerard McEvilly Principal, Horticulture Supply Chain Services 29 Bingara Road, BEECROFT NSW 2119 Phone: (02) 9876 1627 ASSOCIATE PERSONNEL Natasha Wojcik, Manager, Marketing and Communications, Arris Pty Ltd Prof Rick Roush, Dean, Melbourne School of Land and Environment (University of Melbourne) Dr Prue McMichael, Principal Consultant, Scholefield Robinson Horticultural Services Pty Ltd Leanne Orr, Economist, NSW DPI Jim Kelly, Managing Director, Arris Pty Ltd Dr Jenny Ekman, Team Leader - Market Access, NSW DPI Bronwyn Walsh, Senior Horticulturist, Queensland Department of Employment, Economic Development & Innovation (DEEDI) PURPOSE OF THE PROJECT The purpose of the National Vegetable IPM Coordinator project was to plan, coordinate, monitor and support the development and adoption of best practice IPM technology. In the one-year pilot project, significant progress was made towards the following longer term aims that were stated in the tender brief: 1. Consolidate and coordinate IPM investment for the benefit of the Australian vegetable industry. 2. Enhance the opportunities for market access while consolidating profitability and sustainability within
the vegetable industry supply chains. 3. Develop IPM packages and tools for the vegetable industry (using results from the latest R&D) and
facilitate their uptake within industry. ACKNOWLEDGEMENTS This project has been supported by HAL using funds from the National Vegetable R&D Levy, matched by Australian Government funds. The project was managed as an integral part of the national Vegetable Industry Development Program (VIDP) and has been referred to as the IPM Sub-program of the VIDP. We acknowledge the input and support of the National Coordinators of the Vegetable Industry Development Program (VIDP) and personnel involved in the other sub-programs of the VIDP. DISCLAIMER Any recommendations contained in this publication do not necessarily represent current HAL policy. No person should act on the basis of the contents of this publication, whether as to matters of fact or opinion or other content, without first obtaining specific, independent professional advice in respect of the matters set out in this publication.
Horticulture Supply Chain Services
Planning, Strategy, Research, Programs, Review

Scholefield Robinson Horticultural Services Pty Ltd
Final Report : National Vegetable IPM Coordinator (Project VG09191), May 2011 Page ii
TABLE OF CONTENTS
Media Summary .......................................................................................................................................... iv
Executive Summary ......................................................................................................................................v
1 Introduction ......................................................................................................................................1 1.1 The Vegetable Industry Development Program (VIDP)........................................................1 1.2 Aims of the Integrated Pest Management (IPM) Sub-program..............................................2
2 Project Management.........................................................................................................................3 2.1 Tasks involved in Integration and Alignment with the VIDP and Finalisation
of the Work Plan ....................................................................................................................3 2.2 Tasks involved in Project Management, Communications and Milestone Reports ...............4 2.3 Final Approved Operating Plan for 2010/11..........................................................................4
3 Project Components – Activities, Outputs and Outcomes................................................................5 3.1 Benchmarking ........................................................................................................................5 3.2 Strategic Planning ................................................................................................................12 3.3 Western Flower Thrips (also referred to as Thrips and Tospoviruses) ................................14 3.4 Integrated Information Packages..........................................................................................16 3.5 Review of IPM and Chemical Access..................................................................................19 3.6 Pathology Program Extension..............................................................................................22 3.7 Tasks involved in Supporting the InnoVeg Sub-program....................................................23 3.8 Tasks associated with a Possible Follow-on Project ............................................................25 3.9 Roles and responsibilities of a future National Vegetable IPM Coordination project
or program............................................................................................................................26
4 Evaluation.......................................................................................................................................28
5 Recommendations ..........................................................................................................................29
6 Implications ....................................................................................................................................30
7 Acknowledgements ........................................................................................................................31
APPENDICES
“Benchmarking Vegetable IPM Adoption” Appendices
1. Literature Review and Analysis: IPM Definition, Current Adoption and Future Benchmarking Options..................................................................................................................................................32
2. Obtaining Benchmarking Data via Grower Surveys: Options, Guidelines and Standardised Survey Questions ..................................................................................................................................70
3. Assessing the Current Status of IPM Adoption via a Survey of Key Informants: Guidelines, Sampling Subsets, Options and Recommended Survey Method..........................................................93
4. Review of the Potential for Online Business Tools to be used for Capturing Benchmarking Data.......130
5. IPM Continuum for Australian Vegetable Crops (Draft)....................................................................152
6. Cost-benefit Analysis of IPM Adoption by NSW Lettuce Growers...................................................164
7. Business case for adoption of Integrated Pest Management (IPM) in lettuce ....................................190

Scholefield Robinson Horticultural Services Pty Ltd
Final Report : National Vegetable IPM Coordinator (Project VG09191), May 2011 Page iii
Other Appendices
8. Vegetable Integrated Crop Protection Research, Development & Extension (RD&E) Plan 2011-2015...................................................................................................................................201
Consisting of: a. an overarching Plan b. the Action Plan associated with the overarching Plan (in Appendix 1 of the document) c. an RD&E Program Plan for Thrips & Tospoviruses (in Appendix 2), and d. a partially developed IPM Adoption RD&E Program Plan (in Appendix 3)
9. Thrips & Tospovirus Resources (fact sheet).......................................................................................277
10. Integrated information “packages” to be scoped as part of a future IPM Coordination project or program ..............................................................................................................................284
11. Scope of proposed extension “package” for improved management of Thrips and Tospoviruses in vegetables .......................................................................................................................................289
12. Final Operating Plans for the IPM Sub-Program of the VIDP, 2009/10 and 2010/11 .......................295
PROJECT OUTPUTS PROVIDED TO HAL SEPARATELY
• Adobe In Design version of the strategic plan and two low resolution pdfs created from it, one without and one with a watermark stating “Work in Progress” (pdf with watermark supplied by e-mail to Peter Melville and all three files supplied to HAL via FTP site)
• Excel file containing appendices for the Thrips & Tospoviruses RD&E Program Plan (available online and also supplied to HAL via FTP site)
• Excel sheets for Lettuce and Celery Chemical-IPM database (supplied to HAL via FTP site)
• Excel sheets with details of extension resources “delivered” to the Knowledge Management Sub-program (supplied to HAL via FTP site)

Scholefield Robinson Horticultural Services Pty Ltd
Final Report : National Vegetable IPM Coordinator (Project VG09191), May 2011 Page iv
MEDIA SUMMARY
National Vegetable IPM Coordination project delivers significant results This one-year pilot project was part of the Vegetable Industry Development Program (VIDP) and was also referred to as the Integrated Pest Management (IPM) Sub-program of the VIDP.
Its purpose was to plan, coordinate, monitor and support the development and adoption of best practice IPM technology.
Five key 'components' were carried out by the project team, which consisted of people from the following organisations: • Scholefield Robinson Horticultural Services • NSW DPI • Horticulture Supply Chain Services • Arris • DEEDI (Queensland Government)
In addition, Prof Rick Roush, Dean of the Melbourne School of Land and Environment (University of Melbourne) provided high-level input for initial project development.
The deliverables included: • development of an approach for benchmarking the current level of adoption of IPM practices
and for monitoring adoption levels in the future; • development of an overarching Strategic Plan for Vegetable Integrated Crop Protection (ICP)
RD&E that encompasses all elements of the supply chain (from inputs to production to consumers) and covers all types of pests including insects, diseases, nematodes and weeds;
• providing resources and information to the Knowledge Management (KM) and InnoVeg Sub-programs of the VIDP on the control of western flower thrips (WFT) and tomato spotted wilt virus (TSWV) and development of a Thrips & Tospoviruses RD&E Program Plan that forms part of the Vegetable ICP RD&E Plan;
• providing KM with other relevant IPM information and resources and scoping the development of further high-priority IPM packages; and
• working with the HAL Minor Use Coordinator and the HAL Pesticide Regulation Coordinator to develop a pilot, searchable database covering chemical and non-chemical options for managing pests of field lettuce and celery.
The project has made significant progress by developing an integrated framework for the future planning and management of IPM RD&E activity. It has also made significant breakthroughs in enabling growers to access the wealth of IPM extension material and in planning future benchmarking activities to monitor IPM adoption rates. None of this would have been possible without the valuable input of many growers, researchers and other service providers. It is expected that many recommendations from this pilot project will be advanced by the VIDP for the betterment of the Australian vegetable industry. A key recommendation is to fund a new phase of the project so there will continue to be national coordination of efforts towards the development and adoption of best practice IPM technology.

Scholefield Robinson Horticultural Services Pty Ltd
Final Report : National Vegetable IPM Coordinator (Project VG09191), May 2011 Page v
EXECUTIVE SUMMARY
The National Vegetable IPM Coordination Project was initially approved as a one-year pilot project and was managed as an integral part of the Vegetable Industry Development Program (VIDP). The project was also referred to as the Integrated Pest Management (IPM) Sub-program, one of nine sub-programs that were part of the VIDP in 2010/11.
The purpose of the project was to plan, coordinate, monitor and support the development and adoption of best practice IPM technology.
Five key 'components' were carried out by the project team, which consisted of people from five different organisations, as follows: • Scholefield Robinson Horticultural Services Pty Ltd (Key contact: Lauren Thompson –
Project Leader) • NSW Department of Primary Industries (Key contact: Sandra McDougall – Entomology and
IPM expert) • Horticulture Supply Chain Services (Gerard McEvilly – Strategic planning and supply chain
management expert) • Arris Pty Ltd (Key contact: Natasha Wojcik – Marketing and communications specialist) • Queensland Department of Employment, Economic Development and Innovation (Key
contact: Bronwyn Walsh – Senior Horticulturist) In addition, Prof Rick Roush, Dean of the Melbourne School of Land and Environment (University of Melbourne) provided high-level input for initial and ongoing project development.
The deliverables of the one-year project included: • development of an approach for benchmarking the current level of adoption of IPM practices
and for monitoring levels of adoption in the future; • development of an overarching Strategic Plan for Vegetable Integrated Crop Protection
RD&E that encompasses all elements of the supply chain (from inputs to production to consumers) and covers all pest types including insects, mites, diseases, nematodes, weeds and vertebrate pests as well as soil health and postharvest disinfestation;
• providing resources and information to the Knowledge Management and InnoVeg Sub-programs of the VIDP on the control of western flower thrips (WFT) and tomato spotted wilt virus (TSWV) and development of a Thrips & Tospoviruses RD&E Program Plan that forms part of the Vegetable Integrated Crop Protection RD&E Plan;
• providing the Knowledge Management Sub-Program with other relevant IPM information and resources and scoping the development of further high-priority IPM packages; and
• working with the HAL Minor Use Coordinator and the HAL Pesticide Regulation Coordinator to develop a pilot, searchable database covering chemical and non-chemical options for managing pests of field lettuce and celery (including insects and mites, diseases and weeds). It will be functioning within the secure area of the AUSVEG website in the near future.
A brief summary of the outputs and outcomes achieved against each deliverable is provided below.
Benchmarking
Five distinct but interrelated activities were undertaken within this component to lay the foundations for a potential benchmarking IPM adoption exercise by the vegetable industry. The

Scholefield Robinson Horticultural Services Pty Ltd
Final Report : National Vegetable IPM Coordinator (Project VG09191), May 2011 Page vi
outputs (reports) associated with these five activities are in Appendices 1 - 5 of this Final Report and have the following titles: 1. Literature Review and Analysis: IPM Definition, Current Adoption and Future
Benchmarking Options 2. Obtaining Benchmarking Data via Grower Surveys: Options, Guidelines and Standardised
Survey Questions 3. Assessing the Current Status of IPM Adoption via a Survey of Key Informants: Guidelines,
Sampling Subsets, Options and Recommended Survey Method 4. Review of the Potential for Online Business Tools to be used for Capturing Benchmarking
Data 5. IPM Continuum for Australian Vegetable Crops (Draft)
The first four comprehensive reports contain recommendations and options for the next steps to be taken to progress a benchmarking initiative. The IPM Continuum underpins the next steps. It requires further work including development of a scoring system.
A cost-benefit analysis of IPM adoption by NSW lettuce growers was also conducted (Appendix 7), showing that it is financially beneficial for lettuce growers to adopt IPM. There are additional, non-financial benefits from adoption of IPM and these are included along with the financial benefits in a ‘business case’ for adoption of IPM in lettuce. The business case document is in Appendix 7 and it is likely it will be turned into a fact sheet by the InnoVeg Sub-program for distribution to vegetable industry members. Much of the information is relevant to other vegetable crops for which IPM systems are well developed.
Overall recommendations from this component include funding an IPM Benchmarking project/officer to coordinate:
1. development of a benchmarking plan drawing on the report in the Benchmarking section of this Final Report and the associated appendices;
2. further development of the IPM continuum concept with codified practices and a scoring system;
3. discussions with EnviroVeg and FreshCare Environmental intellectual property holders about including the IPM continuum into their self assessments or external audits; and
4. work with the agribusiness software owners/developers to decide on suitable IPM metrics to be incorporated into business management tools.
If the vegetable industry adopts the benchmarking recommendations and engages in regular monitoring of the uptake of IPM practices in a standardised way, the findings will help the industry with RD&E planning and with managing the image of the industry. Ultimately benchmarking can help drive adoption and continual improvement of crop protection practices in the Australian vegetable industry.
Strategic Planning
The output from this component is the 'overarching' portion of the Vegetable Integrated Crop Protection RD&E Plan, 2011-2015. As a result of consultations with stakeholders and a review of background documents, four high-level Objectives were established to support an overall Vision of “A vegetable industry effectively addressing those production, market access and consumer issues related to pests* and their management (*where “pests” refers to insects, diseases, weeds, vertebrate pests etc)”.

Scholefield Robinson Horticultural Services Pty Ltd
Final Report : National Vegetable IPM Coordinator (Project VG09191), May 2011 Page vii
The high-level Objectives in the Plan are as follows: 1. Information is readily available 2. There are clear roles and responsibilities in addressing issues 3. Market impacts are monitored and addressed 4. Short, medium and long-term RD&E needs are addressed through a Program Approach
Strategies and Actions have been developed to support achievement of each of the Objectives. Many of the actions relate to the roles and responsibilities of a future National Vegetable IPM Coordination project or program and they have been summarised in Section 3.9 of this Final Report.
In its final form, it is envisaged that this Plan will have nine appended RD&E Program Plans covering the key pest types and other aspects of crop protection RD&E. In its present form it contains the first fully developed Program Plan, which is for Thrips and Tospoviruses (see discussion in the next section). The overarching Plan and the Program Plan for Thrips and Tospoviruses have been approved by HAL and were recently provided to the consultants who are undertaking the development of the Industry Investment Plan for the vegetable industry. It is expected that the next steps for the Vegetable Integrated Crop Protection RD&E Plan, including development of the eight remaining Program Plans, will be clearer once the Industry Investment Plan is finalised (in late 2011).
Thrips & Tospoviruses
A major part of this component was the development of the first RD&E “Program Plan”, which was intended to act as a model for development of the remaining eight program plans. Once completed, these program plans will sit under the overarching strategic plan. Previous RD&E projects, literature and extension resources related to thrips and tospoviruses were reviewed and project recommendations were captured. A draft version of the plan was circulated and feedback was incorporated, leading to finalisation. This plan forms Appendix 2 of the Vegetable Integrated Crop Protection RD&E Plan. Recommendations are made for Extension, Development and Research priorities; along with a suggested set of “foundation projects”.
The second part of this component involved reviewing information resources relating to thrips and tospoviruses and producing a short summary with web links or information on how they could be obtained. This information was “delivered” to the Knowledge Management (KM) Sub-program of the VIDP in the form of an Excel spreadsheet. Some resources that only existed in hard copy were provided as pdfs or as actual hard copies. These resources are now accessible via the Technical Insights search engine within the secure area of the AUSVEG website.
The third part of this component involved development of a fact sheet to an ‘electronic version’ stage. The Thrips & Tospovirus Resources document highlights key points about the biology and management of these pests and provides information about key existing extension resources including how to obtain them. A pdf of this fact sheet has been provided to the KM and InnoVeg Sub-programs and also to the coordinator of the Communications Support Sub-program with the request that it be hosted in the public area of the AUSVEG website.
Integrated Information Packages
The initial part of this component involved providing details about IPM related information resources to KM in Excel files. This information was then uploaded into a knowledge management system in the secure area of the AUSVEG website. For each resource, short and long summaries were written, ensuring appropriate “key words” were contained in the long summary. The initial “delivery” to KM was of resources that could be accessed via web

Scholefield Robinson Horticultural Services Pty Ltd
Final Report : National Vegetable IPM Coordinator (Project VG09191), May 2011 Page viii
addresses (URLs) and included approximately 40 resources that have specific relevance for the management of WFT, TSWV and other thrips and tospoviruses, and 80 resources related to the management of other pests. Other fact sheet resources were extracted from final reports as pdfs, and along with new fact sheets were supplied to KM with appropriate summaries etc for hosting on the AUSVEG website.
The second part of this component involved ‘scoping’ high-priority information resources to be developed in 2010/11 and developing a list of information “packages” to be scoped as part of a future National Vegetable IPM Coordination Project. The 2010/11 scoping exercise led to the production of five fact sheets covering “mega pests” that many vegetable growers have to deal with, emphasising an Integrated Crop Protection (ICP) approach to managing these pests and presenting grower case studies where possible.
The third part of this component involved scoping an extension project to create awareness and adoption of recommended management practices for Thrips and Tospoviruses in the regions where this pest-disease complex is causing serious losses. The recommended approach includes running workshops in these regions. The scoping document was recently distributed to InnoVeg, the VIDP National Coordinators and relevant HAL personnel with the recommendation that the next steps to turn this into a full proposal be undertaken by InnoVeg.
Chemical-IPM Database
This component has involved the IPM Sub-program team working with Excel spreadsheets that contain information about current chemical registrations and potential new chemical registrations for field lettuce and celery. This data was collated in 2009 as part of the Strategic Agrichemical Review Program (SARP) carried out by Peter Dal Santo, the HAL Minor Use Coordinator. There is additional information on the potential ‘IPM-fit’ of each chemical including its impact on beneficial organisms and its Environmental Impact Quotient. Some of the information about chemical registration or permit status of the chemicals had to be modified, as there had already been some changes since the original data was collated for the SARP project. The IPM team has added information to the Excel spreadsheets about the pests including how they are transmitted, their natural enemies, alternate hosts for the pests and non-chemical management options.
The modified Excel files have been forwarded to the programming provider for the AUSVEG website to enable development of a pilot, searchable database covering chemical and non-chemical options for managing pests of field lettuce and celery (i.e. invertebrate pests, weeds and diseases) to be made available within the secure area of the AUSVEG website. It was not yet functional when the project ended (mid-May 2011), but the IPM Sub-program team will continue to liaise with the programmers to develop the functional specification and sign off on each stage until the database is fully functional within the AUSVEG website.
Overall Outcome
The National Vegetable IPM Coordination Project has made significant progress by developing an integrated framework for the future planning and management of IPM RD&E activity. A completed plan for RD&E activity related to the management of thrips and tospoviruses has been incorporated into this framework. The project has also made significant breakthroughs in enabling growers and service providers to access the wealth of IPM extension material and in planning future benchmarking activities to monitor IPM adoption levels. None of this would have been possible without the valuable input of many growers, researchers and other service providers. It is expected that many recommendations from this pilot project will be advanced by the VIDP for the betterment of the Australian vegetable industry. A key recommendation is to fund a new phase of the project so there will continue to be national coordination of efforts towards the development and adoption of best practice IPM technology.

Scholefield Robinson Horticultural Services Pty Ltd
Final Report : National Vegetable IPM Coordinator (Project VG09191), May 2011 Page 1
1 INTRODUCTION
Establishment of a National Vegetable Integrated Pest Management (IPM) Coordinator Project was one of the recommendations within the Vegetable IPM “Stocktake” report (VG05043), which was further developed by Brad Wells as the then HAL manager for Plant Health. The project was initially developed and tendered as a four-year project and was then revised and re-tendered in January 2010 as a single year project within the Vegetable Industry Development Program (VIDP). A team was put together with the skills and experience to carry out a very complex brief and a successful tender, involving Scholefield Robinson Horticultural Services as the lead agency and NSW DPI, Horticulture Supply Chain Services and Arris Pty Ltd as subcontractors, was submitted in February 2010. Prof Rick Roush, Dean of the Melbourne School of Land and Environment (University of Melbourne) was also included in the submission in the role of providing high-level input for initial and ongoing project development.
The project commenced on 16th April 2010 and the scope of the project was finalised as part of a Project Inception Meeting on 7th May 2010. Midway through the project, changes to the ‘Operating Plan’ were negotiated with HAL via the National Coordinators of the VIDP and a new subcontractor, the Queensland Department of Employment, Economic Development & Innovation (DEEDI) was added to the team to carry out part of the Benchmarking component.
1.1 The Vegetable Industry Development Program (VIDP) The Vegetable Industry Development Program (VIDP) was devised to help growers build their businesses and remain competitive in an increasingly market driven and globalised industry.
Overall, the role of the VIDP is to assist the industry with achieving the aim of its strategic plan, VegVision 2020 – to double the 2006 value of fresh, processed and packaged vegetables in real terms.
Industry reviews had highlighted the need for an industry development program that supports vegetable growers and those in the supply chain to make better business decisions. These reviews also highlighted that growers needed a centralised program that would increase awareness about consumers and competitors in target markets, improve cost effectiveness, and develop a culture of continual innovation and collaboration within the industry.
The seven key objectives of the VIDP program are: 1. A new generation of leaders are active in the industry 2. Decision making in the industry is increasingly market driven 3. Industry is more informed and understands the benefits and the qualities of Australian
vegetable products, so as to optimise their path to market 4. More growers are actively seeking to evolve their business models to meet new challenges
posed by the market 5. Findings and outputs from research are increasingly being applied by industry stakeholders
in decision making 6. Industry is effectively using findings and outputs from research to formulate policy and
manage the image of the industry 7. Levy payers are better able to provide feedback into the National R&D system

Scholefield Robinson Horticultural Services Pty Ltd
Final Report : National Vegetable IPM Coordinator (Project VG09191), May 2011 Page 2
There are nine sub-programs within the VIDP, which will contribute to achieving the program’s outcomes. Figure 1 is a schematic of the program’s structure, showing the nine sub-programs and the service providers contracted to carry them out. The program is funded to June 2012, with the exception of the IPM Sub-program, i.e. the National Vegetable IPM Coordinator project, which was initially funded as a one-year pilot project.
Figure 1 : The structure of the Vegetable Industry Development Program (VIDP)
1.2 Aims of the Integrated Pest Management (IPM) Sub-program As indicated above, the National Vegetable IPM Coordinator project was also referred to as the IPM Sub-program of the VIDP. The purpose of the project was to plan, coordinate, monitor and support the development and adoption of best practice IPM technology. In the one-year pilot project, significant progress was made towards the following longer term aims that were stated in the tender brief: 1. Consolidate and coordinate IPM investment for the benefit of the Australian vegetable
industry. 2. Enhance the opportunities for market access while consolidating profitability and
sustainability within the vegetable industry supply chains. 3. Develop IPM packages and tools for the vegetable industry (using results from the latest
R&D) and facilitate their uptake within industry.
In working towards these aims, the IPM Sub-program has mainly contributed to achieving objectives 2, 5, 6 and 7 of the VIDP (referred to in Section 1.1 above).

Scholefield Robinson Horticultural Services Pty Ltd
Final Report : National Vegetable IPM Coordinator (Project VG09191), May 2011 Page 3
2 PROJECT MANAGEMENT
This project consisted of five ‘key components’ and other components and tasks related to project management, communications, integration with other sub-programs of the VIDP including the National Coordinators, alignment with wider VIDP planning processes and specific liaison with and provision of support to the InnoVeg Sub-program. The methodology, activities, outputs and outcomes for the components and tasks are discussed in the following sections. To set the scene, an important subset of tasks is initially discussed.
2.1 Tasks involved in Integration and Alignment with the VIDP and Finalisation of the Work Plan
In order to function effectively as part of the VIDP, it was necessary to gain an understanding of the policies and procedures of the VIDP and develop relationships with the National Coordinators (NCs) and the coordinators of the other VIDP sub-programs. The relevant subset of tasks and the milestones involved are outlined in Table 1.
Table 1 : Milestones involved in Integration and Alignment with the VIDP and Finalisation of the Work Plan
Integrate with other Sub-programs & National Coordinators (NCs) and Align with wider VIDP planning processes
Description Milestone No. Project inception meeting held and work plan finalised [Due on 7/05/10] 102.1.1 Communication channels established with HAL, VIDP NCs, VIDP Sub-program coordinators and IPM Working Group (a HAL/AUSVEG committee) [Due on 28/05/10]
102.1.2
Attend VIDP meeting [on 28/05/10 in association with AUSVEG Convention] 102.1.3 Monthly conference call (VIDP meeting) [on 17/06/10] 102.1.4 Operating Plan to 30th June 2010 signed off by HAL and NCs and appended to the contract as a schedule (as Milestone 103 criteria) [Due on 30/06/10]
102.2 & 102.3
Monthly conference calls & face-to-face meeting [Jul-Nov 2010] 104.2.1 to 104.2.7 Monthly conference calls [Jan-May 2011] 190.4.1 to 190.4.5
In our proposal to deliver this project, it was made clear that a team had been brought together that had the expertise, experience and capacity to ensure that the outputs and outcomes could be delivered. When the proposal was submitted it was understood that each of the components of the tender were potentially full projects in their own right and that a number of options or methods for undertaking each component had been put forward by the project team. Our proposed approach included convening an Inception Meeting/Workshop with key members of the IPM Coordination team, HAL management and VIDP Coordinators (particularly those involved in National Program Coordination and the InnoVeg and Knowledge Management Sub-Programs) to negotiate and agree on the actual methodology and tasks that would be followed in this 12-month pilot project.
The first face-to-face meeting of the project team was held on 6th May 2010 and the Project Inception Meeting was held on 7th May 2010 in Adelaide SA. The inception meeting enabled the project team, HAL and the VIDP National Coordinators (NCs) to refine the project details and confirm the operating plan.

Scholefield Robinson Horticultural Services Pty Ltd
Final Report : National Vegetable IPM Coordinator (Project VG09191), May 2011 Page 4
2.2 Tasks involved in Project Management, Communications and Milestone Reports
The milestones associated with this subset of tasks are outlined in Table 2.
Table 2 : Milestones involved in Project Management, Communications and Milestone Reports
Project Management & Communications Description Milestone No.
Sub-contractor contracts, policies and procedures understood; team meetings convened 102.2.7 Participation in VIDP meetings, VIDP monthly report developed, Milestone 102 report submitted 102.2.8 Communications initiated via press releases, magazine articles, information on Google Groups site etc 102.2.9 Team meetings held and industry updated via articles, press releases etc 104.1.16
& 190.1.14
Milestone Reports Description Milestone No.
Report on integration with other sub-programs and program co-ordination, Operating Plan and key outcomes to 30th June [Due on 30/06/10]
102
Report against operating plan to 30th June (report to be approved by NCs prior to submission to HAL) [Due on 31/07/10]
103
Report against operating plan for first 6 months of 2010/11 (report to be approved by NCs prior to submission to HAL) [ Due on 31/01/11]
104.3
Project management tasks have included preparing and finalising contracts with sub-contractors, convening team meetings as required, participating in VIDP meetings and attending to “actions” from these meetings. Also, on a monthly basis the IPM Sub-program has prepared information for inclusion in the VIDP-IAC report and has provided an updated version of the project’s Operating Plan (OP), indicating whether due dates of milestones have been met or the reason for completion being postponed. In addition, three HAL Milestone Reports have been prepared and submitted to the VIDP NCs for approval before being submitted to HAL. An updated OP has also been required at the time of submission of Milestone Reports.
2.3 Final Approved Operating Plan for 2010/11 Prior to submission of the Milestone Report covering the first six months of 2010/11, the Project Manager engaged in discussions with the VIDP NCs to request variations to some of the remaining milestones of the one-year project. A varied OP was approved by HAL, including a four-week extension (to 13th May 2011) to enable milestones to be completed to the level expected by all parties.
In the remainder of this report, the wording of the task or output/outcome associated with each of the milestone numbers is in line with the final approved OPs for 2009/10 and 2010/11.
A document containing the final versions of these two OPs is attached at the back of this report (in Appendix 12) for easy access.

Scholefield Robinson Horticultural Services Pty Ltd
Final Report : National Vegetable IPM Coordinator (Project VG09191), May 2011 Page 5
3 PROJECT COMPONENTS – ACTIVITIES, OUTPUTS AND OUTCOMES
The accomplishments discussed in this Final Report and the outputs contained in the Appendices are the result of a combined team effort. In all cases more than one team member was involved in ensuring that tasks were carried out in a professional manner and that the outputs were completed to the level expected by Scholefield Robinson Horticultural Services, the VIDP NCs and HAL.
The team members who had primary responsibility for technical content, analysis and recommendations are acknowledged where appropriate in this section of the report and on the appendix cover sheets.
The overarching management of VIDP Sub-programs by the NCs has involved monitoring of progress towards meeting the milestones in the OPs. The IPM Sub-program was complex and there were multiple milestones. The style that has been chosen for this section (Section 3) of the report uses the relevant milestone descriptions and numbers at the start of each of the sub-sections below to outline the methodology. This style also enables HAL and others to track performance against the agreed milestones.
3.1 Benchmarking Sandra McDougall had primary responsibility for the Benchmarking component. However, several team members were involved in the investigations and their contributions are acknowledged on the cover pages of Appendices 1 - 7. The method used to fulfil this component is outlined in Table 3.
Table 3 : Milestones involved in the Benchmarking component
Description Milestone No.
Team members involved and outcomes clarified 102.2.2
Draft guidelines developed for IPM project leaders re capture of baseline data within projects 104.1.9
Consultation with project leaders on draft guidelines and guidelines finalised 104.1.11
Definition of IPM; assess current adoption of IPM practices (via literature review); recommended future benchmarking methods
104.1.10
Design of a Key Informants survey to validate findings from 104.1.10 and collect additional baseline information
190.1.5
Evaluation of on-line tool(s) for measuring practice change completed 190.1.6
Cost:benefit analysis of Lettuce IPM adoption by NSW growers and a ‘business case’ for adoption of IPM in lettuce
190.1.7
Five distinct but interrelated activities were undertaken within this component to lay the foundations for a potential benchmarking IPM adoption exercise by the vegetable industry. The outputs associated with these five activities are in the following appendices:
• Appendix 1 - Literature Review and Analysis: IPM Definition, Current Adoption and Future Benchmarking Options
• Appendix 2 - Obtaining Benchmarking Data via Grower Surveys: Options, Guidelines and Standardised Survey Questions

Scholefield Robinson Horticultural Services Pty Ltd
Final Report : National Vegetable IPM Coordinator (Project VG09191), May 2011 Page 6
• Appendix 3 - Assessing the Current Status of IPM Adoption via a Survey of Key Informants • Appendix 4 - Review of the Potential for Online Business Tools to be used for Capturing
Benchmarking Data • Appendix 5 - IPM Continuum for Australian Vegetable Crops (Draft)
The comprehensive reports in the first four appendices contain recommendations and options for the next steps to be taken to progress a benchmarking initiative. The IPM Continuum in Appendix 5 underpins the next steps recommended in those reports. The relationship between the reports and the IPM Continuum is shown in Figure 2.
In addition, a cost-benefit analysis (CBA) of IPM adoption by NSW lettuce growers was produced and a ‘business case’ for adoption of IPM in lettuce was developed based on the CBA. The outputs from these activities are in Appendices 6 and 7.
Figure 2 : Structure of the Benchmarking Vegetable IPM adoption report with Appendices
3.1.1 Benchmarking Introduction Benchmarking and Integrated Pest Management (IPM) are both terms with a wide variety of connotations and definitions, which can lead to confusion and misunderstanding when they are not clearly defined. Similarly the Australian vegetable industry is diverse and highly fragmented. As a result, the apparently simple task of benchmarking IPM adoption in the Australian vegetable industry becomes a complex task in the absence of clear definitions and goals.
In 2009, the vegetable industry was valued at $3.1 billion annually1. Close to $40m was spent on vegetable crop protection RD&E between 2001-2009, which was approximately 50% of the total investment in vegetable RD&E and included the Minor Use program as well as expenditure on
1 Summary of ABS data 2010 – www.ausveg.com.au
Appendix 5 IPM Continuum
Benchmarking Vegetable IPM
Adoption Summary and
Recommendations within VG09191 Final Report
Appendix 1 Literature Review and Analysis: IPM Definition, Current Adoption & Future Benchmarking
Options
Appendix 2 Obtaining Benchmarking Data via Grower Surveys: Options, Guidelines and Standardised Survey Questions
Appendix 3Assessing Current Status of IPM Adoption via a Survey of Key Informants
Appendix 4Review of the
Potential for Online Business Tools to
be used for Capturing
Benchmarking Data
Appendices 6 & 7Cost‐benefit Analysis of IPM Adoption by NSW Lettuce Growers & ‘Business case’ for adoption of IPM in
lettuce

Scholefield Robinson Horticultural Services Pty Ltd
Final Report : National Vegetable IPM Coordinator (Project VG09191), May 2011 Page 7
invertebrate pests and diseases as well as a small amount on weeds2. Only 14% of the RD&E projects were specifically defined as IPM projects although some information from all crop protection projects can inform an integrated approach to crop protection.
In 2010, the vegetable industry indicated its desire to know the level of adoption of IPM in vegetable crops in Australia as part of taking stock of progress towards short and long term goals; a practice common to any progressive or growing innovative industry, business or organisation and usually done at a relatively small cost in comparison to the level of investment.
3.1.2 Benchmarking Methods The project team used four avenues to contribute to progressing the benchmarking of IPM adoption in the Australian vegetable industry. The first was a literature review of benchmarking IPM adoption both in Australia and overseas to answer the question, “What has been done before?” (Appendix 1). The second avenue was synthesising questions used in previous IPM project evaluations into a single unified set of questions that could be used in future projects (Appendix 2). Thirdly, a survey of key informants was developed to provide data covering a commodity or region, thereby reducing the number of surveys required (Appendix 3). A fourth activity was to investigate whether IPM benchmarking data could be mined from business analysis software tools (Appendix 4). An outcome of these four activities was the development of the IPM continuum concept for Australian vegetables (Appendix 5).
A separate set of activities involved refocussing a cost-benefit analysis of NSW DPI’s investment into lettuce IPM research to look at the cost-benefit of adopting IPM at the level of a farming business involved in growing lettuce (Appendix 6). This information was then used to prepare a ‘business case’ for adoption of IPM in lettuce (Appendix 7).
Different members of the IPM Coordination team conducted the separate reviews and made recommendations. This report draws the findings together and makes overall recommendations on benchmarking the adoption of IPM in the Australian vegetable industry.
3.1.3 Benchmarking Reports In the absence of a clear benchmarking goal or defined benchmarking purpose, a broad approach to benchmarking IPM adoption was taken. Each report in this series dealt with a different component of a potential approach to benchmarking and within each report there are several recommendations for taking the particular topic forward as part of progressing the benchmarking of IPM adoption in the Australian vegetable industry. The recommendations from each are as follows: • In the literature review (Appendix 1) there are three recommendations for establishing the
capacity for benchmarking and on-going reporting on the level of IPM adoption in the Australian vegetable industry: 1. defining IPM adoption goals; 2. setting benchmarking goals and levels; and 3. establishing benchmarking methods linked to the goals, including development of the
IPM continuum concept. Under each recommendation, options are provided that correspond to two levels of commitment.
• Four delivery options are presented for the process of undertaking the Vegetable Grower Benchmarking IPM Adoption survey (Appendix 2): 1. offer it as an optional activity within crop protection RD&E projects;
2 Personal Communication from HAL program manager for Entomology, IPM and Chemicals, 2010

Scholefield Robinson Horticultural Services Pty Ltd
Final Report : National Vegetable IPM Coordinator (Project VG09191), May 2011 Page 8
2. make it a required activity within crop protection RD&E projects; 3. conduct it as part of a separate benchmarking project that coordinates with crop
protection RD&E projects; or 4. commission a separate benchmarking project that may or may not include coordination
with RD&E projects. • Options similar to those presented in Appendix 2 are presented for managing the delivery of
a Survey of Key Informants (Appendix 3). • With respect to the potential for mining data from existing business management software
(Appendix 4) it is recommended that the systems be harmonised. Common IPM metrics should be agreed upon in consultation with an IPM specialist and the software owners/developers. Agreement should also be reached on allowing the data to be pooled for analysis. It is further recommended that the Australian vegetable industry utilise the potential for benchmarking to improve performance by using semi-quantitative benchmarking, eg a scoring system using the IPM continuum concept as a basis or development of a process benchmarking approach.
The cost-benefit analysis of IPM adoption using data from lettuce production in NSW as a case study showed the economic benefits of adopting IPM practices (Appendix 6). A similar analysis is not automatically recommended for other vegetable crops, as it requires detailed information about grower practices that is not readily available and most growers are not comfortable with handing over the data, nor are they willing to make the time to collate it. Best guesses, past monitoring records and research results were used in this case for many of the estimates and this information would only be available within a small number of previous projects. Generating this data from scratch would be expensive and if it were undertaken as a stand-alone activity it may not be possible develop the trust with growers to the point where they would pass over sensitive financial and chemical information. However, if the data is available through other means then a rigorous economic analysis is a powerful tool to evaluate the costs and benefits of different practices.
There are additional, non-financial benefits from adoption of IPM and these have been included along with the financial benefits in a ‘business case’ for adoption of IPM in lettuce. The business case document is in Appendix 7 and it is likely it will be turned into a fact sheet by the InnoVeg Sub-program for distribution to vegetable industry members. Much of the information is relevant to other vegetable crops for which IPM systems are well developed.
A synthesis of the recommendations for progressing the benchmarking of IPM adoption in vegetables is provided at the end of the following discussion.
3.1.4 Benchmarking Discussion The IPM adoption literature review found that a variety of approaches were used for benchmarking IPM adoption in Australia and internationally. The different approaches reflect the different goals and systems being benchmarked. The approaches included in the appendices have all been used to benchmark IPM adoption. The IPM continuum concept has not been used in Australia for benchmarking before and it offers an opportunity to avoid the unhelpful debate about what is real IPM and recognises progressive improvements as more crop protection practices are integrated into a grower’s pest management strategy. It also has the potential to form the basis of a variety of benchmarking activities by providing a common language and understanding under the general definition of IPM.
The grower and key informant surveys in Appendix 2 and Appendix 3 are comprehensive and largely ready-to-go; modifications may be needed as the IPM continuum concept develops. If the surveys are conducted and generate enough responses covering an appropriate subset of growers then we should be able to answer a number of questions along the lines of what proportion of growers or area of crop is covered by IPM practices graded along the IPM continuum. The

Scholefield Robinson Horticultural Services Pty Ltd
Final Report : National Vegetable IPM Coordinator (Project VG09191), May 2011 Page 9
grower survey covers a broad range of crop protection practices, and responses to this survey would be valuable information for the detailed planning and delivery of crop protection projects.
Confidence in the validity of these surveys to meet a defined benchmarking goal will lie in the selection of subsets of the grower population to be surveyed. For example, if the benchmarking goal is to evaluate effectiveness of investment in IPM RD&E to increase IPM adoption then two survey populations need to be covered - growers of crops that have had significant IPM RD&E investment and growers who have had reasonable exposure to IPM RD&E initiatives (eg regional extension programs); versus growers of crops that have not had IPM RD&E investment and growers who have not had exposure to IPM RD&E initiatives. The results from the two survey populations on their IPM adoption can be compared to complete the evaluation.
If the surveys are included within IPM projects and not managed or coordinated by a single benchmarking project, then there are issues around how the data is centrally collated, stored, pooled and analysed over time, i.e. who has responsibility for the data? It is highly recommended that the surveys be managed within a single benchmarking project, which may coordinate with other projects to conduct surveys with a specific subset of growers or key informants to maximise the information that can be drawn from the surveys. It is further recommended that this benchmarking exercise be designed to assist in planning and evaluating the vegetable industry’s IPM RD&E investment as well as for publicising the food safety and environmental stewardship of the vegetable industry.
In the long term the Vegetable Industry should look towards a comprehensive IPM benchmarking component within a business analysis tool for use by vegetable businesses. It should align with the IPM continuum concept, integrate with the financial accounting components of the tool, and be connected via the internet to allow for pooling of data with appropriate safeguards to prevent the identification of any individual business. If such a tool were used by the majority of growers, the vegetable industry would have a powerful tool to pool and analyse IPM adoption data to meet a wide range of benchmarking goals from the individual business level to the industry level. The tool itself would be useful to the growers in structuring their thinking about improvements to their crop protection practices and if the tool generated reports illustrating to the growers where they fit in relation to ‘industry best practice’, it is likely they would be motivated to improve. If the tool could conduct partial analysis of gross margins then growers could look at their actual costs associated with crop protection and how these costs change as they change their approach. If the tool had a scenario planning component they could make predictions about the impact on their finances of a change in practice, such as paying a crop scout to monitor their crops.
The first step in benchmarking IPM adoption is setting a goal for the adoption of IPM and defining the purpose of the benchmarking exercise. The second step is the further development of the IPM continuum concept.
Once data “ownership” issues are successfully negotiated, the first step towards an IPM module in a business analysis tool or for a dedicated IPM benchmarking software tool is getting an IPM specialist to work with the current business analysis tool developers to agree on IPM adoption metrics to be incorporated into their software and common download parameters. After a couple of years the programs should be re-evaluated for usefulness for benchmarking IPM adoption, primarily with regard to tracking chemical use patterns as well as an assessment of whether there has been greater uptake of business analysis tools by growers. It will be worth tracking use of the greenhouse business analysis tool by growers, as it will be part of an overall extension methodology and will include helping growers (many of whom have little computer experience) with registering and entering data.

Scholefield Robinson Horticultural Services Pty Ltd
Final Report : National Vegetable IPM Coordinator (Project VG09191), May 2011 Page 10
Development of crop protection modules within the software that incorporate more of the preventative practices (not just the chemical use components that are currently captured) will require incorporation of the practices that are included in the IPM continuum concept, eg using pest-free seed/plant material, using biofumigant crops and trap crops, eliminating alternate hosts and implementing good sanitation practices. These practices need to be agreed to broadly by crop protection experts for all pests and a scoring or grading mechanism will have to also be developed and agreed. How the practices are individually scored may vary between crops depending on key pests and their management needs; but there should be an attempt to make the scoring as generic and objective as possible so that it can be applied as widely as possible across vegetables.
The current downside to using business analysis software tools is the small extent to which they are currently being used by growers. For a benchmarking process to be representative of any segment of the vegetable industry it needs to representative of the target population and not skewed towards early adopters. However, there are benefits from using electronic records for a variety of activities and the “pressure” to use them is increasing, not decreasing. Therefore, it is likely that use of these tools will move from only the early adopters to include the majority of growers in the coming years.
Collecting data for cost-benefit analyses on crop protection practices is very time-consuming and subject to a lot of error without having “high quality” quantitative data from a broad number of growers. Unless there is a pressing need, collection of such data is not likely to be a high priority for funding. However it could be a very useful by-product of the incorporation of IPM metrics and preventative practices into business analysis tools.
3.1.5 Benchmarking Recommendations On the assumption that:
1. the revised Vegetable Industry Strategic plan sets a goal towards adopting IPM; 2. the vegetable industry is committed to a strategic approach to funding, selecting and
managing IPM projects into the future and substantially adopts the Vegetable Integrated Crop Protection RD&E Strategic Plan; and
3. that a significant (>20%) portion of the vegetable levy is committed to crop protection RD&E projects
then we recommend funding an IPM Benchmarking project/officer that has the support of the vegetable IAC to consult and set goals on the purpose of the benchmarking activity (Figure 3).
The officer would coordinate: 1. development of a benchmarking plan based on the benchmarking goals set, and draw on
this benchmarking report and the associated appendices to choose a suitable survey method and suitable survey population;
2. input into developing the IPM continuum concept with codified practices and a scoring system that can be incorporated into benchmarking surveys or a process benchmarking software tool;
3. discussions with EnviroVeg and FreshCare Environmental intellectual property holders about the potential of integrating the IPM continuum or a variation into their self assessments or external audits; and
4. work with the agribusiness software owners/developers to negotiate data “ownership” issues, decide on suitable IPM metrics to be incorporated into business management tools using components of the IPM continuum and agree on a process for exporting the pooled data for analysis.

Scholefield Robinson Horticultural Services Pty Ltd
Final Report : National Vegetable IPM Coordinator (Project VG09191), May 2011 Page 11
Figure 3 : Decision hierarchy for progressing the benchmarking of IPM adoption
3.1.6 Benchmarking Conclusion Where to go from here depends on the commitment to IPM by the vegetable industry, whether the future investment is likely to be significant or there are other more pressing priorities and whether the industry is committed to a strategic approach to RD&E investment. By adopting the benchmarking recommendations the industry will inform targeted investment and tracking of progress in crop protection RD&E projects; highlight emerging crop protection issues; and provide data to support the vegetable industry’s clean green image as well as highlight potential risk areas in chemical use that may impact on the image of the industry from a consumer perspective. Ultimately benchmarking can help drive adoption and continual improvement of crop protection practices in the Australian vegetable industry.
Set Goal for IPM adoption in Australian
vegetable industry
Benchmarking Plan
Benchmarking Goal Benchmarking Level Benchmarking Timeframe
Benchmarking Methodology
IPM Continuum scoring system
Grower survey Survey of Key Informants
Business analysis tools
Level of IPM Adoption in Australian Vegetable Industry

Scholefield Robinson Horticultural Services Pty Ltd
Final Report : National Vegetable IPM Coordinator (Project VG09191), May 2011 Page 12
3.2 Strategic Planning Development of an overarching strategic plan for Vegetable IPM RD&E was primarily the responsibility of Gerard McEvilly. Sandra McDougall and Lauren Thompson also had a significant time commitment towards this component.
The version of the document that represents the final output from this project is entitled Vegetable Integrated Crop Protection Research, Development & Extension (RD&E) Plan, 2011-2015 and is included in Appendix 8.
The method used to fulfil this component is outlined in Table 4.
Table 4 : Milestones involved in the Strategic Planning component
Description Milestone No.
Briefing paper and mechanism for access and feedback developed, press release distributed, consultation activities and literature review commenced
102.2.1
Literature review and consultations completed 104.1.1
Unformatted draft submitted to Arris personnel for formatting 104.1.2
Formatted "Draft Plan for Approval" to W. Gordon (HAL) for inclusion in IAC meeting papers 104.1.3
Feedback from 14/09 IAC meeting incorporated and Final Plan approved by IAC 104.1.4
A briefing paper was produced to inform stakeholders of the broad aims of the National Vegetable IPM Coordination project and the specific aims of the strategic planning component. The IPM team set up a “GoogleGroup” (GG) site that included an e-mail discussion forum and the ability to upload documents, making them accessible to members and non-members of the GG. The briefing paper and important background documents were put on the site. Shorter versions of the briefing paper were included in an AUSVEG Weekly Update, including a link to the full paper on the GG site, which included instructions for providing feedback. Longer versions were produced for inclusion in the July/August 2010 edition of Vegetables Australia and for distribution to grower organisations in all States and the NT.
To meet the requirement for a strategic plan that encompasses all elements of the supply chain (from inputs to production to consumers) and covers all types of pests as well as soil health, post-harvest disinfestation, biosecurity and market access issues, many background documents were reviewed and consultations were carried out with more than 100 industry stakeholders. These consultations were undertaken in person and by phone and e-mail. A list of the people consulted was provided to HAL in October 2010. One of the consultation mechanisms was a workshop with RD&E providers from all States and the NT, held at the HAL headquarters in Sydney on 24th-25th June 2010.
The team member with primary responsibility for this component, Gerard McEvilly was invited to make a presentation on the draft plan at the IAC meeting on 14th September 2010.
Following feedback from the IAC, the VIDP NCs and HAL, the NCs approved the Plan in mid-December 2010 and HAL subsequently approved the plan. At the time this project ended (mid-May 2011) the IAC, AUSVEG and HAL were reviewing the overall strategic planning process for the industry. The Vegetable Integrated Crop Protection RD&E Plan has been provided to the consultants undertaking the development of the Industry Investment Plan for the vegetable industry.

Scholefield Robinson Horticultural Services Pty Ltd
Final Report : National Vegetable IPM Coordinator (Project VG09191), May 2011 Page 13
3.2.1 Key features of the Plan The output from this component is the 'overarching' portion of the Vegetable Integrated Crop Protection RD&E Plan, 2011-2015. As a result of the consultations and the review of background documents, four high-level Objectives were established to support an overall Vision of “A vegetable industry effectively addressing those production, market access and consumer issues related to pests* and their management (*where “pests” refers to insects, diseases, weeds, vertebrate pests etc)”.
The high-level Objectives in the Plan are as follows: 1. Information is readily available 2. There are clear roles and responsibilities in addressing issues 3. Market impacts are monitored and addressed 4. Short, medium and long-term RD&E needs are addressed through a Program Approach
Strategies and Actions have been developed to support achievement of each of the Objectives. Actions that relate to the roles and responsibilities of a future National Vegetable IPM Coordination project or program have been summarised in Section 3.9 of this report.
A significant feature of the plan is the guidance it provides for engaging with the market in relation to crop protection issues. The market’s requirement for produce that is free of damage and free of any organisms (whether they are pests or beneficials) is considered to be a significant barrier to the adoption of IPM. One of the strategies under Objective 3 is to work collaboratively with like-minded industry organisations to monitor consumer attitudes about IPM, pesticide use and the minor presence of pests and/or beneficials in produce. A consumer education initiative is one of the possible actions that could be undertaken in collaboration with these other industries.
3.2.2 Next Steps In its final form, it is envisaged that this Plan will have nine appended RD&E Program Plans covering the key pest types and other aspects of crop protection RD&E. This relates to the first strategy under Objective 4, which involves development of a ‘program approach’ to the management of RD&E. In its present form the Vegetable Integrated Crop Protection RD&E Plan contains the first fully developed Program Plan, which is for Thrips and Tospoviruses (see discussion in the next section). This Program Plan has also been approved by HAL and was included in the document provided to the consultants who are undertaking development of the Industry Investment Plan. It is expected that the next steps for the Vegetable Integrated Crop Protection RD&E Plan, including development of the eight remaining Program Plans, will be clearer once the Industry Investment Plan is finalised (in late 2011).

Scholefield Robinson Horticultural Services Pty Ltd
Final Report : National Vegetable IPM Coordinator (Project VG09191), May 2011 Page 14
3.3 Western Flower Thrips (also referred to as Thrips and Tospoviruses) Sandra McDougall had primary responsibility for this component. The method used to fulfil this component is outlined in Table 5.
Table 5 : Milestones involved in the Western Flower Thrips component
Description Milestone No.
Contact with current & previous project leaders commenced, draft Action Plan for WFT/TSWV developed & consultation activity commenced
102.2.3
Existing resources reviewed and "delivered" to KM 104.1.5
Action Plan for WFT/TSWV RD&E developed & incorporated into Strategic Plan 104.1.6
WFT/TSWV "package" developed to electronic version stage 190.1.1
3.3.1 Development of RD&E Program Plan for Thrips and Tospoviruses Within the tender brief this component of the project was called Western Flower Thrips (WFT). However, it was broadened to cover Thrips and Tospoviruses in general because: • the most significant damage this species of thrips causes is the transmission of a tospovirus –
Tomato spotted wilt virus (TSWV); • there are other thrips vectors of this virus; and • there are other relatively new tospoviruses on vegetables in Australia that are causing
significant damage, eg Capsicum chlorosis virus (CaCV), which has become a serious problem in capsicums (including chilli types) in Queensland production districts and in Kununurra WA, and Iris yellow spot virus (IYSV), which is a developing problem in the Riverina district of NSW in onions, garlic, leeks, shallots and several species of ornamental plants.
A major part of this component was to use this topic as an example of how an RD&E “program plan” would be developed and to show how these ‘sub-plans’ would sit under the overarching Vegetable Integrated Crop Protection RD&E Plan (‘ICP strategic plan’). Note that in the OP this sub-plan was referred to as an “action plan” but as a result of consultation with HAL and the VIDP NCs, the terminology was changed to “RD&E Program Plan” to show a clear linkage with the overarching ICP strategic plan.
Previous RD&E projects, literature and extension resources related to thrips and tospoviruses were reviewed where possible and project recommendations were captured. A document with the collated resources, summary of recommendations and draft “action plan” for RD&E was circulated for comment. A consultation session was also held as part of a meeting of entomologists, pathologists, extension specialists and other interested people in June 2010, and input was also sought via a Google Groups online discussion site and via an on-line survey. Specific input was sought from researchers or consultants with current RD&E experience on thrips and tospoviruses for input on later drafts and for comment on the Proposed Foundation Projects in the plan. The RD&E Program Plan for Thrips and Tospoviruses, which forms Appendix 2 of the Vegetable Integrated Crop Protection RD&E Plan (see Appendix 8 of this report) was approved by the VIDP NCs in mid-February 2011 and by HAL in late February.
The proposed foundation projects in this Program Plan are primarily extension initiatives. If some or all of them are funded and managed as part of a coordinated program (as is the case with the pathology projects in the vegetable industry’s pathology program) it is likely there will be significant improvement in the adoption of integrated management practices for controlling thrips and tospoviruses.

Scholefield Robinson Horticultural Services Pty Ltd
Final Report : National Vegetable IPM Coordinator (Project VG09191), May 2011 Page 15
3.3.2 Review and “delivery” of resources to the Knowledge Management Sub-program Since WFT arrived in Australia in the early 1990s it has caused considerable damage partly through direct feeding but primarily as a very efficient vector of TSWV. WFT is difficult to control due to it being resistant to most insecticides. A number of projects were funded and a range of information resources were produced and distributed. However, there has been no central repository of these resources. Some only exist as hard copies, some were included as appendices in final reports and some were loaded on state DPI websites or in some cases were on the AUSVEG website. Part of this component involved tracking down information resources relating to thrips and tospoviruses, reviewing them and producing a short summary with web links or information on how they could be obtained. This information was then passed onto the Knowledge Management (KM) Sub-program of the VIDP in the form of an Excel spreadsheet. Some resources that only existed in hard copy were provided as pdfs or as actual hard copies. These resources are now accessible via the Technical Insights search engine within the secure area of the AUSVEG website.
3.3.3 Thrips & Tospovirus Resources fact sheet (electronic version) This component also involved development of a fact sheet to an ‘electronic version’ stage. The document, which is in Appendix 9 highlights key points about the biology and management of these pests and provides information about key existing extension resources including how to obtain them. A pdf of the fact sheet has been provided to the KM and InnoVeg Sub-programs and also to the coordinator of the Communications Support Sub-program with the request that it be hosted in the public area of the AUSVEG website.
The benefit of this new fact sheet is its potential to significantly improve the accessibility of information for growers and the consultants and advisors that work with them. Many of the existing resources featured in the document can be downloaded from a website and be in their hands immediately.

Scholefield Robinson Horticultural Services Pty Ltd
Final Report : National Vegetable IPM Coordinator (Project VG09191), May 2011 Page 16
3.4 Integrated Information Packages Lauren Thompson had primary responsibility for this component. Sandra McDougall also had a significant time commitment towards this component and provided a substantial amount of information on existing extension resources, which she had been maintaining in an Excel file prior to the commencement of this project. The method used to fulfil this component is outlined in Table 6.
Table 6 : Milestones involved in the Integrated Information Packages component
Description Milestone No.
Mechanism for providing information to Knowledge Management (KM) established 102.2.5
"Easy" existing resources "delivered" to KM 104.1.7
Progress with negotiations to enable delivery of "harder" existing resources to KM 104.1.8
List of packages to be scoped in Year 2 developed & funding options considered 190.1.2
Project scoped: electronic version of WFT/TSWV "package" into "hard" version 190.1.3
Projects scoped: 2 x Packages (e.g. crop-specific or "principles of IPM") 190.1.4
3.4.1 Providing resources to the Knowledge Management (KM) Sub-program Liaison with the KM Sub-program commenced early in the life of the project. The IPM team was provided with instructions for how to supply information about extension resources (in an Excel file) so that it could be uploaded to the knowledge management system within the AUSVEG website. For each resource, short and long summaries were written, ensuring appropriate “key words” were contained in the long summary. The term “easy” in the wording of the second milestone in Table 6 refers to resources that were hosted on websites and therefore could be easily accessed via their URLs, which were also provided in the Excel file.
Initial delivery to KM included approximately 40 “easy” resources that have specific relevance for the management of WFT, TSWV and other thrips and tospoviruses and 80 “easy” resources related to the management of other pests. (Note that many of the resources that were labelled as “WFT/TSWV resources” also have information about management of pests other than thrips and tospoviruses. For example, the training course workbook “IPM Onfarm - Protected Cropping” covers all pests but was included in the WFT/TSWV list due to its relevance for this insect-disease complex.)
Subsequent “deliveries” included: • Fact sheets extracted from the final report on Project VG07109, “Development of effective
pesticide strategies compatible with IPM management used on farm” • Two Farm Biosecurity Manuals written specifically for the Bundaberg region and the
Northern Adelaide Plains (NAP) and descriptions of other aspects of the page on the Plant Health Australia (PHA) website from which they can be downloaded
• Three new virus fact sheets produced by DEEDI researchers • Four new fact sheets produced as part of the vegetable industry’s Pathology Program
Regarding Milestone 104.1.8 in Table 6, the IPM team identified relevant “hard copy only” resources and in this case the requirement was to provide ordering instructions along with the other information in the Excel file. The other aspect of this milestone is to try to “revive” some older, valuable resources that were only produced in hard copy format and in some cases, to gain

Scholefield Robinson Horticultural Services Pty Ltd
Final Report : National Vegetable IPM Coordinator (Project VG09191), May 2011 Page 17
permission to modify them somewhat (i.e. remove old chemical recommendations and out-of-date contact details) and supply the rest of the information as a pdf for KM to host on the AUSVEG website. As these resources often have copyrights associated with them, this requires negotiation and written permission from the organisation that produced them (to make modifications and have them hosted on the AUSVEG website, particularly if the resource was not produced as part of a vegetable R&D levy-funded project). The progress that has been made is as follows: • Jerry Lovatt, who maintains the web pages and hard copy resources produced by the Primary
Industries and Fisheries division within DEEDI, has been contacted regarding some of the Agrilink resources including the “Sweet Corn Agrilink” produced under Project VG97036, “Insect Pest Management in Sweet Corn”. The requested permission has not yet been granted.
• Caroline Donald of DPI Victoria has agreed to resurrect a series of seven Clubroot Factsheets for Nurseries. This will involve using Word versions and modifying them to get them as close as possible to the professionally printed versions, which are no longer available. This had not been finalised at the time of submitting this report, but information on these resources will be forwarded to KM when they are finalised and their URLs are known.
• Tony Burfield of SARDI has agreed to update and modify his 35MB resource, Controlling Key Pests in Virginia Greenhouses, into a document with a smaller file size so that it can be hosted and downloaded more easily. This will not be completed before 30th June 2011 and it has been proposed that this be done in conjunction with the project that has been scoped under Milestone 190.1.3 (see discussion in Section 3.4.3 below).
3.4.2 Packages to be scoped in a future IPM Coordination project or program Accomplishing milestone 190.1.2 involved obtaining feedback from industry on integrated information “packages” to be scoped during the next phase of a National Vegetable IPM Coordination project or program. The InnoVeg Sub-program was asked to seek feedback on the IPM-related information needs in the growing regions. Kristen Stirling sent an e-mail message to her regional contacts including the CIO Sub-program partners on 26th January 2011 with the subject line: “What are the high-priority crop protection issues for the vegetable industry?”
The feedback was incorporated into a report, which was sent to the VIDP NCs and InnoVeg on 21st February. Further input has since been received and the additional feedback has been incorporated into the updated report in Appendix 10 entitled, Integrated information “packages” to be scoped as part of a future IPM Coordination project or program.
3.4.3 Scoped “package” to improve the management of Thrips and Tospoviruses Milestone 190.1.3 involved scoping an extension project to create awareness and adoption of recommended management practices for Thrips and Tospoviruses in the regions where these insect pest/disease complexes are causing serious losses. The scoping document, which is in Appendix 11, was recently distributed to InnoVeg, the VIDP NCs and relevant HAL personnel with the recommendation that the next steps to turn this into a full proposal be undertaken by InnoVeg. The role that InnoVeg played in gathering feedback from industry to enable this scoping document to be prepared is acknowledged in the document.
If the recommended extension “package” is progressed and approved, it will include production of updated extension materials to incorporate the latest information on an IPM approach to managing these insect pest/disease complexes, translation of some materials for LOTE (language other than English) growers and a series of workshops in the regions and via webinars, all of which will deliver benefits to growers and service providers including IPM scouts and consultants.

Scholefield Robinson Horticultural Services Pty Ltd
Final Report : National Vegetable IPM Coordinator (Project VG09191), May 2011 Page 18
3.4.4 Scoping the production of high-priority fact sheets Milestone 190.1.4 involved scoping the production of new, high-priority fact sheets. IPM Sub-program team member Prue McMichael liaised with InnoVeg to scope the development of five fact sheets covering the “mega pests” that many vegetable growers have to deal with, emphasising an Integrated Crop Protection (ICP) approach to managing these pests and presenting grower case studies where possible. The actual development of these fact sheets was managed by Prue McMichael under a separate contract with InnoVeg. Lauren Thompson and Sandra McDougall assisted with technical editing and choosing extension resources to be listed at the end of the documents. Electronic versions of these fact sheets were recently finalised and distributed by InnoVeg. They have the following titles:
• Mega Pests - The Basics of Protecting your Crops • Mega Pests - Managing Soilborne Diseases • Mega Pests - Managing Foliar Diseases • Mega Pests - Managing Chewing and Biting Insects • Mega Pests - Managing Sucking Pests
3.4.5 Outcomes and recommended future emphasis Through this component of the project and parts of other components, a wealth of IPM-related extension material has been made accessible to growers and other industry members via the knowledge management system in the secure area of the AUSVEG website. The challenge is in getting industry members to go to the AUSVEG website for their information needs and to use the search engine. Through the VIDP and other initiatives, hard copies of some of these resources are also made available to industry.
The IPM Sub-program team has also scoped and assisted the development of new fact sheets designed to be appealing to growers by including case studies of successful integrated management of “mega pests”. Electronic copies of these resources have been distributed by InnoVeg with the offer to supply high quality hard copies upon request.
Although information provision is an important aspect of improving awareness and adoption of technology, it may not be the most important aspect for many members of the Australian vegetable industry. The term “packages” also covers other means of providing learning experiences for industry members, such as the Thrips and Tospoviruses extension “package” that has been scoped as part of this component. It is recommended that more of these types of packages be scoped as part of a future IPM Coordination project and a list of high-priority topics has been developed to support this potential future activity.

Scholefield Robinson Horticultural Services Pty Ltd
Final Report : National Vegetable IPM Coordinator (Project VG09191), May 2011 Page 19
3.5 Review of IPM and Chemical Access Sandra McDougall had primary responsibility for this component. Natasha Wojcik and her staff at Arris Pty Ltd originally had responsibility for the software development aspects but in the end this was done by LCubed, the company responsible for setting up web applications that sit within the AUSVEG website. The method used to fulfil this component is outlined in Table 7.
Table 7 : Milestones involved in the Review of IPM and Chemical Access component
Description Milestone No.
Integration requirements between IPM-Chemical Access database and KM system explored 102.2.6
Excel file containing Celery information for database completed 104.1.12
Process for database updates & ongoing coordination incorporated into Strategic Plan 104.1.13
Draft "functionality specification" for database and Excel file with Lettuce information completed 190.1.8
Functioning database covering celery & field lettuce accessible within AUSVEG website 190.1.9
The former wording of Milestone 190.1.9 was, "Recommendations to KM re integration of IPM and Chemical areas of website", which was completed in a face-to-face meeting between IPM and KM personnel on 17th November 2010. In addition, on 7th February 2011 the IPM team provided KM with a document containing a recommended structure for integrating the two areas of the AUSVEG website. It is beyond the scope of the one-year pilot phase of the IPM Sub-program to have further involvement in this integration initiative. However, this initiative would possibly be included in the roles and responsibilities of a future IPM coordination project or program (see Section 3.9) in conjunction with ensuring there is on-going liaison between the HAL Minor Use Coordinator, HAL Pesticide Regulation Coordinator and National Vegetable IPM Coordinator.
3.5.1 Activities undertaken to fulfil this component On 6th August 2010, two members of the IPM Sub-program team participated in an online meeting with Peter Dal Santo (HAL Minor Use Coordinator, Project No. MT10029) and Kevin Bodnaruk (HAL Pesticide Regulation Coordinator, Project No. AH09003). Joint development of an “IPM and Chemical Access database” was agreed to in principle. At this point it was envisaged to combine a number of Excel spreadsheets of information that were held by the meeting participants and combine them into a database integrating information about pesticide registration, ‘IPM-fit’, likelihood of de-registration, and target organisms. This proposed ‘database’ would contain information about new chemistry and host ranges for existing chemicals that were wider than current registrations or permits. Therefore there was concern about who would have access to the database, particularly where pesticides are not registered (noting that almost no chemicals are registered for all crops). Also, if it was to be publically available a lot more effort needed to go into some of the spreadsheets to reference data sources and complete the incomplete data sets. However, by January 2011 the actions identified in the minutes of this meeting had only been attended to in a minor way by the three parties due to time and technical constraints. The three parties did not consider it to be possible to fulfil the original vision for this component in the remaining months of the project.
David Heinjus (VIDP NC) was notified of these issues and an alternative activity was proposed. The suggested alternative involved working with KM to have an integrated Crop Protection section within the AUSVEG website including information on pests, chemicals and non-chemical management options. David held discussions with HAL in response to this request by the IPM Sub-program to revise the milestones for this component.

Scholefield Robinson Horticultural Services Pty Ltd
Final Report : National Vegetable IPM Coordinator (Project VG09191), May 2011 Page 20
The alternative activity request was rejected and on 16th February 2011, a teleconference was held between Sandra McDougall, Lauren Thompson, Peter Dal Santo and David Heinjus to re-establish momentum and clarify how a database could be produced. The agreed revised milestones are listed above. It was decided that a searchable database be developed for two crops – one major (lettuce) and one minor (celery). The data for the database would come from combining information about current registrations and potential new chemical registrations that was collected for the Strategic Agrichemical Review Program (SARP) in 2009 by Peter Dal Santo for lettuce and celery, and additional information collated by this project on the potential IPM-fit of each chemical, information on its impact on beneficial organisms, its Environmental Impact Quotient and non-chemical management options for the pest organisms. The current chemical registration or permit status for all chemicals included in the lettuce and celery worksheets had to be checked and modified appropriately, as there had already been some changes since the original data was collated for the SARP project.
Further discussions were held between the IPM, KM and NC Sub-programs, leading to the following decisions and arrangements: • It is preferable for the searchable database to be housed within the secure area of the
AUSVEG website, as opposed to being accessed via a link to an outside website where it could be hosted.
• All applications within the AUSVEG website must be enabled by the company that does the programming for the AUSVEG website, LCubed (L&L Communications Australia Pty Ltd).
• A quote received by Arris Pty Ltd from LCubed (to design, build, test and deploy the application) was accepted, and LCubed is responsible for development of the functional specification document in conjunction with Arris.
• David Heinjus agreed to take responsibility for liaising with AUSVEG including gaining permission for the implementation to occur on the AUSVEG website.
The IPM Sub-program team has: • Finalised the Excel files for field lettuce and celery, from which data is to be uploaded into
the database; • Provided information to LCubed to enable quoting and preparation of the functional
specification document; and • Provided timely input and signoff in accordance with the project schedule outlined by
LCubed.
In addition, a partially developed IPM Adoption RD&E Program Plan has been written and incorporated as Appendix 3 of the Vegetable Integrated Crop Protection RD&E Plan to enable documentation of the need for continual updating of this database and ongoing coordination between project leaders involved in a future IPM Coordination project and the ongoing Minor Use and Chemical Registration Coordination projects.
The pilot, searchable database covering chemical and non-chemical options for managing pests of field lettuce and celery (i.e. invertebrate pests, weeds and diseases) was not yet available within the secure area of the AUSVEG website when this report was submitted. It is expected that it will be available by 30th June 2011. However, the IPM Sub-program team has no control over the timing of AUSVEG’s processes for approving outputs and allowing them to be accessed on their website. The VIDP NCs will liaise with AUSVEG on this matter.
3.5.2 IPM & Chemical Access database – pilot with lettuce and celery pests Once it is available, users will be able to firstly select either celery or field lettuce. They will then be presented with a screen displaying all of the pests for which information is included, i.e.

Scholefield Robinson Horticultural Services Pty Ltd
Final Report : National Vegetable IPM Coordinator (Project VG09191), May 2011 Page 21
invertebrate pests, diseases and weeds. There will be a check-box next to each of the pests, which will be listed by their common names, followed by their scientific names in parentheses. Output will be generated for each pest that is selected and the user will have the option of viewing the output in their web browser or exporting the output to an Excel file. The output will have information under the following headings: • Pest group (i.e. invertebrate pest, disease, nematode, weed) • Order (scientific grouping such as: bacteria, Lepidoptera [moths & butterflies] etc) • Pest common name, followed by scientific name • Priority rating (eg Major, Moderate or Minor problem) • Type of damage and the site of this damage (eg Chewing, Roots) • How pest is transmitted • Alternative hosts for the pest • Pesticide options [registered and by permit] including bio-pesticides such as Bacillus
thuringiensis (with relevant details such as: active ingredient, trade name, chemical group, withholding period)
• Frequency of use of pesticide options (eg commonly, occasionally, rarely) • Environmental Impact Quotient3 (EIQ) - Total environment (numerical score) • EIQ - Beneficial insects and fungi (a numerical score that allows comparison between
options in terms of their impact on beneficials) • Further information on the impact on beneficials from two different sources (i.e. low impact,
moderately harmful or harmful as determined by Horne & Cole and by cotton researchers) • An overall summary rating of the impact on beneficials • Natural enemies of the pest • Cultural control methods for the pest
The aim of presenting all of this information is to enable informed crop protection decisions to be made. It is particularly important when implementing an IPM approach to understand the impact of pesticides on beneficials and the non-chemical options that can be successfully integrated with the chemical options. It has been made clear on the entry screen of the application and on the outputs that it is the responsibility of the user to ensure that chemical registrations are current and permits have not expired.
3.5.3 Maintenance and future expansion If it were feasible, it would be valuable to incorporate a mechanism for tracking the number of ‘hits’ on this database that were followed through to completion of a search (as opposed to ‘just having a look’). At present it is not envisaged that there will be a mechanism for evaluating the usefulness of this pilot database, which would enable determination of whether it should be maintained and expanded in future to cover more crops. It is recommended that the leaders of the KM and Communications Support Sub-programs determine the feasibility and desirability of such a mechanism.
3 Each pesticide is rated according to its impact on the person applying it, other field workers (eg pickers), birds, bees, fish and invertebrate or
fungal beneficial organisms, as well as whether it leaches and the "consumer effects" in terms of possible residues in food. These ratings are combined into an Environmental Impact Quotient (EIQ) that allows comparison between pesticide options.

Scholefield Robinson Horticultural Services Pty Ltd
Final Report : National Vegetable IPM Coordinator (Project VG09191), May 2011 Page 22
3.6 Pathology Program Extension Lauren Thompson had primary responsibility for this component. The method used to fulfil this component is outlined in Table 8.
Table 8 : Milestones involved in the Pathology Program Extension component
Description Milestone No.
Initial meeting with key pathology project leaders held and extension coordination requirements explored 102.2.4
Extension coordination requirements & mechanisms clarified 104.1.14
Recently available outputs "delivered" to KM and InnoVeg 190.1.12
Additional milestones previously associated with this component were cancelled by agreement with HAL and the VIDP NCs after the initial meeting was held with pathology project leaders. This meeting was part of the Vegetable IPM Workshop on 24th - 25th June 2010 at the HAL headquarters in Sydney. Expectations regarding our involvement in coordination of the Pathology Program’s extension activities were discussed. Due to the long delay in the commencement of National Vegetable IPM Coordination project the extension program had gone ahead without the expected involvement of the IPM team. It was stated in this meeting that there was no longer a need for the IPM team to coordinate activities.
Further discussions were held with HAL and the VIDP, including the idea of setting up an ‘electronic calendar’. If R&D providers involved in the Pathology Program could put their planned extension activities into a calendar, and an e-mail message was generated each time an entry was added or changed, other providers could coordinate their planned activities to ensure that growers in each region were not overwhelmed by too many events in the same time period. It would also provide opportunities for planned events to be combined into a single event. It was decided within the VIDP that this role would be undertaken by the InnoVeg Sub-program.
The final milestone in Table 8 was completed in conjunction with the IPM team’s involvement in listing items at the end of the Mega Pest fact sheets referred to above in the Integrated Information Packages section. Four recent fact sheets produced by the Pathology Program were included in these listings, along with instructions for accessing them via the search engine in the ‘Technical Insights’ area of the AUSVEG website.

Scholefield Robinson Horticultural Services Pty Ltd
Final Report : National Vegetable IPM Coordinator (Project VG09191), May 2011 Page 23
3.7 Tasks involved in Supporting the InnoVeg Sub-program As shown in Figure 1 (on page 5) the InnoVeg Sub-program is responsible for translation of RD&E outcomes into practical information and activities for industry. To ensure continual focus on liaison with and provision of support to the InnoVeg team, two identical milestones were inserted into the IPM Sub-program’s 2010/11 OP by the VIDP NCs as shown in Table 9 below. It was also noted that these milestones were on-going and occurred in each month:
Table 9 : Milestones involved in Supporting the InnoVeg Sub-program
Description Milestone No.
Evaluate opportunities & provide InnoVeg with support in developing outputs for delivery to CIO and industry
104.1.17 &
190.1.15
Activities involving liaison with and provision of support to the InnoVeg Sub-program have included:
• Submission of five (5) short updates for the VIDP Newsletters sent to the CIO Sub-program partners and others, as follows:
- Mid-December 2010 newsletter (first issue) - highlighted that many extension resources had been “delivered” to KM and could be accessed via the search engine in the Technical Insights area of the AUSVEG website;
- February 2011 (second issue) - repeated the above message and highlighted that two Farm Biosecurity Manuals (FBMs) written specifically for the Bundaberg area and the Northern Adelaide Plains, but relevant to all vegetable production businesses, had recently been added.
- March 2011 - reported on findings from the first step in the Benchmarking component (i.e. the literature review of adoption of IPM in the Australian vegetable industry and the definition of IPM), including an introduction of the concept of the IPM Continuum.
- April 2011 - reported that a new fact sheet had been produced, with a summary of the key aspects of managing thrips and tospoviruses and a list of some key extension resources, with summaries and instructions for obtaining them. A hyperlink to the fact sheet was also included.
- May 2011 - reported that the IPM team had developed a draft IPM Continuum to define IPM in terms of the practices used for managing each of the pest types (insects and mites, diseases, nematodes, weeds and vertebrate pests), and setting them out in terms of the step-wise shift in pest management practices that often takes place when growers adopt IPM, i.e. from No IPM, to Low IPM, to Medium IPM and finally to High or Biointensive IPM. A hyperlink to the document was also included.
• Preparing the contents of a poster for the VIDP trade booth set up at the AUSVEG Convention (April 2011) and providing suggestions for extension resources to be displayed and made available in the trade booth. Some display copies were also delivered to the trade booth in person by Sandra McDougall in conjunction with her attendance at the IPM Working Group Meeting. A project update document was also supplied to InnoVeg team members so that they could speak about the IPM Sub-program’s accomplishments during meetings they held with RD&E providers and CIO Sub-program partners.

Scholefield Robinson Horticultural Services Pty Ltd
Final Report : National Vegetable IPM Coordinator (Project VG09191), May 2011 Page 24
• At InnoVeg’s request, the IPM team scoped the production of several “case studies” covering the “dirty dozen” high-priority pests so that fact sheets about managing them could be made available on the AUSVEG website. This resulted in the development of the five “mega pest” fact sheets as discussed in Section 3.4.4.
• During VIDP meetings the IPM team mentioned the need for a “contacts database” to streamline communications. This would involve creating a database with contact details of service providers and other vegetable industry stakeholders and setting it up in such a way that it can be kept up to date in an efficient manner. In discussions with Kristen Stirling, it was decided that InnoVeg would take charge of setting up this database. Names and contact details compiled by the IPM team have been supplied to InnoVeg. It is likely this database will sit within the secure area of the AUSVEG website.
3.7.1 Support received from InnoVeg In early April 2011, the IPM Sub-program asked InnoVeg to seek input on how the electronic fact sheet Thrips and Tospovirus Resources, which was produced as part of the WFT (or Thrips and Tospoviruses) component of this project, could be expanded into a “package” that would meet the needs of growers in the regions. Kristen Stirling sent an e-mail message to the CIO Sub-program partners and others on her contact list, asking for their feedback on the best way to get the information in the electronic fact sheet out to growers who are having difficulty managing this pest-disease complex. This assisted the IPM team with scoping a proposed extension “package” for improved management of Thrips and Tospoviruses in vegetables, which is discussed in Section 3.4.3.
The InnoVeg sub-program was also asked to assist with development of a list of integrated information “packages” to be scoped in a future phase of the IPM Sub-program, by requesting feedback from regional contacts including representatives of the CIO partners. She issued an e-mail message on 26th January 2011 with the subject line: “What are the high priority crop protection issues for the vegetable industry?” The feedback was used to develop a report on Milestone 190.1.2, which is discussed in Section 3.4.2.

Scholefield Robinson Horticultural Services Pty Ltd
Final Report : National Vegetable IPM Coordinator (Project VG09191), May 2011 Page 25
3.8 Tasks associated with a Possible Follow-on Project The tasks in Table 10 were included in the OP based on the possibility that there would be support for the National Vegetable IPM Coordination project to continue beyond the timeframe of the initial one-year pilot project.
Table 10 : Milestones associated with a Possible Follow-on Project
Description Milestone No.
Prepare Work Plan for follow-on project to 30th June 2012 190.2
Follow-on Project Approval Step early March; additions to VG09191 or creation of New project submission in HALO
190.3
It is our understanding that the other VIDP sub-programs have contracts that end on 30th June 2012 (or possibly on 31st July 2012 to allow one month for preparation of final reports). It was envisaged at the beginning of the IPM Sub-program that there would likely be a follow-on project that also finished on 30th June or 31st July 2012, depending on the performance of the project team during the one-year pilot project.
At the time of renegotiating the project’s remaining milestones in February 2011, the Project Leader was directed to make sure all of the other milestones were attended to before attending to Milestone 190.2. Recent discussions with HAL indicated that a follow-on project will not be considered until the Industry Investment Plan is finalised, which is likely to be in November 2011. The above two milestones have therefore not been completed in the manner that was originally envisaged. Instead, we have summarised the responsibilities that could be part of a future National IPM Coordination project/position in the next section (Section 3.9) of this report.
As shown in the OP in Appendix 12, Milestone 190.3 has been cancelled.
Scholefield Robinson Horticultural Services Pty Ltd
Final Report : National Vegetable IPM Coordinator (Project VG09191), May 2011 Page 26
3.9 Roles and responsibilities of a future National Vegetable IPM Coordination project or program
During the course of this project, many responsibilities have been identified that would be part of a National IPM Coordination role4. These include:
• With HAL, coordinate the development of the remaining eight RD&E Program Plans: - IPM Adoption - Invertebrate Pests (insects and mites) - Pathology (diseases caused by fungal, viral and bacterial pathogens) - Nematology - Soil Health - Greenhouse IPM - Weeds - Vertebrate Pests
• Continue making extension resources from HAL-funded projects available to industry through multiple channels including the knowledge management system on the AUSVEG website
• Facilitate projects to fill key gaps in information via options such as: - Develop fresh extension material from existing HAL projects - Find/adapt material from overseas work - Develop/adapt material with commercial partners - Scope the development of extension “packages” and new technical RD&E projects
• Provide technical review of IPM-related outputs from the VIDP • Develop an information providers program5 • Develop a Communications Plan that includes:
- Negotiation with information providers and review of their effectiveness - Promotion of risk awareness and responsiveness, including an education and training
component for all sectors of the supply chain - Establishment of a Crop Protection Forum with membership that encompasses the
supply chain and a formal approach to identifying and assessing strategic threats, eg new pest incursions, major threats to current field control or market access strategies and changes in consumer requirements
• Facilitate the inclusion of crop protection related issues in consumer and market research conducted by industry
• With HAL and/or AUSVEG and appropriate VIDP sub-programs, facilitate the establishment of collaborative arrangements with other industry organisations to develop a generic consumer monitoring and education program, eg a cross-industry Consumer Awareness Campaign to create “market pull” for the adoption of IPM
• Ensure on-going liaison with the HAL Minor Use Coordinator and HAL Pesticide Regulation Coordinator to ensure that industry has up-to-date information, including within the AUSVEG website6.
4 Much of this is documented in the overarching portion of the Vegetable Integrated Crop Protection RD&E Plan and other project outputs. For
example, the reports that are in the appendices related to the Benchmarking component contain recommendations that could be part of a National IPM Coordination role, and these were summarised above in Section 3.1.5.
5 See the actions under Strategy 1.3 in Appendix 1A of the overarching strategic plan in Appendix 8 of this report. 6 See Development Theme 1 - Methods & Tasks in the IPM Adoption RD&E Program Plan in Appendix 3 of the strategic plan (in Appendix 8).

Scholefield Robinson Horticultural Services Pty Ltd
Final Report : National Vegetable IPM Coordinator (Project VG09191), May 2011 Page 27
• Assist HAL with further scoping of recommended foundation projects in the RD&E Program Plans
• Assist as required with the regular review and updating of the overarching RD&E Plan and the nine associated Program Plans
• Monitor and assist as required with the successful coordination of projects that have cross-over between two or more RD&E Program Plans, to ensure the desired outcomes for both programs are met
• Collaborate with HAL and supply chain partners to expand the voluntary contribution element of the crop protection RD&E program

Scholefield Robinson Horticultural Services Pty Ltd
Final Report : National Vegetable IPM Coordinator (Project VG09191), May 2011 Page 28
4 EVALUATION
This report has provided information with which to assess the performance of the project. Appropriate methodology and activities have been undertaken to accomplish what was required in relation to the project components and outputs. The outputs are provided as appendices to this report or have been provided separately to HAL. The team members involved in the IPM Sub-program have also completed the necessary project management tasks including those involved in integration with other sub-programs of the VIDP and alignment with wider VIDP planning processes. In addition to participating in monthly VIDP meetings, monthly contributions to the VIDP-IAC report have been provided along with monthly updates of the Operating Plan. More recently, the IPM team has made monthly contributions to the VIDP Newsletter distributed by InnoVeg. Three milestone reports have been written and they were approved by the VIDP NCs prior to submission to HAL.
The IPM team has had strong liaison with the National Coordinators and the KM and InnoVeg teams. Early involvement with the KM team enabled many extension resources to become accessible to industry via the search engine in the Technical Insights area of the AUSVEG website. Tasks involved in providing support to the InnoVeg Sub-program were completed in a timely manner and instances in which the InnoVeg team supported accomplishment of IPM milestones have been documented in this report. As individuals, we hope and expect to have ongoing interaction with our fellow IPM team members as well as the team members involved in the VIDP.
Whilst a formal Monitoring and Evaluation project was initially planned as part of VIDP, the project brief was not approved by the IAC. For this reason, formal independent evaluation of this project had not been initiated at the completion of this project.

Scholefield Robinson Horticultural Services Pty Ltd
Final Report : National Vegetable IPM Coordinator (Project VG09191), May 2011 Page 29
5 RECOMMENDATIONS
The key recommendations from this one-year pilot project are as follows: • Funding of a continued National Vegetable IPM Coordination project to undertake the roles
and responsibilities outlined above in Section 3.9 and work towards the aims outlined above in Section 1.2.
• Consideration of the Vegetable Integrated Crop Protection RD&E Plan 2011-2015, which includes the overarching Plan, the Thrips and Tospoviruses RD&E Program Plan and the partially developed IPM Adoption RD&E Program Plan, by HAL, the IAC, relevant Advisory and Working Groups and the consultants reviewing the vegetable industry strategic plan, with a view to future investment in integrated crop protection projects.
• Development of eight (8) additional Program Plans for consideration by HAL, the IAC and relevant Advisory and Working Groups. Development of RD&E priorities for integrated weed management is occurring within two current projects and it is envisaged that these initiatives will result in completion of the Weeds RD&E Program Plan. Of the remaining seven program plans, the following four are considered to be higher priority:
- IPM Adoption - Invertebrate Pests (insects and mites) - Pathology (diseases caused by fungal, viral and bacterial pathogens) - Nematology
Procedural recommendations are as follows: • There has been a request by the KM team that HAL set up a mechanism for project leaders to
write the précis that is uploaded to the KM system. Similarly, a mechanism could be set up for project leaders to provide the necessary information about extension resources produced as part of their project, to enable them to be uploaded to the KM system.
• A process by which recommendations from projects are collated, assessed and carried forward with priority status needs to be established and maintained, and the listing needs to be made available to RD&E decision makers in the industry and others for priority setting and development of proposals. If a running record of recommendations is kept and modified as new projects are funded, it will enable RD&E providers to review recommendations and potentially include some low priority recommendations into a related higher priority project for minimal additional expenditure.
It is also recommended that the following administrative matter be taken into consideration: • Tender briefs for any future sub-programs that might be added to the VIDP should clearly
outline the time involved in monthly reporting, meetings (including the number of meetings per year that require travel funds and their likely locations) and follow-up from meetings so that these things can be budgeted for appropriately.

Scholefield Robinson Horticultural Services Pty Ltd
Final Report : National Vegetable IPM Coordinator (Project VG09191), May 2011 Page 30
6 IMPLICATIONS
The implications of the IPM Coordination project will not be fully realised until the current review of the industry strategic plan is completed and investment priorities have been determined. Because the majority of this project was focused on strategic planning, resulting in recommendations for future actions that need to be funded, the implications are largely in the future and are dependent on the current strategic planning process being undertaken by industry.
The recommendations in relation to benchmarking have the potential to: 1. inform targeted investment and tracking of progress in crop protection RD&E projects; 2. highlight emerging crop protection issues; and 3. provide data to support the vegetable industry’s clean green image as well as highlight
potential risk areas in chemical use that may impact on the image of the industry from a consumer perspective.
Ultimately benchmarking can help drive adoption and continual improvement of crop protection practices in the Australian vegetable industry. The Vegetable Integrated Crop Protection RD&E Plan 2011-2015 has the potential to improve the flow of benefits to vegetable levy payers from their investment in crop protection RD&E by providing:
1. access to crop protection information to meet production and market needs; 2. protection from whole-of-industry risks; 3. opportunities for links with supply chain participants and consumers; and 4. improved efficiency and accountability for levy investments.
The RD&E Program Plan for Thrips and Tospoviruses provides the vegetable industry with the opportunity to ensure that:
1. vegetable growers have access to current knowledge on best practice management of thrips and tospoviruses;
2. there is knowledge on how and when to use available tools; and 3. there is a balanced portfolio of research into developing management tools, which
includes low risk research and incremental improvements to or maintenance of existing tools as well as higher risk research with potentially much greater gains in managing thrips or tospoviruses.
The program will enable decision-makers to maximise the returns to growers from levy investments in RD&E, while leveraging off commercial and government programs.
By funding the proposed extension “package” for thrips and tospoviruses, growers in the regions in which thrips and tospoviruses are causing the heaviest losses will have access to workshops presenting current best practice management of thrips and tospoviruses, information resources to support adoption and practical assistance to do a sanitation audit of their farm, which is a critical area of management that is often overlooked. Growers in other regions or those not able to attend the face-to-face workshops will have access to the workshops via the internet or a ‘webinar’.
Because of the diversity of the vegetable industry and the pests that impact on it, a strategic investment plan for crop protection and specific RD&E program plans to address the major focus areas are recommended by this project. Issues of crop protection have impact along the entire length of the supply chain and will only be successfully addressed if an integrated approach is taken with some form of IPM coordination at a national level.

Scholefield Robinson Horticultural Services Pty Ltd
Final Report : National Vegetable IPM Coordinator (Project VG09191), May 2011 Page 31
7 ACKNOWLEDGEMENTS
In addition to the team members who have been acknowledge by being listed on the inside front cover, we also gratefully acknowledge the input of personnel at Scholefield Robinson Horticultural Services, in particular Cheryl Jenkins, who was the Administrator of the project. Personnel from Arris Pty Ltd, in addition to those listed on the inside front cover, also provided valuable input to the project, namely: Darren Oemcke, who assisted with the Benchmarking component; Chris Williams who assisted with the Review of IPM and Chemical Access component; and Bridget Merrett who assisted with the Strategic Planning component.
The project’s accomplishments would not have been possible without the valuable input from many growers, researchers and other service providers. They are too numerous to list and we would risk leaving someone out if we attempted it. Nevertheless, we are very grateful for their assistance during the 13 months of the project.
We again acknowledge the input and support of the National Coordinators of the Vegetable Industry Development Program (VIDP) and personnel involved in the other sub-programs of the VIDP. We hope that they remain a strong component of our individual networks. SCHOLEFIELD ROBINSON HORTICULTURAL SERVICES PTY LTD
LAUREN THOMPSON Senior Consultant/Project Leader Appendices: There are 12 appendices as listed under the Table of Contents.

Appendix 1 : Page 1
Appendix 1 Benchmarking Vegetable IPM Adoption: Literature Review and Analysis: IPM Definition, Current Adoption and Future Benchmarking Options
February 2011
This literature review and analysis has been conducted by the following team members of the National Vegetable IPM Coordination project (VG09191): Bronwyn Walsh, Queensland Department of Employment, Economic Development & Innovation (DEEDI), Sandra McDougall, NSW Department of Primary Industries (NSW DPI) and Lauren Thompson, Scholefield Robinson Horticultural Services.
Page 32

Appendix 1 : Page 2
CONTENTS
Summary and Recommendations ........................................................................................................... 3
1. Introduction.................................................................................................................................... 5
2. Level of IPM adoption by Australian vegetable growers................................................................ 7
3. Definition of IPM and criteria for measuring adoption ................................................................ 10
4. Description of IPM adoption indices ............................................................................................ 15
5. Data collection methods............................................................................................................... 21
6. Conclusion and Recommendations .............................................................................................. 28
7. References .................................................................................................................................... 31
Note regarding use of superscript numbers:
• Numbers that appear in superscript refer to the number of the reference listed in the References section.
• Numbers that appear in superscript preceded by an asterisk (eg *1) refer to footnotes.
Page 33

Appendix 1 : Page 3
Summary and Recommendations This literature review and analysis focuses on answering four questions to provide background information for a broader Benchmarking objective that is part of the National Vegetable IPM Coordination project. The questions are:
1. What is the level of IPM adoption by Australian vegetable growers (according to the available literature)?
2. How is IPM defined (from a benchmarking perspective)?
3. What indices have been used by others to measure IPM adoption?
4. What are the pros and cons of common data collection methods? The literature review revealed that within the Australian vegetable industry:
• Pesticide use has been reduced;
• Pests have been managed, even with reduced pesticide use;
• Farms have been able to remain profitable with reduced pesticide use;
• Alternative options for managing pests are available for many crops; and
• Scouting, farm hygiene and biological control have a place in Australian vegetable pest management systems.
The level of adoption of IPM, or its component practices, in Australian vegetable crops has been reported via individual RD&E projects in the last 15 years. However, due to the complex nature of IPM and the fragmented way in which projects have assessed adoption it is difficult to report on an industry wide adoption level. At a national level it was estimated that 28% of Australian vegetable growers had adopted IPM in 2006. At a regional industry scale it was estimated that 68% of southeast Queensland brassica growers were using IPM in 2002. For individual IPM practices including scouting, use of biological pesticides and the release and/or maintenance of beneficials in various crops and regions, there has been a range from 20% to 90% of growers using these practices, as a result of multiple factors such as ‘time’, drivers, investment, access and compatibility with current practices to name only a few. Most assessments of IPM adoption have focussed on management of invertebrate pests (insects and mites). The use of IPM approaches for management of diseases in Australian vegetable crops was stated to be extremely low in 2007, with growers still mostly using calendar spraying. However for particular diseases, eg clubroot, there has been a high level of uptake of new practices in association with long‐term R&D project activity. Weed IPM is considered to be very poorly developed for vegetable crops. The literature review and analysis highlighted the substantial effort that will be required to enable assessment of IPM practice across the whole Australian vegetable industry in a consistent and reliable manner. There are significant information gaps, which is not surprising given the diversity of the industry and the number of production regions. Although there is a reasonably well recognised definition of IPM internationally there is confusion and misunderstanding of the definition on the ground. IPM is a system involving the use of several pest management practices that often emerges by making step by step practice changes from no IPM through to Low IPM (including crop monitoring for making
Page 34

Appendix 1 : Page 4
spray decisions) then to Medium IPM (incorporating more preventative practices) and finally High or Biointensive IPM. By this stage preventative tactics such as resistant varieties, high levels of sanitation, crop rotations and habitat management are primarily in use; as well as biological controls and processes with minimal, if any, pesticide applications. This is referred to as moving forward along an IPM continuum towards the most desirable level of IPM, that of achieving economic benefits as well as environmental benefits. From the analysis of Australian studies the most common level of IPM practice in Australia includes routine crop monitoring for invertebrate pests and beneficial insects and using narrow spectrum insecticides, which in some instances is referred to as integrated or intelligent pesticide management rather than true IPM and is equivalent to Low IPM on the IPM continuum. However, some Australian vegetable growers are likely to qualify for the High or Biointensive level. Recommendations
The following recommendations are proposed for establishing the capacity for benchmarking and on‐going reporting on the level of IPM adoption in the Australian vegetable industry. Under each recommendation there are two options. Option 1 describes a high‐level approach to implementing the recommendation and Option 2 is an acceptable, alternative approach that requires a lower level of commitment on the part of Australian vegetable industry stakeholders.
A. Develop measurable, achievable, realistic IPM adoption goals
Option 1: Develop IPM adoption goals via a formal stakeholder consultation process
Option 2: Provide goal‐setting guidelines (including stakeholder consultation) as part of project submission guidelines and templates
B. Develop a benchmarking plan that ideally incorporates business, regional, industry, national and international scales of benchmarking and that links to goals
Option 1: Negotiate benchmarking commitments at all scales and establish a plan that identifies goals, responsibilities, budgets, links between levels etc
Option 2: Develop benchmarking plans for business, regional and industry levels
C. Develop benchmarking methodologies that will provide comprehensive, credible measurement of IPM adoption
Option 1: Develop an IPM continuum scoring mechanism, initially for brassicas and lettuce, incorporating invertebrate pest, disease, nematode, weed and if possible vertebrate pest management practices
Option 2: Use standardised surveys for growers and key informants, and the draft IPM continuum concept to add value to existing processes
Consideration of these recommendations and those of other studies within the Benchmarking component of the project will assist with establishing a pathway enabling the Australian vegetable industry to confidently report its responsible pesticide use and environmental credentials within a profitable environment.
Page 35

Appendix 1 : Page 5
1. Introduction In 2006, the vegetable industry was valued at $3 billion annually. At this time, a decade after the introduction of the vegetable research and development levy, $47 million had been spent on crop protection projects with $7 million on IPM‐specific projects60. In 2011, crop protection remains a high priority for industry investment, enabling Australian vegetable growers to use practices that go beyond calendar spraying of broad‐spectrum pesticides that are harmful to the environment and human health. In the past two decades new pest incursions, significant crop losses, new chemistries and new biological options have changed the setting in which the industry is managing its pests. Common to any progressive or growing innovative industry, business or organisation, there is some point of taking stock of progress towards short and long terms goals whether as a farmer, researcher, consultant or politician, usually at a relatively small cost in comparison to the level of investment. In this case the vegetable industry has indicated a desire to know the state of play of the use of IPM in vegetable crops in Australia.
“How will we know if we have achieved IPM adoption in vegetables?”
”What progress is being made towards achieving IPM adoption in vegetables?”
“How can we improve our progress?”
“Is our goal for using IPM in vegetables realistic?”
“How can we reduce pesticide residues in the environment and in our food?”
“Can we back up our Clean Green image with hard data?” Measures or benchmarks are used to answer these types of questions or to let us know the point at which we are starting, so that in the future we can see how things have changed with time and activity investment. In the absence of monitoring our progress towards our goal, the consequences can be at the least frustration at not accomplishing what we set out to do, reduced or cessation of funding, reduced profitability or the failure to deliver outcomes for our business or industry. In addition to the strategic advantages of benchmarking towards achieving goals, in the case of measuring the level of IPM adoption, some of the benefits for growers, RD&E providers, policy makers, those administering IPM labelling programs and regulators 33 are:
it encourages growers to continue or move towards producing high‐quality crops using more environmentally benign pest management systems;
it provides clear indications of which parts of the pest management program are achieving the two goals of sound IPM and economic profitability; and
it identifies alternative pest management tools that growers need or are willing to use.
Page 36

Appendix 1 : Page 6
Vegetable IPM R&D projects conducted internationally over the last 50 years have often included some aspect of measuring the adoption of IPM practices (eg as part of a cost‐benefit analysis). However, in the Australian vegetable industry monitoring the implementation of IPM has been fragmented at a project, program and industry level. As part of the National Vegetable IPM Coordination project, the following literature review and analysis seeks to consolidate, scope and prepare for a potential vegetable industry exercise in benchmarking IPM adoption.
Page 37

Appendix 1 : Page 7
2. Level of IPM adoption by Australian vegetable growers The literature review focussed on research that reported the level of IPM adoption for the whole spectrum of crop pests including insects, mites, pathogens (bacteria, fungi, viruses, nematodes) and weeds. Searches on search engine Google and business and science databases using keywords such as: benchmarking, monitoring, impact, evaluation, IPM, measures, IPM adoption, IPM implementation, vegetables found the recent relevant information for the literature review. In addition scanning grey material that doesn’t traditionally appear in databases such as Research and Development Corporation reports and Quality Assurance standards as well as discussions with project leaders, field and industry members consolidated or clarified some of the facts. Reports of the level of adoption of IPM in the Australian vegetable industry are relatively few as most assessments are of individual practices rather than IPM adoption as a whole system of practices60. However one study showed that 28% of growers used IPM in 2006. Individual commodity studies in processing tomatoes, potatoes and brassicas, revealed 40%, 60% and 68% of growers respectively were using IPM practices (Table 1). A study in Victoria reported high levels of IPM adoption by five growers, which represented 80% of Australia’s celery production.
Table 1: Levels of adoption of IPM in vegetables in Australia and overseas 1997‐2006
Crop and location Level of adoption Details or questions asked Vegetables Australia 2006
28% growers Growers using IPM monitored beneficial insects and knew the impact of insecticides on these species
Processing tomatoes Australia 1997
40% of industry
IPM practices led to benefits through a reduction in chemical use and improved pest control
Lettuce NSW 2006
8‐56% of total area sown
IPM practices involved use of crop monitoring used to determine spray decisions
Potatoes Australia 2000
35‐60% of growers
Assessment criteria: • IPM awareness • Do you practice IPM? • How much crop was
treated with insecticide? Brassicas SE Qld 2002
60‐68% of growers Based on number of growers considered to be doing IPM
Agriculture USA 2000
86% of total area sown Based on use of IPM practices
Source: 87,13,40,41,84,15,66,62.
Page 38

Appendix 1 : Page 8
Comparing between these studies and others can be somewhat misleading as results are affected by the questions posed during the research and the context within which the assessments were undertaken as well as sample size and representation. Similarly overseas research reports the level of IPM adoption in terms of the proportion of area under IPM practice rather than the number of growers using IPM. In the case of the tomato and potato industries in Florida, 75% and 97% of the total acreage was stated to be under IPM practice respectively32. More breadth of information on the level of IPM adoption in the vegetable industry is available for practices that are considered to be IPM for the sweet corn, brassica, lettuce, potato and processing tomato industries. It has been reported that 90% of brassica growers were using the biological pesticide Bt in Queensland in 1998, but by 2002 it was only being used by 50% of growers. In NSW in 2006 no more than 50% of lettuce growers were using Bt (Table 2). However 80% of lettuce growers are using the narrow spectrum new chemistry pesticides. For scouting, one of the key practices of IPM, 16% of growers in Queensland are scouting for silverleaf whitefly (SLW) while 38% of the planted area (on a national basis) of tomatoes is scouted in the USA.
Table 2: IPM practices and recently reported levels of adoption in vegetable crops
Type of monitoring or control Crop Location Level of adoption Year of survey
Scouting tomatoes vegetables brassicas
USA Qld SE Qld
38% of planted area 16% of growers, for SLW 74% of growers
1999 2008 2002
Production break brassicas SE Qld 70% of grower 95% of growers (but shorter break)
1996 2002
Farm hygiene vegetables Qld 14% of growers, for SLW 2008 Using biological control pesticides Bt brassicas
lettuce processing tomatoes
SE Qld NSW California
90% of growers 50% of growers 20‐50% of non & IPM growers 5% of crop area 10 or 15% of crop area
1998 2002 2006 1996 2005
Gemstar® lettuce NSW 0‐10% of non & IPM growers 2006 Use of new chemistries eg Success®, Avatar®
lettuce vegetables
NSW Qld
80% of IPM growers 27% of growers, for SLW
2006 2008
Resistant varieties tomatoes lettuce
USA NSW
37% of area planted (considered a high rate) 68% of growers
1999 2006
Alternating pesticides to reduce resistance
tomatoes USA Most common practice 1999
Combination of monitoring and increased parasitism
processing tomatoes
NZ Reductions of approx 60% in overall insecticide use
NA
Reduced use of pyrethroids processing tomatoes
California 41% of crop area 20% of crop area
1996 2005
Seedling drench lettuce NSW 90% of IPM growers 2006
Source: 40,30,15,10,22,62,23. NA = Not available
Page 39

Appendix 1 : Page 9
For diseases in Australian vegetable crops, Porter et al. (2007) suggested 3 stages of IPM adoption and that “the present grower use of IPM for pathology issues is extremely low as most growers still mostly calendar spray and do not base spray schedules on the first sign of diseases or use predictive tools to monitor pathogen loads in the soil”. However for particular diseases, for example clubroot, there has been a high level of uptake of new practices during long‐term project activity. Weed IPM is very poorly developed for vegetable crops60. “Weed management relies on herbicides and cultivation in vegetable production. Classical biological control for weeds is more suited to perennial systems. Other IPM options in intensive vegetable production include mulching, various cultivation techniques, weed mapping, rotations and selective spraying”60. In many reports the focus is on key pests rather than the crop, eg clubroot or diamondback moth. The silverleaf whitefly project (VG05050) reports a high level of adoption of improved SLW management practices and approximately 60% of growers indicated a recent change in relation to the management of SLW23. The level of IPM adoption in Australian vegetable crops has changed with RD&E investment to provide new knowledge about pests, beneficials, and management practices. In reviewing the IPM studies it becomes evident that long term Australian vegetable IPM research has formed a successful pattern for achieving adoption, with on‐going funding, suitable drivers and multidisciplinary teams. McDougall (2007) stated that responses to a pest management crisis usually evolved from a pest incursion or pesticide resistance in an environment of calendar spraying of broad‐spectrum pesticides. An RD&E team effort with industry participation usually results in the use of a basic IPM strategy, which consists of crop monitoring, using some narrow spectrum chemical options, some biological options and a few cultural practices to manage the key invertebrate pest. Then as practices to control other pests conflict with the IPM strategy for the dominant pest, the research effort moves to find more IPM compatible management practices. As the strategy develops for the crop, effort moves towards other pests, farm management and generally encouraging more generalist predators through changes in cultural, chemical and habitat management. With each progressive step is a move away from crisis status and therefore an immediate driver or reason to be changing further practice. Associated with the lack of a crisis or change in other circumstances that influence crop production is the cessation of some IPM practices15,93. The range in levels of adoption reported in this section between crops, regions and years can be a function of different assessment formats, drivers, investment activities and/or barriers to adoption at the time of the projects. The specific analyses however are available for each case study but there is limited opportunity for pooling and drawing of meaningful conclusions as a result of the nature of the fragmented assessments and circumstances.
Page 40

Appendix 1 : Page 10
3. Definition of IPM and criteria for measuring adoption The range of practices being used by industry between crops and regions suggests that in some way all growers could be using IPM in the context of its broad definition of an integration of cultural, chemical and biological control practices. However the level of IPM adoption outlined in Table 1 suggests that not all combinations qualify as IPM, leading to the question “What is the definition of IPM?”. In addition the answer to this question is critical in order to recommend benchmarking measures for tracking the progress of adoption and to set boundaries and guidelines for investment. Therefore the IPM adoption goal should clearly be defined along with its components. Some examples of goals set for achieving adoption of IPM that include important detail such as timeframes and quantified goals are as follows: In Australia:
• In 1996 the processing tomato industry set a target of 100% adoption of IPM techniques by 200160; and
• In 1991 the Australian Apple and Pear Growers Association made an agreement to reduce pesticide use by 50% by 1996 and 75% by the year 200025,2,3.
Overseas goals related to IPM beyond the vegetable industry have included:
• Canada set a goal of a 50% reduction of pesticide use by 2002 for a range of crops12;
• In the early 1990s, Denmark and Sweden set similar goals of a 50% reduction of pesticide use within 10 years90,14;
• In 1972 the USA set a goal to achieve a 40‐50% reduction in the use of the more environmentally polluting insecticides within a five‐year period, and perhaps by 70‐80% in 10 years 52;
• In 1993 the USA federal government submitted that implementing IPM practices on 75% of the nation’s crop acres by the year 2000 was a national goal7; and
• In 2009, the European Union issued a Directive requiring Member States to establish National Action Plans for meeting sustainable pesticide use goals and to establish pesticide‐free areas. There is also a requirement to establish or support the establishment of necessary conditions for the implementation of IPM. Each year there is a deadline for complying with different aspects of the EU Directive*1.
Other less specific goals of an IPM program are usually along the lines of improving farmer profitability and minimising the risk of pesticide use to human health and the environment30. Reduction in levels of crop damage, savings in chemical application costs and reducing risk are other objectives that are sometimes listed. Noticeably few instances exist where there are very visible specific detailed goals amongst the IPM projects or program for Australian research despite mention of this type of criteria within project templates from funding bodies.
*1 European Union 2009. Legislation. Official Journal of the European Union L309 vol. 52
Page 41

Appendix 1 : Page 11
Evident from Australian and overseas studies is the concept of an IPM continuum. This is used overseas for ranking practices, measuring IPM adoption at a National scale and marketing certification (Table 3)*2. Broadly the IPM continuum can be described as practice change steps within three broad categories of IPM practices. The steps involve moving towards goals such as a reduction of pesticide use, an increase in monitoring and an increase in preventative practices. At the lowest level of the continuum is No IPM. Moving up to the next level involves scouting and reaction‐based pesticide applications using thresholds, use of selective chemicals instead of broad‐spectrum chemicals and use of non‐chemical options as well as application of pesticides at the lowest effective rate and/or to as limited an area as possible. Some scientists and IPM consultants refer to this level as integrated or intelligent pesticide management and do not consider it to be true IPM.
Table 3: IPM preventative and field practices, based on USA groupings
Practices No IPM Low Medium High or Biointensive IPM
Monitoring No monitoring Scouting, record keeping, accurate identification and diagnosis
Weather‐based forecasting, nutrient and water monitoring, scouting and threshold‐based decisions
Scouting and threshold‐based decisions
Reactive practice
Primary control is pesticide treatment No alternative, non‐chemical control methods used. Reliance on chemical controls
Selective pesticides, edge treatment, sprayer calibration
Pesticide treatment and 1 or 2 IPM preventative practices precision agriculture
Pesticide treatment and at least 3 IPM preventative practices
Preventative practice
No preventative practices
Pest‐free seed/plant material, pest‐resistant varieties, cultivation, attractant baits/crops, crop rotation
Green manures/compost, induced resistance activators, elimination of alternate host, pest biotype monitoring
Release of beneficials, biocontrols, pheromones, trap crops, soil solarization, interactive pest/weather/crop models, primarily non‐chemical preventative approach
Source: 84,7,11,45,62 Moving up to high levels of IPM practice in the continuum means using preventative tactics such as resistant varieties, high levels of sanitation, crop rotations and habitat management as well as forming a strategy that relies firstly on biological controls with minimal, if any, pesticide interventions. This higher level has been called Biointensive IPM. At this level pest management is integrated with other practices including training of personnel to enable them to actively participate and share responsibility in preventing and avoiding pest problems.
*2 See Appendix 5 for detail of an Australian version of the IPM Continuum for invertebrate pests, diseases, nematodes and weeds, as well as an all‐pest version.
Page 42

Appendix 1 : Page 12
Alternative terminology for the stages in the continuum is to move from high‐risk to least‐risk practices. The concept of risk is touched on in one Australian study lead by Dr Furlong (2004) where his research found there was less risk in fully committing to IPM than in only implementing a few of the practices. The risk terminology can also be found in goals of IPM, such as minimising the risk of pesticide use to human health and the environment. Tactical and strategic levels of IPM are other terms used to describe the different practices that may come under the definition of IPM. The first, tactical IPM refers to thresholds, sampling schedules and judicious use of pesticides or in the case of the above example (Table 3) this would be the equivalent of the Low IPM 83,17,9 stage. Strategic IPM has on the other hand a greater focus on natural enemies and includes a greater number of management and ecological factors in deciding whether interventions are needed9. This is equivalent to the Biointensive level in the continuum shown in Table 3. From the analysis of Australian studies the most common level of IPM practice in Australia includes routine crop monitoring for invertebrate pests and beneficial insects and using narrow spectrum insecticides60,80, which in some instances is referred to as integrated or intelligent pesticide management as discussed above. However, some Australian vegetable growers are likely to qualify for the High or Biointensive level. Including diseases within the term IPM is relatively recent in Australia and hasn’t been evaluated as such, however most disease management projects have come up with basic disease management strategies that involve: use of resistant varieties where possible; sanitation practices to reduce infestation, spread or carry‐over of disease; and preventative treatments when environmental conditions indicate a high potential of infection or spread. Although such an IPM continuum system is not currently in place in Australia, it is possible to extract an approximate set of IPM criteria for the commodities where there has been investment in IPM such as in brassicas, sweet corn, lettuce, potatoes and processing tomatoes. An example for brassicas is provided below (Table 4) of what potentially qualifies as a medium to Biointensive stage of IPM for invertebrate pest management (noting that the region and market have been nominated). The complexity of the system becomes evident if for example the same exercise was done for autumn crops. At that time of year the other significant caterpillar pests and silverleaf whitefly are more common, thereby increasing the number of pesticides required, which could shift the ‘stage’ achieved from Biointensive IPM to Low or Medium IPM. To complete the development of the integrated pest management strategy, the disease and weed management practices would need to be added to the example. Table 4: Example of a biointensive integrated invertebrate pest management strategy in winter brassica crops in the Lockyer Valley, Queensland for the domestic fresh market
Invertebrates Diamondback moth
Other caterpillar pests
Silverleaf whitefly
Other minor sucking pests
Preventative Pest free, healthy seedlings. Low pesticide use in Autumn plantings. Monitoring, record keeping, staff trained in identification Chemical treatments Not usually required Cultural practices Production break Farm hygiene
Biological control Bt
Parasitoids & predators Parasitoids & predators
Learning Participate in pest management experiments, actively seek information
Page 43

Appendix 1 : Page 13
Quality assurance standards for meeting market specifications are another measurement system in which pest management practices are recorded. The level of participation in or use of these standards may be an indicator of the level of IPM adoption. These exist in two groups: the first as part of a specific IPM or environment label certification, and the second as more of a general good environmental stewardship program, without attached price premium, product differentiation or advertising but designed for meeting quality assurance standards. These types of measurement systems provide an incentive for growers to record and adopt practices. In the 1990s companies internationally started using ecolabels to differentiate their product on the basis of their management practices in response to demand for low pesticide use and environmental stewardship, often termed Clean & Green. At least 20 American companies are now demanding IPM‐grown vegetables with the goal of promoting environmental stewardship and Canada also has an active certification scheme 82,39,80. An example of such a scheme is the Protected Harvest label, established in 1996 by the World Wildlife Fund (WWF) and Wisconsin potato and vegetable growers. Wisconsin Healthy Grown® Potato brand with Protected Harvest certification is environmentally proactive, socially responsible, and economically viable. Protected Harvest’s standards reflect the growing requirements and environmental considerations of each crop and region. Each crop and region‐specific standard is divided into three parts. These parts are audited and measured. The measures include field scouting, information sources, pest management, field management, weed management, insect management, disease management, soil and water quality, and storage management. To qualify for certification, growers must stay below an established total number of chemical inputs per acre. Dangerous pesticides are prohibited. Other pesticides may be used with restriction. The overall number of inputs permitted is low, and growers must use their chemical choices wisely in order to pass. Lastly, to ensure the integrity of Protected Harvest's certification an audit of the chain‐of‐custody by each packer or handler of the crop from field to retail, which includes storage, packing, pallet loading, and transportation is used. It aims to eliminate specific high‐risk pesticides and achieve industry‐wide adoption of biologically based IPM systems, plus ecosystem restoration and wildlife conservation. In recognition of the fact that practices have to remain profitable the aim is to identify market‐based incentives for growers to progress in reducing the environmental impacts from potato farming. A goal of one the labels was “50% reduction in fumigant toxicity by 2007” and “no detectable residues in their produce“24. As mentioned in the example above, a common feature of some of the label systems is that they use independent auditors and that they partnered with researchers, retailers and growers to develop the label standards24. They also use a points system; assigning points to practices and in some cases specifically restricting the use of highly toxic pesticides on certified fields54. Ecolabels or marketing in Australia includes an IPM label owned by Australasian Biological Control and environmental stewardship labels that incorporate IPM practices, eg EnviroVeg and Field Fresh Tasmania onions and carrots. Researchers from the field of supply chain development, rather than from the field of IPM, often contribute to developing these label systems and so there is not always a high level of detail around pest management practices. This is particularly the case for ecolabels rather than IPM labels.
Page 44

Appendix 1 : Page 14
The value of IPM certification can also be in its potential to help farmers to communicate their concerns about the environment to their clients and their community, stressing environmental stewardship as opposed to an emphasis on food safety42. It also serves to define IPM more clearly and in so doing attracts more farmers as they can see “what IPM is”, highlighting that a key factor for influencing adoption is that the new technology is visible – or defined. Criteria outlined in the groupings described in the IPM continuum (Table 3) and as part of market standards for ecolabels are key components for defining IPM. The specific detailed requirements for at least 3 markets (export, processing and domestic), at least 10 crops and their diverse growing regions are outside the scope of this report. However, in conducting this literature review it has become evident that the information is available from project reports, industry notes and market standards, which means this activity can be completed and this has been incorporated into a recommendation in the last part of the next section (section 5). Any benchmarking activity needs to be developed with goals in mind and clarity of terms. Therefore, the absence of specific goals relating to IPM in vegetables in Australia means that developing goals that are measureable, achievable and realistic is a priority activity. This needs to happen before further discussion of benchmarking and its criteria is progressed. Goal statements should include the level of adoption being targeted and by when, and they may be specific for regions, industries (commodities) or markets. Setting clear goals that include measurable targets and timeframes, means efficient use of resources and the potential to link the measures between the levels. It will also enable a clearer method of accounting for investment by industry stakeholders in pest management. Developing goals is important for driving activity but requires participation by the key parties responsible for meeting them. Therefore a stakeholder consultation process to develop the goals will help ensure buy‐in. Such a process could be lead by and discussed at head of organisation levels depending on the level being targeted i.e. national, regional/industry and/or local goals. Providing guidelines in the form of examples and strict adherence to the requirement for SMART (specific, measureable, achievable, realistic and time framed) characteristics for goals could be included as part of a project template for submissions. A process of adjustment might be required as stakeholders gain experience with realistic goal setting using historic and on‐going data and information. Also if goal setting is done in consultation then a better understanding of the project’s objectives and related activities is likely. Lastly, setting IPM adoption goals at the level of a motherhood statement eg to reduce pesticide use will mean projects will continue to aim at this target but when funding bodies, government, business and industry are asked to explain the level of investment, they are likely to be frustrated due to the range of expectations of what are reasonable adoption rates and the lack of clarity on this matter when the goal was set.
Page 45

Appendix 1 : Page 15
4. Description of IPM adoption indices From the reporting on adoption of individual IPM practices in the previous section and in evidence gathered from other literature, it is clear that a single measure or a combination of measures is used to assess IPM adoption (Table 5) and these measures tend to fall into themes that reflect the nature of IPM, for example that it must be financially viable. Also there is usually a system of practices being used, meaning that more than one measure is likely to be required to adequately capture the level of adoption of IPM within a benchmarking activity. Table 5: A summary of the frequency of indicators for assessing the level of adoption of
IPM (from the reviewed literature)
Indicator Theme International Australia Profitability 32 9 Reduced pesticide use 27 22 Towards change of practice 40 5 Other Management Practices 15 12 Environmental 2 Health 1
Source: 86,1,64,78,63,37,27,32,72,30,41,31,58,81,15,19,48,28,34,36,65,88,26,49,68,74,76,91,55,60,92,6,56,62,69.
Methods for collecting the data included economic evaluations using cost‐benefit analyses (with before and after and with and without scenarios), surveys, case studies, participatory evaluations as well as use of the IPM continuum discussed in the previous section. Not surprisingly the most frequently used measures align with the goals of implementing IPM – to improve farmer profitability and reduce pesticide use. Within each indicator theme (Table 5) there are a variety of different units. For example, profitability has been measured using:
• revenue and gross margin,
• internal rate of return,
• net present value,
• net profit of farmers,
• profitability of pest management practices,
• increase in yield (eg t/ha),
• input costs,
• quality of produce,
• marketability, and/or
• the proportion of crop loss, or market rejection due to pest damage or contamination.
Page 46

Appendix 1 : Page 16
Similarly for the other common indicator theme related to pesticide use, the units used were:
• number of sprays (per season or crop),
• the dose (kg active ingredient/ha or volume),
• the type of pesticide (toxicity ratings, specific groups),
• the level of mixing,
• pesticide sales, and/or
• pesticide expenditure.
It is generally relatively easy to get an estimate of the number of sprays from growers’ records. However, in terms of the impact on the environment, a more useful unit is that based on a per hectare measure, i.e. the area of land that has been exposed to pesticides and the nature of those pesticides. This however is a slightly more complicated measure and therefore has not been used as frequently. Similarly using pesticide use as a reporting term or measure alone can be misleading without a qualifying description of whether the term refers to the type of pesticide, for example ‘broad‐spectrum pesticides’. In the absence of such clarification, a benchmarking activity may report the same number of pesticides used on two properties, however one property may be using environmentally benign pesticides and so have less impact on the environment. The legal ramifications of illegal pesticide use and the sensitive nature of financial affairs can sometimes make collection of some of these measures difficult. At the least it usually requires confidentiality and anonymity within the data. Recognising that IPM adoption is about changing pest management behaviour, measures that indicate a movement along the stages of behaviour change is also common amongst measures of IPM adoption. The units for this indicator theme of behaviour change include:
• reaction,
• attitudes,
• perceptions,
• knowledge,
• skills,
• changes to practices,
• farmer performance in regard to decision‐making, acquiring information etc,
• spreading information, and/or
• use of field experiments.
The choice of measure within this theme will be affected by the period the assessment covers, realising that achieving a change of practice may take months or years, depending on the drivers for change and activities undertaken, and therefore may be outside the life of a single project (usually 1‐3 years). Subtlety in question design becomes important if ‘reaction, attitudes and perceptions’ are trying to be recorded as they tend to be ‘subconscious’ behaviours.
Page 47

Appendix 1 : Page 17
Other management practices recorded through surveys include: the presence or absence of using scouting and thresholds for making treatment decisions; and using alternate management practices such as cultural, physical, mechanical or biological control. Monitoring the change in use of these practices is the most common approach used in the Australian projects along with ‘pesticide use’. Environmental measures include the level of groundwater contamination, use of responsible pesticide waste disposal practices and species diversity. Health impact has been measured by the incidence of pesticide‐related health symptoms. The environmental and social measures such as environmental impacts and chemical residues in food are rarely used or reported within the literature reviewed. This type of testing has only become prominent relatively recently, and is often difficult to measure and outside the scope of project budgets or expertise. It is more common at a higher level of assessment or in a parallel field of investigation such as health and environment. Combining measures
As well as the different individual measures, combining a group of measures to calculate an index has been used for providing a simple representation of a complex set of characteristics, for example with pesticides. Pesticides vary in activity, the site of application, timing of application, persistence, efficacy, cost, environmental effects, toxicity, compatibility with IPM and availability of alternatives and therefore their impact and cost67. These will all influence profitability and social and environmental impacts of pest management in different ways. So for each characteristic values are assigned and a calculation produces a single number. Building on this concept for representing a set of pest management practices as a single index, various studies 53,67,11,45,33,34 described formal processes of calculating an index that can then be ranked in an IPM continuum, as mentioned earlier. This has been used for National assessments as well as for a single crop in a production region. For any of these indices an opinion of what constitutes an IPM practice is necessary as well as a weighting – assigning values to the different practices so a set of practices used by a grower can then be compared with another grower’s index, or the required market standard. Implicit in this is that the practices are within the IPM definition that includes profitable for the grower and therefore the IPM‐grown produce would meet market demand. The calculated indices then form a scale and a point or range is chosen along the scale that represents acceptable IPM practice. The use of an index provides a more flexible system of assessing practices than the simplified allocation to a cell in a table as in the general description of the IPM continuum (Table 3), which may not accurately reflect what could be a dynamic and healthy or a relatively less dynamic and more unstable environment based on a particular combination of practices and circumstances. The process of developing and calculating the index is relatively complex, which can act as a barrier to its adoption. However, more recently the calculations and data have become internet based, in an open access system format that is capable of measuring the efficacy, environmental impacts and economics of IPM system choices, including pesticide selection and application decision‐making12. This may simplify the interface and enable background
Page 48

Appendix 1 : Page 18
calculation of the index and therefore make it more likely to be used. Such indices could be used in an accreditation scheme for meeting market or labelling standards, which may be an incentive for implementing such measures67. However, establishing the indices would require considerable effort in assigning points as well as weightings to practices for the range of products. A notable shortcoming is that a compromise on the number of measures that can be included in the calculation may mean some sets of practices aren’t fully represented in the continuum. Benchmarking at different levels (or scales) and across industries
The level of IPM adoption can be reported on, and therefore measured, at different scales, for example the field, crop, landscape or ecoregional scale52 (Figure 2). The scale will influence the expected level of adoption. For example in one study, the rate of adoption decreased from 40% to 0.4% as the scale increased. This is partly because it is more difficult to develop and implement IPM at the larger scales and partly because the concept of scaling IPM strategies is relatively new and management programs for larger‐scale systems have only begun to be developed. A third reason for this lag results from the complications associated with understanding pest distribution and how, when and where pests move in the context of larger scales. Similarly systems designed to measure or track risk levels across hundreds of growers at the scale of a state or country can’t be as field specific or sophisticated as models designed for use at the field level12. However if indices at each level are linked then it can ensure efficient use of resources and some comparison. At the farm and program level, cost benefit analyses have been used 27,12,62. At the regional level where the goal may be reducing and maintaining key pest populations at acceptable low densities, coordination within the area would be necessary51. In the USA, national levels of IPM adoption were derived from a national survey of individual pest management practices that were then analysed by pest classes, crops and regions. In this case the study went across horticultural and field crops30. The requirement for farmers to keep records under quality assurance programs means that some electronic data exists that could be used for the measures at the business level, and therefore lift the burden on project budgets to do evaluations if there is a higher level assessment conducted intermittently using that data. Some on‐line/ electronic tools are being evaluated as a potentially feasible data collection method for benchmarking IPM adoption, and this is being explored in another milestone within the Benchmarking component of VG09191. At the higher level, funding bodies or agencies may conduct an industry level review of some of its investment program such as conducted by Horticulture Australia Limited in 2005. Linking the goals at the project/business level to those at the higher national level will mean efficient benchmarking, which can minimise the load on financial resources. The measures being used to report on the level of IPM adoption in Australia draw on relatively few of the other health and environmental measures that may be potentially relevant (Figure 2).
Page 49

Appendix 1 : Page 19
Figure 2: The scales of environmental and health measures, with current Australian IPM adoption measures and their links
International
National
Regional/ industry/ organisational
Business
Level
Pesticide registration (preventative) APVMA
Environmental testing – water quality, runoff EPA
MRLs Mg residue/kg commodity National residue survey APVMA
Pesticide registration (preventative) APVMA
Health reports
Program impact assessments • cost benefit analyses • no. sprays • type of spray • alternative control measures
Funding bodies
Water testing Grower business
Health incident reports (OWHS) Doctors, Emergency ward
Pesticide records Grower business, Consultancies, Resellers
Health measures
Environmental
measures
Pesticide records Grower businesses, Consultancies, Resellers
EnviroVeg, EMS, QA standards, IPM label
Residue testing Authorities, Retailers, Processors, Wholesalers, State Departments
Impact assessments • cost benefit analyses • no. sprays • type of spray • alternative control measures Regional/industry, Project leaders
Residue testing Grower businesses
To minimise the impact of pesticides on the environment
To minimise the impact of pesticides on human health
Environmental testing ‐ biodiversity WWF World Heritage
Environmental testing ‐ biodiversity WWF
Environmental testing ‐ biodiversity Great Barrier Reef
Water testing Councils
Australian IPM
adoption measures
Page 50

Appendix 1 : Page 20
Also evident is that different organisations operate at the different levels. If the current data that they collect is useful for benchmarking IPM adoption at the relevant levels, then negotiating access, establishing clear communication and allocating resources will be necessary. For example in the USA three organisations shared in meeting the national goal to develop and implement IPM. In addition to the organisations represented in Figure 2, there are other agricultural organisations and businesses that also have an IPM priority, for example fruit, grains and cotton. These industries may be interested in linking with the vegetable industry’s IPM benchmarking agenda to create efficiencies or consistency of measures. Benchmarking plan
Given the different scales for measurement of IPM adoption, developing a benchmarking plan that incorporates business, industry, national and international scales would help clarify for all parties how the processes link, how efficiencies may be made and how the data set would be enhanced for tracking social and environmental impacts of pest management practices.
It would be good practice for the benchmarking plan to also link to the goals set on IPM adoption via a stakeholder consultation process. This report has provided a synthesis of some of the existing information that has been collected and can point towards areas requiring negotiation with industry, funding and government bodies and private enterprises. The highest level of investment for progressing benchmarking of IPM adoption requires that stakeholder representatives participate in a strategic planning exercise that incorporates negotiation of responsibilities and data collection and access at all levels. Commitment by stakeholders to the benchmarking of IPM adoption will be indicated by budget allocation and responsibility for planning and implementation. Establishing a benchmarking plan at the business, regional or industry level may contribute to influencing higher levels and be within the resources available in the short term. An IPM champion, who would interact between the levels, could assist with ensuring consistency in the message and negotiating links between the levels. This could be accomplished within an on‐going National Vegetable IPM Coordination project (i.e. as part of the high‐level work by the project team) or it could be the role of HAL, AUSVEG or another service provide organisation. Allocating responsibilities and budget to the benchmarking activity and adjusting project templates or strategic plans to reflect the new responsibility will show the potential of this activity with the added benefit of improved reporting. At present there is a relatively fragmented approach by project leaders (in time, location, crop and discipline) to carrying out impact assessment activities. Funding bodies and/or industry, in line with strategic plans and RD&E submission guidelines, require assessing the impact of RD&E. Without any changes to the current processes, the fragmented approach will continue and it will not provide a mechanism for clearly tracking progress on the level of IPM adoption in the vegetable industry. It is recommended that project leaders undertake a consistent approach to impact assessment and reporting. A benchmarking plan would incorporate this recommendation and would further recommend appropriate processes to be incorporated into project submission guidelines and templates.
Page 51

Appendix 1 : Page 21
5. Data collection methods The foundation of a benchmarking plan is choosing suitable methodologies for measuring the level of IPM adoption. The wide range of potential measures were identified in the previous section but selection for benchmarking will be subject to the constraints of purpose, focus, time and budget.
Resourcing benchmarking
The allocation of resources will determine the feasibility of measuring IPM adoption in a meaningful way. The level of defensibility is an important part of the benchmarking activity, i.e. the reliability, validity and sensitivity of data collection methods determine whether the assessment is credible79 (Figure 3). However, the decision on methodology must be made in relation to funding levels. Figure 3: Features of benchmarking and the effect of different levels of investment on the
credibility of the benchmarking activity
Features of benchmarking Credibility in relation to level of investment
Low investment
High investment
Detail of information
Broad (poor)
In depth
Potential for error
High
Low
Depth of understanding
Poor
High Feedback to inform RD&E investment
Poor
Good
Figure 4 shows how sample size and the method of data collection will be affected by resource allocation. In one study that assessed IPM adoption30, the interviewing sample size of 20 growers represented 10.5% of the national targeted crop area, 25% of the state area and 42% of the regional area. Their criteria for subsampling were: the current level of insecticide use in the crops – very high and very low; the potential for successful biological control/IPM; representation of a non‐agricultural system52; and a major and minor crop grown across the country 43. Another US study collected data for the spring, fall and whole season crops 32, recognising the influence of the season on pest management choices and therefore IPM adoption.
Page 52

Appendix 1 : Page 22
Figure 4: An example of how resource investment impacts on survey methodology components
Impact of level of investment on methodology Survey components
Low investment High investmentNo. of respondents
Fewer respondents
Many respondents Level of engagement
Respondents engaged with project/industry
Respondents include some not
well engaged with project/industry
Selection
Self selecting respondents
More representative sample of
growers Sample size
Small subsample eg regional, single crop
National Complexity of survey
Simple survey ‐ few parameters
Complex survey ‐ many parameters
The costs involved in obtaining data from a representative sample of growers are not uniform. Costs vary with the economic differences in communities and geographic locations and cultural differences such as attitudes, language and political process20,25. For example in Australia the diversity of production regions might mean extra travel costs. Also, some industry communities have a very strong hierarchy with a particular community leader’s opinions being very important, resulting in filtering of responses. In these types of situations extra effort may be required and in some cases translators are required (McDougall pers comm.). In terms of the respondents, growers are traditionally interviewees for measuring IPM adoption. In some studies surveys were sent to industry members who had knowledge of a region, subsection of industry or market, which created efficiencies in data collection. Input suppliers (eg chemical resellers), professional scouts, extension advisers30, supply chain members or health and environmental professionals may also represent interviewees for data collection, depending on the criteria of the assessment. Different groups will prefer different data collection methods. Surveys in two Australian projects found a preference for person‐to‐person or paper‐based information by farmers but electronic‐based information was used by farm advisers89. Many interviewees nominated a visit or a telephone interview to do the survey and different members will have different time of the day preferences. For example growers may prefer lunchtime while farm advisers may prefer early morning or office hours. If there is sufficient flexibility, preferences of the target group can be sought as part of the planning stage of the survey or benchmarking activity to ensure maximum participation and meaningful data collection.
Page 53

Appendix 1 : Page 23
Funding benchmarking
Sometimes there is a perception that benchmarking activities are a waste of levy or agency funds, with the thinking that available resources should be spent on members to improve their profitability alone. However benchmarking serves an accountability purpose for the levy payer, government and business and should be seen in this light rather than as a diversion of their funds. In their most common form benchmarking budgets are usually relatively small compared to funding attached to improving profitability. The most common benchmarking budget is 10‐20% of the project’s or program’s total budget 85. For past Australian projects, the budget for some form of assessment of the project’s impact has ranged from $5,000 ‐ $50,000, well under a 10% of total project budget estimate in most cases, with the associated limitations of the data at that level of investment as is described below. In measuring IPM adoption in the vegetable industry, government funding has been a significant source of funds for the activity. However, external sources including grower levies have also played a role, including in many Australian studies 41,34,16. Agencies will usually fund their own internal evaluation of investment at a program level and this is often done at five‐year intervals. For example government and funding bodies will usually conduct cost‐benefit analyses on a subsample of their projects as well as some social or environmental impact assessments if resources allow. Some examples of budgets associated with a program level evaluation, which requires a higher level of funding than project or business benchmarking, are described below with the benefits and shortcomings.
• Lowest budget assessments, for example under $40,000 for assessing the activities used to reach an outcome, will provide numerical counts of participants, services, or products and information about the characteristics of participants. Assessments at this level may be able to find out how satisfied participants were with the services or the training. This type of information usually forms the basis of an evaluation. However it does not tell you whether you have been successful in attaining your participant outcome objectives. Also, at this cost level you will not have in‐depth information about implementation and operations to understand whether your program was implemented as intended and, if not, what changes were made and why they were made.
• Low‐moderate budget, for example $40,000 to $80,000, enables cost benefit analyses, needs assessment or outcome evaluation. The assessment will show whether there has been a change in participants' knowledge, attitudes, or behaviours, and also collect in‐depth information about the implementation. At this cost level, it may not be able to attribute participant changes specifically to the program because it will not have similar information on a comparison or control group.
• Moderate‐high budget, for example $80,000 to 100,000, allows for a comparison between groups, and therefore it is possible the capacity to attribute any changes in participants to the program itself. At this cost level, however, information on participant outcomes may be limited to short‐term changes, i.e. those that occurred during or immediately after participation in the program.
Page 54

Appendix 1 : Page 24
• The highest budget level of over $100,000 allows for an impact evaluation to obtain all of the information available from the other options already mentioned above as well as longer‐term outcome information on program participants. The high cost of this type of evaluation is partly due to the need to track or contact participants after they have left the industry. Although follow up activities often are expensive, longer‐term outcome information is important because it assesses whether the changes in knowledge, attitudes, or behaviours that the participants or target group experienced initially are maintained over time, while they are still in the industry.
Therefore the cost of benchmarking is dependent on the scope and nature of the activities and measures requested. The amount of funding required depends on what aspects of the program are to be assessed, the complexity of the activity and the number of outcomes to be measured. Multiple methods, such as the combination of qualitative and quantitative data can increase validity through triangulation and save time and money. Additionally, time and money constraints can be overcome with careful planning and consultation with stakeholders. By clearly identifying the client (who the benchmarking is being conducted for) and understanding the client’s needs ahead of the assessment, costs and time of the process can be streamlined and reduced, while still maintaining credibility. A specific comparison of some common methodologies used in measuring adoption of IPM is presented next. A comparison of a direct survey within projects, an independent direct survey of growers and other methods
Many of the IPM projects in Australia have included a budget item for surveying growers and farm advisers to demonstrate a movement along the ‘adoption continuum’ towards the goal of changes in pest management practices as a result of their project activities. Surveys are one of the most common forms of collecting the information for benchmarking or evaluating investment. Most surveys are designed by the project team, or in consultation with them, for ensuring the survey uses appropriate language, questions are easily understood and the collection method is appropriate. It is important to use a person who is skilled in evaluation and attend to related requirements such as rigorous survey design, interviewing and analyses for ensuring that the data is not subjected to bias due to ‘leading questions’ or miscoding of data for example. With these basic good practices in place the method for conducting the survey can vary. Firstly the assessor/s may be team members involved in the program or project activities (internal) or they may be external, i.e. they are not associated with any other part of the program or project. Some advantages and disadvantages of the use of internal and external assessors are listed in Table 6. Whether the assessor(s) is from within the project team, semi‐attached or totally independent offers a variety of advantages and disadvantages. These choices of sourcing assessors are evident in the literature, especially in the case of economic evaluations. An
Page 55

Appendix 1 : Page 25
independent assessor can be perceived as less biased by funders and might provide more freedom to the interviewees to respond accurately rather than influenced by what they think the scientist/collaborator wants to hear. However, with transparency and good design this may be overcome and allow an internal assessor to bring insight to the analysis that might otherwise be lacking. Use of an internal assessor may also enable capture of information that can help guide decisions in research direction through the informal interaction that is likely to take place. The skills base of the assessor should be the key factor in making a decision regarding the source of the assessor and availability of people and resources usually determines the decision that is ultimately made. Good communication at the outset with the client (i.e. the organisation using the benchmarking information) and stakeholders and using good practice usually means disadvantages associated with using internal or external assessors (see Table 6) can be mitigated. Australian projects have tended to outsource evaluation activities simply because of the lack of availability of internal staff to join the team. Given that surveys can be web‐based or conducted by telephone, in person or by email, the assessor may have a different level of involvement. The target interviewees, time and resources will largely determine the method of delivery of the survey. Research has shown farm advisers, including farm managers, are more likely to use a computer than a grower. The different delivery mechanisms will affect the layout of the survey and the form of response. However as with the assessor decision steps can be taken to mitigate any negative impact and meet the needs of the client. Telephone or one‐on‐one surveys have been used in Australian impact studies, providing a mechanism for a higher‐level analysis as required and increasing the rate of return. However it is a time intense method of surveying. With more than 100 different vegetable crops grown in Australia, and over 4000 growers, resources are not likely to extend across all crops and members. Once the IPM adoption goals are in place, along with the benchmarking plan, the suitable methodologies for measuring the level of IPM adoption can be chosen, taking into consideration the level of funding and the other factors described earlier in this section.
Page 56

Appendix 1 : Page 26
Table 6: Advantages and disadvantages of data collection methods
Method Advantages
Disadvantages
Direct survey within projects ‐ internal assessor (team member)
• Better overall knowledge of the assessment targets and team members possess informal knowledge
• Less threatening as already familiar with industry members
• Less costly
• Less objective • More distracted with other activities of the
project/program and not able to give the evaluation complete attention
• Lack of appropriate skills (in many cases) • Competition for funds for ‘core business’ activities
of the ‘project/program’ Independent direct survey ‐ external assessor
• More objective of the process • Offers new perspectives, different angles to observe
and can critique the process • Able to dedicate greater amount of time and attention
to the evaluation • Greater expertise and assessment skills
• More costly and requires more time for the contract, monitoring, negotiations etc.
• Unfamiliar with stakeholders, which can create anxiety about being assessed
• Unfamiliar with organisation policies, certain constraints affecting the project/program etc
Other methods ‐ proxy indices ‐ online tools Covered in another report
• Less resource intense for within projects • Serves multiple ‘evaluation’ purposes, with
coordination by person who understands the ‘bigger picture’
• Save time in data collecting • Already some systems in place
• Doesn’t provide depth of detail that might guide
future priorities within specific context, eg at project/crop level
• Less influence over whether it gets ‘done’ • Access to data likely to have a charge attached • Data may not be in form required for answering
benchmarking questions
Page 57

Appendix 1 : Page 27
The most intense form that a future benchmarking exercise could take is to develop an IPM continuum scoring mechanism. The IPM continuum concept captures grower practices and allocates points and weightings to practices. The points of practices used are added together to give an indication of the level of IPM adoption. Some thought on allocation of points for practices by crop is required and, as highlighted by other researchers, will require a team of research, market and industry members to fine tune the analysis system. Such a mechanism would ideally serve multiple purposes including continuous farm improvement, meeting market standards, marketing advantage and tracking progress towards the industry IPM adoption goals. To rationalise the effort a pilot program could focus on crops that have IPM information readily available and that are grown and serviced by individuals who have an interest in IPM adoption. The IPM continuum scoring systems set up for these crops could demonstrate the potential for future development and application in more crops. The best practice guides for lettuce and brassicas that have recently been completed and include both invertebrate pest and disease recommendations could be the basis for this initial exercise. Another complementary approach would be developing benchmarking guidelines for project leaders to use to generate benchmarking data that can be used within their projects, thereby improving project management, and be collated for use by industry and funding bodies. This data may then be used to track impacts on adoption of IPM practices from investment in IPM projects. The last option is that the process of measuring IPM adoption in vegetables remains the same, i.e. it is left up to the respective projects whether benchmarking data is collected or not, and if it is collected it will remain fragmented with one‐off project‐ based assessments by regions, crops or pests that cannot be readily compared between studies but provide some indication of what the project has achieved with respect to pest management practice change.
Page 58

Appendix 1 : Page 28
6. Conclusion and Recommendations The level of adoption of IPM, or its component practices, in Australian vegetable crops has been reported via individual RD&E projects in the last 15 years. The level of adoption of IPM in Australian vegetable crops was estimated to have been 28% of growers in 2006 but was as high as 68% of brassica growers in southeast Queensland in 2002; with a range of low and high levels of use of IPM friendly practices including monitoring, use of biological pesticides and release and/or maintenance of beneficials in various crops. The fragmented project reporting means it is difficult to report on an industry wide adoption level. More detail is available on a crop basis (sweet corn, brassicas, lettuce, potatoes, processing tomatoes) for practices that are considered to be part of an IPM approach as assessed for projects. The literature review highlighted the substantial effort that will be required to enable assessment of IPM practice across the whole Australian vegetable industry. There are significant gaps, which is not surprising given the diversity of the industry and the number of production regions. The following recommendations are proposed for establishing the capacity for benchmarking and on‐going reporting on the level of IPM adoption in the Australian vegetable industry. Recommendations A. Develop measureable, achievable, realistic IPM adoption goals Stated goals should include the level of adoption that is trying to be achieved and by when, and they may be specific for regions, industries (commodities) or markets. Setting clear goals that include measurable targets and timeframes will result in efficient use of resources and the potential to link the measures between the levels (i.e. business, regional, industry, national and international levels). It will also enable a clearer method of accounting for investment by industry stakeholders in pest management.
Option 1. Develop IPM adoption goals via a formal stakeholder consultation process Coordinate a stakeholder consultation process to develop goals, which will help ensure ‘buy‐in’ to achieving the shared goals. Such a process could be lead by and discussed at head of organisation levels, depending on the level being targeted, i.e. national, regional, industry and/or local goals.
Option 2. Provide goal‐setting guidelines (including stakeholder consultation) as part of project submission guidelines and templates Provide guidelines and attention to the requirement for SMART (specific, measurable, achievable, realistic and time framed) characteristics for goals as part of project submission guidelines and templates. A process of adjustment might be required as stakeholders gain experience with realistic goal setting. Similarly if this is done in consultation then it is likely there will be a better understanding of the project’s objectives and related activities as well as the likely budget requirements.
Option 3. Status Quo (not recommended) Goals remain within projects and indirectly visible through needs being highlighted and ‘motherhood statements’ such as an intent to reduce pesticide use.
Page 59

Appendix 1 : Page 29
B. Develop a benchmarking plan that ideally incorporates business, regional, industry, national and international scales of benchmarking and that links to goals
It is considered good practice for the benchmarking plan to link to IPM adoption goals set via a stakeholder consultation process (which is part of Recommendation A). This report has provided a synthesis of some of the existing information that has been collected and can point towards areas of negotiation for industry, funding and government bodies as well as with private enterprises.
Option 1. Negotiate benchmarking commitments at all scales and establish a plan that identifies goals, responsibilities, budgets, links between levels etc Coordinate a strategic planning exercise (involving representatives of all stakeholders) that incorporates negotiation of responsibilities and data collection and access for all scales (or levels) of benchmarking. Commitment by stakeholders to the benchmarking of IPM adoption will be indicated by budget allocation and responsibility for planning and implementation.
Option 2. Develop benchmarking plans for business, regional and industry levels Develop benchmarking plans for business, regional and industry levels as part of strategic planning exercises. Allocate responsibilities and budget to the benchmarking activity and adjust project templates or strategic plans to reflect the new responsibility.
Option 3. Status quo (not recommended) Project leaders include impact assessment activities as prioritised by industry or as indicated via RD&E prioritisation processes and strategic planning exercises.
C. Develop benchmarking methodologies that will provide comprehensive, credible measurement of IPM adoption
Option 1. Develop an IPM continuum scoring mechanism, initially for brassicas and lettuce, incorporating invertebrate pest, disease, nematode, weed and if possible vertebrate pest management practices The IPM continuum concept captures grower practices and allocates points and weightings to practices. The points for practices used are added together to give an indication of the level of IPM adoption. Some thought on allocation of points for practices by crop is required and, as highlighted by other researchers, will require a team to fine tune the analysis system. Ideally this point system can serve multiple purposes including continuous farm improvement, meeting market standards, marketing advantage and tracking progress towards the industry’s IPM adoption goals. Draft tables of practices for invertebrate pests, diseases, nematodes and weeds along the IPM continuum for Australian conditions are included in Appendix 5. Measures include scouting and biological, cultural and chemical control practices at the preventative, tactical and reactive stages. The generic term pesticide makes it important to define its qualities such as its environmental impact.
Page 60

Appendix 1 : Page 30
To rationalise the effort a pilot program could focus on crops that have IPM information readily available and that are grown and serviced by individuals who have an interest in IPM adoption. The IPM continuum scoring systems set up for these crops could demonstrate the potential for future development and application in more crops. The best practice guides for lettuce and brassicas that have recently been completed and include both invertebrate pest and disease recommendations could be the basis for this initial exercise.
Option 2. Standardise and add value to existing processes Make the standardised grower survey (Appendix 2), key informer survey (Appendix 3) and draft IPM Continuum for Australian conditions (Appendix 5) available to project leaders to generate benchmarking data that can be both used to improve project management and be collated for use by industry funding bodies. This data may then be used to track impacts on IPM adoption of investment into IPM projects. This approach will require someone to collate the data, ideally electronically, from multiple projects to analyse at the higher level.
Option 3. Status quo (not recommended) Project leaders include impact assessment activities as proposed in their project submission or as stipulated by the vegetable IAC or HAL managers. Data is not easily pooled or compared across projects, regions or crops.
D. Synthesise these recommendations with other recommendations for inclusion in the final benchmarking report
This report provides background information on what others have done regarding benchmarking IPM adoption in vegetable crops. It will be combined with reports covering other aspects of the Benchmarking component of the National Vegetable IPM Coordination project, and an overall report will contain the final recommendations. Choosing any option other than the status quo will require an understanding of the goals of the benchmarking recommendations, and negotiating and influencing businesses and organisations to carry out the recommendations. Therefore a communication strategy and allocating responsibilities and timeframes to the recommendations are also essential for successfully moving this objective forward.
Page 61

Appendix 1 : Page 31
7. References
1. Alvarez P, Escarrama ́n V, Go ́mez E, Villar A, Jimenez R, Ortiz O, Alcazar J and Palacios M 1996. Economic impact of managing sweetpotato weevil (Cylas formicarius) with sex pheromones in the Dominican Republic. In Walker T and Crissman C (eds), Case Studies of the Economic Impact of CIP‐Related Technology. Lima, Peru: International Potato Center pp. 83–93. Cited Peshin et al 2009.
2. Anonymous 1991a. Towards a national food policy. Pesticides Charter p21 National Working Group on Food Policy Australian Consumers Association, Sydney. Cited Penrose et al 1994.
3. Anonymous 1991b. Cutting down on chemicals Choice (May) pp10‐15, Australian Consumer’s Association Sydney. Cited Penrose et al 1994.
4. Australian Government 2008. APVMA Chemicals and food safety. APVMA Fact Sheet,
Sept, 4p.
5. Baker G 2007. National diamondback moth project: Integrating biological, chemical and area wide management of brassica pests. Final Report Horticulture Australia Limited project VG04004.
6. Balleras GD 2008. Comparative stuffy of farmers IPM (integrated pest management)
practices for hybrid and inbred rice production in Digo, Davao del Sure, Philippines. Thesis Masters in ethnology, Philippines University Los Banos, Laguna.
7. Balling S 1994. The IPM Continuum. In Constraints to the Adoption of Integrated Pest
Management, A Sorenson, (ed) National Foundation for IPM Education; and Benbrook et al., 1996. Pest Management at the Crossroads. Consumers Union, Yonkers NY.
8. Bamberger M, Rugh J, Church M, and Fort L 2004. Shoestring evaluation: Designing
impact evaluations under budget, time and data constraints. American Journal of Evaluation, 25,5 ‐ 37.
9. Barfield CS and Swisher ME 1994. Integrated pest management: ready for export?
Historical context and internationalization of IPM. Food Review International 10, 215‐267. Cited Zalucki et al 2009.
10. Bechaz K 2006. Lettuce Integrated Pest Management (IPM) Survey 2006, NSW DPI
Report No. 2. Cited Orr et al 2008. 11. Benbrook CM, Groth E, Holloran JM, Hansen MK and Marquardt S 1996. Pest
management at the crossroads. Yonkers NY Consumers Union 272pp. Cited Kogan 1998.
Page 62

Appendix 1 : Page 32
12. Benbrook C, Benbrook KL and Mineau P 2008. PM‐EI3 the pest management efficacy, environment and economic impact system: a tool for tracking and managing the impacts of IPM systems and pesticide use. p1‐15.
13. Bentley J 1997. Advanced IPM for processing tomatoes. Institute Horticulture
Development, Agriculture Victoria 1996‐97 Report 4, p86.
14. Bernson V and Ekstrom G 1991. Swedish policy to reduce pesticide use. Pesticide Outlook 2, 33‐36.
15. Bilston L and Heritage S 2006. Evaluation report. ACIAR project HORT/2002/016
Improving the implementation of integrated crop management in Brassica vegetables through a decision support toolkit based on end‐user needs in China and Australia.
16. Bilston L 2004. Evaluation of sweet corn. In Insect pest management in sweet corn.
Final Report Horticulture Australia Limited Project VG97036.
17. Binns MR and Nyrop JP 1992. Sampling insect populations for the purpose of IPM decision‐making. Annual Review of Entomology 37, 427‐453.
18. Bower CC, Penrose LJ and Dodds K 1993. A practical approach to pesticide reduction
on apple crops using supervised pest and disease control – preliminary results and problems. Plant Protection Quarterly 8, 57‐62.
19. Buck A 2002. Participatory evaluation of farmers’ perceptions about impact from
Farmer Field Schools: Case study Province San Miguel, Peru. Thesis for the degree of Agricultural Engineer. Technical University of Munich. Cited Peshin et al 2009.
20. Bulmer M and Warwick D 1993. Social research in developing countries: surveys and
censuses in the Third World. London: Routledge. Cited Peshin et al 2009.
21. Cameron PJ, Walker GP, Hodson AJ, Kale AJ and Herman TJB 2009. Trends in IPM and insecticide use in processing tomatoes in New Zealand. Crop Protection 28 p421‐427.
22. Chen M, Zhao, J_Z, Collins, HL, Earle ED, Cao J and Shelton AM 2008. A critical
assessment of the effects of Bt transgenic plants on parasitoids. PloS ONE 3, e2284,doi:10.1371/journal.pone.0002284.
23. Coutts J and R 2008. Summary of surveys of agribusiness and vegetable growers for
“Development and promotion of IPM strategies for silverleaf whitefly in vegetables” Project VG05050, p1‐62.
24. DeKryger T and Hether N 2001. Integrated pest management adoption requires
infrastructure. Exploring New Frontiers in Integrated Pest Management Conference, Toronto, Mar 24‐26.
Page 63

Appendix 1 : Page 33
25. Ebbutt D 1998. Evaluation of projects in the developing world: some cultural and methodological issues. International Journal of Educational Development, 18, 415‐424.
26. Echols GW and Soomro MH 2005. Impact of the FAO‐EU IPM program for cotton in
Asia on the environment. In: Ooi PAC, Praneetvatakul S, Waibel H and Echols GW (eds), The Impact of the FAO‐EU IPM Program for Cotton in Asia. A Publication of the Pesticide Policy Project Hannover, Special Issue Publication Series.
27. Feder G and Quizon JB 1998. Integrated pest management (IPM) in Asia: Are there
real returns to IPM and its diffusion? In Waibel H, Fleischer G, Kenmore PE and Feder G (eds), Evaluation of IPM programs‐Concepts and Methodologies. A Publication of the Pesticide Policy Project Hannover, April 1999 Publication Series No. 8.
28. Feder G, Murgai R and Quizon JB 2004. Sending farmers back to school: The impact
of farmer field school in Indonesia. Review of Agricultural Economics 26,45–62.
29. Fernandez‐Cornejo J, Beach ED and Huang WY 1994. The adoption of IPM technologies by vegetable growers in Florida, Michigan and Texas. Journal of agricultural and applied economics 26(1), 158‐172.
30. Fernandez‐Cornejo J and Jans S 1999. Pest management in US agriculture. Resource
Economics Division, Economic Research Service, USDA Agricultural Handbook no 717, 1‐67.
31. Finch S and Collier RH 2000. Integrated pest management in field vegetable crops in
northern Europe – with focus on two key pests. Crop Protection 19, 817‐824.
32. Frantz G and Mellinger HC 1998. Measuring integrated pest management adoption in South Florida vegetable crops. Proc Fla State Hort Soc 111, 82‐87.
33. Frantz G and Mellinger HC 1998. IPM adoption evaluated: a strong foundation for a
safe, profitable crop.
34. Furlong MJ, Shi ZH, Liu SS and Zalucki MP 2004. Evaluation of the impact of the impact of natural enemies on Plutella xylostella L (Lepidoptera: Ypoonmeutidae) populations on commercial Brassica farms. Agricultural and Forest Entomology 6(4), 311‐322.
35. Furlong MJ, Shi ZH, Liu YQ, Guo SJ, Lu YB, Liu SS and Zalucki MP 2004. Experimental
analysis of the influence of pest management practice on the efficacy of an endemic arthropod natural enemy complex of the diamondback moth. Journal of economic entomology 97(6), 1814‐1827.
Page 64

Appendix 1 : Page 34
36. Godtland , Sadoulet EE, de Janvry A, Murgai R and Ortiz O 2004. The impact of farmer field‐ schools on knowledge and productivity: A study of potato farmers in the Peruvian Andes. Economic Development and Cultural Change 53(1), 63–92.
37. Gilkeson LA, Letendre M, Philip H and Smith RF 1997. Survey of integrated pest management in Canada: Apple, canola, carrot and potato. 30p.
38. Griffiths H 1999. Ecolabel for agricultural products from Tasmania.
39. Heacox L 1997 IPM hits the shelves. Marketing. AVG May p49.
40. Heisswolf S, Houlding BJ and Deuter PL 1997. A decade of integrated pest
management (IPM) in Brassica vegetable crops – the role of farmer participation in t its development in southern Queensland, Australia. In: The Management of Diamondback Moth and Other Crucifer Pests, Proceedings of the 3rd International Workshop, Kuala Lumpur, Malaysia. (eds A Silvavpragasam, WH Loke, AK Hussan and GS Lim), pp228‐232. Malaysia Agricultural Research and Development Institute, Kuala Lumpur, Malaysia.
41. Horne PA, Rae JE, Henderson AP and Spooner‐Hart R 1999. Awareness and adoption of IPM by Australian potato growers. Plant Protection Quarterly 14(4), 139‐142.
42. Hollingsworth CS 1994. Integrated pest management certification: a sign by the road.
American Entomologist Summer p74‐75.
43. Huffaker CB and Smith RF 1980. Rationale, organization, and development of a national integrated pest management project. In New Technology of Pest Control. New York: Wiley p1‐24. Cited Kogan 1998.
44. Irwin ME 1999. Implications of movement in developing and deploying integrated
pest management strategies. Agricultural and Forest Meteorology 97, 235‐248. 45. Jacobsen BJ 1997. Role of Plant Pathology in Integrated Pest Management. Annual
Review of Phytopathology, 35, 373‐391 APS, St. Paul, MN.
46. Jayaratne KSU 2007a. Collecting evaluation data. Program Evaluation Institute. North Carolina State University Extension, Raleigh, NC. Cited Peshin et al 2009.
47. Jayaratne KSU 2007b. Evaluation tools. Program Evaluation Institute. North Carolina
State University Extension, Raleigh, NC. Cited Peshin et al 2009.
48. Jiggins JLS 2002. New approaches to evaluation. International learning workshop on farmer field schools (FFS): Emerging issues and challenges, 21–25 October 2002, Yogyakarta.
49. Khan MA, Ahmad I and Echols GW 2005. Impact of an FFS based IPM approach on
farmer capacity, production practices and income: Evidence from Pakistan. In: Ooi
Page 65

Appendix 1 : Page 35
PAC, Peshin et al. Praneetvatakul S, Waibel H and Echols GW (eds), The Impact of the FAO‐EU IPM Pro‐ gram for Cotton in Asia. A Publication of the Pesticide Policy Project Hannover, Special Issue Publication Series, No. 9.
50. Knauer KH 1991. US government policy and integrated pest management. Forest
ecology and management 39, 305‐307.
51. Knipling EF 1980. Regional management of the fall armyworm Spodoptera frugiperda – a realistic approach to insect ecology. Florida Entomol. 63, 468‐80.
52. Kogan M 1998. Integrated pest management: historical perspectives and
contemporary developments. Annual Review of Entomology 43, 243‐270.
53. Kovach J, Petzoldt C, Degni J and Tette J 1992. A method to measure the environmental impact of pesticides. New York Food Life Science Bulletin 139. New York State Agricultural Experimental Station Geneva NY 8pp. Cited Penrose et al 1994.
54. Lynch S and Sexson D 2002. Partnering agriculture and the environment: Wisconsin
potato and vegetable growers’ association and world wildlife fund Exploring New Frontiers in IPM, Toronto, Mar 24‐26 p81‐82.
55. Mancini F, van Bruggen AHC and Jiggins JLS 2006. Evaluating cotton integrated pest
management (IPM) Farmer field school outcomes using the sustainable livelihood approach in India. Experimental Agriculture 43, 97–112.
56. Mancini F, Termorshuizen AJ, Jiggins JLS and van Bruggen AHC 2008. Increasing the
environmental and social sustainability of cotton farming through farmer education in Andhra Pradesh, India. Agricultural Systems 96, 16–25.
57. Manktelow DW 1990. A systems approach to apple blackspot management in
Canterbury. M Horticultural Science thesis, Lincoln University Canterbury New Zealand. Cited Penrose et al 1994.
58. Maza N, Morales A, Ortiz O, Winters P, Alcazar J and Scott G 2000. Impacto del
manejo integrado del tetua ́n del boniato (Cylas formicarius) en Cuba. Lima, Peru. Instituto de Investigaciones en Viandas Tropicales (INIVIT). Centro Internacional de la Papa (CIP). Cited Peshin et al 2009.
59. McDonald DG and Glynn CJ 1994 Difficulties in measuring adoption of apple IPM: a
case study. Agriculture, Ecosystems and Environment 48, 219‐230.
60. McDougall S 2007. Benchmarking vegetable integrated pest management systems against other agricultural industries. Final report Horticulture Australia Limited project VG05043 143p.
Page 66

Appendix 1 : Page 36
61. Olson DL, Nechols, JR and Marr CW 1995. Consumers’ preference for insecticide‐free pumpkins in eastern Kansas. HortTechnology 5(3), 274‐278.
62. Orr LM, McDougall S and Mullen JD 2008. An evaluation of the economic,
environmental and social impacts of NSW DPI investments in IPM research in lettuce. NSW Department of Primary Industries. Economic Research Report 40, 29p.
63. Ortiz O 1997. The Information System for IPM in Subsistence Potato Production in
Peru: Experience of Introducing Innovative Information in Cajamarca Province. PhD dissertation. Department of Agricultural Extension and Rural Development. The University of Reading, Reading, UK.
64. Ortiz O, Alcazar J, Catala ́n W, Villano W, Cerna V, Fano H and Walker T 1996.
Economic impact of IPM practices on the Andean potato weevil in Peru. I. In Walker T and Crissman C (eds), Case Studies of the Economic Impact of CIP‐Related Technology. International Potato Center Lima, Peru. p 95–110.
65. Ortiz O, Garret KA, Heath JJ, Orrego R and Nelson R 2004. Management of potato late
blight in the Peruvian Highlands: Evaluating the benefits of farmer field schools and farmer participatory research. Plant Disease 88(5), 565–571.
66. Page J and Horne PA 2007. Scoping study on IPM potential and requirements. Final Report, Horticulture Australian Limited Project VG06086.
67. Penrose LJ, Thwaite WG and Bower CC 1994. Rating index as a basis for decision
making on pesticide use reduction and for accreditation of fruit produced under integrated pest management. Crop Protection 13 (2), 146‐152.
68. Peshin R 2005. Evaluation of the Dissemination of Insecticide Resistance
Management Program in Cotton in Punjab. PhD Dissertation, Punjab Agricultural University, Ludhiana, India.
69. Peshin R 2009. Evaluation of Insecticide Resistance Management Program: Theory
and Practice. Daya publishers, New Delhi.
70. Peshin R and Dhawan AK 2009. Integrated Pest Management: Innovation‐Developoment Process. Vol 1. Impact Springer Science+Business media BV.
71. Peshin R, Jayaratne KSU and Singh G 2009. Evaluation research: methodologies for
evaluation of IPM programs. Chapter 2, p31‐78 in R Peshin, AK Dhawan (eds), Integrated Pest Management: Dissemination Impact Springer Science+Business media BV.
72. Peshin R and Kalra R 1998. Integrated pest management at farmer’s level. Man and
Development 22,137–141.
Page 67

Appendix 1 : Page 37
73. Porter I, Donald, C and Minchinton L 2007. National vegetable industry IPM pathology GAP analysis. Summary Report Horticulture Australia Limited project VG 04016. 19p.
74. Praneetvatakul S, Echols GE and Waibel H 2005. The costs and benefits of the FAO‐EU
IPM program for cotton in Asia. In: Ooi PAC, Praneetvatakul S, Waibel H and Echols GW (eds), The Impact of the FAO‐EU IPM Program for Cotton in Asia. A Publication of the Pesticide Policy Project Hannover, Special Issue Publication Series, No. 9.
75. Prokopy R, Frantz GF and Mellinger HC 1998. Arthropod pest abundance at first level
integrated pest management practices in apple orchards. Florida Entomologist 81, 234‐249.
76. Reddy VS and Suryamani M 2005. Impact of Farmer field school approach on acquisition of knowledge and skills by farmers about cotton pests and other managmement practices: Evi‐ dence from India. In Ooi PAC, Praneetvatakul S, Waibel H and Echols GW (eds), The Impact of the FAO‐EU IPM Program for Cotton in Asia. A Publication of the Pesticide Policy Project Hannover, Special Issue Publication Series, No. 9.
77. Rola AC, Roquia FH, Chupungco AR and Hernandez JT 1999. Pesticides, food safety
and the environment: socio‐cultural, economic concerns and policy adjustments. 1998 Regional Research and Development Symposia 15 Jul‐11 Sep, p28‐29.
78. Rola WR, Laigo FK, Abellear CD, Bulasco AF, Milo VC, Mamaril EK, Malabayabase A
1996. Impact analysis of the integrated pest management (IPM) for highland vegetable project. Anniversary and annual scientific meeting of the pest management council of the Philippines Inc, Davao City, 7‐10 May 1996. p95‐96.
79. Rossi P, Lipsey MW and Freeman, HE 2004. Evaluation: a systematic approach (7th
ed.). Thousand Oaks: Sage.
80. Schellhorn NA, Nyoike TW and Liburd OE 2009. IPM programs in vegetable crops in Australia and USA: Current status and emerging trends. In Integrated pest management: innovation‐development process. Eds: R Peshin, AK Dhawan. Springer Science+ Business Media BV Chapter 19 p575‐597.
81. Sikora EJ, Zehnder GW, Kemble JM, Goodman R, Andrianifahanana M, Bauske EM
and Murphy JF 2001. Tomato IPM field demonstrations in Alabama. Journal of Extension 392.
82. Smith R, Larsen M, Sheffield C and Rogers D 2002. Dollars and sense of Nova Scotia’s
advanced IPM within integrated fruit production. Exploring New Frontiers in Integrated Pest Management Conference, Toronto, Mar 24‐26.
83. Stern VM, Smith RF, van den Bosch R and Hagen KS 1959. The integrated control
concept. Hilgardia 29, 81‐101. Cited Zalucki et al 2009.
Page 68

Appendix 1 : Page 38
84. USDA 1993, Agricultural Research Service USDA programs related to integrated pest
management. USDA program Aid 1506. Cited Fernandez‐Cornejo and Jans 1999.
85. US Department of Health Services 2010. Office of planning, research and evaluation. Chapter 2, What is program evaluation.
http://www.acf.hhs.gov/programs/opre/other_resrch/pm_guide_eval/reports/pmguide/chapter_2_pmguide.html.
86. van de Fliert E 1993. Integrated Pest Management: Farmer Field School Generate
Sustainable Practices. Wageningen Agricultural University Papers 93.3.
87. Vanderman A, Fernandez‐Cornejo J, Jans S and Lin BH 1994. Adoption of integrated pest management in US Agriculture. Washington, DC: USDA‐ERS, Agriculture Information Bulletin 707, 26pp.
88. van den Berg H 2004. IPM Farmer Field School: A Synthesis of 25 Impact Evaluation
Studies. Wageningen University, Prepared for the Global IPM facility. http://www.fao.org/docrep/ 006/ad487e/ad487e00.htm.
89. Walsh BJ, Vock N, Bilston L and Heisswolf S 2003. Needs analysis of Brassica
vegetable farmers and their farm advisers. Interim report. ACIAR project HORT/2002/016. 9p.
90. Warrell E 1990. Reducing pesticide use: the Danish experience. Shell Agriculture 8,
19‐20. Cited Penrose et al 1994.
91. Wu L, Praneetvatakul S, Wiabel H and Wang L 2005. The impact of FFS on yield, pesticide cost and gross margin in Shadong Province, P R China: an econometric approach. In: Ooi PAC, Praneetvatakul S, Waibel H and Echols GW (eds), The Impact of the FAO‐EU IPM Program for Cotton in Asia. A Publication of the Pesticide Policy Project Hannover, Special Issue Publication Series, No. 9.
92. Yamazaki S and Resosudarmo BP 2007. Does sending farmers back to school have an
impact? A spatial econometric approach. Working Papers in Trade and Development, Working paper no. 2007/03, Division of Economics, Research school of Pacific and Asian Economics, ANU College of Asia and Pacific.
http://rspas.anu.edu.au/economics/publish/papers/wp2007/wp‐econ‐ 2007‐03.pdf.
93. Zalucki MP, Adamson D and Furlong MJ 2009. The future of IPM: whither or wither. Australian Journal of Entomology 48, 85‐96.
Page 69

Appendix 2 : Page 1
Appendix 2 Benchmarking Vegetable IPM Adoption: Obtaining Benchmarking Data via Grower Surveys: Options, Guidelines and Standardised Survey Questions
March 2011
These options, guidelines and survey questions were developed by the following team members of the National Vegetable IPM Coordination project (VG09191): Sandra McDougall, NSW Department of Primary Industries (NSW DPI), Bronwyn Walsh, Queensland Department of Employment, Economic Development & Innovation (DEEDI) and Lauren Thompson, Scholefield Robinson Horticultural Services. Early versions were distributed to more than 100 research project leaders and interested industry members for comments. Comments from the seven respondents were incorporated. We thank Jeff Coutts (of Coutts J&R, Toowoomba Qld) for comments on later drafts.
Page 70

Appendix 2 : Page 2
CONTENTS
1. Summary and Recommendation .......................................................................................................... 3
2. Introduction .......................................................................................................................................... 4
3. Methods................................................................................................................................................ 6
4. Sample letter to project leaders (introducing survey)........................................................................ 10
5. Sample Survey : Vegetable Grower Benchmarking IPM Adoption Survey ....................................... 13
6. Logic framework of survey.................................................................................................................. 22
Page 71

Appendix 2 : Page 3
1. Summary and Recommendation
A standardised set of benchmarking questions for use in RD&E projects is one remedy for improving reporting on IPM adoption in Australian vegetables. The survey in this report was designed to provide standard questions and definitions and reflect the information required to assess the level of IPM adoption. It is meant to be flexible, useful and ‘ready to go’ in order to appeal to project leaders and/or ‘third party’ entities involved in conducting the surveys. Four options are presented for the process of undertaking the Vegetable Grower Benchmarking IPM Adoption survey: 1) offer it as an optional activity within crop protection RD&E projects; 2) make it a required activity within crop protection RD&E projects; 3) conduct it as part of a separate benchmarking project that coordinates with crop protection RD&E projects; or 4) commission a separate benchmarking project that may or may not include coordination with RD&E projects. The first option would improve the current situation without an increase in investment. The second, third and fourth options would require an increase in investment of between $50‐100K per annum. Recommendation The third option of having a separate benchmarking project that coordinates with the crop protection RD&E project teams to deliver the survey is the preferred option. It would provide the greatest consistency in data and it could report both to the project teams to allow for continuous improvement within existing projects and to industry on IPM adoption over time. However, if resource priorities preclude a separate project or additional funding within R&D projects then the first option to make the standard questions available for optional use by project teams would at least allow the data that is collected to be pooled and analysed across projects at a later date.
Page 72

Appendix 2 : Page 4
2. Introduction
Close to $40m was spent on vegetable crop protection RD&E between 2001 and 20091. During that time surveys measuring the level of adoption of IPM strategies asked differently worded questions and often did not define IPM or other terms, meaning their results cannot easily be used to compare between projects or over time. Most of these surveys also only focused on invertebrate pests and not the full spectrum of crop pests including: diseases, nematodes, weeds, invertebrate and vertebrate pests. To assist with tracking changes in the adoption of key IPM practices over time on a national basis we are recommending that IPM projects or a specific third party benchmarking project use some standard questions to capture pest management practices by vegetable growers. If those projects that have conducted grower adoption or benchmarking surveys in the past had used a standardised set of questions then the collected data could have been pooled to evaluate IPM adoption in a few key vegetable commodities in a number of key vegetable production regions. A modest increase in investment in all of the crop protection projects that have an extension component, to include a survey of the growers they are targeting with their project, would possibly enable evaluation of IPM adoption in a range of vegetable commodities in virtually all of the major production areas. Hence a standardised set of benchmarking questions for use in RD&E projects is recommended for improving reporting on IPM adoption in Australian vegetables. The survey in this report was designed to provide standard questions, definitions and reflect the information required to assess the level of IPM adoption. It is meant to be flexible, useful and ready to go in order to appeal to project leaders to use it. Given the breadth of types of crop protection RD&E projects it is likely that project leaders will want to include some additional questions that relate specifically to their project outcomes. Some of the standard questions may not be relevant to their project activities, however the collection of this additional data from their target industry group will nevertheless add to tracking IPM adoption in vegetables in Australia over time. The following assumptions have been made for the purposes of development of the Vegetable Grower Benchmarking IPM Adoption survey:
• it is being used as part of a project
• it is primarily targeting one crop
• funding is available for the survey activity
• it is optional for growers to complete it
• it will be completed by a self‐selecting group of respondents (Growers surveyed are more likely to be those engaged with the project. It is expected that some effort will be made to contact growers not actively involved with the project but it is understood that limited effort can be put into following up with growers who are not particularly interested in participating in the survey.)
• sample size is likely to be limited to a small number of regions unless it is attached to a national project with collaborators in each state
• one of the goals of the participating projects is to improve knowledge and skills of growers and farm advisers, enabling them to: manage a particular pest or group of pests; reduce
1 Personal Communication from HAL program manager for Entomology, IPM and Chemicals, 2010
Page 73

Appendix 2 : Page 5
reliance on pesticides, particularly older chemistry that is likely to be lost due to chemical reviews or resistance; and maintain or improve the quality of produce.
As the survey was developed as part of the benchmarking component of the Vegetable IPM Coordination project (VG09191) it links to other activities, such as the Benchmarking IPM Adoption: Literature Review and Analysis report (in Appendix 1) and the IPM continuum (Appendix 5). Action on recommendations from that report may mean changes to the content of this survey.
Page 74

Appendix 2 : Page 6
3. Methods
Delivery Options
The Vegetable Grower Benchmarking IPM Adoption Survey could be conducted in one of four ways: as an optional or compulsory part of individual RD&E projects, or part of a Benchmarking project that collaborates or co‐ordinates with new and existing crop protection RD&E projects or stands alone.
1. Survey as an optional part of RD&E crop protection projects (similar proportion of projects will budget for a survey as in the past but will use the standard questions).
2. Survey as a compulsory part of crop protection projects with extension component (approximately 5% increase of project budget).
3. Survey component of crop protection projects is outsourced to a single provider ($50‐100K per annum project budget).
4. Standalone IPM Adoption Benchmarking project ($50‐100K per annum project budget). Option 1. Survey is an optional component of crop protection RD&E projects
Those projects that are planning to conduct grower surveys would use the standard questions as part of their survey. The data would be analysed internally for project improvement and evaluation, and be made available to a third party for meta‐analysis between projects. The project team may choose to outsource their survey component to a third party.
Benefit(s): Without any change in historical investment levels on crop protection projects the survey data using the standard questions could be pooled and analysed between regions and over time to track IPM adoption in some vegetable crops and some regions. Collated data would feed back into indentifying gaps for future RD&E and development of targeted RD&E projects.
Downside(s) and Challenge(s): Coverage will depend on the scope of the current projects that choose to conduct surveys and may result in a series of snapshots in quite different regions and crops conducted in different years.
Option 2. Survey included as a compulsory component in all crop protection projects that have
an extension component
All crop protection projects with an extension component would be required to include a grower survey using the standard questions as a project activity. The data would be analysed internally for project improvement and evaluation, and made available to a third party for meta‐analysis between projects. The project team may choose to outsource the survey component to a third party.
Benefit(s): Some projects that may not have previously planned to survey growers would collect data that would improve the design and implementation of their project. Depending on the length of the project a survey conducted 3‐5 years after the initial survey would provide feedback on changes in practice that the project may have contributed to as well as track changes in other crop protection practices the project didn’t address. It would also identify future RD&E needs or gaps.
Page 75

Appendix 2 : Page 7
Downside(s) and Challenge(s): Coverage will depend on the scope of the current projects and may result in a series of snapshots in quite different regions and crops. The survey data would be more useful if key production areas and crops were surveyed at regular intervals. Some project teams that have little interest and experience with conducting surveys may make little effort to get survey returns and hence not collect enough data to be useful. Option 3. Third party is commissioned to conduct the survey in collaboration with the crop
protection projects
A project provider is commissioned to work with crop protection project teams that have an extension component to conduct the Vegetable Grower Benchmarking IPM Adoption survey. They work with the project team to add additional questions if necessary and provide support in the collection, analysis and reporting of the results back to the team. They also pool the data from all the surveys and report to industry on the level of IPM adoption within the vegetable industry, based on current projects.
Benefit(s): Combining surveying and evaluation expertise with the technical insights of the crop protection team would improve the quality of the survey analysis. Having a single person or group coordinating the surveys would ensure consistency and a deeper understanding of the limitations of the data than someone brought in later to pool and analyse the different survey results from different projects. Issues on which on‐line survey system or database to use would be easily handled.
Downside(s) and Challenge(s): Working effectively and collaboratively with the project teams and negotiating what is conducted by each party (given some project teams may want to be actively involved in the survey and others not) would be a challenge if this option were chosen. The set of projects underway at the time of the survey would most likely not be representative of the industry. Option 4. Standalone IPM Adoption Benchmarking project
A project is commissioned to benchmark IPM adoption in vegetables and works to a benchmarking plan with articulated goals and a defined sampling plan, i.e. it is not possible to survey all vegetable growers so decisions need to be made regarding appropriate subsets of growers to survey. This project may or may not include working with existing or new crop protection projects depending on the regions or crops they are working with and the agreed sampling plan.
Benefit(s): The project would work to a national industry benchmarking plan and a sampling strategy that is more representative of the vegetable industry. They could utilise any existing networks to reach the targeted growers, which may include working through projects or other networks such as the state vegetable grower associations.
Downside(s) and Challenge(s): Benchmarking data collected from growers, which can also be used by related crop protection projects so they can respond to the information with project improvements, may not be available in a timely manner to enable realisation of this potential benefit. A standalone benchmarking project may find it more difficult to access grower contact databases due to privacy issues. The project team may also have a less positive response to surveys if they have not had previous interaction with the growers, i.e. if there is not the ‘social
Page 76

Appendix 2 : Page 8
contract’ that there often is between established research providers and the growers they work with. Option 4, having a separate IPM Benchmarking project could be complementary to both Options 1 and 2 and the project team could act as the ‘third party’ that does the meta‐analysis of the pooled data collected from the optional or compulsory surveys. The standalone project may also include the task of working closely with the projects in implementing and analysing the surveys, which is essentially Option 3.
Conducting the Survey
Surveys can be conducted over the phone, via fax, via the post or electronically via the Internet. Ultimately for analysis the data needs to be in electronic form.
Only the highly motivated and engaged growers are likely to respond positively to an unsolicited survey and return the survey completed. Most will need a personal introduction whether at an industry function or via a phone call from someone they respect. For a reasonable return rate on surveys multiple methods need to be used and some personal follow‐up is required. Surveys are optional therefore there will be a level of self‐selection or bias in that the data, given it is collected only from growers who return the survey.
Growers are also busy people and a long survey is not likely to be a high priority so it is important that it is made as easy as possible for growers to respond to. Those who are comfortable on the computer or Internet may be quite happy to work through the survey on their own; others may prefer to have someone ask them the questions.
The Vegetable Grower Benchmarking IPM Adoption survey is quite long because it needs to capture the different practices used for managing the breadth of pests in a range of different vegetables, different markets and different production systems. Crop protection projects have traditionally focused mostly on invertebrate pests and plant diseases so the management practices for these pests are covered in greater detail than practices for managing weeds, invertebrate pests etc. Data handling
Survey data needs to be in an electronic form to be analysed. This is particularly the case where data coming from a number of different groups of growers is to be pooled and analysed. Internet based surveys are very time efficient and increasingly easy to conduct. Surveys completed on the web either by the grower or someone speaking with the grower do not have to be double‐handled. There are web‐based survey providers such as Survey Monkey2 who will host a survey that is built online. Basic analysis reports are automatically generated and they allow data to be stored and exported for a subscription fee. Alternatively there are evaluation service companies such as QualDATA3 who offer tailored data handling and evaluation services.
If the survey is conducted within discrete crop protection projects then a decision needs to be made regarding the form in which the data is to be stored, who will hold it and who will
2 Survey Monkey (USA company): AUD $299/year or $25/month subscription, http://www.surveymonkey.com 3 Australian company that offers a range of evaluation data handling and analysis services, http://qualdata.net.au
Page 77

Appendix 2 : Page 9
analyse the pooled data. If there is a separate benchmarking project then this issue is resolved for the duration of the project. Confidentiality
Confidentiality of any identifying information that is collected is critical and only pooled data with no identifying information can be made public. However, surveys cannot be stored without some identifying information because of the issue of growers being surveyed by different groups covering different crops and the need for them to be surveyed over time to enable changes to be tracked. Project teams conducting or responsible for the survey need to be aware of the confidentiality issues and undertake to not report any information that is identifiable to any specific grower without prior permission.
Page 78

Appendix 2 : Page 10
4. Sample letter to project leaders (introducing survey)
Note that the wording in italics is the recommended wording for inclusion in a letter to project leaders or where noted, for inclusion in project submission guidelines.
In the case of Option 1 or 2 being approved:
• To be included in project submission guidelines for new projects: If you are planning to apply for a crop protection project in vegetables you are encouraged (Option 1)/required (Option 2) to include a benchmarking survey in your project design at the start of the project and then to conduct another follow‐up survey 3‐5 years after the first survey, if your project runs over 3 years. You may choose to do it using an internal assessor or contract an external assessor to conduct the survey.
• To leaders of existing projects: You are receiving this letter as your project has been identified as being suitable for incorporating a survey using standard IPM adoption benchmarking questions. If Option 3 is approved:
• To be included in project submission guidelines for new projects: If you are planning to apply for a crop protection project in vegetables you will be required to work with the Vegetable Benchmarking IPM Adoption project (which will be or has recently been tendered/commissioned) to include a benchmarking IPM adoption survey in your project at the start of the project and then to conduct another follow‐up survey 3‐5 years after the first survey, if your project runs over 3 years. The Vegetable Benchmarking IPM Adoption project will work with you to add any additional survey questions to the standard questions, to assist in identifying the number of growers to sample, to potentially assist in surveying the growers and to assist with conducting the analysis. Sections for inclusion in letters to project leaders if Option 1, 2 or 3 is approved:
Background Close to $40m was spent on vegetable crop protection RD&E between 1993 and 2009. During that time surveys measuring the level of adoption of IPM strategies asked differently worded questions and often did not define “IPM” or other terms, meaning their results cannot easily be used for comparison between projects or over time. Most of these surveys also only focused on invertebrate pests and not the full spectrum of crop pests including: diseases, nematodes, weeds, invertebrate and vertebrate pests. To assist with tracking changes in the adoption of key IPM practices over time on a national basis we are recommending that IPM projects use some standard questions to capture pest management practices by vegetable growers. These questions can supplement other project specific questions that you may add to the surveying exercise. Some optional questions may be included depending on whether the questionnaire is used at the beginning of a project or at the end. Process The survey can be emailed, faxed, posted or personally given to the growers. It is likely that for good returns, follow‐up phone calls or emails, and face‐to‐face interviews or phone interviews will be required to gather data from a wide cross section of growers. An online electronic version will be available.
Page 79

Appendix 2 : Page 11
In the case of Option 1 or 2 being approved, the survey is being conducted independently by projects and the following needs to be included in the letter: Analysis Information from conducting the survey that should be included in the survey report includes:
1. total number of growers contacted 2. number of surveys returned 3. production regions covered 4. crops covered 5. estimate of the number of growers per crop per region 6. estimate of area of production per crop in the regions covered 7. proportion of growers and area covered by survey responses 8. any variation in definition of the IPM continuum categories from Table 1 (below) that is
relevant to the crop or region being surveyed Analysis from the survey itself would include number of growers and crop area covered by the different practices identified in the survey. It would also include information on where growers identify themselves on the IPM continuum (see Appendix 5) and where their responses to other questions place them on the continuum. If a standalone Benchmarking IPM Adoption project were commissioned then this project would include a write‐up of the analysis of each of the surveys within its annual report and the crop protection RD&E projects would only need to include in their final reports the components that directly related to their project focus area. The following sections are also to be included in letters to project leaders if Option 1, 2 or 3 is approved:
IPM Definition For the purposes of this Benchmarking IPM Adoption survey, integrated pest management (IPM) is defined as covering all pests including: diseases, nematodes, weeds, invertebrate and vertebrate pests. IPM is a strategy that utilises a range of tools to manage pests and covers a ‘continuum’ of practices. At the ‘low’ end of the IPM continuum pest management essentially involves monitoring crops to make spray decisions. At the ‘high or biointensive’ end of the IPM continuum the cropping system is managed to maximise use of biological controls and preventative tactics with relatively few pesticides being applied and ‘soft’ chemicals being used. It is not possible to have a rigidly defined set of practices within each grouping of the IPM continuum because for each cropping system the suite of pests needing management varies and the tools available also vary between regions and over time. An IPM strategy is a problem solving approach drawing on the available tools for a specific crop, business and market environment. Nevertheless if we want to track adoption of IPM in Australian vegetables we need to make some generalisations. A wide range of crop protection practices are covered in the IPM adoption benchmarking survey and respondents are not necessarily going to fall neatly into the four categories defined within the IPM Continuum (Appendix 5): non IPM, Low IPM, Medium IPM and High IPM.
Page 80

Appendix 2 : Page 12
Within the survey, questions are asked that essentially enable growers to be categorised as to where they sit within the IPM continuum. A grower’s answer to Q8 is a self‐assessment of his/her current level of IPM adoption and the answer to Q9 indicates whether there is an intention to move forward along the continuum. Assessors should also analyse the answers to other questions to determine whether the IPM category indicated by those responses is consistent with the grower’s answer to Q8. If the grower being surveyed uses different practices for different crops then one option is to fill in separate returns for each crop using questions from Question 6 (Q6) onwards, or if the differences are only slight then notes about the differences can be written in the places where comments can be left, i.e. in the spaces next to instances of the word ‘Other’ or at the end of the standard survey (i.e. in Q44). Answers to Q39‐Q43 will need to be crop specific. Importance of maintaining confidentiality Confidentiality of identifying information is critical and only pooled data with no identifying information can be made public. However, surveys cannot be stored without some identifying information because of the issue of growers being surveyed by different groups covering different crops and the need for them to be surveyed over time to enable changes to be tracked. Project teams conducting or responsible for the grower survey need to understand the importance of maintaining confidentiality. The team must undertake to not report any information that is identifiable to any specific grower without getting prior permission to do so.
Page 81

Benchmarking IPM Adoption Grower’s survey
Appendix 2 : Page 13
5. Sample Survey : Vegetable Grower Benchmarking IPM Adoption Survey
This survey is being undertaken to assist in planning future programs to help with crop protection issues. By filling out the details below, you will help us understand what is working and where more assistance is needed to ensure that individual enterprises and farms are best supported in their crop protection requirements.
You will not be identified in any reporting of this information. Results will be grouped according to crop type and region and will not be based on individual farms.
Some questions may not be relevant to you – so please leave these blank.
Some questions may vary depending on which crop you are referring to. If your crop protection practices vary considerably between crops then a separate return from Question 6 (Q6) onwards needs to be filled in for each crop. Where crop protection practices only vary a little between crops please note the difference in the comments spots, i.e. in the spaces next to instances of the word ‘Other’ or in Q44.
Please provide some background information
1. Name: ___________________ 2. Business name:_________________
3. Date:____________________
4. In which state is your vegetable production business located? NSW QLD SA Tas Vic WA NT .ACT
5. What is the post‐code for this business location? __________________
6. Please describe your vegetable crop production & marketing situation in the table below:
Name of crop Area grown last year (hectares)
Type of production Main Market
Field Open hydro Open tunnel Closed screen greenhouse
Other:
Fresh____% Processing____% Domestic____% Export____%
Field Open hydro Open tunnel Closed screen greenhouse
Other:
Fresh____% Processing____% Domestic____% Export____%
Field Open hydro Open tunnel Closed screen greenhouse
Other:
Fresh____% Processing____% Domestic____% Export____%
Field Open hydro Open tunnel Closed screen greenhouse
Other:
Fresh____% Processing____% Domestic____% Export____%
Page 82

Benchmarking IPM Adoption Grower’s survey
Appendix 2 : Page 14
7. What sort of sprayer(s) do you use? Standard Boom Boom with droppers Air‐assist CDA SARDI head Canon Backpack Other (describe)_________________________
8. What are your current crop protection strategies? Spray at regular intervals (Calender spray) Monitor and spray when pests are present (low IPM) Monitor pests and beneficials, choose softer chemicals, use a range of preventative
strategies such as resistant varieties, crop rotations, sanitation (medium IPM) Redesigned cropping system to rely primarily on preventative practices, actively
encourage beneficials (bio‐intensive IPM) Other (describe)____________________________________________________________
9. Which of the above strategies that you aren’t doing now (if any) are you planning on introducing in the next 5 years
Spray at regular intervals (Calender spray) Monitor and spray when pests are present (low IPM) Monitor pests and beneficials, choose softer chemicals, use a range of preventative strategies such as resistant varieties, crop rotations, sanitation (medium IPM)
Redesign cropping system to rely primarily on preventative practices, actively encourage beneficials (bio‐intensive IPM)
Other: (describe)____________________________________________________________
We are interested in what crop monitoring you do: 10. Is crop monitoring undertaken by
Yourself Your staff Crop consultant Not undertaken
11. If you monitor crops, how often do you do so? More than once per week Weekly Fortnightly Longer intervals
12. If you monitor crops, what do you monitor for? (please tick all that apply) Diseases Insect pests Mite pests Beneficials (predators or parasitoids of insect or mite pests) Nematodes Nutritional deficiency/toxicity Soil moisture Water quality Weeds Other (describe)____________________________________________________________
13. Do you keep records of the monitoring results?
Page 83

Benchmarking IPM Adoption Grower’s survey
Appendix 2 : Page 15
No Sometimes Always
This section asks what prevention practices you may be using: 14. Which of the following sanitation or prevention practices do you have/use or have you
used? (please tick all that apply) A biosecurity plan A Quality Assurance program An Environmental Management Strategy Workflow designed to work in clean areas/crops first and in dirty/infested areas last Use resistant varieties Crop rotation to reduce diseases Soil amendments to improve soil health to reduce disease problems Modify pH to reduce specific disease problems Have changed the timing of irrigation to reduce diseases Have changed the method of irrigation to reduce diseases Reuse water with a strategy/method to reduce disease innoculum Reuse water and test water quality Control weeds to reduce pests Designate clean (disease or invertebrate pest –free) areas Pull out plants showing disease symptoms and leave on ground Pull out plants showing disease symptoms and dispose of Don’t plant new crops next to old crops Plant crops consecutively Plant new crops up wind of old crops/problem areas Avoid hot spots Spray out old crops with insecticide Spray off harvested crops with quick action herbicide (e.g. Spray Seed®) Slash or cultivate crop in straight after harvest Other (describe) _____________________________________________________
_________________________________________________________________
15. If you have a greenhouse, do you have it designed to exclude pests? (please tick all that apply) Yes – sealed with insect proof screening Yes – foot bath before entry Yes – vestibule – double doors on entry way No
16. If you use hydroponics, do you: Sanitise hydroponic channels between crops Sanitise annually or at other set intervals Don’t sanitise
Page 84

Benchmarking IPM Adoption Grower’s survey
Appendix 2 : Page 16
This section deals with chemicals and their application 17. Which level of chemical user certificate do you have?
AQF 3 AQF 4 AQF 5 Not sure None
18. How often do you calibrate your sprayer? Every spray Monthly‐ quarterly Half yearly Annually Once only Never
19. How do you check your sprayer setup for coverage? Water sensitive paper Dye Look at leaf wetness Don’t check Other (describe)___________________________________________________________
20. How do you residue test your produce – and how often do you do it? Test for all chemicals used on property Standard lab test/ not sure what test Don’t residue test
21. If you do residue test, how often do you do it? Once a year 3‐4 times a year 5‐10 times a year Every planting
22. Do you manage an insecticide‐resistant pest? (please tick all that apply) Helicoverpa armigera (Heliothis) Silverleaf whitefly [SLW] Western flower thrips [WFT] Diamondback moth [DBM] Other_________________________ No
23. If you do, what resistance management strategy do you use? (please tick all that apply) Rotate chemical groups Use the three spray strategy Other (describe) ____________________________________________________________
24. If you manage a fungicide resistant disease, what disease is it? _____________________
Page 85

Benchmarking IPM Adoption Grower’s survey
Appendix 2 : Page 17
25. If you manage a herbicide resistant weed, what weed is it?________________________
26. Do you use preventative fungicides? Yes No
27. If you do use fungicides, do you modify applications depending on: (please tick all that apply) Weather Varieties Monitoring Leaf wetness Models
28. Do you avoid using synthetic pyrethroid or organophosphate insecticides? Regularly (in more than 50% of your plantings) Sometimes (in less than 50% of your plantings) Rarely (in less than 10% of your plantings) Never
29. Do you consider impacts of sprays on beneficials when choosing control options? Regularly (in more than 50% of your plantings) Sometimes (in less than 50% of your plantings) Rarely (in less than 10% of your plantings Never
This section focuses on the use of biological control 30. Do you use Bts or NPVs (eg Gemstar®, or Vivus®)?
Sometimes Regularly Never
31. Have you purchased beneficials from an insectary? Sometimes Regularly Never
32. Do you conserve beneficials? (please tick all that apply) Yes ‐by choosing softer chemicals Yes ‐ spray when not active Yes ‐ use intercrops/refuges Yes ‐ planted native vegetation No Other(describe)_____________________________________________________________
33. Do you use Trichoderma or other soil biological additives to prevent diseases? Yes No
Page 86

Benchmarking IPM Adoption Grower’s survey
Appendix 2 : Page 18
34. What are the main beneficials (predators or parasitoids of invertebrate pests) that control your insect or mite pests? (please list) ___________________________________________________________________________________________________________________________________________________________________________________________________________________________________________________________________________________________________
This section relates to Reviewing & Planning: 35. How often do you review monitoring records (please tick all that apply)
weekly seasonally annually every now and then never
36. How often do you review chemical records (please tick all that apply)
weekly seasonally annually every now and then never
37. How often do you review harvest records (please tick all that apply) weekly seasonally annually every now and then never
38. In the last 3 years, have you had a consignment rejected for: Insect contamination (including contamination by beneficial organisms) Disease symptoms Size Weed contamination Residues Other (describe) _________________________________________________ Never had a rejection
This section asks about the level of damage from pests in the last year. This section needs to be filled out for each crop grown. Repeat this section for different crops.
Crop:__________________________
39. Approximately what level of loss of marketable yield (of this crop) would you estimate that pests caused on your farm in the last year? Please provide an estimate of the % of your overall crop that was unmarketable as a result of pests (insects, mites, disease, nematodes, weeds, and animals such as ducks and wallabies) and if you have multiple plantings then note whether damage is seasonal (eg 20% loss in 1 summer planting out of 5 annual plantings, 5% loss in remaining 4 plantings)
____________%
40. Approximately, how much gross income did your farm lose from this damage over the last year? $___________
41. What pests caused the most damage? Insects, mites Disease Nematodes Weeds Animals such as ducks and wallabies
Page 87

Benchmarking IPM Adoption Grower’s survey
Appendix 2 : Page 19
42. In the last year, what was your approximate cost for chemicals used to control all pests of this crop (including chemicals for controlling insects, mites, diseases, nematodes, weeds and vertebrate pests)?
$___________
43. Approximately, how much did you pay for non‐chemical management of all of the above pests of this crop (eg cost of monitoring, cost of foot baths, cost of beneficials) in the last 12 months?
$___________
Please answer the above questions (Q39 ‐ Q43) again for different crops. Be sure to identify the Crop each time you provide a new set of answers. Use the back side of this page if you are using a paper copy of this survey.
44. Please make any comments about pest management in your crops or provide clarification on any previous answers.
_____________________________________________________________________________________
_____________________________________________________________________________________
_____________________________________________________________________________________
_____________________________________________________________________________________
Thankyou for your time and assistance.
Page 88

Benchmarking IPM Adoption Grower’s survey
Appendix 2 : Page 20
Optional Survey Sections and Further Project Specific Questions The remainder of the survey is for optional inclusion by project leaders. The information will be useful for understanding the circumstances and influences affecting IPM adoption but will require extra time to complete. Further project specific questions may also be added.
OPTIONAL SECTION: project involvement
45. Have you ever participated in any of the following project activities run by the government or private providers in the last 3 years? (please tick all that apply)
Attended field days/workshops or seminars Been surveyed (apart from this one) Had a trial conducted on your farm Hosted a field day/farm walk on your own farm Been on a project steering committee Other: (describe)____________________________________________________________
46. If you have participated in a project activity and you remember the name of the project or organisation that ran the activity, please note: ______________________________________________________________________________
OPTIONAL SECTION: change in damage and chemical costs over last 3 years
47. Over the last 3 years, did your level of damage change? Yes – it went up No – it went down It stayed the same
Any idea why?_________________________________________________________________
48. If the level of damage changed, can you please estimate the % of change (for example whether it has decreased by X% or increased by Y% and if you have multiple plantings then please note whether the change in damage was seasonal i.e. summer plantings or 1 out of 5 plantings) ______________________________________________________________________________
49. In what way did your annual use of chemicals for controlling all pests change over this 3 year period (in terms of number of spray applications)?
It went up It went down It stayed the same
50. If the number of applications has changed, can you please estimate the % change per year (for example, has the number decreased by X% per year or increased by Y% per year?)
__________% per year
51. By what percentage (approximately) did your non‐chemical management costs (for example, cost of monitoring, cost of foot baths, cost of beneficials) change per year over this same 3 year period? (for example have these costs decreased by 10% per year or increased by 10% per year?) ____________% per year
Page 89

Benchmarking IPM Adoption Grower’s survey
Appendix 2 : Page 21
OPTIONAL SECTION: Information sources about managing pests* *where the term “pests” refers to invertebrate pests (insects and mites), diseases, nematodes, weeds, invertebrate pests etc.
1. Where do you get your most useful information about managing pests*? (please tick your top 5 sources)
IPM specialist crop consultants
Other crop consultants/agronomists
Resellers/distributors Chemical companies/reps
State Dept of Ag officers Researchers Newsletters Fact sheets Websites/internet
Industry magazines (Vegetables Australia, Good Fruit & Vegetables, Market News)
Field guides Seminars/meetings/field days
Neighbours Other growers
2. Please provide any details of sources of particularly useful information that you have received in recent years about managing pests* (for example, particular newsletters, fact sheets, posters, magazines or websites).
Page 90

Appendix 2 : Page 22
6. Logic framework of survey
To avoid compromising the completion rate or response rate of the survey, the questions that were included were analysed via a logic framework (Table 1) to eliminate unnecessary questions that could make the survey too lengthy. As a result some questions have been included as ‘optional’, i.e. non‐essential for assessing the level of IPM adoption.
The survey aims to identify what pest management practices growers are using on their farms, to obtain an indication of the costs of damage and management, and to track changes in those practices over time.
This data can be used to:
1. identify where growers fit on the IPM continuum
2. identify regional or crop differences in the spread of growers along the IPM continuum
3. help plan better pest management projects
4. evaluate changes in practices that growers may have adopted as a result of project research and extension
Table 1: Logic framework for Vegetable Grower Benchmarking IPM Adoption Survey
Reason for inclusion Survey question 1. Name: 2. Business name:
Unique identifier
3. Date:
Location data 4. In which state is your vegetable production business located?
Regional pooling 5. What is the post‐code for this business location?
Spread of crops covered 6. Crop/area grown, production type, market
Indicates level of investment – also information for project activities
7. What sort of sprayer do you use?
Self perception of where on IPM continuum
8. What are your current crop protection strategies?
Aspiration on where on IPM continuum
9. Which of the above strategies that you aren’t doing now (if any) are you planning on introducing in the next 5 years
Indicates IPM practice; and
separates along IPM continuum
Identifies breadth of pests managed potentially by IPM
Monitoring 10. Is crop monitoring undertaken by
11. If you monitor crops, how often do you do so?
12. If you monitor crops, what do you monitor for? (please tick all that apply)
13. Do you keep records of the monitoring results?
Indicates IPM practice; and
separates along IPM continuum
Identifies breadth of pests managed potentially by IPM
Prevention practices 14. Which of the following do you have/use or have you used?
15. If you have a greenhouse, do you have it designed to exclude pests?
16. If you use hydroponics, do you
Indicates IPM practice; and
separates along IPM continuum
Chemical practices 17. Which level chemical user certificate do you have?
18. How often do you calibrate your sprayer?
19. How do you check your sprayer setup for coverage?
20. How do you residue test your produce – and how often do you do it?
21. If you do residue test, how often do you do it?
22. Do you manage an insecticide‐resistant pest?
Page 91

Appendix 2 : Page 23
Identifies breadth of pests managed potentially by IPM
23. If you do, what strategy do you use?
24. If you manage a fungicide resistant disease, what is it?
25. If you manage a herbicide resistant weed, what is it?
26. Do you use preventative fungicides?
27. If you do use fungicides, do you modify applications depending on:
28. Do you avoid using synthetic pyrethroid or organophosphate insecticides?
29. Do you consider impacts of sprays on beneficials when choosing control options
Indicates IPM practice; and
separates along IPM continuum
Biological control 30. Do you use Bts or NPVs (e.g. Gemstar®, or Vivus®)?
31. Have you purchased beneficials from an insectary?
32. Do you conserve beneficials?
33. Do you use Trichoderma or other soil biological additives to prevent diseases?
34. What are your main beneficials that control insects or mites? Indicates IPM practice; and separates along IPM continuum
Reviewing & Planning 35. Review monitoring records
36. Review chemical records
37. Review harvest records
38. In the last 3 years, have you had a consignment rejected for:
Information to aid planning and if compared in 3‐5 years as an evaluation tool to quantify impact
Costs over last year (Q39 ‐ Q43 to be repeated for each crop) 39. Approximately what level of loss of marketable yield (of this crop) would you
estimate that pests caused on your farm in the last year?
40. Approximately, how much gross income did your farm lose from this damage over a year?
41. What pests caused the most damage?
42. In the last year, approximately what were your chemical costs for this crop?
43. Approximately how much did your other (non‐chemical) management practices cost last year?
44. Make additional comments or provide clarification.
Indicates likely ‘adoptor’ – ie influenced – relates to ‘information’ question
OPTIONAL: Past project involvement 45. Have you ever participated in any of the following project activities run by the
government or private providers in the last 3 years?
Indicates impact of project 46. If you have participated in a project activity and you remember the name of the project or organisation that ran the activity,
Gives indication of volatility of changes in crop protection ‘environment’ and if co‐inside with project activity a potential evaluation of impact of extension activities
OPTIONAL: Changes over last 3 years 47. Over the last 3 years, did your level of damage change?
48. If the level of damage changed, can you please estimate the change
49. In what way did your annual use of chemicals change over this 3 year period in terms of number of applications of chemicals for controlling all pests?
50. If the number of chemical applications has changed, can you please estimate the % change per year?
51. Approximately how much did your other (non‐chemical) management annual costs change over this same 3 year period?
Information for planning projects
Potential evaluation of impact of extension information resources
OPTIONAL: Information sources about managing pests 52. Where do you get your most useful information about managing pests?
53. Please provide any details of sources of particularly useful information that you have received in recent years about managing pests.
Page 92

Appendix 3 : Page 1
Appendix 3 Benchmarking Vegetable IPM Adoption: Assessing the Current Status of IPM Adoption via a Survey of Key Informants: Guidelines, Sampling Subsets, Options and Recommended Survey Method
May 2011
This report has been compiled by the following team members of the National Vegetable IPM Coordination project (VG09191): Bronwyn Walsh, Queensland Department of Employment, Economic Development & Innovation (DEEDI) and Sandra McDougall, NSW Department of Primary Industries (NSW DPI).
Page 93

Appendix 3 : Page 2
CONTENTS
1. Summary and Recommendation ................................................................................................ 3
2. Introduction ................................................................................................................................ 5
3. Methods...................................................................................................................................... 6
3.1 Sampling ........................................................................................................................ 7
3.2 Who will complete the survey? ................................................................................... 16
3.3 Recruitment and training of Key Informants............................................................... 20
3.4 Delivery of survey ........................................................................................................ 20
3.5 Analysis ........................................................................................................................ 22
3.6 Resourcing ................................................................................................................... 22
3.7 Survey Package content............................................................................................... 24
4. Draft Survey Package ................................................................................................................ 26
5. References ................................................................................................................................ 36
Note regarding use of superscript numbers:
• Numbers that appear in superscript refer to the number of the reference listed in the References section.
• Numbers that appear in superscript preceded by an asterisk (eg *1) refer to footnotes.
Page 94

Appendix 3 : Page 3
1. Summary and Recommendation
The most recent representative survey that aimed to determine the status of IPM adoption by Australian vegetable growers on a national basis was carried out in 200716. Although 49% of respondents identified themselves as IPM growers, further analysis indicated that only 28% of respondents were using IPM “correctly” (according to the criteria established by the researchers). The team conducting the National Vegetable IPM Coordination project (VG09191) was asked to develop a Survey of Key Informants (as an alternative to a Grower Survey) that could provide an update on these findings and, obtain additional baseline data, including on practices for managing diseases, weeds etc. The 2007 survey focussed solely on management of invertebrate pests and did not use an IPM continuum approach to defining IPM. The IPM continuum approach is explained in Appendix 5. Asking key informants, i.e. people who have knowledge on crop protection practices of vegetable growers, to provide information on these practices is a potentially quick, cost‐effective approach for assessing the current status of IPM adoption by vegetable growers in Australia but is not without its own complexity. The survey in this report was designed to provide standard questions and definitions and reflect the information required to assess the level of IPM adoption. The survey approach that has been developed takes into account the matters explored in the report in Appendix 1: Benchmarking IPM Adoption: Literature Review and Analysis, including likely budget constraints, preferred contact methods, former data collected on IPM practices and good survey design. Adjustments to the approach may be required in consideration of the resources available, the objective of the exercise and the person coordinating the activity. A key upfront decision needs to be made regarding the goal of measuring the adoption of IPM. For example, the context could be:
1. A simple requirement to know the level of adoption of IPM practices by vegetable growers;
2. As part of an analysis of the return on investment of levy payers’ funds; or
3. An assessment of progress towards an IPM goal of reducing environmental impacts and human health hazards.
The approach taken in developing the survey is based on the assumption that the goal of measuring the adoption of IPM, the exercise proposed by the vegetable industry, was to know the level of adoption of IPM practices by vegetable growers. Therefore commodities that are grown by a significant number of growers and make up a significant part of the total area of vegetable production, eg potatoes and tomatoes have been included. If the Vegetable Industry wishes to only include vegetables that are part of the National Vegetable Levy, the guidelines in this report will assist with making the necessary adjustments. The recommendation outlined below regarding the ‘next steps’ for the survey is presented for discussion between those responsible for decisions on crop protection project investment and industry direction. The decision to use a Survey of Key Informants will be influenced by decisions made on options presented in the other appendices. A decision to undertake a
Page 95

Appendix 3 : Page 4
benchmarking survey will mean adding value to current reporting on the level of IPM adoption in vegetables, and analysis of the results will assist with future investment decisions. Recommendation: Undertake a Survey of Key Informants to obtain rigorous, meaningful benchmarking data for determining the current level of IPM adoption in Australian vegetable crops. This would be a way of determining the level of IPM adoption for managing invertebrate pests, obtaining richer data by aligning responses with the categories of IPM in the IPM Continuum tables and obtaining baseline data on approaches to management of the other pest types (diseases, nematodes, weeds etc). Some of the ‘pros’ and ‘cons’ of this approach are as follows: Pros:
- It may be a relatively quick option for obtaining the necessary data.
- The cost is uncertain but may be similar to the cost of conducting a comprehensive, national survey of growers. This is due to the considerable time commitment required by the Key Informants, for which they may wish to be reimbursed at commercial consulting rates. However, a Key Informants Survey may be more efficient and yield better information than a Grower Survey.
Cons:
- This method of obtaining benchmarking data may have limitations in accessing informants who have sufficient levels of confidence in their knowledge of current crop protection practices across the suggested cross section of crops, regions, markets and production systems.
- The IPM continuum concept that forms the basis of the survey questions is still under development*1. Further development will require significant work that is outside the scope of VG09191, including review by experts in integrated management of pests other than insects and mites. (Note that the fully developed IPM Continuum will also be the basis for Grower Survey questions and analysis.)
Within this recommendation to conduct a Survey of Key Informants, the following options could be considered:
• Undertake the Survey of Key Informants using information in the Draft IPM Continuum tables in Appendix 5 (noting that the table for vertebrate pests is yet to be developed), prior to finalisation of the tables and development of a ‘scoring system’, recognising that in essence this would be an exercise to update the results of the survey conducted in 2007 and would mainly collect information on management of invertebrate pests and perhaps some information on disease management practices; or
• Delay undertaking the survey until the IPM continuum tables have undergone further development and a scoring system has been agreed upon by relevant experts, which is the option recommended by the authors of this report.
*1 Further development of the IPM Continuum tables and development of scoring system is a recommendation from Appendix 1: Benchmarking IPM Adoption: Literature Review and Analysis.
Page 96

Appendix 3 : Page 5
2. Introduction
The most recent representative survey that aimed to determine the status of IPM adoption by Australian vegetable growers on a national basis was carried out in 200716. Although 49% of respondents identified themselves as IPM growers, further analysis indicated that only 28% of respondents were using IPM “correctly” (according to the criteria established by the researchers). At a regional industry scale, a survey showed that 68% of southeast Queensland brassica growers were using IPM in 2002, and for individual IPM practices, a range of 20% to 90% of growers were found to be using these practices in various crops and regions (see the report in Appendix 1). Close to $40m was spent on vegetable crop protection RD&E from 2001/02 to 2008/09*2. During that time the surveys measuring the level of adoption of IPM strategies asked differently worded questions and often did not define IPM or other terms, meaning their results cannot easily be used to compare between projects or over time. Most of these surveys also only focused on invertebrate pests and not the full spectrum of crop pests including: diseases, nematodes, weeds, invertebrate and vertebrate pests. Similarly they targeted different subsets of the vegetable industry: some surveyed nationally, others regionally, and some were limited to specific crops or pests. The surveys were collected using a variety of different methods and had a range of response rates. The aim of this benchmarking sub‐project was to design a survey to determine the level of IPM adoption in Australian vegetable crops by collecting information from key individuals within the broader vegetable industry who can report on a region or industry sector rather than only one farm. These individuals are referred to as Key Informants. Key questions to be answered by the survey, in terms of the number (or percentage) of growers and the amount (or percentage) of area grown, are:
‐ What is the level of IPM adoption for key growing regions?
‐ What is the level of IPM adoption for each vegetable crop? For defining IPM, the IPM Continuum presented Appendix 5 is used, so the survey additionally aims to determine whether growers are using a Low, Medium or High level of IPM practice for managing the various pest types, i.e. invertebrate pests, diseases, nematodes, weeds and vertebrate pests. The survey was also developed in the context of other potential methods for measuring the level of adoption of IPM such as a grower survey or ‘mining’ data from farm management software, so future steps for developing or implementing this survey are subject to decisions outlined in the over‐arching Benchmarking report (within the Final Report on the National Vegetable IPM Coordination project).
*2 Personal communication from HAL program manager for Entomology, IPM and Chemicals, 2010
Page 97

Appendix 3 : Page 6
3. Methods
Three factors will influence the final design of the survey:
1. the decision on the objective or goal of the benchmarking exercise;
2. the person(s) responsible for the benchmarking exercise; and
3. the resources available for the benchmarking exercise. Clearly identifying the goal of IPM (and therefore the measures to be benchmarked) is essential for designing the survey within this report and was also raised in the report in Appendix 1, Literature Review and Analysis: Recommendation A ‐ Develop measurable, achievable, realistic IPM adoption goals. Firstly, the criteria for selecting the survey sample are linked to the goal of the survey and the planned use of the data. For example, measuring the level of IPM adoption could be considered in the following contexts:
1. If the intent is to simply to know the current level of adoption of IPM practices by vegetable growers then
the sampling criteria would consider all vegetable crops and could consider various segments within each crop such as: production region(s), production system(s), climatic conditions (tropical and sub‐tropical versus temperate) and markets.
2. If the survey is associated with an analysis of return on investment of levy payers’ funds then
the sampling criteria would include only levy‐paying crops potentially segmented by regions, climatic conditions, and/or production systems that were included in previously funded projects.
3. If the survey is for assessing progress towards an IPM goal of reducing environmental impacts and human health hazards then
the sampling criteria would include all vegetable crops, not just levy‐paying crops, and segmentation would be based on environmental and health risks along with other production criteria.
The detail of which survey sample criteria are relevant for inclusion in the final version of this survey will be determined by what measurable, achievable, realistic IPM adoption goals are adopted by the vegetable industry. In the interim, the first context listed above will be used for development of this survey, with a ‘whole of industry’ representation as this is the basis for the maximum investment that would be required for this benchmarking activity. Secondly, decisions on the final design, testing, contact with informants, data collation, analysis and reporting for this survey all require someone to be responsible for the benchmarking activity. This was also highlighted in the recommendations from both Appendix 1, Literature Review and Analysis and Appendix 2, Obtaining Benchmarking Data via Grower Surveys. This person/team is referred to as the ‘IPM Benchmarking Officer’ in this document.
Page 98

Appendix 3 : Page 7
Lastly, “The more completed surveys, the greater the confidence and the greater the cost”*3. This highlights that there is a compromise between two aims of any survey: to maximize confidence in the results but minimize costs in getting the data. This point is further explained in Appendix 1, Literature Review and Analysis in the Data Collection Methods section and in part is the reason for developing the survey presented in this report, i.e. it is an attempt to reduce costs but still gather valid, reliable information about the level of IPM adoption in the vegetable industry, by using key informants to report on segments of the industry rather than have individual growers respond to a survey about their farm alone. In the opinion of the authors, the decision to undertake a Survey of Key Informants should be considered in conjunction with the four Options presented in Appendix 2, Obtaining Benchmarking Data via Grower Surveys. Regardless of which scenario is implemented, it will be a significant improvement on the ‘option’ of maintaining the status quo, which would mean that the level of IPM adoption in vegetable crops would continue to be determined within some RD&E projects in a non‐standard, fragmented manner. Information regarding development of the survey is presented under the following headings:
3.1. Sampling; 3.2. Who will complete the survey?; 3.3. Recruitment and training of Key Informants; 3.4. Delivery of survey; 3.5. Analysis; 3.6. Resourcing; and 3.7. Survey Package content.
The general information in these sections is relevant to simply undertaking a Survey of Key Informants and to Option 4 in Appendix 2, commissioning a Standalone IPM Adoption Benchmarking project. (It is possibly also relevant to Option 3 in Appendix 2, commissioning a project provider to work with crop protection RD&E project teams to conduct grower surveys and perhaps with Key Informants to collect additional data.) The detail in the sections provides information for making choices that will determine the different investment and industry representation levels required within these two scenarios. 3.1 Sampling
The number of survey recipients is the sample for the survey activity. Ideally it represents the population to be surveyed; in this case it is key informants within the vegetable industry reporting on behalf of a segment of the industry. Four factors determine the acceptable level of confidence in the survey results, which will also determine the minimum sample size:
1. the size of the population; 2. any stratification that is required for analysis of different segments of the
population;
*3 Dr Van Bennekom, Principal, Great Brook Consulting
Page 99

Appendix 3 : Page 8
3. the degree of variance in responses from the population; and 4. the tolerance for error.
Each of these will be explained in the context of the vegetable industry and this survey in the following sections. Of the various surveys conducted for Australian IPM projects, only a few reported on these factors9,16. Depending on decisions on the level of investment and given the complexity of the vegetable industry and associated segmentation, consultation with a Biometrician is recommended for finalizing the design and confirming analyses. However, guidelines and relevant information on factors relevant to the vegetable industry are included in the following sections. 3.1.1. Size of the population (group of interest for surveying) The ‘population’ of the vegetable industry is over 4000 vegetable growers and so it is not likely that they can all be surveyed. However a smaller population, referred to as ‘Key Informants’ could report on the level of IPM adoption in vegetables through their knowledge of the pest management practices of their 8‐200 clients8 within a region or vegetable commodity for example. This is an alternative approach to that used in an IPM survey in 2007 in which 150 questionnaires per State Industry Development Officer (IDO), totalling 900 questionnaires were distributed to the growers or advisors of their choosing16. The population of informants is estimated to be less than 50 businesses and organisations nationally that have some level of knowledge of pest management practices of vegetable growers. Some examples include: Elders, EE Muir & Sons, Wesfarmers, ServeAg, Peracto, several independent crop consultants (eg IPM Technologies, Manchil IPM Services, Biological Services, Sustainable Farming Services, Hortus Technical Services, Bowen Crop Monitoring Services), agronomists working for major growers, market agents, field officers of processing companies, and extension or research officers employed by State Departments of Agriculture. Some of the businesses have regional distribution of their staff, which increases the likelihood of them having local knowledge. The suitability of Key Informants for completing the survey will be based on their ability to meet the following criteria:
• have good knowledge of IPM in vegetable crops grown in the production regions of the sample;
• have wide and regular contact with vegetable growers; and
• are very familiar with the pest management practices of those growers. Using these criteria will help avoid bias by not basing the choice of participants solely on who you know. Having established the identity of the population, the rate of return of surveys by the population is useful to know for working out the necessary size of the sample for participating in the survey, to have confidence in the accuracy of the results. Fortunately some of the previous surveys related to vegetable IPM reported this information. The reported sample response rate from agribusiness contacts was 42.6%, from growers was 38.5% and from a mixed population was 67% using a telephone survey5,9. Other projects had
Page 100

Appendix 3 : Page 9
response rates of less than 1%, up to 23% for surveys that were mailed out to a database of growers and farm advisers for completion13,14. Where it has been recorded, the refusal rates*4 have varied from 0 to 40% 8,9. In terms of what the above rates translate into regarding the actual number of growers or farm advisers responding, it was between 16 and 75 grower responses for State or crop specific data collection and 14 to 20 grower responses for regional crop data collection7,8,9,16. When interviewing farm advisers, 10 to 20 farm advisers responded for regional data collection and 35 for State data collection7,8,9,16. Using this information and ABS data1 a rough estimate of the respondent rate for the survey of a population of growers and farm advisers from 2007 is 2.5%16*5 per State. For a telephone survey conducted in one State, a higher rate was recorded of 16.3%9 for farm advisers alone. 3.1.2. Stratification of the industry for analysis Most surveys involving IPM have collected information so that the complete set of responses can be grouped (known as segmentation or stratification). Grouping could be by locality or crops for example. Gathering this extra information means that any differences in results caused by these factors can be seen from analysis of the subsets of data. However, for each grouping, the sample size will need to increase to allow the same level of accuracy. This is particularly important if one of the groupings is used for making critical investment decisions. In the case of factors affecting the level of adoption of IPM in vegetables, some of the criteria selected for segmenting the sample are included in Table 1. Table 1: Factors for segmenting the vegetable industry for an IPM Adoption survey sample
Segment description Number of segments Levels within segment
Production region 53 regions Across all states*6
Market 4 markets Domestic: fresh, processing Export: fresh, processing
Production system 2 production systems Field and undercover
Climatic conditions 2 conditions Tropical*7 and temperate
Levy system 3 levy systems National, ‘own’, none
The level of IPM RD&E investment into specific crops and/or into regional extension initiatives
3 levels High (More than 10 years), Medium (4‐10 years), Low (Less than 4 years)
Proportion of total area of Australian vegetable production
3 levels of production More than 5%, Less than 5% and more than 1%, Less than 1% of production area
4 A “refusal” is an instance in which a person who is contacted states (verbally or in writing) that he/she declines to participate in the survey. *5 Using an average response rate of 16.2% for a sample of 750 (121.5), from a population of 4794 growers; Note – an over estimate, as population doesn’t include advisers. Also excludes Qld due to extremely low response rate – likely a function of IDO related issue rather than poor grower or advisor interest. *6 Using ABS statistical divisions *7 Tropical = sub‐tropical and tropical
Page 101

Appendix 3 : Page 10
To include all of these segments, with a grower or crop represented from each would mean a maximum of 143,300 (53x4x2x2x3x3x3). However, the reality is not all regions have all of the crops, markets, production systems, climatic conditions or investment related criteria represented within them. The sample for the Survey of Key Informants can be randomly selected from this group, proportionally sampled from each category or focussed on particular categories. To allocate crops into most of the different segments, data from the Australian Bureau of Statistics (ABS)1 was used. ABS data is available on the: number of growers, area of production or yield. The number of growers data can give an indication of the total number of cropping businesses that could be IPM growers or the number of cropping businesses who could be ‘risks’ for residue or health violations, which would then negatively impact on the wider industry via negative publicity. The area of production data represents the area of land subject to pesticide application and therefore potential environmental impact. Yield data can be related to the potential financial returns to the growers. For the purposes of addressing population segmentation for an IPM adoption survey the area of production is largely used with some reference to the number of growers depending on the criteria to describe each factor with examples for each level. Segment ‐ Production region
Using the number of growers as an indicator for classifying production regions, there are 11 major production regions, i.e. those with more than 200 vegetable growers, from the total of 53 regions throughout Australia. Using the alternate indicator of area of production however, there are 7 major regions of over 6000ha in vegetable production and up to 11 if including those regions with over 4000ha. The use of the different reporting units also has implications for which regions are identified as major. Most of the regions identified between the two indicators overlapped, with major regions located in Victoria, New South Wales, Western Australia, South Australia, Queensland and Tasmania (Table 2). However, if only a number of growers‐based classification was used then a tropical growing region would not be included but by including the area of production‐based classification, Mackay (Bowen) would be included within the major production regions. By including the area of production classification for major production regions then all States and climatic regions are represented. However, for the Territories of Australia, the Northern Territory has two production regions (78 growers and 743ha) and the ACT has one production region (1 grower and less than 1ha); they clearly do not fall into the category of ‘major’ by either area of production or number of growers. If NT and ACT were to be included then minor regions would have to be included making the survey population essentially all vegetable growers. Between the major and very small regions mentioned are another 33 regions with different sizes of production area, number of growers and crops represented.
Page 102

Appendix 3 : Page 11
Table 2: Major ‘regions’ (at the Statistical Division level) based on the number of agricultural businesses growing vegetables for human consumption and the associated
area of production across States, 2006/07.1
States Qld Vic NSW SA Tas WA
Total no. regions per State 11 11 11 6 4 7
Total No. Businesses Growing Vegetables for Human Consumption*
1,756 1,139 1,618 769 631 637
Proportion of Businesses* 26% 17% 24% 12% 10% 10%
Wide Bay‐Burnett
Melbourne
Sydney
Adelaide Mersey‐Lyell
Perth Regions with over 200 businesses growing vegetables for human consumption* West Moreton,
Far North, Darling Downs
Mid‐North Coast
Northern
Total Area (ha) of Vegetables Produced for Human Consumption*
35,131 ha
31,858 ha
19,163 ha
14,795 ha
14,907 ha 9,005 ha
Proportion of total area of vegetables produced for human consumption*
32% 29% 17% 13% 13% 8%
Regions with over 4,000 ha**
West Moreton, Wide Bay‐Burnett, Mackay,
Melbourne
Murrumbidgee Murray Lands
Mersey‐Lyell, Northern
Darling Downs East Gippsland, Gippsland
South East South West (3,464 ha)***
1Numbers that appear in superscript, including in titles of tables and figures, refer to the number of the reference listed in the References section of this document. The source of information in this case is an Australian Bureau of Statistics report based on 2006/07 data. *Bold type indicates the highest number (between all States) of agricultural businesses growing vegetables for human consumption and the largest area of production. In the top half of the table, the Statistical Divisions (‘regions’) that appear in bold indicate the region within each State that has the highest number of agricultural businesses growing vegetables for human consumption. **Bold type indicates the regions with over 6,000 ha. ***Included South West WA because very close to 4,000 ha and the only WA region included in area of production
Segment ‐ Market and production system
The majority of Australian‐grown vegetables are sold fresh on the domestic market. This includes minimally processed vegetables. Both processing and export markets are represented by less than 10% of national vegetable production so are not significant for representation in the sample. Export vegetables include: carrots, dominated by WA, some potatoes, onions, broccoli, capsicum and frozen vegetables from other states. Processing vegetables include: peas (mostly from Tasmania), tomatoes (‘mostly’ from Goulburn Valley, Victoria) and sweet corn from New South Wales, although the area of sweet corn has declined significantly in recent years. Processing potatoes are by far the largest processing vegetable crop in terms of area of production at 18,575ha grown across all States, while the other processing vegetables are all grown on less than 4000ha1. The processing industry has the advantage of usually being coordinated through a processing company which means accessing information on pest management practices for that
Page 103

Appendix 3 : Page 12
segment of the vegetable industry may be relatively simple, assuming the company is willing to share the information. In Australia vegetables are grown in either outdoor (field) or protected (undercover) production systems. By far the largest group by area and number of growers is the field grown vegetable category. Potato production represents more than 15% of the national production area, for fresh and processing together, with the next closest being tomatoes (Figure 1), which are in the ‘5‐10% of production area’ category along with head lettuce and broccoli. Most types of vegetable crops are produced on less than 5% of the Australian production area, or on less than 6280ha. There are approximately 28 crops in the ‘less than 1% of production area’ category including: artichokes, swedes and turnips, mushrooms, chillies, garlic, herbs, honeydew melons, celery and Asian vegetables. There are 21 crops in the ‘between 1% and 5% of the production area’ category including: beetroot, asparagus, capsicums, snow peas, cauliflower, peas, French beans, sweet corn, silverbeet and sweet potatoes to name a few.
Page 104

Appendix 3 : Page 13
Figure 1: The proportion of vegetable production area for Australian vegetable crops1
Approximately one third of the vegetable crop types are grown in every State and Territory, and include: head lettuce, broccoli, brussels sprouts, cabbages, cucumbers and onions (Figure 2). Only 12 crop types are grown in five or less States or Territories. However, for some of these crop types there is a high degree of variation in number of growers or area grown.
Figure 2: The number of States and Territories in which each vegetable crop is grown1
Page 105

Appendix 3 : Page 14
Protected cropping is represented by less than 10% of the national production area, so is not likely to be well represented in sampling unless it is specifically targeted. Of the crops grown undercover, the largest area of production is for cucumbers followed by ‘fancy lettuce’, tomatoes and capsicum (Table 3). There are over 400 growers each for undercover cucumbers and tomatoes and less than 200 for the other crops. Lastly undercover cucumbers are grown in 26 regions while undercover head lettuce is only grown in 3, followed by capsicum in 13 regions and tomatoes and ‘fancy lettuce’ in 18 and 17 respectively.
Table 3: Crop production figures for protected cropping in Australia, 2006/071
Undercover crops
No. growers
Area m2 Major regions
Total no.
regions Lettuce (head) 85 606,893 NSW ‐ Sydney, WA ‐ Perth 3
Capsicum 173 1,499,439 SA ‐ Adelaide, WA ‐ Central 13
Tomatoes 411 1,594,987 SA ‐ Adelaide, Vic ‐ Barwon & Mallee, Qld ‐ Wide Bay‐Burnett
18
Lettuce (fancy) 85 1,922,285 NSW ‐ Richmond‐Tweed, Qld ‐ Brisbane
17
Cucumbers 478 3,077,458 NSW ‐ Sydney, SA ‐ Adelaide Qld ‐ Darling Downs & Wide Bay‐Burnett
26
Some crops have unique conditions to which they are suited, resulting in one region or State dominating Australia’s production at over 80% of production area. Examples include the processing industries in the temperate zones: processing peas in Tasmania, processing potatoes across all the temperate regions and processing sweet corn in Murrumbidgee NSW. The Northern Territory has the sole production regions for Asian gourds, snake beans, okra and bitter melon. Sweet potatoes are mostly grown in Queensland, with 30% of the production area in northern NSW, where in the summer the crops experience matching subtropical conditions. Queensland also dominates in the production of beetroot, chillies, capsicums and eggplant with over 72% of national production for each crop. The production of celery, fennel, artichoke, leek, parsnip, sugar snap and snow peas is dominated by Victorian regions with over 72% of national production for each crop listed. Segment ‐ Levy system
Three systems have been used to group the crops; those contributing to the national vegetable levy, those contributing to their own levy and those which have no levy. Onions, potatoes, mushrooms and processing tomatoes all contribute to their own industry levy, which may or may not be in partnership with the national vegetable levy. Melons, fresh tomato, garlic, asparagus, herbs and spices have no current levy contribution, although at times they may call for voluntary contributions or regions may operate a local “levy”. The remainder of vegetable crops contribute to the National Vegetable Levy.
Page 106

Appendix 3 : Page 15
Segment ‐ Level of RD&E investment
Within all of the levy groups mentioned above investment in crop protection RD&E projects has occurred via one of three key funding corporations: Horticulture Australia Limited (HAL), the Australian Centre for International Agricultural Research (ACIAR) and/or the Rural Industries Research and Development Corporation (RIRDC). The three levels used within this segment*8 are:
• a High prolonged level of investment as is the case in brassicas, potatoes and lettuce for over 10 years;
• a Medium level of investment, which is represented by shorter projects (4‐10 years) that have had a national focus such as in sweet corn (5 years, $1.5m), projects addressing separate State issues such as in beans (5 years, $1m) or projects that have had a specific pest focus for short periods of time such as in celery, carrot, capsicum, cucumber, sweet potato and eggplant; and
• those crops that have had a relatively Low level of investment (less than 4 years) through the RD&E spectrum, which were identified in the IPM Stocktake project (VG05043) as beetroot, Asian vegetables, pumpkins, zucchinis and field peas12.
In choosing crops from the above pool, a sample from each of these three categories could be included. Segment ‐ Crops
Within the ABS data1, 49 vegetable crop types were identified, including the sub categories of production systems and markets already mentioned. As already discussed, the production system category is split by size of area of production, with 28 crop types having an area of production that is less than 1% (1,256ha) of the national production area. Another 21 crop types are grown on 1‐5% (1,257ha to 6,280ha) of the vegetable production area including: melons, cauliflower, fancy lettuce, beans and pumpkins. Head lettuce, tomatoes and broccoli are produced on between 6,000 and 7,500ha, leaving only potatoes at 34,098ha. This means there are a variety of crop types that can be used as representatives of the different scales of production. Similarly the different production systems, markets, climatic conditions and RD&E investment levels are usually represented by more than one crop. In addition to the commodity data available from ABS, the presence or absence of food safety violations could be used for choosing crops or regions from which to collect data for measuring IPM adoption. The majority of market wholesalers in Australia have a quality assurance program that includes a food safety strategy that incorporates chemical and microbial testing3. Testing results show that violations are either due to off‐label detections, often from spray drift, or detections that exceed the MRL (reported to be as a result of mixing, ignoring withholding periods, or poor equipment calibration)3. The compliance rate for FreshTest data is comparable to rates found overseas3 and was 96.6% for chemicals that were tested across the horticulture samples for 2006, which represented an increase of 0.2% from 20032 and was similar to compliance rates found by other Australian testing programs15. Results for Victorian *8 Based on agreement between McDougall and Walsh who have both been working with the Australian vegetable industry for more than 10 years.
Page 107

Appendix 3 : Page 16
grown samples showed the majority of samples were compliant, with 6.3% containing unacceptable residues9. Sufficient data was not available for segmenting the sample for this survey, however if considered important, the FreshTest data is available for purchase. In Australia and internationally many other factors that affect the level of IPM adoption have been identified that could be included in a survey as a means of analysing the reasons behind the level of adoption recorded. However as previously mentioned, there is firstly the need to identify the goal of the survey, link the measures taken and find the balance between the resources available and the accuracy of the survey. The use of these criteria for stratifying the sample for the Survey of Key Informants will be outlined below in section 3.2., ‘Who will complete the survey’. 3.1.3. Degree of variance The degree of variance is the third factor that affects confidence in survey results and refers to the degree by which the responses from informants are likely to vary. If there is a high likelihood of differences between responses, then a larger sample size will be necessary. However, if there is a high likelihood of similar responses, a smaller sample size can be used. In the case of gaining an estimate of the level of IPM adoption in vegetables from Key Informants, the level of knowledge that the informants have on pest management practices within their region will determine the degree of variation in the responses as well as differences based on the factors described earlier. This variation may be minimised by only recruiting those informants who meet a certain level of confidence in their knowledge of pest management practices for the group of crops, the growers or the region(s) they are representing. 3.1.4. Tolerance of error Lastly the tolerance of error affects the confidence in results. For example, how accurate do the results have to be? This is important for example if the results are going to be used for significant investment decisions. For confidence in results, it is typical to aim for a certainty of 95%, plus or minus 5% or 10%. For any of these factors measures can be taken to improve the accuracy of results. For example, the response rate would be improved by identifying the preferred method for completing the survey before its format is finalised, undertaking pre‐survey activities such as notifying informants that they will be contacted by the interviewer, ensuring terms within the survey and the process are understood, making a reminder call and/or providing an incentive to reply – eg prize‐draw, new information (or training) or payment/acknowledgement to complete the survey. 3.2 Who will complete the survey?
As previously mentioned surveying all vegetable crops and related industry segments is a relatively unmanageable task within most RD&E project and industry budgets. However the analysis has shown that a Survey of Key Informants could provide some information on IPM adoption in vegetables using a subset of regions and crops that cover major regions, including State representation, market segments, production systems, climatic conditions and RD&E levy investment criteria.
Page 108

Appendix 3 : Page 17
It is expected that IPM adoption will vary primarily by crop and the level of RD&E investment, with relatively minor differences attributed to markets or production systems. Most markets have low tolerance of contamination by pests or poor quality and so differentiating between the four markets is about fine‐tuning an IPM system rather than radical new interventions. A similar minor variation is expected with IPM practices in the different production systems, i.e. field versus undercover. There is greater variation in IPM practices between low‐ and high‐tech undercover systems than low‐tech undercover and field systems. By comparison, significant effects on the potential for IPM adoption are considered to result from the level of RD&E investment in developing tools relevant to the crop and their pests and the effort in training, collaborating and sharing knowledge gained during RD&E projects. There are a variety of combinations of crops and regions that can be used to represent the vegetable industry in the survey sample. In choosing the combinations presented in Table 4 (below) for consideration for the sample to be used in the Survey of Key Informants, a key focus was maximising the area of production represented by choosing high production area crops and/or a high number of regions. This is based on the assumption that assessing the area of Australian vegetable production under IPM practice is a major focus for the Survey of Key Informants. The other factors considered were the logistics to improve the likelihood of successful data collection, and meaningful results within an estimated budget allocation. For example considering the number of growers in a region, a high number may indicate a more complicated effort on behalf of the Key Informant to report on that crop or the Key Informant may be restricted in the number of crops he/she would be willing to report on. Efficiencies can be gained by using a representative crop that is marketed in each market segment (4) and grown in both production systems (2), therefore reducing the number of crops and Key Informants needed. For example ‘Tomatoes’ are useful as they incorporate the different markets and production systems and two levy systems, meaning the individual data sets for these factors can also be brought together to report on a high level of IPM adoption in tomatoes. However, if the intent was to represent as many vegetables as possible, then a different approach would be necessary. Considering these points, one combination that will maximise the area of production covered by the survey involves using the two largest production area crops (potatoes and tomatoes) and then choosing another crop/s (eg pumpkin or zucchini and squash) to fill in the missing categories (Combination 1 in Table 4). Almost all of the regions would be included but there would only be one representative of the undercover system, levy criteria and export market. There would need to be Key Informants from 43 regions and they would be asked to report on a maximum of 3 crops. A second combination is to reduce the number of regions by not including minor regions of production and so reducing the number of regions down to 20 (Combination 2 in Table 4). Using only one informant per region would mean that for Combination 2, there would be a requirement for 20 Key Informants and each would be reporting on up to 3 crops.
Page 109

Appendix 3 : Page 18
Table 4: Segments represented by choice of crops included in surveys*.
Crops No. regions Production size
Markets Production system
Climate RD&E levy
IPM RD&E investment
<1%
1‐5%
>5%
Fresh
Dom
estic
Processing
Expo
rt
Outdo
or
Und
ercover
Trop
ical
Tempe
rate
National
Own
Non
e
High
Med
ium
Low
Combination 1. Maximum area, regional representation, example of most sub categories Potatoes 40
Tomatoes
43 incl. 13 regions with no
potatoes
P F
Zucchini 39 Combination 2. Maximum area, only major regions, example of sub categories Potatoes 20
Tomatoes
20 P F
Zucchini 16 Combination 3. Maximum area, only major regions, more crops and increased representation across segments Potatoes 20
Tomatoes
20 P F
Zucchini 16 Lettuce 17 Onions 17 Brassicas 18 Melons 13 Carrots 16 *P=processing, F=fresh
A third combination would be to use the reduced number of regions from Combination 2, but increase the representation of sub categories by increasing the number of crops represented (Combination 3 in Table 4). Using only one informant per region, this would mean 20 Key Informants would be required and each would be reporting on at least 4 crops, with up to 17 regions reporting on 6 to 8 crops. To add rigour to the assessment up to three informants per region or industry could be used to triangulate information. Extra informants in a region may ease the burden of one Key Informant reporting on 8 crops. Providing they can meet the Key Informant requirements mentioned earlier, finding extra Key Informants is not likely to be an issue. Each region is likely to have at least one reseller company and major regions are likely to have state government research and extension staff working with growers. Further within each crop there is likely to be one or a group of major
Page 110

Appendix 3 : Page 19
growers who have their own agronomists or contract farm advisers. In Queensland and New South Wales for example there were at least 6 businesses per region that had farm advisers, and 35 to 51 agribusiness contacts per region9. Therefore if we want to triangulate the sample (i.e. three informants per region that overlap in the crops or industries on which they are reporting on) then a maximum number of 129 Key Informants for Combination 1 and 60 Key Informants for Combination 2 and 3 will be required. The willingness to participate is more likely to be the issue of concern, particularly in an environment of potential ‘survey’ overload*9, rather than the numbers available. Depending on the need for independence between the three informants versus getting accurate coverage, the informants may form regional IPM teams to report back on the survey requirements. With relatively ‘few’ informants in the population compared to the grower population, there is the potential to send an invitation to all informants or advertise for interest in participating in the survey and then screen responses for suitability and finalise the selection*10. This process may bring added or alternative combinations to those already suggested, and represents the inevitable compromise between survey goal, participation and final result. Getting endorsement of the process through high level discussions between HAL portfolio managers, vegetable industry representatives and with company and organisational CEOs from which Key Informants may be drawn should encourage participation. Endorsement via industry and employer may improve the quality of the responses by legitimising the time needed to respond accurately to the survey. Some examples of potential informants to meet the Key Informant representation are listed in Table 5 and could be complemented by other sources with information on industry networks such as the InnoVeg Sub‐program of the Vegetable Industry Development Program (VIDP). Table 5: Preliminary list of potential informants that could complete the survey from each
State and the Northern Territory (NT)
NSW Qld Tas WA SA Vic Industry D Cavallaro Consultant
EE Muir & Sons T Burfield SARDI & IPM consultant
Processing companies NT
A Ryland IPM consultant
L Tesoriero NSW DPI ‐Greenhouse crops
A Anderson NSW Farmers
GSF, Simplot Processing companies
Hortus Tech. Services
D Carey DEEDI Gatton
Tropical Qld Bowen Crop Monitoring Services
Peracto Bowen
S Limpus DEEDI Bowen
Serve Ag
Roberts
P Horne IPM consultant
McCains, Simplot Processing companies
L Chilman IPM consultant
J Shannon WA IDO
Merco Bros
Elders
GSF Processing company
J‐Marc
S Broughton DAFWA
A McLennan NT DPI
P Horne IPM consultant
C Donald DPI VIC
EE Muir & Sons
S Vujovic & H Whitman VGA – IDOs
Cedenco, SPC‐Ardmona, Heinz Processing companies
Minimal processing: Freshpack
R Premier Salad Fresh
Mulgowie Farming Co.
Other: Potato & Tomato industries Wholesalers
*9 Early feedback from grains grower regarding a planned IPM benchmarking activity is that the industry has ‘survey’ overload *10 For example, several invitations for participation in surveys have been included in the AUSVEG Weekly Update e‐newsletters over the last six months (Nov 2010, Feb 2011, Apr 2011). Such advertisements may need to go in a wider or different media to target Key Informants.
Page 111

Appendix 3 : Page 20
3.3 Recruitment and training of Key Informants A recruitment strategy will be required to ensure the dataset is complete so that it can be analysed. Part of the strategy will involve a process to gain an understanding of the potential cost and complexity of undertaking the survey. One aspect of the process will be to determine the initial level of confidence of an individual Key Informant with regard to reporting on levels of IPM adoption for the different pest types in the crop(s), region(s) and production system(s) for which he/she is being recruited. It is expected that many Key Informants will feel confident reporting on levels of IPM adoption for management of invertebrate pests, but they may feel less confident with regard to the other pest types. If the level of confidence is lower than desirable (i.e. only ‘Fairly confident’ or ‘Not confident’), it will be possible to ascertain whether the Key Informant is willing to contact others (eg growers, consultants, advisors) to enable completion of all parts of the survey with a desirable level of confidence (i.e. ‘Very confident’ or ‘Mostly confident’). If so, the amount of time involved can be estimated and it can be determined whether the Key Informant would charge for this ‘extra time’ and what the hourly or daily rate would be. This would help determine whether a Survey of Key Informants would be the most cost‐effective means of obtaining benchmarking data for the other pest types for this particular crop, region or production system. In situations in which Key Informants are not willing to spend extra time gathering information on pest types they do not feel confident to report on, they should only be asked to complete the survey for the pest types they feel ‘Mostly confident’ or ‘Very confident’ to report on. Training will also be required, as the Key Informants are being asked to make judgements in a situation in which there are multiple ‘practices’ listed in each box in an IPM Continuum table. This is like having a multipronged question, which is ambiguous if there are no ‘rules’. For example, if individual growers are only doing 3 of the 5 things listed in a box, what level of IPM are they using? It would need to be clarified in a training session that, for example, if growers are doing any of the things in the ‘Low IPM’ box, then put them in that box; for ‘Medium IPM’, if they are doing all of the things in the ‘Low IPM’ box (that are relevant for this crop and production system) plus any of the new things in the ‘Medium IPM’ box, then consider them to be at the ‘Medium IPM’ stage in regard to that particular row of boxes in the IPM continuum table.
3.4 Delivery of survey After finalising the survey content and sampling plan and considering some of the points made in the previous section for recruiting Key Informants, it will take roughly up to 12 weeks to carry out the remainder of the process for conducting the benchmarking survey effectively depending on the delivery mechanism. This includes the lead time of 6 weeks before the flagged Survey Day for notifying Key Informants that the survey is being sent or that contact will be made. During the planning stage, conversations may have identified ideal windows for Survey Day. In the event that it is a mail‐out survey, next the survey is sent and 2‐3 weeks allowed for its completion. A reminder email or phone call is made 7‐10 days after the survey is sent. Lastly on return of the survey, up to 2 weeks is allowed for data collation, analysis and reporting. Scanning the data as it is returned will mean timely clarification of any response issues while it is fresh in the informants’ minds.
Page 112

Appendix 3 : Page 21
Regarding the mechanism of delivering the survey, the relatively higher response rate of telephone surveys to paper surveys 6,7,8,15 makes it the preferred choice of the two (Table 6). Using an electronic survey is relatively untested in terms of response rates but is tempting given the time savings in entering data and the basic analysis tools provided with the software. Barriers to its use could be overcome with some on‐line or face‐to‐face training. Future surveys are increasingly likely to be electronic so this time spent in training on using on‐line survey software should be a good investment. There may be two options for the use of the on‐line survey software: the informants can complete it themselves or the Benchmarking Officer can complete it on behalf of the informant via a phone interview or visit. Alternatively a web‐based training session could be offered and the actual completion could be facilitated via individual or group teleconference. Further, Key Informants are highly likely to be active users of computers and the Internet8,10
therefore delivery of the survey electronically is likely to be the best delivery method for the survey. The preferred method for completing the survey – paper, telephone or on‐line survey for Key Informants could be confirmed through an introductory session via a phone call or web conference with the informants. This event would also be necessary to introduce what is required and to provide the opportunity for any questions. Regardless of the delivery method of the survey, it is essential for the Benchmarking Officer to be involved in designing, planning and conducting the survey (Table 6). However, the amount of time required within the process varies between the three options, with the least amount of time being required for On‐line survey delivery (Table 6).
Table 6: A comparison of different survey delivery methods including cost components and involvement by Benchmarking Officer
Paper Telephone On‐line Introduction
Phone/teleconference/web conference Benchmarking Officer
Training Software training Benchmarking Officer
Delivery and Data collection
Postage for mail out and reply‐paid envelope for response; if emailed no cost
Phone calls for interviews Benchmarking Officer
Subscription Link provided to Informants by email
Clarification/follow‐up Benchmarking Officer Data entry and Analysis Benchmarking Officer Benchmarking Officer
may be involved in some data entry. Some analysis included in subscription; some by Benchmarking Officer
Reporting Benchmarking Officer Summary of Benchmarking Officer Involvement ‐based on activities indicated in above sections
More time than On‐line: for clarification, data
entry, analysis
More time than On‐line and Paper: for interviews,
clarification, data entry and analysis
Least amount of time, but may require software training
session, data entry and clarification
Expected Response rate <20% response 38‐67% response Not known
Page 113

Appendix 3 : Page 22
A conceptual framework for the stages of IPM adoption, called an ‘IPM continuum’ is to be used in the survey for allocating the pest management ‘practices’ of growers as being at the stage of ‘No IPM’, ‘Low IPM’, ‘Medium IPM’ or ‘High or Biointensive IPM’. The further development of the IPM continuum concept and development of a scoring and weighting system has been recommended in the report in Appendix 1: Benchmarking IPM Adoption: Literature Review and Analysis, and it is recommended that this be done before a Survey of Key Informants is undertaken. The use of this framework is a relatively new concept in Australia and so may require some explanation to informants to ensure accurate data reporting and therefore collation and analysis. Similarly, the survey refers to the inclusion of the whole pest spectrum, which may require added emphasis given results from the 2007 survey indicating that industry thinks of IPM as referring to the management of insects and mites16. Using a videoconference/teleconference may be useful for providing an initial introduction of the IPM continuum concept and how it is to be used in the survey. A follow‐up email and/or phone call near the survey closing time will also assist in ensuring maximum response rate. The time requirement asked of Key Informants to complete the survey is based on previous telephone and face‐to‐face surveys that used interviews designed to last a maximum of one hour, with a few minutes either side for introduction and wrap up conversations. This time estimate is considered to be an acceptable amount of time for Key Informants to complete the survey and has been used for ‘budgeting’ the Combinations presented in Table 4 above. For Combination 1 and 2, with 3 crops represented, Key Informants would be spending a total of 3 hours to complete the surveys for their crops plus time spent on the initial introduction and any follow‐up that is required. For Combination 3, the majority of regions will have more than 6 crops on which reporting is required, resulting in an allocation of 6‐8 hours to complete the surveys. Unless completing the survey adds significant value to the Key Informant’s role this may not be acceptable. Therefore for Combination 3, at least two Key Informants per region may be required (a total of 40). It would be advisable to implement procedures to achieve triangulation of information, which may involve having three informants in each region with one of them taking primary responsibility for a subset of the crops, enabling a reasonable estimate for each crop and two ‘second opinions’. 3.5 Analysis Beyond comparing the use of individual practices between regions any further analysis to describe the combination of practices as ‘low’, ‘medium’ or ‘high’ IPM would require a scoring mechanism and calculations to provide an indicator of the level of adoption (see recommendation C in the report in Appendix 1, Literature Review and Analysis). The Benchmarking Officer will be responsible for receiving responses from informants, following up unclear responses, collating data and reporting on the level of adoption. 3.6 Resourcing The costs associated with conducting surveys within past HAL‐funded vegetable projects are estimated to have ranged from $5000 ‐$30,000. The budget size reflects variation in the target crops and regions covered. The actual budget required for this Survey of Key Informants will be determined by the decision on the goals of the survey and the level of
Page 114

Appendix 3 : Page 23
accuracy and representation required, which relates to the appropriate sampling combination and source of assessors/collators. One source of difference in costs of the survey is the delivery mechanism, whether by paper, telephone or an on‐line survey. Although an on‐line survey has been suggested as the preferred option, the increased response rate of a telephone survey may make it an option for consideration. The largest cost difference in this scenario is the additional Benchmarking Officer’s time required to conduct interviews and enter the data. Other costs such as for a Benchmarking Officer to finalise the design, make introductory contact, obtain clarification and make follow‐up calls, and undertake the analysis and reporting will be required for all three delivery mechanisms, although the on‐line survey includes basic analysis in its subscription cost and therefore has the lowest cost associated with the Benchmarking Officer’s time (Table 6). The analysis cost associated with delivery by telephone could be reduced somewhat if the Benchmarking Officer entered the data directly into an on‐line survey and used the partial analysis capabilities of the software. The concept of IPM teams for responding to the survey, eg the group of three Key Informants per region as discussed above for Combination 3, depending on the level of independence required may create synergies and cost savings for group training and introduction to the survey as well as for support and motivation in completing the survey. The use of video/web/teleconference technologies as an alternative to travel involved with regional visits by either the Benchmarking Officer or the informants could reduce costs involved with the introduction of the survey depending on the method chosen and confidence in participation rates. The final decision to undertake a Survey of Key Informants needs to be considered in conjunction with the Options presented in the report in Appendix 2: Benchmarking IPM Adoption: Obtaining Benchmarking Data via Grower Surveys. The following are descriptions of some possible scenarios for progressing the benchmarking of IPM adoption: Scenario 1: Option of a part‐time ‘Benchmarking Officer’ Conducting a Survey of Key Informants A benchmarking survey is conducted with Key Informants to assess the level of IPM adoption in vegetables within the limitations of the confidence of the knowledge of the informants across a defined cross section of crops, regions, markets, production systems and levels of RD&E investment. The resource allocation for this activity would need to cover the employment, travel and operating costs of a part‐time Benchmarking Officer (paid for approximately for 4 months of work, which may take 6 months to complete), whose responsibility would include planning, implementing and reporting on this survey. Operating costs would be related to the survey delivery mechanism and the time involved in training and contacting Key Informants.
Page 115

Appendix 3 : Page 24
Scenario 2: Option 4 in Appendix 2. Standalone IPM Adoption Benchmarking project A project is commissioned and adequately resourced to benchmark IPM adoption in vegetables. It works to a benchmarking plan with articulated goals and a defined sampling plan. As it is not possible to survey all vegetable growers, decisions need to be made in terms of the articulated goals regarding appropriate subsets of the industry to survey. It would be up to the Project Leader of the ‘IPM Adoption Benchmarking project’ to decide on appropriate approaches, which may include Grower Surveys and potentially implementation of this Survey of Key Informants. The resource allocation required for this activity would need to cover the employment, travel and operating costs of a full time Benchmarking Officer for two years.
Scenario 3a, b, c: Option 1, 2 or 3 in Appendix 2. Use of Grower Surveys It is likely a Survey of Key Informants would not be undertaken if Option 1 or 2 were chosen, as these options involve obtaining benchmarking data using standardised grower surveys as part of IPM‐related RD&E projects. In the report in Appendix 2: Benchmarking IPM Adoption: Obtaining Benchmarking Data via Grower Surveys, it is recommended that Option 3 be adopted. This involves having a separate benchmarking project that coordinates with the crop protection RD&E project teams to undertake surveys of growers and it may have a similar resource requirement to Option 4 above (i.e. covering the employment, travel and operating costs of a full time project leader for two years). Under Option 3 it is possible that a Survey of Key Informants could be used to obtain data from segments of the vegetable industry not covered by grower surveys carried out via RD&E projects. Status quo (not recommended) Maintaining the status quo means that the level of IPM adoption in vegetable crops would continue to be determined within some RD&E projects in a non‐standard, fragmented manner. The cost of a ‘third party’ or team member responsible for conducting the survey is usually included in the budget for these projects. The scope of the surveys is usually reasonably narrow. 3.7 Survey Package content
The survey package includes an introductory letter and a survey for the Key Informant. Introductory letter
This explains that the survey is for the vegetable industry to track the adoption of IPM. It provides definitions for terms that will be covered in the survey, such as for IPM, and introduces the ‘IPM continuum’ concept of assessing adoption. Survey
The survey has been designed within this report as a paper based format. Given the target group of informants is likely to be made up of individuals who have a relatively high level of computer literacy and preference for electronic sources of information, the survey will be formatted so it is compatible with electronic delivery.
Page 116

Appendix 3 : Page 25
The survey will require a final test in its ultimate format depending on decisions on recommendations and their affect on the survey’s content. Current questions within the survey were tested with non‐participants for clarity of meaning and length of the survey. Questions within the survey are linked to the key questions related to the objective, to check for relevance using a logic framework (Table 7). The ‘Extra questions’ are those that may offer insight into reasons for the different levels of adoption. As they are not directly related to the key objectives of this Survey, it is indicated that they are ‘Optional’.
Table 7: Logic framework for design of survey
Objective: What is the level of IPM adoption in Australian vegetable crops?
Key questions related to objective to be answered from the survey
Questions from within the survey
What is the level of adoption for key growing regions?
In your opinion what proportion of growers and if possible what proportion of crop production would you consider to be:
What is the level of adoption for each vegetable crop?
Sample is representative of the vegetable industry; and questions offer opportunity to nominate the ‘crop’.
What is the level of adoption for key market segments?
Key informant asked to record the target market for each crop
What is the level of adoption for production systems?
Key informant asked to record the production system for each crop
Extra questions, time permitting What influences the adoption of pest management practices?
Of the above approaches can you characterise the growers who fit into those categories?
Page 117

Appendix 3 : Page 26
4. Draft Survey Package
The following sections contain a sample introductory letter (section 4.1) and a draft version of the survey (section 4.2) to be supplied to Key Informants. 4.1. Introductory letter To industry informants: You are receiving this letter as you have been identified as a source of information on IPM adoption in particular vegetable crops and/or in the crops grown in your region. We have also contacted others in your region so we can ‘cross‐reference’ the information and highlight any significant variations that may indicate that follow‐up contact is necessary. Background Close to $40m was spent on vegetable crop protection RD&E between 1993 and 2009. During that time surveys measuring the level of adoption of IPM asked differently worded questions and often did not define “IPM” or used other terms, meaning their results cannot easily be used to compare between projects or over time. Most of these surveys also only focused on invertebrate pests and not the full spectrum of crop pests including: diseases, nematodes, weeds, invertebrate and vertebrate pests. To assist with tracking changes in the adoption of key IPM practices over time on a national basis, we are trying to capture a picture of the current level of adoption of IPM by vegetable growers across Australia. Process You can opt to complete the survey on‐line or send it via attachment to an email, or fax, post or personally deliver a hard copy. For each crop in your region, a separate set of survey forms need to be filled in for each of the pest types. If there is a variation in practices used between seasons, please indicate this in your responses. Example responses are included for some of the questions. We understand that your responses will be estimates based on your experience in the region. If it helps to provide more accurate estimates you may wish to consult with others in your region. It is estimated that it will take 1 hour of your time to complete the survey for each crop. When we receive your responses your data will be collated for analysis and reporting as part of a National assessment of the level of adoption of IPM. Important: Confidentiality of identifying information is critical and only pooled data with no identifying information will be made public. IPM Definition For the purposes of this survey Integrated Pest Management (IPM) is defined as covering all pests including: diseases, nematodes, weeds, invertebrate (insects and mites) and vertebrate pests. It is a strategy that utilises a range of tools to manage pests and covers a ‘continuum’ of
Page 118

Appendix 3 : Page 27
practices. At the ‘Low’ end of the ‘IPM continuum’, pest management essentially involves monitoring conditions or crops and using the information for making spray decisions. At the ‘high or biointensive’ end of the IPM continuum the cropping system is managed to maximise use of preventative tactics and biological controls and relatively few pesticide applications are made. It is not possible to have a rigidly defined set of practices within each grouping of the IPM continuum because for each cropping system the suite of pests needing management varies and the tools available also vary between regions and over time so that an IPM strategy is a problem solving approach drawing on the available tools that are ‘working’ within a specific crop, business and market environment. Nevertheless, to track adoption of IPM in Australian vegetables we need to make some generalisations. A wide range of crop protection practices are covered in the IPM adoption benchmarking survey and respondents are not necessarily going to fall neatly into the four categories defined in the IPM Continuum attachment (attach the most recent version of the IPM Continuum in Appendix 5). The meanings of other terms often used when talking about IPM are: Monitoring and scouting refer to actively and systematically walking through the crop specifically looking for signs of pests. It usually involves looking at a defined number of plants for insects and other invertebrate pests, disease symptoms, weeds, damage as well as ‘beneficials’. It may involve checking pheromone or sticky traps, and weather stations. It does not refer to glancing out of the window while driving past the crop. Although this might provide information to the grower, it is not what is meant by ‘monitoring or scouting’ when talking about IPM. Beneficials refers to the groups of biological organisms that reduce pest populations via direct predation or parasitism, disease or competition. The term is commonly used to cover invertebrate beneficials such as predatory or parasitic insects, spiders, nematodes or mites but may also include bacterial, viral or fungal pathogens of pests. Beneficials may occur naturally in the crop usually in the absence of or reduction in pesticide use and/or can be bought, for example in the form of a biological pesticide (eg Bt), or predatory insects. For further information regarding the survey please contact us/me at (insert phone number and email). Thank you again for your time. Yours sincerely Name HAL program manager/ IPM Benchmarking Officer /other
Page 119

Appendix 3 : Page 28
4.2. Draft survey to be used by Key Informants
Informant background data
Please provide some background information
1. Name: ________________________________________
2. Business name:______________________________________
3. Date:____________________
4. In which state is your business located?
NSW QLD SA Tas Vic WA NT ACT
5. What is the post‐code for this business location? __________________
6. How many years have you been located in your region?
7. How many vegetable production businesses are you regularly in contact with?__________________________________________
Along with this page, please return the following for each Region and for each of the Crops and Pest Types you’ve agreed to report on in each region: (Note: Survey manager to fill in Crops and cross out any Pest Types the Informant will not be able to report on with a reasonable level of confidence.)
Part A: Questions at a Regional Level Part B: Crop 1 Part B: Crop 2 Part Bs for additional Crops Part C: Crop 1: Invertebrate Pests
Part C: Crop 1: Diseases
Part C: Crop 2: Invertebrate Pests
Part C: Crop 2: Diseases
Part Cs for add’l Crops: Invertebrate Pests
Part Cs for additional Crops: Diseases
Part C: Crop 1: Nematodes
Part C: Crop 1: Weeds
Part C: Crop 2: Nematodes
Part C: Crop 2: Weeds
Part Cs for add’l Crops: Nematodes
Part Cs for additional Crops: Weeds
Part C: Crop 1: Vertebrate Pests
Part C: Crop 2: Vertebrate Pests
Part Cs for Additional Crops: Vertebrate Pests
Page 120

Appendix 3 : Page 29
PART A: Use one Part A for each Region you’ve agreed to report on (Make enough copies of this blank form to cover all Regions you will be reporting on.)
Questions at a Regional Level
Name of Region: ___________________________________________ (eg Lockyer Valley, Qld) Crop production in this Region Please describe the vegetable crop production & marketing situation for this region in the table below:
Name of crop Total area in production last year (hectares)
No. growers Type of production Main Market
Field Open hydro Open tunnel Closed screen greenhouse
Other:
Fresh____% Processing____% Domestic____% Export____%
Field Open hydro Open tunnel Closed screen greenhouse
Other:
Fresh____% Processing____% Domestic____% Export____%
Field Open hydro Open tunnel Closed screen greenhouse
Other:
Fresh____% Processing____% Domestic____% Export____%
Field Open hydro Open tunnel Closed screen greenhouse
Other:
Fresh____% Processing____% Domestic____% Export____%
Go to Page 2 of Part A
Page 121

Appendix 3 : Page 30
PART A, page 2 of 2 The following section refers to pest management practices in Vegetable Crops in the region you are reporting on. IPM in the region
In your opinion, in this region overall, what proportion of vegetable growers, and if possible what proportion of vegetable crop production area would you consider to be using the following sets of practices:
Eg 30% growers, 50% crop area
Spray at regular intervals (calendar spraying)
Monitor for invertebrate pests (including looking at % of
parasitised eggs etc) and obtain accurate identification; observe disease symptoms and obtain accurate diagnosis; use results for selection and timing of sprays; selective pesticides used but also use of some broad‐spectrum sprays; chemical options are first choice (Low IPM)
Monitor for pests & beneficials and make threshold or trend‐
based decisions re interventions; choose softer chemicals; use a variety of preventative strategies such as resistant varieties, crop rotations, sanitation, elimination of alternate hosts (Medium IPM)
High degree of monitoring of pests and beneficials and the
conditions that favour their increase or decrease. Whole farm designed to minimise introduction or movement of pests. Excellent sanitation practices, staff training and workflow to avoid movement from areas of higher pest load or potential contamination to ‘clean’ areas or younger plantings. All farm practices reviewed and modified to reduce potential to introduce or spread pests. Priority to using biological processes such as green manures, rotations, initiatives that enhance the activity of beneficials, and using biological controls over chemical interventions (High or Biointensive IPM)
End of Part A
The next set of questions in Part B relate to the separate Crops within this region. You will need to make copies of the blank form before you start completing it, i.e. one for each Crop you will be reporting on.
Page 122

Appendix 3 : Page 31
PART B: Use a separate Part B for each Crop in the Region covered in Part A (Make enough copies of this blank form to cover all Crops you will be reporting on.)
Region: _______________ Crop: _________________ Area: _______________ (eg Lockyer Valley, Qld) (eg Broccoli) (eg 50 000ha)
Market: ________________ Production System: _________________ (eg Fresh, Domestic, Export, Processing) (eg Field or undercover)
No. growers: ______________ Is this number of growers: Exact A close estimate OR
An approximation (eg in the case of there being a large number of growers of varying sizes)
Key Pests
Please list the two or three (2 ‐ 3) most challenging pests in each of the Pest Type categories below, that growers in this region are managing in the above specified crop:
Insects/Mites 1 2
3
Diseases 1 2
3
Nematodes 1 2
3
Weeds 1 2
3
Vertebrate pests (eg mice, birds, ducks) 1 2
3
Now, please circle or put a star (*) next to the three (3) most challenging pests that growers in this region have to manage in this crop.
End of Part B
Go to Part C, which starts on the next page. For each of the Crops in this region, please answer the questions for each of the Pest Types you’ve been asked to report on, i.e. use a separate Part C for each pest type. You will need to make several copies of the blank form before you start completing it.
Page 123

Appendix 3 : Page 32
PART C: Use a separate Part C for each Pest Type in the Crop covered in Part B (Make enough copies of this blank form to cover all Pest Types you will be reporting on in all of the Crops/Regions you have agreed to cover.)
Region: ____________ Crop: ___________ Production system:____________ (eg Lockyer Valley, Qld) (eg Broccoli) (eg Field or undercover)
Indicate the PEST TYPE this Part C is reporting on:___________________ (i.e. Invertebrate Pests (insects & mites) or Diseases or Nematodes or Weeds)
Q1. Regarding Monitoring in this Crop in this region, what proportion of crop area and what proportion of growers use the levels of monitoring in the IPM continuum table for this Pest Type?
Monitoring No IPM* Low IPM* Medium IPM* High or Biointensive
IPM* Proportion of crop area:
Proportion of growers:
eg 20% of area
eg 40% of growers
eg 50% of area
eg 30% of growers
eg 20%
eg 25%
eg 10%
eg 5%
Comments:
* Refer to Draft IPM Continuum tables for each of the individual pest types (which you received with your introductory letter) for descriptions of the practices for each level of IPM.
Q2. Regarding Preventative Practices used in this Crop in this region, what proportion of crop area and what proportion of growers use the levels of preventative practices in the IPM continuum table for this Pest Type?
Preventative Practices
No IPM Low IPM Medium IPM High or Biointensive IPM
Proportion of crop area:
Proportion of growers:
eg 20% of area
eg 40% of growers
eg 50% of area
eg 30% of growers
eg 20%
eg 25%
eg 10%
eg 5%
Comments:
Page 124

Appendix 3 : Page 33
Q3. Regarding Reactive Practices used in this Crop in this region, what proportion of crop area and what proportion of growers use the levels of reactive practices in the IPM continuum table for this Pest Type?
Reactive Practices No IPM Low IPM Medium IPM High or Biointensive IPM
Proportion of crop area:
Proportion of growers:
eg 20% of area
eg 40% of growers
eg 50% of area
eg 30% of growers
eg 20%
eg 25%
eg 10%
eg 5%
Comments:
Q4. In this Crop in this region, what proportion of crop area and what proportion of growers are associated with recording, reviewing and planning at the levels identified in the IPM continuum table for this Pest Type?
Recording, Reviewing and Planning
No IPM Low IPM Medium IPM High or Biointensive IPM
Proportion of crop area:
Proportion of growers:
eg 20% of area
eg 40% of growers
eg 50% of area
eg 30% of growers
eg 20%
eg 25%
eg 10%
eg 5%
Comments:
Q5. In this Crop in this region, what proportion of crop area and what proportion of growers are associated with the levels of information seeking identified in the IPM continuum table for this Pest Type?
Information Seeking
No IPM Low IPM Medium IPM High or Biointensive IPM
Proportion of crop area:
Proportion of growers:
eg 20% of area
eg 40% of growers
eg 50% of area
eg 30% of growers
eg 20%
eg 25%
eg 10%
eg 5%
Comments:
Page 125

Appendix 3 : Page 34
We realise that it can be difficult to report on a region with a diversity of crops and a number of growers, with the added complexity of the various practices used for management of this Pest Type.
Q6. What is your level of confidence in the information you’ve provided for this Pest Type in this Crop?
Very confident Mostly confident Fairly confident Not confident
Q7. Did you consult with anyone to answer the questions for this Pest Type in this Crop? Yes No
If Yes please supply their name(s) and role(s) __________________________________________________________________ __________________________________________________________________
Please complete the same set of questions for the other Pest Types you’ve been asked to report on for this Crop in this region, i.e. start a new Part C (Q1 ‐ Q7) for this crop. If you have completed all of the Pest Type sheets for this crop, please start filling in the Part B sheet for any additional Crops you are reporting on in this region and the Part C sheets for the Pest Types in these crops.
Thank you for your time Optional questions (if you choose to provide responses, please answers these questions once only for this Crop, eg on the last Part C you’ve filled in for the Crop). There is also a space at the end for providing any Additional Comments. Of the different stages of IPM adoption (in the IPM Continuum Summary Table) do you see any characteristics that the growers who fit into those categories share, other than using those practices? For example their target market sector
a. Do you see differences in IPM adoption by particular sectors: eg fresh market to supermarket versus fresh market to central markets versus processing; or by production method: field versus protected cropping
_________________________________________________________________________ _________________________________________________________________________ _________________________________________________________________________ _________________________________________________________________________
Page 126

Appendix 3 : Page 35
b. Given your comments in a. above – are there any shared characteristics amongst the members of that group? for example – no information, no contact from IPM experts, no choices, literacy, age, isolation, size of production, LOTE (language other than English), secondary income, market requirements
_________________________________________________________________________ _________________________________________________________________________ _________________________________________________________________________ _________________________________________________________________________ Comments Please don’t hesitate to provide any other feedback on the survey you have completed or on IPM in this crop or in vegetables in general in this region.
Page 127

Appendix 3 : Page 36
5. References
1. Australian Bureau of Statistics 2008. Agricultural Commodities: Small Area Data,
Australia, 2006‐07. Report 71250. 2. The Australian Chamber of Fruit and Vegetable Industries Limited Yearbook 2003.
FreshTest Australia 2003 Report, 6p. 3. The Australian Chamber of Fruit and Vegetable Industries Limited Yearbook 2006.
FreshTest Australia 2006 Report, p23‐27. 4. Balling S 1994. The IPM Continuum. In Constraints to the Adoption of Integrated
Pest Management, A Sorenson, (ed) National Foundation for IPM Education; and Benbrook et al., 1996. Pest Management at the Crossroads. Consumers Union, Yonkers NY.
5. Bechaz K 2006. Lettuce Integrated Pest Management (IPM) Survey 2006. Report,
Horticulture Australia Limited project no. VG05044, 17p. 6. Benbrook CM, Groth E, Holloran JM, Hansen MK and Marquardt S 1996. Pest
management at the crossroads. Yonkers NY Consumers Union 272pp. 7. Bilston L 2002. Brassica pest management in the Lockyer Valley, Queensland,
Survey Report. ACIAR project “Improving pest management in Brassica vegetables in China and Australia” 67pp.
8. Brunton, V 2006. IPM Consultants Survey 2006 Summary. From Horticulture
Australia Limited project VG05044. 8p. 9. Coutts J&R 2008. Summary of surveys of Agribusinesses and vegetable growers for
“development and promotion of IPM strategies for silverleaf whitefly in vegetables” HAL project VG 050505. 62p.
10. Department of Primary Industries, Victoria 2011. Victorian produce monitoring
program 2008/09. http://new.dpi.vic.gov.au/agriculture/about‐agriculture/publications‐resources/produce‐monitoring‐report‐200809, 17p
11. Fernandez‐Cornejo J and Jans S 1999. Pest management in US agriculture. Resource
Economics Division, Economic Research Service, USDA Agricultural Handbook no 717, 1‐67.
12. Jacobsen BJ 1997. Role of Plant Pathology in Integrated Pest Management. Annual
Review of Phytopathology, 35, 373‐391 APS, St. Paul, MN. 13. McDougall S 2007. Benchmarking vegetable integrated pest management systems
against other agricultural industries or Field Vegetable IPM stocktake. Final report Horticulture Australia Limited Project VG05043.
Page 128

Appendix 3 : Page 37
14. McDougall S, Creek A, Napier T and Duff J 2005. Improving lettuce pest
management – NSW and SE Queensland. Final Report Horticulture Australia Limited Project No. VG01028. 276p
15. Orr LM, McDougall S and Mullen JD 2008. An evaluation of the economic,
environmental and social impacts of NSW DPI investments in IPM research in lettuce. NSW Department of Primary Industries. Economic Research Report 40, 29p.
16. Page J and Horne P 2008. Scoping study on IPM potential and requirements. Final
report Horticulture Australia Limited project no. VG06086. 22p. 17. USDA 1993, Agricultural Research Service USDA programs related to integrated
pest management. USDA program Aid 1506. Cited Fernandez‐Cornejo and Jans 1999.
18. Walsh BJ, Vock N, Bilston, L and Heisswolf, S 2003. Report on needs analyses of
Brassica vegetable farmers and their farm advisers. ACIAR project “Improving the implementation of integrated crop management in Brassica vegetable crops through a decision support toolkit based on end user needs in China and Australia (Hort/2002/016) p9.
19. Ward B and Hardy S 2006. Testing for chemical residues. Information on pesticide
issues NSW Department of Primary Industries, No. 3, 2p.
Page 129

Appendix 4 : Page 1
Appendix 4 Benchmarking Vegetable IPM Adoption: Review of the Potential for Online Business Tools to be used for Capturing Benchmarking Data
March 2011
This review on the usefulness of current online business tools for benchmarking IPM adoption in the Australian vegetable industry was prepared by Jim Kelly and Darren Oemcke, Arris Pty Ltd with input from Sandra McDougall (NSW DPI) as part of the National Vegetable IPM Coordination project (VG09191).
Page 130

Appendix 4 : Page 2
CONTENTS
1 Summary .........................................................................................................................................3
2 Recommendations ..........................................................................................................................3
3 Benchmarking & Online Systems....................................................................................................4
3.1 Types of Benchmarking ......................................................................................................4
3.2 Some Examples of Online Benchmarking in Agriculture....................................................6
3.2.1 Vegetable Carbon Calculator (www.vegiecarbontool.com.au).............................6
3.2.2 Winery Benchmarker (www.benchmarker.com.au) .............................................7
3.2.3 California Sustainable Winegrowing Program.......................................................9
4 Benchmarking for IPM ..................................................................................................................14
4.1 Process benchmarking for IPM.........................................................................................14
4.2 Performance Benchmarking for IPM................................................................................15
4.2.1 Quantitative performance benchmarking...........................................................15
4.2.2 Semi‐quantitative (and relative) benchmarking..................................................15
5 Review of Vegetable Industry Farm Management Software........................................................16
5.1 ProCheck...........................................................................................................................16
5.2 Undercover Grower..........................................................................................................17
5.3 Wirelessfarmer (www.wirelessfarmer.com)....................................................................19
5.4 Discussion.........................................................................................................................21
6 References ....................................................................................................................................22
Acknowledgements The Australian Vegetable Industry and the Authors of this review would like to thank those who personally contributed information to the report. These included Software owners and developers: Jack Milbank, Hortus Technical Services Jeremy Badgery‐Parker, NSW DPI Mark Delana, Farm Solutions Disclaimer This report is presented “as is” without any warranties or assurances. Whilst all reasonable efforts have been made to ensure the information provided in this review is current and reliable, Arris Pty Ltd does not accept any responsibility for errors or omissions in the content.
Page 131

Appendix 4 : Page 3
1 Summary
This paper is a review of the potential for online benchmarking and the opportunity it presents for improving the uptake and performance of IPM in the Australian Vegetable Industry. In this review we have specifically examined existing farm management tools in the vegetable and other industries that could be utilised to collect data for quantitatively benchmarking IPM. Although these tools present an opportunity, they are not without limitations as they vary in metrics used, and data recorded. Rather than generating a new system, it would be more effective to harmonise these systems so that they all collect data that can be utilised widely in the vegetable industry. The industry could consider three different approaches to benchmarking:
1. Quantitative benchmarking, utilising quantitative data generated from farm management tool databases.
2. Semi‐quantitative benchmarking that utilises the degree of adoption of IPM practices to generate an adoption score/benchmark that can be compared across operations and over time.
3. Process benchmarking that can be used to compare the processes in use to implement IPM practices on vegetable enterprises in Australia.
We have also reviewed benchmarking in the wine industry to gain insight into industry‐based IPM benchmarking as there was little evidence of IPM benchmarking found in the vegetable industry worldwide, other than the US experience referred to in Benchmarking Vegetable Integrated Pest Management (IPM) Adoption, Appendix 1, Walsh B et. al. (2011).
2 Recommendations
It is recommended that IPM specialists work with the software developers of the three business management tools evaluated to agree on a common set of IPM metrics that can be incorporated into their existing farm management software or in one case into their software currently under development. Exporting the pooled data for analysis should be relatively straightforward, as all databases already have an export function. However, access to the data needs to be agreed upon. Reaching agreement will be a function of cost and will be a matter for negotiation between commercial partners. It is also recommended that an IPM Benchmarking initiative utilises the potential for benchmarking to improve performance, not just as a counting exercise to report on levels of adoption. Learning occurs during the process of filling in a well designed questionnaire, particularly if improvement processes are clearly articulated within the questionnaire. Two potential ways the Australian Vegetable Industry could foster improved IPM adoption through benchmarking is with a qualitative process benchmarking approach or a semi‐quantitative approach. Both approaches have merit and both also need the IPM Continuum (see Appendix 5) set of practices to be well defined to include graded practices from ‘No IPM’ up to ’High IPM’ for all pest types and to encapsulate our current best practice
Page 132

Appendix 4 : Page 4
research outcomes and knowledge. In a semi‐quantitative system such as the one used by the California Wine Grape Growers a scoring system is attached to individual practices. Unlike many surveys a benchmarking exercise directly feeds back to the participant where they fit with respect to their peers and against ‘industry best practice’, which is a strong driver to improve if this is an on‐going process.
3 Benchmarking & Online Systems
The identification of performance indicators and benchmarking is a process by which an enterprise or systems can be comparatively assessed against best (or better) practice. These comparators may include: best practice, similar businesses, same business in one or more years, or business models. A key deliverable of benchmarking is that it acts as a driver for practice change or for any system of continuous improvement. The adage “you can’t manage what you don’t measure” is true in management systems but once you have measured, how do you really know how you are performing? Answering this question is the basis of benchmarking. An online system for IPM benchmarking with a centralised database would be the most practical solution for the Australian Vegetable Industry. The system may have the capacity to capture data from other farm management databases. This opportunity would add value to an industry‐based benchmarking tool, as the value of any benchmarking program is underpinned by the quality and quantity of data, which are particularly important factors in the early adoption of the tool. A smaller number of “quality” metrics will encourage higher participation and make analysis more straightforward. The ability to capture data from other farm management databases would add value in that a greater quantity of data would be used in the analysis. A further opportunity would be the integration of the IPM Benchmarking tool and QA systems to simplify management and reporting for those involved. 3.1 Types of Benchmarking
Performance benchmarking consists of comparing a business’ processes and performance to those of other companies directly, against industry best practice or against best practice from another industry. The basis of benchmarking is to learn how to perform better, faster and/or at a lower cost. Performance benchmarking is mostly used to measure performance using a specific indicator (cost per unit of measure, productivity per unit of measure, cycle time of x per unit of measure, defects per unit of measure), or (potentially) the reduction in chemical use per area (for a crop), resulting in a metric of performance that is then compared in an unbiased way to others. Financial benchmarking is a specific subset of performance benchmarking that specifically looks at investment performance and can be used to compare companies on the basis of which is the more effective investment.
Page 133

Appendix 4 : Page 5
In process benchmarking companies compare their processes with the processes of companies that use best practice, usually with similar organisations. In product benchmarking, companies benchmark their product against competitors on the basis of cost per unit of performance or by dismantling products and comparing the parts, with benchmarks including scores on ease of repair, number of components and complexity of manufacturing processes used to make the product. Benchmarking is often conducted as a one‐off event, but can be built into continuous performance improvement practices. Collaborative benchmarking is the term used when companies collaborate to develop a pre‐competitive understanding of their business performance. One example is Winery Benchmarker where Australian wine companies anonymously share their performance data through a third party provider and receive comparisons of their performance against industry benchmarks. A second example is the Vegetable Carbon Calculator, where vegetable producers are able to compare their carbon emissions against pooled results of other growers. Benchmarking answers the specific question of “How does my performance compare to others?” The pooled data can also answer the questions, “How many growers use IPM practices?” or “What area of vegetables are grown using IPM?” This process will typically include the identification of a particular area or areas of concern for the individual business by highlighting areas where they may not be reaching standard or best practice. Similarly the pooled industry data may highlight crops or regions that are underperforming relative to other crops or regions and may reveal an unaddressed issue requiring industry RD&E investment. The driver for participating in benchmarking will be to identify opportunities for improvement and to address concerns. This could involve an entire company and all functions or specific functions such as human resources, R&D or production. Specific practices such as IPM also lend themselves to discrete benchmarking exercises. Examples of performance benchmarks are:
1. Environmental performance, for example using metrics or performance criteria such as:
• $ spent on environmental programs per $ turnover
• Wastewater produced per unit process input (tonne of product)
• Wastewater cost per unit process input
• Greenhouse gases produced per unit of production
2. Financial performance, for example using metrics or performance criteria such as:
• $ turnover per staff member
• $ turnover per unit of production (eg tonne of crop, by broad crop types such as: leaf, root, or other harvestable portion)
Page 134

Appendix 4 : Page 6
3. IPM Benchmarking, for example the following metrics or performance criteria could potentially be used:
• Grams of active ingredient of chemical used per ha
• Number of factors monitored per crop
• Number of preventative practices per crop
• Number of assessments of beneficial organisms per crop
Characteristics of effective benchmarks are:
• Relatively easy to measure
• Ease of collection of data
• Easily interpreted and understood
• Not subject to bias
• Not subject to misinterpretation
• Can be reduced to an easily comparable metric such as $income per tonne of product
Poor benchmarks will be difficult to measure or will not be able to be readily reduced to a cross comparable measure. Examples of poor benchmarks are:
• Number of sprays per season or crop, as it will be swamped by regional and seasonal variation and local decisions will be difficult to interpret
• Pesticide expenditure, as many growers will be unwilling to go through their accounts
• Profitability per ha, as profit is a financial measure that is affected by factors that are irrelevant to IPM benchmarking such as depreciation and tax structuring
Sources of benchmarking data include:
• Available industry data collated from sources such as industry organisation surveys and market data
• Other divisions within national or multi‐national companies
• Companies that are prepared to share information about their performance, typically leaders in the area of business being benchmarked
• Collaborators in benchmarking (as discussed above)
3.2 Some Examples of Online Benchmarking in Agriculture
To increase understanding of benchmarking and its use in agricultural industries three tools have been reviewed: Vegetable Carbon Calculator (Australian Vegetable Industry), Winery Benchmarker (Australian Wine Industry), and California Sustainable Winegrowing Program (USA). 3.2.1 Vegetable Carbon Calculator (www.vegiecarbontool.com.au) The Australian Vegetable Industry’s Vegetable Carbon Calculator benchmarks greenhouse gas production by vegetable producers in Australia. It is primarily a measurement tool to
Page 135

Appendix 4 : Page 7
help producers calculate their greenhouse gas production. The tool currently has 50 registrants, with 10 entering data for benchmarking. Vegetable Carbon Calculator is a performance benchmarking tool that uses direct measures to generate the comparison metrics. Figure 1 shows sample input metrics for benchmarking.
Figure 1: Vegetable Carbon Calculator showing sample data input metrics
3.2.2 Winery Benchmarker (www.benchmarker.com.au) Winery Benchmarker was specifically developed for the Australian wine industry to facilitate direct comparison of winery performance between participating wineries. Table 1 below shows an extract of the (over 100) performance metrics used by Winery Benchmarker. Winery Benchmarker was developed in consultation with winemakers. The strengths of this program are that the performance benchmarks have been designed to be relevant to all wine producers, whether boutique or high volume manufacturers. To date this program has assisted businesses responsible for over 50% of the Australian winegrape crush to assess their performance relative to their peers.
Page 136

Appendix 4 : Page 8
An area of concern that developed as a result of the high level of stakeholder engagement on the Winery Benchmarker was the high number of metrics that were considered to be important. These created two main issues in the development of and use of Benchmarker: the high number of metrics became a barrier to use as users felt input was too onerous, and some metrics were less relevant to benchmark. A key element of the Winery Benchmarker program is the use of volume of wine produced and winegrapes crushed as the major metric denominators. These denominators ensured a repeatable, directly comparable program with relative ease of data capture and interpretation. Financial measures were deliberately ignored as they vary significantly with approach to accounting. Other benchmarking in the wine industry is specifically targeted at financial performance of wine making.
Table 1: Examples of Metrics used in Winery Benchmarker
Overall Metrics Breakdowns Units Litres of finished wine per tonne crushed red and white L/t Energy consumption per tonne crushed vintage and non‐vintage MJ/t Water used per litre of finished wine vintage and non‐vintage L/L Recycled water per litre of finished wine L/L Rainwater usage per litre of finished wine L/L Person hours per tonne crushed vintage and non‐vintage hr/t Analysis person‐hours per tonne crushed hr/t Wastewater COD vintage and non‐vintage kg/t Wastewater BOD vintage and non‐vintage kg/t Products per tonne crushed red and white per tonne Efficiency of bulk wine transfers no of transfersCost of Maintenance per fixed asset cost hr/$,000 Crushing Metrics Person‐hours per tonne crushed hr/t Water used per tonne crushed L/t Percent downtime of scheduled use % Unplanned maintenance downtime % Grapes yield red and white % Average crushing throughput t/hr
An area of difficulty is that with over 100 individual benchmarks, Winery Benchmarker is considered to require too intensive a data collection process and has been undergoing a refinement of the metrics over the last 6 months, which will continue into the future in consultation with users. This knowledge is valuable for the Australian Vegetable Industry. Onerous data collection and entry will be a barrier to adoption. The Winery Benchmarker is undergoing review and redevelopment as analysis of the data has been able to identify some strong statistical relationships between certain metrics. This has provided an opportunity for reducing the number of metrics without adversely impacting the benchmarking capability and value to the client.
Page 137

Appendix 4 : Page 9
Winery Benchmarker is also a performance benchmarking tool that uses direct measures to generate the comparison metrics. 3.2.3 California Sustainable Winegrowing Program California Sustainable Winegrowing is a performance benchmarking approach that uses relative (semi‐quantitative and quantitative) rather than direct measures to allow grape growers and wine producers to benchmark themselves against both other producers and against best practice. The long‐term mission for the Sustainable Winegrowing Program includes:
• “Establishing voluntary high standards of sustainable practices to be followed and maintained by the entire wine community;
• Enhancing winegrower‐to‐winegrower and vintner‐to‐vintner education on the importance of sustainable practices and how self‐governing will enhance the economic viability and future of the wine community; and
• Demonstrating how working closely with neighbours, communities and other stakeholders to maintain an open dialogue can address concerns, enhance mutual respect, and accelerate results.”
“The Code of Sustainable Winegrowing Practices Self‐Assessment Workbook is the foundation of the sustainable winegrowing program and a tool for program participants to measure their level of sustainability and to learn about ways they can improve their practices. The workbook addresses ecological, economic and social equity criteria through an integrated set of 14 chapters and 227 criteria, which includes a built‐in system with metrics to measure performance.” The workbook chapters are:
• Viticulture
• Soil Management
• Vineyard Water Management
• Pest Management
• Wine Quality
• Ecosystem Management
• Energy Efficiency
• Winery Water Conservation and Quality
• Material Handling
• Solid Waste Reduction and Management
• Environmentally Preferred Purchasing
• Human Resources
• Neighbors and Community
• Air Quality
Page 138

Appendix 4 : Page 10
Figure 2 shows the benchmarking output from the California Sustainable Winegrowing tool. This output is based on a series of self assessment guides as shown in Figure 3. The web input page in Figure 3 shows how input is guided and how users indicate their responses. The program allows for data to be entered by a consultant or mailed into a data processing supplier for electronic entering. Figure 4 shows the self benchmarking data summary available from the direct web entry version. The California Sustainable Winegrowing Program utilises relative metrics for benchmarking rather than direct measures such as those used in Winery Benchmarker or Vegetable Carbon Calculator.
Page 139

Appendix 4 : Page 11
Figure 2: Benchmarking output from the California Sustainable Winegrowing Tool
Page 140

Appendix 4 : Page 12
Figure 3: Sample web version of guided input sheets
Page 141

Appendix 4 : Page 13
Figure 4: Data summary page from web entry form
The users of the benchmarking tool can qualitatively assess their performance against the guided performance criteria in Figure 3 and then benchmarking is assessed against those criteria. The strength of this method is underpinned by the definition of the performance criteria metrics and the user’s ability to understand the distinction between each of the categories.
Page 142

Appendix 4 : Page 14
4 Benchmarking for IPM
4.1 Process benchmarking for IPM
As IPM is a process, process benchmarking should be considered for benchmarking IPM. An example of process benchmarking would be to develop a best practice implementation approach utilising flow charts to demonstrate a best practice program, and then benchmarking the practices of consultants and industry groups promoting IPM against the best practice program. Alternatively, the practices of a leading consultants, growers or results of recent research could be used to generate the benchmarks. A draft IPM Continuum has been developed by the National Vegetable IPM Coordination project team (see Appendix 5) and has been circulated for comment. This provides a significant foundation for defining “best practice” IPM systems that can be used as a driver of continual improvement. This approach can generate some direct performance measures such as the number of steps in the program that are followed, but would be better suited to relative measures of effectiveness. More importantly the benchmarking would be about measuring complexity and performance, possibly using scores such as:
• Relative complexity of process
• Effectiveness of associated documentation
• Degree to which processes draw producers through the stages of low to medium to high engagement in IPM practices
• Effectiveness of monitoring practices and timing
• Effectiveness of reactive practices in the process
• Effectiveness of preventative practices in the process
• Are the interventions in the process up to date with current science?
A benefit of process benchmarking is that it is relatively simple to bring in processes from non‐vegetable crops, other industry bodies and from overseas. One example is from the Washington State (USA) Personnel Department’s “Recruitment Process Benchmark and Best Practice Study”, dated July 2009, which covers in detail the processes and metrics they used and could be modified to be relevant for IPM benchmarking. (This study can be accessed via the URL provided in the References section of this report.) An additional benefit of process benchmarking is that it benchmarks delivery performance, giving an opportunity to introduce best practice training for consultants, industry and growers alike. In the case of IPM process benchmarking, it could benchmark the delivery methodology of an advisor or consultant and potentially identify missed opportunities in their methodology. This would lead to training and improved practices and methodologies. As part of a recommended future mentoring program for IPM consultants, this potential use of benchmarking would be presented to them in a positive way, i.e. as something that can lead to professional development and business improvement opportunities.
Page 143

Appendix 4 : Page 15
It needs to be understood that IPM practices will be continually evolving to meet industry needs and to take into account new pests (or races or biotypes), development of resistance to pesticides, loss of chemistry, new R&D findings etc. This will require continual updating of what defines “best practice” IPM systems for different crops, different production systems, different regions etc. The IPM consultants and advisors servicing the industry will also need to keep up to date with their methods and practices. 4.2 Performance Benchmarking for IPM
4.2.1 Quantitative performance benchmarking Direct quantitative performance benchmarking could be difficult for IPM due to the effects of:
• Seasonal variability
• Different practices between crops
• Need for large uniform datasets
• Different practices for different (often regionalised) pests
• Spatial variability
• The many different interventions that can be used to obtain similar beneficial outcomes
• Accessing quantitative data from surrogate metrics
However, there are several opportunities, involving mining of existing databases (section 5) that are emerging in the Australian Vegetable Industry that could provide some quantitative data for benchmarking. 4.2.2 Semi‐quantitative (and relative) benchmarking Consideration should be given to utilising a relative benchmark for performance benchmarking of IPM in a similar way to that used in the California Sustainable Winegrowing Program. This program benchmarks pest management practices utilising a graded practices and scoring system. To develop these benchmarks a series of questions would have to be developed around the utilisation/implementation on‐farm of various elements of IPM tools, practices and processes. For example, weather could have a series of graded questions from 1 to 4 such as:
1. I use no weather forecasting to support my spraying program, other than to ensure that rain or wind will not affect spray efficacy AND pesticide spraying is calendar based.
2. I use long‐term weather forecasting to determine my pest risk for significant pests in my production system AND I use this to modify my spray program.
3. Same as 2, but I keep easily accessible records of past weather, spraying and other control practices and outcomes.
Page 144

Appendix 4 : Page 16
4. I use long and short‐term weather information to pre‐emptively control fungal disease outbreak in inclement weather conditions (extreme humidity) OR ….. OR….
The IPM continuum (in Appendix 5) codifies pest management practices under 5 groups of practices: Monitoring; Preventative practices; Reactive practices; Recording, reviewing & planning; and Information seeking; and within four categories along a continuum: No IPM, Low IPM, Medium IPM and High or Biointensive IPM. The practices can be considered separately for different pest types such as: invertebrate pests, diseases, nematodes, weeds and vertebrate pests or as a unified table of practices. This IPM continuum could be integrated into an effective quantitative benchmarking program if a scoring system were included to give relative weight to the practices. This approach to benchmarking is analogous to “tear down” assessments conducted on car and electronics manufacturers, which have some very direct measures such as numbers of parts, but also utilise scores on ease of repair, which although are qualitative, are often the more useful aspects of the tear down benchmarks. 5 Review of Vegetable Industry Farm Management Software
In this review of farm enterprise management software currently being used in the Australian Vegetable Industry, three programs have been assessed in relation to their potential usefulness for providing data to assist in benchmarking IPM adoption. The three programs are ProCheck by Hortus Technical Services, Undercover Grower (VG08045) by NSW DPI (in development) and Wirelessfarmer by Farm Solutions. These farm management programs are not benchmarking tools; they are business tools that could capture and provide data to assist with benchmarking IPM adoption.
5.1 ProCheck
ProCheck is a farm monitoring tool that enables uploading of data to the AgPro Database enabling multiple access by growers, advisors and other farm consultants to gain information with respect to a specific farmer’s crops and needs. It is an online database system that allows farmers to request actions and receive results and recommendations primarily on soil and tissue analysis. The system has a large number of metrics. One of the key features of the database is its search capabilities, enabling potential users to compare efficacy and other management outcomes. The database has a web interface enabling either a farmer or his advisor to have easy access to both their own and pooled information and data. The ProCheck system is built on the fundamental principle, ‘if you don’t measure it, you can’t manage it’, eg it promotes the booking of services and the remediation of a range of farm issues. The management system is based on a high level of monitoring and recording and provides recommendations and product registry for growers. This information would be useful in the development of an IPM benchmarking system.
Page 145

Appendix 4 : Page 17
In discussion with Hortus, they are supportive of the use of their database for IPM benchmarking. They see a number of benefits that will come from a system where analysis of results can be done on a constant analysis system. Some of the benefits may include the ability to critically analyse pest and disease thresholds, speed of population expansion and efficacy of spray programs. This will allow them to further refine management and spray programs, potentially reducing the need for harsh chemicals. A further theoretical advantage could be the identification and management of pesticide resistance, as the monitoring program will assess pest pressure before and after, chemical application. This could lead to temporal and spatial mapping of resistance movement enabling early intervention strategies. Key features:
1. ProCheck is a technical services management tool for use in agriculture and horticulture which is run by Hortus Technical Services.
2. A range of pest management data is collected including monitoring dates, pests and diseases identified and numbers. Following assessment of monitoring data, recommendations are made for pesticide applications or other remedial action.
3. During monitoring beneficials are identified and quantified and in the reporting process beneficial/pest ratios are recorded.
4. All data collected is stored on a centralised database and the system has an effective filter that enables some level of exploratory evaluation of data.
5. Currently, the tool is being used by in excess of 110 corporate farmer and farm advisor clients of which approximately 50% include vegetable clients. The membership is predominantly made up of advisor clients. There is little or no limit to the number of clients who could use the database.
6. The cost to access ProCheck is $220 for smart phone and/or PDA software. Access to the wider database system, AgPro is $1,100 per client.
5.2 Undercover Grower
Undercover Grower is business management software for greenhouse growers and is currently under development. The software will enable the farmer to establish a virtual farm on a web based system for monitoring, reporting and developing management action plans for the property. It has a large number of metrics that could potentially be useful in a benchmarking system. The aim is to include all variables that growers are likely to want to use. The current (incomplete) list of variables is in Table 2.
Page 146

Appendix 4 : Page 18
Table 2: Variables to be used in Undercover Grower
Sections Incomplete list of variables Demographic data Address, user, Farm plan Greenhouse size, shape, technologies, components,
fittings, production layout Crop management Type, variety, location, spacing, sowing dates, expected
and actual harvest dates, costs, crop registration/growth parameters
Invertebrate pests & diseases Monitoring dates and numbers, spray applications, biological releases, monitoring dates & threshold numbers
Packing shed Harvest date, quality, grade, waste, packing type, number, sale price, quantity sold, quantity in store
Chemical shed Inventory of product & product info, purchase date, price, quantity, sell/dispose date, cost, expiry
Fertilizer shed Inventory of product & product info, price, quantity bought, targets, hydroponic recipe and application, water volume/s, whp, purchase/sell date & cost
Farm shed Inventory of tools, equipment, vehicles, bulk materials, fuel, consumables: range of info for each
Office Policies/registration, equipment, consumers, loan/lease agreements, wages; range of info for each item
Staff room Employee details, contractors, consultants: contact details, qualifications, costs
Tasks All actions captured as tasks, info includes who, what, when, how long
Financial tools Budgets and business tools, enterprise budgets, benefit‐cost analysis, live trial analysis, cost analysis
Energy & environment Carbon emissions budget A number of the proposed metrics in this system could be useful in the benchmarking of IPM adoption and systems in greenhouses. These metrics include:
• Task times
• Labour involved in specific areas, eg pest management
• Volume of chemical used for crop/period of time
• Number of chemical applications for crop/period of time
• Type of products used
• Pest, disease and bio‐control numbers/incidence
• Harvest records
• Cost benefit analysis for change of practices/technologies
Page 147

Appendix 4 : Page 19
Key features:
1. Undercover Grower is a greenhouse business management tool for use in protected cropping, and will be managed by Jeremy Badgery‐Parker of NSW DPI.
2. A range of pest management data will be collected including: monitoring dates, pests, diseases, beneficials and incidence, and following assessment of this data, recommendations (either in the software or by an external consultant) will be made for pesticide applications or other remedial action.
3. All data collected is to be stored on a centralised database, and there is also the option for growers to use a standalone system.
4. Currently, the tool is in the development phase. The developers are working with industry (end users) to build the metric list and the planned release date is in early 2012. It is planned that there will be extensive training for growers as part of the wider release of the program.
5. It is anticipated that the use of the software will be free, subject to adequate sponsorship; if not then a subscription may be required.
6. In the delivery of the program there will be extensive grower training focused on developing grower familiarity with the program. However, its strength will be that it will form the basis for an on‐going extension program and will be used in conjunction with ‘best practice’ training.
There is a good opportunity in the development stage of this tool to ensure that suitable metrics are included and collected to enable IPM benchmarking. Given a key goal of this project is to drive continuous improvement, building the benchmarking capability into the database should be highly desirable. There is a further advantage in that the database is being designed specifically for protected cropping, an expanding system of production in the Australian Vegetable Industry. The other programs reviewed were largely being utilised in field vegetable production systems and although there are potentially metrics that are common to both systems it would be unlikely that comparisons could be made across the different production systems. 5.3 Wirelessfarmer (www.wirelessfarmer.com1)
Wirelessfarmer is an Australian‐developed program by Mark Delana of Farm Solutions that is quite widely used in Victoria by vegetable growers in the Cranbourne, Werribee, Bacchus Marsh and Keilor areas where 22 growers currently subscribe to the software. The software is a complete farm business management package including sections on paddock/crop management, as well as an accounting section that allows for full product traceability and procurement/logistics, sales and distribution data to be collected and analysed. This software has a high level of customisation enabling it to meet the needs of the simplest farm through to the most complex farm requiring a high level of management
1 At the time of submission of this report as part of the VG09191 Final Report (mid‐May 2011), this website could not be accessed, as it was being redeveloped.
Page 148

Appendix 4 : Page 20
and reporting. The capacity for customisation would require the metrics for IPM benchmarking to be hard coded into the software. A key feature of this program is its usability in that it has been built to interface wirelessly with PDAs that are used by management and workers, whether in the office or in the field. Two growers were contacted about their experience with Wirelessfarmer. Both commented on the simplicity of the program and how easy it has been to get the most technologically challenged worker to use the system effectively. This program has the ability to capture a wide range of data that could potentially be used to benchmark IPM performance on an individual property or indicate IPM adoption at an industry level. Currently the software is in redevelopment and by the end of May 2011 it is anticipated that the software will have full web, smart phone and PDA interfaces. When this upgrade is undertaken there will be the potential to access information stored in an online database that could be analysed. Key features:
1. Wirelessfarmer is a farm, paddock and business management tool for use in agriculture and horticulture, which is run by Farm Solutions.
2. A range of pest management data is collected including: monitoring dates, pests and diseases identified and numbers. Following assessment of the data, recommendations can be made by business agronomists or external consultants linked into the system for pesticide applications or other remedial action. Complete spray history including chemicals used, application rates, climatic conditions and other relevant data is also recorded.
3. All data collected is stored on a centralised database on farm. Key staff members have PDAs that automatically update the office database when they come into range.
4. Currently, the tool is being used by just over 20 farmer enterprises. There is little or no limit to the number of clients who could use the software.
5. The cost to access Wirelessfarmer is $4,600 for the base system and there is a further installation cost for use on smart phones and PDAs.
6. The capacity for customisation suggests that the Wirelessfarmer software could readily incorporate specific metrics required for IPM benchmarking.
7. The major current limitation for data capture is that it does not have a centralised data storage system although a centralised web based system was currently in development at the time of writing (March 2011).
It would be possible and practical to have a macro developed that could upload data from a user’s database to a centralised IPM database for benchmarking. This option could easily and cost effectively be developed for Wirelessfarmer clients who wanted to participate in IPM benchmarking.
Page 149

Appendix 4 : Page 21
5.4 Discussion
The tools that have been reviewed have the potential to collect, store and provide information to be analysed for quantitative IPM benchmarking. What is clear is that the three particular systems have significant similarities in terms of data collected but they also have some variations that would need to be addressed. If industry benchmarking is to be undertaken utilising existing agribusiness management software it would be very useful to ensure that key relevant metrics are consistent across all systems. In discussing the systems with each of the providers, all can see the merits in a standardised system of assessment, analysis, data storage and reporting. One of the key benefits would be the identification of critical threshold levels for specific crops and pests in different regions. It is important to note that there will be a need for the recording of beneficial invertebrates and for information to be provided on the impact of pesticides on specific beneficial species, enabling the selection of softer chemicals, which is a potential IPM benchmarking metric. The metrics currently captured by these farm management tools appear to be focused at the pesticide end of management rather than the biointensive end of the continuum of pest management practices. However, biointensive and cultural management metrics such as those identified within the IPM Continuum (in Appendix 5) or its subsequent revisions could easily be incorporated into these tools. As IPM is heavily reliant on a system of monitoring and appropriate decision making, the management of data and interpretation of that data would be a key feature that would need to be addressed when utilising established industry databases. In discussion with the owners and managers of the databases there appears to be an appetite to participate in an industry‐based IPM benchmarking program/system. The databases would require harmonisation to ensure that matchable datasets were attainable with standardised methodology of information collection and entry. The issue of privacy and commercial sensitivity will need to be overcome prior to the use of these programs as data access tools for benchmarking. One option is to develop a software program for benchmarking IPM adoption and performance that could be built into the existing web‐based software. Another issue that will need to be considered is the volume of data, as currently there is a low number of users; hence establishing adequate data sets across a wide range of crops and farm sizes and systems may prove problematic. However, unlike statistical analysis where the sample population is critical to the analysis, data sample size is not critical for benchmarking individual businesses against best practice benchmarks or for using benchmarking as a tool to drive the practice of continual improvement. Sample size is however still important if pooled data is to be used to state the numbers of growers using IPM or the area of production on which IPM is used.
Page 150

Appendix 4 : Page 22
6 References
California Sustainable Winegrowing Program, http://www.sustainablewinegrowing.org/ Washington State (USA) Department of Personnel (2009), Recruitment process benchmark and best practice study http://www.dop.wa.gov/SiteCollectionDocuments/Strategic HR/Research and Resources/Recruitment Process Study.pdf Farm Solutions. Wirelessfarmer. http://www.wirelessfarmer.com/ (note that at the time of submission of this document as part of the VG09191 Final Report in mid‐May 2011, this website was being redeveloped) Hortus Technical Services. AgPro, ProCheck. http://www.hortus.net.au/ Walsh, B., McDougall, S., Thompson, L. (2011). Benchmarking Vegetable Integrated Pest Management (IPM) Adoption, Appendix 1 ‐ Literature Review and Analysis: IPM Definition, Current Adoption & Future Benchmarking Options Vegetable Carbon Calculator, http://www.vegiecarbontool.com.au/ Wilson, R., Charry, A., Kemp, D. () Performance Indicators and Benchmarking in Australian agriculture: synthesis and perspectives in Extension Farming Systems 1, 1 Winery Benchmarker, http://www.benchmarker.com.au/
Page 151

Appendix 5 : Page 1
Appendix 5 Benchmarking Vegetable IPM Adoption: IPM Continuum for Australian Vegetable Crops (Draft)
April 2011
This Draft IPM Continuum has been developed by Sandra McDougall, NSW Department of Primary Industries (NSW DPI) as part of the National Vegetable IPM Coordination project (VG09191). An earlier draft was circulated to specialists in integrated management of invertebrate pests, diseases and nematodes in vegetable crops. Their feedback is gratefully acknowledged and has been incorporated into the tables for the individual pest types and the summary table.
Page 152

Appendix 5 : Page 2
IPM Continuum for Australian Vegetable Crops (Draft)
Consisting of Individual IPM Continuum Tables for: • Invertebrate Pests (Insects & Mites); • Diseases; • Nematodes; • Weeds; and • Vertebrate Pests (not yet developed)
and a Summary Table
Integrated Pest Management (IPM) is defined as covering all pests including: invertebrate pests (insects and mites), diseases, nematodes, weeds and vertebrate pests.
IPM is a strategy that utilises a range of tools to manage pests to produce marketable product and covers a continuum of practices. At the Low end of the IPM continuum, pest management essentially involves monitoring conditions or crops to make spray decisions. At the High or Biointensive end of the IPM continuum the cropping system is managed to maximise use of preventative tactics and biological controls, and relatively few pesticide applications are made.
IPM was a concept that was initially applied to invertebrate pest management; nevertheless the concept is applicable but perhaps less developed for other pests. A truly integrated management system needs to include and consider all pests. The following tables are an attempt to codify practices along a continuum for the different pest types. The final table contains a synthesis of the information in the tables for the individual pest types.
It is not possible to have a rigidly defined set of practices within each grouping of the IPM continuum because for each cropping system the suite of pests needing management varies and the tools available also vary between regions and over time and with new research advances; therefore an IPM strategy is a problem solving approach drawing on the available tools that are working within a specific crop, business and market environment.
The categories that specific crop protection practices fall under in the following tables may change over time and these tables are to be considered as working documents.
The meanings of terms often used when talking about IPM are as follows:
• Monitoring and scouting refer to actively and systematically walking through the crop specifically looking for signs of pests. It usually involves looking at a defined number of plants for insects and other invertebrate pests, disease symptoms, weeds, damage as well as ‘beneficials’. It may involve checking pheromone or sticky traps, and weather stations. It does not refer to glancing out of the window while driving past the crop. Although this might provide information to the grower, it is not what is meant by ‘monitoring or scouting’ when talking about IPM.
• Beneficials refers to the groups of biological organisms that reduce pest populations via direct predation or parasitism, disease or competition. The term is commonly used to cover invertebrate beneficials such as predatory or parasitic insects, spiders, nematodes or mites but may also include bacterial, viral or fungal pathogens of pests. Beneficials may occur naturally in the crop usually in the absence of or reduction in pesticide use and/or can be bought, for example in the form of a biological pesticide (eg Bt), or predatory insects.
Please do not hesitate to ask one of the team members involved in managing this survey about any terms you are unfamiliar with or any other aspects of the survey.
Page 153

Appendix 5 : Page 3
Draft IPM Continuum ‐ Invertebrate Pests (Insects & Mites)
Practices No IPM Low IPM Medium IPM High or Biointensive IPM Monitoring • No monitoring • Scouting
invertebrate pests
• Accurate identification and diagnosis
Low IPM practices plus: • Monitoring for
invertebrate beneficials – visual, sticky traps and pheromones where appropriate
• Threshold or trend-based decisions
Medium IPM practices plus: • Temperature monitoring as
applicable to invertebrate pest population models
Preventative practices
• No preventative practices
• Pest-free seed/plant material
• Pest-resistant varieties
• Cultivation • Attractant
baits/crops
Low IPM practices plus: • Elimination of
alternate hosts • Good sanitation
practices: crop roguing, post harvest crop destruction
Medium IPM practices plus: • Whole farm designed to
minimise introduction or movement of invertebrate pests
• Excellent sanitation practices, staff training and workflow to avoid movement from areas of higher pest pressure to ‘clean’ areas or younger plantings
• All farm practices reviewed and modified to reduce potential to introduce or spread invertebrate pests
• ‘Biosecurity’ management plan/practices developed for common and likely pests
• Primarily non-chemical preventative approach
• Release of beneficials or biocontrols in greenhouse situations and conservation and enhancement of endemic beneficials in field situations
• Use of non-crop vegetation to reduce pest loads on crops (trap, insectary, break, or screening crops)
• Soil amendments to increase organic carbon and soil predatory organisms
Reactive practices
• Primary control is pesticide treatment
• No alternative, non-chemical control methods used
• Selective pesticides
• Edge treatment • Sprayer
calibration
Low IPM practices plus: • Targeted selective
pesticide applications with knowledge of their impact on the key beneficials in crop and neighbouring crops
• Excellent spray application techniques
As with Medium IPM plus: • May choose a biological
release option
Continued on next page
Page 154

Appendix 5 : Page 4
Invertebrate Pests (Insects & Mites), continued
Practices No IPM Low IPM Medium IPM High or Biointensive IPM Recording, reviewing & planning
• May have chemical records but not reviewed
• Invertebrate pest monitoring records
• Chemical records • Weekly review of
monitoring and chemicals
As with Low IPM plus: • Farm plan noting
rotations and invertebrate pest loads, high risk areas particularly for soil pests
• Review weekly, seasonal and annual records for changes in invertebrate pest status; seek understanding of changes and plan to improve prevention or management strategies if required
As with Medium IPM plus: • Farm plan including
surrounding vegetation, and a sanitation plan
• Incorporate more factors into understanding of crop-pest-environment interactions
Information seeking
• Little information seeking, relies on own experience/ traditions
• Seeks primarily Chemical options
• Seeks information on: - Chemical
options for pests
- New chemistry - Spray
application - Spray timing - Thresholds
• Uses information that is readily available
As with Low IPM plus: • Understanding of
crop-pest-environment interactions
• Invertebrate pest and beneficial biology, alternative hosts, and disease vector potential
• Proven invertebrate pest management tools
As with Medium IPM plus: • Impact of farm management
practices on enhancing or suppressing invertebrate pests
• Any new information or early research findings that may be experimented with to reduce populations of or introduction of invertebrate pests
Page 155

Appendix 5 : Page 5
Draft IPM Continuum ‐ Diseases
Practices No IPM Low IPM Medium IPM High or Biointensive IPM Monitoring • No monitoring • Visually monitor
crop for disease symptoms and disease vectors
As with Low IPM plus: • Systematic approach to
disease scouting • Potential weed hosts of
diseases • Weather conditions for
windows of high pressure
• Some monitoring of nutrients and moisture to avoid encouraging diseases
• Hydroponic systems: pathogen load in solution
As with Medium IPM plus: • High degree of monitoring of
nutrients and moisture to ensure optimal crop health
• Greenhouse: high level of monitoring/control of house temperature, humidity – vapour pressure deficit, airflow and nutrient levels
Preventative practices
• Some resistant varieties
• Use of some preventative fungicides
• Use resistant varieties where possible
• Source disease-free seed or transplants
• Heat treat seed if don’t have certified seed and seedborne diseases issue
• Avoid double cropping with same family
• Preventative fungicides for common diseases in window when diseases likely to occur
• Usually ploughs in crop post harvest
As with Low IPM plus: • Manage weeds within
and around crops • Avoid consecutive
planting of known hosts of key soil fungal diseases (eg Sclerotinia – lettuce, celery, brassicas)
• 2-3 sanitation practices adopted to reduce introduction or movement of diseases
• Irrigate to minimise disease spread
• Avoid planting a host of a virus nearby
• Use composted soil amendments
• Reducing plant density and aligning rows to maximise airflow movement
• Use of biostimulants and plant defence activators
• Reduced risk fungicides • Greenhouse: Clean out
sheds after crops finished. Solution sanitised prior to recycling in hydroponic system.
• Always ploughs in crops immediately after harvest
As with Medium IPM plus: • Whole farm designed to
minimise introduction or movement of diseases
• Excellent sanitation practices, staff training and workflow to avoid movement from areas of higher disease or potential contamination to ‘clean’ areas or younger plantings
• All farm practices reviewed and modified to reduce potential to introduce or spread disease
• ‘Biosecurity’ management plan/practices developed for common and likely diseases
• Disease forecasting models (at present there are not many weather-based disease prediction models that have been validated in Australia)
• Green manure and biofumigant crops
Continued on next page
Page 156

Appendix 5 : Page 6
Diseases, continued
Practices No IPM Low IPM Medium IPM High or Biointensive IPM Reactive practices
• Regular fungicide program
• Curative fungicides when early symptoms observed
• Use of curative fungicides when windows of high potential infection likely for recurrent diseases or when early symptoms and favourable conditions present
As with Medium IPM plus: • Rogue crops and remove
diseased plants from site • Biosecurity plan enacted
when disease found on site in order to contain, remove or control it
Recording, reviewing & planning
• Spray application records
As with No IPM plus: • Monitoring
records of diseases and vectors and efficacy of sprays
As with Low IPM plus: • Farm plan noting
rotations and disease loads, high risk areas
• Review weekly and seasonal records for changes in disease status; seek understanding of changes and plan to improve prevention or management strategies if required
As with Medium IPM plus: • Farm plan including
surrounding vegetation and a sanitation plan
• Incorporate more factors into understanding of crop-disease-environment interactions
Information seeking
• When significant spray failure
• Identification of disease symptoms on crops
• Vectors of viruses
As with Low IPM plus: • Understanding of
crop-disease-environment interactions including non-crop hosts
• Disease and vector biology
• Proven disease management tools for managing diseases
As with Medium IPM plus: • Impact of farm management
practices on enhancing or suppressing diseases
• Any new information or early research findings that may be experimented with to reduce disease inoculum or reduce chances of movement or enhance plant defences against disease
Page 157

Appendix 5 : Page 7
Draft IPM Continuum ‐ Nematodes
Practices No IPM Low IPM Medium IPM High or Biointensive IPM Monitoring • No monitoring • Pre-plant counts
of nematodes
As with Low IPM plus: • Identification of
nematode species • Nematode load
assessment prior to harvest
As with Medium IPM plus: • Nematode counts in break
crops • Yield and quality data • Soil temperature • Soil nitrate • Soil biology
Preventative practices
• Pre-plant nematicides or soil fumigation in root crops and other high risk crops for nematodes
• Use resistant varieties where possible
• Source nematode-free transplants
• Avoid double cropping with same family
• Usually ploughs in crop post harvest
As with Low IPM plus: • Crop rotations
include at least one non-nematode host every 2nd or 3rd year where nematodes have been found
• Manage nematode hosting weeds within and around crops
• Use soil amendments with high C/N ration to increase soil organic matter
• Chicken manure when pre-plant counts indicate likely problem with nematodes
• Always ploughs in crops immediately after harvest
As with Medium IPM plus use of experimental practices such as: • Non-host break crops
matched to species of nematode found in previous plantings
• Rotations matched to soil type and past history of nematode load
• Green manure and biofumigant crops
• Use of experimental hazard indicies and thresholds
• Use of trap crops • Minimum tillage and
permanent beds
Reactive practices
• • Pre-plant nematicides or soil fumigation when pre-plant counts indicate potential problem prior to planting a susceptible crop
• [Potentially use high rates of high nitrogen amendments]
• Soil solarisation in areas where high nematode counts found and to be planted with high value crop
• Nematicide or soil fumigation as last resort
As with Medium IPM
Continued on next page
Page 158

Appendix 5 : Page 8
Nematodes, continued
Practices No IPM Low IPM Medium IPM High or Biointensive IPM Recording, reviewing & planning
• Fumigant and chemical application records
As with No IPM plus: • Monitoring
records of pre-plant nematode counts
As with Low IPM plus: • Farm plan noting
rotations and nematode loads and high risk areas
• Review pre-plant and pre-harvest nematode records for trends; seek understanding of changes and plan to include non-host break crop if required
As with Medium IPM plus: • Farm plan including
paddock history of crop rotations including nematode loads & management practices
• Incorporate more factors into understanding of crop-nematode-environment interactions
Information seeking
• When significant crop failure
• Identification of nematodes
As with Low IPM plus: • Understanding of
crop-nematode-environment interactions
• Potential non-host break crops
• Nematode biology and alternative hosts,
• Proven nematode management tools
As with Medium IPM plus: • Actively seeking
information on host range of nematodes found on farm and non-host crops that could be used as break crops
• Impact of farm management practices on enhancing or suppressing nematodes
• Any new information or early research findings that may be experimented with to reduce nematode populations or enhance plant defences against nematodes
Page 159

Appendix 5 : Page 9
Draft IPM Continuum ‐ Weeds
Practices No IPM Low IPM Medium IPM High or Biointensive IPM Monitoring • No systematic
monitoring • Monitoring
• Weed survey 1-2 times per year, once after transplanting or germination but prior to weeding
• Weed survey after transplant/germination but prior to weeding, and again prior to harvest; also survey outside fields, along tracks, fences around ditches and other sources of weeds
• Note species and relative abundance – identify annual and perennial weeds
Preventative practices
• Ground preparation for planting
• Knock down herbicides prior to planting
• Pre-emergent herbicides where registered
As with No IPM plus: • Where economic
use plastic mulch • Pre-irrigate to
germinate weeds then cultivate just prior to planting
• Pre-emergent herbicides
As with Low IPM plus: • Rotations to
reduce weed load • Minimise weeds
setting seed in and around crops
• Pre-emergent herbicides in areas with known weed load
As with Medium IPM plus: • Multi-year plan to reduce
seed load and prevent new weeds spreading
• Sanitation plan and training for staff to reduce introduction or movement of weed seed around farm
• Selected soil solarisation or remediation of areas with high weed seed load
Reactive practices
• Post emergence herbicides
• Hoeing/chipping
• Post emergence herbicides
• Hoeing/chipping • Inter-row
cultivation
As with Low IPM plus: • More precise
inter-row cultivation (hand- or vision-guided)
• Use of precision agriculture for targeted herbicide application within crop
As with Medium IPM plus: • Shielded, spot spraying • Use of vision-guided,
precision in-row cultivation (where economic)
Recording, reviewing & planning
• Required chemical records
• Chemical records As with Low IPM plus: • Records of
weeds found in surveys
• Keep weed map and records of survey for each block and farm
• Keep records of management practices and efficacy
• Plans for different blocks and particular weeds (eg herbicide resistant, noxious or weeds from same family as the crop, eg solanaceous weeds in capsicums)
Information seeking
• Only after spray failure
• Identification of main weeds and particularly chemical resistant species
• Chemical options
As with Low IPM plus: • Weed biology
and non-chemical management options
• Integrated weed management practices
Page 160

Appendix 5 : Page 10
Draft IPM Continuum ‐ Vertebrate Pests (not yet developed)
Practices No IPM Low IPM Medium IPM High or Biointensive IPM Monitoring
• • • •
Preventative practices
• • • •
Reactive practices
• • • •
Recording, reviewing & planning
• • • •
Information seeking
• • • •
Page 161

Appendix 5 : Page 11
Draft IPM Continuum ‐ Summary Table
Practices No IPM Low IPM Medium IPM High or Biointensive IPM Monitoring • No monitoring • Scouting for
invertebrate pests • Observing disease
symptoms in crops • Accurate
identification and diagnosis
• Pre-plant nematode counts in high risk situations
Low IPM practices plus: • Scouting for diseases
and getting accurate diagnosis
• Weather-based disease forecasting*
• Some nutrient and water monitoring
• Starting to monitor for invertebrate beneficials and potential weed hosts of diseases
• Threshold or trend-based decisions
Medium IPM practices plus: • More intense monitoring of
pests, beneficials, potential weed hosts. nutrients, soil moisture etc
• In greenhouses, high level of monitoring and control of environmental conditions etc
• Monitoring temperature for use in invertebrate pest development models
• Monitoring nematode counts in break crops
• Monitoring soil biology Preventative practices
• Some pest- resistant varieties
• Some preventative fungicides
• Pre-plant nematicides or soil fumigation in crops with high risk for nematodes
• Weeds killed during ground preparation
• Knock-down herbicides prior to planting
• Pre-emergent herbicides
• Pest-free seed/plant material
• Heat treatment of seed
• Pest-resistant varieties
• Cultivation • Attractant
baits/crops • Crop rotation • Appropriate timing
of preventative fungicides
• Pre-irrigation to germinate weeds
• Plastic mulch • Crop usually
ploughed in after harvest
Low IPM practices plus: • Good sanitation
practices: crop roguing, post harvest crop destruction, greenhouse and channel cleaning
• Elimination of alternate hosts
• Rotation crops selected to assist with reducing weed load and as break crops, eg for nematodes & soilborne diseases
• Green manures/compost
• Induced resistance activators
Medium IPM practices plus: • Primarily non-chemical
preventative approach • Insect-proof screening in
greenhouses, double doors, climate control
• Whole farm designed to minimise introduction and movement of pests; staff trained and workflow managed accordingly
• Release of beneficials, biocontrols, pheromones
• Conservation and enhancement of endemic beneficials
• Trap crops • Soil solarisation • Biofumigant crops • Interactive pest/weather/crop
models* Reactive practices
• Primary control is pesticide treatment
• No alternative, non-chemical control methods used (reliance on chemical controls)
• Selective pesticides used
• Targeted location spraying (eg edge treatment)
• Sprayer calibrated • Decision to use
pre-plant nematicides or fumigants based on nematode counts and crop susceptibility
Low IPM practices plus: • Combination of
pesticide treatment with 1 or 2 IPM preventative practices
• Use of precision agriculture for targeted application within crop
• Excellent spray application techniques
• Selection of pesticide and timing of application based on knowledge of favourable conditions for pest, impact on beneficials etc
• Pesticide treatment integrated with at least 3 IPM preventative practices
• Low and Medium IPM spraying practices utilised
• Roguing of crops and removal of diseased plants to off-site location
• Biosecurity plan enacted if relevant pest found on site
• Shielded, spot spraying for weeds
• Use of vision-guided, precision in-row cultivation (where economic)
*At present there are not many weather‐based disease prediction models that have been validated in Australia.
Continued on next page
Page 162

Appendix 5 : Page 12
Draft IPM Continuum ‐ Summary Table, continued
Practices No IPM Low IPM Medium IPM High or Biointensive IPM Recording, reviewing & planning
• May have chemical (including soil fumigant) application records but not reviewed
• Invertebrate pest monitoring records
• Pre-plant nematode counts
• Chemical records • Weekly review of
invertebrate pest monitoring records and chemical efficacy
Low IPM practices plus: • Records of monitoring
for diseases and 1-2 other pests or factors (eg weeds found in surveys, nematode species, pre-harvest nematode counts or factors such as weather conditions for disease prediction, presence of weed hosts, nutrient and moisture levels)
• Farm plan noting rotations, pest loads, high risk areas etc
• Records reviewed weekly as well as annually (re pest patterns and overall pest management strategy)
Medium IPM practices plus: • Records of monitoring for
invertebrate beneficials and at least 3 other pests or factors
• Recording and review of preventative practices
• More detailed farm plan including surrounding vegetation, and a sanitation plan
• Review records weekly, seasonally and annually
Information seeking
• Little information seeking; reliance on own experience/ traditions
• Seeks primarily Chemical options
• Seeks information on:
- Chemical options for pests
- New chemistry - Spray application - Spray timing - Thresholds - Pest identification - Vectors of viruses - Weed hosts of
diseases and other pests
• Uses information that is readily available
Low IPM practices plus: • Consults outside
experts on management of pests
• Seeks information on preventative options, new management techniques
• Seeks to understand crop-pest-environment interactions
• Actively seeks information
Medium IPM practices plus: • Seeks to understand the impact
of farm management practices on enhancing or suppressing pests
• Actively seeks information on new developments in pest management
• Takes advice from a range of professionals
Page 163

Appendix 6 : Page 1
Appendix 6 Benchmarking Vegetable IPM Adoption: Cost‐benefit Analysis of IPM Adoption by NSW Lettuce Growers
May 2011
This cost‐benefit analysis of IPM adoption by NSW lettuce growers was prepared by Leanne Orr and Sandra McDougall, NSW Department of Primary Industries (NSW DPI) as part of the National Vegetable IPM Coordination project (VG09191).
Page 164

Appendix 6 : Page 2
CONTENTS 1. Introduction......................................................................................................................................4
2. The Australian lettuce industry ........................................................................................................4
3. Significant pests in lettuce................................................................................................................6
3.1. Lettuce insect pests ..................................................................................................................6
3.2. Lettuce diseases........................................................................................................................7
4. Integrated pest management in lettuce...........................................................................................8
5. Key features of IPM ........................................................................................................................13
5.1. Features of an IPM strategy for field grown head lettuce......................................................13
5.2. Features of an IPM strategy for hydroponic fancy lettuce .....................................................13
6. Methods and assumptions .............................................................................................................14
6.1. Methodology...........................................................................................................................14
6.2. Period of analysis ....................................................................................................................15
6.3. Data sources............................................................................................................................15
7. Benefits from adoption of IPM practices in lettuce production.....................................................16
7.1. Calculating financial benefits from adopting IPM practices in field grown head lettuce.......17
7.1.1. Incremental net benefit from IPM adoption in field grown head lettuce .................20
7.2. Calculating financial benefits from adopting IPM practices in hydroponic fancy lettuce ......22
7.2.1. Incremental net benefit from IPM adoption in hydroponic fancy lettuce ................25
List of Tables
Table 1: Australian lettuce production 2008‐09, by State ...................................................................... 5
Table 2 : Key Lettuce Diseases and Insect Pests with a Summary of Relevant Management Information and Options ....................................................................................................... 11
Table 3 : Baseline (non‐IPM) lettuce production systems, field grown head lettuce ........................... 18
Table 4 : IPM lettuce production systems, field grown head lettuce ................................................... 19
Table 5 : Analysis of incremental net benefit increase – IPM vs non‐IPM production of inland and coastal field grown head lettuce..................................................................................... 20
Table 6a : Parametric budget (% damage from insect pests and diseases and crop protection costs in the IPM case) for inland field grown lettuce ..................................................................... 21
Table 6b : Parametric budget (% damage from insect pests and diseases and crop protection costs in the IPM case) for coastal field grown lettuce ................................................................... 22
Table 7 : Baseline (non‐IPM) lettuce production systems, hydroponic fancy lettuce .......................... 22
Table 8 : IPM lettuce production systems, hydroponic fancy lettuce................................................... 24
Table 9 : Chemicals used in the baseline (non‐IPM) and IPM hydroponic fancy lettuce systems ........ 24
Table 10 : Analysis of incremental net benefit increase – IPM vs non‐IPM production of hydroponic fancy lettuce ...................................................................................................... 25
Table 11 : Parametric budget (% damage from insect pests and diseases and crop protection costs in the IPM case) for hydroponic fancy lettuce...................................................................... 26
Page 165

Appendix 6 : Page 3
Key findings
The financial benefits of adopting integrated pest management in lettuce
• Crop monitoring and knowledge of pests, diseases and beneficial insects is key to implementing an effective IPM system in lettuce.
• Income is increased due to reduced levels of crop damage from pests and diseases.
• Production costs change from adoption of cultural practices and the use of targeted
chemical controls.
• New, softer chemicals suitable for use in an IPM system are generally more expensive than older broad‐spectrum chemicals.
• Marginal analysis estimates that in an inland field grown head lettuce production
system, adopting IPM can result in an annual incremental net benefit of $3,175 per hectare (a 6.4% increase).
• Using marginal analysis an annual incremental net benefit of $2,419 per hectare (a
4.8% increase) is estimated to arise from adoption of IPM in a coastal field grown head lettuce production system.
• Marginal analysis shows an incremental net benefit of $6,287 or 17.9% per 1,000 m2
in a one year period from adoption of IPM in a hydroponic fancy lettuce production system.
Social and environmental benefits from adopting integrated pest management in lettuce
• New, softer selective insecticides used in IPM systems require less active ingredient to be applied. This, along with reduced usage of broad‐spectrum insecticides, leads to an increase in farm biodiversity.
• Adoption of an IPM system means reduced exposure of farm owners and workers to
pesticides and particularly to S7 and S6 pesticides1.
• Growers have satisfaction that they are fulfilling their environmental stewardship and OH&S obligations.
• A key social benefit from adoption of IPM is the improved communication,
networking and education activities supporting lettuce growers in their understanding and adoption of IPM systems.
1 Agricultural chemicals are given codes on the poison schedule to indicate relative toxicity to humans. The most toxic = Highly toxic = S7; Moderately toxic = S6; Slightly toxic = S5; very low toxicity = unscheduled.
Page 166

Appendix 6 : Page 4
1. Introduction Integrated Pest Management (IPM) is a strategy that draws on a range of management tools with the goal of using the least ecologically disruptive techniques to manage pests to economically acceptable levels (McDougall, 2007). The distinguishing features of an IPM strategy are:
• the use of knowledge about the biology of pests and their interaction with their natural enemies,
• knowledge of cultural and chemical control strategies, and
• the monitoring of pest and beneficial populations
to allow growers to make profitable pest management decisions. The term IPM was originally coined in relation to managing invertebrate pests (insects and mites) but IPM systems have now been developed to cover all other pest types including: diseases, weeds, nematodes and vertebrate pests. IPM systems for specific crops are developing and currently most recommendations are for invertebrate pests and diseases. While new scientific information has enabled farmers to make more profitable pest management decisions particularly with respect to pesticides, it has also been a valuable input into the management of externalities associated with pests and the use of pesticides and into the public regulation of pest management. IPM is a system for managing pests, particularly the management and minimisation of pesticide resistance. Lettuce growers are faced with increasingly ineffective broad‐spectrum pesticides to control a number of significant insect species, necessitating the use of a combination of selective chemical, biological and cultural controls in an integrated management program. For the lettuce grower there are significant changes to production and management costs associated with adopting IPM and therefore the main issue for growers is whether it is cost‐effective to adopt an IPM system. This paper addresses this issue of cost‐effectiveness and outlines the key benefits from adopting an IPM system for lettuce production. The size and nature of the lettuce industry in NSW is described and the significant pest issues facing lettuce producers in NSW are outlined. We summarise the nature of IPM cultural and chemical control practices, key benefits from their adoption and the farm‐level financial, environmental and social impacts.
2. The Australian lettuce industry In the field, lettuce is a short‐season crop produced under irrigation in rotation with other vegetable crops. Lettuce is also grown in hydroponic production systems. The bulk of lettuce production in Australia is concentrated in the eastern states, particularly Victoria, Queensland and New South Wales.
Page 167

Appendix 6 : Page 5
Around 164,000 tonnes of lettuce was produced in Australia in 2009, which includes both field and hydroponic lettuce. In the field, production declines through summer due to the warm conditions. Field lettuce producers in the Eastern states primarily supply fresh markets with a small percentage going to processors. In inland NSW, lettuce is sown from early February through to late July for harvesting from April to the end of October, using field production systems only.
Victoria and Queensland produce over two‐thirds of the national crop accounting for approximately 37% and 34% of production nationally. NSW accounts for roughly 12% of lettuce production in Australia. Data on key production parameters such as area sown, production and yield are presented in Table 1 for head and fancy lettuce grown both in the field and hydroponically for the major lettuce producing States.
Table 1: Australian lettuce production 2008‐09, by State
Australia NSW Victoria Queensland South Australia
Western Australia
Production % % % % % %
Total tonnes 164,543 100 20,277 60,389 55,960 12,007 14,401
Head 135,733 82.5 14,518 71.6 51,664 85.6 49,355 88.2 8,461 70.5 11,671 81.0
Field 135,263 14,502 51,663 49,355 8,461 11,217
Hydroponic 470 16 1 0 0 454
Looseleaf, butterhead, fancy 28,810 17.5 5,759 28.4 8,725 14.4 6,605 11.8 3,547 29.5 2,730 19.0
Field 26,383 4,229 8,143 6,435 3,401 2,730
Hydroponic 2,427 1,530 582 170 145 0
Area
Total (ha) 7,411 1,056 2,991 2,294 356 594
Head (ha) 5,356 714 2,008 1,916 297 399
Field (ha) 5,352 713 2,008 1,916 297 397
Hydroponic (m2) 31,183 6,122 646 4,000 0 20,415
Looseleaf, butterhead, fancy 2,055 342 983 377 59 195
Field (ha) 2,006 321 969 367 55 195
Hydroponic (m2) 487,981 204,463 135,914 103,205 44,388 11
Yield
Total 22.2 19.2 20.2 24.4 33.7 24.2
Head (tonnes/ha) 25.3 20.3 25.7 25.8 28.5 29.3
Field (tonnes/ha) 25.3 20.3 25.7 25.8 28.5 28.3
Hydroponic (kg/m2) 15.1 2.6 0.9 0.0 0.0 22.2
Looseleaf, butterhead, fancy 14.0 16.8 8.9 17.5 59.6 14.0
Field (tonnes/ha) 13.2 13.2 8.4 17.5 61.8 14.0
Hydroponic (kg/m2) 5.0 7.5 4.3 1.6 3.3 32.0
Source: ABS Catalogue 7121.0
It should be noted when using ABS figures that area sown is not always an accurate guide to actual area harvested because of pest and disease damage. Actual areas harvested will be lower in any case where a crop has had to be abandoned due to significant levels of pest and disease damage.
Page 168

Appendix 6 : Page 6
In 2009 Victoria and Queensland produced almost equal amounts of head lettuce and together accounted for 75% of head lettuce production in Australia. NSW was the major producer of fancy hydroponic lettuce, producing 63% of total fancy hydroponic lettuce in Australia in 2009. Average yields Australia‐wide for field grown head lettuce grown are around 25.3 tonnes (t) of lettuce harvested per ha sown, equating to an average of approximately 1,900 cartons of lettuce produced per ha (ABS 7121.0). However researchers and industry specialists estimate that average field grown head lettuce yields in inland NSW are in the order of 2,200 cartons per ha for Australian growers using furrow irrigation. Average Australian fancy lettuce yields in hydroponic systems from ABS figures are 5kg per square metre (equates to 25 heads per square metre per year) over 6 croppings. However industry specialists estimate actual yields for fancy hydroponic lettuce are closer to 9kg per square metre, or 45 heads per square metre per year spread over 6 croppings. The industry estimates of expected yield are used in this analysis. This difference in yields is largely accounted for by the difference between the area of lettuce sown as recorded by the ABS and the actual area harvested by growers, which is reduced by the area of crops damaged or abandoned.
3. Significant pests in lettuce Information about pests in lettuce in Australia and their management can be obtained from a number of sources including McDougall and Creek (2003) and various NSW DPI PrimeFacts and industry notes. Insect pests and diseases reduce both the yield and quality of lettuce. Most insect pests of lettuce are common pests of other vegetable and field crops (PrimeFact 154, 2006).
3.1. Lettuce insect pests Pest insects either physically damage the plants or transmit diseases. Significant insect pests of lettuce have historically included: Heliothis caterpillars, cutworms, thrips and a number of aphid species. Helicoverpa (Heliothis) species are by far the most serious insect pests found attacking head lettuce grown in fields throughout Australia. The most problematic species is Helicoverpa armigera (Tobacco Budworm) which has developed resistance to the key insecticide groups used for its control. Inland in the eastern States, H. armigera is most commonly a problem over the summer and autumn months while another species of Heliothis, H. punctigera (Native Budworm), is more commonly a problem in spring. In the coastal regions of the eastern States crop damage from Heliothis is most severe during the spring growing season. Insects such as thrips and aphids are the next most significant pests affecting head lettuce grown in fields. As recently as early 2006, a significant new pest emerged as a threat to lettuce production in Australia. The currant lettuce aphid (CLA), Nasonovia ribis‐nigri was first detected in Tasmania in 2004 and is believed to have spread from New Zealand by wind. CLA is a potentially devastating pest for the lettuce industry with the aphid preferring to be
Page 169

Appendix 6 : Page 7
sheltered within the lettuce head and hence difficult to reach with foliar insecticides. CLA contaminates the lettuce to such a degree that it cannot be sold. Western flower thrips, Frankliniella occidentalis (WFT), are the major pest problem for fancy hydroponic lettuce production as they are an important vector of tomato spotted wilt virus (TSWV). Tomato thrips, Frankliniella schultzei and Onion thrips, Thrips tabaci are also vectors of this disease, however many of the insecticides that are effective on these thrips are not effective on WFT as it is highly resistant to most insecticides. Rutherglen bug is a contamination pest. Although it is generally a minor pest, it was a common problem when surrounding vegetation was very dry during extended drought conditions in the first decade of the 2000s. A range of other aphids and caterpillars can also be a problem in lettuce.
3.2. Lettuce diseases Plant diseases are either fungal, bacterial or viral. Fungal diseases affecting lettuce include: downy mildew, sclerotinia, grey mould, anthracnose and septoria spot. New downy mildew strains develop each season and some establish for multiple seasons. Current available lettuce varieties have genetic resistance to as many as 27 downy mildew strains. Fungal diseases spread with free water, due to rainy conditions or excess irrigation, and most are also transmitted via crop debris so post‐harvest crop destruction and rotations are important. Bacterial diseases of lettuce include: leaf spot, varnish spot and soft rot and are spread via water splash and mechanical transmission. Varnish spot is seen sporadically in head lettuce, usually in conditions in which there is a large variance between day and night temperatures leading to the lettuce ‘sweating’ within the head. Avoiding injury to plants and refraining from moving through the crop when the lettuce foliage is wet can reduce spread of bacterial diseases. Viruses affecting lettuce include: lettuce necrotic yellows virus, big vein virus, tomato spotted wilt virus and lettuce mosaic virus; each vectored by different organisms. Lettuce necrotic yellows virus is transmitted by green sowthistle aphids, Hyperomyzus lactucae. The aphids do not survive on lettuce so the control of sowthistle weeds in and around fields is critical for managing lettuce necrotic yellows virus since viruses cannot be cured. Big vein virus is transmitted by a fungus which needs free water to move. Some varieties are more tolerant than others and cool wet conditions favour this virus. Tomato spotted wilt virus is vectored by some thrips species: Onion thrips, Thrips tabaci, Tomato thrips, Frankliniella schultzei and Western flower thrips, F. occidentalis. Weed management to reduce sources of the thrips and of the virus is a critical management practice. Finally, lettuce mosaic virus is vectored by some aphids: Green peach aphid, Myzus persicae and probably potato aphid, Macrosiphum euphorbiae. Having virus‐free seedlings is a critical first step to virus management. Managing weeds in and around crops, monitoring and managing vectors helps and roguing or removing lettuce plants showing virus symptoms can reduce spread. Diseases in lettuce typically cause production losses of around 10% for affected crops of both field grown head lettuce and hydroponic fancy lettuce (McDougall et al., 2002).
Page 170

Appendix 6 : Page 8
4. Integrated pest management in lettuce Decisions about pest control strategies are complex because of the mobility of pests and their ability to respond to control strategies. Many control strategies, particularly those of a chemical nature, have adverse impacts, sometimes distant in time, on non‐target species and non‐target sites. These non‐target impacts, sometimes referred to as externalities, come in many forms. Externalities include the loss of natural enemies of target species, secondary pest outbreaks, and the emergence of resistant pest strains. Externalities also include health risks to farm labour and the consumers of farm produce, as well as risks to environmental resources such as air and water. In the decades immediately following the development of synthetic pesticides, lettuce growers developed almost total reliance on these chemicals for pest control. Right from these early years there were spillover impacts of consequence to human and environmental health, although not all of these were immediately recognised or thought to be significant at the time. On the farm, however, pests began to develop resistance to the chemicals used for their control requiring ever more chemical applications and the search for alternative chemicals – a pesticide treadmill. Much of the early research into IPM was conducted within the University of California (UC) system. The key elements of IPM programs seem to have been first brought together in a classic paper by Stern et al. (1959). Stern et al. (1959) discussed the management of arthropod pests and recognised that pests had to be managed in ways profitable to farmers. Their paper began with a discussion of why arthropods had increased in significance as pests of agriculture. They identified the recent development of agriculture and the sometimes indiscriminate use of pesticides as the main causes for the increased problems with arthropods. They spoke in terms of ‘general equilibrium’ populations of pests and suggested that, in general, pesticides provided only a temporary lowering of the equilibrium population, whereas biological controls held the potential of a permanent lowering. The objective of pest management was to lower the pest population below an economic threshold, but the problem was complex because the threshold was not fixed, varying with economic, biological and physical parameters. They called for the integration of biological and chemical control strategies based on greater knowledge of the ecosystem, science‐based monitoring and prediction of pest populations, the augmentation of natural enemies, and the use of selective insecticides. All of these have become important components of IPM programs. A component they did not foresee was the use of gene technology, although they did talk about traditional breeding for resistance. Initially very few pesticides were registered for use in lettuce, but the few pesticides available were highly successful at controlling the major pests and diseases. In the 1980s and 1990s Heliothis management relied heavily on insecticides classed as synthetic pyrethroids (SPs), organophosphates (OPs) and carbamates as well as one organochlorine (OC) for control, with most growers routinely using these insecticides whether caterpillar pests were present or not. As the key caterpillar pest H. armigera developed resistance to SP and OP insecticides, control became less effective. The insecticides available for Heliothis control
Page 171

Appendix 6 : Page 9
included: methomyl (S7, dangerous poison2), endosulfan (S7), diazinon (S6, poison), synthetic pyrethroids (S6) and carbaryl (S6). Sucking insect pests were generally controlled by dimethoate (S6) and endosulfan. A typical pest management regime for lettuce growers in this era would involve the use of hard or broad‐spectrum insecticides such as Lannate®, Fastac®, Endosulfan and Dimethoate®. Fungicides such as Sumisclex® (S7) and Rovral® (S5, caution) were used to control sclerotinia, and Ridomil® (S6), mancozeb (S5) and copper oxychloride (S6) were used for downy mildew. Prior to research into strategies for IPM, and due to the low tolerance by consumers of insect or disease damage, growers largely used pesticides in a preventative manner. All but a few growers were spraying on a routine calendar basis with some modification depending on weather conditions or casual observations in the crop. In autumn most growers sprayed for insects every 7‐10 days and in spring every 7‐21 days. Few growers could identify their key pests, and even fewer knew what other insects or diseases could help manage these pests (McDougall et al., 2002). The majority of field grown head lettuce growers in Australia applied pesticides using a conventional boom sprayer, which alone does not provide good coverage of the chemical over the whole plant (McDougall et al., 2002). Most growers did not calibrate their spray equipment regularly. Emerging pesticide resistance problems in the 1990s eventually required solutions including an IPM component. Initial recommendations forming an IPM program for the control of pests and diseases in lettuce were developed by 1999. Elements of this research program included: studying the life cycle of pests and diseases and their predators; gaining an understanding of the impact of pesticides and other management technologies on pests, diseases and predators; and the development of monitoring tools to identify threshold pest populations. The aim was to develop IPM strategies that were profitable for farmers to use with fewer environmental and human health risks. Soft or narrow spectrum insecticides such as Success® (spinosad, S5) and Avatar® (indoxacarb, S6) and the biological insecticide Gemstar® (Nuclear Polyhedrosis Virus, NPV, unscheduled – very low toxicity) were registered for use in controlling Heliothis. Success® was registered for use in lettuce in spring 1999. In 2001 Avatar® and in 2002 Gemstar® were also registered for use in lettuce. In 1998 a permit for the use of a biological control, Bacillus thuringiensis (Bt, unscheduled – very low toxicity) for Heliothis control was granted. These insecticides are thought to be less harmful to beneficial insects than other broad‐spectrum insecticides. The elements of an IPM program for control of pests and diseases in field grown head lettuce include: adoption of cultural practices (monitoring and recording, spray management and timing and improved knowledge about pests and diseases and their life cycles); weed management; post‐harvest crop destruction; optimal irrigation to reduce leaf wetness; and use of soft pesticides and biological controls (see Table 2).
2 Agricultural chemicals are given codes on the poison schedule to indicate relative toxicity to humans. The most toxic = Highly toxic = S7; Moderately toxic = S6; Slightly toxic = S5; very low toxicity = unscheduled.
Page 172

Appendix 6 : Page 10
Insecticide use in lettuce has declined significantly since recommendations regarding IPM strategies were released. Figure 1 shows that the estimated amount of active ingredient required per hectare for Heliothis control in an inland field grown head lettuce production system in autumn fell by over 80%, from around 2,450 g/ha active ingredient for a typical non‐IPM grower in the late 1990s to around 435 g/ha active ingredient for a grower adopting a suite of IPM practices and pest management controls. The environmental and human health impacts of any chemicals and biological controls used in an IPM system are likely to be lower due to the active ingredients being more pest specific, as opposed to broad‐spectrum chemicals. Success® acts on the nervous system of the target insect; has low toxicity to predatory beetles and other beneficial insects and humans; and it is rapidly broken down in soil and water leaving no toxic residues (McDougall et al., 2002). Avatar® is ‘soft’ on aquatic species, has low mammalian toxicity and has little impact on beneficial insects or mites. Bt produces exotoxins which are ingested by the target pest as they feed on the crop, and exhibits little or no toxicity to beneficial terrestrial invertebrates, birds, mammals or aquatic organisms. Gemstar® and Vivus®, the two currently registered NPVs, attack only Heliothis caterpillars, do not affect beneficial invertebrates or vertebrates and leave no toxic residues (McDougall et al., 2002).
Figure 1 : Estimated active ingredient (g/ha) for Heliothis control, field lettuce in the Hay region of NSW
0
500
1000
1500
2000
2500
3000
Non-IPM IPM
activ
e in
gred
ient
(g/h
a)
Fastac Endosulfan Lannate Success Avatar
Page 173

Appendix 6 : Page 11
Table 2 : Key Lettuce Diseases and Insect Pests with a Summary of Relevant Management Information and Options
Cultural practices Chemical practices
Pest name Priority Damage/Symptoms Site found Transmission Alternative hosts
Sani
tatio
n
Tol
eran
t or
Res
ista
nt
vari
etie
s W
eath
er
cond
ition
s
Rot
atio
ns
Irri
gatio
n
Nat
ural
ene
mie
s
Prot
ecta
nt
Che
mic
al
Era
dica
nt
Che
mic
al
Pest
icid
e re
sist
ance
issu
es
Botrytis rot = Grey mould Botrytis cinerea Moderate
Lower leaves wilt then whole plant dies. Grey fungal growth can be seen often at base of plant or on infected leaves.
Lower leaves initially.
soil sclerotia, fungal hyphae in infected crop debris, mechanical injury
wide host range
Downy mildew Bremia lactucae Mod -Major
Light green patches which turn yellow then brown. White fluffy growth on underside of leaves.
leaves
spores in crop debris or from hosts, water splash, seed
Prickly lettuce (Lactuca serriola)
Sclerotinia rot Sclerotinia minor or Sclerotinia sclerotiorum
Major-mod
Brown lesions at or near soil line or on leaves. Lesions expand into soft watery decayed areas. Whole plant may collapse. Black sclerotia (irregularly shaped resting structures).
Leaves. Dark irregularly shaped Sclerotia found in soil and at base of infected plants. S. sclerotiorum often found near top of lettuce.
soil sclerotia and S. sclerotiorum can spread by wind-blown spores
wide host range (not cereals)
Septoria spot Septoria lactucae Minor-mod
Causes small yellow spots on leaves that are bordered by leaf veins. As dry out small dark round 'spots' (pycnidia) will appear in lesions.
Usually seen on older leaves first. Seed transmission or water splash disperses spores
Seed, air currents can spread in crop
Prickly lettuce (Lactuca serriola)
Tomato spotted wilt virus (TSWV)
Minor- field Major -hydroponic
Brown russetting on leaves. Often yellowing associated with russetting. Central leaves may be distorted.
leaves transmitted by thrips wide host range
Page 174

Appendix 6 : Page 12
Pest Common name Priority Damage/Symptoms Site found Transmission Alternative hosts
Sani
tatio
n
Tol
eran
t or
Res
ista
nt
vari
etie
s W
eath
er
cond
ition
s
Rot
atio
ns
Irri
gatio
n
Nat
ural
ene
mie
s
Bro
ad-s
pect
rum
ch
emis
try
Nar
row
sp
ectr
um
chem
istr
y
Pest
icid
e re
sist
ance
issu
es
Brown sowthistle aphid Uroleucon sonchi Major Contamination and sucking pest
Underside lower leaves, also colonize sowthistles heavily
Sowthistle
Currant lettuce aphid Nasonovia ribisnigri Major Contamination and sucking pest
Prefers to be hidden and often scattered within head lettuce or more shelted areas on fancy lettuce
Blackberry family, chicory, endive, nipplewort, hawksbeard, speedwell, artichoke, tobacco and petunia
Green peach aphid Myzus persicae Potato aphid Macrosiphum euphorbiae
Moderate Lettuce mosaic virus transmission & minor sucking damage
Underside lower leaves CMV, LMV, TuMV wide host range
not in lettuce
Green sowthistle aphid Hypermyzus lactucae Sporadic
Vector for Lettuce necrotic yellows virus, doesn't colonise lettuce
sowthistles LNYV Sowthistle
Rutherglen Bug Nysius vinitor Moderate Contamination pest, can be a
sucking pest of seedlings Leaves, often down near base. wide host range
Cutworms Agrotis spp. Moderate Chewing Leaves, will cut-off seedlings at base wide host range
Heliothis Helicoverpa armigera, Helicoverpa punctigera
Mod - major Chewing Leaves wide host range
Looper caterpillars Chrysodeixis spp. Minor-mod Chewing Leaves wide host range
Onion thrips Thrips tabaci Tomato thrips Frankliniella schultzei
Moderate vector of TSWV, sucking damage to seedlings
Leaves, often down near base. TSWV wide host range
not in lettuce
Western Flower Thrips Frankliniella occidentalis
Major (hydro) Moderate (field)
vector of TSWV, sucking damage to seedlings
Leaves, often down near base. TSWV wide host range
Page 175

Appendix 6 : Page 13
5. Key features of IPM
5.1. Features of an IPM strategy for field grown head lettuce • Knowledge of key insect pests and diseases, their life cycles, their natural predators
(beneficials) and recommended management options
• Prevention of insect pests and diseases through:
o choosing resistant or tolerant varieties;
o using crop rotations for insect pest and disease breaks;
o planting only insect pest‐free and disease‐free transplants (if not direct seeding);
o effective water and nutrient planning and minimising leaf wetness; and
o implementing field hygiene practices such as roguing diseased plants, post‐harvest crop clean‐up, weed management and planning crop operations to minimise disease spread.
• Observation of presence of pests and diseases in crops through routine crop monitoring and use of pest monitoring techniques such as pheromone traps and sticky traps.
• Intervention for the timely control of insect pests and diseases through mechanical and biological controls and through the use of soft chemicals ensuring:
o Effective timing of sprays;
o Use of effective spray equipment to achieve excellent spray coverage; and
o Correct calibration of spray equipment.
• Maintaining crop records and recording the success or otherwise of insect pest and disease management practices used.
5.2. Features of an IPM strategy for hydroponic fancy lettuce An IPM strategy for hydroponic fancy lettuce includes the practices listed above for field grown head lettuce plus the following additional IPM practices relevant to hydroponic production systems:
• Sanitation
o Clean out channels and nutrient supply systems between crops when diseases have affected previous plantings.
o Check seedlings when they arrive on the farm for signs of disease and discard any showing disease symptoms.
o Ensure plants and seedlings never touch the ground.
o Rogue crops 1‐2 times per week. Any diseased plants should be bagged and removed to an appropriate off‐site location.
o Bag all harvest trimmings and remove to an off‐site location.
• Weed management
o Control weeds under tables.
Page 176

Appendix 6 : Page 14
• Screening
o Establish suitable plant or artificial wind breaks to prevent blow‐in of pests from surrounding areas.
• Three spray treatment for WFT
o Apply three consecutive sprays with an appropriate soft insecticide to gain effective control of WFT at each stage of their life cycle (adults and emerging nymphs).
6. Methods and assumptions
6.1. Methodology Returns to an enterprise in the short term (one production cycle or one year) are measured through a gross margin budget. Calculation of a gross margin involves subtracting costs for production inputs such as fertiliser, planting, pest and disease control, casual labour, harvesting, marketing, water etc from crop gross income (crop yield multiplied by price). Crop yield is directly influenced by insect pest and disease damage which itself is a function of insect pest and disease control. For this analysis, gross margin budgets were developed for the following three lettuce production systems:
• field head lettuce production in inland NSW (Riverina);
• field head lettuce production in coastal NSW (Sydney Basin); and
• hydroponic fancy lettuce production in coastal NSW (Sydney Basin). Using the gross margin budgets, a partial or marginal analysis was conducted. A partial or marginal analysis examines the elements of the gross margin budget which change as a result of adoption of IPM practices with all other elements remaining the same. Partial budgeting is used to assess the net benefits from adopting IPM practices in each production system compared to a non‐IPM scenario in each production system. To determine the net benefits of different technologies the gross benefit and the total costs that vary in switching technologies must be calculated from the estimated gross margin budgets. The gross benefit is the yield expected with each technology adjusted by the estimated level of crop damage from pests and diseases, multiplied by the farmgate price (the farmgate price is the price that the producer receives less any marketing costs). The total costs that vary for each technology is the sum of ONLY those costs that are expected to change by switching from a non‐IPM to an IPM production system. If adopting a technology results in cost savings then the amount saved will be accounted for in the marginal analysis as a benefit of adopting the technology. Where additional costs are incurred the additional amount will detract from any increase in income resulting from adoption of the technology. However, it is the net benefit that is important in the comparative analysis.
Page 177

Appendix 6 : Page 15
The net benefit for a given technology is obtained by subtracting the total costs that vary from the gross benefit. It should be pointed out that the net benefit is not the same as net profit, as it only takes into account those costs that vary by switching from one technology to another. The net benefit from each technology is then compared to calculate the marginal return. In this analysis the net benefit from adoption of IPM practices is compared to the net benefit from a scenario which is reflective of production practices typical of non‐IPM lettuce production. Marginal return in this analysis is referred to as the incremental net benefit and is expressed in dollar terms and as a percentage of the baseline (non‐IPM) scenario net benefit.
6.2. Period of analysis Analysis of the benefits from IPM adoption in each production system is undertaken over a one year period. For field grown head lettuce production this relates to two crops per year; one crop grown over summer/autumn and one grown in late winter/spring. For fancy lettuce grown hydroponically it is assumed that six crops are grown per year.
6.3. Data sources Data for this analysis was provided by NSW DPI horticulturalists, leading IPM researchers, industry specialists and key producers. Average crop production details and typical insecticide or fungicide application recommendations were based on data collected from between 2‐4 years for each production system. Data sources included regular crop monitoring data, chemical records and in some cases gross margins collected as part of R&D projects or extension activities. In addition, discussions were held with IPM consultants and growers to obtain information about average practices.
Page 178

Appendix 6 : Page 16
7. Benefits from adoption of IPM practices in lettuce production Key financial factors There are two main areas that determine the financial benefit for lettuce producers from adoption of IPM practices. These are:
• a reduction in the levels of crop damage from pests and diseases, and
• changes in pest and disease control costs. Illustrating the financial benefits from individual IPM practices is difficult. In this analysis we have based estimates of yields and production costs for each production system on information provided by NSW DPI horticulturalists, leading IPM researchers, industry specialists and key producers. Individual producer results will vary significantly between and within regions, farms and seasons. Key environmental benefits The Australian lettuce industry operates in an environment which exerts conflicting pressures on lettuce growers. On one hand there is considerable market pressure for insect‐free (pest or beneficial) cheap produce in an environment where pesticide resistance problems also threaten industry profitability. On the other hand there is pressure for the lettuce industry to use technologies with lower risk to human and environmental health. The dimensions of human health include the risks from pesticide use to farm workers and families and the risks to consumers from chemical residues. Environmental risks include threats to biodiversity and on‐ and off‐site soil and water contamination. To these ends, the lettuce industry is moving towards the adoption of growing practices which while still being profitable, use fewer pesticides and leave the minimum possible chemical residues on lettuce. On‐farm benefits from adoption of IPM practices include:
• reduced usage of broad‐spectrum insecticides which can lead to an increase in farm biodiversity; and
• reduced exposure of farm owners and workers to harmful effects of broad‐spectrum insecticides.
On the whole, the more selective insecticides have fewer harmful effects on mammals. The newer chemistries generally require less active ingredient to be applied, hence the total quantity of insecticide applied is greatly reduced compared to situations in which older chemistry is used. Broader community environmental outcomes from lettuce grower adoption of IPM practices include:
Page 179

Appendix 6 : Page 17
• reduced spray drift, as improved crop management practices mean more targeted spray applications and allow use of beneficial insects, therefore resulting in the possibility of less frequent chemical sprays; and
• reduced risk of chemicals moving off‐site as a result of lower chemical application. Although this risk is relatively small, the perception of lettuce production as an environmentally friendly activity is very important.
These two points are particularly important in the peri‐urban areas such as the Sydney basin where urban communities can be in close proximity to lettuce production. There is also opportunity for increased regional biodiversity associated with replacement of broad‐spectrum chemicals with more selective chemicals. Key social benefits An integral component of IPM is the social, networking and education activities supporting lettuce growers in their understanding and adoption of IPM systems. Key social benefits of lettuce IPM adoption are:
• the development of social support networks in the industry,
• greater access to information,
• a more educated industry with greater access to technical and professional assistance and
• improved communication in the industry between government, consultants and lettuce producers.
This build‐up of social capital gives farm families and communities greater capacity to adapt to the range of economic and social changes confronting them. Social benefits also arise from the improved prosperity of the lettuce industry as a result of the improvements to marketable yield, which in some instances (eg in the case of hydroponic fancy lettuce production) are combined with reductions in cost of production associated with adopting IPM practices.
7.1. Calculating financial benefits from adopting IPM practices in field grown head lettuce
The baseline (non‐IPM) production system used in the analysis for inland field grown head lettuce and coastal field grown head lettuce is outlined in Table 3. This baseline (non‐IPM) pest and disease control program was determined through consultation with industry specialists, NSW DPI horticulturalists and researchers and from budgets and grower records. Features of a typical non‐IPM field grown head lettuce production insect pest and disease control program include:
• Pesticides are largely used in a preventative manner.
Page 180

Appendix 6 : Page 18
• Growers spray on a routine calendar basis with some modification depending on weather conditions or casual observations in the crop. In autumn most growers spray for insects every 7‐10 days and in spring every 7‐21 days.
• Few growers are able to identify their key pests, and few know what other insects or diseases could help manage these pests.
• Non‐IPM lettuce growers may apply pesticides using a conventional boom sprayer, which does not provide good coverage of the chemical over the whole plant and they may not calibrate their spray equipment regularly.
Table 3 : Baseline (non‐IPM) lettuce production systems, field grown head lettuce
Inland field grown head lettuce
Coastal field grown head lettuce
Income Summer/
Autumn Winter/ Spring
Summer/ Autumn
Winter/Spring
Damage from pests and diseases % 14.5% 0% 0% 11.75% Baseline yield Cartons/ha 1,881 2,200 2,200 1,941 Gross benefit (A) $ $23,513 $27,500 $27,500 $24,269 Insect pest and disease control production costs
Spray operations Number of spray applications No. 8 4 4 8 Cost of spray applications $/ha $166 $83 $83 $166
Chemicals* Poison Schedule^
Rate/ha $/L No. No. No. No. Alpha‐cypermethrin (Fastac Duo) S6 0.4 $8.65 3 $10.4 1 $3.46 1 $3.46 3 $10.4 Methamidophos (Monitor) S7 2.1 $44.00 1 $92.4 1 $92.4 1 $92.4 1 $92.4 Dimethoate (Rogor) S6 0.8 $8.75 1 $7.0 1 $7.0 Spinosad (Success 2) S5 0.8 $363.6 1 $290.9 1 $290.9 Mancozeb (Dithane) S5 2.2 $8.14 3 $53.7 2 $35.8 2 $35.8 3 $53.7 Iprodione (Rovral) S5 0.8 $24.50 2 $39.3 1 $19.6 1 $19.6 2 $39.3 Mancozeb/Metalaxyl (Ridomil +) S6 2.5 $62.00 2 $310.0 1 $155.0 1 $155.0 2 $310.0
Cost of chemicals $/ha $804 $306 $306 $804 Total costs that vary (B) $/ha $969 $389 $389 $969 Net benefit (A) – (B) $/ha $22,543 $27,111 $27,111 $23,300 *Note: the choice of chemicals is typical for non‐IPM growers, but not representative of all non‐IPM growers or crops. The chemicals in the table are currently registered as of May 2011.
^Agricultural chemicals are given codes on the poison schedule to indicate relative toxicity to humans. The most toxic = Highly toxic = S7; Moderately toxic = S6; Slightly toxic = S5; very low toxicity = unscheduled (US). With adoption of IPM practices and principles enabling better understanding, more timely and effective management and targeted control of lettuce pests and diseases, field grown head lettuce producers in the inland and coastal regions of the eastern States experience a reduction in levels of crop damage. Adoption of IPM practices for lettuce production will lead to changes in the on‐farm cost of pest and disease control. Chemical application costs are reduced due to better crop monitoring. This results in more targeted, less frequent spray applications for those adopting IPM strategies. Whilst there are savings due to a reduced number of spray applications, the newer chemical and biological controls tend to be more expensive than the old chemicals. Consequently, use of new chemicals can lead to an increase in crop protection costs for the lettuce producer.
Page 181

Appendix 6 : Page 19
Key changes to the baseline scenario with adoption of an effective IPM field grown head lettuce production insect pest and disease control program include:
• Planting insect pest/disease resistant varieties appropriate to the production timeslot.
• Reduction in the percentage of crop affected by insect pest and disease damage.
• Routine crop monitoring by a crop scout or IPM consultant.
• Control of insect pests and diseases through timely mechanical and biological controls and through the use of soft chemicals, ensuring excellent spray coverage is achieved with the use of effective spray equipment.
• No broad‐spectrum insecticides or seedling drenches are used and different fungicides are used in rotation so that the same fungicide is not used twice in a row.
• Field hygiene practices are undertaken such as roguing diseased plants, post‐harvest crop clean‐up, weed management and planning crop operations to avoid spreading insect pests and diseases.
Table 4 : IPM lettuce production systems, field grown head lettuce
Inland field grown head lettuce
Coastal field grown head lettuce
Summer/ Autumn
Winter/ Spring
Summer/ Autumn
Winter/ Spring
Income Damage from pests and diseases
% 2% 0% 0% 2%
Baseline yield Cartons/ha 2156 2200 2200 2156 Gross benefit (A) $/ha $26,950 $27,500 $27,500 $26,950 Insect pest and disease control production costs
Crop scouting# $/ha $89 $89 $89 $89 Spray operations
Number of spray applications
No. 5 3 3 5
Cost of spray applications
$/ha $104 $62 $62 $104
Chemicals* Poison Schedule^
Rate/ha $/L No. No. No. No.
Spinosad (Success 2) S5 0.80 $363.6 2 $581.8 1 $290.9 1 $290.9 2 $581.8 Indoxacarb (Avatar) S6 0.17 $172.0 1 $29.2 1 $29.2 1 $29.2 1 $29.2 Dimethomorph (Acrobat) S5 0.36 $272.7 1 $98.2 1 $98.2 1 $98.2 1 $98.2 Iprodione (Rovral) S5 0.80 $24.5 1 $19.6 1 $19.6 1 $19.6 1 $19.6 NPV (Gemstar) US 0.75 $72.8 1 $54.6 1 $54.6 Bt (Xentari / DiPel ES) US 1.00 $56.0 1 $56.0 1 $56.0
Cost of chemicals $/ha $840 $438 $438 $840 Total costs that vary (B) $/ha $1,032 $589 $589 $1,032 Net benefit (A) – (B) $/ha $25,918 $26,911 $26,911 $25,918 # Based on an actual consultant’s cost *Note: the choice of chemicals is typical for IPM growers, but not representative of all IPM growers or crops. The chemicals in the table are currently registered as of May 2011.
^Agricultural chemicals are given codes on the poison schedule to indicate relative toxicity to humans. The most toxic = Highly toxic = S7; Moderately toxic = S6; Slightly toxic = S5; very low toxicity = unscheduled (US).
Page 182

Appendix 6 : Page 20
7.1.1. Incremental net benefit from IPM adoption in field grown head lettuce Table 5 shows the marginal analysis of benefits and costs from a change from a non‐IPM production system to an IPM production system for field grown head lettuce. When comparing scenarios, extra benefits from a change in crop protection practices can arise from extra income due to higher yields as a result of reduced crop damage, or from savings in avoided production costs. Production costs are saved if insect pest and disease control costs are lower and production costs may be higher in this analysis if insect pest and disease control costs are higher. The value of incremental production in each season for non‐IPM and IPM production systems is calculated from the net benefits calculated in Tables 3 and 4. The annual incremental net benefit is calculated from summing the net value of incremental production in each season. The incremental net benefit between the non‐IPM and IPM scenario for inland and coastal field grown head lettuce in each season is expressed in dollar and percentage terms in Table 5.
Table 5 : Analysis of incremental net benefit increase – IPM vs non‐IPM production of inland and coastal field grown head lettuce
Net benefit non‐IPM
(from Table 3)
Net benefit IPM
(from Table 4)
Net value incremental production (season)
Annual incremental net benefit increase
$/ha $/ha $/ha $/ha %
Inland field grown head lettuce
Summer/ Autumn $22,543.2 $25,918.0 $3,374.8
Winter/ Spring $27,110.9 $26,910.9 ‐$200.0 $3,174.9 6.39
Coastal field grown head lettuce Summer/ Autumn $27,110.9 $26,910.9 ‐$200.0
Winter/ Spring $23,299.5 $25,918.0 $2,618.6 $2,418.6 4.80
From this analysis it can be seen that moving from a non‐IPM production system to an IPM production system for both inland and coastal head lettuce provides a net benefit increase in both cases. For inland field grown head lettuce, adoption of IPM practices results in an incremental net benefit of $3,175 per hectare due to financial benefits in the summer/autumn production period. The increase in net benefit from IPM adoption in inland field grown head lettuce over the one year period of the analysis equates to 6.4%. In a coastal head lettuce system net benefits of $2,419 per hectare arise from adoption of IPM practices due to financial benefits in the winter/spring production period. Over a one year period there is a 4.8% increase in net benefits.
Page 183

Appendix 6 : Page 21
This indicates that adoption of IPM practices would result in financial benefits to inland and coastal head lettuce producers within the one year timeframe of the marginal analysis. The sensitivity of the results of the marginal analysis to changes in the level of damage from insect pests and diseases in the IPM case was investigated. The sensitivity of the marginal analysis results to changes in crop protection costs (for scouting, spraying and chemicals) in the IPM case used in the analysis was also calculated. Using a range of damage percentages in the IPM field lettuce scenarios from no damage to 10% damage (yield reduction) from insect pests and diseases, as well as a range of crop protection costs varying from ‐25% to +50% of the estimated crop protection costs in Table 4, the impact on the annual incremental net benefit from adoption of IPM in inland field grown head lettuce can be seen in the parametric budget in Table 6a.
Table 6a : Parametric budget (% damage from insect pests and diseases and crop protection costs in the IPM case) for inland field grown lettuce
Damage from insect pests and diseases (% yield loss) for IPM inland field grown head lettuce
(summer/autumn)
0% No change 5% 10% ‐25% $3,982.8 $3,432.8 $2,607.8 $1,232.8
No change $3,724.9 $3,174.9 $2,349.9 $974.9 +25% $3,466.9 $2,916.9 $2,091.9 $716.9
Change in
crop
protectio
n costs
+50% $3,208.9 $2,658.9 $1,833.9 $458.9
It can be seen in the analysis that the net financial benefit remains positive in all cases for inland field grown lettuce. Table 6b below shows the sensitivity of the annual incremental net benefit from adoption of IPM in coastal field grown head lettuce using the same parameters as outlined above. The shaded cells represent those scenarios showing a negative marginal return. It can be seen in the analysis that a negative return would be experienced when damage from insect pests and diseases is increased to 10% and crop protection costs are increased by 25% or more.
Table 6b : Parametric budget (% damage from insect pests and diseases and crop protection costs in the IPM case) for coastal field grown lettuce
Damage from insect pests and diseases (% yield loss) for IPM coastal field grown head lettuce
(winter/spring)
0% No change 5% 10% ‐25% $3,226.6 $2,676.6 $1,851.6 $476.6
No change $2,968.6 $2,418.6 $1,593.6 $218.6 +25% $2,710.6 $2,160.6 $1,335.6 ‐$39.4
Change in
crop
protectio
n costs
+50% $2,452.6 $1,902.6 $1,077.6 ‐$297.4
Page 184

Appendix 6 : Page 22
7.2. Calculating financial benefits from adopting IPM practices in hydroponic fancy lettuce
The baseline (non‐IPM) production system used in the analysis for hydroponic fancy lettuce is outlined in Table 7. The chemicals used in this example are shown in Table 9. This baseline (non‐IPM) insect pest and disease control program was determined through consultation with industry specialists, NSW DPI horticulturalists and researchers, and from budgets and grower records. Features of a typical non‐IPM hydroponic fancy lettuce production insect pest and disease control program include:
• Pesticides are largely used in a preventative manner.
• Growers spray on a routine calendar basis with some modification depending on climate conditions or casual observations in the crop. In spring and summer most growers spray for insects every 2 to 7 days.
• Few growers are able to identify their key pests, and few know what other insects or diseases could help manage these pests.
• Growers treat diseases when they are noticed. In periods of moist conditions growers use fungicides weekly.
Table 7 : Baseline (non‐IPM) lettuce production systems, hydroponic fancy lettuce
Hydroponic fancy lettuce Crop 1
(spring) Crop 2 (early
summer)
Crop 3 (late
summer /autumn)
Crop 4 (autumn)
Crop 5 (autumn/ early winter)
Crop 6 (late
winter/ spring)
Income Damage from insect pests and diseases
% 5 30 40 5 10 10
Baseline yield kg/1,000m2 1,425 1,050 900 1,425 1,350 1,350 Gross benefit (A) $/1,000 m2 $7,125 $5,250 $4,500 $7,125 $6,750 $6,750 Insect pest and disease control production costs
Spray operations Number of spray applications No. 8 13 13 8 8 8 Cost of spray applications $/1,000 m2 $220 $358 $358 $220 $220 $220
Chemicals Cost of chemicals $/1,000 m2 $110 $147 $147 $110 $110 $110 Total costs that vary (B)
$/1,000 m2 $330 $504 $504 $330 $330 $330
Net benefit (A) – (B) $/1,000 m2 $6,795 $4,746 $3,996 $6,795 $6,420 $6,420
With adoption of IPM practices and principles enabling better understanding, more timely and effective management and targeted control of lettuce insect pests and diseases, hydroponic fancy lettuce producers can experience a reduction in levels of crop damage.
Page 185

Appendix 6 : Page 23
Key changes to the baseline scenario with adoption of an effective IPM hydroponic fancy lettuce production insect pest and disease control program include:
• Reduction in the percentage of crop affected by insect pest and disease damage.
• Use of insect pest/disease resistant varieties.
• Routine crop monitoring by a crop scout or IPM consultant.
• Control of insect pests and diseases through timely mechanical and biological controls and through the use of soft chemicals using effective spray equipment for targeted application (including the 3‐spray treatment recommendation for WFT).
• No broad‐spectrum insecticides or seedling drenches are used and different fungicides are used in rotation so that the same fungicide is not used twice in a row.
• Undertake sanitation practices such as:
o cleaning out channels and nutrient supply systems between crops when diseases are present in the system;
o checking seedlings when they arrive on the farm for signs of disease and discarding any showing disease symptoms;
o ensuring plants and seedlings never touch the ground;
o roguing crops 1‐2 times per week and bagging any diseased plants and removing them to an appropriate off‐site location; and
o bagging all harvest trimmings and removing them to an off‐site location.
• Weed management by controlling weeds under tables.
• Screening by establishing suitable plant or artificial wind breaks to prevent blow‐in of pests from surrounding areas.
Adoption of IPM practices for lettuce production will lead to changes in the on‐farm cost of insect pest and disease control. It is estimated that adoption of the above practices will have the following impacts:
• An increase in crop yield due to reduced damage from better management of insect pests and diseases.
• A reduction in the number of spray operations used – this will vary for each crop as the seasons vary and insect pest pressure changes.
• A change in insect pest and disease control costs from use of more targeted and effective chemical, biological and mechanical controls, some of which may be more expensive than non‐IPM options.
• An increase in costs associated with crop scouting and IPM advisor consultancy fees.
• Some practices may involve an increase in labour requirements, for example cleaning channels and water and nutrient supply systems.
• Additional weed control costs. Table 8 below shows the estimated production, insect pest and disease damage levels, gross benefit, and insect pest and disease control costs that vary for an IPM hydroponic fancy lettuce production system. Table 9 shows the chemicals, rates, number of applications and costs used for both the IPM and non‐IPM scenarios.
Page 186

Appendix 6 : Page 24
Table 8 : IPM lettuce production systems, hydroponic fancy lettuce
Hydroponic fancy lettuce Crop 1
(spring) Crop 2 (early
summer)
Crop 3 (late
summer /autumn)
Crop 4 (autumn)
Crop 5 (autumn/ early winter)
Crop 6 (late
winter/ spring)
Income Damage from insect pests and diseases
% 2 5 8 5 2 2
Baseline yield kg/1,000m2 1,470 1,425 1,380 1,425 1,470 1,470 Gross benefit(A) $/1,000m2 $7,350 $7,125 $6,900 $7,125 $7,350 $7,350 Insect pest and disease control production costs
Cultural control practices Additional labour sanitation/disposal $/1,000 m2 $60 $60 $60 $60 $60 $60 Crop scout/IPM consultant# $/1,000 m2 $67 $67 $67 $67 $67 $33
Spray operations Number of spray applications
No. 3 5 5 3 3 3
Cost of spray applications $/1,000 m2 $83 $138 $138 $83 $83 $83
Chemicals Cost of chemicals $/1,000 m2 $50 $108 $108 $50 $50 $50 Total costs that vary (B)
$/1,000 m2 $258 $371 $371 $258 $258 $225
Net benefit (A) – (B) $/1,000 m2 $7,092 $6,754 $6,529 $6,867 $7,092 $7,125
# Based on an actual consultant’s cost
Table 9 : Chemicals* used in the baseline (non‐IPM) and IPM hydroponic fancy lettuce systems
Crops 1, 4, 5 & 6 Crops 2 & 3 Conventional IPM Conventional IPM
Chemical* Poison Schedule^ Rate/1000m2 $/L(kg) No. $/1000m2 No. $/1000m2No. $/1000m2 No. $/1000m2
Mancozeb/Metalaxyl (Ridomil) S6 0.25 $62.0 1 $15.5 1 $15.5 1 $15.5 1 $15.5 Mancozeb (Dithane) S5 0.22 $8.1 1 $1.8 2 $3.6 Spinosad (Success) S5 0.08 $363.6 3 $87.3 1 $29.1 4 $116.4 3 $87.3 Alpha‐cypermethrin (Fastac) S6 0.04 $8.7 2 $0.7 4 $1.4 Pirimicarb (Pirimor) S6 0.10 $49.4 1 $4.9 1 $4.9 2 $9.9 1 $4.9 Chemical cost $110.2 $49.5 $146.7 $107.7 Total cost of chemicals ‐ conventional = $734.2 Total cost of chemicals ‐ IPM = $413.5
*Note: the choice of chemicals is typical for non‐IPM or IPM growers, but not representative of all non‐IPM or IPM growers or crops. The chemicals in the table are currently registered as of May 2011.
^Agricultural chemicals are given codes on the poison schedule to indicate relative toxicity to humans. The most toxic = Highly toxic = S7; Moderately toxic = S6; Slightly toxic = S5; very low toxicity = unscheduled (US).
Page 187

Appendix 6 : Page 25
7.2.1. Incremental net benefit from IPM adoption in hydroponic fancy lettuce Table 10 shows the marginal analysis of benefits and costs from a change from a non‐IPM production system to an IPM production system for hydroponic fancy lettuce. The increase in the incremental net benefit is expressed in dollar and percentage terms. From this analysis it can be seen that moving from a non‐IPM production system to an IPM production system for hydroponic fancy lettuce provides a net benefit increase. This indicates that adoption of IPM practices by the hydroponic fancy lettuce producer would result in an increase in net benefit of $6,287 per 1000m2 or 17.9% in the one year timeframe of the marginal analysis. Table 10 : Analysis of incremental net benefit increase – IPM vs non‐IPM production of
hydroponic fancy lettuce
Margin non‐IPM
Margin IPM
Net value incremental production
(per cropping) Annual Incremental net benefit increase
$/1000m2 $/1000m2 $/1000m2 $/1000m2 % Crop 1 $6,795 $7,092 $297 Crop 2 $4,746 $6,754 $2,008 Crop 3 $3,996 $6,529 $2,533 Crop 4 $6,795 $6,867 $72 Crop 5 $6,420 $7,092 $672 Crop 6 $6,420 $7,125 $705 $6,287 17.9% The sensitivity of the results of the marginal analysis to changes in the level of damage from insect pests and diseases in the IPM case was also investigated for hydroponic lettuce. Similarly, the sensitivity of the marginal analysis results to changes in crop protection costs (for scouting, spraying and chemicals) in the IPM case used in the analysis was also calculated. The levels of damage from insect pests and diseases in the IPM case shown in Table 8 were varied by a range of common factors between 0.5 and 2. Crop protection costs in Table 8 were varied in the range of ‐25% of estimate to +50% of estimate. The impact on the annual incremental net benefit from adoption of IPM in hydroponic fancy lettuce can be seen in the parametric budget in Table 11.
Page 188

Appendix 6 : Page 26
Table 11 : Parametric budget (% damage from insect pests and diseases and crop protection costs in the IPM case) for hydroponic fancy lettuce
Damage from insect pests and diseases (% yield impact) for IPM hydroponic fancy lettuce
x 0.5 No change x 1.5 x 2 ‐25% $7,291 $6,391 $5,491 $4,591
No change $7,187 $6,287 $5,387 $4,487 +25% $7,084 $6,184 $5,284 $4,384
Change in
crop
protectio
n costs
+50% $6,980 $6,080 $5,180 $4,280
It can be seen in the above table that even after doubling the Table 8 levels of damage from insect pests and diseases and increasing the Table 8 IPM crop protection costs by 50%, the net benefit of the marginal analysis between IPM and non‐IPM production in hydroponic fancy lettuce remains positive. This indicates a positive economic return and that the adoption of IPM in hydroponic fancy lettuce is economically feasible in the one year timeframe of the marginal analysis.
Acknowledgements We wish to thank the Hay lettuce growers, the NSW project team members involved in VG98048, VG01028 & VG05044 and the Sydney Basin grower collaborators; Rob Weppler and Andy Ryland, IPM consultants; NSW DPI District Horticulturists: Jeremy Badgery‐Parker, Leigh James and Tony Napier; and Alan Boulton.
References
Australian Bureau of Statistics, Agricultural Commodities, Australia, Catalogue 7121.0, Various issues, Canberra.
Evans, E. (2005), ‘Marginal Analysis: An Economic Procedure for Selecting Alternative Technologies/Practices’, IFAS Extension, FE565, University of Florida
Gittinger, J.P (1982), Economic Evaluation of Agricultural Projects, Second edition, World Bank.
Napier, T. (2004), ‘Field lettuce production’, Agfact H8.1.40, NSW Agriculture.
McDougall, S., Creek, A. (2003), Pests, beneficials, diseases and disorders in lettuce: field identification guide, NSW Agriculture
McDougall, S. (2006) Lettuce IPM, PrimeFact 154, NSW DPI
Mullen, J.D., Alston, J.M., Sumner, D.A., Kreith. M.T., Kuminoff, N.V., (2003), Returns to University of California Pest Management Research and Extension: Overview and Case Studies Emphasizing IPM’, ANR Publication 3482.
Orr, L.M., McDougall, S., and Mullen, J.D. (2008), An Evaluation of the Economic, Environmental and Social Impacts of NSW DPI Investments in IPM Research in Lettuce, Economic Research Report No 40, NSW Department of Primary Industries, Orange. Shaw, T. Lindhout, K. and McDougall, S. (2007), ‘Monitoring lettuce in Sydney Basin’, Final report VG05044, Further developing integrated pest management in lettuce’, NSW Department of Primary Industries
Page 189

Appendix 7 : Page 1
Appendix 7 Benchmarking Vegetable IPM Adoption: Business case for adoption of Integrated Pest Management (IPM) in lettuce
May 2011 This ‘business case’ for adoption of IPM in lettuce was prepared by Sandra McDougall and Leanne Orr, NSW Department of Primary Industries (NSW DPI) as part of the National Vegetable IPM Coordination project (VG09191).
Page 190

Appendix 7 : Page 2
Business case for adoption of Integrated Pest Management (IPM) in lettuce
The term Integrated Pest Management (IPM) was originally coined in relation to managing invertebrate pests (insects and mites) but IPM systems have now been developed to cover all other pest types including: diseases, weeds, nematodes and vertebrate pests. Integrated crop protection (ICP) might be a term less prone to misinterpretation. IPM is perhaps best thought of as a continual improvement strategy that moves away from a single pest management tactic (chemical) to a range of management options with increasing reliance on preventative practices as one moves along the IPM spectrum or ‘continuum’. The cost‐benefit analysis underlying this business case for IPM adoption is focused primarily on insect pest management and some aspects of disease management in lettuce – early steps along the IPM continuum. Adoption of IPM in lettuce for insect pests and diseases is economically beneficial. It is essential for managing insecticide and fungicide resistance; managing deregistration of older pesticides; minimising exposure of farm workers, consumers and the environment to pesticides; and reducing the risk of quality reduction due to insect pests and diseases.
Benefits from adoption of IPM practices in lettuce production Key financial factors
Income is increased due to reduced levels of crop damage from insect pests and diseases.
There are changes in pest and disease control costs for the following reasons: o A crop scout/consultant needs to be employed or a staff member needs to be
trained; o Production costs change due to adoption of cultural practices and the use of
targeted chemical controls; and o New, softer chemicals suitable for use in an IPM system are generally more
expensive than older broad‐spectrum chemicals.
Marginal analysis estimates that in an inland field grown head lettuce production system, adopting IPM can result in an annual incremental net benefit of $3,175 per hectare (a 6.4% increase) [Table 1c] and it remains positive with increases in damage to 10% and increases in crop protection costs (for scouting, spraying and chemicals) by as much as 50% [Table 1d].
Using marginal analysis an annual incremental net benefit of $2,419 per hectare (a 4.8% increase) is estimated to arise from adoption of IPM in a coastal field grown head lettuce production system [Table 1c] and it remains positive with an increase in damage to 5% plus an increase in crop protection costs by as much as 50%, but it is negative when damage increases to 10% and crop protection costs increase by 25% or more [Table 1e].
Marginal analysis shows an incremental net benefit of $6,287 or 17.9% per 1,000 m2
in a one year period from adoption of IPM in a hydroponic fancy lettuce production system [Table 2d] and it remains positive as damage levels increase by as much as a factor of 2 together with an increase in crop protection costs by as much as 50% [Table 2e].
Page 191

Appendix 7 : Page 3
Key environmental benefits On‐farm benefits from adoption of IPM practices include:
reduced usage of broad‐spectrum insecticides, which can lead to an increase in farm biodiversity; and
reduced exposure of farm owners and workers to pesticides and particularly to S7 and S6 pesticides1.
Broader community environmental outcomes from lettuce grower adoption of IPM practices include:
reduced spray drift, as improved crop management practices mean more targeted spray applications and allow use of beneficial insects, therefore resulting in the possibility of less frequent chemical sprays; and
reduced risk of chemicals moving off‐site as a result of lower chemical application. Although this risk is relatively small, the perception of lettuce production as an environmentally friendly activity is very important and significant proportions of lettuce are grown in peri‐urban areas.
Key social benefits Social benefits that accrue through participation in IPM projects, training and demonstration activities are:
the development of social support networks in the industry;
greater access to information;
a more educated industry with greater access to technical and professional assistance; and
improved communication in the industry between government, consultants and lettuce producers.
This build‐up of social capital gives farm families and communities greater capacity to adapt to the range of economic and social changes confronting them.
Risks associated with adopting IPM
There are few experienced IPM consultants – there may not be a locally available person; and if there is, he/she/they may already be fully committed or may leave the district without adequately training a replacement IPM consultant/scout.
Significant time must be invested in building knowledge (IPM involves substituting products with knowledge) about insect pests, beneficials and diseases and their biology and ecology (how they interact with the surrounding environment); about management options; and about impacts of agronomic practices on populations of pests and beneficials.
There may not be a ‘quick fix’ if pest populations increase more rapidly than expected.
There is not a full range of ‘soft’ options or effective preventative strategies for all insect pests in all conditions and available options for one insect pest may cause another to flare up.
1 Agricultural chemicals are given codes on the poison schedule to indicate relative toxicity to humans. The most toxic = Highly toxic = S7; Moderately toxic = S6; Slightly toxic = S5; very low toxicity = unscheduled.
Page 192

Appendix 7 : Page 4
Transitioning at the wrong time, i.e. adopting an IPM strategy when conditions are pest‐promoting, eg when winter is approaching and there are few beneficial insects present or in situations in which there is a need to double crop lettuce or plant next to a highly infested crop.
Partial adoption, eg relying on beneficials to manage insect pests but not adopting good sanitation practices to limit arrival of pests or spread through the crop.
Risks associated with not adopting IPM
Crop failure ‐ Without regular monitoring and record keeping it is difficult to evaluate the effectiveness of control measures and a failure may result in unexpected damage at harvest. Since the cause cannot be pinpointed, there is no means of learning from mistakes.
Potential chemical residues and MRL breaches.
Potential to induce pesticide resistance from over‐use of chemical options.
Potential to induce major pest outbreaks of pesticide‐resistant pests by killing off beneficial organisms.
Creating pest‐promoting environments ‐ Through lack of knowledge of pest biology and ecology, pest‐promoting environments can inadvertently be created, eg by using prolonged overhead watering which can promote many fungal diseases, by rotating with disease host crops or planting lettuce on lettuce or by planting soon after a weedy or pasture fallow.
Financial comparison of IPM‐grown vs non‐IPM lettuce using partial analysis In order to quantify the financial benefits of adopting IPM in lettuce it is necessary to initially determine the characteristics and costs of crop protection practices in lettuce in a ‘baseline’ (non‐IPM) system and in IPM systems. A partial analysis approach was used [see explanation of methodology in box]. For the purposes of this analysis three production systems were chosen:
• Field grown head lettuce production in inland NSW (Riverina);
• Field grown head lettuce production in coastal NSW (Sydney Basin); and
• Hydroponic fancy lettuce production in coastal NSW (Sydney Basin).
Estimates of yields and production costs for each production system were based on information provided by NSW DPI horticulturalists, leading IPM researchers, industry specialists and key producers. The typical insecticide or fungicide applications for IPM and non‐IPM growers were based on data collected from between 2‐4 years for each production system and modified based on current (May 2011) registrations or permits. Individual producer results will vary significantly between and within regions, farms and seasons.
Page 193

Appendix 7 : Page 5
Features of the baseline (non‐IPM) pest management strategy for lettuce
• Insect pest and disease management is based on regular preventative chemical applications.
• Insect pests, beneficials and specific diseases are not accurately identified.
• Crops are not routinely monitored. Although resellers may do some scouting and make recommendations, they are not paid to monitor crops.
• In spring through autumn insecticides are sprayed weekly and fungicides fortnightly, and in winter insecticides are sprayed fortnightly and fungicides weekly.
• Pesticides are applied with a boom sprayer which may be calibrated annually.
• Broad‐spectrum insecticides are preferred eg synthetic pyrethroids, organophosphates and carbamates.
• Tank mixing is common.
• Planting, irrigation, weed management, post‐harvest crop destruction and other agronomic practices are done when convenient and timing is not driven by pest management considerations.
Field grown head lettuce Features of an IPM strategy for field grown head lettuce
• Growers and/or IPM scouts/consultants have knowledge of key insect pests and diseases, their life cycles, their natural predators (beneficials) and recommended management options.
• Prevention of insect pests and diseases is achieved through:
o choosing resistant varieties where possible;
o using crop rotations for insect pest and disease breaks;
o planting only insect pest‐ and disease‐free transplants (if not direct seeding);
Partial analysis method for determining financial benefit of IPM (or other technology) adoption Returns to an enterprise in the short term (one production cycle or one year) are measured through a gross margin budget. Calculation of a gross margin involves subtracting costs for production inputs such as fertiliser, planting, pest and disease control, casual labour, harvesting, marketing, water etc from crop gross income (crop yield multiplied by price). Crop yield is directly influenced by insect pest and disease damage which itself is a function of insect pest and disease control.
A partial or marginal analysis examines the elements of the gross margin budget which change as a result of adoption of IPM practices with all other elements remaining the same. Partial budgeting is used to assess the net benefits from adopting IPM practices in each production system compared to scenarios in which IPM is not adopted.
Partial analysis involves determining the net benefits of different technologies by calculating the gross benefit and the total costs that vary in switching technologies using the estimated gross margin budgets.
The gross benefit is the yield expected with each technology, adjusted by the estimated level of crop damage from pests and diseases, multiplied by the farmgate price (the farmgate price is the price that the producer receives less any marketing costs).
The total costs that vary for each technology is the sum of ONLY those costs that are expected to change by switching from a non‐IPM to an IPM production system. If adopting a technology results in cost savings then the amount saved will be subtracted from the total cost; where additional costs are incurred the additional amount will be added to the total cost.
The net benefit for a given technology is then obtained by subtracting the total cost from the gross benefit. It should be pointed out that the net benefit is not the same as net profit, as it only takes into account those costs that vary by switching from one technology to another.
The net benefit from each technology is compared to calculate the marginal return. In this analysis the net benefit from adoption of IPM practices is compared to the net benefit from a scenario which is reflective of production practices typical of non‐IPM lettuce production. Marginal return in this analysis is referred to as the incremental net benefit and it is expressed in dollar terms and as a percentage of the baseline non‐IPM scenario net benefit.
Page 194

Appendix 7 : Page 6
o effective water and nutrient planning and minimising leaf wetness; and
o implementing field hygiene practices such as roguing diseased plants, post‐harvest crop clean‐up, weed management and planning crop operations to minimise disease spread.
• Regular monitoring of pests and diseases in crops is carried out with visual or ‘bugvac’ checks and use of tools such as pheromone traps and sticky traps. Crop consultants are usually paid to monitor and make management recommendations.
• Intervention for the timely control of insect pests and diseases involves mechanical controls, biological controls and the use of soft chemicals ensuring:
o Effective timing of sprays;
o Excellent spray coverage; and
o Correct calibration of spray equipment.
• Crop records are maintained and the success or otherwise of insect pest and disease management practices is recorded.
Calculating financial benefits from adopting IPM The financial components of crop protection in field grown head lettuce in both inland and coastal situations in NSW are summarised in Table 1a (baseline or non‐IPM) and Table 1b (IPM), and a comparison of the two is presented in Table 1c. Analyses of the sensitivity of the results to changes in the damage estimates and crop protection costs (for scouting, spraying and chemicals) used in the IPM case are shown in Tables 1d (inland) and 1e (coastal). When comparing scenarios, it can be seen that extra income from adopting IPM is the result of a combination of higher yields and reduced crop damage. The benefit on the income side outweighs the higher crop protection‐related production costs associated with adopting IPM. The annual incremental net benefit due to the adoption of IPM is calculated from summing the seasonal incremental net benefit figures for inland field grown head lettuce and for coastal field grown head lettuce, resulting in an annual increase of $3,175 per hectare (a 6.4% increase) and $2,419 per hectare (a 4.8% increase) respectively [Table 1c]. If the damage levels or the crop protection costs from Table 1b are varied for the IPM case, the net financial benefit remains positive in all cases for the inland field grown lettuce [Table 1d]. In the case of coastal field grown head lettuce a negative return would be experienced when damage from insect pests and diseases is increased to 10% and crop protection costs are increased by 25% or more [Table 1e].
With IPM you have a better chance of getting control of your pests. I adopted IPM because we were seeing resistance to the old chemicals and I wasn’t timing the sprays to egg hatch – I can’t identify the eggs on the leaves nor determine their hatching time. The cost of employing a consultant will be outweighed by the extra sprays you would have put on unnecessarily. Eddie Galea, field lettuce grower, Werombi, Sydney
Page 195

Appendix 7 : Page 7
Table 1a : Baseline (non‐IPM) lettuce production systems, field grown head lettuce
Inland field grown head lettuce Coastal field grown head lettuceIncome Summer/ Autumn Winter/ Spring Summer/ Autumn Winter/Spring
Damage from pests and diseases % 14.5% 0% 0% 11.75% Baseline yield Cartons/ha 1,881 2,200 2,200 1,941 Gross benefit (A) $ $23,513 $27,500 $27,500 $24,269 Insect pest and disease control production costs
Spray operations Number of spray applications No. 8 4 4 8 Cost of spray applications $/ha $166 $83 $83 $166
Chemicals* Poison Schedule^ Rate/ha $/L No. No. No. No.
Alpha‐cypermethrin (Fastac Duo) S6 0.4 $8.65 3 $10.4 1 $3.46 1 $3.46 3 $10.4 Methamidophos (Monitor) S7 2.1 $44.00 1 $92.4 1 $92.4 1 $92.4 1 $92.4 Dimethoate (Rogor) S6 0.8 $8.75 1 $7.0 1 $7.0 Spinosad (Success 2) S5 0.8 $363.6 1 $290.9 1 $290.9 Mancozeb (Dithane) S5 2.2 $8.14 3 $53.7 2 $35.8 2 $35.8 3 $53.7 Iprodione (Rovral) S5 0.8 $24.50 2 $39.3 1 $19.6 1 $19.6 2 $39.3 Mancozeb/Metalaxyl (Ridomil +) S6 2.5 $62.00 2 $310.0 1 $155.0 1 $155.0 2 $310.0 Cost of chemicals $/ha $804 $306 $306 $804 Total costs that vary (B) $/ha $969 $389 $389 $969 Net benefit (A) – (B) $/ha $22,543 $27,111 $27,111 $23,300
*Note: the choice of chemicals is typical for non‐IPM growers, but not representative of all non‐IPM growers or crops. The chemicals are currently registered as of May 2011.
^Agricultural chemicals are given codes on the poison schedule to indicate relative toxicity to humans. The most toxic = Highly toxic = S7; Moderately toxic = S6; Slightly toxic = S5; very low toxicity = unscheduled (US).
Table 1b : IPM lettuce production systems, field grown head lettuce
Inland field grown head lettuce Coastal field grown head lettuceIncome Summer/Autumn Winter/Spring Summer/Autumn Winter/Spring
Damage from pests and diseases % 2% 0% 0% 2% Baseline yield Cartons/ha 2156 2200 2200 2156 Gross benefit (A) $/ha $26,950 $27,500 $27,500 $26,950 Insect pest and disease control production costs
Crop scouting# $/ha $89 $89 $89 $89 Spray operations
Number of spray applications No. 5 3 3 5 Cost of spray applications (B) $/ha $104 $62 $62 $104
Chemicals* Poison Schedule^ Rate/ha $/L No. No. No. No.
Spinosad (Success 2) S5 0.80 $363.6 2 $581.8 1 $290.9 1 $290.9 2 $581.8 Indoxacarb (Avatar) S6 0.17 $172.0 1 $29.2 1 $29.2 1 $29.2 1 $29.2 Dimethomorph (Acrobat) S5 0.36 $272.7 1 $98.2 1 $98.2 1 $98.2 1 $98.2 Iprodione (Rovral) S5 0.80 $24.5 1 $19.6 1 $19.6 1 $19.6 1 $19.6 NPV (Gemstar) US 0.75 $72.8 1 $54.6 1 $54.6 Bt (Xentari / DiPel ES) US 1.00 $56.0 1 $56.0 1 $56.0 Cost of chemicals $/ha $840 $438 $438 $840 Total costs that vary (B) $/ha $1,032 $589 $589 $1,032 Net benefit (A) – (B) $/ha $25,918 $26,911 $26,911 $25,918
# Based on an actual consultant’s cost
*Note: the choice of chemicals is typical for IPM growers, but not representative of all IPM growers or crops. The chemicals are currently registered as of May 2011.
^Agricultural chemicals are given codes on the poison schedule to indicate relative toxicity to humans. The most toxic = Highly toxic = S7; Moderately toxic = S6; Slightly toxic = S5; very low toxicity = unscheduled (US).
Page 196

Appendix 7 : Page 8
Table 1c : Analysis of incremental net benefit increase – IPM vs non‐IPM production of inland and coastal field grown head lettuce
Net benefit non‐IPM
(from Table 1a)
Net benefit IPM
(from Table 1b)
Net value incremental production (season)
Annual incremental net benefit increase
$/ha $/ha $/ha $/ha % Inland field grown head lettuce Summer/ Autumn $22,543.2 $25,918.0 $3,374.8 Winter/ Spring $27,110.9 $26,910.9 ‐$200.0 $3,174.9 6.39 Coastal field grown head lettuce Summer/ Autumn $27,110.9 $26,910.9 ‐$200.0 Winter/ Spring $23,299.5 $25,918.0 $2,618.6 $2,418.6 4.80
Table 1d : Sensitivity analysis for inland field grown lettuce
Damage from insect pests and diseases (% yield impact) for inland field grown head lettuce (summer/autumn)
0% No change 5% 10%
‐25% $3,982.8 $3,432.8 $2,607.8 $1,232.8
No change $3,724.9 $3,174.9 $2,349.9 $974.9
+25% $3,466.9 $2,916.9 $2,091.9 $716.9
Change in
crop
protectio
n costs
+50% $3,208.9 $2,658.9 $1,833.9 $458.9 The shaded cells represent those scenarios showing a negative marginal return. It can be seen that in the analysis below for coastal field grown lettuce the scenarios using a damage level of 10% yield loss along with an increase in crop protection costs (for scouting, spraying and chemicals) by 25% or more show a negative return.
Table 1e : Sensitivity analysis for coastal field grown lettuce
Damage from insect pests and diseases (% yield impact) for coastal field grown head lettuce (winter/spring)
0% No change 5% 10%
‐25% $3,226.6 $2,676.6 $1,851.6 $476.6
No change $2,968.6 $2,418.6 $1,593.6 $218.6
+25% $2,710.6 $2,160.6 $1,335.6 ‐$39.4
Change in
crop
protectio
n costs
+50% $2,452.6 $1,902.6 $1,077.6 ‐$297.4
Page 197

Appendix 7 : Page 9
I’ve been growing lettuce hydroponically for 23 years, supplying the major supermarkets. This year we cut down sprays by 80%! We’ve hardly sprayed at all this year when normally (before IPM) we were spraying every 3‐4 days. I’d prefer to pay someone $100 a week to monitor to not spray! Our greatest challenge with IPM is keeping on top of the hygiene practices we’ve adopted – roguing, binning trimmings and weed cleanup.
Joe D’Anastasi, Hydroponic grower, Glenorie, Sydney
Hydroponic fancy lettuce
Features of an IPM strategy for hydroponic fancy lettuce
An IPM strategy for hydroponic fancy lettuce includes the practices listed above for field grown head lettuce plus the following additional IPM practices relevant to hydroponic production systems:
• Sanitation
o Cleaning out channels and nutrient supply systems between crops when diseases have affected previous plantings.
o Ensuring plants and seedlings never touch the ground.
o Roguing crops 1‐2 times per week and bagging any diseased plants and removing them to an appropriate off‐site location.
o Bagging all harvest trimmings and removing them to an off‐site location.
• Weed management Controlling weeds under tables.
• Screening Establishing suitable plant or artificial wind breaks to prevent blow‐in of pests from surrounding areas.
• Three spray treatment for western flower thrips (WFT) Applying three consecutive sprays with an appropriate soft insecticide to gain effective control of WFT at each stage of their life cycle (adults and emerging nymphs).
Calculating financial benefits from adopting IPM The financial components of crop protection in hydroponic fancy lettuce in NSW are summarised in Table 2a (non‐IPM) and Table 2b (IPM), and a comparison of the two is presented in Table 2c.
From the information in the tables it can be seen that moving from a non‐IPM production system to an IPM production system for hydroponic fancy lettuce provides an incremental net benefit for each of the six crops produced in the one‐year timeframe of the marginal analysis. This analysis indicates that adoption of IPM by hydroponic fancy lettuce producers would result in an annual incremental net benefit of $6,287 per 1000m2 or 17.9% [Table 2d]. It can be seen in Table 2e that even doubling the Table 2b levels of damage from insect pests and diseases and increasing the Table 2b IPM crop protection costs by 50% results in the net benefit of the marginal analysis between IPM and non‐IPM production in hydroponic fancy lettuce remaining positive [Table 2e]. This indicates a positive economic return and that the adoption of IPM in hydroponic fancy lettuce is economically feasible in the one year timeframe of the marginal analysis.
Page 198

Appendix 7 : Page 10
Table 2a : Baseline (non IPM) lettuce production systems, hydroponic fancy lettuce
Hydroponic fancy lettuce
Income
Crop 1 (spring)
Crop 2 (early
summer)
Crop 3 (late summer /autumn)
Crop 4 (autumn)
Crop 5 (autumn/early
winter)
Crop 6 (late
winter/spring)
Damage from insect pests and diseases % 5 30 40 5 10 10 Baseline yield kg/1,000m2 1,425 1,050 900 1,425 1,350 1,350 Gross benefit (A) $/1,000 m2 $7,125 $5,250 $4,500 $7,125 $6,750 $6,750 Insect pest and disease control production costs
Spray operations Number of spray applications No. 8 13 13 8 8 8 Cost of spray applications $/1,000 m2 $220 $358 $358 $220 $220 $220
Chemicals* Cost of chemicals $/1,000 m2 $110 $147 $147 $110 $110 $110 Total costs that vary (B) $/1,000 m2 $330 $504 $504 $330 $330 $330 Net benefit (A) – (B) $/1,000 m2 $6,795 $4,746 $3,996 $6,795 $6,420 $6,420
*Note: the choice of chemicals is typical for non‐IPM growers, but not representative of all non‐IPM growers or crops.
Table 2b : IPM lettuce production systems, hydroponic fancy lettuce
Hydroponic fancy lettuce
Income
Crop 1 (spring)
Crop 2 (early
summer)
Crop 3 (late summer /autumn)
Crop 4 (autumn)
Crop 5 (autumn/
early winter)
Crop 6 (late winter/
spring) Damage from insect pests and diseases % 2 5 8 5 2 2 Baseline yield kg/1,000m2 1,470 1,425 1,380 1,425 1,470 1,470 Gross benefit(A) $/1,000m2 $7,350 $7,125 $6,900 $7,125 $7,350 $7,350 Insect pest and disease control production costs
Cultural control practices Additional labour sanitation/ disposal
$/1,000 m2 $60 $60 $60 $60 $60 $60
Crop scout/IPM consultant# $/1,000 m2 $67 $67 $67 $67 $67 $33 Spray operations
Number of spray applications No. 3 5 5 3 3 3 Cost of spray applications $/1,000 m2 $83 $138 $138 $83 $83 $83
Chemicals Cost of chemicals $/1,000 m2 $50 $108 $108 $50 $50 $50 Total costs that vary (B) $/1,000 m2 $258 $371 $371 $258 $258 $225 Net benefit (A) – (B) $/1,000 m2 $7,092 $6,754 $6,529 $6,867 $7,092 $7,125
# Based on an actual consultant’s cost
Table 2c : Chemicals used in the baseline (non‐IPM) and IPM hydroponic fancy lettuce systems
Crops 1, 4, 5 & 6 Crops 2 & 3 Conventional IPM Conventional IPM
Chemical* Poison Schedule^ Rate/1000m2 $/L(kg) No. $/1000m2 No. $/1000m2 No. $/1000m2 No. $/1000m2
Mancozeb/Metalaxyl (Ridomil) S6 0.25 $62.0 1 $15.5 1 $15.5 1 $15.5 1 $15.5 Mancozeb (Dithane) S5 0.22 $8.1 1 $1.8 2 $3.6 Spinosad (Success) S5 0.08 $363.6 3 $87.3 1 $29.1 4 $116.4 3 $87.3 Alpha‐cypermethrin (Fastac) S6 0.04 $8.7 2 $0.7 4 $1.4 Pirimicarb (Pirimor) S6 0.10 $49.4 1 $4.9 1 $4.9 2 $9.9 1 $4.9 Chemical cost $110.2 $49.5 $146.7 $107.7 Total cost of chemicals ‐ conventional = $734.2 Total cost of chemicals ‐ IPM = $413.5
*Note: the choice of chemicals is typical for IPM or Non‐IPM growers, but not representative of all IPM or non‐IPM growers or crops. The chemicals are currently registered as of May 2011.
^Agricultural chemicals are given codes on the poison schedule to indicate relative toxicity to humans. The most toxic = Highly toxic = S7; Moderately toxic = S6; Slightly toxic = S5; very low toxicity = unscheduled.
Page 199

Appendix 7 : Page 11
Table 2d : Analysis of incremental net benefit increase – IPM vs non‐IPM production of hydroponic fancy lettuce
Margin non IPM
Margin IPM
Net value incremental production (per cropping)
Annual Incremental net benefit increase
$/1000m2 $/1000m2 $/1000m2 $/1000m2 %
Crop 1 $6,795 $7,092 $297
Crop 2 $4,746 $6,754 $2,008
Crop 3 $3,996 $6,529 $2,533
Crop 4 $6,795 $6,867 $72
Crop 5 $6,420 $7,092 $672
Crop 6 $6,420 $7,125 $705 $6,287 17.9%
Table 2e : Sensitivity analysis for hydroponic fancy lettuce
Damage from insect pests and diseases (% yield
impact) for IPM hydroponic fancy lettuce X0.5 No change X1.5 X2
‐25% $7,291 $6,391 $5,491 $4,591
No change $7,187 $6,287 $5,387 $4,487
+25% $7,084 $6,184 $5,284 $4,384
Change in crop
protection costs
+50% $6,980 $6,080 $5,180 $4,280
Acknowledgements: We wish to thank the Hay lettuce growers, the NSW project team members involved in VG98048, VG01028 & VG05044 and the Sydney Basin grower collaborators; Rob Weppler and Andy Ryland, IPM consultants; NSW DPI District Horticulturists: Jeremy Badgery‐Parker, Leigh James and Tony Napier; and Alan Boulton. For more detail see the Cost‐benefit Analysis of IPM Adoption by NSW Lettuce Growers report. [If/when this is made into a fact sheet, information needs to be provided about how they can access this report, which is in Appendix 6.]
By adopting good sanitation practices and other cultural controls Joe has been able to manage and control western flower thrips (WFT) and therefore tomato spotted wilt virus (TSWV). Joe had periods of 10 weeks where no thrips were detected and he did not have to spray at all!
Andy Ryland, IPM Consulting, Sydney
Page 200

Appendix 8 : Page 1
Appendix 8 Vegetable Integrated Crop Protection Research, Development & Extension (RD&E) Plan 2011‐2015 consisting of: a. an over‐arching Plan
b. the Action Plan associated with the over‐arching Plan (in Appendix 1)
c. an RD&E Program Plan for Thrips & Tospoviruses (in Appendix 2), and
d. a partially developed IPM Adoption RD&E Program Plan (in Appendix 3)
February 2011
These Plans were developed by the following team members of the National Vegetable IPM Coordination project (VG09191): Gerard McEvilly, Horticulture Supply Chain Services, Sandra McDougall, NSW Department of Primary Industries (NSW DPI) and Lauren Thompson, Scholefield Robinson Horticultural Services.
Page 201

Vegetable Integrated Crop Protection
Research, Development & Extension (RD&E) Plan 2011 - 2015*
(Version 1.0)Work
In P
rogres
s
Appendix 8 : Page 2 Page 202

Work
In P
rogres
s
Appendix 8 : Page 3 Page 203

» CONTENTS
INTRODUCTION.....................................................................................3
PLAN STRUCTURE.................................................................................5
SUMMARY.............................................................................................7
STRATEGIES........................................................................................11
APPENDICES.......................................................................................15
1A Action Plan....................................................................15
1B Examples and information to illustrate each of the objectives......................................................21
1C SWOT analysis of the relevant internal and external factors.........................................................31
1D Reference List................................................................32
1E Summary of how the plan was developed..........................34
2 Thrips and Tospoviruses RD&E Program Plan....................35
3 IPM Adoption RD&E Program Plan (partially developed).....67
4-10 Additional Program Plans (to be developed)
*Version 1.0, 2011 - 2015, subject to ongoing review
Work
In P
rogres
s
Appendix 8 : Page 4 Page 204

2 NOTE: INDUSTRY SIGN-OFF IS REQUIRED BEFORE THIS CAN BE FINALISED
Work
In P
rogres
s
Appendix 8 : Page 5 Page 205

3NOTE: INDUSTRY SIGN-OFF IS REQUIRED BEFORE THIS CAN BE FINALISED
» IntroductionThe Vegetable Integrated Crop Protection Research, Development and Extension (RD&E) Plan is designed to improve the flow of benefits to vegetable levy payers from their investment in crop protection RD&E. This diverse area has accounted for 50% of RD&E investment by industry and HAL from 2001-2010 (see background information in Appendix 1B). While this research has benefitted many growers, it is important to consider better ways to manage and deliver the program.
This Plan provides a framework for future management of the program which, if implemented, will achieve the following benefits for growers:
access to crop protection information to meet production and market needs•
protection from whole-of-industry risks •
opportunities for links with supply chain participants and consumers •
improved efficiency and accountability for levy investments •
Development of this Plan was done as part of the National Vegetable Integrated Pest Management (IPM) Coordination project (VG09191)1. As directed by the project brief from industry, the plan covers all aspects of vegetable crop protection, including:
all forms of pests (weeds, diseases, invertebrates, vertebrates etc)•
all forms of prevention (biosecurity, hygiene, breeding resistant varieties etc)•
all forms of cure (incursion management, beneficials, chemicals etc)•
all elements of the supply chain (from inputs to production to consumers)•
The Plan is structured around the overarching framework presented in this document and nine associated “Program Plans” in Appendices 2 - 10. The “overarching Plan” defines the outcomes to be achieved via coordination across a range of stakeholders. The Program Plans cover the following specialised areas:
Thrips and Tospoviruses (including western flower thrips and tomato spotted wilt virus)•
IPM Adoption• 2
Invertebrate Pests (insects and mites)•
Pathology (diseases caused by fungal, bacterial and viral pathogens)•
Nematology•
Soil Health•
Greenhouse IPM•
Weeds•
Vertebrate Pests•
1This project has been funded by HAL using the National Vegetable Levy and matched funds from the Australian Government. It forms part of the Vegetable Industry Development Program (VIDP) and aims to plan, coordinate, monitor and support the development and adoption of best practice Integrated Pest Management (IPM) technology.
2This Program covers the broad IPM Adoption issues, including investigations into comprehensive “whole farm” IPM adoption, regional IPM programs, uptake by “non-English speaking background” (NESB) growers, determinants of viable commercial scouting businesses, incorporation of IPM into “systems approaches” that meet the risk management requirements of Market Access regulators, chemical access (eg registration requirements for biorationals), “market pull” as a driver of adoption, other market access and supply chain issues etc.
Work
In P
rogres
s
Appendix 8 : Page 6 Page 206

4 NOTE: INDUSTRY SIGN-OFF IS REQUIRED BEFORE THIS CAN BE FINALISED
…INTRODUCTION
The framework is based on four “themes” that emerged from consultation with stakeholders along the supply chain. The themes also draw on the reports from detailed reviews (or “stocktakes”) and a series of meetings and workshops related to crop protection over the past several years.
One outcome of the consultations was a decision to adopt the term “Integrated Crop Protection” to encompass the breadth of issues encompassed by the brief and this resulting Plan, since IPM is subject to a range of definitions, which could cause confusion.
Given this breadth, it is important that the plan is seen in the context of the overall planning hierarchy for the vegetable industry. As illustrated below, it draws on and refers to other plans related to crop protection, both inside and outside the vegetable industry. It should also be related to the broader vegetable industry planning framework.
Existing Related Plans
Biosecurity
HAL Plant Health
Minor Use
Etc Etc
Integrated Crop Protection Plan
Thrips & Tospoviruses Pathology Etc Etc
Specific RD&E Program Plans
Integrated Crop Protection Plan
Market Development Plan
Industry Development Plan
Etc Etc
Plans for Industry Priority Areas
Industry Strategic Plan
Work
In P
rogres
s
Appendix 8 : Page 7 Page 207

5NOTE: INDUSTRY SIGN-OFF IS REQUIRED BEFORE THIS CAN BE FINALISED
» PLAN STRUCTUREThe Summary includes the Vision statement and explains the purpose of the Plan. It also introduces the Objectives that have been developed based on the themes that emerged from the review and consultation process. In addition, specific ways in which the plan can improve the flow of benefits to growers are presented.
The Strategies section includes performance targets under each Objective and lists the Strategies required to achieve these targets.
The Action Plan (in Appendix 1A) spells out the specific Actions for addressing these Strategies and the associated timeframes, priorities, responsibilities and resource requirements.
Background information is presented in Appendices 1B - 1E, which provides context for the plan and helps to explain why certain strategies were selected. The information will also be useful when reviewing the plan in the future, as it helps identify changes in the operating environment that may call for adjustments to the plan. The contents of these appendices are:
Appendix 1B - Examples and information to illustrate each of the objectives
Appendix 1C - SWOT analysis of the relevant internal and external factors
Appendix 1D - Reference List
Appendix 1E - Summary of how the plan was developed
As shown in the diagram at the end of the previous section, it is intended that specific Program Plans will be developed as part of the Integrated Crop Protection RD&E Plan. Most of the plans will cover RD&E associated with the technical aspects of managing particular pest types. Some priority programs require integrative, cross-discipline RD&E (i.e. Soil Health, Greenhouse IPM and Thrips & Tospoviruses) and there is also a need for an IPM Adoption RD&E Program covering the human and business aspects, market access and supply chain issues etc.
At the Research end of RD&E, projects within some of these programs may be pest/crop specific. However, it will be important for the Development and Extension portions to incorporate information about interactions with other categories of pests, the “fit” within a holistic, integrated management approach to crop protection as well as implications for other crops, the supply chain and market access.
The plan covering western flower thrips (WFT) and tomato spotted wilt virus (TSWV) was developed as part of the VG09191 project brief. It has been broadened into a Thrips and Tospoviruses RD&E Program Plan, which is attached in Appendix 2. The eight other Program Plans should be developed as soon as possible to enable the industry to move forward with a balanced Integrated Crop Protection RD&E program. Their development will require additional project funding and as they are completed they will form Appendix 3, 4, 5 etc. The IPM Adoption RD&E Program Plan was partially written in January 2011 to enable important Themes to be documented. This draft Program Plan is attached in Appendix 3.
Work
In P
rogres
s
Appendix 8 : Page 8 Page 208

6 NOTE: INDUSTRY SIGN-OFF IS REQUIRED BEFORE THIS CAN BE FINALISED
Work
In P
rogres
s
Appendix 8 : Page 9 Page 209

7NOTE: INDUSTRY SIGN-OFF IS REQUIRED BEFORE THIS CAN BE FINALISED
» SUMMARYCrop Protection in vegetables covers a wide range of issues – multiple crop types, multiple pest organisms and multiple approaches to controlling them. This has led to a project-by-project approach in the past, which has produced some excellent results for industry.
However, there were suggestions both in the reviewed documents and during the consultations, for an alternative approach. It was considered that use of a more coordinated and strategic approach could result in better crop protection solutions with a more efficient use of funds.
In addition, the consultation process revealed that industry members were unclear as to the various roles and responsibilities related to crop protection, including the ongoing delivery of information, risk management and supply chain engagement.
This is described in more detail in the background information contained in Appendix 1B, including the need to partner more effectively with the supply chain in reconciling pest management with consumer requirements. The diagram below illustrates the many ways in which crop protection issues involve the supply chain – crop protection is not just a production issue.
Concerns about the current RD&E system for crop protection were found to be consistent across industry. The Objectives that provide the framework for the plan have been developed to address these concerns. The diagram below shows how these Objectives overlap to some extent in supporting an overall Vision of “A vegetable industry effectively addressing those production, market access and consumer issues related to pests* and their management (*where pests include insects/diseases/weeds/vertebrate pests)”.
CommunicationExport Dev’t
Market accessP a c k a g i n g & Processing
PostharvestPlant production
NRMBiosecurity
Plant health
Consumer
Satisfaction
Industry
Profitability&
PostFarm
Gate
P reFa rm
Gate
Transport,
Distribution
&
Logistics (T
DL)
Retail & fo
od
service
Breeding
Crop Protection
Crop Protection
Crop Protection
Crop Protection
IntegratedCropProtectionPlan
Crop ProtectionWork
In P
rogres
s
Appendix 8 : Page 10 Page 210

8 NOTE: INDUSTRY SIGN-OFF IS REQUIRED BEFORE THIS CAN BE FINALISED
…SUMMARY
This overarching Plan has three main levels:
1. Objectives (Outcomes that need to be achieved to deliver the Vision);
2. Strategies (How the outcomes will be achieved); and
3. Action Plan (Who will do what, when should it be done and what resources will be required to implement the identified actions).
Objective 1
Information is readily available
Objective 2
There are clear Roles and Responsibilities in
addressing issues
Objective 3
Market Impacts are monitored and
addressed
Objective 4
Short, medium and long-term RD&E needs are addressed through a
Program Approach
Strategies Strategies Strategies Strategies
Actions Actions Actions Actions
Work
In P
rogres
s
Appendix 8 : Page 11 Page 211

9NOTE: INDUSTRY SIGN-OFF IS REQUIRED BEFORE THIS CAN BE FINALISED
Past/Current Circumstances Future Situation Which Objective(s) address this issue
A focus on individual, uncoordinated projects, with individual extension strategies
Related issues are grouped into programs based on thorough planning
1. Information
4. Program Appraoch
Difficult for Industry Advisory Committee to establish the relative merits of projects competing for limited funds
Transparency regarding the information and assumptions used in making funding decisions, i.e. clear documentation of processes undertaken in assessing the relative risks and relative benefits of alternative project and program investments
2. Roles and Responsibilities
4. Program Approach
Difficult to provide ongoing provision of extension resources, once project is completed
Information strategies will ensure ongoing availability and reappraisal of extension resources
1.Information
Lack of clear process for monitoring and addressing levy payer issues (R&D or extension)
Growers can raise Crop Protection issue and receive feedback on status of that issue (e.g. solution, if available, or action proposed in existing or potential future programs)
2. Roles and Responsibilities
The nine Program Plans are intended to guide the achievement of Objective 4, i.e. implementation of a Program Approach to addressing short, medium and long-term integrated crop protection RD&E needs. The “Task Plans” in the Program Plans are set out as follows (using the wording in the Thrips & Tospoviruses Program Plan as an example):
…SUMMARY
Once all of the nine Program Plans are in place, this Integrated Crop Protection RD&E Plan will be a comprehensive guide to achieving the Objectives in this “overarching Plan” as well as the desired outcomes described in the RD&E Themes in the Program Plans.
The next section of this document provides more detail about the Strategies within this overarching Plan and the associated Action Plan is in Appendix 1A.
The table below includes some of the issues that emerged from workshops and discussions over the past few years, as well as during the consultation process that led to this plan. It describes how these issues can be addressed, through implementation of this plan, to provide an improved future situation for levy payers, and which Objectives will address each issue.
Extension Theme(s)eg Current best practice pest management used by growers
Development Theme(s)eg Research outcomes
modified for specific crops and regions
Research Theme(s)eg Development of new pest
management approaches/tools
Methods Methods Methods
Tasks Tasks Tasks
Work
In P
rogres
s
Appendix 8 : Page 12 Page 212

10 NOTE: INDUSTRY SIGN-OFF IS REQUIRED BEFORE THIS CAN BE FINALISED
Past/Current Circumstances Future Situation Which Objective(s) address this issue
Heavy reliance on dwindling state department resources for information and advice
All parties in the vegetable industry supply chain play an appropriate role in information exchange regarding crop protection issues
1.Information
2. Roles and Responsibilities
3. Market ImpactsFocus on short-term, “wish-list” issues More strategic approach based on objective
evaluation of importance vs urgency and risk vs reward
2. Roles and Responsibilities
3. Market Impacts
4. Program AppraochLack of clear signals to RD&E providers and short response time contributes to poorly focussed proposals
Program approach provides long-term signals and timeframes enable collaborative approaches that add value
4. Program Approach
Domination of on-farm issues On-farm issues are addressed alongside other crop protection issues along the supply chain, from seed and other inputs through to market requirements
3. Market Impacts
Cumbersome systems make it difficult to respond to genuine emergencies
Budgeting and program management processes enable responsiveness
2. Roles and Responsibilities
4. Program ApproachMinimal linkage/co-funding with input suppliers or produce marketers
Responsibilities are clearly established to optimise communication with other stakeholders
1.Information
3. Market Impacts
No monitoring of changes in consumer attitudes/demands regarding pest management impacts
Developments are closely monitored in domestic and overseas markets and discussed with industry
1.Information
3. Market Impacts
Most stakeholders are unclear as to who is responsible for dealing with various major threats to the industry, related to crop protection
Robust risk and crisis management plans establish responsibilities and contribute to reducing threats to industry
1.Information
2. Roles and Responsibilities
…SUMMARY
Work
In P
rogres
s
Appendix 8 : Page 13 Page 213

11NOTE: INDUSTRY SIGN-OFF IS REQUIRED BEFORE THIS CAN BE FINALISED
» STRATEGIESThe Strategies below are grouped according to the overall Objectives of this plan.
They are designed to support the overall Mission or purpose of the program, as follows:
The Integrated Crop Protection RD&E Program will draw together the multiple, inter-related aspects of pest management in vegetables. These relate to quarantine and biosecurity issues, as well as quality factors such as insect contamination, disease damage or pesticide residues.
Key elements include ongoing access to appropriate technology, information and analysis as the marketing and production environments evolve. This will require a whole-of-supply-chain approach.
The program will enable decision-makers to maximise the returns to growers from levy investments in research, development and extension, while leveraging off commercial and government programs.
Objective 1: Information is readily availableIndustry members are aware of the scope of crop protection and the various options to access the information they need, when they need it.
Strategy 1.1 Make extension materials from past HAL projects accessibleKey deliverable: All past HAL crop protection projects audited and resulting extension resources made accessible. System developed to enable resources to be catalogued, listings to be updated and access to be improved where required. (As part of the overall Vegetable Industry Development Program.)
Strategy 1.2 Address information needs identified through gap analysisKey deliverable: Gaps in information identified through HAL project audit addressed where possible by accessing material from non-HAL sources or developing fresh extension material from existing HAL projects.
Strategy 1.3 Develop an information providers programKey deliverable: Program developed in consultation with industry to enable all members of the supply chain (including public and commercial service providers) to play an effective role in achieving adoption of improved integrated crop protection practices and providing information about crop protection issues.
Measured by: By 2012, all growers will have access to directories of user-friendly information from past HAL-funded crop protection projects.
By 2012, the full scope of crop protection, including market access and consumer issues, will be highlighted through a communication program.
By 2015, growers of all major crops will have access to directories of user-friendly information from non-HAL R&D, including from overseas.
By 2012, guidelines will exist to assist growers and other information users to understand the various roles of all parties in the “information supply chain” for crop protection issues.
Work
In P
rogres
s
Appendix 8 : Page 14 Page 214

12 NOTE: INDUSTRY SIGN-OFF IS REQUIRED BEFORE THIS CAN BE FINALISED
Objective 2: There are clear roles and responsibilities in addressing issuesAcute risks to the vegetable industry and its markets as well as strategic crop protection threats are addressed, utilising the appropriate combination of public sector and commercially-driven expertise.
Strategy 2.1 Establish a “crisis readiness” system Key deliverable: An established and tested Incident Response Plan to protect the industry from acute technical and market risk factors, including food scares and loss of market access. This will complement the Vegetable Industry Biosecurity Plan and include an education and training component throughout the supply chain.
Strategy 2.2 Establish a formal ”threat readiness” systemKey deliverable: A Crop Protection Forum is established with clear terms of reference to identify and address emerging crop protection threats, including:
• newpestincursions
• majorthreatstocurrentfieldcontrol or market access strategies, eg resistance, deregistration
• technicalskillshortages
• changesinconsumerrequirements
Objective 3: Market impacts are monitored and addressedIndustry engages through the supply chain to maximise the competitive advantage from adoption of innovative and sustainable pest management practices.
Strategy 3.1 Engage with the marketKey deliverable: Industry is kept well-informed about the changing nature of consumer attitudes to issues such as pesticide use, IPM and traceability, both in Australia and overseas.
Key deliverable: Those market issues that have commonality across the whole produce and/or food sector are addressed collaboratively with other industry organisations. This requires monitoring by the vegetable industry as well as identification of other like-minded organisations.
…STRATEGIES
Measured by: By 2012, industry is proactively managing acute risks associated with crop protection, with clearly defined industry/government/commercial responsibilities.
By 2013, a process exists, involving the whole supply chain, to identify and prepare for emerging threats.
Threat Crisis
ConcernMinor
High
High
Low
Low
Importance
Likelihood
•
••
••
•
•
•
••
•
Risk Matrix approach to addressing issues
Measured by: By 2012, linkages are in place between industry and key input providers as well as key customers to enable informed discussion related to crop protection issues.
By 2013, supply chain partners have increased their co-investment in the crop protection program by 10%.
By 2012, the vegetable industry market analysis program encompasses the monitoring and analysis of developments related to crop protection.
By 2013, the vegetable industry has explored partnerships with other produce associations to share market monitoring and communication costs.
Work
In P
rogres
s
Appendix 8 : Page 15 Page 215

13NOTE: INDUSTRY SIGN-OFF IS REQUIRED BEFORE THIS CAN BE FINALISED
Strategy 3.2 Expand co-investment along the supply chainKey deliverable: Key opportunities for voluntary contributions by commercial partners are identified and pursued, in order to maximise the overall returns on levy investments. These may include:
• developmentofpest-resistantvarieties
• triallingofnewbiologicalsorpesticides
• consumerresearch
• productdevelopmentandtesting,suchaslow-inputvarieties
• extensionprograms
Objective 4: Short, medium and long-term needs are addressed through a program approachAccountability and coordination are underpinned by a planning framework that establishes long term strategic goals (based on sound scientific and risk:reward analysis) while accommodating the need for tactical response capacity.
Strategy 4.1 Develop Program Plans to enhance coordination and guide effective program managementKey deliverables: With nine RD&E Program Plans added to the Integrated Crop Protection RD&E Plan, recent moves towards a program approach are accelerated and strengthened. The inclusion of more rigorous approaches to evaluating alternative options and to balancing risk across the portfolio enhances efficiency and improves outcomes for industry.
Strategy 4.2 Ensure that program funding decisions are underpinned by transparent risk:reward analysis Key deliverable: Priority areas derived from industry and technical consultation are subject to risk:reward analysis to drive the case for investment, while also identifying potential barriers to adoption. Processes undertaken in assessing the relative risks and rewards of alternative investments, including assumptions and information sources, are documented.
Strategy 4.3 Review decision structure and funding processes to enable responsiveness, coordination and strategy development Key deliverable: The current short timeframe between the Industry Call and submission deadline has been replaced with a transparent and well-managed process of program development that attracts the best expertise available.
Key deliverable: Decision structure reviewed, including processes, terms of reference, training and accountability for committees, ensuring robust, effective and efficient decision-making.
Strategy 4.4 Invest in communication tools to ensure the program is well-understoodKey deliverable: Through consistent reference to the planning framework by all stakeholders for all audiences, the program design is familiar and there is discipline in its use. Coordination of the broad, complex area of Integrated Crop Protection RD&E has improved due to adoption of the planning framework as the “common language”.
…STRATEGIES
Measured by: By 2012, the Integrated Crop Protection Plan extends to nine detailed Program Plans for the key pest types, the broad IPM Adoption issues and the priority program areas that require an integrative, cross-discipline approach. Risk:reward analysis is incorporated in these plans to ensure a balanced portfolio.
Investments from 2012-13 onwards are substantially based on program approaches to implementation.
By 2011, a communication plan has been implemented to explain the planning framework to all industry members and stakeholders. This extends to adopting the framework for ongoing updates and reviews at all levels.
Work
In P
rogres
s
Appendix 8 : Page 16 Page 216

14 NOTE: INDUSTRY SIGN-OFF IS REQUIRED BEFORE THIS CAN BE FINALISED
Work
In P
rogres
s
Appendix 8 : Page 17 Page 217

15NOTE: INDUSTRY SIGN-OFF IS REQUIRED BEFORE THIS CAN BE FINALISED
» APPENDIX 1Appendix 1A: Action Plan This Action Plan for the “overarching Integrated Crop Protection RD&E Plan” has three main levels:
1. Objectives (Outcomes that need to be achieved to deliver the Vision);
2. Strategies (How the outcomes will be achieved); and
3. Actions (Who will do what, when should it be done and what resources will be required to implement the identified actions).
Objective 1Information is readily
available
Objective 2There are clear Roles and Responsibilities in addressing issues
Objective 3Market Impacts
are monitored and addressed
Objective 4Short, medium and
long-term RD&E needs are addressed through a Program
Approach
Strategies 1.1 - 1.3 Strategies 2.1 & 2.2 Strategies 3.1 & 3.2 Strategy 4.1
Strategies 4.2 - 4.4
Actions Under Each of the Strategies
Actions Under Each of the Strategies
Actions Under Each of the Strategies
Action 4.1.1
Actions Under
Strategies 4.2 - 4.4
Thrips & Tospoviruses
RD&E Program
IPM Adoption
RD&E Program
Invertebrate Pests RD&E
Program
Pathology RD&E Program
Nematology RD&E Program
Themes Themes Themes Themes Themes
↓ ↓ ↓ ↓ ↓Methods Methods Methods Methods Methods
↓ ↓ ↓ ↓ ↓Tasks Tasks Tasks Tasks Tasks
Soil Health RD&E
Program
Greenhouse IPM RD&E Program
Weeds RD&E Program
Vertebrate Pests RD&E
Program
Themes Themes Themes Themes
↓ ↓ ↓ ↓Methods Methods Methods Methods
↓ ↓ ↓ ↓Tasks Tasks Tasks Tasks
Nine RD&E Program Plans are associated with achievement of Objective 4. They are structured around RD&E “Themes”, “Methods” and “Tasks” as shown below. The Thrips & Tospoviruses RD&E Program Plan is in Appendix 2. The other plans indicated below are to be developed as soon as possible. The IPM Adoption RD&E Program Plan was partially written in January 2011 to enable documentation of important Themes and is in Appendix 3.
Work
In P
rogres
s
Appendix 8 : Page 18 Page 218

16 NOTE: INDUSTRY SIGN-OFF IS REQUIRED BEFORE THIS CAN BE FINALISED
The following are Required to enable successful achievement of this Objective:
• anon-goingIPMCoordinationProject,i.e.beyond15thApril2011(ShortTerm,HIGHPRIORITY)
• developmentofeightadditionalRD&EProgramPlansasindicatedonPage1ofthisActionPlan(ShortTerm,URGENT - #1 PRIORITY)
Strategy 1.1 Make extension materials from past HAL projects accessible – Short Term and On-going (HIGH PRIORITY)
Actions (in priority order)
1.1.1 Audit all past HAL-funded crop protection projects, identify grower-friendly extension resources that were produced and liaise with the Knowledge Management (KM) sub-program of the VIDP2 to enable access via AUSVEG website.
Timeframe & Responsibilities: Current (as part of VG091911) and On-going (as part of on-going IPM Coordination project and KM project)
Resources: $200,000 - $300,000 per annum for on-going IPM Coordination Project
1.1.2 Assess extension resources for relevance and accessibility (including during development of additional eight Program Plans shown on Page 1 of this Action Plan). Develop a system to catalogue extension resources, update the listings and improve access & distribution where required.
Timeframe & Responsibilities: Current (as part of VG091911), Short Term (during development of the eight additional RD&E Program Plans) and On-going (as part of on-going IPM and KM Projects)
Resources: As above (ref Action 1.1.1) for on-going IPM Coordination Project
See Action 4.1.1 below (under Objective 4) for indication of resources required for development of the remaining eight RD&E Program Plans (ideally by June 2011).
Strategy 1.2 Address information needs identified through gap analysis – On-going (HIGH PRIORITY)
Action
1.2.1 Implement options to fill key gaps in information (as identified during development of RD&E Program Plans or as requested by the InnoVeg sub-program of the VIDP). Options include: develop fresh extension material from existing HAL projects; find/adapt material from overseas work; develop/adapt material with commercial partners; undertake new technical research. (Ensure any new research requirements are fed into appropriate channels.)
Timeframe & Responsibilities: Current (as part of VG091911) and On-going (as part of on-going IPM, KM and InnoVeg Projects)
Resources: As above (ref Action 1.1.1) for on-going IPM Coordination Project
Objective 1: Information is readily available
Industry members are aware of the scope of crop protection and the various options to access the information they need, when they need it.
…APPENDIX 1ATimeframe and priority terms used in this document are defined as follows:
• Timeframe terms refer to whether the Strategy/Action should be enacted soon (i.e. in the “Short Term”), somewhat later (“Medium Term”) or is considered to be part of the “On-going” responsibilities within a project or program.
• Priority terms (in enclosed parentheses) refer to the relevant urgency of the Strategy/Action, eg “URGENT”, “HIGH PRIORITY” or “Lower Priority”.
1. VG09191 is the National Vegetable IPM Coordination project, initially funded from 16/04/10 through 15/04/11.2. The Vegetable Industry Development Program (VIDP) commenced in 2009/10. It consists of a National Coordination program and
eight sub-programs including VG09191.
Work
In P
rogres
s
Appendix 8 : Page 19 Page 219

17NOTE: INDUSTRY SIGN-OFF IS REQUIRED BEFORE THIS CAN BE FINALISED
Strategy 1.3 Develop information providers program – Medium Term (Lower Priority)
Actions (in priority order)
1.3.1 Review existing information channels with the “information supply chain” to ensure any existing databases identify information providers such as researchers, extension officers, crop consultants, input suppliers, field officers and marketers.
Timeframe and Responsibilities: Medium Term (as part of on-going IPM Coordination Project in conjunction with VIDP sub-programs, particularly InnoVeg & KM, and also with the CIO Program and other Delivery Partners).
Resources: As above (ref Action 1.1.1) for on-going IPM Coordination Project
Requires a functional, accessible contact management system to be created/maintained (i.e. contact details of information providers to be housed in a database that is designed to streamline communications and be kept up to date in an efficient manner).
Requires a Communications Plan that includes negotiation with information providers and review of their effectiveness (to be developed within on-going VIDP sub-programs).
1.3.2 Establish an ongoing communication program with information providers, recognising their range of skills and their roles in the two-way discussion with growers about crop protection issues. Aim is to establish awareness of the extension resource materials, belief that these are relevant to their roles and commitment to engage (both in provision of information and in identification of information needs).
Strategy 2.1 Establish a “crisis readiness” system - Short Term (URGENT)
Actions (in priority order)
2.1.1 Develop and test Incident Response Plan (IRP) extending beyond response to incursions to food safety scares and other threats to industry integrity. (There is currently no formalised approach to addressing acute risks to the industry and its markets, as adopted by the mushroom industry and others.)
Timeframe & Responsibilities: ASAP Responsibility generally sits with peak industry body, i.e. AUSVEG
Resources: Requires a brief and budget based on other horticultural industry IRPs.
2.1.2 Establish communication program to promote risk awareness and responsiveness (taking into account that all parties in the supply chain have a role in identifying potential crisis issues and supporting a coherent response). Include an education and training component throughout the supply chain.
Timeframe & Responsibilities: Short Term (as part of the on-going IPM Coordination Project or possibly managed in-house by AUSVEG)
Resources: As above (ref Action 1.1.1) for on-going IPM Coordination Project
Requires incorporation into the Communications Plan as part of a required on-going IPM Coordination Project
…APPENDIX 1A
Objective 2: There are clear roles and responsibilities in addressing issues
Acute risks to the vegetable industry and its markets as well as strategic crop protection threats are addressed, utilising the appropriate combination of public sector and commercially-driven expertise.
Work
In P
rogres
s
Appendix 8 : Page 20 Page 220

18 NOTE: INDUSTRY SIGN-OFF IS REQUIRED BEFORE THIS CAN BE FINALISED
Strategy 2.2 Establish a formal “threat readiness” system – Medium Term (Lower Priority)
Action
2.2.1 Establish Crop Protection Forum with membership that encompasses the supply chain and a formal approach to identifying and assessing strategic threats including:
• newpestincursions
• majorthreatstocurrentfieldcontrol or market access strategies, eg resistance, deregistration
• technicalskillshortages
• changesinconsumerrequirements
(Some input suppliers and marketers have expressed interest in participating to assist with project planning. Also a mechanism for managing interaction with key marketers to enable better understanding of potential market impacts of crop protection practices.)
Timeframe & Responsibilities: Medium Term (as part of on-going IPM Coordination Project)
Resources: As above (ref Action 1.1.1) for on-going IPM Coordination Project
Requires budget and incorporation into the Communications Plan as part of a required ongoing IPM Coordination Project
Strategy 3.1 Engage with the market – Medium Term (Lower Priority)
Actions (in priority order)
3.1.1 Ensure that market and consumer research by industry includes focus on crop protection related demand drivers. (In some markets there are moves to develop consumer awareness of modern pest management practices, eg IPM as an alternative to organics and this type of thing should be monitored in domestic and export markets via market and consumer research.)
Timeframe & Responsibilities: Medium Term (as part of on-going IPM Coordination Project in conjunction with Consumers & Markets sub-program of VIDP)
Resources: As above (ref Action 1.1.1) for on-going IPM Coordination Project
3.1.2 Seek collaboration with other industry organisations regarding market implications of crop protection practices. (Significant transaction and operational cost savings could flow from a collaborative approach to development of a generic consumer monitoring/education program.)
Timeframe & Responsibilities: Medium Term (as part of on-going IPM Coordination Project in conjunction with Consumers & Markets sub-program of VIDP)
Resources: As above (ref Action 1.1.1) for on-going IPM Coordination Project
…APPENDIX 1A
Objective 3: Market impacts are monitored and addressed
Industry engages through the supply chain to maximise the competitive advantage from adoption of innovation and sustainable pest management practices.
Work
In P
rogres
s
Appendix 8 : Page 21 Page 221

19NOTE: INDUSTRY SIGN-OFF IS REQUIRED BEFORE THIS CAN BE FINALISED
Strategy 3.2 Expand co-investment along the supply chain - Medium Term (Lower Priority)
Action
3.2.1 Collaborate with HAL and supply chain partners to expand the voluntary contribution (VC) element of the crop protection program, eg for extension programs as well as RD&E relating to:
• developmentofpest-resistantvarieties
• triallingofnewbiologicalsorpesticides
• consumerresearch
• productdevelopmentandtesting, such as low-input varieties.
Timeframe & Responsibilities: Medium Term (interaction with supply chain partners to be managed as part of on-going IPM Coordination Project)
Resources: As above (ref Action 1.1.1) for on-going IPM Coordination Project
Strategy 4.1 Develop Program Plans to enhance coordination and guide effective program management – Short Term (URGENT - #1 PRIORITY)
Action
4.1.1 Develop RD&E Program Plans covering the key pest types, the broad IPM adoption issues and the priority program areas that require an integrative, cross-discipline approach to RD&E: 1. Thrips & Tospoviruses (including WFT & TWSV) 2. IPM Adoption 3. Invertebrate Pests (insects and mites) 4. Pathology (diseases caused by fungal, bacterial and viral pathogens) 5. Nematology 6. Soil Health 7. Greenhouse IPM 8. Weeds 9. Vertebrate Pests.
Program plan development to include reviewing existing reports and “stocktakes” and compiling and assessing existing extension resources (including whether up-to-date and how to access if only in hard copy) as well as an “extension resources gap analysis” by topic, crop, production region and format of the resource.
Timeframe & Responsibilities: Short Term, Urgent, #1 Priority The first plan (Thrips & Tospoviruses) has been produced as part of VG09191. Other plans could be produced within VG09191 (but would require extra budget and negotiation of milestones), or within the on-going IPM Coordination Project (beyond 15 April 2011) or by other appropriate service providers (eg in response to a tender brief). The brief should specify that consultation with experts and industry is expected and for each topic, a risk:reward analysis should be undertaken to justify the selected approaches.
Resources: Each plan could require 10 – 30 days of professional time (depending on complexity of subject area, whether a recent “stocktake” has been undertaken and experience of person/team doing the work). Average cost per plan is estimated to be $30,000 assuming 20 days of professional time (for consultations and desktop research) plus travel and operating expenses, resulting in a total budget requirement of approximately $240,000 for development of the remaining eight Program Plans.
…APPENDIX 1A
Objective 4: Short, medium and long-term needs are addressed through a program approach
Accountability and coordination are underpinned by a planning framework that establishes long term strategic goals (based on sound scientific and risk:reward analysis) while accommodating the need for tactical response capacity.
Work
In P
rogres
s
Appendix 8 : Page 22 Page 222

20 NOTE: INDUSTRY SIGN-OFF IS REQUIRED BEFORE THIS CAN BE FINALISED
Strategy 4.2 Ensure that program funding decisions are underpinned by transparent risk:reward analysis - Medium Term (Lower Priority)
Action
4.2.1 Establish portfolio analysis to ensure balanced investments and communicate any additional information requirements to project proponents. Aim is to strike a balance across the overall crop protection program between incremental (low risk:low reward) and disruptive (high risk:high reward) approaches. (Where risk includes technical risk and risk of non-adoption.)
Timeframe & Responsibilities: Medium Term (HAL responsibility in conjunction with AUSVEG, the IAC, Advisory Groups and Working Groups)
Resources: Requires a management process for proposal evaluation that includes risk:reward analysis. May require some economics R&D later to finetune process.
Strategy 4.3 Review decision structure & funding processes to enable responsiveness, coordination and strategy development - Short Term (URGENT)
Actions (in priority order)
4.3.1 Establish program development timetable that maximises collaboration and efficiency. (The current short timeframe between the Industry Call and the deadline for proposals undermines a strategic, well-coordinated approach. It also increases transaction costs and dissuades many potential providers from being involved.)
Timeframe & Responsibilities: ASAP (HAL responsibility in conjunction with AUSVEG, the IAC, Advisory Groups and Working Groups)
Resources: Requires management processes that cater for the long lead time required for development of a program approach
4.3.2 Ensure management structures support achievement of outcomes. (Review decision processes, terms of reference, training and accountability provisions to ensure committee structure is robust, effective and efficient.)
Timeframe & Responsibilities: ASAP (HAL responsibility in conjunction with AUSVEG, the IAC, Advisory Groups and Working Groups)
Resources: Requires a management process that enables roles & responsibilities to be understood and fulfilled
Strategy 4.4 Invest in communication tools to ensure the program is well-understood – Short Term (URGENT)
Actions (in priority order)
4.4.1 IAC/AUSVEG/HAL to refer all crop protection-related matters to the planning framework. (Any plan that covers a diverse range of activities requires a significant commitment by the owners of the plan to instil discipline in its use.)
Timeframe & Responsibilities: Immediately upon adoption of the plan (HAL responsibility in conjunction with AUSVEG, the IAC, Advisory Groups and Working Groups)
Resources: Requires a management process that ensures HAL is confident of adherence to plan
4.4.2 In concert with all the preceding activities, adopt the plan framework as a “common language”. (Although some of the changes will take some time to implement, it is important to transmit a clear and consistent message about the design and purpose of the new approach to crop protection issues.)
Timeframe & Responsibilities: ASAP (HAL responsibility in conjunction with AUSVEG, the IAC, Advisory Groups and Working Groups)
Resources: Requires clear and consistent communication guidelines
…APPENDIX 1A
Work
In P
rogres
s
Appendix 8 : Page 23 Page 223

21NOTE: INDUSTRY SIGN-OFF IS REQUIRED BEFORE THIS CAN BE FINALISED
Objective 1: Information is readily available
Industry members are aware of the scope of crop protection and the various options to access the information they need, when they need it.
Who can access the information?Generally, the hardcopy information outputs from HAL/vegetable levy projects fall into two broad types. Their availability is as follows:
1. Final Reports These are posted on the HAL website and short summaries are available to all site users. There is a limited search function. The full report can be purchased online (hard copy only). HAL staff and senior industry office holders can access the full report as an electronic version via a password. The final report tends to be, of necessity, quite detailed and is not designed to be the primary delivery channel to the bulk of growers.
This distribution is now under review as the HAL final reports have been loaded onto the Vegetable Industry Development Program - Knowledge Management database housed on the AUSVEG website.
…APPENDIX 1B
INFORMATION INTERMEDIARIESMost researchers are very keen to communicate with growers about their work, both during and after a project. In a few cases, state departments have specialist extension staff, who may play a key role in interpreting the R&D outcomes.
However, the decline in both research and extension staff in state agencies has left a gap that is yet to be filled. Growers interact with many other commercial service providers who play a role in information provision.
They include suppliers of inputs such as seed, fertiliser, equipment and pesticides, as well as agronomists, pest advisors and field staff from marketers and processors.
However, at present, these people are not generally privy to the information that comes from industry projects.
Some people from supply chain businesses may be linked into the projects themselves and/or attend information sessions, but this is not currently managed to optimise benefits to growers.
However, access is only available to industry participants that are registered for the AUSVEG website.
2. Extension Resources Project proposals are expected to include an extension strategy and many projects produce hard copy, “grower-friendly” materials such as Ute Guides, Fact Sheets, CDs etc. These are distributed by whatever means possible, usually by means of state grower organisations. However, when this initial distribution is complete, (usually as a project finishes) there is no mechanism for ongoing distribution as either hard or soft copies.
This distribution is also under review, with the aim of locating electronic copies of these extension resources within the industry Knowledge Management database on the AUSVEG website. However, access is only available to industry participants that register on the site.
What other examples of crop protection extension could provide ideas?
Many other industries in Australia and overseas have grappled similar issues regarding the most effective way to extend information. Each situation is unique, but the Australian industry’s current commitment to improve the effectiveness of web-based delivery through its Knowledge Management database makes the long history of the University of California (UC) Statewide IPM system of particular interest. Professor Rick Roush of Melbourne University provided particular insights from his several years experience as director of the UC Statewide IPM program.
Appendix 1B: Examples and information to illustrate each of the objectives
For further information contact: Sarah Sullivan Program Manager Horticulture Australia Ltd. Phone: (02) 8295 2374
Vegetable IPM Diseases Program An overview
Some of the key issues include:- Information on a website is
important, but will not of itself change behaviour – it is one element of an overall communication, research and training package
- In California this package includes teams of qualified farm advisors though the Cooperative Research Program run through the US Land Grants system, as well as through USDA
- The services undertaken extend to compiling weather station data that can feed into pest and disease prediction models.
Work
In P
rogres
s
Appendix 8 : Page 24 Page 224

22 NOTE: INDUSTRY SIGN-OFF IS REQUIRED BEFORE THIS CAN BE FINALISED
…APPENDIX 1B
- The website covers all crops and also home garden and domestic pest control (important sources of chemical runoff).
However, website resources are produced by two people plus 4-5 writers
- The UC IPM program decided against seeking sponsorship from chemical companies for risk management reasons
- The UC IPM system is 90% government funded and therefore must deliver clear public benefits – large numbers of the 50,000 hits/month are domestic enquiries.
- Other examples of “public good” activity are addressing “orphan pests” that don’t fit neatly into one specific industry. Other activity relates
Macadamias have funded, with HAL, important R&D on a wide range of pests and diseases (including invertebrate pests).
The industry also emphasises the health-giving properties and “clean and green” production practices.
Commercial crop advisory business based in Bundaberg, Hortus (formerly CropTech) has data from decades of soil and water analysis and pest management services across many
EXTENSION PROVIDES EVALUATION OPPORTUNITYIt is very difficult to establish changes in pest management (or any other factor) across even one commodity, let alone an entire industry such as vegetables. One approach involves “learning by doing” and using the learning outcomes to provide evidence of improved practices. A version of this was applied successfully in a section of the US winegrape industry in Lodi Woodbridge.
Researcher Cliff Omart measured some benchmarks for crop protection practices and then mentored growers in “softer” approaches. This approach also involved some auditing of on-farm practices against the initial benchmarks. Within one season, Dr Omart’s growers were able to provide firm evidence of improved practices. A similar approach is taken with the Rice industry in Australia with annual benchmarking being an integral component of the extension strategy and feeding into research priorities.
AUSTRALIAN WINE INDUSTRY EXTENSION PROGRAM FOR IPM
In the wine industry, IPM is well entrenched in the business practices of successful wine grape producers. It is reported that IPM is now just part of Industry Best Practice, rather than a standout issue on its own.
Several factors have contributed to this. Firstly, the development of alternative technologies through R&D was supported throughout the supply chain.
As a processed product, factors affecting wine quality and consumer perceptions need to be, and are, managed closely by wineries.
Also, from about 2000 – 2005 major efforts were made to boost adoption of IPM including a significant “Research to Practice” extension effort. Cost savings in going away from calendar spraying to the current practices were also a big reason for adoption.
to developing healthy natural ecosystems.
- Information has extended beyond IPM and now includes water quality and air quality issues – the vast scale and concentration of agriculture in places such as the Central Valley now involves monitoring of Volatile Organic Compounds (VOCs). VOCs are released from pesticide EC or emulsifiable concentrate formulations and react with sunlight to form ozone, a major contributor to smog.
crops, including macadamias and vegetables.
This information has now been compiled on a database that provides a rich source of information for future monitoring and crop protection decisions.
Importantly, the whole process for ongoing advisory services is managed electronically.
This covers field monitoring for pests and beneficial, to ordering control agents as required, recording their use and assessing
COMMERCIAL WHOLE OF SUPPLY CHAIN ADVISORY SERVICES IN MACADAMIAS
crop quality before and after packing.
At every stage, information is communicated electronically and amalgamated to reveal localised or regional issues.
This enriches pest management knowledge for all participants and the macadamia industry has been piloting the development of tailored systems with Hortus that now involve 80% of growers.
Work
In P
rogres
s
Appendix 8 : Page 25 Page 225

23NOTE: INDUSTRY SIGN-OFF IS REQUIRED BEFORE THIS CAN BE FINALISED
Objective 2: There are clear roles and responsibilities in addressing issues
Acute risks to the vegetable industry and its markets as well as strategic crop protection threats are addressed, utilising the appropriate combination of public sector and commercially-driven expertise.
Are the key risks and opportunities related to crop protection being covered?During consultations undertaken to inform this plan, questions emerged about some of the key risks related to crop protection. These include loss of markets due to pesticide scares or due to quarantine issues prompted by incursions.
Other risks include deregistration of products considered essential for control of particular pests.
One example is the pending loss of dimethoate and fenthion as a postharvest treatment against fruit fly for export vegetables such as capsicum.
This is an example of a long-term, low-level risk escalating to become a real and imminent threat to major sections of the industry and potentially a crisis if no alternative treatments are available when needed.
…APPENDIX 1B
There are processes available for industry to analyse risks and develop preparedness. The mushroom industry is one that has taken this process very seriously and is well prepared with its AMSAFE scheme.
While not all risks are linked to crop protection, it is proposed that strategies within this plan are adopted to address this area. These will then be integrated with issues specific to biosecurity, managed in conjunction with Plant Health Australia.
The flip side of risk is opportunity. Many stakeholders raised the need to educate consumers about the sophisticated pest management practices undertaken by industry today.
There is frustration that the retreat from “blanket spraying” may mean that some produce may contain beneficial insects, such as ladybugs. Consumer complaints mean that supermarket specifications say “no insects” – a potential deterrent to IPM adoption.
There may be opportunities for branding to capture value for growers who practice IPM, as with Nature Grown in the UK. However, this would require involvement of supply chain partners – who is responsible for facilitating discussions about these marketing matters?
One of the biggest risks is making assumptions about the roles and responsibilities of the many varied stakeholders in an industry such as vegetables.
Some believe that commercial players such as pesticide companies and suppliers, (as well as producers of beneficial insects) can provide all the technology needed for the industry to thrive.
Others recognise the role of levy programs and government research agencies in developing independent information, as well as in areas such as incursion preparedness.
IS PERFORMANCE IMPROVING?
Most growers are familiar with completing spray diaries and undergoing food safety audits to satisfy customers such as retailers and processors. This confidential information ensures that only registered products have been used, but reveals little about use patterns. While it is a very different industry, it is interesting to note that, in New Zealand, deliveries of winegrapes are accompanied by spray diaries, whose contents are logged confidentially by the winery. This enables the industry to analyse changes in pesticide use over time.
CONFUSED RESPONSIBILITIES?A serious new plant disease, Tomato Yellow leaf curl virus, is believed to have been present in industry for around two years before it was brought to the notice of qualified pathologists and action was then taken.
While it is difficult to determine exactly, it appears that concerned growers may have been led to believe that high diagnostic costs would apply. There may also have been incorrect diagnoses from unqualified advisors who mistook the symptoms for nutrient deficiency. Delay can lead to disaster when it comes to exotic incursions.
Exotic Plant Pest Hotline on 1800 084 881“With a large number of
smaller-scale growers and different crops, there are particular biosecurity issues that need to be carefully managed. AUSVEG’s membership of PHA provides ongoing access to advice and partnerships with other biosecurity stakeholders across industry and government to help manage these biosecurity issues.”Plant Health Australia websiteW
ork In
Prog
ress
Appendix 8 : Page 26 Page 226

24 NOTE: INDUSTRY SIGN-OFF IS REQUIRED BEFORE THIS CAN BE FINALISED
These issues overlap with the roles of public/private providers discussed under Objective 4.
Assumptions are also rife about the way that priorities are set for investing levy funds. Some believe that, as levy-payers, only growers should be involved. Others point out that, on past performance, poor engagement with industry meant that few growers contributed, their
…APPENDIX 1B
Currant Lettuce Aphid (CLA) response – preparation or reaction?An example of the benefits of overseas linkages is the fact that existing lettuce project staff were aware of the impact of CLA in New Zealand. Before CLA arrived in Australia, researchers had arranged permits in advance and undertaken efficacy work. Bayer provided important support in developing effective soil drench protocols with seedling nurseries. A “de-brief” would be useful to learn any lessons for future incursions, particularly regarding responsibilities.However, experts in the industry state that the problem has not gone away forever and suggest that industry may have a false sense of security. Reliance on a single chemical active and a failure to use alternative management strategies could cause insect resistance.
ideas were little more than a “wish list” and many of these did not progress because the solutions were already available. Yet, there was no process to feed back that information in a helpful manner in order to drive awareness and adoption.
One approach, the two-pronged strategy adopted in the development of the plant pathology program, appears to have merit.
1. Linkage with industry – Identify key issues from growers’ perspective
2. Basic science development – Identify key gaps from practitioners’ perspective
A key area of responsibility is the “honest broker” role to ensure a balance between these different perspectives and to flush out any unrealistic expectations.
Across the potato and vegetable crops there are more than 30 high priority exotic pest threats that have been identified through the threat assessment process with PHA. With a large number of smaller-scale growers and different crops, there are particular biosecurity issues that need to be carefully managed. (PHA Tendrils magazine, Nov 2008)
Many different answers were received from stakeholders when asked who is responsible for:- managing pest/ disease incursions? - negotiating market access for international imports and Exports? - negotiating market access for interstate trade? - ensuring availability of pesticides? - developing IPM tools? - checking for residues? - communicating with consumers about crop protection/IPM?The options included -
IAC - Industry Advisory Committee AQIS PHA - Plant Health Australia AUSVEG HAL - Horticulture Australia Limited
Research agencies
Vegetable Growers Retailers/processors
Chemical companies FSANZ - Food Standards Australia New Zealand
Biosecurity Australia DAFF - Departmet of Agriculture Fisheries and Forestry
Chemical resellers State agencies APVMA - Australian Pesticides and Veterinary Medicines Authority
Work
In P
rogres
s
Appendix 8 : Page 27 Page 227

25NOTE: INDUSTRY SIGN-OFF IS REQUIRED BEFORE THIS CAN BE FINALISED
Objective 3: Market impacts are monitored and addressed
Industry engages through the supply chain to maximise the competitive advantage from adoption of innovative and sustainable pest management practices.
Do consumers really demand insect-free produce?Preliminary results from focus group studies undertaken by researchers at NSW Industry & Investment suggest that many consumers are not concerned by insect contamination. While results from a more detailed study are needed to confirm this, it could help to relax supermarket specifications. This, in turn, could remove an important barrier to the adoption of integrated pest management (IPM).
IPM minimises the use of pesticide sprays, which can kill beneficial insects as well as problem pests, leading to the “pesticide treadmill”.
…APPENDIX 1B
Importantly, this reduced use also reduces the likelihood of insects developing resistance to the spray, thus extending the useful lifetime of the pesticide products. It is essential to have effective sprays on hand for those times when the balance swings too far in the pest’s favour. After spray treatment in greenhouses growers need to re-introduce laboratory-reared beneficial insects to restore the balance, in the field they will need to re-colonize. This IPM approach has many benefits, but can result in produce going to market containing some of these “beneficial bugs”. If any consumers complain about this, it encourages retailers to reject any deliveries containing these.
The solution may lie in improved communication along the supply chain. Growers have invested heavily in IPM, both through levy-funded R&D, as well as individually, as they learned how to do things differently. However, no-one took responsibility for communicating with retailers and consumers about the changes that were happening. Discussions occurring in the preparation of this plan indicated that some retailers would welcome opportunities to educate consumers about the efforts growers make on their behalf.
Beneficial bugs help rescue Spanish capsicum industryBy the mid-2000’s, biocontrol was well-established in this sector in North America and Northern Europe.
However the large greenhouse industry in Southern Europe was predominantly chemical based. This changed forever following a damning series of residue violations, emanating from the vast acreage of capsicums grown under plastic in the Spanish province of Almeria.
Initial data from research involving six focus groups who assessed acceptability of some insects in lettuce. Key: tick = ok, easily washed off; dash = maybe ok if only one; blob = not ok, would result in product rejection (NOTE data from Jenny Ekman NSW I&I, Gosford)
This shook consumer confidence in retailers’ food safety systems and led to a slump in demand for produce from the region. In response, the Spanish government initiated an extensive extension and training program and subsidised the cost of biocontrol agents, in order to rapidly rebuild Almeria’s reputation.
Biocontrol in AustraliaWhile grower- and government funded R&D has played an important role in developing the use of beneficial insects, their ongoing availability rests with commercial laboratories.
For vegetables, much of the early development of biocontrol has occurred in the protected cropping (greenhouse) sector. With support from innovative growers, as well as research agencies, a number of independent biological control companies have become established in Australia over the past 20-30 years.
THE CHINA QUESTION China’s expanding food industry has suffered major blows to its reputation from a number of serious contamination events over the past several years. However, this has not prevented Chinese vegetables from succeeding in a number of markets previously very important to Australian vegetable exporters. This success, in turn, poses a real threat to domestic production of processed vegetables, where market access barriers are minimal. Unfortunately, scare stories can hurt all market participants by turning consumers off a whole product category. The Australian industry is in a position to use more positive signals about our “clean and green” production – but it must be confident in its own integrity before doing so.
Work
In P
rogres
s
Appendix 8 : Page 28 Page 228

26 NOTE: INDUSTRY SIGN-OFF IS REQUIRED BEFORE THIS CAN BE FINALISED
As well as competing for the supply of some bugs, many of these businesses collaborate under the banner of Australasian Biological Control (ABC).
This organisation has also developed an IPM logo for potential branding of low-pesticide produce.
One example of the potential impact of biocontrol is the capsicum industry in Western Australia. Working with local grower clients, IPM specialist Lachlan Chilman of Manchil IPM Services developed insectaries to raise natural predators of some of the key greenhouse pests.
While gaining insights from similar industries overseas, unique approaches had to be developed for local growing conditions. Now, the entire WA capsicum crop is grown under IPM.
Watching the trends overseasMarket conditions and growing conditions in Australia are unique. That is one reason that Australian authorities make their own decisions about pesticide approvals and regulation.
Despite this, when pesticides are de-registered overseas, consumers in Australia start to ask questions about their continued use in our industry.
The Australian Pesticide and Veterinary Medicines Authority (APVMA) reviews “old” chemistry – the Existing Chemical Review Process (ECRP) and new registrations under a ‘risk-assessment’ framework.
In Europe, registrations and deregistrations are decided within an ‘hazard-assessment’ framework which at times comes up with a difference of opinion to the Australian risk-assessment.
Consumer pressure is a major driver for many common pesticides being due for de-registration in the near future in Europe. This is placing an added impetus behind the search for alternatives. In some cases, chemical companies are coming up with “softer” products.
However, as the development and registration costs mount up, these companies are starting to ration the use of these products, to make sure
…APPENDIX 1B
they are not over-used or misused in ways that promote the development of resistance.
This may mean that some products never become available to the vegetable sector in Australia. Resistance can occur very quickly with fungicides and so the companies themselves may be keen to see biological treatments developed in concert with the judicious use of chemicals.
PACKAGING(1) – GOOD FOR SWEETCORN IPMSome consumers might say they don’t like packaging, but retailers reported increased sales of sweetcorn when they were unwrapped, trimmed and wrapped in trays.
The “cobbettes” had another advantage for growers – the trimming removed any traces of damage caused by caterpillars feeding at the tip.
Protected by the silks, these are notoriously difficult to control and trimming at the tip means that 100% control just isn’t necessary.
POSTHARVEST CHEMICALS The ECRP is currently assessing two important postharvest chemicals – Fenthion and Dimethoate – that are crucial for interstate and overseas market access from fruit fly endemic regions. This review has been flagged for many years, but at this stage industry has no alternative process in place.
SPECIAL COMPOST STOPS THE ROT IN ONIONSThe UK has withdrawn one of the most effective chemicals for the control of white rot in onions. This is a serious soil-borne disease, causing major crop losses and is also prevalent in Australia. A natural fungus, Trichoderma viridae, has been found to suppress the disease to some extent. However, when it was inoculated into compost before being applied as a band beneath the onion row, the mixture provided excellent disease control. This is one example of the way R&D needs to respond to Crop Protection drivers along the supply chain.
PACKAGING (2) – NOT SO GOOD FOR LETTUCE IPMA field-grown cos or iceberg lettuce is a large vegetable and is difficult to grow entirely free of insects. It is also difficult to manage along the supply chain to reach the consumer at its best, so overwrapping with plastic to seal in freshness seemed like a good idea.
However, the plastic wrap also seals in any insects, many of which are not causing any damage and would escape the lettuce if packed in boxes without plastic wrap. The bagging tends to see the captured insects gather at the surface and slightly magnified through the plastic highlighting their presence.
Work
In P
rogres
s
Appendix 8 : Page 29 Page 229

27NOTE: INDUSTRY SIGN-OFF IS REQUIRED BEFORE THIS CAN BE FINALISED
Objective 4: Short, medium and long-term needs are addressed through program approach
Accountability and coordination are underpinned by a planning framework that establishes long term strategic goals (based on sound scientific and risk:reward analysis) while accommodating the need for tactical response capacity.
What is IPM?IPM (Integrated Pest Management) simply means using a combination of strategies to manage pests. However, many definitions of IPM are far from simple, as shown by this example. This emphasises a broad definition of the term “pest”, whereas IPM is sometimes thought to cover only insect pests.
…APPENDIX 1B
It is easy to confuse the issue when describing something that could encompass using disease resistant varieties, spraying when pest populations reach a threshold , netting against bird damage or incorporating a “green manure” crop to suppress soil-borne pathogens.
Some industry people may believe that IPM is “non-chemical” or “organic”, or “on-farm only” (whereas it is none of these). Therefore this plan has used the term “Integrated Crop Protection” to indicate to these stakeholders and others that it covers all aspects of managing all types of pests and their implications.
How is the Integrated Crop Protection program organised?As with most levy-funded programs in horticulture, an Industry Advisory Committee (IAC) is convened on industry’s behalf, to advise the HAL Board on the recommended total R&D program for each year. With vegetables, the IAC is itself advised by a set of more specialised advisory groups. One of these, the Production Advisory Group, is in turn advised by a series of working groups. One of these, the IPM Working Group, has acted as a
reference group for the Integrated Crop Protection planning and coordination process.
However, each working group covers areas of central concern to crop protection. This crop protection plan also covers areas of concern to the other three Advisory groups.
What is a program approach and will it increase benefits to growers?As noted above, vegetable R&D is currently arranged as a set of four programs and there are some sub-programs under the Production area. However, a program approach is about a lot more than categorising similar projects together. It is designed to switch the focus of industry and HAL decision-makers away from deciding between a multitude of competing projects. Instead, the focus is on identifying key long-term goals that will deliver the greatest benefit. This involves preparing detailed operating plans for these key issues that evaluate alternative technical and extension approaches. This more macro approach also enables partnerships with other interested public and commercial partners to be developed.
IPM is considered to be a sustainable approach to managing pests using a combination of pest control methods combining biological, cultural, mechanical and chemical pest management tools to minimise economic (yield loss and quality), health, and environmental risks. IPM has a holistic approach to pest management and therefore the term refers to the management of ALL agricultural pests including plant pathogens (fungal, bacterial and viral), weeds, invertebrates (e.g. insects, mites and nematodes) and vertebrates (e.g. birds, mice, bats). IPM considers the production system as a whole, and therefore requires an understanding of all the facets of horticultural production inside the farm gate and how it impacts on the market requirements throughout the whole horticultural produce supply chain.
Work
In P
rogres
s
Appendix 8 : Page 30 Page 230

28 NOTE: INDUSTRY SIGN-OFF IS REQUIRED BEFORE THIS CAN BE FINALISED
The vegetable pathology program was developed from a stocktake process that included workshops in all the main growing regions.
At around the same time, soil health stocktakes were also undertaken for the subtropical and temperate industries.
Synergies were recognised between the findings from the soil health and pathology stocktakes, in relation to soil-borne diseases.
The resulting program addressed a large number of soil and leaf disease issues and is currently engaged in a major extension exercise regarding key findings.
What is the return on investment in Integrated Crop Protection R&D?Crop protection issues have always rated highly in prioritising R&D under the vegetable levy. Pest issues pose a clear and present challenge for growers, while other challenges (such as low prices) may appear to be less amenable to R&D solutions.
To date, there has been little attention to the relative benefit cost analysis (BCA) of alternate vegetable R&D funding decisions.
It is often difficult to derive meaningful BCAs for small projects. However, BCA is more viable for larger programs and can provide other benefits such as setting a baseline for future benchmarking of adoption rates by industry. (This approach is reflected in the current project VG09191, which is to
WEED CONTROL IN VEGETABLESWeeds tend not to directly affect product appearance in the way that pests and diseases do. However, without weed control, there may be no marketable yield at all. Plus, “Certain weeds on farms act as refuges for insect pests and disease inoculum, thus demonstrating an increased value in managing weeds.” (Frost, P. VG04024).”
A good example is the Western Flower Thrips/TSWV pest/disease complex, where farm hygiene in terms of weed control is a key element of IPM.
There are also specific weeds issue for freshcut babyleaf where some weed leaves pose food safety concerns. However, relatively few projects have been funded on weeds. This may be an instance where the “weed management program”, such as it is, sits outside the HAL R&D program and is mostly undertaken by chemical companies.
However, this reduces the chances of non-chemical alternatives being developed in case existing products are withdrawn. Further review may be merited, particularly with regard to herbicide resistance.
(Refer also to note regarding the RIRDC weed program)
INTERNATIONAL COLLABORATION TO DELIVER THROUGH MINOR USE AND ECRP PROGRAMSLinkages created by Kevin Bodnaruk (AKC Consulting) and Peter Dal Santo (Agaware Consulting) with IR4 in the USA are being used to work towards greater sharing of data and collaborations between countries. This is of great importance for the minor use program and is expected to reduce the cost of obtaining more minor use permits and will also assist in the extension of labels for more product uses in Australia.
Pathology program collaboration extended across all states as well as overseas, with Warwick HRI in the UK co-funding some of the work.
The collaboration also resulted in a major revision of the key “Diseases in Vegetables” book, published in 2010.
develop benchmarking indices and guidelines for future projects to assess practice change and assess the potential of on-line systems.)
This table indicates spending over a ten-year period averaged $4.7m per annum (combined levy and HAL matching funds). From 2001-2007, the average budget for crop protection was about 50% of total levy spend (see graph)
Who else can or does pay for crop protection R&D?When analysing potential returns from crop protection R&D, it is important to review the value of additional external funds generated by the industry levy investment.
…APPENDIX 1B
VEGETABLE CROP PROTECTION FUNDING 1996-2006 (DATA PROVIDED BY HAL IN VG05043)
Category $
Chemical $ 7,012,388Entomology $12,974,498IPM $ 7,076,120Pathology $14,431,518Weed $ 2,113,118Other pests $ 3,206,572TOTAL $46,814,214
Work
In P
rogres
s
Appendix 8 : Page 31 Page 231

29NOTE: INDUSTRY SIGN-OFF IS REQUIRED BEFORE THIS CAN BE FINALISED
For example, it should be noted that the true cost of this R&D was considerably higher, since much of it was undertaken by State Departments of Primary Industries and CSIRO.
These public research agencies generally provide permanent staff and research facilities at a value equal to the HAL/industry contribution.
Other government funding may be injected to some projects that are undertaken in partnership with organisations such as ACIAR (the Australian Centre for International
Agricultural Research), RIRDC or Cooperative Research Centres (such as the CRC for National Plant Biosecurity).
In addition, commercial-in-confidence research is funded in-house by chemical companies and others seeking to develop products for sale. Private funds from companies such as these may also assist with project costs and attract additional funds through the HAL Voluntary Contribution program, such as when the vegetable industry wishes to accelerate access to new chemistry.
What are the roles of public and commercial R&D service providers?The traditional concept of crop protection R&D is field-based or laboratory research on new pests or new methods to control existing ones. These days, rather than just developing scientific results, R&D aims for integrated packages of workable solutions.
The bulk of levy-funded crop protection R&D has been undertaken by public research agencies, such as state DPIs, universities or CSIRO. These organisations are involved because
…APPENDIX 1B
“ In the predicted scenarios, the threat of foreign disease invasions is likely to cause over $2.4 billion in costs to the vegetable industry and government. This represents about 7 to 12 times the investment needed to bring a new crop protection product to the market. Therefore, the ROI for R&D investment is positive from the perspective of potential losses”. (Cook et al, 2010 in Estrada-Flores,S. 2010 VG08087 - Emerging Technologies for Production and Harvest)
of scientific or policy imperatives (such as regional economic development) and provide significant infrastructure support.
However, to achieve the goal of workable solutions, their projects generally link to the broader public and commercial crop protection services used by the vegetable industry. These include:
• Breedingpest/diseaseresistant varieties
• Developingbeneficialinsectsfor biological control
• Developingnewcropprotection chemicals and machinery to apply them
• Developingalternativefertilisers, soil conditioners and irrigation systems that help reduce pest or disease attack
• Testingcommercialproductsfor efficacy under various conditions
• Registeringandregulatingtheuse of pesticides
• Cropmonitoring,analysisanddiagnostic services
• Providingadviceandtrainingrelated to crop protection
Vegetable Levy Funding by HAL Portfolio Area (Wells, B, 2010)
Work
In P
rogres
s
Appendix 8 : Page 32 Page 232

30 NOTE: INDUSTRY SIGN-OFF IS REQUIRED BEFORE THIS CAN BE FINALISED
• Providingpesticides,beneficial insects and other inputs as required
• Providingadvisoryandcertification services to satisfy food safety, OHS and environmental requirements
• Researchingandmonitoringmarket/consumer demands regarding product attributes
Some of these linkages are stronger than others, depending on circumstances. The aim of levy-funded and publicly-funded R&D is to address “market failure” – dealing with issues that neither the commercial sector, nor individual growers, can address. In recent years, the erosion of publicly-funded R,D&E has continued, with provision of staff and resources led by industry priorities and funding. The NHRN/PISC process is an attempt to share these dwindling resources across the
RIRDC $12m weeds program has potential benefits for vegetable industryExpected key outputs for 2010-11 • WeedsstrategicR&Dplan• ImplementationofWeeds
research program• Toprovideclearsignals
concerning R&D needs and priorities for 2010-11
• Publishpreviousweedsresearch
• Partneringwithotherkeygovernment and non-government agencies on Weeds research development and extension
What is the NHRN/PISC process for R&D rationalisation?The National Horticulture Research Network (NHRN – comprises state DPIs, CSIRO and TIAR) has developed a proposal for each horticultural sector for the delivery of R&D services. This is designed to remove any unnecessary duplication between states and also to ration and identify major gaps in available expertise. It is linked to a similar exercise through the Primary Industries Standing Committee (PISC – comprises State and Federal Agriculture Departments), covering agriculture as a whole.
Some attributes of Public R&D providers Some attributes of Commercial service providersIndividuals develop specialised knowledge including some highly specialised experts e.g. taxonomists, nematologists
Often generalists, need flexibility across broad customer base, but may be more targeted, e.g. seeds, nutrition
Broader approaches developed through:1 Inter-agency linkages and information sharing
2 Intra-agency linkages – universities, CSIRO and state departments contain multiple disciplines
Multiple individuals interact regularly with large numbers of growers and can gain broad picture of developments. Closer relationship with growers.
Training of next generation of technical expertise Important career paths offered, but not generally highly science-focussed
Undertake public good R&D- Biosecurity- Environmental/Natural Resource Management
focus- Cross-sector issues (e.g. climate change)- Regional development
Commercial drivers
Customer-driven
Some parts of some state agencies provide limited extension support, but not Universities or CSIRO
Uptake of private extension is patchy – most advanced in Tasmania
Government agencies provide infrastructure and resources equivalent to HAL/industry funding
May provide some voluntary contribution funding or in-kind
Independence, peer review, academic standards, information sharing
Must deal with all growers but find good operators to work with on projects
Some private providers can select their clients. Others, such as resellers, must deal with everyone.
NB Value of strong and effective linkages between public and private sectors, (but important that private providers acknowledge when information is sourced from public providers
…APPENDIX 1B
Work
In P
rogres
s
Appendix 8 : Page 33 Page 233

31NOTE: INDUSTRY SIGN-OFF IS REQUIRED BEFORE THIS CAN BE FINALISED
…APPENDIX 1C
Strengths (internal)• Steadyflowofincomevialevies
• Geographicspreadincreasesreliabilityofsupply
• SignificantbodyofpastR&Dresults
• Changesincropprotectionmethodsprovidepotential good news stories for consumers
• Manycropssharethesamekeypests
• SignificantR&Dexpertisefocusedonvegetablecrop protection issues
Weaknesses (internal)• DiversityofcropsandregionscandiluteR&D
effort and reduce focus
• Poorlydevelopedcommunicationschannelsimpede flow of information into and out of R&D program
• Fewbarrierstoentryresultsinprice-drivenmarketing, poor margins and reduced ability to adopt innovations
• Pricerewardisusuallytiedtocropfailureinother regions and often paid on poorest quality produce during short supply
• Pooreducationlevelsinpartsofindustrycanact as barrier to innovation
• Poorindustryimageispotentialbarriertoattracting younger entrants
• Industryfragmentationmakesitdifficulttogenerate unified, positive message about industry or respond to external opportunities
This analysis includes some of the key internal and external factors impacting on the ability of the vegetable industry to manage its crop protection program to drive competitiveness. These factors were compiled by the team involved in development of the Vegetable Integrated Crop Protection RD&E Plan from input provided by stakeholders involved in the consultation process that occurred in July-August 2010.
Appendix 1C: SWOT analysis of the relevant internal and external factors
Work
In P
rogres
s
Appendix 8 : Page 34 Page 234

32 NOTE: INDUSTRY SIGN-OFF IS REQUIRED BEFORE THIS CAN BE FINALISED
Appendix 1D: Reference ListGiven the breadth of this topic, only a few references are provided to guide further investigation and assist with implementation.
A. Key Crop Protection review documents:VG05026 Nematode stocktake
VG05043 IPM Stocktake final report with appendices (2)-1
VG06090 Soil health stocktake - temperate - Porter
VG06092 Pathology Stocktake - IPM Gap Analysis for Vegetable Pathology
VG06094 Sucking Pests stocktake
VG06100 Soil health stocktake - sub-tropical – Pattison
B. National IPM Co-ordination processes/meetings (notes available)Jan 27th 2005 National IPM Meeting - NZ
May 10th 2005 National IPM Meeting – Indooroopilly
July 7th 2005 AUSVEG & HAL IPM investment planning meeting – Sydney
Feb 15th 2006 VG05043 Vegetable IPM Stocktake - Sydney
May 10th 2006 IPM Workshop – Vegetable Conference, Brisbane - Entomologists and Pathologists met separately on 9th
July 3rd 2006 Vegetable IPM Working Group Meeting - Sydney
June 2007 Vegetable IPM Working Group Meeting – Melbourne
Sept 18th 2007 HAL WFT meeting, Sydney
May 22nd 2008 IPM Meeting Sydney
July 2008 IPM Working Group
Aug 6th 2009 IPM Working Group, Melbourne
Aug 13th, 14th 2009 Ento and Path meetings separate and together, Melbourne
C. Related planning documents VegVision 2020
HAL Strategic Planning Guidelines incl Appendices - 2009 12
Victorian Vegetable Strategic Plan web
HAL Plant Health Strategic Plan 2007-12
HAL Horticulture Industry Crisis Management Guidelines V1 0 (2) 22nd Jan 2010
NHRN Horticulture Framework - PISC RD&E FINAL 28th Jan 2010
National Vegetable Industry Biosecurity Plan
Emergency Plant Pest Response Deed (EPPRD) between Ausveg and Plant Health Australia (PHA)
D. Extension methodsVG05007 Demonstrating integrated pest management of IPM in brassica crops
…APPENDIX 1D
Work
In P
rogres
s
Appendix 8 : Page 35 Page 235

33NOTE: INDUSTRY SIGN-OFF IS REQUIRED BEFORE THIS CAN BE FINALISED
VG06066 LOTE AUSVEG
VG06086 IPM adoption survey 2007
IPM Adoption - Horne et al, AJEA 2008
VG07118 Build capacity of greenhouse growers to reduce crop loss through adoption of preventative disease management practices
E. Consumer and market issuesChoice - Food endorsement programs http://www.choice.com.au/Reviews-and-Tests/Food-and-Health/Labelling-and-advertising/Sustainability/Food-endorsement-programs/page/Introduction.aspx
Spray Drift - http://www.apvma.gov.au/use_safely/spray_drift/index.php
Eco-labels - http://www.greenerchoices.org/eco-labels
Good Natured (UK IPM brand) - http://www.angussoftfruits.co.uk/good-natured-fruit.html
Australasian Biological Control Association IPM logo scheme - http://www.goodbugs.org.au/ipmlogoscheme.html
Ekman, J. 2010 What’s that bug in my lettuce? IPM and consumers – project briefing note NSW I&I
F. Emerging technologiesCook, D. C., Hurley, M., Liu, S., Siddique A.M., Lowell, K. E. and Diggle, A. (2010), “Enhanced Risk Analysis Tools”, CRC10010 Cooperative Research Centre for National Plant Biosecurity pp. 1-479. cited in
Estrada-Flores, S. (2010), “Technology Platform 5: Emerging Technologies for Production and Harvest“, Opportunities and challenges faced with emerging technologies in the Australian vegetable industry. Horticulture Australia Ltd.pp20-21
G. Other partners in technology development for crop protection in vegetablesG.1 Rural Industries R&D Corporation (RIRDC) – eg (1) weeds program
http://www.rirdc.gov.au/programs/national-rural-issues/weeds/overview/overview_home.cfm
(2) Asian vegetables/LOTE growers program
http://www.rirdc.gov.au/RIRDC/programs/new-rural-industries/new-plant-products/new-plant-products_home.cfm
and (3) proposed herb and spice levy
http://www.rirdc.gov.au/programs/new-rural-industries/new-plant-products/rirdc-projects-and-results/project-details.cfm?project_id=PRJ-005684
G.2 Cooperative Research Centre for National Plant Biosecurity
http://www.crcplantbiosecurity.com.au
G.3 Plant Health Australia
http://www.phau.com.au/index.cfm?objectid=565470B8-B714-84FF-254B1511E28B5827
G.4 Australian Centre for International Agricultural Research (ACIAR)
http://aciar.gov.au/HORT
G.5
http://www.mincos.gov.au/pi_standing_committee/pisc_members
…APPENDIX 1D
Work
In P
rogres
s
Appendix 8 : Page 36 Page 236

34 NOTE: INDUSTRY SIGN-OFF IS REQUIRED BEFORE THIS CAN BE FINALISED
…APPENDIX 1E
Appendix 1E: Summary of how the plan was developedThis plan was developed as part of a 12-month pilot project for improved coordination of the vegetable IPM R&D program, which commenced in April, 2010. Numerous review reports and meetings related to crop protection over the previous five years had emphasised the need for such a plan.
It was developed from a process of reviewing relevant documentation and consulting with over a hundred individual stakeholders from along the supply chain from June to August, 2010. This was designed to deliver a plan for consideration at the September 2010 Industry Advisory Committee meeting. This consultation process aimed not to be comprehensive, but to be representative of the vegetable supply chain.
Workshops or meetings were held as follows:
• IPMresearchers(HALoffices,Sydney)
• VGAVictoriaBoardmeeting(Melbournemarkets)
• NSWFarmersHorticultureConference(Homebush)
• Variousgrowers,industrypersonnel,inputsuppliersandresearchers(Multi-sitewebinar)
• VegetablePathology/SoilHealthRoadshowmeeting(Gatton)
The broader industry was also invited to participate through the following:
1. Summary of aims of planning process, offer to send briefing paper, invitation to provide input (Ausveg Weekly Update)
2. Email note to State Vegetable Associations with copy of briefing paper, requesting further circulation to members
3. Short article about planning process (Vegetables Australia magazine, July-August edition)
4. Update on progress to date and invitation to share ideas and information via googlegroup and to complete online survey (Ausveg Weekly Update)
The documentation reviewed included those listed in the bibliography. This includes some in-depth reviews (IPM Stocktake, Pathology Gap analysis, Nematode Gap analysis and Soil Health). Neither the agreed project scope, nor the available time allowed for these reviews to be repeated.
Top left: Veg IPM consultation in Tasmania.
Top right: Meeting with Bayer.
Bottom left: VGA Victoria Board meeting at Melbourne markets.
Work
In P
rogres
s
Appendix 8 : Page 37 Page 237

35NOTE: INDUSTRY SIGN-OFF IS REQUIRED BEFORE THIS CAN BE FINALISED
» APPENDIX 2Vegetable Integrated Crop Protection RD&E Plan
Program Plan 1
Thrips & Tospoviruses
February 2011
Work
In P
rogres
s
Appendix 8 : Page 38 Page 238

36 NOTE: INDUSTRY SIGN-OFF IS REQUIRED BEFORE THIS CAN BE FINALISED
Introduction 37
Plan Structure 38
Summary 39
Vision 39
Mission Statement 39
Situation Statement 39
Extension, Development and Research Themes 41
Methods and Task Plan 43
Extension Theme: Current best practice pest
management used by growers 43
Development Theme: Research outcomes modified for specific crops and regions 46
Research Theme: Development of new pest management approaches/tools 48
Proposed Foundation Projects 51
Summary table of proposed Thrips/Tospovirus foundation projects 52
Background 53
SWOT Analysis 53
Thrips and Tospoviruses Affecting Vegetables in Australia 55
Plan Development Process 56
Recommendations from Previous Work 56
Appendices (instructions for on-line access) 65
Acknowledgements: This plan has been based on the recommendations from previous related projects, in particular the ‘Sucking pest scoping study’ (VG06094). Further input was sought from researchers, growers, consultants and other interested industry members before it was presented to the National Coordinators of the Vegetable Industry Development Program (VIDP) and Horticulture Australia Limited (HAL). It is intended that this RD&E Program Plan, which forms part of the overall Vegetable Integrated Crop Protection RD&E Plan will be used as a working document by the members of the Vegetable Industry’s RD&E committees, i.e. the Industry Advisory Committee (IAC), Advisory Groups and Working Groups.
…APPENDIX 2
» CONTENTS
Work
In P
rogres
s
Appendix 8 : Page 39 Page 239

37NOTE: INDUSTRY SIGN-OFF IS REQUIRED BEFORE THIS CAN BE FINALISED
Introduction The Thrips & Tospoviruses RD&E Program Plan is the first of a series of program plans developed in conjunction with the “overarching” Vegetable Integrated Crop Protection Research, Development and Extension (RD&E) Plan. It falls primarily under Objective 4 of the overarching Plan, “Short, medium and long-term needs are addressed through a program approach” and provides a framework for future investment in RD&E for managing thrips and tospoviruses in vegetables, including Western flower thrips (WFT) and Tomato spotted wilt virus (TSWV).
The purpose of the plan is to improve the flow of benefits to vegetable levy payers from their investment in thrips and tospovirus related RD&E. There will be some cross-over between this program plan and the Pathology, Invertebrate Pests, Weeds and IPM Adoption RD&E program plans. Sometimes the same RD&E personnel will be working on the related projects that come under the different programs. Where this is not the case, some coordination will be needed to ensure the programs are working together where possible, complementing each other and drawing on results from the other programs as relevant.
This plan captures the recommendations from past projects related to thrips and tospoviruses, in particular the thrips section of VG06094 - A scoping study of IPM compatible options for the management of key vegetable sucking pests. If implemented, this plan will achieve the following benefits for growers:
access to all information generated from past projects that investigated thrips and tospoviruses, including •summaries and best practice information
access to knowledgeable IPM specialists who can assist with the transition to an approach that integrates •a range of management practices, i.e. a “multi-tactic approach”
clear recommendations on when and how to use thrips/tospovirus management tools and strategies •
continued research into better thrips/tospovirus management tools and strategies •
Development of this plan was done as part of the National Vegetable Integrated Pest Management (IPM) Coordination project (VG09191)1 as directed by the project brief from industry. This plan is one of nine recommended program plans to fall under the overarching Vegetable Integrated Crop Protection RD&E Plan. The overarching plan covers issues relating to biosecurity, the supply chain and coordination of crop protection related activities, which are therefore not covered in this program plan.
1 This project has been funded by HAL using the National Vegetable R&D Levy and matched funds from the Australian Government. It forms part of the Vegetable Industry Development Program (VIDP) and aims to plan, coordinate, monitor and support the development and adoption of best practice Integrated Pest Management (IPM) technology.
…APPENDIX 2
Work
In P
rogres
s
Appendix 8 : Page 40 Page 240

38 NOTE: INDUSTRY SIGN-OFF IS REQUIRED BEFORE THIS CAN BE FINALISED
Plan Structure In the Summary section, the Vision is presented and the Mission and Situation Statements explain the purpose of the plan. The Extension, Development and Research Themes are also introduced.
The Methods and Task Plan section outlines the methods required for achieving the desired outcomes under each of the Extension, Development and Research Themes. These approaches were derived from the common recommendations from a number of previous projects. There are specific Tasks under each Method and for each Task the mechanism(s), risk/reward ratings and expected project length are indicated.
Tasks (i.e. projects) to be undertaken as soon as possible are described in the Proposed Foundation Projects within a Coordinated Program section. They are listed in priority order with indicative budgets and they include some low risk/low impact tasks, which are the building blocks of an integrated management strategy for thrips and tospoviruses, as well as some higher risk and high reward tasks. Each of the research, development and extension themes are represented by the tasks selected for the foundation projects.
The Background section provides context for the plan and helps to explain why certain methods were selected. The information will also be useful when reviewing the plan in the future, as it helps with identifying changes in the operating environment that may call for adjustments to the plan. This section consists of:
• ASWOTanalysisoftherelevantinternalandexternalfactorsconstructedfromthrips-andtospovirus-related project reports and input from stakeholders involved in the consultation process during the development of this RD&E program plan
• Informationonthripsspeciesandtospoviruses,theirvegetablehostsandtheirrelativeimportanceindifferent regions of Australia
• Asummaryofhowtheplanwasdeveloped
• Alistingofrecommendationsfrompreviousprojects
• InstructionsforaccessingtheAppendices,whichareinanExcelworkbookthatismaintainedonawebsite. Individual worksheets in this file contain:
Information resources related to thrips and tospoviruses *
Past and present HAL projects covering thrips and/or tospoviruses *
Literature on thrips and tospoviruses*
A list of Stakeholders*
Risk/Reward matrices for various RD&E subject areas as determined in a workshop and via an on-* line survey
SWOT analysis (as presented in this Program Plan)*
Methods and Task Plan (as presented in this Program Plan)*
…APPENDIX 2
Work
In P
rogres
s
Appendix 8 : Page 41 Page 241

39NOTE: INDUSTRY SIGN-OFF IS REQUIRED BEFORE THIS CAN BE FINALISED
Summary VisionBy 2015 thrips and thrips-transmitted diseases are being effectively managed by vegetable growers to minimise the risk of crop loss, pesticide residues and/or the disruption of biological control options for other pests.
Mission StatementThe Thrips and Tospoviruses RD&E Program Plan will draw together the multiple, inter-related aspects of management of thrips and thrips-vectored diseases (tospoviruses) in vegetables.
Key objectives include:
vegetable growers have access to current knowledge on best practice management of thrips and 1. tospoviruses;
there is knowledge on how and when to use available tools; and2.
there is a balanced portfolio of research into developing management tools, which includes low risk 3. research and incremental improvements to or maintenance of existing tools as well as higher risk research with potentially much greater gains in managing thrips or tospoviruses.
The program will enable decision-makers to maximise the returns to growers from levy investments in research, development and extension, while leveraging off commercial and government programs.
Situation StatementThrips can cause significant feeding damage, particularly in flowers or developing fruits in a number of vegetable commodities, for example capsicums, eggplants and cucumbers. Some thrips species are also vectors of a class of viruses called the tospoviruses. Tomato spotted wilt virus (TSWV) is the most significant of the tospoviruses and the most widely distributed of all viruses in Australia. Although TSWV was first identified in 1927 and has been responsible for significant crop loss, the arrival of the Western flower thrips, Frankliniella occidentalis (WFT) into Australia in 1991 has seen the levels and severity of the disease increase. Capsicum chlorosis virus (CaCV) and Iris yellow spot virus (IYSV) are two other tospoviruses new to Australia, with CaCV first identified in 1999 in Queensland and IYSV in 2003. Both viruses are developing and have caused significant damage in some areas. In Bundaberg CaCV is displacing TSWV as the main virus and its’ primary vector is Melon thrips, Thrips palmi. In the Riverina whole onion plantings have been lost to IYSV vectored by Onion thrips, Thrips tabaci. A number of other significantly damaging tospoviruses could be introduced from SE Asia.
The worst areas for TSWV are in the intensive production areas, particularly areas with large numbers of low-technology greenhouses. Insecticides have been the primary management tool. However, insecticide resistance by WFT is high to most of the available chemistries and even in situations in which the thrips are susceptible, insecticides are not effective against virus-carrying thrips moving into a crop given virus transmission can be made within minutes of the thrips feeding. Although incidence and severity appears to be most severe in greenhouse and hydroponic situations, some field growers, particularly in intensive production areas can also have significant TSWV losses and often rely on insecticides as the primary management tool. Insecticides can only help reduce “within crop” transmission and can disrupt the natural enemies that can help reduce thrips populations.
…APPENDIX 2
Work
In P
rogres
s
Appendix 8 : Page 42 Page 242

40 NOTE: INDUSTRY SIGN-OFF IS REQUIRED BEFORE THIS CAN BE FINALISED
Despite a consistent message about crop sanitation being one of the most important management tools for WFT and TSWV, adoption of this one practice is still very poor. This can be attributed to the history of chemical control being very effective and belief that their must be an effective chemical solution, the often false perception that cultural practices such as sanitation are time consuming and costly and that cultural practices need to be in place prior to significant damage being observed. The challenge in changing the mindset from a ‘curative’ to a ‘preventative’ strategy in agricultural pest management is similar to the challenge that the health authorities and medical establishment are facing with getting us to adopt “healthy lifestyles”.
There are some demonstrated cases of growers successfully using a biologically-based IPM strategy, resulting in their crops having relatively fewer WFT compared to the crops of neighbours who are using an “insecticide first” approach. More consistent management with significantly less chemicals can also be achieved by adopting a range of management strategies or a “multi-tactic” approach: regular systematic crop monitoring, removal and careful disposal of diseased plants, weed management, crop destruction straight after harvest and selective use of pesticides for example.
Horticulture Australia Ltd (HAL) has co-funded 53 projects that have addressed management of tospoviruses or thrips in some way. Thirteen of these projects had a primary focus on WFT and/or TSWV or CaCV and six were focused on onions, strawberries, ornamentals or potatoes. Projects ranged from developing diagnostic tools for tospoviruses, monitoring insecticide resistance in WFT and investigating capsicum genetic resistance to TSWV, to industry communication and training about WFT after it was detected in Australia and a range of regionally specific management projects.
RD&E to date has identified that:
key management strategies include monitoring and a range of sanitation practices;•
new chemistries such as spinosad, which initially provided excellent control of WFT, can be quickly •“lost” due to insecticide resistance; and
biological and cultural controls have been shown to be successful in high WFT pressure periods in both •capsicums and strawberries and commercial IPM consultants are successfully working with growers dealing with thrips and tospovirus issues in a range of crops in four states.
Because WFT and TSWV in particular have very broad host and climatic ranges, and WFT is very effective at developing tolerance or resistance to insecticides there is not a simple fix. Multi-tactic approaches are inherently more complicated and therefore it takes longer to:
do the research;•
develop a good understanding of when and where the approaches are best used; and•
achieve widespread adoption by industry. •
Different crops, cropping situations and regions need different combinations of management tools. Changing an approach to pest management from a single primary control measure to working with a range of options is inherently more difficult and requires more than written procedures and guidelines to initiate the change process.
Key CHALLENGES include overcoming barriers to adoption of current best practice by growers and undertaking adaptive research that uses existing management options under a variety of cropping and environmental situations. Research into understanding more about thrips’ ecosystem ecology and relationships with its natural enemies (beneficials/biological control agents [BCAs]) and that addresses specific questions about rearing BCAs or building up numbers in fields needs to continue. In addition, specific questions relating to monitoring and managing viruses and their vectors need investigation.
A key BENEFIT of shifting the industry’s pest management “norm” from a single control measure (usually chemical) to an integrated approach (i.e. a multi-tactic approach) is that systems will be in place for management of other pests. A truly integrated crop protection or IPM strategy needs to consider all pests in the system, market requirements and the impact of all farm activities on promoting or reducing the likelihood of a pest causing economic damage.
…APPENDIX 2
Work
In P
rogres
s
Appendix 8 : Page 43 Page 243

41NOTE: INDUSTRY SIGN-OFF IS REQUIRED BEFORE THIS CAN BE FINALISED
Extension, Development and Research ThemesThis Plan’s framework is underpinned by extension, development and research “Themes” that overlap to some extent and are designed to achieve the Vision, as shown in the following diagram:
The Plan has three main levels:
Extension, Development and Research Themes (i.e. the Outcomes that need to be achieved to deliver the 1. Vision, as shown in the above diagram);
Under each of the Themes there are four or five Methods to be implemented in order to achieve the 2. Outcomes; and
The final level consists of Task(s) under each of the Methods. These are the individual steps to be 3. undertaken in carrying out each Method.
This is illustrated in the following diagram.
Extension ThemeCurrent best practice
pest management used by growers
Development ThemeResearch outcomes modified for specific crops and regions
VisionBy 2015 thrips and thrips-transmitted
diseases are being effectively managed by vegetable growers to minimise the risk of crop loss, pesticide
residues and/or the disruption of biological control options for other pests.
Research ThemeDevelopment of new pest management approaches/tools
Extension ThemeCurrent best practice pest
management used by growers
Development ThemeResearch outcomes
modified for specific crops and regions
Research ThemeDevelopment of new pest management approaches/
tools
MethodsR&D project outcomes available1.
Demonstrations of best practice2.
Communication, training 3. and mentoring opportunities available
Evaluation of extension 4. methods
MethodsChemical options1.
Biological options2.
Cultural options3.
Decision support tool4.
MethodsNew overseas options1.
Biological options2.
Habitat management3.
Varietal resistance4.
Microbial biorationals5.
Tasks Tasks Tasks
…APPENDIX 2
Work
In P
rogres
s
Appendix 8 : Page 44 Page 244

42 NOTE: INDUSTRY SIGN-OFF IS REQUIRED BEFORE THIS CAN BE FINALISED
The three “levels” of the framework are organised into a Task Plan, which is contained in the next section. A “Project” may consist of a Method, including all of the identified Tasks under it, or it may involve carrying out only one or two Tasks. The vegetable industry may wish to fund a single, large Project that has several sub-projects. However, it is recognised that the vegetable industry is not in a position to undertake all of the work identified in the Task Plan in the short term. It is recommended that a series of small, well-connected projects be undertaken initially and that a mix of low and high risk/reward subject areas be included. The risk/reward terminology is explained in footnotes 2 and 3 in the next section (section 4, Methods and Task Plan). The initial “foundation projects” to be considered are outlined in section 5, Proposed Foundation Projects within a Coordinated Program.
The next section provides more detail on the Themes, recommended Methods and required Tasks, which have been derived from a synthesis of recommendations from previous projects with added weight given to recurring recommendations made by different teams and the more recent recommendations given by teams that have had a series of projects funded. These were then cross checked through the stakeholder consultation process.
As this is intended to be a working document, it is expected that the Methods and Tasks will be reviewed and updated regularly. Some of the identified Methods and Tasks may overlap with Methods and Tasks in one of the other RD&E Program Plans, resulting in the work being carried out under a project within another program plan. In these instances, there will need to be coordination to ensure the desired outcomes for both programs are met.
…APPENDIX 2
Work
In P
rogres
s
Appendix 8 : Page 45 Page 245

43NOTE: INDUSTRY SIGN-OFF IS REQUIRED BEFORE THIS CAN BE FINALISED
Methods and Task Plan Extension Theme: Current best practice pest management used by growersIndustry members are aware of the best practice recommendations for management of thrips and thrips-vectored diseases (tospoviruses) and the various options to access the information they need, when they need it.
Measured by: By 2011 all growers will have access to directories of user-friendly information from past HAL-funded thrips and thrips vectored disease related projects. By 2011 a process for on-going sharing of information will be in place.By 2012 a process will be in place to review and evaluate key management practices.By 2012 a process will be in place to review and evaluate the effectiveness of key extension methods for achieving awareness and adoption of best practice.
Methods and Tasks Justification Mechanism(s), Risk/Reward2 and Project Length3
Method 1.1 Ensure outcomes from R&D projects are accessible to growers, industry and RD&E providers
1.1.1 Audit all past HAL crop protection projects and resulting extension resources.
Identify existing resources and availability, target audience and subject matter.
Write webpage with links to key resources.
Synthesize key information into factsheets when not already produced.
Ensure that resources already produced are available to growers. Identify resources that need modification, updating or producing from existing information, eg useful data or recommendations that are only found in a final report. Ensure that new resources are reviewed from the perspective of virologists, entomologists, extension specialists, IPM consultants and growers.
By 2011. VG09191 is undertaking this task in conjunction with the Knowledge Management sub-program of the VIDP.
Low Risk/Low Impact/on-going
2 Risk and reward indications are Low, High or Moderate (“Mod”). For example, a Low Risk rating indicates that there is a low risk of failure, i.e. it is likely that the recommended Task or Method will be successful in terms of producing described outcomes to be adopted. A High Risk rating indicates that there could be difficulties with achieving desirable outcomes and/or levels of adoption. The reward term that is used is “Impact”. A High Impact rating indicates that if the RD&E were successful and the outcomes were widely adopted, it would lead to a significant, “step-change” improvement in management of the pest(s) as opposed to the expectation of an “incremental” improvement in the case of a Low Impact project. 3 Project length is the likely number of years a project needs to be conducted to achieve a successful outcome. In some cases a short term (1 - 3 years) project is required. In other cases it is likely to take a full term project or two project terms (3 - 5 years). It may take several years before investigations into complex issues are successfully completed (5-10 years). “On-going” refers to Tasks or Methods that need to be implemented on a continuing basis, eg as new chemistries and/or biorationals continue to become available there will be an on-going requirement for them to be tested for efficacy under Australian conditions.
…APPENDIX 2
Work
In P
rogres
s
Appendix 8 : Page 46 Page 246

44 NOTE: INDUSTRY SIGN-OFF IS REQUIRED BEFORE THIS CAN BE FINALISED
Methods and Tasks Justification Mechanism(s), Risk/Reward2 and Project Length3
1.1.2 Write and disseminate case studies of growers adopting best practice integrated pest management (IPM) strategies
Growers learn from and give weight to other growers’ experiences.
Include in 2011/12 funding within a broader adoption project.
Low Risk/High Impact/1-3 years [different messages over time]
Method 1.2 Demonstrations of best practice options1.2.1 Organise demonstrations of current best practice in key production areas in both field and greenhouse situations
Growers give greater weight to seeing results than hearing about them, particularly under local conditions. Can use as a site for ‘adaptive’ research to identify factors and limitations in use of management strategies that have had success in other regions or situations. Topics included under Objective 2.
Include in 2011/12 funding within a broader adoption project.
Low Risk/High Impact/on-going [different messages over time]
Method 1.3 Facilitate communication, training and mentoring opportunities for growers, advisors and IPM consultants
1.3.1 Ensure growers can contact a trusted technical person for practical information to assist with the adoption of IPM, eg via an “IPM HelpLine” manned by trusted IPM Advisor(s)
In instances in which there are insufficient advisors (eg in some regions), growers need ready access to trusted technical people as they are incorporating IPM into their farming systems. New IPM consultants/advisors may also need this type of support.
Low Risk/High Impact/on-going
…APPENDIX 2
Work
In P
rogres
s
Appendix 8 : Page 47 Page 247

45NOTE: INDUSTRY SIGN-OFF IS REQUIRED BEFORE THIS CAN BE FINALISED
Methods and Tasks Justification Mechanism(s), Risk/Reward2 and Project Length3
1.3.2 Facilitate the availability of accredited and non-accredited training and/or mentoring for growers, agricultural advisors and IPM consultants
Accredited training is competency based and has assessment so greater confidence that trainee has skills, also usually conducted over a longer period of time. However non-accredited training is easier to provide where awareness-raising is the aim or where addressing a specific issue that trainees are particularly concerned with, i.e. have a vested interest to learn.
Training in:
• identificationofthrips,tospoviruses and beneficials;
• monitoring
• managementoptions
• sprayapplication
• impactsofspraysonbeneficials
• smallbusinessmanagement(forconsultants)
Mentoring of new IPM consultants for a defined period to develop confidence and experience, utilising the assistance of experienced consultants.
Use demonstration sites for training. Combine training where possible with other industry events. Pilot use of webinar, message boards and other e-technologies. Work in conjunction with VIDP- People Development, InnoVeg and Knowledge Management subprograms.
Low Risk/High Impact/on-going
1.3.3 Facilitate the use of IPM consultants by growers
IPM consultants are integral in most IPM growers’ operations. In areas where growers do not have access to any IPM consultants or the available consultants do not have vegetable experience or where vegetable growers do not use the services of IPM consultants, there is a basis for a project to assist in subsidising consultant services for a period of time or training of IPM consultant(s) in vegetable systems.
Only for areas where <20% growers use IPM consultants.
3-4 year regional project.
Low Risk/High Impact/3-5 years
1.3.4 Ensure non-English speaking background (NESB) growers have access to someone who speaks their language (bilingual officers)
Getting access to current best practice information is particularly difficult if you do not readily understand English. Having access to someone who speaks their language and has a basic understanding of agricultural systems and information sources can greatly improve matters.
Seek co-funding from State or Federal departments, needs national co-ordination of part-time positions.
Mod Risk/Mod Impact/on-going
…APPENDIX 2
Work
In P
rogres
s
Appendix 8 : Page 48 Page 248

46 NOTE: INDUSTRY SIGN-OFF IS REQUIRED BEFORE THIS CAN BE FINALISED
Methods and Tasks Justification Mechanism(s), Risk/Reward2 and Project Length3
Method 1.4 Evaluate the effectiveness of extension tools and techniques for achieving awareness and adoption of IPM
1.4.1 Implement evaluation methods to enable analysis of efficacy of extension techniques & tools
Many different extension tools exist and all require resources. What have been the most effective mechanisms for improving awareness and more particularly adoption?
Regular symposia at vegetable conferences to review extension techniques.
Perhaps sponsor a session at an Australasia-Pacific Extension Network conference.
Benchmarking with both quantitative and qualitative surveys.
Low Risk/High Impact/on-going
Development Theme: Research outcomes modified for specific crops and regions Further development of the range of pest management tools developed from previous R&D is required to address a broader range of production situations. Different combinations suit different circumstances. Existing tools need adaptation as factors such as resistance or new varieties emerge.
Measured by: On-going - resistance testing of priority organisms [major pest, few control options and history of chemical resistance, eg WFT] annually reported; resistance management strategy modified and accessible; baseline information collected for Melon thrips resistance.On-going - old & new chemistry tested for impact on key beneficials; reported and accessibleOn-going - guidelines published for optimal management practices and limitations for biological control organisms in greenhouse and field production systems By 2012 – Guide for field growers on good hygiene practices published
Methods and Tasks Justification Mechanism(s), Risk/Reward2 and Project Length3
Method 2.1 Chemicals: carry out resistance testing of new and existing chemistry, modify resistance management strategies and determine impacts on biological control agents
2.1.1 Prepare a “risk list” of organisms and prioritise them for collection of baseline data, maintenance of susceptible strains and resistance monitoring.
WFT develops resistance to insecticides relatively quickly and resistance testing provides background information on which chemistry is under pressure and can inform the modification of resistance management strategies. Melon thrips is becoming increasingly problematic in northern production areas and baseline information for resistance testing needed.
On-going while WFT still a major pest and few management options. Seek co-funding with chemical companies. IPM Coordination project liaison with HAL Chemical Access program.
Low Risk/High Impact/on-going
…APPENDIX 2
Work
In P
rogres
s
Appendix 8 : Page 49 Page 249

47NOTE: INDUSTRY SIGN-OFF IS REQUIRED BEFORE THIS CAN BE FINALISED
Methods and Tasks Justification Mechanism(s), Risk/Reward2 and Project Length3
2.1.2 Test and report on the impact of chemicals on biological control agents (BCAs)
Both invertebrate and fungal BCAs can be important control measures against invertebrate pests and fungal pathogens respectively. Agrichemicals can negatively impact BCAs. Having the information on how commonly used and new chemistry impacts on BCAs allows for management of negative impacts.
On-going with new chemistry and gaps in knowledge with common old chemistry.
Low Risk/High Impact/3-5 years with some on-going maintenance with new chemistry
2.1.3 Ensure the list of BCAs and the chemical impact data are accessible via the Integrated Crop Protection area of the AUSVEG website and that the information is kept up-to-date
Up-to-date information that is readily accessible is fundamental to successful implementation of IPM.
On-going with new chemistry and gaps in knowledge with common old chemistry.
Low Risk/High Impact/3-5 years with some on-going maintenance with new chemistry
Method 2.2 Biological control agents (BCAs): develop recommendations for greenhouse and field use
High Risk/High Impact/5-10 years2.2.1 Conduct adaptive research to identify the use-guidelines and limitations for commercially available BCAs for greenhouse use and in which situations they are likely to work in field situations
VC with commercial insectaries
2.2.2 Carry out identification and impact assessment of endemic BCAs in field
Include as a component of IPM demonstration sites
Method 2.3 Develop cultural management recommendations
Low Risk/High Impact/1-3 years2.3.1 Develop farm hygiene guidelines: reduce likelihood of introduction of thrips & tospoviruses
Identification of important local reservoirs for thrips and tospoviruses e.g. key weed hosts, neighbouring crops
Include as a component of IPM demonstration sites
2.3.2 Develop crop monitoring guidelines for thrips, thrips’ natural enemies and tospovirus symptoms
A number of thrips attracting chemicals to enhance thrips capture on sticky traps are now commercially available. Early independent research suggests that thrips’ natural enemies capture on sticky traps may also be enhanced. Recommendations for use are needed.
Tospovirus field test kits exist – are they cost-effective for crop consultants and does their use improve management?
2011/12 project developed – good honours or masters project topic. IPM Co-ordinator to work with universities in putting forward suitable student topics.
…APPENDIX 2
Work
In P
rogres
s
Appendix 8 : Page 50 Page 250
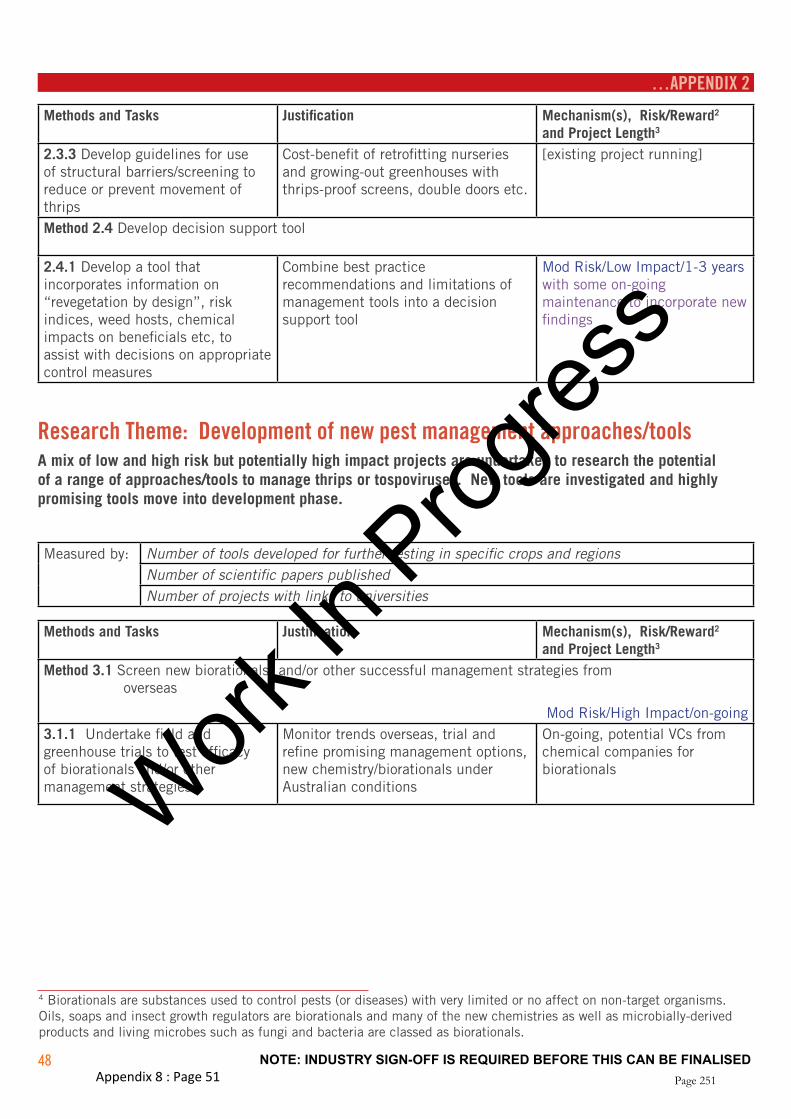
48 NOTE: INDUSTRY SIGN-OFF IS REQUIRED BEFORE THIS CAN BE FINALISED
Methods and Tasks Justification Mechanism(s), Risk/Reward2 and Project Length3
2.3.3 Develop guidelines for use of structural barriers/screening to reduce or prevent movement of thrips
Cost-benefit of retrofitting nurseries and growing-out greenhouses with thrips-proof screens, double doors etc.
[existing project running]
Method 2.4 Develop decision support tool
2.4.1 Develop a tool that incorporates information on “revegetation by design”, risk indices, weed hosts, chemical impacts on beneficials etc, to assist with decisions on appropriate control measures
Combine best practice recommendations and limitations of management tools into a decision support tool
Mod Risk/Low Impact/1-3 years with some on-going maintenance to incorporate new findings
Research Theme: Development of new pest management approaches/tools A mix of low and high risk but potentially high impact projects are undertaken to research the potential of a range of approaches/tools to manage thrips or tospoviruses. New tools are investigated and highly promising tools move into development phase.
Measured by: Number of tools developed for further testing in specific crops and regionsNumber of scientific papers publishedNumber of projects with links to universities
Methods and Tasks Justification Mechanism(s), Risk/Reward2 and Project Length3
Method 3.1 Screen new biorationals4 and/or other successful management strategies from overseas
Mod Risk/High Impact/on-going3.1.1 Undertake field and greenhouse trials to test efficacy of biorationals and/or other management strategies.
Monitor trends overseas, trial and refine promising management options, new chemistry/biorationals under Australian conditions
On-going, potential VCs from chemical companies for biorationals
4 Biorationals are substances used to control pests (or diseases) with very limited or no affect on non-target organisms. Oils, soaps and insect growth regulators are biorationals and many of the new chemistries as well as microbially-derived products and living microbes such as fungi and bacteria are classed as biorationals.
…APPENDIX 2
Work
In P
rogres
s
Appendix 8 : Page 51 Page 251

49NOTE: INDUSTRY SIGN-OFF IS REQUIRED BEFORE THIS CAN BE FINALISED
Methods and Tasks Justification Mechanism(s), Risk/Reward2 and Project Length3
Method 3.2 Biological control agents5 (BCAs): develop recommendations for use of BCAs in integrated systems
High Risk/High Impact/variable time3.2.1 Undertake field surveys of new BCAs for thrips
3.2.2 Carry out efficacy testing of BCAs against thrips
3.2.3 Develop rearing methods for promising BCAs for commercial rearing
3.2.4 Conduct trials of methods to encourage increase in endemic BCAs
3.2.5 Develop management recommendations for use of BCAs
Greenhouse production systems in Europe for example use a range of BCAs covering the spectrum of pests found in their crops; we have relatively few commercially available BCAs in Australia. BCAs provide an alternative control tool for those pests that are highly pesticide resistant. However the BCAs can be killed by chemicals targeted at other pests; hence a suite of BCAs are needed for all pests in crops/systems with major problems with pesticide resistant pests such as WFT and whitefly. Recommendations may be different in systems with a low or high probability of tospoviruses being present.
Work with existing commercial BCA insectaries with VCs, explore potential for licensing rearing technology from international majors eg Koppert.
Method 3.3 Habitat management: create environments that discourage movement of pests into susceptible crops
Mod Risk/Mod Impact/3-5 years3.3.1 Conduct trial(s) aimed at proving revegetation sites reduce incidence of virus-carrying thrips entering greenhouses
3.3.2 Screen suitable vegetation for use in other production regions
3.3.3 Scope potential push-pull6 systems for thrips management
Given viruses cannot be ‘cured’ and in-crop sprays targeting thrips only reduce ’within crop’ transmission of virus, it is important to research methods for creating environments alien to thrips or tospoviruses within crops and in surrounding ‘source’ areas. Two Revegetation by Design projects have investigated the potential for native vegetation to reduce source populations of thrips and tospoviruses. The final step of proving that the strategy results in reduced influx of virus-carrying thrips into neighbouring crops, and screening of suitable vegetation in other regions has not been done.
Current project VG07040 with CSIRO focused in QLD is covering aspects of 3.3.2. Links to Government priority of Natural Resource Management.
…APPENDIX 2
5 Biological control agents (BCAs) are organisms that feed on and kill target pests. They may be predatory or parasitic insects, mites, nematodes or fungi. They can also be called “beneficials” or “natural enemies”. BCAs may be found naturally in the environment and colonise crops – these are termed “endemic BCAs” or they may be reared in commercial insectaries and purchased for release in greenhouse or field situations. Generally if BCAs are formulated into a sprayable product they are classified as biorationals.6 “Push-pull systems” is the terminology used for management strategies that target the moving of invertebrate pests and biological control agents (BCAs) around the cropping environment. Some examples include: •plantingastripofplantsthataremoreattractivetothepestthanthecroptodrawor“pull”themoutoftheproduction
crop to the ‘trap crop’; •spraysofchemicalsthatthepestfindsrepulsiveto“push”thepestoutofthecroporrepelitfromenteringthecrop;and•havingnon-cropplantsthatprovidealternativefood(‘insectarycrops’)forBCAstoenhancethenumbersofBCAs
predating in the cropping environment.
Work
In P
rogres
s
Appendix 8 : Page 52 Page 252

50 NOTE: INDUSTRY SIGN-OFF IS REQUIRED BEFORE THIS CAN BE FINALISED
Methods and Tasks Justification Mechanism(s), Risk/Reward2 and Project Length3
Method 3.4 Varietal resistance: investigate potential of pre-breeding7 genetic research
Mod Risk/High Impact/on-going3.4.1 Undertake scoping project to identify potential for tospovirus resistance in vegetables, potential for co-investment and likelihood of success.
Varietal resistance increases tolerance levels for thrips, thereby reducing control pressure, and is highly desirable. However only a few vegetables show variation in susceptibility to tospoviruses, eg TSWV-tolerant capsicums are commercially available although in some areas (eg Virginia SA) the resistance has broken down. Need more work on understanding the molecular basis of the TSWV resistance breaking strains in capsicums and the role of weed hosts in maintaining these strains. Previously funded project has produced experimental lines with both TSWV & CaCV resistance and now working with commercial partner.
Current project with DEEDI and Syngenta incorporating CaCV and TSWV resistance into elite capsicum lines.
Potential for VC with seed companies?
Method 3.5 Microbial biorationals, eg Metarhizium and Beauveria entomopathogens: develop recommendations and obtain registration for use in integrated systems
High Risk/Mod Impact/5-10 years3.5.1 Undertake field surveys
3.5.2 Carry out efficacy testing
3.5.3 Develop recommendations for use in integrated systems
3.5.4 Identify pathway for registration
Microbial pesticides have potential to control key pests that are resistant to insecticides such as WFT and have low impact on BCAs. However there are regulatory hurdles that are preventing registration. Potential for overcoming these hurdles needs clarification & costing.
Current project finishing, potential to tie in with GRDC investment
…APPENDIX 2
7 Pre-breeding genetic research is typically all the science behind finding the techniques, varietal attributes and means for inserting or selecting them prior to the breeding being undertaken on a commercial basis.
Work
In P
rogres
s
Appendix 8 : Page 53 Page 253

51NOTE: INDUSTRY SIGN-OFF IS REQUIRED BEFORE THIS CAN BE FINALISED
Proposed Foundation ProjectsScope: Emphasis on Extension/adoption of current best practice assuming initially only a relatively small budget can be supported and that adoption of existing recommendations could have significant benefit to the vegetable industry. Four-year program, $200-$300K per year [multi-state/multi-provider] involving a series of related and coordinated projects (listed in priority order). The included research projects are extensions to those that have been previously funded, show great potential and need relatively little investment to realise significant benefits.
1. Demonstration sites: 1 per state per year as a basis for field days/training site [$30-100K pa each]. This is an example of a task that should cross over between all RD&E programs that are part of the Vegetable Integrated Crop Protection RD&E Plan. Steering committee to include virologist/pathologist, entomologist, IPM consultant and grower to identify priority best practices to demonstrate, what other tools could be trialled for development, how best to utilise the site for training, subsidising diagnostics and biological inputs. More funds could fund more sites. Prioritise in areas where WFT/TSWV has least control [Virginia SA and Sydney basin].
2. Pilot an IPM HelpLine with respected IPM advisor/s to give growers and their service providers access to trusted technical person for practical help. [Fund on a step-wise scale depending on the use of the service, i.e. ~$1,500/yr for 0-30 calls less than 1 hour in duration;, $2,800/yr for 31-60 calls less than 1 hour in duration. These amounts include the cost of a 1- 800 or 13 number @ ~$300/yr plus call costs.] Initially focus on invertebrate pests and disease management – one or multiple technical people.
3. Resistance testing: Obtain baseline data on new chemistry [$50-100K pa]. Grant Herron has WFT susceptible and reference resistant strains in culture. This is an example of a task that crosses over with the Invertebrate Pests and Pathology RD&E Programs and the HAL Minor Use Project. Basic requirement is to maintain WFT reference strains and to test these and field collected WFT (particularly from where spray failures are experienced) against existing and potential new chemistry to establish baseline data, obtain information on cross-resistance and track development of field resistance. Data is needed for permit recommendations and to modify resistance management strategies. With more funds research into resistance mechanisms can be conducted to better inform resistance management.
4. Chemical impacts on beneficials: Obtain baseline data on new chemistry [$30-100K pa]. IPM Technologies Pty Ltd has beneficials in culture and testing protocols. Example of a task that crosses over with Invertebrate Pests RD&E Program and HAL Minor Use Project. Beneficial organisms can be important to managing a range of invertebrate pests. However, they can be effectively killed by applications of agricultural chemicals. Although the older broad spectrum insecticides are usually highly toxic to all beneficial invertebrates the new chemistry is highly variable and it is important to understand which organisms they impact and how. More funds translate into more beneficials tested against a greater number of chemicals. All newly registered chemicals should have the “impact on beneficials” data collected and publically available at the time the chemical is registered or permitted.
5. Case studies: Video/audio/fact sheet case studies of growers who have successfully improved management of thrips/tospoviruses loaded on web and advertised [$20K]. Many growers who previously struggled with thrips and tospoviruses have overcome their problems by adopting an integrated strategy. Where possible these should be publicised using the growers’ own words.
6. Sanitation - the key message for managing WFT & TSWV: Keep it Clean – Field edition, i.e. produce a version of the sanitation/hygiene manual for field growers [$20K]. Example of a task which crosses over with Invertebrate Pests and Pathology RD&E Programs. Printed resources don’t change practices but they can support change with useful information, recommendations and templates.
7. Revegetation by design: Validate whether “reveg” plantings reduce incidence of virus-carrying thrips entering adjacent crops [$50K first year to develop and validate PCR test (stop-go milestone) then $115K pa for 2 seasons to conduct trials]. The initial step required is to be able to test whether thrips are carrying the virus; a PCR test is the most likely test that will be developed. Once thrips can be tested for tospoviruses, then the test can be used in a range of research including validating the revegetation model.
…APPENDIX 2
Work
In P
rogres
s
Appendix 8 : Page 54 Page 254

52 NOTE: INDUSTRY SIGN-OFF IS REQUIRED BEFORE THIS CAN BE FINALISED
Summary table of proposed Thrips/Tospovirus foundation projectsProjects (in priority order) Purpose/method Budget Project LengthDemonstration Sites 1 per state per year as a basis for field days/
training site (prioritised in areas where least control of WFT/TSWV, Virginia SA and Sydney basin)
$30-100K pa each On-going
IPM Helpline Access to trusted technical person for practical help
~$1500 pa per 30-call “block”
4 years
Resistance testing Obtain baseline data on new chemistry $50-100K pa 4 yearsChemical impacts on beneficials
Obtain baseline data on new chemistry $30-100K pa 4 years
Case Studies Video/audio/factsheet case studies of growers who have successfully improved management of thrips/tospoviruses loaded on web and advertised
$20K 1 year
Sanitation Keep it Clean – Field edition, i.e. produce a version of the sanitation/hygiene manual for field growers
$20K 1 year
Revegetation by Design Validate whether “reveg” plantings reduce incidence of virus-carrying thrips entering adjacent crops a) develop and validate PCR test $50K (stop-go
milestone)1 year
b) field trials $115K pa 2 years
…APPENDIX 2
Work
In P
rogres
s
Appendix 8 : Page 55 Page 255

53NOTE: INDUSTRY SIGN-OFF IS REQUIRED BEFORE THIS CAN BE FINALISED
Background The information in this section provides context for the plan and helps to explain why certain methods were selected. This information will also be useful when reviewing the plan in the future, as it helps with identifying changes in the operating environment that may call for adjustments to the plan.
This section consists of:• ASWOTanalysisoftherelevantinternalandexternalfactorsimpactingontheabilityofthevegetable
industry to manage thrips and thrips-vectored diseases• Informationonthripsspeciesandtospoviruses,theirvegetablehostsandtheirrelativeimportancein
different regions of Australia • Asummaryofhowtheplanwasdeveloped• Alistingofrecommendationsfrompreviousprojects• InstructionsforaccessingtheAppendices,whichcontain:
Information resources related to thrips and tospoviruses* Past and present HAL projects covering thrips and/or tospoviruses * Literature on Thrips and Tospoviruses* A list of Stakeholders* Risk/Reward matrices for various RD&E subject areas as determined in a workshop and via an on-* line survey SWOT analysis (as presented in this Program Plan)* Methods and Task Plan (as presented in this Program Plan)*
SWOT AnalysisThis analysis is a summary of the key internal and external factors impacting on the ability of the vegetable industry to manage thrips and thrips-vectored diseases (tospoviruses). These factors were compiled from a review of previously funded projects relating to thrips and tospoviruses and through input provided by stakeholders involved in the consultation process from July to December 2010.
…APPENDIX 2
Work
In P
rogres
s
Appendix 8 : Page 56 Page 256

54 NOTE: INDUSTRY SIGN-OFF IS REQUIRED BEFORE THIS CAN BE FINALISED
Strengths⇒ Capsicum varieties tolerant to TSWV
⇒ CaCV limited to sub-tropics and tropics
⇒ CaCV with limited host range
⇒ Not all thrips are vectors of tospoviruses and not all vectors are carriers (larvae must have fed on tospovirus infected hosts)
⇒ A range of projects conducted in multiple crop production areas reinforce that integrated approaches are necessary to manage thrips- vectored viruses and that these approaches can be effective and resilient to unexpected outbreaks.
⇒ Extensive body of literature on TSWV and WFT
⇒ Field tests for TSWV in plants
⇒ Thrips have natural enemies
⇒ Some growers/consultants/researchers have >10 years of experience managing thrips and tospoviruses
⇒ Range of extension materials on WFT and TSWV
⇒ Some extension material on tospoviruses and thrips in Australia
Weaknesses⇒ Viruses not curable
⇒ Virus symptoms don’t appear for days to weeks after transmission
⇒ Virus symptoms missed or mistaken
⇒ Thrips very small
⇒ Thrips identification difficult (not all thrips vector tospoviruses and some thrips are more resistant to insecticides than others)
⇒ Thrips vector capacity not easily assessed (the larvae of thrips vector species need to have fed on an infected host to be a vector of the virus themselves)
⇒ Range of IYSV and CaCV within Australia unknown
⇒ WFT range still increasing
⇒ WFT develops insecticide resistance
⇒ Few chemicals are effective on WFT
⇒ Almost no chemicals registered for Melon thrips
⇒ Loss of TSWV resistance in capsicum varieties
⇒ No TSWV resistance/tolerance in most crops
⇒ TT and OT can move large distances
⇒ Poor chemical application practices => poor control
⇒ Chemicals used in crop (for thrips or other pests or diseases) impact on thrips’ natural enemies
⇒ Proportion of growers growing crops very susceptible to thrips and tospoviruses are from non-English speaking backgrounds and have poor understanding of English so have limited access to extension resources
⇒ No one management strategy will work in all situations
Opportunities⇒ Thrips larvae must feed on tospovirus infected host to
become carriers
⇒ Weed management can significantly reduce source of WFT & TSWV
⇒ CaCV is commonly found in a common weed in Bundaberg, Ageratum conyzoides
⇒ Not all hosts are equally attractive to thrips
⇒ Not all hosts are equally susceptible to viruses
⇒ There is now a capsicum breeding line with both TSWV and CaCV resistance
⇒ Improved understanding of thrips’ natural enemies and their potential to reduce populations [Predatory mites: Transieus montdorensis, Neoseiulus cucumeris and Stratiolaelaps scimitus (Hypoaspis), Pergmasus spp. Other predators: Orius armatus, Hippodamia and other ladybeetles, staphylinid beetles.]
⇒ Insect fungal pathogens [Beavaria and Metarhizium] as control option
⇒ Vegetation management – using non-host vegetation, managing weeds
⇒ Most seedlings from a few nurseries: if good management strategies adopted then most seedlings safe
⇒ Some growers/consultants/researchers have >10 years of experience managing thrips and tospoviruses
⇒ Improved collaboration between virologists, entomologists, extension specialists and industry resulting in more robust and integrated RD&E
Threats⇒ Growers desperate to control TSWV using unregistered or
excess insecticides => Residues =>consumer scares => loss of markets
⇒ Residues not seen as a threat
⇒ If unmanaged, can lose whole crop to virus
⇒ Unmanaged crops are a source of thrips and tospoviruses for neighbours
⇒ Unmanaged thrips feeding can cause significant crop loss due to poor fruit set –tomatoes/capsicums/cucumbers
⇒ Chemical-only approaches either ineffective or vulnerable to resistance
⇒ If tospovirus or thrips management strategies not adopted or breakdown in a nursery then seedlings a significant source of infection
⇒ CaCV extends to more temperate climes (greenhouse production vulnerable and CaCV has been detected near Gosford NSW and Kununurra WA)
⇒ New tospoviruses introduced: Impatiens necrotic spot virus (INSV) found in ornamentals near Gosford in 2010 and was probably not completely eradicated. Watermelon silver mottle group of tospoviruses (serogroup IV) are widespread in SE Asia and new species are regularly reported.
⇒ New species of thrips introduced that vector tospoviruses
…APPENDIX 2
Work
In P
rogres
s
Appendix 8 : Page 57 Page 257

55NOTE: INDUSTRY SIGN-OFF IS REQUIRED BEFORE THIS CAN BE FINALISED
Thrips and Tospoviruses Affecting Vegetables in AustraliaNot all thrips found in Australia cause economic damage to vegetable crops, nor do all thrips transmit tospoviruses. Table 1 records which vegetable crops are susceptible to which tospoviruses. The host range of key economic thrips as well as the tospovirus/es they may transmit are presented in Table 2.
Table 1 Vegetable hosts of tospoviruses in Australia
Tomato spotted wilt virus TSWV Capsicum chlorosis virus CaCV Iris yellow spot virus IYSVSolanaceous vegetables
Celery
Lettuce
Pea
Broadbean
Capsicum
Tomato
Onion
Leek
[Source: Thrips and Tospovirus: A management guide 2007 Persley D et al. QDPI]
Table 2 Key thrips species found on vegetables in Australia
Thrips Species Crop Affected Feeding damage Virus VectorFrankliniella occidentalis Western flower thrips [WFT]
Wide range vegetables
Flowers and developing fruit
TSWV
Frankliniella schultzei Tomato thrips [TT]
Wide range of vegetables
Damage to leaves, flowers and young fruit
TSWV, CaCV
Thrips palmi Melon thrips [MT]
Potato, cucurbits, capsicum, beans, eggplant
Damage to leaves, growing points, scarring of fruit, fruit drop
TSWV, CaCV
Thrips tabaci Onion thrips [OT]
Wide range vegetables particularly Onions & garlic
Leaf damage TSWV, IYSV
Thrips imaginis Plague thrips [PT]
Wide range of hosts Damage to flowers and young fruit
Megalurothrips usitatus Bean blossom thrips [BBT]
Beans Flower feeding causing twisting of pods
[Source: Thrips and Tospovirus: A management guide 2007 Persley D et al. QDPI]
Thrips & Tospovirus On-line Survey
Given there was relatively little published information on the relative importance of thrips and tospoviruses in vegetables in Australia, all known researchers, extension officers, consultants, field officers and some growers were requested to provide information via an on-line survey. An electronic invitation was sent to members of the Vegetable Integrated Crop Protection “Google Group” and was directly emailed to over 100 stakeholders in September 2010. A reminder e-mail was issued in October 2010. They were asked whether they had experience in managing thrips and/or tospoviruses and if so they were asked to complete an on-line survey. The first part of the survey covered the relative importance of thrips and tospoviruses in their region and the second part asked them to rate the “risk/reward” of various RD&E strategies/topics. The results of the survey are contained in the Appendices, which are in an Excel file that can be accessed on-line (see instructions on the last page of this Program Plan).
…APPENDIX 2
Work
In P
rogres
s
Appendix 8 : Page 58 Page 258

56 NOTE: INDUSTRY SIGN-OFF IS REQUIRED BEFORE THIS CAN BE FINALISED
Plan Development ProcessThis Thrips and Tospoviruses RD&E Program Plan was developed as part of a 12-month pilot project (VG09191, “National Vegetable IPM Coordinator”) that commenced in April 2010. It is the first of nine recommended RD&E program plans to sit under the “overarching” Vegetable Integrated Crop Protection RD&E Plan. Its development involved a synthesis of recommendations from previous HAL-funded thrips and tospovirus projects with particular weight given to the thrips chapter in the final report for VG06094, “A scoping study of IPM compatible options for the management of key vegetable sucking pests”, which reviewed the literature and consulted experts on management options for a range of sucking insects.
All accessible final reports from previous HAL-funded thrips or tospovirus related projects were scanned for benchmarking information relating to thrips or tospovirus management practices, levels of reported damage and the overall project recommendations. Projects were categorised into research or extension or both, the topic, species involved, crops, and the sorts of information they contained as were extension materials produced by the projects relating to thrips and tospoviruses. This information is contained within an Excel workbook.
Consultation and review of the RD&E Program Plan was conducted with over 100 individual stakeholders along the supply chain, in tandem with the development of the Vegetable Integrated Crop Protection RD&E Plan, although in most cases there was only brief discussion of the Thrips and Tospoviruses RD&E Program Plan. More extensive consultation was undertaken via a meeting of the IPM Working Group (27th May 2010) and at a meeting on 24-25th June 2010 organised by the Vegetable IPM Coordination project to consult with RD&E specialists working in vegetable pathology or entomology. A very basic draft Western Flower Thrips/Tomato Spotted Wilt Virus Action Plan (as the plan was initially named) was presented and discussed in a session with entomologists, extension specialists and virologists. They were polled on the risk/reward of components of the plan and it was agreed that it was more logical to broaden the scope of the plan to cover all Thrips and Tospoviruses affecting vegetables in Australia.
Feedback was sought more broadly via an email invitation to over 100 industry people who were likely to be interested in reviewing the plan and background information and providing feedback via a “Google Groups” site. They were also asked to participate in an on-line survey. The survey was designed to assist in prioritisation of strategies and gather information on the regional and crop specific importance of the different thrips species and the different tospoviruses. For the development of the foundation project budgets, project leaders who undertook similar, previously-funded projects were consulted. They were also asked to review the whole document.
Recommendations from Previous WorkBelow is a summary of recommendations from most of the thrips and tospovirus related projects. Some projects are not included because the final report could not be located. The RD&E plan is itself a synthesis of these recommendations with weight being given to the more recent recommendations from a particular research or extension group and from the scoping project VG06094.
HG97007 National WFT Strategy
Recommendations for future R&D1. Focused research within commodity groups2. Address high level of resistance in WFT across Australia3. Revise current field pesticide use rates4. Maintain current minor use permits5. Improve rearing technology and facilities for BCAs6. Evaluate new pesticides with low toxicity to beneficials 7. Develop a forecasting and prediction system for WFT outbreaks and TSWV epidemics
…APPENDIX 2
Work
In P
rogres
s
Appendix 8 : Page 59 Page 259

57NOTE: INDUSTRY SIGN-OFF IS REQUIRED BEFORE THIS CAN BE FINALISED
8. Develop a decision support system (based on above prediction system) to decide on appropriate control measures in selected vegetable crops
9. Demonstration crops grown under IPM strategy to increase grower confidence
Recommendations for practical application by industry1. Use of the Crop Specific Management Sheets (lettuce, tomato, capsicum, cucumber, strawberry,
ornamental)2. Adoption of the TSWV Disease Management Strategy3. Use of BCA’s in enclosed and semi-enclosed cropping systems4. Use of IPM strategy using 3 insecticide applications and rotation5. Use of TSWV-resistant lines (capsicum and tomato)6. Attend WFT training courses
VG00085 SA WFT ⇒
VG98004: TSWV in capsicums
1. TSWV resistance capsicum varieties are effective but is single gene and new TSWV strains arising regularly so use needs to be part of integrated strategy which reduces innoculum and vector levels as well to reduce pressure on resistance genes.
2. TSWV and CaCV and Bacterial Spot resistance lines need to be developed in parallel. VG02035 Capsicum breeding for tospovirus resistance ⇒
VG98006: TSWV Monitoring in Tropics
1. Monitor susceptible hosts regularly from plant-out for the presence of F. schultzei (tomato thrips) and other suspected TSWV vectors.
2. Apply an appropriate insecticide when TSWV vectors are detected, since the tolerance level for these pests is very low.
3. Assess efficacy of insecticides and levels of TSWV in-field as a means of monitoring insecticide resistance levels in F. schultzei and detecting the presence of other thrips species vectoring TSWV.
PT00019 TSWV potatoes
1. Further field monitoring of epidemics, and associations with inoculum sources and vectors. We have developed a tool to assist in predicting vector thrips population dynamics within potato fields. This can be used to indicate potential risk periods for TSWV transmission. However, thrips themselves are not the driving force behind TSWV epidemics. Presence of inoculum sources is more likely to determine the extent of disease. Thus we need additional information on prediction of inoculum levels in the vicinity of the crop. This may be most easily determined through development of a test for presence of TSWV within migratory thrips.
2. Cultivar screening has revealed several lines more tolerant of virus infection than others. Greater screening of a wide range of genotypes within the potato breeding program would allow us to determine the scope and extent of resistance within current germplasm, and indicate useful parents for cultivar development in further breeding experiments.
3. We have shown temperature influences TSWV infection rate, systemic movement in infected plants, and symptom expression. Further work could concentrate on effect of diurnal fluctuations of temperature and thus determine how weather patterns from different cropping regions in Australia may influence virus epidemiology, and tuber infections.
…APPENDIX 2
Work
In P
rogres
s
Appendix 8 : Page 60 Page 260

58 NOTE: INDUSTRY SIGN-OFF IS REQUIRED BEFORE THIS CAN BE FINALISED
4. Resistance to thrips preference and breeding has been shown. This trait offers avoidance of the disease and is thus a highly useful approach to resistance. Further more, presence of a thrips deterring volatile from potato foliage offers a potential chemical approach to disease management. Additional work examining the chemical basis of thrips deterrence, and development of gene markers to this trait would be a valuable approach to take.
5. Insecticide treatments appear to show some promise for disease control, but further testing is required. The data collected from trials to date has been obtained under low inoculum pressure. Further testing of insecticide treatments under high inoculum pressure is recommended.
VG00026 IPM systems for eggplant & capsicums dry tropics
The adoption of IPM in these crops has been hindered by the inability of growers and crop consultants to distinguish between pests and beneficial species and that all growers should get a copy of the INSECT PEST GUIDE - a guide to identifying vegetable pests and their natural enemies in the dry tropics.
A new project should be developed. Titled “Integrated Pest Management – Phase 2”. Integrated Pest Management is an ongoing process and should not be lost with the incursion of new pests. This second phase of the project should encompass the following:
1. A series of information seminars should be given in all of the capsicum and eggplant growing regions to demonstrate the use of the INSECT PEST GUIDE in these crops. This publication was not available during the project and is seen as the most important tool in helping growers adopt IPM systems.
2. Evaluate utilising the new imported parasites for Silverleaf whitefly. This insect pest is the main reason for IPM not succeeding in eggplant.
3. During this project, Western Flower Thrips were detected in the dry tropics for the first time. There is a need to undertake research into developing new controls of this pest, as the current recommendations do not fit IPM systems. Initial work started to evaluate predatory mites that are native to this area and this needs to be explored further in the control of thrips.
4. Spiralling Whitefly has reached the Burdekin, one of the main capsicum and eggplant growing regions. Current recommendations to control this pest rely on parasites. Their effectiveness is questionable.
VG00065 WFT TSWV WA
1. Develop a crop risk index for TSWV (based on Georgia model 2004 version):
a. Variety tolerance/susceptibilityb. Planting datec. Plant population: Higher density => healthy plants compensate for diseased plantsd. At plant insecticidese. Row pattern => double rows (still same density) found early canopy covering of infected TSWV
plants reduced spreadf. Tillage g. Weed control - chemical
http://sacs.cpes.peachnet.edu/spotwilt/index.htm
VG00085 SA WFT
Extend nationally – funded extension workers
1. Collaborative Action Learning approach2. Translated and interpreted resources were necessary3. Recommended R&D – incorporating range of pests, biological options, chemical and non chemical4. Monitoring strategies5. Trials and demonstrations6. Advanced IPM training and mentoring support for crop consultants
…APPENDIX 2
Work
In P
rogres
s
Appendix 8 : Page 61 Page 261

59NOTE: INDUSTRY SIGN-OFF IS REQUIRED BEFORE THIS CAN BE FINALISED
7. Communication strategies amongst IDOs, consultants, RD&E workers to improve regional initiativesVG03098 Regional extension strategy for managing western flower thrips and tomato spotted wilt ⇒virus in the Sydney RegionVG03099 Provision of western flower thrips technology transfer services in Bundaberg and Bowen ⇒VG05093 IPM for greenhouse vegetables - research to industry ⇒VG06037 Increasing adoption of IPM by WA vegetable growers and development of an ongoing ⇒technical support serviceVG06088 IPM advisory service for Tasmania ⇒
VX01018 Melon thrips
1. Monitor crops for pests and natural enemies2. Investigate alternative management options3. Validate the ‘best management option’ used in this trial at higher level of thrips4. Investigate in autumn and spring crops
VG01069 Molecular ecology of pest thrips
WFT needs to move between hosts to survive -- implications for pest management:
1. Knowing sources of thrips infestation and whether they are also sources of TSWV and adapting farm management to this knowledge to minimise thrips outbreaks at key times in production cycle
2. Knowing how thrips move across a wide geographic area may help develop more effective insecticide resistance management
3. Understanding how the landscape contributes to the development of effective areawide management and insecticide resistance management.
Suggested the work continue as a project to:
1. Resolve uncertainties over the microsatellites and2. Investigate the role played by the different farming systems in the genetic structure of WFT populations.
Using a protected cropping system, eg in SA, an intensive cropping system, eg in SE Qld, and another in central Qld
VG02030 IPM Green bean
Work done by Saxena and Kidiavai (1997) found neem seed extract useful in controlling flower thrips. Perhaps this could be investigated for its efficacy under Australian conditions. Thrips activity is looked at in a little more detail in the BMO trials. Bayer is doing more work against thrips with another of their products in beans, but additional work is still needed to address this insect pest problem.
VG07017 Thrips management in the green beans industry ⇒
VG02035 Capsicum breeding for tospovirus resistance
1. The CaCV-resistant backcross 3 lines and backcross 4 breeding populations should be commercialised along with the DNA marker technology developed in the project.
2. The performance of CaCV resistance should be monitored in field situations to ensure no virulent strains emerge to threaten its effectiveness.
3. The additional PI lines identified as resistant to CaCV in glasshouse assays should be screened using the DNA marker to determine if they have additional gene(s) not yet identified.
4. The DNA marker is not fully developed to the point where it is sufficiently robust for routine use in all situations. Further work to develop locus-specific primers and a more efficient detection system is recommended.
…APPENDIX 2
Work
In P
rogres
s
Appendix 8 : Page 62 Page 262

60 NOTE: INDUSTRY SIGN-OFF IS REQUIRED BEFORE THIS CAN BE FINALISED
5. More work on the epidemiology of CaCV and its relationship to the weed host Ageratum conyzoides is recommended.
6. CaCV is widespread in several Asian countries, particularly Thailand and China. Collaboration with research partners in Asia would extend knowledge of the virus and encourage better control measures and germplasm development.
7. CaCV is becoming an increasing problem in tomato crops at Bundaberg and has caused crop failures in Thailand. A tomato PI line resistant to CaCV has been identified in this project and a study to determine the feasibility of developing resistant cultivars is warranted.
VG03099 QLD WFT extension project
1. The registration of new insecticides to control WFT should be encouraged and supported to overcome the current dearth of effective chemicals. Resistance management through the 3-spray strategy depends on the availability of effective insecticides in different chemical groups.
2. Farm hygiene and district weed control are important factors in managing WFT and TSWV. Efforts to promote good farm hygiene and district weed control should be supported.
3. Management methods for WFT and TSWV must be integrated with the management of other pests and diseases in target crops. The development of whole-of-crop IPM systems should be supported. These IPM systems must be practical and realistic for growers to implement. They must be adaptable and fit into the whole farm business.
4. IPM technology transfer project teams should be encouraged to undertake a needs analysis at the start of the project to determine exactly who makes up the target audience, what the needs of the audience are, and how best to engage the audience.
5. It is desirable to include field demonstrations/trials and local case studies in technology transfer projects to allow growers and service providers to gain confidence in new approaches through observation and integration with personal experience.
6. Service providers need to be included as key members of the target audience in technology transfer projects. They have a large influence on growers.
7. The importance of one-on-one interactions on information flow and decision making must be emphasised in technology transfer projects.
8. IPM is a dynamic process. On-going RD&E for all pest and disease problems in vegetables should be supported.
9. On-going support for the commercialisation process (i.e. for consultants and other service providers) is necessary and should be supported.
10. External evaluation of all technology transfer projects should be encouraged.
VG03109 Greenhouse IPM
1. Development of new BC agents for use in GH situationsVG05093 IPM for greenhouse vegetables - research to industry ⇒
2. Evaluation of impact of new chemistry on BC agents: Aphidius colemani, Encarsia formosa, Neoseiulus cucumeris, Pyhtoseiulus persimilis, Steinernema feltiae, Stratioalaelaps scimitus and Transeius montdorensis.
3. Continued research into best use of available tools in combination
VG04032 IPM Asian Vegetables
1. Gaps in the legal availability of some reduced-risk pesticides, particularly for robust chemical resistance management.
2. Further grower education to gain a better understanding of IPM principles, pest monitoring and strategies. Particularly resources for LOTE growers The ‘case manager’ approach and use of bilingual officers have proved to be an effective method for building the capability of LOTE growers in Victoria.
…APPENDIX 2
Work
In P
rogres
s
Appendix 8 : Page 63 Page 263

61NOTE: INDUSTRY SIGN-OFF IS REQUIRED BEFORE THIS CAN BE FINALISED
VG05008 Cultural control
It is much easier to avoid problems with WFT than to have to deal with this pest when it is in high numbers. Similarly, there is no need to develop specific strategies for WFT. It is dealt with through an effective IPM strategy covering all pests in leafy vegetables. It is not that any one of the predators alone is likely to succeed but when used as part of an IPM strategy they have the potential to provide significant control of WFT.
1. Explore control of western flower thrips without the use of chemicals in a range of crops and locations.
VG06014 Revegetation by Design
1. Testing WFT ability to reproduce on plants: To increase the reliability of the lab-based assay in predicting low risk plants, we need to further * investigate the variables that affect thrips attraction, oviposition and emergence/development. This was illustrated in part by the high thrips larval emergence on some saltbushes in the initial lab screening, which contradicted previous field measurements (indicating there are field-specific inhibitory factors that reduce the ability of thrips to produce larvae on the foliage). The lab-based assay would be most useful for this research as it can be used to measure the effect of single plant variables (e.g. nutrition, age, growth stage, plant part etc.) in a controlled environment, in a similar way to the preliminary leaf-age data. If these factors can be understood in detail, it would facilitate the development of accurate lab based screens for thrips biological parameters and field-based management practices.
2. Ceranisus: There are several questions that require further research:Is plague thrips a host for Ceranisus nr menes?* Are there other thrips hosts for Ceranisus nr menes?* Can local populations of the wasp be altered through host (or other resource) provision associated * with specific native plants?What is the role of migration versus breeding in regulating thrips and wasp populations within study * sites?What are the key features of the wasps’ biology: host range, overwintering strategy, pupation site in * the field etc?Can the wasp work as an inundative release to control thrips hosts in enclosed or semi-enclosed * systems?What key (non-host) features of plants are important for attracting/supporting large Ceranisus sp. * populations during key periods of crop growth?Is WFT parasitism increased if wasp-supporting plants are grown amongst crops?*
3. Rutherglen bug parasitoid: Telenomus: Biology of Telenomus in field. * Potential as a biological control agent?* Where are the key breeding sites for Rutherglen bug.*
4. Brown Lacewing (BLW): Where is the breeding site (source) of the large M. tasmaniae influx? This is important because if * the breeding site is related to an endemic plant species (or group of species) then the prospects are good for onfarm manipulation of M. tasmaniae populations using endemic revegetation (that also inhibits WFT and TWSV). Further research is also required to confirm that lacewings were indeed migrating towards the * lettuce crop, presumably to feed on lettuce aphid.Role of native grasses, particularly Austrodanthonia linkii in regulating BLW populations.* Biology of BLW in summer.*
…APPENDIX 2
Work
In P
rogres
s
Appendix 8 : Page 64 Page 264

62 NOTE: INDUSTRY SIGN-OFF IS REQUIRED BEFORE THIS CAN BE FINALISED
VG06087 Chemical impacts on Beneficials
The key intention of this project was to improve awareness that successful IPM in crops relies heavily on preserving the beneficial species that can exert biological control of pests. The judicious application of pesticides is critical to preserving these natural enemies. We recommend:
1. Consideration of pesticide impacts on beneficial insects and mites in crops should be part of decision making for all spray applications.
2. Application of insecticides should be considered as a back-up to other pest control strategies such as biological and cultural controls.
3. Selective insecticides should be chosen whenever beneficial species are capable of exerting control pressure on pest species.
4. Growers and advisors need better understanding of the beneficial species present in their crops and to achieve this requires monitoring of crops and education in insect identification.
5. The pesticide charts and information developed in this project should be consulted to help choose the most appropriate pesticide in terms of preserving beneficial species.
6. Field application factors, such as multiple applications of the same product or tank-mixing of products could change the pesticide impacts on certain beneficial species.
7. There is a continuous need for researchers to test currently registered pesticides with beneficial species to improve the knowledge base available to industry. Additionally, new pesticides are being developed, current pesticides gain registration in different crops, and new pest issues arise which all create further need for pesticide testing.
8. The on-line pesticide charts and information need to be made more accessible and be available to the public rather than just vegetable levy payers. This will greatly improve the adoption of this research.
9. Further promotion of the research outcomes could be achieved through presentations at grower meetings and industry workshops Australia-wide.
VG06010 Spinosad Resistance
Resistance was found to be still increasing and now exceeds 200 fold in one strain, 43% of strains collected contained 20% or more resistant WFT and 28% contained 30% or more resistant WFT. Of those more resistant strains some 75% were definitely associated with spinosad field control failure when collected.
Cross-resistance testing identified chlorfenapyr (Secure®) and methidathion (Nitofol®) as suitable alternation candidates for spinosad to help manage resistance, but the chloronicotinyl chemicals (eg imidacloprid, Confidor®) were not considered suitable for use with spinosad.
There is a specific genetic difference in spinosad resistant WFT. A level of 10-40% resistance affects control and that resistance should be manageable within an integrated system. WFT populations were never fully controlled even when the population was completely susceptible.
Of the new active ingredients pyridalyl, acrinathrin, clothianidin and DPX-HGW86 that were tested, the latter product showed the most promise for WFT control.
More work is required to define more precisely where resistance control issues would be experienced, and a real time molecular genetic method needs development to monitor spinosad resistance.
…APPENDIX 2
Work
In P
rogres
s
Appendix 8 : Page 65 Page 265

63NOTE: INDUSTRY SIGN-OFF IS REQUIRED BEFORE THIS CAN BE FINALISED
VG06024 Phase II - Native Vegetation to enhance biodiversity
1. Determine the response time of beneficial insects to pests in cropping systems near remnant vegetation and the scale of changes in vegetation management to delay pest colonisation.
VG07040 Revegetation by design, Queensland: natural resource management and IPM. ⇒2. Create decision-support tools to help growers adopt information about native plants that are low risk for
their production system, plus capturing additional benefits such as drought and fire tolerant. This activity will require additional funds.
3. Provide funding for adoption and communication activities to support the findings of VG06024 and the new project VG07040.
VG06088 IPM advisory service for Tasmania
Once IPM has been adopted, there is still a requirement for constant collaboration between entomologists, farmers and agronomists to avoid IPM being seen as simply an alternative insecticide programme. Once IPM for invertebrate pests has been adopted, there is further opportunity to increase the scope to deal with a range of other pests in an holistic approach.
This project has been successful in providing IPM advice to the Tasmanian vegetable industry and has demonstrated how to achieve adoption of IPM in a range of vegetable crops, even where there is no particular crisis in pest management. The approach used provides a pilot of a method to achieve adoption of IPM in a wide range of crops. The project has also demonstrated how to deal with western flower thrips in vegetable crops – a topic of interest to many and considered extremely difficult.
1. We suggest that this project could be a model for other IPM projects across Australia and not only in vegetable crops but in all areas of horticulture.
VG06094 Sucking pest scoping study
SOFT OPTION SPECIFIC PRODUCTS
1. Beauveria and Metarhizium are entomopathogenic fungi identified as having potential for commercialisation in Australian vegetable crops. Current APVMA registration hurdles are apparently hindering this option. A project to assist and guide the APVMA to actively pursue the registration of the native strain of this biopesticide may assist commercialisation, industry acceptance, and adoption.
2. Identify from local and overseas research data any new soft option or entomopathogenic products that are specific to sucking pests and may assist in thrips control. Field test these products in our major thrips affected crops.
MONITORING
1. Develop an effective, practical, grower friendly monitoring system to allow on farm tracking of thrips numbers.
2. Develop thrips specific control threshold guidelines that can be reviewed and updated over time, to develop and fine tune district action guidelines. This will become more relevant as access to soft option specific products allows growers to stop using broad spectrum products.
3. Investigate a semiochemical (pheromone) based system. Individual on farm monitoring would be ideal so a semiochemical attractant, or similar local population sampling tool should be developed.
4. Consider a weather based population model linked to knowledge of thrips biology and population dynamics to predict pest influxes. This sort of system would need to take an area wide approach.
…APPENDIX 2
Work
In P
rogres
s
Appendix 8 : Page 66 Page 266

64 NOTE: INDUSTRY SIGN-OFF IS REQUIRED BEFORE THIS CAN BE FINALISED
PREDATORY INSECTS
1. There are two Orius species which have been used for WFT control one of which (Orius armatus) is native to Australia and has been shown previously in Western Australia to consume large numbers of adult western flower thrips, Frankliniella occidentalis. In the USA another Orius species is raised and released commercially to control thrips. A previous effort to raise the native Orius armatus in Australia failed.
VG06037 Increasing adoption of IPM by WA vegetable growers and development of ongoing ⇒technical support service. VG08186 Rearing Orius for vegetable industry ⇒VG09070 Managing a greenhouse capsicum crop – interactive DVD demonstration and resource ⇒packageVG09102 Biocontrol of WFT and other key pests in commercial greenhouse crops. ⇒
2. The predatory mites Transeius montdorensis, Neoseiulus cucumeris and Stratiolaelaps scimitus (Hypoaspis) are available commercially and work is needed to develop BMO for WFT in greenhouse systems.
EDUCATION
1. Continue to educate growers and industry groups regarding the important role of good farm hygiene practices, the removal of virus affected weeds, crop plants and residues which can both harbour resident thrips populations and be a continual source of virus spread.
VG07118 Build capacity of greenhouse growers to reduce crop loss through adoption of ⇒preventative disease management practicesneed a field version ⇒
2. Publicise more widely the major weeds that act as virus hosts and in some way demonstrate visually to growers the exponential infection nature of the virus/sucking pest interaction.
3. Manage resistance influences by providing a multiple control strategy, involving soft option products, monitoring, product rotation, and exclusion recommendations for covered cropping structures.
4. Link with virology research programs in conjunction with HAL to ensure work already done by virologists is recognised and integrated into IPM education and programs.
ENVIRONMENT MANIPULATION
1. LOTE market gardeners need to be targeted with educational activities and demonstration events to assist the adoption of good hygiene and sucking pest control practices. This should include a push towards education about, and release of predators and entomopathogens in enclosed structures. To ensure good adoption and the best results from such options, education about the potential to improve the environmental controls and general hygiene within the structures may have to occur to maximise pest and disease control results
2. Native vegetation as weed management tool and source of beneficials particularly around protected cropping structures.
…APPENDIX 2
Work
In P
rogres
s
Appendix 8 : Page 67 Page 267

65NOTE: INDUSTRY SIGN-OFF IS REQUIRED BEFORE THIS CAN BE FINALISED
APPENDICESThe appendices to this RD&E Program Plan are made up of individual worksheets in an Excel file.
This Excel file is accessible on the following project website:
https://sites.google.com/site/vegipmcoordinationproject/
Click on “Files” in the menu on the left, then view or download the Excel file sitting under the following folder name:
Appendices of the Thrips&Tospoviruses RD&E Program Plan 2011-2015
The individual worksheets contain the following, and it is intended that the information will be kept up to date:
1. Existing extension resources from HAL-funded RD&E projects
2. Previously funded projects as well as projects submitted in the 2008 and 2009 Industry Calls for projects commencing in 2009/10 and 2010/11 respectively
3. Literature on Thrips and Tospoviruses
4. A list of Stakeholders
5. Risk/Reward matrices for various RD&E subject areas as determined in a workshop and via an on-line survey
6. SWOT analysis (as presented in this Program Plan)
7. Methods and Task Plan (as presented in this Program Plan)
…APPENDIX 2
Work
In P
rogres
s
Appendix 8 : Page 68 Page 268

66 NOTE: INDUSTRY SIGN-OFF IS REQUIRED BEFORE THIS CAN BE FINALISED
Work
In P
rogres
s
Appendix 8 : Page 69 Page 269

67NOTE: INDUSTRY SIGN-OFF IS REQUIRED BEFORE THIS CAN BE FINALISED
» APPENDIX 3Vegetable Integrated Crop Protection RD&E Plan
Program Plan 2
IPM Adoption
This Program Plan was partially written in January 2011 to enable documentation of important Themes that emerged during the first nine months of the National Vegetable Integrated Pest Management (IPM) Coordination project (VG09191).
Completion of this draft plan is not within the scope of the initial one-year phase of VG09191.
January 2011
Work
In P
rogres
s
Appendix 8 : Page 70 Page 270

68 NOTE: INDUSTRY SIGN-OFF IS REQUIRED BEFORE THIS CAN BE FINALISED
Introduction 69
Plan Structure 70
Summary 71
Methods and Task Plan 72
…APPENDIX 3
» CONTENTS
Work
In P
rogres
s
Appendix 8 : Page 71 Page 271

69NOTE: INDUSTRY SIGN-OFF IS REQUIRED BEFORE THIS CAN BE FINALISED
Introduction The IPM Adoption RD&E Program Plan will be the second of a series of program plans that are to be developed in conjunction with the “overarching” Vegetable Integrated Crop Protection Research, Development and Extension (RD&E) Plan. Once completed, it will provide a framework for future investment in RD&E related to the broad IPM Adoption issues that are not implicitly covered in the other program plans. Adoption is a key goal of all IPM RD&E activities. The goal of this plan is to pick up overarching adoption issues to ensure a thorough and coordinated approach. There will be some cross-over between this program plan and the other plans and coordination will be needed to ensure the programs are working together effectively.
Partial development of this plan occurred in January 2011 as part of the National Vegetable Integrated Pest Management (IPM) Coordination project (VG09191)1 to capture important Themes that emerged during the first nine months of the project. Completion of this draft plan is not within the scope of the initial one-year phase of VG09191.
Once it is fully developed, it is expected that this program plan will cover areas of RD&E such as:
• comprehensive(i.e.coveringalltypesofpests),“wholefarm”IPMadoption;
• regionalIPMprograms;
• uptakebygrowersfromnon-Englishspeakingbackgrounds(NESB);
• determinantsofviablecommercialscoutingbusinesses;
• incorporationofIPMinto“systemsapproaches”thatmeettheriskmanagementrequirementsofMarketAccess regulators;
• chemicalaccessissues,egmodificationstoregistrationrequirementsforbiorationals;
• “marketpull”asadriverofadoption;and
• othermarketaccessandsupplychainissues.
…APPENDIX 3
1This project has been funded by HAL using the National Vegetable R&D Levy and matched funds from the Australian Government. It forms part of the Vegetable Industry Development Program (VIDP) and aims to plan, coordinate, monitor and support the development and adoption of best practice Integrated Pest Management (IPM) technology.
Work
In P
rogres
s
Appendix 8 : Page 72 Page 272

70 NOTE: INDUSTRY SIGN-OFF IS REQUIRED BEFORE THIS CAN BE FINALISED
Plan Structure The sections contained in the fully developed plan will be similar to what appears in the Thrips and Tospoviruses RD&E Program Plan, as follows:
• aSummary section containing the Vision, Mission and Situation Statements as well as an introduction to the Extension, Development and Research Themes;
• aMethods and Task Plan section, which outlines the methods required to achieve the desired outcomes under each of the Extension, Development and Research Themes and includes the specific Tasks to be undertaken under each Method;
• asectionoutliningProposed Foundation Projects within a Coordinated Program; and
• aBackground section that provides context for the plan and helps to explain why certain methods were selected.
As this is a partially written draft, the sections are different from the above.
…APPENDIX 3
Work
In P
rogres
s
Appendix 8 : Page 73 Page 273

71NOTE: INDUSTRY SIGN-OFF IS REQUIRED BEFORE THIS CAN BE FINALISED
Summary It is expected that several Themes will be included in this Plan when it is completed and the following three “levels” will be described:
1. Extension, Development and Research Themes (the Outcomes that need to be achieved in order to deliver the Vision);
2. Methods (the recommended approaches for achieving the Outcomes under each Theme); and
3. Task Plan (a plan for undertaking specific Tasks to implement the identified Methods).
Two Development Themes are presented in this draft document for consideration by members of the vegetable industry’s R&D committees.
Development Theme 1 (D1): Integration and regular updating of chemical and non-chemical crop protection information and tools in the secure area of the AUSVEG website. Growers currently have ready access to information on registered chemicals and Minor Use Permits from various sources including websites. One of the aims of VG09191 is to develop a pilot database within the secure area of the AUSVEG website that provides straightforward access to information required for implementing a holistic approach to pest management, including chemical options, initially for field-grown lettuce and celery. Another aim is to provide guidance for integration of the ‘Chemicals & Pesticides’ and ‘IPM’ areas of the AUSVEG website. Combining these areas will encourage consideration of all options for managing pests. It is envisaged that this will become the ‘Crop Protection’ area of the website and the chemical and non-chemical information that it contains will require regular updating on an ongoing basis.
Development Theme 2 (D2): “Market pull” as a driver of adoption of best practice integrated crop protection approaches. A significant barrier to the adoption of IPM (or “integrated crop protection”) is considered to be the market’s negative attitude to produce that has imperfections or contains dead/live organisms and/or frass. Buyers are known to reject consignments or offer lower prices even when the organisms that are present are beneficials. Market specifications that say “no insects” may lead to the use of broad spectrum pesticides close to the time of harvest including in situations in which growers have used an IPM approach for the majority of the crop’s life. A multi-pronged approach is needed to address the market barriers to adoption and to create “market pull” for vegetables produced using best practice integrated crop protection approaches.
…APPENDIX 3
Work
In P
rogres
s
Appendix 8 : Page 74 Page 274

72 NOTE: INDUSTRY SIGN-OFF IS REQUIRED BEFORE THIS CAN BE FINALISED
Methods and Task Plan The Methods and Tasks outlined in this section were partially developed in January 2011. Further development is not within the scope of the initial one-year phase of VG09191.
DEVELOPMENT THEME 1 (D1): Integration and regular updating of chemical and non-chemical crop protection information and tools in the secure area of the AUSVEG website.
Methods and Tasks Timeframe or Project Length
Method D1.1: Ensure ongoing liaison between HAL Minor Use Coordinator, HAL Pesticide Regulation Coordinator and National Vegetable IPM Coordinator
Tasks
D1.1.1: Develop mechanisms and define roles and responsibilities for monitoring and regularly updating the current ‘IPM’ and ‘Chemicals & Pesticides’ areas and the future ‘Crop Protection’ area of the AUSVEG website and any associated tools (eg searchable database). Incorporate roles and responsibilities into contracts of the three coordination projects.
Timeframe: Short Term (eg by July 2011)
D1.1.2: National Vegetable IPM Coordinator to convene regular meetings with the Minor Use and Pesticide Regulation Coordinators to ensure updating mechanisms have been implemented and to explore other possible joint initiatives.
Timeframe: On-going from time of implementation of Task D.1.1.1
Method D1.2: Integrate the ‘Chemicals & Pesticides’ and ‘IPM’ areas of the AUSVEG website
Tasks D1.2.1: National Vegetable IPM Coordinator (“IPM sub-program”) to liaise with the Knowledge Management and InnoVeg sub-programs of the Vegetable Industry Development Program (VIDP) to conceptualise integration and to define roles and responsibilities for achieving integration. Roles and responsibilities to be incorporated into contracts of the three sub-programs.
Timeframe: Short Term (eg by July 2011)
D1.2.2: Implementation in accordance with agreed roles and responsibilities. Project Length: 1 year or less
DEVELOPMENT THEME 2 (D2): “Market pull” as a driver of adoption of best practice integrated crop protection approaches.
Methods and Tasks Timeframe or Project Length
Method D2.1: Implement a cross-industry Consumer Awareness Campaign. (Consumer education is required to address market barriers to IPM adoption. Some retailers have indicated they would welcome opportunities to educate consumers about adoption of best practice pest management by vegetable growers. See Action 3.1.2 in the “overarching Plan”, which highlights the benefits of a collaborative approach to development and implementation of a consumer monitoring and education program.)
Tasks
D2.1.1: Establish collaborative arrangements with other industry organisations. The IPM and Consumers & Markets sub-programs of the VIDP may have a role in seeking collaboration (eg in conjunction with HAL and/or AUSVEG).
Timeframe: to be enacted in the Medium Term (eg in 2012/13)
Project Length: to be determined via scoping study (Task D2.1.2)
D2.1.2: Initiate a scoping study or other mechanism of establishing preferred approaches, likely costs etc. (For example, a committee with representatives from all collaborating industry organisations may identify a need for this step.)
D2.1.3: Secure funding commitments including voluntary contributions (VCs) and identify appropriate person to write tender brief on behalf of all industry partners.
D2.1.4: Consider tenders, finalise contract etc.
D2.1.5: Monitor and evaluate the campaign.
…APPENDIX 3
Work
In P
rogres
s
Appendix 8 : Page 75 Page 275

73NOTE: INDUSTRY SIGN-OFF IS REQUIRED BEFORE THIS CAN BE FINALISED
» APPENDIX 4
Work
In P
rogres
s
Appendix 8 : Page 76 Page 276

Appendix 9 : Page 1
Appendix 9 Thrips & Tospovirus Resources (fact sheet)
February 2011
The information in this fact sheet was compiled by Sandra McDougall, NSW Department of Primary Industries (NSW DPI) as part of the National Vegetable IPM Coordination project (VG09191).
Page 277

Thrips & Tospovirus Resources
Western Flower thrips (WFT) and Tomato Spotted Wilt Virus (TSWV) are serious pests of a wide range of
vegetables.
Western fl ower thrips is one of a number of thrips species that causes direct feeding damage to vegetables. Some
of the most sensitive include: cucumbers, silverbeet, spring onions and shallots and a range of herbs. It is a more
serious problem than many other thrips in that it has developed high levels of insecticide resistance.
Tomato Spotted Wilt Virus is the most widespread and damaging virus affecting Australian vegetable crops. It
is a tospovirus and is transmitted by WFT, Onion thrips, Tomato thrips and Melon thrips. It is a serious disease
of tomatoes and other solanaceous crops such as capsicums, eggplant and potato. It can also devastate lettuce
crops and cause signifi cant damage in peas and celery.
Capsicum chlorosis virus (CaCV) and Iris yellow spot virus (IYSV) are two other tospoviruses new to Australia.
CaCV is vectored (i.e. carried and transmitted) by Melon thrips and Tomato thrips in capsicums and tomatoes.
IYSV is vectored by Onion thrips in onions and leeks.
To effectively manage these pests it is important to understand some key points about their biology and
management, namely:
• Sanitation is critical. Avoid getting thrips or TSWV in seedlings, reduce chances of them coming into your
crop and remove and destroy any diseased plants.
• Not all thrips transmit viruses and different tospoviruses are transmitted by different thrips species.
• For an adult thrips to transmit the virus(es) it vectors, it must have developed on an infected plant.
• WFT and TSWV both have very broad host ranges and both are found on a range of weed species
therefore weed management around crops is a critical factor in managing these pests.
• WFT is resistant to many insecticides and not all thrips vector TSWV
therefore being able to identify WFT and other thrips species is critical to the development of
sound management strategies.
• Viruses can not be cured – only prevented.
• A chemical-fi rst or chemical-only strategy will fail.
• Maintaining an environment in which viruses are absent or at very low levels and a range of the natural
enemies of thrips are present will keep damage below economic levels.
An integrated strategy, using knowledge about the thrips and the tospoviruses as well as the natural enemies that
are present and how they move around the environment, is essential to effectively manage both pests.
Below is a selection of information resources that can assist in managing thrips and tospoviruses in vegetables.
A brief description is given along with a web link or information on where copies may be obtained.
BOOKLETThrips and Tospovirus – a management guide (2007)This 18 page guide covers each of the tospoviruses and thrips species found in Australia
that affect vegetable crops and includes tables of host crops, excellent photos of virus
symptoms and basic management information.
http://www.dpi.qld.gov.au/4790_11607.htm
http://www.dpi.qld.gov.au/documents/Biosecurity_
GeneralPlantHealthPestsDiseaseAndWeeds/Thrips-Tospovirus-Booklet-
lorez.pdf
Appendix 9 : Page 2 Page 278

CD-ROMManaging Western Flower Thrips and Tomato Spotted Wilt Virus in Vegetables (2003) This CD has a series of 4 short videos in English or in Vietnamese covering the following
topics:
Identifying the pest1. How the damage is caused 2. Non-chemical control 3. Chemical control 4.
It also has a section with fact sheets on WFT and TSWV, including an extensive list of TSWV hosts.
To order the CD, go to the bottom of the web page and in the “Feedback” area (boxes within an orange border)
type in your Full Name and Email Address and in the box for “Feedback and comments” state that you wish to
obtain 1 copy of the “Western Flower Thrips CD-ROM” and also state whether you are a levy-paying vegetable
grower or how you are associated with the vegetable industry (eg IPM consultant, R&D service provider or
agronomist working with growers). Then give your complete postal address so the CD can be mailed to you. It
might pay to also include your phone number. Once you’ve typed in all of the required information, click the
“Submit” button.
http://www.vgavic.org.au/communication/research_and_development_shop/western_fl ower_thrips_cd_rom.htm
IDENTIFICATION RESOURCESIdentifi cation of western fl ower thrips (2002) An informative PowerPoint presentation that shows the key features that enable
identifi cation of Western fl ower thrips (WFT) versus the other thrips that are commonly
found in vegetable crops.
http://www.hin.com.au/Resources/Western-Flower-Thrip-Identifi cation
Which thrips is that? (2005) This factsheet contains information, photographs, and diagrams to assist with the correct
identifi cation of the different thrips species that are found in vegetable crops. The guides also
show examples of thrips damage and show where to look for damage on plants.
http://www.dpi.nsw.gov.au/agriculture/horticulture/pests-diseases-hort/multiple/thrips/which-
thrips-is-that
SUMMARY FACT SHEETSIntegrated disease management strategy (2002) for tomato spotted wilt virus in:
1. vegetable crops
2. seedling nurseries
3. protected crops
Three one-page fact sheets that provide an
integrated disease management strategy to
minimise Tomato spotted wilt virus (TSWV)
infections in open fi eld vegetable crops,
seedling nurseries and protected crops.
http://www.hin.com.au/Resources/Western-Flower-Thrip-in-Vegetables
thrips & tospovirus resources
page 2
Appendix 9 : Page 3 Page 279

Viruses in vegetable crops in Australia (2009) This 6 page factsheet covers the range of viruses found in vegetable crops in Australia, how
they are spread and basic management strategies to avoid viruses in vegetable crops.
http://www.dpi.qld.gov.au/26_19759.htm
http://www.dpi.qld.gov.au/documents/PlantIndustries_FruitAndVegetables/Viruses-in-vegies.pdf
Western fl ower thrips and tomato spotted wilt virus (2007)This 5 page fact sheet covers basic biology and management information
for vegetable growers.
http://www.dpi.nsw.gov.au/agriculture/horticulture/pests-diseases-hort/
multiple/thrips/wft-and-tswv
Management of thrips and tomato spotted wilt virus (2007) This 4 page fact sheet covers thrips and TSWV identifi cation, symptoms and
management for vegetable growers.
http://www.agric.wa.gov.au/objtwr/imported_assets/content/pw/ins/pp/hort/fn069_2004.pdf
Western Flower Thrips (2004) This 2-page fact sheet gives basic lifecycle and management options for
Western fl ower thrips.
http://www.vegetablesvictoria.com.au/communication/vege_notes/
western_fl ower_thrips.htm
Capsicum virus diseases (2005) This 2 page fact sheet covers capsicum virus diseases including the
tospovirus Capsicum Chlorosis Virus (CaCV) and strategies to avoid virus
infection in capsicums.
http://vgavic.org.au/communication/vege_notes/capsicum_viruses.htm
RESISTANCE MANAGEMENT FOR WFT Western fl ower thrips (WFT) insecticide resistance management planThis series of web pages gives basic information on WFT
resistance management and provides a list of the permitted
insecticides for several crops.
http://www.dpi.nsw.gov.au/agriculture/horticulture/pests-
diseases-hort/multiple/thrips/wft-resistance
Controlling Spinosad Resistance with WFT (2009) Spinosad is one of the few chemicals registered or permitted to control WFT. However, WFT
has now developed high levels of resistance in some production areas. This 4 page fact sheet
covers the mechanisms of resistance development and strategies for using spinosad in ways
that will prevent resistance build-up.
www.ausveg.com.au > grower portal> search Vegenotes
thrips & tospovirus resources
page 3
Appendix 9 : Page 4 Page 280

OTHER USEFUL RESOURCES The following resources have some useful information about thrips and tospoviruses and using an integrated pest
management strategy for managing crop pests.
Information Guides/ManualsKeep It Clean (2009) Comprehensive guide for greenhouse growers that lists and describes more than 70
management practices that can signifi cantly reduce the costs and losses that can result from
pests and diseases. A series of summary fact sheets and example record sheets are also
available to download. Manual can be downloaded or a hard copy can be ordered.
http://www.dpi.nsw.gov.au/agriculture/horticulture/greenhouse/pest-disease/general/preventing
Commercial Greenhouse Cucumber Production (2010) This 216 page growing guide for greenhouse cucumber growers includes sections on
managing crop pests. This manual can be purchased.
http://www.dpi.nsw.gov.au/aboutus/resources/bookshop/commercial-greenhouse-cucumber-
production
Revegetation by design guidebook (2006) Weeds in and around crops can be major sources of WFT or TSWV. Work
in the Northern Adelaide Plains with native vegetation has found that many native plant species
are not hosts for either pest. This 76 page guide covers information on property planning,
pests and natural enemies and establishment and maintenance of native vegetation including
indicative costs.
http://www.sardi.sa.gov.au/__data/assets/pdf_fi le/0008/44945/reveg_by_design_guidebook.pdf
Guide to using native plants on the Northern Adelaide Plains to benefi t horticulture (2009) A fi eld guide style of publication covering the information on the native plants that
have the best potential as substitutes to bare ground or weeds in and around crops to
reduce sources of WFT or TSWV and increase potential benefi cials.
http://www.sardi.sa.gov.au/__data/assets/pdf_fi le/0005/103469/SARDI_Reveg_
Guide_2009.pdf
Vegetable Integrated Pest Mangement (IPM) in Tasmania (2004) This 200+ page manual covers vegetable IPM and practices, diseases, insects, and weeds
for the key vegetables grown in Tasmania: potatoes, carrots, beans, peas, broccoli and
onions. It is available for purchase as a CD or a manual or can be downloaded.
http://www.dpiw.tas.gov.au/inter.nsf/WebPages/TTAR-68Q6CX?open
Integrated pest management in lettuce: information guide (2002) 150 pages
http://www.dpi.nsw.gov.au/aboutus/resources/bookshop/ipm-lettuce-
infoguide
Integrated pest management in greenhouse vegetables: information guide (2002) 216 pages http://www.dpi.nsw.gov.au/aboutus/resources/bookshop/veg-ipm-info-
guide
Both information guides provide information about IPM, what it is,
recognising and monitoring of pests, benefi cials, diseases and weeds
(lettuce only), spray application and record sheets.
thrips & tospovirus resources
page 4
Appendix 9 : Page 5 Page 281

thrips & tospovirus resourcesQueensland Primary Industries Agrilink seriesAlthough many of these were produced in the late 1990s they are still relevant and contain
good information on crop production, answers to common questions, problem solving guides
and other information. Very few are still available for purchase, but pdfs can be downloaded
from the DEEDI archive site.
Lettuce Information Kit: a growing manual.
http://era.deedi.qld.gov.au/1660/
Capsicum and Chilli Information Kit: a growing manual.
http://era.deedi.qld.gov.au/1651/
Field ID/Ute Guides These guides are excellent resources for taking into the fi eld to assist in identifying invertebrate pests and
benefi cials, plant diseases and in some cases nutritional defi ciencies.
Green beans: insect pests, benefi cials and diseases 2008 - The Ute Guidehttps://www.bookshop.qld.gov.au/ProdView.aspx?popup=1&Category=SXXC306030&Product=
9780734503954
Insect Pest Guide: a guide to identifying vegetable insect pests and their natural enemies in the dry topics contact [email protected]
Pests, benefi cials, diseases and disorders in lettucehttp://www.dpi.nsw.gov.au/aboutus/resources/bookshop/ipm-lettuce-fi eld-id-guide
Pests, diseases, disorders and benefi cials in greenhouse vegetableshttp://www.dpi.nsw.gov.au/aboutus/resources/bookshop/veg-ipm-fi eld-id-guide
Pests, Benefi cials, Diseases and Disorders in Cucurbitshttp://www.dpi.nsw.gov.au/aboutus/resources/bookshop/cucurbits-fi eld-id-guide
page 5
Appendix 9 : Page 6 Page 282

thrips & tospovirus resourcesChemical Impact on Benefi cialsAll organisms have their natural enemies (organisms that prey on them). When invertebrate pests are feeding on
a crop their natural enemies are usually not far behind and may control your pests without the need for any other
control method.
These resources provide knowledge of the impact of pesticides on non-target
benefi cial insects and mites, which is essential for planning and implementing
IPM programs.
The following three one-page tables detail the effects of pesticides on benefi cials:
Insecticide effects on benefi cial insects and mites1.
Insecticide compatibility with non target benefi cials2.
Fungicide and herbicide effects on benefi cial insects3.
From project: VG06087 Pesticide Effects on Benefi cial Insects and Mites in
Vegetables (2009)
http://www.ipmtechnologies.com.au/index.php?option=com_content&view=article&id=14&Itemid=21
www.ipmtechnologies.com.au > IPM tools> Insecticide compatibility
Colour coded tables detail insecticide impact on greenhouse biological control agents under the following
headings:
Pesticide residues on foliage 1.
Pesticide residues in media 2.
Pesticide residues on greenhouse plastic 3.
Side-effects of pesticides on natural enemies4.
From project VG3109 Extension to Greenhouse IPM Program (2007)
www.ausveg.com.au > grower portal> Technical Insights database> search for VG3109 –
download the fi nal report, go to pages p173-183
Impact of insecticides on natural enemies found in brassica vegetables (2004)
This is a two-page factsheet detailing the impact of insecticides on natural
enemies found in brassica vegetables.
http://www.sardi.sa.gov.au/__data/assets/pdf_fi le/0011/44876/toxchart.pdf
Many of the above resources can be obtained from the “login” area of the AUSVEG
website (www.ausveg.com.au), where you can also fi nd ordering instructions for
“hard copy only” resources.
Once you have logged in, click on “Technical Insights”. Then go to the Search
Engine where you can type in key words or the entire title of the
resource.
page 6
Appendix 9 : Page 7 Page 283

Appendix 10 : Page 1
Appendix 10 Integrated information “packages” to be scoped as part of a future IPM
Coordination project or program
May 2011
This document was prepared by Lauren Thompson, Scholefield Robinson Horticultural Services, to meet the requirements of Milestone 190.1.2 of the National Vegetable IPM Coordination project (VG09191). It is based on responses to an e‐mail message issued to industry members in the vegetable growing regions by Kristen Stirling, RM Consulting Group (InnoVeg Sub‐Program of the VIDP) asking, “What are the high‐priority crop protection issues for the vegetable industry?”
Page 284

Appendix 10 : Page 2
National Vegetable IPM Coordination project (VG09191) May 2011 (update of report sent to VIDP NCs and InnoVeg on 21st February 2011) This document has been prepared to meet the requirements of: Milestone 190.1.2: Integrated Information Packages - List of packages to be scoped in
Year 2 developed & funding options considered
Integrated information “packages” to be scoped as part of a future IPM Coordination project or program The Integrated Information Packages component of the one-year pilot project (VG09191) includes identifying gaps in IPM-related resources and appropriate formats to fill the gaps, resulting in a list of packages to be scoped during a future IPM Coordination project or program. Kristen Stirling (InnoVeg sub-program) was asked to assist with development of the list by requesting feedback from regional contacts including representatives of the CIO Sub-program partners. She issued an e-mail message on 26th January 2011 with the subject line: “What are the high-priority crop protection issues for the vegetable industry?” See the “Notes” section at the end of this report for the content of her e-mail message.
The first three responses in Table 1 were received in time to issue the original report on this milestone on 21st February 2011. One of these responses was a joint response from DPI Victoria researchers. Further input has since been received and the feedback has been added to Table 1.
Table 1 : High-priority IPM-related information packages needed in vegetable production regions (feedback received as at 21st February 2011)
Feedback from: Region(s) represented Information Package Needs Additional feedback
Clinton McGrath Industry Development Officer (Horticulture) Applethorpe Research Station [email protected]
South Region of Queensland, which includes the following production regions: • Lockyer Valley • Fassifern Valley • Eastern Darling
Downs • Stanthorpe
• Resistance management • Chemical application • Chemical stewardship
including the meaning of “legal” info on chemical labels, eg buffer zones, nozzle sizes
None of the issues (dot points) in Kristen’s e-mail are of priority at the current time in the regions in which he works
Alison Anderson NSW Farmers’ Association Senior Policy Officer Horticulture & Ag Chem
All vegetable production regions of NSW
• Western flower thrips (WFT) particularly regarding resistance management & expected response of thrips to softer chemistry
• Clubroot • Update 10-year-old DBM
brochure and include info for Chinese Asian vegetable growers (ask Leigh James of I&I NSW if this is needed)
In the wet weather fungal diseases and Heliothis have been major problems. Contact Silvia Jelinek, Sandra McDougall and Len Tesoriero of I&I NSW for further info
Joint response from DPI Victoria: Ian Porter, Caroline Donald, Liz Minchinton, Dolf de Boer, Jacky Edwards, Oscar Villalta and Scott Mattner
All vegetable production regions of Victoria, based on phone calls to some major growers and crop consultants
• Anthracnose of lettuce (field and nursery control)
• White blister of brassicas • Anthracnose of celery • Pythium in lettuce and celery
Contact these additional people for input: • Slobodan
Vujovic (IDO
Page 285

Appendix 10 : Page 3
• Downy mildews (particularly lettuce)
• Sclerotinia (lettuce) • Clubroot extension (growers
getting “lazy” with controls) • Bacterial diseases and rots
(eg in celery and parsley) • Powdery mildews • TSWV • Diseases of rhubarb,
especially downy mildew • Benefits of indicators (of soil
health) and good soil health treatments
• Effectiveness of disease predictive models
East) • Helena Whitman
(IDO West) • Rob Dimsey Examine the scoping study for National Disease Program, which developed good priority lists for disease issues across Australia. Look at the reports on the “Think Tanks” run in 2009 and 2010: • Brassica Think
Tank • Root Vegetables
Think Tank • Leafy
Vegetables Think Tank
Anthony Mason A Mason Pty Ltd Grower (received by Kristen 17th Feb 2011)
Werribee South VIC • There are limited fungicides for White Blister on broccoli
• They have no control for Corky Root on lettuce when they get this disease
• There are not enough ‘soft’ chemicals (such as Success) for lettuce
Tony Imeson forwarded Kristen’s e-mail message to him
Andrew Heap TFGA (received by Kathryn Lee, 9th March 2011)
Tasmania • From a biosecurity perspective, Tasmania would like to maintain freedom from:
o PSN (he possibly means PCN, potato cyst nematode)
o Fruit Fly o Psyllid-transmitted
diseases (eg zebra chip of potatoes)
o White snail o TSWV
• Downy mildew has had an impact this year
• Corby grub has had an impact this year (in pasture)
• Significant weed problems (eg wild radish) have occurred due to concerns about using chemicals such as MCPA
• There is a lack of registered herbicides for fodder beets; Eptam is registered in NZ
Kristen Stirling (from her e-mail below, in which she lists the responses she received in response to a request for feedback on high-priority fact sheet topics)
Unknown • Diamondback Moth Management Strategies
• Managing Chemical Resistance
• Zucchini yellow mosaic virus and cucumber mosaic virus
• Viruses in celery
Kristen may have already produced factsheets in response to this feedback or given guidance on fact sheets and websites already covering some of these topics, eg the Diamondback
Page 286

Appendix 10 : Page 4
Moth website The feedback received is valuable as a starting point. It would be desirable to have responses from people representing more (ideally all) of the production regions. The recommendations from the “Think Tank” reports and the various scoping studies have or will be examined as part of the process of developing RD&E Program Plans. The program plan development process should also include a “gap analysis of extension resources” as stated in the over-arching Vegetable Integrated Crop Protection RD&E Plan (see Objective 4, Strategy 4.1, Action 4.1.1). The Thrips and Tospoviruses RD&E Program Plan has been developed. The eight RD&E Program Plans that are to be developed as soon as possible cover the following specialised areas: • IPM Adoption • Invertebrate Pests (insects and mites) • Pathology (diseases caused by fungal, bacterial and viral pathogens) • Nematology • Soil Health • Greenhouse IPM • Weeds • Vertebrate Pests Extension resources that address many of the items in Table 1 have been “delivered” to the Knowledge Management sub-program. Development of additional fact sheets is most likely not required in these cases. The type of “information package” that needs to be developed to facilitate adoption of the recommended approaches needs to be determined by InnoVeg in conjunction with CIO partners and other potential Delivery Partners (including RD&E providers). Scoping of these “information packages” can then take place as part of a future National Vegetable IPM Coordination project or program. Part of the scoping will include consideration of funding sources. In some cases the “packages” might be funded via the InnoVeg sub-program’s budget. In other cases, “sponsorship” might be a logical source of funds. For example, chemical companies might agree to provide funding for development of an information package (which could be used as part of an extension initiative) on Chemical Stewardship, which was identified as a high priority need by Clinton McGrath. SCHOLEFIELD ROBINSON HORTICULTURAL SERVICES PTY LTD
LAUREN THOMPSON Senior Consultant VG09191 Project Leader F:\HAL\National Vegetable IPM Coordinator\VIDP-MtgsRprtsOPsPolicies\HAL FINAL REPORT May2011\A10\InfoPackages2beScopedInYr2(Milestone190.1.2)update.doc
Page 287

Appendix 10 : Page 5
NOTES:
The content of Kristen’s e-mail message was: Dear All, The IPM sub-program (part of the Vegetable Industry Development Program) is looking for information on what you believe to be the 'high priority' crop protection related information packages needed by vegetable growers in your region. This information will be used to inform the development of information packages in year 2 of the IPM sub-program (dependent on funding) and advise the InnoVeg program as to what future RD&E activities in this area should be funded. I already have an indication of what are considered some of the main pest & disease issues based on our previous request for fact sheet topics. These include:
• Diamondback Moth Management Strategies • Managing Chemical Resistance • Zucchini yellow mosaic virus and cucumber mosaic virus • Viruses in celery
But are there other 'high priority' crop protection issues? Please keep in mind that these 'information packages' don't need to be only printed material and I would be interested in hearing what other ways you would like to inform and advise growers about managing these issues (i.e. on-farm workshops, field walks etc). If you could please provide us with some feedback by the 11 February it would be most appreciated. Thanks, Kristen There were 52 recipients of the e-mail message. The previous version of this report listed several e-mail addresses, which have been deleted to maintain the privacy of those people. If necessary, the names of the recipients can be obtained from Kristen Stirling.
Page 288

Appendix 11 : Page 1
Appendix 11 Scope of proposed extension “package” for improved management of Thrips and Tospoviruses in vegetables
May 2011
This document was prepared by Sandra McDougall, NSW Department of Primary Industries (NSW DPI) and Natasha Wojcik, Arris Pty Ltd to meet the requirements of Milestone 190.1.3 of the National Vegetable IPM Coordination project (VG09191). It is partly based on responses to an e‐mail message issued to industry members in the vegetable growing regions by Kristen Stirling, RM Consulting Group (InnoVeg Sub‐Program of the VIDP) asking, “What is the best way to get the information in the Thrips & Tospovirus Resources fact sheet out to growers who are having difficulty managing these pest‐disease complexes?”
Page 289

Appendix 11 : Page 2
NATIONAL VEGETABLE IPM COORDINATION PROJECT (VG09191) (also known as the IPM Sub‐program of the VIDP)
May 2011
This document has been prepared to meet the requirements of: MILESTONE 190.1.3 ‐ Integrated Information Packages ‐ Project scoped: electronic version of WFT/TSWV "package" into "hard" version
Scope of proposed extension “package” for improved management of Thrips and Tospoviruses in vegetables 1. Introduction Western flower thrips, Frankliniella occidentalis (WFT) and tomato spotted wilt virus (TSWV) are serious pests of a wide range of vegetables. WFT is one of a number of thrips vectors of the tospovirus TSWV, along with Tomato thrips, Frankliniella schultzei (TT), Onion thrips, Thrips tabaci (OT) and Melon thrips, Thrips palmi (MT). Thrips that have developed as larvae on virus infected plants can vector or transmit the virus as an adult when feeding. Other tospoviruses that impact on vegetables in Australia include capsicum chlorosis virus (CaCV) which is vectored by TT and MT; Iris yellow spot virus (IYSV which is vectored by OT; and a virus recently found in NSW, Impatiens necrotic spot virus (INSV) which is vectored by WFT. Thrips can also cause damage to plants when feeding by killing the cells they feed on, which leaves whitish spots or silvering on the leaves or fruit, or by causing flower abortions. Once a plant has a virus there is no cure for it, hence preventing infection is critical. Management of alternative hosts, roguing diseased plants, excellent hygiene and management of vectors are all important. As part of the National Vegetable IPM Coordination project, a Thrips & Tospovirus Resources fact sheet (electronic form) was developed to meet Milestone 190.1.1 ‐ Western Flower Thrips ‐ WFT/TSWV "package" developed to electronic version stage. Availability of this fact sheet was highlighted and a hyperlink to it was included in the VIDP Update section of the VIDP Newsletter ‐ April 2011, which was developed and distributed by InnoVeg. In early April 2011, the IPM Sub‐program asked InnoVeg to seek input on how this electronic fact sheet could be expanded into a “package” that would meet the needs of growers in the regions. Kristen Stirling sent an e‐mail message to the CIO Sub‐program partners and others on her contact list, asking for their feedback on the best way to get the information in the electronic fact sheet out to growers who are having difficulty managing these pest‐disease complexes. This scoped “package” is partly based on the feedback received. A Thrips & Tospoviruses RD&E Program Plan (‘T&T Plan’) was also developed as part of the National Vegetable IPM Coordination project. It is the first of nine proposed Program Plans to form part of the Vegetable Integrated Crop Protection RD&E Plan 2011‐2015. The T&T Plan includes more detailed information on thrips and tospoviruses, existing resources that are available and areas for further investment including recommended Extension components. Components of the Proposed Foundation Projects within the T&T Plan that relate to information resources and training have been included in this scoping document. The ‘demonstration sites’ component of the Proposed Foundation Projects is highly recommended but it is recognised that the cost is likely to limit them to one or two sites per
Page 290

Appendix 11 : Page 3
year. Training sessions are less expensive and will reach more growers but they are considered to be less effective for changing practices. However, they will result in improvements in knowledge, awareness and attitude. It is envisaged that the ‘phone help‐line’ component would be run by an experienced IPM consultant who can provide one‐on‐one assistance to growers and answer questions that they perhaps are unwilling to ask in public forums. Future investment in the development of this Integrated Information Package for Thrips and Tospoviruses (emphasising WFT/TSWV) should proceed without duplication of activities. It should be noted that a project targeted at language other than English (LOTE) growers is being negotiated with InnoVeg, which may overlap with this proposed extension project (eg the InnoVeg proposal involves carrying out workshops on sanitation and this scoped project also involves workshops in districts where there are many LOTE growers). Therefore, if this scoped proposal is developed into a commissioned project, the teams carrying out the two initiatives will need to coordinate to avoid duplication.
2. Integrated Information Package for Thrips & Tospoviruses The components of this package include:
1. Thrips & Tospovirus Resources fact sheet (electronic form), which has already been produced, will be updated to include recently published resources and new research results. In addition, it will be:
• Translated into Vietnamese and Khmer (funded separately)
2. Updated and formatted 17 page booklet: Controlling Key Pests in Virginia Greenhouses
3. Field version of the Keep It Clean farm hygiene manual (current version is for Greenhouse growers) and Farm Management Review Booklet (workbook for farm sanitation audit & planning).
4. Case studies: Produce two new case studies covering successfully management of WFT and TSWV by growers. Produce in 3 formats – video, fact sheet & audio. Combine previously produced and currently in‐production case studies that are relevant for integrated management of thrips and tospoviruses for inclusion on a CD ‐ROM (outlined below). Existing case studies include one in the “Mega Pests ‐ Managing Sucking Pests” fact sheet, some written ones from a Lettuce IPM project and a video case study being produced as part of a current Lettuce IPM project, as well as audio case studies produced by Tony Burfield (SARDI) in 2007/08.
5. Thrips/Tospovirus CD‐ROM. Reprint the 2003 WFT & TSWV CD‐ROM (copies no longer available) with additional files including pdfs of all current resources that will be highlighted on the revised Thrips & Tospovirus Resources fact sheet, and existing and new grower case studies of successful WFT & TSWV management.
6. Thrips and Tospovirus Workshop/Training Session series. Three sessions are suggested with the first session being face‐to‐face in cropping regions that experience regular and significant damage due to thrips and tospoviruses; the second and third being via the internet or a webinar. The first session will also be available via webinar for growers unable to make the face‐to‐face workshops.
• Sessions will be geared more towards greenhouse or field sessions depending on the location. Vegetable growers in regions will be generally invited as many of the management practices have relevance to management of other invertebrate pests, diseases and viruses.
Page 291

Appendix 11 : Page 4
Additional information on proposed Training Sessions First session:
1. Review what we know • biology of thrips and tospoviruses, symptoms • information resources
2. Prevention • Sanitation‐ use of Farm Management Booklet for Greenhouse and separate
Field version of booklet to audit farm sanitation practices 3. Management options – separate options presented for greenhouse versus field 4. Records, reviewing, planning and using outside help
Second session: Work through the Farm Management Booklet for greenhouse or field Third session:
1. Grower case studies 2. Question & answer session 3. Planning to implement change 4. Getting further help ‐ outside help & resources available.
Workshop materials include: copies of CD‐ROM, Keep It Clean manual – Farm Management Review Booklet, and PowerPoint presentations It is envisaged that the first training session would be a face‐to‐face workshop held in locations with a history of significant crop loss caused by thrips and tospoviruses, with the second and third sessions being held via webinar (the number of webinars required for each session would depend on the numbers that attended the actual workshops, as a webinar works best with a maximum of 15 participants). It would also be beneficial to hold the first training session as a one‐off webinar to cater for those who wanted to attend the face‐to‐face workshop but could not leave their property to attend or had to travel too far. Webinars are being used more as a training tool as they allow farmers to attend when they would otherwise be unable. Suggested locations for face‐to‐face workshops:
SA: Northern Adelaide Plains – greenhouse session Significant problem with WFT and TSWV in greenhouse capsicums. Strain of TSWV found has broken through the capsicum varietal resistance.
NSW: Sydney Basin – field and greenhouse sessions WFT and TSWV significant problem in field and greenhouse capsicums and lettuce.
WA: Swan Plain (Wanneroo) – field session WFT and TSWV significant problem in field capsicums and lettuce.
Carnarvon – field session WFT and TSWV significant problem in field capsicums and eggplants.
QLD: Bowen – field session WFT, MT, TSWV and CaCV significant problem in field capsicums. Bundaberg – field session MT, WFT and CaCV significant problem in field capsicums.
First Session Webinar – field and greenhouse session x 1 each
Page 292

Appendix 11 : Page 5
To be considered when developing full proposal:
• Bowen – field and greenhouse session (?) ‐ Greenhouse cropping minor. TSWV and CaCv both present in field crops and can cause sporadic problems.
• Bundaberg – field and greenhouse session (?) ‐ Greenhouse cropping minor but a general session would be good as there are some greenhouse growers and interest is increasing. CaCV common in field capsicums and sometimes significant. TSWV hardly ever occurs.
Summary table of proposed Thrips/Tospovirus extension “package”
Projects (in priority order)
Purpose/method Budget Project Length
Information Resources Thrips & Tospovirus Resources fact sheet
Summarise current and accessible information resources on thrips and tospoviruses
Done – electronic form in English. $500 for formatting of updated English version and translated versions. Translation to be done under budget of existing project.
Some additional time required for updating & translation of document into various languages, estimated to be 2 months
Mega‐Pests fact sheet
Fact sheet produced to summarise information on sucking pests: case study of successful WFT/TSWV management
Done ‐ electronic form
Controlling Key Pests in Virginia Greenhouses
Was never professionally formatted and not currently available. Recommend a revision and professional formatting.
$3000 for revision and $2000 for formatting
3 months
Case Studies [overlaps with foundation project in Thrips & Tospoviruses RD&E Program Plan]
Two new grower video/audio/fact sheet case studies filmed and edited.Case studies of growers who have successfully improved management of thrips/tospoviruses loaded on web and added to revised CD‐ROM. Presence on web an availability of CD “advertised”, eg promoted in monthly VIDP Newsletter sent to CIO partners and others, AUSVEG Weekly Update etc.
$5,000 for production – to be included on CD‐ROM below
3 months
Sanitation [from list of foundation projects in Thrips & Tospoviruses RD&E Program Plan]
Keep it Clean – Field edition, i.e. Prepare, format and print (1000 copies) of the sanitation/hygiene manual for field growers including a Farm Management Review Booklet – Field Vegetables
$9,000 prepare; $4000 format; $7,000 print TOTAL= $20,000
1 year
Page 293

Appendix 11 : Page 6
Projects (in priority order)
Purpose/method Budget Project Length
CD‐ROM Managing WFT & TSWV ‐ 2003 CD + other resources from Thrips & Tospovirus Resources fact sheet and grower case studies (exisiting & 2 new) that have been produced Workshop materials: Pdf of Farm Management Booklet field & greenhouse version Powerpoint presentations on managing thrips & tospoviruses
Development: $5,000‐10,000 depending on content Production: Roughly $2000 for 2000 copies
Getting the information out to growers Training days A series of separate training sessions
for greenhouse and field growers on managing thrips & tospoviruses that include: 1. What do we know – biology of thrips and tospoviruses, symptoms – information resources 2. Prevention – Sanitation ‐ use Farm Management Booklet to audit farm sanitation practices 3. Management options – separate out greenhouse from field 4. Records, reviewing, planning and using outside help 8‐11 face to face training sessions 18‐24 Webinars
Workshops approx $1000 ea (including venue hire and catering) X7 =$7000
$3000‐$4500 (professional time and travel costs for presenters) ~=$24000
Webinars $2500 ea x 16 =$40000
Resources for face‐to‐face workshops $300 each workshop x7=$2100 (rough estimate) TOTAL= ~$73100
Delivery after resources completed could be over 2 months. First sessions approx 5hours [ideally tied in to a demonstration site] Webinars: 1.5 hours each
Optional additional means of getting the information out to growers, from Proposed Foundation Projects in Thrips and Tospoviruses RD&E Program Plan IPM Helpline
Access to trusted technical person for practical help
~$1500 pa per 30‐call “block”
Trial 1 year
Demonstration Sites
1 per region – if funded site should be used as field days/training site (prioritised in areas where least control of WFT/TSWV: Virginia SA and Sydney basin, Bowen/Bundaberg, Waneroo)
$30‐100K pa each Single planting‐1 year each site
3. Outcomes 1. Growers have access to current information and resources on management of thrips and
tospoviruses including resources that assist with identification of thrips species.
2. Growers implement a sanitation audit of their farm and take action as a result – a critical first step in successfully managing WFT, TSWV and other thrips and tospoviruses.
Page 294

Appendix 12 : Page 1
Appendix 12 Final Operating Plans for the IPM Sub‐Program of the VIDP, 2009/10 and 2010/11
The National Vegetable IPM Coordination project (VG09191), also known as the IPM Sub‐program of the Vegetable Industry Development Program (VIDP), was initially approved as a one‐year pilot project. It commenced on 16th April 2010 and the original completion date was 15th April 2011. In line with VIDP processes, the project team members developed an Operating Plan (OP) for each of the financial years in which the project was conducted. These OPs were approved by the VIDP National Coordinators (NCs) and HAL. A varied 2010/11 OP was approved by the VIDP NCs and HAL in March 2011, including a four‐week extension (to 13th May 2011) to enable milestones to be completed to the level expected by all parties. The document in this Appendix shows the wording of the tasks or outputs/outcomes associated with each of the milestone numbers in the final approved OPs for 2009/10 and 2010/11.
Page 295

Final Approved Operating Plans for the IPM Sub-program of the VIDP, 2009/10 and 2010/11
Project code
Milestone number
Project task Completion Date
Yr 1 09/10VG09191 101 Agreements signed and IP arrangements in place 16/04/2010VG09191 101.1 Review agreement, sign and return to HAL 16/04/2010VG09191 102 Integration with other sub-programs and program co-ordination, Operating Plan and key outcomes to 30th June 30/06/2010VG09191 102.1 Integration with other sub-programs and program co-ordination clarified and confirmed 30/06/2010VG09191 102.1.1 Project Inception Meeting held to initiate integration with VIDP and finalisation of workplan 7/05/2010VG09191 102.1.2 Communication channels established with HAL, VIDP national co-ordination, sub-program coordinators and IPM Working Group 28/05/2010VG09191 102.1.3 Attend VIDP meetings 28/05/2010VG09191 102.1.4 Monthly conference call 17/06/2010VG09191 102.2 Operating Plan to 30th June 2010 signed off by HAL and National Co-ordinator and appended to the contract as a schedule 30/06/2010
VG09191 102.2.1Strategic Planning - Briefing paper and mechanism for access and feedback developed, press release distributed, consultation activities and literature review commenced 30/06/2010
VG09191 102.2.2 Benchmarking - Team members involved and Year 1 outcomes clarified 31/05/2010
VG09191 102.2.3Western Flower Thrips - Contact with current & previous project leaders commenced, draft Action Plan for WFT/TSWV developed & consultation activity commenced 18/06/2010
VG09191 102.2.4 Pathology Program Extension - Initial meeting with key pathology project leaders held and extension coordination requirements explored 24/06/2010VG09191 102.2.5 Integrated Information Packages - Mechanism for providing information to Knowledge Management established 18/06/2010VG09191 102.2.6 Review of IPM and Chemical Access - Integration requirements between IPM-Chem Access database and KM system explored 10/06/2010VG09191 102.2.7 Project Management - sub-contractor contracts distributed, policies and procedures understood, team meetings convened 30/06/2010VG09191 102.2.8 Project Management - participation in VIDP meetings, VIDP monthly report and Milestone 102 report submitted 30/06/2010VG09191 102.2.9 Project Communications - initiated via press release(s), magazine article(s) and information on Google Groups site 30/06/2010VG09191 102.3 Key outcomes to 30th June inserted into Milestone 103 criteria 30/06/2010VG09191 103 Report against key performance indicators, activities and outcomes of operating plan to June 30th 31/07/2010VG09191 103 Milestone report approved by the National Co-ordinator prior to submission to HAL 31/07/2010VG09191 103 Information to support monitoring and evaluation program collected (Postponed, see Milestone 190.5) 31/07/2010
Project code
Milestone number
Project outcome Outcome Completion
Date
Yr 2 10/11 Bold indicates ongoing and occurring in each monthVG09191 104 Report on performance and outcomes against first 6 months of 2010/11 Operating Plan 31/01/2011VG09191 104.1 Report against key performance indicators, activities and outcomes from first 6 months of 2010/11 Operating Plan 31/01/2011VG09191 104.1.1 Strategic Planning - Literature review and consultations completed 15/08/2010VG09191 104.1.2 Strategic Planning - Unformatted draft submitted to Arris personnel for formatting 17/08/2010VG09191 104.1.3 Strategic Planning - Formatted "Draft Plan for Approval" to W. Gordon (HAL) for inclusion in IAC meeting papers 31/08/2010VG09191 104.1.4 Strategic Planning - Feedback from 14/09 IAC meeting incorporated and Final Plan approved by IAC 30/09/2010VG09191 104.1.5 Western Flower Thrips - Existing resources reviewed and "delivered" to KM 30/09/2010VG09191 104.1.6 Western Flower Thrips - Action Plan for WFT/TSWV RD&E developed & incorporated into Strategic Plan 31/10/2010VG09191 104.1.7 Integrated Info Packages - "Easy" existing resources "delivered" to KM 31/07/2010VG09191 104.1.8 Integrated Info Packages - Progress with negotiations to enable delivery of "harder" existing resources to KM 30/11/2010VG09191 104.1.9 Benchmarking - Draft guidelines developed for IPM project leaders re capture of baseline data w/in projects 15/11/2010VG09191 104.1.10 Benchmarking - Definition of IPM; assess (via lit review) adoption of IPM practices; recommended future benchmarking methods 28/02/2011VG09191 104.1.11 Benchmarking - Consultation with project leaders on draft guidelines and guidelines finalised 16/12/2010VG09191 104.1.12 Review of IPM & Chem Access - Excel file containing Celery information for database completed 25/03/2011VG09191 104.1.13 Review of IPM & Chem Access - Process for database updates & ongoing coordination incorp into Strategic Plan 16/12/2010VG09191 104.1.14 Pathology Program Extension - Extension coordination requirements & mechanisms clarified 30/09/2010VG09191 104.1.15 Pathology Program Exten - Draft Communications and Extension Plan for Pathology Program developed (Cancelled) 16/12/2010VG09191 104.1.16 Project Mgt & Communications - Team meetings held and industry updated via articles, press releases etc 31/12/2010VG09191 104.1.17 Evaluate opportunities & provide InnoVeg with support in developing outputs for delivery to CIO and industry 31/12/2010VG09191 104.2 Align with wider VIDP planning processes 31/12/2010VG09191 104.2.1 Monthly conference call (Cancelled) 15/07/2010VG09191 104.2.2 Monthly conference call 12/08/2010VG09191 104.2.3 Monthly conference call (Cancelled) 16/09/2010VG09191 104.2.4 Monthly conference call 21/10/2010VG09191 104.2.5 Monthly conference call 18/11/2010VG09191 104.2.6 Monthly conference call 16/12/2010VG09191 104.2.7 Attend VIDP/IAC meetings 19/11/2010VG09191 104.3 Milestone report approved by National Co-ordinator prior to submission to HAL 31/01/2011VG09191 104.4 Information to support monitoring and evaluation project collected (Postponed, see Milestone 190.5) 31/01/2011VG09191 190 Final Report on Year 1 Received by HAL 13/05/2011VG09191 190.1 Report against key performance indicators, activities and outcomes emphasising final 3.5 months of 1-Year project 13/05/2011VG09191 190.1.1 Western Flower Thrips - WFT/TSWV "package" developed to electronic version stage 15/02/2011VG09191 190.1.2 Integrated Info Packages - List of packages to be scoped in Year 2 developed & funding options considered 15/02/2011VG09191 190.1.3 Integrated Info Packages - Project scoped: electronic version of WFT/TSWV "package" into "hard" version 15/03/2011VG09191 190.1.4 Integrated Info Packages - Projects scoped: 2 x Packages (e.g. crop-specific or "principles of IPM") 15/04/2011VG09191 190.1.5 Benchmarking - Design of a survey of influencers to validate IPM adoption findings from 104.1.10 & collect additional baseline info 31/03/2011VG09191 190.1.6 Benchmarking - Evaluation of on-line tool(s) for measuring practice change completed 15/03/2011VG09191 190.1.7 Benchmarking - Cost:benefit analysis of Lettuce IPM adoption by NSW growers and business case for adoption of IPM in lettuce 15/04/2011VG09191 190.1.8 Review of IPM & Chem Access - Draft "functionality specification" for database and Excel file with Lettuce information completed 8/04/2011VG09191 190.1.9 Review of IPM & Chem Access - Functioning database covering celery & field lettuce accessible within AUSVEG website 13/05/2011VG09191 190.1.10 Pathology Program Exten - Communications and Extension Plan for Pathology Program finalised (Cancelled) 31/01/2011VG09191 190.1.11 Pathology Program Exten - Info exchanged with Pathology (& Entomology) project leaders in 6-monthly meeting (Cancelled) 15/03/2011VG09191 190.1.12 Pathology Program Exten - Recently available outputs "delivered" to KM and InnoVeg 31/03/2011VG09191 190.1.13 Project Mgt & Communications - Contribute to VIDP Roadshow in conjunction with InnoVeg DPs where required (Cancelled) 31/03/2011VG09191 190.1.14 Project Mgt & Communications - Team meetings held and industry updated via articles, press releases etc 13/05/2011VG09191 190.1.15 Evaluate opportunities & provide InnoVeg with support in developing outputs for delivery to CIO and industry 13/05/2011VG09191 190.2 Prepare Work Plan for follow-on project to 30th June 2012 15/02/2011VG09191 190.3 Follow-on Project Approval Step early March; additions to VG09191 or creation of New project submission in HALO (Cancelled) 15/03/2011VG09191 190.4 Align with wider VIDP planning processes 13/05/2011VG09191 190.4.1 Monthly conference call (Cancelled) 20/01/2011VG09191 190.4.2 Monthly conference call 17/02/2011VG09191 190.4.3 Monthly conference call 17/03/2011VG09191 190.4.4 Monthly conference call (Cancelled) 21/04/2011VG09191 190.4.5 Monthly conference call 18/05/2011VG09191 190.5 Final information to support monitoring and evaluation project collected 13/05/2011VG09191 190.6 Final Report approved by National Co-ordinator prior to submission to HAL 13/05/2011
HAL Project VG09191, 16th April 2010 - 13th May 2011Appendix 12 : Page 2 Page 296
Related Documents