National Travel Survey: 2007 Interview Data SB (08) 22

Welcome message from author
This document is posted to help you gain knowledge. Please leave a comment to let me know what you think about it! Share it to your friends and learn new things together.
Transcript

National Travel Survey: 2007 Interview Data
SB (08) 22
A National Statistics publication produced by Transport Statistics: DfT National Statistics are produced to high professional standards set out in the National Statistics Code of Practice. They undergo regular quality reviews to ensure that they meet customer needs. Contact Points: For general enquiries call the National Statistics Customer Contact Centre at: Room 1.015, Office for National Statistics, Cardiff Road, Newport NP10 8XG, telephone: 0845 601 3034 fax: 01633 652747,
mail: E [email protected] You can also obtain National Statistics through the internet – go to www.statistics.gov.uk. For information relating to Transport Statistics go to www.dft.gov.uk/pgr/statistics © Crown copyright 2008 Copyright in the typographical arrangement rests with the Crown. This publication may be reproduced free of charge in any format or medium for research, private study or for internal circulation within an organisation. This is subject to it being reproduced accurately and not used in a misleading context. The material must be acknowledged as Crown copyright and the title of the document/publication specified. This publication can also be accessed at the Department's website. For any other use of this material please apply for a Click-Use Licence at www.opsi.gov.uk/click-use/index.htm, or by writing to HMSO at: Information Policy Team, St Clements House, 2-16 Colegate, Norwich NR3 1BQ Fax: 01603 723000 or e-mail to [email protected]. Further information and queries concerning this publication should be directed to: ST2, 3/09 Great Minster House, 76 Marsham Street, London SW1P 4DR +44 (0)20 7944-6594, Fax +44 (0)20 7944-2166, E-mail: [email protected] Brief extracts from this publication may be reproduced provided the source is fully acknowledged. Proposals for the eproduction of larger extracts should be addressed to the Department at the following address: r
Department for Transport (DfT), Transport Statistics, 2/29, Great Minster House, 76 Marsham Street, London SW1P 4DR 020 7944-4846, Fax: 020 7944-2165, E-mail: [email protected] Printed in the United Kingdom on material containing 100% post-consumer waste. Symbols and conventions: (i) Unless otherwise stated, all tables refer to Great Britain. (ii) Metric units are generally used. U
nits: Figures are shown in italics when they represent percentages, indices or ratios.
Rounding of figures: In tables where figures have been rounded to the nearest final digit, there may be an apparent slight discrepancy between the sum of the constituent items and the total as shown. Conversion factors: 1 kilometre = 0.6214 mile 1 tonne = 0.9842 ton 1 tonne-km = 0.6116 ton-mile 1 gallon = 4.546 litres 1 billion = 1,000 million 1 litre = 0.220 gallons S
ymbols: The following symbols have been used throughout.
.. = not available . = not applicable - = Negligible (less than half the final digit shown) 0 = Nil * = Sample size too small for reliable estimates. ow = of which { = subsequent data is disaggregated } = subsequent data is aggregated | = break in the series P = provisional data F = forecast expenditure e = estimated outturn n.e.s = not elsewhere specified TSO = The Stationery Office
Contents Key Points 1 Section 1 Introduction 3 The 2007 National Travel Survey 3 Earlier methodological changes 3
Sample size 4 Sampling errors 5 Technical reports 5 Publications and unpublished data 5 Section 2 Trends in Personal Travel 6 Trends in car ownership 6 Trends in driving licence holding 8
Trends in personal car availability 10 Section 3 Public Transport and Active Travel 12
Frequency of use of public transport 12 Public transport use by age 13
Public transport by car availability 14 Public transport use by area type 15 International air travel 16 Concessionary bus travel 17 Walking 18 Cycling 21 Section 4 Social inclusion 26
Travel by income group 26 Car availability and access by income 26 Bicycle and motorcycle ownership by income 28
Frequency of use of bicycles and public transport by income
28
Car availability and licence holding by ethnic group 32 Section 5 Accessibility 34 Access to bus and train services 34
Time to local facilities on foot or by public transport 36 Travel difficulties 39 Workplace and working from home 40
Workplace by area type and income group 42

Section 6 Road Safety 43 New road accident questions 43
Percentage of adults involved in road accidents 43 Nature of road accidents 44 Whether children are accompanied to school 46 Children crossing roads alone 46 Front and rear passengers 47 Section 7 Vehicles 48 Annual car mileage 48
Vehicles by household characteristics 50Parking 52
Appendix A: National Travel Survey notes and definitions 53 Appendix B: Comparisons with earlier publications 55 Index Symbols and conventions In tables where figures have been rounded to the nearest final digit, there may be an apparent slight discrepancy between the sum of the constituent items and the total shown.
It is assumed in this report that there are 52.14 weeks in a year.
Symbols used are shown inside the front cover.
Acknowledgements
The 2007 survey was carried out by the National Centre for Social Research. Special thanks are due to the past and present team in London, the coders in Brentwood and to all the interviewers. The help of all those members of the public who gave their time and co-operation is gratefully acknowledged.

Key points The National Travel Survey (NTS) is a household survey designed to provide a databank of personal travel information for Great Britain. This report presents the results from the interview element of the 2007 survey. It does not cover data from the travel diary. Car access and licence holding • Between 1995/97 and 2007 the proportion of households in Great Britain without access to a car
fell from 30 per cent to 25 per cent, while the proportion of households with two or more cars increased from 25 per cent to 32 per cent.
• Since 1995/97 the proportion of men with a driving licence has remained relatively stable, at around 80 per cent but it has increased among women from 57 per cent to 63 per cent in 2007. Over the same period, licence holding among all those aged 70 and over has increased from 38 per cent to 52 per cent.
Public transport and active travel
• Local bus is the most frequently used mode of public transport, with 28 per cent of respondents using a bus at least weekly in 2007. This compares with 10 per cent for taxi and 7 per cent for rail.
• Weekly bus use is most common among those under the age of 30 and those aged 60 or older, while frequent rail and taxi use is most common among 17 to 29 year-olds.
• In 2007, 58 per cent of respondents said they made a walk of 20 minutes or more at least once a week and 24 per cent said they did this less than once a year or never.
• Fourteen per cent of respondents aged 5 and over said they cycled at least once a week. This proportion was higher for children aged 5 to 15 than for adults, at 45 per cent and 10 per cent respectively.
• In 2007 ten per cent of respondents said they made an internal flight within Great Britain at least once a year and 46 per cent had made an international flight from Great Britain in the last 12 months.
Social inclusion
• In 2007 54 per cent of households in the lowest income quintile did not have access to a car, compared with 10 per cent in the highest income quintile. Motorcycle and bicycle ownership also increase with household income.
• Those living in the lowest income households are most likely to travel frequently by bus or taxi, with 44 per cent using buses and 14 per cent using taxis at least weekly. Frequent rail travel and cycling tends to increase with household income.
• In 2007 25 per cent of those in the lowest income households had made an international flight in the last 12 months, compared with 71 per cent those in the highest income households.
1

Accessibility
• The proportion of rural households that were within a 13 minute walk of a bus stop with at least an hourly service increased from 45 per cent in 1998/00 to 57 per cent in 2007.
• In 2007 72 per cent of rural households were within 15 minutes of a grocery shop by foot or public transport and 52 per cent were within 15 minutes of a GP. In urban areas the figures were over 90 per cent and around 80 per cent respectively.
• 90 per cent of households in rural areas have access to a car. Car access declines in more urban areas, being lowest in London where 57 per cent of households had access to a car.
• Workers living in the highest income households were far more likely to be able to work from home (33 per cent) than those living in the lowest income households (10 per cent).
• Overall 3 per cent of people who were employed always worked from home and a further 15 per cent said it was possible for them to work from home. These proportions have been relatively stable since 2002.
Road safety
• In 2007 7 per cent of adults said they had been in a road accident in the 12 months before interview, including 2 per cent who had been injured in a road accident. In the majority of these incidents the respondent was a car occupant.
• Respondents said that the police were aware of 59 per cent of injury accidents and 31 per cent of non-injury accidents.
• Among 7 to 10 year-olds 85 per cent were usually accompanied to school by an adult in 2007, a slight increase from 81 per cent in 2003. Over the same period, the proportion of 7 to 10 year-olds usually allowed to cross roads alone fell from 19 to 13 per cent.
2
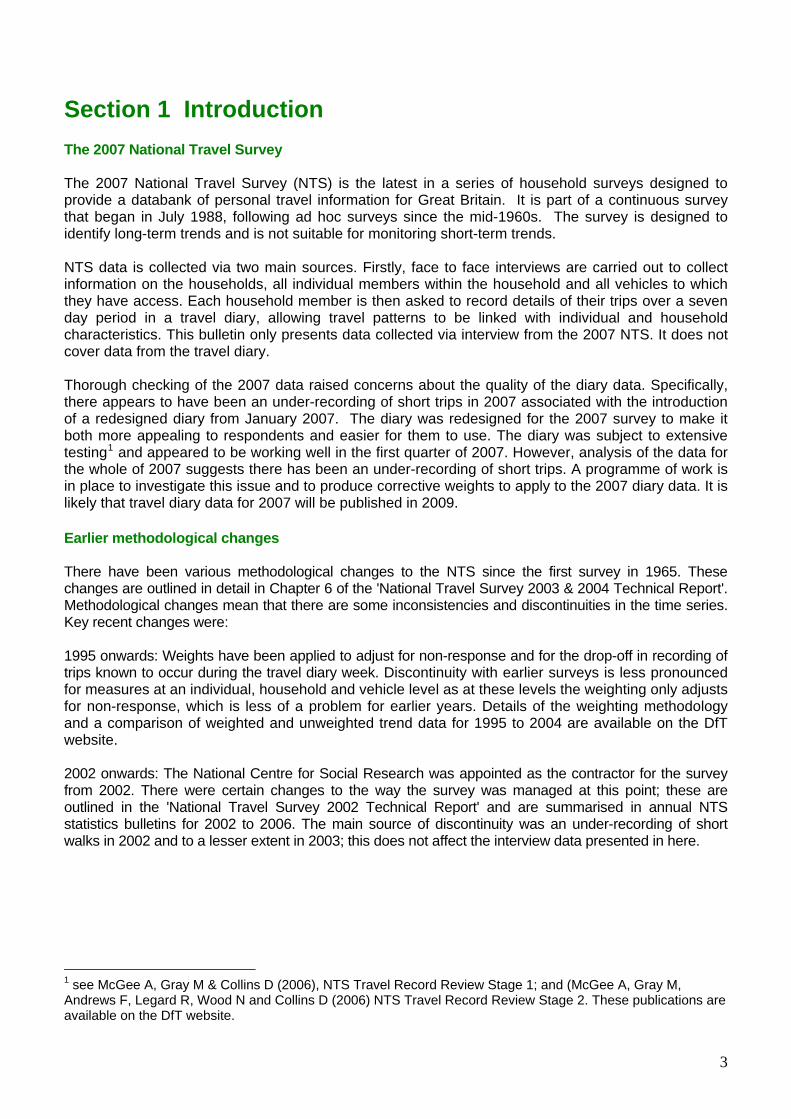
Section 1 Introduction The 2007 National Travel Survey The 2007 National Travel Survey (NTS) is the latest in a series of household surveys designed to provide a databank of personal travel information for Great Britain. It is part of a continuous survey that began in July 1988, following ad hoc surveys since the mid-1960s. The survey is designed to identify long-term trends and is not suitable for monitoring short-term trends. NTS data is collected via two main sources. Firstly, face to face interviews are carried out to collect information on the households, all individual members within the household and all vehicles to which they have access. Each household member is then asked to record details of their trips over a seven day period in a travel diary, allowing travel patterns to be linked with individual and household characteristics. This bulletin only presents data collected via interview from the 2007 NTS. It does not cover data from the travel diary. Thorough checking of the 2007 data raised concerns about the quality of the diary data. Specifically, there appears to have been an under-recording of short trips in 2007 associated with the introduction of a redesigned diary from January 2007. The diary was redesigned for the 2007 survey to make it both more appealing to respondents and easier for them to use. The diary was subject to extensive testing1 and appeared to be working well in the first quarter of 2007. However, analysis of the data for the whole of 2007 suggests there has been an under-recording of short trips. A programme of work is in place to investigate this issue and to produce corrective weights to apply to the 2007 diary data. It is likely that travel diary data for 2007 will be published in 2009. Earlier methodological changes There have been various methodological changes to the NTS since the first survey in 1965. These changes are outlined in detail in Chapter 6 of the 'National Travel Survey 2003 & 2004 Technical Report'. Methodological changes mean that there are some inconsistencies and discontinuities in the time series. Key recent changes were: 1995 onwards: Weights have been applied to adjust for non-response and for the drop-off in recording of trips known to occur during the travel diary week. Discontinuity with earlier surveys is less pronounced for measures at an individual, household and vehicle level as at these levels the weighting only adjusts for non-response, which is less of a problem for earlier years. Details of the weighting methodology and a comparison of weighted and unweighted trend data for 1995 to 2004 are available on the DfT website. 2002 onwards: The National Centre for Social Research was appointed as the contractor for the survey from 2002. There were certain changes to the way the survey was managed at this point; these are outlined in the 'National Travel Survey 2002 Technical Report' and are summarised in annual NTS statistics bulletins for 2002 to 2006. The main source of discontinuity was an under-recording of short walks in 2002 and to a lesser extent in 2003; this does not affect the interview data presented in here.
1 see McGee A, Gray M & Collins D (2006), NTS Travel Record Review Stage 1; and (McGee A, Gray M, Andrews F, Legard R, Wood N and Collins D (2006) NTS Travel Record Review Stage 2. These publications are available on the DfT website.
3

Sample size In 2002, the drawn sample size was nearly trebled compared with previous years following recommendations in a National Statistics Review of the NTS. This enables key results to be presented on a single year basis from 2002. Previously data from the continuous survey was shown for three year time periods because of the smaller sample size. Details of sample sizes are given in Table 1.1. During 2007, just over 8,400 households participated fully in the survey by providing information via interview and completing a seven day travel diary. An additional 800 households participated in the household interviews but did not all complete a diary; although these cases cannot be used for trip-level analysis, their data is included in all analysis at household, individual and vehicle level. Analysis presented here is therefore based on data from nearly 9,300 responding households, covering just under 22,000 individuals. Table 1.1 Sample numbers on which analyses are based
Number/thousands
1995 1996 1997 1998 1999 2000 2001 2002 2003 2004 2005 2006 2007
Households Unweighted diary sample 3,211 3,210 3,139 2,935 3,020 3,435 3,469 7,437 8,258 8,122 8,430 8,297 8,431
Unweighted interview sample 3,491 3,505 3,465 3,300 3,376 3,783 3,760 8,849 9,196 8,991 9,453 9,261 9,278
Weighted diary sample 3,209 3,211 3,139 2,938 3,018 3,431 3,472 7,437 8,258 8,122 8,430 8,297 8,431
Weighted interview sample 3,490 3,506 3,463 3,303 3,374 3,782 3,761 8,849 9,196 8,991 9,453 9,261 9,278
Individuals Unweighted diary sample 7,723 7,665 7,473 6,842 6,970 8,056 7,978 16,886 19,467 19,199 19,904 19,490 19,735
Unweighted interview sample 8,521 8,504 8,452 7,945 8,000 9,054 8,833 20,827 21,990 21,588 22,702 22,141 21,931
Weighted diary sample 7,675 7,704 7,487 6,986 7,109 8,114 8,132 17,494 19,578 19,302 20,103 19,794 19,940
Weighted interview sample 8,348 8,405 8,258 7,857 7,945 8,942 8,811 20,789 21,795 21,369 22,539 22,098 21,959
Children (<16 yrs) Unweighted diary sample 1,744 1,666 1,650 1,433 1,466 1,731 1,659 3,413 4,178 4,129 4,150 3,938 3,971
Unweighted interview sample 1,945 1,869 1,917 1,708 1,703 1,971 1,860 4,398 4,702 4,690 4,776 4,497 4,408
Weighted diary sample 1,602 1,634 1,547 1,447 1,467 1,666 1,624 3,523 3,900 3,815 3,963 3,848 3,759
Weighted interview sample 1,741 1,782 1,704 1,626 1,631 1,835 1,764 4,181 4,336 4,222 4,443 4,296 4,141
Adults (16+) Unweighted diary sample 5,979 5,999 5,823 5,409 5,504 6,325 6,319 13,473 15,289 15,070 15,754 15,552 15,764
Unweighted interview sample 6,576 6,635 6,535 6,237 6,297 7,083 6,973 16,429 17,288 16,898 17,926 17,644 17,523
Weighted diary sample 6,074 6,069 5,940 5,539 5,640 6,447 6,508 13,971 15,678 15,487 16,142 15,945 16,181
Weighted interview sample 6,606 6,623 6,553 6,231 6,315 7,107 7,047 16,608 17,459 17,147 18,097 17,801 17,818
Motor vehicles Unweighted diary sample 3,296 3,301 3,238 3,121 3,217 3,772 3,707 8,195 9,264 9,065 9,847 9,758 9,898
Unweighted interview sample 3,642 3,691 3,653 3,608 3,681 4,240 4,081 9,954 10,452 10,190 11,228 11,118 10,975
Weighted diary sample 3,339 3,374 3,313 3,201 3,270 3,843 3,780 8,391 9,408 9,261 10,059 9,875 10,005
Weighted interview sample 3,629 3,694 3,663 3,601 3,664 4,237 4,090 9,959 10,465 10,270 11,264 11,028 10,995
Great Britain demographic data for survey periods:
Population ('000s) 56,279 56,381 56,496 56,627 56,802 56,960 57,149 57,625 57,851 58,125 58,485 58,846 59,216
Grossing up factors (diary sample) 7,287 7,356 7,560 8,276 8,150 7,071 7,163 3,413 2,972 3,027 2,938 3,019 3,001
Grossing up factors (interview sample) 6,605 6,630 6,684 7,127 7,100 6,291 6,470 2,767 2,631 2,692 2,576 2,658 2,700 Historically, all NTS analysis was based on 'fully co-operating households', defined as households for which the following information is available: a household interview, an individual interview for each household member, a seven day travel diary for each individual and, where applicable, at least one completed vehicle section. This is referred to as the 'Diary sample'. Following the introduction of the weighting methodology, data from some additional 'partially co-operating households' are now included in analyses of weighted data at household, individual and vehicle level. Generally these partially co-operating households had co-operated fully with the various interviews but not all household members had completed the travel diary. This expanded sample is referred to as the 'Interview sample'. Most analyses presented in this bulletin are based on the 'Interview sample'.
4
Sampling errors Because estimates made from a sample survey depend upon the particular sample chosen, they generally differ from the true values for the population. This is not usually a problem when considering large samples but may give misleading information when considering data from small samples. In general, it should be remembered that for estimates of households, individuals and vehicles, unweighted samples of under 100 should not be used, while samples of under 300 should be used cautiously. Tables of sampling errors for selected key statistics derived from the NTS are published in the 2003 & 2004 Technical Report. Technical reports
Technical reports for the NTS are normally published annually. The 2007 Technical Report, which is available at www.dft.gov.uk/transtat/personaltravel, includes details of sampling, fieldwork and data processing and a full set of the questionnaires. Periodically, extended Technical Reports are published covering a wider range of technical issues. The last extended Technical Report, covering the 2003 and 2004 surveys, included additional details of the NTS variables; sampling errors; a summary of definitional differences between NTS survey years; a comparison of NTS data with other sources and a note on progress made since the National Statistics Review of the NTS in 2000.
Publications and unpublished data The most recent editions of all NTS publications are available on the DfT website at www.dft.gov.uk/transtat/personaltravel. Bulletins of key results are normally published annually. Personal travel factsheets covering specific topics are published periodically. The most recent factsheets published cover the following topics: walking; cycling; health-related travel difficulties; travel to work; shopping; travel in urban and rural areas and travel to school. These are based on 2005 data, with the exception of 'Travel to school' which includes 2006 data. Customised tables using unpublished NTS data can be obtained from the NTS enquiry point (telephone 020 7944 3097 or e-mail [email protected]). Charges may be made to cover the costs of data extraction.
5

Section 2 Trends in personal travel Two of the main factors which affect how people travel are whether they have access to a car and whether they hold a driving licence. This section shows trends over the last 20 to 30 years in car access and driving licence holding. These trends underpin many of the changes in personal travel over this period. Trends in car ownership Table 2.1 Household car availability: 1985/86 to 2007 and by area type of residence1: 2007
Percentage/number
No car One carTwo or
more carsAll house-
holdsCars per
householdCars per
adult (17+)
Unweighted sample size
(house- holds)
1985/1986 38 45 17 100 0.82 0.42 10,2661989/1991 33 45 22 100 0.94 0.50 10,7521992/1994 33 44 23 100 0.96 0.52 10,2961995/19972 30 44 25 100 1.00 0.54 10,4611998/2000 28 44 28 100 1.05 0.57 10,4592002 27 44 29 100 1.08 0.58 8,8492003 27 43 31 100 1.10 0.59 9,1962004 26 44 30 100 1.10 0.59 8,9912005 25 43 32 100 1.15 0.61 9,4532006 25 44 32 100 1.15 0.61 9,2612007 25 43 32 100 1.14 0.60 9,278
Percentage/number
No car One carTwo or
more carsAll house-
holdsCars per
householdCars per
adult (17+)
Unweighted sample size
(house- holds)
2007London Boroughs 43 41 16 100 0.77 0.40 1,153Metropolitan built-up areas 31 42 27 100 1.01 0.54 1,391Large urban 27 44 29 100 1.08 0.58 1,399Medium urban 23 44 32 100 1.16 0.62 2,480Small/medium urban 22 46 32 100 1.17 0.65 770Small urban 19 42 40 100 1.31 0.70 655Rural 10 38 51 100 1.54 0.79 1,430All areas 25 43 32 100 1.14 0.60 9,278
1 See definitions in Appendix A.2 Figures for 1995 onwards are based on weighted data
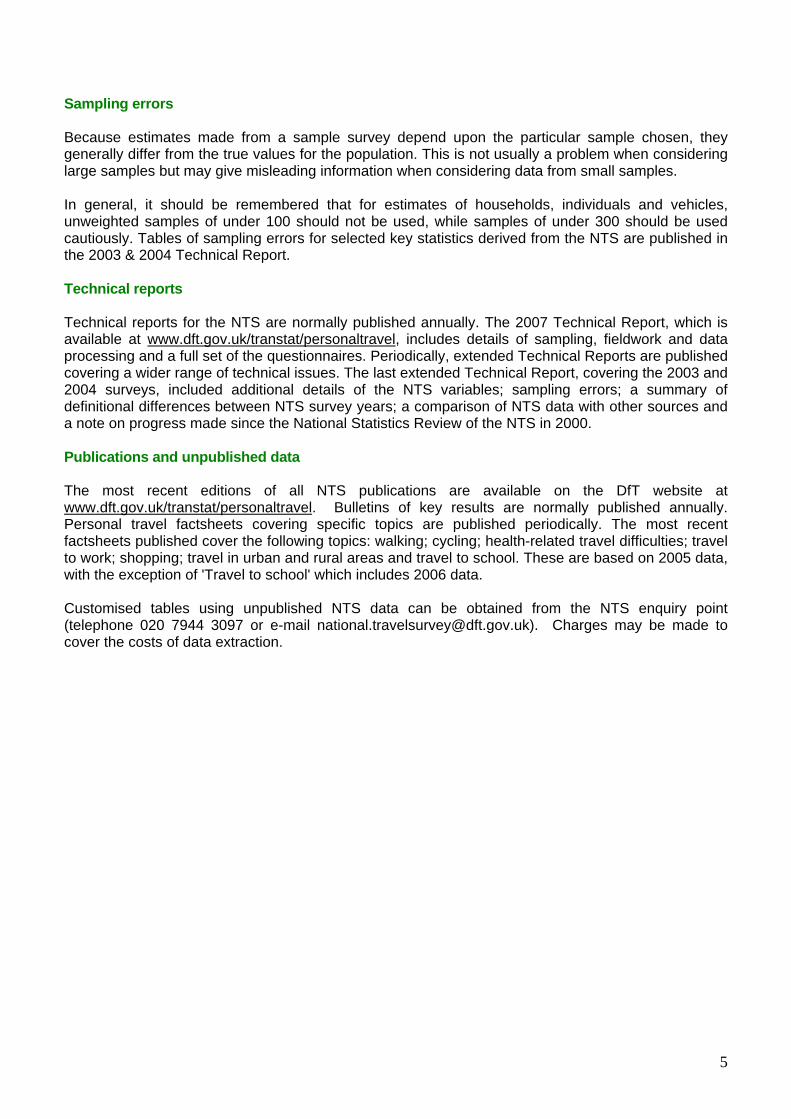
• The proportion of households in Great Britain which did not have access to a car fell from 38 per cent in 1985/1986 to 30 per cent in 1995/1997, and to 25 per cent in 2005. It remained at this level in 2006 and 2007. The proportion with two or more cars rose from 17 per cent in 1985/1986 to 25 per cent in 1995/1997, and to 32 per cent in 2007. There are many more households with at least two cars than households with no car.
6
• Urban areas have better access to more frequent public transport so it is easier for people to manage without a car. In London in 2007, 43 per cent of households did not have access to a car, compared with 31 per cent in Metropolitan built-up areas and 10 per cent in rural areas.
• In rural areas, just over half (51 per cent) of households had access to two or more cars compared with 16 per cent in London.
Chart 2.1 Household car availability: 1985/86 to 2007
0
10
20
30
40
50
85/86 89/91 91/93 93/95 95/97 97/99 99/01 2003 2005 2007
Perc
enta
ge
No car One car Two or more cars
Chart 2.2 Household car availability by area type of residence: 2007
31
27
23
22
19
10
25
16
27
29
32
32
40
51
32
43
43
38
42
46
44
44
42
41
0 10 20 30 40 50 60 70 80 90 100
London boroughs
Metropolitan built-up areas
Large urban
Medium urban
Small/medium urban
Small urban
Rural
All Areas
Percentage
No car One car Two or more cars
7
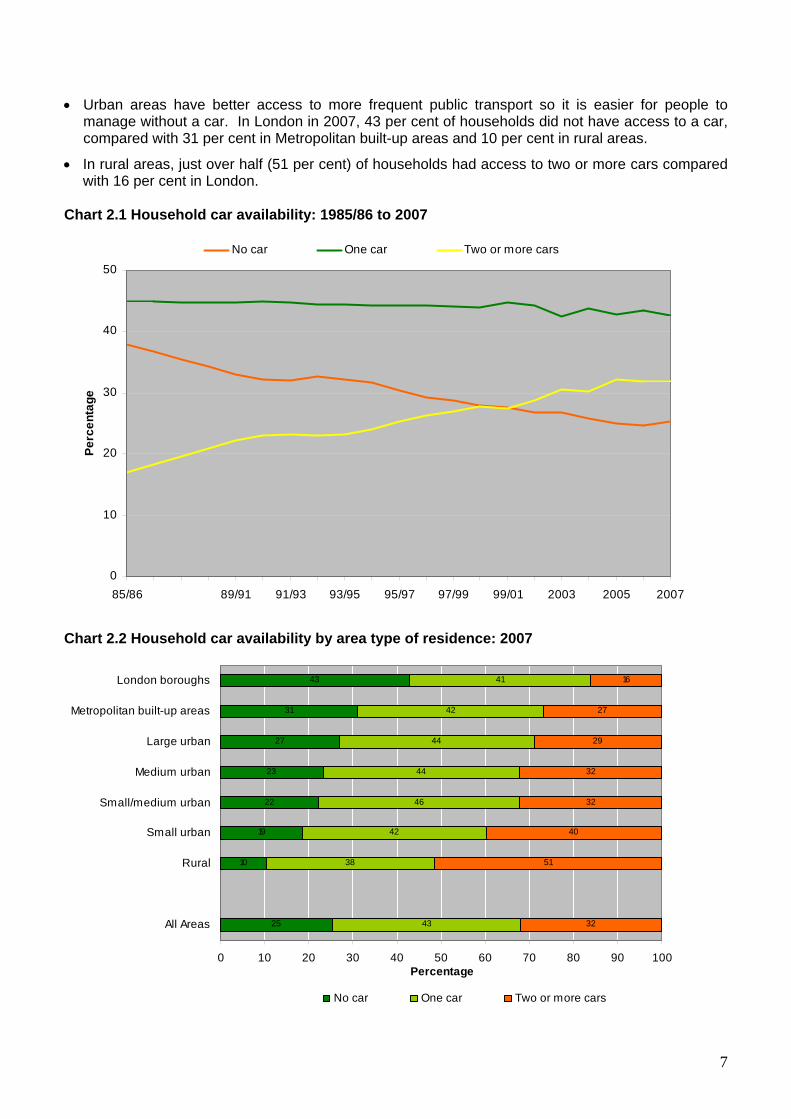
Trends in driving licence holding Table 2.2 Full car driving licence holders by age and gender: 1975/1976 to 2007
Percentage/millions/number
All aged 17+ 17-20 21-29 30-39 40-49 50-59 60-69
70 and over
Estimated licence
holders (m)
Unweighted sample size (individuals aged 17+)
All adults1975/1976 48 28 59 67 60 50 35 15 19.4 17,0641985/1986 57 33 63 74 71 60 47 27 24.3 19,8351989/1991 64 43 72 77 78 67 54 32 27.8 20,3981992/1994 67 48 75 82 79 72 57 33 29.3 19,0301995/19971 69 43 74 81 81 75 63 38 30.3 19,4221998/2000 71 41 75 84 83 77 67 39 31.4 19,2992002 70 33 67 82 84 81 70 44 31.9 16,1662003 70 29 67 82 83 80 72 44 32.1 16,9942004 70 27 65 82 83 80 72 46 32.2 16,6122005 72 32 66 82 84 82 74 51 33.3 17,6192006 72 34 67 82 84 82 76 50 33.7 17,3452007 71 38 66 81 83 82 75 52 33.8 17,199
Males1975/1976 69 36 78 85 83 75 58 32 13.4 8,1131985/1986 74 37 73 86 87 81 72 51 15.1 9,3671989/1991 80 52 82 88 89 85 78 58 16.7 9,6791992/1994 81 54 83 91 88 88 81 59 17.0 8,8621995/19971 81 50 80 88 89 89 83 65 17.2 9,2111998/2000 82 44 80 89 91 88 83 65 17.4 9,1492002 80 35 71 88 90 89 85 68 17.5 7,6562003 81 33 73 87 90 91 87 69 17.8 8,0962004 79 30 68 87 89 90 86 72 17.7 7,8552005 81 37 69 86 90 90 88 73 18.1 8,3482006 81 37 71 86 89 91 90 76 18.4 8,2712007 80 41 69 86 88 90 87 75 18.4 8,146
Females1975/1976 29 20 43 48 37 24 15 4 6.0 8,9511985/1986 41 29 54 62 56 41 24 11 9.2 10,4681989/1991 49 35 64 67 66 49 33 15 11.1 10,7191992/1994 54 42 68 73 70 57 37 16 12.2 10,1681995/19971 57 36 67 74 73 62 45 21 13.1 10,2111998/2000 60 38 69 78 76 67 53 22 14.0 10,1502002 61 31 62 76 78 73 55 27 14.4 8,5102003 61 25 62 77 77 70 58 26 14.3 8,8982004 61 24 62 77 77 71 58 28 14.5 8,7572005 63 27 62 77 79 73 61 35 15.2 9,2712006 63 31 63 78 79 74 63 31 15.3 9,0742007 63 34 62 76 78 74 63 36 15.4 9,053
1 Figures for 1995 onwards are based on weighted data • Since the early 1990s, the proportion of men holding a full car driving licence has remained fairly
stable at around 80 per cent while the proportion of women with a licence has increased from approximately half to 63 per cent in 2007.
8

• The proportion of young adults with a driving licence has decreased since the early 1990s although this trend has reversed in recent years. In 2007, 38 per cent of those aged 17-20 held a licence, compared with 27 per cent in 2004 and 43 per cent in 1995/1997.
• There has been a large increase in the number of older women holding a driving licence. Between 1995/97 and 2007 the proportion of women aged 60-69 holding a licence increased from 45 to 63 per cent. Over the same period, the proportion of women aged 70 or over holding licences increased from 21 to 36 per cent. Licence holding will continue to increase in these age groups, as women currently in the younger age groups keep their licence as they grow older.
Chart 2.3 Full car driving licence holders by age and gender: 1975/1976, 1985/86, 1995/97 and 2007
0
10
20
30
40
50
60
70
80
90
100
17-20 21-29 30-39 40-49 50-59 60-69 70+ 17-20 21-29 30-39 40-49 50-59 60-69 70+
Perc
enta
ge
1975/1976 1985/1986 1995/1997 2007
Males Females
9

Trends in personal car availability In the NTS each car is associated with a main driver. This is the household member that drives the furthest in that car in the course of a year. 'Other drivers' are people in car-owning households who have a full driving licence to drive a car but are not the main driver of a household car.
Table 2.3 Adult personal car availability by gender: 1975/76 to 2007 Percentage/number
Persons in households with a car
Main driver
Other driver
Non driver All
All persons
All adults1975/1976 41 31 9 20 59 100 18,5961985/1986 31 41 12 17 69 100 19,8351989/1991 26 46 12 16 74 100 20,3981992/1994 25 48 13 14 75 100 19,0301995/19971 23 50 13 13 77 100 19,4261998/2000 21 53 13 13 79 100 19,2992002 20 54 12 13 80 100 16,1692003 21 55 11 13 79 100 17,0002004 20 54 12 14 80 100 16,6142005 19 55 12 13 81 100 17,6192006 19 55 13 14 81 100 17,3462007 19 55 13 13 81 100 17,201
Males1975/1976 36 51 7 6 64 100 8,6711985/1986 26 59 8 6 74 100 9,3671989/1991 21 64 9 6 79 100 9,6791992/1994 20 64 10 6 80 100 8,8621995/19971 19 64 11 6 81 100 9,2141998/2000 17 66 11 7 83 100 9,1492002 17 64 11 8 83 100 7,6582003 17 66 10 8 83 100 8,0982004 16 62 13 9 84 100 7,8562005 16 63 12 8 84 100 8,3482006 16 63 13 9 84 100 8,2722007 16 62 13 9 84 100 8,148
Females1975/1976 45 13 11 31 55 100 9,9251985/1986 35 24 15 26 65 100 10,4681989/1991 30 31 15 24 70 100 10,7191992/1994 30 35 15 21 70 100 10,1681995/19971 27 38 16 20 73 100 10,2121998/2000 25 42 15 19 75 100 10,1502002 24 45 13 18 76 100 8,5112003 24 45 13 19 76 100 8,9022004 24 46 12 19 76 100 8,7582005 22 48 12 18 78 100 9,2712006 22 47 13 18 78 100 9,0742007 22 48 12 18 78 100 9,053
1 Figures for 1995 onwards are based on weighted data
Persons in households
without a car
Unweighted sample size (individuals aged 17+)
10

• The proportion of people living in households with a car has risen over the last 30 years, but has levelled off in recent years. In 2007 81 per cent of adults aged 17 and over lived in a household with a car. Between 1995/97 and 2007 this proportion increased from 81 to 84 per cent among men and from 73 to 78 per cent among women.
• The proportion of women who were main drivers increased from 38 per cent in 1995/1997 to 48 per cent in 2007. However, this was still well below the proportion of men who were main drivers (64 per cent in 1995/1997 and 62 per cent in 2007).
Chart 2.4 Adult personal car availability by gender: 1975/76, 1985/86, 1995/97 and 2007
3626
19 16
4535
27 22
5159
6462
1324 38 48
7 8 1113
1115
1612
6 6 6 9
31 2620 18
0
10
20
30
40
50
60
70
80
90
100
1975/1976 1985/1986 1995/1997 2007 1975/1976 1985/1986 1995/1997 2007
Perc
enta
ge
Persons in households without a car Main driver Other driver Non driver
Males Females
11

Section 3 Public Transport and Active Travel Although most data on travel patterns from the NTS is based on analysis of trip data from the travel diary, respondents are also asked how frequently they use different modes of transport during the interview. These data are summarised here together with additional interview data on concessionary travel, walking and cycling. Frequency of use of public transport • Local bus is the most frequently used mode of public transport, with over a quarter (28 per cent) of
respondents in 2007 saying they use a bus at least once a week and a further 12 per cent saying they use a bus at least once a month.
• Taxis are the next most commonly used form of public transport. In 2007 10 per cent of respondents used a taxi at least once a week and a further 17 per cent at least once a month. The equivalent figures for rail are 7 per cent and 12 per cent respectively.
• In 2007, 10 per cent of respondents said they made a flight within GB at least once a year.
• Self-reported frequency of use of key public transport modes has remained relatively stable between 1998/00 and 2007, although there has been a slight increase in the use of surface rail and a slight decrease in the use of taxis/minicabs.
Table 3.1 Frequency of use of public transport modes: 1998/2000, 2003, 2005 and 2007
Percentage of individuals/number
Local bus Express bus or coach Surface rail
1998/ 2000 2003 2005 2007
1998/ 2000 2003 2005 2007
1998/ 2000 2003 2005 2007
3 or more times a week 18 17 16 17 - - - - 3 3 3 3Once or twice a week 10 11 10 11 - - - - 2 3 3 3
Less than once a week, more than once or twice a month 4 4 4 4 - - - - 2 2 3 3Once or twice a month 9 7 8 8 1 1 1 1 8 7 8 9
Less than once a month, more than once or twice a year 7 7 7 7 4 4 4 3 13 13 14 14Once or twice a year 9 10 10 9 11 11 11 10 20 20 20 20
Less than once a year or never 43 44 45 43 82 83 84 84 51 52 49 47Total 100 100 100 100 100 100 100 100 100 100 100 100
Unweighted sample size (individuals) 24,624 21,977 22,692 21,914 24,630 21,978 22,695 21,917 24,628 21,977 22,694 21,916
Taxi or minicab Domestic air
1998/ 2000 2003 2005 2007
1998/ 2000 2003 2005 2007
3 or more times a week 4 3 3 2 - - - -Once or twice a week 10 9 8 8 - - - -
Less than once a week, more than once or twice a month 4 5 5 5 - - - -Once or twice a month 14 12 13 13 1 - 1 1
Less than once a month, more than once or twice a year 14 13 14 14 2 2 3 2Once or twice a year 15 15 16 15 5 6 8 7
Less than once a year or never 39 42 42 43 92 91 89 90Total 100 100 100 100 100 100 100 100
Unweighted sample size (individuals) 24,630 21,975 22,691 21,910 24,630 21,978 22,695 21,920
12

Public transport use by age
• Among adults, the use of local buses is most common among those aged under 30 and aged 60 or older, partly reflecting the lower levels of driving licence holding in these age groups. Bus use is also relatively high among children. In 2007, 51 per cent of 17 to 20 year olds said they use a local bus at least once a week, while around a third of children, those aged between 20 and 29 and those aged 60 or older used buses at least weekly. Among 30-59 year olds, around a fifth used buses at least weekly.
• Rail use among adults declines steadily with age, with 13 per cent of 17 to 29 year olds travelling by train at least once a week compared with 6 per cent of people in their forties and 2 per cent of people aged 70 and over. Only 4 per cent of children aged under 17 travel by rail once a week and over half (55 per cent) say they use trains less than once a year or never.
• Adults aged 17 to 29 years were most likely to say they travelled by taxi at least once a week, with around a fifth saying this is the case compared with around 10 per cent of older people. Children and those aged 60 and over were most likely to travel by taxi less than once a year or never.
Table 3.2 Frequency of use of bus, rail and taxi/minicab by age: 2007 Percentage of individuals/number
Local bus
0-16 17-20 21-29 30-39 40-49 50-59 60-69 70+
At least once a week 32 51 32 22 19 19 31 36At least once a month 16 14 13 11 10 10 12 11At least once a year 14 7 16 21 21 21 16 12Less than once a year or never 39 28 38 46 49 51 41 41
Total 100 100 100 100 100 100 100 100
Unweighted sample size (individuals) 4,726 975 2,293 2,896 3,190 2,795 2,565 2,474
Surface rail
0-16 17-20 21-29 30-39 40-49 50-59 60-69 70+
At least once a week 4 13 13 10 6 5 4 2At least once a month 10 19 17 15 13 12 10 6At least once a year 31 32 34 39 38 38 32 23Less than once a year or never 55 37 36 36 42 45 53 69
Total 100 100 100 100 100 100 100 100
Unweighted sample size (individuals) 4,727 976 2,293 2,897 3,189 2,795 2,565 2,474
Taxi or minicab
0-16 17-20 21-29 30-39 40-49 50-59 60-69 70+
At least once a week 6 22 19 12 9 8 7 10At least once a month 8 24 33 26 19 16 11 10At least once a year 18 18 24 34 38 37 32 31Less than once a year or never 68 36 25 28 35 39 49 49
Total 100 100 100 100 100 100 100 100
Unweighted sample size (individuals) 4,727 976 2,293 2,894 3,188 2,794 2,565 2,473
13

Chart 3.1 Percentage of individuals who use selected mode at least once a week by age: 2007
32
51
32
2219 19
31
36
4
13 1310
6 5 42
6
2219
129 8 7
10
0
10
20
30
40
50
60
70
0-16 17-20 21-29 30-39 40-49 50-59 60-69 70+Age
Perc
enta
ge
Local bus Surface rail Taxi or minicab
Public transport use by car availability
• Frequency of use of public transport also varies according to car availability. This variation is particularly pronounced for bus use.
• In 2007, two thirds (66 per cent) of adults aged 17 and over who lived in a household without a car travelled by local bus at least once a week, as did 50 per cent of non-drivers in car owning households. Main drivers of a household car were least likely to travel by bus at least once a week, with only nine per cent saying they did so.
• A similar pattern is apparent for taxi use, with 24 per cent of adults in non car households and 16 per cent of non-drivers in car owning households using taxis at least weekly, compared with 7 per cent of main drivers.
• There is less variation in frequency of train travel, although main drivers were least likely to travel by train at least weekly; five per cent did so compared with 10 per cent among adults in households without a car, non-drivers and 'other drivers' in households with a car.
Chart 3.2 Percentage of adults aged 17 or above who use selected mode at least once a week by personal car access: 2007
9
24
50
18
28
105
10 107 7
24
7 8
16
811
66
0
10
20
30
40
50
60
70
Persons inhouseholdswithout a car
Main driver(hh with car)
Other driver (hh with car)
Non-driver(hh with car)
All in householdwith car
All aged 17+
Age
Perc
enta
ge
Local bus Surface rail Taxi or minicab
14

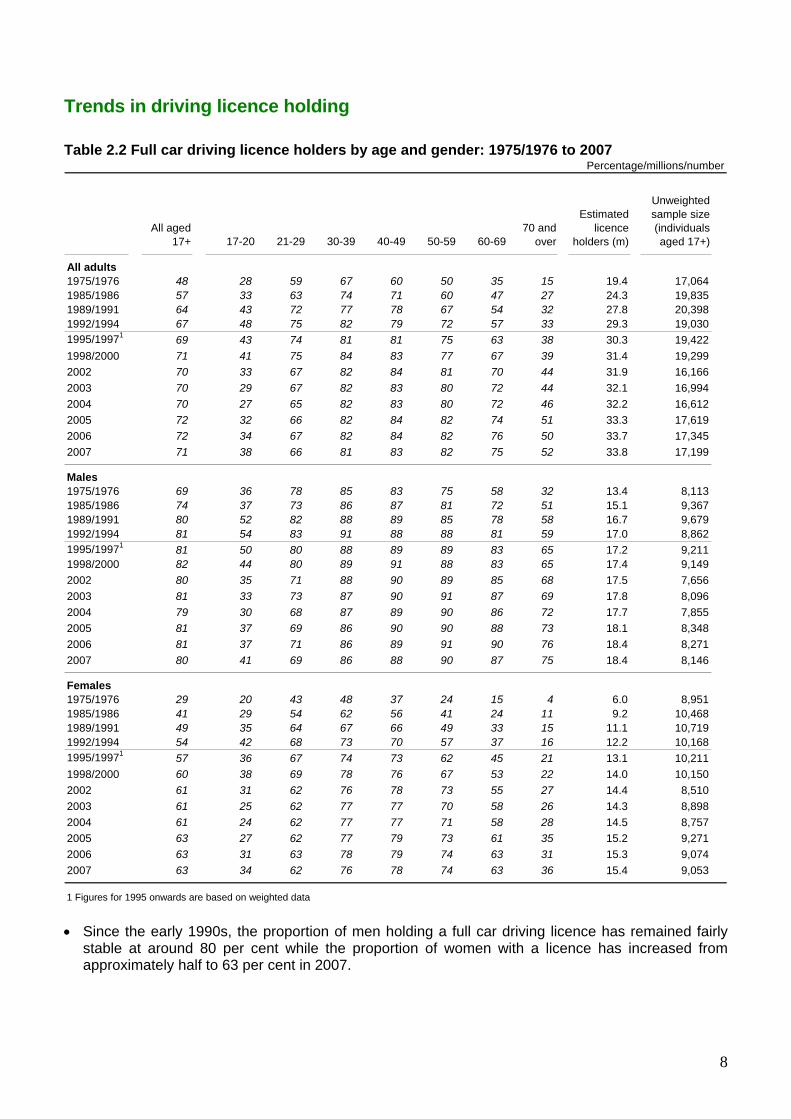
Public transport use by area type
• Bus use declines with settlement size. In 2007, 55 per cent of those in London said they use buses at least once a week compared with 35 per cent of those in metropolitan areas and 14 per cent in rural areas. Sixty per cent of rural residents said that they use buses less than once a year or never.
• Generally, taxi use follows a similar pattern and declines with settlement size. The main exception is for London residents who have relatively low levels of frequent taxi use. Nine per cent of London residents said they use taxis at least once a week in 2007. In metropolitan, large urban and medium urban areas the respective figures were 17, 11 and 12 per cent.
• Levels of rail use were relatively similar across all area types apart from London in 2007. In London around two thirds of residents use surface rail at least once a year. For other areas around half said they used rail at least once a year.
Table 3.3 Frequency of use of bus, rail and taxi/minicab by area type of residence1: 2007 Percentage of individuals/number
Local bus
London Boroughs
Metro-politan
built-upLarge urban
Medium urban
Small/ medium
urbanSmall urban Rural
At least once a week 55 35 31 25 15 16 14At least once a month 16 13 14 11 13 10 9At least once a year 13 16 17 17 19 18 17Less than once a year or never 16 36 38 46 53 56 60
Total 100 100 100 100 100 100 100
Unweighted sample size (individuals) 2,800 3,262 3,273 5,880 1,740 1,507 3,452
Surface rail
London Boroughs
Metro-politan
built-upLarge urban
Medium urban
Small/ medium
urbanSmall urban Rural
At least once a week 16 7 6 5 4 6 3At least once a month 20 13 11 12 9 10 8At least once a year 31 31 35 35 34 34 35Less than once a year or never 33 49 48 47 53 50 54
Total 100 100 100 100 100 100 100
Unweighted sample size (individuals) 2,800 3,263 3,273 5,880 1,740 1,507 3,453
Taxi or minicab
London Boroughs
Metro-politan
built-upLarge urban
Medium urban
Small/ medium
urbanSmall urban Rural
At least once a week 9 17 11 12 7 4 5At least once a month 20 21 18 18 14 14 12At least once a year 27 29 30 29 29 31 29Less than once a year or never 45 33 41 40 49 51 54
Total 100 100 100 100 100 100 100
Unweighted sample size (individuals) 2,799 3,261 3,274 5,879 1,738 1,507 3,452
1 See definitions in Appendix A.
15
Chart 3.3 Percentage of individuals who use selected modes at least once a week by area type of residence: 2007
55
3531
25
15 16 1416
7 6 5 46
3
9
17
11 12
74 5
0
10
20
30
40
50
60
70
LondonBoroughs
Metropolitanbuilt-up
Large urban Medium urban Small/medium
urban
Small urban Rural
Area of residence
Perc
enta
ge
Local bus Surface rail Taxi or minicab
International air travel In 2006 a new question was added to the NTS, asking respondents how many times they had left the country by plane in the last 12 months.
• Just under a half of respondents (46 per cent) said they had made at least one international flight in 2007, with more than one in ten (11 per cent) flying abroad three or more times.
• Adults aged 21 to 59 were most likely to made an international flight with over half of respondents in this age group saying they had flown abroad at least once in the previous 12 months compared with 38 per cent of children and 36 per cent of people aged 60 and over.
Table 3.4 Number of flights abroad: 2006R and by age: 2007 Percentage/number
2006R
All ages All ages 0-16 17-20 21-29 30-39 40-49 50-59 60 +
Number of international flights from Great Britain in the last 12 months
None 53 54 62 57 48 47 45 44 64One 24 24 27 29 28 26 27 24 17Two 11 11 7 9 13 12 13 16 10Three 5 5 2 4 5 6 6 6 5Four or more 6 6 2 2 6 9 10 10
All 100 100 100 100 100 100 100 100 100
Unweighted sample size:(individuals) 22,123 21,907 4,727 976 2,288 2,894 3,191 2,793 5,038
2007
4
16
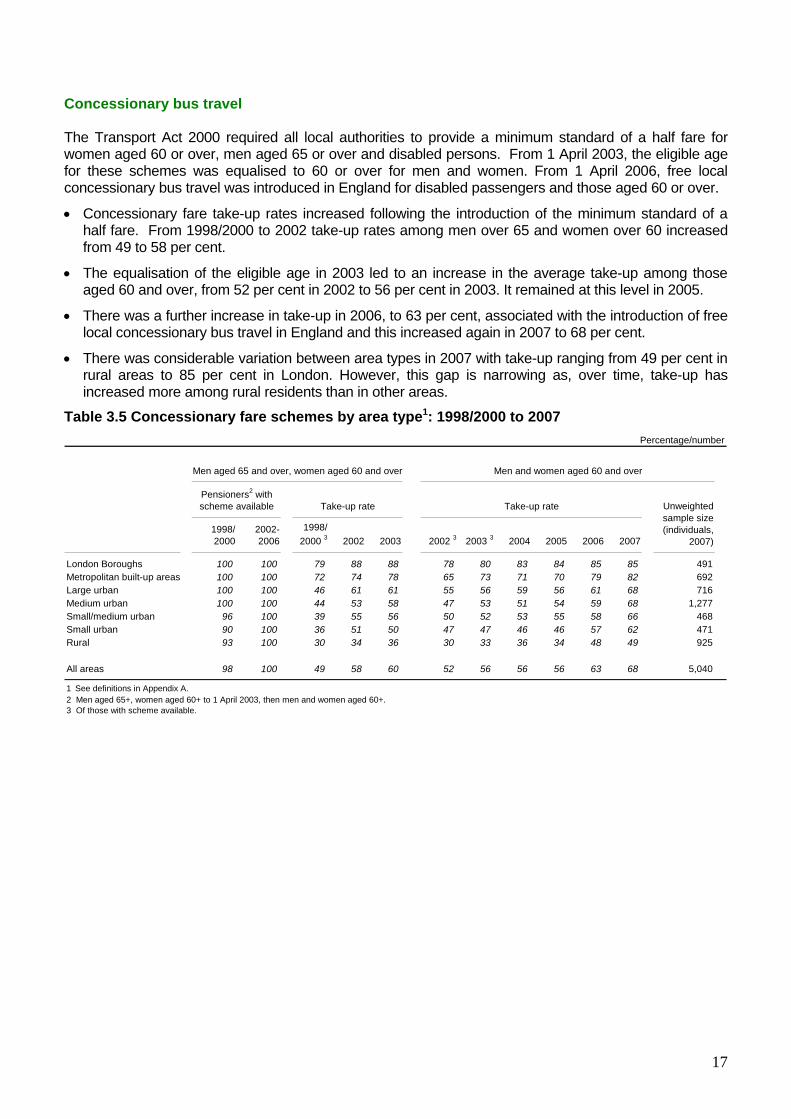
Concessionary bus travel The Transport Act 2000 required all local authorities to provide a minimum standard of a half fare for women aged 60 or over, men aged 65 or over and disabled persons. From 1 April 2003, the eligible age for these schemes was equalised to 60 or over for men and women. From 1 April 2006, free local concessionary bus travel was introduced in England for disabled passengers and those aged 60 or over.
• Concessionary fare take-up rates increased following the introduction of the minimum standard of a half fare. From 1998/2000 to 2002 take-up rates among men over 65 and women over 60 increased from 49 to 58 per cent.
• The equalisation of the eligible age in 2003 led to an increase in the average take-up among those aged 60 and over, from 52 per cent in 2002 to 56 per cent in 2003. It remained at this level in 2005.
• There was a further increase in take-up in 2006, to 63 per cent, associated with the introduction of free local concessionary bus travel in England and this increased again in 2007 to 68 per cent.
• There was considerable variation between area types in 2007 with take-up ranging from 49 per cent in rural areas to 85 per cent in London. However, this gap is narrowing as, over time, take-up has increased more among rural residents than in other areas.
Table 3.5 Concessionary fare schemes by area type1: 1998/2000 to 2007 Percentage/number
Men aged 65 and over, women aged 60 and over Men and women aged 60 and over
Take-up rate Take-up rate
1998/ 2000
2002-2006
1998/ 2000 3 2002 2003 2002 3 2003 3 2004 2005 2006 2007
London Boroughs 100 100 79 88 88 78 80 83 84 85 85 491Metropolitan built-up areas 100 100 72 74 78 65 73 71 70 79 82 692Large urban 100 100 46 61 61 55 56 59 56 61 68 716Medium urban 100 100 44 53 58 47 53 51 54 59 68 1,277Small/medium urban 96 100 39 55 56 50 52 53 55 58 66 468Small urban 90 100 36 51 50 47 47 46 46 57 62 471Rural 93 100 30 34 36 30 33 36 34 48 49 925
All areas 98 100 49 58 60 52 56 56 56 63 68 5,040
1 See definitions in Appendix A.2 Men aged 65+, women aged 60+ to 1 April 2003, then men and women aged 60+.3 Of those with scheme available.
Pensioners2 with scheme available Unweighted
sample size (individuals,
2007)
17
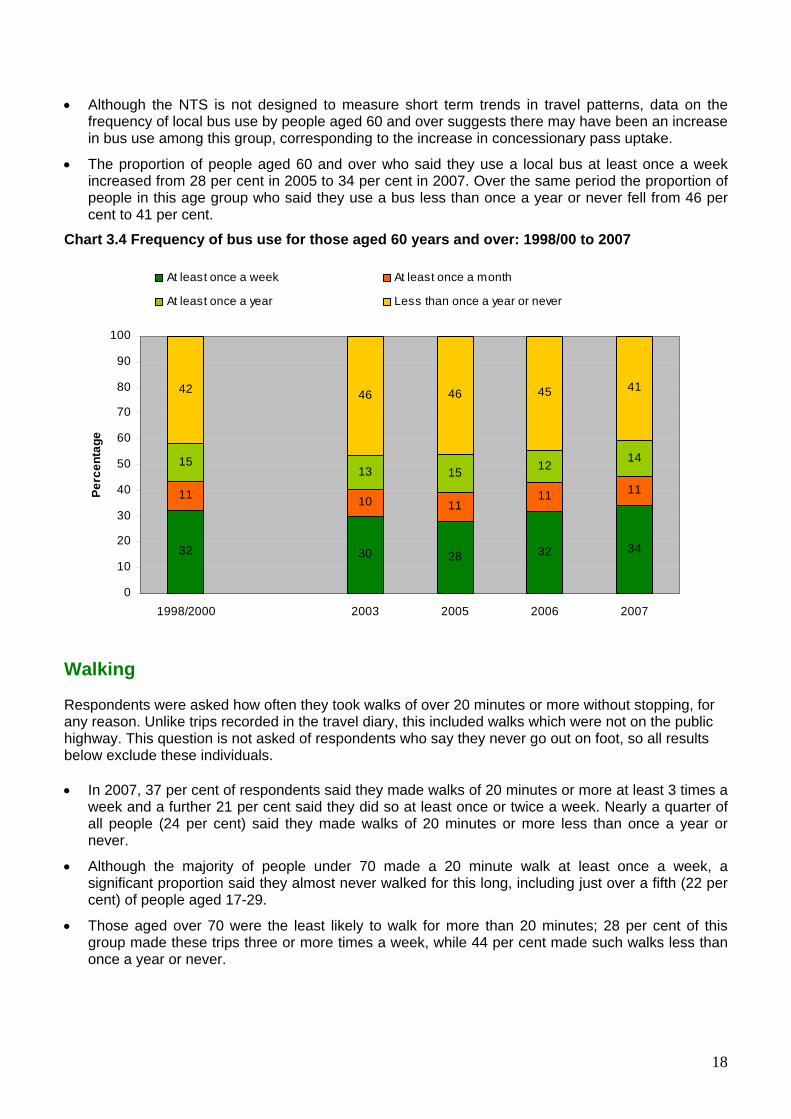
• Although the NTS is not designed to measure short term trends in travel patterns, data on the frequency of local bus use by people aged 60 and over suggests there may have been an increase in bus use among this group, corresponding to the increase in concessionary pass uptake.
• The proportion of people aged 60 and over who said they use a local bus at least once a week increased from 28 per cent in 2005 to 34 per cent in 2007. Over the same period the proportion of people in this age group who said they use a bus less than once a year or never fell from 46 per cent to 41 per cent.
Chart 3.4 Frequency of bus use for those aged 60 years and over: 1998/00 to 2007
32 30 28 32 34
11 10 1111 11
1513 15 12
14
42 46 46 45 41
0
10
20
30
40
50
60
70
80
90
100
1998/2000 2003 2005 2006 2007
Perc
enta
ge
At least once a week At least once a month
At least once a year Less than once a year or never
Walking Respondents were asked how often they took walks of over 20 minutes or more without stopping, for any reason. Unlike trips recorded in the travel diary, this included walks which were not on the public highway. This question is not asked of respondents who say they never go out on foot, so all results below exclude these individuals. • In 2007, 37 per cent of respondents said they made walks of 20 minutes or more at least 3 times a
week and a further 21 per cent said they did so at least once or twice a week. Nearly a quarter of all people (24 per cent) said they made walks of 20 minutes or more less than once a year or never.
• Although the majority of people under 70 made a 20 minute walk at least once a week, a significant proportion said they almost never walked for this long, including just over a fifth (22 per cent) of people aged 17-29.
• Those aged over 70 were the least likely to walk for more than 20 minutes; 28 per cent of this group made these trips three or more times a week, while 44 per cent made such walks less than once a year or never.
18
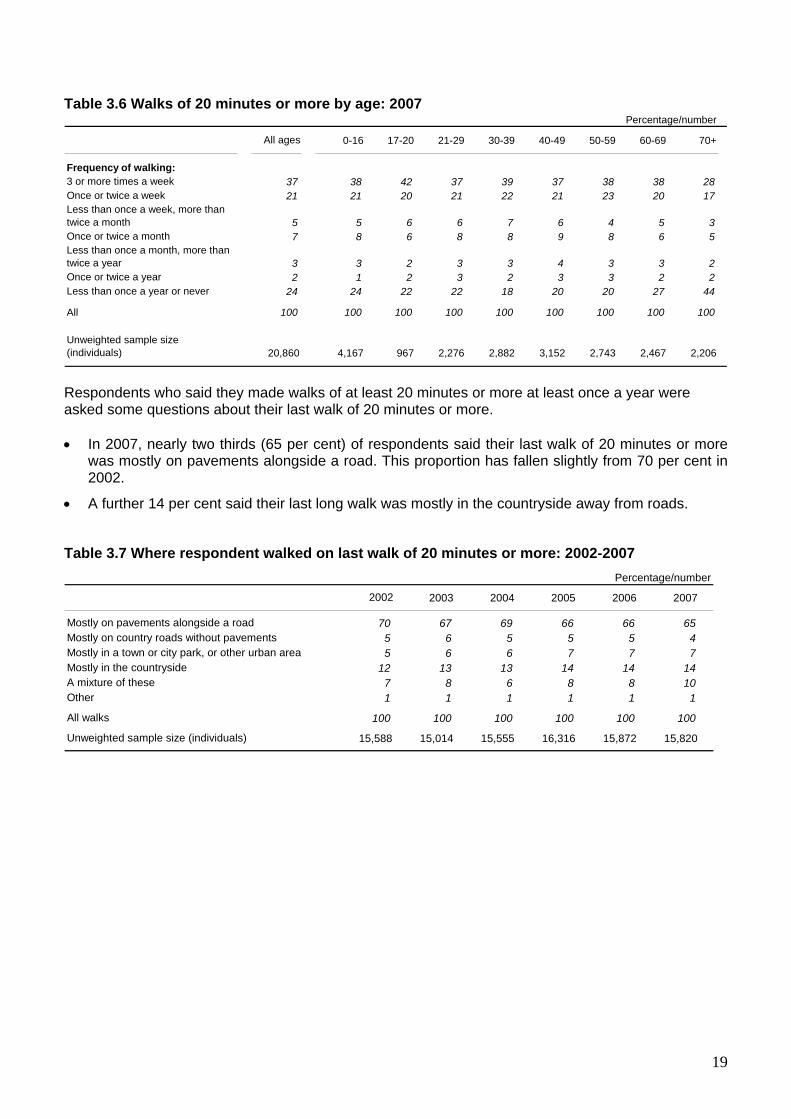
Table 3.6 Walks of 20 minutes or more by age: 2007 Percentage/number
All ages 0-16 17-20 21-29 30-39 40-49 50-59 60-69 70+
Frequency of walking:3 or more times a week 37 38 42 37 39 37 38 38 28Once or twice a week 21 21 20 21 22 21 23 20 17Less than once a week, more than twice a month 5 5 6 6 7 6 4 5 3Once or twice a month 7 8 6 8 8 9 8 6 5Less than once a month, more than twice a year 3 3 2 3 3 4 3 3 2Once or twice a year 2 1 2 3 2 3 3 2 2Less than once a year or never 24 24 22 22 18 20 20 27 44
All 100 100 100 100 100 100 100 100 100
Unweighted sample size (individuals) 20,860 4,167 967 2,276 2,882 3,152 2,743 2,467 2,206 Respondents who said they made walks of at least 20 minutes or more at least once a year were asked some questions about their last walk of 20 minutes or more. • In 2007, nearly two thirds (65 per cent) of respondents said their last walk of 20 minutes or more
was mostly on pavements alongside a road. This proportion has fallen slightly from 70 per cent in 2002.
• A further 14 per cent said their last long walk was mostly in the countryside away from roads.
Table 3.7 Where respondent walked on last walk of 20 minutes or more: 2002-2007 Percentage/number
2002 2003 2004 2005 2006 2007
Mostly on pavements alongside a road 70 67 69 66 66 65Mostly on country roads without pavements 5 6 5 5 5 4Mostly in a town or city park, or other urban area 5 6 6 7 7 7Mostly in the countryside 12 13 13 14 14 14A mixture of these 7 8 6 8 8 10Other 1 1 1 1 1 1
All walks 100 100 100 100 100 100
Unweighted sample size (individuals) 15,588 15,014 15,555 16,316 15,872 15,820
19

There were variations in the type of area respondents had walked in during their last walk of 20 minutes or more depending on the type of area type where they lived.
• Residents of rural areas were more likely to walk in the countryside with 35 per cent saying this was the case for their last walk compared with 4 per cent of people in London and 7 per cent of people in other metropolitan built up areas.
• Conversely, respondents living in London were most likely to make their walks on pavements alongside a road with 81 per cent saying their last walk had been on pavements compared with 75 per cent in metropolitan areas and 31 per cent in rural areas.
Chart 3.5 Type of area walked in during last walk of 20 minutes or more by area type of residence: 2007
65
81 75 73 6858 54
31
4
5
17
7
117 6
8
74
4
14
47 10 10
17 2135
103 8 8 11 15 15 12
3
231
2
0
10
20
30
40
50
60
70
80
90
100
All areas LondonBoroughs
Metropolitanbuilt-upareas
Largeurban
Mediumurban
Small/medium
urban
Small urban Rural
Area type of residence
Perc
enta
ge
Mostly on pavements alongside a road Mostly on country roads without pavementsMostly in a town or city park, or other urban area Mostly in the countrysideA mixture of these Other
Respondents were also asked how they travelled to their last walk of 20 minutes or more.
• In 2007, almost four-fifths (79 per cent) of respondents said that they did not travel to their last walk of 20 minutes or more and 16 per cent said they travelled by car or van.
• The proportion travelling by car was much higher where their last walk was mostly in the countryside, with 44 per cent saying this was the case.
20
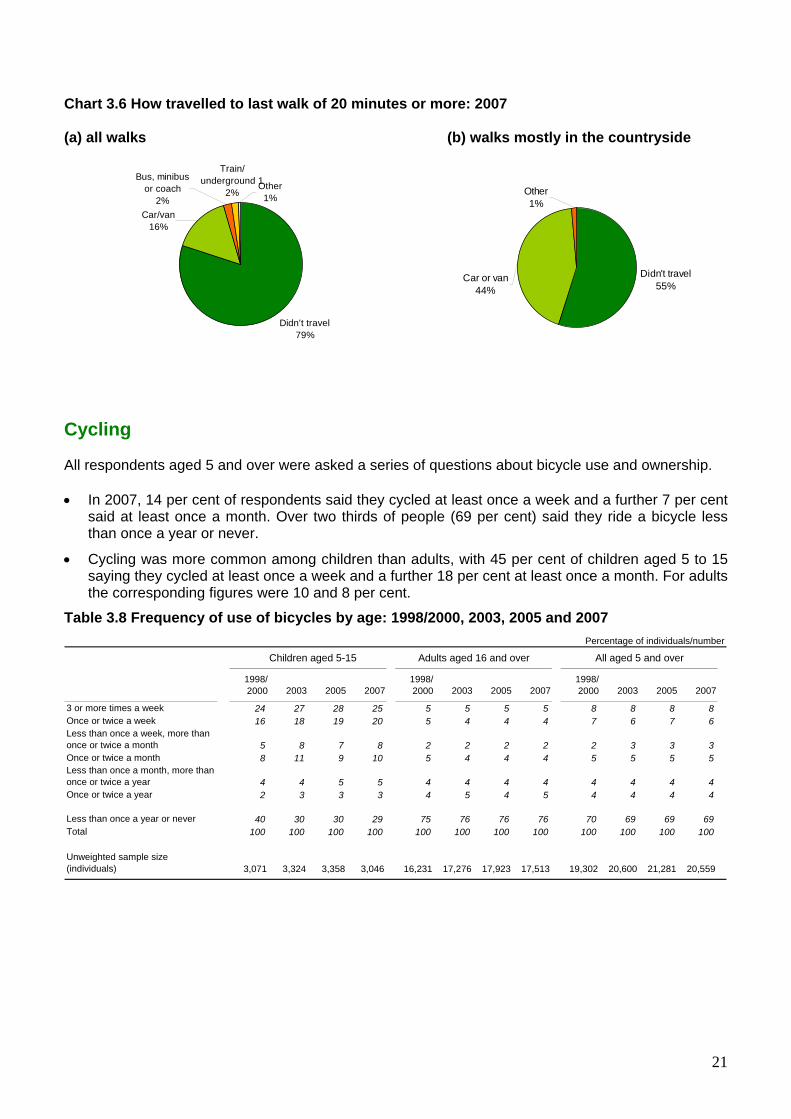
Chart 3.6 How travelled to last walk of 20 minutes or more: 2007 (a) all walks (b) walks mostly in the countryside
Didn't travel79%
Other1%
Train/ underground 1
2%
Bus, minibus or coach
2%Car/van
16%
Didn't travel55%
Other1%
Car or van44%
Cycling All respondents aged 5 and over were asked a series of questions about bicycle use and ownership. • In 2007, 14 per cent of respondents said they cycled at least once a week and a further 7 per cent
said at least once a month. Over two thirds of people (69 per cent) said they ride a bicycle less than once a year or never.
• Cycling was more common among children than adults, with 45 per cent of children aged 5 to 15 saying they cycled at least once a week and a further 18 per cent at least once a month. For adults the corresponding figures were 10 and 8 per cent.
Table 3.8 Frequency of use of bicycles by age: 1998/2000, 2003, 2005 and 2007 Percentage of individuals/number
Children aged 5-15 Adults aged 16 and over All aged 5 and over
1998/ 2000 2003 2005 2007
1998/ 2000 2003 2005 2007
1998/ 2000 2003 2005 2007
3 or more times a week 24 27 28 25 5 5 5 5 8 8 8 8Once or twice a week 16 18 19 20 5 4 4 4 7 6 7 6Less than once a week, more than once or twice a month 5 8 7 8 2 2 2 2 2 3 3 3Once or twice a month 8 11 9 10 5 4 4 4 5 5 5 5Less than once a month, more than once or twice a year 4 4 5 5 4 4 4 4 4 4 4 4Once or twice a year 2 3 3 3 4 5 4 5 4 4 4 4
Less than once a year or never 40 30 30 29 75 76 76 76 70 69 69 69Total 100 100 100 100 100 100 100 100 100 100 100 100
Unweighted sample size (individuals) 3,071 3,324 3,358 3,046 16,231 17,276 17,923 17,513 19,302 20,600 21,281 20,559
21

All respondents aged over 5 were asked whether they owned or had access to a bicycle.
• Overall, 42 per cent of individuals aged 5 and over said they owned a bicycle and a further one per cent said they had use of a bicycle in 2007. The proportion of respondents with access to a bicycle was higher among males (50 per cent) than females (37 per cent).
• Children were much more likely to own a bicycle than adults. In 2007, 89 per cent of those aged between 5 and 10 and 75 per cent of those aged between 11 and 16 owned a bicycle. After the age of 16 bicycle ownership falls sharply; less than half of people aged 17 and over have access to a bicycle.
Table 3.9 Bicycle ownership by age and sex: 2007 Percentage of individuals/number
Males Females
Own a bicycle
Use of a bicycle
No use of bicycle Total
Unweighted sample size (individuals)
Own a bicycle
Use of a bicycle
No use of bicycle Total
Unweighted sample size (individuals)
5-10 90 1 10 100 819 88 1 11 100 78411-16 80 2 17 100 882 69 2 29 100 88417-20 49 5 46 100 498 35 2 63 100 47821-29 40 3 57 100 1,059 27 2 72 100 1,23530-39 51 1 48 100 1,404 42 1 57 100 1,49440-49 53 1 45 100 1,535 40 1 59 100 1,65750-59 43 2 56 100 1,362 30 1 70 100 1,43460+ 25 1 75 100 2,285 13 0 87 100 2,754
All aged 5+ 49 2 50 100 9,844 36 1 63 100 10,720 Chart 3.7 Bicycle ownership by age: 2007
89
75
4334
46 4736
18
42
1023
5464
53 5263
81
56
0
10
20
30
40
50
60
70
80
90
100
5-10 11-16 17-20 21-29 30-39 40-49 50-59 60+ All aged5+Age
Perc
enta
ge
Own a bicycle Use of a bicycle No use of bicycle
22

Individuals were also asked whether they had ridden a bicycle in the previous 12 months.
• Just over one third (36 per cent) of individuals aged 5 and over said they had ridden a bicycle in the last 12 months.
• This proportion was much higher for children at 87 per cent among those aged 5 to 10 and 70 per cent of those aged 11 to 16, reflecting the high levels of bicycle ownership in these age groups.
• The proportion who had ridden a bike in the last 12 months was the same for girls and boys aged 5 to 10 (87 per cent) but was higher for males than females at all other ages.
Chart 3.8 Proportion of individuals who have ridden a bicycle in the last 12 months by age and sex: 2007
8782
4539
46 44
32
17
43
87
57
27 26
3431
18
7
29
0
10
20
30
40
50
60
70
80
90
100
5-10 11-16 17-20 21-29 30-39 40-49 50-59 60+ All aged5+Age
Perc
enta
ge
Males Females
23
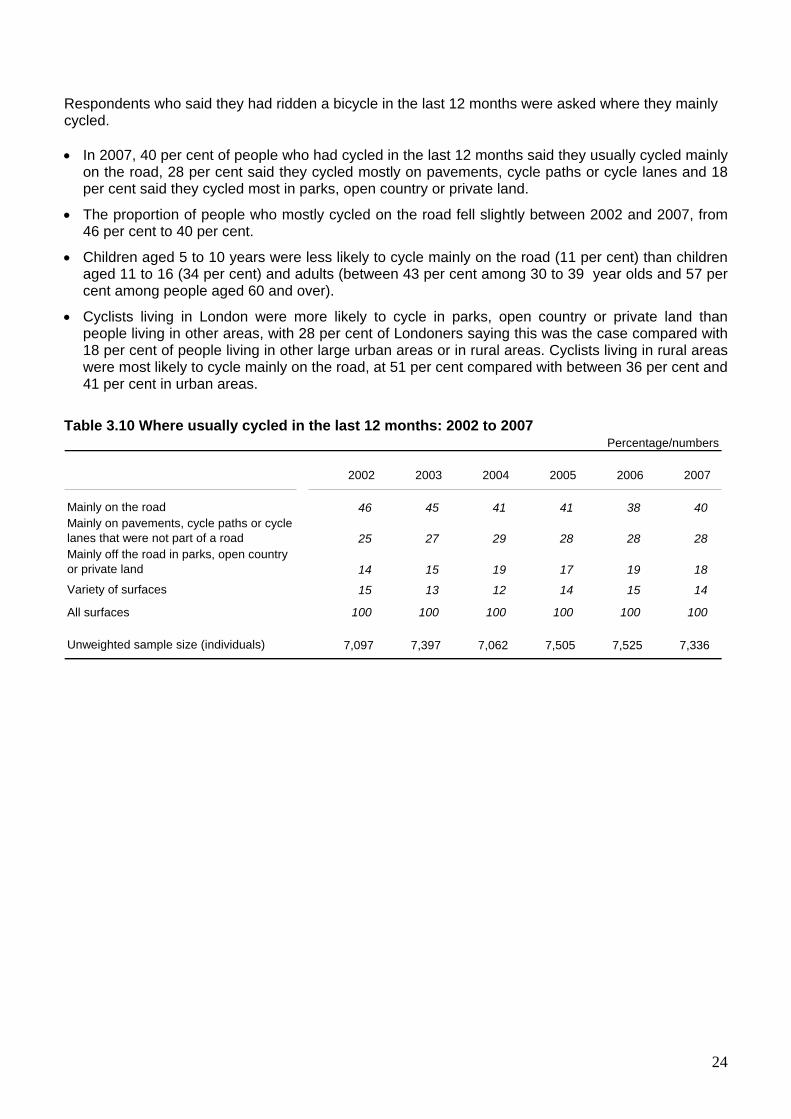
Respondents who said they had ridden a bicycle in the last 12 months were asked where they mainly cycled. • In 2007, 40 per cent of people who had cycled in the last 12 months said they usually cycled mainly
on the road, 28 per cent said they cycled mostly on pavements, cycle paths or cycle lanes and 18 per cent said they cycled most in parks, open country or private land.
• The proportion of people who mostly cycled on the road fell slightly between 2002 and 2007, from 46 per cent to 40 per cent.
• Children aged 5 to 10 years were less likely to cycle mainly on the road (11 per cent) than children aged 11 to 16 (34 per cent) and adults (between 43 per cent among 30 to 39 year olds and 57 per cent among people aged 60 and over).
• Cyclists living in London were more likely to cycle in parks, open country or private land than people living in other areas, with 28 per cent of Londoners saying this was the case compared with 18 per cent of people living in other large urban areas or in rural areas. Cyclists living in rural areas were most likely to cycle mainly on the road, at 51 per cent compared with between 36 per cent and 41 per cent in urban areas.
Table 3.10 Where usually cycled in the last 12 months: 2002 to 2007
Percentage/numbers
2002 2003 2004 2005 2006 2007
Mainly on the road 46 45 41 41 38 40Mainly on pavements, cycle paths or cycle lanes that were not part of a road 25 27 29 28 28 28Mainly off the road in parks, open country or private land 14 15 19 17 19 18Variety of surfaces 15 13 12 14 15 14
All surfaces 100 100 100 100 100 100
Unweighted sample size (individuals) 7,097 7,397 7,062 7,505 7,525 7,336
24

Chart 3.9 Where usually cycled in the last 12 months by area type of residence: 2007
11
34
53 5243 47 52 57
40
45
35
22 1922
2324
20
28
3013
10 16 22 1613 12
18
14 18 15 13 13 15 10 11 14
0
10
20
30
40
50
60
70
80
90
100
5-10 11-16 17-20 21-29 30-39 40-49 50-59 60+ All aged 5+
Age
Perc
enta
ge
Mainly on the road Pavement, cycle path or cycle lane Parks, open country or private land Variety of surfaces
Chart 3.10 Where usually cycled in the last 12 months by age: 2007
41 38 36 36 41 4051
40
20 31 31 35 2922
1828
28 18 18 15 1317
18 18
11 13 14 13 16 2213 14
0
10
20
30
40
50
60
70
80
90
100
LondonBoroughs
Metropolitanbuilt-upareas
Large urban Mediumurban
Small/medium
urban
Small urban Rural All areas
Area type of residence
Perc
enta
ge
Mainly on the road Pavement, cycle path or cycle lane Parks, open country or private land Variety of surfaces
25

Section 4 Social inclusion This section provides analysis for different income groups, including vehicle availability, frequency of public transport use and international flights. It also gives information on car availability and driving licence holding by ethnicity. Travel by income group The NTS collects information on the income band of each household. A weighting factor is applied to account for the different number of individuals living within the household and these incomes are deflated to 1990 values using the Retail Price Index. Households are then ranked according to this weighted household income and assigned to one of five income quintiles. (See Appendix A for more details.) Car availability and access by income • Car availability is strongly related to income. In 2007, 54 per cent of households in the lowest
income quintile had no car compared with 10 per cent in the highest income quintile.
• Over a half of households (51 per cent) in the highest income quintile had two or more cars. This proportion decreases steadily with decreasing income, to 8 per cent of households in the lowest income quintile.
• In 2007, 47 per cent of respondents aged 17 and over in the lowest income quintile lived in households with no car compared with just 7 per cent in the highest income quintile.
• Of those living in households with cars, those in the highest income quintile were most likely to be the main driver of a household car. This reflects the higher proportion of households with more than one car in this income group.
Table 4.1 Household car availability by household income quintile: 2007 Percentage/number
No car One car Two carsThree or
more carsAll
households
Unweighted sample size
(households)
Lowest real income level 54 37 7 1 100 1,872Second level 36 46 15 3 100 1,895Third level 17 49 28 7 100 1,877Fourth level 10 42 38 10 100 1,825Highest real income level 10 39 43 8 100 1,809
All households 25 43 26 6 100 9,278
Unweighted sample size (households) 2,299 4,020 2,458 501 9,278
26

Table 4.2 Adult personal 1 car access by household income quintile: 2007 Percentage/number
Persons in households with a car
Main driver
Other driver
Non driver All
All persons
Lowest real income level 47 32 8 14 53 100 2,931Second level 28 43 12 17 72 100 3,397Third level 13 56 14 17 87 100 3,744Fourth level 8 65 14 13 92 100 3,812Highest real income level 7 74 12 7 93 100 3,317
All income levels 19 55 13 13 81 100 17,201
Unweighted sample size:(individuals aged 17+) 3,218 9,585 2,171 2,227 13,983 17,201
1 For those aged 17+.
Persons in households
without a car
Unweighted sample size (individuals aged 17+)
Chart 4.1 Household car availability by income quintile: 2007
54
36
1710 10
25
37
46
49
42 39
43
818
34
48 51
32
0
10
20
30
40
50
60
70
80
90
100
Lowest realincome level
Second level Third level Fourth level Highest realincome level
All incomelevels
Household income quintile
Perc
enta
ge
Two or more
One
None
27

Bicycle and motorcycle ownership by income Households were asked how many motorcycles they owned and individuals aged 5 and over were asked whether they owned or had access to a bicycle. • Household motorcycle ownership increases with increasing income. In 2007, 4 per cent of
households in the highest income quintile owned at least one motorcycle compared with 1 per cent of those in the lowest income quintile.
• Bicycle ownership also increases with income. Over half (53 per cent) of individuals in the highest
income quintile owned or had access to a bicycle in 2007 compared with a third (33 per cent) of those in the lowest income quintile.
Table 4.3 Household motorcycle ownership by household income quintile: 2007
Percentage/number
None OneTwo or
more Total
Unweighted sample size
(households)
Lowest real income level 99 1 0 100 1,872Second level 98 1 0 100 1,895Third level 97 3 1 100 1,877Fourth level 96 3 1 100 1,825Highest real income level 96 3 1 100 1,809
All households 97 2 0 100 9,278
Table 4.4 Personal bicycle ownership by household income quintile: 2007
Percentage/number
Own a bicycle
Use of a bicycle
No use of bicycle Total
Unweighted sample size (individuals)
Lowest real income level 31 2 67 100 3,757Second level 36 1 63 100 4,136Third level 42 1 56 100 4,490Fourth level 48 1 51 100 4,469Highest real income level 52 1 47 100 3,712
All aged 5+ 42 1 56 100 20,564 Frequency of use of bicycles and public transport by income Frequency of use by mode is influenced by vehicle access, which in turn is related to household income. However, there is not always a straightforward linear relationship between travel by mode and income. • Use of local buses is highest among people in low income households and declines as income
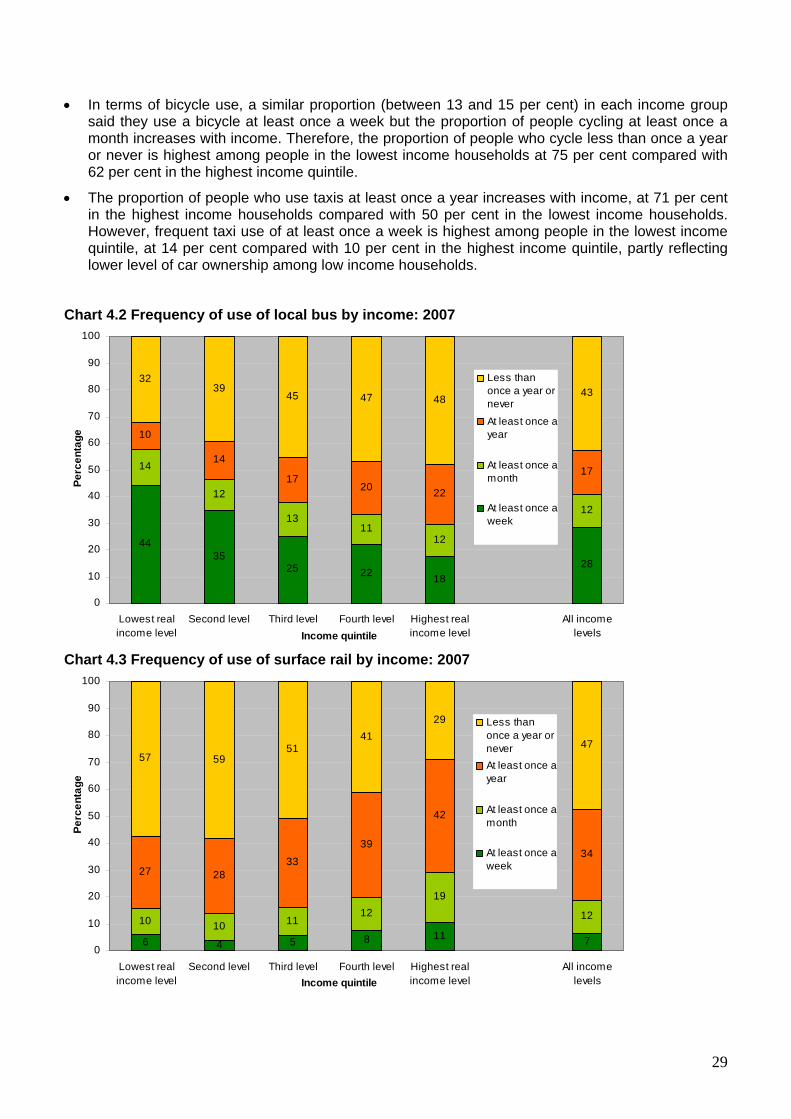
increases. In 2007, 44 per cent of people in the lowest income quintile used local buses at least once a week and 32 per cent used them less than once a year or never. The equivalent figures for people in the highest income quintile were 18 per cent and 48 per cent respectively.
• Travel by surface rail, on the other hand, tends to increase with household income. In 2007, 11 per cent of people in the highest income quintile travelled by train at least once a week and a further 19 per cent did so at least once a month. This compares with 6 per cent and 10 per cent respectively among those in the lowest income quintile.
28
• In terms of bicycle use, a similar proportion (between 13 and 15 per cent) in each income group said they use a bicycle at least once a week but the proportion of people cycling at least once a month increases with income. Therefore, the proportion of people who cycle less than once a year or never is highest among people in the lowest income households at 75 per cent compared with 62 per cent in the highest income quintile.
• The proportion of people who use taxis at least once a year increases with income, at 71 per cent in the highest income households compared with 50 per cent in the lowest income households. However, frequent taxi use of at least once a week is highest among people in the lowest income quintile, at 14 per cent compared with 10 per cent in the highest income quintile, partly reflecting lower level of car ownership among low income households.
Chart 4.2 Frequency of use of local bus by income: 2007
4435
25 22 1828
14
12
1311
12
12
10
14
1720 22
17
3239
45 47 4843
0
10
20
30
40
50
60
70
80
90
100
Lowest realincome level
Second level Third level Fourth level Highest realincome level
All incomelevelsIncome quintile
Perc
enta
ge
Less thanonce a year ornever
At least once ayear
At least once amonth
At least once aweek
Chart 4.3 Frequency of use of surface rail by income: 2007
6 4 5 8 11 7
10 10 1112
19
12
27 2833
39
42
34
57 5951
4129
47
0
10
20
30
40
50
60
70
80
90
100
Lowest realincome level
Second level Third level Fourth level Highest realincome level
All incomelevelsIncome quintile
Perc
enta
ge
Less thanonce a year orneverAt least once ayear
At least once amonth
At least once aweek
29

Chart 4.4 Frequency of use of bicycle by income: 2007
15 13 15 14 14 14
5 7 8 9 11 85 6
8 1012
8
75 7469 67 62
69
0
10
20
30
40
50
60
70
80
90
100
Lowest realincome level
Second level Third level Fourth level Highest realincome level
All incomelevelsIncome quintile
Perc
enta
ge
Less thanonce a year ornever
At least once ayear
At least once amonth
At least once aweek
Chart 4.5 Frequency of use of taxi/minicab by income: 2007
14 12 8 8 10 10
15 1415
2025
17
22 26 30
33
36
29
50 48 4839
29
43
0
10
20
30
40
50
60
70
80
90
100
Lowest realincome level
Second level Third level Fourth level Highest realincome level
All incomelevelsIncome quintile
Perc
enta
ge
Less thanonce a year ornever
At least once ayear
At least once amonth
At least once aweek
30
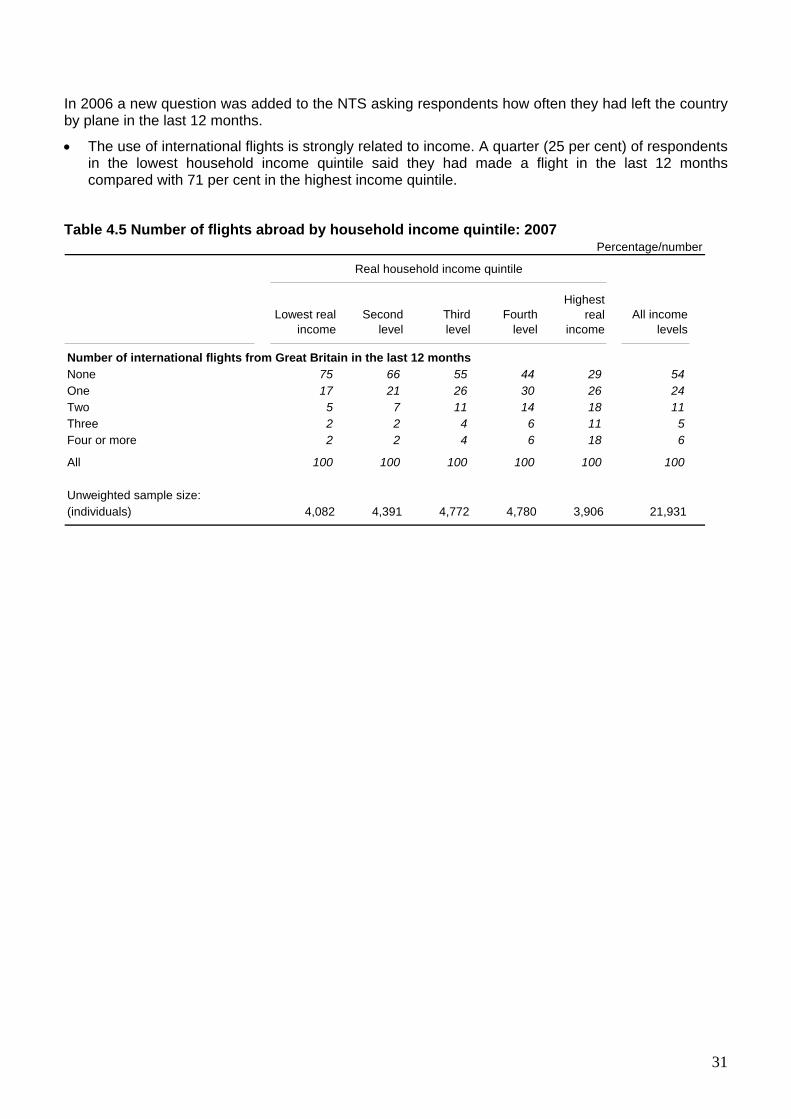
In 2006 a new question was added to the NTS asking respondents how often they had left the country by plane in the last 12 months.
• The use of international flights is strongly related to income. A quarter (25 per cent) of respondents in the lowest household income quintile said they had made a flight in the last 12 months compared with 71 per cent in the highest income quintile.
Table 4.5 Number of flights abroad by household income quintile: 2007 Percentage/number
Real household income quintile
Lowest real income
Second level
Third level
Fourth level
Highestreal
incomeAll income
levels
Number of international flights from Great Britain in the last 12 monthsNone 75 66 55 44 29 54One 17 21 26 30 26 24Two 5 7 11 14 18 11Three 2 2 4 6 11Four or more 2 2 4 6 18
All 100 100 100 100 100 100
Unweighted sample size:(individuals) 4,082 4,391 4,772 4,780 3,906 21,931
56
31
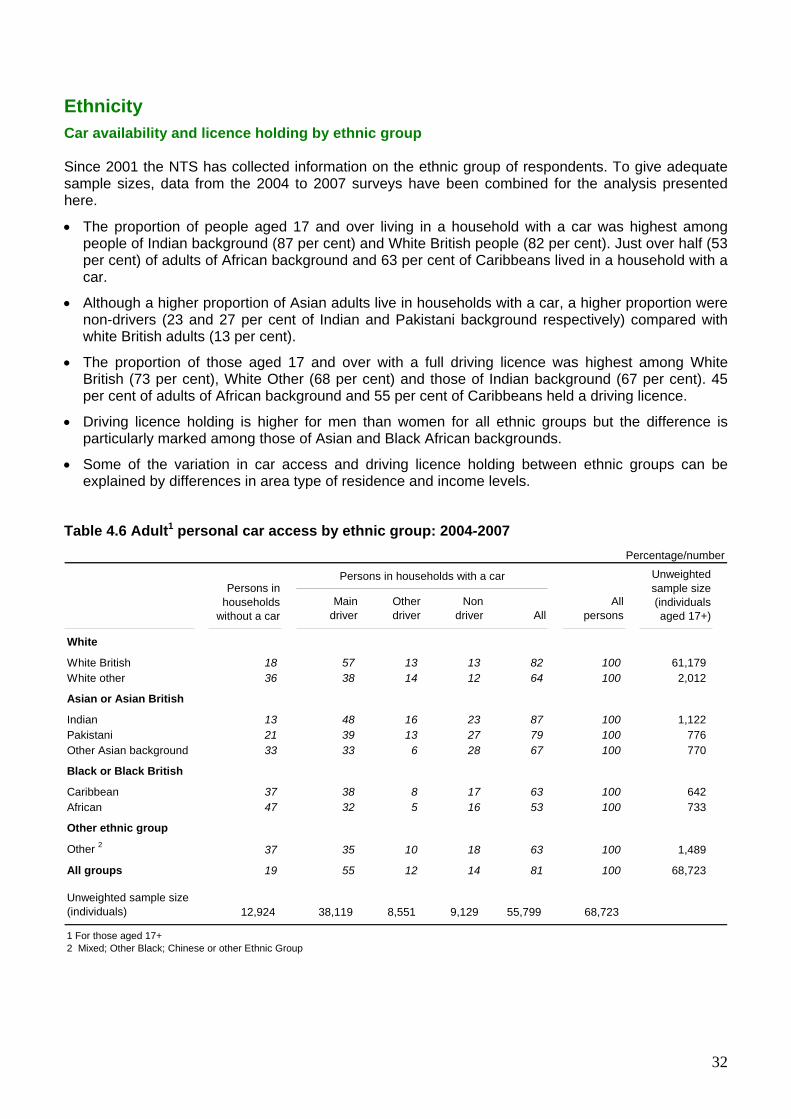
Ethnicity Car availability and licence holding by ethnic group Since 2001 the NTS has collected information on the ethnic group of respondents. To give adequate sample sizes, data from the 2004 to 2007 surveys have been combined for the analysis presented
ere. h • The proportion of people aged 17 and over living in a household with a car was highest among
people of Indian background (87 per cent) and White British people (82 per cent). Just over half (53 per cent) of adults of African background and 63 per cent of Caribbeans lived in a household with a car.
• Although a higher proportion of Asian adults live in households with a car, a higher proportion were non-drivers (23 and 27 per cent of Indian and Pakistani background respectively) compared with white British adults (13 per cent).
• The proportion of those aged 17 and over with a full driving licence was highest among White British (73 per cent), White Other (68 per cent) and those of Indian background (67 per cent). 45 per cent of adults of African background and 55 per cent of Caribbeans held a driving licence.
• Driving licence holding is higher for men than women for all ethnic groups but the difference is particularly marked among those of Asian and Black African backgrounds.
• Some of the variation in car access and driving licence holding between ethnic groups can be explained by differences in area type of residence and income levels.
Table 4.6 Adult1 personal car access by ethnic group: 2004-2007 Percentage/number
Persons in households with a car
Main driver
Other driver
Non driver All
All persons
White
White British 18 57 13 13 82 100 61,179 White other 36 38 14 12 64 100 2,012
Asian or Asian British
Indian 13 48 16 23 87 100 1,122 Pakistani 21 39 13 27 79 100 776 Other Asian background 33 33 6 28 67 100 770
Black or Black British
Caribbean 37 38 8 17 63 100 642 African 47 32 5 16 53 100 733
Other ethnic group Other 2 37 35 10 18 63 100 1,489
All groups 19 55 12 14 81 100 68,723
Unweighted sample size (individuals) 12,924 38,119 8,551 9,129 55,799 68,723
1 For those aged 17+2 Mixed; Other Black; Chinese or other Ethnic Group
Persons in households
without a car
Unweighted sample size (individuals aged 17+)
32
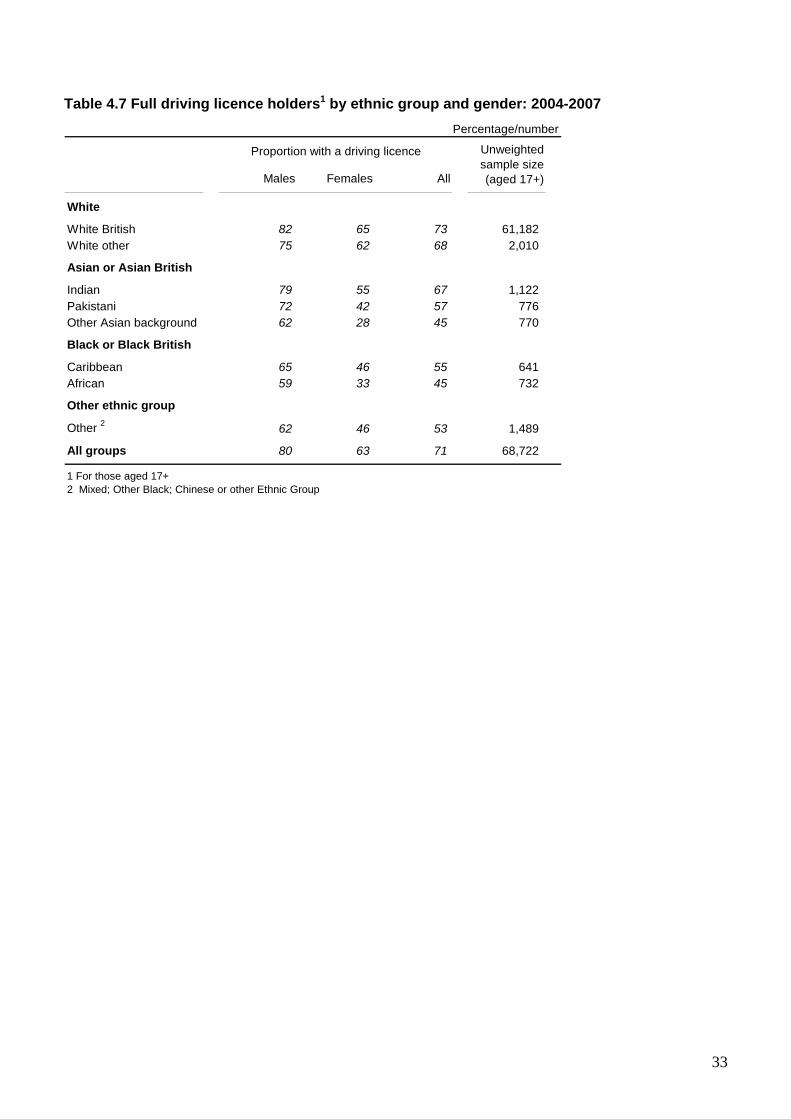
Table 4.7 Full driving licence holders1 by ethnic group and gender: 2004-2007 Percentage/number
Proportion with a driving licence
Males Females All
White
White British 82 65 73 61,182 White other 75 62 68 2,010
Asian or Asian British
Indian 79 55 67 1,122 Pakistani 72 42 57 776 Other Asian background 62 28 45 770
Black or Black British
Caribbean 65 46 55 641 African 59 33 45 732
Other ethnic group
Other 2 62 46 53 1,489
All groups 80 63 71 68,722
1 For those aged 17+2 Mixed; Other Black; Chinese or other Ethnic Group
Unweighted sample size (aged 17+)
33

Section 5 Accessibility This section provides information about access to public transport services and other local facilities. It also looks at individuals' ability to work from home. Access to services Access to bus and train services • In 2007, 86 per cent of households in Great Britain lived within 6 minutes walk of a bus stop. In
Great Britain as a whole, the average distance that households live from the nearest bus stop has changed little since 1998/00.
• Between 1998/00 and 2007, the proportion of households in rural areas that were within 13 minutes walk of an hourly or better bus service (the minimum criteria for the government’s bus availability indicator for England) increased from 45 to 57 per cent. The proportion of households with this access increased from 74 per cent to 87 per cent over the same period in small urban areas and from 86 to 93 per cent in small/medium urban areas. There was little change in medium and large urban areas, where the vast majority (over 90 per cent) of households live within 13 minutes walk of a bus stop with a service at least once an hour.
• People are much less likely to live within a short walk of a railway station than a bus stop. In 2007, 7 per cent of responding households in Great Britain were within 6 minutes walk of a train station. Households in London were more likely to be near a train station than in other areas with 37 per cent living within 13 minutes walk of a station compared with 20 per cent in other metropolitan built-up areas and 7 per cent in rural areas. Over three quarters (78 per cent) of households in rural areas were at least 44 minutes walk from a train station.
Table 5.1 Time taken to walk to nearest bus stop by area type1 and bus availability indicator for Great Britain and England: 1998/2000 and 2007
Percentage of households/number
Availability Indicator 2
Time in minutes 1998/2000 Time in minutes 2007 Great Britain England
6 or less 7-13
14 or more
All house-
holds6 or less 7-13
14 or more
All house-
holds1998/ 2000 2007
1998/ 2000 2007
London Boroughs 89 10 2 100 90 9 1 100 97 99 97 90Metropolitan built-up areas 91 7 1 100 91 8 1 100 97 97 97 99Large urban 91 8 2 100 88 10 1 100 96 95 96 97Medium urban 90 9 1 100 90 9 1 100 95 96 94 95Small/medium urban 84 12 4 100 85 13 2 100 86 93 84 96Small urban 81 13 7 100 81 15 4 100 74 87 71 92Rural 75 12 13 100 73 13 14 100 45 57 41 87
All areas 87 10 3 100 86 10 3 100 88 90 88 55
Unweighted sample size (households) 9,084 1,009 359 10,452 7,979 966 329 9,274 10,452 9,278 8,019 7,884
1 See definitions in Appendix A.2 Households whose nearest bus stop is within 13 minutes walk and has a service at least once an hour.
34

Table 5.2 Time taken to walk to nearest train station by area type1: 2007 Percentage of households/number
Time in minutes 2007
6 or less 7-13 14-26 27-43
44 or more
Allhouseholds
Unweighted sample size
(households)
London Boroughs 13 24 36 17 10 100 1,151Metropolitan built-up areas 7 13 29 17 34 100 1,390Large urban 7 11 25 19 38 100 1,398Medium urban 5 10 33 22 30 100 2,480Small/medium urban 7 12 25 12 45 100 770Small urban 8 11 21 8 52 100 655Rural 3 3 7 9 78 100 1,430
All areas 7 12 26 16 39 100 9,274
1 See definitions in Appendix A. • Distance from the nearest bus stop or railway station will have an impact on the level of use of
buses and trains. • In 2007, 29 per cent of those living within 6 minutes walk of a bus stop travelled by bus at least
once a week compared with 14 per cent of those living 14 minutes or more from their nearest bus stop.
• Similarly, 18 per cent of those living within 6 minutes of their nearest railway station travelled by train at least once a week compared with 8 per cent of those living 14-26 minutes away and 2 per cent of those living 44 minutes or more.
Chart 5.1 Walk time to nearest bus stop by frequency of bus use: 2007
29 2514
28
1310
8
12
17
17
14
17
4149
64
43
0
10
20
30
40
50
60
70
80
90
100
6 or less 7-13 14 or more All distancesMinutes
Perc
enta
ge
At least once a week At least once a month At least once a year Less than once a year or never
35

Chart 5.2 Walk time to nearest train station by frequency of rail use: 2007
18 158 4 2 7
2020
1512
6
12
30 33
35
35
33
34
32 3141
4959
47
0
10
20
30
40
50
60
70
80
90
100
6 or less 7-13 14-26 27-43 44 or more All distancesMinutes
Perc
enta
ge
At least once a week At least once a month At least once a year Less than once a year or never
Time to local facilities on foot or by public transport In 2005 a new set of questions was added to the NTS covering the time taken to travel to various key services on foot or by public transport, whichever is quickest. These questions replaced the previous set which asked about the time to key services on foot and by public transport separately. The new questions were designed to be in line with the Department's accessibility indicators. • In 2007, 93 per cent of households in Great Britain were within 15 minutes of a shop selling
groceries and 79 per cent were within 15 minutes of a doctor’s surgery.
• Over half (54 per cent) of households were within 15 minutes of a shopping centre in 2007. Just 2 per cent were over 60 minutes from a shopping centre.
• Around three-fifths (59 per cent) of households were within 30 minutes of a hospital in 2007.
• Households containing children of school or college age were asked how far they were from the nearest relevant educational establishment. Among households with children of primary school age, 90 per cent were within 15 minutes, on foot or by public transport, of their nearest primary school. The equivalent figures were lower for secondary schools (61 per cent) and colleges (49 per cent).
36

Table 5.3 Shortest journey time to local facilities on foot or by public transport: 2005, 2006 and 2007
Percentage of households/number
Post Office 1
2005 2006 2007 2005 2006 2007 2005 2006 2007
15 minutes or less 93 92 93 56 53 54 .. 87 ..16 - 20 minutes 3 3 3 17 18 17 .. 7 ..21 - 30 minutes 2 2 2 16 17 17 .. 4 ..31 - 40 minutes - - - 4 4 3 .. 1 ..41 - 60 minutes 1 1 1 6 6 7 .. 1 ..Over 60 minutes - 1 - 2 2 2 .. 1 ..Total 100 100 100 100 100 100 .. 100 ..
Unweighted sample size (households) 9,453 9,257 9,276 9,438 9,247 9,272 .. 9,253 ..
Chemist 1
2005 2006 2007 2005 2006 2007 2005 2006 2007
15 minutes or less 78 78 79 22 23 22 .. 83 ..16 - 20 minutes 10 10 10 13 13 14 .. 8 ..21 - 30 minutes 7 6 6 22 23 23 .. 5 ..31 - 40 minutes 1 1 1 9 9 9 .. 1 ..41 - 60 minutes 2 2 2 24 23 22 .. 2 ..Over 60 minutes 1 1 1 10 9 9 .. 1 ..
Total 100 100 100 100 100 100 .. 100 ..Unweighted sample size (households) 9,418 9,219 9,230 9,413 9,238 9,228 .. 9,247 ..
2005 2006 2007 2005 2006 2007 2005 2006 2007
15 minutes or less 91 91 90 65 65 61 50 52 4916 - 20 minutes 5 4 6 15 15 18 17 16 2021 - 30 minutes 2 3 3 12 13 14 18 19 1631 - 40 minutes 1 - - 2 3 3 5 6 541 - 60 minutes 1 1 1 4 4 2 7 6 8Over 60 minutes - - - 2 1 1 2 2 2
Total 100 100 100 100 100 100 100 100 100
Unweighted sample size (households) 1,350 1,271 1,209 1,250 1,150 1,156 863 891 847
1 This question is asked in alternate years and was not asked in 20072 This information is only asked of households which include at least one child of primary school age (5-10yrs)3 This information is only asked of households which include at least one child of secondary school age (11-15yrs)4 College providing post-GCSE courses for 16-19yr olds. This information is only asked of households with at least one member aged 16-19yrs
College4
Shopping centre
HospitalGP
Shop selling groceries
Primary school2 Secondary school 3
37

There is some variation in access to services according to area type of residence, with people in rural areas, in particular, likely to live further from key services.
• In 2007, 91 per cent of households in London were within 15 minutes of their nearest GP on foot or by public transport. This figure was around 80 per cent for people in other urban and metropolitan areas and 52 per cent in rural areas. The proportion of households living within 15 minutes of a hospital is lower, at 35 per cent in London and 9 per cent in rural areas.
• In terms of shopping facilities, 72 per cent of households in rural areas were within 15 minutes of a shop selling groceries compared with over 90 per cent in urban areas. Just over a fifth (21 per cent) of households in rural areas and 41 per cent in small urban areas were within 15 minutes of a shopping centre compared with between 54 per cent and 66 per cent in larger urban areas.
Chart 5.3 Households within 15 minutes of key services on foot or by public transport by area type: 2007
91
84 8280 78
84
52
78
98 97 96 96 95 94
72
93
66 64
54
6165
41
21
54
35
2521
2522
15
9
22
0
10
20
30
40
50
60
70
80
90
100
LondonBoroughs
Met built-upareas
Large urban Medium urban Small/mediumurban
Small urban Rural All areas
Area type
Perc
enta
ge
GP Shop selling groceries Shopping centre Hospital
38

Travel difficulties Respondents were asked what kind of difficulties they encountered when using transport when doing their main food shopping and travelling to work. • In 2007, 85 per cent of people who do their main food shopping by car or motorcycle said they
experienced no travel difficulties when making these trips and 65 per cent of people who used public transport said this was the case.
• Among people who drive to the shops, traffic congestion/roadworks was the main difficulty experienced, cited by 8 per cent of respondents. For people who do their main food shopping by public transport, the most common problem was carrying the shopping home, reported by 20 per cent of respondents, followed by unreliable public transport (8 per cent).
• Over half of respondents in employment said they experienced no travel difficulties when travelling to work; this proportion was slightly higher for people who usually travelled to work by car or motorcycle (57 per cent) than for those who usually travelled by public transport (53 per cent).
• Among people who usually travelled to work by car, the main difficulty experienced was congestion/roadworks which was cited by 40 per cent of respondents. For public transport users, the main problem cited was the unreliability of public transport (31 per cent), followed by public transport being unpleasant (12 per cent) and congestion/roadworks (10 per cent).
Table 5.4 Travel difficulties going to work or main food shopping: 2007 Percentage/number
Travel difficulties going to work 1: Travel difficulties going shopping 2:
Difficulties getting to work by car/motorcycle3 Difficulties getting to shops by car/motorcycle3
No difficulty 57 No difficulty 85Traffic congestion/roadworks 40 Traffic congestion/roadworks 8Lack of parking facilities 3 Lack of parking 4Cost of petrol 2Inadequate public transport 2
Unweighted sample size(individuals) 6,959
Unweighted sample size(individuals) 6,846
Difficulties getting to work by public transport3 Difficulties getting to shops by public transport3
No difficulty 53 No difficulty 65Unreliable public transport 31 Carrying shopping 20Public transport unpleasant 12 Unreliable public transport 8Traffic congestion/roadworks 10 Personal disability 5Poor connections 6 Public transport unpleasant 4
Unweighted sample size(individuals) 1,506
Unweighted sample size(individuals) 671
1 By those who work full or part time, where their usual place of work is not their home2 By the person who does the main food shopping3 Most frequent reasons shown here. Percentages may add to more than 100 as more than one reason can be given
39
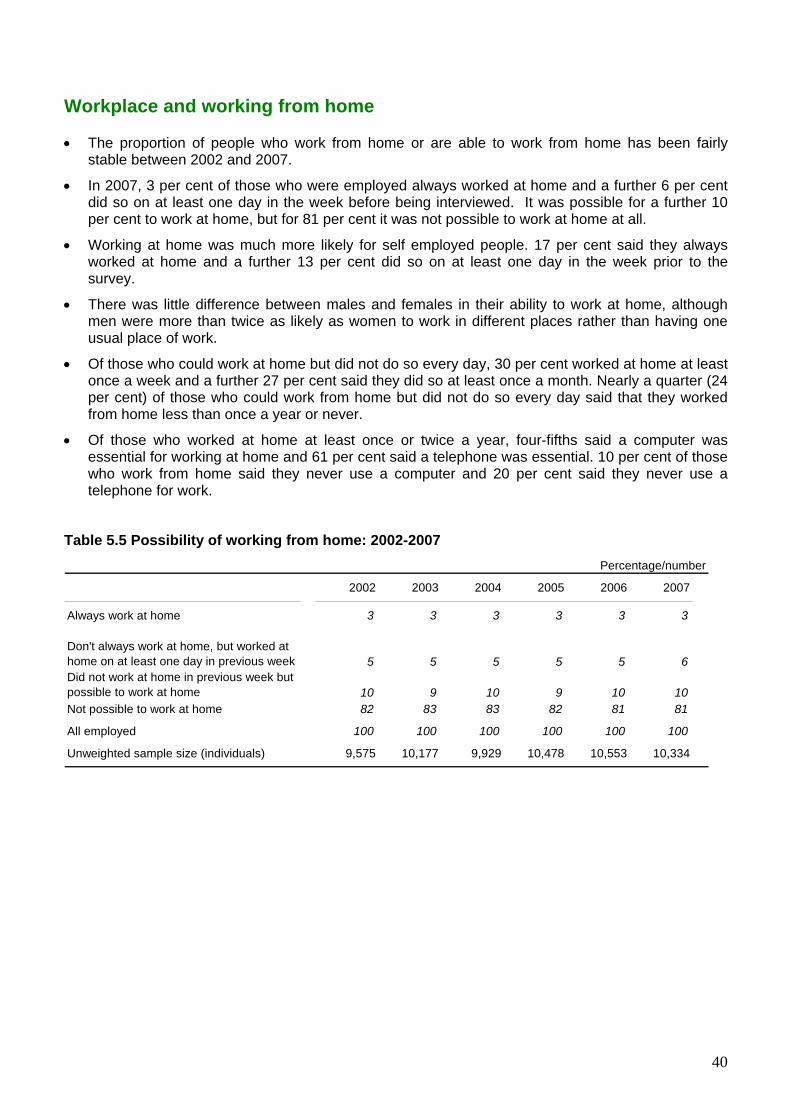
Workplace and working from home • The proportion of people who work from home or are able to work from home has been fairly
stable between 2002 and 2007.
• In 2007, 3 per cent of those who were employed always worked at home and a further 6 per cent did so on at least one day in the week before being interviewed. It was possible for a further 10 per cent to work at home, but for 81 per cent it was not possible to work at home at all.
• Working at home was much more likely for self employed people. 17 per cent said they always worked at home and a further 13 per cent did so on at least one day in the week prior to the survey.
• There was little difference between males and females in their ability to work at home, although men were more than twice as likely as women to work in different places rather than having one usual place of work.
• Of those who could work at home but did not do so every day, 30 per cent worked at home at least once a week and a further 27 per cent said they did so at least once a month. Nearly a quarter (24 per cent) of those who could work from home but did not do so every day said that they worked from home less than once a year or never.
• Of those who worked at home at least once or twice a year, four-fifths said a computer was essential for working at home and 61 per cent said a telephone was essential. 10 per cent of those who work from home said they never use a computer and 20 per cent said they never use a telephone for work.
Table 5.5 Possibility of working from home: 2002-2007
Percentage/number
2002 2003 2004 2005 2006 2007
Always work at home 3 3 3 3 3 3
Don't always work at home, but worked at home on at least one day in previous week 5 5 5 5 5 6Did not work at home in previous week but possible to work at home 10 9 10 9 10 10Not possible to work at home 82 83 83 82 81 81
All employed 100 100 100 100 100 100
Unweighted sample size (individuals) 9,575 10,177 9,929 10,478 10,553 10,334
40

Table 5.6 Workplace and working from home by employment status and gender: 2007 Percentage/number
Employment status
AllEmployed
full timeEmployed part time
Self employed Male Female
Unweighted sample size (individuals)
Usual workplaceSame place every day 75 80 88 32 69 84 7,756Different places 21 19 10 51 28 13 2,198Home/ same building as home 3 1 2 17 3 4 380
All people 100 100 100 100 100 100 10,334
Possible to work at home instead of travelling to workAlways work at home 3 1 2 17 3 4 380Don't always work at home, but worked at home on at least one day in previous week 6 5 3 13 6 5 591Did not work at home in previous week but possible to work at home 10 11 5 9 10 9 1,003
Not possible to work at home 81 82 90 62 80 83 8,358
All employed 100 100 100 100 100 100 10,334
Unweighted sample size (individuals) 10,334 6,736 2,226 1,372 5,507 4,827
Gender
Chart 5.4 Frequency of working from home: 2007 (Excludes those who always work at home and those for whom it is not possible to work at home)
3 or more times a week9%
Once or twice a week21%
Once or twice a year9%
Less than once a year or never
24%
Less than once a week, more than
twice a month7%
Once or twice a month20%
Less than one a month, more than
twice a year10%
Chart 5.5 Possibility of working from home without a telephone or computer: 2007 (Those who work from home at least once or twice a year)
61
80
15
752
20
10
0
10
20
30
40
50
60
70
80
90
100
Telephone Computer
Perc
enta
ge
Would never be possible Would sometimes be possible Would always be possible Never use
41

Workplace by area type and income group • People living in rural areas were most likely to be able to work from home followed by people in
London.
• In 2007, 7 per cent of people in employment who lived in rural areas said they always worked from home and a further 17 per cent said it was possible for them to do so. The equivalent figures for London were 4 per cent and 19 per cent. People living in other metropolitan built up areas were least likely to be able to work from home, with 86 per cent saying it was never possible for them to do so.
• Likelihood of working from home is also related to income, with people in higher incomes being more likely to be able to work from home.
• Among people living in households in the highest income quintile, 5 per cent said they always worked from home and a further 28 per cent said it was possible for them to work from home compared with 3 per cent and 7 per cent respectively in the lowest income quintile.
Table 5.7 Possibility of working from home by area type of residence: 2007 Percentage/number
London boroughs
Metro-politan
built-up areas
Large urban
Medium urban
Small/ medium
urbanSmall urban Rural All areas
Unweighted sample size (individuals)
Possible to work at home instead of travelling to workAlways work at home 4 2 3 2 3 4 7 3 380Don't always work at home, but worked at home on at least one day in previous week 7 4 6 5 5 6 7 6 591Did not work at home in previous week but possible to work at home 12 8 11 9 10 9 10 10 1,003
Not possible to work at home 77 86 80 84 82 81 76 81 8,358
All 100 100 100 100 100 100 100 100 10,334
Unweighted sample size (individuals) 1,278 1,510 1,572 2,807 788 705 1,674 10,334
Table 5.8 Possibility of working from home by household income: 2007
Percentage/number
Lowest real
incomeSecond
level Third levelFourth
level
Highest real
income All
Unweighted sample size (individuals)
Possible to work at home instead of travelling to workAlways work at home 3 3 3 3 5 3 380
Don't always work at home, but worked at home on at least one day in previous week 3 3 3 5 10 6 591Did not work at home in previous week but possible to work at home 4 3 5 10 18 10 1,003
Not possible to work at home 90 91 89 82 67 81 8,358
All 100 100 100 100 100 100 10,334
Unweighted sample size (individuals) 745 1,365 2,382 3,036 2,806 10,334
42
Section 6 Road Safety This section contains data relating to road safety, collected via the NTS. New questions were added to the survey in 2007 to investigate self-reported involvement in road accidents. Trend data on children's independence, in terms of being accompanied to school by an adult and being allowed to cross the road alone, are also presented. New road accident questions In the 2007 NTS respondents were asked whether or not they had been involved in a road accident in the previous 3 years and 12 months and if so whether or not they had been injured. They were then asked details of the most recent incident in which they were involved (those who had been involved in both non-injury and injury incidents were asked about the injury incident). The questions were asked of respondents aged 16 or over2. The findings complement the statistics collated from police records on road casualties and over time will offer an opportunity to assess to what extent reporting levels influence police casualty statistics.3
Key headline results are given below. Further analysis will be undertaken in due course to examine accident rates by relative exposure to risk among different socio-demographic groups. Percentage of adults involved road accidents
• 14 per cent of adults said they had been involved in at least one road accident during the past three years, including 4 per cent who had been injured in a road accident. Most of those involved in a road accident had been involved in one incident only (82 per cent).
• 7 per cent of adults said they had been involved in a road accident in the 12 months before
interview, including 2 per cent who had been injured. • There is a ratio of about two to one for the proportion of respondents involved in an accident during
the last three years and during the last year when one might expect to see a ratio of three to one. This may indicate that either people are forgetting incidents that happened in the three year period or bringing forward incidents into the one year time frame that actually happened beforehand.
• Men were more likely to say they had been in a road accident than women, while involvement in
accidents tended to decline after the age of 40. These patterns reflect involvement in any road accident, whether as car or motorcycle driver, car passenger, cyclist or pedestrian.
• The majority of accidents occurred when people were car occupants so the extent to which people
travel by car influences the likelihood of being involved in an accident. 9 per cent of adults who were main drivers of a household car said they had been in a road accident in the last year, compared with 8 per cent of other drivers, 4 per cent of non-drivers in a car owning household and 3 per cent of those in non-car households.
• It is not possible to separately examine incidents in which the respondent was driving but the
results do suggest that drivers with less experience are more likely to be involved in a road accident. 14 per cent of those with less than 4 years experience had been involved in an accident in the last year, compared with 11 per cent of those with 4 to 10 years experience, 9 per cent of
2 These questions were tested in the Office for National Statistics' Omnibus Survey prior to their inclusion in the NTS. See: http://www.dft.gov.uk/pgr/statistics/datatablespublications/personal/methodology/. 3 The police record accidents reported to them that involve injury to an individual, occur on the public highway (including footways) and in which at least one vehicle is involved. The definition of road accidents provided to NTS respondents was designed to be as consistent as possible with this.
43

those with 11 to 29 years experience and 6 per cent of those with 30 or more years driving experience.
Table 6.1 Proportion of individuals who have been involved in a road accident: 2007 NTS
Percentage/number
Any road accident Injury accident
In last 3 years
In last 12 months
In last 3 years
In last 12 months
Unweighted sample size (individuals)
All adults 14.0 7.1 3.9 1.8 17,784
Males 15.9 8.1 4.2 2.0 8,628Females 12.2 6.2 3.6 1.5 9,156
16-19 11.0 7.4 3.5 2.0 1,17320-24 17.9 9.0 5.9 2.4 1,42625-29 19.3 9.7 5.2 2.8 1,41730-39 18.2 9.5 5.0 2.4 3,12340-49 16.6 8.3 4.8 2.4 3,18650-59 12.7 6.4 3.4 1.3 2,75760 and over 8.0 3.7 2.0 0.7 4,700
Unweighted sample size(individuals) 2,417 1,225 666 295 Nature of road accidents
• In the majority of incidents the respondent was a car occupant at the time of the accident (69 per cent of injury accidents and 89% of non-injury accidents). Being a motorcyclist, cyclist, or pedestrian was more common in accidents where the respondent was injured than in non-injury accidents.
• The road user profile of the injury accidents measured in the NTS is similar to that in the police recorded casualty statistics. 68 per cent of adult casualties captured by police statistics in 2007 were travelling in a car; 10 per cent were motorcyclists; 6 per cent cyclists and 9 per cent pedestrians.4 The higher proportion of cyclist incidents in the NTS may be because cyclists are more able or more inclined to leave the scene of an accident without recourse to the police.
• A quarter (25 per cent) of NTS respondents who said they had been injured in an accident in the last 3 years were classified as having a serious injury. This includes 23 per cent who reported one or more severe injury5 and a further 2 per cent whom had less severe injuries but required an overnight stay in hospital.
• Among the 132 respondents who were classified as having a severe injury the most common injury types were fractured or broken bones (40 per cent), severe cuts (25 per cent) or severe shock (24 per cent). A quarter of those with a severe injury had an overnight stay in hospital.
• The proportion of adult casualties classified as serious is lower in police casualty records at 13 per cent. This difference may arise because the police, with the information available to them, may consider injuries, such as cuts, to be less serious than the individuals who are injured. The survey may also over-represent more serious incidents relative to minor injuries because they are more likely to be remembered by those involved.
4 Excludes those killed in accidents. 5 Severe cuts, fractured or broken bones, concussion, internal injuries, burns, crushing or severe shock requiring medical treatment.
44

• According to respondents, the police were aware of 59 per cent of injury road accidents (67 per cent of serious injury incidents and 56 per cent of minor injury incidents). 31 per cent of non-injury incidents came to the attention of the police.
Table 6.2 Details of involvement and any injuries sustained in road accidents in previous three years: 2007 NTS
Percentage/number
Injury accidentNon-injury
accident
Respondent was…Car occupant 69 89Cyclist 12 2Motorcyclist 7 1Pedestrian 7 2Other type of vehicle 5 6
Type of injury experienced1
Whiplash 56 .Minor brusing or cuts 41 .Slight shock 33 .Sprains 11 .Fracture/broken bones 10 .Severe cuts 6 .Severe shock 6 .Concussion 4 .Internal injuries 4 .Crushing 3 .Burns 1 .Other 7 .
Medical attention1
No medical attention 25 .First aid at roadside 17 .At GP surgery 34 .At a minor injuries unit 4 .At Accident and Emergency 40 .As an inpatient in hospital 6 .Other 6 .
Whether police awareYes - attended scene 44 19Yes - reported later 14 12No 40 69
Unweighted sample size (individuals) 521 1,408
1 Percentages sum to more than 100 as more than one answer may be given.
45
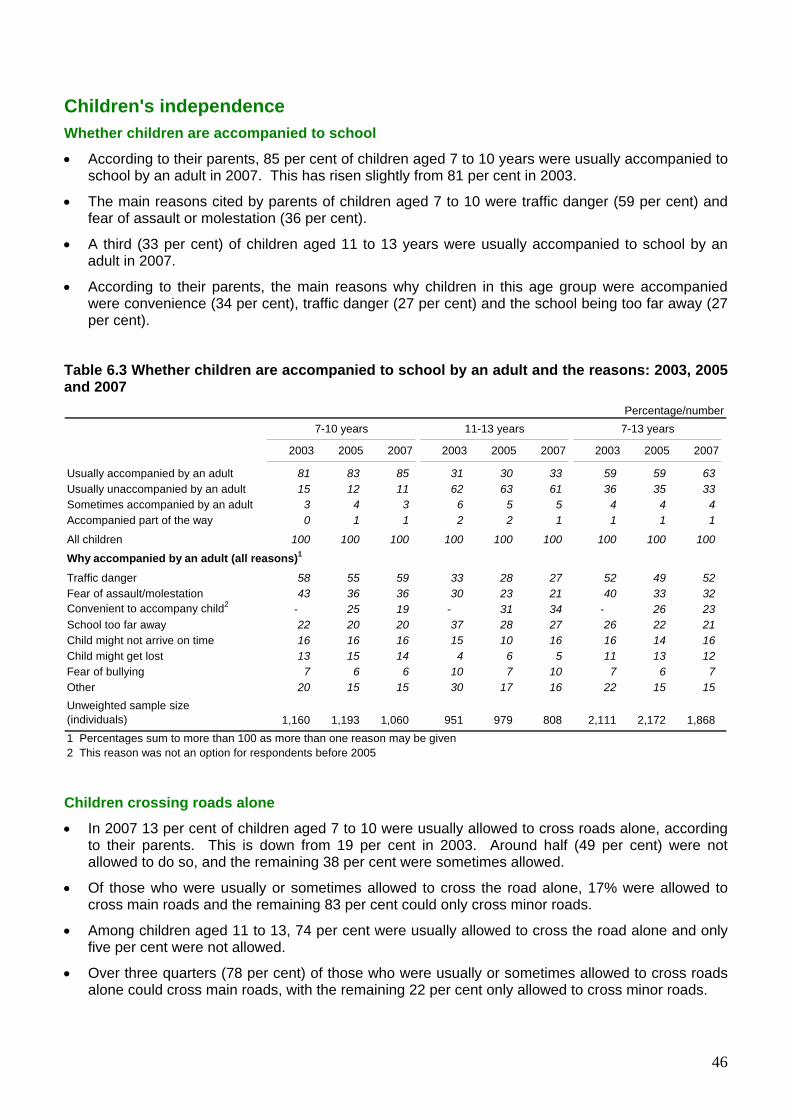
Children's independence Whether children are accompanied to school
• According to their parents, 85 per cent of children aged 7 to 10 years were usually accompanied to school by an adult in 2007. This has risen slightly from 81 per cent in 2003.
• The main reasons cited by parents of children aged 7 to 10 were traffic danger (59 per cent) and fear of assault or molestation (36 per cent).
• A third (33 per cent) of children aged 11 to 13 years were usually accompanied to school by an adult in 2007.
• According to their parents, the main reasons why children in this age group were accompanied were convenience (34 per cent), traffic danger (27 per cent) and the school being too far away (27 per cent).
Table 6.3 Whether children are accompanied to school by an adult and the reasons: 2003, 2005 and 2007
Percentage/number7-10 years 11-13 years 7-13 years
2003 2005 2007 2003 2005 2007 2003 2005 2007
Usually accompanied by an adult 81 83 85 31 30 33 59 59 63 Usually unaccompanied by an adult 15 12 11 62 63 61 36 35 33 Sometimes accompanied by an adult 3 4 3 6 5 5 4 4 4 Accompanied part of the way 0 1 1 2 2 1 1 1 1
All children 100 100 100 100 100 100 100 100 100
Why accompanied by an adult (all reasons)1
Traffic danger 58 55 59 33 28 27 52 49 52 Fear of assault/molestation 43 36 36 30 23 21 40 33 32 Convenient to accompany child2 - 25 19 - 31 34 - 26 23 School too far away 22 20 20 37 28 27 26 22 21 Child might not arrive on time 16 16 16 15 10 16 16 14 16 Child might get lost 13 15 14 4 6 5 11 13 12 Fear of bullying 7 6 6 10 7 10 7 6 7 Other 20 15 15 30 17 16 22 15 15 Unweighted sample size (individuals) 1,160 1,193 1,060 951 979 808 2,111 2,172 1,868 1 Percentages sum to more than 100 as more than one reason may be given2 This reason was not an option for respondents before 2005
Children crossing roads alone
• In 2007 13 per cent of children aged 7 to 10 were usually allowed to cross roads alone, according to their parents. This is down from 19 per cent in 2003. Around half (49 per cent) were not allowed to do so, and the remaining 38 per cent were sometimes allowed.
• Of those who were usually or sometimes allowed to cross the road alone, 17% were allowed to cross main roads and the remaining 83 per cent could only cross minor roads.
• Among children aged 11 to 13, 74 per cent were usually allowed to cross the road alone and only five per cent were not allowed.
• Over three quarters (78 per cent) of those who were usually or sometimes allowed to cross roads alone could cross main roads, with the remaining 22 per cent only allowed to cross minor roads.
46

Table 6.4 Whether children are allowed to cross roads alone: 2003, 2005 and 2007 Percentage/number
2003 2005 2007 2003 2005 2007 2003 2005 2007
Almost always allowed 19 16 13 78 78 74 45 44 39 Sometimes allowed 37 38 38 18 17 21 28 29 30 Not allowed 43 46 49 5 5 5 26 27 30
All 100 100 100 100 100 100 100 100 100 If allowed:Main roads 24 21 17 78 77 78 55 54 52 Minor roads only 76 79 83 22 23 22 45 46 48
All 100 100 100 100 100 100 100 100 100
Unweighted sample size (individuals) 1,167 1,199 1,070 956 985 815 2,123 2,184 1,885
7-10 years 11-13 years All 7-13 years
Front and rear passengers In 2007, when the travel diary was redesigned, the requirement to record whether car passengers travelled in the front or back seat was removed. Instead, a question was added to the interview to monitor whether children usually travel in the front or back seat when travelling by car. • The majority of children sit in the back seat when travelling by car but this proportion decreases as
children get older; 92 per cent of children aged less than 5 always or usually sit in the back seat compared 86 per cent of 5 to 10 year olds and 61 per cent of children aged 11 to 15 years. 16 per cent of 11 to 15 year olds have no usual position when travelling by car.
Table 6.5 Whether children travel as a front or rear passenger by age: 20071 Percentage/number
Always in front
Usually in front
Always in back
Usually in back
No usual position
Do not travel by
car Total
Unweighted sample size (individuals)
Less than 5 years 3 2 78 14 2 1 100 1,2455 to 10 years 1 6 58 28 5 1 100 1,45211 to 15 years 6 16 23 37 16 1 100 1,274 1 Figures are based on the 'Diary sample'
47

48
Section 7 Vehicles As well as collecting information on each individual within the household, the NTS also collects information on all vehicles to which the household has access. This section contains data on household vehicle characteristics, particularly household cars. Household cars Annual car mileage • In 2007, the average company owned car travelled more than twice as far as the average privately
owned car (19,990 miles and 8,260 miles respectively). The proportion of cars which are company cars has fallen slightly from 7 per cent in 1995/97 to 5 per cent in 2007.
• The average annual mileage per car fell from about 9,700 in 1995/97 to 8,870 in 2007. The average mileage per car has fallen as the number of cars per household has risen.
• The fall in the proportion of company cars, which generally have high business mileage, will have contributed to the fall in mileages in this purpose category in particular.
• The proportion of mileage which was for business or commuting purposes was higher for company cars (71 per cent) than for privately owned cars (39 per cent).
Table 7.1 Annual mileage of 4-wheeled cars by type of car and trip purpose: 1995/97 to 2007
Miles/percentage/number
2007Business
mileageCommuting
mileage
Other private
mileageTotal
mileage
Proportion of cars in
sample
Unweighted sample size
(vehicles)
Company cars 8,060 6,100 5,830 19,990 5 479
Self-employed business car 5,030 3,640 4,580 13,260 3 303Household car used for work 3,670 3,810 4,720 12,200 12 1,110Other household car 60 2,320 5,080 7,460 80 7,361
All private cars 690 2,550 5,020 8,260 95 8,774
All 4-wheeled cars 1,070 2,740 5,060 8,870 100 9,253
Business mileage
Commuting mileage
Other private
mileageTotal
mileage
Proportion of company
cars in sample
Unweighted sample size
(vehicles)
All 4-wheeled cars:1995/1997 1,710 2,830 5,160 9,700 7 9,4921998/2000 1,590 2,940 5,030 9,550 8 10,0262002 1,250 2,780 5,140 9,170 7 8,5552003 1,230 2,840 5,160 9,230 6 9,0882004 1,140 2,850 5,170 9,160 6 8,7072005 1,090 2,840 5,080 9,010 6 9,5342006 1,040 2,770 4,960 8,770 5 9,4482007 1,070 2,740 5,060 8,870 5 9,253

0
2,000
4,000
6,000
8,000
10,000
All companycars
Self-employedbusiness
car
Householdcar used for
work
Otherhousehold
car
All privatecars
All 4-wheeled
carsType of car
Mile
s
Business mileage Commuting mileage Other private mileage
•
The average annual mileage is higher for diesel cars than petrol cars, at 12,700 miles and 7,940 miles respectively in 2007. This gap has narrowed since 1995/97 as the average mileage has fallen more for diesel cars than for petrol cars over this period.
Table 7.2 Annual car mileage of 4-wheeled cars by fuel type: 1995/97 to 2007 Miles/number
Petrol and Unweighteddiesel sample size
Petrol Diesel cars (vehicles)
1995/1997 9,120 15,920 9,690 9,490 1998/2000 9,060 13,610 9,550 10,025 2002 8,580 12,750 9,170 8,547 2003 8,490 13,250 9,220 9,080 2004 8,350 13,360 9,150 8,692 2005 8,170 12,820 9,010 9,528 2006 7,810 12,620 8,760 9,429 2007 7,840 12,700 8,870 9,231
49
Chart 7.1 Annual mileage of 4-wheeled cars by type and purpose: 2007

Vehicles by household characteristics • A third of household cars/vans have an engine size of up to 1400cc but this proportion is higher in
Metropolitan built up areas (40 per cent) and lower in rural areas (26 per cent).
• The proportion of vehicles of 2000cc or over is highest in rural areas (20 per cent) and small urban areas (16 per cent) and lowest in Metropolitan built up areas (9 per cent).
• Engine size also varies by household income. Nearly a fifth (19 per cent) of vehicles owned by households in the highest income quintile are 2000cc or over compared with 9 per cent in the lowest income quintile.
• Similarly, high income households tend to have access to newer vehicles than low income households. In 2007, 10 per cent of vehicles to which households in the highest income quintile had access were under a year old and 15 per cent were at least 10 years old. The corresponding figures for the lowest income quintile were 4 per cent and 31 per cent.
Chart 7.2 Engine size of household cars by area type: 2007
3240
33 33 35 3226
33
5651
55 55 5252
5454
12 9 12 11 12 16 2013
0
10
20
30
40
50
60
70
80
90
100
LondonBoroughs
Metro-politanbuilt-upareas
Largeurban
Mediumurban
Small/medium
urban
Smallurban
Rural All areas
Area type
Perc
enta
ges
Up to 1400cc 1401 - 2000cc 2001cc and over
Table 7.3 Engine size of household cars by household income: 2007
Percentage/ number
Lowest real
incomeSecond
levelThird level
Fourth level
Highest real
incomeAll income
levels
Up to 1400cc 39 39 36 32 24 331401 - 2000cc 52 51 53 54 57 542001cc and over 9 10 10 13 19 13
Total 100 100 100 100 100 100
Unweighted sample size:(vehicles) 1,034 1,613 2,341 2,722 2,728 10,438
50

Table 7.4 Age of household cars by household income: 2007
Percentage/number
Lowest real
incomeSecond
levelThirdlevel
Fourthlevel
Highestreal
incomeAll income
levels
Unweightedsample size
(vehicles)
Up to 1 year 4 6 6 7 10 7 75 Over 1 to 2 years 6 6 7 8 11 8 85 Over 2 to 3 years 5 7 8 9 12 9 89 Over 3 to 6 years 22 23 27 29 29 27 2,749 Over 6 to 10 years 31 31 30 29 23 28 2,871 Over 10 years 31 27 22 19 15 21 2,101
All ages 100 100 100 100 100 100 10,229
Unweighted sample size(vehicles) 1,004 1,575 2,300 2,671 2,679 10,229
909
• Just under three per cent of households owned a motorcycle in 2007. Household motorcycle
ownership increased with car ownership, suggesting that households tend to acquire motorcycles in addition to cars rather than as substitute.
• Just over one per cent of households with no car had at least one motorcycle compared with nearly four per cent of households which had two or more cars.
Chart 7.3 Percentage of households with one or more motorcycles by household car ownership: 2007
0
1
2
3
4
5
Households without acar
Households with onecar
Households with two ormore cars
All households
Number of cars
Perc
enta
ge
51
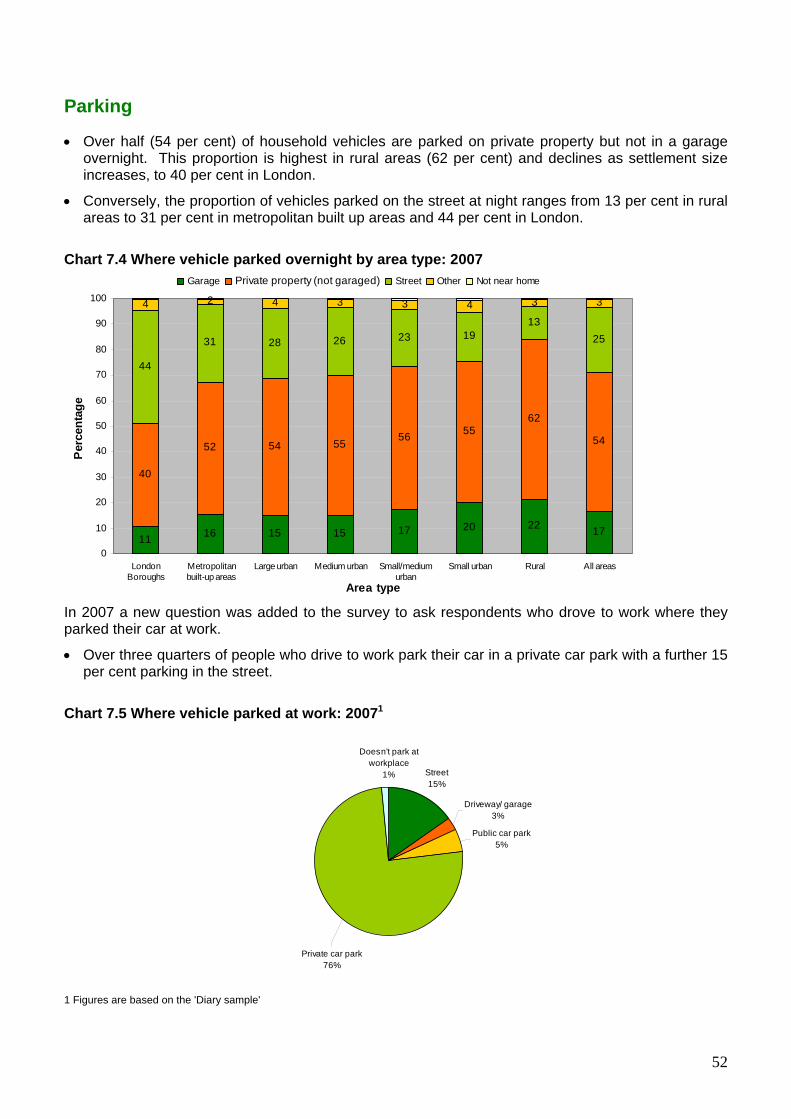
Parking • Over half (54 per cent) of household vehicles are parked on private property but not in a garage
overnight. This proportion is highest in rural areas (62 per cent) and declines as settlement size increases, to 40 per cent in London.
• Conversely, the proportion of vehicles parked on the street at night ranges from 13 per cent in rural areas to 31 per cent in metropolitan built up areas and 44 per cent in London.
Chart 7.4 Where vehicle parked overnight by area type: 2007
11 16 15 15 17 20 22 17
40
52 54 5556 55
62
54
44
31 28 26 23 1913
25
4 2 4 3 3 4 3 3
0
10
20
30
40
50
60
70
80
90
100
LondonBoroughs
Metropolitanbuilt-up areas
Large urban Medium urban Small/mediumurban
Small urban Rural All areas
Area type
Per
cent
age
Garage Private property (not garaged) Street Other Not near home
In 2007 a new question was added to the survey to ask respondents who drove to work where they parked their car at work.
• Over three quarters of people who drive to work park their car in a private car park with a further 15 per cent parking in the street.
Chart 7.5 Where vehicle parked at work: 20071
Street15%
Driveway/ garage3%
Public car park5%
Doesn't park at workplace
1%
Private car park76%
1 Figures are based on the 'Diary sample'
52
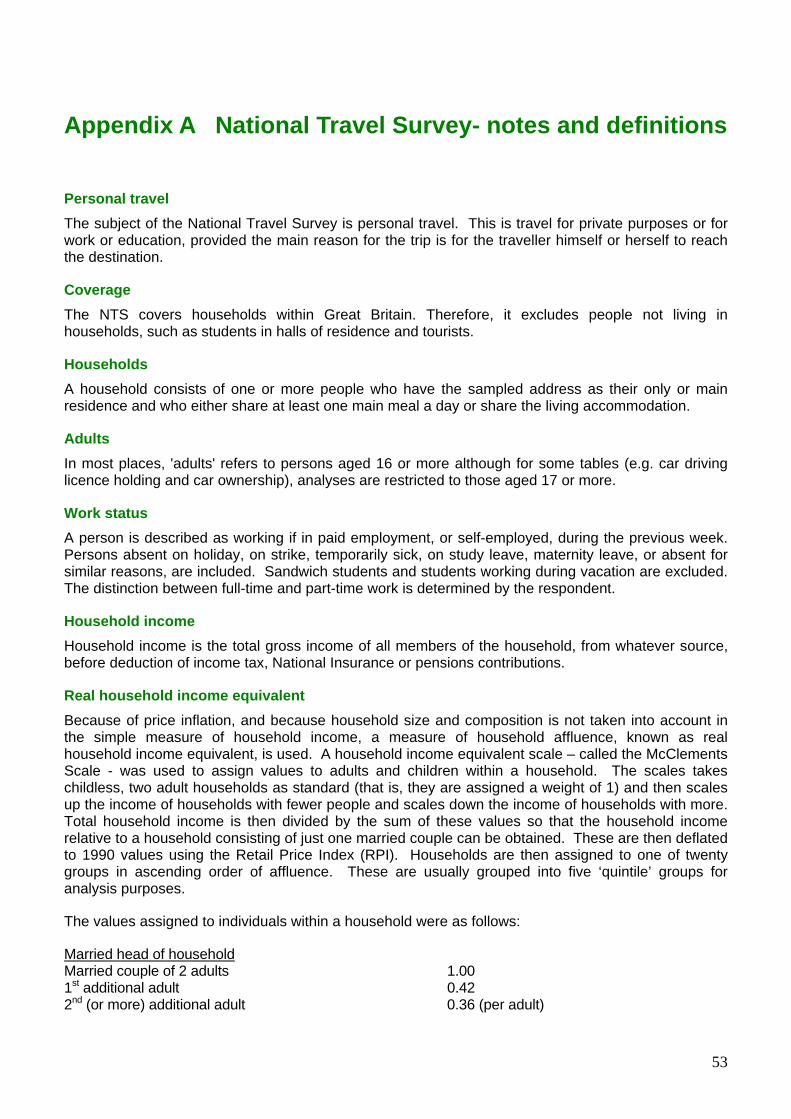
Appendix A National Travel Survey- notes and definitions
Personal travel The subject of the National Travel Survey is personal travel. This is travel for private purposes or for work or education, provided the main reason for the trip is for the traveller himself or herself to reach the destination.
Coverage The NTS covers households within Great Britain. Therefore, it excludes people not living in households, such as students in halls of residence and tourists.
Households A household consists of one or more people who have the sampled address as their only or main residence and who either share at least one main meal a day or share the living accommodation.
Adults In most places, 'adults' refers to persons aged 16 or more although for some tables (e.g. car driving licence holding and car ownership), analyses are restricted to those aged 17 or more.
Work status A person is described as working if in paid employment, or self-employed, during the previous week. Persons absent on holiday, on strike, temporarily sick, on study leave, maternity leave, or absent for similar reasons, are included. Sandwich students and students working during vacation are excluded. The distinction between full-time and part-time work is determined by the respondent.
Household income Household income is the total gross income of all members of the household, from whatever source, before deduction of income tax, National Insurance or pensions contributions.
Real household income equivalent Because of price inflation, and because household size and composition is not taken into account in the simple measure of household income, a measure of household affluence, known as real household income equivalent, is used. A household income equivalent scale – called the McClements Scale - was used to assign values to adults and children within a household. The scales takes childless, two adult households as standard (that is, they are assigned a weight of 1) and then scales up the income of households with fewer people and scales down the income of households with more. Total household income is then divided by the sum of these values so that the household income relative to a household consisting of just one married couple can be obtained. These are then deflated to 1990 values using the Retail Price Index (RPI). Households are then assigned to one of twenty groups in ascending order of affluence. These are usually grouped into five ‘quintile’ groups for analysis purposes.
The values assigned to individuals within a household were as follows:
Married head of householdMarried couple of 2 adults 1.00 1st additional adult 0.42 2nd (or more) additional adult 0.36 (per adult)
53
Single head of household1 adult only 0.61 1st additional adult 0.46 2nd additional adult 0.42 3rd (or more) additional adult 0.36 (per adult) Child aged:16-18yrs 0.36 13-15yrs 0.27 11-12yrs 0.25 8-10yrs 0.23 5-7yrs 0.21 2-4yrs 0.18 Under 2 0.09 Household vehicles The term ‘car’ is used for all three or four wheeled vehicles with a car body type, and also light vans, 4x4 vehicles, dormobiles and motorcaravans. Such vehicles are regarded as household cars if they are either owned by a member of the household, or available for the private use of household members. Vehicles used only for the carriage of goods, as public service passenger vehicles, or solely for hire by other people are excluded. Hired or borrowed vehicles are included only if they were available to the household over the whole of the sample travel week. Company cars provided by an employer for the use of a particular employee (or director) are included, but cars borrowed temporarily from a company pool are not.
The term 4-wheeled car excludes light vans, 4x4 vehicles, dormobiles and motorcaravans.
Access to cars The ‘main driver’ of a household car is the household member that drives the furthest in that car in the course of a year. Households with two or more cars are likely to have two or more main drivers, one for each car.
‘Other drivers’ are people in car-owning households, who have a full driving licence to drive a car, but are not main drivers of a household car. No account is taken of whether or not they actually drive a household car.
Non-drivers are all other people in car-owning households. They include children below driving age and adults with provisional driving licences.
Type of area Households are classified according whether they are within an urban area of at least 3,000 population or in a rural area. Urban areas are subdivided for the purpose of this publication as follows:
• London boroughs - the whole of the Greater London Authority
• Metropolitan built-up areas - the built-up areas of former metropolitan counties of Greater Manchester, Merseyside, West Midlands, West Yorkshire, Tyne and Wear and Strathclyde (excludes South Yorkshire)
• Large urban - self-contained urban areas over 250,000 population
• Medium urban - self-contained urban areas over 25,000 but not over 250,000 population
• Small/medium urban - self-contained urban areas over 10,000 but not over 25,000 population
• Small urban - self-contained urban areas over 3,000 but not over 10,000 population
54
• Rural - all other areas including urban areas under 3,000 population
Prior to 1996, 'small urban' and 'small/medium urban' were combined into one category covering self-contained urban areas over 3,000 but not over 25,000 population.
England and Wales
The classification specifies urban areas based on the extent of urban development indicated on Ordnance Survey maps. An urban area is a tract of continuously built-up urban land extending 20 hectares or more and with a minimum associated population of 1,000 (at the 2001 census). Urban areas thus defined but less than 200 metres apart are combined into a single urban area.
Scotland
In Scotland postcodes were classified as urban or rural using population density. Urban postcodes were then aggregated together to form localities using a minimum population of 500 together with other rules. The method for classifying postcodes in Scotland was amended slightly in 2007 to bring it more in line with the classification for England and Wales.
Data up to 2001 use a classification which reflects built-up areas and population at the time of the 1991 Census. Data from 2002 use a classification which reflects built-up areas and population at the time of the 2001 Census.
The following area classifications are available on the NTS database but no tables on these bases have been included in this Bulletin:
ONS area classification The 2001 Area Classification is used to group together geographic areas according to key characteristics common to the population in that grouping. These groupings are called clusters, and are derived using census data. The classification is used by government departments and academics for analysis and comparison, and by members of the public for finding out about where they live and how it compares with the rest of the country. The classification has been produced for Great Britain after each census since 1971. It has been produced for the whole of the UK for the first time after the 2001 census. The classification is available at local authority, ward and health area level, and is based on 2003 boundaries. The area classification comprises 9 super-groups, 17 groups and 26 sub-groups. For this publication the ward level based classification at super group level is used.
Index of Multiple Deprivation 2004 The Index of Deprivation 2004 (IMD 2004) is a measure of deprivation at the Super Output Area (SOA) in England. SOAs are a continuous geography of areas of approximately equal population size (the mean SOA population in England according to the 2001 Census was approximately 1,500). The model of multiple deprivation which underpins the IMD 2004 is based on the idea of distinct dimensions of deprivation which can be recognised and measured separately. The IMD 2004 contains seven domains of deprivation: Income deprivation; Employment deprivation; Health deprivation and disability; Education, skills and training deprivation; Barriers to Housing and Services; Living environment deprivation and Crime. IMD 2004 combines indicators in each of the domains into a single deprivation score for each SOA. Each SOA is ranked according to an overall deprivation score, and the ranking list divided into 10 equal groups, or deciles. Further details may be found at: http://www.odpm.gov.uk/indices
55

Appendix B National Travel Survey
Comparisons with earlier publications For reference the table below shows the table numbers for the Bulletin compared with each of the main Bulletins for 2002 to 2005.
2007 Bulletin
2006 Bulletin
2005 Bulletin
2004 Bulletin
2002 Bulletin
2007 Bulletin
2006 Bulletin
2005 Bulletin
2004 Bulletin
2002 Bulletin
1.1 1.1 1.1 1.1 1.1 4.6 5.5 5.6 5.6 5.72.1 2.2 2.2 2.2 2.2 4.72.2 2.3 2.3 2.3 2.3 5.1 5.8 5.9 5.9 5.122.3 2.4 2.4 2.4 . 5.2 . . . .3.1 5.6a 5.7 5.7 . 5.3 5.9 5.10 . .3.2 . . . . 5.4 . . .3.3 . . . . 5.5 . . . .3.4 . . . . 5.6 6.4 6.4 6.4 7.53.5 5.7 5.8a 5.8 5.11 5.7 . . . .3.6 3.8 3.9 3.9 3.9 5.8 . . . .3.7 . . . . 6.1 . . . .3.8 . . . . 6.2 . . . .3.9 . . . . 6.3 6.8 . . .
3.10 . . . . 6.4 6.9 . . .4.1 5.3a 5.4a 5.4a 5.4a 6.5 . . . .4.2 5.3b 5.4b 5.4b 5.4b 7.1 6.1 6.1 6.1 7.14.3 . . . . 7.2 . . . .4.4 . . . . 7.3 . . . .4.5 5.6b . . . 7.4 . . . .
2002 Bulletin = National Travel Survey: 2002 (revised July 2004) SB(04)22
56

Index to tables Access Bus accessibility indicator 5.1 Nearest bus stop by area type 5.1 Time taken to on foot/public transport to GP, grocer, primary school, secondary school, college, shopping centre, hospital 5.3
Time taken to walk to nearest train station by area type 5.2
Travel difficulties to work or shopping 5.4 Working from home by area type 5.7 Adults 17+ Car ownership 2.3 Sample numbers 1.1 Age Bicycle ownership 3.9
Car age by income 7.4 Children accompaniment to school 6.3
Crossing the road alone 6.4 Frequency of use of bicycles 3.8
Frequency of use of bus, rail and taxi/minicab 3.2 Full car driving licence holders 2.2 Number of flights abroad 3.4 Proportion of individuals who have been involved in a road accident 6.1 Travel as a front or rear passenger 6.5
Walks of 20 minutes or more 3.6 Air Flights abroad by age 3.4 Flights abroad by income 4.5 Frequency of domestic flights 3.1 Annual mileage
Annual mileage by fuel type 7.2 Annual mileage by type of car and purpose 7.1
Area type of residence (urban/rural) Car ownership 2.1 Concessionary bus fare schemes 3.5 Frequency of use 3.3 Time to nearest bus stop 5.1 Time to nearest train station 5.2 Working from home 5.7
Bicycles - see also Mode Bicycle ownership 3.9 Frequency of use 3.8
Ownership by income 4.4 Where usually cycle 3.10
Bus - see also Mode Bus accessibility indicator 5.8 Concessionary bus fare schemes 3.5
Frequency of use 3.1 Frequency of use by age 3.2 Frequency of use by area type 3.3
Frequency of use by income Chart 4.3 Stops - see access Walk time to bus stop by frequency of use Chart 5.1
Business Mileage by type of car 7.1 Car
Annual mileage 7.1, 7.2 Company cars 7.1 Drivers - see Mode Driving licence holders 2.2, 4.7 Engine size 7.3 Household availability 2.1, 4.1 Passengers 6.5 Per household/adult 2.1 Personal car access 2.3, 4.2, 4.6 Purpose, annual mileage 7.1
Children - see Age and School travel Accompaniment to School 6.3 Crossing the road alone 6.4
Frequency of bicycle use 3.8 Front or rear passenger 6.5 Sample numbers 1.1
Commuting Mileage by type of car 7.1 Travel difficulties to work 5.4 Company cars
Annual mileage by trip purpose 6.1 Concessionary bus fare schemes 3.5 Definitions - Appendix A Doctor - see Access Driving licence holders
Ethnic group 4.7 Full car 2.2
Ethnic group Driving licence holding 4.7
Personal car access 4.6 Facilities - see Access Food store - see Access Frequency of use of bicycles 3.8 Frequency of use of public transport By age 3.2 By area type 3.3 Time series 3.1 Frequency of working at home Chart 5.4 Fuel type 7.2 Gender
Bicycle ownership 3.9

Driving licence holders 2.2 Driving licence holding by ethnic group 4.7 Personal car access 2.3 Road accidents 6.1 Working from home 5.6
GP - see Access Grocer - see Access Grossing factors 1.1 Hospital - see Access Household
Sample numbers 1.1 Income
Age of household cars 7.4 Engine size of household cars 7.3 Flights abroad 4.5 Frequency of use Charts 4.2-4.5 Household car availability 4.1 Household motorcycle ownership 4.3 Personal bicycle ownership 4.4 Personal car access 4.2 Working from home 5.8
Individual sample numbers 1.1 London - see Area type Mileage - see annual mileage Mode
Concessionary bus fare schemes 3.5 Frequency of use of bicycles 3.8 Frequency of use of public transport 3.1, 3.2, 3.3 Travel difficulties by mode 5.4 Walks of 20 minutes or more 3.6
Motorcycles Household ownership by income 4.3
Post offices - see Access Public transport Concessionary fares by area type 3.5 Flights abroad 3.4, 4.5
Frequency of use 3.1, 3.2, 3.3, Charts 4.2-4.5
Travel difficulties 5.4
Purpose Annual car mileage 7.1
Rail – also see Mode Frequency of use 3.1 Frequency of use by age 3.2 Frequency of use by area type 3.3 Frequency of use by income Chart 4.4 Time to train station 5.2
Walk time to station by frequency of use Chart 5.2
Road Accidents 6.1, 6.2 Rural areas - see Area type Sample numbers 1.1 Schools - see Access School travel Accompaniment to school 6.3 Shopping centre - see Access Taxi – also see Mode
Frequency of use 3.1 Frequency of use by age 3.2 Frequency of use by area type 3.3 Frequency of use by income Chart 4.4 Time taken to local facilities - see Access Travel to work- see Commuting Urban areas - see Area type Vans - see Mode Vehicle sample numbers 1.1 Visiting friends - see Purpose Walking - see Access, Mode
20 minutes or more 3.6 How travelled to last walk Charts 3.6 and 3.7 Time taken to walk to nearest bus stop 5.1 Time taken to walk to nearest train station 5.2 Type of area walked in by area type of residence Chart 3.5 Where respondent walked 3.7
Working at home 5.5, 5.6, 5.7, 5.8, Charts 5.4 and 5.5

Scottish Government Transport Publications Scottish Transport Statistics Main Transport Trends Household Transport - some SHS results Transport Across Scotland: some SHS results for parts of Scotland SHS Travel Diary results Travel by Scottish Residents: some NTS results Bus and Coach Statistics Road Accidents Scotland Key Road Accidents Statistics (SHS = Scottish Household Survey; NTS = National Travel Survey) General enquires on Scottish Transport Statistics: Transport Statistics Branch, Scottish Executive, Victoria Quay, Edinburgh, EH6 6QQ Phone: +44 (0)131-244 7256 Fax: +44 (0)131-244 7281 E-mail: [email protected]: www.scotland.gov.uk/Topics/Statistics These publications are available, payment with orders From: Scottish Executive Publication Sales, Blackwell's Bookshop, 53 South Bridge, Edinburgh EH1 1YS Phone: +44 (0)131-622 8283 Fax: +44 (0)131-557 8149
National Assembly for Wales - Cynulliad Cenedlaethol Cymru Transport Publications Road Casualties: Wales Welsh Transport Statistics Other publications with transport topics Digest of Welsh Local Area Statistics Digest of Welsh Statistics Statistics for Assembly Constituency Areas Digest of Welsh Historical Statistics These publications are available from: Central Support Unit, Statistical Directorate, Welsh Assembly Government, Cathays Park, Cathays, Cardiff CF10 3NQ Phone: +44 (0)29-2082 5054 E-mail: [email protected]: http://new.wales.gov.uk Northern Ireland Transport Statistics Available from: Central Statistics and Research Branch Clarence Court, 10-18 Adelaide Street, Belfast BT2 8GB Phone: +44 (0)28 9054 0801 E-mail: [email protected]: http://www.drdni.gov.uk/index/statistics.htm
Transport Statistics Users Group The Transport Statistics Users Group (TSUG) was set up in 1985 as a result of an initiative by the Statistics Users Council and the Chartered Institute for Transport (now known as The Institute of Logistics and Transport). From its inception it has had strong links with the government Departments responsible for transport. The aims of the group are:
to identify problems in the collection, provision, use and understanding of transport statistics, and to discuss solutions with the responsible authorities;
to provide a forum for the exchange of views and information between users and providers of transport statistics; to encourage the proper use of statistics through publicity and education.
The group holds regular seminars on topical subjects connected with the provision and/or use of transport statistics. Recent seminars have included:
Road Traffic Statistics Maritime Statistics Transport and Social Inclusion Developments in Road Safety Statistics Energy Use in Freight Transport Rail Freight Statistics The Statistics Behind Simplified Streetscapes
A Scottish seminar was also held A newsletter is sent to all members about four times a year. Corporate membership of the Group is £50, personal membership £22.50, and student membership £10. For further details please visit www.tsug.org.uk or contact: Nina Webster Walking and Accessibility Programme Manager Surface Transport Strategy Transport for London 9th floor (area green 7) Palestra, 197 Blackfriars Road London SE1 8NJ Tel: 020 3054 0874 Fax: 020 3054 2004 Email: [email protected] The TSUG is contributing to the production of the Transport Yearbook 2008. This contains information on sources from governmental and non-governmental organisations, including some European sources. One copy is supplied free to TSUG members. Non-members can purchase a copy from The Stationery Office (TSO).

Transport Statistics Publications (as at August 2008)
TSO publications (Transport Statistics Reports - priced) Obtainable from: TSO Mail, Telephone, Fax and E-mail PO Box 29, Norwich NR3 1GN Telephone orders & general enquiries: +44 (0)870 600 5522 Fax orders: +44 (0)870 600 5533 E-mail: [email protected]: +44(0)870 240 3701 TSO Shops – London, Belfast and Edinburgh TSO@Blackwell and other Accredited Agents Annual Reports Transport Statistics Great Britain: 2007 Edition (ISBN: 978-0-11-552907-8) Focus on Personal Travel: 2005 Edition (ISBN: 978-0-11-552658-7) Focus on Ports: 2006 Edition (ISBN: 978-0-230-00215-3) Focus on Freight: 2006 Edition (ISBN: 978-0-11-552785-0) Road Casualties in Great Britain: 2006 (ISBN: 978-0-11-552905-4) Maritime Statistics: 2006 (ISBN: 978-0-11-552906-1)
See also TSO’s virtual bookshop at: - http://www.tsoshop.co.uk
Publications no longer produced by Transport Statistics, which have transferred to other Government Departments:
National Rail Trends (replaced Bulletin of Rail Statistics) (From Q1 2005/06 editions of this quarterly bulletin are produced by the Office of Rail Regulation – Contact +44 (0)20 7282 2007 for details) ______________________________________________________ NOTE: Prior to 1997, many of the Transport Statistics Bulletins were published as HMSO publications. Enquiries about back issues, or transport publications in general, should be made to Transport Statistics, 2/29, Great Minster House, 76 Marsham Street, London SW1P 4DR. +44 (020)7944 4846.
DfT: Transport Statistics Publications (Transport Statistics Bulletins - free) Obtainable from: Department for Transport 2/29 Great Minster House 76 Marsham Street London SW1P 4DR +
44 (0)20 7944 4846
Annual Bulletins – produced by Transport Statistics Compendium of Motorcycling Statistics National Rail Travel Survey National Travel Survey Public Transport Statistics: GB Regional Transport Statistics Road Casualties in Great Britain: Main Results Road Conditions in England (formerly NRMCS) Road Statistics: Traffic Speeds and Congestion Road Freight Statistics Sea Passenger Statistics Transport Trends UK Seafarer Statistics Vehicle Excise Duty Evasion Vehicle Licensing Statistics Waterborne Freight in the United Kingdom Quarterly Bulletins – produced by Transport Statistics Bus and Light Rail Statistics +44 (0)20 7944 4139 Road Traffic and Congestion in Great Britain
+44 (0)20 7944 3095 Road Goods Vehicles Travelling to Mainland Europe
+44 (0)20 7944 4131 Road Casualties in Great Britain: Quarterly Provisional Estimates
+44 (0)20 7944 3078
See also the Transport Statistics web site at: -
http://www.dft.gov.uk/pgr/statistics
Related Documents


![[ES] The National Pulse Interview DrYan1](https://static.cupdf.com/doc/110x72/62d1bd20e1123879b50b90e8/es-the-national-pulse-interview-dryan1.jpg)