National Tracking Project Data for School Improvement

National Tracking Project Data for School Improvement.
Dec 28, 2015
Welcome message from author
This document is posted to help you gain knowledge. Please leave a comment to let me know what you think about it! Share it to your friends and learn new things together.
Transcript

National Tracking Project
Data for School Improvement
Who’s Involved? Standards of Excellence and Learning
(SEA+L)
Brock University Coral Mitchell, Department of Education Brock Business Consulting Group – MBA
students
41 SEA+L schools across Canada

Motivation for the National Tracking Project Canadian independent schools declare themselves to
be excellent university preparatory schools
Most schools have detailed data on university acceptance but little or no concrete information on post-secondary performance
SEA+L standards require schools to track graduate performance
SEA+L defines its member schools as “providing outstanding academic preparation for higher education”
Why quantitative data?
For reflection To confirm or refute our predictions To establish trends and drive
decision making To build community discussions To improve teaching and learning in
our schools

What data is being collected?
Academic achievements of graduating class
Extra-curricular participation by graduating class
University and college transcripts for past graduates each spring
National data – comparing results between SEA+L schools

History Two pioneer schools
Rothesay Netherwood School Balmoral Hall School
2006 - Pilot Project 19 schools from across Canada Creation of the NTP Advisory Group Donna Alexander (BHS) - NTP coordinator Partnership with Coral Mitchell, Brock University & Larry
Sackney, University of Saskatchewan Development of a comprehensive support manual and
training programme for data collection for participating schools

History 2007
40 schools involved in tracking
2008 Kim Tulloch (LCC) appointed NTP Coordinator Brock Business Consulting Group joins in to do data
collection and analysis Preliminary cross-Canada data analysis results are shared
with NTP schools
2009 42 schools across Canada involved in tracking Brock Business Consulting Group providing data analysis
for individual schools

Process
Graduating students (& parents) are asked to sign five/six transcript release forms
School submits transcript release forms to receiving universities beginning 13 months after secondary graduation
School collects transcripts, enters data and submits aggregate information to NTP coordinator

Process National trends are identified and reported
back to participating schools for comparative purposes
“Soft” data on extra-curricular and co-curricular participation also collected and correlated
Schools maintain confidentiality of data for first five years of project

Timeline for NTPFall 2010 Speak to students and parents, about the intent of project.
(This will be on-going throughout the school year)
Spring 2011 Ask students to complete on-line survey – link sent to you
by NTP coordinator. Survey results will be sent back to you as an Excel worksheet.
Ask graduating students to sign transcript release form with their full name and date of birth University name and ID number is not necessary. Requiring parent’s signature is at the discretion of each
individual school. Enter graduates’ final high school marks in the Excel
worksheet once the students complete the survey and it is sent to you.
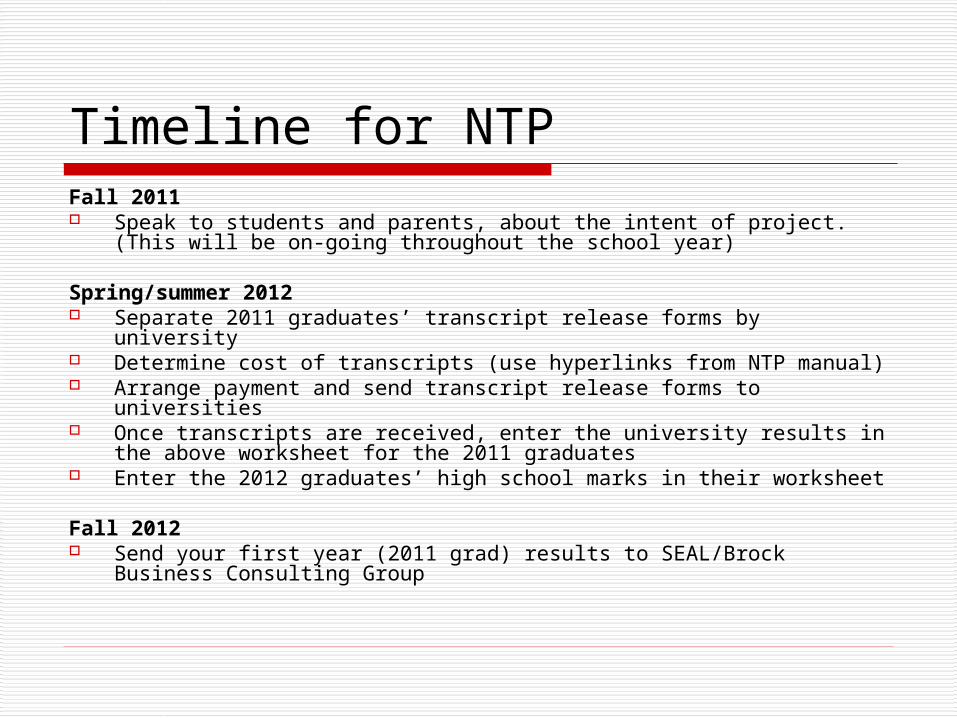
Timeline for NTPFall 2011 Speak to students and parents, about the intent of project. (This
will be on-going throughout the school year)
Spring/summer 2012 Separate 2011 graduates’ transcript release forms by university Determine cost of transcripts (use hyperlinks from NTP manual) Arrange payment and send transcript release forms to universities Once transcripts are received, enter the university results in the
above worksheet for the 2011 graduates Enter the 2012 graduates’ high school marks in their worksheet
Fall 2012 Send your first year (2011 grad) results to SEAL/Brock Business
Consulting Group

Student Involvement
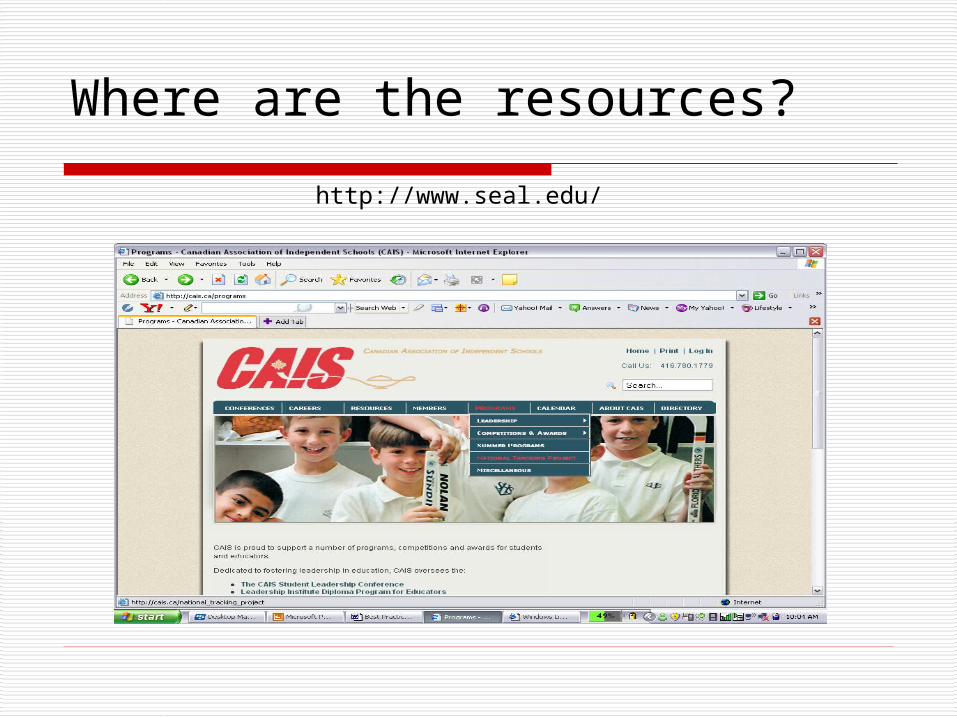
Where are the resources?
http://www.seal.edu/
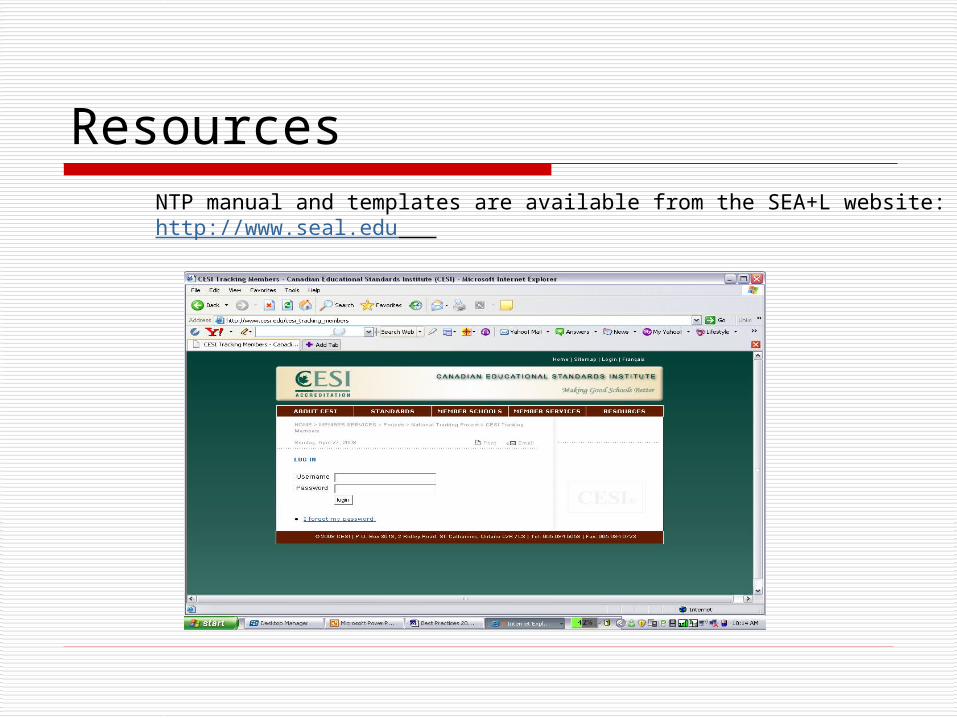
ResourcesNTP manual and templates are available from the SEA+L website: http://www.seal.edu
Resources
Brock Business Consulting Group Doing data collection and analysis for all
participating NTP schools Individual school data analysis Cross analysis with national data
Providing technical support for data entry
Will complete data entry for NTP schools for a small fee
Resources & Support Kimberly Tulloch-Wynn,
Project Co-ordinator – [email protected]
Lindsay Ireland , Administrative Assistant SEA+L – [email protected]
David Bungay, Brock Business Consulting – [email protected]
Outcomes
Early results have been tabulated, shared and compared with published, aggregate university data
Schools have been reflecting on programme needs and university selection process
NTP in the future In conjunction with Brock Business Consulting
Group, we’re working to make the NTP process more “user friendly” for individual NTP coordinators: Streamlining of data collection Providing analysis of data that is relevant
for each individual school Student surveys that are shorter and more
specifically relevant for each individual school

Conclusions Reputation built on “good news” stories
and alumni profiles will come under greater scrutiny
Schools that collect concrete data on graduate performance will be able to: accurately assess the success of their
programmes have the data they need to effect significant and
targeted school improvement strategies
Related Documents