NATIONAL SURVEY OF MICRO SMALL & MEDIUM ENTERPRISES (MSMEs) 2017 Small & Medium Enterprises Development Agency Of Nigeria nbs NATIONAL BUREAU OF STATISTICS

Welcome message from author
This document is posted to help you gain knowledge. Please leave a comment to let me know what you think about it! Share it to your friends and learn new things together.
Transcript

NATIONAL SURVEY OF MICRO SMALL & MEDIUM ENTERPRISES (MSMEs) 2017
Small & MediumEnterprisesDevelopmentAgencyOf Nigeria
nbsNATIONAL BUREAU OF STATISTICS


ii
FOREWORD
It is with satisfaction that I salute the publication of the third Edition of the
National Survey of
National Survey of MSMEs Report has become an invaluable compendium on the
state of the micro, small and medium enterprises (MSMEs) sub-sector in Nigeria. Let
me at once congratulate the Small and Medium Development Agency of Nigeria
(SMEDAN) and the National Bureau of Statistics (NBS), whose enduring partnership
a that form the
basis of this publication once every three years. Indeed the strategic partnership
between SMEDAN and the NBS, the apex Agency saddled with responsibility
for producing socio-economic statistics in Nigeria, is an example of the
synergies that can be harvested when public institutions leverage their
strengths/expertise for the national good.
Set up in 2003, by the SMIDA Establishment Act, as amended, SMEDAN, the
apex/coordinating Agency for MSMEs development in Nigeria, is charged in the
main with nurturing, promoting and facilitating the development programmes and
projects in the MSMEs sub-sector of the Nigerian economy. SMEDAN’s mandate as
contained in the enabling Act includes the following, viz:
ü Initiating and articulating policy ideas for small and medium enterprises growth
and development.
ü Promoting and facilitating development programmes, instruments and support
services to accelerate the development and modernization of MSMEs
operations.
ü Serving as a vanguard for rural industrialization, poverty reduction, job creation
and enhanced livelihoods.
ü
technology and technical skills as well as large enterprises.
ü Promoting and providing access to industrial infrastructures such as layouts,
incubators, industrial parks et.c.
ü Intermediating between MSMEs and Government as the voice of the micro,
small and medium enterprises (MSMEs).
ü Working in contact with other institutions in both public and private sector to
create a good enabling environment for business in general and MSMEs
activities in particular.
Micro, small and medium enterprises are globally recognized as engines of
socio-economic transformation, as has become well established in both
developing and developed economies. They offer opportunities to drive
jobs and wealth creation as well as income re-distribution within society.
These further unveil them as a distinctive mainstay of the economy that requires

iii
one of the challenges that faced SMEDAN at inception, apart from the confusion
surrounding their classification, was the palpable dearth of statistics about the sub-
sector - their size, persons they employ, productive sectors they operate in
contribution GDP et.c. This was largely the situation that existed leading up to the
partnership with the NBS in 2010.
That baseline survey report - 2010 National MSME Collaborative Survey -
provided a watershed moment in our understanding of the sub-sector in Nigeria.
Amongst others, it became public knowledge that the total number of MSMEs was
17,284,678. These employed a total 32,414,884 persons as at December, 2010. On
the heels of the national economy re-basing, enterprise numbers surged at the
next edition of the survey in 2013 to 37,067,416 with complementary employment
contribution of 59,741,211 persons. Such indices as the contribution of MSMEs to
GDP, exports as well as their distribution across major economic sectors and states
also emerged. This was besides identifying challenges faced by the sub-sector.
In similar fashion, the third edition of the survey provides update on
important indices on the sub-sector, and more. For instance, the section dealing
with data analyses has been re-packaged into two chapters to optimize the
information available and to make it easier to obtain by stakeholders. Also, as our
knowledge on the sub-sector has seeming improved, this Edition contains
recommendation for the creation of a “one man business class” (of informal
income generating activities only) to distinguish them from the actual jobs/wealth
creating MSMEs. This was reinforced by another recommendation for a dual-
criterion (comprising paid employment and/or formal registration) to define
enterprises further reinforces this trend. Consequently, going into the future, these
recommendations are expected to redefine the MSMEs landscape compared to
how we know it today.
Finally, let me again express appreciation for the tenacity of the Director
General, SMEDAN and the Statistician General of the NBS, and their dedicated
staff, for this seminal work on a very important sub-sector of the Nigerian economy.
I strongly recommend this report to all stakeholders and operators in the sub-
sector; researchers, students and our international development partners.
Aisha Abubakar
Hon. Minister of State, Industry, Trade and Investment

iv
PREFACE
The National Bureau of Statistics (NBS) in collaboration with the Small and
Medium Enterprises Development Agency of Nigeria (SMEDAN) presents the results
of the third survey on Micro Small and Medium Enterprises (MSMEs) in Nigeria. This is
a statistical exercise undertaken to understand the characteristics and activities of
MSMEs in Nigeria, with the two rounds of the MSME survey conducted in 2010 and
programs, as well as to aid the design of new programs and interventions within
the sector. MSMEs in Nigeria, just as in most developing and developed countries,
are the bedrock of the economy. This is seen in the value contribution they make
to national Gross Domestic Product (GDP), (which stood at 49.78 percent to GDP
in 2017) as well as in the number of persons they engage in terms of employment
and labour. The outcome from the survey shows notable improvements in certain
areas of operations and activities of MSMEs in Nigeria. While the sector recorded
an increase in its contribution to GDP and employment, albeit within a period
where the economy suffered a recession, it also improved in terms of overall
business performance when compared to the previous year. In terms of the
number of enterprises in the sector, this increased to 41,543,028 in 2017, with the
Education and Manufacturing sectors making the most contribution to Small and
Medium Enterprises, while Wholesale and Retail trade, and Agriculture
contributing the largest number of enterprises in the Micro Enterprises sector.
improved socio-economic conditions of citizens of Nigeria, and in particular to
individuals directly engaged within the sector.
collection mechanism, Computer Assisted Personal Interviewing (CAPI) was
invariably means ti
translated to better survey. The coverage of the study considered all 36 states of the
Federation including the Federal Capital Territory, Abuja; Micro Enterprises were
covered through the household, with 600 households with micro-enterprises per state
surveyed; while the Small and Medium Enterprises component considered 4,000

v
small and medium enterprises nationwide cutting across 16 sectors of the
economy. The selection technique used was the principle of Probability
Proportional to Size (PPS) per state to give a fair representation of the results. The
report is structured in a way to give the reader a coherent understanding of the
characteristics of MSMEs in Nigeria. It starts with the executive summary and
concludes with possible policy interventions. The executive summary provides a
bird's eye view of the report, it gives some information on the methodology and
scope of the survey, including the economic sectors covered; and some of the
rvey. Successive chapters provide further details about the survey
recommendations.
common stan
Enterprise’s policy as adopted worldwide.
On behalf of the staff of NBS, I would like to express sincere appreciation to
the Director-General and Staff of SMEDAN for their commitment to this study. It has
indeed been a pleasure working with such a professional team and NBS is pleased
to hav working relationship with this follow-up study. One of the
challenges of building the Nigeria Statistical System is ensuring the consistency of
data production, so we are delighted that the management of SMEDAN
continues to support us in this mission. I would also like to express my gratitude to
the staff of NBS who worked tirelessly on the production of this report. Finally, this
report could not have been possible without the support of data suppliers and
respondents – the thousands of businesses visited - who provided the necessary
information and thus contributed immensely to the successful outcome of the
study. It is my hope that more businesses will show greater cooperation to the staff
of NBS, as we strive to improve data quality and availability towards a greater
economic future for our nation, Nigeria.
Finally, I would like to thank you, the stakeholder and users of our data, including
individuals and organizations that use our data, both locally and internationally.
The sole purpose for us producing data is for it to be applied in the aid of better
policy making, and ultimately to the betterment of our society and economy.
Therefore, we share our sincere gratitude for your continuous engagement at all

vi
useful than the previous rounds and continue to work together with our teams
towards the aim of further improving subsequent rounds of this survey.
Dr Yemi Kale
Statistician General of the Federation and Chief
Executive Of reau of Statistics

vii
ACKNOWLEDGEMENTS
The success of this survey is attributed to the joint efforts of both the National
Bureau of Statistics (NBS), and the Small and Medium Enterprises Development
Agency of Nigeria (SMEDAN) as the sponsor. Other stakeholders that also
contributed to the enrichment of the survey instruments are also appreciated for
their contributions.
SMEDAN for his relentless support and indefatigable zeal in driving the project to
completion.
The tireless efforts of the staff of both organizations (NBS and SMEDAN) who
were laboriously involved in the planning and implementation of the survey are
highly commended. To mention a few are Mr. Babayo Samanja (Director of Field
Services and Methodology Department, NBS), Mr. Adeyemi Adeniran (Deputy
Director in charge of Household Statistics Division, NBS) Mr. FafumiBiyi (Deputy
Director in charge of ICT) and Mr. Babalola Ayodele (Deputy Director in charge of
Agric and Business
, A. Robert. (Director,
PRM&E), Dr. Opara, Friday (Director, SP&L), Mr. Israel Ikyumior (Asst. Director,
Planning & Research), Ijomah Ebere (Chief Acct, Research & Library) and Kayode
Meyambe (Head, ICT).
Other members of staff of both NBS and SMEDAN that were actively
involved in analysis and report writing are highly appreciated, they include Kola
Ogundiya, Awolowo Titilola, Kareem Bolakale, Paul Oshokumoboh, Lateef
Olasukanmi, Victor Uttah, Aroniyo Ajoke, Ekele Azubuike, Babalola Omoniyi etc
We also recognize the invaluable contributions of others not mentioned for
want of space, they are highly appreciated.
Finally, we thank all our trainers, monitors, enumerators and supervisors for
being focused and result oriented. We also appreciate our respondents both at
the households and establishments for their cooperation to the conduct of the
survey.
Dr. Isiaka Olarewaju
Director (Real Sector and Household Statistics Department)
National Bureau of Statistics.

viii
AGSMEIS - Agri-Business Small and Medium Enterprises Investment Scheme
ABP - Anchor Borrowers’ Program
BOA - Bank of Agriculture
BoI - Bank of Industry
BPP - Bureau for Public Procurement
CBN - Central Bank of Nigeria
CAPI - Computer Assisted Personal Interviewing
CGS - Conditional Grant Scheme
CPC - Consumer Protection Council
CAC - Corporate Affairs Commission
DBN - Development Bank of Nigeria
DFIs - Development Finance Institutions
ERGP - Economic Recovery and Growth Plan
EAs - Enumeration Areas
FEAP - Family Economic Advancement Programme
FCT - Federal Capital Territory
FGN - Federal Government of Nigeria
FIRS - Federal Inland Revenue Service
FMTI - Federal Ministry of Trade and Investment
FSMD - Field Services and Methodology Department
GEEP - Government Enterprise and Empowerment Programme
GDP - Gross Domestic Product
GEMS - Growth and Employment Mobility in States
IDCs - Industrial Development Centres
ICT - Information and Communication Technology
MFB – Micro Finance Banks
MFI – Micro Finance Banks
MEs - Micro Enterprises
NAP - National Action Plan
NAFDAC - National Agency for Food, Drug Administration and Control
NBS - National Bureau of Statistics
NDLEA - National Drug Law Enforcement Agency
NEEDS - National Economic Empowerment and Development Strategy
NISE - National Integrated Survey of Establishment
NISH - National Integrated Survey of Households
NPopC - National Population Commission
NBCI - Nigerian Bank for Commerce and Industry
NCS - Nigeria Custom Service
NERFUND - Nigeria Economic Reconstruction Fund
NEPC - Nigeria Export Promotion Council

ix
NIS - Nigeria Immigration Service
NIDB - Nigeria Industrial Development Bank
OLOP - One Local Government One Product
OVOP - One-Village-One-Product
PBN - Peoples Bank of Nigeria
PEDEC - Presidential Ease of Doing Business Council
PPS - Principle of Probability Proportional to Size
Pro-MEs - Pro-Establishment Micro Enterprises
R & D - Research and Development
RSHSD - Real Sector and Household Survey Department
SHG - Self Help Groups
SMEDAN - Small and Medium Enterprises Development Agency of Nigeria
SMEs - Small and Medium Enterprises
SIP - Social Investment Programme
SON - Standards Organization of Nigeria
SAP - Structural Adjustment Programme
ToT - Training of Trainers
DFID - United Kingdom’s Department for International Development
WB - World Bank
YOU-WIN – Youth Enterprises with Innovation

x
F CONTENTS
Executive Summary ---------------------------------------------------------------------------------- xviii
1.0 INTRODUCTION ....................................................................................................1
1.1 Background of the Study ................................................................................ 2
1.2 Objectives of the Study ...................................................................................2
1.3 .........................................................................................3
1.4 Relevance of MSMEs - Summary ....................................................................4
2.0 ND MEDIUM ENTERPRISES SUB- SECTOR
2.1 Introduction ......................................................................................................5
2.2 Government Policies and Programmes for MSMEs Development ..........8
2.3 Current Efforts by Government to Stimulate the MSMEs Sub-Sector .......9
3.0 MSMEs SURVEY DESIGN -------------------------------- --------------------------
3.1 ............................................................................14
3.2 Objectives .........................................................................................................14
3.3 Coverage ..........................................................................................................14
3.4 Scope ................................................................................................................15
3.5 Sample Design-Frame .....................................................................................15
3.6 Survey Instruments ...........................................................................................17
3.7 Training for Field Work .....................................................................................17
3.8 Fieldwork Arrangement for Data Collection ...............................................17
3.9 Distribution of Workload and Field Staff by Zone and State .....................18
3.10 Monitoring of Fieldwork ...................................................................................19
3.11 Coordination of Activities ...............................................................................20
3.12 Retrieval of Records ........................................................................................20
3.13 Data Processing and Analysis ........................................................................20
3.14 Report Writing ...................................................................................................20
4.0 - - SMEs .....................21
4.1 Distribution of SMEs by State: ........................................................................21
4.2 Economic Sectors (SMEs): .............................................................................22
4.3 Ownership Structure (SMEs): ..........................................................................23

xi
4.4 Regulatory Awareness (SMEs) ........................................................................25
4.5 Employment (SMEs): ........................................................................................26
4.6 Use of Professional Services/Associations (SMEs): .................................................29
4.7 Financial Status (SMEs): ...................................................................................30
4.8 Internal Operating Environment (SMEs): .......................................................33
4.9 Sales and Marketing Outlook (SMEs) ............................................................35
4.10 Government Policies/Awareness of SMEDAN: ............................................37
5.0 - MICRO ENTERPRISE-S MEs: ................................................43
5.1 Number of Micro Enterprises by State ..........................................................43
5.2 Economic Sectors (MEs) .................................................................................44
5.3 Ownership Structure (MEs)..............................................................................46
5.4 Regulatory Awareness (MEs): .........................................................................48
5.5 Total Employment/Employees Number (MEs) .............................................48
5.6 Use of Professional Services/Associations (MEs): .........................................50
5.7 Financial Status (MEs): .....................................................................................52
5.8 Internal Operating Envi ronment (MEs): .......................................................52
5.9 Sales and Marketing Outlook (MEs) ..............................................................54
5.10 Government Policies/SMEDAN Awareness (MEs) .......................................55
5.11 Pro-Establishment Micro Enterprises (Pro-MEs): ..........................................57
6.0 .................................................................60
6.1 Key Findings ......................................................................................................60
6.2 Key Findings – Others .......................................................................................60
6.3 Predictability of the National Survey of MSMEs ...........................................61
6.4 Policy Recommendations – Taxonomy ........................................................62

xii
Table 1: Number of Small and Medium Enterprise by state 2017 Table 2: Number of Small and Medium Enterprise by state 2017, 2013 and 2010 Table 3: Number of Small and Medium Enterprise by Sector 2017 Table 4: Ownership Status by Sector Table 5: Economic Sector by Ownership (Sole Proprietorship) and Gender 2017
and 2013 Table 6: Number of Small and Medium Enterprise by Economic Sector
2017/2013 Table 7: Ownership Status Table 8: Ownership (Sole Proprietorship) by Gender Table 9: Age of Owner (Sole Proprietorship) Table 10: er (Sole Proprietorship) Table 11: Awareness of Regulatory Bodies Table 12: Business Registration with C.A.C. by Legal Status Table 13: Business Registration with C.A.C. by State Table 14: Total Employment by State as at December 2017 Table 15: Employment by Sector as at December 2017 Table 16: Table 17: Average Years of Apprenticeship Table 18: Skills Gap by Sector Table 19: Total Employment by State as at December 2017/2013 Table 20: Professional Services Used by Sector Table 21: Use of Business Plans by Sector Table 22: Business Insurance Table 23: Promotional Media by the Enterprise Table 24: Business Association Membership Table 25: Support Received From Associations Table 26: Total Asset Value (₦'Million) as at December
Table 27: Initial Start-Up Capital Table 28: Total Capital as at December 2017 (National) Table 29: Source of Capital Table 30: Access to Bank Finance by State (Sole Proprietorship) Table 31: Access to Finance by Type of Bank (Summary) Table 32a: Source of Capital Table 32b: Initial Start-Up Capital Table 33: Source of Main Raw Material Used for Business Operations Table 34: Daily Usage of Alternative Source of Power Table 35: Daily Usage of Alternative Source of Power by Sector Table 36: Hours of Shift per Day Table 37: Number of Enterprises Operating Shift by Sector Table 38: Months of Temporary Closure Table 39: Reason for Temporary Closure Table 40: Market Channel of Product(S) Table 41: E-Commerce by Sector Table 42: Average Customer per Day Table 43: Average Monthly Sales/ Turnover by Economic Sector

xiii
Table 44: Export of Product(S)/Service by Sector Table 45: Value of Export by Sector (Million Naira) Table 46: Comparison of Performance Table 47: Major Government Policy that Affect Business Most Favourably Table 48: Major Government Policies that Affect Business Most Unfavourably Table 49: Awareness of New Federal Government Initiatives Table 50: Awareness of New Federal Government Initiatives By State Table 51: Awareness of SMEDAN by Sector Table 52: Awareness of SMEDAN by State Table 53: Source of Information about SMEDAN Table 54: Major Challenges Militating Against Enterprises Development in Nigeria Table 55: Measures by SMEDAN to Alleviate Challenges Table 56: Top Priority Areas of Assistance Table 57: SMEDAN Table 58: SMEDAN Service by Sector Table 59: SMEDAN Service by State Table 60a: Awareness of SMEDAN 2017/2013 Table 60 b: SMEDAN
Enterprises Table 61: Number of Micro Enterprises by State, 2017 Table 62: Number of Micro Enterprises by State, 2017 vs 2013 Table 63: Number of Micro Enterprises by Sector, 2017 Table 64: Ownership Status by Sector, 2017 Table 65: Sex of Owners by Economic Sector (Sole Proprietorship), 2017 Table 66: Business Registration by Sector, 2017 Table 67: Number of Micro Enterprises by Sector (Informal), 2017 Table 68: Ownership Structure, 2017 Table 69: Age Of Owner (Sole Proprietorship), 2017 Table 70: -Proprietorship), 2017 Table 71: Ownership Status by Business Registration Compliance, 2017 Table 72: Ownership Status Trends Table 73: Awareness of Regulatory Bodies, 2017 Table 74: Number of Enterprises Registered by State, 2017 Table 75: Employment in Micro Enterprises (Mes) By State as at December, 2017 Table 76: Employment by Sector and Gender (Dec. 2017) Table 77: Educ Table 78: Skills Gap by Sector, 2017 Table 79: Employment In Micro Enterprises (Mes) by State (Employees Only), 2017
Table 80: Use of Professional Services, 2017 Table 80a: Professional Services by Economic Sector, 2017 Table 81: Number of Enterprises with Business Plans by Sector, 2017 Table 82: Number of Enterprises Insured by Sectors, 2017 Table 83: Number of Establishments by Channel of Promotion, 2017 Table 84: Enterprises Operating Online Businesses by Sector, 2017 Table 85: Business Association Table 86: Support Received from Association, 2017 Table 87: Number of Enterprises Insured by Sectors, 2017 Table 88: Initial Start-up Capital, 2017 Table 89: Start-Up Capital by Sector (N'000), 2017

xiv
Table 90: Sources of Capital, 2017 Table 91: Personal Banking Relationship of Owners, 2017 Table 92: Initial Start-Up Capital by Sector (N'000), 2017 Table 93: Source of Capital, 2017 Table 94: Sources of Main Raw Materials used for Business Operation, 2017 Table 95: Sources of Equipment for Business Operation Table 96: Daily Usage of Alternative Source of Power by Sector, 2017 Table 97: Hours of shift per Day, 2017 Table 98: Months of Temporary Closure, 2017 Table 99: Distribution of Enterprises by Reasons for Temporary Closure, 2017 Table 100: Staff Wages and Salaries (Total Staff Emolument) December 2016 and 2017
Table 101: Table 102a: Local Market Channel of Product(s)/Services, 2017 Table 102b: Export Value for Micro Enterprises, 2017 Table 103: Business Capacity Turnover / Monthly Average Sales, 2017 Table 104: Gross Earnings/Turnover, 2017 Table 105: Business Capacity Turnover/ Monthly Average Sales Trends Table 106: Major Government Policies that Affect Business Most Favourably, 2017 Table 107: Major Government Policies that Affect Business Most
Unfavourably,2017 Table 108: Awareness of SMEDAN by State, 2017 Table 109: Source of Information about SMEDAN, 2017 Table 110: Major Challenges that Militate against Enterprise Development in
Nigeria, 2017 Table 111: Measures by SMEDAN to Alleviate Challenges of Enterprises
Development, 2017 Table 112:
Ownership, 2017 Table 113: Table 114: Table 115: Awareness of SMEDAN by State, 2017 Table 116: Major Government Policies that Affect Business Most Favourably, 2017 Table 117: Major Government Policies that Affect Business Most Unfavourably, 2017
Table 118: Number of Micro Enterprises that Offer Paid Employment, 2017 Table 119: Enterprises Registered with CAC and Offer Paid Employment by Sector Table120: Micro Enterprises Registered with Corporate Affairs Commission (CAC)
and Offer Paid Employment, 2017

xv
LIST OF FIGURES
Figure 1: TOTAL NUMBER OF SMALL AND MEDIUM ENTERPRISES BY STATE Figure 2: NUMBER OF SMALL AND MEDIUM ENTERPRISES BY ECONOMIC SECTOR
2017/2013 Figure 3: OWNERSHIP STATUS Figure 4: GENDER OF OWNERSHIP (SOLE PROPRIETORSHIP) Figure 5: AGE OF OWNER (SOLE PROPRIETORSHIP) Figure 6: REGULATORY AWARENESS Figure 7: EMPLOYMENT BY GENDER Figure 8: EMPLOYMENT BY GENDER2017/2013 Figure 9: PROMOTION MEDIA BY THE ENTERPRISE Figure 10: BUSINESS ASSOCIATION
Figure 11: INITIAL START-UP CAPITAL
Figure 12: SOURCE OF CAPITAL
Figure 13: INITIAL START-UP CAPITAL2017/2013
Figure 14: DAILY USE OF ALTERNATIVE SOURCE OF POWER
Figure 15: MARKET CHANNEL OF PRODUCTS Figure 16: AVERAGE MONTHLY SALES TURNOVER ACROSS ECONOMIC SECTORS FOR
2017/2013
Figure 17: MOST FAVOURABLE GOVERNMENT POLICIES
Figure 18: MOST UNFAVOURABLE GOVERNMENT POLICIES
Figure 19: AWARENESS OF NEW GOVERNMENT INITIATIVES Figure 20: AWARENESS OF SMEDAN BY STATES
Figure 21: SOURCE OF INFORMATION
Figure 22: TOP PRIORITY AREA OF ASSISTANCE
Figure 23: Formal Sector/Micro Enterprises 2017 & 2013
Figure 24: Micro Enterprises by State 2017 and 2013
Figure 25: Business Registration by Sector Figure 26: Age-group of Owner (Sole Proprietorship) Figure 27: Percentage of Micro enterprises with business plan by sector Figure 28: Pro-Establishment Micro Enterprises

xvi
EXECUTIVE SUMMARY
The 2017 National Survey of MSMEs covered enterprises in Nigeria employing
below 200 persons (i.e. micro, small and medium enterprises - MSMEs), and was
conducted in all the 36 States of the Federation and FCT. The following was the
outcome from the exercise.
The total number of MSMEs as at December, 2017 stood at 41,543,028, with
components as follows, viz: micro enterprises - MEs: 41, 469,947 (or 99.8 percent),
small and medium enterprises - SMEs: 73,081 (or 0.2 percent). While Lagos States
had the highest numbers of enterprises across all classes, only three (3) States, viz:
Katsina (36.4 percent), Rivers (21.7 percent) and Kaduna (18.1 percent) recorded
The Wholesale/Retail trade (42.3
percent), Agriculture (20.9 percent), Other Services (13.1 percent), Manufacturing
(9.0 percent) and Accommodation & Food Services (5.7 percent). Together, these
account for about 91.0 percent of all MSMEs. However, while males were
dominant in Agriculture (84.9 percent), female-dominance was instead observed
in Accommodation & Food Services (86.8 percent), Manufacturing (68.7 percent)
and Wholesale/Retail Trade (64.5%). With regards to Ownership Status, Sole
Proprietorship predominated at 97.1 percent, followed by partnerships (2.2
percent). Also, while most entrepreneurs were within the age brackets 26 - 35 years
(30.2 percent) and 36 – 50 years (40.2 percent), male-ownership was superior at
51.3 percent
Senior Secondary Scho
who mostly had university degrees (56.3 percent). Disparity was also seen for
business registration compliance with 2.1 percent (MEs) and 71.9 percent (SMEs),
respectively.
With a total employment contribution of 59,647,954 persons, including
owners, at December, 2017 (equal to 86.3 percent of national workforce), MEs
alone contributed a whopping 95.1 percent but with innately weaker capacity for
jobs creation at 1.37 persons per entity (compared with 39.5 persons for SMEs).
When employers were excluded, it emerged that 18.1 million jobs were created by
the sub-sector. Male-
percent, which were mostly generated by the Manufacturing, Agriculture and
Wholesale/Retail Trade sectors (across/ within gender). In addition, availability of
readily- -sector, with most
Not surprising, most MSMEs did not utilize professional services. It, however,
emerged that Business Consultants followed by Accountants/Auditors were the
services most patronized. Consequently, while about 24.4 percent of MEs (up to
65.1 percent for SMEs) had used a business plan, comparative values for business

xvii
insurance penetration and on-line business set-up dropped sharply to 3.3 percent
and 1.8 percent, respectively.
-sector was
underlined by most businesses (or 85 percent) having initial start-up capital of
≤N100,000.00, which was complicated by their limited access to formal credit. Only
5.3 percent of businesses (up to 21.6 percent for SMEs) had access to bank credit
even with 40 percent of operators having personal banking relationships.
The predominant source of raw materials and machinery amongst MSMEs
was local (≥87.5 percent), which is indicative of the innate capacity for local
content utilization. While most operators have little-to-nil need for power supply
(probably due to large numbers of operators in Wholesale/Retail Trade), this
changed drastically for Real Sector operators, 25 percent of whom depended on
alternative sources for ≥10 hours daily (up to 75 percent for SMEs). This is a recurring
factor for high operating costs, with implications for competitiveness.
As was expected, marketing of MSMEs products was dominated by local
channels (as contrasted with export). Also, consistent with the economic downturn
observed in 2017, most MSMEs reported average monthly sales/ turnover of
≥N100,000.00. Nevertheless, exports contribution by the sub-sector, improved
marginally to 7.64 percent (from 7.27 percent in 2013) with contribution to GDP,
also, posted at 49.78 percent.
Ranking for the most favourable Government policies (or interventions), was
as follows, viz: Environmental Sanitation, Infrastructure (especially roads
maintenance, power supply) and Fertilizer Subsidy while the most Unfavourable
were High Fuel Price, High Taxes and Poor power supply/High Electricity Tariff. Also,
while corporate awareness of SMEDAN improved to 63.3 percent (compared to
50.05 percent in 2013) amongst SMEs, it remained steady at 15.7 percent for MEs.
Even so,
the Agency by MSMEs.
Finally, two policy recommendations were made as follows, viz:
i. Recognition for a new One -Man Business class to accommodate the 37.1
million (or 89.1 percent) MEs, which being only income generating activities
have not matured to be recognized as enterp rises.
ii. A new dual-criterion, comprising paid employment and/or formal
registration, for recognizing enterprise s. This is to be used in conjunction with
the current MSMEs class limits (i.e. employment and/or asset base).
The above ensures the emergence of (of 1 – 9
salaried employees and/or formal registration only) as well as
count income generating activities ). While
both recommendations must be included into the National Policy on MSMEs to be
effective, based on this exercise, only 4.3 million MEs and 4.4 million
MSMEs can though may reach 5.0 million entities).

1.0 INTRODUCTION
as
engines of socio-economic transformation, including industrialization, of
many economies the world over. As has become well established, they
present a vital platform for boosting technical, technological and
entrepreneurial capacities amongst critical segments of the populace.
MSMEs also offer opportunities to drive jobs and wealth creation as well as
income re-
transition from agriculture-based economies to industrial ones, providing
opportunities for value chain linkages that generate sustainable livelihoods
for the bottom-of-the-pyramid citizenry. MSMEs are responsible for most of the
advances in new products and processes, provide most of the employment
opportunities but is also a key indicator of the overall performance of an
economy. They help to absorb productive resources at all levels of the
-linked. Such linkages are very crucial for the
attraction of foreign investment which further unveils them as the distinctive
Unfortunately in Nigeria, MSMEs have performed below expectation
due to a combination of problems which may be innate to the operators or
from their external environment, including oft-
and frequent public policy changes and somersaults. Besides, in Nigeria,
there is the outstanding issue of more inclusive participation in the sub-sector
by a burgeoning youth population, who require re-orientation to effect
optimal migration from a jobs-seeking mentality to one of jobs-and-wealth
creation. With a national population of over 190 million people, of which ˃
65% are persons below the age of 35 years, the imperative for more youths-
participation in entrepreneurship cannot be overemphasized.
Not surprisingly, there have been serious efforts by the Federal and
State Governments to develop the MSMEs sub-sector, including the adoption
under the erstwhile National Economic Empowerment and Development
Strategy (NEEDS) of a private sector-led economic development approach,
with MSMEs development as a central strategy in 2003. Since that time,
however, several other concurrent efforts to boost this sub-sector of the
national economy, has seen amongst others the enactment of the SMEDAN
Establishment Act setting up the apex/coordinating Agency for the
promotion and development of this important sector. This was followed by
the implementation of several programmes such as the Entrepreneurship
Development Programmes (Youth/Women/General), National MSMEs Policy,
National/State Councils on MSMEs, One Local Government One Product
NBS -SMEDAN NATIONAL SURVEY OF MICRO SMALL & MEDIUM ENTERPRISES (MSMEs), 2017
1

(OLOP), Conditional Grant Scheme (CGS), GEMS Project and YOU-WIN
amongst others. These were complemented with several access-to-credit
schemes of the Central Bank of Nigeria (CBN) and other Development
Finance Institutions (DFIs).
The MSMEs sub-sector as an important catalyst for growth will continue
to require such fundamental public support for the long run. These include
additional support for agri-business and the provision of regular and
affordable power supply. In the latter regard, several efforts are underway in
boosting the generation and distribution of electricity nationwide while new
credit facilities, agro-extension services, value-chain improvement, and
enhancement in the supply of fertiliser are being pursued.
1.1 Background to the Study
The Small and Medium Enterprises Development Agency of Nigeria
(SMEDAN) was established in 2003, to facilitate the promotion and
development of the micro, small and medium enterprises (MSMEs) sub-sector
in a The overall objective was reducing
poverty through wealth and jobs creation, within the overall goal of
facilitating socio-economic transformation. This highlighted the need for
accurate and reliable data on which to backstop planning for the sub-
sector, which was incidentally one of the challenges SMEDAN inherited at
inception. Such dearth of statistics about the sub-sector, included operator
numbers, persons they employ, major economic sectors et.c. Even so, initial
effort at addressing this challenge produced only limited results. It was this
state of affairs that eventually led to commencement of the strategic
partnership, in 2010, with the National Bureau of Statistics (NBS) - the apex
Agency saddled with responsibility for producing socio-economic statistics in
Nigeria.
The collaboration with the NBS is embodied in a memorandum of
understanding (MoU), which provides for the survey to be reviewed after
every three years, with the most recent exercise being 2013. SMEDAN will
continue to update and provide credible MSMEs data through collaboration
with both private and public institutions. The Agency through a robust MSMEs
data-base will continue to evolve plans and programmes that will contribute
to improving output and competitiveness of the sub-sector and economic
development of Nigeria in general.
1.2 Objectives of the Study
The main objective of this survey is to establish a credible and reliable
database for the MSMEs sub-sector in Nigeria, and their contribution to jobs
and wealth creation over the span of three years. Secondary objectives are:
i. Assessing the contribution of the MSMEs sub-sector to GDP.
NBS -SMEDAN NATIONAL SURVEY OF MICRO SMALL & MEDIUM ENTERPRISES (MSMEs), 2017
2

ii. Knowing the number of MSMEs in the Nigerian Federation, on state
wide and sectoral basis.
iii. Identify the main challenges and constraints facing the MSMEs sub-
sector.
iv. Determine the contribution of the MSMEs sub-sector to employment
generation.
v. Determine the contribution of MSMEs to export.
vi. Identify the number of MSMEs owned on gender basis.
vii. Identify the ownership structure of MSMEs by age.
viii. Identify the skills gap within the MSMEs sub-sector.
ix. Determine capacity utilization within the sub-sector.
x. Ascertain the top priority areas for intervention and assistance to the
sub-sector.
xi. ub-sector for raising low cost
1.3
With the introduction of the National Policy on MSMEs, has now been
addressed the equally topical issue of what constitutes micro, small and
medium enterprises. The adopts dual-criteria class limits,
employment and assets (excluding land and buildings) as shown below. The
employment criterion, however, retains precedence over assets in resolving
S/N Size Category Employment Assets (=N= Million)
(excl. land and
buildings)
1 Micro enterprises Less than 10 Less than 10
2 Small enterprises 10 to 49 10 to less than 100
3 Medium
enterprises
50 to 199 100 to less than 1,000
Source: SMEDAN National Policy on MSMEs , 2015
Consequently:
§ Micro Enterprises are those enterprises whose total assets (excluding
land and buildings) are less than Ten Million Naira with a workforce not
exceeding ten employees.
§ Small Enterprises are those enterprises whose total assets (excluding
land and building) are above Ten Million Naira but not exceeding One
Hundred Million Naira with a total workforce of above ten, but not
exceeding forty-nine employees.
§ Medium Enterprises are those enterprises with total assets excluding
land and building) are above Fifty Million Naira, but not exceeding
NBS -SMEDAN NATIONAL SURVEY OF MICRO SMALL & MEDIUM ENTERPRISES (MSMEs), 2017
3

One Billion Naira with a total workforce of between 50 and 199
employees.
the issue of MSMEs
edition, to distinguish actual “enterprises” from mere “income generating
activities”. The latter (i.e. “income generating activities”), were then
proposed to form a new “One Man Business” class.
1.4 Relevance of MSMEs - Summary
It is evidently clear that the MSMEs could play a catalytic role in the
economic transformation of Nigeria. The role includes substantial
contribution of the sub-sector to the gross domestic product (GDP),
employment generation, export, increasing local value addition and
technological advancement. Other measures advanced by the advocates
of MSMEs development in the country include:
i. The low level of capital required for the establishment of these
enterprises.
ii. Their large number and labour-intensive modes of operation
guarantees employment for a large number of persons.
iii. Inventions, adaptations, and general technological development are
common in these enterprises.
iv. A more equitable distribution of income is usually achieved through this
sub-sector.
v.
development are assured.
vi. The evolution of indigenous enterprise is facilitated by MSMEs.
vii. General enhancement of the tempo of industrial development is
accelerated by these enterprises.
viii. Tendency among these enterprises to become feeders of large-scale
enterprises and thus service as production out-posts for the latter.
NBS -SMEDAN NATIONAL SURVEY OF MICRO SMALL & MEDIUM ENTERPRISES (MSMEs), 2017
4

NBS -SMEDAN NATIONAL SURVEY OF MICRO SMALL & MEDIUM ENTERPRISES (MSMEs), 2017
5
2.0 ENTERPRISES SUB- SECTOR
2.1 INTRODUCTION
The relevance of micro, small and medium enterprises (MSMEs) to the
Nigerian economy is no longer in doubt. They possess great potentials for
employment generation, improvement of local technology, output
cation, development of indigenous entrepreneurship and to drive
integration with large-scale industries. In Nigeria, the sub-sector is credited with
(85%) of total industrial employment. Also,
agriculture which holds prime potential for achieving national economic
aspirations comprise
mostly operators who fall within the MSMEs ambit. The above is amongst
several other attractions of the sub-sector.
Thus while the potential of MSMEs have long being recognized, it was
its development that had a long and tortuous history in Nigeria. Under colonial
rule, for instance, with an avowed policy of treating colonies as estates to be
developed for metropolitan trade, local industries were neglected, and in
some cases actively discouraged in favour of import promotion. Not
surprisingly, small scale manufacturing accounted for only about 15% of
manufacturing output at independence, in 1960. Subsequent national
Governments, especially during the early Post-Independence era, promoted
import substitution policies aimed at encouraging local
production/consumption of goods and services that otherwise would have
been imported. Industrial output grew under this policy but this was ultimately
to propel Government to the “commanding heights” of the economy.
Even so, the ‘80s, ushered in the “golden era” for MSMEs in Nigeria,
especially in terms of facilitating their access to credit. Existing support
institutions such as the Nigeria Industrial Development Bank (NIDB) and
Nigerian Bank for Commerce and Industry (NBCI) – currently Bank of Industry,
provided development-oriented funding for the sub-sector. These were to be
joined by Nigeria Economic Reconstruction Fund (NERFUND), Peoples Bank of
Nigeria and Bank of Agriculture. With abundant and cheap petrol -dollars ,
foreign exchange-denominated loans were readily available for
procurement of machinery and raw materials. Complemented with friendly
interest rates and amortization periods, the deliberate effort to grow the
of 73.3% for industry and contribution of industrial output to GDP.
Fuelled, also, by a surfeit of the local appetite for foreign products
coupled with poorly-developed local raw materials, sustainability of many of
the industrial projects of that time would soon come to the fore. This was as
the policies of the succeeding Structural Adjustment Programme (SAP) took
hold, leading to currency devaluation with concomitant higher exchange

rates and low pricing of raw materials in the export market. Consequently,
the emerging MSMEs sub-sector began to unravel in spite of Government’s
bailout efforts, and would subsequently collapse.
Since then the several programmes addressing employment creation,
poverty reduction, women empowerment and youth development have
made MSMEs development a primary focus. Other promotional measures
i
Development support, specialized SMEs support in collaboration with external
donors, and entrepreneurship training, amongst others. Yet at the turn of the
Millennium, after about four decades of the various supportive
measures, the MSMEs sector was still in a situation where it was without
assistance. There were also constraints related to concepts, and
objectives, development and promotion of the sector, including issues
of market access and challenges of globalization.
Encapsulated in the National Economic Empowerment and
Development Strategy (NEEDS), Government’s response articulated a
paradigm shift to a private-sector led growth, with MSMEs as the
vehicle for realizing same. Thus, within the cardinal objective of
creating a competitive non-oil private sector-driven economy, NEEDS
envisioned a MSMEs sub-sector that would deliver
employment generation, wealth creation, poverty reduction and
sustainable economic growth. Also, with a focus on enhancing growth
and competitiveness of MSMEs, the intention was for a sub-sector that
reduced cost of doing business would be able to compete effectively
in local, regional and global markets. It was such recognition for MSMEs,
under NEEDS, that also saw to the establishment of an apex institution for
MSMEs development in Nigeria – the Small and Medium Agency
Development Agency of Nigeria (SMEDAN).
The establishment of SMEDAN, in 2003, was Government’s major
response to tackling the problems of MSMEs in a coordinated fashion.
With a mandate to promote the development of the MSMEs sector of
the Nigerian economy, SMEDAN assumed the twin roles of coordination
and facilitation as the apex Agency for MSMEs development in Nigeria.
SMEDAN’s mandate as contained in the enabling Act included the
following, viz:
ü Initiating and articulating policy ideas for small and medium enterprises
growth and development.
NBS -SMEDAN NATIONAL SURVEY OF MICRO SMALL & MEDIUM ENTERPRISES (MSMEs), 2017
6

ü Promoting and facilitating development programmes, instruments and
support services to accelerate the development and modernization of
MSMEs operations.
ü Serving as a vanguard for rural industrialization, poverty reduction, job
creation and enhanced livelihoods.
ü
technology and technical skills as well as large enterprises.
ü Promoting and providing access to industrial infrastructures such as
layouts, incubators, industrial parks et.c.
ü Intermediating between MSMEs and Government as the voice of the
micro, small and medium enterprises (MSMEs).
ü Working in contact with other institutions in both public and private sector
to create a good enabling environment for business in general and MSMEs
activities in particular.
Despite obvious evidence of the relevance of MSMEs in Nigeria, one of the
challenges that faced SMEDAN at inception, apart from the confusion
was the palpable dearth of statistics about the
sub-sector - their numbers, persons they employ, productive sectors they
operate in et.c.
for the sub-sector (National Policy on MSMEs, 2007, 2015), but has also before
now produced two editions of the National Survey on MSMEs (2010, 2013).
The current edition of the survey has revealed a marginal increase in the
size of the sub-sector nation-wide/across all sub-national entities, to
41,543,028 MSMEs. The components are 41,469,947 micro enterprises (MEs)
and 73,081 small and medium enterprises (SMEs). Together they offer a total
employment contribution of 59,647,954 persons, including owners, (which is
equal to 76.5 percent of national workforce), 49.78 percent of GDP and 7.64
percent of export receipts. In an obvious addition to the scope of previous
surveys, this Edition also discovered that 4,471,235 MSMEs (or 11 percent) of
the total count offered salaried employment (and/or are formally registered).
This is important. The latter represent the so called “opportunity” enterprises,
which alone can serve the national aspiration of jobs/wealth creation at a
time when unemployment, especially youth unemployment, has arguably
become the single greatest problem confronting our country and is the major
cause of youth restiveness and escalation in violent crimes nation-wide.
In its response, SMEDAN has since its establishment attempted to address
the critical challenges mitigating the growth of MSMEs such as access to
(local, international, online), access to business
infrastructure (through on-going effort to convert Industrial Development
Centres (IDCs) to enterprise clusters), production technology/vocational
training, entrepreneurship capacity development
gap in the sub-sector), promoting ease-of-doing-business activities, driving
NBS -SMEDAN NATIONAL SURVEY OF MICRO SMALL & MEDIUM ENTERPRISES (MSMEs), 2017
7

harmonious stakeholders inter-relationships via an umbrella National Council
on MSMEs, and a suite of programmes driving enterprises delivery. The latter
(OLOP), Conditional Grant Scheme (CGS) for Micro-enterprise Development
et.c.
2.2
IN NIGERIA
MSMEs operating in Nigeria are not immune from the typical
challenges of their peers, especially in other developing climes. Typically, most
countries provide assistance to grow MSMEs because of the crucial role they
have come to play in economic growth and development. Such assistance is
often in the form of facilities and support services. Other support measures
access to formal credit and al
information, training and re-training programmes, research and development
In recognition of the crucial roles MSMEs play with respect to economic
growth and development, successive governments in Nigeria had availed
various initiatives aimed at promoting MSMEs in the country. As seen below
access to credit featured prominently amongst the measures offered, the
several changes in government notwithstanding. Some of the support
institutions and opportunities created by government to enable MSMEs access
funding in the past about forty years included:-
Ø Mandatory Credit Guideline in respect of MSMEs (1970)
Ø Small Scale Industries Credit Guarantee Scheme (1971)
Ø Agriculture Credit Guarantee Scheme (1973)
Ø Nigeria Agriculture and Cooperative Bank (1973)
Ø Rural Banking Scheme (1977)
Ø The World Bank Assisted SME 1 (1985)/World Bank Assisted SME 2
(1990).
Ø Second Tier Security Market/SEC (1985).
Ø Peoples Bank of Nigeria (1989).
Ø National Economic Reconstruction Fund (1992).
Ø Small and Medium Scale Enterprises Loan Scheme (1997).
Ø African Development Bank – Export Stimulation Loan Scheme (ADB-
ESL), 1988.
Ø Bank of Industry (BoI) – being the merger of Nigeria Industrial
Development Bank (NIDB), Nigeria Bank of Commerce and Industry
(NBCI) and NERFUND, 2001.
Ø Nigerian Agricultural Cooperative and Rural Development Bank
(NACRDB) being merger of NACB Peoples Bank of Nigeria and Family
Economic Advancement Programme (FEAP), 2002. NBS -SMEDAN NATIONAL SURVEY OF MICRO SMALL & MEDIUM ENTERPRISES (MSMEs), 2017
8

Ø Small and Medium Enterprises Development Agency of Nigeria
(SMEDAN), 2003.
Ø Establishment of Micro Finance Banks.
Ø Small and Medium Enterprises Credit Guarantee Scheme for MSMEs,
2010.
2.3. -
SECTOR.
In Nigeria, the current medium term strategy (2017- 2020) - the
Economic Recovery and Growth Plan (ERGP), in line with more current trend,
has also recognized micro, small and medium enterprises as the vehicle for
driving national industrial output. The ERGP focuses on integrated, people-
centred, development planning. Attention is on raising the country’s standard
of living and prioritized development under four key pillars, viz: agriculture and
food security, transport infrastructure (especially roads and rails) as well as
synchronized with the on-going campaign against corruption as well as a
Presidential Ease of Doing Business Council (PEDEC) expects to restore growth,
invest in human capital and ultimately build a globally-competitive economy.
-sectoral, programmes currently being
implemented to grow the MSMEs sub-sector.
1. Establishment of a National Collateral Registry for MSMEs
The Central Bank of Nigeria (CBN) established the National Collateral
The registry
would enable MSMEs to use movable or personal assets as collateral while
these remain in possession of the borrowers. Entrepreneurs may now thus
use such movable assets, such as generator, car, machine or even gold,
as far as it is registered to access funds.
2. Development Bank o f Nigeria (DBN).
The Development Bank of Nigeria (DBN) was conceived by the Federal
Government of Nigeria (FGN) in collaboration with global development
MSMEs in
Nigeria.
ints that
hamper the growth of domestic production and commerce by providing
the MSMEs segment. The DBN will also play a focal and catalytic role in
providing funding and risk-
institutions, predominantly Deposit-
augmenting their capacity and by providing them with funding facilities
designed to meet the needs of these smaller clients to meet MSMEs
demands. DBN commenced operation in Nigeria in 2017. NBS -SMEDAN NATIONAL SURVEY OF MICRO SMALL &
MEDIUM ENTERPRISES (MSMEs), 2017
9

3. CBN/Bankers Committee AGSMEIS
The Agri-Business Small and Medium Enterprises Investment Scheme
(AGSMEIS), an initiative targeted at start-ups and the expansion of
established companies as well as the reviving of ailing companies to
enhance job creation and agribusiness for a sustainable economy. The
.
4. Establishment of a MSMEs
A platform to maintain the credit history of operators (and their businesses)
has become one of the modern measures to de-risk MSMEs, and so
improve their access to formal sources of credit. The Small and Medium
Enterprises Development Agency of Nigeria (SMEDAN) in collaboration
with Bank of Industry (BoI), Nigeria Export and Import Bank (NEXIM) and
Dun & Brad
agency for MSMEs in Nigeria.
5. N-Power Scheme
N-POWER is a project under the Social Investment Programme (SIP), of the
Federal Government of Nigeria, for job creation and empowerment
initiatives. The project aims to reduce graduate and youths
unemployment by helping them to create jobs and engaging them in
wealth generating economic activities while unemployed. The main
objectives of the N-POWER programme are:-
Ø To reduce the rate of unemployment in the country.
Ø To enshrine a system that would facilitate transferability of
employability, entrepreneurial and technical skills.
Ø To bring solutions to ailing public service and Federal Government
Three categories are recognized as follows, viz: N-POWER Teacher Corps, N-
POWER Knowledge Scheme and N-POWER Build Scheme.
6. Tradermoni Scheme
TraderMoni is a loan project, of the Federal Government, created
It is a component of the
Government Enterprise and Empowerment Programme (GEEP), being
executed by the Bank of Industry. TraderMoni, allows
enterprises to receive interest-free incremental loans of between N10,000
and N100,000, as you pay back.
7. Ease of Doing Business/PEBEC
Inaugurated in July 2016, the Presidential Enabling Business Environment
Council, is a
PEBEC, chaired by Vice President, is also to attract investment and
diversify the economy to reduce the nation’s reliance on oil. The big
picture was to make it easier for micro, small and medium enterprises to
NBS -SMEDAN NATIONAL SURVEY OF MICRO SMALL & MEDIUM ENTERPRISES (MSMEs), 2017
10

do business, grow and contribute to sustainable economic activity, and
provide the jobs essential to improving social inclusion. By April 5, 2018, the
PEBEC had approved its third 60-day National Action Plan (NAP 3.0) to
drive the ease of doing business initiative to remove critical bottlenecks
and bureaucratic constraints to doing business in Nigeria. Complemented
with Executive Order 1 on improving transparency and the business
environment in Nigeria (May, 2017), Nigeria has moved up 24 places in the
World Bank’s Ease of Doing Business Index 2018. The Reform continues.
The Central Bank of Nigeria (CBN), in line with its developmental function,
established the Anchor Borrowers’ Programme (ABP), in November, 2015.
The ABP was intended to create a linkage between anchor companies
involved in the processing and small holder farmers (SHFs) of the required
key agricultural commodities. The program’s thrust is the provision of farm
inputs in kind and cash (for farm labor) to small holder farmers to boost
production of these commodities, stabilize inputs supply to agro-
processors and address the country’s negative balance of payments on
food. At harvest, the SHF supplies their produce to the Agro-processor
(Anchor) who pays the cash equivalent to the farmer’s account.
The targeted commodities included but not limited to:
Ø Cereals (Rice, Maize, wheat etc.)
Ø Cotton
Ø Roots and Tubers (Cassava, Potatoes, Yam, Ginger etc.)
Ø Sugarcane
Ø Tree crops (Oil palm, Cocoa, Rubber etc.)
Ø Legumes (Soybean, Sesame seed, Cowpea etc.)
Ø Tomato
Ø Livestock (Fish, Poultry, Ruminants etc.).
8. Anchor Borrowers Programme
9. Conditional Grant Scheme (CGS)
Micro enterprises are critical in the Nigerian MSMEs space - they
collectively account for a majority of the enterprises in Nigeria and also
account for the highest number of jobs created in the economy.
J
intervention for the entrepreneurs at the bottom-of-the-pyramid cannot
be overemphasized based on the need to industrialize the nation,
develop the rural economy and stem youth restiveness/ unemployment in
Nigeria. The CGS aims to promote the activities of micro enterprises across
the country in the areas of capacity building and the delivery of post-
intervention support s
grants), markets, workspace, technology, etc.
The objectives of the scheme include:
Ø Creation of jobs, wealth and poverty alleviation in the society.
NBS -SMEDAN NATIONAL SURVEY OF MICRO SMALL & MEDIUM ENTERPRISES (MSMEs), 2017
11

Ø Improving the internally generated revenue of the three tiers of
government across the country thereby reducing over-
dependence on oil revenue.
Ø Moving micro entrepreneurs from the informal to the formal sector.
Ø Enhancing the competitiveness of these enterprises towards
meeting national, regional and global standards.
Ø
operators of micro enterprises.
The Scheme commenced implementation in 2017,
10. One Local Government One Product Programme (OLOP)
SMEDAN refocused its OLOP programme in 2016, to revitalize the rural
economy, improve employment opportunities and alleviate poverty in
rural areas. This was based on the One-Village-One-Product (OVOP)
movement implemented in the Oita Prefecture in Japan. The OLOP
programme is a bottom-top approach spec
micro small and medium enterprises (MSMEs) development in communities
by focusing on products distinctive to the each locality where they have
comparative advantage, and cultivate same through value-addition into
a national and global brand. As part of its implementation strategy,
SMEDAN partners with
Help Groups (SHG) across the country.
Since 2017, when full-blown nation-wide implementation commenced,
about 109 projects have been delivered annually,
advisory and monitoring services.
11. Incentivizing Business Registration Compliance for MSMEs
Cu -enterprises registration in Nigeria is at a lowly 2.1
percent (based on the 2017 National Survey of MSMEs). To improve
compliance, the Corporate Affairs Commission (CAC) incentivized
registration compliance for micro-enterprises w
and complementary process Initially geared to run from
31st May 2018 to 31st March 2019, the window remains open. During this
window, registration will cost
12. Growth and Employment Mobility in States (GEMS - 1, 2 & 3).
Growth and Employment Mobility in States (GEMS) is an employment
project supported by Nigeria’s Federal Ministry of Trade and Investment
(FMTI), with funds from the World Bank and the United Kingdom’s
Department for International Development (DFID). The project is aimed at
job creation and increased non-
chain sectors. A key target is the creation of at least 100,000 jobs directly in
NBS -SMEDAN NATIONAL SURVEY OF MICRO SMALL & MEDIUM ENTERPRISES (MSMEs), 2017
12

the selected sectors, viz: Information and Communication Technology
(ICT), Entertainment, Wholesale and Retail, Construction and Real Estate,
Hospitality and Tourism, and Meat and Leather.
The project can be summarized in three main pillars that together aim to
create employment and growth in the non-oil sector. These are:
Ø The project will provide for investments to address gaps that prevent
key growth centers from expanding and hiring more Nigerians, in
particular the young and poor.
Ø The project will support MSMEs to develop new business models,
train the labor force to enable Nigerian businesses to participate
more successfully in national and global supply chains, create more
value in Nigeria, and employ more Nigerians.
Ø The project will improve the business enabling environment so that
13. Conversion o -Three (23) Industrial Development Centres (IDCs) to
Industrial Parks and Clusters
Industrial Development Centres (IDCs) were initially established in the ‘60s
and ‘70s to provide middle level manpower in woodwork and metalwork
to local industries but were recently transferred to the Agency for proper
attention, after falling into disrepair. Given the large tracks of
undeveloped land available within these Centres, 23 in all, the underlying
objective of the this conversion project is to establish Common
Infrastructure Facility Centres that would resolve some of the challenges
faced by MSMEs with particular regard to accessing work space and
business infrastructure like internet services, water, power, machinery and
roads among others. The facility is projected to improve the global
competiveness of MSMEs, by reducing overhead costs and enjoying
economies of scale as is usually the case with clusters. An initial study was
sponsored by a grant of approximately $600,000, secured from the middle
income country technical assistance fund of AfDB, which
granted to the Ministry of Industry, Trade and Investment/SMEDAN to
encourage and improve sustainable entrepreneurial development
The more critical phase of
identifying interested partners for actual development of requisite
structures/facility management now beckons.
NBS -SMEDAN NATIONAL SURVEY OF MICRO SMALL & MEDIUM ENTERPRISES (MSMEs), 2017
13

3.0 MSMES SURVEY DESIGN
Following the successful production of two consistent and reliable rounds of
the Micro, Small and Medium Enterprises (MSMEs) survey data; there was the
need for a re-assessment of the impact of government programmes and
policies, with the aim of furthering their economic value contribution – i.e. to
3.1
In practice, the number of employees is the most common standard used in
National SMEs policies worldwide; hence, t
adopted for the survey is as stated below:
SECTOR
MICRO
SMALL
MEDIUM
Employment Band
1-9
10-49
50-199
3.2 Objectives
The main objective of this survey is to establish a credible and reliable
database for the MSMEs sub-sector in Nigeria and their contribution to jobs
and wealth creation.
Ø determine the contribution of Micro, Small and Medium enterprises
(MSMEs) to GDP in Nigeria
Ø know the number of Micro, Small and Medium Enterprises (MSMEs) in
Nigeria on the basis of national, geo-political zones, states and sector
Ø identify the challenges and constraints facing the operation of MSMEs
in Nigeria
Ø identify number of people engaged in MSMEs sub-sector
Ø identify the number of MSMEs that are not registered with the
Corporate Affairs Commission(C.A.C.)in Nigeria
Ø Determine gender ownership of the MSMEs within age brackets, their
etc.
3.3 Coverage
The survey was conducted in all the 36 states of the Federation and the
Federal Capital Territory (FCT), Abuja. Both urban and rural
enumeration areas (EAs) with Micro enterprises were covered through
the National Integrated Survey of Households (NISH) module.
Furthermore, both urban and rural areas where small and medium
NBS -SMEDAN NATIONAL SURVEY OF MICRO SMALL & MEDIUM ENTERPRISES (MSMEs), 2017
14

enterprises are located were covered through National Integrated
Survey of Establishment (NISE) module.
The sectors and sub-sectors covered include:
Ø Manufacturing
Ø Trade (Wholesale and Retail); Repairs of Motor Vehicles and
Motor Cycles
Ø Accommodation and Food service Activities
Ø Mining and Quarrying
Ø Construction
Ø Water Supply; Sewerage, Waste Management and Remediation
Ø Agriculture, Forestry, Fishing and Hunting
Ø Transport and Storage
Ø Information and Communication
Ø Administrative and Support Services Activities
Ø Education
Ø Art Entertainment and Recreation
Ø Other Services Activities
Ø Real Estate Activities
Ø Human Health and Social Works
Ø
3.4 Scope
The subject areas covered in the two (2) modules include:
Ø Ownership Status
Ø Employment Information
Ø
Ø Operating Cost
Ø Capacity Utilization
Ø Market Channel and Export
Ø Revenue
Ø Establishment Growth
Ø Technical Support Services etc.
3.5 Sample Design-Frame
The frame of enumeration areas (EAs) demarcated by National
Population Commission (NPopC) for 2006 Housing and Population Census
NBS -SMEDAN NATIONAL SURVEY OF MICRO SMALL & MEDIUM ENTERPRISES (MSMEs), 2017
15

was used for the Household component. In each of the EAs selected, a
quick Household Listing Exercise was carried out in order to update the
frame and determine households with Micro enterprises.
For the establishment component, Small and Medium Enterprises frame
was used.
3.5.1 Household Sample Size (Informal Sector)
A total of 1,480 enumeration areas were covered across the country, forty
(40) EAs were selected per state and FCT, Abuja. A total of 22,200 households
were sampled across the 36 states and FCT, Abuja.
In each state and FCT, six hundred (600) Households with enterprises were
interviewed
selected per EA
3.5.2 SMEs Sample Size (Formal Sector)
A total of 4,000 Small and Medium Enterprises were visited across the country.
Probability Proportional to Size (PPS) was used to allocate number of
establishments to be covered in each state, PPS was also used to allocate
number to be covered within sub-sector in each state.
0
2000000
4000000
6000000
8000000
10000000
12000000
0 0 0 0 0 0
5,965,896
29,330
2,631,467
10,005,431
NBS -SMEDAN NATIONAL SURVEY OF MICRO SMALL & MEDIUM ENTERPRISES (MSMEs), 2017
16

3.6 Survey Instruments
The following instruments were used:
Ø Informal Sector Questionnaire (Household)
Ø Formal Sector Questionnaire (Enterprise)
Ø Manual of Instruction
Ø Listing Form
Ø EA map
Ø EA sampled Frame
Ø Establishment Frame
Ø Lodgment Sheet
Ø Computer Assisted Personal Interviewer (CAPI) etc.
3.7 Training for Field Work
Two (2) levels of st level training which is the training of trainers (ToT) was held at NBS Headquarters, Abuja, and had in attendance 60 Trainers/Monitors and 12 Coordinators. The training lasted for two (2) days.
The second level training took place in all the 36 states and FCT, Abuja. The trainees include:
· Team mates (311)
· Team Leaders (111)
·
· Zonal Controllers (6)
The training lasted for three (3) days
cs arrangement; for informal (Household), one Urban EA was covered from the list of Sampled EAs.
3.8
3.8.1 Household (Micro Enterprises) component
Three (3) teams were constituted per state, each team comprises of one (1)
team leader and one (1) team-mate. A team covered 1 EA per day and
EAs.
NBS -SMEDAN NATIONAL SURVEY OF MICRO SMALL & MEDIUM ENTERPRISES (MSMEs), 2017
17

NBS -SMEDAN NATIONAL SURVEY OF MICRO SMALL & MEDIUM ENTERPRISES (MSMEs), 2017
18
served as supervisors in their respective states, the work load in each state
varies depending on the number of enterprises allocated to the state.
Each of
SUMMARY OF FORMAL SECTOR WORKLOAD BY ZONE
3.9
and Formal Components of the Survey
S/N ZONE NO. of EAs
to be
covered
NO. HH
Enterprises to
be covered
for Informal (HH
Enterprises)
Leaders for
Informal (HH
Enterprises)
No. Of
Establishment to
be covered
No. of
Interviewers for
Formal sector
1. North
Central
Plateau
Benue
Nasarawa
Kogi
Kwara
Niger
FCT Abuja
40
40
40
40
40
40
40
600
600
600
600
600
600
600
3
3
3
3
3
3
3
3
3
3
3
3
3
3
100
55
74
65
21
63
110
5
3
4
3
1
3
5
3.8.2 Small and Medium Enterprises (Formal Sector) component

Sub- 280 4,200 21 21 488 24
2. North.
East
Borno
Yobe
Bauchi
Adamawa
Gombe
Taraba
40
40
40
40
40
40
600
600
600
600
600
600
3
3
3
3
3
3
3
3
3
3
3
3
21
27
120
63
65
65
1
2
6
3
3
3
Sub- 240 3,600 18 18 361 18
Distribution of Workload and Field
Formal Components of the Survey (Cont’d)
S/N ZONE STATE NO. of EAs to be
covered
NO. HH
Enterprises to
be covered
No. Team Mates
for Informal (HH
Enterprises)
No. of Team
Leaders for
Informal (HH
Enterprises)
No. Of
Establishment to
be covered
No. of
Interviewers
for Formal
sector
3. North West Kaduna
Katsina
Kano
Kebbi
Sokoto
Jigawa
Zamfara
40
40
40
40
40
40
40
600
600
600
600
600
600
600
3
3
3
3
3
3
3
3
3
3
3
3
3
3
143
121
165
42
44
51
107
7
6
8
2
2
3
5
Sub-Total 280 4,200 21 21 673 33
4. South East Enugu
Abia
Ebonyi
Imo
Anambra
40
40
40
40
40
600
600
600
600
600
3
3
3
3
3
3
3
3
3
3
94
92
98
85
81
5
5
5
4
4
Sub-Total 200 3,000 15 15 450 23
3.10 Monitoring of Fieldwork
NBS & SMEDAN H/Q monitors worked for 3 days immediately after State
sector and as well monitored the informal sector in their respective states. NBS zonal controllers coordinated the activities within his/her zone. Copy of report on monitoring was submitted to D(RSHSD) and D(FSMD).
NBS -SMEDAN NATIONAL SURVEY OF MICRO SMALL & MEDIUM ENTERPRISES (MSMEs), 2017
19

Directorate staff of NBS/SMEDAN coordinated the activities of the survey. Activities coordinated include:
ü Training ü Fieldwork ü Data Processing ü Report writing ü Etc.
Twelve (12) Coordinators were involved. Coordination lasted throughout the period of the exercise. 3.12 Retrieval of Records All completed enterprise questionnaires were properly edited and returned to NBS Headquarters in Abuja including the CAPI devices for data processing. 3.13 Data processing and analysis was carried out at NBS Headquarters, Abuja. This involved:
ü System development ü Data Editing ü Data Entry ü Data Cleaning ü Table Generation/Tabulation
3.14 Report Writing
The report was written by both NBS and SMEDAN staff
3.11
NBS -SMEDAN NATIONAL SURVEY OF MICRO SMALL & MEDIUM ENTERPRISES (MSMEs), 2017
20

4.0 S: FORMAL -
As was in previous editions, the Formal Sector data (encompassing Small and
Medium enterprises - SMEs) for 2017 are presented together, for purposes of
convenience. We have also attempted to present trend analysis for each
thematic/sub-thematic area, by comparing the result obtained for 2017
against their 2013 equivalent.
In 2017, out of the total 41,543,028 micro, small and medium enterprises
(MSMEs) surveyed, Small Enterprises accounted for 71,288 entities (or 0.17
percent) while Medium Enterprises were 1,793 entities (or 0.004 percent).
Consequently, SMEs make up 73,081 entities (or 0.18 percent) of total MSMEs
numbers. Comparatively, also, 1,793 entities of Medium Enterprises make up
only 2.4 percent of the SMEs data-
were similar to the 72,838 SMEs (or 0.20 percent) reported in 2013.
4.1 Enterprises Distribution by States (SMEs)
Table 1, shows the total number of small and medium enterprises as well as
their distribution across 36 States and FCT. States with the highest distribution
of SMEs are Lagos State (8,395 entities or 11.5 percent), Oyo State (6,131
entities or 8.4 percent) and Osun State (3,007 entities or 4.1 percent).
Conversely, Yobe State (102 entities or 0.1 percent), Bayelsa State (300
entities or 0.4 percent) and Borno State (538 entities; or 0.7 percent) bring up
the rear.
FIGURE1: TOTAL NUMBER OF SMALL AND MEDIUM ENTERPRISES BY STATE
(Table 2), it was observed in the following States
viz: Kano, Rivers and Plateau (descending order) witnessed contractions in
0
2000
4000
6000
8000
10000
AB
IA
AN
AM
BR
A
BE
NU
E
BO
RN
O
CR
OS
S R
IVE
R
DE
LTA
EB
ON
YI
ED
O
EK
ITI
EN
UG
U
GO
MB
E
IMO
KA
DU
NA
KA
NO
KE
BB
I
KO
GI
NIG
ER
OG
UN
ON
DO
OS
UN
RIV
ER
S
SO
KO
TO
TA
RA
BA
2,342
734
1,8871,504
2,241
300
1,811
538
1,456
1,5242,433
2,677
9281,432
904
2,020
2,3702,650
2,4411,367
815
1,0271,416
8,395
2,604
2,121
2,4652,3633,007
6,131
1,5741,658
852930
1021,236
2,825
NU
MB
ER
STATE
NBS -SMEDAN NATIONAL SURVEY OF MICRO SMALL & MEDIUM ENTERPRISES (MSMEs), 2017
21

reported SMEs numbers while Nasarawa, Ebonyi, Jigawa and Kwara
4.2 Economic Sectors (SMEs)
Table 3, shows the sixteen (16) economic (or enterprise) sectors recognised
under small and medium
(5) major economic sectors were Education (27.0 percent), Manufacturing
(23.4 percent), Wholesale/Retail trade (18.0 percent), Human Health & Social
Work (10.4 percent) and Accommodation & Food Services (8.4 percent).
Together, these account for 87.2 percent of all SMEs. However, as also seen
from the Table, the following were the marginal economic sectors, viz: Water
Supply, Sewerage, Waste Management & Remediation Activities; Arts,
Entertainment & Recreation; Mining & Quarrying and Agriculture (decreasing
order).
4.2.1 Economic Sectors by Ownership Structure: As Table 4 shows, the
dominance of the afore-mentioned .2) was
-set was further analysed across
Ownership Structure (especially Sole Proprietorship and Private Limited
Liability Company - PLLCs). The only noteworthy difference was the
additionally important sector, under the PLLCs.
4.2.2 Economic Sectors by Ownership and Gender : Table 5 shows the
prevailing gender preferences for the economic sectors, based on an
analysis of sole proprietorship (i.e. the predominant ownership structure) only.
It was observed that whereas males were dominant in Manufacturing,
Education and Wholesale/Retail Trade (decreasing order), conversely
females showed preference for Education, Wholesale/Retail Trade and
Manufacturing (decreasing order).
4.2.3 s - Economic Sectors: Table 6 shows that the three (3)
major economic sectors, viz: Education, Manufacturing, Wholesale/Retail
trade (descending order), generally held stable in 2017 and 2013 within the
reduction within the medium enterprises class was observed in 2017 (132
entities) compared to 2013 (3,250 entities).
NBS -SMEDAN NATIONAL SURVEY OF MICRO SMALL & MEDIUM ENTERPRISES (MSMEs), 2017
22

FIGURE2: NUMBER OF SMALL AND MEDIUM ENTERPRISES
4.3 Ownership Structure (SMEs)
Table 7 shows the distribution of small and medium enterprises (SMEs) in 2017,
by Ownership Structure. Sole Proprietorship, at 65.7 percent occurrence,
predominated. This is followed by limited liability companies (20.8 percent),
faith-based institutions (5.7 percent) and partnerships (5.0 percent).
Conversely, Cooperatives contributed only 0.9 percent of the data-set
13,637
245
7,108
1,535
15,119
552 839 467
27,284
2,982260
2,78624 0 0 0 0
17,094
200
6,108
386
13,130
506 748
621
19,719
971
1891,958
0 9 1,073
7,5962,773
NU
MB
ER
65.75
20.8
0.9
5.7
1.8
SOLE PROPRIETORSHIP
COOPERATIVE
FAITH BASED ORGANISATION OTHERS
NBS -SMEDAN NATIONAL SURVEY OF MICRO SMALL & MEDIUM ENTERPRISES (MSMEs), 2017
23

When Ownership structure (based on the predominant Sole Proprietorship
class only) was further analysed by gender (see Table 8), it emerged that
male participation at 37,424 entities (or 78 percent) was superior to that of
females 10,562 entities (or 22 percent).
4.3.2: Ownership (Sole Proprietorship) Table 9 shows
the age distribution of SMEs owners. Age was generally found to increase with
enterprise numbers. Over 88 percent of enterprises were found to be owned
by persons within the two (2) age brackets, viz: between 36 – 50 years (40.1
percent) and ≥51years (48.2 percent). Conversely, young adults (and youths)
made up only a combined 11.8 percent of enterprise owners. These included
the age brackets 26 – 35 years, 20 – 25 years and ≤19 years
(SOLE PROPRIETORSHIP)
78.0
22.0
MALE FEMALE
2 0 - 2 5 2 6 - 3 5 3 6 - 5 0
0.3 0.6
10.9
40.1
48.1
PER
CEN
T
AGE GROUP
4.3.1 Ownership (Sole Proprietorship) by Gender
NBS -SMEDAN NATIONAL SURVEY OF MICRO SMALL & MEDIUM ENTERPRISES (MSMEs), 2017
24

4.3.3 Ownership (Sole Proprietorship) : Table 10
shows
generally increased from “No Education” (2.5 percent) to “Primary
Education” (4.0 percent) to “Secondary Education” (15.8 percent) to
“Bachelor’s Degree” (37.0 percent), before falling off sharply at “Master’s
Degree” (14.3 percent) and “Doctorate Degree” (5.1 percent) respectively.
Interestingly, an aggregate 56.4 percent of enterprise owners had tertiary
education qu
4.3.4 s - Ownership status:, As seen from Table 5, the most
important intra-sectorial contraction in SMEs number in 2017 (relative to 2013)
were observed in Agriculture (-77.2 percent), Water Supply, Sewerage, Waste
Management & Remediation Activities (-72.7 percent) and Administrative &
Support Services (-70.3 percent) while Manufacturing (43.5 percent),
Construction (43.1 percent) and Information & Communication (39.8
percent) recorded higher intra-sectoral SMEs number.
4.4 (SMEs)
Table 11 shows the major Regulatory bodies operating in Nigeria, and their
reported level of awareness amongst SMEs. Not surprisingly, the Corporate
Affairs Commission (CAC) topped the awareness chart with 72.6 percent.
Federal Inland Revenue Service (FIRS), National Agency for Food, Drug
Administration and Control (NAFDAC), Standards Organization of Nigeria
(SON), National Drug Law Enforcement Agency (NDLEA) and Nigeria Custom
Service (NCS) followed with 61.0 percent, 55.6 percent, 43.0 percent and 40.0
percent respectively. Conversely, it emerged that such relatively-new
Regulators as Consumer Protection Council (CPC), Bureau for Public
Procurement (BPP), and Nigeria Export Promotion Council (NEPC) recorded
lower rate of awareness at 33.5 percent, 24.4 percent and 24.4 percent
respectively.
NBS -SMEDAN NATIONAL SURVEY OF MICRO SMALL & MEDIUM ENTERPRISES (MSMEs), 2017
25

4.4.1 Business Registration with CAC (Legal Status-Compliance) : Table12
shows the distribution of CAC-registered SMEs across Ownership Structure. A
total of 52,515 (or 71.9 percent) of all SMEs were reportedly registered with the
CAC (note however that “Cooperatives” are registered by authorized State
formal status of SMEs operating in Nigeria, it is nevertheless remarkable that
up to 28.1 percent of these entities are unregistered. Also, within “Ownership
Structure” classes, percentage-registration ranged from 89.5 percent (Private
Limited Liability Companies) to 79.1 percent (Partnerships) and 65.0 percent
for Sole Proprietorship – these are Schedule A-registered entities. Faith-Based
Organizations, on the other hand, registered under Schedule B, posted
registration-
4.4.2 Business Registration with CAC by State As Table 13 shows, most States
(21) and FCT recorded legal status compliance above the national average
(i.e. 71.9 percent). Consequently, States with the highest legal status
compliance were Kwara (99.9 percent), Jigawa (98.8 percent), Adamawa
(97.1 percent) and FCT (95 percent). The less compliant-States, however,
emerged as Bauchi (50.6 percent), Katsina (51.6 percent), Osun (52.6
percent), Gombe (53.1 percent), Edo (53.8 percent), Zamfara (54.2 percent),
Ondo (54.8 percent), Ekiti (55 percent) and Delta (55 percent).
4.5 Employment (SMEs)
Table 14 shows that the 73,081 SMEs generated total employment of 2,
889,714 persons (including owners, as at Dec. 2017). This translates to an
average of 39.5 persons per entity, (which is also equal to about 5.0 percent,
of the total 59,647,954 employment generated by MSMEs in Nigeria). Across
48.2
55.6
72.6
33.5
61
40
36.9
24.4
43
24.4
0 10 20 30 40 50 60 70 80
FEDERAL INLAND REVENUE SERVICE…
NIGERIA CUSTOM SERVICE (NCS)
PERCENT
NBS -SMEDAN NATIONAL SURVEY OF MICRO SMALL & MEDIUM ENTERPRISES (MSMEs), 2017
26

States, however, it emerged that Lagos (11.5 percent), Oyo (8.4 percent) and
Kano (5.2 percent) States generated the most employment by SMEs.
Incidentally, the latter directly corresponds to the earlier data for reported
SMEs numbers (see section 4.1).
4.5.1 Employment by Gender: Also, from Table 14, it emerged that total
employment generated (as at Dec, 2017) is expectedly skewed towards
males, at 1,634,686 persons (or 56.6 percent) as against 1,255,028 (or 43.4
percent) for females.
FIGURE 7:
4.5.2 Employment by Sector: Breakdown of total employment by economic
sectors (vide Table 15), showed that the Education sector generated the lion
share at 1,065,755 persons (or 36.9 percent). This was followed by Human
Health and Social Works, 612,622 (or 21.2 percent), Manufacturing, 607,498
(or 21.0 percent), Accommodation & Food Services (7.3 percent) and
Wholesale/Retail Trade (5.3 percent).
4.5.3 Employment by Sector by Gender: Vide Table 15 (section 5.5.2) above,
the three major economic sectors, viz: Education, Human Health & Social
Works and Manufacturing also respectively employed the most males and
females. However, while there were more females (than males) in Human
Health and Social Works, on the other hand, more males (than females) were
employed in Manufacturing. Notably, only the Education sector employed
almost equal numbers across gender, viz: 560,558 (females) and 505,197
(males), respectively.
4.5.4 Employment by Educational (Employee) : Table 16 shows
trend is generally similar to one earlier established for business owners (see
section 4.1.3.3), with Bachelor’s Degree holders accounting for the most
employees (803,123
2,889,714
1,255,028
1,634,686
TOTAL FEMALE MALE
NBS -SMEDAN NATIONAL SURVEY OF MICRO SMALL & MEDIUM ENTERPRISES (MSMEs), 2017
27

NCE/
however, reported here than with business owners (i.e. section 5.3.3). While
cation, more males
egree.
4.5.5 Employment by Years of Apprenticeship: Table 17 shows the number of
years of apprenticeship by employees. Most employees, it emerged, went
through either one year (23.9 percent) or two years (27.6 percent) or three
years (18.2 percent) apprenticeship before employment. Together, these
accounted for about 70.0 percent of all such employees. Notably, also,
about 19.2 percent of employees went through six-year apprenticeship –
which may include situations of persons being apprenticed as minors.
4.5.6 Skills Gap by Sector: Across sectors, most businesses (77.1 percent)
as seen at Table 18. Intra-
sectorial analyses showed only two (2) sectors with less than 67.0 score, viz:
“Agriculture” (65.0 percent) and “Other Services” (63.8 percent).
4. s: With relatively similar enterprise numbers, SMEs (vide
Table 19), reportedly employed 985,894 more persons in 2017 (total:
2,889,714), compared to 2013 (total: 1,903,820). Consequently, average
employment per entity increased from 26.1 persons (2013) to 39.5 persons
(2017). Also, States contributing the highest SMEs employment over the period
remained steady as Lagos and Oyo- this is true both across/within gender.
However, States with the highest numerical employee gains were Kano
(72,869), Ebonyi (66,106), Niger (64,882), Nasarawa (63,605), Osun (63,225)
and Ogun (61,163) but notable contractions were observed in Rivers (-23,833)
and Plateau (-11, 408).
0
500,000
1,000,000
1,500,000
2,000,000
2,500,000
3,000,000
3,500,000
2017 2013
MALE FEMALE TOTAL
NBS -SMEDAN NATIONAL SURVEY OF MICRO SMALL & MEDIUM ENTERPRISES (MSMEs), 2017
28

4.6 Use of Professional Services/Associations (SMEs)
Use of Professional Services by SMEs is summarized at Table 20. Three (3)
professional services were evaluated, viz: Lawyers, Accountants/Auditors and
Business Consultants. 14, 845 SMEs (or 20. 3 percent) reportedly did not
engage any professionals –
percent of SMEs operate informally (see section 4.4.1).
4.6.1 Professional Services by Sector: Nevertheless, it was observed from Table
20 that Accountants/Auditors, as a group, is the professional service most
demanded (53.3 percent), which is closely followed by Lawyers (52.2
percent). Conversely, less than one-third (or 31.8 percent) of SMEs had
employed the services of Business consultants.
4.6.2 Professional Service - Business Plans:
percent of SMEs had employed the services of Business consultants (see
section 4.6 above), Table 21 instead shows that 65.1 percent of SMEs have
procured/used a business plan (the latter may possibly be a one-off activity
compared to engaging a business consultant for a short/long-term). Analysis
of intra-sectoral use, revealed the following three (3) sectors, viz: Professional,
and Education (75.4 percent) had the most use for business plan.
4.6.3 Professional Service - Business Insurance: Only 36.0 percent of SMEs
have used business insurance service (Table 22). However, intra-sectoral
intensity of use was most manifest in Transport & Storage (75.7 percent) and
4.6.4 Professional Service - Promotional Media: Table 23 shows the
breakdown of promotional media use by SMEs. Person-to-Person (i.e. “Word-
of-mouth”) showed up as the most popular promotional media by far, with
usage by 50.3 percent of enterprises. Other promotional media used, in a
descending order, were Handbills (38 percent), Radio (24.7 percent),
Billboard (24.0 percent), Television (16.5 percent) and E-Adverts (14.4
percent).
0
10
20
30
40
50
60
NBS -SMEDAN NATIONAL SURVEY OF MICRO SMALL & MEDIUM ENTERPRISES (MSMEs), 2017
29

FIGURE 9: PROMOTION MEDIA BY THE ENTERPRISE
4.6.5 Table 24 shows the participation/
membership of SMEs in business associations. The major associations were
found to be Trade Associations (i.e. Business Membership Organizations), 36.6
percent and Professional Associations, 34.3 percent. Consequently, only
about one-third of SMEs belonged either to a Trade Associations or
Professional Associations. Minor associations were Cooperatives (12.7
percent) and Technical Association (7.1 percent).
FIGURE 10: BUSINESS ASSOCIATION
4.6.6 Support Received Table 25, shows the kinds of support
received by SMEs from their business association. In descending order of
importance, these support services were Advisory (39.9 percent), Training
(35.9 percent), Monitoring & Regulation (32.4 percent), Awareness of Best
Practices (31.2 percent), Protection against Harassment (27.7 percent) and
Dissemination of Information on Government Policies (27.5 percent). At least
one-quarter of all SMEs reportedly received one (or more) of the above-listed
support services.
4.7 Financial Status (SMEs)
A number of related sub-themes are analysed under this theme.
4.7.1 Total assets value of SMEs, national,
was N2.719 Trillion as at Dec, 2017(see Table 26). However, distribution of the
total assets value across its components, showed the dominance of Transport
Equipment (i.e. Bus) at N1.331Trillion (or 49.0 percent) of total value. Indeed,
when combined together, Transport Equipment (across buses, cars and vans)
important components of SMEs total assets include Non-Residential Buildings
0
5,000
10,000
15,000
20,000
25,000
30,000
TRADE ASSOCIATION
PROFESSIONAL ASSOCIATION ASSOCIATION SOCIETY
OTHERS
26,77925,033
5,170
9,25411,105
NU
MB
ER
ASSOCIATION
NBS -SMEDAN NATIONAL SURVEY OF MICRO SMALL & MEDIUM ENTERPRISES (MSMEs), 2017
30

at N946.1 Billion (or 34.8 percent), Residential Buildings at N131.8 Billion (or 4.8
percent) and Machinery & Equipment – Computers at N120.1 Billion (or 4.4
percent).
4.7.2 Financial Status: Initial Start-up Capital: Table 27 shows that 69.1 percent
of all SMEs reported start-up capital ˂N5 Million. Additional 8.5 percent (or
6236 SMEs) had start-up capital of between N5 – 10 Million. Together, these
make up about 78 percent of all SMEs. Conversely, only about 6.3 percent of
all entities (or 4,626 SMEs) reported start-up capital in excess of N41 Million.
FIGURE 11: INITIAL START-UP CAPITAL
4.7.3 Compared with section 5.7.2 above, total
capital expectedly grew larger (Table 28). For instance, about 80.0 percent
of all entities had total capital of ≤N30 Million (reported as ˂N10 Million – 55.0
percent; N10 – 20 Million – 14.6 percent; and N20 – 30 Million – 10.0 percent).
Conversely, 15.2 percent of SMEs reported total capital in excess of N41
Million (reported as N41 – 50 Million – 3.3 percent; ˃N50 Million – 11.9 percent).
Notwithstanding, it should be noted that SMEs generally tend to under-report
their capital/Assets value for purpose of tax avoidance.
4.7.4 Financial Status: Sources of Capital: Table 29 shows that the pre-
dominant source of Capital for SMEs was informal, especially “Personal
Saving” (68.3 percent) and “Family Sources” (14.4 percent). Conversely,
formal sources, especially bank credit, make up only 21.6 percent. These
4.7.5 Financial Status: Access to Bank Credit by Ownership Structure:
Table 30 shows
Ownership Structure (based on data for Sole Proprietorship only). On a
national basis, it emerged that 49.5 percent of SMEs had access to bank
credit. On a State-wise basis, however, Oyo, Jigawa, Lagos, Kano and FCT (in
a descending order) had the most SMEs with access to bank credit.
69.1
8.55.3
2 0.96.3 7.9
MILLION5 TO 10 11 TO 20 21 - 30 31 - 40 NOT STATED
PE
RC
EN
T
N MILLION
NBS -SMEDAN NATIONAL SURVEY OF MICRO SMALL & MEDIUM ENTERPRISES (MSMEs), 2017
31

4.7.6 Financial Status: Analysis of
which banks opened their doors to SMEs the most (Table 31), showed that
commercial banks (i.e. Deposit- Money Banks) predominated at 91.9
percent. Development banks (or DFIs), however, accounted for only 1.0
percent of SMEs with access to bank credit.
4.7.7 alysis: As Table 32A shows, no significant differences were
SMEs. Formal sources (especially bank credit), however, reported a marginal
improvement from 17.9 percent (2013) to 21.6 percent (2017).
FIGURE 12: SOURCE OF CAPITAL
Similarly, trend for Initial Start-up Capital (Table 32B) showed only a marginal
increase. With regards to the latter, the N10 - 20 Million segment (39.9
percent) and N41 – 50 Million segments (905.8 percent) showed the most
improvement.
0
10
20
30
40
50
60
70
PE
RC
EN
T
SOURCE OF CAPITAL
PERSONALSAVING
FAMILY SOURCEUSU
OTHERS
2017 68.3 21.6 14.4 6.5 3.3 8.6
2013 65.4 17.9 12 3.8 1.8 4.3
NBS -SMEDAN NATIONAL SURVEY OF MICRO SMALL & MEDIUM ENTERPRISES (MSMEs), 2017
32

FIGURE 13: INITIAL START-UP CAPITAL2017/2013
4.8 Internal Operating Environment (SMEs)
A number of related sub-themes are analysed under this theme.
4.8.1 Sources of Raw Materials: As available from Table 33, 47.4 percent of
the raw materials used by SMEs are locally sourced, compared with 8.3
percent (foreign-sourced) while 44.3 percent combine use of both local and
foreign raw materials. Also, on a sectoral basis, Agriculture (68.9 percent)
expectedly had the largest number of SMEs using local raw materials. This is
followed by Education (57.3 percent) and Arts, Entertainment & Recreation
(56.1 percent). Conversely, the Construction (20.2 percent) sector has the
highest number of SMEs using foreign raw materials.
4.8.2 Establishing the level of use
alternative source of power provides an indirect indication of the availability
of public power supply. The latter is important for SMEs which are known for
their high dependence on public infrastructure, including power. Table 34
shows that the greater proportion of SMEs (or 44.6 percent) reported
between 1 – 5 hours use of alternative power daily. This was followed by 6 –
10 hours daily usage (26.2 percent). On the other hand 5.1 percent reported
˃20 hours daily usage, which suggest “almost complete - complete”
dependence on alternative power usage. Interestingly another 6.0 percent
reported nil usage of alternative power, suggesting probably SMEs that have
little-to-nil need for power supply.
0
10,000
20,000
30,000
40,000
50,000
60,000
Below 10 10 iio20 21 - 30 31 - 40 41 - 50 Above 50
54,703
5,845
1,489 6393,822
804
5,778
53,917
4,178
637 264 380 1537
11,926
NU
MB
ER
N MILLION
2017 2013
NBS -SMEDAN NATIONAL SURVEY OF MICRO SMALL & MEDIUM ENTERPRISES (MSMEs), 2017
33

4.8.3 Using the main
three (of four) categories already recognised in the preceding section (i.e.
4.8.2), Table 35, as follows, viz: 1 – 5
hours alternative power use : Construction (66.6 percent), Real Estate (56.2
percent), Other Services (55.6 percent), Education (52.3 percent) and
Agriculture (52.1 percent) (descending order); ˃20 hours alternative power
use: Accommodation & Food Services (11.4 percent) as well as Human
Health & Social Work (10.8 percent); little-to-nil alternative power use :
Agriculture (13.2 percent), Wholesale & Retail Trade (10.2 percent) and
Transport and Storage (7.9 percent).
4.8.4 Hours of Operational Shift per Day: Table 36, shows most SMEs (54.0
percent) operated between 5 – 8 hours of shift per day, followed by 9 – 12
- 10 hours
work-day operated by most businesses in Nigeria. Conversely, 5.2 percent of
SMEs adopted 20 - 24 hours (or whole-day) shift duty, where workers probably
observe 1-day-on and 1-day-off duty routine.
4.8.5 Operational Shift per Day by Sector: With reference to Table 37, the
sectors most disposed to shift duty were expectedly Human Health & Social
Work (76.7 percent), Accommodation & Food Services (70.3 percent) and
Wholesale & Retail Trade (28.4 percent). Conversely, the following sectors
reported the least occurrence of shift duty, viz: water Supply, Sewerage,
Waste Management & Remediation Activities (0.0 percent), Real Estate
percent).
4.8.6 As Table 38 shows, that 10,447 (or 14.3
percent) SMEs suffered temporary closure. Most, however, are for 1 – 3
0
5
10
15
20
25
30
35
40
45
1-5 HOURS 6-10 HOURS 11-15HOURS 16-20HOURSHOURS
NONE
44.6
26.2
14.2
3.9 5.1 6
PER
CEN
T
NBS -SMEDAN NATIONAL SURVEY OF MICRO SMALL & MEDIUM ENTERPRISES (MSMEs), 2017
34

months (48.9 percent), followed by 4 – 6 months (22.9 percent). These
account together for about 72 percent of SMEs. The remainder (i.e. about
28.3 percent) reported closure for period ˃7 months, which may be a sign of
stress.
4.8.7 The four (4) major reasons reported for
temporary closure (Table 39), are Lack of Funds (42.1 percent), Economic
Meltdown (30.2 percent), Low Patronage (25.8 percent) and Inadequate
Power Supply (23.1 percent). It is notable that inadequate power rated the
least of the four above-
current economic downturn (and related factors) may possibly be the most
important factor.
4.9 Sales and Marketing Outlook (SMEs)
This section reports on SMEs sales and marketing performance.
4.9.1 Market Channels (Products): Expectedly the local market was by far the
predominant channel for SMEs products (Table 40). This increased in
relevance from “within Nigeria” (62.7 percent), “State of domicile” (72.4
percent) and “Town/City of domicile” (72.7 percent). Conversely, export
trade outlook remained marginal as follows, viz: ECOWAS (2.1 percent),
World-wide (1.9 percent) and Africa (1.7 percent).
4.9.2 E-commer ce by Sector: Table 41, shows that only 20.8 percent of
SMEs use e-commerce as a marketing medium (please note that e-
commerce is a relatively new medium). Across economic sectors, however,
the Information & Communication sector led with 35.3 percent usage. This
Transport & Storage (30.6 percent).
4.9.3 Number of Customers per Day: Table 42, reports the number of
customers (average) per day for SMEs.
70.5 72.7 72.4
62.7
1.7 2.1 1.9
SAME SAME STATE NIGERIA ONLY AFRICA ONLY
PER
CEN
T
MARKET CHANNEL
NBS -SMEDAN NATIONAL SURVEY OF MICRO SMALL & MEDIUM ENTERPRISES (MSMEs), 2017
35
NBS -SMEDAN NATIONAL SURVEY OF MICRO SMALL & MEDIUM ENTERPRISES (MSMEs), 2017
36
patronage/economic downturn (see section 4.8.7), average daily customers
mostly ranged from ˂ 10 customers (24.7 percent) to 10 – 20 customers (20.4
percent). Notably, however, 11.5 percent reported average daily customer
numbers ˃50.
4.9.4 From Table 43, it emerges
that the sector with the highest average monthly sales performance is
Agriculture, with N110.9 Million. Other reportedly well-performing sectors are
Construction (N44.6 Million), Accommodation & Food Services (N27.5 Million)
(N24.8 Million). Least performing
sectors are Water Supply, Sewerage, Waste Management & Remediation
(N1.7 Million) and Real Estate (N1.8 Million).
4.9.5 Exports by Sector: Table 44, shows the number of SMEs with exportable
products, by sector. Only 2,529 entities (or 3.5 percent) reportedly had
exportable products/services. Across sectors, however, Manufacturing
reported the highest number of entities with exportable products at 1176
entities. This is followed by Wholesale/Retail Trade (540 entities) and Transport
& Storage (341 entities). With regards to export value, however, Table 45,
shows that SMEs with export value N˂10 million (71.4 percent) predominated,
which is followed by those with export value N˃40 million (19.3 percent). Total
export value was estimated at N2.53 billion.
4.9.6 Comparison of General Business Performance: Table 46 summarizes
SMEs rating of their general performance, year-on-year. It emerged that 37,944
entities (or 51.9 percent) rated their business performance in 2017 as “better” than
2016, while another 24.3 percent rated their performance as “same” (or
unchanged). Nevertheless, 14,745 SMEs (or 20.2 percent) rated their performance
as “worse” in 2017, compared to 2016.The latter may be part of the earlier 28
percent of SMEs which seeming showed sign of stress (see section 4.8.6).
4.9.7 Trends: Consistent with the preceding section (i.e. 4.9.6), average monthly
sales turnover across economic sectors for 2017 (compared with 2013) showed 23.3
were observed in Manufacturing, Accommodation & Food Services, Wholesale &
tions were,
however, found in Agriculture, Arts, Entertainment & Recreation as well as Mining &
Quarrying.

FIGURE 16: 2017/2013
4.10 Government Policies/SMEDAN Awareness (SMEs)
This section reports on SMEs perception of Government policies as well as
their rating of SMEDAN’s intermediation effort.
4.10.1 Most Favourable /Unfavourable Government Policies: In a descending
order (Table 47), SMEs rated the following as the Government
policies/interventions that affect them most favourably, viz: Environmental
Sanitation (51.2 percent), Infrastructure/Social Amenities (37.2 percent),
Political Stability (29.3 percent), Low Taxes (25.9 percent) and Low Electricity
Tariff (24.0 percent).
0
20,000,000
40,000,000
60,000,000
80,000,000
100,000,000
120,000,000
140,000,000
MO
NY
HLY
SA
LES
TUR
NO
VER
2017 2013
0 10 20 30 40 50 60
ENVIRONMENTAL SANITATION
INTERVENTION FUND
POLITICAL STABILITY
PERCENT
NBS -SMEDAN NATIONAL SURVEY OF MICRO SMALL & MEDIUM ENTERPRISES (MSMEs), 2017
37

FIGURE 17:
Government policies/interventions that affect them most
unfavourably (Table 48), were as follows: High Electricity Tariff (79.1 percent),
High Taxes (76.0 percent), High Interest Rate (48.6 percent), Subsidies
Withdrawal (30.5 percent) and Regulatory Bottlenecks (i.e. Trade Permits) at
26.5 percent.
FIGURE 18: MOST UN
4.10.2 Awareness of New Government Initiatives: SMEs reported (Table 49),
comparative awareness of some new Government Initiatives in the following
descending order, viz: National MSMEs Clinics (58.9 percent), Nigerian Public
Procurement Act (35 percent) and National Collateral Registry (6.1 percent).
Across States (Table 50), SMEs with the least awareness of these new
Government Initiatives were reported as follows, viz: National MSMEs Clinics:
Benue/Cross River (14.7 percent) and Taraba (19.6 percent); Nigerian Public
: Nasarawa (1.8 percent), Kwara (2.5 percent) and Akwa
Ibom/Ogun (3.7 percent); National Collateral Registry: Sokoto/Kebbi/Kano/
Jigawa/Kogi/Enugu/Delta/Bayelsa/Akwa Ibom (0.0 percent), Nasarawa (0.1
percent) and Edo/Cross River (0.2 percent). Understandably, the National
Collateral Registry is the most recent initiative on the list.
0 20 40 60 80
DEMOLITION
TRADE PERMIT
BANNING OF IMPORTATION OF GOODS
79.1
20.9
76
18.9
26.5
30.5
15.4
20.4
22.3
48.6
26.9
3.7
PERCENT
OO
VER
NM
ENT
UN
FAV
OU
RA
BLE
PO
LIC
IES
NBS -SMEDAN NATIONAL SURVEY OF MICRO SMALL & MEDIUM ENTERPRISES (MSMEs), 2017
38

MENT INITIATIVES
4.10.3 Awareness of SMEDAN: Awareness of SMEDAN, as a corporate
entity was reported at 63.3 percent across SMEs (Table 51). The same Table
showed the situation across sectors, where a higher proportion of SMEs
reporting
Works” (78.4 percent), “Education” (70.3 percent) and “Human Health &
Social Works”(69.9 percent). Similarly, across States, the following were the
Table 52), viz: Lagos, Oyo, Jigawa, Ebonyi and Edo (descending order).
However, intra-
(84.1%) and Awka Ibom (81.2%). Conversely, the lowest intra-State
d for the following States, viz: Oyo
(40.5 percent), Delta (41.1 percent), Enugu (47.2 percent), Niger (47.5
percent) and Abia (47.8 percent).
NATIONAL MSMES CLINICS, 58.9
NIGERIAN PUBLIC
, 35
NATIONAL
, 6.1
NBS -SMEDAN NATIONAL SURVEY OF MICRO SMALL & MEDIUM ENTERPRISES (MSMEs), 2017
39

4.10.4 Awareness of SMEDAN by Source of Information: In order of
importance, Table 53 rated the most important media sources from which
SMEs obtained information about SMEDAN as Television (57.0 percent) and
Radio (56.9 percent). Others are Person-to-Person (47.2 percent), Newspapers
(44.9 percent) and Internet/Social media (23.6 percent).
FIGURE 21: SOURCE OF INFORMATION
4.10.5 Major Challenges of Business Development: Tables 54 presents
major challenges of business development. Of these, it emerged that most
AB
IA
AN
AM
BR
A
BE
NU
E
BO
RN
O
CR
OS
S R
IVE
R
DE
LTA
EB
ON
YI
ED
O
EK
ITI
EN
UG
U
GO
MB
E
IMO
KA
DU
NA
KA
NO
KE
BB
I
KO
GI
LAG
OS
NIG
ER
OG
UN
ON
DO
OS
UN
RIV
ER
S
SO
KO
TO
TA
RA
BA
47.8
64.9
81.2
69.6
55.2
62.7
86.4
69.966.8
41.1
84.3
69.774.5
47.2
75
55.7
89.5
62.760.8
92.4
66.3
75.780.2
65.6
52.847.5
54.8
67.8
53.4
40.5
64.570.4
80.6
66.3
78.4
70.6
59.4
PE
RC
EN
T
56.9 57
44.9 47.2
23.6
2.8
PER
CEN
T
SOURCE OF INFORMATION
NBS -SMEDAN NATIONAL SURVEY OF MICRO SMALL & MEDIUM ENTERPRISES (MSMEs), 2017
40

SMEs (89.6 percent) rated Lack of Access to Finance as the most important
encumbrance. This was followed by Inconsistent Policies (58.3 percent), Weak
Infrastructure (57.2 percent) and Lack of Entrepreneurship/Vocational
Training (53.3 percent) amongst others. Also, consistent with measures offered
by SMEDAN to provide remediation, Table 55 shows that SMEs rated the
following as most relevant measures, viz: Facilitating Access to Finance (87.3
percent), Entrepreneurship Training (71.7 percent), Access to Business
Information (59.1 percent), Vocational Skills Upgrading (55.3 percent) and
Business Counselling/Monitoring (53.3 percent). SMEDAN services as
Advocacy (which responds to external environment inadequacies) and
Clustering (which provides targeted solution to Weak Infrastructure) were
inadvertently missing from the list.
4.10.6 tance: Complementary, however, to
section 4.1.10.5, SMEs rated their top priority areas of assistance (Table 56), to
include the following, viz: Adequate/Reliable Power & Water Supply (83.5
percent), Reduced Tax Rate (73.1 percent), Financing/Financial Assistance
(67.9 percent), Adequate Security (57.9 percent), Adequate Transport
Facilities (54.6 percent) and Regular Fuel Supply at Approved Prices (50.5
percent), amongst others. The fore-going mostly fall under SMEDAN’s focal
area of “Access to critical resources by MSMEs”. Amongst others, under this
heading, SMEDAN facilitates access to Enterprise Clusters, which are industrial
centres where targeted solutions are offered to SMEs. The challenge of
reduced tax rate, however, may only be addressed by Advocacy to the FIRS.
4.10.7 SMEs: Table 57, shows that 43,410
SMEs (or 59.4 percent These
SMEs (same Table), rated Entrepreneurship Training (68.6 percent), as the
0102030405060708090
PE
RC
EN
T
NBS -SMEDAN NATIONAL SURVEY OF MICRO SMALL & MEDIUM ENTERPRISES (MSMEs), 2017
41

SMEDAN service
Business Counselling/Monitoring (28.9 percent), Facilitating Access to Markets
(22.4 percent), Facilitating access to Finance (21.9 percent), Vocational Skills
Upgrading (21.6 percent) and Access to Business Information (20.1 percent).
4.10.8 SMEs by Sector: As seen from Table
58, the economic sectors with highest numbers of be
“Education” (66.0 percent) and “Human Health & Social Works”(62.6
percent). Notably, SMEs in Administrative & Support Services (46.5 percent)
and Water Supply, Sewerage, Waste Management & Remediation Activities
services
4.10.9 SMEs by States:
MEDAN services, were
from, viz: Katsina (85.9 percent) Jigawa (83.3 percent) Benue (80.3 percent),
Ebonyi (78.4 percent) and Ekiti (73.5 percent) (descending order). Conversely,
States Niger (44.2 percent),
Enugu (43.9 percent) and Delta (38.2 percent).
4.10.10 Trends: Compared to the reported situation in 2013(50.05
percent), awareness of SMEDAN, as a corporate entity amongst SMEs
increased in 2017 to 63.3 percent (vide Table 60A). SMEs that reportedly
from SMEDAN services similarly increased from 53.6 percent (2013)
to 59.4 percent (2017), as analysed on Table 60B.
NBS -SMEDAN NATIONAL SURVEY OF MICRO SMALL & MEDIUM ENTERPRISES (MSMEs), 2017
42

5.0 INFORMAL SECTOR/MICRO ENTERPRISES -
Unlike previous editions, Informal Sector (or micro enterprises) data for 2017
are presented over two (2) sub-sections, viz:
i. Sections 5.1 – 5.10 dealing, generally, with micro enterprises (i.e. to
permit comparison with 2013, data), and
ii. Section 5.11 dealing with a so-called Pro-establishment micro
enterprises class (i.e. comprising micro enterprises which were
registered formally and/or offer paid wages/salaries to its
employees).
This approach apart from offering opportunity for a better understanding of
-set for formal sector
enterprises (see Section 5.1), which omitted micro-enterprises.
In 2017, micro enterprises (MEs) totalled 41, 469,947 entities (or 99.8 percent)
out of 41,543,028 micro, small and medium enterprises (MSMEs) surveyed. This
36,994,578 (or 99.8 percent), out of the total 37,067,416
MSMEs reported in 2013. Consequently, because of their pervasive
occurrence, MEs trends, as reported hereunder, i
the entire MSMEs sub-sector.
5.1 Number of Micro Enterprises by State (MEs)
Table 61, shows the total number of micro enterprises as well as their
distribution across 36 States and FCT. States with the highest distribution of MEs
are Lagos State (3,329,156 entities or 8.0 percent), Rivers State (2,129,780
entities or 5.1 percent), Kaduna State (I, 931,387 entities or 4.7 percent), Oyo
State (1,909,475 entities or 4.6 percent), Kano State (1,824,961 entities or 4.4
percent) and Katsina State (1,659,304 entities or 4.0 percent). Conversely,
Nasarawa State (385,489 entities or 0.9 percent), Taraba State (520,759
entities or 1.3 percent), Gombe State (538,205 entities or 1.3 percent), Bayelsa
MSME ME Formal SME
41
,54
3,0
28
41
,46
9,9
47
73
,08
1
37
,06
7,4
16
36
,99
4,5
78
72
,83
8 2,017
2,013
NBS -SMEDAN NATIONAL SURVEY OF MICRO SMALL & MEDIUM ENTERPRISES (MSMEs), 2017
43

State (548,049 entities or 1.3 percent) and Ebonyi State (590,355 entities; or 1.4
percent) bring up the rear.
Katsina (442,700 new entities or 36.4 percent), Rivers (379,869 new entities or
21.7 percent) and Kaduna (295,934 new entities or 18.1 percent) only
marginal increases were witnessed in the following four (4) States, viz:
Nasarawa, Bayelsa and Taraba (descending order).
5.2 Economic Sectors (MEs)
Table 63, shows the sixteen (16) economic (or enterprise) sectors recognised
economic sectors were Wholesale/Retail trade (42.3 percent), Agriculture
(20.9 percent), Other Services (13.1 percent), Manufacturing (9.0 percent)
and Accommodation & Food Services (5.7 percent). Together, these
account for 91.0 percent of all MEs. However, as also seen from the Table,
the following were the marginal economic sectors, viz: Real Estate Activities,
Administrative & Support Services, Education, Mining & Quarrying and Water
Supply, Sewerage, Waste Management & Remediation Activities (decreasing
order).
5.2.1 Economic Sector by Ownership Status: As Table 64 shows, the
dominance of the afore-
-set was further analysed across
Ownership Structure (especially Sole Proprietorship and Partnerships). The only
noteworthy difference was the emergence of Transport & Storage as an
additionally important sector, under Partnerships.
5.2.2 Economic Sector by Ownership (Sole Proprietorship) and Gender : Table
65 presents the prevailing gender preferences for the economic sectors,
based on an analysis of sole proprietorship (i.e. the predominant ownership
AB
IA
AN
AM
BR
A
BE
NU
E
BO
RN
O
CR
OS
S R
IVE
R
DE
LTA
EB
ON
YI
ED
O
EK
ITI
EN
UG
U
GO
MB
E
IMO
KA
DU
NA
KA
NO
KA
TS
INA
KE
BB
I
KO
GI
LAG
OS
NIG
ER
OG
UN
ON
DO
OS
UN
RIV
ER
TA
RA
BA
2017
2013
NBS -SMEDAN NATIONAL SURVEY OF MICRO SMALL & MEDIUM ENTERPRISES (MSMEs), 2017
44

and females were as follows, viz: 1). Males: Agriculture, Wholesale/Retail
Trade, Other Services, Transport & Storage and Manufacturing (decreasing
order), 2). Females: Wholesale/Retail Trade, Other Services, Manufacturing,
Accommodation & Food Services and Agriculture (decreasing order). Further
analysis revealed that whereas the majority of males were fairly split between
Agriculture (35.5 percent) and Wholesale/Retail Trade (29.2 percent),
Wholesale/Retail Trade exclusively predominated amongst females (55.9
percent). Also, whereas Transport & Storage (97.5 percent) and Agriculture
(84.9 percent) were comparatively male-dominated sectors, female-
dominance was instead observed in Accommodation & Food Services (86.8
percent), Manufacturing (68.7 percent) and Wholesale/Retail Trade (64.5
percent). Finally, eight (8) other sectors (minor) showed comparative male-
dominance but Real Estate (100.0 percent) and Construction (99.5 percent)
were outstanding for their virtual absence of female participation.
5.2.3 Economic Sector by Business Registration: Table 66 shows the
distribution of MEs by Legal Status compliance across Sectors. Only 2.1
largely informal nature of MEs in Nigeria. Across Sectors, however, most
registered MEs were observed to be found in four (4) sectors, viz: (Wholesale
& Retail Trade (268,521 entities), other Services (110,877 entities), Agriculture
(107,456 entities) and Manufacturing (106,536 entities). Together, these four
sectors account for 69.4 percent of all registered MEs. However, highest intra-
sectorial registration was observed in Human Health & Social Work (27.2
percent) and Real Estate (20.7 percent).
1.2
7.1
3
13.1
3.31.5
3.51.4
5.9
20.7
2.9
13.316.1
27.2
10
2
NBS -SMEDAN NATIONAL SURVEY OF MICRO SMALL & MEDIUM ENTERPRISES (MSMEs), 2017
45

5.2.4 s - Economic Sectors:
major economic sectors, viz: Wholesale/Retail trade, Agriculture, Other
Services, Manufacturing and Accommodation & Food Service (descending
order), generally held stable in 2017 and 2013. Also, as seen from same Table,
the most important intra-sectorial contraction in MEs number in 2017 (relative
to 2013) was observed in Wholesale & Retail Trade, Manufacturing and
Transport & Storage (descending order). Nevertheless, it was in the following
-sectorial percentage
contractions were seen, viz: Administrative & Support Services, Education,
Information & Communication and Arts, Entertainment & Recreation while
Agriculture, Other Services and Water Supply, Sewerage, Waste
Management & Remediation (descending order) recorded higher intra-
sectorial MEs number.
5.3 Ownership Structure (MEs)
Table 68 shows the distribution of micro enterprises (MEs) in 2017, by
Ownership Structure. Sole Proprietorship, at 97.1 percent occurrence,
predominated. This was followed by Partnerships (2.2 percent). Conversely,
-based institutions contributed only 0.3 percent of
the data-set.
5.3.1 Ownership Structure by Gender: When Ownership Structure (based on
the predominant Sole Proprietorship class only) was further analysed by
gender (see Table 65), it emerged that male participation at 19,707,712
entities (or 51.3 percent) was relatively superior to that of females (48.7
percent).
5.3.2 Ownership (Sole Proprietorship) preneurs: Table 69 shows
the age distribution of MEs owners by Ownership Structure (based on the
predominant sole Proprietorship class only). Expectedly, up to the age
bracket 36 – 50 years, age of owners grew proportionately to number of
enterprises, thereafter declining at the age bracket 51 – 60. Over 68 percent
of enterprises were found to be owned by persons within the two (2) age
brackets, viz: 26 – 35 (30.2 percent) and 36 – 50 years (40.2 percent).
Conversely, young adults made up only a combined 16.3 percent of
enterprise owners. These included the age brackets 20 – 25 years and ≤19
years.
NBS -SMEDAN NATIONAL SURVEY OF MICRO SMALL & MEDIUM ENTERPRISES (MSMEs), 2017
46

5.3.3 Ownership (Sole Proprietorship) by : Table 70
enterprise owners across Ownership Structure (i.e. based on the predominant
accounted for 93.8 percent of all enterprise owners, viz: No Education (23.8
percent), Primary (21.7 percent), JSS (7.5 percent) and SSS (30.9 percent). This
enterprise owners. Conversely, “Bachelors Degree” and “Masters Degree”
holders, together make up only 3.9 percent of enterprise owners while
Vocational/Commercial type graduates add up another 0.9 percent. These
5.3.4 Ownership Status by Business Registration Compliance: Table 71 shows
the distribution of CAC-registered MEs across Ownership Status. A total of
854,445 (or 2.1 percent) of all MEs were reportedly registered with the CAC.
While the preponderant 97.9 percent of MEs are thus not registered, it also
shows that Faith Based Organisation has the highest percentage (12.0
percent) of MEs entities that are registered while Sole Proprietorship has the
least 1.9 percent.
5.3.5 Ownership Status Trends: As Table 72 shows, percentage contribution of
the major Ownership Status classes remained generally stable across the
period, for MEs. However, while Partnerships reportedly increased from 2013
(1.3 percent) to 2017 (2.2 percent), the minor occurrence of Private Limited
Liability Companies (PLLCs), and Cooperatives, earlier reported in 2013, were
notably absent in 2017.
9.86.6
30.2
40.2
13.2
Below 20 20-25 26-35 36-50 51-60
Age-
NBS -SMEDAN NATIONAL SURVEY OF MICRO SMALL & MEDIUM ENTERPRISES (MSMEs), 2017
47

5.4 (MEs)
Table 73 shows the major Regulatory bodies, operating in Nigeria, and their
reported level of awareness amongst MEs. Unlike the situation earlier reported
for SMEs (see section 5.1.4), National Agency for Food, Drug Administration
and Control (NAFDAC) and Nigeria Custom Service (NCS) were by far the
front runners. These were followed by Nigeria Immigration Service (NIS),
Federal Inland Revenue Service (FIRS) and Bureau for Public Procurement
(BPP). Finally, the surprising low awareness ranking of the Corporate Affairs
Commission (CAC) and the Standards Organization of Nigeria (SON) is
probably related to the very high informality status of these enterprises.
5.4.1 Business Registration with CAC (Legal Status-Compliance) : Refer to
section 5.3.4 (Ownership Structure by Legal Status Compliance) for results
under this theme. Only 2.1 percent of SMEs were registered. Most MEs (or 97.9
percent) thus operate informally.
5.4.2 Business Registration with CAC by State: As Table 74 shows, most States
(27) and FCT recorded legal status compliance below the national average
(i.e. 2.1 percent). However, States with the highest numbers of registered MEs
were Rivers (127,553 entities), C/River (82,741 entities) and A/Ibom (67,165
entities) but percentage of legal status compliance were highest in C/River
(8.5 percent), Borno (7.5 percent), Rivers (6.9 percent) and A/Ibom (4.8
percent).
5.5 Numbers (MEs)
Table 75 shows that 41,469,947 MEs generated a total employment of
56,758,240 persons (including owners, as at Dec. 2017). This translates to an
average of 1.37 persons per entity, (which is also equal to 95.0%, of the total
59,647,954 employment generated by MSMEs in Nigeria). When owners were,
employees only
were reportedly engaged by the MEs. The latter translated to employment
ratio of 0.37 employees per entity. Across States, however, it emerged that
Lagos (10.2%), Oyo (7.2%), Rivers (6.2%), Ekiti (5.6%) and Kano (5.6%) States
generated the most employees by MEs.
.
5.5.1 Employees by Gender: Also from Table 75, it emerged that total
employee numbers
at 11,849,781 persons (or 78.0 percent) as against 3,438,512 (or 22.0 percent)
for females.
5.5.2 Employees by Sector: Breakdown of total employment by economic
sectors (vide Table 76), shows that the Manufacturing sector generated the
lion share at 7,253,908 persons (or 47.4 percent). This was followed by
Agriculture, 4,523,306 persons (or 29.6 percent), Wholesale/Retail Trade, NBS -SMEDAN NATIONAL SURVEY OF MICRO SMALL & MEDIUM ENTERPRISES (MSMEs), 2017
48

1,545,069 persons (or 10.1 percent), and Other Services (5.6 percent).
Conversely, the least employee following
three (3) sectors, viz: Real Estate, Arts, Entertainment & Recreation and
Administrative & Support Services (descending order).
5.5.3 Employees by Sector and Gender: As also seen from Table 76 above,
the three (3) economic sectors with highest employees numbers (see Section
5.5.2 above), viz: Manufacturing, Agriculture, and Wholesale/Retail Trade,
also generally held sway with regards to male or female employees
respectively. Gender preferences, however, emerged with more males in
Agriculture and Wholesale/Retail Trade than in Manufacturing. There were
also more females (than males) in Accommodation & Food Services,
Administration and support services and other services consistent with the
earlier observation at section 5.5.1
5.5.4 Employees Qua by Gender : Table 77 shows the distribution of
ee
section 5.
relative to their employers (or business owners). T
relatively low level of illiteracy amongst employees for instance, Otherwise,
n increase from “Primary”
(1,767,584 persons) to “SSS” (3,121,009 persons) before declining sharply at
“NCE/OND/Nursing” (315,986 persons) and further still at “Bachelor’s” (170,090
persons) and beyond. The trend for female employees was similar.
5.5.5 Skills Gap by Sector: Table 78 shows skill gap across sectors, most
businesses (65.58 percent) reported lack of readily-
as seen at Table 78
artisans.
5. s on Employment, 2017: With relatively higher enterprise
numbers, MEs (Vide Table 79 reportedly generated less employment in 2017
(total: 56,758,240), compared to 2013 (total: 57,836,391). Consequently,
average employment per entity decreased from 1.56 percent (2013) to 1.37
percent (2017). The decrease in total employment in 2017 compared to 2013
is attributable to the economic recession experienced in 2017. Also, States
contributing the highest MEs employment in over the period remained steady
as Lagos and Oyo- this is true both across/within gender. However, States with
the highest numerical employee gains were Kano (424,831), Niger (334,270),
Nasarawa (596,831), Osun (564,668) and Ogun (114,934) but notable
contractions were observed in Kwara (-72,850) and Zamfara (-72, 368).
NBS -SMEDAN NATIONAL SURVEY OF MICRO SMALL & MEDIUM ENTERPRISES (MSMEs), 2017
49

Use of Professional Services by MEs is summarized at Table 80. Three (3)
professional services evaluated, viz: Lawyers, Accountants/Auditors and
Business Consultants. Not surprisingly, 34.32 million MEs (or 82.8%) reported
using nil professional services. Nevertheless, as observed from Table 80,
Business Consultant is the professional service most demanded (12.5%), which
is followed by Accountants/Auditors (1.9%) and Lawyers (1.3%). These results
are also consistent with the largely informal nature of these entities.
5.6.1 Professional Services by Sector: Analysis across all economic sectors
(see Table 80A), showed that the Education sector had the highest demand
for professional services at 19,719 entities (or 27.0 percent). This was followed
by Manufacturing (17,094 entities), Wholesale/Retail Trade (13,130 entities)
and Human and Health Services (7,596 entities).
5.6.2 Professional Services - Business Plans:
65.1 percent of SMEs have procured/used a business plan (see section 4.6.2),
only 24.4 percent of MEs had business plans (vide Table 81). Consistent with
relative sectorial size, further scrutiny also showed wholesale/Retail Trade,
Agriculture, Other Services, Manufacturing and Accommodation & Food
Services (descending order) as the sectors with the highest use of business
plans. Analysis of intra-
of use of business
plans (range: 17.9 - 26.75). However, it was the following three (3) sectors, viz:
Real Estate Activities, Water Supply, Sewerage, Waste Management &
Remediation and Mining &Quarrying, (descending order) that showed the
most use of business plans. The latter may be related to relatively minor sizes
of each of these sectors.
70.7
53.045.6
44.1 42.6 40.7 41.6
31.228.2 26.6 26.5 25.9 25.1 21.2 21.2
18.2
5.6 Use of Professional Services/Associations (MEs)
NBS -SMEDAN NATIONAL SURVEY OF MICRO SMALL & MEDIUM ENTERPRISES (MSMEs), 2017
50

5.6.3 Professional Service - Business Insurance: Compared to 36.0 percent of
SMEs that have used business insurance service (see section 4.6.3), business
insurance penetration is very low amongst MEs (Table 82). Only 1,375,639
entities (or 3.3 percent of MEs) had reportedly used business insurance.
Sectors with the highest use of business insurance emerged as
Wholesale/Retail Trade, Agriculture and Transport & Storage (descending
order).
5.6.4 Professional Service - Promotional Media: Table 83 shows the
breakdown of promotional media use by MEs. Radio advertisement showed
up as the most popular promotional media, with usage by 39.2 percent of
enterprises. Other promotional media used, in a descending order, were
Person-to-Person (30.8 percent), Television (19.6 percent), Newspaper
advertisement (6.6 percent) and Internet/Social Media (3.0 percent). Finally,
MEs reported 0.0 percent use of Billboard and handbills as promotional media
– while billboards may be pricy and seeming elitist, the latter, handbills, is
5.6.5 Professional Service – Online Business Setup: Table 84, shows the
distribution of MEs running online businesses across economic sectors. A total
of 753,109 MEs (or 1.8 percent), across all sectors, had set up online
businesses/shops. While MEs lag far behind of embracing the opportunities
available for business online, the current active sectors were Wholesale/Retail
Trade, Other Services and Manufacturing (descending order).
5.6. Membership: Table 85 shows the participation/
membership of MEs in business associations. The major association was Trade
Associations (15.8%). Minor associations were Cooperative Societies (3.1%)
and Professional Associations (2.5%).
5.6.7 Table 86 shows the kinds of support
received by MEs from their Business Associations. In descending order of
importance, these support services were Loan (6.2 percent), Morals (4.6
percent), Training (4.1 percent), and Motivation (3.6 percent). The single-digit
penetration achieved by business associations amongst MEs. It also emerged
from the data that the most important “pull factor” for membership by MEs is
probably the opportunity to obtain a loan.
5.6.8 Trends Analysis: Table 87
across economic sectors in 2017 (compared to 2013) for MEs. Penetration
5.4 percent (2013), which is made worse by the relative contraction reported
in 2017 (-63.6 percent). NBS -SMEDAN NATIONAL SURVEY OF MICRO SMALL &
MEDIUM ENTERPRISES (MSMEs), 2017
51

5.7: Financial Status (MEs)
A number of related sub-themes are analysed under this theme.
5.7.1 Financial Status: Initial Start-up Capital: Table 88, shows that 63.8
percent of MES reported start-up capital below N50,000.00 with another 20.6
percent having start-up capital between N50,000.00 – N100,000.00. Together, these
made up 84.4 percent of all MEs. Conversely, only about 0.8 percent of all
entities (or 297,015 MEs) reported start-up capital in excess of N1 Million.
Consequently, this data-
these entities.
5.7.2 Financial Status: Initial Start-up Capita by Economic Sector: When
analysed across sectors (vide Table 89), it turns out that the majority (approx.
60.0 percent) of MEs operating within the below N100,000.00 start-up capital
bracket (see section 5.7.1 above) were in the following four (4) sectors, viz:
Wholesale &Retail Trade, Agriculture, Other Services, Manufacturing and
Accommodation & Food Services sectors.
5.7.3 Financial Status: Sources of Capital: Table 90, shows that the pre-
dominant source of Capital for MEs was informal, especially “Personal Saving”
(61.2 percent) and “Family Sources” (23.6 percent). Conversely, formal
ings
which were expectedly direr than previously analysed for SMEs (see section
4.7.4), probably explain the very limited initial capital outlay of these entities.
5.7.4 Financial Status: Personal Banking Relationship by Ownership Status:
Table 91 shows that 15.2 Million MEs (or 40.9 percent) reported personal
banking relationship, with the vast majority of these expectedly being Sole
Proprietors – these make up 97.1 percent of all MEs (see section 5.3).
5.7.5 s: As Tables 92 and 93 compares, respectively, Initial Start-
up Capital and Sources of Capital for MEs, over 2017 and 2013. Generally, the
(i.e. 2017/2013). Formal sources (especially bank credit), however, reported
an improvement from 3.6 percent (2013) to 6.6 percent (2017). Similarly, Initial
Start-up Capital showed only marginal increases as follows, viz: the N50,000.00
– N100.000.00 bracket (53.1 percent) showed the most improvement
5.8 Internal Operating Environment (MEs)
A number of related sub-themes are analysed under this theme.
5.8.1 Sources of Raw Materials: As available from Table 94, 87.7% of the raw
materials used by MEs are locally sourced, compared with 2.5% (foreign-
sourced) while 9.8% combine use of both local and foreign raw materials.
NBS -SMEDAN NATIONAL SURVEY OF MICRO SMALL & MEDIUM ENTERPRISES (MSMEs), 2017
52

Also, all States except Borno (26.3%) reported ≥68.8% use of local raw
materials by MEs with another 14 States at the upper end reporting ≥90.0%
use of local raw materials by MEs. Conversely, Kaduna (16.4%), Jigawa
(11.9%) and Borno (11.1%) reported the highest use of foreign raw materials
by MEs. Also, on a sectorial basis, Agriculture (68.9 percent) expectedly had
the largest number of MEs using local raw materials. This is followed by
Education (57.3 percent) and Arts, Entertainment & Recreation (56.1
percent). Conversely, the Construction sector (20.2 percent) has the highest
number of MEs using foreign raw materials.
5.8.2 Sources of Machinery/Equipment: Similar to the situation for raw
materials, Table 95 shows that the vast majority of MEs used locally-sourced
machinery/equipment for their business operations (i.e. 37.0 million entities or
89.2%). Another 3.6 million (or 8.8%) used a combination of local/foreign
machinery while only 2.0% reported use of foreign machinery only. Distribution
by states reveals that Lagos State had the highest number MEs that sourced
their raw materials locally, which is closely followed by Oyo State. States with
the least number of ME who source their equipment locally are FCT (1.3
percent), Taraba (1.2 percent) and Borno (1.1 percent). Incidentally, also,
Lagos recorded the highest number MEs whose source of equipment is
foreign (24.3 percent) followed by Delta (8.5 percent). Finally, six (6) states
namely, Bayelsa, Edo, Kebbi, Kwara, Oyo and Zamfara reported nil foreign-
sourced equipment/ machinery.
5.8.3 Establishing the level of
use alternative source of power provides an indirect indication of the
availability of public power supply. The latter is even more important for MEs
which are known for their high dependence on public infrastructure,
including power. Table 96, shows that most MEs (or 70.4 percent) reported nil
usage of alternative power, suggesting probably little-to-nil need for power
supply for their economic activities. This was followed by 1 - 5 hours daily
usage (15.2 percent), and 6 – 10 hours (9.5 percent). Together, these
categories account for 95.1 percent of all MEs.
5.8.4 Using the main
three categories already recognised in the preceding section (i.e. 5.8.3),
the typical economic sectors as follows, viz: Nil alternative
power use: Agriculture and Transport & Storage (descending order). 1 – 6
hours alternative power use: Information & Communication, Real Estate,
Human Health & Social Work and Education (descending order); 6 – 10 hours
alternative power use : Information & Communication and Education.
5.8.5 Hours of Operational Shift per Day: With reference to Table 97, only
about 3.6% of MEs operated shift duty with the sectors most disposed to shift NBS -SMEDAN NATIONAL SURVEY OF MICRO SMALL &
MEDIUM ENTERPRISES (MSMEs), 2017
53

duty expectedly being Construction, Accommodation & Food Services as
well as Manufacturing.
5.8.6 As Table 98 shows, that 7,181,469 (or 14.3
percent) MEs suffered temporary closure. Most, however, are for 1 – 3 months
(38.8 percent), followed by 4 – 6 months (22.4 percent). These account
together for about 72 percent of MEs. The remainder (i.e. about 28 percent)
reported closure for period ˃7 months, which may be a sign of stress.
5.8.7 The two (2) major reasons reported for
temporary closure (Table 99), were Sickness (28.1 percent) and Lack of Funds
(24.4 percent). Other minor reported reasons were Crisis (6.8 percent) and
Low Patronage (5.5 percent). The implication is that the current economic
downturn (and its related factors) as well as on-going communal/ethno-
religious crisis are probably the most important causative factors.
5.8.8 Table 100 shows the categorization of staff
wages and salaries of MEs for 2017. It emerged that most MEs (37,771,522
entities or 91.1 percent) reported wages and salaries bills above N100,000.00.
While this is the most consequential of the operating costs reportedly incurred
by MEs, wages per worker are still relatively low given that the referenced
total wage bill was accumulated over the period of one year. It was
to these
entities (see section 5.7.1).
5.8.9 t.c: Table 101
2017. It emerged that most MEs (38,455,723 entities or 92.7 percent) reported
implication is that many
use modern machinery and equipment. This is what is seen in the very low
ioneries; ii.
Packaging Materials; iii. Minor Repairs & Maintenance and iv. Other Expenses.
5.9 Sales and Marketing Outlook (MEs)
This section reports on SMEs sales and marketing performance.
5.9.1 Market Channels (Products) /Value of Exports: Expectedly the local
market was by far the predominant channel for MEs products (Table 102A).
This increased in relevance from “Other States” (2.9 percent), “Same State”
(14.8 percent), “Same Town” (32.2 percent) and “Same Locality” (50.1
percent). While the survey did not attempt to compare local market
channels against export, it nevertheless established a value of N57.5 billion NBS -SMEDAN NATIONAL SURVEY OF MICRO SMALL & MEDIUM ENTERPRISES (MSMEs), 2017
54

exports attainment by MEs, and the sectors most active in exports amongst
MEs (Table 102B).
5.9.2 E-commerce by Sector: Table 83, shows the distribution of MEs running
online businesses across economic sectors. A total of 753,109 MEs (or 1.8
percent), across all sectors, had set up online businesses/ shops. While MEs lag
far behind in embracing the opportunities available for business online, the
current active sectors were Wholesale/Retail Trade, Other Services and
Manufacturing (descending order).
5.9.3 From Table 103, it emerges that most
MEs (26,440,176 entities or 63.8 percent) reported monthly average turnover
˂N50,000.00. This was followed by the turnover bracket N50,000.00 –
N100,000.00 (8,556,105 entities or 20.6 percent). Together, these two lowest
generally low business turnover of these entities, which itself may not be
unconnected to a combination of current economic downturn and
communal/ethno-religious crisis e ).
5.9.4 Expectedly, gross earnings showed a spike
earning is expectedly a combination of original cost of the products and
m the
earlier trend in section 5.9.3. Consequently, as seen in Table 104, all MEs
reported gross earnings above N100,000.00.
5.9.5 Exports by Sector: Unlike SMEs which reported few exportable products
and traded values, export by MEs topped N57.55billion, with the
Wholesale/Retail Trade sector leading the way (see section 5.9.1).
5.9.6 Trends Analysis: Average monthly sales turnover for 2017 (compared
with 2013) showed general appreciation (Table 105). Appreciation was
A similar trend
percent (2013).
5.10 Government Policies/SMEDAN Awareness (MEs)
This section reports on SMEs perception of Government policies as well as
their rating of SMEDAN’s intermediation effort.
5.10.1 Most Favourable/Unfavourable Government Policies: In a descending
order (Table 106
policies/interventions that affect them most favourably, viz: Road NBS -SMEDAN NATIONAL SURVEY OF MICRO SMALL &
MEDIUM ENTERPRISES (MSMEs), 2017
55

Maintenance (20.3 percent), Environmental Sanitation (20.2 percent),
Fertilizer Subsidy (7.0 percent), Jobs Creation (6.8 percent), Political Stability
policies/interventions that affect them most unfavourably (Table 107), were
as follows: High Fuel Price (19.3 percent), Taxes (12.8 percent), Power Supply
(10.1 percent), Demolition of Illegal Structures (7.4 percent) and Trade Permits
(6.3 percent).
5.10.2 Awareness of SMEDAN: Awareness of SMEDAN, as a corporate
entity was reported at 15.7 percent (or 6,521,161 MEs) at Table 108. Across
States, the following
awareness of SMEDAN, viz: Lagos, Delta, Kaduna, Rivers and Kogi
(descending order). However, intra-
rcent), Sokoto (33.2
percent), Delta (32.8 percent), Kogi (25.6 percent) and Kaduna (25.2
percent). Conversely, the lowest intra-
were reported for the following States, viz: Kano (2.9 percent), Nasarawa (3.7
percent), Borno (4.0 percent), Kwara (4.9 percent) and Taraba (5.1 percent).
5.10.3 Awareness of SMEDAN by Source of Information: In order of
importance, Table 109, rated the most important media sources from which
MEs obtained information about SMEDAN as Radio (55.7 percent) and
Person-to-Person (43.7 percent). Others are Television (27.8 percent),
Television (27.8 percent), Newspapers (9.4 percent) and Internet/Social
media (4.2 percent).
5.10.4 Major Challenges of Business Development: Tables 110 presents
major challenges of business development. Of these, it emerged that most
MEs (90.5 percent) rated Lack of Access to Finance as the most important
encumbrance. This was followed by Lack of entrepreneurship/vocational
training (24.8 percent), Lack of workspace (21.8 percent), Weak Infrastructure
(19.4 percent) amongst others. Also, consistent with measures offered by
SMEDAN to provide remediation, Table 111 shows that MEs rated the
following as most relevant measures, viz: Facilitating Access to Finance (65.8
percent), Entrepreneurship Training (44.7 percent), Access to Markets (33.9
percent), Vocational Skills Upgrading (26.2 percent) and Business
Counselling/Monitoring (15.8 percent). Note, however, that such SMEDAN
services as Advocacy and Enterprise Clustering (which responds to Weak
Infrastructure) were inadvertently missing from the list of measures.
5.10.5 Table 112, shows that 164,336
Proprietors (i Similarly, these
MEs (Table 113), rated Entrepreneurship Training (48.3 percent), as the NBS -SMEDAN NATIONAL SURVEY OF MICRO SMALL & MEDIUM ENTERPRISES (MSMEs), 2017
56
Facilitating access to Finance (29.6 percent), Vocational Skills Upgrading
(28.0 percent) and Facilitating Access to Markets (20.3 percent).
5.10.6
114
Kogi, Lagos, Rivers, Kaduna and Delta (descending order).Conversely, 16
SMEDAN, as a Federal Agency, is continually
mindful of ensuring national spread for its services.
5.10.7 Trends Analysis: Compared to the reported situation in 2013 (15.7
percent), awareness of SMEDAN, as a corporate entity, amongst MEs
remained generally steady at 15.7 percent in 2017 (Table 115).
SMEDAN awareness, viz: Kogi (528.98 percent), Enugu (416.40 percent), Ekiti
(243.71 percent), Anambra (156.37 percent), Edo (122.96 percent), Delta
(110.77 percent) and Ogun (110.31 percent). Similarly, the two (2) major
Government policies affecting enterprise development remained generally
steady over the comparative period as follows, viz: Favourable : Road
maintenance and Environmental sanitation (Table 116); Unfavourable : Power
supply and Taxes (Table 117).
5.11 PRO- – Pro-
As earlier stated pro-establishment (or transitional) micro enterprises would be
considered, separately, under this sub-heading, distinct from the general
treatment of micro enterprises in sections 5.1 – 5.10 above. Pro-establishment
micro enterprises (Pro-MEs), as a new sub-class, comprise micro enterprises
which are formally registered and/or offer paid wages (or salaries) to their
employees. The latter is distinguished from unpaid family hands and/or
apprentices or “journeymen”, commonly associated with the informal sector.
Apart from offering opportunity to better understand these entities, their
separate recognition here also deals with an identi -set for
formal sector enterprises (see Section 4.0 -
enterprises.
In 2017, the two (2) categories of pro-establishment micro enterprises (Pro-
MEs) are as follows, viz:
i. Pro-MEs Offering Paid Wages: A total of 3,794,981 entities were
surveyed. Of these, 251,273 (or 6.6 percent) were also formally
registered.
ii. Pro-MEs that were Formally Registered: A total of 854,446 entities
were surveyed. However, of these, 251,273 (or 29.4 percent) also
offered paid wages.
NBS -SMEDAN NATIONAL SURVEY OF MICRO SMALL & MEDIUM ENTERPRISES (MSMEs), 2017
57

Consequently, 4,398,154 Pro-MEs were surveyed, across the two (2)
categories in 2017. While 3,543,708 entities (or 80.6 percent) offered paid
wages only, another 603,173 entities (13.7 percent) were formally registered
only, with 251,273 entities (or 5.7 percent) being both formally registered and
offering paid wages (Fig. 28).
Fig. 28: Pro-Establishment Micro Enterprises
5.11.1 Pro-Establishment Micro Enterprises Distribution by States
Table 118, shows the total number of Pro-MEs as well as their distribution
across 36 States and FCT (based on the dominant Pro-MEs Offering Paid
Wages only). States with the highest distribution of Pro-MEs are Oyo State
(402,886 entities or 10.6 percent), Rivers State (318,723 entities or 8.4 percent),
Delta State (294,218 entities or 7.7 percent), Osun State (288,780 entities or 7.6
percent), Ondo State (273,256 entities or 7.2 percent) and Akwa Ibom State
(261,360 entities or 6.9 percent). Conversely, Jigawa State (13,085 entities or
0.3 percent), Kwara State (14,781 entities or 0.4 percent), Adamawa State
(21,966 entities or 0.6 percent), Enugu State (26,086 entities or 0.7 percent)
and Ogun State (28,005 entities; or 0.7 percent) bring up the rear.
5.11.2 Pro-Establishment Micro Enterprises by Sector: Table 119, shows the sixteen (16) economic sectors recognised under pro-establishment micro enterprises (based on the dominant Pro-MEs Offering Paid Wages only) in
(31.3 percent), Wholesale/Retail trade (22.4 percent), Other Services (15.3 percent), Manufacturing (14.1 percent) and Accommodation & Food Services (5.0 percent). Together, these account for 88.1 percent of all Pro-
section 4.2. 2). However, as also seen from the Table, the following were the marginal economic sectors, viz: Real Estate Activities, Education, Arts, Entertainment & Recreation, Water Supply, Sewerage, Waste Management &
NBS -SMEDAN NATIONAL SURVEY OF MICRO SMALL & MEDIUM ENTERPRISES (MSMEs), 2017
58

Remediation Activities Administrative & Support Services and Mining & Quarrying (decreasing order). 5.11.3 Pro-Establishment Micro Enterprises by Business Registration Compliance: Table 120, shows the distribution of CAC-registered Pro-MEs across States (based on the dominant Pro-MEs Offering Paid Wages only). A total of 251,273 entities (or 6.6 percent) of all Pro-MEs were reportedly registered with the CAC. However, these registered Pro-MEs were 29.4 percent of the total 854,446 registered MEs reported in section 5.2.3.4. It also emerged from same Table, that registered Pro-MEs occurred the most in Rivers State (55,354 entities or 22.0 percent). This was followed by the following States, viz: Delta (32,568), Lagos (23,631), Akwa-Ibom (21,901) and Borno (11,159). Conversely, no ME was registered with CAC in twelve (12) states namely Adamawa, Balyelsa, Benue, Gombe, Imo, Jigawa, Katsina, Kebbi, Kwara, Taraba, Yobe and Zamfara.
5.11.4 Pro-Establishment Micro-Enterprises – General Characteristics:
Pro-establishment micro enterprises (Pro-
comprising micro enterprises which are formally registered and/or offer paid
wages to their employees (see section 5.11). In addition, the following
characteristics may also generally apply, including:
i. Pro-
is often a simple (or more elaborate), own/rented covered space in a
market, shopping mall, corner shop etc. This separates them from the
“footloose” (or migratory) tendency of other MEs.
ii. Business Name: Pro-MEs generally have a business name. While this may/ may not yet be formally registered, they are known by this name in their local area, and are may eventually be registered under this name, as they attain legal status compliance.
iii. While Pro-MEs may/may not yet be captured into the formal tax net, they nevertheless pay some local levy/ies or Rate within their area of operation, at the least. The fore-going thus signal their pathway to eventual corporate citizenship.
iv. Business Records: Pro-MEs, while they may/may not yet keep proper business records, at least maintain some form of simple purchase/sale records. This is usually the inception to more proper records keeping in the future.
v. Personal Banking Relationship: Most MEs have a personal banking relationship. While this may/may not yet be with a Deposit- Money Bank, such at least exits with a MFB/MFI.
vi. Savings Culture: Most Pro-MEs have inculcated a savings culture. While this may/may not yet be with a Money Deposit Bank, such at least exists with a MFB/MFI or thrift society.
vii. Access to Bank Credit: Pro-MEs, while most may not yet have accessed a formal bank credit, already at least have used some form of business credit from a MFB/MFI or thrift society.
NBS -SMEDAN NATIONAL SURVEY OF MICRO SMALL & MEDIUM ENTERPRISES (MSMEs), 2017
59

6.0
6.1 KEY FINDINGS
Small and Medium
Enterprises are summarized in the Table below with regards to the following
vital statistics, viz: Total Enterprises Number, MSMEs Contribution to
Employment, MSMEs Contribution to GDP, MSMEs Contribution to Export and
Enterprises Class Numbers.
S/No SUMMARY
1. Total Enterprises Number – MSMEs 41,543,028 2. MSMEs Contribution to Employment 76.5 percent of
total workforce (or 59,647,954
persons)
3.
MSMEs Contribution to GDP
49.78
percent
4.
MSMEs Contribution to Export
7.64
percent
5.
Enterprise Class Numbers
-
Micro Enterprise Class:
i.
Micro Enterprises -
MEs
(Operating informally
without registration and not offering paid
employment)
ii.
Pro-Establishment Micro Enterprises -
Pro-MEs
-
Small Enterprises Class:
-
Medium Enterprises Class:
41, 469,947 (or 99.8
percent)
(37,071,794
(or 89.4
percent)
(4,398,154 (or 10.6
percent)
71,288 (or 0.2 percent)
1,793 (or 0.004 percent)
Table 121: National MSMEs Status (Statistical Summary, 2017)
6.2 KEY FINDINGS – OTHERS
Other major summaries, from the 2017 national survey of MSMEs, are as
follows:
1. Largest Economic Sectors: Wholesale/Retail Trade, Agriculture, Other
Services, Manufacturing, and Accommodation & Food Services (descending
order).
NBS -SMEDAN NATIONAL SURVEY OF MICRO SMALL & MEDIUM ENTERPRISES (MSMEs), 2017
60

2. Most Favourable Government Policies/interventions: Environmental
Sanitation, Infrastructure (especially Road maintenance), Fertilizer Subsidy,
Political Stability and Power supply (descending order).
3. Most Unfavourable Government Policies/interventions: High Fuel Price
(19.3 percent), High Taxes (76.0 percent), Poor power supply/High Electricity
Tariff (79.1 percent), High Interest Rate (48.6 percent), Demolition of Illegal
Structures (7.4 percent) and Regulatory Bottlenecks (i.e. Trade Permits) at 26.5
percent (descending order).
4. Awareness of SMEDAN: Remained steady at 15.7 percent. Amongst
SMEs only, however, it increased to 63.3 percent from 50.05 percent (2013).
The most important media sources for information about SMEDAN were
reportedly Radio, Person-to-Person and Television. Others were Newspapers
and Internet/Social media.
i. States with the highest awareness of SMEDAN were: Lagos, Delta,
Kaduna, Rivers and Kogi (descending order).
ii. States with the lowest awareness of SMEDAN were: Taraba, Gombe,
Bayelsa and Ebonyi (descending order).
5. Major Challenges of Business Development: Lack of Access to Finance,
Lack of entrepreneurship/vocational training, Lack of workspace, Weak
Infrastructure and Inconsistent Government Policies (descending order).
6. Most important Remediation Measures by SMEDAN: Facilitating Access
to Finance, Entrepreneurship Training, Facilitating Access to Markets,
Vocational Skills Upgrading, Business Counselling/Monitoring and Facilitating
Access to Business Information (descending order). Note, however, that such
SMEDAN services as Advocacy and Enterprise Clustering were accidentally
not included for rating by MSMEs.
7. Entrepreneurship
Training, Facilitating access to Finance, Vocational Skills Upgrading,
Facilitating Access to Markets and Access to Business Information.
i. : SMEs only: 53.6 percent
(2013) to 59.4 percent (2017). For MEs Entrepreneurship training and
Vocational skill upgrading remain constantly higher for (2017) and
(2013) as 48.3 percent and 56.1 percent respectively.
6.3
This section is a new addition to this important national exercise, and
represents an effort to re-
the exercise based on related, independent, data-base that is recent and
reliable. In this instance, the December, 2017 records of the Corporate Affairs
Commission (CAC), the national corporate registry, offered this opportunity.
6.3.1 Micro Enterprises Numbers: Records available at the CAC d
that it had, since inception, registered 1,009,004 Business Names as at Dec, NBS -SMEDAN NATIONAL SURVEY OF MICRO SMALL &
MEDIUM ENTERPRISES (MSMEs), 2017
61

2017. In Nigeria, these invariable translate as micro enterprises. Thus,
compared to the 854,446 MEs captured as registered entities (see section
5.3.4), under this exercise, the latter returned 84.68 -
going, for all purposes, is considered high corroboration (the remainder or
25.32% of the CAC data-base may have ceased to exist or were omitted or
both). It is therefore, also, taken as a general validation of the 41,469,947 MEs
numbers obtained from the 2017 national survey of micro small and medium
enterprises. Consequently, only about 2.0% of MEs (compared with 71.9% of
SMEs) were legal status-compliant.
6.3.2 Small and Medium Enterprises Numbers: From same records (Dec,
2017), 1,597,958 Limited Liability
Companies, since inception. Unlike Business Names which are invariably
micro enterprises, Limited Liability Companies, here referenced, may instead
belong to all enterprise classes in Nigeria. Nevertheless, using the Rule of
Thumb, it may be deduced that while the vast majority (up to 60%) are small
and medium enterprises (SMEs), micro enterprises may reach 33%, leaving
probably another 7% as large enterprises. If the 84.68% affirmation level (see
section 6.3.1 above) is super-imposed on the 60% of the CAC database
expected to be SMEs, a projected count of 811,890 SMEs in Nigeria emerges.
This is a far cry from the 52,515 SMEs captured as registered from this survey,
and also the total of 73,081
issue about the sensitivity of the Establishment Frame used in implementing
the complementary survey of small and medium enterprises. The latter may
regularly obtained for the SMEs component only (compared with about 2%,
for the above-
attributed to SMEs, the seeming insensitivity of the Establishment Frame, under
obtained from this national survey.
41,543,028 MSMEs, 41, 469,947 MEs and 73,081 SMEs, outcome of this exercise,
in the light of afore-mentioned validation are fair and acceptable within
reasonable limit of error. In the future, however, every effort must be made to
w emergent hypothesis that the numbers of SMEs in
Nigeria exceed 73,081, and may indeed approach 811,890 entities.
6.4 –
6 -Man Business” Class Proposed: With the exclusion of pro-
establishment micro enterprises, the vast majority of enterprises captured
from this exercise, that is 37,071,794 entities (or 89.4 percent) of the total 41,
543,028 MSMES are more appropriately termed income generating activities . NBS -SMEDAN NATIONAL SURVEY OF MICRO SMALL & MEDIUM ENTERPRISES (MSMEs), 2017
62

Recognising them as such, would also help to separate them from actual
micro, small and medium enterprises (MSMEs). The general characteristics of
the former (i.e. income generating activities ) include the following, viz:
i. Nil (0.0 percent) business registration (or legal status compliance),
ii. Mostly, simple, necessity, one-man businesses, as gleaned from the
˃80 percent
being SSS-equivalent or less), salaried employees are unknown
(100.0 percent), while another ≥55 percent neither have informal
employees (i.e. apprentices/ family hands etc.), who incur less than
and have no
need for power usage (70.4 percent).
iii. Predominantly, have start-up capital/monthly turn-over of ≤ N100,
000 (85 percent), and are limited to personal savings/family as
source of business capital (85 percent).
iv. Market channels are limited to same town (82.3 percent), with nil
(0.0 percent) exports.
v.
Wholesale/Retail Trade, Agriculture, Other Services, Manufacturing,
and Accommodation & Food Services (91.2 percent).
It is recommended that a separate category, viz: “One-man Business” be
recognised to accommodate these entities. These businesses are not only
structured around their owners but their objective, apparently, is also creating
employment/wealth for the owner and his/her immediate family. Where they
engage informal employees (≥54 percent, do not), these are temporary in
nature, often apprentices, journeymen and family hands who are invariably
“paid in kind”, and move on in time once the objective for the “relationship”
is meet. This must be differentiated from the “Sole Proprietor” who may offer
salaried employment to 1 - 9 employees (micro enterprise class), and as such
is structured to create employment and/or wealth both for the owner and
employees. Most artisans, local food processors, local farmers (market
vegetable gardeners, animal husbandry-men/women etc.), sundry service
providers/vendors, and shop keepers belong to this One-Man Business
category, which constitute the well-known “informal sector” (excluding,
subsistence agriculture which was not captured in this exercise).
They are in a sense emerging businesses (i.e. income-generating activities),
which have not matured to qualify as enterprises. The Brazilian taxonomy for
small businesses incorporates this proposed “One-Man Business” category.
However, for it to be effective, on
MSMEs is required to recognise this additional non-enterprise category, from
the current micro enterprise class.
6.4.2 A New Dual Criteria for Qualifying Enterprises Proposed: The lack of
clarity as to qualify as an enterprise before now, had created the unfortunate NBS -SMEDAN NATIONAL SURVEY OF MICRO SMALL &
MEDIUM ENTERPRISES (MSMEs), 2017
63

situation in the fore-going section (i.e. 6.4.1) where ordinary income
generating activities were confused as enterprises. Consequently, a dual
s hereby proposed for an enterprise as follows, viz:
It shall, in addition to satisfying the basic requirement of generating
employment and/ or wealth for its owner(s),
i. Create “paid” (or salaried) employment for at least 1 person, and/or
ii. Be formally registered, as a corporate entity.
Where a disagreement occurs in recognising an enterprise using the above
dual criteria, formal registration shall override. Consequently, where an
enterprise meets the registration criterion, it shall not be queried for salaried
employment (i.e. whether offering salaried or informal employment shall not
enterprise is not formally registered. Support for the fore-going, is see from
section 5.11, which clearly shows that while 80.6 percent (or 3,543,708 Pro-
MEs) offered “paid wages only”, 13.7 percent (or 603,173 Pro-MEs) were
“formally registered only”. An additional 5.7 percent (or 251,273 Pro-MEs)
were both “formally registered and offered paid wages” out of 4,398,154
entities evaluated. Also, see section 4.
SMEs were not registered.
Finally, it should be emphasized that the above dual criteria does not seek to
replace an existing one (i.e. employment size/assets base) for setting
enterprise class limits. Instead, this former pre-
as an enterprise before assigning it a class using the latter. Like the previous
recommendation for a “One-Man Business” class, the proposed enterprise
to be effective.
6.4.3 In the light of the
recommendations in the fore- ed), only the so-
called, Pro-Establishment micro enterprises (see section 5.11), would now
constitute the micro enterprise class. For one, they meet the proposed dual
criteria for recognising enterprises. They, also, meet the existing dual class
criteria for micro enterprises. Together they make up 4,398,154 entities (see
section 5.11), and their general characteristics include the following, viz:
i. 86.3 percent offer salaried (or “paid”) employment (with balance
13.7 percent offering only informal employment),
ii. 19.4 percent have formal business registration (with 97.1 percent
being Sole Proprietors),
iii. Like the earlier “One-Man Business” class, they also mostly (or 88.1
NBS -SMEDAN NATIONAL SURVEY OF MICRO SMALL & MEDIUM ENTERPRISES (MSMEs), 2017
64

Wholesale/Retail Trade, Agriculture, Other Services, Manufacturing,
and Accommodation & Food Services.
iv. o enterprise class see
section 5.11.4, dealing with Pro-establishment micro enterprises.
6.4.4 Also, in the light of section 6.4.2 (i.e.
if approved), MSMEs would henceforth count as numbers of the new micro
enterprise class (see section 6.4.3) + small enterprise class + medium
enterprise class. Consequently, based on the outcome of this edition of the
National Survey of MSMEs, these entities would collectively make up 4,471,235
(or 10.8 percent) of the total 41,543,028 captured. {However, they may
approach 5,000,000 entities, if some of the 811,890 SMEs projected in section
6.3.2 were to be (i.e. 4,471,235) enterprises represent the so
called “opportunity” MSMEs, which alone can serve the national aspiration of
jobs/wealth creation for the sub-sector. They also compare well with their
Chinese equivalent of about 50,000,000 MSMEs (with compensation made for
the economies). Yet if anything, the
latter presents a smarter MSMEs count for Nigeria.
NBS -SMEDAN NATIONAL SURVEY OF MICRO SMALL & MEDIUM ENTERPRISES (MSMEs), 2017
65

APPENDICES TABLE 1
STATE NUMBER PERCENT
ABIA 2,342 3.2
734 1.0
-IBOM 1,887 2.6
ANAMBRA 1,504 2.1
2,241 3.1
300 0.4
BENUE 1,811 2.5
BORNO 538 0.7
CROSS RIVER 1,456 2.0
DELTA 1,524 2.1
EBONYI 2,433 3.3
EDO 2,677 3.7
EKITI 928 1.3
ENUGU 1,432 2.0
GOMBE 904 1.2
IMO 2,020 2.8
2,370 3.2
KADUNA 2,650 3.6
KANO 2,441 3.3
1,367 1.9
KEBBI 815 1.1
KOGI 1,027 1.4
1,416 1.9
8,395 11.5
2,604 3.6
NIGER 2,121 2.9
OGUN 2,465 3.4
ONDO 2,363 3.2
OSUN 3,007 4.1
6,131 8.4
1,574 2.2
1,658 2.3
SOKOTO 852 1.2
TARABA 930 1.3
102 0.1
1,236 1.7
2,825 3.9
TOTAL 73,081 100
NBS -SMEDAN NATIONAL SURVEY OF MICRO SMALL & MEDIUM ENTERPRISES (MSMEs), 2017
66

TABLE 2
2017 2013 2010
Small Medium Total Small Medium Total Small Medium
ABIA 2,289 53 2,342 1769 40 1809 526 7 533
726 8 734 235 11 246 -
IBOM 1,882 5 1,887 898 195 1093 275 39 314
ANAMBRA 1,455 49 1,504 1620 117 1737 656 81 737
BAUCHI 2,209 32 2,241 2039 27 2066 497 49 546
BAYELSA 297 3 300 354 72 426 134 134
BENUE 1,783 28 1,811 1146 22 1168 357 16 373
BORNO 498 40 538 131 37 168 CROSS RIVER 1,417 39 1,456 1126 168 1294 318 47 365
DELTA 1,470 54 1,524 1444 1444 576 33 609
EBONYI 2,404 29 2,433 1206 4 1210 232 12 244
EDO 2,633 44 2,677 1879 118 1997 899 29 928
EKITI 926 2 928 903 126 1029 280 5 285
ENUGU 1,404 28 1,432 812 99 911 402 30 432
GOMBE 876 28 904 1043 65 1108 225 31 256
IMO 1,976 44 2,020 1259 135 1394 534 40 574
2,360 10 2,370 1022 75 1097 217 14 231
KADUNA 2,574 76 2,650 2712 170 2882 1137 145 1282
KANO 2,298 143 2,441 7790 496 8286 1740 69 1809
KATSINA 1,335 32 1,367 1256 99 1355 464 70 534
KEBBI 809 6 815 898 91 989 221 11 232
KOGI 1,011 16 1,027 827 17 844 328 11 339
1,398 18 1,416 164 62 226 415 28 443
LAGOS 8,042 354 8,396 11044 619 11663 4146 389 4535
2,586 18 2,604 1098 22 1120 387 32 419 NIGER 2,074 47 2,121 1258 100 1358 433 46 479 OGUN 2,394 71 2,465 1690 104 1794 506 40 546 ONDO 2,324 39 2,363 1805 194 1999 596 18 614 OSUN 2,995 12 3,007 2247 25 2272 100 100 OYO 6,039 92 6,131 7468 519 7987 1300 94 1394 PLATEAU 1,533 41 1,574 2070 110 2180 613 49 662 RIVERS 1,593 65 1,658 2981 41 3022 662 60 722
691 161 852 631 210 841 562 19 581
TARABA 916 14 930 891 69 960 242 5 247
YOBE 99 3 102 150 5 155
1,222 14 1,236 577 16 593 341 341
FCT
2,750
75
2,825
2244
446
2690
427
80
507
Total
71,288
1,793
73,081
68,168
4,670
72,838 21,264
1,654
22,918
NBS -SMEDAN NATIONAL SURVEY OF MICRO SMALL & MEDIUM ENTERPRISES (MSMEs), 2017
67

TABLE 3: NUMBER OF S
2017
SMALL MEDIUM PERCENT 16,322 772 17094 23.4
MINING & QUARRYING 172 28 200 0.3
SERVICES 5,940 168 6,108
8.4
386 0 386 0.5
12,889 241 13,130 18.0
CONSTRUCTION 423 83 506 0.7
699 49 748 1.0
573 48 621
0.8
19,587 132 19,719 27.0
SERVICE 956 15 971
1.3
188 1 189
0.3
1,924 34 1,958 2.7
9 0 9
0.0
1,073 0 1,073 1.5
7,377 219 7,596 10.4
2,772 1 2,773
3.8
71,288 1,793 73,081 100.0
NBS -SMEDAN NATIONAL SURVEY OF MICRO SMALL & MEDIUM ENTERPRISES (MSMEs), 2017
68

TA
BL
E 4
SOLE
PRIV
ATE
LIM
ITED
OR
GA
NIS
ATI
ON
OTH
ERS
Nu
mb
er
Nu
mb
er
Nu
mb
er
Nu
mb
er
Nu
mb
er
Nu
mb
er
N
um
ber
11,5
92
67.8
535
3.1
4,47
3
26.1
6
315
2
7
0.0
172
1.0
17,0
94
MIN
ING
& Q
UA
RR
YIN
G
124
62.0
0
0.0
74
37.0
0
0
0
0.0
2
1.0
200
3,
948
64.6
484
7.9
1,49
5
24.5
3
0
21
0.3
157
2.6
6,10
8
AG
RIC
ULT
UR
E 28
6
74.1
25
6.5
55
14.2
12
3
1
0.3
7
1.8
386
WH
OLE
SALE
/RET
AIL
TR
AD
E 8,
199
62.4
659
5.0
4,11
2
31.3
61
0
27
0.2
72
0.5
13,1
30
29
9
59.1
12
2.4
194
38.3
0
0
0
0.0
1
0.2
506
54
5
72.9
6
0.8
176
23.5
19
3
1
0.1
1
0.1
748
INFO
RM
ATI
ON
AN
D
439
70.7
49
7.9
104
16.7
6
1
1
0.2
22
3.5
621
EDU
CA
TIO
N 14
,573
74
481
2
1,53
9
8
89
0
3,00
1
15
36
0
19,7
19
AD
MIN
ISTR
ATI
VE
AN
D S
UPP
OR
T
740
76
44
5
157
16
12
1
1
0
17
2
971
AR
TS, E
NTE
RTA
INM
ENT
AN
D
155
82
9
5
14
7
4
2
2
1
5
3
189
1,48
3
76
63
3
355
18
38
2
2
0
17
1
1,95
8
6
67
1
11
1
11
1
11
0
0
0
0
9
759
71
86
8
132
12
60
6
0
0
36
3
1,07
3
3,35
0
44
465
6
2,03
1
27
0
0
1,10
5
15
645
8
7,59
6
PRO
FESS
ION
AL,
SC
IEN
TIFI
C A
ND
1,48
8
5.3
753
2.7
302
10.8
68
2
12
0
150
5
2,77
3
TOTA
L47
,986
663,
672
515
,214
2168
81
4,18
16
1,34
02
73,0
81
NBS -SMEDAN NATIONAL SURVEY OF MICRO SMALL & MEDIUM ENTERPRISES (MSMEs), 2017
69

MALE FEMALE
Number 2017
Number 2013
Number 2017
Number 2013
Number 2017
Number 2013
11,550
8,089
1,042
688
12,592
8,777
3,815
43.46588
112
174
12
30
124
204
-80
-39.2157
3,161
4,075
787
1,108
3,948
5,183
-1,235
-23.8279
AGRICULTURE
256
1,165
30
87
286
1,253
-967
-77.1748
6,669
9,664
1,529
1,261
8,198
10,925
-2,727
-24.9611
282
209
17
0
299
209
90
43.0622
TRANSPORT & STORAGE
500
460
44
0
543
460
83
18.04348
INFORMATION AND COMMUNICATION
390
280
49
34
439
314
125
39.80892
EDUCATION
8,689
12,409
5,884
7,811
14,573
20,220
-5,647
-27.9278
ADMINISTRATIVE AND SUPPORT SERVICE
631
2,049
109
440
740
2,489
-1,749
-70.2692
142
200
13
23
154
223
-69
-30.9417
984
2,204
494
592
1,478
2,796
-1,318
-47.1388
SUPPLY,
MANAGEMENT AND
6
21
0
1
6
22
-16
-72.7273
786
0
786
2,937
394
3,331
330 158 488
37,424 40,998 10,562 12,076 47,986 53,074
NBS -SMEDAN NATIONAL SURVEY OF MICRO SMALL & MEDIUM ENTERPRISES (MSMEs), 2017
70

/2013
ECONOMIC SECTOR
SMALL 2017
SMALL 2013
MEDIUM 2017
MEDIUM 2013
MANUFACTURING
16,322
13,109
772
528
MINNING & QUARRYING
172
213
28
32
ACCOMMODATION & FOOD SERVICES
5,940
6,953
168
155
386
1,389
0
146
12,889
14,870
241
249
CONSTRUCTION
423
487
83
65
TRANSPORT & STORAGE
699
800
49
39
573
437
48
30
EDUCATION
19,587
24,034
132
3,250
ACTIVITIES
956
2,883
15
99
RECREATION
188
245
1
15
1,924
2,724
34
62
9
23
0
1
1,073
0
7,377
219
TECHNICAL WORKS2,772 1
Total 71,288 68,168 1,793 4,670
NBS -SMEDAN NATIONAL SURVEY OF MICRO SMALL & MEDIUM ENTERPRISES (MSMEs), 2017
71

TABLE 7:
NUMBER
PERCENT
47,986
65.7
3,672
5
PRIVATE LIMITED
15,214
20.8
COOPERATIVE
688
0.9
FAITH BASED ORGANISATION
4,181
5.7
1,340
1.8
TOTAL
73,081
100
HIGHEST EDUCATIONAL LEVEL
NO OF SOLE
NO EDUCATION
1,202
2.5
300
0.6
PRIMARY
1,900
4.0
JSS
1,142
2.4
1,047
2.2
SSS
7,587
15.8
NCE/ND/NURSING
6,123
12.8
B.SC/B.A/HND
17,751
37.0
M.SC/M.A/M.ADMIN
6,867
14.3
2,437
5.1
OTHERS (SPECIFY)
1,630
3.4
47,986
100.0
NBS -SMEDAN NATIONAL SURVEY OF MICRO SMALL & MEDIUM ENTERPRISES (MSMEs), 2017
72

TABLE 11
TOTAL NO OF
35,198 48.2
40,640 55.6
53,090 72.6
24,448 33.5
44,563 61.0
NIGERIA CUSTOM SERVICE (NCS) 29,237 40.0
(NIS) 26,937 36.9
17,810 24.4
31,412 43.0
17,858 24.4
STATE
TOTAL NUMBER OF ESTABLISHMENT Number
SOLE PROPRIETORSHIP 31,192 65.0 47,986
PARTNERSHIP 2,906 79.1 3,672
PRIVATE LIMITED LIABILITY COMPANY 13,616 89.5 15,214
COOPERATIVE 460 66.9 688
ORGANISATION 3,411 81.6 4,181
930 69.4 1,340
NATIONAL 52,515 71.9 73,081
NBS -SMEDAN NATIONAL SURVEY OF MICRO SMALL & MEDIUM ENTERPRISES (MSMEs), 2017
73

TABLE 13
STATE
TOTAL NUMBER OF ESTABLISHMENT NUMBER
ABIA 1,932 82.5 2,343
713 97.1 734 -IBOM 1,320 70 1,887
ANAMBRA
1,194
79.4
1,504
1,134
50.6
2,241
213
71
300
BENUE
1,153
63.7
1,811
BORNO
442
82.2
538 CROSS RIVER
1,070
73.5
1,456
DELTA
838
55.0
1,524 EBONYI
1,823
74.9
2,433
EDO
1,439
53.8
2,677 EKITI
510
55.0
928
ENUGU
1,283
89.6
1,432
GOMBE
480
53.1
904
IMO
1,760
87.1
2,020
2,341
98.8
2,370
KADUNA
2,377
89.7
2,650
KANO
1,740
71.3
2,441
705
51.6
1,367
KEBBI
490
60.1
815
774
75.4
1,027
1,415
99.9
1,416
LAGOS
6,364
75.8
8,395
1,979
76
2,604
NIGER
1,365
64.4
2,121
OGUN
1,418
57.5
2,465
ONDO
1,294
54.8
2,363
OSUN
1,581
52.6
3,007
4,038
65.9
6,131
PLATEAU
1,385
88
1,574
RIVERS
1,030
62.1
1,658
691
81.1
852
794
85.4
930
77
75.5
102
ZAMFARA
670
54.2
1,236
FCT
2,685
95
2,825
NATIONAL
52,517
71.9
73,081
NBS -SMEDAN NATIONAL SURVEY OF MICRO SMALL & MEDIUM ENTERPRISES (MSMEs), 2017
74

TABLE 14: TOTAL
MALE FEMALE PERCENT
ABIA 38,817 53,925 92,742 3.2 ADAMAWA 22,413 6,536 28,949 1.0 AKWA-IBOM 28,213 46,546 74,759 2.6 ANAMBRA 19,840 39,776 59,616 2.1
66,738 21,665 88,403 3.1
4,669 7,214 11,883 0.4
BENUE
39,975 31,625 71,600 2.5 BORNO
15,037
6,198
21,234
0.7
31,592
25,979
57,571
2.0
28,618
31,694
60,311
2.1
EBONYI
41,798
54,531
96,329
3.3
EDO
61,024
44,793
105,817
3.7
EKITI
21,264
15,417
36,681
1.3
ENUGU
29,020
27,626
56,646
2.0
GOMBE
27,717
7,935
35,652
1.2
IMO
26,970
53,095
80,065
2.8 JIGAWA
31,514
9,476
40,990
1.4 KADUNA
77,076
48,663
125,739
4.4 KANO
113,293
35,860
149,153
5.2
49,034
4,797
53,830
1.9
KEBBI
27,625
4,487
32,112
1.1
29,405
11,122
40,527
1.4
KWARA
31,607
24,372
55,980
1.9
182,246
149,697
331,943
11.5
56,135
46,833
102,968
3.6
NIGER
48,413
35,425
83,838
2.9
OGUN
56,300
41,135
97,436
3.4
ONDO
58,676
34,673
93,350
3.2
OSUN
72,322
46,495
118,818
4.1
OYO
104,095
138,660
242,756
8.4
31,406
30,863
62,269
2.2
RIVERS
30,368
35,519
65,887
2.3
19,478
14,199
33,677
1.2
22,565
14,180
36,746
1.3
YOBE
3,194
827
4,022
0.1
ZAMFARA
35,998
12,769
48,767
1.7
FCT
50,232
40,418
90,649
3.1
1,634,686
1,255,028
2,889,715
100.0
NBS -SMEDAN NATIONAL SURVEY OF MICRO SMALL & MEDIUM ENTERPRISES (MSMEs), 2017
75

TABLE 15
MALE FEMALE TOTAL PERCENT
133,879 76,527 210,406 7.3
ADMINISTRATIVE AND SUPPORT
15,161 6,569 21,730 0.8
10,647 4,462 15,108 0.5
1,310 544 1,854 0.1
8,736 1,433 10,168 0.4
EDUCATION 505,197 560,558 1,065,755 36.9
270,722 341,900 612,622 21.2
INFORMATION AND COMMUNICATION
5,794 3,251 9,045 0.3
456,690 150,808 607,498 21.0
7,940 5,358 13,298 0.5
24,755 14,606 39,361 1.4
46,514 38,968 85,483 3.0
8,029 2,664 10,693 0.4
26,639 6,072 32,711 1.1
279 79 358 0.0
112,396 41,228 153,624 5.3
NATIONAL 1,634,686 1,255,028 2,889,714 100.0
NBS -SMEDAN NATIONAL SURVEY OF MICRO SMALL & MEDIUM ENTERPRISES (MSMEs), 2017
76

Table 16:
Male Female
Number Number
NO EDUCATION 81,972 69.6 35,723 30.4 117,695
PRIMARY 101,786 61.1 64,872 38.9 166,658
SCHOOL (JSS) 77,312 66.6 38,846 33.4 116,158
SCHOOL (SSS) 396,721 55.8 313,699 44.2 710,420
VOCATIONAL/COMMERCIAL 56,893 64.2 31,699 35.8 88,592
312,765 44.4 391,593 55.6 704,359
BA/B.SC/B.ED/HND 437,458 54.5 365,665 45.5 803,123
M.SC/M.A/M.ADMIN 59,465 61.0 38,031 39.0 97,496
24,317 72.9 9,042 27.1 33,359
27,802 53.6 24,052 46.4 51,854
TOTAL 1,576,492 54.6 1,313,223 45.4 2,889,714
TABLE 17: AVERAGE YEARS OF APPRENTICESHIP
NUMBER OF YEARS
TOTAL NO OF ENTERPRISES
PERCENTAGE
4,704 23.9
5,450 27.6
3,593 18.2
1,237 6.3
958 4.9
3,779 19.2
TOTAL 19,721 100.0
NBS -SMEDAN NATIONAL SURVEY OF MICRO SMALL & MEDIUM ENTERPRISES (MSMEs), 2017
77

TABLE 18 R
TOTAL NUMBER OF
NUMBER
13,055 76.4 17,094
172 86.0 200
4,117 67.4 6,108
251 65.0 386
9,839 74.9 13,130
423 83.6 506
650 86.9 748
INFORMATION AND COMMUNICATION
455 73.3 621
EDUCATION 16,222 82.3 19,719
ADMINISTRATIVE AND SUPPORT
714 73.5 971
AND
126 66.7 189
1,250 63.8 1,958
6 66.7
9
778 72.5 1,073
6,380 84.0 7,596
SCIENTIFIC AND 1,938
69.9 2,773
TOTAL 56,377 77.1 73,081
NBS -SMEDAN NATIONAL SURVEY OF MICRO SMALL & MEDIUM ENTERPRISES (MSMEs), 2017
78

TABLE 19
STATE
2017
2013
Male
Female
Total
Male
Female
Total
Change
ABIA
38,817
53,925
92,742
28,851
39,913
52,829
132.36
ADAMAWA
22,413
6,536
28,949
AKWA-IBOM
28,213
46,546
74,759
33,069
44,295
30,464
68.78
ANAMBRA
19,840
39,776
59,616
20,570
9,781
30,351
29,265
96.42
BAUCHI
66,738
21,665
88,403
26,460
30,624
57,083
31,320
54.87
BAYELSA
4,669
7,214
4,451
10,829
15,279
-3,396
(22.23)
BENUE
39,975
31,625
71,600
22,961
466
23,427
48,173
205.63
BORNO
15,037
6,198
21,234
CROSS RIVER
31,592
25,979
57,571
12,156
30,973
43,129
14,442
33.49
28,618
31,694
21,013
10,884
31,897
28,414
89.08
EBONYI
41,798
54,531
96,329
24,223
6,000
30,223
66,106
218.73
EDO
61,024
44,793
105,817
36,291
48,168
57,649
119.68
EKITI
21,264
15,417
36,681
26,548
38,483
-1,802
(4.68)
ENUGU
29,020
27,626
56,646
12,687
15,603
28,290
28,356
100.23
GOMBE
27,717
7,935
35,652
15,433
8,384
23,817
11,835
49.69
IMO
26,970
53,095
80,065
14,924
26,315
41,239
38,826
94.15
JIGAWA
31,514
9,476
40,990
17,979
9,315
27,294
13,696
50.18
KADUNA
77,076
48,663
125,739
30,645
83,487
11,607
10.17
KANO
35,860
149,153
46,941
29,343
76,284
72,869
95.52
KATSINA
49,034
4,797
53,830
23,404
35,397
18,433
52.08
KEBBI
27,625
4,487
17,492
3,027
20,520
11,592
56.49
KOGI
29,405
40,527
9,432
20,968
19,559
93.28
KWARA
31,607
24,372
55,980
1,572
10,596
12,168
43,812
360.06
LAGOS
182,246
149,697
331,943
161,017
176,406
337,423
-5,480
(1.62)
NASARAWA
56,135
46,833
102,968
19,219
20,144
39,363
63,605
161.59
NIGER
48,413
35,425
83,838
17,559
1,397
18,956
64,882
342.28
OGUN
56,300
41,135
97,436
26,725
9,548
36,273
61,163
168.62
ONDO
58,676
34,673
93,350
27,500
20,144
47,644
45,706
95.93
OSUN
72,322
46,495
39,059
16,534
55,593
63,225
113.73
OYO
104,095
138,660
242,756
147,200
59,501
206,701
36,055
17.44
PLATEAU
31,406
30,863
62,269
33,855
39,822
73,677
-11,408
(15.48)
RIVERS
30,368
35,519
65,887
46,055
43,665
89,720
-23,833
(26.56)
SOKOTO
19,478
14,199
33,677
10,761
20,144
30,905
2,772
8.97
TARABA
22,565
14,180
36,746
14,990
3,493
18,483
18,263
98.81
YOBE
3,194
827
4,022
ZAMFARA
35,998
12,769
48,767
46,565
4,192
50,757
-1,990
(3.92)
FCT 50,232 40,418 90,649 30,645 65,323 95,967 -5,318 (5.54)
Total 1,634,686 1,255,028 2,889,714 1,033,900 869,920 1,903,820 985,894 51.79
NBS -SMEDAN NATIONAL SURVEY OF MICRO SMALL & MEDIUM ENTERPRISES (MSMEs), 2017
79

TA
BLE
20
NO
NE
NO
OF
E
NT
ER
-P
RIS
E
N
UM
BE
R
N
UM
BE
R
N
UM
BE
R
N
UM
BE
R
MA
NU
FA
CT
UR
ING
6
,38
6
37
.4
6,2
47
3
6.5
4
,87
9 2
8.5
4
,86
8
28
.5
17
,09
4
MIN
ING
& Q
UA
RR
YIN
G
12
1
60
.5
13
7
68
.5 10
3 5
1.5
4
0
20
.0
20
0
3,8
29
62
.7
3,9
56
64
.8
2,3
64
38
.7
85
0
13
.9
6,1
08
10
1
26
.2
11
7
30
.3
12
6
32
.6
85
22
.0
38
6
5,5
47
42
.2
6,1
74
47
.0
4,1
90
31
.9
3,5
09
26
.7
13
,13
0
30
5
60
.3
33
5
66
.2
22
9
45
.3
75
14
.8
50
6
63
5
84
.9
43
3
57
.9
31
1
41
.6
31
0
41
.4
74
8
21
5
34
.6
21
9
35
.3
21
9
35
.3
19
1
30
.8
62
1
ED
UC
AT
ION
12
,61
0
63
.9
12
,73
4
64
.6
5,6
35
28
.6
2,3
50
11
.9
19
,71
9
AC
TIV
ITIE
S
36
3
37
.4
28
1
28
.9
34
0
35
.0
29
5
30
.4
97
1
50
26
.5
45
23
.8
42
22
.2
77
40
.7
18
9
71
1
36
.3
54
7
27
.9
43
1
22
.0
80
8
41
.3
1,9
58
MA
NA
GE
ME
NT
AN
D R
EM
ED
AT
ION
A
CT
IVIT
IES
5
55
.6
3
33
.3
2
22
.2
2
22
.2
9
87
2
81
.3
52
9
49
.3
54
7
51
.0
26
2.4
1,0
73
4,3
85
57
.7
5,0
75
66
.8
2,5
04
33
.0
98
3
12
.9
7,5
96
2,0
38
73
.5
2,1
36
77
.0
1,2
97
46
.8
37
3
13
.5
2,7
73
38
,17
3
52
.2
38
,96
8
53
.3
23
,21
9
31
.8
14
,84
5
20
.3
73
,08
1
NBS -SMEDAN NATIONAL SURVEY OF MICRO SMALL & MEDIUM ENTERPRISES (MSMEs), 2017
80

TABLE 21: USE OF BUSINESS PLANS
NO OF ENTERPRISE
WITH PLAN PERCENT
9,755 57.1 17,094
MINING & QUARRYING 160 80.0 200
3,865 63.3 6,108
AGRICULTURE 265 68.7 386
8,324 63.4 13,130
345 68.2 506
380 50.8 748
INFORMATION AND COMMUNICATION 407 65.5 621
EDUCATION 14,860 75.4 19,719
613 63.1 971
117 61.9 189
1,054 53.8 1,958
3 33.3 9
652 60.8 1,073
4,530 59.6 7,596
2,225 80.2 2,773 TOTAL 47,554 65.1 73,081
TABLE 22: BUSINESS INSURANCE
INSURED
OF ENTERPRISES
NUMBER
4,466
26.1
17,094
MINING & QUARRYING 38
19.0
200
2,893
47.4
6,108
AGRICULTURE 68
17.6
386
4,959
37.8
13,130
155
30.6
506
566
75.7
748
INFORMATION AND COMMUNICATION
124
20.0
621
EDUCATION
6,650
33.7
19,719
221
22.8
971
30
15.9
189
429
21.9
1,958
MANAGEMENT
2
22.2
9
389
36.3
1,073
3,276
43.1
7,596
2,055
74.1
2,773
TOTAL
26,322
36.0
73,081
NBS -SMEDAN NATIONAL SURVEY OF MICRO SMALL & MEDIUM ENTERPRISES (MSMEs), 2017
81

TABLE 23 THE ENTERPRISE
PROMOTIONAL CHANNELS
TOTAL NO OF
ENTERPRISES
PERCENTAGE
TELEVISION 12,089 16.5
5,933 8.1 HANDBIL DISTRIBUTION 28,328 38.8
-TO- 36,789 50.3 RADIO ADVERTISEMENT 18,033 24.7
17,541 24.0 E- 10,510 14.4
3,294
4.5
TABLE 25 SUPPORT FROM ASSOCIATIONS
TYPES OF SUPPORT TOTAL NO OF ENTERPRISES PERCENTAGE
8,739 12.0
TRAINING 26,203 35.9
11,163 15.3
10,306 14.1
MORAL
16,436
22.5
9,708
13.3
6,330
8.7
MOTIVATION
17,254
23.6
DISSEMINATION OF IMFORMATION ON 20,113
27.5
TABLE 24: BUSINESS ASSOCIATION MEMBERSHIP
NUMBER
TRADE ASSOCIATION 26,779 36.6
25,033 34.3
5,170 7.1
COOPERATIVE SOCIETY 9,254 12.7
11,105 15.2
NBS -SMEDAN NATIONAL SURVEY OF MICRO SMALL & MEDIUM ENTERPRISES (MSMEs), 2017
82

EDUCATION 16,197 22.2
ADVICE 29,145 39.9
23,707 32.4
20,261 27.7
22,793 31.2
5,549 7.6
TABLE 26: TOTAL ASSET VALUE (
2016 2017
251,664 131,811
NON- 919,927 946,143
- COMPUTER 133,212 120,078
- 13,131 83,134
- VAN 18,170 15,423
- CAR 277,420 18,515
- BUS 1,159,592 1,331,366
OFFICE FURNITURE 35,170 32,755
9,986 40,097
2,818,272 2,719,322
TABLE 27: INITIAL START-UP CAPITAL
INITIAL START-UP CAPITAL (₦'MILLION)
TOTAL NO OF
50,463 69.1
5 TO 10 6,236 8.5
11 TO 20 3,850 5.3
21 - 30 1,489 2
31 - 40 639 0.9
4,626 6.3
NOT STATED 5,778 7.9
TOTAL 73,081 100
NBS -SMEDAN NATIONAL SURVEY OF MICRO SMALL & MEDIUM ENTERPRISES (MSMEs), 2017
83

TABLE28
TOTAL CAPITAL (₦'MILLION)
TOTAL NO OF ENTERPRISES
PERCENTAGE
40,208
55.0
10 -
20
10,673
14.6
21 -
30
7,285
10.0
31 -
40
3,754
5.1
41 -
50
2,430
3.3
8,731
11.9
TOTAL
73081
100.00
TABLE 29: SOURCE OF CAPITAL
SOURCE
NUMBER
PERCENTAGE
49,896
68.3
15,755
21.6
FAMILY SOURCE
10,540
14.4
4,854
6.6
2,409
3.3
6,321
8.6
NBS -SMEDAN NATIONAL SURVEY OF MICRO SMALL & MEDIUM ENTERPRISES (MSMEs), 2017
84

TABLE 30
TOTAL NUMBER OF SOLE
NUMBER PERCENT
ABIA 771 46.7 1,650
203
55.3
367
-IBOM
701
49.5
1,416
ANAMBRA
592
65.5
904
708
41.8
1,694
77
30.4
253
BENUE
323
27.3
1,183
BORNO
193
100
193
228
30.9
737
464
44.2
1,049
EBONYI
939
46.3
2,028
EDO
582
34
1,710
EKITI
381
41.4
921
ENUGU
408
78.6
519
GOMBE
355
66.7
532
IMO
785
88.9
883
2,143
95.6
2,241
KADUNA
680
50.3
1,353
KANO
1,367
75.2
1,818
846
79.1
1,069
KEBBI
220
37.2
591
KOGI
274
46.4
590
99
37.6
263
LAGOS
2,065
36.1
5,725
183
24.5
747
NIGER
429
26.2
1,639
OGUN
733
41.2
1,777
ONDO
483
34.2
1,413
OSUN
803
31.8
2,528
2,794
63.3
4,417
141
28.7
491
623
52.8
1,179
205
32
640
281
52.7
533
33
48.5
68
353
32.7
1,078
1,300
72.7
1,787
23,765
49.5
47,986
NBS -SMEDAN NATIONAL SURVEY OF MICRO SMALL & MEDIUM ENTERPRISES (MSMEs), 2017
85

TABLE 31: Y TYPE OF (SUMMARY)
NUMBER PERCENTAGE
COMMERCIAL BANK 67,173 91.9
MICRO FINANCE BANK 3,414 4.7
760 1
1,924 2.6
TOTAL 73,081 100.0
TABLE 32B: INITIAL START-UP CAPITAL
INITIAL START -
CAPITAL ( ₦'Million)
NUMBER OF ENTERPRISES 2017
NUMBER OF
ENTERPRISES 2013 Change % Change
Below 10 54,703 53,917 786 1.46
10 to 20 5,845
4,178
1,667 39.90 21 -
30
1,489
637
852
133.75
31 -
40
639
264
375
142.05
41 -
50
3,822
380
3,442
905.79
Above 50
804
1537
-733 (47.69)
Not Stated
5,778
-6,148 (51.55)
73,081 72,839 242 0.33
TABLE 32A: SOURCE OF CAPITAL
SOURCE OF CAPITAL
NUMBER 2017
PERCENT NUMBER 2013 PERCENT
PERSONAL SAVING
49,896
68.3
47,664
65.4
LOAN
15,755
21.6
13,031
17.9
10,540
14.4
8,759
12.0
COOPERATIVE/ESUSU
4,854
6.5
2,762
3.8
GRANTS
2,409
3.3
1,282
1.8
OTHERS
6,321
8.6
3,122
4.3
73081
100.0
72,838
100.0
NBS -SMEDAN NATIONAL SURVEY OF MICRO SMALL & MEDIUM ENTERPRISES (MSMEs), 2017
86

TABLE 33
FOREIGN BOTH
MANUFACTURING
8,390
49.1
1,335
7.8
7,369
43.1
17,094
93
46.5
25
12.5
82
41.0
200
ACCOMODATION & FOOD SERVICES
2,910
47.6
274
4.5
2,924
47.9
6,108
266
68.9
18
4.7
102
26.4
386
5,061
38.5
1,848
14.1
6,221
47.4
13,130
CONSTRUCTION
250
49.4
102
20.2
154
30.4
506
266
35.6
62
8.3
420
56.1
748
INFORMATION AND COMMUNICATION
301
48.5
77
12.4
243
39.1
621
EDUCATION
11,292
57.3
891
4.5
7,536
38.2
19,719
ACTIVITIES
453
46.7
114
11.7
404
41.6
971
106
56.1
16
8.5
67
35.4
189
OTHERS SERVICES ACTIVITIES
1,004
51.3
73
3.7
881
45.0
1,958
MANAGEMENT AND REMEDATION ACTIVITIES
1
11.1
1
11.1
7
77.8
9
483
45.0
51
4.8
539
50.2
1,073
2,302
30.3
1,088
14.3
4,206
55.4
7,596
TECHNICAL
1,484
53.5
95
3.4
1,194
43.1
2,773
34,662
47.4
6,070
8.3
32,349
44.3
73,081
NUMBER PERCENT
1- 32,606 44.6
6- 19,148 26.2
11- 10,358 14.2
16- 2,879 3.9
3,736 5.1
NONE 4,354 6.0
TOTAL 73,081 100
NBS -SMEDAN NATIONAL SURVEY OF MICRO SMALL & MEDIUM ENTERPRISES (MSMEs), 2017
87

TA
BL
E35
1
-
5 H
OU
RS
6
-
10 H
OU
RS
11
-
15 H
OU
RS
16
-
20 H
OU
RS
A
BO
VE
20 H
OU
RS
N
ON
E
ENTE
RP
RIS
ES
NU
MB
ER
N
UM
BER
NU
MB
ER
N
UM
BER
NU
MB
ER
N
UM
BER
7
,83
9
45
.9
5,1
36
3
0.0
1
,62
3
9.5
7
75
4
.5
89
4
5.2
8
27
4
.8
17
,09
4
MIN
ING
& Q
UA
RR
YIN
G
81
4
0.5
4
9
24
.5
25
1
2.5
3
4
17
.0
10
5
.0
1
0.5
2
00
1
,82
7
29
.9
1,7
74
2
9.0
1
,07
5
17
.6
61
4
10
.1
69
8
11
.4
12
0
2.0
6
,10
8
2
01
5
2.1
8
1
21
.0
20
5
.2
10
2
.6
23
6
.0
51
1
3.2
3
86
5
,09
0
38
.8
3,0
62
2
3.3
2
,92
3
22
.3
26
5
2.0
4
47
3
.4
1,3
43
1
0.2
1
3,1
30
CO
NST
RU
CTI
ON
3
37
6
6.6
1
22
2
4.1
3
0
5.9
3
0
.6
9
1.8
5
1
.0
50
6
3
24
4
3.3
1
47
1
9.7
1
07
1
4.3
8
9
11
.9
22
2
.9
59
7
.9
74
8
INFO
RM
ATI
ON
AN
D
CO
MM
UN
ICA
TIO
N
26
1
42
.0
22
0
35
.4
67
1
0.8
4
4
7.1
1
3
2.1
1
6
2.6
6
21
EDU
CA
TIO
N
10
,31
9
52
.3
4,5
85
2
3.3
2
,55
5
13
.0
13
9
0.7
6
75
3
.4
1,4
46
7
.3
19
,71
9
47
8
49
.2
30
0
30
.9
80
8
.2
63
6
.5
14
1
.4
36
3
.7
97
1
REC
REA
TIO
N
91
4
8.1
4
2
22
.2
27
1
4.3
6
3
.2
8
4.2
1
5
7.9
1
89
1,0
89
5
5.6
4
66
2
3.8
1
22
6
.2
60
3
.1
87
4
.4
13
4
6.8
1
,95
8
2
22
.2
5
55
.6
1
11
.1
1
11
.1
0
0.0
0
0
.0
9
6
03
5
6.2
3
81
3
5.5
3
1
2.9
4
6
4.3
0
0
.0
12
1
.1
1,0
73
2,7
54
3
6.3
1
,90
3
25
.1
1,3
81
1
8.2
6
55
8
.6
78
6
10
.8
11
7
1.5
7
,59
6
1,3
10
4
7.2
8
75
3
1.6
2
91
1
0.5
7
5
2.7
5
0
1.8
1
72
6
.2
2,7
73
32,6
06
44.6
19
,148
26
.2
10,3
58
14.2
2,
879
3.
9
3,7
36
5.1
4,
354
6.
0
73,0
81
NBS -SMEDAN NATIONAL SURVEY OF MICRO SMALL & MEDIUM ENTERPRISES (MSMEs), 2017
88

TABLE 37
ENTERPRISE WITH OPERATING SHIFT
TOTAL NUMBER OF ENTERPRISENUMBER PERCENT
2,106
12.3
17,094
48
24.0
200
4,295
70.3
6,108
44
11.4
386
3,724
28.4
13,130
41
8.1
506
98
13.1
748
INFORMATION AND COMMUNICATION
36
5.8
621
EDUCATION
2,182
11.1
19,719
112
11.5
971
12
6.3
189
92
4.7
1,958
0
0.0
9
21
2.0
1,073
5,825
76.7
7,596
96 3.5 2,773
TOTAL 18,732 25.6 73,081
TABLE 38: MONTHS OF TEMPORARY CLOSURE
NUMBER OF MONTHS TOTAL NO OF ENTERPRISES
PERCENTAGE
1-3 MONTHS 5,105 48.9
4-6 MONTHS 2,396 22.9
7-9 MONTHS 894 8.6
10-12 MONTHS 1,041 10
1,012 9.7
TOTAL 10,447 100
TABLE 36
HOURS NUMBER PERCENT
1- 2,546 13.6
5- 10,118 54.0
9- 4,967 26.5
13- 130 0.7
20- 971 5.2
TOTAL 18,732 100.0
NBS -SMEDAN NATIONAL SURVEY OF MICRO SMALL & MEDIUM ENTERPRISES (MSMEs), 2017
89

TABLE 39:
TOTAL NO OF ENTERPRISES PERCENTAGE
2,412 23.1
DEMOLITION
1,009
9.7
4,401
42.1
551
5.3
1,783
17.1
485
4.6
3,157
30.2
930
8.9
POLICY
1,439
13.8
CRISIS
1,679
16.1
VISITATION
83
0.8
2,696
25.8
430
4.1
632
6
TURN ROUND MAINTENANCE
1,286
12.3
543
5.2
633
6.1
860
8.2
TOTAL NUMBER OF ENTERPRISE WITH CLOSURE
10,447
TABLE40: MARKET CHANNEL OF PRODUCT(S) MARKET CHANNELS NUMBER
51,554 70.5
53,115 72.7
SAME STATE 52,905 72.4 NIGERIA ONLY 45,849 62.7 AFRICA ONLY 1258 1.7
1,501 2.1
1,388 1.9 TOTAL NUMBER OF ENTERPRISE 73,081
NBS -SMEDAN NATIONAL SURVEY OF MICRO SMALL & MEDIUM ENTERPRISES (MSMEs), 2017
90

TABLE 41: E-
NO OF ENTERPRISE
WITH E-COMMENCE
NUMBER OF ENTERPRISENo.
%
2,763
16.2
17,094
MINING & QUARRYING
22
11.0
200
1,643
26.9
6,108
45
11.7
386
2,432
18.5
13,130
43
8.5
506
229
30.6
748
INFORMATION AND COMMUNICATION
219
35.3
621
EDUCATION
4,619
23.4
19,719
266
27.4
971
42
22.2
189
473
24.2
1,958
0
0.0
9
218
20.3
1,073
1,270
16.7
7,596
890 32.1 2,773
TOTAL
15,176 20.8
TABLE 42
NUMBER TOTAL NO OF ENTERPRISES PERCENTAGE
18,016 24.7
10 - 20 14,873 20.4
21 - 30 4,324 5.9
31 - 40 1,686 2.3
41 - 50 3,590 4.9
8,370 11.5
22,221 30.4
TOTAL 73081 100.0
73,081
NBS -SMEDAN NATIONAL SURVEY OF MICRO SMALL & MEDIUM ENTERPRISES (MSMEs), 2017
91

Table 43 /
ECONOMIC SECTOR 2017 2013
MANUFACTURING 16,804,593 7,612,399
MINNING & QUARRYING 2,395,875 4,949,013
ACCOMMODATION & FOOD SERVICES 27,503,550 3,016,532
125,801,443
22,928,087 10,406,487
CONSTRUCTION 44,635,672 29,408,581
TRANSPORT & STORAGE 9,506,204 13,652,849
INFORMATION AND COMMUNICATION 8,770,143 9,450,967
EDUCATION 3,620,161 2,243,500
9,125,516 10,345,168
2,586,232 5,788,754
5,285,175 2,265,854
1,741,250 2,282,024
1,808,001
23,714,355
24,814,971
Total
280,227,836 227,225,584
NBS -SMEDAN NATIONAL SURVEY OF MICRO SMALL & MEDIUM ENTERPRISES (MSMEs), 2017
92

TABLE 44 EXPORT
NO OF ENTERPRISE WITH EXPORTABLE
NUMBER OF ENTERPRISE NUMBER %
1176 6.9 17,094 MINING & QUARRYING 21 10.5 200
124 2.0 6,108
13 3.4 386
540 4.1 13,130
13 2.6 506
341 45.6 748 INFORMATION AND COMMUNICATION
36
5.8
621
EDUCATION
95
0.5
19,719
14
1.4
971
ARTS, ENTERTAINMENT AND
5
2.6
189
24
1.2
1,958
2
22.2
9
0
0.0
1,073
93
1.2
7,596
32
1.2
2,773
TOTAL 2,529 3.5 73,081
NBS -SMEDAN NATIONAL SURVEY OF MICRO SMALL & MEDIUM ENTERPRISES (MSMEs), 2017
93

94
TABLE 45 NAIRA)
21 - 30 31 - 40 ABOVE 40 TNUMBER
NUMBER
NUMBER
NUMBER
NUMBER
MANUFACTURING
828
70.4
78
6.6
0
0
33
2.8
237
20.1
1176
MINING & QUARRYING
21
100
0
0
0
0
0
0
0
0
21
102
82.3
22
17.7
0
0
0
0
0
0
124
10
72.7
0
0
0
0
0
0
4
27.3
13
TRADE 433
80.2
55
10.2
0
0
0
0
52
9.6
540
13
100
0
0
0
0
0
0
0
0
13
162
47.6
0
0
4
1.2
0
0
175
51.3
341
INFORMATION AND
30
81.9
7
18.1
0
0
0
0
0
0
36
EDUCATION
95
100
0
0
0
0
0
0
0
0
95
ADMINISTRATIVE
ACTIVITIES
14
100
0
0
0
0
0
0
0
0
14
AND RECREATION
5
100
0
0
0
0
0
0
0
0
5
ACTIVITIES
24
100
0
0
0
0
0
0
0
0
24
SEWERAGE, WASTE MANAGEMENT AND REMEDATION ACTIVITIES
0
0
0
0
0
0
2
100
0
0
2
&
58
62.5
0
0
23
25
12
12.5
0
0
93
SCIENTIFIC AND
13
39.2
0
0
0
0
0
0
20
60.8
32
1,807
71.4
161
6.4
27
1.1
47
1.9
487
19.3
2,529
TABLE 46
SEVERITY NUMBER (2015
WITH 2016) NUMBER (2016
WITH 2017)
BETTER 49282 67.4 37944 51.9
8826 12.1 14745 20.2
SAME 12455 17.0 17734 24.3
2518 3.4 2658 3.6
73081 100.0 73081 100.0
NBS -SMEDAN NATIONAL SURVEY OF MICRO SMALL & MEDIUM ENTERPRISES (MSMEs), 2017
94

TABLE 47
NUMBER PERCENTAGE
ENVIRONMENTAL SANITATION 37,408 51.2
27,174 37.2
10,373 14.2
18,940 25.9
11,130 15.2
INTERVENTION FUND 10,359 14.2
17,508 24.0
POLITICAL STABILITY 21,401 29.3
11,857 16.2
FERTILIZER SUBSIDY 5,446 7.5
4,762 6.5
TOTAL NO OF ENTERPRISES 73,081
TABLE 48 BUSINESS MOST
NUMBER PERCENTAGE
57,774 79.1
DEMOLITION 15,256 20.9
55,531 76.0
13,794 18.9
TRADE PERMIT 19,371 26.5
22,264 30.5
11,254 15.4
14,899 20.4
BANNING OF IMPORTATION OF GOODS 16,271 22.3
35,496 48.6
19,692 26.9
2,689 3.7
ITEMS NUMBER PERCENT
13,654 58.9
8,126 35
1,414 6.1
TOTAL 23,194 100
NBS -SMEDAN NATIONAL SURVEY OF MICRO SMALL & MEDIUM ENTERPRISES (MSMEs), 2017
95

TABLE 50: AWARENESS OF NEW
STATE
NATIONAL MSMES CLINICS
NIGERIAN PUBLIC
NATIONAL
TOTAL NUMBER PERCENT NUMBER PERCENT NUMBER PERCENT
ABIA 386 76.4 87 17.2 32 6.4 506
115 63.9 62 34.7 2 1.4 180
-IBOM 1,148 96.3 44 3.7 0 0 1,192
ANAMBRA 541 57.1 387 40.8 20 2.1 948
BAUCHI 280 54.6 142 27.7 91 17.7 512
52 62.6 31 37.4 0 0 83
BENUE 66 14.7 167 37 218 48.3 452
BORNO 73 33.3 138 63.1 8 3.6 220
CROSS RIVER 95 14.7 549 85.1 2 0.2 645
DELTA 311 77.9 88 22.1 0 0 399
EBONYI 189 22.4 437 52 216 25.6 842
EDO 402 91.2 38 8.5 1 0.2 441
EKITI 152 47.5 167 52.1 1 0.4 320
ENUGU 33 53.7 29 46.3 0 0 62
GOMBE 46 32.4 52 36.6 44 31 143
IMO 217 30 464 63.9 44 6.1 725
1,040 72.1 403 27.9 0 0 1,443
KADUNA 457 47.9 468 49.1 28 3 954
KANO 349 56.4 270 43.6 0 0 620
KATSINA 120 39.6 171 56.4 12 4.1 304
KEBBI 100 67.6 48 32.4 0 0 148
487 90.3 52 9.7 0 0 539
145 89.9 4 2.5 12 7.6 161
1,413 49.9 1,247 44 171 6.1 2,831
1,115 98.1 21 1.8 1 0.1 1,137
NIGER 85 34.1 136 55 27 10.9 248
OGUN 760 95.4 30 3.8 6 0.8 797
ONDO 561 70.6 218 27.5 15 1.9 795
OSUN 462 55.8 257 31 109 13.2 827
1,013 56.3 719 40 67 3.7 1,799
326 57.7 163 28.8 76 13.5 565
RIVERS 316 42 372 49.4 64 8.5 752
123 50.5 120 49.5 0 0 243
TARABA 42 19.6 133 62.8 37 17.6 212
11 46.7 10 43 2 10.3 23
273 55.4 199 40.5 20 4.1 492
349 55.1 201 31.8 84 13.2 634
TOTAL 13,654 58.9 8,126 35 1,414 6.1 23,194
NBS -SMEDAN NATIONAL SURVEY OF MICRO SMALL & MEDIUM ENTERPRISES (MSMEs), 2017
96

TOTAL NUMBER
NUMBER
10,184 59.6 17,094
123 61.3 200
3,761 61.6 6,108
265 68.7 386
7,116 54.2 13,130
278 54.9 506
437 58.5 748
INFORMATION AND COMMUNICATION 409 65.9 621
EDUCATION 13,859 70.3 19,719
ADMINISTRATIVE AND SUPPORT SERVICE
481 49.5
971
102 54.1 189
1,097 56.0 1,958
4 44.4
9
656 61.1 1,073
5313 69.9 7,596
2174 78.4 2,773
TOTAL 46259 63.3 73,081
NBS -SMEDAN NATIONAL SURVEY OF MICRO SMALL & MEDIUM ENTERPRISES (MSMEs), 2017
97

STATE
TOTAL NUMBER OF ENTERPRISE NUMBER
ABIA 1,120 47.8 2,343
476 64.9 734
-IBOM 1,532 81.2 1,887
ANAMBRA 1,047 69.6 1,504
BAUCHI 1,238 55.2 2,241
188 62.7 300
BENUE 1,564 86.4 1,811
BORNO 376 69.9 538
CROSS RIVER 973 66.8 1,456
DELTA 626 41.1 1,524
EBONYI 2,052 84.3 2,433
EDO 1,865 69.7 2,677
EKITI 691 74.5 928
ENUGU 676 47.2 1,432
GOMBE 678 75 904
IMO 1,126 55.7 2,020
2,122 89.5 2,370
KADUNA 1,662 62.7 2,650
KANO 1,483 60.8 2,441
KATSINA 1,263 92.4 1,367
KEBBI 540 66.3 815
777 75.7 1,027
1,136 80.2 1,416
5,504 65.6 8,395
1,376 52.8 2,604
NIGER 1,007 47.5 2,121
OGUN 1,351 54.8 2,465
ONDO 1,601 67.8 2,363
OSUN 1,605 53.4 3,007
2,485 40.5 6,131
1,016 64.5 1,574
RIVERS 1,167 70.4 1,658
687 80.6 852
TARABA 617 66.3 930
80 78.4 102
872 70.6 1,236
1,679 59.4 2,825
TOTAL 46,259 63.3 73,081
NBS -SMEDAN NATIONAL SURVEY OF MICRO SMALL & MEDIUM ENTERPRISES (MSMEs), 2017
98

TABLE 53
MEDIA NUMBER PERCENT
RADIO 26,306 56.9
TELEVISION 26,366 57.0
20,772 44.9
- 21,856 47.2
10,909 23.6
1,285 2.8
46,259
TABLE 54DEVELOPMENT IN NIGERIA
NUMBER PERCENTAGE
65,507 89.6
23,741 32.5
41,775 57.2
TRAINING 38,967 53.3
29,751 40.7
34,495 47.2
42,616 58.3
3,678 5
NBS -SMEDAN NATIONAL SURVEY OF MICRO SMALL & MEDIUM ENTERPRISES (MSMEs), 2017
99

TABLE 56: TOP PRIORITY AREAS OF ASSISTANCE
AREA OF ASSISTANCE NUMBER PERCENTAGE
39,881 54.6
61,015 83.5
53,439 73.1
33,996 46.5
36,898 50.5
FINANCING/FINANCIAL ASSISTANCE 49,616 67.9
FERTILIZER ETC) 7,819 10.7
MARKET ETC) 29,945 41.0
42,301 57.9
1,548 2.1
TABLE 55
MEASURE TO ALLEVIATE CHALLENGES NUMBER PERCENTAGE
52,433 71.7
VOCATIONAL SKILL UPGRADING 40,438 55.3
32,784 44.9
63,795 87.3
38,938 53.3
CONTROL & CERTIFICATION 29,101 39.8
INFORMATION 43,213 59.1
4,030 5.5
NBS -SMEDAN NATIONAL SURVEY OF MICRO SMALL & MEDIUM ENTERPRISES (MSMEs), 2017
100

TABLE 57 FROM
NUMBER PERCENTAGE
29,779 68.6
VOCATIONAL SKILL UPGRADING 9,377 21.6
9,724 22.4
9,507 21.9
MONITORING 12,545 28.9
CONTROL & CERTIFICATION 3,907 9
INFORMATION 8,725 20.1
1,519 3.5
TOTAL ENTERPRISES BENEFITED 43,410 59.4
TABLE 58
SMEs BENEFITTED TOTAL NO
OF ENTERPRISES
NUMBER PERCENTAGE
9,887 55.9 17,094
115 57.7 200
3,529 57.8 6,108
249 64.4 386
6,678 50.9 13,130
261 51.6 506
410 54.8 748
INFORMATION AND COMMUNICATION
384 61.8 621
EDUCATION 13,005 66.0 19,719
ADMINISTRATIVE AND SUPPORT SERVICE
451 46.5 971
96 50.6
189
1,029 52.6 1,958
4 41.7
9
616 57.4 1,073
4,986 65.6 7,596
2,040 73.6 2,773
TOTAL 43,410 59.4 73,081
NBS -SMEDAN NATIONAL SURVEY OF MICRO SMALL & MEDIUM ENTERPRISES (MSMEs), 2017
101

NUMBER PERCENTAGE
ABIA 1,042 44.5 2,343
443 60.3 734
1,425 75.5 1,887
ANAMBRA 974 64.7 1,504
1,200 53.5 2,241
175 58.3 300
BENUE 1,455 80.3 1,811
BORNO 350 65.0 538
745 51.2 1,456
DELTA 582 38.2 1,524
EBONYI 1,908 78.4 2,433
EDO 1,734 64.8 2,677
EKITI 682 73.5 928
ENUGU 629 43.9 1,432
GOMBE 631 69.8 904
IMO 1,047 51.8 2,020
1,973 83.3 2,370
KADUNA 1,546 58.3 2,650
KANO 1,379 56.5 2,441
1,175 85.9 1,367
KEBBI 502 61.6 815
723 70.4 1,027
1,056 74.6 1,416
5,384 64.1 8,395
1,317 50.6 2,604
NIGER 937 44.2 2,121
OGUN 1,321 53.6 2,465
ONDO 1,489 63.0 2,363
OSUN 1,501 49.9 3,007
2,311 37.7 6,131
945 60.0 1,574
RIVERS 1,085 65.5 1,658
639 75.0 852
TARABA 574 61.7 930
74 72.9 102
811 65.6 1,236
1,648 58.3 2,825
TOTAL 43,410 59.4 73,081
TOTAL NO OF
ENTERPRISES
BENEFITTED
TABLE59: BENEFIT FROM SMEDAN SERVICE BY STATES
NBS -SMEDAN NATIONAL SURVEY OF MICRO SMALL & MEDIUM ENTERPRISES (MSMEs), 2017
102

TABLE 60B: FROM
NUMBER 2017 PERCENT
NUMBER 2013 PERCENT
29,799 68.6 8,803 22.53
VOCATIONAL SKILL UPGRADING 9,377 21.6 4,181 10.7
MARKET 9,724 22.4 3,403
8.71
9,507 21.9 5,222 13.37
MONITORING 12,545 28.9 7,210
18.45
CONTROL & CERTIFICATION 3,907 9 2,533 6.48
INFORMATION
8,725 20.1 7,153 18.31
1,519 3.5 566 1.45 TOTAL ENTERPRISES BENEFITED 43,410 59.4 39,071 53.6
TABLE 60A 2017/2013
NUMBER
PERCENTAGE
NUMBER
PERCENTAGE
10,184
59.6
7,043
53.94
MINING & QUARRYING
123
61.3
141
59.78
3,761
61.6
3,618
53.18
AGRICULTURE
265
68.7
893
60.51
7,116
54.2
7,247
50.17
278
54.9
355
66.61
437
58.5
404
50.46
INFORMATION AND COMMUNICATION
409
65.9
275
61.16
EDUCATION
13,859
70.3
13,620
46.55
481
49.5
1,344
47.24
102
54.1
104
41.89
1,097
56
1,401
52.57
4
44.4
13
53.63
656
61.1
5,313
69.9
2,174 78.4
TOTAL 46,259 63.3 36,457 50.05
NBS -SMEDAN NATIONAL SURVEY OF MICRO SMALL & MEDIUM ENTERPRISES (MSMEs), 2017
103

NTERPRISES
State Number Percentage
Abia 959,803 2.3
Adamawa 689,571 1.7
Akwa-Ibom 1,357,412 3.3
Anambra 1,233,676 3
Bauchi 1,016,997 2.5
Bayelsa 548,049 1.3
Benue 1,578,658 3.8
Borno 1.7
Cross River 1,020,384 2.5
Delta 1,560,679 3.8
Ebonyi 590,355 1.4
Edo 924,944 2.2
Ekiti 1,017,510 2.5
Enugu 1,088,620 2.6
Gombe 538,205 1.3
Imo 1,400,848 3.4
Jigawa 834,200 2
Kaduna 1,931,387 4.7
Kano 1,824,961 4.4
Katsina 1,659,304 4
Kebbi 708,541 1.7
Kogi 996,748 2.4
Kwara 802,418 1.9
Lagos 3,329,156 8
Nasarawa 385,489 0.9
Niger 1,066,792 2.6
Ogun 1,178,109 2.8
Ondo 1,058,025 2.6
Osun 1,370,908 3.3
Oyo 1,909,475 4.6
Plateau 815,430 2
River 2,129,780 5.1
Sokoto 706,341 1.7
520,759 1.3
784,044 1.9
Zamfara 736,929 1.8
FCT 504,329 1.2
41,469,947 100
NBS -SMEDAN NATIONAL SURVEY OF MICRO SMALL & MEDIUM ENTERPRISES (MSMEs), 2017
104

Table 62: Number of Micro Enterprises by State, 2017 vs 2013 State Number 2017 Number 2013 Change % Change Abia 959,803 904,721 55,082 6.09
Adamawa 689,571 - - 0
Akwa-ibom 1,357,412 1,319,607 37,805 2.86
Anambra 1,233,676 1,223,395 10,281 0.84
Bauchi 1,016,997 944,503 72,494 7.68
Bayelsa 548,049 541,332 6,717 1.24
Benue 1,578,658 1,479,145 99,513 6.73
Borno - - 0
Cross river 1,020,384 921,256 99,128 10.76
Delta 1,560,679 1,536,158 24,521 1.6
Ebonyi 590,355 577,216 13,139 2.28
Edo 924,944 898,084 26,860 2.99
Ekiti 1,017,510 964,179 53,331 5.53
Enugu 1,088,620 1,064,893 23,727 2.23
Gombe 538,205 527,230 10,975 2.08
Imo 1,400,848 1,296,386 104,462 8.06
Jigawa 834,200 820,001 14,199 1.73
Kaduna 1,931,387 1,635,453 295,934 18.09
Kano 1,824,961 1,794,358 30,603 1.71
Katsina 1,659,304 1,216,604 442,700 36.39
Kebbi 708,541 692,104 16,437 2.37
Kogi 996,748 967,431 29,317 3.03
Kwara 802,418 717,909 84,509
Lagos 3,329,156 3,224,324 104,832 3.25
Nasarawa 385,489 382,086 3,403 0.89
Niger 1,066,792 977,240 89,552 9.16
Ogun 1,178,109 1,165,848 12,261 1.05
Ondo 1,058,025 1,026,770 31,255 3.04
Osun 1,370,908 1,356,174 14,734 1.09
Oyo 1,909,475 1,864,954 44,521 2.39
Plateau 815,430 786,504 28,926 3.68
River 2,129,780 379,869 21.71
Sokoto 706,341 700,106 6,235 0.89
520,759 513,973 6,786 1.32
784,044 - - 0
Zamfara 736,929 722,360 14,569 2.02
FCT 504,329 482,365 21,964 4.55
41,469,947 36,994,578 4,475,369 12.1
NBS -SMEDAN NATIONAL SURVEY OF MICRO SMALL & MEDIUM ENTERPRISES (MSMEs), 2017
105

Table 63: Number of Micro Enterprises by Sector, 2017
Number Percentage
Agriculture 8,687,580 20.9 Mining & quarrying 79,188 0.2 Manufacturing
3,722,292
9
Water supply, sewerage, waste management and remediation activities
79,714
0.2
Construction
904,639
2.2
Wholesale/retail trade
17,533,925
42.3
Transport & storage
1,274,270
3.1 Accommodation & food services
2,351,498
5.7
Information and communication
128,105
0.3
Real estate activities
41,515
0.1
technical works
733,023
1.8
Administrative and support service activities
42,357
0.1
Education
43,930
0.1
Human health & social works
230,727
0.6
Arts, entertainment and recreation
187,003
0.5
Others services activities
5,430,181
13.1
41,469,947 100
NBS -SMEDAN NATIONAL SURVEY OF MICRO SMALL & MEDIUM ENTERPRISES (MSMEs), 2017
106

Tab
le 6
4:
Ow
ners
hip
Sta
tus b
y S
ecto
r, 2
017
S
ole
Pro
pri
eto
rship
P
art
ners
hip
F
aith
Base
d
Org
aniz
atio
n O
thers
N
um
ber
P
erc
ent
N
um
ber
P
erc
ent
N
um
ber
P
erc
ent
N
um
ber
Perc
ent
Num
ber
Perc
ent
Agricu
lture
8,6
48,4
62
21
.47
12
4,3
85
13.8
700
0.6
49,8
38
28.0
8,8
23,3
85
21.3
Min
ing &
quarr
yin
g
71,0
57
0.1
8
4,6
64
0.5
0.0
0.0
75,7
21
0.2
Manufa
cturing
3,5
17,7
21
8.7
3
75,3
21
8.4
6,5
61
5.9
881
0.5
3,6
00,4
85
8.7
managem
ent and r
em
edia
tion
act
iviti
es
78,5
58
0.2
0
96
5
0.1
0.0
0.0
79,5
23
0.2
Const
ruct
ion
919,4
31
2.2
8
16,4
29
1.8
4,2
75
3.8
2,4
13
1.4
94
2,5
47
2.3
Whole
sale
/re
tail
tra
de
17,0
13,0
11
42
.24
36
1,9
95
40.2
74,6
77
67.1
10,3
90
5.8
17
,460,0
74
42.1
Tra
nsp
ort
& s
tora
ge
1,2
07,0
34
3.0
0
87,2
63
9.7
6,8
67
6.2
15,5
91
8.8
1,3
16,7
55
3.2
Acc
om
modatio
n&
food
serv
ices
2,2
17,1
99
5.5
0
30,7
26
3.4
4,1
86
3.8
0.0
2,2
52,1
11
5.4
Info
rmatio
n a
nd c
om
munic
atio
n
128,2
45
0.3
2
6,1
08
0.7
0.0
0.0
13
4,3
53
0.3
Real e
state
act
iviti
es
42,5
72
0.1
1
96
8
0.1
0.0
0.0
43,5
40
0.1
tech
nic
al w
ork
s
736,3
64
1.8
3
16,2
99
1.8
1,8
16
1.6
770
0.4
75
5,2
49
1.8
Adm
inis
trativ
e a
nd s
upp
ort
serv
ice
act
iviti
es
38,8
37
0.1
0
1,3
67
0.2
0.0
2,4
76
1.4
42,6
80
0.1
Educa
tion
20,9
02
0.0
5
4,5
25
0.5
0.0
20,6
45
11.6
46,0
72
0.1
Hum
an h
ealth
& s
oci
al w
ork
s
227,2
37
0.5
6
4,7
74
0.5
1,4
51
1.3
4,5
58
2.6
23
8,0
21
0.6
Art
s, e
nte
rtain
ment and r
ecr
eatio
n
179,0
06
0.4
4
12,0
55
1.3
0.0
958
0.5
19
2,0
18
0.5
Oth
ers
serv
ices
act
iviti
es
5,2
33,7
76
12
.99
15
3,6
86
17.0
10,7
30
9.6
69,2
22
38.9
5,4
67,4
14
13.2
40,2
79,4
12
10
0.0
0
90
1,5
29
10
0.0
111
,264
100
177,7
42
100.0
41
,469,9
47
100.0
NBS -SMEDAN NATIONAL SURVEY OF MICRO SMALL & MEDIUM ENTERPRISES (MSMEs), 2017
107

by E
co
no
mic
Secto
r (S
ole
pro
pri
eto
rsh
ip),
2017
M
ale
Fem
ale
T
ota
l
Num
ber
Perc
ent
Num
ber
Perc
ent
Num
ber
Perc
ent
Agriculture
7,3
41,3
35
84.9
1
,307,1
28
15.1
8,6
48,4
63
100
Min
ing &
quarr
ying
36,8
73
51.9
34,1
86
48.1
7
1,0
58
100
Manufa
ctu
ring
1,1
02,0
60
31.3
2
,415,6
63
68.7
3,5
17,7
22
100
Wate
r su
pply
, sew
era
ge, w
ast
e
managem
ent and r
em
edia
tion a
ctiv
itie
s 53,6
37
68.3
24,9
21
31.7
7
8,5
58
100
Const
ruct
ion
915,1
92
99.5
4,2
38
0.5
9
19,4
31
100
Whole
sale
/reta
il tr
ade
6,0
43,4
66
35.5
10,9
69,5
45
64.5
100
Tra
nsport
& s
tora
ge
1,1
76,2
65
97.5
30,7
69
2.5
1,2
07,0
34
100
Acco
mm
odatio
n &
food s
erv
ices
293,6
94
13.2
1
,923,5
05
86.8
2,2
17,1
99
100
Info
rmation a
nd c
om
munic
ation
96,2
24
75.0
32,0
20
25.0
1
28,2
44
100
Real e
state
act
ivitie
s 42,5
72
100.0
0.0
4
2,5
72
100
tech
nic
al w
ork
s 648,7
73
88.1
87,5
90
7
36,3
63
100
Adm
inis
trativ
e a
nd s
upport
serv
ice
act
ivitie
s 30,5
46
78.7
8,2
90
21.3
3
8,8
37
100
Education
14,7
71
70.7
6,1
31
29.3
2
0,9
02
100
Hum
an h
ealth
& s
oci
al w
ork
s
49.5
50.5
2
27,2
36
100
Art
s, e
nte
rtain
ment and r
ecr
eatio
n 137,9
86
77.1
41,0
19
22.9
1
79,0
06
100
Oth
ers
serv
ices
activ
ities
2,6
22,9
87
50.1
2
,610,7
89
49.9
5,2
33,7
76
100
20,6
68,7
89
51.3
19,6
10,6
23
48.7
4
0,2
79,4
12
100
NBS -SMEDAN NATIONAL SURVEY OF MICRO SMALL & MEDIUM ENTERPRISES (MSMEs), 2017
108

Registered
Number Percent Agriculture 107,456 1.2 Mining & quarrying
5,372
7.1
Manufacturing
106,536
3
Water supply, sewerage, waste management and remediation activities
10,426
13.1
Construction
31,133
3.3
Wholesale/retail trade
268,521
1.5 Transport & storage
46,238
3.5
Accommodation & food services
31,694
1.4
Information and communication
7,901
5.9
Real estate activities
8,995
20.7
22,193
2.9
Administrative and support service activities
5,665
13.3
Education
7,426
16.1
Human health & social works
64,728
27.2
Arts, entertainment and recreation
19,286
10
Others services activities 2
854,446 2.1
NBS -SMEDAN NATIONAL SURVEY OF MICRO SMALL & MEDIUM ENTERPRISES (MSMEs), 2017
109
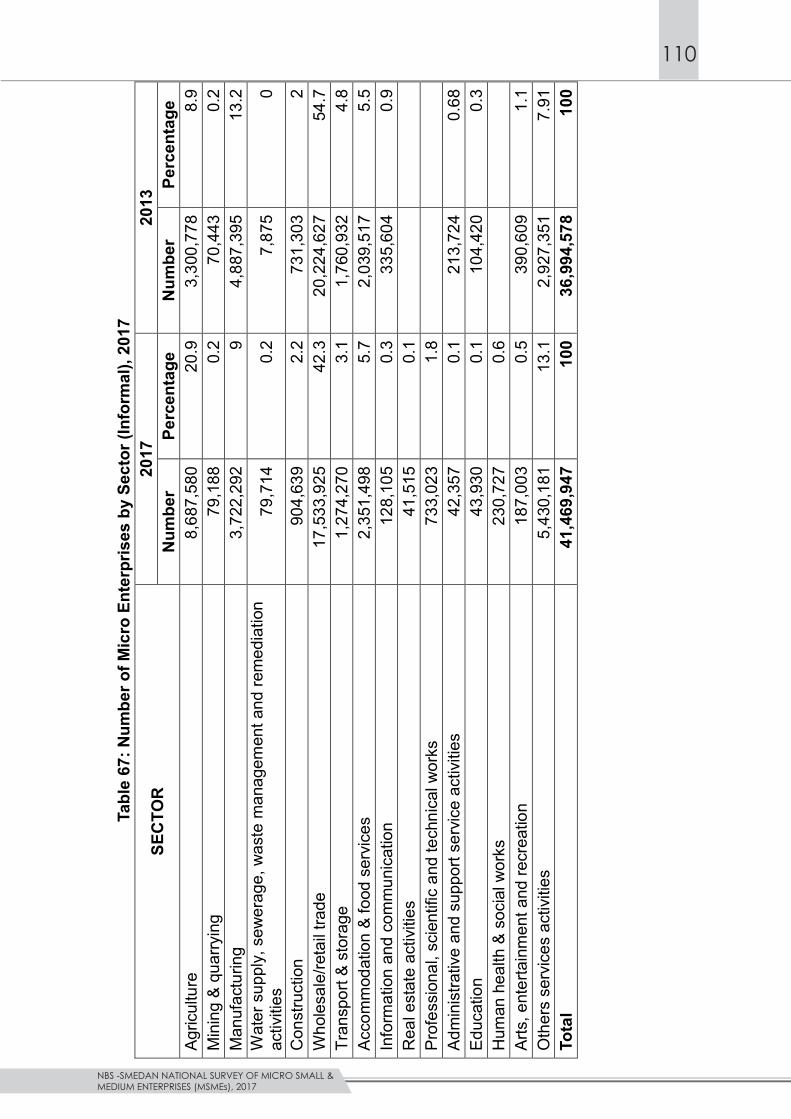
SE
CT
OR
2
017
2
013
Nu
mb
er
P
erc
en
tag
e
Nu
mb
er
P
erc
en
tag
e
Ag
ricu
lture
8
,687
,58
0
20
.9
3,3
00
,77
8
8.9
Min
ing &
qu
arr
yin
g
79
,18
8
0.2
7
0,4
43
0
.2
Ma
nu
fact
urin
g
3,7
22
,29
2
9
4,8
87
,39
5
13
.2
Wa
ter
sup
ply
, se
we
rag
e,
wa
ste
ma
na
ge
men
t a
nd
rem
ed
iation
a
ctiv
itie
s
79
,71
4
0.2
7
,875
0
Co
nst
ruct
ion
9
04
,63
9
2.2
7
31
,30
3
2
Wh
ole
sale
/reta
il tr
ad
e
17
,53
3,9
25
4
2.3
2
0,2
24
,62
7
54
.7
Tra
nsp
ort
& s
tora
ge
1
,274
,27
0
3.1
1
,760
,93
2
4.8
Acc
om
mod
atio
n &
fo
od
se
rvic
es
2
,351
,49
8
5.7
2
,039
,51
7
5.5
Info
rma
tion
an
d c
om
mu
nic
atio
n
12
8,1
05
0
.3
33
5,6
04
0
.9
Re
al e
sta
te a
ctiv
itie
s
41
,51
5
0.1
7
33
,02
3
1.8
Ad
min
istr
ativ
e a
nd
su
pp
ort
se
rvic
e a
ctiv
itie
s
42
,35
7
0.1
2
13
,72
4
0.6
8
Ed
uca
tion
4
3,9
30
0
.1
10
4,4
20
0
.3
Hu
man
he
alth
& s
oci
al w
ork
s
23
0,7
27
0
.6
Art
s, e
nte
rta
inm
en
t a
nd
re
cre
atio
n
18
7,0
03
0
.5
39
0,6
09
1
.1
Oth
ers
se
rvic
es
act
iviti
es
5
,430
,18
1
13
.1
2,9
27
,35
1
7.9
1
4
1,4
69
,94
7
10
0
36
,99
4,5
78
1
00
NBS -SMEDAN NATIONAL SURVEY OF MICRO SMALL & MEDIUM ENTERPRISES (MSMEs), 2017
110

41,469,946
, 2017
Business Number Percent
Sole Proprietorship 40,279,412 97.1
Partnership 901,528 2.2
Faith Based Organization 0.3
Others 177,742 0.4
100
69
-group Number Percent
Below 20 3,933,816 9.8
20-25 2,655,869 6.6
26-35 12,149,936 30.2
36-50 40.2
51-60 5,327,947 13.2
40,279,412 100
of Owners (Sole-Proprietorship), 2017
Number Percent
No Education 9,584,976 23.80
Below Primary 1,486,334 3.69
Primary 8,721,153 21.65
JSS 7.54
Vocational/Commercial 362,742 0.90
SSS 12,430,208 30.86 NCE/ND/Nursing 2,234,102 5.55
1,526,270 3.79
61,261 0.15 Others 834,246 2.07
40,279,412
100
, 2017
Form of ownership Registered
Number Percent
Sole Proprietorship 755,782 1.9
Partnership 73,700 8.2
Faith Based Organization 13,358 12.0
Others 6.5
854,445 2.1
NBS -SMEDAN NATIONAL SURVEY OF MICRO SMALL & MEDIUM ENTERPRISES (MSMEs), 2017
111

Status Trends
Ownership Status
Number Percent Number 2017
2013
Sole Proprietorship
40,279,412
97.1
36,158,903
97.7
Partnership
901,528
2.2
473,351
1.3Private Limited Liability Company
-
-
219,429
0.6
Cooperative
-
-
34,956
0.1
Faith Based Organization
0.3
997
0.0
Others
177,742
0.4
106,942
0.3
41,469,947
100.0
36,994,578
100.0
Agency
Number
Percent
CAC
2,687,793
23.7
Consumer Protection council
2,564,771
21.0
NAFDAC
8,405,807
73.1
Standard organisation of Nigeria
2,727,289
23.7
FIRS
4,013,476
33.3
Nigeria Custom Service
7,049,715
59.5
Nigeria immigration Service 4,732,246 42.5
Bureau for Public Procurement(BPP) 3,593,359 25.4
NBS -SMEDAN NATIONAL SURVEY OF MICRO SMALL & MEDIUM ENTERPRISES (MSMEs), 2017
112

Number Percent Abia 31,896 3.3 Adamawa 13,464 1.9 Akwa-ibom 67,165 4.8 Anambra 24,292 1.9 Bauchi 5,171 0.5 Bayelsa 4,001 0.7 Benue 0.7 Borno
54,017
7.5
Cross river
82,741
8.5
Delta
53,540
3.3
Ebonyi
10,460
1.7
Edo
1.3
Ekiti
20,490
2
Enugu
10,295
0.9
Gombe
8,918
1.6 Imo
14,453
1.1
Jigawa
6,294
0.7 Kaduna
13,355
0.8
Kano
24,641
1.3 Katsina
7,244
0.6
Kebbi
4,918
0.7
Kogi
12,187
1.2
Kwara
4,680
0.6
Lagos
53,156
1.6
Nasarawa
7,659
1.9
Niger
13,440
1.3
Ogun
25,273
2
Ondo
12,213
1.1
Osun
18,359
1.3
Oyo
15,008
0.8
Plateau
5,429
0.7
River
127,553
6.9
Sokoto
18,628
2.5
3,687
0.7
27,486
3.3
.Zamfara
26,186
3.4
Fct
3,090
0.6
854,445 2.1
NBS -SMEDAN NATIONAL SURVEY OF MICRO SMALL & MEDIUM ENTERPRISES (MSMEs), 2017
113

N
UM
BE
R O
F E
MP
LO
YE
ES
A
S A
T D
EC
EM
BE
R 2
01
7
SO
LE
PR
OP
RIE
TO
RS
HIP
(O
WN
ER
OF
BU
SIN
ES
S)
20
17
OT
HE
RS
F
OR
MS
OF
B
US
INE
SS
M
ale
F
em
ale
M
ale
Fe
ma
le
Ma
le F
em
ale
AB
IA
16
1,2
20
94
,85
1
34
4,2
21
60
3,1
76
7
,10
5
50
5,4
41
69
8,0
27
1,2
10
,57
4
63
,16
7
5
,53
0
45
6,8
13
25
5,7
70
9
,83
9
51
9,9
80
26
1,3
01
7
91
,12
0
-IB
OM
24
5,5
87
24
4,3
34
53
7,3
21
83
1,5
33
32
,85
3
78
2,9
08
1,0
75,8
68
1,8
91
,62
8
AN
AM
BR
A
18
8,7
55
33
,85
9
54
7,5
77
74
4,3
92
-
73
6,3
32
77
8,2
51
1,5
14
,58
3
BA
UC
HI
61
0,9
81
25
,37
7
82
9,1
97
17
0,9
17
3
,15
2
1,4
40
,17
8
19
6,2
94
1,6
39
,62
4
BA
YE
LS
A
9
,31
9
6
,85
1
26
7,5
43
30
1,0
71
3
,61
7
27
6,8
62
30
7,9
22
5
88
,40
0
BE
NU
E
12
3,5
78
15
,91
8
39
7,3
42
1,1
28,6
23
39
,12
7
52
0,9
20
1,1
44,5
41
1,7
04
,58
8
BO
RN
O
73
,87
4
-
58
5,3
08
46,5
22
85
,39
4
65
9,1
82
4
6,5
22
7
91
,09
8
CR
OS
S R
IVE
R
15
4,5
15
44
,07
1
58
5,0
63
35
3,7
94
34
,98
3
73
9,5
78
39
7,8
66
1,1
72
,42
7
21
0,2
70
99
,66
1
76
1,6
13
86
1,9
31
5
,03
0
97
1,8
83
96
1,5
92
1,9
38
,50
5
EB
ON
YI
111
,47
6
10
1,9
09
35
5,4
60
24
4,8
86
9
,22
4
46
6,9
36
34
6,7
95
8
22
,95
5
ED
O
57
0,7
18
81
,34
1
31
1,1
96
58
0,3
92
55
,91
2
88
1,9
14
66
1,7
34
1,5
99
,55
9
EK
ITI
57
2,5
74
28
6,1
17
42
7,9
00
59
0,9
04
2
,39
0
1,0
00
,47
4
87
7,0
21
1,8
79
,88
5
EN
UG
U
12
3,5
02
19
8,9
77
47
6,3
93
65
0,3
77
-
59
9,8
95
84
9,3
53
1,4
49
,24
8
GO
MB
E
74
,08
8
1
,19
4
42
0,7
96
12
1,5
83
16
,57
0
49
4,8
84
12
2,7
77
6
34
,23
1
IMO
117
,10
8
75
,41
5
65
6,7
71
69
9,7
17
17
,88
9
77
3,8
79
77
5,1
32
1,5
66
,90
0
96
,47
4
20
,53
8
54
3,1
74
21
1,2
72
112
,35
9
63
9,6
49
23
1,8
10
9
83
,81
8
KA
DU
NA
60
8,3
39
43
,78
1
1,5
45
,94
0
17
5,1
26
9
,41
7
2,1
54
,27
9
21
8,9
07
2,3
82
,60
3
KA
NO
82
0,3
35
37
,07
0
97
7,9
06
88
4,4
67
42
,33
0
1,7
98
,24
2
92
1,5
37
2,7
62
,11
0
NBS -SMEDAN NATIONAL SURVEY OF MICRO SMALL & MEDIUM ENTERPRISES (MSMEs), 2017
114

–
Co
nti
nu
ed
N
UM
BE
R O
F E
MP
LO
YE
ES
A
S A
T D
EC
EM
BE
R 2
017
SO
LE
PR
OP
RIE
TO
RS
(OW
NE
RS
OF
BU
SIN
ES
SE
S)
2017
OT
HE
RS
F
OR
MS
OF
B
US
INE
SS
M
ale
Fem
ale
Ma
le F
em
ale
M
ale
Fem
ale
KA
TS
INA
86,4
45
14,7
95
544,5
68
707,9
31
41,1
30
631,0
13
7
22,7
26
1,3
94,8
68
KE
BB
I
116,1
16
5,4
64
603,4
62
94,3
47
39,5
05
719,5
78
99,8
11
8
58,8
93
KO
GI
136,2
56
96,1
21
449,3
45
554,7
53
19,5
47
585,6
01
6
50,8
74
1,2
56,0
22
159,6
53
21,0
72
439,4
00
316,9
70
3,2
54
599,0
52
3
38,0
42
9
40,3
49
LA
GO
S
1,1
14,7
58
439,9
63
1,0
96,9
59
2,3
06,4
37
14,9
06
2,2
11,7
16
2,7
46,4
00
4,9
73,0
22
564,4
37
141,7
72
273,9
81
121,0
77
9,2
30
838,4
18
2
62,8
49
1,1
10,4
97
NIG
ER
228,8
44
44,3
56
436,3
22
580,6
21
16,0
71
665,1
65
6
24,9
77
1,3
06,2
13
OG
UN
461,0
89
169,5
19
565,0
39
582,0
67
90,0
78
1,0
26,1
28
7
51,5
86
1,8
67,7
91
ON
DO
644,9
84
139,7
62
531,5
83
524,0
40
30,8
09
1,1
76,5
67
6
63,8
02
1,8
71,1
79
OS
UN
518,6
09
204,8
26
664,0
43
754,0
28
19,6
91
1,1
82,6
52
9
58,8
54
2,1
61,1
96
OY
O
923,4
83
184,1
13
553,3
72
1,4
24,0
09
3,6
02
1,4
76,8
55
1,6
08,1
22
3,0
88,5
79
PLA
TE
AU
323,2
46
67,1
98
444,7
52
362,8
54
22,1
76
767,9
97
4
30,0
52
1,2
20,2
25
RIV
ER
701,6
54
251,9
59
993,3
64
821,3
68
44,0
50
1,6
95,0
17
1,0
73,3
27
2,8
12,3
95
SO
KO
TO
119,1
96
32,5
10
567,8
97
146,8
97
25,9
93
687,0
93
1
79,4
07
8
92,4
93
372,1
12
38,3
99
387,1
58
150,1
64
5,9
88
759,2
71
1
88,5
62
9
53,8
21
YO
BE
296,5
63
102,5
43
678,9
25
110,6
36
32,7
19
975,4
87
2
13,1
79
1,2
21,3
85
78,1
82
44,4
06
186,6
95
304,3
77
274,7
46
264,8
77
3
48,7
83
8
88,4
06
FC
T
68,2
73
22,9
40
224,3
94
291,5
93
9,8
49
292,6
68
3
14,5
33
6
17,0
50
11
,849,7
81
3,4
38,5
12
20,6
68,7
89
19,6
10,6
23
1,1
90,5
35
32,5
18,5
70
23,0
49,1
35
56,7
58,2
40
NBS -SMEDAN NATIONAL SURVEY OF MICRO SMALL & MEDIUM ENTERPRISES (MSMEs), 2017
115

en
t b
y S
ecto
r an
d G
en
de
r (D
ec. 20
17
)
M
ale
Fem
ale
Num
be
r
Pe
rcent
Num
be
r
Perc
en
t
Num
ber
P
erc
ent
Agricu
lture
3,4
24,3
79
29
.5
1,0
98
,927
30
.0
4
,523,3
06
29
.6
Min
ing a
nd
Qua
rryi
ng
49,2
23
0.4
49
,22
3
0.3
Manufa
ctu
ring
6,4
08,5
01
55
.1
84
5,4
07
23
.1
7
,253,9
08
47
.4
Wate
r S
upply
, S
ew
era
ge
36,5
88
0.3
7,5
98
0.2
44
,18
6
0.3
Con
stru
ctio
n
21
8,5
06
1.9
59
,61
0
1.6
1.8
Whole
sale
an
d R
eta
il
78
7,0
55
6.8
75
8,0
14
20
.7
1
,545,0
69
10
.1
Tra
nsp
ort
atio
n a
nd
Sto
rage
0.5
0.0
0.4
Acc
om
mod
atio
n a
nd F
ood
Serv
ices
66,3
63
0.6
36
9,1
86
10
.1
435,5
49
2.8
Info
rma
tion a
nd
Com
munic
ation
28,9
17
0.2
7,2
93
0.2
36
,20
9
0.2
Ad
min
istr
atio
n a
nd S
upp
ort
Se
rvic
es
2,8
77
0.0
3,0
58
0.1
5,9
36
0.0
Ed
uca
tion
40,4
49
0.3
25
,20
3
0.7
65
,65
2
0.4
Art
s, e
nte
rtain
ment and R
ecr
ea
tion
89,8
17
0.8
46
,66
1
1.3
136,4
78
0.9
Oth
er
Serv
ices
41
6,7
92
3.6
44
2,7
59
12
.1
859,5
51
5.6
1
00
3,6
63
,715
10
0
15
,28
8,2
93
10
0
NBS -SMEDAN NATIONAL SURVEY OF MICRO SMALL & MEDIUM ENTERPRISES (MSMEs), 2017
116

Fo
rm o
f O
wn
ers
hip
wo
rke
r
Pa
rtn
ers
hip
Fa
ith
Ba
sed
O
the
rs
To
tal
No
E
Mal
e
3,7
37
,31
7
22
3,3
22
3
,96
0,6
39
Fem
ale
1
,08
3,4
13
83
,18
8
1,1
66
,60
0
rim
ary
M
ale
5
13
,19
0
2
3,5
07
5
36
,69
7
Fem
ale
1
15
,58
0
6,1
61
1
21
,74
1
Pri
mar
y
Mal
e
1,6
89
,67
3
6
5,2
67
1
2,6
45
1,7
67
,58
4
Fem
ale
6
24
,49
4
1
6,0
28
10
,95
4
65
1,4
75
JSS
M
ale
9
08
,88
0
5
3,3
14
5,7
96
9
67
,99
0
Fem
ale
3
79
,74
0
3
79
,74
0
Co
mm
erc
ial
M
ale
35
3,9
06
15
,87
7
36
9,7
84
Fem
ale
12
9,4
92
12
9,4
92
SSS
M
ale
2,9
69
,50
7
1
47
,86
2
3,6
40
3,1
21
,00
9
Fem
ale
1,2
43
,19
5
50
,12
5
1,2
93
,32
0
NC
E/O
ND
/Nu
rsin
g
M
ale
30
6,2
05
9
,78
2
31
5,9
86
Fem
ale
15
0,1
62
5
,39
5
15
5,5
57
B.A
/B.S
c/B
.Ed
/HN
D
Mal
e
16
7,7
28
2
,36
2
17
0,0
90
Fem
ale
12
9,3
99
12
9,3
99
M.S
c/M
.A/M
.Ad
min
Mal
e
1,5
50
1,5
50
Fem
ale
45
,00
1
45
,00
1
Mal
e
4,6
36
4,6
36
Fem
ale
-
14
,55
3,0
68
7
02
,19
0
27
,23
8
5,7
96
15
,28
8,2
93
NBS -SMEDAN NATIONAL SURVEY OF MICRO SMALL & MEDIUM ENTERPRISES (MSMEs), 2017
117

Nu
mb
er
Agricu
lture
3,1
95,4
55
36
.78
Min
ing &
qu
arr
ying
49
,605
6
2.6
4
Manufa
ctu
ring
1,2
30,6
18
33
.06
Wate
r su
pply
, se
wera
ge
, w
ast
e m
anagem
ent and
rem
edia
tion a
ctiv
ities
40
,023
5
0.2
1
Con
stru
ctio
n
45
7,5
21
50
.57
Whole
sale
/reta
il tr
ade
5,6
52,4
15
3
2.2
4
Tra
nsp
ort
& s
tora
ge
48
2,4
45
37
.86
Acc
om
mod
atio
n &
food s
erv
ices
68
0,0
01
28
.92
Info
rma
tion a
nd
com
mu
nic
atio
n
34
,905
27
.25
Rea
l est
ate
act
iviti
es
28
,287
68
.14
36
8,5
46
50
.28
Ad
min
istr
ativ
e a
nd s
upport
se
rvic
e a
ctiv
ities
24
,485
5
7.8
1
Ed
uca
tion
19
,266
43.8
6
Hum
an
hea
lth &
soci
al w
ork
s
13
0,6
07
57
.6
Art
s, e
nte
rtain
ment and r
ecr
eatio
n
10
6,1
80
57
Oth
ers
serv
ices
act
iviti
es
1,7
74,5
71
32.6
8
14
,274
,93
2
34.4
2
NBS -SMEDAN NATIONAL SURVEY OF MICRO SMALL & MEDIUM ENTERPRISES (MSMEs), 2017
118

ES
) b
y S
tate
(E
mp
loye
es
on
ly),
201
7
Stat
e
To
tal
Ma
le F
em
ale
Nu
mb
er 2
017
Nu
mb
er 2
013
Nu
mb
er 2
017
N
um
ber
201
3
Nu
mb
er 2
017
N
um
ber
201
3
Ab
ia
50
5,4
41
1
.6 1
,09
3,4
63
3
.1 6
98
,02
7 3
.0 8
74
,94
7 3
.9 1
,21
0,5
74
2.1
1
,96
8,4
10
Ad
am
aw
a
51
9,9
80
1
.6
-
26
1,3
01
1.1
-
79
1,1
20
1.4
-
Akw
a-
Ib
om
7
82
,90
8
2.4
1,1
01
,99
1
3.1
1,0
75
,86
8 4
.7 1
,06
2,3
45
4.7
1,8
91
,62
8 3
.3
2,1
64
,33
6
An
am
bra
7
36
,33
2
2.3
74
1,6
53
2
.1 7
78
,25
1 3
.4 6
99
,39
5 3
.1 1
,51
4,5
83
2.7
1
,44
1,0
48
Ba
uch
i
1,4
40
,17
8
4.4
1,2
82
,22
5
3.6
19
6,2
94
0.9
23
,42
6 0
.1 1
,63
9,6
24
2.9
1
,30
5,6
51
Ba
yels
a
27
6,8
62
0
.9 3
25
,32
2
0.9
30
7,9
22
1.3
29
3,1
08
1.3
58
8,4
00
1.0
6
18
,43
0 B
enu
e
52
0,9
20
1
.6 1
,14
7,6
27
3
.3 1
,14
4,5
41
5.0
81
9,5
27
3.6
1,7
04
,58
8 3
.0
1,9
67
,15
4 B
orn
o
65
9,1
82
2
.0
-
46
,52
2 0
.2
- 7
91
,09
8 1
.4
- C
ross
Riv
er
7
39
,57
8
2.3
80
4,1
70
2
.3 3
97
,86
6 1
.7 6
43
,94
0 2
.9 1
,17
2,4
27
2.1
1
,44
8,1
10
De
lta
97
1,8
83
3
.0 5
33
,73
7
1.5
96
1,5
92
4.2
1,8
69
,83
9 8
.3 1
,93
8,5
05
3.4
2
,40
3,5
76
Eb
on
yi
46
6,9
36
1
.4 8
89
,66
7
2.5
34
6,7
95
1.5
24
0,7
56
1.1
82
2,9
55
1.4
1
,13
0,4
23
Ed
o
88
1,9
14
2
.7 7
55
,87
3
2.1
66
1,7
34
2.9
52
7,2
77
2.3
1,5
99
,55
9 2
.8
1,2
83
,15
0 E
kiti
1
,00
0,4
74
3
.1 7
16
,77
7
2 8
77
,02
1 3
.8 7
23
,99
3 3
.2 1
,87
9,8
85
3.3
1
,44
0,7
70
En
ug
u
59
9,8
95
1
.8 8
55
,02
0
2.4
84
9,3
53
3.7
60
1,9
20
2.7
1,4
49
,24
8 2
.6
1,4
56
,94
0 G
om
be
4
94
,88
4
1.5
1,6
59
,92
6
4.7
12
2,7
77
0.5
17
2,5
05
0.8
63
4,2
31
1.1
1
,83
2,4
31
Imo
7
73
,87
9
2.4
85
8,0
03
2
.4 7
75
,13
2 3
.4 6
02
,33
1 2
.7 1
,56
6,9
00
2.8
1
,46
0,3
34
Jig
aw
a
63
9,6
49
2
.0 7
78
,17
6
2.2
23
1,8
10
1.0
16
1,9
31
0.7
98
3,8
18
1.7
9
40
,10
7 K
adu
na
2
,15
4,2
79
6
.6 2
,07
1,9
29
5
.9 2
18
,90
7 0
.9 2
95
,53
1 1
.3 2
,38
2,6
03
4.2
2
,36
7,4
60
NBS -SMEDAN NATIONAL SURVEY OF MICRO SMALL & MEDIUM ENTERPRISES (MSMEs), 2017
119

E
S)
by S
tate
(E
mp
loyees o
nly
), 2
017
– co
nti
nu
ed
STA
TE
To
tal
Male
Fem
ale
Nu
mb
er 2
017
N
um
ber
201
3
Nu
mb
er 2
017
N
um
ber
201
3
Nu
mb
er 2
017
N
um
ber
201
3
Kano
1,7
98,2
42
5.5
2,0
09,7
34
5.7
921,5
37
4.0
327,5
44
1.5
2,7
62
,11
0 4
.9
2,3
37
,27
8
Kats
ina
631,0
13
1.9
1,6
82,0
90
4.8
722,7
26
3.1
273,1
44
1.2
1,3
94
,86
8 2
.5
1,9
55
,23
4
Kebbi
719,5
78
2.2
1,0
34,0
35
2.9
99,8
11
0.4
59,8
97
0.3
85
8,8
93
1.5
1
,09
3,9
32
Kogi
585,6
01
1.8
2,8
97,8
35
8.2
650,8
74
2.8
1,3
12,7
71
5.8
1,2
56
,02
2 2
.2
4,2
10
,60
6
Kw
ara
599,0
52
1.8
438,9
35
1.2
338,0
42
1.5
574,2
64
2.5
94
0,3
49
1.7
1
,01
3,1
99
Lagos
2,2
11,7
16
6.8
2,3
79,7
13
6.7
2,7
46,4
00
11.9
3,1
97,2
99
14
.2 4
,97
3,0
22
8.8
5
,57
7,0
12
Nasa
raw
a 838,4
18
2.6
348,7
01
1 262,8
49
1.1
164,9
64
0.7
1,1
10
,49
7 2
.0
51
3,6
65
Nig
er
665,1
65
2.0
725,5
52
2.1
624,9
77
2.7
246,3
91
1.1
1,3
06
,21
3 2
.3
97
1,9
43
Og
un
1,0
26,1
28
3.2
1,0
04,9
08
2.8
751,5
86
3.3
747,9
49
3.3
1,8
67
,79
1 3
.3
1,7
52
,85
7
Ondo
1,1
76,5
67
3.6
282,4
42
0.8
663,8
02
2.9
845,0
32
3.7
1,8
71
,17
9 3
.3
1,1
27
,47
4
Osu
n 1,1
82,6
52
3.6
547,0
16
1.6
958,8
54
4.2
1,0
49,5
13
4.7
2,1
61
,19
6 3
.8
1,5
96
,52
9 O
yo 1,4
76,8
55
4.5
1,6
64,9
76
4.7
1,6
08,1
22
7.0
1,8
37,5
67
8.1
3,0
88
,57
9 5
.4
3,5
02
,54
3 P
late
au
767,9
97
2.4
911,4
18
2.6
430,0
52
1.9
288,3
42
1.3
1,2
20
,22
5 2
.1
1,1
99
,76
0 R
iver
1,6
95,0
17
5.2
1,1
58,7
97
3.3
1,0
73,3
27
4.7
1,3
95,0
49
6.2
2,8
12
,39
5 5
.0
2,5
53
,84
6 S
oko
to 687,0
93
2.1
1,0
48,1
76
3 179,4
07
0.8
31,1
05
0.1
89
2,4
93
1.6
1
,07
9,2
81
759,2
71
2.3
509,7
27
1.4
188,5
62
0.8
51,7
12
0.2
95
3,8
21
1.7
5
61
,43
9 Y
obe
975,4
87
3.0
-
213,1
79
0.9
-
1,2
21
,38
5 2
.2
- Z
am
fara
264,8
77
0.8
721,0
57
2 348,7
83
1.5
239,7
17
1.1
88
8,4
06
1.6
9
60
,77
4 F
CT
292,6
68
0.9
295,6
96
0.8
314,5
33
1.4
304,9
93
1.4
61
7,0
50
1.1
6
00
,68
9
32,5
18,5
70
100
35,2
76,3
66
100
23,0
49,1
35
100.0
22,5
60,0
25
10
0 5
6,7
58,2
40
10
0.0
5
7,8
36,3
91
NBS -SMEDAN NATIONAL SURVEY OF MICRO SMALL & MEDIUM ENTERPRISES (MSMEs), 2017
120

: Use of Professional Services, 2017
Number Percentage
NONE 34,320,571 82.8
LAWYER 544,900 1.3
798,340
1.9
5,201,753
12.5
OTHERS
884,864
2.1
NBS -SMEDAN NATIONAL SURVEY OF MICRO SMALL & MEDIUM ENTERPRISES (MSMEs), 2017
121

Table 80A: Professional Services by Economic Sector, 2017
None Lawyer Accountants
/Auditors Business
Consultant Other
Number
percent
Number
percent
Number
percent
Number
percent
Number
percent l
Agriculture 7,133,241
82.1 57,115
.7 71,488
.8 1,125,230
13.0 300,506
3.5 8,687,580
Mining & quarrying
64,938
82.0 6,42
8
8.1 2,135
2.7 2,422
3.1 3,265
4.1
79,188
Manufacturing 2,899,
158
77.9 45,6
75
1.2 89,60
8
2.4 656,3
76
17.6 31,47
6
0.8
3,722,292
sewerage, waste management
61,087
76.6
5,03
0
6.3
781
1.0
11,48
1
14.4
1,335
1.7
79,714
Construction 716,80
5
79.2 34,5
59
3.8 25,30
1
2.8 95,92
1
10.6 32,05
2
3.5
904,639
Wholesale/retail trade
14,986,632
85.5
187,451
85.5
275,216
1.6
1,858,143
10.6
226,483
1.3
17,533,925
Transport & storage
964,147
75.7
48,094
75.7
44,175
3.5
162,733
12.8
55,121
4.3
1,274,270
Accomodation& food services
1,791,638
76.2
24,616
76.2
150,529
76.2
366,007
15.6
18,708
0.8
2,351,498
Information and communication
85,363 66.6
6,683
66.6
2,025 1.6
25,426
19.8
8,608 6.7
128,105
Real estate activities
6,511 15.7
18,046
15.7
10,064
24.2
5,080 12.2
1,815 4.4
41,515
Professional,
technical works
580,971
79.3
19,886
79.3
15,545
2.1
102,816
14.0
13,805
1.9
733,023
Administrative and support service activities
36,313 85.7
4,300
85.7
- .0
1,744 4.1
- 0.0
42,357
Education
29,719 67.7
3,078
67.7
11,132
25.3
- 0.0
- 0.0
43,930
Human health & social works
178,126
77.2
5,817
77.2
4,696 13.6
34,587
15.0
7,499 3.3
230,727
Arts, entertainment and recreation
157,882
84.4
1,469
84.4
7,653 4.1
19,999
10.7
- 0.0
187,003
Others services activities
4,347,558
80.1
76,651
80.1
87,993
1.6
733,788
13.5
184,191
3.4
5,430,181
34,040,090
82.1
544,900
1.3
798,340
1.9
5,201,753
12.5
884,864
2.1
41,469,947
NBS -SMEDAN NATIONAL SURVEY OF MICRO SMALL & MEDIUM ENTERPRISES (MSMEs), 2017
122

: Number of Enterprises with Business Plans by Sector, 2017
Sector Number Percent
Agriculture 1,576,847 18.2
Mining & quarrying 45.6
Manufacturing 787,801 21.2 Water supply, sewerage, waste management and remediation activities
42,240 53.0
Construction 254,869 28.2
Wholesale/retail trade 4,666,479 26.6 Transport & storage 319,935 25.1 Accommodation & food services 498,203 21.2 Information and communication 56,496 44.1 Real estate activities 29,360 70.7
229,031 31.2 Administrative and support service activities 17,222 40.7 Education 18,735 42.6 Human health & social works 96,015 41.6 Arts, entertainment and recreation 48,447 25.9 Others services activities 1,437,970 26.5
24.4
NBS -SMEDAN NATIONAL SURVEY OF MICRO SMALL & MEDIUM ENTERPRISES (MSMEs), 2017
123

Table 82: Number of Enterprises Insured by Sectors, 2017
Insured
Number
Agriculture 255,763 18.6
Mining & quarrying 9,413 0.7
Manufacturing 82,534 6.0
and remediation activities 13,267 1.0
Construction 42,968 3.1
Wholesale/retail trade 598,263 43.5
Transport & storage 116,844 8.5
Accommodation& food services 33,733 2.5
Information and communication 4,829 0.4
Real estate activities 5,140 0.4
Professional, 105,746 7.7
Administrative and support service activities -
Education 6,397 0.5
Human health & social works 4,915 0.4
Arts, entertainment and recreation 15,072 1.1
Others services activities 80,757 5.9
Total 1,375,639 100.0
Table 83: Number of Establishments by Channel of Promotion, 2017
Promotion Media Number Percent
TELEVISION 1,815,903 19.6
610,682 6.6
HANDBILL DISTRIBUTION -
PERSON- -PERSON 2,851,997 30.8
3,632,986 39.2
INTERNET/SOCIAL MEDIA 274,352 3.0
BILLBOARD -
OTHERS 82,103 0.9
9,268,022 100.0
NBS -SMEDAN NATIONAL SURVEY OF MICRO SMALL & MEDIUM ENTERPRISES (MSMEs), 2017
124

nline Businesses
S/N
Sectors
Online Businesses
Number
1 Agriculture 37,384 5.0
2 Mining & quarrying 5,364 0.7
3 Manufacturing 15
4 Water supply, sewerage, waste management and remediation activities
2,277 0.3
5 Construction 26,288 3.5
6 Wholesale/retail trade 221,161 29.4
7 Transport & storage 24,996 3.3
8 Accommodation & food services 29,048 3.9
9 Information and communication 29,019 3.9
10 Real estate activities 1.5
11 24,884 3.3
12 Administrative and support service activities 7,502 1
13 Education 1,855 0.2
14 Human health & social works 1,870 0.2
15 Arts, entertainment and recreation
25,324
3.4
16
Others services activities
191,769
25.5
753,109
100
NBS -SMEDAN NATIONAL SURVEY OF MICRO SMALL & MEDIUM ENTERPRISES (MSMEs), 2017
125

TABLE 85
BUSINESS ASSOCIATION
NUMBER
TRADE ASSOCIATION
6,555,064
15.8
PROFESSIONAL ASSOCIATION
1,036,240
2.5
716,258
1.7
COOPERATIVE SOCIETY
1,298,323
3.1
OTHERS
968,793
15.2
NONE
27,162,791
65.5
NBS -SMEDAN NATIONAL SURVEY OF MICRO SMALL & MEDIUM ENTERPRISES (MSMEs), 2017
126

: Support Received
Number
2,568,306
6.2
TRAINING
1,703,518
4.1
747,427
1.8
671,495
1.6
MORAL
1,898,457
4.6
920,055
2.2
979,814
2.4
MOTIVATION
1,494,995
3.6
627,037
1.5
EDUCATION
ADVICE
2,068,157
5.0
: Number of Enterprises Insured by Sectors, 2017
Insured
2017 2013
Number Number
Agriculture
255,763
18.59
353,585 17.8
Mining & quarrying
9,413
0.68
9,596
0.5
Manufacturing
82,534
6
202,896
10.2
remediation activities
13,267
0.96
-
0
Construction
42,968
3.12
52,679
2.6 Wholesale/retail trade
598,263
43.49
856,258
43
storage
116,844
8.49
198,541
10
Accommodation & food services
33,733
2.45
72,949
3.7
Information and communication
4,829
0.35
33,361
1.7
Real estate activities
5,140
0.37
0
105,746
7.69
0
Administrative and support service activities
-
14,464
0.7
Education
6,397
0.47
11,192
0.6
Human health & social works
4,915
0.36
0
Arts, entertainment and recreation
15,072
1.1
33,491
1.7
Others services activities
80,757
5.87
143,417
7.2
1,375,638
100
1,989,796
100
NBS -SMEDAN NATIONAL SURVEY OF MICRO SMALL & MEDIUM ENTERPRISES (MSMEs), 2017
127

: Initial Start-up Capital, 2017
Amount (N'000)
Number
Below 50
26,440,176
63.8
50-100
8,556,105
20.6 101-200
3,269,416
7.9
201-300
1,284,475
3.1 301-400
477,946
1.2
401-500
589,607
1.4
501-600
130,330
0.3
601-700
134,170
0.3
701-800 0.3 801-900 46,575 0.1 901-1000 0.3
Above 1000 0.8
41,469,946 100
NBS -SMEDAN NATIONAL SURVEY OF MICRO SMALL & MEDIUM ENTERPRISES (MSMEs), 2017
128

Ta
ble
89
: S
tart
-Up
Cap
ital b
y S
ec
tor
(N'0
00
),201
7
B
elo
w 5
0
50 -
100
101 -
200
201 -
300
301 -
400
401 -
500
501 -
600
601 - 7
00
701 -
800
801 -
900
901 -
100
0
Ab
ove
100
0 To
tal
Agri
cultu
re
6,1
21,0
27
1,6
34,9
90
44
6,2
87
18
4,3
01
45
,675
22
,661
30
,243
4,5
31
3,9
74
18
,261
56
,244
8,6
87,5
80
Min
ing
& q
uarr
ying
34
,221
15
,224
21
,430
4,8
42
897
1,7
85
78
8
79
,188
Man
ufa
ctu
ring
2,8
81,6
02
46
8,6
75
22
4,0
15
49
,217
12
,806
42
,351
1,0
54
3,8
42
26
,906
3,7
22,2
92
Wate
r su
pply
, se
we
rage
, w
ast
e
manag
em
ent an
d
rem
edia
tion a
ctiv
ities
47
,506
7,1
56
13
,427
1,3
08
3,3
27
896
6,0
94
79
,714
Con
stru
ctio
n
60
2,9
73
15
4,7
62
59
,016
47
,971
21
,301
6,4
88
4,0
23
2,3
68
5,7
37
90
4,6
39
Whole
sale
/reta
il tr
ade
10
,567
,212
4,1
53,3
43
1,4
69,5
63
53
4,8
72
22
5,9
47
24
6,0
19
41
,210
23
,501
62
,515
25
,335
71
,716
17
,533
,925
Tra
nsp
ort
& s
tora
ge
26
6,2
50
28
3,5
93
16
5,2
80
74
,145
82
,718
32
,027
52
,950
23
,536
10
,470
12
,306
59
,229
1,2
74,2
70
Acc
om
mo
datio
n &
food
se
rvic
es
1,9
01,8
57
30
6,2
78
63
,484
40
,943
4,0
23
13
,017
6,0
90
10
,605
4,0
23
1,1
78
2,3
51,4
98
Info
rma
tion
and
co
mm
unic
atio
n
33
,492
46
,965
36
,771
5,8
57
5,0
20
12
8,1
05
Rea
l est
ate
act
iviti
es
13
,626
7,4
85
3,8
21
2,0
25
4,3
00
5,1
40
41
,515
an
d tech
nic
al w
ork
s
40
6,3
69
14
7,9
72
99
,420
44
,384
4,3
17
16
,329
6,0
94
8,1
38
73
3,0
23
Adm
inis
tra
tive a
nd
su
ppo
rt s
erv
ice
act
iviti
es
16
,123
7,3
24
12
,717
2,3
68
3,8
25
42
,357
Edu
catio
n25
,250
4,6
97
6,9
72
1,2
81
2,2
07
1,0
29
2,4
94
43
,930
Hum
an h
ealth
& s
oci
al
wo
rks
96
,508
55
,217
54
,286
12
,833
1,5
76
3,7
09
3,0
76
3,5
22
23
0,7
27
Art
s, e
nte
rtain
me
nt an
d
recr
eatio
n96
,045
47
,958
26
,546
1,4
69
7,6
54
4,2
13
18
7,0
03
Oth
ers
se
rvic
es
act
iviti
es
1,2
25,6
68
44
4,4
01
19
3,2
35
65
,644
47
,136
5,6
93
7,7
78
5,9
40
4,4
27
13
,024
24
,125
5,4
30,1
81
To
tal
26
,440
,178
8,5
56,1
04
3,2
69,4
15
1,2
84,4
75
47
7,9
47
58
9,6
06
13
0,3
28
13
4,1
68
46
,574
41
,469
,947
NBS -SMEDAN NATIONAL SURVEY OF MICRO SMALL & MEDIUM ENTERPRISES (MSMEs), 2017
129

: Sources of Capital, 2017
Number
31,931,514 61.2
2,756,946
5.3
FAMILY SOURCE
12,325,244
23.6
COOPERATIVE
681,550
1.3
3,642,087
7
344,991
0.7
452,346
0.9
Form of Ownership
Own a Bank Account
Number
Percent
Others
47,895
29.9
Faith Based Organization
16,308
14.9
Partnership
272,667
32.5
Sole Proprietorship
14,873,613
41.3
15,210,485
40.9
-Up Capital by Sector (N'000), 2017
Number
Number
Number
Percent
Amount (N'000)
2017
2013
Change
% Change
Below 50
26,440,176
25,284,047
1,156,129
4.57
50-100
8,556,105
5,328,769
3,227,336
60.56
101-200
3,269,416
3,321,920
-52,504
(1.58)
201-300
1,284,475
978,266
306,209
31.30
301-400
477,946
413,326
64,620
15.63
401-500
589,607
503,340
86,267
17.14
501-600
130,330
131,363
-1,033
(0.79)
601-700
134,170
105,012
29,158
27.77
701-800
91,734
22,606
24.64
801-900
46,575
53,422
-6,847
(12.82)
901-1000 100,091 15,216 15.20
Above 1000 471,835 -160,336 (33.98)
41,469,947 36,996,590 4,473,357 12.09
NBS -SMEDAN NATIONAL SURVEY OF MICRO SMALL & MEDIUM ENTERPRISES (MSMEs), 2017
130

SOURCE OF CAPITAL Number Number
2017 2013 Change % Change
31,931,514 28,885,499 3,046,015 10.55
2,756,946 1,344,326 1,412,620 105.08 FAMILY SOURCE 12,325,244 8,681,701 3,643,543 41.97 COOPERATIVE 681,550
3,642,087
3,139,794 0
344,991 730,434 -385,443 -52.77
452,346 872,930 -420,584 -48.18
NBS -SMEDAN NATIONAL SURVEY OF MICRO SMALL & MEDIUM ENTERPRISES (MSMEs), 2017
131

2017
Local Foreign Local/Foreign
State Number Percent Number Percent Number PercentAbia 921,344 2.6 16,387 1.9 22,073 0.4Adamawa 585,731 1.7 10,951 1.3 92,889 1.7Akwa-Ibom
1,098,004
3.1
24,182
2.9
235,227
4.4
Anambra
1,010,971
2.9
1,330
0.2
221,375
4.1Bauchi
927,483
2.6
-
0.0
89,514
1.7
Bayelsa
526,587
1.5
5,590
0.7
15,873
0.3Benue
1,486,338
4.2
75,551
9.0
16,769
0.3
Borno
258,985
0.7
6,426
0.8
425,700
7.9Cross River
939,769
2.7
44,183
5.2
36,431
0.7
Delta
1,267,375
3.6 52,708
6.2
240,597
4.5
Ebonyi
549,188
1.6
3,054
0.4
0.7
Edo
820,892
2.3
1.4
92,578
1.7Ekiti
871,075
2.5
28,312
3.4
2.2Enugu
959,628
2.7
20,563
2.4
108,429
2.0Gombe
373,151
1.1
57,481
6.8
107,574
2.0Imo
994,499
2.8
76,074
9.0
330,275
6.2Jigawa
558,868
1.6
101,537
12.0
173,794
3.2Kaduna
1,880,614
5.3
29,200
3.5
21,573
0.4Kano
1,490,557
4.2
19,242
2.3
315,162
5.9Katsina
1,649,894
4.7
-
0.0
9,410
0.2Kebbi
656,278
1.9
1,918
0.2
50,345
0.9Kogi
879,755
2.5
5,216
0.6
2.1Kwara
626,976
1.8
76,991
9.1
98,451
1.8Lagos
2,981,516
8.5
1,513
0.2
346,126
6.4Nasarawa
353,582
1.0
10,131
1.2
21,776
0.4Niger
939,529
2.7
7.1
67,752
1.3Ogun
862,385
2.4
3,556
0.4
312,168
5.8Ondo
888,852
2.5
-
0.0
169,173
3.2Osun
1,070,649
3.0
-
0.0
300,259
5.6Oyo
1,669,085
4.7
14,233
1.7
226,157
4.2Plateau
682,492
1.9
8,851
1.0
124,087
2.3River
1,735,836
4.9
21,660
2.6
372,283
6.9Sokoto
569,354
1.6
13,876
1.6
2.3
424,900
1.2
16,775
2.0
79,084
1.5
731,684
2.1
0.6
47,246
0.9Zamfara
583,362
1.7
5,145
0.6
148,422
2.8FCT
430,829
1.2
15,208
1.8
58,292
1.1
35,258,015
100.0
843,941
100.0
5,367,991
100.0
NBS -SMEDAN NATIONAL SURVEY OF MICRO SMALL & MEDIUM ENTERPRISES (MSMEs), 2017
132

le 95: Sources of Equipment for Business Operation
Local Foreign Local/Foreign State Number Percent Number Percent Number Percent
Abia
926,081
2.5
2,368
.3
31,354
0.9
Adamawa
596,917
1.6
4,275
.5
88,378
2.4
Akwa-Ibom
1,064,660
2.9
21,902
2.7
270,851
7.4
Anambra
1,035,269
2.8
13,088
1.6
185,319
5.1
Bauchi
995,453
2.7
1,016
.1
20,528
0.6
Bayelsa
526,729
1.4
-
.0
21,320
0.6
Benue
1,443,558
3.9
35,135
4.4
99,965
2.7
Borno
410,641
1.1
57,229
7.1
223,241
6.1
Cross River
932,249
2.5
14,360
1.8
73,775
2.0
Delta
1,234,782
3.3
68,287
8.5
257,610
7.0
Ebonyi
587,164
1.6
3,191
.4
-
0.0
Edo
861,360
2.3
-
.0
63,584
1.7
Ekiti
945,319
2.6
8,606
1.1
63,585
1.7
Enugu
1,015,973
2.7
18,353
2.3
54,295
1.5
Gombe
489,654
1.3
13,388
1.7
35,163
1.0
Imo
1,052,265
2.8
21,234
2.6
327,349
8.9
Jigawa
783,956
2.1
40,828
5.1
9,415
0.3
Kaduna
1,866,266
5.0
7,897
1.0
57,224
1.6
Kano
1,677,992
4.5
32,703
4.1
3.1
Katsina
4.4
8,918
1.1
21,975
0.6
Kebbi
684,410
1.8
-
.0
24,131
0.7
Kogi
898,046
2.4
4,395
.5
94,308
2.6
Kwara
797,869
2.2
-
.0
4,549
0.1
Lagos
2,861,054
7.7
195,280
24.3
272,822
7.5
Nasarawa
342,708
0.9
3,430
.4
39,352
1.1
Niger
935,012
2.5
6,677
.8
125,103
3.4
Ogun
968,972
2.6
66,683
8.3
142,454
3.9
Ondo
857,678
2.3
6,073
.8
194,274
5.3
Osun
1,351,482
3.7
12,595
1.6
6,831
0.2
Oyo
1,904,192
5.1
-
.0
5,283
0.1
Plateau
699,916
1.9
20,641
2.6
94,873
2.6
River
1,618,800
4.4
34,332
4.3
476,648
13.0
Sokoto
594,756
1.6
46,471
5.8
1.8
459,866
1.2
1.5
49,217
1.3
758,240 2.0 19,176 2.4 6,629 0.2
Zamfara 735,023 2.0 - .0 1,906 0.1
FCT 466,260 1.3 3,087 .4 34,982 1.0
37,008,981 100.0 803,295 100.0 3,657,671 100.0
NBS -SMEDAN NATIONAL SURVEY OF MICRO SMALL & MEDIUM ENTERPRISES (MSMEs), 2017
133

Tab
le 9
6:
Daily U
sag
e o
f A
lte
rnati
ve S
ou
rce
of
Po
wer
by S
ecto
r, 2
017
Secto
r
1-5
Ho
urs
6-1
0 h
ou
rs
11-1
5 h
ou
rs
16-2
0 h
ou
rs
Ab
ov
e 2
0 h
ou
rs N
on
e
Nu
mb
er
Nu
mb
er
Nu
mb
er
Nu
mb
er
Nu
mb
er
Nu
mb
er
Agricu
lture
655,0
82
7.5
595,1
29
6.9
144,1
72
1.7
37,4
70
0.4
39,5
10
0.5
7,2
16,2
17
83.0
64
8,6
87
,58
0 M
inin
g &
quarr
yin
g
17,9
38
22.7
964.8
65
22
1.2
7,1
49
9.0
0.0
1,4
69
1.9
51,6
66
65.2
45
79
,18
8 M
anufa
ctu
ring
589,3
61
15.8
420,7
61
11
.3
140,5
13
3.8
49,4
82
1.3
31,3
85
0.8
2,4
90,7
90
66.9
16
3,7
22
,29
2
wast
e m
anagem
ent and
rem
edia
tion a
ctivi
ties
14,7
18
18.5
4,1
26
5.2
5,9
99
7.5
0.0
1,1
09
1.4
53,7
62
67.4
44
79
,71
4
Constr
uction
128,9
21
14.3
11
9,1
39
13.2
34,7
11
3.8
1,8
99
0.2
5,9
33
0.7
614,0
36
67.8
76
90
4,6
39
Whole
sale
/re
tail
tra
de
2,6
86,2
18
15.3
1,6
80,5
50
9.6
529,3
77
3.0
146,2
45
0.8
102,7
69
0.6
12,3
88,7
65
70.6
56
17
,53
3,9
25
Tra
nsport
& s
tora
ge
91,3
29
7.2
90,2
36
7.1
42,5
51
3.3
17,8
93
1.4
35,0
70
2.8
997,1
92
78.2
56
1,2
74
,27
0 A
ccom
modatio
n
& f
ood
serv
ices
274,4
32
11.7
182,2
02
7.7
34,9
63
1.5
16,9
99
0.7
148,8
14
6.3
1,6
94,0
88
72.0
43
2,3
51
,49
8 In
form
atio
n a
nd
com
munic
atio
n
64,5
09
50.4
22,2
35
17.4
12,4
72
9.7
0.0
1,4
53
1.1
27,4
37
21.4
18
12
8,1
05
Real esta
te a
ctivi
ties
19,5
00
47.0
0.0
0.0
0.0
2,1
66
5.2
19,8
50
47.8
13
41
,51
5 te
chnic
al w
ork
s
166,2
07
22.7
128,5
55
17.5
107,1
55
14.6
15,2
69
2.1
5,4
32
0.7
310,4
06
42.3
46
73
3,0
23
Adm
inis
trativ
e a
nd s
upp
ort
serv
ice a
ctiv
itie
s
6,2
33
14.7
3,2
02
7.6
0.0
0.0
2,3
68
5.6
30,5
54
72.1
35
42
,35
7 E
ducatio
n19,1
21
43.5
7,2
64
16.5
1,2
31
2.8
0.0
0.0
16,3
14
37.1
36
43
,93
0 H
um
an h
ealth &
socia
l w
ork
s100,9
68
43.8
29,1
21
12.6
3,4
92
1.5
0.0
1,4
53
0.6
95,6
93
41.4
75
23
0,7
27
Art
s, e
nte
rtain
ment and
recre
atio
n75,8
49
40.6
18,4
89
9.9
1,2
06
0.6
7,6
10
4.1
0.0
83,8
49
44.8
39
18
7,0
03
Oth
ers
serv
ices
activitie
s
1,4
00,8
97
25.8
638,6
67
11.8
201,4
05
3.7
51,7
64
1.0
31,8
34
0.6
3,1
05,6
13
57.1
92
5,4
30
,18
1 T
ota
l6,3
11,2
82
15.2
3,9
40,6
40
9.5
1,2
66,3
96
3.1
344,6
32
0.8
410,7
63
1.0
29,1
96,2
34
70.4
03
41
,46
9,9
47
NBS -SMEDAN NATIONAL SURVEY OF MICRO SMALL & MEDIUM ENTERPRISES (MSMEs), 2017
134

Hours of shift per D
Hours Number Percent
1 Hour 49,800 36.2 2 Hours 78,066 56.7 3 Hours
2,747
2.0
4 Hours
and above
6,958
5.1
137,571
100.0
Number of months
No of enterprises
Percentage
1-3 months
2,788,879
38.8 4-6 months
1,605,101
22.4
7-9 months
814,624 10-12 months
527,536
7.3
13 months above
1,445,329
20.1
7,181,469
100
: Distribution
Number
Sickness
2,783,544
28.1
274,876
2.8
Lack of Fund
2,421,806
24.4
30,878
0.3
395,059
4
94,008
0.9
603,500
6.1
146,712
1.5
83,750
0.8
Crisis
673,217
6.8
506,649
5.1
545,456
5.5
406,784
4.1
Break down Vehicle
83,950
0.8
58,234
0.6
52,167
0.5
Others 748,337 7.6
Total 9,908,925 100
NBS -SMEDAN NATIONAL SURVEY OF MICRO SMALL & MEDIUM ENTERPRISES (MSMEs), 2017
135

136
2016 2017 Amount(N’000)
Number
Percent
Number
Percent
Below 50
2,042,816
4.93
1,913,223
4.61
50 -
100
613,343
1.48
612,808
1.48
101 -
200
522,507
1.26
581,820
1.40
201 -
300
157,517
0.38
223,281
0.54
301 -
400
117,086
0.28
109,801
0.26
401 -
500
88,309
0.21
110,582
0.27
501 -
600
60,425
0.15
49,396
0.12
601 -
700
14,890
0.04
17,582
0.04
701 -
800
47,036
0.11
49,593
0.12
801 -
900
22,375
0.05
7,622
0.02
901 -
1000
7,296
0.02
22,719
0.05
Above 1000
37,776,344
91.09
37,771,522
91.08
41,469,947
100.00
41,469,947
100.00
Amount(N"000") 2016 2017
Below 50 38,718,174 93.4 38,455,723 92.7
50 - 100
1,787,059
4.3
1,990,076
4.8
101 - 200
607,268
1.5
639,334
1.5
201 - 300
219,295
0.5
226,586
0.5
301 - 400
48,865
0.1
52,622
0.1
401 -
500
40,457
0.1
37,161
0.1
501 -
600
2,984
0
12,279
0
601 -
700
9,514
0
8,814
0
701 -
800
12,758
0
11,978
0
801 -
900
4,607
0
20,376
0
901 -
1000
5,843
0
4,482
0
Above 1000 13,121 0 10,515 0
Total 41,469,947 100 41,469,947 100
Table 102A: Local Market Channels of Product(s)/Services, 2017
Market Channel Number Percent
Same locality 30,174,824 50.1
Same town 19,416,047 32.2
Same state 8,903,398 14.8
Other state 1,717,560 2.9
NBS -SMEDAN NATIONAL SURVEY OF MICRO SMALL & MEDIUM ENTERPRISES (MSMEs), 2017
136

Export Value For Micro Enterprises
Sectors Amount (Million Naira)
1
1,107.50
2 MINING & QUARRYING
-
3
MANUFACTURING
2,318.03
4
ACTIVITIES
-
5
CONSTRUCTION
28.88
6
18,001.54
7
TRANSPORT & STORAGE
14,936.41
8
ACCOMODATION & FOOD SERVICES
-
9
-
10
-
TECHNICAL WORKS
17,091.08
12
ACTIVITIES
-
13
EDUCATION
-
14
-
15
RECREATION
730.98
16
3,342.55
57,556.97
NBS -SMEDAN NATIONAL SURVEY OF MICRO SMALL & MEDIUM ENTERPRISES (MSMEs), 2017
137

: Business Capac ales, 2017
Amount (N'000) Number
Below 50 26,440,176
63.76
50-100 8,556,105 20.6
101-200 3,269,416 7.9
201-300 1,284,475 3.1
301-400 477,946 1.2
401-500 589,607 1.4
501-600 130,330 0.3
601-700 134,170 0.3
701-800 0.3
801-900 46,575 0.1
901-1000 0.3
Above 1000 0.8
41,469,947 100
le 104
Amount(N’000) 2017
Number Percent
Below 50 - -
50 - 100 - -
101 - 200 - -
201 - 300 - -
301 - 400 - -
401 - 500 - -
501 - 600 - -
601 - 700 - -
701 - 800 - -
801 - 900 - -
901 - 1000 - -
Above 1000 41,469,947 100
41,469,947 100
NBS -SMEDAN NATIONAL SURVEY OF MICRO SMALL & MEDIUM ENTERPRISES (MSMEs), 2017
138

105 Average Sales Trends Amount (N'000)
Number Number 2017 2013 Change % Change
Below 50
26,440,176
24,965,245
1,474,931
5.91
50-100
8,556,105
4,556,715
3,999,390
87.77 101-200
3,269,416
2,129,017
1,140,399
53.56
201-300
1,284,475
804,493
479,982
59.66
301-400
477,946
364,912
30.98
401-500
589,607
162,059
427,548
263.82
501-600
130,330
91,289
39,041
42.77
601-700
134,170
68,965
65,205
94.55
701-800
91,741
22,599
24.63
801-900
46,575
63,779
-17,204
(26.97)
901-1000
78,678
36,629
46.56
Above 1000
355,163
-43,664
(12.29)
41,469,947
33,732,057
7,737,890
22.94
Number
12,151,464 20.2
12,207,319 20.3
3,361,987 5.6
4,073,654 6.8
2,930,321 4.9
1,590,650 2.6
2,923,516 4.9
3,845,923 6.4
3,904,247 6.5
1,887,234 3.1
4,186,286 7
Others 7,044,512 11.7
NBS -SMEDAN NATIONAL SURVEY OF MICRO SMALL & MEDIUM ENTERPRISES (MSMEs), 2017
139

140
Policies Number Percent
Power supply 7,320,201 10.1
Demolition 5,389,955 7.4
9,323,248 12.8
2,357,030 3.2
Prohibition of sales of certain goods 2,970,832 4.1
Banning of importation of goods 3,333,830 4.6
High fuel price 14,038,841 19.3
Trade permit 4,559,068 6.3
Withdrawal of subsidies 6
Custom duties 1,991,252 2.7
Banning of important of goods 3,333,830 4.6
Interest rate 3,653,832 5
Embargo on loan facilities 4,393,975 6
Others 5,741,035 7.9
: Awareness of SMEDAN by State,2017
State
Total Number
Abia 146,531 15.27 959,803
111,011 16.10 689,571
Akwa-Ibom 154,772 11.40 1,357,412
123,008 9.97 1,233,676
Bauchi 213,633 21.01 1,016,997
Bayelsa 110,882 20.23 548,049
Benue 134,630 8.53 1,578,658
Borno 28,552 4.13 691,111
Cross River 76,590 7.51 1,020,384
Delta 534,401 34.24 1,560,679
67,169 11.38 590,355
Edo 160,809 17.39 924,944
181,093 17.80 1,017,510
Enugu 85,656 7.87 1,088,620
Gombe 136,657 25.39 538,205
Imo 76,771 5.48 1,400,848
98,356 11.79 834,200
436,765 22.61 1,931,387
NBS -SMEDAN NATIONAL SURVEY OF MICRO SMALL & MEDIUM ENTERPRISES (MSMEs), 2017
140

54,922 3.01 1,824,961
187,822 11.32 1,659,304
Kebbi 97,608 13.78 708,541
Kogi 262,222 26.31 996,748
37,527 4.68 802,418
Lagos 1,146,646 34.44 3,329,156
15,037 3.90 385,489
Niger 139,866 13.11 1,066,792
Ogun 209,223 17.76 1,178,109
Ondo 157,615 14.90 1,058,025
Osun 240,267 17.53 1,370,908
Oyo 172,422 9.03 1,909,475
71,738 8.80 815,430
River 309,568 14.54 2,129,780
246,101 34.84 706,341
27,552 5.29 520,759
Yobe 91,877 11.72 784,044
94,834 12.87 736,929
81,031 16.07 504,329
Total 6,521,161 15.73 41,469,947 Table 109: Source of Information about SMEDAN,2017
Source of Information
Number Percent
Radio 3,464,056 55.7
1,731,465 27.8
Newspaper 582,286 9.4
Person-to-person 2,719,382 43.7
Internet/social media 261,595 4.2
Table 110: Major Challenges that Militate against Enterprise Development in Nigeria, 2017
Major Challenges Number Percent
Lack of 35,793,901 90.5
Lack of work space 8,614,305 21.8
Weak infrastructure 7,654,220 19.4
Lack of entrepreneurship/vocational training 9,803,087 24.8
Obsolete equipment 3,379,819 8.5
Lack of access to research & development 3,021,424 7.6
Inconsistent policies 3,227,807 8.2
Others 858,406 2.2
NBS -SMEDAN NATIONAL SURVEY OF MICRO SMALL & MEDIUM ENTERPRISES (MSMEs), 2017
141

: Measures by SMEDAN of Enterprises
Development, 2017
Problems Number Percent
Entrepreneurship training
18,542,784
44.7
Vocational skill upgrading
10,852,315
26.2
Facilitation of access to market
14,054,353
33.9
27,279,867
65.8
Business counselling/ monitoring
6,554,928
15.8
3,052,421
7.4
Facilitation of access to information
3,744,318
9
Others
1,153,819
2.8
: Micro Enterprises
Form of Ownership, 2017
Form of Ownership
Number
Sole Proprietorship
159,015
2.5
Partnership
5,321
3.5
Faith Based Organization
Others
164,336
2.5
Number
Percent
Entrepreneurship training
79,301
48.3
Vocational skill upgrading
46,049
28
Facilitation of access to market
33,378
20.3
48,640
29.6
Business counselling/ monitoring
36,910
22.5
16,846
10.3
Facilitation of access to information
8,929
5.4
Others
12,757
7.8
NBS -SMEDAN NATIONAL SURVEY OF MICRO SMALL & MEDIUM ENTERPRISES (MSMEs), 2017
142

Table 114
State
Number
Abia 2,368 1.6
Adamawa 2,891 2.6
Akwa-Ibom
Anambra
Bauchi 2,216 1.0
Bayelsa
Benue
Borno 1,746 6.1
Cross River 1,744 2.3
Delta 7,648 1.4
Ebonyi 2,887 4.3
Edo 1,231 0.8
Ekiti 1,912 1.1
Enugu
Gombe 1,827 1.3
Imo
Jigawa
Kaduna 8,231 1.9
Kano
Katsina
Kebbi 5,124 5.2
Kogi 71,899 27.4
Kwara 780 2.1
Lagos 19,290 1.7
Nasarawa
Niger 4,460 3.2
Ogun
Ondo 3,479 2.2
Osun 6,404 2.7
Oyo
Plateau 897 1.3
River 17,300 5.6
Sokoto
Zamfara
FCT
Total 164,336 2.5
NBS -SMEDAN NATIONAL SURVEY OF MICRO SMALL & MEDIUM ENTERPRISES (MSMEs), 2017
143

: Awareness of SMEDAN by State, 2017
State Aware2017 Aware2013 Change %Change
Abia 146,531 69,128 77,403 112.0
Adamawa 111,011 -
Akwa-ibom 154,772 181,164 -26,392 (14.6)
123,008 47,980 75,028 156.4
Bauchi 213,633 229,523 -15,890 (6.9)
110,882 89,517 21,365 23.9
Benue 134,630 125,724 8,906 7.1
Borno 28,552 -
76,590 150,770 -74,180 (49.2)
Delta 534,401 253,550 280,851 110.8
67,169
145,078
-77,909
(53.7)
Edo
160,809
72,124
88,685
123.0
Ekiti
181,093
52,687
128,406
243.7
Enugu
85,656
16,587
69,069
416.4
Gombe
136,657
200,329
-63,672
(31.8)
Imo
76,771
4,660
72,111
1,547.4
98,356
209,477
-111,121
(53.0)
Kaduna
436,765
217,092
219,673
101.2
Kano
54,922
612,725
-557,803
(91.0)
Katsina
187,822
670,939
-483,117
(72.0)
97,608
322,551
-224,943
(69.7)
262,222
41,690
220,532
529.0
37,527
95,125
-57,598
(60.5)
Lagos
1,146,646
273,128
873,518
319.8
15,037
28,961
-13,924
(48.1)
Niger
139,866
229,413
-89,547
(39.0)
Ogun
209,223
99,482
109,741
110.3
Ondo
157,615
140,609
17,006
12.1
Osun
240,267
134,268
105,999
78.9
172,422
129,160
43,262
33.5
71,738
102,347
-30,609
(29.9)
309,568
228,844
80,724
35.3
246,101
267,199
-21,098
(7.9)
27,552
15,779
11,773
74.6
Yobe
91,877
-
94,834
247,568
-152,734
(61.7)
FCT
81,031
131,768
-50,737
(38.5)
Total
6,521,161
5,836,947
684,214
11.7
NBS -SMEDAN NATIONAL SURVEY OF MICRO SMALL & MEDIUM ENTERPRISES (MSMEs), 2017
144

116
Number Number
2017 2013
12,744,049 18,505,191
12,802,628 19,701,440
3,525,939 9,752,374 Job 4,272,312 11,754,288
3,073,223 4,869,741
1,668,221
4,120,167
3,066,086
7,783,543
4,033,475
11,358,723
4,094,644
11,632,135
1,979,268
6,340,532
4,390,437
8,626,993
Others
7,388,048
753,688
Policies
Number
Number 2017
2013
Power supply
7,677,182
20,623,973
Demolition
5,652,804
11,847,433
9,777,911
15,519,701
2,471,974
7,416,017
Prohibition of sales of certain goods
3,115,709
Banning of importation of goods
3,496,409
High fuel price
14,723,467
Trade permit
4,781,398
9,903,041
Withdrawal of subsidies
4,553,127
13,736,072
Custom duties
2,088,358
8,549,901
Banning of important of goods
3,496,409
9,533,950
Interest rate
3,832,017
8,255,754
Embargo on loan facilities
4,608,254
9,491,992
Environmental sanitation
7,995,490
Infrastructure/social amenities
13,606,614
Importation of fuel
11,752,140
Introduction of sharia
5,109,919
Poverty alleviation
7,208,231
Pension
3,500,236
Others
6,021,005
795,239
NBS -SMEDAN NATIONAL SURVEY OF MICRO SMALL & MEDIUM ENTERPRISES (MSMEs), 2017
145

: Number of Mi , 2017
State Number Percent
Abia 87,634 2.31
Adamawa 21,966 0.58
Akwa-Ibom 261,360 6.89
Anambra 28,995 0.76
Bauchi 180,548 4.76
Bayelsa 48,486 1.28
Benue 29,439 0.78
Borno 31,562 0.83
Cross River 47,074 1.24
Delta 294,218 7.75
Ebonyi 31,398 0.83
Edo 43,908 1.16
Ekiti 191,234 5.04
Enugu 26,086 0.69
Gombe 35,787 0.94
Imo 29,526 0.78
Jigawa 13,085 0.34
Kaduna 147,031 3.87
Kano 106,610 2.81
Katsina 29,067 0.77
Kebbi 23,886 0.63
Kogi 79,263 2.09
Kwara 14,781 0.39
Lagos 205,531 5.42
Nasarawa 52,913 1.39
Niger 43,839 1.16
Ogun 28,005 0.74
Ondo 273,256 7.2
Osun 288,780 7.61
Oyo 402,886 10.62
Plateau 128,222 3.38
River 318,723 8.4
Sokoto 41,864 1.1
33,880 0.89
59,871 1.58
Zamfara 95,607 2.52
FCT 18,660 0.49
3,794,981 100
NBS -SMEDAN NATIONAL SURVEY OF MICRO SMALL & MEDIUM ENTERPRISES (MSMEs), 2017
146

19:
En
terp
rises
Reg
iste
red
wit
h C
AC
an
d
Em
plo
ym
en
t
by S
ecto
r
Sect
ors
Num
be
r
Perc
en
t
Agricu
lture
78
,53
9
31
.3
Min
ing &
qu
arr
ying
1,0
74
0.4
Manufa
ctu
ring
35
,50
3
14
.1
W
ate
r su
pply
, se
wera
ge
, w
ast
e m
anagem
ent and
re
media
tion a
ctiv
ities
1,0
27
0.4
C
onst
ruct
ion
10
,09
5
4.0
W
hole
sale
/reta
il tr
ade
56
,20
6
22
.4
Tra
nsp
ort
& s
tora
ge
4,4
67
1.8
Acc
om
odatio
n &
fo
od s
erv
ices
12
,46
7
5.0
Info
rma
tion a
nd c
om
mu
nic
atio
n
1,4
74
0.6
Real e
state
act
iviti
es
25
4
0.1
7,2
12
2.9
Adm
inis
trativ
e a
nd s
upport
se
rvic
e a
ctiv
ities
1,0
80
0.4
Edu
catio
n
81
5
0.3
Hum
an h
ea
lth &
so
cial w
ork
s
1,6
55
0.7
Art
s, e
nte
rtain
ment and
recr
eatio
n
1,0
16
0.4
Oth
ers
serv
ices
act
iviti
es
38
,38
8
15
.3
251,2
73
10
0.0
NBS -SMEDAN NATIONAL SURVEY OF MICRO SMALL & MEDIUM ENTERPRISES (MSMEs), 2017
147

Table 120: Micro Enterprises Registered with Corporat, 2017
State Number
Abia 2,368
Adamawa
Akwa-Ibom 21,901
Anambra 7,766
Bauchi 5,171
Bayelsa
Benue
Borno 11,159
Cross River 8,534
Delta 32,568
Ebonyi 1,063
Edo 3,832
Ekiti 10,928
Enugu 2,897
Gombe
Imo
Jigawa
Kaduna 9,862
Kano 3,416
Katsina
Kebbi
Kogi 3,894
Kwara
Lagos 23,631
Nasarawa 3,459
Niger 4,798
Ogun 4,184
Ondo 6,880
Osun 10,246
Oyo 7,444
Plateau 2,499
River 55,354
Sokoto 4,332
Zamfara
FCT 3,088
Total 251,273
NBS -SMEDAN NATIONAL SURVEY OF MICRO SMALL & MEDIUM ENTERPRISES (MSMEs), 2017
148

Small & MediumEnterprisesDevelopmentAgencyOf Nigeria
nbsNATIONAL BUREAU OF STATISTICS
Related Documents


