NATIONAL POLICE CONTACT MANAGEMENT BENCHMARKING REPORT 2008

Welcome message from author
This document is posted to help you gain knowledge. Please leave a comment to let me know what you think about it! Share it to your friends and learn new things together.
Transcript
NATIONAL POLICE CONTACT MANAGEMENT
BENCHMARKING REPORT 2008
2
National Police Contact Management Benchmarking Report 2008
Contents
Foreword ......................................................................................................................................................4
Introduction ..................................................................................................................................................5
Merchants and the Global Contact Centre Benchmarking Report ...................................................................6
Research Methodology..................................................................................................................................7
Executive Summary .......................................................................................................................................9
Fundamental KPI Scorecard .........................................................................................................................25
Chapter 1: Background Information.............................................................................................................29
Introduction ......................................................................................................................................................................... 29 Findings ................................................................................................................................................................................ 29
Organisation Details................................................................................................................................................................................ 29 Contact Centre Details ............................................................................................................................................................................ 30
Observations and Recommendations .................................................................................................................................. 30 Chapter 2: Strategy and Development .........................................................................................................33
Introduction ......................................................................................................................................................................... 33 Global Perspective................................................................................................................................................................ 33 Findings ................................................................................................................................................................................ 38
Business Strategy and Drivers ................................................................................................................................................................. 38 Location Strategy .................................................................................................................................................................................... 40 Organisational Strategy, Maturity and Development ............................................................................................................................. 41 Channel Use and Strategy ....................................................................................................................................................................... 43
Observations and Recommendations .................................................................................................................................. 44 Chapter 3: Financial Rationale and Management .........................................................................................47
Introduction ......................................................................................................................................................................... 47 Global Perspective................................................................................................................................................................ 47 Findings ................................................................................................................................................................................ 52
Financial Rationale and Objectives.......................................................................................................................................................... 52 Financial Management and Procedures.................................................................................................................................................. 53
Observations and Recommendations .................................................................................................................................. 54 Chapter 4: Customer Knowledge and Management .....................................................................................57
Introduction ......................................................................................................................................................................... 57 Global Perspective................................................................................................................................................................ 57 Findings ................................................................................................................................................................................ 64
Segmentation.......................................................................................................................................................................................... 64 Service Offering Per Segment.................................................................................................................................................................. 66 Customer Knowledge .............................................................................................................................................................................. 66 Impact of Service Changes on Customers................................................................................................................................................ 68
Observations and Recommendations .................................................................................................................................. 70
3
National Police Contact Management Benchmarking Report 2008
Chapter 5: Performance Measurement and Metrics.....................................................................................73
Introduction ......................................................................................................................................................................... 73 Global Perspective................................................................................................................................................................ 73 Findings ................................................................................................................................................................................ 78
Telephone Interactions Statistics............................................................................................................................................................. 78 Resolution and Response Times .............................................................................................................................................................. 84 Key Performance Indicators and Targets................................................................................................................................................. 88 Statistical Analysis and Reporting ........................................................................................................................................................... 90
Observations and Recommendations .................................................................................................................................. 92 Chapter 6: Processes and Procedures...........................................................................................................95
Introduction ......................................................................................................................................................................... 95 Global Perspective................................................................................................................................................................ 95 Findings ................................................................................................................................................................................ 98
Process Design and Documentation ........................................................................................................................................................ 98 Organisation Process Management ........................................................................................................................................................ 99 Assessment and Quality .......................................................................................................................................................................... 99 Facilities ................................................................................................................................................................................................ 102 Premises and Environment.................................................................................................................................................................... 103
Observations and Recommendations ................................................................................................................................ 104 Chapter 7: Structure and Resource Management .......................................................................................107
Introduction ....................................................................................................................................................................... 107 Global Perspective.............................................................................................................................................................. 107 Findings .............................................................................................................................................................................. 111
Strategy and Positioning ....................................................................................................................................................................... 111 Structure and Resources........................................................................................................................................................................ 112 Recruitment .......................................................................................................................................................................................... 116 Training, Coaching and Support ............................................................................................................................................................ 117 Performance Appraisals and remuneration .......................................................................................................................................... 122 Culture and Alignment .......................................................................................................................................................................... 122
Observations and Recommendations ................................................................................................................................ 126 Chapter 8: Technology Environment ..........................................................................................................129
Introduction ....................................................................................................................................................................... 129 Global Perspective.............................................................................................................................................................. 129 Findings .............................................................................................................................................................................. 135
Current and Planned Infrastructure....................................................................................................................................................... 135 Support ................................................................................................................................................................................................. 137 Strategy and Infrastructure................................................................................................................................................................... 138
Observations and Recommendations ................................................................................................................................ 140 Glossary of Terms......................................................................................................................................141
4
National Police Contact Management Benchmarking Report 2008
Foreword
The HMIC thematic on call handling, ‘First Contact’ (2005) recommended that an independent and externally led contact
management benchmarking exercise be carried out. In the summer of 2007 we contacted all forces to establish the level of
willingness to take part in such an event. There was clear support for this work to be undertaken.
The importance of this work has increased in line with the raised profile of the Citizen Focus Agenda (CFA) and the
understanding that effective contact management lies at the heart of strategic and citizen focussed service delivery.
I am grateful to all the Forces who took part in this exercise and to Merchants for the production of this excellent report.
For the first time the Police Service has an opportunity to establish a true baseline position around contact management.
Forces will now be able to benchmark against one another and to make effective comparisons against the public and
private sector, both within the UK and globally.
Benchmarking activity will help the Service to identify where there are similarities of approach as well to determine areas
where we differ, (or are perhaps unique), from other organisations, in our approach to the management of public contact.
Better understanding of trends and variations in performance will allow the Police Service to identify those factors that are
critical in terms of improving public service delivery. Benchmarking not only focuses on the strengths and good practice of
others but it also provides an opportunity to identify and validate that, which works well in Policing. This report shows that
there are areas in which the Service is already at the leading edge.
This benchmarking exercise is a significant event in the drive to develop a truly citizen focused approach to policing. The
outputs of this exercise will also inform ongoing work around a Review of National Call Handling Standards (NCHS), and the
creation of a National Contact Management Standard (NCMS). The NCMS will exist to ensure that contact management in
the police service is truly citizen focused, reflects advances in technology and appropriately meets needs of the public in the
21st century.
It is important to stress that the aim of this exercise is to support performance improvement in the round and not to create
a system of leagues and tables. Should this exercise prove as productive to the police service as it has to other public and
private sector organisations, then funding permitting, a programme of annual or bi‐annual benchmarking will be
introduced. This will allow individual Forces and the Service, as a whole, to understand what improvements, over time,
have been achieved.
I hope sincerely that this work will prove a valuable source of information to colleagues and which will help us deliver a
continuously improving service to the public
Commander Simon Foy
National Contact Management Programme, ACPO Lead
5
National Police Contact Management Benchmarking Report 2008
Introduction
The Police Service has always recognised its responsibilities in relation to customer care and the importance of its
relationship with the public. This responsibility has been identified within a number of national reports, including ‘Policing
Bureaucracy Taskforce’, ‘Open All Hours’,’ The National Policing Plan 2005 – 2008’, ‘The Police Reform Agenda’, ‘Building
Communities, Beating Crime’, ‘The Quality of Service Commitment’ and ‘Citizen Focus Policing Guide’.
The Police Service acknowledges that prior to the introduction of the National Call Handling Standards (NCHS) in 2005, the
public’s expectations in respect of call handling and primary contact with the police had not been sufficiently well met.
There was and remains a requirement for consistency and harmonisation between forces in contact management
methodology. This point was reinforced by HMIC in the thematic inspections of police contact management ‐ ‘First Contact’
and ‘Beyond the Call’. These reports recommended that an independent and externally led benchmarking exercise be
carried out.
Contact Management is much wider than call handling and sits at the heart of Citizen Focused service delivery. The
National Contact Management Programme is currently developing NCHS into a National Contact Management Standard
(NCMS) that will meet the needs of the public in the 21st century. The findings of the National Police Contact Management
Benchmarking Report 2008 will inform this process and set a baseline for contact management in the Police Service.
Additionally, it will allow identification and celebration of existing areas of world class performance and/or good practice
that is evident within Police contact management.
The national police contact management benchmarking exercise will provide the Service with the opportunity to compare
itself internally and with other public and private sector organisations from across the globe. The report also considers the
uniqueness of the Police Service, whilst acknowledging that the vast bulk of police contact with the public is similar to other
public or private sector service providers and therefore open to productive benchmark. To address the unique aspects of
police contact, potential international police benchmarking partners will in the near future, be identified and appropriate
comparison activity commissioned.
Delivery of the National Police Contact Management Benchmarking Report 2008 has been co‐ordinated by the National
Contact Management Programme (NCMP), which is located within the National Policing Improvement Agency (NPIA). This
work has the full support and involvement of Her Majesty’s Inspectorate of Constabulary (HMIC), the Association of Chief
Police Officers (ACPO) and the Police Service of England and Wales. All Forces accept the need to improve contact
management and the responsibility they have to manage such activity efficiently and to the satisfaction of the Police
Authorities and the communities they serve. This work is both aligned to and supportive of Sir David Varney’s report on
‘Service Transformation’ (2006).
This is the first time within policing (globally it is believed) that at a national level benchmarking of contact management
has been undertaken. This is an important factor, because as with all ‘path finding’ activity there will always be a period of
learning and reflection. We will overtime identify how best to use the information that results from this activity to help the
Police Service provide a truly world class citizen focused service.
Acknowledgements
The Association of Chief Police Officers (ACPO), the National Policing Improvement Agency (NPIA) and Her Majesty’s
Inspectorate of Constabulary (HMIC) would like to acknowledge the support and commitment of all staff who contributed
to the production of this report.. Thank you to all forces for taking part and specifically Mike Horne (Her Majesty’s
Inspectorate of Constabulary), Pauline Smith (Staffordshire Police), Kay Southall, Peter Major, Mike Rawsthorn and other
members of the National Contact Management Programme Team (National Policing Improvement Agency ‐ Assisted
Implementation).
6
National Police Contact Management Benchmarking Report 2008
Merchants and the Global Contact Centre Benchmarking Report
Merchants – a division of Dimension Data – is a
leading customer management firm, providing a
full range of innovative managed services and
contact centre consultancy expertise.
Internationally recognised for providing best
practice consulting and managed service
solutions for over 25 years, they have gained
over 70 awards of recognition in the industry
that testify the premium nature of their
customer contact solutions and industry
knowledge.
Their in‐depth understanding and specialised
skills enable them to provide organisations with
a range of services from creating customer
management strategy solutions, developing
people including training of frontline managers
and agents and providing business solutions for process and technology issues. They provide industry innovation and
thought leadership by combining strategic understanding with practitioner’s knowledge and experience, Performance
Improvement is at the core of both their own operations and work with other organisations around the globe.
With increasing pressures being placed on customer contact professionals to contain the costs of, improve efficiencies in
and improve the performance of their centre, the need to know what is happening and to understand the reasons for it are
essential. As a key player in the global contact centre industry, Merchants are firmly committed to the ongoing growth of
this vibrant sector. They demonstrate their dedication by providing the industry with an extremely valuable tool for
customer contact and contact centre review: The Global Contact Centre Benchmarking report.
The Global Contact Centre Benchmarking Report was first published by Merchants in 1997 and to draw on their operational
and commercial expertise. It is a rich and comprehensive information source on the day‐to‐day realities faced by contact
centres and the trends occurring in the industry.
The report is an industry‐renowned study of contact centres around the world and has a proud history of comprehensively
investigating and reporting the performance levels achieved and operational realities experienced by global contact
centres. The Benchmarking Report aims to add value to you and your contact centre: providing information and analysis of
operational daily productivity benchmarks through to helping you articulate the true purpose and value of your centres.
The report is concerned with the current status of the global contact centre market. Its content encompasses the entire
sphere of today’s contact centre environment. It includes all aspects of contact centre operations and performance from
strategy, customer management and financial management, through processes and procedures, human resources and
training, to technology environment and overall performance management. The Global Contact Centre Benchmarking
Report provides you with global contact centre information of an unparalleled depth and scale.
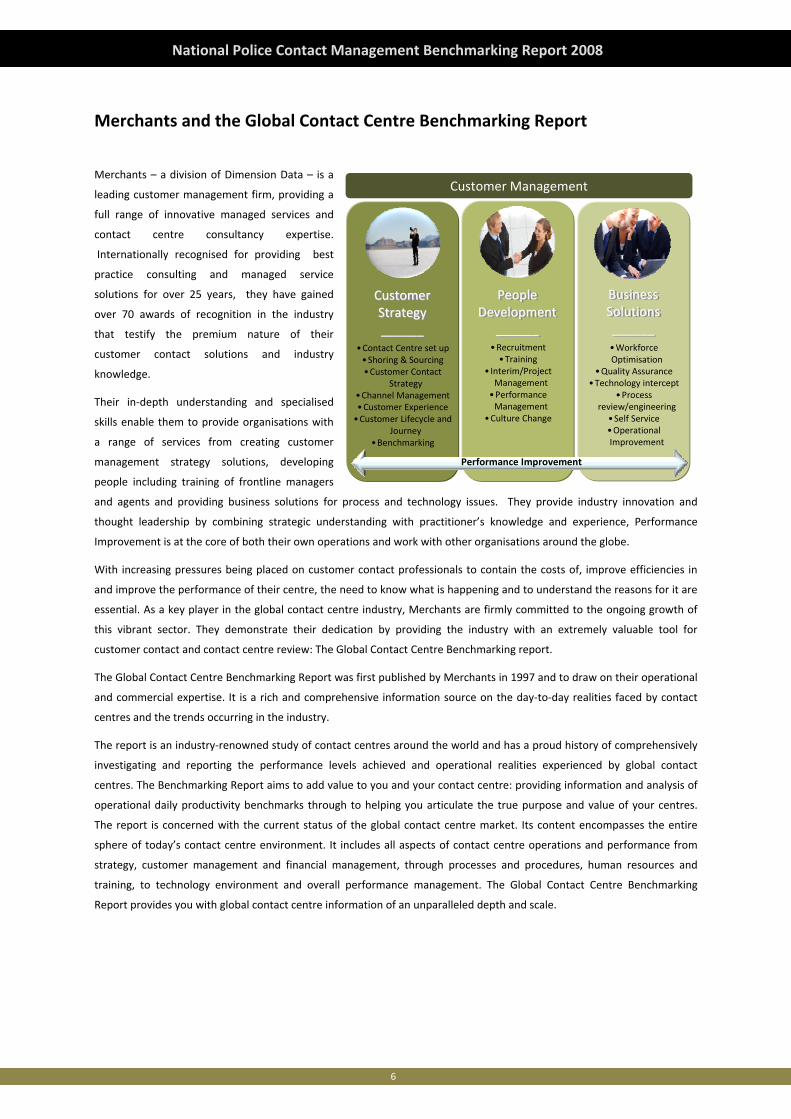
Customer Management
•Contact Centre set up•Shoring & Sourcing•Customer Contact
Strategy•Channel Management•Customer Experience•Customer Lifecycle and
Journey•Benchmarking
•Recruitment•Training
• Interim/Project Management
•Performance Management
•Culture Change
•Workforce Optimisation
•Quality Assurance•Technology intercept
•Process review/engineering
•Self Service•Operational Improvement
Customer Strategy______
Customer Customer StrategyStrategy____________
People Development
______
People People DevelopmentDevelopment
____________
Business Solutions______
Business Business SolutionsSolutions____________
Performance ImprovementPerformance Improvement
7
National Police Contact Management Benchmarking Report 2008
Research Methodology
1. The key elements of the
Benchmarking research
approach were produced
by identifying those
standard questions
contained within the
Merchants Global Contact
Centre Benchmarking data
set, that were agreed to
be applicable and of
statistical valuable to the
survey. A number of
questions were amended
to remove specific
commercial contact centre
terminology i.e. marketing
and sales to ensure
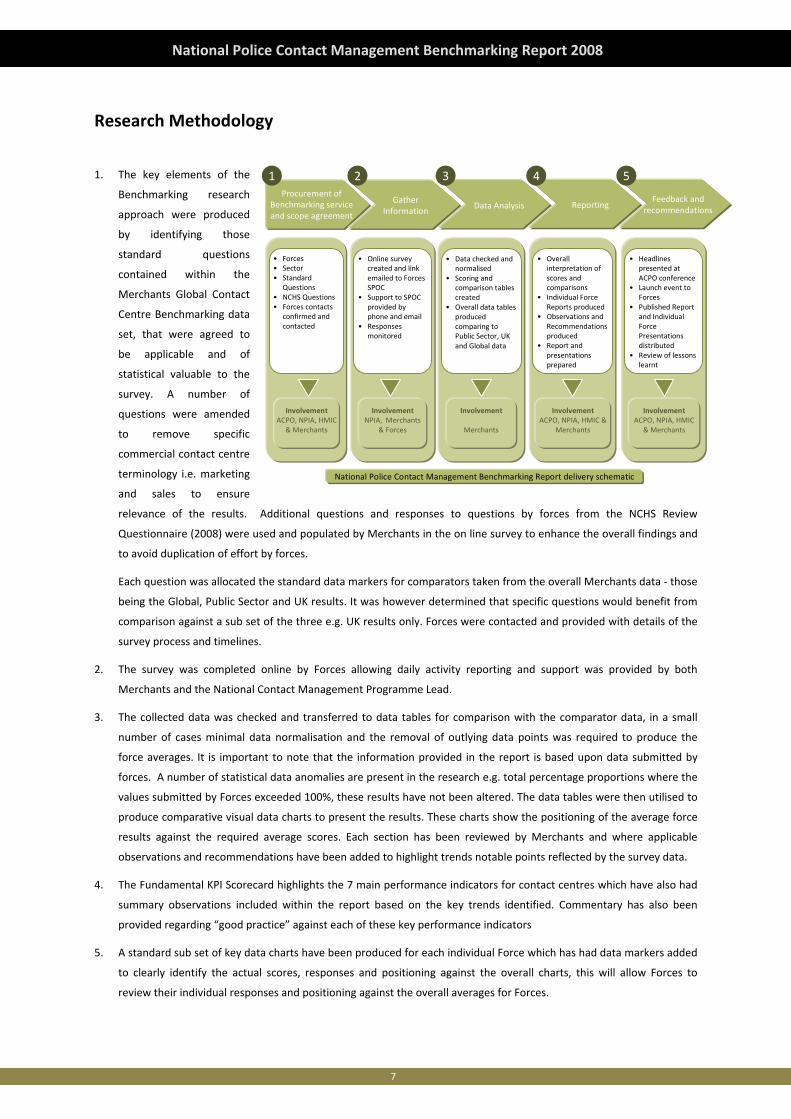
relevance of the results. Additional questions and responses to questions by forces from the NCHS Review
Questionnaire (2008) were used and populated by Merchants in the on line survey to enhance the overall findings and
to avoid duplication of effort by forces.
Each question was allocated the standard data markers for comparators taken from the overall Merchants data ‐ those
being the Global, Public Sector and UK results. It was however determined that specific questions would benefit from
comparison against a sub set of the three e.g. UK results only. Forces were contacted and provided with details of the
survey process and timelines.
2. The survey was completed online by Forces allowing daily activity reporting and support was provided by both
Merchants and the National Contact Management Programme Lead.
3. The collected data was checked and transferred to data tables for comparison with the comparator data, in a small
number of cases minimal data normalisation and the removal of outlying data points was required to produce the
force averages. It is important to note that the information provided in the report is based upon data submitted by
forces. A number of statistical data anomalies are present in the research e.g. total percentage proportions where the
values submitted by Forces exceeded 100%, these results have not been altered. The data tables were then utilised to
produce comparative visual data charts to present the results. These charts show the positioning of the average force
results against the required average scores. Each section has been reviewed by Merchants and where applicable
observations and recommendations have been added to highlight trends notable points reflected by the survey data.
4. The Fundamental KPI Scorecard highlights the 7 main performance indicators for contact centres which have also had
summary observations included within the report based on the key trends identified. Commentary has also been
provided regarding “good practice” against each of these key performance indicators
5. A standard sub set of key data charts have been produced for each individual Force which has had data markers added
to clearly identify the actual scores, responses and positioning against the overall charts, this will allow Forces to
review their individual responses and positioning against the overall averages for Forces.
Procurement of Benchmarking service and scope agreement
1 2 3 4 5
• Forces• Sector• Standard
Questions• NCHS Questions• Forces contacts
confirmed and contacted
• Online survey created and link emailed to Forces SPOC
• Support to SPOC provided by phone and email
• Responses monitored
• Data checked and normalised
• Scoring and comparison tables created
• Overall data tables produced comparing to Public Sector, UK and Global data
• Overall interpretation of scores and comparisons
• Individual Force Reports produced
• Observations and Recommendations produced
• Report and presentations prepared
• Headlines presented at ACPO conference
• Launch event to Forces
• Published Report and Individual Force Presentations distributed
• Review of lessons learnt
InvolvementACPO, NPIA, HMIC
& Merchants
Gather Information
Data Analysis ReportingFeedback and
recommendations
InvolvementNPIA, Merchants
& Forces
Involvement
Merchants
InvolvementACPO, NPIA, HMIC &
Merchants
InvolvementACPO, NPIA, HMIC
& Merchants
National Police Contact Management Benchmarking Report delivery schematic

8
National Police Contact Management Benchmarking Report 2008
6. The final outputs of the Benchmarking survey include a presentation to the Forces and the production and distribution
of a printed report. In addition a Force specific CD containing copies of this report, the Overall presentation including
all of the survey charts and a copy of the Forces individual presentation (each force receiving a personalised CD
containing their own presentation).
7. Each Chapter within this report contains an introductory section which provides a commentary around the chapter
subject matter based on the results of the 2008 Global Contact Centre Benchmarking report and Merchants industry
experience.
8. All charts shown within this report display the question asked of the survey respondents followed by the number of
responses to the question eg (n.45). The Report also includes nine questions that have been taken from the NCHS
questionnaire previously responded to by forces and these questions have been highlighted by the inclusion of the
following indicator, (NCHS).
9
National Police Contact Management Benchmarking Report 2008
Executive Summary
Introduction
This report is the result of the initial National Police Contact Management Benchmarking exercise, co‐ordinated by the
National Policing Improvement Agency (NPIA) with the support of Association of Police Officers (ACPO) and Her Majesty’s
Inspectorate of Constabulary (HMIC), and delivered by Merchants. The findings of the report will serve as a baseline for
contact management, enabling progress to be tracked and improvements measured.
Merchants produce the industry standard Global Contact Benchmark Report annually, and have subsequently created a
specific survey for Police Contact Management Benchmarking. Each of the 43 Forces from England & Wales plus British
Transport Police (BTP) and Civil Nuclear Constabulary (CNC) were invited to participate in the survey, and all 45 of these
Forces responded with high quality submissions.
During the Benchmarking exercise, 23,500 police‐specific pieces of data have been collated and analysed, in addition to
existing data gained from the recent National Call handling Standards (NCHS) Review Questionnaire. The Police‐specific
data has been compared with Merchants’ 2008 Global Contact Centre Benchmark Report data, providing direct
comparisons with Global, UK Commercial, and Public Sector data.
Selected Findings
This report comprises 8 chapters which contain charts and graphs of the data collected during the Benchmarking exercise,
together with high‐level observations and recommendations. The report chapters are:
• Background Information
• Strategy and Development
• Financial Management and Rationale
• Customer Knowledge and Management
• Performance Measurement and Metrics
• Processes and Procedures
• Structure and Resource Management
• Technology Environment
Whilst the individual chapters comprise the detail of the collated and analysed data, there follow some selected findings
and interpretations of the results.
10
National Police Contact Management Benchmarking Report 2008
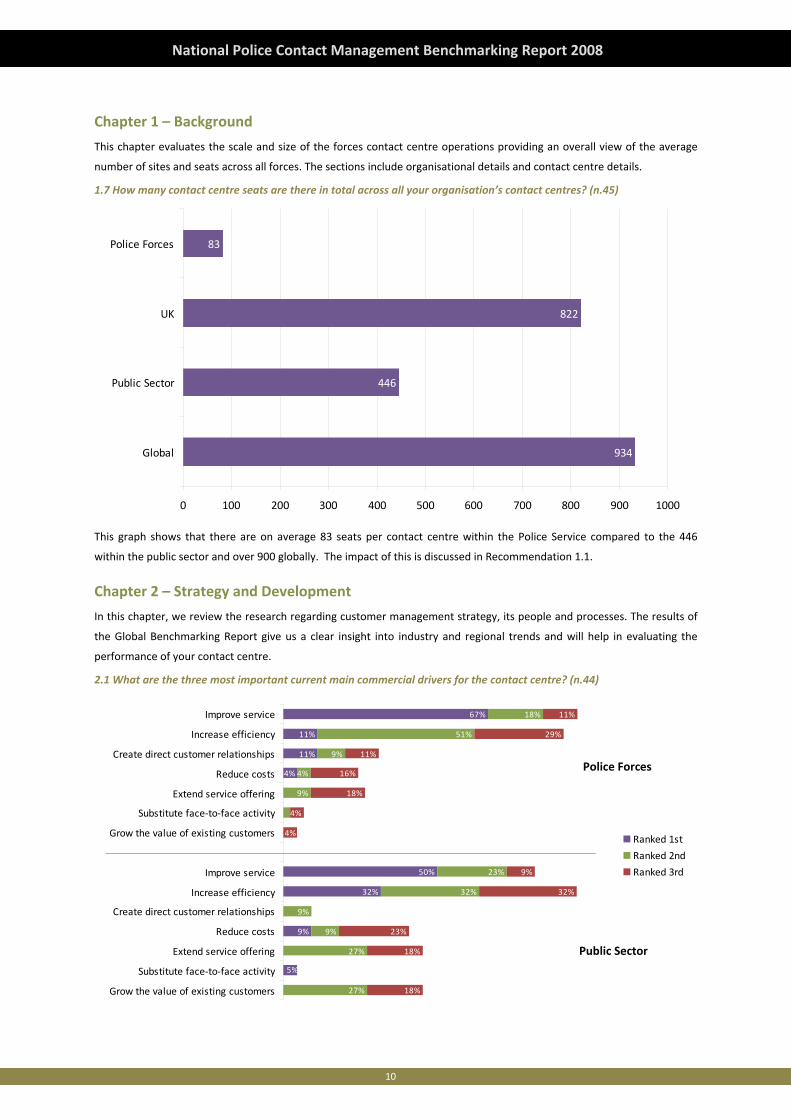
Chapter 1 – Background
This chapter evaluates the scale and size of the forces contact centre operations providing an overall view of the average
number of sites and seats across all forces. The sections include organisational details and contact centre details.
1.7 How many contact centre seats are there in total across all your organisation’s contact centres? (n.45)
934
446
822
83
0 100 200 300 400 500 600 700 800 900 1000
Global
Public Sector
UK
Police Forces
This graph shows that there are on average 83 seats per contact centre within the Police Service compared to the 446
within the public sector and over 900 globally. The impact of this is discussed in Recommendation 1.1.
Chapter 2 – Strategy and Development
In this chapter, we review the research regarding customer management strategy, its people and processes. The results of
the Global Benchmarking Report give us a clear insight into industry and regional trends and will help in evaluating the
performance of your contact centre.
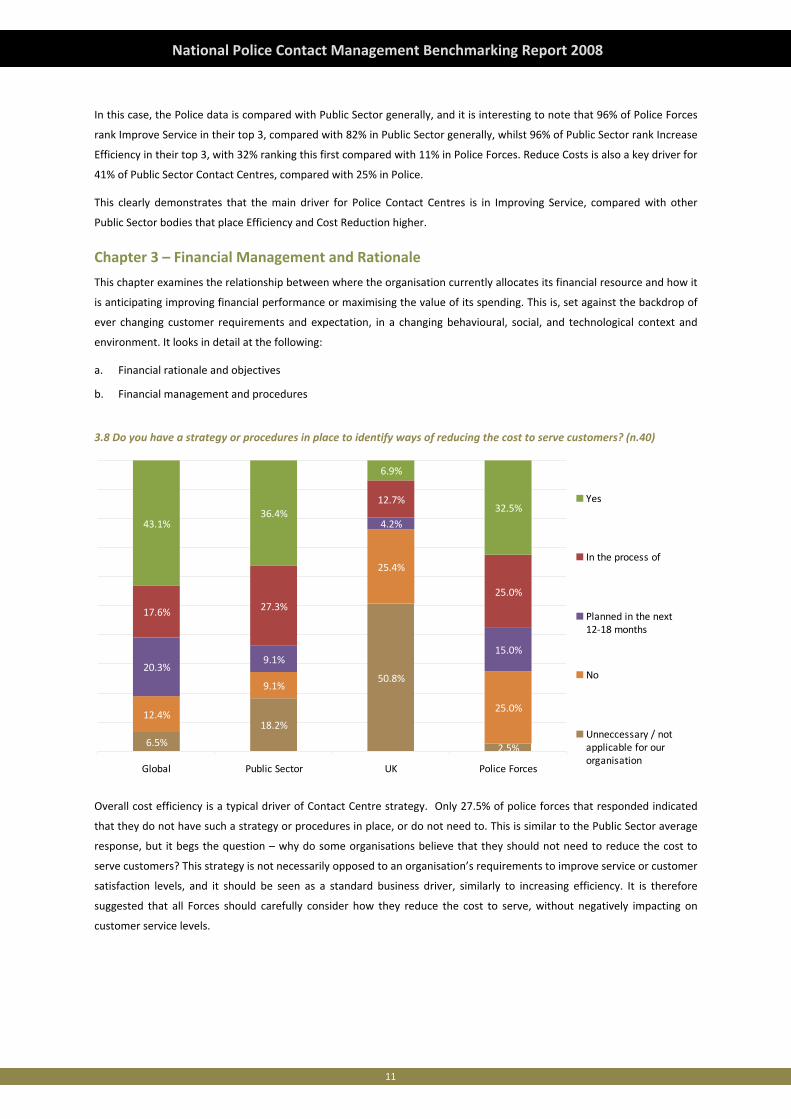
2.1 What are the three most important current main commercial drivers for the contact centre? (n.44)
0%
9%
32%
50%
11%
11%
67%
27%
27%
9%
32%
23%
4%
9%
51%
18%
18%
18%
32%
9%
4%
18%
16%
11%
29%
11%
5%
4%
9%
9%
0%
23%
4%
Grow the value of existing customers
Substitute face‐to‐face activity
Extend service offering
Reduce costs
Create direct customer relationships
Increase efficiency
Improve service
Grow the value of existing customers
Substitute face‐to‐face activity
Extend service offering
Reduce costs
Create direct customer relationships
Increase efficiency
Improve service
Ranked 1st
Ranked 2nd
Ranked 3rd
Police Forces
Public Sector
11
National Police Contact Management Benchmarking Report 2008
In this case, the Police data is compared with Public Sector generally, and it is interesting to note that 96% of Police Forces
rank Improve Service in their top 3, compared with 82% in Public Sector generally, whilst 96% of Public Sector rank Increase
Efficiency in their top 3, with 32% ranking this first compared with 11% in Police Forces. Reduce Costs is also a key driver for
41% of Public Sector Contact Centres, compared with 25% in Police.
This clearly demonstrates that the main driver for Police Contact Centres is in Improving Service, compared with other
Public Sector bodies that place Efficiency and Cost Reduction higher.
Chapter 3 – Financial Management and Rationale
This chapter examines the relationship between where the organisation currently allocates its financial resource and how it
is anticipating improving financial performance or maximising the value of its spending. This is, set against the backdrop of
ever changing customer requirements and expectation, in a changing behavioural, social, and technological context and
environment. It looks in detail at the following:
a. Financial rationale and objectives
b. Financial management and procedures
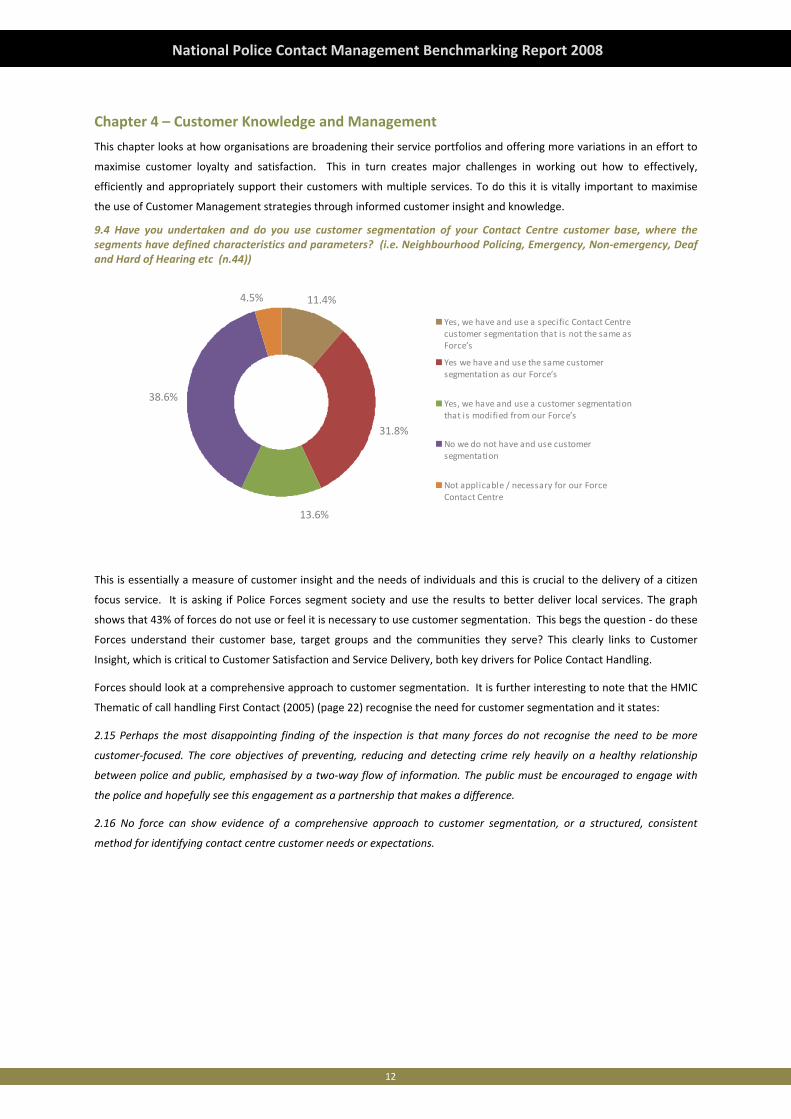
3.8 Do you have a strategy or procedures in place to identify ways of reducing the cost to serve customers? (n.40)
6.5%
18.2%
50.8%
2.5%
12.4%
9.1%
25.4%
25.0%
20.3%9.1%
4.2%
15.0%
17.6% 27.3%
12.7%
25.0%
43.1%36.4%
6.9%
32.5%
Global Public Sector UK Police Forces
Yes
In the process of
Planned in the next12‐18 months
No
Unneccessary / notapplicable for ourorganisation
Overall cost efficiency is a typical driver of Contact Centre strategy. Only 27.5% of police forces that responded indicated
that they do not have such a strategy or procedures in place, or do not need to. This is similar to the Public Sector average
response, but it begs the question – why do some organisations believe that they should not need to reduce the cost to
serve customers? This strategy is not necessarily opposed to an organisation’s requirements to improve service or customer
satisfaction levels, and it should be seen as a standard business driver, similarly to increasing efficiency. It is therefore
suggested that all Forces should carefully consider how they reduce the cost to serve, without negatively impacting on
customer service levels.
12
National Police Contact Management Benchmarking Report 2008
Chapter 4 – Customer Knowledge and Management
This chapter looks at how organisations are broadening their service portfolios and offering more variations in an effort to
maximise customer loyalty and satisfaction. This in turn creates major challenges in working out how to effectively,
efficiently and appropriately support their customers with multiple services. To do this it is vitally important to maximise
the use of Customer Management strategies through informed customer insight and knowledge.
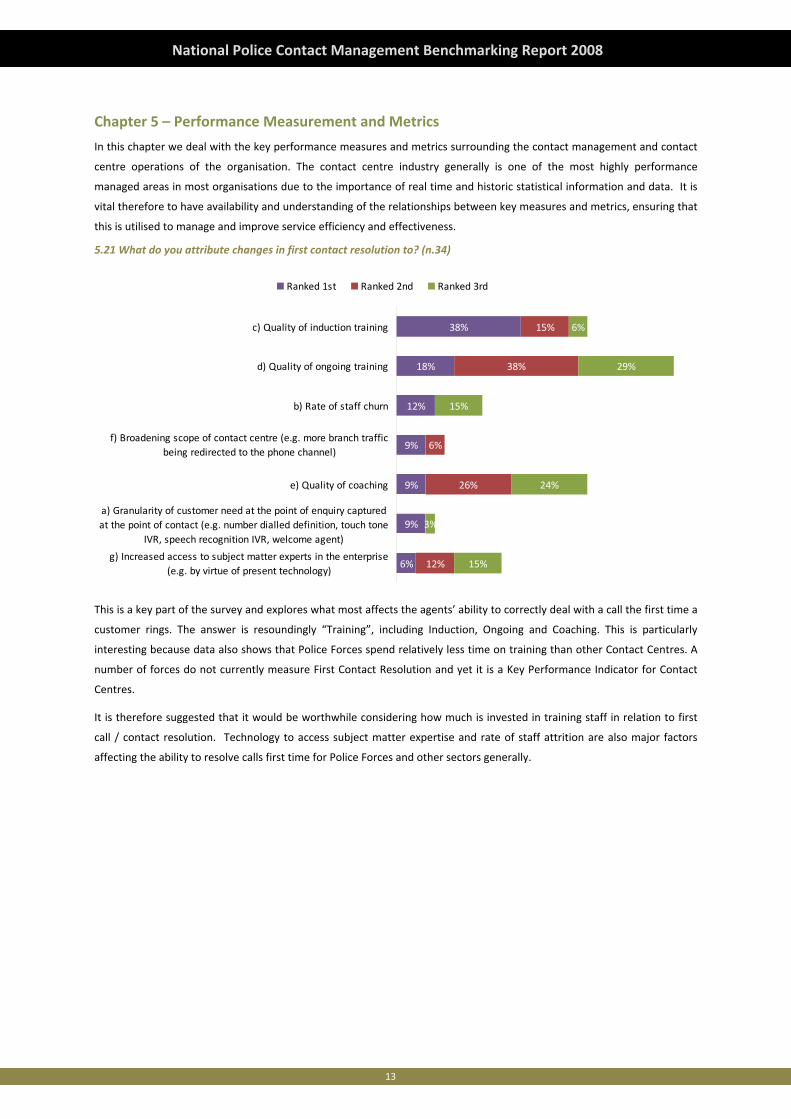
9.4 Have you undertaken and do you use customer segmentation of your Contact Centre customer base, where the segments have defined characteristics and parameters? (i.e. Neighbourhood Policing, Emergency, Non‐emergency, Deaf and Hard of Hearing etc (n.44))
38.6%
13.6%
4.5% 11.4%
31.8%
Yes, we have and use a specific Contact Centrecustomer segmentation that is not the same asForce’s
Yes we have and use the same customersegmentation as our Force’s
Yes, we have and use a customer segmentationthat is modified from our Force’s
No we do not have and use customersegmentation
Not applicable / necessary for our ForceContact Centre
This is essentially a measure of customer insight and the needs of individuals and this is crucial to the delivery of a citizen
focus service. It is asking if Police Forces segment society and use the results to better deliver local services. The graph
shows that 43% of forces do not use or feel it is necessary to use customer segmentation. This begs the question ‐ do these
Forces understand their customer base, target groups and the communities they serve? This clearly links to Customer
Insight, which is critical to Customer Satisfaction and Service Delivery, both key drivers for Police Contact Handling.
Forces should look at a comprehensive approach to customer segmentation. It is further interesting to note that the HMIC
Thematic of call handling First Contact (2005) (page 22) recognise the need for customer segmentation and it states:
2.15 Perhaps the most disappointing finding of the inspection is that many forces do not recognise the need to be more
customer‐focused. The core objectives of preventing, reducing and detecting crime rely heavily on a healthy relationship
between police and public, emphasised by a two‐way flow of information. The public must be encouraged to engage with
the police and hopefully see this engagement as a partnership that makes a difference.
2.16 No force can show evidence of a comprehensive approach to customer segmentation, or a structured, consistent
method for identifying contact centre customer needs or expectations.
13
National Police Contact Management Benchmarking Report 2008
Chapter 5 – Performance Measurement and Metrics
In this chapter we deal with the key performance measures and metrics surrounding the contact management and contact
centre operations of the organisation. The contact centre industry generally is one of the most highly performance
managed areas in most organisations due to the importance of real time and historic statistical information and data. It is
vital therefore to have availability and understanding of the relationships between key measures and metrics, ensuring that
this is utilised to manage and improve service efficiency and effectiveness.
5.21 What do you attribute changes in first contact resolution to? (n.34)
6%
9%
9%
9%
12%
18%
38%
12%
26%
6%
38%
15%
15%
3%
24%
15%
29%
6%
g) Increased access to subject matter experts in the enterprise(e.g. by virtue of present technology)
a) Granularity of customer need at the point of enquiry capturedat the point of contact (e.g. number dialled definition, touch tone
IVR, speech recognition IVR, welcome agent)
e) Quality of coaching
f) Broadening scope of contact centre (e.g. more branch trafficbeing redirected to the phone channel)
b) Rate of staff churn
d) Quality of ongoing training
c) Quality of induction training
Ranked 1st Ranked 2nd Ranked 3rd
This is a key part of the survey and explores what most affects the agents’ ability to correctly deal with a call the first time a
customer rings. The answer is resoundingly “Training”, including Induction, Ongoing and Coaching. This is particularly
interesting because data also shows that Police Forces spend relatively less time on training than other Contact Centres. A
number of forces do not currently measure First Contact Resolution and yet it is a Key Performance Indicator for Contact
Centres.
It is therefore suggested that it would be worthwhile considering how much is invested in training staff in relation to first
call / contact resolution. Technology to access subject matter expertise and rate of staff attrition are also major factors
affecting the ability to resolve calls first time for Police Forces and other sectors generally.
14
National Police Contact Management Benchmarking Report 2008
Chapter 6 – Processes and Procedures
This chapter concentrates on the process element of the contact centre industry which underpins technology and people to
deliver against the organisations needs and that of its customers and stakeholders. Process management is an essential
component in ensuring that the contact centre remains aligned to changing and developing requirements for managing
customer contact.
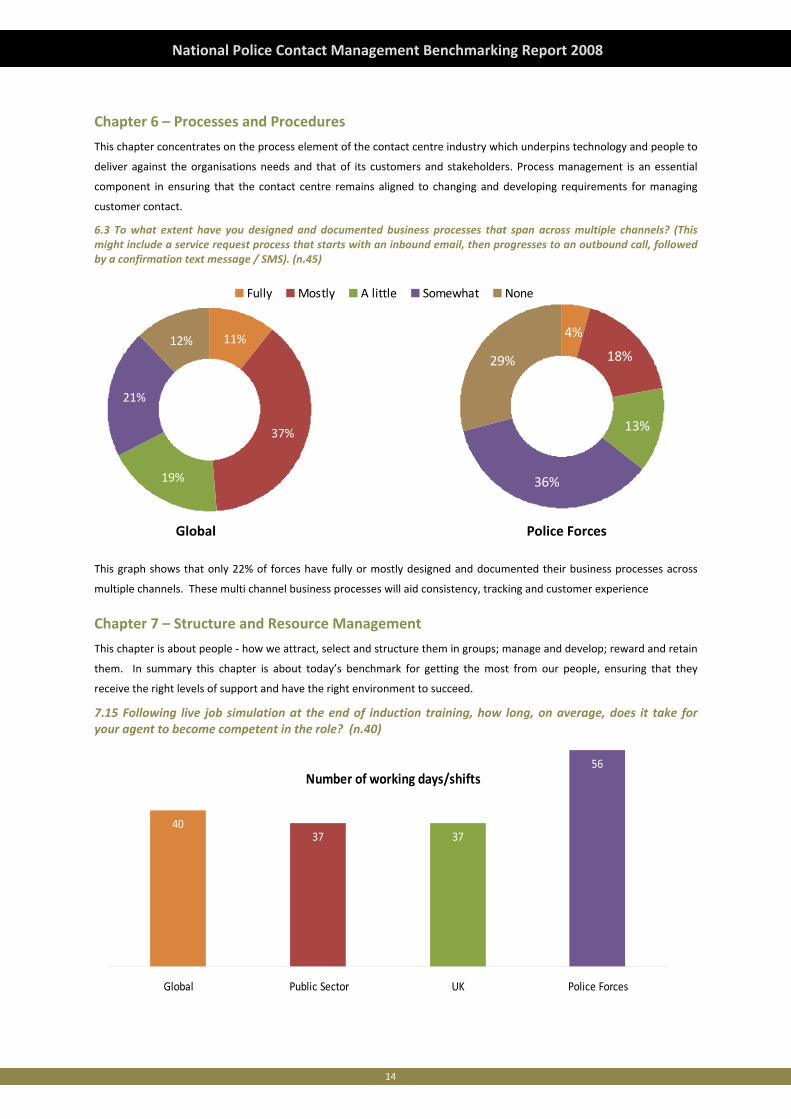
6.3 To what extent have you designed and documented business processes that span across multiple channels? (This might include a service request process that starts with an inbound email, then progresses to an outbound call, followed by a confirmation text message / SMS). (n.45)
11%
37%
19%
21%
12%
Fully Mostly A little Somewhat None
4%
18%
13%
36%
29%
Police ForcesGlobal
This graph shows that only 22% of forces have fully or mostly designed and documented their business processes across
multiple channels. These multi channel business processes will aid consistency, tracking and customer experience
Chapter 7 – Structure and Resource Management
This chapter is about people ‐ how we attract, select and structure them in groups; manage and develop; reward and retain
them. In summary this chapter is about today’s benchmark for getting the most from our people, ensuring that they
receive the right levels of support and have the right environment to succeed.
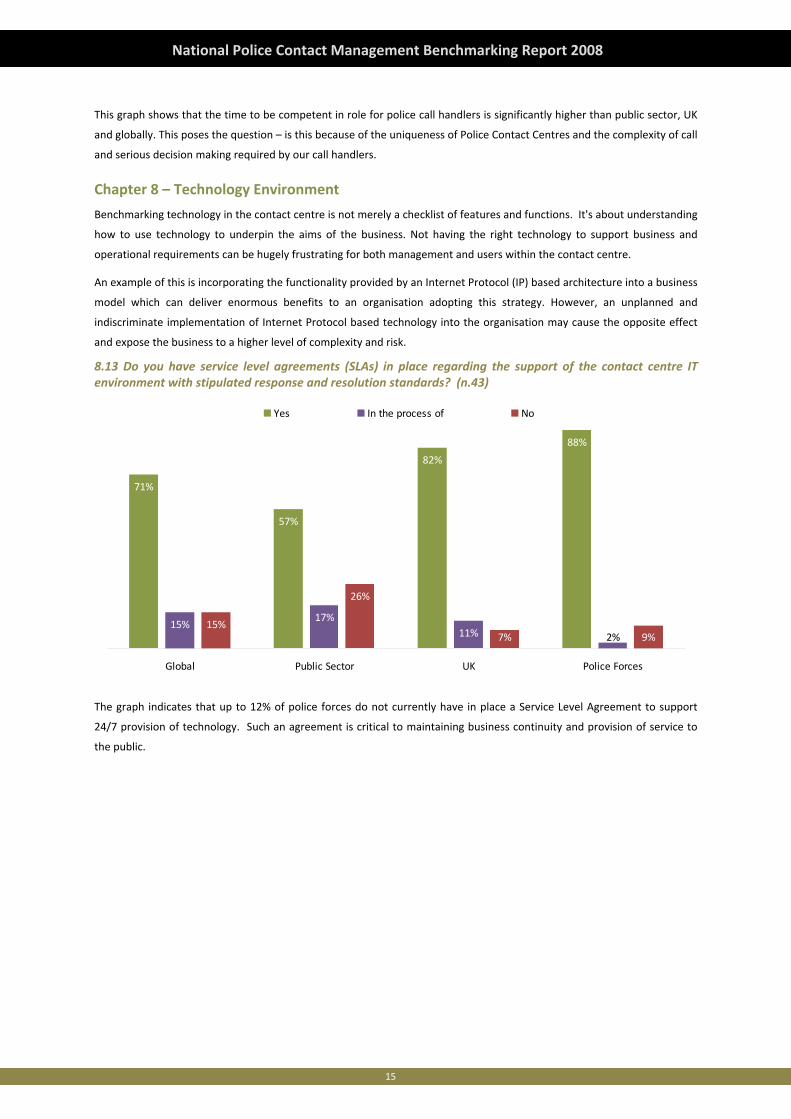
7.15 Following live job simulation at the end of induction training, how long, on average, does it take for your agent to become competent in the role? (n.40)
Number of working days/shifts
4037 37
56
Global Public Sector UK Police Forces
15
National Police Contact Management Benchmarking Report 2008
This graph shows that the time to be competent in role for police call handlers is significantly higher than public sector, UK
and globally. This poses the question – is this because of the uniqueness of Police Contact Centres and the complexity of call
and serious decision making required by our call handlers.
Chapter 8 – Technology Environment
Benchmarking technology in the contact centre is not merely a checklist of features and functions. It's about understanding
how to use technology to underpin the aims of the business. Not having the right technology to support business and
operational requirements can be hugely frustrating for both management and users within the contact centre.
An example of this is incorporating the functionality provided by an Internet Protocol (IP) based architecture into a business
model which can deliver enormous benefits to an organisation adopting this strategy. However, an unplanned and
indiscriminate implementation of Internet Protocol based technology into the organisation may cause the opposite effect
and expose the business to a higher level of complexity and risk.
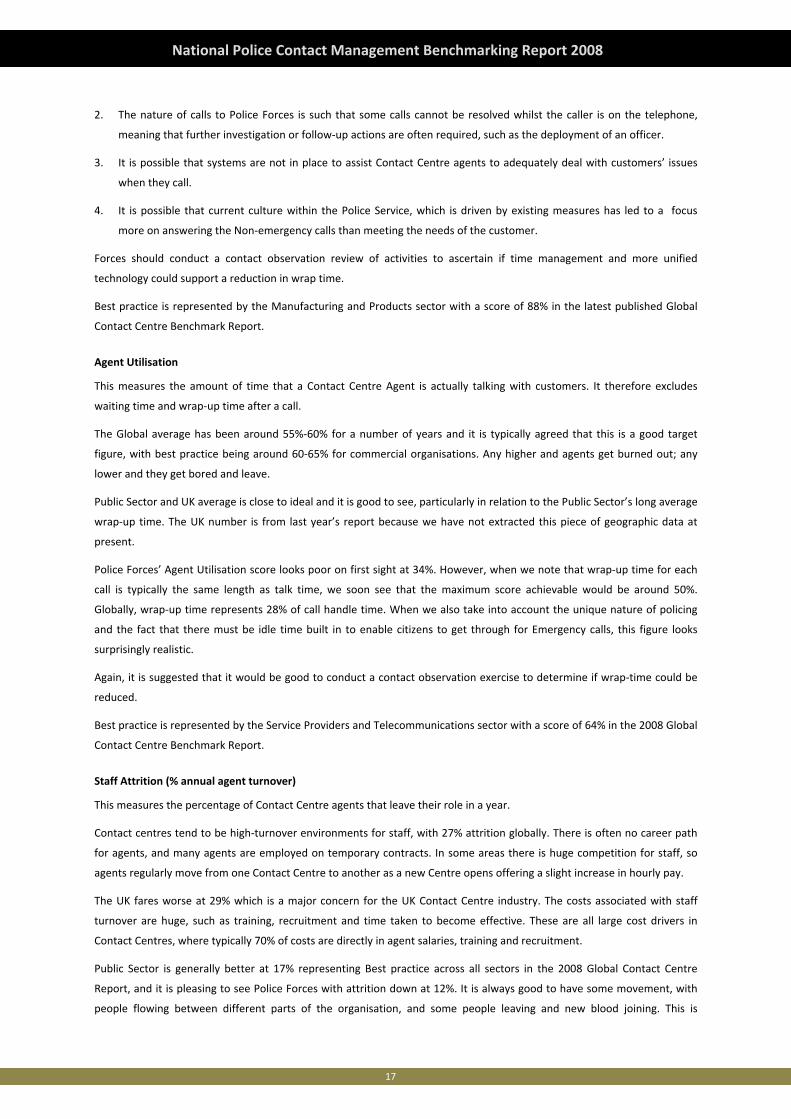
8.13 Do you have service level agreements (SLAs) in place regarding the support of the contact centre IT environment with stipulated response and resolution standards? (n.43)
71%
57%
82%
88%
15%17%
11%15%
26%
7% 9%2%
Global Public Sector UK Police Forces
Yes In the process of No
The graph indicates that up to 12% of police forces do not currently have in place a Service Level Agreement to support
24/7 provision of technology. Such an agreement is critical to maintaining business continuity and provision of service to
the public.
16
National Police Contact Management Benchmarking Report 2008
Fundamental KPI Scorecard for Contact Centres
Within the Contact Centre industry there are numerous performance criteria and metrics surrounding both qualitative and
quantitative measurements. Merchants has been tracking a set of KPI’s for the last 10 years. As mentioned these are not
the only KPI’s that Contact Centres track, however they are generally recognised as the most powerful generic Contact
Centre KPI’s providing a good snapshot of performance. Merchants has a wealth of data comparing different sectors’
performance and year‐on‐year changes. Police Forces’ performance has therefore been compared to Global, Public Sector
and UK geographic results from the 2008 Global Contact Centre Survey KPI Scorecard results.
Customer Satisfaction
This measures how satisfied callers are with the service received on a call to the Contact Centre. Different organisations
measure customer satisfaction in different ways and it can be affected by perception of “brand” if not done correctly.
The UK generally performs better than the Global average since organisations place high emphasis on customer
satisfaction, and many Contact Centres overseas are targeted more on cost reduction, which inevitably adversely affects
customer satisfaction. Compared to last year, it is encouraging to see UK increase from 83% to 86%, reflecting the
improvements many organisations have made in response to customers’ demands for better service.
The Public Sector generally out‐performs most other sectors in customer satisfaction, and represents Best Practice across
all sectors in the 2008 Global Contact Centre Report, partly because there is often no competition, partly due to lower
customer expectations, but also due to the fact that Public Sector understands service. Most Public Sector employees see
themselves as Public Servants and strive to do just that – serve the public.
It is extremely encouraging to note that all 45 Police Forces surveyed measure customer satisfaction, and it is good to see
that the average Police Force score is a percentage point in advance of Public Sector generally. This is based on customer
satisfaction measured by Police Forces themselves, and it will be interesting to see how this changes over the next year.
This is a very difficult KPI to improve year‐on‐year due to the ever‐increasing expectations from customers.
First Contact / Call Resolution
This KPI measures the percentage of calls to a Contact Centre that are resolved the first time, without the need for a
customer to call again or for a follow‐up action.
Last year’s Global score was 81%, which is consistent with this year’s score.
The UK score shows a marked increase compared with the Global average, and is an improvement on last year’s score.
Most customers call to access information or to get an issue resolved as quickly as possible, and this is a key driver of
Customer Satisfaction; there is a direct link between First Contact Resolution (FCR) and customer satisfaction,
demonstrated by the UK’s higher performance compared to the Global average.
Public Sector is generally behind the average on FCR, since the nature of the calls tend to be more complex and wide‐
ranging in scope. Many commercial organisations deal with relatively straight‐forward transactions, such as order‐taking,
balance enquiries and delivery schedules. The range of calls to a Local Authority can be very broad, including Housing,
Parking, Refuse Collection, Revenues and Benefits, and many more. It is not always possible to route a caller to someone
who can deal with this range of enquiries first time.
The Police Service FCR score is significantly lower than the Public Sector average, but this question was only answered by
68% of Forces. This suggests three points:
1. Not all Police Forces can measure FCR, which is a real concern, since FCR drives customer satisfaction, and also
because it drives efficiency; if a call is resolved first time, there is no repeat call from a customer, or follow‐up action
required.
17
National Police Contact Management Benchmarking Report 2008
2. The nature of calls to Police Forces is such that some calls cannot be resolved whilst the caller is on the telephone,
meaning that further investigation or follow‐up actions are often required, such as the deployment of an officer.
3. It is possible that systems are not in place to assist Contact Centre agents to adequately deal with customers’ issues
when they call.
4. It is possible that current culture within the Police Service, which is driven by existing measures has led to a focus
more on answering the Non‐emergency calls than meeting the needs of the customer.
Forces should conduct a contact observation review of activities to ascertain if time management and more unified
technology could support a reduction in wrap time.
Best practice is represented by the Manufacturing and Products sector with a score of 88% in the latest published Global
Contact Centre Benchmark Report.
Agent Utilisation
This measures the amount of time that a Contact Centre Agent is actually talking with customers. It therefore excludes
waiting time and wrap‐up time after a call.
The Global average has been around 55%‐60% for a number of years and it is typically agreed that this is a good target
figure, with best practice being around 60‐65% for commercial organisations. Any higher and agents get burned out; any
lower and they get bored and leave.
Public Sector and UK average is close to ideal and it is good to see, particularly in relation to the Public Sector’s long average
wrap‐up time. The UK number is from last year’s report because we have not extracted this piece of geographic data at
present.
Police Forces’ Agent Utilisation score looks poor on first sight at 34%. However, when we note that wrap‐up time for each
call is typically the same length as talk time, we soon see that the maximum score achievable would be around 50%.
Globally, wrap‐up time represents 28% of call handle time. When we also take into account the unique nature of policing
and the fact that there must be idle time built in to enable citizens to get through for Emergency calls, this figure looks
surprisingly realistic.
Again, it is suggested that it would be good to conduct a contact observation exercise to determine if wrap‐time could be
reduced.
Best practice is represented by the Service Providers and Telecommunications sector with a score of 64% in the 2008 Global
Contact Centre Benchmark Report.
Staff Attrition (% annual agent turnover)
This measures the percentage of Contact Centre agents that leave their role in a year.
Contact centres tend to be high‐turnover environments for staff, with 27% attrition globally. There is often no career path
for agents, and many agents are employed on temporary contracts. In some areas there is huge competition for staff, so
agents regularly move from one Contact Centre to another as a new Centre opens offering a slight increase in hourly pay.
The UK fares worse at 29% which is a major concern for the UK Contact Centre industry. The costs associated with staff
turnover are huge, such as training, recruitment and time taken to become effective. These are all large cost drivers in
Contact Centres, where typically 70% of costs are directly in agent salaries, training and recruitment.
Public Sector is generally better at 17% representing Best practice across all sectors in the 2008 Global Contact Centre
Report, and it is pleasing to see Police Forces with attrition down at 12%. It is always good to have some movement, with
people flowing between different parts of the organisation, and some people leaving and new blood joining. This is
18
National Police Contact Management Benchmarking Report 2008
sustainable at the 12% indicated by Police Forces and represents good practice in the UK contact centre industry. It tends to
indicate that Police Contact Centres are viewed as attractive places to work.
Effective resource planning and forecasting of attrition play a key role in having the right people at the right time to deal
with demands for service. This will result in lower abandoned call rates and decreased agent idle time which in turn can
have a positive impact upon both staff moral and cost.
Staff Absenteeism (% annual agent absenteeism)
This measures the amount of time that agents are absent when they are scheduled for a shift. This includes short‐term
unplanned sickness, but excludes long‐term planned absences.
Absenteeism varies significantly by country with UK better than the global average, although 7% means that agents are
absent for 15 days a year, which is poor compared to other industries.
It is interesting to think about illness and absenteeism on a global basis. Perhaps one should expect much higher numbers
in 3rd world countries, where agents are often affected by social issues (such as AIDS, gang masters and basic transportation
issues). A 2 hour commute each way in the middle of the night to match US or European time zones is not unusual in some
parts of the world.
Police Contact Centre absenteeism is similar to the Public Sector average of 8%. This could be improved and it is suggested
that absenteeism should be investigated to determine if there are reasons for Police Forces to be higher than their
commercial counterparts. Absenteeism represents a large direct and indirect cost to the Contact Centre leading to
unnecessarily increased staffing levels, and needs focus on motivation and satisfaction initiatives to resolve.
Best practice is represented by the Utilities and Energy sector with a score of 6% in the 2008 Global Contact Centre
Benchmark Report.
Abandoned Call Rate (% calls abandoned)
This measures the number of calls abandoned when they have been put through to an agent queue and where one typically
listens to music or “please wait” messages.
Globally, 14% of calls are abandoned whilst waiting to speak to an agent. The abandon rate gives a clear indication of an
organisation’s service levels in response to customers’ calls and their ability to effectively apply routing and channel
strategies to meet volume demands.
UK tends to provide a better service, but it is clear that Contact Centres still have some way to go to meet customers’
expectations; well over one in ten customers give up. This is last year’s number since the 2008 data has not been calculated
at the time of publishing.
Public Sector’s service ethos shows through clearly, with abandon rate down at 9% and Financial Services at 4%. Police
Forces show a very good, low score of 3.6%, which is likely caused by three factors:
• Emergency callers are answered very quickly and are extremely unlikely to hang up.
• Callers are prepared to wait to speak to someone in a Police Contact Centre, whether for Emergency on Non‐
emergency calls.
• There is a lower expectation of how quickly a call is answered in Public Sector compared to many commercial
organisations, such as banks.
Best practice across all sectors is represented by Police Service with a score of 3.6%.
19
National Police Contact Management Benchmarking Report 2008
Speed‐to‐answer (% calls answered in 20 seconds)
This measures the number of calls answered within 20 seconds of reaching the agent queue. This metric, together with
Abandoned Call Rate and First Contact Resolution are the key drivers of Customer Satisfaction. Speed to Answer is often is
impacted by Agent Utilisation; the more free time for agents, the more likely someone is available to answer a call when it
arrives.
The Global average across all sectors is 69%, meaning that almost one third of customers’ calls are kept waiting longer that
20 seconds.
UK does very well at 81% with Public sector a little behind at 74%.
In the police forces, this is 79%, made up of a combination of Emergency calls, of which 95% are answered in 20 seconds
and Non‐emergency calls at 76%. It should be noted that police forces currently measure their speed to answer in 10
seconds (Emergency calls), 30 seconds (Non‐emergency calls) and 40 seconds (one stop shop). Best practice is represented
by the Travel and Transportation sector with a score of 83% in the latest published Global Contact Centre Benchmark
Report.
Overall Conclusion
The results of this survey paint a good picture for Police Force Contact Centres, with a number of observations and
recommendations for improvement being made. This represents a good baseline of the as is position for contact
management, enabling progress to be tracked and improvements measured.
20
National Police Contact Management Benchmarking Report 2008
Recommendations
Chapter 1 – Background
Recommendation 1.1
Forces should review the potential to share demand by means of integrated telephony and command and control systems
in order to achieve benefits of scale opportunities. This will further support business continuity and disaster recovery
needs.
Chapter 2 – Strategy and Development
Recommendation 2.1
Forces should review processes to improve First Contact Resolution and explore the use of self‐service mechanisms such as
Interactive Voice Response (IVR) and web self‐help to move Frequently Asked Questions (FAQs) and transactional processes
away from contact centre staff activity.
Recommendation 2.2
Forces should review commercial drivers to determine if service improvement and efficiency can be balanced within the
bounds of business objectives and regulations.
Recommendation 2.3
Forces should ensure that their contact centres apply National Intelligence Model (NIM) discipline and use a flow of
intelligence to develop and meet individual and corporate strategies.
Recommendation 2.4
Forces should integrate the customer experience into strategic objectives to support understanding of customers and their
behaviours.
Recommendation 2.5
The NPIA should, through the National Contact Management Programme, further explore the reasons why 14% of forces
have not implemented the national call grades and definitions as part of the ongoing NCHS review.
Chapter 3 – Financial Management and Rationale
Recommendation 3.1
Forces should review the use of technology to reduce call volumes into the Contact Centre and additionally review the use
of training to improve efficiency of call handling and First Contact Resolution. Technology changes should realise customer
benefits and or support staff in the delivery of customer service.
Recommendation 3.2
Forces should have a strategy in place to identify ways to reduce cost to serve or provide improved service at the same cost.
Recommendation 3.3
Forces should review (or in the absence of, develop) a channel strategy to explore the potential areas for self service. (Also
see Recommendation 6.1).
21
National Police Contact Management Benchmarking Report 2008
Chapter 4 – Customer Knowledge and Management
Recommendation 4.1
Forces should use call recording analysis and Contact Centre agent review sessions to improve knowledge and
understanding of customers. Agents have direct contact with the customer and will therefore have insight into their needs.
Recommendation 4.2
Forces should focus on continuing to improve satisfaction through the increased use of segmentation. Once segmented
groups have been identified, a range of different consultation methods may be used (surveys, focus groups, in‐depth
interviews with users etc) to gain Customer Insight regarding customer views of the services being provided and then an
appropriate strategy based on those demands can be formed.
Recommendation 4.3
Forces should ensure that they have a single view of the customer across channels, services, data / customer information
and transaction history to maximise customer satisfaction.
Chapter 5 – Performance Measurement and Metrics
Recommendation 5.1
Forces should continue to monitor trends of call volumes to establish the reasons behind increases or decreases.
Recommendation 5.2
Forces should conduct a contact observation review of activities to ascertain if time management and more unified
technology could support a reduction in wrap time.
Recommendation 5.3
Forces should have processes in place to measure First Contact Resolution, either on each call, or as part of Customer
Satisfaction procedures.
Recommendation 5.4
Forces should increase focus on training to improve First Contact Resolution and improve efficiency. Police Force Contact
Centre training budget is less than 25% of UK average.
Recommendation 5.5
Forces should measure the percentage of incidents that result in an emergency response, priority response, scheduled
response or that are resolved without deployment to monitor trend increases or decreases and to ensure that resources
are appropriately aligned / realigned.
Chapter 6 – Processes and Procedures
Recommendation 6.1
Forces should develop a contact channel strategy to support consistency, tracking and customer experience.
Recommendation 6.2
Forces should benchmark, assess and accredit their contact centre(s) to ensure standards are maintained and to provide a
baseline to measure change against in the future.
22
National Police Contact Management Benchmarking Report 2008
Recommendation 6.3
Forces should review guidelines and prompts more frequently to ensure processes match business needs in a changing
environment. Current best practice suggests categorising guidelines and prompts and ensuring that they are reviewed in
terms of “shelf life” and changeability etc is critical to successful and relevant application. Current best practice suggests
reviewing within a maximum time frame of once per year.
Chapter 7 – Structure and Resource Management
Recommendation 7.1
Forces should review cost to hire to determine why there is a cost differential with other sectors.
Recommendation 7.2
Forces should determine the reasons for 40% additional time required to become competent in role and determine ways to
reduce. May include enhanced training, improved recruitment and selection processes, skills profiling, improved systems
and processes.
Recommendation 7.3
Forces should continue to monitor absenteeism to understand the reasons for trend increase / decrease and implement an
immediate programme to address.
Recommendation 7.4
Forces should determine the reasons why career development assistance is so low in force and where necessary develop a
plan to support / address.
Chapter 8 – Technology Environment
Recommendation 8.1
Forces should ensure that Contact Centre IT is business critical and that they have robust Service Level Agreements in place
to maintain business continuity 24/7.
Recommendation 8.2
Forces should consider renting or hosting technology as it is typically better supported, more cost‐effective and future
proofed.
Recommendation 8.3
The NPIA should work with ACPO (IT & Communications) to revisit the potential for a national contact management
technology solution. In the absence of such a solution, ACPO and NPIA should ensure that a set of agreed system capability
standards are developed to help assist in force procurement decisions.

23
National Police Contact Management Benchmarking Report 2008

24
National Police Contact Management Benchmarking Report 2008
25
National Police Contact Management Benchmarking Report 2008
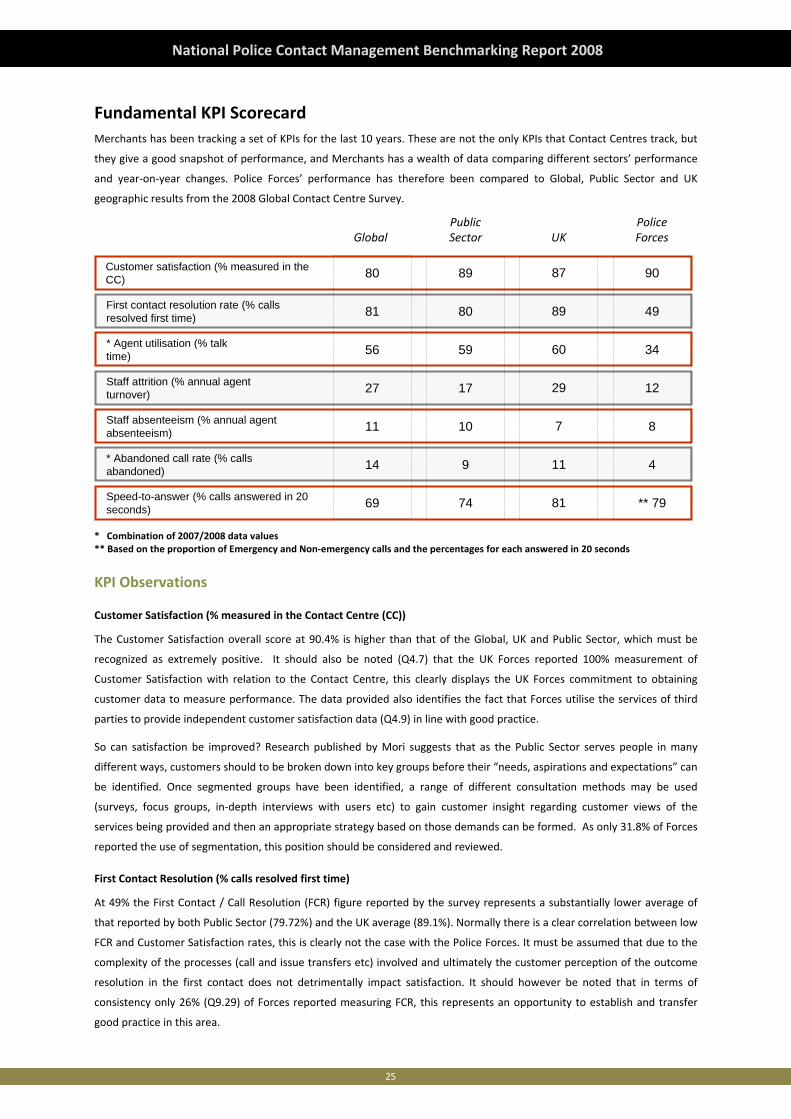
Fundamental KPI Scorecard Merchants has been tracking a set of KPIs for the last 10 years. These are not the only KPIs that Contact Centres track, but
they give a good snapshot of performance, and Merchants has a wealth of data comparing different sectors’ performance
and year‐on‐year changes. Police Forces’ performance has therefore been compared to Global, Public Sector and UK
geographic results from the 2008 Global Contact Centre Survey.
Customer satisfaction (% measured in the CC)
First contact resolution rate (% calls resolved first time)
* Agent utilisation (% talk time)
Staff attrition (% annual agent turnover)
Staff absenteeism (% annual agent absenteeism)
* Abandoned call rate (% calls abandoned)
Speed-to-answer (% calls answered in 20 seconds)
Public Sector
89
80
59
17
10
9
74
Global
80
81
56
27
11
14
69
UK
87
89
60
29
7
11
81
Police Forces
90
49
34
12
8
4
** 79
* Combination of 2007/2008 data values ** Based on the proportion of Emergency and Non‐emergency calls and the percentages for each answered in 20 seconds
KPI Observations
Customer Satisfaction (% measured in the Contact Centre (CC))
The Customer Satisfaction overall score at 90.4% is higher than that of the Global, UK and Public Sector, which must be
recognized as extremely positive. It should also be noted (Q4.7) that the UK Forces reported 100% measurement of
Customer Satisfaction with relation to the Contact Centre, this clearly displays the UK Forces commitment to obtaining
customer data to measure performance. The data provided also identifies the fact that Forces utilise the services of third
parties to provide independent customer satisfaction data (Q4.9) in line with good practice.
So can satisfaction be improved? Research published by Mori suggests that as the Public Sector serves people in many
different ways, customers should to be broken down into key groups before their “needs, aspirations and expectations” can
be identified. Once segmented groups have been identified, a range of different consultation methods may be used
(surveys, focus groups, in‐depth interviews with users etc) to gain customer insight regarding customer views of the
services being provided and then an appropriate strategy based on those demands can be formed. As only 31.8% of Forces
reported the use of segmentation, this position should be considered and reviewed.
First Contact Resolution (% calls resolved first time)
At 49% the First Contact / Call Resolution (FCR) figure reported by the survey represents a substantially lower average of
that reported by both Public Sector (79.72%) and the UK average (89.1%). Normally there is a clear correlation between low
FCR and Customer Satisfaction rates, this is clearly not the case with the Police Forces. It must be assumed that due to the
complexity of the processes (call and issue transfers etc) involved and ultimately the customer perception of the outcome
resolution in the first contact does not detrimentally impact satisfaction. It should however be noted that in terms of
consistency only 26% (Q9.29) of Forces reported measuring FCR, this represents an opportunity to establish and transfer
good practice in this area.
26
National Police Contact Management Benchmarking Report 2008
Agent Utilisation (% talk time)
Agent utilised talk time is substantially lower at 34.45% than the National UK average of 49.1%, in isolation this would
normally be expected to represent a negative impact on both service realisation and cost. However, when reviewed
alongside the average after call work or “wrap” time, which is high at 3 minutes 10 seconds compared to the UK average of
50 seconds (Q9.21), it becomes clearer that post call activity is complex or hampered by technology / process constraints.
The provided data also identified greatly varying times in terms of individual Forces “wrap” times. It would seem prudent to
identify those Forces where lower after call handling is being experienced and look to leverage the enablers of this in terms
of process or technology good practice.
Staff Attrition (% annual agent turnover)
The Survey has identified that the Forces overall report an average attrition rate in the Contact Centre area of only 12%
verses a UK average of 29%. This is extremely positive, as it presumes that the environment, working conditions and career
prospects within the Contact Centre are producing a stable platform for staff retention. This is supported for example by
the fact that for although Management attrition is higher at 18% than the 5% UK average for this role (Q7.30), over 54% of
this is as a result of internal promotion, as opposed to only 12% as the UK average (Q7.31).
Staff Absenteeism (% annual agent absenteeism)
Staff absenteeism is 8%, which is in line with the Public Sector generally but minimally higher than the UK average at 7%. It
should however be noted that the proportion of long term absenteeism is much higher at 32% than the UK 17%, this may
be due to the way Forces report intervals of absenteeism. Conversely the Short Term figure is 55% as opposed to 65% UK
average, which would indicate that investigation into the reporting mechanisms needs consideration.
Abandoned Call (% calls abandoned)
The overall percentage of calls abandoned has been calculated based on Combination of 2007/2008 data values. At 4% this
is dramatically lower than the UK average at 11% and the Public Sector average at 9%. It would be expected for this overall
figure to be substantially lower due to the number of Emergency calls received and the SLA’s required for the handling of
these calls. It should also be noted however that on average calls are abandoning in 16 seconds (Q5.5) as opposed to longer
hold times before a caller abandons as the UK average of 27 seconds and 26 in the Public Sector once connected to an
agent queue. This again probably linked to the nature of the call types and may be a driver of repeat calls which will drive
up both the abandon rate and call volumes. It would possibly be worth further investigating in more detail the types of call
that abandon and finding the correlation between these and repeat calls. In summary the Forces are however maintaining
excellent call abandon rates.
Speed‐to‐answer (% calls answered in 20 seconds)
The overall percentage of speed to answer has been calculated based on the proportion of Emergency and Non‐emergency
calls and the percentages for each answered in 20 seconds. For Emergency calls it is 12 seconds against a UK average of 21
seconds (Q5.6) and for Non‐emergency it is 26 seconds as opposed to 21 UK average (Q9.21). It should however be noted
that when looking specifically at Non‐emergency calls answered in 10 and 20 seconds the averages are 57 and 76 seconds
respectively (Q9.21). The UK average for these time frames are 77 and 81 seconds respectively. As Non‐emergency calls
represent a large percentage of the call volumes it would seem prudent to review this area in more detail within the
context of balancing Emergency and Non‐emergency call types and weighting. One observation regarding a possible area
for increasing agent availability therefore impacting service levels is that of average “wrap time” (post call handling) which
for Non‐emergency calls is 3 minutes 10 seconds opposed to the UK average of 50 seconds for similar call talk time
durations (Q9.21) as previously discussed under Agent Utilisation.

27
National Police Contact Management Benchmarking Report 2008

28
National Police Contact Management Benchmarking Report 2008
29
National Police Contact Management Benchmarking Report 2008
Chapter 1: Background Information
Introduction
Chapter 1 evaluates the scale and size of the forces contact centre operations, providing an overall view of the average
number of sites and seats across all forces. The section includes:
1. Organisational Details
2. Contact Centre Details
Findings
Organisation Details
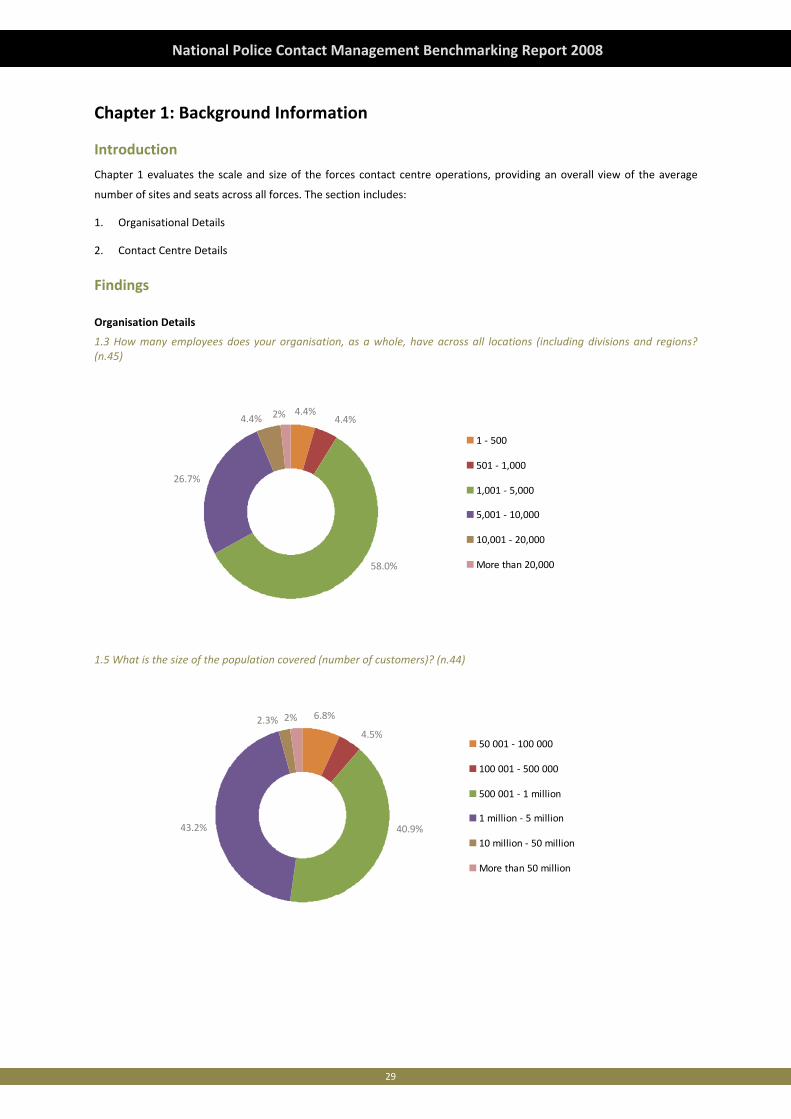
1.3 How many employees does your organisation, as a whole, have across all locations (including divisions and regions? (n.45)
4.4%4.4%
4.4% 2%
58.0%
26.7%
1 ‐ 500
501 ‐ 1,000
1,001 ‐ 5,000
5,001 ‐ 10,000
10,001 ‐ 20,000
More than 20,000
1.5 What is the size of the population covered (number of customers)? (n.44)
4.5%
6.8%2.3% 2%
40.9%43.2%
50 001 ‐ 100 000
100 001 ‐ 500 000
500 001 ‐ 1 million
1 million ‐ 5 million
10 million ‐ 50 million
More than 50 million
30
National Police Contact Management Benchmarking Report 2008
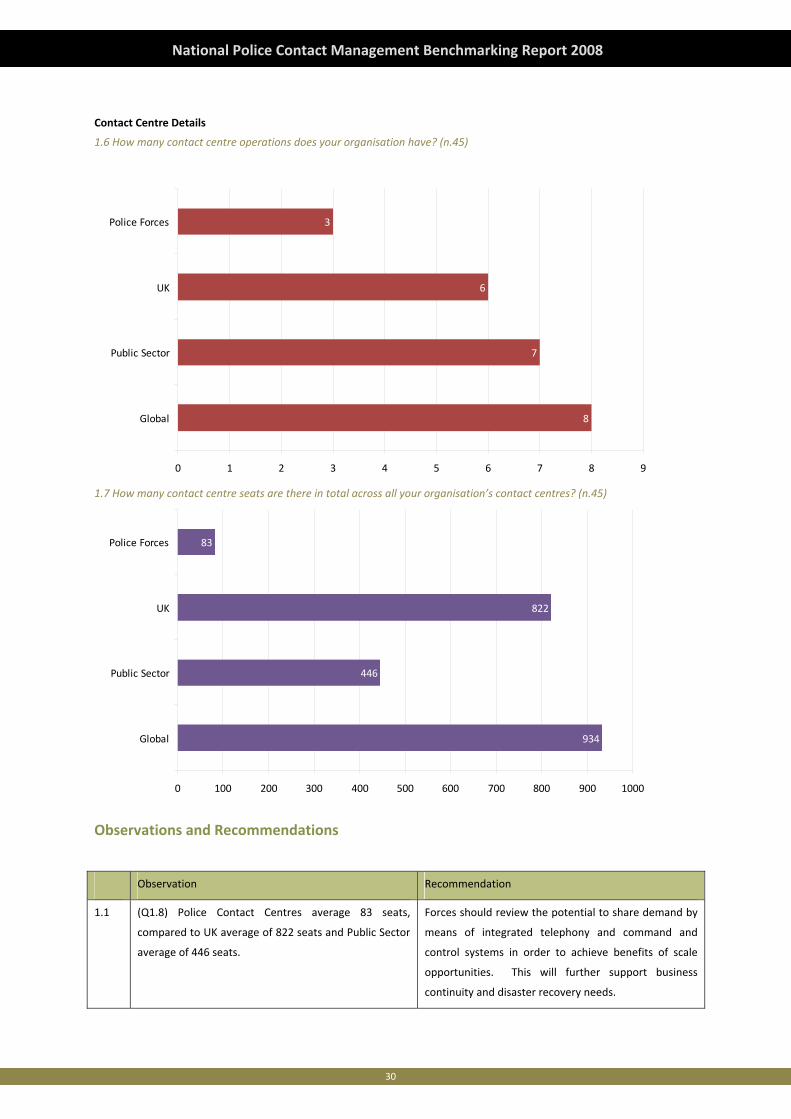
Contact Centre Details
1.6 How many contact centre operations does your organisation have? (n.45)
8
7
6
3
0 1 2 3 4 5 6 7 8 9
Global
Public Sector
UK
Police Forces
1.7 How many contact centre seats are there in total across all your organisation’s contact centres? (n.45)
934
446
822
83
0 100 200 300 400 500 600 700 800 900 1000
Global
Public Sector
UK
Police Forces
Observations and Recommendations
Observation Recommendation
1.1 (Q1.8) Police Contact Centres average 83 seats,
compared to UK average of 822 seats and Public Sector
average of 446 seats.
Forces should review the potential to share demand by
means of integrated telephony and command and
control systems in order to achieve benefits of scale
opportunities. This will further support business
continuity and disaster recovery needs.

31
National Police Contact Management Benchmarking Report 2008

32
National Police Contact Management Benchmarking Report 2008
33
National Police Contact Management Benchmarking Report 2008
Chapter 2: Strategy and Development
Introduction
In this chapter, we review the research regarding customer management strategy, its people and processes. The results of
the Global Benchmarking Report give us a clear insight into industry and regional trends and will help in evaluating the
performance of your contact centre. We look at the evolving patterns and industry trends for:
a. Business strategy and drivers
b. Location strategy
c. Operating models and implementation options
d. Organisational strategy, maturity and development
e. Channel use and strategy
Global Perspective
Putting the centre at the centre
Contact centres continue to gain strategic ground within organisations. They are now finding themselves increasingly
integrated into core business objectives and not simply as standalone functions. Driving business outcomes is mission
critical for contact centres which are growing in value and importance to businesses.
In light of fast‐paced technology and the electronic communications age we find ourselves in, operations are continuing to
move from traditional routes to market to contact centres handling multiple contact channels. This means a serious mind
shift for organisations in their core business activities.
The swing to a more effective use of the contact centre in customer facing operations is forcing organisations to think out
of the box. But the question is: are executive boards prepared to take the leap of faith to get ahead of customer
expectations?
Lining up the strategies
With more emphasis and pressures on contact centres, embedding key strategic objectives and goals and frameworks into
their processes is crucial. This clearly offers a better solution than putting limiting operational targets in their place, which
only reduce capability and customer and employee satisfaction. The message is clear – “integrating the customer
experience into strategic objectives means understanding your customer and their behaviours”.
With the rise in web and telephone as preferred routes to market, customer behaviours have to be understood to ensure
businesses stay ahead of their competition. Why then are these factors and Customer Relationship Management (CRM)
opportunities pushed aside in favour of cost savings? Poor senior and board level representation may be an issue, but
more often than not it's a mismatch between strategic business objectives and operational targets in contact centres. If the
role of contact centres is becoming more critical to core business activities, then organisations have to protect their
reputations and align operations with their vision.
Service Profit Chain
Many organisations are recognising the link between employee satisfaction and the customer experience. More and more,
businesses are looking into investing in what is known as the 'Service Profit Chain'.
This phenomenon means Private Sector companies are looking at putting their employees and customers ahead of profit.
As employee satisfaction rises and customer loyalty grows, the result is an increase in lifetime value and ultimately profit,
34
National Police Contact Management Benchmarking Report 2008
the result for Public Sector is that loyalty drives increased trust. Research shows that the resultant 'service smile' after
dealing with contact centres has a huge impact on whether customers display positive satisfaction with the service.
What's driving your centre?
While there may be many commercial drivers in each contact centre, most operations are grouped into either a cost or
profit centre. Those viewed as cost centres have suffered, especially operating under traditional call centre SLAs and not
promoting their value to the business. This can lead to a vicious circle.
Service improvement ranks as the first choice key driver in the Global Survey this year – improving on its position last year.
This is in line with the contact centre industry's movement towards a service improvement phase but it doesn't necessarily
mean a better experience for customers. To contact centres, improved services usually mean improving quality and better
SLA adherence. Perhaps businesses should be asking why and for whom quality is important.
Instead of incorporating customer views into performance measurement, inexperienced managers are often trying to meet
in‐house quality criteria. The quarter of organisations without a defined contact centre strategy almost always fall back
onto an overall service strategy.
Making up the Contact Centre Development Strategy
Encouragingly organisations are leaning towards putting customer satisfaction, quality improvement and staff satisfaction
ahead of budgets.
What does this mean?
Customer value remains one of the lowest and most surprising results. Ignoring the impact of retaining existing business
and driving organic growth appears to be a common weakness emerging from this year’s report. In summary, a 'Back to
Basics' approach seems to have been adopted by many organisations’ contact centres.
What you measure is what you get
It's no surprise that quality of service features as the top issue again this year at 28.7%. But it is a symptom rather than the
cause and an area where contact centres continue to fail to represent themselves effectively within the organisation.
Core to any strategic plan, this key element is still often forgotten about in the strategic development process. Through
board level representation and ownership of CRM, the organisation can integrate the end customer experience into
corporate goals. By merging the contact centre operating model into its strategic principles of communication, control and
culture, organisations can deliver a service which delights and retains its customers.
Contact centre managers need to focus on improving communication, managing the perceptions of relinquished control
and aligning themselves culturally with the business.
Process uniformity, holding second place, is a common challenge across a fast‐paced and evolving industry, which if not
managed properly will impact on service quality. Issues of communication, in third place, are becoming less of an issue
across the more mature regions of Europe and the US.
A third of contact centres still do not have a communication strategy to educate the rest of the organisation about the
contact centre.
The industry is often described as being formed around people, process and technology. This year's results again show
opportunities for people and processes while technology is of less concern to businesses as they become more comfortable
with it.
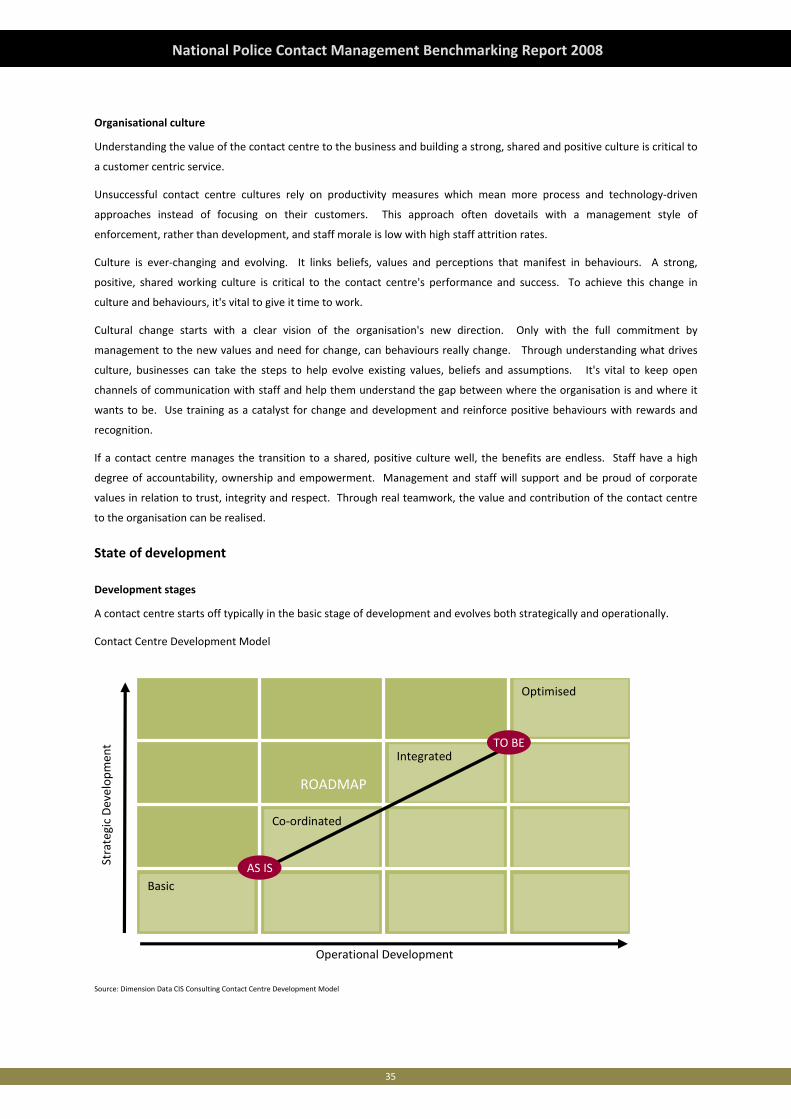
35
National Police Contact Management Benchmarking Report 2008
Organisational culture
Understanding the value of the contact centre to the business and building a strong, shared and positive culture is critical to
a customer centric service.
Unsuccessful contact centre cultures rely on productivity measures which mean more process and technology‐driven
approaches instead of focusing on their customers. This approach often dovetails with a management style of
enforcement, rather than development, and staff morale is low with high staff attrition rates.
Culture is ever‐changing and evolving. It links beliefs, values and perceptions that manifest in behaviours. A strong,
positive, shared working culture is critical to the contact centre's performance and success. To achieve this change in
culture and behaviours, it's vital to give it time to work.
Cultural change starts with a clear vision of the organisation's new direction. Only with the full commitment by
management to the new values and need for change, can behaviours really change. Through understanding what drives
culture, businesses can take the steps to help evolve existing values, beliefs and assumptions. It's vital to keep open
channels of communication with staff and help them understand the gap between where the organisation is and where it
wants to be. Use training as a catalyst for change and development and reinforce positive behaviours with rewards and
recognition.
If a contact centre manages the transition to a shared, positive culture well, the benefits are endless. Staff have a high
degree of accountability, ownership and empowerment. Management and staff will support and be proud of corporate
values in relation to trust, integrity and respect. Through real teamwork, the value and contribution of the contact centre
to the organisation can be realised.
State of development
Development stages
A contact centre starts off typically in the basic stage of development and evolves both strategically and operationally.
Contact Centre Development Model
Basic
Co‐ordinated
Integrated
Optimised
ROADMAP
AS IS
TO BE
Operational Development
Strategic Develop
ment
Source: Dimension Data CIS Consulting Contact Centre Development Model
36
National Police Contact Management Benchmarking Report 2008
There is a clear trend towards improving quality and overall service across the contact centre industry. To do this
effectively, it's essential to pinpoint the current state before plotting the roadmap and vision for optimised performance.
Improving on delivery, position within the wider organisation and ultimately with customers means contact centre
managers focus on improving quality, increasing efficiency and enhancing processes. That's the easy part. The process of
improvement usually fails due to poor execution of the plan or in some cases the total absence of a phased roadmap.
Major customer contact industry developments
Contact centres are ever more aware of the need to move with the times. As the scope of centres evolves and globalisation
exerts its pressures, contact centres need to seize market opportunities as soon as they appear, often through technology.
Ignoring advances means risking being left behind and possibly being unable to compete on the service front. It's critical to
stay ahead of the game in process and design to avoid poor productivity and efficiency.
The key to success is choosing a well thought out and sustainable solution when planning a development strategy.
There is no let up in the speed of change within the industry as the scope of contact centres grows and with it the
importance of multiple channel solutions. The number of centres planning to expand the scope of the contact centre, to
now include new and transitioned services, is higher than last year at just under 70%. (This figure also represents an
ongoing plan within certain areas). The number of contact centres developing the business into a multiple channel solution
has risen to just under 60% from last year’s 53%.
This is good news for the industry's age‐old fight against staff attrition. Staff are given the chance to grow and develop their
skills and knowledge by combining different tasks and spreading the load of calls evenly.
As roles within the contact centre become more challenging, agents are more motivated and a career path emerges in what
used to be a 'stepping stone job'. In the end, the customer benefits from happier agents who are more empowered to
perform their duties.
The employee lifecycle
Ensuring that contact centre agents feel valued and that personal development plans are in place has a positive impact on
attrition and absenteeism. But this is not enough. Agents must understand the business strategy and have the reasons for
actions clearly explained. By advertising a real commitment to investing and managing an employee lifecycle model, contact
centre staff can better understand the career paths available, the time involved and responsibilities for their own
progression.
Staff are then able to understand that beyond initial induction training, they and the organisation will benefit from
development, progression and promotion. It's important to note that the lifecycle may not always centre on advancement,
and incentives can also be provided through development opportunities, sideways moves and job satisfaction techniques.
The trend towards linking contact centres on a national basis continues with a third of centres planning this in the next two
years. There is very little desire to do the same on a global level. Perhaps the industry is just not ready for the process
consistency and cultural challenges that this will present, especially within short‐term plans.
Channel use and strategy
The spotlight has been focused on the evolving role of the contact centre. There is a widely held belief that customer
contact strategies have been expanded to use emerging technologies that are now being expected by customers. The
results show that while there are small increases in certain areas, most of the core interactions with customers still centre
on agent‐assisted telephone calls. We see a small decrease in the use of the channel to 63% and an increase in the use of
IVR self‐service technologies at 12.6%. These two channels combined dominate how contacts are handled.
37
National Police Contact Management Benchmarking Report 2008
If you add email (which has dropped across the board except within Government and Media), these three 'core' contact
channels represent over 83.4% of activities.
Mobile applications, at just below half a percent, may be an area worth watching, particularly within the financial services
industry whose usage is triple the industry norm. As yet, it's just one of many innovative technologies that businesses need
to keep up to date with.
What is not captured is the number of interactions resulting from moving back office and administrative activities to
contact centres. With expanding roles and more empowerment, contact centres are changing for the better.
Making technology work for you
Can the technology do what you want? Will staff be able to cope with the changes and new ways of working? Will your
structure and methods of operation allow the project to succeed?
Before deciding on the model for running your contact centre, you need to gather the evidence and data needed to make a
robust decision:
• The volume of customer contacts you receive and expect, broken down into the smallest units of time possible (for
example by hour or day).
• Profile customer contacts by times of day, days of week and weeks of year to see what the time and seasonal effects
are. Knowing this will help to shape your overall resource requirement.
• Look at both the volume of contacts historically achieved and attempted. For example, on a phone system, your
resource planning should aim to achieve the full number of 'attempts' (minus re‐diallings) and information from your
telecom supplier will be of help here.
• This process cannot be completed until you know about the following issues:
‐ Types of activity to be managed, for example what customer contacts and from what department? What is the
nature and purpose of the enquiries? This applies to all media: phone calls, emails, letters, etc.
‐ Average length of time to manage each type of activity.
‐ What improvements can be made to this average with better processes, technology and grouping with other
activities?
‐ What combined skills are needed to manage these contacts? Are additional skills and training required?
‐ What hours of operation will you offer and what flexibility will there be in staffing rosters?
‐ What are your targets or ideas for productivity or staff utilisation? Will you locate staff purely in a contact
management environment or have them working on administration and other duties as well?
Trends and issues affecting contact centres
The top market trend affecting contact centres today is process optimisation. Commercial pressure is never far away for
any business and this result ties in with the top commercial drivers to improve service and efficiency. It also links up with
quality and uniformity of process being seen as the top two issues affecting the industry .This could indicate a move
towards a more service‐oriented approach across the board and the maturing of both operating and business models.
The use of self service channels ranks second highest in influence on contact centres. Despite major publicity drives by
organisations to 'humanise' the customer experience, the trend in using more self service shows no sign of abating.
Organisations are looking at complex solutions that facilitate customer choice and a less painful experience when self
service is the only option.
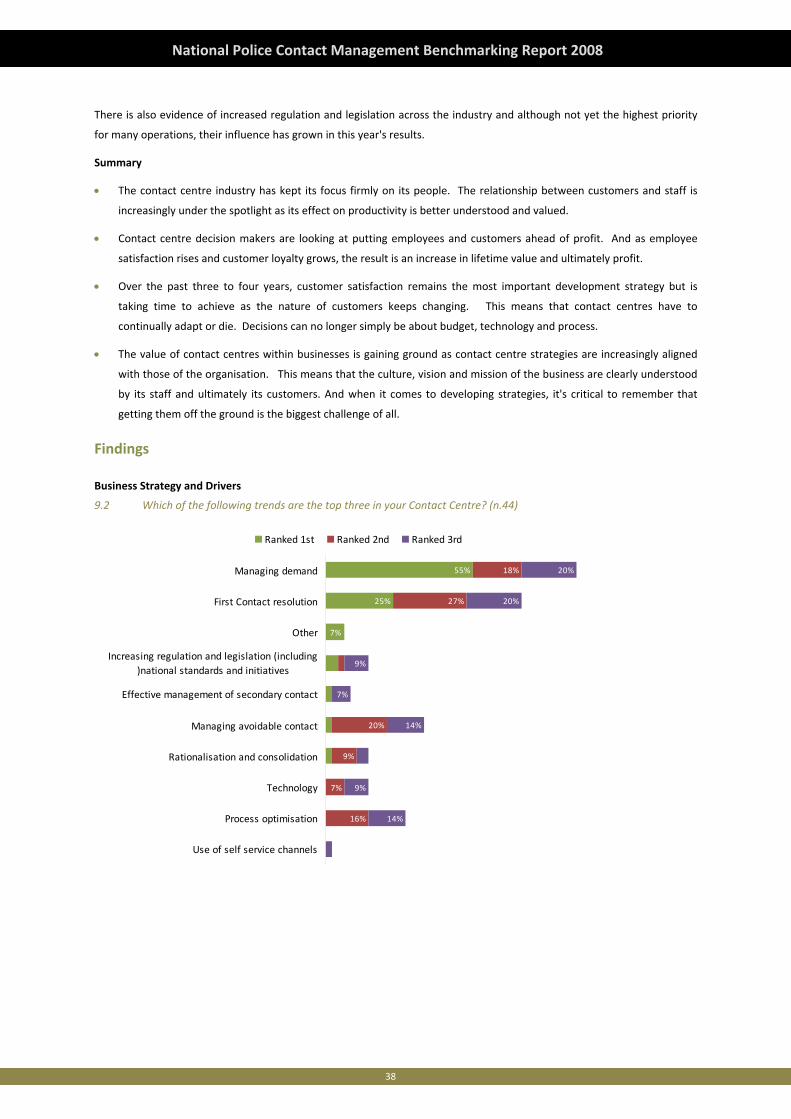
38
National Police Contact Management Benchmarking Report 2008
There is also evidence of increased regulation and legislation across the industry and although not yet the highest priority
for many operations, their influence has grown in this year's results.
Summary
• The contact centre industry has kept its focus firmly on its people. The relationship between customers and staff is
increasingly under the spotlight as its effect on productivity is better understood and valued.
• Contact centre decision makers are looking at putting employees and customers ahead of profit. And as employee
satisfaction rises and customer loyalty grows, the result is an increase in lifetime value and ultimately profit.
• Over the past three to four years, customer satisfaction remains the most important development strategy but is
taking time to achieve as the nature of customers keeps changing. This means that contact centres have to
continually adapt or die. Decisions can no longer simply be about budget, technology and process.
• The value of contact centres within businesses is gaining ground as contact centre strategies are increasingly aligned
with those of the organisation. This means that the culture, vision and mission of the business are clearly understood
by its staff and ultimately its customers. And when it comes to developing strategies, it's critical to remember that
getting them off the ground is the biggest challenge of all.
Findings
Business Strategy and Drivers
9.2 Which of the following trends are the top three in your Contact Centre? (n.44)
0%
0%
0%
25%
55%
0%
16%
7%
20%
18%
14%
9%
14%
7%
9%
20%
7%
27%
9%
20%
Use of self service channels
Process optimisation
Technology
Rationalisation and consolidation
Managing avoidable contact
Effective management of secondary contact
Increasing regulation and legislation (including)national standards and initiatives
Other
First Contact resolution
Managing demand
Ranked 1st Ranked 2nd Ranked 3rd
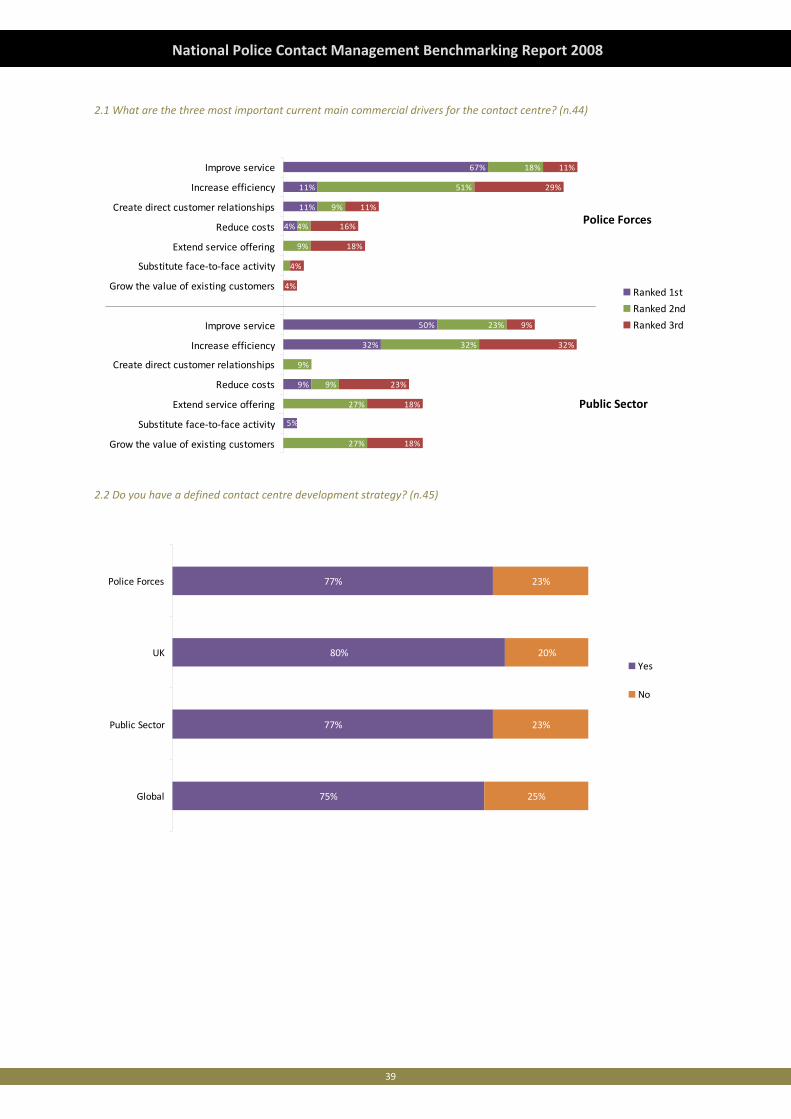
39
National Police Contact Management Benchmarking Report 2008
2.1 What are the three most important current main commercial drivers for the contact centre? (n.44)
0%
9%
32%
50%
11%
11%
67%
27%
27%
9%
32%
23%
4%
9%
51%
18%
18%
18%
32%
9%
4%
18%
16%
11%
29%
11%
5%
4%
9%
9%
0%
23%
4%
Grow the value of existing customers
Substitute face‐to‐face activity
Extend service offering
Reduce costs
Create direct customer relationships
Increase efficiency
Improve service
Grow the value of existing customers
Substitute face‐to‐face activity
Extend service offering
Reduce costs
Create direct customer relationships
Increase efficiency
Improve service
Ranked 1st
Ranked 2nd
Ranked 3rd
Police Forces
Public Sector
2.2 Do you have a defined contact centre development strategy? (n.45)
75%
77%
80%
25%
23%
20%
77% 23%
Global
Public Sector
UK
Police Forces
Yes
No
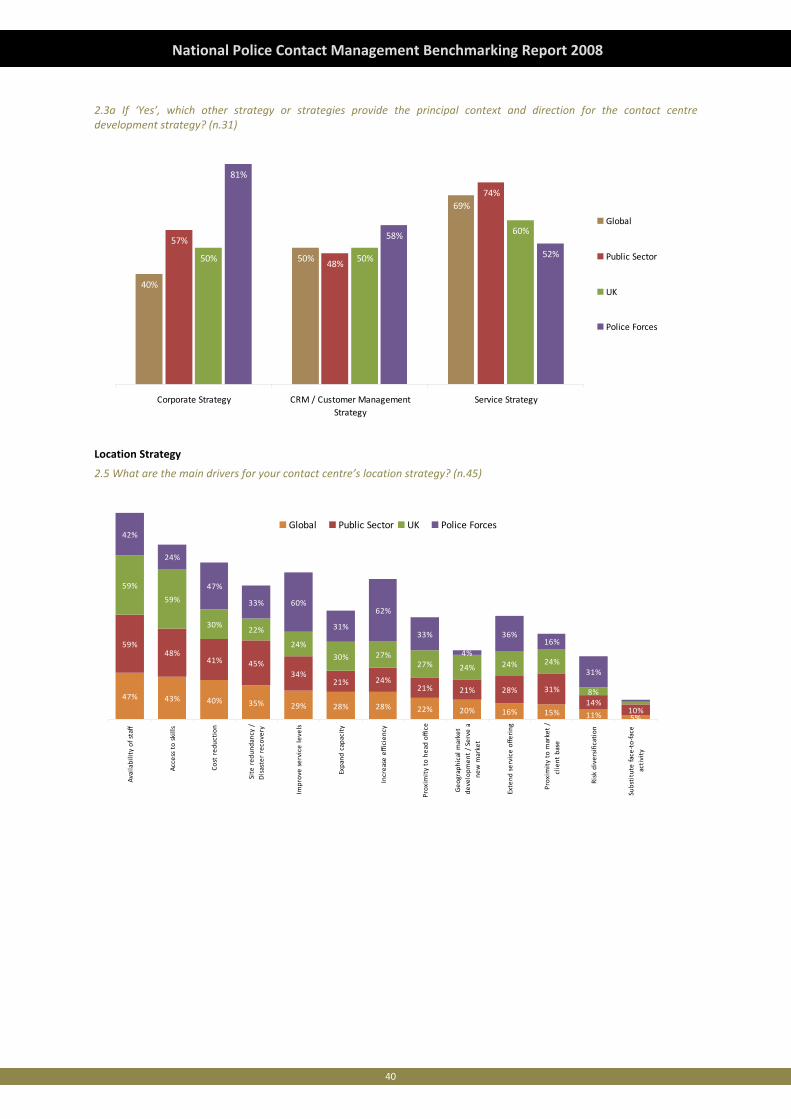
40
National Police Contact Management Benchmarking Report 2008
2.3a If ‘Yes’, which other strategy or strategies provide the principal context and direction for the contact centre development strategy? (n.31)
40%
50%
69%
57%
48%
74%
50% 50%
60%
81%
58%
52%
Corporate Strategy CRM / Customer ManagementStrategy
Service Strategy
Global
Public Sector
UK
Police Forces
Location Strategy
2.5 What are the main drivers for your contact centre’s location strategy? (n.45)
47% 43% 40% 35% 29% 28% 28% 22% 20% 16% 15% 11% 5%
59%48%
41% 45%34%
21% 24%21% 21% 28% 31%
14%10%
59%
59%
30%22%
24%
30% 27%27% 24% 24% 24%
8%
42%
24%
47%
33%
31%
62%
4%
36%16%
31%
33%
60%
Availability of staff
Access to skills
Cost red
uction
Site red
undancy /
Disaster recovery
Improve service levels
Expand
capacity
Increase efficien
cy
Proxim
ity to head office
Geo
graphical m
arket
developm
ent / Serve a
new m
arket
Extend
service
offe
ring
Proxim
ity to m
arket /
client base
Risk diversification
Substitute face
‐to‐face
activity
Global Public Sector UK Police Forces
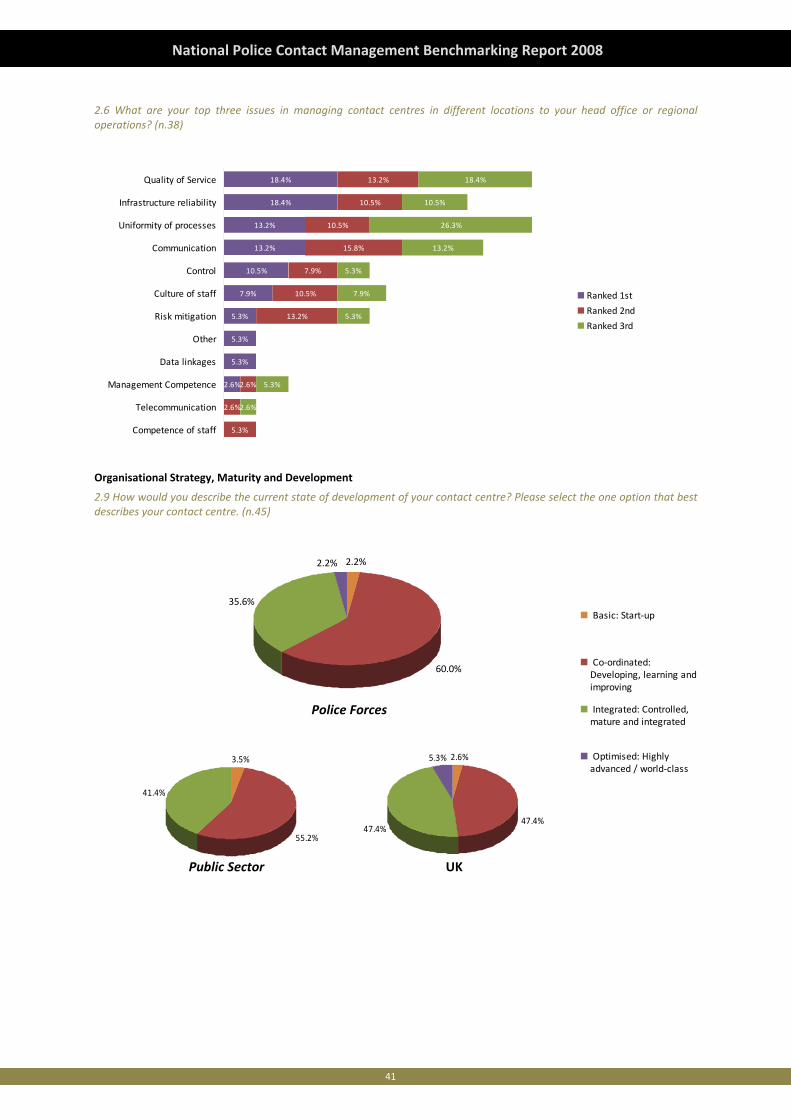
41
National Police Contact Management Benchmarking Report 2008
2.6 What are your top three issues in managing contact centres in different locations to your head office or regional operations? (n.38)
2.6%
5.3%
5.3%
5.3%
7.9%
10.5%
13.2%
13.2%
18.4%
18.4%
5.3%
2.6%
2.6%
13.2%
10.5%
7.9%
15.8%
10.5%
10.5%
13.2%
2.6%
5.3%
5.3%
7.9%
5.3%
13.2%
26.3%
10.5%
18.4%
Competence of staff
Telecommunication
Management Competence
Data linkages
Other
Risk mitigation
Culture of staff
Control
Communication
Uniformity of processes
Infrastructure reliability
Quality of Service
Ranked 1st
Ranked 2nd
Ranked 3rd
Organisational Strategy, Maturity and Development
2.9 How would you describe the current state of development of your contact centre? Please select the one option that best describes your contact centre. (n.45)
2.2%
60.0%
35.6%
2.2%
Basic: Start‐up
Co‐ordinated:Developing, learning andimproving
Integrated: Controlled,mature and integrated
Optimised: Highlyadvanced / world‐class
3.5%
55.2%
41.4%
2.6%
47.4%47.4%
5.3%
UK
Police Forces
Public Sector
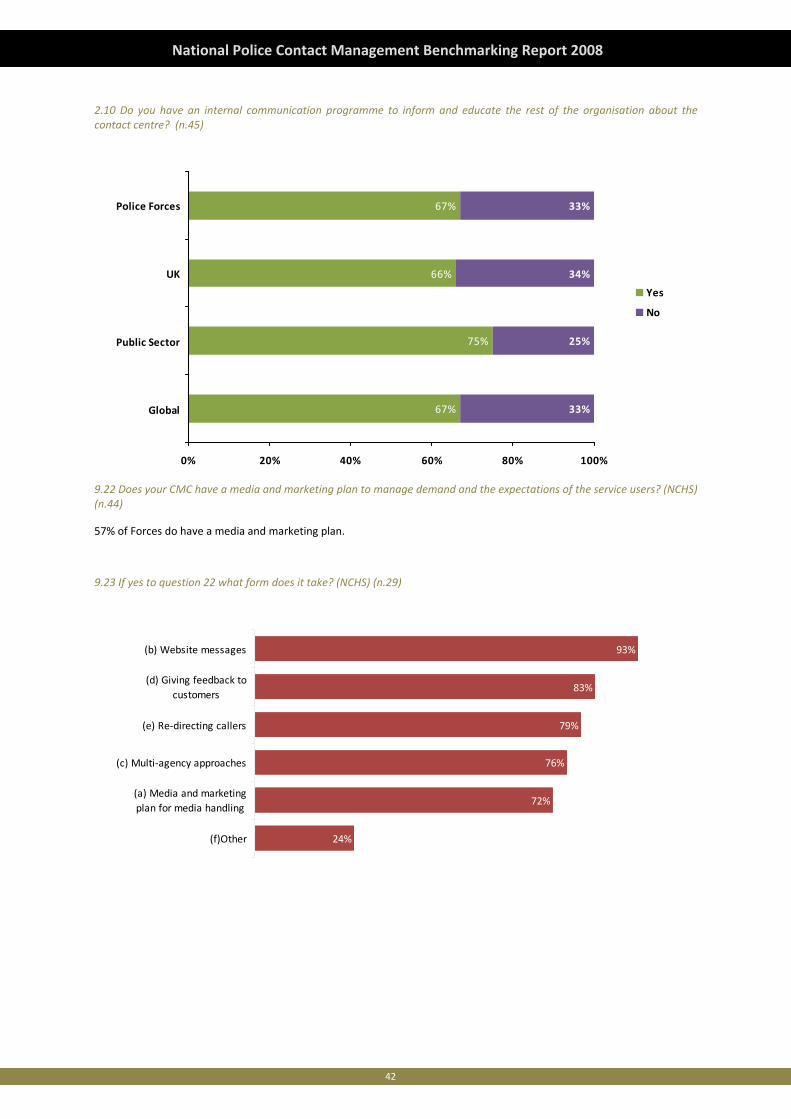
42
National Police Contact Management Benchmarking Report 2008
2.10 Do you have an internal communication programme to inform and educate the rest of the organisation about the contact centre? (n.45)
67%
75%
66%
67%
33%
25%
34%
33%
0% 20% 40% 60% 80% 100%
Global
Public Sector
UK
Police Forces
Yes
No
9.22 Does your CMC have a media and marketing plan to manage demand and the expectations of the service users? (NCHS) (n.44)
57% of Forces do have a media and marketing plan.
9.23 If yes to question 22 what form does it take? (NCHS) (n.29)
93%
83%
79%
76%
72%
24%
(b) Website messages
(d) Giving feedback tocustomers
(e) Re‐directing callers
(c) Multi‐agency approaches
(a) Media and marketingplan for media handling
(f)Other
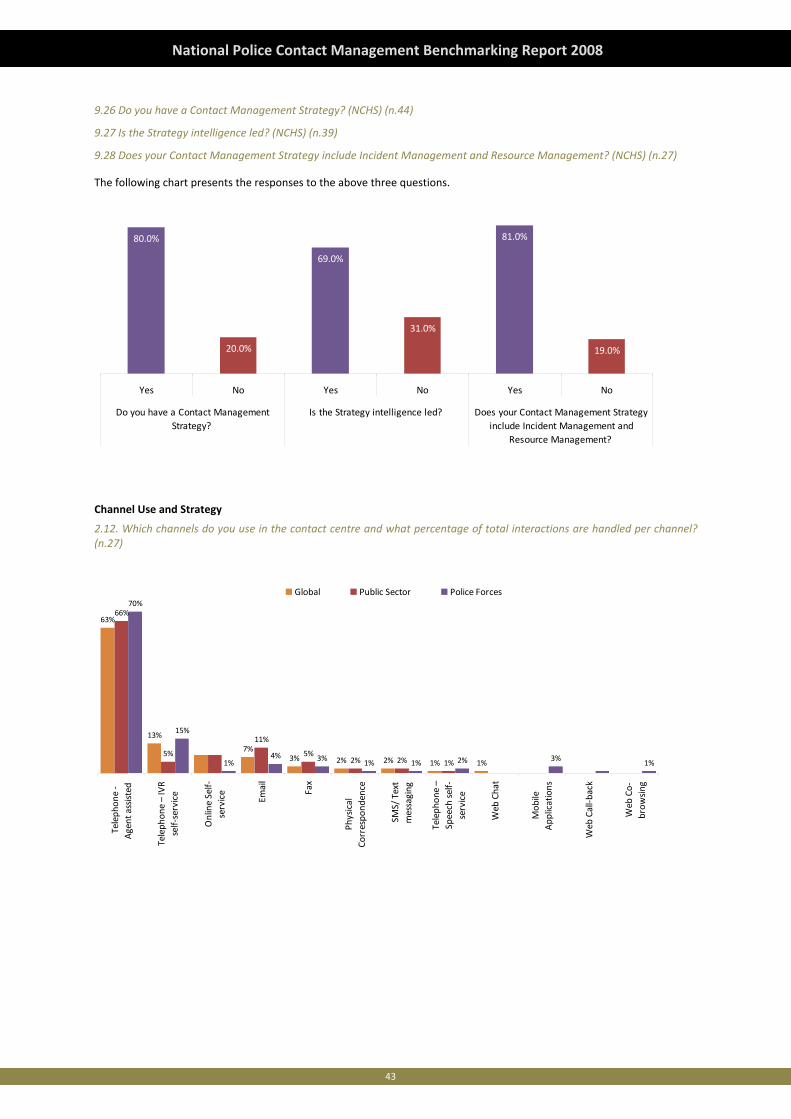
43
National Police Contact Management Benchmarking Report 2008
9.26 Do you have a Contact Management Strategy? (NCHS) (n.44)
9.27 Is the Strategy intelligence led? (NCHS) (n.39)
9.28 Does your Contact Management Strategy include Incident Management and Resource Management? (NCHS) (n.27)
The following chart presents the responses to the above three questions.
80.0%
20.0%
69.0%
31.0%
81.0%
19.0%
Yes No Yes No Yes No
Do you have a Contact ManagementStrategy?
Is the Strategy intelligence led? Does your Contact Management Strategyinclude Incident Management and
Resource Management?
Channel Use and Strategy
2.12. Which channels do you use in the contact centre and what percentage of total interactions are handled per channel? (n.27)
63%
13%
7%3% 2% 2% 1% 1%
66%
5%
11%
5%2% 2% 1%
70%
15%
1%4% 3% 1% 1% 2% 3% 1%
Teleph
one ‐
Agent assisted
Teleph
one – IVR
self‐service
Online Self‐
service
Fax
Physical
Correspo
ndence
SMS/ Text
messaging
Teleph
one –
Speech self‐
service
Web
Chat
Mob
ileApp
lications
Web
Call‐b
ack
Web
Co‐
brow
sing
Global Public Sector Police Forces
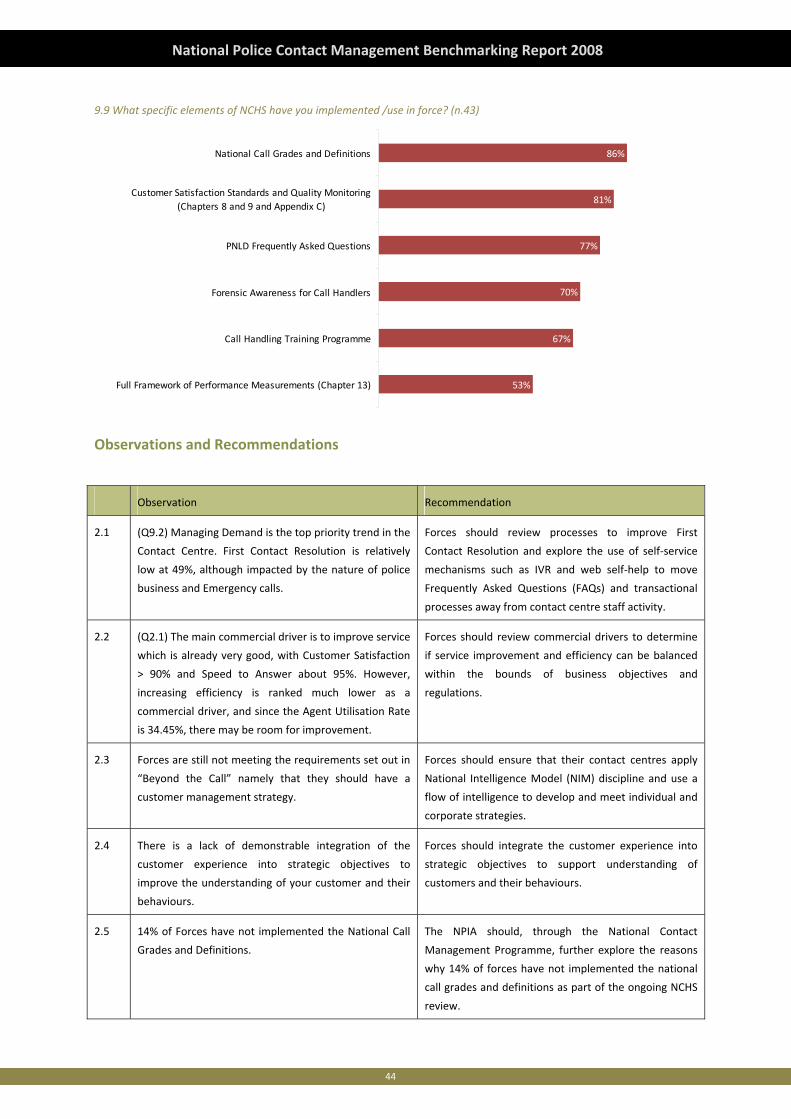
44
National Police Contact Management Benchmarking Report 2008
9.9 What specific elements of NCHS have you implemented /use in force? (n.43)
53%
67%
70%
77%
81%
86%
Full Framework of Performance Measurements (Chapter 13)
Call Handling Training Programme
Forensic Awareness for Call Handlers
PNLD Frequently Asked Questions
Customer Satisfaction Standards and Quality Monitoring(Chapters 8 and 9 and Appendix C)
National Call Grades and Definitions
Observations and Recommendations
Observation Recommendation
2.1 (Q9.2) Managing Demand is the top priority trend in the
Contact Centre. First Contact Resolution is relatively
low at 49%, although impacted by the nature of police
business and Emergency calls.
Forces should review processes to improve First
Contact Resolution and explore the use of self‐service
mechanisms such as IVR and web self‐help to move
Frequently Asked Questions (FAQs) and transactional
processes away from contact centre staff activity.
2.2 (Q2.1) The main commercial driver is to improve service
which is already very good, with Customer Satisfaction
> 90% and Speed to Answer about 95%. However,
increasing efficiency is ranked much lower as a
commercial driver, and since the Agent Utilisation Rate
is 34.45%, there may be room for improvement.
Forces should review commercial drivers to determine
if service improvement and efficiency can be balanced
within the bounds of business objectives and
regulations.
2.3 Forces are still not meeting the requirements set out in
“Beyond the Call” namely that they should have a
customer management strategy.
Forces should ensure that their contact centres apply
National Intelligence Model (NIM) discipline and use a
flow of intelligence to develop and meet individual and
corporate strategies.
2.4 There is a lack of demonstrable integration of the
customer experience into strategic objectives to
improve the understanding of your customer and their
behaviours.
Forces should integrate the customer experience into
strategic objectives to support understanding of
customers and their behaviours.
2.5 14% of Forces have not implemented the National Call
Grades and Definitions.
The NPIA should, through the National Contact
Management Programme, further explore the reasons
why 14% of forces have not implemented the national
call grades and definitions as part of the ongoing NCHS
review.

45
National Police Contact Management Benchmarking Report 2008

46
National Police Contact Management Benchmarking Report 2008
47
National Police Contact Management Benchmarking Report 2008
Chapter 3: Financial Rationale and Management
Introduction
This chapter examines the relationship between where the organisation currently allocates its financial resource and how it
is anticipating improving financial performance or maximising the value of its spending. This is set against the backdrop of
ever changing customer requirements sand expectation, in a changing behavioural, social, and technological context and
environment. It looks in detail at the following:
a. Financial rationale and objectives
b. Financial management and procedures
Global Perspective
Creating a brilliant customer experience every time with self service
Within a financial context, it may seem odd to focus on self service. In this chapter and within the broader context, lower
cost channels are becoming more important in how organisations operate. We will look at the self service benefits that
have a financial impact on contact centres and the organisation.
In this day and age of channel proliferation, ever‐increasing customer demands and education, we view self service as a
supporting mechanism in trying to drive down costs, increase and maximise profits and efficiencies in technology and
operational budgets.
We also discuss how to ensure your contact centre is providing a differentiated customer experience and premium service
that appeals to your customers and ultimately builds a relationship and trust of your services.
Why self service?
Over the past two decades the internet has matured from being used as an information tool to an indispensable transaction
management tool. The internet, with many new sites and functionality being added hourly, is becoming more usable and
accessible to customers and self service is following the same development path.
Contact centres’ self service offering needs to be highly usable and instil confidence in customers being able to, and
wanting to use self service as an alternative and hopefully preferred method. It is vital that contact centres start integrating
self service strategies into their customer management strategy.
What are the financial benefits of self service to the contact centre?
• Lower interaction costs
• Reduced agent headcount
• Extended and leveraged current technology platforms
• Increased satisfaction on a transaction by transaction basis
What are the benefits to consumers?
• Potentially lower servicing costs
• Consistent and repeatable customer experience
• Shorter turnaround times
• Information which is easily accessible at any time
• Simpler call flows
48
National Police Contact Management Benchmarking Report 2008
Where does self service fit in the industry?
Self service technologies have developed in much the same way as the internet. With increased consumer knowledge and
willingness to access the internet, better access and improved usability, organisations have used the power of technology
to extend their fixed location boundaries into a virtual e‐commerce arena with exponential growth.
Previous constraints placed on organisations in how they would like to interact with customers have fallen away or been
overcome. Organisations can see the benefits of extending business boundaries and are starting to see the added benefits
of cost effectiveness in without having to interact face‐to‐face.
Channel use and measurement
Key indicators show that customers still use the voice channel for complex and emotive enquiries. This is as expected since
telephone has historically been an unconstrained access and communication channel.
The offering of more features and the proliferation of channels has meant that contact centres have seen a huge influx of
inbound customer queries, thus driving the need to extend the scope of self service. The global contact centre
benchmarking report has identified that 10 years ago human voice transactions accounted for 90% of all transactions. Now,
this has dropped to just over 50% and self service accounts for just over 30% of transactions. (See Chapter 5 for more
information).
Organisations that have successfully implemented self service understand that the critical success factor is not only in the
configuration of the technology, but most importantly in the user's experience being supported by the application.
Organisations have realised that customer satisfaction means that consumers should be able to complete their enquiries
the first time. By migrating more simple enquiries to Web and IVR self service, these transactions account for nearly 30% of
all inbound transactions this year. This in turn allows for more cost efficiency as agents spend more time dealing with more
complex enquiries and organisations save costs on time spent dealing with simple enquiries.
Taking this one step further in terms of cost of First Contact Resolution, there are huge financial benefits to be had by
servicing customers on a lower cost channel and serving them well the first time. For every transaction that needs to be
redirected to an agent, costs rise and then include those of the initial transaction plus preparation time on any call‐backs
and extra agent time taken to resolve the query. This supports the idea of designing your technology to enhance the user
experience and satisfaction.
The methodology involved in implementing effective self service applications is:
• Understand the target audience and demographics.
• Design the application to suit customer needs and wants.
• Involve objective human language and behaviour experts.
• Use representative and spoken languages.
Measuring the cost per interaction on the telephone channel ranks highest at an overall average of 53%. This is hardly
surprising, but we would like to see a dramatic increase in the total centres that measure costs per interaction for every
channel. By using all the financial information you have, on how much you’re spending to talk to your customers on various
channels, you are better able to make sound financial decisions that will impact on your investment strategy.
Clearly, there is some way to go in improving all measurement capabilities. We see this with only 33% of centres who use
self service proactively measuring whether the channel has a positive or negative impact on inbound call volumes. This is
just not good enough given the number of transactions moving through these channels now.
49
National Police Contact Management Benchmarking Report 2008
Growing technology to build value
In the near future, we expect to see more use of self service channels in local government, financial services and transport
sectors. To increase accessibility, they will be aiming to leverage existing investments and extend current self service
channels. The key to success is not driven by technology but rather an optimised repeatable user experience and human
interaction.
When looking at centres’ operating budgets, the biggest expense is staff at an overall average of 60%. The second highest
operating expense is technology at an overall average of 7.6% of total operating expenditure. This is quite small compared
to the expense on agent salaries. We would venture to say that it is far too low if we think that centres should spend more
on minimising agent‐assisted transactions to allow agents to deal with high value, complex and emotive issues driving
customer satisfaction. Whatever is spent though, it is vitally important to leverage past and future spend on technology to
the fullest extent possible.
Operating expenditure
Due to the premium cost of labour components, many organisations are still investing in operational initiatives designed to
optimise the performance and use of agents. The challenge for today's contact centres is to scale these efficiencies by
driving costs down through appropriate and planned automation.
They cannot however be looked at in isolation. Operational improvements contribute to an appropriate automation
strategy designed to reduce cost without degrading the customer experience.
Today's self service market place is crowded with vendors with proven technologies which have been widely deployed in
contact centres. Most organisations have realised that a fault‐free implementation of technology will not ensure adoption
by customers.
Organisations have to make sure their automated service is usable and that they deliver a consistently brilliant customer
experience when interacting with customers. This will enable the organisation to build confidence in the products /
services being used while limiting customer churn.
A sensible strategy for contact centres is to extend core technology platforms instead of deploying new and separate
platforms to offer self service. The reality though has meant that many organisations have focused on technology and the
need to drive costs down, and not the sensitive, emotional and potentially negative customer reactions. It is vital that
organisations manage the customer perception of their contact centres. To do this, they need to get back to basics by
placing the customer experience at the core of their operations.
Contact centres are able to offer a consistent level of service across all channels while focusing on the outcome of the
interaction. Customers in mature markets don't have a preference for the channel as long as they are provided with
appropriate information the first time. Self service interaction is no different.
Although self service can reduce the cost of interaction, the real benefit for the organisation and its related contact centre
lies in the fact that they can extend their core technology platform. This can mean big savings when compared to acquiring
stand alone technologies.
Segmenting for financial value
The evolving science and practice of customer segmentation will mean that organisations can realise the full value of their
contact centre. Customer segmentation is the practice of dividing a customer base into different groups based on certain
criteria.
Using segmentation allows organisations to:
• Target customer groups effectively with messages tailored to their needs and improve the overall satisfaction rate.
50
National Police Contact Management Benchmarking Report 2008
• Implement service strategies that balance customer objectives with cost‐to‐serve metrics.
• Identify additional service propositions that may be relevant to customer segments.
• Provide the agent with more information about the customer in the first few critical seconds of the call that allow
faster call resolution.
• Identify further support and service opportunities for that segment after successful call resolution.
Segmentation needs to be considered as multi‐dimensional since customers move regularly from one segment to another.
This migration between segments is usually linked to service experiences, both positive and negative. Many organisations
however are still not segmenting customers and are not aligned with sales and marketing functions of the organisation. This
may lead to the contact centre being less able to deliver a consistent customer experience. Organisations need to closely
align themselves through technology and information systems that draw on sophisticated customer profiling and customer
segmentation information already available in the organisation.
This trend is gathering momentum as many contact centres look to implement intelligent segmentation strategies to exploit
opportunities and expand their effectiveness.
Users are now deciding how and when to interact with the contact centre which means taking a multi‐channel approach to
customer service. But these multiple channels are not being deployed with the same consistency in design, resulting in
poorer delivery and service and ultimately less of a 'brilliant customer experience'. Organisations need to understand the
channels a customer wants to use and to plot this on a roadmap to gaining a single view of its customers.
There is still a breakdown in the link between vendor, contact centre (organisation) and the customer. Self service
continues to grow and customers are more familiar with the self service concept across multiple industries. With a greater
range of technologies that offer more choice for the customer, organisations need to develop an investment strategy with
technology vendors that will ensure an optimised customer experience across the agent‐assisted and self service channels.
Reducing cost to serve – through lower cost channels
The following trends in customer behaviour show demand for:
• Cheaper cost of transacting with the organisation
• Quicker, more efficient service
• Better First Contact Resolution
• Offering of 24x7 services
• Avoiding long call waiting
• Avoiding off‐shoring
These trends are driving customers to use relatively cheap or free technology to communicate with the organisation.
Organisations need to make provision for this in their channel media offering and strategy.
The explosion of channels offered to customers and the way customers interact with each other socially is driving the
immediacy of communication. Customers expect organisations to implement the technologies they use socially as an
alternative to calling into the contact centre and talking to an agent about routine and ad‐hoc requests. There is a clear
growth in the use of online services across segments, geographies and vertical markets.
While many contact centres offer different means for their customers to communicate with the organisation, the challenge
is no longer to offer these diverse and mixed options of self service. Rather the channels need to be consistent, optimised
and aligned to the organisation's sales and marketing strategy. A customer expects the same experience across any
channel, be it online or calling into a centre, with the same promise of service levels in resolving the call.
51
National Police Contact Management Benchmarking Report 2008
Conclusions
Among the potential benefits of self service are sustainable, lower interaction costs. Well automated self service
interactions can cost as little as 15% of costs when compared to the costs of interacting with a live agent.
Although self service can reduce the cost of interaction, the real benefit for the organisation and its contact centre is being
able to extend their core technology platform to provide brilliant customer experiences on a consistent basis. This can
mean huge savings when compared to acquiring stand alone technologies.
For customers, the real benefit of a well designed and appropriate self service application is lower service costs and an
enhanced experience with shorter turnaround times, simpler call flows, easier and better access and consistency in service.
Organisations need to understand the channels a customer wants to use and to, in turn, use this information to gain a
single view of the customer. This single view, which is the overall objective of segmentation, will allow the organisation to
offer discounts, rebates or even non‐financial rewards to customers that return to the organisation for more products or
services.
With more technologies giving greater choice to customers, organisations need to develop an investment strategy with
technology vendors to ensure an optimised customer experience across the agent‐assisted and self service channels.
As we focus on agents dealing with more complex and emotive calls, organisations need to start incentivising customers
(financially and non‐financially) to use cheaper self service channels. There is a growing trend towards assisted self service
where the first part of the call goes through a self service channel and, once enough information is gathered, the customer
is passed through to an agent with the correct skill and language profile.
The challenge for today's contact centres is to continue driving down costs and plan for appropriate automation.
Segmentation also needs to be considered as multi‐dimensional as customers have the potential to regularly move from
one segment to another. Customers move between segments mostly based on their positive and negative service
experiences.
This also means that customers are turning to relatively cheap or free technology to communicate with organisations. This
must be factored into the organisations' channel media offering and strategy. This explosion of channels and the way
customers interact with each other socially is driving the immediacy of communication.
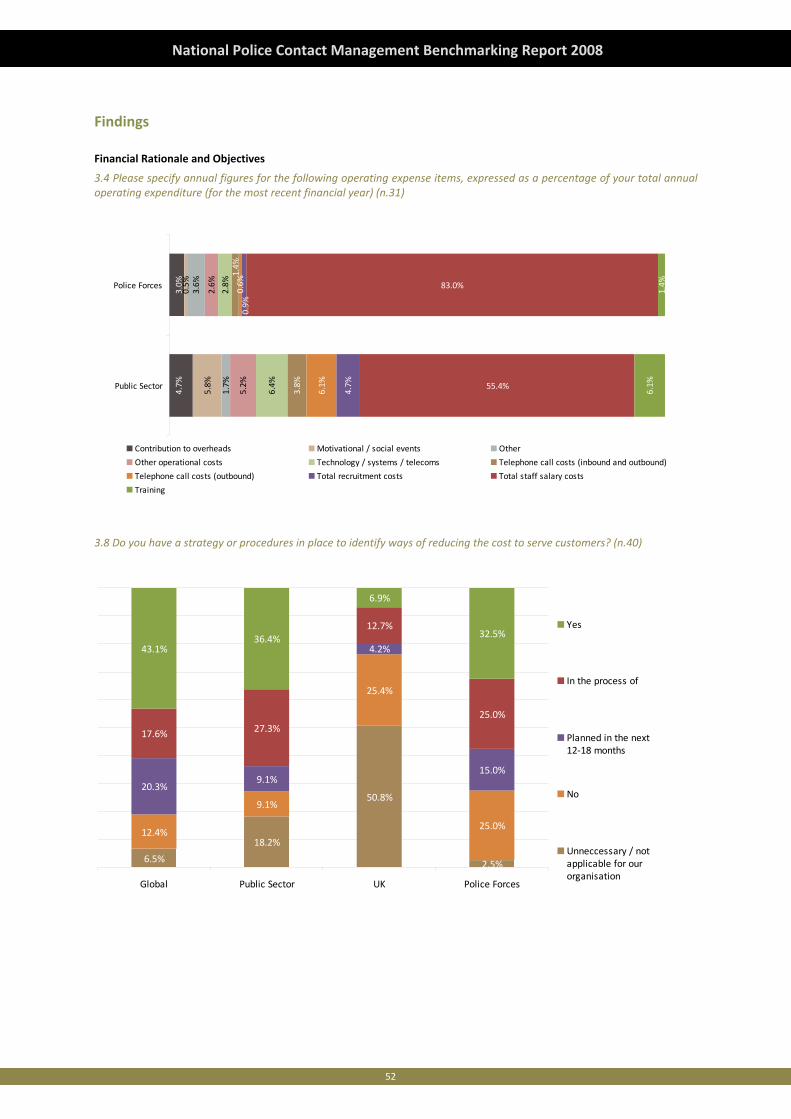
52
National Police Contact Management Benchmarking Report 2008
Findings
Financial Rationale and Objectives
3.4 Please specify annual figures for the following operating expense items, expressed as a percentage of your total annual operating expenditure (for the most recent financial year) (n.31)
4.7%
3.0%
5.8%
0.5%
1.7%
3.6%
5.2%
2.6%
6.4%
2.8%
3.8%
6.1%
4.7% 55.4%
83.0%
6.1%
1.4%
1.4%
0.6%
0.9%
0.0%
Public Sector
Police Forces
Contribution to overheads Motivational / social events Other
Other operational costs Technology / systems / telecoms Telephone call costs (inbound and outbound)
Telephone call costs (outbound) Total recruitment costs Total staff salary costs
Training
3.8 Do you have a strategy or procedures in place to identify ways of reducing the cost to serve customers? (n.40)
6.5%
18.2%
50.8%
2.5%
12.4%
9.1%
25.4%
25.0%
20.3%9.1%
4.2%
15.0%
17.6% 27.3%
12.7%
25.0%
43.1%36.4%
6.9%
32.5%
Global Public Sector UK Police Forces
Yes
In the process of
Planned in the next12‐18 months
No
Unneccessary / notapplicable for ourorganisation
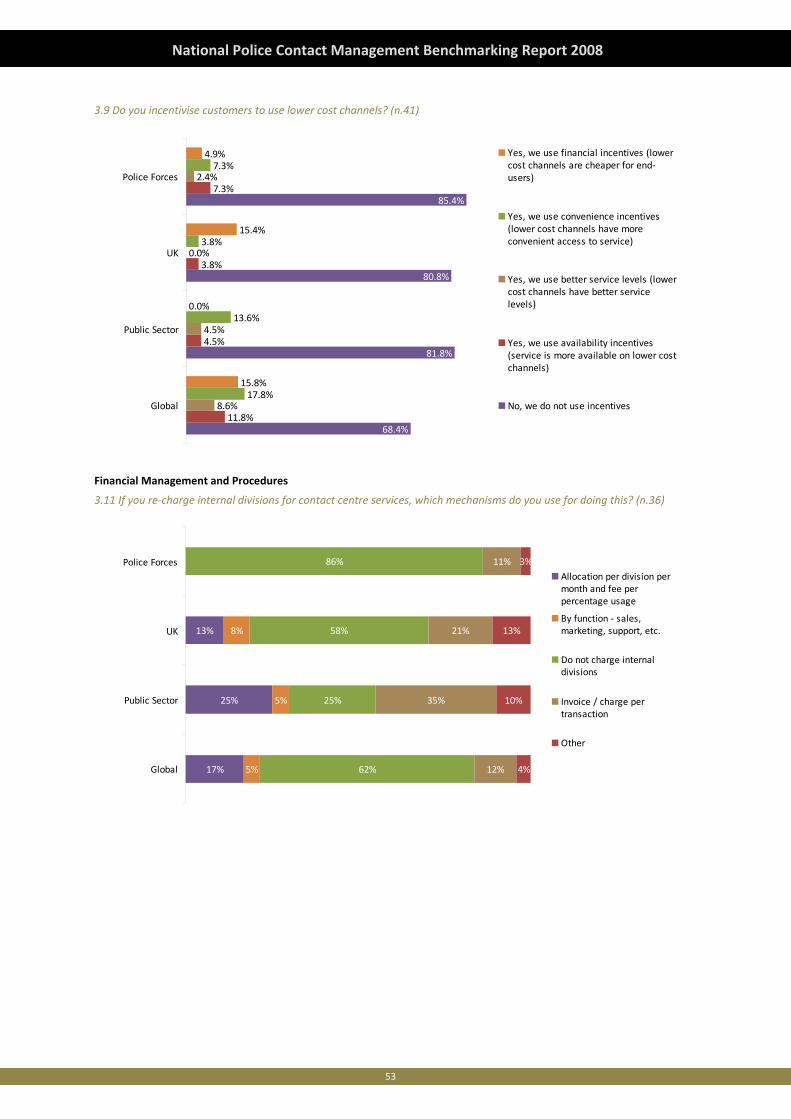
53
National Police Contact Management Benchmarking Report 2008
3.9 Do you incentivise customers to use lower cost channels? (n.41)
68.4%
81.8%
80.8%
85.4%
11.8%
4.5%
3.8%
7.3%
8.6%
4.5%
0.0%
2.4%
17.8%
13.6%
3.8%
7.3%
15.8%
0.0%
15.4%
4.9%
Global
Public Sector
UK
Police Forces
Yes, we use financial incentives (lowercost channels are cheaper for end‐users)
Yes, we use convenience incentives(lower cost channels have moreconvenient access to service)
Yes, we use better service levels (lowercost channels have better servicelevels)
Yes, we use availability incentives(service is more available on lower costchannels)
No, we do not use incentives
Financial Management and Procedures
3.11 If you re‐charge internal divisions for contact centre services, which mechanisms do you use for doing this? (n.36)
17%
25%
13%
5%
5%
8%
62%
25%
58%
86%
12%
35%
21%
11%
4%
10%
13%
3%
Global
Public Sector
UK
Police ForcesAllocation per division permonth and fee perpercentage usage
By function ‐ sales,marketing, support, etc.
Do not charge internaldivisions
Invoice / charge pertransaction
Other
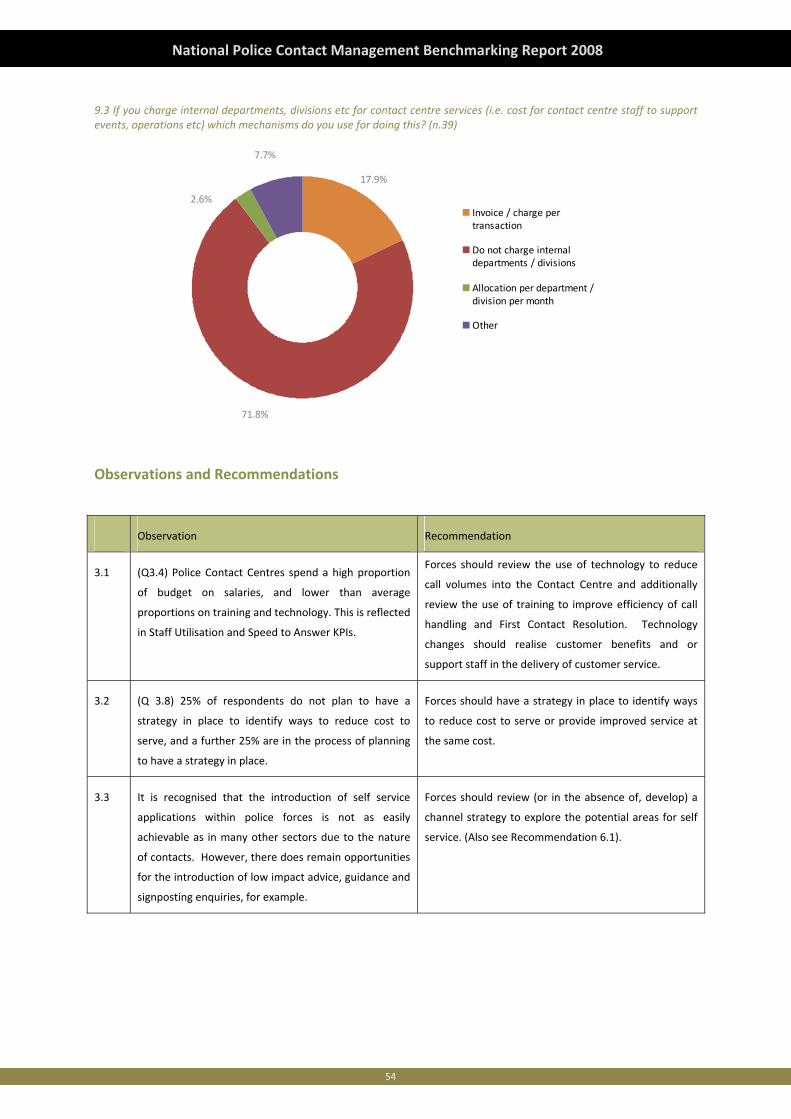
54
National Police Contact Management Benchmarking Report 2008
9.3 If you charge internal departments, divisions etc for contact centre services (i.e. cost for contact centre staff to support events, operations etc) which mechanisms do you use for doing this? (n.39)
71.8%
17.9%
2.6%
7.7%
Invoice / charge pertransaction
Do not charge internaldepartments / divisions
Allocation per department /division per month
Other
Observations and Recommendations
Observation Recommendation
3.1 (Q3.4) Police Contact Centres spend a high proportion
of budget on salaries, and lower than average
proportions on training and technology. This is reflected
in Staff Utilisation and Speed to Answer KPIs.
Forces should review the use of technology to reduce
call volumes into the Contact Centre and additionally
review the use of training to improve efficiency of call
handling and First Contact Resolution. Technology
changes should realise customer benefits and or
support staff in the delivery of customer service.
3.2 (Q 3.8) 25% of respondents do not plan to have a
strategy in place to identify ways to reduce cost to
serve, and a further 25% are in the process of planning
to have a strategy in place.
Forces should have a strategy in place to identify ways
to reduce cost to serve or provide improved service at
the same cost.
3.3 It is recognised that the introduction of self service
applications within police forces is not as easily
achievable as in many other sectors due to the nature
of contacts. However, there does remain opportunities
for the introduction of low impact advice, guidance and
signposting enquiries, for example.
Forces should review (or in the absence of, develop) a
channel strategy to explore the potential areas for self
service. (Also see Recommendation 6.1).

55
National Police Contact Management Benchmarking Report 2008
56
National Police Contact Management Benchmarking Report 2008
57
National Police Contact Management Benchmarking Report 2008
Chapter 4: Customer Knowledge and Management
Introduction
This chapter looks at how organisations are broadening their service portfolios and offering more variations in an effort to
maximise customer loyalty and satisfaction. This in turn creates major challenges in working out how to effectively,
efficiently and appropriately support these customers with multiple services. To do this it is vitally important to maximise
the use of Customer Management strategies through informed customer insight and knowledge. The themes covered
include:
a. Segmentation
b. Service offering per segment
c. Customer Knowledge
d. Impact of service changes on customers
Global Perspective
Contact centres are at the front line of customer management with agents being the first point of contact for customers.
Centres potentially influence all aspects of an organisations interactions with its customers ‐ from the first perception of
callers, the correct service delivery, customer satisfaction and loyalty / trust levels (confidence and reassurance) and the
cost of service provision. As such, they explicitly or implicitly make decisions as to how they'll manage the customer
relationship. The reality of what they do and the extent to which their actions line up with the organisation's overall policy
vary widely.
Many organisations know the key to sustainable loyalty, profitability and productivity is focusing on their customers and
their relationships with the organisation including:
• Customer characteristics (age, gender, geo‐demographics, etc.)
• Service holding and usage
• Interactions with the organisation (inbound and outbound, by channel and by type ‐ sales, service, etc.)
• Customer preferences and responsiveness in relation to products, communications styles and channels
• Customer actual and potential personal impact or value, based on current and potential service usage and the
associated costs to serve
• Identifying the various customer types, groups and segments of their customer base (defined by characteristics,
service usage and special requirements)
• Collating information on these groups to build knowledge, insight and understanding. Using this knowledge to see how
best to relate to these groups and which groups to nurture, grow, increase/decrease engagement.
• Using this knowledge to treat groups differently in terms of:
‐ Service offerings
‐ Service specific treatments
‐ Service availability
‐ Communications
‐ Broader engagement model
Best practice means collecting this data and using it to gain a real insight into how the organisation relates to its customers.
By analysing different customer groups, organisations can use the information at a strategic level to develop overall
policies, service level provision and approaches. This affects the contact centre on both a strategic and tactical level.
58
National Police Contact Management Benchmarking Report 2008
At a strategic level, decisions need to be made as to the service levels needed for each customer type. Many organisations
use a lot of energy in deciding how much effort and cost to invest in customer service and the simple rule of 'low impact /
need means customers get low impact service' applies.
By using this rule, low impact / need customers would be encouraged or 'forced' to use automated or self service channels.
The reality is much more complex. Service models must be matched to customer priority, needs and characteristics,
regardless of impact. There is no point in making low impact / need customers use a self service web channel if they don't
have access to or are not familiar with the technology.
The reality is that the choice of channel varies within each customer group and is dependent on the type of transaction.
This means that organisations should understand that customers’ needs differ according to their requirement at a specific
point, whether it is face‐to‐face, telephonic communication, email or self service. It also means that organisations must
realise that customers want to be able to choose how they interact.
Within a centre that deals with a customer base across a variety of customer segments, there may be different policies in
relation to the level of focus on activity or on agent discretion depending on the nature of the contact type.
Some examples of this are:
Policies for each customer segment
At the centre level this may affect:
• Service accessibility/opening hours
• Channel availability and ease of accessing agents (is the ‘contact us’ number hidden at the bottom of four levels of web
help pages or the ‘press 0 for a customer advisor’ the final choice on the fifth IVR menu?)
• Relative pricing of calling in (Toll free, share call, local rate or premium rated number) compared to self service
channels
• Supervision ratios
• Training investment
• Salaries of staff (are these selected as upper quartile of the local labour market or median)
• Investment in support and information systems
Focus of KPIs and therefore management attention between sales, service quality/customer satisfaction and
throughputs/cost control.
At the level of the individual customer this may affect:
• Agent KPIs – a strong focus on average handle times (AHTs) will provide better, faster throughputs and improved initial
cost control while a strong focus on customer satisfaction may increase AHTs but assist customer satisfaction and
retention
• Policies related to discretionary decisions e.g. priority of contact.
• Level of proactive service contacts e.g. courtesy or follow up calls
• Access to named individuals/specific service support team
• Ability to leave messages for an agent call‐back
What is critical is the need to decide how to manage customers not only in the centre, but across the whole organisation.
There are many examples of contact centres having either no policies or inconsistent policies. Successful customer
management must have an integrated approach that is aligned across the whole organisation.
59
National Police Contact Management Benchmarking Report 2008
Pre‐2000, many contact centres had a limited understanding of the different needs of their customer segments. Customer
information that would allow centres to tailor their interaction model was not available, not collected or not applied
properly. Now, a growing number of centres have become closely aligned with the strategies and policies of the wider
organisation. The organisation has, in turn, gained more of an insight and understanding of different customer groups, what
they want and what the organisation wants in return.
In this chapter we will look at:
• How contact centres use segmentation and customer knowledge to manage customers in relation to:
‐ Segmenting specific goals and objectives
‐ Policies and business rules
‐ Differences in systems and processes
‐ Management information to monitor outcomes and their effectiveness.
• A major element of customer management is delivering appropriate levels of service and tracking its impact on
customer satisfaction. We will look at how this is managed and the emerging trends. A differential service strategy has
to be based upon a full understanding of the key drivers of satisfaction.
• Customer contact management and approaches, inbound and outbound.
Tailoring services to value – best practice for all?
Whenever there is talk about setting service levels, we find the following question being asked: Should low impact
customers get a poor service?
Very few businesses are comfortable saying yes. In fact the advances in our understanding of contact centre management
means an improved customer experience for all by:
• Better people management means contact centre staff are more motivated. Good recruitment and training practices
mean good staff profiling and training.
• Better information for the agent through systems integration and applications means better information and support
to serve the customer.
Now, more than ever, organisations have the understanding and tools available to them which are cost effective to help
provide a better service. We suggest a policy of 'best fit' as opposed to best practice for some areas of call centre
management. It is critical that each centre looks at the way it has evolved and makes decisions on the basis of a good
understanding of its compliance regimes, data and customers.
Key trends and changes
Contact centres are evolving and becoming more sophisticated with their people, processes and technology. They are also
integrating more with other centres and other parts of the organisation. This also applies to customer management.
In recent years we have seen key trends in relation to:
Segmentation
We have seen a growing trend towards integration with the wider organisation. By looking at centre policies and their
alignment with the whole organisation, we can see whether they use the same segmentation system.
Customer satisfaction
A key metric for all organisations is customer satisfaction. Satisfied customers translate into loyalty, trust and ultimately
service advocates.
60
National Police Contact Management Benchmarking Report 2008
In terms of actual customer satisfaction scores, the Global Benchmarking Report this year shows that findings have stayed
very much the same as in previous years, this might seem disappointing for the industry at first, however it could be due to
increasing complexity of contact centre functions and growing customer expectations, in light of these two elements alone
to maintain a similar level of satisfaction is far less disappointing.
As contact centres develop and there is a growing uptake of technology, more simple transactions are being automated
through self service channels like IVR, web and speech self service. This means that contact centre agents are left to deal
with more complex queries that need more skill and take longer.
Knowing this, we would expect it to be even harder to get growing satisfaction scores. This means static satisfaction scores
may well be a very positive result.
Telephone number strategy
Customer needs in terms of contact centres are quite simple and have remained so since the start:
1. Clear and simple channels or methods of contacting the organisation, where organisation structure has no influence.
2. Calls that are answered promptly, with no long ring tones or repetitive messages.
3. Ensuring that calls are answered by a person able to deal with their enquiry or need, not being passed around.
4. That requests are handled in a pleasant, knowledgeable and prompt manner.
Being customers ourselves, we are sure everyone would agree that this is not unreasonable and should be simple to do,
especially as in most organisations around 80% of calls usually fall into the 'simple' category. In reality it can be difficult. An
example of this is a business wanting to have a single contact number and coming up against many challenges. For
example, with one number, how do you:
• Differentiate between your customers to:
‐ Provide enhanced or standard services?
‐ Know what and when to offer different / new or additional services?
• Enable agents to answer multiple queries across multiple service and product ranges. Will you need to:
‐ Increase your training budget to train, train and train again?
‐ Develop, maintain and provide a product knowledge base?
‐ Increase the agent profile and usually the salary and benefits package?
• Identify which skill set is needed for more complex customer interactions in order to:
‐ Maintain or improve performance in specific areas
‐ Control the interaction to ensure a positive customer experience
So, whilst it is encouraging to see that companies are listening to their customers and providing a single number at almost
70% this year (having increased from 51% in 2006) with a further 30% planning to or introducing one, it is how the calls that
are handled from that point that determines how well the company achieves the other basic customer “wants”.
Proactive customer contact
We all lead busy lives and a gentle, well‐timed reminder can be helpful at certain times.
The survey shows more proactive contact for negative reasons. After the first New Customer call, the top three reasons for
initiating contact are complaints (74%), lapsed payments (33%) and retention triggers (33%). In an attempt to avoid contact
for negative reasons, we find industries like Financial Services sending prompts to customers via SMS to remind them to
61
National Police Contact Management Benchmarking Report 2008
manage accounts before getting into negative situations like arrears. By doing this, the contact is positive and more likely to
get a better reaction from the customer.
How many of us get a reminder from our garage to say that our next vehicle service is due? In this case, the garage is
unlikely to see you as a customer between these times, but the prompts are there and easy to use, like for instance:
• Date of last visit
• Reason for visit
• Average mileage between visits
• Expected next required visit
• Name, address, contact method and supporting details
Many organisations now utilise proactive SMS messaging to provide service updates e.g. road side assistance and telecoms
fault repair, for ETA of engineers which informs, manages expectation and ultimately improves customer satisfaction and
loyalty during and after the service experience.
Organisations need to look at their positive interactions with customers and involve customers in decisions over the contact
strategy, i.e. financial services will ask what account triggers should prompt an SMS message. This ties the customer into
the Customer Knowledge Management strategy and starts to generate a 'prosumer' – a term first used by Alvin Toffler in
1980 to show that a customer can be a producer and consumer in their interactions with companies. This is not a new
concept. Even pre‐1980s it was used in the business to business environment for co‐production of products. The idea
should be carried through into the organisation to consumer relationship. Most organisations are able to identify a number
of triggers for proactive contact and in turn choose the method and reason by segment.
Benchmark and best practice review
Customer knowledge and customer management are necessary for best practice operation of contact centres.
Although these concepts are not new, it's important to understand the differences between them and to use them in
devising a strategic vision for an organisation. This can mean the difference between success and failure.
Knowledge Management:
If only we knew what we know (use and making available information)
Customer Knowledge Management:
If only we knew what our customers want (gaining customer insight and knowledge)
Customer Relationship Management:
Customers are different, if only we could use our knowledge to look after our customers in different ways, appropriate to
their needs and impact
How contact centres use segmentation and customer knowledge to manage customers
We suggest using technologies like Call Line Identity (CLI) or using a look‐up based on IVR account number capture. Another
way is to allocate separate numbers for particular customers groups e.g. vulnerable customers.
Whatever the mechanism, it is important to be able to identify certain customers so that they can be routed to the right
agents with the right policies.
Of the centres that belong to an organisation that uses segmentation, 63% can identify customers when they contact them.
How many of these actually use this knowledge to change the way they treat their customers? Best practice is being able to
segment your service intelligently with the particular customer in mind.
62
National Police Contact Management Benchmarking Report 2008
For the first time in this year’s survey we asked for more detail on how personalised / segmented services would be
delivered. We looked at two aspects.
The first related to the process:
• Are segment‐specific goals and objectives set?
• Are there specific and defined business rules and policies to achieve these?
• Are different systems and processes in place?
• Is Management Information collected to measure the effectiveness of segmentation?
We would advise having all four of the above in place in order to treat particular customers differently.
The second was whether these were applied in different areas such as:
• Customer satisfaction
• Communications strategy/frequency of contacts
• Frequency and impact of contact
• Sales/retention activity
• Costs to serve
• Service standards such as ‘speed to answer’ and its impact on resourcing
• Service delivery by specific teams
We would suggest using all of these when personalising services.
In knowing what segments a customer belongs to, it is important to know more about the relationship with the business,
products and services used, pricing agreements, contact history, etc. We think this information is critical to respond
effectively to queries or to make appropriate outbound calls.
Customer satisfaction measurement and the key drivers of satisfaction
Customer satisfaction is one of many important elements of customer data. The contact centre is a major source of such
intelligence, given its ongoing interactions with customers. Contact centres are able to collect data on customers’
preferences and needs, views and aptitudes regarding the services provided. It is considered best practice to systematically
collect and analyse this data. Information is only useful if it's turned into actionable knowledge. However, the 2008 Global
Contact Centre Report identifies that only 24% of centres overall have a formal mechanism for feeding back customer or
market intelligence to the rest of the organisation.
If organisations understand this they can focus their measurement, management and investment activity on the areas with
the greatest impact. It is important in terms of best practice to set specific service policies for different customer groups.
Customer contact management and approaches ‐ inbound and outbound
It would be pointless to segment customers and identify customer satisfaction drivers if the first contact they have with the
organisation is a confusing array of numbers or if they only receive a contact from the organisation generated by a negative
reason.
We would expect to see a marked increase in combining approaches to developing a segmentation strategy. This is
especially true, given the challenges of providing a simple contact strategy for customers while introducing strategic
differentiated services. It could be argued that best practice is about giving the customer a single number supported by a
simple call routing and self service IVR. The idea is to identify and validate customers before being handed to an agent or
option depending on the segmentation strategy for that customer.
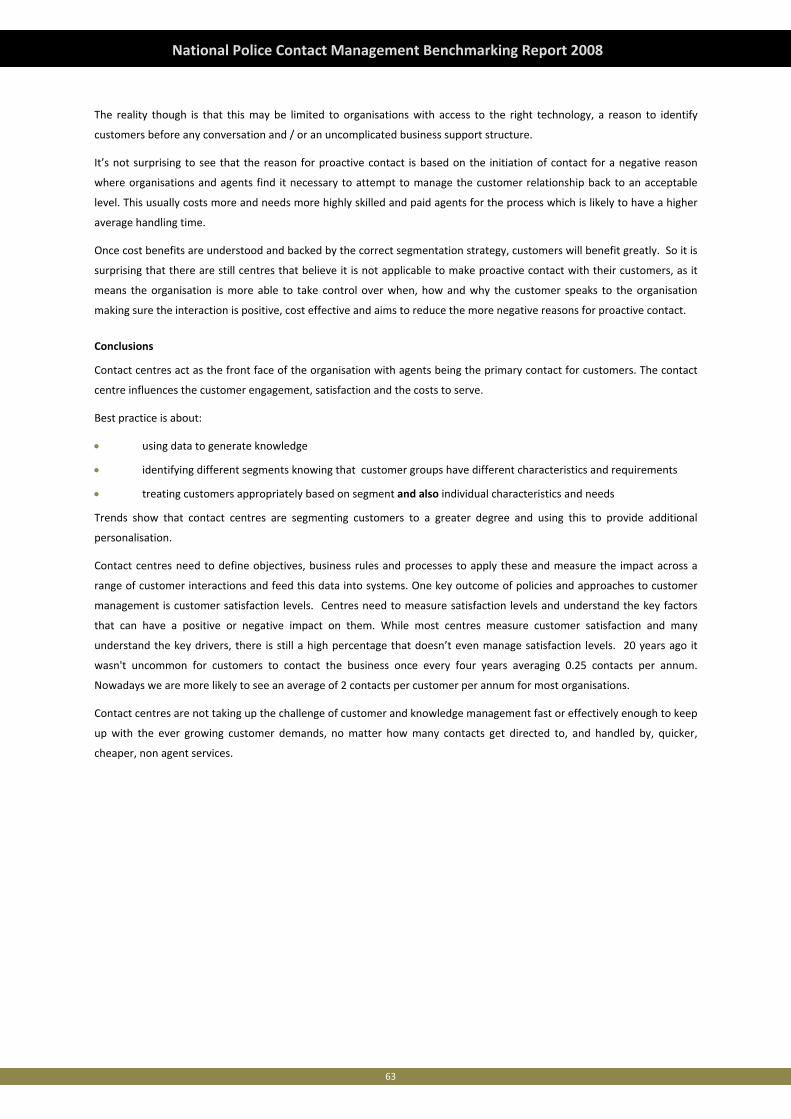
63
National Police Contact Management Benchmarking Report 2008
The reality though is that this may be limited to organisations with access to the right technology, a reason to identify
customers before any conversation and / or an uncomplicated business support structure.
It’s not surprising to see that the reason for proactive contact is based on the initiation of contact for a negative reason
where organisations and agents find it necessary to attempt to manage the customer relationship back to an acceptable
level. This usually costs more and needs more highly skilled and paid agents for the process which is likely to have a higher
average handling time.
Once cost benefits are understood and backed by the correct segmentation strategy, customers will benefit greatly. So it is
surprising that there are still centres that believe it is not applicable to make proactive contact with their customers, as it
means the organisation is more able to take control over when, how and why the customer speaks to the organisation
making sure the interaction is positive, cost effective and aims to reduce the more negative reasons for proactive contact.
Conclusions
Contact centres act as the front face of the organisation with agents being the primary contact for customers. The contact
centre influences the customer engagement, satisfaction and the costs to serve.
Best practice is about:
• using data to generate knowledge
• identifying different segments knowing that customer groups have different characteristics and requirements
• treating customers appropriately based on segment and also individual characteristics and needs
Trends show that contact centres are segmenting customers to a greater degree and using this to provide additional
personalisation.
Contact centres need to define objectives, business rules and processes to apply these and measure the impact across a
range of customer interactions and feed this data into systems. One key outcome of policies and approaches to customer
management is customer satisfaction levels. Centres need to measure satisfaction levels and understand the key factors
that can have a positive or negative impact on them. While most centres measure customer satisfaction and many
understand the key drivers, there is still a high percentage that doesn’t even manage satisfaction levels. 20 years ago it
wasn't uncommon for customers to contact the business once every four years averaging 0.25 contacts per annum.
Nowadays we are more likely to see an average of 2 contacts per customer per annum for most organisations.
Contact centres are not taking up the challenge of customer and knowledge management fast or effectively enough to keep
up with the ever growing customer demands, no matter how many contacts get directed to, and handled by, quicker,
cheaper, non agent services.
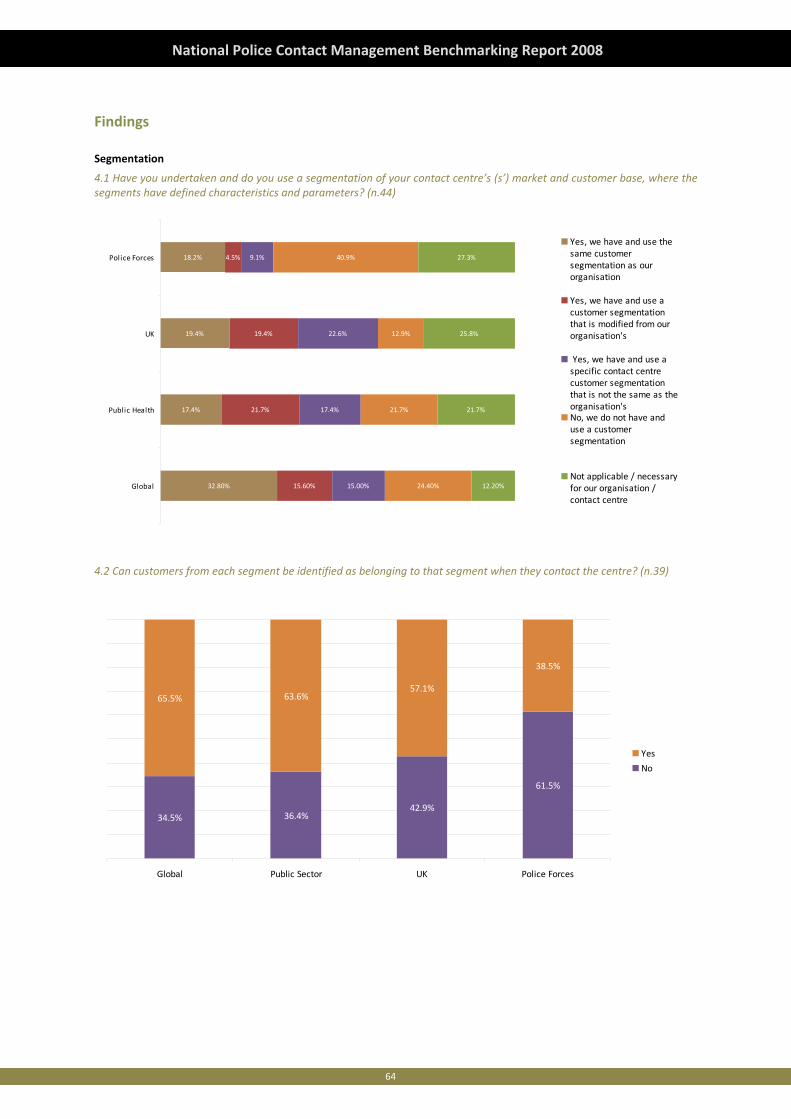
64
National Police Contact Management Benchmarking Report 2008
Findings
Segmentation
4.1 Have you undertaken and do you use a segmentation of your contact centre’s (s’) market and customer base, where the segments have defined characteristics and parameters? (n.44)
32.80%
17.4%
19.4%
18.2%
15.60%
21.7%
19.4%
4.5%
15.00%
17.4%
22.6%
9.1%
24.40%
21.7%
12.9%
40.9%
12.20%
21.7%
25.8%
27.3%
Global
Public Health
UK
Police Forces
Yes, we have and use thesame customersegmentation as ourorganisation
Yes, we have and use acustomer segmentationthat is modified from ourorganisation's
Yes, we have and use aspecific contact centrecustomer segmentationthat is not the same as theorganisation'sNo, we do not have anduse a customersegmentation
Not applicable / necessaryfor our organisation /contact centre
4.2 Can customers from each segment be identified as belonging to that segment when they contact the centre? (n.39)
34.5% 36.4%42.9%
61.5%
65.5% 63.6%57.1%
38.5%
Global Public Sector UK Police Forces
Yes
No
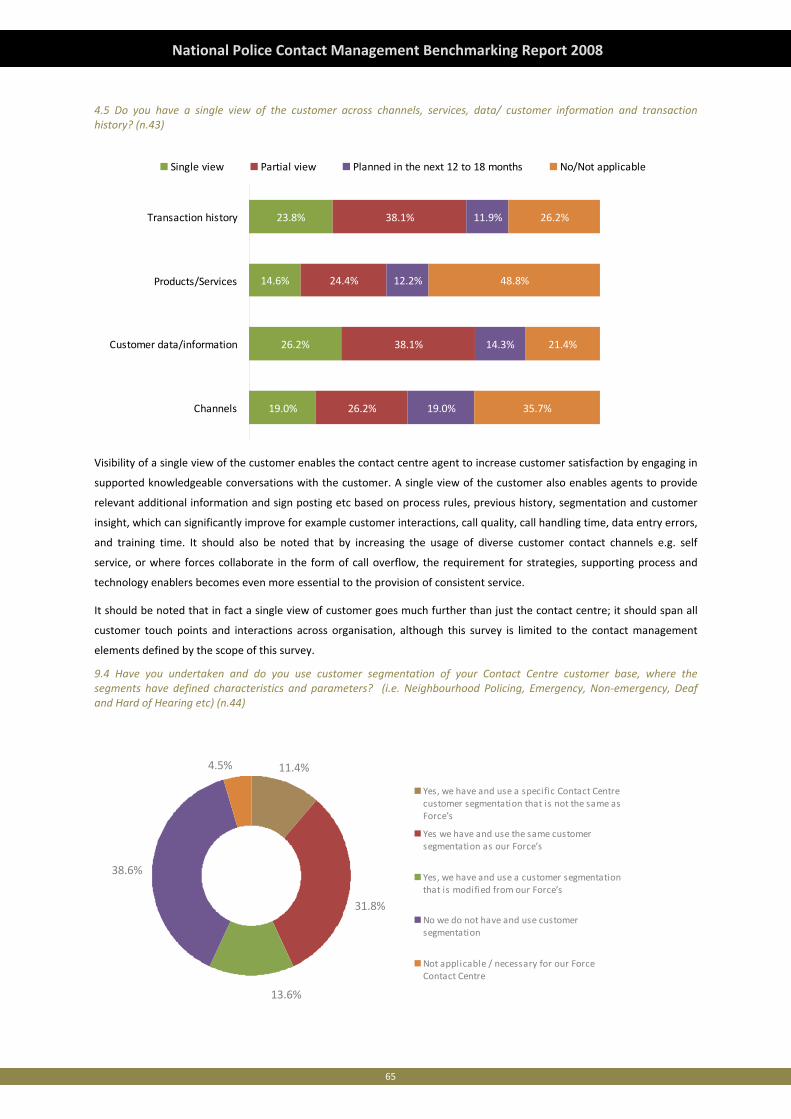
65
National Police Contact Management Benchmarking Report 2008
4.5 Do you have a single view of the customer across channels, services, data/ customer information and transaction history? (n.43)
19.0%
26.2%
14.6%
23.8%
26.2%
38.1%
24.4%
38.1%
19.0%
14.3%
12.2%
11.9%
35.7%
21.4%
48.8%
26.2%
Channels
Customer data/information
Products/Services
Transaction history
Single view Partial view Planned in the next 12 to 18 months No/Not applicable
Visibility of a single view of the customer enables the contact centre agent to increase customer satisfaction by engaging in
supported knowledgeable conversations with the customer. A single view of the customer also enables agents to provide
relevant additional information and sign posting etc based on process rules, previous history, segmentation and customer
insight, which can significantly improve for example customer interactions, call quality, call handling time, data entry errors,
and training time. It should also be noted that by increasing the usage of diverse customer contact channels e.g. self
service, or where forces collaborate in the form of call overflow, the requirement for strategies, supporting process and
technology enablers becomes even more essential to the provision of consistent service.
It should be noted that in fact a single view of customer goes much further than just the contact centre; it should span all
customer touch points and interactions across organisation, although this survey is limited to the contact management
elements defined by the scope of this survey.
9.4 Have you undertaken and do you use customer segmentation of your Contact Centre customer base, where the segments have defined characteristics and parameters? (i.e. Neighbourhood Policing, Emergency, Non‐emergency, Deaf and Hard of Hearing etc) (n.44)
38.6%
13.6%
4.5% 11.4%
31.8%
Yes, we have and use a specific Contact Centrecustomer segmentation that is not the same asForce’s
Yes we have and use the same customersegmentation as our Force’s
Yes, we have and use a customer segmentationthat is modified from our Force’s
No we do not have and use customersegmentation
Not applicable / necessary for our ForceContact Centre
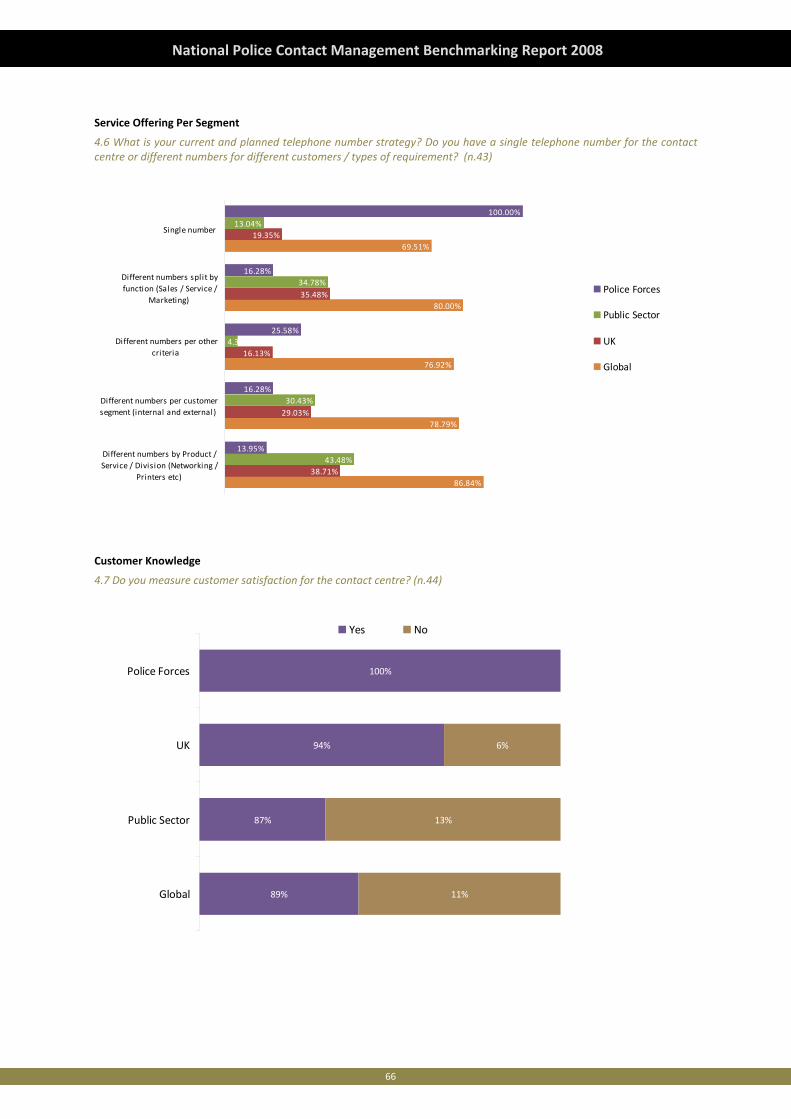
66
National Police Contact Management Benchmarking Report 2008
Service Offering Per Segment
4.6 What is your current and planned telephone number strategy? Do you have a single telephone number for the contact centre or different numbers for different customers / types of requirement? (n.43)
86.84%
78.79%
76.92%
80.00%
69.51%
38.71%
29.03%
16.13%
35.48%
19.35%
43.48%
30.43%
4.35%
34.78%
13.04%
13.95%
16.28%
25.58%
16.28%
100.00%
Different numbers by Product /Service / Division (Networking /
Printers etc)
Different numbers per customersegment (internal and external)
Different numbers per othercriteria
Different numbers split byfunction (Sales / Service /
Marketing)
Single number
Police Forces
Public Sector
UK
Global
Customer Knowledge
4.7 Do you measure customer satisfaction for the contact centre? (n.44)
89%
87%
94%
100%
11%
13%
6%
Global
Public Sector
UK
Police Forces
Yes No
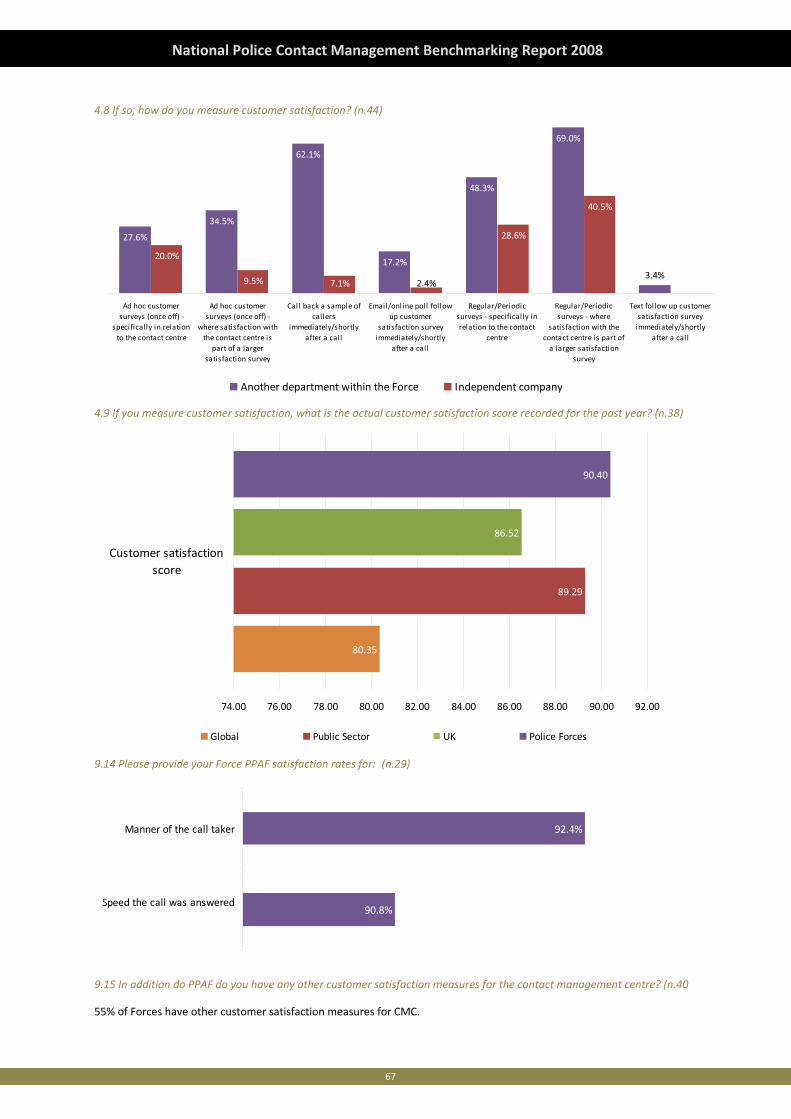
67
National Police Contact Management Benchmarking Report 2008
4.8 If so, how do you measure customer satisfaction? (n.44)
27.6%
34.5%
62.1%
17.2%
48.3%
69.0%
20.0%
9.5% 7.1%
28.6%
40.5%
0.0%3.4%
2.4%
Ad hoc customersurveys (once off) ‐
specifically in relationto the contact centre
Ad hoc customersurveys (once off) ‐
where satisfaction withthe contact centre is
part of a largersatisfaction survey
Call back a sample ofcallers
immediately/shortlyafter a cal l
Email/online poll followup customer
satisfaction surveyimmediately/shortly
after a call
Regular/Periodicsurveys ‐ specifically inrelation to the contact
centre
Regular/Periodicsurveys ‐ where
satisfaction with thecontact centre is part ofa larger satisfaction
survey
Text follow up customersatisfaction surveyimmediately/shortly
after a cal l
Another department within the Force Independent company
4.9 If you measure customer satisfaction, what is the actual customer satisfaction score recorded for the past year? (n.38)
80.35
89.29
86.52
90.40
74.00 76.00 78.00 80.00 82.00 84.00 86.00 88.00 90.00 92.00
Customer satisfactionscore
Global Public Sector UK Police Forces
9.14 Please provide your Force PPAF satisfaction rates for: (n.29)
90.8%
92.4%
Speed the call was answered
Manner of the call taker
9.15 In addition do PPAF do you have any other customer satisfaction measures for the contact management centre? (n.40
55% of Forces have other customer satisfaction measures for CMC.
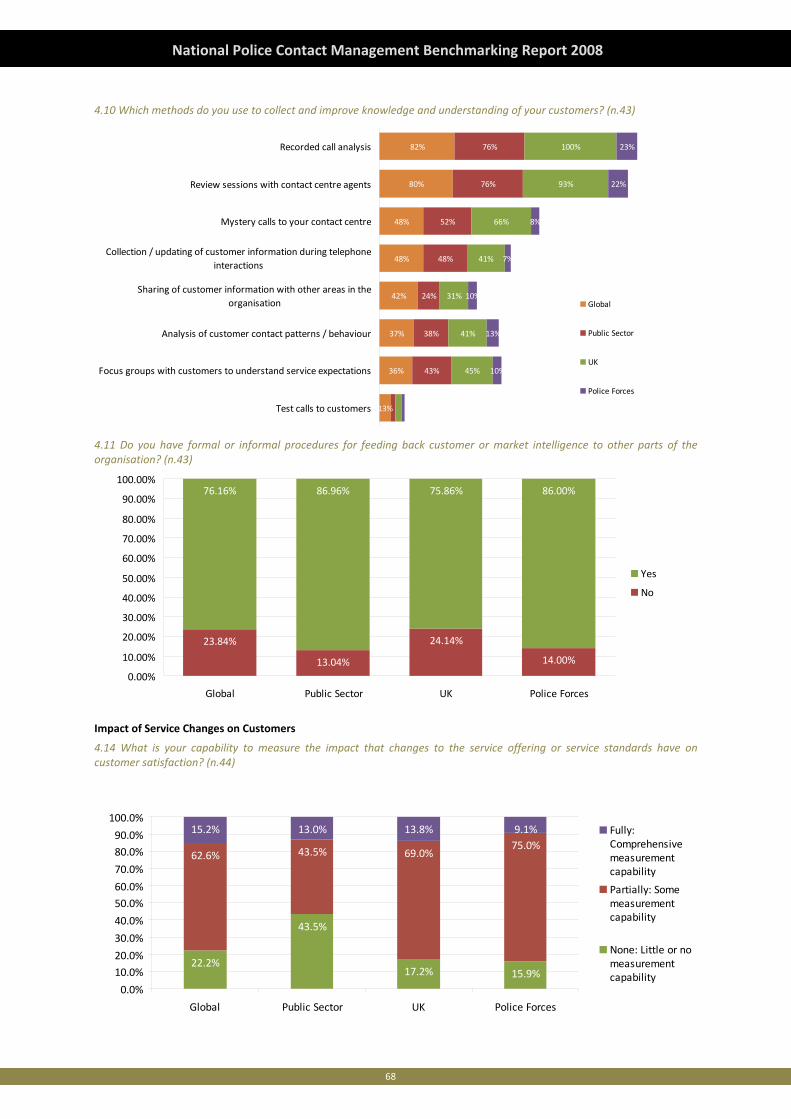
68
National Police Contact Management Benchmarking Report 2008
4.10 Which methods do you use to collect and improve knowledge and understanding of your customers? (n.43)
13%
36%
37%
42%
48%
48%
80%
43%
38%
24%
48%
52%
76%
45%
41%
31%
41%
66%
93%
10%
13%
10%
7%
8%
22%
23%82% 76% 100%
Test calls to customers
Focus groups with customers to understand service expectations
Analysis of customer contact patterns / behaviour
Sharing of customer information with other areas in theorganisation
Collection / updating of customer information during telephoneinteractions
Mystery calls to your contact centre
Review sessions with contact centre agents
Recorded call analysis
Global
Public Sector
UK
Police Forces
4.11 Do you have formal or informal procedures for feeding back customer or market intelligence to other parts of the organisation? (n.43)
23.84%
13.04%
24.14%
14.00%
76.16% 86.96% 75.86% 86.00%
0.00%
10.00%
20.00%
30.00%
40.00%
50.00%
60.00%
70.00%
80.00%
90.00%
100.00%
Global Public Sector UK Police Forces
Yes
No
Impact of Service Changes on Customers
4.14 What is your capability to measure the impact that changes to the service offering or service standards have on customer satisfaction? (n.44)
22.2%
43.5%
17.2% 15.9%
62.6% 43.5% 69.0%75.0%
15.2% 13.0% 13.8% 9.1%
0.0%
10.0%
20.0%
30.0%
40.0%
50.0%
60.0%
70.0%
80.0%
90.0%
100.0%
Global Public Sector UK Police Forces
Fully:Comprehensivemeasurementcapability
Partially: Somemeasurementcapability
None: Little or nomeasurementcapability
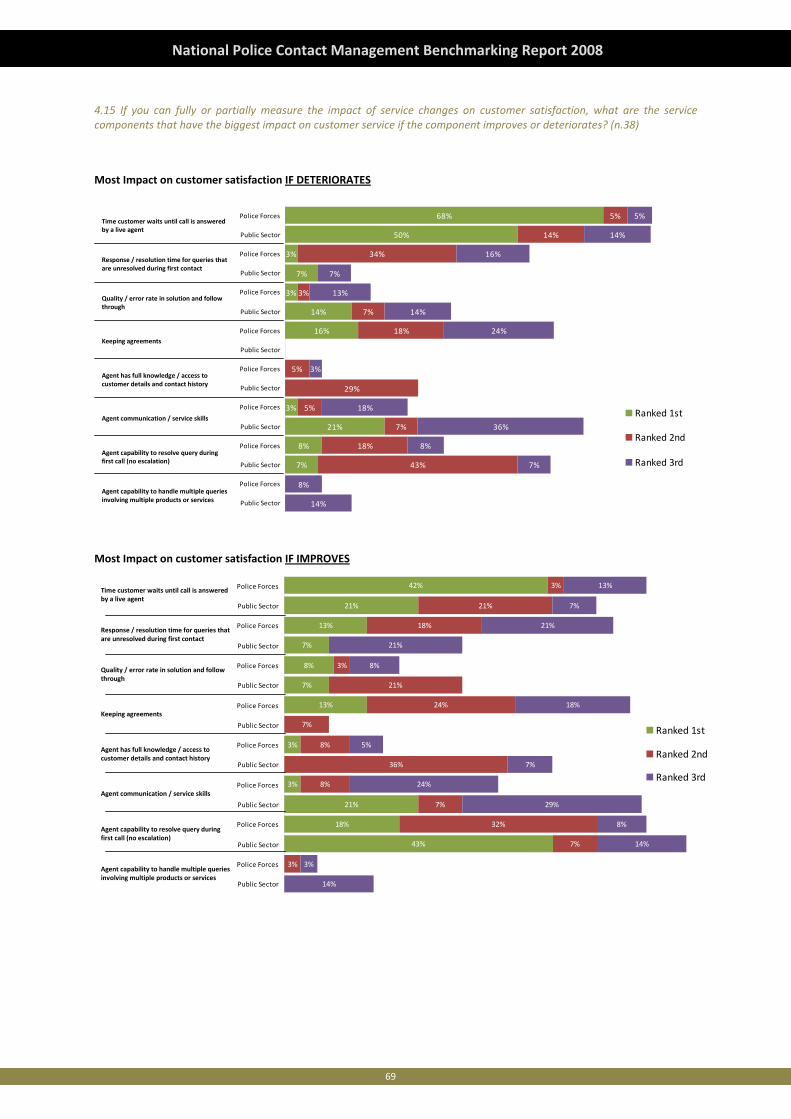
69
National Police Contact Management Benchmarking Report 2008
4.15 If you can fully or partially measure the impact of service changes on customer satisfaction, what are the service components that have the biggest impact on customer service if the component improves or deteriorates? (n.38)
Most Impact on customer satisfaction IF DETERIORATES
7%
21%
3%
16%
14%
3%
7%
3%
50%
68%
43%
18%
7%
5%
29%
5%
18%
7%
3%
34%
14%
5%
14%
8%
7%
8%
36%
18%
3%
24%
14%
13%
7%
16%
14%
5%
8%
Public Sector
Police Forces
Public Sector
Police Forces
Public Sector
Police Forces
Public Sector
Police Forces
Public Sector
Police Forces
Public Sector
Police Forces
Public Sector
Police Forces
Public Sector
Police Forces
Ranked 1st
Ranked 2nd
Ranked 3rd
Agent capability to handle multiple queries involving multiple products or services
Agent capability to resolve query during first call (no escalation)
Agent communication / service skills
Agent has full knowledge / access to customer details and contact history
Keeping agreements
Quality / error rate in solution and follow through
Response / resolution time for queries that are unresolved during first contact
Time customer waits until call is answered by a live agent
Most Impact on customer satisfaction IF IMPROVES
43%
18%
21%
3%
3%
13%
7%
8%
7%
13%
21%
42%
3%
7%
32%
7%
8%
36%
8%
7%
24%
21%
3%
18%
21%
3%
14%
3%
14%
8%
29%
24%
7%
5%
18%
8%
21%
21%
7%
13%
Public Sector
Police Forces
Public Sector
Police Forces
Public Sector
Police Forces
Public Sector
Police Forces
Public Sector
Police Forces
Public Sector
Police Forces
Public Sector
Police Forces
Public Sector
Police Forces
Ranked 1st
Ranked 2nd
Ranked 3rd
Agent capability to handle multiple queries involving multiple products or services
Agent capability to resolve query during first call (no escalation)
Agent communication / service skills
Agent has full knowledge / access to customer details and contact history
Keeping agreements
Quality / error rate in solution and follow through
Response / resolution time for queries that are unresolved during first contact
Time customer waits until call is answered by a live agent
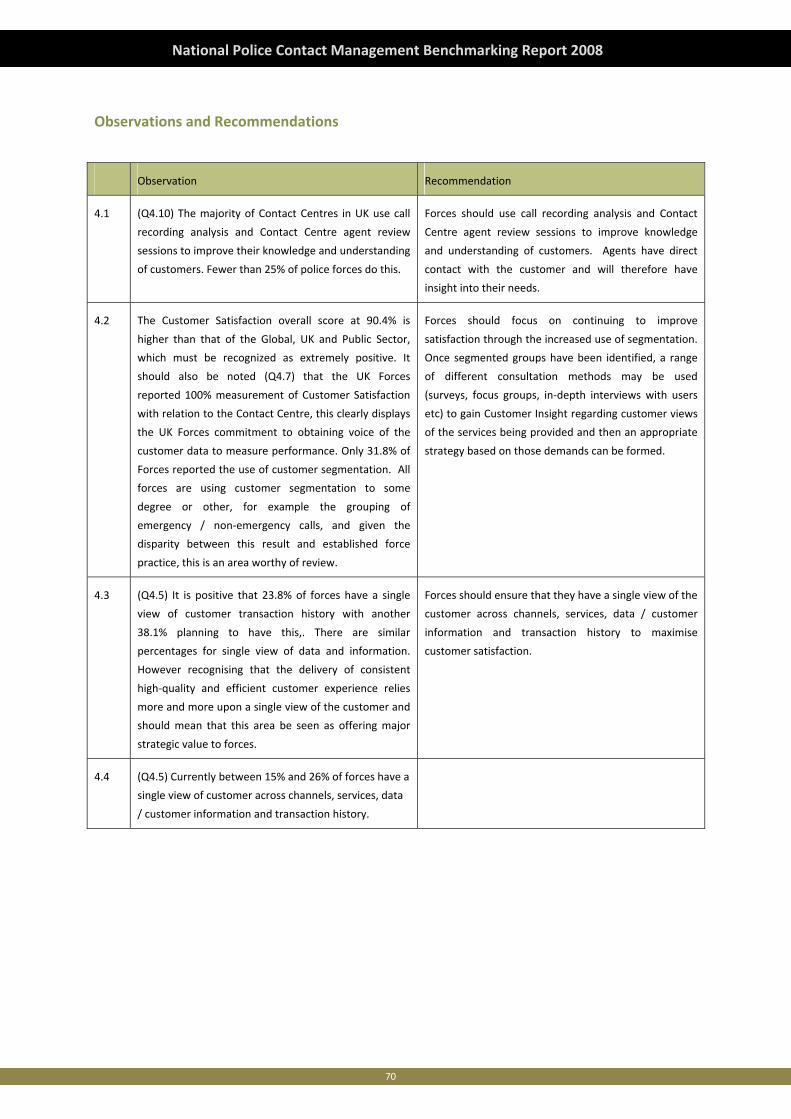
70
National Police Contact Management Benchmarking Report 2008
Observations and Recommendations
Observation Recommendation
4.1 (Q4.10) The majority of Contact Centres in UK use call
recording analysis and Contact Centre agent review
sessions to improve their knowledge and understanding
of customers. Fewer than 25% of police forces do this.
Forces should use call recording analysis and Contact
Centre agent review sessions to improve knowledge
and understanding of customers. Agents have direct
contact with the customer and will therefore have
insight into their needs.
4.2 The Customer Satisfaction overall score at 90.4% is
higher than that of the Global, UK and Public Sector,
which must be recognized as extremely positive. It
should also be noted (Q4.7) that the UK Forces
reported 100% measurement of Customer Satisfaction
with relation to the Contact Centre, this clearly displays
the UK Forces commitment to obtaining voice of the
customer data to measure performance. Only 31.8% of
Forces reported the use of customer segmentation. All
forces are using customer segmentation to some
degree or other, for example the grouping of
emergency / non‐emergency calls, and given the
disparity between this result and established force
practice, this is an area worthy of review.
Forces should focus on continuing to improve
satisfaction through the increased use of segmentation.
Once segmented groups have been identified, a range
of different consultation methods may be used
(surveys, focus groups, in‐depth interviews with users
etc) to gain Customer Insight regarding customer views
of the services being provided and then an appropriate
strategy based on those demands can be formed.
4.3 (Q4.5) It is positive that 23.8% of forces have a single
view of customer transaction history with another
38.1% planning to have this,. There are similar
percentages for single view of data and information.
However recognising that the delivery of consistent
high‐quality and efficient customer experience relies
more and more upon a single view of the customer and
should mean that this area be seen as offering major
strategic value to forces.
Forces should ensure that they have a single view of the
customer across channels, services, data / customer
information and transaction history to maximise
customer satisfaction.
4.4 (Q4.5) Currently between 15% and 26% of forces have a
single view of customer across channels, services, data
/ customer information and transaction history.

71
National Police Contact Management Benchmarking Report 2008
72
National Police Contact Management Benchmarking Report 2008
73
National Police Contact Management Benchmarking Report 2008
Chapter 5: Performance Measurement and Metrics
Introduction
The following Chapter deals with the key performance measures and metrics surrounding the contact management and
contact centre operations of the organisation. The contact centre industry generally is one of the most highly performance
managed areas in most organisations due to the importance of real time and historic statistical information and data. It is
vital therefore to have availability and understanding of the relationships between key measures and metrics, ensuring that
this information is utilised to manage and improve service efficiency and effectiveness. The following topics are included:
a. Telephone Interaction Statistics
b. Resolution & Response Times
c. Key Performance Indicators and Targets
d. Statistical Analysis and Reporting
Global Perspective
Increasing requirement
If we were asked to choose a word to describe the contact centre industry over the past 10 years, the word 'increasing'
would be on the shortlist.
It applies to all facets of contact centres:
• Increasing deployment, complexity, scope and volume of transactions
• Increasing costs and investment
• Increasing opportunities, benefits, risks and consequences
• Increasing market acceptance and customer expectations
This means there is also an increasing pressure on contact centres to perform. In the same vein, improving performance
standards or efficiencies are high on the list for most centres’ key priorities.
But what do we actually mean by performance? How are we measuring it? In many of today's contact centres, performance
is defined by three primary factors:
• Cost
• Efficiency Metrics
• Customer Complaints
These performance efficiency initiatives revolve around budget adherence, cost containment or reductions: doing more for
less. To ensure performance standards are not hugely impacted by efficiency initiatives, many contact centres rely upon a
standard set of Best Practice metrics. These efficiency metrics and standards have formed the foundation for performance
evaluation in the contact centre industry for years. They focus mostly on availability of service and speed of connection and
are promoted as the only metrics that matter to all contact centres.
The third aspect of performance measurement is the number of customer complaints received by the business. If these are
kept at an acceptable level, it means performance delivered meets the required standards.
We may be guilty of over‐simplifying performance measurement by grouping it into these three factors. It may also be
argued that progress within the industry hasn’t been acknowledged either. The reality, however, is that this is how it works
in today's contact centres.
74
National Police Contact Management Benchmarking Report 2008
Relying on a standard set of efficiency metrics is no longer enough to understand how a contact centre is performing.
Given the growing role played by contact centres in achieving organisations' strategies, it is vital that we are able to
accurately and comprehensively measure how we are performing against these objectives.
Contact centres need to ask and be able to answer the following key questions:
• What role do we play in achieving the organisation’s objectives?
• Given this, what performance is required?
• What standard should we be attaining?
• What should we be measuring?
• Why should we be measuring them (what is it telling us)?
• How should we be measuring them?
• What are the interrelations and connections between each performance area?
When setting performance measures and metrics for contact centres, they should be underpinned by the following
principles:
1. Linked to a desired business outcome.
2. A clear understanding between 'indicator metrics' and 'business outcome metrics' e.g. abandoned rate is not a desired
business outcome, but it does inform / indicate potential issues that may be impacting the business outcome.
3. Alignment between strategic objectives and contact centre performance.
4. Commercial value / business contribution delivered by achieving specific performance standards / levels.
5. Commercial impacts / business consequences from reduced / non‐delivery of specific performance standards / levels.
6. Performance influencers – e.g. support functions / training / remuneration.
7. Performance standards informed and defined from a customer experience / service requirement perspective.
8. Ability to differentiate between performance symptoms and core performance issues.
9. Presentation of an accurate, objective and unambiguous picture.
10. Clear link between the desired performance and individual remuneration.
Of course, it's easy to lay principles on paper. The reality is somewhat different in practice. Contact centres face a number
of key challenges when trying to link their performance to the organisation’s overall objectives. How can a centre
accurately measure the contribution they have made to a strategic objective such as improved customer perception of the
organisation, for example? How do we build a valid and measurable business case or Return on Investment (ROI) for
changing service‐related performance standards in the contact centre?
These are not easy questions to answer. Achieving this level of performance measurement will mean significant expansion
of the current Management Information Systems (MIS) model deployed. This includes a greater focus on customer /
employee data collation, feedback, research and engagement.
It is our view that the contact centres who have worked out how to answer these questions will lead the way into the
future and are best positioned to fulfil their organisations' strategic potential.
Channel Transactions
From a holistic perspective, the total inbound and outbound transactions that involve a human voice agent account for
slightly over 50% of the total volumes. In comparison with the first Benchmarking report 10 years ago, human voice
transactions represented well over 90%. This clearly shows the progress that has been made with the establishment and
acceptance of non‐voice channels. The more traditional channels, such as fax and physical correspondence, show a big
drop. This is understandable as organisations seek to minimise their paper‐based environments or reliance on the written

75
National Police Contact Management Benchmarking Report 2008
word and move towards electronic images and voice. However, given the existing legislative or legal requirements, the
need to exchange physical documentation will remain for certain transactions.
The findings also indicate the significant growth in SMS text communications. This is especially the case in an outbound
capacity. SMS has given organisations the chance to send progress updates, completion confirmations or reminders to their
customers in an efficient, fast, automated and low cost way. This year’s findings also show that self service has become a
firmly established, accepted and used channel by customers. Web and IVR‐related self service now accounts for nearly one
third of all inbound transactions. That level of acceptance or use has yet to extend to speech recognition‐based self service.
Inbound call statistics overview
The overall figure for inbound call volumes given by recipients globally shows an increase of over 20% on 2005 levels. The
findings also show that nearly a quarter of calls select an IVR self‐service option to handle their transactions. Given that
approximately 75% of those self‐service calls are then completed (as opposed to resolved), it clearly shows the level of
acceptance within the market as well as the value provided for both organisation and customer.
Average speed to answer
Across the board though, in 2007, both talk and wrap‐up times rose by about a third (34.8% and 32.2% respectively on last
year’s numbers). This is partly due to the increased adoption of voice self Service and outsourcing in the past 12 months,
both of which take out the easy calls. Another major contributor is staff churn, where many agents never reach a
reasonable competency level before leaving.
2007 saw the most movement in financial services with 20 seconds shorter call duration (compared to 2006), but this was
counterbalanced by agents spending on average 33 seconds longer in wrap‐up. This shows a recognition of customer
service, by letting the customer go while the agent completes the transaction, but also shows that systems supporting
agents don’t allow the completion of the transaction in a timely manner. The banks and insurers in this sector have
invested heavily in large‐scale CRM and (Enterprise Resource Planning) ERP programmes which can at times block
productivity, as simple changes to these systems take too long to introduce and an array of manual workarounds are too
often necessary. This phenomenon is also evident in the government, education and health sector where talk time is stable
(<1% variation on 2006) but wrap increased by just over a minute.
Average call duration and wrap up time
This year’s findings show the average call duration is still growing, which has been the general trend over the past 10 years.
Since 2004 the level of growth has slowed, with duration across each region stabilising between the four and five minute
mark. There are a number of reasons for the increased call duration. These include:
• Growing complexity of transactions
With many of the more simple enquiries being migrated to self‐service channels, enquiries being handled by human
agents are more complex.
• Call resolution focus
Many contact centres are willing to allow their average call duration to increase in order to improve the overall
resolution rates.
• Increasing agent attrition
With agent attrition rising, the continuous influx of new and inexperienced agents will impact the call duration, taking
longer to complete calls than a more experienced agent would need.
• Multiple transactions per call
The number of calls that involve multiple transactions are increasing, which will impact the length of call duration.
76
National Police Contact Management Benchmarking Report 2008
Resolution rates
Various terms are used to describe enquiry resolution including resolution at point of contact and First Contact Resolution.
From our perspective, an accurate definition of a resolved call is as follows:
“A customer enquiry or transaction that is resolved or completed to the customer’s satisfaction by the initial agent or
another resource that the call has been escalated to and no further manual action is required to be taken by the agent or
any other resource within the organisation after the call has been completed, other than initiating an automated process or
standard post call administration.”
The post call activity is a particularly sensitive point. A number of contact centres include calls where further activity is
required, post call, within their volumes of resolved calls. The rationale for this is yet another interpretation of what
constitutes a resolved call, by defining the metric as 'calls where no further action is needed by the customer'. While this
may be valid, there is a risk that the value of measuring this metric is severely diluted. By using the definition that we have
outlined, a manager is clear on the level of completed calls that don't need further capacity to complete them. Whereas, if
contact centres define resolution based on customer actions, a manager will be unclear about the level of effort and
capacity used in completing these 'resolved calls'.
It's also important to discern between 'first call' and 'first contact' resolution. We define First Contact Resolution as any
enquiry that has been satisfied during the call, regardless of any transfers that may have been required, as long as the
original call has not been interrupted in any way. First Contact Resolution is defined as those enquiries that were resolved
by the initial agent without any need to transfer to, or involve, an additional resource.
This year’s findings show that the overall First Contact Resolution rate is 81%. The split between first contact and First
Contact Resolution is clearly in favour of first contact. Overall, 74% of all calls are resolved by the first agent that a customer
is connected to. This equates to over 90% of the total number of resolved calls. Therefore, only 9% of the total resolved
calls require escalation or involvement of another resource.
The remaining 19% of all inbound calls received are not resolved during the initial call. The resolution rate for this year has
remained fairly constant against the previous four years. However, to assume that progress has not been made may be
misleading. It's important to consider that, although the resolution has remained the same, the complexity of enquiry has
increased. Given that more basic transactions are being handled through self service, the enquiries that human agents are
faced with are more complex. Therefore, the maintenance of the resolution rate may actually signify genuine progress
being made by contact centres.
Those calls that remain unresolved during the initial call show over 50% are completed satisfactorily within the contact
centre. Therefore, less than 10% of all enquiries are escalated to business areas outside the contact centres for resolution.
Compared to the levels of 10 years ago, when nearly 30% were escalated, it clearly demonstrates the progress that has
been made to optimise the front line value. In total, less than 1% of all enquiries remain unresolved once the standard
business escalation process has been followed. These enquiries are subsequently handled by specialist business areas
within the respective organisations.
Capacity utilisation
Capacity utilisation is another major area of measurement that varies widely in definition and method. From our
perspective, the value in quantifying the utilisation includes:
• To benchmark the current level of agent productivity.
• To ascertain the agent call handling capacity in order to plan / schedule effectively.
• To ascertain the percentage of wasted / unaccountable time per agent.
• To identify any areas that may require attention / efficiency improvements.
77
National Police Contact Management Benchmarking Report 2008
• To understand the impact / costs of multi‐skilling / different mediums with regards to utilisation.
We have experienced a number of challenges in presenting an accurate benchmark of capacity utilisation. The key
influences on collating accurate data include:
• Ability for centres to accurately measure capacity utilised on each specific activity.
• Level of assumptions made by contact centres instead of quantifiable measurements.
• Influence of performance targets related to utilisation on the method of calculation.
Despite these challenges, we believe that the overall findings do reflect an accurate picture of the current situation. The
utilisation rate for inbound agents reflects the highly productive level of 84% in the first place. 56% of agents’ time is
actually used in speaking to customers with an additional 11% spent on post call wrap up activities. This certainly equates to
a productive level of utilisation being achieved. Any rate between 70 – 85% utilisation is optimal – below this level, the
agents are not as productive as they should be. Above this level and the agents are at risk of burnout.
The findings show that the overall utilisation reduces as additional channels are introduced. This is of interest as many
contact centres introduce multi‐skilling with the assumption that productivity and utilisation will increase. Whilst this may
be true, the findings show that this may be more difficult to achieve than originally thought.
Strategic and operational MIS
We started this chapter with a discussion of the alignment between strategic business objectives and performance metrics.
We raised the concern that there was a gulf between these two areas and their measurement in the contact centre
environment. We also suggested that those contact centres that truly committed themselves to accurate, comprehensive
and valuable performance measurement would differentiate themselves in the industry.
The findings from this year, relating to the deployment of both operational and strategic MIS / KPIs, only serve to reinforce
our views. Despite nearly three quarters of contact centres stating their own objectives and targets were aligned to the
overall strategic objectives of their organisations, the findings present a different picture.
In terms of KPIs that are relied upon at a strategic level, the results show limited progress being made and over‐
dependence on the usual suspects.
The most widely used KPIs on a strategic basis remain customer satisfaction and complaints at 87% and 80.3% respectively.
Though both metrics are essential, they can be viewed as indicators that impact key business outcomes such as retention,
customer profitability or lapsed customer rates. Again, the predominance of the complaint and satisfaction KPIs strongly
indicate that targeting and monitoring within contact centres, and the subsequent reporting to senior management, has
not kept pace with overall contact centre development.
We have already stressed the importance of using performance metrics in an integrated and holistic manner. This would
allow contact centre management to effectively manage and improve their operation from a customer value and
organisational benefit perspective. It is essential that managers understand the impact that one performance lever has on
other aspects of their operation.
A drop in performance levels for one lever, taken in isolation, may be considered as deterioration but may actually yield
benefit for a key strategic outcome. These dependencies, influences and interrelationships between operational and
strategic performance indicators and levers need to be explored and understood. This year’s findings show that contact
centres are still relying on the standard efficiency metrics as opposed to the more advanced customer oriented KPIs.
An advanced MIS capability is an essential requirement as opposed to a preferred ability. Without this capability in place,
contact centres will continue to be viewed as strategic enablers whilst still being judged through operational targets.
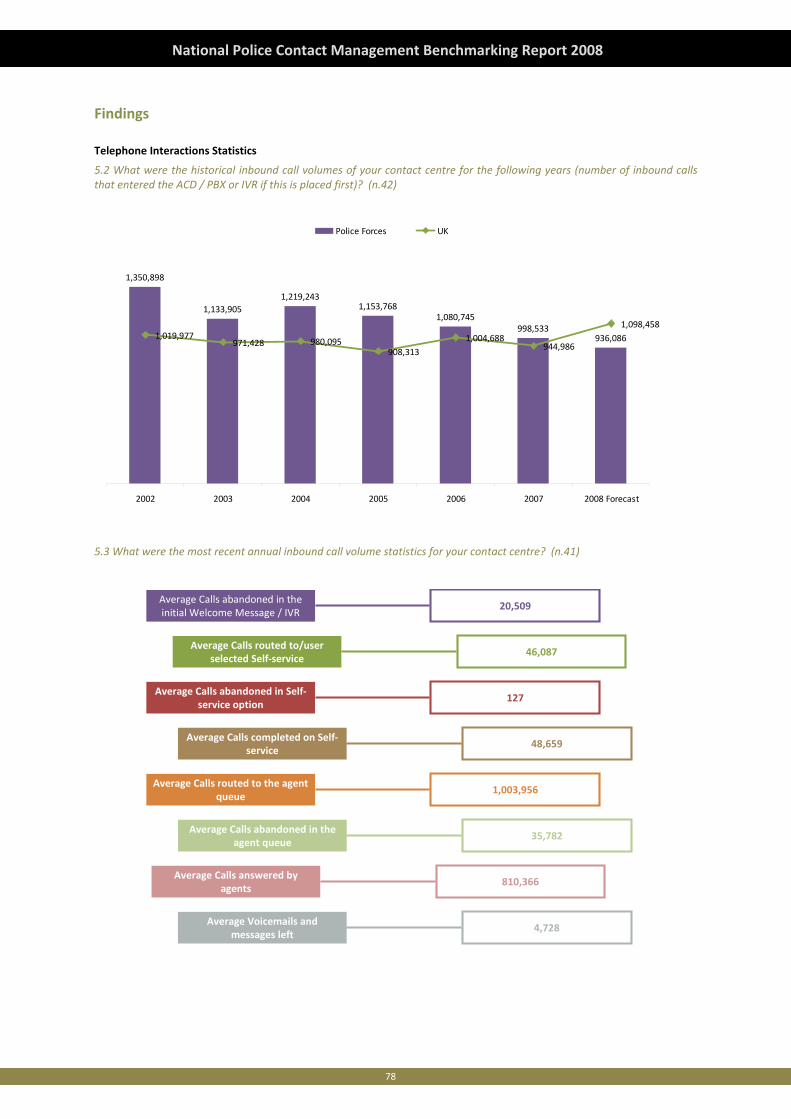
78
National Police Contact Management Benchmarking Report 2008
Findings
Telephone Interactions Statistics
5.2 What were the historical inbound call volumes of your contact centre for the following years (number of inbound calls that entered the ACD / PBX or IVR if this is placed first)? (n.42)
1,350,898
1,133,9051,219,243
1,153,7681,080,745
998,533936,0861,019,977
971,428 980,095908,313
1,004,688944,986
1,098,458
2002 2003 2004 2005 2006 2007 2008 Forecast
Police Forces UK
5.3 What were the most recent annual inbound call volume statistics for your contact centre? (n.41)
Average Calls abandoned in the initial Welcome Message / IVR
Average Calls routed to/user selected Self‐service
Average Calls abandoned in Self‐service option
Average Calls completed on Self‐service
Average Calls routed to the agent queue
Average Calls abandoned in the agent queue
Average Calls answered by agents
Average Voicemails and messages left
20,509
46,087
127
48,659
1,003,956
35,782
810,366
4,728
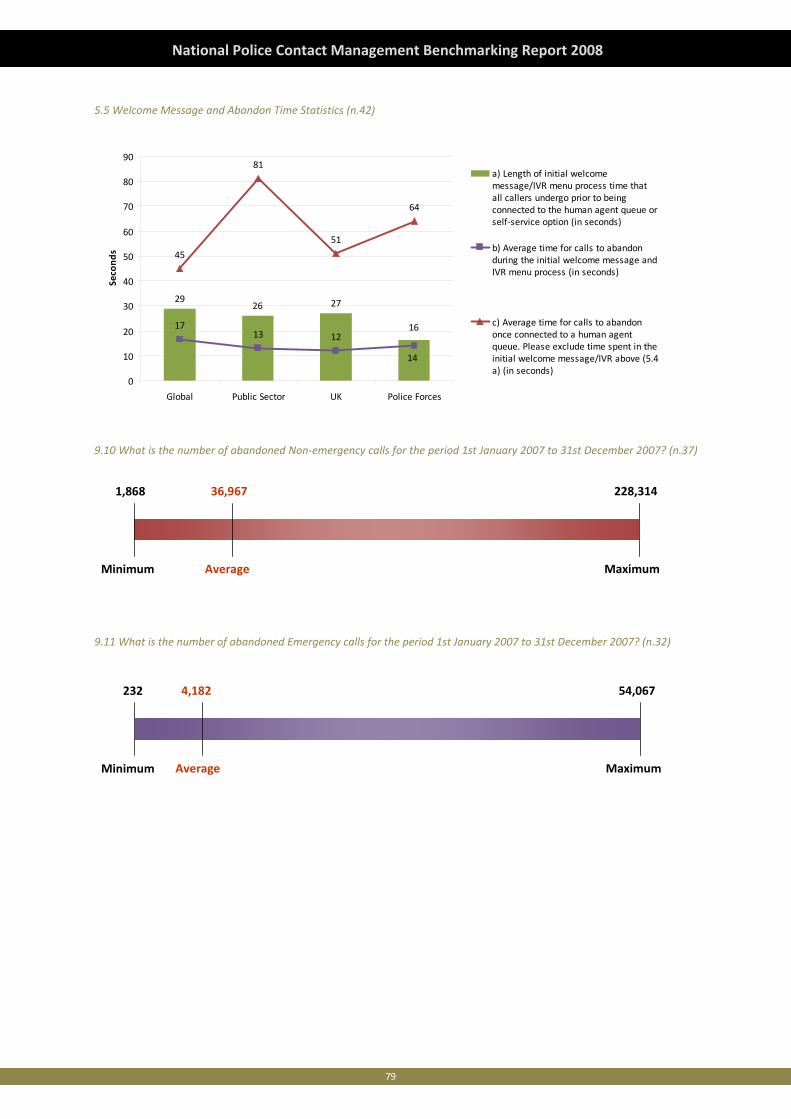
79
National Police Contact Management Benchmarking Report 2008
5.5 Welcome Message and Abandon Time Statistics (n.42)
2926 27
161713 12
45
81
51
64
14
0
10
20
30
40
50
60
70
80
90
Global Public Sector UK Police Forces
Second
s
a) Length of initial welcomemessage/IVR menu process time thatall callers undergo prior to beingconnected to the human agent queue orself‐service option (in seconds)
b) Average time for calls to abandonduring the initial welcome message andIVR menu process (in seconds)
c) Average time for calls to abandononce connected to a human agentqueue. Please exclude time spent in theinitial welcome message/IVR above (5.4a) (in seconds)
9.10 What is the number of abandoned Non‐emergency calls for the period 1st January 2007 to 31st December 2007? (n.37)
Minimum MaximumAverage
1,868 228,31436,967
9.11 What is the number of abandoned Emergency calls for the period 1st January 2007 to 31st December 2007? (n.32)
Minimum MaximumAverage
232 54,0674,182
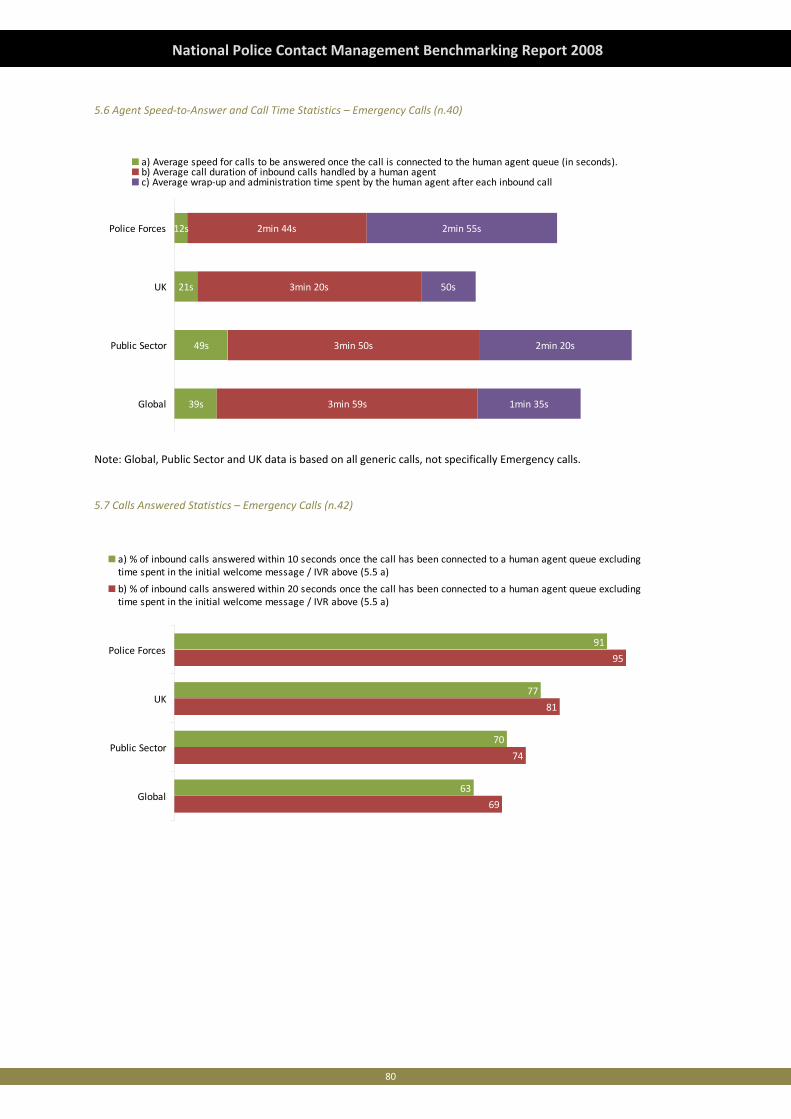
80
National Police Contact Management Benchmarking Report 2008
5.6 Agent Speed‐to‐Answer and Call Time Statistics – Emergency Calls (n.40)
12s
21s
49s
39s
2min 44s
3min 20s
3min 50s
3min 59s 1min 35s
2min 20s
50s
2min 55s
Global
Public Sector
UK
Police Forces
a) Average speed for calls to be answered once the call is connected to the human agent queue (in seconds).b) Average call duration of inbound calls handled by a human agent c) Average wrap‐up and administration time spent by the human agent after each inbound call
Note: Global, Public Sector and UK data is based on all generic calls, not specifically Emergency calls.
5.7 Calls Answered Statistics – Emergency Calls (n.42)
69
74
81
95
63
70
77
91
Global
Public Sector
UK
Police Forces
a) % of inbound calls answered within 10 seconds once the call has been connected to a human agent queue excludingtime spent in the initial welcome message / IVR above (5.5 a)
b) % of inbound calls answered within 20 seconds once the call has been connected to a human agent queue excludingtime spent in the initial welcome message / IVR above (5.5 a)
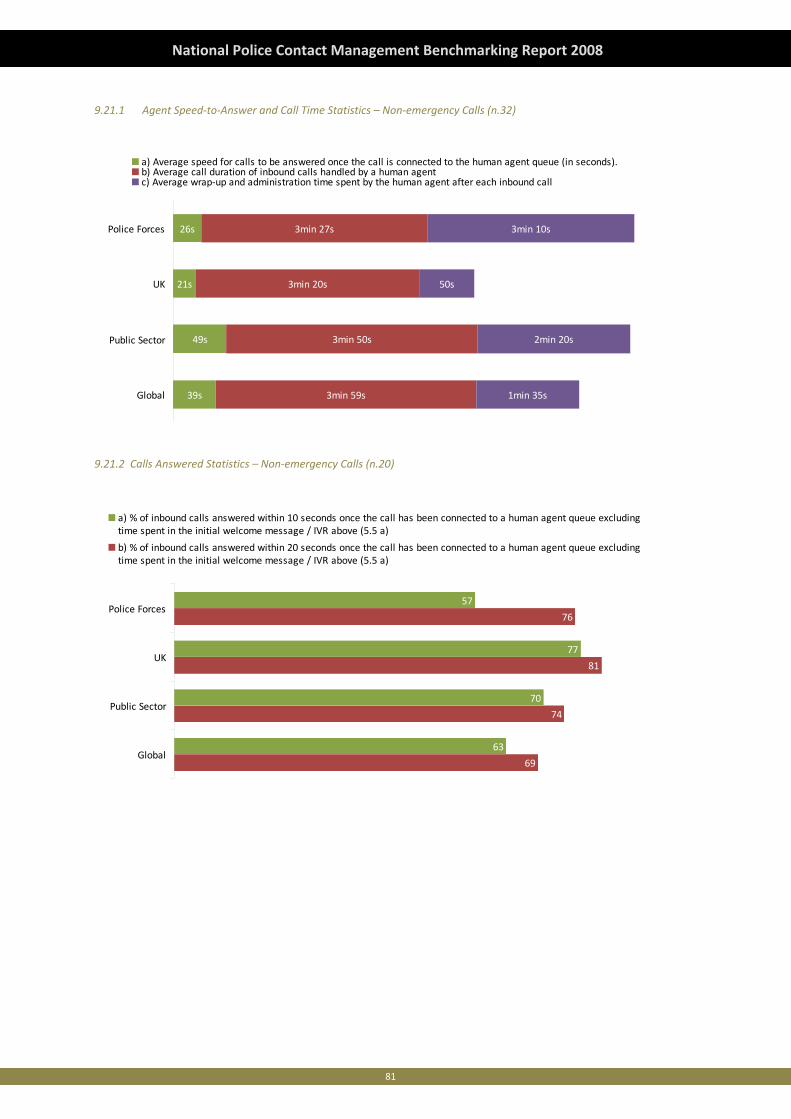
81
National Police Contact Management Benchmarking Report 2008
9.21.1 Agent Speed‐to‐Answer and Call Time Statistics – Non‐emergency Calls (n.32)
26s
21s
49s
39s
3min 27s
3min 20s
3min 50s
3min 59s 1min 35s
2min 20s
50s
3min 10s
Global
Public Sector
UK
Police Forces
a) Average speed for calls to be answered once the call is connected to the human agent queue (in seconds).b) Average call duration of inbound calls handled by a human agent c) Average wrap‐up and administration time spent by the human agent after each inbound call
9.21.2 Calls Answered Statistics – Non‐emergency Calls (n.20)
69
74
81
76
63
70
77
57
Global
Public Sector
UK
Police Forces
a) % of inbound calls answered within 10 seconds once the call has been connected to a human agent queue excludingtime spent in the initial welcome message / IVR above (5.5 a)
b) % of inbound calls answered within 20 seconds once the call has been connected to a human agent queue excludingtime spent in the initial welcome message / IVR above (5.5 a)
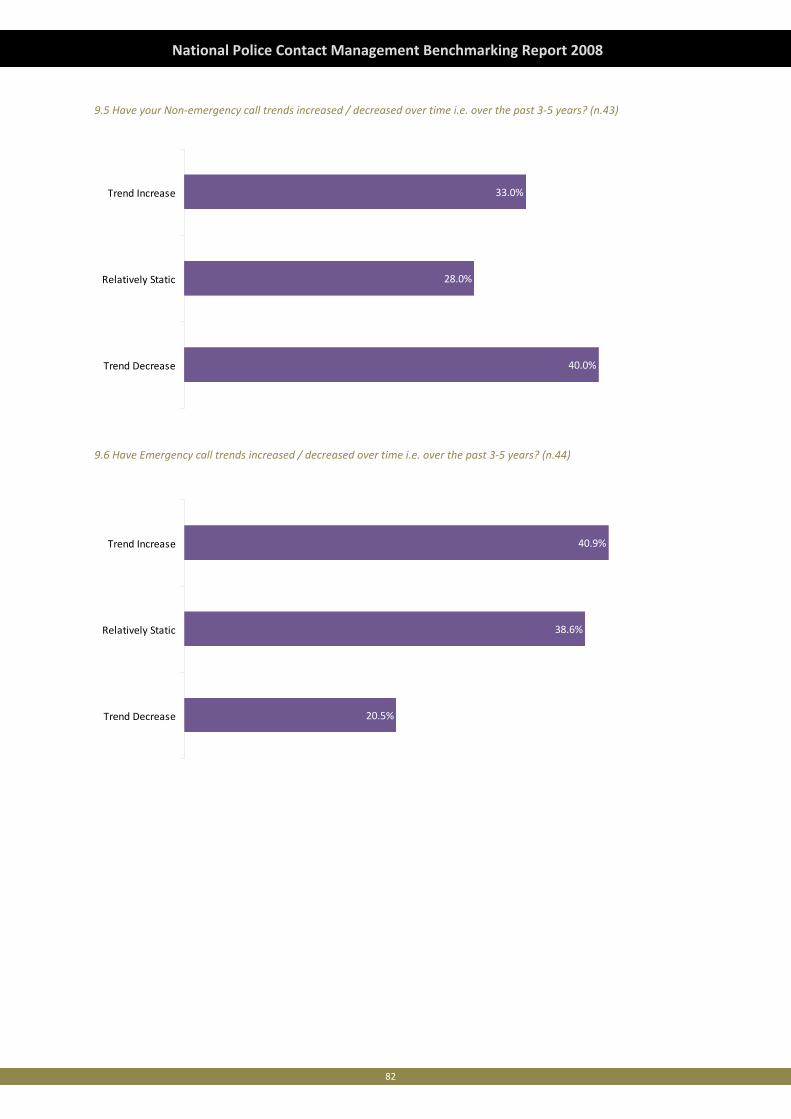
82
National Police Contact Management Benchmarking Report 2008
9.5 Have your Non‐emergency call trends increased / decreased over time i.e. over the past 3‐5 years? (n.43)
33.0%
28.0%
40.0%
Trend Increase
Relatively Static
Trend Decrease
9.6 Have Emergency call trends increased / decreased over time i.e. over the past 3‐5 years? (n.44)
40.9%
38.6%
20.5%
Trend Increase
Relatively Static
Trend Decrease
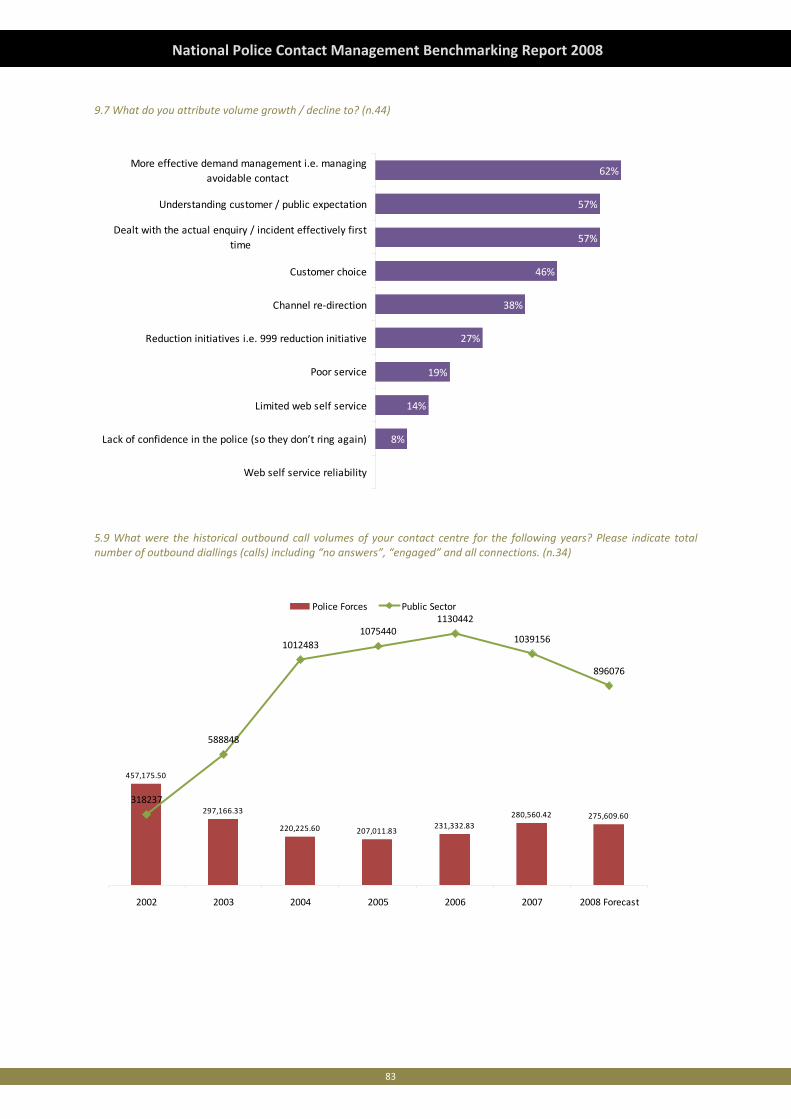
83
National Police Contact Management Benchmarking Report 2008
9.7 What do you attribute volume growth / decline to? (n.44)
0%
8%
14%
19%
27%
38%
46%
57%
57%
62%
Web self service reliability
Lack of confidence in the police (so they don’t ring again)
Limited web self service
Poor service
Reduction initiatives i.e. 999 reduction initiative
Channel re‐direction
Customer choice
Dealt with the actual enquiry / incident effectively firsttime
Understanding customer / public expectation
More effective demand management i.e. managingavoidable contact
5.9 What were the historical outbound call volumes of your contact centre for the following years? Please indicate total number of outbound diallings (calls) including “no answers”, “engaged” and all connections. (n.34)
457,175.50
297,166.33
220,225.60 207,011.83231,332.83
280,560.42 275,609.60
318237
588848
10754401130442
1039156
896076
1012483
2002 2003 2004 2005 2006 2007 2008 Forecast
Police Forces Public Sector
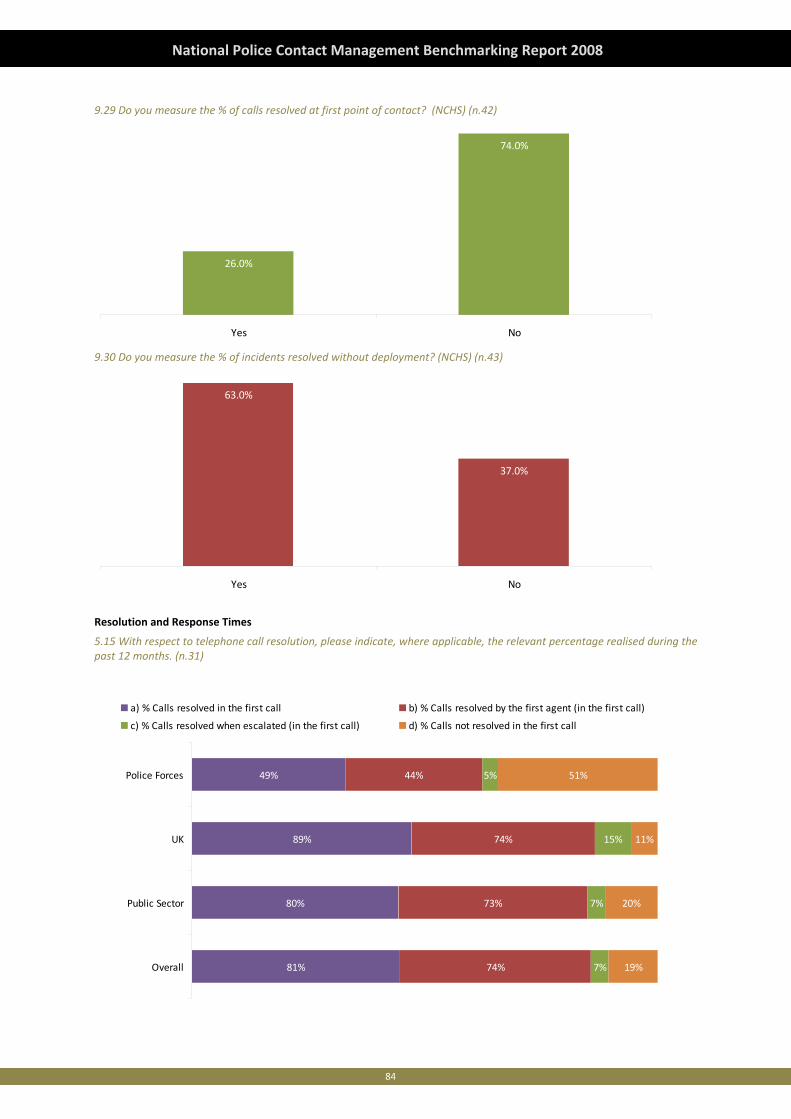
84
National Police Contact Management Benchmarking Report 2008
9.29 Do you measure the % of calls resolved at first point of contact? (NCHS) (n.42)
26.0%
74.0%
Yes No
9.30 Do you measure the % of incidents resolved without deployment? (NCHS) (n.43)
63.0%
37.0%
Yes No
Resolution and Response Times
5.15 With respect to telephone call resolution, please indicate, where applicable, the relevant percentage realised during the past 12 months. (n.31)
81%
80%
89%
49%
74%
73%
74%
44%
7%
7%
15%
5%
19%
20%
11%
51%
Overall
Public Sector
UK
Police Forces
a) % Calls resolved in the first call b) % Calls resolved by the first agent (in the first call)
c) % Calls resolved when escalated (in the first call) d) % Calls not resolved in the first call
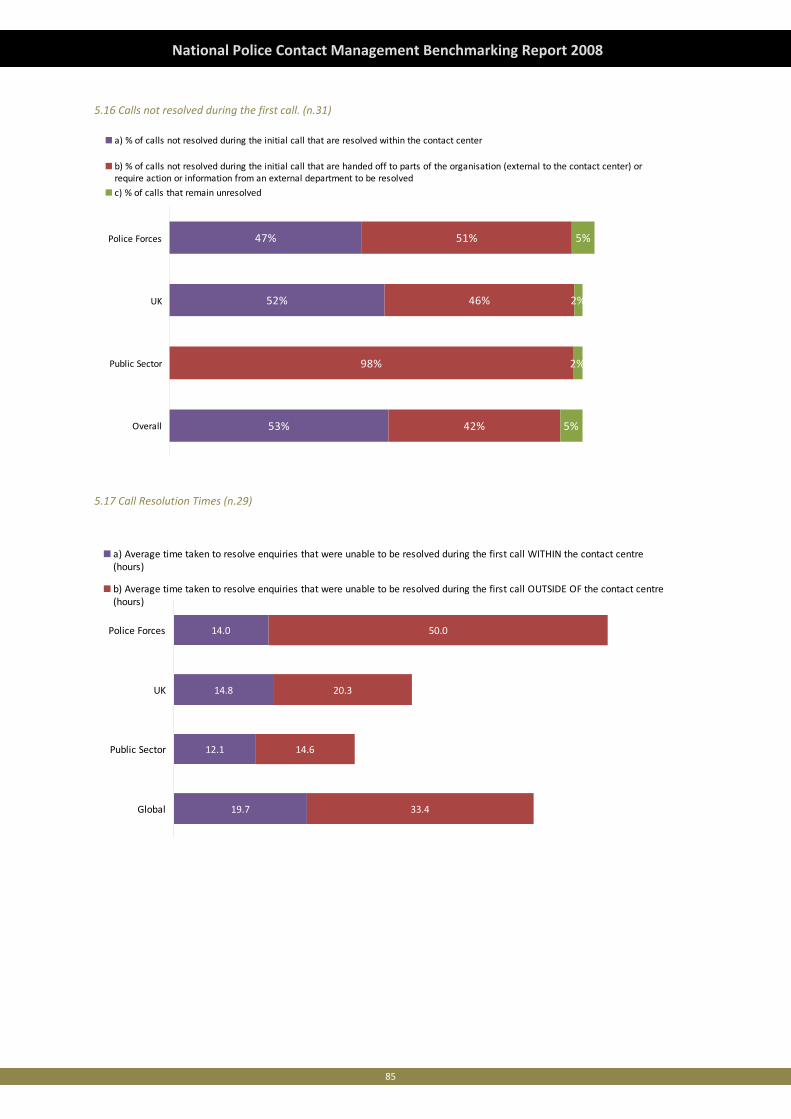
85
National Police Contact Management Benchmarking Report 2008
5.16 Calls not resolved during the first call. (n.31)
53%
52%
47%
42%
98%
46%
51%
5%
2%
2%
5%
Overall
Public Sector
UK
Police Forces
a) % of calls not resolved during the initial call that are resolved within the contact center
b) % of calls not resolved during the initial call that are handed off to parts of the organisation (external to the contact center) orrequire action or information from an external department to be resolved
c) % of calls that remain unresolved
5.17 Call Resolution Times (n.29)
19.7
12.1
14.8
14.0
33.4
14.6
20.3
50.0
Global
Public Sector
UK
Police Forces
a) Average time taken to resolve enquiries that were unable to be resolved during the first call WITHIN the contact centre(hours)
b) Average time taken to resolve enquiries that were unable to be resolved during the first call OUTSIDE OF the contact centre(hours)
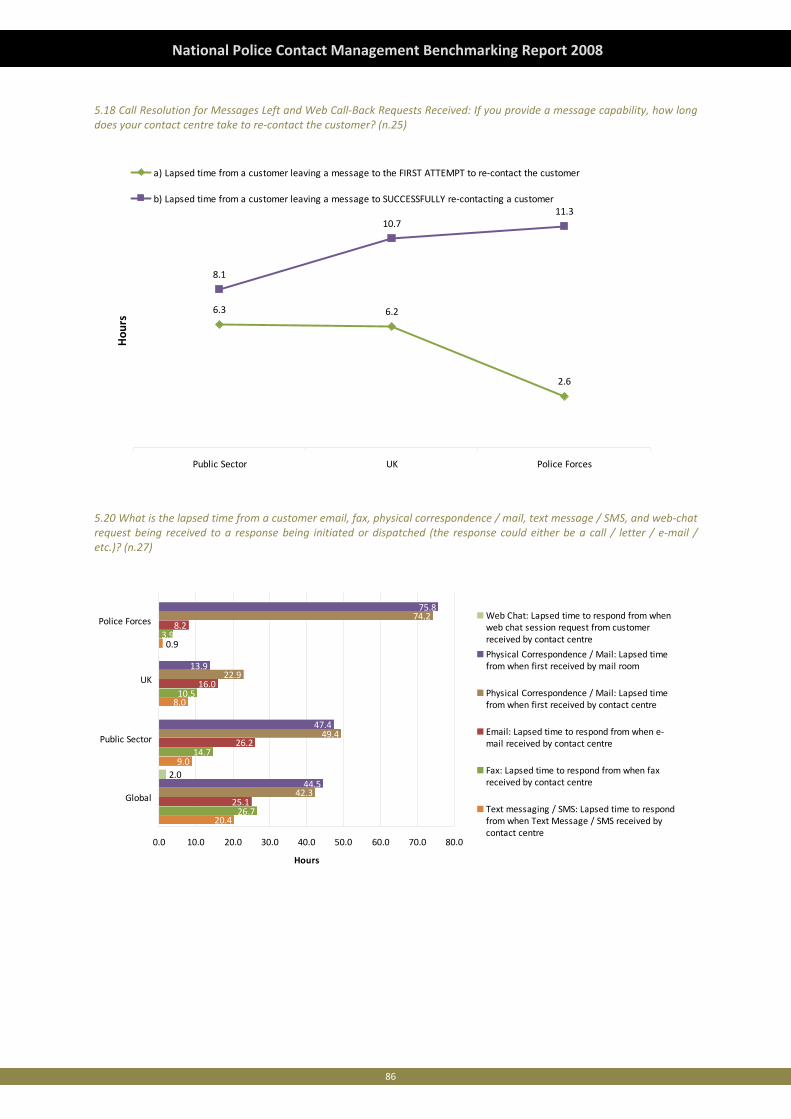
86
National Police Contact Management Benchmarking Report 2008
5.18 Call Resolution for Messages Left and Web Call‐Back Requests Received: If you provide a message capability, how long does your contact centre take to re‐contact the customer? (n.25)
6.3 6.2
2.6
8.1
10.711.3
Public Sector UK Police Forces
Hou
rs
a) Lapsed time from a customer leaving a message to the FIRST ATTEMPT to re‐contact the customer
b) Lapsed time from a customer leaving a message to SUCCESSFULLY re‐contacting a customer
5.20 What is the lapsed time from a customer email, fax, physical correspondence / mail, text message / SMS, and web‐chat request being received to a response being initiated or dispatched (the response could either be a call / letter / e‐mail / etc.)? (n.27)
20.4
9.0
8.0
26.7
14.7
10.5
3.9
25.1
26.2
16.0
8.2
42.3
49.4
22.9
74.2
44.5
47.4
13.9
75.8
2.0
0.9
0.0 10.0 20.0 30.0 40.0 50.0 60.0 70.0 80.0
Global
Public Sector
UK
Police Forces
Hours
Web Chat: Lapsed time to respond from whenweb chat session request from customerreceived by contact centre
Physical Correspondence / Mail: Lapsed timefrom when first received by mail room
Physical Correspondence / Mail: Lapsed timefrom when first received by contact centre
Email: Lapsed time to respond from when e‐mail received by contact centre
Fax: Lapsed time to respond from when faxreceived by contact centre
Text messaging / SMS: Lapsed time to respondfrom when Text Message / SMS received bycontact centre
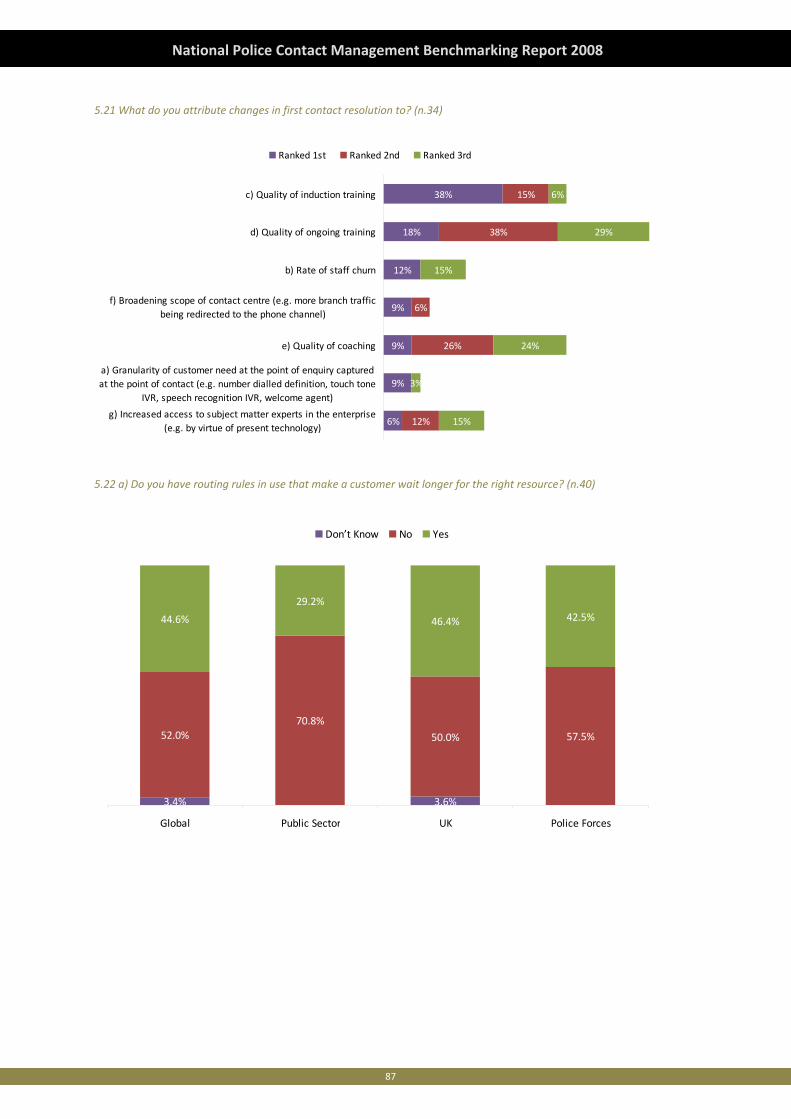
87
National Police Contact Management Benchmarking Report 2008
5.21 What do you attribute changes in first contact resolution to? (n.34)
6%
9%
9%
9%
12%
18%
38%
12%
26%
6%
38%
15%
15%
3%
24%
15%
29%
6%
g) Increased access to subject matter experts in the enterprise(e.g. by virtue of present technology)
a) Granularity of customer need at the point of enquiry capturedat the point of contact (e.g. number dialled definition, touch tone
IVR, speech recognition IVR, welcome agent)
e) Quality of coaching
f) Broadening scope of contact centre (e.g. more branch trafficbeing redirected to the phone channel)
b) Rate of staff churn
d) Quality of ongoing training
c) Quality of induction training
Ranked 1st Ranked 2nd Ranked 3rd
5.22 a) Do you have routing rules in use that make a customer wait longer for the right resource? (n.40)
3.4% 3.6%
52.0%70.8%
50.0% 57.5%
44.6%
29.2%
46.4% 42.5%
Global Public Sector UK Police Forces
Don’t Know No Yes
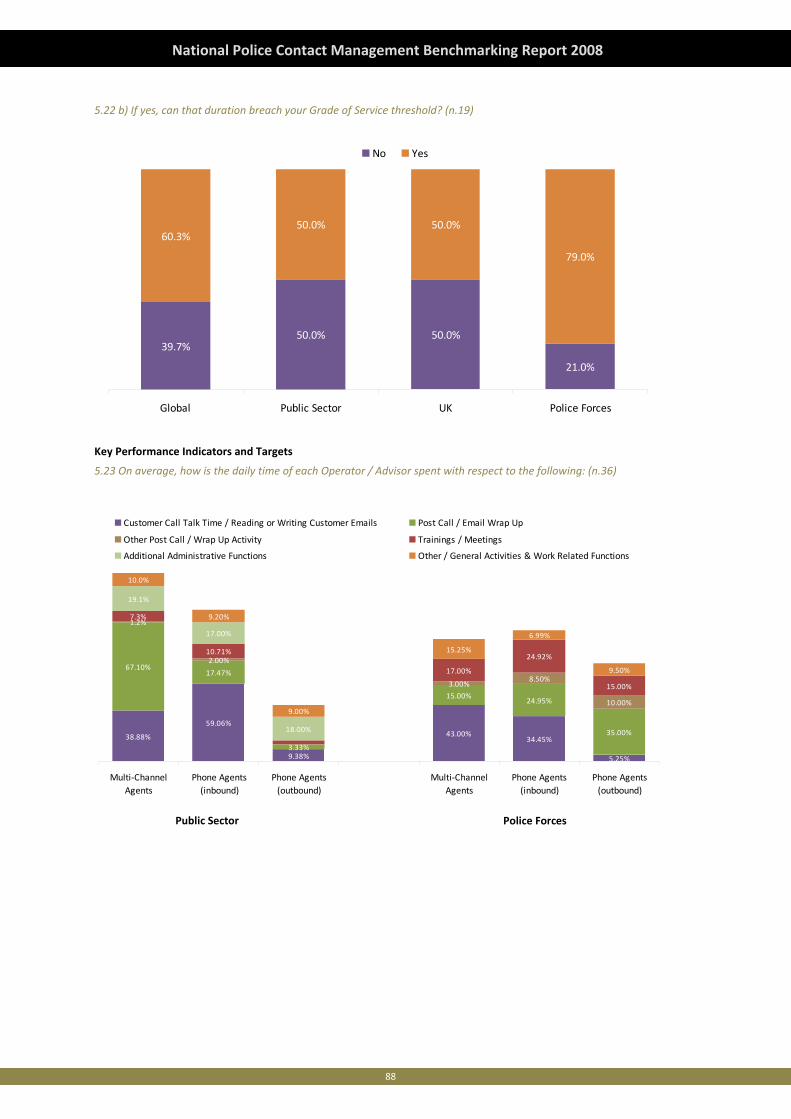
88
National Police Contact Management Benchmarking Report 2008
5.22 b) If yes, can that duration breach your Grade of Service threshold? (n.19)
39.7%50.0% 50.0%
21.0%
60.3%50.0% 50.0%
79.0%
Global Public Sector UK Police Forces
No Yes
Key Performance Indicators and Targets
5.23 On average, how is the daily time of each Operator / Advisor spent with respect to the following: (n.36)
38.88%
59.06%
9.38%
43.00%34.45%
5.25%
67.10%17.47%
3.33%
15.00%24.95%
35.00%
1.2%
2.00%
3.00%8.50%
10.00%
7.3%
10.71%
17.00%
24.92%
15.00%
19.1%
17.00%
18.00%
10.0%
9.20%
9.00%
15.25%
6.99%
9.50%
Multi‐ChannelAgents
Phone Agents(inbound)
Phone Agents(outbound)
Multi‐ChannelAgents
Phone Agents(inbound)
Phone Agents(outbound)
Customer Call Talk Time / Reading or Writing Customer Emails Post Call / Email Wrap Up
Other Post Call / Wrap Up Activity Trainings / Meetings
Additional Administrative Functions Other / General Activities & Work Related Functions
Public Sector Police Forces
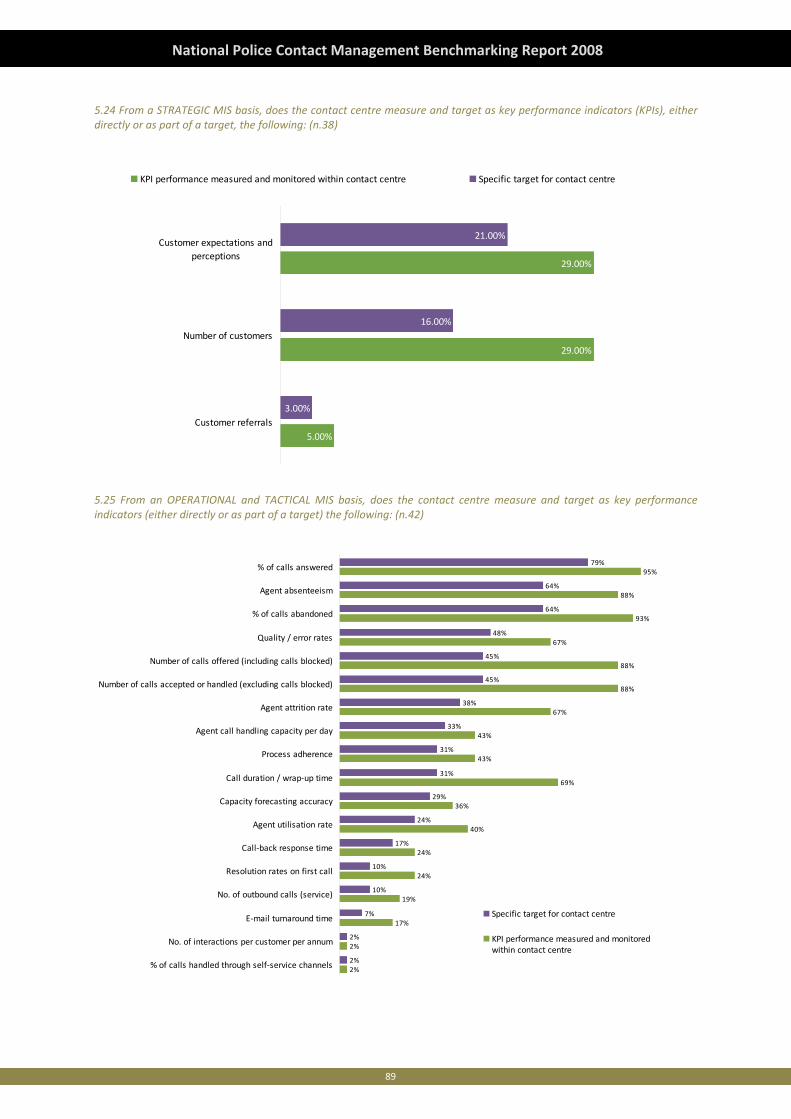
89
National Police Contact Management Benchmarking Report 2008
5.24 From a STRATEGIC MIS basis, does the contact centre measure and target as key performance indicators (KPIs), either directly or as part of a target, the following: (n.38)
5.00%
29.00%
29.00%
3.00%
16.00%
21.00%
Customer referrals
Number of customers
Customer expectations andperceptions
KPI performance measured and monitored within contact centre Specific target for contact centre
5.25 From an OPERATIONAL and TACTICAL MIS basis, does the contact centre measure and target as key performance indicators (either directly or as part of a target) the following: (n.42)
2%
2%
17%
19%
24%
24%
40%
36%
69%
43%
43%
67%
88%
88%
67%
93%
88%
95%
2%
2%
7%
10%
10%
17%
24%
29%
31%
31%
33%
38%
45%
45%
48%
64%
64%
79%
% of calls handled through self‐service channels
No. of interactions per customer per annum
E‐mail turnaround time
No. of outbound calls (service)
Resolution rates on first call
Call‐back response time
Agent utilisation rate
Capacity forecasting accuracy
Call duration / wrap‐up time
Process adherence
Agent call handling capacity per day
Agent attrition rate
Number of calls accepted or handled (excluding calls blocked)
Number of calls offered (including calls blocked)
Quality / error rates
% of calls abandoned
Agent absenteeism
% of calls answered
Specific target for contact centre
KPI performance measured and monitoredwithin contact centre
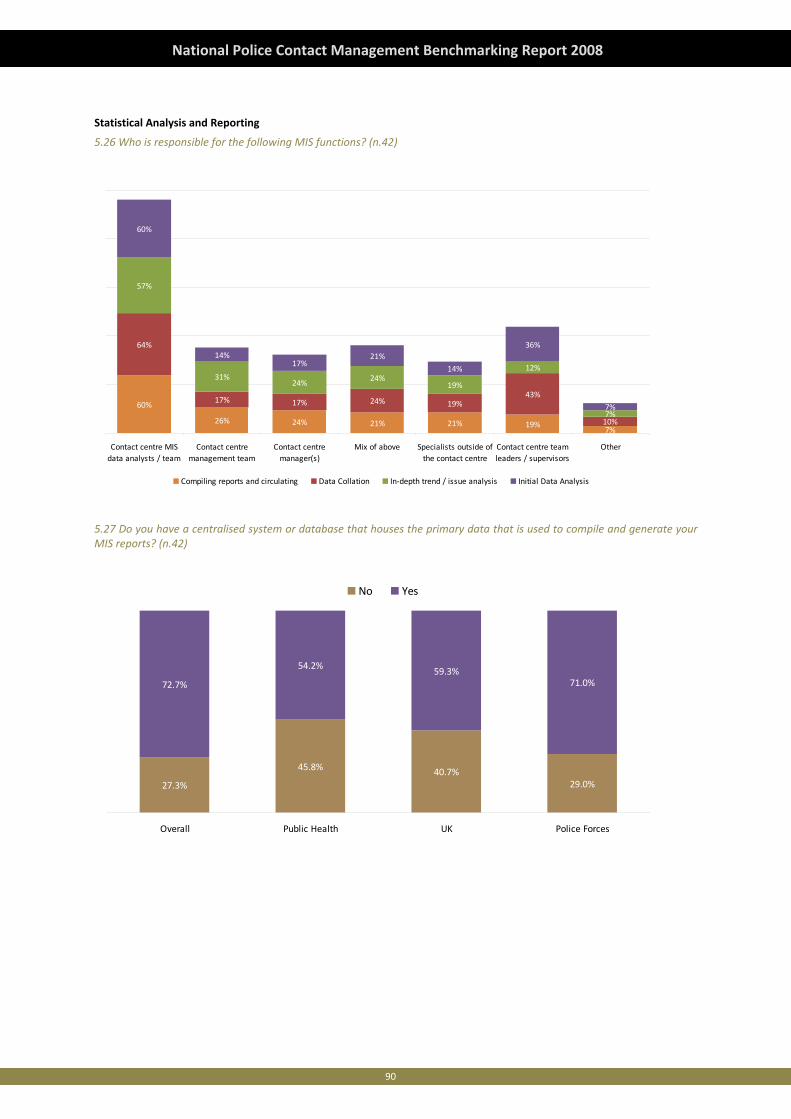
90
National Police Contact Management Benchmarking Report 2008
Statistical Analysis and Reporting
5.26 Who is responsible for the following MIS functions? (n.42)
60%
26% 24% 21% 21% 19%7%
64%
17% 17% 24% 19%43%
10%
57%
31%24% 24%
19%
12%
7%
60%
14%17%
21%
14%
36%
7%
Contact centre MISdata analysts / team
Contact centremanagement team
Contact centremanager(s)
Mix of above Specialists outside ofthe contact centre
Contact centre teamleaders / supervisors
Other
Compiling reports and circulating Data Collation In‐depth trend / issue analysis Initial Data Analysis
5.27 Do you have a centralised system or database that houses the primary data that is used to compile and generate your MIS reports? (n.42)
27.3%
45.8% 40.7%29.0%
72.7%
54.2% 59.3%71.0%
Overall Public Health UK Police Forces
No Yes
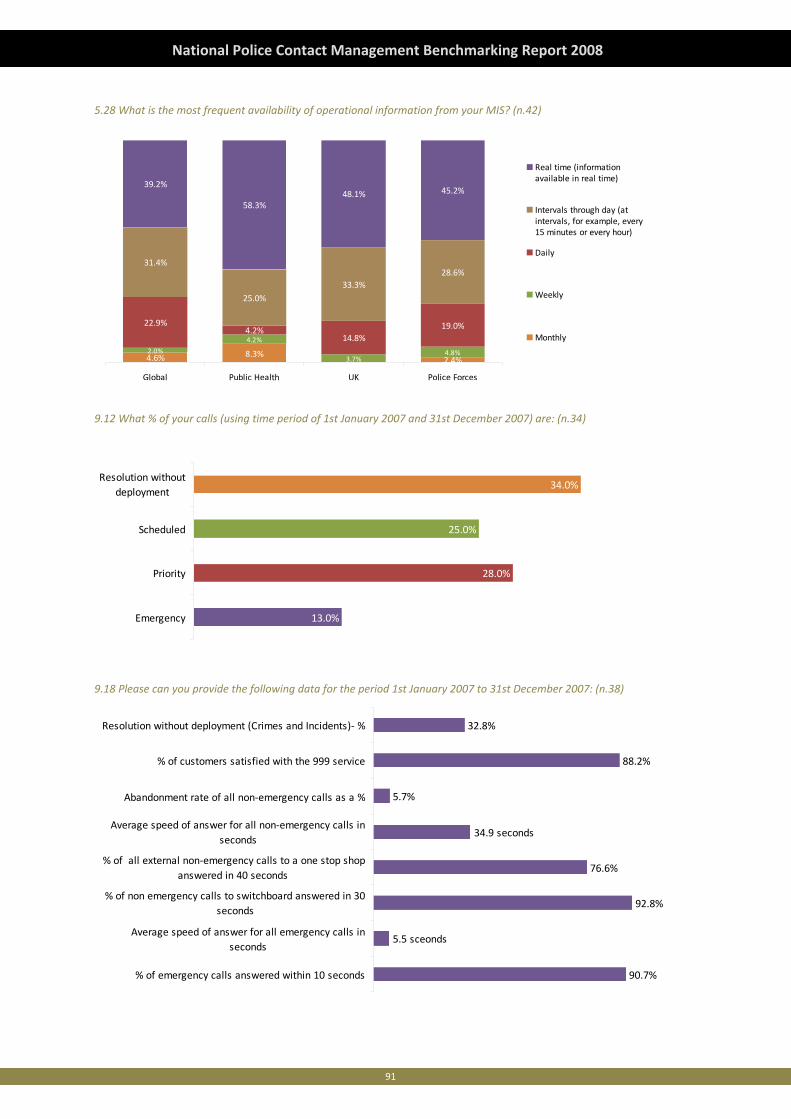
91
National Police Contact Management Benchmarking Report 2008
5.28 What is the most frequent availability of operational information from your MIS? (n.42)
4.6% 8.3%2.4%
2.0%
4.2%
3.7%4.8%
22.9%4.2% 19.0%
31.4%
25.0%33.3%
28.6%
39.2%
58.3%48.1% 45.2%
14.8%
Global Public Health UK Police Forces
Real time (informationavailable in real time)
Intervals through day (atintervals, for example, every15 minutes or every hour)
Daily
Weekly
Monthly
9.12 What % of your calls (using time period of 1st January 2007 and 31st December 2007) are: (n.34)
13.0%
28.0%
25.0%
34.0%
Emergency
Priority
Scheduled
Resolution withoutdeployment
9.18 Please can you provide the following data for the period 1st January 2007 to 31st December 2007: (n.38)
90.7%
92.8%
76.6%
5.7%
88.2%
32.8%
34.9 seconds
5.5 sceonds
% of emergency calls answered within 10 seconds
Average speed of answer for all emergency calls inseconds
% of non emergency calls to switchboard answered in 30seconds
% of all external non‐emergency calls to a one stop shopanswered in 40 seconds
Average speed of answer for all non‐emergency calls inseconds
Abandonment rate of all non‐emergency calls as a %
% of customers satisfied with the 999 service
Resolution without deployment (Crimes and Incidents)‐ %
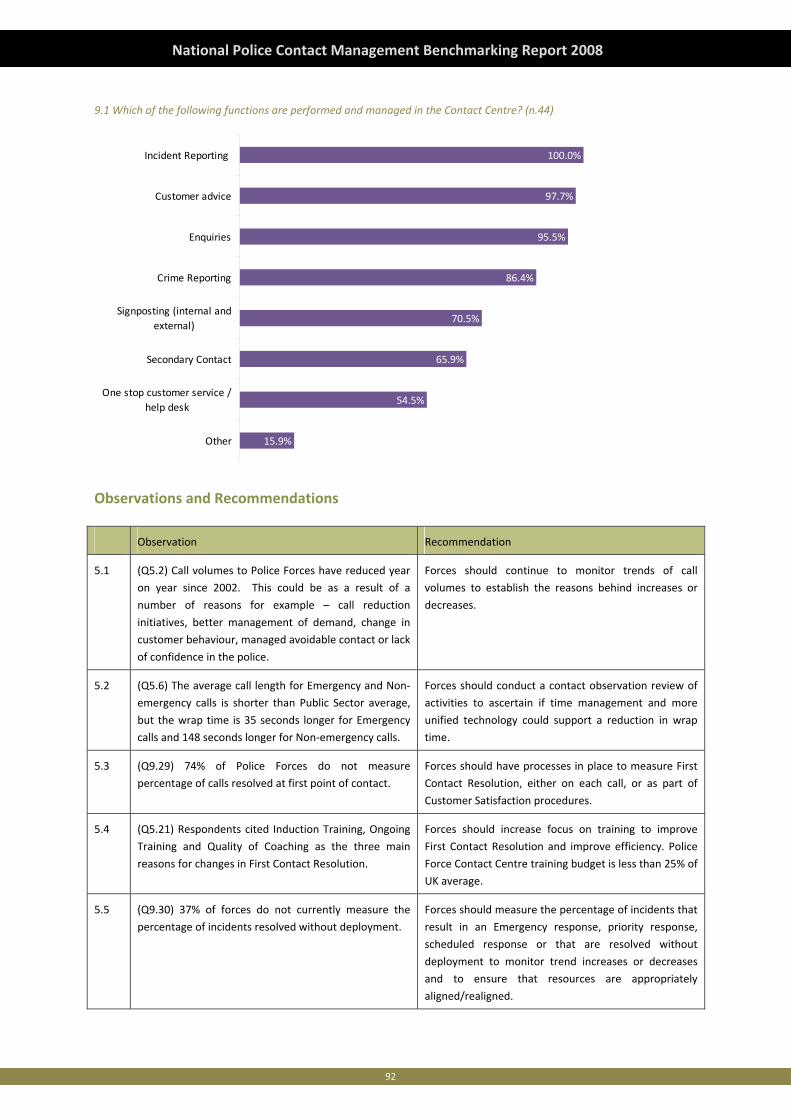
92
National Police Contact Management Benchmarking Report 2008
9.1 Which of the following functions are performed and managed in the Contact Centre? (n.44)
15.9%
54.5%
65.9%
70.5%
86.4%
95.5%
97.7%
100.0%
Other
One stop customer service /help desk
Secondary Contact
Signposting (internal andexternal)
Crime Reporting
Enquiries
Customer advice
Incident Reporting
Observations and Recommendations
Observation Recommendation
5.1 (Q5.2) Call volumes to Police Forces have reduced year
on year since 2002. This could be as a result of a
number of reasons for example – call reduction
initiatives, better management of demand, change in
customer behaviour, managed avoidable contact or lack
of confidence in the police.
Forces should continue to monitor trends of call
volumes to establish the reasons behind increases or
decreases.
5.2 (Q5.6) The average call length for Emergency and Non‐
emergency calls is shorter than Public Sector average,
but the wrap time is 35 seconds longer for Emergency
calls and 148 seconds longer for Non‐emergency calls.
Forces should conduct a contact observation review of
activities to ascertain if time management and more
unified technology could support a reduction in wrap
time.
5.3 (Q9.29) 74% of Police Forces do not measure
percentage of calls resolved at first point of contact.
Forces should have processes in place to measure First
Contact Resolution, either on each call, or as part of
Customer Satisfaction procedures.
5.4 (Q5.21) Respondents cited Induction Training, Ongoing
Training and Quality of Coaching as the three main
reasons for changes in First Contact Resolution.
Forces should increase focus on training to improve
First Contact Resolution and improve efficiency. Police
Force Contact Centre training budget is less than 25% of
UK average.
5.5 (Q9.30) 37% of forces do not currently measure the
percentage of incidents resolved without deployment.
Forces should measure the percentage of incidents that
result in an Emergency response, priority response,
scheduled response or that are resolved without
deployment to monitor trend increases or decreases
and to ensure that resources are appropriately
aligned/realigned.

93
National Police Contact Management Benchmarking Report 2008

94
National Police Contact Management Benchmarking Report 2008
95
National Police Contact Management Benchmarking Report 2008
Chapter 6: Processes and Procedures
Introduction
The following Chapter concentrates on the process element of the contact centre industry which underpins technology and
people to deliver against the organisations needs and that of its customers and stakeholders. Process management is an
essential component in ensuring that the contact centre remains aligned to changing and developing requirements for
managing customer contact.
a. Process Design and Documentation
b. Organisation Process Management
c. Assessment and Quality Management
d. Facilities
e. Premises and Environment
Global Perspective
It’s time to go back to basics
The arrival of contact centres, process automation and integration of the front and back office has meant better efficiency
and lower costs for businesses. But there are some worrying trends. Chief among these is the fact that processes are losing
importance in business. Specifically, “In an industry where technology and people dimensions enjoy unprecedented focus,
many companies are neglecting to maintain or build the capability to manage processes effectively and in so doing are
rapidly losing competitive advantage.”
The contact centre industry is characterised by fast moving technology and the constant launching of new operating
models, best practices and approaches in the management of resources. Although it is easier for organisations to obtain
technology and people initiatives, it is much harder adopt “drop in” processes. Since processes are a key driver of service
excellence, with proper management they can have a huge impact on the return on investment and efficiency in contact
centres. If there is a message for today’s contact centre managers, it's quite simple – ignore process management at your
peril.
Learning the lessons of the past
The biggest trend in the 2007 Benchmarking Report was a clear move towards some level of contact centre automation.
While this still dominates the future plans of many contact centres, this year's survey supports a different view.
The top drivers of automation are cost reduction and service excellence. After all, contact centres have long understood the
need to reduce costs without cutting quality and efficiency. The end goal is clear, as are the benefits. The challenge is to
actively re‐examine process management capabilities and ensure that automating poor processes is avoided. The key issue
coming out of this year's data is the mismatch between the drivers for redesigning processes and the methods chosen.
Process redesign is often ignored as a way of driving success for contact centres, and the number of centres downplaying
process is concerning. Today, centres admit their industry is people‐driven, but the legacy of technology and its
importance from the beginning is a very real issue centres keep ignoring.
Technology is the usual ‘safe’ solution. While process efficiency holds the key to dealing with most of today's contact
centre challenges, it shouldn't be used as the easy option in dealing with changing customer demands. Why are contact
centres so hesitant to embrace a thorough process redesign? Barriers for today's contact centres to process efficiency
redesign include: complexity, surety of benefits, internal conflicts, IT challenges, customer involvement and conflicting
objectives.
96
National Police Contact Management Benchmarking Report 2008
Where is the industry headed?
Despite these challenges, we are predicting a swing towards process management efficiency within the next few years as
contact centres seek to improve efficiency and customer service levels, while keeping costs down. It is clear that while best
practice contact centres seem to have regular process reviews and can claim to have fully documented process inventories,
almost half have developed their contact centre model without any marked process management intervention.
Contact centres are likely to find untapped potential business improvements as they review their process management. It
is worth noting that primary contact centre channels such as voice, email, physical correspondence and IVR have higher
process support and the number of processes is greater.
It is important that contact centres do not confuse enhanced technology with process automation. While newer
technologies like SMS, video, web chat and mobile applications have opened up a range of new contact channels for
customers, they cannot make up for poorly initiated or designed processes. To maximise the benefits, it's vital that they are
underpinned by strong processes.
Process is fundamentally about discipline. For that reason, it poses some unique challenges in an industry that prides itself
on high levels of innovation and creative people management strategies. Although innovative technology supports
customer service strategies and well‐trained agents can enhance customer experience, consistency is driven by process
efficiency. Long‐term sustainable customer relationships are more dependent on contact centre processes than people or
technology.
Identifying potential
Over the past few years, contact centres have become more integrated into businesses which have in turn gained a better
understanding of the contact centre's value. However, the findings from this year’s report still present a rather depressing
view with a high number of contact centres reporting minimal or limited cooperation between themselves and other
business areas in relation to process redesign.
The term ‘end to end’ processes has always been an ideal rather than the real or current state of affairs. Even if individual
processes are still poor, there is a definite move towards higher levels of cooperation on process automation as opposed to
end‐to‐end process redesign.
In business verticals, such as Government, Education and Health and Service Providers and Telecommunications, where
customer choice is sometimes limited, there is less often lower levels of cooperation. Service level agreements, like
processes, are viewed as a necessary evil and few contact centres manage inter‐departmental dependencies and hand‐offs
through well enforced service levels.
A rising number of contact centres are able to track enquiries and hand‐offs both within the contact centre and through the
delivery service delivery process, and often this has been automated. It is surprising to see how many centres still track
enquiries manually and this should be questioned in light of the many trends surrounding process inefficiency.
Contact centre attrition is still a major concern for the industry. Until more defined career goals and career paths can be
rolled out, contact centres will be forced to keep using technology and ‘process smarts’ to reduce the impact of untrained
and inexperienced agents.
We can expect the number of centres using agent prompts to increase steadily. It is also likely that even a drop in attrition
will not reduce this aspect as businesses will adapt the technology to match their changing needs. Over time, it is likely that
agent prompts will not only be more prolific, they will be more flexible and this should hopefully mean an upsurge in
customer service excellence.
97
National Police Contact Management Benchmarking Report 2008
Accreditation Programmes
As contact centres come under increasing pressure to improve customer service initiatives, there is likely to be a move
towards external assessments. For reasons of impartiality, the industry is likely to see more organisations offering
procedural or performance audits and accreditation programs. While the industry is familiar with certification and
accreditation, the shift of focus from technology and people issues to processes should be the catalyst for properly
structured accreditation programs. While initiatives like this are more appealing to less mature industry segments and
regions, any big focus on contact centre processes will make this a global trend.
Review – where to from here?
It is not uncommon in the contact centre industry for businesses to focus more on people and technology issues. These are
the highest costs in any contact centre and, at face value, managing them carefully will ensure contact centre success.
Processes are far less tangible and are often, perhaps too often, taken for granted. contact centre innovation has focused
on improving technology and this has meant that often centres benchmark their success on the functionality provided by
their technology spend.
While processes have battled to gain a foothold in this rapidly evolving industry, recent developments mean greater
awareness of the role of process. Process efficiency is characterised by business maturity and as the industry moves
forward, the value of building activities on robust and workable processes will continue to grow.
Technology has often been used to make up for process deficiencies. While many past contact centre innovations were
really technological solutions to process dependent problems, this state of affairs is unlikely to be sustained for much
longer. Customer service is highly reliant on people and technology, but it needs to be underpinned by efficient repeatable
processes.
The contact centres that will dominate the industry in the future are those that can add to their existing architecture and
people models using more reliance on process efficiency.
One of the biggest challenges facing contact centres is their ability to identify and deploy the right processes. It is not their
ability to build or automate processes, as this will happen naturally in the industry. Therefore, it may be time to start from
the beginning again.
Consider the following alternatives:
• Does your contact centre build processes to support the technology it has deployed?
or
• Does your contact centre get its technology vendors to find technology solutions to support processes that are already
in place?
Unfortunately, over time, the industry has shown a preference for deploying technology and building appropriate processes
later in light of, customer driven initiatives forcing centres to look at cheaper and more effective ways of providing services.
We don't expect a reduction in the use of technology, but rather more of a focus on process and technology working
together to drive contact centre service initiatives. Technology vendors will have to adapt their products to better support
contact centre processes and this will mean better customer service.
The early adapters in the industry will spend the next few years consolidating their business processes instead of renewing
technology. The contact centre industry on the whole is likely to see the following in the short and long term:
• A definite move towards more formal and structured process management.
• Better levels of service as process efficiencies are exploited.
• Smarter, more creative solutions to common problem areas.
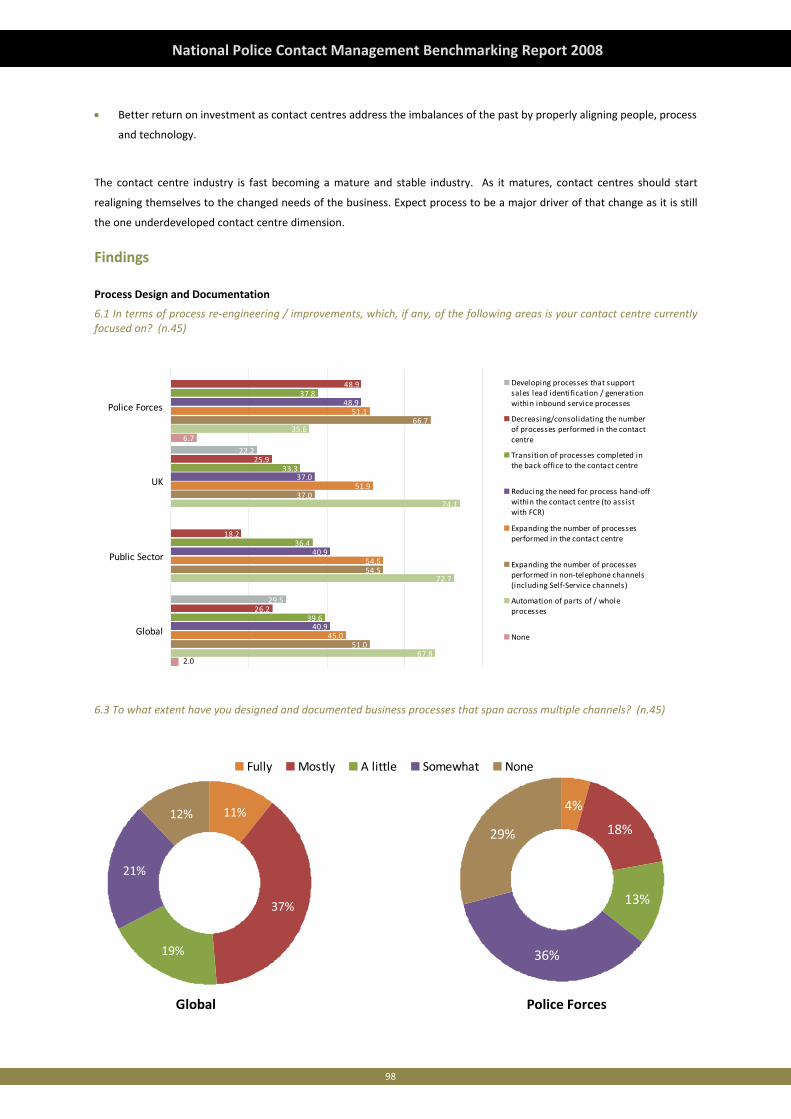
98
National Police Contact Management Benchmarking Report 2008
• Better return on investment as contact centres address the imbalances of the past by properly aligning people, process
and technology.
The contact centre industry is fast becoming a mature and stable industry. As it matures, contact centres should start
realigning themselves to the changed needs of the business. Expect process to be a major driver of that change as it is still
the one underdeveloped contact centre dimension.
Findings
Process Design and Documentation
6.1 In terms of process re‐engineering / improvements, which, if any, of the following areas is your contact centre currently focused on? (n.45)
22.2
0.0
29.5
25.9
26.2
37.8
33.3
36.4
39.6
48.9
37.0
40.9
40.9
51.1
51.9
54.5
45.0
66.7
37.0
54.5
51.0
35.6
74.1
72.7
67.8
6.7
0.0
0.0
0.0
18.2
48.9
2.0
Police Forces
UK
Public Sector
Global
Developing processes that supportsales lead identification / generationwithin inbound service processes
Decreasing/consolidating the numberof processes performed in the contactcentre
Transition of processes completed inthe back office to the contact centre
Reducing the need for process hand‐offwithin the contact centre (to assistwith FCR)
Expanding the number of processesperformed in the contact centre
Expanding the number of processesperformed in non‐telephone channels(including Self‐Service channels)
Automation of parts of / wholeprocesses
None
6.3 To what extent have you designed and documented business processes that span across multiple channels? (n.45)
11%
37%
19%
21%
12%
Fully Mostly A little Somewhat None
4%
18%
13%
36%
29%
Police ForcesGlobal
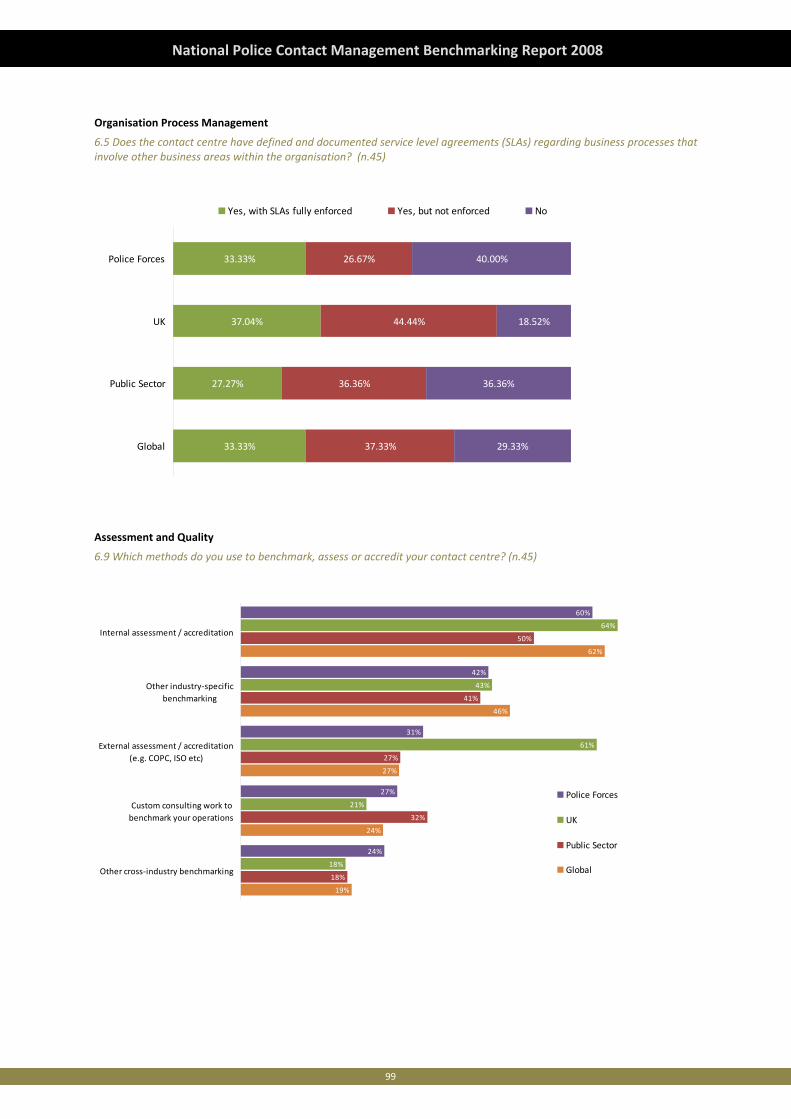
99
National Police Contact Management Benchmarking Report 2008
Organisation Process Management
6.5 Does the contact centre have defined and documented service level agreements (SLAs) regarding business processes that involve other business areas within the organisation? (n.45)
33.33%
27.27%
37.04%
33.33%
37.33%
36.36%
44.44%
26.67%
29.33%
36.36%
18.52%
40.00%
Global
Public Sector
UK
Police Forces
Yes, with SLAs fully enforced Yes, but not enforced No
Assessment and Quality
6.9 Which methods do you use to benchmark, assess or accredit your contact centre? (n.45)
60%
42%
31%
27%
24%
64%
43%
61%
21%
18%
50%
41%
27%
32%
18%
62%
46%
27%
24%
19%
Internal assessment / accreditation
Other industry‐specificbenchmarking
External assessment / accreditation(e.g. COPC, ISO etc)
Custom consulting work tobenchmark your operations
Other cross‐industry benchmarking
Police Forces
UK
Public Sector
Global
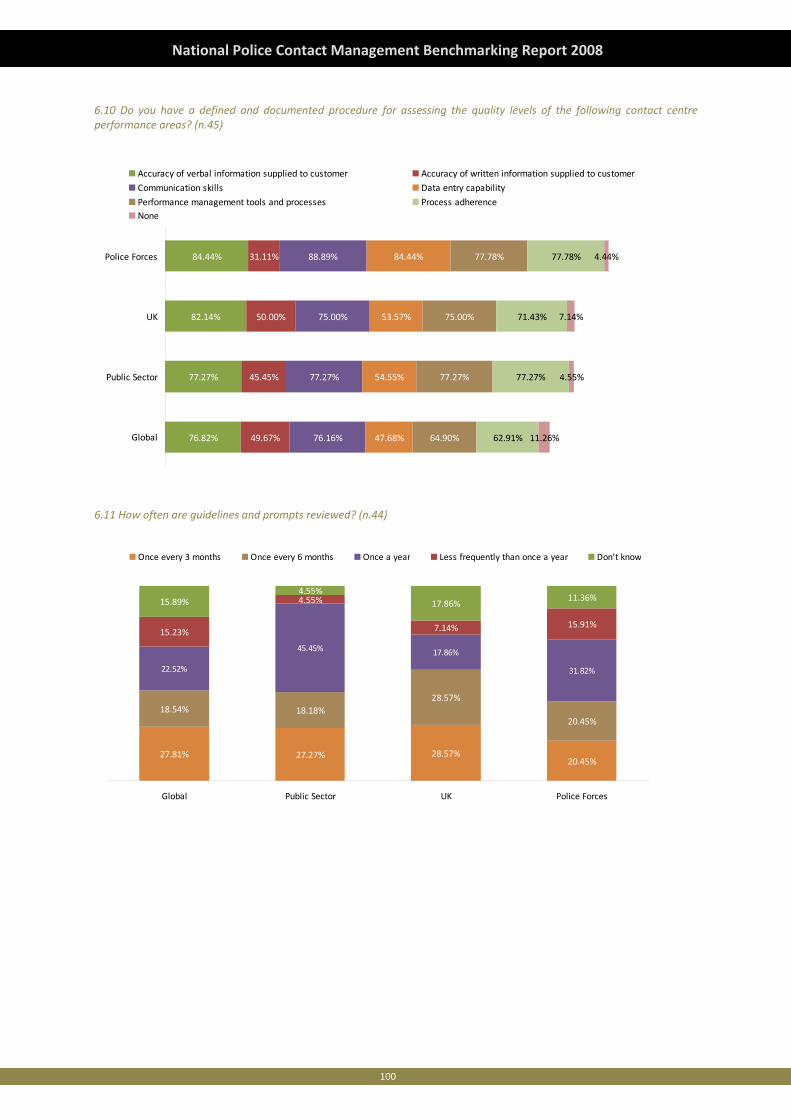
100
National Police Contact Management Benchmarking Report 2008
6.10 Do you have a defined and documented procedure for assessing the quality levels of the following contact centre performance areas? (n.45)
76.82%
77.27%
82.14%
84.44%
49.67%
45.45%
50.00%
31.11%
76.16%
77.27%
75.00%
88.89%
47.68%
54.55%
53.57%
84.44%
64.90%
77.27%
75.00%
77.78%
62.91%
77.27%
71.43%
77.78%
11.26%
4.55%
7.14%
4.44%
Global
Public Sector
UK
Police Forces
Accuracy of verbal information supplied to customer Accuracy of written information supplied to customer
Communication skills Data entry capability
Performance management tools and processes Process adherenceNone
6.11 How often are guidelines and prompts reviewed? (n.44)
27.81% 27.27% 28.57%20.45%
18.54% 18.18%28.57%
20.45%
22.52%
45.45% 17.86%
31.82%
15.23%
4.55%
7.14% 15.91%
15.89%4.55%
17.86%11.36%
Global Public Sector UK Police Forces
Once every 3 months Once every 6 months Once a year Less frequently than once a year Don't know
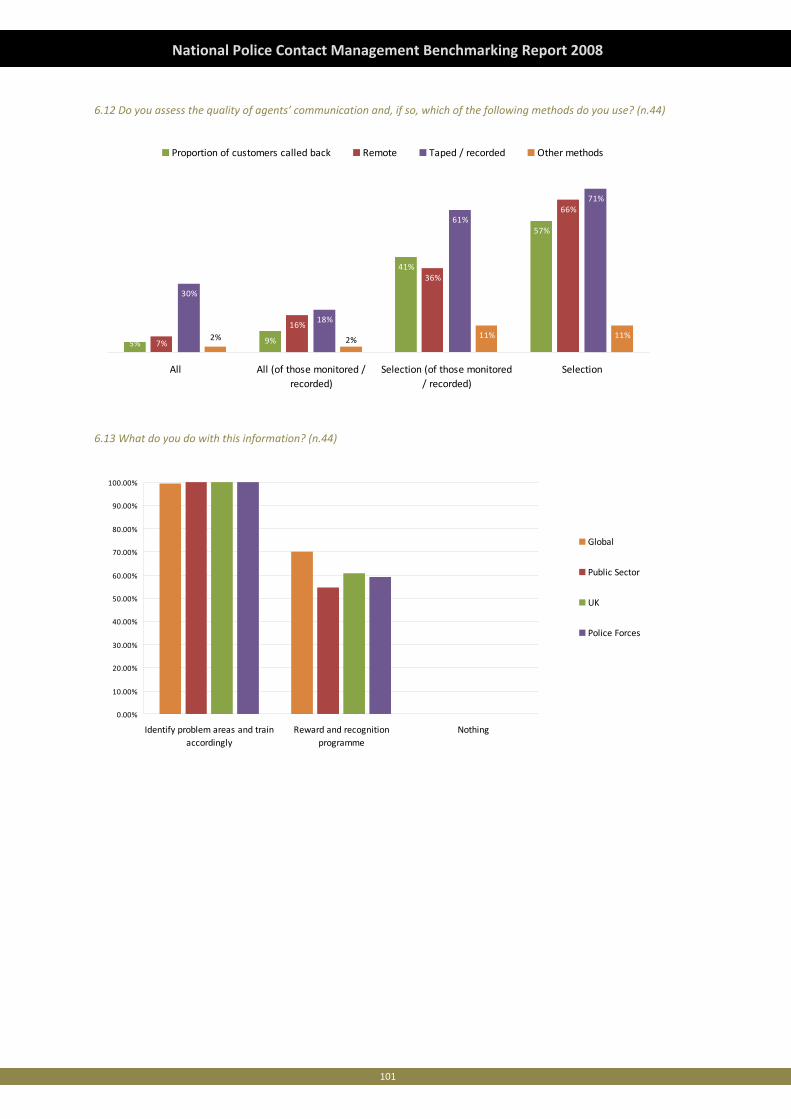
101
National Police Contact Management Benchmarking Report 2008
6.12 Do you assess the quality of agents’ communication and, if so, which of the following methods do you use? (n.44)
5% 9%
41%
57%
7%
16%
36%
66%
30%
18%
61%
71%
11% 11%2% 2%
All All (of those monitored /recorded)
Selection (of those monitored/ recorded)
Selection
Proportion of customers called back Remote Taped / recorded Other methods
6.13 What do you do with this information? (n.44)
0.00%
10.00%
20.00%
30.00%
40.00%
50.00%
60.00%
70.00%
80.00%
90.00%
100.00%
Identify problem areas and trainaccordingly
Reward and recognitionprogramme
Nothing
Global
Public Sector
UK
Police Forces
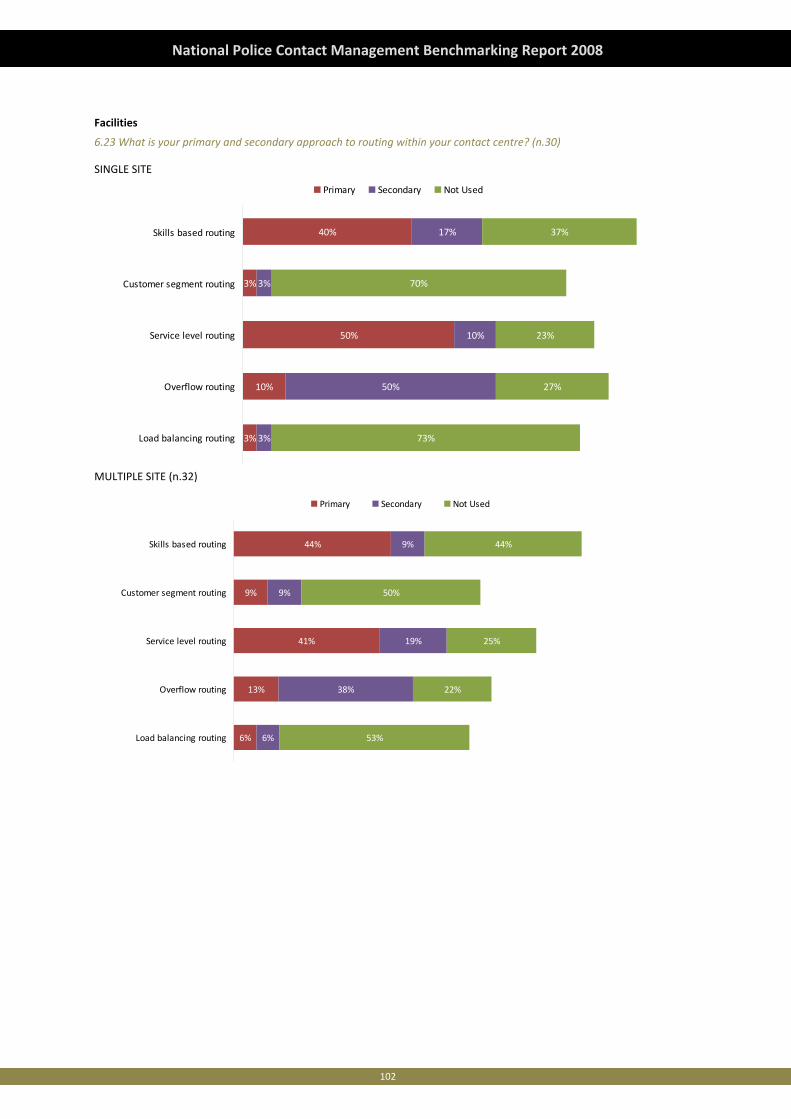
102
National Police Contact Management Benchmarking Report 2008
Facilities
6.23 What is your primary and secondary approach to routing within your contact centre? (n.30)
SINGLE SITE
3%
10%
50%
3%
40%
3%
50%
10%
3%
17%
73%
27%
23%
70%
37%
Load balancing routing
Overflow routing
Service level routing
Customer segment routing
Skills based routing
Primary Secondary Not Used
MULTIPLE SITE (n.32)
6%
13%
41%
9%
44%
6%
38%
19%
9%
9%
53%
22%
25%
50%
44%
Load balancing routing
Overflow routing
Service level routing
Customer segment routing
Skills based routing
Primary Secondary Not Used
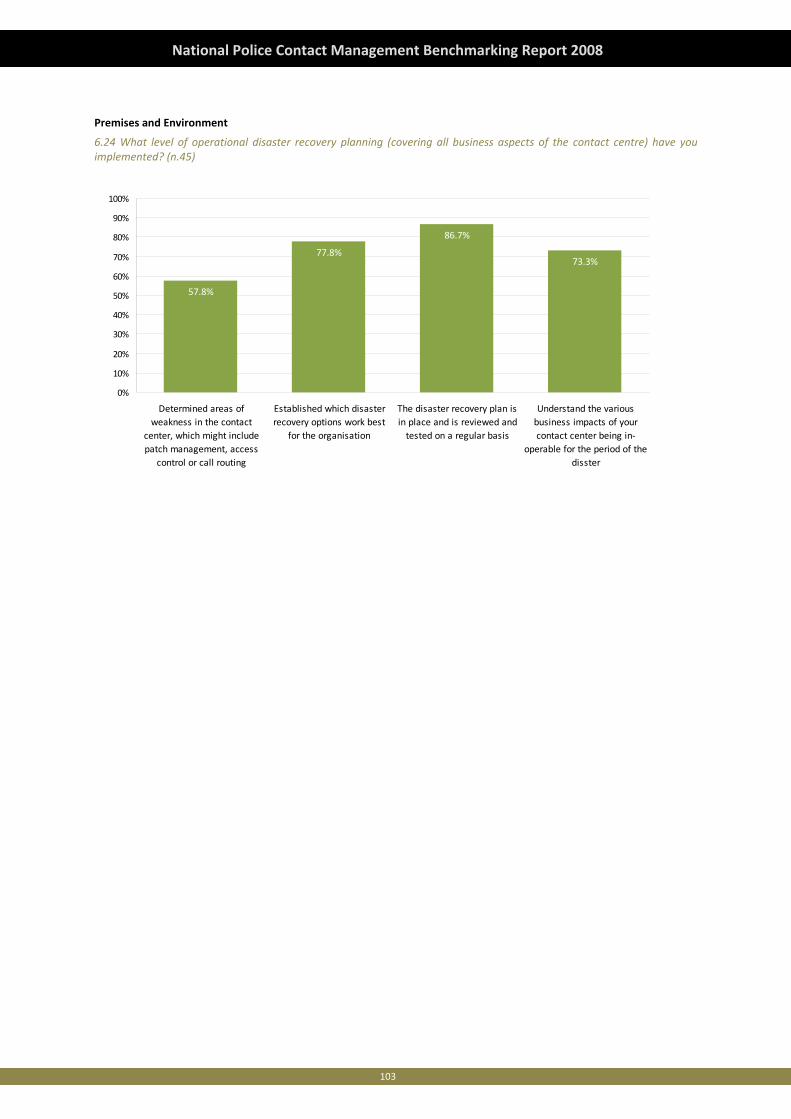
103
National Police Contact Management Benchmarking Report 2008
Premises and Environment
6.24 What level of operational disaster recovery planning (covering all business aspects of the contact centre) have you implemented? (n.45)
57.8%
77.8%
86.7%
73.3%
0%
10%
20%
30%
40%
50%
60%
70%
80%
90%
100%
Determined areas ofweakness in the contact
center, which might includepatch management, access
control or call routing
Established which disasterrecovery options work best
for the organisation
The disaster recovery plan isin place and is reviewed andtested on a regular basis
Understand the variousbusiness impacts of yourcontact center being in‐
operable for the period of thedisster
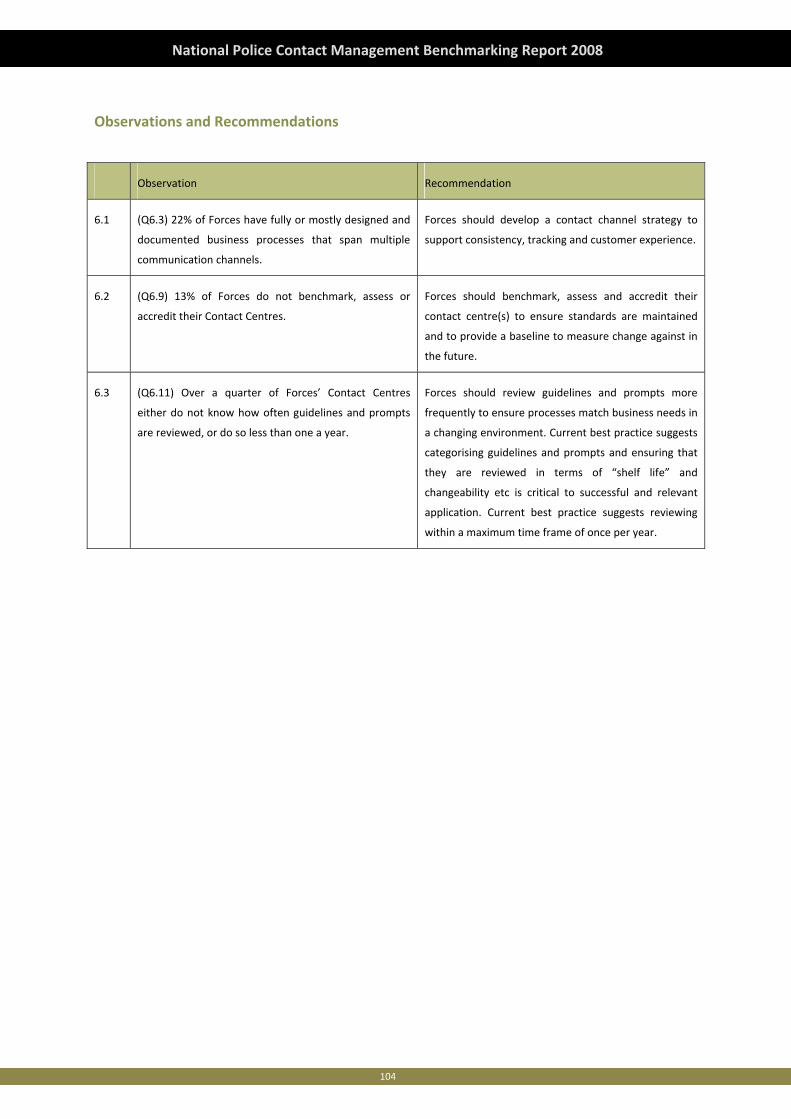
104
National Police Contact Management Benchmarking Report 2008
Observations and Recommendations
Observation Recommendation
6.1 (Q6.3) 22% of Forces have fully or mostly designed and
documented business processes that span multiple
communication channels.
Forces should develop a contact channel strategy to
support consistency, tracking and customer experience.
6.2 (Q6.9) 13% of Forces do not benchmark, assess or
accredit their Contact Centres.
Forces should benchmark, assess and accredit their
contact centre(s) to ensure standards are maintained
and to provide a baseline to measure change against in
the future.
6.3 (Q6.11) Over a quarter of Forces’ Contact Centres
either do not know how often guidelines and prompts
are reviewed, or do so less than one a year.
Forces should review guidelines and prompts more
frequently to ensure processes match business needs in
a changing environment. Current best practice suggests
categorising guidelines and prompts and ensuring that
they are reviewed in terms of “shelf life” and
changeability etc is critical to successful and relevant
application. Current best practice suggests reviewing
within a maximum time frame of once per year.

105
National Police Contact Management Benchmarking Report 2008

106
National Police Contact Management Benchmarking Report 2008
107
National Police Contact Management Benchmarking Report 2008
Chapter 7: Structure and Resource Management
Introduction
People are what this chapter is about; how we attract, select and structure them in groups, manage and develop, reward
and retain them. In a nutshell, this chapter is about today’s benchmark for getting the most from our people ensuring that
they receive the right levels of support and the correct environment to succeed from the organisation.
a. Strategy and Positioning
b. Structure and Resources
c. Recruitment
d. Training Coaching and Support
e. Performance Appraisals and Remuneration
f. Culture and Alignment
g. HR Metrics
Global Perspective
With the Global Benchmarking Survey identifying that people account for an average of 60% of the cost of contact centre
operations no other factors, alone or combined, cost us more. When we talk about the age‐old issues of absenteeism and
attrition, or the cost of management and training, we must remember that we are talking about huge sums of money
making up our biggest annual outlay – the salary bill.
Agents and activities
Throughout the report we can see that customer demands are on the rise. Expectations are rising and contact centres are
needing to increase cost efficiency and handle as much customer contact in each transaction as is humanly possible. This in
turn means increased pressure and greater demands on people within contact centres.
There exists an increased pressure on our contact centres to handle more complex contacts, both in terms of the channel
set and the type of query our agents deal with. It's interesting then that management ratios have stayed more or less static
for a number of years now. You would think that a more complex working environment would need better supervision and
control, but centres are innovating around the problem. Agents are becoming a more skilled breed, capable of better self
management and motivation, and have higher levels of competence.
Organisational design – A trend for the future?
Can one size fit all? All the evidence in this benchmarking report says no.
We don’t specifically ask this question in our survey, but how many contact centre organisations and apply the same
structure across all areas? How much thought goes into structure, into how roles interact and relate to one another? How
often do we create new roles? Empirical evidence like unchanging roles shows that we spend very little time designing
organisations which are fit for purpose.
This will have to change in contact centres of the near future. More emphasis will be placed on the design of streamlined
reporting lines and management structures. The use of ergonomics will be a result of an increased use of technology, the
need to offset its cost elsewhere in the business and to ensure a return on investment. And it's already happening.
Resource planning tools have never been so high‐tech and widely used in providing the most efficient working patterns for
our staff.
We are witnessing a slow evolution of the contact centre in terms of our agents and activities. Given that the contact
centre concept is already mature, the current focus seems to be on creating the right environment, with the right support
mechanisms that enable careers to flourish. This means retaining talent for longer and helping centres be more cost‐
108
National Police Contact Management Benchmarking Report 2008
efficient, which in turn supports the delivery of quality service. The answers to the question above show that there is no
major factor that we’re all planning that will revolutionise our world. We are generally planning sensible, grown‐up
initiatives like the development of people‐orientated policies, improvement of cultural alignment and more staff training.
Recruitment procedures – best practice nets best results
So our people form the backbone of our contact centre operations. We’re asking them to step up and deliver even more for
us and we know that people are our most expensive commodity. With this in mind, it pays to make sure that when we hire
we use the right process for every role.
• Before reviewing your process, have a very clear brief for each role in the contact centre. We know that over 97% of
respondents have these in place, but just over 12% have no recruitment policy. A good brief will include a bullet‐point
listing of daily activities, competency requirements linked to a framework and other traits, like the kind of person that
would fit best with your brand and culture. All of this should be backed up by a profile of your ideal candidate.
• Your recruitment procedure should test each of the competence requirements listed in the brief objectively and
specifically at least two or three times. This will help later on in training, service delivery and attrition control.
• The next step is to make sure that all managers, supervisors and team leaders are trained properly to recruit for you.
This can be done in‐house, but must involve an element of role playing to get the recruitment team used to questions,
assessments and varied scenarios.
• The next two steps after the recruitment and selection procedure are often forgotten. Before making any hiring
decisions, recruiters should meet to moderate their scores. Go through each question / assessment and ensure
consistency in scoring. Change scores if necessary to bring them into alignment with the broader group.
• After hiring and initial training is complete, get together to undertake a continuous improvement review. This will
ensure that you have the right recruitment procedure for each role that outputs the right candidates. Look for gaps
and weaknesses that may have come out of training and feed these back into the recruitment process for next time.
It's also a good opportunity to respond to change within your business.
Training and development
It stands to reason that if the recruitment and ongoing management of contact centre staff is ever more complex, training
requirements will be the same. There has been a general view that agents are taking far longer to become fully effective.
While from about 2000 to 2005 this was generally the case, data from the 2007 survey shows that agents in the more
mature markets are, on average, becoming effective far more quickly.
Closer scrutiny of the figures shows that this is an incredibly inconsistent area, regionally and by industry. This is doubly
interesting, as training durations have remained relatively static, as have the training methods employed. The data from
the global contact centre benchmarking survey appears inconsistent, therefore the assumption is that there are
inconsistencies in how the industry applies training.
High performance culture
There are some really simple ways to improve performance and even create a best‐in‐class performance culture. Some are
discussed elsewhere in this chapter and include principles of organisational design, communication, recruitment, retention
and coaching. Here are a few others that, in our experience, are often missing from contact centre operations.
• Context setting is such an easy concept, yet often easy to overlook. This, despite the fact that it can save time, money,
and can reap so many more rewards. Setting a context for communication, for meetings and personal interactions,
gives us all a feeling of ease and comfort. From our comfort zones we all perform best, react well to change, and have
a more positive outlook. An example is ensuring all meetings have an agenda and purpose set out in advance or
where a coach explains the aim, outcomes and actions following on from a coaching session.
109
National Police Contact Management Benchmarking Report 2008
• Performance management and reward procedures must be very specifically linked. Coaching and quality outputs
should be discussed and documented in one‐to‐one update meetings, which are in turn discussed in performance
review and appraisal sessions. Progress should be tracked and rewards, such as increases in salary, should be based on
performance. I also recommend reward and recognition programmes that recognise individual and team effort.
• Finally, ensure that return on investment (ROI) metrics are available to the contact centre manager for all areas. For
example, in training it is possible to easily measure ROI at the end of each module of training. This will help
understand how well the recruitment process works and how well the training was designed. This combined with the
length of time needed to bring an agent to full competence levels gives easily measurable, clear and simple efficiency
targets.
There is a key that unlocks best‐in‐class performance potential: joined‐up thinking. Any procedure, practice or policy that
affects people in the contact centre should link together. A competence framework is a good start and should be as
important as the concept of consequence management.
We spend much less time on the culture and value of our own organisations during new hire training. This in and of itself
would seem sensible – new hire training gives us the best chance to ensure our new hires have the skills they need for the
tasks ahead, so product and systems must remain the order of the day. However, the amount of time we spend on our
internal organisational cultures, and therefore on any link to brand identity and thus market differentiation, is
proportionately less the more time passes, to the extent that the time spent is almost negligible.
Measuring the quality and effectiveness of training programmes and coaching methodologies is of paramount importance if
we are to understand whether there is enough return on the investment. It is shocking that so many organisations fail to
measure the cost of training against the overall benefit.
In short, training continues to surprise us and is still probably the single biggest area for improvement in our centres. The
application of training standards remains relatively inconsistent, and as a result the output can be a mixed bag. Improved
measurement of training ROI would really improve visibility of this situation at the senior level, which would help us to
focus on an approach that is more in line with the needs of our centres.
Absence and attrition
If the salary bill is the biggest single cost of contact centre operations, then together absence and attrition are single biggest
impacting factor on that cost.
There can be no question that staff will fall ill, and that employment tenure cannot last forever, but both absence and
attrition can be controlled and minimised, and the contact centre industry is one of the worst at doing so.
Human resources – all change
The role of Human Resources has evolved significantly over the years, but none more so than in the contact centre industry.
Two elements combine worldwide to make contact centre Human Resources a unique role that is essential to a smooth
operation.
• Employment legislation is one of the fastest moving branches of law in areas where most contact centres exist.
Legislation in the UK and across Europe has become particularly arduous, where multiple changes are made each year,
often carrying significant consequences and strict financial penalties for compliance failure. Keep up to date with these
changes and challenges and make sure that updates are made regularly to terms and conditions, policy, procedure and
management practice.
• The contact centre industry is a fast paced one. The rate at which the average centre must respond to new technology,
customer demands, changing contact arrival patterns and company product lines would be enough to worry about,
never mind the high rates of staff absenteeism and attrition. Contact centre outsourcing is growing even faster still as
110
National Police Contact Management Benchmarking Report 2008
is the search for ever greater economies in staffing.
There are a few factors that can help any contact centre ensure the human resources department add value to the
business.
• Consider the ratio you work to. Lower‐end ratios can enable a redistribution of workload, taking pressure off your
managers and team leaders, resulting in better service level adherence. Centres across Europe tend to work to a low
end of around 1:100, to a high of 1:400 (human resources support personnel to contact centre total headcount). At the
low end, I would expect the HR team to be actively engaged in contact centre operations reporting line to the senior
contact centre manager. They should manage recruitment and provide a very strong support service in all first level
line management activities, as well as input to strategy and organisational development and take the organising lead
on communication and culture.
• Consider where support is physically delivered. Often it is vital that first level line managers remain on the contact
centre floor. Equip human resources personnel with laptop computers, take away the office, and have HR support
delivered out on the floor too. Quiet corners and your usual one‐to‐one meeting rooms can provide all the
confidentiality that is required. HR is a support service, so they should go where the support is required. From a
cultural and 'image' perspective, the value of good HR is clear to all when the HR team can be seen regularly in the
workplace.
• Finally, consider where you hire HR support personnel. Those with a corporate background, who have never worked in
a contact centre environment, may be well qualified but they will take longer to add value back into your business.
Seek professionals who have a background in contact centres, or at least those who have worked in similarly fast‐
paced environments, such as in the retail or distribution sectors. There are synergies in these sectors that you can tap
into.
The main challenge is to assess HR support candidates not only for their human resources skills, but also for their
commercial capability. The HR team will have a huge influence on how the contact centre's greatest and most valuable
asset is maintained, which means they need to 'do' numbers as well as people.
Conclusion
It can be argued that certain areas represented in this chapter require greater focus and more rapid change. We have an
older workforce who are better skilled and seek greater challenges, yet overall we have little success in developing careers
and retaining talent. The contact centre is a fast paced and exciting division of our businesses, yet we struggle to turn
around our problems with sporadic absenteeism. These are the areas in which, on a widespread level, we should to refocus
some of our energies.
Much of the data presented in this chapter shows that while the Global Contact Centre industry moves on apace, there is
little real change in how we recruit, structure, manage, train, develop and deploy our staff. Change in these areas is gradual
and, importantly, positive change in the right direction. Perhaps this reflects the maturity of management principles in a
now mature division of our organisations. The contact centre has grown up; it’s not the new kid on the block any more.
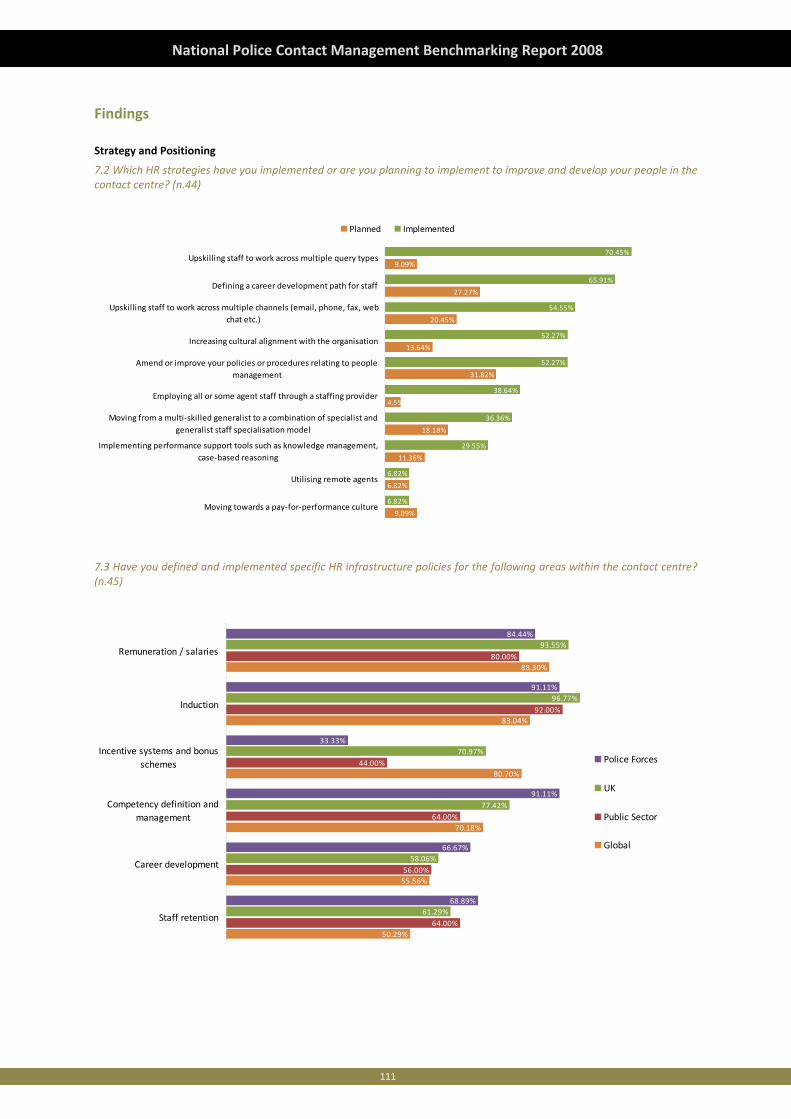
111
National Police Contact Management Benchmarking Report 2008
Findings
Strategy and Positioning
7.2 Which HR strategies have you implemented or are you planning to implement to improve and develop your people in the contact centre? (n.44)
9.09%
6.82%
11.36%
18.18%
4.55%
31.82%
13.64%
20.45%
27.27%
9.09%
6.82%
6.82%
29.55%
36.36%
38.64%
52.27%
52.27%
54.55%
65.91%
70.45%
Moving towards a pay‐for‐performance culture
Utilising remote agents
Implementing performance support tools such as knowledge management,case‐based reasoning
Moving from a multi‐skilled generalist to a combination of specialist andgeneralist staff specialisation model
Employing all or some agent staff through a staffing provider
Amend or improve your policies or procedures relating to peoplemanagement
Increasing cultural alignment with the organisation
Upskilling staff to work across multiple channels (email, phone, fax, webchat etc.)
Defining a career development path for staff
Upskilling staff to work across multiple query types
Planned Implemented
7.3 Have you defined and implemented specific HR infrastructure policies for the following areas within the contact centre? (n.45)
50.29%
55.56%
70.18%
80.70%
83.04%
88.30%
64.00%
56.00%
64.00%
44.00%
92.00%
80.00%
61.29%
58.06%
77.42%
70.97%
96.77%
93.55%
68.89%
66.67%
91.11%
33.33%
91.11%
84.44%
Staff retention
Career development
Competency definition andmanagement
Incentive systems and bonusschemes
Induction
Remuneration / salaries
Police Forces
UK
Public Sector
Global
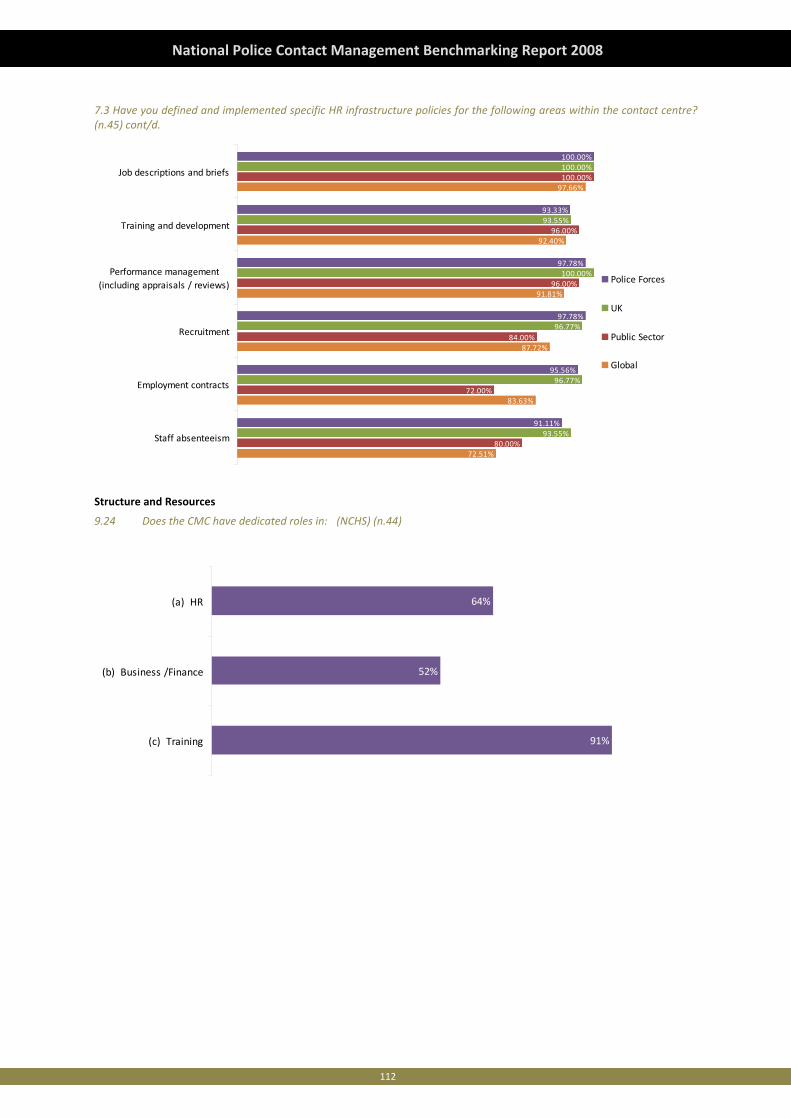
112
National Police Contact Management Benchmarking Report 2008
7.3 Have you defined and implemented specific HR infrastructure policies for the following areas within the contact centre? (n.45) cont/d.
72.51%
83.63%
87.72%
91.81%
92.40%
97.66%
80.00%
72.00%
84.00%
96.00%
96.00%
100.00%
93.55%
96.77%
96.77%
100.00%
93.55%
100.00%
91.11%
95.56%
97.78%
97.78%
93.33%
100.00%
Staff absenteeism
Employment contracts
Recruitment
Performance management(including appraisals / reviews)
Training and development
Job descriptions and briefs
Police Forces
UK
Public Sector
Global
Structure and Resources
9.24 Does the CMC have dedicated roles in: (NCHS) (n.44)
64%
52%
91%
(a) HR
(b) Business /Finance
(c) Training
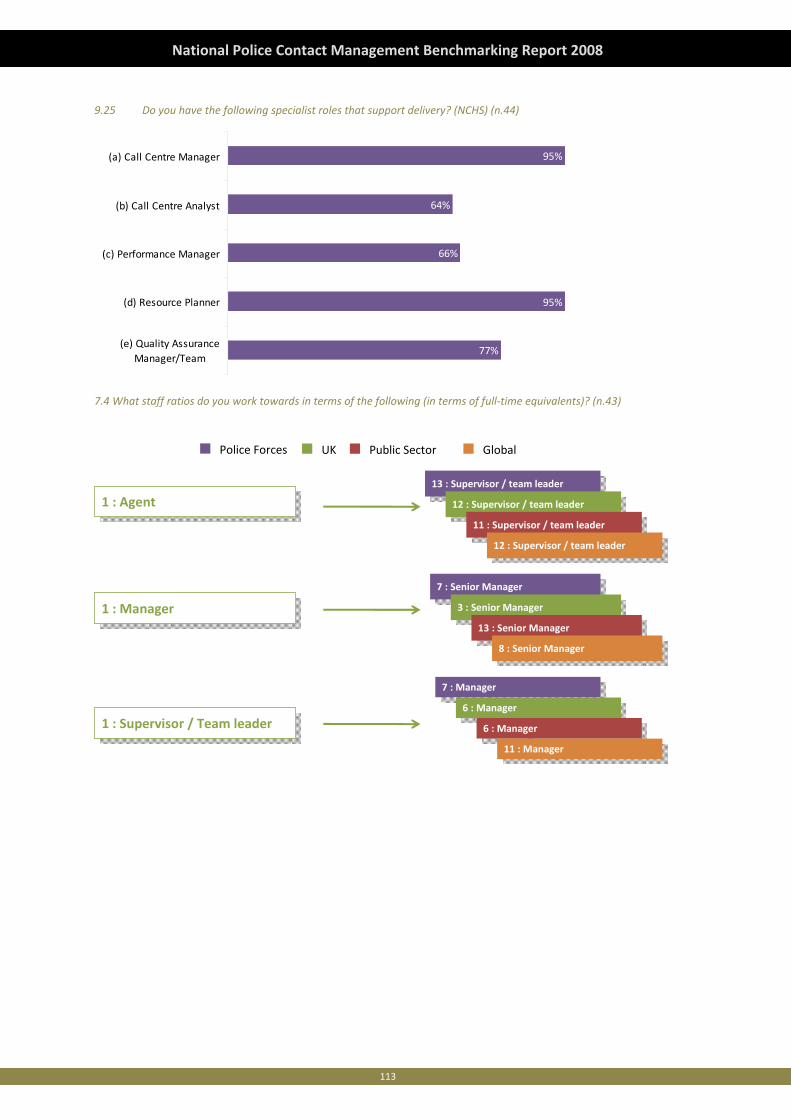
113
National Police Contact Management Benchmarking Report 2008
9.25 Do you have the following specialist roles that support delivery? (NCHS) (n.44)
95%
64%
66%
95%
77%
(a) Call Centre Manager
(b) Call Centre Analyst
(c) Performance Manager
(d) Resource Planner
(e) Quality AssuranceManager/Team
7.4 What staff ratios do you work towards in terms of the following (in terms of full‐time equivalents)? (n.43)
13 : Supervisor / team leader13 : Supervisor / team leader
12 : Supervisor / team leader12 : Supervisor / team leader
11 : Supervisor / team leader11 : Supervisor / team leader
12 : Supervisor / team leader12 : Supervisor / team leader
1 : Supervisor / Team leader1 : Supervisor / Team leader
1 : Agent1 : Agent
1 : Manager1 : Manager7 : Senior Manager7 : Senior Manager
3 : Senior Manager3 : Senior Manager
13 : Senior Manager13 : Senior Manager
8 : Senior Manager8 : Senior Manager
7 : Manager7 : Manager
6 : Manager6 : Manager
6 : Manager6 : Manager
11 : Manager11 : Manager
Police Forces UK Public Sector Global
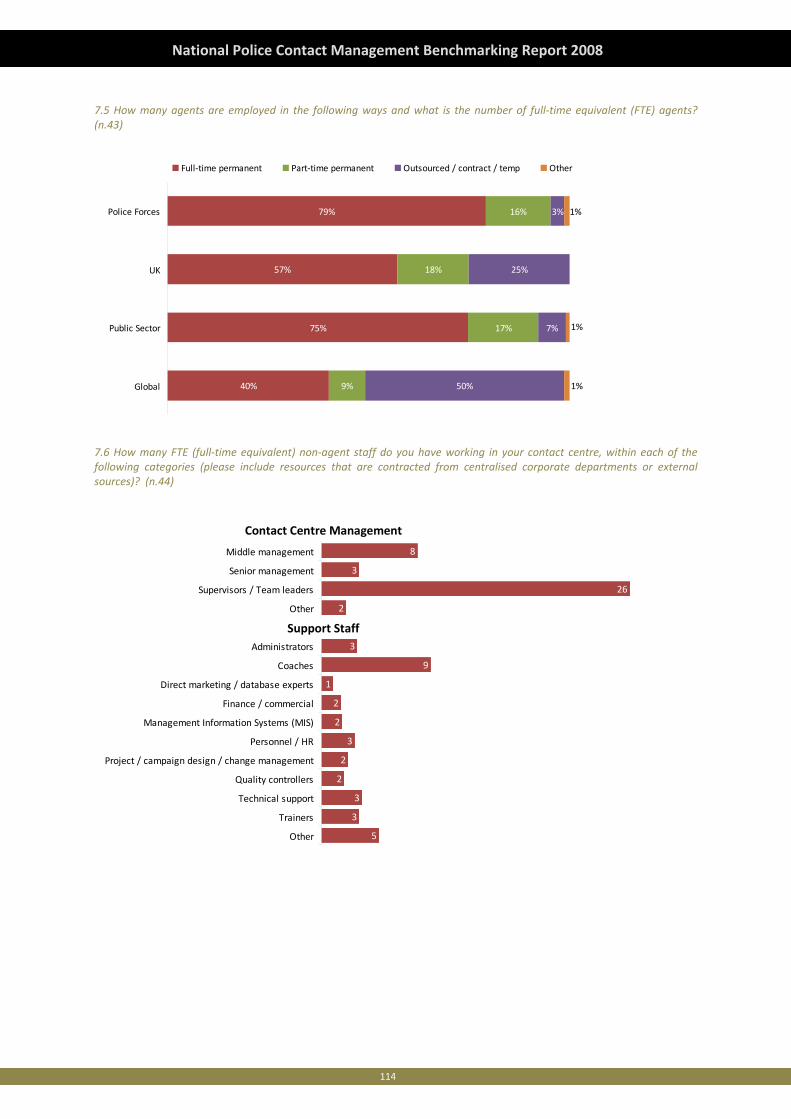
114
National Police Contact Management Benchmarking Report 2008
7.5 How many agents are employed in the following ways and what is the number of full‐time equivalent (FTE) agents? (n.43)
40%
75%
57%
79%
9%
17%
16%
50%
7%
25%18%
3%
1%
1%
1%
Global
Public Sector
UK
Police Forces
Full‐time permanent Part‐time permanent Outsourced / contract / temp Other
7.6 How many FTE (full‐time equivalent) non‐agent staff do you have working in your contact centre, within each of the following categories (please include resources that are contracted from centralised corporate departments or external sources)? (n.44)
8
3
26
2
9
1
2
2
3
2
2
3
3
5
3
Middle management
Senior management
Supervisors / Team leaders
Other
Administrators
Coaches
Direct marketing / database experts
Finance / commercial
Management Information Systems (MIS)
Personnel / HR
Project / campaign design / change management
Quality controllers
Technical support
Trainers
Other
Contact Centre Management
Support Staff
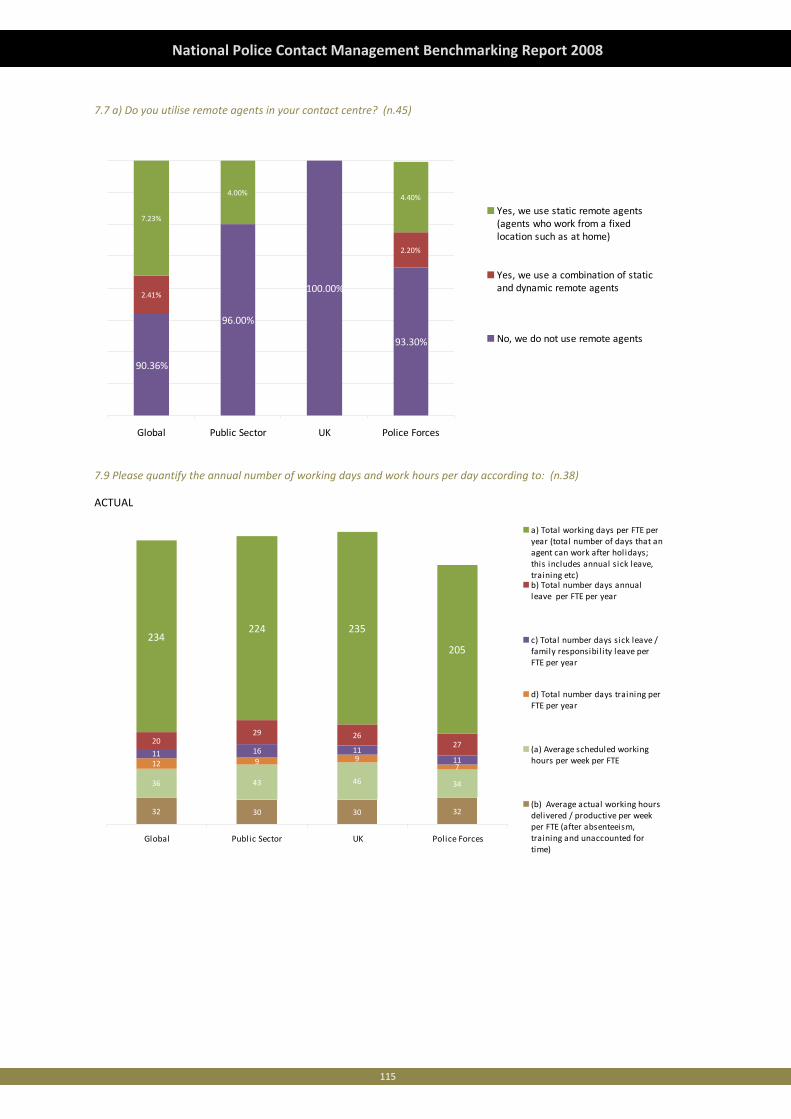
115
National Police Contact Management Benchmarking Report 2008
7.7 a) Do you utilise remote agents in your contact centre? (n.45)
90.36%
96.00%
100.00%
93.30%
2.41%
2.20%
7.23%
4.00%4.40%
Global Public Sector UK Police Forces
Yes, we use static remote agents(agents who work from a fixedlocation such as at home)
Yes, we use a combination of staticand dynamic remote agents
No, we do not use remote agents
7.9 Please quantify the annual number of working days and work hours per day according to: (n.38)
ACTUAL
32 30 30 32
36 43 46 34
12 9 97
11 16 1111
2029 26
27
234224 235
205
Global Public Sector UK Police Forces
a) Total working days per FTE peryear (total number of days that anagent can work after holidays;this includes annual sick leave,training etc)b) Total number days annualleave per FTE per year
c) Total number days sick leave /family responsibi lity leave perFTE per year
d) Total number days training perFTE per year
(a) Average scheduled workinghours per week per FTE
(b) Average actual working hoursdelivered / productive per weekper FTE (after absenteeism,training and unaccounted fortime)
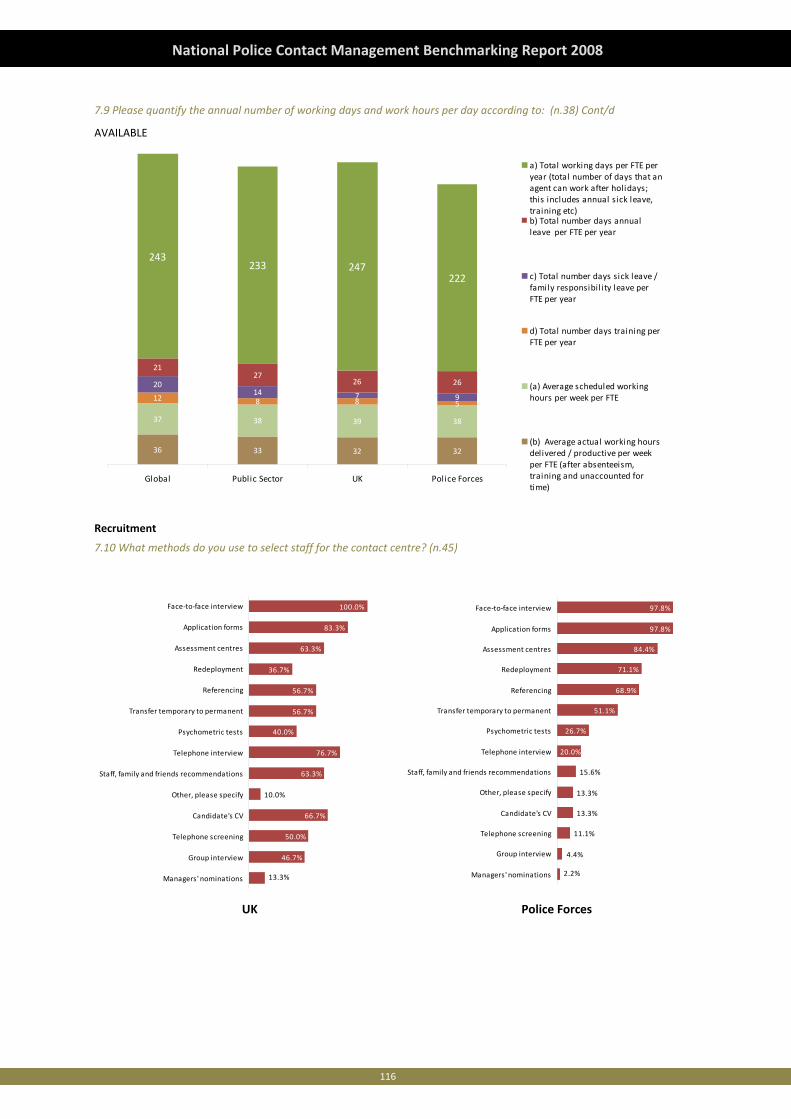
116
National Police Contact Management Benchmarking Report 2008
7.9 Please quantify the annual number of working days and work hours per day according to: (n.38) Cont/d
AVAILABLE
36 33 32 32
37 38 39 38
12 8 8 5
2014 7 9
2127
26 26
243233 247
222
Global Public Sector UK Police Forces
a) Total working days per FTE peryear (total number of days that anagent can work after holidays;this includes annual sick leave,training etc)b) Total number days annualleave per FTE per year
c) Total number days sick leave /family responsibility leave perFTE per year
d) Total number days training perFTE per year
(a) Average scheduled workinghours per week per FTE
(b) Average actual working hoursdelivered / productive per weekper FTE (after absenteeism,training and unaccounted fortime)
Recruitment
7.10 What methods do you use to select staff for the contact centre? (n.45)
20.0%
26.7%
51.1%
68.9%
71.1%
84.4%
97.8%
97.8%
2.2%
4.4%
11.1%
13.3%
13.3%
15.6%
Managers' nominations
Group interview
Telephone screening
Candidate's CV
Other, please specify
Staff, family and friends recommendations
Telephone interview
Psychometric tests
Transfer temporary to permanent
Referencing
Redeployment
Assessment centres
Application forms
Face‐to‐face interview
Police ForcesUK
76.7%
40.0%
56.7%
56.7%
36.7%
63.3%
83.3%
100.0%
63.3%
10.0%
66.7%
50.0%
46.7%
13.3%Managers' nominations
Group interview
Telephone screening
Candidate's CV
Other, please specify
Staff, family and friends recommendations
Telephone interview
Psychometric tests
Transfer temporary to permanent
Referencing
Redeployment
Assessment centres
Application forms
Face‐to‐face interview
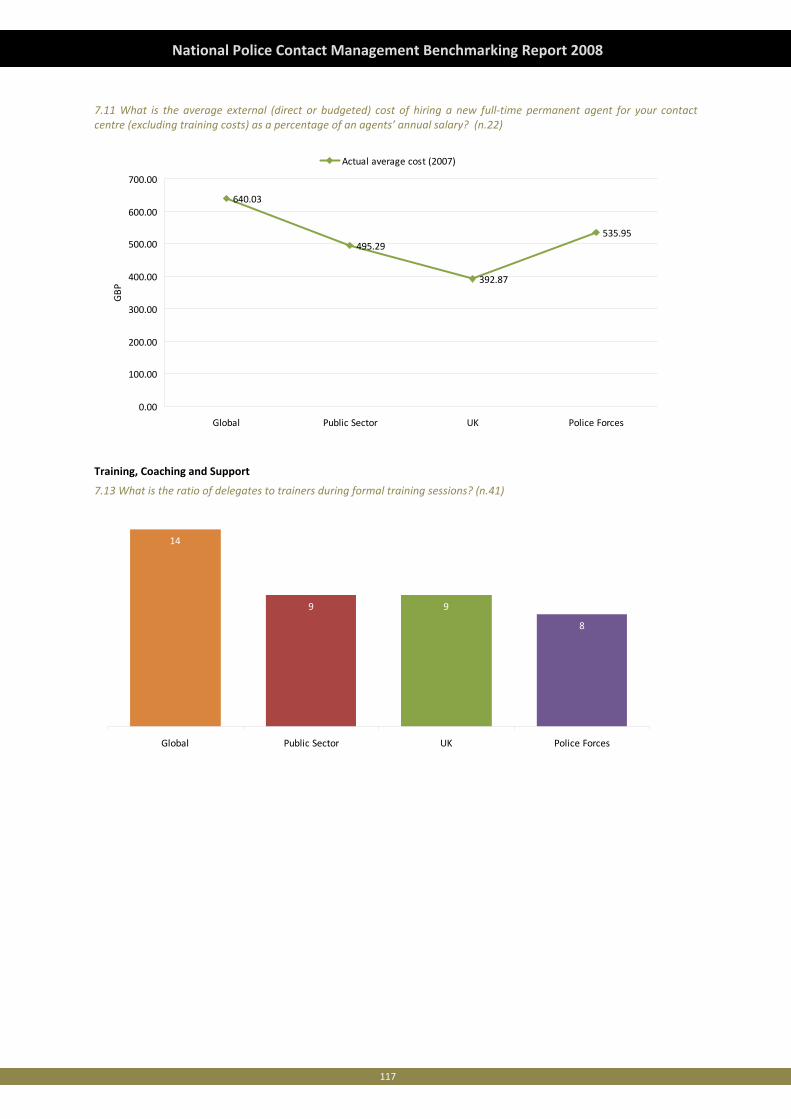
117
National Police Contact Management Benchmarking Report 2008
7.11 What is the average external (direct or budgeted) cost of hiring a new full‐time permanent agent for your contact centre (excluding training costs) as a percentage of an agents’ annual salary? (n.22)
640.03
495.29
392.87
535.95
0.00
100.00
200.00
300.00
400.00
500.00
600.00
700.00
Global Public Sector UK Police Forces
GBP
Actual average cost (2007)
Training, Coaching and Support
7.13 What is the ratio of delegates to trainers during formal training sessions? (n.41)
14
9 9
8
Global Public Sector UK Police Forces
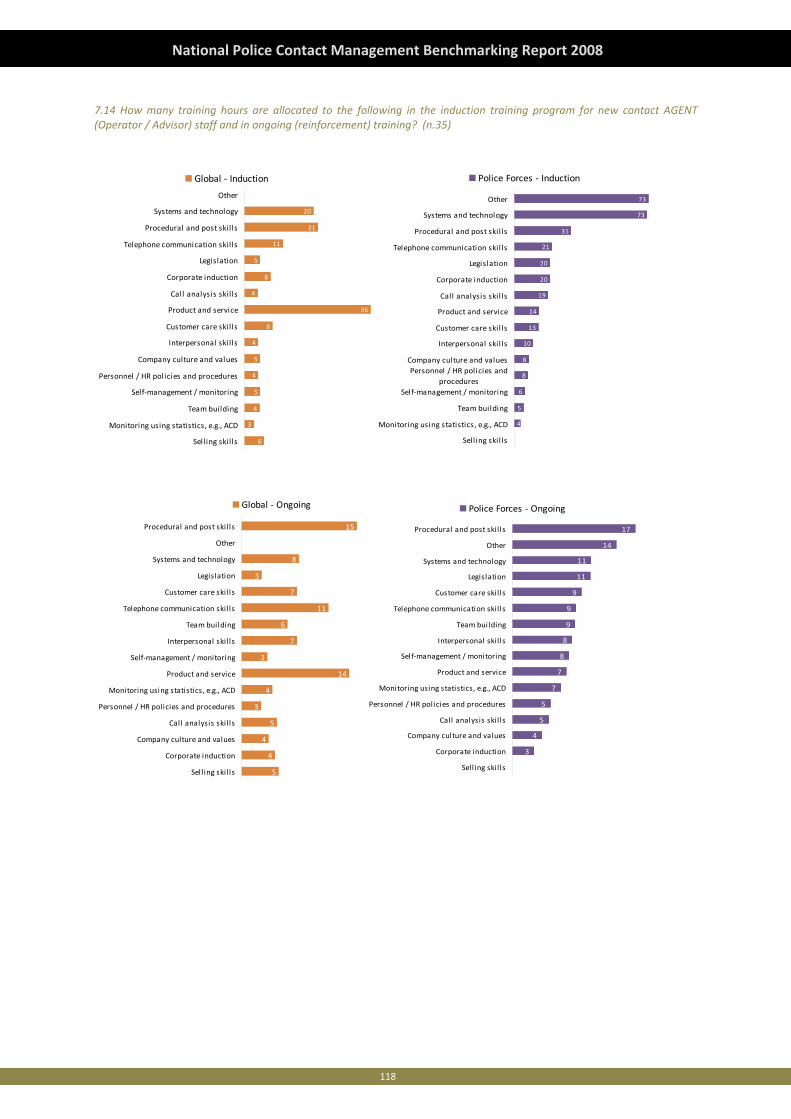
118
National Police Contact Management Benchmarking Report 2008
7.14 How many training hours are allocated to the following in the induction training program for new contact AGENT (Operator / Advisor) staff and in ongoing (reinforcement) training? (n.35)
6
3
4
5
4
5
4
8
36
4
8
5
11
21
20
Selling skil ls
Monitoring using statistics, e.g., ACD
Team building
Self‐management / monitoring
Personnel / HR policies and procedures
Company culture and values
Interpersonal skil ls
Customer care skil ls
Product and service
Call analysis skil ls
Corporate induction
Legislation
Telephone communication skil ls
Procedural and post skil ls
Systems and technology
Other
Global ‐ Induction
0
4
5
6
8
8
10
13
14
19
20
20
21
31
73
73
Sell ing skills
Monitoring using statistics, e.g., ACD
Team building
Self‐management / monitoring
Personnel / HR policies andprocedures
Company culture and values
Interpersonal skills
Customer care skills
Product and service
Call analysis skills
Corporate induction
Legislation
Telephone communication skills
Procedural and post skills
Systems and technology
Other
Police Forces ‐ Induction
5
4
4
5
3
4
14
3
7
6
11
7
3
8
15
Sell ing skills
Corporate induction
Company culture and values
Call analysis skills
Personnel / HR policies and procedures
Monitoring using statistics, e.g., ACD
Product and service
Self‐management / monitoring
Interpersonal skills
Team building
Telephone communication skills
Customer care skills
Legislation
Systems and technology
Other
Procedural and post skills
Global ‐ Ongoing
‐
3
4
5
5
7
7
8
8
9
9
9
11
11
14
17
Selling skil ls
Corporate induction
Company culture and values
Call analysis skil ls
Personnel / HR policies and procedures
Monitoring using statistics, e.g., ACD
Product and service
Self‐management / monitoring
Interpersonal skil ls
Team building
Telephone communication skil ls
Customer care skil ls
Legislation
Systems and technology
Other
Procedural and post skil ls
Police Forces ‐ Ongoing
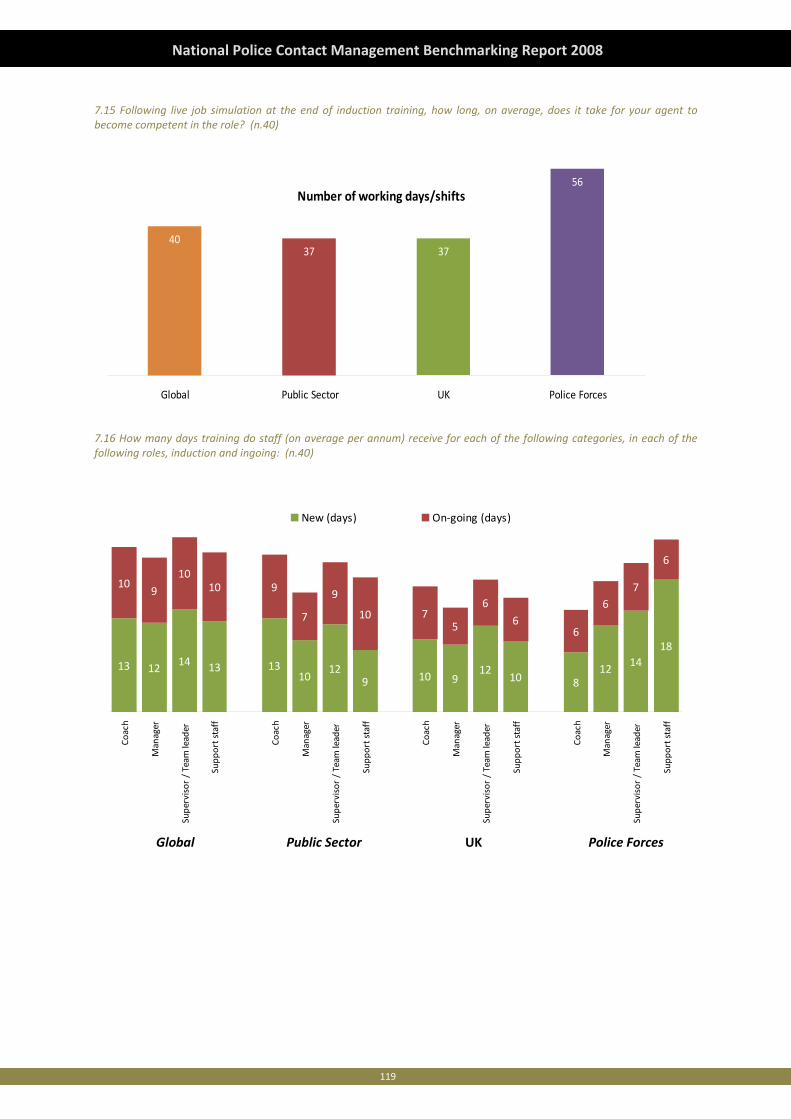
119
National Police Contact Management Benchmarking Report 2008
7.15 Following live job simulation at the end of induction training, how long, on average, does it take for your agent to become competent in the role? (n.40)
Number of working days/shifts
4037 37
56
Global Public Sector UK Police Forces
7.16 How many days training do staff (on average per annum) receive for each of the following categories, in each of the following roles, induction and ingoing: (n.40)
13 12 14 13 1310
129 10 9
1210 8
12 1418
109
1010 9
7
9
10 75
6
66
67
6
Coach
Manager
Supervisor / Team leader
Supp
ort staff
Coach
Manager
Supervisor / Team leader
Supp
ort staff
Coach
Manager
Supervisor / Team leader
Supp
ort staff
Coach
Manager
Supervisor / Team leader
Supp
ort staff
New (days) On‐going (days)
UK Police ForcesPublic SectorGlobal
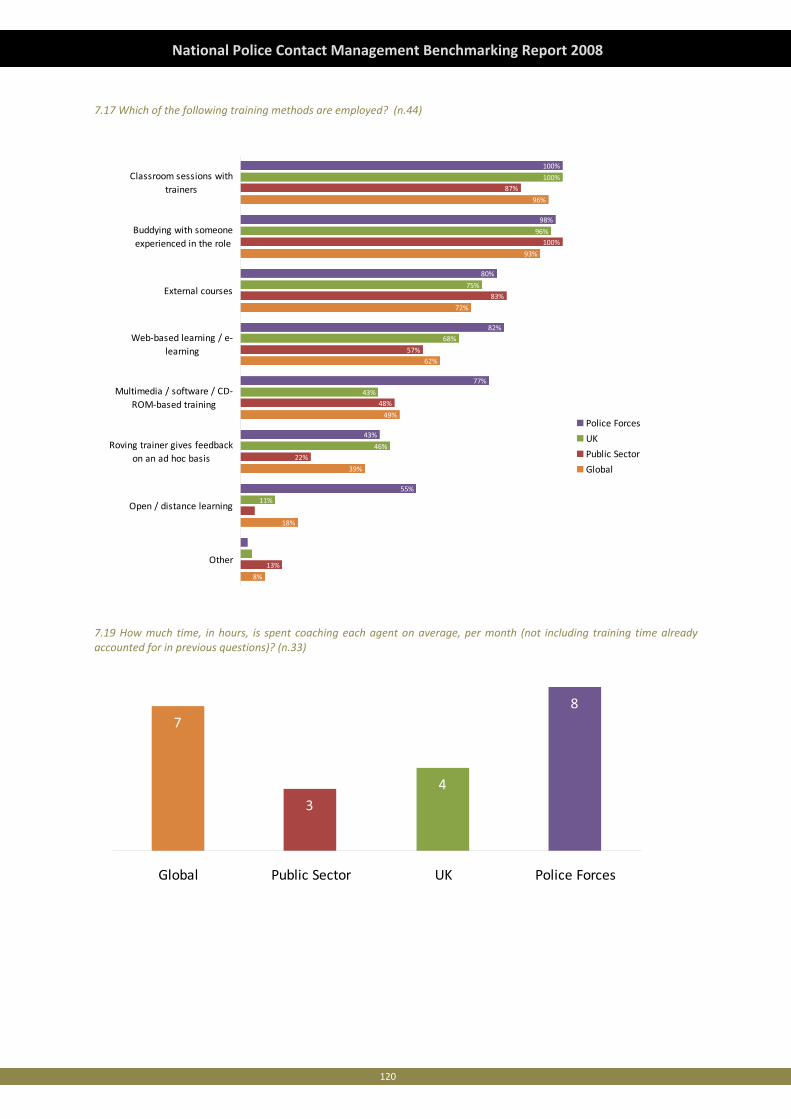
120
National Police Contact Management Benchmarking Report 2008
7.17 Which of the following training methods are employed? (n.44)
8%
18%
39%
49%
62%
72%
93%
96%
13%
22%
48%
57%
83%
100%
87%
11%
46%
43%
68%
75%
96%
100%
55%
43%
77%
82%
80%
98%
100%
Other
Open / distance learning
Roving trainer gives feedbackon an ad hoc basis
Multimedia / software / CD‐ROM‐based training
Web‐based learning / e‐learning
External courses
Buddying with someoneexperienced in the role
Classroom sessions withtrainers
Police Forces
UK
Public Sector
Global
7.19 How much time, in hours, is spent coaching each agent on average, per month (not including training time already accounted for in previous questions)? (n.33)
7
34
8
Global Public Sector UK Police Forces
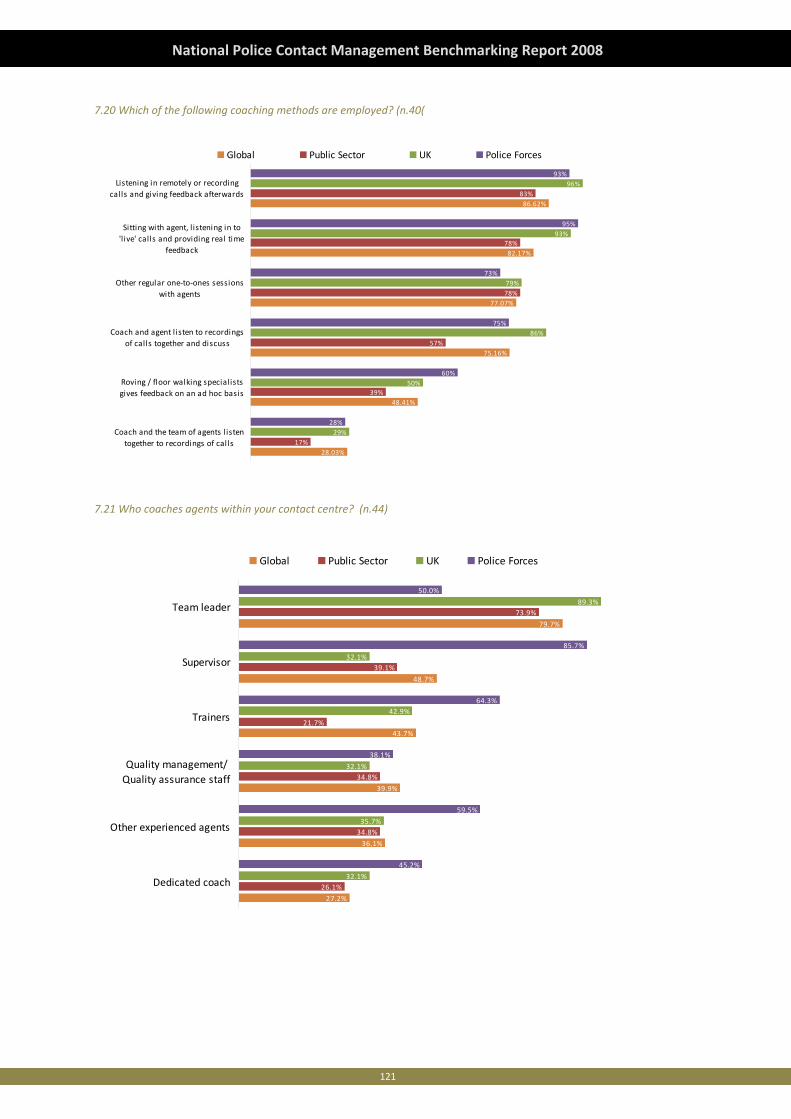
121
National Police Contact Management Benchmarking Report 2008
7.20 Which of the following coaching methods are employed? (n.40(
28.03%
48.41%
75.16%
77.07%
82.17%
86.62%
17%
39%
57%
78%
78%
83%
29%
50%
86%
79%
93%
96%
28%
60%
75%
73%
95%
93%
Coach and the team of agents l istentogether to recordings of calls
Roving / floor walking specialistsgives feedback on an ad hoc basis
Coach and agent l isten to recordingsof calls together and discuss
Other regular one‐to‐ones sessionswith agents
Sitting with agent, l istening in to'live' calls and providing real time
feedback
Listening in remotely or recordingcalls and giving feedback afterwards
Global Public Sector UK Police Forces
7.21 Who coaches agents within your contact centre? (n.44)
27.2%
36.1%
39.9%
43.7%
48.7%
79.7%
26.1%
34.8%
34.8%
21.7%
39.1%
73.9%
32.1%
35.7%
32.1%
42.9%
32.1%
89.3%
45.2%
59.5%
38.1%
64.3%
85.7%
50.0%
Dedicated coach
Other experienced agents
Quality management/Quality assurance staff
Trainers
Supervisor
Team leader
Global Public Sector UK Police Forces
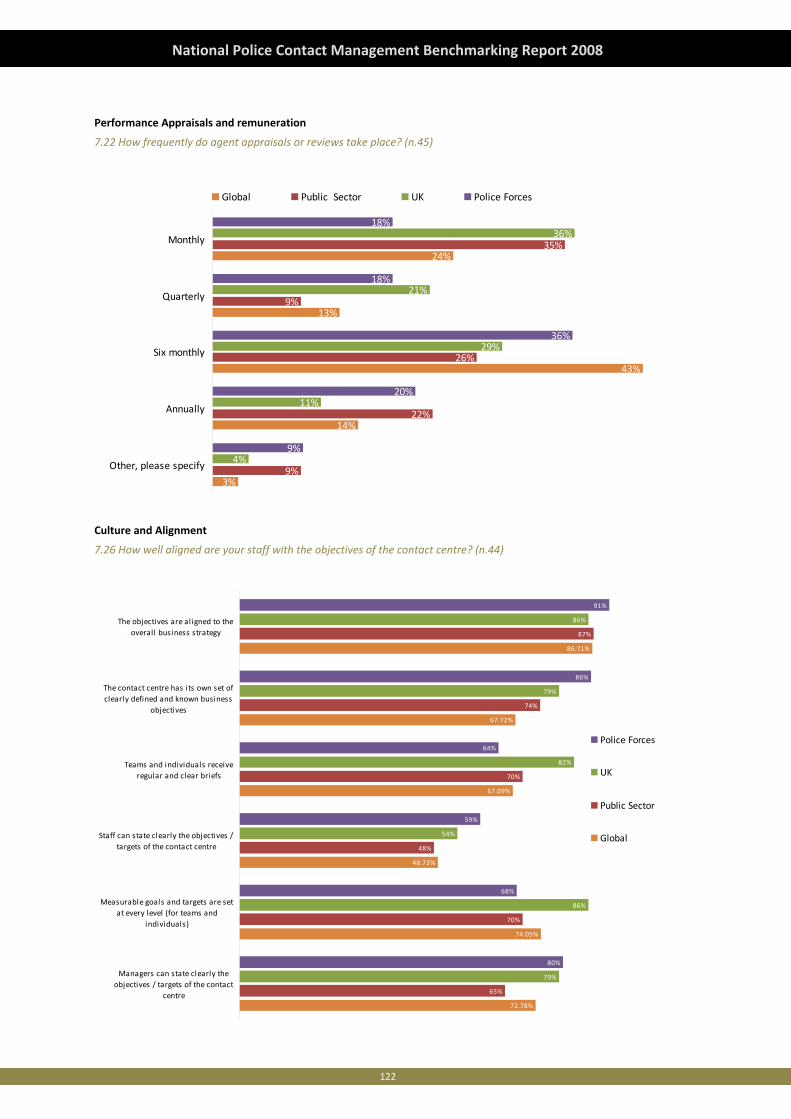
122
National Police Contact Management Benchmarking Report 2008
Performance Appraisals and remuneration
7.22 How frequently do agent appraisals or reviews take place? (n.45)
3%
14%
43%
13%
24%
9%
22%
26%
9%
35%
4%
11%
29%
21%
36%
9%
20%
36%
18%
18%
Other, please specify
Annually
Six monthly
Quarterly
Monthly
Global Public Sector UK Police Forces
Culture and Alignment
7.26 How well aligned are your staff with the objectives of the contact centre? (n.44)
72.78%
74.05%
48.73%
67.09%
67.72%
86.71%
65%
70%
48%
70%
74%
87%
79%
86%
54%
82%
79%
86%
80%
68%
59%
64%
86%
91%
Managers can state clearly theobjectives / targets of the contact
centre
Measurable goals and targets are setat every level (for teams and
individuals)
Staff can state clearly the objectives /targets of the contact centre
Teams and individuals receiveregular and clear briefs
The contact centre has its own set ofclearly defined and known business
objectives
The objectives are aligned to theoverall business strategy
Police Forces
UK
Public Sector
Global
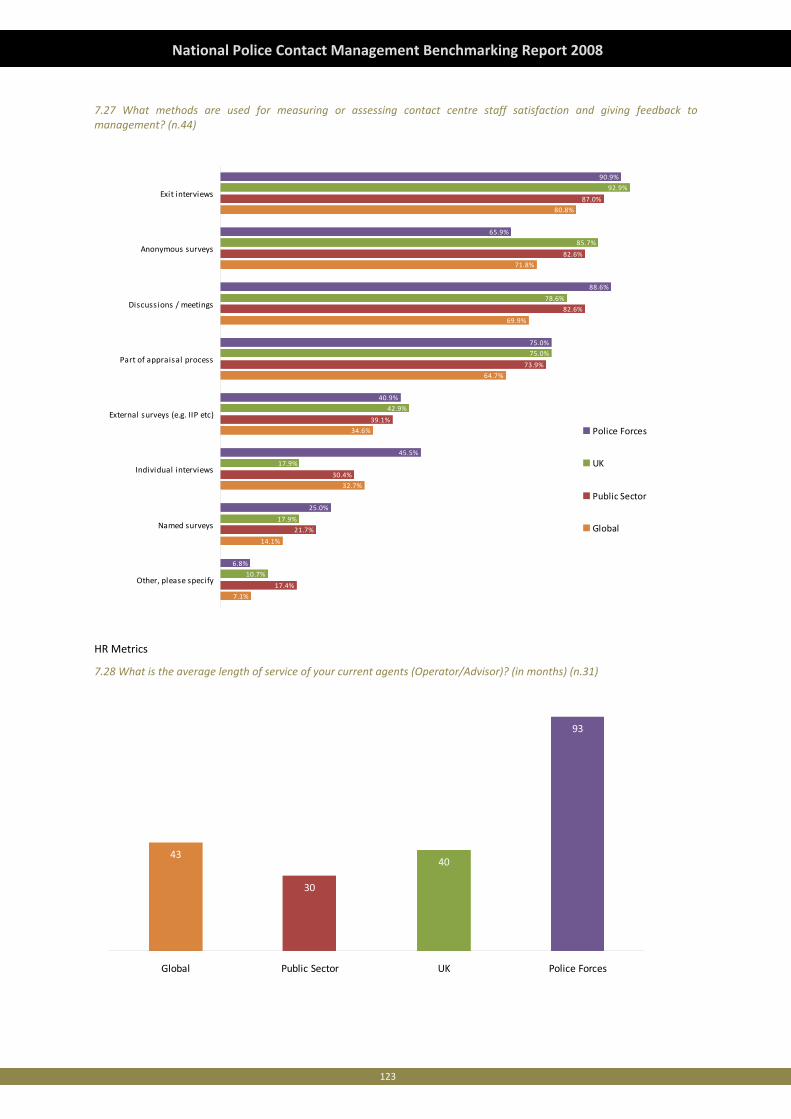
123
National Police Contact Management Benchmarking Report 2008
7.27 What methods are used for measuring or assessing contact centre staff satisfaction and giving feedback to management? (n.44)
7.1%
14.1%
32.7%
34.6%
64.7%
69.9%
71.8%
80.8%
17.4%
21.7%
30.4%
39.1%
73.9%
82.6%
82.6%
87.0%
10.7%
17.9%
42.9%
75.0%
78.6%
85.7%
92.9%
6.8%
25.0%
45.5%
40.9%
75.0%
88.6%
65.9%
90.9%
17.9%
Other, please specify
Named surveys
Individual interviews
External surveys (e.g. IIP etc)
Part of appraisal process
Discussions / meetings
Anonymous surveys
Exit interviews
Police Forces
UK
Public Sector
Global
HR Metrics
7.28 What is the average length of service of your current agents (Operator/Advisor)? (in months) (n.31)
43
30
40
93
Global Public Sector UK Police Forces
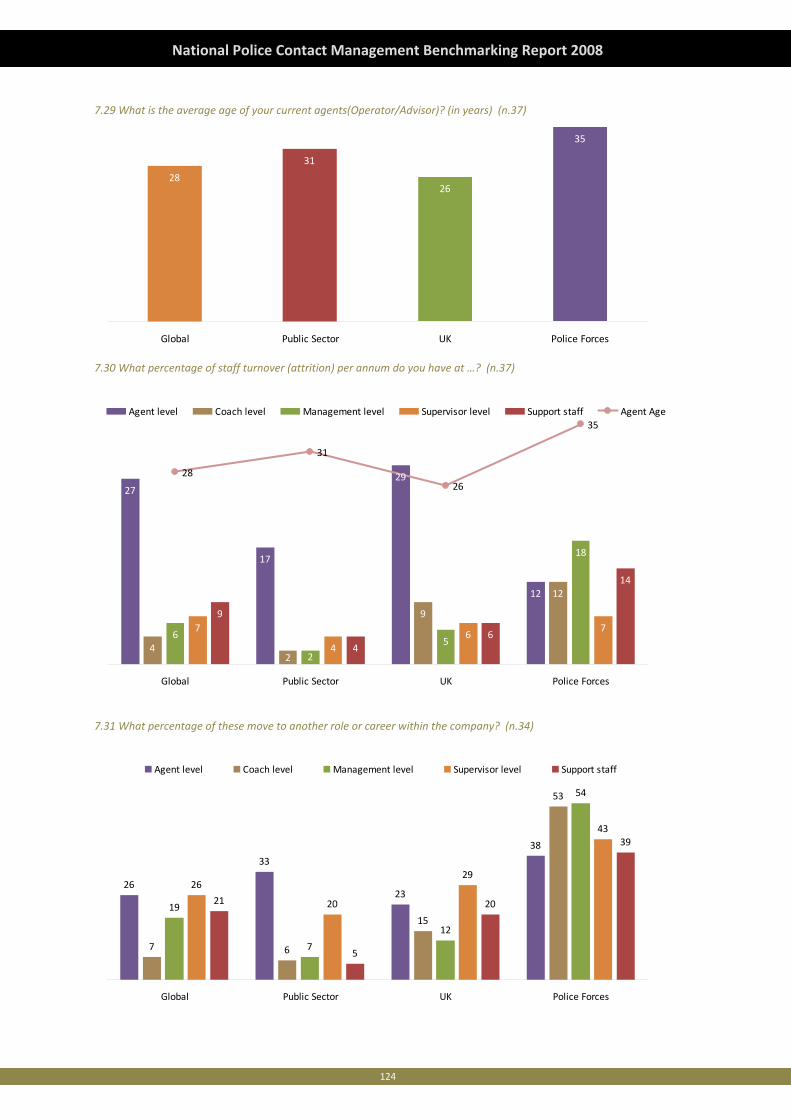
124
National Police Contact Management Benchmarking Report 2008
7.29 What is the average age of your current agents(Operator/Advisor)? (in years) (n.37)
31
26
35
28
Global Public Sector UK Police Forces
7.30 What percentage of staff turnover (attrition) per annum do you have at …? (n.37)
27
17
29
12
4
9
12
65
18
7
46
79
46
14
2 2
28
31
26
35
Global Public Sector UK Police Forces
Agent level Coach level Management level Supervisor level Support staff Agent Age
7.31 What percentage of these move to another role or career within the company? (n.34)
26
33
23
38
7 6
15
53
19
7
12
54
26
20
29
43
21
5
20
39
Global Public Sector UK Police Forces
Agent level Coach level Management level Supervisor level Support staff
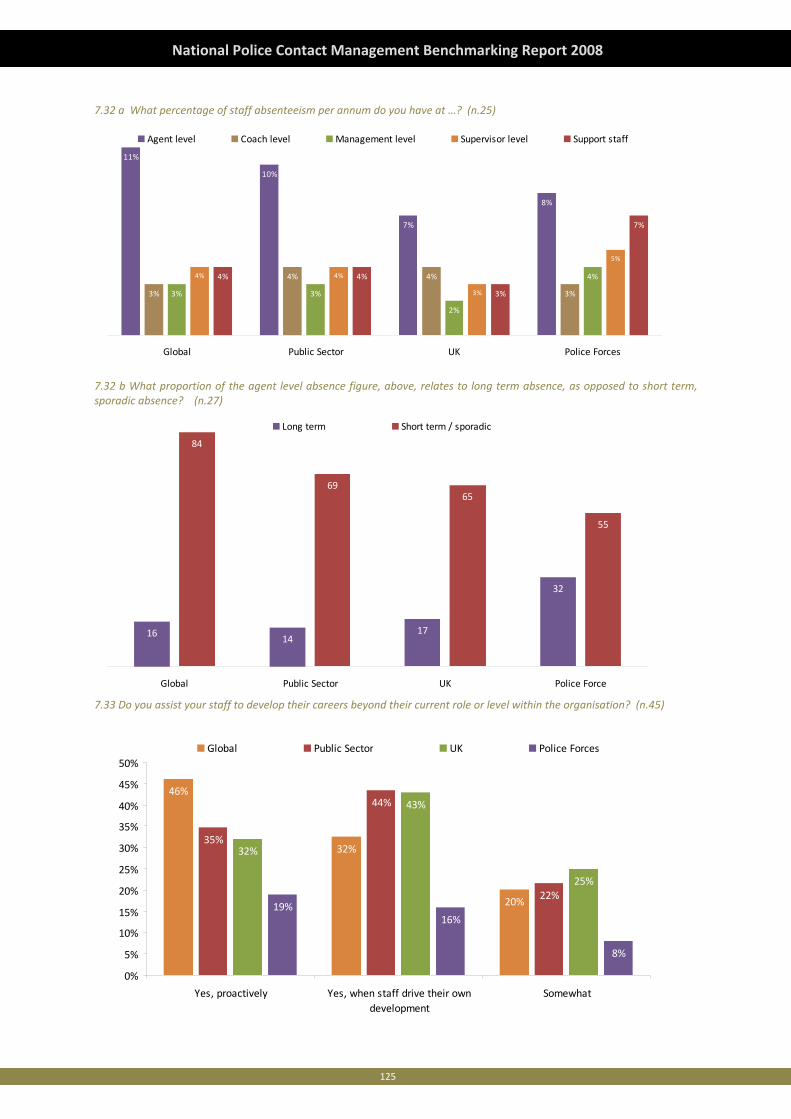
125
National Police Contact Management Benchmarking Report 2008
7.32 a What percentage of staff absenteeism per annum do you have at …? (n.25)
11%
10%
7%
8%
3%
4% 4%
3%3% 3%
2%
4%4% 4%
3%
5%
4% 4%
3%
7%
Global Public Sector UK Police Forces
Agent level Coach level Management level Supervisor level Support staff
7.32 b What proportion of the agent level absence figure, above, relates to long term absence, as opposed to short term, sporadic absence? (n.27)
16 1417
32
84
6965
55
Global Public Sector UK Police Force
Long term Short term / sporadic
7.33 Do you assist your staff to develop their careers beyond their current role or level within the organisation? (n.45)
46%
32%
20%
35%
44%
22%
32%
43%
25%
19%16%
8%
0%
5%
10%
15%
20%
25%
30%
35%
40%
45%
50%
Yes, proactively Yes, when staff drive their owndevelopment
Somewhat
Global Public Sector UK Police Forces
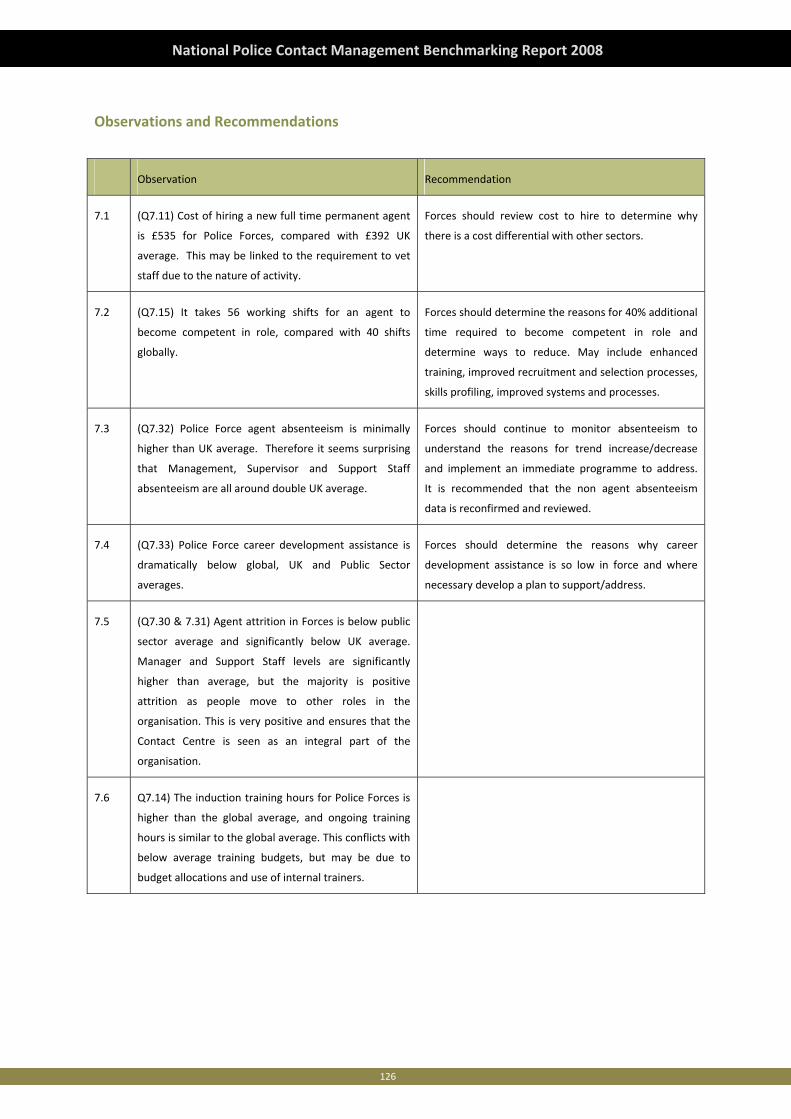
126
National Police Contact Management Benchmarking Report 2008
Observations and Recommendations
Observation Recommendation
7.1 (Q7.11) Cost of hiring a new full time permanent agent
is £535 for Police Forces, compared with £392 UK
average. This may be linked to the requirement to vet
staff due to the nature of activity.
Forces should review cost to hire to determine why
there is a cost differential with other sectors.
7.2 (Q7.15) It takes 56 working shifts for an agent to
become competent in role, compared with 40 shifts
globally.
Forces should determine the reasons for 40% additional
time required to become competent in role and
determine ways to reduce. May include enhanced
training, improved recruitment and selection processes,
skills profiling, improved systems and processes.
7.3 (Q7.32) Police Force agent absenteeism is minimally
higher than UK average. Therefore it seems surprising
that Management, Supervisor and Support Staff
absenteeism are all around double UK average.
Forces should continue to monitor absenteeism to
understand the reasons for trend increase/decrease
and implement an immediate programme to address.
It is recommended that the non agent absenteeism
data is reconfirmed and reviewed.
7.4 (Q7.33) Police Force career development assistance is
dramatically below global, UK and Public Sector
averages.
Forces should determine the reasons why career
development assistance is so low in force and where
necessary develop a plan to support/address.
7.5 (Q7.30 & 7.31) Agent attrition in Forces is below public
sector average and significantly below UK average.
Manager and Support Staff levels are significantly
higher than average, but the majority is positive
attrition as people move to other roles in the
organisation. This is very positive and ensures that the
Contact Centre is seen as an integral part of the
organisation.
7.6 Q7.14) The induction training hours for Police Forces is
higher than the global average, and ongoing training
hours is similar to the global average. This conflicts with
below average training budgets, but may be due to
budget allocations and use of internal trainers.

127
National Police Contact Management Benchmarking Report 2008

128
National Police Contact Management Benchmarking Report 2008
129
National Police Contact Management Benchmarking Report 2008
Chapter 8: Technology Environment
Introduction
Benchmarking technology in the contact centre is not merely a checklist of features and functions. It's about understanding
how to use technology to underpin the aims of the business. Not having the right technology to support business and
operational requirements can be hugely frustrating for both management and users within the contact centre.
An example of this is incorporating the functionality provided by an IP‐based architecture into a business model which can
mean enormous benefits for the proactive organisation. However, an unplanned and indiscriminate implementation of IP‐
based technology into the organisation may cause the opposite effect and expose the business to a higher level of
complexity and risk. The following topics are included:
a. Current and Planned IT Environment
b. Support
c. Strategy and Architecture
Global Perspective
Technology is advancing at a rapid pace in today's world. It is changing the world we live in and how we go about our daily
lives. If we think back to 10 years ago and compare it to now, the level of change is staggering. We can see the impact of
technology on the way we bank, the way we communicate both in business and personally, and our expectations of being
able to reach our friends and workplaces any time, anywhere. This also means that the rate of change and speed of
information flow is making the management of businesses ever more difficult.
Getting it right – a balancing act
Contact centres support service delivery within most companies today. Total service delivery is complex and takes a huge
effort to get right and even more to maintain. The ability to maintain involves the ability to respond to constant change.
Within these responses, there are many opportunities.
Organisations that operate contact centres often battle to understand the costs of service delivery vs. the benefits. While it
may be simple on a conceptual or theoretical level, the operational reality is much more complex. Most contact centres are
defined by their role, people, systems, processes and technology. With each of these factors working together, the
technology in a contact centre is instrumental to the fundamental nature of the operation. A change in technology can
create change across the rest of the operation before showing results.
For technology to support brilliant service delivery, it almost always needs to support the following key requirements:
• High First Contact Resolution (FCR).
• Consistent processes and managed high adherence.
• Up and down communication that works ‐ agents feel empowered to represent the whole company with all the
information they need to ensure an excellent customer experience.
• Data and information systems that are flexible enough to ensure a lower staff turnover where management is able to
manage and report and agents feel valued using systems, incentives and encouragement. Management tools that can
support achieving business outcomes.
• Use of different channels to benefit both customers and the company.
The cost of getting it right is almost always less than the cost of getting it wrong. The problem is that it’s not always clear
how technology on the whole can support the above requirements. It takes careful planning and often the glitz and glam of
the features and functions overshadows the attributes underpinning the various contact centre technologies.
130
National Police Contact Management Benchmarking Report 2008
It’s difficult for managers to look past the cost of inefficiencies and to understand that getting it right now will mean the
extra investment pays for itself in more efficiency and greater overall returns for the business. The cost of advanced
technology is often easily justified by overenthusiastic initiatives, spurred on by the usual hype that comes with new
technologies.
Consistent service delivery needs a well organised operation supported by people, process and technology, that is in line
with the best interests of customers and the business itself. This is a tall order and not many contact centres get it right.
From a technology perspective, it’s important to line up the business and customer performance factors with each of the
technology functions, within the contact centre, to make sure the technology performs at its best.
Contact centre technology must also support business objectives at a reasonable cost for the returns expected on service
delivery. So many organisations get it wrong. They either cut IT budgets, leaving contact centre staff and management
frustrated by the technology not supporting overall service delivery, or they believe technology will solve all their problems
and so overspend, leaving management frustrated over the high operational costs, lack of returns and little or no focus on
people or process.
Key trends and changes
Judging technology trends can help us understand where the industry is headed. Trends help us cut through the complexity
and focus on the things that matter.
While it's important to look at trends in contact centre technologies, we need to look at the underlying reason for these
trends. It might be the rising popularity of a particular technology or something that's being done to improve service
delivery. We believe it's a combination of the two, which is why it is so encouraging to see that service availability and
business continuity planning is top of the list of trends this year.
Other top technology trends include:
• The move towards a service‐based architecture where the IP Network becomes the core platform on which the
contact centre services reside.
• The use of open standards, made possible initially by the move of voice towards IP followed by the decoupling of the
actual conversation, and the control and management of the call.
• The move towards niche self service with a focus on high value (customer/company benefits).
• Performance – if you can’t measure it, you can’t fix it.
• Process and workflow – the move from analogue to digital; time‐based to real time, data when it matters most.
• Multiple media – consumer driven focus required.
The network – breaking down the functional boundaries
The IP network is becoming core to supporting the distributed new architectures in the contact centre. The network needs
to support how calls are routed in order to support new business models – hosted services, specialist skills, etc.
Virtual contact centres are becoming increasingly important to many companies. Executives understand the need to
support many sites across the globe and the benefits of managing them from a central location. Routing calls across a
virtual contact centre to the right agent, in terms of skill and availability can mean significant cost savings and improved
service delivery.
An architecture based on IP, using open standards such as SIP (session initiated protocol), is ideal for providing managed or
hosted services. This means that businesses are seeing the value of new levels of hosting and outsourcing in their overall
contact centre business models.
131
National Police Contact Management Benchmarking Report 2008
Where’s the promise?
Many contact centres are questioning the investments in technologies that have had little or no impact on their ability to
improve performance or respond to customer requirements.
Contact centre management needs to have a clear understanding of how the technology is used to support the business,
what it's responsible for and what the limitations are. All contact centres will have many projects on the go at one time and
management needs to understand how important each is to the business and operational objectives. These projects could
involve the deployment of new technologies, the integration of existing technologies or the configuration and
customisation of existing functionality.
The criteria used to measure the value and priority of projects is however not always based on business value or customer
benefit. This can mean that contact centres risk deploying technology that is out of touch with what's important – their
customers and long term profitability.
Internet Protocol (IP)
The use of IP as a transport mechanism for voice services has been around for 10 years and for the past five years as the
main basis for switching voice calls. During this time, many organisations have questioned its use within the contact centre.
It's a question that seemed justified, given the traditional view that the contact centre performs a specialised and strategic
function within the business.
This year's results show without a doubt that such IP concerns are a thing of the past. There is a clear trend towards
organisations making use of IP within their contact centres.
The use of IP‐based technologies within contact centres has shown a steady growth over the past three years after a slow
start. This year, a growth of 46% in core infrastructure shows just how fast this is happening. It is no longer a question of
'should we', but more how best to develop the roadmap for IP deployment.
The high growth in the use of IP in recording (75%) and IVR (82%) is as expected and shows that the overall contact centre
architecture has now embraced IP as a relevant technology.
Let’s consider the current use of IP in the typical contact centre. Do contact centres use IP strategically or have they been
migrated into it as part of a natural evolution? Most vendors now support IP as the foundation for their solution and in
many cases it’s impossible to buy technology that doesn't have some level of IP as part of its architecture.
It would be safe to say that any new contact centre being built now would have the option of using IP somewhere within its
solution. At the same time the IP‐based technology can be made to function in a traditional way in support of traditional
operational environments. There is real potential for organisations that are building new contact centres to make the most
of IP benefits. These include cost savings, flexible deployment options, integration of the contact centre into the enterprise,
etc. A good question might be to look at whether the use of IP in your contact centre is based on a strategic initiative or just
due to a natural evolution on the part of the vendors’ technology deployment.
From this year’s benchmark data, it’s clear that the major reasons for contact centres moving to IP are flexible architecture
and a technology cost drive. The fact that over 30% of contact centres that have moved to IP to meet a specific business or
functional requirement in the contact centre is also encouraging. We expect to see organisations that drive business‐
specific benefits from their IP architectures, starting to differentiate the services they offer and reducing the cost base of
interactions because of the flexibility that IP architectures provide.
Self service
The case for self service applications is very clear – manage more calls 24 hours a day and reduce the overall cost per
interaction. This is the only way many organisations will meet the demand of more calls vs. the cost of delivering the
132
National Police Contact Management Benchmarking Report 2008
service. Agents can be far more aware of customers' needs and respond to specific requests more effectively. However it's
expensive to meet the rising service interactions with a corresponding rise in head count.
Self service is inevitable, but the business objective should still be to meet customer expectations and maintain loyalty.
Having a successful self service strategy without compromising customer loyalty needs precise planning and gaining the
support of customers for such initiatives.
More businesses are realising that using self service is the best way to deal with the increase in customer service calls while
keeping costs down. We see many organisations taking a practical view of self service by focusing on particular functions
and services instead of trying to do it all.
Although the biggest issue with Automatic Speech Recognition (ASR) is the disappointing results of many deployments, we
do see enough evidence of well planned and positioned ASR projects which have shown good user support and incredible
returns on investment.
The adoption of self service continues with more customers being exposed to them. In a recent end user survey, done by
Dimension Data outside of the Benchmarking Survey, we discovered that more customers were in support of self service
than expected by those delivering self service offerings.
However we also identified that fewer users were satisfied with the overall channel than expected. We noted that it’s
critical for organisations to first identify the services best suited to self service and then to make sure that the overall
customer service channel strategy supports its use. This is the best way to make sure that a positive customer experience is
delivered and developed. We saw, through the survey, that self service users weren't given the choice to speak to an agent
which showed a lack of integration across the channels.
The ability to cut costs is one of the main advantages of a self service solution. Being able to support calls 24 hours a day
and to remove many of them from the contact centre can show significant savings.
Self service has matured into an accepted channel but it’s critical to understand the difference between its dedicated and
facilitated roles. Some applications can be delivered without the support from the contact centre, with services like
directory enquiries or message management being offered as self service only.
If calls to the contact centre are offered as self service options, it's important to look at the impact on customers and to
effectively manage the handoff between the self service and contact centre channels.
The focus is shifting from technology to usage in thinking about the customer experience. We see a trend where businesses
focus more on the impact of self service within the contact centre than on the performance of the technology. Specifically,
we see businesses thinking about the impact that self service is having on the end user. With end users being more
accepting of self service than businesses had originally thought, this can be good news for the future as use of the self
service channel grows to meet user and business objectives.
Email ever growing
Email management offers a huge opportunity for organisations to increase productivity within their contact centres and
improve customer satisfaction. Over half of the contact centres that responded now make use of inbound email
management.
Contact centres making use of automated outbound email has risen slightly from 25% to 27.9%. Outbound email gives
businesses the ability to keep customers up to date on the status of their enquiry. By analysing call data, the average time
taken for customers to phone for a progress update is an indicator of when emails should be sent out. If timed properly, a
proactive email update can significantly reduce the volume of inbound customer update calls as well as support overall
satisfaction.
133
National Police Contact Management Benchmarking Report 2008
Web in the contact centre
The introduction of the Internet into the contact centre has had many advantages. One of these has been the opportunity
to reduce inbound call volumes by allowing customers to help themselves without relying on an agent. The idea of involving
agents in helping customers use the internet has been less successful.
We are entering into a phase where Internet use is exceeding all expectations and the social network phenomenon has
caught us by surprise. No one dares predict what the next big internet behaviour or opportunity will be. Customer facing
organisations will have to continue exploring the use of the internet and how it is integral to the contact centre if they want
to understand their customers’ expectations.
The use of web technologies in the contact centre is entering a phase where more specific applications of the technology
are being explored. The number of those who plan to install online self service has increased by over 50% from last year.
Although an online self‐service web presence removes many calls from the contact centre, it is clear that these web sites
also add new call types into the contact centre.
WEB 2.0 – The Concept
Most of us have by now either heard of, or have been exposed to, the terms social‐networking, wiki’s and blogs. Web 2.0 is
about using web technology in a way purists believe the internet was meant to be used i.e. information sharing and
collaboration among users usually set up in communities or user groups.
According to Tim O’Reilly (O’Reilly Media) Web 2.0 is the business revolution in the computer industry caused by the move
to the internet as a platform, and an attempt to understand the rules for success on that new platform.
We see a huge growth in the use of social networking sites like Facebook and LinkedIn which shows how much support is
being aimed at collaboration and sharing of information on the internet.
The question from a contact centre perspective should be how this all affects customer service for the organisation. Many
customers find it quite normal to go into online consumer communities to get answers to problems and issues they face.
A disgruntled customer may very well first see what’s being said about your products on the Internet before phoning your
contact centre.
This poses an interesting challenge for businesses in how this might pan out. Businesses are going to need to be creative in
servicing their customers and finding ways of using internet communities as a tool. While using a community to meet
certain customer requirements can be beneficial, it can also become a services manager’s worst nightmare. It is incredibly
difficult to manage situations where a community outside the control of the organisation is left to resolve problems, make
recommendations on products and/or promote or slam your products or services over that of a competitor.
Trying to control and manage information on the internet is futile, but ignoring it is like burying your head in the sand.
Contact centre IT managers need to understand how the internet will affect the needs of the architectures and technologies
used in their centres. So be sure to get involved, investigate, understand and include the internet, its communities and the
technologies that support this world into your overall customer service strategy.
Performance management
We see a trend emerging for organisations to manage performance, based upon operational and business outcomes. Data
analytics and real‐time reporting across multiple applications are key focus areas and will drive many new enhancements in
people management within the contact centre.
Performance management has always been an integral part of contact centre operations. Identifying this as a trend should
be explained further. Over the years we’ve seen performance management move from being event‐based to focusing more
134
National Police Contact Management Benchmarking Report 2008
on quality and business performance. Noting this trend means having to look at the specifics – what's being managed vs.
the impact of the management on the organisation and on customer satisfaction.
From a technology perspective we see the merging of multiple workforce, quality and performance management
technologies into integrated, single‐suite offerings. This shows a likely move to a more consolidated and balanced
approach to performance management.
An example of this might be where contact centre reports include more business and customer satisfaction related data,
used to measure and rate agents' performance. Added to this, workforce management systems may also be set up to
schedule agents with business performance criteria in mind. So, although from a technology perspective there’s a far
greater drive to demonstrate an end‐to‐end integrated performance model, many organisations are realising the benefits
within distinct areas of focus.
Process management
Process management within contact centres has been slow to respond to the real‐time nature of transactions in this
environment. First Contact Resolution relies on systems and processes that are both responsive and supportive in achieving
a successful result for each individual interaction.
Successful process management involves understanding customer needs and responding in a way that benefits both the
customer and the organisation. This may sound simple in theory, but in practice it can be more complex. For an agent to
achieve this, they need technology to support the process by giving them access to relevant information while being able to
functionally carry out the transaction.
The reality is that many contact centres use processes not specifically designed for a real‐ time call environment, which is
key to First Contact Resolution. As we move forward, business models set up for contact centres will become increasingly
complex. The pressure to deliver on customer demands and the types of services being supported will make sure of it.
For technology to take its rightful role in enabling high quality service delivery, the development of a specific strategy
through careful and deliberate planning is essential.
Benchmark and best practice review
The integration of the contact centre into business systems tells us about the overall role the contact centre plays within
the organisation. We still see many contact centres doing service related functions with sales and revenue generation
functions lagging behind.
The integration of applications in the contact centre is generally a very good indicator of their position and function within
the wider business. First Contact Resolution rates usually reflect how well the contact centre is integrated into the
organisations business systems. From the data we can see clear progress being made.
Conclusion
For many contact centres it may seem that the battle to meet customer expectations is trying to do more with less. If
contact centre managers, and those responsible for the technology, are to meet the ongoing demands of customers and
the business, then a well defined products and technology roadmap is essential. Technology needs to support the basics
first and do it well.
Information and the management of data will become key in handling the complexities of the contact centre in the future.
Behaviours within contact centres are driven by the way the centre is managed and the incentives used to motivate agents.
The more complex the contact centre, the more critical the implementation of well‐defined, well‐managed processes.
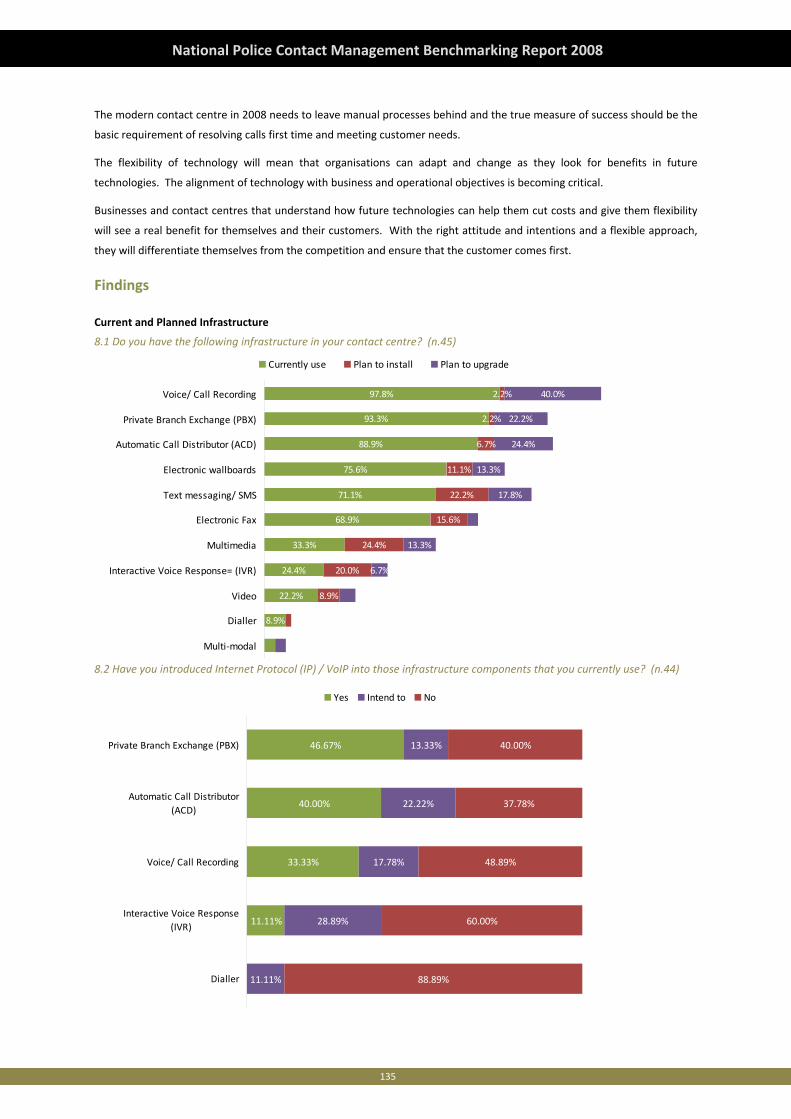
135
National Police Contact Management Benchmarking Report 2008
The modern contact centre in 2008 needs to leave manual processes behind and the true measure of success should be the
basic requirement of resolving calls first time and meeting customer needs.
The flexibility of technology will mean that organisations can adapt and change as they look for benefits in future
technologies. The alignment of technology with business and operational objectives is becoming critical.
Businesses and contact centres that understand how future technologies can help them cut costs and give them flexibility
will see a real benefit for themselves and their customers. With the right attitude and intentions and a flexible approach,
they will differentiate themselves from the competition and ensure that the customer comes first.
Findings
Current and Planned Infrastructure
8.1 Do you have the following infrastructure in your contact centre? (n.45)
8.9%
22.2%
24.4%
33.3%
68.9%
71.1%
75.6%
88.9%
93.3%
97.8%
8.9%
20.0%
24.4%
15.6%
22.2%
11.1%
6.7%
2.2%
2.2%
6.7%
13.3%
17.8%
13.3%
24.4%
22.2%
40.0%
Multi‐modal
Dialler
Video
Interactive Voice Response= (IVR)
Multimedia
Electronic Fax
Text messaging/ SMS
Electronic wallboards
Automatic Call Distributor (ACD)
Private Branch Exchange (PBX)
Voice/ Call Recording
Currently use Plan to install Plan to upgrade
8.2 Have you introduced Internet Protocol (IP) / VoIP into those infrastructure components that you currently use? (n.44)
33.33%
40.00%
46.67%
11.11%
28.89%
17.78%
22.22%
13.33%
88.89%
60.00%
48.89%
37.78%
40.00%
11.11%
Dialler
Interactive Voice Response(IVR)
Voice/ Call Recording
Automatic Call Distributor(ACD)
Private Branch Exchange (PBX)
Yes Intend to No
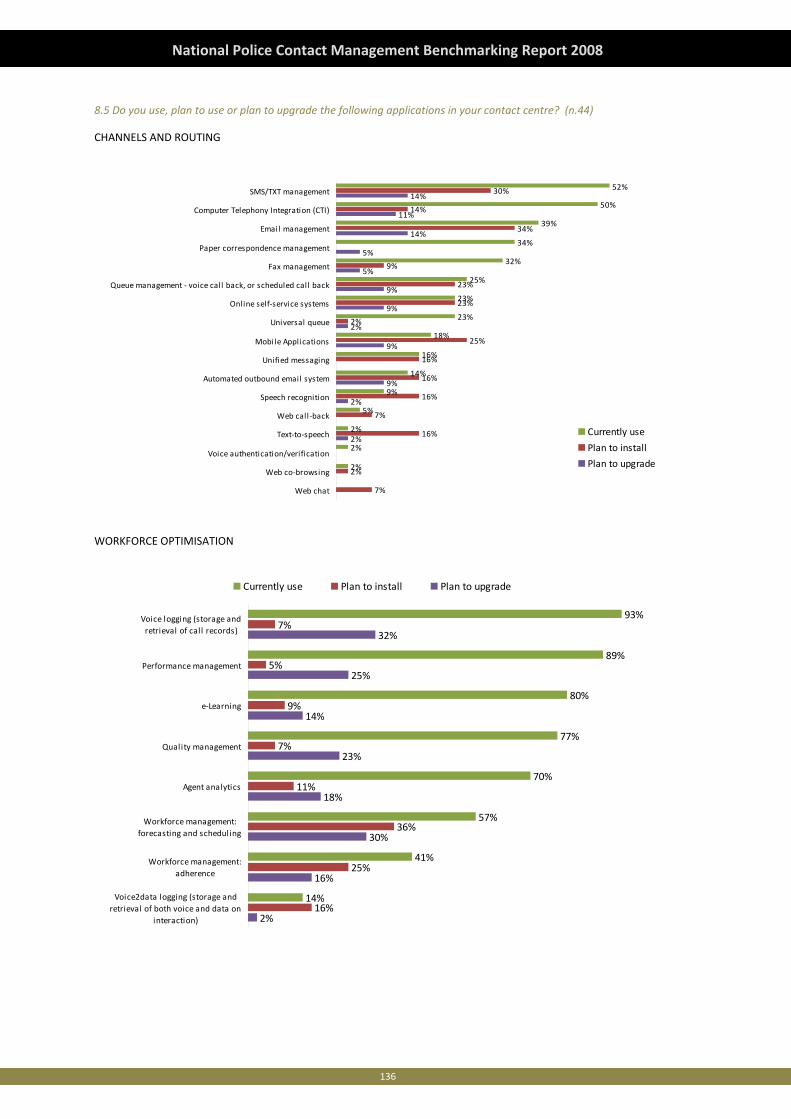
136
National Police Contact Management Benchmarking Report 2008
8.5 Do you use, plan to use or plan to upgrade the following applications in your contact centre? (n.44)
CHANNELS AND ROUTING
52%
50%
39%
34%
32%
25%
23%
23%
18%
16%
14%
9%
5%
2%
2%
2%
30%
14%
34%
9%
23%
23%
2%
25%
16%
16%
16%
7%
16%
2%
7%
14%
11%
14%
5%
5%
9%
9%
2%
9%
9%
2%
2%
SMS/TXT management
Computer Telephony Integration (CTI)
Email management
Paper correspondence management
Fax management
Queue management ‐ voice call back, or scheduled call back
Online self‐service systems
Universal queue
Mobile Applications
Unified messaging
Automated outbound email system
Speech recognition
Web call‐back
Text‐to‐speech
Voice authentication/verification
Web co‐browsing
Web chat
Currently use
Plan to install
Plan to upgrade
WORKFORCE OPTIMISATION
93%
89%
80%
77%
70%
57%
41%
14%
7%
5%
9%
7%
11%
36%
25%
16%
32%
25%
14%
23%
18%
30%
16%
2%
Voice logging (storage andretrieval of call records)
Performance management
e‐Learning
Quality management
Agent analytics
Workforce management:forecasting and scheduling
Workforce management:adherence
Voice2data logging (storage andretrieval of both voice and data on
interaction)
Currently use Plan to install Plan to upgrade
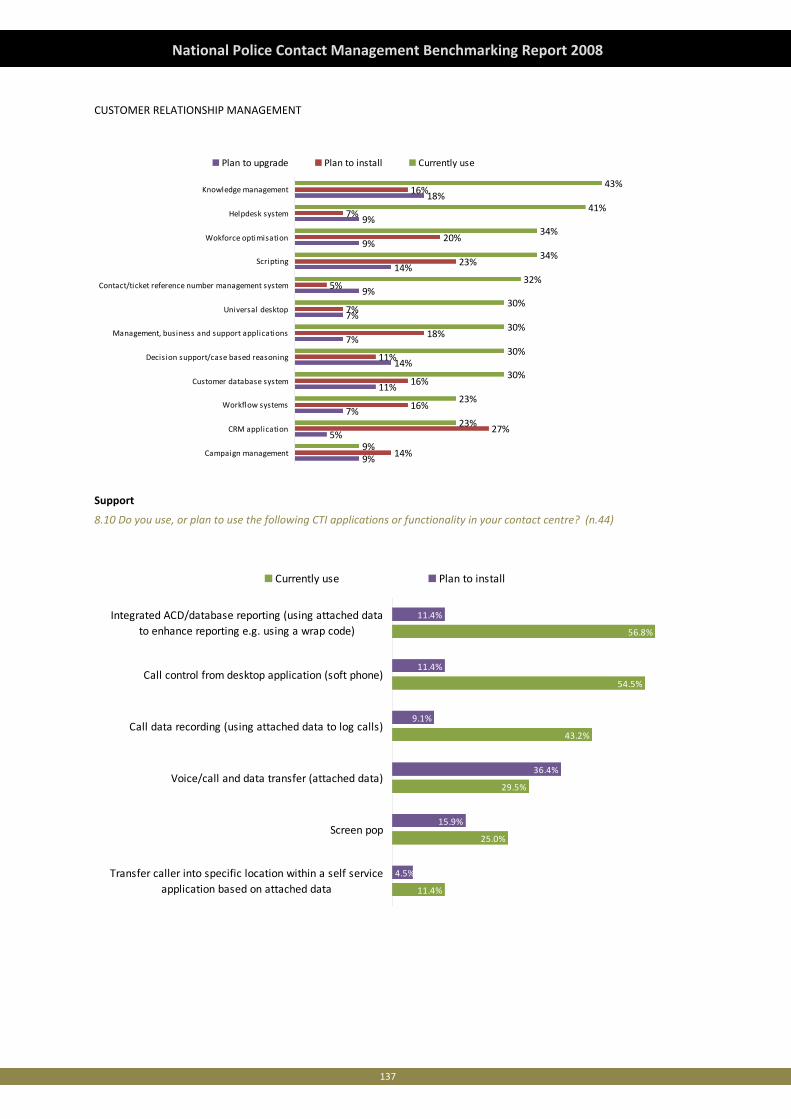
137
National Police Contact Management Benchmarking Report 2008
CUSTOMER RELATIONSHIP MANAGEMENT
9%
5%
7%
11%
14%
7%
7%
9%
14%
9%
9%
18%
14%
27%
16%
16%
11%
18%
7%
5%
23%
20%
7%
16%
9%
23%
23%
30%
30%
30%
30%
32%
34%
34%
41%
43%
Campaign management
CRM application
Workflow systems
Customer database system
Decision support/case based reasoning
Management, business and support applications
Universal desktop
Contact/ticket reference number management system
Scripting
Wokforce optimisation
Helpdesk system
Knowledge management
Plan to upgrade Plan to install Currently use
Support
8.10 Do you use, or plan to use the following CTI applications or functionality in your contact centre? (n.44)
11.4%
25.0%
29.5%
43.2%
54.5%
56.8%
15.9%
36.4%
9.1%
11.4%
11.4%
4.5%Transfer caller into specific location within a self serviceapplication based on attached data
Screen pop
Voice/call and data transfer (attached data)
Call data recording (using attached data to log calls)
Call control from desktop application (soft phone)
Integrated ACD/database reporting (using attached datato enhance reporting e.g. using a wrap code)
Currently use Plan to install
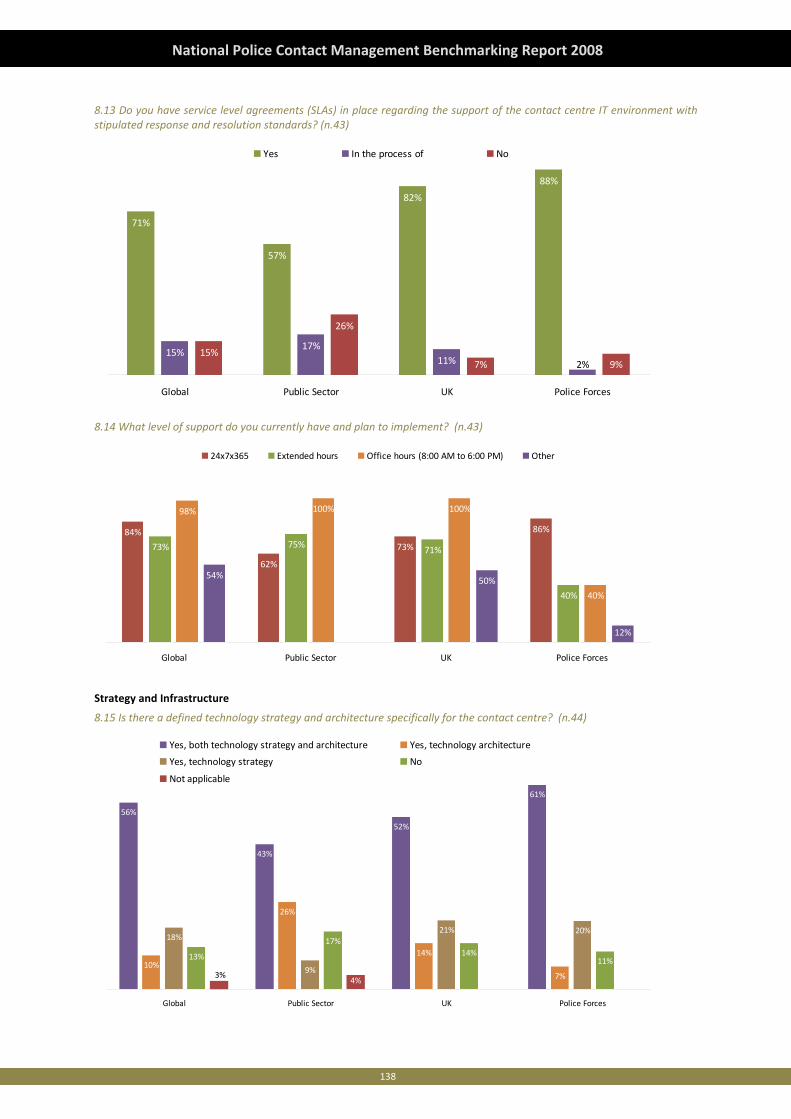
138
National Police Contact Management Benchmarking Report 2008
8.13 Do you have service level agreements (SLAs) in place regarding the support of the contact centre IT environment with stipulated response and resolution standards? (n.43)
71%
57%
82%
88%
15%17%
11%15%
26%
7% 9%2%
Global Public Sector UK Police Forces
Yes In the process of No
8.14 What level of support do you currently have and plan to implement? (n.43)
84%
62%
73%
86%
73% 75% 71%
40%
98% 100% 100%
40%
54%
0%
50%
12%
Global Public Sector UK Police Forces
24x7x365 Extended hours Office hours (8:00 AM to 6:00 PM) Other
Strategy and Infrastructure
8.15 Is there a defined technology strategy and architecture specifically for the contact centre? (n.44)
56%
43%
52%
61%
10%
26%
14%
7%
18%
9%
21% 20%
13%
17%14%
11%
4% 0%3%
Global Public Sector UK Police Forces
Yes, both technology strategy and architecture Yes, technology architecture
Yes, technology strategy No
Not applicable
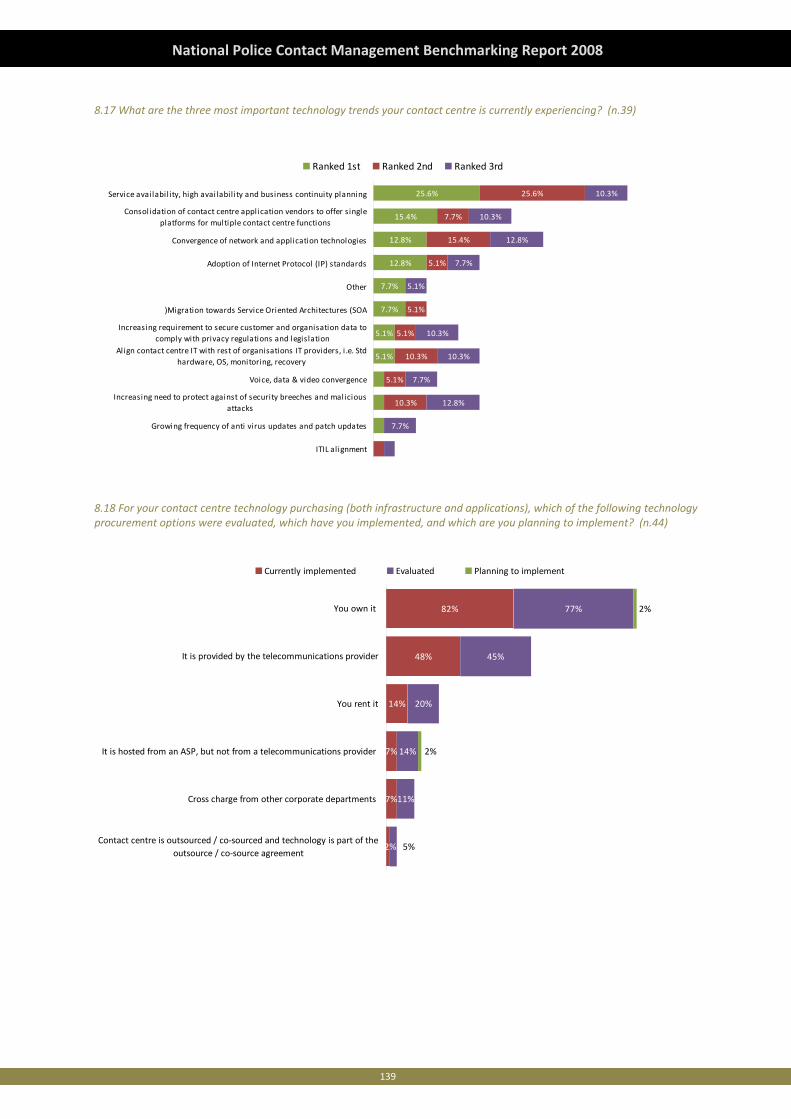
139
National Police Contact Management Benchmarking Report 2008
8.17 What are the three most important technology trends your contact centre is currently experiencing? (n.39)
5.1%
5.1%
7.7%
7.7%
12.8%
12.8%
15.4%
25.6%
10.3%
5.1%
10.3%
5.1%
5.1%
5.1%
15.4%
7.7%
25.6%
7.7%
12.8%
7.7%
10.3%
10.3%
5.1%
7.7%
12.8%
10.3%
10.3%
ITIL alignment
Growing frequency of anti virus updates and patch updates
Increasing need to protect against of security breeches and maliciousattacks
Voice, data & video convergence
Align contact centre IT with rest of organisations IT providers, i .e. Stdhardware, OS, monitoring, recovery
Increasing requirement to secure customer and organisation data tocomply with privacy regulations and legislation
)Migration towards Service Oriented Architectures (SOA
Other
Adoption of Internet Protocol (IP) standards
Convergence of network and application technologies
Consolidation of contact centre application vendors to offer singleplatforms for multiple contact centre functions
Service availability, high availabil ity and business continuity planning
Ranked 1st Ranked 2nd Ranked 3rd
8.18 For your contact centre technology purchasing (both infrastructure and applications), which of the following technology procurement options were evaluated, which have you implemented, and which are you planning to implement? (n.44)
7%
7%
14%
48%
82%
11%
14%
20%
45%
77%
2% 5%
2%
2%
Contact centre is outsourced / co‐sourced and technology is part of theoutsource / co‐source agreement
Cross charge from other corporate departments
It is hosted from an ASP, but not from a telecommunications provider
You rent it
It is provided by the telecommunications provider
You own it
Currently implemented Evaluated Planning to implement
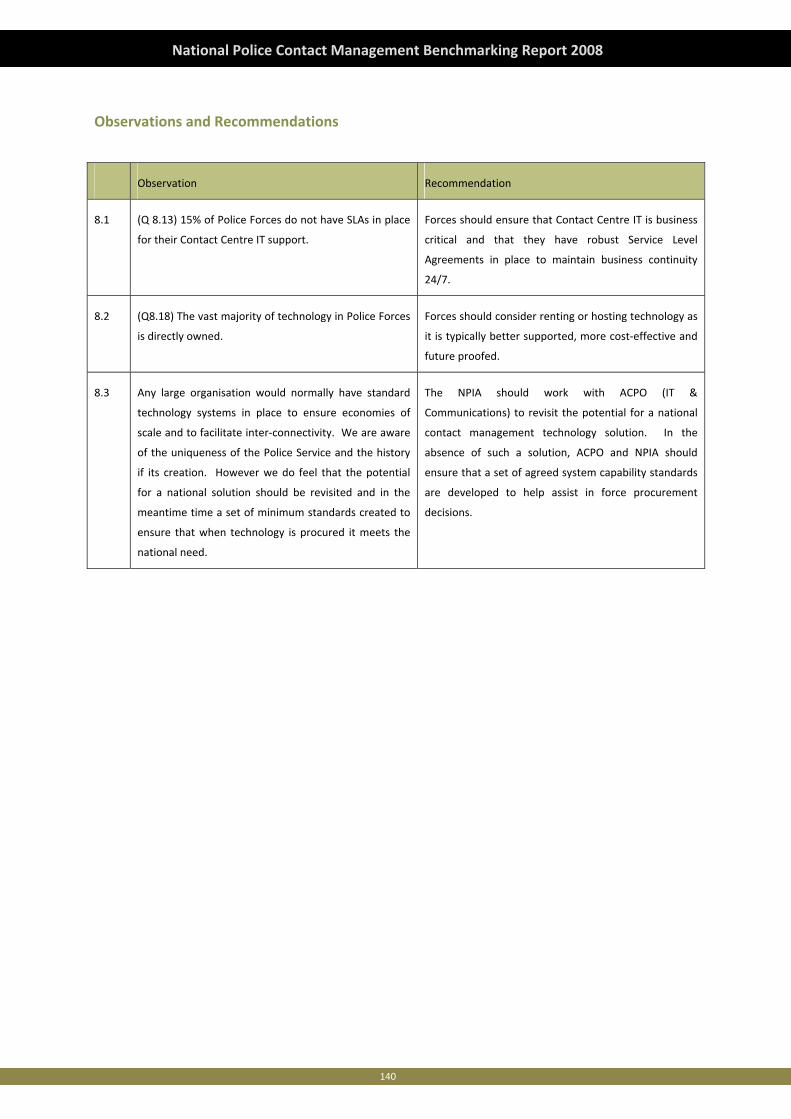
140
National Police Contact Management Benchmarking Report 2008
Observations and Recommendations
Observation Recommendation
8.1 (Q 8.13) 15% of Police Forces do not have SLAs in place
for their Contact Centre IT support.
Forces should ensure that Contact Centre IT is business
critical and that they have robust Service Level
Agreements in place to maintain business continuity
24/7.
8.2 (Q8.18) The vast majority of technology in Police Forces
is directly owned.
Forces should consider renting or hosting technology as
it is typically better supported, more cost‐effective and
future proofed.
8.3 Any large organisation would normally have standard
technology systems in place to ensure economies of
scale and to facilitate inter‐connectivity. We are aware
of the uniqueness of the Police Service and the history
if its creation. However we do feel that the potential
for a national solution should be revisited and in the
meantime time a set of minimum standards created to
ensure that when technology is procured it meets the
national need.
The NPIA should work with ACPO (IT &
Communications) to revisit the potential for a national
contact management technology solution. In the
absence of such a solution, ACPO and NPIA should
ensure that a set of agreed system capability standards
are developed to help assist in force procurement
decisions.
141
National Police Contact Management Benchmarking Report 2008
Glossary of Terms
Agent
Person working primarily on the telephone within a contact centre. Also known as telephone agent, human agent,
telephone operator, telephone communicator (TC), telephone sales representative (TSR) or customer service
representative (CSR)
Agent Utilisation
Metric that focuses on managing staff capacity and a critical indicator of management’s ability to plan and manage
resources, based on the time that agents actually spend on various activities, e.g. time spent talking to customers, post call
handling work.
Attrition
Also referred to as churn or staff turnover. The annual average number of staff that leave an organisation as a percentage
of the total staff complement (number of staff). It can be calculated for the organisation as a whole or for a particular role.
Benchmarking
The term Benchmarking has various definitions, but fundamentally it is about learning, sharing data and adopting best
practices. Benchmarking involve identifying gaps and weaknesses in your performance and comparing information against
others. It is a continuous process of measuring and comparing against industry and sector leaders.
Caller/Calling Line Identification (CLI)
The number of the caller is presented to the agent or used to enable intelligent answering, whereby the caller’s details or
an appropriate screen is presented, with the call, to the most appropriate agent.
Coach
Person providing on‐the‐job skills development inputs to agents.
Coaching
Developing a person’s skills and knowledge so that their job performance improves, hopefully leading to the achievement
of organisational objectives. It targets high performance and improvement at work, although it may also have an impact on
an individual’s private life. It usually lasts for a short period and focuses on specific skills and goals.
Converged Communications
The integration of voice, data and internet services over common networks and systems.
Customer Relationship Management (CRM)
CRM entails all aspects of interaction a company has with its customer base, including intermittent, regular or scheduled
service relationships with a customer. CRM involves identifying customer needs, improving customer interactions and
customising approaches to provide each customer with optimum service. Large organisations often make use of complex
software to improve the customer experience. Each stage of the customer interaction is logged onto the system thereby
providing information to all staff about each customer’s accumulated interactions and experience.
142
National Police Contact Management Benchmarking Report 2008
Customer Segmentation
This is the process of dividing customers into addressable groups and developing specific propositions and treatments for
these segments. All areas of the organisation then respond and communicate in a consistent and appropriate fashion to
each segment.
Enterprise Resource Planning (ERP) System
Enterprise Resource Planning (ERP) systems integrate (or attempt to integrate) all data and processes and an organisation
into a unified system. A typical ERP system will use multiple components of computer software and hardware to achieve
the integration. A key ingredient of most ERP systems is the use of a unified database to store data for the various system
modules.
First Contact Resolution (FCR)
A customer enquiry or transaction that is resolved or completed to the satisfaction of the customer by the initial agent or
any other resource that the call has been escalated to within the first call. No further manual action for this call needs to be
taken by the initial agent or any other resource within the organisation after the call has been completed other than
initiating an automated process or standard post call administration.
Full‐Time Equivalent (FTE)
The number of part time staff that is equivalent to the number of full time staff, based upon an organisations standard for
hours worked per day, and days per year.
Interactive Voice Response (IVR)
Also sometimes referred to as Voice Response Unit (VRU)
Provides information or guidance to a caller in response to input from the caller. Input may be as tone dialling or speech
recognition, output is usually by recorded speech segments. May provide the caller with menu options to capture or
provide information.
Key Performance Indicators (KPI)
Key Performance Indicators (KPI’s) help define an organisation in terms of quantifiable measures agreed to before that
reflect the critical success factors of either the organisation, a department or a defined project.
Management Information Systems (MIS)
Management Information Systems (MIS) is a general term for computer systems within an organisation that provide
information about its operations. It also refers to the people who manage these systems.
Private Branch Exchange (PABX)
System providing telephone call switching to an organisation, ports of an organisation or even several locations. Connects
extensions to extensions and extension to and from public telephone networks. Also known as PBX or a switch.
Public Switched Telephone Network (PSTN)
The PSTN is the network of the worlds public circuit – switched telephone networks, in much the same way that the
internet is the network of the worlds public IP‐based packet‐switched networks. Originally of fixed – line analogue
telephone system, the PSTN is now almost entirely digital, and now includes mobile as well as fixed telephone
143
National Police Contact Management Benchmarking Report 2008
Return on Investment
A performance measure used to evaluate the efficiency of an investment or to compare the efficiency of a number of
different investments. To calculate ROI, the benefit (return) of an investment is divided by the cost of the investment.
Service Level Agreements (SLA’s)
Written performance objectives reached by consensus between the user and a provider of a service, or between internal
functions or departments. A service level agreement specifies a variety of performance standards.
Short Message Service (SMS)
Is a communications protocol allowing the interchange of short text messages between mobile telephone devices.
Staff Attrition
Gradual reduction in work force without the firing of personnel, as when workers resign or retire and are not replaced.
Voice over Internet Protocol (VoIP)
Voice over Internet Protocol enables a router to carry normal telephony – style voice traffic (for example telephone calls
and faxes) over an IP network, maintaining reliability and voice quality.
Workforce Optimisation (WFO)
Enabling and enhancing the performance and empowerment of agents, to provide effective and efficient service to
customers through competency, workforce, quality & performance management processes and tools.
Workforce Management (WFM)
The balancing of work factors, such as optimal staff levels, anticipated workloads, resource availability and technological
capability, all while considering elements such as agent preferences and unexpected absences.
Wrap – up
Post call work that is necessitated by and immediately follows an inbound interaction. Often includes entering data, filling
out forms, handing over action to another department or function and making outbound calls necessary to complete the
transaction. The agent is unavailable to receive another inbound call while in this mode.

144
National Police Contact Management Benchmarking Report 2008
Related Documents