NATIONAL OVERVIEW 2014 ENERGY MARKET PERSPECTIVE Neil Copeland Management Consulting Division

NATIONAL OVERVIEW 2014 ENERGY MARKET PERSPECTIVE Neil CopelandManagement Consulting Division.
Dec 26, 2015
Welcome message from author
This document is posted to help you gain knowledge. Please leave a comment to let me know what you think about it! Share it to your friends and learn new things together.
Transcript

NATIONAL OVERVIEW 2014ENERGY MARKET PERSPECTIVE
Neil Copeland Management Consulting Division

2
BLAC
K &
VEA
TCH
CO
NFI
DEN
TIAL
—FO
R CL
IEN
T’S
INTE
RNAL
USE
ON
LY—
SECO
NDA
RY D
ISTR
IBU
TIO
N P
ROH
IBIT
ED
About the Black & Veatch Energy Market Perspective
.
The EMP is available as a National Service or as one or more regional services: Western, Texas (ERCOT), Northeast, Midwest and Southeast.
EMP North American Market Coverage
Black & Veatch EMP: 2014 Outlook

3
BLAC
K &
VEA
TCH
CO
NFI
DEN
TIAL
—FO
R CL
IEN
T’S
INTE
RNAL
USE
ON
LY—
SECO
NDA
RY D
ISTR
IBU
TIO
N P
ROH
IBIT
EDBlack & Veatch EMP: 2014 Outlook
Top 7 Electric Industry Issues
20
12
ST
RA
TE
GIC
DIR
EC
TIO
NS
SU
RV
EY
3Reliability, environmental regulation, and economic regulation are the top issues industry-wide

4
BLAC
K &
VEA
TCH
CO
NFI
DEN
TIAL
—FO
R CL
IEN
T’S
INTE
RNAL
USE
ON
LY—
SECO
NDA
RY D
ISTR
IBU
TIO
N P
ROH
IBIT
ED
Black & Veatch Outlook on U.S. Power Demand
• Growth of 1.6% annually from 2014-2016, before reverting to a long-term growth trend of about 1.0% per year
Source: EIA, Black & Veatch Energy Market Perspective Analysis
20082009
20102011
20122013
20142015
20162017
20182019
20202021
20222023
20242025
-
100
200
300
400
500
600
700
800
900
1,000
-6.0%
-4.0%
-2.0%
0.0%
2.0%
4.0%
6.0%
Peak Demand - United StatesCoincident Peak Demand (GW) Annual Growth Rate (%)
Coin
ciden
t Pea
k De
man
d (G
W)
Annu
al G
row
th ra
te (%
)
Black & Veatch EMP: 2014 Outlook

5
BLAC
K &
VEA
TCH
CO
NFI
DEN
TIAL
—FO
R CL
IEN
T’S
INTE
RNAL
USE
ON
LY—
SECO
NDA
RY D
ISTR
IBU
TIO
N P
ROH
IBIT
ED
5
Black & Veatch EMP: 2014 Outlook
Natural Gas; 352,226
Nuclear; 97,393 Coal; 293,597
Hydro & Other Re-
newables; 112,175
Wind; 67,681 Solar; 12,815
Coal (IGCC); 1,709
Other Steam Turbine; 86,246
34%
10%29%
11%
7%1%0%
8%
Natural Gas; 717,028
Nuclear; 61,137
Coal; 162,885
Hydro & Other Re-
newables; 113,324
Wind; 133,321
Solar; 39,227
Coal (IGCC); 5,166 Other Steam Turbine; 50,126
56%
5%
13%
9%
10%
3%0%4%
CAPACITY MIX (MW) IN 2014 CAPACITY MIX (MW) IN 2038
Capacity represents the total amount of electricity that can be produced.
The Changing Capacity Mix: Where U.S. energy will come from

6
BLAC
K &
VEA
TCH
CO
NFI
DEN
TIAL
—FO
R CL
IEN
T’S
INTE
RNAL
USE
ON
LY—
SECO
NDA
RY D
ISTR
IBU
TIO
N P
ROH
IBIT
ED
6
Black & Veatch EMP: 2014 Outlook
ENERGY MIX (GWh) IN 2014 ENERGY MIX (GWh) IN 2038
Energy mix refers to total electricity consumed and where that electricity came from.
Natural Gas;
1,048,284
Nuclear; 773,764
Coal; 1,596,070
Other Steam
Turbine; 63,899
Wind; 185,157
Solar; 23,982
Hydro & Other Re-newables; 356,139 Coal (IGCC); 10,519
26%
19%39%
2%5%
1%9% 0%
Natural Gas; 2,705,297
Nuclear; 486,210
Coal; 1,079,001
Other Steam
Turbine; 39,076
Wind; 416,767
Solar; 123,609
Hydro & Other Re-newables; 371,286 Coal (IGCC); 40,879
51%
9%
21%
1%
8%
2%7%1%
The Changing U.S. Energy Mix

7
BLAC
K &
VEA
TCH
CO
NFI
DEN
TIAL
—FO
R CL
IEN
T’S
INTE
RNAL
USE
ON
LY—
SECO
NDA
RY D
ISTR
IBU
TIO
N P
ROH
IBIT
ED
Black & Veatch forecasts additional 86.2 GW of coal-fueled generator retirements by 2038
• Continuing trend in retirement of smaller, older coal-fired assets through 2020
• Forecasted retirements driven primarily by low-cost natural gas prices and EPA hazardous air pollutant requirements
• Future Green House Gas emission regulations could materially alter projections
Coal Unit Retirements Forecasted at 60.1 GW by 2020
Source: Black & Veatch
Black & Veatch EMP: 2014 Outlook
7

8
BLAC
K &
VEA
TCH
CO
NFI
DEN
TIAL
—FO
R CL
IEN
T’S
INTE
RNAL
USE
ON
LY—
SECO
NDA
RY D
ISTR
IBU
TIO
N P
ROH
IBIT
ED
West County Energy Center, Fla.
Coal retirements and decline in regional reserve margins will drive continued capacity growth
• Power sector demand for gas expected to grow 3.1% annually
• More than 364,000 MW of new gas capacity is expected before 2038
• Technology advances, clean air initiatives drive growth
Natural Gas-Fueled Generation Will Continue to Grow
Source: Black & Veatch
Black & Veatch EMP: 2014 Outlook
8

9
BLAC
K &
VEA
TCH
CO
NFI
DEN
TIAL
—FO
R CL
IEN
T’S
INTE
RNAL
USE
ON
LY—
SECO
NDA
RY D
ISTR
IBU
TIO
N P
ROH
IBIT
ED
2010 2011 2012 2013 2014 2015 2016 2017 2018 2019 2020 2021 2022 $-
$1.00
$2.00
$3.00
$4.00
$5.00
$6.00
Henry Hub Natural Gas Spot PriceHistorical (Nominal) B&V Projection (Mid-Year 2013) B&V Projection (Year End 2013) EIA AEO 2013
2013
$/M
MBt
uNatural Gas Price Forecast
2013-2017Growth in low-cost supplies
dampens price growth
2017-2022Price growth is driven by LNG exports, coal capacity retirements, and GHG legislation
Black & Veatch EMP: 2014 Outlook

10
BLAC
K &
VEA
TCH
CO
NFI
DEN
TIAL
—FO
R CL
IEN
T’S
INTE
RNAL
USE
ON
LY—
SECO
NDA
RY D
ISTR
IBU
TIO
N P
ROH
IBIT
ED
New England price spikes in winter signal infrastructure constraints
Black & Veatch EMP: 2014 Outlook

11
BLAC
K &
VEA
TCH
CO
NFI
DEN
TIAL
—FO
R CL
IEN
T’S
INTE
RNAL
USE
ON
LY—
SECO
NDA
RY D
ISTR
IBU
TIO
N P
ROH
IBIT
ED
Major Pipeline Constraint Points During Peak Winter in New England
Iroquois Gas TransmissionMaritimes & Northeast
Portland Natural GasTennessee Gas Pipeline
Algonquin Gas Transmission
Tennessee 300 Line
Algonquin G System/J Loop
Tennessee 200 Line
M&NE and TGP Dracut
Pipeline Constraint Points
• Winter pipeline constraints exist due to a lack of market area storage and growing peak residential, commercial, and power generation demand
• During last week’s winter storm, regional natural gas prices reached above $40.00/MMBtu while Gulf Coast prices remained at $4.00/MMBtu
Black & Veatch EMP: 2014 Outlook

12
BLAC
K &
VEA
TCH
CO
NFI
DEN
TIAL
—FO
R CL
IEN
T’S
INTE
RNAL
USE
ON
LY—
SECO
NDA
RY D
ISTR
IBU
TIO
N P
ROH
IBIT
ED
Planned U.S. Pipeline Projects Highlight Constraints on the System
Source: EIA, March, 2013
Over 50% of 2012 projects are in theNortheast U.S.

13
BLAC
K &
VEA
TCH
CO
NFI
DEN
TIAL
—FO
R CL
IEN
T’S
INTE
RNAL
USE
ON
LY—
SECO
NDA
RY D
ISTR
IBU
TIO
N P
ROH
IBIT
ED
Lopburi 55 MW Solar Farm - Thailand
Renewable capacity additions are driven by state Renewable Portfolio Standards requirements
• In the short term, the status of tax incentives for wind looms in the political arena
• ~93,200 MW of new capacity additions anticipated by 2038
• Wind will make up majority of new capacity additions
• Solar capacity expected to grow as a result of technology advances
Renewable Energy Growth Will Continue
Source: Black & Veatch
Black & Veatch EMP: 2014 Outlook
13

14
BLAC
K &
VEA
TCH
CO
NFI
DEN
TIAL
—FO
R CL
IEN
T’S
INTE
RNAL
USE
ON
LY—
SECO
NDA
RY D
ISTR
IBU
TIO
N P
ROH
IBIT
ED
Trajectory of Renewables Growth
Source: Black & Veatch Energy Market Perspective Analysis
15
BLAC
K &
VEA
TCH
CO
NFI
DEN
TIAL
—FO
R CL
IEN
T’S
INTE
RNAL
USE
ON
LY—
SECO
NDA
RY D
ISTR
IBU
TIO
N P
ROH
IBIT
EDBlack & Veatch EMP: 2013 Outlook
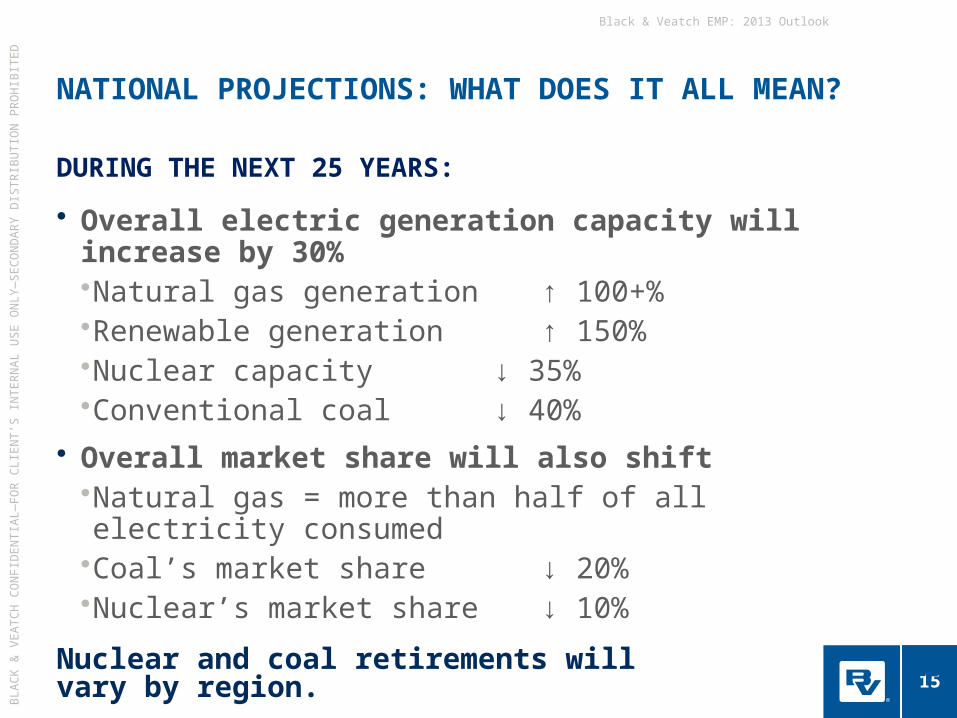
• Overall electric generation capacity will increase by 30%•Natural gas generation ↑ 100+%•Renewable generation ↑ 150%•Nuclear capacity ↓ 35%•Conventional coal ↓ 40%
• Overall market share will also shift•Natural gas = more than half of all electricity consumed•Coal’s market share ↓ 20%•Nuclear’s market share ↓ 10%
Nuclear and coal retirements will vary by region.
NATIONAL PROJECTIONS: WHAT DOES IT ALL MEAN?
DURING THE NEXT 25 YEARS:
15

Related Documents