INDIA National Multidimensional Poverty Index Baseline Report Based on NFHS-4 (2015-16)

Welcome message from author
This document is posted to help you gain knowledge. Please leave a comment to let me know what you think about it! Share it to your friends and learn new things together.
Transcript
CoverSECTION
A
INDIANational
MultidimensionalPoverty Index
Baseline ReportBased on NFHS-4 (2015-16)
NITI Aayog, 2021Based on the National Family Health Survey-4 (2015-16)
INDIA
BASELINE REPORT
NATIONALMULTIDIMENSIONAL
POVERTY INDEX
Copyright@ NITI Aayog, 2021
NITI Aayog, Government of India,Sansad Marg, New Delhi - 110001, India
visit the dashboard:sdgindiaindex.niti.gov.in/MPI
Contact us at:e-mail: [email protected]
Source of Maps: Census of India 2011 & Political Map of India 10th Edition (Survey of India)
Cover & report Design by Sourav Das,Data Analytics Officer (MPI-SDG), NITI [email protected]
INDIA MPI BASELINE REPORT
II III
FOREWORD
Vice Chairperson
National Institution for Transforming India
Government of India
DR. RAJIV KUMAR
MESSAGE
The Sustainable Development Goals framework, adopted by 193 countries in 2015, has redefined de-
velopment policies, government priorities, and metrics for measuring development progress across
the world. The SDG framework, with seventeen Global Goals and 169 targets, is significantly wider
in scope and scale relative to the Millennium Development Goals, its predecessor. The expansion
of scope includes the significant development of recognising the need to address poverty in all its
forms and dimensions. This has been articulated in the SDG framework through target 1.2 –which
is aimed at reducing “at least by half the proportion of men, women and children of all ages living
in poverty in all its dimensions according to national definitions”. The development of the National
Multidimensional Poverty Index of India is an important contribution towards instituting a public
policy tool which monitors multidimensional poverty, informs evidence-based and focused inter-
ventions, thereby ensuring that no one is left behind.
India’s national MPI measure uses the globally accepted and robust methodology developed by the
Oxford Poverty and Human Development Initiative (OPHI) and the United Nations Development
Programme (UNDP), who have been key partners in ensuring the public policy utility and technical
rigour of the Index. Importantly, as a measure of multidimensional poverty, it captures multiple and
simultaneous deprivation faced by households. This report presents an in-depth analysis of the
headcount ratio and intensity of multidimensional poverty at the national, State/UT, and district
levels. I am certain that the results and findings of this baseline edition of the index will be of great
relevance and interest to policy makers and administrators in States and districts, researchers and
scholars, and the wider public.
This baseline report of India’s first ever national MPI measure is based on the reference period of
2015-16 of the National Family Health Survey (NFHS). The national MPI measure has been construct-
ed by utilising twelve key components which cover areas such as health and nutrition, education
and standard of living.
It has been envisaged as a comprehensive tool to expedite goal-oriented action to measure multi-
dimensional poverty and steer its systematic eradication. Since the data reference period of NFHS
2015-16, India has made remarkable strides through flagship programmatic interventions in housing,
electricity, sanitation, drinking water, and cooking fuel, among others. Apart from building infra-
structure and ensuring basic services, focused initiatives to improve health and nutritional outcomes
have been undertaken expeditiously during this period. The baseline report will be updated upon
the release of the NFHS-5 (2019-20) dataset. I am confident that India’s multisectoral approach to
address poverty and the impact of the flagship programmes and schemes will be reflected in that
edition, thereby improving the national MPI score further.
I congratulate Shri Amitabh Kant, CEO, NITI Aayog, for encouraging the SDG team at NITI Aayog,
led by Ms. Sanyukta Samaddar, Adviser, to develop India’s inaugural Multidimensional Poverty Index.
My compliments and sincere thanks to the officials of State Governments, UTs, Union ministries,
OPHI and UNDP, who have contributed towards this report.
DR. RAJIV KUMAR
20 September 2021
New Delhi
India
INDIA MPI BASELINE REPORT
IV V
FOREWORD
The year 2021 marks the sixth anniversary of the adoption of the Sustainable Development Goals
which envisages to end poverty in all its forms everywhere. Steered by the Government of India’s
Global Indices for Reforms and Growth (GIRG) initiative, the National Multidimensional Poverty
Index (MPI) for India is aimed at leveraging the monitoring mechanism and methodology of the
globally recognised MPI to rigorously benchmark national and subnational performance and drive
programmatic actions and reforms.
India’s national MPI captures multiple and simultaneous deprivations faced by households across
the three macro dimensions of health, education and living standards. It highlights the need for a
whole-of-government approach towards addressing poverty and its multidimensionality. This mul-
tisectoral approach must be horizontally and vertically integrated across all levels of governance.
Estimates of national MPI headcount ratio and intensity have been furnished not only for the coun-
try and States but also for all the districts, which is a unique feature of this report. This will not only
enable the analysis of comparative and relative performance among States and UTs but also among
the districts of a State. This assumes salience given the federal structure of the country and the im-
portance of the involvement of district administrations for effective implementation of interventions
and schemes.
As a multidimensional poverty measure and a policy tool, this inaugural baseline Report provides us
with important insights into the degree of success of multi-sectoral interventions to address various
aspects of poverty. With the release of the National Family Health Survey 2019-20, the subsequent
update of the Report will capture the remarkable strides the country has taken to improve the lives
of households across these multifaceted parameters.
Simultaneously, under the GIRG initiative, reform areas and actions are being formulated to utilise
the insights made available through the Index to ramp up our efforts further to aggressively and
systematically eradicate poverty. My appreciation goes to the Union Ministries and State/UT Gov-
ernments, and all officials who have been engaging with us in this endeavour. I also compliment
our technical partners, Oxford Poverty and Human Development Initiative (OPHI) and the United
Nations Development Programme (UNDP), for their support.
I congratulate the SDG team at NITI Aayog led by Ms. Sanyukta Samaddar, Adviser, who has been
steering our overall national MPI efforts in bringing out our first national Multidimensional Poverty
Index & Dashboard and our continuous engagement with key stakeholders, the Governments of
States and UTs and Union Ministries through her commendable leadership.
Chief Executive Officer
National Institution for Transforming India
Government of India
AMITABH KANT
MESSAGE
AMITABH KANT
20 September 2021
New Delhi
India
INDIA MPI BASELINE REPORT
VI VII
FOREWORD
Director
Human Development Report Office
United Nations Development Programme
PEDRO CONCEIÇÃO
MESSAGE
I congratulate the Government of India, NITI Aayog, and my UNDP colleagues on the launch of In-
dia's first National Multidimensional Poverty Index: Baseline Report & Dashboard.
Since its development in 2010, the Multidimensional Poverty Index has served as a valuable analyti-
cal tool to identify the most vulnerable people – the poorest among the poor and revealing poverty
patterns within countries and over time, thereby enabling policy makers to target resources and
design policies more effectively.
This new Indian national version of the index complements the 10 indicators of the global MPI with
metrics on maternal health and bank account under the dimensions of health and standard of liv-
ing, respectively. The resulting work offers powerful insights that can enhance India’s capability to
reduce poverty as the country builds back stronger from the effects of the COVID-19 pandemic.
National and state averages can mask important distinctions. The Indian national MPI’s granular data
– which cover not only all the States and Union Territories, but also all the districts – can empower
policymakers and local officials to manage complexity and scale, inform evidence-led policy, design
programs, and track progress. It can also help fine-tune the policies and programmes of State gov-
ernments who are at the forefront of public service delivery, social protection, and multidimensional
poverty reduction in India’s federal structure. It will also be a tool to inform public dialogue across a
range of stakeholders, including civil society, the research community, and businesses.
We at UNDP reaffirm our commitment to our partners Government of India and NITI Aayog in the
collective journey to eradicate poverty in all its forms and accelerate the achievement of the Sus-
tainable Development Goals.
PEDRO CONCEIÇÃO
20 September 2021
New York
United States of America
INDIA MPI BASELINE REPORT
VIII IX
FOREWORD
Resident Representative
United Nations Development Programme
India
SHOKO NODA
MESSAGE
To end poverty in all its forms everywhere is at the core of the comprehensive, expansive, and in-
terdependent framework of the 2030 Agenda for Sustainable Development adopted by the world
in 2015. The Multidimensional Poverty Index (MPI) is a systematic, robust, and nuanced measure to
estimate our progress towards achieving this goal. MPI as a measure was first developed by Oxford
Poverty and Human Development Initiative (OPHI) and United Nations Development Programme
(UNDP) for inclusion in UNDP’s flagship Human Development Report in 2010, where it has been
since published.
India’s National MPI: Baseline Report & Dashboard is a milestone in its journey towards realising the
SDGs, in particular –target 1.2 of the 2030 Agenda which specifically focuses on addressing poverty
in all its dimensions. The national MPI is being launched at an important juncture where I am sure
it will provide key insights into the development scenario at the national, State and district levels,
especially for India’s sustainable recovery from the COVID-19 pandemic. On this important national
endeavour, it has been a genuine pleasure to collaborate with NITI Aayog –Government of India’s
premier thinktank, and with our partner OPHI.
India’s national MPI will provide crucial insights into multiple cross-sectoral indicators for decision
makers at the national, State and district levels. From the perspective of planning and policy design,
it will complement existing metrices in tracking progress, informing high-impact interventions and
simultaneously engendering evidence-based policy making.
I would like to express my heartfelt gratitude to Dr Rajiv Kumar, Vice Chairperson, NITI Aayog, for
his visionary leadership and unwavering commitment in steering the process of instituting India’s
national MPI. I also extend my sincere appreciation to Shri Amitabh Kant, CEO, NITI Aayog, for his
continuous engagement and encouragement in this endeavour. UNDP is committed to continue and
strengthen this important partnership. Lastly, I commend Dr Sabina Alkire, Director, OPHI, and her
team for the technical support in this exercise.
SHOKO NODA
20 September 2021
New Delhi
India
INDIA MPI BASELINE REPORT
X XI
FOREWORD
It has been an honour to collaborate on India’s National MPI: Baseline Report & Dashboard under
the leadership of NITI Aayog, Government of India. This baseline report is a contribution towards
measuring and monitoring progress on achieving target 1.2 of the Sustainable Development Goals
on multidimensional poverty. It not only presents the MPI results – plus headcount ratio and inten-
sity – at the national level, but also at the levels of States and all the districts of the country. The
high-resolution disaggregation by indicators makes it a powerful policy tool to benchmark progress
and inform policy making.
Similar to the interlinked nature of the goals and targets of the 2030 Agenda, as a measure, India’s
national MPI reflects the interlinkages across the indicators at the level of households. This is salient
to designing and implementing coordinated multisectoral policies and focused interventions. As
a policy tool, it can be utilised by decision makers to focus on reducing overall multidimensional
poverty by targeting to reduce deprivations in each of its dimensions and indicators across the
country at the sub-national and district levels. This disaggregation is crucial, especially in a country
as diverse as India, for not only reflecting information on inter-State variations in outcomes, but also
intra-State variations. The National MPI: Baseline Report & Dashboard is based on the rich dataset
of the National Family Health Survey (NFHS) 2015-16. The follow-up to this baseline report, with the
release of the NFHS 2019-20, will make it possible to estimate multidimensional poverty reduction
trends as envisaged under SDG target 1.2.
I would like to express my sincere gratitude to Dr Rajiv Kumar, Vice Chairperson, NITI Aayog for his
leadership, guidance and constant encouragement extended to this important project. Our techni-
cal assistance in this regard is a product of our strengthened partnership with UNDP India.
I would also like to congratulate Shri Amitabh Kant, CEO, NITI Aayog and his energetic, dedicated,
and professional SDG team led by Ms Sanyukta Samaddar, Adviser, NITI Aayog, for producing this
technically rigorous measure.
Director
Oxford Poverty and Human Development Initiative
Department of International Development,
University of Oxford
DR. SABINA ALKIRE
MESSAGE
DR. SABINA ALKIRE
20 September 2021
Oxford
United Kingdom
INDIA MPI BASELINE REPORT
XII XIII
FOREWORD
Our relentless efforts at NITI Aayog in adopting, implementing, and monitoring the Sustainable
Development Goals at the national and subnational levels have been anchored on the core principle
of “Leaving No One Behind”. Instituting a robust SDG monitoring framework, promoting healthy
competition among the States, strengthening the statistical systems, and building partnerships with
a range of stakeholders have primarily aimed at reaching the farthest behind first. Given India’s de-
velopment context, the most effective way to ensure development of the most disadvantaged sec-
tions is through faster poverty reduction. To implement this strategy, the first step is to estimate and
monitor poverty levels, using a framework which defines poverty in all its forms, which is relevant to
the present and aligns with the SDGs and our national context. This is precisely what our efforts at
NITI Aayog regarding Multidimensional Poverty Index (MPI) aim to achieve.
The national MPI, an aggregate measure which defines poverty, in simple terms, as the deprivation
in crucial and basic parameters of health, education, and living standards, is a significant departure
from the way poverty has been understood and conceptualised historically. This shift in focus from
income or consumption expenditure as the basis of poverty estimation is founded on the policy
narrative at the national level that human and capability development along with access to basic
infrastructure is at the centre of India’s development policy. The national MPI is an outcome of NITI
Aayog’s focussed strategy to execute this policy directive and the mandate given by the Cabinet
Secretariat to improve India’s position in global rankings of important and globally accepted indices.
This baseline report on the national MPI estimates at the national, State/ UT, and district levels
based on NFHS-4 (2015-16) is a pivotal first step in bringing multidimensional poverty as a tool to
the policy table. The national MPI will complement monetary poverty statistics, throw light on “how
many are poor” and “how poor are the poor”, track poverty over time, offer disaggregated esti-
mates by States, districts, and population groups, and support priority-based resource allocation
and targeted reforms, all at a granular level. We expect that the Report will play an instrumental role
in sensitizing governments, researchers, civil society, the public, and other stakeholders on the need
for and importance of MPI as a powerful policy instrument.
Adviser (SDG)
National Institution for Transforming India
Government of India
SANYUKTA SAMADDAR
FOREWORD In this nationally important endeavour, we owe our deepest gratitude to the Central Ministries and
the State Governments, which have strongly supported the national MPI initiative. The insightful
discussions we have had during the MPI Coordination Committee meetings, and the detailed delib-
erations held with the States as part of our SDG-MPI workshops in more than 20 States in the past
four months, have contributed immensely to improving the framework. We hope that the State-
specific reform action plan will aid faster reduction of multidimensional poverty and will result in
better outcomes as measured by subsequent NFH Surveys.
To fully realise the potential of the MPI as a policy tool for focused interventions towards addressing
multidimensional poverty, utilising it at the level of States and districts is of paramount importance.
In this regard we thank all the State Governments and especially the ones where we organised over
20 workshops in the State capitals with Chief Secretaries and senior Government officials from the
departments and districts. These workshops facilitated building interest and engendering under-
standing and acceptability of this important tool for governance. The positive, enthusiastic and
constructive feedback from our State governments has played a very important role in the process
of developing the national MPI.
We are unequivocally thankful to Dr Sabina Alkire, Director, Oxford Poverty and Human Develop-
ment Initiative, and her team for offering technical advice from time to time. As the designer of the
global MPI, Sabina’s deep knowledge on the subject based on her experience of working with coun-
tries across the globe, has contributed significantly to the robustness of the national MPI.
We would like to place on record our gratitude to Ms Shoko Noda, Resident Representative, UNDP
India, for her support to the project, as a key partner. We are certain that the MPI initiative will offer
crucial inputs to UNDP’s SDG efforts across the country. We are also grateful to the United Nations
Resident Coordinator and his office for their support to the project.
Our deepest thanks goes to Prof KS James, Director and Senior Professor, International Institute for
Population Sciences (IIPS), and his team, for their unswerving support to the project. IIPS has been
kind enough to share its expertise in Demographic and Health Surveys which has supported the
project technically to a great extent.
Finally, sincere appreciation to my team in the SDG Vertical in NITI Aayog: Alen John, Farha Anis,
Soumya Guha, Sourav Das, Sundar Mishra and Vidya Warrier. Special acknowledgments are due
to the core team, comprising Soumya Guha, SDG Officer, and Sourav Das, Data Analytics Officer,
who have remarkably shouldered the responsibility of this inordinately vast range of computations,
estimations and visualisations at all levels, and the development of the reform action plan and the
MPI Dashboard.
We are grateful to Shri Amitabh Kant, CEO, NITI Aayog, for his consistent support to the idea of mul-
tidimensional poverty, and the project and its initiatives. The project would not have been a success
without the relentless support of our Hon’ble Vice Chairman, Dr Rajiv Kumar who has thrown his
weight behind all efforts, with passion, to pursue the execution of the national MPI project.
We sincerely hope that the national MPI project and its outcomes will act as a strong force which
will further accelerate SDG achievements for our country.
SANYUKTA SAMADDAR (IAS)
20 September 2021
New Delhi
India
INDIA MPI BASELINE REPORT
XIV XV
CoNTeNTS
Message from the Vice Chairperson, NITI Aayog II
Message from the CEO, NITI Aayog Iv
Message from the Director, Human Development Report Office, United Nations Development Programme
vI
Message from the Resident Representative, United Nations Development Programme, India
vIII
Message from the Director, Oxford Poverty and Human Development Initiative
X
Foreword by Adviser, NITI Aayog XII
contents1. Introduction 2
2. Developing India’s MPI 6
PAGE 1
Context & Introduction
3. Methodology 14
4. Way forward 28
5. India 32
Stat
es
Andhra Pradesh 50
Arunachal Pradesh 56
Assam 62
Bihar 68
Chhattisgarh 74
Goa 80
Gujarat 84
Haryana 90
Himachal Pradesh 96
Jharkhand 102
Karnataka 108
Kerala 114
Madhya Pradesh 120
Maharashtra 126
Manipur 132
Meghalaya 138
Mizoram 144
Nagaland 150
Odisha 156
Punjab 162
Rajasthan 168
Sikkim 174
Tamil Nadu 178
Telangana 184
Tripura 190
Uttar Pradesh 194
Uttarakhand 202
West Bengal 208
PAGE 31
IIINational & State/UT results
6. Technical Notes 246
7. References 250
8. Index of tables 251
9. Data Tables 250-414
PAGE 245
IVTechnical Notes & Data Tables
Uni
on
Terr
ito
ries
Andaman & Nicobar Islands 214
Chandigarh 218
Dadra & Nagar Haveli 220
Daman & Diu 222
Delhi 226
Jammu & Kashmir, & Ladakh 232
Lakshadweep 238
Puducherry 240
National & State/UT results
PAGE 31
I
PAGE 13
Methodology & Way Forward
II
ChApTer 1SECTION
SECTION
ICONTEXT
&INTRODUCTION
INDIA MPI
2 3
INTroDUCTIoN
CHAPTER
ChApTer 1
INDIA’S NATIONAL MPI
The Resolution of the United Nations General Assem-
bly on 25 September 2015 established the 17 Sustain-
able Development Goals (SDG). SDG 1 in its entirety
(“End poverty in all its forms everywhere”) is multi-
dimensional in nature and definition. While target 1.1
seeks to eradicate extreme poverty –measured as
people living on less than $1.25 a day (subsequently
increased to $1.90/day), target 1.2 aims at reducing
multidimensional poverty, as defined by national defi-
nitions, by half.
The Multidimensional Poverty Index (MPI) has been
used by the United Nations Development Programme
in its flagship Human Development Report since 2010
and is the most widely employed non-monetary pov-
erty index in the world (Godinot & Walker, 2020). It
captures overlapping deprivations in health, education
and living standards (UNDP, 2010). It complements
income poverty measurements because it measures
and compares deprivations directly. In this context, a
national Multidimensional Poverty Index for India will
enable estimation of poverty not only at the level of
the States but also for all the 700 plus districts (600
plus in 2015-16, 700 plus in 2019-20) across twelve
indicators, capture simultaneous deprivations and in-
dicator-wise contribution to poverty, and most impor-
tantly, will facilitate formulation of sectoral policies
and targeted interventions which contribute towards
ensuring that “no one is left behind”. The district-wise
estimation of the national MPI will also ensure reach-
ing out to the furthest behind first through focused
efforts on specific indicators and dimensions.
This chapter provides a brief overview of the national
and international context of measuring poverty across
multiple dimensions, the conceptual framework be-
hind multidimensional measures and how they con-
tribute towards ending poverty in all its forms. The
latter half of this chapter discusses the salience and
features of the national MPI and the purpose of such
a measure
1.1 India - Multidimensional Poverty Index: National context and Global Goals
The history of poverty estimation in India dates back
to as early as 1901 when Dadabhai Naoroji estimated
poverty in the country based on the cost of a subsis-
tence diet. In 1938, the National Planning Committee
suggested a poverty line estimation based on living
standards followed by the authors of the Bombay Plan
in 1944. Addressing and ending poverty has been part
of the national agenda since independence. Various
committees, working groups and scholars including
the working group of 1962, Dandekar and Rath in 1971
and the Y.K. Alagh taskforce in 1979 were engaged
in the estimating the headline statistic of poverty to
inform public policy. Similarly, the Expert Groups un-
der Lakdawala (1993) and Tendulkar (2009) and the
Rangarajan Committee (2014) undertook the exercise
of estimating monetary poverty. Globally, the focus
on reducing monetary poverty was mirrored in the
Millennium Development Goals target of halving the
proportion of people living on less than $ 1.25 a day
between 1990 and 2015.
The adoption of Transforming our world: the 2030
Agenda for Sustainable Development by 193 countries
of the United National General Assembly, including In-
dia, brought institutionalised focus in measuring, and
addressing poverty in “all its forms” enshrined in its
preamble and explicated under Goal 1. The impact of
this was also reflected in the work of the World Bank,
the custodian of the International Poverty Line (IPL)
statistic, which convened a high-level Commission led
by Sir Anthony Atkinson and supported by an advi-
sory board of global poverty measurement experts.
One of the specific tasks of this commission was to
go “beyond Goal 1.1” and engage with “complemen-
tary indicators and multidimensionality” (World Bank,
2017). The Commission recommended the inclusion
of a multidimensional poverty measure based on the
counting approach, seen in the Alkire-Foster method
of the MPI. The Global Coalition of Partners to End
Child Poverty in its submission to this Commission
emphasised on the importance of an aggregate mul-
tidimensional poverty measure and its potential to
powerfully summarize and communicate global and
national figures to a wider audience, therefore mobil-
ising public support to end poverty in all its dimen-
sions.
In India, the Cabinet Secretariat’s mandate on the MPI
is aimed at utilising the monitoring mechanism of the
Index to gauge and benchmark poverty reduction to
improve the country’s performance and therefore,
reach out to the furthest behind by identifying reform
areas and formulating reform actions on each of its
components. The development of the India MPI is in-
tended to drive competition among the States and
Union Territories and provide insights on multidimen-
sional poverty at the subnational and district levels.
1.2 Conceptual framework of poverty and its multidimensionality
Early 20th century examples of attempts at capturing
poverty and its multidimensionality include studies
by Booth (1903) and Rowntree (1901) in the United
Kingdom. For a measure of wellbeing, application
of multidimensional approaches dates back to the
Level of Living Survey conducted in Sweden in 1968
(World Bank, 2017). Townsend’s landmark study in
1979 serves as an early example of a multidimension-
al approach towards relative deprivation across 60
indicators which covered dimensions like diet, cloth-
ing, fuel and light, housing, conditions and security
of work, recreation, health, and education. Similarly,
the European Union’s portfolio of social indicators to
monitor social protection and inclusion is inherently
multidimensional in nature. The need for complemen-
tary non-monetary statistics also stems from the rec-
ognition that income is one of the many dimensions
and not the only attribute of wellbeing (Chakravarty,
2009).
The theoretical underpinnings of a non-monetary
approach towards poverty and instead, as a multidi-
mensional phenomenon is drawn from the capability
approach (Sen 1979, 1987, 1999). The capability ap-
proach suggests that functionings and capabilities are
two integral parts of a person’s quality of life and well
being where functionings are the “beings and doings”
that they value and have reason to value –such as be-
ing healthy and nourished; and capabilities reflect the
freedom that they have in achieving valuable func-
tionings. Therefore, to arrive at the conclusion that a
household or individual is deprived in basic capabili-
ties, it is pertinent to examine and consider multiple
dimensions of well being (Dotter & Klasen, 2020).
Multidimensional measures complement monetary
measures by capturing information they lack –such as
broader qualitative aspects of life such as child mor-
tality, housing conditions, and other basic services
such as water and sanitation (Greve, 2020). This is of
significance to policy formulation and targeted inter-
ventions in the context of intra-country or intra-re-
gion heterogeniety in development.
Simple headcount related measures do not provide
information on the depth of poverty, as the Atkin-
son Commission observes, and therefore, potentially,
while the extent of poverty captured by the head-
count ratio can reduce, the poorest may fall even
further behind. To address this, the Multidimensional
Poverty Index, based on the Alkire-Foster method,
employs an adjusted headcount ratio (MPI score)
which is arrived at by multiplying the headcount ra-
tio with the average deprivation among the MPI poor
(Alkire & Foster, Counting and Multidimensional Pov-
erty Measurement, 2011). In 2010, this measure of mul-
tidimensional poverty replaced the Human Poverty
Index (HPI) in UNDP’s Human Development Report. It
draws from the capability approach by including mul-
tiple dimensions of poverty across the dimensions of
health, education and living standards, and examines
the “fundamental objective features” which affect the
poor (Brando & Fragoso, 2020).
1.3 Ending poverty in all its forms: Multidi-mensional Poverty Index
The multidimensionality of poverty is an integral part
of the Sustainable Development Goals. Target 1.2. re-
fers to reducing “at least by half the proportion of
men, women and children of all ages living in poverty
in all its dimensions according to national definitions”.
The interlinked nature of the SDGs is reflected in mul-
1
INTRODUCTION
12
INDIA MPI BASELINE REPORT
4 5
INTroDUCTIoNChApTer 1
tidimensional poverty measures as well, since they
examine deprivations in areas such as nutrition (Goal
2), health (SDG 3), education (SDG 4) and living stan-
dards related indicators such as water and sanitation
(SDG 6), and electricity and clean cooking fuel (SDG
7), among others.
Development of multidimensional poverty measures
was motivated to not only capture multiple but also
overlapping deprivations faced by the poor, which
was not sufficiently reflected in monetary poverty
measures (Alkire, 2020). Measures such as the MPI,
based on the Alkire-Foster methodology, consider si-
multaneous deprivations and disadvantages articulat-
ed through indicators in the broad dimensions of ade-
quate health and nutrition, education, and standard of
living. MPI can be utilised as a complementary policy
tool to monetary poverty, to build and illuminate a
more comprehensive depiction of poverty. The infor-
mation and insights from this tool can drive cross-sec-
toral policies which address the interconnected and
simultaneous disadvantages and deprivations faced
by the poor. Two distinctive normative conditions are
fulfilled by the MPI –the recognition that non-mone-
tary deprivations are integral to what can be termed
as poverty, and that deprivations often simultane-
ously overlap. As discussed above, MPI not only con-
cerns itself with the headcount ratio of proportion
of people who are multidimensionally poor but also
includes important information on average depriva-
tions or “depth of poverty”. The Index also provides
information of policy relevance on each of the indica-
tors by way of deconstructing each of the indicators
for sectoral focus and elucidating cross-sectoral over-
laps exhibited through multiple deprivations. There-
fore, the MPI as a measure of multiple dimensions of
poverty complements monetary poverty statistics,
enables close monitoring of individual indicators and
dimensions which overlap with several SDGs, allows
for disaggregation at the levels of States and districts,
and urban and rural to better inform policy focus, and
engenders integrated cross-sectoral policy actions by
capturing multiple deprivations in its methodology.
Apart from its theoretical and statistical merits, the
MPI produces clear and easy insights to communicate
policy relevant information for a wider audience.
In 2010, the Multidimensional Poverty Index (MPI)
developed by Sabina Alkire and James Foster was
adopted by the United Nations Development Pro-
gramme (UNDP) in their Human Development Re-
port as a replacement for its Human Poverty Index.
The MPI serves as a complementary measure to the
more traditional measures that are based on income
or consumption. The rationale for multidimension-
al measurement of poverty is that wellbeing can be
adversely impacted in many forms that may only be
indirectly related to an individual’s income or level
of consumption. Deprivations can include an over-
lap related to poor health, undernourishment, and
inadequate access to clean cooking fuel, electricity,
water, sanitation, and housing. Importantly, the MPI
also reflects some of our national priorities articulat-
ed through focused interventions on housing, clean
water, sanitation, cooking fuel, electricity along with
our universal education goals, improved nutrition and
good health for all.
1.4 National MPI: Salience and features
A national MPI is a headline statistic of multidimen-
sional poverty that is used (OPHI, 2019):
• To compare poverty across subnational regions,
• To track poverty over time,
• To highlight “how” poor are the people in poverty, using direct information from the set of MPI indi-cators.
• National MPIs are always reported along with sev-eral intuitive statistics that show the level and com-position of poverty by indicator. These are:
• Incidence, ‘H’ which shows the percentage of peo-ple who are multidimensionally poor.
• Intensity, ‘A’ which shows the percentage of weighted deprivations the average multidimen-sionally poor person suffers from.
• The national MPI is constructed directly from each person’s profile of deprivations across each indica-tor, built from a single household survey that cap-tures the data on all the indicators. So, the national MPI is always reported together with its composi-tion by indicator. This is done in one of two ways: (1) analysing the percentage of people who are multidimensionally poor and deprived in each in-dicator one by one, and (2) analysing the weighted contributions of each indicator to the national MPI.
1.5 Purpose of National MPI as a measure
A national MPI statistic for a country is tailored to the
national priorities and therefore, countries choose
their own set of dimensions, indicators, weights, and
cut-offs, according to their plans and contexts (OPHI,
2019). National MPIs are disaggregated by subnation-
al regions, urban or rural areas, age, and other factors.
They are also always reported with the indicator-wise
deconstruction and breakdown. These details can
guide and monitor national policies such as budget
allocation, targeting specific interventions, and poli-
cy coordination across sectors. The purpose of con-
structing such a measure is discussed below:
• enhanced high-level view of poverty at the na-tional level: The international community, includ-
ing government officials, international agencies,
academia, and society, understand poverty today
as a complex, multidimensional phenomenon. The
national MPI provides a high-level view of the level
of multidimensional poverty and its change with
time. This presents an overall picture of poverty in
the country, while also enabling closer and more
in-depth analyses of areas of interest such as re-
gions –State or districts, and specific sectors –un-
der the dimensions of health and nutrition, educa-
tion and living standards.
• Complements monetary poverty measures: The
national MPI complements existing monetary pov-
erty statistics. The dimensions of the Index have
proven to help identify and achieve targeted policy
interventions. The ability to provide a better de-
piction of poverty and inform more precise policy
actions has been an incentive in every country that
has developed a national MPI so far. Evidence has
shown that people who are experiencing multiple
deprivations in crucial areas of their lives, such as
education, health, safety, or employment, may not
be income poor (Bourguignon, et al., 2008), and
policies to reduce income poverty may not affect
other deprivations. Furthermore, public action
in areas like education, infrastructure, and hous-
ing, which might only impact income in the next
generation, are not well captured by traditional
monetary metrics. In contrast, a national MPI that
includes such indicators can show rapid improve-
ments in these areas, making visible the impact of
social policies and interventions more directly.
• Information to shape policy: A national MPI can
guide coordinated actions by several ministries
and departments, provide clear goals and targets
for each indicator, and act as a monitoring and ac-
countability tool within the government. One rea-
son for this is that it allows robust disaggregation
by groups (such as between urban and rural areas,
subnational regions, gender, age groups,). One can
also unpack the numbers to analyse the compo-
sition of poverty by dimensions and indicators –
nationally, and at the level of States and districts,
which allows for more efficient policy design, pol-
icy coordination and focus, and assignment of re-
sources.
• The MpI is based on each person’s or household’s profile of the overlapping or “joint” deprivations they experience: This provides new information
that is not available in many other measures of
poverty estimation. For example, 20 percent of the
population may not have access to adequate san-
itation and 20 percent may have insufficient edu-
cation, but these two indicators separately do not
provide information on the degree of intersection
of the population without adequate sanitation and
those without an adequate education. Elucidating
such overlaps is a specific feature of the MPI. This
additional information is extremely relevant for
identifying the poorest of the poor, who experi-
ence serious and multiple deprivations at the same
time. It is also useful for guiding multisectoral and
integrated policies, because it highlights the com-
plexity of simultaneous deprivations.
• provides incentives for leaving no one behind and reaching the furthest behind first: By reflect-
ing the intensity of poverty (detailing the multiple
deprivations that a family has at the same time),
the national MPI has an advantage over headcount
poverty measures since efforts to reduce the pro-
portion of simultaneous hardships faced by the
poor will reduce the MPI even if they have not yet
moved out of poverty. For example, if a poor per-
son goes from being deprived in 90 percent of the
indicators to being deprived in 50 percent of them,
then the MPI goes down, even if they are still iden-
tified as multidimensionally poor. This further bol-
sters the incentive for focussing on the poorest of
the poor, because if any deprivation of any multidi-
mensionally poor person is removed, the MPI falls.
• Adaptable to national context and transparent: The design of the national MPI is flexible, as the di-
mensions, indicators and weights can be adapted
to the national context. These are attributes that
can be defined by policymakers to accurately char-
acterize poverty in diverse contexts. The national
MPI is also transparent and easy to implement. This
provides legitimacy for official estimates. In addi-
tion, it is intuitive and easy to communicate to the
media, private sector and civil society as seen in
countries which have implemented such a mea-
sure.
• robustness and rigor: It is crucial that an official
poverty measure be robust. It means that the pol-
icy conclusions are not overly sensitive to small
changes in its own components, like indicators,
cut-offs or weights. This is because in a pluralist
societies people often agree on a broad range of
priorities but disagree on details. A measure that
is robust to a number of specifications has more
legitimacy among a wider group of citizens and
stakeholders. Furthermore, the national MPI can
be rigorously applied, using standard errors and
tests of statistical inference. This means that pol-
icymakers can ensure that their statements –such
as “poverty has reduced” refer to statistically sig-
nificant changes.
INDIA MPI
6 7
DevelopING INDIA’S MpI
CHAPTER
ChApTer 2
THE PROCESSDEVELOPING INDIA’S MPI
2.1 The Global Indices for Reforms & Growth (GIRG) mandate
In early 2020, the Cabinet Secretariat, Government
of India, identified 29 global indices to monitor, anal-
yse and evaluate with the aim of improving India’s
position in global rankings. Under this mandate, also
known as the Global Indices for Reforms and Growth
(GIRG) mandate, NITI Aayog was identified as the
nodal agency for the Multidimensional Poverty Index
(MPI).
The GIRG exercise is aimed at leveraging the moni-
toring mechanism of important social, economic and
other internationally recognised indices to drive re-
forms and growth. The primary goal of this exercise is
to gauge India’s performance - not only on the overall
country's result in the indices but on the parameters
and sub-parameters as well; and subsequently draft
an action plan to improve in those areas and sub-areas.
It was widely recognised that this exercise would re-
quire a whole-of-government approach in letter and
spirit. As one of the first steps in this direction, NITI
Aayog, as the nodal Ministry for the MPI, identified
all relevant Union Ministries and departments which
mapped not only to the broad dimensions of the in-
dex but also to the individual components, parame-
ters and sub-parameters. For example -improvement
in dimensions such as living standards required co-
ordination among Ministries concerned with cooking
gas, electricity, rural and urban development, minis-
tries which work on housing, sanitation and drinking
water, and so on. This exercise also enabled the iden-
tification of existing government actions articulated
through schemes and policies which were definition-
ally impacting the parameters and sub-parameters
of the index: for example, various nutrition, and child
and maternal health related schemes which impact
the MPI dimension of health. It underscored the im-
portance of inter-ministerial coordination and part-
nership for effective and focused action.
The emphasis of the GIRG initiative is not only to im-
prove country’s performance and ranking but to lever-
age them as tools for systemic reforms in the policies
and processes aimed at improving and enhancing the
ease of living. In this context, NITI Aayog has been co-
ordinating with the concerned Ministries and depart-
ments mapped to the indicators and sub-indicators
of the index to develop a roadmap and action plan.
Parameter and sub-parameter linked reform areas
and actions are being developed by the inter-ministe-
rial committee on the index. The exercise includes the
identification of reform actions, duration, sub-national
applicability, priority and target setting for implemen-
tation by Ministries and departments.
As the nodal agency, NITI Aayog is also responsible
for constructing an indigenised index for monitoring
the performance of States and Union Territories and
ranking them. The national MPI for India is a milestone
contribution towards this effort. It aims to become the
primary tool for monitoring progress on SDG 1 ‘end-
ing poverty in all its forms everywhere’ in the coun-
try and simultaneously foster competition among
the States and Union Territories to expeditiously take
action towards this goal. In this endeavour, engage-
ment with publishing agencies and relevant technical
partners was impressed upon from the outset. Build-
ing partnerships and engaging with- i) the publishing
agencies— United Nations Development Programme
(UNDP) and Oxford Poverty and Human Develop-
ment Initiative (OPHI) and ii) other technical partners
such as the survey implementors of the National Fam-
ily Health Survey— International Institute for Popula-
tion Sciences (IIPS) of Ministry of Health and Family
Welfare, has been critical in developing the national
MPI for States and districts and ensuring its technical
rigour and robustness.
To institutionalise this inter-ministerial effort for de-
veloping the national MPI and formulating reform ar-
eas and actions, the Multidimensional Poverty Index
Coordination Committee (MPICC) was constituted by
NITI Aayog, which included twelve Ministries and de-
partments.
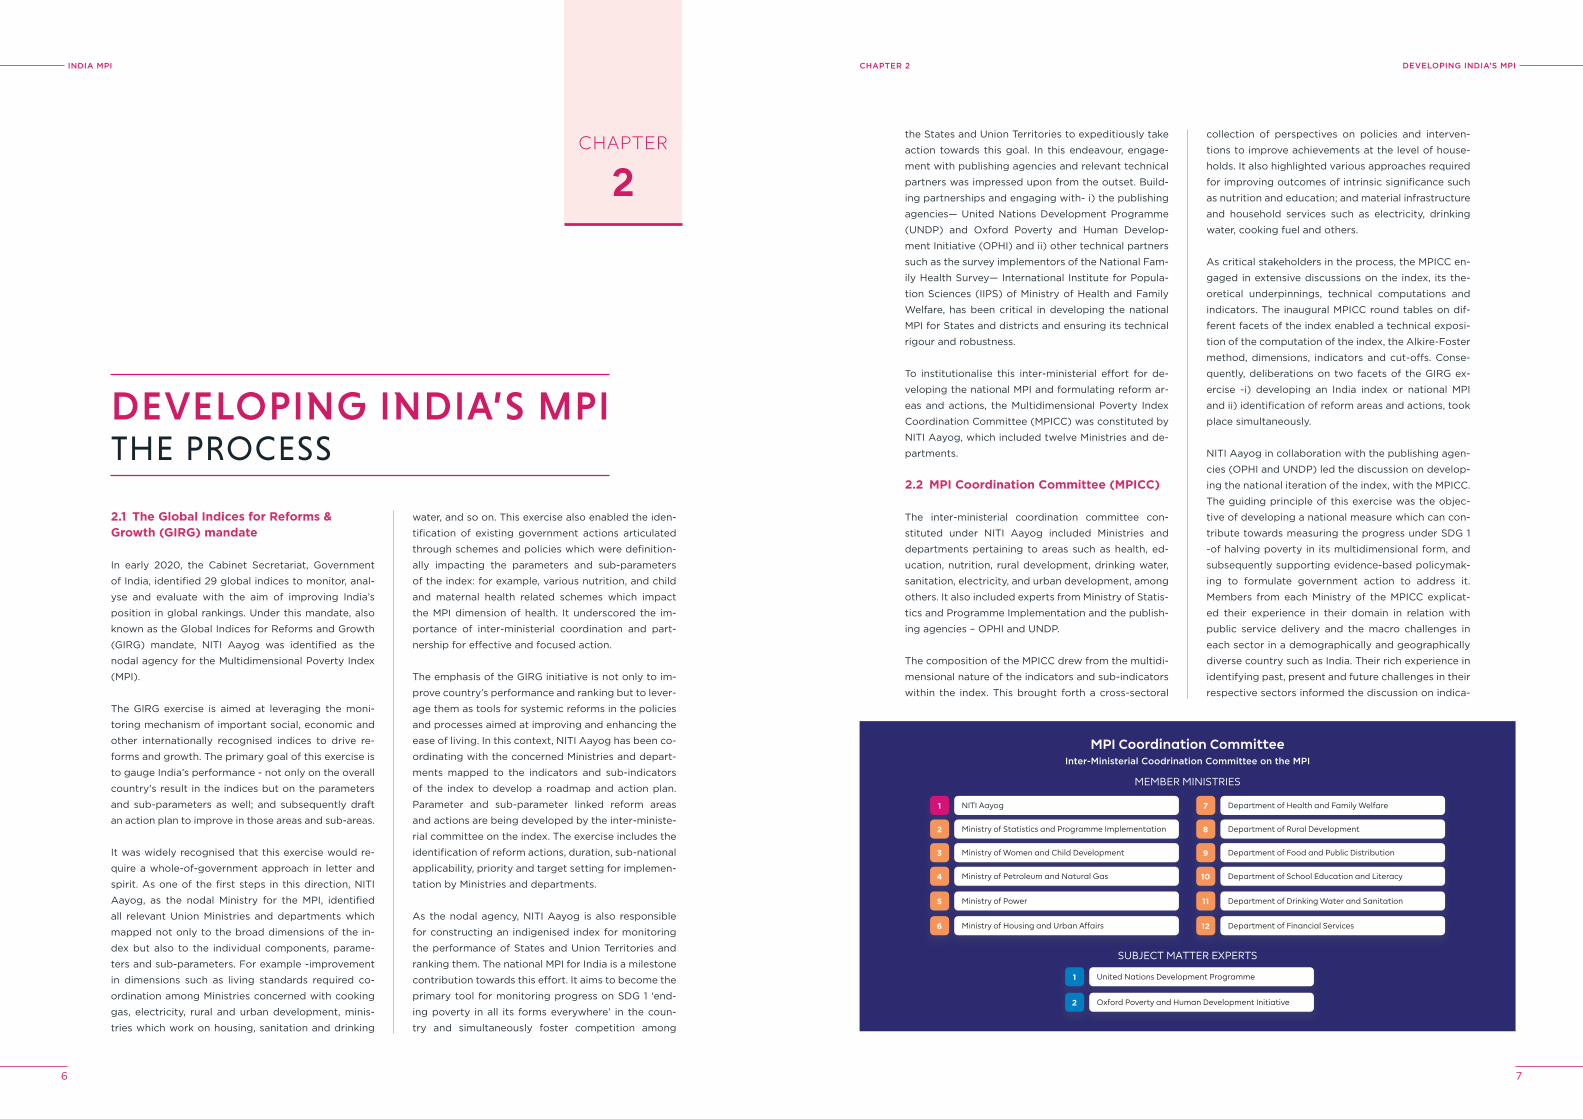
2.2 MPI Coordination Committee (MPICC)
The inter-ministerial coordination committee con-
stituted under NITI Aayog included Ministries and
departments pertaining to areas such as health, ed-
ucation, nutrition, rural development, drinking water,
sanitation, electricity, and urban development, among
others. It also included experts from Ministry of Statis-
tics and Programme Implementation and the publish-
ing agencies – OPHI and UNDP.
The composition of the MPICC drew from the multidi-
mensional nature of the indicators and sub-indicators
within the index. This brought forth a cross-sectoral
collection of perspectives on policies and interven-
tions to improve achievements at the level of house-
holds. It also highlighted various approaches required
for improving outcomes of intrinsic significance such
as nutrition and education; and material infrastructure
and household services such as electricity, drinking
water, cooking fuel and others.
As critical stakeholders in the process, the MPICC en-
gaged in extensive discussions on the index, its the-
oretical underpinnings, technical computations and
indicators. The inaugural MPICC round tables on dif-
ferent facets of the index enabled a technical exposi-
tion of the computation of the index, the Alkire-Foster
method, dimensions, indicators and cut-offs. Conse-
quently, deliberations on two facets of the GIRG ex-
ercise -i) developing an India index or national MPI
and ii) identification of reform areas and actions, took
place simultaneously.
NITI Aayog in collaboration with the publishing agen-
cies (OPHI and UNDP) led the discussion on develop-
ing the national iteration of the index, with the MPICC.
The guiding principle of this exercise was the objec-
tive of developing a national measure which can con-
tribute towards measuring the progress under SDG 1
-of halving poverty in its multidimensional form, and
subsequently supporting evidence-based policymak-
ing to formulate government action to address it.
Members from each Ministry of the MPICC explicat-
ed their experience in their domain in relation with
public service delivery and the macro challenges in
each sector in a demographically and geographically
diverse country such as India. Their rich experience in
identifying past, present and future challenges in their
respective sectors informed the discussion on indica-
2
22
MPI Coordination CommitteeInter-Ministerial Coodrination Committee on the MpI
MEMBER MINISTRIES
NITI Aayog
Ministry of Statistics and Programme Implementation
1
2
Ministry of Women and Child Development3
Ministry of Petroleum and Natural Gas4
Ministry of Power5
Ministry of Housing and Urban Affairs6
Department of Health and Family Welfare
Department of Rural Development
7
8
Department of Food and Public Distribution9
Department of School Education and Literacy10
Department of Drinking Water and Sanitation11
Department of Financial Services12
SUBJECT MATTER EXPERTS
United Nations Development Programme
Oxford Poverty and Human Development Initiative
1
2
INDIA MPI BASELINE REPORT
8 9
DevelopING INDIA’S MpIChApTer 2
tor selection and formulating the reform areas. This
was followed by technical feasibility assessment of
the indicators in the NFHS and selection of respective
weights. Cognizance was taken to enable the national
MPI to simultaneously track the performance of the
country, and all States and districts on the global indi-
cators of the Index. Drawing from the GIRG mandate,
the consensus was twofold: i) to adapt the MPI to the
national and local contexts while tracking the global
MPI indicators and ii) to estimate it not only at the
level of the States, but districts as well.
2.2.1 engagement with States: Building consensus on MpI at the subnational level
State and Union Governments are pivotal stakehold-
ers which make up the institutional bulwark of the
country. With 36 States and Union Territories and
over 700 districts –subnational entities represent the
myriad socio-political, geographical and econom-
ic diversity in the country. For a public policy tool
such as the national MPI to fully realise its potential,
utilisation of its results and findings by State and UT
governments is crucial. Simultaneously, the success of
identification and implementation of reform areas and
actions to improve the lives of households and indi-
viduals, would significantly be influenced by the level
of adoption at the level of States. Therefore, build-
ing consensus on the need to create a national MPI
and the model thereof, developing capacities, under-
standing and appetite for this novel policy tool, with
our primary stakeholders, ie., the State governments
and policy makers and implementers at the sub-na-
tional level, was felt to be imperative at the stage of
MPI project design. Close collaboration and extensive
engagement with subnational governments –through
State MPI workshops with top policy makers and all
line departments in the States, was recognised as a
pivotal driver of outreach on the Index.
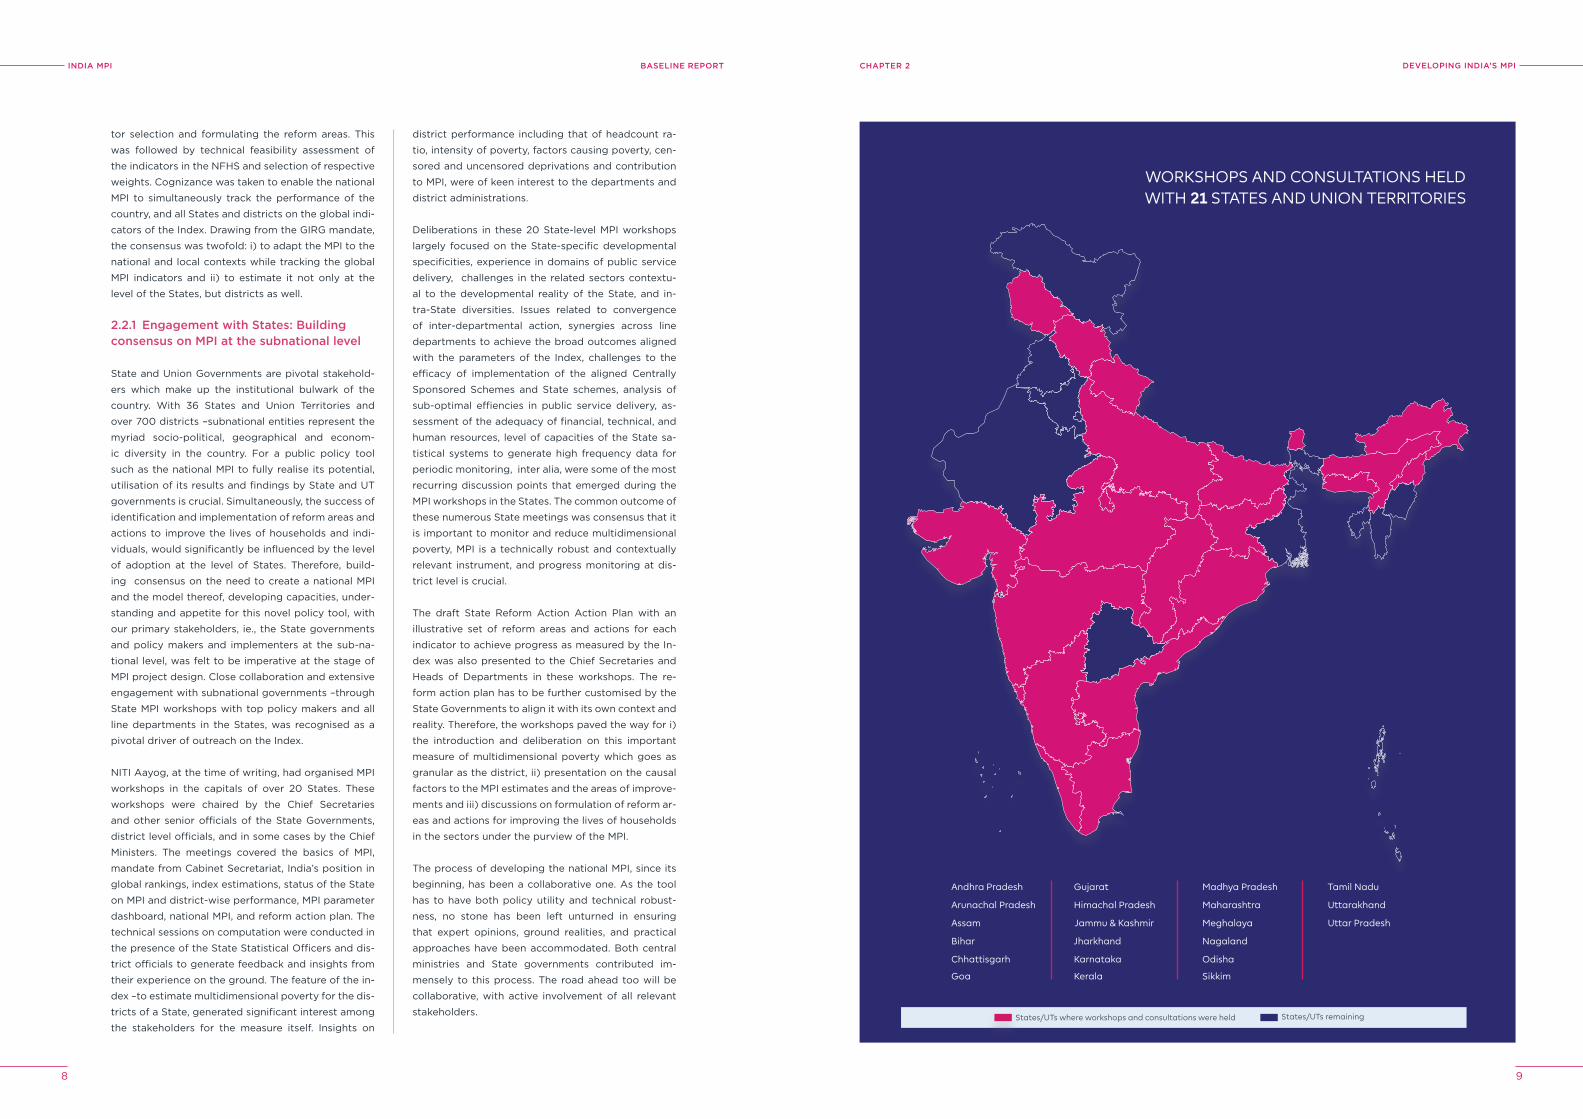
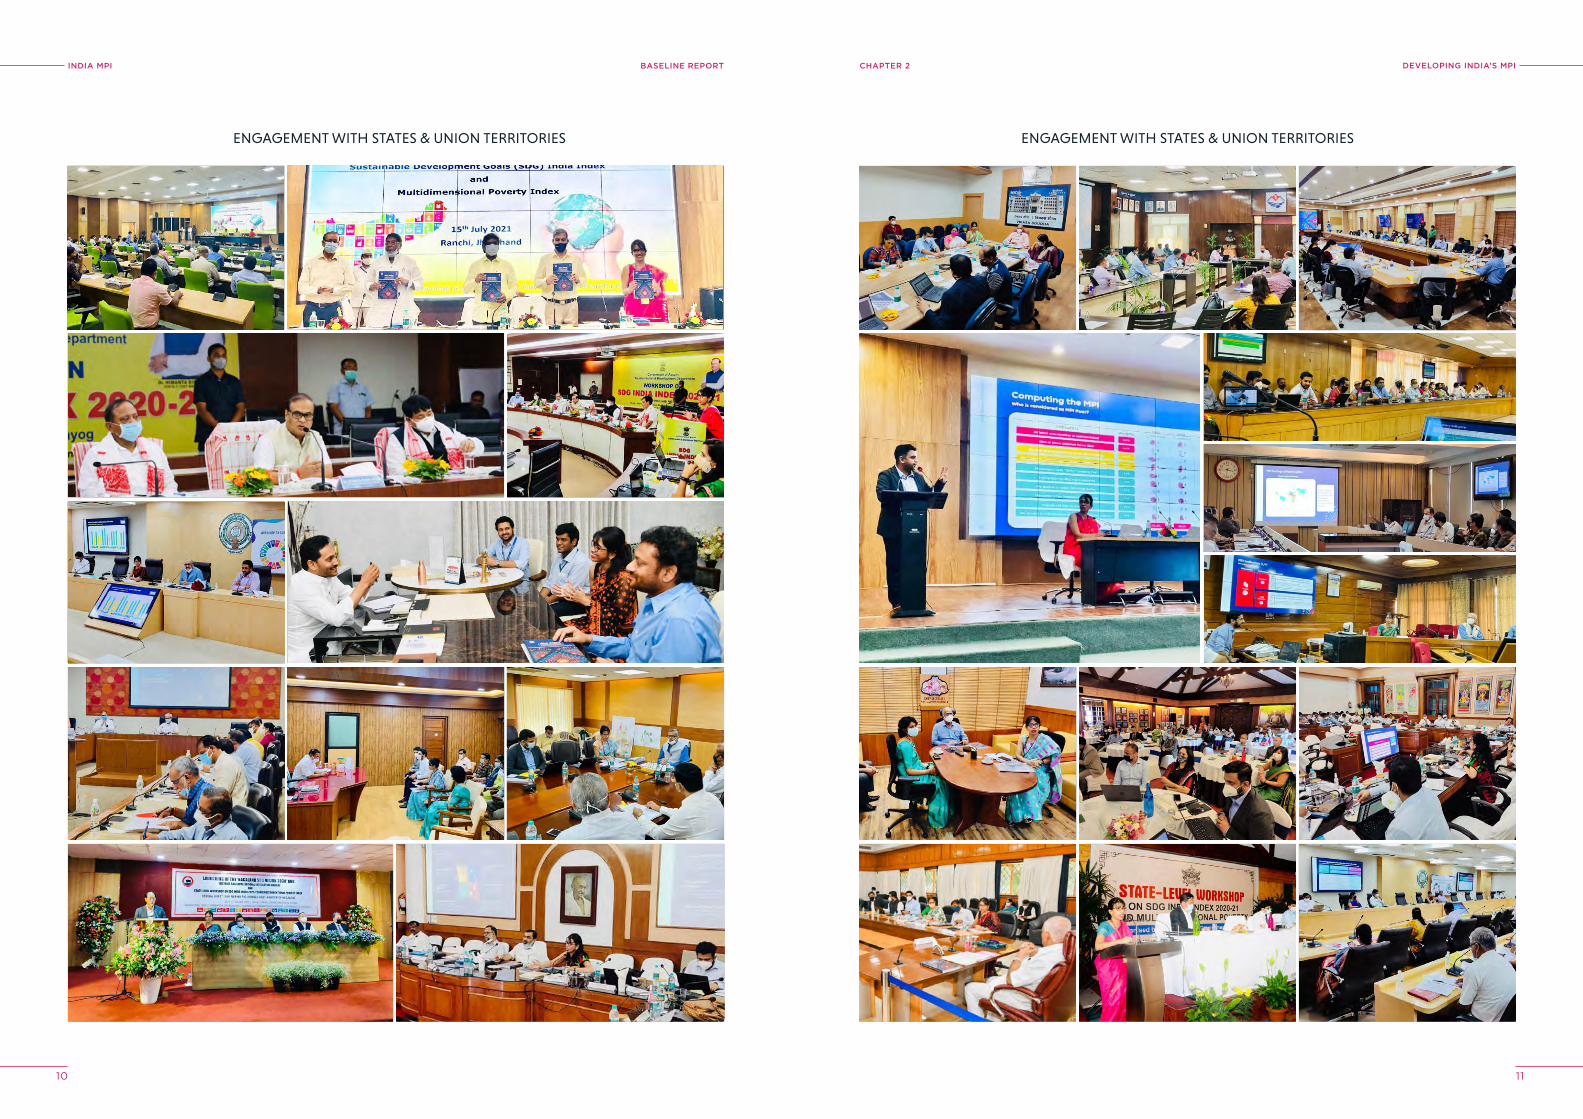
NITI Aayog, at the time of writing, had organised MPI
workshops in the capitals of over 20 States. These
workshops were chaired by the Chief Secretaries
and other senior officials of the State Governments,
district level officials, and in some cases by the Chief
Ministers. The meetings covered the basics of MPI,
mandate from Cabinet Secretariat, India’s position in
global rankings, index estimations, status of the State
on MPI and district-wise performance, MPI parameter
dashboard, national MPI, and reform action plan. The
technical sessions on computation were conducted in
the presence of the State Statistical Officers and dis-
trict officials to generate feedback and insights from
their experience on the ground. The feature of the in-
dex –to estimate multidimensional poverty for the dis-
tricts of a State, generated significant interest among
the stakeholders for the measure itself. Insights on
district performance including that of headcount ra-
tio, intensity of poverty, factors causing poverty, cen-
sored and uncensored deprivations and contribution
to MPI, were of keen interest to the departments and
district administrations.
Deliberations in these 20 State-level MPI workshops
largely focused on the State-specific developmental
specificities, experience in domains of public service
delivery, challenges in the related sectors contextu-
al to the developmental reality of the State, and in-
tra-State diversities. Issues related to convergence
of inter-departmental action, synergies across line
departments to achieve the broad outcomes aligned
with the parameters of the Index, challenges to the
efficacy of implementation of the aligned Centrally
Sponsored Schemes and State schemes, analysis of
sub-optimal effiencies in public service delivery, as-
sessment of the adequacy of financial, technical, and
human resources, level of capacities of the State sa-
tistical systems to generate high frequency data for
periodic monitoring, inter alia, were some of the most
recurring discussion points that emerged during the
MPI workshops in the States. The common outcome of
these numerous State meetings was consensus that it
is important to monitor and reduce multidimensional
poverty, MPI is a technically robust and contextually
relevant instrument, and progress monitoring at dis-
trict level is crucial.
The draft State Reform Action Action Plan with an
illustrative set of reform areas and actions for each
indicator to achieve progress as measured by the In-
dex was also presented to the Chief Secretaries and
Heads of Departments in these workshops. The re-
form action plan has to be further customised by the
State Governments to align it with its own context and
reality. Therefore, the workshops paved the way for i)
the introduction and deliberation on this important
measure of multidimensional poverty which goes as
granular as the district, ii) presentation on the causal
factors to the MPI estimates and the areas of improve-
ments and iii) discussions on formulation of reform ar-
eas and actions for improving the lives of households
in the sectors under the purview of the MPI.
The process of developing the national MPI, since its
beginning, has been a collaborative one. As the tool
has to have both policy utility and technical robust-
ness, no stone has been left unturned in ensuring
that expert opinions, ground realities, and practical
approaches have been accommodated. Both central
ministries and State governments contributed im-
mensely to this process. The road ahead too will be
collaborative, with active involvement of all relevant
stakeholders.
Assam
Andhra Pradesh
Arunachal Pradesh
Goa
Bihar
Chhattisgarh
Jammu & Kashmir
Gujarat
Himachal Pradesh
Kerala
Jharkhand
Karnataka
Uttar Pradesh
Tamil Nadu
Uttarakhand
Meghalaya
Madhya Pradesh
Maharashtra
Sikkim
Nagaland
Odisha
WORKSHOPS AND CONSULTATIONS HELD WITH 21 STATES AND UNION TERRITORIES
States/UTs remainingStates/UTs where workshops and consultations were held
INDIA MPI BASELINE REPORT
10 11
DevelopING INDIA’S MpIChApTer 2
ENGAGEMENT WITH STATES & UNION TERRITORIES ENGAGEMENT WITH STATES & UNION TERRITORIES
DevelopING INDIA’S MpIChApTer 2
SECTION
IIMETHODOLOGY
&WAY FORWARD
INDIA MPI
14 15
MeThoDoloGy
CHAPTER
ChApTer 3
COMPUTING INDIA’S MPIMETHODOLOGY
3.1 The Alkire-Foster Methodology
At the core of the MPI is the Alkire-Foster (AF) meth-
odology. The AF methodology is a general framework
for measuring multidimensional poverty that identi-
fies people as poor or not poor based on a dual-cutoff
counting method. The first order cut-off within each
component indicator is applied to determine which
person is “deprived” in that indicator. The information
across all indicators is then aggregated to arrive at
a deprivation score for each individual. The second
order cut-off is then applied to identify the individ-
uals who are multidimensionally poor. The AF meth-
odology is an extension of the widely accepted Fos-
ter-Greer-Thorbecke (FGT) class of poverty measures
and has a range of technical and practical advantages
that make it favorable for use in non-monetary pover-
ty estimation.
Poised within a family of axiomatic measures, the AF
methodology achieves multiple technical milestones
associated with poverty measures including dimen-
sional monotonicity, subgroup decomposability, scale
and replication invariance, poverty and deprivation
focus and symmetry. This ability of the AF methodol-
ogy to provide an idea of not only the degree of pov-
erty but also its composition and distribution is what
makes it a powerful tool for decision-making.
The AF methodology’s intuitive counting approach
for poverty identification, explicit consideration of
joint distributions, consistent partial indices and most
importantly, its ability to utilize ordinal or binary data,
make it adaptable to existing data systems without
the need to introduce any specialized modules within
surveys that relate only to the estimation of multidi-
mensional poverty.
The dual-cutoff approach of the AF methodology also
mitigates a number of issues that arise from the union
and intersection approaches in the measurement of
multidimensional poverty with the former tending to-
wards overestimation and the latter tending towards
underestimation. The flexibility it provides (within
bounds of logic and reason) in terms of selection of
indicators, determination of first and second order
cutoffs and indicator weights adds a layer of custom-
ization essential for the construction of a multidimen-
sional poverty measure suited to the national context.
3.2 Steps in computing the MPI
The process of computing the MPI can be divided into
2 broad categories: i) Identification, and ii) Aggre-
gation.
3.2.1 Identification
i. Determine the set of indicators to be used in the
MPI and group thematically similar indicators into
dimensions. For example, years of schooling and
school attendance are indicators under the di-
mension of education.
3
31
ii. Set the deprivation cut-offs for each indicator, i.e.,
the level of achievement considered normatively
sufficient in order for an individual to be consid-
ered not deprived in an indicator. E.g., the individ-
ual has completed at least six years of schooling.
iii. Apply the cutoff and determine whether the indi-
vidual is deprived in each indicator.
iv. Select weights to be applied to each indicator
such that the sum of the weights for all indicators
adds up to 1. Optionally, the weights of the indica-
tors could be such that the weight attributable to
each dimension (i.e. the sum of the weights of the
indicators in that dimension) is the same.
v. Calculate the weighted sum of deprivations for
each individual. This is known as their deprivation
score.
vi. Apply the second order cutoff, i.e., the proportion
of weighted deprivations that an individual needs
to experience to be identified as multidimension-
ally poor. India’s national MPI follows the second
order cutoff of 33.33 percent used in the global
MPI measure.
3.2.2 Aggregation
i. Determine the proportion of individuals identified
as multidimensionally poor in the population. This
is known as the headcount ratio (H) of the MPI
or the incidence of poverty. The headcount ratio
broadly explains ‘how many are poor’.
ii. Determine the average share of weighted indica-
tors in which multidimensionally poor individuals
are deprived i.e., add the deprivation scores of the
poor and divide it by the total number of poor in-
dividuals. This is known as the intensity of poverty
(A) in the MPI or the breadth of poverty, which
broadly explains ‘how poor are the poor’.
iii. Compute the MPI score (M0) as the product of the
partial indices of Headcount Ratio and Intensity.
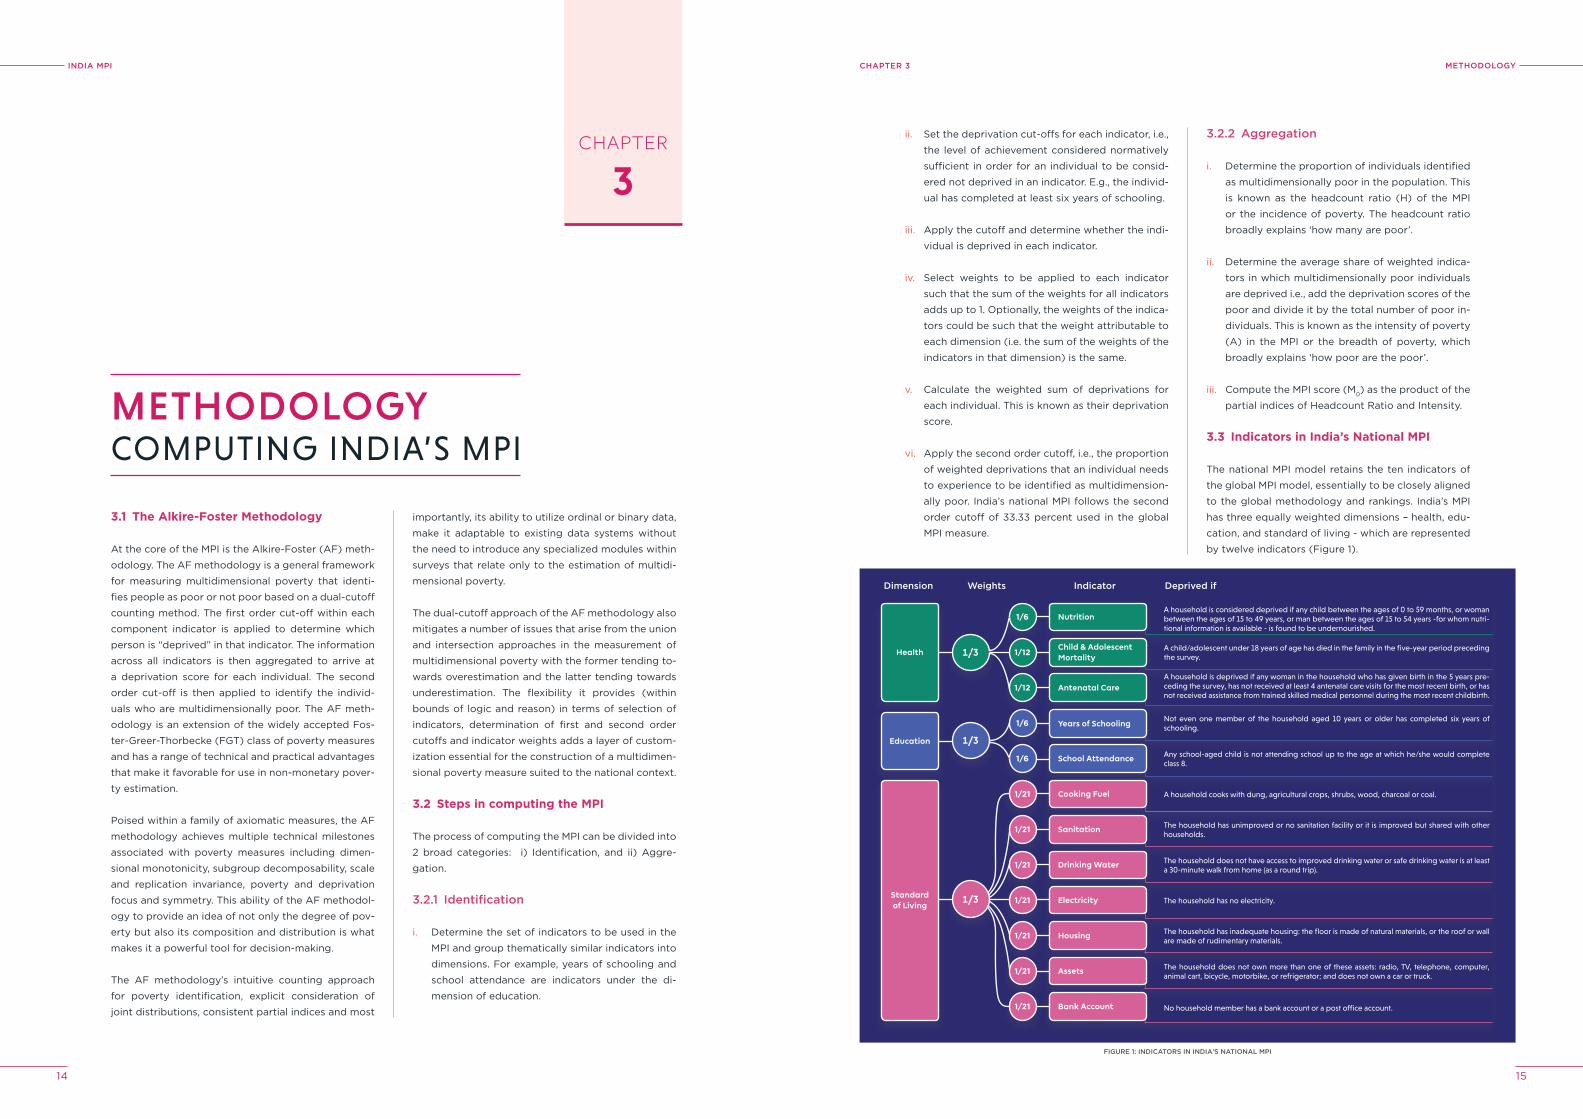
3.3 Indicators in India’s National MPI
The national MPI model retains the ten indicators of
the global MPI model, essentially to be closely aligned
to the global methodology and rankings. India’s MPI
has three equally weighted dimensions – health, edu-
cation, and standard of living - which are represented
by twelve indicators (Figure 1).
FIGUre 1: INDICATorS IN INDIA'S NATIoNAl MpI
Education
Standard of Living
1/3
1/3
1/3
1/6
1/6
1/6
1/12
1/12
1/21
1/21
1/21
1/21
1/21
1/21
1/21
A household is considered deprived if any child between the ages of 0 to 59 months, or woman between the ages of 15 to 49 years, or man between the ages of 15 to 54 years -for whom nutri-tional information is available - is found to be undernourished.
A child/adolescent under 18 years of age has died in the family in the five-year period preceding the survey.
A household is deprived if any woman in the household who has given birth in the 5 years pre-ceding the survey, has not received at least 4 antenatal care visits for the most recent birth, or has not received assistance from trained skilled medical personnel during the most recent childbirth.
Not even one member of the household aged 10 years or older has completed six years of schooling.
Any school-aged child is not attending school up to the age at which he/she would complete class 8.
A household cooks with dung, agricultural crops, shrubs, wood, charcoal or coal.
The household has unimproved or no sanitation facility or it is improved but shared with other households.
The household does not have access to improved drinking water or safe drinking water is at least a 30-minute walk from home (as a round trip).
The household has no electricity.
The household has inadequate housing: the floor is made of natural materials, or the roof or wall are made of rudimentary materials.
The household does not own more than one of these assets: radio, TV, telephone, computer, animal cart, bicycle, motorbike, or refrigerator; and does not own a car or truck.
No household member has a bank account or a post office account.
Nutrition
Child & Adolescent Mortality
Antenatal Care
Years of Schooling
School Attendance
Cooking Fuel
Sanitation
Drinking Water
Electricity
Housing
Assets
Bank Account
Dimension Weights Indicator Deprived if
Health
INDIA MPI BASELINE REPORT
16 17
MeThoDoloGyChApTer 3
3.3.1 Dimension: health
The ‘health’ dimension comprises parameters repre-
senting nutrition, child mortality and maternal health.
The indicators for Nutrition and Child Mortality echo
the definitions and cutoffs followed by their coun-
terparts in the Global MPI. The indicator for Maternal
Health is unique to India’s national MPI. A point of note
is that in the national MPI, the Child Mortality indica-
tor has been renamed as Child-Adolescent Mortality.
According to the parlance of the Indian statistical sys-
tem, the use of the term “Child Mortality” is usually
associated with mortality under 5 years of age. Given
that the indicator in the MPI refers to deaths below 18
years of age, the indicator has been renamed so as
to mitigate confusion arising from the nomenclature.
Digressing from the precedent set by the Global MPI
measure, the indicators in the dimension for Health
are not equally weighted. Nutrition – with a weight of
1/6, carries half the dimension weight of 1/3. The re-
maining dimension weight is split between Child-Ad-
olescent Mortality and Maternal Health, with each in-
dicator having a weight of 1/12. The sharing of weights
between the Child-Mortality and Maternal Health Mor-
tality prevents the overall MPI measure from favoring
households with no children or households with no
births in the last 5 years, while allowing for the mon-
itoring of deprivations in the domains of childbirth,
and access to antenatal and maternal care. The shared
weights also allow for the indicator on Nutrition to re-
tain its weight in the Global MPI, thus enabling unifor-
mity in reporting across both.
3.3.1.i Nutrition
A household is considered deprived if any child be-tween the ages of 0 to 59 months, or woman be-tween the ages of 15 to 49 years, or man between the ages of 15 to 54 years -for whom nutritional informa-tion is available- is found to be undernourished.
A woman (15 to 49 years) or a man (15 to 54 years) is
considered undernourished if their Body Mass Index
(BMI) is below 18.5 kg/m2. Children under 5 years of
age are considered malnourished if their z-score of
height-for-age (stunting) or weight-for-age (under-
weight) is below minus two standard deviations from
the median of the reference population.
It is to be noted that even if a single member of the
household is identified as undernourished, the entire
household is treated as deprived in nutrition. This is
owing to two primary reasons: i) the unit of analysis is
the household, and ii) the indicator for nutrition oper-
ates within the implicit principle of shared positive or
negative externality, wherein the debilitating effects
of undernourishment on one household member will
have a direct or indirect effect on other members of
the same household.
Contributing to nearly one-third of the multidimen-
sional poverty in India, nutrition is arguably one of the
most important indicators in India’s national MPI. Mal-
nutrition has significant consequences to early child-
hood development as well as to the health and overall
wellbeing of adults. The indicator for nutrition carries
a weight of 1/6 and its definition is aligned with the
Global MPI.
3.3.1.ii Child-Adolescent Mortality
A household is deprived if any child or adolescent under 18 years of age has died in the household in the five-year period preceding the survey.
The child-adolescent mortality indicator is based on
birth history data provided by mothers aged 15-49
years. However, if the data from the mother is missing,
and if the male in the household reported no child-ad-
olescent mortality, then the household is reported to
be not deprived. A household with no children would
also be treated as not deprived.
For the five-year period preceding NFHS 2015-16, the
neonatal mortality rate (i.e., the probability of death
within the first month of life) was 30 deaths per 1000
live births. This means that one newborn in 33 live
births died during the neonatal period. The under-five
mortality rate during this time period stood at 50
deaths per 1000 live births, indicating that one in 20
children in India, died before their fifth birthday. A sig-
nificant proportion of neonatal deaths are a result of
preventable diseases and, lack of access to pediatric
healthcare. Certain demographic risk factors can also
be identified with under five deaths being significant-
ly higher among vulnerable population groups (for in-
stance, Scheduled Tribes, and Scheduled Castes) and
among the lowest wealth quintiles (Ministry of Health
and Family Welfare, 2017).
The rationale behind the indicator on Child-Adoles-
cent Mortality and the age group it considers is that it
is indicative of the set of deprivations experienced by
the household which may have contributed to the un-
fortunate demise of a child in the household and the
effect of that incident on the set of deprivations that
the household may experience over time.
The death of a child or adolescent in a household is
emblematic of a larger set of deprivations already
experienced by the household. Factors such as, lack
of access to healthcare, infectious diseases, malnutri-
tion, iron-deficiency anemia, an unsafe environment
are all contributors to child and adolescent mortal-
ity (WHO, 2017). The death of a child or adolescent
therefore indicates the deprivations experienced by
a household in one or more of these factors. Further-
more, it highlights the risks that other living children
or adolescents in the household are being exposed to.
Child-Adolescent mortality also possesses multiple
negative externalities which directly affect all indi-
viduals and in extension the deprivation status of the
individuals in that household. These externalities can
manifest in a number of different ways over time.
For example, the death of a school-going child aged
10 years or older may deprive the household of their
only member who had attained more than six years
of schooling, thereby depriving them of the positive
externalities that are associated with having a house-
hold member with formal education. Another exam-
ple, where a more direct effect can be observed is
where a 17-year-old adolescent who was an earning
member of a household in the lowest wealth quintile
passes away resulting in their sibling having to drop
out of school.
It is therefore that the death of a child or adolescent
below the age of 18 years in a household is normative-
ly considered a tragedy for the household and is in-
cluded as a determinant for multidimensional poverty.
The indicator for Child-Adolescent Mortality carries a
weight of 1/12 and its definition remains aligned with
the Global MPI.
3.3.1.iii Maternal health
A household is deprived if any woman in the house-hold who has given birth in the 5 years preceding the survey has not received at least 4 antenatal care visits for the most recent birth or has not received assistance from trained skilled medical personnel during the most recent childbirth.
Introduced as a new indicator to India’s national MPI,
the indicator for Maternal Health is a union of two dis-
tinct components – antenatal care and assisted deliv-
ery. The indicator captures if a woman in the house-
hold who has given birth in the 5 years preceding the
survey has received at least 4 antenatal care visits and
has received assistance from skilled medical person-
nel during the most recent childbirth. Not fulfilling any
one of the two criteria would cause the household to
be considered deprived. If the household has not had
any births in the 5 years preceding the survey, it would
be considered to be not deprived in this indicator. The
indicator carries a weight of 1/12.
Antenatal care (ANC) and assisted delivery, even
when taken in isolation, form a critical prerequisite to
positive healthcare outcomes for mothers and new-
borns alike. With a significant percentage of maternal
deaths occurring during the period of pregnancy, the
four-visit antenatal care model outlined in the WHO
clinical guidelines has been instrumental in the early
identification of complications in pregnancy, monitor-
ing of foetal growth and the management of compli-
cations through the referral of mothers to the appro-
priate facility for further treatment.
In India, as per NFHS-4, only 51 percent of women had
received at least 4 ANC visits during their most recent
pregnancy with the highest proportion of women be-
ing in Kerala (90 percent) and the lowest in Bihar (14
percent). There also exists a significant disparity of
ANC among income groups with women in the high-
est wealth quintile being almost twice as likely to have
received ANC from a skilled provider than women in
the lowest wealth quintile.
Of all globally reported child deaths, 2.5 million oc-
curred within the first month of life and 2 million were
stillbirths (UNICEF, WHO, World Bank, United Nations,
2019). According to NFHS-4, in India, approximately
60 percent of deaths below 18 years are neo-natal and
infant deaths occurring before the completion of the
first month since birth and before the completion of
one year since birth, respectively.
The causes of nearly 80 percent of new-born deaths
can be identified and there are solutions to address
them, preventing death or life-long disability (WHO,
UNICEF, 2014). These causes are - complications due
to prematurity, intrapartum deaths, and neonatal in-
fections. Thus, ANC cannot be looked at in isolation
as prevention of intrapartum deaths requires quality
care provided during childbirth. In India, 81 percent of
live births were assisted by a skilled provider. 93 per-
cent of women who had received four or more ANC
visits also received skilled assistance during delivery
as compared to only 60 percent of women who had
no ANC visits.
It is based on this premise that India’s national MPI
digresses from the precedence of Afghanistan, Gua-
INDIA MPI BASELINE REPORT
18 19
MeThoDoloGyChApTer 3
temala, Panama, and Pakistan (which have indicators
for either one of the two, ANC or assisted delivery in
their respective national MPIs). India’s MPI seeks to
adopt a stricter union measure when determining the
deprivation status of an individual in Maternal Health -
ensuring that an expectant mother must receive both
4 or more antenatal care visits and be assisted by
skilled personnel during childbirth.
India being a signatory to the 2030 Agenda, the ma-
ternal health indicator in the national MPI aims to en-
force strict compliance to the SDG targets of reduc-
ing maternal mortality and end preventable deaths of
new-borns in the country.
3.3.2 Dimension: education
The ‘Education’ dimension is represented by param-
eters pertaining to school attendance and years of
schooling, with each indicator – weighted at 1/6 - car-
rying half of the dimension weight (1/3) for Education.
The definitions and cut-offs for the indicators remain
unchanged and aligned with the Global MPI.
3.3.2.i years of Schooling
A household is deprived if not even one member of the household aged 10 years or older has completed six years of schooling.
Years of schooling has a shared positive effect on the
household, wherein even if one member has more
than six years of schooling, the positive effect of that
education, be in terms of increase in economic oppor-
tunities such as the ability to enter high paying em-
ployment or in terms of improvement in social stand-
ing, is shared among all members of the household.
A point to be noted is that because of the nature of
the indicator, an individual living in a household where
there is at least one member with six years of school-
ing is considered to be non-deprived, even though
they themselves may not have attended school. The
indicator carries a weight of 1/6.
3.3.2.ii School Attendance
A household is deprived if any school-aged child is not attending school up to the age at which he/she would complete class 8.
The indicator for school attendance is the logical pre-
cursor to the indicator for years of schooling. A child
not attending school is indicative of both the present
set of deprivations experienced by the household as
well as the possible future deprivations that may un-
fold as a result of the child not attending school. A
child not attending school is emblematic of a greater
set of deprivations being experienced by the house-
hold that acts as an impediment to the education of
the child. Similarly, because the child is not attending
school, the household members will be deprived of
the positive externalities that arise from having a for-
mally educated member in the household.
An individual living in a household where there is at
least one child not attending school, is treated as de-
prived in this indicator, even though they themselves
may have completed schooling. The indicator has a
weight of 1/6.
3.3.3 Dimension: Standard of living
Lastly, the dimension for ‘Standard of Living’ compris-
es parameters representing access of the household
to basic services such as electricity, clean cooking
fuel, improved and safe drinking water, improved
sanitation, pucca housing (proper flooring, roof and
walls), bank account, and household assets. All indi-
cators with the exception of the indicator for bank ac-
counts – which is unique to India’s national MPI – align
with the global definitions and cutoffs. The dimension
weight of 1/3 is split evenly across all the seven indica-
tors therefore giving each a weight of 1/21.
3.3.3.i Cooking Fuel
A household is deprived if the primary source of cooking fuel is dung, agricultural crops, shrubs, wood, charcoal or coal.
Improved or safe sources of cooking fuel include elec-
tricity, LPG/natural gas, biogas. A point of importance
here is that simply the presence of an improved/safe
source of cooking fuel in the household is not enough
to warrant a “not deprived” status. The household
must also be utilizing the improved/safe source of
cooking fuel as their primary source of cooking fuel
- i.e. a household may have a LPG connection and
stove, but if wood/coal is the primary (most used) fuel
for cooking, then the household will be considered to
be deprived in the indicator.
3.3.3.ii Sanitation
The household has unimproved or no sanitation fa-cility or it is improved but shared with other house-holds.
Improved sanitation includes any non-shared toilet of
the following types: flush/pour flush toilets to piped
sewer systems, septic tanks, and pit latrines; venti-
lated improved pit (VIP)/biogas latrines; pit latrines
with slabs; and twin pit/composting toilets. It must be
noted that exclusive access to an improved sanitation
facility, which is not shared with members of another
household, is required for a household to be consid-
ered not deprived in this indicator.
3.3.3.iii Drinking Water
A household is deprived if it does not have access to improved drinking water or safe drinking water is more than a 30-minute walk from home (as a round trip).
Safe or improved sources of drinking water include
piped water supply, public taps, standpipes, tube
wells, boreholes, protected dug wells and springs,
rainwater, and community reverse osmosis (RO)
plants. Even if a household has access to an improved
water source, it will be considered deprived in this in-
dicator if the source is more than 30-minute roundtrip
walk from home.
3.3.3.iv electricity
A household is deprived if it has no electricity.
Access to household electricity has a multiplier effect
on any household and deprivation in this basic and
essential service is ground for treating any household
as deprived.
3.3.3.v housing
A household is deprived if it has inadequate hous-ing: the floor is made of natural materials, or the roof or walls are made of rudimentary materials.
Mud/clay/earth, sand and dung are considered rudi-
mentary/natural materials.
3.3.3.vi ownership of Assets
The household is deprived if it does not own more than one of these assets: radio, Tv, telephone, com-puter, animal cart, bicycle, motorbike, or refrigera-tor; and does not own a car or truck.
In the case of the indicator for assets, the criteria for
the car or truck ownership acts as an exclusion cri-
teria. Therefore, even if a household does not have
a radio, television, telephone, computer, animal cart,
bicycle, motorbike, or refrigerator, but has either a
car or a truck, then the household will be treated as
non-deprived.
3.3.3.vii Bank Account
No household member has a bank account or a post office account.
The indicator for bank accounts is an additional indi-
cator in India’s national MPI. The ownership of a bank
account or post office account is the key to financial
inclusion of the hitherto unbanked households. The
access of a household to a bank account is critical for
availing the benefits of several flagship government
programs aimed at reduction of poverty, increas-
ing access to education, and creation of livelihoods
– which often utilize direct benefit transfers. Bank
accounts also play an important role in the delivery
of public services, access to institutionalized credit
and also act as long-term savings instruments - ei-
ther through self-deposits or through institutionalized
savings schemes.
Extensive evidence suggests that there exists a strong
and positive correlation between access to financial
services and improved capabilities and functionings.
Empirical studies that have analyzed spatial data have
cited significant correlation between areas with lower
banking access and higher or relatively severe inci-
dences of poverty (Iqbal, Roy, & Alam, 2020). Oth-
er studies which have probed demographic datasets
have concluded that financial inclusion plays an im-
portant role in preventing a household’s exposure to
future poverty while also aiding in sustained escapes
from poverty, especially female-headed households
(Koomson, Villano, & Hadley, 2020).
These factors necessitate the inclusion of an indica-
tor pertaining to financial inclusion in India’s national
MPI not only to identify the geographical regions and
population sub-groups where immediate intervention
is required but also to ensure that the efforts to fast-
track financial inclusion in India are sustained.
The SDG target 8.1 focuses on strengthening the ca-
pacity of domestic financial institutions to encourage
and expand access to banking and financial services
for all. The inclusion of the indicator for bank accounts
thus allows for the national MPI to have a larger cov-
erage of and increased cross-linkages with the SDGs.
At the global front, the national MPIs of Rwanda and
Sierra Leone also include indicator for bank accounts
with the former having included it in a new dimen-
sion titled as “Social Services and Economic Inequal-
ity” and the latter having kept in in the dimension for
“Standard of Living”.
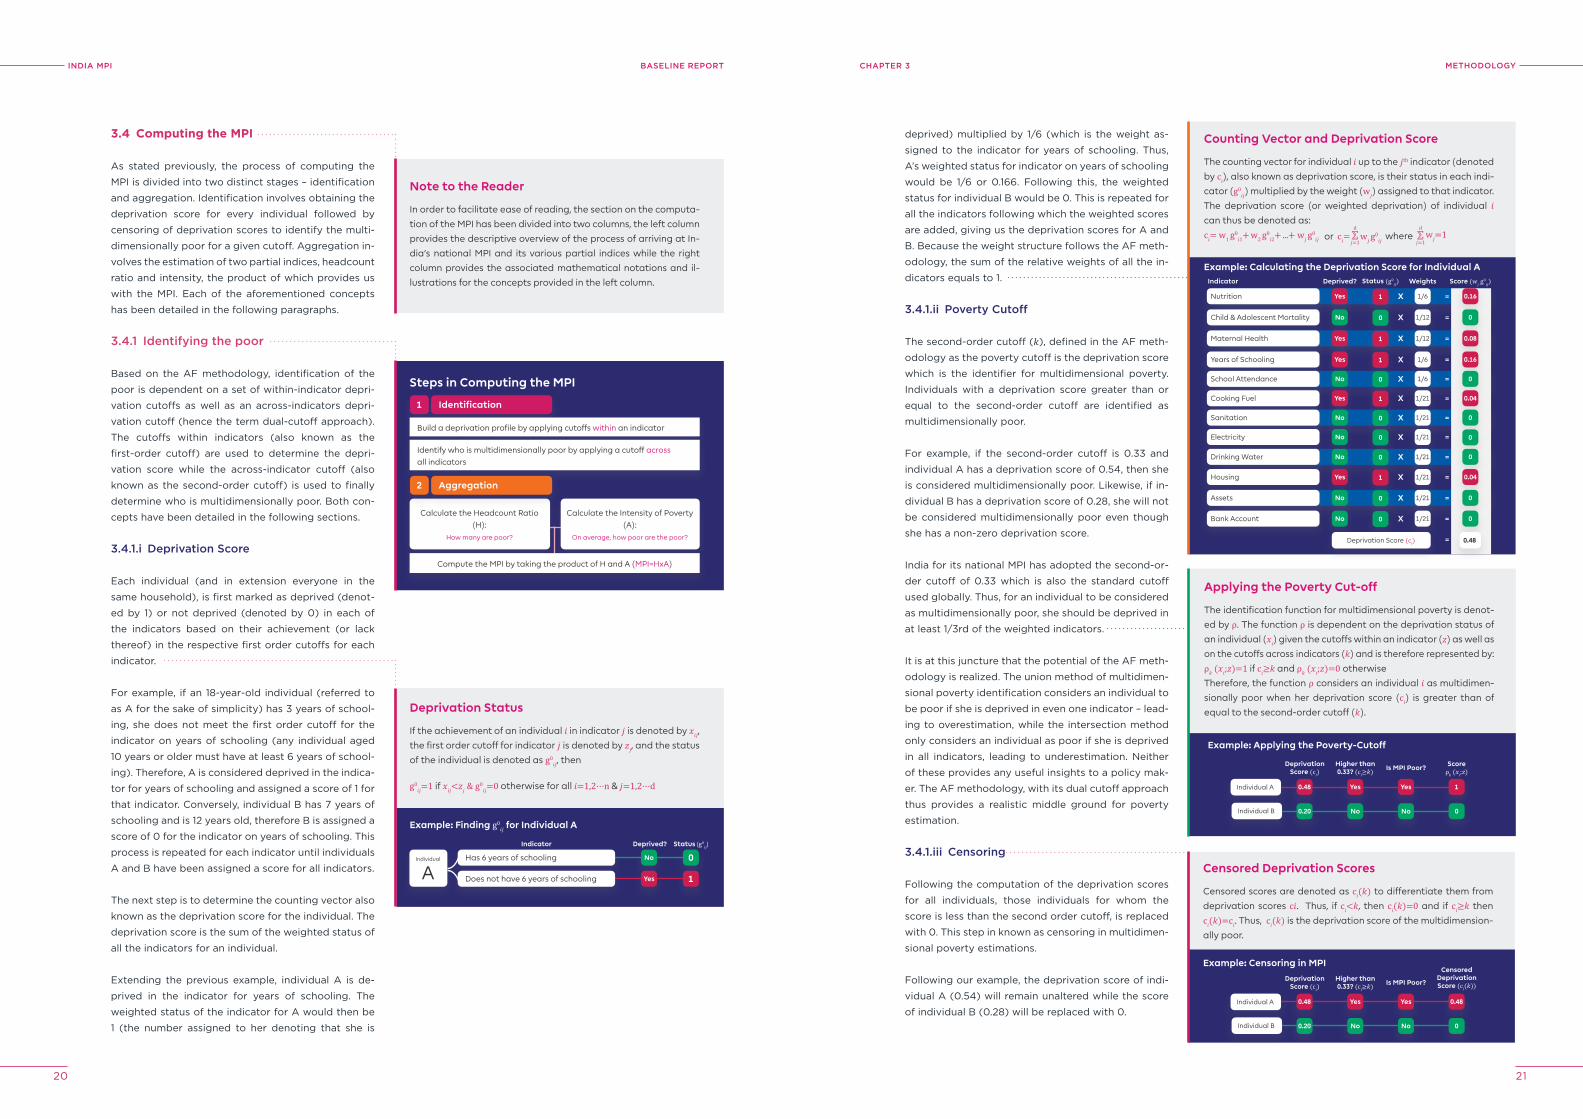
INDIA MPI BASELINE REPORT
20 21
MeThoDoloGyChApTer 3
3.4 Computing the MPI
As stated previously, the process of computing the
MPI is divided into two distinct stages – identification
and aggregation. Identification involves obtaining the
deprivation score for every individual followed by
censoring of deprivation scores to identify the multi-
dimensionally poor for a given cutoff. Aggregation in-
volves the estimation of two partial indices, headcount
ratio and intensity, the product of which provides us
with the MPI. Each of the aforementioned concepts
has been detailed in the following paragraphs.
3.4.1 Identifying the poor
Based on the AF methodology, identification of the
poor is dependent on a set of within-indicator depri-
vation cutoffs as well as an across-indicators depri-
vation cutoff (hence the term dual-cutoff approach).
The cutoffs within indicators (also known as the
first-order cutoff) are used to determine the depri-
vation score while the across-indicator cutoff (also
known as the second-order cutoff) is used to finally
determine who is multidimensionally poor. Both con-
cepts have been detailed in the following sections.
3.4.1.i Deprivation Score
Each individual (and in extension everyone in the
same household), is first marked as deprived (denot-
ed by 1) or not deprived (denoted by 0) in each of
the indicators based on their achievement (or lack
thereof) in the respective first order cutoffs for each
indicator.
For example, if an 18-year-old individual (referred to
as A for the sake of simplicity) has 3 years of school-
ing, she does not meet the first order cutoff for the
indicator on years of schooling (any individual aged
10 years or older must have at least 6 years of school-
ing). Therefore, A is considered deprived in the indica-
tor for years of schooling and assigned a score of 1 for
that indicator. Conversely, individual B has 7 years of
schooling and is 12 years old, therefore B is assigned a
score of 0 for the indicator on years of schooling. This
process is repeated for each indicator until individuals
A and B have been assigned a score for all indicators.
The next step is to determine the counting vector also
known as the deprivation score for the individual. The
deprivation score is the sum of the weighted status of
all the indicators for an individual.
Extending the previous example, individual A is de-
prived in the indicator for years of schooling. The
weighted status of the indicator for A would then be
1 (the number assigned to her denoting that she is
Deprivation Status
If the achievement of an individual 𝑖 in indicator 𝑗 is denoted by 𝑥𝑖𝑗,
the first order cutoff for indicator 𝑗 is denoted by 𝑧𝑗, and the status
of the individual is denoted as g0𝑖𝑗, then
g0𝑖𝑗=1 if 𝑥𝑖𝑗<𝑧𝑗 & g0
𝑖𝑗=0 otherwise for all 𝑖=1,2⋯n & 𝑗=1,2⋯d
Note to the Reader
In order to facilitate ease of reading, the section on the computa-
tion of the MPI has been divided into two columns, the left column
provides the descriptive overview of the process of arriving at In-
dia’s national MPI and its various partial indices while the right
column provides the associated mathematical notations and il-
lustrations for the concepts provided in the left column.
Example: Finding g0𝑖𝑗 for Individual A
Steps in Computing the MPI
Identification1
Build a deprivation profile by applying cutoffs within an indicator
Identify who is multidimensionally poor by applying a cutoff across
all indicators
Calculate the Intensity of Poverty
(A):
On average, how poor are the poor?
Calculate the Headcount Ratio
(H):
How many are poor?
Compute the MPI by taking the product of H and A (MPI=HxA)
Aggregation2
Has 6 years of schooling
Does not have 6 years of schooling
Indicator Deprived? Status (g0𝑖𝑗)
Individual
A 1Yes
0No
deprived) multiplied by 1/6 (which is the weight as-
signed to the indicator for years of schooling. Thus,
A’s weighted status for indicator on years of schooling
would be 1/6 or 0.166. Following this, the weighted
status for individual B would be 0. This is repeated for
all the indicators following which the weighted scores
are added, giving us the deprivation scores for A and
B. Because the weight structure follows the AF meth-
odology, the sum of the relative weights of all the in-
dicators equals to 1.
3.4.1.ii poverty Cutoff
The second-order cutoff (𝑘), defined in the AF meth-
odology as the poverty cutoff is the deprivation score
which is the identifier for multidimensional poverty.
Individuals with a deprivation score greater than or
equal to the second-order cutoff are identified as
multidimensionally poor.
For example, if the second-order cutoff is 0.33 and
individual A has a deprivation score of 0.54, then she
is considered multidimensionally poor. Likewise, if in-
dividual B has a deprivation score of 0.28, she will not
be considered multidimensionally poor even though
she has a non-zero deprivation score.
India for its national MPI has adopted the second-or-
der cutoff of 0.33 which is also the standard cutoff
used globally. Thus, for an individual to be considered
as multidimensionally poor, she should be deprived in
at least 1/3rd of the weighted indicators.
It is at this juncture that the potential of the AF meth-
odology is realized. The union method of multidimen-
sional poverty identification considers an individual to
be poor if she is deprived in even one indicator – lead-
ing to overestimation, while the intersection method
only considers an individual as poor if she is deprived
in all indicators, leading to underestimation. Neither
of these provides any useful insights to a policy mak-
er. The AF methodology, with its dual cutoff approach
thus provides a realistic middle ground for poverty
estimation.
3.4.1.iii Censoring
Following the computation of the deprivation scores
for all individuals, those individuals for whom the
score is less than the second order cutoff, is replaced
with 0. This step in known as censoring in multidimen-
sional poverty estimations.
Following our example, the deprivation score of indi-
vidual A (0.54) will remain unaltered while the score
of individual B (0.28) will be replaced with 0.
Counting Vector and Deprivation Score
The counting vector for individual 𝑖 up to the 𝑗th indicator (denoted
by c𝑖), also known as deprivation score, is their status in each indi-
cator (g0𝑖𝑗) multiplied by the weight (w𝑗) assigned to that indicator.
The deprivation score (or weighted deprivation) of individual 𝑖 can thus be denoted as:
c𝑖= w1 g0𝑖1+ w2 g0
𝑖2+ ...+ w𝑗 g0𝑖𝑗 w𝑗 g0
𝑖𝑗ord
𝑗=1⅀c𝑖= w𝑗=1where
d
𝑗=1⅀
Example: Calculating the Deprivation Score for Individual A
Indicator WeightsDeprived? Status (g0𝑖𝑗) Score (w𝑗 g0
𝑖𝑗)
1/6Yes 1 0.16X =Nutrition
Child & Adolescent Mortality 1/12No 0 0X =
Maternal Health 1/12Yes 1 0.08X =
Years of Schooling 1/6Yes 1 0.16X =
School Attendance 1/6No 0 0X =
Cooking Fuel 1/21Yes 1 0.04X =
Sanitation 1/21No 0 0X =
Electricity 1/21No 0 0X =
Drinking Water 1/21No 0 0X =
Housing 1/21Yes 1 0.04X =
X =Assets 1/21No 0 0
X =1/21No 0 0Bank Account
Deprivation Score (c𝑖) 0.48=
Applying the Poverty Cut-off
The identification function for multidimensional poverty is denot-
ed by ρ. The function ρ is dependent on the deprivation status of
an individual (𝑥𝑖) given the cutoffs within an indicator (𝑧) as well as
on the cutoffs across indicators (𝑘) and is therefore represented by:
ρ𝑘 (𝑥𝑖;𝑧)=1 if c𝑖≥𝑘 and ρ𝑘 (𝑥𝑖;𝑧)=0 otherwise
Therefore, the function ρ considers an individual 𝑖 as multidimen-
sionally poor when her deprivation score (c𝑖) is greater than of
equal to the second-order cutoff (𝑘).
Example: Applying the Poverty-Cutoff
Censored Deprivation Scores
Censored scores are denoted as c𝑖(𝑘) to differentiate them from
deprivation scores c𝑖. Thus, if c𝑖<𝑘, then c𝑖(𝑘)=0 and if c𝑖≥𝑘 then
c𝑖(𝑘)=c𝑖. Thus, c𝑖(𝑘) is the deprivation score of the multidimension-
ally poor.
Example: Censoring in MPI
DeprivationScore (c𝑖)
Higher than0.33? (c𝑖≥𝑘) Is MPI Poor?
Scoreρ𝑘 (𝑥𝑖;𝑧)
Individual A
No No 0Individual B 0.20
0.48 Yes Yes 1
DeprivationScore (c𝑖)
Higher than0.33? (c𝑖≥𝑘) Is MPI Poor?
CensoredDeprivationScore (c𝑖(𝑘))
Individual A
No No 0Individual B 0.20
0.48 Yes Yes 0.48
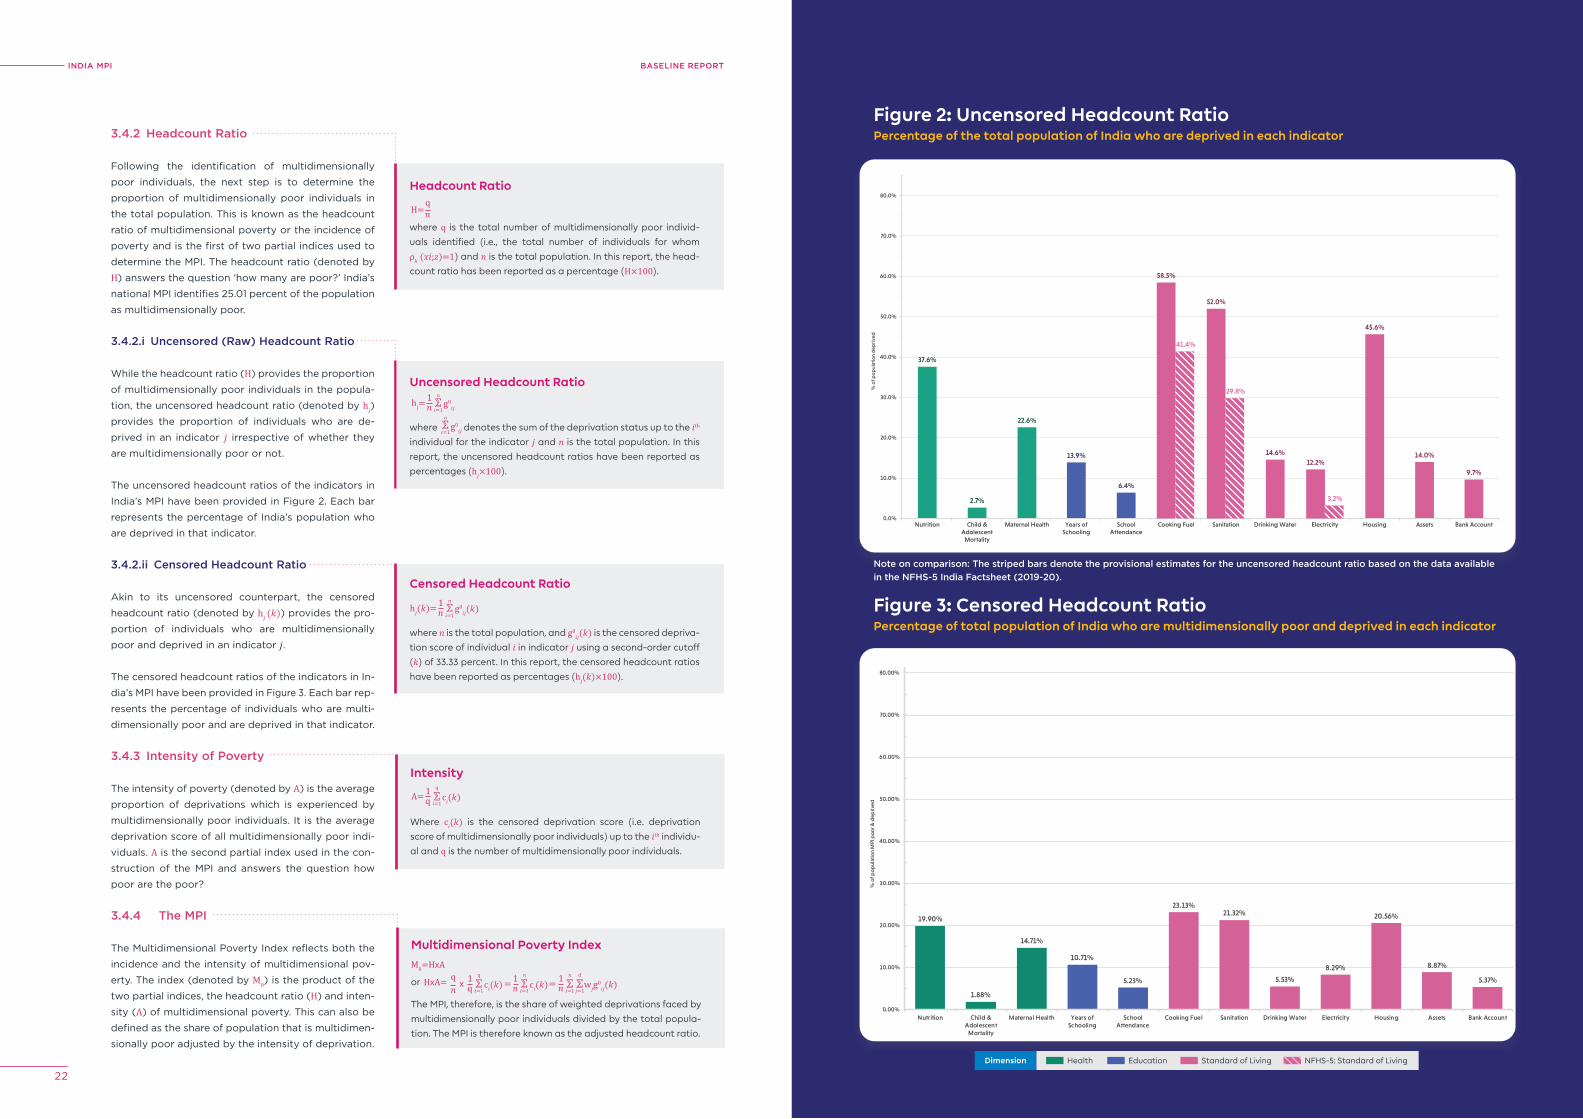
INDIA MPI BASELINE REPORT
22 23
MeThoDoloGyChApTer 3
3.4.2 headcount ratio
Following the identification of multidimensionally
poor individuals, the next step is to determine the
proportion of multidimensionally poor individuals in
the total population. This is known as the headcount
ratio of multidimensional poverty or the incidence of
poverty and is the first of two partial indices used to
determine the MPI. The headcount ratio (denoted by
H) answers the question ‘how many are poor?’ India’s
national MPI identifies 25.01 percent of the population
as multidimensionally poor.
3.4.2.i Uncensored (raw) headcount ratio
While the headcount ratio (H) provides the proportion
of multidimensionally poor individuals in the popula-
tion, the uncensored headcount ratio (denoted by h𝑗)
provides the proportion of individuals who are de-
prived in an indicator 𝑗 irrespective of whether they
are multidimensionally poor or not.
The uncensored headcount ratios of the indicators in
India’s MPI have been provided in Figure 2. Each bar
represents the percentage of India’s population who
are deprived in that indicator.
3.4.2.ii Censored headcount ratio
Akin to its uncensored counterpart, the censored
headcount ratio (denoted by h𝑗 (𝑘)) provides the pro-
portion of individuals who are multidimensionally
poor and deprived in an indicator 𝑗.
The censored headcount ratios of the indicators in In-
dia’s MPI have been provided in Figure 3. Each bar rep-
resents the percentage of individuals who are multi-
dimensionally poor and are deprived in that indicator.
3.4.3 Intensity of poverty
The intensity of poverty (denoted by A) is the average
proportion of deprivations which is experienced by
multidimensionally poor individuals. It is the average
deprivation score of all multidimensionally poor indi-
viduals. A is the second partial index used in the con-
struction of the MPI and answers the question how
poor are the poor?
3.4.4 The MpI
The Multidimensional Poverty Index reflects both the
incidence and the intensity of multidimensional pov-
erty. The index (denoted by M0) is the product of the
two partial indices, the headcount ratio (H) and inten-
sity (A) of multidimensional poverty. This can also be
defined as the share of population that is multidimen-
sionally poor adjusted by the intensity of deprivation.
Headcount Ratio
where q is the total number of multidimensionally poor individ-
uals identified (i.e., the total number of individuals for whom
ρ𝑘 (𝑥𝑖;𝑧)=1) and 𝑛 is the total population. In this report, the head-
count ratio has been reported as a percentage (H×100).
H=q𝑛
Uncensored Headcount Ratio
where denotes the sum of the deprivation status up to the 𝑖th
individual for the indicator 𝑗 and 𝑛 is the total population. In this
report, the uncensored headcount ratios have been reported as
percentages (h𝑗×100).
g0𝑖𝑗
𝑛
𝑖=1⅀h𝑗=
1𝑛
g0𝑖𝑗
𝑛
𝑖=1⅀
Censored Headcount Ratio
where 𝑛 is the total population, and g0𝑖𝑗(𝑘) is the censored depriva-
tion score of individual 𝑖 in indicator 𝑗 using a second-order cutoff
(𝑘) of 33.33 percent. In this report, the censored headcount ratios
have been reported as percentages (h𝑗(𝑘)×100).
g0𝑖𝑗(𝑘)
𝑛
𝑖=1⅀h𝑗(𝑘)= 1
𝑛
Intensity
Where c𝑖(𝑘) is the censored deprivation score (i.e. deprivation
score of multidimensionally poor individuals) up to the 𝑖th individu-
al and q is the number of multidimensionally poor individuals.
c𝑖(𝑘)q
𝑖=1⅀A= 1
q
Multidimensional Poverty Index
M0=H𝗑Aq𝑛 c𝑖(𝑘)
q
𝑖=1⅀1
qH𝗑A= 𝗑 = c𝑖(𝑘)𝑛
𝑖=1⅀1
𝑛 = w𝑗g0𝑖𝑗(𝑘)
𝑛
𝑖=1⅀1
𝑛d
𝑗=1⅀or
The MPI, therefore, is the share of weighted deprivations faced by
multidimensionally poor individuals divided by the total popula-
tion. The MPI is therefore known as the adjusted headcount ratio.
Percentage of the total population of India who are deprived in each indicator
37.6%
2.7%
22.6%
13.9%
6.4%
14.6%
45.6%
14.0%
9.7%
58.5%
41.4%
52.0%
29.8%
12.2%
3.2%
0.0%
10.0%
20.0%
30.0%
40.0%
50.0%
60.0%
70.0%
80.0%
Nutrition Child &Adolescent
Mortality
Maternal Health Years ofSchooling
SchoolAttendance
Cooking Fuel Sanitation Drinking Water Electricity Housing Assets Bank Account
% o
f po
pul
atio
n d
epri
ved
19.90%
1.88%
14.71%
10.71%
5.23%
23.13%21.32%
5.53%
8.29%
20.56%
8.87%
5.37%
0.00%
10.00%
20.00%
30.00%
40.00%
50.00%
60.00%
70.00%
80.00%
Nutrition Child &Adolescent
Mortality
Maternal Health Years ofSchooling
SchoolAttendance
Cooking Fuel Sanitation Drinking Water Electricity Housing Assets Bank Account
% o
f pop
ulat
ion
MPI
poo
r & d
epriv
ed
Figure 2: Uncensored Headcount Ratio
Percentage of total population of India who are multidimensionally poor and deprived in each indicator
Figure 3: Censored Headcount Ratio
Dimension Health Education Standard of Living NFHS-5: Standard of Living
Note on comparison: The striped bars denote the provisional estimates for the uncensored headcount ratio based on the data available in the NFhS-5 India Factsheet (2019-20).
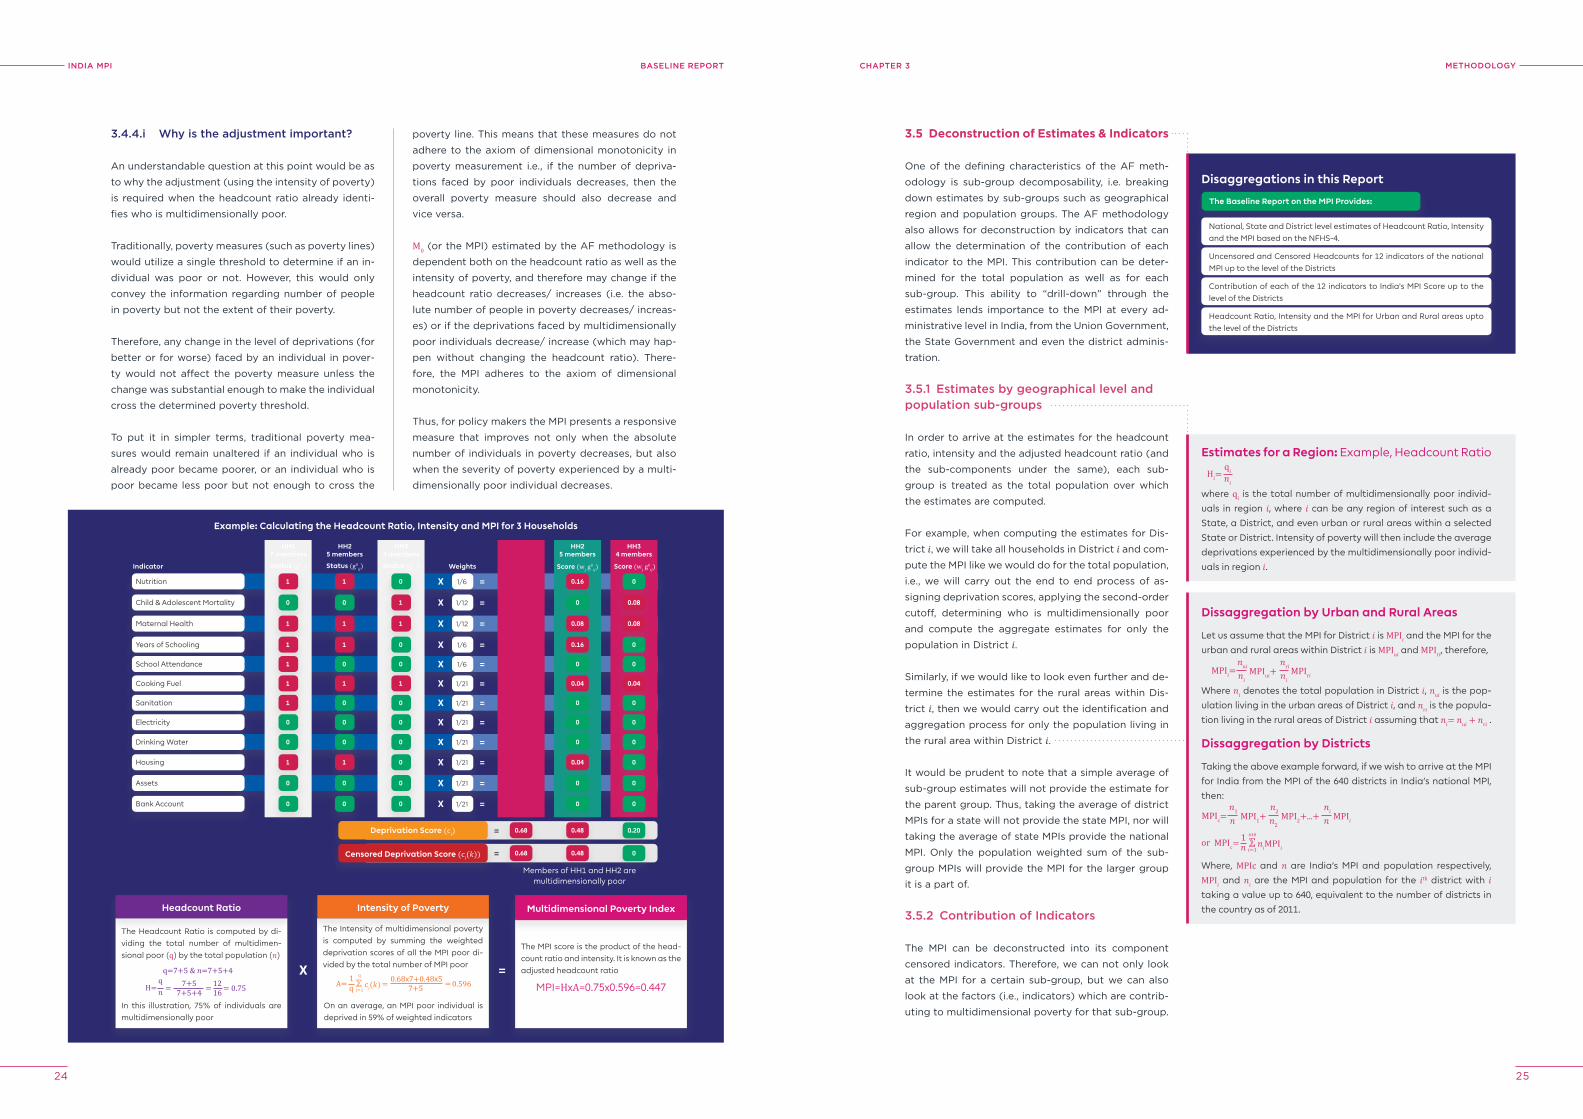
INDIA MPI BASELINE REPORT
24 25
MeThoDoloGyChApTer 3
3.4.4.i Why is the adjustment important?
An understandable question at this point would be as
to why the adjustment (using the intensity of poverty)
is required when the headcount ratio already identi-
fies who is multidimensionally poor.
Traditionally, poverty measures (such as poverty lines)
would utilize a single threshold to determine if an in-
dividual was poor or not. However, this would only
convey the information regarding number of people
in poverty but not the extent of their poverty.
Therefore, any change in the level of deprivations (for
better or for worse) faced by an individual in pover-
ty would not affect the poverty measure unless the
change was substantial enough to make the individual
cross the determined poverty threshold.
To put it in simpler terms, traditional poverty mea-
sures would remain unaltered if an individual who is
already poor became poorer, or an individual who is
poor became less poor but not enough to cross the
poverty line. This means that these measures do not
adhere to the axiom of dimensional monotonicity in
poverty measurement i.e., if the number of depriva-
tions faced by poor individuals decreases, then the
overall poverty measure should also decrease and
vice versa.
M0 (or the MPI) estimated by the AF methodology is
dependent both on the headcount ratio as well as the
intensity of poverty, and therefore may change if the
headcount ratio decreases/ increases (i.e. the abso-
lute number of people in poverty decreases/ increas-
es) or if the deprivations faced by multidimensionally
poor individuals decrease/ increase (which may hap-
pen without changing the headcount ratio). There-
fore, the MPI adheres to the axiom of dimensional
monotonicity.
Thus, for policy makers the MPI presents a responsive
measure that improves not only when the absolute
number of individuals in poverty decreases, but also
when the severity of poverty experienced by a multi-
dimensionally poor individual decreases.
Headcount Ratio
The Headcount Ratio is computed by di-
viding the total number of multidimen-
sional poor (q) by the total population (𝑛)
q=7+5 & 𝑛=7+5+4
H=q𝑛
7+57+5+4
1216 0.75= = =
In this illustration, 75% of individuals are
multidimensionally poor
Intensity of Poverty
The Intensity of multidimensional poverty
is computed by summing the weighted
deprivation scores of all the MPI poor di-
vided by the total number of MPI poor
On an average, an MPI poor individual is
deprived in 59% of weighted indicators
0.68𝗑7+0.48𝗑57+5= 0.596=c𝑖(𝑘)
q
𝑖=1⅀A=
1q
Multidimensional Poverty Index
The MPI score is the product of the head-
count ratio and intensity. It is known as the
adjusted headcount ratio
MPI=H𝗑A=0.75𝗑0.596=0.447
Example: Calculating the Headcount Ratio, Intensity and MPI for 3 Households
Indicator
Nutrition
Child & Adolescent Mortality
Maternal Health
Years of Schooling
School Attendance
Cooking Fuel
Sanitation
Electricity
Drinking Water
Housing
Assets
Bank Account
Deprivation Score (c𝑖) =
Censored Deprivation Score (c𝑖(𝑘)) =
Members of HH1 and HH2 aremultidimensionally poor
HH25 members
Status (g0𝑖𝑗)
1
0
1
1
0
1
0
0
0
1
0
0
HH1 7 members
Status (g0𝑖𝑗)
1
0
1
1
1
1
1
0
0
1
0
0
=
=
=
=
=
=
=
=
=
=
=
=
1/6X
1/12X
1/12X
1/6X
1/6X
1/21X
1/21X
1/21X
1/21X
1/21X
X 1/21
X 1/21
Weights
HH25 members
0.16
0
0.08
0.16
0
0.04
0
0
0
0.04
0
0
Score (w𝑗 g0𝑖𝑗)
HH34 members
0
0.08
0.08
0
0
0.04
0
0
0
0
0
0
Score (w𝑗 g0𝑖𝑗)
HH34 members
Status (g0𝑖𝑗)
0
1
1
0
0
1
0
0
0
0
0
0
0.68
0.68
0.48
0.48
0.20
0
HH1 7 members
0.16
0
0.08
0.16
0.16
0.04
0.04
0
0
0.04
0
0
Score (w𝑗 g0𝑖𝑗)
X =
3.5 Deconstruction of Estimates & Indicators
One of the defining characteristics of the AF meth-
odology is sub-group decomposability, i.e. breaking
down estimates by sub-groups such as geographical
region and population groups. The AF methodology
also allows for deconstruction by indicators that can
allow the determination of the contribution of each
indicator to the MPI. This contribution can be deter-
mined for the total population as well as for each
sub-group. This ability to “drill-down” through the
estimates lends importance to the MPI at every ad-
ministrative level in India, from the Union Government,
the State Government and even the district adminis-
tration.
3.5.1 estimates by geographical level and population sub-groups
In order to arrive at the estimates for the headcount
ratio, intensity and the adjusted headcount ratio (and
the sub-components under the same), each sub-
group is treated as the total population over which
the estimates are computed.
For example, when computing the estimates for Dis-
trict 𝑖, we will take all households in District 𝑖 and com-
pute the MPI like we would do for the total population,
i.e., we will carry out the end to end process of as-
signing deprivation scores, applying the second-order
cutoff, determining who is multidimensionally poor
and compute the aggregate estimates for only the
population in District 𝑖.
Similarly, if we would like to look even further and de-
termine the estimates for the rural areas within Dis-
trict 𝑖, then we would carry out the identification and
aggregation process for only the population living in
the rural area within District 𝑖.
It would be prudent to note that a simple average of
sub-group estimates will not provide the estimate for
the parent group. Thus, taking the average of district
MPIs for a state will not provide the state MPI, nor will
taking the average of state MPIs provide the national
MPI. Only the population weighted sum of the sub-
group MPIs will provide the MPI for the larger group
it is a part of.
3.5.2 Contribution of Indicators
The MPI can be deconstructed into its component
censored indicators. Therefore, we can not only look
at the MPI for a certain sub-group, but we can also
look at the factors (i.e., indicators) which are contrib-
uting to multidimensional poverty for that sub-group.
Estimates for a Region: Example, Headcount Ratio
where q𝑖 is the total number of multidimensionally poor individ-
uals in region 𝑖, where 𝑖 can be any region of interest such as a
State, a District, and even urban or rural areas within a selected
State or District. Intensity of poverty will then include the average
deprivations experienced by the multidimensionally poor individ-
uals in region 𝑖.
H𝑖=q𝑖𝑛𝑖
Dissaggregation by Urban and Rural Areas
Let us assume that the MPI for District 𝑖 is MPI𝑖 and the MPI for the
urban and rural areas within District 𝑖 is MPIu𝑖 and MPIr𝑖, therefore,
Where 𝑛𝑖 denotes the total population in District 𝑖, 𝑛u𝑖 is the pop-
ulation living in the urban areas of District 𝑖, and 𝑛r𝑖 is the popula-
tion living in the rural areas of District 𝑖 assuming that 𝑛𝑖= 𝑛u𝑖 + 𝑛r𝑖 .
MPI𝑖=𝑛u𝑖
𝑛𝑖MPIu𝑖+ MPIr𝑖
𝑛r𝑖
𝑛𝑖
Dissaggregation by Districts
Taking the above example forward, if we wish to arrive at the MPI
for India from the MPI of the 640 districts in India’s national MPI,
then:
Where, MPIc and 𝑛 are India’s MPI and population respectively,
MPI𝑖 and 𝑛𝑖 are the MPI and population for the 𝑖th district with 𝑖 taking a value up to 640, equivalent to the number of districts in
the country as of 2011.
MPIc=𝑛1 𝑛𝑖
𝑛 𝑛MPI1+ MPI𝑖MPI2+...+𝑛2
𝑛2
𝑛𝑖MPI𝑖
640
𝑖=1⅀MPIc=
1𝑛or
Disaggregations in this Report
The Baseline Report on the MPI Provides:
National, State and District level estimates of Headcount Ratio, Intensity
and the MPI based on the NFHS-4.
Uncensored and Censored Headcounts for 12 indicators of the national
MPI up to the level of the Districts
Contribution of each of the 12 indicators to India's MPI Score up to the
level of the Districts
Headcount Ratio, Intensity and the MPI for Urban and Rural areas upto
the level of the Districts
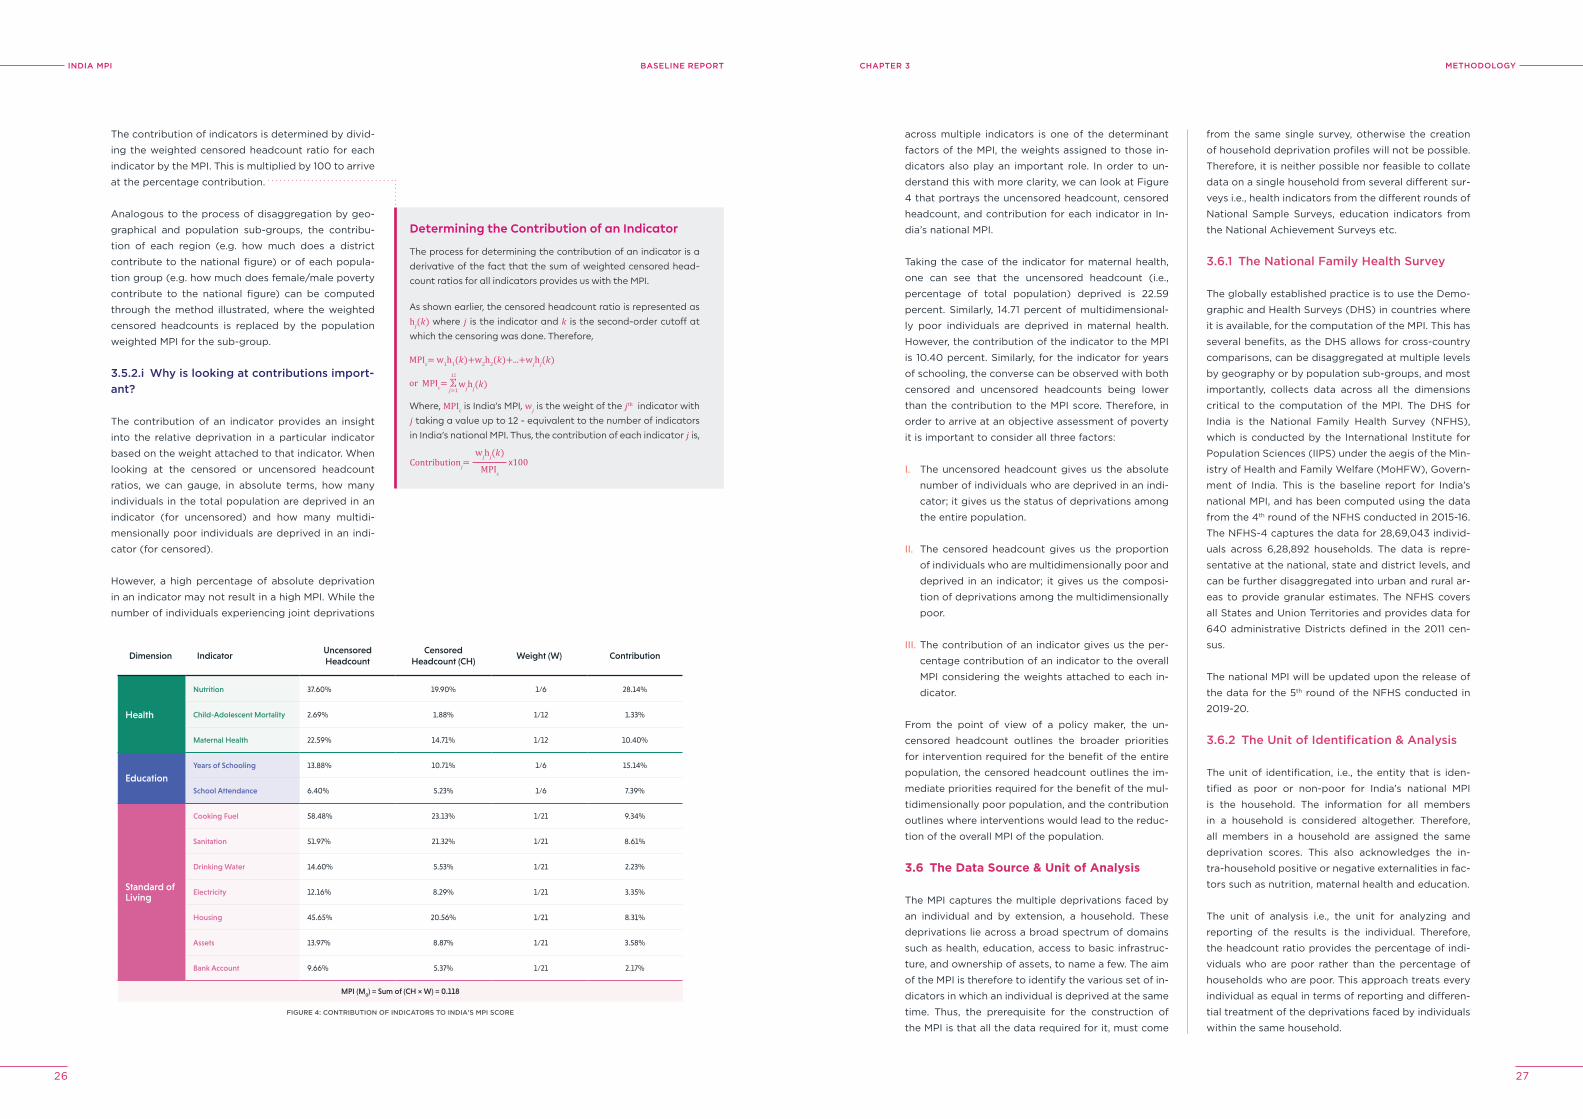
INDIA MPI BASELINE REPORT
26 27
MeThoDoloGyChApTer 3
The contribution of indicators is determined by divid-
ing the weighted censored headcount ratio for each
indicator by the MPI. This is multiplied by 100 to arrive
at the percentage contribution.
Analogous to the process of disaggregation by geo-
graphical and population sub-groups, the contribu-
tion of each region (e.g. how much does a district
contribute to the national figure) or of each popula-
tion group (e.g. how much does female/male poverty
contribute to the national figure) can be computed
through the method illustrated, where the weighted
censored headcounts is replaced by the population
weighted MPI for the sub-group.
3.5.2.i Why is looking at contributions import-ant?
The contribution of an indicator provides an insight
into the relative deprivation in a particular indicator
based on the weight attached to that indicator. When
looking at the censored or uncensored headcount
ratios, we can gauge, in absolute terms, how many
individuals in the total population are deprived in an
indicator (for uncensored) and how many multidi-
mensionally poor individuals are deprived in an indi-
cator (for censored).
However, a high percentage of absolute deprivation
in an indicator may not result in a high MPI. While the
number of individuals experiencing joint deprivations
Determining the Contribution of an Indicator
The process for determining the contribution of an indicator is a
derivative of the fact that the sum of weighted censored head-
count ratios for all indicators provides us with the MPI.
As shown earlier, the censored headcount ratio is represented as
h𝑗(𝑘) where 𝑗 is the indicator and 𝑘 is the second-order cutoff at
which the censoring was done. Therefore,
Where, MPIc is India’s MPI, w𝑗 is the weight of the 𝑗th indicator with
𝑗 taking a value up to 12 - equivalent to the number of indicators
in India’s national MPI. Thus, the contribution of each indicator 𝑗 is,
Con tribution 𝑗=w𝑗h𝑗(𝑘)
MPIc
𝗑100
MPIc= w1h1(𝑘)+w2h2(𝑘)+...+w𝑗h𝑗(𝑘)
w𝑗h𝑗(𝑘)12
𝑗=1⅀MPIc=or
Dimension IndicatorUncensored Headcount
Censored Headcount (CH)
Weight (W) Contribution
Health
Nutrition 37.60% 19.90% 1/6 28.14%
Child-Adolescent Mortality 2.69% 1.88% 1/12 1.33%
Maternal Health 22.59% 14.71% 1/12 10.40%
EducationYears of Schooling 13.88% 10.71% 1/6 15.14%
School Attendance 6.40% 5.23% 1/6 7.39%
Standard of Living
Cooking Fuel 58.48% 23.13% 1/21 9.34%
Sanitation 51.97% 21.32% 1/21 8.61%
Drinking Water 14.60% 5.53% 1/21 2.23%
Electricity 12.16% 8.29% 1/21 3.35%
Housing 45.65% 20.56% 1/21 8.31%
Assets 13.97% 8.87% 1/21 3.58%
Bank Account 9.66% 5.37% 1/21 2.17%
MPI (M0) = Sum of (CH × W) = 0.118
FIGUre 4: CoNTrIBUTIoN oF INDICATorS To INDIA'S MpI SCore
across multiple indicators is one of the determinant
factors of the MPI, the weights assigned to those in-
dicators also play an important role. In order to un-
derstand this with more clarity, we can look at Figure
4 that portrays the uncensored headcount, censored
headcount, and contribution for each indicator in In-
dia’s national MPI.
Taking the case of the indicator for maternal health,
one can see that the uncensored headcount (i.e.,
percentage of total population) deprived is 22.59
percent. Similarly, 14.71 percent of multidimensional-
ly poor individuals are deprived in maternal health.
However, the contribution of the indicator to the MPI
is 10.40 percent. Similarly, for the indicator for years
of schooling, the converse can be observed with both
censored and uncensored headcounts being lower
than the contribution to the MPI score. Therefore, in
order to arrive at an objective assessment of poverty
it is important to consider all three factors:
I. The uncensored headcount gives us the absolute
number of individuals who are deprived in an indi-
cator; it gives us the status of deprivations among
the entire population.
II. The censored headcount gives us the proportion
of individuals who are multidimensionally poor and
deprived in an indicator; it gives us the composi-
tion of deprivations among the multidimensionally
poor.
III. The contribution of an indicator gives us the per-
centage contribution of an indicator to the overall
MPI considering the weights attached to each in-
dicator.
From the point of view of a policy maker, the un-
censored headcount outlines the broader priorities
for intervention required for the benefit of the entire
population, the censored headcount outlines the im-
mediate priorities required for the benefit of the mul-
tidimensionally poor population, and the contribution
outlines where interventions would lead to the reduc-
tion of the overall MPI of the population.
3.6 The Data Source & Unit of Analysis
The MPI captures the multiple deprivations faced by
an individual and by extension, a household. These
deprivations lie across a broad spectrum of domains
such as health, education, access to basic infrastruc-
ture, and ownership of assets, to name a few. The aim
of the MPI is therefore to identify the various set of in-
dicators in which an individual is deprived at the same
time. Thus, the prerequisite for the construction of
the MPI is that all the data required for it, must come
from the same single survey, otherwise the creation
of household deprivation profiles will not be possible.
Therefore, it is neither possible nor feasible to collate
data on a single household from several different sur-
veys i.e., health indicators from the different rounds of
National Sample Surveys, education indicators from
the National Achievement Surveys etc.
3.6.1 The National Family health Survey
The globally established practice is to use the Demo-
graphic and Health Surveys (DHS) in countries where
it is available, for the computation of the MPI. This has
several benefits, as the DHS allows for cross-country
comparisons, can be disaggregated at multiple levels
by geography or by population sub-groups, and most
importantly, collects data across all the dimensions
critical to the computation of the MPI. The DHS for
India is the National Family Health Survey (NFHS),
which is conducted by the International Institute for
Population Sciences (IIPS) under the aegis of the Min-
istry of Health and Family Welfare (MoHFW), Govern-
ment of India. This is the baseline report for India’s
national MPI, and has been computed using the data
from the 4th round of the NFHS conducted in 2015-16.
The NFHS-4 captures the data for 28,69,043 individ-
uals across 6,28,892 households. The data is repre-
sentative at the national, state and district levels, and
can be further disaggregated into urban and rural ar-
eas to provide granular estimates. The NFHS covers
all States and Union Territories and provides data for
640 administrative Districts defined in the 2011 cen-
sus.
The national MPI will be updated upon the release of
the data for the 5th round of the NFHS conducted in
2019-20.
3.6.2 The Unit of Identification & Analysis
The unit of identification, i.e., the entity that is iden-
tified as poor or non-poor for India’s national MPI
is the household. The information for all members
in a household is considered altogether. Therefore,
all members in a household are assigned the same
deprivation scores. This also acknowledges the in-
tra-household positive or negative externalities in fac-
tors such as nutrition, maternal health and education.
The unit of analysis i.e., the unit for analyzing and
reporting of the results is the individual. Therefore,
the headcount ratio provides the percentage of indi-
viduals who are poor rather than the percentage of
households who are poor. This approach treats every
individual as equal in terms of reporting and differen-
tial treatment of the deprivations faced by individuals
within the same household.
INDIA MPI
28 29
WAy ForWArD
CHAPTER
ChApTer 4
REFORMS & PROGRESSWAY FORWARD
This baseline National MPI Report and Dashboard is
a landmark first step in bringing multidimensional
poverty as a tool to the policy table at the nation-
al and subnational levels in India. It is expected that
the report will play an instrumental role in sensitizing
government, researchers, civil society, citizens, and
other stakeholders on the need for and importance
of MPI as a powerful policy instrument. At the higher
levels, MPI could be used as an input to the design
of development policies schemes, budget allocations,
and target setting. At the lower levels, for instance,
of that of district, MPI could decide priority of execu-
tion and delivery. With every revision of MPI based on
new survey data, actions could be redesigned to shift
focus to those who need it the most. NITI Aayog will
play a key role in charting this path and supporting
the stakeholders in their actions, through the follow-
ing approaches.
4.1 Trend analysis based on estimates from NFHS-5
While this report is an indispensable first step in
mainstreaming MPI, it is based on a dataset which
is five years old. The success of numerous develop-
ment interventions in the recent past have resulted in
progress in key parameters on health, education, and
standard of living. For instance, saturation of village
electrification and toilets was achieved in 2018 and
2019, respectively. The NFHS-5, conducted during
2019-20, is expected to capture the progress achieved
in these areas. The unit-level data of the survey re-
quired for MPI estimations is likely to be published
before the end of 2021, based on which the nation-
al MPI figures will be revised, at the national, State/
UT, and district levels. A trend analysis, using the two
datasets, will also be carried out. This will clearly point
out areas of focus for the near future. The decision to
conduct subsequent National Family Health Surveys
once in every three years will increase the frequency
of MPI revisions and reduce the lag in the reflection of
development outcomes in poverty estimates. A high-
er frequency of NFHS will also address the issue of
stagnation of India’s global rankings in MPI and reflect
the improvements adequately. Corresponding to the
revision of MPI estimates, the MPI dashboard, which
will present national, State, and district-level MPI and
related figures, will be updated.
4.2 Reform action plan for the States/UTs
Between two consecutive NFH Surveys, focused gov-
ernment action to fill the gaps and reduce depriva-
tions will result in improved outcomes. The reform
action plan is a tool designed to support the States in
this crucial endeavor. The plan maps the government
schemes and policies which have a direct bearing on
the health, education, and living standards outcomes
which MPI captures, to each national MPI indicator.
Further, the plan also identifies indicators under these
4
44
schemes and programmes whose achievements are
directly and positively correlated with MPI outcomes.
This implies that progress, as measured by these
indicators, will result in improvement of the corre-
sponding national MPI indicators. To demonstrate,
one of the indicators in the reform action plan, under
the “nutrition” indicator of national MPI, is “number
of Anganwadi Centres having weighing scales as a
proportion of total number of Anganwadi Centres”,
which is mapped to the ICDS scheme. Improvement
as measured under this indicator will result in bet-
ter monitoring of nutritional outcomes by the AWCs
which will in turn trigger action to improve nutrition,
whose success will consequently bring about reduc-
tion in levels of malnutrition. This change will result in
reduction of deprivation under the “nutrition” indica-
tor of the national MPI, leading to a better MPI score,
ceteris paribus.
While NITI Aayog has prepared a template for the re-
form action plan through consultations with central
ministries, it is important to note that the States are
being encouraged to suitably modify it, taking into
account their realities, development challenges, and
priorities. Though national MPI measures outcomes,
the reform action plan will invariably consist of admin-
istrative and input indicators. The idea is that these
input indicators will act as high- frequency proxies for
the outcome indicators. In the coming months, NITI
Aayog aims to support the States in developing effec-
tive reform action plans which will periodically cap-
ture progress under development programmes and
schemes, and contribute to reduction in deprivations
and multidimensional poverty.
4.3 Progress dashboard
While the periodic NFH Surveys will measure out-
comes and will be used for revising MPI estimates,
there is a need to strengthen implementation which
will eventually result in improved outcomes. To moni-
tor the progress of the implementation, the Develop-
ment Monitoring and Evaluation Office (DMEO), an
attached office under NITI Aayog, is in the process of
developing a progress dashboard.
This dashboard will track the progress of the reforms
implemented by the States to improve outcomes
which will eventually reflect in reduced multidimen-
sional poverty. Though this dashboard will not mon-
itor outcomes directly, nevertheless it plays a crucial
role, as the implementation of reform actions by the
States is the only way the country can achieve faster
poverty reduction and correspondingly a better posi-
tion in global MPI rankings.
4.4 Technical support to States
While NITI Aayog will continue to estimate and pub-
lish MPI figures based on NFHS data periodically, the
States are encouraged to pursue analysis at multiple
levels. Household surveys could be designed and
carried out to estimate MPI at block or district lev-
els, with higher frequency. This will offer insights into
block-level estimates, which are not possible from
NFHS owing to its sample design and size and deliver
more frequent estimations at the district levels. The
experience of the Government of Andhra Pradesh,
which carried out a household survey in 2016 exclu-
sively to estimate MPI at the State and district lev-
els is an example in this regard. NITI Aayog has in-
house capabilities and will be willing to offer technical
support to the States, should they be interested in
surveys for this purpose. This support could include
design of indicators, sampling design, questionnaire
development, training of enumerators, data cleaning,
processing, and analysis, report structuring, and ac-
tion plan for improvement. On one hand, this support
will result in disaggregated and more frequent MPI
estimates and corresponding action plans for poverty
reduction, while on the other hand, it will contribute
significantly to improving state capacity in poverty
estimation, monitoring, and reduction.
While the aforementioned are the clear actions
planned for the near future to further mainstream MPI
as a powerful policy tool at the national and subna-
tional levels, the long-term actions will depend on
how the project and its associated initiatives will un-
fold. Depending on the acceptance at various levels,
NITI Aayog will accordingly design and implement or
support further initiatives to fast track the adoption
of MPI. Some of this could include State-specific MPI
reports, focus on disaggregated MPI etc. The util-
ity, relevance and acceptability of a national MPI as
a powerful policy tool for fast tracking development
and leaving no one behind at the national and local
levels, will eventually shape the discourse on devel-
opmental policy in the coming days in the country as
much as in the global arena.
INDIA MPI BASELINE REPORT reSUlTSSECTION
30 31
SECTION
IIINATIONAL
&STATE/UT RESULTS
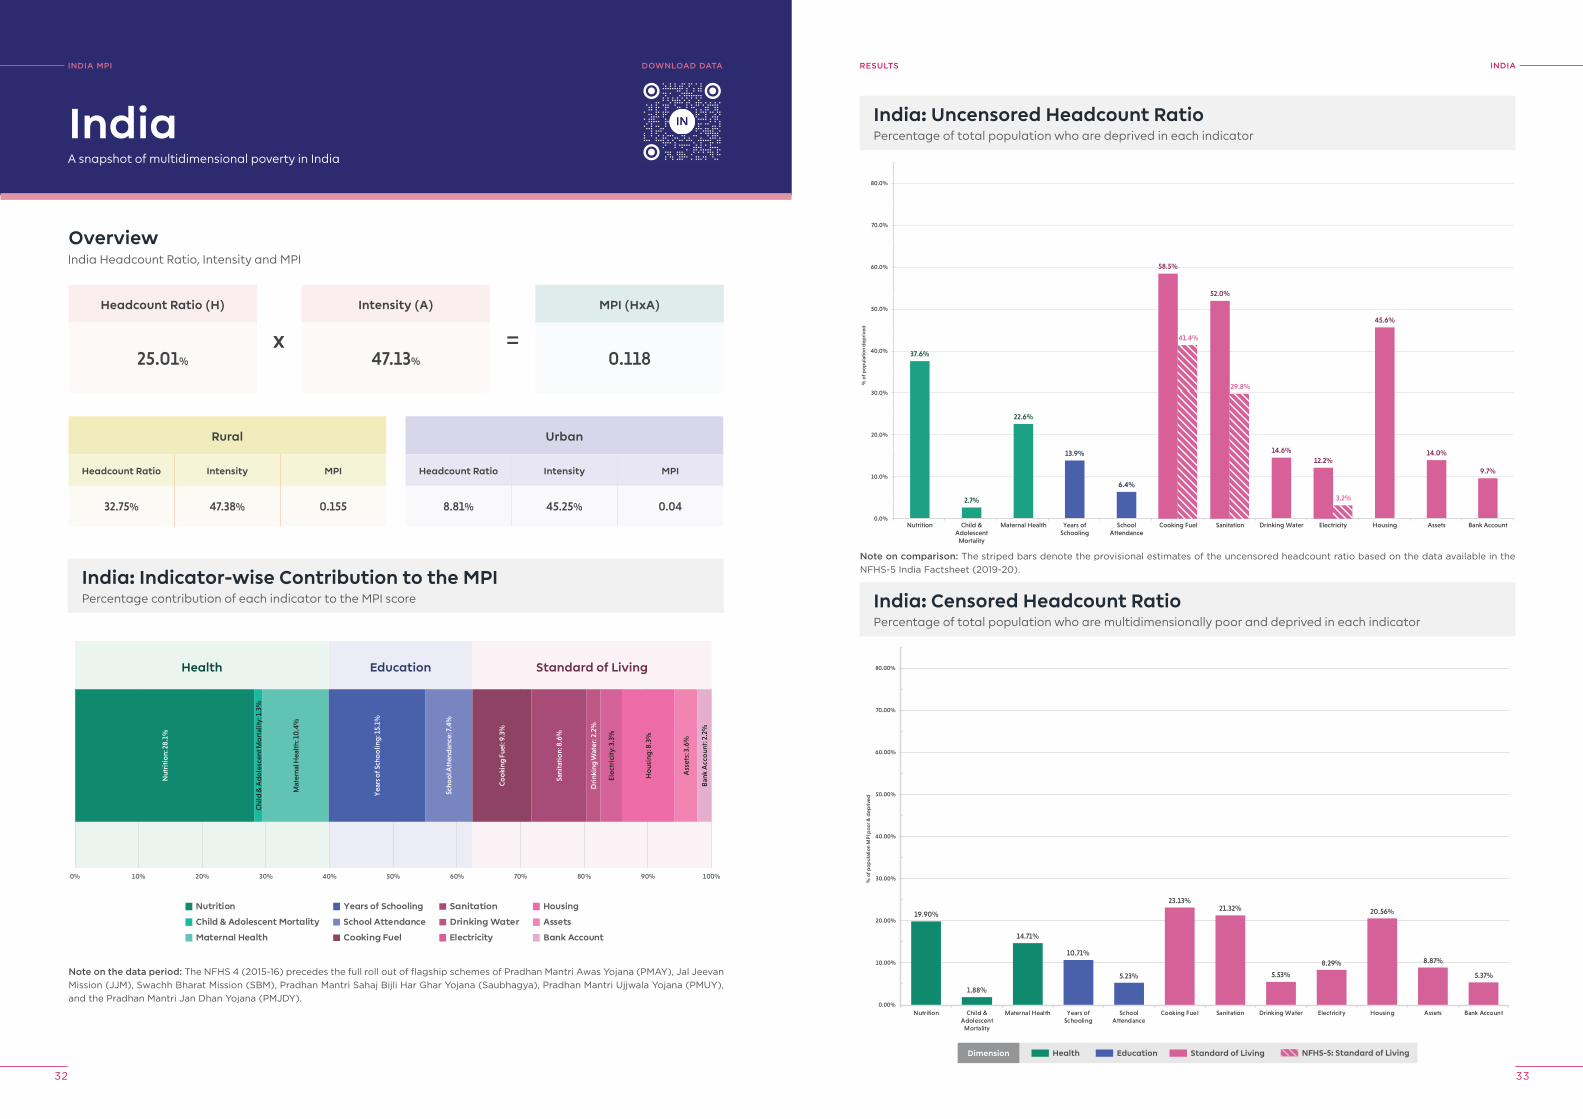
INDIA MPI BASELINE REPORT
32 33
INDIAreSUlTS
India: Uncensored Headcount RatioPercentage of total population who are deprived in each indicator
37.6%
2.7%
22.6%
13.9%
6.4%
14.6%
45.6%
14.0%
9.7%
58.5%
41.4%
52.0%
29.8%
12.2%
3.2%
0.0%
10.0%
20.0%
30.0%
40.0%
50.0%
60.0%
70.0%
80.0%
Nutrition Child &Adolescent
Mortality
Maternal Health Years ofSchooling
SchoolAttendance
Cooking Fuel Sanitation Drinking Water Electricity Housing Assets Bank Account
% o
f po
pul
atio
n d
epri
ved
19.90%
1.88%
14.71%
10.71%
5.23%
23.13%21.32%
5.53%
8.29%
20.56%
8.87%
5.37%
0.00%
10.00%
20.00%
30.00%
40.00%
50.00%
60.00%
70.00%
80.00%
Nutrition Child &Adolescent
Mortality
Maternal Health Years ofSchooling
SchoolAttendance
Cooking Fuel Sanitation Drinking Water Electricity Housing Assets Bank Account
% o
f pop
ulat
ion
MPI
poo
r & d
epriv
ed
India: Censored Headcount RatioPercentage of total population who are multidimensionally poor and deprived in each indicator
INDIA MpI DoWNloAD DATA
A snapshot of multidimensional poverty in India
OverviewIndia Headcount Ratio, Intensity and MPI
Headcount Ratio (H)
25.01%
Rural
Headcount Ratio Intensity MPI
32.75% 47.38% 0.155
India: Indicator-wise Contribution to the MPIPercentage contribution of each indicator to the MPI score
Intensity (A)
47.13%
MPI (HxA)
0.118
India
Urban
Headcount Ratio Intensity MPI
8.81% 45.25% 0.04
x =
Note on the data period: The NFHS 4 (2015-16) precedes the full roll out of flagship schemes of Pradhan Mantri Awas Yojana (PMAY), Jal Jeevan Mission (JJM), Swachh Bharat Mission (SBM), Pradhan Mantri Sahaj Bijli Har Ghar Yojana (Saubhagya), Pradhan Mantri Ujjwala Yojana (PMUY), and the Pradhan Mantri Jan Dhan Yojana (PMJDY).
Nutrition
Child & Adolescent Mortality
Maternal Health
Years of Schooling
School Attendance
Cooking Fuel
Sanitation
Drinking Water
Electricity
Housing
Assets
Bank Account
0% 10% 20% 30% 40% 50% 60% 70% 80% 90% 100%
Health Education Standard of Living
Nut
riti
on:
28.
1%
Chi
ld &
Ad
ole
scen
t Mo
rtal
ity: 1
.3%
Mat
erna
l Hea
lth:
10
.4%
Yea
rs o
f Sch
oo
ling
: 15.
1%
Scho
ol A
tten
dan
ce: 7
.4%
Co
oki
ng F
uel:
9.3%
Sani
tati
on:
8.6
%
Dri
nkin
g W
ater
: 2.2
%
Elec
tric
ity:
3.3
%
Ho
usin
g: 8
.3%
Ass
ets:
3.6
%
Ban
k A
cco
unt:
2.2
%
Note on comparison: The striped bars denote the provisional estimates of the uncensored headcount ratio based on the data available in the NFHS-5 India Factsheet (2019-20).
Dimension Health Education Standard of Living NFHS-5: Standard of Living
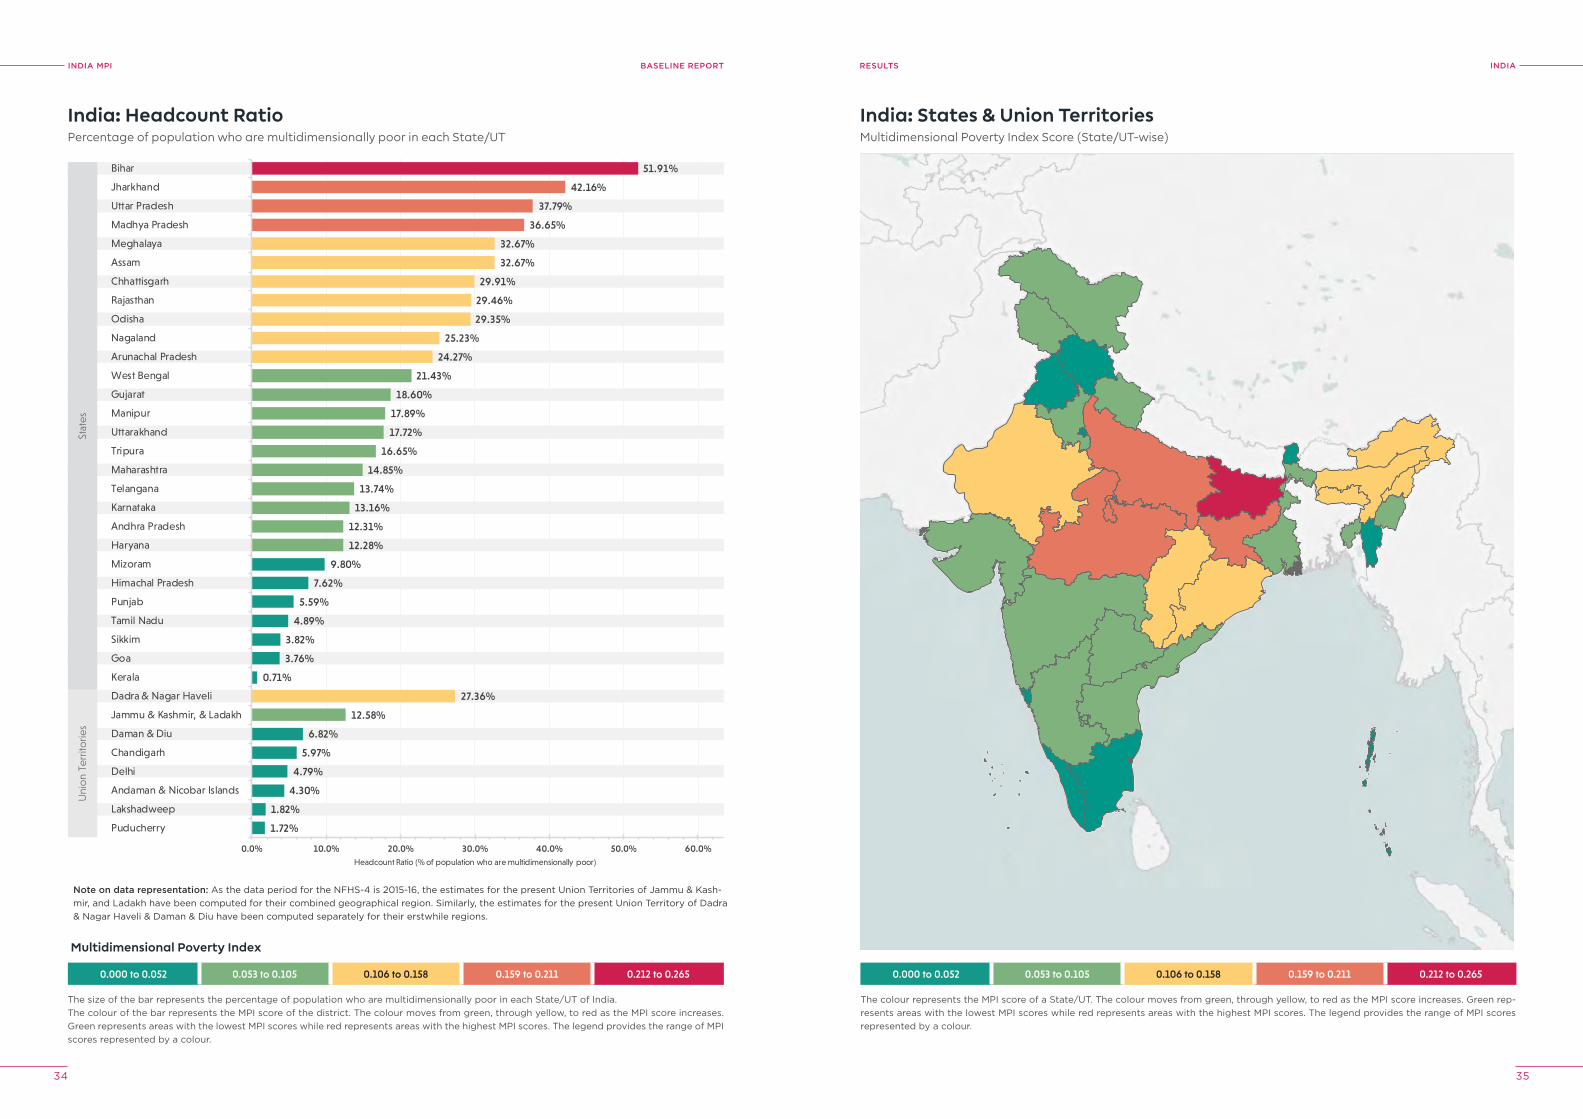
INDIA MPI BASELINE REPORT
34 35
INDIAreSUlTS
Percentage of population who are multidimensionally poor in each State/UT
India: Headcount Ratio
The size of the bar represents the percentage of population who are multidimensionally poor in each State/UT of India.The colour of the bar represents the MPI score of the district. The colour moves from green, through yellow, to red as the MPI score increases. Green represents areas with the lowest MPI scores while red represents areas with the highest MPI scores. The legend provides the range of MPI scores represented by a colour.
0.000 to 0.052 0.053 to 0.105 0.106 to 0.158 0.159 to 0.211 0.212 to 0.265
Stat
esU
nio
n Te
rrito
ries
1.72%
1.82%
4.30%
4.79%
5.97%
6.82%
0.71%
3.76%
3.82%
4.89%
5.59%
7.62%
9.80%
12.58%
12.28%
12.31%
13.16%
13.74%
14.85%
16.65%
17.72%
17.89%
18.60%
21.43%
27.36%
24.27%
25.23%
29.35%
29.46%
29.91%
32.67%
32.67%
36.65%
37.79%
42.16%
51.91%
0.0% 10.0% 20.0% 30.0% 40.0% 50.0% 60.0%
Puducherry
Lakshadweep
Andaman & Nicobar Islands
Delhi
Chandigarh
Daman & Diu
Jammu & Kashmir, & Ladakh
Dadra & Nagar Haveli
Kerala
Goa
Sikkim
Tamil Nadu
Punjab
Himachal Pradesh
Mizoram
Haryana
Andhra Pradesh
Karnataka
Telangana
Maharashtra
Tripura
Uttarakhand
Manipur
Gujarat
West Bengal
Arunachal Pradesh
Nagaland
Odisha
Rajasthan
Chhattisgarh
Assam
Meghalaya
Madhya Pradesh
Uttar Pradesh
Jharkhand
Bihar
Headcount Ratio (% of population who are multidimensionally poor)
Note on data representation: As the data period for the NFHS-4 is 2015-16, the estimates for the present Union Territories of Jammu & Kash-mir, and Ladakh have been computed for their combined geographical region. Similarly, the estimates for the present Union Territory of Dadra & Nagar Haveli & Daman & Diu have been computed separately for their erstwhile regions.
Multidimensional Poverty Index Score (State/UT-wise)
India: States & Union Territories
The colour represents the MPI score of a State/UT. The colour moves from green, through yellow, to red as the MPI score increases. Green rep-resents areas with the lowest MPI scores while red represents areas with the highest MPI scores. The legend provides the range of MPI scores represented by a colour.
0.000 to 0.052 0.053 to 0.105 0.106 to 0.158 0.159 to 0.211 0.212 to 0.265
Multidimensional Poverty Index
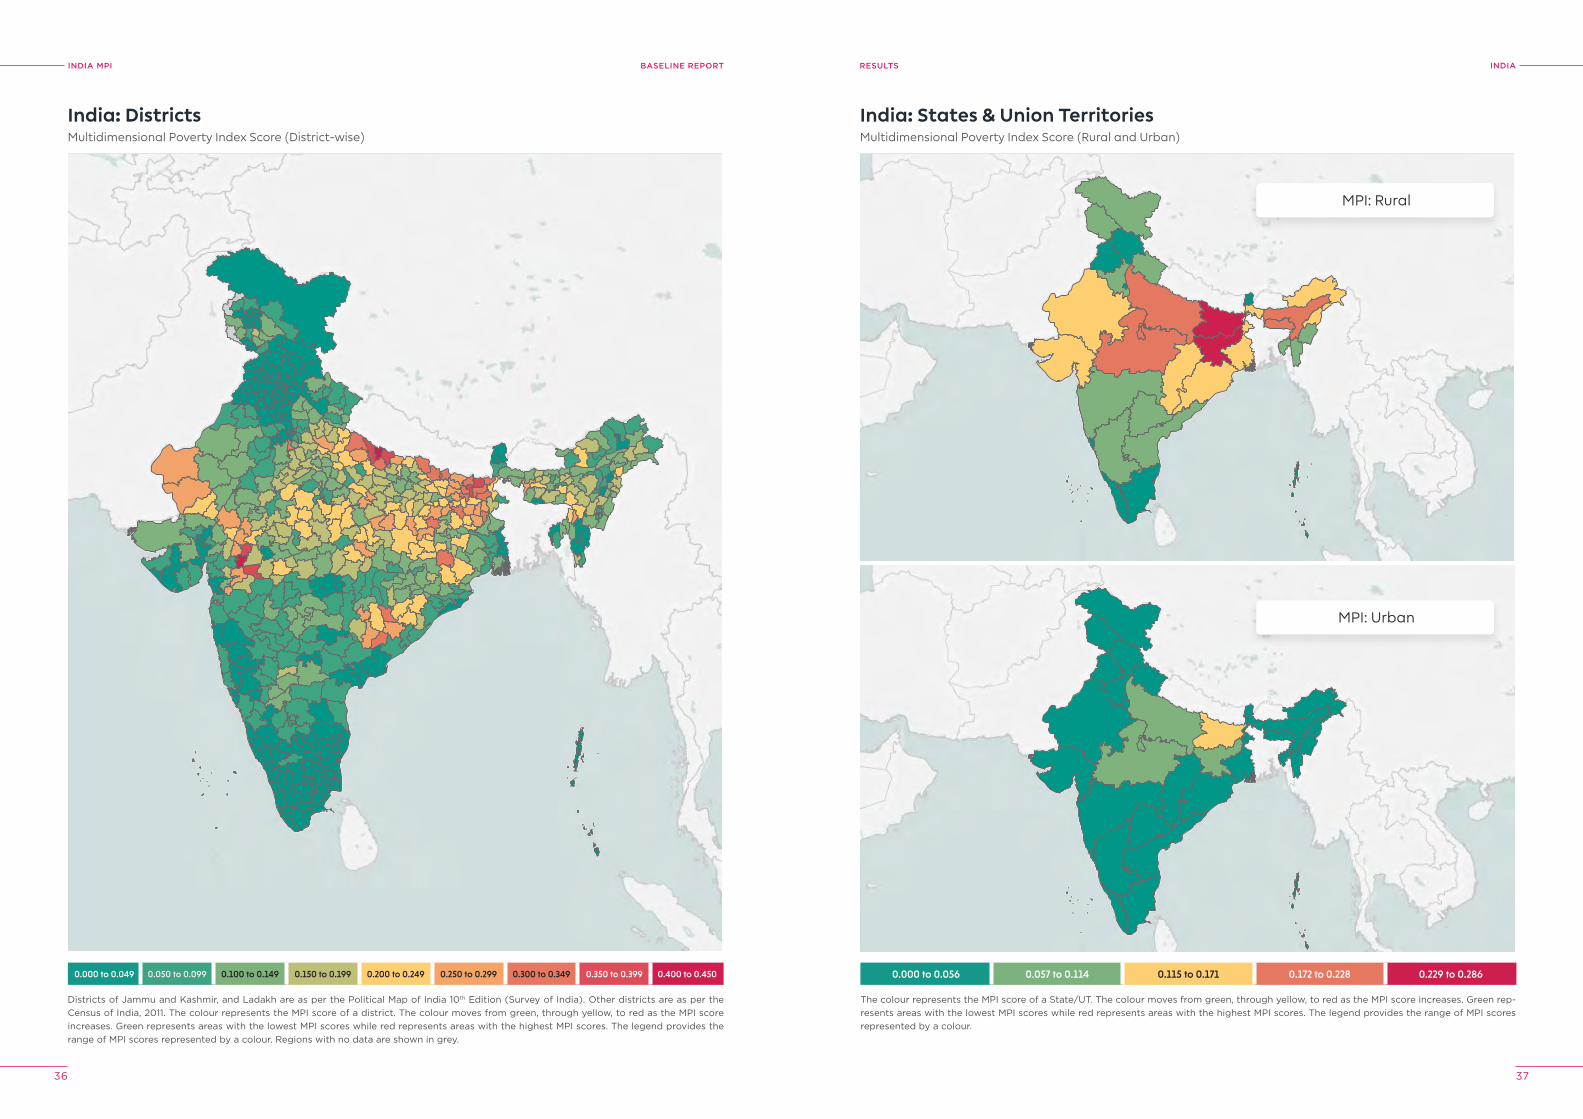
INDIA MPI BASELINE REPORT
36 37
INDIAreSUlTS
0.000 to 0.049 0.050 to 0.099 0.100 to 0.149 0.150 to 0.199 0.200 to 0.249 0.250 to 0.299 0.300 to 0.349 0.350 to 0.399 0.400 to 0.450
Multidimensional Poverty Index Score (District-wise)
India: Districts
Districts of Jammu and Kashmir, and Ladakh are as per the Political Map of India 10th Edition (Survey of India). Other districts are as per the Census of India, 2011. The colour represents the MPI score of a district. The colour moves from green, through yellow, to red as the MPI score increases. Green represents areas with the lowest MPI scores while red represents areas with the highest MPI scores. The legend provides the range of MPI scores represented by a colour. Regions with no data are shown in grey.
Multidimensional Poverty Index Score (Rural and Urban)
India: States & Union Territories
The colour represents the MPI score of a State/UT. The colour moves from green, through yellow, to red as the MPI score increases. Green rep-resents areas with the lowest MPI scores while red represents areas with the highest MPI scores. The legend provides the range of MPI scores represented by a colour.
0.000 to 0.056 0.057 to 0.114 0.115 to 0.171 0.172 to 0.228 0.229 to 0.286
MPI: Rural
MPI: Urban
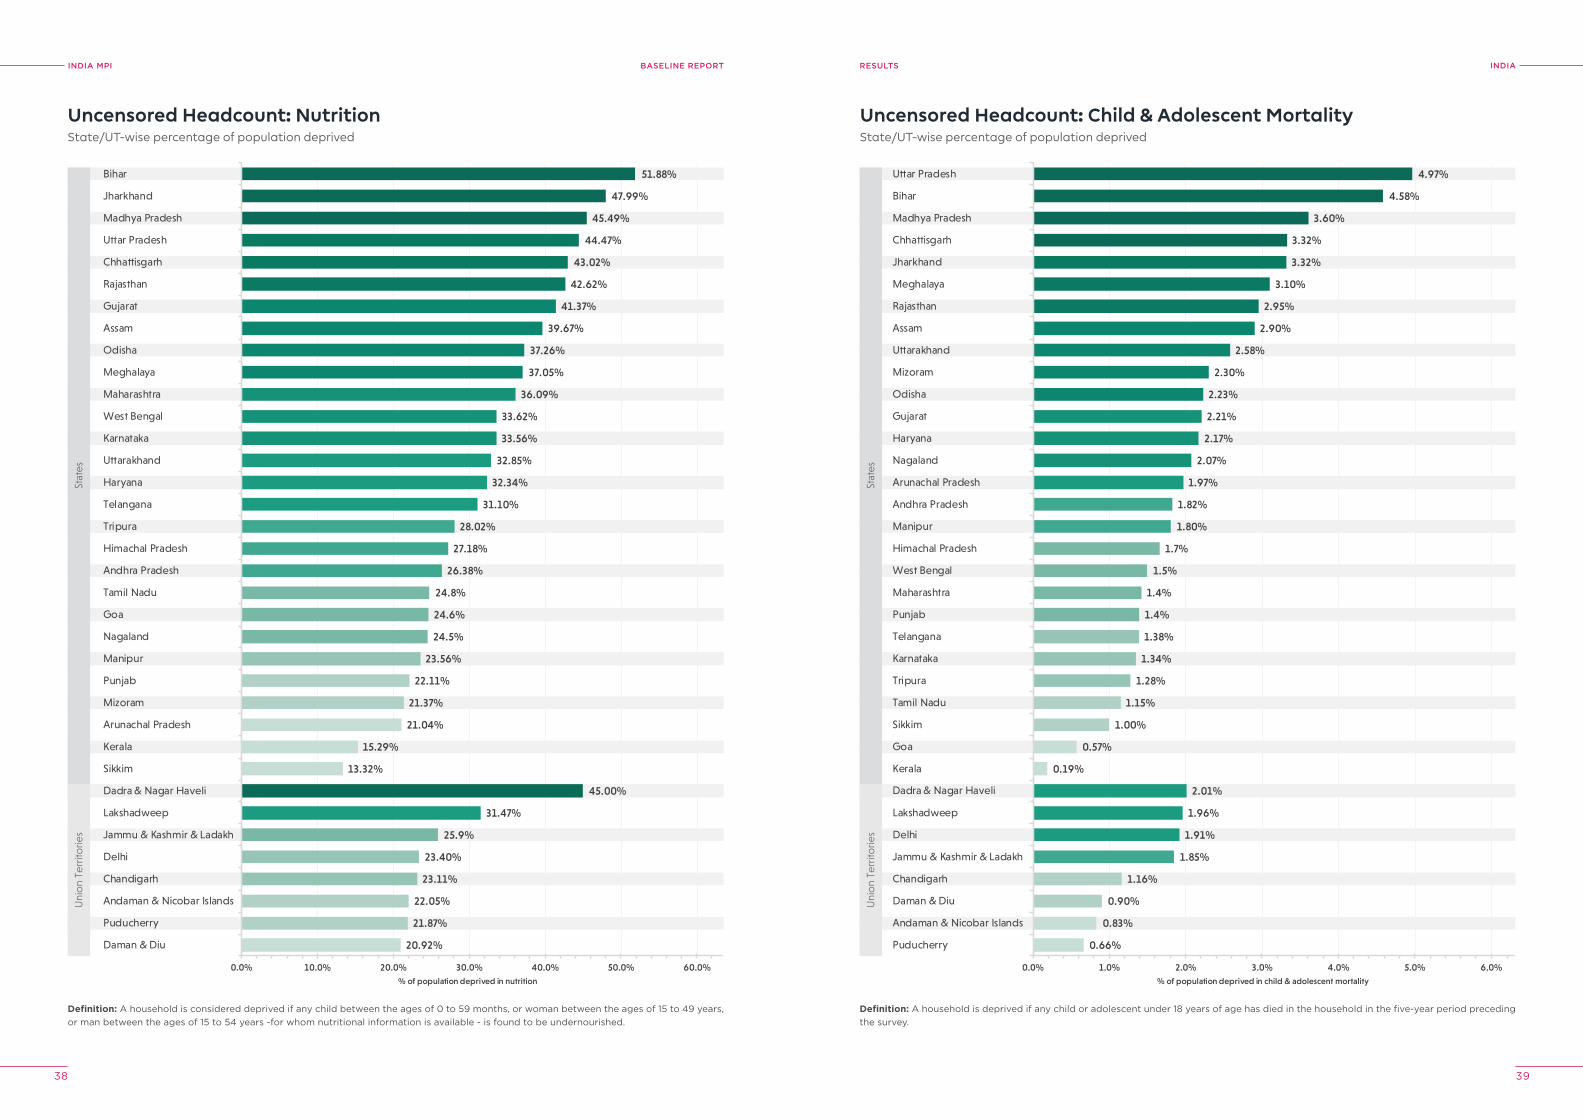
INDIA MPI BASELINE REPORT
38 39
INDIAreSUlTS
State/UT-wise percentage of population deprived
Uncensored Headcount: Nutrition
Uni
on
Terr
itorie
sSt
ates
20.92%
13.32%
15.29%
21.04%
21.87%
22.05%
21.37%
22.11%
23.11%
23.40%
23.56%
25.9%
24.5%
24.6%
24.8%
26.38%
27.18%
28.02%
31.47%
31.10%
32.34%
32.85%
33.56%
33.62%
36.09%
37.05%
37.26%
39.67%
41.37%
42.62%
43.02%
44.47%
45.00%
45.49%
47.99%
51.88%
0.0% 10.0% 20.0% 30.0% 40.0% 50.0% 60.0%
Daman & Diu
Puducherry
Andaman & Nicobar Islands
Chandigarh
Delhi
Jammu & Kashmir & Ladakh
Lakshadweep
Dadra & Nagar Haveli
Sikkim
Kerala
Arunachal Pradesh
Mizoram
Punjab
Manipur
Nagaland
Goa
Tamil Nadu
Andhra Pradesh
Himachal Pradesh
Tripura
Telangana
Haryana
Uttarakhand
Karnataka
West Bengal
Maharashtra
Meghalaya
Odisha
Assam
Gujarat
Rajasthan
Chhattisgarh
Uttar Pradesh
Madhya Pradesh
Jharkhand
Bihar
% of population deprived in nutrition
State/UT-wise percentage of population deprived
Uncensored Headcount: Child & Adolescent Mortality
Uni
on
Terr
itorie
s
0.66%
0.83%
0.19%
0.57%
0.90%
1.16%
1.00%
1.15%
1.28%
1.34%
1.38%
1.4%
1.4%
1.5%
1.7%
1.85%
1.80%
1.82%
1.91%
1.96%
2.01%
1.97%
2.07%
2.17%
2.21%
2.23%
2.30%
2.58%
2.90%
2.95%
3.10%
3.32%
3.32%
3.60%
4.58%
4.97%
0.0% 1.0% 2.0% 3.0% 4.0% 5.0% 6.0%
Puducherry
Andaman & Nicobar Islands
Daman & Diu
Chandigarh
Jammu & Kashmir & Ladakh
Delhi
Lakshadweep
Dadra & Nagar Haveli
Kerala
Goa
Sikkim
Tamil Nadu
Tripura
Karnataka
Telangana
Punjab
Maharashtra
West Bengal
Himachal Pradesh
Manipur
Andhra Pradesh
Arunachal Pradesh
Nagaland
Haryana
Gujarat
Odisha
Mizoram
Uttarakhand
Assam
Rajasthan
Meghalaya
Jharkhand
Chhattisgarh
Madhya Pradesh
Bihar
Uttar Pradesh
% of population deprived in child & adolescent mortality
Stat
es
Definition: A household is considered deprived if any child between the ages of 0 to 59 months, or woman between the ages of 15 to 49 years, or man between the ages of 15 to 54 years -for whom nutritional information is available - is found to be undernourished.
Definition: A household is deprived if any child or adolescent under 18 years of age has died in the household in the five-year period preceding the survey.
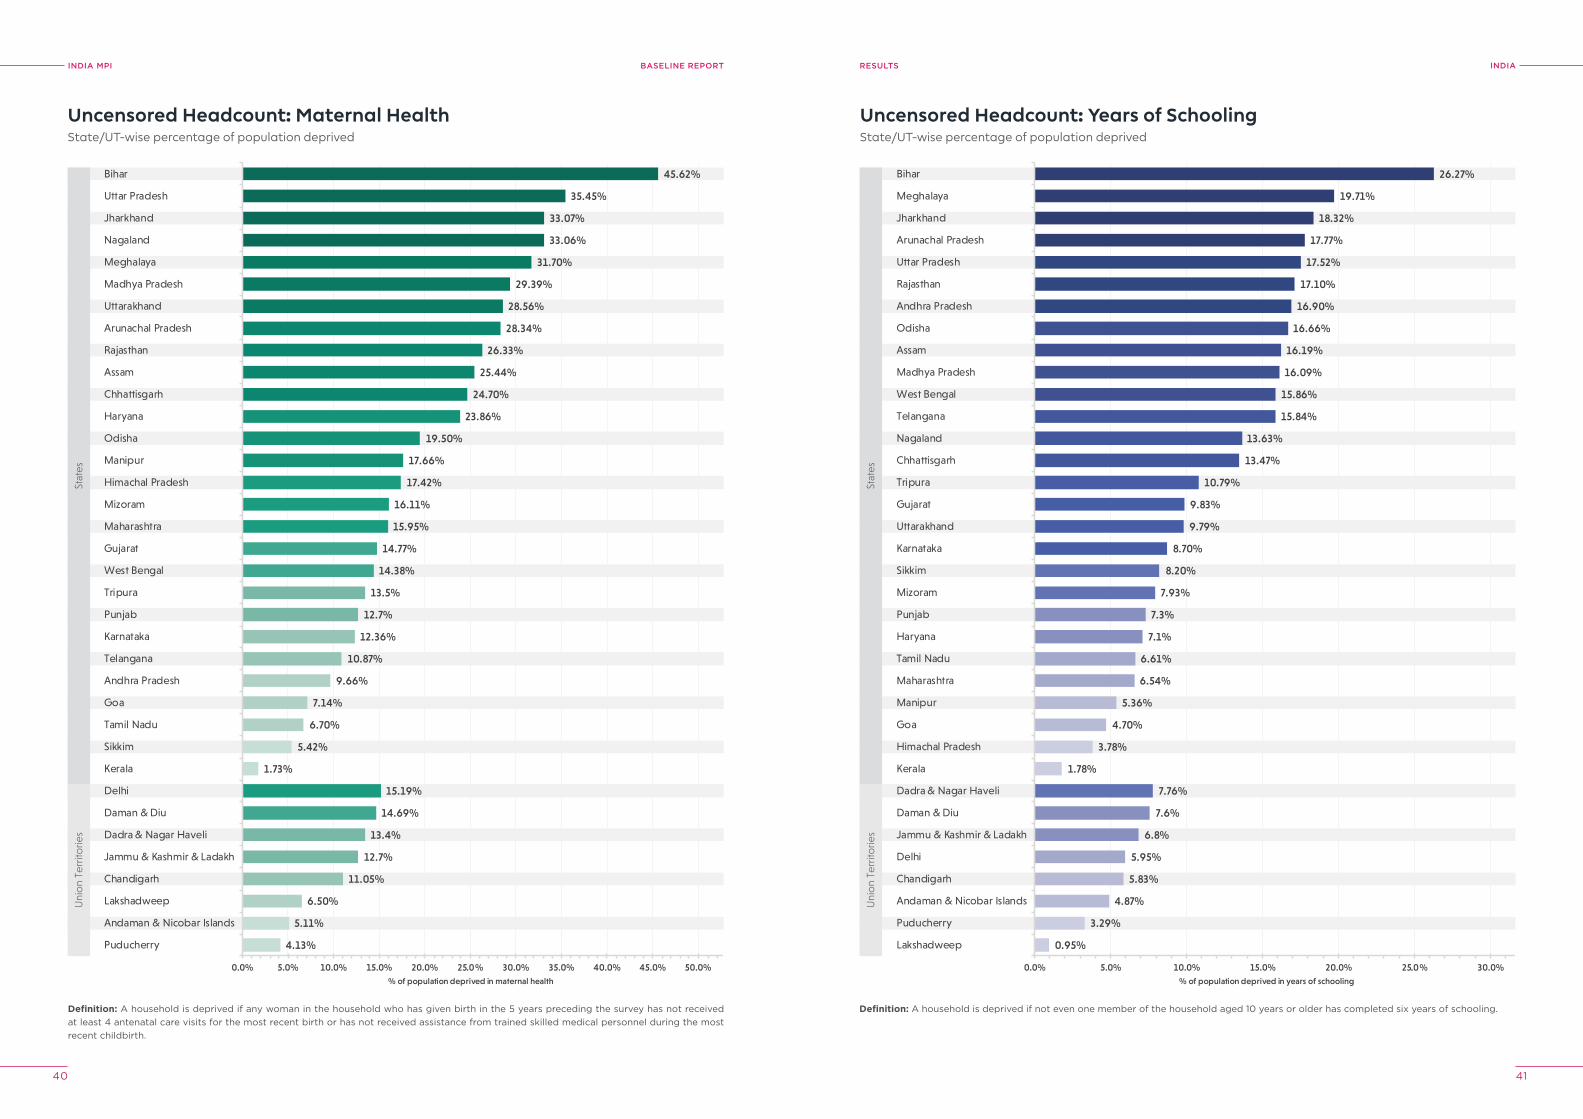
INDIA MPI BASELINE REPORT
40 41
INDIAreSUlTS
State/UT-wise percentage of population deprived
Uncensored Headcount: Maternal Health
Uni
on
Terr
itorie
sSt
ates
4.13%
5.11%
1.73%
5.42%
6.50%
6.70%
7.14%
9.66%
11.05%
10.87%
12.36%
12.7%
13.4%
12.7%
13.5%
14.69%
14.38%
14.77%
15.19%
15.95%
16.11%
17.42%
17.66%
19.50%
23.86%
24.70%
25.44%
26.33%
28.34%
28.56%
29.39%
31.70%
33.06%
33.07%
35.45%
45.62%
0.0% 5.0% 10.0% 15.0% 20.0% 25.0% 30.0% 35.0% 40.0% 45.0% 50.0%
Puducherry
Andaman & Nicobar Islands
Lakshadweep
Chandigarh
Jammu & Kashmir & Ladakh
Dadra & Nagar Haveli
Daman & Diu
Delhi
Kerala
Sikkim
Tamil Nadu
Goa
Andhra Pradesh
Telangana
Karnataka
Punjab
Tripura
West Bengal
Gujarat
Maharashtra
Mizoram
Himachal Pradesh
Manipur
Odisha
Haryana
Chhattisgarh
Assam
Rajasthan
Arunachal Pradesh
Uttarakhand
Madhya Pradesh
Meghalaya
Nagaland
Jharkhand
Uttar Pradesh
Bihar
% of population deprived in maternal health
State/UT-wise percentage of population deprived
Uncensored Headcount: Years of Schooling
Uni
on
Terr
itorie
sSt
ates
0.95%
3.29%
1.78%
3.78%
4.87%
5.83%
4.70%
5.36%
5.95%
6.54%
6.61%
6.8%
7.6%
7.1%
7.3%
7.76%
7.93%
8.20%
8.70%
9.79%
9.83%
10.79%
13.47%
13.63%
15.84%
15.86%
16.09%
16.19%
16.66%
16.90%
17.10%
17.52%
17.77%
18.32%
19.71%
26.27%
0.0% 5.0% 10.0% 15.0% 20.0% 25.0% 30.0%
Lakshadweep
Puducherry
Andaman & Nicobar Islands
Chandigarh
Delhi
Jammu & Kashmir & Ladakh
Daman & Diu
Dadra & Nagar Haveli
Kerala
Himachal Pradesh
Goa
Manipur
Maharashtra
Tamil Nadu
Haryana
Punjab
Mizoram
Sikkim
Karnataka
Uttarakhand
Gujarat
Tripura
Chhattisgarh
Nagaland
Telangana
West Bengal
Madhya Pradesh
Assam
Odisha
Andhra Pradesh
Rajasthan
Uttar Pradesh
Arunachal Pradesh
Jharkhand
Meghalaya
Bihar
% of population deprived in years of schooling
Definition: A household is deprived if not even one member of the household aged 10 years or older has completed six years of schooling. Definition: A household is deprived if any woman in the household who has given birth in the 5 years preceding the survey has not received at least 4 antenatal care visits for the most recent birth or has not received assistance from trained skilled medical personnel during the most recent childbirth.
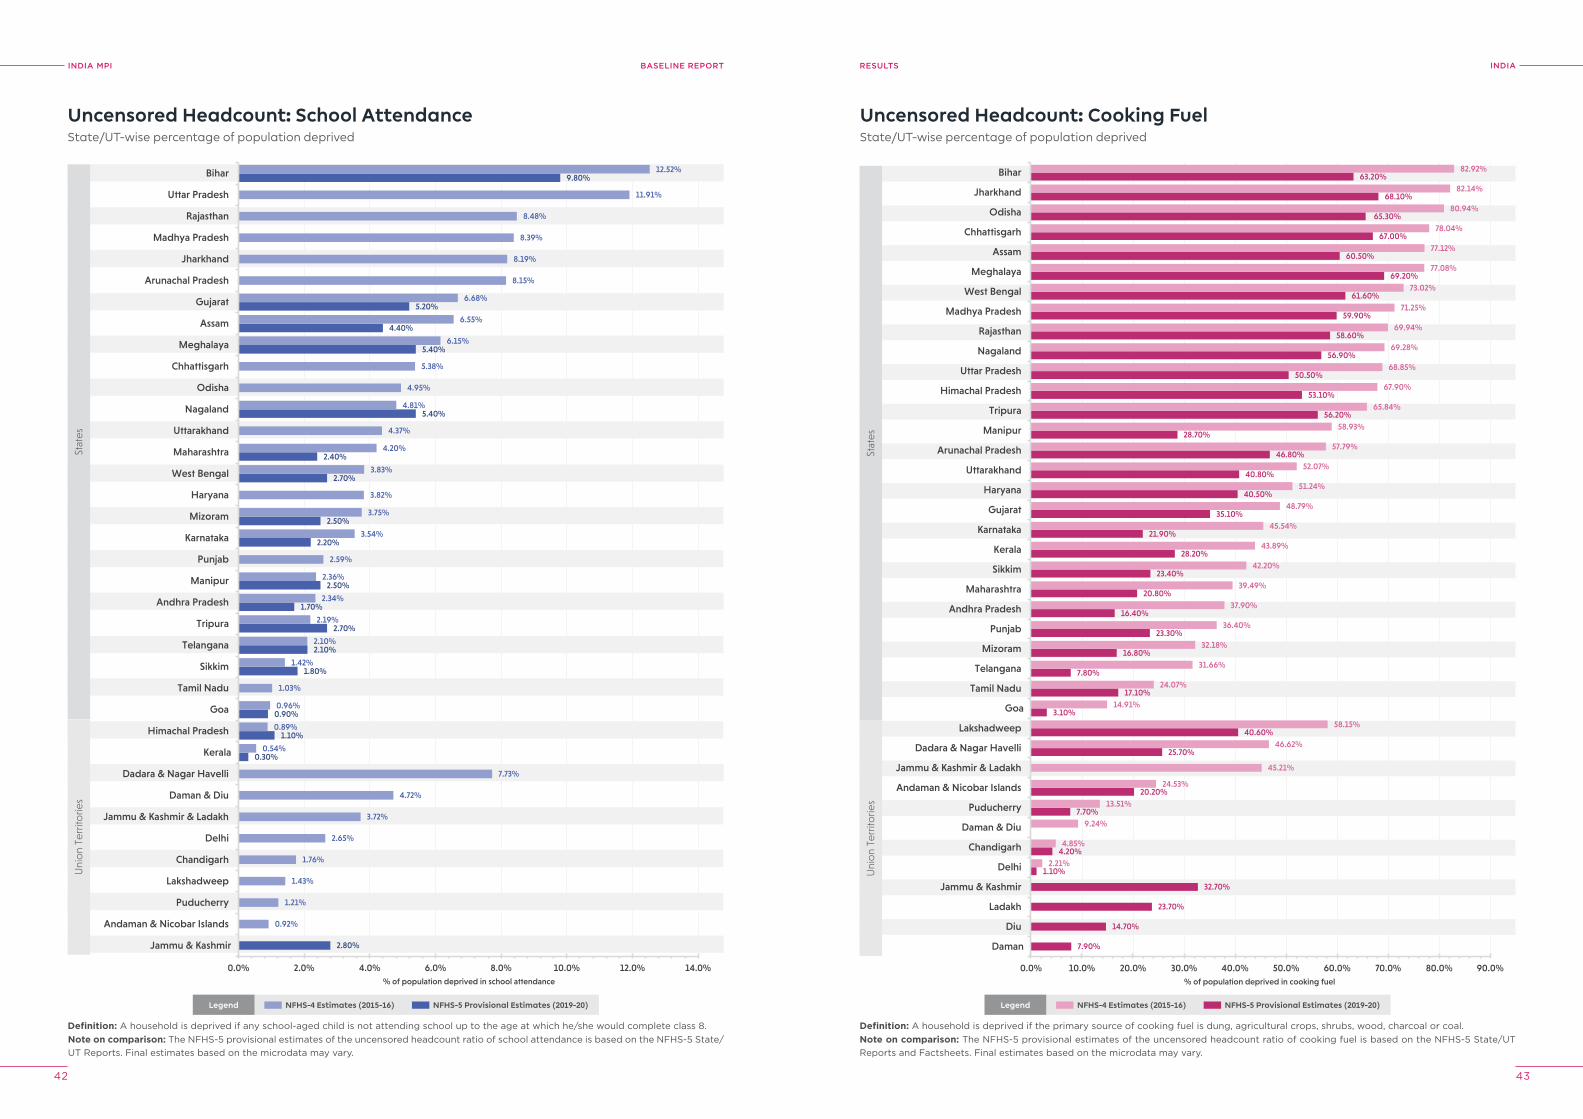
INDIA MPI BASELINE REPORT
42 43
INDIAreSUlTS
Definition: A household is deprived if the primary source of cooking fuel is dung, agricultural crops, shrubs, wood, charcoal or coal.
State/UT-wise percentage of population deprived
Uncensored Headcount: School Attendance
Uni
on
Terr
itorie
sSt
ates
2.80%
0.30%
1.10%
0.90%
1.80%
2.10%
2.70%
1.70%
2.50%
2.20%
2.50%
2.70%
2.40%
5.40%
5.40%
4.40%
5.20%
9.80%
0.92%
1.21%
1.43%
1.76%
2.65%
3.72%
4.72%
7.73%
0.54%
0.89%
0.96%
1.03%
1.42%
2.10%
2.19%
2.34%
2.36%
2.59%
3.54%
3.75%
3.82%
3.83%
4.20%
4.37%
4.81%
4.95%
5.38%
6.15%
6.55%
6.68%
8.15%
8.19%
8.39%
8.48%
11.91%
12.52%
0.0% 2.0% 4.0% 6.0% 8.0% 10.0% 12.0% 14.0%
Jammu & Kashmir
Andaman & Nicobar Islands
Puducherry
Lakshadweep
Chandigarh
Delhi
Jammu & Kashmir & Ladakh
Daman & Diu
Dadara & Nagar Havelli
Kerala
Himachal Pradesh
Goa
Tamil Nadu
Sikkim
Telangana
Tripura
Andhra Pradesh
Manipur
Punjab
Karnataka
Mizoram
Haryana
West Bengal
Maharashtra
Uttarakhand
Nagaland
Odisha
Chhattisgarh
Meghalaya
Assam
Gujarat
Arunachal Pradesh
Jharkhand
Madhya Pradesh
Rajasthan
Uttar Pradesh
Bihar
% of population deprived in school attendance
State/UT-wise percentage of population deprived
Uncensored Headcount: Cooking Fuel
Uni
on
Terr
itorie
sSt
ates
7.90%
14.70%
23.70%
32.70%
1.10%
4.20%
7.70%
20.20%
25.70%
40.60%
3.10%
17.10%
7.80%
16.80%
23.30%
16.40%
20.80%
23.40%
28.20%
21.90%
35.10%
40.50%
40.80%
46.80%
28.70%
56.20%
53.10%
50.50%
56.90%
58.60%
59.90%
61.60%
69.20%
60.50%
67.00%
65.30%
68.10%
63.20%
2.21%
4.85%
9.24%
13.51%
24.53%
45.21%
46.62%
58.15%
14.91%
24.07%
31.66%
32.18%
36.40%
37.90%
39.49%
42.20%
43.89%
45.54%
48.79%
51.24%
52.07%
57.79%
58.93%
65.84%
67.90%
68.85%
69.28%
69.94%
71.25%
73.02%
77.08%
77.12%
78.04%
80.94%
82.14%
82.92%
0.0% 10.0% 20.0% 30.0% 40.0% 50.0% 60.0% 70.0% 80.0% 90.0%
Daman
Diu
Ladakh
Jammu & Kashmir
Delhi
Chandigarh
Daman & Diu
Puducherry
Andaman & Nicobar Islands
Jammu & Kashmir & Ladakh
Dadara & Nagar Havelli
Lakshadweep
Goa
Tamil Nadu
Telangana
Mizoram
Punjab
Andhra Pradesh
Maharashtra
Sikkim
Kerala
Karnataka
Gujarat
Haryana
Uttarakhand
Arunachal Pradesh
Manipur
Tripura
Himachal Pradesh
Uttar Pradesh
Nagaland
Rajasthan
Madhya Pradesh
West Bengal
Meghalaya
Assam
Chhattisgarh
Odisha
Jharkhand
Bihar
% of population deprived in cooking fuel
Definition: A household is deprived if any school-aged child is not attending school up to the age at which he/she would complete class 8.
Legend NFHS-4 Estimates (2015-16) NFHS-5 Provisional Estimates (2019-20)
Note on comparison: The NFHS-5 provisional estimates of the uncensored headcount ratio of school attendance is based on the NFHS-5 State/UT Reports. Final estimates based on the microdata may vary.
Legend NFHS-4 Estimates (2015-16) NFHS-5 Provisional Estimates (2019-20)
Note on comparison: The NFHS-5 provisional estimates of the uncensored headcount ratio of cooking fuel is based on the NFHS-5 State/UT Reports and Factsheets. Final estimates based on the microdata may vary.
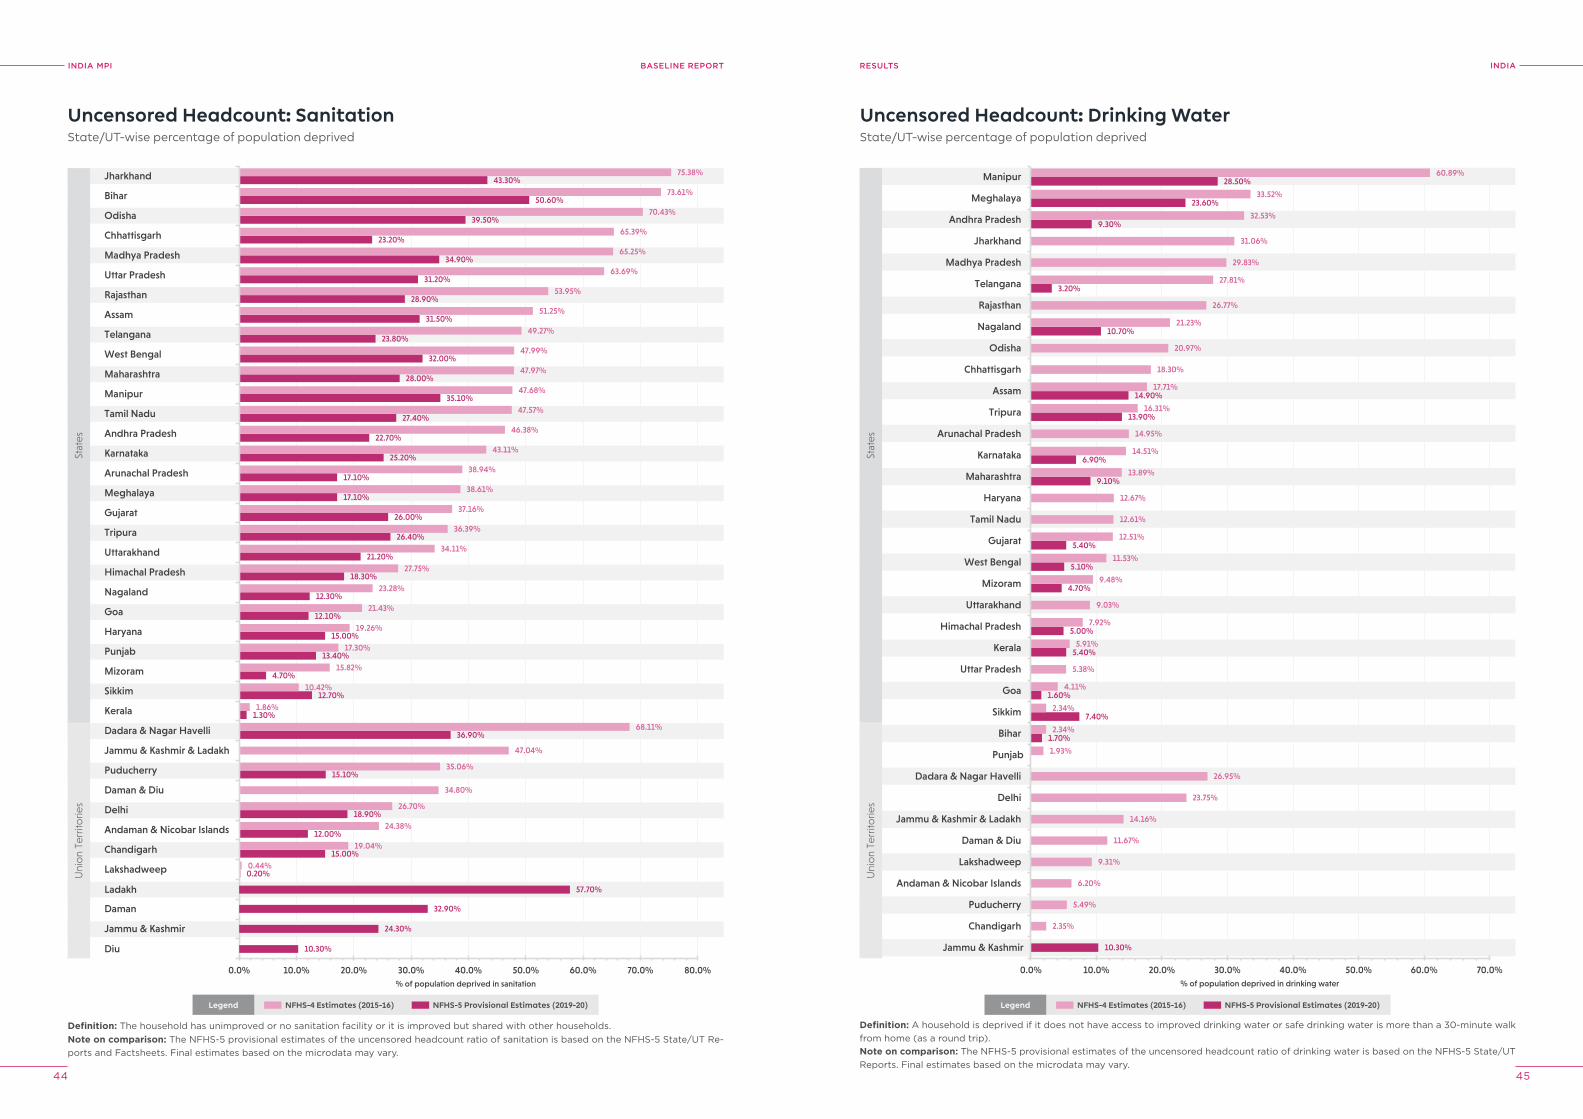
INDIA MPI BASELINE REPORT
44 45
INDIAreSUlTS
Definition: A household is deprived if it does not have access to improved drinking water or safe drinking water is more than a 30-minute walk from home (as a round trip).
Definition: The household has unimproved or no sanitation facility or it is improved but shared with other households.
State/UT-wise percentage of population deprived
Uncensored Headcount: Sanitation
Uni
on
Terr
itorie
sSt
ates
0.20%
15.00%
12.00%
18.90%
15.10%
36.90%
1.30%
12.70%
4.70%
13.40%
15.00%
12.10%
12.30%
18.30%
21.20%
26.40%
26.00%
17.10%
17.10%
25.20%
22.70%
27.40%
35.10%
28.00%
32.00%
23.80%
31.50%
28.90%
31.20%
34.90%
23.20%
39.50%
50.60%
43.30%
0.44%
19.04%
24.38%
26.70%
34.80%
35.06%
47.04%
68.11%
1.86%
10.42%
15.82%
17.30%
19.26%
21.43%
23.28%
27.75%
34.11%
36.39%
37.16%
38.61%
38.94%
43.11%
46.38%
47.57%
47.68%
47.97%
47.99%
49.27%
51.25%
53.95%
63.69%
65.25%
65.39%
70.43%
73.61%
75.38%
0.0% 10.0% 20.0% 30.0% 40.0% 50.0% 60.0% 70.0% 80.0%
32.90%Daman
57.70%Ladakh
24.30%Jammu & Kashmir
10.30%Diu
Lakshadweep
Chandigarh
Andaman & Nicobar Islands
Delhi
Daman & Diu
Puducherry
Jammu & Kashmir & Ladakh
Dadara & Nagar Havelli
Kerala
Sikkim
Mizoram
Punjab
Haryana
Goa
Nagaland
Himachal Pradesh
Uttarakhand
Tripura
Gujarat
Meghalaya
Arunachal Pradesh
Karnataka
Andhra Pradesh
Tamil Nadu
Manipur
Maharashtra
West Bengal
Telangana
Assam
Rajasthan
Uttar Pradesh
Madhya Pradesh
Chhattisgarh
Odisha
Bihar
Jharkhand
% of population deprived in sanitation
State/UT-wise percentage of population deprived
Uncensored Headcount: Drinking Water
Uni
on
Terr
itorie
sSt
ates
10.30%
1.70%
7.40%
1.60%
5.40%
5.00%
4.70%
5.10%
5.40%
9.10%
6.90%
13.90%
14.90%
10.70%
3.20%
9.30%
23.60%
28.50%
2.35%
5.49%
6.20%
9.31%
11.67%
14.16%
23.75%
26.95%
1.93%
2.34%
2.34%
4.11%
5.38%
5.91%
7.92%
9.03%
9.48%
11.53%
12.51%
12.61%
12.67%
13.89%
14.51%
14.95%
16.31%
17.71%
18.30%
20.97%
21.23%
26.77%
27.81%
29.83%
31.06%
32.53%
33.52%
60.89%
0.0% 10.0% 20.0% 30.0% 40.0% 50.0% 60.0% 70.0%
Jammu & Kashmir
Chandigarh
Puducherry
Andaman & Nicobar Islands
Lakshadweep
Daman & Diu
Jammu & Kashmir & Ladakh
Delhi
Dadara & Nagar Havelli
Punjab
Bihar
Sikkim
Goa
Uttar Pradesh
Kerala
Himachal Pradesh
Uttarakhand
Mizoram
West Bengal
Gujarat
Tamil Nadu
Haryana
Maharashtra
Karnataka
Arunachal Pradesh
Tripura
Assam
Chhattisgarh
Odisha
Nagaland
Rajasthan
Telangana
Madhya Pradesh
Jharkhand
Andhra Pradesh
Meghalaya
Manipur
% of population deprived in drinking water
Legend NFHS-4 Estimates (2015-16) NFHS-5 Provisional Estimates (2019-20)
Note on comparison: The NFHS-5 provisional estimates of the uncensored headcount ratio of drinking water is based on the NFHS-5 State/UT Reports. Final estimates based on the microdata may vary.
Legend NFHS-4 Estimates (2015-16) NFHS-5 Provisional Estimates (2019-20)
Note on comparison: The NFHS-5 provisional estimates of the uncensored headcount ratio of sanitation is based on the NFHS-5 State/UT Re-ports and Factsheets. Final estimates based on the microdata may vary.
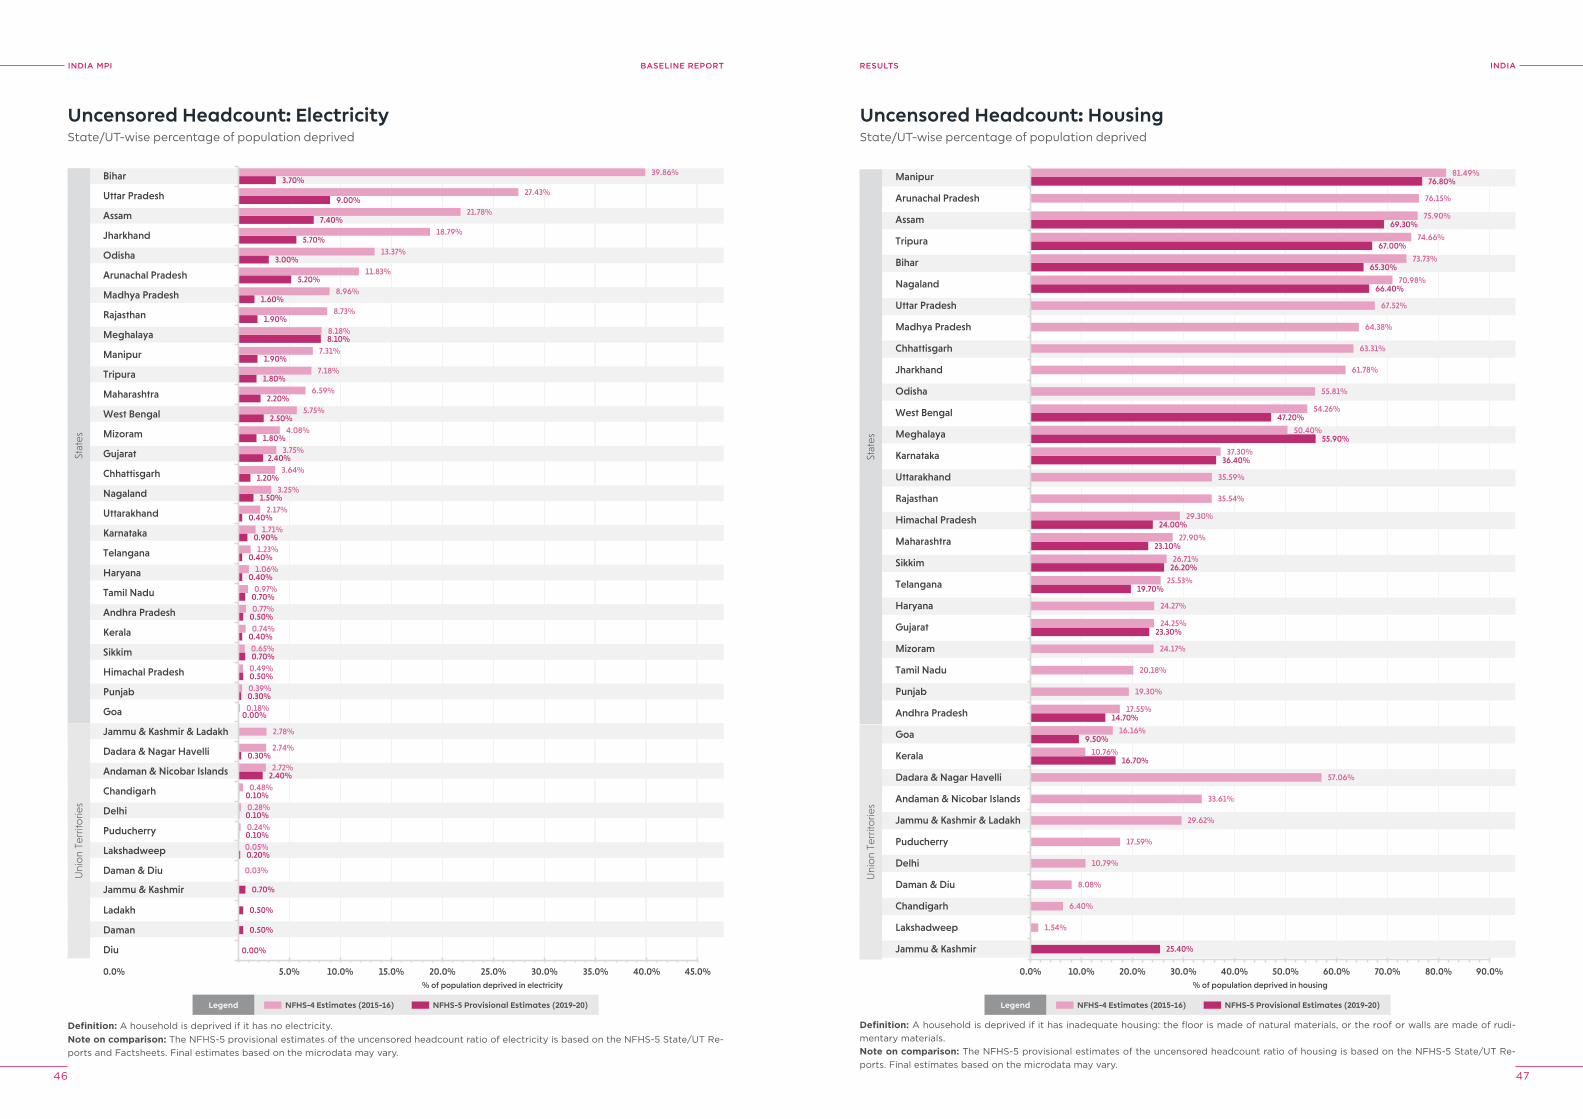
INDIA MPI BASELINE REPORT
46 47
INDIAreSUlTS
Definition: A household is deprived if it has inadequate housing: the floor is made of natural materials, or the roof or walls are made of rudi-mentary materials.
Definition: A household is deprived if it has no electricity.
State/UT-wise percentage of population deprived
Uncensored Headcount: Electricity
Uni
on
Terr
itorie
sSt
ates
0.50%
0.70%
0.50%
0.20%
0.10%
0.10%
0.10%
2.40%
0.30%
0.30%
0.50%
0.70%
0.40%
0.50%
0.70%
0.40%
0.40%
0.90%
0.40%
1.50%
1.20%
2.40%
1.80%
2.50%
2.20%
1.80%
1.90%
8.10%
1.90%
1.60%
5.20%
3.00%
5.70%
7.40%
9.00%
3.70%
0.03%
0.05%
0.24%
0.28%
0.48%
2.72%
2.74%
2.78%
0.18%
0.39%
0.49%
0.65%
0.74%
0.77%
0.97%
1.06%
1.23%
1.71%
2.17%
3.25%
3.64%
3.75%
4.08%
5.75%
6.59%
7.18%
7.31%
8.18%
8.73%
8.96%
11.83%
13.37%
18.79%
21.78%
27.43%
39.86%
0.0% 5.0% 10.0% 15.0% 20.0% 25.0% 30.0% 35.0% 40.0% 45.0%
Diu
Daman
Jammu & Kashmir
Ladakh
Daman & Diu
Lakshadweep
Puducherry
Delhi
Chandigarh
Andaman & Nicobar Islands
Dadara & Nagar Havelli
Jammu & Kashmir & Ladakh
Goa
Punjab
Himachal Pradesh
Sikkim
Kerala
Andhra Pradesh
Tamil Nadu
Haryana
Telangana
Karnataka
Uttarakhand
Nagaland
Chhattisgarh
Gujarat
Mizoram
West Bengal
Maharashtra
Tripura
Manipur
Meghalaya
Rajasthan
Madhya Pradesh
Arunachal Pradesh
Odisha
Jharkhand
Assam
Uttar Pradesh
Bihar
% of population deprived in electricity
0.00%
0.00%
State/UT-wise percentage of population deprived
Uncensored Headcount: Housing
Uni
on
Terr
itorie
sSt
ates
25.40%
16.70%
9.50%
14.70%
23.30%
19.70%
26.20%
23.10%
24.00%
36.40%
55.90%
47.20%
66.40%
65.30%
67.00%
69.30%
76.80%
1.54%
6.40%
8.08%
10.79%
17.59%
29.62%
33.61%
57.06%
10.76%
16.16%
17.55%
19.30%
20.18%
24.17%
24.25%
24.27%
25.53%
26.71%
27.90%
29.30%
35.54%
35.59%
37.30%
50.40%
54.26%
55.81%
61.78%
63.31%
64.38%
67.52%
70.98%
73.73%
74.66%
75.90%
76.15%
81.49%
0.0% 10.0% 20.0% 30.0% 40.0% 50.0% 60.0% 70.0% 80.0% 90.0%
Jammu & Kashmir
Lakshadweep
Chandigarh
Daman & Diu
Delhi
Puducherry
Jammu & Kashmir & Ladakh
Andaman & Nicobar Islands
Dadara & Nagar Havelli
Kerala
Goa
Andhra Pradesh
Punjab
Tamil Nadu
Mizoram
Gujarat
Haryana
Telangana
Sikkim
Maharashtra
Himachal Pradesh
Rajasthan
Uttarakhand
Karnataka
Meghalaya
West Bengal
Odisha
Jharkhand
Chhattisgarh
Madhya Pradesh
Uttar Pradesh
Nagaland
Bihar
Tripura
Assam
Arunachal Pradesh
Manipur
% of population deprived in housing
Legend NFHS-4 Estimates (2015-16) NFHS-5 Provisional Estimates (2019-20)
Note on comparison: The NFHS-5 provisional estimates of the uncensored headcount ratio of electricity is based on the NFHS-5 State/UT Re-ports and Factsheets. Final estimates based on the microdata may vary.
Legend NFHS-4 Estimates (2015-16) NFHS-5 Provisional Estimates (2019-20)
Note on comparison: The NFHS-5 provisional estimates of the uncensored headcount ratio of housing is based on the NFHS-5 State/UT Re-ports. Final estimates based on the microdata may vary.
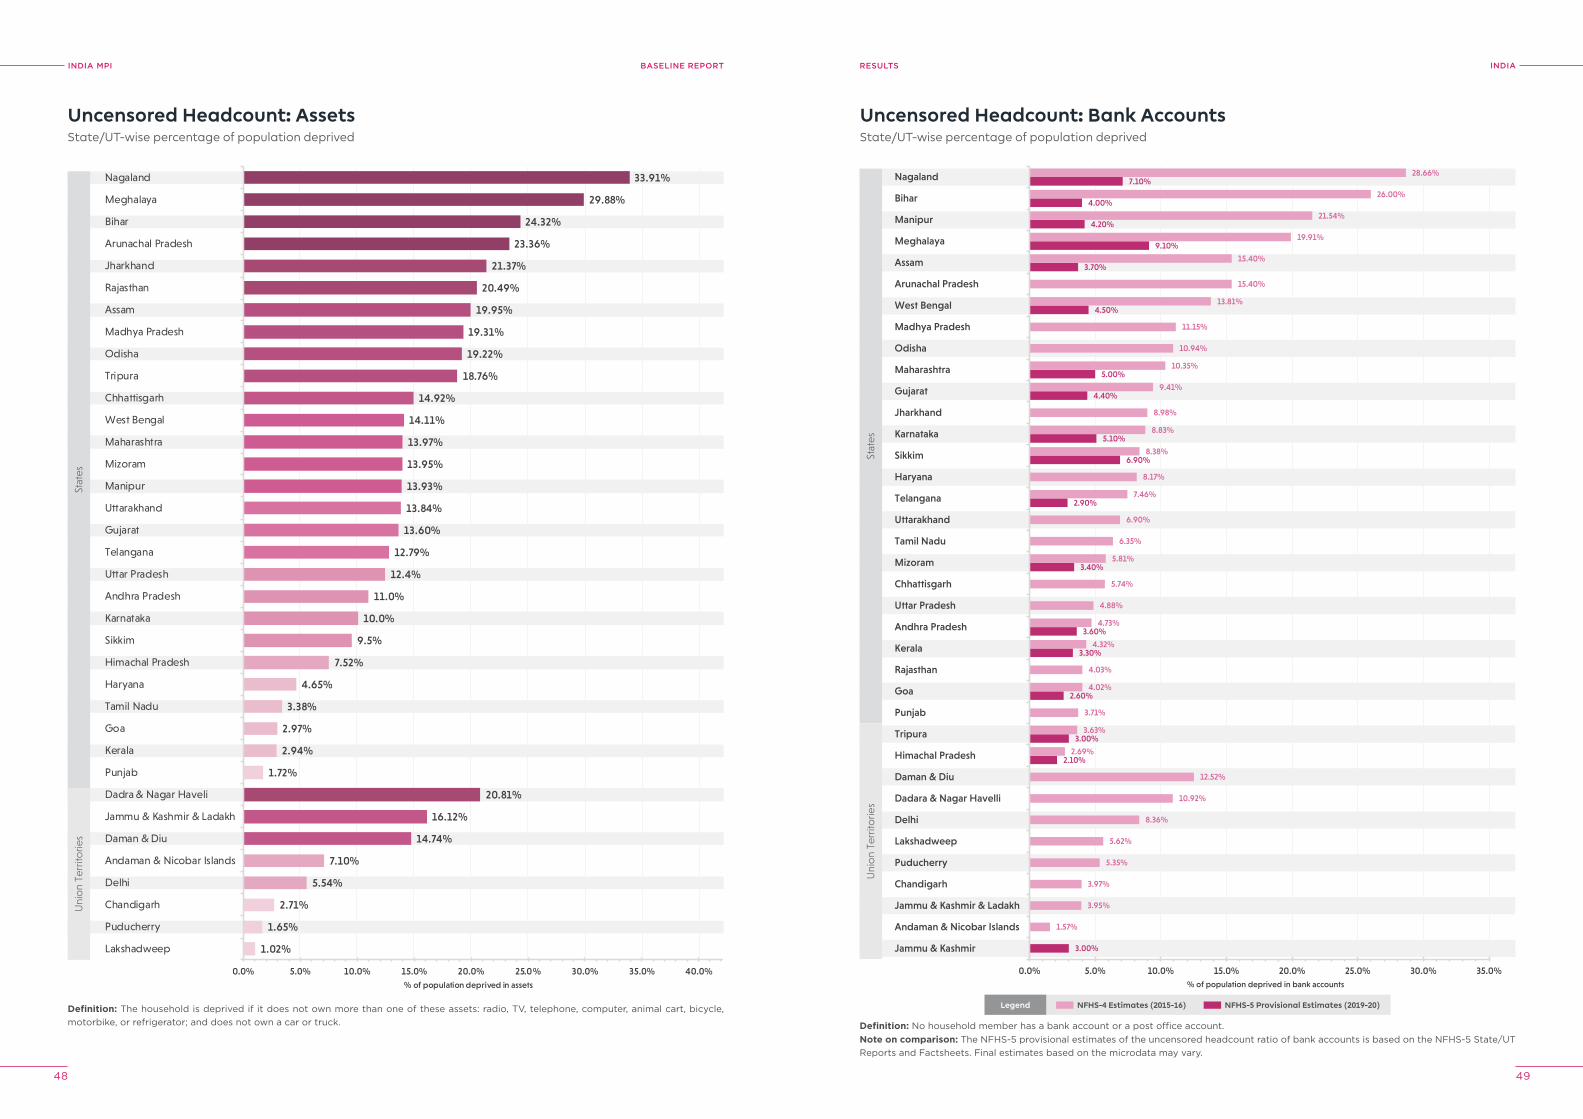
INDIA MPI BASELINE REPORT
48 49
INDIAreSUlTS
Definition: No household member has a bank account or a post office account.
State/UT-wise percentage of population deprived
Uncensored Headcount: Assets
Uni
on
Terr
itorie
sSt
ates
1.02%
1.65%
2.71%
1.72%
2.94%
2.97%
3.38%
4.65%
5.54%
7.10%
7.52%
9.5%
10.0%
11.0%
12.4%
12.79%
13.60%
13.84%
13.93%
13.95%
13.97%
14.11%
14.74%
16.12%
14.92%
18.76%
19.22%
19.31%
19.95%
20.81%
20.49%
21.37%
23.36%
24.32%
29.88%
33.91%
0.0% 5.0% 10.0% 15.0% 20.0% 25.0% 30.0% 35.0% 40.0%
Lakshadweep
Puducherry
Chandigarh
Delhi
Andaman & Nicobar Islands
Daman & Diu
Jammu & Kashmir & Ladakh
Dadra & Nagar Haveli
Punjab
Kerala
Goa
Tamil Nadu
Haryana
Himachal Pradesh
Sikkim
Karnataka
Andhra Pradesh
Uttar Pradesh
Telangana
Gujarat
Uttarakhand
Manipur
Mizoram
Maharashtra
West Bengal
Chhattisgarh
Tripura
Odisha
Madhya Pradesh
Assam
Rajasthan
Jharkhand
Arunachal Pradesh
Bihar
Meghalaya
Nagaland
% of population deprived in assets
State/UT-wise percentage of population deprived
Uncensored Headcount: Bank Accounts
Uni
on
Terr
itorie
sSt
ates
3.00%
2.10%
3.00%
2.60%
3.30%
3.60%
3.40%
2.90%
6.90%
5.10%
4.40%
5.00%
4.50%
3.70%
9.10%
4.20%
4.00%
7.10%
1.57%
3.95%
3.97%
5.35%
5.62%
8.36%
10.92%
12.52%
2.69%
3.63%
3.71%
4.02%
4.03%
4.32%
4.73%
4.88%
5.74%
5.81%
6.35%
6.90%
7.46%
8.17%
8.38%
8.83%
8.98%
9.41%
10.35%
10.94%
11.15%
13.81%
15.40%
15.40%
19.91%
21.54%
26.00%
28.66%
0.0% 5.0% 10.0% 15.0% 20.0% 25.0% 30.0% 35.0%
Jammu & Kashmir
Andaman & Nicobar Islands
Jammu & Kashmir & Ladakh
Chandigarh
Puducherry
Lakshadweep
Delhi
Dadara & Nagar Havelli
Daman & Diu
Himachal Pradesh
Tripura
Punjab
Goa
Rajasthan
Kerala
Andhra Pradesh
Uttar Pradesh
Chhattisgarh
Mizoram
Tamil Nadu
Uttarakhand
Telangana
Haryana
Sikkim
Karnataka
Jharkhand
Gujarat
Maharashtra
Odisha
Madhya Pradesh
West Bengal
Arunachal Pradesh
Assam
Meghalaya
Manipur
Bihar
Nagaland
% of population deprived in bank accounts
Definition: The household is deprived if it does not own more than one of these assets: radio, TV, telephone, computer, animal cart, bicycle, motorbike, or refrigerator; and does not own a car or truck.
Legend NFHS-4 Estimates (2015-16) NFHS-5 Provisional Estimates (2019-20)
Note on comparison: The NFHS-5 provisional estimates of the uncensored headcount ratio of bank accounts is based on the NFHS-5 State/UT Reports and Factsheets. Final estimates based on the microdata may vary.

INDIA MPI BASELINE REPORT
50 51
ANDhrA prADeShreSUlTS
Andhra Pradesh: Uncensored Headcount RatioPercentage of total population who are deprived in each indicator
26.4%
1.8%
9.7%
16.9%
2.3%
11.0%
1.7%
37.9%
16.4%
46.4%
22.7%
32.5%
9.3%
0.8% 0.5%
17.5%
14.7%
4.7%3.6%
0.0%
10.0%
20.0%
30.0%
40.0%
50.0%
60.0%
70.0%
80.0%
Nutrition Child &Adolescent
Mortality
Maternal Health Years ofSchooling
SchoolAttendance
Cooking Fuel Sanitation Drinking Water Electricity Housing Assets Bank Account
% o
f pop
ulat
ion
dep
rive
d
9.22%
0.87%
4.76%
7.72%
1.47%
9.72% 10.50%
4.39%
0.60%
5.69% 4.82%
1.74%
0.00%
10.00%
20.00%
30.00%
40.00%
50.00%
60.00%
70.00%
80.00%
Nutrition Child &Adolescent
Mortality
Maternal Health Years ofSchooling
SchoolAttendance
Cooking Fuel Sanitation Drinking Water Electricity Housing Assets Bank Account
% o
f po
pul
atio
n M
PI p
oo
r & d
epri
ved
Andhra Pradesh: Censored Headcount RatioPercentage of total population who are multidimensionally poor and deprived in each indicator
INDIA MpI
A snapshot of multidimensional poverty in Andhra Pradesh
OverviewAndhra Pradesh Headcount Ratio, Intensity and MPI
Headcount Ratio (H)
12.31%
Rural
Headcount Ratio Intensity MPI
15.37% 43.28% 0.067
Andhra Pradesh: Indicator-wise Contribution to the MPIPercentage contribution of each indicator to the MPI score
Intensity (A)
43.23%
MPI (HxA)
0.053
Andhra Pradesh
Urban
Headcount Ratio Intensity MPI
4.91% 42.83% 0.021
x =
Note on the data period: The NFHS 4 (2015-16) precedes the full roll out of flagship schemes of Pradhan Mantri Awas Yojana (PMAY), Jal Jeevan Mission (JJM), Swachh Bharat Mission (SBM), Pradhan Mantri Sahaj Bijli Har Ghar Yojana (Saubhagya), Pradhan Mantri Ujjwala Yojana (PMUY), and the Pradhan Mantri Jan Dhan Yojana (PMJDY).
Nutrition
Child & Adolescent Mortality
Maternal Health
Years of Schooling
School Attendance
Cooking Fuel
Sanitation
Drinking Water
Electricity
Housing
Assets
Bank Account
0% 10% 20% 30% 40% 50% 60% 70% 80% 90% 100%
Nut
riti
on:
28.
9%
Chi
ld &
Ad
ole
scen
t Mo
rtal
ity: 1
.4%
Mat
erna
l Hea
lth:
7.5%
Yea
rs o
f Sch
oo
ling
: 24.
2%
Scho
ol A
tten
dan
ce: 4
.6%
Co
oki
ng F
uel:
8.7%
Sani
tati
on:
9.4
%
Dri
nkin
g W
ater
: 3.9
%
Elec
tric
ity:
0.5
%
Ho
usin
g: 5
.1%
Ass
ets:
4.3
%
Ban
k A
cco
unt:
1.6
%
Health Education Standard of Living
DoWNloAD DATA
Note on comparison: The striped bars denote the provisional estimates of the uncensored headcount ratio based on the data available in the NFHS-5 Andhra Pradesh State Report (2019-20).
Dimension Health Education Standard of Living NFHS-5: Standard of LivingNFHS-5: Education
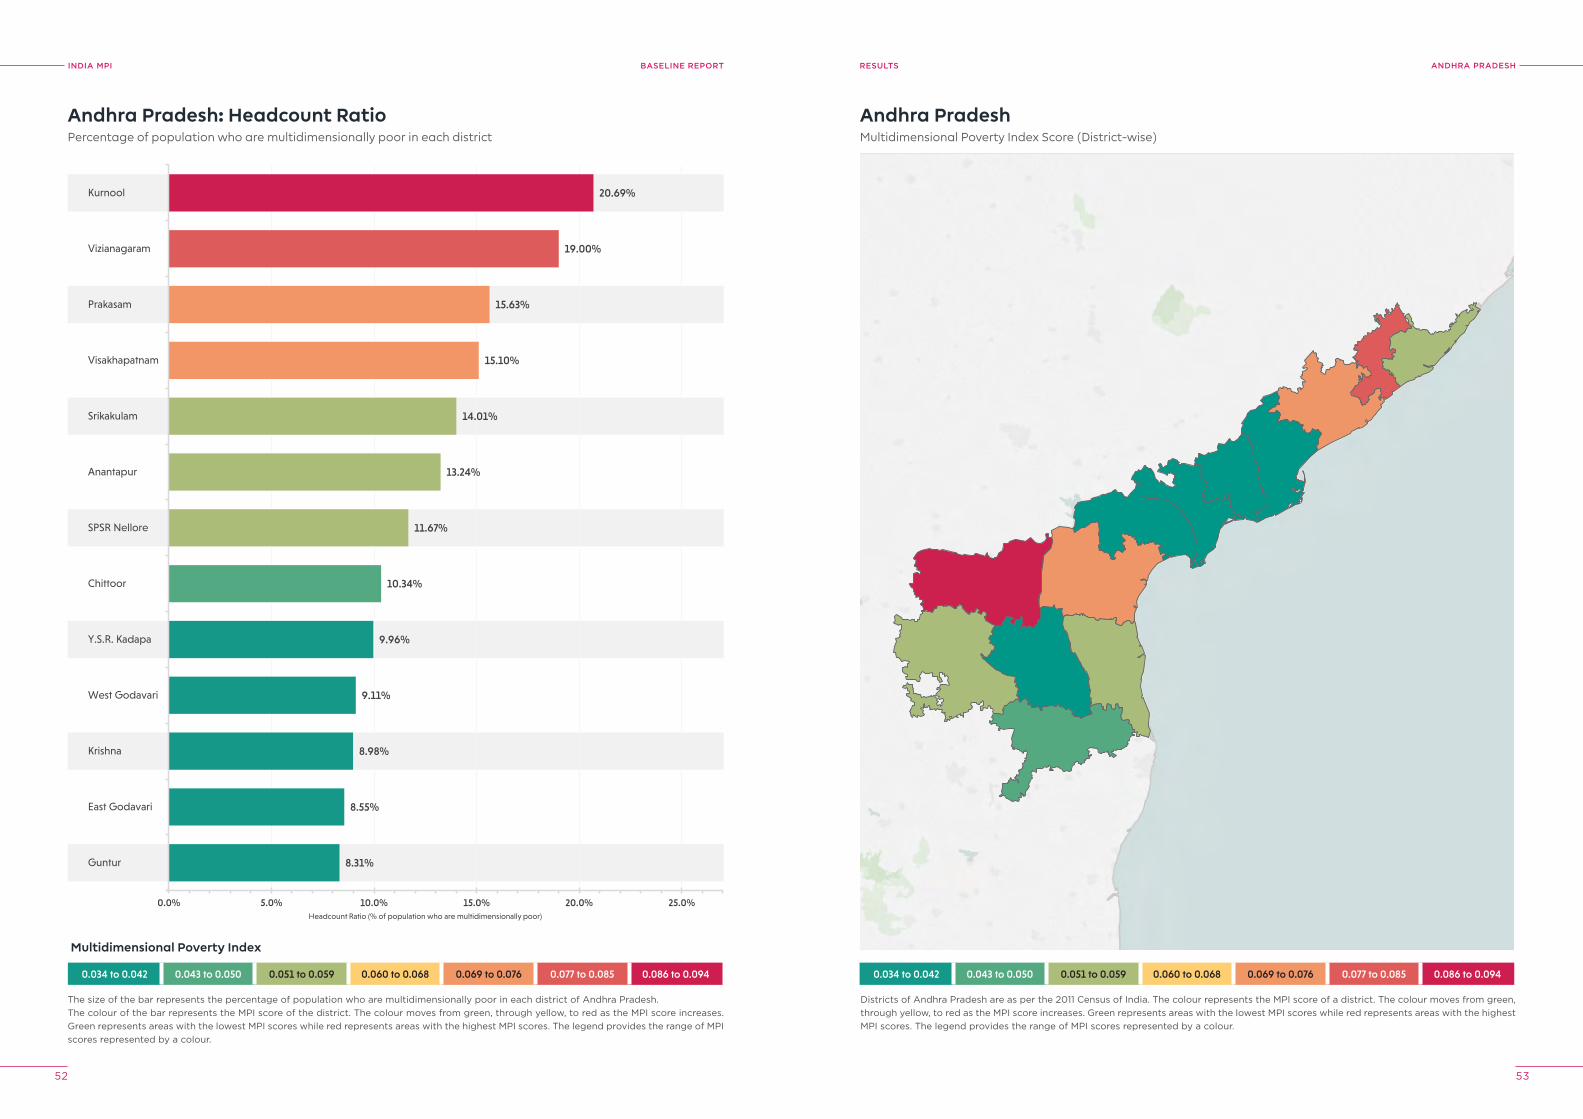
INDIA MPI BASELINE REPORT
52 53
ANDhrA prADeShreSUlTS
0.034 to 0.042 0.043 to 0.050 0.051 to 0.059 0.060 to 0.068 0.069 to 0.076 0.077 to 0.085 0.086 to 0.094
8.31%
8.55%
8.98%
9.11%
9.96%
10.34%
11.67%
13.24%
14.01%
15.10%
15.63%
19.00%
20.69%
0.0% 5.0% 10.0% 15.0% 20.0% 25.0%
Guntur
East Godavari
Krishna
West Godavari
Y.S.R. Kadapa
Chittoor
SPSR Nellore
Anantapur
Srikakulam
Visakhapatnam
Prakasam
Vizianagaram
Kurnool
Headcount Ratio (% of population who are multidimensionally poor)
Andhra Pradesh: Headcount RatioPercentage of population who are multidimensionally poor in each district
The size of the bar represents the percentage of population who are multidimensionally poor in each district of Andhra Pradesh.The colour of the bar represents the MPI score of the district. The colour moves from green, through yellow, to red as the MPI score increases. Green represents areas with the lowest MPI scores while red represents areas with the highest MPI scores. The legend provides the range of MPI scores represented by a colour.
Andhra PradeshMultidimensional Poverty Index Score (District-wise)
Districts of Andhra Pradesh are as per the 2011 Census of India. The colour represents the MPI score of a district. The colour moves from green, through yellow, to red as the MPI score increases. Green represents areas with the lowest MPI scores while red represents areas with the highest MPI scores. The legend provides the range of MPI scores represented by a colour.
0.034 to 0.042 0.043 to 0.050 0.051 to 0.059 0.060 to 0.068 0.069 to 0.076 0.077 to 0.085 0.086 to 0.094
Multidimensional Poverty Index
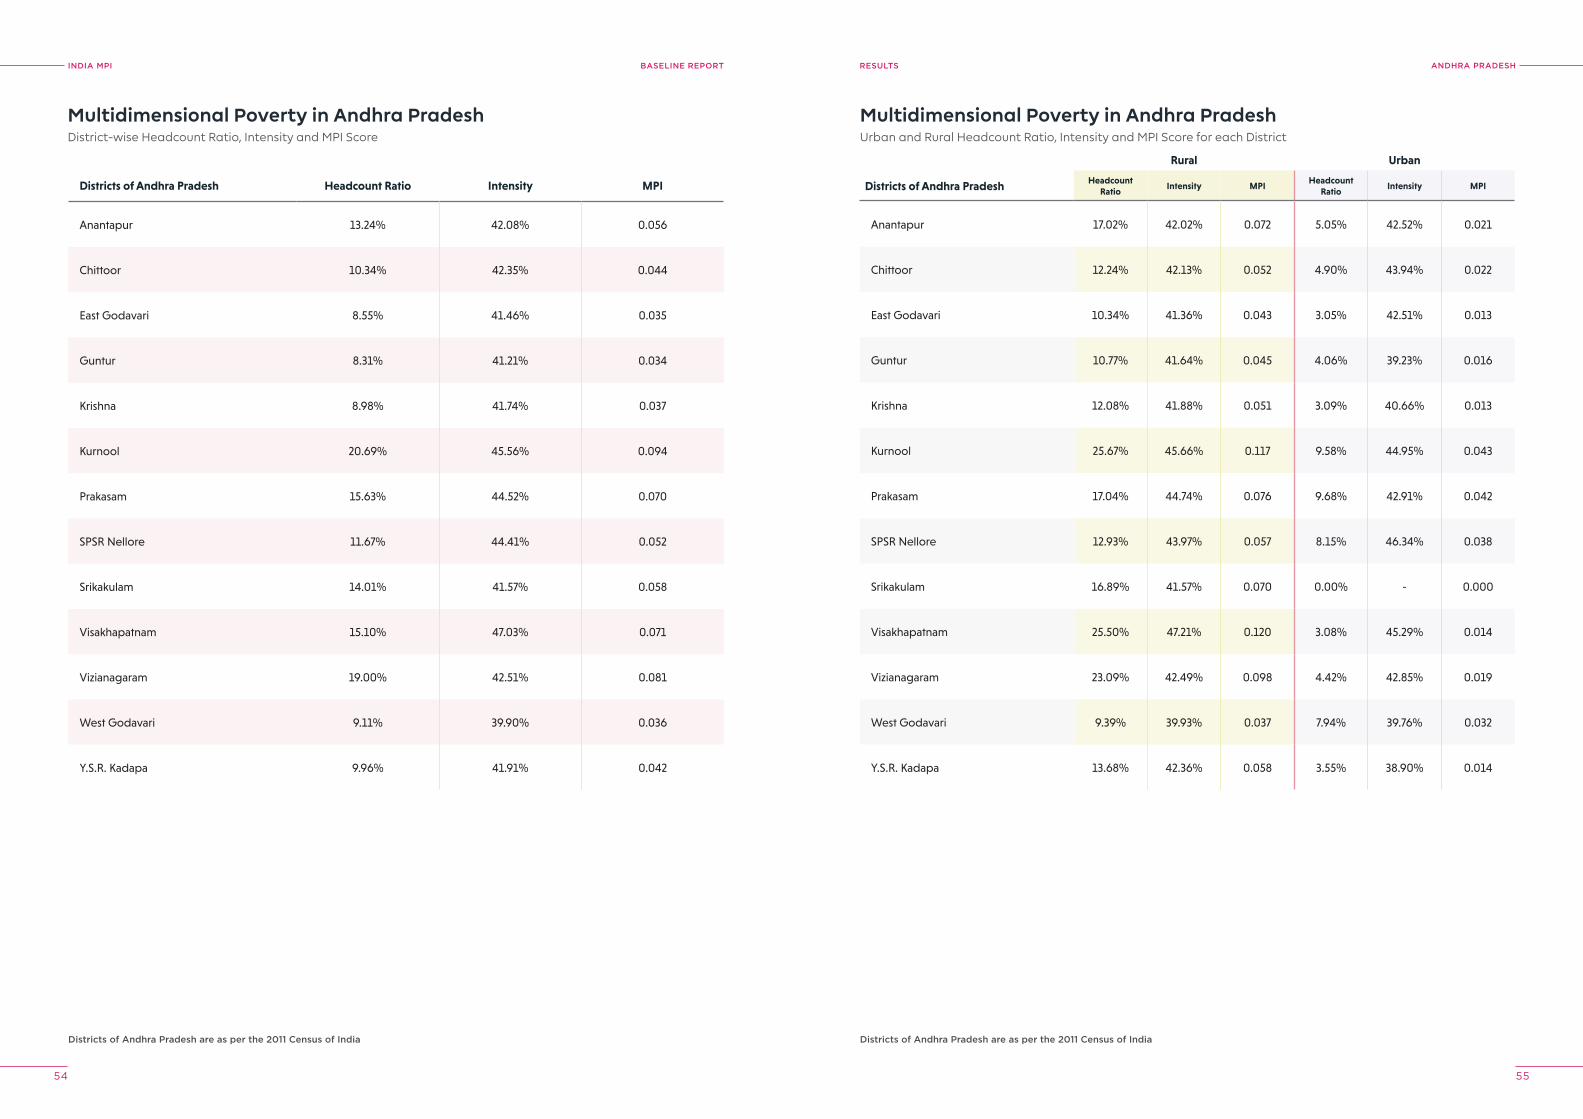
INDIA MPI BASELINE REPORT
54 55
ANDhrA prADeShreSUlTS
Multidimensional Poverty in Andhra PradeshDistrict-wise Headcount Ratio, Intensity and MPI Score
Multidimensional Poverty in Andhra PradeshUrban and Rural Headcount Ratio, Intensity and MPI Score for each District
Districts of Andhra pradesh are as per the 2011 Census of India Districts of Andhra pradesh are as per the 2011 Census of India
Districts of Andhra Pradesh Headcount Ratio Intensity MPI
Anantapur 13.24% 42.08% 0.056
Chittoor 10.34% 42.35% 0.044
East Godavari 8.55% 41.46% 0.035
Guntur 8.31% 41.21% 0.034
Krishna 8.98% 41.74% 0.037
Kurnool 20.69% 45.56% 0.094
Prakasam 15.63% 44.52% 0.070
SPSR Nellore 11.67% 44.41% 0.052
Srikakulam 14.01% 41.57% 0.058
Visakhapatnam 15.10% 47.03% 0.071
Vizianagaram 19.00% 42.51% 0.081
West Godavari 9.11% 39.90% 0.036
Y.S.R. Kadapa 9.96% 41.91% 0.042
Rural Urban
Districts of Andhra Pradesh Headcount Ratio
Intensity MPIHeadcount
RatioIntensity MPI
Anantapur 17.02% 42.02% 0.072 5.05% 42.52% 0.021
Chittoor 12.24% 42.13% 0.052 4.90% 43.94% 0.022
East Godavari 10.34% 41.36% 0.043 3.05% 42.51% 0.013
Guntur 10.77% 41.64% 0.045 4.06% 39.23% 0.016
Krishna 12.08% 41.88% 0.051 3.09% 40.66% 0.013
Kurnool 25.67% 45.66% 0.117 9.58% 44.95% 0.043
Prakasam 17.04% 44.74% 0.076 9.68% 42.91% 0.042
SPSR Nellore 12.93% 43.97% 0.057 8.15% 46.34% 0.038
Srikakulam 16.89% 41.57% 0.070 0.00% - 0.000
Visakhapatnam 25.50% 47.21% 0.120 3.08% 45.29% 0.014
Vizianagaram 23.09% 42.49% 0.098 4.42% 42.85% 0.019
West Godavari 9.39% 39.93% 0.037 7.94% 39.76% 0.032
Y.S.R. Kadapa 13.68% 42.36% 0.058 3.55% 38.90% 0.014
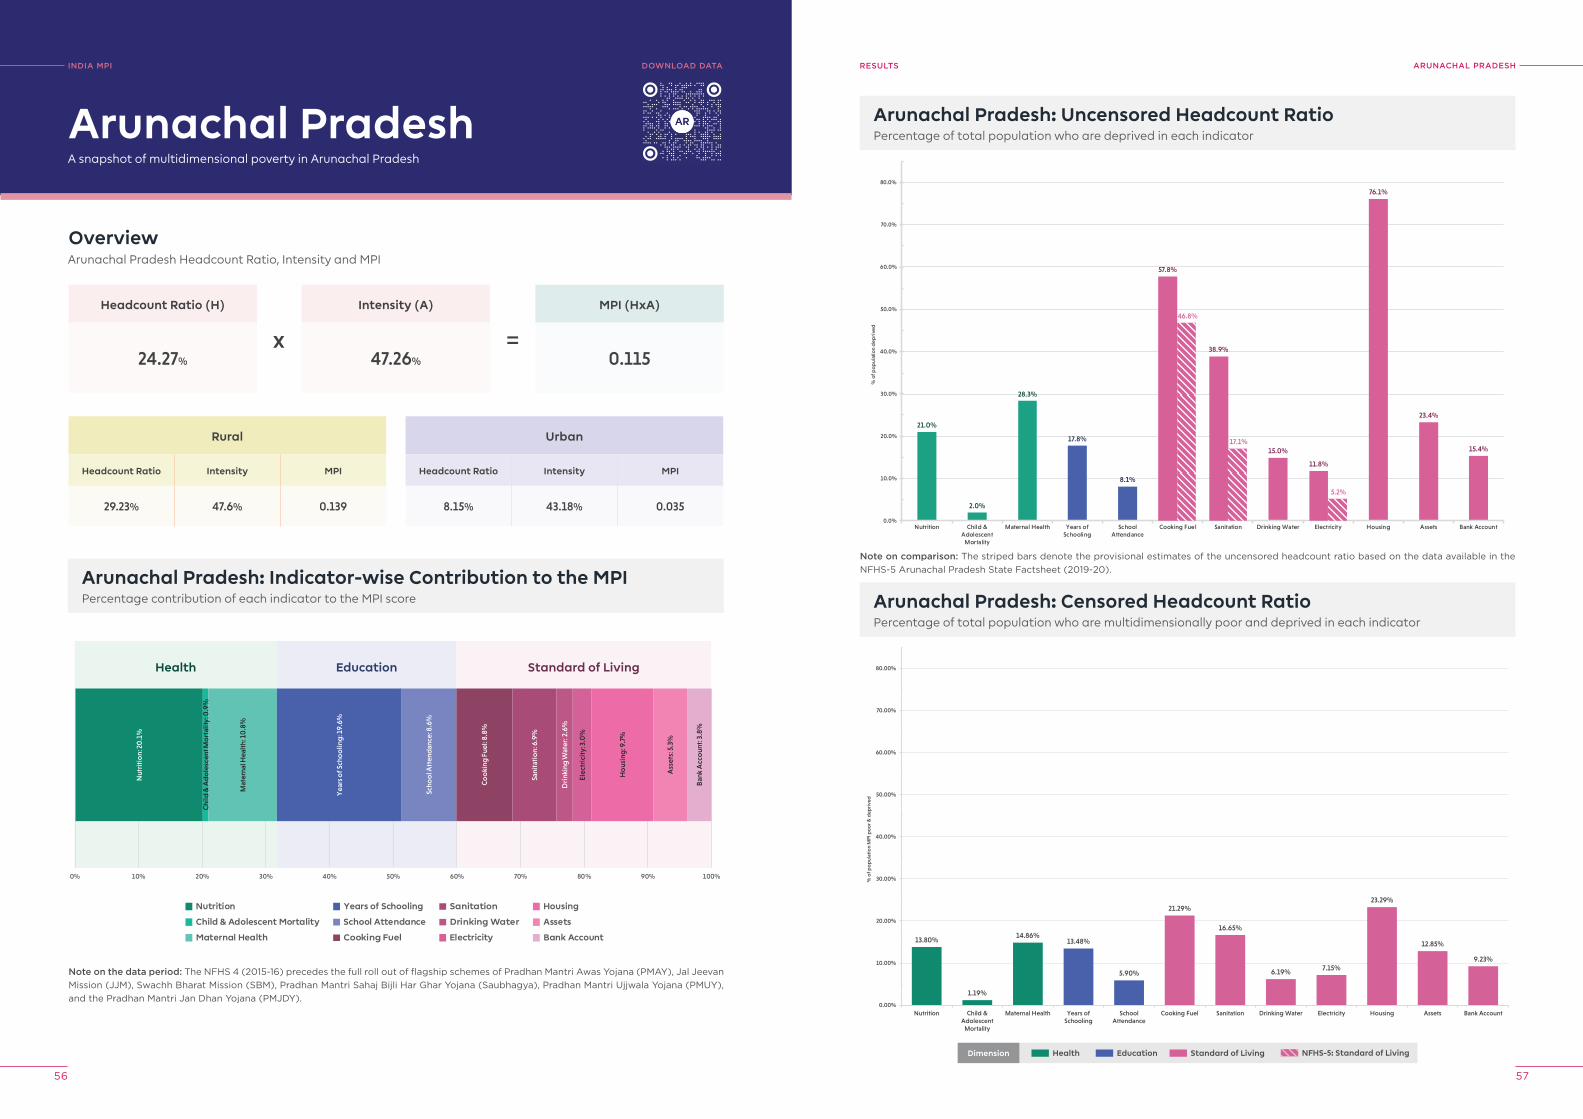
INDIA MPI BASELINE REPORT
56 57
ArUNAChAl prADeShreSUlTS
Arunachal Pradesh: Uncensored Headcount RatioPercentage of total population who are deprived in each indicator
21.0%
2.0%
28.3%
17.8%
8.1%
15.0%
76.1%
23.4%
15.4%
57.8%
46.8%
38.9%
17.1%
11.8%
5.2%
0.0%
10.0%
20.0%
30.0%
40.0%
50.0%
60.0%
70.0%
80.0%
Nutrition Child &Adolescent
Mortality
Maternal Health Years ofSchooling
SchoolAttendance
Cooking Fuel Sanitation Drinking Water Electricity Housing Assets Bank Account
% o
f pop
ulat
ion
dep
rive
d
13.80%
1.19%
14.86%13.48%
5.90%
21.29%
16.65%
6.19% 7.15%
23.29%
12.85%
9.23%
0.00%
10.00%
20.00%
30.00%
40.00%
50.00%
60.00%
70.00%
80.00%
Nutrition Child &Adolescent
Mortality
Maternal Health Years ofSchooling
SchoolAttendance
Cooking Fuel Sanitation Drinking Water Electricity Housing Assets Bank Account
% o
f po
pul
atio
n M
PI p
oo
r & d
epri
ved
Arunachal Pradesh: Censored Headcount RatioPercentage of total population who are multidimensionally poor and deprived in each indicator
INDIA MpI
A snapshot of multidimensional poverty in Arunachal Pradesh
OverviewArunachal Pradesh Headcount Ratio, Intensity and MPI
Headcount Ratio (H)
24.27%
Rural
Headcount Ratio Intensity MPI
29.23% 47.6% 0.139
Arunachal Pradesh: Indicator-wise Contribution to the MPIPercentage contribution of each indicator to the MPI score
Intensity (A)
47.26%
MPI (HxA)
0.115
Arunachal Pradesh
Urban
Headcount Ratio Intensity MPI
8.15% 43.18% 0.035
x =
Note on the data period: The NFHS 4 (2015-16) precedes the full roll out of flagship schemes of Pradhan Mantri Awas Yojana (PMAY), Jal Jeevan Mission (JJM), Swachh Bharat Mission (SBM), Pradhan Mantri Sahaj Bijli Har Ghar Yojana (Saubhagya), Pradhan Mantri Ujjwala Yojana (PMUY), and the Pradhan Mantri Jan Dhan Yojana (PMJDY).
Nutrition
Child & Adolescent Mortality
Maternal Health
Years of Schooling
School Attendance
Cooking Fuel
Sanitation
Drinking Water
Electricity
Housing
Assets
Bank Account
0% 10% 20% 30% 40% 50% 60% 70% 80% 90% 100%
Health Education Standard of Living
Nut
riti
on:
20
.1%
Chi
ld &
Ad
ole
scen
t Mo
rtal
ity: 0
.9%
Mat
erna
l Hea
lth:
10
.8%
Yea
rs o
f Sch
oo
ling
: 19.
6%
Scho
ol A
tten
dan
ce: 8
.6%
Co
oki
ng F
uel:
8.8%
Sani
tati
on:
6.9
%
Dri
nkin
g W
ater
: 2.6
%
Elec
tric
ity:
3.0
%
Ho
usin
g: 9
.7%
Ass
ets:
5.3
%
Ban
k A
cco
unt:
3.8
%
DoWNloAD DATA
Note on comparison: The striped bars denote the provisional estimates of the uncensored headcount ratio based on the data available in the NFHS-5 Arunachal Pradesh State Factsheet (2019-20).
Dimension Health Education Standard of Living NFHS-5: Standard of Living
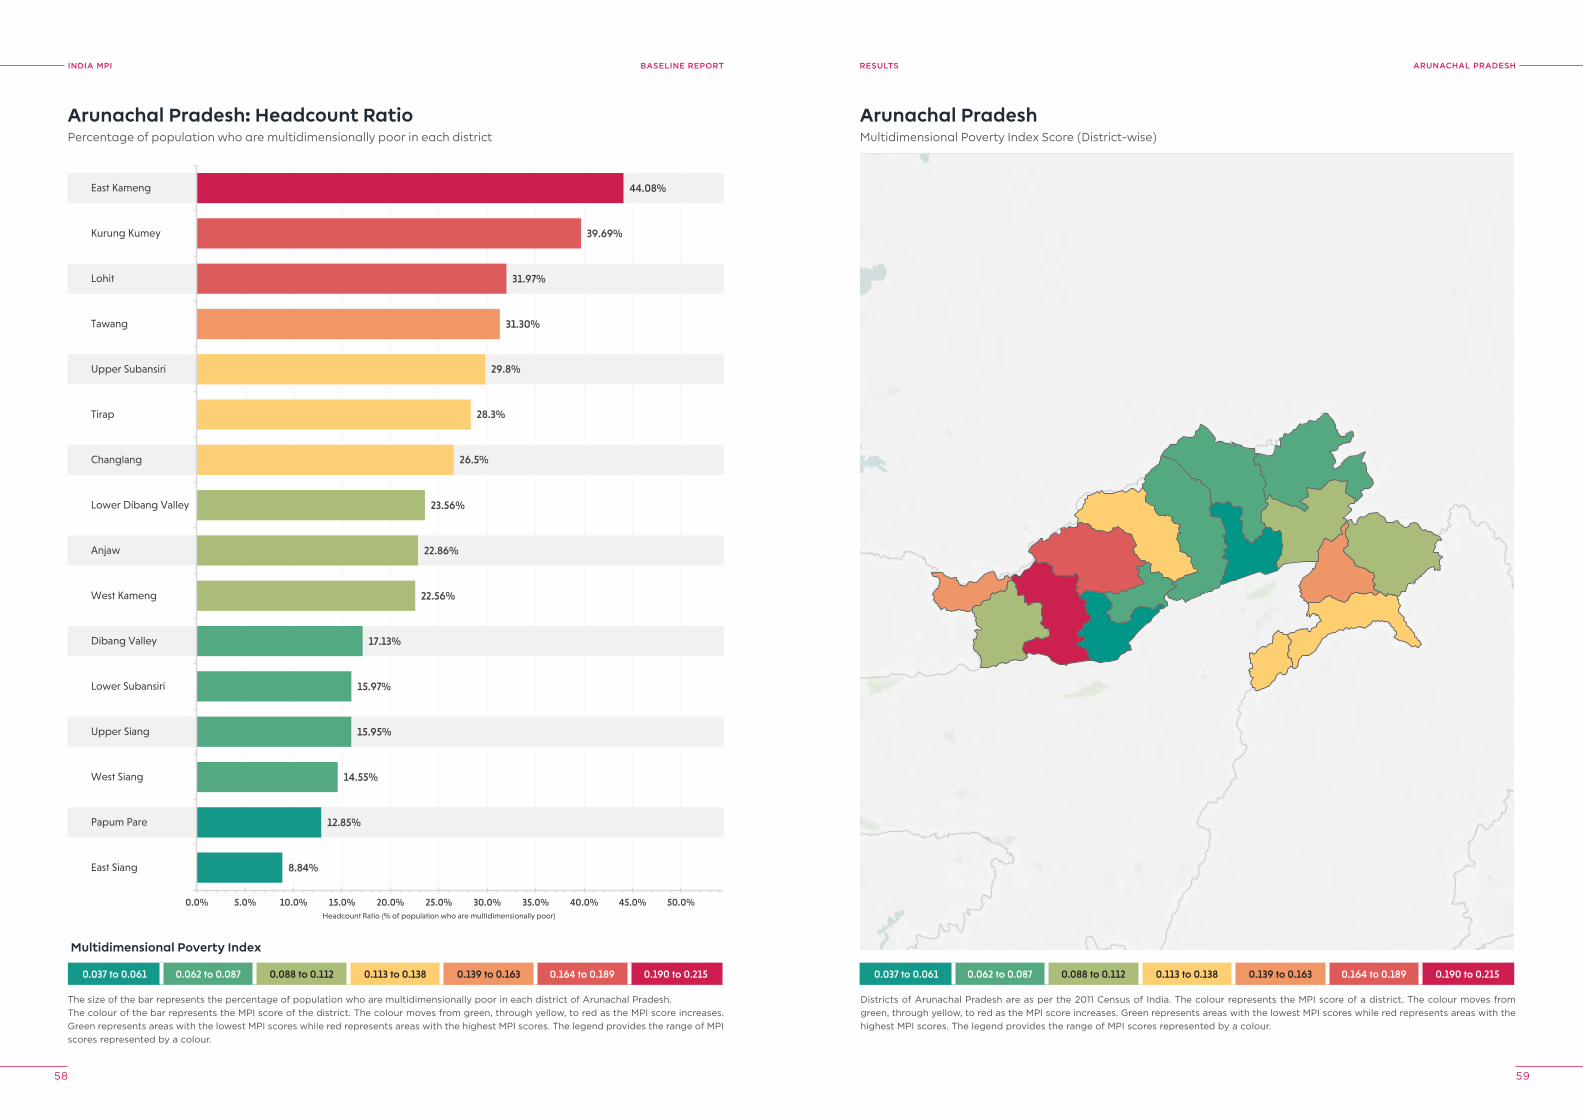
INDIA MPI BASELINE REPORT
58 59
ArUNAChAl prADeShreSUlTS
0.037 to 0.061 0.062 to 0.087 0.088 to 0.112 0.113 to 0.138 0.139 to 0.163 0.164 to 0.189 0.190 to 0.215
8.84%
12.85%
14.55%
15.95%
15.97%
17.13%
22.56%
22.86%
23.56%
26.5%
28.3%
29.8%
31.30%
31.97%
39.69%
44.08%
0.0% 5.0% 10.0% 15.0% 20.0% 25.0% 30.0% 35.0% 40.0% 45.0% 50.0%
East Siang
Papum Pare
West Siang
Upper Siang
Lower Subansiri
Dibang Valley
West Kameng
Anjaw
Lower Dibang Valley
Changlang
Tirap
Upper Subansiri
Tawang
Lohit
Kurung Kumey
East Kameng
Headcount Ratio (% of population who are multidimensionally poor)
Arunachal Pradesh: Headcount RatioPercentage of population who are multidimensionally poor in each district
The size of the bar represents the percentage of population who are multidimensionally poor in each district of Arunachal Pradesh.The colour of the bar represents the MPI score of the district. The colour moves from green, through yellow, to red as the MPI score increases. Green represents areas with the lowest MPI scores while red represents areas with the highest MPI scores. The legend provides the range of MPI scores represented by a colour.
Arunachal PradeshMultidimensional Poverty Index Score (District-wise)
Districts of Arunachal Pradesh are as per the 2011 Census of India. The colour represents the MPI score of a district. The colour moves from green, through yellow, to red as the MPI score increases. Green represents areas with the lowest MPI scores while red represents areas with the highest MPI scores. The legend provides the range of MPI scores represented by a colour.
0.037 to 0.061 0.062 to 0.087 0.088 to 0.112 0.113 to 0.138 0.139 to 0.163 0.164 to 0.189 0.190 to 0.215
Multidimensional Poverty Index
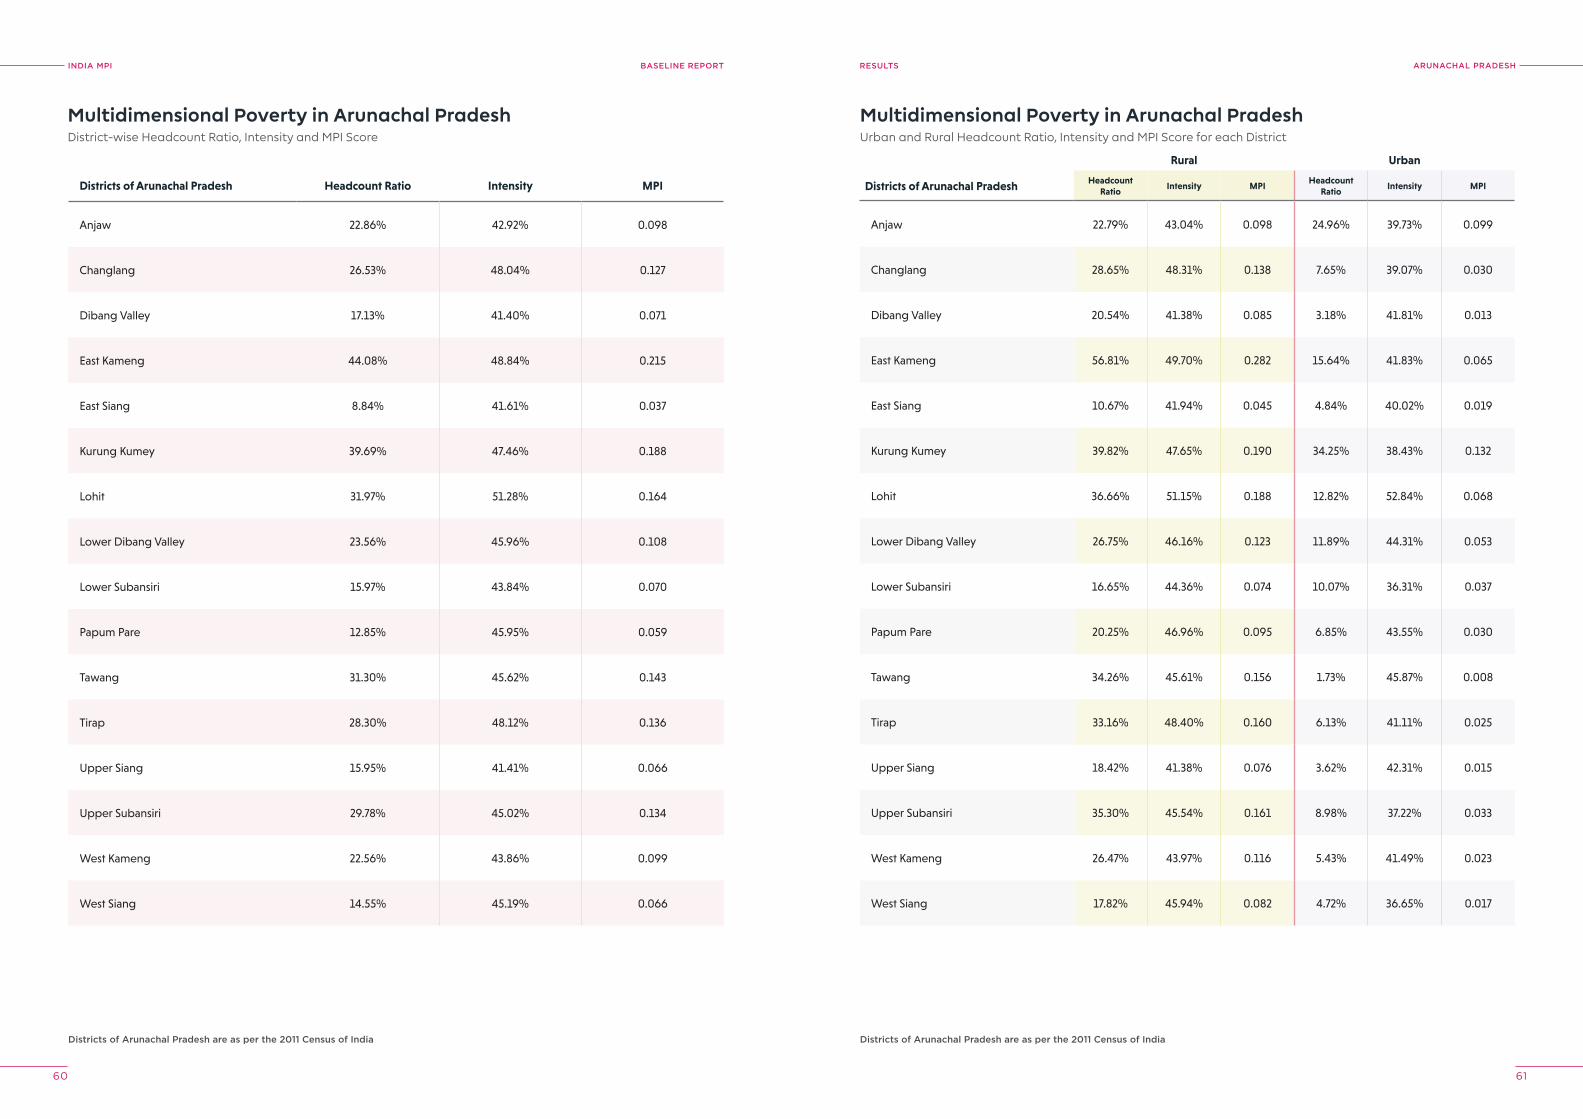
INDIA MPI BASELINE REPORT
60 61
ArUNAChAl prADeShreSUlTS
Multidimensional Poverty in Arunachal PradeshDistrict-wise Headcount Ratio, Intensity and MPI Score
Multidimensional Poverty in Arunachal PradeshUrban and Rural Headcount Ratio, Intensity and MPI Score for each District
Districts of Arunachal pradesh are as per the 2011 Census of India Districts of Arunachal pradesh are as per the 2011 Census of India
Districts of Arunachal Pradesh Headcount Ratio Intensity MPI
Anjaw 22.86% 42.92% 0.098
Changlang 26.53% 48.04% 0.127
Dibang Valley 17.13% 41.40% 0.071
East Kameng 44.08% 48.84% 0.215
East Siang 8.84% 41.61% 0.037
Kurung Kumey 39.69% 47.46% 0.188
Lohit 31.97% 51.28% 0.164
Lower Dibang Valley 23.56% 45.96% 0.108
Lower Subansiri 15.97% 43.84% 0.070
Papum Pare 12.85% 45.95% 0.059
Tawang 31.30% 45.62% 0.143
Tirap 28.30% 48.12% 0.136
Upper Siang 15.95% 41.41% 0.066
Upper Subansiri 29.78% 45.02% 0.134
West Kameng 22.56% 43.86% 0.099
West Siang 14.55% 45.19% 0.066
Rural Urban
Districts of Arunachal Pradesh Headcount Ratio
Intensity MPIHeadcount
RatioIntensity MPI
Anjaw 22.79% 43.04% 0.098 24.96% 39.73% 0.099
Changlang 28.65% 48.31% 0.138 7.65% 39.07% 0.030
Dibang Valley 20.54% 41.38% 0.085 3.18% 41.81% 0.013
East Kameng 56.81% 49.70% 0.282 15.64% 41.83% 0.065
East Siang 10.67% 41.94% 0.045 4.84% 40.02% 0.019
Kurung Kumey 39.82% 47.65% 0.190 34.25% 38.43% 0.132
Lohit 36.66% 51.15% 0.188 12.82% 52.84% 0.068
Lower Dibang Valley 26.75% 46.16% 0.123 11.89% 44.31% 0.053
Lower Subansiri 16.65% 44.36% 0.074 10.07% 36.31% 0.037
Papum Pare 20.25% 46.96% 0.095 6.85% 43.55% 0.030
Tawang 34.26% 45.61% 0.156 1.73% 45.87% 0.008
Tirap 33.16% 48.40% 0.160 6.13% 41.11% 0.025
Upper Siang 18.42% 41.38% 0.076 3.62% 42.31% 0.015
Upper Subansiri 35.30% 45.54% 0.161 8.98% 37.22% 0.033
West Kameng 26.47% 43.97% 0.116 5.43% 41.49% 0.023
West Siang 17.82% 45.94% 0.082 4.72% 36.65% 0.017
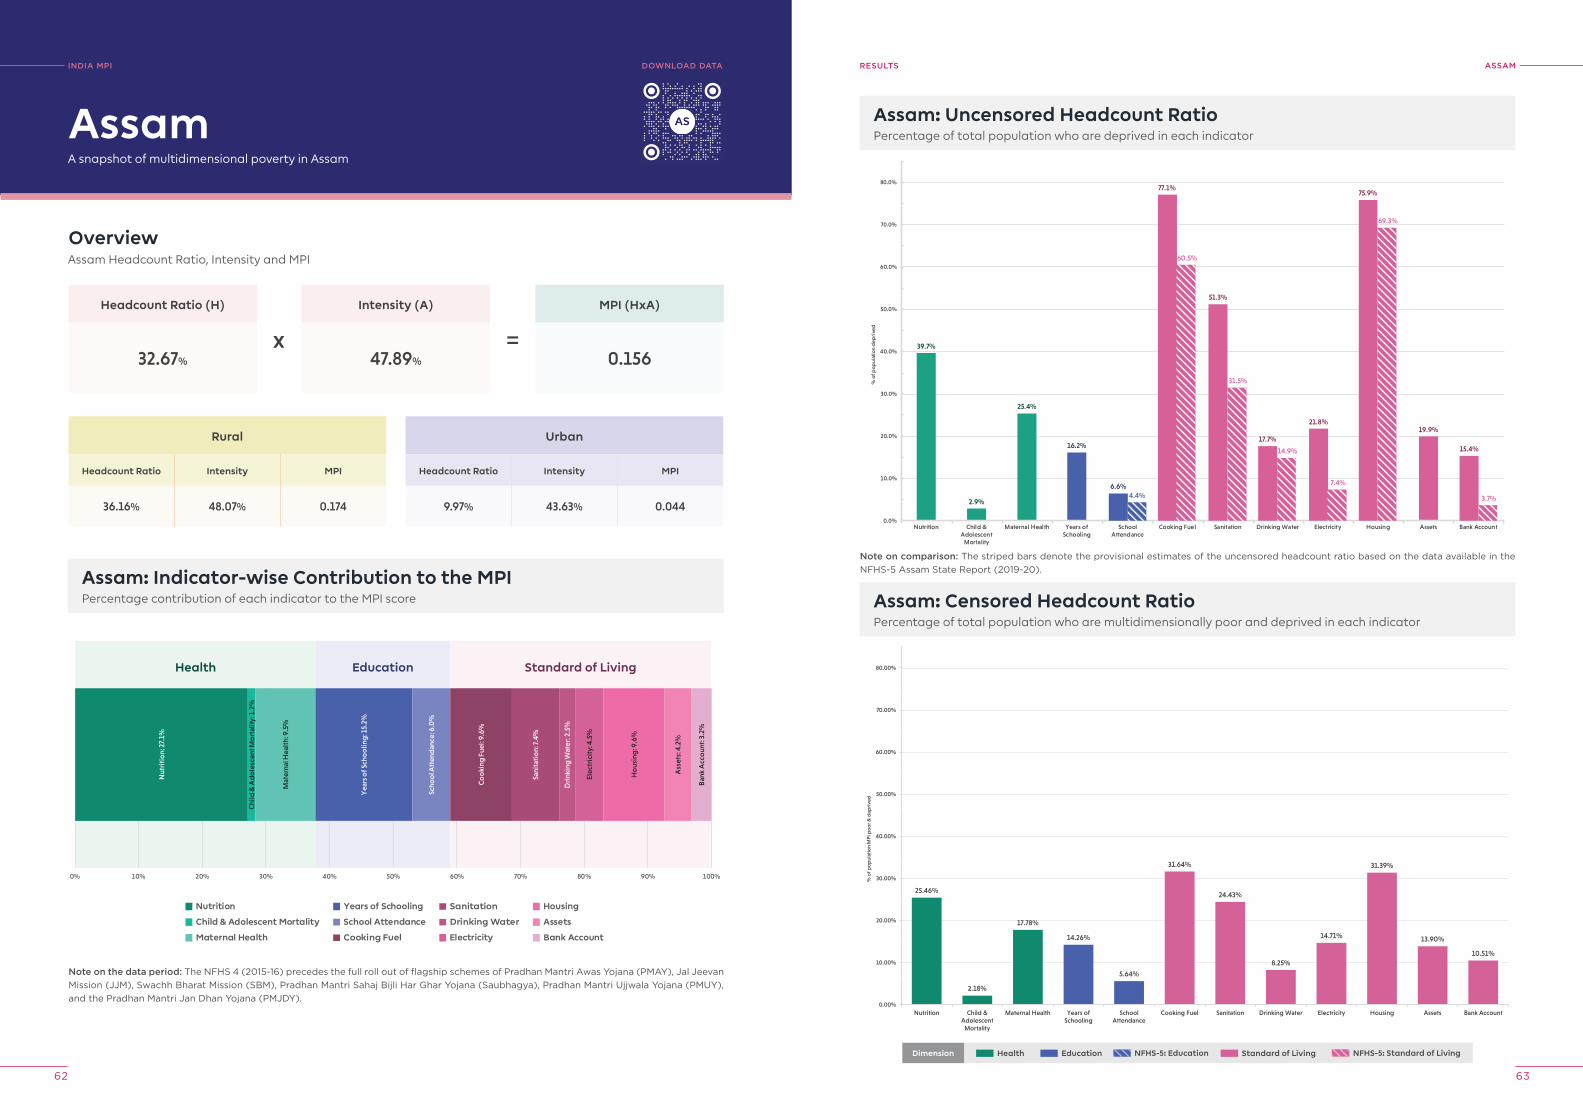
INDIA MPI BASELINE REPORT
62 63
ASSAMreSUlTS
Assam: Uncensored Headcount RatioPercentage of total population who are deprived in each indicator
39.7%
2.9%
25.4%
16.2%
19.9%
6.6%4.4%
77.1%
60.5%
51.3%
31.5%
17.7%
14.9%
21.8%
7.4%
75.9%
69.3%
15.4%
3.7%
0.0%
10.0%
20.0%
30.0%
40.0%
50.0%
60.0%
70.0%
80.0%
Nutrition Child &Adolescent
Mortality
Maternal Health Years ofSchooling
SchoolAttendance
Cooking Fuel Sanitation Drinking Water Electricity Housing Assets Bank Account
% o
f pop
ulat
ion
dep
rive
d
25.46%
2.18%
17.78%
14.26%
5.64%
31.64%
24.43%
8.25%
14.71%
31.39%
13.90%
10.51%
0.00%
10.00%
20.00%
30.00%
40.00%
50.00%
60.00%
70.00%
80.00%
Nutrition Child &Adolescent
Mortality
Maternal Health Years ofSchooling
SchoolAttendance
Cooking Fuel Sanitation Drinking Water Electricity Housing Assets Bank Account
% o
f po
pul
atio
n M
PI p
oo
r & d
epri
ved
Assam: Censored Headcount RatioPercentage of total population who are multidimensionally poor and deprived in each indicator
INDIA MpI
A snapshot of multidimensional poverty in Assam
OverviewAssam Headcount Ratio, Intensity and MPI
Headcount Ratio (H)
32.67%
Rural
Headcount Ratio Intensity MPI
36.16% 48.07% 0.174
Assam: Indicator-wise Contribution to the MPIPercentage contribution of each indicator to the MPI score
Intensity (A)
47.89%
MPI (HxA)
0.156
Assam
Urban
Headcount Ratio Intensity MPI
9.97% 43.63% 0.044
x =
Note on the data period: The NFHS 4 (2015-16) precedes the full roll out of flagship schemes of Pradhan Mantri Awas Yojana (PMAY), Jal Jeevan Mission (JJM), Swachh Bharat Mission (SBM), Pradhan Mantri Sahaj Bijli Har Ghar Yojana (Saubhagya), Pradhan Mantri Ujjwala Yojana (PMUY), and the Pradhan Mantri Jan Dhan Yojana (PMJDY).
Nutrition
Child & Adolescent Mortality
Maternal Health
Years of Schooling
School Attendance
Cooking Fuel
Sanitation
Drinking Water
Electricity
Housing
Assets
Bank Account
0% 10% 20% 30% 40% 50% 60% 70% 80% 90% 100%
Health Education Standard of Living
Nut
riti
on:
27.
1%
Chi
ld &
Ad
ole
scen
t Mo
rtal
ity: 1
.2%
Mat
erna
l Hea
lth:
9.5
%
Yea
rs o
f Sch
oo
ling
: 15.
2%
Scho
ol A
tten
dan
ce: 6
.0%
Co
oki
ng F
uel:
9.6%
Sani
tati
on:
7.4%
Dri
nkin
g W
ater
: 2.5
%
Elec
tric
ity:
4.5
%
Ho
usin
g: 9
.6%
Ass
ets:
4.2
%
Ban
k A
cco
unt:
3.2
%
DoWNloAD DATA
Note on comparison: The striped bars denote the provisional estimates of the uncensored headcount ratio based on the data available in the NFHS-5 Assam State Report (2019-20).
Dimension Health Education Standard of Living NFHS-5: Standard of LivingNFHS-5: Education
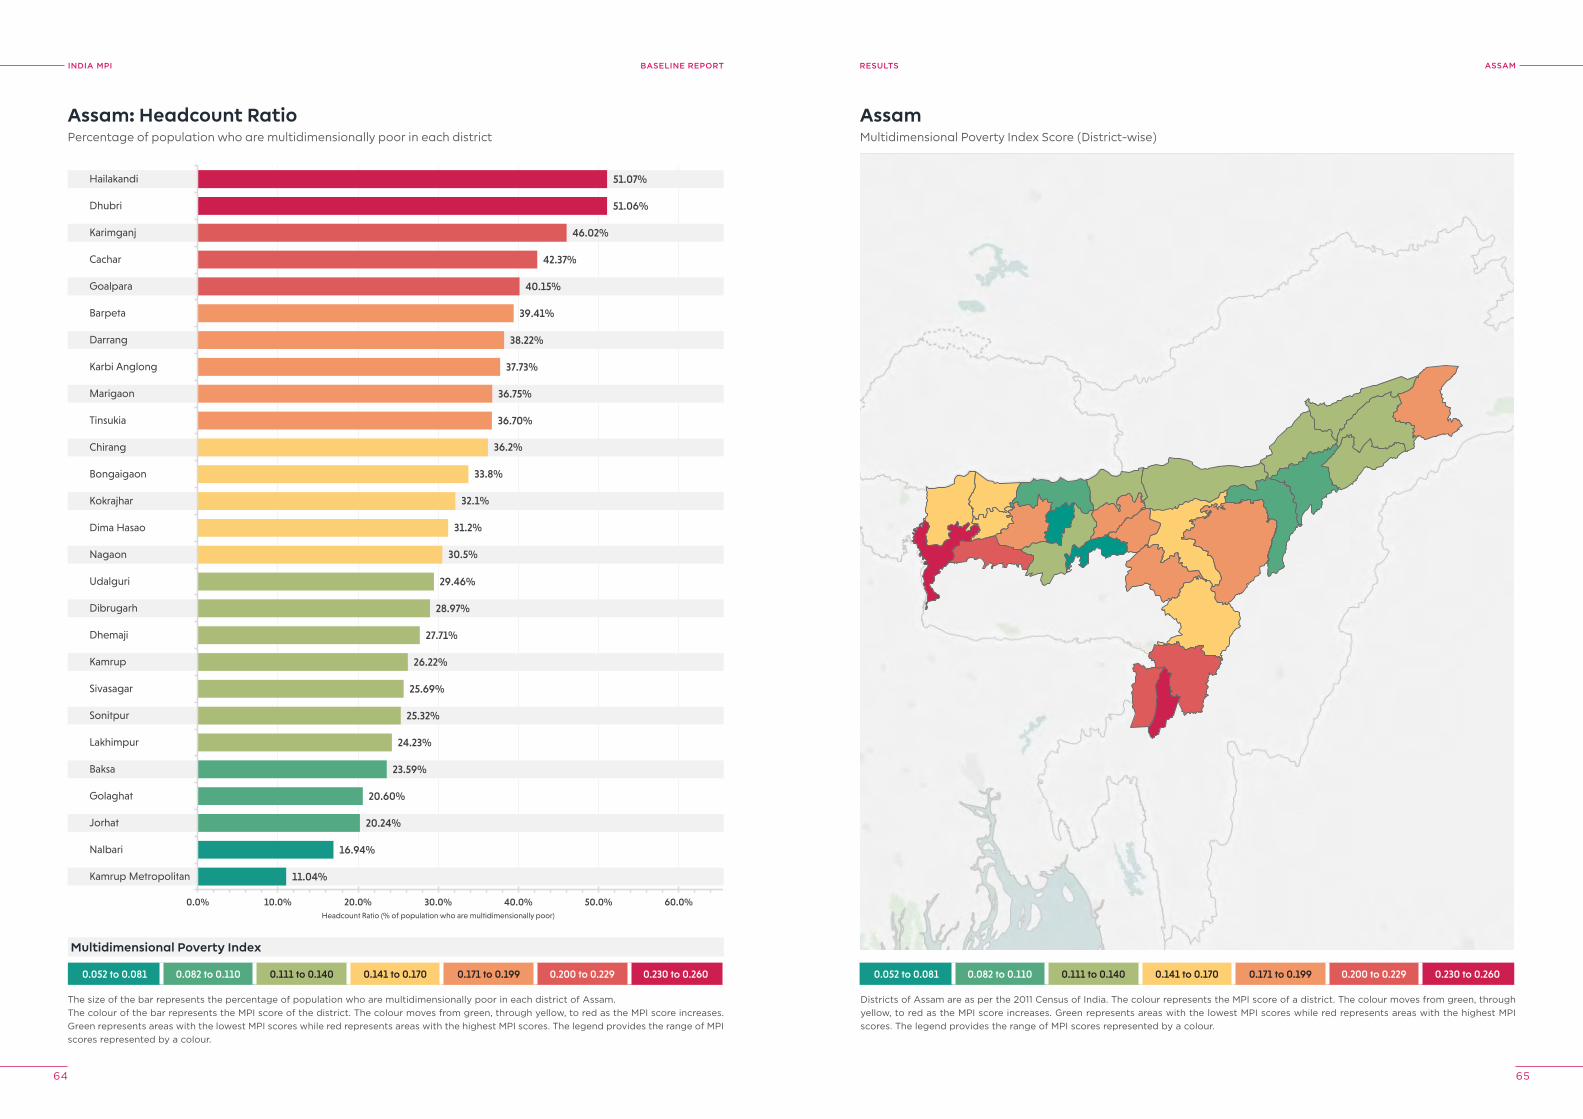
INDIA MPI BASELINE REPORT
64 65
ASSAMreSUlTS
0.052 to 0.081 0.082 to 0.110 0.111 to 0.140 0.141 to 0.170 0.171 to 0.199 0.200 to 0.229 0.230 to 0.260
11.04%
16.94%
20.24%
20.60%
23.59%
24.23%
25.32%
25.69%
26.22%
27.71%
28.97%
29.46%
30.5%
31.2%
32.1%
33.8%
36.2%
36.70%
36.75%
37.73%
38.22%
39.41%
40.15%
42.37%
46.02%
51.06%
51.07%
0.0% 10.0% 20.0% 30.0% 40.0% 50.0% 60.0%
Kamrup Metropolitan
Nalbari
Jorhat
Golaghat
Baksa
Lakhimpur
Sonitpur
Sivasagar
Kamrup
Dhemaji
Dibrugarh
Udalguri
Nagaon
Dima Hasao
Kokrajhar
Bongaigaon
Chirang
Tinsukia
Marigaon
Karbi Anglong
Darrang
Barpeta
Goalpara
Cachar
Karimganj
Dhubri
Hailakandi
Headcount Ratio (% of population who are multidimensionally poor)
Assam: Headcount RatioPercentage of population who are multidimensionally poor in each district
The size of the bar represents the percentage of population who are multidimensionally poor in each district of Assam.The colour of the bar represents the MPI score of the district. The colour moves from green, through yellow, to red as the MPI score increases. Green represents areas with the lowest MPI scores while red represents areas with the highest MPI scores. The legend provides the range of MPI scores represented by a colour.
AssamMultidimensional Poverty Index Score (District-wise)
Districts of Assam are as per the 2011 Census of India. The colour represents the MPI score of a district. The colour moves from green, through yellow, to red as the MPI score increases. Green represents areas with the lowest MPI scores while red represents areas with the highest MPI scores. The legend provides the range of MPI scores represented by a colour.
0.052 to 0.081 0.082 to 0.110 0.111 to 0.140 0.141 to 0.170 0.171 to 0.199 0.200 to 0.229 0.230 to 0.260
Multidimensional Poverty Index
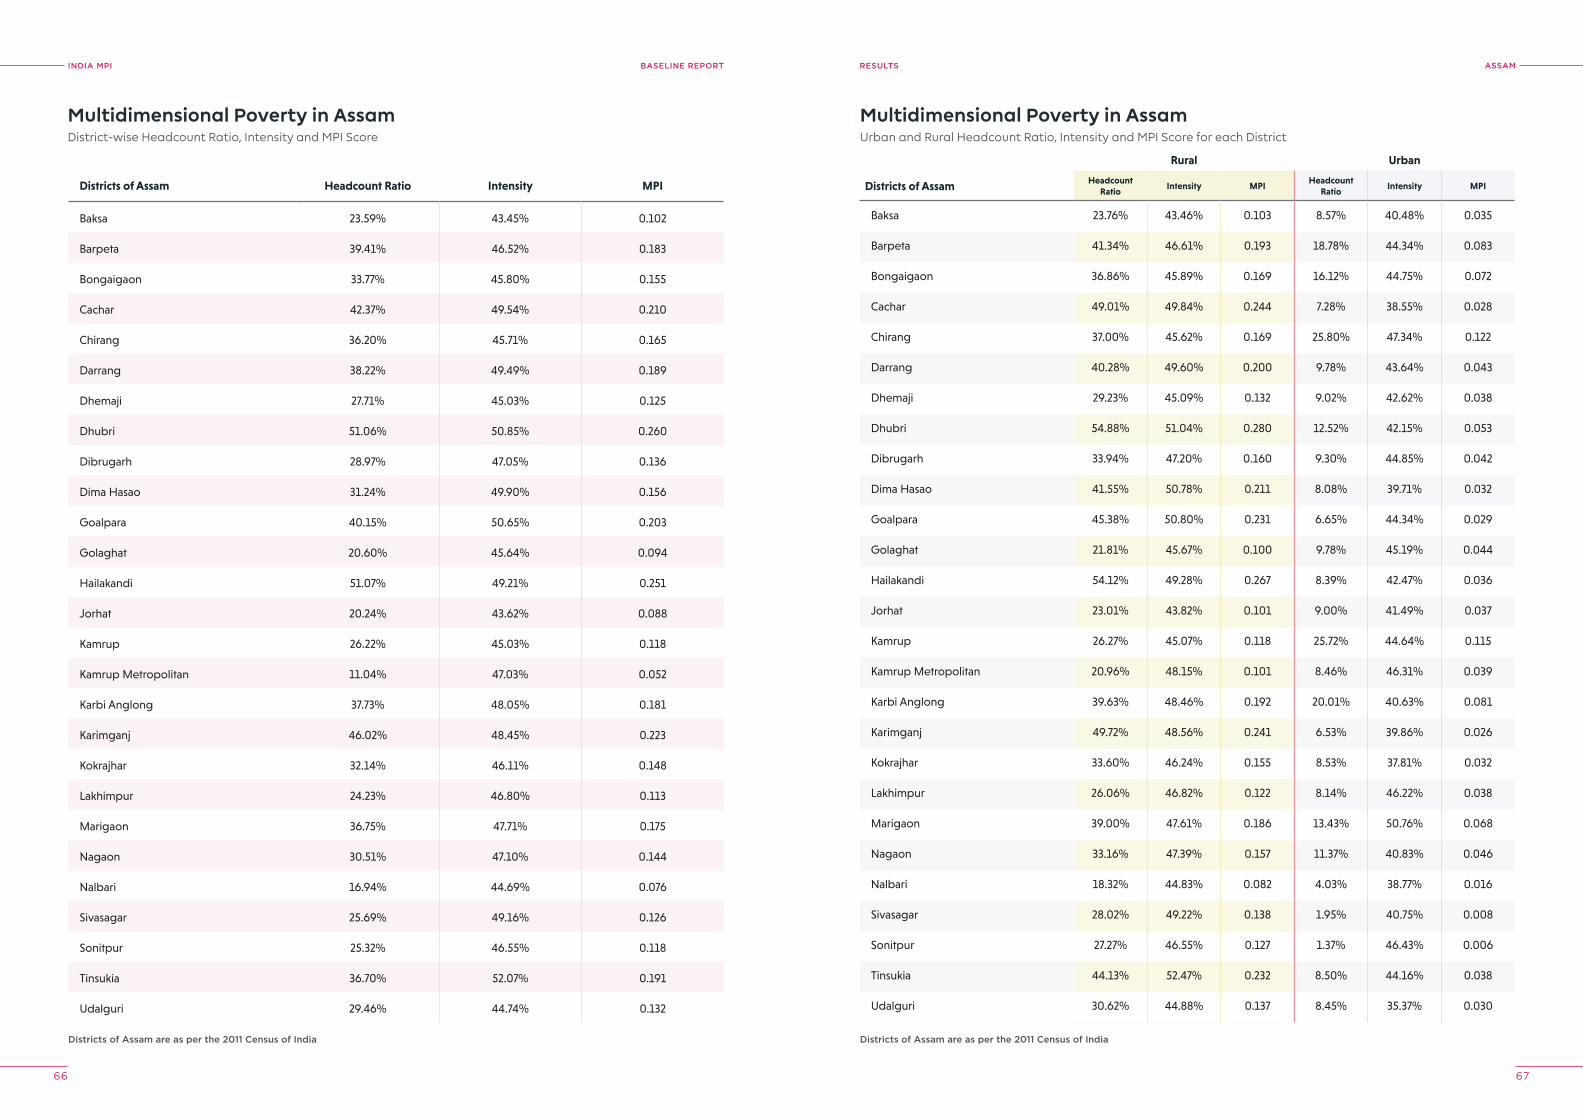
INDIA MPI BASELINE REPORT
66 67
ASSAMreSUlTS
Multidimensional Poverty in AssamDistrict-wise Headcount Ratio, Intensity and MPI Score
Multidimensional Poverty in AssamUrban and Rural Headcount Ratio, Intensity and MPI Score for each District
Districts of Assam are as per the 2011 Census of India Districts of Assam are as per the 2011 Census of India
Districts of Assam Headcount Ratio Intensity MPI
Baksa 23.59% 43.45% 0.102
Barpeta 39.41% 46.52% 0.183
Bongaigaon 33.77% 45.80% 0.155
Cachar 42.37% 49.54% 0.210
Chirang 36.20% 45.71% 0.165
Darrang 38.22% 49.49% 0.189
Dhemaji 27.71% 45.03% 0.125
Dhubri 51.06% 50.85% 0.260
Dibrugarh 28.97% 47.05% 0.136
Dima Hasao 31.24% 49.90% 0.156
Goalpara 40.15% 50.65% 0.203
Golaghat 20.60% 45.64% 0.094
Hailakandi 51.07% 49.21% 0.251
Jorhat 20.24% 43.62% 0.088
Kamrup 26.22% 45.03% 0.118
Kamrup Metropolitan 11.04% 47.03% 0.052
Karbi Anglong 37.73% 48.05% 0.181
Karimganj 46.02% 48.45% 0.223
Kokrajhar 32.14% 46.11% 0.148
Lakhimpur 24.23% 46.80% 0.113
Marigaon 36.75% 47.71% 0.175
Nagaon 30.51% 47.10% 0.144
Nalbari 16.94% 44.69% 0.076
Sivasagar 25.69% 49.16% 0.126
Sonitpur 25.32% 46.55% 0.118
Tinsukia 36.70% 52.07% 0.191
Udalguri 29.46% 44.74% 0.132
Rural Urban
Districts of Assam Headcount Ratio
Intensity MPIHeadcount
RatioIntensity MPI
Baksa 23.76% 43.46% 0.103 8.57% 40.48% 0.035
Barpeta 41.34% 46.61% 0.193 18.78% 44.34% 0.083
Bongaigaon 36.86% 45.89% 0.169 16.12% 44.75% 0.072
Cachar 49.01% 49.84% 0.244 7.28% 38.55% 0.028
Chirang 37.00% 45.62% 0.169 25.80% 47.34% 0.122
Darrang 40.28% 49.60% 0.200 9.78% 43.64% 0.043
Dhemaji 29.23% 45.09% 0.132 9.02% 42.62% 0.038
Dhubri 54.88% 51.04% 0.280 12.52% 42.15% 0.053
Dibrugarh 33.94% 47.20% 0.160 9.30% 44.85% 0.042
Dima Hasao 41.55% 50.78% 0.211 8.08% 39.71% 0.032
Goalpara 45.38% 50.80% 0.231 6.65% 44.34% 0.029
Golaghat 21.81% 45.67% 0.100 9.78% 45.19% 0.044
Hailakandi 54.12% 49.28% 0.267 8.39% 42.47% 0.036
Jorhat 23.01% 43.82% 0.101 9.00% 41.49% 0.037
Kamrup 26.27% 45.07% 0.118 25.72% 44.64% 0.115
Kamrup Metropolitan 20.96% 48.15% 0.101 8.46% 46.31% 0.039
Karbi Anglong 39.63% 48.46% 0.192 20.01% 40.63% 0.081
Karimganj 49.72% 48.56% 0.241 6.53% 39.86% 0.026
Kokrajhar 33.60% 46.24% 0.155 8.53% 37.81% 0.032
Lakhimpur 26.06% 46.82% 0.122 8.14% 46.22% 0.038
Marigaon 39.00% 47.61% 0.186 13.43% 50.76% 0.068
Nagaon 33.16% 47.39% 0.157 11.37% 40.83% 0.046
Nalbari 18.32% 44.83% 0.082 4.03% 38.77% 0.016
Sivasagar 28.02% 49.22% 0.138 1.95% 40.75% 0.008
Sonitpur 27.27% 46.55% 0.127 1.37% 46.43% 0.006
Tinsukia 44.13% 52.47% 0.232 8.50% 44.16% 0.038
Udalguri 30.62% 44.88% 0.137 8.45% 35.37% 0.030
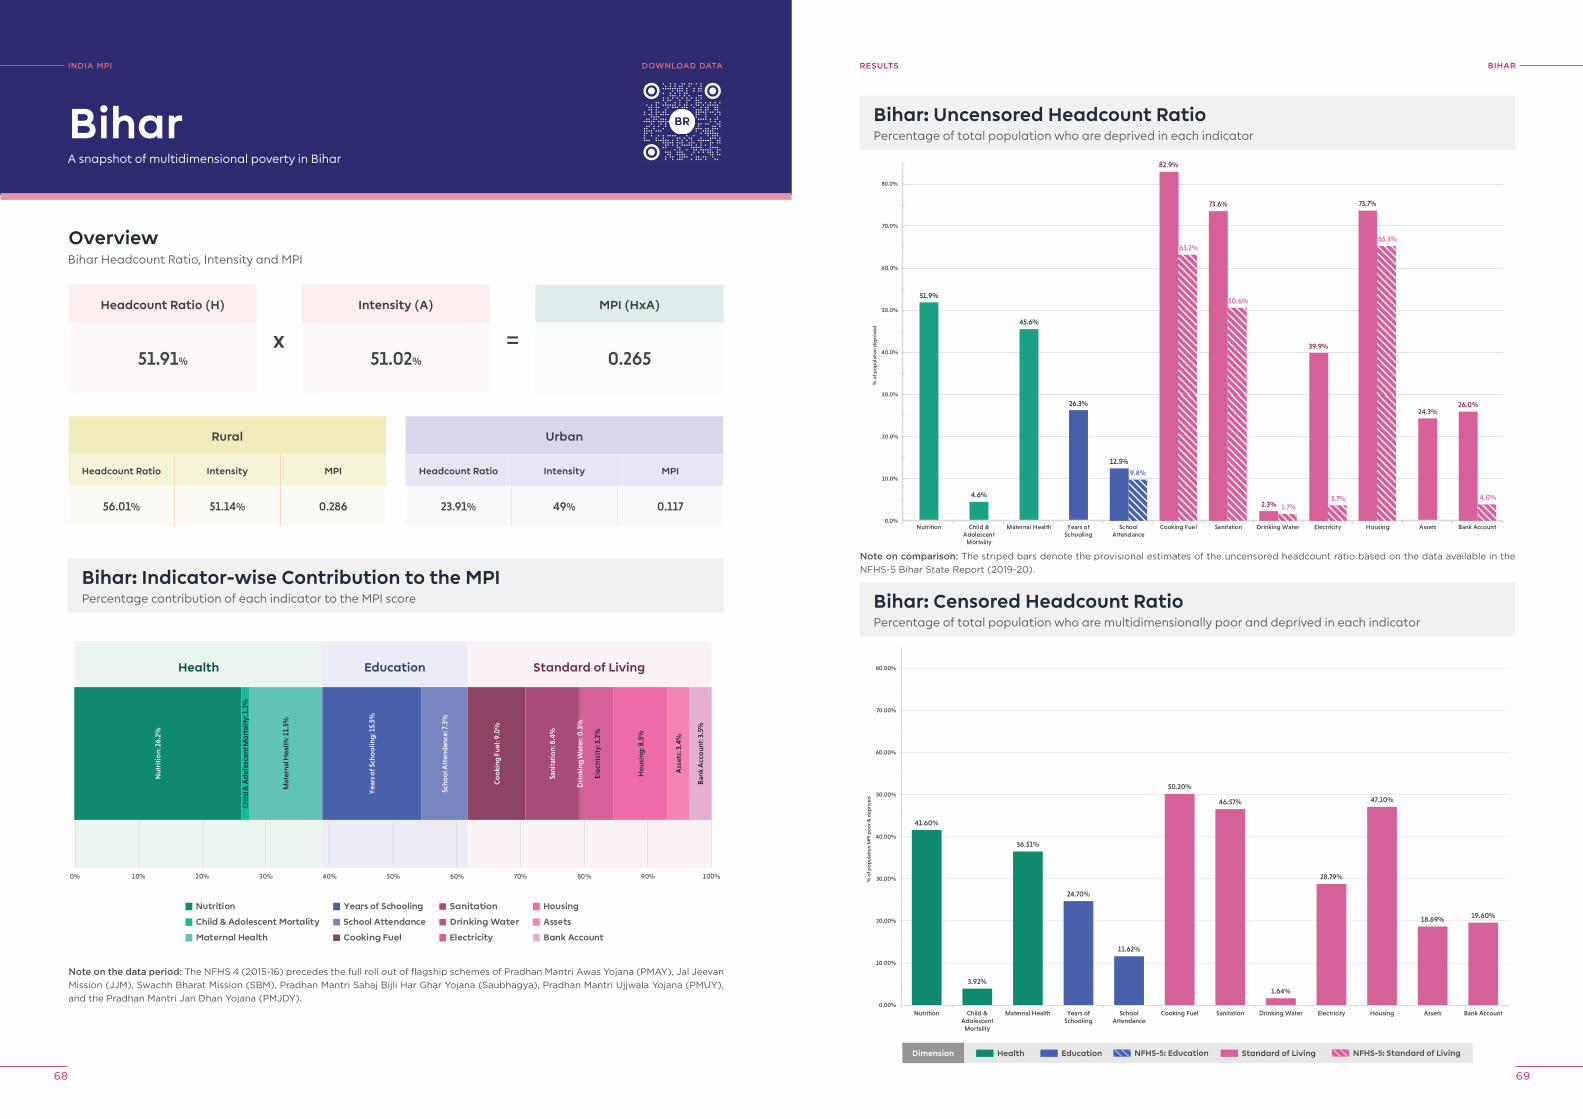
INDIA MPI BASELINE REPORT
68 69
BIhArreSUlTS
Bihar: Uncensored Headcount RatioPercentage of total population who are deprived in each indicator
51.9%
4.6%
45.6%
26.3%24.3%
12.5%
9.8%
82.9%
63.2%
73.6%
50.6%
2.3% 1.7%
39.9%
3.7%
73.7%
65.3%
26.0%
4.0%
0.0%
10.0%
20.0%
30.0%
40.0%
50.0%
60.0%
70.0%
80.0%
Nutrition Child &Adolescent
Mortality
Maternal Health Years ofSchooling
SchoolAttendance
Cooking Fuel Sanitation Drinking Water Electricity Housing Assets Bank Account
% o
f pop
ulat
ion
dep
rive
d
41.60%
3.92%
36.51%
24.70%
11.62%
50.20%
46.57%
1.64%
28.79%
47.10%
18.69% 19.60%
0.00%
10.00%
20.00%
30.00%
40.00%
50.00%
60.00%
70.00%
80.00%
Nutrition Child &Adolescent
Mortality
Maternal Health Years ofSchooling
SchoolAttendance
Cooking Fuel Sanitation Drinking Water Electricity Housing Assets Bank Account
% o
f po
pul
atio
n M
PI p
oo
r & d
epri
ved
Bihar: Censored Headcount RatioPercentage of total population who are multidimensionally poor and deprived in each indicator
INDIA MpI
A snapshot of multidimensional poverty in Bihar
OverviewBihar Headcount Ratio, Intensity and MPI
Headcount Ratio (H)
51.91%
Rural
Headcount Ratio Intensity MPI
56.01% 51.14% 0.286
Bihar: Indicator-wise Contribution to the MPIPercentage contribution of each indicator to the MPI score
Intensity (A)
51.02%
MPI (HxA)
0.265
Bihar
Urban
Headcount Ratio Intensity MPI
23.91% 49% 0.117
x =
Note on the data period: The NFHS 4 (2015-16) precedes the full roll out of flagship schemes of Pradhan Mantri Awas Yojana (PMAY), Jal Jeevan Mission (JJM), Swachh Bharat Mission (SBM), Pradhan Mantri Sahaj Bijli Har Ghar Yojana (Saubhagya), Pradhan Mantri Ujjwala Yojana (PMUY), and the Pradhan Mantri Jan Dhan Yojana (PMJDY).
Nutrition
Child & Adolescent Mortality
Maternal Health
Years of Schooling
School Attendance
Cooking Fuel
Sanitation
Drinking Water
Electricity
Housing
Assets
Bank Account
0% 10% 20% 30% 40% 50% 60% 70% 80% 90% 100%
Health Education Standard of Living
Nut
riti
on:
26.
2%
Chi
ld &
Ad
ole
scen
t Mo
rtal
ity: 1
.2%
Mat
erna
l Hea
lth:
11.
5%
Yea
rs o
f Sch
oo
ling
: 15.
5%
Scho
ol A
tten
dan
ce: 7
.3%
Co
oki
ng F
uel:
9.0
%
Sani
tati
on:
8.4
%
Dri
nkin
g W
ater
: 0.3
%
Elec
tric
ity:
5.2
%
Ho
usin
g: 8
.5%
Ass
ets:
3.4
%
Ban
k A
cco
unt:
3.5
%
DoWNloAD DATA
Note on comparison: The striped bars denote the provisional estimates of the uncensored headcount ratio based on the data available in the NFHS-5 Bihar State Report (2019-20).
Dimension Health Education Standard of Living NFHS-5: Standard of LivingNFHS-5: Education
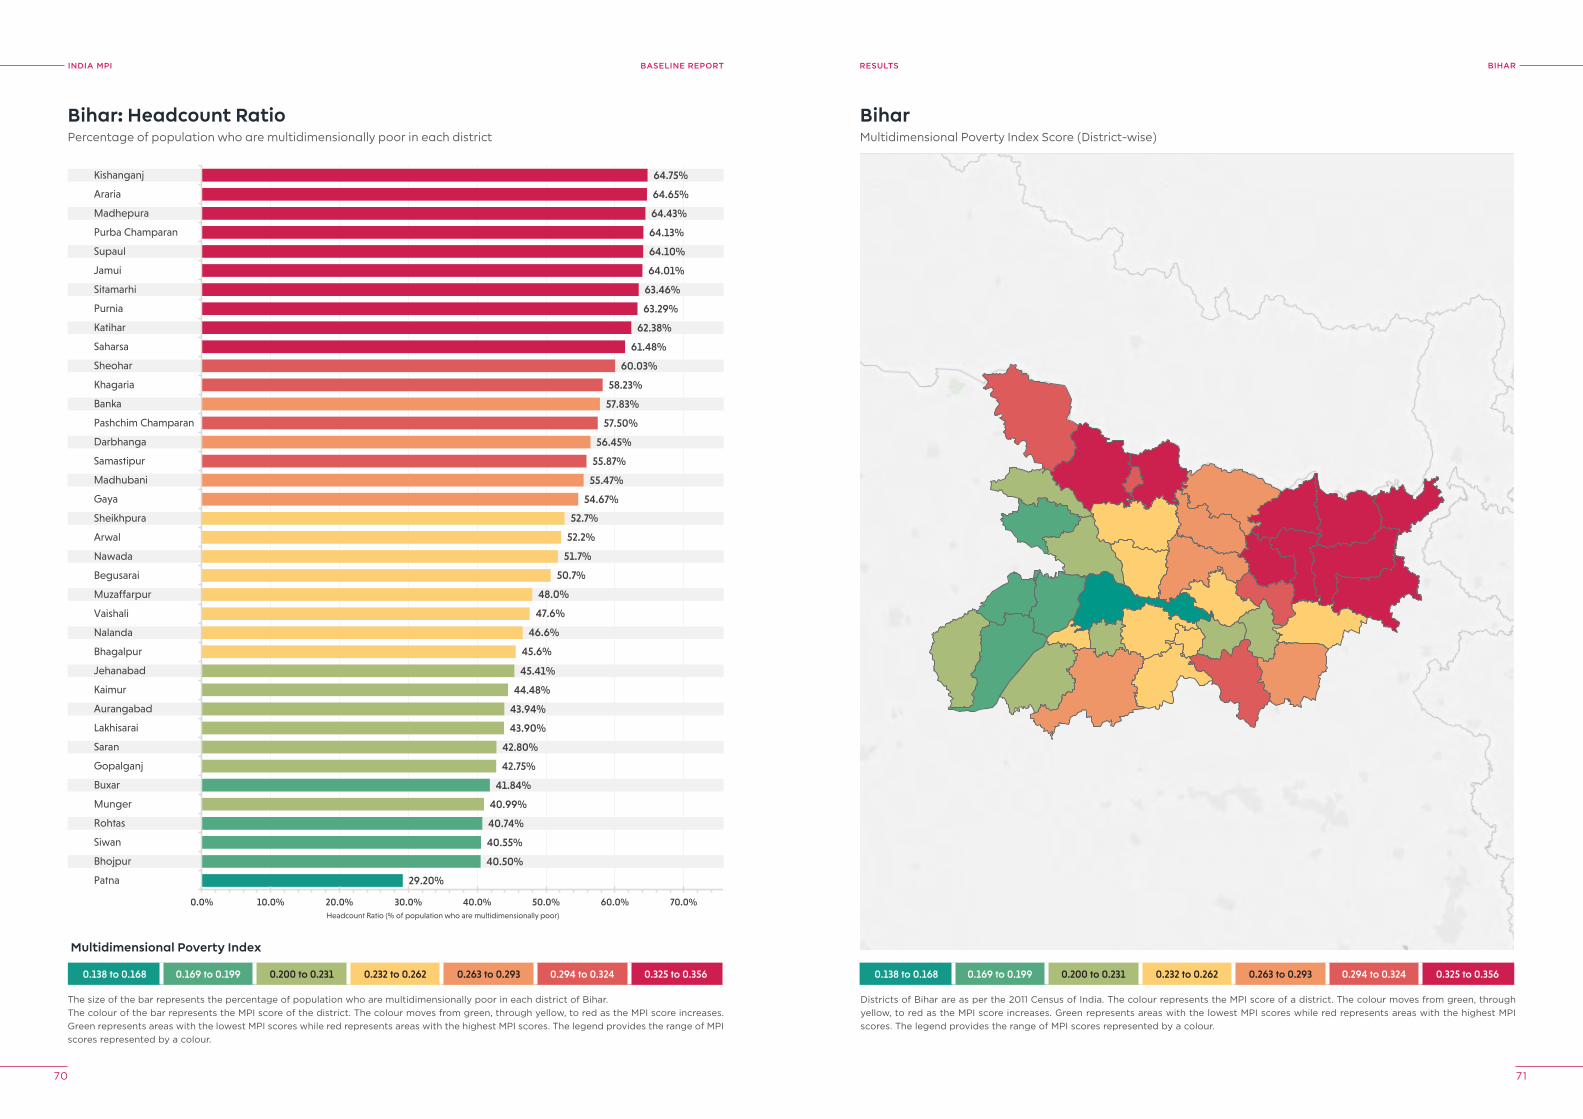
INDIA MPI BASELINE REPORT
70 71
BIhArreSUlTS
0.138 to 0.168 0.169 to 0.199 0.200 to 0.231 0.232 to 0.262 0.263 to 0.293 0.294 to 0.324 0.325 to 0.356
29.20%
40.50%
40.55%
40.74%
41.84%
40.99%
42.75%
42.80%
43.90%
43.94%
44.48%
45.41%
45.6%
46.6%
47.6%
48.0%
50.7%
51.7%
52.2%
52.7%
54.67%
55.47%
56.45%
57.83%
55.87%
57.50%
58.23%
60.03%
61.48%
62.38%
63.29%
63.46%
64.01%
64.10%
64.13%
64.43%
64.65%
64.75%
0.0% 10.0% 20.0% 30.0% 40.0% 50.0% 60.0% 70.0%
Patna
Bhojpur
Siwan
Rohtas
Munger
Buxar
Gopalganj
Saran
Lakhisarai
Aurangabad
Kaimur
Jehanabad
Bhagalpur
Nalanda
Vaishali
Muzaffarpur
Begusarai
Nawada
Arwal
Sheikhpura
Gaya
Madhubani
Samastipur
Darbhanga
Pashchim Champaran
Banka
Khagaria
Sheohar
Saharsa
Katihar
Purnia
Sitamarhi
Jamui
Supaul
Purba Champaran
Madhepura
Araria
Kishanganj
Headcount Ratio (% of population who are multidimensionally poor)
Bihar: Headcount RatioPercentage of population who are multidimensionally poor in each district
The size of the bar represents the percentage of population who are multidimensionally poor in each district of Bihar.The colour of the bar represents the MPI score of the district. The colour moves from green, through yellow, to red as the MPI score increases. Green represents areas with the lowest MPI scores while red represents areas with the highest MPI scores. The legend provides the range of MPI scores represented by a colour.
BiharMultidimensional Poverty Index Score (District-wise)
Districts of Bihar are as per the 2011 Census of India. The colour represents the MPI score of a district. The colour moves from green, through yellow, to red as the MPI score increases. Green represents areas with the lowest MPI scores while red represents areas with the highest MPI scores. The legend provides the range of MPI scores represented by a colour.
0.138 to 0.168 0.169 to 0.199 0.200 to 0.231 0.232 to 0.262 0.263 to 0.293 0.294 to 0.324 0.325 to 0.356
Multidimensional Poverty Index
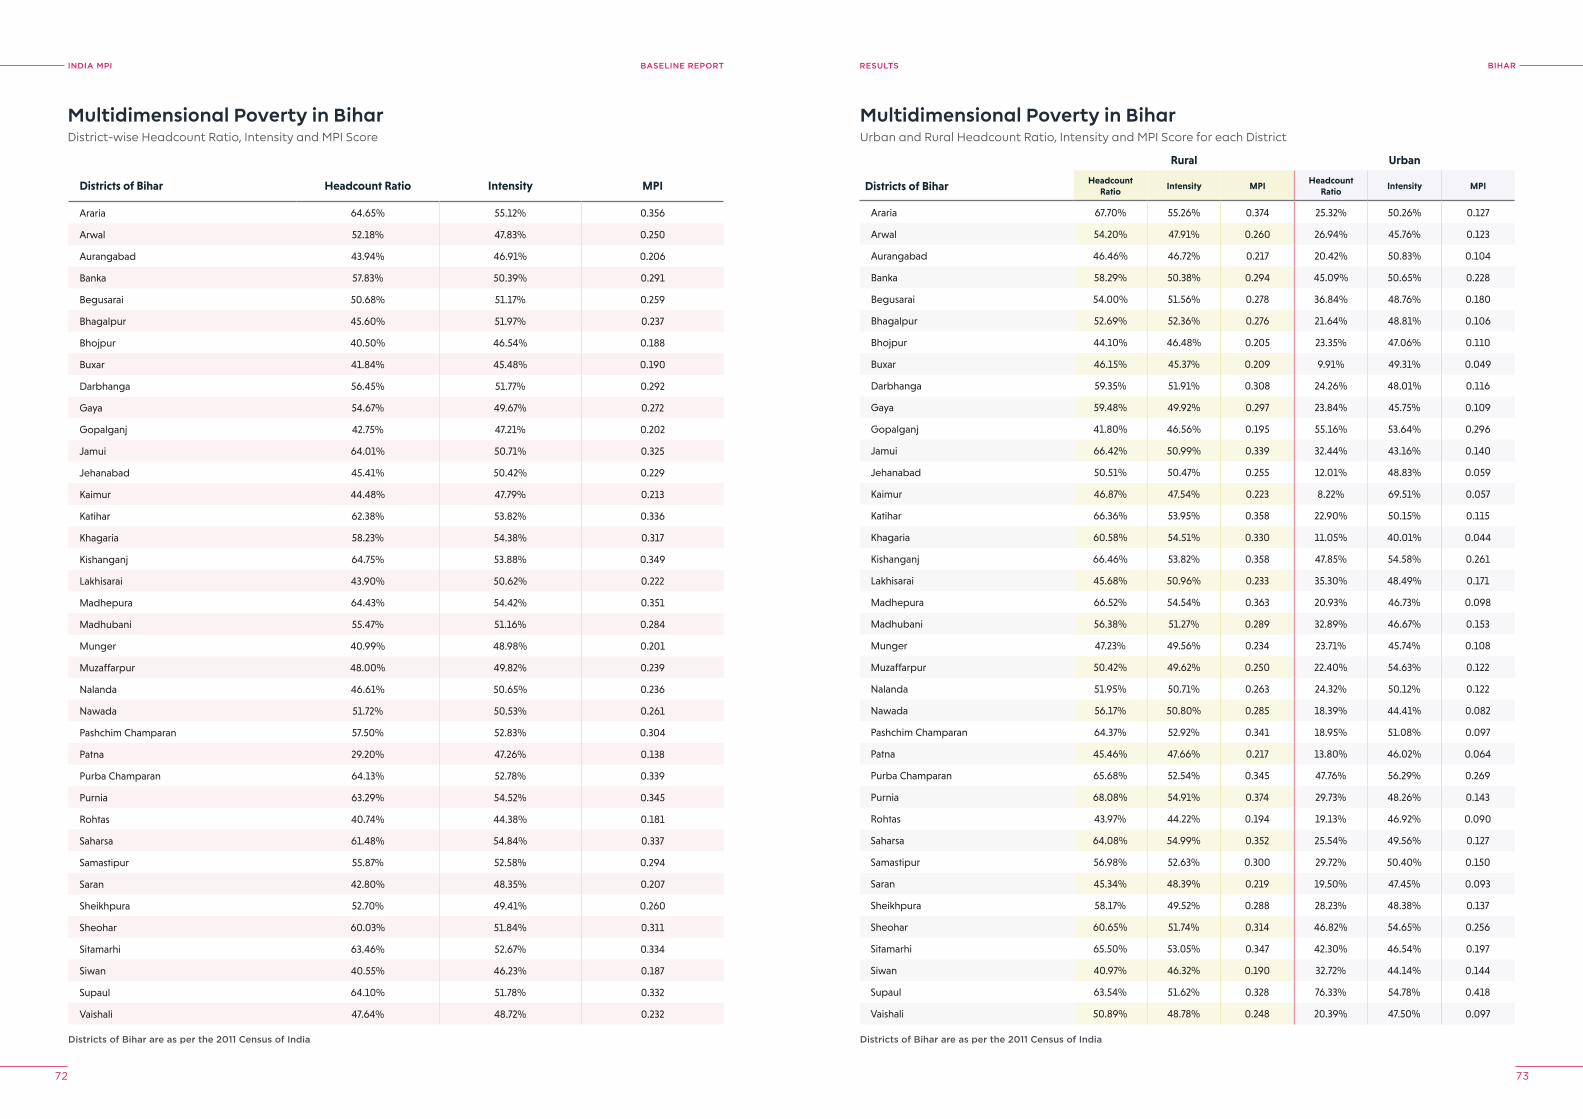
INDIA MPI BASELINE REPORT
72 73
BIhArreSUlTS
Multidimensional Poverty in BiharDistrict-wise Headcount Ratio, Intensity and MPI Score
Multidimensional Poverty in BiharUrban and Rural Headcount Ratio, Intensity and MPI Score for each District
Districts of Bihar are as per the 2011 Census of India Districts of Bihar are as per the 2011 Census of India
Districts of Bihar Headcount Ratio Intensity MPI
Araria 64.65% 55.12% 0.356
Arwal 52.18% 47.83% 0.250
Aurangabad 43.94% 46.91% 0.206
Banka 57.83% 50.39% 0.291
Begusarai 50.68% 51.17% 0.259
Bhagalpur 45.60% 51.97% 0.237
Bhojpur 40.50% 46.54% 0.188
Buxar 41.84% 45.48% 0.190
Darbhanga 56.45% 51.77% 0.292
Gaya 54.67% 49.67% 0.272
Gopalganj 42.75% 47.21% 0.202
Jamui 64.01% 50.71% 0.325
Jehanabad 45.41% 50.42% 0.229
Kaimur 44.48% 47.79% 0.213
Katihar 62.38% 53.82% 0.336
Khagaria 58.23% 54.38% 0.317
Kishanganj 64.75% 53.88% 0.349
Lakhisarai 43.90% 50.62% 0.222
Madhepura 64.43% 54.42% 0.351
Madhubani 55.47% 51.16% 0.284
Munger 40.99% 48.98% 0.201
Muzaffarpur 48.00% 49.82% 0.239
Nalanda 46.61% 50.65% 0.236
Nawada 51.72% 50.53% 0.261
Pashchim Champaran 57.50% 52.83% 0.304
Patna 29.20% 47.26% 0.138
Purba Champaran 64.13% 52.78% 0.339
Purnia 63.29% 54.52% 0.345
Rohtas 40.74% 44.38% 0.181
Saharsa 61.48% 54.84% 0.337
Samastipur 55.87% 52.58% 0.294
Saran 42.80% 48.35% 0.207
Sheikhpura 52.70% 49.41% 0.260
Sheohar 60.03% 51.84% 0.311
Sitamarhi 63.46% 52.67% 0.334
Siwan 40.55% 46.23% 0.187
Supaul 64.10% 51.78% 0.332
Vaishali 47.64% 48.72% 0.232
Rural Urban
Districts of Bihar Headcount Ratio
Intensity MPIHeadcount
RatioIntensity MPI
Araria 67.70% 55.26% 0.374 25.32% 50.26% 0.127
Arwal 54.20% 47.91% 0.260 26.94% 45.76% 0.123
Aurangabad 46.46% 46.72% 0.217 20.42% 50.83% 0.104
Banka 58.29% 50.38% 0.294 45.09% 50.65% 0.228
Begusarai 54.00% 51.56% 0.278 36.84% 48.76% 0.180
Bhagalpur 52.69% 52.36% 0.276 21.64% 48.81% 0.106
Bhojpur 44.10% 46.48% 0.205 23.35% 47.06% 0.110
Buxar 46.15% 45.37% 0.209 9.91% 49.31% 0.049
Darbhanga 59.35% 51.91% 0.308 24.26% 48.01% 0.116
Gaya 59.48% 49.92% 0.297 23.84% 45.75% 0.109
Gopalganj 41.80% 46.56% 0.195 55.16% 53.64% 0.296
Jamui 66.42% 50.99% 0.339 32.44% 43.16% 0.140
Jehanabad 50.51% 50.47% 0.255 12.01% 48.83% 0.059
Kaimur 46.87% 47.54% 0.223 8.22% 69.51% 0.057
Katihar 66.36% 53.95% 0.358 22.90% 50.15% 0.115
Khagaria 60.58% 54.51% 0.330 11.05% 40.01% 0.044
Kishanganj 66.46% 53.82% 0.358 47.85% 54.58% 0.261
Lakhisarai 45.68% 50.96% 0.233 35.30% 48.49% 0.171
Madhepura 66.52% 54.54% 0.363 20.93% 46.73% 0.098
Madhubani 56.38% 51.27% 0.289 32.89% 46.67% 0.153
Munger 47.23% 49.56% 0.234 23.71% 45.74% 0.108
Muzaffarpur 50.42% 49.62% 0.250 22.40% 54.63% 0.122
Nalanda 51.95% 50.71% 0.263 24.32% 50.12% 0.122
Nawada 56.17% 50.80% 0.285 18.39% 44.41% 0.082
Pashchim Champaran 64.37% 52.92% 0.341 18.95% 51.08% 0.097
Patna 45.46% 47.66% 0.217 13.80% 46.02% 0.064
Purba Champaran 65.68% 52.54% 0.345 47.76% 56.29% 0.269
Purnia 68.08% 54.91% 0.374 29.73% 48.26% 0.143
Rohtas 43.97% 44.22% 0.194 19.13% 46.92% 0.090
Saharsa 64.08% 54.99% 0.352 25.54% 49.56% 0.127
Samastipur 56.98% 52.63% 0.300 29.72% 50.40% 0.150
Saran 45.34% 48.39% 0.219 19.50% 47.45% 0.093
Sheikhpura 58.17% 49.52% 0.288 28.23% 48.38% 0.137
Sheohar 60.65% 51.74% 0.314 46.82% 54.65% 0.256
Sitamarhi 65.50% 53.05% 0.347 42.30% 46.54% 0.197
Siwan 40.97% 46.32% 0.190 32.72% 44.14% 0.144
Supaul 63.54% 51.62% 0.328 76.33% 54.78% 0.418
Vaishali 50.89% 48.78% 0.248 20.39% 47.50% 0.097
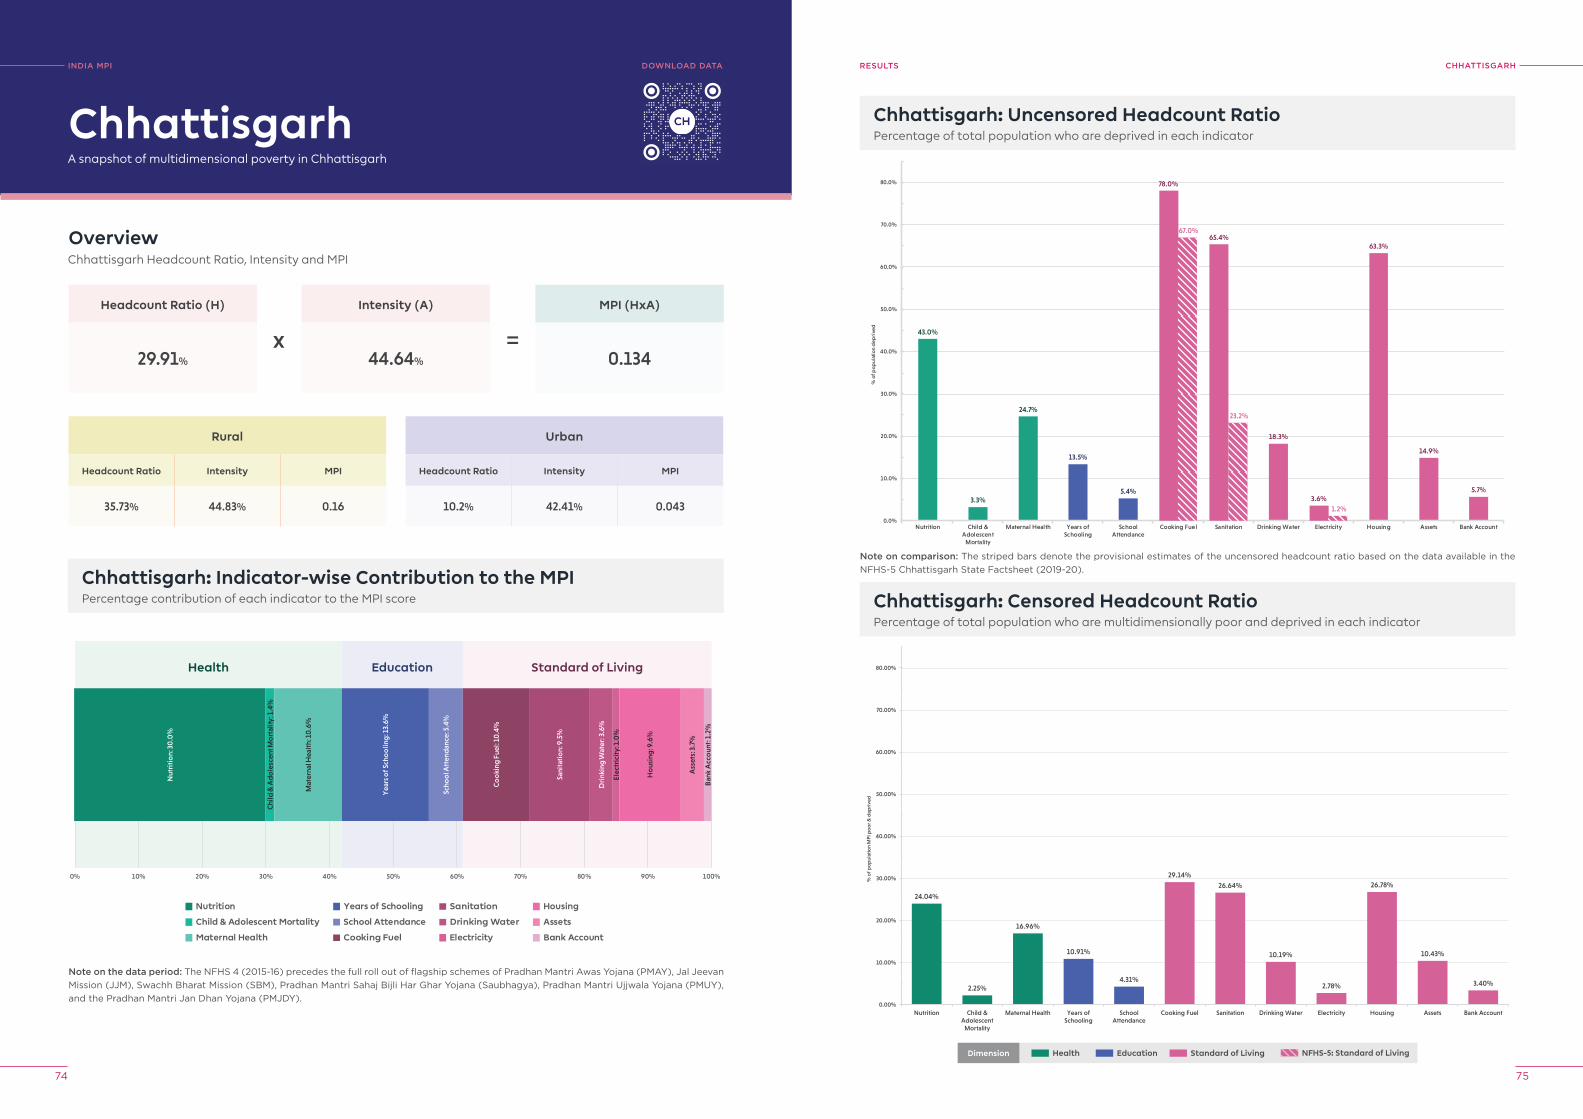
INDIA MPI BASELINE REPORT
74 75
ChhATTISGArhreSUlTS
Chhattisgarh: Uncensored Headcount RatioPercentage of total population who are deprived in each indicator
43.0%
3.3%
24.7%
13.5%
5.4%
18.3%
63.3%
14.9%
5.7%
78.0%
67.0%65.4%
23.2%
3.6%1.2%
0.0%
10.0%
20.0%
30.0%
40.0%
50.0%
60.0%
70.0%
80.0%
Nutrition Child &Adolescent
Mortality
Maternal Health Years ofSchooling
SchoolAttendance
Cooking Fuel Sanitation Drinking Water Electricity Housing Assets Bank Account
% o
f pop
ulat
ion
dep
rive
d
24.04%
2.25%
16.96%
10.91%
4.31%
29.14%
26.64%
10.19%
2.78%
26.78%
10.43%
3.40%
0.00%
10.00%
20.00%
30.00%
40.00%
50.00%
60.00%
70.00%
80.00%
Nutrition Child &Adolescent
Mortality
Maternal Health Years ofSchooling
SchoolAttendance
Cooking Fuel Sanitation Drinking Water Electricity Housing Assets Bank Account
% o
f po
pul
atio
n M
PI p
oo
r & d
epri
ved
Chhattisgarh: Censored Headcount RatioPercentage of total population who are multidimensionally poor and deprived in each indicator
INDIA MpI
A snapshot of multidimensional poverty in Chhattisgarh
OverviewChhattisgarh Headcount Ratio, Intensity and MPI
Headcount Ratio (H)
29.91%
Rural
Headcount Ratio Intensity MPI
35.73% 44.83% 0.16
Chhattisgarh: Indicator-wise Contribution to the MPIPercentage contribution of each indicator to the MPI score
Intensity (A)
44.64%
MPI (HxA)
0.134
Chhattisgarh
Urban
Headcount Ratio Intensity MPI
10.2% 42.41% 0.043
x =
Note on the data period: The NFHS 4 (2015-16) precedes the full roll out of flagship schemes of Pradhan Mantri Awas Yojana (PMAY), Jal Jeevan Mission (JJM), Swachh Bharat Mission (SBM), Pradhan Mantri Sahaj Bijli Har Ghar Yojana (Saubhagya), Pradhan Mantri Ujjwala Yojana (PMUY), and the Pradhan Mantri Jan Dhan Yojana (PMJDY).
Nutrition
Child & Adolescent Mortality
Maternal Health
Years of Schooling
School Attendance
Cooking Fuel
Sanitation
Drinking Water
Electricity
Housing
Assets
Bank Account
0% 10% 20% 30% 40% 50% 60% 70% 80% 90% 100%
Health Education Standard of Living
Nut
riti
on:
30
.0%
Chi
ld &
Ad
ole
scen
t Mo
rtal
ity: 1
.4%
Mat
erna
l Hea
lth:
10
.6%
Yea
rs o
f Sch
oo
ling
: 13.
6%
Scho
ol A
tten
dan
ce: 5
.4%
Co
oki
ng F
uel:
10.4
%
Sani
tati
on:
9.5
%
Dri
nkin
g W
ater
: 3.6
%
Elec
tric
ity:
1.0
%
Ho
usin
g: 9
.6%
Ass
ets:
3.7
%
Ban
k A
cco
unt:
1.2
%
DoWNloAD DATA
Note on comparison: The striped bars denote the provisional estimates of the uncensored headcount ratio based on the data available in the NFHS-5 Chhattisgarh State Factsheet (2019-20).
Dimension Health Education Standard of Living NFHS-5: Standard of Living
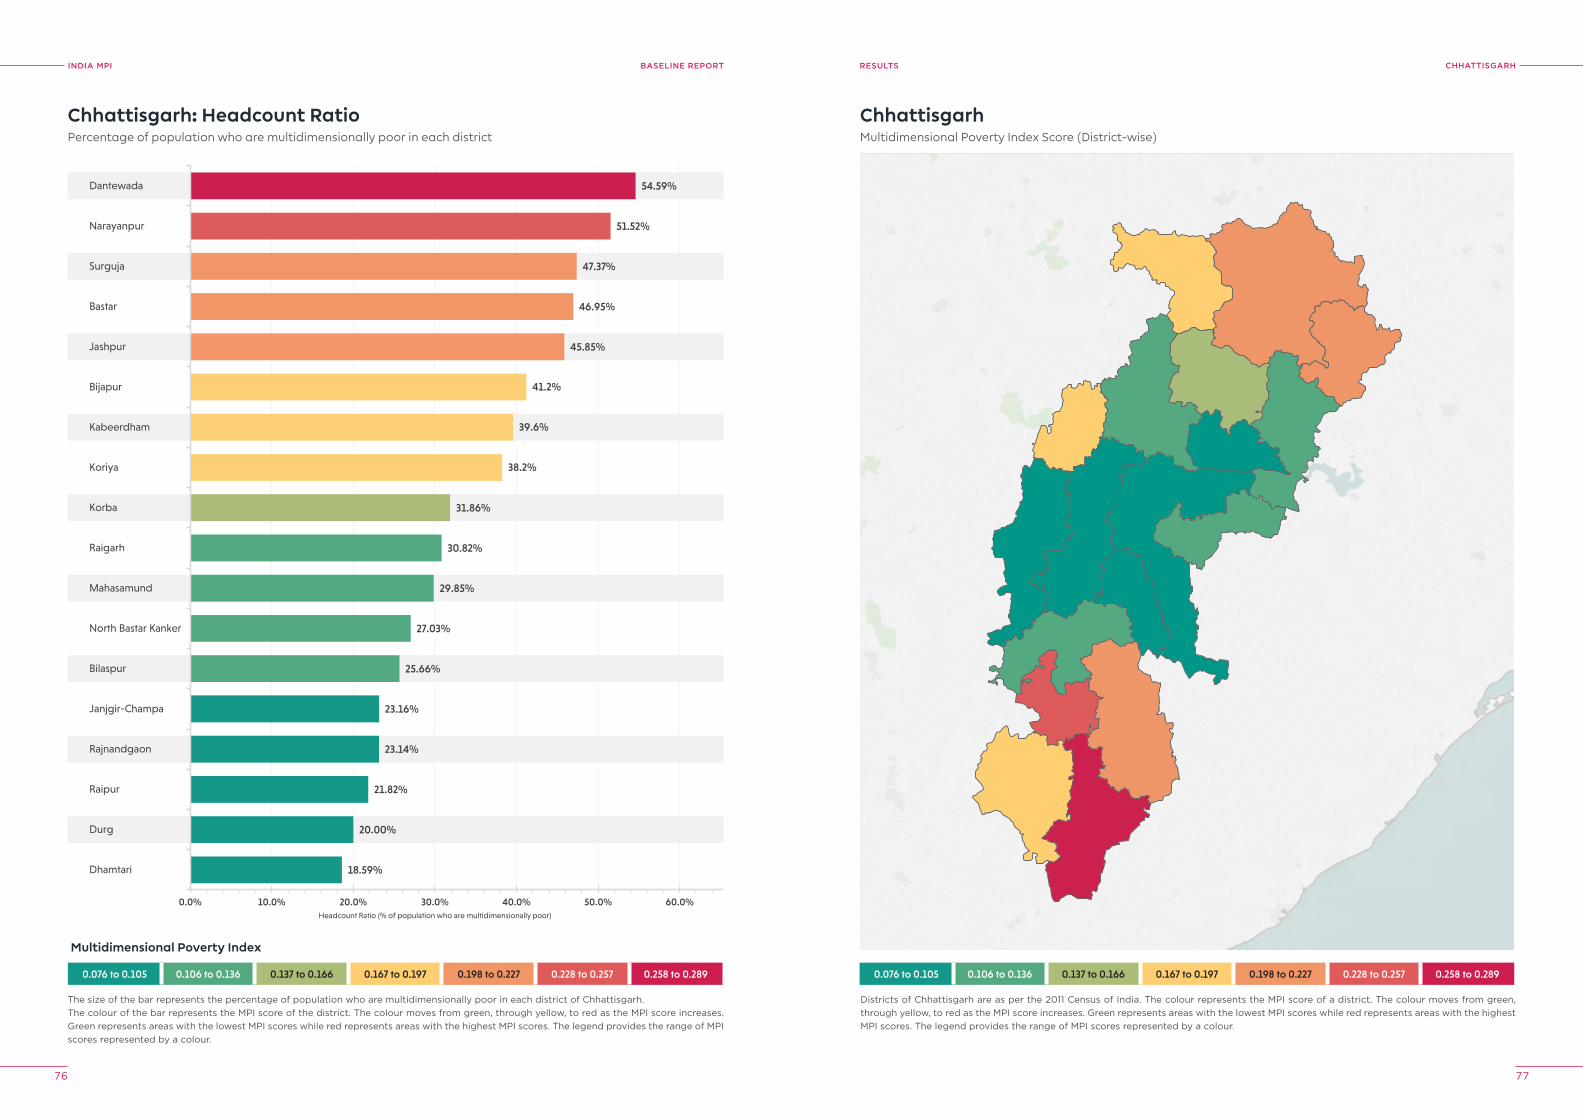
INDIA MPI BASELINE REPORT
76 77
ChhATTISGArhreSUlTS
0.076 to 0.105 0.106 to 0.136 0.137 to 0.166 0.167 to 0.197 0.198 to 0.227 0.228 to 0.257 0.258 to 0.289
18.59%
20.00%
21.82%
23.14%
23.16%
25.66%
27.03%
29.85%
30.82%
31.86%
38.2%
39.6%
41.2%
45.85%
46.95%
47.37%
51.52%
54.59%
0.0% 10.0% 20.0% 30.0% 40.0% 50.0% 60.0%
Dhamtari
Durg
Raipur
Rajnandgaon
Janjgir-Champa
Bilaspur
North Bastar Kanker
Mahasamund
Raigarh
Korba
Koriya
Kabeerdham
Bijapur
Jashpur
Bastar
Surguja
Narayanpur
Dantewada
Headcount Ratio (% of population who are multidimensionally poor)
Chhattisgarh: Headcount RatioPercentage of population who are multidimensionally poor in each district
The size of the bar represents the percentage of population who are multidimensionally poor in each district of Chhattisgarh.The colour of the bar represents the MPI score of the district. The colour moves from green, through yellow, to red as the MPI score increases. Green represents areas with the lowest MPI scores while red represents areas with the highest MPI scores. The legend provides the range of MPI scores represented by a colour.
ChhattisgarhMultidimensional Poverty Index Score (District-wise)
Districts of Chhattisgarh are as per the 2011 Census of India. The colour represents the MPI score of a district. The colour moves from green, through yellow, to red as the MPI score increases. Green represents areas with the lowest MPI scores while red represents areas with the highest MPI scores. The legend provides the range of MPI scores represented by a colour.
0.076 to 0.105 0.106 to 0.136 0.137 to 0.166 0.167 to 0.197 0.198 to 0.227 0.228 to 0.257 0.258 to 0.289
Multidimensional Poverty Index
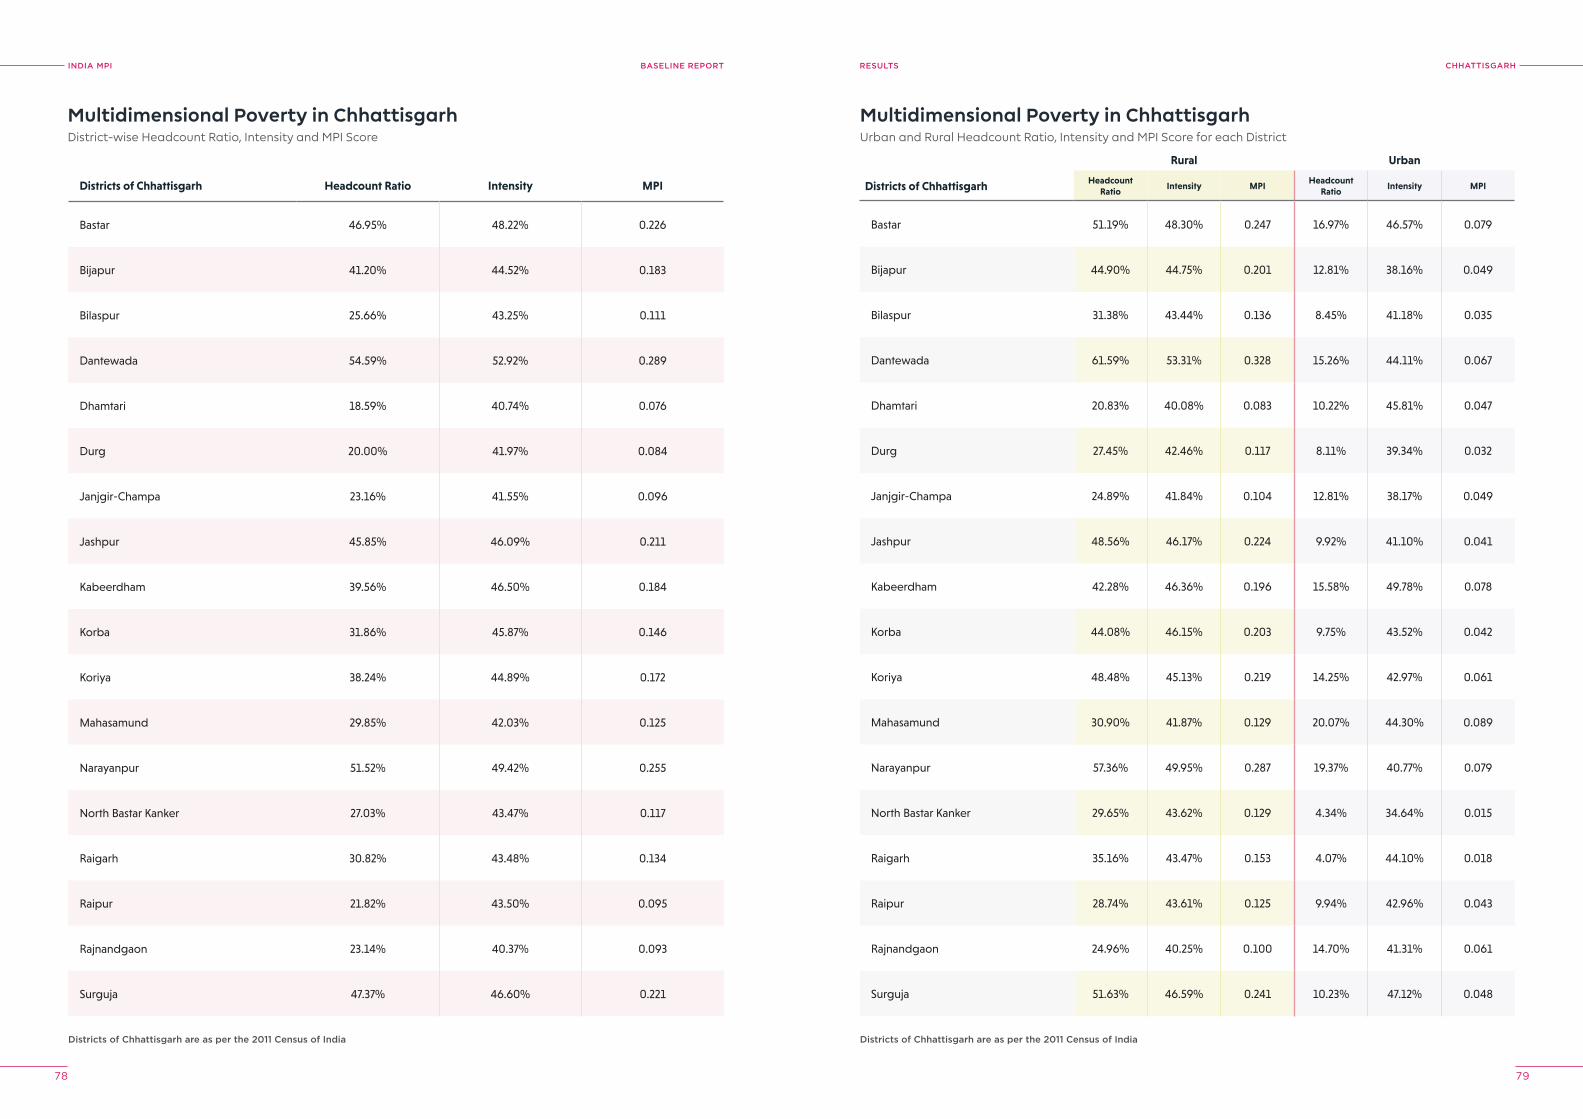
INDIA MPI BASELINE REPORT
78 79
ChhATTISGArhreSUlTS
Multidimensional Poverty in ChhattisgarhDistrict-wise Headcount Ratio, Intensity and MPI Score
Multidimensional Poverty in ChhattisgarhUrban and Rural Headcount Ratio, Intensity and MPI Score for each District
Districts of Chhattisgarh are as per the 2011 Census of India Districts of Chhattisgarh are as per the 2011 Census of India
Districts of Chhattisgarh Headcount Ratio Intensity MPI
Bastar 46.95% 48.22% 0.226
Bijapur 41.20% 44.52% 0.183
Bilaspur 25.66% 43.25% 0.111
Dantewada 54.59% 52.92% 0.289
Dhamtari 18.59% 40.74% 0.076
Durg 20.00% 41.97% 0.084
Janjgir-Champa 23.16% 41.55% 0.096
Jashpur 45.85% 46.09% 0.211
Kabeerdham 39.56% 46.50% 0.184
Korba 31.86% 45.87% 0.146
Koriya 38.24% 44.89% 0.172
Mahasamund 29.85% 42.03% 0.125
Narayanpur 51.52% 49.42% 0.255
North Bastar Kanker 27.03% 43.47% 0.117
Raigarh 30.82% 43.48% 0.134
Raipur 21.82% 43.50% 0.095
Rajnandgaon 23.14% 40.37% 0.093
Surguja 47.37% 46.60% 0.221
Rural Urban
Districts of Chhattisgarh Headcount Ratio
Intensity MPIHeadcount
RatioIntensity MPI
Bastar 51.19% 48.30% 0.247 16.97% 46.57% 0.079
Bijapur 44.90% 44.75% 0.201 12.81% 38.16% 0.049
Bilaspur 31.38% 43.44% 0.136 8.45% 41.18% 0.035
Dantewada 61.59% 53.31% 0.328 15.26% 44.11% 0.067
Dhamtari 20.83% 40.08% 0.083 10.22% 45.81% 0.047
Durg 27.45% 42.46% 0.117 8.11% 39.34% 0.032
Janjgir-Champa 24.89% 41.84% 0.104 12.81% 38.17% 0.049
Jashpur 48.56% 46.17% 0.224 9.92% 41.10% 0.041
Kabeerdham 42.28% 46.36% 0.196 15.58% 49.78% 0.078
Korba 44.08% 46.15% 0.203 9.75% 43.52% 0.042
Koriya 48.48% 45.13% 0.219 14.25% 42.97% 0.061
Mahasamund 30.90% 41.87% 0.129 20.07% 44.30% 0.089
Narayanpur 57.36% 49.95% 0.287 19.37% 40.77% 0.079
North Bastar Kanker 29.65% 43.62% 0.129 4.34% 34.64% 0.015
Raigarh 35.16% 43.47% 0.153 4.07% 44.10% 0.018
Raipur 28.74% 43.61% 0.125 9.94% 42.96% 0.043
Rajnandgaon 24.96% 40.25% 0.100 14.70% 41.31% 0.061
Surguja 51.63% 46.59% 0.241 10.23% 47.12% 0.048

INDIA MPI BASELINE REPORT
80 81
GoAreSUlTS
Goa: Uncensored Headcount RatioPercentage of total population who are deprived in each indicator
24.6%
0.6%
7.1%
4.7%3.0%
1.0% 0.9%
14.9%
3.1%
21.4%
12.1%
4.1%
1.6%0.2% 0.0%
16.2%
9.5%
4.0%2.6%
0.0%
10.0%
20.0%
30.0%
40.0%
50.0%
60.0%
70.0%
80.0%
Nutrition Child &Adolescent
Mortality
Maternal Health Years ofSchooling
SchoolAttendance
Cooking Fuel Sanitation Drinking Water Electricity Housing Assets Bank Account
% o
f pop
ulat
ion
dep
rive
d
2.96%
0.20%1.39% 2.24%
0.59%2.06% 2.81%
0.30% 0.00%1.83% 0.86% 0.79%
0.00%
10.00%
20.00%
30.00%
40.00%
50.00%
60.00%
70.00%
80.00%
Nutrition Child &Adolescent
Mortality
Maternal Health Years ofSchooling
SchoolAttendance
Cooking Fuel Sanitation Drinking Water Electricity Housing Assets Bank Account
% o
f po
pul
atio
n M
PI p
oo
r & d
epri
ved
Goa: Censored Headcount RatioPercentage of total population who are multidimensionally poor and deprived in each indicator
INDIA MpI
A snapshot of multidimensional poverty in Goa
OverviewGoa Headcount Ratio, Intensity and MPI
Headcount Ratio (H)
3.76%
Rural
Headcount Ratio Intensity MPI
4.44% 39.3% 0.017
Goa: Indicator-wise Contribution to the MPIPercentage contribution of each indicator to the MPI score
Intensity (A)
40.16%
MPI (HxA)
0.015
Goa
Urban
Headcount Ratio Intensity MPI
3.34% 40.84% 0.014
x =
Note on the data period: The NFHS 4 (2015-16) precedes the full roll out of flagship schemes of Pradhan Mantri Awas Yojana (PMAY), Jal Jeevan Mission (JJM), Swachh Bharat Mission (SBM), Pradhan Mantri Sahaj Bijli Har Ghar Yojana (Saubhagya), Pradhan Mantri Ujjwala Yojana (PMUY), and the Pradhan Mantri Jan Dhan Yojana (PMJDY).
Nutrition
Child & Adolescent Mortality
Maternal Health
Years of Schooling
School Attendance
Cooking Fuel
Sanitation
Drinking Water
Electricity
Housing
Assets
Bank Account
0% 10% 20% 30% 40% 50% 60% 70% 80% 90% 100%
Health Education Standard of Living
Nut
riti
on:
32.
7%
Chi
ld &
Ad
ole
scen
t Mo
rtal
ity: 1
.1%
Mat
erna
l Hea
lth:
7.7%
Yea
rs o
f Sch
oo
ling
: 24.
8%
Scho
ol A
tten
dan
ce: 6
.5%
Co
oki
ng F
uel:
6.5%
Sani
tati
on:
8.9
%
Dri
nkin
g W
ater
: 0.9
%El
ectr
icit
y: 0
.0%
Ho
usin
g: 5
.8%
Ass
ets:
2.7
%
Ban
k A
cco
unt:
2.5
%
DoWNloAD DATA
Note on comparison: The striped bars denote the provisional estimates of the uncensored headcount ratio based on the data available in the NFHS-5 Goa State Report (2019-20).
Dimension Health Education Standard of Living NFHS-5: Standard of LivingNFHS-5: Education
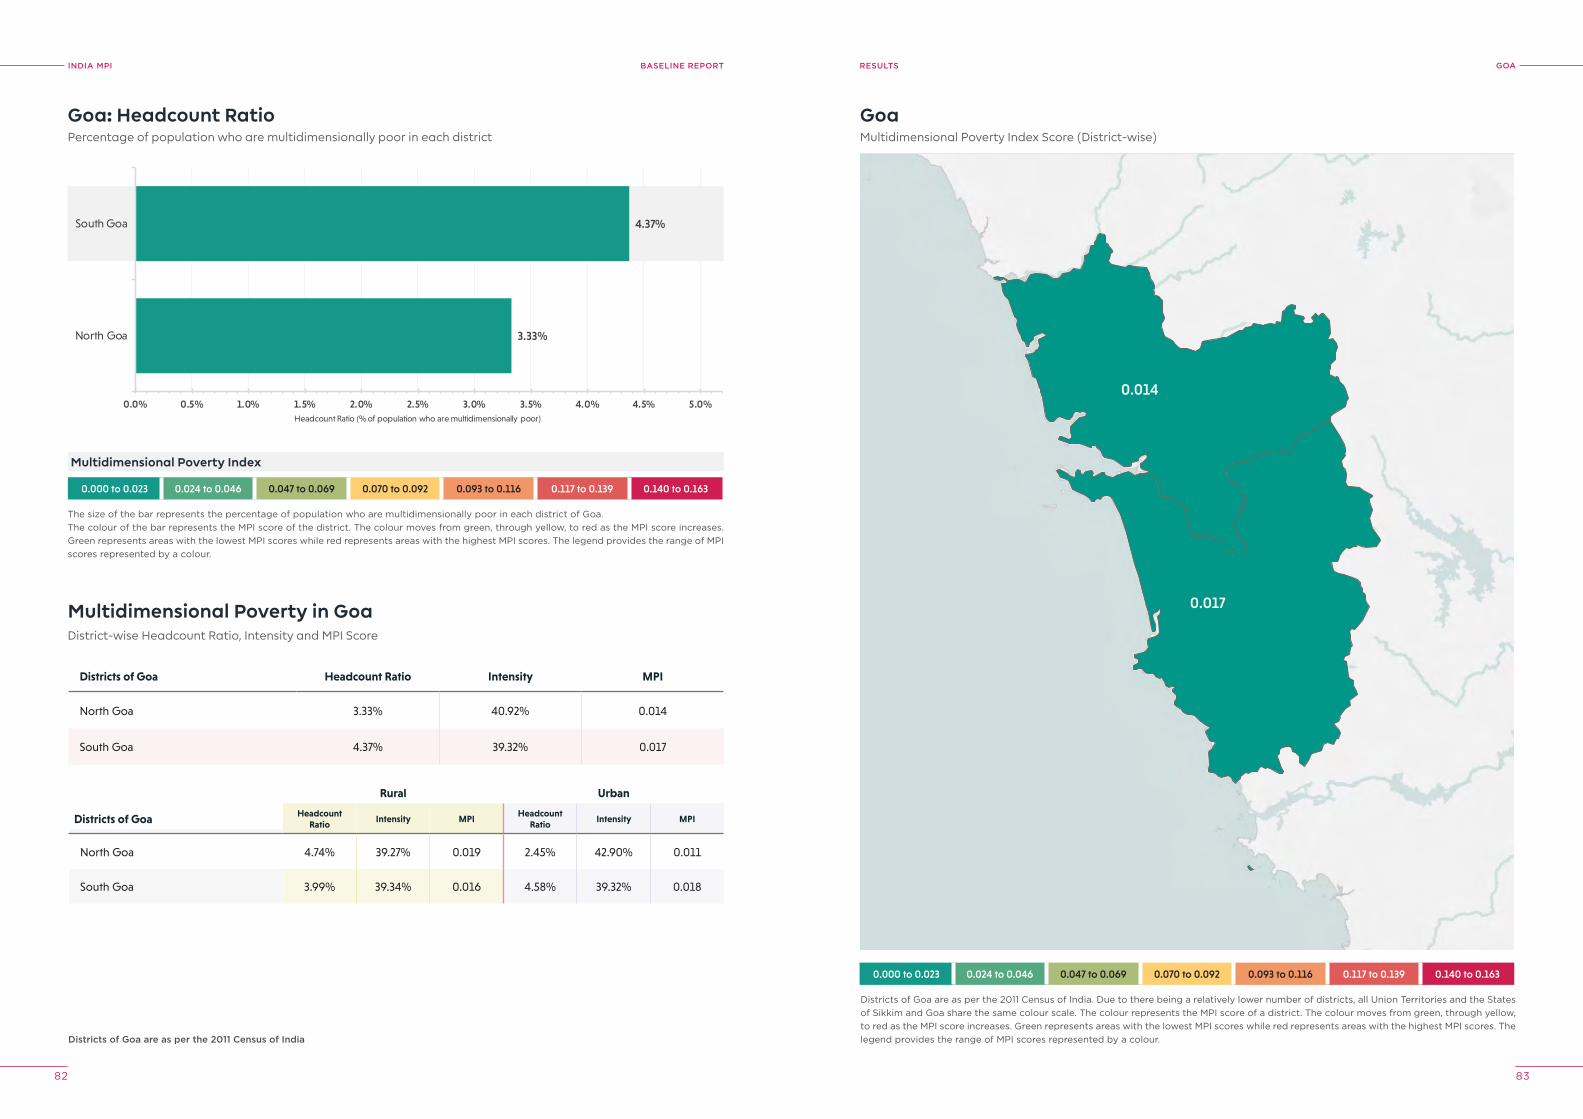
INDIA MPI BASELINE REPORT
82 83
GoAreSUlTS
0.000 to 0.023 0.024 to 0.046 0.047 to 0.069 0.070 to 0.092 0.093 to 0.116 0.117 to 0.139 0.140 to 0.163
3.33%
4.37%
0.0% 0.5% 1.0% 1.5% 2.0% 2.5% 3.0% 3.5% 4.0% 4.5% 5.0%
North Goa
South Goa
Headcount Ratio (% of population who are multidimensionally poor)
Goa: Headcount RatioPercentage of population who are multidimensionally poor in each district
0.014
0.017
GoaMultidimensional Poverty Index Score (District-wise)
Districts of Goa are as per the 2011 Census of India. Due to there being a relatively lower number of districts, all Union Territories and the States of Sikkim and Goa share the same colour scale. The colour represents the MPI score of a district. The colour moves from green, through yellow, to red as the MPI score increases. Green represents areas with the lowest MPI scores while red represents areas with the highest MPI scores. The legend provides the range of MPI scores represented by a colour.
The size of the bar represents the percentage of population who are multidimensionally poor in each district of Goa.The colour of the bar represents the MPI score of the district. The colour moves from green, through yellow, to red as the MPI score increases. Green represents areas with the lowest MPI scores while red represents areas with the highest MPI scores. The legend provides the range of MPI scores represented by a colour.
0.000 to 0.023 0.024 to 0.046 0.047 to 0.069 0.070 to 0.092 0.093 to 0.116 0.117 to 0.139 0.140 to 0.163
Multidimensional Poverty Index
District-wise Headcount Ratio, Intensity and MPI Score
Rural Urban
Districts of Goa Headcount Ratio
Intensity MPIHeadcount
RatioIntensity MPI
North Goa 4.74% 39.27% 0.019 2.45% 42.90% 0.011
South Goa 3.99% 39.34% 0.016 4.58% 39.32% 0.018
Multidimensional Poverty in Goa
Districts of Goa Headcount Ratio Intensity MPI
North Goa 3.33% 40.92% 0.014
South Goa 4.37% 39.32% 0.017
Districts of Goa are as per the 2011 Census of India
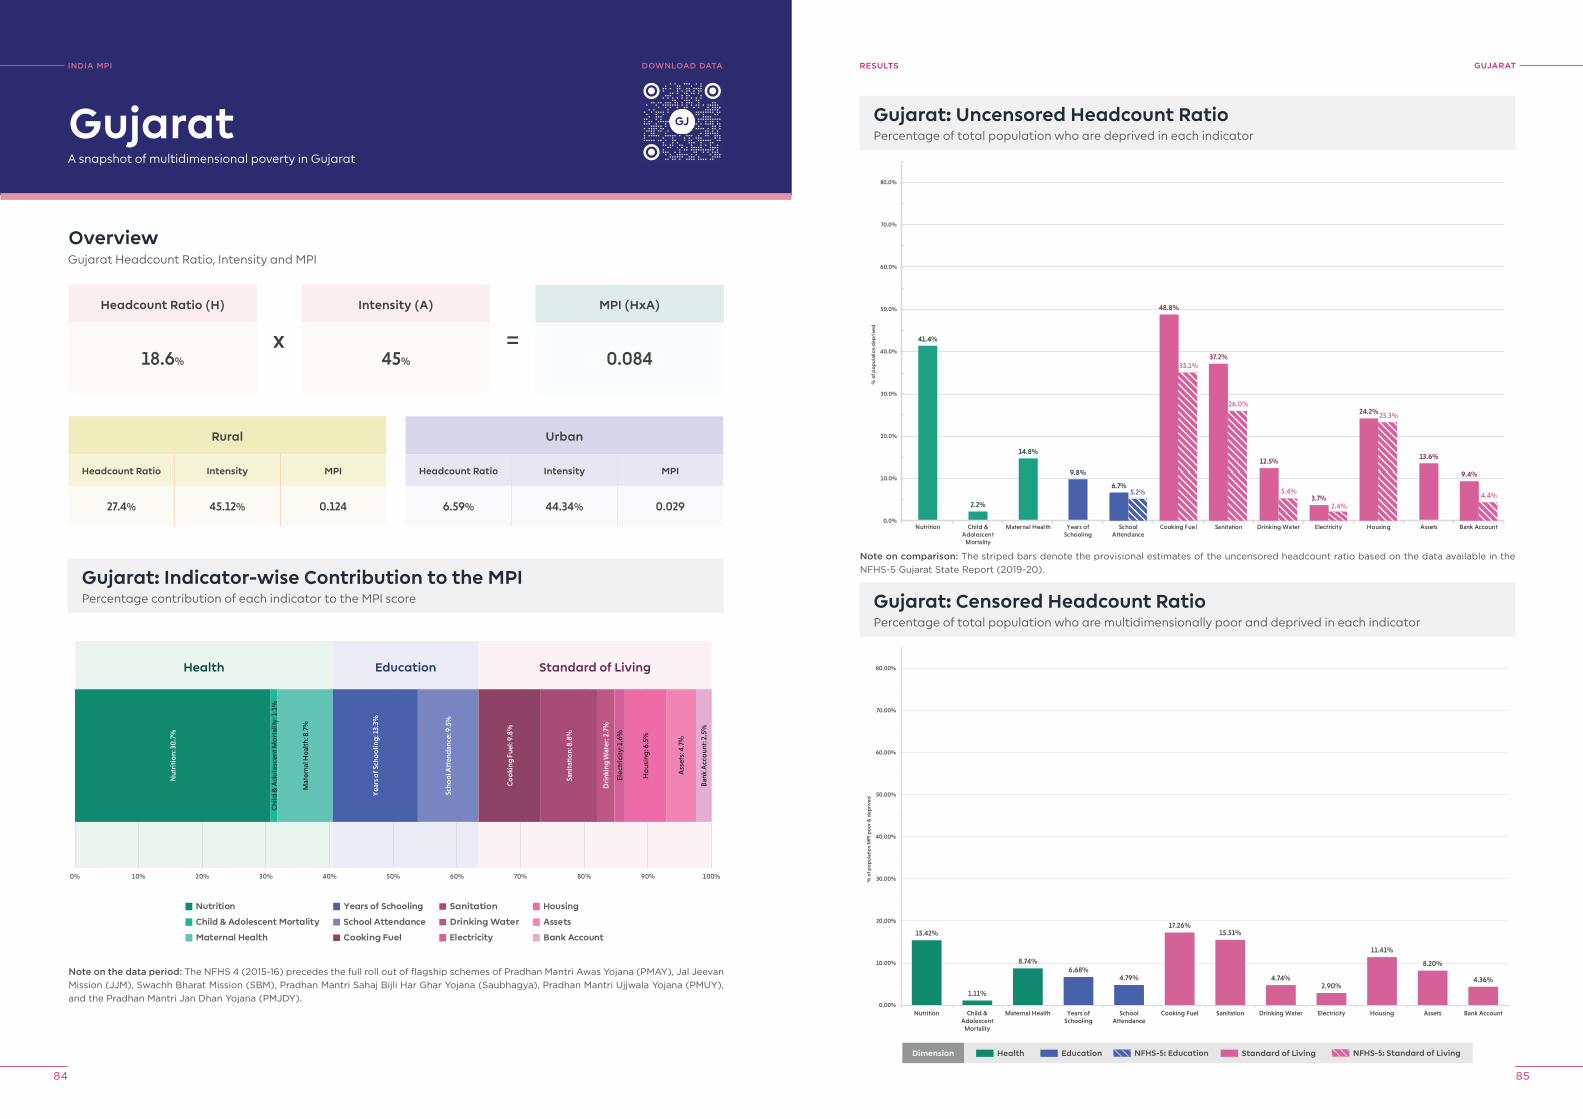
INDIA MPI BASELINE REPORT
84 85
GUjArATreSUlTS
Gujarat: Uncensored Headcount RatioPercentage of total population who are deprived in each indicator
41.4%
2.2%
14.8%
9.8%
13.6%
6.7%5.2%
48.8%
35.1%37.2%
26.0%
12.5%
5.4%3.7%
2.4%
24.2% 23.3%
9.4%
4.4%
0.0%
10.0%
20.0%
30.0%
40.0%
50.0%
60.0%
70.0%
80.0%
Nutrition Child &Adolescent
Mortality
Maternal Health Years ofSchooling
SchoolAttendance
Cooking Fuel Sanitation Drinking Water Electricity Housing Assets Bank Account
% o
f pop
ulat
ion
dep
rive
d
15.42%
1.11%
8.74%6.68%
4.79%
17.26%15.51%
4.74%2.90%
11.41%
8.20%
4.36%
0.00%
10.00%
20.00%
30.00%
40.00%
50.00%
60.00%
70.00%
80.00%
Nutrition Child &Adolescent
Mortality
Maternal Health Years ofSchooling
SchoolAttendance
Cooking Fuel Sanitation Drinking Water Electricity Housing Assets Bank Account
% o
f po
pul
atio
n M
PI p
oo
r & d
epri
ved
Gujarat: Censored Headcount RatioPercentage of total population who are multidimensionally poor and deprived in each indicator
INDIA MpI
A snapshot of multidimensional poverty in Gujarat
OverviewGujarat Headcount Ratio, Intensity and MPI
Headcount Ratio (H)
18.6%
Rural
Headcount Ratio Intensity MPI
27.4% 45.12% 0.124
Gujarat: Indicator-wise Contribution to the MPIPercentage contribution of each indicator to the MPI score
Intensity (A)
45%
MPI (HxA)
0.084
Gujarat
Urban
Headcount Ratio Intensity MPI
6.59% 44.34% 0.029
x =
Note on the data period: The NFHS 4 (2015-16) precedes the full roll out of flagship schemes of Pradhan Mantri Awas Yojana (PMAY), Jal Jeevan Mission (JJM), Swachh Bharat Mission (SBM), Pradhan Mantri Sahaj Bijli Har Ghar Yojana (Saubhagya), Pradhan Mantri Ujjwala Yojana (PMUY), and the Pradhan Mantri Jan Dhan Yojana (PMJDY).
Nutrition
Child & Adolescent Mortality
Maternal Health
Years of Schooling
School Attendance
Cooking Fuel
Sanitation
Drinking Water
Electricity
Housing
Assets
Bank Account
0% 10% 20% 30% 40% 50% 60% 70% 80% 90% 100%
Health Education Standard of Living
Nut
riti
on:
30
.7%
Chi
ld &
Ad
ole
scen
t Mo
rtal
ity: 1
.1%
Mat
erna
l Hea
lth:
8.7
%
Yea
rs o
f Sch
oo
ling
: 13.
3%
Scho
ol A
tten
dan
ce: 9
.5%
Co
oki
ng F
uel:
9.8%
Sani
tati
on:
8.8
%
Dri
nkin
g W
ater
: 2.7
%
Elec
tric
ity:
1.6
%
Ho
usin
g: 6
.5%
Ass
ets:
4.7
%
Ban
k A
cco
unt:
2.5
%
DoWNloAD DATA
Note on comparison: The striped bars denote the provisional estimates of the uncensored headcount ratio based on the data available in the NFHS-5 Gujarat State Report (2019-20).
Dimension Health Education Standard of Living NFHS-5: Standard of LivingNFHS-5: Education
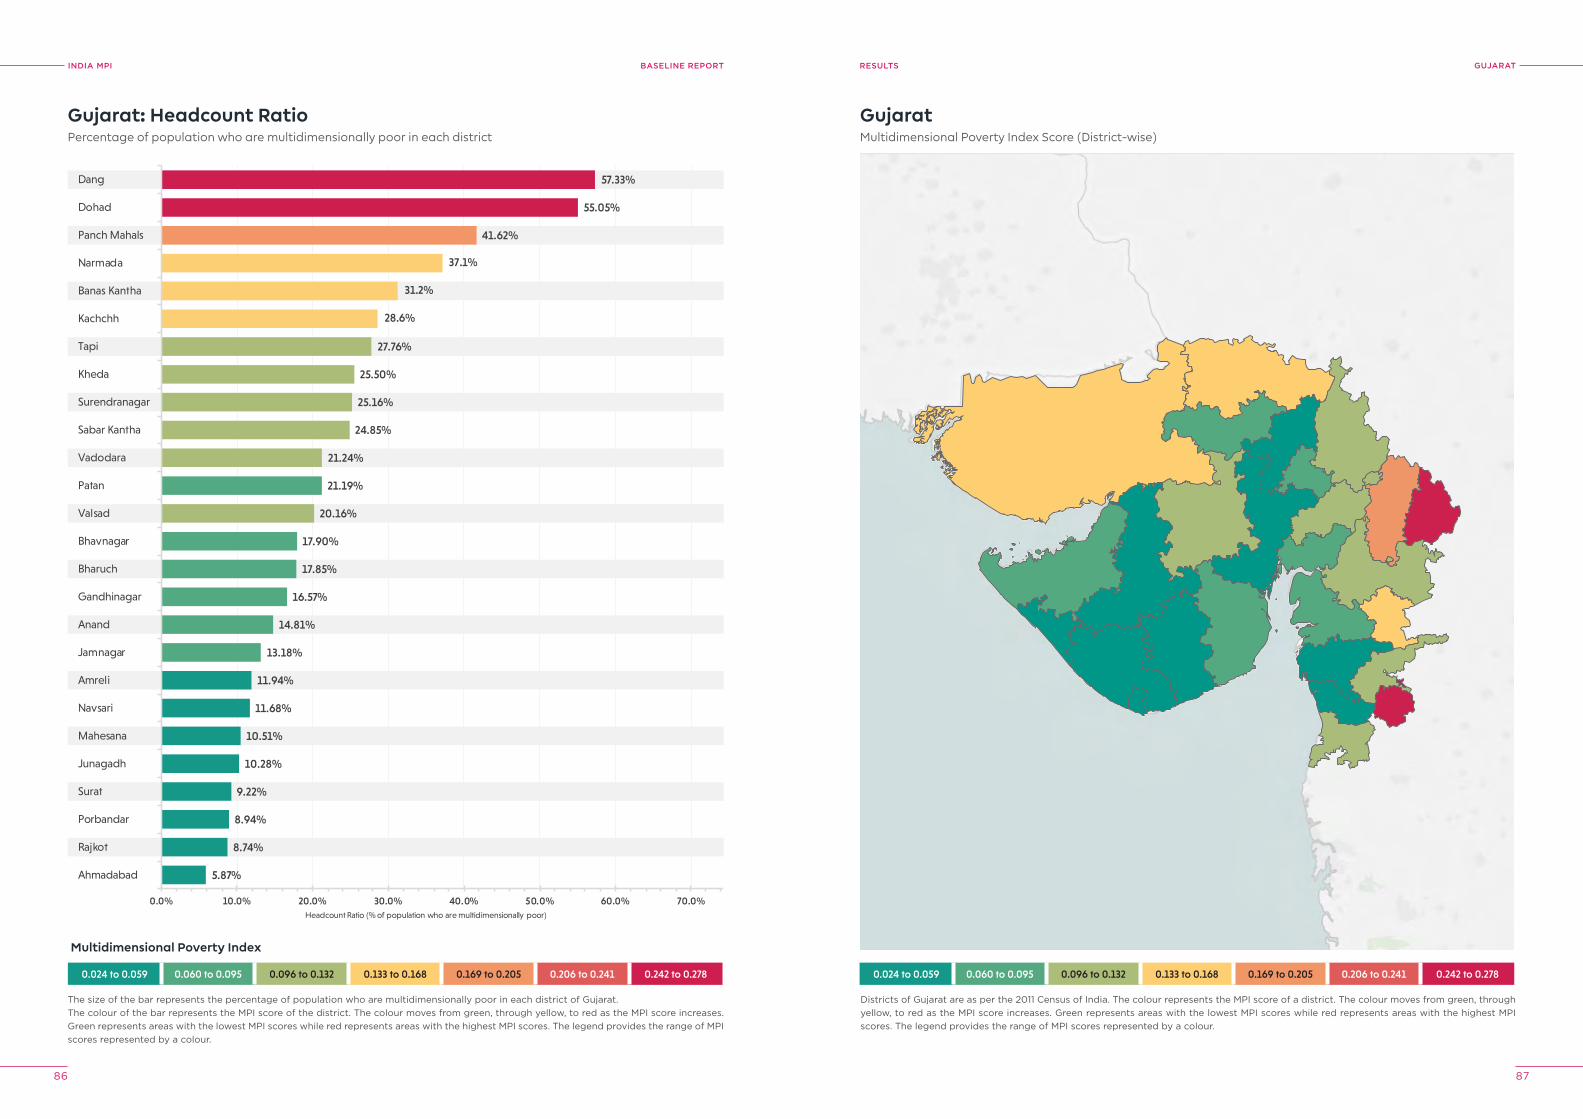
INDIA MPI BASELINE REPORT
86 87
GUjArATreSUlTS
0.024 to 0.059 0.060 to 0.095 0.096 to 0.132 0.133 to 0.168 0.169 to 0.205 0.206 to 0.241 0.242 to 0.278
5.87%
8.74%
8.94%
9.22%
10.28%
10.51%
11.68%
11.94%
13.18%
14.81%
16.57%
17.85%
17.90%
21.19%
20.16%
21.24%
24.85%
25.16%
25.50%
27.76%
28.6%
31.2%
37.1%
41.62%
55.05%
57.33%
0.0% 10.0% 20.0% 30.0% 40.0% 50.0% 60.0% 70.0%
Ahmadabad
Rajkot
Porbandar
Surat
Junagadh
Mahesana
Navsari
Amreli
Jamnagar
Anand
Gandhinagar
Bharuch
Bhavnagar
Valsad
Patan
Vadodara
Sabar Kantha
Surendranagar
Kheda
Tapi
Kachchh
Banas Kantha
Narmada
Panch Mahals
Dohad
Dang
Headcount Ratio (% of population who are multidimensionally poor)
Gujarat: Headcount RatioPercentage of population who are multidimensionally poor in each district
The size of the bar represents the percentage of population who are multidimensionally poor in each district of Gujarat.The colour of the bar represents the MPI score of the district. The colour moves from green, through yellow, to red as the MPI score increases. Green represents areas with the lowest MPI scores while red represents areas with the highest MPI scores. The legend provides the range of MPI scores represented by a colour.
GujaratMultidimensional Poverty Index Score (District-wise)
Districts of Gujarat are as per the 2011 Census of India. The colour represents the MPI score of a district. The colour moves from green, through yellow, to red as the MPI score increases. Green represents areas with the lowest MPI scores while red represents areas with the highest MPI scores. The legend provides the range of MPI scores represented by a colour.
0.024 to 0.059 0.060 to 0.095 0.096 to 0.132 0.133 to 0.168 0.169 to 0.205 0.206 to 0.241 0.242 to 0.278
Multidimensional Poverty Index
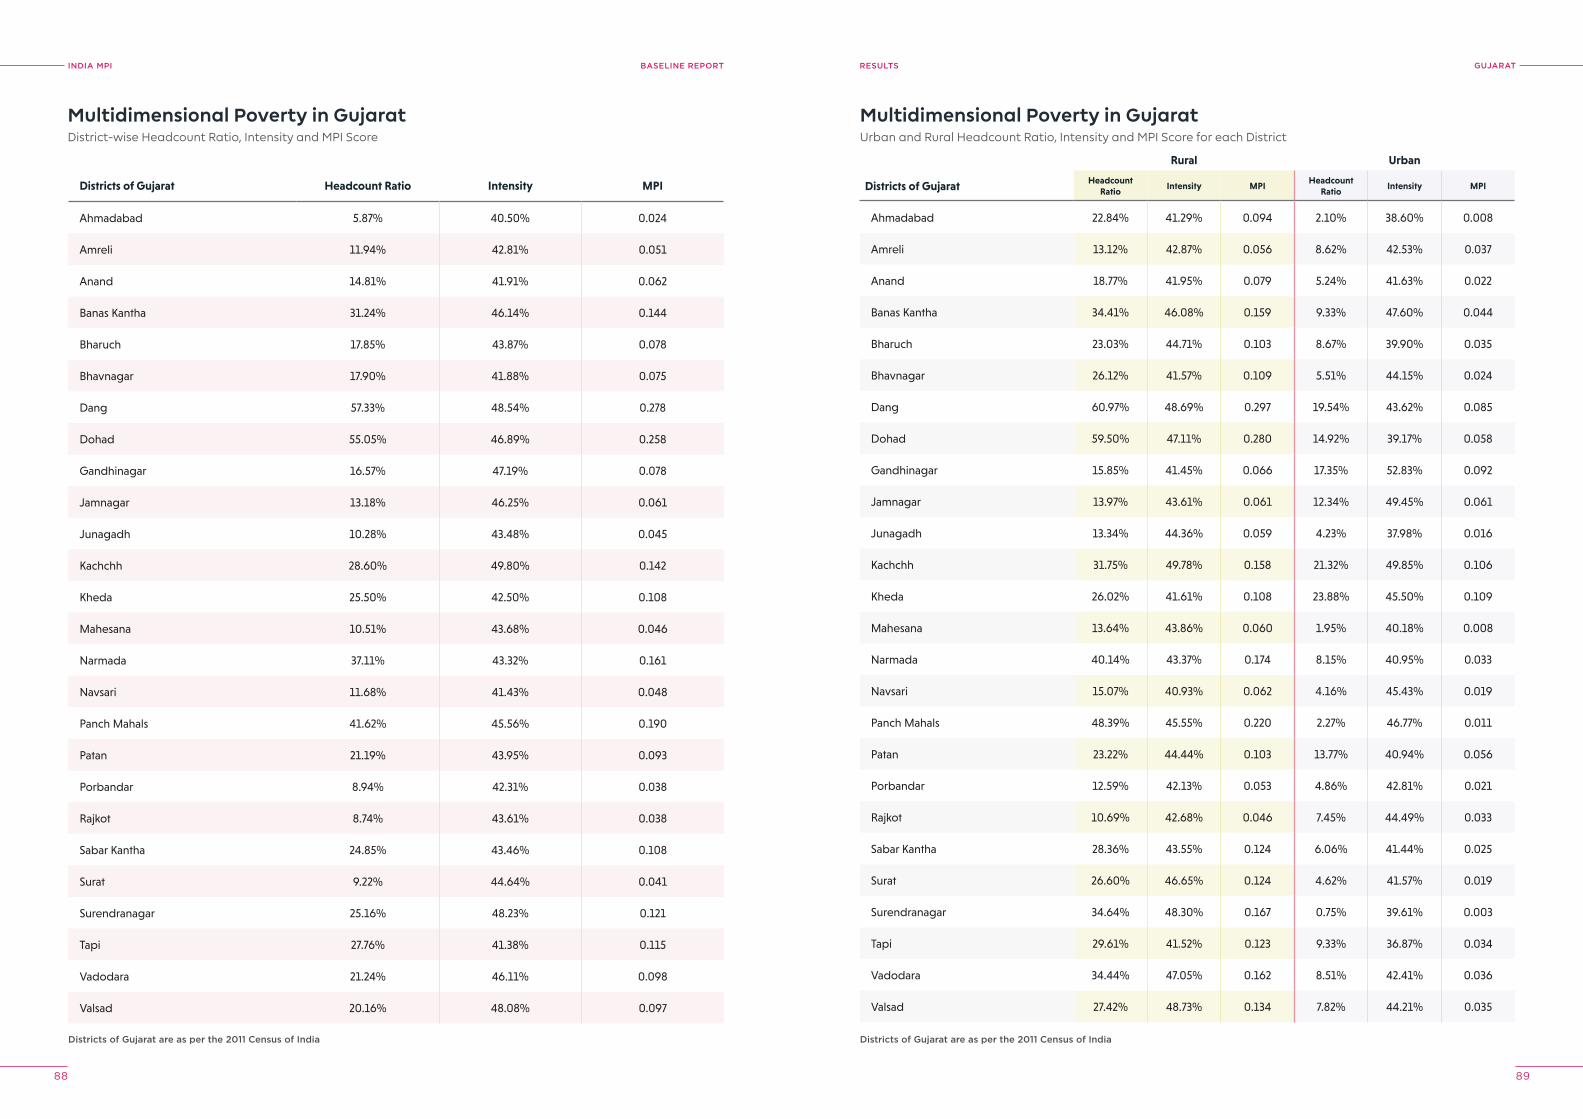
INDIA MPI BASELINE REPORT
88 89
GUjArATreSUlTS
Multidimensional Poverty in GujaratDistrict-wise Headcount Ratio, Intensity and MPI Score
Multidimensional Poverty in GujaratUrban and Rural Headcount Ratio, Intensity and MPI Score for each District
Districts of Gujarat are as per the 2011 Census of India Districts of Gujarat are as per the 2011 Census of India
Districts of Gujarat Headcount Ratio Intensity MPI
Ahmadabad 5.87% 40.50% 0.024
Amreli 11.94% 42.81% 0.051
Anand 14.81% 41.91% 0.062
Banas Kantha 31.24% 46.14% 0.144
Bharuch 17.85% 43.87% 0.078
Bhavnagar 17.90% 41.88% 0.075
Dang 57.33% 48.54% 0.278
Dohad 55.05% 46.89% 0.258
Gandhinagar 16.57% 47.19% 0.078
Jamnagar 13.18% 46.25% 0.061
Junagadh 10.28% 43.48% 0.045
Kachchh 28.60% 49.80% 0.142
Kheda 25.50% 42.50% 0.108
Mahesana 10.51% 43.68% 0.046
Narmada 37.11% 43.32% 0.161
Navsari 11.68% 41.43% 0.048
Panch Mahals 41.62% 45.56% 0.190
Patan 21.19% 43.95% 0.093
Porbandar 8.94% 42.31% 0.038
Rajkot 8.74% 43.61% 0.038
Sabar Kantha 24.85% 43.46% 0.108
Surat 9.22% 44.64% 0.041
Surendranagar 25.16% 48.23% 0.121
Tapi 27.76% 41.38% 0.115
Vadodara 21.24% 46.11% 0.098
Valsad 20.16% 48.08% 0.097
Rural Urban
Districts of Gujarat Headcount Ratio
Intensity MPIHeadcount
RatioIntensity MPI
Ahmadabad 22.84% 41.29% 0.094 2.10% 38.60% 0.008
Amreli 13.12% 42.87% 0.056 8.62% 42.53% 0.037
Anand 18.77% 41.95% 0.079 5.24% 41.63% 0.022
Banas Kantha 34.41% 46.08% 0.159 9.33% 47.60% 0.044
Bharuch 23.03% 44.71% 0.103 8.67% 39.90% 0.035
Bhavnagar 26.12% 41.57% 0.109 5.51% 44.15% 0.024
Dang 60.97% 48.69% 0.297 19.54% 43.62% 0.085
Dohad 59.50% 47.11% 0.280 14.92% 39.17% 0.058
Gandhinagar 15.85% 41.45% 0.066 17.35% 52.83% 0.092
Jamnagar 13.97% 43.61% 0.061 12.34% 49.45% 0.061
Junagadh 13.34% 44.36% 0.059 4.23% 37.98% 0.016
Kachchh 31.75% 49.78% 0.158 21.32% 49.85% 0.106
Kheda 26.02% 41.61% 0.108 23.88% 45.50% 0.109
Mahesana 13.64% 43.86% 0.060 1.95% 40.18% 0.008
Narmada 40.14% 43.37% 0.174 8.15% 40.95% 0.033
Navsari 15.07% 40.93% 0.062 4.16% 45.43% 0.019
Panch Mahals 48.39% 45.55% 0.220 2.27% 46.77% 0.011
Patan 23.22% 44.44% 0.103 13.77% 40.94% 0.056
Porbandar 12.59% 42.13% 0.053 4.86% 42.81% 0.021
Rajkot 10.69% 42.68% 0.046 7.45% 44.49% 0.033
Sabar Kantha 28.36% 43.55% 0.124 6.06% 41.44% 0.025
Surat 26.60% 46.65% 0.124 4.62% 41.57% 0.019
Surendranagar 34.64% 48.30% 0.167 0.75% 39.61% 0.003
Tapi 29.61% 41.52% 0.123 9.33% 36.87% 0.034
Vadodara 34.44% 47.05% 0.162 8.51% 42.41% 0.036
Valsad 27.42% 48.73% 0.134 7.82% 44.21% 0.035
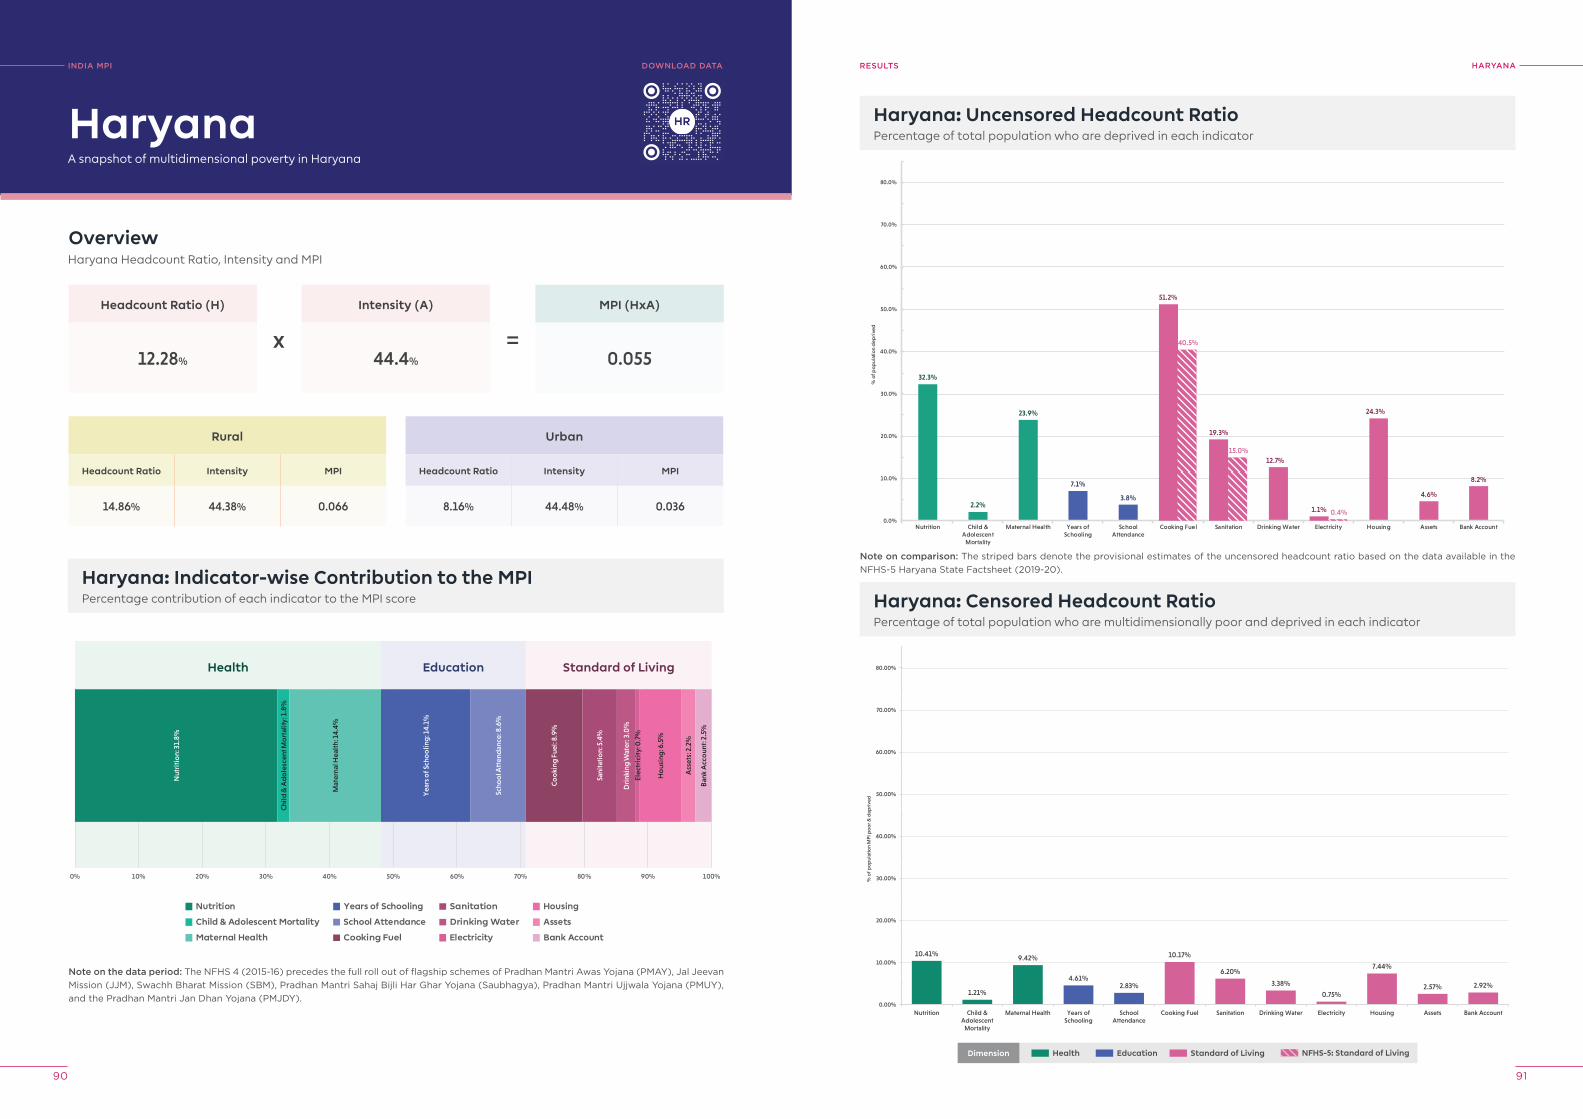
INDIA MPI BASELINE REPORT
90 91
hAryANAreSUlTS
Haryana: Uncensored Headcount RatioPercentage of total population who are deprived in each indicator
32.3%
2.2%
23.9%
7.1%
3.8%
12.7%
24.3%
4.6%
8.2%
51.2%
40.5%
19.3%
15.0%
1.1% 0.4%0.0%
10.0%
20.0%
30.0%
40.0%
50.0%
60.0%
70.0%
80.0%
Nutrition Child &Adolescent
Mortality
Maternal Health Years ofSchooling
SchoolAttendance
Cooking Fuel Sanitation Drinking Water Electricity Housing Assets Bank Account
% o
f pop
ulat
ion
dep
rive
d
10.41%
1.21%
9.42%
4.61%2.83%
10.17%
6.20%
3.38%
0.75%
7.44%
2.57% 2.92%
0.00%
10.00%
20.00%
30.00%
40.00%
50.00%
60.00%
70.00%
80.00%
Nutrition Child &Adolescent
Mortality
Maternal Health Years ofSchooling
SchoolAttendance
Cooking Fuel Sanitation Drinking Water Electricity Housing Assets Bank Account
% o
f po
pul
atio
n M
PI p
oo
r & d
epri
ved
Haryana: Censored Headcount RatioPercentage of total population who are multidimensionally poor and deprived in each indicator
INDIA MpI
A snapshot of multidimensional poverty in Haryana
OverviewHaryana Headcount Ratio, Intensity and MPI
Headcount Ratio (H)
12.28%
Rural
Headcount Ratio Intensity MPI
14.86% 44.38% 0.066
Haryana: Indicator-wise Contribution to the MPIPercentage contribution of each indicator to the MPI score
Intensity (A)
44.4%
MPI (HxA)
0.055
Haryana
Urban
Headcount Ratio Intensity MPI
8.16% 44.48% 0.036
x =
Note on the data period: The NFHS 4 (2015-16) precedes the full roll out of flagship schemes of Pradhan Mantri Awas Yojana (PMAY), Jal Jeevan Mission (JJM), Swachh Bharat Mission (SBM), Pradhan Mantri Sahaj Bijli Har Ghar Yojana (Saubhagya), Pradhan Mantri Ujjwala Yojana (PMUY), and the Pradhan Mantri Jan Dhan Yojana (PMJDY).
Nutrition
Child & Adolescent Mortality
Maternal Health
Years of Schooling
School Attendance
Cooking Fuel
Sanitation
Drinking Water
Electricity
Housing
Assets
Bank Account
0% 10% 20% 30% 40% 50% 60% 70% 80% 90% 100%
Health Education Standard of Living
Nut
riti
on:
31.
8%
Chi
ld &
Ad
ole
scen
t Mo
rtal
ity: 1
.8%
Mat
erna
l Hea
lth:
14.
4%
Yea
rs o
f Sch
oo
ling
: 14.
1%
Scho
ol A
tten
dan
ce: 8
.6%
Co
oki
ng F
uel:
8.9%
Sani
tati
on:
5.4
%
Dri
nkin
g W
ater
: 3.0
%
Elec
tric
ity:
0.7
%
Ho
usin
g: 6
.5%
Ass
ets:
2.2
%
Ban
k A
cco
unt:
2.5
%
DoWNloAD DATA
Note on comparison: The striped bars denote the provisional estimates of the uncensored headcount ratio based on the data available in the NFHS-5 Haryana State Factsheet (2019-20).
Dimension Health Education Standard of Living NFHS-5: Standard of Living
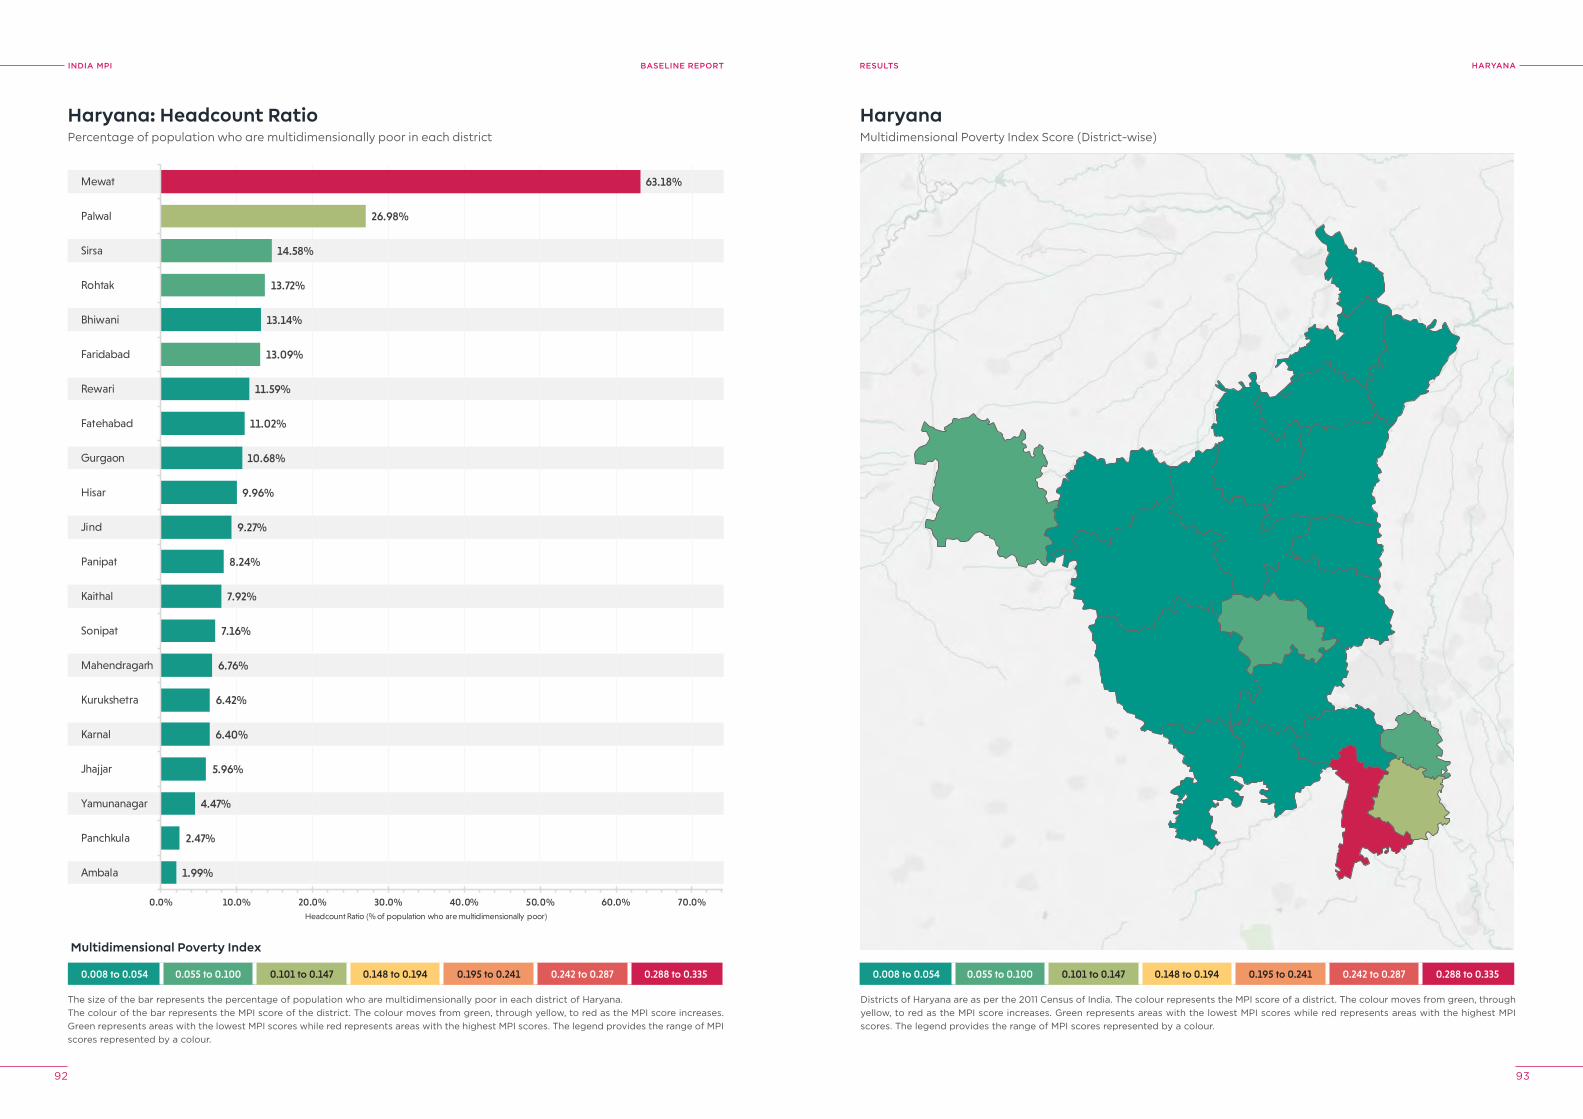
INDIA MPI BASELINE REPORT
92 93
hAryANAreSUlTS
0.008 to 0.054 0.055 to 0.100 0.101 to 0.147 0.148 to 0.194 0.195 to 0.241 0.242 to 0.287 0.288 to 0.335
1.99%
2.47%
4.47%
5.96%
6.40%
6.42%
6.76%
7.16%
7.92%
8.24%
9.27%
9.96%
10.68%
11.02%
11.59%
13.14%
13.09%
13.72%
14.58%
26.98%
63.18%
0.0% 10.0% 20.0% 30.0% 40.0% 50.0% 60.0% 70.0%
Ambala
Panchkula
Yamunanagar
Jhajjar
Karnal
Kurukshetra
Mahendragarh
Sonipat
Kaithal
Panipat
Jind
Hisar
Gurgaon
Fatehabad
Rewari
Faridabad
Bhiwani
Rohtak
Sirsa
Palwal
Mewat
Headcount Ratio (% of population who are multidimensionally poor)
Haryana: Headcount RatioPercentage of population who are multidimensionally poor in each district
The size of the bar represents the percentage of population who are multidimensionally poor in each district of Haryana.The colour of the bar represents the MPI score of the district. The colour moves from green, through yellow, to red as the MPI score increases. Green represents areas with the lowest MPI scores while red represents areas with the highest MPI scores. The legend provides the range of MPI scores represented by a colour.
HaryanaMultidimensional Poverty Index Score (District-wise)
Districts of Haryana are as per the 2011 Census of India. The colour represents the MPI score of a district. The colour moves from green, through yellow, to red as the MPI score increases. Green represents areas with the lowest MPI scores while red represents areas with the highest MPI scores. The legend provides the range of MPI scores represented by a colour.
0.008 to 0.054 0.055 to 0.100 0.101 to 0.147 0.148 to 0.194 0.195 to 0.241 0.242 to 0.287 0.288 to 0.335
Multidimensional Poverty Index
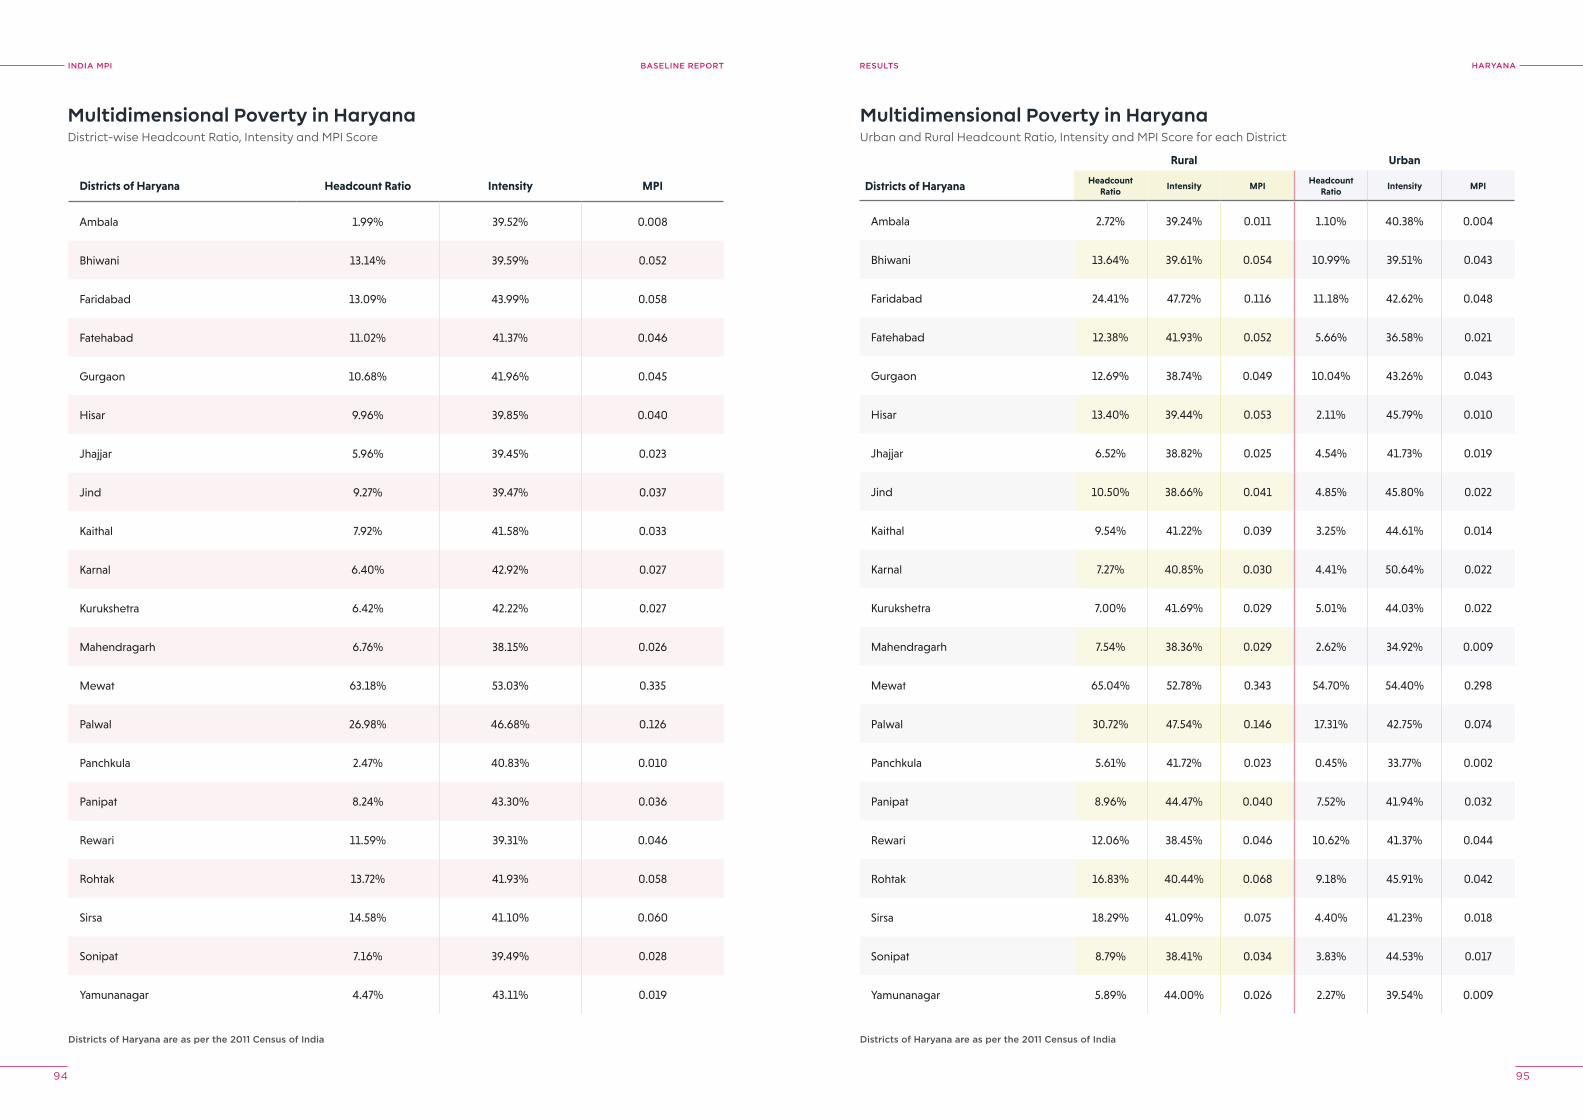
INDIA MPI BASELINE REPORT
94 95
hAryANAreSUlTS
Multidimensional Poverty in HaryanaDistrict-wise Headcount Ratio, Intensity and MPI Score
Multidimensional Poverty in HaryanaUrban and Rural Headcount Ratio, Intensity and MPI Score for each District
Districts of haryana are as per the 2011 Census of India Districts of haryana are as per the 2011 Census of India
Districts of Haryana Headcount Ratio Intensity MPI
Ambala 1.99% 39.52% 0.008
Bhiwani 13.14% 39.59% 0.052
Faridabad 13.09% 43.99% 0.058
Fatehabad 11.02% 41.37% 0.046
Gurgaon 10.68% 41.96% 0.045
Hisar 9.96% 39.85% 0.040
Jhajjar 5.96% 39.45% 0.023
Jind 9.27% 39.47% 0.037
Kaithal 7.92% 41.58% 0.033
Karnal 6.40% 42.92% 0.027
Kurukshetra 6.42% 42.22% 0.027
Mahendragarh 6.76% 38.15% 0.026
Mewat 63.18% 53.03% 0.335
Palwal 26.98% 46.68% 0.126
Panchkula 2.47% 40.83% 0.010
Panipat 8.24% 43.30% 0.036
Rewari 11.59% 39.31% 0.046
Rohtak 13.72% 41.93% 0.058
Sirsa 14.58% 41.10% 0.060
Sonipat 7.16% 39.49% 0.028
Yamunanagar 4.47% 43.11% 0.019
Rural Urban
Districts of Haryana Headcount Ratio
Intensity MPIHeadcount
RatioIntensity MPI
Ambala 2.72% 39.24% 0.011 1.10% 40.38% 0.004
Bhiwani 13.64% 39.61% 0.054 10.99% 39.51% 0.043
Faridabad 24.41% 47.72% 0.116 11.18% 42.62% 0.048
Fatehabad 12.38% 41.93% 0.052 5.66% 36.58% 0.021
Gurgaon 12.69% 38.74% 0.049 10.04% 43.26% 0.043
Hisar 13.40% 39.44% 0.053 2.11% 45.79% 0.010
Jhajjar 6.52% 38.82% 0.025 4.54% 41.73% 0.019
Jind 10.50% 38.66% 0.041 4.85% 45.80% 0.022
Kaithal 9.54% 41.22% 0.039 3.25% 44.61% 0.014
Karnal 7.27% 40.85% 0.030 4.41% 50.64% 0.022
Kurukshetra 7.00% 41.69% 0.029 5.01% 44.03% 0.022
Mahendragarh 7.54% 38.36% 0.029 2.62% 34.92% 0.009
Mewat 65.04% 52.78% 0.343 54.70% 54.40% 0.298
Palwal 30.72% 47.54% 0.146 17.31% 42.75% 0.074
Panchkula 5.61% 41.72% 0.023 0.45% 33.77% 0.002
Panipat 8.96% 44.47% 0.040 7.52% 41.94% 0.032
Rewari 12.06% 38.45% 0.046 10.62% 41.37% 0.044
Rohtak 16.83% 40.44% 0.068 9.18% 45.91% 0.042
Sirsa 18.29% 41.09% 0.075 4.40% 41.23% 0.018
Sonipat 8.79% 38.41% 0.034 3.83% 44.53% 0.017
Yamunanagar 5.89% 44.00% 0.026 2.27% 39.54% 0.009
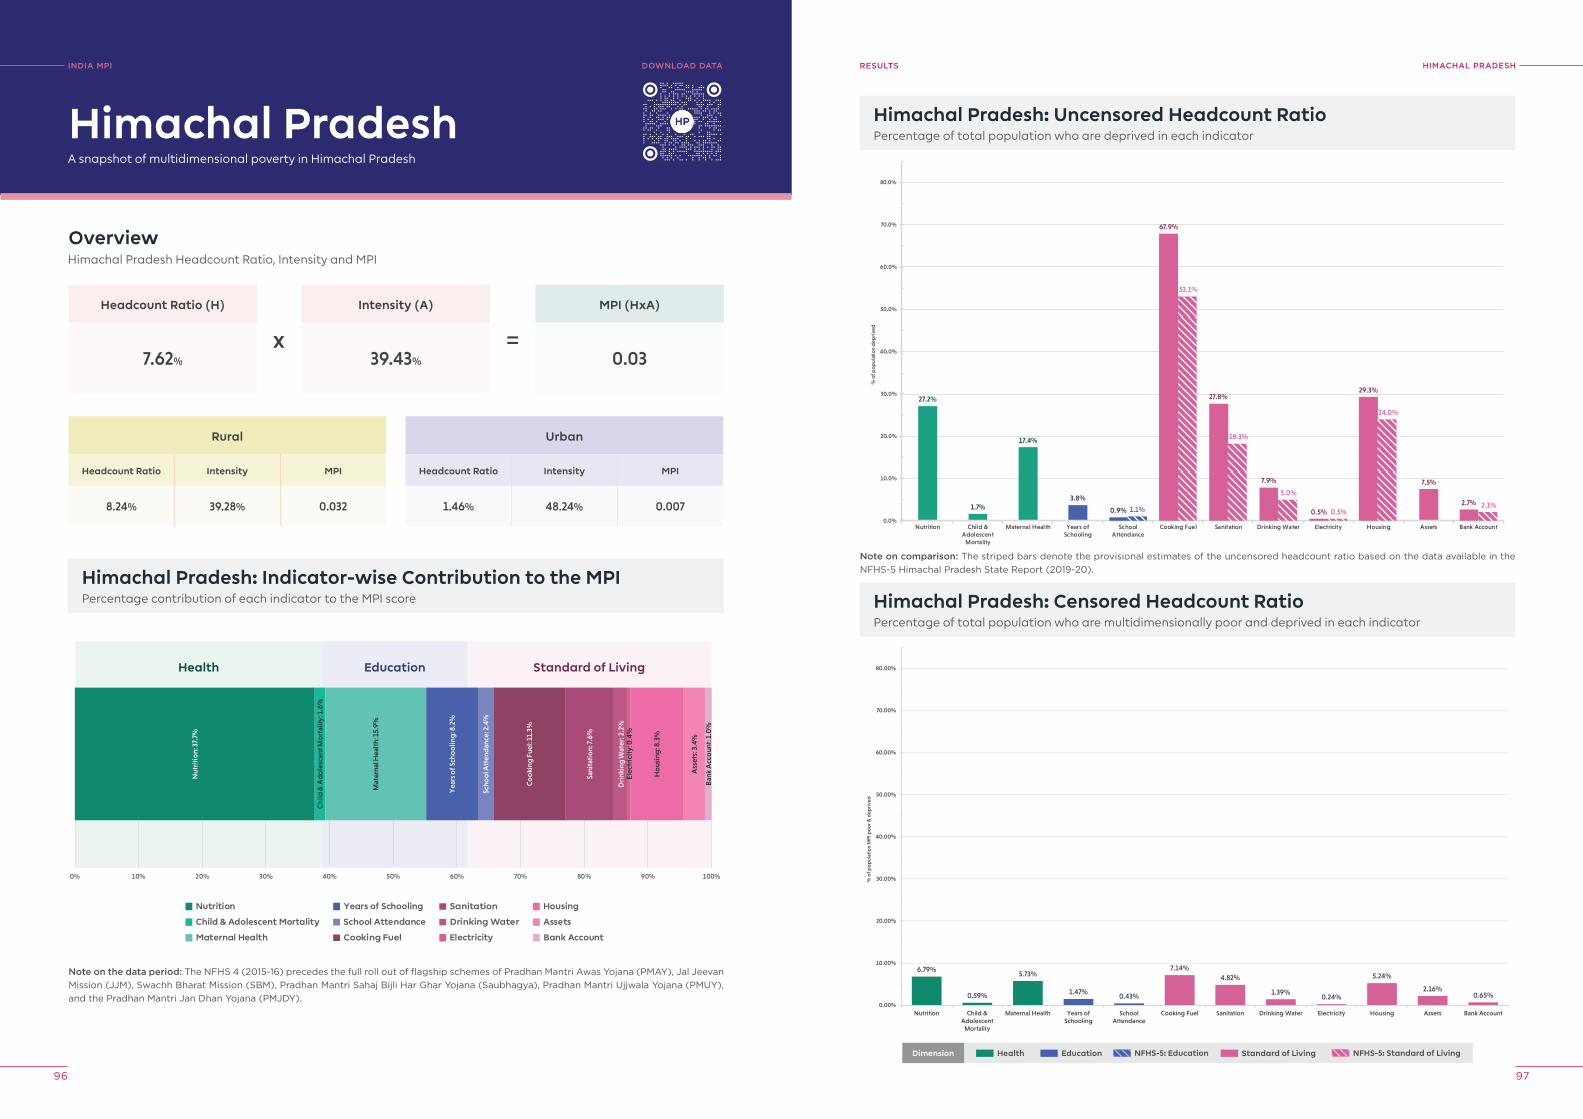
INDIA MPI BASELINE REPORT
96 97
hIMAChAl prADeShreSUlTS
Himachal Pradesh: Uncensored Headcount RatioPercentage of total population who are deprived in each indicator
27.2%
1.7%
17.4%
3.8%
7.5%
0.9% 1.1%
67.9%
53.1%
27.8%
18.3%
7.9%
5.0%
0.5% 0.5%
29.3%
24.0%
2.7% 2.1%
0.0%
10.0%
20.0%
30.0%
40.0%
50.0%
60.0%
70.0%
80.0%
Nutrition Child &Adolescent
Mortality
Maternal Health Years ofSchooling
SchoolAttendance
Cooking Fuel Sanitation Drinking Water Electricity Housing Assets Bank Account
% o
f pop
ulat
ion
dep
rive
d
6.79%
0.59%
5.73%
1.47%0.43%
7.14%4.82%
1.39%0.24%
5.24%
2.16%0.65%
0.00%
10.00%
20.00%
30.00%
40.00%
50.00%
60.00%
70.00%
80.00%
Nutrition Child &Adolescent
Mortality
Maternal Health Years ofSchooling
SchoolAttendance
Cooking Fuel Sanitation Drinking Water Electricity Housing Assets Bank Account
% o
f po
pul
atio
n M
PI p
oo
r & d
epri
ved
Himachal Pradesh: Censored Headcount RatioPercentage of total population who are multidimensionally poor and deprived in each indicator
INDIA MpI
A snapshot of multidimensional poverty in Himachal Pradesh
OverviewHimachal Pradesh Headcount Ratio, Intensity and MPI
Headcount Ratio (H)
7.62%
Rural
Headcount Ratio Intensity MPI
8.24% 39.28% 0.032
Himachal Pradesh: Indicator-wise Contribution to the MPIPercentage contribution of each indicator to the MPI score
Intensity (A)
39.43%
MPI (HxA)
0.03
Himachal Pradesh
Urban
Headcount Ratio Intensity MPI
1.46% 48.24% 0.007
x =
Note on the data period: The NFHS 4 (2015-16) precedes the full roll out of flagship schemes of Pradhan Mantri Awas Yojana (PMAY), Jal Jeevan Mission (JJM), Swachh Bharat Mission (SBM), Pradhan Mantri Sahaj Bijli Har Ghar Yojana (Saubhagya), Pradhan Mantri Ujjwala Yojana (PMUY), and the Pradhan Mantri Jan Dhan Yojana (PMJDY).
Nutrition
Child & Adolescent Mortality
Maternal Health
Years of Schooling
School Attendance
Cooking Fuel
Sanitation
Drinking Water
Electricity
Housing
Assets
Bank Account
0% 10% 20% 30% 40% 50% 60% 70% 80% 90% 100%
Health Education Standard of Living
Nut
riti
on:
37.
7%
Chi
ld &
Ad
ole
scen
t Mo
rtal
ity: 1
.6%
Mat
erna
l Hea
lth:
15.
9%
Yea
rs o
f Sch
oo
ling
: 8.2
%
Scho
ol A
tten
dan
ce: 2
.4%
Co
oki
ng F
uel:
11.3
%
Sani
tati
on:
7.6%
Dri
nkin
g W
ater
: 2.2
%El
ectr
icit
y: 0
.4%
Ho
usin
g: 8
.3%
Ass
ets:
3.4
%
Ban
k A
cco
unt:
1.0
%
DoWNloAD DATA
Note on comparison: The striped bars denote the provisional estimates of the uncensored headcount ratio based on the data available in the NFHS-5 Himachal Pradesh State Report (2019-20).
Dimension Health Education Standard of Living NFHS-5: Standard of LivingNFHS-5: Education
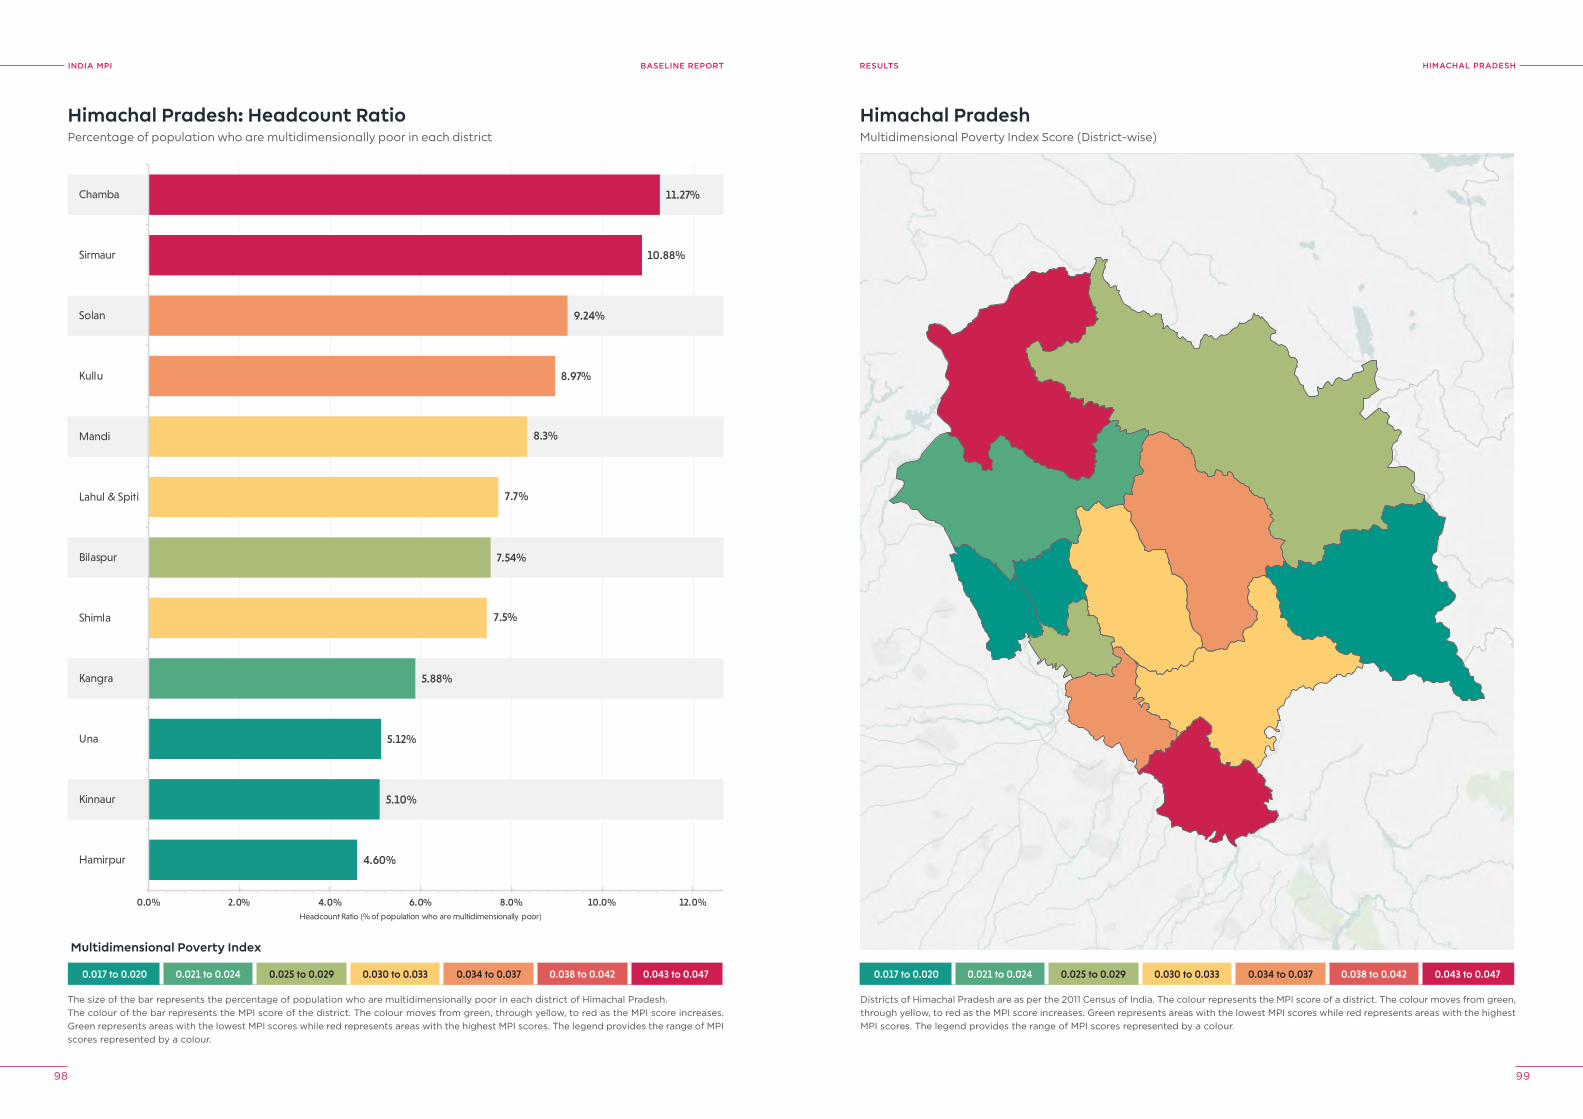
INDIA MPI BASELINE REPORT
98 99
hIMAChAl prADeShreSUlTS
0.017 to 0.020 0.021 to 0.024 0.025 to 0.029 0.030 to 0.033 0.034 to 0.037 0.038 to 0.042 0.043 to 0.047
4.60%
5.10%
5.12%
5.88%
7.54%
7.5%
7.7%
8.3%
8.97%
9.24%
10.88%
11.27%
0.0% 2.0% 4.0% 6.0% 8.0% 10.0% 12.0%
Hamirpur
Kinnaur
Una
Kangra
Shimla
Bilaspur
Lahul & Spiti
Mandi
Kullu
Solan
Sirmaur
Chamba
Headcount Ratio (% of population who are multidimensionally poor)
Himachal Pradesh: Headcount RatioPercentage of population who are multidimensionally poor in each district
The size of the bar represents the percentage of population who are multidimensionally poor in each district of Himachal Pradesh.The colour of the bar represents the MPI score of the district. The colour moves from green, through yellow, to red as the MPI score increases. Green represents areas with the lowest MPI scores while red represents areas with the highest MPI scores. The legend provides the range of MPI scores represented by a colour.
Himachal PradeshMultidimensional Poverty Index Score (District-wise)
Districts of Himachal Pradesh are as per the 2011 Census of India. The colour represents the MPI score of a district. The colour moves from green, through yellow, to red as the MPI score increases. Green represents areas with the lowest MPI scores while red represents areas with the highest MPI scores. The legend provides the range of MPI scores represented by a colour.
0.017 to 0.020 0.021 to 0.024 0.025 to 0.029 0.030 to 0.033 0.034 to 0.037 0.038 to 0.042 0.043 to 0.047
Multidimensional Poverty Index
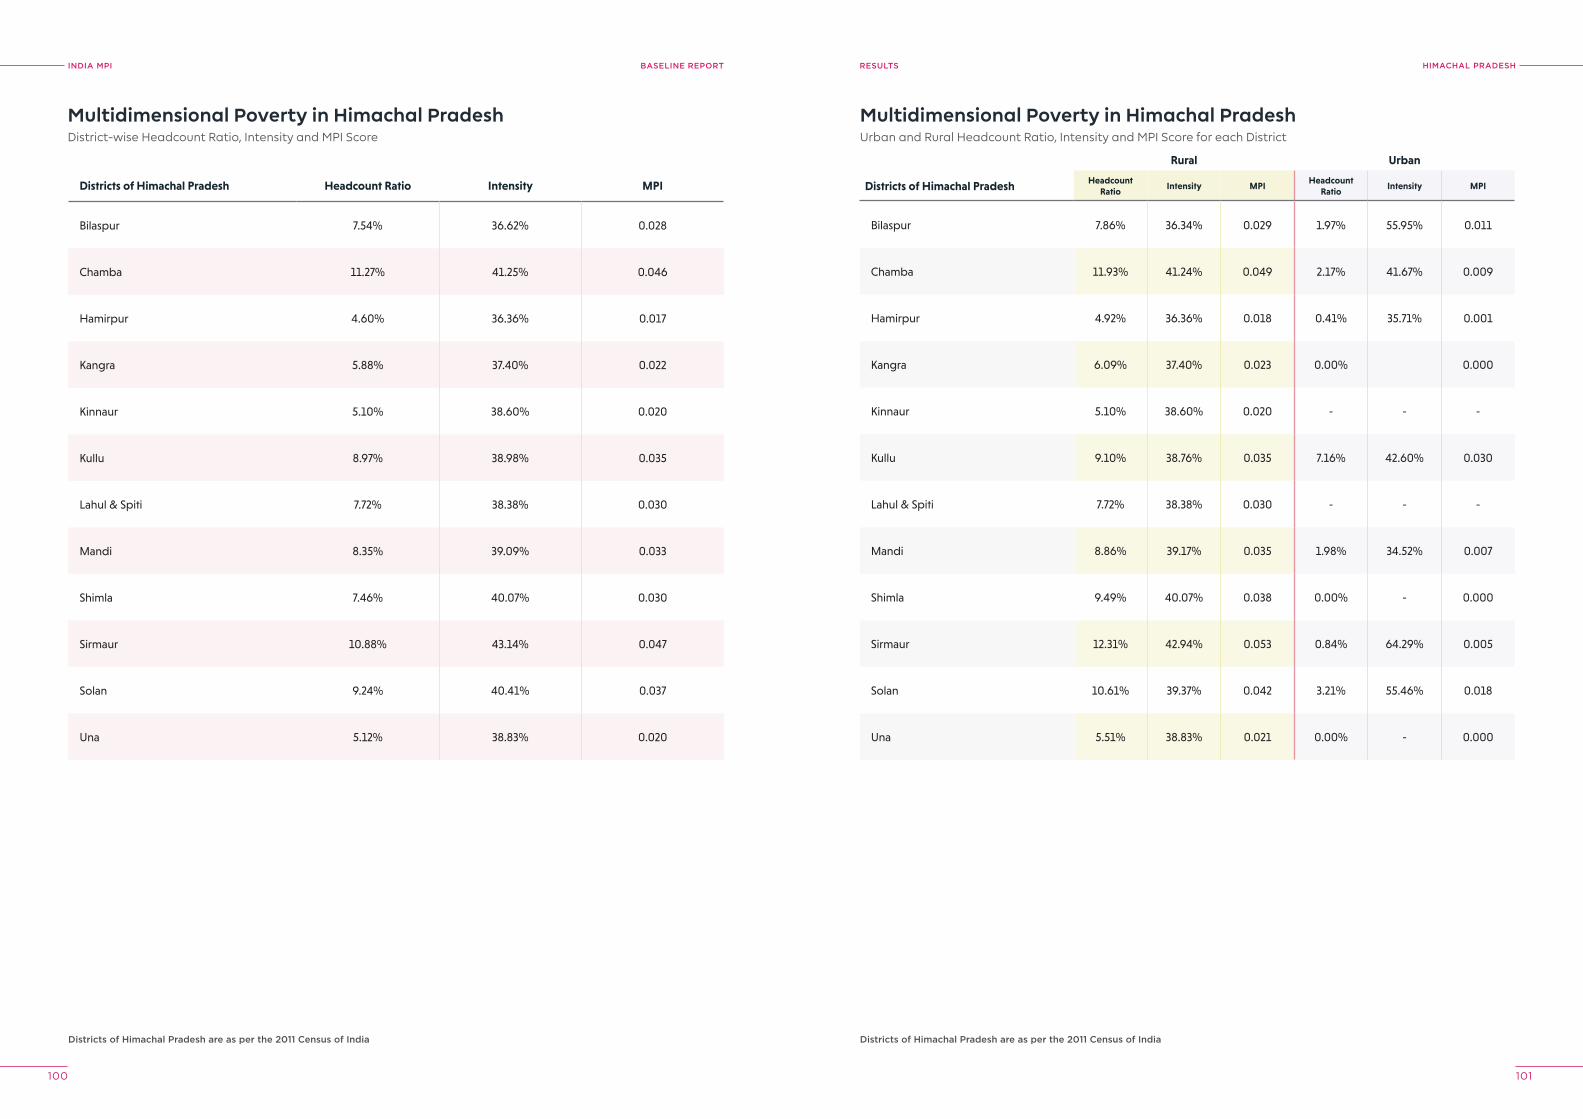
INDIA MPI BASELINE REPORT
100 101
hIMAChAl prADeShreSUlTS
Multidimensional Poverty in Himachal PradeshDistrict-wise Headcount Ratio, Intensity and MPI Score
Multidimensional Poverty in Himachal PradeshUrban and Rural Headcount Ratio, Intensity and MPI Score for each District
Districts of himachal pradesh are as per the 2011 Census of India Districts of himachal pradesh are as per the 2011 Census of India
Districts of Himachal Pradesh Headcount Ratio Intensity MPI
Bilaspur 7.54% 36.62% 0.028
Chamba 11.27% 41.25% 0.046
Hamirpur 4.60% 36.36% 0.017
Kangra 5.88% 37.40% 0.022
Kinnaur 5.10% 38.60% 0.020
Kullu 8.97% 38.98% 0.035
Lahul & Spiti 7.72% 38.38% 0.030
Mandi 8.35% 39.09% 0.033
Shimla 7.46% 40.07% 0.030
Sirmaur 10.88% 43.14% 0.047
Solan 9.24% 40.41% 0.037
Una 5.12% 38.83% 0.020
Rural Urban
Districts of Himachal Pradesh Headcount Ratio
Intensity MPIHeadcount
RatioIntensity MPI
Bilaspur 7.86% 36.34% 0.029 1.97% 55.95% 0.011
Chamba 11.93% 41.24% 0.049 2.17% 41.67% 0.009
Hamirpur 4.92% 36.36% 0.018 0.41% 35.71% 0.001
Kangra 6.09% 37.40% 0.023 0.00% 0.000
Kinnaur 5.10% 38.60% 0.020 - - -
Kullu 9.10% 38.76% 0.035 7.16% 42.60% 0.030
Lahul & Spiti 7.72% 38.38% 0.030 - - -
Mandi 8.86% 39.17% 0.035 1.98% 34.52% 0.007
Shimla 9.49% 40.07% 0.038 0.00% - 0.000
Sirmaur 12.31% 42.94% 0.053 0.84% 64.29% 0.005
Solan 10.61% 39.37% 0.042 3.21% 55.46% 0.018
Una 5.51% 38.83% 0.021 0.00% - 0.000

INDIA MPI BASELINE REPORT
102 103
jhArkhANDreSUlTS
Jharkhand: Uncensored Headcount RatioPercentage of total population who are deprived in each indicator
48.0%
3.3%
33.1%
18.3%
8.2%
31.1%
61.8%
21.4%
9.0%
82.1%
68.1%
75.4%
43.3%
18.8%
5.7%
0.0%
10.0%
20.0%
30.0%
40.0%
50.0%
60.0%
70.0%
80.0%
Nutrition Child &Adolescent
Mortality
Maternal Health Years ofSchooling
SchoolAttendance
Cooking Fuel Sanitation Drinking Water Electricity Housing Assets Bank Account
% o
f pop
ulat
ion
dep
rive
d
34.42%
2.74%
26.51%
16.46%
7.17%
41.25%39.40%
17.47%
13.58%
35.93%
15.54%
6.63%
0.00%
10.00%
20.00%
30.00%
40.00%
50.00%
60.00%
70.00%
80.00%
Nutrition Child &Adolescent
Mortality
Maternal Health Years ofSchooling
SchoolAttendance
Cooking Fuel Sanitation Drinking Water Electricity Housing Assets Bank Account
% o
f po
pul
atio
n M
PI p
oo
r & d
epri
ved
Jharkhand: Censored Headcount RatioPercentage of total population who are multidimensionally poor and deprived in each indicator
INDIA MpI
A snapshot of multidimensional poverty in Jharkhand
OverviewJharkhand Headcount Ratio, Intensity and MPI
Headcount Ratio (H)
42.16%
Rural
Headcount Ratio Intensity MPI
50.93% 48.27% 0.246
Jharkhand: Indicator-wise Contribution to the MPIPercentage contribution of each indicator to the MPI score
Intensity (A)
47.91%
MPI (HxA)
0.202
Jharkhand
Urban
Headcount Ratio Intensity MPI
15.26% 44.24% 0.067
x =
Note on the data period: The NFHS 4 (2015-16) precedes the full roll out of flagship schemes of Pradhan Mantri Awas Yojana (PMAY), Jal Jeevan Mission (JJM), Swachh Bharat Mission (SBM), Pradhan Mantri Sahaj Bijli Har Ghar Yojana (Saubhagya), Pradhan Mantri Ujjwala Yojana (PMUY), and the Pradhan Mantri Jan Dhan Yojana (PMJDY).
Nutrition
Child & Adolescent Mortality
Maternal Health
Years of Schooling
School Attendance
Cooking Fuel
Sanitation
Drinking Water
Electricity
Housing
Assets
Bank Account
0% 10% 20% 30% 40% 50% 60% 70% 80% 90% 100%
Health Education Standard of Living
Nut
riti
on:
28.
4%
Chi
ld &
Ad
ole
scen
t Mo
rtal
ity: 1
.1%
Mat
erna
l Hea
lth:
10
.9%
Yea
rs o
f Sch
oo
ling
: 13.
6%
Scho
ol A
tten
dan
ce: 5
.9%
Co
oki
ng F
uel:
9.7%
Sani
tati
on:
9.3
%
Dri
nkin
g W
ater
: 4.1
%
Elec
tric
ity:
3.2
%
Ho
usin
g: 8
.5%
Ass
ets:
3.7
%
Ban
k A
cco
unt:
1.6
%
DoWNloAD DATA
Note on comparison: The striped bars denote the provisional estimates of the uncensored headcount ratio based on the data available in the NFHS-5 Jharkhand State Factsheet (2019-20).
Dimension Health Education Standard of Living NFHS-5: Standard of Living
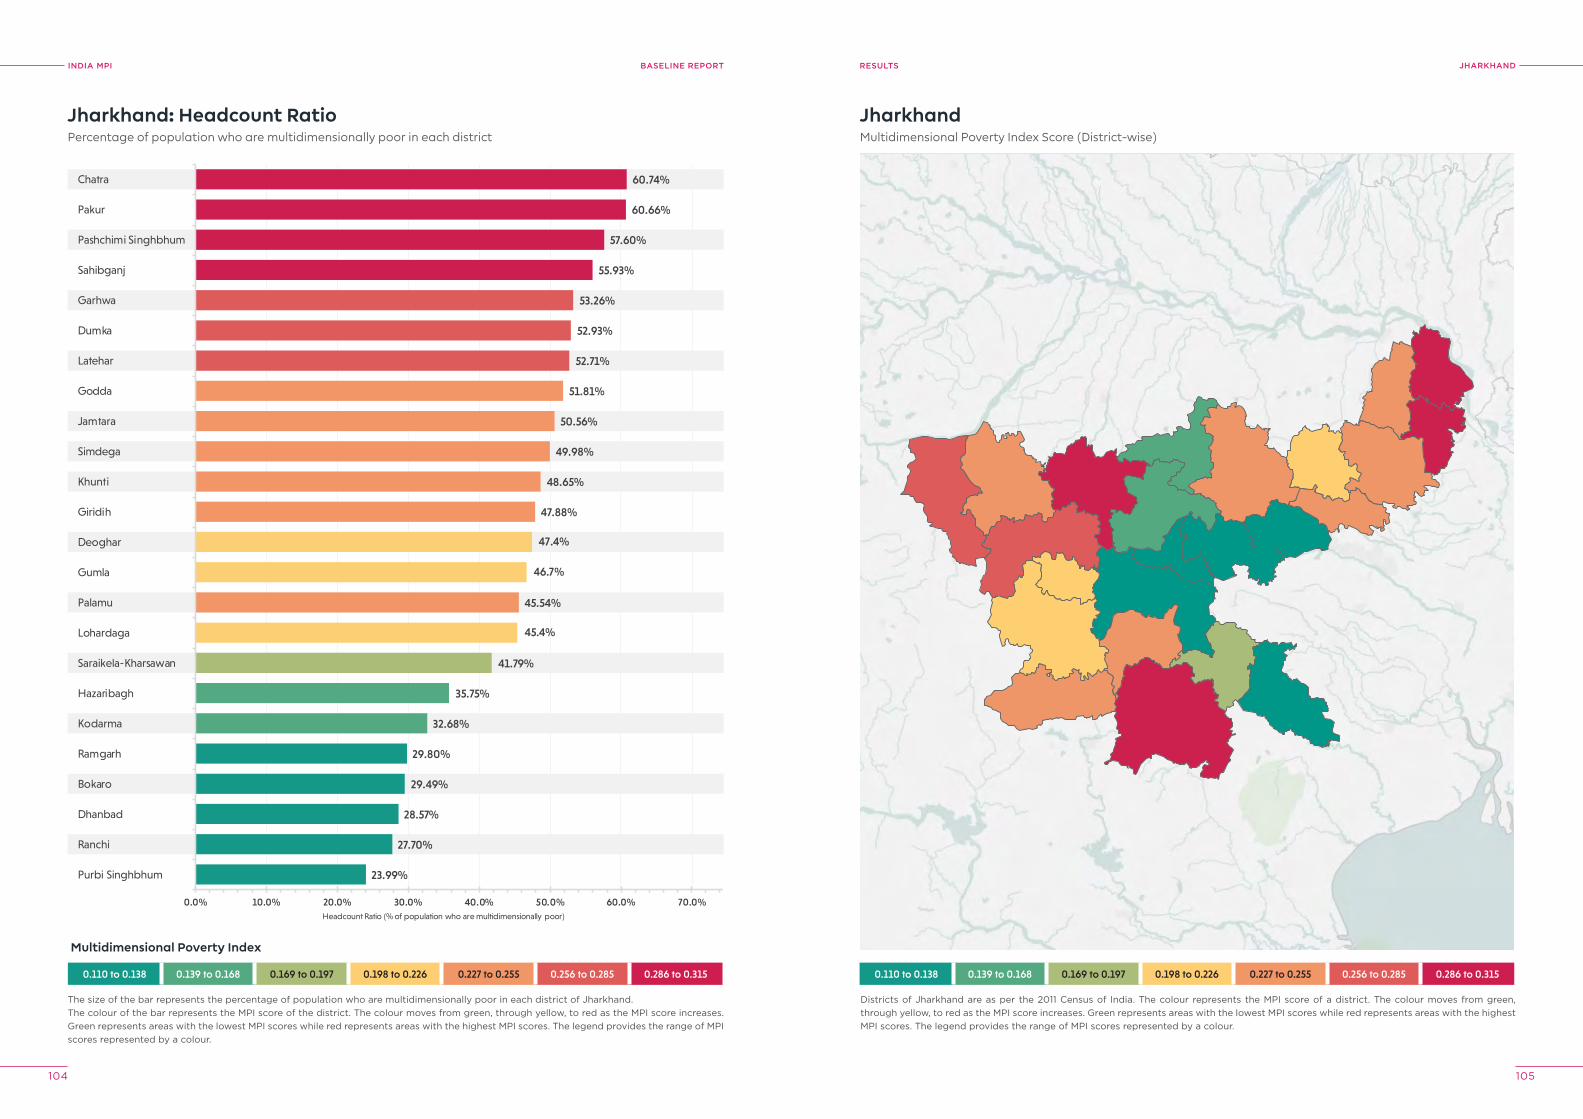
INDIA MPI BASELINE REPORT
104 105
jhArkhANDreSUlTS
0.110 to 0.138 0.139 to 0.168 0.169 to 0.197 0.198 to 0.226 0.227 to 0.255 0.256 to 0.285 0.286 to 0.315
23.99%
27.70%
28.57%
29.49%
29.80%
32.68%
35.75%
41.79%
45.4%
46.7%
47.4%
45.54%
47.88%
48.65%
49.98%
50.56%
51.81%
52.71%
52.93%
53.26%
55.93%
57.60%
60.66%
60.74%
0.0% 10.0% 20.0% 30.0% 40.0% 50.0% 60.0% 70.0%
Purbi Singhbhum
Ranchi
Dhanbad
Bokaro
Ramgarh
Kodarma
Hazaribagh
Saraikela-Kharsawan
Lohardaga
Palamu
Gumla
Deoghar
Giridih
Khunti
Simdega
Jamtara
Godda
Latehar
Dumka
Garhwa
Sahibganj
Pashchimi Singhbhum
Pakur
Chatra
Headcount Ratio (% of population who are multidimensionally poor)
Jharkhand: Headcount RatioPercentage of population who are multidimensionally poor in each district
The size of the bar represents the percentage of population who are multidimensionally poor in each district of Jharkhand.The colour of the bar represents the MPI score of the district. The colour moves from green, through yellow, to red as the MPI score increases. Green represents areas with the lowest MPI scores while red represents areas with the highest MPI scores. The legend provides the range of MPI scores represented by a colour.
JharkhandMultidimensional Poverty Index Score (District-wise)
Districts of Jharkhand are as per the 2011 Census of India. The colour represents the MPI score of a district. The colour moves from green, through yellow, to red as the MPI score increases. Green represents areas with the lowest MPI scores while red represents areas with the highest MPI scores. The legend provides the range of MPI scores represented by a colour.
0.110 to 0.138 0.139 to 0.168 0.169 to 0.197 0.198 to 0.226 0.227 to 0.255 0.256 to 0.285 0.286 to 0.315
Multidimensional Poverty Index
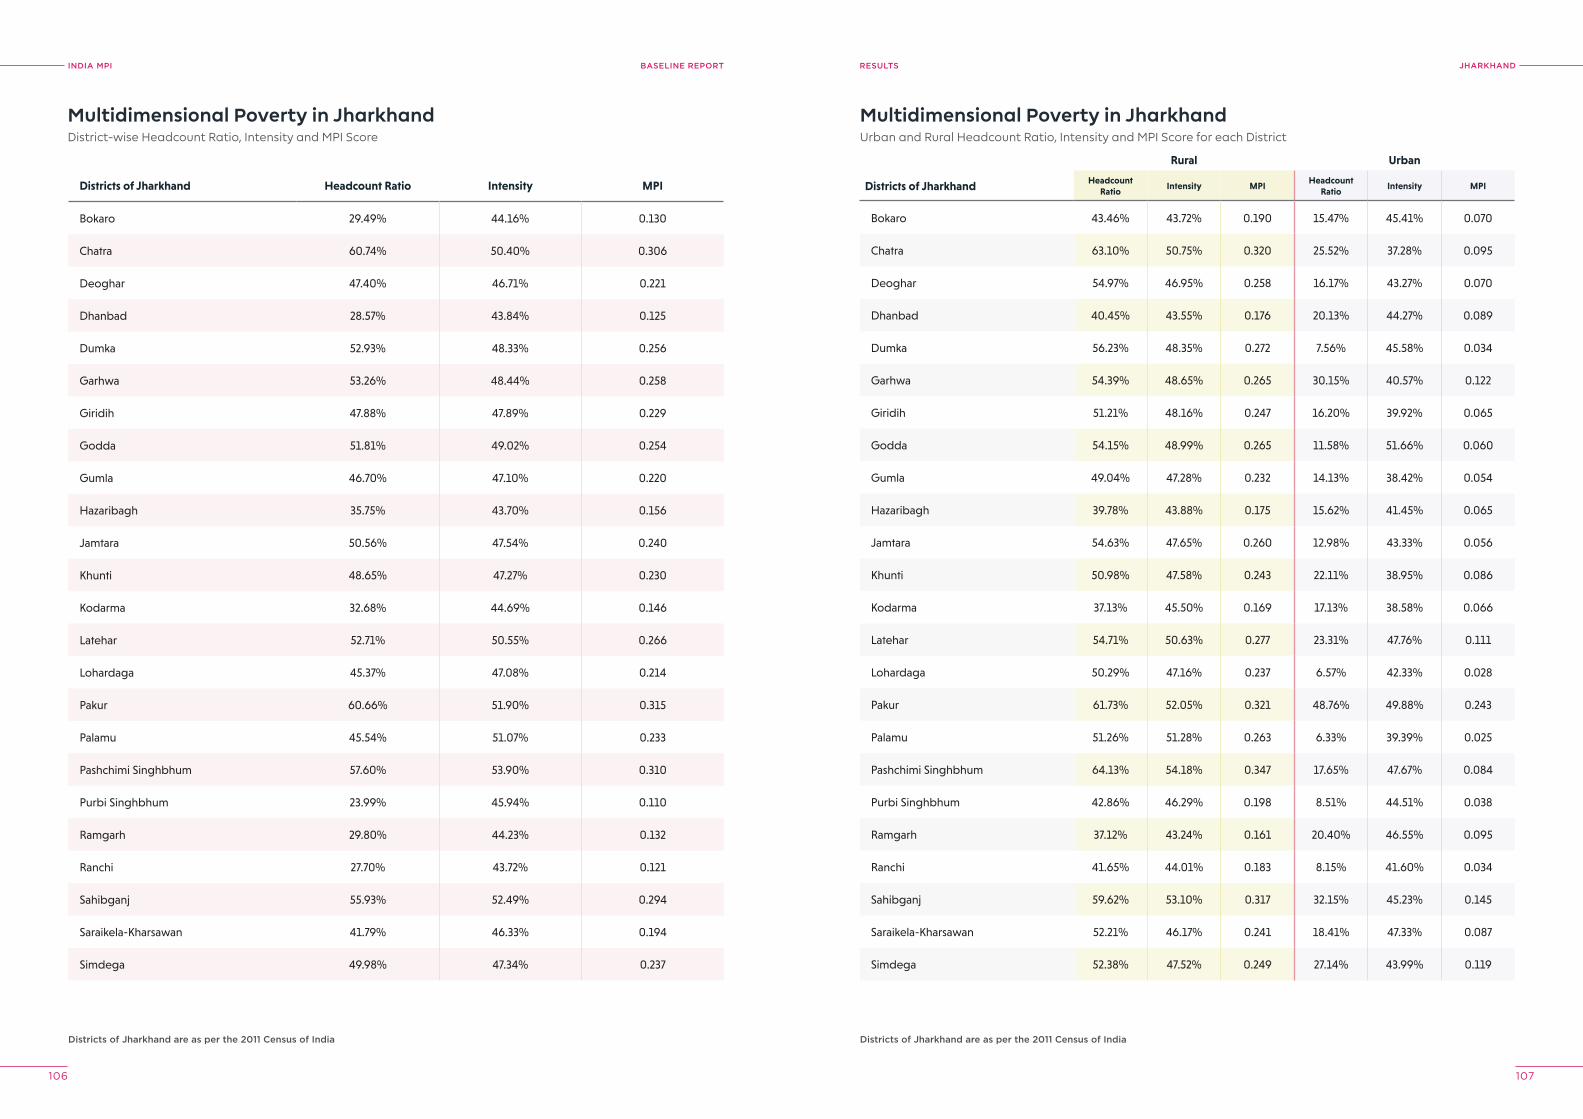
INDIA MPI BASELINE REPORT
106 107
jhArkhANDreSUlTS
Multidimensional Poverty in JharkhandDistrict-wise Headcount Ratio, Intensity and MPI Score
Multidimensional Poverty in JharkhandUrban and Rural Headcount Ratio, Intensity and MPI Score for each District
Districts of jharkhand are as per the 2011 Census of India Districts of jharkhand are as per the 2011 Census of India
Districts of Jharkhand Headcount Ratio Intensity MPI
Bokaro 29.49% 44.16% 0.130
Chatra 60.74% 50.40% 0.306
Deoghar 47.40% 46.71% 0.221
Dhanbad 28.57% 43.84% 0.125
Dumka 52.93% 48.33% 0.256
Garhwa 53.26% 48.44% 0.258
Giridih 47.88% 47.89% 0.229
Godda 51.81% 49.02% 0.254
Gumla 46.70% 47.10% 0.220
Hazaribagh 35.75% 43.70% 0.156
Jamtara 50.56% 47.54% 0.240
Khunti 48.65% 47.27% 0.230
Kodarma 32.68% 44.69% 0.146
Latehar 52.71% 50.55% 0.266
Lohardaga 45.37% 47.08% 0.214
Pakur 60.66% 51.90% 0.315
Palamu 45.54% 51.07% 0.233
Pashchimi Singhbhum 57.60% 53.90% 0.310
Purbi Singhbhum 23.99% 45.94% 0.110
Ramgarh 29.80% 44.23% 0.132
Ranchi 27.70% 43.72% 0.121
Sahibganj 55.93% 52.49% 0.294
Saraikela-Kharsawan 41.79% 46.33% 0.194
Simdega 49.98% 47.34% 0.237
Rural Urban
Districts of Jharkhand Headcount Ratio
Intensity MPIHeadcount
RatioIntensity MPI
Bokaro 43.46% 43.72% 0.190 15.47% 45.41% 0.070
Chatra 63.10% 50.75% 0.320 25.52% 37.28% 0.095
Deoghar 54.97% 46.95% 0.258 16.17% 43.27% 0.070
Dhanbad 40.45% 43.55% 0.176 20.13% 44.27% 0.089
Dumka 56.23% 48.35% 0.272 7.56% 45.58% 0.034
Garhwa 54.39% 48.65% 0.265 30.15% 40.57% 0.122
Giridih 51.21% 48.16% 0.247 16.20% 39.92% 0.065
Godda 54.15% 48.99% 0.265 11.58% 51.66% 0.060
Gumla 49.04% 47.28% 0.232 14.13% 38.42% 0.054
Hazaribagh 39.78% 43.88% 0.175 15.62% 41.45% 0.065
Jamtara 54.63% 47.65% 0.260 12.98% 43.33% 0.056
Khunti 50.98% 47.58% 0.243 22.11% 38.95% 0.086
Kodarma 37.13% 45.50% 0.169 17.13% 38.58% 0.066
Latehar 54.71% 50.63% 0.277 23.31% 47.76% 0.111
Lohardaga 50.29% 47.16% 0.237 6.57% 42.33% 0.028
Pakur 61.73% 52.05% 0.321 48.76% 49.88% 0.243
Palamu 51.26% 51.28% 0.263 6.33% 39.39% 0.025
Pashchimi Singhbhum 64.13% 54.18% 0.347 17.65% 47.67% 0.084
Purbi Singhbhum 42.86% 46.29% 0.198 8.51% 44.51% 0.038
Ramgarh 37.12% 43.24% 0.161 20.40% 46.55% 0.095
Ranchi 41.65% 44.01% 0.183 8.15% 41.60% 0.034
Sahibganj 59.62% 53.10% 0.317 32.15% 45.23% 0.145
Saraikela-Kharsawan 52.21% 46.17% 0.241 18.41% 47.33% 0.087
Simdega 52.38% 47.52% 0.249 27.14% 43.99% 0.119
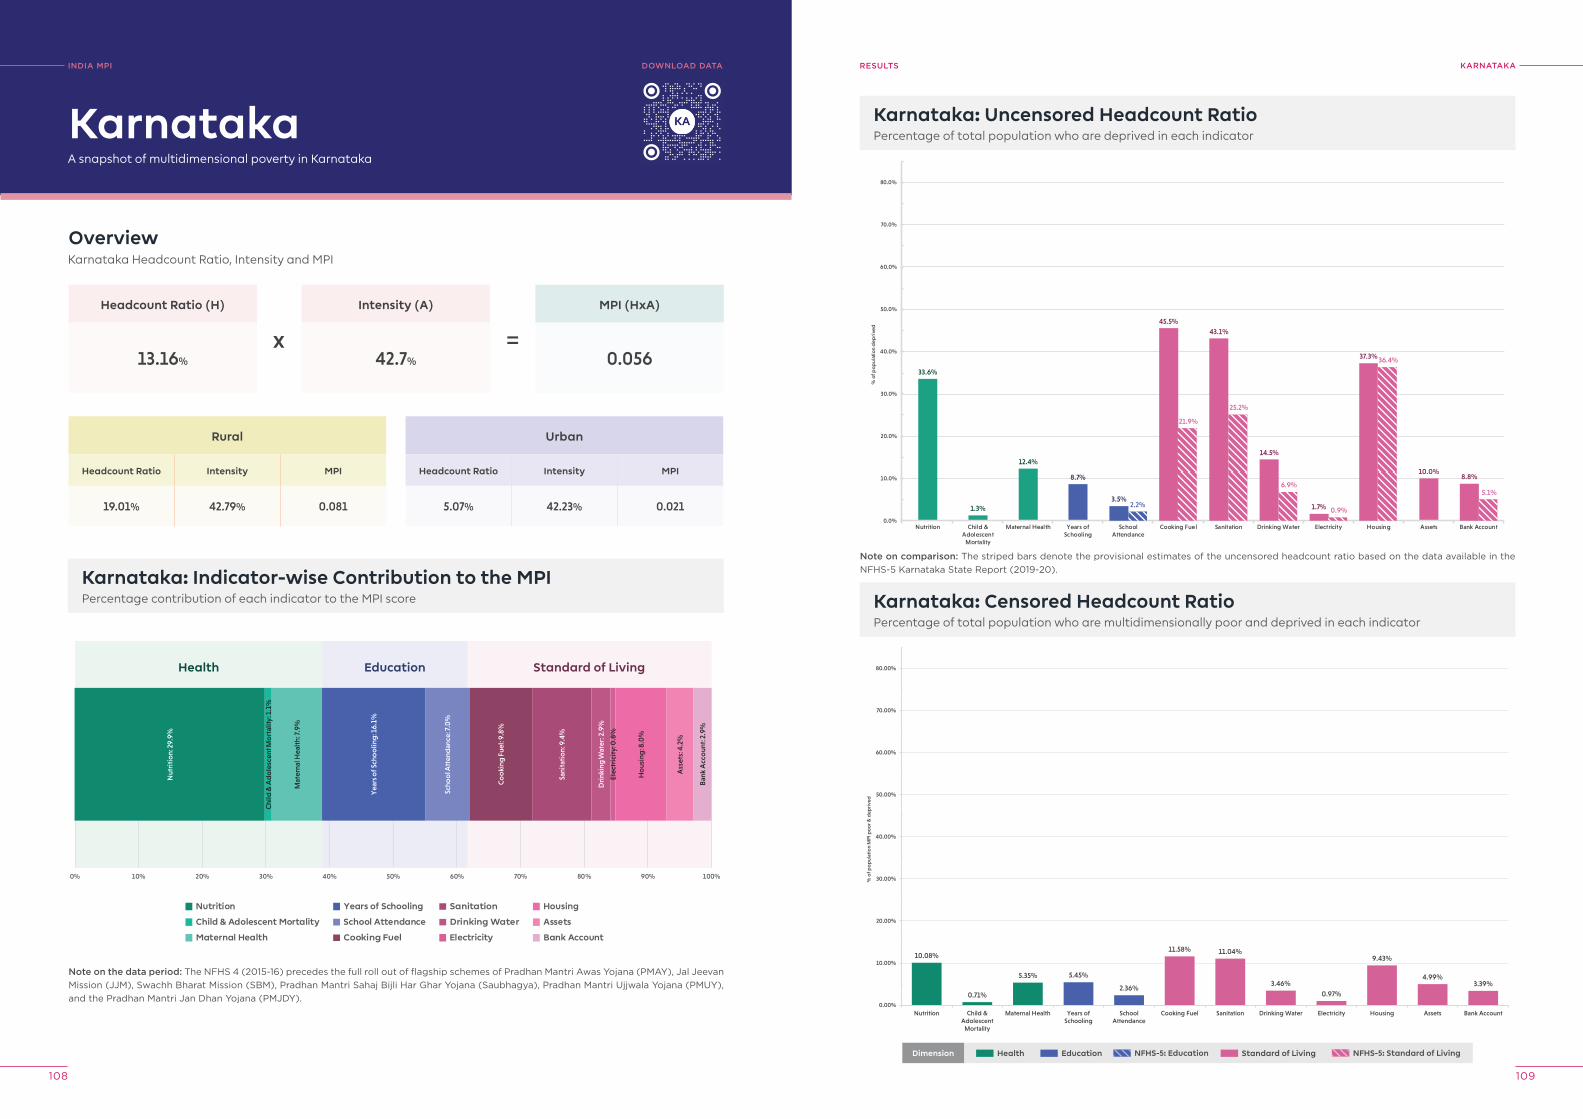
INDIA MPI BASELINE REPORT
108 109
kArNATAkAreSUlTS
Karnataka: Uncensored Headcount RatioPercentage of total population who are deprived in each indicator
33.6%
1.3%
12.4%
8.7%10.0%
3.5%2.2%
45.5%
21.9%
43.1%
25.2%
14.5%
6.9%
1.7% 0.9%
37.3% 36.4%
8.8%
5.1%
0.0%
10.0%
20.0%
30.0%
40.0%
50.0%
60.0%
70.0%
80.0%
Nutrition Child &Adolescent
Mortality
Maternal Health Years ofSchooling
SchoolAttendance
Cooking Fuel Sanitation Drinking Water Electricity Housing Assets Bank Account
% o
f pop
ulat
ion
dep
rive
d
10.08%
0.71%
5.35% 5.45%
2.36%
11.58% 11.04%
3.46%
0.97%
9.43%
4.99%3.39%
0.00%
10.00%
20.00%
30.00%
40.00%
50.00%
60.00%
70.00%
80.00%
Nutrition Child &Adolescent
Mortality
Maternal Health Years ofSchooling
SchoolAttendance
Cooking Fuel Sanitation Drinking Water Electricity Housing Assets Bank Account
% o
f po
pul
atio
n M
PI p
oo
r & d
epri
ved
Karnataka: Censored Headcount RatioPercentage of total population who are multidimensionally poor and deprived in each indicator
INDIA MpI
A snapshot of multidimensional poverty in Karnataka
OverviewKarnataka Headcount Ratio, Intensity and MPI
Headcount Ratio (H)
13.16%
Rural
Headcount Ratio Intensity MPI
19.01% 42.79% 0.081
Karnataka: Indicator-wise Contribution to the MPIPercentage contribution of each indicator to the MPI score
Intensity (A)
42.7%
MPI (HxA)
0.056
Karnataka
Urban
Headcount Ratio Intensity MPI
5.07% 42.23% 0.021
x =
Note on the data period: The NFHS 4 (2015-16) precedes the full roll out of flagship schemes of Pradhan Mantri Awas Yojana (PMAY), Jal Jeevan Mission (JJM), Swachh Bharat Mission (SBM), Pradhan Mantri Sahaj Bijli Har Ghar Yojana (Saubhagya), Pradhan Mantri Ujjwala Yojana (PMUY), and the Pradhan Mantri Jan Dhan Yojana (PMJDY).
Nutrition
Child & Adolescent Mortality
Maternal Health
Years of Schooling
School Attendance
Cooking Fuel
Sanitation
Drinking Water
Electricity
Housing
Assets
Bank Account
0% 10% 20% 30% 40% 50% 60% 70% 80% 90% 100%
Health Education Standard of Living
Nut
riti
on:
29.
9%
Chi
ld &
Ad
ole
scen
t Mo
rtal
ity: 1
.1%
Mat
erna
l Hea
lth:
7.9%
Yea
rs o
f Sch
oo
ling
: 16.
1%
Scho
ol A
tten
dan
ce: 7
.0%
Co
oki
ng F
uel:
9.8%
Sani
tati
on:
9.4
%
Dri
nkin
g W
ater
: 2.9
%
Elec
tric
ity:
0.8
%
Ho
usin
g: 8
.0%
Ass
ets:
4.2
%
Ban
k A
cco
unt:
2.9
%
DoWNloAD DATA
Note on comparison: The striped bars denote the provisional estimates of the uncensored headcount ratio based on the data available in the NFHS-5 Karnataka State Report (2019-20).
Dimension Health Education Standard of Living NFHS-5: Standard of LivingNFHS-5: Education
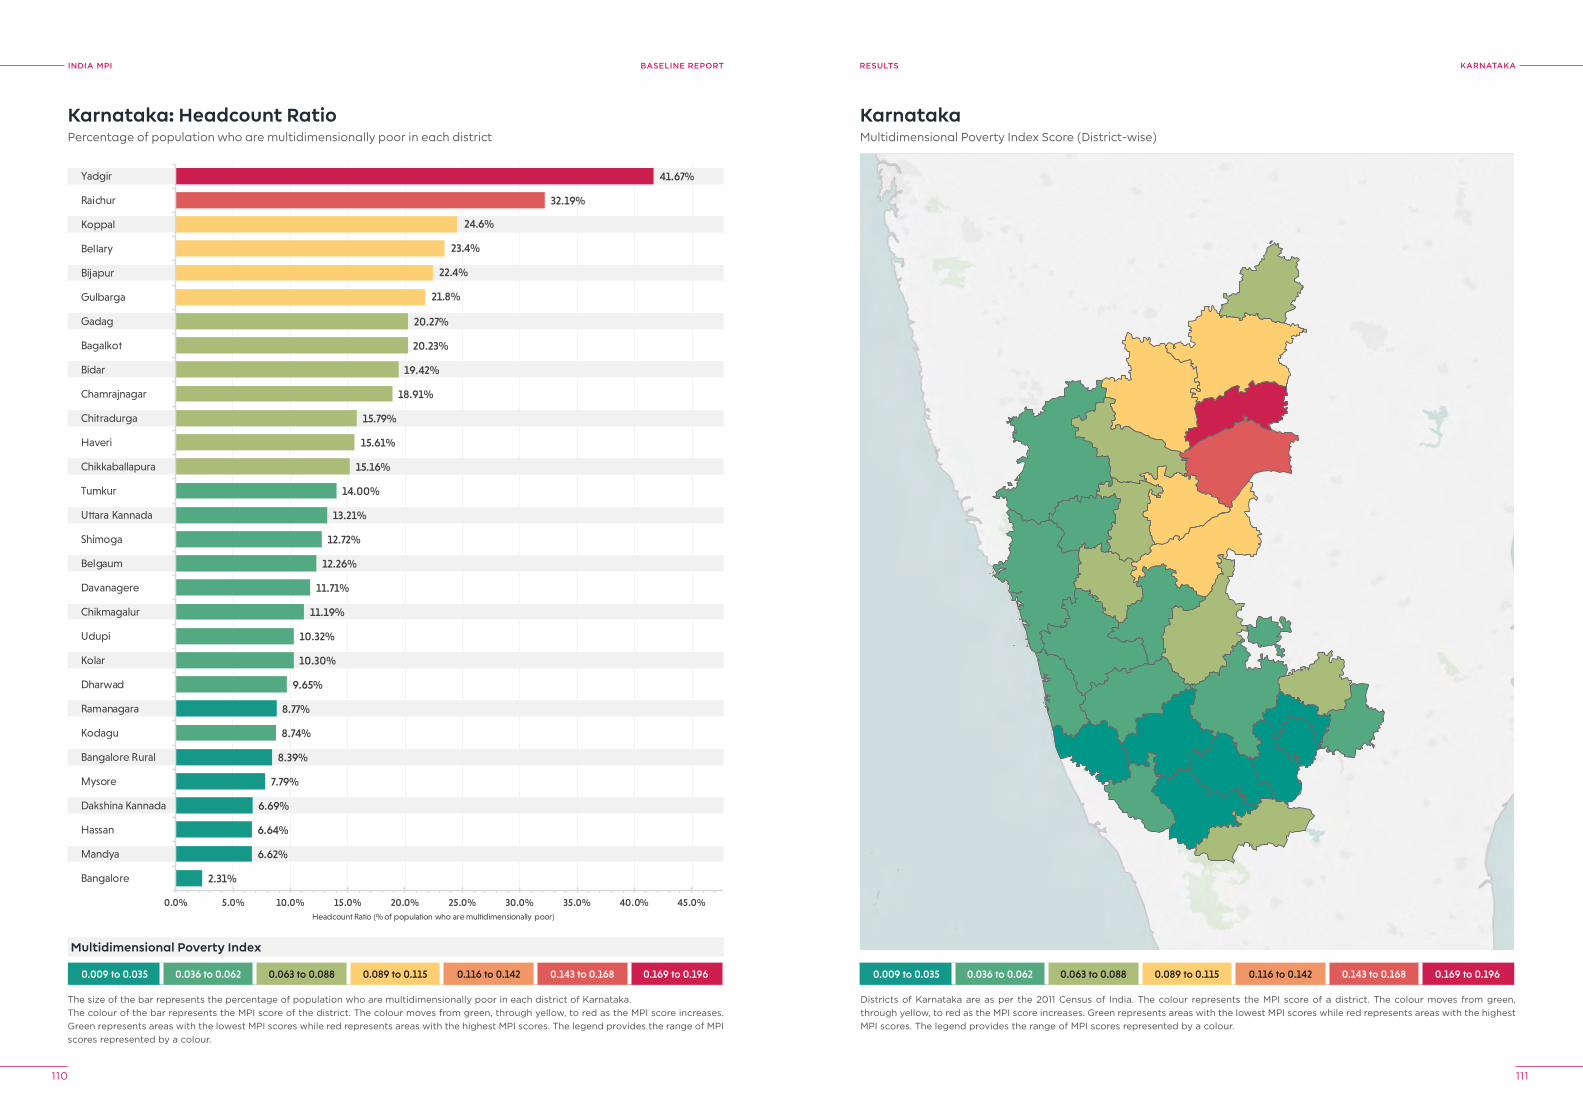
INDIA MPI BASELINE REPORT
110 111
kArNATAkAreSUlTS
0.009 to 0.035 0.036 to 0.062 0.063 to 0.088 0.089 to 0.115 0.116 to 0.142 0.143 to 0.168 0.169 to 0.196
2.31%
6.62%
6.64%
6.69%
7.79%
8.39%
8.77%
8.74%
9.65%
10.30%
10.32%
11.19%
11.71%
12.26%
12.72%
13.21%
14.00%
15.16%
15.61%
15.79%
18.91%
19.42%
20.23%
20.27%
21.8%
22.4%
23.4%
24.6%
32.19%
41.67%
0.0% 5.0% 10.0% 15.0% 20.0% 25.0% 30.0% 35.0% 40.0% 45.0%
Bangalore
Mandya
Hassan
Dakshina Kannada
Mysore
Bangalore Rural
Kodagu
Ramanagara
Dharwad
Kolar
Udupi
Chikmagalur
Davanagere
Belgaum
Shimoga
Uttara Kannada
Tumkur
Chikkaballapura
Haveri
Chitradurga
Chamrajnagar
Bidar
Bagalkot
Gadag
Gulbarga
Bijapur
Bellary
Koppal
Raichur
Yadgir
Headcount Ratio (% of population who are multidimensionally poor)
Karnataka: Headcount RatioPercentage of population who are multidimensionally poor in each district
The size of the bar represents the percentage of population who are multidimensionally poor in each district of Karnataka.The colour of the bar represents the MPI score of the district. The colour moves from green, through yellow, to red as the MPI score increases. Green represents areas with the lowest MPI scores while red represents areas with the highest MPI scores. The legend provides the range of MPI scores represented by a colour.
KarnatakaMultidimensional Poverty Index Score (District-wise)
Districts of Karnataka are as per the 2011 Census of India. The colour represents the MPI score of a district. The colour moves from green, through yellow, to red as the MPI score increases. Green represents areas with the lowest MPI scores while red represents areas with the highest MPI scores. The legend provides the range of MPI scores represented by a colour.
0.009 to 0.035 0.036 to 0.062 0.063 to 0.088 0.089 to 0.115 0.116 to 0.142 0.143 to 0.168 0.169 to 0.196
Multidimensional Poverty Index
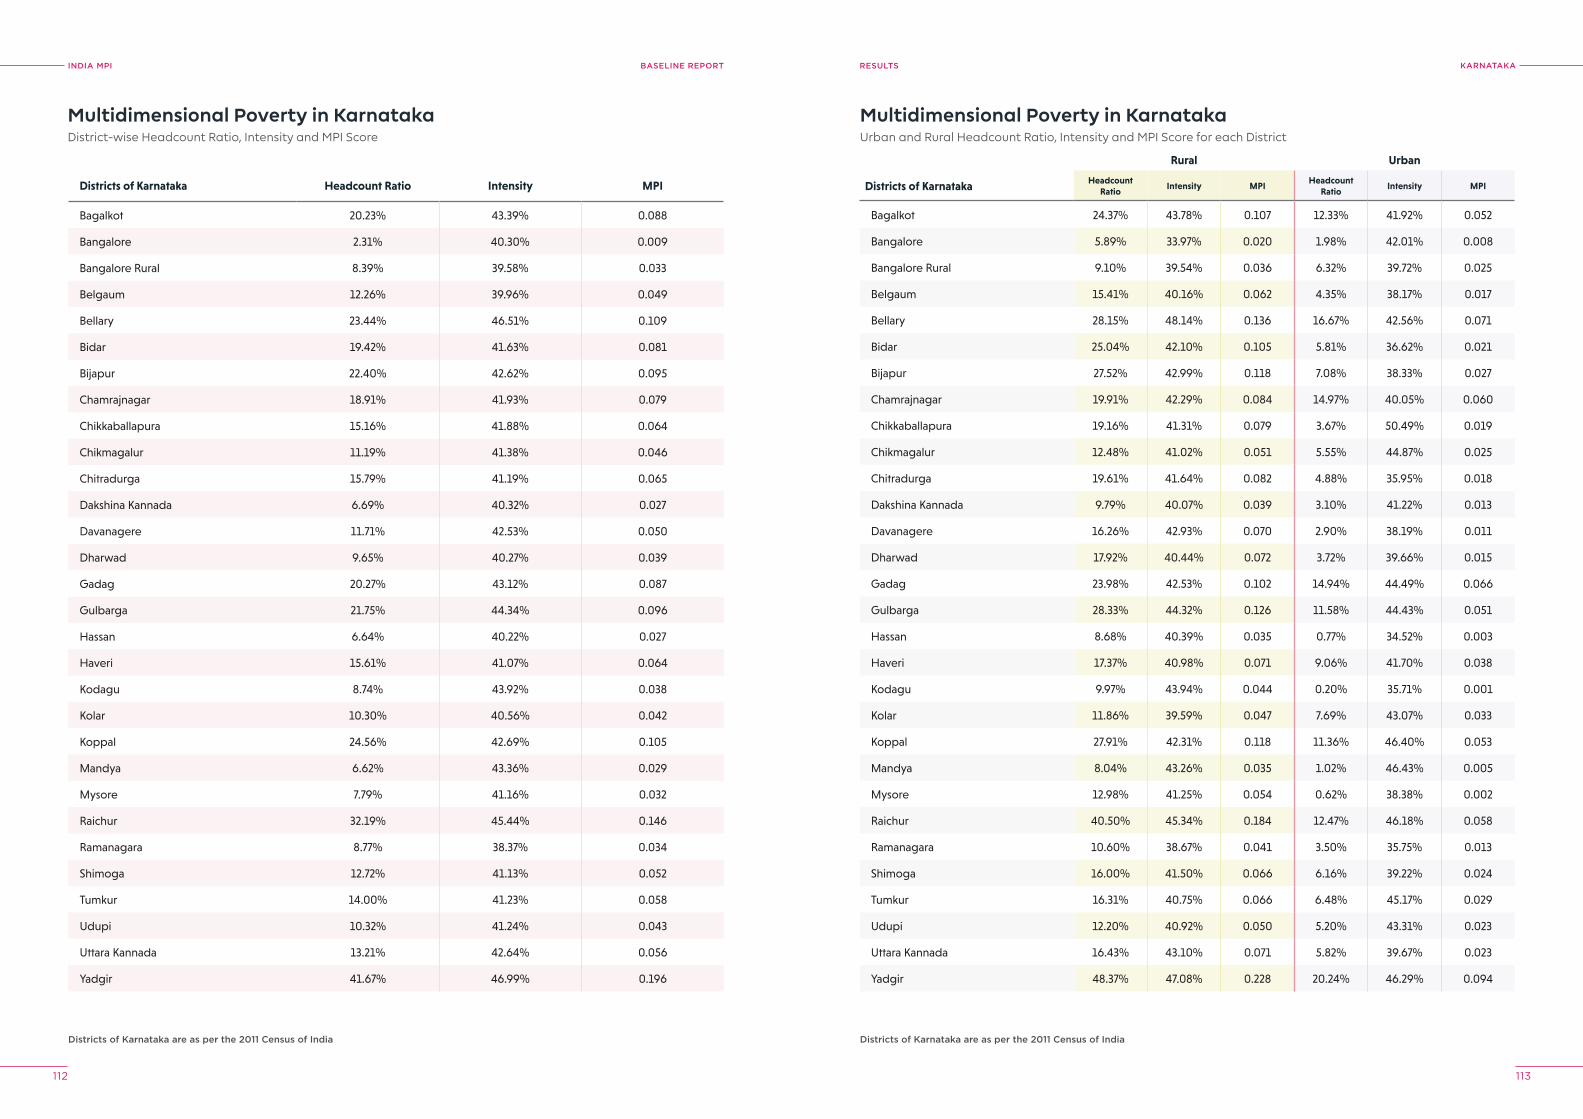
INDIA MPI BASELINE REPORT
112 113
kArNATAkAreSUlTS
Multidimensional Poverty in KarnatakaDistrict-wise Headcount Ratio, Intensity and MPI Score
Multidimensional Poverty in KarnatakaUrban and Rural Headcount Ratio, Intensity and MPI Score for each District
Districts of karnataka are as per the 2011 Census of India Districts of karnataka are as per the 2011 Census of India
Districts of Karnataka Headcount Ratio Intensity MPI
Bagalkot 20.23% 43.39% 0.088
Bangalore 2.31% 40.30% 0.009
Bangalore Rural 8.39% 39.58% 0.033
Belgaum 12.26% 39.96% 0.049
Bellary 23.44% 46.51% 0.109
Bidar 19.42% 41.63% 0.081
Bijapur 22.40% 42.62% 0.095
Chamrajnagar 18.91% 41.93% 0.079
Chikkaballapura 15.16% 41.88% 0.064
Chikmagalur 11.19% 41.38% 0.046
Chitradurga 15.79% 41.19% 0.065
Dakshina Kannada 6.69% 40.32% 0.027
Davanagere 11.71% 42.53% 0.050
Dharwad 9.65% 40.27% 0.039
Gadag 20.27% 43.12% 0.087
Gulbarga 21.75% 44.34% 0.096
Hassan 6.64% 40.22% 0.027
Haveri 15.61% 41.07% 0.064
Kodagu 8.74% 43.92% 0.038
Kolar 10.30% 40.56% 0.042
Koppal 24.56% 42.69% 0.105
Mandya 6.62% 43.36% 0.029
Mysore 7.79% 41.16% 0.032
Raichur 32.19% 45.44% 0.146
Ramanagara 8.77% 38.37% 0.034
Shimoga 12.72% 41.13% 0.052
Tumkur 14.00% 41.23% 0.058
Udupi 10.32% 41.24% 0.043
Uttara Kannada 13.21% 42.64% 0.056
Yadgir 41.67% 46.99% 0.196
Rural Urban
Districts of Karnataka Headcount Ratio
Intensity MPIHeadcount
RatioIntensity MPI
Bagalkot 24.37% 43.78% 0.107 12.33% 41.92% 0.052
Bangalore 5.89% 33.97% 0.020 1.98% 42.01% 0.008
Bangalore Rural 9.10% 39.54% 0.036 6.32% 39.72% 0.025
Belgaum 15.41% 40.16% 0.062 4.35% 38.17% 0.017
Bellary 28.15% 48.14% 0.136 16.67% 42.56% 0.071
Bidar 25.04% 42.10% 0.105 5.81% 36.62% 0.021
Bijapur 27.52% 42.99% 0.118 7.08% 38.33% 0.027
Chamrajnagar 19.91% 42.29% 0.084 14.97% 40.05% 0.060
Chikkaballapura 19.16% 41.31% 0.079 3.67% 50.49% 0.019
Chikmagalur 12.48% 41.02% 0.051 5.55% 44.87% 0.025
Chitradurga 19.61% 41.64% 0.082 4.88% 35.95% 0.018
Dakshina Kannada 9.79% 40.07% 0.039 3.10% 41.22% 0.013
Davanagere 16.26% 42.93% 0.070 2.90% 38.19% 0.011
Dharwad 17.92% 40.44% 0.072 3.72% 39.66% 0.015
Gadag 23.98% 42.53% 0.102 14.94% 44.49% 0.066
Gulbarga 28.33% 44.32% 0.126 11.58% 44.43% 0.051
Hassan 8.68% 40.39% 0.035 0.77% 34.52% 0.003
Haveri 17.37% 40.98% 0.071 9.06% 41.70% 0.038
Kodagu 9.97% 43.94% 0.044 0.20% 35.71% 0.001
Kolar 11.86% 39.59% 0.047 7.69% 43.07% 0.033
Koppal 27.91% 42.31% 0.118 11.36% 46.40% 0.053
Mandya 8.04% 43.26% 0.035 1.02% 46.43% 0.005
Mysore 12.98% 41.25% 0.054 0.62% 38.38% 0.002
Raichur 40.50% 45.34% 0.184 12.47% 46.18% 0.058
Ramanagara 10.60% 38.67% 0.041 3.50% 35.75% 0.013
Shimoga 16.00% 41.50% 0.066 6.16% 39.22% 0.024
Tumkur 16.31% 40.75% 0.066 6.48% 45.17% 0.029
Udupi 12.20% 40.92% 0.050 5.20% 43.31% 0.023
Uttara Kannada 16.43% 43.10% 0.071 5.82% 39.67% 0.023
Yadgir 48.37% 47.08% 0.228 20.24% 46.29% 0.094
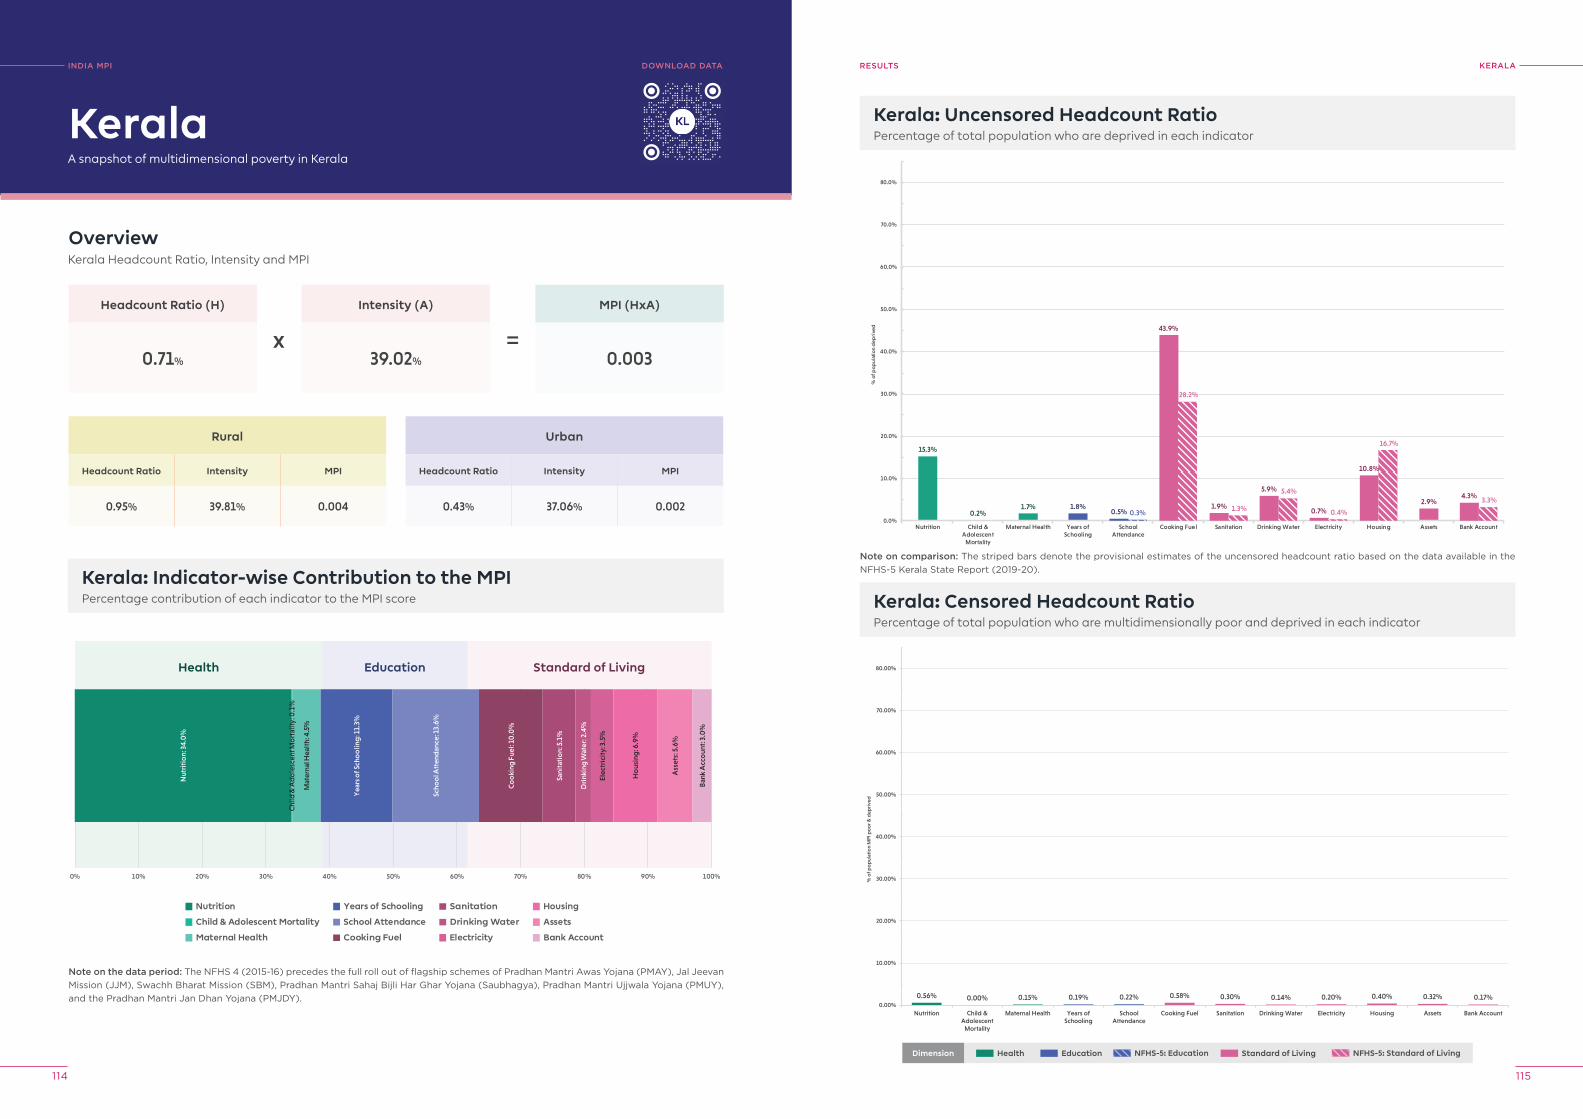
INDIA MPI BASELINE REPORT
114 115
kerAlAreSUlTS
Kerala: Uncensored Headcount RatioPercentage of total population who are deprived in each indicator
15.3%
0.2%1.7% 1.8%
2.9%0.5% 0.3%
43.9%
28.2%
1.9% 1.3%
5.9% 5.4%
0.7% 0.4%
10.8%
16.7%
4.3%3.3%
0.0%
10.0%
20.0%
30.0%
40.0%
50.0%
60.0%
70.0%
80.0%
Nutrition Child &Adolescent
Mortality
Maternal Health Years ofSchooling
SchoolAttendance
Cooking Fuel Sanitation Drinking Water Electricity Housing Assets Bank Account
% o
f pop
ulat
ion
dep
rive
d
0.56% 0.00% 0.15% 0.19% 0.22% 0.58% 0.30% 0.14% 0.20% 0.40% 0.32% 0.17%0.00%
10.00%
20.00%
30.00%
40.00%
50.00%
60.00%
70.00%
80.00%
Nutrition Child &Adolescent
Mortality
Maternal Health Years ofSchooling
SchoolAttendance
Cooking Fuel Sanitation Drinking Water Electricity Housing Assets Bank Account
% o
f po
pul
atio
n M
PI p
oo
r & d
epri
ved
Kerala: Censored Headcount RatioPercentage of total population who are multidimensionally poor and deprived in each indicator
INDIA MpI
A snapshot of multidimensional poverty in Kerala
OverviewKerala Headcount Ratio, Intensity and MPI
Headcount Ratio (H)
0.71%
Rural
Headcount Ratio Intensity MPI
0.95% 39.81% 0.004
Kerala: Indicator-wise Contribution to the MPIPercentage contribution of each indicator to the MPI score
Intensity (A)
39.02%
MPI (HxA)
0.003
Kerala
Urban
Headcount Ratio Intensity MPI
0.43% 37.06% 0.002
x =
Note on the data period: The NFHS 4 (2015-16) precedes the full roll out of flagship schemes of Pradhan Mantri Awas Yojana (PMAY), Jal Jeevan Mission (JJM), Swachh Bharat Mission (SBM), Pradhan Mantri Sahaj Bijli Har Ghar Yojana (Saubhagya), Pradhan Mantri Ujjwala Yojana (PMUY), and the Pradhan Mantri Jan Dhan Yojana (PMJDY).
Nutrition
Child & Adolescent Mortality
Maternal Health
Years of Schooling
School Attendance
Cooking Fuel
Sanitation
Drinking Water
Electricity
Housing
Assets
Bank Account
0% 10% 20% 30% 40% 50% 60% 70% 80% 90% 100%
Health Education Standard of Living
Nut
riti
on:
34.
0%
Chi
ld &
Ad
ole
scen
t Mo
rtal
ity: 0
.1%
Mat
erna
l Hea
lth:
4.5
%
Yea
rs o
f Sch
oo
ling
: 11.
3%
Scho
ol A
tten
dan
ce: 1
3.6%
Co
oki
ng F
uel:
10.0
%
Sani
tati
on:
5.1
%
Dri
nkin
g W
ater
: 2.4
%
Elec
tric
ity:
3.5
%
Ho
usin
g: 6
.9%
Ass
ets:
5.6
%
Ban
k A
cco
unt:
3.0
%
DoWNloAD DATA
Note on comparison: The striped bars denote the provisional estimates of the uncensored headcount ratio based on the data available in the NFHS-5 Kerala State Report (2019-20).
Dimension Health Education Standard of Living NFHS-5: Standard of LivingNFHS-5: Education
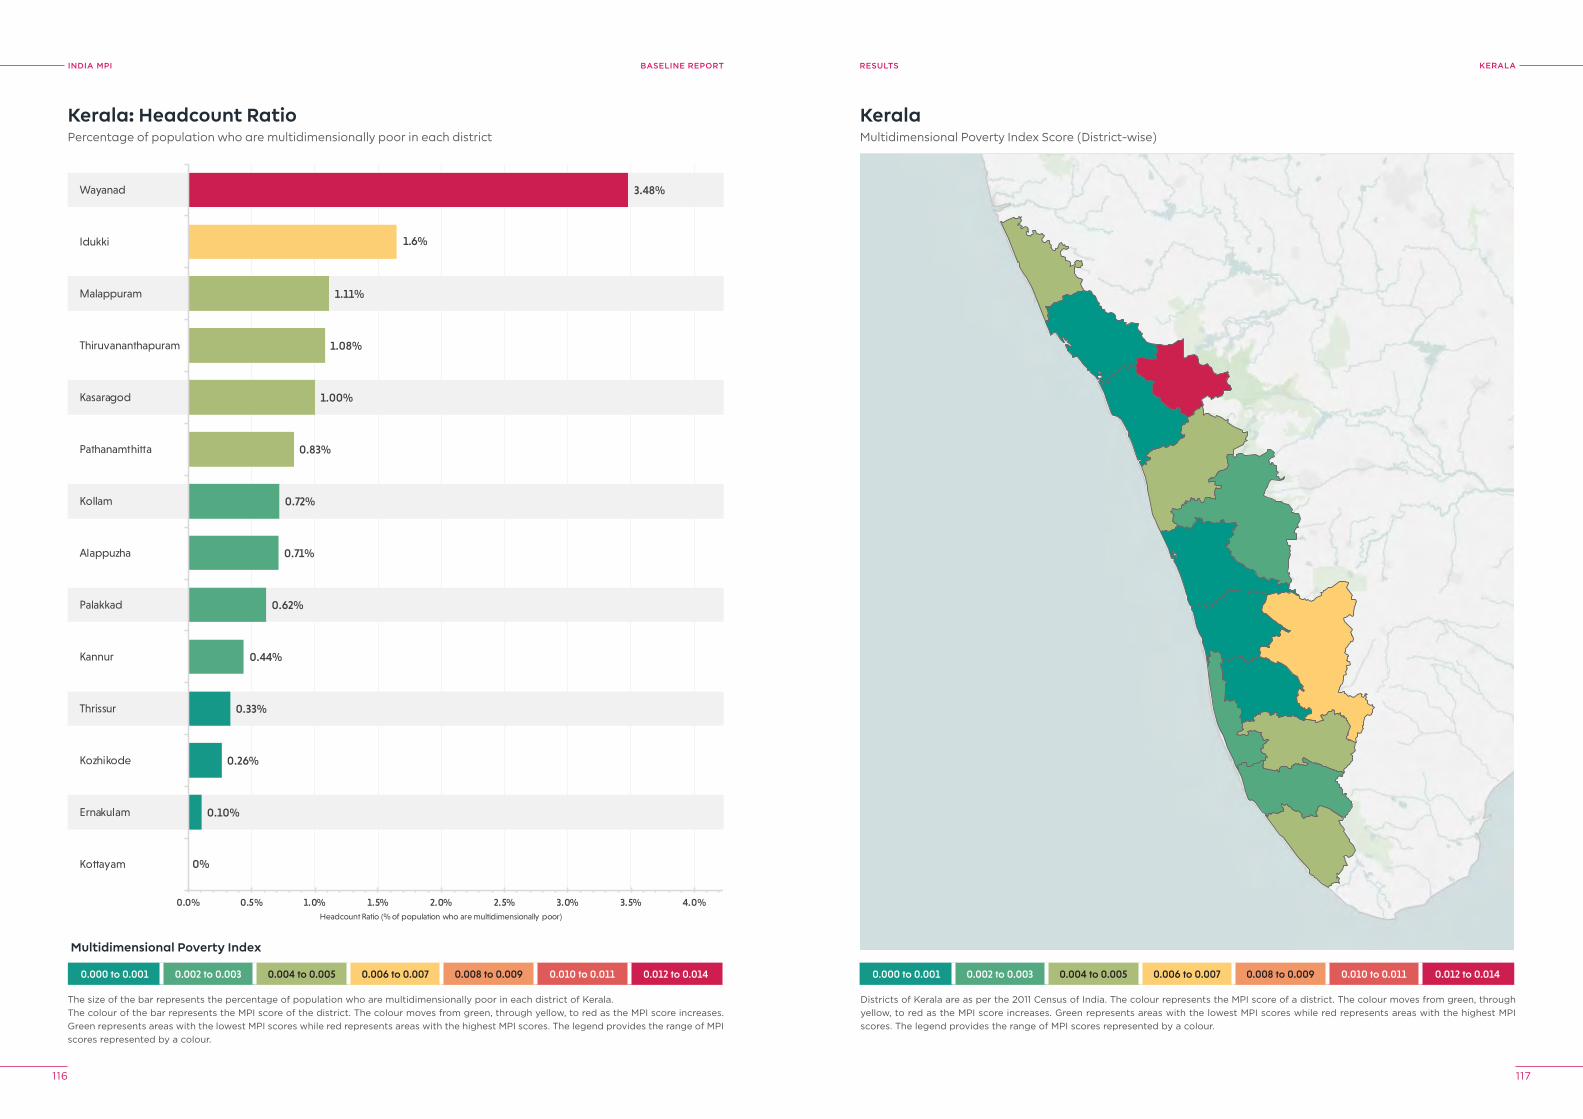
INDIA MPI BASELINE REPORT
116 117
kerAlAreSUlTS
0.000 to 0.001 0.002 to 0.003 0.004 to 0.005 0.006 to 0.007 0.008 to 0.009 0.010 to 0.011 0.012 to 0.014
0.10%
0.26%
0.33%
0.44%
0.62%
0.71%
0.72%
0.83%
1.00%
1.08%
1.11%
1.6%
3.48%
0.0% 0.5% 1.0% 1.5% 2.0% 2.5% 3.0% 3.5% 4.0%
Kottayam
Ernakulam
Kozhikode
Thrissur
Kannur
Palakkad
Alappuzha
Kollam
Pathanamthitta
Kasaragod
Thiruvananthapuram
Malappuram
Idukki
Wayanad
Headcount Ratio (% of population who are multidimensionally poor)
0%
Kerala: Headcount RatioPercentage of population who are multidimensionally poor in each district
The size of the bar represents the percentage of population who are multidimensionally poor in each district of Kerala.The colour of the bar represents the MPI score of the district. The colour moves from green, through yellow, to red as the MPI score increases. Green represents areas with the lowest MPI scores while red represents areas with the highest MPI scores. The legend provides the range of MPI scores represented by a colour.
KeralaMultidimensional Poverty Index Score (District-wise)
Districts of Kerala are as per the 2011 Census of India. The colour represents the MPI score of a district. The colour moves from green, through yellow, to red as the MPI score increases. Green represents areas with the lowest MPI scores while red represents areas with the highest MPI scores. The legend provides the range of MPI scores represented by a colour.
0.000 to 0.001 0.002 to 0.003 0.004 to 0.005 0.006 to 0.007 0.008 to 0.009 0.010 to 0.011 0.012 to 0.014
Multidimensional Poverty Index
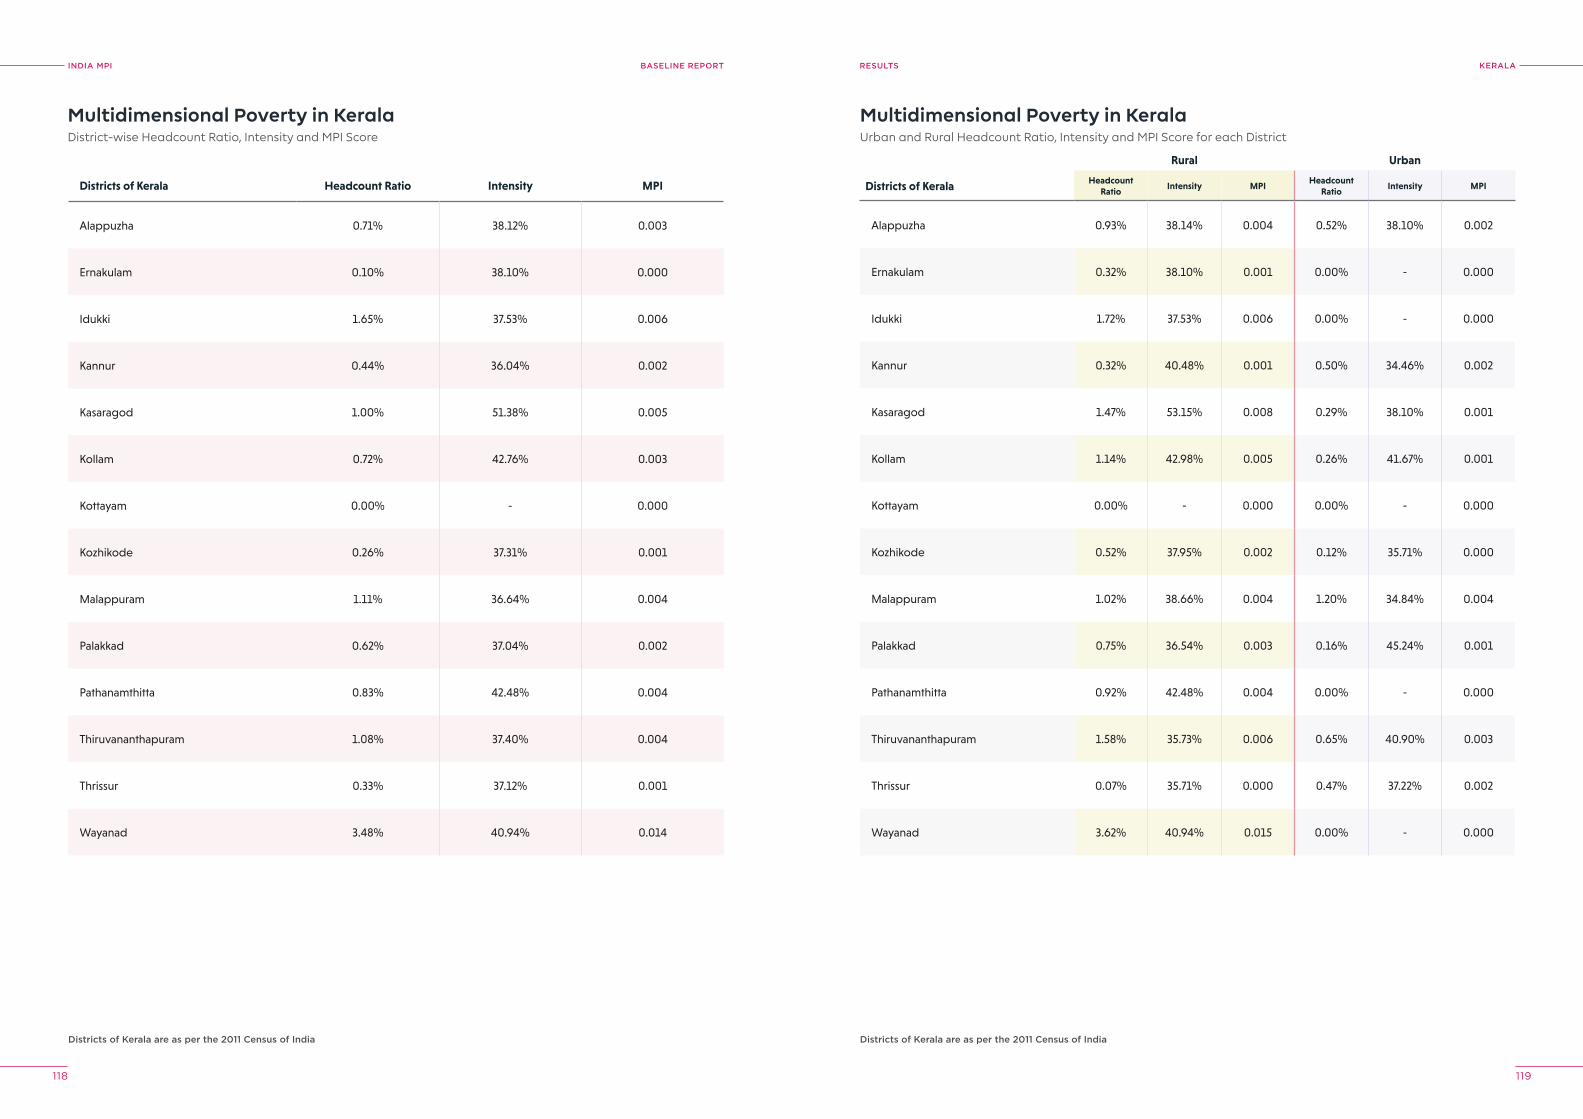
INDIA MPI BASELINE REPORT
118 119
kerAlAreSUlTS
Multidimensional Poverty in KeralaDistrict-wise Headcount Ratio, Intensity and MPI Score
Multidimensional Poverty in KeralaUrban and Rural Headcount Ratio, Intensity and MPI Score for each District
Districts of kerala are as per the 2011 Census of India Districts of kerala are as per the 2011 Census of India
Districts of Kerala Headcount Ratio Intensity MPI
Alappuzha 0.71% 38.12% 0.003
Ernakulam 0.10% 38.10% 0.000
Idukki 1.65% 37.53% 0.006
Kannur 0.44% 36.04% 0.002
Kasaragod 1.00% 51.38% 0.005
Kollam 0.72% 42.76% 0.003
Kottayam 0.00% - 0.000
Kozhikode 0.26% 37.31% 0.001
Malappuram 1.11% 36.64% 0.004
Palakkad 0.62% 37.04% 0.002
Pathanamthitta 0.83% 42.48% 0.004
Thiruvananthapuram 1.08% 37.40% 0.004
Thrissur 0.33% 37.12% 0.001
Wayanad 3.48% 40.94% 0.014
Rural Urban
Districts of Kerala Headcount Ratio
Intensity MPIHeadcount
RatioIntensity MPI
Alappuzha 0.93% 38.14% 0.004 0.52% 38.10% 0.002
Ernakulam 0.32% 38.10% 0.001 0.00% - 0.000
Idukki 1.72% 37.53% 0.006 0.00% - 0.000
Kannur 0.32% 40.48% 0.001 0.50% 34.46% 0.002
Kasaragod 1.47% 53.15% 0.008 0.29% 38.10% 0.001
Kollam 1.14% 42.98% 0.005 0.26% 41.67% 0.001
Kottayam 0.00% - 0.000 0.00% - 0.000
Kozhikode 0.52% 37.95% 0.002 0.12% 35.71% 0.000
Malappuram 1.02% 38.66% 0.004 1.20% 34.84% 0.004
Palakkad 0.75% 36.54% 0.003 0.16% 45.24% 0.001
Pathanamthitta 0.92% 42.48% 0.004 0.00% - 0.000
Thiruvananthapuram 1.58% 35.73% 0.006 0.65% 40.90% 0.003
Thrissur 0.07% 35.71% 0.000 0.47% 37.22% 0.002
Wayanad 3.62% 40.94% 0.015 0.00% - 0.000

INDIA MPI BASELINE REPORT
120 121
MADhyA prADeShreSUlTS
Madhya Pradesh: Uncensored Headcount RatioPercentage of total population who are deprived in each indicator
45.5%
3.6%
29.4%
16.1%
8.4%
29.8%
64.4%
19.3%
11.1%
71.2%
59.9%
65.3%
34.9%
9.0%
1.6%
0.0%
10.0%
20.0%
30.0%
40.0%
50.0%
60.0%
70.0%
80.0%
Nutrition Child &Adolescent
Mortality
Maternal Health Years ofSchooling
SchoolAttendance
Cooking Fuel Sanitation Drinking Water Electricity Housing Assets Bank Account
% o
f pop
ulat
ion
dep
rive
d29.05%
2.72%
20.87%
14.02%
7.34%
34.90%33.21%
17.56%
6.47%
32.73%
13.65%
7.36%
0.00%
10.00%
20.00%
30.00%
40.00%
50.00%
60.00%
70.00%
80.00%
Nutrition Child &Adolescent
Mortality
Maternal Health Years ofSchooling
SchoolAttendance
Cooking Fuel Sanitation Drinking Water Electricity Housing Assets Bank Account
% o
f po
pul
atio
n M
PI p
oo
r & d
epri
ved
Madhya Pradesh: Censored Headcount RatioPercentage of total population who are multidimensionally poor and deprived in each indicator
INDIA MpI
A snapshot of multidimensional poverty in Madhya Pradesh
OverviewMadhya Pradesh Headcount Ratio, Intensity and MPI
Headcount Ratio (H)
36.65%
Rural
Headcount Ratio Intensity MPI
45.96% 47.57% 0.219
Madhya Pradesh: Indicator-wise Contribution to the MPIPercentage contribution of each indicator to the MPI score
Intensity (A)
47.25%
MPI (HxA)
0.173
Madhya Pradesh
Urban
Headcount Ratio Intensity MPI
13.82% 44.62% 0.062
x =
Note on the data period: The NFHS 4 (2015-16) precedes the full roll out of flagship schemes of Pradhan Mantri Awas Yojana (PMAY), Jal Jeevan Mission (JJM), Swachh Bharat Mission (SBM), Pradhan Mantri Sahaj Bijli Har Ghar Yojana (Saubhagya), Pradhan Mantri Ujjwala Yojana (PMUY), and the Pradhan Mantri Jan Dhan Yojana (PMJDY).
Nutrition
Child & Adolescent Mortality
Maternal Health
Years of Schooling
School Attendance
Cooking Fuel
Sanitation
Drinking Water
Electricity
Housing
Assets
Bank Account
0% 10% 20% 30% 40% 50% 60% 70% 80% 90% 100%
Health Education Standard of Living
Nut
riti
on:
28.
0%
Chi
ld &
Ad
ole
scen
t Mo
rtal
ity: 1
.3%
Mat
erna
l Hea
lth:
10
.0%
Yea
rs o
f Sch
oo
ling
: 13.
5%
Scho
ol A
tten
dan
ce: 7
.1%
Co
oki
ng F
uel:
9.6%
Sani
tati
on:
9.1
%
Dri
nkin
g W
ater
: 4.8
%
Elec
tric
ity:
1.8
%
Ho
usin
g: 9
.0%
Ass
ets:
3.8
%
Ban
k A
cco
unt:
2.0
%
DoWNloAD DATA
Note on comparison: The striped bars denote the provisional estimates of the uncensored headcount ratio based on the data available in the NFHS-5 Madhya Pradesh State Factsheet (2019-20).
Dimension Health Education Standard of Living NFHS-5: Standard of Living
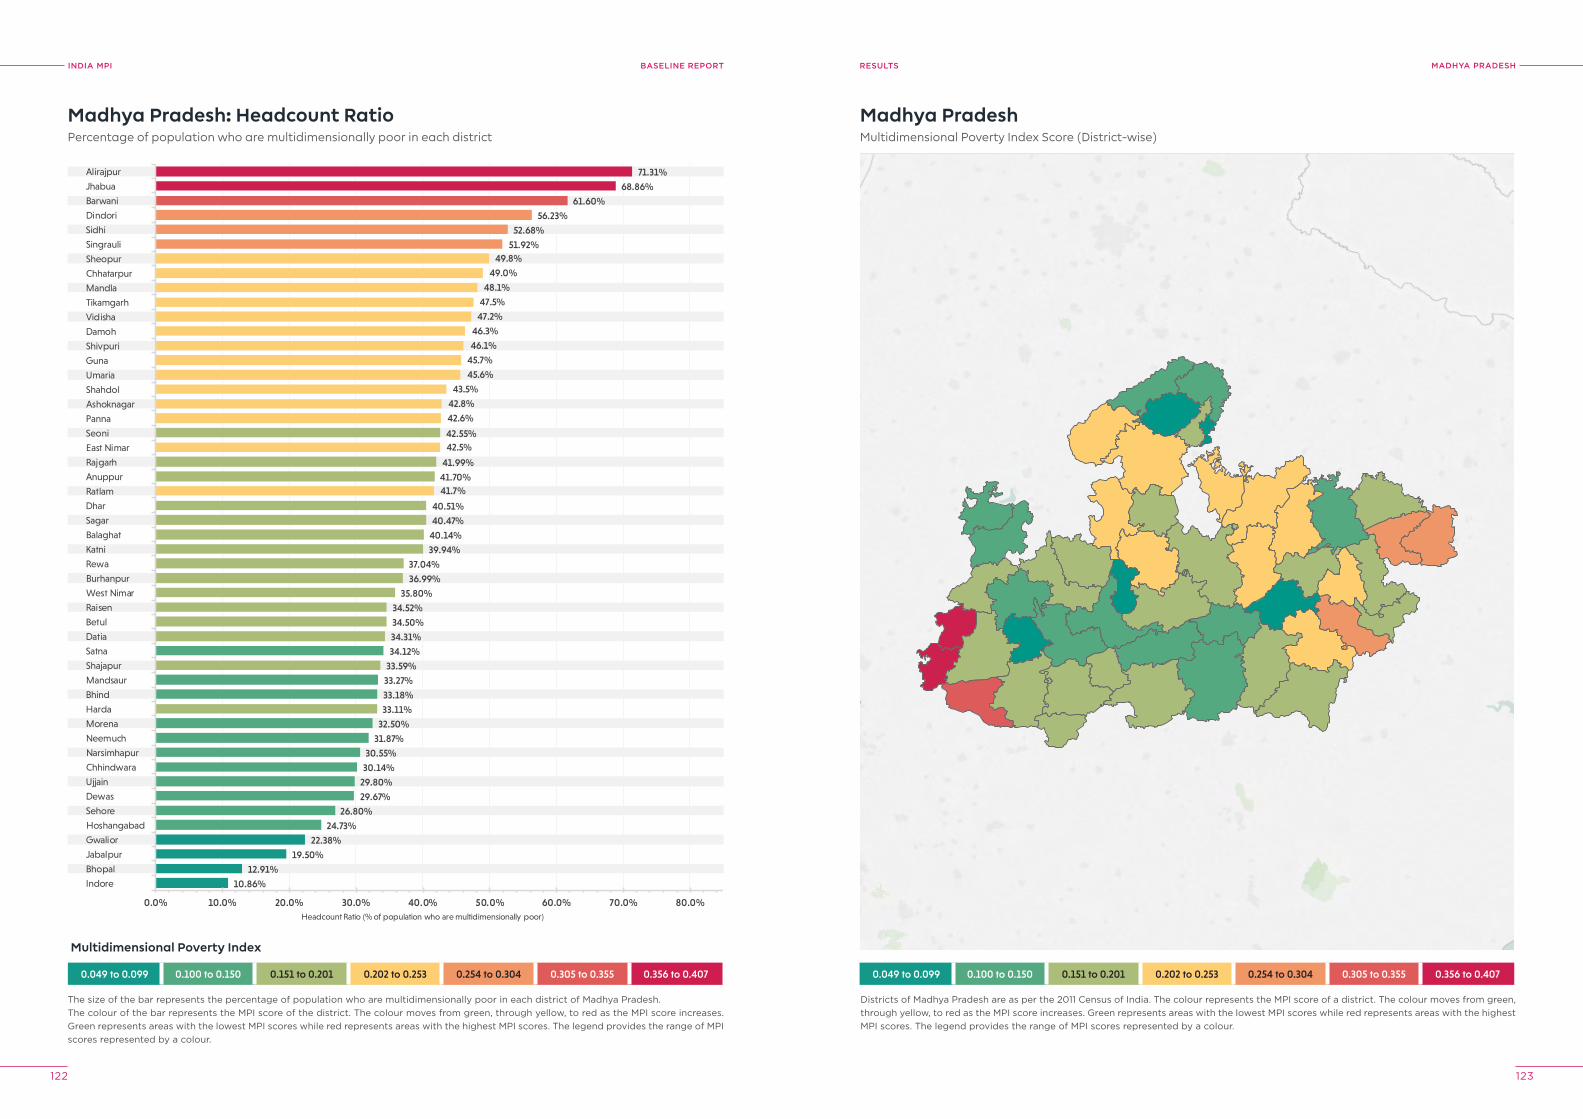
INDIA MPI BASELINE REPORT
122 123
MADhyA prADeShreSUlTS
0.049 to 0.099 0.100 to 0.150 0.151 to 0.201 0.202 to 0.253 0.254 to 0.304 0.305 to 0.355 0.356 to 0.407
10.86%
12.91%
19.50%
22.38%
24.73%
26.80%
29.67%
29.80%
30.14%
30.55%
31.87%
32.50%
33.18%
33.27%
34.12%
33.11%
33.59%
34.31%
34.50%
34.52%
35.80%
36.99%
37.04%
39.94%
40.14%
40.47%
40.51%
41.70%
41.99%
42.55%
41.7%
42.5%
42.6%
42.8%
43.5%
45.6%
45.7%
46.1%
46.3%
47.2%
47.5%
48.1%
49.0%
49.8%51.92%
52.68%
56.23%
61.60%
68.86%
71.31%
0.0% 10.0% 20.0% 30.0% 40.0% 50.0% 60.0% 70.0% 80.0%
Indore
Bhopal
Jabalpur
Gwalior
Hoshangabad
Sehore
Dewas
Ujjain
Chhindwara
Narsimhapur
Neemuch
Morena
Harda
Bhind
Mandsaur
Shajapur
Satna
Datia
Betul
Raisen
West Nimar
Burhanpur
Rewa
Katni
Balaghat
Sagar
Dhar
Ratlam
Anuppur
Rajgarh
East Nimar
Seoni
Panna
Ashoknagar
Shahdol
Umaria
Guna
Shivpuri
Damoh
Vidisha
Tikamgarh
Mandla
Chhatarpur
Sheopur
Singrauli
Sidhi
Dindori
Barwani
Jhabua
Alirajpur
Headcount Ratio (% of population who are multidimensionally poor)
Madhya Pradesh: Headcount RatioPercentage of population who are multidimensionally poor in each district
The size of the bar represents the percentage of population who are multidimensionally poor in each district of Madhya Pradesh.The colour of the bar represents the MPI score of the district. The colour moves from green, through yellow, to red as the MPI score increases. Green represents areas with the lowest MPI scores while red represents areas with the highest MPI scores. The legend provides the range of MPI scores represented by a colour.
Madhya PradeshMultidimensional Poverty Index Score (District-wise)
Districts of Madhya Pradesh are as per the 2011 Census of India. The colour represents the MPI score of a district. The colour moves from green, through yellow, to red as the MPI score increases. Green represents areas with the lowest MPI scores while red represents areas with the highest MPI scores. The legend provides the range of MPI scores represented by a colour.
0.049 to 0.099 0.100 to 0.150 0.151 to 0.201 0.202 to 0.253 0.254 to 0.304 0.305 to 0.355 0.356 to 0.407
Multidimensional Poverty Index
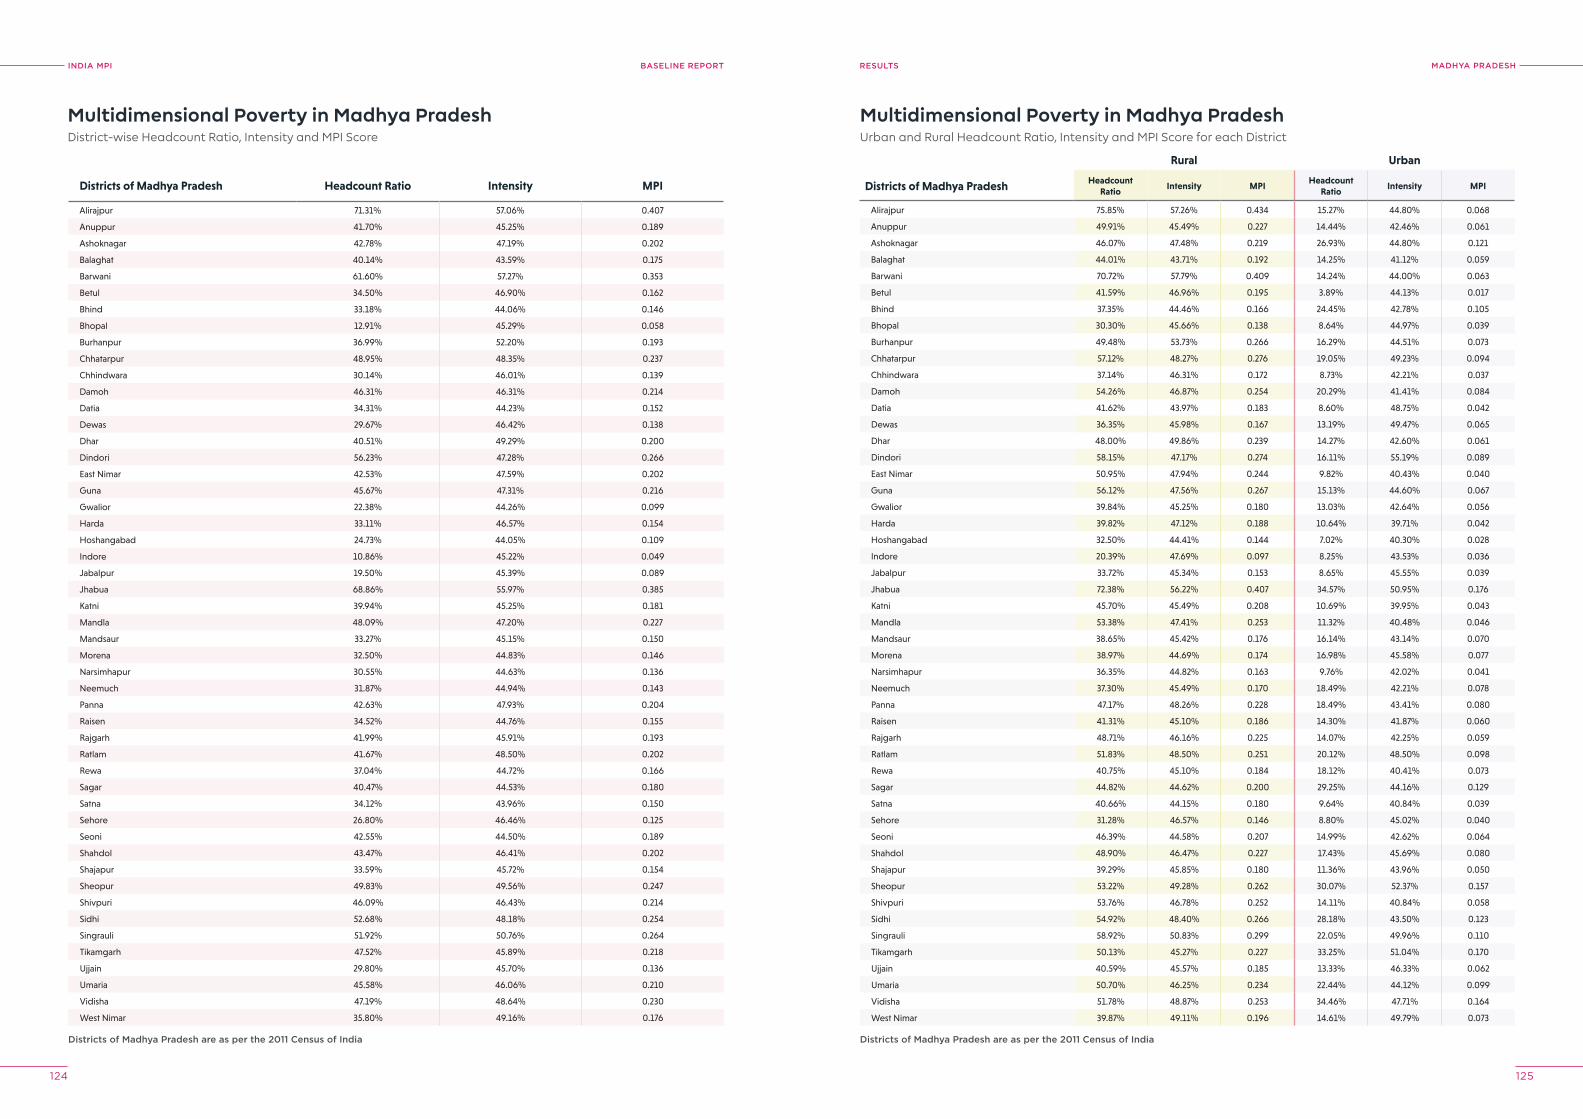
INDIA MPI BASELINE REPORT
124 125
MADhyA prADeShreSUlTS
Multidimensional Poverty in Madhya PradeshDistrict-wise Headcount Ratio, Intensity and MPI Score
Multidimensional Poverty in Madhya PradeshUrban and Rural Headcount Ratio, Intensity and MPI Score for each District
Districts of Madhya pradesh are as per the 2011 Census of India Districts of Madhya pradesh are as per the 2011 Census of India
Districts of Madhya Pradesh Headcount Ratio Intensity MPI
Alirajpur 71.31% 57.06% 0.407
Anuppur 41.70% 45.25% 0.189
Ashoknagar 42.78% 47.19% 0.202
Balaghat 40.14% 43.59% 0.175
Barwani 61.60% 57.27% 0.353
Betul 34.50% 46.90% 0.162
Bhind 33.18% 44.06% 0.146
Bhopal 12.91% 45.29% 0.058
Burhanpur 36.99% 52.20% 0.193
Chhatarpur 48.95% 48.35% 0.237
Chhindwara 30.14% 46.01% 0.139
Damoh 46.31% 46.31% 0.214
Datia 34.31% 44.23% 0.152
Dewas 29.67% 46.42% 0.138
Dhar 40.51% 49.29% 0.200
Dindori 56.23% 47.28% 0.266
East Nimar 42.53% 47.59% 0.202
Guna 45.67% 47.31% 0.216
Gwalior 22.38% 44.26% 0.099
Harda 33.11% 46.57% 0.154
Hoshangabad 24.73% 44.05% 0.109
Indore 10.86% 45.22% 0.049
Jabalpur 19.50% 45.39% 0.089
Jhabua 68.86% 55.97% 0.385
Katni 39.94% 45.25% 0.181
Mandla 48.09% 47.20% 0.227
Mandsaur 33.27% 45.15% 0.150
Morena 32.50% 44.83% 0.146
Narsimhapur 30.55% 44.63% 0.136
Neemuch 31.87% 44.94% 0.143
Panna 42.63% 47.93% 0.204
Raisen 34.52% 44.76% 0.155
Rajgarh 41.99% 45.91% 0.193
Ratlam 41.67% 48.50% 0.202
Rewa 37.04% 44.72% 0.166
Sagar 40.47% 44.53% 0.180
Satna 34.12% 43.96% 0.150
Sehore 26.80% 46.46% 0.125
Seoni 42.55% 44.50% 0.189
Shahdol 43.47% 46.41% 0.202
Shajapur 33.59% 45.72% 0.154
Sheopur 49.83% 49.56% 0.247
Shivpuri 46.09% 46.43% 0.214
Sidhi 52.68% 48.18% 0.254
Singrauli 51.92% 50.76% 0.264
Tikamgarh 47.52% 45.89% 0.218
Ujjain 29.80% 45.70% 0.136
Umaria 45.58% 46.06% 0.210
Vidisha 47.19% 48.64% 0.230
West Nimar 35.80% 49.16% 0.176
Rural Urban
Districts of Madhya Pradesh Headcount Ratio
Intensity MPIHeadcount
RatioIntensity MPI
Alirajpur 75.85% 57.26% 0.434 15.27% 44.80% 0.068
Anuppur 49.91% 45.49% 0.227 14.44% 42.46% 0.061
Ashoknagar 46.07% 47.48% 0.219 26.93% 44.80% 0.121
Balaghat 44.01% 43.71% 0.192 14.25% 41.12% 0.059
Barwani 70.72% 57.79% 0.409 14.24% 44.00% 0.063
Betul 41.59% 46.96% 0.195 3.89% 44.13% 0.017
Bhind 37.35% 44.46% 0.166 24.45% 42.78% 0.105
Bhopal 30.30% 45.66% 0.138 8.64% 44.97% 0.039
Burhanpur 49.48% 53.73% 0.266 16.29% 44.51% 0.073
Chhatarpur 57.12% 48.27% 0.276 19.05% 49.23% 0.094
Chhindwara 37.14% 46.31% 0.172 8.73% 42.21% 0.037
Damoh 54.26% 46.87% 0.254 20.29% 41.41% 0.084
Datia 41.62% 43.97% 0.183 8.60% 48.75% 0.042
Dewas 36.35% 45.98% 0.167 13.19% 49.47% 0.065
Dhar 48.00% 49.86% 0.239 14.27% 42.60% 0.061
Dindori 58.15% 47.17% 0.274 16.11% 55.19% 0.089
East Nimar 50.95% 47.94% 0.244 9.82% 40.43% 0.040
Guna 56.12% 47.56% 0.267 15.13% 44.60% 0.067
Gwalior 39.84% 45.25% 0.180 13.03% 42.64% 0.056
Harda 39.82% 47.12% 0.188 10.64% 39.71% 0.042
Hoshangabad 32.50% 44.41% 0.144 7.02% 40.30% 0.028
Indore 20.39% 47.69% 0.097 8.25% 43.53% 0.036
Jabalpur 33.72% 45.34% 0.153 8.65% 45.55% 0.039
Jhabua 72.38% 56.22% 0.407 34.57% 50.95% 0.176
Katni 45.70% 45.49% 0.208 10.69% 39.95% 0.043
Mandla 53.38% 47.41% 0.253 11.32% 40.48% 0.046
Mandsaur 38.65% 45.42% 0.176 16.14% 43.14% 0.070
Morena 38.97% 44.69% 0.174 16.98% 45.58% 0.077
Narsimhapur 36.35% 44.82% 0.163 9.76% 42.02% 0.041
Neemuch 37.30% 45.49% 0.170 18.49% 42.21% 0.078
Panna 47.17% 48.26% 0.228 18.49% 43.41% 0.080
Raisen 41.31% 45.10% 0.186 14.30% 41.87% 0.060
Rajgarh 48.71% 46.16% 0.225 14.07% 42.25% 0.059
Ratlam 51.83% 48.50% 0.251 20.12% 48.50% 0.098
Rewa 40.75% 45.10% 0.184 18.12% 40.41% 0.073
Sagar 44.82% 44.62% 0.200 29.25% 44.16% 0.129
Satna 40.66% 44.15% 0.180 9.64% 40.84% 0.039
Sehore 31.28% 46.57% 0.146 8.80% 45.02% 0.040
Seoni 46.39% 44.58% 0.207 14.99% 42.62% 0.064
Shahdol 48.90% 46.47% 0.227 17.43% 45.69% 0.080
Shajapur 39.29% 45.85% 0.180 11.36% 43.96% 0.050
Sheopur 53.22% 49.28% 0.262 30.07% 52.37% 0.157
Shivpuri 53.76% 46.78% 0.252 14.11% 40.84% 0.058
Sidhi 54.92% 48.40% 0.266 28.18% 43.50% 0.123
Singrauli 58.92% 50.83% 0.299 22.05% 49.96% 0.110
Tikamgarh 50.13% 45.27% 0.227 33.25% 51.04% 0.170
Ujjain 40.59% 45.57% 0.185 13.33% 46.33% 0.062
Umaria 50.70% 46.25% 0.234 22.44% 44.12% 0.099
Vidisha 51.78% 48.87% 0.253 34.46% 47.71% 0.164
West Nimar 39.87% 49.11% 0.196 14.61% 49.79% 0.073
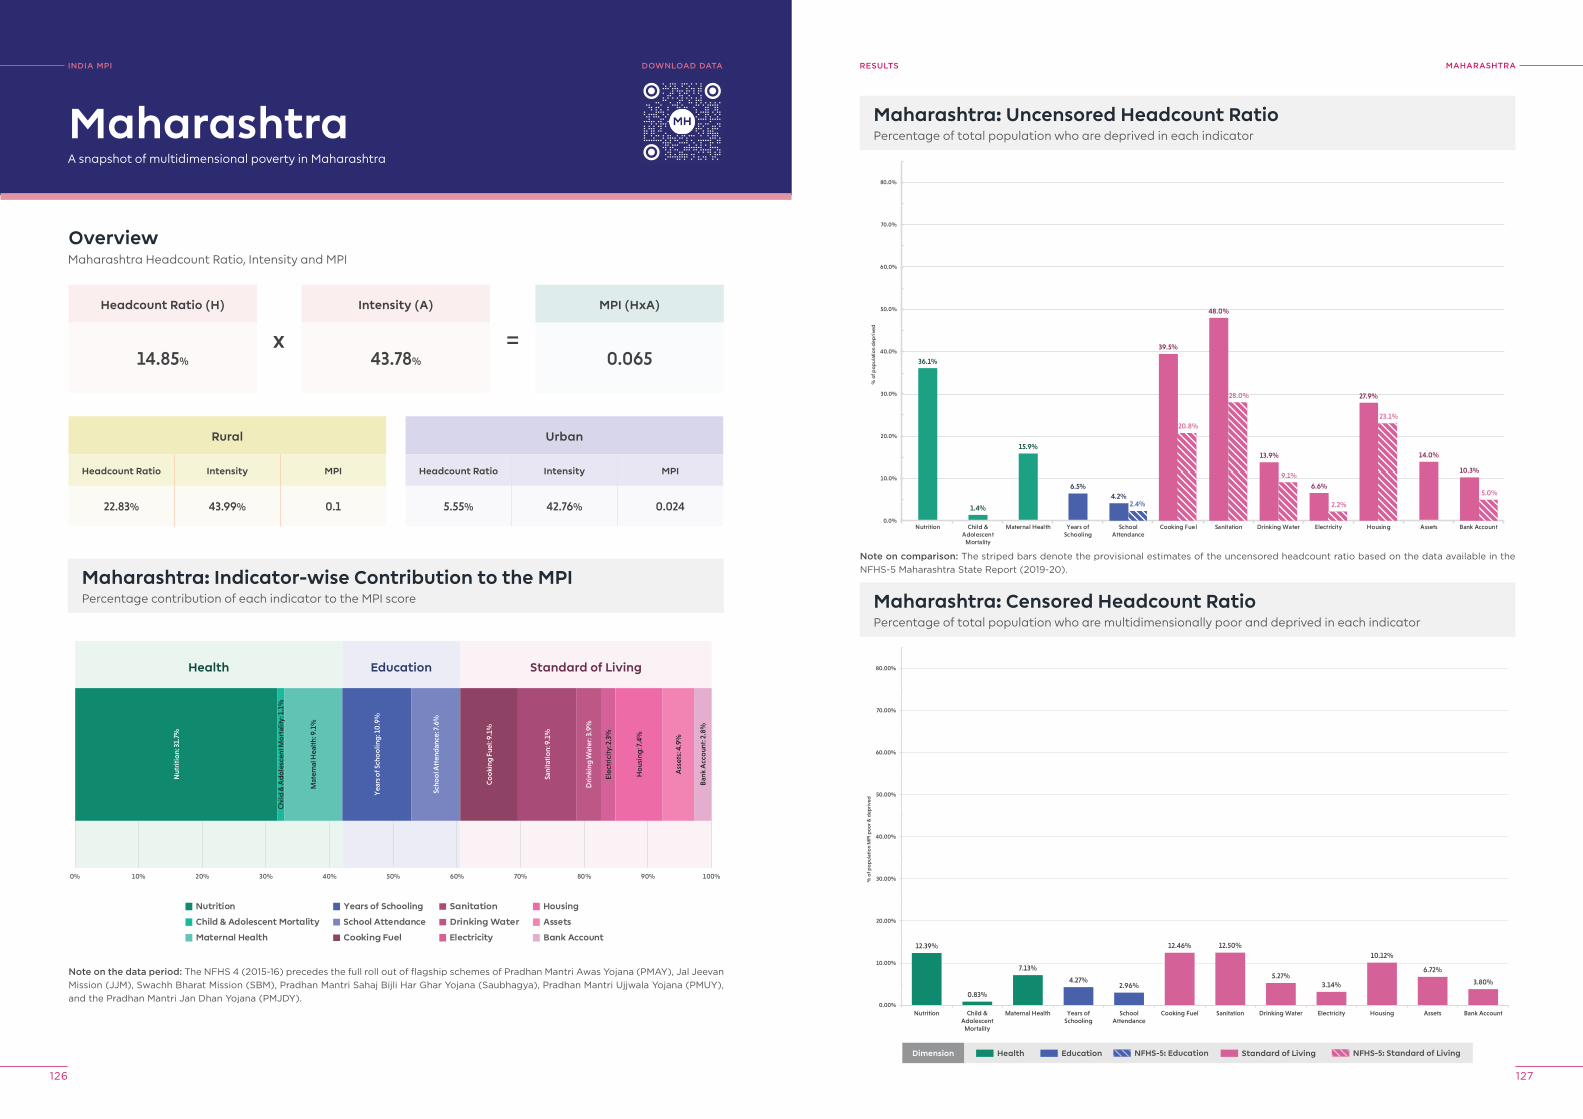
INDIA MPI BASELINE REPORT
126 127
MAhArAShTrAreSUlTS
Maharashtra: Uncensored Headcount RatioPercentage of total population who are deprived in each indicator
36.1%
1.4%
15.9%
6.5%
14.0%
4.2%2.4%
39.5%
20.8%
48.0%
28.0%
13.9%
9.1%
6.6%
2.2%
27.9%
23.1%
10.3%
5.0%
0.0%
10.0%
20.0%
30.0%
40.0%
50.0%
60.0%
70.0%
80.0%
Nutrition Child &Adolescent
Mortality
Maternal Health Years ofSchooling
SchoolAttendance
Cooking Fuel Sanitation Drinking Water Electricity Housing Assets Bank Account
% o
f pop
ulat
ion
dep
rive
d
12.39%
0.83%
7.13%
4.27%2.96%
12.46% 12.50%
5.27%3.14%
10.12%
6.72%
3.80%
0.00%
10.00%
20.00%
30.00%
40.00%
50.00%
60.00%
70.00%
80.00%
Nutrition Child &Adolescent
Mortality
Maternal Health Years ofSchooling
SchoolAttendance
Cooking Fuel Sanitation Drinking Water Electricity Housing Assets Bank Account
% o
f po
pul
atio
n M
PI p
oo
r & d
epri
ved
Maharashtra: Censored Headcount RatioPercentage of total population who are multidimensionally poor and deprived in each indicator
INDIA MpI
A snapshot of multidimensional poverty in Maharashtra
OverviewMaharashtra Headcount Ratio, Intensity and MPI
Headcount Ratio (H)
14.85%
Rural
Headcount Ratio Intensity MPI
22.83% 43.99% 0.1
Maharashtra: Indicator-wise Contribution to the MPIPercentage contribution of each indicator to the MPI score
Intensity (A)
43.78%
MPI (HxA)
0.065
Maharashtra
Urban
Headcount Ratio Intensity MPI
5.55% 42.76% 0.024
x =
Note on the data period: The NFHS 4 (2015-16) precedes the full roll out of flagship schemes of Pradhan Mantri Awas Yojana (PMAY), Jal Jeevan Mission (JJM), Swachh Bharat Mission (SBM), Pradhan Mantri Sahaj Bijli Har Ghar Yojana (Saubhagya), Pradhan Mantri Ujjwala Yojana (PMUY), and the Pradhan Mantri Jan Dhan Yojana (PMJDY).
Nutrition
Child & Adolescent Mortality
Maternal Health
Years of Schooling
School Attendance
Cooking Fuel
Sanitation
Drinking Water
Electricity
Housing
Assets
Bank Account
0% 10% 20% 30% 40% 50% 60% 70% 80% 90% 100%
Health Education Standard of Living
Nut
riti
on:
31.
7%
Chi
ld &
Ad
ole
scen
t Mo
rtal
ity: 1
.1%
Mat
erna
l Hea
lth:
9.1
%
Yea
rs o
f Sch
oo
ling
: 10
.9%
Scho
ol A
tten
dan
ce: 7
.6%
Co
oki
ng F
uel:
9.1%
Sani
tati
on:
9.1
%
Dri
nkin
g W
ater
: 3.9
%
Elec
tric
ity:
2.3
%
Ho
usin
g: 7
.4%
Ass
ets:
4.9
%
Ban
k A
cco
unt:
2.8
%
DoWNloAD DATA
Note on comparison: The striped bars denote the provisional estimates of the uncensored headcount ratio based on the data available in the NFHS-5 Maharashtra State Report (2019-20).
Dimension Health Education Standard of Living NFHS-5: Standard of LivingNFHS-5: Education
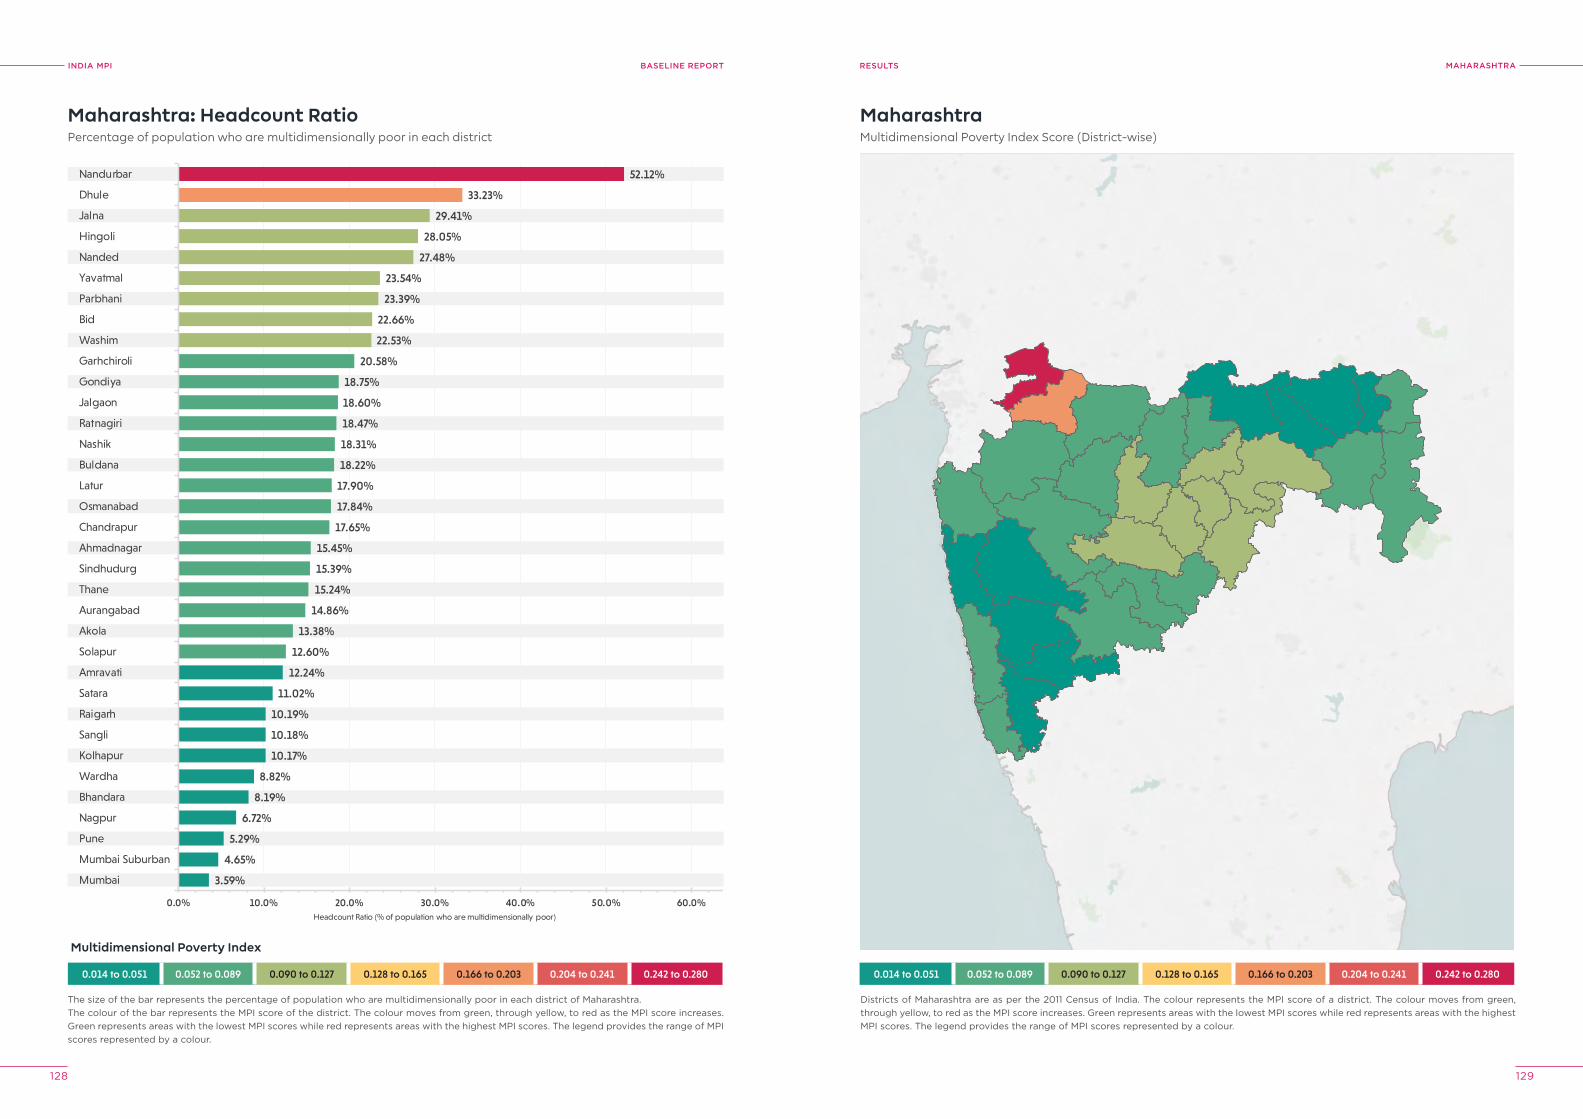
INDIA MPI BASELINE REPORT
128 129
MAhArAShTrAreSUlTS
0.014 to 0.051 0.052 to 0.089 0.090 to 0.127 0.128 to 0.165 0.166 to 0.203 0.204 to 0.241 0.242 to 0.280
3.59%
4.65%
5.29%
6.72%
8.19%
8.82%
10.17%
10.18%
10.19%
11.02%
12.24%
12.60%
13.38%
14.86%
15.24%
15.39%
15.45%
17.65%
17.84%
17.90%
18.22%
18.31%
18.47%
18.60%
18.75%
20.58%
22.53%
22.66%
23.39%
23.54%
27.48%
28.05%
29.41%
33.23%
52.12%
0.0% 10.0% 20.0% 30.0% 40.0% 50.0% 60.0%
Mumbai
Mumbai Suburban
Pune
Nagpur
Bhandara
Wardha
Kolhapur
Sangli
Raigarh
Satara
Amravati
Solapur
Akola
Aurangabad
Thane
Sindhudurg
Ahmadnagar
Chandrapur
Osmanabad
Latur
Buldana
Nashik
Ratnagiri
Jalgaon
Gondiya
Garhchiroli
Washim
Bid
Parbhani
Yavatmal
Nanded
Hingoli
Jalna
Dhule
Nandurbar
Headcount Ratio (% of population who are multidimensionally poor)
Maharashtra: Headcount RatioPercentage of population who are multidimensionally poor in each district
The size of the bar represents the percentage of population who are multidimensionally poor in each district of Maharashtra.The colour of the bar represents the MPI score of the district. The colour moves from green, through yellow, to red as the MPI score increases. Green represents areas with the lowest MPI scores while red represents areas with the highest MPI scores. The legend provides the range of MPI scores represented by a colour.
MaharashtraMultidimensional Poverty Index Score (District-wise)
Districts of Maharashtra are as per the 2011 Census of India. The colour represents the MPI score of a district. The colour moves from green, through yellow, to red as the MPI score increases. Green represents areas with the lowest MPI scores while red represents areas with the highest MPI scores. The legend provides the range of MPI scores represented by a colour.
0.014 to 0.051 0.052 to 0.089 0.090 to 0.127 0.128 to 0.165 0.166 to 0.203 0.204 to 0.241 0.242 to 0.280
Multidimensional Poverty Index
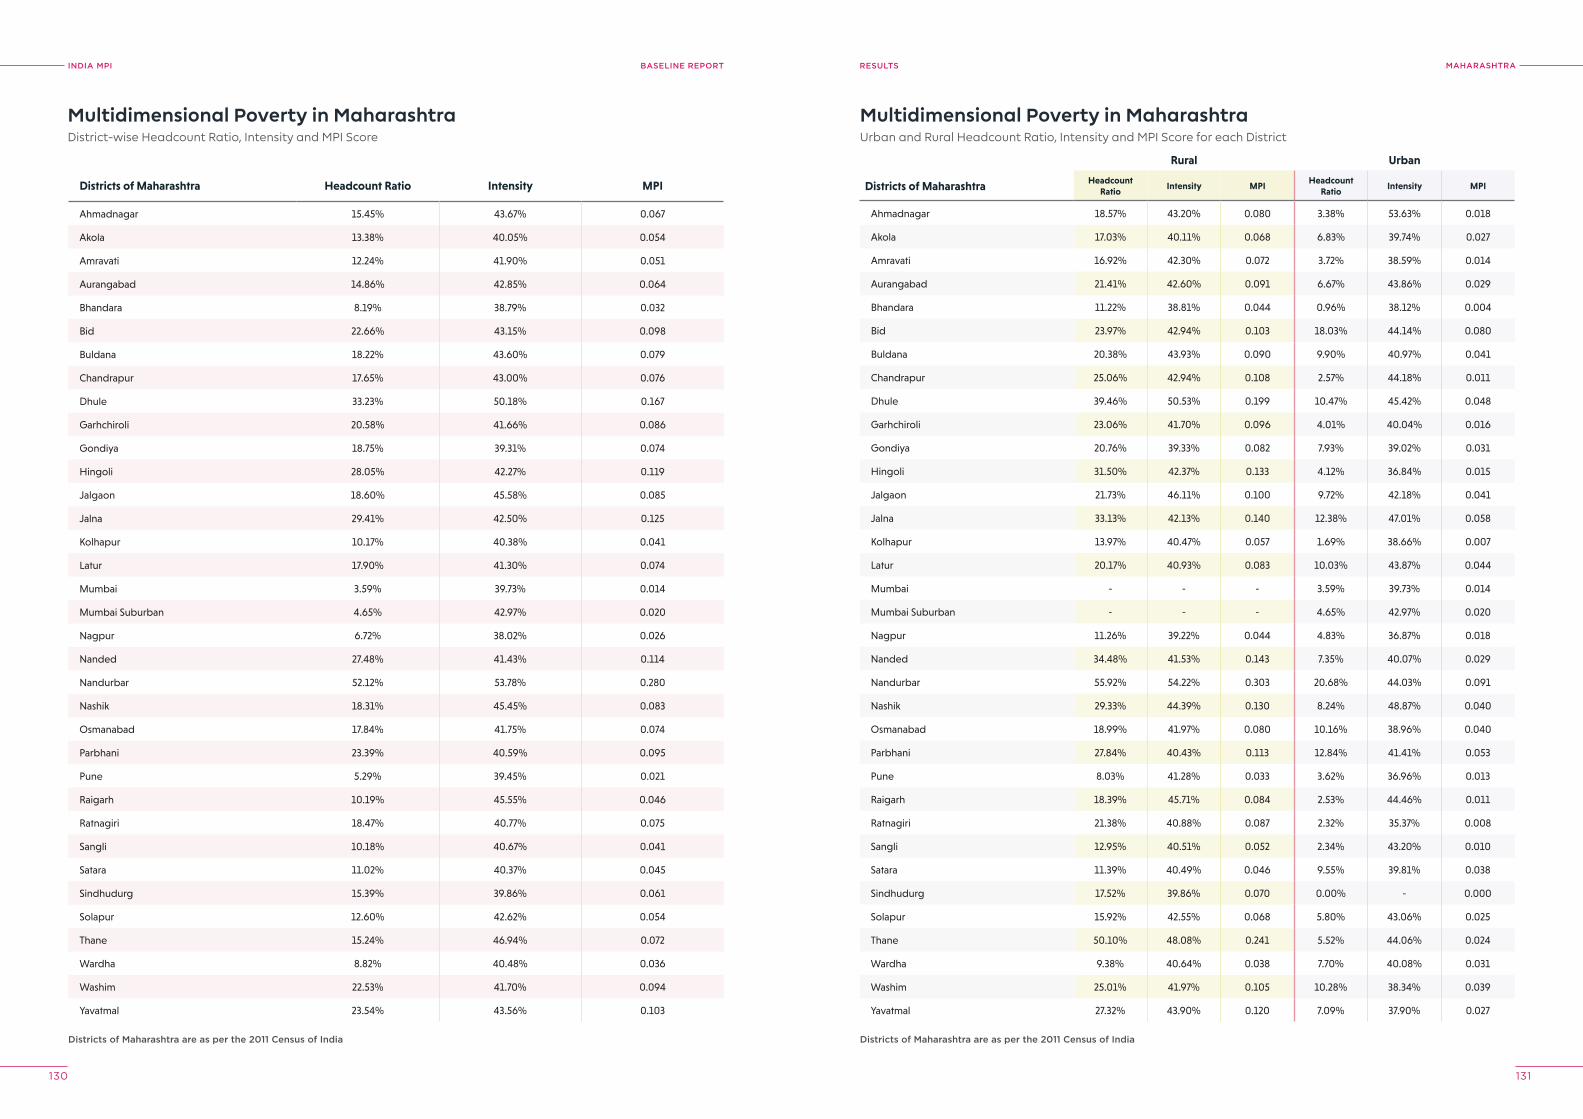
INDIA MPI BASELINE REPORT
130 131
MAhArAShTrAreSUlTS
Multidimensional Poverty in MaharashtraDistrict-wise Headcount Ratio, Intensity and MPI Score
Multidimensional Poverty in MaharashtraUrban and Rural Headcount Ratio, Intensity and MPI Score for each District
Districts of Maharashtra are as per the 2011 Census of India Districts of Maharashtra are as per the 2011 Census of India
Districts of Maharashtra Headcount Ratio Intensity MPI
Ahmadnagar 15.45% 43.67% 0.067
Akola 13.38% 40.05% 0.054
Amravati 12.24% 41.90% 0.051
Aurangabad 14.86% 42.85% 0.064
Bhandara 8.19% 38.79% 0.032
Bid 22.66% 43.15% 0.098
Buldana 18.22% 43.60% 0.079
Chandrapur 17.65% 43.00% 0.076
Dhule 33.23% 50.18% 0.167
Garhchiroli 20.58% 41.66% 0.086
Gondiya 18.75% 39.31% 0.074
Hingoli 28.05% 42.27% 0.119
Jalgaon 18.60% 45.58% 0.085
Jalna 29.41% 42.50% 0.125
Kolhapur 10.17% 40.38% 0.041
Latur 17.90% 41.30% 0.074
Mumbai 3.59% 39.73% 0.014
Mumbai Suburban 4.65% 42.97% 0.020
Nagpur 6.72% 38.02% 0.026
Nanded 27.48% 41.43% 0.114
Nandurbar 52.12% 53.78% 0.280
Nashik 18.31% 45.45% 0.083
Osmanabad 17.84% 41.75% 0.074
Parbhani 23.39% 40.59% 0.095
Pune 5.29% 39.45% 0.021
Raigarh 10.19% 45.55% 0.046
Ratnagiri 18.47% 40.77% 0.075
Sangli 10.18% 40.67% 0.041
Satara 11.02% 40.37% 0.045
Sindhudurg 15.39% 39.86% 0.061
Solapur 12.60% 42.62% 0.054
Thane 15.24% 46.94% 0.072
Wardha 8.82% 40.48% 0.036
Washim 22.53% 41.70% 0.094
Yavatmal 23.54% 43.56% 0.103
Rural Urban
Districts of Maharashtra Headcount Ratio
Intensity MPIHeadcount
RatioIntensity MPI
Ahmadnagar 18.57% 43.20% 0.080 3.38% 53.63% 0.018
Akola 17.03% 40.11% 0.068 6.83% 39.74% 0.027
Amravati 16.92% 42.30% 0.072 3.72% 38.59% 0.014
Aurangabad 21.41% 42.60% 0.091 6.67% 43.86% 0.029
Bhandara 11.22% 38.81% 0.044 0.96% 38.12% 0.004
Bid 23.97% 42.94% 0.103 18.03% 44.14% 0.080
Buldana 20.38% 43.93% 0.090 9.90% 40.97% 0.041
Chandrapur 25.06% 42.94% 0.108 2.57% 44.18% 0.011
Dhule 39.46% 50.53% 0.199 10.47% 45.42% 0.048
Garhchiroli 23.06% 41.70% 0.096 4.01% 40.04% 0.016
Gondiya 20.76% 39.33% 0.082 7.93% 39.02% 0.031
Hingoli 31.50% 42.37% 0.133 4.12% 36.84% 0.015
Jalgaon 21.73% 46.11% 0.100 9.72% 42.18% 0.041
Jalna 33.13% 42.13% 0.140 12.38% 47.01% 0.058
Kolhapur 13.97% 40.47% 0.057 1.69% 38.66% 0.007
Latur 20.17% 40.93% 0.083 10.03% 43.87% 0.044
Mumbai - - - 3.59% 39.73% 0.014
Mumbai Suburban - - - 4.65% 42.97% 0.020
Nagpur 11.26% 39.22% 0.044 4.83% 36.87% 0.018
Nanded 34.48% 41.53% 0.143 7.35% 40.07% 0.029
Nandurbar 55.92% 54.22% 0.303 20.68% 44.03% 0.091
Nashik 29.33% 44.39% 0.130 8.24% 48.87% 0.040
Osmanabad 18.99% 41.97% 0.080 10.16% 38.96% 0.040
Parbhani 27.84% 40.43% 0.113 12.84% 41.41% 0.053
Pune 8.03% 41.28% 0.033 3.62% 36.96% 0.013
Raigarh 18.39% 45.71% 0.084 2.53% 44.46% 0.011
Ratnagiri 21.38% 40.88% 0.087 2.32% 35.37% 0.008
Sangli 12.95% 40.51% 0.052 2.34% 43.20% 0.010
Satara 11.39% 40.49% 0.046 9.55% 39.81% 0.038
Sindhudurg 17.52% 39.86% 0.070 0.00% - 0.000
Solapur 15.92% 42.55% 0.068 5.80% 43.06% 0.025
Thane 50.10% 48.08% 0.241 5.52% 44.06% 0.024
Wardha 9.38% 40.64% 0.038 7.70% 40.08% 0.031
Washim 25.01% 41.97% 0.105 10.28% 38.34% 0.039
Yavatmal 27.32% 43.90% 0.120 7.09% 37.90% 0.027
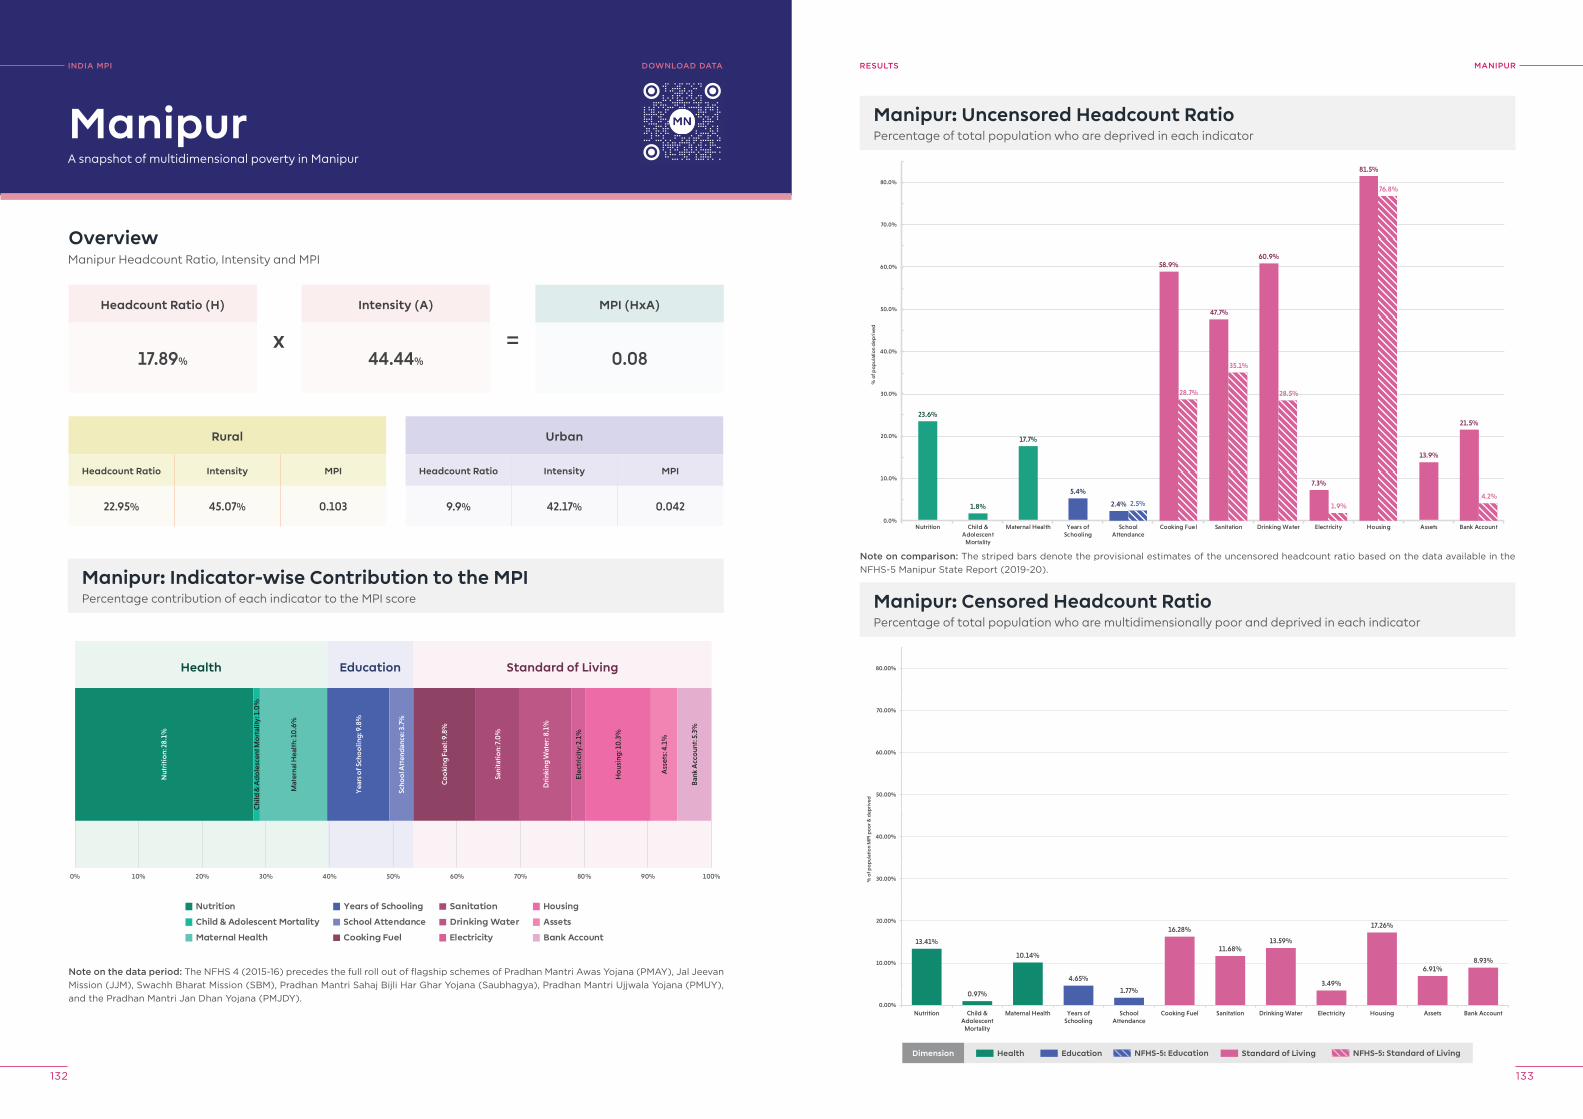
INDIA MPI BASELINE REPORT
132 133
MANIpUrreSUlTS
Manipur: Uncensored Headcount RatioPercentage of total population who are deprived in each indicator
23.6%
1.8%
17.7%
5.4%
13.9%
2.4% 2.5%
58.9%
28.7%
47.7%
35.1%
60.9%
28.5%
7.3%
1.9%
81.5%
76.8%
21.5%
4.2%
0.0%
10.0%
20.0%
30.0%
40.0%
50.0%
60.0%
70.0%
80.0%
Nutrition Child &Adolescent
Mortality
Maternal Health Years ofSchooling
SchoolAttendance
Cooking Fuel Sanitation Drinking Water Electricity Housing Assets Bank Account
% o
f pop
ulat
ion
dep
rive
d
13.41%
0.97%
10.14%
4.65%
1.77%
16.28%
11.68%13.59%
3.49%
17.26%
6.91%8.93%
0.00%
10.00%
20.00%
30.00%
40.00%
50.00%
60.00%
70.00%
80.00%
Nutrition Child &Adolescent
Mortality
Maternal Health Years ofSchooling
SchoolAttendance
Cooking Fuel Sanitation Drinking Water Electricity Housing Assets Bank Account
% o
f po
pul
atio
n M
PI p
oo
r & d
epri
ved
Manipur: Censored Headcount RatioPercentage of total population who are multidimensionally poor and deprived in each indicator
INDIA MpI
A snapshot of multidimensional poverty in Manipur
OverviewManipur Headcount Ratio, Intensity and MPI
Headcount Ratio (H)
17.89%
Rural
Headcount Ratio Intensity MPI
22.95% 45.07% 0.103
Manipur: Indicator-wise Contribution to the MPIPercentage contribution of each indicator to the MPI score
Intensity (A)
44.44%
MPI (HxA)
0.08
Manipur
Urban
Headcount Ratio Intensity MPI
9.9% 42.17% 0.042
x =
Note on the data period: The NFHS 4 (2015-16) precedes the full roll out of flagship schemes of Pradhan Mantri Awas Yojana (PMAY), Jal Jeevan Mission (JJM), Swachh Bharat Mission (SBM), Pradhan Mantri Sahaj Bijli Har Ghar Yojana (Saubhagya), Pradhan Mantri Ujjwala Yojana (PMUY), and the Pradhan Mantri Jan Dhan Yojana (PMJDY).
Nutrition
Child & Adolescent Mortality
Maternal Health
Years of Schooling
School Attendance
Cooking Fuel
Sanitation
Drinking Water
Electricity
Housing
Assets
Bank Account
0% 10% 20% 30% 40% 50% 60% 70% 80% 90% 100%
Health Education Standard of Living
Nut
riti
on:
28.
1%
Chi
ld &
Ad
ole
scen
t Mo
rtal
ity: 1
.0%
Mat
erna
l Hea
lth:
10
.6%
Yea
rs o
f Sch
oo
ling
: 9.8
%
Scho
ol A
tten
dan
ce: 3
.7%
Co
oki
ng F
uel:
9.8%
Sani
tati
on:
7.0
%
Dri
nkin
g W
ater
: 8.1
%
Elec
tric
ity:
2.1
%
Ho
usin
g: 1
0.3
%
Ass
ets:
4.1
%
Ban
k A
cco
unt:
5.3
%
DoWNloAD DATA
Note on comparison: The striped bars denote the provisional estimates of the uncensored headcount ratio based on the data available in the NFHS-5 Manipur State Report (2019-20).
Dimension Health Education Standard of Living NFHS-5: Standard of LivingNFHS-5: Education
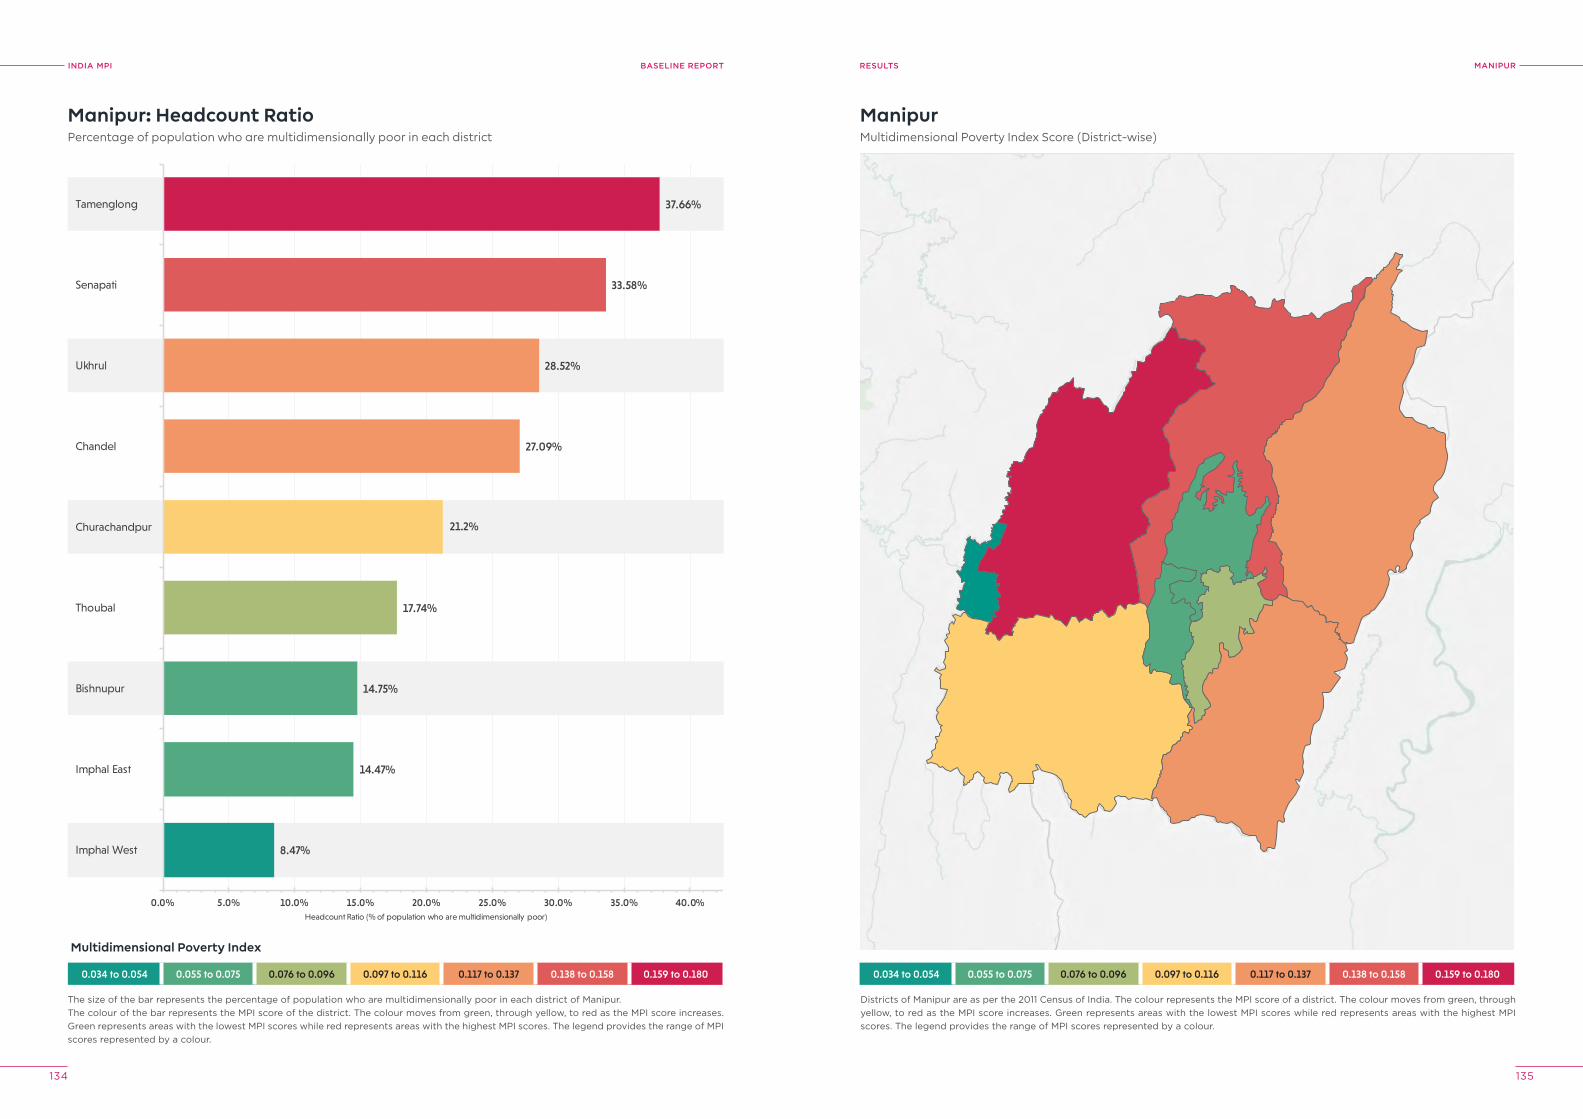
INDIA MPI BASELINE REPORT
134 135
MANIpUrreSUlTS
0.034 to 0.054 0.055 to 0.075 0.076 to 0.096 0.097 to 0.116 0.117 to 0.137 0.138 to 0.158 0.159 to 0.180
8.47%
14.47%
14.75%
17.74%
21.2%
27.09%
28.52%
33.58%
37.66%
0.0% 5.0% 10.0% 15.0% 20.0% 25.0% 30.0% 35.0% 40.0%
Imphal West
Imphal East
Bishnupur
Thoubal
Churachandpur
Chandel
Ukhrul
Senapati
Tamenglong
Headcount Ratio (% of population who are multidimensionally poor)
Manipur: Headcount RatioPercentage of population who are multidimensionally poor in each district
The size of the bar represents the percentage of population who are multidimensionally poor in each district of Manipur.The colour of the bar represents the MPI score of the district. The colour moves from green, through yellow, to red as the MPI score increases. Green represents areas with the lowest MPI scores while red represents areas with the highest MPI scores. The legend provides the range of MPI scores represented by a colour.
ManipurMultidimensional Poverty Index Score (District-wise)
Districts of Manipur are as per the 2011 Census of India. The colour represents the MPI score of a district. The colour moves from green, through yellow, to red as the MPI score increases. Green represents areas with the lowest MPI scores while red represents areas with the highest MPI scores. The legend provides the range of MPI scores represented by a colour.
0.034 to 0.054 0.055 to 0.075 0.076 to 0.096 0.097 to 0.116 0.117 to 0.137 0.138 to 0.158 0.159 to 0.180
Multidimensional Poverty Index
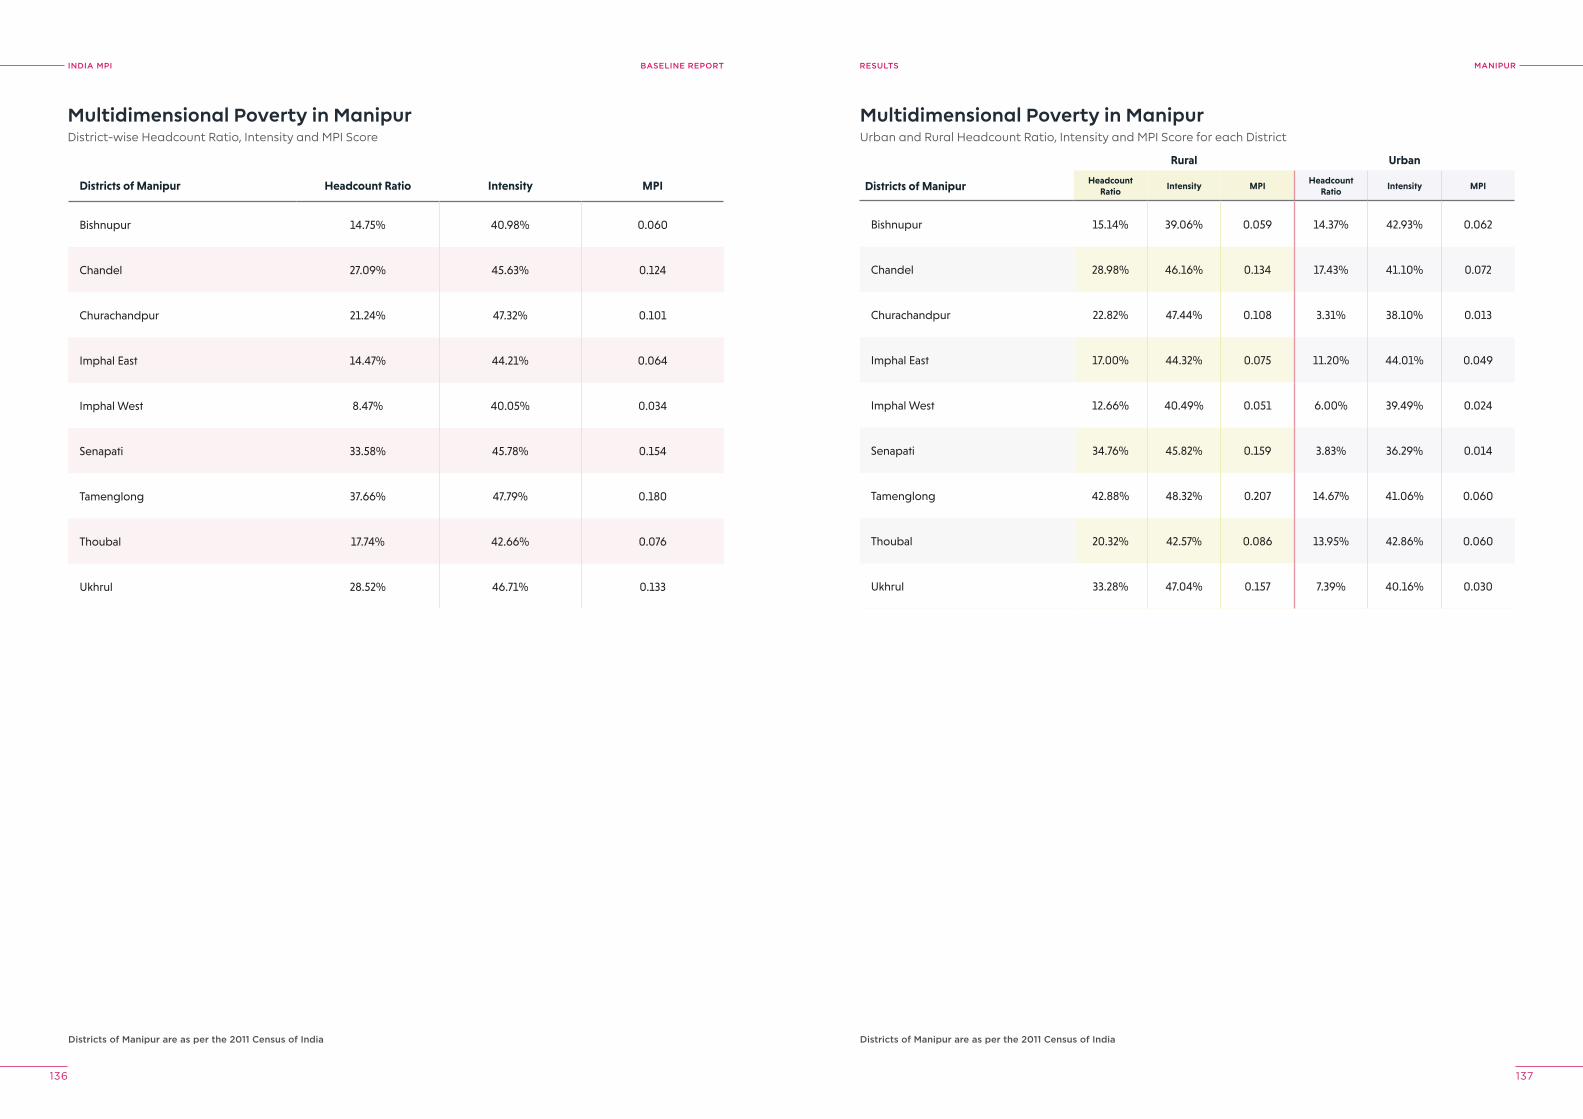
INDIA MPI BASELINE REPORT
136 137
MANIpUrreSUlTS
Multidimensional Poverty in ManipurDistrict-wise Headcount Ratio, Intensity and MPI Score
Multidimensional Poverty in ManipurUrban and Rural Headcount Ratio, Intensity and MPI Score for each District
Districts of Manipur are as per the 2011 Census of India Districts of Manipur are as per the 2011 Census of India
Districts of Manipur Headcount Ratio Intensity MPI
Bishnupur 14.75% 40.98% 0.060
Chandel 27.09% 45.63% 0.124
Churachandpur 21.24% 47.32% 0.101
Imphal East 14.47% 44.21% 0.064
Imphal West 8.47% 40.05% 0.034
Senapati 33.58% 45.78% 0.154
Tamenglong 37.66% 47.79% 0.180
Thoubal 17.74% 42.66% 0.076
Ukhrul 28.52% 46.71% 0.133
Rural Urban
Districts of Manipur Headcount Ratio
Intensity MPIHeadcount
RatioIntensity MPI
Bishnupur 15.14% 39.06% 0.059 14.37% 42.93% 0.062
Chandel 28.98% 46.16% 0.134 17.43% 41.10% 0.072
Churachandpur 22.82% 47.44% 0.108 3.31% 38.10% 0.013
Imphal East 17.00% 44.32% 0.075 11.20% 44.01% 0.049
Imphal West 12.66% 40.49% 0.051 6.00% 39.49% 0.024
Senapati 34.76% 45.82% 0.159 3.83% 36.29% 0.014
Tamenglong 42.88% 48.32% 0.207 14.67% 41.06% 0.060
Thoubal 20.32% 42.57% 0.086 13.95% 42.86% 0.060
Ukhrul 33.28% 47.04% 0.157 7.39% 40.16% 0.030
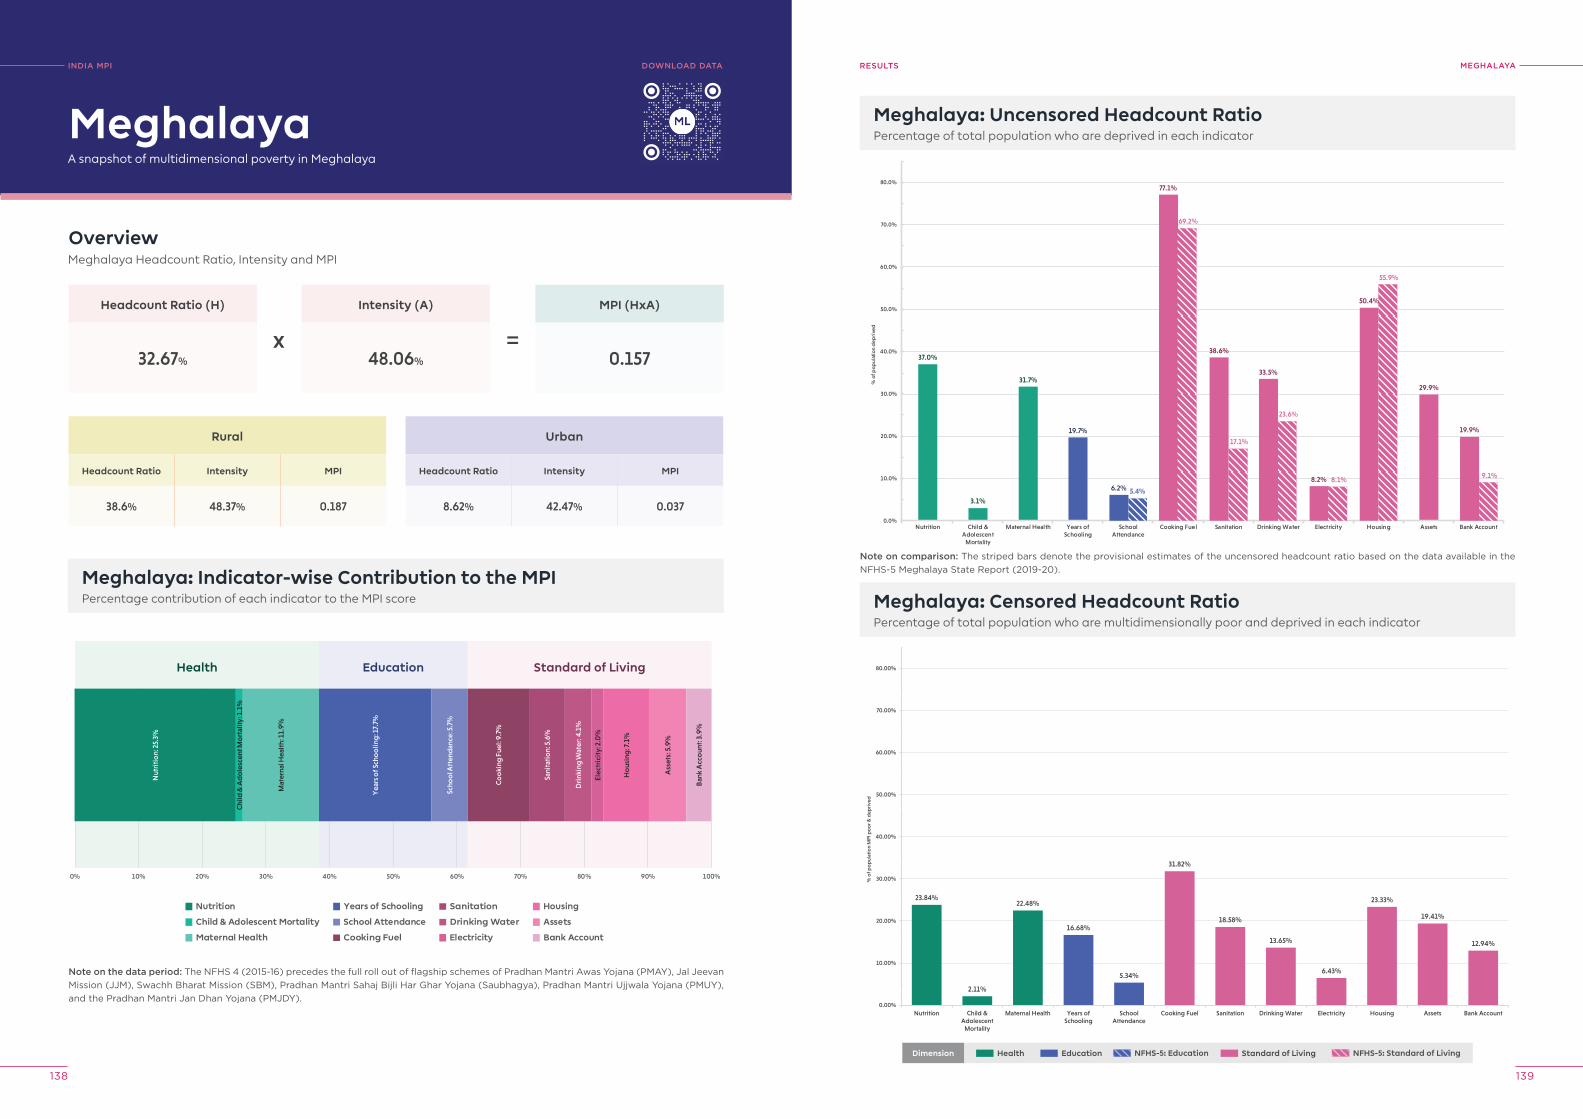
INDIA MPI BASELINE REPORT
138 139
MeGhAlAyAreSUlTS
Meghalaya: Uncensored Headcount RatioPercentage of total population who are deprived in each indicator
37.0%
3.1%
31.7%
19.7%
29.9%
6.2% 5.4%
77.1%
69.2%
38.6%
17.1%
33.5%
23.6%
8.2% 8.1%
50.4%
55.9%
19.9%
9.1%
0.0%
10.0%
20.0%
30.0%
40.0%
50.0%
60.0%
70.0%
80.0%
Nutrition Child &Adolescent
Mortality
Maternal Health Years ofSchooling
SchoolAttendance
Cooking Fuel Sanitation Drinking Water Electricity Housing Assets Bank Account
% o
f pop
ulat
ion
dep
rive
d
23.84%
2.11%
22.48%
16.68%
5.34%
31.82%
18.58%
13.65%
6.43%
23.33%
19.41%
12.94%
0.00%
10.00%
20.00%
30.00%
40.00%
50.00%
60.00%
70.00%
80.00%
Nutrition Child &Adolescent
Mortality
Maternal Health Years ofSchooling
SchoolAttendance
Cooking Fuel Sanitation Drinking Water Electricity Housing Assets Bank Account
% o
f po
pul
atio
n M
PI p
oo
r & d
epri
ved
Meghalaya: Censored Headcount RatioPercentage of total population who are multidimensionally poor and deprived in each indicator
INDIA MpI
A snapshot of multidimensional poverty in Meghalaya
OverviewMeghalaya Headcount Ratio, Intensity and MPI
Headcount Ratio (H)
32.67%
Rural
Headcount Ratio Intensity MPI
38.6% 48.37% 0.187
Meghalaya: Indicator-wise Contribution to the MPIPercentage contribution of each indicator to the MPI score
Intensity (A)
48.06%
MPI (HxA)
0.157
Meghalaya
Urban
Headcount Ratio Intensity MPI
8.62% 42.47% 0.037
x =
Note on the data period: The NFHS 4 (2015-16) precedes the full roll out of flagship schemes of Pradhan Mantri Awas Yojana (PMAY), Jal Jeevan Mission (JJM), Swachh Bharat Mission (SBM), Pradhan Mantri Sahaj Bijli Har Ghar Yojana (Saubhagya), Pradhan Mantri Ujjwala Yojana (PMUY), and the Pradhan Mantri Jan Dhan Yojana (PMJDY).
Nutrition
Child & Adolescent Mortality
Maternal Health
Years of Schooling
School Attendance
Cooking Fuel
Sanitation
Drinking Water
Electricity
Housing
Assets
Bank Account
0% 10% 20% 30% 40% 50% 60% 70% 80% 90% 100%
Health Education Standard of Living
Nut
riti
on:
25.
3%
Chi
ld &
Ad
ole
scen
t Mo
rtal
ity: 1
.1%
Mat
erna
l Hea
lth:
11.
9%
Yea
rs o
f Sch
oo
ling
: 17.
7%
Scho
ol A
tten
dan
ce: 5
.7%
Co
oki
ng F
uel:
9.7%
Sani
tati
on:
5.6
%
Dri
nkin
g W
ater
: 4.1
%
Elec
tric
ity:
2.0
%
Ho
usin
g: 7
.1%
Ass
ets:
5.9
%
Ban
k A
cco
unt:
3.9
%
DoWNloAD DATA
Note on comparison: The striped bars denote the provisional estimates of the uncensored headcount ratio based on the data available in the NFHS-5 Meghalaya State Report (2019-20).
Dimension Health Education Standard of Living NFHS-5: Standard of LivingNFHS-5: Education
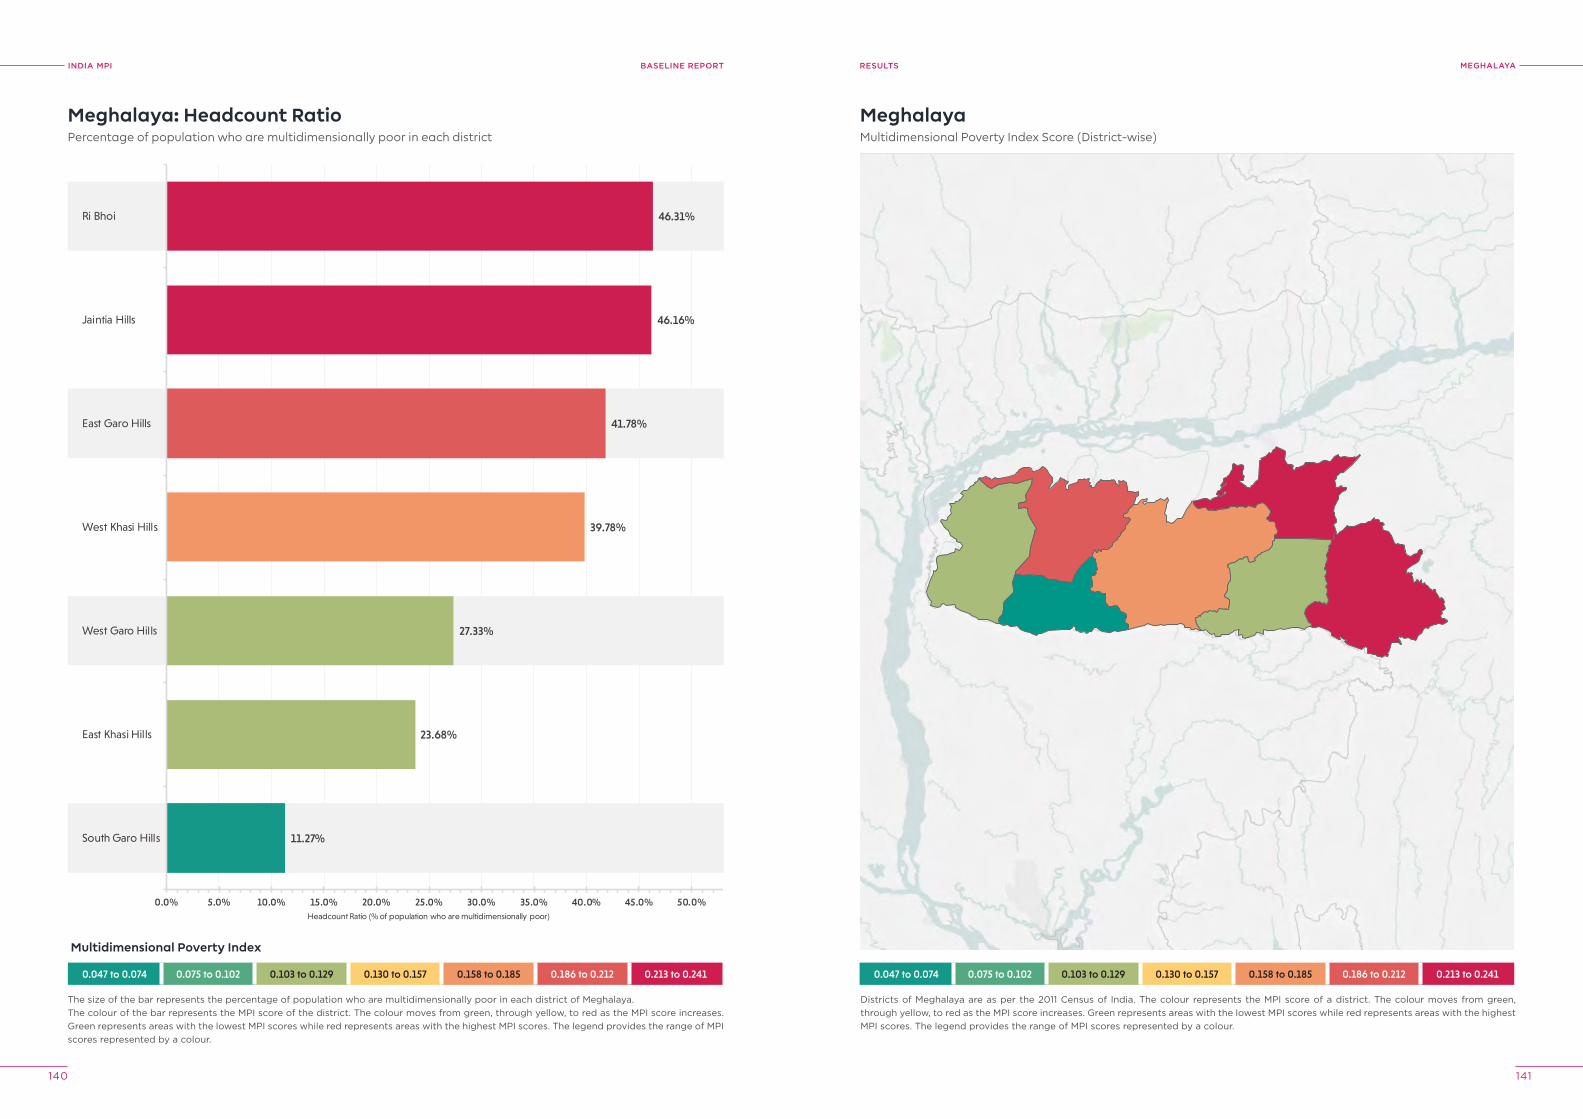
INDIA MPI BASELINE REPORT
140 141
MeGhAlAyAreSUlTS
0.047 to 0.074 0.075 to 0.102 0.103 to 0.129 0.130 to 0.157 0.158 to 0.185 0.186 to 0.212 0.213 to 0.241
11.27%
23.68%
27.33%
39.78%
41.78%
46.16%
46.31%
0.0% 5.0% 10.0% 15.0% 20.0% 25.0% 30.0% 35.0% 40.0% 45.0% 50.0%
South Garo Hills
East Khasi Hills
West Garo Hills
West Khasi Hills
East Garo Hills
Jaintia Hills
Ri Bhoi
Headcount Ratio (% of population who are multidimensionally poor)
Meghalaya: Headcount RatioPercentage of population who are multidimensionally poor in each district
The size of the bar represents the percentage of population who are multidimensionally poor in each district of Meghalaya.The colour of the bar represents the MPI score of the district. The colour moves from green, through yellow, to red as the MPI score increases. Green represents areas with the lowest MPI scores while red represents areas with the highest MPI scores. The legend provides the range of MPI scores represented by a colour.
MeghalayaMultidimensional Poverty Index Score (District-wise)
Districts of Meghalaya are as per the 2011 Census of India. The colour represents the MPI score of a district. The colour moves from green, through yellow, to red as the MPI score increases. Green represents areas with the lowest MPI scores while red represents areas with the highest MPI scores. The legend provides the range of MPI scores represented by a colour.
0.047 to 0.074 0.075 to 0.102 0.103 to 0.129 0.130 to 0.157 0.158 to 0.185 0.186 to 0.212 0.213 to 0.241
Multidimensional Poverty Index
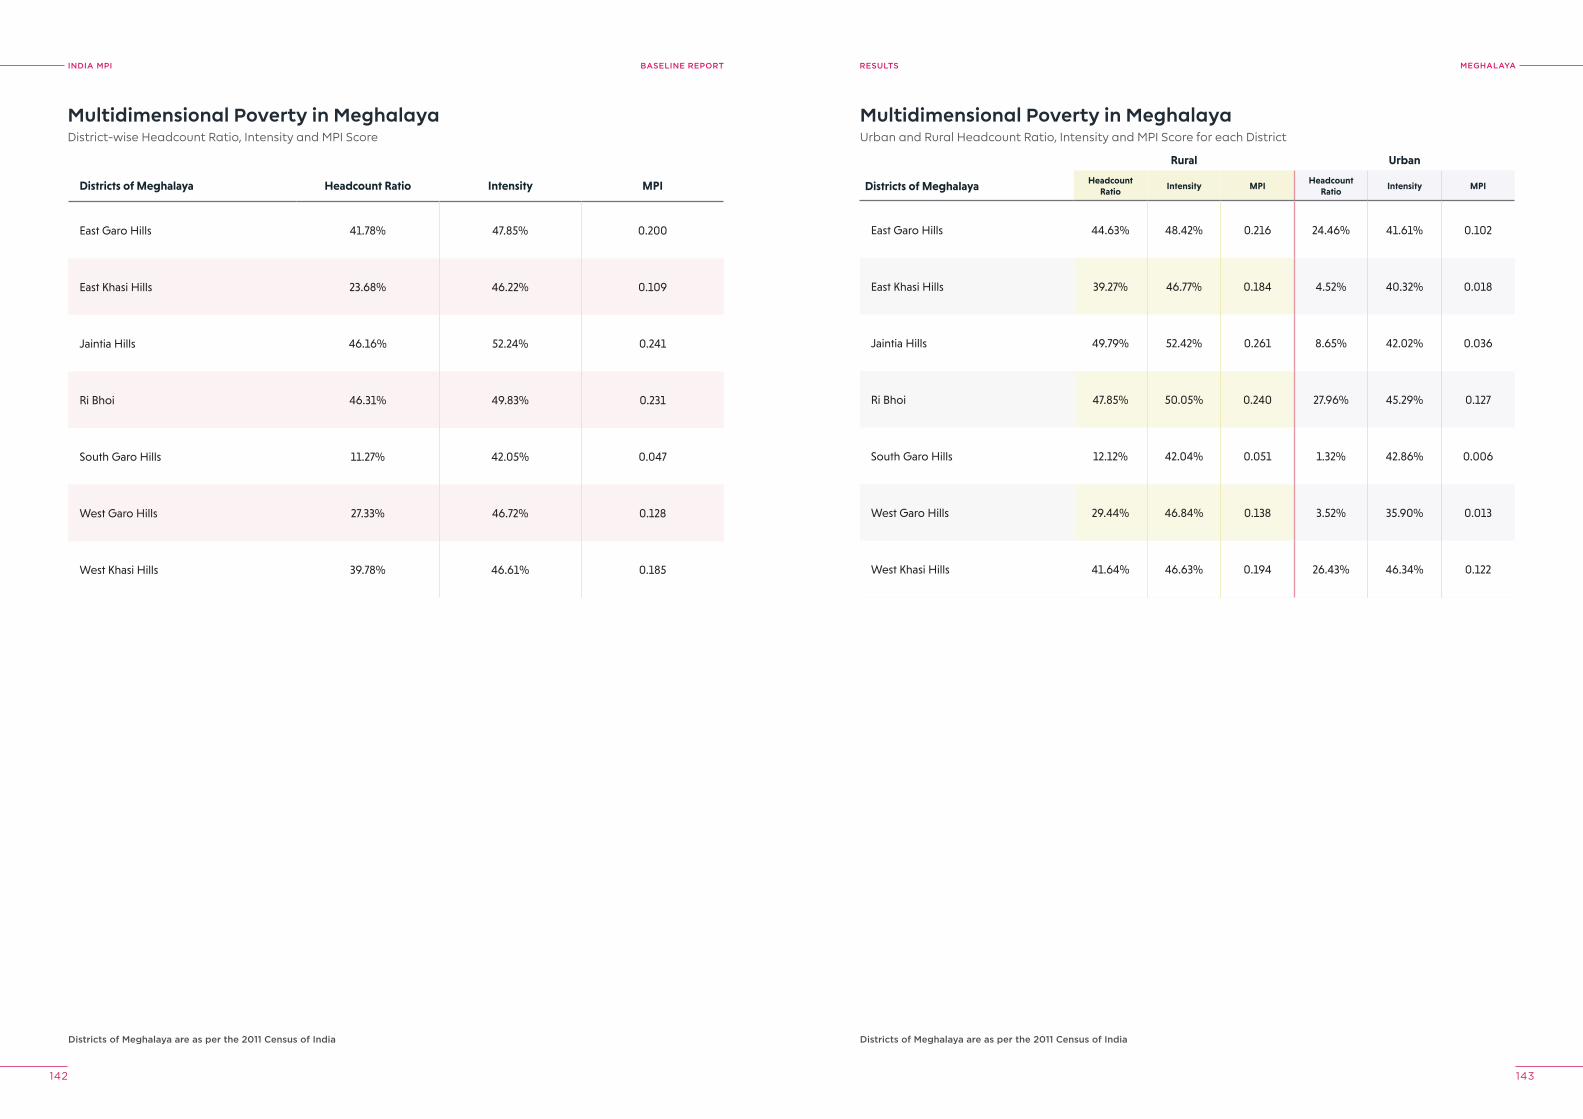
INDIA MPI BASELINE REPORT
142 143
MeGhAlAyAreSUlTS
Multidimensional Poverty in MeghalayaDistrict-wise Headcount Ratio, Intensity and MPI Score
Multidimensional Poverty in MeghalayaUrban and Rural Headcount Ratio, Intensity and MPI Score for each District
Districts of Meghalaya are as per the 2011 Census of India Districts of Meghalaya are as per the 2011 Census of India
Districts of Meghalaya Headcount Ratio Intensity MPI
East Garo Hills 41.78% 47.85% 0.200
East Khasi Hills 23.68% 46.22% 0.109
Jaintia Hills 46.16% 52.24% 0.241
Ri Bhoi 46.31% 49.83% 0.231
South Garo Hills 11.27% 42.05% 0.047
West Garo Hills 27.33% 46.72% 0.128
West Khasi Hills 39.78% 46.61% 0.185
Rural Urban
Districts of Meghalaya Headcount Ratio
Intensity MPIHeadcount
RatioIntensity MPI
East Garo Hills 44.63% 48.42% 0.216 24.46% 41.61% 0.102
East Khasi Hills 39.27% 46.77% 0.184 4.52% 40.32% 0.018
Jaintia Hills 49.79% 52.42% 0.261 8.65% 42.02% 0.036
Ri Bhoi 47.85% 50.05% 0.240 27.96% 45.29% 0.127
South Garo Hills 12.12% 42.04% 0.051 1.32% 42.86% 0.006
West Garo Hills 29.44% 46.84% 0.138 3.52% 35.90% 0.013
West Khasi Hills 41.64% 46.63% 0.194 26.43% 46.34% 0.122
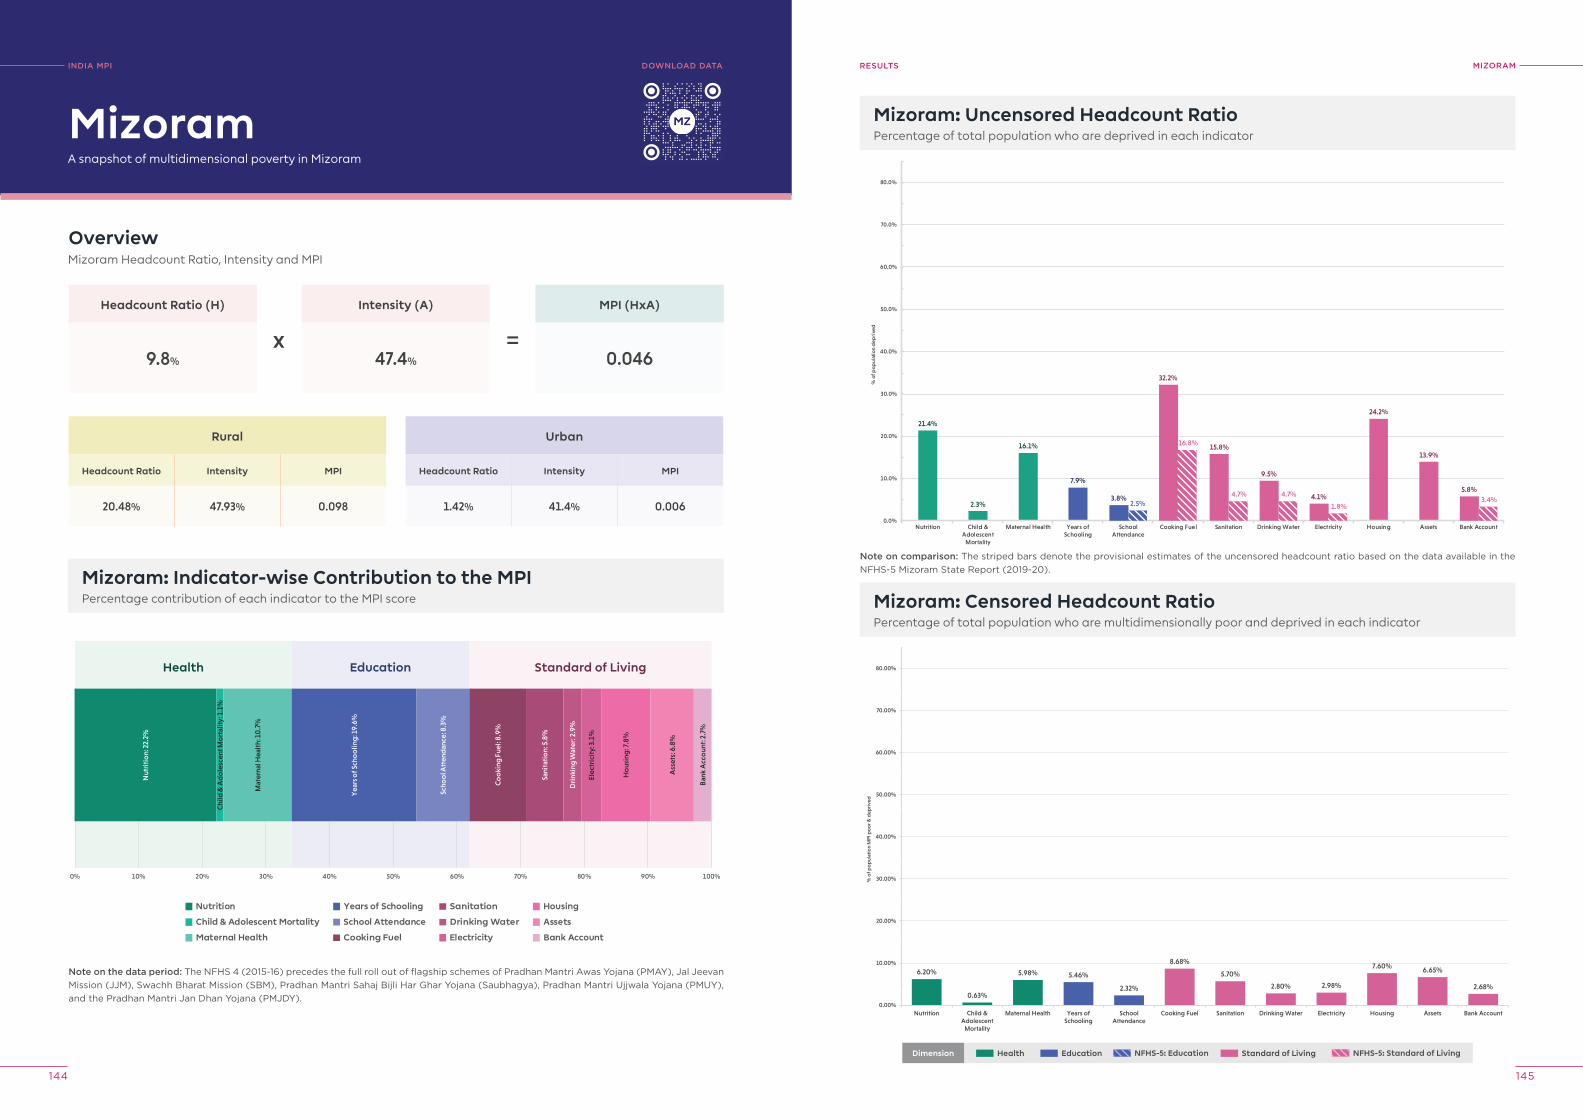
INDIA MPI BASELINE REPORT
144 145
MIzorAMreSUlTS
Mizoram: Uncensored Headcount RatioPercentage of total population who are deprived in each indicator
21.4%
2.3%
16.1%
7.9%
24.2%
13.9%
3.8%2.5%
32.2%
16.8%15.8%
4.7%
9.5%
4.7% 4.1%1.8%
5.8%3.4%
0.0%
10.0%
20.0%
30.0%
40.0%
50.0%
60.0%
70.0%
80.0%
Nutrition Child &Adolescent
Mortality
Maternal Health Years ofSchooling
SchoolAttendance
Cooking Fuel Sanitation Drinking Water Electricity Housing Assets Bank Account
% o
f pop
ulat
ion
dep
rive
d
6.20%
0.63%
5.98% 5.46%
2.32%
8.68%
5.70%
2.80% 2.98%
7.60% 6.65%
2.68%
0.00%
10.00%
20.00%
30.00%
40.00%
50.00%
60.00%
70.00%
80.00%
Nutrition Child &Adolescent
Mortality
Maternal Health Years ofSchooling
SchoolAttendance
Cooking Fuel Sanitation Drinking Water Electricity Housing Assets Bank Account
% o
f po
pul
atio
n M
PI p
oo
r & d
epri
ved
Mizoram: Censored Headcount RatioPercentage of total population who are multidimensionally poor and deprived in each indicator
INDIA MpI
A snapshot of multidimensional poverty in Mizoram
OverviewMizoram Headcount Ratio, Intensity and MPI
Headcount Ratio (H)
9.8%
Rural
Headcount Ratio Intensity MPI
20.48% 47.93% 0.098
Mizoram: Indicator-wise Contribution to the MPIPercentage contribution of each indicator to the MPI score
Intensity (A)
47.4%
MPI (HxA)
0.046
Mizoram
Urban
Headcount Ratio Intensity MPI
1.42% 41.4% 0.006
x =
Note on the data period: The NFHS 4 (2015-16) precedes the full roll out of flagship schemes of Pradhan Mantri Awas Yojana (PMAY), Jal Jeevan Mission (JJM), Swachh Bharat Mission (SBM), Pradhan Mantri Sahaj Bijli Har Ghar Yojana (Saubhagya), Pradhan Mantri Ujjwala Yojana (PMUY), and the Pradhan Mantri Jan Dhan Yojana (PMJDY).
Nutrition
Child & Adolescent Mortality
Maternal Health
Years of Schooling
School Attendance
Cooking Fuel
Sanitation
Drinking Water
Electricity
Housing
Assets
Bank Account
0% 10% 20% 30% 40% 50% 60% 70% 80% 90% 100%
Health Education Standard of Living
Nut
riti
on:
22.
2%
Chi
ld &
Ad
ole
scen
t Mo
rtal
ity: 1
.1%
Mat
erna
l Hea
lth:
10
.7%
Yea
rs o
f Sch
oo
ling
: 19.
6%
Scho
ol A
tten
dan
ce: 8
.3%
Co
oki
ng F
uel:
8.9%
Sani
tati
on:
5.8
%
Dri
nkin
g W
ater
: 2.9
%
Elec
tric
ity:
3.1
%
Ho
usin
g: 7
.8%
Ass
ets:
6.8
%
Ban
k A
cco
unt:
2.7
%
DoWNloAD DATA
Note on comparison: The striped bars denote the provisional estimates of the uncensored headcount ratio based on the data available in the NFHS-5 Mizoram State Report (2019-20).
Dimension Health Education Standard of Living NFHS-5: Standard of LivingNFHS-5: Education

INDIA MPI BASELINE REPORT
146 147
MIzorAMreSUlTS
0.007 to 0.028 0.029 to 0.050 0.051 to 0.072 0.073 to 0.094 0.095 to 0.116 0.117 to 0.138 0.139 to 0.161
1.76%
3.45%
8.69%
10.12%
10.16%
12.74%
25.29%
30.50%
0.0% 5.0% 10.0% 15.0% 20.0% 25.0% 30.0% 35.0%
Aizawl
Serchhip
Kolasib
Champhai
Lunglei
Saiha
Mamit
Lawangtlai
Headcount Ratio (% of population who are multidimensionally poor)
Mizoram: Headcount RatioPercentage of population who are multidimensionally poor in each district
The size of the bar represents the percentage of population who are multidimensionally poor in each district of Mizoram.The colour of the bar represents the MPI score of the district. The colour moves from green, through yellow, to red as the MPI score increases. Green represents areas with the lowest MPI scores while red represents areas with the highest MPI scores. The legend provides the range of MPI scores represented by a colour.
MizoramMultidimensional Poverty Index Score (District-wise)
Districts of Mizoram are as per the 2011 Census of India. The colour represents the MPI score of a district. The colour moves from green, through yellow, to red as the MPI score increases. Green represents areas with the lowest MPI scores while red represents areas with the highest MPI scores. The legend provides the range of MPI scores represented by a colour.
0.007 to 0.028 0.029 to 0.050 0.051 to 0.072 0.073 to 0.094 0.095 to 0.116 0.117 to 0.138 0.139 to 0.161
Multidimensional Poverty Index
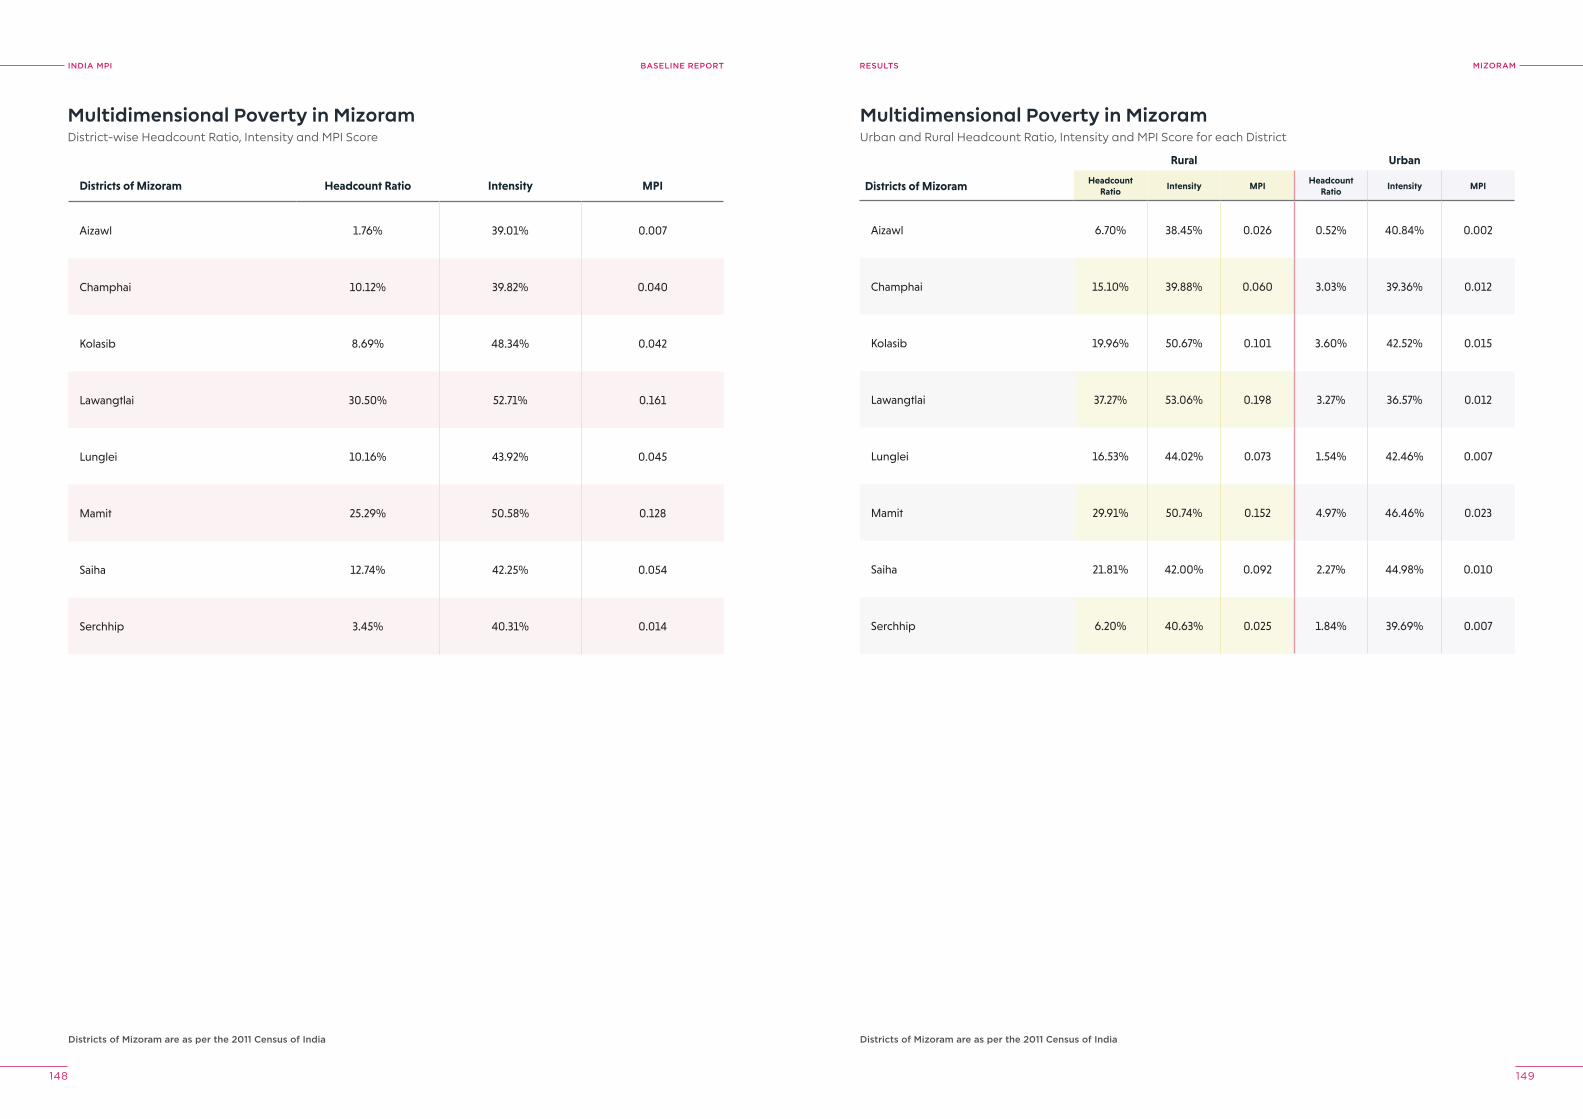
INDIA MPI BASELINE REPORT
148 149
MIzorAMreSUlTS
Multidimensional Poverty in MizoramDistrict-wise Headcount Ratio, Intensity and MPI Score
Multidimensional Poverty in MizoramUrban and Rural Headcount Ratio, Intensity and MPI Score for each District
Districts of Mizoram are as per the 2011 Census of India Districts of Mizoram are as per the 2011 Census of India
Districts of Mizoram Headcount Ratio Intensity MPI
Aizawl 1.76% 39.01% 0.007
Champhai 10.12% 39.82% 0.040
Kolasib 8.69% 48.34% 0.042
Lawangtlai 30.50% 52.71% 0.161
Lunglei 10.16% 43.92% 0.045
Mamit 25.29% 50.58% 0.128
Saiha 12.74% 42.25% 0.054
Serchhip 3.45% 40.31% 0.014
Rural Urban
Districts of Mizoram Headcount Ratio
Intensity MPIHeadcount
RatioIntensity MPI
Aizawl 6.70% 38.45% 0.026 0.52% 40.84% 0.002
Champhai 15.10% 39.88% 0.060 3.03% 39.36% 0.012
Kolasib 19.96% 50.67% 0.101 3.60% 42.52% 0.015
Lawangtlai 37.27% 53.06% 0.198 3.27% 36.57% 0.012
Lunglei 16.53% 44.02% 0.073 1.54% 42.46% 0.007
Mamit 29.91% 50.74% 0.152 4.97% 46.46% 0.023
Saiha 21.81% 42.00% 0.092 2.27% 44.98% 0.010
Serchhip 6.20% 40.63% 0.025 1.84% 39.69% 0.007
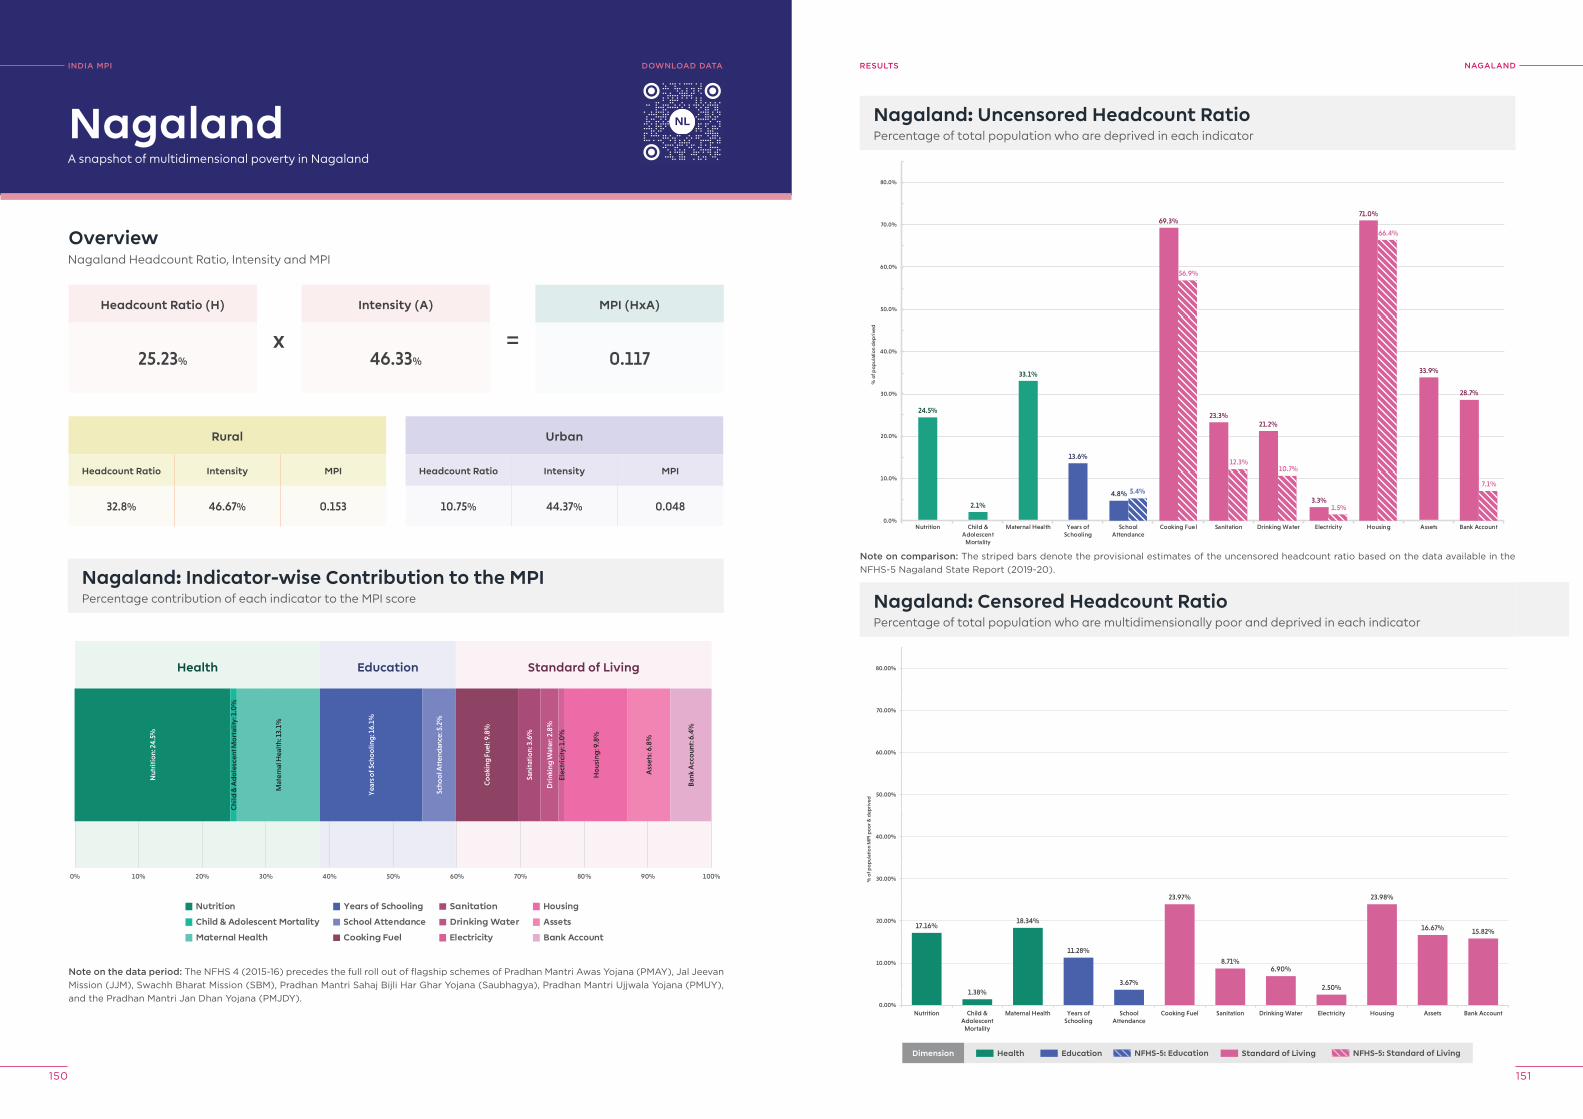
INDIA MPI BASELINE REPORT
150 151
NAGAlANDreSUlTS
Nagaland: Uncensored Headcount RatioPercentage of total population who are deprived in each indicator
24.5%
2.1%
33.1%
13.6%
33.9%
4.8% 5.4%
69.3%
56.9%
23.3%
12.3%
21.2%
10.7%
3.3%1.5%
71.0%
66.4%
28.7%
7.1%
0.0%
10.0%
20.0%
30.0%
40.0%
50.0%
60.0%
70.0%
80.0%
Nutrition Child &Adolescent
Mortality
Maternal Health Years ofSchooling
SchoolAttendance
Cooking Fuel Sanitation Drinking Water Electricity Housing Assets Bank Account
% o
f pop
ulat
ion
dep
rive
d
17.16%
1.38%
18.34%
11.28%
3.67%
23.97%
8.71%6.90%
2.50%
23.98%
16.67% 15.82%
0.00%
10.00%
20.00%
30.00%
40.00%
50.00%
60.00%
70.00%
80.00%
Nutrition Child &Adolescent
Mortality
Maternal Health Years ofSchooling
SchoolAttendance
Cooking Fuel Sanitation Drinking Water Electricity Housing Assets Bank Account
% o
f po
pul
atio
n M
PI p
oo
r & d
epri
ved
Nagaland: Censored Headcount RatioPercentage of total population who are multidimensionally poor and deprived in each indicator
INDIA MpI
A snapshot of multidimensional poverty in Nagaland
OverviewNagaland Headcount Ratio, Intensity and MPI
Headcount Ratio (H)
25.23%
Rural
Headcount Ratio Intensity MPI
32.8% 46.67% 0.153
Nagaland: Indicator-wise Contribution to the MPIPercentage contribution of each indicator to the MPI score
Intensity (A)
46.33%
MPI (HxA)
0.117
Nagaland
Urban
Headcount Ratio Intensity MPI
10.75% 44.37% 0.048
x =
Note on the data period: The NFHS 4 (2015-16) precedes the full roll out of flagship schemes of Pradhan Mantri Awas Yojana (PMAY), Jal Jeevan Mission (JJM), Swachh Bharat Mission (SBM), Pradhan Mantri Sahaj Bijli Har Ghar Yojana (Saubhagya), Pradhan Mantri Ujjwala Yojana (PMUY), and the Pradhan Mantri Jan Dhan Yojana (PMJDY).
Nutrition
Child & Adolescent Mortality
Maternal Health
Years of Schooling
School Attendance
Cooking Fuel
Sanitation
Drinking Water
Electricity
Housing
Assets
Bank Account
0% 10% 20% 30% 40% 50% 60% 70% 80% 90% 100%
Health Education Standard of Living
Nut
riti
on:
24.
5%
Chi
ld &
Ad
ole
scen
t Mo
rtal
ity: 1
.0%
Mat
erna
l Hea
lth:
13.
1%
Yea
rs o
f Sch
oo
ling
: 16.
1%
Scho
ol A
tten
dan
ce: 5
.2%
Co
oki
ng F
uel:
9.8%
Sani
tati
on:
3.6
%
Dri
nkin
g W
ater
: 2.8
%
Elec
tric
ity:
1.0
%
Ho
usin
g: 9
.8%
Ass
ets:
6.8
%
Ban
k A
cco
unt:
6.4
%
DoWNloAD DATA
Note on comparison: The striped bars denote the provisional estimates of the uncensored headcount ratio based on the data available in the NFHS-5 Nagaland State Report (2019-20).
Dimension Health Education Standard of Living NFHS-5: Standard of LivingNFHS-5: Education
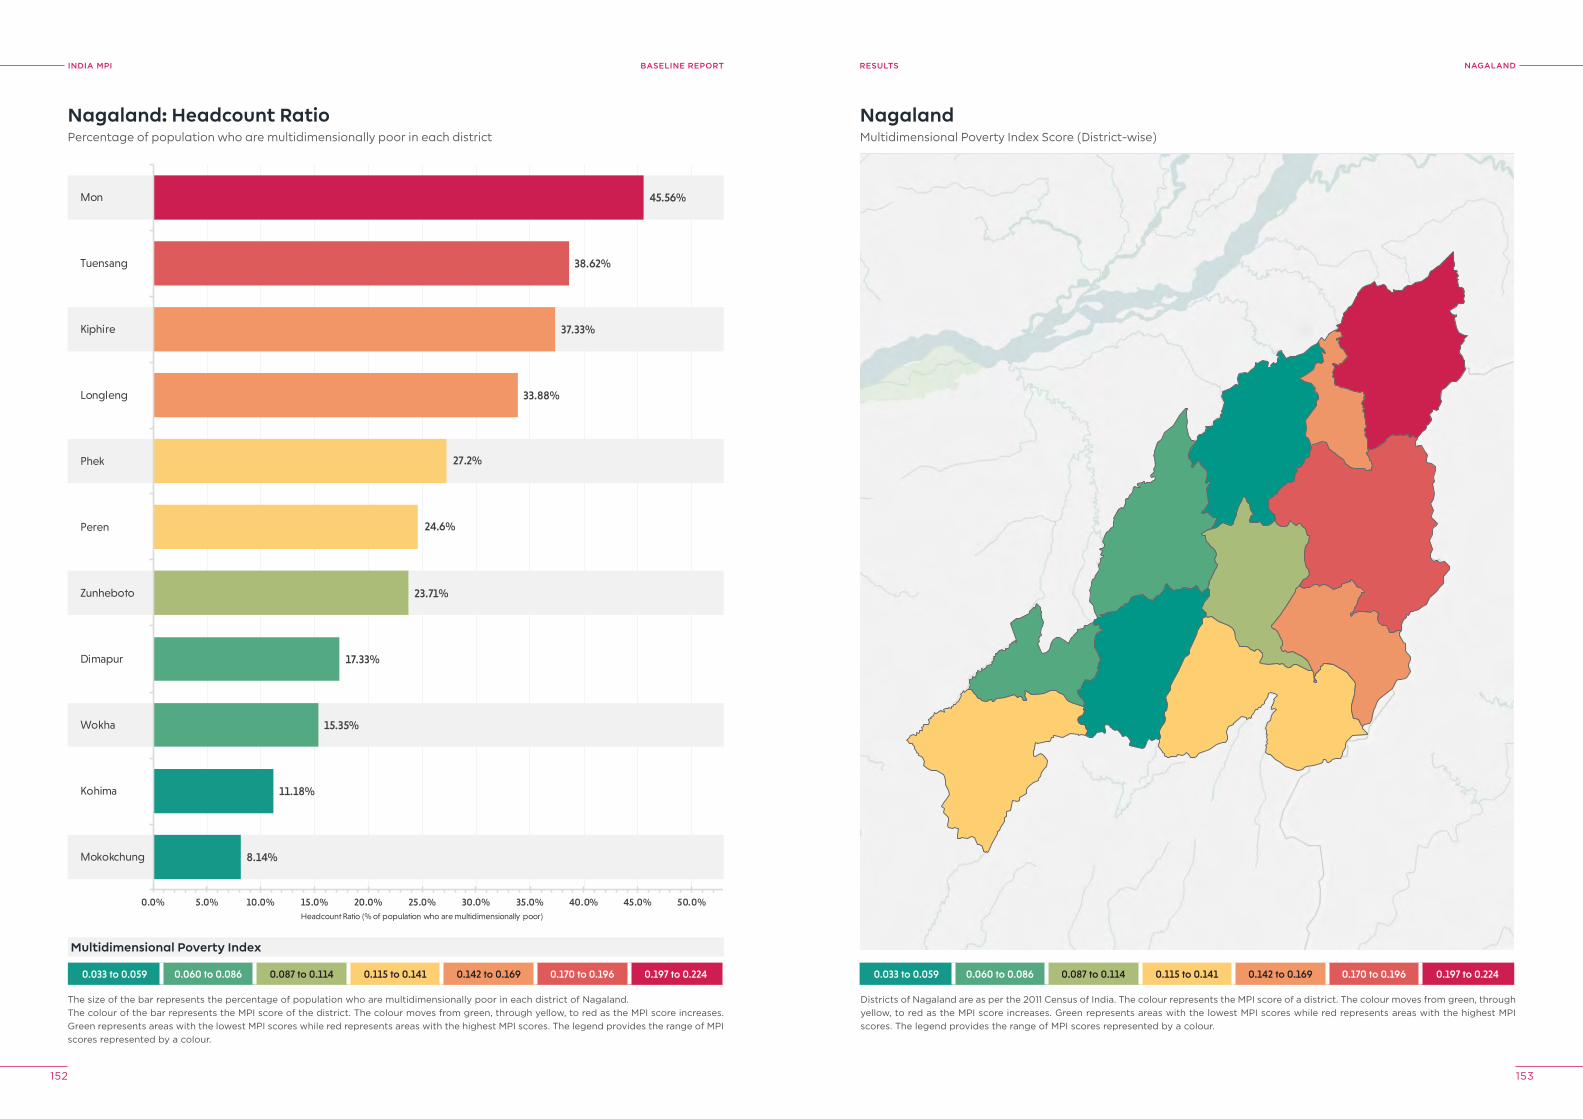
INDIA MPI BASELINE REPORT
152 153
NAGAlANDreSUlTS
0.033 to 0.059 0.060 to 0.086 0.087 to 0.114 0.115 to 0.141 0.142 to 0.169 0.170 to 0.196 0.197 to 0.224
8.14%
11.18%
15.35%
17.33%
23.71%
24.6%
27.2%
33.88%
37.33%
38.62%
45.56%
0.0% 5.0% 10.0% 15.0% 20.0% 25.0% 30.0% 35.0% 40.0% 45.0% 50.0%
Mokokchung
Kohima
Wokha
Dimapur
Zunheboto
Peren
Phek
Longleng
Kiphire
Tuensang
Mon
Headcount Ratio (% of population who are multidimensionally poor)
Nagaland: Headcount RatioPercentage of population who are multidimensionally poor in each district
The size of the bar represents the percentage of population who are multidimensionally poor in each district of Nagaland.The colour of the bar represents the MPI score of the district. The colour moves from green, through yellow, to red as the MPI score increases. Green represents areas with the lowest MPI scores while red represents areas with the highest MPI scores. The legend provides the range of MPI scores represented by a colour.
NagalandMultidimensional Poverty Index Score (District-wise)
Districts of Nagaland are as per the 2011 Census of India. The colour represents the MPI score of a district. The colour moves from green, through yellow, to red as the MPI score increases. Green represents areas with the lowest MPI scores while red represents areas with the highest MPI scores. The legend provides the range of MPI scores represented by a colour.
0.033 to 0.059 0.060 to 0.086 0.087 to 0.114 0.115 to 0.141 0.142 to 0.169 0.170 to 0.196 0.197 to 0.224
Multidimensional Poverty Index
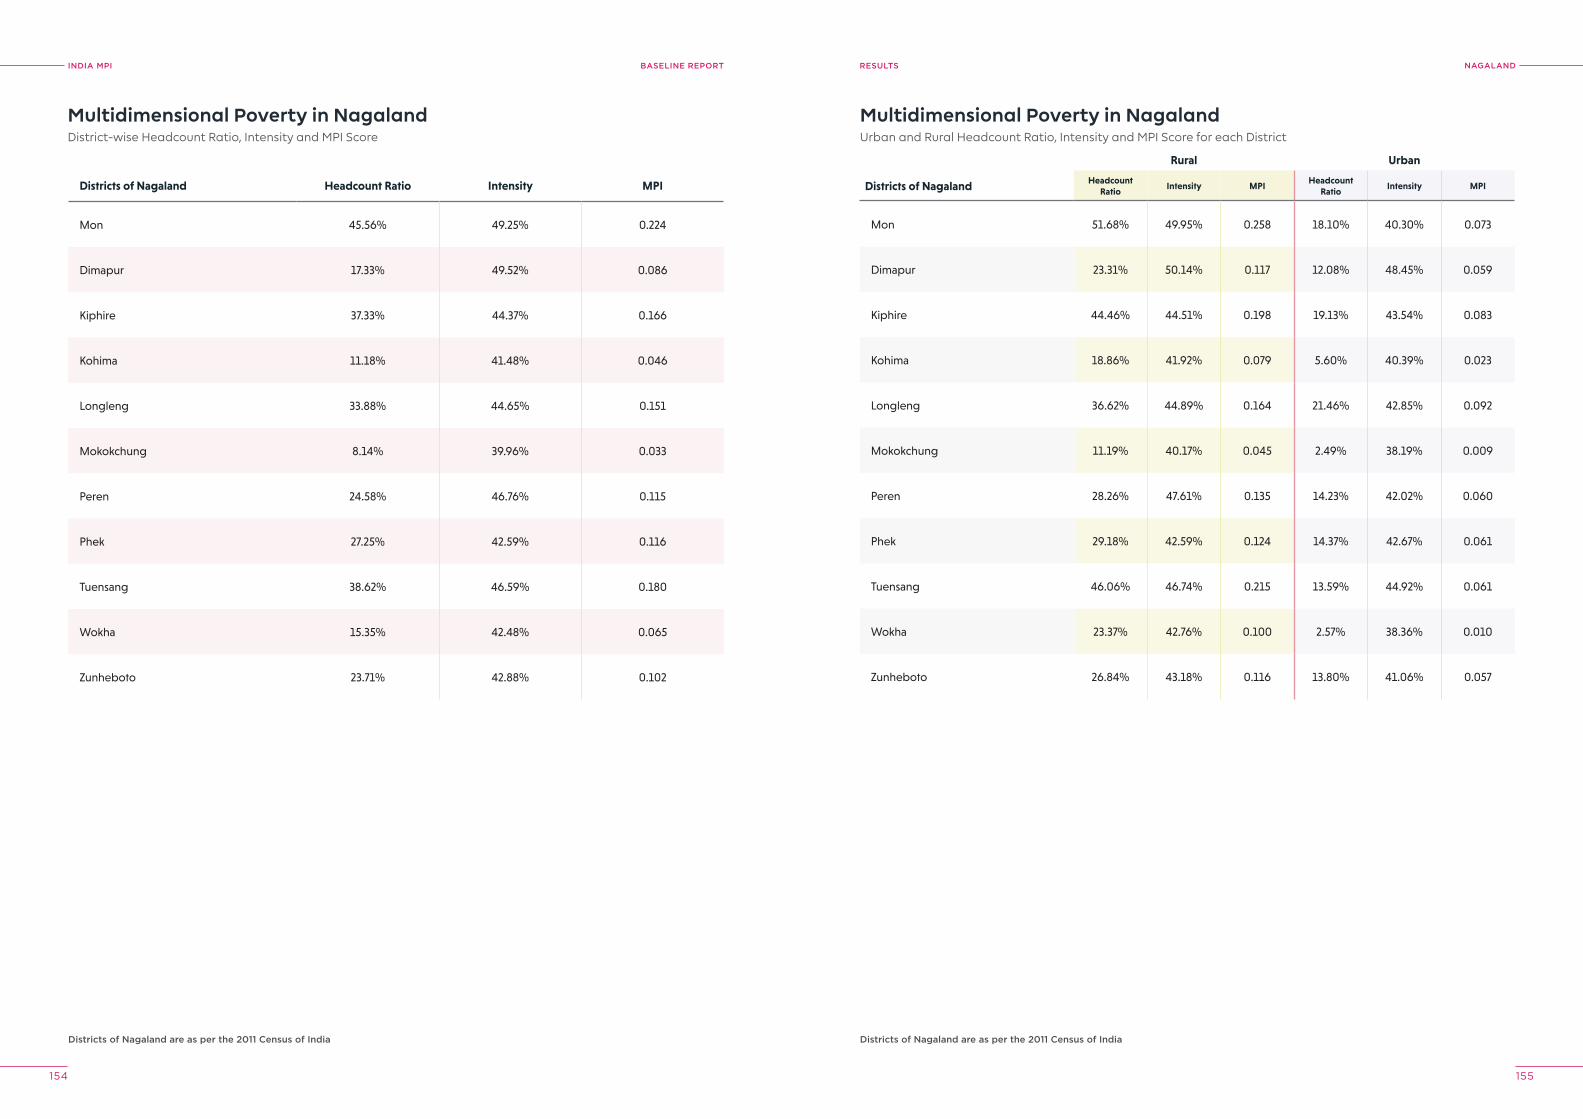
INDIA MPI BASELINE REPORT
154 155
NAGAlANDreSUlTS
Multidimensional Poverty in NagalandDistrict-wise Headcount Ratio, Intensity and MPI Score
Multidimensional Poverty in NagalandUrban and Rural Headcount Ratio, Intensity and MPI Score for each District
Districts of Nagaland are as per the 2011 Census of India Districts of Nagaland are as per the 2011 Census of India
Districts of Nagaland Headcount Ratio Intensity MPI
Mon 45.56% 49.25% 0.224
Dimapur 17.33% 49.52% 0.086
Kiphire 37.33% 44.37% 0.166
Kohima 11.18% 41.48% 0.046
Longleng 33.88% 44.65% 0.151
Mokokchung 8.14% 39.96% 0.033
Peren 24.58% 46.76% 0.115
Phek 27.25% 42.59% 0.116
Tuensang 38.62% 46.59% 0.180
Wokha 15.35% 42.48% 0.065
Zunheboto 23.71% 42.88% 0.102
Rural Urban
Districts of Nagaland Headcount Ratio
Intensity MPIHeadcount
RatioIntensity MPI
Mon 51.68% 49.95% 0.258 18.10% 40.30% 0.073
Dimapur 23.31% 50.14% 0.117 12.08% 48.45% 0.059
Kiphire 44.46% 44.51% 0.198 19.13% 43.54% 0.083
Kohima 18.86% 41.92% 0.079 5.60% 40.39% 0.023
Longleng 36.62% 44.89% 0.164 21.46% 42.85% 0.092
Mokokchung 11.19% 40.17% 0.045 2.49% 38.19% 0.009
Peren 28.26% 47.61% 0.135 14.23% 42.02% 0.060
Phek 29.18% 42.59% 0.124 14.37% 42.67% 0.061
Tuensang 46.06% 46.74% 0.215 13.59% 44.92% 0.061
Wokha 23.37% 42.76% 0.100 2.57% 38.36% 0.010
Zunheboto 26.84% 43.18% 0.116 13.80% 41.06% 0.057

INDIA MPI BASELINE REPORT
156 157
oDIShAreSUlTS
Odisha: Uncensored Headcount RatioPercentage of total population who are deprived in each indicator
37.3%
2.2%
19.5%
16.7%
5.0%
21.0%
55.8%
19.2%
10.9%
80.9%
65.3%
70.4%
39.5%
13.4%
3.0%
0.0%
10.0%
20.0%
30.0%
40.0%
50.0%
60.0%
70.0%
80.0%
Nutrition Child &Adolescent
Mortality
Maternal Health Years ofSchooling
SchoolAttendance
Cooking Fuel Sanitation Drinking Water Electricity Housing Assets Bank Account
% o
f pop
ulat
ion
dep
rive
d
22.41%
1.51%
12.77%13.77%
4.32%
28.77%27.14%
9.89% 8.93%
24.87%
13.29%
6.49%
0.00%
10.00%
20.00%
30.00%
40.00%
50.00%
60.00%
70.00%
80.00%
Nutrition Child &Adolescent
Mortality
Maternal Health Years ofSchooling
SchoolAttendance
Cooking Fuel Sanitation Drinking Water Electricity Housing Assets Bank Account
% o
f po
pul
atio
n M
PI p
oo
r & d
epri
ved
Odisha: Censored Headcount RatioPercentage of total population who are multidimensionally poor and deprived in each indicator
INDIA MpI
A snapshot of multidimensional poverty in Odisha
OverviewOdisha Headcount Ratio, Intensity and MPI
Headcount Ratio (H)
29.35%
Rural
Headcount Ratio Intensity MPI
32.66% 46.45% 0.152
Odisha: Indicator-wise Contribution to the MPIPercentage contribution of each indicator to the MPI score
Intensity (A)
46.42%
MPI (HxA)
0.136
Odisha
Urban
Headcount Ratio Intensity MPI
12.33% 46.12% 0.057
x =
Note on the data period: The NFHS 4 (2015-16) precedes the full roll out of flagship schemes of Pradhan Mantri Awas Yojana (PMAY), Jal Jeevan Mission (JJM), Swachh Bharat Mission (SBM), Pradhan Mantri Sahaj Bijli Har Ghar Yojana (Saubhagya), Pradhan Mantri Ujjwala Yojana (PMUY), and the Pradhan Mantri Jan Dhan Yojana (PMJDY).
Nutrition
Child & Adolescent Mortality
Maternal Health
Years of Schooling
School Attendance
Cooking Fuel
Sanitation
Drinking Water
Electricity
Housing
Assets
Bank Account
0% 10% 20% 30% 40% 50% 60% 70% 80% 90% 100%
Health Education Standard of Living
Nut
riti
on:
27.
4%
Chi
ld &
Ad
ole
scen
t Mo
rtal
ity: 0
.9%
Mat
erna
l Hea
lth:
7.8%
Yea
rs o
f Sch
oo
ling
: 16.
8%
Scho
ol A
tten
dan
ce: 5
.3%
Co
oki
ng F
uel:
10.1
%
Sani
tati
on:
9.5
%
Dri
nkin
g W
ater
: 3.5
%
Elec
tric
ity:
3.1
%
Ho
usin
g: 8
.7%
Ass
ets:
4.6
%
Ban
k A
cco
unt:
2.3
%
DoWNloAD DATA
Note on comparison: The striped bars denote the provisional estimates of the uncensored headcount ratio based on the data available in the NFHS-5 Odisha State Report (2019-20).
Dimension Health Education Standard of Living NFHS-5: Standard of LivingNFHS-5: Education
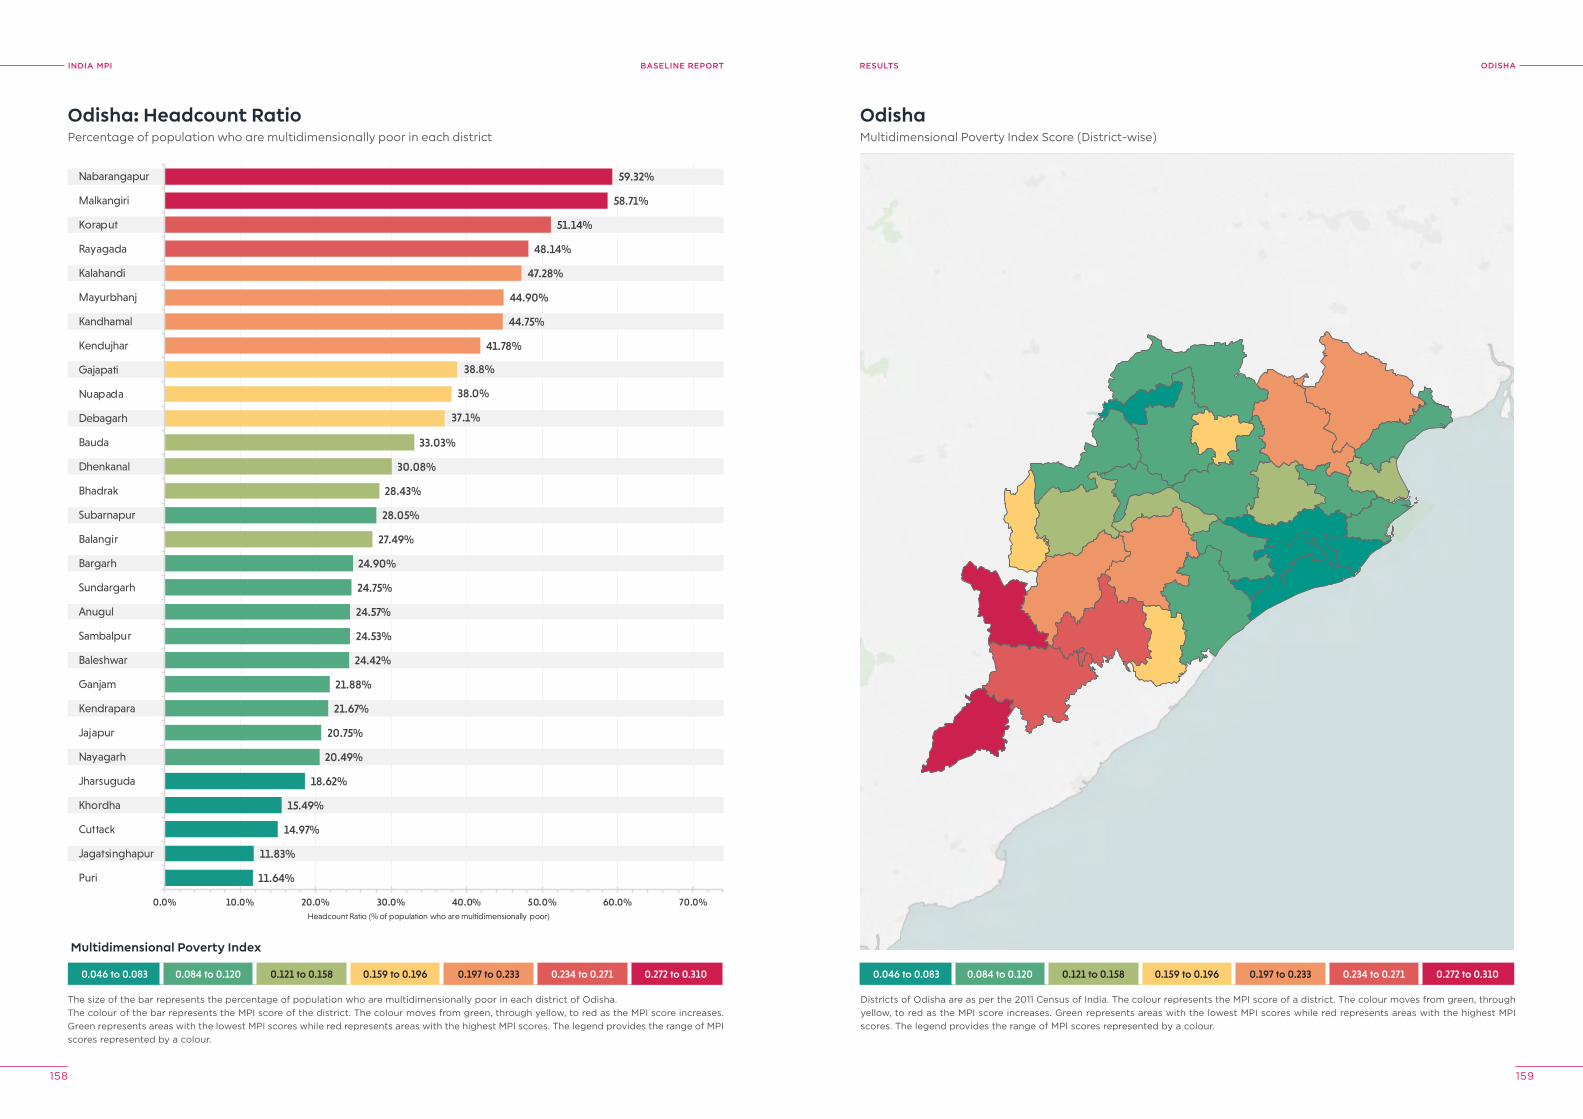
INDIA MPI BASELINE REPORT
158 159
oDIShAreSUlTS
0.046 to 0.083 0.084 to 0.120 0.121 to 0.158 0.159 to 0.196 0.197 to 0.233 0.234 to 0.271 0.272 to 0.310
11.64%
11.83%
14.97%
15.49%
18.62%
20.49%
20.75%
21.67%
21.88%
24.42%
24.53%
24.57%
24.75%
24.90%
28.05%
27.49%
28.43%
30.08%
33.03%
37.1%
38.0%
38.8%
41.78%
44.75%
44.90%
47.28%
48.14%
51.14%
58.71%
59.32%
0.0% 10.0% 20.0% 30.0% 40.0% 50.0% 60.0% 70.0%
Puri
Jagatsinghapur
Cuttack
Khordha
Jharsuguda
Nayagarh
Jajapur
Kendrapara
Ganjam
Baleshwar
Sambalpur
Anugul
Sundargarh
Bargarh
Balangir
Subarnapur
Bhadrak
Dhenkanal
Bauda
Debagarh
Nuapada
Gajapati
Kendujhar
Kandhamal
Mayurbhanj
Kalahandi
Rayagada
Koraput
Malkangiri
Nabarangapur
Headcount Ratio (% of population who are multidimensionally poor)
Odisha: Headcount RatioPercentage of population who are multidimensionally poor in each district
The size of the bar represents the percentage of population who are multidimensionally poor in each district of Odisha.The colour of the bar represents the MPI score of the district. The colour moves from green, through yellow, to red as the MPI score increases. Green represents areas with the lowest MPI scores while red represents areas with the highest MPI scores. The legend provides the range of MPI scores represented by a colour.
OdishaMultidimensional Poverty Index Score (District-wise)
Districts of Odisha are as per the 2011 Census of India. The colour represents the MPI score of a district. The colour moves from green, through yellow, to red as the MPI score increases. Green represents areas with the lowest MPI scores while red represents areas with the highest MPI scores. The legend provides the range of MPI scores represented by a colour.
0.046 to 0.083 0.084 to 0.120 0.121 to 0.158 0.159 to 0.196 0.197 to 0.233 0.234 to 0.271 0.272 to 0.310
Multidimensional Poverty Index
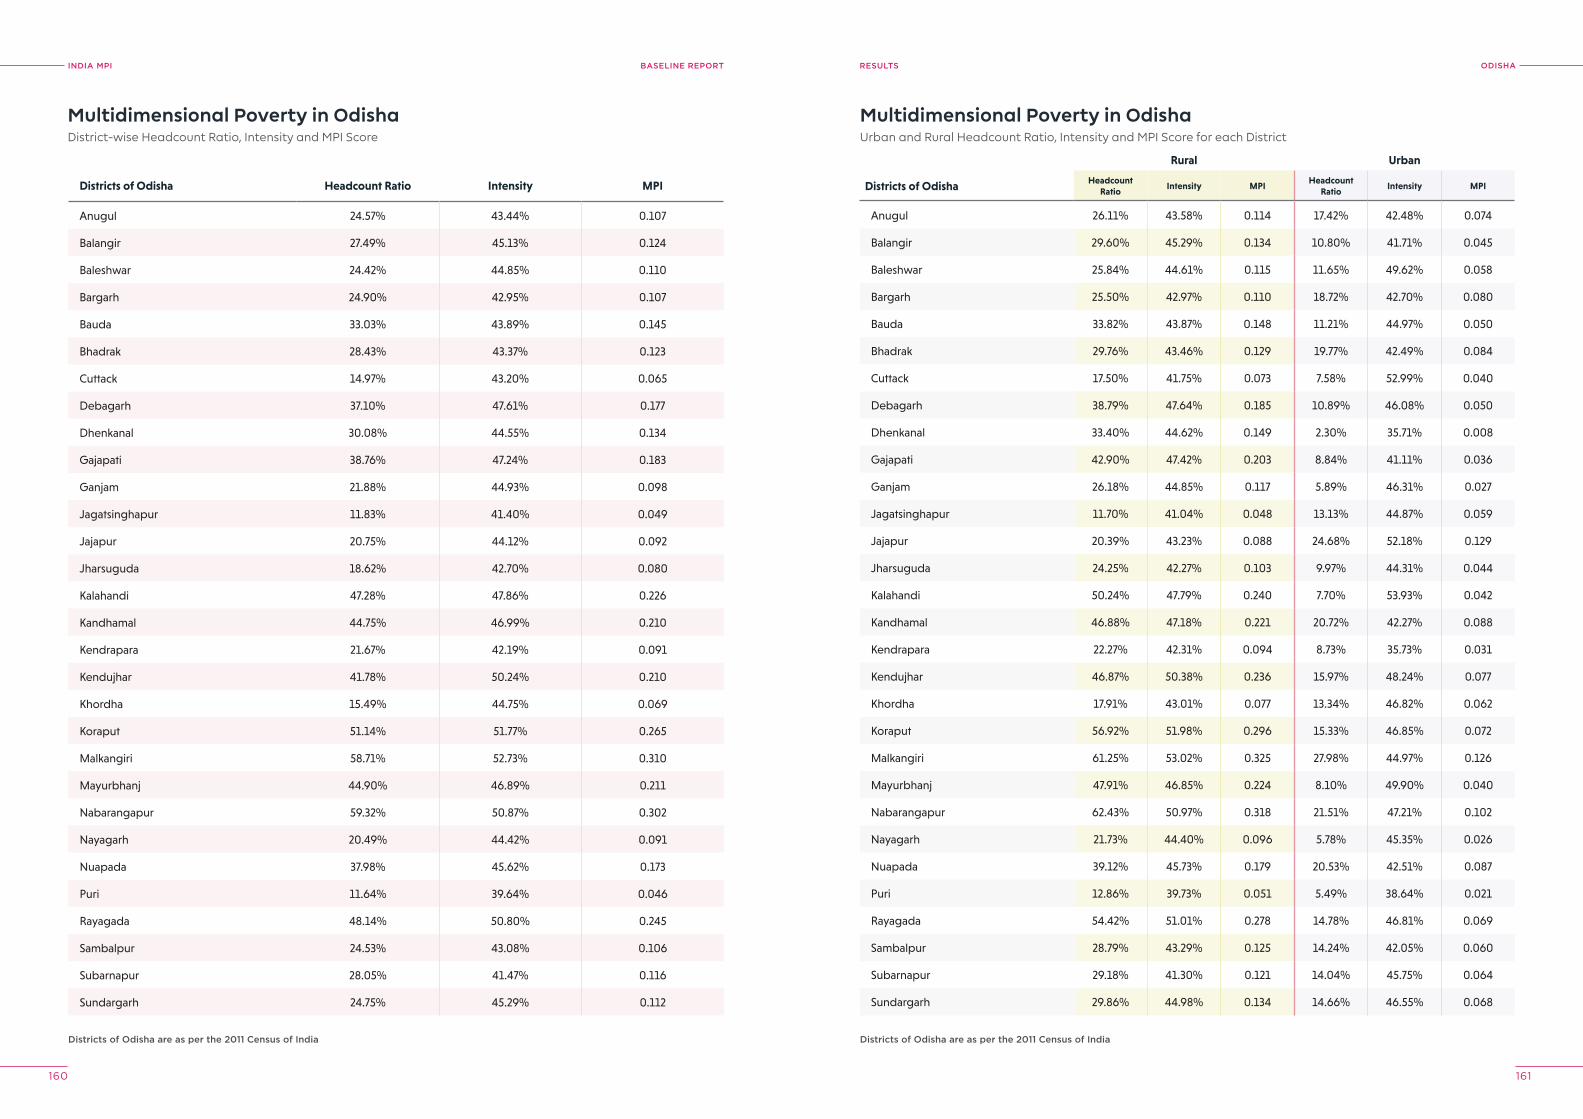
INDIA MPI BASELINE REPORT
160 161
oDIShAreSUlTS
Multidimensional Poverty in OdishaDistrict-wise Headcount Ratio, Intensity and MPI Score
Multidimensional Poverty in OdishaUrban and Rural Headcount Ratio, Intensity and MPI Score for each District
Districts of odisha are as per the 2011 Census of India Districts of odisha are as per the 2011 Census of India
Districts of Odisha Headcount Ratio Intensity MPI
Anugul 24.57% 43.44% 0.107
Balangir 27.49% 45.13% 0.124
Baleshwar 24.42% 44.85% 0.110
Bargarh 24.90% 42.95% 0.107
Bauda 33.03% 43.89% 0.145
Bhadrak 28.43% 43.37% 0.123
Cuttack 14.97% 43.20% 0.065
Debagarh 37.10% 47.61% 0.177
Dhenkanal 30.08% 44.55% 0.134
Gajapati 38.76% 47.24% 0.183
Ganjam 21.88% 44.93% 0.098
Jagatsinghapur 11.83% 41.40% 0.049
Jajapur 20.75% 44.12% 0.092
Jharsuguda 18.62% 42.70% 0.080
Kalahandi 47.28% 47.86% 0.226
Kandhamal 44.75% 46.99% 0.210
Kendrapara 21.67% 42.19% 0.091
Kendujhar 41.78% 50.24% 0.210
Khordha 15.49% 44.75% 0.069
Koraput 51.14% 51.77% 0.265
Malkangiri 58.71% 52.73% 0.310
Mayurbhanj 44.90% 46.89% 0.211
Nabarangapur 59.32% 50.87% 0.302
Nayagarh 20.49% 44.42% 0.091
Nuapada 37.98% 45.62% 0.173
Puri 11.64% 39.64% 0.046
Rayagada 48.14% 50.80% 0.245
Sambalpur 24.53% 43.08% 0.106
Subarnapur 28.05% 41.47% 0.116
Sundargarh 24.75% 45.29% 0.112
Rural Urban
Districts of Odisha Headcount Ratio
Intensity MPIHeadcount
RatioIntensity MPI
Anugul 26.11% 43.58% 0.114 17.42% 42.48% 0.074
Balangir 29.60% 45.29% 0.134 10.80% 41.71% 0.045
Baleshwar 25.84% 44.61% 0.115 11.65% 49.62% 0.058
Bargarh 25.50% 42.97% 0.110 18.72% 42.70% 0.080
Bauda 33.82% 43.87% 0.148 11.21% 44.97% 0.050
Bhadrak 29.76% 43.46% 0.129 19.77% 42.49% 0.084
Cuttack 17.50% 41.75% 0.073 7.58% 52.99% 0.040
Debagarh 38.79% 47.64% 0.185 10.89% 46.08% 0.050
Dhenkanal 33.40% 44.62% 0.149 2.30% 35.71% 0.008
Gajapati 42.90% 47.42% 0.203 8.84% 41.11% 0.036
Ganjam 26.18% 44.85% 0.117 5.89% 46.31% 0.027
Jagatsinghapur 11.70% 41.04% 0.048 13.13% 44.87% 0.059
Jajapur 20.39% 43.23% 0.088 24.68% 52.18% 0.129
Jharsuguda 24.25% 42.27% 0.103 9.97% 44.31% 0.044
Kalahandi 50.24% 47.79% 0.240 7.70% 53.93% 0.042
Kandhamal 46.88% 47.18% 0.221 20.72% 42.27% 0.088
Kendrapara 22.27% 42.31% 0.094 8.73% 35.73% 0.031
Kendujhar 46.87% 50.38% 0.236 15.97% 48.24% 0.077
Khordha 17.91% 43.01% 0.077 13.34% 46.82% 0.062
Koraput 56.92% 51.98% 0.296 15.33% 46.85% 0.072
Malkangiri 61.25% 53.02% 0.325 27.98% 44.97% 0.126
Mayurbhanj 47.91% 46.85% 0.224 8.10% 49.90% 0.040
Nabarangapur 62.43% 50.97% 0.318 21.51% 47.21% 0.102
Nayagarh 21.73% 44.40% 0.096 5.78% 45.35% 0.026
Nuapada 39.12% 45.73% 0.179 20.53% 42.51% 0.087
Puri 12.86% 39.73% 0.051 5.49% 38.64% 0.021
Rayagada 54.42% 51.01% 0.278 14.78% 46.81% 0.069
Sambalpur 28.79% 43.29% 0.125 14.24% 42.05% 0.060
Subarnapur 29.18% 41.30% 0.121 14.04% 45.75% 0.064
Sundargarh 29.86% 44.98% 0.134 14.66% 46.55% 0.068

INDIA MPI BASELINE REPORT
162 163
pUNjABreSUlTS
Punjab: Uncensored Headcount RatioPercentage of total population who are deprived in each indicator
22.1%
1.4%
12.7%
7.3%
2.6% 1.9%
19.3%
1.7%3.7%
36.4%
23.3%
17.3%
13.4%
0.4% 0.3%0.0%
10.0%
20.0%
30.0%
40.0%
50.0%
60.0%
70.0%
80.0%
Nutrition Child &Adolescent
Mortality
Maternal Health Years ofSchooling
SchoolAttendance
Cooking Fuel Sanitation Drinking Water Electricity Housing Assets Bank Account
% o
f pop
ulat
ion
dep
rive
d
4.41%
0.50%
3.09% 3.41%1.41%
4.23%3.02%
0.34% 0.22%
3.32%
0.60% 1.03%
0.00%
10.00%
20.00%
30.00%
40.00%
50.00%
60.00%
70.00%
80.00%
Nutrition Child &Adolescent
Mortality
Maternal Health Years ofSchooling
SchoolAttendance
Cooking Fuel Sanitation Drinking Water Electricity Housing Assets Bank Account
% o
f po
pul
atio
n M
PI p
oo
r & d
epri
ved
Punjab: Censored Headcount RatioPercentage of total population who are multidimensionally poor and deprived in each indicator
INDIA MpI
A snapshot of multidimensional poverty in Punjab
OverviewPunjab Headcount Ratio, Intensity and MPI
Headcount Ratio (H)
5.59%
Rural
Headcount Ratio Intensity MPI
6.4% 43.2% 0.028
Punjab: Indicator-wise Contribution to the MPIPercentage contribution of each indicator to the MPI score
Intensity (A)
43.75%
MPI (HxA)
0.024
Punjab
Urban
Headcount Ratio Intensity MPI
4.32% 45.02% 0.019
x =
Note on the data period: The NFHS 4 (2015-16) precedes the full roll out of flagship schemes of Pradhan Mantri Awas Yojana (PMAY), Jal Jeevan Mission (JJM), Swachh Bharat Mission (SBM), Pradhan Mantri Sahaj Bijli Har Ghar Yojana (Saubhagya), Pradhan Mantri Ujjwala Yojana (PMUY), and the Pradhan Mantri Jan Dhan Yojana (PMJDY).
Nutrition
Child & Adolescent Mortality
Maternal Health
Years of Schooling
School Attendance
Cooking Fuel
Sanitation
Drinking Water
Electricity
Housing
Assets
Bank Account
0% 10% 20% 30% 40% 50% 60% 70% 80% 90% 100%
Health Education Standard of Living
Nut
riti
on:
30
.1%
Chi
ld &
Ad
ole
scen
t Mo
rtal
ity: 1
.7%
Mat
erna
l Hea
lth:
10
.5%
Yea
rs o
f Sch
oo
ling
: 23.
2%
Scho
ol A
tten
dan
ce: 9
.6%
Co
oki
ng F
uel:
8.2%
Sani
tati
on:
5.9
%
Dri
nkin
g W
ater
: 0.7
%El
ectr
icit
y: 0
.4%
Ho
usin
g: 6
.5%
Ass
ets:
1.2
%B
ank
Acc
oun
t: 2
.0%
DoWNloAD DATA
Note on comparison: The striped bars denote the provisional estimates of the uncensored headcount ratio based on the data available in the NFHS-5 Punjab State Factsheet (2019-20).
Dimension Health Education Standard of Living NFHS-5: Standard of Living
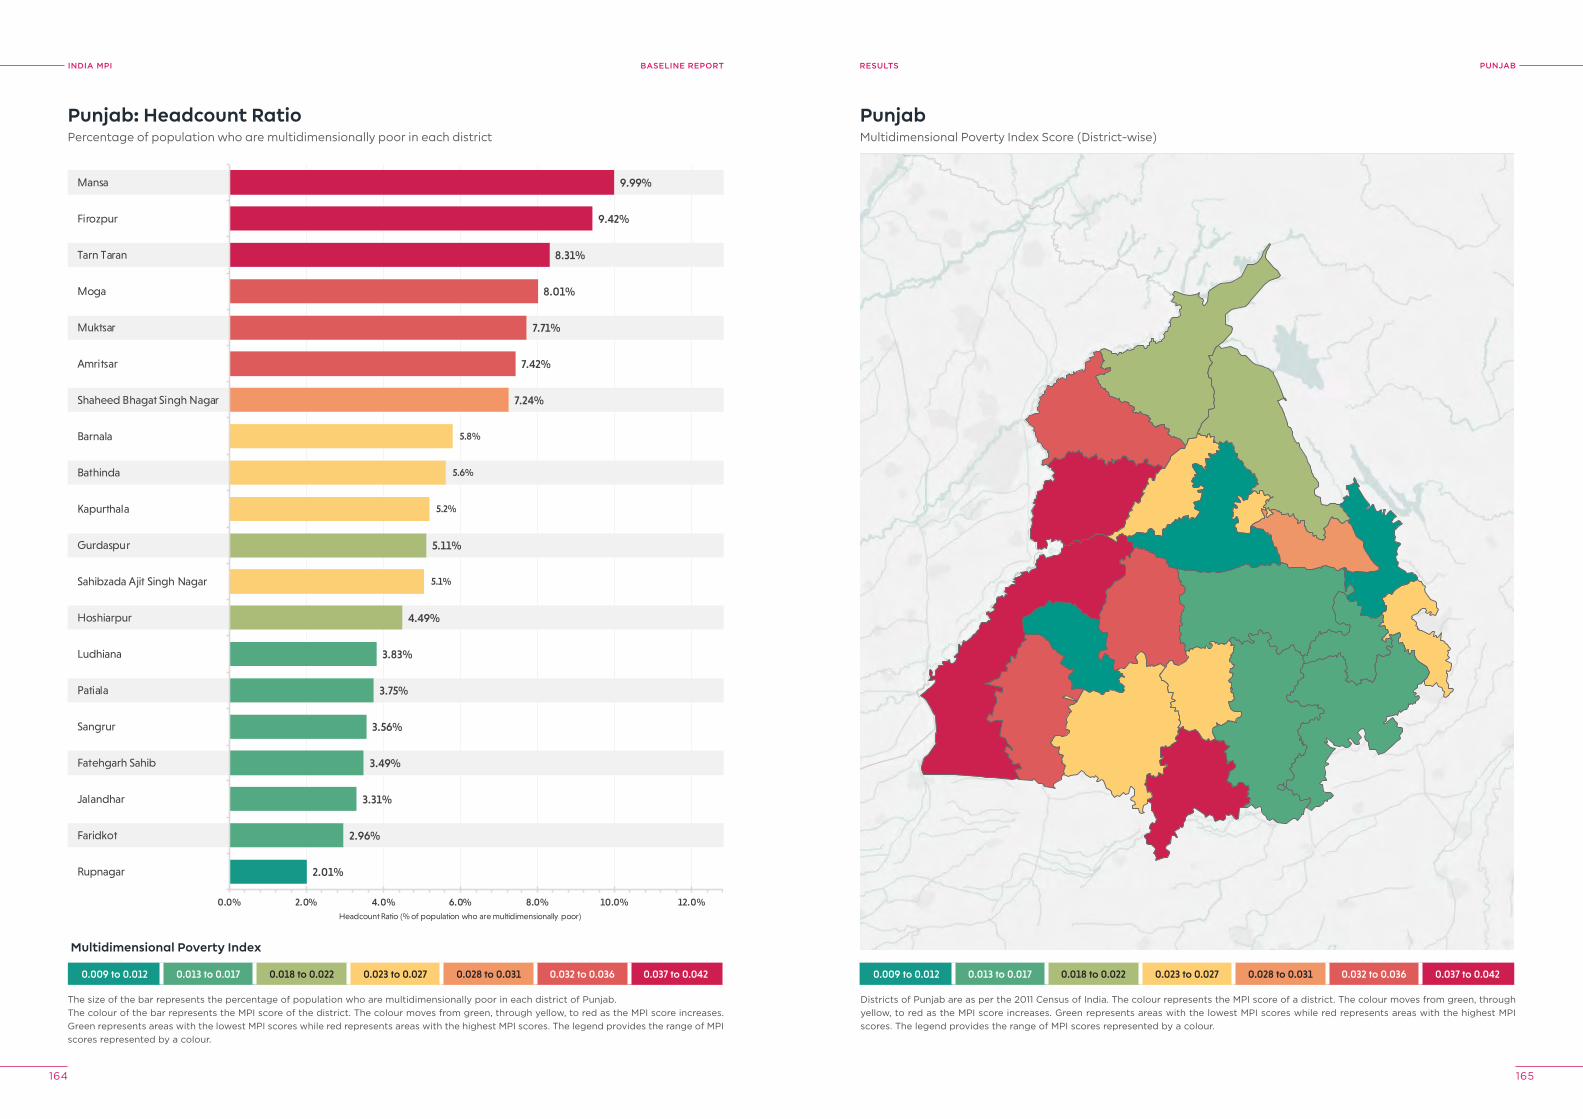
INDIA MPI BASELINE REPORT
164 165
pUNjABreSUlTS
0.009 to 0.012 0.013 to 0.017 0.018 to 0.022 0.023 to 0.027 0.028 to 0.031 0.032 to 0.036 0.037 to 0.042
2.01%
2.96%
3.31%
3.49%
3.56%
3.75%
3.83%
4.49%
5.11%
5.1%
5.2%
5.6%
5.8%
7.24%
7.42%
7.71%
8.01%
8.31%
9.42%
9.99%
0.0% 2.0% 4.0% 6.0% 8.0% 10.0% 12.0%
Rupnagar
Faridkot
Jalandhar
Fatehgarh Sahib
Sangrur
Patiala
Ludhiana
Hoshiarpur
Sahibzada Ajit Singh Nagar
Gurdaspur
Kapurthala
Bathinda
Barnala
Shaheed Bhagat Singh Nagar
Amritsar
Muktsar
Moga
Tarn Taran
Firozpur
Mansa
Headcount Ratio (% of population who are multidimensionally poor)
Punjab: Headcount RatioPercentage of population who are multidimensionally poor in each district
The size of the bar represents the percentage of population who are multidimensionally poor in each district of Punjab.The colour of the bar represents the MPI score of the district. The colour moves from green, through yellow, to red as the MPI score increases. Green represents areas with the lowest MPI scores while red represents areas with the highest MPI scores. The legend provides the range of MPI scores represented by a colour.
PunjabMultidimensional Poverty Index Score (District-wise)
Districts of Punjab are as per the 2011 Census of India. The colour represents the MPI score of a district. The colour moves from green, through yellow, to red as the MPI score increases. Green represents areas with the lowest MPI scores while red represents areas with the highest MPI scores. The legend provides the range of MPI scores represented by a colour.
0.009 to 0.012 0.013 to 0.017 0.018 to 0.022 0.023 to 0.027 0.028 to 0.031 0.032 to 0.036 0.037 to 0.042
Multidimensional Poverty Index
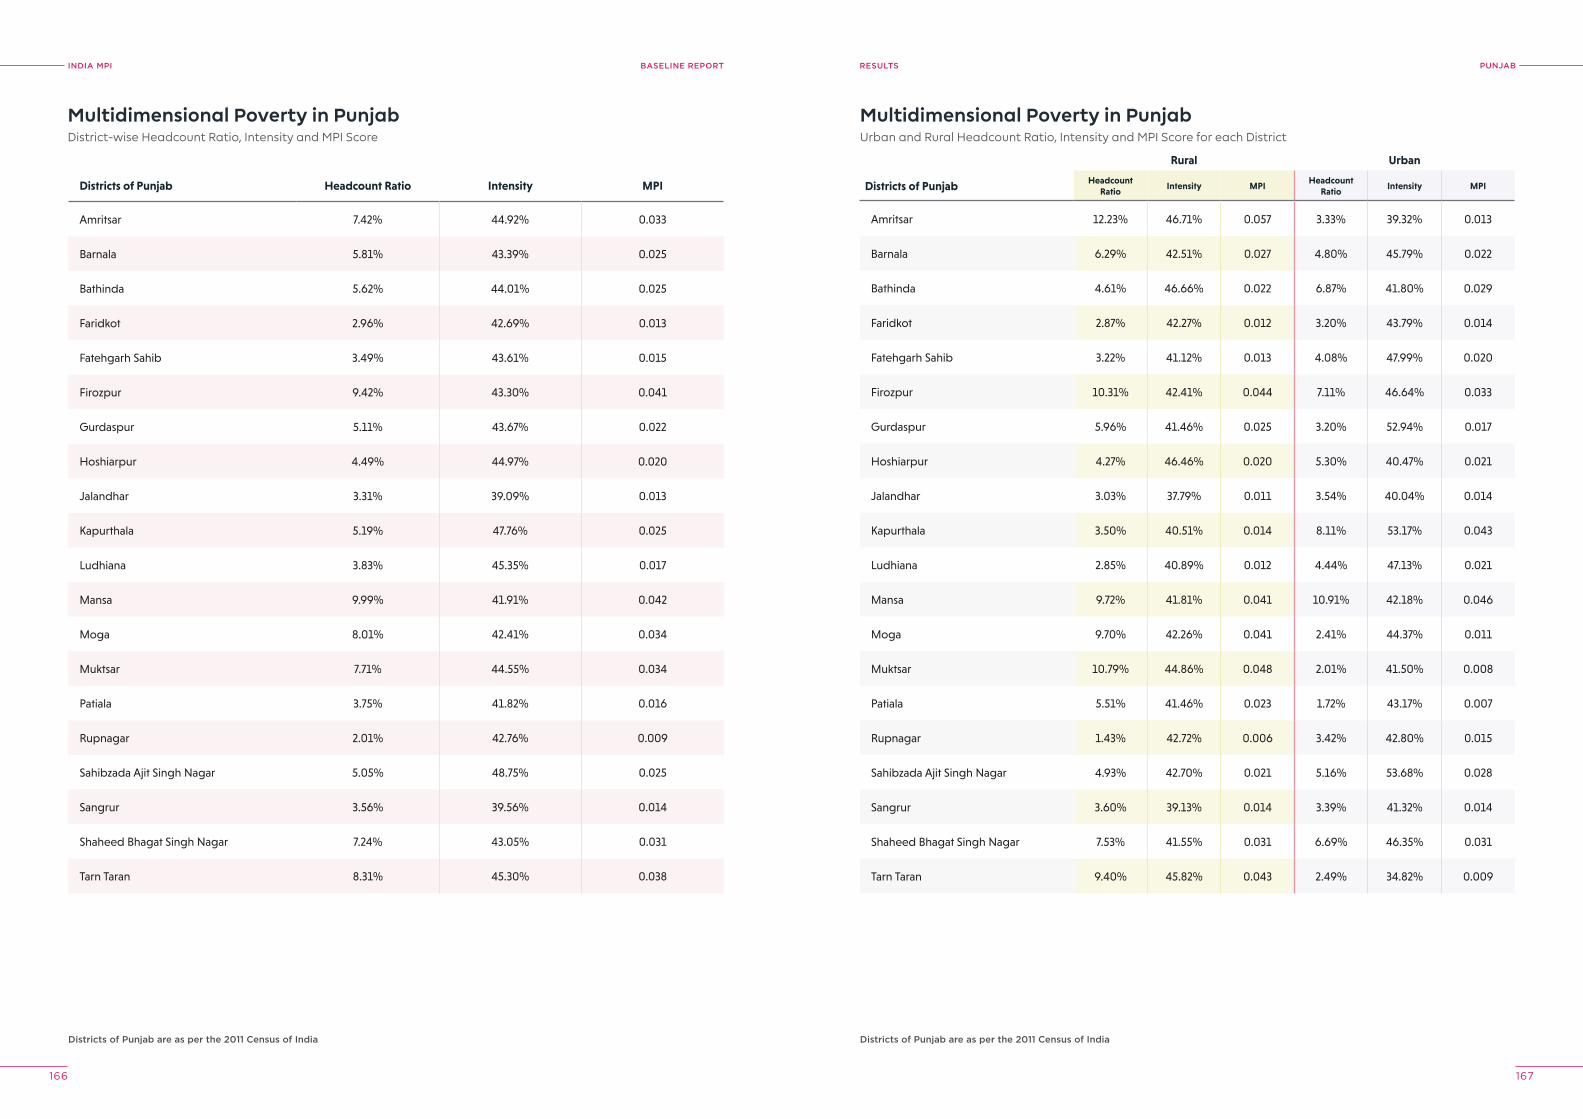
INDIA MPI BASELINE REPORT
166 167
pUNjABreSUlTS
Multidimensional Poverty in PunjabDistrict-wise Headcount Ratio, Intensity and MPI Score
Multidimensional Poverty in PunjabUrban and Rural Headcount Ratio, Intensity and MPI Score for each District
Districts of punjab are as per the 2011 Census of India Districts of punjab are as per the 2011 Census of India
Districts of Punjab Headcount Ratio Intensity MPI
Amritsar 7.42% 44.92% 0.033
Barnala 5.81% 43.39% 0.025
Bathinda 5.62% 44.01% 0.025
Faridkot 2.96% 42.69% 0.013
Fatehgarh Sahib 3.49% 43.61% 0.015
Firozpur 9.42% 43.30% 0.041
Gurdaspur 5.11% 43.67% 0.022
Hoshiarpur 4.49% 44.97% 0.020
Jalandhar 3.31% 39.09% 0.013
Kapurthala 5.19% 47.76% 0.025
Ludhiana 3.83% 45.35% 0.017
Mansa 9.99% 41.91% 0.042
Moga 8.01% 42.41% 0.034
Muktsar 7.71% 44.55% 0.034
Patiala 3.75% 41.82% 0.016
Rupnagar 2.01% 42.76% 0.009
Sahibzada Ajit Singh Nagar 5.05% 48.75% 0.025
Sangrur 3.56% 39.56% 0.014
Shaheed Bhagat Singh Nagar 7.24% 43.05% 0.031
Tarn Taran 8.31% 45.30% 0.038
Rural Urban
Districts of Punjab Headcount Ratio
Intensity MPIHeadcount
RatioIntensity MPI
Amritsar 12.23% 46.71% 0.057 3.33% 39.32% 0.013
Barnala 6.29% 42.51% 0.027 4.80% 45.79% 0.022
Bathinda 4.61% 46.66% 0.022 6.87% 41.80% 0.029
Faridkot 2.87% 42.27% 0.012 3.20% 43.79% 0.014
Fatehgarh Sahib 3.22% 41.12% 0.013 4.08% 47.99% 0.020
Firozpur 10.31% 42.41% 0.044 7.11% 46.64% 0.033
Gurdaspur 5.96% 41.46% 0.025 3.20% 52.94% 0.017
Hoshiarpur 4.27% 46.46% 0.020 5.30% 40.47% 0.021
Jalandhar 3.03% 37.79% 0.011 3.54% 40.04% 0.014
Kapurthala 3.50% 40.51% 0.014 8.11% 53.17% 0.043
Ludhiana 2.85% 40.89% 0.012 4.44% 47.13% 0.021
Mansa 9.72% 41.81% 0.041 10.91% 42.18% 0.046
Moga 9.70% 42.26% 0.041 2.41% 44.37% 0.011
Muktsar 10.79% 44.86% 0.048 2.01% 41.50% 0.008
Patiala 5.51% 41.46% 0.023 1.72% 43.17% 0.007
Rupnagar 1.43% 42.72% 0.006 3.42% 42.80% 0.015
Sahibzada Ajit Singh Nagar 4.93% 42.70% 0.021 5.16% 53.68% 0.028
Sangrur 3.60% 39.13% 0.014 3.39% 41.32% 0.014
Shaheed Bhagat Singh Nagar 7.53% 41.55% 0.031 6.69% 46.35% 0.031
Tarn Taran 9.40% 45.82% 0.043 2.49% 34.82% 0.009
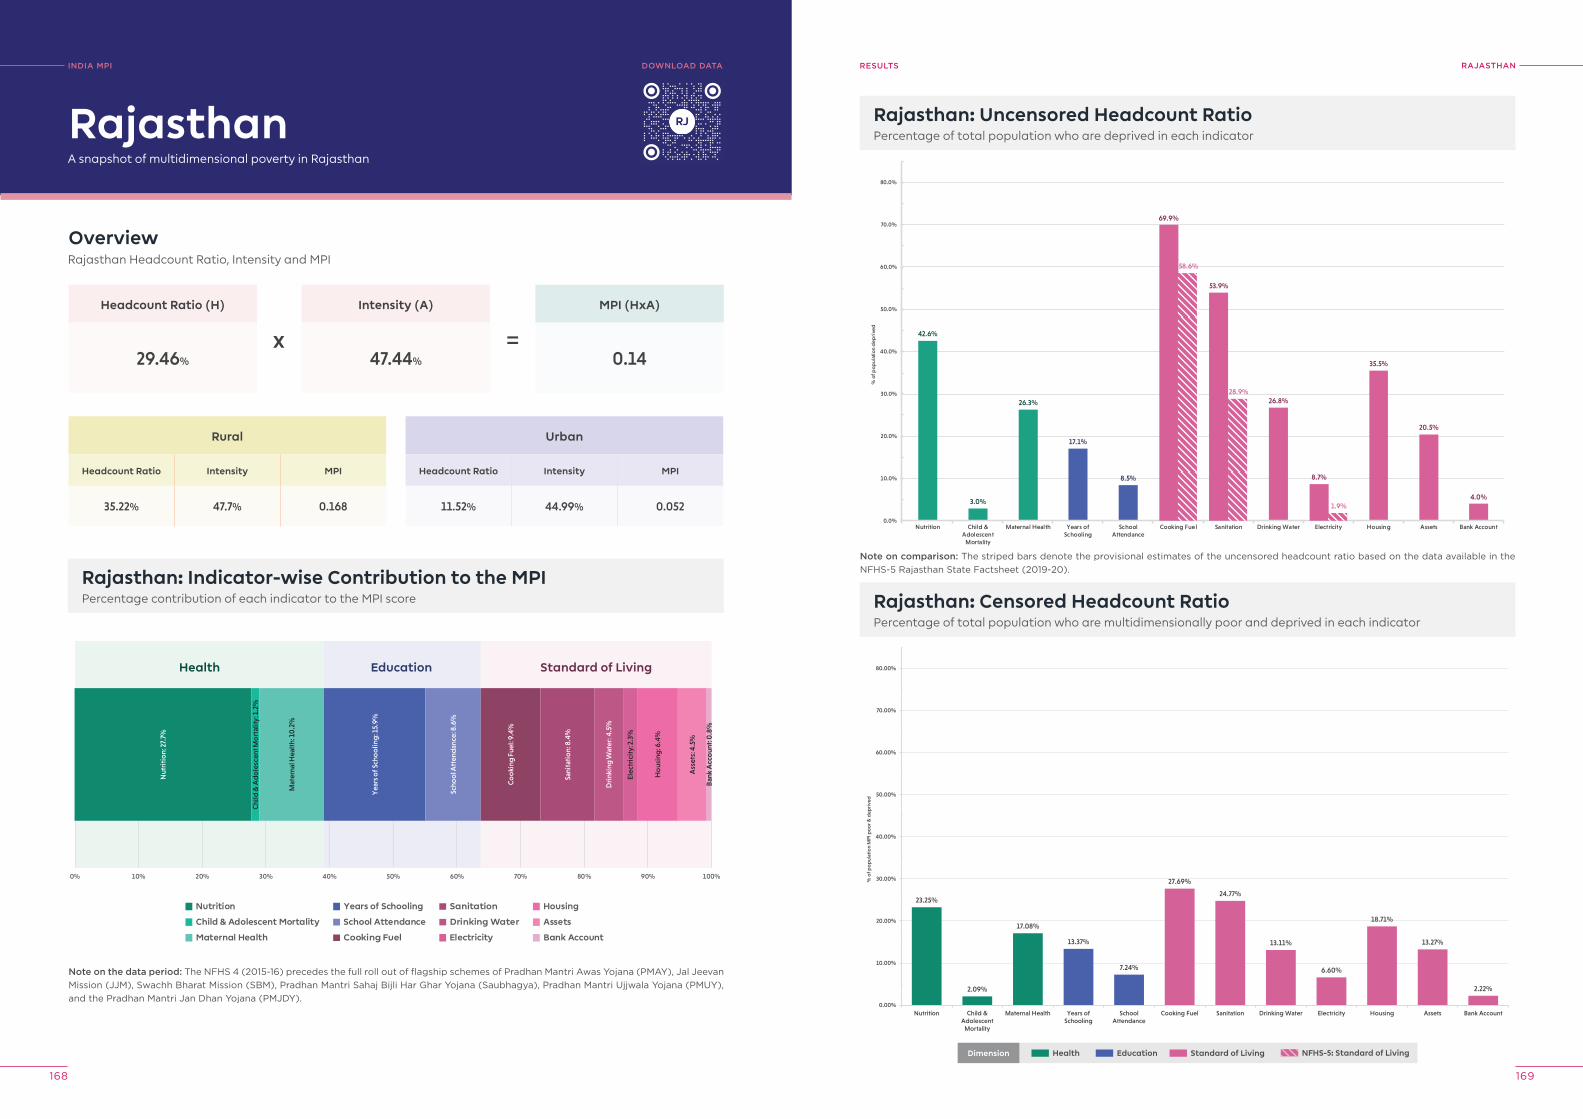
INDIA MPI BASELINE REPORT
168 169
rAjASThANreSUlTS
Rajasthan: Uncensored Headcount RatioPercentage of total population who are deprived in each indicator
42.6%
3.0%
26.3%
17.1%
8.5%
26.8%
35.5%
20.5%
4.0%
69.9%
58.6%
53.9%
28.9%
8.7%
1.9%
0.0%
10.0%
20.0%
30.0%
40.0%
50.0%
60.0%
70.0%
80.0%
Nutrition Child &Adolescent
Mortality
Maternal Health Years ofSchooling
SchoolAttendance
Cooking Fuel Sanitation Drinking Water Electricity Housing Assets Bank Account
% o
f pop
ulat
ion
dep
rive
d
23.25%
2.09%
17.08%
13.37%
7.24%
27.69%
24.77%
13.11%
6.60%
18.71%
13.27%
2.22%
0.00%
10.00%
20.00%
30.00%
40.00%
50.00%
60.00%
70.00%
80.00%
Nutrition Child &Adolescent
Mortality
Maternal Health Years ofSchooling
SchoolAttendance
Cooking Fuel Sanitation Drinking Water Electricity Housing Assets Bank Account
% o
f po
pul
atio
n M
PI p
oo
r & d
epri
ved
Rajasthan: Censored Headcount RatioPercentage of total population who are multidimensionally poor and deprived in each indicator
INDIA MpI
A snapshot of multidimensional poverty in Rajasthan
OverviewRajasthan Headcount Ratio, Intensity and MPI
Headcount Ratio (H)
29.46%
Rural
Headcount Ratio Intensity MPI
35.22% 47.7% 0.168
Rajasthan: Indicator-wise Contribution to the MPIPercentage contribution of each indicator to the MPI score
Intensity (A)
47.44%
MPI (HxA)
0.14
Rajasthan
Urban
Headcount Ratio Intensity MPI
11.52% 44.99% 0.052
x =
Note on the data period: The NFHS 4 (2015-16) precedes the full roll out of flagship schemes of Pradhan Mantri Awas Yojana (PMAY), Jal Jeevan Mission (JJM), Swachh Bharat Mission (SBM), Pradhan Mantri Sahaj Bijli Har Ghar Yojana (Saubhagya), Pradhan Mantri Ujjwala Yojana (PMUY), and the Pradhan Mantri Jan Dhan Yojana (PMJDY).
Nutrition
Child & Adolescent Mortality
Maternal Health
Years of Schooling
School Attendance
Cooking Fuel
Sanitation
Drinking Water
Electricity
Housing
Assets
Bank Account
0% 10% 20% 30% 40% 50% 60% 70% 80% 90% 100%
Health Education Standard of Living
Nut
riti
on:
27.
7%
Chi
ld &
Ad
ole
scen
t Mo
rtal
ity: 1
.2%
Mat
erna
l Hea
lth:
10
.2%
Yea
rs o
f Sch
oo
ling
: 15.
9%
Scho
ol A
tten
dan
ce: 8
.6%
Co
oki
ng F
uel:
9.4%
Sani
tati
on:
8.4
%
Dri
nkin
g W
ater
: 4.5
%
Elec
tric
ity:
2.3
%
Ho
usin
g: 6
.4%
Ass
ets:
4.5
%
Ban
k A
cco
unt:
0.8
%
DoWNloAD DATA
Note on comparison: The striped bars denote the provisional estimates of the uncensored headcount ratio based on the data available in the NFHS-5 Rajasthan State Factsheet (2019-20).
Dimension Health Education Standard of Living NFHS-5: Standard of Living
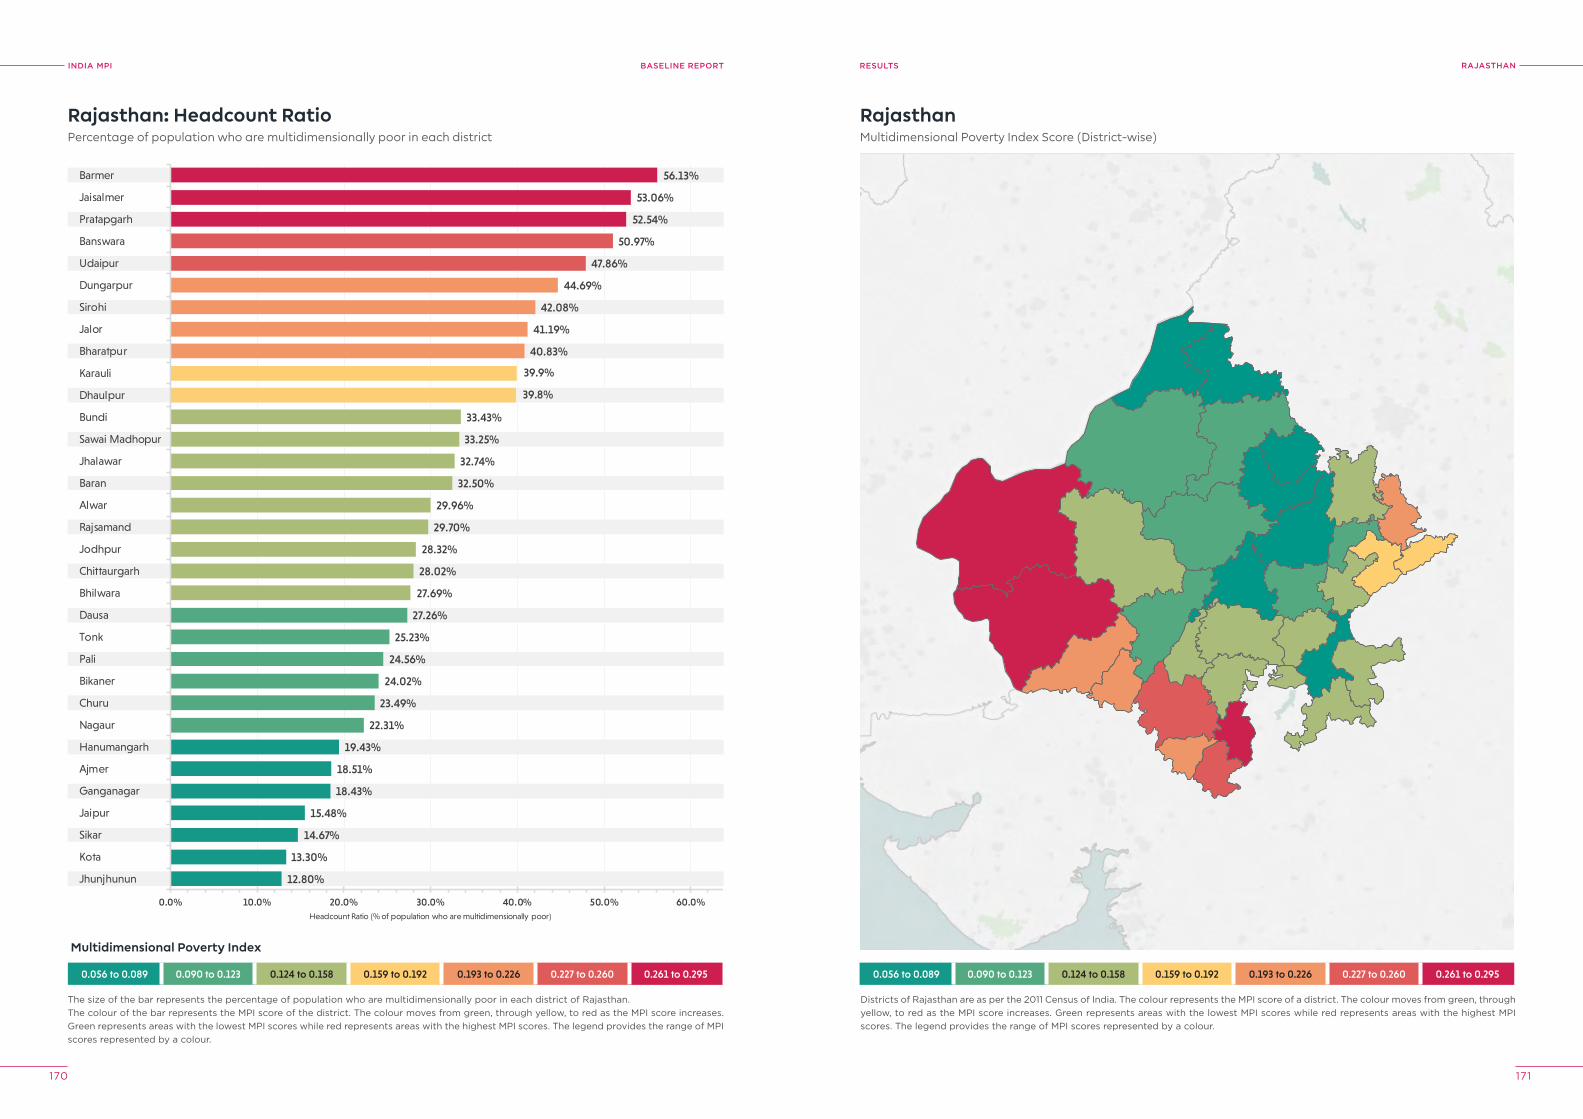
INDIA MPI BASELINE REPORT
170 171
rAjASThANreSUlTS
0.056 to 0.089 0.090 to 0.123 0.124 to 0.158 0.159 to 0.192 0.193 to 0.226 0.227 to 0.260 0.261 to 0.295
12.80%
13.30%
14.67%
15.48%
18.43%
18.51%
19.43%
22.31%
23.49%
24.02%
24.56%
25.23%
27.26%
27.69%
28.02%
28.32%
29.70%
29.96%
32.50%
32.74%
33.25%
33.43%
39.8%
39.9%
40.83%
41.19%
42.08%
44.69%
47.86%
50.97%
52.54%
53.06%
56.13%
0.0% 10.0% 20.0% 30.0% 40.0% 50.0% 60.0%
Jhunjhunun
Kota
Sikar
Jaipur
Ganganagar
Ajmer
Hanumangarh
Nagaur
Churu
Bikaner
Pali
Tonk
Dausa
Bhilwara
Chittaurgarh
Jodhpur
Rajsamand
Alwar
Baran
Jhalawar
Sawai Madhopur
Bundi
Dhaulpur
Karauli
Bharatpur
Jalor
Sirohi
Dungarpur
Udaipur
Banswara
Pratapgarh
Jaisalmer
Barmer
Headcount Ratio (% of population who are multidimensionally poor)
Rajasthan: Headcount RatioPercentage of population who are multidimensionally poor in each district
The size of the bar represents the percentage of population who are multidimensionally poor in each district of Rajasthan.The colour of the bar represents the MPI score of the district. The colour moves from green, through yellow, to red as the MPI score increases. Green represents areas with the lowest MPI scores while red represents areas with the highest MPI scores. The legend provides the range of MPI scores represented by a colour.
RajasthanMultidimensional Poverty Index Score (District-wise)
Districts of Rajasthan are as per the 2011 Census of India. The colour represents the MPI score of a district. The colour moves from green, through yellow, to red as the MPI score increases. Green represents areas with the lowest MPI scores while red represents areas with the highest MPI scores. The legend provides the range of MPI scores represented by a colour.
0.056 to 0.089 0.090 to 0.123 0.124 to 0.158 0.159 to 0.192 0.193 to 0.226 0.227 to 0.260 0.261 to 0.295
Multidimensional Poverty Index
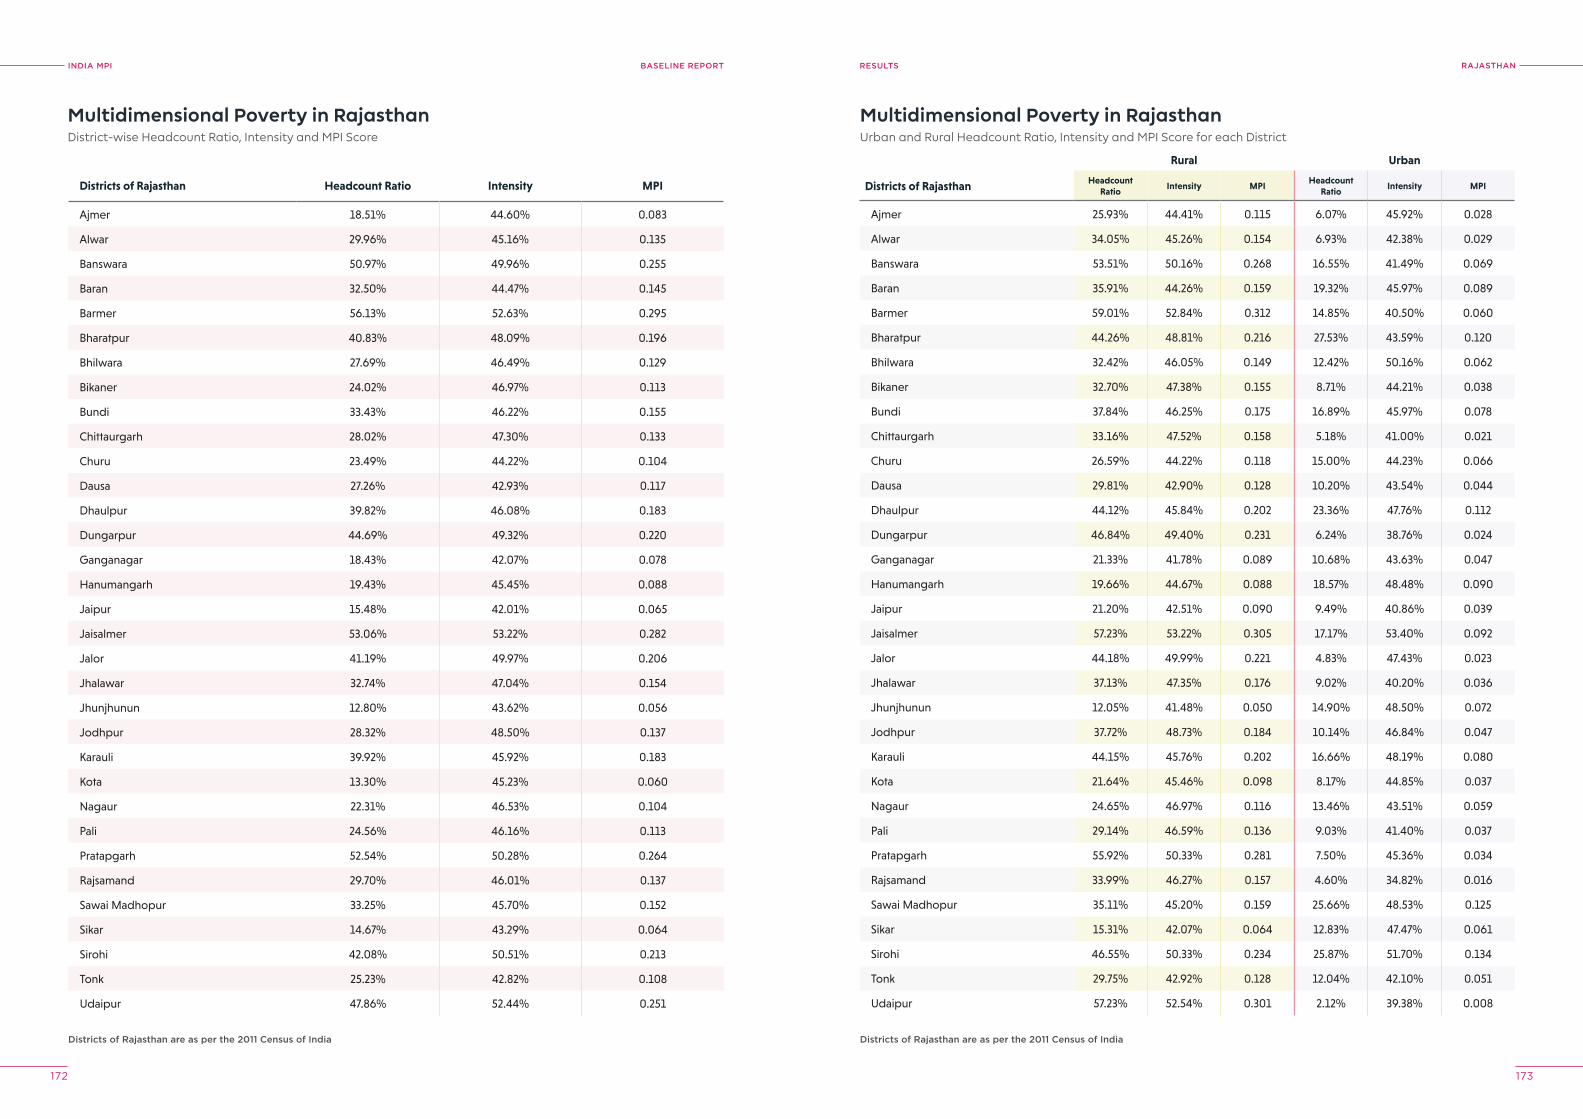
INDIA MPI BASELINE REPORT
172 173
rAjASThANreSUlTS
Multidimensional Poverty in RajasthanDistrict-wise Headcount Ratio, Intensity and MPI Score
Multidimensional Poverty in RajasthanUrban and Rural Headcount Ratio, Intensity and MPI Score for each District
Districts of rajasthan are as per the 2011 Census of India Districts of rajasthan are as per the 2011 Census of India
Districts of Rajasthan Headcount Ratio Intensity MPI
Ajmer 18.51% 44.60% 0.083
Alwar 29.96% 45.16% 0.135
Banswara 50.97% 49.96% 0.255
Baran 32.50% 44.47% 0.145
Barmer 56.13% 52.63% 0.295
Bharatpur 40.83% 48.09% 0.196
Bhilwara 27.69% 46.49% 0.129
Bikaner 24.02% 46.97% 0.113
Bundi 33.43% 46.22% 0.155
Chittaurgarh 28.02% 47.30% 0.133
Churu 23.49% 44.22% 0.104
Dausa 27.26% 42.93% 0.117
Dhaulpur 39.82% 46.08% 0.183
Dungarpur 44.69% 49.32% 0.220
Ganganagar 18.43% 42.07% 0.078
Hanumangarh 19.43% 45.45% 0.088
Jaipur 15.48% 42.01% 0.065
Jaisalmer 53.06% 53.22% 0.282
Jalor 41.19% 49.97% 0.206
Jhalawar 32.74% 47.04% 0.154
Jhunjhunun 12.80% 43.62% 0.056
Jodhpur 28.32% 48.50% 0.137
Karauli 39.92% 45.92% 0.183
Kota 13.30% 45.23% 0.060
Nagaur 22.31% 46.53% 0.104
Pali 24.56% 46.16% 0.113
Pratapgarh 52.54% 50.28% 0.264
Rajsamand 29.70% 46.01% 0.137
Sawai Madhopur 33.25% 45.70% 0.152
Sikar 14.67% 43.29% 0.064
Sirohi 42.08% 50.51% 0.213
Tonk 25.23% 42.82% 0.108
Udaipur 47.86% 52.44% 0.251
Rural Urban
Districts of Rajasthan Headcount Ratio
Intensity MPIHeadcount
RatioIntensity MPI
Ajmer 25.93% 44.41% 0.115 6.07% 45.92% 0.028
Alwar 34.05% 45.26% 0.154 6.93% 42.38% 0.029
Banswara 53.51% 50.16% 0.268 16.55% 41.49% 0.069
Baran 35.91% 44.26% 0.159 19.32% 45.97% 0.089
Barmer 59.01% 52.84% 0.312 14.85% 40.50% 0.060
Bharatpur 44.26% 48.81% 0.216 27.53% 43.59% 0.120
Bhilwara 32.42% 46.05% 0.149 12.42% 50.16% 0.062
Bikaner 32.70% 47.38% 0.155 8.71% 44.21% 0.038
Bundi 37.84% 46.25% 0.175 16.89% 45.97% 0.078
Chittaurgarh 33.16% 47.52% 0.158 5.18% 41.00% 0.021
Churu 26.59% 44.22% 0.118 15.00% 44.23% 0.066
Dausa 29.81% 42.90% 0.128 10.20% 43.54% 0.044
Dhaulpur 44.12% 45.84% 0.202 23.36% 47.76% 0.112
Dungarpur 46.84% 49.40% 0.231 6.24% 38.76% 0.024
Ganganagar 21.33% 41.78% 0.089 10.68% 43.63% 0.047
Hanumangarh 19.66% 44.67% 0.088 18.57% 48.48% 0.090
Jaipur 21.20% 42.51% 0.090 9.49% 40.86% 0.039
Jaisalmer 57.23% 53.22% 0.305 17.17% 53.40% 0.092
Jalor 44.18% 49.99% 0.221 4.83% 47.43% 0.023
Jhalawar 37.13% 47.35% 0.176 9.02% 40.20% 0.036
Jhunjhunun 12.05% 41.48% 0.050 14.90% 48.50% 0.072
Jodhpur 37.72% 48.73% 0.184 10.14% 46.84% 0.047
Karauli 44.15% 45.76% 0.202 16.66% 48.19% 0.080
Kota 21.64% 45.46% 0.098 8.17% 44.85% 0.037
Nagaur 24.65% 46.97% 0.116 13.46% 43.51% 0.059
Pali 29.14% 46.59% 0.136 9.03% 41.40% 0.037
Pratapgarh 55.92% 50.33% 0.281 7.50% 45.36% 0.034
Rajsamand 33.99% 46.27% 0.157 4.60% 34.82% 0.016
Sawai Madhopur 35.11% 45.20% 0.159 25.66% 48.53% 0.125
Sikar 15.31% 42.07% 0.064 12.83% 47.47% 0.061
Sirohi 46.55% 50.33% 0.234 25.87% 51.70% 0.134
Tonk 29.75% 42.92% 0.128 12.04% 42.10% 0.051
Udaipur 57.23% 52.54% 0.301 2.12% 39.38% 0.008
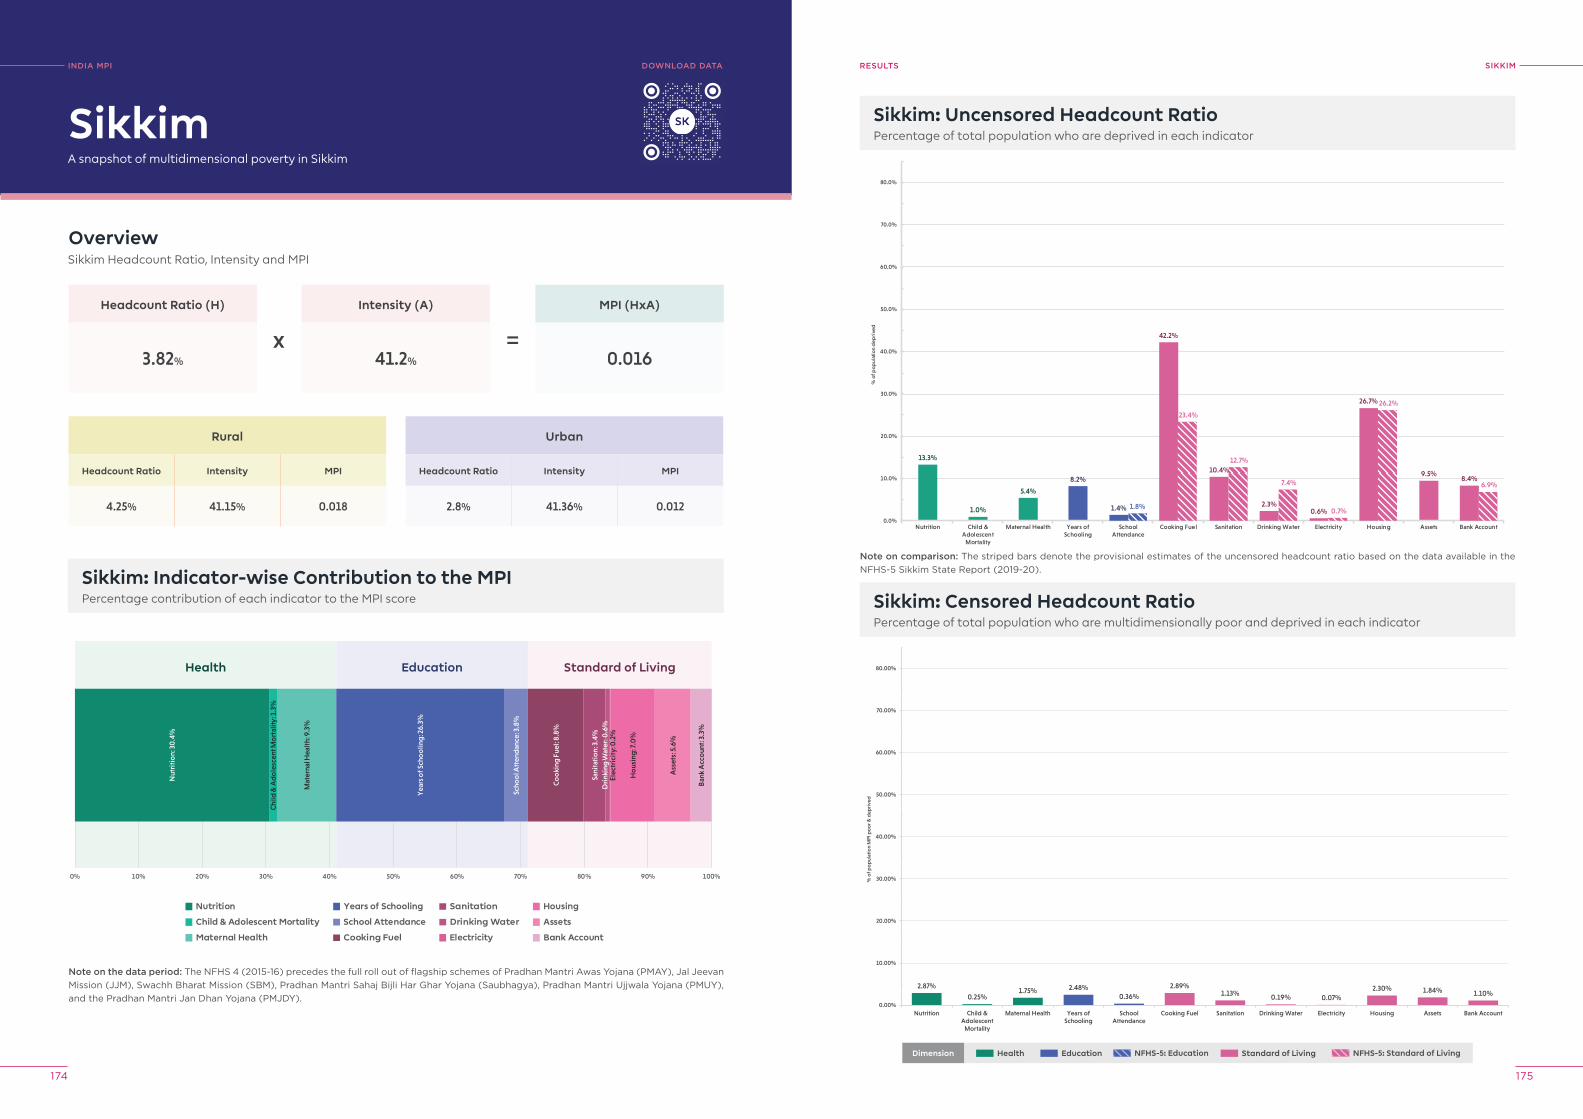
INDIA MPI BASELINE REPORT
174 175
SIkkIMreSUlTS
Sikkim: Uncensored Headcount RatioPercentage of total population who are deprived in each indicator
13.3%
1.0%
5.4%
8.2%9.5%
1.4% 1.8%
42.2%
23.4%
10.4%12.7%
2.3%
7.4%
0.6% 0.7%
26.7% 26.2%
8.4%6.9%
0.0%
10.0%
20.0%
30.0%
40.0%
50.0%
60.0%
70.0%
80.0%
Nutrition Child &Adolescent
Mortality
Maternal Health Years ofSchooling
SchoolAttendance
Cooking Fuel Sanitation Drinking Water Electricity Housing Assets Bank Account
% o
f pop
ulat
ion
dep
rive
d
2.87%
0.25%1.75% 2.48%
0.36%
2.89%1.13% 0.19% 0.07%
2.30% 1.84% 1.10%
0.00%
10.00%
20.00%
30.00%
40.00%
50.00%
60.00%
70.00%
80.00%
Nutrition Child &Adolescent
Mortality
Maternal Health Years ofSchooling
SchoolAttendance
Cooking Fuel Sanitation Drinking Water Electricity Housing Assets Bank Account
% o
f po
pul
atio
n M
PI p
oo
r & d
epri
ved
Sikkim: Censored Headcount RatioPercentage of total population who are multidimensionally poor and deprived in each indicator
INDIA MpI
A snapshot of multidimensional poverty in Sikkim
OverviewSikkim Headcount Ratio, Intensity and MPI
Headcount Ratio (H)
3.82%
Rural
Headcount Ratio Intensity MPI
4.25% 41.15% 0.018
Sikkim: Indicator-wise Contribution to the MPIPercentage contribution of each indicator to the MPI score
Intensity (A)
41.2%
MPI (HxA)
0.016
Sikkim
Urban
Headcount Ratio Intensity MPI
2.8% 41.36% 0.012
x =
Note on the data period: The NFHS 4 (2015-16) precedes the full roll out of flagship schemes of Pradhan Mantri Awas Yojana (PMAY), Jal Jeevan Mission (JJM), Swachh Bharat Mission (SBM), Pradhan Mantri Sahaj Bijli Har Ghar Yojana (Saubhagya), Pradhan Mantri Ujjwala Yojana (PMUY), and the Pradhan Mantri Jan Dhan Yojana (PMJDY).
Nutrition
Child & Adolescent Mortality
Maternal Health
Years of Schooling
School Attendance
Cooking Fuel
Sanitation
Drinking Water
Electricity
Housing
Assets
Bank Account
0% 10% 20% 30% 40% 50% 60% 70% 80% 90% 100%
Health Education Standard of Living
Nut
riti
on:
30
.4%
Chi
ld &
Ad
ole
scen
t Mo
rtal
ity: 1
.3%
Mat
erna
l Hea
lth:
9.3
%
Yea
rs o
f Sch
oo
ling
: 26.
3%
Scho
ol A
tten
dan
ce: 3
.8%
Co
oki
ng F
uel:
8.8%
Sani
tati
on:
3.4
%D
rink
ing
Wat
er: 0
.6%
Elec
tric
ity:
0.2
%
Ho
usin
g: 7
.0%
Ass
ets:
5.6
%
Ban
k A
cco
unt:
3.3
%
DoWNloAD DATA
Note on comparison: The striped bars denote the provisional estimates of the uncensored headcount ratio based on the data available in the NFHS-5 Sikkim State Report (2019-20).
Dimension Health Education Standard of Living NFHS-5: Standard of LivingNFHS-5: Education
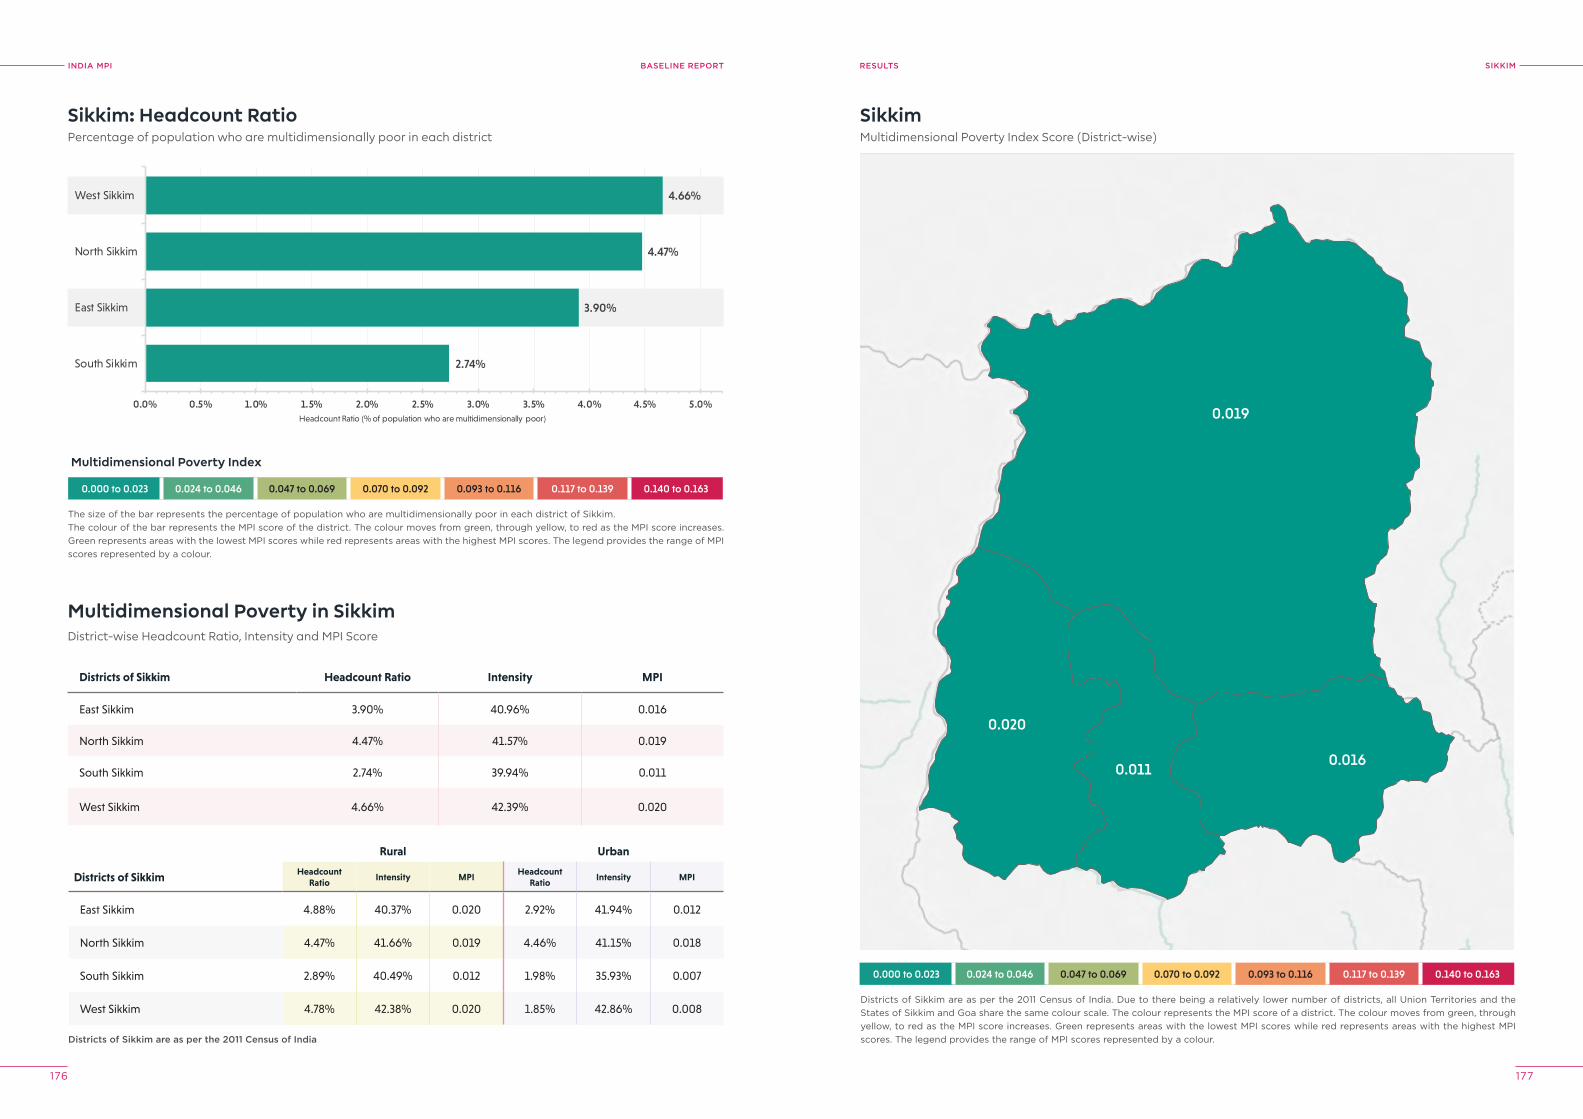
INDIA MPI BASELINE REPORT
176 177
SIkkIMreSUlTS
0.000 to 0.023 0.024 to 0.046 0.047 to 0.069 0.070 to 0.092 0.093 to 0.116 0.117 to 0.139 0.140 to 0.163
2.74%
3.90%
4.47%
4.66%
0.0% 0.5% 1.0% 1.5% 2.0% 2.5% 3.0% 3.5% 4.0% 4.5% 5.0%
South Sikkim
East Sikkim
North Sikkim
West Sikkim
Headcount Ratio (% of population who are multidimensionally poor)
Sikkim: Headcount RatioPercentage of population who are multidimensionally poor in each district
The size of the bar represents the percentage of population who are multidimensionally poor in each district of Sikkim.The colour of the bar represents the MPI score of the district. The colour moves from green, through yellow, to red as the MPI score increases. Green represents areas with the lowest MPI scores while red represents areas with the highest MPI scores. The legend provides the range of MPI scores represented by a colour.
0.020
0.016
0.019
0.011
SikkimMultidimensional Poverty Index Score (District-wise)
0.000 to 0.023 0.024 to 0.046 0.047 to 0.069 0.070 to 0.092 0.093 to 0.116 0.117 to 0.139 0.140 to 0.163
Multidimensional Poverty Index
District-wise Headcount Ratio, Intensity and MPI Score
Rural Urban
Districts of Sikkim Headcount Ratio
Intensity MPIHeadcount
RatioIntensity MPI
East Sikkim 4.88% 40.37% 0.020 2.92% 41.94% 0.012
North Sikkim 4.47% 41.66% 0.019 4.46% 41.15% 0.018
South Sikkim 2.89% 40.49% 0.012 1.98% 35.93% 0.007
West Sikkim 4.78% 42.38% 0.020 1.85% 42.86% 0.008
Multidimensional Poverty in Sikkim
Districts of Sikkim Headcount Ratio Intensity MPI
East Sikkim 3.90% 40.96% 0.016
North Sikkim 4.47% 41.57% 0.019
South Sikkim 2.74% 39.94% 0.011
West Sikkim 4.66% 42.39% 0.020
Districts of Sikkim are as per the 2011 Census of India. Due to there being a relatively lower number of districts, all Union Territories and the States of Sikkim and Goa share the same colour scale. The colour represents the MPI score of a district. The colour moves from green, through yellow, to red as the MPI score increases. Green represents areas with the lowest MPI scores while red represents areas with the highest MPI scores. The legend provides the range of MPI scores represented by a colour.Districts of Sikkim are as per the 2011 Census of India
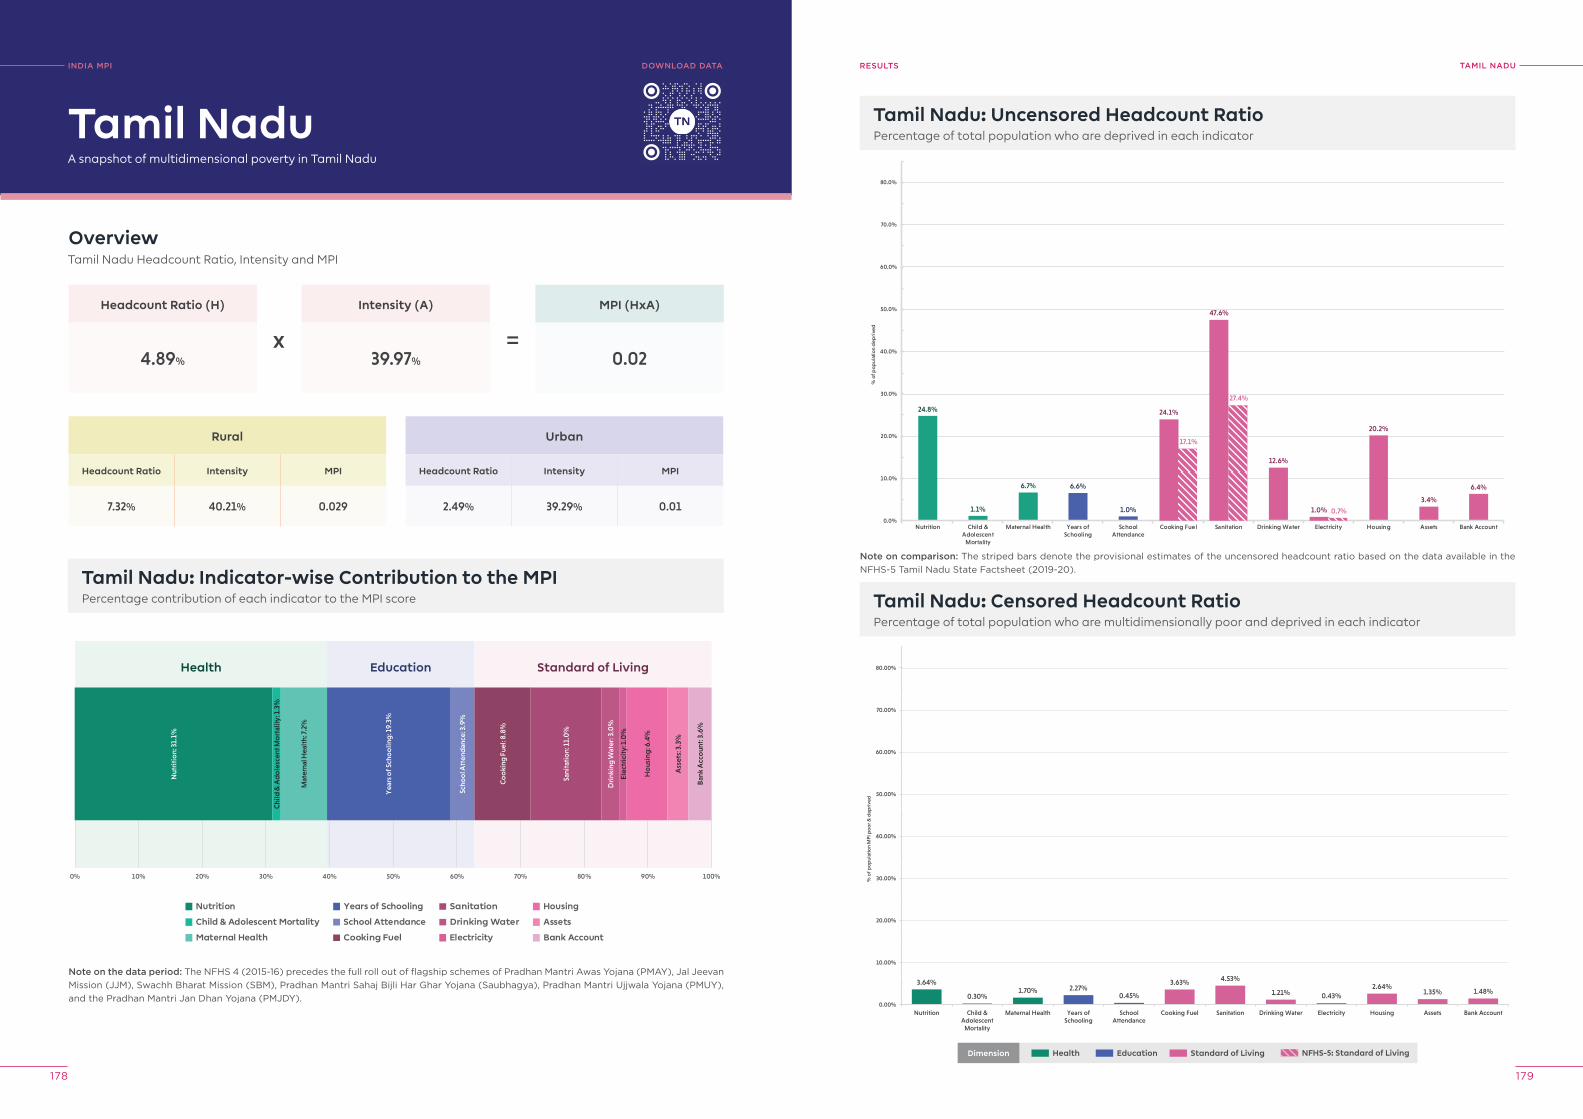
INDIA MPI BASELINE REPORT
178 179
TAMIl NADUreSUlTS
Tamil Nadu: Uncensored Headcount RatioPercentage of total population who are deprived in each indicator
24.8%
1.1%
6.7% 6.6%
1.0%
12.6%
20.2%
3.4%
6.4%
24.1%
17.1%
47.6%
27.4%
1.0% 0.7%0.0%
10.0%
20.0%
30.0%
40.0%
50.0%
60.0%
70.0%
80.0%
Nutrition Child &Adolescent
Mortality
Maternal Health Years ofSchooling
SchoolAttendance
Cooking Fuel Sanitation Drinking Water Electricity Housing Assets Bank Account
% o
f pop
ulat
ion
dep
rive
d
3.64%
0.30%1.70% 2.27%
0.45%
3.63% 4.53%
1.21% 0.43%2.64%
1.35% 1.48%
0.00%
10.00%
20.00%
30.00%
40.00%
50.00%
60.00%
70.00%
80.00%
Nutrition Child &Adolescent
Mortality
Maternal Health Years ofSchooling
SchoolAttendance
Cooking Fuel Sanitation Drinking Water Electricity Housing Assets Bank Account
% o
f po
pul
atio
n M
PI p
oo
r & d
epri
ved
Tamil Nadu: Censored Headcount RatioPercentage of total population who are multidimensionally poor and deprived in each indicator
INDIA MpI
A snapshot of multidimensional poverty in Tamil Nadu
OverviewTamil Nadu Headcount Ratio, Intensity and MPI
Headcount Ratio (H)
4.89%
Rural
Headcount Ratio Intensity MPI
7.32% 40.21% 0.029
Tamil Nadu: Indicator-wise Contribution to the MPIPercentage contribution of each indicator to the MPI score
Intensity (A)
39.97%
MPI (HxA)
0.02
Tamil Nadu
Urban
Headcount Ratio Intensity MPI
2.49% 39.29% 0.01
x =
Note on the data period: The NFHS 4 (2015-16) precedes the full roll out of flagship schemes of Pradhan Mantri Awas Yojana (PMAY), Jal Jeevan Mission (JJM), Swachh Bharat Mission (SBM), Pradhan Mantri Sahaj Bijli Har Ghar Yojana (Saubhagya), Pradhan Mantri Ujjwala Yojana (PMUY), and the Pradhan Mantri Jan Dhan Yojana (PMJDY).
Nutrition
Child & Adolescent Mortality
Maternal Health
Years of Schooling
School Attendance
Cooking Fuel
Sanitation
Drinking Water
Electricity
Housing
Assets
Bank Account
0% 10% 20% 30% 40% 50% 60% 70% 80% 90% 100%
Health Education Standard of Living
Nut
riti
on:
31.
1%
Chi
ld &
Ad
ole
scen
t Mo
rtal
ity: 1
.3%
Mat
erna
l Hea
lth:
7.2%
Yea
rs o
f Sch
oo
ling
: 19.
3%
Scho
ol A
tten
dan
ce: 3
.9%
Co
oki
ng F
uel:
8.8%
Sani
tati
on:
11.
0%
Dri
nkin
g W
ater
: 3.0
%
Elec
tric
ity:
1.0
%
Ho
usin
g: 6
.4%
Ass
ets:
3.3
%
Ban
k A
cco
unt:
3.6
%
DoWNloAD DATA
Note on comparison: The striped bars denote the provisional estimates of the uncensored headcount ratio based on the data available in the NFHS-5 Tamil Nadu State Factsheet (2019-20).
Dimension Health Education Standard of Living NFHS-5: Standard of Living
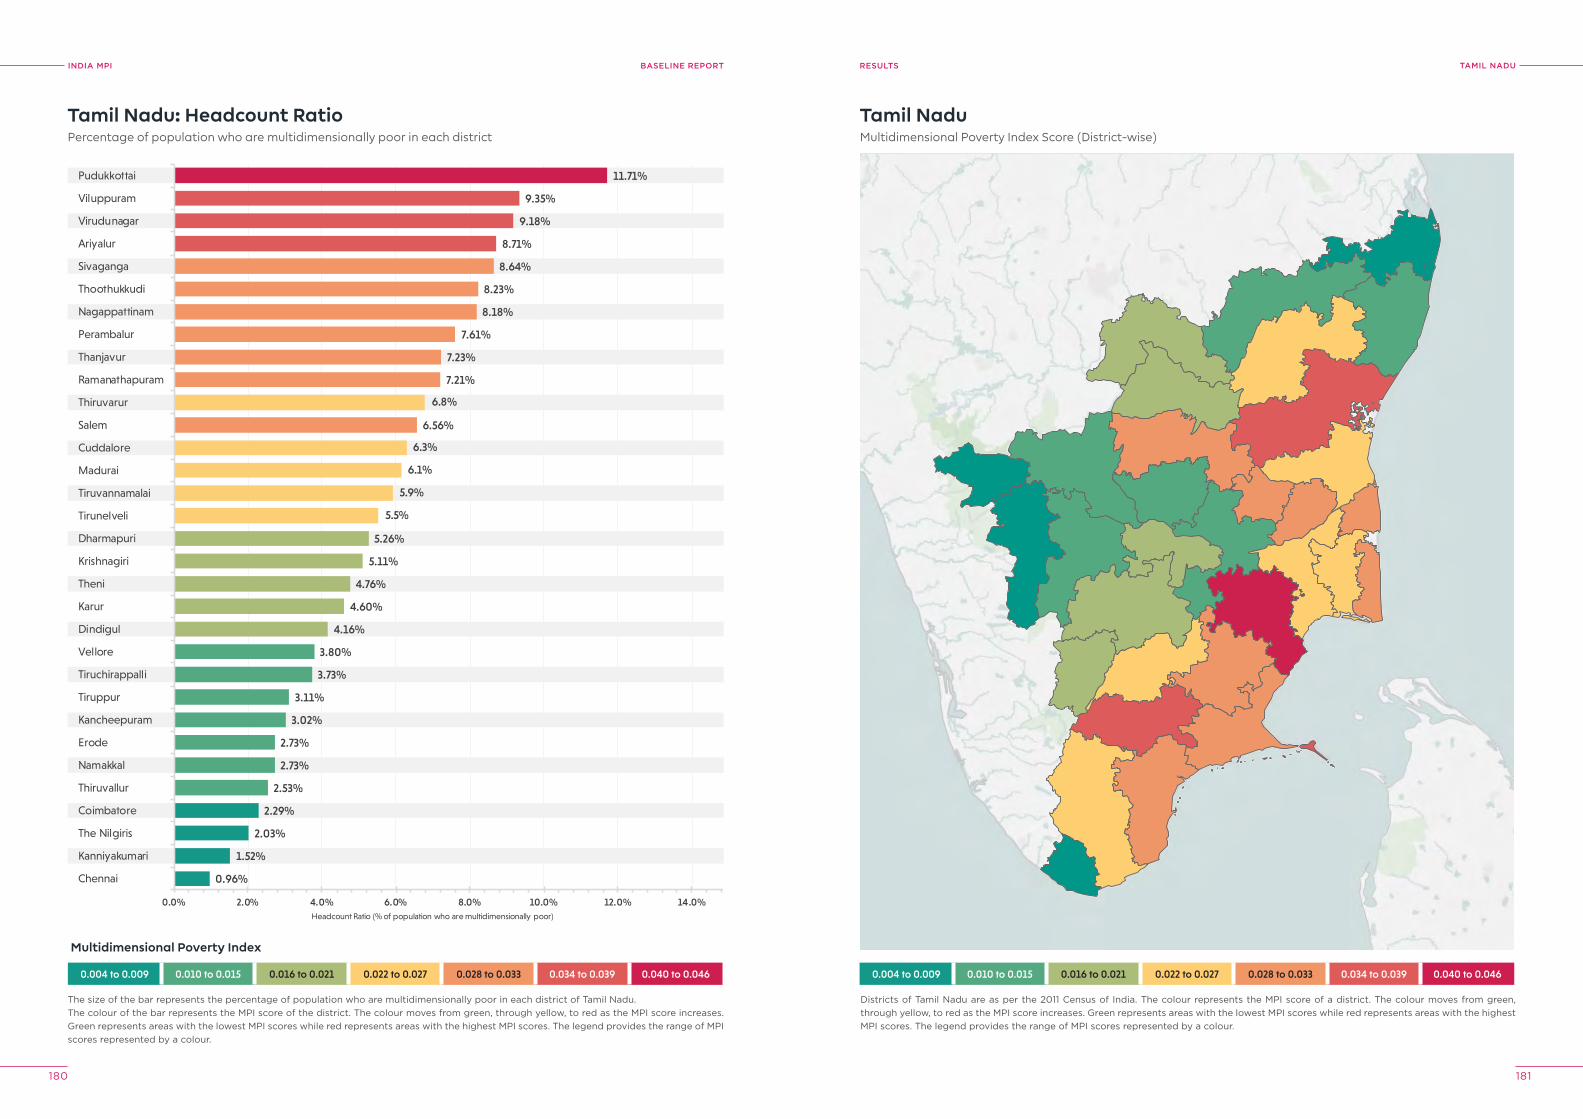
INDIA MPI BASELINE REPORT
180 181
TAMIl NADUreSUlTS
0.004 to 0.009 0.010 to 0.015 0.016 to 0.021 0.022 to 0.027 0.028 to 0.033 0.034 to 0.039 0.040 to 0.046
0.96%
1.52%
2.03%
2.29%
2.53%
2.73%
2.73%
3.02%
3.11%
3.73%
3.80%
4.16%
4.60%
4.76%
5.11%
5.26%
5.5%
5.9%
6.1%
6.3%
6.8%
6.56%
7.21%
7.23%
7.61%
8.18%
8.23%
8.64%
8.71%
9.18%
9.35%
11.71%
0.0% 2.0% 4.0% 6.0% 8.0% 10.0% 12.0% 14.0%
Chennai
Kanniyakumari
The Nilgiris
Coimbatore
Thiruvallur
Namakkal
Erode
Kancheepuram
Tiruppur
Tiruchirappalli
Vellore
Dindigul
Karur
Theni
Krishnagiri
Dharmapuri
Tirunelveli
Tiruvannamalai
Madurai
Cuddalore
Salem
Thiruvarur
Ramanathapuram
Thanjavur
Perambalur
Nagappattinam
Thoothukkudi
Sivaganga
Ariyalur
Virudunagar
Viluppuram
Pudukkottai
Headcount Ratio (% of population who are multidimensionally poor)
Tamil Nadu: Headcount RatioPercentage of population who are multidimensionally poor in each district
The size of the bar represents the percentage of population who are multidimensionally poor in each district of Tamil Nadu.The colour of the bar represents the MPI score of the district. The colour moves from green, through yellow, to red as the MPI score increases. Green represents areas with the lowest MPI scores while red represents areas with the highest MPI scores. The legend provides the range of MPI scores represented by a colour.
Tamil NaduMultidimensional Poverty Index Score (District-wise)
Districts of Tamil Nadu are as per the 2011 Census of India. The colour represents the MPI score of a district. The colour moves from green, through yellow, to red as the MPI score increases. Green represents areas with the lowest MPI scores while red represents areas with the highest MPI scores. The legend provides the range of MPI scores represented by a colour.
0.004 to 0.009 0.010 to 0.015 0.016 to 0.021 0.022 to 0.027 0.028 to 0.033 0.034 to 0.039 0.040 to 0.046
Multidimensional Poverty Index
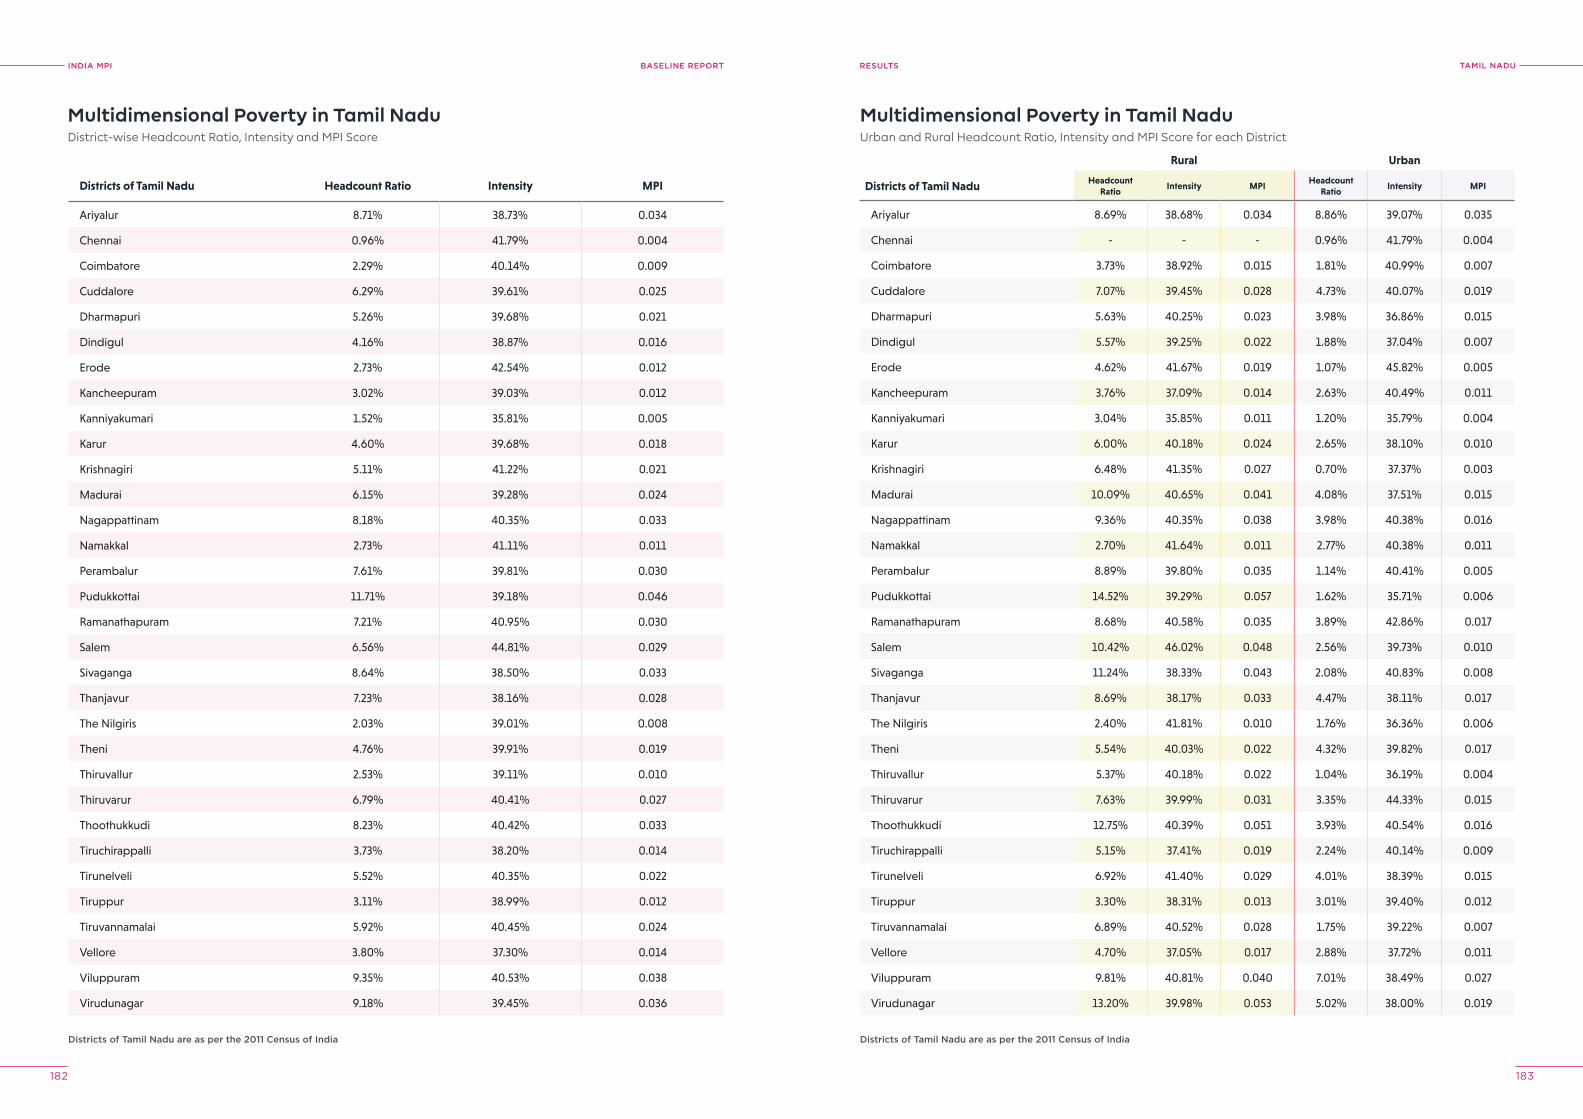
INDIA MPI BASELINE REPORT
182 183
TAMIl NADUreSUlTS
Multidimensional Poverty in Tamil NaduDistrict-wise Headcount Ratio, Intensity and MPI Score
Multidimensional Poverty in Tamil NaduUrban and Rural Headcount Ratio, Intensity and MPI Score for each District
Districts of Tamil Nadu are as per the 2011 Census of India Districts of Tamil Nadu are as per the 2011 Census of India
Districts of Tamil Nadu Headcount Ratio Intensity MPI
Ariyalur 8.71% 38.73% 0.034
Chennai 0.96% 41.79% 0.004
Coimbatore 2.29% 40.14% 0.009
Cuddalore 6.29% 39.61% 0.025
Dharmapuri 5.26% 39.68% 0.021
Dindigul 4.16% 38.87% 0.016
Erode 2.73% 42.54% 0.012
Kancheepuram 3.02% 39.03% 0.012
Kanniyakumari 1.52% 35.81% 0.005
Karur 4.60% 39.68% 0.018
Krishnagiri 5.11% 41.22% 0.021
Madurai 6.15% 39.28% 0.024
Nagappattinam 8.18% 40.35% 0.033
Namakkal 2.73% 41.11% 0.011
Perambalur 7.61% 39.81% 0.030
Pudukkottai 11.71% 39.18% 0.046
Ramanathapuram 7.21% 40.95% 0.030
Salem 6.56% 44.81% 0.029
Sivaganga 8.64% 38.50% 0.033
Thanjavur 7.23% 38.16% 0.028
The Nilgiris 2.03% 39.01% 0.008
Theni 4.76% 39.91% 0.019
Thiruvallur 2.53% 39.11% 0.010
Thiruvarur 6.79% 40.41% 0.027
Thoothukkudi 8.23% 40.42% 0.033
Tiruchirappalli 3.73% 38.20% 0.014
Tirunelveli 5.52% 40.35% 0.022
Tiruppur 3.11% 38.99% 0.012
Tiruvannamalai 5.92% 40.45% 0.024
Vellore 3.80% 37.30% 0.014
Viluppuram 9.35% 40.53% 0.038
Virudunagar 9.18% 39.45% 0.036
Rural Urban
Districts of Tamil Nadu Headcount Ratio
Intensity MPIHeadcount
RatioIntensity MPI
Ariyalur 8.69% 38.68% 0.034 8.86% 39.07% 0.035
Chennai - - - 0.96% 41.79% 0.004
Coimbatore 3.73% 38.92% 0.015 1.81% 40.99% 0.007
Cuddalore 7.07% 39.45% 0.028 4.73% 40.07% 0.019
Dharmapuri 5.63% 40.25% 0.023 3.98% 36.86% 0.015
Dindigul 5.57% 39.25% 0.022 1.88% 37.04% 0.007
Erode 4.62% 41.67% 0.019 1.07% 45.82% 0.005
Kancheepuram 3.76% 37.09% 0.014 2.63% 40.49% 0.011
Kanniyakumari 3.04% 35.85% 0.011 1.20% 35.79% 0.004
Karur 6.00% 40.18% 0.024 2.65% 38.10% 0.010
Krishnagiri 6.48% 41.35% 0.027 0.70% 37.37% 0.003
Madurai 10.09% 40.65% 0.041 4.08% 37.51% 0.015
Nagappattinam 9.36% 40.35% 0.038 3.98% 40.38% 0.016
Namakkal 2.70% 41.64% 0.011 2.77% 40.38% 0.011
Perambalur 8.89% 39.80% 0.035 1.14% 40.41% 0.005
Pudukkottai 14.52% 39.29% 0.057 1.62% 35.71% 0.006
Ramanathapuram 8.68% 40.58% 0.035 3.89% 42.86% 0.017
Salem 10.42% 46.02% 0.048 2.56% 39.73% 0.010
Sivaganga 11.24% 38.33% 0.043 2.08% 40.83% 0.008
Thanjavur 8.69% 38.17% 0.033 4.47% 38.11% 0.017
The Nilgiris 2.40% 41.81% 0.010 1.76% 36.36% 0.006
Theni 5.54% 40.03% 0.022 4.32% 39.82% 0.017
Thiruvallur 5.37% 40.18% 0.022 1.04% 36.19% 0.004
Thiruvarur 7.63% 39.99% 0.031 3.35% 44.33% 0.015
Thoothukkudi 12.75% 40.39% 0.051 3.93% 40.54% 0.016
Tiruchirappalli 5.15% 37.41% 0.019 2.24% 40.14% 0.009
Tirunelveli 6.92% 41.40% 0.029 4.01% 38.39% 0.015
Tiruppur 3.30% 38.31% 0.013 3.01% 39.40% 0.012
Tiruvannamalai 6.89% 40.52% 0.028 1.75% 39.22% 0.007
Vellore 4.70% 37.05% 0.017 2.88% 37.72% 0.011
Viluppuram 9.81% 40.81% 0.040 7.01% 38.49% 0.027
Virudunagar 13.20% 39.98% 0.053 5.02% 38.00% 0.019
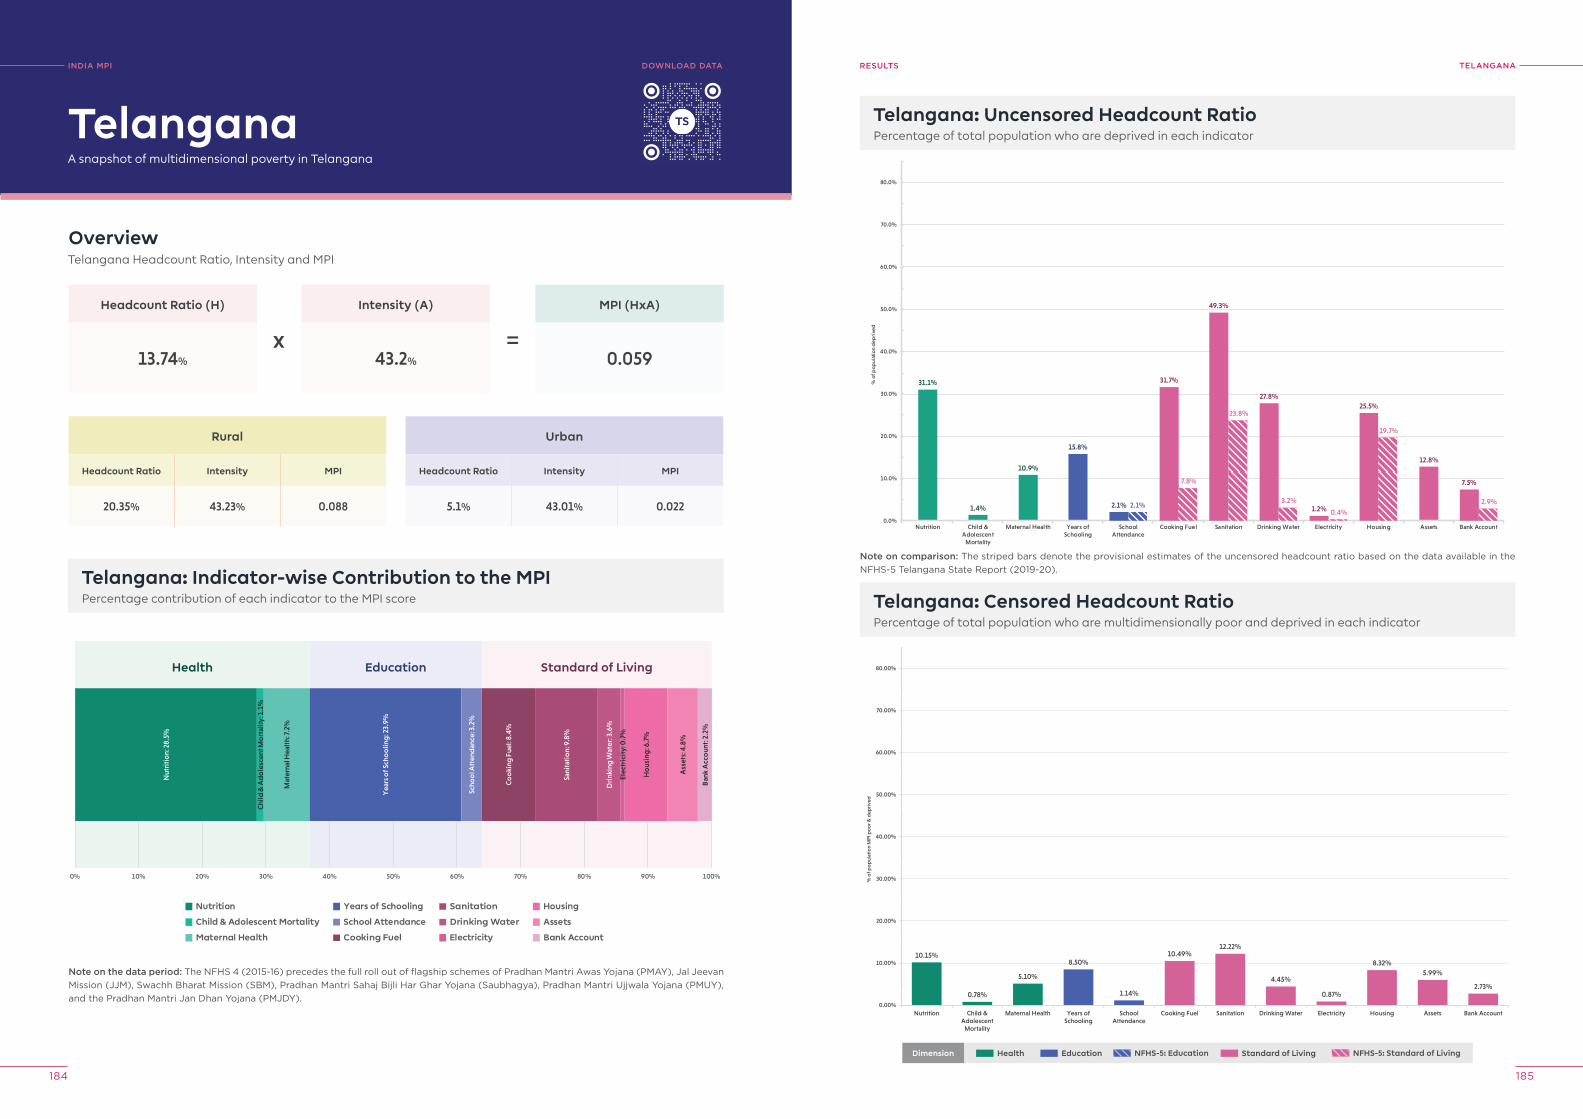
INDIA MPI BASELINE REPORT
184 185
TelANGANAreSUlTS
Telangana: Uncensored Headcount RatioPercentage of total population who are deprived in each indicator
31.1%
1.4%
10.9%
15.8%
12.8%
2.1% 2.1%
31.7%
7.8%
49.3%
23.8%
27.8%
3.2%1.2% 0.4%
25.5%
19.7%
7.5%
2.9%
0.0%
10.0%
20.0%
30.0%
40.0%
50.0%
60.0%
70.0%
80.0%
Nutrition Child &Adolescent
Mortality
Maternal Health Years ofSchooling
SchoolAttendance
Cooking Fuel Sanitation Drinking Water Electricity Housing Assets Bank Account
% o
f pop
ulat
ion
dep
rive
d
10.15%
0.78%
5.10%
8.50%
1.14%
10.49%12.22%
4.45%
0.87%
8.32%5.99%
2.73%
0.00%
10.00%
20.00%
30.00%
40.00%
50.00%
60.00%
70.00%
80.00%
Nutrition Child &Adolescent
Mortality
Maternal Health Years ofSchooling
SchoolAttendance
Cooking Fuel Sanitation Drinking Water Electricity Housing Assets Bank Account
% o
f po
pul
atio
n M
PI p
oo
r & d
epri
ved
Telangana: Censored Headcount RatioPercentage of total population who are multidimensionally poor and deprived in each indicator
INDIA MpI
A snapshot of multidimensional poverty in Telangana
OverviewTelangana Headcount Ratio, Intensity and MPI
Headcount Ratio (H)
13.74%
Rural
Headcount Ratio Intensity MPI
20.35% 43.23% 0.088
Telangana: Indicator-wise Contribution to the MPIPercentage contribution of each indicator to the MPI score
Intensity (A)
43.2%
MPI (HxA)
0.059
Telangana
Urban
Headcount Ratio Intensity MPI
5.1% 43.01% 0.022
x =
Note on the data period: The NFHS 4 (2015-16) precedes the full roll out of flagship schemes of Pradhan Mantri Awas Yojana (PMAY), Jal Jeevan Mission (JJM), Swachh Bharat Mission (SBM), Pradhan Mantri Sahaj Bijli Har Ghar Yojana (Saubhagya), Pradhan Mantri Ujjwala Yojana (PMUY), and the Pradhan Mantri Jan Dhan Yojana (PMJDY).
Nutrition
Child & Adolescent Mortality
Maternal Health
Years of Schooling
School Attendance
Cooking Fuel
Sanitation
Drinking Water
Electricity
Housing
Assets
Bank Account
0% 10% 20% 30% 40% 50% 60% 70% 80% 90% 100%
Health Education Standard of Living
Nut
riti
on:
28.
5%
Chi
ld &
Ad
ole
scen
t Mo
rtal
ity: 1
.1%
Mat
erna
l Hea
lth:
7.2%
Yea
rs o
f Sch
oo
ling
: 23.
9%
Scho
ol A
tten
dan
ce: 3
.2%
Co
oki
ng F
uel:
8.4%
Sani
tati
on:
9.8
%
Dri
nkin
g W
ater
: 3.6
%
Elec
tric
ity:
0.7
%
Ho
usin
g: 6
.7%
Ass
ets:
4.8
%
Ban
k A
cco
unt:
2.2
%
DoWNloAD DATA
Note on comparison: The striped bars denote the provisional estimates of the uncensored headcount ratio based on the data available in the NFHS-5 Telangana State Report (2019-20).
Dimension Health Education Standard of Living NFHS-5: Standard of LivingNFHS-5: Education
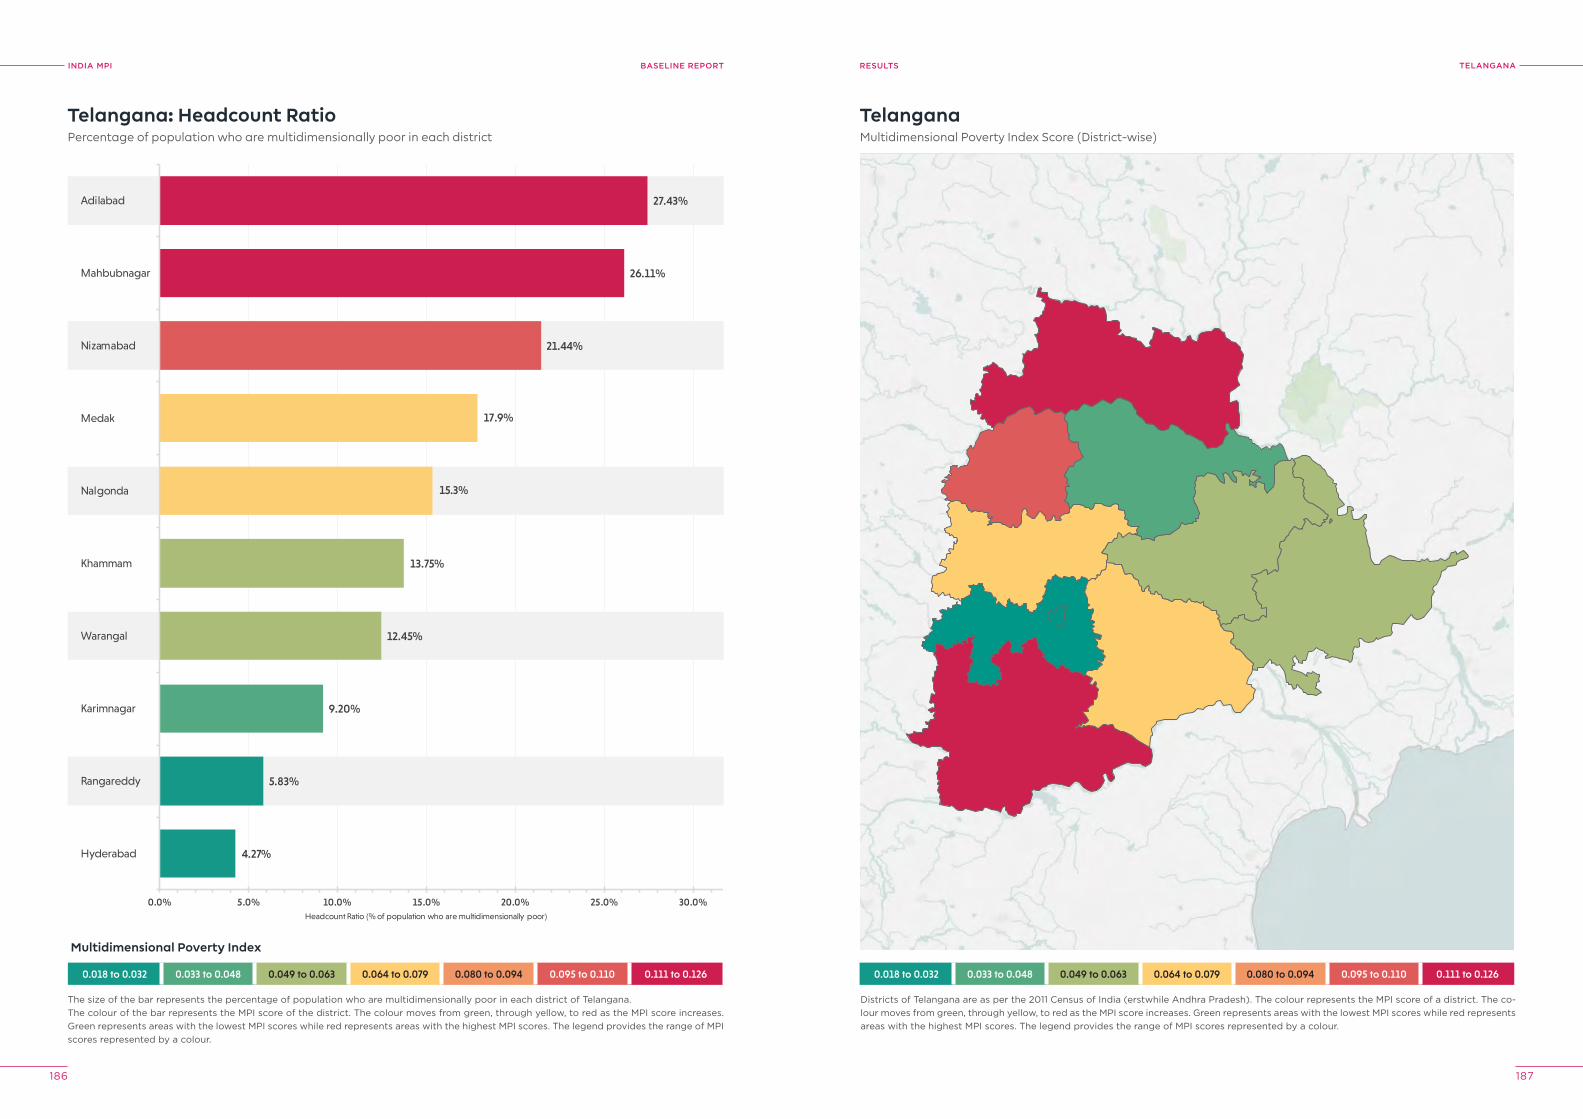
INDIA MPI BASELINE REPORT
186 187
TelANGANAreSUlTS
0.018 to 0.032 0.033 to 0.048 0.049 to 0.063 0.064 to 0.079 0.080 to 0.094 0.095 to 0.110 0.111 to 0.126
4.27%
5.83%
9.20%
12.45%
13.75%
15.3%
17.9%
21.44%
26.11%
27.43%
0.0% 5.0% 10.0% 15.0% 20.0% 25.0% 30.0%
Hyderabad
Rangareddy
Karimnagar
Warangal
Khammam
Nalgonda
Medak
Nizamabad
Mahbubnagar
Adilabad
Headcount Ratio (% of population who are multidimensionally poor)
Telangana: Headcount RatioPercentage of population who are multidimensionally poor in each district
The size of the bar represents the percentage of population who are multidimensionally poor in each district of Telangana.The colour of the bar represents the MPI score of the district. The colour moves from green, through yellow, to red as the MPI score increases. Green represents areas with the lowest MPI scores while red represents areas with the highest MPI scores. The legend provides the range of MPI scores represented by a colour.
TelanganaMultidimensional Poverty Index Score (District-wise)
Districts of Telangana are as per the 2011 Census of India (erstwhile Andhra Pradesh). The colour represents the MPI score of a district. The co-lour moves from green, through yellow, to red as the MPI score increases. Green represents areas with the lowest MPI scores while red represents areas with the highest MPI scores. The legend provides the range of MPI scores represented by a colour.
0.018 to 0.032 0.033 to 0.048 0.049 to 0.063 0.064 to 0.079 0.080 to 0.094 0.095 to 0.110 0.111 to 0.126
Multidimensional Poverty Index
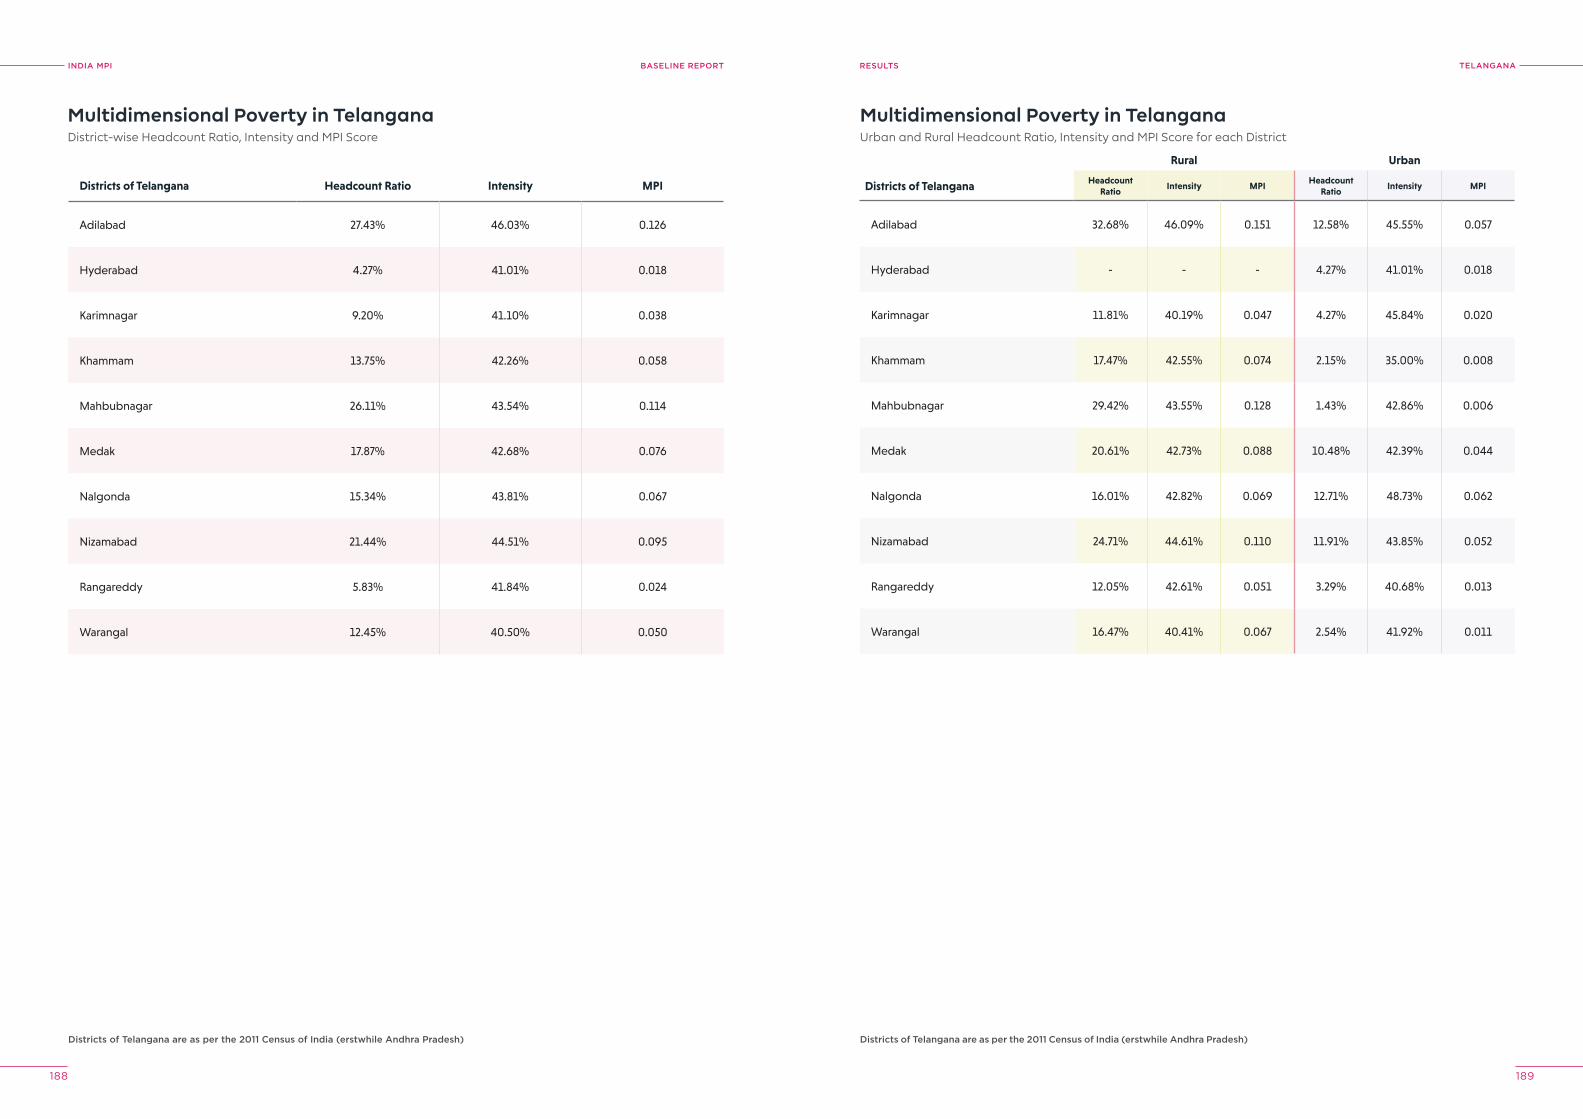
INDIA MPI BASELINE REPORT
188 189
TelANGANAreSUlTS
Multidimensional Poverty in TelanganaDistrict-wise Headcount Ratio, Intensity and MPI Score
Multidimensional Poverty in TelanganaUrban and Rural Headcount Ratio, Intensity and MPI Score for each District
Districts of Telangana are as per the 2011 Census of India (erstwhile Andhra pradesh) Districts of Telangana are as per the 2011 Census of India (erstwhile Andhra pradesh)
Districts of Telangana Headcount Ratio Intensity MPI
Adilabad 27.43% 46.03% 0.126
Hyderabad 4.27% 41.01% 0.018
Karimnagar 9.20% 41.10% 0.038
Khammam 13.75% 42.26% 0.058
Mahbubnagar 26.11% 43.54% 0.114
Medak 17.87% 42.68% 0.076
Nalgonda 15.34% 43.81% 0.067
Nizamabad 21.44% 44.51% 0.095
Rangareddy 5.83% 41.84% 0.024
Warangal 12.45% 40.50% 0.050
Rural Urban
Districts of Telangana Headcount Ratio
Intensity MPIHeadcount
RatioIntensity MPI
Adilabad 32.68% 46.09% 0.151 12.58% 45.55% 0.057
Hyderabad - - - 4.27% 41.01% 0.018
Karimnagar 11.81% 40.19% 0.047 4.27% 45.84% 0.020
Khammam 17.47% 42.55% 0.074 2.15% 35.00% 0.008
Mahbubnagar 29.42% 43.55% 0.128 1.43% 42.86% 0.006
Medak 20.61% 42.73% 0.088 10.48% 42.39% 0.044
Nalgonda 16.01% 42.82% 0.069 12.71% 48.73% 0.062
Nizamabad 24.71% 44.61% 0.110 11.91% 43.85% 0.052
Rangareddy 12.05% 42.61% 0.051 3.29% 40.68% 0.013
Warangal 16.47% 40.41% 0.067 2.54% 41.92% 0.011
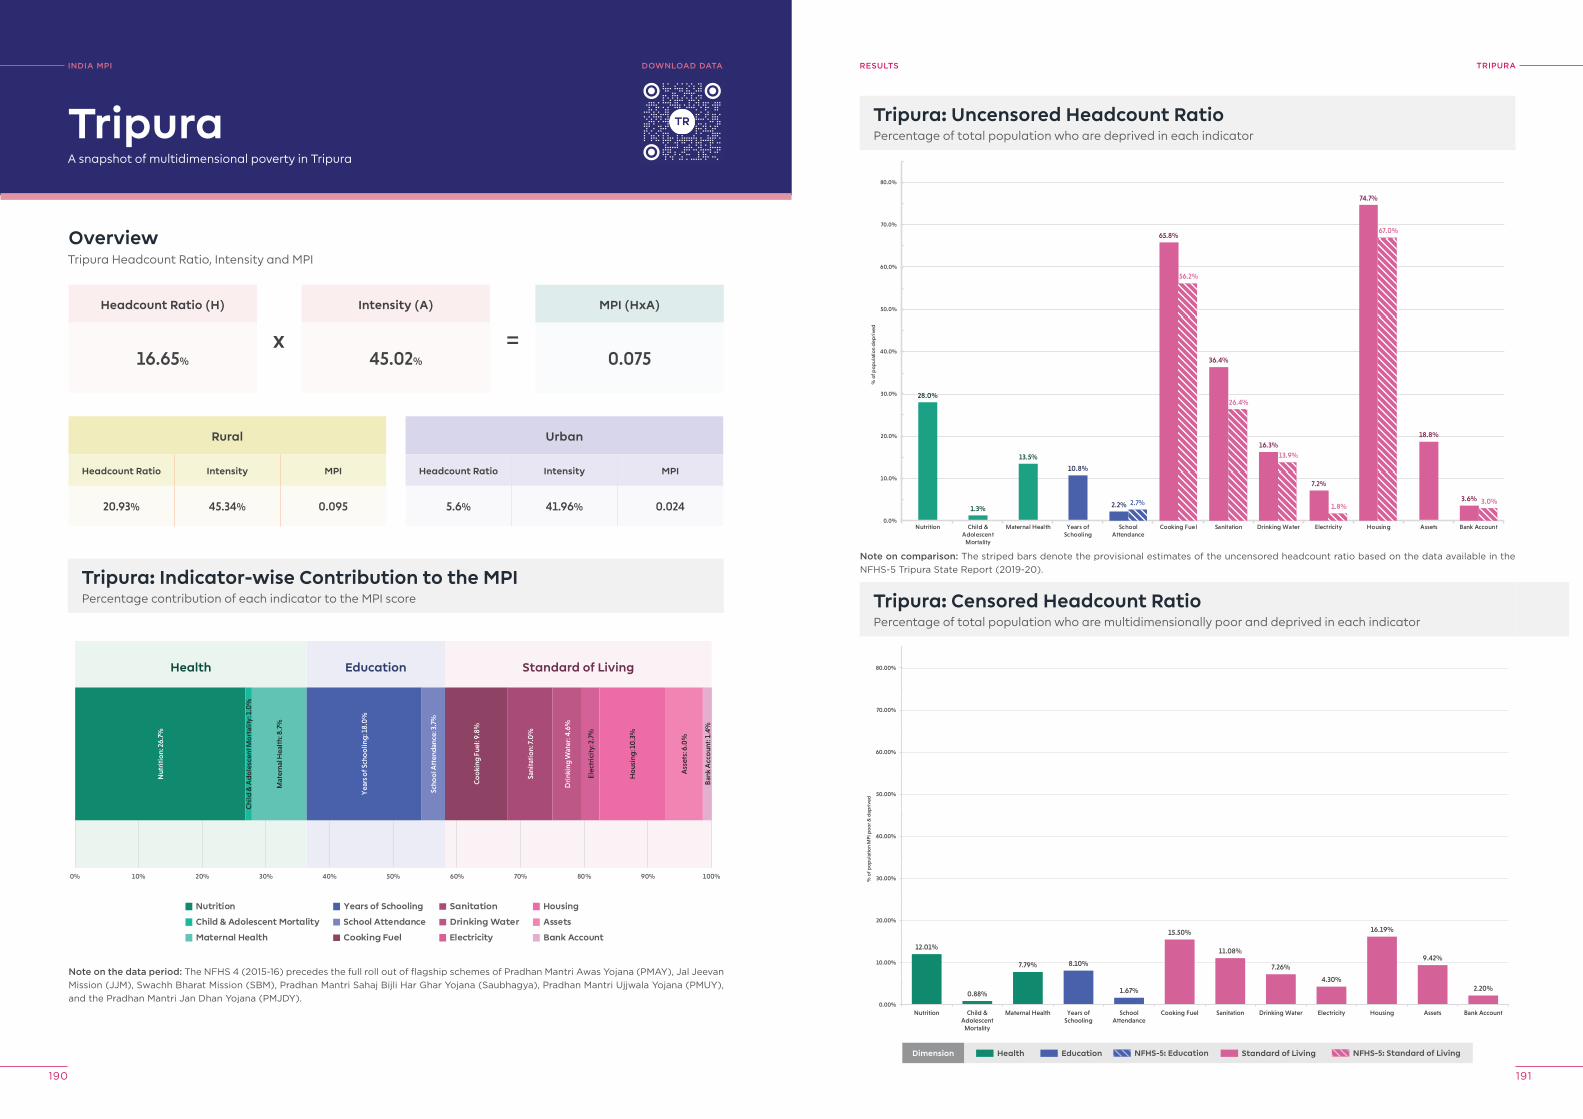
INDIA MPI BASELINE REPORT
190 191
TrIpUrAreSUlTS
Tripura: Uncensored Headcount RatioPercentage of total population who are deprived in each indicator
28.0%
1.3%
13.5%
10.8%
18.8%
2.2% 2.7%
65.8%
56.2%
36.4%
26.4%
16.3%13.9%
7.2%
1.8%
74.7%
67.0%
3.6% 3.0%
0.0%
10.0%
20.0%
30.0%
40.0%
50.0%
60.0%
70.0%
80.0%
Nutrition Child &Adolescent
Mortality
Maternal Health Years ofSchooling
SchoolAttendance
Cooking Fuel Sanitation Drinking Water Electricity Housing Assets Bank Account
% o
f pop
ulat
ion
dep
rive
d
12.01%
0.88%
7.79% 8.10%
1.67%
15.50%
11.08%
7.26%
4.30%
16.19%
9.42%
2.20%
0.00%
10.00%
20.00%
30.00%
40.00%
50.00%
60.00%
70.00%
80.00%
Nutrition Child &Adolescent
Mortality
Maternal Health Years ofSchooling
SchoolAttendance
Cooking Fuel Sanitation Drinking Water Electricity Housing Assets Bank Account
% o
f po
pul
atio
n M
PI p
oo
r & d
epri
ved
Tripura: Censored Headcount RatioPercentage of total population who are multidimensionally poor and deprived in each indicator
INDIA MpI
A snapshot of multidimensional poverty in Tripura
OverviewTripura Headcount Ratio, Intensity and MPI
Headcount Ratio (H)
16.65%
Rural
Headcount Ratio Intensity MPI
20.93% 45.34% 0.095
Tripura: Indicator-wise Contribution to the MPIPercentage contribution of each indicator to the MPI score
Intensity (A)
45.02%
MPI (HxA)
0.075
Tripura
Urban
Headcount Ratio Intensity MPI
5.6% 41.96% 0.024
x =
Note on the data period: The NFHS 4 (2015-16) precedes the full roll out of flagship schemes of Pradhan Mantri Awas Yojana (PMAY), Jal Jeevan Mission (JJM), Swachh Bharat Mission (SBM), Pradhan Mantri Sahaj Bijli Har Ghar Yojana (Saubhagya), Pradhan Mantri Ujjwala Yojana (PMUY), and the Pradhan Mantri Jan Dhan Yojana (PMJDY).
Nutrition
Child & Adolescent Mortality
Maternal Health
Years of Schooling
School Attendance
Cooking Fuel
Sanitation
Drinking Water
Electricity
Housing
Assets
Bank Account
0% 10% 20% 30% 40% 50% 60% 70% 80% 90% 100%
Health Education Standard of Living
Nut
riti
on:
26.
7%
Chi
ld &
Ad
ole
scen
t Mo
rtal
ity: 1
.0%
Mat
erna
l Hea
lth:
8.7
%
Yea
rs o
f Sch
oo
ling
: 18.
0%
Scho
ol A
tten
dan
ce: 3
.7%
Co
oki
ng F
uel:
9.8%
Sani
tati
on:
7.0
%
Dri
nkin
g W
ater
: 4.6
%
Elec
tric
ity:
2.7
%
Ho
usin
g: 1
0.3
%
Ass
ets:
6.0
%
Ban
k A
cco
unt:
1.4
%
DoWNloAD DATA
Note on comparison: The striped bars denote the provisional estimates of the uncensored headcount ratio based on the data available in the NFHS-5 Tripura State Report (2019-20).
Dimension Health Education Standard of Living NFHS-5: Standard of LivingNFHS-5: Education
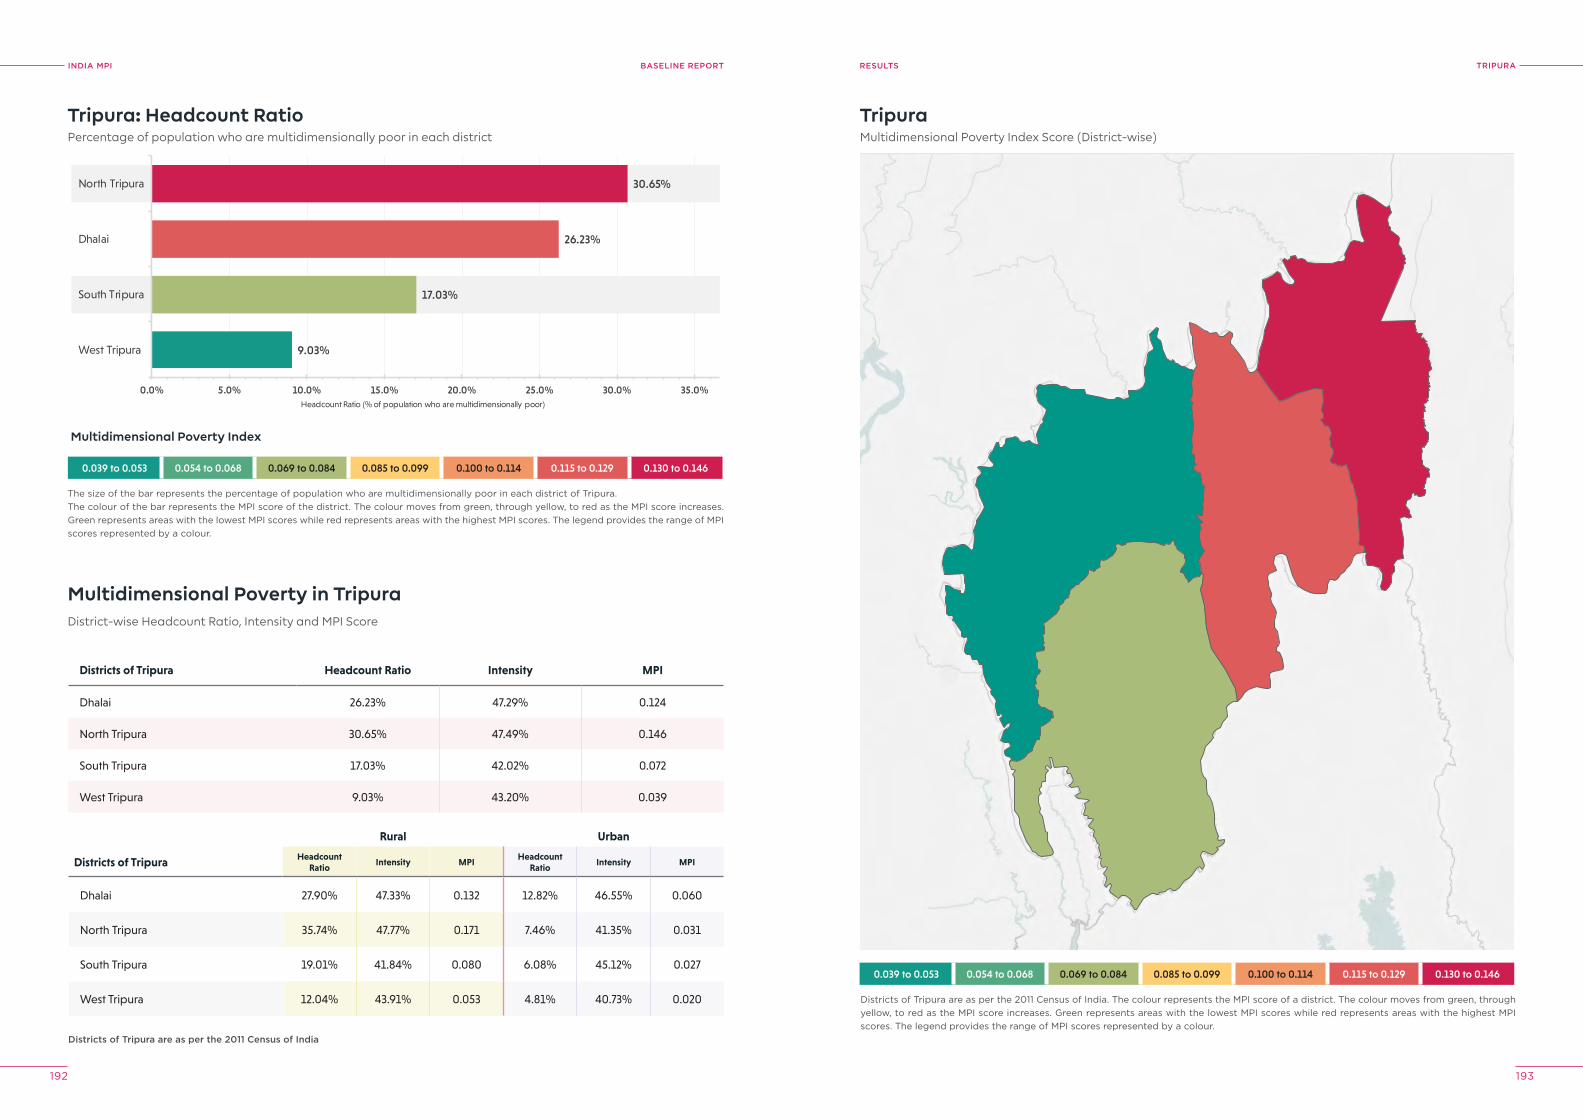
INDIA MPI BASELINE REPORT
192 193
TrIpUrAreSUlTS
0.039 to 0.053 0.054 to 0.068 0.069 to 0.084 0.085 to 0.099 0.100 to 0.114 0.115 to 0.129 0.130 to 0.146
9.03%
17.03%
26.23%
30.65%
0.0% 5.0% 10.0% 15.0% 20.0% 25.0% 30.0% 35.0%
West Tripura
South Tripura
Dhalai
North Tripura
Headcount Ratio (% of population who are multidimensionally poor)
Tripura: Headcount RatioPercentage of population who are multidimensionally poor in each district
The size of the bar represents the percentage of population who are multidimensionally poor in each district of Tripura.The colour of the bar represents the MPI score of the district. The colour moves from green, through yellow, to red as the MPI score increases. Green represents areas with the lowest MPI scores while red represents areas with the highest MPI scores. The legend provides the range of MPI scores represented by a colour.
TripuraMultidimensional Poverty Index Score (District-wise)
Districts of Tripura are as per the 2011 Census of India. The colour represents the MPI score of a district. The colour moves from green, through yellow, to red as the MPI score increases. Green represents areas with the lowest MPI scores while red represents areas with the highest MPI scores. The legend provides the range of MPI scores represented by a colour.
0.039 to 0.053 0.054 to 0.068 0.069 to 0.084 0.085 to 0.099 0.100 to 0.114 0.115 to 0.129 0.130 to 0.146
Multidimensional Poverty Index
District-wise Headcount Ratio, Intensity and MPI Score
Rural Urban
Districts of Tripura Headcount Ratio
Intensity MPIHeadcount
RatioIntensity MPI
Dhalai 27.90% 47.33% 0.132 12.82% 46.55% 0.060
North Tripura 35.74% 47.77% 0.171 7.46% 41.35% 0.031
South Tripura 19.01% 41.84% 0.080 6.08% 45.12% 0.027
West Tripura 12.04% 43.91% 0.053 4.81% 40.73% 0.020
Multidimensional Poverty in Tripura
Districts of Tripura Headcount Ratio Intensity MPI
Dhalai 26.23% 47.29% 0.124
North Tripura 30.65% 47.49% 0.146
South Tripura 17.03% 42.02% 0.072
West Tripura 9.03% 43.20% 0.039
Districts of Tripura are as per the 2011 Census of India
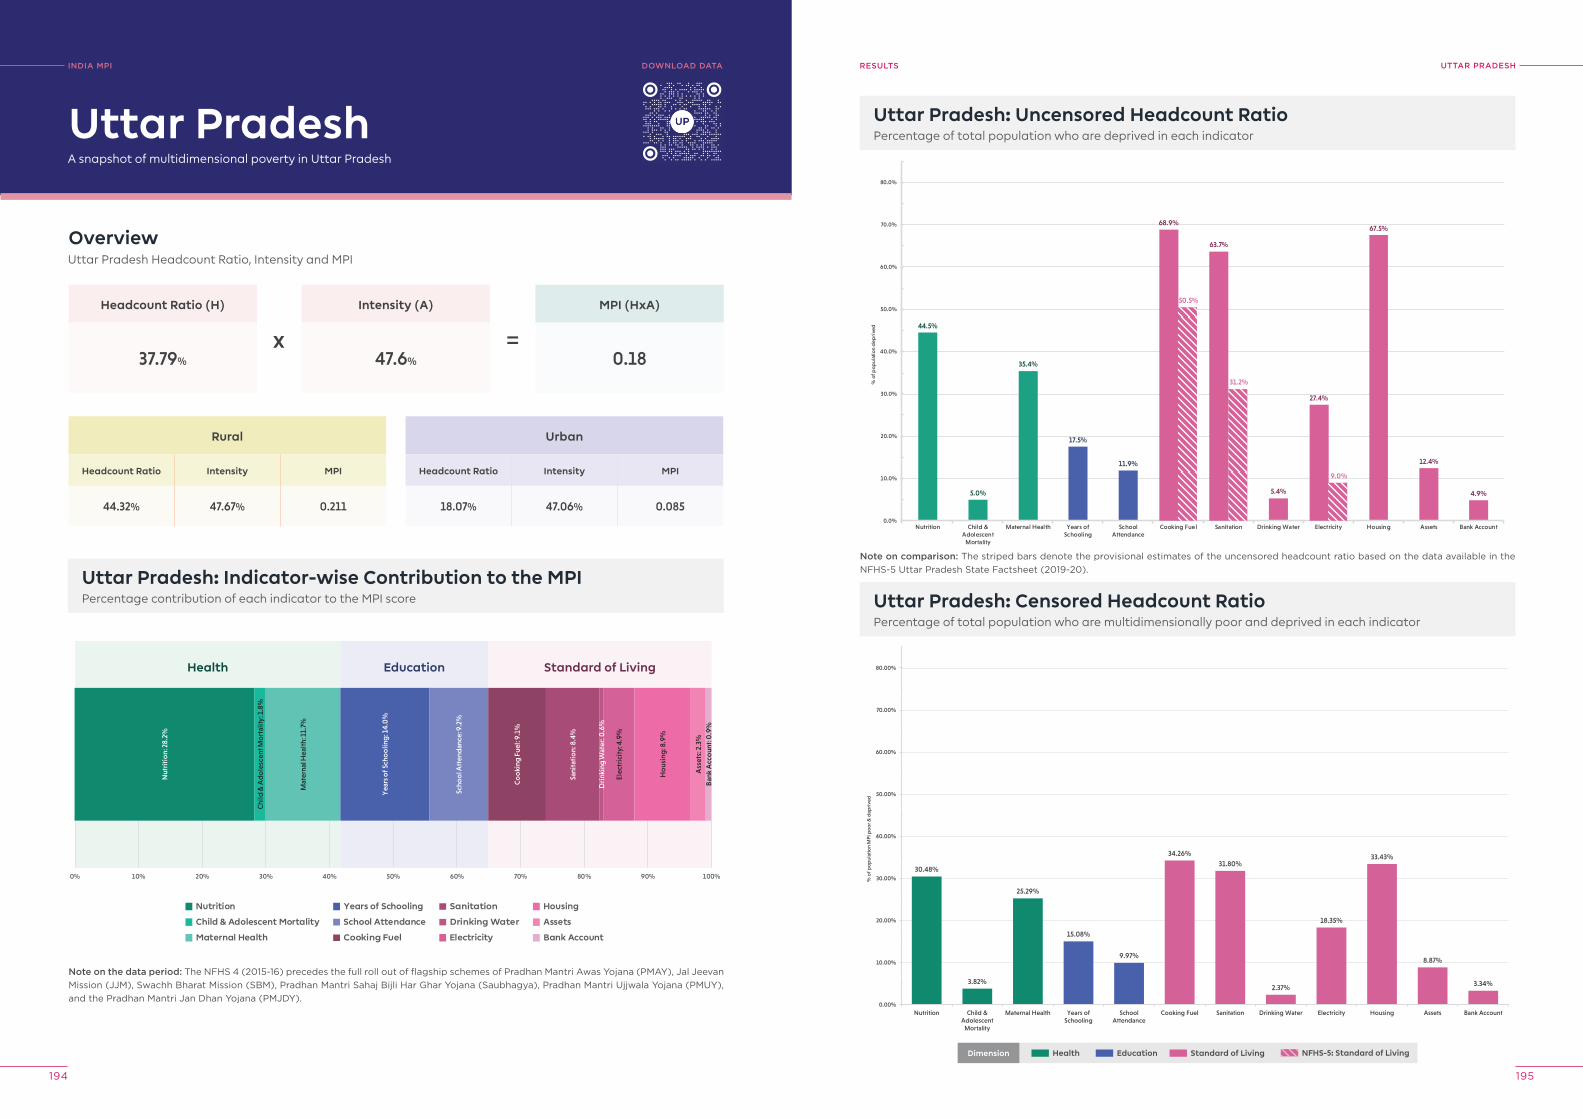
INDIA MPI BASELINE REPORT
194 195
UTTAr prADeShreSUlTS
Uttar Pradesh: Uncensored Headcount RatioPercentage of total population who are deprived in each indicator
44.5%
5.0%
35.4%
17.5%
11.9%
5.4%
67.5%
12.4%
4.9%
68.9%
50.5%
63.7%
31.2%
27.4%
9.0%
0.0%
10.0%
20.0%
30.0%
40.0%
50.0%
60.0%
70.0%
80.0%
Nutrition Child &Adolescent
Mortality
Maternal Health Years ofSchooling
SchoolAttendance
Cooking Fuel Sanitation Drinking Water Electricity Housing Assets Bank Account
% o
f pop
ulat
ion
dep
rive
d30.48%
3.82%
25.29%
15.08%
9.97%
34.26%
31.80%
2.37%
18.35%
33.43%
8.87%
3.34%
0.00%
10.00%
20.00%
30.00%
40.00%
50.00%
60.00%
70.00%
80.00%
Nutrition Child &Adolescent
Mortality
Maternal Health Years ofSchooling
SchoolAttendance
Cooking Fuel Sanitation Drinking Water Electricity Housing Assets Bank Account
% o
f po
pul
atio
n M
PI p
oo
r & d
epri
ved
Uttar Pradesh: Censored Headcount RatioPercentage of total population who are multidimensionally poor and deprived in each indicator
INDIA MpI
A snapshot of multidimensional poverty in Uttar Pradesh
OverviewUttar Pradesh Headcount Ratio, Intensity and MPI
Headcount Ratio (H)
37.79%
Rural
Headcount Ratio Intensity MPI
44.32% 47.67% 0.211
Uttar Pradesh: Indicator-wise Contribution to the MPIPercentage contribution of each indicator to the MPI score
Intensity (A)
47.6%
MPI (HxA)
0.18
Uttar Pradesh
Urban
Headcount Ratio Intensity MPI
18.07% 47.06% 0.085
x =
Note on the data period: The NFHS 4 (2015-16) precedes the full roll out of flagship schemes of Pradhan Mantri Awas Yojana (PMAY), Jal Jeevan Mission (JJM), Swachh Bharat Mission (SBM), Pradhan Mantri Sahaj Bijli Har Ghar Yojana (Saubhagya), Pradhan Mantri Ujjwala Yojana (PMUY), and the Pradhan Mantri Jan Dhan Yojana (PMJDY).
Nutrition
Child & Adolescent Mortality
Maternal Health
Years of Schooling
School Attendance
Cooking Fuel
Sanitation
Drinking Water
Electricity
Housing
Assets
Bank Account
0% 10% 20% 30% 40% 50% 60% 70% 80% 90% 100%
Health Education Standard of Living
Nut
riti
on:
28.
2%
Chi
ld &
Ad
ole
scen
t Mo
rtal
ity: 1
.8%
Mat
erna
l Hea
lth:
11.
7%
Yea
rs o
f Sch
oo
ling
: 14.
0%
Scho
ol A
tten
dan
ce: 9
.2%
Co
oki
ng F
uel:
9.1%
Sani
tati
on:
8.4
%
Dri
nkin
g W
ater
: 0.6
%
Elec
tric
ity:
4.9
%
Ho
usin
g: 8
.9%
Ass
ets:
2.3
%B
ank
Acc
oun
t: 0
.9%
DoWNloAD DATA
Note on comparison: The striped bars denote the provisional estimates of the uncensored headcount ratio based on the data available in the NFHS-5 Uttar Pradesh State Factsheet (2019-20).
Dimension Health Education Standard of Living NFHS-5: Standard of Living
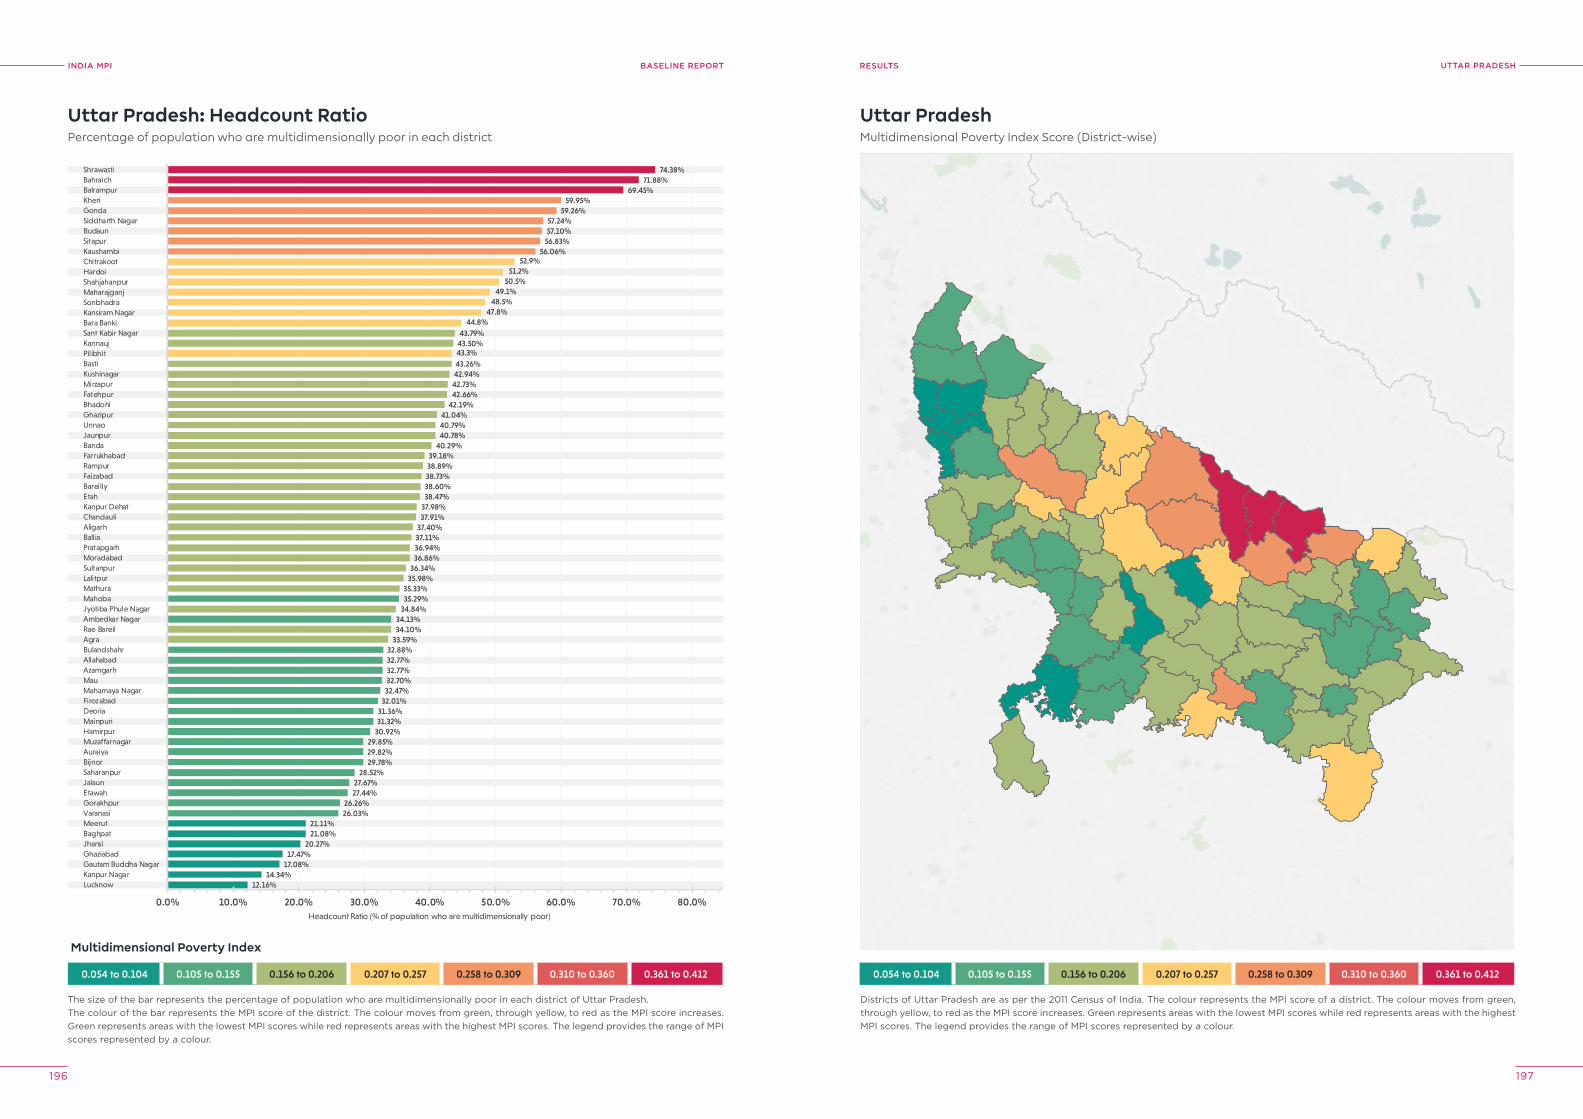
INDIA MPI BASELINE REPORT
196 197
UTTAr prADeShreSUlTS
0.054 to 0.104 0.105 to 0.155 0.156 to 0.206 0.207 to 0.257 0.258 to 0.309 0.310 to 0.360 0.361 to 0.412
0.0%
LucknowKanpur NagarGautam Buddha NagarGhaziabadJhansiBaghpatMeerutVaranasiGorakhpurEtawahJalaunSaharanpurBijnorAuraiyaMuzaffarnagarHamirpurMainpuriDeoriaFirozabadMahamaya NagarMauAzamgarhAllahabadBulandshahrAgraRae BareliAmbedkar NagarJyotiba Phule NagarMahobaMathuraLalitpurSultanpurMoradabadPratapgarhBalliaAligarhChandauliKanpur DehatEtahBareillyFaizabadRampurFarrukhabadBandaJaunpurUnnaoGhazipurBhadohiFatehpurMirzapurKushinagarBastiPilibhitKannaujSant Kabir NagarBara BankiKansiram NagarSonbhadraMaharajganjShahjahanpurHardoiChitrakootKaushambiSitapurBudaunSiddharth NagarGondaKheriBalrampurBahraichShrawasti
12.16%14.34%
17.08%17.47%
20.27%21.08%21.11%
26.03%26.26%
27.44%27.67%
28.52%29.78%29.82%29.85%
30.92%31.32%31.36%
32.01%32.47%32.70%32.77%32.77%32.88%
34.13%
35.29%
33.59%34.10%
34.84%
35.33%35.98%36.34%
36.86%36.94%37.11%37.40%37.91%37.98%38.47%38.60%38.73%38.89%39.18%
40.29%40.78%40.79%41.04%
42.19%42.66%42.73%42.94%43.26%
43.50%43.79%
43.3%
44.8%47.8%
48.5%49.1%
50.5%51.2%
52.9%56.06%
56.83%57.10%57.24%
59.26%59.95%
69.45%71.88%
74.38%
10.0% 20.0% 30.0% 40.0% 50.0% 60.0% 70.0% 80.0%Headcount Ratio (% of population who are multidimensionally poor)
Uttar Pradesh: Headcount RatioPercentage of population who are multidimensionally poor in each district
The size of the bar represents the percentage of population who are multidimensionally poor in each district of Uttar Pradesh.The colour of the bar represents the MPI score of the district. The colour moves from green, through yellow, to red as the MPI score increases. Green represents areas with the lowest MPI scores while red represents areas with the highest MPI scores. The legend provides the range of MPI scores represented by a colour.
Uttar PradeshMultidimensional Poverty Index Score (District-wise)
Districts of Uttar Pradesh are as per the 2011 Census of India. The colour represents the MPI score of a district. The colour moves from green, through yellow, to red as the MPI score increases. Green represents areas with the lowest MPI scores while red represents areas with the highest MPI scores. The legend provides the range of MPI scores represented by a colour.
0.054 to 0.104 0.105 to 0.155 0.156 to 0.206 0.207 to 0.257 0.258 to 0.309 0.310 to 0.360 0.361 to 0.412
Multidimensional Poverty Index
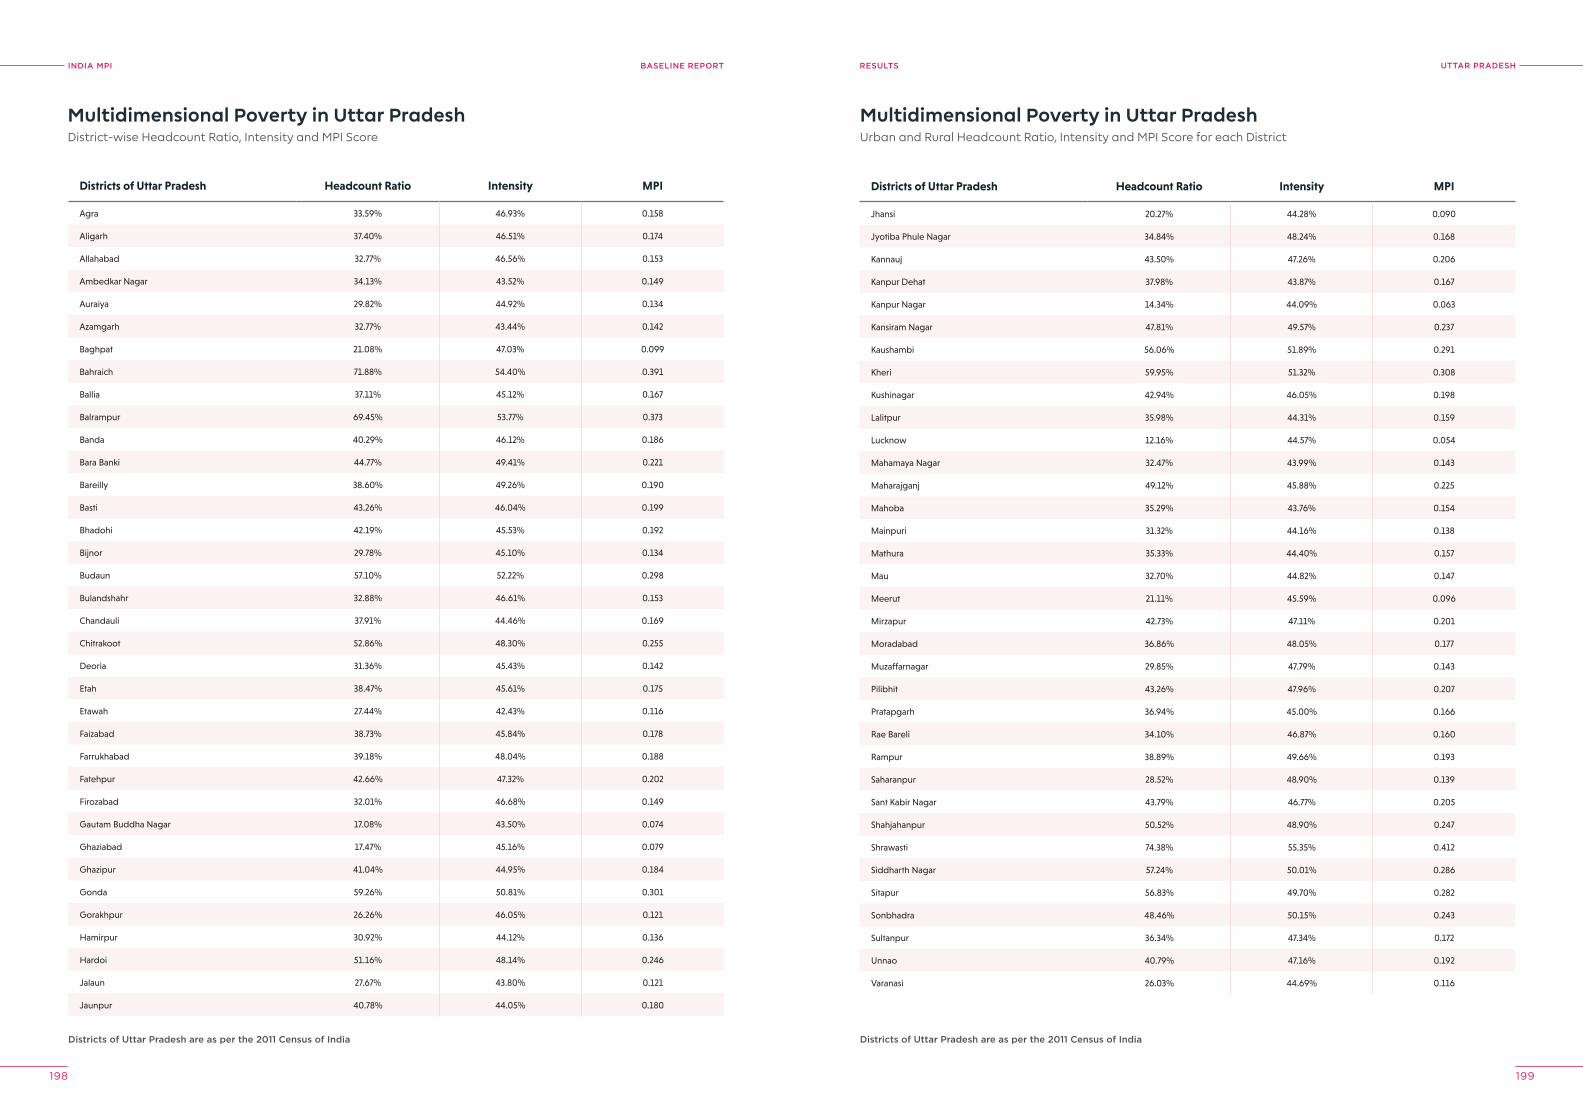
INDIA MPI BASELINE REPORT
198 199
UTTAr prADeShreSUlTS
Multidimensional Poverty in Uttar PradeshDistrict-wise Headcount Ratio, Intensity and MPI Score
Multidimensional Poverty in Uttar PradeshUrban and Rural Headcount Ratio, Intensity and MPI Score for each District
Districts of Uttar pradesh are as per the 2011 Census of India Districts of Uttar pradesh are as per the 2011 Census of India
Districts of Uttar Pradesh Headcount Ratio Intensity MPI
Agra 33.59% 46.93% 0.158
Aligarh 37.40% 46.51% 0.174
Allahabad 32.77% 46.56% 0.153
Ambedkar Nagar 34.13% 43.52% 0.149
Auraiya 29.82% 44.92% 0.134
Azamgarh 32.77% 43.44% 0.142
Baghpat 21.08% 47.03% 0.099
Bahraich 71.88% 54.40% 0.391
Ballia 37.11% 45.12% 0.167
Balrampur 69.45% 53.77% 0.373
Banda 40.29% 46.12% 0.186
Bara Banki 44.77% 49.41% 0.221
Bareilly 38.60% 49.26% 0.190
Basti 43.26% 46.04% 0.199
Bhadohi 42.19% 45.53% 0.192
Bijnor 29.78% 45.10% 0.134
Budaun 57.10% 52.22% 0.298
Bulandshahr 32.88% 46.61% 0.153
Chandauli 37.91% 44.46% 0.169
Chitrakoot 52.86% 48.30% 0.255
Deoria 31.36% 45.43% 0.142
Etah 38.47% 45.61% 0.175
Etawah 27.44% 42.43% 0.116
Faizabad 38.73% 45.84% 0.178
Farrukhabad 39.18% 48.04% 0.188
Fatehpur 42.66% 47.32% 0.202
Firozabad 32.01% 46.68% 0.149
Gautam Buddha Nagar 17.08% 43.50% 0.074
Ghaziabad 17.47% 45.16% 0.079
Ghazipur 41.04% 44.95% 0.184
Gonda 59.26% 50.81% 0.301
Gorakhpur 26.26% 46.05% 0.121
Hamirpur 30.92% 44.12% 0.136
Hardoi 51.16% 48.14% 0.246
Jalaun 27.67% 43.80% 0.121
Jaunpur 40.78% 44.05% 0.180
Districts of Uttar Pradesh Headcount Ratio Intensity MPI
Jhansi 20.27% 44.28% 0.090
Jyotiba Phule Nagar 34.84% 48.24% 0.168
Kannauj 43.50% 47.26% 0.206
Kanpur Dehat 37.98% 43.87% 0.167
Kanpur Nagar 14.34% 44.09% 0.063
Kansiram Nagar 47.81% 49.57% 0.237
Kaushambi 56.06% 51.89% 0.291
Kheri 59.95% 51.32% 0.308
Kushinagar 42.94% 46.05% 0.198
Lalitpur 35.98% 44.31% 0.159
Lucknow 12.16% 44.57% 0.054
Mahamaya Nagar 32.47% 43.99% 0.143
Maharajganj 49.12% 45.88% 0.225
Mahoba 35.29% 43.76% 0.154
Mainpuri 31.32% 44.16% 0.138
Mathura 35.33% 44.40% 0.157
Mau 32.70% 44.82% 0.147
Meerut 21.11% 45.59% 0.096
Mirzapur 42.73% 47.11% 0.201
Moradabad 36.86% 48.05% 0.177
Muzaffarnagar 29.85% 47.79% 0.143
Pilibhit 43.26% 47.96% 0.207
Pratapgarh 36.94% 45.00% 0.166
Rae Bareli 34.10% 46.87% 0.160
Rampur 38.89% 49.66% 0.193
Saharanpur 28.52% 48.90% 0.139
Sant Kabir Nagar 43.79% 46.77% 0.205
Shahjahanpur 50.52% 48.90% 0.247
Shrawasti 74.38% 55.35% 0.412
Siddharth Nagar 57.24% 50.01% 0.286
Sitapur 56.83% 49.70% 0.282
Sonbhadra 48.46% 50.15% 0.243
Sultanpur 36.34% 47.34% 0.172
Unnao 40.79% 47.16% 0.192
Varanasi 26.03% 44.69% 0.116
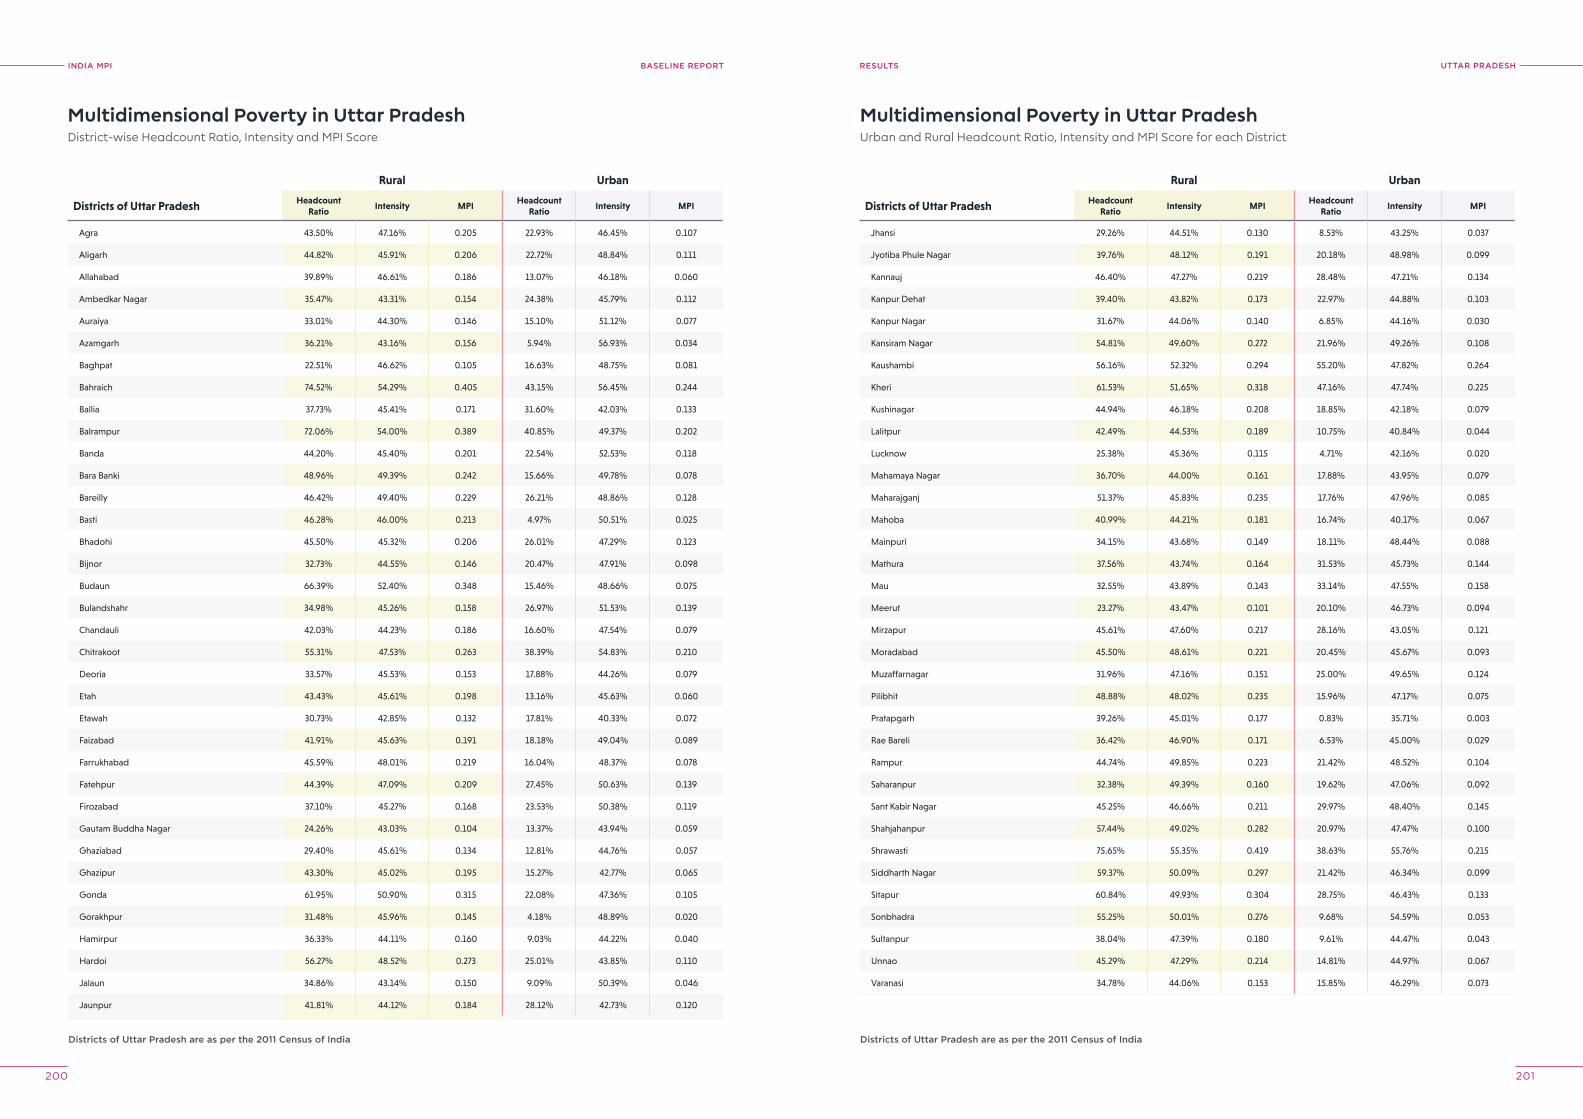
INDIA MPI BASELINE REPORT
200 201
UTTAr prADeShreSUlTS
Multidimensional Poverty in Uttar PradeshDistrict-wise Headcount Ratio, Intensity and MPI Score
Multidimensional Poverty in Uttar PradeshUrban and Rural Headcount Ratio, Intensity and MPI Score for each District
Rural Urban
Districts of Uttar Pradesh Headcount Ratio
Intensity MPIHeadcount
RatioIntensity MPI
Agra 43.50% 47.16% 0.205 22.93% 46.45% 0.107
Aligarh 44.82% 45.91% 0.206 22.72% 48.84% 0.111
Allahabad 39.89% 46.61% 0.186 13.07% 46.18% 0.060
Ambedkar Nagar 35.47% 43.31% 0.154 24.38% 45.79% 0.112
Auraiya 33.01% 44.30% 0.146 15.10% 51.12% 0.077
Azamgarh 36.21% 43.16% 0.156 5.94% 56.93% 0.034
Baghpat 22.51% 46.62% 0.105 16.63% 48.75% 0.081
Bahraich 74.52% 54.29% 0.405 43.15% 56.45% 0.244
Ballia 37.73% 45.41% 0.171 31.60% 42.03% 0.133
Balrampur 72.06% 54.00% 0.389 40.85% 49.37% 0.202
Banda 44.20% 45.40% 0.201 22.54% 52.53% 0.118
Bara Banki 48.96% 49.39% 0.242 15.66% 49.78% 0.078
Bareilly 46.42% 49.40% 0.229 26.21% 48.86% 0.128
Basti 46.28% 46.00% 0.213 4.97% 50.51% 0.025
Bhadohi 45.50% 45.32% 0.206 26.01% 47.29% 0.123
Bijnor 32.73% 44.55% 0.146 20.47% 47.91% 0.098
Budaun 66.39% 52.40% 0.348 15.46% 48.66% 0.075
Bulandshahr 34.98% 45.26% 0.158 26.97% 51.53% 0.139
Chandauli 42.03% 44.23% 0.186 16.60% 47.54% 0.079
Chitrakoot 55.31% 47.53% 0.263 38.39% 54.83% 0.210
Deoria 33.57% 45.53% 0.153 17.88% 44.26% 0.079
Etah 43.43% 45.61% 0.198 13.16% 45.63% 0.060
Etawah 30.73% 42.85% 0.132 17.81% 40.33% 0.072
Faizabad 41.91% 45.63% 0.191 18.18% 49.04% 0.089
Farrukhabad 45.59% 48.01% 0.219 16.04% 48.37% 0.078
Fatehpur 44.39% 47.09% 0.209 27.45% 50.63% 0.139
Firozabad 37.10% 45.27% 0.168 23.53% 50.38% 0.119
Gautam Buddha Nagar 24.26% 43.03% 0.104 13.37% 43.94% 0.059
Ghaziabad 29.40% 45.61% 0.134 12.81% 44.76% 0.057
Ghazipur 43.30% 45.02% 0.195 15.27% 42.77% 0.065
Gonda 61.95% 50.90% 0.315 22.08% 47.36% 0.105
Gorakhpur 31.48% 45.96% 0.145 4.18% 48.89% 0.020
Hamirpur 36.33% 44.11% 0.160 9.03% 44.22% 0.040
Hardoi 56.27% 48.52% 0.273 25.01% 43.85% 0.110
Jalaun 34.86% 43.14% 0.150 9.09% 50.39% 0.046
Jaunpur 41.81% 44.12% 0.184 28.12% 42.73% 0.120
Rural Urban
Districts of Uttar Pradesh Headcount Ratio
Intensity MPIHeadcount
RatioIntensity MPI
Jhansi 29.26% 44.51% 0.130 8.53% 43.25% 0.037
Jyotiba Phule Nagar 39.76% 48.12% 0.191 20.18% 48.98% 0.099
Kannauj 46.40% 47.27% 0.219 28.48% 47.21% 0.134
Kanpur Dehat 39.40% 43.82% 0.173 22.97% 44.88% 0.103
Kanpur Nagar 31.67% 44.06% 0.140 6.85% 44.16% 0.030
Kansiram Nagar 54.81% 49.60% 0.272 21.96% 49.26% 0.108
Kaushambi 56.16% 52.32% 0.294 55.20% 47.82% 0.264
Kheri 61.53% 51.65% 0.318 47.16% 47.74% 0.225
Kushinagar 44.94% 46.18% 0.208 18.85% 42.18% 0.079
Lalitpur 42.49% 44.53% 0.189 10.75% 40.84% 0.044
Lucknow 25.38% 45.36% 0.115 4.71% 42.16% 0.020
Mahamaya Nagar 36.70% 44.00% 0.161 17.88% 43.95% 0.079
Maharajganj 51.37% 45.83% 0.235 17.76% 47.96% 0.085
Mahoba 40.99% 44.21% 0.181 16.74% 40.17% 0.067
Mainpuri 34.15% 43.68% 0.149 18.11% 48.44% 0.088
Mathura 37.56% 43.74% 0.164 31.53% 45.73% 0.144
Mau 32.55% 43.89% 0.143 33.14% 47.55% 0.158
Meerut 23.27% 43.47% 0.101 20.10% 46.73% 0.094
Mirzapur 45.61% 47.60% 0.217 28.16% 43.05% 0.121
Moradabad 45.50% 48.61% 0.221 20.45% 45.67% 0.093
Muzaffarnagar 31.96% 47.16% 0.151 25.00% 49.65% 0.124
Pilibhit 48.88% 48.02% 0.235 15.96% 47.17% 0.075
Pratapgarh 39.26% 45.01% 0.177 0.83% 35.71% 0.003
Rae Bareli 36.42% 46.90% 0.171 6.53% 45.00% 0.029
Rampur 44.74% 49.85% 0.223 21.42% 48.52% 0.104
Saharanpur 32.38% 49.39% 0.160 19.62% 47.06% 0.092
Sant Kabir Nagar 45.25% 46.66% 0.211 29.97% 48.40% 0.145
Shahjahanpur 57.44% 49.02% 0.282 20.97% 47.47% 0.100
Shrawasti 75.65% 55.35% 0.419 38.63% 55.76% 0.215
Siddharth Nagar 59.37% 50.09% 0.297 21.42% 46.34% 0.099
Sitapur 60.84% 49.93% 0.304 28.75% 46.43% 0.133
Sonbhadra 55.25% 50.01% 0.276 9.68% 54.59% 0.053
Sultanpur 38.04% 47.39% 0.180 9.61% 44.47% 0.043
Unnao 45.29% 47.29% 0.214 14.81% 44.97% 0.067
Varanasi 34.78% 44.06% 0.153 15.85% 46.29% 0.073
Districts of Uttar pradesh are as per the 2011 Census of India Districts of Uttar pradesh are as per the 2011 Census of India

INDIA MPI BASELINE REPORT
202 203
UTTArAkhANDreSUlTS
Uttarakhand: Uncensored Headcount RatioPercentage of total population who are deprived in each indicator
32.9%
2.6%
28.6%
9.8%
4.4%
9.0%
35.6%
13.8%
6.9%
52.1%
40.8%
34.1%
21.2%
2.2%0.4%
0.0%
10.0%
20.0%
30.0%
40.0%
50.0%
60.0%
70.0%
80.0%
Nutrition Child &Adolescent
Mortality
Maternal Health Years ofSchooling
SchoolAttendance
Cooking Fuel Sanitation Drinking Water Electricity Housing Assets Bank Account
% o
f pop
ulat
ion
dep
rive
d
14.66%
1.63%
13.06%
6.74%
3.18%
15.80%
11.22%
3.21%1.39%
12.35%
6.21%
3.23%
0.00%
10.00%
20.00%
30.00%
40.00%
50.00%
60.00%
70.00%
80.00%
Nutrition Child &Adolescent
Mortality
Maternal Health Years ofSchooling
SchoolAttendance
Cooking Fuel Sanitation Drinking Water Electricity Housing Assets Bank Account
% o
f po
pul
atio
n M
PI p
oo
r & d
epri
ved
Uttarakhand: Censored Headcount RatioPercentage of total population who are multidimensionally poor and deprived in each indicator
INDIA MpI
A snapshot of multidimensional poverty in Uttarakhand
OverviewUttarakhand Headcount Ratio, Intensity and MPI
Headcount Ratio (H)
17.72%
Rural
Headcount Ratio Intensity MPI
21.94% 43.78% 0.096
Uttarakhand: Indicator-wise Contribution to the MPIPercentage contribution of each indicator to the MPI score
Intensity (A)
44.37%
MPI (HxA)
0.079
Uttarakhand
Urban
Headcount Ratio Intensity MPI
9.89% 46.82% 0.046
x =
Note on the data period: The NFHS 4 (2015-16) precedes the full roll out of flagship schemes of Pradhan Mantri Awas Yojana (PMAY), Jal Jeevan Mission (JJM), Swachh Bharat Mission (SBM), Pradhan Mantri Sahaj Bijli Har Ghar Yojana (Saubhagya), Pradhan Mantri Ujjwala Yojana (PMUY), and the Pradhan Mantri Jan Dhan Yojana (PMJDY).
Nutrition
Child & Adolescent Mortality
Maternal Health
Years of Schooling
School Attendance
Cooking Fuel
Sanitation
Drinking Water
Electricity
Housing
Assets
Bank Account
0% 10% 20% 30% 40% 50% 60% 70% 80% 90% 100%
Health Education Standard of Living
Nut
riti
on:
31.
1%
Chi
ld &
Ad
ole
scen
t Mo
rtal
ity: 1
.7%
Mat
erna
l Hea
lth:
13.
8%
Yea
rs o
f Sch
oo
ling
: 14.
3%
Scho
ol A
tten
dan
ce: 6
.7%
Co
oki
ng F
uel:
9.6%
Sani
tati
on:
6.8
%
Dri
nkin
g W
ater
: 1.9
%El
ectr
icit
y: 0
.8%
Ho
usin
g: 7
.5%
Ass
ets:
3.8
%
Ban
k A
cco
unt:
2.0
%
DoWNloAD DATA
Note on comparison: The striped bars denote the provisional estimates of the uncensored headcount ratio based on the data available in the NFHS-5 Uttarakhand State Factsheet (2019-20).
Dimension Health Education Standard of Living NFHS-5: Standard of Living
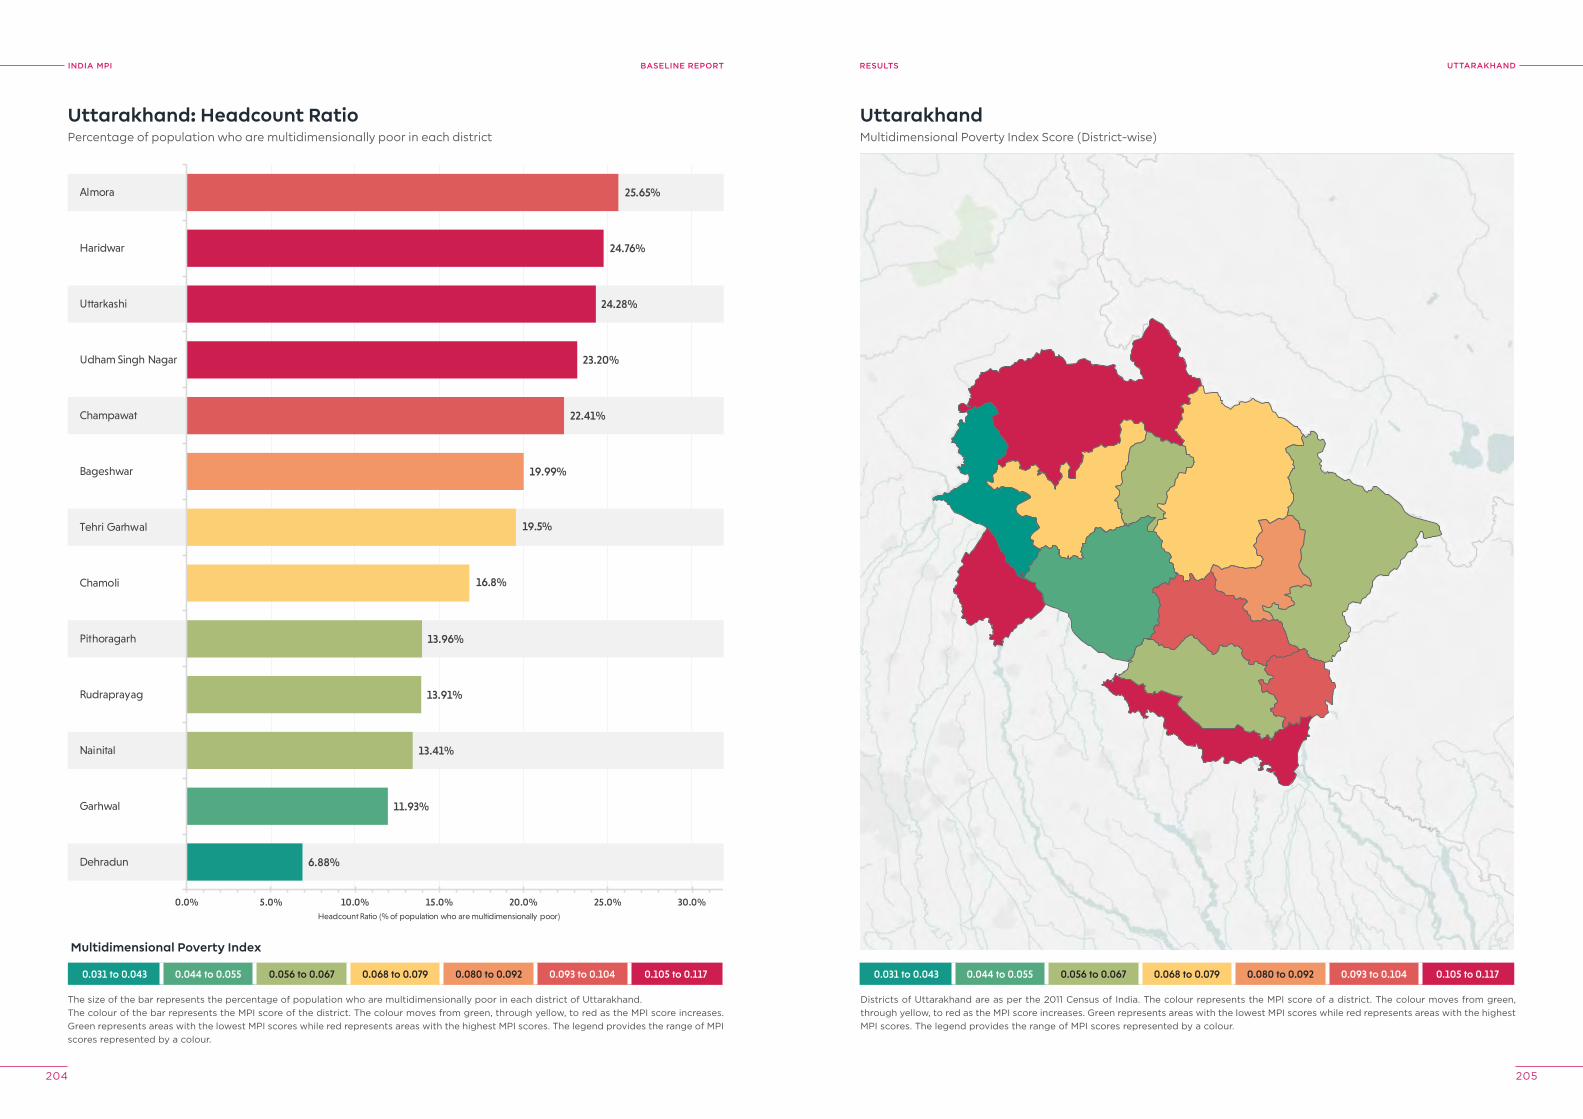
INDIA MPI BASELINE REPORT
204 205
UTTArAkhANDreSUlTS
0.031 to 0.043 0.044 to 0.055 0.056 to 0.067 0.068 to 0.079 0.080 to 0.092 0.093 to 0.104 0.105 to 0.117
6.88%
11.93%
13.41%
13.91%
13.96%
16.8%
19.5%
19.99%
22.41%
25.65%
23.20%
24.28%
24.76%
0.0% 5.0% 10.0% 15.0% 20.0% 25.0% 30.0%
Dehradun
Garhwal
Nainital
Rudraprayag
Pithoragarh
Chamoli
Tehri Garhwal
Bageshwar
Champawat
Udham Singh Nagar
Uttarkashi
Haridwar
Almora
Headcount Ratio (% of population who are multidimensionally poor)
Uttarakhand: Headcount RatioPercentage of population who are multidimensionally poor in each district
The size of the bar represents the percentage of population who are multidimensionally poor in each district of Uttarakhand.The colour of the bar represents the MPI score of the district. The colour moves from green, through yellow, to red as the MPI score increases. Green represents areas with the lowest MPI scores while red represents areas with the highest MPI scores. The legend provides the range of MPI scores represented by a colour.
UttarakhandMultidimensional Poverty Index Score (District-wise)
Districts of Uttarakhand are as per the 2011 Census of India. The colour represents the MPI score of a district. The colour moves from green, through yellow, to red as the MPI score increases. Green represents areas with the lowest MPI scores while red represents areas with the highest MPI scores. The legend provides the range of MPI scores represented by a colour.
0.031 to 0.043 0.044 to 0.055 0.056 to 0.067 0.068 to 0.079 0.080 to 0.092 0.093 to 0.104 0.105 to 0.117
Multidimensional Poverty Index
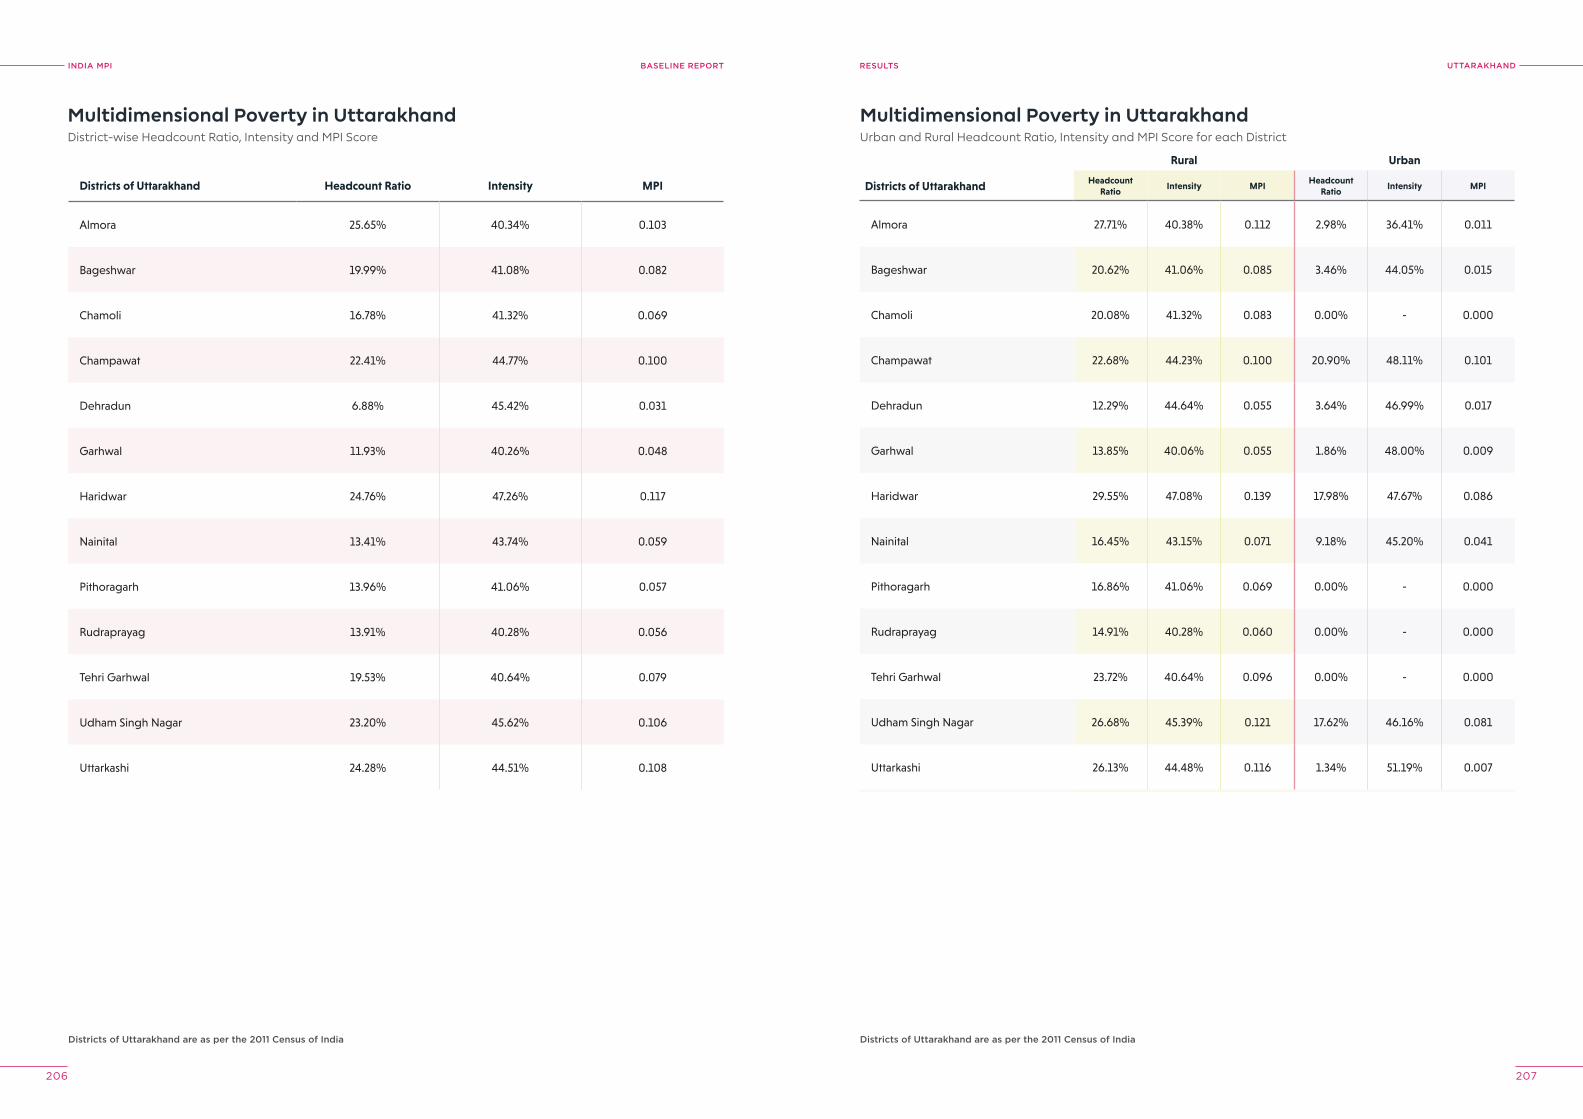
INDIA MPI BASELINE REPORT
206 207
UTTArAkhANDreSUlTS
Multidimensional Poverty in UttarakhandDistrict-wise Headcount Ratio, Intensity and MPI Score
Multidimensional Poverty in UttarakhandUrban and Rural Headcount Ratio, Intensity and MPI Score for each District
Districts of Uttarakhand are as per the 2011 Census of India Districts of Uttarakhand are as per the 2011 Census of India
Districts of Uttarakhand Headcount Ratio Intensity MPI
Almora 25.65% 40.34% 0.103
Bageshwar 19.99% 41.08% 0.082
Chamoli 16.78% 41.32% 0.069
Champawat 22.41% 44.77% 0.100
Dehradun 6.88% 45.42% 0.031
Garhwal 11.93% 40.26% 0.048
Haridwar 24.76% 47.26% 0.117
Nainital 13.41% 43.74% 0.059
Pithoragarh 13.96% 41.06% 0.057
Rudraprayag 13.91% 40.28% 0.056
Tehri Garhwal 19.53% 40.64% 0.079
Udham Singh Nagar 23.20% 45.62% 0.106
Uttarkashi 24.28% 44.51% 0.108
Rural Urban
Districts of Uttarakhand Headcount Ratio
Intensity MPIHeadcount
RatioIntensity MPI
Almora 27.71% 40.38% 0.112 2.98% 36.41% 0.011
Bageshwar 20.62% 41.06% 0.085 3.46% 44.05% 0.015
Chamoli 20.08% 41.32% 0.083 0.00% - 0.000
Champawat 22.68% 44.23% 0.100 20.90% 48.11% 0.101
Dehradun 12.29% 44.64% 0.055 3.64% 46.99% 0.017
Garhwal 13.85% 40.06% 0.055 1.86% 48.00% 0.009
Haridwar 29.55% 47.08% 0.139 17.98% 47.67% 0.086
Nainital 16.45% 43.15% 0.071 9.18% 45.20% 0.041
Pithoragarh 16.86% 41.06% 0.069 0.00% - 0.000
Rudraprayag 14.91% 40.28% 0.060 0.00% - 0.000
Tehri Garhwal 23.72% 40.64% 0.096 0.00% - 0.000
Udham Singh Nagar 26.68% 45.39% 0.121 17.62% 46.16% 0.081
Uttarkashi 26.13% 44.48% 0.116 1.34% 51.19% 0.007
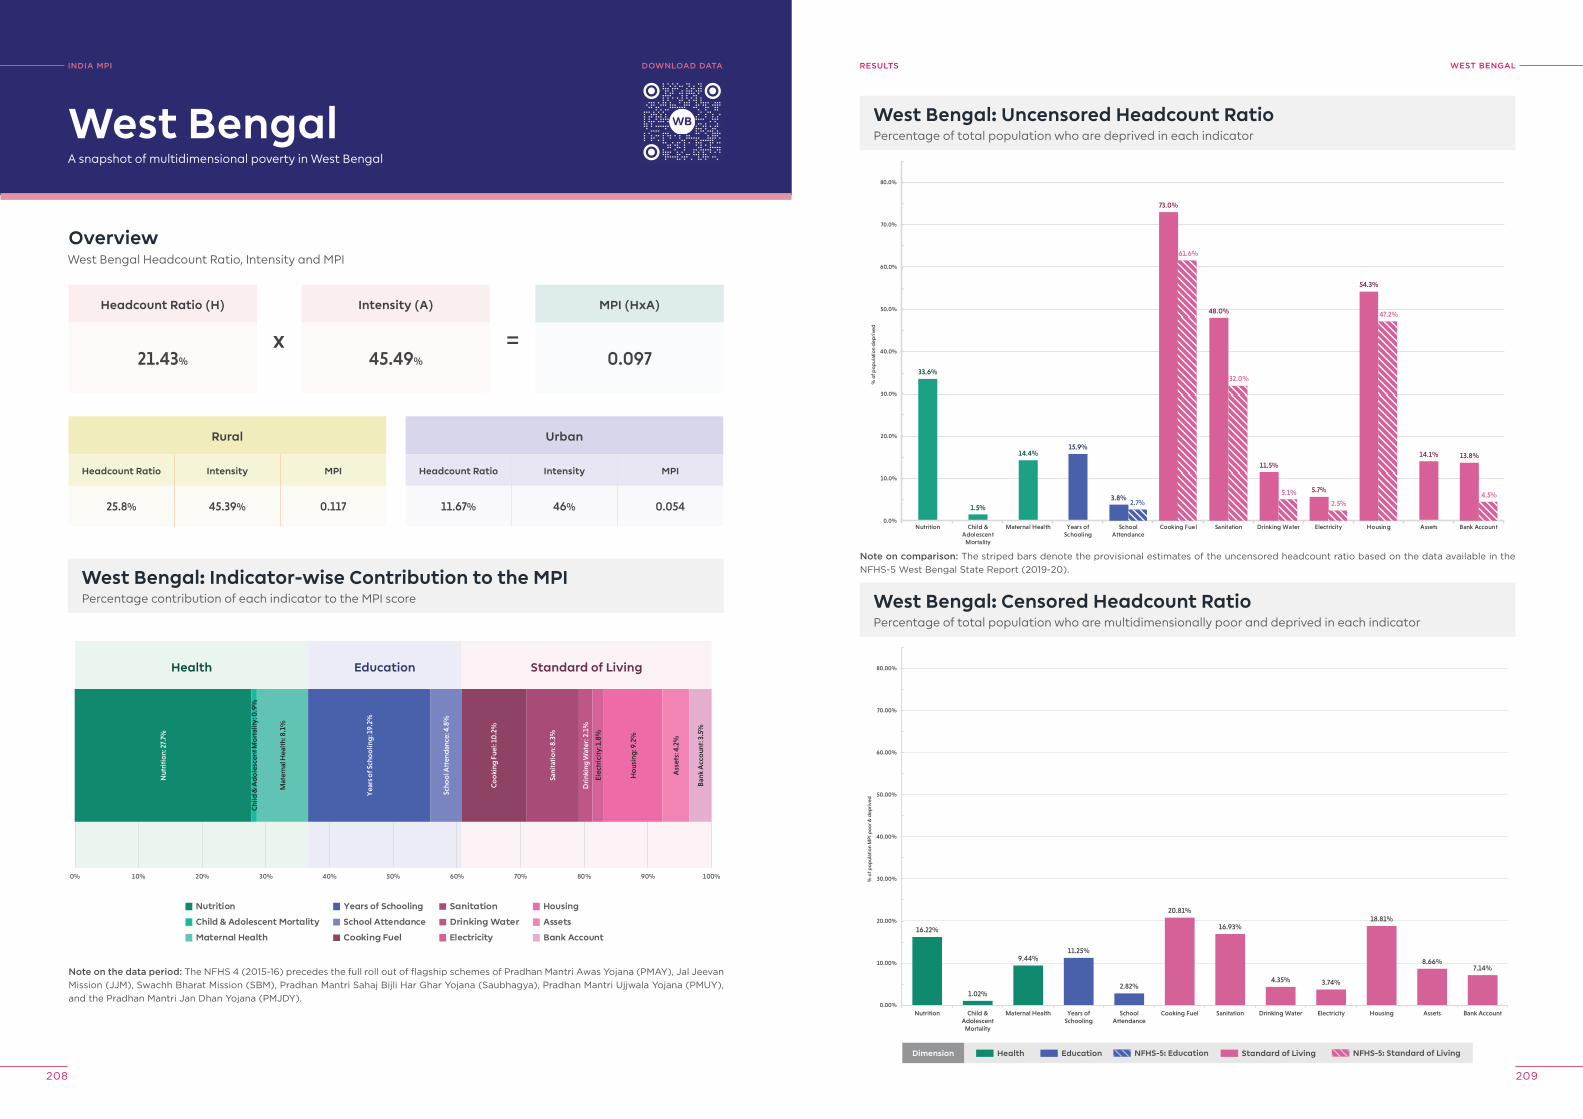
INDIA MPI BASELINE REPORT
208 209
WeST BeNGAlreSUlTS
West Bengal: Uncensored Headcount RatioPercentage of total population who are deprived in each indicator
33.6%
1.5%
14.4%15.9%
14.1%
3.8%2.7%
73.0%
61.6%
48.0%
32.0%
11.5%
5.1% 5.7%
2.5%
54.3%
47.2%
13.8%
4.5%
0.0%
10.0%
20.0%
30.0%
40.0%
50.0%
60.0%
70.0%
80.0%
Nutrition Child &Adolescent
Mortality
Maternal Health Years ofSchooling
SchoolAttendance
Cooking Fuel Sanitation Drinking Water Electricity Housing Assets Bank Account
% o
f pop
ulat
ion
dep
rive
d
16.22%
1.02%
9.44%11.25%
2.82%
20.81%
16.93%
4.35% 3.74%
18.81%
8.66%7.14%
0.00%
10.00%
20.00%
30.00%
40.00%
50.00%
60.00%
70.00%
80.00%
Nutrition Child &Adolescent
Mortality
Maternal Health Years ofSchooling
SchoolAttendance
Cooking Fuel Sanitation Drinking Water Electricity Housing Assets Bank Account
% o
f po
pul
atio
n M
PI p
oo
r & d
epri
ved
West Bengal: Censored Headcount RatioPercentage of total population who are multidimensionally poor and deprived in each indicator
INDIA MpI
A snapshot of multidimensional poverty in West Bengal
OverviewWest Bengal Headcount Ratio, Intensity and MPI
Headcount Ratio (H)
21.43%
Rural
Headcount Ratio Intensity MPI
25.8% 45.39% 0.117
West Bengal: Indicator-wise Contribution to the MPIPercentage contribution of each indicator to the MPI score
Intensity (A)
45.49%
MPI (HxA)
0.097
West Bengal
Urban
Headcount Ratio Intensity MPI
11.67% 46% 0.054
x =
Note on the data period: The NFHS 4 (2015-16) precedes the full roll out of flagship schemes of Pradhan Mantri Awas Yojana (PMAY), Jal Jeevan Mission (JJM), Swachh Bharat Mission (SBM), Pradhan Mantri Sahaj Bijli Har Ghar Yojana (Saubhagya), Pradhan Mantri Ujjwala Yojana (PMUY), and the Pradhan Mantri Jan Dhan Yojana (PMJDY).
Nutrition
Child & Adolescent Mortality
Maternal Health
Years of Schooling
School Attendance
Cooking Fuel
Sanitation
Drinking Water
Electricity
Housing
Assets
Bank Account
0% 10% 20% 30% 40% 50% 60% 70% 80% 90% 100%
Health Education Standard of Living
Nut
riti
on:
27.
7%
Chi
ld &
Ad
ole
scen
t Mo
rtal
ity: 0
.9%
Mat
erna
l Hea
lth:
8.1
%
Yea
rs o
f Sch
oo
ling
: 19.
2%
Scho
ol A
tten
dan
ce: 4
.8%
Co
oki
ng F
uel:
10.2
%
Sani
tati
on:
8.3
%
Dri
nkin
g W
ater
: 2.1
%
Elec
tric
ity:
1.8
%
Ho
usin
g: 9
.2%
Ass
ets:
4.2
%
Ban
k A
cco
unt:
3.5
%
DoWNloAD DATA
Note on comparison: The striped bars denote the provisional estimates of the uncensored headcount ratio based on the data available in the NFHS-5 West Bengal State Report (2019-20).
Dimension Health Education Standard of Living NFHS-5: Standard of LivingNFHS-5: Education
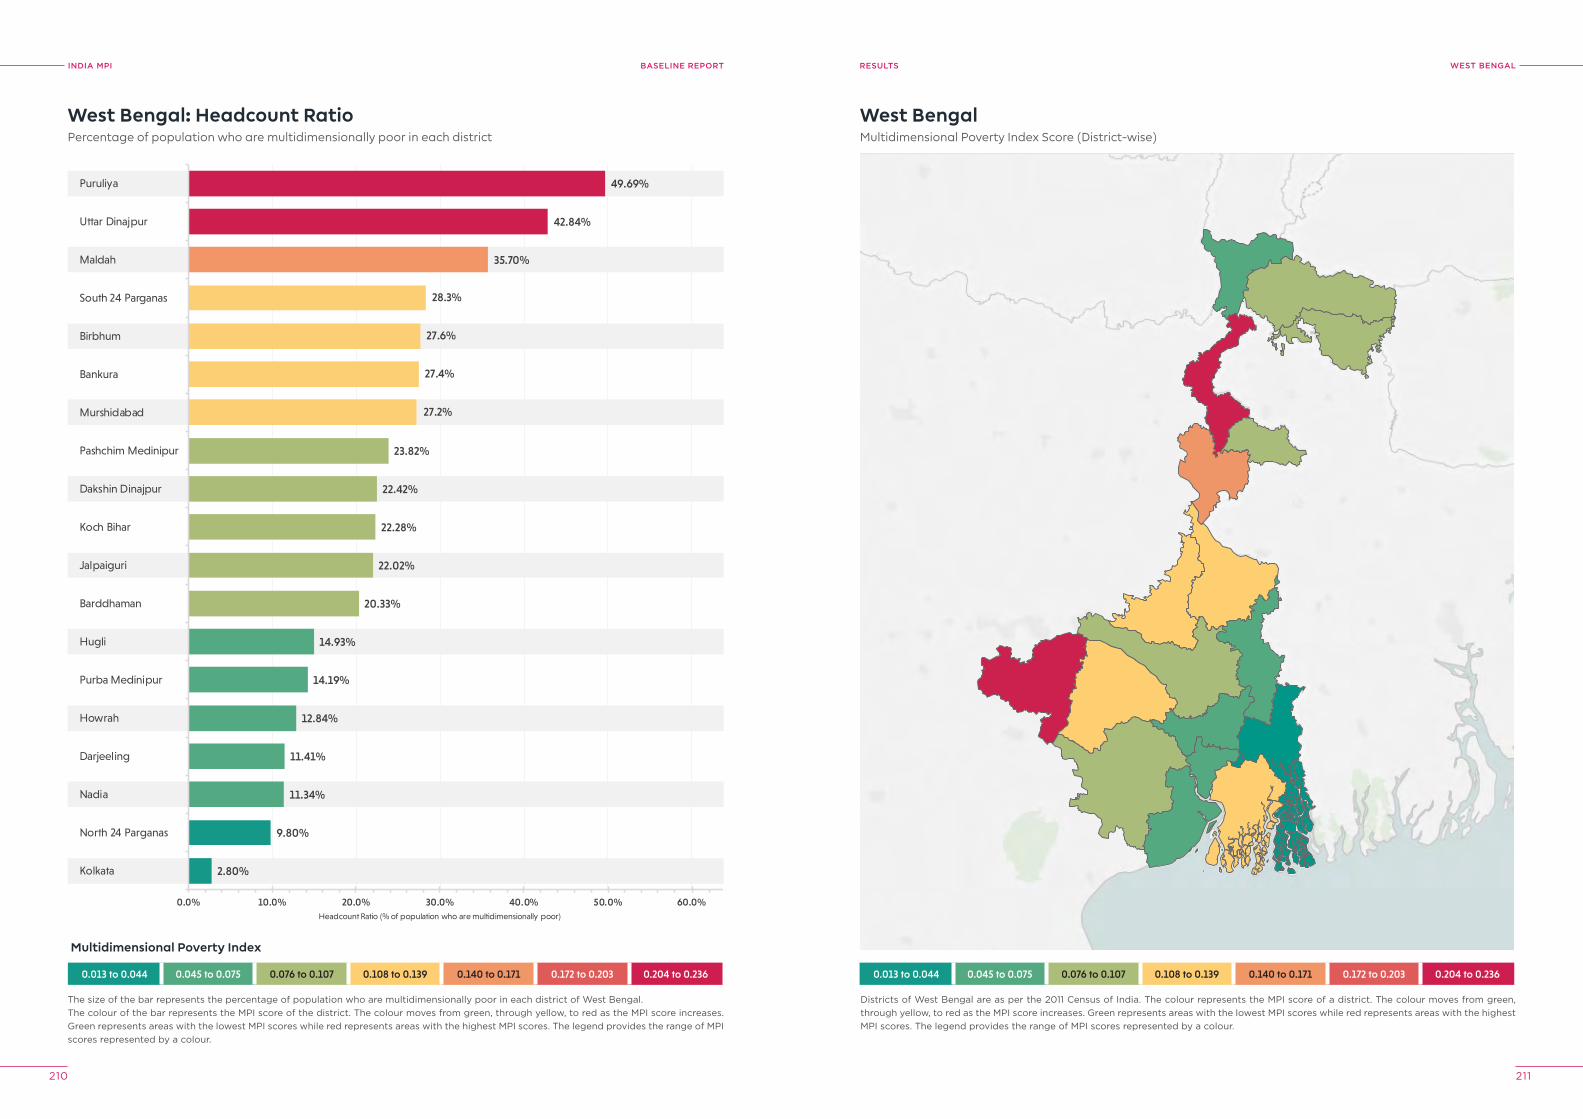
INDIA MPI BASELINE REPORT
210 211
WeST BeNGAlreSUlTS
0.013 to 0.044 0.045 to 0.075 0.076 to 0.107 0.108 to 0.139 0.140 to 0.171 0.172 to 0.203 0.204 to 0.236
2.80%
9.80%
11.34%
11.41%
12.84%
14.19%
14.93%
20.33%
22.02%
22.28%
22.42%
23.82%
27.2%
27.4%
27.6%
28.3%
35.70%
42.84%
49.69%
0.0% 10.0% 20.0% 30.0% 40.0% 50.0% 60.0%
Kolkata
North 24 Parganas
Nadia
Darjeeling
Howrah
Purba Medinipur
Hugli
Barddhaman
Jalpaiguri
Koch Bihar
Dakshin Dinajpur
Pashchim Medinipur
Murshidabad
Bankura
Birbhum
South 24 Parganas
Maldah
Uttar Dinajpur
Puruliya
Headcount Ratio (% of population who are multidimensionally poor)
West Bengal: Headcount RatioPercentage of population who are multidimensionally poor in each district
The size of the bar represents the percentage of population who are multidimensionally poor in each district of West Bengal.The colour of the bar represents the MPI score of the district. The colour moves from green, through yellow, to red as the MPI score increases. Green represents areas with the lowest MPI scores while red represents areas with the highest MPI scores. The legend provides the range of MPI scores represented by a colour.
West BengalMultidimensional Poverty Index Score (District-wise)
Districts of West Bengal are as per the 2011 Census of India. The colour represents the MPI score of a district. The colour moves from green, through yellow, to red as the MPI score increases. Green represents areas with the lowest MPI scores while red represents areas with the highest MPI scores. The legend provides the range of MPI scores represented by a colour.
0.013 to 0.044 0.045 to 0.075 0.076 to 0.107 0.108 to 0.139 0.140 to 0.171 0.172 to 0.203 0.204 to 0.236
Multidimensional Poverty Index
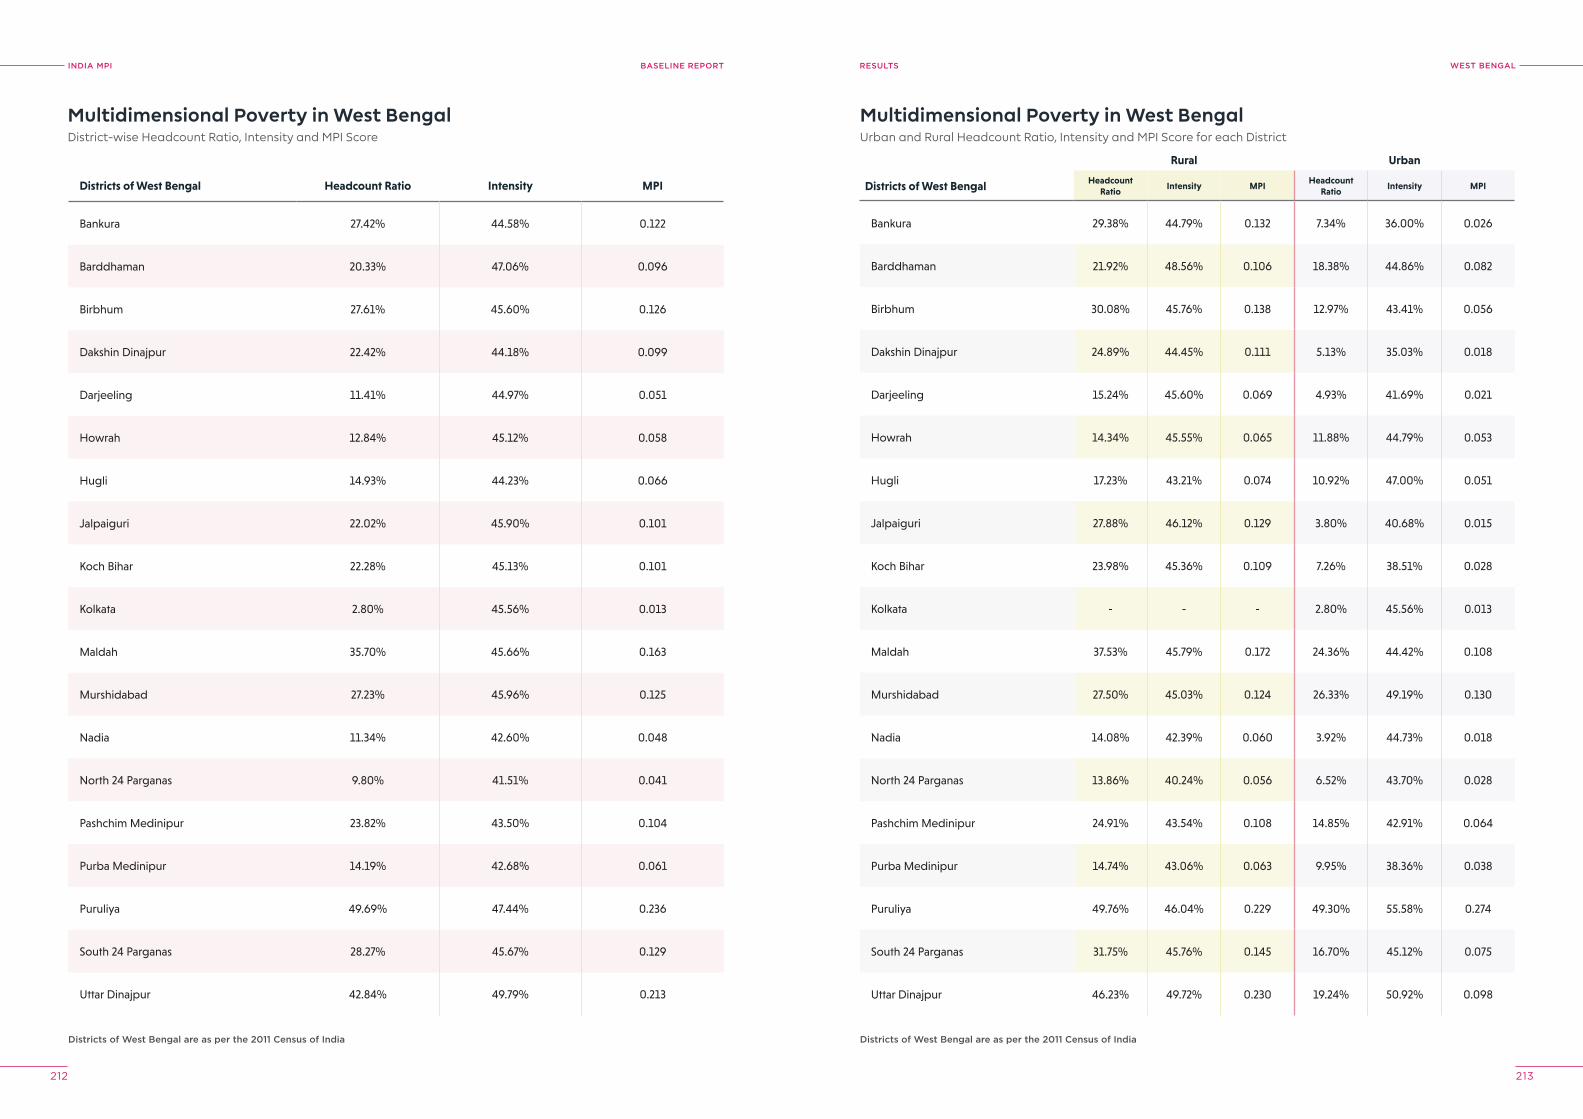
INDIA MPI BASELINE REPORT
212 213
WeST BeNGAlreSUlTS
Multidimensional Poverty in West BengalDistrict-wise Headcount Ratio, Intensity and MPI Score
Multidimensional Poverty in West BengalUrban and Rural Headcount Ratio, Intensity and MPI Score for each District
Districts of West Bengal are as per the 2011 Census of India Districts of West Bengal are as per the 2011 Census of India
Districts of West Bengal Headcount Ratio Intensity MPI
Bankura 27.42% 44.58% 0.122
Barddhaman 20.33% 47.06% 0.096
Birbhum 27.61% 45.60% 0.126
Dakshin Dinajpur 22.42% 44.18% 0.099
Darjeeling 11.41% 44.97% 0.051
Howrah 12.84% 45.12% 0.058
Hugli 14.93% 44.23% 0.066
Jalpaiguri 22.02% 45.90% 0.101
Koch Bihar 22.28% 45.13% 0.101
Kolkata 2.80% 45.56% 0.013
Maldah 35.70% 45.66% 0.163
Murshidabad 27.23% 45.96% 0.125
Nadia 11.34% 42.60% 0.048
North 24 Parganas 9.80% 41.51% 0.041
Pashchim Medinipur 23.82% 43.50% 0.104
Purba Medinipur 14.19% 42.68% 0.061
Puruliya 49.69% 47.44% 0.236
South 24 Parganas 28.27% 45.67% 0.129
Uttar Dinajpur 42.84% 49.79% 0.213
Rural Urban
Districts of West Bengal Headcount Ratio
Intensity MPIHeadcount
RatioIntensity MPI
Bankura 29.38% 44.79% 0.132 7.34% 36.00% 0.026
Barddhaman 21.92% 48.56% 0.106 18.38% 44.86% 0.082
Birbhum 30.08% 45.76% 0.138 12.97% 43.41% 0.056
Dakshin Dinajpur 24.89% 44.45% 0.111 5.13% 35.03% 0.018
Darjeeling 15.24% 45.60% 0.069 4.93% 41.69% 0.021
Howrah 14.34% 45.55% 0.065 11.88% 44.79% 0.053
Hugli 17.23% 43.21% 0.074 10.92% 47.00% 0.051
Jalpaiguri 27.88% 46.12% 0.129 3.80% 40.68% 0.015
Koch Bihar 23.98% 45.36% 0.109 7.26% 38.51% 0.028
Kolkata - - - 2.80% 45.56% 0.013
Maldah 37.53% 45.79% 0.172 24.36% 44.42% 0.108
Murshidabad 27.50% 45.03% 0.124 26.33% 49.19% 0.130
Nadia 14.08% 42.39% 0.060 3.92% 44.73% 0.018
North 24 Parganas 13.86% 40.24% 0.056 6.52% 43.70% 0.028
Pashchim Medinipur 24.91% 43.54% 0.108 14.85% 42.91% 0.064
Purba Medinipur 14.74% 43.06% 0.063 9.95% 38.36% 0.038
Puruliya 49.76% 46.04% 0.229 49.30% 55.58% 0.274
South 24 Parganas 31.75% 45.76% 0.145 16.70% 45.12% 0.075
Uttar Dinajpur 46.23% 49.72% 0.230 19.24% 50.92% 0.098
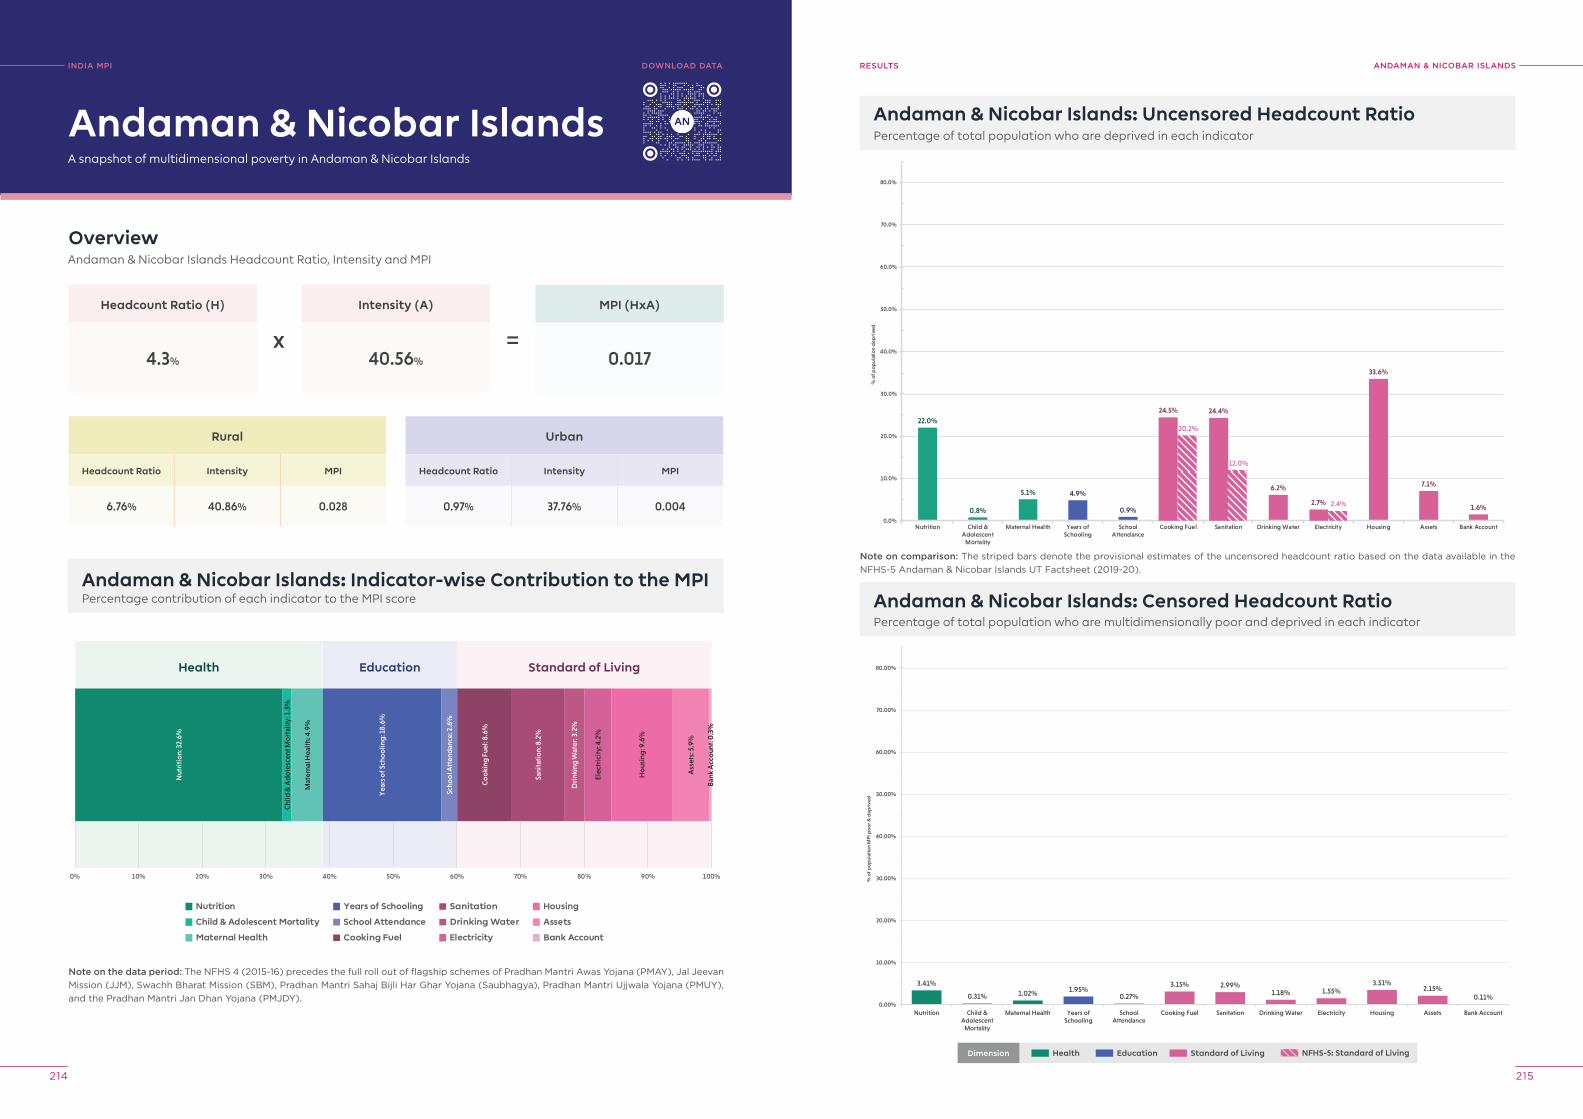
INDIA MPI BASELINE REPORT
214 215
ANDAMAN & NICoBAr ISlANDSreSUlTS
Andaman & Nicobar Islands: Uncensored Headcount RatioPercentage of total population who are deprived in each indicator
22.0%
0.8%
5.1% 4.9%
0.9%
6.2%
33.6%
7.1%
1.6%
24.5%
20.2%
24.4%
12.0%
2.7% 2.4%
0.0%
10.0%
20.0%
30.0%
40.0%
50.0%
60.0%
70.0%
80.0%
Nutrition Child &Adolescent
Mortality
Maternal Health Years ofSchooling
SchoolAttendance
Cooking Fuel Sanitation Drinking Water Electricity Housing Assets Bank Account
% o
f pop
ulat
ion
dep
rive
d
3.41%
0.31% 1.02% 1.95%0.27%
3.15% 2.99%1.18% 1.55%
3.51%2.15%
0.11%0.00%
10.00%
20.00%
30.00%
40.00%
50.00%
60.00%
70.00%
80.00%
Nutrition Child &Adolescent
Mortality
Maternal Health Years ofSchooling
SchoolAttendance
Cooking Fuel Sanitation Drinking Water Electricity Housing Assets Bank Account
% o
f po
pul
atio
n M
PI p
oo
r & d
epri
ved
Andaman & Nicobar Islands: Censored Headcount RatioPercentage of total population who are multidimensionally poor and deprived in each indicator
INDIA MpI
A snapshot of multidimensional poverty in Andaman & Nicobar Islands
OverviewAndaman & Nicobar Islands Headcount Ratio, Intensity and MPI
Headcount Ratio (H)
4.3%
Rural
Headcount Ratio Intensity MPI
6.76% 40.86% 0.028
Andaman & Nicobar Islands: Indicator-wise Contribution to the MPIPercentage contribution of each indicator to the MPI score
Intensity (A)
40.56%
MPI (HxA)
0.017
Andaman & Nicobar Islands
Urban
Headcount Ratio Intensity MPI
0.97% 37.76% 0.004
x =
Note on the data period: The NFHS 4 (2015-16) precedes the full roll out of flagship schemes of Pradhan Mantri Awas Yojana (PMAY), Jal Jeevan Mission (JJM), Swachh Bharat Mission (SBM), Pradhan Mantri Sahaj Bijli Har Ghar Yojana (Saubhagya), Pradhan Mantri Ujjwala Yojana (PMUY), and the Pradhan Mantri Jan Dhan Yojana (PMJDY).
Nutrition
Child & Adolescent Mortality
Maternal Health
Years of Schooling
School Attendance
Cooking Fuel
Sanitation
Drinking Water
Electricity
Housing
Assets
Bank Account
0% 10% 20% 30% 40% 50% 60% 70% 80% 90% 100%
Health Education Standard of Living
Nut
riti
on:
32.
6%
Chi
ld &
Ad
ole
scen
t Mo
rtal
ity: 1
.5%
Mat
erna
l Hea
lth:
4.9
%
Yea
rs o
f Sch
oo
ling
: 18.
6%
Scho
ol A
tten
dan
ce: 2
.6%
Co
oki
ng F
uel:
8.6%
Sani
tati
on:
8.2
%
Dri
nkin
g W
ater
: 3.2
%
Elec
tric
ity:
4.2
%
Ho
usin
g: 9
.6%
Ass
ets:
5.9
%
Ban
k A
cco
unt:
0.3
%
DoWNloAD DATA
Note on comparison: The striped bars denote the provisional estimates of the uncensored headcount ratio based on the data available in the NFHS-5 Andaman & Nicobar Islands UT Factsheet (2019-20).
Dimension Health Education Standard of Living NFHS-5: Standard of Living
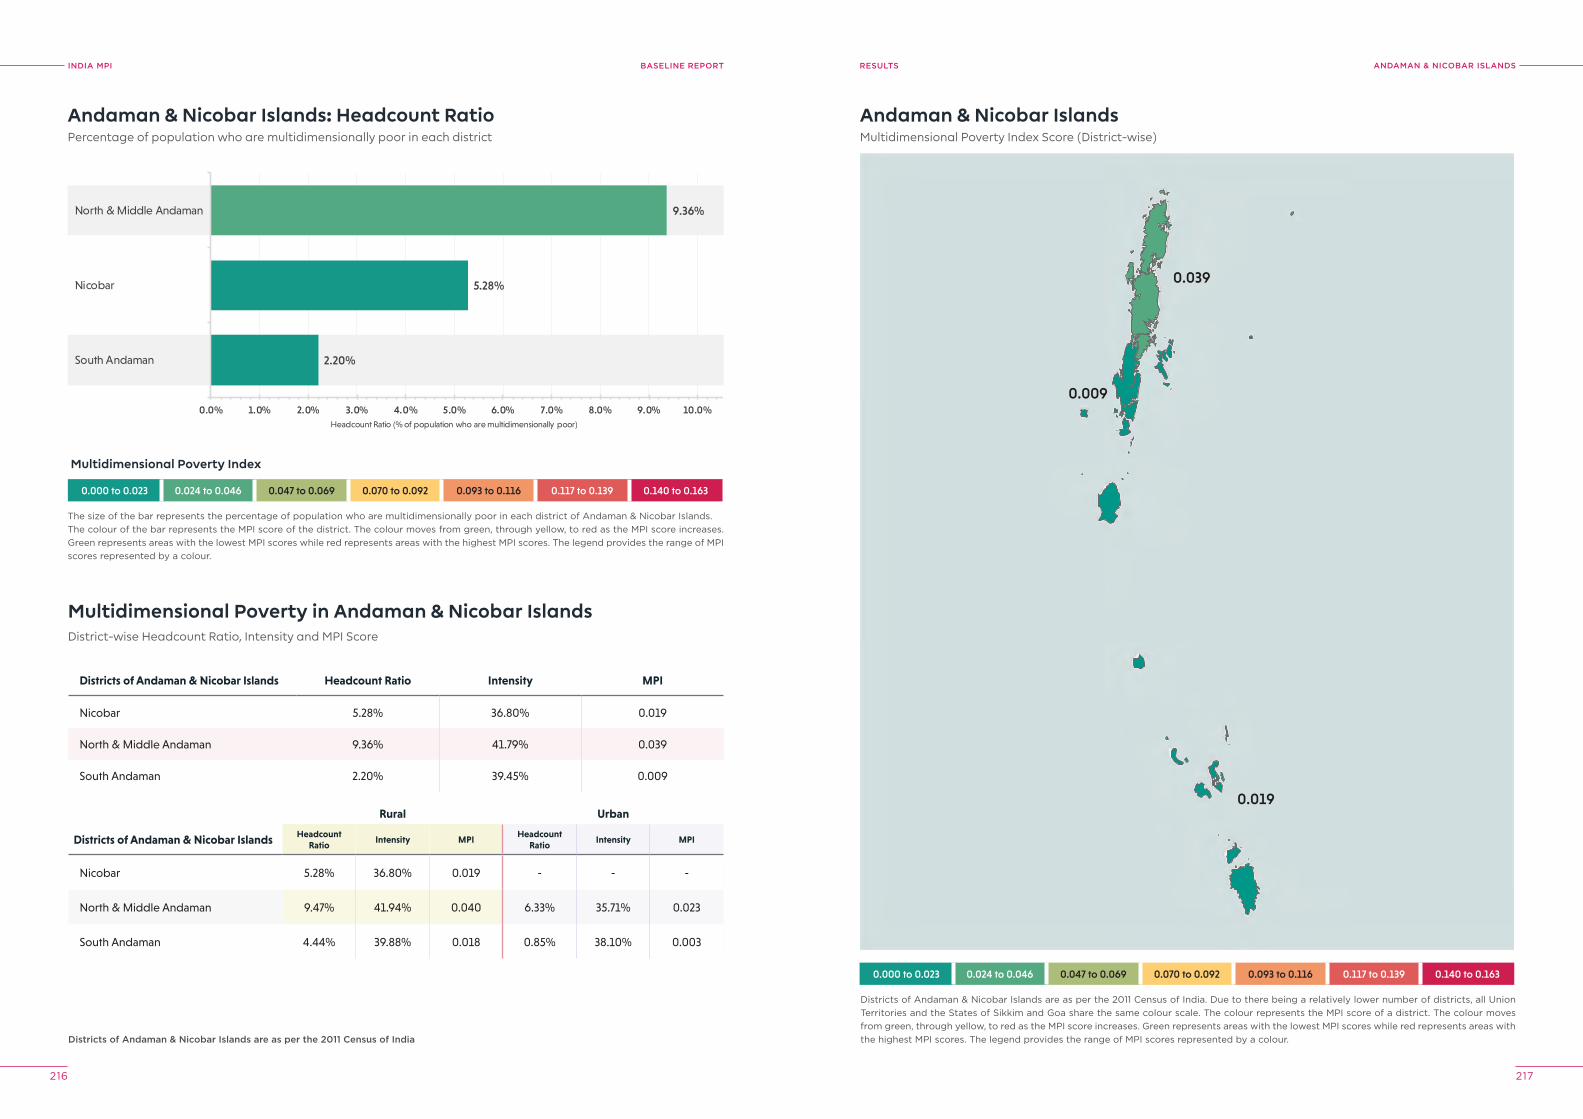
INDIA MPI BASELINE REPORT
216 217
ANDAMAN & NICoBAr ISlANDSreSUlTS
0.000 to 0.023 0.024 to 0.046 0.047 to 0.069 0.070 to 0.092 0.093 to 0.116 0.117 to 0.139 0.140 to 0.163
Andaman & Nicobar Islands: Headcount RatioPercentage of population who are multidimensionally poor in each district
0.009
0.019
0.039
Andaman & Nicobar IslandsMultidimensional Poverty Index Score (District-wise)
Districts of Andaman & Nicobar Islands are as per the 2011 Census of India. Due to there being a relatively lower number of districts, all Union Territories and the States of Sikkim and Goa share the same colour scale. The colour represents the MPI score of a district. The colour moves from green, through yellow, to red as the MPI score increases. Green represents areas with the lowest MPI scores while red represents areas with the highest MPI scores. The legend provides the range of MPI scores represented by a colour.
The size of the bar represents the percentage of population who are multidimensionally poor in each district of Andaman & Nicobar Islands.The colour of the bar represents the MPI score of the district. The colour moves from green, through yellow, to red as the MPI score increases. Green represents areas with the lowest MPI scores while red represents areas with the highest MPI scores. The legend provides the range of MPI scores represented by a colour.
0.000 to 0.023 0.024 to 0.046 0.047 to 0.069 0.070 to 0.092 0.093 to 0.116 0.117 to 0.139 0.140 to 0.163
2.20%
5.28%
9.36%
0.0% 1.0% 2.0% 3.0% 4.0% 5.0% 6.0% 7.0% 8.0% 9.0% 10.0%
South Andaman
Nicobar
North & Middle Andaman
Headcount Ratio (% of population who are multidimensionally poor)
District-wise Headcount Ratio, Intensity and MPI Score
Rural Urban
Districts of Andaman & Nicobar Islands Headcount Ratio
Intensity MPIHeadcount
RatioIntensity MPI
Nicobar 5.28% 36.80% 0.019 - - -
North & Middle Andaman 9.47% 41.94% 0.040 6.33% 35.71% 0.023
South Andaman 4.44% 39.88% 0.018 0.85% 38.10% 0.003
Multidimensional Poverty in Andaman & Nicobar Islands
Districts of Andaman & Nicobar Islands Headcount Ratio Intensity MPI
Nicobar 5.28% 36.80% 0.019
North & Middle Andaman 9.36% 41.79% 0.039
South Andaman 2.20% 39.45% 0.009
Multidimensional Poverty Index
Districts of Andaman & Nicobar Islands are as per the 2011 Census of India
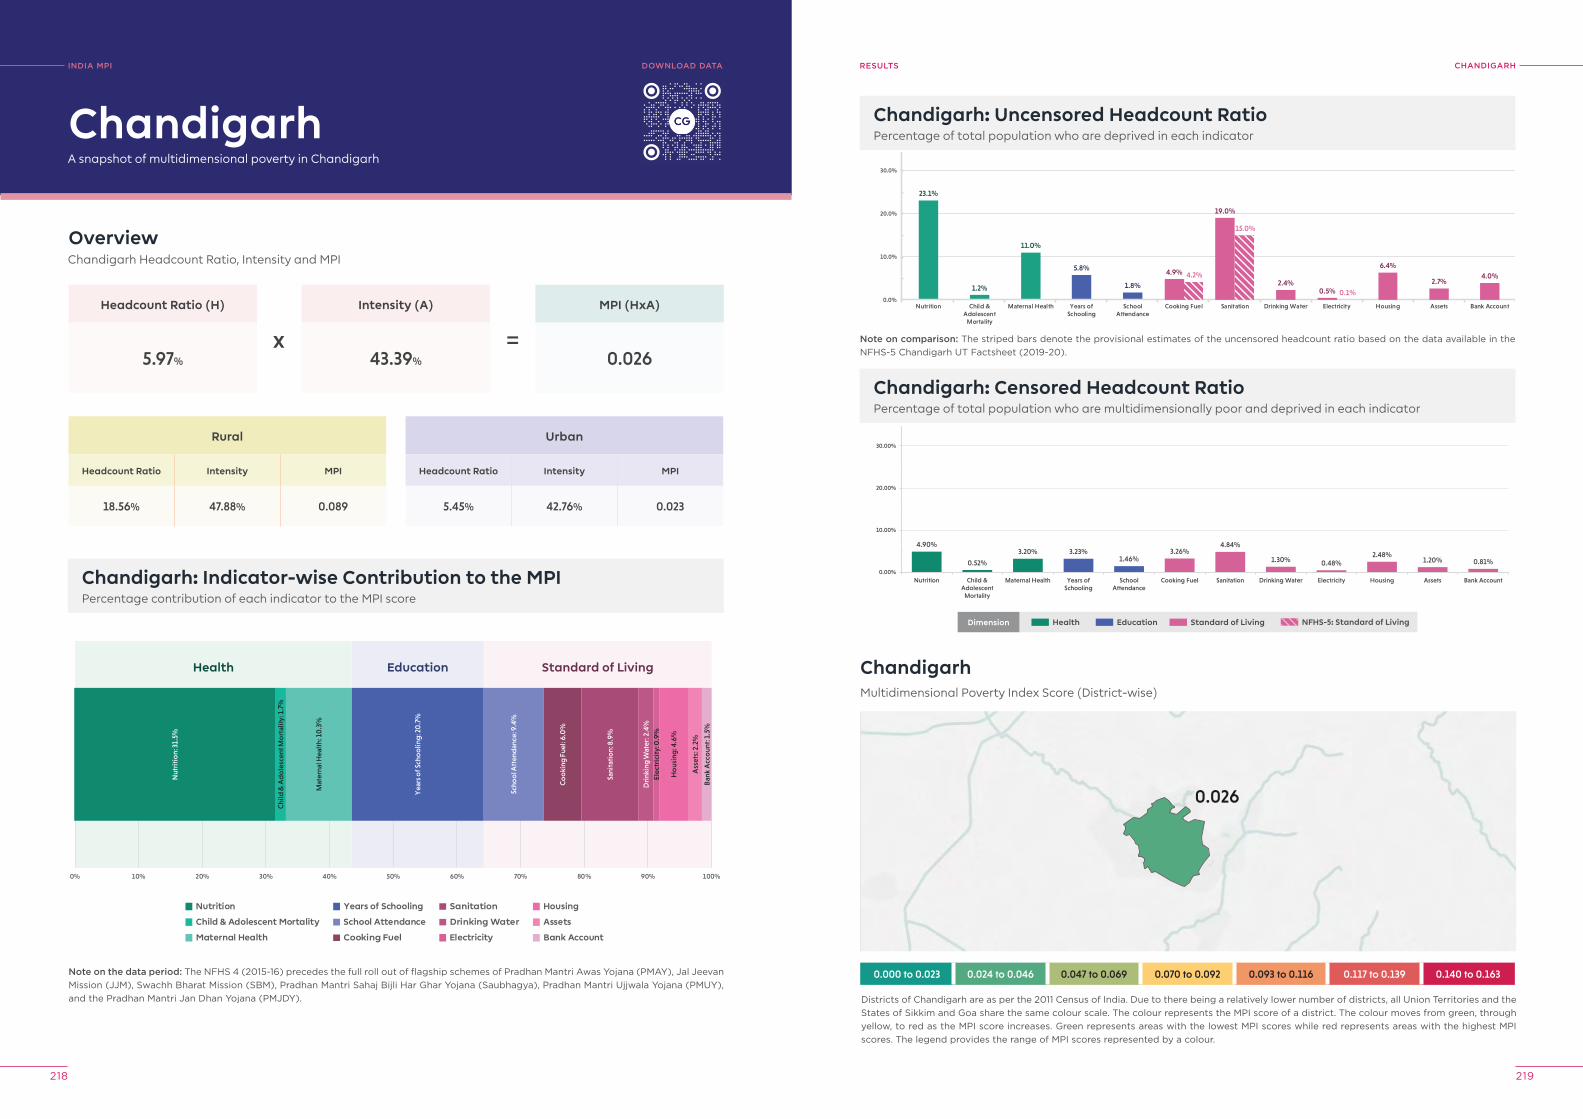
INDIA MPI BASELINE REPORT
218 219
ChANDIGArhreSUlTS
4.90%
0.52%
3.20% 3.23%1.46%
3.26%4.84%
1.30% 0.48%2.48%
1.20% 0.81%0.00%
10.00%
20.00%
30.00%
40.00%
50.00%
60.00%
70.00%
80.00%
Nutrition Child &Adolescent
Mortality
Maternal Health Years ofSchooling
SchoolAttendance
Cooking Fuel Sanitation Drinking Water Electricity Housing Assets Bank Account
% o
f po
pul
atio
n M
PI p
oo
r & d
epri
ved
Chandigarh: Uncensored Headcount RatioPercentage of total population who are deprived in each indicator
Chandigarh: Censored Headcount RatioPercentage of total population who are multidimensionally poor and deprived in each indicator
INDIA MpI
A snapshot of multidimensional poverty in Chandigarh
OverviewChandigarh Headcount Ratio, Intensity and MPI
Headcount Ratio (H)
5.97%
Rural
Headcount Ratio Intensity MPI
18.56% 47.88% 0.089
Chandigarh: Indicator-wise Contribution to the MPIPercentage contribution of each indicator to the MPI score
Intensity (A)
43.39%
MPI (HxA)
0.026
Chandigarh
Urban
Headcount Ratio Intensity MPI
5.45% 42.76% 0.023
x =
Note on the data period: The NFHS 4 (2015-16) precedes the full roll out of flagship schemes of Pradhan Mantri Awas Yojana (PMAY), Jal Jeevan Mission (JJM), Swachh Bharat Mission (SBM), Pradhan Mantri Sahaj Bijli Har Ghar Yojana (Saubhagya), Pradhan Mantri Ujjwala Yojana (PMUY), and the Pradhan Mantri Jan Dhan Yojana (PMJDY).
Nutrition
Child & Adolescent Mortality
Maternal Health
Years of Schooling
School Attendance
Cooking Fuel
Sanitation
Drinking Water
Electricity
Housing
Assets
Bank Account
0% 10% 20% 30% 40% 50% 60% 70% 80% 90% 100%
Health Education Standard of Living
Nut
riti
on:
31.
5%
Chi
ld &
Ad
ole
scen
t Mo
rtal
ity: 1
.7%
Mat
erna
l Hea
lth:
10
.3%
Yea
rs o
f Sch
oo
ling
: 20
.7%
Scho
ol A
tten
dan
ce: 9
.4%
Co
oki
ng F
uel:
6.0
%
Sani
tati
on:
8.9
%
Dri
nkin
g W
ater
: 2.4
%El
ectr
icit
y: 0
.9%
Ho
usin
g: 4
.6%
Ass
ets:
2.2
%
Ban
k A
cco
unt:
1.5
%
23.1%
1.2%
11.0%
5.8%
1.8% 2.4%
6.4%
2.7%4.0%
0.0%
10.0%
20.0%
30.0%
40.0%
50.0%
60.0%
70.0%
80.0%
Nutrition Child &Adolescent
Mortality
Maternal Health Years ofSchooling
SchoolAttendance
Cooking Fuel Sanitation Drinking Water Electricity Housing Assets Bank Account
% o
f pop
ulat
ion
dep
rive
d
4.9% 4.2%
19.0%
15.0%
0.5% 0.1%
0.026
ChandigarhMultidimensional Poverty Index Score (District-wise)
0.000 to 0.023 0.024 to 0.046 0.047 to 0.069 0.070 to 0.092 0.093 to 0.116 0.117 to 0.139 0.140 to 0.163
Districts of Chandigarh are as per the 2011 Census of India. Due to there being a relatively lower number of districts, all Union Territories and the States of Sikkim and Goa share the same colour scale. The colour represents the MPI score of a district. The colour moves from green, through yellow, to red as the MPI score increases. Green represents areas with the lowest MPI scores while red represents areas with the highest MPI scores. The legend provides the range of MPI scores represented by a colour.
DoWNloAD DATA
Note on comparison: The striped bars denote the provisional estimates of the uncensored headcount ratio based on the data available in the NFHS-5 Chandigarh UT Factsheet (2019-20).
Dimension Health Education Standard of Living NFHS-5: Standard of Living
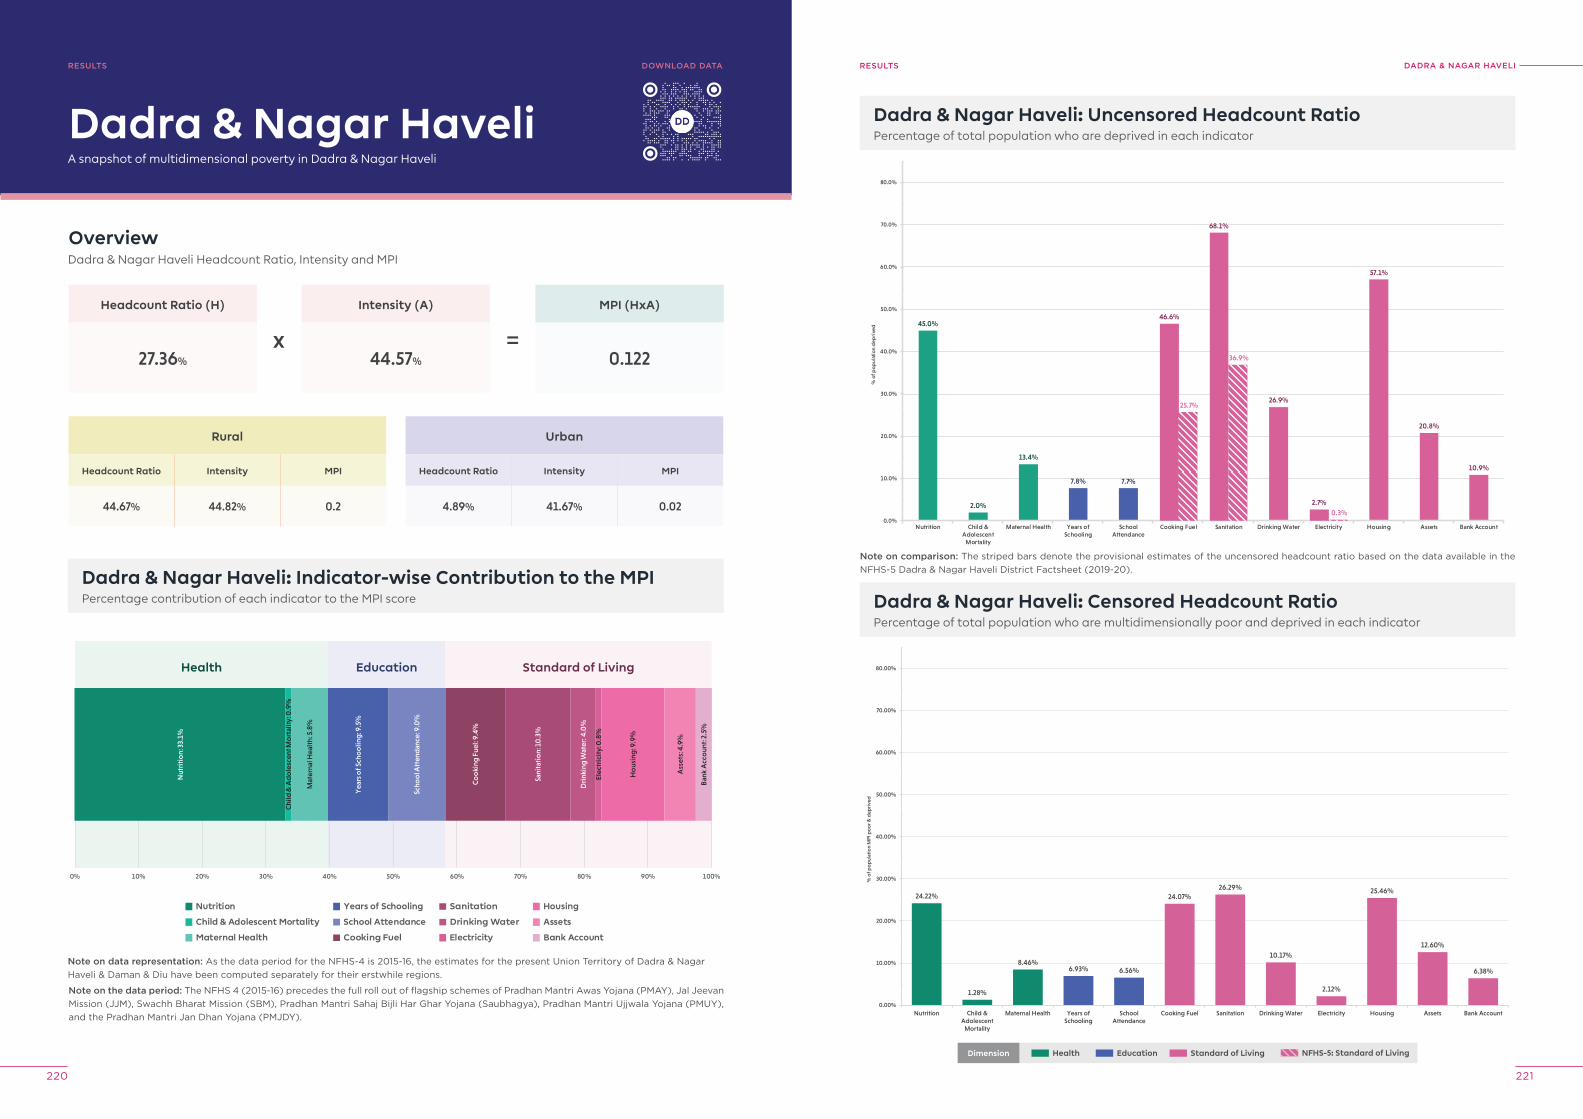
INDIA MPI BASELINE REPORT
220 221
DADrA & NAGAr hAvelIreSUlTSreSUlTS
A snapshot of multidimensional poverty in Dadra & Nagar Haveli
OverviewDadra & Nagar Haveli Headcount Ratio, Intensity and MPI
Headcount Ratio (H)
27.36%
Rural
Headcount Ratio Intensity MPI
44.67% 44.82% 0.2
Dadra & Nagar Haveli: Indicator-wise Contribution to the MPIPercentage contribution of each indicator to the MPI score
Intensity (A)
44.57%
MPI (HxA)
0.122
Dadra & Nagar Haveli
Urban
Headcount Ratio Intensity MPI
4.89% 41.67% 0.02
x =
Note on the data period: The NFHS 4 (2015-16) precedes the full roll out of flagship schemes of Pradhan Mantri Awas Yojana (PMAY), Jal Jeevan Mission (JJM), Swachh Bharat Mission (SBM), Pradhan Mantri Sahaj Bijli Har Ghar Yojana (Saubhagya), Pradhan Mantri Ujjwala Yojana (PMUY), and the Pradhan Mantri Jan Dhan Yojana (PMJDY).
Nutrition
Child & Adolescent Mortality
Maternal Health
Years of Schooling
School Attendance
Cooking Fuel
Sanitation
Drinking Water
Electricity
Housing
Assets
Bank Account
0% 10% 20% 30% 40% 50% 60% 70% 80% 90% 100%
Health Education Standard of Living
Nut
riti
on:
33.
1%
Chi
ld &
Ad
ole
scen
t Mo
rtal
ity: 0
.9%
Mat
erna
l Hea
lth:
5.8
%
Yea
rs o
f Sch
oo
ling
: 9.5
%
Scho
ol A
tten
dan
ce: 9
.0%
Co
oki
ng F
uel:
9.4%
Sani
tati
on:
10
.3%
Dri
nkin
g W
ater
: 4.0
%
Elec
tric
ity:
0.8
%
Ho
usin
g: 9
.9%
Ass
ets:
4.9
%
Ban
k A
cco
unt:
2.5
%
Note on data representation: As the data period for the NFHS-4 is 2015-16, the estimates for the present Union Territory of Dadra & Nagar Haveli & Daman & Diu have been computed separately for their erstwhile regions.
Dadra & Nagar Haveli: Uncensored Headcount RatioPercentage of total population who are deprived in each indicator
Dadra & Nagar Haveli: Censored Headcount RatioPercentage of total population who are multidimensionally poor and deprived in each indicator
45.0%
2.0%
13.4%
7.8% 7.7%
26.9%
57.1%
20.8%
10.9%
46.6%
25.7%
68.1%
36.9%
2.7%0.3%
0.0%
10.0%
20.0%
30.0%
40.0%
50.0%
60.0%
70.0%
80.0%
Nutrition Child &Adolescent
Mortality
Maternal Health Years ofSchooling
SchoolAttendance
Cooking Fuel Sanitation Drinking Water Electricity Housing Assets Bank Account
% o
f pop
ulat
ion
dep
rive
d
24.22%
1.28%
8.46%6.93% 6.56%
24.07%26.29%
10.17%
2.12%
25.46%
12.60%
6.38%
0.00%
10.00%
20.00%
30.00%
40.00%
50.00%
60.00%
70.00%
80.00%
Nutrition Child &Adolescent
Mortality
Maternal Health Years ofSchooling
SchoolAttendance
Cooking Fuel Sanitation Drinking Water Electricity Housing Assets Bank Account
% o
f po
pul
atio
n M
PI p
oo
r & d
epri
ved
DoWNloAD DATA
Note on comparison: The striped bars denote the provisional estimates of the uncensored headcount ratio based on the data available in the NFHS-5 Dadra & Nagar Haveli District Factsheet (2019-20).
Dimension Health Education Standard of Living NFHS-5: Standard of Living
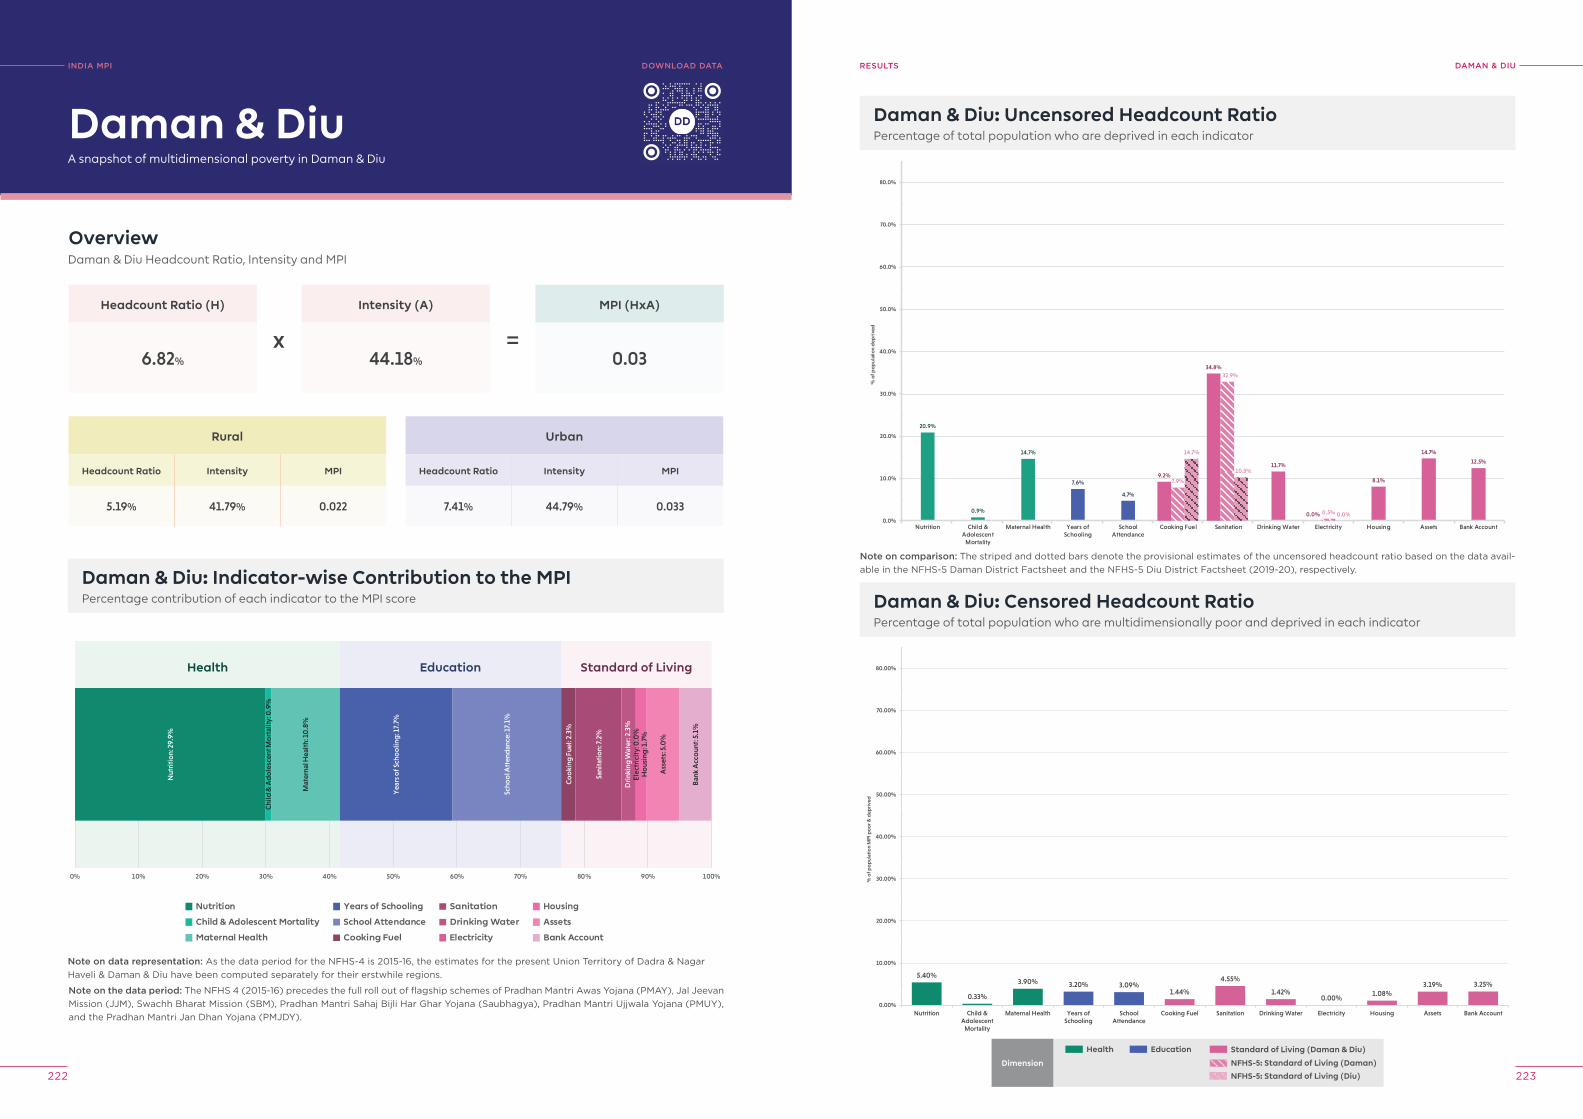
INDIA MPI BASELINE REPORT
222 223
DAMAN & DIUreSUlTSINDIA MpI
A snapshot of multidimensional poverty in Daman & Diu
OverviewDaman & Diu Headcount Ratio, Intensity and MPI
Headcount Ratio (H)
6.82%
Rural
Headcount Ratio Intensity MPI
5.19% 41.79% 0.022
Daman & Diu: Indicator-wise Contribution to the MPIPercentage contribution of each indicator to the MPI score
Intensity (A)
44.18%
MPI (HxA)
0.03
Daman & Diu
Urban
Headcount Ratio Intensity MPI
7.41% 44.79% 0.033
x =
Nutrition
Child & Adolescent Mortality
Maternal Health
Years of Schooling
School Attendance
Cooking Fuel
Sanitation
Drinking Water
Electricity
Housing
Assets
Bank Account
0% 10% 20% 30% 40% 50% 60% 70% 80% 90% 100%
Health Education Standard of Living
Nut
riti
on:
29.
9%
Chi
ld &
Ad
ole
scen
t Mo
rtal
ity: 0
.9%
Mat
erna
l Hea
lth:
10
.8%
Yea
rs o
f Sch
oo
ling
: 17.
7%
Scho
ol A
tten
dan
ce: 1
7.1%
Co
oki
ng F
uel:
2.3%
Sani
tati
on:
7.2%
Dri
nkin
g W
ater
: 2.3
%El
ectr
icit
y: 0
.0%
Ho
usin
g: 1
.7%
Ass
ets:
5.0
%
Ban
k A
cco
unt:
5.1
%
Note on the data period: The NFHS 4 (2015-16) precedes the full roll out of flagship schemes of Pradhan Mantri Awas Yojana (PMAY), Jal Jeevan Mission (JJM), Swachh Bharat Mission (SBM), Pradhan Mantri Sahaj Bijli Har Ghar Yojana (Saubhagya), Pradhan Mantri Ujjwala Yojana (PMUY), and the Pradhan Mantri Jan Dhan Yojana (PMJDY).
Note on data representation: As the data period for the NFHS-4 is 2015-16, the estimates for the present Union Territory of Dadra & Nagar Haveli & Daman & Diu have been computed separately for their erstwhile regions.
Daman & Diu: Uncensored Headcount RatioPercentage of total population who are deprived in each indicator
20.9%
0.9%
14.7%
7.6%
4.7%
11.7%
8.1%
14.7%
12.5%
9.2%7.9%
14.7%
34.8%32.9%
10.3%
0.0% 0.5% 0.0%0.0%
10.0%
20.0%
30.0%
40.0%
50.0%
60.0%
70.0%
80.0%
Nutrition Child &Adolescent
Mortality
Maternal Health Years ofSchooling
SchoolAttendance
Cooking Fuel Sanitation Drinking Water Electricity Housing Assets Bank Account
% o
f pop
ulat
ion
dep
rive
d
5.40%
0.33%
3.90% 3.20% 3.09%1.44%
4.55%
1.42%0.00%
1.08%3.19% 3.25%
0.00%
10.00%
20.00%
30.00%
40.00%
50.00%
60.00%
70.00%
80.00%
Nutrition Child &Adolescent
Mortality
Maternal Health Years ofSchooling
SchoolAttendance
Cooking Fuel Sanitation Drinking Water Electricity Housing Assets Bank Account
% o
f po
pul
atio
n M
PI p
oo
r & d
epri
ved
Daman & Diu: Censored Headcount RatioPercentage of total population who are multidimensionally poor and deprived in each indicator
DoWNloAD DATA
Note on comparison: The striped and dotted bars denote the provisional estimates of the uncensored headcount ratio based on the data avail-able in the NFHS-5 Daman District Factsheet and the NFHS-5 Diu District Factsheet (2019-20), respectively.
Dimension
Health Education Standard of Living (Daman & Diu)
NFHS-5: Standard of Living (Daman)
NFHS-5: Standard of Living (Diu)
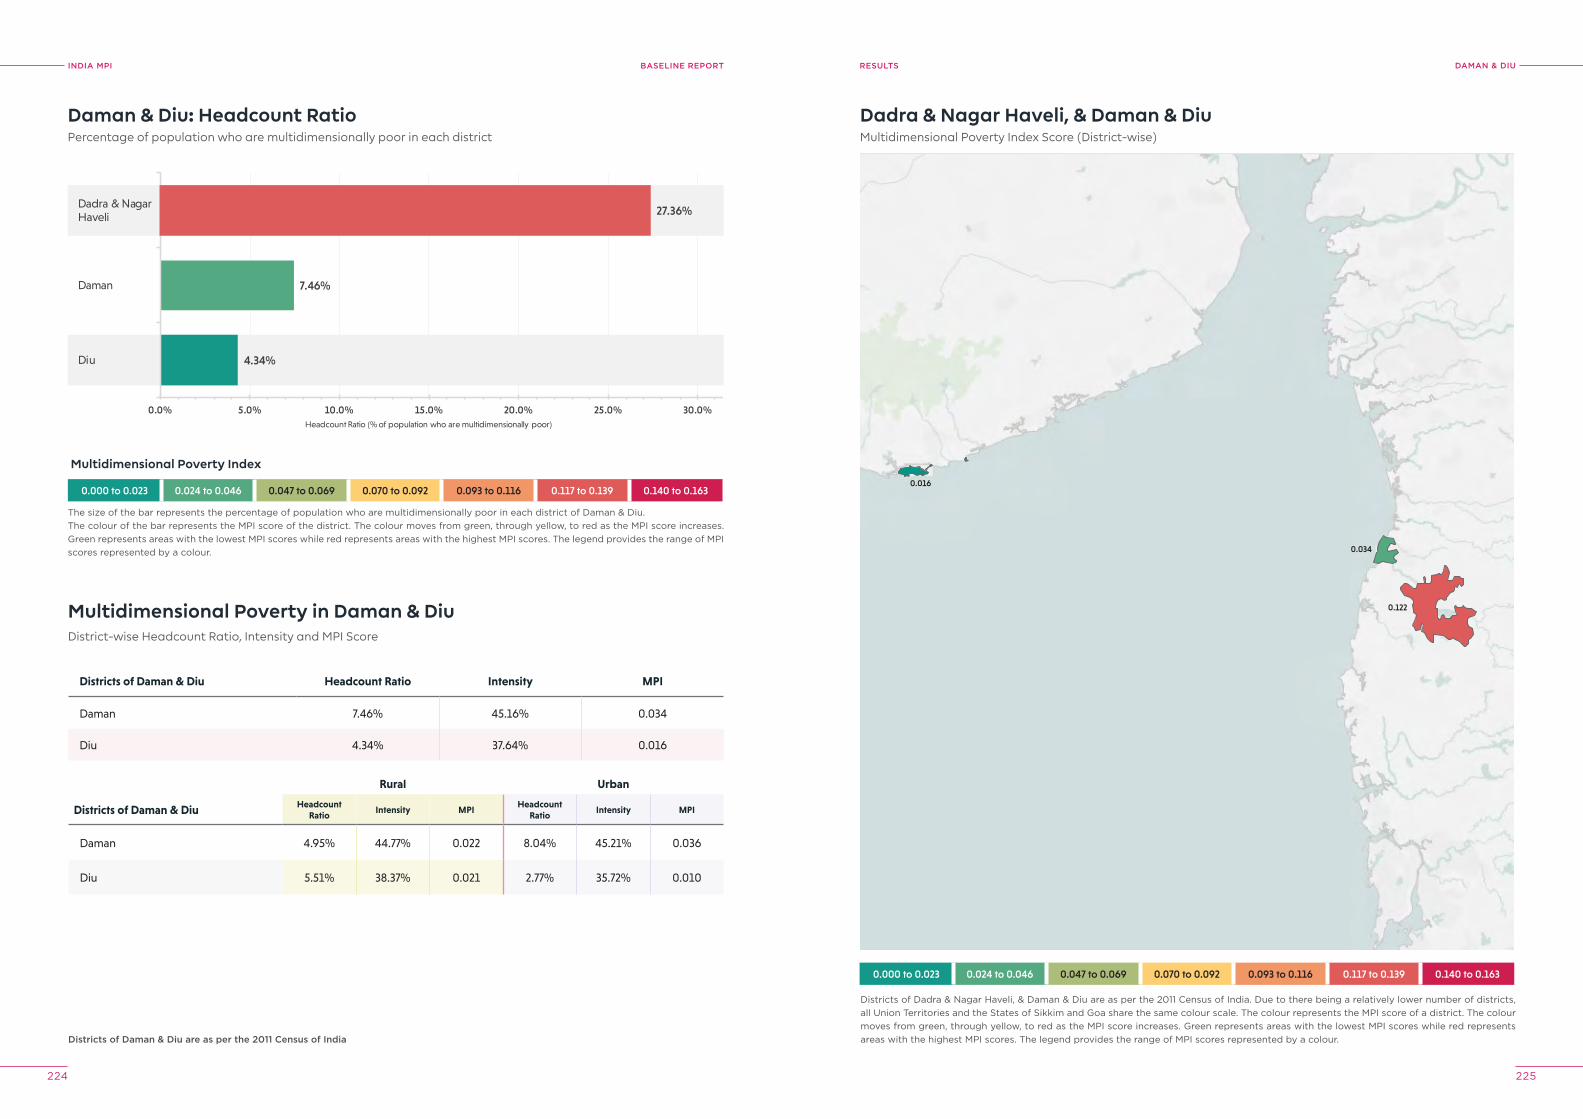
INDIA MPI BASELINE REPORT
224 225
DAMAN & DIUreSUlTS
Daman & Diu: Headcount RatioPercentage of population who are multidimensionally poor in each district
Multidimensional Poverty Index
0.000 to 0.023 0.024 to 0.046 0.047 to 0.069 0.070 to 0.092 0.093 to 0.116 0.117 to 0.139 0.140 to 0.163
The size of the bar represents the percentage of population who are multidimensionally poor in each district of Daman & Diu.The colour of the bar represents the MPI score of the district. The colour moves from green, through yellow, to red as the MPI score increases. Green represents areas with the lowest MPI scores while red represents areas with the highest MPI scores. The legend provides the range of MPI scores represented by a colour.
4.34%
7.46%
0.0% 5.0% 10.0% 15.0% 20.0% 25.0% 30.0%
Diu
Daman
Headcount Ratio (% of population who are multidimensionally poor)
27.36%Dadra & NagarHaveli
District-wise Headcount Ratio, Intensity and MPI Score
Multidimensional Poverty in Daman & Diu
Districts of Daman & Diu Headcount Ratio Intensity MPI
Daman 7.46% 45.16% 0.034
Diu 4.34% 37.64% 0.016
Rural Urban
Districts of Daman & Diu Headcount Ratio
Intensity MPIHeadcount
RatioIntensity MPI
Daman 4.95% 44.77% 0.022 8.04% 45.21% 0.036
Diu 5.51% 38.37% 0.021 2.77% 35.72% 0.010
Districts of Daman & Diu are as per the 2011 Census of India
0.000 to 0.023 0.024 to 0.046 0.047 to 0.069 0.070 to 0.092 0.093 to 0.116 0.117 to 0.139 0.140 to 0.163
0.034
0.016
0.122
Dadra & Nagar Haveli, & Daman & DiuMultidimensional Poverty Index Score (District-wise)
Districts of Dadra & Nagar Haveli, & Daman & Diu are as per the 2011 Census of India. Due to there being a relatively lower number of districts, all Union Territories and the States of Sikkim and Goa share the same colour scale. The colour represents the MPI score of a district. The colour moves from green, through yellow, to red as the MPI score increases. Green represents areas with the lowest MPI scores while red represents areas with the highest MPI scores. The legend provides the range of MPI scores represented by a colour.
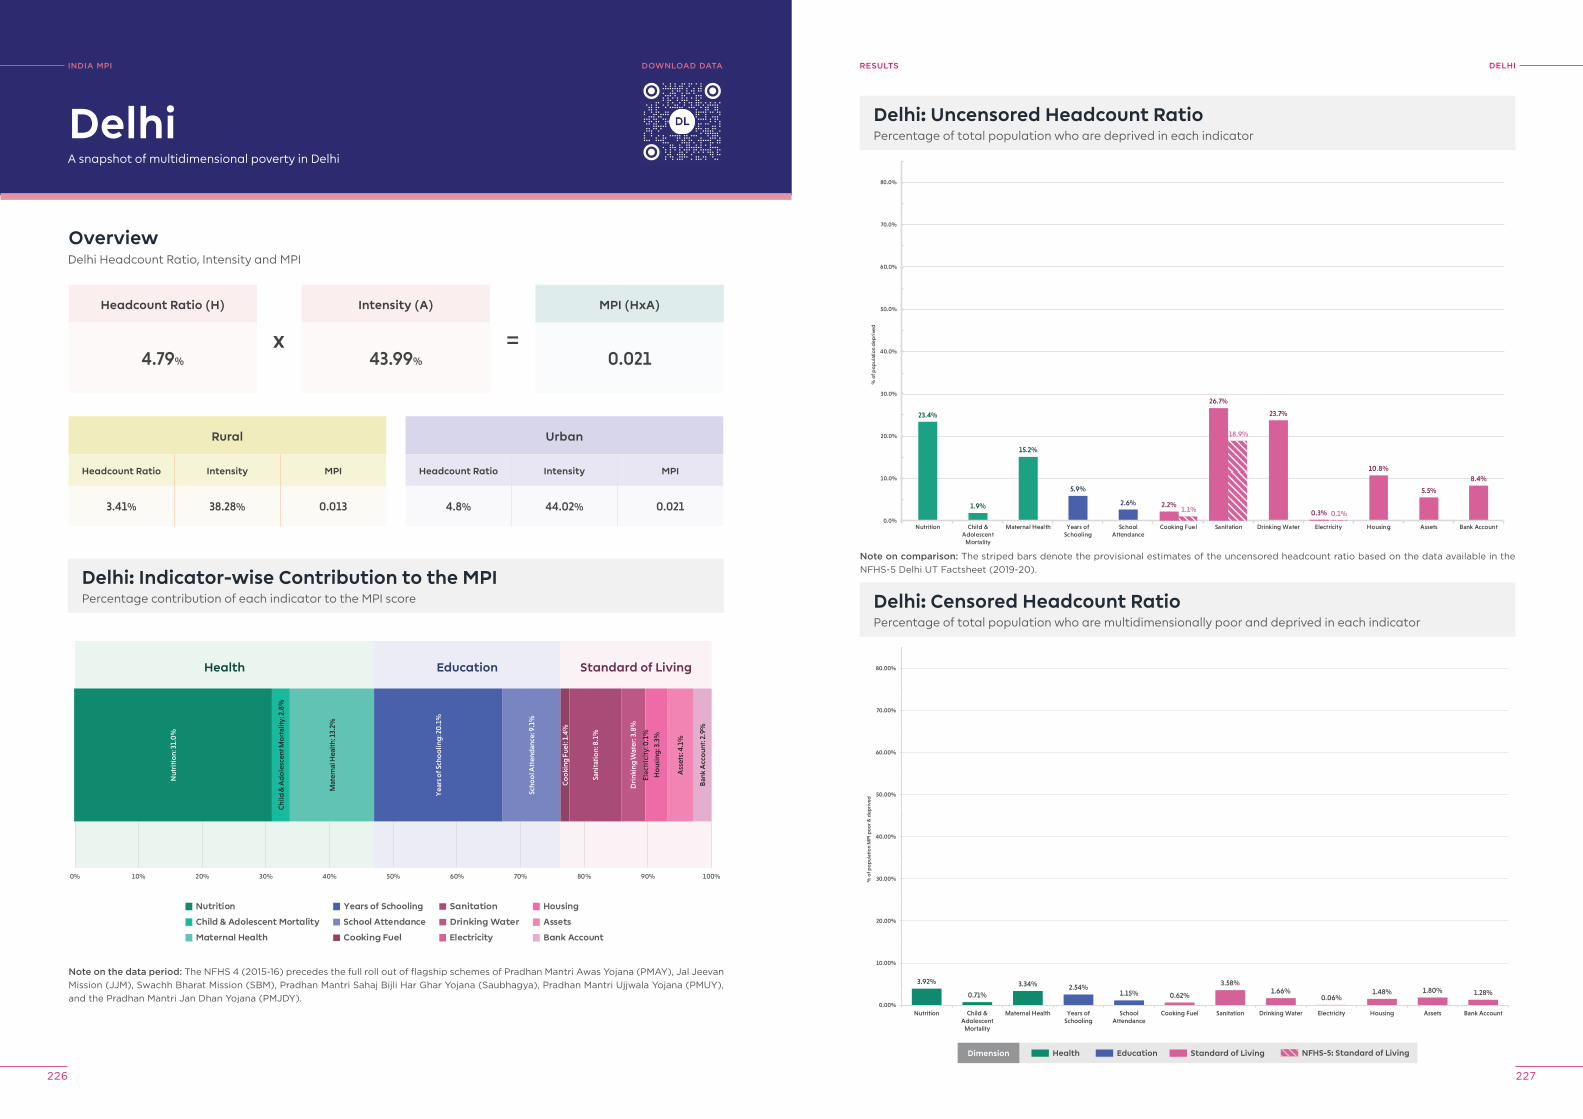
INDIA MPI BASELINE REPORT
226 227
DelhIreSUlTSINDIA MpI
A snapshot of multidimensional poverty in Delhi
OverviewDelhi Headcount Ratio, Intensity and MPI
Headcount Ratio (H)
4.79%
Rural
Headcount Ratio Intensity MPI
3.41% 38.28% 0.013
Delhi: Indicator-wise Contribution to the MPIPercentage contribution of each indicator to the MPI score
Intensity (A)
43.99%
MPI (HxA)
0.021
Delhi
Urban
Headcount Ratio Intensity MPI
4.8% 44.02% 0.021
x =
Note on the data period: The NFHS 4 (2015-16) precedes the full roll out of flagship schemes of Pradhan Mantri Awas Yojana (PMAY), Jal Jeevan Mission (JJM), Swachh Bharat Mission (SBM), Pradhan Mantri Sahaj Bijli Har Ghar Yojana (Saubhagya), Pradhan Mantri Ujjwala Yojana (PMUY), and the Pradhan Mantri Jan Dhan Yojana (PMJDY).
Nutrition
Child & Adolescent Mortality
Maternal Health
Years of Schooling
School Attendance
Cooking Fuel
Sanitation
Drinking Water
Electricity
Housing
Assets
Bank Account
0% 10% 20% 30% 40% 50% 60% 70% 80% 90% 100%
Health Education Standard of Living
Nut
riti
on:
31.
0%
Chi
ld &
Ad
ole
scen
t Mo
rtal
ity: 2
.8%
Mat
erna
l Hea
lth:
13.
2%
Yea
rs o
f Sch
oo
ling
: 20
.1%
Scho
ol A
tten
dan
ce: 9
.1%
Co
oki
ng F
uel:
1.4%
Sani
tati
on:
8.1
%
Dri
nkin
g W
ater
: 3.8
%
Elec
tric
ity:
0.1
%
Ho
usin
g: 3
.3%
Ass
ets:
4.1
%
Ban
k A
cco
unt:
2.9
%
Delhi: Uncensored Headcount RatioPercentage of total population who are deprived in each indicator
23.4%
1.9%
15.2%
5.9%
2.6%
23.7%
10.8%
5.5%
8.4%
2.2%1.1%
26.7%
18.9%
0.3% 0.1%0.0%
10.0%
20.0%
30.0%
40.0%
50.0%
60.0%
70.0%
80.0%
Nutrition Child &Adolescent
Mortality
Maternal Health Years ofSchooling
SchoolAttendance
Cooking Fuel Sanitation Drinking Water Electricity Housing Assets Bank Account
% o
f pop
ulat
ion
dep
rive
d
3.92%
0.71%
3.34% 2.54%1.15% 0.62%
3.58%1.66%
0.06%1.48% 1.80% 1.28%
0.00%
10.00%
20.00%
30.00%
40.00%
50.00%
60.00%
70.00%
80.00%
Nutrition Child &Adolescent
Mortality
Maternal Health Years ofSchooling
SchoolAttendance
Cooking Fuel Sanitation Drinking Water Electricity Housing Assets Bank Account
% o
f po
pul
atio
n M
PI p
oo
r & d
epri
ved
Delhi: Censored Headcount RatioPercentage of total population who are multidimensionally poor and deprived in each indicator
DoWNloAD DATA
Note on comparison: The striped bars denote the provisional estimates of the uncensored headcount ratio based on the data available in the NFHS-5 Delhi UT Factsheet (2019-20).
Dimension Health Education Standard of Living NFHS-5: Standard of Living
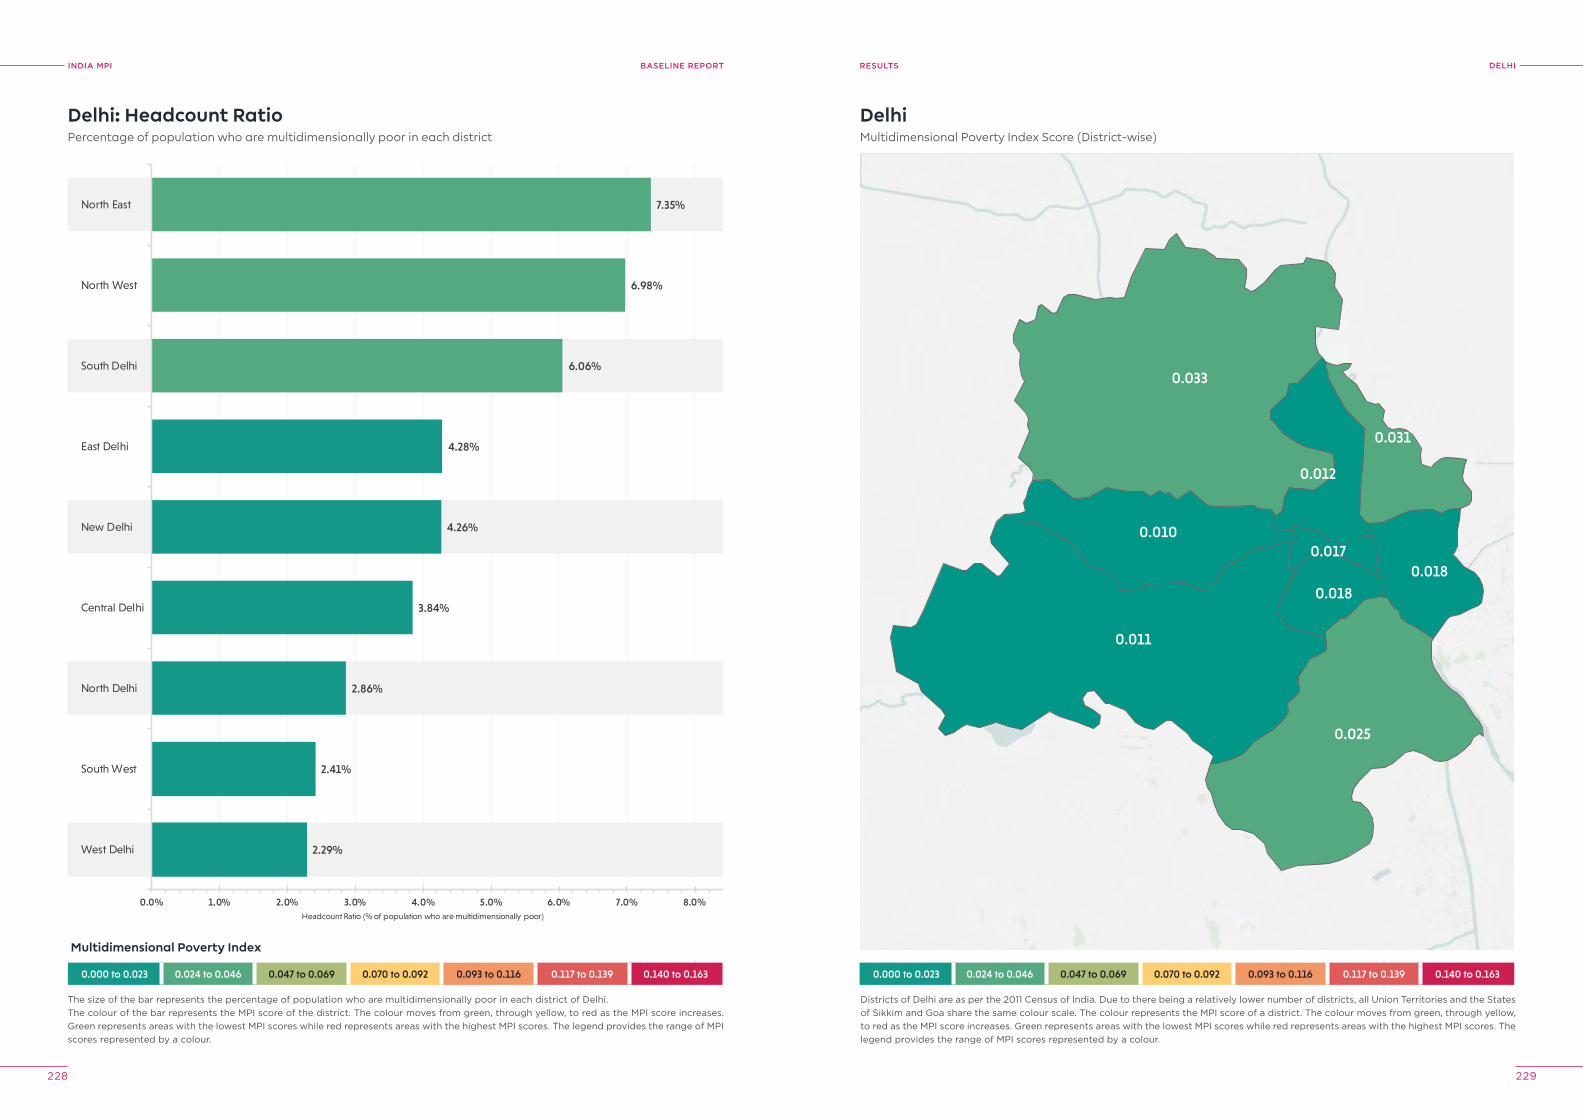
INDIA MPI BASELINE REPORT
228 229
DelhIreSUlTS
2.29%
2.41%
2.86%
3.84%
4.26%
4.28%
6.06%
6.98%
7.35%
0.0% 1.0% 2.0% 3.0% 4.0% 5.0% 6.0% 7.0% 8.0%
West Delhi
South West
North Delhi
Central Delhi
New Delhi
East Delhi
South Delhi
North West
North East
Headcount Ratio (% of population who are multidimensionally poor)
Delhi: Headcount RatioPercentage of population who are multidimensionally poor in each district
The size of the bar represents the percentage of population who are multidimensionally poor in each district of Delhi.The colour of the bar represents the MPI score of the district. The colour moves from green, through yellow, to red as the MPI score increases. Green represents areas with the lowest MPI scores while red represents areas with the highest MPI scores. The legend provides the range of MPI scores represented by a colour.
0.000 to 0.023 0.024 to 0.046 0.047 to 0.069 0.070 to 0.092 0.093 to 0.116 0.117 to 0.139 0.140 to 0.163
Multidimensional Poverty Index
0.000 to 0.023 0.024 to 0.046 0.047 to 0.069 0.070 to 0.092 0.093 to 0.116 0.117 to 0.139 0.140 to 0.163
0.010
0.018
0.018
0.025
0.011
0.031
0.012
0.033
0.017
DelhiMultidimensional Poverty Index Score (District-wise)
Districts of Delhi are as per the 2011 Census of India. Due to there being a relatively lower number of districts, all Union Territories and the States of Sikkim and Goa share the same colour scale. The colour represents the MPI score of a district. The colour moves from green, through yellow, to red as the MPI score increases. Green represents areas with the lowest MPI scores while red represents areas with the highest MPI scores. The legend provides the range of MPI scores represented by a colour.
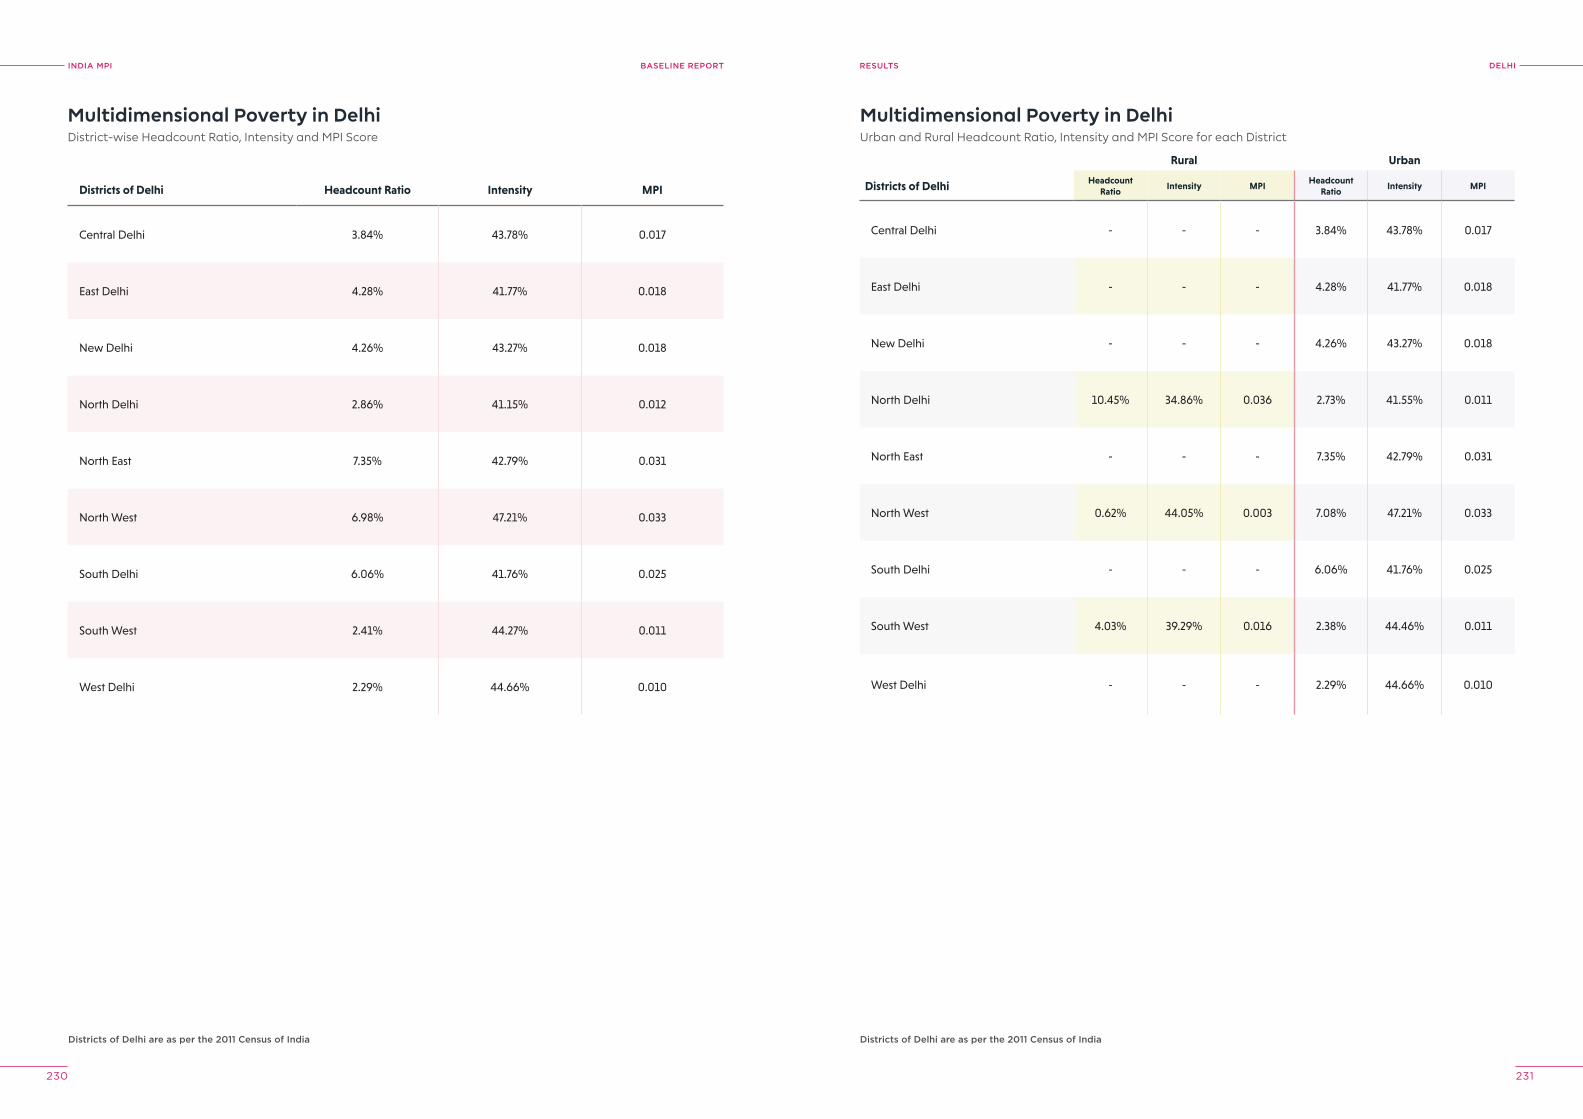
INDIA MPI BASELINE REPORT
230 231
DelhIreSUlTS
Multidimensional Poverty in DelhiDistrict-wise Headcount Ratio, Intensity and MPI Score
Districts of Delhi are as per the 2011 Census of India
Districts of Delhi Headcount Ratio Intensity MPI
Central Delhi 3.84% 43.78% 0.017
East Delhi 4.28% 41.77% 0.018
New Delhi 4.26% 43.27% 0.018
North Delhi 2.86% 41.15% 0.012
North East 7.35% 42.79% 0.031
North West 6.98% 47.21% 0.033
South Delhi 6.06% 41.76% 0.025
South West 2.41% 44.27% 0.011
West Delhi 2.29% 44.66% 0.010
Multidimensional Poverty in DelhiUrban and Rural Headcount Ratio, Intensity and MPI Score for each District
Districts of Delhi are as per the 2011 Census of India
Rural Urban
Districts of Delhi Headcount Ratio
Intensity MPIHeadcount
RatioIntensity MPI
Central Delhi - - - 3.84% 43.78% 0.017
East Delhi - - - 4.28% 41.77% 0.018
New Delhi - - - 4.26% 43.27% 0.018
North Delhi 10.45% 34.86% 0.036 2.73% 41.55% 0.011
North East - - - 7.35% 42.79% 0.031
North West 0.62% 44.05% 0.003 7.08% 47.21% 0.033
South Delhi - - - 6.06% 41.76% 0.025
South West 4.03% 39.29% 0.016 2.38% 44.46% 0.011
West Delhi - - - 2.29% 44.66% 0.010
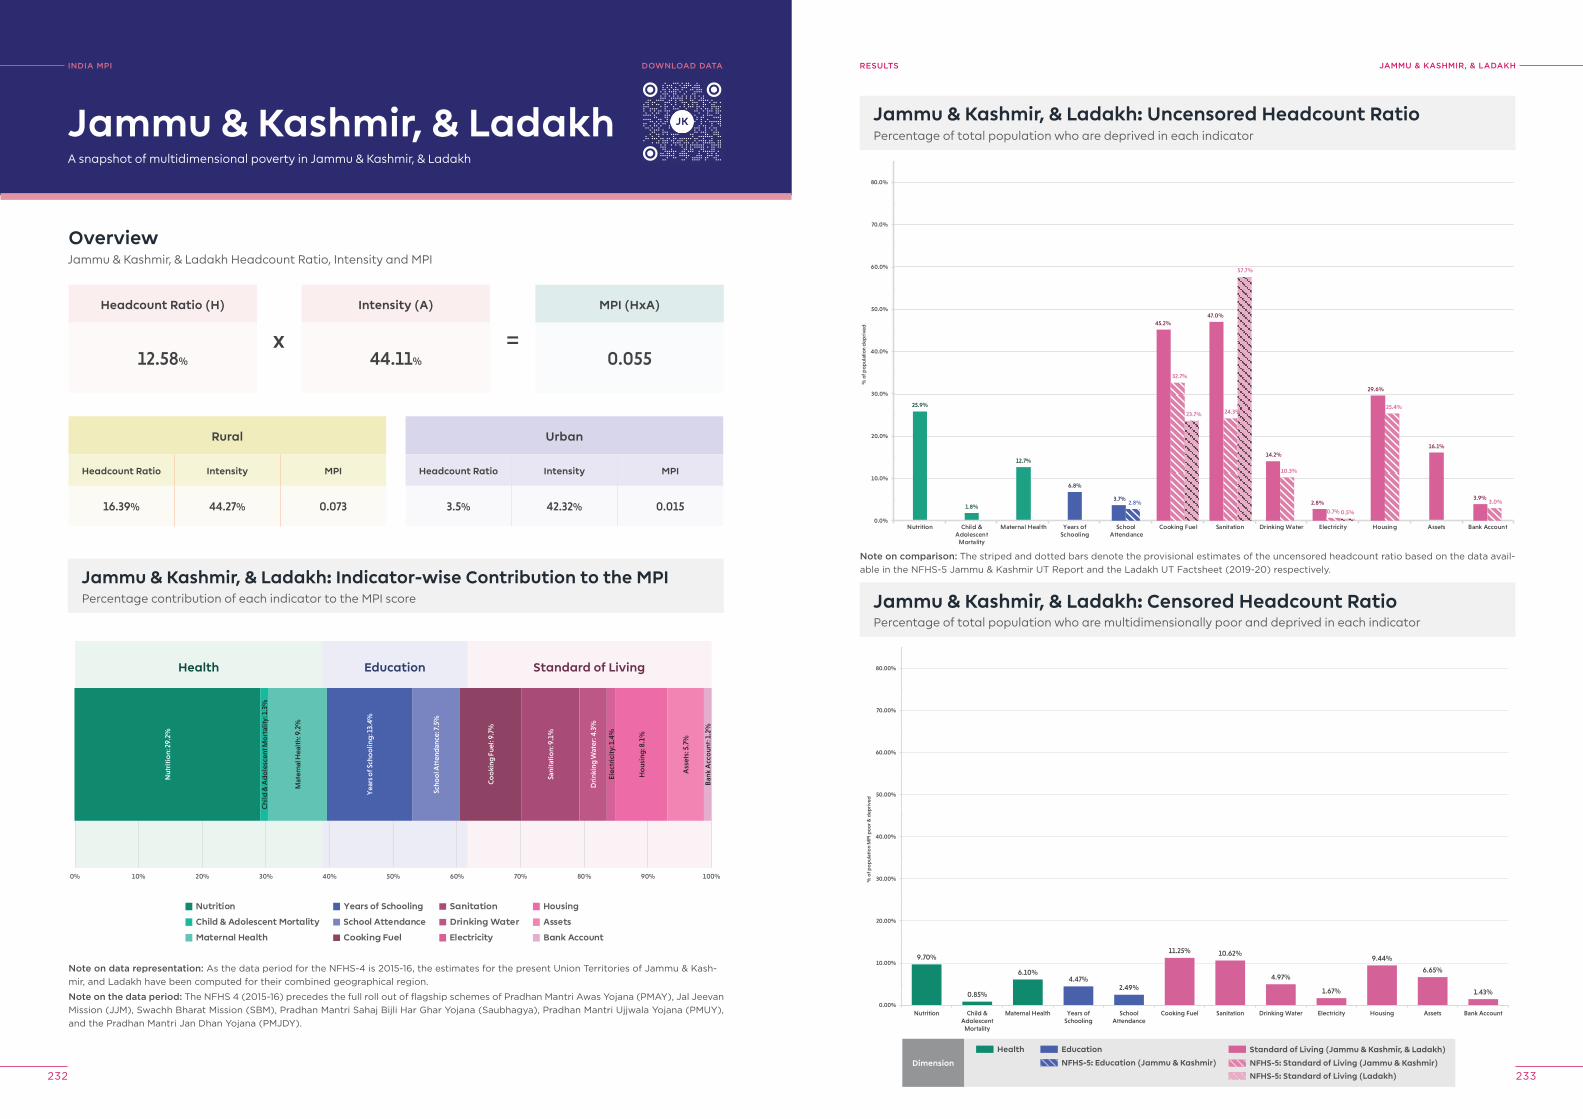
INDIA MPI BASELINE REPORT
232 233
jAMMU & kAShMIr, & lADAkhreSUlTSINDIA MpI
A snapshot of multidimensional poverty in Jammu & Kashmir, & Ladakh
OverviewJammu & Kashmir, & Ladakh Headcount Ratio, Intensity and MPI
Headcount Ratio (H)
12.58%
Rural
Headcount Ratio Intensity MPI
16.39% 44.27% 0.073
Jammu & Kashmir, & Ladakh: Indicator-wise Contribution to the MPIPercentage contribution of each indicator to the MPI score
Intensity (A)
44.11%
MPI (HxA)
0.055
Jammu & Kashmir, & Ladakh
Urban
Headcount Ratio Intensity MPI
3.5% 42.32% 0.015
x =
Note on the data period: The NFHS 4 (2015-16) precedes the full roll out of flagship schemes of Pradhan Mantri Awas Yojana (PMAY), Jal Jeevan Mission (JJM), Swachh Bharat Mission (SBM), Pradhan Mantri Sahaj Bijli Har Ghar Yojana (Saubhagya), Pradhan Mantri Ujjwala Yojana (PMUY), and the Pradhan Mantri Jan Dhan Yojana (PMJDY).
Nutrition
Child & Adolescent Mortality
Maternal Health
Years of Schooling
School Attendance
Cooking Fuel
Sanitation
Drinking Water
Electricity
Housing
Assets
Bank Account
0% 10% 20% 30% 40% 50% 60% 70% 80% 90% 100%
Health Education Standard of Living
Nut
riti
on:
29.
2%
Chi
ld &
Ad
ole
scen
t Mo
rtal
ity: 1
.3%
Mat
erna
l Hea
lth:
9.2
%
Yea
rs o
f Sch
oo
ling
: 13.
4%
Scho
ol A
tten
dan
ce: 7
.5%
Co
oki
ng F
uel:
9.7%
Sani
tati
on:
9.1
%
Dri
nkin
g W
ater
: 4.3
%
Elec
tric
ity:
1.4
%
Ho
usin
g: 8
.1%
Ass
ets:
5.7
%
Ban
k A
cco
unt:
1.2
%
Note on data representation: As the data period for the NFHS-4 is 2015-16, the estimates for the present Union Territories of Jammu & Kash-mir, and Ladakh have been computed for their combined geographical region.
Jammu & Kashmir, & Ladakh: Uncensored Headcount RatioPercentage of total population who are deprived in each indicator
Jammu & Kashmir, & Ladakh: Censored Headcount RatioPercentage of total population who are multidimensionally poor and deprived in each indicator
25.9%
1.8%
12.7%
6.8%
16.1%
3.7%2.8%
14.2%
10.3%
29.6%
25.4%
3.9%3.0%
45.2%
32.7%
23.7%
47.0%
24.3%
57.7%
2.8%
0.7% 0.5%
0.0%
10.0%
20.0%
30.0%
40.0%
50.0%
60.0%
70.0%
80.0%
Nutrition Child &Adolescent
Mortality
Maternal Health Years ofSchooling
SchoolAttendance
Cooking Fuel Sanitation Drinking Water Electricity Housing Assets Bank Account
% o
f pop
ulat
ion
dep
rive
d
9.70%
0.85%
6.10%4.47%
2.49%
11.25% 10.62%
4.97%
1.67%
9.44%
6.65%
1.43%
0.00%
10.00%
20.00%
30.00%
40.00%
50.00%
60.00%
70.00%
80.00%
Nutrition Child &Adolescent
Mortality
Maternal Health Years ofSchooling
SchoolAttendance
Cooking Fuel Sanitation Drinking Water Electricity Housing Assets Bank Account
% o
f po
pul
atio
n M
PI p
oo
r & d
epri
ved
DoWNloAD DATA
Note on comparison: The striped and dotted bars denote the provisional estimates of the uncensored headcount ratio based on the data avail-able in the NFHS-5 Jammu & Kashmir UT Report and the Ladakh UT Factsheet (2019-20) respectively.
Dimension
Health Education Standard of Living (Jammu & Kashmir, & Ladakh)
NFHS-5: Education (Jammu & Kashmir) NFHS-5: Standard of Living (Jammu & Kashmir)
NFHS-5: Standard of Living (Ladakh)
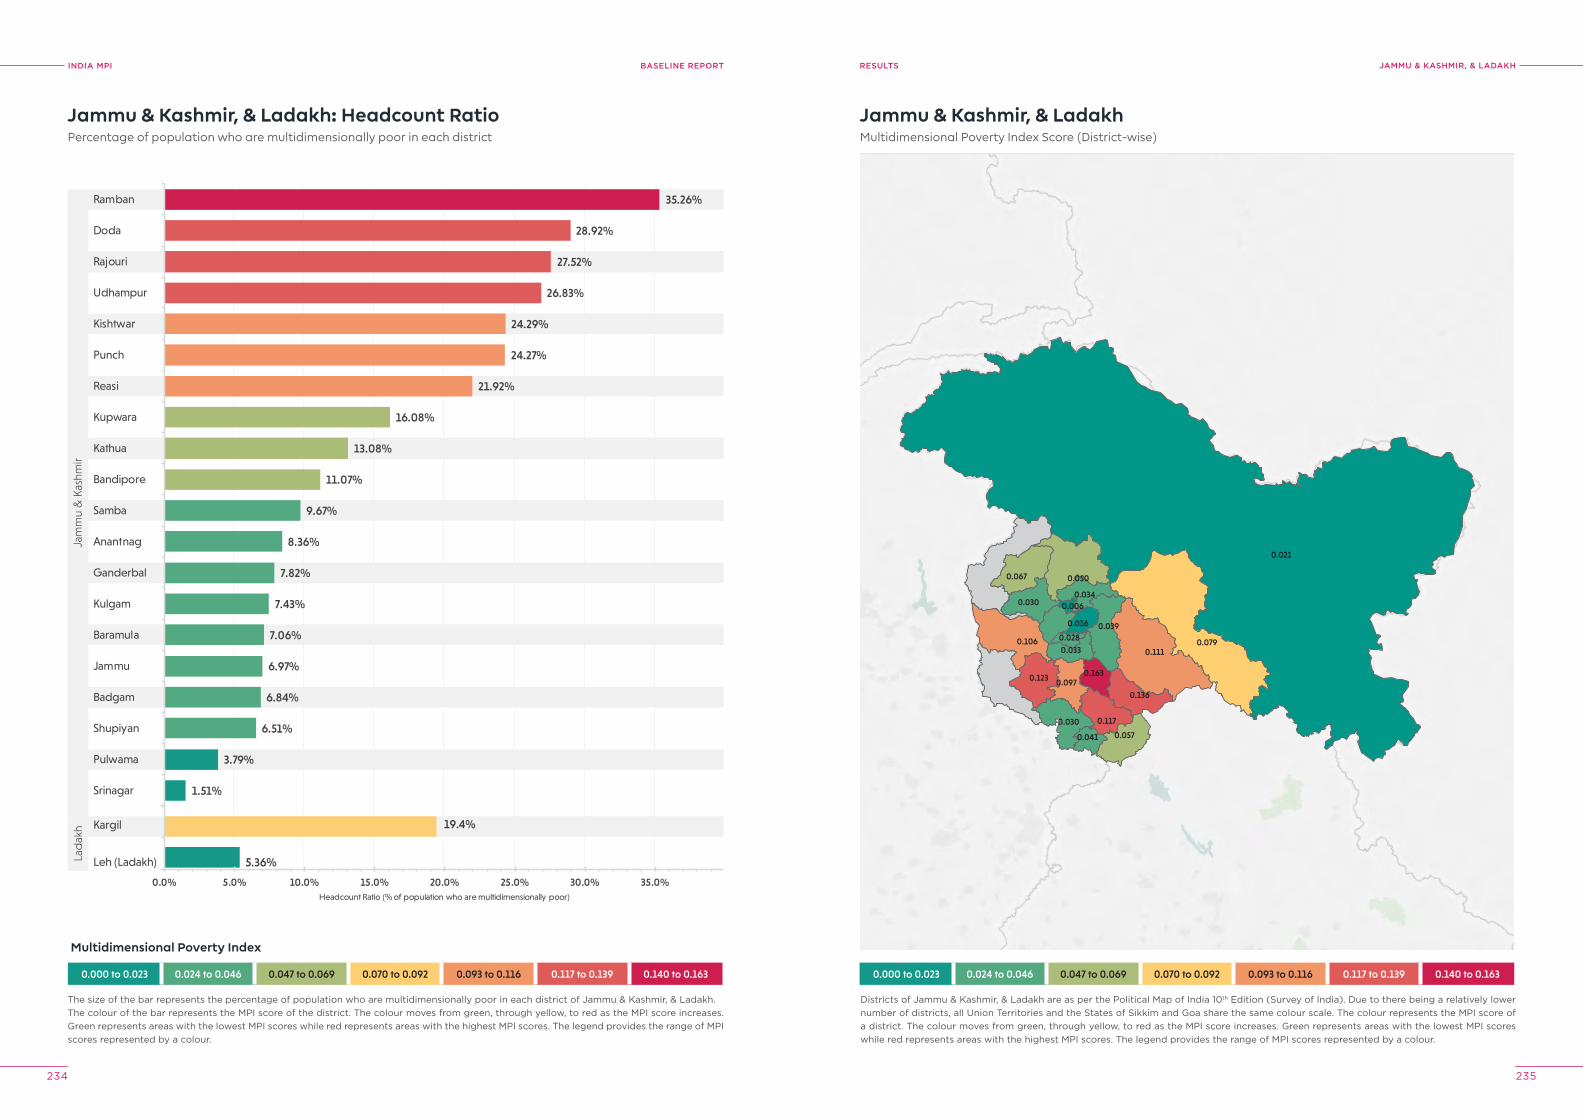
INDIA MPI BASELINE REPORT
234 235
jAMMU & kAShMIr, & lADAkhreSUlTS
1.51%
3.79%
6.51%
6.84%
6.97%
7.06%
7.43%
7.82%
8.36%
9.67%
11.07%
13.08%
16.08%
21.92%
24.27%
24.29%
26.83%
27.52%
28.92%
35.26%
Srinagar
Pulwama
Shupiyan
Badgam
Jammu
Baramula
Kulgam
Ganderbal
Anantnag
Samba
Bandipore
Kathua
Kupwara
Reasi
Punch
Kishtwar
Udhampur
Rajouri
Doda
Ramban
5.36%
19.4%
0.0% 5.0% 10.0% 15.0% 20.0% 25.0% 30.0% 35.0%
Leh (Ladakh)
Kargil
Headcount Ratio (% of population who are multidimensionally poor)
Jam
mu
& K
ashm
irLa
dak
h
Jammu & Kashmir, & Ladakh: Headcount RatioPercentage of population who are multidimensionally poor in each district
The size of the bar represents the percentage of population who are multidimensionally poor in each district of Jammu & Kashmir, & Ladakh.The colour of the bar represents the MPI score of the district. The colour moves from green, through yellow, to red as the MPI score increases. Green represents areas with the lowest MPI scores while red represents areas with the highest MPI scores. The legend provides the range of MPI scores represented by a colour.
0.000 to 0.023 0.024 to 0.046 0.047 to 0.069 0.070 to 0.092 0.093 to 0.116 0.117 to 0.139 0.140 to 0.163
Multidimensional Poverty Index
0.000 to 0.023 0.024 to 0.046 0.047 to 0.069 0.070 to 0.092 0.093 to 0.116 0.117 to 0.139 0.140 to 0.163
0.006
0.050
0.030
0.030
0.041
0.034
0.016
0.106
0.0390.028 0.079
0.067
0.097
0.033
0.021
0.057
0.136
0.163
0.111
0.123
0.117
Jammu & Kashmir, & LadakhMultidimensional Poverty Index Score (District-wise)
Districts of Jammu & Kashmir, & Ladakh are as per the Political Map of India 10th Edition (Survey of India). Due to there being a relatively lower number of districts, all Union Territories and the States of Sikkim and Goa share the same colour scale. The colour represents the MPI score of a district. The colour moves from green, through yellow, to red as the MPI score increases. Green represents areas with the lowest MPI scores while red represents areas with the highest MPI scores. The legend provides the range of MPI scores represented by a colour.
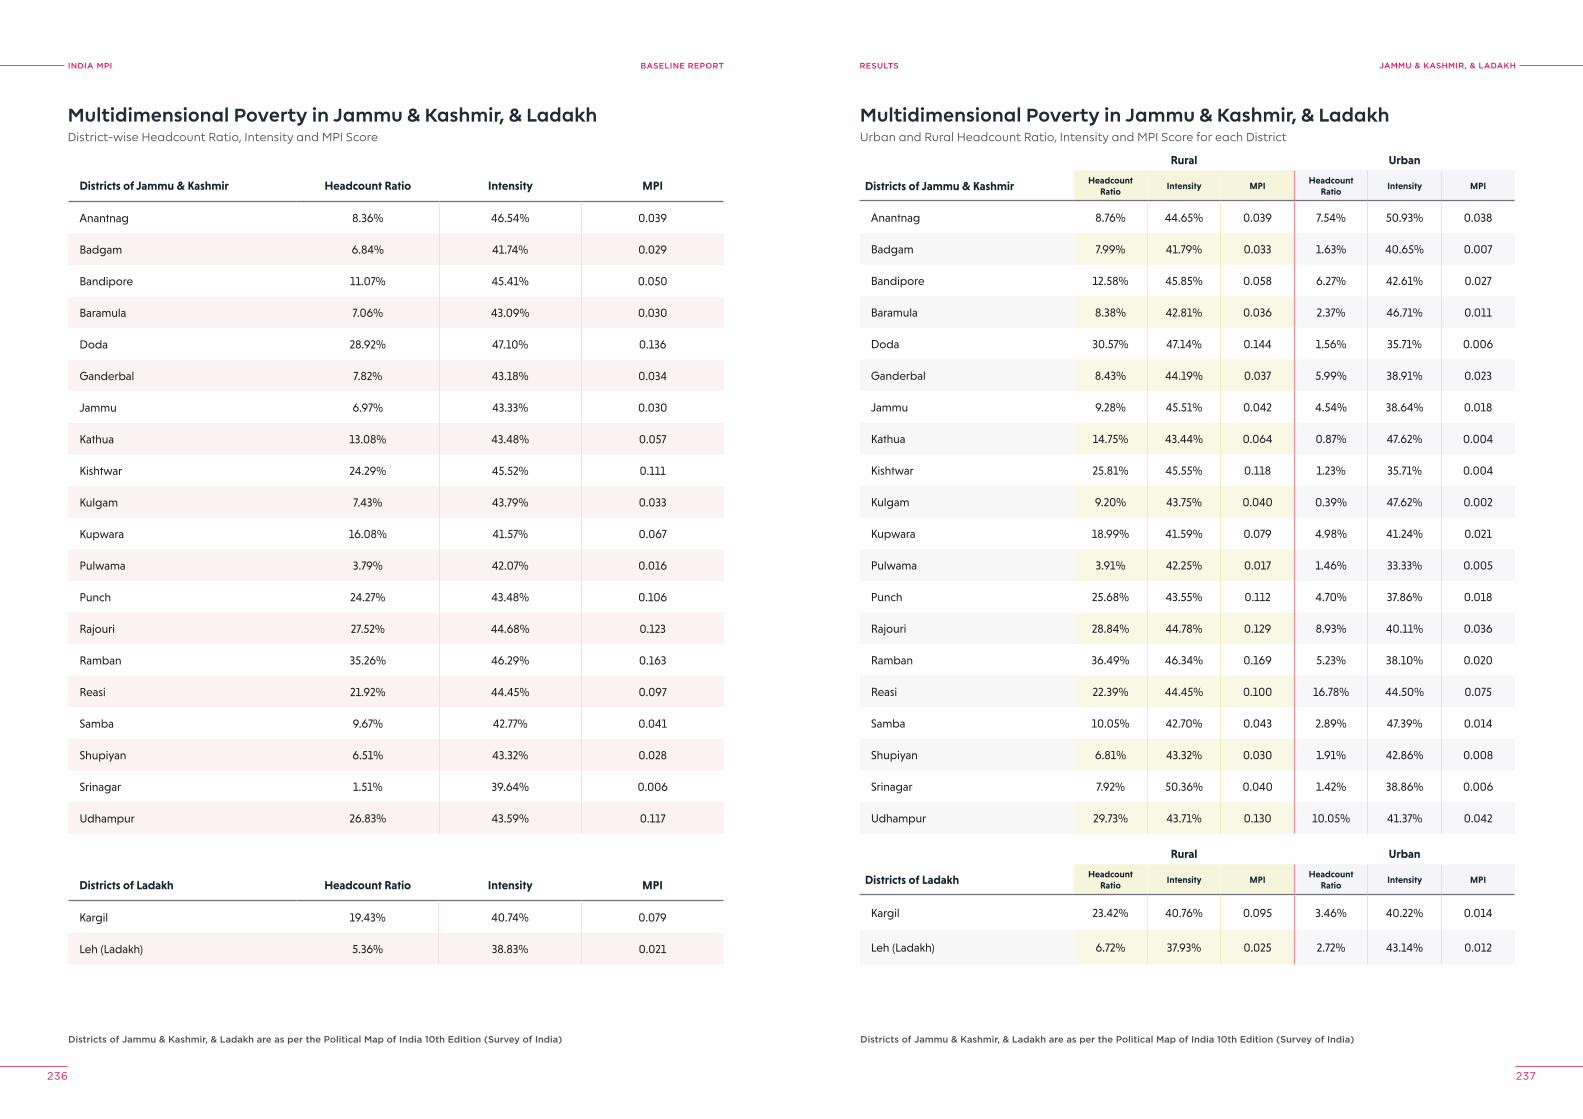
INDIA MPI BASELINE REPORT
236 237
jAMMU & kAShMIr, & lADAkhreSUlTS
Multidimensional Poverty in Jammu & Kashmir, & LadakhDistrict-wise Headcount Ratio, Intensity and MPI Score
Districts of Jammu & Kashmir Headcount Ratio Intensity MPI
Anantnag 8.36% 46.54% 0.039
Badgam 6.84% 41.74% 0.029
Bandipore 11.07% 45.41% 0.050
Baramula 7.06% 43.09% 0.030
Doda 28.92% 47.10% 0.136
Ganderbal 7.82% 43.18% 0.034
Jammu 6.97% 43.33% 0.030
Kathua 13.08% 43.48% 0.057
Kishtwar 24.29% 45.52% 0.111
Kulgam 7.43% 43.79% 0.033
Kupwara 16.08% 41.57% 0.067
Pulwama 3.79% 42.07% 0.016
Punch 24.27% 43.48% 0.106
Rajouri 27.52% 44.68% 0.123
Ramban 35.26% 46.29% 0.163
Reasi 21.92% 44.45% 0.097
Samba 9.67% 42.77% 0.041
Shupiyan 6.51% 43.32% 0.028
Srinagar 1.51% 39.64% 0.006
Udhampur 26.83% 43.59% 0.117
Districts of Ladakh Headcount Ratio Intensity MPI
Kargil 19.43% 40.74% 0.079
Leh (Ladakh) 5.36% 38.83% 0.021
Multidimensional Poverty in Jammu & Kashmir, & LadakhUrban and Rural Headcount Ratio, Intensity and MPI Score for each District
Rural Urban
Districts of Ladakh Headcount Ratio
Intensity MPIHeadcount
RatioIntensity MPI
Kargil 23.42% 40.76% 0.095 3.46% 40.22% 0.014
Leh (Ladakh) 6.72% 37.93% 0.025 2.72% 43.14% 0.012
Rural Urban
Districts of Jammu & Kashmir Headcount Ratio
Intensity MPIHeadcount
RatioIntensity MPI
Anantnag 8.76% 44.65% 0.039 7.54% 50.93% 0.038
Badgam 7.99% 41.79% 0.033 1.63% 40.65% 0.007
Bandipore 12.58% 45.85% 0.058 6.27% 42.61% 0.027
Baramula 8.38% 42.81% 0.036 2.37% 46.71% 0.011
Doda 30.57% 47.14% 0.144 1.56% 35.71% 0.006
Ganderbal 8.43% 44.19% 0.037 5.99% 38.91% 0.023
Jammu 9.28% 45.51% 0.042 4.54% 38.64% 0.018
Kathua 14.75% 43.44% 0.064 0.87% 47.62% 0.004
Kishtwar 25.81% 45.55% 0.118 1.23% 35.71% 0.004
Kulgam 9.20% 43.75% 0.040 0.39% 47.62% 0.002
Kupwara 18.99% 41.59% 0.079 4.98% 41.24% 0.021
Pulwama 3.91% 42.25% 0.017 1.46% 33.33% 0.005
Punch 25.68% 43.55% 0.112 4.70% 37.86% 0.018
Rajouri 28.84% 44.78% 0.129 8.93% 40.11% 0.036
Ramban 36.49% 46.34% 0.169 5.23% 38.10% 0.020
Reasi 22.39% 44.45% 0.100 16.78% 44.50% 0.075
Samba 10.05% 42.70% 0.043 2.89% 47.39% 0.014
Shupiyan 6.81% 43.32% 0.030 1.91% 42.86% 0.008
Srinagar 7.92% 50.36% 0.040 1.42% 38.86% 0.006
Udhampur 29.73% 43.71% 0.130 10.05% 41.37% 0.042
Districts of jammu & kashmir, & ladakh are as per the political Map of India 10th edition (Survey of India) Districts of jammu & kashmir, & ladakh are as per the political Map of India 10th edition (Survey of India)
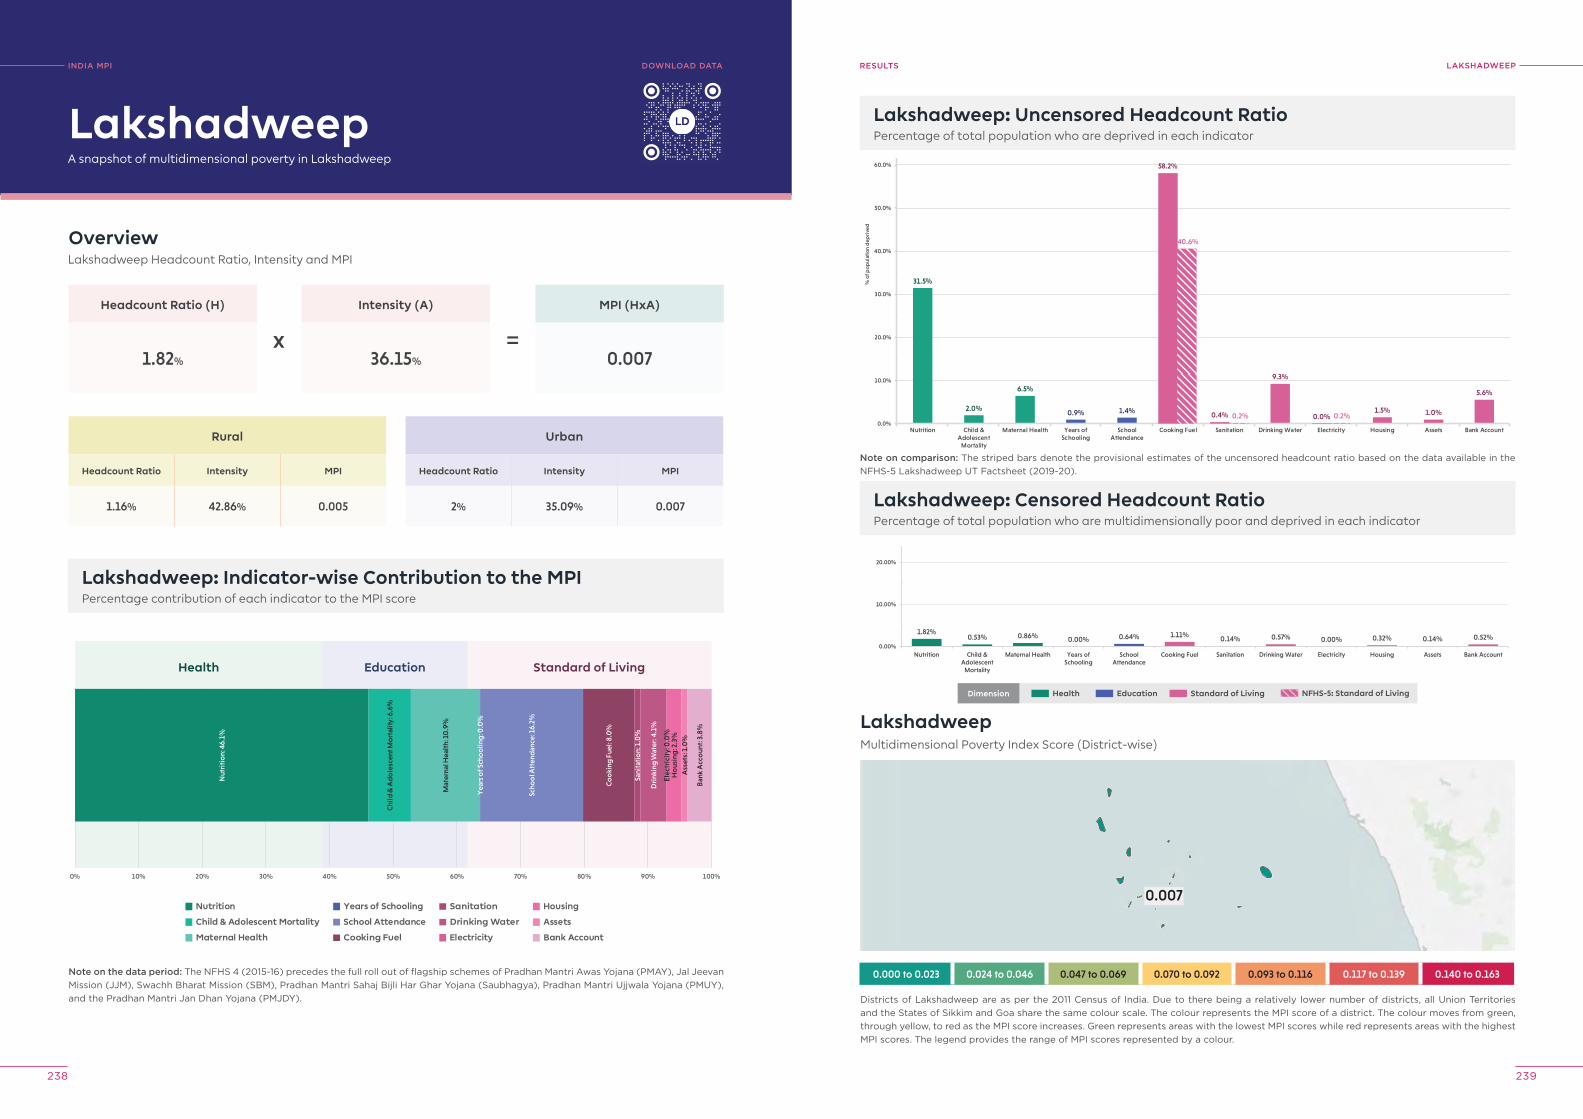
INDIA MPI BASELINE REPORT
238 239
lAkShADWeepreSUlTSINDIA MpI
A snapshot of multidimensional poverty in Lakshadweep
OverviewLakshadweep Headcount Ratio, Intensity and MPI
Headcount Ratio (H)
1.82%
Rural
Headcount Ratio Intensity MPI
1.16% 42.86% 0.005
Lakshadweep: Indicator-wise Contribution to the MPIPercentage contribution of each indicator to the MPI score
Intensity (A)
36.15%
MPI (HxA)
0.007
Lakshadweep
Urban
Headcount Ratio Intensity MPI
2% 35.09% 0.007
x =
Note on the data period: The NFHS 4 (2015-16) precedes the full roll out of flagship schemes of Pradhan Mantri Awas Yojana (PMAY), Jal Jeevan Mission (JJM), Swachh Bharat Mission (SBM), Pradhan Mantri Sahaj Bijli Har Ghar Yojana (Saubhagya), Pradhan Mantri Ujjwala Yojana (PMUY), and the Pradhan Mantri Jan Dhan Yojana (PMJDY).
Nutrition
Child & Adolescent Mortality
Maternal Health
Years of Schooling
School Attendance
Cooking Fuel
Sanitation
Drinking Water
Electricity
Housing
Assets
Bank Account
0% 10% 20% 30% 40% 50% 60% 70% 80% 90% 100%
Health Education Standard of Living
Nut
riti
on:
46.
1%
Chi
ld &
Ad
ole
scen
t Mo
rtal
ity: 6
.6%
Mat
erna
l Hea
lth:
10
.9%
Yea
rs o
f Sch
oo
ling
: 0.0
%
Scho
ol A
tten
dan
ce: 1
6.2%
Co
oki
ng F
uel:
8.0
%
Sani
tati
on:
1.0
%
Dri
nkin
g W
ater
: 4.1
%
Elec
tric
ity:
0.0
%H
ous
ing
: 2.3
%A
sset
s: 1
.0%
Ban
k A
cco
unt:
3.8
%
Lakshadweep: Uncensored Headcount RatioPercentage of total population who are deprived in each indicator
1.82%0.53% 0.86% 0.00% 0.64% 1.11% 0.14% 0.57% 0.00% 0.32% 0.14% 0.52%
0.00%
10.00%
20.00%
30.00%
40.00%
50.00%
60.00%
70.00%
80.00%
Nutrition Child &Adolescent
Mortality
Maternal Health Years ofSchooling
SchoolAttendance
Cooking Fuel Sanitation Drinking Water Electricity Housing Assets Bank Account
% o
f po
pul
atio
n M
PI p
oo
r & d
epri
ved
Lakshadweep: Censored Headcount RatioPercentage of total population who are multidimensionally poor and deprived in each indicator
31.5%
2.0%
6.5%
0.9% 1.4%
9.3%
1.5% 1.0%
5.6%
58.2%
40.6%
0.4% 0.2% 0.0% 0.2%0.0%
10.0%
20.0%
30.0%
40.0%
50.0%
60.0%
70.0%
80.0%
Nutrition Child &Adolescent
Mortality
Maternal Health Years ofSchooling
SchoolAttendance
Cooking Fuel Sanitation Drinking Water Electricity Housing Assets Bank Account
% o
f pop
ulat
ion
dep
rive
d
0.007
LakshadweepMultidimensional Poverty Index Score (District-wise)
0.000 to 0.023 0.024 to 0.046 0.047 to 0.069 0.070 to 0.092 0.093 to 0.116 0.117 to 0.139 0.140 to 0.163
Districts of Lakshadweep are as per the 2011 Census of India. Due to there being a relatively lower number of districts, all Union Territories and the States of Sikkim and Goa share the same colour scale. The colour represents the MPI score of a district. The colour moves from green, through yellow, to red as the MPI score increases. Green represents areas with the lowest MPI scores while red represents areas with the highest MPI scores. The legend provides the range of MPI scores represented by a colour.
DoWNloAD DATA
Note on comparison: The striped bars denote the provisional estimates of the uncensored headcount ratio based on the data available in the NFHS-5 Lakshadweep UT Factsheet (2019-20).
Dimension Health Education Standard of Living NFHS-5: Standard of Living
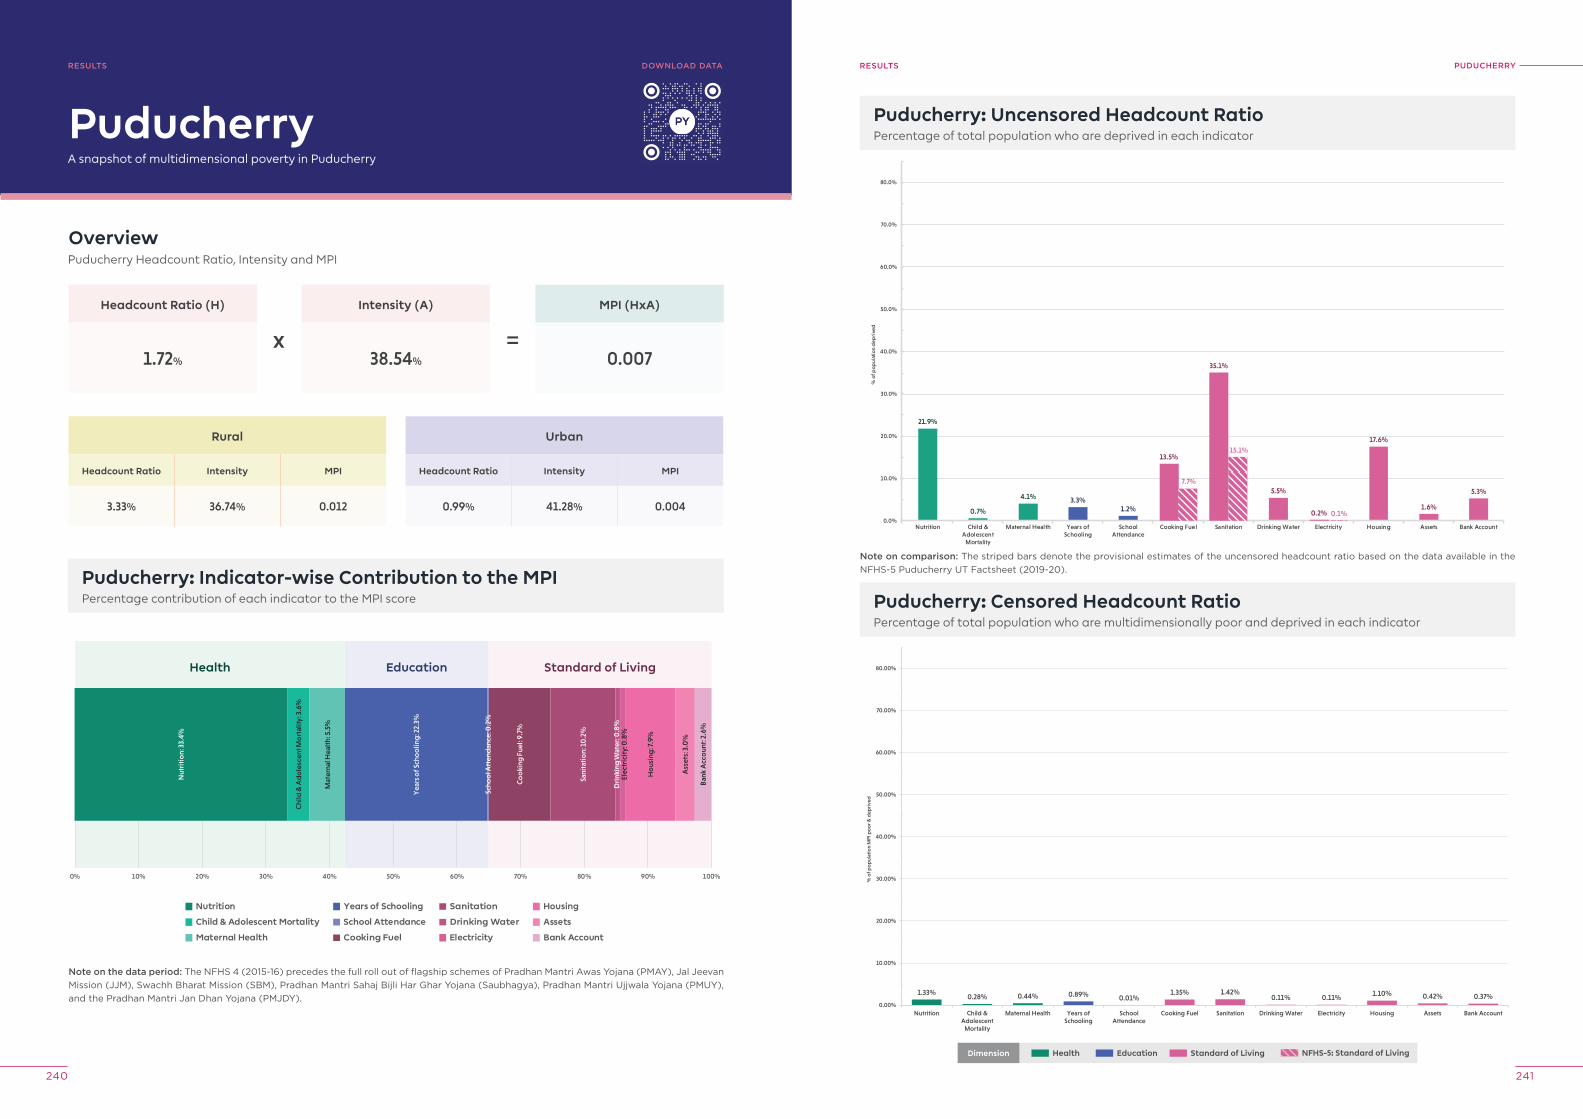
INDIA MPI BASELINE REPORT
240 241
pUDUCherryreSUlTS
A snapshot of multidimensional poverty in Puducherry
OverviewPuducherry Headcount Ratio, Intensity and MPI
Headcount Ratio (H)
1.72%
Rural
Headcount Ratio Intensity MPI
3.33% 36.74% 0.012
Puducherry: Indicator-wise Contribution to the MPIPercentage contribution of each indicator to the MPI score
Intensity (A)
38.54%
MPI (HxA)
0.007
Puducherry
Urban
Headcount Ratio Intensity MPI
0.99% 41.28% 0.004
x =
Note on the data period: The NFHS 4 (2015-16) precedes the full roll out of flagship schemes of Pradhan Mantri Awas Yojana (PMAY), Jal Jeevan Mission (JJM), Swachh Bharat Mission (SBM), Pradhan Mantri Sahaj Bijli Har Ghar Yojana (Saubhagya), Pradhan Mantri Ujjwala Yojana (PMUY), and the Pradhan Mantri Jan Dhan Yojana (PMJDY).
Nutrition
Child & Adolescent Mortality
Maternal Health
Years of Schooling
School Attendance
Cooking Fuel
Sanitation
Drinking Water
Electricity
Housing
Assets
Bank Account
0% 10% 20% 30% 40% 50% 60% 70% 80% 90% 100%
Health Education Standard of Living
Nut
riti
on:
33.
4%
Chi
ld &
Ad
ole
scen
t Mo
rtal
ity: 3
.6%
Mat
erna
l Hea
lth:
5.5
%
Yea
rs o
f Sch
oo
ling
: 22.
3%
Scho
ol A
tten
dan
ce: 0
.2%
Co
oki
ng F
uel:
9.7%
Sani
tati
on:
10
.2%
Dri
nkin
g W
ater
: 0.8
%El
ectr
icit
y: 0
.8%
Ho
usin
g: 7
.9%
Ass
ets:
3.0
%
Ban
k A
cco
unt:
2.6
%
reSUlTS
Puducherry: Uncensored Headcount RatioPercentage of total population who are deprived in each indicator
21.9%
0.7%
4.1% 3.3%1.2%
5.5%
17.6%
1.6%
5.3%
13.5%
7.7%
35.1%
15.1%
0.2% 0.1%0.0%
10.0%
20.0%
30.0%
40.0%
50.0%
60.0%
70.0%
80.0%
Nutrition Child &Adolescent
Mortality
Maternal Health Years ofSchooling
SchoolAttendance
Cooking Fuel Sanitation Drinking Water Electricity Housing Assets Bank Account
% o
f pop
ulat
ion
dep
rive
d
1.33%0.28% 0.44% 0.89% 0.01%
1.35% 1.42%0.11% 0.11%
1.10% 0.42% 0.37%0.00%
10.00%
20.00%
30.00%
40.00%
50.00%
60.00%
70.00%
80.00%
Nutrition Child &Adolescent
Mortality
Maternal Health Years ofSchooling
SchoolAttendance
Cooking Fuel Sanitation Drinking Water Electricity Housing Assets Bank Account
% o
f po
pul
atio
n M
PI p
oo
r & d
epri
ved
Puducherry: Censored Headcount RatioPercentage of total population who are multidimensionally poor and deprived in each indicator
DoWNloAD DATA
Note on comparison: The striped bars denote the provisional estimates of the uncensored headcount ratio based on the data available in the NFHS-5 Puducherry UT Factsheet (2019-20).
Dimension Health Education Standard of Living NFHS-5: Standard of Living
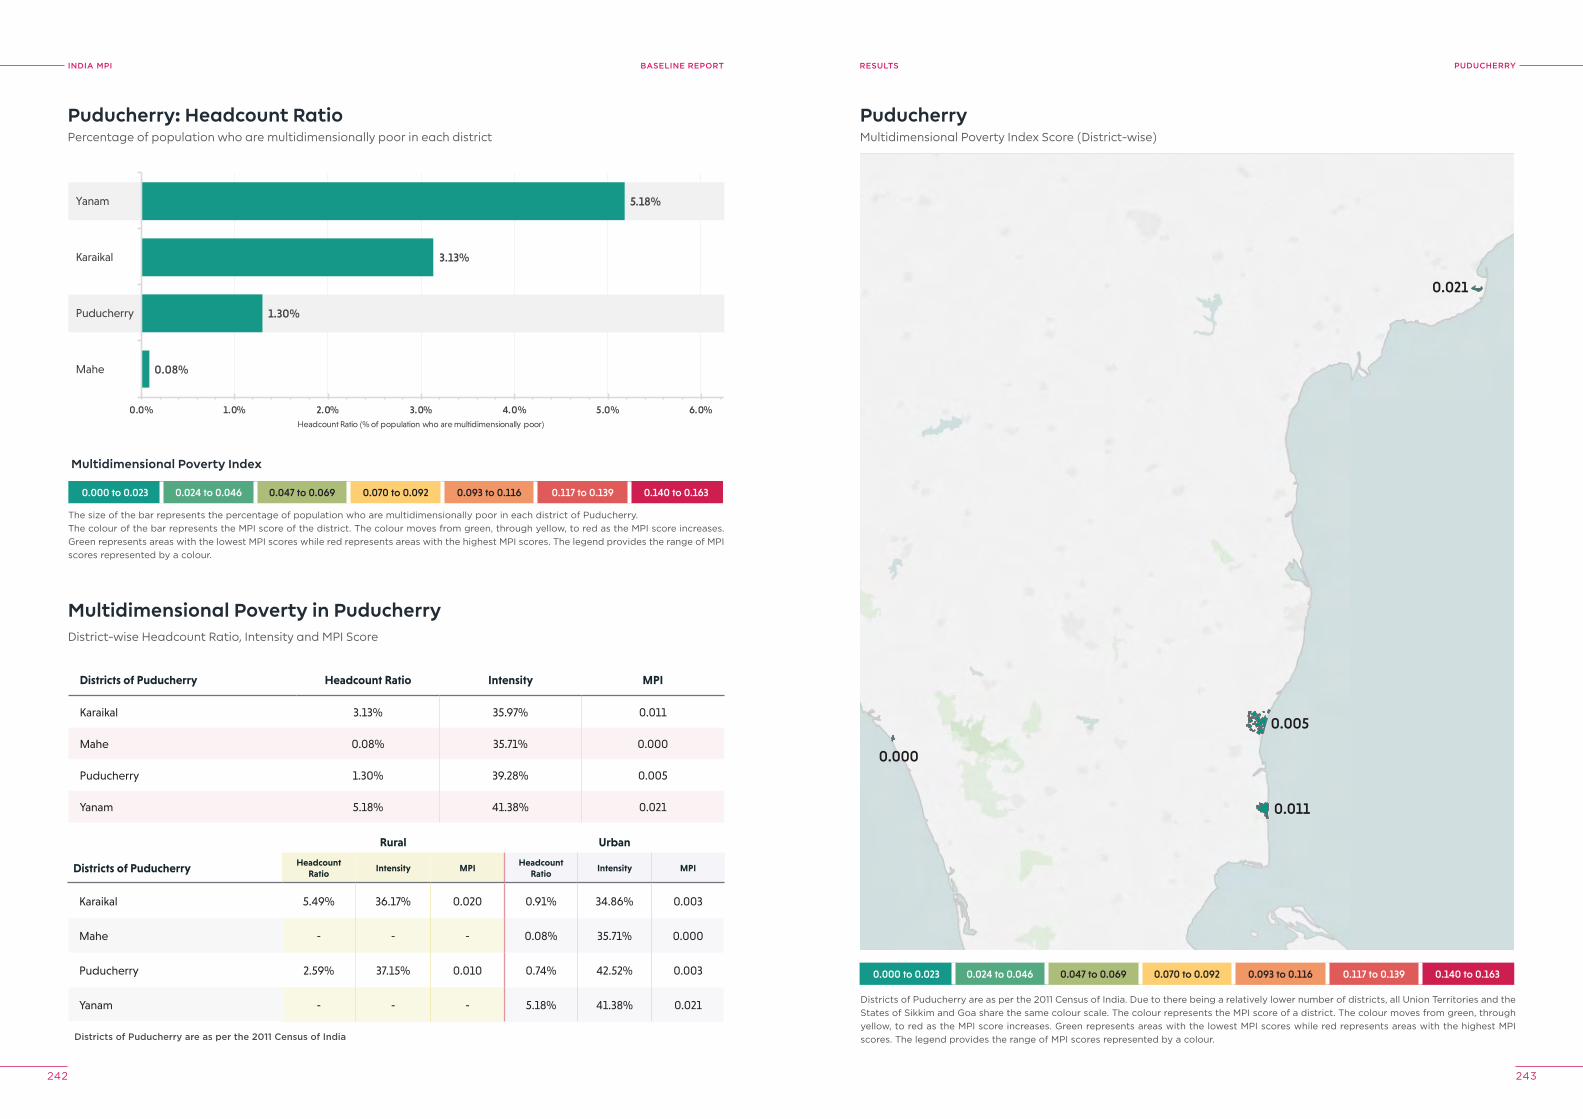
INDIA MPI BASELINE REPORT
242 243
pUDUCherryreSUlTS
Puducherry: Headcount RatioPercentage of population who are multidimensionally poor in each district
The size of the bar represents the percentage of population who are multidimensionally poor in each district of Puducherry.The colour of the bar represents the MPI score of the district. The colour moves from green, through yellow, to red as the MPI score increases. Green represents areas with the lowest MPI scores while red represents areas with the highest MPI scores. The legend provides the range of MPI scores represented by a colour.
0.000 to 0.023 0.024 to 0.046 0.047 to 0.069 0.070 to 0.092 0.093 to 0.116 0.117 to 0.139 0.140 to 0.163
0.08%
1.30%
3.13%
5.18%
0.0% 1.0% 2.0% 3.0% 4.0% 5.0% 6.0%
Mahe
Puducherry
Karaikal
Yanam
Headcount Ratio (% of population who are multidimensionally poor)
Multidimensional Poverty Index
Districts of Puducherry Headcount Ratio Intensity MPI
Karaikal 3.13% 35.97% 0.011
Mahe 0.08% 35.71% 0.000
Puducherry 1.30% 39.28% 0.005
Yanam 5.18% 41.38% 0.021
District-wise Headcount Ratio, Intensity and MPI Score
Multidimensional Poverty in Puducherry
Rural Urban
Districts of Puducherry Headcount Ratio
Intensity MPIHeadcount
RatioIntensity MPI
Karaikal 5.49% 36.17% 0.020 0.91% 34.86% 0.003
Mahe - - - 0.08% 35.71% 0.000
Puducherry 2.59% 37.15% 0.010 0.74% 42.52% 0.003
Yanam - - - 5.18% 41.38% 0.021
Districts of puducherry are as per the 2011 Census of India
0.000 to 0.023 0.024 to 0.046 0.047 to 0.069 0.070 to 0.092 0.093 to 0.116 0.117 to 0.139 0.140 to 0.163
0.000
0.005
0.011
0.021
PuducherryMultidimensional Poverty Index Score (District-wise)
Districts of Puducherry are as per the 2011 Census of India. Due to there being a relatively lower number of districts, all Union Territories and the States of Sikkim and Goa share the same colour scale. The colour represents the MPI score of a district. The colour moves from green, through yellow, to red as the MPI score increases. Green represents areas with the lowest MPI scores while red represents areas with the highest MPI scores. The legend provides the range of MPI scores represented by a colour.
INDIA MPI BASELINE REPORT reSUlTSSECTION
244 245
SECTION
IVTECHNICAL NOTES
& DATA TABLES
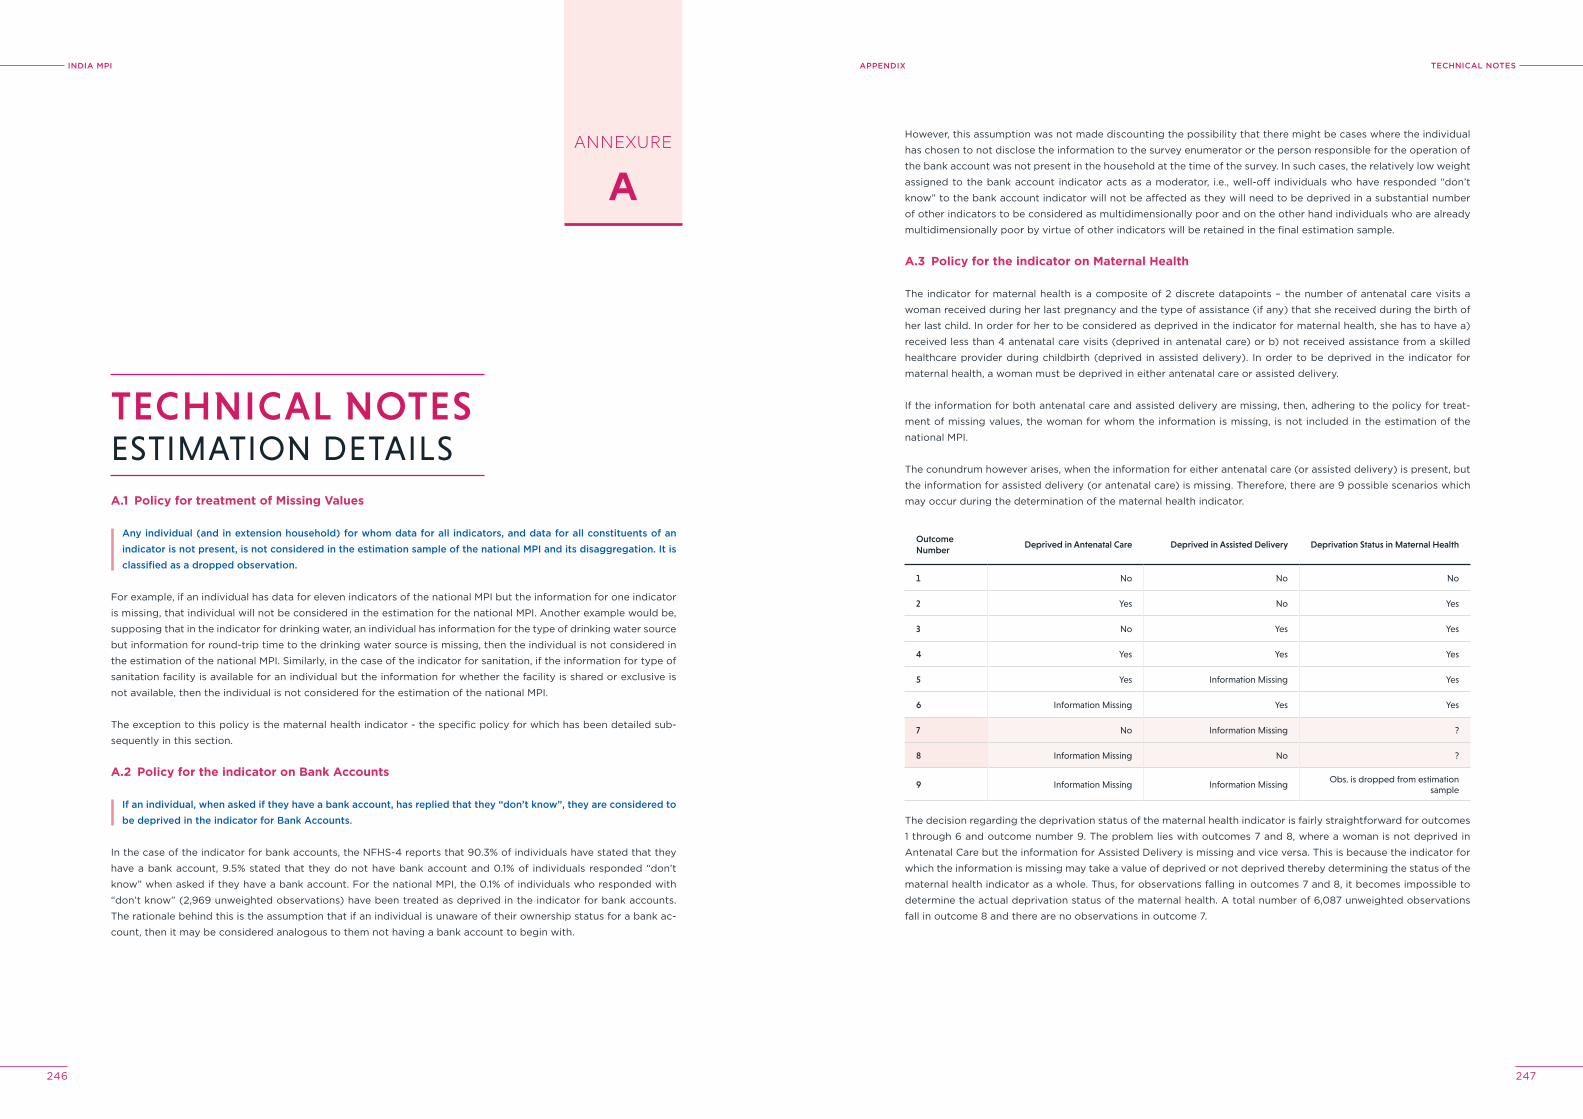
INDIA MPI
246 247
TeChNICAl NoTeSAppeNDIX
A.1 Policy for treatment of Missing Values
Any individual (and in extension household) for whom data for all indicators, and data for all constituents of an indicator is not present, is not considered in the estimation sample of the national MpI and its disaggregation. It is classified as a dropped observation.
For example, if an individual has data for eleven indicators of the national MPI but the information for one indicator
is missing, that individual will not be considered in the estimation for the national MPI. Another example would be,
supposing that in the indicator for drinking water, an individual has information for the type of drinking water source
but information for round-trip time to the drinking water source is missing, then the individual is not considered in
the estimation of the national MPI. Similarly, in the case of the indicator for sanitation, if the information for type of
sanitation facility is available for an individual but the information for whether the facility is shared or exclusive is
not available, then the individual is not considered for the estimation of the national MPI.
The exception to this policy is the maternal health indicator - the specific policy for which has been detailed sub-
sequently in this section.
A.2 Policy for the indicator on Bank Accounts
If an individual, when asked if they have a bank account, has replied that they “don’t know”, they are considered to be deprived in the indicator for Bank Accounts.
In the case of the indicator for bank accounts, the NFHS-4 reports that 90.3% of individuals have stated that they
have a bank account, 9.5% stated that they do not have bank account and 0.1% of individuals responded “don’t
know” when asked if they have a bank account. For the national MPI, the 0.1% of individuals who responded with
“don’t know” (2,969 unweighted observations) have been treated as deprived in the indicator for bank accounts.
The rationale behind this is the assumption that if an individual is unaware of their ownership status for a bank ac-
count, then it may be considered analogous to them not having a bank account to begin with.
AANNEXURE
TECHNICAL NOTESESTIMATION DETAILS
A1
However, this assumption was not made discounting the possibility that there might be cases where the individual
has chosen to not disclose the information to the survey enumerator or the person responsible for the operation of
the bank account was not present in the household at the time of the survey. In such cases, the relatively low weight
assigned to the bank account indicator acts as a moderator, i.e., well-off individuals who have responded “don’t
know” to the bank account indicator will not be affected as they will need to be deprived in a substantial number
of other indicators to be considered as multidimensionally poor and on the other hand individuals who are already
multidimensionally poor by virtue of other indicators will be retained in the final estimation sample.
A.3 Policy for the indicator on Maternal Health
The indicator for maternal health is a composite of 2 discrete datapoints – the number of antenatal care visits a
woman received during her last pregnancy and the type of assistance (if any) that she received during the birth of
her last child. In order for her to be considered as deprived in the indicator for maternal health, she has to have a)
received less than 4 antenatal care visits (deprived in antenatal care) or b) not received assistance from a skilled
healthcare provider during childbirth (deprived in assisted delivery). In order to be deprived in the indicator for
maternal health, a woman must be deprived in either antenatal care or assisted delivery.
If the information for both antenatal care and assisted delivery are missing, then, adhering to the policy for treat-
ment of missing values, the woman for whom the information is missing, is not included in the estimation of the
national MPI.
The conundrum however arises, when the information for either antenatal care (or assisted delivery) is present, but
the information for assisted delivery (or antenatal care) is missing. Therefore, there are 9 possible scenarios which
may occur during the determination of the maternal health indicator.
The decision regarding the deprivation status of the maternal health indicator is fairly straightforward for outcomes
1 through 6 and outcome number 9. The problem lies with outcomes 7 and 8, where a woman is not deprived in
Antenatal Care but the information for Assisted Delivery is missing and vice versa. This is because the indicator for
which the information is missing may take a value of deprived or not deprived thereby determining the status of the
maternal health indicator as a whole. Thus, for observations falling in outcomes 7 and 8, it becomes impossible to
determine the actual deprivation status of the maternal health. A total number of 6,087 unweighted observations
fall in outcome 8 and there are no observations in outcome 7.
Outcome Number
Deprived in Antenatal Care Deprived in Assisted Delivery Deprivation Status in Maternal Health
1 No No No
2 Yes No Yes
3 No Yes Yes
4 Yes Yes Yes
5 Yes Information Missing Yes
6 Information Missing Yes Yes
7 No Information Missing ?
8 Information Missing No ?
9 Information Missing Information MissingObs. is dropped from estimation
sample
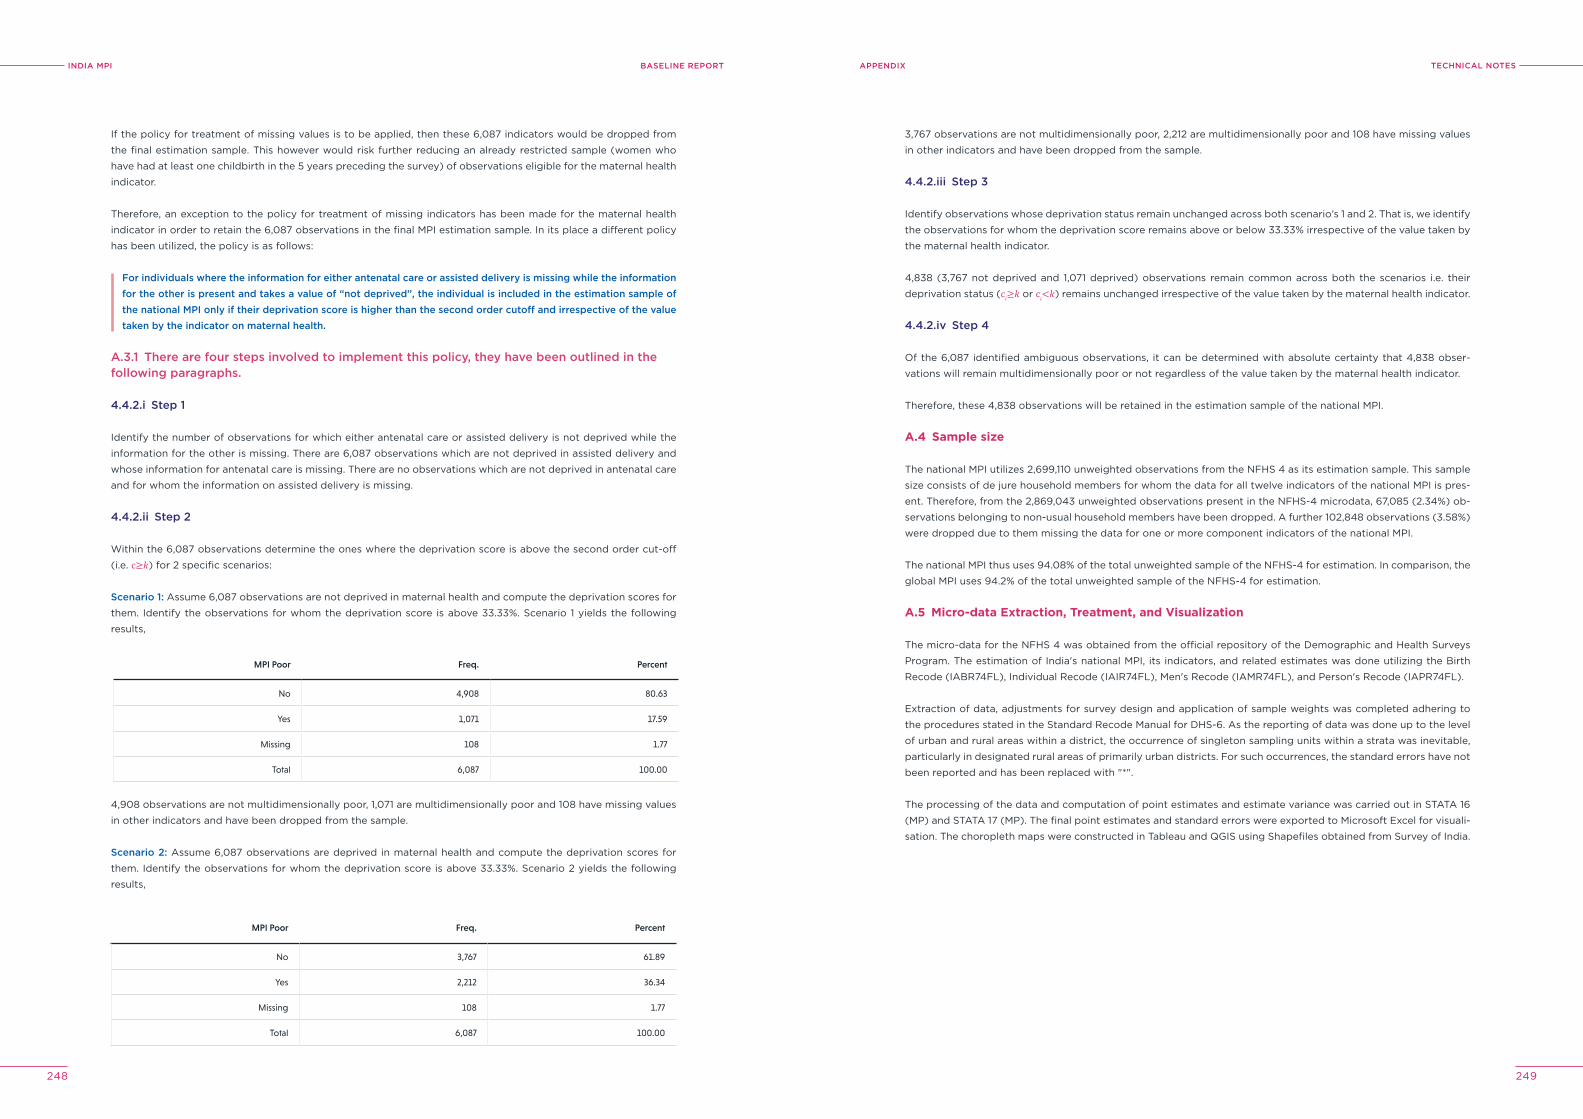
INDIA MPI BASELINE REPORT
248 249
TeChNICAl NoTeSAppeNDIX
If the policy for treatment of missing values is to be applied, then these 6,087 indicators would be dropped from
the final estimation sample. This however would risk further reducing an already restricted sample (women who
have had at least one childbirth in the 5 years preceding the survey) of observations eligible for the maternal health
indicator.
Therefore, an exception to the policy for treatment of missing indicators has been made for the maternal health
indicator in order to retain the 6,087 observations in the final MPI estimation sample. In its place a different policy
has been utilized, the policy is as follows:
For individuals where the information for either antenatal care or assisted delivery is missing while the information for the other is present and takes a value of “not deprived”, the individual is included in the estimation sample of the national MpI only if their deprivation score is higher than the second order cutoff and irrespective of the value taken by the indicator on maternal health.
A.3.1 There are four steps involved to implement this policy, they have been outlined in the following paragraphs.
4.4.2.i Step 1
Identify the number of observations for which either antenatal care or assisted delivery is not deprived while the
information for the other is missing. There are 6,087 observations which are not deprived in assisted delivery and
whose information for antenatal care is missing. There are no observations which are not deprived in antenatal care
and for whom the information on assisted delivery is missing.
4.4.2.ii Step 2
Within the 6,087 observations determine the ones where the deprivation score is above the second order cut-off
(i.e. c≥𝑘) for 2 specific scenarios:
Scenario 1: Assume 6,087 observations are not deprived in maternal health and compute the deprivation scores for
them. Identify the observations for whom the deprivation score is above 33.33%. Scenario 1 yields the following
results,
4,908 observations are not multidimensionally poor, 1,071 are multidimensionally poor and 108 have missing values
in other indicators and have been dropped from the sample.
Scenario 2: Assume 6,087 observations are deprived in maternal health and compute the deprivation scores for
them. Identify the observations for whom the deprivation score is above 33.33%. Scenario 2 yields the following
results,
MPI Poor Freq. Percent
No 4,908 80.63
Yes 1,071 17.59
Missing 108 1.77
Total 6,087 100.00
MPI Poor Freq. Percent
No 3,767 61.89
Yes 2,212 36.34
Missing 108 1.77
Total 6,087 100.00
3,767 observations are not multidimensionally poor, 2,212 are multidimensionally poor and 108 have missing values
in other indicators and have been dropped from the sample.
4.4.2.iii Step 3
Identify observations whose deprivation status remain unchanged across both scenario’s 1 and 2. That is, we identify
the observations for whom the deprivation score remains above or below 33.33% irrespective of the value taken by
the maternal health indicator.
4,838 (3,767 not deprived and 1,071 deprived) observations remain common across both the scenarios i.e. their
deprivation status (c𝑖≥𝑘 or c𝑖<𝑘) remains unchanged irrespective of the value taken by the maternal health indicator.
4.4.2.iv Step 4
Of the 6,087 identified ambiguous observations, it can be determined with absolute certainty that 4,838 obser-
vations will remain multidimensionally poor or not regardless of the value taken by the maternal health indicator.
Therefore, these 4,838 observations will be retained in the estimation sample of the national MPI.
A.4 Sample size
The national MPI utilizes 2,699,110 unweighted observations from the NFHS 4 as its estimation sample. This sample
size consists of de jure household members for whom the data for all twelve indicators of the national MPI is pres-
ent. Therefore, from the 2,869,043 unweighted observations present in the NFHS-4 microdata, 67,085 (2.34%) ob-
servations belonging to non-usual household members have been dropped. A further 102,848 observations (3.58%)
were dropped due to them missing the data for one or more component indicators of the national MPI.
The national MPI thus uses 94.08% of the total unweighted sample of the NFHS-4 for estimation. In comparison, the
global MPI uses 94.2% of the total unweighted sample of the NFHS-4 for estimation.
A.5 Micro-data Extraction, Treatment, and Visualization
The micro-data for the NFHS 4 was obtained from the official repository of the Demographic and Health Surveys
Program. The estimation of India's national MPI, its indicators, and related estimates was done utilizing the Birth
Recode (IABR74FL), Individual Recode (IAIR74FL), Men's Recode (IAMR74FL), and Person's Recode (IAPR74FL).
Extraction of data, adjustments for survey design and application of sample weights was completed adhering to
the procedures stated in the Standard Recode Manual for DHS-6. As the reporting of data was done up to the level
of urban and rural areas within a district, the occurrence of singleton sampling units within a strata was inevitable,
particularly in designated rural areas of primarily urban districts. For such occurrences, the standard errors have not
been reported and has been replaced with "*".
The processing of the data and computation of point estimates and estimate variance was carried out in STATA 16
(MP) and STATA 17 (MP). The final point estimates and standard errors were exported to Microsoft Excel for visuali-
sation. The choropleth maps were constructed in Tableau and QGIS using Shapefiles obtained from Survey of India.
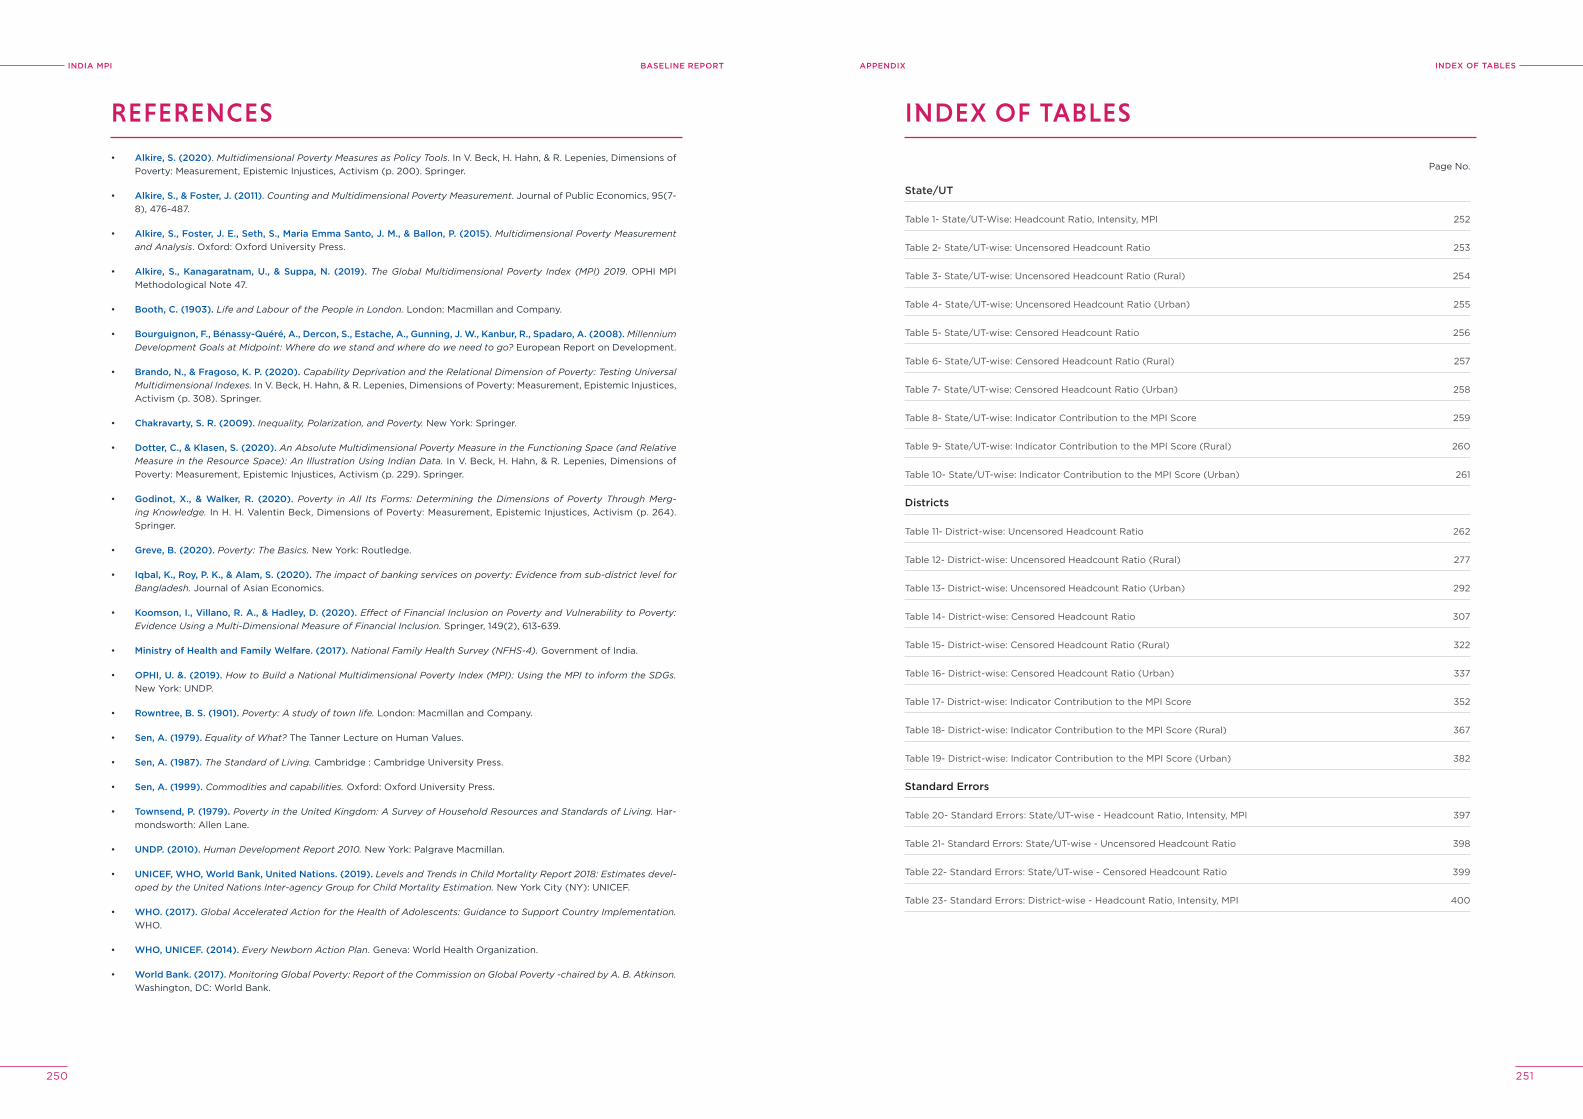
INDIA MPI BASELINE REPORT
250 251
INDeX oF TABleSAppeNDIX
• Alkire, S. (2020). Multidimensional Poverty Measures as Policy Tools. In V. Beck, H. Hahn, & R. Lepenies, Dimensions of Poverty: Measurement, Epistemic Injustices, Activism (p. 200). Springer.
• Alkire, S., & Foster, j. (2011). Counting and Multidimensional Poverty Measurement. Journal of Public Economics, 95(7-8), 476-487.
• Alkire, S., Foster, j. e., Seth, S., Maria emma Santo, j. M., & Ballon, p. (2015). Multidimensional Poverty Measurement and Analysis. Oxford: Oxford University Press.
• Alkire, S., kanagaratnam, U., & Suppa, N. (2019). The Global Multidimensional Poverty Index (MPI) 2019. OPHI MPI Methodological Note 47.
• Booth, C. (1903). Life and Labour of the People in London. London: Macmillan and Company.
• Bourguignon, F., Bénassy-Quéré, A., Dercon, S., estache, A., Gunning, j. W., kanbur, r., Spadaro, A. (2008). Millennium Development Goals at Midpoint: Where do we stand and where do we need to go? European Report on Development.
• Brando, N., & Fragoso, k. p. (2020). Capability Deprivation and the Relational Dimension of Poverty: Testing Universal Multidimensional Indexes. In V. Beck, H. Hahn, & R. Lepenies, Dimensions of Poverty: Measurement, Epistemic Injustices, Activism (p. 308). Springer.
• Chakravarty, S. r. (2009). Inequality, Polarization, and Poverty. New York: Springer.
• Dotter, C., & klasen, S. (2020). An Absolute Multidimensional Poverty Measure in the Functioning Space (and Relative Measure in the Resource Space): An Illustration Using Indian Data. In V. Beck, H. Hahn, & R. Lepenies, Dimensions of Poverty: Measurement, Epistemic Injustices, Activism (p. 229). Springer.
• Godinot, X., & Walker, r. (2020). Poverty in All Its Forms: Determining the Dimensions of Poverty Through Merg-ing Knowledge. In H. H. Valentin Beck, Dimensions of Poverty: Measurement, Epistemic Injustices, Activism (p. 264). Springer.
• Greve, B. (2020). Poverty: The Basics. New York: Routledge.
• Iqbal, k., roy, p. k., & Alam, S. (2020). The impact of banking services on poverty: Evidence from sub-district level for Bangladesh. Journal of Asian Economics.
• koomson, I., villano, r. A., & hadley, D. (2020). Effect of Financial Inclusion on Poverty and Vulnerability to Poverty: Evidence Using a Multi-Dimensional Measure of Financial Inclusion. Springer, 149(2), 613-639.
• Ministry of health and Family Welfare. (2017). National Family Health Survey (NFHS-4). Government of India.
• ophI, U. &. (2019). How to Build a National Multidimensional Poverty Index (MPI): Using the MPI to inform the SDGs. New York: UNDP.
• rowntree, B. S. (1901). Poverty: A study of town life. London: Macmillan and Company.
• Sen, A. (1979). Equality of What? The Tanner Lecture on Human Values.
• Sen, A. (1987). The Standard of Living. Cambridge : Cambridge University Press.
• Sen, A. (1999). Commodities and capabilities. Oxford: Oxford University Press.
• Townsend, p. (1979). Poverty in the United Kingdom: A Survey of Household Resources and Standards of Living. Har-mondsworth: Allen Lane.
• UNDp. (2010). Human Development Report 2010. New York: Palgrave Macmillan.
• UNICeF, Who, World Bank, United Nations. (2019). Levels and Trends in Child Mortality Report 2018: Estimates devel-oped by the United Nations Inter-agency Group for Child Mortality Estimation. New York City (NY): UNICEF.
• Who. (2017). Global Accelerated Action for the Health of Adolescents: Guidance to Support Country Implementation. WHO.
• Who, UNICeF. (2014). Every Newborn Action Plan. Geneva: World Health Organization.
• World Bank. (2017). Monitoring Global Poverty: Report of the Commission on Global Poverty -chaired by A. B. Atkinson. Washington, DC: World Bank.
Page No.
State/UT
Table 1- State/UT-Wise: Headcount Ratio, Intensity, MPI 252
Table 2- State/UT-wise: Uncensored Headcount Ratio 253
Table 3- State/UT-wise: Uncensored Headcount Ratio (Rural) 254
Table 4- State/UT-wise: Uncensored Headcount Ratio (Urban) 255
Table 5- State/UT-wise: Censored Headcount Ratio 256
Table 6- State/UT-wise: Censored Headcount Ratio (Rural) 257
Table 7- State/UT-wise: Censored Headcount Ratio (Urban) 258
Table 8- State/UT-wise: Indicator Contribution to the MPI Score 259
Table 9- State/UT-wise: Indicator Contribution to the MPI Score (Rural) 260
Table 10- State/UT-wise: Indicator Contribution to the MPI Score (Urban) 261
Districts
Table 11- District-wise: Uncensored Headcount Ratio 262
Table 12- District-wise: Uncensored Headcount Ratio (Rural) 277
Table 13- District-wise: Uncensored Headcount Ratio (Urban) 292
Table 14- District-wise: Censored Headcount Ratio 307
Table 15- District-wise: Censored Headcount Ratio (Rural) 322
Table 16- District-wise: Censored Headcount Ratio (Urban) 337
Table 17- District-wise: Indicator Contribution to the MPI Score 352
Table 18- District-wise: Indicator Contribution to the MPI Score (Rural) 367
Table 19- District-wise: Indicator Contribution to the MPI Score (Urban) 382
Standard errors
Table 20- Standard Errors: State/UT-wise - Headcount Ratio, Intensity, MPI 397
Table 21- Standard Errors: State/UT-wise - Uncensored Headcount Ratio 398
Table 22- Standard Errors: State/UT-wise - Censored Headcount Ratio 399
Table 23- Standard Errors: District-wise - Headcount Ratio, Intensity, MPI 400
REFERENCES INDEX OF TABLES
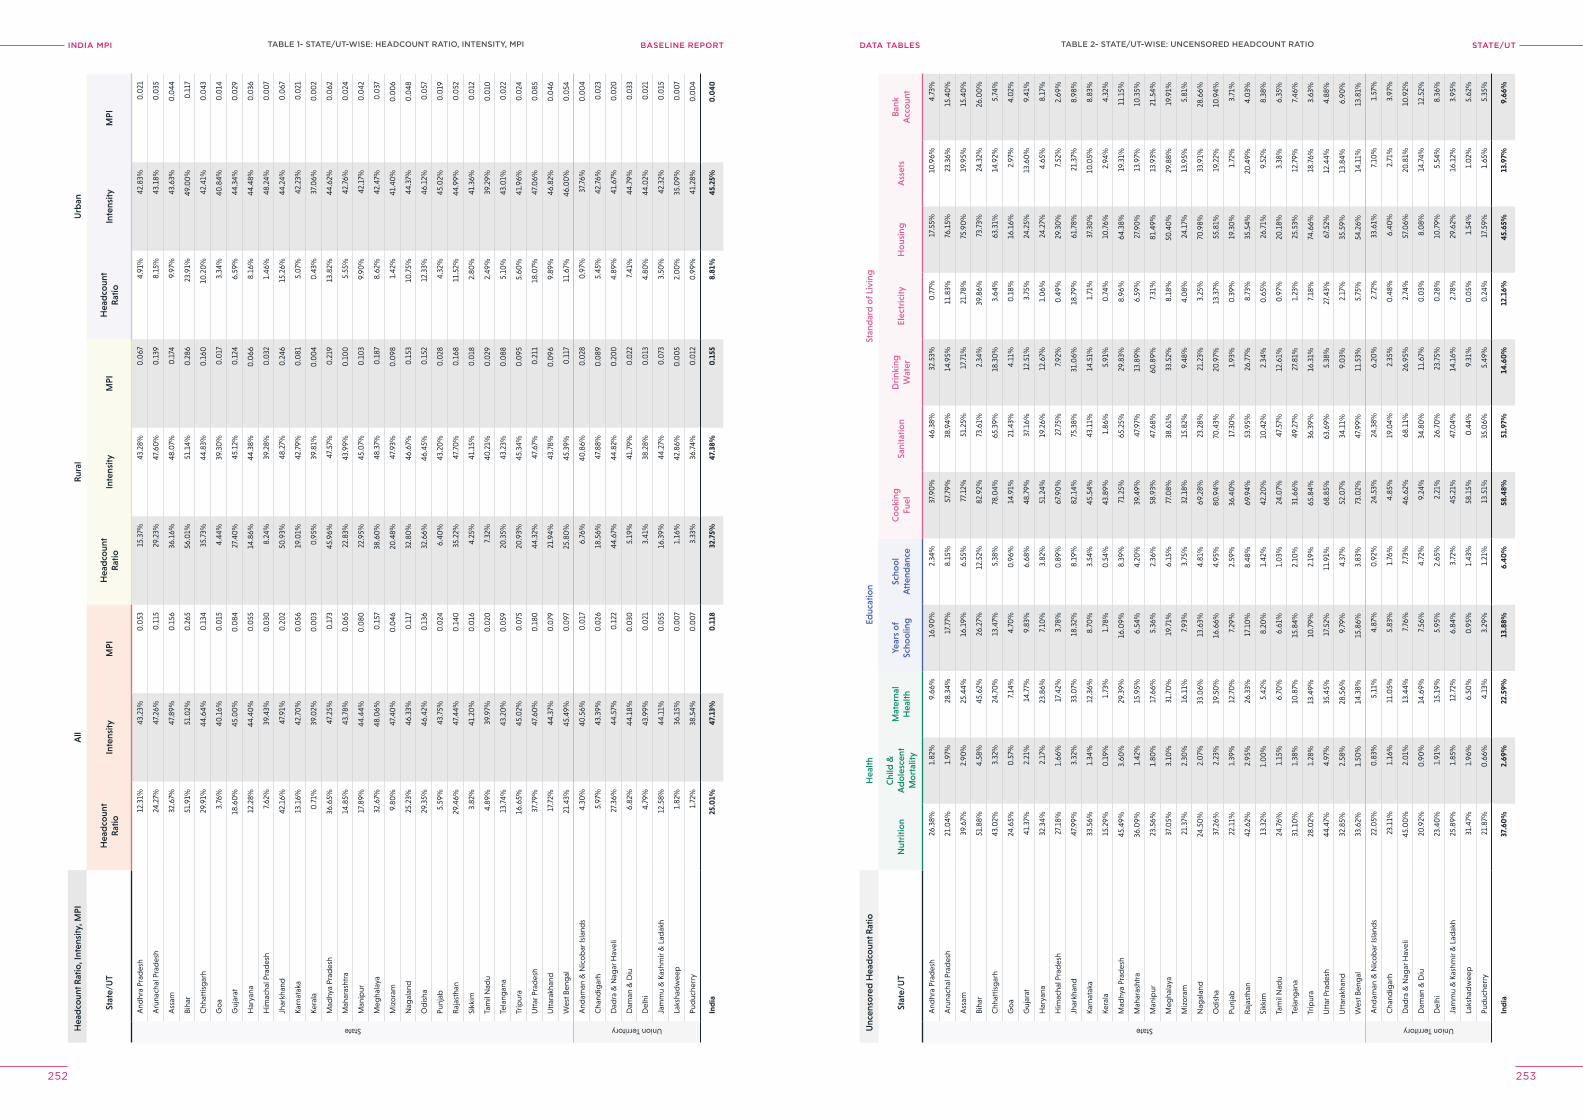
INDIA MPI BASELINE REPORT STATe/UTDATA TABleS
252 253
Hea
dco
unt R
atio
, Int
ensi
ty, M
PIA
llR
ural
Urb
an
Stat
e/U
TH
ead
coun
tR
atio
Inte
nsity
MPI
Hea
dco
unt
Rat
ioIn
tens
ityM
PIH
ead
coun
tR
atio
Inte
nsity
MPI
State
And
hra
Prad
esh
12.3
1%43
.23%
0.0
5315
.37%
43.2
8%0
.067
4.91
%42
.83%
0.0
21
Aru
nach
al P
rad
esh
24.2
7%47
.26%
0.1
1529
.23%
47.6
0%
0.1
398.
15%
43.1
8%0
.035
Ass
am32
.67%
47.8
9%0
.156
36.1
6%48
.07%
0.1
749.
97%
43.6
3%0
.044
Biha
r51
.91%
51.0
2%0
.265
56.0
1%51
.14%
0.2
8623
.91%
49.0
0%
0.1
17
Chh
attis
gar
h29
.91%
44.6
4%0
.134
35.7
3%44
.83%
0.1
6010
.20
%42
.41%
0.0
43
Go
a3.
76%
40.1
6%0
.015
4.44
%39
.30
%0
.017
3.34
%40
.84%
0.0
14
Guj
arat
18.6
0%
45.0
0%
0.0
8427
.40
%45
.12%
0.1
246.
59%
44.3
4%0
.029
Har
yana
12.2
8%44
.40
%0
.055
14.8
6%44
.38%
0.0
668.
16%
44.4
8%0
.036
Him
acha
l Pra
des
h7.
62%
39.4
3%0
.030
8.24
%39
.28%
0.0
321.
46%
48.2
4%0
.00
7
Jhar
khan
d42
.16%
47.9
1%0
.20
250
.93%
48.2
7%0
.246
15.2
6%44
.24%
0.0
67
Karn
atak
a13
.16%
42.7
0%
0.0
5619
.01%
42.7
9%0
.081
5.0
7%42
.23%
0.0
21
Kera
la0
.71%
39.0
2%0
.00
30
.95%
39.8
1%0
.00
40
.43%
37.0
6%0
.00
2
Mad
hya
Prad
esh
36.6
5%47
.25%
0.1
7345
.96%
47.5
7%0
.219
13.8
2%44
.62%
0.0
62
Mah
aras
htra
14.8
5%43
.78%
0.0
6522
.83%
43.9
9%0
.10
05.
55%
42.7
6%0
.024
Man
ipur
17.8
9%44
.44%
0.0
8022
.95%
45.0
7%0
.10
39.
90%
42.1
7%0
.042
Meg
hala
ya32
.67%
48.0
6%0
.157
38.6
0%
48.3
7%0
.187
8.62
%42
.47%
0.0
37
Miz
ora
m9.
80%
47.4
0%
0.0
4620
.48%
47.9
3%0
.098
1.42
%41
.40
%0
.00
6
Nag
alan
d25
.23%
46.3
3%0
.117
32.8
0%
46.6
7%0
.153
10.7
5%44
.37%
0.0
48
Od
isha
29.3
5%46
.42%
0.1
3632
.66%
46.4
5%0
.152
12.3
3%46
.12%
0.0
57
Punj
ab5.
59%
43.7
5%0
.024
6.40
%43
.20
%0
.028
4.32
%45
.02%
0.0
19
Raj
asth
an29
.46%
47.4
4%0
.140
35.2
2%47
.70
%0
.168
11.5
2%44
.99%
0.0
52
Sikk
im3.
82%
41.2
0%
0.0
164.
25%
41.1
5%0
.018
2.80
%41
.36%
0.0
12
Tam
il N
adu
4.89
%39
.97%
0.0
207.
32%
40.2
1%0
.029
2.49
%39
.29%
0.0
10
Tela
ngan
a13
.74%
43.2
0%
0.0
5920
.35%
43.2
3%0
.088
5.10
%43
.01%
0.0
22
Trip
ura
16.6
5%45
.02%
0.0
7520
.93%
45.3
4%0
.095
5.60
%41
.96%
0.0
24
Utt
ar P
rad
esh
37.7
9%47
.60
%0
.180
44.3
2%47
.67%
0.2
1118
.07%
47.0
6%0
.085
Utt
arak
hand
17.7
2%44
.37%
0.0
7921
.94%
43.7
8%0
.096
9.89
%46
.82%
0.0
46
Wes
t Ben
gal
21.4
3%45
.49%
0.0
9725
.80
%45
.39%
0.1
1711
.67%
46.0
0%
0.0
54
Union Territory
And
aman
& N
ico
bar
Isla
nds
4.30
%40
.56%
0.0
176.
76%
40.8
6%0
.028
0.9
7%37
.76%
0.0
04
Cha
ndig
arh
5.97
%43
.39%
0.0
2618
.56%
47.8
8%0
.089
5.45
%42
.76%
0.0
23
Dad
ra &
Nag
ar H
avel
i27
.36%
44.5
7%0
.122
44.6
7%44
.82%
0.2
00
4.89
%41
.67%
0.0
20
Dam
an &
Diu
6.82
%44
.18%
0.0
305.
19%
41.7
9%0
.022
7.41
%44
.79%
0.0
33
Del
hi4.
79%
43.9
9%0
.021
3.41
%38
.28%
0.0
134.
80%
44.0
2%0
.021
Jam
mu
& K
ashm
ir &
Lad
akh
12.5
8%44
.11%
0.0
5516
.39%
44.2
7%0
.073
3.50
%42
.32%
0.0
15
Laks
had
wee
p1.
82%
36.1
5%0
.00
71.
16%
42.8
6%0
.00
52.
00
%35
.09%
0.0
07
Pud
uche
rry
1.72
%38
.54%
0.0
07
3.33
%36
.74%
0.0
120
.99%
41.2
8%0
.00
4
Ind
ia25
.01%
47.1
3%0
.118
32.7
5%47
.38%
0.1
558.
81%
45.2
5%0
.040
TABle 1- STATe/UT-WISe: heADCoUNT rATIo, INTeNSITy, MpI
Unc
enso
red
Hea
dco
unt R
atio
Hea
lthEd
ucat
ion
Stan
dar
d o
f Liv
ing
Stat
e/U
TN
utri
tion
Chi
ld &
A
do
lesc
ent
Mo
rtal
ity
Mat
erna
l H
ealth
Year
s o
f Sc
hoo
ling
Scho
ol
Att
end
ance
Co
oki
ng
Fuel
Sani
tatio
nD
rink
ing
Wat
erEl
ectr
icity
Ho
usin
gA
sset
sB
ank
Acc
oun
t
State
And
hra
Prad
esh
26.3
8%1.
82%
9.66
%16
.90
%2.
34%
37.9
0%
46.3
8%32
.53%
0.7
7%17
.55%
10.9
6%4.
73%
Aru
nach
al P
rad
esh
21.0
4%1.
97%
28.3
4%17
.77%
8.15
%57
.79%
38.9
4%14
.95%
11.8
3%76
.15%
23.3
6%15
.40
%
Ass
am39
.67%
2.90
%25
.44%
16.1
9%6.
55%
77.1
2%51
.25%
17.7
1%21
.78%
75.9
0%
19.9
5%15
.40
%
Biha
r51
.88%
4.58
%45
.62%
26.2
7%12
.52%
82.9
2%73
.61%
2.34
%39
.86%
73.7
3%24
.32%
26.0
0%
Chh
attis
gar
h43
.02%
3.32
%24
.70
%13
.47%
5.38
%78
.04%
65.3
9%18
.30
%3.
64%
63.3
1%14
.92%
5.74
%
Go
a24
.65%
0.5
7%7.
14%
4.70
%0
.96%
14.9
1%21
.43%
4.11
%0
.18%
16.1
6%2.
97%
4.0
2%
Guj
arat
41.3
7%2.
21%
14.7
7%9.
83%
6.68
%48
.79%
37.1
6%12
.51%
3.75
%24
.25%
13.6
0%
9.41
%
Har
yana
32.3
4%2.
17%
23.8
6%7.
10%
3.82
%51
.24%
19.2
6%12
.67%
1.0
6%24
.27%
4.65
%8.
17%
Him
acha
l Pra
des
h27
.18%
1.66
%17
.42%
3.78
%0
.89%
67.9
0%
27.7
5%7.
92%
0.4
9%29
.30
%7.
52%
2.69
%
Jhar
khan
d47
.99%
3.32
%33
.07%
18.3
2%8.
19%
82.1
4%75
.38%
31.0
6%18
.79%
61.7
8%21
.37%
8.98
%
Karn
atak
a33
.56%
1.34
%12
.36%
8.70
%3.
54%
45.5
4%43
.11%
14.5
1%1.
71%
37.3
0%
10.0
5%8.
83%
Kera
la15
.29%
0.1
9%1.
73%
1.78
%0
.54%
43.8
9%1.
86%
5.91
%0
.74%
10.7
6%2.
94%
4.32
%
Mad
hya
Prad
esh
45.4
9%3.
60%
29.3
9%16
.09%
8.39
%71
.25%
65.2
5%29
.83%
8.96
%64
.38%
19.3
1%11
.15%
Mah
aras
htra
36.0
9%1.
42%
15.9
5%6.
54%
4.20
%39
.49%
47.9
7%13
.89%
6.59
%27
.90
%13
.97%
10.3
5%
Man
ipur
23.5
6%1.
80%
17.6
6%5.
36%
2.36
%58
.93%
47.6
8%60
.89%
7.31
%81
.49%
13.9
3%21
.54%
Meg
hala
ya37
.05%
3.10
%31
.70
%19
.71%
6.15
%77
.08%
38.6
1%33
.52%
8.18
%50
.40
%29
.88%
19.9
1%
Miz
ora
m21
.37%
2.30
%16
.11%
7.93
%3.
75%
32.1
8%15
.82%
9.48
%4.
08%
24.1
7%13
.95%
5.81
%
Nag
alan
d24
.50
%2.
07%
33.0
6%13
.63%
4.81
%69
.28%
23.2
8%21
.23%
3.25
%70
.98%
33.9
1%28
.66%
Od
isha
37.2
6%2.
23%
19.5
0%
16.6
6%4.
95%
80.9
4%70
.43%
20.9
7%13
.37%
55.8
1%19
.22%
10.9
4%
Punj
ab22
.11%
1.39
%12
.70
%7.
29%
2.59
%36
.40
%17
.30
%1.
93%
0.3
9%19
.30
%1.
72%
3.71
%
Raj
asth
an42
.62%
2.95
%26
.33%
17.1
0%
8.48
%69
.94%
53.9
5%26
.77%
8.73
%35
.54%
20.4
9%4.
03%
Sikk
im13
.32%
1.0
0%
5.42
%8.
20%
1.42
%42
.20
%10
.42%
2.34
%0
.65%
26.7
1%9.
52%
8.38
%
Tam
il N
adu
24.7
6%1.
15%
6.70
%6.
61%
1.0
3%24
.07%
47.5
7%12
.61%
0.9
7%20
.18%
3.38
%6.
35%
Tela
ngan
a31
.10
%1.
38%
10.8
7%15
.84%
2.10
%31
.66%
49.2
7%27
.81%
1.23
%25
.53%
12.7
9%7.
46%
Trip
ura
28.0
2%1.
28%
13.4
9%10
.79%
2.19
%65
.84%
36.3
9%16
.31%
7.18
%74
.66%
18.7
6%3.
63%
Utt
ar P
rad
esh
44.4
7%4.
97%
35.4
5%17
.52%
11.9
1%68
.85%
63.6
9%5.
38%
27.4
3%67
.52%
12.4
4%4.
88%
Utt
arak
hand
32.8
5%2.
58%
28.5
6%9.
79%
4.37
%52
.07%
34.1
1%9.
03%
2.17
%35
.59%
13.8
4%6.
90%
Wes
t Ben
gal
33.6
2%1.
50%
14.3
8%15
.86%
3.83
%73
.02%
47.9
9%11
.53%
5.75
%54
.26%
14.1
1%13
.81%
Union Territory
And
aman
& N
ico
bar
Isla
nds
22.0
5%0
.83%
5.11
%4.
87%
0.9
2%24
.53%
24.3
8%6.
20%
2.72
%33
.61%
7.10
%1.
57%
Cha
ndig
arh
23.1
1%1.
16%
11.0
5%5.
83%
1.76
%4.
85%
19.0
4%2.
35%
0.4
8%6.
40%
2.71
%3.
97%
Dad
ra &
Nag
ar H
avel
i45
.00
%2.
01%
13.4
4%7.
76%
7.73
%46
.62%
68.1
1%26
.95%
2.74
%57
.06%
20.8
1%10
.92%
Dam
an &
Diu
20.9
2%0
.90
%14
.69%
7.56
%4.
72%
9.24
%34
.80
%11
.67%
0.0
3%8.
08%
14.7
4%12
.52%
Del
hi23
.40
%1.
91%
15.1
9%5.
95%
2.65
%2.
21%
26.7
0%
23.7
5%0
.28%
10.7
9%5.
54%
8.36
%
Jam
mu
& K
ashm
ir &
Lad
akh
25.8
9%1.
85%
12.7
2%6.
84%
3.72
%45
.21%
47.0
4%14
.16%
2.78
%29
.62%
16.1
2%3.
95%
Laks
had
wee
p31
.47%
1.96
%6.
50%
0.9
5%1.
43%
58.1
5%0
.44%
9.31
%0
.05%
1.54
%1.
02%
5.62
%
Pud
uche
rry
21.8
7%0
.66%
4.13
%3.
29%
1.21
%13
.51%
35.0
6%5.
49%
0.2
4%17
.59%
1.65
%5.
35%
Ind
ia37
.60
%2.
69%
22.5
9%13
.88%
6.40
%58
.48%
51.9
7%14
.60
%12
.16%
45.6
5%13
.97%
9.66
%
TABle 2- STATe/UT-WISe: UNCeNSoreD heADCoUNT rATIo
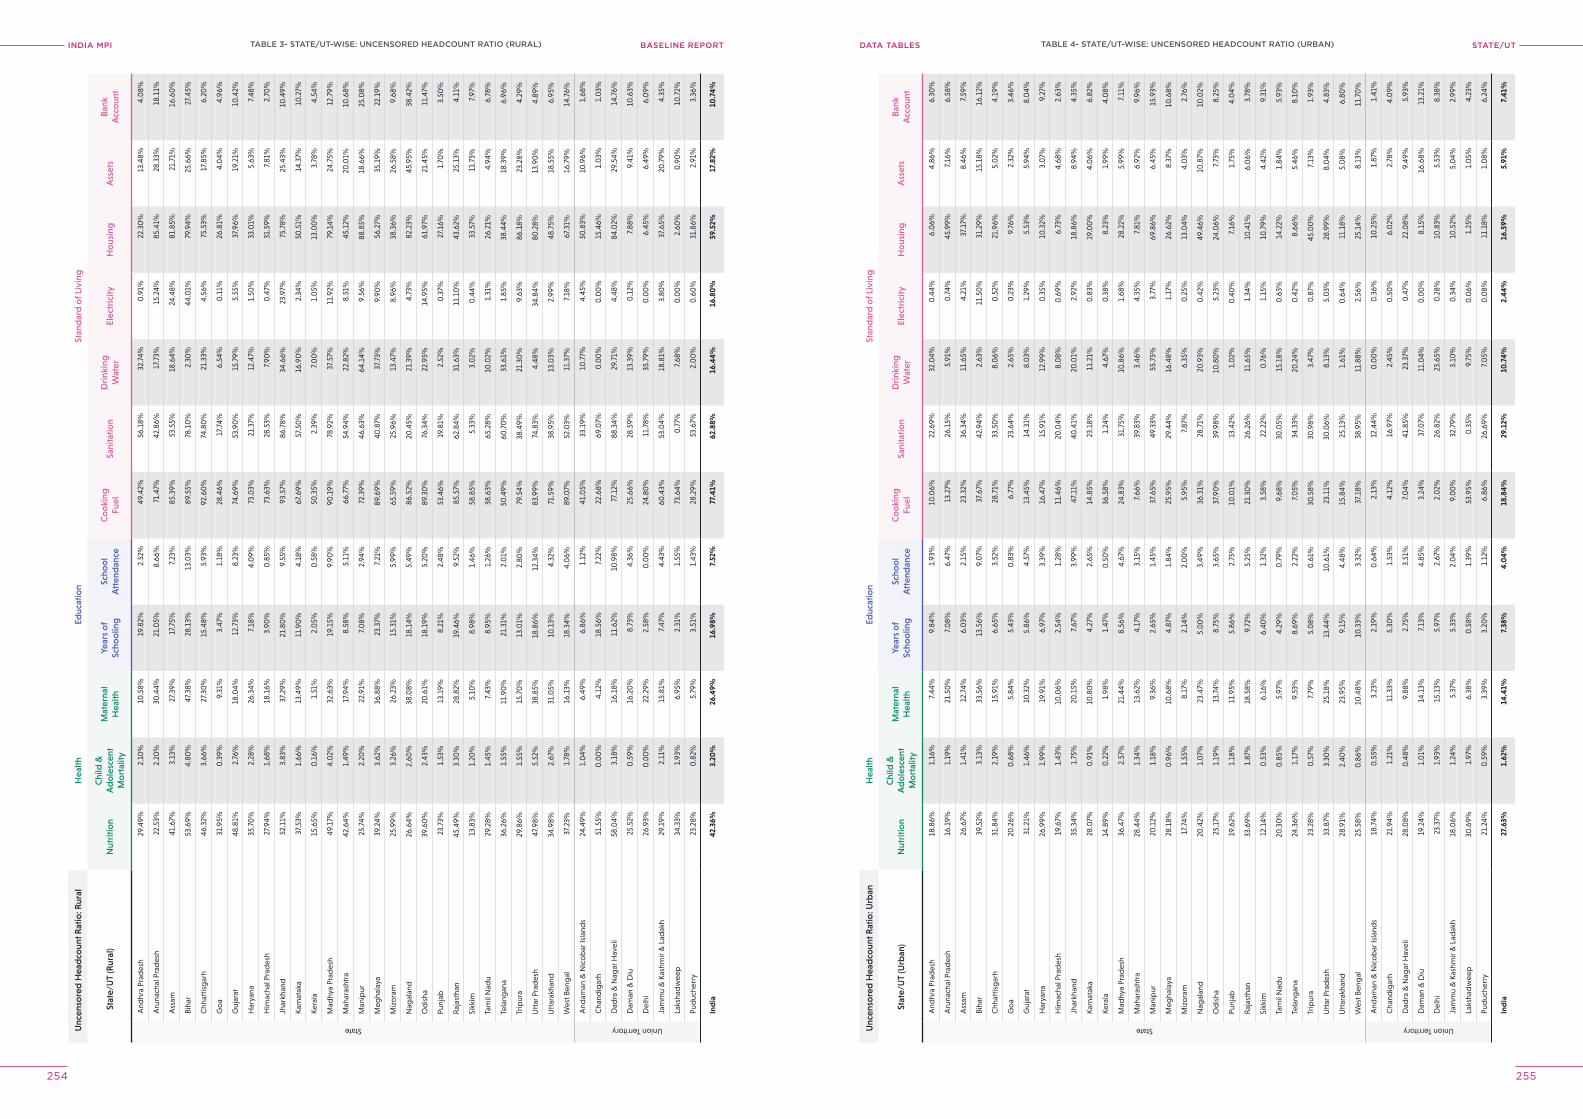
INDIA MPI BASELINE REPORT STATe/UTDATA TABleS
254 255
Unc
enso
red
Hea
dco
unt R
atio
: Rur
alH
ealth
Educ
atio
nSt
and
ard
of L
ivin
g
Stat
e/U
T (R
ural
)N
utri
tion
Chi
ld &
A
do
lesc
ent
Mo
rtal
ity
Mat
erna
l H
ealth
Year
s o
f Sc
hoo
ling
Scho
ol
Att
end
ance
Co
oki
ng
Fuel
Sani
tatio
nD
rink
ing
Wat
erEl
ectr
icity
Ho
usin
gA
sset
sB
ank
Acc
oun
t
State
And
hra
Prad
esh
29.4
9%2.
10%
10.5
8%19
.82%
2.52
%49
.42%
56.1
8%32
.74%
0.9
1%22
.30
%13
.48%
4.0
8%
Aru
nach
al P
rad
esh
22.5
3%2.
20%
30.4
4%21
.05%
8.66
%71
.47%
42.8
6%17
.73%
15.2
4%85
.41%
28.3
3%18
.11%
Ass
am41
.67%
3.13
%27
.39%
17.7
5%7.
23%
85.3
9%53
.55%
18.6
4%24
.48%
81.8
5%21
.71%
16.6
0%
Biha
r53
.69%
4.80
%47
.38%
28.1
3%13
.03%
89.5
5%78
.10
%2.
30%
44.0
1%79
.94%
25.6
6%27
.45%
Chh
attis
gar
h46
.32%
3.66
%27
.30
%15
.48%
5.93
%92
.60
%74
.80
%21
.33%
4.56
%75
.53%
17.8
5%6.
20%
Go
a31
.95%
0.3
9%9.
31%
3.47
%1.
18%
28.4
6%17
.74%
6.54
%0
.11%
26.8
1%4.
04%
4.96
%
Guj
arat
48.8
1%2.
76%
18.0
4%12
.73%
8.23
%74
.69%
53.9
0%
15.7
9%5.
55%
37.9
6%19
.21%
10.4
2%
Har
yana
35.7
0%
2.28
%26
.34%
7.18
%4.
09%
73.0
3%21
.37%
12.4
7%1.
50%
33.0
1%5.
63%
7.48
%
Him
acha
l Pra
des
h27
.94%
1.68
%18
.16%
3.90
%0
.85%
73.6
3%28
.53%
7.90
%0
.47%
31.5
9%7.
81%
2.70
%
Jhar
khan
d52
.11%
3.83
%37
.29%
21.8
0%
9.55
%93
.57%
86.7
8%34
.66%
23.9
7%75
.78%
25.4
3%10
.49%
Karn
atak
a37
.53%
1.66
%13
.49%
11.9
0%
4.18
%67
.69%
57.5
0%
16.9
0%
2.34
%50
.51%
14.3
7%10
.27%
Kera
la15
.65%
0.1
6%1.
51%
2.0
5%0
.58%
50.3
5%2.
39%
7.0
0%
1.0
5%13
.00
%3.
78%
4.54
%
Mad
hya
Prad
esh
49.1
7%4.
02%
32.6
3%19
.15%
9.90
%90
.19%
78.9
2%37
.57%
11.9
2%79
.14%
24.7
5%12
.79%
Mah
aras
htra
42.6
4%1.
49%
17.9
4%8.
58%
5.11
%66
.77%
54.9
4%22
.82%
8.51
%45
.12%
20.0
1%10
.68%
Man
ipur
25.7
4%2.
20%
22.9
1%7.
08%
2.94
%72
.39%
46.6
3%64
.14%
9.56
%88
.85%
18.6
6%25
.08%
Meg
hala
ya39
.24%
3.62
%36
.88%
23.3
7%7.
21%
89.6
9%40
.87%
37.7
3%9.
90%
56.2
7%35
.19%
22.1
9%
Miz
ora
m25
.99%
3.26
%26
.23%
15.3
1%5.
99%
65.5
9%25
.96%
13.4
7%8.
96%
38.3
6%26
.58%
9.68
%
Nag
alan
d26
.64%
2.60
%38
.08%
18.1
4%5.
49%
86.5
2%20
.45%
21.3
9%4.
73%
82.2
3%45
.95%
38.4
2%
Od
isha
39.6
0%
2.43
%20
.61%
18.1
9%5.
20%
89.3
0%
76.3
4%22
.95%
14.9
5%61
.97%
21.4
5%11
.47%
Punj
ab23
.73%
1.53
%13
.19%
8.21
%2.
48%
53.4
6%19
.81%
2.52
%0
.37%
27.1
6%1.
70%
3.50
%
Raj
asth
an45
.49%
3.30
%28
.82%
19.4
6%9.
52%
85.5
7%62
.84%
31.6
3%11
.10
%43
.62%
25.1
3%4.
11%
Sikk
im13
.83%
1.20
%5.
10%
8.98
%1.
46%
58.8
5%5.
33%
3.0
2%0
.44%
33.5
7%11
.73%
7.97
%
Tam
il N
adu
29.2
8%1.
45%
7.43
%8.
95%
1.26
%38
.63%
65.2
8%10
.02%
1.31
%26
.21%
4.94
%6.
78%
Tela
ngan
a36
.26%
1.55
%11
.90
%21
.31%
2.0
1%50
.49%
60.7
0%
33.6
1%1.
85%
38.4
4%18
.39%
6.96
%
Trip
ura
29.8
6%1.
55%
15.7
0%
13.0
1%2.
80%
79.5
4%38
.49%
21.3
0%
9.63
%86
.18%
23.2
8%4.
29%
Utt
ar P
rad
esh
47.9
8%5.
52%
38.8
5%18
.86%
12.3
4%83
.99%
74.8
3%4.
48%
34.8
4%80
.28%
13.9
0%
4.89
%
Utt
arak
hand
34.9
8%2.
67%
31.0
5%10
.13%
4.32
%71
.59%
38.9
5%13
.03%
2.99
%48
.75%
18.5
5%6.
95%
Wes
t Ben
gal
37.2
3%1.
78%
16.1
3%18
.34%
4.0
6%89
.07%
52.0
3%11
.37%
7.18
%67
.31%
16.7
9%14
.76%
Union Territory
And
aman
& N
ico
bar
Isla
nds
24.4
9%1.
04%
6.49
%6.
86%
1.12
%41
.05%
33.1
9%10
.77%
4.45
%50
.83%
10.9
6%1.
68%
Cha
ndig
arh
51.5
5%0
.00
%4.
12%
18.5
6%7.
22%
22.6
8%69
.07%
0.0
0%
0.0
0%
15.4
6%1.
03%
1.0
3%
Dad
ra &
Nag
ar H
avel
i58
.04%
3.18
%16
.18%
11.6
2%10
.98%
77.1
2%88
.34%
29.7
1%4.
48%
84.0
2%29
.54%
14.7
6%
Dam
an &
Diu
25.5
2%0
.59%
16.2
0%
8.73
%4.
36%
25.6
6%28
.59%
13.3
9%0
.12%
7.88
%9.
41%
10.6
3%
Del
hi26
.93%
0.0
0%
22.2
9%2.
58%
0.0
0%
24.8
0%
11.7
8%35
.79%
0.0
0%
6.45
%6.
49%
6.0
9%
Jam
mu
& K
ashm
ir &
Lad
akh
29.1
9%2.
11%
15.8
1%7.
47%
4.43
%60
.43%
53.0
4%18
.81%
3.80
%37
.65%
20.7
9%4.
35%
Laks
had
wee
p34
.33%
1.93
%6.
95%
2.31
%1.
55%
73.6
4%0
.77%
7.68
%0
.00
%2.
60%
0.9
0%
10.7
2%
Pud
uche
rry
23.2
8%0
.82%
5.79
%3.
51%
1.43
%28
.29%
53.6
7%2.
00
%0
.60
%31
.86%
2.91
%3.
36%
Ind
ia42
.36%
3.20
%26
.49%
16.9
8%7.
52%
77.4
1%62
.88%
16.4
4%16
.80
%59
.52%
17.8
2%10
.74%
Unc
enso
red
Hea
dco
unt R
atio
: Urb
anH
ealth
Educ
atio
nSt
and
ard
of L
ivin
g
Stat
e/U
T (U
rban
)N
utri
tion
Chi
ld &
A
do
lesc
ent
Mo
rtal
ity
Mat
erna
l H
ealth
Year
s o
f Sc
hoo
ling
Scho
ol
Att
end
ance
Co
oki
ng
Fuel
Sani
tatio
nD
rink
ing
Wat
erEl
ectr
icity
Ho
usin
gA
sset
sB
ank
Acc
oun
t
State
And
hra
Prad
esh
18.8
6%1.
16%
7.44
%9.
84%
1.93
%10
.06%
22.6
9%32
.04%
0.4
4%6.
06%
4.86
%6.
30%
Aru
nach
al P
rad
esh
16.1
9%1.
19%
21.5
0%
7.0
8%6.
47%
13.2
7%26
.15%
5.91
%0
.74%
45.9
9%7.
16%
6.58
%
Ass
am26
.67%
1.41
%12
.74%
6.0
3%2.
15%
23.3
2%36
.34%
11.6
5%4.
21%
37.1
7%8.
46%
7.59
%
Biha
r39
.52%
3.13
%33
.56%
13.5
6%9.
07%
37.6
7%42
.94%
2.63
%11
.50
%31
.29%
15.1
8%16
.12%
Chh
attis
gar
h31
.84%
2.19
%15
.91%
6.65
%3.
52%
28.7
1%33
.50
%8.
06%
0.5
2%21
.96%
5.0
2%4.
19%
Go
a20
.26%
0.6
8%5.
84%
5.43
%0
.83%
6.77
%23
.64%
2.65
%0
.23%
9.76
%2.
32%
3.46
%
Guj
arat
31.2
1%1.
46%
10.3
2%5.
86%
4.57
%13
.45%
14.3
1%8.
03%
1.29
%5.
53%
5.94
%8.
04%
Har
yana
26.9
9%1.
99%
19.9
1%6.
97%
3.39
%16
.47%
15.9
1%12
.99%
0.3
5%10
.32%
3.0
7%9.
27%
Him
acha
l Pra
des
h19
.67%
1.43
%10
.06%
2.54
%1.
28%
11.4
6%20
.04%
8.0
8%0
.69%
6.73
%4.
68%
2.63
%
Jhar
khan
d35
.34%
1.75
%20
.15%
7.67
%3.
99%
47.1
1%40
.41%
20.0
1%2.
92%
18.8
6%8.
94%
4.35
%
Karn
atak
a28
.07%
0.9
1%10
.80
%4.
27%
2.65
%14
.85%
23.1
8%11
.21%
0.8
3%19
.00
%4.
06%
6.82
%
Kera
la14
.89%
0.2
2%1.
98%
1.47
%0
.50
%36
.58%
1.24
%4.
67%
0.3
8%8.
23%
1.99
%4.
08%
Mad
hya
Prad
esh
36.4
7%2.
57%
21.4
4%8.
56%
4.67
%24
.83%
31.7
5%10
.86%
1.68
%28
.22%
5.99
%7.
11%
Mah
aras
htra
28.4
4%1.
34%
13.6
2%4.
17%
3.15
%7.
66%
39.8
3%3.
46%
4.35
%7.
81%
6.92
%9.
96%
Man
ipur
20.1
2%1.
18%
9.36
%2.
65%
1.45
%37
.65%
49.3
3%55
.75%
3.77
%69
.86%
6.45
%15
.93%
Meg
hala
ya28
.18%
0.9
6%10
.68%
4.87
%1.
84%
25.9
5%29
.44%
16.4
8%1.
17%
26.6
2%8.
37%
10.6
8%
Miz
ora
m17
.74%
1.55
%8.
17%
2.14
%2.
00
%5.
95%
7.87
%6.
35%
0.2
5%13
.04%
4.0
3%2.
76%
Nag
alan
d20
.42%
1.0
7%23
.47%
5.0
0%
3.49
%36
.31%
28.7
1%20
.93%
0.4
2%49
.46%
10.8
7%10
.02%
Od
isha
25.1
7%1.
19%
13.7
4%8.
75%
3.65
%37
.90
%39
.98%
10.8
0%
5.23
%24
.06%
7.73
%8.
25%
Punj
ab19
.62%
1.18
%11
.95%
5.86
%2.
75%
10.0
1%13
.42%
1.0
2%0
.40
%7.
16%
1.75
%4.
04%
Raj
asth
an33
.69%
1.87
%18
.58%
9.72
%5.
25%
21.3
0%
26.2
6%11
.65%
1.34
%10
.41%
6.0
6%3.
78%
Sikk
im12
.14%
0.5
3%6.
16%
6.40
%1.
32%
3.58
%22
.22%
0.7
6%1.
15%
10.7
9%4.
42%
9.31
%
Tam
il N
adu
20.3
0%
0.8
5%5.
97%
4.29
%0
.79%
9.68
%30
.05%
15.1
8%0
.63%
14.2
2%1.
84%
5.93
%
Tela
ngan
a24
.36%
1.17
%9.
53%
8.69
%2.
22%
7.0
5%34
.33%
20.2
4%0
.42%
8.66
%5.
46%
8.10
%
Trip
ura
23.2
8%0
.57%
7.79
%5.
08%
0.6
1%30
.58%
30.9
8%3.
47%
0.8
7%45
.00
%7.
13%
1.93
%
Utt
ar P
rad
esh
33.8
7%3.
30%
25.1
8%13
.44%
10.6
1%23
.11%
30.0
6%8.
13%
5.0
3%28
.99%
8.0
4%4.
83%
Utt
arak
hand
28.9
1%2.
40%
23.9
5%9.
15%
4.48
%15
.84%
25.1
3%1.
61%
0.6
4%11
.18%
5.0
8%6.
80%
Wes
t Ben
gal
25.5
8%0
.86%
10.4
8%10
.33%
3.32
%37
.18%
38.9
5%11
.88%
2.56
%25
.14%
8.13
%11
.70
%
Union Territory
And
aman
& N
ico
bar
Isla
nds
18.7
4%0
.55%
3.23
%2.
19%
0.6
4%2.
13%
12.4
4%0
.00
%0
.36%
10.2
5%1.
87%
1.41
%
Cha
ndig
arh
21.9
4%1.
21%
11.3
3%5.
30%
1.53
%4.
12%
16.9
7%2.
45%
0.5
0%
6.0
2%2.
78%
4.0
9%
Dad
ra &
Nag
ar H
avel
i28
.08%
0.4
8%9.
88%
2.75
%3.
51%
7.0
4%41
.85%
23.3
7%0
.47%
22.0
8%9.
49%
5.93
%
Dam
an &
Diu
19.2
4%1.
01%
14.1
3%7.
13%
4.85
%3.
24%
37.0
7%11
.04%
0.0
0%
8.15
%16
.68%
13.2
1%
Del
hi23
.37%
1.93
%15
.13%
5.97
%2.
67%
2.0
2%26
.82%
23.6
5%0
.28%
10.8
3%5.
53%
8.38
%
Jam
mu
& K
ashm
ir &
Lad
akh
18.0
6%1.
24%
5.37
%5.
33%
2.0
4%9.
00
%32
.79%
3.10
%0
.34%
10.5
2%5.
04%
2.99
%
Laks
had
wee
p30
.69%
1.97
%6.
38%
0.5
8%1.
39%
53.9
5%0
.35%
9.75
%0
.06%
1.25
%1.
05%
4.23
%
Pud
uche
rry
21.2
4%0
.59%
3.39
%3.
20%
1.12
%6.
86%
26.6
9%7.
05%
0.0
8%11
.18%
1.0
8%6.
24%
Ind
ia27
.63%
1.62
%14
.41%
7.38
%4.
04%
18.8
4%29
.12%
10.7
4%2.
44%
16.5
9%5.
91%
7.41
%
TABle 3- STATe/UT-WISe: UNCeNSoreD heADCoUNT rATIo (rUrAl) TABle 4- STATe/UT-WISe: UNCeNSoreD heADCoUNT rATIo (UrBAN)
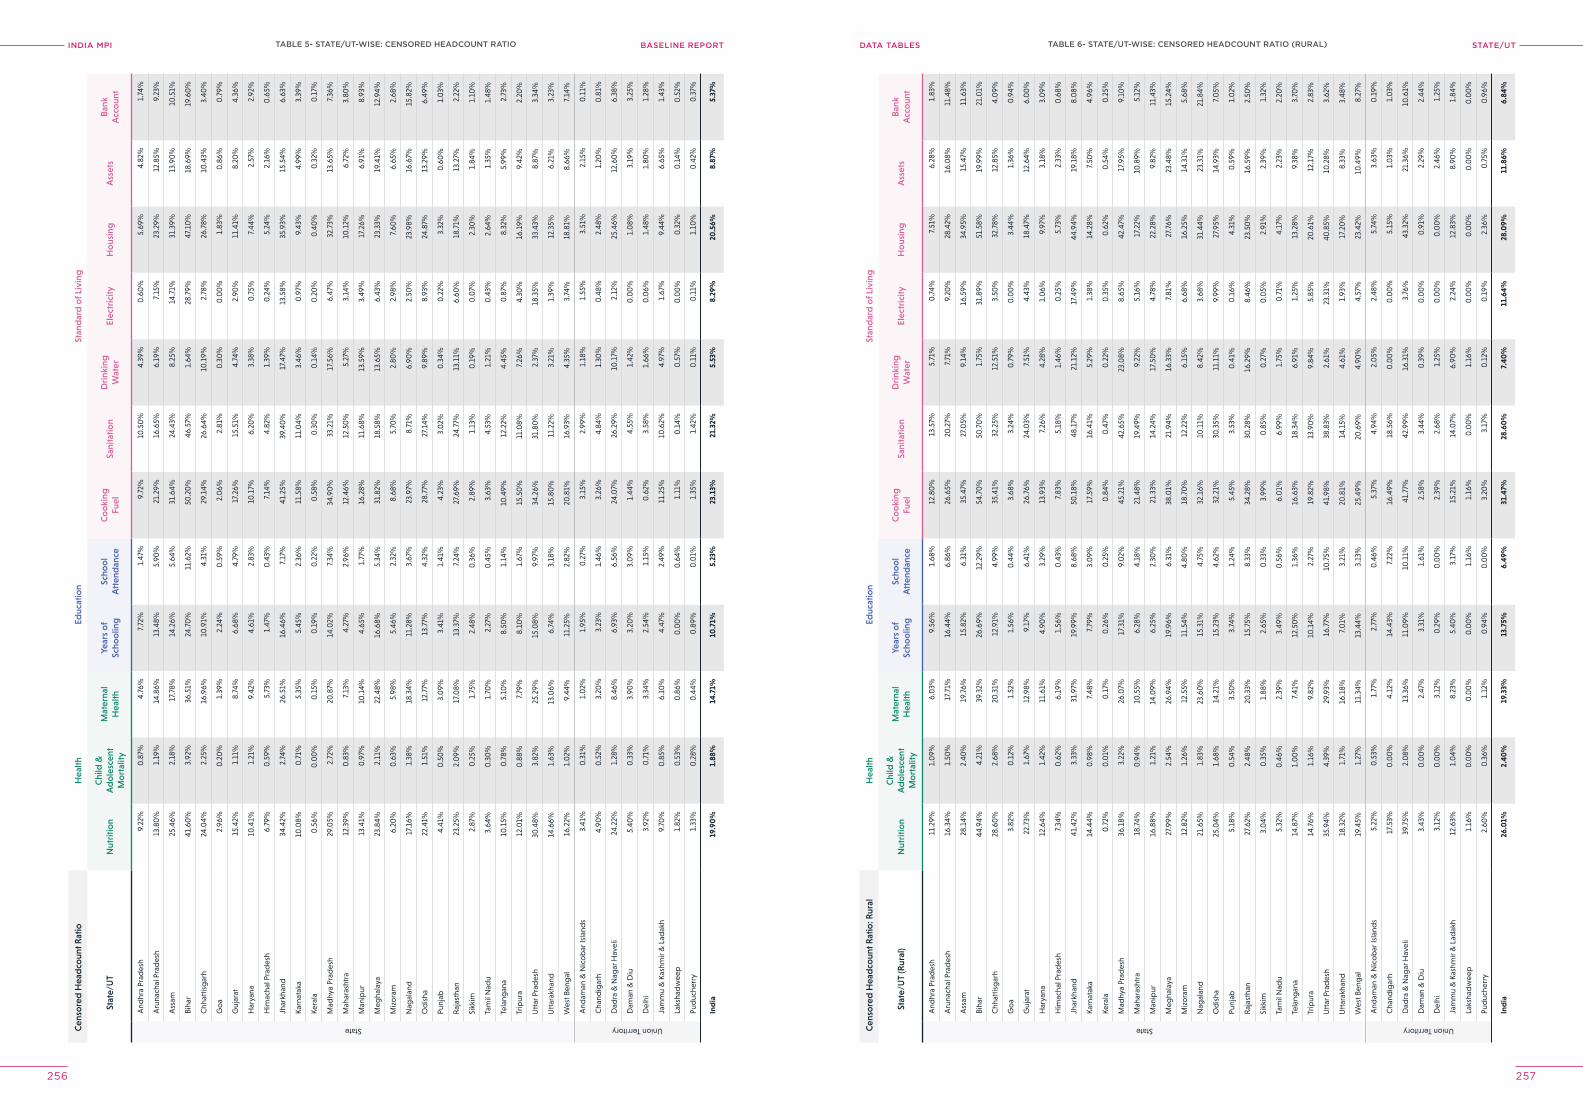
INDIA MPI BASELINE REPORT STATe/UTDATA TABleS
256 257
Cen
sore
d H
ead
coun
t Rat
ioH
ealth
Educ
atio
nSt
and
ard
of L
ivin
g
Stat
e/U
TN
utri
tion
Chi
ld &
A
do
lesc
ent
Mo
rtal
ity
Mat
erna
l H
ealth
Year
s o
f Sc
hoo
ling
Scho
ol
Att
end
ance
Co
oki
ng
Fuel
Sani
tatio
nD
rink
ing
Wat
erEl
ectr
icity
Ho
usin
gA
sset
sB
ank
Acc
oun
t
State
And
hra
Prad
esh
9.22
%0
.87%
4.76
%7.
72%
1.47
%9.
72%
10.5
0%
4.39
%0
.60
%5.
69%
4.82
%1.
74%
Aru
nach
al P
rad
esh
13.8
0%
1.19
%14
.86%
13.4
8%5.
90%
21.2
9%16
.65%
6.19
%7.
15%
23.2
9%12
.85%
9.23
%
Ass
am25
.46%
2.18
%17
.78%
14.2
6%5.
64%
31.6
4%24
.43%
8.25
%14
.71%
31.3
9%13
.90
%10
.51%
Biha
r41
.60
%3.
92%
36.5
1%24
.70
%11
.62%
50.2
0%
46.5
7%1.
64%
28.7
9%47
.10
%18
.69%
19.6
0%
Chh
attis
gar
h24
.04%
2.25
%16
.96%
10.9
1%4.
31%
29.1
4%26
.64%
10.1
9%2.
78%
26.7
8%10
.43%
3.40
%
Go
a2.
96%
0.2
0%
1.39
%2.
24%
0.5
9%2.
06%
2.81
%0
.30
%0
.00
%1.
83%
0.8
6%0
.79%
Guj
arat
15.4
2%1.
11%
8.74
%6.
68%
4.79
%17
.26%
15.5
1%4.
74%
2.90
%11
.41%
8.20
%4.
36%
Har
yana
10.4
1%1.
21%
9.42
%4.
61%
2.83
%10
.17%
6.20
%3.
38%
0.7
5%7.
44%
2.57
%2.
92%
Him
acha
l Pra
des
h6.
79%
0.5
9%5.
73%
1.47
%0
.43%
7.14
%4.
82%
1.39
%0
.24%
5.24
%2.
16%
0.6
5%
Jhar
khan
d34
.42%
2.74
%26
.51%
16.4
6%7.
17%
41.2
5%39
.40
%17
.47%
13.5
8%35
.93%
15.5
4%6.
63%
Karn
atak
a10
.08%
0.7
1%5.
35%
5.45
%2.
36%
11.5
8%11
.04%
3.46
%0
.97%
9.43
%4.
99%
3.39
%
Kera
la0
.56%
0.0
0%
0.1
5%0
.19%
0.2
2%0
.58%
0.3
0%
0.1
4%0
.20
%0
.40
%0
.32%
0.1
7%
Mad
hya
Prad
esh
29.0
5%2.
72%
20.8
7%14
.02%
7.34
%34
.90
%33
.21%
17.5
6%6.
47%
32.7
3%13
.65%
7.36
%
Mah
aras
htra
12.3
9%0
.83%
7.13
%4.
27%
2.96
%12
.46%
12.5
0%
5.27
%3.
14%
10.1
2%6.
72%
3.80
%
Man
ipur
13.4
1%0
.97%
10.1
4%4.
65%
1.77
%16
.28%
11.6
8%13
.59%
3.49
%17
.26%
6.91
%8.
93%
Meg
hala
ya23
.84%
2.11
%22
.48%
16.6
8%5.
34%
31.8
2%18
.58%
13.6
5%6.
43%
23.3
3%19
.41%
12.9
4%
Miz
ora
m6.
20%
0.6
3%5.
98%
5.46
%2.
32%
8.68
%5.
70%
2.80
%2.
98%
7.60
%6.
65%
2.68
%
Nag
alan
d17
.16%
1.38
%18
.34%
11.2
8%3.
67%
23.9
7%8.
71%
6.90
%2.
50%
23.9
8%16
.67%
15.8
2%
Od
isha
22.4
1%1.
51%
12.7
7%13
.77%
4.32
%28
.77%
27.1
4%9.
89%
8.93
%24
.87%
13.2
9%6.
49%
Punj
ab4.
41%
0.5
0%
3.0
9%3.
41%
1.41
%4.
23%
3.0
2%0
.34%
0.2
2%3.
32%
0.6
0%
1.0
3%
Raj
asth
an23
.25%
2.0
9%17
.08%
13.3
7%7.
24%
27.6
9%24
.77%
13.1
1%6.
60%
18.7
1%13
.27%
2.22
%
Sikk
im2.
87%
0.2
5%1.
75%
2.48
%0
.36%
2.89
%1.
13%
0.1
9%0
.07%
2.30
%1.
84%
1.10
%
Tam
il N
adu
3.64
%0
.30
%1.
70%
2.27
%0
.45%
3.63
%4.
53%
1.21
%0
.43%
2.64
%1.
35%
1.48
%
Tela
ngan
a10
.15%
0.7
8%5.
10%
8.50
%1.
14%
10.4
9%12
.22%
4.45
%0
.87%
8.32
%5.
99%
2.73
%
Trip
ura
12.0
1%0
.88%
7.79
%8.
10%
1.67
%15
.50
%11
.08%
7.26
%4.
30%
16.1
9%9.
42%
2.20
%
Utt
ar P
rad
esh
30.4
8%3.
82%
25.2
9%15
.08%
9.97
%34
.26%
31.8
0%
2.37
%18
.35%
33.4
3%8.
87%
3.34
%
Utt
arak
hand
14.6
6%1.
63%
13.0
6%6.
74%
3.18
%15
.80
%11
.22%
3.21
%1.
39%
12.3
5%6.
21%
3.23
%
Wes
t Ben
gal
16.2
2%1.
02%
9.44
%11
.25%
2.82
%20
.81%
16.9
3%4.
35%
3.74
%18
.81%
8.66
%7.
14%
Union Territory
And
aman
& N
ico
bar
Isla
nds
3.41
%0
.31%
1.0
2%1.
95%
0.2
7%3.
15%
2.99
%1.
18%
1.55
%3.
51%
2.15
%0
.11%
Cha
ndig
arh
4.90
%0
.52%
3.20
%3.
23%
1.46
%3.
26%
4.84
%1.
30%
0.4
8%2.
48%
1.20
%0
.81%
Dad
ra &
Nag
ar H
avel
i24
.22%
1.28
%8.
46%
6.93
%6.
56%
24.0
7%26
.29%
10.1
7%2.
12%
25.4
6%12
.60
%6.
38%
Dam
an &
Diu
5.40
%0
.33%
3.90
%3.
20%
3.0
9%1.
44%
4.55
%1.
42%
0.0
0%
1.0
8%3.
19%
3.25
%
Del
hi3.
92%
0.7
1%3.
34%
2.54
%1.
15%
0.6
2%3.
58%
1.66
%0
.06%
1.48
%1.
80%
1.28
%
Jam
mu
& K
ashm
ir &
Lad
akh
9.70
%0
.85%
6.10
%4.
47%
2.49
%11
.25%
10.6
2%4.
97%
1.67
%9.
44%
6.65
%1.
43%
Laks
had
wee
p1.
82%
0.5
3%0
.86%
0.0
0%
0.6
4%1.
11%
0.1
4%0
.57%
0.0
0%
0.3
2%0
.14%
0.5
2%
Pud
uche
rry
1.33
%0
.28%
0.4
4%0
.89%
0.0
1%1.
35%
1.42
%0
.11%
0.1
1%1.
10%
0.4
2%0
.37%
Ind
ia19
.90
%1.
88%
14.7
1%10
.71%
5.23
%23
.13%
21.3
2%5.
53%
8.29
%20
.56%
8.87
%5.
37%
Cen
sore
d H
ead
coun
t Rat
io: R
ural
Hea
lthEd
ucat
ion
Stan
dar
d o
f Liv
ing
Stat
e/U
T (R
ural
)N
utri
tion
Chi
ld &
A
do
lesc
ent
Mo
rtal
ity
Mat
erna
l H
ealth
Year
s o
f Sc
hoo
ling
Scho
ol
Att
end
ance
Co
oki
ng
Fuel
Sani
tatio
nD
rink
ing
Wat
erEl
ectr
icity
Ho
usin
gA
sset
sB
ank
Acc
oun
t
State
And
hra
Prad
esh
11.2
9%1.
09%
6.0
3%9.
56%
1.68
%12
.80
%13
.57%
5.71
%0
.74%
7.51
%6.
28%
1.83
%
Aru
nach
al P
rad
esh
16.3
4%1.
50%
17.7
1%16
.44%
6.86
%26
.65%
20.2
7%7.
71%
9.20
%28
.42%
16.0
8%11
.48%
Ass
am28
.14%
2.40
%19
.76%
15.8
2%6.
31%
35.4
7%27
.05%
9.14
%16
.59%
34.9
5%15
.47%
11.6
3%
Biha
r44
.94%
4.21
%39
.32%
26.6
9%12
.29%
54.7
0%
50.7
0%
1.75
%31
.89%
51.5
8%19
.99%
21.0
1%
Chh
attis
gar
h28
.60
%2.
68%
20.3
1%12
.91%
4.99
%35
.41%
32.2
5%12
.51%
3.50
%32
.78%
12.8
5%4.
09%
Go
a3.
82%
0.1
2%1.
52%
1.56
%0
.44%
3.68
%3.
24%
0.7
9%0
.00
%3.
44%
1.36
%0
.94%
Guj
arat
22.7
3%1.
67%
12.9
8%9.
17%
6.41
%26
.76%
24.0
3%7.
51%
4.43
%18
.47%
12.6
4%6.
00
%
Har
yana
12.6
4%1.
42%
11.6
1%4.
90%
3.29
%13
.93%
7.26
%4.
28%
1.0
6%9.
97%
3.18
%3.
09%
Him
acha
l Pra
des
h7.
34%
0.6
2%6.
19%
1.56
%0
.43%
7.83
%5.
18%
1.46
%0
.25%
5.73
%2.
33%
0.6
8%
Jhar
khan
d41
.42%
3.33
%31
.97%
19.9
9%8.
68%
50.1
8%48
.17%
21.1
2%17
.49%
44.9
4%19
.18%
8.0
8%
Karn
atak
a14
.44%
0.9
8%7.
48%
7.79
%3.
09%
17.5
9%16
.41%
5.29
%1.
38%
14.2
8%7.
50%
4.96
%
Kera
la0
.72%
0.0
1%0
.17%
0.2
6%0
.25%
0.8
4%0
.47%
0.2
2%0
.35%
0.6
2%0
.54%
0.2
5%
Mad
hya
Prad
esh
36.1
8%3.
22%
26.0
7%17
.31%
9.0
2%45
.21%
42.6
5%23
.08%
8.65
%42
.47%
17.9
5%9.
10%
Mah
aras
htra
18.7
4%0
.94%
10.5
5%6.
28%
4.18
%21
.48%
19.4
9%9.
22%
5.16
%17
.22%
10.8
9%5.
12%
Man
ipur
16.8
8%1.
21%
14.0
9%6.
25%
2.30
%21
.33%
14.2
4%17
.50
%4.
78%
22.2
8%9.
82%
11.4
3%
Meg
hala
ya27
.99%
2.54
%26
.94%
19.9
6%6.
31%
38.0
1%21
.94%
16.3
3%7.
81%
27.7
6%23
.48%
15.2
4%
Miz
ora
m12
.82%
1.26
%12
.55%
11.5
4%4.
80%
18.7
0%
12.2
2%6.
15%
6.68
%16
.25%
14.3
1%5.
68%
Nag
alan
d21
.65%
1.83
%23
.60
%15
.31%
4.75
%32
.16%
10.1
1%8.
42%
3.68
%31
.44%
23.3
1%21
.84%
Od
isha
25.0
4%1.
68%
14.2
1%15
.23%
4.62
%32
.21%
30.3
5%11
.11%
9.99
%27
.95%
14.9
3%7.
05%
Punj
ab5.
18%
0.5
4%3.
50%
3.74
%1.
24%
5.45
%3.
53%
0.4
1%0
.16%
4.31
%0
.59%
1.0
2%
Raj
asth
an27
.62%
2.48
%20
.33%
15.7
5%8.
33%
34.2
8%30
.28%
16.2
9%8.
46%
23.5
0%
16.5
9%2.
50%
Sikk
im3.
04%
0.3
5%1.
88%
2.65
%0
.33%
3.99
%0
.85%
0.2
7%0
.05%
2.91
%2.
39%
1.32
%
Tam
il N
adu
5.32
%0
.46%
2.39
%3.
49%
0.5
6%6.
01%
6.99
%1.
75%
0.7
1%4.
17%
2.23
%2.
20%
Tela
ngan
a14
.87%
1.0
0%
7.41
%12
.50
%1.
36%
16.6
3%18
.34%
6.91
%1.
25%
13.2
8%9.
38%
3.70
%
Trip
ura
14.7
6%1.
16%
9.82
%10
.14%
2.27
%19
.82%
13.9
0%
9.84
%5.
85%
20.6
1%12
.17%
2.83
%
Utt
ar P
rad
esh
35.9
4%4.
39%
29.9
3%16
.77%
10.7
5%41
.98%
38.8
3%2.
61%
23.3
1%40
.85%
10.2
8%3.
62%
Utt
arak
hand
18.3
2%1.
71%
16.1
8%7.
01%
3.21
%20
.81%
14.1
5%4.
61%
1.93
%17
.20
%8.
33%
3.48
%
Wes
t Ben
gal
19.4
5%1.
27%
11.3
4%13
.44%
3.13
%25
.49%
20.6
9%4.
90%
4.57
%23
.42%
10.4
9%8.
27%
Union Territory
And
aman
& N
ico
bar
Isla
nds
5.22
%0
.53%
1.77
%2.
77%
0.4
6%5.
37%
4.94
%2.
05%
2.48
%5.
74%
3.63
%0
.19%
Cha
ndig
arh
17.5
3%0
.00
%4.
12%
14.4
3%7.
22%
16.4
9%18
.56%
0.0
0%
0.0
0%
5.15
%1.
03%
1.0
3%
Dad
ra &
Nag
ar H
avel
i39
.75%
2.0
8%13
.36%
11.0
9%10
.11%
41.7
7%42
.99%
16.3
1%3.
76%
43.3
2%21
.36%
10.6
1%
Dam
an &
Diu
3.43
%0
.00
%2.
47%
3.31
%1.
61%
2.58
%3.
44%
0.3
9%0
.00
%0
.91%
2.29
%2.
44%
Del
hi3.
12%
0.0
0%
3.12
%0
.29%
0.0
0%
2.39
%2.
68%
1.25
%0
.00
%0
.00
%2.
46%
1.25
%
Jam
mu
& K
ashm
ir &
Lad
akh
12.6
3%1.
04%
8.23
%5.
40%
3.17
%15
.21%
14.0
7%6.
90%
2.24
%12
.83%
8.90
%1.
84%
Laks
had
wee
p1.
16%
0.0
0%
0.0
0%
0.0
0%
1.16
%1.
16%
0.0
0%
1.16
%0
.00
%0
.00
%0
.00
%0
.00
%
Pud
uche
rry
2.60
%0
.36%
1.12
%0
.94%
0.0
0%
3.20
%3.
17%
0.1
2%0
.19%
2.36
%0
.75%
0.9
6%
Ind
ia26
.01%
2.40
%19
.33%
13.7
5%6.
49%
31.4
7%28
.60
%7.
40%
11.6
4%28
.09%
11.8
6%6.
84%
TABle 5- STATe/UT-WISe: CeNSoreD heADCoUNT rATIo TABle 6- STATe/UT-WISe: CeNSoreD heADCoUNT rATIo (rUrAl)
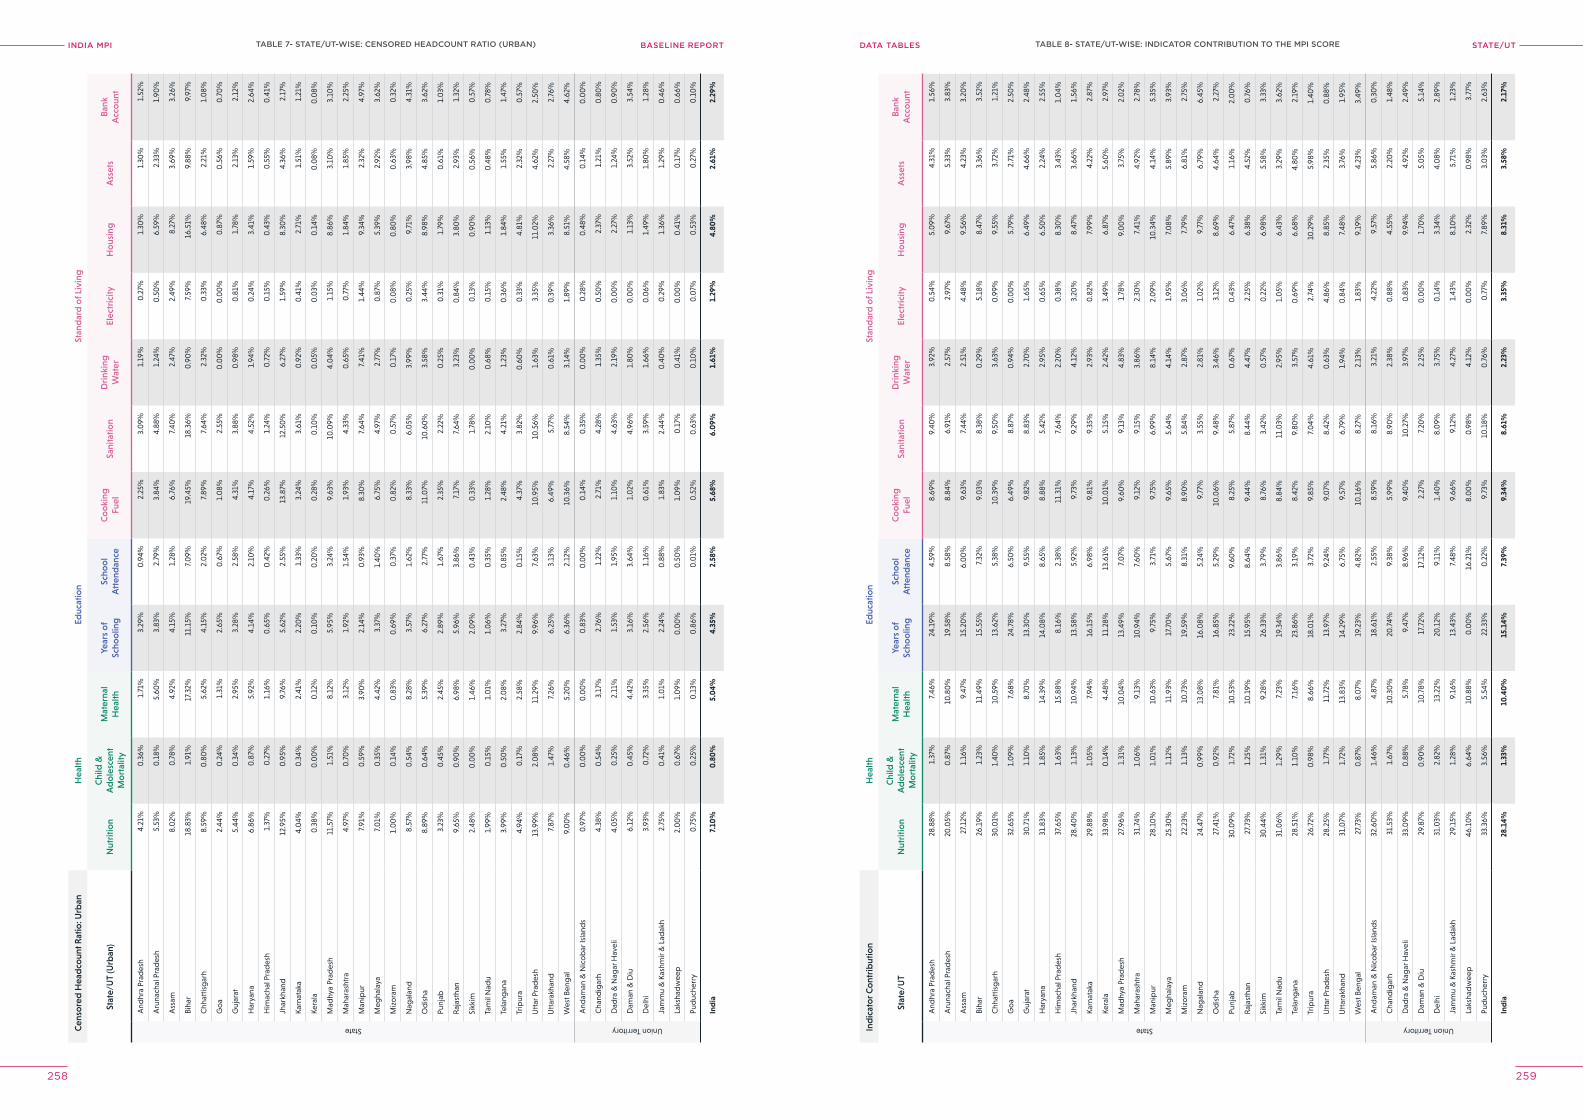
INDIA MPI BASELINE REPORT STATe/UTDATA TABleS
258 259
Cen
sore
d H
ead
coun
t Rat
io: U
rban
Hea
lthEd
ucat
ion
Stan
dar
d o
f Liv
ing
Stat
e/U
T (U
rban
)N
utri
tion
Chi
ld &
A
do
lesc
ent
Mo
rtal
ity
Mat
erna
l H
ealth
Year
s o
f Sc
hoo
ling
Scho
ol
Att
end
ance
Co
oki
ng
Fuel
Sani
tatio
nD
rink
ing
Wat
erEl
ectr
icity
Ho
usin
gA
sset
sB
ank
Acc
oun
t
State
And
hra
Prad
esh
4.21
%0
.36%
1.71
%3.
29%
0.9
4%2.
25%
3.0
9%1.
19%
0.2
7%1.
30%
1.30
%1.
52%
Aru
nach
al P
rad
esh
5.53
%0
.18%
5.60
%3.
83%
2.79
%3.
84%
4.88
%1.
24%
0.5
0%
6.59
%2.
33%
1.90
%
Ass
am8.
02%
0.7
8%4.
92%
4.15
%1.
28%
6.76
%7.
40%
2.47
%2.
49%
8.27
%3.
69%
3.26
%
Biha
r18
.83%
1.91
%17
.32%
11.1
5%7.
09%
19.4
5%18
.36%
0.9
0%
7.59
%16
.51%
9.88
%9.
97%
Chh
attis
gar
h8.
59%
0.8
0%
5.62
%4.
15%
2.0
2%7.
89%
7.64
%2.
32%
0.3
3%6.
48%
2.21
%1.
08%
Go
a2.
44%
0.2
4%1.
31%
2.65
%0
.67%
1.0
8%2.
55%
0.0
0%
0.0
0%
0.8
7%0
.56%
0.7
0%
Guj
arat
5.44
%0
.34%
2.95
%3.
28%
2.58
%4.
31%
3.88
%0
.98%
0.8
1%1.
78%
2.13
%2.
12%
Har
yana
6.86
%0
.87%
5.92
%4.
14%
2.10
%4.
17%
4.52
%1.
94%
0.2
4%3.
41%
1.59
%2.
64%
Him
acha
l Pra
des
h1.
37%
0.2
7%1.
16%
0.6
5%0
.42%
0.2
6%1.
24%
0.7
2%0
.15%
0.4
3%0
.55%
0.4
1%
Jhar
khan
d12
.95%
0.9
5%9.
76%
5.62
%2.
55%
13.8
7%12
.50
%6.
27%
1.59
%8.
30%
4.36
%2.
17%
Karn
atak
a4.
04%
0.3
4%2.
41%
2.20
%1.
33%
3.24
%3.
61%
0.9
2%0
.41%
2.71
%1.
51%
1.21
%
Kera
la0
.38%
0.0
0%
0.1
2%0
.10
%0
.20
%0
.28%
0.1
0%
0.0
5%0
.03%
0.1
4%0
.08%
0.0
8%
Mad
hya
Prad
esh
11.5
7%1.
51%
8.12
%5.
95%
3.24
%9.
63%
10.0
9%4.
04%
1.15
%8.
86%
3.10
%3.
10%
Mah
aras
htra
4.97
%0
.70
%3.
12%
1.92
%1.
54%
1.93
%4.
33%
0.6
5%0
.77%
1.84
%1.
85%
2.25
%
Man
ipur
7.91
%0
.59%
3.90
%2.
14%
0.9
3%8.
30%
7.64
%7.
41%
1.44
%9.
34%
2.32
%4.
97%
Meg
hala
ya7.
01%
0.3
5%4.
42%
3.37
%1.
40%
6.75
%4.
97%
2.77
%0
.87%
5.39
%2.
92%
3.62
%
Miz
ora
m1.
00
%0
.14%
0.8
3%0
.69%
0.3
7%0
.82%
0.5
7%0
.17%
0.0
8%0
.80
%0
.63%
0.3
2%
Nag
alan
d8.
57%
0.5
4%8.
28%
3.57
%1.
62%
8.33
%6.
05%
3.99
%0
.25%
9.71
%3.
98%
4.31
%
Od
isha
8.89
%0
.64%
5.39
%6.
27%
2.77
%11
.07%
10.6
0%
3.58
%3.
44%
8.98
%4.
85%
3.62
%
Punj
ab3.
23%
0.4
5%2.
45%
2.89
%1.
67%
2.35
%2.
22%
0.2
5%0
.31%
1.79
%0
.61%
1.0
3%
Raj
asth
an9.
65%
0.9
0%
6.98
%5.
96%
3.86
%7.
17%
7.64
%3.
23%
0.8
4%3.
80%
2.93
%1.
32%
Sikk
im2.
48%
0.0
0%
1.46
%2.
09%
0.4
3%0
.33%
1.78
%0
.00
%0
.13%
0.9
0%
0.5
6%0
.57%
Tam
il N
adu
1.99
%0
.15%
1.0
1%1.
06%
0.3
5%1.
28%
2.10
%0
.68%
0.1
5%1.
13%
0.4
8%0
.78%
Tela
ngan
a3.
99%
0.5
0%
2.0
8%3.
27%
0.8
5%2.
48%
4.21
%1.
23%
0.3
6%1.
84%
1.55
%1.
47%
Trip
ura
4.94
%0
.17%
2.58
%2.
84%
0.1
5%4.
37%
3.82
%0
.60
%0
.33%
4.81
%2.
32%
0.5
7%
Utt
ar P
rad
esh
13.9
9%2.
08%
11.2
9%9.
96%
7.63
%10
.95%
10.5
6%1.
63%
3.35
%11
.02%
4.62
%2.
50%
Utt
arak
hand
7.87
%1.
47%
7.26
%6.
25%
3.13
%6.
49%
5.77
%0
.61%
0.3
9%3.
36%
2.27
%2.
76%
Wes
t Ben
gal
9.0
0%
0.4
6%5.
20%
6.36
%2.
12%
10.3
6%8.
54%
3.14
%1.
89%
8.51
%4.
58%
4.62
%
Union Territory
And
aman
& N
ico
bar
Isla
nds
0.9
7%0
.00
%0
.00
%0
.83%
0.0
0%
0.1
4%0
.35%
0.0
0%
0.2
8%0
.48%
0.1
4%0
.00
%
Cha
ndig
arh
4.38
%0
.54%
3.17
%2.
76%
1.22
%2.
71%
4.28
%1.
35%
0.5
0%
2.37
%1.
21%
0.8
0%
Dad
ra &
Nag
ar H
avel
i4.
05%
0.2
5%2.
11%
1.53
%1.
95%
1.10
%4.
63%
2.19
%0
.00
%2.
27%
1.24
%0
.90
%
Dam
an &
Diu
6.12
%0
.45%
4.42
%3.
16%
3.64
%1.
02%
4.96
%1.
80%
0.0
0%
1.13
%3.
52%
3.54
%
Del
hi3.
93%
0.7
2%3.
35%
2.56
%1.
16%
0.6
1%3.
59%
1.66
%0
.06%
1.49
%1.
80%
1.28
%
Jam
mu
& K
ashm
ir &
Lad
akh
2.75
%0
.41%
1.0
1%2.
24%
0.8
8%1.
83%
2.44
%0
.40
%0
.29%
1.36
%1.
29%
0.4
6%
Laks
had
wee
p2.
00
%0
.67%
1.0
9%0
.00
%0
.50
%1.
09%
0.1
7%0
.41%
0.0
0%
0.4
1%0
.17%
0.6
6%
Pud
uche
rry
0.7
5%0
.25%
0.1
3%0
.86%
0.0
1%0
.52%
0.6
3%0
.10
%0
.07%
0.5
3%0
.27%
0.1
0%
Ind
ia7.
10%
0.8
0%
5.0
4%4.
35%
2.58
%5.
68%
6.0
9%1.
61%
1.29
%4.
80%
2.61
%2.
29%
Ind
icat
or C
ont
rib
utio
nH
ealth
Educ
atio
nSt
and
ard
of L
ivin
g
Stat
e/U
TN
utri
tion
Chi
ld &
A
do
lesc
ent
Mo
rtal
ity
Mat
erna
l H
ealth
Year
s o
f Sc
hoo
ling
Scho
ol
Att
end
ance
Co
oki
ng
Fuel
Sani
tatio
nD
rink
ing
Wat
erEl
ectr
icity
Ho
usin
gA
sset
sB
ank
Acc
oun
t
State
And
hra
Prad
esh
28.8
8%1.
37%
7.46
%24
.19%
4.59
%8.
69%
9.40
%3.
92%
0.5
4%5.
09%
4.31
%1.
56%
Aru
nach
al P
rad
esh
20.0
5%0
.87%
10.8
0%
19.5
8%8.
58%
8.84
%6.
91%
2.57
%2.
97%
9.67
%5.
33%
3.83
%
Ass
am27
.12%
1.16
%9.
47%
15.2
0%
6.0
0%
9.63
%7.
44%
2.51
%4.
48%
9.56
%4.
23%
3.20
%
Biha
r26
.19%
1.23
%11
.49%
15.5
5%7.
32%
9.0
3%8.
38%
0.2
9%5.
18%
8.47
%3.
36%
3.52
%
Chh
attis
gar
h30
.01%
1.40
%10
.59%
13.6
2%5.
38%
10.3
9%9.
50%
3.63
%0
.99%
9.55
%3.
72%
1.21
%
Go
a32
.65%
1.0
9%7.
68%
24.7
8%6.
50%
6.49
%8.
87%
0.9
4%0
.00
%5.
79%
2.71
%2.
50%
Guj
arat
30.7
1%1.
10%
8.70
%13
.30
%9.
55%
9.82
%8.
83%
2.70
%1.
65%
6.49
%4.
66%
2.48
%
Har
yana
31.8
3%1.
85%
14.3
9%14
.08%
8.65
%8.
88%
5.42
%2.
95%
0.6
5%6.
50%
2.24
%2.
55%
Him
acha
l Pra
des
h37
.65%
1.63
%15
.88%
8.16
%2.
38%
11.3
1%7.
64%
2.20
%0
.38%
8.30
%3.
43%
1.0
4%
Jhar
khan
d28
.40
%1.
13%
10.9
4%13
.58%
5.92
%9.
73%
9.29
%4.
12%
3.20
%8.
47%
3.66
%1.
56%
Karn
atak
a29
.88%
1.0
5%7.
94%
16.1
5%6.
98%
9.81
%9.
35%
2.93
%0
.82%
7.99
%4.
22%
2.87
%
Kera
la33
.98%
0.1
4%4.
48%
11.2
8%13
.61%
10.0
1%5.
15%
2.42
%3.
49%
6.87
%5.
60%
2.97
%
Mad
hya
Prad
esh
27.9
6%1.
31%
10.0
4%13
.49%
7.0
7%9.
60%
9.13
%4.
83%
1.78
%9.
00
%3.
75%
2.0
2%
Mah
aras
htra
31.7
4%1.
06%
9.13
%10
.94%
7.60
%9.
12%
9.15
%3.
86%
2.30
%7.
41%
4.92
%2.
78%
Man
ipur
28.1
0%
1.0
1%10
.63%
9.75
%3.
71%
9.75
%6.
99%
8.14
%2.
09%
10.3
4%4.
14%
5.35
%
Meg
hala
ya25
.30
%1.
12%
11.9
3%17
.70
%5.
67%
9.65
%5.
64%
4.14
%1.
95%
7.0
8%5.
89%
3.93
%
Miz
ora
m22
.23%
1.13
%10
.73%
19.5
9%8.
31%
8.90
%5.
84%
2.87
%3.
06%
7.79
%6.
81%
2.75
%
Nag
alan
d24
.47%
0.9
9%13
.08%
16.0
8%5.
24%
9.77
%3.
55%
2.81
%1.
02%
9.77
%6.
79%
6.45
%
Od
isha
27.4
1%0
.92%
7.81
%16
.85%
5.29
%10
.06%
9.48
%3.
46%
3.12
%8.
69%
4.64
%2.
27%
Punj
ab30
.09%
1.72
%10
.53%
23.2
2%9.
60%
8.25
%5.
87%
0.6
7%0
.43%
6.47
%1.
16%
2.0
0%
Raj
asth
an27
.73%
1.25
%10
.19%
15.9
5%8.
64%
9.44
%8.
44%
4.47
%2.
25%
6.38
%4.
52%
0.7
6%
Sikk
im30
.44%
1.31
%9.
28%
26.3
3%3.
79%
8.76
%3.
42%
0.5
7%0
.22%
6.98
%5.
58%
3.33
%
Tam
il N
adu
31.0
6%1.
29%
7.23
%19
.34%
3.86
%8.
84%
11.0
3%2.
95%
1.0
5%6.
43%
3.29
%3.
62%
Tela
ngan
a28
.51%
1.10
%7.
16%
23.8
6%3.
19%
8.42
%9.
80%
3.57
%0
.69%
6.68
%4.
80%
2.19
%
Trip
ura
26.7
2%0
.98%
8.66
%18
.01%
3.72
%9.
85%
7.0
4%4.
61%
2.74
%10
.29%
5.98
%1.
40%
Utt
ar P
rad
esh
28.2
5%1.
77%
11.7
2%13
.97%
9.24
%9.
07%
8.42
%0
.63%
4.86
%8.
85%
2.35
%0
.88%
Utt
arak
hand
31.0
7%1.
72%
13.8
3%14
.29%
6.75
%9.
57%
6.79
%1.
94%
0.8
4%7.
48%
3.76
%1.
95%
Wes
t Ben
gal
27.7
3%0
.87%
8.0
7%19
.23%
4.82
%10
.16%
8.27
%2.
13%
1.83
%9.
19%
4.23
%3.
49%
Union Territory
And
aman
& N
ico
bar
Isla
nds
32.6
0%
1.46
%4.
87%
18.6
1%2.
55%
8.59
%8.
16%
3.21
%4.
22%
9.57
%5.
86%
0.3
0%
Cha
ndig
arh
31.5
3%1.
67%
10.3
0%
20.7
4%9.
38%
5.99
%8.
90%
2.38
%0
.88%
4.55
%2.
20%
1.48
%
Dad
ra &
Nag
ar H
avel
i33
.09%
0.8
8%5.
78%
9.47
%8.
96%
9.40
%10
.27%
3.97
%0
.83%
9.94
%4.
92%
2.49
%
Dam
an &
Diu
29.8
7%0
.90
%10
.78%
17.7
2%17
.12%
2.27
%7.
20%
2.25
%0
.00
%1.
70%
5.0
5%5.
14%
Del
hi31
.03%
2.82
%13
.22%
20.1
2%9.
11%
1.40
%8.
09%
3.75
%0
.14%
3.34
%4.
08%
2.89
%
Jam
mu
& K
ashm
ir &
Lad
akh
29.1
5%1.
28%
9.16
%13
.43%
7.48
%9.
66%
9.12
%4.
27%
1.43
%8.
10%
5.71
%1.
23%
Laks
had
wee
p46
.10
%6.
64%
10.8
8%0
.00
%16
.21%
8.0
0%
0.9
8%4.
12%
0.0
0%
2.32
%0
.98%
3.77
%
Pud
uche
rry
33.3
6%3.
56%
5.54
%22
.33%
0.2
2%9.
73%
10.1
8%0
.76%
0.7
7%7.
89%
3.0
3%2.
63%
Ind
ia28
.14%
1.33
%10
.40
%15
.14%
7.39
%9.
34%
8.61
%2.
23%
3.35
%8.
31%
3.58
%2.
17%
TABle 7- STATe/UT-WISe: CeNSoreD heADCoUNT rATIo (UrBAN) TABle 8- STATe/UT-WISe: INDICATor CoNTrIBUTIoN To The MpI SCore
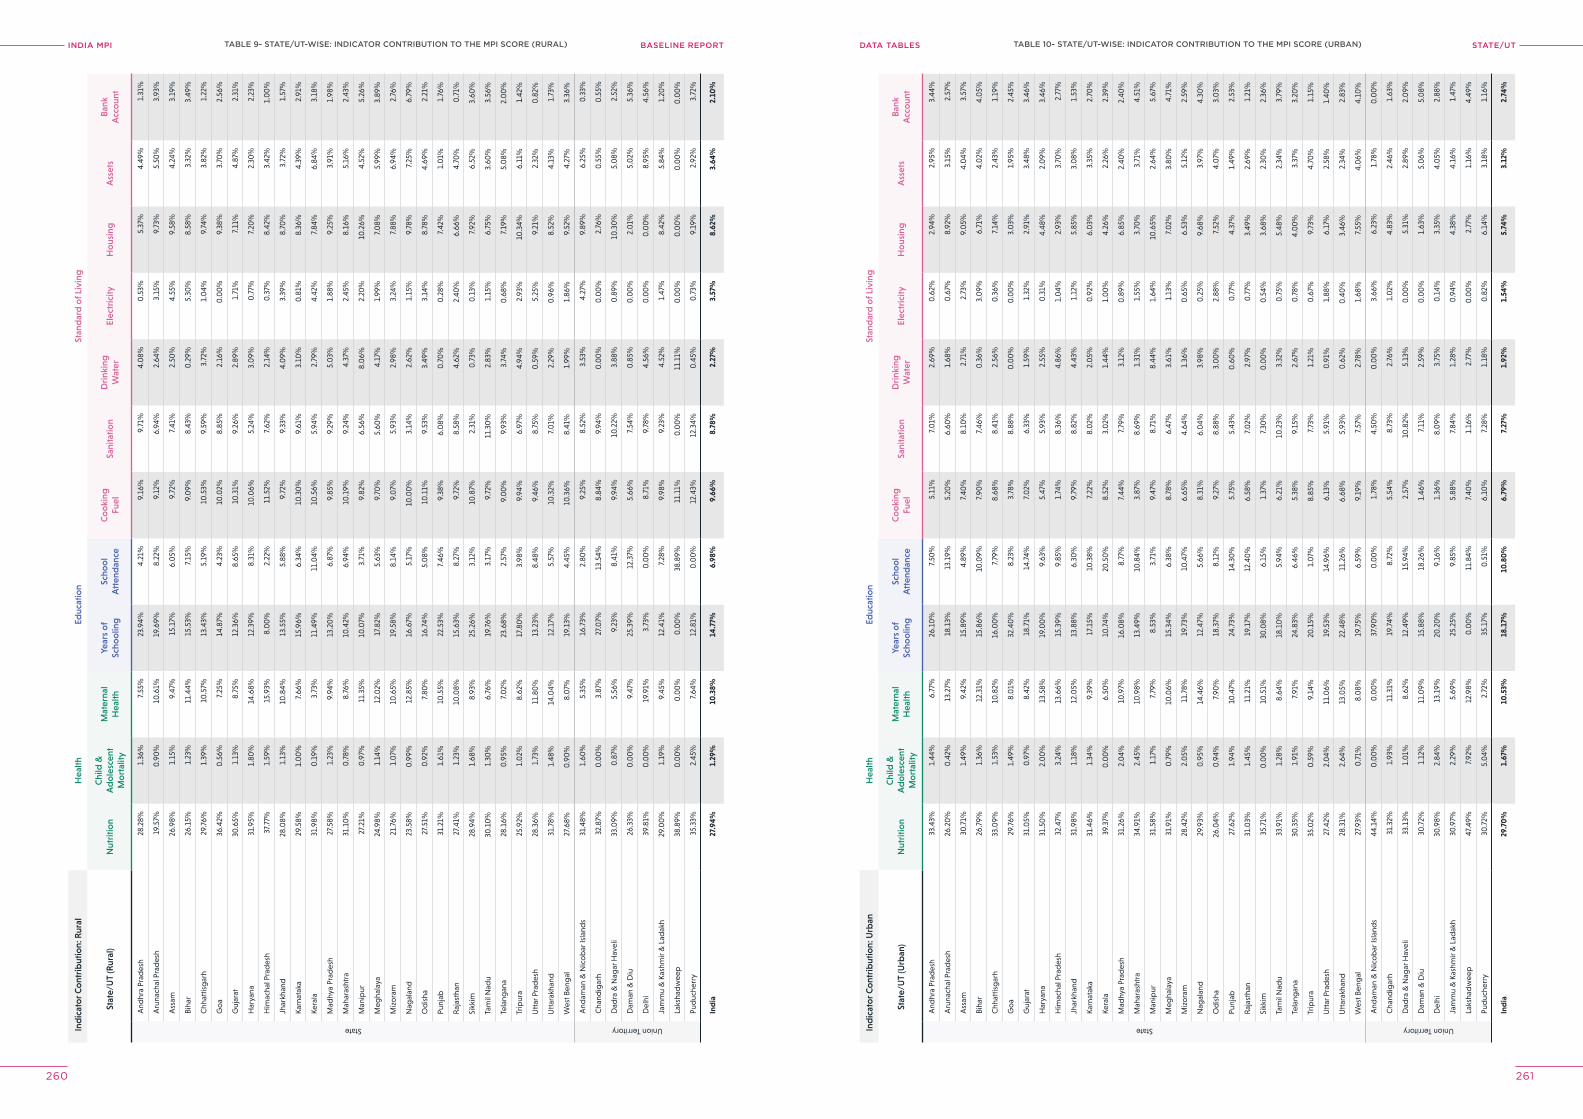
INDIA MPI BASELINE REPORT STATe/UTDATA TABleS
260 261
Ind
icat
or C
ont
rib
utio
n: R
ural
Hea
lthEd
ucat
ion
Stan
dar
d o
f Liv
ing
Stat
e/U
T (R
ural
)N
utri
tion
Chi
ld &
A
do
lesc
ent
Mo
rtal
ity
Mat
erna
l H
ealth
Year
s o
f Sc
hoo
ling
Scho
ol
Att
end
ance
Co
oki
ng
Fuel
Sani
tatio
nD
rink
ing
Wat
erEl
ectr
icity
Ho
usin
gA
sset
sB
ank
Acc
oun
t
State
And
hra
Prad
esh
28.2
8%1.
36%
7.55
%23
.94%
4.21
%9.
16%
9.71
%4.
08%
0.5
3%5.
37%
4.49
%1.
31%
Aru
nach
al P
rad
esh
19.5
7%0
.90
%10
.61%
19.6
9%8.
22%
9.12
%6.
94%
2.64
%3.
15%
9.73
%5.
50%
3.93
%
Ass
am26
.98%
1.15
%9.
47%
15.1
7%6.
05%
9.72
%7.
41%
2.50
%4.
55%
9.58
%4.
24%
3.19
%
Biha
r26
.15%
1.23
%11
.44%
15.5
3%7.
15%
9.0
9%8.
43%
0.2
9%5.
30%
8.58
%3.
32%
3.49
%
Chh
attis
gar
h29
.76%
1.39
%10
.57%
13.4
3%5.
19%
10.5
3%9.
59%
3.72
%1.
04%
9.74
%3.
82%
1.22
%
Go
a36
.42%
0.5
6%7.
25%
14.8
7%4.
23%
10.0
2%8.
85%
2.16
%0
.00
%9.
38%
3.70
%2.
56%
Guj
arat
30.6
5%1.
13%
8.75
%12
.36%
8.65
%10
.31%
9.26
%2.
89%
1.71
%7.
11%
4.87
%2.
31%
Har
yana
31.9
5%1.
80%
14.6
8%12
.39%
8.31
%10
.06%
5.24
%3.
09%
0.7
7%7.
20%
2.30
%2.
23%
Him
acha
l Pra
des
h37
.77%
1.59
%15
.93%
8.0
0%
2.22
%11
.52%
7.62
%2.
14%
0.3
7%8.
42%
3.42
%1.
00
%
Jhar
khan
d28
.08%
1.13
%10
.84%
13.5
5%5.
88%
9.72
%9.
33%
4.0
9%3.
39%
8.70
%3.
72%
1.57
%
Karn
atak
a29
.58%
1.0
0%
7.66
%15
.96%
6.34
%10
.30
%9.
61%
3.10
%0
.81%
8.36
%4.
39%
2.91
%
Kera
la31
.98%
0.1
9%3.
73%
11.4
9%11
.04%
10.5
6%5.
94%
2.79
%4.
42%
7.84
%6.
84%
3.18
%
Mad
hya
Prad
esh
27.5
8%1.
23%
9.94
%13
.20
%6.
87%
9.85
%9.
29%
5.0
3%1.
88%
9.25
%3.
91%
1.98
%
Mah
aras
htra
31.1
0%
0.7
8%8.
76%
10.4
2%6.
94%
10.1
9%9.
24%
4.37
%2.
45%
8.16
%5.
16%
2.43
%
Man
ipur
27.2
1%0
.97%
11.3
5%10
.07%
3.71
%9.
82%
6.56
%8.
06%
2.20
%10
.26%
4.52
%5.
26%
Meg
hala
ya24
.98%
1.14
%12
.02%
17.8
2%5.
63%
9.70
%5.
60%
4.17
%1.
99%
7.0
8%5.
99%
3.89
%
Miz
ora
m21
.76%
1.0
7%10
.65%
19.5
8%8.
14%
9.0
7%5.
93%
2.98
%3.
24%
7.88
%6.
94%
2.76
%
Nag
alan
d23
.58%
0.9
9%12
.85%
16.6
7%5.
17%
10.0
0%
3.14
%2.
62%
1.15
%9.
78%
7.25
%6.
79%
Od
isha
27.5
1%0
.92%
7.80
%16
.74%
5.0
8%10
.11%
9.53
%3.
49%
3.14
%8.
78%
4.69
%2.
21%
Punj
ab31
.21%
1.61
%10
.55%
22.5
3%7.
46%
9.38
%6.
08%
0.7
0%
0.2
8%7.
42%
1.0
1%1.
76%
Raj
asth
an27
.41%
1.23
%10
.08%
15.6
3%8.
27%
9.72
%8.
58%
4.62
%2.
40%
6.66
%4.
70%
0.7
1%
Sikk
im28
.94%
1.68
%8.
93%
25.2
6%3.
12%
10.8
7%2.
31%
0.7
3%0
.13%
7.92
%6.
52%
3.60
%
Tam
il N
adu
30.1
0%
1.30
%6.
76%
19.7
6%3.
17%
9.72
%11
.30
%2.
83%
1.15
%6.
75%
3.60
%3.
56%
Tela
ngan
a28
.16%
0.9
5%7.
02%
23.6
8%2.
57%
9.0
0%
9.93
%3.
74%
0.6
8%7.
19%
5.0
8%2.
00
%
Trip
ura
25.9
2%1.
02%
8.62
%17
.80
%3.
98%
9.94
%6.
97%
4.94
%2.
93%
10.3
4%6.
11%
1.42
%
Utt
ar P
rad
esh
28.3
6%1.
73%
11.8
0%
13.2
3%8.
48%
9.46
%8.
75%
0.5
9%5.
25%
9.21
%2.
32%
0.8
2%
Utt
arak
hand
31.7
8%1.
48%
14.0
4%12
.17%
5.57
%10
.32%
7.0
1%2.
29%
0.9
6%8.
52%
4.13
%1.
73%
Wes
t Ben
gal
27.6
8%0
.90
%8.
07%
19.1
3%4.
45%
10.3
6%8.
41%
1.99
%1.
86%
9.52
%4.
27%
3.36
%
Union Territory
And
aman
& N
ico
bar
Isla
nds
31.4
8%1.
60%
5.35
%16
.73%
2.80
%9.
25%
8.52
%3.
53%
4.27
%9.
89%
6.25
%0
.33%
Cha
ndig
arh
32.8
7%0
.00
%3.
87%
27.0
7%13
.54%
8.84
%9.
94%
0.0
0%
0.0
0%
2.76
%0
.55%
0.5
5%
Dad
ra &
Nag
ar H
avel
i33
.09%
0.8
7%5.
56%
9.23
%8.
41%
9.94
%10
.22%
3.88
%0
.89%
10.3
0%
5.0
8%2.
52%
Dam
an &
Diu
26.3
3%0
.00
%9.
47%
25.3
9%12
.37%
5.66
%7.
54%
0.8
5%0
.00
%2.
01%
5.0
2%5.
36%
Del
hi39
.81%
0.0
0%
19.9
1%3.
73%
0.0
0%
8.71
%9.
78%
4.56
%0
.00
%0
.00
%8.
95%
4.56
%
Jam
mu
& K
ashm
ir &
Lad
akh
29.0
0%
1.19
%9.
45%
12.4
1%7.
28%
9.98
%9.
23%
4.52
%1.
47%
8.42
%5.
84%
1.20
%
Laks
had
wee
p38
.89%
0.0
0%
0.0
0%
0.0
0%
38.8
9%11
.11%
0.0
0%
11.1
1%0
.00
%0
.00
%0
.00
%0
.00
%
Pud
uche
rry
35.3
3%2.
45%
7.64
%12
.81%
0.0
0%
12.4
3%12
.34%
0.4
5%0
.73%
9.19
%2.
92%
3.72
%
Ind
ia27
.94%
1.29
%10
.38%
14.7
7%6.
98%
9.66
%8.
78%
2.27
%3.
57%
8.62
%3.
64%
2.10
%
Ind
icat
or C
ont
rib
utio
n: U
rban
Hea
lthEd
ucat
ion
Stan
dar
d o
f Liv
ing
Stat
e/U
T (U
rban
)N
utri
tion
Chi
ld &
A
do
lesc
ent
Mo
rtal
ity
Mat
erna
l H
ealth
Year
s o
f Sc
hoo
ling
Scho
ol
Att
end
ance
Co
oki
ng
Fuel
Sani
tatio
nD
rink
ing
Wat
erEl
ectr
icity
Ho
usin
gA
sset
sB
ank
Acc
oun
t
State
And
hra
Prad
esh
33.4
3%1.
44%
6.77
%26
.10
%7.
50%
5.11
%7.
01%
2.69
%0
.62%
2.94
%2.
95%
3.44
%
Aru
nach
al P
rad
esh
26.2
0%
0.4
2%13
.27%
18.1
3%13
.19%
5.20
%6.
60%
1.68
%0
.67%
8.92
%3.
15%
2.57
%
Ass
am30
.71%
1.49
%9.
42%
15.8
9%4.
89%
7.40
%8.
10%
2.71
%2.
73%
9.0
5%4.
04%
3.57
%
Biha
r26
.79%
1.36
%12
.31%
15.8
6%10
.09%
7.90
%7.
46%
0.3
6%3.
09%
6.71
%4.
02%
4.0
5%
Chh
attis
gar
h33
.09%
1.53
%10
.82%
16.0
0%
7.79
%8.
68%
8.41
%2.
56%
0.3
6%7.
14%
2.43
%1.
19%
Go
a29
.76%
1.49
%8.
01%
32.4
0%
8.23
%3.
78%
8.88
%0
.00
%0
.00
%3.
03%
1.95
%2.
45%
Guj
arat
31.0
5%0
.97%
8.42
%18
.71%
14.7
4%7.
02%
6.33
%1.
59%
1.32
%2.
91%
3.48
%3.
46%
Har
yana
31.5
0%
2.0
0%
13.5
8%19
.00
%9.
63%
5.47
%5.
93%
2.55
%0
.31%
4.48
%2.
09%
3.46
%
Him
acha
l Pra
des
h32
.47%
3.24
%13
.66%
15.3
9%9.
85%
1.74
%8.
36%
4.86
%1.
04%
2.93
%3.
70%
2.77
%
Jhar
khan
d31
.98%
1.18
%12
.05%
13.8
8%6.
30%
9.79
%8.
82%
4.43
%1.
12%
5.85
%3.
08%
1.53
%
Karn
atak
a31
.46%
1.34
%9.
39%
17.1
5%10
.38%
7.22
%8.
02%
2.0
5%0
.92%
6.0
3%3.
35%
2.70
%
Kera
la39
.37%
0.0
0%
6.50
%10
.74%
20.5
0%
8.52
%3.
02%
1.44
%1.
00
%4.
26%
2.26
%2.
39%
Mad
hya
Prad
esh
31.2
6%2.
04%
10.9
7%16
.08%
8.77
%7.
44%
7.79
%3.
12%
0.8
9%6.
85%
2.40
%2.
40%
Mah
aras
htra
34.9
1%2.
45%
10.9
8%13
.49%
10.8
4%3.
87%
8.69
%1.
31%
1.55
%3.
70%
3.71
%4.
51%
Man
ipur
31.5
8%1.
17%
7.79
%8.
53%
3.71
%9.
47%
8.71
%8.
44%
1.64
%10
.65%
2.64
%5.
67%
Meg
hala
ya31
.91%
0.7
9%10
.06%
15.3
4%6.
38%
8.78
%6.
47%
3.61
%1.
13%
7.0
2%3.
80%
4.71
%
Miz
ora
m28
.42%
2.0
5%11
.78%
19.7
3%10
.47%
6.65
%4.
64%
1.36
%0
.65%
6.53
%5.
12%
2.59
%
Nag
alan
d29
.93%
0.9
5%14
.46%
12.4
7%5.
66%
8.31
%6.
04%
3.98
%0
.25%
9.68
%3.
97%
4.30
%
Od
isha
26.0
4%0
.94%
7.90
%18
.37%
8.12
%9.
27%
8.88
%3.
00
%2.
88%
7.52
%4.
07%
3.0
3%
Punj
ab27
.62%
1.94
%10
.47%
24.7
3%14
.30
%5.
75%
5.43
%0
.60
%0
.77%
4.37
%1.
49%
2.53
%
Raj
asth
an31
.03%
1.45
%11
.21%
19.1
7%12
.40
%6.
58%
7.0
2%2.
97%
0.7
7%3.
49%
2.69
%1.
21%
Sikk
im35
.71%
0.0
0%
10.5
1%30
.08%
6.15
%1.
37%
7.30
%0
.00
%0
.54%
3.68
%2.
30%
2.36
%
Tam
il N
adu
33.9
1%1.
28%
8.64
%18
.10
%5.
94%
6.21
%10
.23%
3.32
%0
.75%
5.48
%2.
34%
3.79
%
Tela
ngan
a30
.35%
1.91
%7.
91%
24.8
3%6.
46%
5.38
%9.
15%
2.67
%0
.78%
4.0
0%
3.37
%3.
20%
Trip
ura
35.0
2%0
.59%
9.14
%20
.15%
1.0
7%8.
85%
7.73
%1.
21%
0.6
7%9.
73%
4.70
%1.
15%
Utt
ar P
rad
esh
27.4
2%2.
04%
11.0
6%19
.53%
14.9
6%6.
13%
5.91
%0
.91%
1.88
%6.
17%
2.58
%1.
40%
Utt
arak
hand
28.3
1%2.
64%
13.0
5%22
.48%
11.2
6%6.
68%
5.93
%0
.62%
0.4
0%
3.46
%2.
34%
2.83
%
Wes
t Ben
gal
27.9
3%0
.71%
8.0
8%19
.75%
6.59
%9.
19%
7.57
%2.
78%
1.68
%7.
55%
4.0
6%4.
10%
Union Territory
And
aman
& N
ico
bar
Isla
nds
44.1
4%0
.00
%0
.00
%37
.90
%0
.00
%1.
78%
4.50
%0
.00
%3.
66%
6.23
%1.
78%
0.0
0%
Cha
ndig
arh
31.3
2%1.
93%
11.3
1%19
.74%
8.72
%5.
54%
8.73
%2.
76%
1.0
2%4.
83%
2.46
%1.
63%
Dad
ra &
Nag
ar H
avel
i33
.13%
1.0
1%8.
62%
12.4
9%15
.94%
2.57
%10
.82%
5.13
%0
.00
%5.
31%
2.89
%2.
09%
Dam
an &
Diu
30.7
2%1.
12%
11.0
9%15
.88%
18.2
6%1.
46%
7.11
%2.
59%
0.0
0%
1.63
%5.
06%
5.0
8%
Del
hi30
.98%
2.84
%13
.19%
20.2
0%
9.16
%1.
36%
8.0
9%3.
75%
0.1
4%3.
35%
4.0
5%2.
88%
Jam
mu
& K
ashm
ir &
Lad
akh
30.9
7%2.
29%
5.69
%25
.25%
9.85
%5.
88%
7.84
%1.
28%
0.9
4%4.
38%
4.16
%1.
47%
Laks
had
wee
p47
.49%
7.92
%12
.98%
0.0
0%
11.8
4%7.
40%
1.16
%2.
77%
0.0
0%
2.77
%1.
16%
4.49
%
Pud
uche
rry
30.7
2%5.
04%
2.72
%35
.17%
0.5
1%6.
10%
7.28
%1.
18%
0.8
2%6.
14%
3.18
%1.
16%
Ind
ia29
.70
%1.
67%
10.5
3%18
.17%
10.8
0%
6.79
%7.
27%
1.92
%1.
54%
5.74
%3.
12%
2.74
%
TABle 10- STATe/UT-WISe: INDICATor CoNTrIBUTIoN To The MpI SCore (UrBAN)TABle 9- STATe/UT-WISe: INDICATor CoNTrIBUTIoN To The MpI SCore (rUrAl)
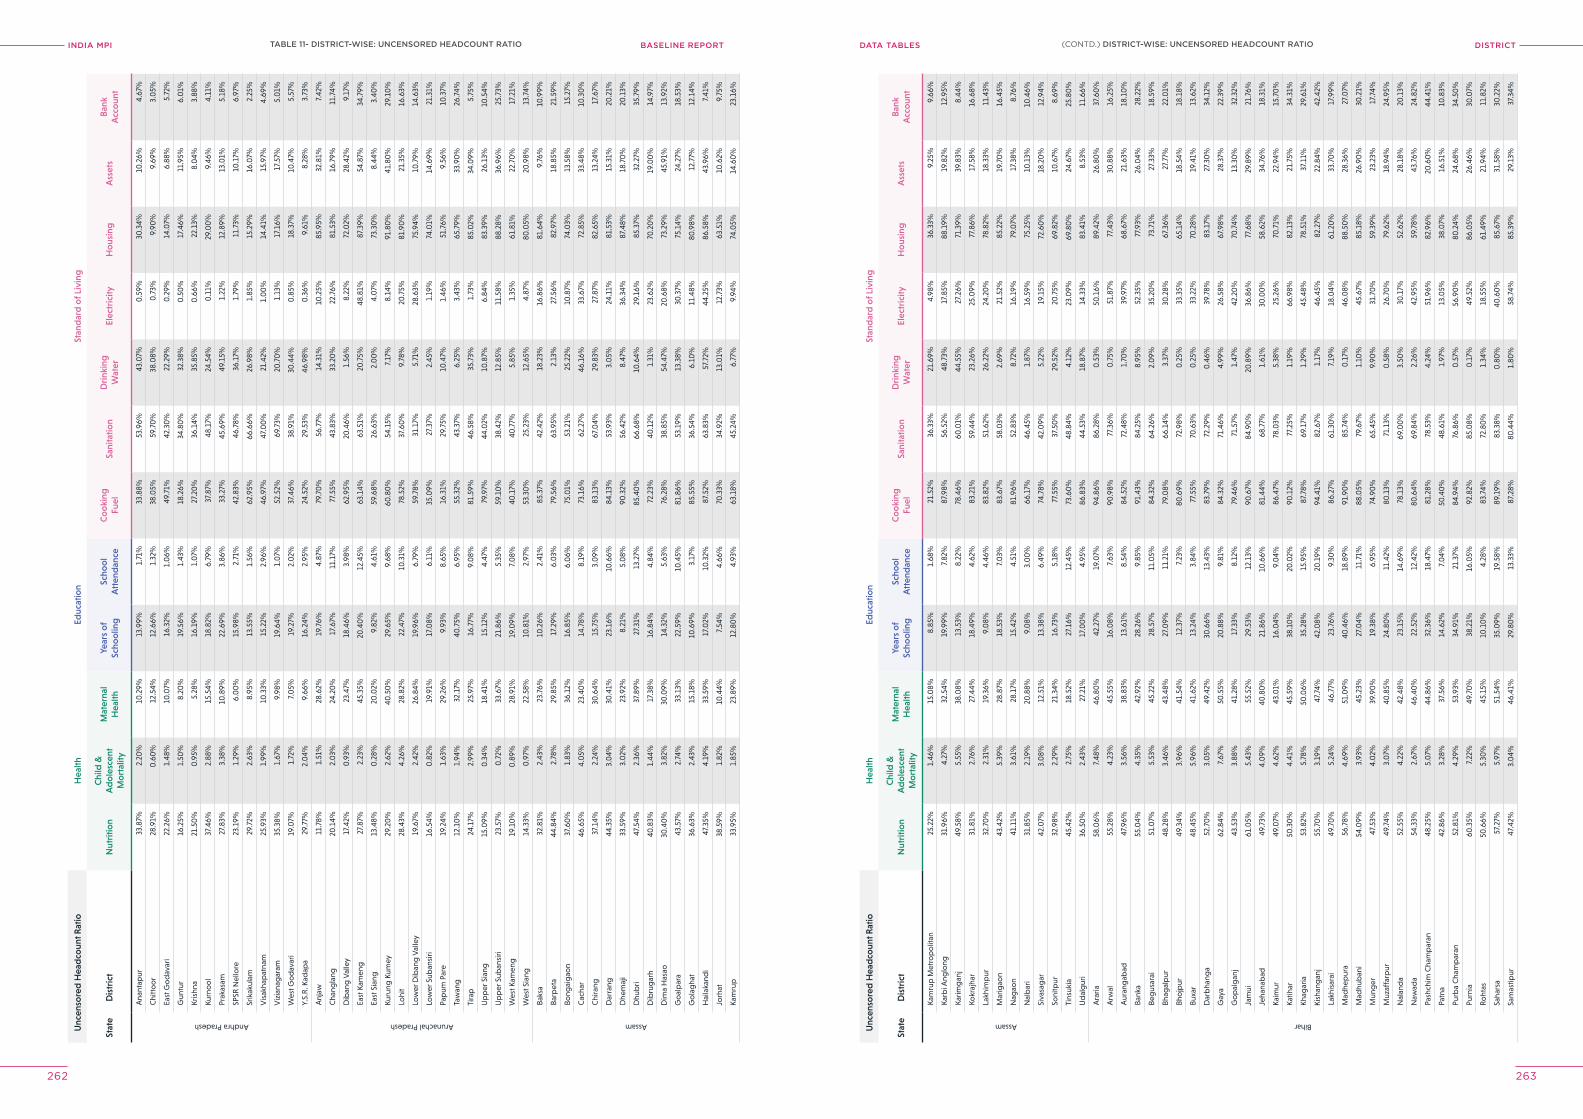
INDIA MPI BASELINE REPORT DISTrICTDATA TABleS
262 263
Unc
enso
red
Hea
dco
unt R
atio
Hea
lthEd
ucat
ion
Stan
dar
d o
f Liv
ing
Stat
eD
istr
ict
Nut
ritio
nC
hild
&
Ad
ole
scen
t M
ort
ality
Mat
erna
l H
ealth
Year
s o
f Sc
hoo
ling
Scho
ol
Att
end
ance
Co
oki
ng
Fuel
Sani
tatio
nD
rink
ing
Wat
erEl
ectr
icity
Ho
usin
gA
sset
sB
ank
Acc
oun
t
Andhra Pradesh
Ana
ntap
ur33
.87%
2.20
%10
.29%
13.9
9%1.
71%
33.8
8%53
.96%
43.0
7%0
.59%
30.3
4%10
.26%
4.67
%
Chi
tto
or
28.9
1%0
.60
%12
.54%
12.6
6%1.
32%
38.0
5%59
.70
%38
.08%
0.7
3%9.
90%
9.69
%3.
05%
East
Go
dav
ari
22.2
6%1.
48%
10.0
7%16
.32%
1.0
6%49
.71%
42.3
0%
22.2
9%0
.29%
14.0
7%6.
88%
5.72
%
Gun
tur
16.2
5%1.
50%
8.20
%19
.56%
1.43
%18
.26%
34.8
0%
32.3
8%0
.50
%17
.46%
11.9
5%6.
01%
Kris
hna
21.5
0%
0.9
5%5.
28%
16.1
9%1.
07%
27.2
0%
36.1
4%35
.85%
0.6
6%22
.13%
8.0
4%3.
88%
Kurn
oo
l37
.46%
2.88
%15
.54%
18.8
2%6.
79%
37.8
7%48
.17%
24.5
4%0
.11%
29.0
0%
9.46
%4.
11%
Prak
asam
27.8
3%3.
38%
10.8
9%22
.69%
3.86
%33
.27%
45.6
9%49
.15%
1.22
%12
.89%
13.0
1%5.
18%
SPSR
Nel
lore
23.1
9%1.
29%
6.0
0%
15.9
8%2.
71%
42.8
3%46
.78%
36.1
7%1.
79%
11.7
3%10
.17%
6.97
%
Srik
akul
am29
.72%
2.63
%8.
95%
13.5
5%1.
56%
62.9
5%66
.66%
26.9
8%1.
85%
15.2
9%16
.07%
2.25
%
Vis
akha
pat
nam
25.9
3%1.
99%
10.3
3%15
.22%
2.96
%46
.97%
47.0
0%
21.4
2%1.
00
%14
.41%
15.9
7%4.
69%
Viz
iana
gar
am35
.38%
1.67
%9.
98%
19.6
4%1.
07%
52.5
2%69
.73%
20.7
0%
1.13
%17
.16%
17.5
7%5.
01%
Wes
t Go
dav
ari
19.0
7%1.
72%
7.0
5%19
.27%
2.0
2%37
.46%
38.9
1%30
.44%
0.8
5%18
.37%
10.4
7%5.
57%
Y.S.
R. K
adap
a29
.77%
2.0
4%9.
66%
16.2
4%2.
95%
24.5
2%29
.53%
46.9
8%0
.36%
9.61
%8.
28%
3.73
%
Arunachal Pradesh
Anj
aw11
.78%
1.51
%28
.62%
19.7
6%4.
87%
79.7
0%
56.7
7%14
.31%
10.2
5%85
.95%
32.8
1%7.
42%
Cha
ngla
ng20
.14%
2.0
3%24
.20
%17
.67%
11.1
7%77
.55%
43.8
3%33
.20
%22
.76%
81.5
3%16
.79%
11.7
4%
Dib
ang
Val
ley
17.4
2%0
.93%
23.4
7%18
.46%
3.98
%62
.95%
20.4
6%1.
56%
8.22
%72
.02%
28.4
2%9.
17%
East
Kam
eng
27.8
7%2.
23%
45.3
5%20
.40
%12
.45%
63.1
4%63
.51%
20.7
5%48
.81%
87.3
9%54
.87%
34.7
9%
East
Sia
ng13
.48%
0.2
8%20
.02%
9.82
%4.
61%
59.6
8%26
.63%
2.0
0%
4.0
7%73
.30
%8.
44%
3.40
%
Kuru
ng K
umey
29.2
0%
2.62
%40
.50
%29
.65%
9.68
%60
.80
%54
.15%
7.17
%8.
14%
91.8
0%
41.8
0%
29.1
0%
Lohi
t28
.43%
4.26
%28
.82%
22.4
7%10
.31%
78.5
2%37
.60
%9.
78%
20.7
5%81
.90
%21
.35%
16.6
3%
Low
er D
iban
g V
alle
y19
.67%
2.42
%26
.84%
19.9
6%6.
79%
59.7
8%31
.17%
5.71
%28
.63%
75.9
4%10
.79%
14.6
3%
Low
er S
uban
siri
16.5
4%0
.82%
19.9
1%17
.08%
6.11
%35
.09%
27.3
7%2.
45%
1.19
%74
.01%
14.6
9%21
.31%
Pap
um P
are
19.2
4%1.
63%
29.2
6%9.
93%
8.65
%16
.31%
29.7
5%10
.47%
1.46
%51
.76%
9.56
%10
.37%
Taw
ang
12.1
0%
1.94
%32
.17%
40.7
5%6.
95%
55.3
2%43
.37%
6.25
%3.
43%
65.7
9%33
.90
%26
.74%
Tira
p24
.17%
2.99
%25
.97%
16.7
7%9.
08%
81.5
9%46
.58%
35.7
3%1.
73%
85.0
2%34
.09%
5.75
%
Up
per
Sia
ng15
.09%
0.3
4%18
.41%
15.1
2%4.
47%
79.9
7%44
.02%
10.8
7%6.
84%
83.3
9%26
.13%
10.5
4%
Up
per
Sub
ansi
ri23
.57%
0.7
2%33
.67%
21.8
6%5.
35%
59.1
0%
38.4
2%12
.85%
11.5
8%88
.28%
36.9
6%25
.73%
Wes
t Kam
eng
19.1
0%
0.8
9%28
.91%
19.0
9%7.
08%
40.1
7%40
.77%
5.85
%1.
35%
61.8
1%22
.70
%17
.21%
Wes
t Sia
ng14
.33%
0.9
7%22
.58%
10.8
1%2.
97%
53.3
0%
25.2
3%12
.65%
4.87
%80
.05%
20.9
8%13
.74%
Assam
Baks
a32
.81%
2.43
%23
.76%
10.2
6%2.
41%
85.3
7%42
.42%
18.2
3%16
.86%
81.6
4%9.
76%
10.9
9%
Barp
eta
44.8
4%2.
78%
29.8
5%17
.29%
6.0
3%79
.56%
63.9
5%2.
13%
27.5
6%82
.97%
18.8
5%21
.59%
Bong
aig
aon
37.6
0%
1.83
%36
.12%
16.8
5%6.
06%
75.0
1%53
.21%
25.2
2%10
.87%
74.0
3%13
.58%
15.2
7%
Cac
har
46.6
5%4.
05%
23.4
0%
14.7
8%8.
19%
73.1
6%62
.27%
46.1
6%33
.67%
72.8
5%33
.48%
10.3
0%
Chi
rang
37.1
4%2.
24%
30.6
4%15
.75%
3.0
9%83
.13%
67.0
4%29
.83%
27.8
7%82
.65%
13.2
4%17
.67%
Dar
rang
44.3
5%3.
04%
30.4
1%23
.16%
10.6
6%84
.13%
53.9
3%3.
05%
24.1
1%81
.53%
15.3
1%20
.21%
Dhe
maj
i33
.59%
3.0
2%23
.92%
8.21
%5.
08%
90.3
2%56
.42%
8.47
%36
.34%
87.4
8%18
.70
%20
.13%
Dhu
bri
47.5
4%2.
36%
37.8
9%27
.31%
13.2
7%85
.40
%66
.68%
10.6
4%29
.16%
85.3
7%32
.27%
35.7
9%
Dib
rug
arh
40.8
3%1.
44%
17.3
8%16
.84%
4.84
%72
.23%
40.1
2%1.
31%
23.6
2%70
.20
%19
.00
%14
.97%
Dim
a H
asao
30.4
0%
3.82
%30
.09%
14.3
2%5.
63%
76.2
8%38
.85%
54.4
7%20
.68%
73.2
9%45
.91%
13.9
2%
Go
alp
ara
43.5
7%2.
74%
33.1
3%22
.59%
10.4
5%81
.86%
53.1
9%13
.38%
30.3
7%75
.14%
24.2
7%18
.53%
Go
lag
hat
36.6
3%2.
43%
15.1
8%10
.69%
3.17
%85
.55%
36.5
4%6.
10%
11.4
8%80
.98%
12.7
7%12
.14%
Hai
laka
ndi
47.3
5%4.
19%
33.5
9%17
.02%
10.3
2%87
.52%
63.8
3%57
.72%
44.2
5%86
.58%
43.9
6%7.
41%
Jorh
at38
.59%
1.82
%10
.44%
7.54
%4.
66%
70.3
3%34
.92%
13.0
1%12
.73%
63.5
1%10
.62%
9.75
%
Kam
rup
33.9
5%1.
85%
23.8
9%12
.80
%4.
93%
63.1
8%45
.24%
6.77
%9.
94%
74.0
5%14
.60
%23
.16%
Unc
enso
red
Hea
dco
unt R
atio
Hea
lthEd
ucat
ion
Stan
dar
d o
f Liv
ing
Stat
eD
istr
ict
Nut
ritio
nC
hild
&
Ad
ole
scen
t M
ort
ality
Mat
erna
l H
ealth
Year
s o
f Sc
hoo
ling
Scho
ol
Att
end
ance
Co
oki
ng
Fuel
Sani
tatio
nD
rink
ing
Wat
erEl
ectr
icity
Ho
usin
gA
sset
sB
ank
Acc
oun
t
Assam
Kam
rup
Met
rop
olit
an25
.22%
1.46
%15
.08%
8.85
%1.
68%
21.5
2%36
.33%
21.6
9%4.
98%
36.3
3%9.
25%
9.66
%
Karb
i Ang
long
31.9
6%4.
27%
32.5
4%19
.99%
7.82
%87
.98%
56.5
2%48
.73%
17.8
5%88
.19%
19.8
2%12
.95%
Karim
gan
j49
.58%
5.55
%38
.08%
13.5
3%8.
22%
78.4
6%60
.01%
44.5
5%27
.26%
71.3
9%39
.83%
8.44
%
Kokr
ajha
r31
.81%
2.76
%27
.44%
18.4
9%4.
62%
83.2
1%59
.44%
23.2
6%25
.09%
77.8
6%17
.58%
16.6
8%
Lakh
imp
ur32
.70
%2.
31%
19.3
6%9.
08%
4.46
%83
.82%
51.6
2%26
.22%
24.2
0%
78.8
2%18
.33%
11.4
3%
Mar
igao
n43
.42%
5.39
%28
.87%
18.5
3%7.
03%
83.6
7%58
.03%
2.69
%21
.52%
85.2
2%19
.70
%16
.45%
Nag
aon
41.1
1%3.
61%
28.1
7%15
.42%
4.51
%81
.96%
52.8
3%8.
72%
16.1
9%79
.07%
17.3
8%8.
76%
Nal
bar
i31
.85%
2.19
%20
.88%
9.0
8%3.
00
%66
.17%
46.4
5%1.
87%
16.5
9%75
.25%
10.1
3%10
.46%
Siva
sag
ar42
.07%
3.0
8%12
.51%
13.3
8%6.
49%
74.7
8%42
.09%
5.22
%19
.15%
72.6
0%
18.2
0%
12.9
4%
Soni
tpur
32.9
8%2.
29%
21.3
4%16
.73%
5.18
%77
.55%
37.5
0%
29.5
2%20
.75%
69.8
2%10
.67%
8.69
%
Tins
ukia
45.4
2%2.
75%
18.5
2%27
.16%
12.4
5%73
.60
%48
.84%
4.12
%23
.09%
69.8
0%
24.6
7%25
.80
%
Ud
alg
uri
36.5
0%
2.43
%27
.21%
17.0
0%
4.95
%86
.83%
44.5
3%18
.87%
14.3
3%83
.41%
8.53
%11
.66%
Bihar
Ara
ria58
.06%
7.48
%46
.80
%42
.27%
19.0
7%94
.86%
86.2
8%0
.53%
50.1
6%89
.42%
26.8
0%
37.6
0%
Arw
al55
.28%
4.23
%45
.55%
16.0
8%7.
63%
90.9
8%77
.36%
0.7
5%51
.87%
77.4
3%30
.88%
16.2
5%
Aur
ang
abad
47.9
6%3.
56%
38.8
3%13
.61%
8.54
%84
.52%
72.4
8%1.
70%
39.9
7%68
.67%
21.6
3%18
.10
%
Bank
a55
.04%
4.35
%42
.92%
28.2
6%9.
85%
91.4
3%84
.25%
8.95
%52
.35%
77.9
3%26
.04%
28.2
2%
Beg
usar
ai51
.07%
5.53
%45
.22%
28.5
7%11
.05%
84.3
2%64
.26%
2.0
9%35
.20
%73
.71%
27.3
3%18
.59%
Bhag
alp
ur48
.28%
3.46
%43
.48%
27.0
9%11
.21%
79.0
8%66
.14%
3.37
%30
.28%
67.3
6%27
.77%
22.0
1%
Bho
jpur
49.3
4%3.
96%
41.5
4%12
.37%
7.23
%80
.69%
72.9
8%0
.25%
33.3
5%65
.14%
18.5
4%18
.18%
Buxa
r48
.45%
5.96
%41
.62%
13.2
4%3.
84%
77.5
5%70
.63%
0.2
5%33
.22%
70.2
8%19
.41%
13.6
2%
Dar
bha
nga
52.7
0%
3.0
5%49
.42%
30.6
6%13
.43%
83.7
9%72
.29%
0.4
6%39
.78%
83.1
7%27
.30
%34
.12%
Gay
a62
.84%
7.67
%50
.55%
20.8
8%9.
81%
84.3
2%71
.46%
4.99
%26
.58%
67.9
8%28
.37%
22.3
9%
Go
pal
gan
j43
.53%
3.88
%41
.28%
17.3
3%8.
12%
79.4
6%71
.57%
1.47
%42
.20
%70
.74%
13.3
0%
32.3
2%
Jam
ui61
.05%
5.43
%55
.52%
29.5
3%12
.13%
90.6
7%84
.90
%20
.89%
36.8
6%77
.68%
29.8
9%21
.76%
Jeha
nab
ad49
.73%
4.0
9%40
.80
%21
.86%
10.6
6%81
.44%
68.7
7%1.
61%
30.0
0%
58.6
2%34
.76%
18.3
1%
Kaim
ur49
.07%
4.62
%43
.01%
16.0
4%9.
04%
86.4
7%78
.03%
5.38
%25
.26%
70.7
1%22
.94%
15.7
0%
Katih
ar50
.30
%4.
41%
45.5
9%38
.10
%20
.02%
90.1
2%77
.25%
1.19
%66
.98%
82.1
3%21
.75%
34.3
1%
Khag
aria
53.8
2%5.
78%
50.0
6%35
.28%
15.9
5%87
.78%
69.1
7%1.
29%
45.4
8%78
.51%
37.1
1%29
.61%
Kish
ang
anj
55.7
0%
3.19
%47
.74%
42.0
8%20
.19%
94.4
1%82
.67%
1.17
%46
.45%
82.2
7%22
.84%
42.4
2%
Lakh
isar
ai49
.70
%5.
24%
46.7
7%23
.76%
9.30
%86
.27%
61.3
0%
7.19
%18
.04%
61.2
0%
33.7
0%
17.9
9%
Mad
hep
ura
56.7
8%4.
69%
51.0
9%40
.46%
18.8
9%91
.90
%85
.74%
0.1
7%46
.08%
88.5
0%
28.3
6%27
.07%
Mad
hub
ani
54.0
9%3.
93%
45.2
3%27
.04%
11.7
1%88
.05%
79.6
7%1.
10%
45.6
7%85
.18%
26.9
0%
30.2
1%
Mun
ger
47.5
3%4.
02%
39.9
0%
19.3
8%6.
95%
74.9
0%
65.4
5%9.
90%
31.7
0%
59.3
9%23
.23%
17.7
4%
Muz
affa
rpur
49.7
4%3.
07%
40.8
5%24
.80
%11
.42%
80.1
3%71
.13%
0.5
8%26
.70
%79
.62%
18.9
4%24
.95%
Nal
and
a52
.55%
4.22
%42
.48%
23.1
5%14
.69%
78.1
3%69
.00
%3.
50%
30.1
7%52
.62%
28.1
8%20
.13%
Naw
ada
54.3
3%2.
67%
46.4
0%
22.5
2%12
.42%
80.6
4%69
.84%
2.26
%42
.95%
59.7
8%43
.76%
24.8
2%
Pash
chim
Cha
mp
aran
48.2
5%5.
07%
44.8
6%32
.36%
18.4
7%81
.28%
78.5
3%4.
24%
51.9
6%82
.96%
20.6
0%
44.4
1%
Patn
a42
.86%
3.28
%37
.56%
14.6
2%7.
04%
50.4
0%
48.6
1%1.
97%
13.0
5%38
.07%
16.5
1%10
.83%
Purb
a C
ham
par
an52
.81%
4.29
%53
.93%
34.9
1%21
.37%
84.9
4%76
.86%
0.5
7%56
.90
%80
.24%
24.6
8%34
.50
%
Purn
ia60
.35%
7.22
%49
.70
%38
.21%
16.0
5%92
.82%
85.0
8%0
.17%
49.5
2%86
.05%
26.4
6%30
.07%
Roht
as50
.66%
5.30
%45
.15%
10.1
0%
4.28
%83
.74%
72.8
0%
1.34
%18
.55%
61.4
9%21
.94%
11.8
2%
Saha
rsa
57.2
7%5.
97%
51.5
4%35
.09%
19.5
8%89
.19%
83.3
8%0
.80
%40
.60
%85
.67%
31.5
8%30
.22%
Sam
astip
ur47
.42%
3.0
4%46
.41%
29.8
0%
13.3
3%87
.28%
80.4
4%1.
80%
58.7
4%85
.39%
29.1
3%37
.34%
(CONTD.) DISTrICT-WISe: UNCeNSoreD heADCoUNT rATIoTABle 11- DISTrICT-WISe: UNCeNSoreD heADCoUNT rATIo
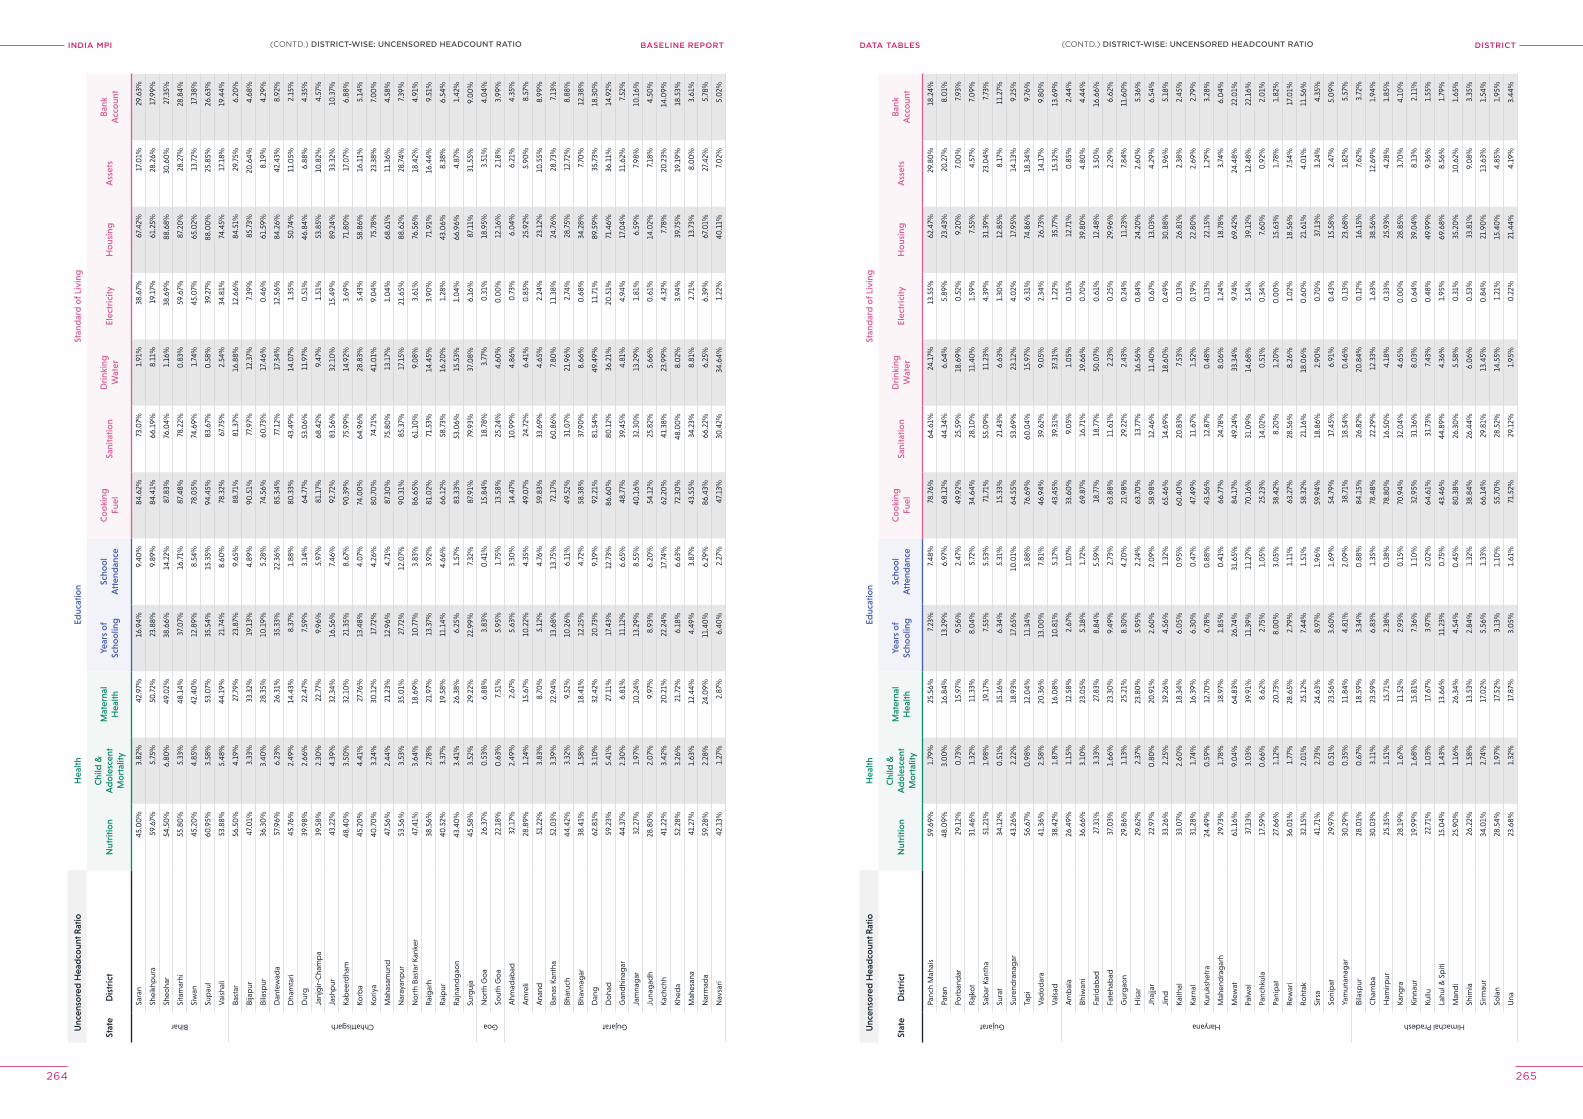
INDIA MPI BASELINE REPORT DISTrICTDATA TABleS
264 265
Unc
enso
red
Hea
dco
unt R
atio
Hea
lthEd
ucat
ion
Stan
dar
d o
f Liv
ing
Stat
eD
istr
ict
Nut
ritio
nC
hild
&
Ad
ole
scen
t M
ort
ality
Mat
erna
l H
ealth
Year
s o
f Sc
hoo
ling
Scho
ol
Att
end
ance
Co
oki
ng
Fuel
Sani
tatio
nD
rink
ing
Wat
erEl
ectr
icity
Ho
usin
gA
sset
sB
ank
Acc
oun
t
Bihar
Sara
n45
.00
%3.
82%
42.9
7%16
.94%
9.40
%84
.62%
73.0
7%1.
91%
38.6
7%67
.42%
17.0
1%29
.63%
Shei
khp
ura
59.6
7%5.
75%
50.7
2%23
.88%
9.89
%84
.41%
66.1
9%8.
11%
19.1
7%61
.25%
28.2
6%17
.99%
Sheo
har
54.5
0%
6.80
%49
.02%
38.6
6%14
.22%
87.8
3%76
.04%
1.16
%38
.69%
88.6
8%30
.60
%27
.35%
Sita
mar
hi55
.80
%5.
33%
48.1
4%37
.07%
16.7
1%87
.48%
78.2
2%0
.83%
59.6
7%87
.20
%28
.27%
28.8
4%
Siw
an45
.20
%4.
85%
42.4
0%
12.8
9%8.
54%
78.0
5%74
.69%
1.74
%45
.07%
65.0
2%13
.72%
17.3
8%
Sup
aul
60.9
5%3.
58%
53.0
7%35
.54%
15.3
5%94
.45%
83.6
7%0
.58%
39.2
7%88
.00
%25
.85%
26.6
3%
Vai
shal
i53
.88%
5.48
%44
.19%
21.7
4%8.
60%
78.3
2%67
.75%
2.54
%34
.81%
74.4
5%17
.18%
19.4
4%
Chhattisgarh
Bast
ar56
.50
%4.
19%
27.7
9%23
.87%
9.65
%88
.71%
81.3
7%16
.88%
12.6
6%84
.51%
29.7
5%6.
20%
Bija
pur
47.0
1%3.
33%
33.3
2%19
.13%
4.89
%90
.51%
77.9
7%12
.37%
7.39
%85
.73%
20.6
4%4.
68%
Bila
spur
36.3
0%
3.40
%28
.35%
10.1
9%5.
28%
74.5
6%60
.73%
17.4
6%0
.46%
61.5
9%8.
19%
4.29
%
Dan
tew
ada
57.9
6%6.
23%
26.3
1%35
.33%
22.3
6%85
.34%
77.1
2%17
.34%
12.5
6%84
.26%
42.4
3%8.
92%
Dha
mta
ri45
.76%
2.49
%14
.43%
8.37
%1.
88%
80.3
3%43
.49%
14.0
7%1.
35%
50.7
4%11
.05%
2.15
%
Dur
g39
.98%
2.66
%22
.47%
7.59
%3.
14%
64.7
7%53
.06%
11.9
7%0
.51%
46.8
4%6.
88%
4.35
%
Janj
gir-
Cha
mp
a39
.58%
2.30
%22
.77%
9.96
%5.
97%
81.1
7%68
.42%
9.47
%1.
51%
53.8
5%10
.82%
4.57
%
Jash
pur
43.2
2%4.
39%
32.3
4%16
.56%
7.46
%92
.72%
83.5
6%32
.10
%15
.49%
89.2
4%33
.32%
10.3
7%
Kab
eerd
ham
48.4
0%
3.50
%32
.10
%21
.35%
8.67
%90
.39%
75.9
9%14
.92%
3.69
%71
.80
%17
.07%
6.88
%
Korb
a45
.20
%4.
41%
27.7
6%13
.48%
4.0
7%74
.00
%64
.96%
28.8
3%5.
43%
58.8
6%16
.11%
5.14
%
Koriy
a40
.70
%3.
24%
30.1
2%17
.72%
4.26
%80
.70
%74
.71%
41.0
1%9.
04%
75.7
8%23
.38%
7.0
0%
Mah
asam
und
47.5
6%2.
44%
21.2
3%12
.96%
4.71
%87
.30
%75
.80
%13
.17%
1.0
4%68
.61%
11.3
6%4.
58%
Nar
ayan
pur
53.5
6%3.
53%
35.0
1%27
.72%
12.0
7%90
.31%
85.3
7%17
.15%
21.6
5%88
.62%
28.7
4%7.
39%
No
rth
Bast
ar K
anke
r47
.41%
3.64
%18
.69%
10.7
7%3.
83%
86.6
5%61
.10
%9.
08%
3.61
%76
.56%
18.4
2%4.
91%
Rai
gar
h38
.56%
2.78
%21
.97%
13.3
7%3.
92%
81.0
2%71
.53%
14.4
5%3.
90%
71.9
1%16
.44%
9.51
%
Rai
pur
40.5
2%3.
37%
19.5
8%11
.14%
4.66
%66
.12%
58.7
3%16
.20
%1.
28%
43.0
6%8.
38%
6.54
%
Raj
nand
gao
n43
.40
%3.
41%
26.3
8%6.
25%
1.57
%83
.33%
53.0
6%15
.53%
1.0
4%66
.96%
4.87
%1.
42%
Surg
uja
45.5
8%3.
52%
29.2
2%22
.99%
7.32
%87
.91%
79.9
3%37
.08%
6.16
%87
.11%
31.5
5%9.
00
%
Goa
No
rth
Go
a26
.37%
0.5
3%6.
88%
3.83
%0
.41%
15.8
4%18
.78%
3.77
%0
.31%
18.9
5%3.
51%
4.0
4%
Sout
h G
oa
22.1
8%0
.63%
7.51
%5.
95%
1.75
%13
.58%
25.2
4%4.
60%
0.0
0%
12.1
6%2.
18%
3.99
%
Gujarat
Ahm
adab
ad32
.17%
2.49
%2.
67%
5.63
%3.
30%
14.4
7%10
.99%
4.86
%0
.73%
6.0
4%6.
21%
4.35
%
Am
reli
28.8
9%1.
24%
15.6
7%10
.22%
4.35
%49
.07%
24.7
2%6.
41%
0.8
5%25
.92%
5.90
%8.
57%
Ana
nd51
.22%
3.83
%8.
70%
5.12
%4.
76%
59.8
3%33
.69%
4.65
%2.
24%
23.1
2%10
.55%
8.99
%
Bana
s Ka
ntha
52.0
3%3.
39%
22.9
4%13
.68%
13.7
5%72
.17%
60.8
6%7.
80%
11.3
8%24
.76%
28.7
3%7.
13%
Bhar
uch
44.4
2%3.
32%
9.52
%10
.26%
6.11
%49
.52%
31.0
7%21
.96%
2.74
%28
.75%
12.7
2%8.
88%
Bhav
nag
ar38
.41%
1.58
%18
.41%
12.2
5%4.
72%
58.3
8%37
.90
%8.
66%
0.6
8%34
.28%
7.70
%12
.38%
Dan
g62
.81%
3.10
%32
.42%
20.7
3%9.
19%
92.2
1%81
.54%
49.4
9%11
.71%
89.5
9%35
.73%
18.3
0%
Do
had
59.2
3%5.
41%
27.1
1%17
.43%
12.7
3%86
.60
%80
.12%
36.2
1%20
.51%
71.4
6%36
.11%
14.9
2%
Gan
dhi
nag
ar44
.37%
2.30
%6.
81%
11.1
2%6.
65%
48.7
7%39
.45%
4.81
%4.
94%
17.0
4%11
.62%
7.52
%
Jam
nag
ar32
.27%
1.97
%10
.24%
13.2
9%8.
55%
40.1
6%32
.30
%13
.29%
1.81
%6.
59%
7.98
%10
.16%
Juna
gad
h28
.80
%2.
07%
9.97
%8.
93%
6.20
%54
.12%
25.8
2%5.
66%
0.6
1%14
.02%
7.18
%4.
50%
Kach
chh
41.2
2%3.
42%
20.2
1%22
.24%
17.7
4%62
.20
%41
.38%
23.9
9%4.
32%
7.78
%20
.23%
14.0
9%
Khed
a52
.28%
3.26
%21
.72%
6.18
%6.
63%
72.3
0%
48.0
0%
8.0
2%3.
94%
39.7
5%19
.19%
18.5
3%
Mah
esan
a41
.27%
1.63
%12
.44%
4.49
%3.
87%
43.5
5%34
.23%
8.81
%2.
71%
13.7
3%8.
00
%3.
61%
Nar
mad
a59
.28%
2.28
%24
.09%
11.4
0%
6.29
%86
.43%
66.2
2%6.
25%
6.39
%67
.01%
27.4
2%5.
78%
Nav
sari
42.1
3%1.
27%
2.87
%6.
40%
2.27
%47
.13%
30.4
2%34
.64%
1.22
%40
.11%
7.0
2%5.
02%
Unc
enso
red
Hea
dco
unt R
atio
Hea
lthEd
ucat
ion
Stan
dar
d o
f Liv
ing
Stat
eD
istr
ict
Nut
ritio
nC
hild
&
Ad
ole
scen
t M
ort
ality
Mat
erna
l H
ealth
Year
s o
f Sc
hoo
ling
Scho
ol
Att
end
ance
Co
oki
ng
Fuel
Sani
tatio
nD
rink
ing
Wat
erEl
ectr
icity
Ho
usin
gA
sset
sB
ank
Acc
oun
t
Gujarat
Panc
h M
ahal
s59
.69%
1.79
%25
.56%
7.23
%7.
48%
78.7
6%64
.61%
24.1
7%13
.55%
62.4
7%29
.80
%18
.24%
Pata
n48
.09%
3.0
0%
16.8
4%13
.29%
6.97
%68
.12%
44.3
4%6.
64%
5.89
%23
.43%
20.2
7%8.
01%
Porb
and
ar29
.12%
0.7
3%15
.97%
9.56
%2.
47%
49.9
2%25
.59%
18.6
9%0
.52%
9.20
%7.
00
%7.
93%
Raj
kot
31.4
6%1.
32%
11.3
3%8.
04%
5.72
%34
.64%
28.1
0%
11.4
0%
1.59
%7.
55%
4.57
%7.
09%
Sab
ar K
anth
a51
.21%
1.98
%19
.17%
7.55
%5.
53%
71.7
1%55
.09%
11.2
3%4.
39%
31.3
9%23
.04%
7.73
%
Sura
t34
.12%
0.5
1%15
.16%
6.34
%5.
31%
15.3
3%21
.43%
6.63
%1.
30%
12.8
5%8.
17%
11.2
7%
Sure
ndra
nag
ar43
.26%
2.22
%18
.93%
17.6
5%10
.01%
64.5
5%53
.69%
23.1
2%4.
02%
17.9
5%14
.13%
9.25
%
Tap
i56
.67%
0.9
8%12
.04%
11.3
4%3.
88%
76.6
9%60
.04%
15.9
7%6.
31%
74.8
6%18
.34%
9.76
%
Vad
od
ara
41.3
6%2.
58%
20.3
6%13
.00
%7.
81%
46.9
4%39
.62%
9.0
5%2.
34%
26.7
3%14
.17%
9.80
%
Val
sad
38.4
2%1.
87%
16.0
8%10
.81%
5.17
%43
.45%
39.3
1%37
.31%
1.22
%35
.77%
15.3
2%13
.69%
Haryana
Am
bal
a26
.49%
1.15
%12
.58%
2.67
%1.
07%
33.6
0%
9.0
5%1.
05%
0.1
5%12
.71%
0.8
5%2.
44%
Bhiw
ani
36.6
6%3.
10%
23.0
5%5.
18%
1.72
%69
.87%
16.7
1%19
.66%
0.7
0%
39.8
0%
4.80
%4.
44%
Farid
abad
27.3
1%3.
33%
27.8
3%8.
84%
5.59
%18
.77%
18.7
7%50
.07%
0.6
1%12
.48%
3.50
%16
.66%
Fate
hab
ad37
.03%
1.66
%23
.30
%9.
49%
2.73
%63
.88%
11.6
1%2.
23%
0.2
5%29
.96%
2.29
%6.
62%
Gur
gao
n29
.86%
1.13
%25
.21%
8.30
%4.
20%
21.9
8%29
.22%
2.43
%0
.24%
11.2
3%7.
84%
11.6
0%
His
ar29
.62%
2.37
%23
.80
%5.
95%
2.24
%63
.70
%13
.77%
16.5
6%0
.84%
24.2
0%
2.60
%5.
36%
Jhaj
jar
22.9
7%0
.80
%20
.91%
2.60
%2.
09%
58.9
8%12
.46%
11.4
0%
0.6
7%13
.03%
4.29
%6.
54%
Jind
33.2
6%2.
25%
19.2
6%4.
56%
1.32
%65
.46%
14.6
9%18
.60
%0
.49%
30.8
8%1.
96%
5.18
%
Kaith
al33
.07%
2.60
%18
.34%
6.0
5%0
.95%
60.4
0%
20.8
3%7.
53%
0.1
3%26
.81%
2.38
%2.
45%
Karn
al31
.28%
1.74
%16
.39%
6.30
%0
.47%
47.4
9%11
.67%
1.52
%0
.19%
22.8
0%
2.69
%2.
79%
Kuru
kshe
tra
24.4
9%0
.59%
12.7
0%
6.78
%0
.88%
43.5
6%12
.87%
0.4
8%0
.13%
22.1
5%1.
29%
3.28
%
Mah
end
rag
arh
29.7
3%1.
78%
18.9
7%1.
85%
0.4
1%66
.77%
24.7
8%8.
06%
1.24
%18
.78%
3.74
%6.
04%
Mew
at61
.16%
9.0
4%64
.83%
26.7
4%31
.65%
84.1
7%49
.24%
33.3
4%9.
74%
69.4
2%24
.48%
22.0
1%
Palw
al37
.13%
3.0
3%39
.91%
11.3
9%11
.27%
70.1
6%31
.09%
14.6
8%5.
14%
39.1
2%12
.48%
22.1
6%
Panc
hkul
a17
.59%
0.6
6%8.
62%
2.75
%1.
05%
25.2
3%14
.02%
0.5
1%0
.34%
7.60
%0
.92%
2.0
1%
Pani
pat
27.6
6%1.
12%
20.7
3%8.
00
%3.
05%
38.4
2%8.
20%
1.20
%0
.00
%15
.63%
1.78
%1.
82%
Rew
ari
36.0
1%1.
77%
28.6
5%2.
79%
1.11
%63
.27%
28.5
6%8.
26%
1.0
2%18
.56%
7.54
%17
.01%
Roht
ak32
.15%
2.0
1%25
.12%
7.44
%1.
51%
58.3
2%21
.16%
18.0
6%0
.60
%21
.61%
4.0
1%11
.56%
Sirs
a41
.71%
2.73
%24
.63%
8.97
%1.
96%
59.9
4%18
.86%
2.90
%0
.70
%37
.13%
3.24
%4.
35%
Soni
pat
29.9
7%0
.51%
23.5
6%3.
60%
1.69
%54
.79%
17.4
5%6.
91%
0.4
3%15
.58%
2.47
%5.
09%
Yam
unan
agar
30.2
9%0
.35%
11.8
4%4.
81%
2.0
9%38
.71%
18.5
4%0
.46%
0.1
3%23
.68%
1.82
%5.
57%
Himachal Pradesh
Bila
spur
28.0
1%0
.67%
18.5
9%3.
34%
0.8
8%84
.15%
26.8
2%20
.84%
0.1
2%16
.15%
7.62
%3.
72%
Cha
mb
a30
.03%
3.11
%23
.59%
6.83
%1.
35%
78.4
8%22
.29%
12.3
3%1.
63%
38.5
6%12
.69%
1.94
%
Ham
irpur
25.3
5%1.
51%
15.7
1%2.
38%
0.3
8%78
.80
%16
.50
%4.
18%
0.3
3%25
.93%
4.28
%1.
85%
Kang
ra28
.19%
1.67
%11
.52%
2.93
%0
.15%
70.9
4%32
.04%
4.65
%0
.00
%28
.85%
3.70
%4.
10%
Kinn
aur
19.9
9%1.
68%
15.8
1%7.
36%
1.10
%32
.95%
31.3
6%8.
03%
0.6
4%39
.04%
8.13
%2.
11%
Kullu
22.7
1%1.
03%
17.6
7%3.
97%
2.0
2%64
.61%
31.7
3%7.
43%
0.4
8%49
.99%
9.36
%1.
55%
Lahu
l & S
piti
15.0
4%1.
43%
13.6
6%11
.23%
0.7
5%43
.46%
44.8
9%4.
36%
1.95
%69
.68%
8.56
%1.
79%
Man
di
25.9
0%
1.16
%26
.34%
4.54
%0
.45%
80.3
8%26
.30
%5.
58%
0.3
1%35
.20
%10
.62%
1.65
%
Shim
la26
.22%
1.58
%13
.53%
2.84
%1.
32%
38.8
4%26
.44%
6.0
6%0
.53%
33.8
1%9.
08%
3.35
%
Sirm
aur
34.0
1%2.
74%
17.0
2%5.
56%
1.33
%66
.14%
29.8
1%13
.45%
0.8
4%21
.90
%13
.63%
1.54
%
Sola
n28
.54%
1.97
%17
.52%
3.13
%1.
10%
55.7
0%
28.5
2%14
.55%
1.21
%15
.40
%4.
85%
1.95
%
Una
23.6
8%1.
32%
17.8
7%3.
05%
1.61
%71
.52%
29.1
2%1.
95%
0.2
2%21
.44%
4.19
%3.
44%
(CONTD.) DISTrICT-WISe: UNCeNSoreD heADCoUNT rATIo(CONTD.) DISTrICT-WISe: UNCeNSoreD heADCoUNT rATIo
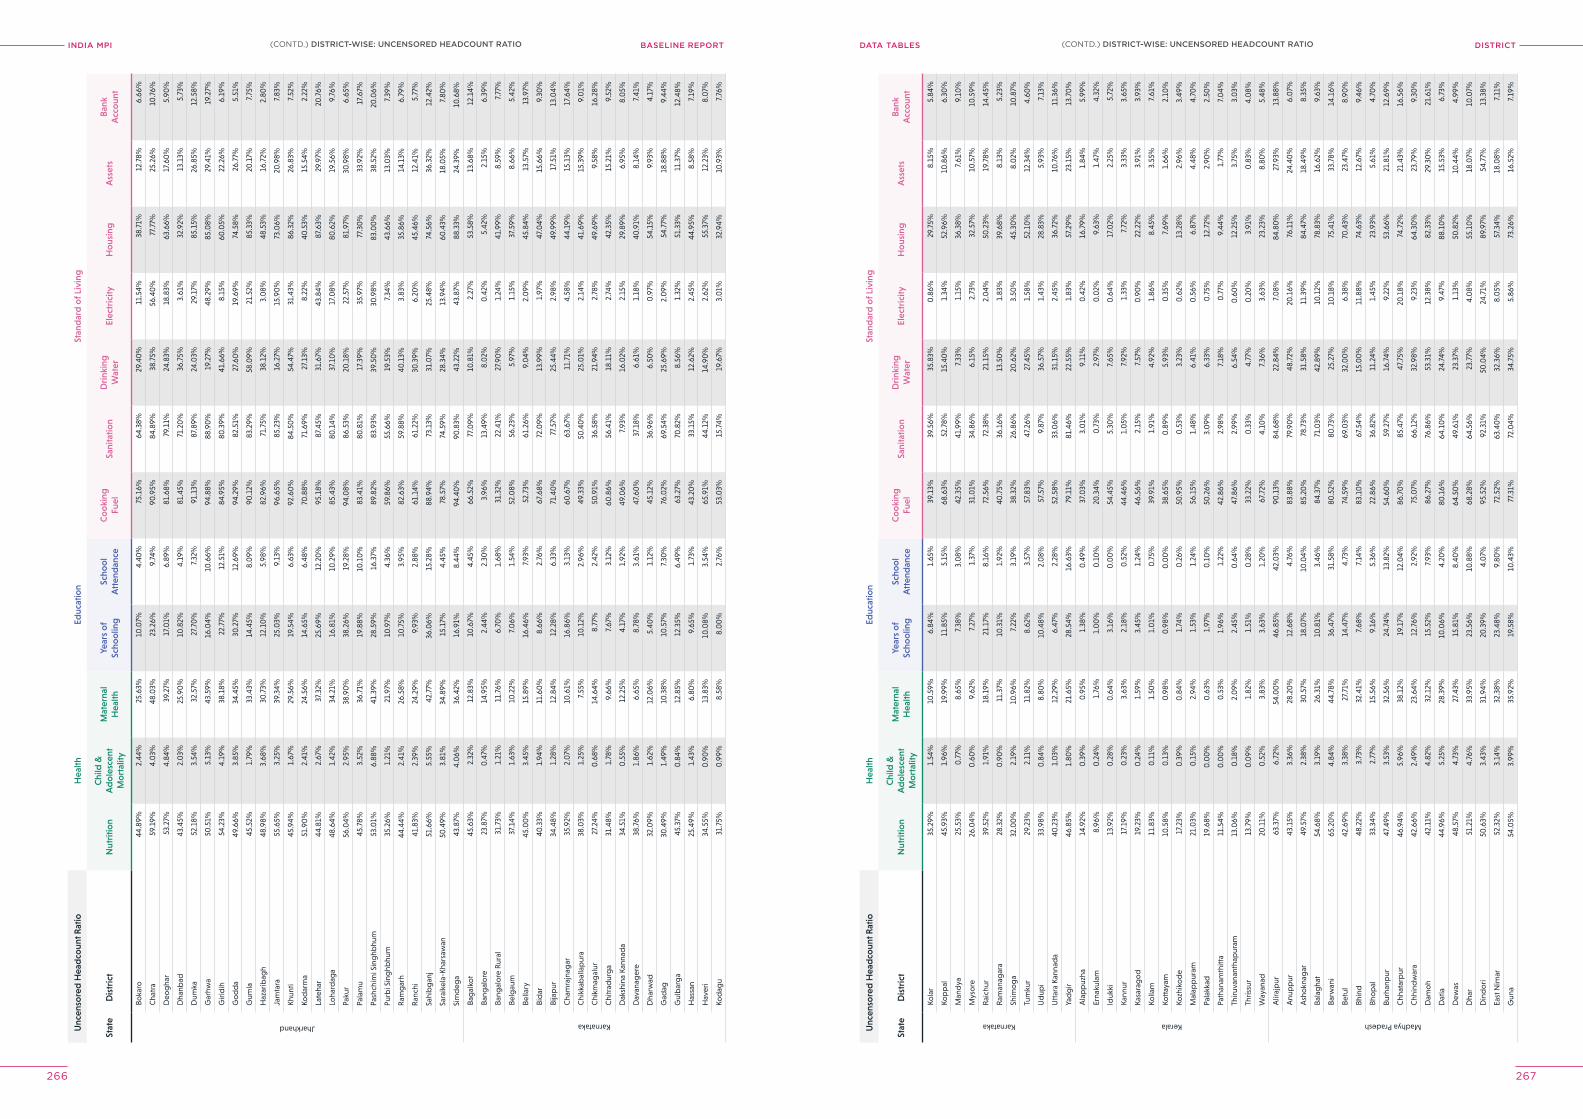
INDIA MPI BASELINE REPORT DISTrICTDATA TABleS
266 267
Unc
enso
red
Hea
dco
unt R
atio
Hea
lthEd
ucat
ion
Stan
dar
d o
f Liv
ing
Stat
eD
istr
ict
Nut
ritio
nC
hild
&
Ad
ole
scen
t M
ort
ality
Mat
erna
l H
ealth
Year
s o
f Sc
hoo
ling
Scho
ol
Att
end
ance
Co
oki
ng
Fuel
Sani
tatio
nD
rink
ing
Wat
erEl
ectr
icity
Ho
usin
gA
sset
sB
ank
Acc
oun
t
Jharkhand
Boka
ro44
.89%
2.44
%25
.63%
10.0
7%4.
40%
75.1
6%64
.38%
29.4
0%
11.5
4%38
.71%
12.7
8%6.
66%
Cha
tra
59.1
9%4.
03%
48.0
3%23
.26%
9.74
%90
.95%
84.8
9%38
.75%
56.4
0%
77.7
7%25
.26%
10.7
6%
Deo
gha
r53
.27%
4.84
%39
.27%
17.0
1%6.
89%
81.6
8%79
.11%
24.8
3%18
.83%
63.6
6%17
.60
%5.
90%
Dha
nbad
43.4
5%2.
03%
25.9
0%
10.8
2%4.
19%
81.4
5%71
.20
%36
.75%
3.61
%32
.92%
13.1
3%5.
73%
Dum
ka52
.18%
3.54
%32
.57%
27.7
0%
7.32
%91
.13%
87.8
9%24
.03%
29.1
7%85
.15%
26.8
5%12
.58%
Gar
hwa
50.5
1%5.
13%
43.5
9%16
.04%
10.6
6%94
.88%
88.9
0%
19.2
7%48
.29%
85.0
8%29
.41%
19.2
7%
Giri
dih
54.2
3%4.
19%
38.1
8%22
.77%
12.5
1%84
.95%
80.3
9%41
.66%
8.15
%60
.05%
22.2
6%6.
19%
Go
dd
a49
.66%
3.85
%34
.45%
30.2
7%12
.69%
94.2
9%82
.51%
27.6
0%
19.6
9%74
.58%
26.7
7%5.
51%
Gum
la45
.52%
1.79
%33
.43%
14.4
5%8.
09%
90.1
2%83
.29%
58.0
9%21
.52%
85.3
3%20
.17%
7.75
%
Haz
arib
agh
48.9
8%3.
68%
30.7
3%12
.10
%5.
98%
82.9
6%71
.75%
38.1
2%3.
08%
48.5
3%16
.72%
2.80
%
Jam
tara
55.6
5%3.
25%
39.3
4%25
.03%
9.13
%96
.65%
85.2
3%16
.27%
15.9
0%
73.0
6%20
.98%
7.83
%
Khun
ti45
.94%
1.67
%29
.56%
19.5
4%6.
63%
92.6
0%
84.5
0%
54.4
7%31
.43%
86.3
2%26
.83%
7.52
%
Kod
arm
a51
.90
%2.
41%
24.5
6%14
.65%
6.48
%70
.88%
71.6
9%27
.13%
8.22
%40
.53%
15.5
4%2.
22%
Late
har
44.8
1%2.
67%
37.3
2%25
.69%
12.2
0%
95.1
8%87
.45%
31.6
7%43
.84%
87.6
3%29
.97%
20.7
6%
Loha
rdag
a48
.64%
1.42
%34
.21%
16.8
1%10
.29%
85.4
3%80
.14%
37.1
0%
17.0
8%80
.62%
19.5
6%9.
76%
Paku
r56
.04%
2.95
%38
.90
%38
.26%
19.2
8%94
.08%
86.5
3%20
.18%
22.5
7%81
.97%
30.9
8%6.
65%
Pala
mu
45.7
8%3.
52%
36.7
1%19
.88%
10.1
0%
83.4
1%80
.81%
17.3
9%35
.97%
77.3
0%
33.9
2%17
.67%
Pash
chim
i Sin
ghb
hum
53.0
1%6.
88%
41.3
9%28
.59%
16.3
7%89
.82%
83.9
3%39
.50
%30
.98%
83.0
0%
38.5
2%20
.06%
Purb
i Sin
ghb
hum
35.2
6%1.
21%
21.9
7%10
.97%
4.36
%59
.86%
55.6
6%19
.53%
7.34
%43
.66%
13.0
3%7.
39%
Ram
gar
h44
.44%
2.41
%26
.58%
10.7
5%3.
95%
82.6
3%59
.88%
40.1
3%3.
83%
35.8
6%14
.13%
6.79
%
Ran
chi
41.8
3%2.
39%
24.2
9%9.
93%
2.88
%61
.14%
61.2
2%30
.39%
6.20
%45
.46%
12.4
1%5.
77%
Sahi
bg
anj
51.6
6%5.
55%
42.7
7%36
.06%
15.2
8%88
.94%
73.1
3%31
.07%
25.4
8%74
.56%
36.3
2%12
.42%
Sara
ikel
a-Kh
arsa
wan
50.4
9%3.
81%
34.8
9%15
.17%
4.45
%78
.57%
74.5
9%28
.34%
13.9
4%60
.43%
18.0
5%7.
80%
Sim
deg
a43
.87%
4.0
6%36
.42%
16.9
1%8.
44%
94.4
0%
90.8
3%43
.22%
43.8
7%88
.33%
24.3
9%10
.68%
Karnataka
Bag
alko
t45
.63%
2.32
%12
.83%
10.6
7%4.
45%
66.5
2%77
.09%
10.8
1%2.
27%
53.5
8%13
.68%
12.1
4%
Bang
alo
re23
.87%
0.4
7%14
.95%
2.44
%2.
30%
3.96
%13
.49%
8.0
2%0
.42%
5.42
%2.
15%
6.39
%
Bang
alo
re R
ural
31.7
3%1.
21%
11.7
6%6.
70%
1.68
%31
.32%
22.4
1%27
.90
%1.
24%
41.9
9%8.
59%
7.77
%
Belg
aum
37.1
4%1.
63%
10.2
2%7.
06%
1.54
%52
.08%
56.2
3%5.
97%
1.15
%37
.59%
8.66
%5.
42%
Bella
ry45
.00
%3.
45%
15.8
9%16
.46%
7.93
%52
.73%
61.2
6%9.
04%
2.0
9%45
.84%
13.5
7%13
.97%
Bid
ar40
.33%
1.94
%11
.60
%8.
66%
2.76
%67
.68%
72.0
9%13
.99%
1.97
%47
.04%
15.6
6%9.
30%
Bija
pur
34.4
8%1.
28%
12.8
4%12
.28%
6.33
%71
.40
%77
.57%
25.4
4%2.
98%
49.9
9%17
.51%
13.0
4%
Cha
mra
jnag
ar35
.92%
2.0
7%10
.61%
16.8
6%3.
13%
60.6
7%63
.67%
11.7
1%4.
58%
44.1
9%15
.13%
17.6
4%
Chi
kkab
alla
pur
a38
.03%
1.25
%7.
55%
10.1
2%2.
96%
49.3
3%50
.40
%25
.01%
2.14
%41
.69%
15.3
9%9.
01%
Chi
kmag
alur
27.2
4%0
.68%
14.6
4%8.
77%
2.42
%50
.91%
36.5
8%21
.94%
2.78
%49
.69%
9.58
%16
.28%
Chi
trad
urg
a31
.48%
1.78
%9.
66%
7.67
%3.
12%
60.8
6%56
.41%
18.1
1%2.
74%
42.3
5%15
.21%
9.52
%
Dak
shin
a Ka
nnad
a34
.51%
0.5
5%12
.25%
4.17
%1.
92%
49.0
6%7.
93%
16.0
2%2.
15%
29.8
9%6.
95%
8.0
5%
Dav
anag
ere
38.7
6%1.
86%
6.65
%8.
78%
3.61
%47
.60
%37
.18%
6.61
%1.
18%
40.9
1%8.
14%
7.41
%
Dha
rwad
32.0
9%1.
62%
12.0
6%5.
40%
1.12
%45
.12%
36.9
6%6.
50%
0.9
7%54
.15%
9.93
%4.
17%
Gad
ag30
.49%
1.49
%10
.38%
10.5
7%7.
30%
76.0
2%69
.54%
25.6
9%2.
09%
54.7
7%18
.88%
9.44
%
Gul
bar
ga
45.3
7%0
.84%
12.8
5%12
.35%
6.49
%63
.27%
70.8
2%8.
56%
1.32
%51
.33%
11.3
7%12
.48%
Has
san
25.4
9%1.
43%
6.80
%9.
65%
1.73
%43
.20
%33
.15%
12.6
2%2.
45%
44.9
5%8.
58%
7.19
%
Hav
eri
34.5
5%0
.90
%13
.83%
10.0
8%3.
54%
65.9
1%44
.12%
14.9
0%
2.62
%55
.37%
12.2
3%8.
07%
Kod
agu
31.7
5%0
.99%
8.58
%8.
00
%2.
76%
53.0
3%15
.74%
19.6
7%3.
01%
32.9
4%10
.93%
7.76
%
Unc
enso
red
Hea
dco
unt R
atio
Hea
lthEd
ucat
ion
Stan
dar
d o
f Liv
ing
Stat
eD
istr
ict
Nut
ritio
nC
hild
&
Ad
ole
scen
t M
ort
ality
Mat
erna
l H
ealth
Year
s o
f Sc
hoo
ling
Scho
ol
Att
end
ance
Co
oki
ng
Fuel
Sani
tatio
nD
rink
ing
Wat
erEl
ectr
icity
Ho
usin
gA
sset
sB
ank
Acc
oun
t
Karnataka
Kola
r35
.29%
1.54
%10
.59%
6.84
%1.
65%
39.1
3%39
.56%
35.8
3%0
.86%
29.7
5%8.
15%
5.84
%
Kop
pal
45.9
3%1.
96%
19.9
9%11
.85%
5.15
%68
.63%
52.7
8%15
.40
%1.
34%
52.9
6%10
.86%
6.30
%
Man
dya
25.5
3%0
.77%
8.65
%7.
38%
3.0
8%42
.35%
41.9
9%7.
33%
1.15
%36
.38%
7.61
%9.
10%
Mys
ore
26.0
4%0
.60
%9.
62%
7.27
%1.
37%
31.0
1%34
.86%
6.15
%2.
73%
32.5
7%10
.57%
10.5
9%
Rai
chur
39.5
2%1.
91%
18.1
9%21
.17%
8.16
%72
.56%
72.3
8%21
.15%
2.0
4%50
.23%
19.7
8%14
.45%
Ram
anag
ara
28.3
2%0
.90
%11
.37%
10.3
1%1.
92%
40.7
5%36
.16%
13.5
0%
1.83
%39
.68%
8.13
%5.
23%
Shim
og
a32
.00
%2.
19%
10.9
6%7.
22%
3.19
%38
.32%
26.8
6%20
.62%
3.50
%45
.30
%8.
02%
10.8
7%
Tum
kur
29.2
3%2.
11%
11.8
2%8.
62%
3.57
%57
.83%
47.2
6%27
.45%
1.58
%52
.10
%12
.34%
4.60
%
Ud
upi
33.9
8%0
.84%
8.80
%10
.48%
2.0
8%57
.57%
9.87
%36
.57%
1.43
%28
.83%
5.93
%7.
13%
Utt
ara
Kann
ada
40.2
3%1.
03%
12.2
9%6.
47%
2.28
%52
.58%
33.0
6%31
.15%
2.45
%36
.72%
10.7
6%11
.36%
Yad
gir
46.8
5%1.
80%
21.6
5%28
.54%
16.6
3%79
.11%
81.4
6%22
.55%
1.83
%57
.29%
23.1
5%13
.70
%
Kerala
Ala
pp
uzha
14.9
2%0
.39%
0.9
5%1.
38%
0.4
9%37
.03%
3.0
1%9.
11%
0.4
2%16
.79%
1.84
%5.
99%
Erna
kula
m8.
96%
0.2
4%1.
76%
1.0
0%
0.1
0%
20.3
4%0
.73%
2.97
%0
.02%
9.63
%1.
47%
4.32
%
Iduk
ki13
.92%
0.2
8%0
.64%
3.16
%0
.00
%54
.45%
5.30
%7.
65%
0.6
4%17
.02%
2.25
%5.
72%
Kann
ur17
.19%
0.2
3%3.
63%
2.18
%0
.52%
44.4
6%1.
05%
7.92
%1.
33%
7.72
%3.
33%
3.65
%
Kasa
rag
od
19.2
3%0
.24%
1.59
%3.
45%
1.24
%46
.56%
2.15
%7.
57%
0.9
0%
22.2
2%3.
91%
3.93
%
Kolla
m11
.83%
0.1
1%1.
50%
1.0
1%0
.75%
39.9
1%1.
91%
4.92
%1.
86%
8.45
%3.
55%
7.61
%
Kott
ayam
10.5
8%0
.13%
0.9
8%0
.98%
0.0
0%
38.6
5%0
.89%
5.93
%0
.35%
7.69
%1.
66%
2.10
%
Kozh
iko
de
17.2
3%0
.39%
0.8
4%1.
74%
0.2
6%50
.95%
0.5
3%3.
23%
0.6
2%13
.28%
2.96
%3.
49%
Mal
app
uram
21.0
3%0
.15%
2.94
%1.
53%
1.24
%56
.15%
1.48
%6.
41%
0.5
6%6.
87%
4.48
%4.
70%
Pala
kkad
19.6
8%0
.00
%0
.63%
1.97
%0
.10
%50
.26%
3.0
9%6.
33%
0.7
5%12
.72%
2.90
%2.
50%
Path
anam
thitt
a11
.54%
0.0
0%
0.5
3%1.
96%
1.22
%42
.86%
2.98
%7.
18%
0.7
7%9.
44%
1.77
%7.
04%
Thiru
vana
ntha
pur
am13
.06%
0.1
8%2.
09%
2.45
%0
.64%
47.8
6%2.
99%
6.54
%0
.60
%12
.25%
3.75
%3.
03%
Thris
sur
13.7
9%0
.09%
1.82
%1.
51%
0.2
8%33
.22%
0.3
3%4.
77%
0.2
0%
3.91
%0
.83%
4.0
8%
Way
anad
20.1
1%0
.52%
3.83
%3.
63%
1.20
%67
.72%
4.10
%7.
36%
3.63
%23
.23%
8.80
%5.
48%
Madhya Pradesh
Alir
ajp
ur63
.37%
6.72
%54
.00
%46
.85%
42.0
3%90
.13%
84.6
8%22
.84%
7.0
8%84
.80
%27
.93%
13.8
8%
Anu
pp
ur43
.15%
3.36
%28
.20
%12
.68%
4.76
%83
.88%
79.9
0%
48.7
2%20
.16%
76.1
1%24
.40
%6.
07%
Ash
okn
agar
49.5
7%2.
38%
30.5
7%18
.07%
10.0
4%85
.20
%78
.73%
31.5
8%11
.39%
84.4
7%18
.49%
8.35
%
Bala
gha
t54
.68%
3.19
%26
.31%
10.8
1%3.
46%
84.3
7%71
. 03%
42.8
9%10
.12%
78.8
3%16
.62%
9.63
%
Barw
ani
65.2
0%
4.84
%44
.78%
36.4
7%31
.58%
80.5
2%80
.73%
25.2
7%10
.18%
75.4
1%33
.78%
14.1
6%
Betu
l42
.69%
3.38
%27
.71%
14.4
7%4.
73%
74.5
9%69
.03%
32.0
0%
6.38
%70
.43%
23.4
7%8.
90%
Bhin
d48
.22%
3.73
%32
.41%
7.68
%7.
14%
83.1
0%
67.5
4%15
.00
%11
.88%
74.6
3%12
.67%
9.46
%
Bho
pal
33.3
4%2.
77%
15.5
6%9.
16%
5.36
%22
.86%
36.8
2%11
.24%
1.45
%23
.93%
5.61
%4.
70%
Burh
anp
ur47
.49%
3.53
%32
.56%
24.7
4%13
.82%
54.6
0%
59.2
7%16
.74%
9.22
%53
.66%
21.8
1%12
.69%
Chh
atar
pur
46.9
4%5.
96%
38.1
2%19
.17%
12.0
4%86
.70
%85
.47%
47.7
5%20
.18%
74.7
2%21
.43%
16.5
6%
Chh
ind
war
a42
.66%
2.49
%23
.64%
12.7
6%2.
92%
75.0
7%66
.12%
32.9
8%9.
23%
64.3
0%
23.7
9%9.
30%
Dam
oh
42.1
1%4.
82%
32.1
2%15
.52%
7.93
%86
.27%
76.8
6%53
.31%
12.3
8%82
.33%
29.3
0%
21.6
1%
Dat
ia44
.96%
5.25
%28
.39%
10.0
6%4.
20%
80.1
6%64
.10
%24
.74%
9.47
%88
.10
%15
.53%
6.73
%
Dew
as48
.57%
4.73
%27
.43%
15.8
1%8.
40%
64.5
0%
49.6
1%23
.37%
1.13
%50
.82%
10.4
4%4.
99%
Dha
r51
.21%
4.76
%33
.95%
23.5
6%10
.88%
68.2
8%64
.56%
23.7
7%4.
08%
55.1
0%
18.0
7%10
.07%
Din
do
ri50
.63%
3.43
%31
.94%
20.3
9%4.
07%
95.5
2%92
.31%
50.0
4%24
.71%
89.9
7%54
.77%
13.3
8%
East
Nim
ar52
.32%
3.14
%32
.38%
23.4
8%9.
80%
72.5
2%63
.40
%32
.36%
8.0
5%57
.34%
18.0
8%7.
11%
Gun
a54
.05%
3.99
%35
.92%
19.5
8%10
.43%
77.3
1%72
.04%
34.7
5%5.
86%
73.2
6%16
.52%
7.19
%
(CONTD.) DISTrICT-WISe: UNCeNSoreD heADCoUNT rATIo(CONTD.) DISTrICT-WISe: UNCeNSoreD heADCoUNT rATIo
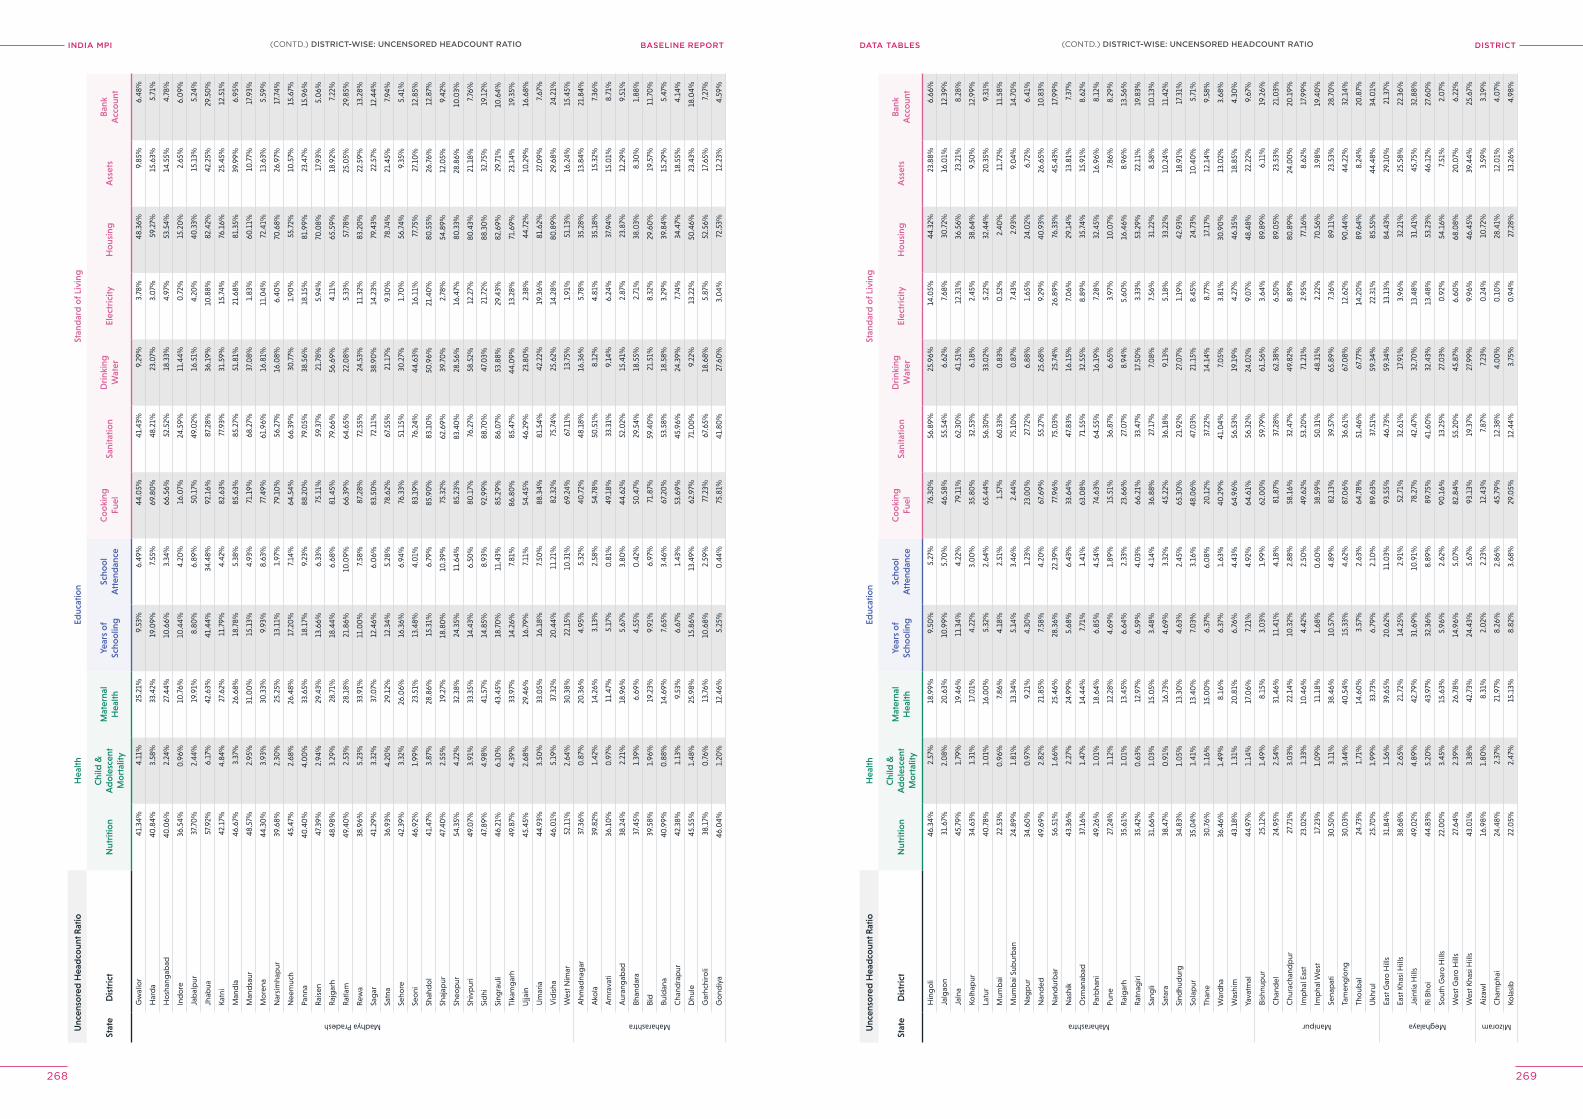
INDIA MPI BASELINE REPORT DISTrICTDATA TABleS
268 269
Unc
enso
red
Hea
dco
unt R
atio
Hea
lthEd
ucat
ion
Stan
dar
d o
f Liv
ing
Stat
eD
istr
ict
Nut
ritio
nC
hild
&
Ad
ole
scen
t M
ort
ality
Mat
erna
l H
ealth
Year
s o
f Sc
hoo
ling
Scho
ol
Att
end
ance
Co
oki
ng
Fuel
Sani
tatio
nD
rink
ing
Wat
erEl
ectr
icity
Ho
usin
gA
sset
sB
ank
Acc
oun
t
Madhya Pradesh
Gw
alio
r41
.34%
4.11
%25
.21%
9.53
%6.
49%
44.0
5%41
.43%
9.29
%3.
78%
48.3
6%9.
85%
6.48
%
Har
da
40.8
4%3.
58%
33.4
2%19
.09%
7.55
%69
.80
%48
.21%
23.0
7%3.
07%
59.2
7%15
.63%
5.71
%
Ho
shan
gab
ad40
.06%
2.24
%27
.44%
10.6
6%3.
34%
66.5
6%52
.52%
18.3
3%4.
97%
53.5
4%14
.55%
4.78
%
Ind
ore
36.5
4%0
.96%
10.7
6%10
.44%
4.20
%16
.07%
24.5
9%11
.44%
0.7
2%15
.20
%2.
65%
6.0
9%
Jab
alp
ur37
.70
%2.
44%
19.9
1%8.
80%
6.89
%50
.17%
49.0
2%16
.51%
4.20
%40
.33%
15.1
3%5.
24%
Jhab
ua57
.92%
6.17
%42
.63%
41.4
4%34
.48%
92.1
6%87
.28%
36.1
9%10
.88%
82.4
2%42
.25%
29.5
0%
Katn
i42
.17%
4.84
%27
.62%
11.7
9%4.
42%
82.6
3%77
.93%
31.5
9%15
.74%
76.1
6%25
.45%
12.5
1%
Man
dla
46.6
7%3.
37%
26.6
8%18
.78%
5.38
%85
.63%
85.2
7%51
.81%
21.6
8%81
.35%
39.9
9%6.
95%
Man
dsa
ur48
.57%
2.95
%31
.00
%15
.13%
4.93
%71
.19%
68.2
7%37
.08%
1.83
%60
.11%
10.7
7%17
.93%
Mo
rena
44.3
0%
3.93
%30
.33%
9.93
%8.
63%
77.4
9%61
.96%
16.8
1%11
.04%
72.4
1%13
.63%
5.59
%
Nar
sim
hap
ur39
.68%
2.30
%25
.25%
13.1
1%1.
97%
79.1
0%
56.2
7%16
.08%
6.40
%70
.68%
26.9
7%17
.74%
Nee
muc
h45
.47%
2.68
%26
.48%
17.2
0%
7.14
%64
.54%
66.3
9%30
.77%
1.90
%55
.72%
10.5
7%15
.67%
Pann
a40
.40
%4.
00
%33
.65%
18.1
7%9.
23%
88.2
0%
79.0
5%38
.56%
18.1
5%81
.99%
23.4
7%15
.96%
Rai
sen
47.3
9%2.
94%
29.4
3%13
.66%
6.33
%75
.11%
59.3
7%21
.78%
5.94
%70
.08%
17.9
3%5.
06%
Raj
gar
h48
.98%
3.29
%28
.71%
18.4
4%6.
68%
81.4
5%79
.66%
56.6
9%4.
11%
65.5
9%18
.92%
7.22
%
Rat
lam
49.4
0%
2.53
%28
.18%
21.8
6%10
.09%
66.3
9%64
.65%
22.0
8%5.
33%
57.7
8%25
.05%
29.8
5%
Rew
a38
.96%
5.23
%33
.91%
11.0
0%
7.58
%87
.28%
72.5
5%24
.53%
11.3
2%83
.20
%22
.59%
13.2
8%
Sag
ar41
.29%
3.32
%37
.07%
12.4
6%6.
06%
83.5
0%
72.1
1%38
.90
%14
.23%
79.4
3%22
.57%
12.4
4%
Satn
a36
.93%
4.20
%29
.12%
12.3
4%5.
28%
78.6
2%67
.55%
21.1
7%9.
30%
78.7
4%21
.45%
7.94
%
Seho
re42
.39%
3.32
%26
.06%
16.3
6%6.
94%
76.3
3%51
.15%
30.2
7%1.
70%
56.7
4%9.
35%
5.41
%
Seo
ni46
.92%
1.99
%23
.51%
13.4
8%4.
01%
83.1
9%76
.24%
44.6
3%16
.11%
77.7
5%27
.10
%12
.85%
Shah
do
l41
.47%
3.87
%28
.86%
15.3
1%6.
79%
85.9
0%
83.1
0%
50.9
6%21
.40
%80
.55%
26.7
6%12
.87%
Shaj
apur
47.4
0%
2.55
%19
.27%
18.8
0%
10.3
9%75
.32%
62.6
9%39
.70
%2.
78%
54.8
9%12
.05%
9.42
%
Sheo
pur
54.3
5%4.
22%
32.3
8%24
.35%
11.6
4%85
.23%
83.4
0%
28.5
6%16
.47%
80.3
3%28
.86%
10.0
3%
Shiv
pur
i49
.07%
3.91
%33
.35%
14.4
3%6.
50%
80.1
7%76
.27%
58.5
2%12
.27%
80.4
3%21
.18%
7.76
%
Sid
hi47
.89%
4.98
%41
.57%
14.8
5%8.
93%
92.9
9%88
.70
%47
.03%
21.7
2%88
.30
%32
.75%
19.1
2%
Sing
raul
i46
.21%
6.10
%43
.45%
18.7
0%
11.4
3%85
.29%
86.0
7%53
.88%
29.4
3%82
.69%
29.7
1%10
.64%
Tika
mg
arh
49.8
7%4.
39%
33.9
7%14
.26%
7.81
%86
.80
%85
.47%
44.0
9%13
.28%
71.6
9%23
.14%
19.3
5%
Ujja
in45
.45%
2.68
%29
.46%
16.7
9%7.
11%
54.4
5%46
.29%
23.8
0%
2.38
%44
.72%
10.2
9%16
.68%
Um
aria
44.9
3%3.
50%
33.0
5%16
.18%
7.50
%88
.34%
81.5
4%42
.22%
19.3
6%81
.62%
27.0
9%7.
67%
Vid
isha
46.0
1%5.
19%
37.3
2%20
.44%
11.2
1%82
.32%
75.7
4%25
.62%
14.2
8%80
.89%
29.6
8%24
.21%
Wes
t Nim
ar52
.11%
2.64
%30
.38%
22.1
5%10
.31%
69.2
4%67
.11%
13.7
5%1.
91%
51.1
3%16
.24%
15.4
5%
Maharashtra
Ahm
adna
gar
37.3
6%0
.87%
20.3
6%4.
95%
5.32
%40
.72%
48.1
8%16
.36%
5.78
%35
.28%
13.8
4%21
.84%
Ako
la39
.82%
1.42
%14
.26%
3.13
%2.
58%
54.7
8%50
.51%
8.12
%4.
81%
35.1
8%15
.32%
7.36
%
Am
rava
ti36
.10
%0
.97%
11.4
7%5.
17%
0.8
1%49
.18%
33.3
1%9.
14%
6.24
%37
.94%
15.0
1%8.
71%
Aur
ang
abad
38.2
4%2.
21%
18.9
6%5.
67%
3.80
%44
.62%
52.0
2%15
.41%
2.87
%23
.87%
12.2
9%9.
51%
Bhan
dar
a37
.45%
1.39
%6.
69%
4.55
%0
.42%
50.4
7%29
.54%
18.5
5%2.
71%
38.0
3%8.
30%
1.88
%
Bid
39.5
8%1.
96%
19.2
3%9.
91%
6.97
%71
.87%
59.4
0%
21.5
1%8.
32%
29.6
0%
19.5
7%11
.70
%
Buld
ana
40.9
9%0
.88%
14.6
9%7.
65%
3.46
%67
.20
%53
.58%
18.5
8%3.
29%
39.8
4%15
.29%
5.47
%
Cha
ndra
pur
42.3
8%1.
13%
9.53
%6.
67%
1.43
%53
.69%
45.9
6%24
.39%
7.74
%34
.47%
18.5
5%4.
14%
Dhu
le45
.55%
1.48
%25
.98%
15.8
6%13
.49%
62.9
7%71
.00
%9.
22%
13.2
2%50
.46%
23.4
3%18
.04%
Gar
hchi
roli
38.1
7%0
.76%
13.7
6%10
.68%
2.59
%77
.23%
67.6
5%18
.68%
5.87
%52
.56%
17.6
5%7.
27%
Go
ndiy
a46
.04%
1.20
%12
.46%
5.25
%0
.44%
75.8
1%41
.80
%27
.60
%3.
04%
72.5
3%12
.23%
4.59
%
Unc
enso
red
Hea
dco
unt R
atio
Hea
lthEd
ucat
ion
Stan
dar
d o
f Liv
ing
Stat
eD
istr
ict
Nut
ritio
nC
hild
&
Ad
ole
scen
t M
ort
ality
Mat
erna
l H
ealth
Year
s o
f Sc
hoo
ling
Scho
ol
Att
end
ance
Co
oki
ng
Fuel
Sani
tatio
nD
rink
ing
Wat
erEl
ectr
icity
Ho
usin
gA
sset
sB
ank
Acc
oun
t
Maharashtra
Hin
go
li46
.34%
2.57
%18
.99%
9.50
%5.
27%
76.3
0%
56.8
9%25
.96%
14.0
5%44
.32%
23.8
8%6.
66%
Jalg
aon
31.6
7%2.
08%
20.6
3%10
.99%
5.70
%46
.58%
55.5
4%6.
62%
7.68
%30
.72%
16.0
1%12
.39%
Jaln
a45
.79%
1.79
%19
.46%
11.3
4%4.
22%
79.1
1%62
.30
%41
.51%
12.3
1%36
.56%
23.2
1%8.
28%
Kolh
apur
34.6
3%1.
31%
17.0
1%4.
22%
3.0
0%
35.8
0%
32.5
3%6.
18%
2.45
%38
.64%
9.50
%12
.99%
Latu
r40
.78%
1.0
1%16
.00
%5.
32%
2.64
%65
.44%
56.3
0%
33.0
2%5.
22%
32.4
4%20
.35%
9.31
%
Mum
bai
22.5
3%0
.96%
7.86
%4.
18%
2.51
%1.
57%
60.3
3%0
.83%
0.5
2%2.
40%
11.7
2%11
.58%
Mum
bai
Sub
urb
an24
.89%
1.81
%13
.34%
5.14
%3.
46%
2.44
%75
.10
%0
.87%
7.43
%2.
93%
9.0
4%14
.70
%
Nag
pur
34.6
0%
0.9
7%9.
21%
4.30
%1.
23%
23.0
0%
27.7
2%6.
88%
1.65
%24
.02%
6.72
%6.
41%
Nan
ded
49.6
9%2.
82%
21.8
5%7.
58%
4.20
%67
.69%
55.2
7%25
.68%
9.29
%40
.93%
26.6
5%10
.83%
Nan
dur
bar
56.5
1%1.
66%
25.4
6%28
.36%
22.3
9%77
.96%
75.0
3%25
.74%
26.8
9%76
.33%
45.4
3%17
.99%
Nas
hik
43.3
6%2.
27%
24.9
9%5.
68%
6.43
%33
.64%
47.8
3%16
.15%
7.0
6%29
.14%
13.8
1%7.
37%
Osm
anab
ad37
.16%
1.47
%14
.44%
7.71
%1.
41%
63.0
8%71
.55%
32.5
5%8.
89%
35.7
4%15
.91%
8.62
%
Parb
hani
49.2
6%1.
01%
18.6
4%6.
85%
4.54
%74
.63%
64.5
5%16
.19%
7.28
%32
.45%
16.9
6%8.
12%
Pune
27.2
4%1.
12%
12.2
8%4.
69%
1.89
%15
.51%
36.8
7%6.
65%
3.97
%10
.07%
7.86
%8.
29%
Rai
gar
h35
.61%
1.0
1%13
.45%
6.64
%2.
33%
23.6
6%27
.07%
8.94
%5.
60%
16.4
6%8.
96%
13.5
6%
Rat
nag
iri35
.42%
0.6
3%12
.97%
6.59
%4.
03%
66.2
1%33
.47%
17.5
0%
3.33
%53
.29%
22.1
1%19
.83%
Sang
li31
.66%
1.0
3%15
.05%
3.48
%4.
14%
36.8
8%27
.17%
7.0
8%7.
56%
31.2
2%8.
58%
10.1
3%
Sata
ra38
.47%
0.9
1%16
.73%
4.69
%3.
32%
45.2
2%36
.18%
9.13
%5.
18%
33.2
2%10
.24%
11.4
2%
Sind
hud
urg
34.8
3%1.
05%
13.3
0%
4.63
%2.
45%
65.3
0%
21.9
2%27
.07%
1.19
%42
.93%
18.9
1%17
.31%
Sola
pur
35.0
4%1.
41%
13.4
0%
7.0
3%3.
16%
48.0
6%47
.03%
21.1
5%8.
45%
24.7
3%10
.40
%5.
71%
Than
e30
.76%
1.16
%15
.00
%6.
37%
6.0
8%20
.12%
37.2
2%14
.14%
8.77
%17
.17%
12.1
4%9.
58%
War
dha
36.4
6%1.
49%
8.16
%6.
37%
1.63
%40
.29%
41.0
4%7.
05%
3.81
%30
.90
%13
.02%
3.68
%
Was
him
43.1
8%1.
31%
20.8
1%6.
76%
4.43
%64
.96%
56.5
3%19
.19%
4.27
%46
.35%
18.8
5%4.
30%
Yava
tmal
44.9
7%1.
14%
17.0
6%7.
21%
4.92
%64
.61%
56.3
2%24
.02%
9.0
7%48
.48%
22.2
2%9.
67%
Manipur
Bish
nup
ur25
.12%
1.49
%8.
15%
3.0
3%1.
99%
62.0
0%
59.7
9%61
.56%
3.64
%89
.89%
6.11
%19
.26%
Cha
ndel
24.9
5%2.
54%
31.4
6%11
.41%
4.18
%81
.87%
37.2
8%62
.38%
6.50
%89
.05%
23.5
3%21
.03%
Chu
rach
and
pur
27.7
1%3.
03%
22.1
4%10
.32%
2.88
%58
.16%
32.4
7%49
.82%
8.89
%80
.89%
24.0
0%
20.1
9%
Imp
hal E
ast
23.0
2%1.
33%
10.4
6%4.
42%
2.50
%49
.62%
53.2
0%
71.2
1%2.
95%
77.1
6%8.
62%
17.9
9%
Imp
hal W
est
17.2
3%1.
09%
11.1
8%1.
68%
0.6
0%
38.5
9%50
.31%
48.3
1%2.
22%
70.5
6%3.
98%
19.4
0%
Sena
pat
i30
.50
%3.
11%
38.4
6%10
.57%
4.89
%82
.13%
39.5
7%65
.89%
7.36
%89
.11%
23.5
3%28
.70
%
Tam
eng
long
30.0
3%3.
44%
40.5
4%15
.33%
4.62
%87
.06%
36.6
1%67
.08%
12.6
2%90
.44%
44.2
2%32
.14%
Tho
ubal
24.7
3%1.
71%
14.6
0%
3.57
%2.
63%
64.7
8%51
.46%
67.7
7%14
.20
%89
.64%
8.24
%20
.87%
Ukh
rul
25.7
0%
1.99
%33
.73%
6.79
%2.
10%
89.6
3%37
.51%
59.3
4%22
.31%
85.5
5%44
.48%
34.0
1%
Meghalaya
East
Gar
o H
ills
31.8
4%1.
56%
39.6
5%20
.62%
11.0
3%93
.55%
46.7
3%59
.34%
13.1
3%84
.43%
29.1
0%
21.3
7%
East
Kha
si H
ills
38.6
8%2.
65%
21.7
2%14
.25%
2.91
%52
.71%
32.6
1%17
.91%
3.96
%32
.21%
25.5
8%22
.36%
Jain
tia H
ills
49.0
2%4.
89%
42.7
9%31
.69%
10.9
1%78
.27%
42.4
7%32
.70
%13
.48%
31.4
1%45
.75%
32.8
8%
Ri B
hoi
44.8
3%5.
20%
43.9
7%32
.36%
8.89
%89
.75%
41.6
0%
32.4
3%13
.48%
53.2
3%46
.12%
27.6
0%
Sout
h G
aro
Hill
s22
.00
%3.
45%
15.6
3%5.
96%
2.62
%90
.16%
13.2
5%27
.03%
0.9
2%54
.16%
7.51
%2.
07%
Wes
t Gar
o H
ills
27.6
4%2.
39%
26.7
8%14
.96%
5.0
7%82
.84%
55.2
0%
45.8
7%6.
60%
68.0
8%20
.07%
6.22
%
Wes
t Kha
si H
ills
43.0
1%3.
38%
42.7
3%24
.43%
5.67
%93
.13%
19.3
7%27
.99%
9.96
%46
.45%
39.4
4%25
.67%
Mizoram
Aiz
awl
16.9
8%1.
80%
8.31
%2.
02%
2.23
%12
.43%
7.87
%7.
23%
0.2
4%10
.72%
3.59
%3.
19%
Cha
mp
hai
24.4
8%2.
37%
21.9
7%8.
26%
2.86
%45
.79%
12.3
8%4.
00
%0
.10
%28
.41%
12.0
1%4.
07%
Kola
sib
22.0
5%2.
47%
15.1
3%8.
82%
3.68
%29
.05%
12.4
4%3.
75%
0.9
4%27
.28%
13.2
6%4.
98%
(CONTD.) DISTrICT-WISe: UNCeNSoreD heADCoUNT rATIo(CONTD.) DISTrICT-WISe: UNCeNSoreD heADCoUNT rATIo
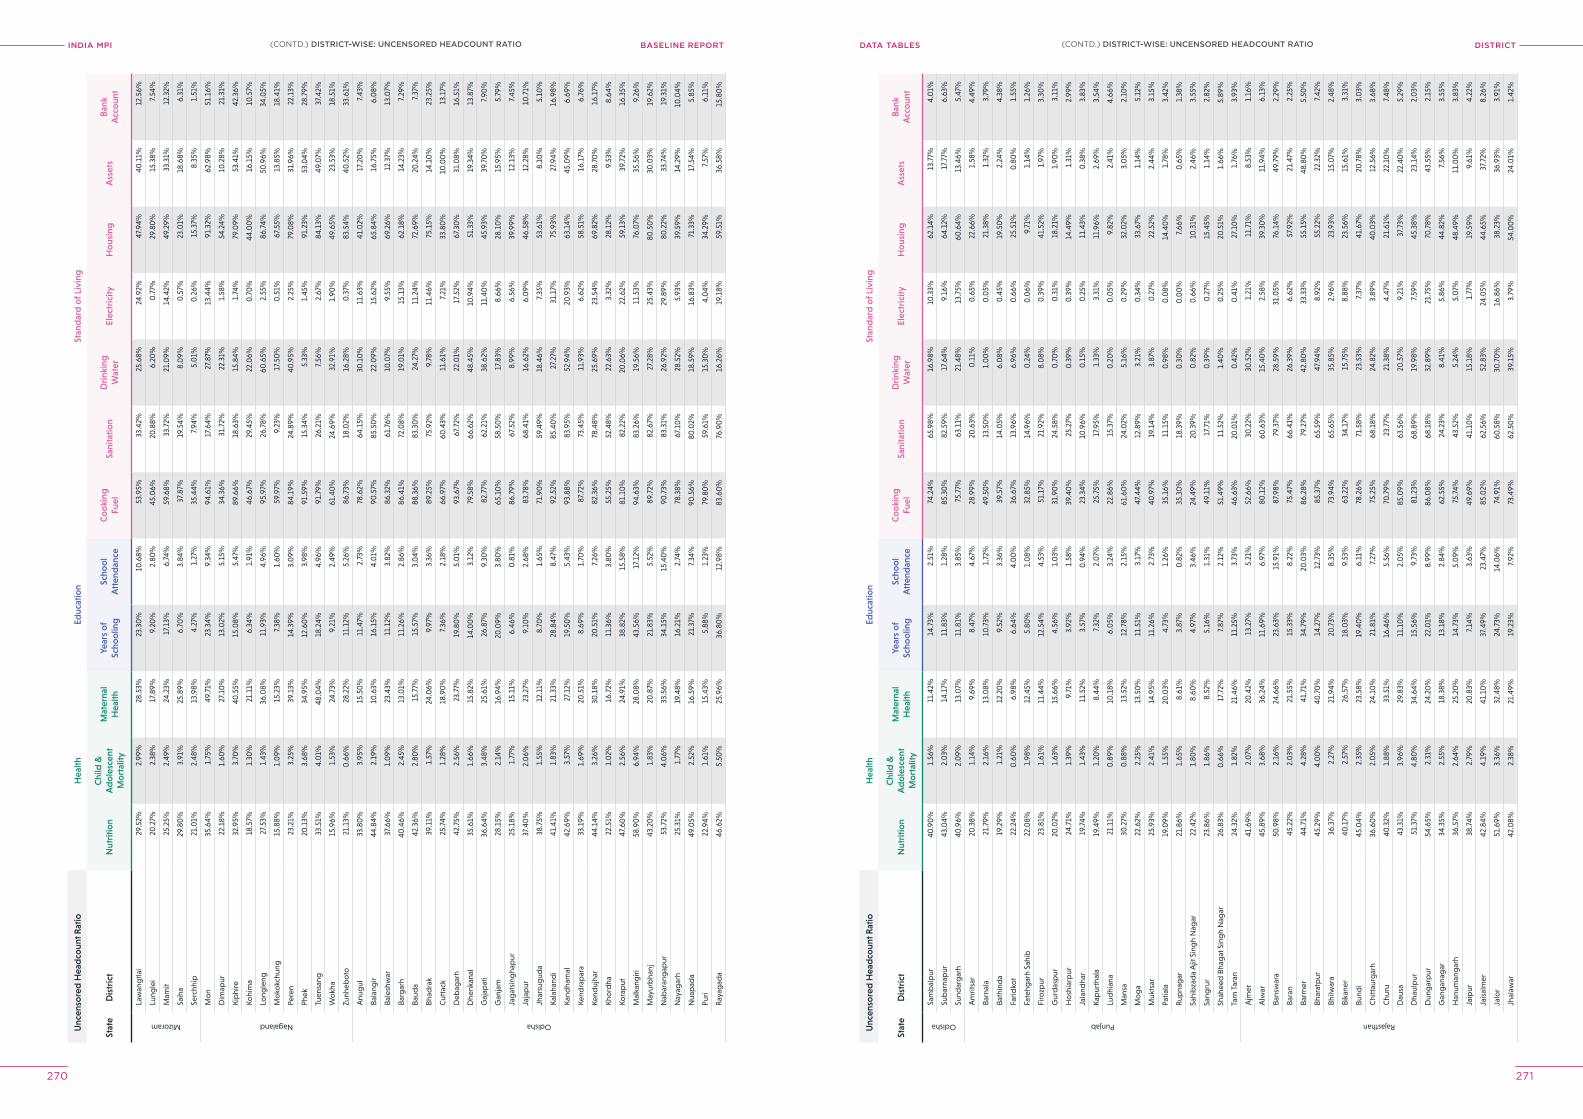
INDIA MPI BASELINE REPORT DISTrICTDATA TABleS
270 271
Unc
enso
red
Hea
dco
unt R
atio
Hea
lthEd
ucat
ion
Stan
dar
d o
f Liv
ing
Stat
eD
istr
ict
Nut
ritio
nC
hild
&
Ad
ole
scen
t M
ort
ality
Mat
erna
l H
ealth
Year
s o
f Sc
hoo
ling
Scho
ol
Att
end
ance
Co
oki
ng
Fuel
Sani
tatio
nD
rink
ing
Wat
erEl
ectr
icity
Ho
usin
gA
sset
sB
ank
Acc
oun
t
Mizoram
Law
ang
tlai
29.5
2%2.
99%
28.5
3%23
.30
%10
.68%
53.9
5%33
.42%
25.6
8%24
.92%
47.9
4%40
.11%
12.5
6%
Lung
lei
20.2
7%2.
38%
17.8
9%9.
20%
2.80
%45
.06%
20.8
8%6.
20%
0.7
7%29
.80
%15
.38%
7.54
%
Mam
it25
.25%
2.49
%24
.23%
17.1
3%6.
74%
59.6
8%33
.72%
21.0
9%14
.42%
49.2
9%33
.31%
12.3
2%
Saih
a29
.80
%3.
91%
25.8
9%6.
70%
3.84
%37
.87%
19.5
4%8.
09%
0.5
7%23
.01%
18.6
8%6.
31%
Serc
hhip
21.0
1%2.
48%
13.9
8%4.
27%
1.27
%35
.44%
7.94
%5.
01%
0.2
6%15
.37%
8.35
%1.
51%
Nagaland
Mo
n35
.64%
1.75
%49
.71%
23.3
4%9.
34%
94.6
1%17
.64%
27.8
7%13
.44%
91.3
2%62
.98%
51.1
6%
Dim
apur
22.1
8%1.
60%
27.1
0%
13.0
2%5.
15%
34.3
6%31
.72%
22.3
1%1.
58%
54.2
4%10
.28%
21.3
1%
Kip
hire
32.9
5%3.
70%
40.5
5%15
.08%
5.47
%89
.66%
18.6
3%15
.84%
1.74
%79
.09%
53.4
1%42
.36%
Kohi
ma
18.5
7%1.
30%
21.1
1%6.
34%
1.91
%46
.67%
29.4
5%22
.06%
0.7
0%
44.0
0%
16.1
5%10
.57%
Long
leng
27.5
3%1.
43%
36.0
8%11
.93%
4.96
%95
.97%
26.7
8%60
.65%
2.55
%86
.74%
50.9
6%34
.05%
Mo
kokc
hung
15.8
8%1.
09%
15.2
3%7.
38%
1.60
%59
.97%
9.23
%17
.50
%0
.51%
67.5
5%13
.85%
18.4
1%
Pere
n23
.21%
3.25
%39
.13%
14.3
9%3.
09%
84.1
9%24
.89%
40.9
5%2.
25%
79.0
8%31
.96%
22.1
3%
Phek
20.1
3%3.
68%
34.9
5%12
.60
%3.
98%
91.5
9%15
.34%
5.33
%1.
45%
91.2
3%53
.04%
28.7
9%
Tuen
sang
33.5
1%4.
01%
48.0
4%18
.24%
4.96
%91
.79%
26.2
1%7.
56%
2.67
%84
.13%
49.0
7%37
.42%
Wo
kha
15.9
6%1.
53%
24.7
3%9.
21%
2.49
%61
.40
%24
.69%
32.9
1%1.
90%
49.6
5%23
.53%
18.5
1%
Zunh
ebo
to21
.13%
0.6
6%28
.22%
11.1
2%5.
26%
86.7
3%18
.02%
16.2
8%0
.37%
83.5
4%40
.52%
33.6
1%
Odisha
Anu
gul
33.8
0%
3.95
%15
.50
%11
.47%
2.73
%78
.62%
64.1
5%30
.10
%11
.63%
41.0
2%17
.20
%7.
43%
Bala
ngir
44.8
4%2.
19%
10.6
3%16
.15%
4.0
1%90
.57%
85.5
0%
22.0
9%15
.62%
65.8
4%16
.75%
6.0
8%
Bale
shw
ar37
.66%
1.0
9%23
.43%
11.1
2%3.
82%
86.3
2%61
.76%
10.0
7%9.
55%
69.2
6%12
.37%
13.0
7%
Barg
arh
40.4
6%2.
45%
13.0
1%11
.26%
2.86
%86
.41%
72.0
8%19
.01%
15.1
3%62
.18%
14.2
3%7.
29%
Baud
a42
.36%
2.80
%15
.77%
15.5
7%3.
04%
88.3
6%83
.30
%24
.27%
11.2
4%72
.69%
20.2
4%7.
37%
Bhad
rak
39.1
1%1.
57%
24.0
6%9.
97%
3.36
%89
.25%
75.9
2%9.
78%
11.4
6%75
.15%
14.1
0%
23.2
5%
Cut
tack
25.7
4%1.
28%
18.9
0%
7.36
%2.
18%
66.9
7%60
.43%
11.6
1%7.
21%
33.8
0%
10.0
0%
13.1
7%
Deb
agar
h42
.75%
2.56
%23
.77%
19.8
0%
5.0
1%93
.67%
67.7
2%22
.01%
17.5
2%67
.30
%31
.08%
16.5
1%
Dhe
nkan
al35
.61%
1.66
%15
.82%
14.0
0%
3.12
%79
.58%
66.6
2%48
.45%
10.9
4%51
.33%
19.3
4%13
.87%
Gaj
apat
i36
.64%
3.48
%25
.61%
26.8
7%9.
30%
82.7
7%62
.21%
38.6
2%11
.40
%45
.93%
39.7
0%
7.90
%
Gan
jam
28.1
5%2.
14%
16.9
4%20
.09%
3.80
%65
.10
%58
.50
%17
.83%
8.66
%28
.10
%15
.95%
5.79
%
Jag
atsi
ngha
pur
25.1
8%1.
77%
15.1
1%6.
46%
0.8
1%86
.79%
67.5
2%8.
99%
6.56
%39
.99%
12.1
3%7.
45%
Jaja
pur
37.4
0%
2.0
6%23
.27%
9.10
%2.
68%
83.7
8%68
.41%
16.6
2%6.
09%
46.5
8%12
.28%
10.7
1%
Jhar
sug
uda
38.7
5%1.
55%
12.1
1%8.
70%
1.65
%71
.90
%59
.49%
18.4
6%7.
35%
53.6
1%8.
10%
5.10
%
Kala
hand
i41
.41%
1.83
%21
.33%
28.8
4%8.
47%
92.5
2%85
.40
%27
.27%
31.1
7%75
.93%
27.9
4%16
.98%
Kand
ham
al42
.69%
3.57
%27
.12%
19.5
0%
5.43
%93
.88%
83.9
5%52
.94%
20.9
3%63
.14%
45.0
9%6.
69%
Kend
rap
ara
33.1
9%1.
69%
20.5
1%8.
69%
1.70
%87
.72%
73.4
5%11
.93%
6.62
%58
.51%
16.1
7%6.
76%
Kend
ujha
r44
.14%
3.26
%30
.18%
20.5
1%7.
26%
82.3
6%78
.48%
25.6
9%23
.54%
69.8
2%28
.70
%16
.17%
Kho
rdha
22.5
1%1.
02%
16.7
2%11
.36%
3.80
%55
.25%
52.4
8%22
.63%
3.32
%28
.12%
9.53
%8.
64%
Kora
put
47.6
0%
2.56
%24
.91%
38.8
2%15
.58%
81.1
0%
82.2
2%20
.06%
22.6
2%59
.13%
39.7
2%16
.35%
Mal
kang
iri58
.90
%6.
94%
28.0
8%43
.56%
17.1
2%94
.63%
83.2
6%19
.56%
11.5
3%76
.07%
35.5
6%9.
26%
May
urb
hanj
43.2
0%
1.83
%20
.87%
21.8
3%5.
52%
89.7
2%82
.67%
27.2
8%25
.43%
80.5
0%
30.0
3%19
.62%
Nab
aran
gap
ur53
.72%
4.0
6%33
.56%
34.1
5%15
.40
%90
.73%
83.3
1%26
.92%
29.8
9%80
.22%
33.7
4%19
.31%
Nay
agar
h25
.31%
1.77
%19
.48%
16.2
1%2.
74%
78.3
8%67
.10
%28
.52%
5.93
%39
.59%
14.2
9%10
.04%
Nua
pad
a49
.05%
2.52
%16
.59%
21.3
7%7.
34%
90.5
6%80
.02%
18.5
9%16
.83%
71.3
3%17
.54%
5.85
%
Puri
22.9
4%1.
61%
15.4
3%5.
88%
1.23
%79
.80
%59
.61%
15.3
0%
4.0
4%34
.29%
7.57
%6.
11%
Ray
agad
a46
.62%
5.50
%25
.96%
36.8
0%
12.9
8%83
.60
%76
.90
%16
.26%
19.1
8%59
.51%
36.5
8%15
.80
%
Unc
enso
red
Hea
dco
unt R
atio
Hea
lthEd
ucat
ion
Stan
dar
d o
f Liv
ing
Stat
eD
istr
ict
Nut
ritio
nC
hild
&
Ad
ole
scen
t M
ort
ality
Mat
erna
l H
ealth
Year
s o
f Sc
hoo
ling
Scho
ol
Att
end
ance
Co
oki
ng
Fuel
Sani
tatio
nD
rink
ing
Wat
erEl
ectr
icity
Ho
usin
gA
sset
sB
ank
Acc
oun
t
Odisha
Sam
bal
pur
40.9
0%
1.56
%11
.42%
14.7
3%2.
51%
74.2
4%65
.98%
16.9
8%10
.33%
62.1
4%13
.77%
4.0
1%
Sub
arna
pur
43.0
4%2.
03%
14.1
7%11
.83%
1.28
%85
.30
%82
.59%
17.6
4%9.
16%
64.1
2%17
.77%
6.63
%
Sund
arg
arh
40.9
6%2.
09%
13.0
7%11
.81%
3.85
%75
.77%
63.1
1%21
.48%
13.7
5%60
.64%
13.4
6%5.
47%
Punjab
Am
ritsa
r20
.38%
1.14
%9.
69%
8.47
%4.
67%
28.9
9%20
.63%
0.1
1%0
.65%
22.6
6%1.
58%
4.49
%
Barn
ala
21.7
9%2.
16%
13.0
8%10
.73%
1.72
%49
.50
%13
.50
%1.
00
%0
.05%
21.3
8%1.
32%
3.79
%
Bath
ind
a19
.29%
1.21
%12
.20
%9.
52%
3.36
%39
.57%
14.0
5%6.
08%
0.4
5%19
.50
%2.
24%
4.38
%
Farid
kot
22.2
4%0
.60
%6.
98%
6.64
%4.
00
%36
.67%
13.9
6%6.
96%
0.6
6%25
.51%
0.8
0%
1.55
%
Fate
hgar
h Sa
hib
22.0
8%1.
98%
12.4
5%5.
80%
1.0
8%32
.85%
14.9
6%0
.24%
0.0
6%9.
71%
1.14
%1.
26%
Firo
zpur
23.8
1%1.
61%
11.4
4%12
.54%
4.53
%51
.17%
21.9
2%8.
08%
0.3
9%41
.52%
1.97
%3.
30%
Gur
das
pur
20.0
2%1.
63%
15.6
6%4.
56%
1.0
3%31
.90
%24
.58%
0.7
0%
0.3
1%18
.21%
1.90
%3.
11%
Ho
shia
rpur
24.7
1%1.
39%
9.71
%3.
92%
1.58
%39
.40
%25
.27%
0.3
9%0
.39%
14.4
9%1.
31%
2.99
%
Jala
ndha
r19
.74%
1.43
%11
.52%
3.57
%0
.94%
23.3
4%10
.96%
0.1
5%0
.25%
11.4
3%0
.38%
3.83
%
Kap
urth
ala
19.4
9%1.
20%
8.44
%7.
32%
2.0
7%25
.75%
17.9
5%1.
33%
3.31
%11
.96%
2.69
%3.
54%
Lud
hian
a21
.11%
0.8
9%10
.18%
6.0
5%3.
24%
22.8
6%15
.37%
0.2
0%
0.0
5%9.
82%
2.41
%4.
66%
Man
sa30
.27%
0.8
8%13
.52%
12.7
8%2.
15%
61.6
0%
24.0
2%5.
16%
0.2
9%32
.02%
3.0
5%2.
10%
Mo
ga
22.6
2%2.
25%
13.5
0%
11.5
1%3.
17%
47.4
4%12
.89%
3.21
%0
.34%
33.6
7%1.
14%
5.12
%
Muk
tsar
25.9
3%2.
41%
14.9
5%11
.26%
2.73
%40
.97%
19.1
4%3.
87%
0.2
7%22
.52%
2.44
%3.
15%
Patia
la19
.09%
1.55
%20
.03%
4.73
%1.
26%
35.1
6%11
.15%
0.9
8%0
.08%
14.4
0%
1.78
%3.
42%
Rup
nag
ar21
.86%
1.65
%8.
61%
3.87
%0
.82%
35.3
0%
18.3
9%0
.30
%0
.00
%7.
66%
0.6
5%1.
38%
Sahi
bza
da
Ajit
Sin
gh
Nag
ar22
.42%
1.80
%8.
60%
4.97
%3.
46%
24.4
9%20
.39%
0.8
2%0
.66%
10.3
1%2.
46%
3.55
%
Sang
rur
23.8
6%1.
86%
8.52
%5.
16%
1.31
%49
.11%
17.7
1%0
.39%
0.2
7%15
.45%
1.14
%2.
82%
Shah
eed
Bha
gat
Sin
gh
Nag
ar26
.83%
0.6
6%17
.72%
7.87
%2.
12%
51.4
9%11
.52%
1.40
%0
.25%
20.5
1%1.
66%
5.89
%
Tarn
Tar
an24
.32%
1.82
%21
.46%
11.2
5%3.
73%
46.6
3%20
.01%
0.4
2%0
.41%
27.1
0%
1.76
%3.
93%
Rajasthan
Ajm
er41
.69%
2.0
7%20
.42%
13.2
7%5.
21%
52.6
6%30
.22%
30.5
2%1.
21%
11.7
1%8.
53%
1.16
%
Alw
ar45
.89%
3.68
%36
.24%
11.6
9%6.
97%
80.1
2%60
.63%
15.4
0%
2.58
%39
.30
%11
.94%
6.13
%
Bans
war
a50
.98%
2.16
%24
.66%
23.6
3%15
.91%
87.9
8%79
.37%
28.5
9%31
.05%
76.1
4%49
.79%
2.29
%
Bara
n45
.22%
2.0
3%21
.55%
15.3
3%8.
22%
75.4
7%66
.41%
26.3
9%6.
62%
57.9
2%21
.47%
2.25
%
Barm
er44
.71%
4.28
%41
.71%
34.7
9%20
.03%
86.2
8%79
.27%
42.8
0%
33.3
3%55
.15%
48.8
0%
5.50
%
Bhar
atp
ur45
.29%
4.0
0%
40.7
0%
14.2
7%12
.73%
85.3
7%65
.59%
47.9
4%8.
92%
55.2
2%22
.32%
7.42
%
Bhilw
ara
36.3
7%2.
27%
21.9
4%20
.73%
8.35
%73
.94%
65.6
5%35
.85%
2.96
%23
.93%
15.0
7%2.
48%
Bika
ner
40.1
7%2.
57%
26.5
7%18
.03%
9.53
%63
.22%
34.1
7%15
.75%
8.88
%23
.56%
15.6
1%3.
31%
Bund
i45
.04%
2.35
%23
.58%
19.4
0%
6.11
%78
.26%
71.5
8%23
.53%
7.37
%41
.67%
20.7
8%3.
03%
Chi
ttau
rgar
h36
.60
%2.
05%
24.1
0%
21.8
1%7.
27%
75.2
5%68
.18%
24.8
2%3.
89%
40.0
3%12
.56%
3.68
%
Chu
ru40
.32%
1.88
%33
.51%
16.4
6%5.
56%
70.7
9%23
.77%
21.3
8%4.
47%
21.6
1%22
.10
%7.
48%
Dau
sa43
.31%
3.96
%29
.83%
11.1
0%
2.0
5%85
.09%
63.5
6%20
.57%
9.21
%37
.73%
22.4
0%
5.29
%
Dha
ulp
ur51
.37%
4.80
%34
.64%
15.5
6%9.
73%
81.2
3%68
.89%
19.9
8%7.
59%
45.3
8%23
.14%
2.0
3%
Dun
gar
pur
54.6
5%2.
31%
24.2
0%
22.0
1%8.
99%
86.0
8%68
.18%
32.8
9%21
.75%
70.7
8%43
.55%
2.15
%
Gan
gan
agar
34.3
5%2.
55%
18.3
8%13
.18%
2.84
%62
.55%
24.2
3%8.
41%
5.86
%44
.82%
7.56
%3.
55%
Han
uman
gar
h36
.57%
2.64
%25
.20
%14
.73%
5.0
9%75
.74%
43.5
2%5.
24%
5.0
7%48
.49%
11.0
0%
3.83
%
Jaip
ur38
.74%
2.79
%20
.83%
7.14
%3.
63%
49.6
9%41
.10
%15
.18%
1.77
%19
.59%
9.61
%4.
22%
Jais
alm
er42
.84%
4.19
%41
.10
%37
.49%
23.4
7%85
.02%
62.5
6%52
.83%
24.0
5%44
.65%
37.7
2%8.
26%
Jalo
r51
.69%
3.36
%32
.48%
24.7
3%14
.06%
74.9
1%60
.58%
30.7
0%
16.8
6%38
.23%
36.9
3%3.
91%
Jhal
awar
42.0
8%2.
38%
21.4
9%19
.23%
7.92
%73
.49%
62.5
0%
39.1
5%3.
79%
54.0
0%
24.0
1%1.
42%
(CONTD.) DISTrICT-WISe: UNCeNSoreD heADCoUNT rATIo(CONTD.) DISTrICT-WISe: UNCeNSoreD heADCoUNT rATIo
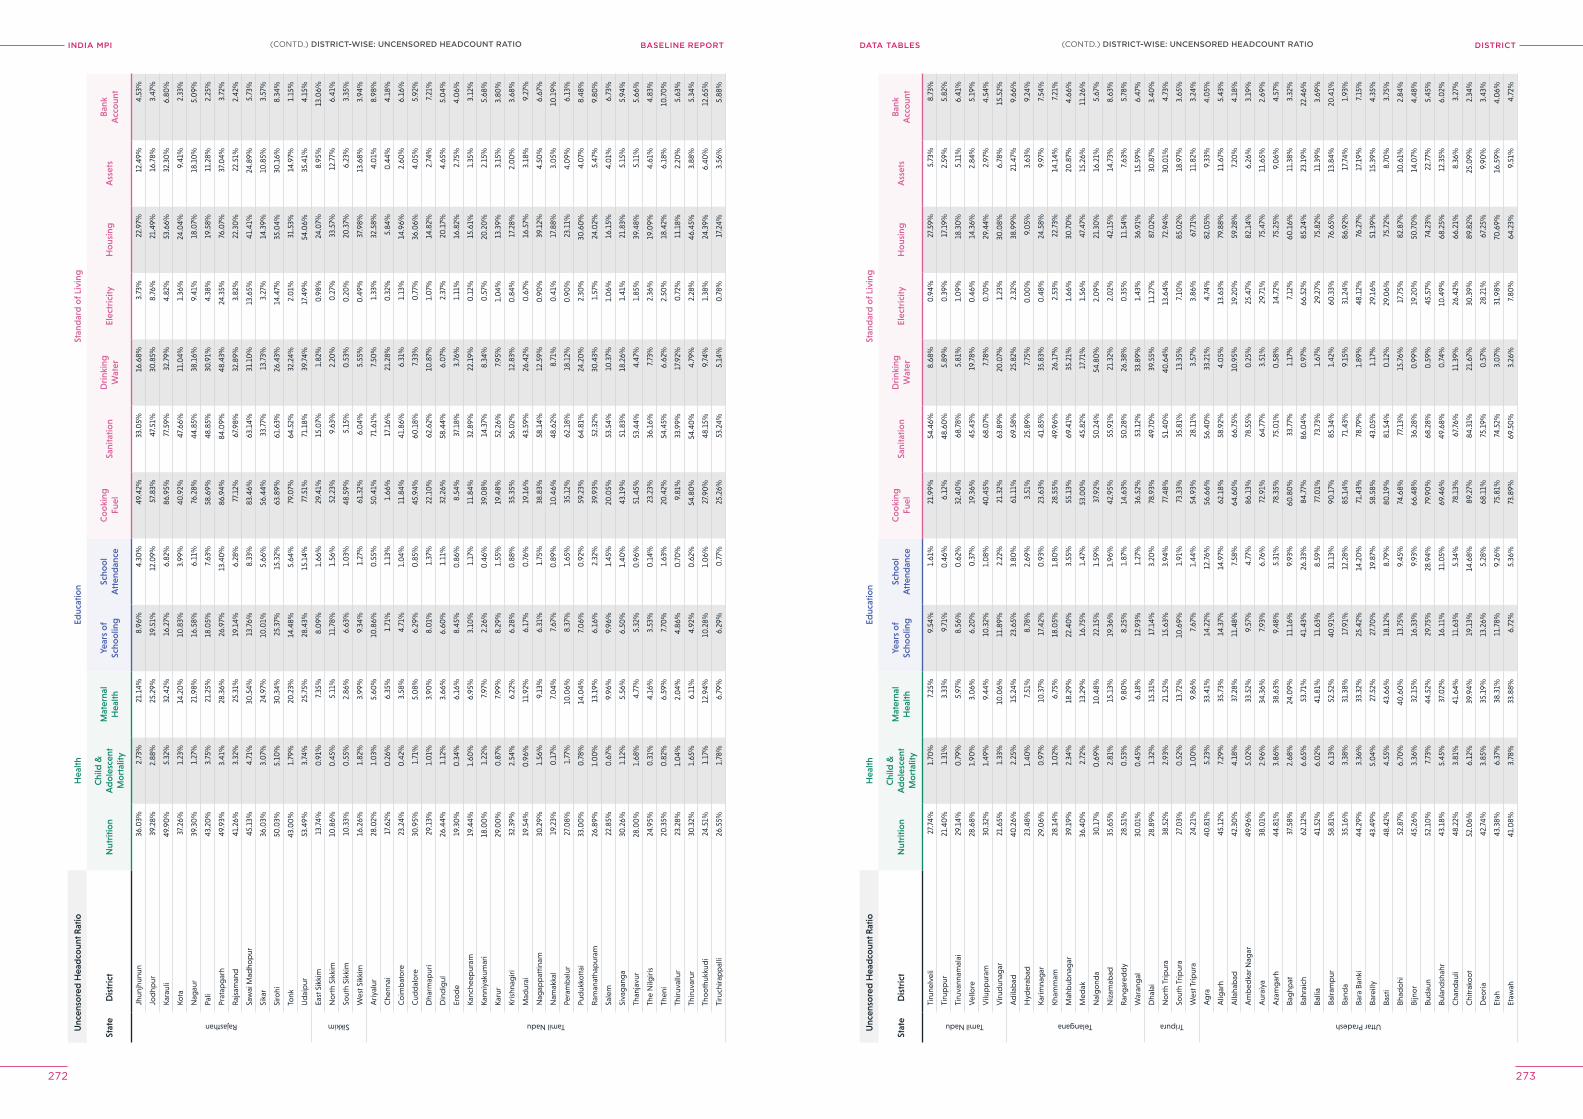
INDIA MPI BASELINE REPORT DISTrICTDATA TABleS
272 273
Unc
enso
red
Hea
dco
unt R
atio
Hea
lthEd
ucat
ion
Stan
dar
d o
f Liv
ing
Stat
eD
istr
ict
Nut
ritio
nC
hild
&
Ad
ole
scen
t M
ort
ality
Mat
erna
l H
ealth
Year
s o
f Sc
hoo
ling
Scho
ol
Att
end
ance
Co
oki
ng
Fuel
Sani
tatio
nD
rink
ing
Wat
erEl
ectr
icity
Ho
usin
gA
sset
sB
ank
Acc
oun
t
Rajasthan
Jhun
jhun
un36
.03%
2.73
%21
.14%
8.96
%4.
30%
49.4
2%33
.05%
16.6
8%3.
73%
22.9
7%12
.49%
4.53
%
Jod
hpur
39.2
8%2.
88%
25.2
9%19
.51%
12.0
9%57
.83%
47.5
1%30
.85%
8.76
%21
.49%
16.7
8%3.
47%
Kara
uli
49.9
0%
5.32
%32
.42%
16.2
7%6.
82%
86.9
5%77
.59%
32.7
9%4.
82%
53.6
6%32
.30
%6.
80%
Kota
37.2
6%1.
23%
14.2
0%
10.8
3%3.
99%
40.9
2%47
.66%
11.0
4%1.
36%
24.0
4%9.
41%
2.33
%
Nag
aur
39.3
0%
1.27
%21
.98%
16.5
8%6.
11%
76.2
8%44
.85%
38.1
6%9.
41%
18.0
7%18
.10
%5.
09%
Pali
43.2
0%
3.75
%21
.25%
18.0
5%7.
63%
58.6
9%48
.85%
30.9
1%4.
38%
19.5
8%11
.28%
2.25
%
Prat
apg
arh
49.9
3%3.
41%
28.3
6%26
.97%
13.4
0%
86.9
4%84
.09%
48.4
3%24
.35%
76.0
7%37
.04%
3.72
%
Raj
sam
and
41.2
6%3.
32%
25.3
1%19
.14%
6.28
%77
.12%
67.9
8%32
.89%
3.82
%22
.30
%22
.51%
2.42
%
Saw
ai M
adho
pur
45.1
3%4.
71%
30.5
4%13
.76%
8.33
%83
.46%
63.1
4%31
.10
%13
.65%
41.4
1%24
.89%
5.73
%
Sika
r36
.03%
3.0
7%24
.97%
10.0
1%5.
66%
56.4
4%33
.77%
13.7
3%3.
27%
14.3
9%10
.85%
3.57
%
Siro
hi50
.03%
5.10
%30
.34%
25.3
7%15
.32%
63.8
9%61
.63%
26.4
3%14
.47%
35.0
4%30
.16%
8.34
%
Tonk
43.0
0%
1.79
%20
.23%
14.4
8%5.
64%
79.0
7%64
.52%
32.2
4%2.
01%
31.5
3%14
.97%
1.15
%
Ud
aip
ur53
.49%
3.74
%25
.75%
28.4
3%15
.14%
77.5
1%71
.18%
39.7
4%17
.49%
54.0
6%35
.41%
4.15
%
Sikkim
East
Sik
kim
13.7
4%0
.91%
7.35
%8.
09%
1.66
%29
.41%
15.0
7%1.
82%
0.9
8%24
.07%
8.95
%13
.06%
No
rth
Sikk
im10
.86%
0.4
5%5.
11%
11.7
8%1.
56%
52.2
3%9.
63%
2.20
%0
.27%
33.5
7%12
.77%
6.41
%
Sout
h Si
kkim
10.3
3%0
.55%
2.86
%6.
63%
1.0
3%48
.59%
5.15
%0
.53%
0.2
0%
20.3
7%6.
23%
3.35
%
Wes
t Sik
kim
16.2
6%1.
82%
3.99
%9.
34%
1.27
%61
.32%
6.0
4%5.
55%
0.4
9%37
.98%
13.6
8%3.
94%
Tamil Nadu
Ariy
alur
28.0
2%1.
03%
5.60
%10
.86%
0.5
5%50
.41%
71.6
1%7.
50%
1.33
%32
.58%
4.0
1%8.
98%
Che
nnai
17.6
2%0
.26%
6.35
%1.
71%
1.13
%1.
66%
17.1
6%21
.28%
0.3
2%5.
84%
0.4
4%4.
18%
Co
imb
ato
re23
.24%
0.4
2%3.
58%
4.71
%1.
04%
11.8
4%41
.86%
6.31
%1.
13%
14.9
6%2.
60%
6.16
%
Cud
dal
ore
30.9
5%1.
71%
5.0
8%6.
29%
0.8
5%45
.94%
60.1
8%7.
33%
0.7
7%36
.06%
4.0
5%5.
92%
Dha
rmap
uri
29.1
3%1.
01%
3.90
%8.
01%
1.37
%22
.10
%62
.62%
10.8
7%1.
07%
14.8
2%2.
74%
7.21
%
Din
dig
ul26
.44%
1.12
%3.
66%
6.60
%1.
11%
32.2
6%58
.44%
6.0
7%2.
37%
20.1
7%4.
65%
5.0
4%
Ero
de
19.3
0%
0.3
4%6.
16%
8.45
%0
.86%
8.54
%37
.18%
3.76
%1.
11%
16.8
2%2.
75%
4.0
6%
Kanc
heep
uram
19.4
4%1.
60%
6.95
%3.
10%
1.17
%11
.84%
32.8
9%22
.19%
0.1
2%15
.61%
1.35
%3.
12%
Kann
iyak
umar
i18
.00
%1.
22%
7.97
%2.
26%
0.4
6%39
.08%
14.3
7%8.
34%
0.5
7%20
.20
%2.
15%
5.68
%
Karu
r29
.00
%0
.87%
7.99
%8.
29%
1.55
%19
.48%
52.2
6%7.
95%
1.0
4%13
.39%
3.15
%3.
80%
Kris
hnag
iri32
.39%
2.54
%6.
22%
6.28
%0
.88%
35.3
5%56
.02%
12.8
3%0
.84%
17.2
8%2.
00
%3.
68%
Mad
urai
19.5
4%0
.96%
11.9
2%6.
17%
0.7
6%19
.16%
43.5
9%26
.42%
0.6
7%16
.57%
3.18
%9.
27%
Nag
app
attin
am30
.29%
1.56
%9.
13%
6.31
%1.
75%
38.8
3%58
.14%
12.5
9%0
.90
%39
.12%
4.50
%6.
67%
Nam
akka
l19
.23%
0.1
7%7.
04%
7.67
%0
.89%
10.4
6%48
.62%
8.71
%0
.41%
17.8
8%3.
05%
10.1
9%
Pera
mb
alur
27.0
8%1.
77%
10.0
6%8.
37%
1.65
%35
.12%
62.1
8%18
.12%
0.9
0%
23.1
1%4.
09%
6.13
%
Pud
ukko
ttai
33.0
0%
0.7
8%14
.04%
7.0
6%0
.92%
59.2
3%64
.81%
24.2
0%
2.30
%30
.60
%4.
07%
8.48
%
Ram
anat
hap
uram
26.8
9%1.
00
%13
.19%
6.16
%2.
32%
39.9
3%52
.32%
30.4
3%1.
57%
24.0
2%5.
47%
9.80
%
Sale
m22
.85%
0.6
7%9.
96%
9.96
%1.
45%
20.0
5%53
.54%
10.3
7%1.
06%
16.1
5%4.
01%
6.73
%
Siva
gan
ga
30.2
6%1.
12%
5.56
%6.
50%
1.40
%43
.19%
51.8
3%18
.26%
1.41
%21
.83%
5.15
%5.
94%
Than
javu
r28
.00
%1.
68%
4.77
%5.
32%
0.9
6%51
.45%
53.4
4%4.
47%
1.85
%39
.48%
5.11
%5.
66%
The
Nilg
iris
24.9
5%0
.31%
4.16
%3.
53%
0.1
4%23
.23%
36.1
6%7.
73%
2.36
%19
.09%
4.61
%4.
83%
Then
i20
.35%
0.8
2%6.
59%
7.70
%1.
63%
20.4
2%54
.45%
6.62
%2.
50%
18.4
2%6.
18%
10.7
0%
Thiru
vallu
r23
.28%
1.0
4%2.
04%
4.86
%0
.70
%9.
81%
33.9
9%17
.92%
0.7
2%11
.18%
2.20
%5.
63%
Thiru
varu
r30
.32%
1.65
%6.
11%
4.92
%0
.62%
54.8
0%
54.4
0%
4.79
%2.
28%
46.4
5%3.
88%
5.34
%
Tho
oth
ukku
di
24.5
1%1.
17%
12.9
4%10
.28%
1.0
6%27
.90
%48
.15%
9.74
%1.
38%
24.3
9%6.
40%
12.6
5%
Tiru
chira
pp
alli
26.5
5%1.
78%
6.79
%6.
29%
0.7
7%25
.26%
53.2
4%5.
14%
0.7
8%17
.24%
3.56
%5.
88%
Unc
enso
red
Hea
dco
unt R
atio
Hea
lthEd
ucat
ion
Stan
dar
d o
f Liv
ing
Stat
eD
istr
ict
Nut
ritio
nC
hild
&
Ad
ole
scen
t M
ort
ality
Mat
erna
l H
ealth
Year
s o
f Sc
hoo
ling
Scho
ol
Att
end
ance
Co
oki
ng
Fuel
Sani
tatio
nD
rink
ing
Wat
erEl
ectr
icity
Ho
usin
gA
sset
sB
ank
Acc
oun
t
Tamil Nadu
Tiru
nelv
eli
27.7
4%1.
70%
7.25
%9.
54%
1.61
%21
.99%
54.4
6%8.
68%
0.9
4%27
.59%
5.73
%8.
73%
Tiru
pp
ur21
.40
%1.
31%
3.33
%9.
71%
0.4
6%6.
12%
48.6
0%
5.89
%0
.39%
17.1
9%2.
59%
5.82
%
Tiru
vann
amal
ai29
.14%
0.7
9%5.
97%
8.56
%0
.62%
32.4
0%
68.7
8%5.
81%
1.0
9%18
.30
%5.
11%
6.41
%
Vel
lore
28.6
8%1.
90%
3.0
6%6.
20%
0.3
7%19
.36%
45.4
3%19
.78%
0.4
6%14
.36%
2.84
%5.
19%
Vilu
pp
uram
30.3
2%1.
49%
9.44
%10
.32%
1.0
8%40
.45%
68.0
7%7.
78%
0.7
0%
29.4
4%2.
97%
4.54
%
Viru
dun
agar
21.6
5%1.
33%
10.0
6%11
.89%
2.22
%21
.32%
63.8
9%20
.07%
1.23
%30
.08%
6.78
%15
.52%
Telangana
Ad
ilab
ad40
.26%
2.25
%15
.24%
23.6
5%3.
80%
61.1
1%69
.58%
25.8
2%2.
32%
38.9
9%21
.47%
9.66
%
Hyd
erab
ad23
.48%
1.40
%7.
51%
8.78
%2.
69%
3.51
%25
.89%
7.75
%0
.00
%9.
05%
3.63
%9.
24%
Karim
nag
ar29
.06%
0.9
7%10
.37%
17.4
2%0
.93%
23.6
3%41
.85%
35.8
3%0
.48%
24.5
8%9.
97%
7.54
%
Kham
mam
28.1
4%1.
02%
6.75
%18
.05%
1.80
%28
.55%
49.9
6%26
.17%
2.53
%22
.73%
14.1
4%7.
21%
Mah
bub
nag
ar39
.19%
2.34
%18
.29%
22.4
0%
3.55
%55
.13%
69.4
1%35
.21%
1.66
%30
.70
%20
.87%
4.66
%
Med
ak36
.40
%2.
72%
13.2
9%16
.75%
1.47
%53
.00
%45
.82%
17.7
1%1.
56%
47.4
7%15
.26%
11.2
6%
Nal
go
nda
30.1
7%0
.69%
10.4
8%22
.15%
1.59
%37
.92%
50.2
4%54
.80
%2.
09%
21.3
0%
16.2
1%5.
67%
Niz
amab
ad35
.65%
2.81
%15
.13%
19.3
6%1.
96%
42.9
5%55
.91%
21.3
2%2.
02%
42.1
5%14
.73%
8.63
%
Ran
gar
edd
y28
.51%
0.5
3%9.
80%
8.25
%1.
87%
14.6
3%50
.28%
26.3
8%0
.35%
11.5
4%7.
63%
5.78
%
War
ang
al30
.01%
0.4
5%6.
18%
12.9
3%1.
27%
36.5
2%53
.12%
33.8
9%1.
43%
36.9
1%15
.59%
6.47
%
Tripura
Dha
lai
28.8
9%1.
32%
15.3
1%17
.14%
3.20
%78
.93%
49.7
0%
39.5
5%11
.27%
87.0
2%30
.87%
3.40
%
No
rth
Trip
ura
38.5
2%2.
93%
21.5
2%15
.63%
3.94
%77
.48%
51.4
0%
40.6
4%13
.64%
72.9
4%30
.01%
4.73
%
Sout
h Tr
ipur
a27
.03%
0.5
2%13
.72%
10.6
9%1.
91%
73.3
3%35
.81%
13.3
5%7.
10%
85.0
2%18
.97%
3.65
%
Wes
t Trip
ura
24.2
1%1.
00
%9.
86%
7.67
%1.
44%
54.9
3%28
.11%
3.57
%3.
86%
67.7
1%11
.82%
3.24
%
Uttar Pradesh
Ag
ra40
.81%
5.23
%33
.41%
14.2
2%12
.76%
56.6
6%56
.40
%33
.21%
4.74
%82
.05%
9.33
%4.
05%
Alig
arh
45.1
2%7.
29%
35.7
3%14
.37%
14.9
7%62
.18%
58.9
2%4.
05%
13.6
3%79
.88%
11.6
7%5.
43%
Alla
hab
ad42
.30
%4.
18%
37.2
8%11
.48%
7.58
%64
.60
%66
.75%
10.9
5%19
.20
%59
.28%
7.20
%4.
18%
Am
bed
kar N
agar
49.9
6%5.
02%
33.5
2%9.
57%
4.77
%86
.13%
78.5
5%0
.25%
25.4
7%82
.14%
6.26
%3.
19%
Aur
aiya
38.0
1%2.
96%
34.3
6%7.
93%
6.76
%72
.91%
64.7
7%3.
51%
29.7
1%75
.47%
11.6
5%2.
69%
Aza
mg
arh
44.8
1%3.
86%
38.6
3%9.
48%
5.31
%78
.35%
75.0
1%0
.58%
14.7
2%75
.25%
9.0
6%4.
57%
Bag
hpat
37.5
8%2.
68%
24.0
9%11
.16%
9.93
%60
.80
%33
.77%
1.17
%7.
12%
60.1
6%11
.38%
3.32
%
Bahr
aich
62.1
2%6.
65%
53.7
1%41
.43%
26.3
3%84
.77%
86.0
4%0
.97%
66.5
2%85
.24%
23.1
9%22
.46%
Balli
a41
.52%
6.0
2%41
.81%
11.6
3%8.
59%
77.0
1%73
.73%
1.67
%29
.27%
75.8
2%11
.39%
3.69
%
Balra
mp
ur58
.81%
6.13
%52
.52%
40.9
1%31
.13%
90.1
7%85
.34%
1.42
%60
.33%
76.6
5%13
.84%
20.4
1%
Band
a35
.16%
3.38
%31
.38%
17.9
1%12
.28%
85.1
4%71
.43%
9.15
%31
.24%
86.9
2%17
.74%
1.93
%
Bara
Ban
ki44
.29%
3.36
%33
.32%
25.4
2%14
.20
%71
.43%
78.7
9%1.
89%
48.1
2%76
.27%
17.1
9%7.
15%
Bare
illy
43.4
9%5.
04%
27.5
2%27
.70
%19
.87%
58.5
8%43
.05%
1.17
%29
.16%
51.3
9%15
.39%
4.35
%
Bast
i48
.42%
4.55
%43
.66%
18.1
2%8.
79%
80.1
9%81
.54%
0.1
2%29
.06%
75.7
2%8.
70%
3.75
%
Bhad
ohi
52.8
7%6.
70%
40.6
0%
13.7
5%9.
45%
74.6
8%77
.13%
15.7
6%17
.75%
82.8
7%10
.61%
2.84
%
Bijn
or
45.2
6%3.
36%
32.1
5%16
.33%
9.93
%66
.48%
36.2
8%0
.99%
19.2
0%
50.7
0%
14.0
7%4.
48%
Bud
aun
52.1
0%
7.73
%44
.52%
29.7
5%28
.94%
79.9
0%
68.2
8%0
.59%
45.5
7%74
.23%
22.7
7%5.
45%
Bula
ndsh
ahr
43.1
8%5.
45%
37.0
2%16
.11%
11.0
5%69
.46%
49.6
8%0
.74%
10.4
9%68
.25%
12.3
5%6.
02%
Cha
ndau
li48
.22%
3.81
%41
.64%
11.6
3%5.
34%
78.1
3%67
.76%
11.3
9%26
.42%
66.2
1%8.
36%
3.27
%
Chi
trak
oo
t52
.06%
6.12
%39
.94%
19.1
3%14
.68%
89.2
7%84
.31%
21.6
7%30
.39%
89.8
2%25
.09%
2.34
%
Deo
ria42
.74%
3.85
%35
.19%
13.2
6%5.
28%
68.1
1%75
.19%
0.5
7%28
.21%
67.2
5%9.
90%
3.43
%
Etah
43.3
8%6.
37%
38.3
1%11
.78%
9.26
%75
.81%
74.5
2%3.
07%
31.9
8%70
.69%
16.5
9%4.
06%
Etaw
ah41
.08%
3.78
%33
.88%
6.72
%5.
36%
73.8
9%69
.50
%3.
26%
7.80
%64
.23%
9.51
%4.
72%
(CONTD.) DISTrICT-WISe: UNCeNSoreD heADCoUNT rATIo(CONTD.) DISTrICT-WISe: UNCeNSoreD heADCoUNT rATIo
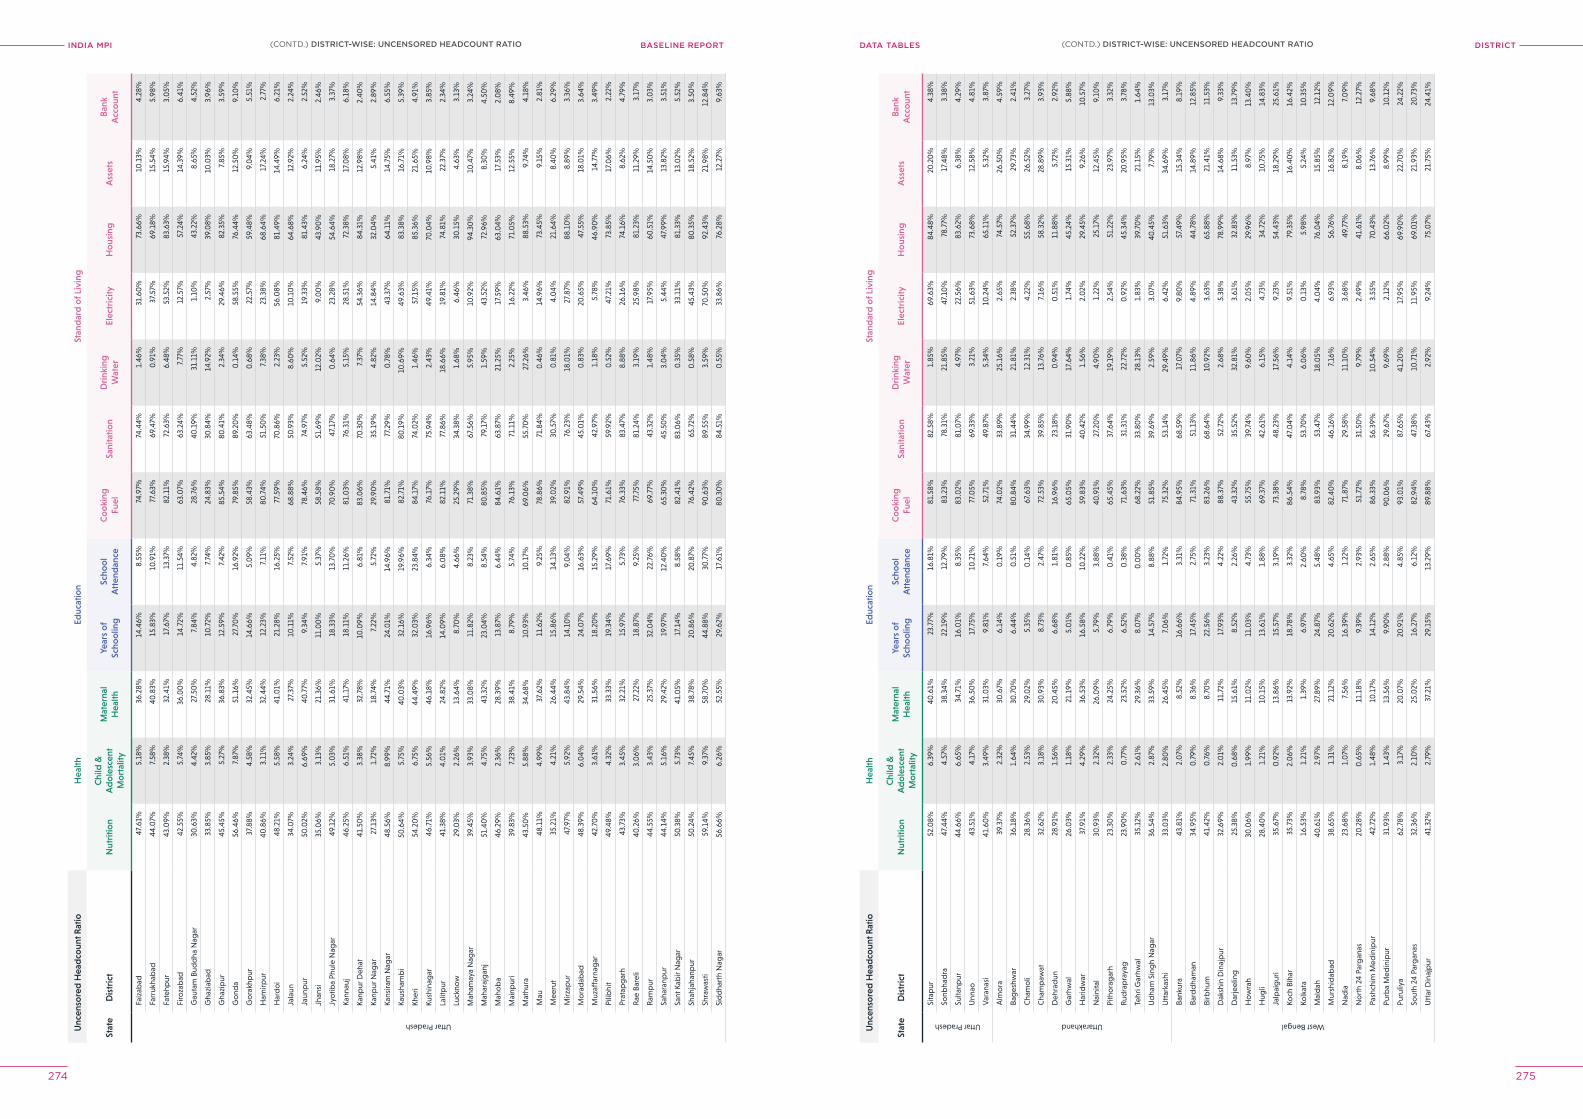
INDIA MPI BASELINE REPORT DISTrICTDATA TABleS
274 275
Unc
enso
red
Hea
dco
unt R
atio
Hea
lthEd
ucat
ion
Stan
dar
d o
f Liv
ing
Stat
eD
istr
ict
Nut
ritio
nC
hild
&
Ad
ole
scen
t M
ort
ality
Mat
erna
l H
ealth
Year
s o
f Sc
hoo
ling
Scho
ol
Att
end
ance
Co
oki
ng
Fuel
Sani
tatio
nD
rink
ing
Wat
erEl
ectr
icity
Ho
usin
gA
sset
sB
ank
Acc
oun
t
Uttar Pradesh
Faiz
abad
47.6
1%5.
18%
36.2
8%14
.46%
8.55
%74
.97%
74.4
4%1.
46%
31.6
0%
73.6
6%10
.13%
4.28
%
Farr
ukha
bad
44.0
7%7.
58%
40.8
3%15
.83%
10.9
1%77
.63%
69.4
7%0
.91%
37.5
7%69
.18%
15.5
4%5.
98%
Fate
hpur
43.0
9%2.
38%
32.4
1%17
.67%
13.3
7%82
.11%
72.6
3%6.
48%
53.5
2%83
.63%
15.9
4%3.
05%
Firo
zab
ad42
.55%
5.74
%36
.00
%14
.72%
11.5
4%63
.07%
63.2
4%7.
77%
12.5
7%57
.24%
14.3
9%6.
41%
Gau
tam
Bud
dha
Nag
ar30
.63%
4.42
%27
.50
%7.
84%
4.82
%28
.76%
40.1
9%31
.11%
1.10
%43
.22%
8.65
%4.
52%
Gha
ziab
ad33
.85%
3.85
%28
.11%
10.7
2%7.
74%
24.8
3%30
.84%
14.9
2%2.
57%
39.0
8%10
.03%
3.96
%
Gha
zip
ur45
.45%
5.27
%36
.83%
12.5
9%7.
42%
85.5
4%80
.41%
2.34
%29
.46%
82.3
5%7.
85%
3.59
%
Go
nda
56.4
6%7.
87%
51.1
6%27
.70
%16
.92%
79.8
5%89
.20
%0
.14%
58.5
5%76
.44%
12.5
0%
9.10
%
Go
rakh
pur
37.8
8%4.
58%
32.4
5%14
.66%
5.0
9%58
.43%
63.4
8%0
.68%
22.5
7%59
.48%
9.0
4%5.
51%
Ham
irpur
40.8
6%3.
11%
32.4
4%12
.23%
7.11
%80
.74%
51.5
0%
7.38
%23
.38%
68.6
4%17
.24%
2.77
%
Har
do
i48
.21%
5.58
%41
.01%
21.2
8%16
.25%
77.5
9%70
.86%
2.23
%56
.08%
81.4
9%14
.49%
6.21
%
Jala
un34
.07%
3.24
%27
.37%
10.1
1%7.
52%
68.8
8%50
.93%
8.60
%10
.10
%64
.68%
12.9
2%2.
24%
Jaun
pur
50.0
2%6.
69%
40.7
7%9.
34%
7.91
%78
.46%
74.9
7%5.
52%
19.3
3%81
.43%
6.24
%2.
52%
Jhan
si35
.06%
3.13
%21
.36%
11.0
0%
5.37
%58
.58%
51.6
9%12
.02%
9.0
0%
43.9
0%
11.9
5%2.
46%
Jyo
tiba
Phul
e N
agar
49.1
2%5.
03%
31.6
1%18
.33%
13.7
0%
70.9
0%
47.1
7%0
.64%
23.2
8%54
.64%
18.2
7%3.
37%
Kann
auj
46.2
5%6.
51%
41.1
7%18
.11%
11.2
6%81
.03%
76.3
1%5.
15%
28.5
1%72
.38%
17.0
8%6.
18%
Kanp
ur D
ehat
41.5
0%
3.38
%32
.78%
10.0
9%6.
81%
83.0
6%70
.30
%7.
37%
54.3
6%84
.31%
12.9
8%2.
40%
Kanp
ur N
agar
27.1
3%1.
72%
18.7
4%7.
22%
5.72
%29
.90
%35
.19%
4.82
%14
.84%
32.0
4%5.
41%
2.89
%
Kans
iram
Nag
ar48
.56%
8.99
%44
.71%
24.0
1%14
.96%
81.7
1%77
.29%
0.7
8%43
.37%
64.1
1%14
.75%
6.55
%
Kaus
ham
bi
50.6
4%5.
75%
40.0
3%32
.16%
19.9
6%82
.71%
80.1
9%10
.69%
49.6
3%83
.38%
16.7
1%5.
39%
Kher
i54
.20
%6.
75%
44.4
9%32
.03%
23.8
4%84
.17%
74.0
2%1.
46%
57.1
5%85
.36%
21.6
5%4.
91%
Kush
inag
ar46
.71%
5.56
%46
.18%
16.9
6%6.
34%
76.1
7%75
.94%
2.43
%49
.41%
70.0
4%10
.98%
3.85
%
Lalit
pur
41.3
8%4.
01%
24.8
2%14
.09%
6.0
8%82
.11%
77.8
6%18
.66%
19.8
1%74
.81%
22.3
7%2.
34%
Luck
now
29.0
3%2.
26%
13.6
4%8.
70%
4.66
%25
.29%
34.3
8%1.
68%
6.46
%30
.15%
4.63
%3.
13%
Mah
amay
a N
agar
39.4
5%3.
93%
33.0
8%11
.82%
8.23
%71
.38%
67.5
6%5.
95%
10.9
2%94
.30
%10
.47%
3.24
%
Mah
araj
gan
j51
.40
%4.
75%
43.3
2%23
.04%
8.54
%80
.85%
79.1
7%1.
59%
43.5
2%72
.96%
8.30
%4.
50%
Mah
ob
a46
.29%
2.36
%28
.39%
13.8
7%6.
44%
84.6
1%63
.87%
21.2
5%17
.59%
63.0
4%17
.53%
2.0
8%
Mai
npur
i39
.83%
7.23
%38
.41%
8.79
%5.
74%
76.1
3%71
.11%
2.25
%16
.22%
71.0
5%12
.55%
8.49
%
Mat
hura
43.5
0%
5.88
%34
.68%
10.9
3%10
.17%
69.0
6%55
.70
%27
.26%
3.46
%88
.53%
9 .74
%4.
18%
Mau
48.1
1%4.
99%
37.6
2%11
.62%
9.25
%78
.86%
71.8
4%0
.46%
14.9
6%73
.45%
9.15
%2.
81%
Mee
rut
35.2
1%4.
21%
26.4
4%15
.86%
14.1
3%39
.02%
30.5
7%0
.81%
4.0
4%21
.64%
8.40
%6.
29%
Mirz
apur
47.9
7%5.
92%
43.8
4%14
.10
%9.
04%
82.9
1%76
.23%
18.0
1%27
.87%
88.1
0%
8.89
%3.
36%
Mo
rad
abad
48.3
9%6.
04%
29.5
4%24
.07%
16.6
3%57
.49%
45.0
1%0
.83%
20.6
5%47
.55%
18.0
1%3.
64%
Muz
affa
rnag
ar42
.70
%3.
61%
31.5
6%18
.20
%15
.29%
64.1
0%
42.9
7%1.
18%
5.78
%46
.90
%14
.77%
3.49
%
Pilib
hit
49.4
8%4.
32%
33.3
3%19
.34%
17.6
9%71
.61%
59.9
2%0
.52%
47.2
1%73
.85%
17.0
6%2.
22%
Prat
apg
arh
43.7
3%3.
45%
32.2
1%15
.97%
5.73
%76
.33%
83.4
7%8.
88%
26.1
6%74
.16%
8.62
%4.
79%
Rae
Bar
eli
40.2
6%3.
06%
27.2
2%18
.87%
9.25
%77
.75%
81.2
4%3.
19%
25.9
8%81
.23%
11.2
9%3.
17%
Ram
pur
44.5
5%3.
43%
25.3
7%32
.04%
22.7
6%69
.77%
43.3
2%1.
48%
17.9
5%60
.51%
14.5
0%
3.0
3%
Saha
ranp
ur44
.14%
5.16
%29
.42%
19.9
7%12
.40
%65
.30
%45
.50
%3.
04%
5.44
%47
.99%
13.8
2%3.
51%
Sant
Kab
ir N
agar
50.3
8%5.
73%
41.0
5%17
.14%
8.58
%82
.41%
83.0
6%0
.35%
33.1
1%81
.33%
13.0
2%5.
52%
Shah
jaha
npur
50.2
4%7.
45%
38.7
8%20
.86%
20.8
7%76
.42%
65.7
2%0
.58%
45.4
3%80
.35%
18.5
2%3.
50%
Shra
was
ti59
.14%
9.37
%58
.70
%44
.88%
30.7
7%90
.63%
89.5
5%3.
59%
70.5
0%
92.4
3%21
.98%
12.8
4%
Sid
dha
rth
Nag
ar56
.66%
6.26
%52
.55%
29.6
2%17
.61%
80.3
0%
84.5
1%0
.55%
33.8
6%76
.28%
12.2
7%9.
63%
Unc
enso
red
Hea
dco
unt R
atio
Hea
lthEd
ucat
ion
Stan
dar
d o
f Liv
ing
Stat
eD
istr
ict
Nut
ritio
nC
hild
&
Ad
ole
scen
t M
ort
ality
Mat
erna
l H
ealth
Year
s o
f Sc
hoo
ling
Scho
ol
Att
end
ance
Co
oki
ng
Fuel
Sani
tatio
nD
rink
ing
Wat
erEl
ectr
icity
Ho
usin
gA
sset
sB
ank
Acc
oun
t
Uttar Pradesh
Sita
pur
52.0
8%6.
39%
40.6
1%23
.77%
16.8
1%81
.58%
82.5
8%1.
85%
69.6
3%84
.48%
20.2
0%
4.38
%
Sonb
had
ra47
.44%
4.57
%38
.34%
22.1
9%12
.79%
83.2
3%78
.31%
21.8
5%47
.10
%78
.77%
17.4
8%3.
38%
Sulta
npur
44.6
6%6.
65%
34.7
1%16
.01%
8.35
%83
.02%
81.0
7%4.
97%
22.5
6%83
.62%
6.38
%4.
29%
Unn
ao43
.51%
4.17
%36
.50
%17
.75%
10.2
1%77
.05%
69.3
3%3.
21%
51.6
3%73
.68%
12.5
8%4.
81%
Var
anas
i41
.60
%3.
49%
31.0
3%9.
81%
7.64
%52
.71%
49.8
7%5.
34%
10.2
4%65
.11%
5.32
%3.
87%
Uttarakhand
Alm
ora
39.3
7%2.
32%
30.6
7%6.
14%
0.1
9%74
.02%
33.8
9%25
.16%
2.65
%74
.57%
26.5
0%
4.59
%
Bag
eshw
ar36
.18%
1.64
%30
.70
%6.
44%
0.5
1%80
.84%
31.4
4%21
.81%
2.38
%52
.37%
29.7
3%2.
41%
Cha
mo
li28
.36%
2.53
%29
.02%
5.35
%0
.14%
67.6
3%34
.99%
12.3
1%4.
22%
55.6
8%26
.52%
3.27
%
Cha
mp
awat
32.6
2%3.
18%
30.9
3%8.
73%
2.47
%72
.53%
39.8
5%13
.76%
7.16
%58
.32%
28.8
9%3.
93%
Deh
rad
un28
.91%
1.56
%20
.45%
6.68
%1.
81%
16.9
6%23
.18%
0.9
4%0
.51%
11.8
8%5.
72%
2.92
%
Gar
hwal
26.0
3%1.
18%
21.1
9%5.
01%
0.8
5%65
.05%
31.9
0%
17.6
4%1.
74%
45.2
4%15
.31%
5.88
%
Har
idw
ar37
.91%
4.29
%36
.53%
16.5
8%10
.22%
59.8
3%40
.42%
1.56
%2.
02%
29.4
5%9.
26%
10.5
7%
Nai
nita
l30
.93%
2.32
%26
.09%
5.79
%3.
88%
40.9
1%27
.20
%4.
90%
1.22
%25
.17%
12.4
5%9.
10%
Pith
ora
gar
h23
.30
%2.
33%
24.2
5%6.
79%
0.4
1%65
.45%
37.6
4%19
.19%
2.54
%51
.22%
23.9
7%3.
32%
Rud
rap
raya
g23
.90
%0
.77%
23.5
2%6.
52%
0.3
8%71
.63%
31.3
1%22
.72%
0.9
2%45
.34%
20.9
5%3.
78%
Tehr
i Gar
hwal
35.1
2%2.
61%
29.3
6%8.
07%
0.0
0%
68.2
2%33
.80
%28
.13%
1.83
%39
.70
%21
.15%
1.64
%
Ud
ham
Sin
gh
Nag
ar36
.54%
2.87
%33
.59%
14.5
7%8.
88%
51.8
5%39
.69%
2.59
%3.
07%
40.4
5%7.
79%
13.0
3%
Utt
arka
shi
33.0
3%2.
80%
26.4
5%7.
06%
1.72
%75
.32%
53.1
4%29
.49%
6.42
%51
.63%
34.6
9%3.
17%
West Bengal
Bank
ura
43.8
1%2.
07%
8.52
%16
.66%
3.31
%84
.95%
68.5
9%17
.07%
9.80
%57
.49%
15.3
4%8.
19%
Bard
dha
man
34.9
5%0
.79%
8.36
%17
.45%
2.75
%71
.31%
51.1
3%11
.86%
4.89
%44
.78%
14.8
9%12
.85%
Birb
hum
41.4
2%0
.76%
8.70
%22
.56%
3.23
%83
.26%
68.6
4%10
.92%
3.63
%65
.88%
21.4
1%11
.53%
Dak
shin
Din
ajp
ur32
.69%
2.0
1%11
.72%
17.9
3%4.
22%
88.3
7%52
.72%
2.68
%5.
38%
78.9
9%14
.68%
9.33
%
Dar
jeel
ing
25.3
8%0
.68%
15.6
1%8.
52%
2.26
%43
.32%
35.5
2%32
.81%
3.61
%32
.83%
11.5
3%13
.79%
Ho
wra
h30
.06%
1.99
%11
.02%
11.0
3%4.
73%
55.7
5%39
.74%
9.60
%2.
05%
29.9
6%8.
97%
13.4
0%
Hug
li28
.40
%1.
21%
10.1
5%13
.61%
1.88
%69
.37%
42.6
1%6.
15%
4.73
%34
.72%
10.7
5%14
.83%
Jalp
aig
uri
35.6
7%0
.92%
13.8
6%15
.57%
3.19
%73
.38%
48.2
3%17
.56%
9.23
%54
.43%
18.2
9%25
.61%
Koch
Bih
ar35
.73%
2.0
6%13
.92%
18.7
8%3.
32%
86.5
4%47
.04%
4.14
%9.
51%
79.3
5%16
.40
%16
.42%
Kolk
ata
16.5
3%1.
21%
1.39
%6.
97%
2.60
%8.
78%
53.7
0%
6.0
6%0
.13%
5.98
%5.
24%
10.3
5%
Mal
dah
40.6
1%2.
97%
27.8
9%24
.87%
5.48
%83
.93%
53.4
7%18
. 05%
4.0
4%76
.04%
15.8
5%12
.12%
Mur
shid
abad
38.6
5%1.
31%
21.1
2%20
.62%
4.65
%82
.40
%46
.16%
7.16
%6.
93%
56.7
6%16
.82%
12.0
9%
Nad
ia23
.68%
1.0
7%7.
56%
16.3
9%1.
22%
71.8
7%29
.58%
11.1
0%
3.68
%49
.77%
8.19
%7.
09%
No
rth
24 P
arg
anas
20.2
8%0
.65%
11.1
8%9.
39%
2.93
%51
.72%
31.5
0%
9.79
%2.
49%
41.6
1%8.
06%
12.2
7%
Pash
chim
Med
inip
ur42
.72%
1.48
%10
.17%
14.1
2%2.
65%
86.3
3%56
.39%
10.5
4%3.
55%
70.4
3%13
.76%
9.68
%
Purb
a M
edin
ipur
31.9
3%1.
43%
13.5
6%9.
90%
2.88
%90
.06%
29.6
7%9.
69%
2.12
%66
.02%
8.99
%10
.12%
Puru
liya
62.7
8%3.
17%
20.0
7%20
.91%
4.85
%93
.01%
87.6
5%41
.20
%17
.95%
69.9
0%
22.7
0%
24.2
2%
Sout
h 24
Par
gan
as32
.36%
2.10
%25
.02%
16.2
7%6.
12%
82.9
4%47
.38%
10.7
1%11
.95%
69.0
1%21
.93%
20.7
3%
Utt
ar D
inaj
pur
41.3
2%2.
79%
37.2
1%29
.15%
13.2
9%89
.88%
67.4
3%2.
92%
9.24
%75
.07%
21.7
5%24
.41%
(CONTD.) DISTrICT-WISe: UNCeNSoreD heADCoUNT rATIo(CONTD.) DISTrICT-WISe: UNCeNSoreD heADCoUNT rATIo
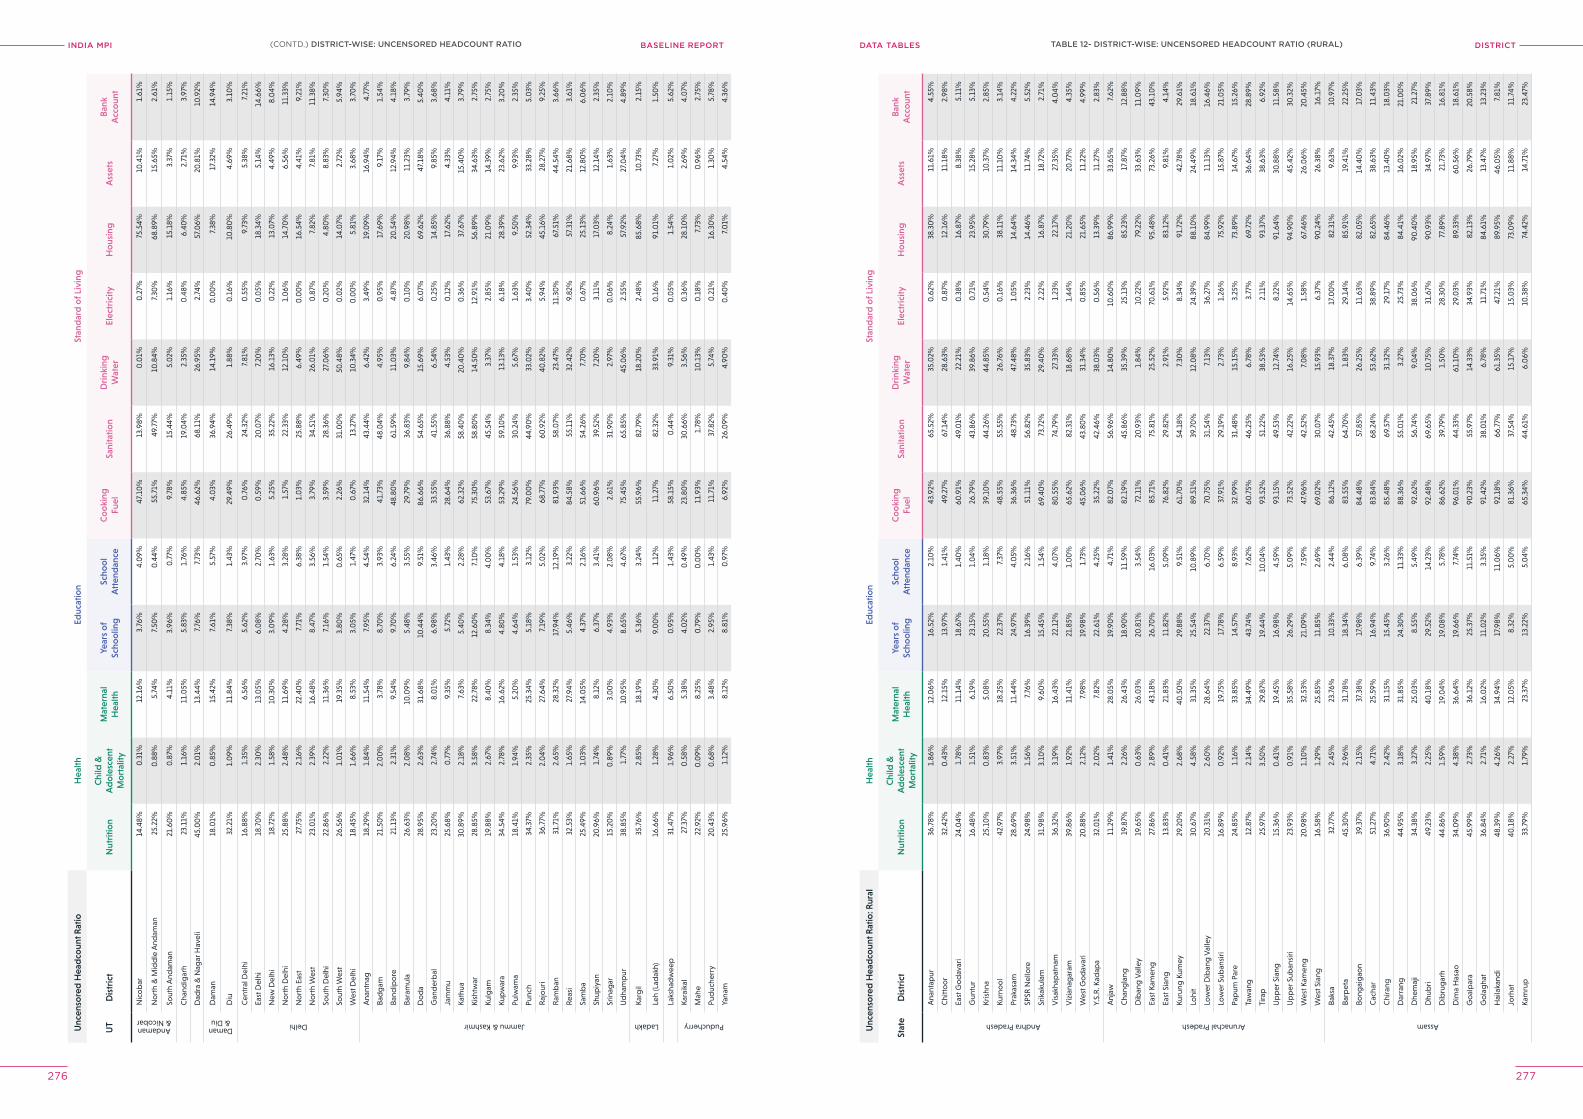
INDIA MPI BASELINE REPORT DISTrICTDATA TABleS
276 277
Unc
enso
red
Hea
dco
unt R
atio
Hea
lthEd
ucat
ion
Stan
dar
d o
f Liv
ing
UT
Dis
tric
tN
utri
tion
Chi
ld &
A
do
lesc
ent
Mo
rtal
ity
Mat
erna
l H
ealth
Year
s o
f Sc
hoo
ling
Scho
ol
Att
end
ance
Co
oki
ng
Fuel
Sani
tatio
nD
rink
ing
Wat
erEl
ectr
icity
Ho
usin
gA
sset
sB
ank
Acc
oun
t
Andaman & Nicobar
Nic
ob
ar14
.48%
0.3
1%12
.16%
3.76
%4.
09%
47.1
0%
13.9
8%0
.01%
0.2
7%75
.54%
10.4
1%1.
61%
No
rth
& M
idd
le A
ndam
an25
.22%
0.8
8%5.
74%
7.50
%0
.44%
55.7
1%49
.77%
10.8
4%7.
30%
68.8
9%15
.65%
2.61
%
Sout
h A
ndam
an21
.60
%0
.87%
4.11
%3.
96%
0.7
7%9.
78%
15.4
4%5.
02%
1.16
%15
.18%
3.37
%1.
15%
Cha
ndig
arh
23.1
1%1.
16%
11.0
5%5.
83%
1.76
%4.
85%
19.0
4%2.
35%
0.4
8%6.
40%
2.71
%3.
97%
Dad
ra &
Nag
ar H
avel
i45
.00
%2.
01%
13.4
4%7.
76%
7.73
%46
.62%
68.1
1%26
.95%
2.74
%57
.06%
20.8
1%10
.92%
Daman & Diu
Dam
an18
.01%
0.8
5%15
.42%
7.61
%5.
57%
4.0
3%36
.94%
14.1
9%0
.00
%7.
38%
17.3
2%14
.94%
Diu
32.2
1%1.
09%
11.8
4%7.
38%
1.43
%29
.49%
26.4
9%1.
88%
0.1
6%10
.80
%4.
69%
3.10
%
Delhi
Cen
tral
Del
hi16
.88%
1.35
%6.
56%
5.62
%3.
97%
0.7
6%24
.32%
7.81
%0
.55%
9.73
%5.
38%
7.21
%
East
Del
hi18
.70
%2.
30%
13.0
5%6.
08%
2.70
%0
.59%
20.0
7%7.
20%
0.0
5%18
.34%
5.14
%14
.66%
New
Del
hi18
.72%
1.58
%10
.30
%3.
09%
1.63
%5.
25%
35.2
2%16
.13%
0.2
2%13
.07%
4.49
%8.
04%
No
rth
Del
hi25
.88%
2.48
%11
.69%
4.28
%3.
28%
1.57
%22
.33%
12.1
0%
1.0
6%14
.70
%6.
56%
11.3
3%
No
rth
East
27.7
5%2.
16%
22.4
0%
7.71
%6.
38%
1.0
3%25
.88%
6.49
%0
.00
%16
.54%
4.41
%9.
21%
No
rth
Wes
t23
.01%
2.39
%16
.48%
8.47
%3.
56%
3.79
%34
.51%
26.0
1%0
.87%
7.82
%7.
81%
11.3
8%
Sout
h D
elhi
22.8
6%2.
22%
11.3
6%7.
16%
1.54
%3.
59%
28.3
6%27
.06%
0.2
0%
4.80
%8.
83%
7.30
%
Sout
h W
est
26.5
6%1.
01%
19.3
5%3.
80%
0.6
5%2.
26%
31.0
0%
50.4
8%0
.02%
14.0
7%2.
72%
5.94
%
Wes
t Del
hi18
.45%
1.66
%8.
53%
3.0
5%1.
47%
0.6
7%13
.27%
10.3
4%0
.00
%5.
81%
3.68
%3.
70%
Jammu & Kashmir
Ana
ntna
g18
.29%
1.84
%11
.54%
7.95
%4.
54%
32.1
4%43
.44%
6.42
%3.
49%
19.0
9%16
.94%
4.77
%
Bad
gam
21.5
0%
2.0
0%
3.78
%8.
70%
3.93
%41
.73%
48.0
4%4.
95%
0.9
5%17
.69%
9.17
%1.
54%
Band
ipo
re21
.13%
2.31
%9.
54%
9.70
%6.
24%
48.8
0%
61.5
9%11
.03%
4.87
%20
.54%
12.9
4%4.
18%
Bara
mul
a26
.63%
2.0
8%10
.09%
5.48
%3.
55%
29.7
9%36
.83%
9.84
%0
.10
%20
.98%
11.2
3%3.
79%
Do
da
28.9
5%2.
63%
31.6
8%10
.44%
9.51
%86
.66%
54.6
5%15
.69%
6.0
7%69
.62%
47.1
8%5.
40%
Gan
der
bal
23.2
0%
2.74
%8.
01%
6.98
%3.
46%
33.5
5%41
.55%
6.54
%0
.25%
14.8
5%9.
85%
3.68
%
Jam
mu
25.6
8%0
.77%
9.35
%5.
72%
1.43
%28
.64%
36.8
8%4.
53%
0.1
2%17
.62%
4.33
%4.
11%
Kath
ua30
.89%
2.18
%7.
63%
5.40
%2.
28%
62.3
2%58
.40
%20
.40
%0
.36%
37.6
7%15
.40
%3.
79%
Kish
twar
28.8
5%3.
58%
22.7
8%12
.60
%7.
10%
75.3
0%
58.8
0%
14.5
0%
12.9
1%56
.89%
34.6
3%2.
75%
Kulg
am19
.88%
2.67
%8.
40%
8.34
%4.
00
%53
.67%
45.5
4%3.
37%
2.85
%21
.09%
14.3
9%2.
75%
Kup
war
a34
.54%
2.78
%16
.62%
4.80
%4.
18%
53.2
9%59
.10
%13
.13%
6.18
%28
.39%
23.6
2%3.
20%
Pulw
ama
18.4
1%1.
94%
5.20
%4.
64%
1.53
%24
.56%
30.2
4%5.
67%
1.63
%9.
50%
9.93
%2.
35%
Punc
h34
.37%
2.35
%25
.34%
5.18
%3.
12%
79.0
0%
44.9
0%
33.0
2%3.
40%
52.3
4%33
.28%
5.0
3%
Raj
our
i36
.77%
2.0
4%27
.64%
7.19
%5.
02%
68.7
7%60
.92%
40.8
2%5.
94%
45.1
6%28
.27%
9.25
%
Ram
ban
31.7
1%2.
65%
28.3
2%17
.94%
12.1
9%81
.93%
58.0
7%23
.47%
11.3
0%
67.5
1%44
.54%
3.66
%
Reas
i32
.53%
1.65
%27
.94%
5.46
%3.
22%
84.5
8%55
.11%
32.4
2%9.
82%
57.3
1%21
.68%
3.61
%
Sam
ba
25.4
9%1.
03%
14.0
5%4.
37%
2.16
%51
.66%
54.2
6%7.
70%
0.6
7%25
.13%
12.8
0%
6.0
6%
Shup
iyan
20.9
6%1.
74%
8.12
%6.
37%
3.41
%60
.96%
39.5
2%7.
20%
3.11
%17
.03%
12.1
4%2.
35%
Srin
agar
15.2
0%
0.8
9%3.
00
%4.
93%
2.0
8%2.
61%
31.9
0%
2.97
%0
.06%
8.24
%1.
63%
2.10
%
Ud
ham
pur
38.8
5%1.
77%
10.9
5%8.
65%
4.67
%75
.45%
65.8
5%45
.06%
2.55
%57
.92%
27.0
4%4.
89%
Ladakh
Karg
il35
.76%
2.85
%18
.19%
5.36
%3.
24%
55.9
6%82
.79%
18.2
0%
2.48
%85
.68%
10.7
3%2.
15%
Leh
(Lad
akh)
16.6
6%1.
28%
4.30
%9.
00
%1.
12%
11.2
7%82
.32%
33.9
1%0
.16%
91.0
1%7.
27%
1.50
%
Laks
had
wee
p31
.47%
1.96
%6.
50%
0.9
5%1.
43%
58.1
5%0
.44%
9.31
%0
.05%
1.54
%1.
02%
5.62
%
Puducherry
Kara
ikal
27.3
7%0
.58%
5.38
%4.
02%
0.4
9%23
.80
%30
.66%
3.56
%0
.36%
28.1
0%
2.69
%4.
07%
Mah
e22
.92%
0.0
9%8.
25%
0.7
9%0
.00
%11
.93%
1.78
%10
.13%
0.1
8%7.
73%
0.9
6%2.
75%
Pud
uche
rry
20.4
3%0
.68%
3.48
%2.
95%
1.43
%11
.71%
37.8
2%5.
74%
0.2
1%16
.30
%1.
30%
5.78
%
Yana
m25
.96%
1.12
%8.
12%
8.81
%0
.97%
6.92
%26
.09%
4.90
%0
.40
%7.
01%
4.54
%4.
36%
Unc
enso
red
Hea
dco
unt R
atio
: Rur
alH
ealth
Educ
atio
nSt
and
ard
of L
ivin
g
Stat
eD
istr
ict
Nut
ritio
nC
hild
&
Ad
ole
scen
t M
ort
ality
Mat
erna
l H
ealth
Year
s o
f Sc
hoo
ling
Scho
ol
Att
end
ance
Co
oki
ng
Fuel
Sani
tatio
nD
rink
ing
Wat
erEl
ectr
icity
Ho
usin
gA
sset
sB
ank
Acc
oun
t
Andhra Pradesh
Ana
ntap
ur36
.78%
1.86
%12
.06%
16.5
2%2.
10%
43.9
2%65
.52%
35.0
2%0
.62%
38.3
0%
11.6
1%4.
55%
Chi
tto
or
32.4
2%0
.43%
12.1
5%13
.97%
1.41
%49
.27%
67.1
4%28
.63%
0.8
7%12
.16%
11.1
8%2.
98%
East
Go
dav
ari
24.0
4%1.
78%
11.1
4%18
.67%
1.40
%60
.91%
49.0
1%22
.21%
0.3
8%16
.87%
8.38
%5.
11%
Gun
tur
16.4
8%1.
51%
6.19
%23
.15%
1.0
4%26
.79%
43.8
6%39
.86%
0.7
1%23
.95%
15.2
8%5.
13%
Kris
hna
25.1
0%
0.8
3%5.
08%
20.5
5%1.
18%
39.1
0%
44.2
6%44
.85%
0.5
4%30
.79%
10.3
7%2.
85%
Kurn
oo
l42
.97%
3.97
%18
.25%
22.3
7%7.
37%
48.5
5%55
.55%
26.7
6%0
.16%
38.1
1%11
.10
%3.
14%
Prak
asam
28.6
9%3.
51%
11.4
4%24
.97%
4.0
5%36
.36%
48.7
3%47
.48%
1.0
5%14
.64%
14.3
4%4.
22%
SPSR
Nel
lore
24.9
8%1.
56%
7.76
%16
.39%
2.16
%51
.11%
56.8
2%35
.83%
2.23
%14
.46%
11.7
4%5.
52%
Srik
akul
am31
.98%
3.10
%9.
60%
15.4
5%1.
54%
69.4
0%
73.7
2%29
.40
%2.
22%
16.8
7%18
.72%
2.71
%
Vis
akha
pat
nam
36.3
2%3.
19%
16.4
3%22
.12%
4.0
7%80
.55%
74.7
9%27
.33%
1.23
%22
.17%
27.3
5%4.
04%
Viz
iana
gar
am39
.86%
1.92
%11
.41%
21.8
5%1.
00
%65
.62%
82.3
1%18
.68%
1.44
%21
.20
%20
.77%
4.35
%
Wes
t Go
dav
ari
20.8
8%2.
12%
7.98
%19
.98%
1.73
%45
.06%
43.8
0%
31.3
4%0
.85%
21.6
5%11
.22%
4.99
%
Y.S.
R. K
adap
a32
.01%
2.0
2%7.
82%
22.6
1%4.
25%
35.2
2%42
.46%
38.0
3%0
.56%
13.3
9%11
.27%
2.83
%
Arunachal Pradesh
Anj
aw11
.29%
1.41
%28
.05%
19.9
0%
4.71
%82
.07%
56.9
6%14
.80
%10
.60
%86
.99%
33.6
5%7.
62%
Cha
ngla
ng19
.87%
2.26
%26
.43%
18.9
0%
11.5
9%82
.19%
45.8
6%35
.39%
25.1
3%85
.23%
17.8
7%12
.88%
Dib
ang
Val
ley
19.6
5%0
.63%
26.0
3%20
.81%
3.54
%72
.11%
20.9
3%1.
84%
10.2
2%79
.22%
33.6
3%11
.09%
East
Kam
eng
27.8
6%2.
89%
43.1
8%26
.70
%16
.03%
85.7
1%75
.81%
25.5
2%70
.61%
95.4
8%73
.26%
43.1
0%
East
Sia
ng13
.83%
0.4
1%21
.83%
11.8
2%5.
09%
76.8
2%29
.82%
2.91
%5.
92%
83.1
2%9.
81%
4.14
%
Kuru
ng K
umey
29.2
0%
2.68
%40
.50
%29
.88%
9.51
%61
.70
%54
.18%
7.30
%8.
34%
91.7
2%42
.78%
29.6
1%
Lohi
t30
.67%
4.58
%31
.35%
25.5
4%10
.89%
89.5
1%39
.70
%12
.08%
24.3
9%88
.10
%24
.49%
18.6
1%
Low
er D
iban
g V
alle
y20
.31%
2.60
%28
.64%
22.3
7%6.
70%
70.7
5%31
.54%
7.13
%36
.27%
84.9
9%11
.13%
16.4
6%
Low
er S
uban
siri
16.8
9%0
.92%
19.7
5%17
.78%
6.59
%37
.91%
29.1
9%2.
73%
1.26
%75
.92%
15.8
7%21
.05%
Pap
um P
are
24.8
5%1.
16%
33.8
5%14
.57%
8.93
%32
.99%
31.4
8%15
.15%
3.25
%73
.89%
14.6
7%15
.26%
Taw
ang
12.8
7%2.
14%
34.4
9%43
.74%
7.62
%60
.75%
46.2
5%6.
78%
3.77
%69
.72%
36.6
4%28
.89%
Tira
p25
.97%
3.50
%29
.87%
19.4
4%10
.04%
93.5
2%51
.22%
38.5
3%2.
11%
93.3
7%38
.63%
6.92
%
Up
per
Sia
ng15
.36%
0.4
1%19
.45%
16.9
8%4.
59%
93.1
5%49
.53%
12.7
4%8.
22%
91.6
4%30
.88%
11.5
8%
Up
per
Sub
ansi
ri23
.93%
0.9
1%35
.58%
26.2
9%5.
09%
73.5
2%42
.22%
16.2
5%14
.65%
94.9
0%
45.4
2%30
.32%
Wes
t Kam
eng
20.9
8%1.
10%
32.5
3%21
.09%
7.59
%47
.96%
42.5
2%7.
08%
1.58
%67
.46%
26.0
6%20
.45%
Wes
t Sia
ng16
.58%
1.29
%25
.85%
11.8
5%2.
69%
69.0
2%30
.07%
15. 9
3%6.
37%
90.2
4%26
.38%
16.1
7%
Assam
Baks
a32
.77%
2.45
%23
.76%
10.3
3%2.
44%
86.1
2%42
.45%
18.3
7%17
.00
%82
.31%
9.63
%10
.97%
Barp
eta
45.3
0%
2.96
%31
.78%
18.3
4%6.
08%
83.5
5%64
.70
%1.
83%
29.1
4%85
.91%
19.4
1%22
.25%
Bong
aig
aon
39.3
7%2.
15%
37.3
8%17
.98%
6.39
%84
.48%
57.8
5%26
.25%
11.6
3%82
.05%
14.4
0%
17.0
3%
Cac
har
51.2
7%4.
71%
25.5
9%16
.94%
9.74
%83
.84%
68.2
4%53
.62%
38.8
9%82
.65%
38.6
3%11
.43%
Chi
rang
36.9
0%
2.42
%31
.15%
15.4
5%3.
26%
85.4
8%69
.57%
31.3
2%29
.17%
84.4
6%13
.40
%18
.03%
Dar
rang
44.9
5%3.
18%
31.8
5%24
.30
%11
.33%
88.3
6%55
.01%
3.27
%25
.73%
84.4
1%16
.02%
21.0
0%
Dhe
maj
i34
.38%
3.27
%25
.03%
8.55
%5.
49%
92.6
2%56
.74%
9.0
4%38
.06%
90.4
0%
18.9
5%21
.27%
Dhu
bri
49.2
3%2.
25%
40.1
8%29
.52%
14.2
3%92
.48%
69.6
5%10
.75%
31.6
7%90
.93%
34.9
7%37
.89%
Dib
rug
arh
44.8
6%1.
59%
19.0
4%19
.08%
5.78
%86
.62%
39.7
9%1.
50%
28.3
0%
77.8
9%21
.73%
16.8
1%
Dim
a H
asao
34.0
9%4.
38%
36.6
4%19
.66%
7.74
%96
.01%
44.3
3%61
.10
%29
.03%
89.3
3%60
.56%
18.6
1%
Go
alp
ara
45.9
9%2.
73%
36.1
2%25
.37%
11.5
1%90
.23%
55.9
7%14
.33%
34.9
3%82
.13%
26.7
9%20
.58%
Go
lag
hat
36.8
4%2.
71%
16.0
2%11
.02%
3.35
%91
.42%
38.0
1%6.
78%
11.7
1%84
.61%
13.4
7%13
.23%
Hai
laka
ndi
48.3
9%4.
26%
34.9
4%17
.98%
11.0
6%92
.18%
66.7
7%61
.35%
47.2
1%89
.95%
46.0
5%7.
81%
Jorh
at40
.18%
2.27
%12
.05%
8.32
%5.
00
%81
.36%
37.5
4%15
.17%
15.0
3%73
.09%
11.8
8%11
.74%
Kam
rup
33.7
9%1.
79%
23.3
7%13
.22%
5.0
4%65
.34%
44.6
1%6.
06%
10.3
8%74
.42%
14.7
1%23
.47%
TABle 12- DISTrICT-WISe: UNCeNSoreD heADCoUNT rATIo (rUrAl)(CONTD.) DISTrICT-WISe: UNCeNSoreD heADCoUNT rATIo
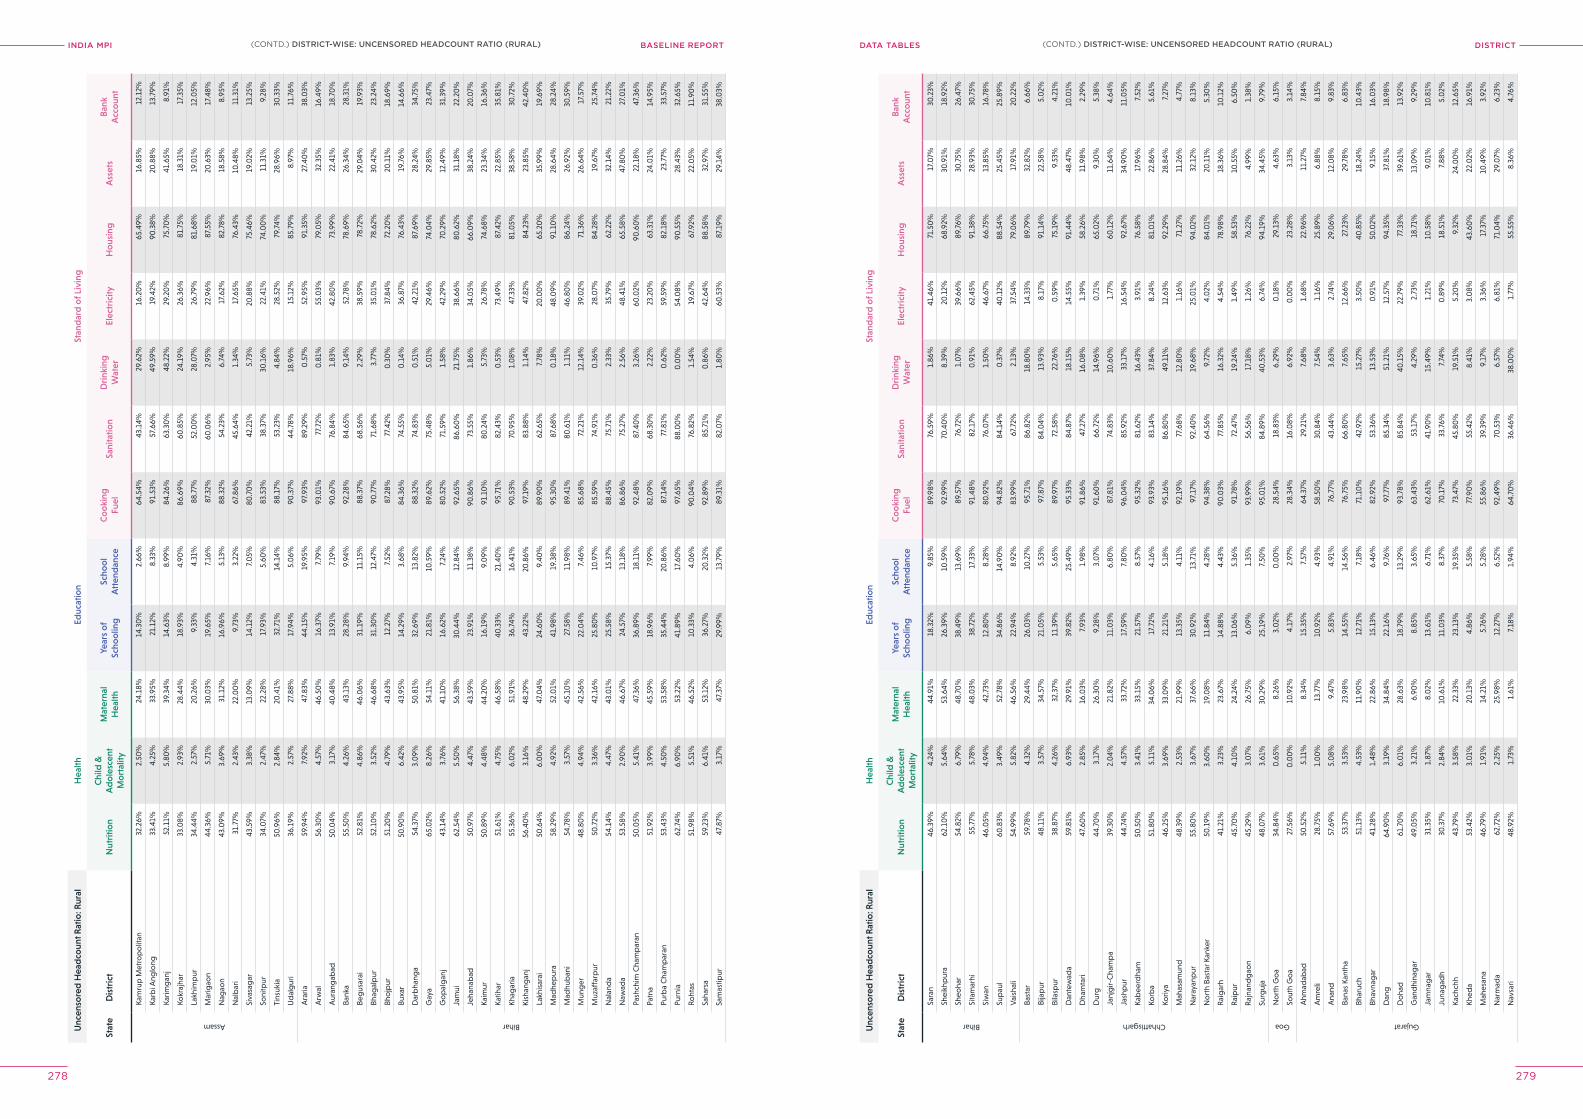
INDIA MPI BASELINE REPORT DISTrICTDATA TABleS
278 279
Unc
enso
red
Hea
dco
unt R
atio
: Rur
alH
ealth
Educ
atio
nSt
and
ard
of L
ivin
g
Stat
eD
istr
ict
Nut
ritio
nC
hild
&
Ad
ole
scen
t M
ort
ality
Mat
erna
l H
ealth
Year
s o
f Sc
hoo
ling
Scho
ol
Att
end
ance
Co
oki
ng
Fuel
Sani
tatio
nD
rink
ing
Wat
erEl
ectr
icity
Ho
usin
gA
sset
sB
ank
Acc
oun
t
Assam
Kam
rup
Met
rop
olit
an32
.26%
2.50
%24
.18%
14.3
0%
2.66
%64
.54%
43.1
4%29
.62%
16.2
0%
65.4
9%16
.85%
12.1
2%
Karb
i Ang
long
33.4
1%4.
25%
33.9
5%21
.12%
8.33
%91
.53%
57.6
6%49
.59%
19.4
2%90
.38%
20.8
8%13
.79%
Karim
gan
j52
.11%
5.80
%39
.34%
14.6
3%8.
99%
84.2
6%63
.30
%48
.22%
29.2
0%
75.7
0%
41.6
5%8.
91%
Kokr
ajha
r33
.08%
2.93
%28
.44%
18.9
3%4.
90%
86.6
9%60
.85%
24.1
9%26
.36%
81.7
5%18
.31%
17.3
5%
Lakh
imp
ur34
.44%
2.57
%20
.26%
9.33
%4.
31%
88.7
7%52
.00
%28
.07%
26.7
9%81
.68%
19.0
1%12
.05%
Mar
igao
n44
.36%
5.71
%30
.03%
19.6
5%7.
16%
87.3
2%60
.06%
2.95
%22
.96%
87.5
5%20
.63%
17.4
8%
Nag
aon
43.0
9%3.
69%
31.1
2%16
.96%
5.13
%88
.32%
54.2
3%6.
74%
17.6
2%82
.78%
18.5
8%8.
95%
Nal
bar
i31
.77%
2.43
%22
.00
%9.
73%
3.22
%67
.86%
45.6
4%1.
34%
17.6
5%76
.43%
10.4
8%11
.31%
Siva
sag
ar43
.59%
3.38
%13
.09%
14.1
2%7.
05%
80.7
0%
42.2
1%5.
73%
20.8
8%75
.46%
19.0
2%13
.25%
Soni
tpur
34.0
7%2.
47%
22.2
8%17
.93%
5.60
%83
.53%
38.3
7%30
.16%
22.4
1%74
.00
%11
.31%
9.28
%
Tins
ukia
50.9
6%2.
84%
20.4
1%32
.71%
14.1
4%88
.17%
53.2
3%4.
84%
28.5
2%79
.74%
28.9
6%30
.33%
Ud
alg
uri
36.1
9%2.
57%
27.8
8%17
.94%
5.0
6%90
.37%
44.7
8%18
.96%
15.1
2%85
.79%
8.97
%11
.76%
Bihar
Ara
ria59
.94%
7.92
%47
.83%
44.1
5%19
.95%
97.9
3%89
.29%
0.5
7%52
.95%
91.3
5%27
.40
%38
.03%
Arw
al56
.30
%4.
57%
46.5
0%
16.3
7%7.
79%
93.0
1%77
.72%
0.8
1%55
.03%
79.0
5%32
.35%
16.4
9%
Aur
ang
abad
50.0
4%3.
17%
40.4
8%13
.91%
7.19
%90
.67%
76.8
4%1.
83%
42.8
0%
73.9
9%22
.41%
18.7
0%
Bank
a55
.50
%4.
26%
43.1
3%28
.28%
9.94
%92
.28%
84.6
5%9.
14%
52.7
8%78
.69%
26.3
4%28
.31%
Beg
usar
ai52
.81%
4.86
%46
.06%
31.1
9%11
.15%
88.3
7%68
.56%
2.29
%38
.59%
78.7
2%29
.04%
19.9
3%
Bhag
alp
ur52
.10
%3.
52%
46.6
8%31
.30
%12
.47%
90.7
7%71
.68%
3.77
%35
.01%
78.6
2%30
.42%
23.2
4%
Bho
jpur
51.2
0%
4.79
%43
.63%
12.2
7%7.
52%
87.2
8%77
.42%
0.3
0%
37.8
4%72
.20
%20
.11%
18.6
9%
Buxa
r50
.90
%6.
42%
43.9
5%14
.29%
3.68
%84
.36%
74.5
5%0
.14%
36.8
7%76
.43%
19.7
6%14
.66%
Dar
bha
nga
54.3
7%3.
09%
50.8
1%32
.69%
13.8
2%88
.32%
74.8
3%0
.51%
42.2
1%87
.69%
28.2
4%34
.75%
Gay
a65
.02%
8.26
%54
.11%
21.8
1%10
.59%
89.6
2%75
.48%
5.0
1%29
.46%
74.0
4%29
.85%
23.4
7%
Go
pal
gan
j43
.14%
3.76
%41
.10
%16
.62%
7.24
%80
.52%
71.5
9%1.
58%
42.2
9%70
.29%
12.4
9%31
.39%
Jam
ui62
.54%
5.50
%56
.38%
30.4
4%12
.84%
92.6
5%86
.60
%21
.75%
38.6
6%80
.62%
31.1
8%22
.20
%
Jeha
nab
ad50
.97%
4.47
%43
.59%
23.9
1%11
.38%
90.8
6%73
.55%
1.86
%34
.05%
66.0
9%38
.24%
20.0
7%
Kaim
ur50
.89%
4.48
%44
.20
%16
.19%
9.0
9%91
.10
%80
.24%
5.73
%26
.78%
74.6
8%23
.34%
16.3
6%
Katih
ar51
.61%
4.75
%46
.58%
40.3
3%21
.40
%95
.71%
82.4
3%0
.53%
73.4
9%87
.42%
22.8
5%35
.81%
Khag
aria
55.3
6%6.
02%
51.9
1%36
.74%
16.4
1%90
.53%
70.9
5%1.
08%
47.3
3%81
.05%
38.5
8%30
.72%
Kish
ang
anj
56.4
0%
3.16
%48
.29%
43.2
2%20
.86%
97.1
9%83
.88%
1.14
%47
.82%
84.2
3%23
.85%
42.4
0%
Lakh
isar
ai50
.64%
6.0
0%
47.0
4%24
.60
%9.
40%
89.9
0%
62.6
5%7.
78%
20.0
0%
65.2
0%
35.9
9%19
.69%
Mad
hep
ura
58.2
9%4.
92%
52.0
1%41
.98%
19.3
8%95
.30
%87
.68%
0.1
8%48
.09%
91.1
0%
28.6
4%28
.24%
Mad
hub
ani
54.7
8%3.
57%
45.1
0%
27.5
8%11
.98%
89.4
1%80
.61%
1.11
%46
.80
%86
.24%
26.9
2%30
.59%
Mun
ger
48.8
0%
4.94
%42
.56%
22.0
4%7.
46%
85.6
8%72
.21%
12.1
4%39
.02%
71.3
6%26
.64%
17.5
7%
Muz
affa
rpur
50.7
2%3.
36%
42.1
6%25
.80
%10
.97%
85.5
9%74
.91%
0.3
6%28
.07%
84.2
8%19
.67%
25.7
4%
Nal
and
a54
.14%
4.47
%43
.01%
25.5
8%15
.37%
88.4
5%75
.71%
2.33
%35
.79%
62.2
2%32
.14%
21.2
2%
Naw
ada
53.5
8%2.
90%
46.6
7%24
.57%
13.1
8%86
.86%
75.2
7%2.
56%
48.4
1%65
.58%
47.8
0%
27.0
1%
Pash
chim
Cha
mp
aran
50.0
5%5.
41%
47.3
6%36
.89%
18.1
1%92
.48%
87.4
0%
3.26
%60
.02%
90.6
0%
22.1
8%47
.36%
Patn
a51
.92%
3.99
%45
.59%
18.9
6%7.
99%
82.0
9%68
.30
%2.
22%
23.2
0%
63.3
1%24
.01%
14.9
5%
Purb
a C
ham
par
an53
.43%
4.50
%53
.58%
35.4
4%20
.86%
87.1
4%77
.81%
0.6
2%59
.59%
82.1
8%23
.77%
33.5
7%
Purn
ia62
.74%
6.90
%53
.22%
41.8
9%17
.60
%97
.65%
88.0
0%
0.0
0%
54.0
8%90
.55%
28.4
3%32
.65%
Roht
as51
.98%
5.51
%46
.52%
10.3
3%4.
06%
90.0
4%76
.82%
1.54
%19
.67%
67.9
2%22
.05%
11.9
0%
Saha
rsa
59.2
3%6.
41%
53.1
2%36
.27%
20.3
2%92
.89%
85.7
1%0
.86%
42.6
4%88
.58%
32.9
7%31
.55%
Sam
astip
ur47
.87%
3.17
%47
.37%
29.9
9%13
.79%
89.3
1%82
.07%
1.80
%60
.53%
87.1
9%29
.14%
38.0
3%
Unc
enso
red
Hea
dco
unt R
atio
: Rur
alH
ealth
Educ
atio
nSt
and
ard
of L
ivin
g
Stat
eD
istr
ict
Nut
ritio
nC
hild
&
Ad
ole
scen
t M
ort
ality
Mat
erna
l H
ealth
Year
s o
f Sc
hoo
ling
Scho
ol
Att
end
ance
Co
oki
ng
Fuel
Sani
tatio
nD
rink
ing
Wat
erEl
ectr
icity
Ho
usin
gA
sset
sB
ank
Acc
oun
t
Bihar
Sara
n46
.39%
4.24
%44
.91%
18.3
2%9.
85%
89.9
8%76
.59%
1.86
%41
.46%
71.5
0%
17.0
7%30
.23%
Shei
khp
ura
62.1
0%
5.64
%53
.64%
26.3
9%10
.59%
92.9
9%70
.40
%8.
39%
20.1
2%68
.92%
30.9
1%18
.92%
Sheo
har
54.8
2%6.
79%
48.7
0%
38.4
9%13
.69%
89.5
7%76
.72%
1.0
7%39
.66%
89.7
6%30
.75%
26.4
7%
Sita
mar
hi55
.77%
5.78
%48
.03%
38.7
2%17
.33%
91.4
8%82
.17%
0.9
1%62
.45%
91.3
8%28
.93%
30.7
5%
Siw
an46
.05%
4.94
%42
.73%
12.8
0%
8.28
%80
.92%
76.0
7%1.
50%
46.6
7%66
.75%
13.8
5%16
.78%
Sup
aul
60.8
3%3.
49%
52.7
8%34
.86%
14.9
0%
94.8
2%84
.14%
0.3
7%40
.12%
88.5
4%25
.45%
25.8
9%
Vai
shal
i54
.99%
5.82
%46
.56%
22.9
4%8.
92%
83.9
9%67
.72%
2.13
%37
.54%
79.0
6%17
.91%
20.2
2%
Chhattisgarh
Bast
ar59
.78%
4.32
%29
.44%
26.0
3%10
.27%
95.7
1%86
.82%
18.8
0%
14.3
3%89
.79%
32.8
2%6.
66%
Bija
pur
48.1
1%3.
57%
34.5
7%21
.05%
5.53
%97
.87%
84.0
4%13
.93%
8.17
%91
.14%
22.5
8%5.
02%
Bila
spur
38.8
7%4.
26%
32.3
7%11
.39%
5.65
%89
.97%
72.5
8%22
.76%
0.5
9%75
.19%
9.53
%4.
21%
Dan
tew
ada
59.8
1%6.
93%
29.9
1%39
.82%
25.4
9%95
.33%
84.8
7%18
.15%
14.5
5%91
.44%
48.4
7%10
.01%
Dha
mta
ri47
.60
%2.
85%
16.0
3%7.
93%
1.98
%91
.86%
47.2
7%16
.08%
1.39
%58
.26%
11.9
8%2.
29%
Dur
g44
.70
%3.
17%
26.3
0%
9.28
%3.
07%
91.6
0%
66.7
2%14
.96%
0.7
1%65
.02%
9.30
%5.
38%
Janj
gir-
Cha
mp
a39
.30
%2.
04%
21.8
2%11
.03%
6.80
%87
.81%
74.8
3%10
.60
%1.
77%
60.1
2%11
.64%
4.64
%
Jash
pur
44.7
4%4.
57%
33.7
2%17
.59%
7.80
%96
.04%
85.9
2%33
.17%
16.5
4%92
.67%
34.9
0%
11.0
5%
Kab
eerd
ham
50.5
0%
3.41
%33
.15%
21.5
7%8.
57%
95.3
2%81
.62%
16.4
3%3.
91%
76.5
8%17
.96%
7.52
%
Korb
a51
.80
%5.
11%
34.0
6%17
.72%
4.16
%93
.93%
83.1
4%37
.84%
8.24
%81
.01%
22.8
6%5.
61%
Koriy
a46
.25%
3.69
%33
.09%
21.2
1%5.
18%
95.1
6%86
.80
%49
.11%
12.6
3%92
.29%
28.8
4%7.
27%
Mah
asam
und
48.3
9%2.
53%
21.9
9%13
.35%
4.11
%92
.19%
77.6
8%12
.80
%1.
16%
71.2
7%11
.26%
4.77
%
Nar
ayan
pur
55.8
0%
3.67
%37
.66%
30.9
2%13
.71%
97.1
7%92
.40
%19
.68%
25.0
1%94
.02%
32.1
2%8.
13%
No
rth
Bast
ar K
anke
r50
.19%
3.60
%19
.08%
11.8
4%4.
28%
94.3
8%64
.56%
9.72
%4.
02%
84.0
1%20
.11%
5.30
%
Rai
gar
h41
.21%
3.23
%23
.67%
14.8
8%4.
43%
90.0
3%77
.85%
16.3
2%4.
54%
78.9
8%18
.36%
10.1
2%
Rai
pur
45.7
0%
4.10
%24
.24%
13.0
6%5.
36%
91.7
8%72
.47%
19.2
4%1.
49%
58.5
3%10
.55%
6.50
%
Raj
nand
gao
n45
.29%
3.0
7%26
.75%
6.0
9%1.
35%
93.9
9%56
.56%
17.1
8%1.
26%
76.2
2%4.
99%
1.38
%
Surg
uja
48.0
7%3.
61%
30.2
9%25
.19%
7.50
%95
.01%
84.8
9%40
.53%
6.74
%94
.19%
34.4
5%9.
79%
Goa
No
rth
Go
a34
.84%
0.6
5%8.
26%
3.0
2%0
.00
%28
.54%
18.8
3%6.
29%
0.1
8%29
.13%
4.63
%6.
15%
Sout
h G
oa
27.5
6%0
.00
%10
.92%
4.17
%2.
97%
28.3
4%16
.08%
6.92
%0
.00
%23
.28%
3.13
%3.
14%
Gujarat
Ahm
adab
ad50
.52%
5.11
%8.
34%
15.3
5%7.
57%
64.3
7%29
.21%
7.68
%1.
68%
22.9
6%11
.27%
7.84
%
Am
reli
28.7
5%1.
00
%13
.77%
10.9
2%4.
93%
58.5
0%
30.8
4%7.
54%
1.16
%25
.89%
6.88
%8.
15%
Ana
nd57
.69%
5.0
8%9.
47%
5.83
%4.
91%
76.7
7%43
.44%
3.63
%2.
74%
29.0
6%12
.08%
9.83
%
Bana
s Ka
ntha
53.3
7%3.
53%
23.9
8%14
.55%
14.5
6%76
.75%
66.8
0%
7.65
%12
.66%
27.2
3%29
.78%
6.83
%
Bhar
uch
51.1
3%4.
53%
11.9
0%
12.7
1%7.
18%
71.1
0%
42.9
2%15
.27%
3.50
%40
.85%
18.2
4%10
.43%
Bhav
nag
ar41
.28%
1.48
%22
.86%
15.1
3%6.
46%
82.9
2%53
.36%
13.5
3%0
.91%
50.0
2%9.
15%
16.0
3%
Dan
g64
.90
%3.
19%
34.8
4%22
.16%
9.76
%97
.77%
85.3
4%51
.21%
12.5
7%94
.35%
37.8
1%18
.98%
Do
had
61.7
0%
6.0
1%28
.63%
18.7
9%13
.29%
93.7
8%85
.84%
40.1
5%22
.79%
77.3
3%39
.61%
13.9
2%
Gan
dhi
nag
ar49
.05%
3.21
%6.
90%
8.85
%3.
65%
63.4
3%53
.17%
4.29
%2.
73%
18.7
1%13
.09%
9.29
%
Jam
nag
ar31
.35%
1.87
%8.
02%
13.6
1%6.
71%
62.6
1%41
.90
%15
.49%
1.21
%10
.58%
9.0
1%10
.81%
Juna
gad
h30
.37%
2.84
%10
.61%
11.0
3%8.
37%
70.1
7%33
.76%
7.74
%0
.89%
18.5
1%7.
88%
5.0
2%
Kach
chh
43.7
9%3.
58%
22.3
3%23
.13%
19.3
5%73
.47%
45.8
0%
19.5
1%5.
20%
9.32
%24
.00
%12
.65%
Khed
a53
.42%
3.0
1%20
.13%
4.86
%5.
58%
77.9
0%
55.4
2%8.
41%
3.0
8%43
.60
%22
.02%
16.9
1%
Mah
esan
a46
.79%
1.91
%14
.21%
5.76
%5.
28%
55.8
6%39
.39%
9.17
%3.
36%
17.3
7%10
.49%
3.92
%
Nar
mad
a62
.72%
2.25
%25
.98%
12.2
7%6.
52%
92.4
9%70
.53%
6.57
%6.
81%
71.0
4%29
.07%
6.23
%
Nav
sari
48.9
2%1.
73%
1.61
%7.
18%
1.94
%64
.70
%36
.46%
38.0
0%
1.77
%55
.55%
8.36
%4.
76%
(CONTD.) DISTrICT-WISe: UNCeNSoreD heADCoUNT rATIo (rUrAl)(CONTD.) DISTrICT-WISe: UNCeNSoreD heADCoUNT rATIo (rUrAl)
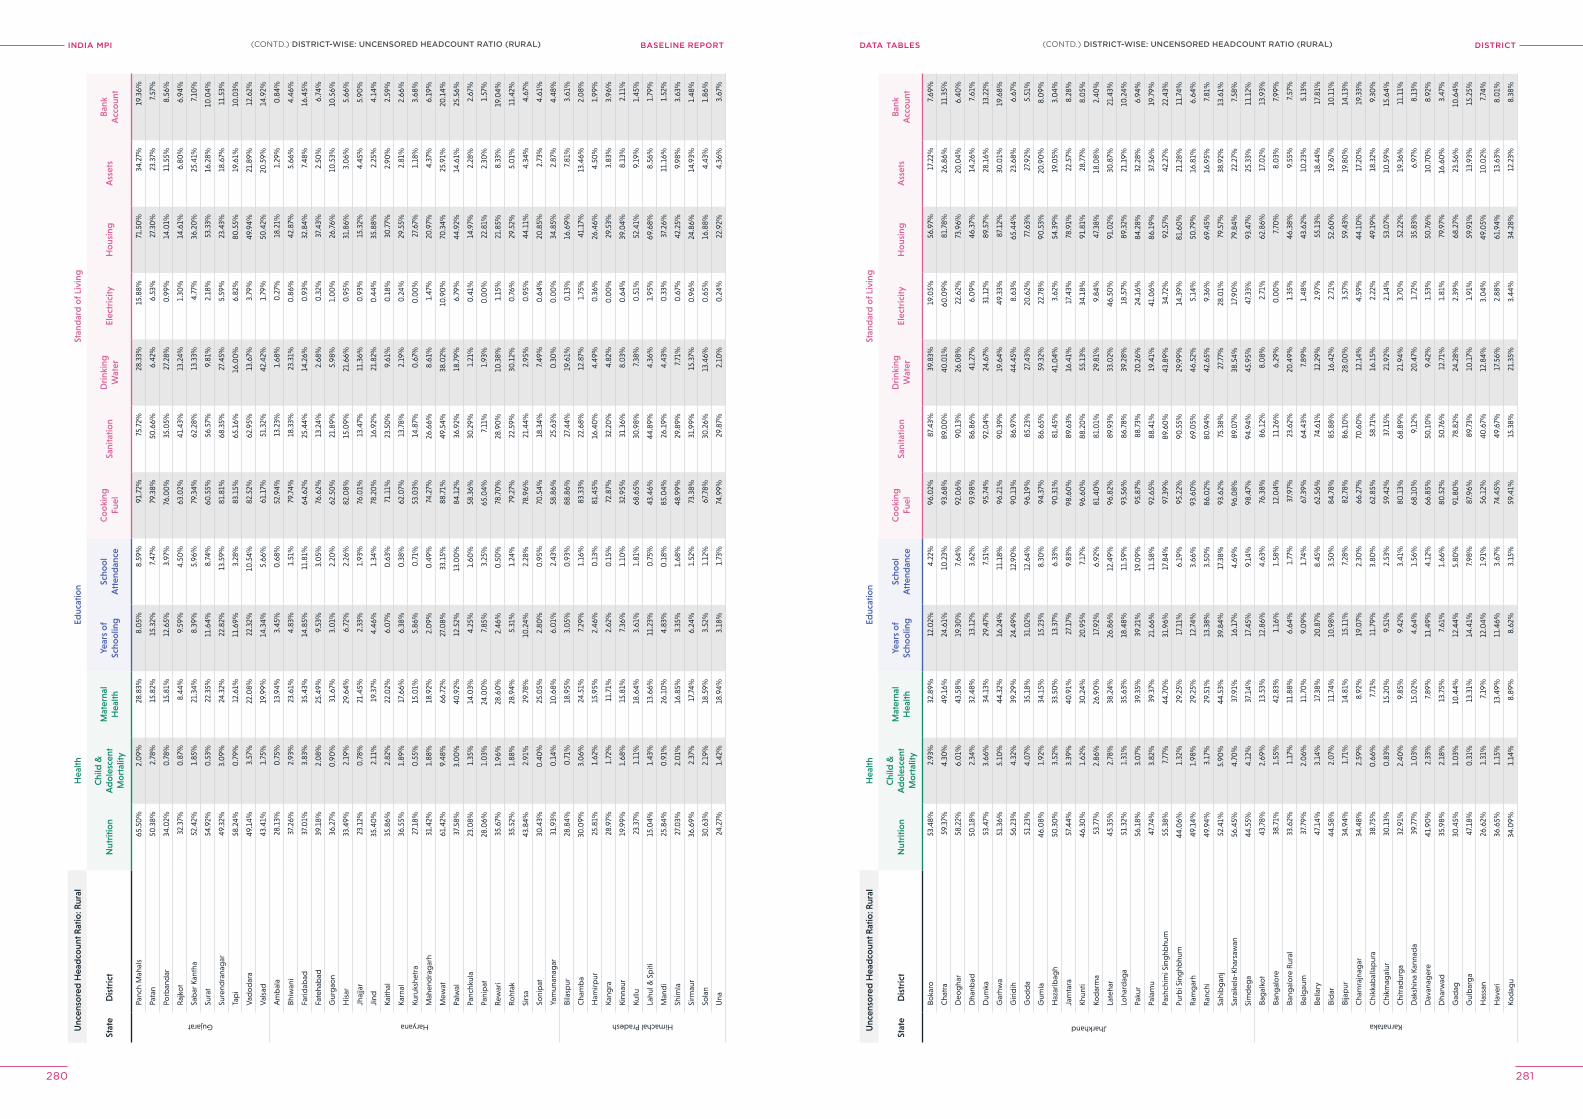
INDIA MPI BASELINE REPORT DISTrICTDATA TABleS
280 281
Unc
enso
red
Hea
dco
unt R
atio
: Rur
alH
ealth
Educ
atio
nSt
and
ard
of L
ivin
g
Stat
eD
istr
ict
Nut
ritio
nC
hild
&
Ad
ole
scen
t M
ort
ality
Mat
erna
l H
ealth
Year
s o
f Sc
hoo
ling
Scho
ol
Att
end
ance
Co
oki
ng
Fuel
Sani
tatio
nD
rink
ing
Wat
erEl
ectr
icity
Ho
usin
gA
sset
sB
ank
Acc
oun
t
Gujarat
Panc
h M
ahal
s65
.50
%2.
09%
28.8
3%8.
05%
8.59
%91
.72%
75.7
2%28
.33%
15.8
8%71
.50
%34
.27%
19.3
6%
Pata
n50
.38%
2.78
%15
.82%
15.3
2%7.
47%
79.3
8%50
.66%
6.42
%6.
53%
27.3
0%
23.3
7%7.
57%
Porb
and
ar34
.02%
0.7
8%15
.81%
12.6
5%3.
97%
76.0
0%
35.0
5%27
.28%
0.9
9%14
.01%
11.5
5%8.
56%
Raj
kot
32.3
7%0
.87%
8.44
%9.
59%
4.50
%63
.02%
41.4
3%13
.24%
1.30
%14
.61%
6.80
%6.
94%
Sab
ar K
anth
a52
.42%
1.85
%21
.34%
8.39
%5.
96%
79.3
4%62
.28%
13.3
3%4.
77%
36.2
0%
25.4
1%7.
10%
Sura
t54
.92%
0.5
3%22
.35%
11.6
4%8.
74%
60.5
5%56
.57%
9.81
%2.
18%
53.3
3%16
.28%
10.0
4%
Sure
ndra
nag
ar49
.32%
3.0
9%24
.32%
22.8
2%13
.59%
81.8
1%68
.35%
27.4
5%5.
59%
23.4
3%18
.67%
11.5
3%
Tap
i58
.24%
0.7
9%12
.61%
11.6
9%3.
28%
83.1
5%65
.16%
16.0
0%
6.82
%80
.55%
19.6
1%10
.03%
Vad
od
ara
49.1
4%3.
57%
22.0
8%22
.32%
10.5
4%82
.52%
62.9
5%13
.67%
3.79
%49
.94%
21.8
9%12
.62%
Val
sad
43.4
1%1.
75%
19.9
9%14
.34%
5.66
%61
.17%
51.3
2%42
.42%
1.79
%50
.42%
20.5
9%14
.92%
Haryana
Am
bal
a28
.13%
0.7
5%13
.94%
3.45
%0
.68%
52.9
4%13
.23%
1.68
%0
.27%
18.2
1%1.
29%
0.8
4%
Bhiw
ani
37.2
6%2.
93%
23.6
1%4.
83%
1.51
%79
.74%
18.3
3%23
.31%
0.8
6%42
.87%
5.66
%4.
46%
Farid
abad
37.0
1%3.
83%
35.4
3%14
.85%
11.8
1%64
.62%
25.4
4%14
.26%
0.9
3%32
.84%
7.48
%16
.45%
Fate
hab
ad39
.18%
2.0
8%25
.49%
9.53
%3.
05%
76.6
2%13
.24%
2.68
%0
.32%
37.4
3%2.
50%
6.74
%
Gur
gao
n36
.27%
0.9
0%
31.6
7%3.
01%
2.20
%62
.50
%21
.89%
5.98
%1.
00
%26
.76%
10.5
3%10
.56%
His
ar33
.49%
2.19
%29
.64%
6.72
%2.
26%
82.0
8%15
.09%
21.6
6%0
.95%
31.8
6%3.
06%
5.66
%
Jhaj
jar
23.1
2%0
.78%
21.4
5%2.
33%
1.93
%76
.01%
13.4
7%11
.36%
0.9
3%15
.32%
4.45
%5.
90%
Jind
35.4
0%
2.11
%19
.37%
4.46
%1.
34%
78.2
0%
16.9
2%21
.82%
0.4
4%35
.88%
2.25
%4.
14%
Kaith
al35
.86%
2.82
%22
.02%
6.0
7%0
.63%
71.1
1%23
.50
%9.
61%
0.1
8%30
.77%
2.90
%2.
59%
Karn
al36
.55%
1.89
%17
.66%
6.38
%0
.38%
62.0
7%13
.78%
2.19
%0
.24%
29.5
5%2.
81%
2.66
%
Kuru
kshe
tra
27.1
8%0
.55%
15.0
1%5.
86%
0.7
1%53
.03%
14.8
7%0
.67%
0.0
0%
27.6
7%1.
18%
3.68
%
Mah
end
rag
arh
31.4
2%1.
88%
18.9
2%2.
09%
0.4
9%74
.27%
26.6
6%8.
61%
1.47
%20
.97%
4.37
%6.
19%
Mew
at61
.42%
9.48
%66
.72%
27.0
8%33
.15%
88.7
1%49
.54%
38.0
2%10
.90
%70
.34%
25.9
1%20
.14%
Palw
al37
.58%
3.0
0%
40.9
2%12
.52%
13.0
0%
84.1
2%36
.92%
18.7
9%6.
79%
44.9
2%14
.61%
25.5
6%
Panc
hkul
a23
.08%
1.35
%14
.03%
4.25
%1.
60%
58.3
6%30
.29%
1.21
%0
.41%
14.9
7%2.
28%
2.67
%
Pani
pat
28.0
6%1.
03%
24.0
0%
7.85
%3.
25%
65.0
4%7.
11%
1.93
%0
.00
%22
.81%
2.30
%1.
57%
Rew
ari
35.6
7%1.
96%
28.6
0%
2.46
%0
.50
%78
.70
%28
.90
%10
.38%
1.15
%21
.85%
8.33
%19
.04%
Roht
ak35
.52%
1.88
%28
.94%
5.31
%1.
24%
79.2
7%22
.59%
30.1
2%0
.76%
29.5
2%5.
01%
11.4
2%
Sirs
a43
.84%
2.91
%29
.78%
10.2
4%2.
28%
78.9
6%21
.44%
2.95
%0
.95%
44.1
1%4.
34%
4.67
%
Soni
pat
30.4
3%0
.40
%25
.05%
2.80
%0
.95%
70.5
4%18
.34%
7.49
%0
.64%
20.8
5%2.
73%
4.61
%
Yam
unan
agar
31.9
3%0
.14%
10.6
8%6.
01%
2.43
%58
.86%
25.6
3%0
.30
%0
.00
%34
.85%
2.87
%4.
48%
Himachal Pradesh
Bila
spur
28.8
4%0
.71%
18.9
5%3.
05%
0.9
3%88
.86%
27.4
4%19
.61%
0.1
3%16
.69%
7.81
%3.
61%
Cha
mb
a30
.09%
3.0
6%24
.51%
7.29
%1.
16%
83.3
3%22
.68%
12.8
7%1.
75%
41.1
7%13
.46%
2.0
8%
Ham
irpur
25.8
1%1.
62%
15.9
5%2.
46%
0.1
3%81
.45%
16.4
0%
4.49
%0
.36%
26.4
6%4.
50%
1.99
%
Kang
ra28
.97%
1.72
%11
.71%
2.62
%0
.15%
72.8
7%32
.20
%4.
82%
0.0
0%
29.5
3%3.
83%
3.96
%
Kinn
aur
19.9
9%1.
68%
15.8
1%7.
36%
1.10
%32
.95%
31.3
6%8.
03%
0.6
4%39
.04%
8.13
%2.
11%
Kullu
23.3
7%1.
11%
18.6
4%3.
61%
1.81
%68
.65%
30.9
8%7.
38%
0.5
1%52
.41%
9.19
%1.
45%
Lahu
l & S
piti
15.0
4%1.
43%
13.6
6%11
.23%
0.7
5%43
.46%
44.8
9%4.
36%
1.95
%69
.68%
8.56
%1.
79%
Man
di
25.8
4%0
.91%
26.1
0%
4.83
%0
.18%
85.0
4%26
.19%
4.43
%0
.33%
37.2
6%11
.16%
1.52
%
Shim
la27
.03%
2.0
1%16
.85%
3.35
%1.
68%
48.9
9%29
.89%
7.71
%0
.67%
42.2
5%9.
98%
3.63
%
Sirm
aur
36.6
9%2.
37%
17.7
4%6.
24%
1.52
%73
.38%
31.9
9%15
.37%
0.9
6%24
.86%
14.9
3%1.
48%
Sola
n30
.63%
2.19
%18
.59%
3.52
%1.
12%
67.7
8%30
.26%
13.4
6%0
.65%
16.8
8%4.
43%
1.86
%
Una
24.2
7%1.
42%
18.9
4%3.
18%
1.73
%74
.99%
29.8
7%2.
10%
0.2
4%22
.92%
4.36
%3.
67%
Unc
enso
red
Hea
dco
unt R
atio
: Rur
alH
ealth
Educ
atio
nSt
and
ard
of L
ivin
g
Stat
eD
istr
ict
Nut
ritio
nC
hild
&
Ad
ole
scen
t M
ort
ality
Mat
erna
l H
ealth
Year
s o
f Sc
hoo
ling
Scho
ol
Att
end
ance
Co
oki
ng
Fuel
Sani
tatio
nD
rink
ing
Wat
erEl
ectr
icity
Ho
usin
gA
sset
sB
ank
Acc
oun
t
Jharkhand
Boka
ro53
.48%
2.93
%32
.89%
12.0
2%4.
22%
96.0
2%87
.43%
39.8
3%19
.05%
56.9
7%17
.22%
7.69
%
Cha
tra
59.3
7%4.
30%
49.1
6%24
.61%
10.2
3%93
.68%
89.0
0%
40.0
1%60
.09%
81.7
8%26
.86%
11.3
5%
Deo
gha
r58
.22%
6.0
1%43
.58%
19.3
0%
7.64
%92
.06%
90.1
3%26
.08%
22.6
2%73
.96%
20.0
4%6.
40%
Dha
nbad
50.1
8%2.
34%
32.4
8%13
.12%
3.62
%93
.98%
86.8
6%41
.27%
6.0
9%46
.37%
14.2
6%7.
61%
Dum
ka53
.47%
3.66
%34
.13%
29.4
7%7.
51%
95.7
4%92
.04%
24.6
7%31
.12%
89.5
7%28
.16%
13.2
2%
Gar
hwa
51.3
6%5.
10%
44.3
2%16
.24%
11.1
8%96
.21%
90.3
9%19
.64%
49.3
3%87
.12%
30.0
1%19
.68%
Giri
dih
56.2
3%4.
32%
39.2
9%24
.49%
12.9
0%
90.1
3%86
.97%
44.4
5%8.
63%
65.4
4%23
.68%
6.67
%
Go
dd
a51
.23%
4.0
7%35
.18%
31.0
2%12
.64%
96.1
9%85
.23%
27.4
3%20
.62%
77.6
3%27
.92%
5.51
%
Gum
la46
.08%
1.92
%34
.15%
15.2
3%8.
30%
94.3
7%86
.65%
59.3
2%22
.78%
90.5
3%20
.90
%8.
09%
Haz
arib
agh
50.3
0%
3.52
%33
.50
%13
.37%
6.33
%90
.31%
81.4
5%41
.04%
3.62
%54
.39%
19.0
5%3.
04%
Jam
tara
57.4
4%3.
39%
40.9
1%27
.17%
9.83
%98
.60
%89
.63%
16.4
1%17
.43%
78.9
1%22
.57%
8.28
%
Khun
ti46
.30
%1.
62%
30.2
4%20
.95%
7.17
%96
.60
%88
.20
%55
.13%
34.1
8%91
.81%
28.7
7%8.
05%
Kod
arm
a53
.77%
2.86
%26
.90
%17
.92%
6.92
%81
.40
%81
.01%
29.8
1%9.
84%
47.3
8%18
.08%
2.40
%
Late
har
45.3
5%2.
78%
38.2
4%26
.86%
12.4
9%96
.82%
89.9
3%33
.02%
46.5
0%
91.0
2%30
.87%
21.4
3%
Loha
rdag
a51
.32%
1.31
%35
.63%
18.4
8%11
.59%
93.5
6%86
.78%
39.2
8%18
.57%
89.3
2%21
.19%
10.2
4%
Paku
r56
.18%
3.0
7%39
.35%
39.2
1%19
.09%
95.8
7%88
.73%
20.2
6%24
.16%
84.2
8%32
.28%
6.94
%
Pala
mu
47.7
4%3.
82%
39.3
7%21
.66%
11.5
8%92
.65%
88.4
1%19
.41%
41.0
6%86
.19%
37.5
6%19
.79%
Pash
chim
i Sin
ghb
hum
55.3
8%7.
77%
44.7
0%
31.9
6%17
.84%
97.3
9%89
.60
%43
.89%
34.7
2%92
.57%
42.2
7%22
.43%
Purb
i Sin
ghb
hum
44.0
6%1.
32%
29.2
5%17
.11%
6.19
%95
.22%
90.5
5%29
.99%
14.3
9%81
.60
%21
.28%
11.7
4%
Ram
gar
h49
.14%
1.98
%29
.25%
12.7
4%3.
66%
93.6
0%
69.0
5%46
.52%
5.14
%50
.79%
16.8
1%6.
64%
Ran
chi
49.9
4%3.
17%
29.5
1%13
.38%
3.50
%86
.02%
80.9
4%42
.65%
9.36
%69
.45%
16.9
5%7.
81%
Sahi
bg
anj
52.4
1%5.
90%
44.5
3%39
.84%
17.3
8%93
.62%
75.3
8%27
.77%
28.0
1%79
.57%
38.9
2%13
.61%
Sara
ikel
a-Kh
arsa
wan
56.4
5%4.
70%
37.9
1%16
.17%
4.69
%96
.08%
89.0
7%38
.54%
17.9
0%
79.8
4%22
.27%
7.58
%
Sim
deg
a44
.55%
4.12
%37
.14%
17.4
5%9.
14%
98.4
7%94
.94%
45.9
5%47
.33%
93.4
7%25
.33%
11.1
2%
Karnataka
Bag
alko
t43
.78%
2.69
%13
.53%
12.8
6%4.
63%
76.3
8%86
.12%
8.0
8%2.
71%
62.8
6%17
.02%
13.9
3%
Bang
alo
re38
.71%
1.55
%42
.83%
1.16
%1.
58%
12.0
4%11
.26%
6.29
%0
.00
%7.
70%
8.0
3%7.
99%
Bang
alo
re R
ural
33.6
2%1.
17%
11.8
8%6.
64%
1.77
%37
.97%
23.6
2%20
.49%
1.35
%46
.38%
9.55
%7.
57%
Belg
aum
37.7
9%2.
06%
11.7
0%
9.0
9%1.
74%
67.3
9%64
.43%
7.89
%1.
48%
43.6
2%10
.23%
5.13
%
Bella
ry47
.14%
3.14
%17
.38%
20.8
7%8.
45%
62.5
6%74
.61%
12.2
9%2.
97%
55.1
3%18
.44%
17.8
1%
Bid
ar44
.58%
2.0
7%11
.74%
10.9
8%3.
50%
84.7
8%85
.88%
16.4
2%2.
71%
52.6
0%
19.6
7%10
.11%
Bija
pur
34.9
4%1.
71%
14.8
1%15
.11%
7.28
%82
.78%
86.1
0%
28.0
0%
3.57
%59
.43%
19.8
0%
14.1
3%
Cha
mra
jnag
ar34
.48%
2.59
%8.
92%
19.0
7%2.
30%
66.2
7%70
.60
%12
.14%
4.59
%44
.10
%17
.20
%19
.33%
Chi
kkab
alla
pur
a38
.75%
0.6
6%7.
71%
11.7
9%3.
80%
62.8
5%58
.71%
16.1
5%2.
22%
49.1
9%18
.32%
9.30
%
Chi
kmag
alur
30.1
3%0
.83%
15.2
0%
9.51
%2.
53%
59.4
2%37
.15%
21.9
2%2.
14%
53.0
7%10
.59%
15.6
4%
Chi
trad
urg
a32
.91%
2.40
%9.
85%
9.42
%3.
41%
80.1
3%68
.89%
21.9
4%3.
70%
52.2
2%19
.36%
11.1
1%
Dak
shin
a Ka
nnad
a39
.77%
1.0
3%15
.02%
4.64
%1.
56%
68.1
0%
9.12
%20
.47%
1.72
%35
.83%
6.97
%8.
13%
Dav
anag
ere
41.9
0%
2.33
%7.
89%
11.4
9%4.
12%
66.8
5%50
.10
%9.
42%
1.53
%50
.76%
10.7
0%
8.92
%
Dha
rwad
35.9
8%2.
18%
13.7
5%7.
61%
1.66
%80
.52%
50.7
6%12
.71%
1.81
%79
.97%
16.6
0%
3.47
%
Gad
ag30
.45%
1.0
3%10
.44%
12.4
4%5.
80%
91.8
0%
78.8
2%24
.28%
2.39
%68
.27%
23.5
6%10
.64%
Gul
bar
ga
47.1
8%0
.31%
13.3
1%14
.41%
7.98
%87
.96%
89.7
3%10
.17%
1.91
%59
.91%
13.9
3%15
.25%
Has
san
26.6
2%1.
31%
7.19
%12
.04%
1.91
%56
.12%
40.6
7%12
.84%
3.0
4%49
.05%
10.0
2%7.
74%
Hav
eri
36.6
5%1.
15%
13.4
9%11
.46%
3.67
%74
.45%
49.6
7%17
.56%
2.88
%61
.94%
13.6
3%8.
01%
Kod
agu
34.0
9%1.
14%
8.89
%8.
62%
3.15
%59
.41%
15.3
8%21
.35%
3.44
%34
.28%
12.2
3%8.
38%
(CONTD.) DISTrICT-WISe: UNCeNSoreD heADCoUNT rATIo (rUrAl)(CONTD.) DISTrICT-WISe: UNCeNSoreD heADCoUNT rATIo (rUrAl)
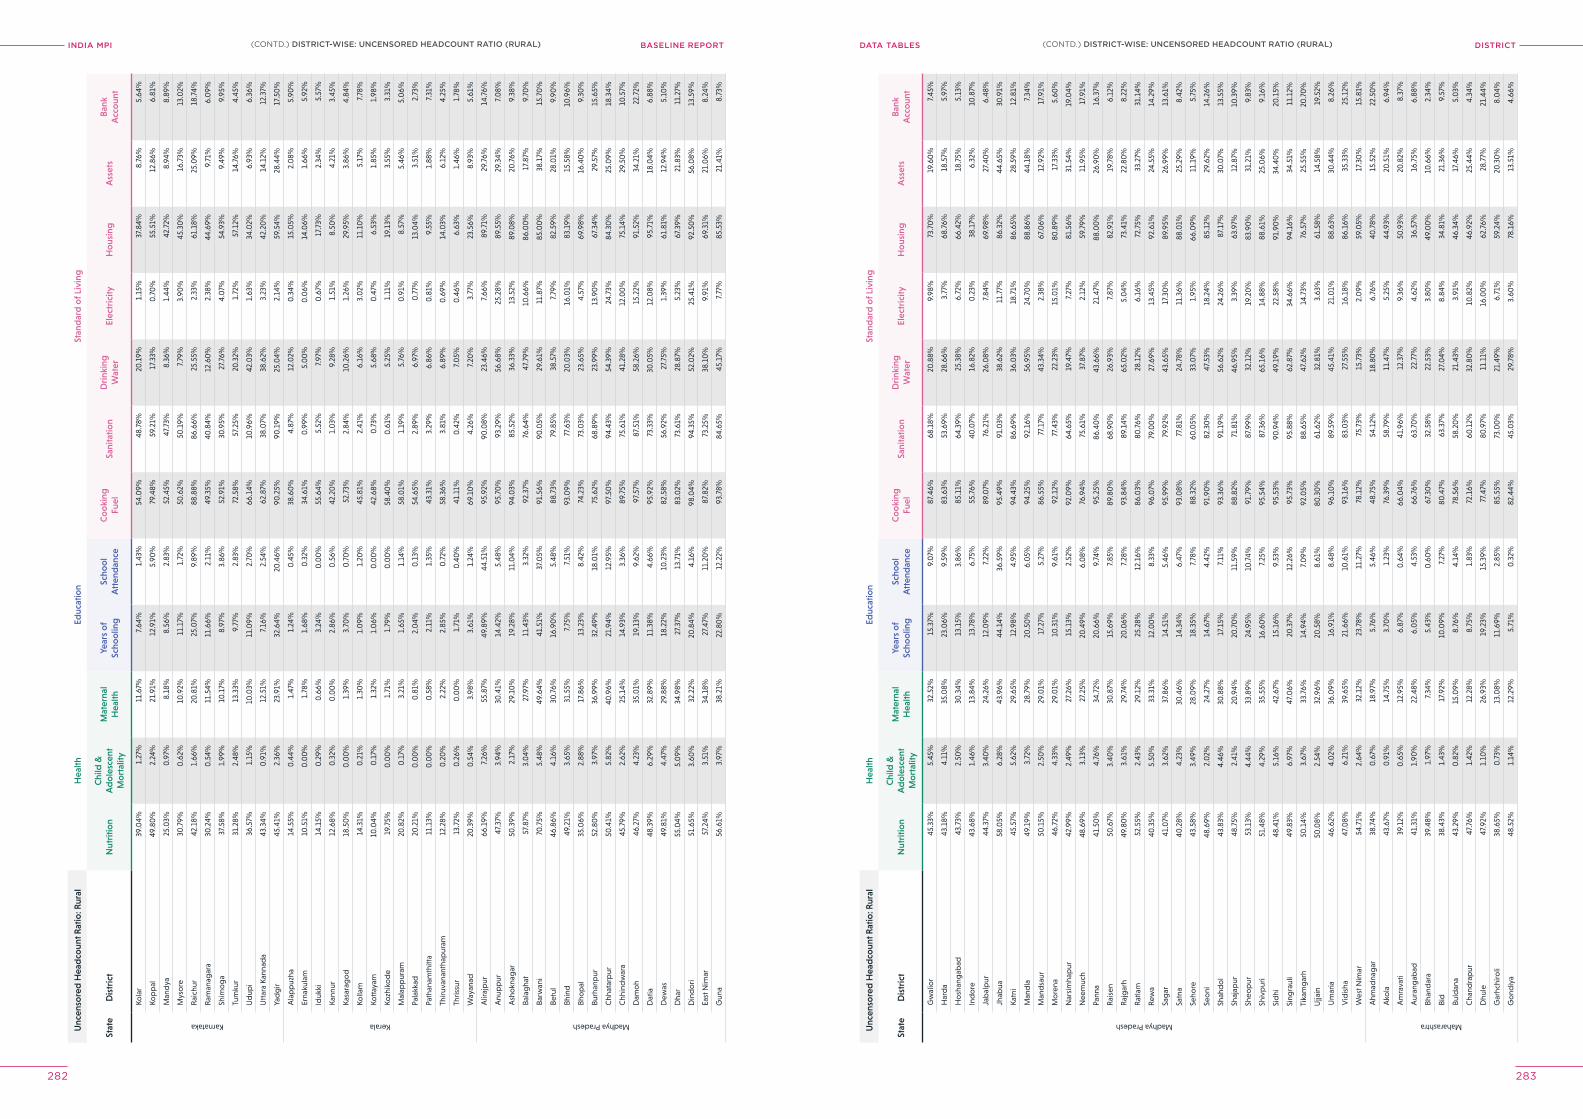
INDIA MPI BASELINE REPORT DISTrICTDATA TABleS
282 283
Unc
enso
red
Hea
dco
unt R
atio
: Rur
alH
ealth
Educ
atio
nSt
and
ard
of L
ivin
g
Stat
eD
istr
ict
Nut
ritio
nC
hild
&
Ad
ole
scen
t M
ort
ality
Mat
erna
l H
ealth
Year
s o
f Sc
hoo
ling
Scho
ol
Att
end
ance
Co
oki
ng
Fuel
Sani
tatio
nD
rink
ing
Wat
erEl
ectr
icity
Ho
usin
gA
sset
sB
ank
Acc
oun
t
Karnataka
Kola
r39
.04%
1.27
%11
.67%
7.64
%1.
43%
54.0
9%48
.78%
20.1
9%1.
15%
37.8
4%8.
76%
5.64
%
Kop
pal
49.8
0%
2.24
%21
.91%
12.9
1%5.
90%
79.4
8%59
.21%
17.3
3%0
.70
%55
.51%
12.8
6%6.
81%
Man
dya
25.0
3%0
.97%
8.18
%8.
56%
2.83
%52
.45%
47.7
3%8.
36%
1.44
%42
.72%
8.94
%8.
89%
Mys
ore
30.7
9%0
.62%
10.9
2%11
.17%
1.72
%50
.62%
50.1
9%7.
79%
3.90
%45
.30
%16
.73%
13.0
2%
Rai
chur
42.1
8%1.
66%
20.8
1%25
.07%
9.89
%88
.88%
86.6
6%25
.55%
2.33
%61
.18%
25.0
9%18
.74%
Ram
anag
ara
30.2
4%0
.54%
11.5
4%11
.66%
2.11
%49
.35%
40.8
4%12
.60
%2.
38%
44.6
9%9.
71%
6.0
9%
Shim
og
a37
.58%
1.99
%10
.17%
8.97
%3.
86%
52.9
1%30
.95%
27.7
6%4.
07%
54.9
3%9.
49%
9.95
%
Tum
kur
31.2
8%2.
48%
13.3
3%9.
77%
2.83
%72
.58%
57.2
5%20
.32%
1.72
%57
.12%
14.7
6%4.
45%
Ud
upi
36.5
7%1.
15%
10.0
3%11
.09%
2.70
%66
.14%
10.9
6%42
.03%
1.63
%34
.02%
6.93
%6.
36%
Utt
ara
Kann
ada
43.3
4%0
.91%
12.5
1%7.
16%
2.54
%62
.87%
38.0
7%38
.62%
3.23
%42
.20
%14
.12%
12.3
7%
Yad
gir
45.4
1%2.
36%
23.9
1%32
.64%
20.4
6%90
.25%
90.1
9%25
.04%
2.14
%59
.54%
28.4
4%17
.50
%
Kerala
Ala
pp
uzha
14.5
5%0
.44%
1.47
%1.
24%
0.4
5%38
.60
%4.
87%
12.0
2%0
.34%
15.0
5%2.
08%
5.90
%
Erna
kula
m10
.51%
0.0
0%
1.78
%1.
68%
0.3
2%34
.61%
0.9
9%5.
00
%0
.06%
14.0
6%1.
66%
5.92
%
Iduk
ki14
.15%
0.2
9%0
.66%
3.24
%0
.00
%55
.64%
5.52
%7.
97%
0.6
7%17
.73%
2.34
%5.
57%
Kann
ur12
.68%
0.3
2%0
.00
%2.
86%
0.5
6%42
.20
%1.
03%
9.28
%1.
51%
8.50
%4.
21%
3.45
%
Kasa
rag
od
18.5
0%
0.0
0%
1.39
%3.
70%
0.7
0%
52.7
3%2.
84%
10.2
6%1.
26%
29.9
5%3.
86%
4.84
%
Kolla
m14
.31%
0.2
1%1.
30%
1.0
9%1.
20%
45.8
1%2.
41%
6.16
%3.
02%
11.1
0%
5.17
%7.
78%
Kott
ayam
10.0
4%0
.17%
1.32
%1.
06%
0.0
0%
42.6
8%0
.73%
5.68
%0
.47%
6.53
%1.
85%
1.98
%
Kozh
iko
de
19.7
5%0
.00
%1.
71%
1.79
%0
.00
%58
.40
%0
.61%
5.25
%1.
11%
19.1
3%3.
55%
3.31
%
Mal
app
uram
20.8
2%0
.17%
3.21
%1.
65%
1.14
%58
.01%
1.19
%5.
76%
0.9
1%8.
57%
5.46
%5.
06%
Pala
kkad
20.2
1%0
.00
%0
.81%
2.0
4%0
.13%
54.6
5%2.
89%
6.97
%0
.77%
13.0
4%3.
51%
2.73
%
Path
anam
thitt
a11
.13%
0.0
0%
0.5
8%2.
11%
1.35
%43
.31%
3.29
%6.
86%
0.8
1%9.
55%
1.88
%7.
31%
Thiru
vana
ntha
pur
am12
.28%
0.2
0%
2.22
%2.
85%
0.7
2%58
.36%
3.81
%6.
89%
0.6
9%14
.03%
6.12
%4.
25%
Thris
sur
13.7
2%0
.26%
0.0
0%
1.71
%0
.40
%41
.11%
0.4
2%7.
05%
0.4
6%6.
63%
1.46
%1.
78%
Way
anad
20.3
9%0
.54%
3.98
%3.
61%
1.24
%69
.10
%4.
26%
7.20
%3.
77%
23.5
6%8.
93%
5.61
%
Madhya Pradesh
Alir
ajp
ur66
.19%
7.26
%55
.87%
49.8
9%44
.51%
95.9
2%90
.08%
23.4
6%7.
66%
89.7
1%29
.76%
14.7
6%
Anu
pp
ur47
.37%
3.94
%30
.41%
14.4
2%5.
48%
95.7
0%
93.2
9%56
.68%
25.2
8%89
.55%
29.3
4%7.
08%
Ash
okn
agar
50.3
9%2.
17%
29.1
0%
19.2
8%11
.04%
94.0
3%85
.52%
36.3
3%13
.52%
89.0
8%20
.76%
9.38
%
Bala
gha
t57
.87%
3.0
4%27
.97%
11.4
3%3.
32%
92.3
7%7 6
.64%
47.7
9%10
.66%
86.0
0%
17.8
7%9.
70%
Barw
ani
70.7
5%5.
48%
49.6
4%41
.51%
37.0
5%91
.56%
90.0
5%29
.61%
11.8
7%85
.00
%38
.17%
15.7
0%
Betu
l46
.86%
4.16
%30
.76%
16.9
0%
5.48
%88
.73%
79.8
5%38
.57%
7.79
%82
.59%
28.0
1%9.
90%
Bhin
d49
.21%
3.65
%31
.55%
7.75
%7.
51%
93.0
9%77
.63%
20.0
3%16
.01%
83.1
9%15
.58%
10.9
6%
Bho
pal
35.0
6%2.
88%
17.8
6%13
.23%
8.42
%74
.23%
73.0
3%23
.65%
4.57
%69
.98%
16.4
0%
9.30
%
Burh
anp
ur52
.80
%3.
97%
36.9
9%32
.49%
18.0
1%75
.62%
68.8
9%23
.99%
13.9
0%
67.3
4%29
.57%
15.6
5%
Chh
atar
pur
50.4
1%5.
82%
40.9
6%21
.94%
12.9
5%97
.50
%94
.43%
54.3
9%24
.73%
84.3
0%
25.0
9%18
.34%
Chh
ind
war
a45
.79%
2.62
%25
.14%
14.9
3%3.
36%
89.7
5%75
.61%
41.2
8%12
.00
%75
.14%
29.5
0%
10.5
7%
Dam
oh
46.2
7%4.
23%
35.0
1%19
.13%
9.62
%97
.57%
87.5
1%58
.26%
15.2
2%91
.52%
34.2
1%22
.72%
Dat
ia48
.39%
6.29
%32
.89%
11.3
8%4.
66%
95.9
2%73
.33%
30.0
5%12
.08%
95.7
1%18
.04%
6.88
%
Dew
as49
.81%
4.47
%29
.88%
18.2
2%10
.23%
82.5
8%56
.92%
27.7
5%1.
39%
61.8
1%12
.94%
5.10
%
Dha
r55
.04%
5.0
9%34
.98%
27.3
7%13
.71%
83.0
2%73
.61%
28.8
7%5.
23%
67.3
9%21
.83%
11.2
7%
Din
do
ri51
.65%
3.60
%32
.22%
20.8
4%4.
16%
98.0
4%94
.35%
52.0
2%25
.41%
92.5
0%
56.0
8%13
.59%
East
Nim
ar57
.24%
3.51
%34
.18%
27.4
7%11
.20
%87
.82%
73.2
5%38
.10
%9.
91%
69.3
1%21
.06%
8.24
%
Gun
a56
.61%
3.97
%38
.21%
22.8
0%
12.2
2%93
.78%
84.6
5%45
.17%
7.77
%85
.53%
21.4
1%8.
73%
Unc
enso
red
Hea
dco
unt R
atio
: Rur
alH
ealth
Educ
atio
nSt
and
ard
of L
ivin
g
Stat
eD
istr
ict
Nut
ritio
nC
hild
&
Ad
ole
scen
t M
ort
ality
Mat
erna
l H
ealth
Year
s o
f Sc
hoo
ling
Scho
ol
Att
end
ance
Co
oki
ng
Fuel
Sani
tatio
nD
rink
ing
Wat
erEl
ectr
icity
Ho
usin
gA
sset
sB
ank
Acc
oun
t
Madhya Pradesh
Gw
alio
r45
.33%
5.45
%32
.52%
15.3
7%9.
07%
87.4
6%68
.18%
20.8
8%9.
98%
73.7
0%
19.6
0%
7.45
%
Har
da
43.1
8%4.
11%
35.0
8%23
.06%
9.59
%83
.63%
53.6
9%28
.66%
3.77
%68
.76%
18.5
7%5.
97%
Ho
shan
gab
ad43
.73%
2.50
%30
.34%
13.1
5%3.
86%
85.1
1%64
.39%
25.3
8%6.
72%
66.4
2%18
.75%
5.13
%
Ind
ore
43.6
8%1.
46%
13.8
4%13
.78%
6.75
%55
.76%
40.0
7%16
.82%
0.2
3%38
.17%
6.32
%10
.87%
Jab
alp
ur44
.37%
3.40
%24
.26%
12.0
9%7.
22%
89.0
7%76
.21%
26.0
8%7.
84%
69.9
8%27
.40
%6.
48%
Jhab
ua58
.05%
6.28
%43
.96%
44.1
4%36
.59%
95.4
9%91
.03%
38.6
2%11
.77%
86.3
2%44
.65%
30.9
1%
Katn
i45
.57%
5.62
%29
.65%
12.9
8%4.
95%
94.4
3%86
.69%
36.0
3%18
.71%
86.6
5%28
.59%
12.8
1%
Man
dla
49.1
9%3.
72%
28.7
9%20
.50
%6.
05%
94.2
5%92
.16%
56.9
5%24
.70
%88
.86%
44.1
8%7.
34%
Man
dsa
ur50
.15%
2.50
%29
.01%
17.2
7%5.
27%
86.5
5%77
.17%
43.3
4%2.
38%
67.0
6%12
.92%
17.9
1%
Mo
rena
46.7
2%4.
33%
29.0
1%10
.31%
9.61
%92
.12%
77.4
3%22
.23%
15.0
1%80
.89%
17.3
3%5.
60%
Nar
sim
hap
ur42
.99%
2.49
%27
.26%
15.1
3%2.
52%
92.0
9%64
.65%
19.4
7%7.
27%
81.5
6%31
.54%
19.0
4%
Nee
muc
h48
.69%
3.13
%27
.25%
20.4
9%6.
08%
76.9
4%75
.61%
37.8
7%2.
12%
59.7
9%11
.95%
17.9
1%
Pann
a41
.50
%4.
76%
34.7
2%20
.66%
9.74
%95
.25%
86.4
0%
43.6
6%21
.47%
88.0
0%
26.9
0%
16.3
7%
Rai
sen
50.6
7%3.
40%
30.8
7%15
.69%
7.85
%89
.80
%68
.90
%26
.93%
7.87
%82
.91%
19.7
8%6.
12%
Raj
gar
h49
.80
%3.
61%
29.7
4%20
.06%
7.28
%93
.84%
89.1
4%65
.02%
5.0
4%73
.41%
22.8
0%
8.22
%
Rat
lam
52.5
5%2.
43%
29.1
2%25
.28%
12.1
6%86
.03%
80.7
6%28
.12%
6.16
%72
.75%
33.2
7%31
.14%
Rew
a40
.35%
5.50
%33
.31%
12.0
0%
8.33
%96
.07%
79.0
0%
27.6
9%13
.45%
92.6
1%24
.55%
14.2
9%
Sag
ar41
.07%
3.62
%37
.86%
14.5
1%5.
46%
95.9
9%79
.92%
43.6
5%17
.30
%89
.95%
26.9
9%13
.61%
Satn
a40
.28%
4.23
%30
.46%
14.3
4%6.
47%
93.0
8%77
.81%
24.7
8%11
.36%
88.0
1%25
.29%
8.42
%
Seho
re43
.58%
3.49
%28
.09%
18.3
5%7.
78%
88.3
2%60
.05%
33.0
7%1.
95%
66.0
9%11
.19%
5.75
%
Seo
ni48
.69%
2.0
2%24
.27%
14.6
7%4.
42%
91.9
0%
82.3
0%
47.5
3%18
.24%
85.1
2%29
.62%
14.2
6%
Shah
do
l43
.83%
4.46
%30
.88%
17.1
5%7.
11%
93.3
6%91
.19%
56.6
2%24
.26%
87.1
7%30
.07%
13.5
5%
Shaj
apur
48.7
5%2.
41%
20.9
4%20
.70
%11
.59%
88.8
2%71
.81%
46.9
5%3.
39%
63.9
7%12
.87%
10.3
9%
Sheo
pur
53.1
3%4.
44%
33.8
9%24
.95%
10.7
4%91
.79%
87.9
9%32
.12%
19.2
0%
83.9
0%
31.2
1%9.
83%
Shiv
pur
i51
.48%
4.29
%35
.55%
16.6
0%
7.25
%95
.54%
87.3
6%65
.16%
14.8
8%88
.61%
25.0
6%9.
16%
Sid
hi48
.41%
5.16
%42
.67%
15.1
6%9.
53%
95.5
3%90
.94%
49.1
9%22
.58%
91.9
0%
34.4
0%
20.1
5%
Sing
raul
i49
.83%
6.97
%47
.06%
20.3
7%12
.26%
95.7
3%95
.88%
62.8
7%34
.66%
94.1
6%34
.51%
11.1
2%
Tika
mg
arh
50.1
4%3.
67%
33.7
6%14
.94%
7.0
9%92
.05%
88.6
5%47
.62%
14.7
3%76
.57%
25.5
5%20
.70
%
Ujja
in50
.08%
2.54
%32
.96%
20.5
8%8.
61%
80.3
0%
61.6
2%32
.81%
3.63
%61
.58%
1 4.5
8%19
.52%
Um
aria
46.6
2%4.
02%
36.0
9%16
.91%
8.48
%96
.10
%89
.59%
45.4
1%21
.01%
88.6
3%30
.44%
8.26
%
Vid
isha
47.0
8%6.
21%
39.6
5%21
.66%
10.6
1%93
.16%
83.0
3%27
.55%
16.1
8%86
.16%
35.3
3%25
.12%
Wes
t Nim
ar54
.71%
2.64
%32
.12%
23.7
8%11
.27%
78.1
2%75
.73%
15.7
3%2.
09%
59.0
5%17
.30
%15
.81%
Maharashtra
Ahm
adna
gar
38.7
4%0
.67%
18.9
7%5.
76%
5.46
%48
.75%
54.1
2%18
.80
%6.
76%
40.7
8%15
.52%
22.5
0%
Ako
la43
.67%
0.9
1%14
.75%
3.70
%1.
23%
76.3
9%58
.79%
11.4
7%5.
25%
44.9
3%20
.51%
6.94
%
Am
rava
ti39
.12%
0.6
5%12
.95%
6.87
%0
.64%
66.0
4%41
.96%
12.3
7%9.
36%
50.9
3%20
.82%
8.37
%
Aur
ang
abad
41.3
1%1.
90%
22.4
8%6.
05%
4.53
%66
.76%
63.7
0%
22.7
7%4.
62%
36.5
7%16
.75%
6.88
%
Bhan
dar
a39
.48%
1.97
%7.
34%
5.43
%0
.60
%67
.30
%32
.58%
22.5
3%3.
80%
49.0
0%
10.6
6%2.
34%
Bid
38.4
3%1.
43%
17.9
2%10
.09%
7.27
%80
.47%
63.3
7%27
.04%
8.84
%34
.81%
21.3
6%9.
57%
Buld
ana
43.2
9%0
.82%
15.0
9%8.
76%
4.14
%78
.56%
58.2
0%
21.4
3%3.
91%
46.3
4%17
.46%
5.0
3%
Cha
ndra
pur
47.7
6%1.
42%
12.2
8%8.
75%
1.83
%72
.16%
60.1
2%32
.80
%10
.82%
46.9
2%25
.44%
4.34
%
Dhu
le47
.92%
1.10
%26
.93%
19.2
3%15
.39%
77.4
7%80
.97%
11.1
1%16
.00
%62
.76%
28.7
7%21
.44%
Gar
hchi
roli
38.6
5%0
.73%
13.0
8%11
.69%
2.85
%85
.55%
73.0
0%
21.4
9%6.
71%
59.2
4%20
.30
%8.
04%
Go
ndiy
a48
.52%
1.14
%12
.29%
5.71
%0
.32%
82.4
4%45
.03%
29.7
8%3.
60%
78.1
6%13
.51%
4.66
%
(CONTD.) DISTrICT-WISe: UNCeNSoreD heADCoUNT rATIo (rUrAl)(CONTD.) DISTrICT-WISe: UNCeNSoreD heADCoUNT rATIo (rUrAl)

INDIA MPI BASELINE REPORT DISTrICTDATA TABleS
284 285
Unc
enso
red
Hea
dco
unt R
atio
: Rur
alH
ealth
Educ
atio
nSt
and
ard
of L
ivin
g
Stat
eD
istr
ict
Nut
ritio
nC
hild
&
Ad
ole
scen
t M
ort
ality
Mat
erna
l H
ealth
Year
s o
f Sc
hoo
ling
Scho
ol
Att
end
ance
Co
oki
ng
Fuel
Sani
tatio
nD
rink
ing
Wat
erEl
ectr
icity
Ho
usin
gA
sset
sB
ank
Acc
oun
t
Maharashtra
Hin
go
li47
.61%
2.67
%19
.81%
10.5
9%5.
52%
85.8
3%61
.90
%29
.22%
15.9
2%49
.51%
26.4
8%6.
97%
Jalg
aon
33.3
5%2.
27%
22.4
1%12
.81%
6.27
%58
.14%
60.2
9%7.
35%
9.0
5%35
.47%
19.1
5%14
.13%
Jaln
a47
.08%
2.0
7%20
.28%
11.5
3%3.
92%
90.6
1%65
.98%
49.3
2%13
.47%
41.5
6%25
.89%
6.75
%
Kolh
apur
39.4
9%1.
82%
18.4
5%5.
74%
3.94
%49
.50
%38
.09%
7.83
%1.
48%
48.6
1%11
.22%
13.8
2%
Latu
r40
.29%
0.5
9%16
.85%
5.95
%1.
81%
77.6
0%
61.6
6%38
.81%
5.62
%36
.37%
22.9
0%
8.56
%
Mum
bai
--
--
--
--
--
--
Mum
bai
Sub
urb
an-
--
--
--
--
--
-
Nag
pur
41.2
3%1.
72%
5.59
%5.
78%
0.5
9%51
.74%
41.6
0%
10.3
7%5.
24%
42.9
8%13
.23%
6.19
%
Nan
ded
54.2
9%3.
22%
26.2
4%9.
55%
4.59
%85
.90
%64
.96%
31.0
3%10
.27%
52.9
0%
31.8
7%11
.39%
Nan
dur
bar
59.4
9%1.
41%
26.0
3%31
.07%
23.8
3%85
.21%
80.1
8%25
.98%
28.9
9%82
.82%
49.7
6%18
.43%
Nas
hik
46.9
6%1.
86%
24.4
3%7.
90%
5.22
%63
.58%
59.7
6%28
.24%
12.3
0%
46.2
7%19
.45%
8.34
%
Osm
anab
ad37
.59%
1.48
%13
.72%
8.62
%1.
56%
69.3
3%73
.53%
35.8
5%9.
60%
37.7
8%17
.81%
8.76
%
Parb
hani
53.7
2%0
.41%
18.6
6%8.
10%
4.29
%90
.06%
74.4
7%17
.70
%8.
51%
39.6
9%20
.02%
7.48
%
Pune
32.7
5%1.
83%
14.3
4%5.
35%
2.44
%38
.66%
35.7
5%15
.20
%4.
48%
21.4
2%14
.05%
6.78
%
Rai
gar
h42
.74%
1.59
%14
.93%
11.6
4%3.
64%
43.9
4%45
.87%
16.0
8%4.
84%
31.8
1%16
.77%
17.7
7%
Rat
nag
iri36
.29%
0.7
5%14
.07%
7.55
%4.
52%
77.2
9%37
.92%
19.9
0%
2.68
%62
.32%
25.7
2%21
.74%
Sang
li34
.60
%1.
40%
16.6
4%3.
46%
4.53
%47
.76%
29.3
7%9.
40%
9.34
%38
.14%
11.1
2%8.
30%
Sata
ra41
.90
%0
.86%
17.1
8%4.
89%
2.0
3%52
.97%
34.0
5%8.
90%
4.21
%37
.69%
10.8
8%12
.72%
Sind
hud
urg
37.1
2%1.
20%
13.3
9%4.
75%
2.78
%73
.90
%22
.69%
28.1
1%1.
12%
47.9
5%21
.21%
19.2
4%
Sola
pur
35.3
1%1.
56%
13.4
0%
8.12
%2.
69%
66.2
9%52
.32%
29.0
7%11
.10
%33
.09%
13.0
6%5.
49%
Than
e60
.51%
2.18
%25
.28%
11.6
4%19
.27%
77.4
9%70
.76%
56.3
9%16
.71%
63.8
0%
31.8
0%
13.4
4%
War
dha
35.3
0%
0.9
5%6.
14%
7.40
%0
.76%
54.5
7%46
.04%
8.39
%4.
41%
42.6
3%15
.10
%3.
89%
Was
him
44.2
0%
1.15
%20
.44%
7.86
%3.
92%
75.6
2%63
.95%
23.0
8%4.
04%
53.1
5%21
.87%
4.50
%
Yava
tmal
46.2
6%1.
29%
16.9
8%8.
33%
5.31
%77
.08%
64.8
8%28
.18%
9.85
%55
.57%
25.5
9%10
.12%
Manipur
Bish
nup
ur25
.20
%1.
35%
9.42
%3.
16%
1.0
8%69
.58%
56.2
5%60
.80
%2.
60%
94.3
7%5.
30%
19.9
0%
Cha
ndel
24.8
4%2.
95%
31.4
4%12
.66%
4.20
%84
.45%
35.9
4%64
.92%
7.76
%92
.96%
25.3
4%21
.72%
Chu
rach
and
pur
28.6
4%2.
93%
23.5
9%11
.10
%2.
94%
60.5
9%32
.56%
48.3
5%9.
68%
82.1
9%25
.52%
21.7
8%
Imp
hal E
ast
23.7
9%1.
47%
12.0
9%4.
78%
2.99
%64
.85%
55.6
0%
75.0
1%3.
04%
88.1
8%9.
67%
20.4
8%
Imp
hal W
est
18.4
1%1.
73%
16.4
1%1.
88%
0.6
5%56
.63%
53.8
9%60
.15%
3.58
%83
.14%
5.56
%23
.71%
Sena
pat
i31
.07%
3.10
%39
.60
%10
.91%
5.0
9%84
.81%
39.8
3%64
.95%
7.66
%90
.27%
24.2
8%29
.73%
Tam
eng
long
31.7
3%3.
71%
44.8
6%18
.03%
5.37
%92
.48%
37.7
3%67
.03%
15.2
1%94
.62%
51.6
9%36
.10
%
Tho
ubal
26.3
3%1.
77%
17.7
3%3.
92%
3.11
%74
.94%
53.3
6%66
.74%
16.4
9%94
.30
%8.
17%
24.0
5%
Ukh
rul
27.3
9%2.
36%
37.1
2%7.
86%
2.57
%95
.48%
36.3
6%64
.60
%26
.68%
86.4
3%49
.01%
38.8
4%
Meghalaya
East
Gar
o H
ills
31.9
1%1.
60%
41.5
1%22
.19%
12.4
3%97
.45%
49.5
5%61
.21%
15.0
8%87
.32%
32.2
7%23
.41%
East
Kha
si H
ills
49.5
7%4.
14%
34.6
5%23
.69%
4.37
%85
.71%
32.2
5%21
.07%
7.0
4%41
.36%
41.6
9%31
.13%
Jain
tia H
ills
51.3
8%5.
25%
46.0
2%34
.18%
11.6
3%84
.94%
43.6
9%34
.68%
14.7
8%34
.40
%49
.29%
35.1
4%
Ri B
hoi
45.2
3%5.
46%
44.7
4%33
.77%
8.96
%90
.48%
43.4
7%33
.89%
13.6
5%54
.30
%46
.81%
27.9
0%
Sout
h G
aro
Hill
s23
.25%
3.75
%16
.51%
6.47
%2.
73%
92.0
5%13
.26%
24.9
4%1.
00
%56
.08%
8.15
%2.
16%
Wes
t Gar
o H
ills
27.4
4%2.
47%
28.1
9%16
.24%
5.25
%88
.36%
58.0
0%
49.1
0%
7.18
%71
.09%
21.6
3%6.
71%
Wes
t Kha
si H
ills
42.0
3%3.
75%
45.1
4%25
.29%
6.14
%94
.70
%20
.16%
30.8
3%10
.26%
47.8
7%41
.42%
27.1
9%
Mizoram
Aiz
awl
20.6
5%4.
04%
18.0
6%5.
09%
2.16
%58
.84%
7.78
%11
.53%
0.4
8%15
.03%
8.22
%2.
64%
Cha
mp
hai
29.1
8%2.
76%
27.6
3%10
.65%
3.48
%65
.09%
17.9
4%5.
54%
0.1
1%32
.23%
16.8
6%4.
35%
Kola
sib
26.2
6%2.
83%
28.5
9%17
.44%
7.40
%60
.08%
19.4
8%5.
06%
1.64
%41
.83%
23.3
6%11
.09%
Unc
enso
red
Hea
dco
unt R
atio
: Rur
alH
ealth
Educ
atio
nSt
and
ard
of L
ivin
g
Stat
eD
istr
ict
Nut
ritio
nC
hild
&
Ad
ole
scen
t M
ort
ality
Mat
erna
l H
ealth
Year
s o
f Sc
hoo
ling
Scho
ol
Att
end
ance
Co
oki
ng
Fuel
Sani
tatio
nD
rink
ing
Wat
erEl
ectr
icity
Ho
usin
gA
sset
sB
ank
Acc
oun
t
Mizoram
Law
ang
tlai
30.1
1%3.
47%
32.1
4%28
.87%
12.9
0%
64.7
1%39
.98%
21.1
1%30
.99%
58.2
9%48
.52%
15.2
5%
Lung
lei
22.4
8%2.
89%
24.6
5%14
.23%
4.10
%71
.43%
31.8
1%9.
58%
1.34
%37
.37%
23.6
1%12
.36%
Mam
it25
.29%
2.67
%27
.11%
20.2
8%7.
68%
68.5
4%38
.61%
24.5
7%17
.28%
57.1
0%
38.3
0%
14.5
9%
Saih
a34
.02%
4.58
%33
.48%
10.2
3%5.
62%
67.8
5%22
.81%
10.4
0%
0.6
8%34
.47%
29.1
8%10
.06%
Serc
hhip
26.2
8%2.
64%
21.2
1%5.
94%
1.20
%67
.20
%9.
38%
7.62
%0
.30
%12
.20
%12
.19%
1.97
%
Nagaland
Mo
n36
.94%
2.14
%52
.12%
27.4
0%
11.1
6%98
.00
%17
.44%
29.6
1%16
.09%
95.5
7%73
.45%
60.7
8%
Dim
apur
23.4
7%2.
04%
29.2
6%17
.51%
6.0
7%52
.77%
26.7
0%
28.0
5%3.
03%
62.8
6%11
.93%
28.4
2%
Kip
hire
35.5
0%
4.64
%43
.03%
19.9
0%
6.70
%95
.90
%11
.94%
13.5
5%1.
99%
83.2
1%64
.22%
53.8
3%
Kohi
ma
19.5
0%
2.45
%26
.76%
11.0
1%1.
05%
86.7
7%26
.83%
26.4
0%
1.20
%65
.56%
28.2
2%15
.89%
Long
leng
28.9
1%1.
32%
37.3
8%13
.58%
5.16
%98
.69%
25.2
0%
58.0
2%2.
98%
90.1
3%55
.30
%37
.85%
Mo
kokc
hung
15.2
3%1.
54%
18.1
7%10
.53%
2.46
%78
.72%
6.75
%10
.57%
0.7
9%78
.52%
20.2
6%26
.18%
Pere
n24
.00
%3.
90%
40.8
3%18
.68%
2.65
%89
.77%
27.1
0%
37.8
4%2.
61%
85.7
8%38
.34%
26.3
8%
Phek
20.9
5%3.
61%
36.7
4%13
.87%
3.96
%96
.10
%15
.14%
5.28
%1.
67%
90.7
7%56
.63%
31.8
2%
Tuen
sang
35.8
3%4.
30%
53.6
4%22
.87%
3.93
%97
.62%
27.5
5%7.
56%
3.30
%89
.17%
59.1
2%46
.31%
Wo
kha
19.3
2%2.
25%
29.0
9%14
.26%
1.30
%81
.22%
25.2
0%
37.3
3%3.
09%
68.0
5%34
.57%
28.2
5%
Zunh
ebo
to21
.69%
0.6
7%32
.18%
14.3
4%6.
19%
92.9
0%
15.4
4%11
.07%
0.4
9%87
.60
%49
.58%
41.8
1%
Odisha
Anu
gul
35.7
9%4.
05%
16.0
0%
12.2
3%2.
47%
84.7
1%68
.98%
33.8
7%12
.61%
44.1
4%18
.93%
6.81
%
Bala
ngir
47.1
4%2.
38%
10.5
6%17
.39%
4.37
%94
.81%
88.5
7%22
.91%
17.3
9%70
.61%
18.0
4%6.
26%
Bale
shw
ar38
.90
%1.
22%
24.1
6%11
.70
%3.
83%
92.4
2%64
.72%
10.4
7%10
.24%
74.0
0%
13.3
2%13
.64%
Barg
arh
41.6
5%2.
69%
13.2
9%11
.14%
2.83
%90
.67%
74.8
5%20
.07%
15.9
0%
65.5
1%14
.66%
7.15
%
Baud
a42
.83%
2.90
%16
.02%
15.7
8%3.
08%
89.9
1%84
.16%
25.0
8%11
.64%
74.1
2%20
.81%
7.48
%
Bhad
rak
40.5
7%1.
59%
24.3
0%
10.2
4%2.
79%
91.6
1%80
.29%
11.2
8%11
.84%
78.3
2%15
.10
%23
.30
%
Cut
tack
27.0
3%1.
72%
20.5
5%7.
12%
1.78
%80
.49%
70.4
4%14
.31%
7.95
%39
.41%
11.1
8%13
.50
%
Deb
agar
h43
.46%
2.73
%24
.46%
20.6
7%5.
25%
96.2
7%69
.46%
22.9
5%18
.09%
69.7
8%32
.34%
16.7
0%
Dhe
nkan
al37
.50
%1.
60%
17.2
9%15
.66%
3.39
%87
.94%
73.7
0%
52.4
9%12
.25%
56.4
8%21
.64%
15.5
3%
Gaj
apat
i38
.80
%3.
96%
26.7
7%28
.73%
10.1
1%89
.94%
65.5
7%43
.57%
12.5
6%49
.48%
44.6
9%8.
56%
Gan
jam
30.4
4%2.
52%
19.2
1%23
.10
%4.
44%
78.0
9%66
.58%
20.7
3%9.
63%
33.3
8%18
.40
%5.
21%
Jag
atsi
ngha
pur
25.6
5%1.
68%
14.8
4%6.
42%
0.8
9%90
.25%
67.0
1%8.
90%
5.22
%38
.60
%12
.28%
7.33
%
Jaja
pur
36.9
7%1.
85%
22.5
1%8.
91%
1.83
%86
.36%
69.6
3%16
.98%
5.87
%47
.75%
12.5
5%10
.60
%
Jhar
sug
uda
44.7
4%1.
98%
12.5
7%10
.42%
1.23
%87
.87%
69.8
5%18
.00
%10
.30
%73
.67%
10.8
7%5.
23%
Kala
hand
i42
.77%
1.56
%22
.32%
30.3
5%9.
10%
96.3
3%89
.67%
28.1
5%33
.17%
79.6
4%29
.52%
17.7
3%
Kand
ham
al44
.02%
3.82
%27
.87%
20.5
0%
5.91
%95
.68%
85.5
1%54
.07%
21.8
0%
65.5
3%47
.75%
6.98
%
Kend
rap
ara
33.8
1%1.
61%
21.2
5%8.
98%
1.78
%88
.19%
73.8
4%12
.46%
6.76
%59
.55%
16.6
2%6.
86%
Kend
ujha
r46
.14%
3.73
%31
.84%
23.4
7%8.
43%
91.2
8%85
.98%
28.1
2%25
.34%
77.0
0%
32.1
6%17
.95%
Kho
rdha
26.5
8%1.
41%
17.6
8%10
.37%
1.50
%79
.87%
74.5
8%33
.51%
3.69
%39
.16%
9.43
%7.
15%
Kora
put
51.1
1%2.
70%
26.4
4%42
.72%
17.4
8%90
.00
%86
.37%
20.2
0%
24.8
8%65
.72%
44.8
7%17
.86%
Mal
kang
iri60
.63%
7.21
%29
.22%
45.9
1%18
.21%
96.1
9%83
.60
%19
.11%
11.5
6%77
.64%
37.6
9%9.
49%
May
urb
hanj
45.4
5%1.
98%
21.8
9%23
.19%
5.68
%94
.52%
86.4
4%28
.98%
26.5
4%84
.04%
31.6
3%20
.93%
Nab
aran
gap
ur55
.31%
4.34
%34
.52%
36.3
4%16
.10
%94
.61%
85.1
5%26
.84%
31.4
4%83
.45%
35.6
0%
20.3
1%
Nay
agar
h25
.46%
1.83
%20
.06%
16.9
8%2.
85%
81.6
4%69
.12%
29.9
8%6.
07%
42.0
1%15
.11%
10.2
9%
Nua
pad
a49
.68%
2.52
%17
.15%
22.1
7%7.
31%
93.7
0%
82.0
6%19
.39%
17.5
9%74
.18%
18.2
9%5.
61%
Puri
23.4
7%1.
68%
15.5
5%6.
30%
1.30
%85
.83%
62.7
6%17
.11%
4.65
%36
.34%
8.73
%6.
50%
Ray
agad
a50
.01%
6.34
%28
.32%
41.3
8%14
.38%
92.5
1%83
.11%
17.5
5%22
.10
%65
.11%
40.9
7%16
.50
%
(CONTD.) DISTrICT-WISe: UNCeNSoreD heADCoUNT rATIo (rUrAl)(CONTD.) DISTrICT-WISe: UNCeNSoreD heADCoUNT rATIo (rUrAl)
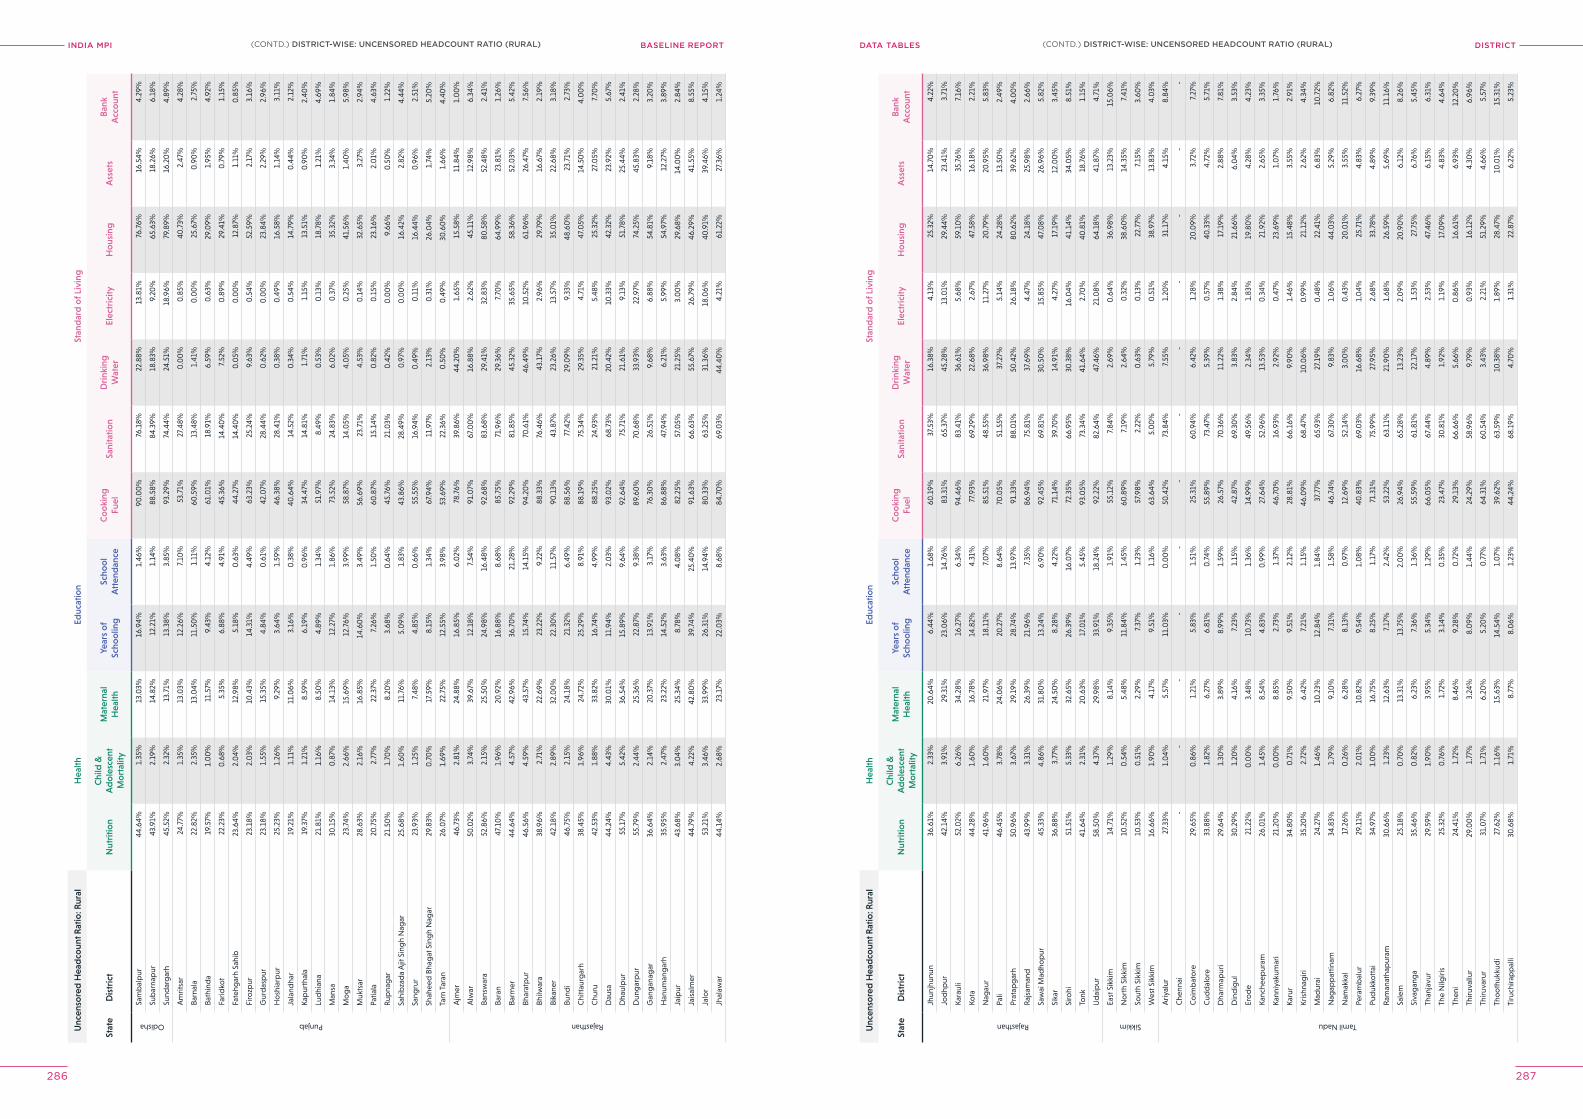
INDIA MPI BASELINE REPORT DISTrICTDATA TABleS
286 287
Unc
enso
red
Hea
dco
unt R
atio
: Rur
alH
ealth
Educ
atio
nSt
and
ard
of L
ivin
g
Stat
eD
istr
ict
Nut
ritio
nC
hild
&
Ad
ole
scen
t M
ort
ality
Mat
erna
l H
ealth
Year
s o
f Sc
hoo
ling
Scho
ol
Att
end
ance
Co
oki
ng
Fuel
Sani
tatio
nD
rink
ing
Wat
erEl
ectr
icity
Ho
usin
gA
sset
sB
ank
Acc
oun
t
Odisha
Sam
bal
pur
44.6
4%1.
35%
13.0
3%16
.94%
1.46
%90
.00
%76
.18%
22.8
8%13
.81%
76.7
6%16
.54%
4.29
%
Sub
arna
pur
43.9
1%2.
19%
14.8
2%12
.21%
1.14
%88
.58%
84.3
9%18
.83%
9.20
%65
.63%
18.2
6%6.
18%
Sund
arg
arh
45.5
2%2.
32%
13.7
1%13
.38%
3.85
%93
.29%
74.4
4%24
.51%
18.9
6%79
.89%
16.2
0%
4.89
%
Punjab
Am
ritsa
r24
.77%
1.35
%13
.03%
12.2
6%7.
10%
53.7
1%27
.48%
0.0
0%
0.8
5%40
.73%
2.47
%4.
28%
Barn
ala
22.8
2%2.
35%
13.0
4%11
.50
%1.
11%
60.5
9%13
.48%
1.41
%0
.00
%25
.67%
0.9
0%
2.75
%
Bath
ind
a19
.57%
1.0
0%
11.5
7%9.
43%
4.12
%61
.01%
18.9
1%6.
59%
0.6
3%29
.09%
1.95
%4.
92%
Farid
kot
22.2
3%0
.68%
5.35
%6.
88%
4.91
%45
.36%
14.4
0%
7.52
%0
.89%
29.4
1%0
.79%
1.15
%
Fate
hgar
h Sa
hib
23.6
4%2.
04%
12.9
8%5.
18%
0.6
3%44
.27%
14.4
0%
0.0
5%0
.00
%12
.87%
1.11
%0
.85%
Firo
zpur
23.1
8%2.
03%
10.4
3%14
.31%
4.49
%63
.23%
25.2
4%9.
63%
0.5
4%52
.59%
2.17
%3.
16%
Gur
das
pur
23.1
8%1.
55%
15.3
5%4.
84%
0.6
1%42
.07%
28.4
4%0
.62%
0.0
0%
23.8
4%2.
29%
2.96
%
Ho
shia
rpur
25.2
3%1.
26%
9.29
%3.
64%
1.59
%46
.38%
28.4
1%0
.38%
0.4
9%16
.58%
1.14
%3.
11%
Jala
ndha
r19
.21%
1.11
%11
.06%
3.16
%0
.38%
40.6
4%14
.52%
0.3
4%0
.54%
14.7
9%0
.44%
2.12
%
Kap
urth
ala
19.3
7%1.
21%
8.59
%6.
19%
0.9
6%34
.47%
14.8
1%1.
71%
1.15
%13
.51%
0.9
0%
2.40
%
Lud
hian
a21
.81%
1.16
%8.
50%
4.89
%1.
34%
51.9
7%8.
49%
0.5
3%0
.13%
18.7
8%1.
21%
4.69
%
Man
sa30
.15%
0.8
7%14
.13%
12.2
7%1.
86%
73.5
2%24
.83%
6.0
2%0
.37%
35.3
2%3.
34%
1.84
%
Mo
ga
23.7
4%2.
66%
15.6
9%12
.76%
3.99
%58
.87%
14.0
5%4.
05%
0.2
5%41
.56%
1.40
%5.
98%
Muk
tsar
28.6
3%2.
16%
16.8
5%14
.60
%3.
49%
56.6
9%23
.71%
4.53
%0
.14%
32.6
5%3.
27%
2.94
%
Patia
la20
.75%
2.77
%22
.37%
7.26
%1.
50%
60.8
7%15
.14%
0.8
2%0
.15%
23.1
6%2.
01%
4.63
%
Rup
nag
ar21
.50
%1.
70%
8.20
%3.
68%
0.6
4%45
.76%
21.0
3%0
.42%
0.0
0%
9.66
%0
.50
%1.
22%
Sahi
bza
da
Ajit
Sin
gh
Nag
ar25
.68%
1.60
%11
.76%
5.0
9%1.
83%
43.8
6%28
.49%
0.9
7%0
.00
%16
.42%
2.82
%4.
44%
Sang
rur
23.9
3%1.
25%
7.48
%4.
85%
0.6
6%55
.55%
16.9
4%0
.49%
0.1
1%16
.44%
0.9
6%2.
51%
Shah
eed
Bha
gat
Sin
gh
Nag
ar29
.83%
0.7
0%
17.5
9%8.
15%
1.34
%67
.94%
11.9
7%2.
13%
0.3
1%26
.04%
1.74
%5.
20%
Tarn
Tar
an26
.07%
1.69
%22
.75%
12.5
5%3.
98%
53.6
9%22
.36%
0.5
0%
0.4
9%30
.60
%1.
66%
4.40
%
Rajasthan
Ajm
er46
.73%
2.81
%24
.88%
16.8
5%6.
02%
78.7
6%39
.86%
44.2
0%
1.65
%15
.58%
11.8
4%1.
00
%
Alw
ar50
.02%
3.74
%39
.67%
12.1
8%7.
54%
91.0
7%67
.00
%16
.88%
2.62
%45
.11%
12.9
8%6.
34%
Bans
war
a52
.86%
2.15
%25
.50
%24
.98%
16.4
8%92
.68%
83.6
8%29
.41%
32.8
3%80
.58%
52.4
8%2.
41%
Bara
n47
.10
%1.
96%
20.9
2%16
.88%
8.68
%85
.75%
71.9
6%29
.36%
7.70
%64
.99%
23.8
1%1.
26%
Barm
er44
.64%
4.57
%42
.96%
36.7
0%
21.2
8%92
.29%
81.8
5%45
.32%
35.6
5%58
.36%
52.0
3%5.
42%
Bhar
atp
ur46
.56%
4.59
%43
.57%
15.7
4%14
.15%
94.2
0%
70.6
1%46
.49%
10.5
2%61
.96%
26.4
7%7.
56%
Bhilw
ara
38.9
6%2.
71%
22.6
9%23
.22%
9.22
%88
.33%
76.4
6%43
.17%
2.96
%29
.79%
16.6
7%2.
19%
Bika
ner
42.1
8%2.
89%
32.0
0%
22.3
0%
11.5
7%90
.13%
43.8
7%23
.26%
13.5
7%35
.01%
22.6
8%3.
18%
Bund
i46
.75%
2.15
%24
.18%
21.3
2%6.
49%
88.5
6%77
.42%
29.0
9%9.
33%
48.6
0%
23.7
1%2.
73%
Chi
ttau
rgar
h38
.45%
1.96
%24
.72%
25.2
9%8.
91%
88.1
9%75
.34%
29.3
5%4.
71%
47.0
5%14
.50
%4.
00
%
Chu
ru42
.53%
1.88
%33
.82%
16.7
4%4.
99%
88.2
5%24
.93%
21.2
1%5.
48%
25.3
2%27
.05%
7.70
%
Dau
sa44
.24%
4.43
%30
.01%
11.9
4%2.
03%
93.0
2%68
.73%
20.4
2%10
.33%
42.3
2%23
.92%
5.67
%
Dha
ulp
ur55
.17%
5.42
%36
.54%
15.8
9%9.
64%
92.6
4%75
.71%
21.6
1%9.
13%
51.7
8%25
.44%
2.41
%
Dun
gar
pur
55.7
9%2.
44%
25.3
6%22
.87%
9.38
%89
.60
%70
.68%
33.9
3%22
.97%
74.2
5%45
.83%
2.28
%
Gan
gan
agar
36.6
4%2.
14%
20.3
7%13
.91%
3.17
%76
.30
%26
.51%
9.68
%6.
88%
54.8
1%9.
18%
3.20
%
Han
uman
gar
h35
.95%
2.47
%23
.22%
14.5
2%3.
63%
86.8
8%47
.94%
6.21
%5.
99%
54.9
7%12
.27%
3.89
%
Jaip
ur43
.68%
3.0
4%25
.34%
8.78
%4.
08%
82.2
5%57
.05%
21.2
5%3.
00
%29
.68%
14.0
0%
2.84
%
Jais
alm
er44
.79%
4.22
%42
.80
%39
.74%
25.4
0%
91.6
3%66
.63%
55.6
7%26
.79%
46.2
9%41
.55%
8.55
%
Jalo
r53
.21%
3.46
%33
.99%
26.3
1%14
.94%
80.3
3%63
.25%
31.3
6%18
.06%
40.9
1%39
.46%
4.15
%
Jhal
awar
44.1
4%2.
68%
23.1
7%22
.03%
8.68
%84
.70
%69
.03%
44.4
0%
4.21
%61
.22%
27.3
6%1.
24%
Unc
enso
red
Hea
dco
unt R
atio
: Rur
alH
ealth
Educ
atio
nSt
and
ard
of L
ivin
g
Stat
eD
istr
ict
Nut
ritio
nC
hild
&
Ad
ole
scen
t M
ort
ality
Mat
erna
l H
ealth
Year
s o
f Sc
hoo
ling
Scho
ol
Att
end
ance
Co
oki
ng
Fuel
Sani
tatio
nD
rink
ing
Wat
erEl
ectr
icity
Ho
usin
gA
sset
sB
ank
Acc
oun
t
Rajasthan
Jhun
jhun
un36
.61%
2.33
%20
.64%
6.44
%1.
68%
60.1
9%37
.53%
16.3
8%4.
13%
25.3
2%14
.70
%4.
22%
Jod
hpur
42.1
4%3.
91%
29.3
1%23
.06%
14.7
6%83
.31%
65.3
7%45
.28%
13.0
1%29
.44%
23.4
1%3.
71%
Kara
uli
52.0
2%6.
26%
34.2
8%16
.27%
6.34
%94
.46%
83.4
1%36
.61%
5.68
%59
.10
%35
.76%
7.16
%
Kota
44.2
8%1.
60%
16.7
8%14
.82%
4.31
%77
.93%
69.2
9%22
.68%
2.67
%47
.58%
16.1
8%2.
21%
Nag
aur
41.9
6%1.
60%
21.9
7%18
.11%
7.0
7%85
.51%
48.5
5%36
.98%
11.2
7%20
.79%
20.9
5%5.
83%
Pali
46.4
5%3.
78%
24.0
6%20
.27%
8.64
%70
.05%
51.5
5%37
.27%
5.14
%24
.28%
13.5
0%
2.49
%
Prat
apg
arh
50.9
6%3.
67%
29.1
9%28
.74%
13.9
7%91
.33%
88.0
1%50
.42%
26.1
8%80
.62%
39.6
2%4.
00
%
Raj
sam
and
43.9
9%3.
31%
26.3
9%21
.96%
7.35
%86
.94%
75.8
1%37
.69%
4.47
%24
.18%
25.9
8%2.
66%
Saw
ai M
adho
pur
45.3
3%4.
86%
31.8
0%
13.2
4%6.
90%
92.4
5%69
.81%
30.5
0%
15.8
5%47
.08%
26.9
6%5.
82%
Sika
r36
.88%
3.77
%24
.50
%8.
28%
4.22
%71
.14%
39.7
0%
14.9
1%4.
27%
17.1
9%12
.00
%3.
45%
Siro
hi51
.51%
5.33
%32
.65%
26.3
9%16
.07%
72.3
5%66
.95%
30.3
8%16
.04%
41.1
4%34
.05%
8.51
%
Tonk
41.6
4%2.
31%
20.6
3%17
.01%
5.45
%93
.05%
73.3
4%41
.64%
2.70
%40
.81%
18.7
6%1.
15%
Ud
aip
ur58
.50
%4.
37%
29.9
8%33
.91%
18.2
4%92
.22%
82.6
4%47
.46%
21.0
8%64
.18%
41.8
7%4.
71%
Sikkim
East
Sik
kim
14.7
1%1.
29%
8.14
%9.
35%
1.91
%55
.12%
7.84
%2.
69%
0.6
4%36
.98%
13.2
3%15
.06%
No
rth
Sikk
im10
.52%
0.5
4%5.
48%
11.8
4%1.
45%
60.8
9%7.
19%
2.64
%0
.32%
38.6
0%
14.3
5%7.
41%
Sout
h Si
kkim
10.5
3%0
.51%
2.29
%7.
37%
1.23
%57
.98%
2.22
%0
.63%
0.1
3%22
.77%
7.15
%3.
60%
Wes
t Sik
kim
16.6
6%1.
90%
4.17
%9.
51%
1.16
%63
.64%
5.0
0%
5.79
%0
.51%
38.9
7%13
.83%
4.0
3%
Tamil Nadu
Ariy
alur
27.3
3%1.
04%
5.57
%11
.03%
0.0
0%
50.4
2%73
.84%
7.55
%1.
20%
31.1
7%4.
15%
8.84
%
Che
nnai
--
--
--
--
--
--
Co
imb
ato
re29
.65%
0.8
6%1.
21%
5.83
%1.
51%
25.3
1%60
.94%
6.42
%1.
28%
20.0
9%3.
72%
7.27
%
Cud
dal
ore
33.8
8%1.
82%
6.27
%6.
81%
0.7
4%55
.89%
73.4
7%5.
39%
0.5
7%40
.33%
4.72
%5.
71%
Dha
rmap
uri
29.6
4%1.
30%
3.89
%8.
99%
1.59
%26
.57%
70.3
6%11
.22%
1.38
%17
.19%
2.88
%7.
81%
Din
dig
ul30
.29%
1.20
%4.
16%
7.23
%1.
15%
42.8
7%69
.30
%3.
83%
2.84
%21
.66%
6.0
4%3.
53%
Ero
de
21.2
2%0
.00
%3.
48%
10.7
3%1.
36%
14.9
9%49
.56%
2.34
%1.
83%
19.8
0%
4.28
%4.
23%
Kanc
heep
uram
26.0
1%1.
45%
8.54
%4.
83%
0.9
9%27
.64%
52.9
6%13
.53%
0.3
4%21
.92%
2.65
%3.
35%
Kann
iyak
umar
i21
.20
%0
.00
%8.
85%
2.73
%1.
37%
46.7
0%
16.9
3%2.
92%
0.4
7%23
.69%
1.0
7%1.
76%
Karu
r34
.80
%0
.71%
9.50
%9.
51%
2.12
%28
.81%
66.1
6%9.
90%
1.46
%15
.48%
3.55
%2.
91%
Kris
hnag
iri35
.20
%2.
72%
6.42
%7.
21%
1.15
%46
.09%
68.4
7%10
.06%
0.9
9%21
.12%
2.62
%4.
34%
Mad
urai
24.2
7%1.
46%
10.2
3%12
.84%
1.84
%37
.77%
65.9
3%27
.19%
0.4
8%22
.41%
6.83
%10
.72%
Nag
app
attin
am34
.83%
1.79
%9.
10%
7.31
%1.
58%
46.7
4%67
.30
%9.
83%
1.0
6%44
.03%
5.29
%6.
82%
Nam
akka
l17
.26%
0.2
6%6.
28%
8.13
%0
.97%
12.6
9%52
.14%
3.0
0%
0.4
3%20
.01%
3.55
%11
.52%
Pera
mb
alur
29.1
1%2.
01%
10.8
2%9.
54%
1.0
8%40
.83%
69.0
3%16
.68%
1.0
4%25
.71%
4.83
%6.
27%
Pud
ukko
ttai
34.9
7%1.
00
%16
.75%
8.25
%1.
17%
71.3
1%75
.99%
27.9
5%2.
68%
33.7
8%4.
89%
9.39
%
Ram
anat
hap
uram
30.6
6%1.
23%
12.6
3%7.
17%
2.42
%53
.22%
63.1
1%21
.90
%1.
68%
26.5
9%5.
69%
11.1
6%
Sale
m25
.18%
0.7
0%
13.3
1%13
.75%
2.0
0%
26.9
4%65
.28%
13.2
3%2.
09%
20.9
0%
6.12
%8.
26%
Siva
gan
ga
35.4
6%0
.82%
6.23
%7.
36%
1.36
%55
.59%
61.8
1%22
.17%
1.53
%27
.75%
6.76
%5.
45%
Than
javu
r29
.59%
1.90
%3.
95%
5.34
%1.
29%
66.0
5%67
.44%
4.89
%2.
53%
47.4
6%6.
15%
6.31
%
The
Nilg
iris
25.3
2%0
.76%
1.72
%3.
14%
0.3
5%23
.47%
30.8
1%1.
92%
1.19
%17
.09%
4.83
%4.
64%
Then
i24
.41%
1.72
%8.
46%
9.28
%0
.72%
29.1
3%66
.66%
5.66
%0
.86%
16.6
1%6.
93%
12.2
0%
Thiru
vallu
r29
.00
%1.
77%
3.24
%8.
09%
1.44
%24
.29%
58.9
6%9.
79%
0.9
3%16
.12%
4.30
%6.
96%
Thiru
varu
r31
.07%
1.71
%6.
20%
5.20
%0
.77%
64.3
1%60
.54%
3.43
%2.
21%
51.2
9%4.
66%
5.57
%
Tho
oth
ukku
di
27.6
2%1.
16%
15.6
3%14
.54%
1.0
7%39
.62%
63.5
9%10
.38%
1.89
%28
.47%
10.0
1%15
.31%
Tiru
chira
pp
alli
30.6
8%1.
71%
8.77
%8.
06%
1.23
%44
.24%
68.1
9%4.
70%
1.31
%22
.87%
6.22
%5.
23%
(CONTD.) DISTrICT-WISe: UNCeNSoreD heADCoUNT rATIo (rUrAl)(CONTD.) DISTrICT-WISe: UNCeNSoreD heADCoUNT rATIo (rUrAl)
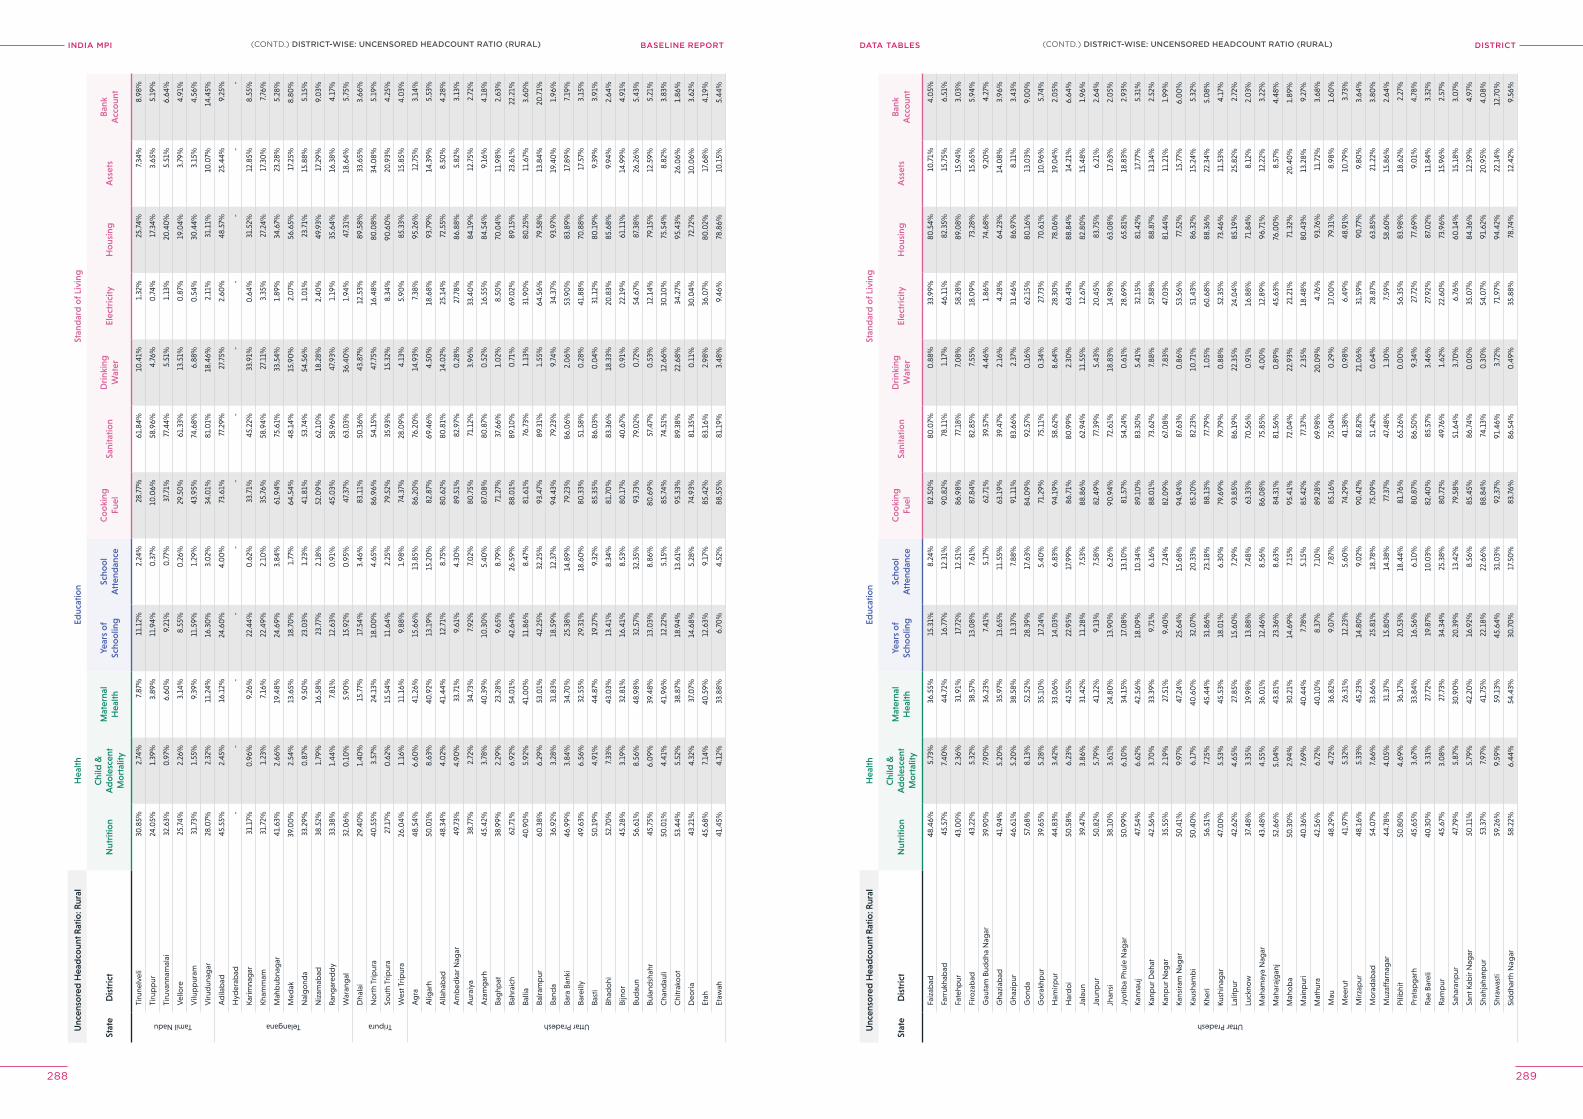
INDIA MPI BASELINE REPORT DISTrICTDATA TABleS
288 289
Unc
enso
red
Hea
dco
unt R
atio
: Rur
alH
ealth
Educ
atio
nSt
and
ard
of L
ivin
g
Stat
eD
istr
ict
Nut
ritio
nC
hild
&
Ad
ole
scen
t M
ort
ality
Mat
erna
l H
ealth
Year
s o
f Sc
hoo
ling
Scho
ol
Att
end
ance
Co
oki
ng
Fuel
Sani
tatio
nD
rink
ing
Wat
erEl
ectr
icity
Ho
usin
gA
sset
sB
ank
Acc
oun
t
Tamil Nadu
Tiru
nelv
eli
30.8
5%2.
74%
7.87
%11
.12%
2.24
%28
.77%
61.8
4%10
.41%
1.32
%25
.74%
7.34
%8.
98%
Tiru
pp
ur24
.05%
1.39
%3.
89%
11.9
4%0
.37%
10.0
6%58
.96%
4.76
%0
.74%
17.3
4%3.
65%
5.19
%
Tiru
vann
amal
ai32
.63%
0.9
7%6.
60%
9.21
%0
.77%
37.7
1%77
.44%
5.51
%1.
13%
20.4
0%
5.51
%6.
64%
Vel
lore
25.7
4%2.
26%
3.14
%8.
55%
0.2
6%29
.50
%61
.33%
13.5
1%0
.87%
19.0
4%3.
79%
4.91
%
Vilu
pp
uram
31.7
3%1.
55%
9.39
%11
.59%
1.29
%43
.95%
74.6
8%6.
88%
0.5
4%30
.44%
3.15
%4.
56%
Viru
dun
agar
28.0
7%2.
32%
11.2
4%16
.30
%3.
02%
34.0
1%81
.01%
18.4
6%2.
11%
31.1
1%10
.07%
14.4
5%
Telangana
Ad
ilab
ad45
.55%
2.45
%16
.12%
24.6
0%
4.0
0%
73.6
1%77
.29%
27.7
5%2.
60%
48.5
7%25
.44%
9.25
%
Hyd
erab
ad-
--
--
--
--
--
-
Karim
nag
ar31
.17%
0.9
6%9.
26%
22.4
4%0
.62%
33.7
1%45
.22%
33.9
1%0
.64%
31.5
2%12
.85%
8.55
%
Kham
mam
31.7
2%1.
23%
7.16
%22
.49%
2.10
%35
.76%
58.9
4%27
.11%
3.35
%27
.24%
17.3
0%
7.76
%
Mah
bub
nag
ar41
.63%
2.66
%19
.48%
24.6
9%3.
84%
61.9
4%75
.61%
33.5
4%1.
89%
34.6
7%23
.28%
5.28
%
Med
ak39
.00
%2.
54%
13.6
5%18
.70
%1.
77%
64.5
4%48
.14%
15.9
0%
2.0
7%56
.65%
17.2
5%8.
80%
Nal
go
nda
33.2
9%0
.87%
9.50
%23
.03%
1.23
%41
.81%
53.7
4%54
.56%
1.0
1%23
.71%
15.8
8%5.
15%
Niz
amab
ad38
.52%
1.79
%16
.58%
23.7
7%2.
18%
52.0
9%62
.10
%18
.28%
2.40
%49
.93%
17.2
9%9.
03%
Ran
gar
edd
y33
.38%
1.44
%7.
81%
12.6
3%0
.91%
45.0
3%58
.96%
47.9
3%1.
19%
35.6
4%16
.38%
4.17
%
War
ang
al32
.06%
0.1
0%
5.90
%15
.92%
0.9
5%47
.37%
63.0
3%36
.40
%1.
94%
47.3
1%18
.64%
5.75
%
Tripura
Dha
lai
29.4
0%
1.40
%15
.77%
17.5
4%3.
46%
83.1
1%50
.36%
43.8
7%12
.53%
89.5
8%33
.65%
3.66
%
No
rth
Trip
ura
40.5
5%3.
57%
24.1
3%18
.00
%4.
65%
86.9
6%54
.15%
47.7
5%16
.48%
80.0
8%34
.08%
5.19
%
Sout
h Tr
ipur
a27
.17%
0.6
2%15
.54%
11.6
4%2.
25%
79.5
2%35
.93%
15.3
2%8.
34%
90.6
0%
20.9
3%4.
25%
Wes
t Trip
ura
26.0
4%1.
16%
11.1
6%9.
88%
1.98
%74
.37%
28.0
9%4.
13%
5.90
%85
.33%
15.8
5%4.
03%
Uttar Pradesh
Ag
ra48
.54%
6.60
%41
.26%
15.6
6%13
.85%
86.2
0%
76.2
0%
14.9
3%7.
38%
95.2
6%12
.75%
3.14
%
Alig
arh
50.0
1%8.
63%
40.9
2%13
.19%
15.2
0%
82.8
7%69
.46%
4.50
%18
.68%
93.7
9%14
.39%
5.53
%
Alla
hab
ad48
.34%
4.0
2%41
.44%
12.7
1%8.
75%
80.6
2%80
.81%
14.0
2%25
.14%
72.5
5%8.
50%
4.28
%
Am
bed
kar N
agar
49.7
3%4.
90%
33.7
1%9.
61%
4.30
%89
.51%
82.9
7%0
.28%
27.7
8%86
.88%
5.82
%3.
13%
Aur
aiya
38.7
7%2.
72%
34.7
3%7.
92%
7.0
2%80
.75%
71.1
2%3.
96%
33.4
0%
84.1
9%12
.75%
2.72
%
Aza
mg
arh
45.4
2%3.
78%
40.3
9%10
.30
%5.
40%
87.0
8%80
.87%
0.5
2%16
.55%
84.5
4%9.
16%
4.18
%
Bag
hpat
38.9
9%2.
29%
23.2
8%9.
65%
8.79
%71
.27%
37.6
6%1.
02%
8.50
%70
.04%
11.9
8%2.
63%
Bahr
aich
62.7
1%6.
92%
54.0
1%42
.64%
26.5
9%88
.01%
89.1
0%
0.7
1%69
.02%
89.1
5%23
.61%
22.2
1%
Balli
a40
.90
%5.
92%
41.0
0%
11.8
6%8.
47%
81.6
1%7 6
.73%
1.13
%31
.90
%80
.25%
11.6
7%3.
60%
Balra
mp
ur60
.38%
6.29
%53
.01%
42.2
5%32
.25%
93.4
7%89
.31%
1.55
%64
.56%
79.5
8%13
.84%
20.7
1%
Band
a36
.92%
3.28
%31
.83%
18.5
9%12
.37%
94.4
3%79
.23%
9.74
%34
.37%
93.9
7%19
.40
%1.
96%
Bara
Ban
ki46
.99%
3.84
%34
.70
%25
.38%
14.8
9%79
.23%
86.0
6%2.
06%
53.9
0%
83.8
9%17
.89%
7.19
%
Bare
illy
49.6
3%6.
56%
32.5
5%29
.31%
18.6
0%
80.3
3%51
.58%
0.2
8%41
.88%
70.8
8%17
.57%
3.15
%
Bast
i50
.19%
4.91
%44
.87%
19.2
7%9.
32%
85.3
5%86
.03%
0.0
4%31
.12%
80.1
9%9.
39%
3.91
%
Bhad
ohi
52.7
0%
7.33
%43
.03%
13.4
1%8.
34%
81.7
0%
83.3
6%18
.33%
20.8
3%85
.68%
9.94
%2.
64%
Bijn
or
45.2
8%3.
19%
32.8
1%16
.41%
8.53
%80
.17%
40.6
7%0
.91%
22.1
9%61
.11%
14.9
9%4.
91%
Bud
aun
56.6
1%8.
56%
48.9
8%32
.57%
32.3
5%93
.73%
79.0
2%0
.72%
54.6
7%87
.38%
26.2
6%5.
43%
Bula
ndsh
ahr
45.7
5%6.
09%
39.4
8%13
.03%
8.86
%80
.69%
57.4
7%0
.53%
12.1
4%79
.15%
12.5
9%5.
21%
Cha
ndau
li50
.01%
4.41
%41
.96%
12.2
2%5.
15%
85.7
4%74
.51%
12.6
6%30
.10
%75
.54%
8.82
%3.
83%
Chi
trak
oo
t53
.44%
5.52
%38
.87%
18.9
4%13
.61%
95.3
3%89
.38%
22.6
8%34
.27%
95.4
3%26
.06%
1.86
%
Deo
ria43
.21%
4.32
%37
.07%
14.6
8%5.
28%
74.9
3%81
.35%
0.1
1%30
.04%
72.7
2%10
.06%
3.62
%
Etah
45.6
8%7.
14%
40.5
9%12
.63%
9.17
%85
.42%
83.1
6%2.
98%
36.0
7%80
.02%
17.6
8%4.
19%
Etaw
ah41
.45%
4.12
%33
.88%
6.70
%4.
52%
88.5
5%81
.19%
3.48
%9.
46%
78.8
6%10
.15%
5.44
%
Unc
enso
red
Hea
dco
unt R
atio
: Rur
alH
ealth
Educ
atio
nSt
and
ard
of L
ivin
g
Stat
eD
istr
ict
Nut
ritio
nC
hild
&
Ad
ole
scen
t M
ort
ality
Mat
erna
l H
ealth
Year
s o
f Sc
hoo
ling
Scho
ol
Att
end
ance
Co
oki
ng
Fuel
Sani
tatio
nD
rink
ing
Wat
erEl
ectr
icity
Ho
usin
gA
sset
sB
ank
Acc
oun
t
Uttar Pradesh
Faiz
abad
48.4
6%5.
73%
36.5
5%15
.31%
8.24
%82
.50
%80
.07%
0.8
8%33
.99%
80.5
4%10
.71%
4.0
5%
Farr
ukha
bad
45.5
7%7.
40%
44.7
2%16
.77%
12.3
1%90
.82%
78.1
1%1.
17%
46.1
1%82
.35%
15.7
5%6.
51%
Fate
hpur
43.0
0%
2.36
%31
.91%
17.7
2%12
.51%
86.9
8%77
.18%
7.0
8%58
.28%
89.0
8%15
.94%
3.0
3%
Firo
zab
ad43
.22%
5.32
%38
.57%
13.0
8%7.
61%
87.8
4%82
.85%
7.55
%18
.09%
73.2
8%15
.65%
5.94
%
Gau
tam
Bud
dha
Nag
ar39
.90
%7.
90%
36.2
3%7.
41%
5.17
%62
.71%
39.5
7%4.
46%
1.86
%74
.68%
9.20
%4.
27%
Gha
ziab
ad41
.94%
5.20
%35
.97%
13.6
5%11
.55%
63.1
9%39
.47%
2.16
%4.
28%
64.2
3%14
.08%
3.96
%
Gha
zip
ur46
.61%
5.20
%38
.58%
13.3
7%7.
88%
91.1
1%83
.66%
2.37
%31
.46%
86.9
7%8.
11%
3.43
%
Go
nda
57.6
8%8.
13%
52.5
2%28
.39%
17.6
3%84
.09%
92.5
7%0
.16%
62.1
5%80
.16%
13.0
3%9.
00
%
Go
rakh
pur
39.6
5%5.
28%
35.1
0%
17.2
4%5.
40%
71.2
9%75
.11%
0.3
4%27
.73%
70.6
1%10
.96%
5.74
%
Ham
irpur
44.8
3%3.
42%
33.0
6%14
.03%
6.83
%94
.19%
58.6
2%8.
64%
28.3
0%
78.0
6%19
.04%
2.0
5%
Har
do
i50
.58%
6.23
%42
.55%
22.9
5%17
.99%
86.7
1%80
.99%
2.30
%63
.43%
88.8
4%14
.21%
6.64
%
Jala
un39
.47%
3.86
%31
.42%
11.2
8%7.
53%
88.8
6%62
.94%
11.5
5%12
.67%
82.8
0%
15.4
8%1.
96%
Jaun
pur
50.8
2%5.
79%
41.2
2%9.
13%
7.58
%82
.49%
77.3
9%5.
43%
20.4
5%83
.75%
6.21
%2.
64%
Jhan
si38
.10
%3.
61%
24.8
0%
13.9
0%
6.26
%90
.94%
72.6
1%18
.83%
14.9
8%63
.08%
17.6
3%2.
05%
Jyo
tiba
Phul
e N
agar
50.9
9%6.
10%
34.1
5%17
.08%
13.1
0%
81.5
7%54
.24%
0.6
1%28
.69%
65.8
1%18
.83%
2.93
%
Kann
auj
47.5
4%6.
62%
42.5
6%18
.09%
10.3
4%89
.10
%83
.30
%5.
41%
32.1
5%81
.42%
17.7
7%5.
31%
Kanp
ur D
ehat
42.5
6%3.
70%
33.3
9%9.
71%
6.16
%88
.01%
73.6
2%7.
88%
57.8
8%88
.87%
13.1
4%2.
52%
Kanp
ur N
agar
35.5
5%2.
19%
27.5
1%9.
40%
7.24
%82
.09%
67.0
8%7.
83%
47.0
3%81
.44%
11.2
1%1.
99%
Kans
iram
Nag
ar50
.41%
9.97
%47
.24%
25.6
4%15
.68%
94.9
4%87
.63%
0.8
6%53
.56%
77.5
2%15
.77%
6.0
0%
Kaus
ham
bi
50.4
0%
6.17
%40
.60
%32
.07%
20.3
3%85
.20
%82
.23%
10.7
1%51
.43%
86.3
2%15
.24%
5.32
%
Kher
i56
.51%
7.25
%45
.44%
31.8
6%23
.18%
88.1
3%77
.79%
1.0
5%60
.68%
88.3
6%22
.34%
5.0
8%
Kush
inag
ar47
.00
%5.
53%
45.5
3%18
.01%
6.30
%79
.69%
79.7
9%0
.88%
52.3
5%73
.46%
11.5
3%4.
17%
Lalit
pur
42.6
2%4.
65%
27.8
5%15
.60
%7.
29%
93.8
5%86
.19%
22.3
5%24
.04%
85.1
9%25
.82%
2.72
%
Luck
now
37.4
8%3.
35%
19.9
8%13
.88%
7.48
%63
.33%
70.5
6%0
.91%
16.8
8%71
.84%
8.12
%2.
03%
Mah
amay
a N
agar
43.4
8%4.
55%
36.0
1%12
.46%
8.56
%86
.08%
75.8
5%4.
00
%12
.89%
96.7
1%12
.22%
3.22
%
Mah
araj
gan
j52
.66%
5.0
4%43
.81%
23.3
6%8.
63%
84.3
1%81
.56%
0.8
9%45
.63%
76.0
0%
8.57
%4.
48%
Mah
ob
a50
.30
%2.
94%
30.2
1%14
.69%
7.15
%95
.41%
72.0
4%22
.93%
21.2
1%71
.32%
20.4
0%
1.89
%
Mai
npur
i40
.36%
7.69
%40
.44%
7.78
%5.
15%
85.4
2%77
.37%
2.35
%18
.48%
80.4
3%13
.28%
9.27
%
Mat
hura
42.5
6%6.
72%
40.1
0%
8.37
%7.
10%
89.2
8%69
.98%
20.0
9%4.
7 6%
93.7
6%11
.72%
3.68
%
Mau
48.2
9%4.
72%
36.8
2%9.
07%
7.87
%85
.16%
75.0
4%0
.29%
17.0
0%
79.3
1%8.
98%
1.60
%
Mee
rut
41.9
7%5.
32%
26.3
1%12
.23%
5.60
%74
.29%
41.3
8%0
.98%
6.49
%48
.91%
10.7
9%3.
73%
Mirz
apur
48.1
6%5.
33%
45.2
3%14
.80
%9.
02%
90.4
2%82
.82%
21.0
6%31
.59%
90.7
7%9.
80%
3.64
%
Mo
rad
abad
54.0
7%7.
66%
33.6
6%25
.81%
18.7
8%75
.09%
51.4
2%0
.64%
28.8
7%63
.85%
21.2
2%3.
80%
Muz
affa
rnag
ar44
.78%
4.0
5%31
.37%
15.8
0%
14.3
8%77
.37%
47.4
8%1.
30%
7.59
%58
.60
%15
.86%
2.64
%
Pilib
hit
50.8
0%
4.69
%36
.17%
20.5
3%18
.44%
81.7
6%65
.26%
0.0
0%
56.3
5%83
.98%
18.6
2%2.
27%
Prat
apg
arh
45.6
5%3.
67%
33.8
4%16
.56%
6.10
%80
.87%
86.5
0%
9.34
%27
.72%
77.6
9%9.
01%
4.78
%
Rae
Bar
eli
40.3
0%
3.31
%27
.72%
19.8
7%10
.03%
82.4
0%
85.5
7%3.
46%
27.9
2%87
.02%
11.8
4%3.
32%
Ram
pur
45.6
7%3.
08%
27.7
3%34
.34%
25.3
8%80
.72%
49.7
6%1.
62%
22.6
0%
73.9
6%15
.96%
2.57
%
Saha
ranp
ur47
.79%
5.87
%30
.90
%20
.39%
13.4
2%79
.58%
51.6
4%3.
70%
6.76
%60
.14%
15.1
8%3.
07%
Sant
Kab
ir N
agar
50.1
1%5.
79%
42.2
0%
16.9
2%8.
56%
85.4
5%86
.74%
0.0
0%
35.0
7%84
.36%
12.3
9%4.
97%
Shah
jaha
npur
53.3
7%7.
97%
41.7
5%22
.18%
22.6
6%88
.84%
74.1
3%0
.30
%54
.07%
91.6
2%20
.95%
4.0
8%
Shra
was
ti59
.26%
9.59
%59
.13%
45.6
4%31
.03%
92.3
7%91
.46%
3.72
%71
.97%
94.4
2%22
.14%
12.7
0%
Sid
dha
rth
Nag
ar58
.22%
6.44
%54
.43%
30.7
0%
17.5
0%
83.7
6%86
.54%
0.4
9%35
.88%
78.7
4%12
.42%
9.56
%
(CONTD.) DISTrICT-WISe: UNCeNSoreD heADCoUNT rATIo (rUrAl)(CONTD.) DISTrICT-WISe: UNCeNSoreD heADCoUNT rATIo (rUrAl)
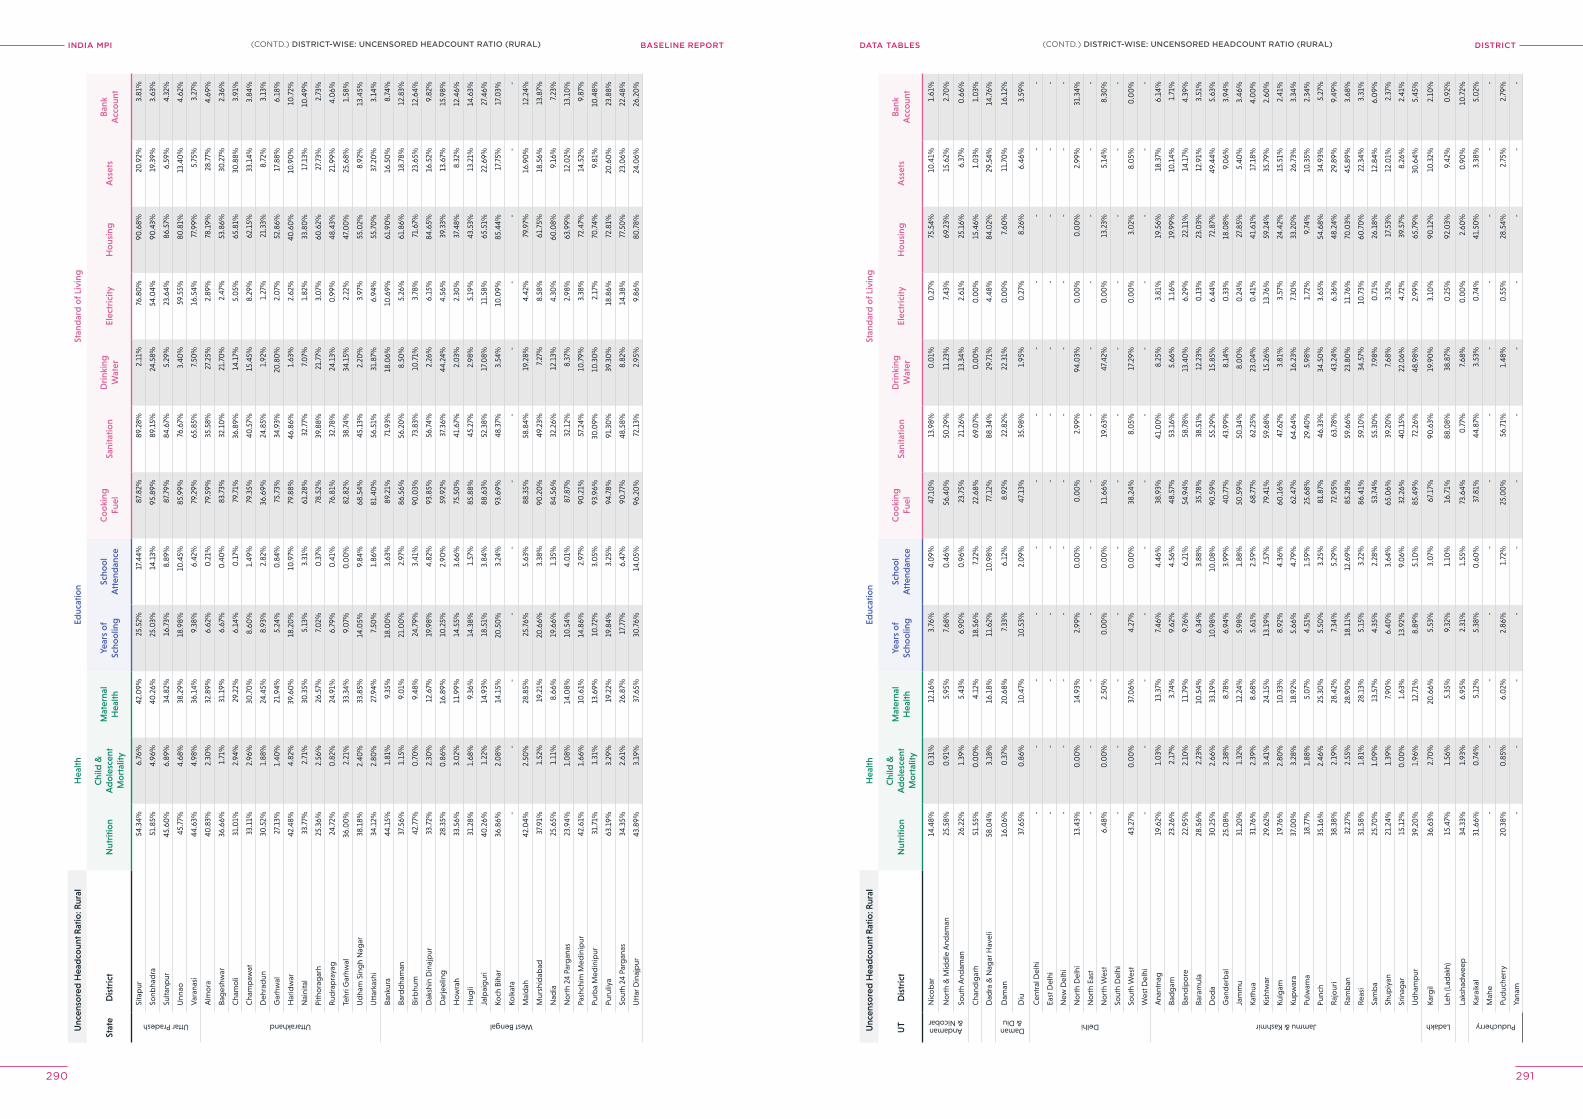
INDIA MPI BASELINE REPORT DISTrICTDATA TABleS
290 291
Unc
enso
red
Hea
dco
unt R
atio
: Rur
alH
ealth
Educ
atio
nSt
and
ard
of L
ivin
g
Stat
eD
istr
ict
Nut
ritio
nC
hild
&
Ad
ole
scen
t M
ort
ality
Mat
erna
l H
ealth
Year
s o
f Sc
hoo
ling
Scho
ol
Att
end
ance
Co
oki
ng
Fuel
Sani
tatio
nD
rink
ing
Wat
erEl
ectr
icity
Ho
usin
gA
sset
sB
ank
Acc
oun
t
Uttar Pradesh
Sita
pur
54.3
4%6.
76%
42.0
9%25
.52%
17.4
4%87
.82%
89.2
8%2.
11%
76.8
0%
90.6
8%20
.92%
3.81
%
Sonb
had
ra51
.85%
4.96
%40
.26%
25.0
3%14
.13%
95.8
9%89
.15%
24.5
8%54
.04%
90.4
3%19
.39%
3.63
%
Sulta
npur
45.6
0%
6.89
%34
.82%
16.7
3%8.
89%
87.7
9%84
.67%
5.29
%23
.64%
86.5
7%6.
59%
4.32
%
Unn
ao45
.77%
4.68
%38
.29%
18.9
8%10
.45%
85.9
9%76
.67%
3.40
%59
.55%
80.8
1%13
.40
%4.
62%
Var
anas
i44
.63%
4.98
%36
.14%
9.38
%6.
42%
79.2
9%65
.85%
7.50
%16
.54%
77.9
9%5.
75%
3.27
%
Uttarakhand
Alm
ora
40.8
3%2.
30%
32.8
9%6.
62%
0.2
1%79
.59%
35.5
8%27
.25%
2.89
%78
.19%
28.7
7%4.
69%
Bag
eshw
ar36
.66%
1.71
%31
.19%
6.67
%0
.40
%83
.73%
32.1
0%
21.7
0%
2.47
%53
.86%
30.2
7%2.
36%
Cha
mo
li31
.01%
2.94
%29
.22%
6.14
%0
.17%
79.7
1%36
.89%
14.1
7%5.
05%
65.8
1%30
.88%
3.91
%
Cha
mp
awat
33.1
1%2.
96%
30.7
0%
8.60
%1.
49%
79.3
5%40
.57%
15.4
5%8.
29%
62.1
5%33
.14%
3.84
%
Deh
rad
un30
.52%
1.88
%24
.45%
8.93
%2.
82%
36.6
9%24
.85%
1.92
%1.
27%
21.3
3%8.
72%
3.13
%
Gar
hwal
27.1
3%1.
40%
21.9
4%5.
24%
0.8
4%75
.73%
34.9
3%20
.80
%2.
07%
52.8
6%17
.88%
6.18
%
Har
idw
ar42
.48%
4.82
%39
.60
%18
.20
%10
.97%
79.8
8%46
.86%
1.63
%2.
62%
40.6
0%
10.9
0%
10.7
2%
Nai
nita
l33
.77%
2.71
%30
.35%
5.13
%3.
31%
61.2
8%32
.77%
7.0
7%1.
82%
33.8
0%
17.1
3%10
.49%
Pith
ora
gar
h25
.36%
2.56
%26
.57%
7.0
2%0
.37%
78.5
2%39
.88%
21.7
7%3.
07%
60.6
2%27
.73%
2.73
%
Rud
rap
raya
g24
.72%
0.8
2%24
.91%
6.79
%0
.41%
76.8
1%32
.78%
24.1
3%0
.99%
48.4
3%21
.99%
4.0
6%
Tehr
i Gar
hwal
36.0
0%
2.21
%33
.34%
9.0
7%0
.00
%82
.82%
38.7
4%34
.15%
2.22
%47
.00
%25
.68%
1.58
%
Ud
ham
Sin
gh
Nag
ar38
.18%
2.40
%33
.85%
14.0
5%9.
84%
68.5
4%45
.13%
2.20
%3.
97%
55.0
2%8.
92%
13.4
5%
Utt
arka
shi
34.1
2%2.
80%
27.9
4%7.
50%
1.86
%81
.40
%56
.51%
31.8
7%6.
94%
55.7
0%
37.2
0%
3.14
%
West Bengal
Bank
ura
44.1
5%1.
81%
9.35
%18
.00
%3.
63%
89.2
1%71
.93%
18.0
6%10
.69%
61.9
0%
16.5
0%
8.74
%
Bard
dha
man
37.5
6%1.
15%
9.0
1%21
.00
%2.
97%
86.5
6%56
.20
%8.
50%
5.26
%61
.86%
18.7
8%12
.83%
Birb
hum
42.7
7%0
.70
%9.
48%
24.7
9%3.
41%
90.0
3%73
.83%
10.7
1%3.
78%
71.6
7%23
.65%
12.6
4%
Dak
shin
Din
ajp
ur33
.72%
2.30
%12
.67%
19.9
8%4.
82%
93.8
5%56
.74%
2.26
%6.
15%
84.6
5%16
.52%
9.82
%
Dar
jeel
ing
28.3
5%0
.86%
16.8
9%10
.25%
2.90
%59
.92%
37.3
6%44
.24%
4.56
%39
.33%
13.6
7%15
.98%
Ho
wra
h33
.56%
3.0
2%11
.99%
14.5
5%3.
66%
75.5
0%
41.6
7%2.
03%
2.30
%37
.48%
8.32
%12
.46%
Hug
li31
.28%
1.68
%9.
36%
14.3
8%1.
57%
85.8
8%45
.27%
2.98
%5.
19%
43.5
3%13
.21%
14.6
3%
Jalp
aig
uri
40.2
6%1.
22%
14.9
3%18
.51%
3.84
%88
.63%
52.3
8%17
.08%
11.5
8%65
.51%
22.6
9%27
.46%
Koch
Bih
ar36
.86%
2.0
8%14
.15%
20.5
0%
3.24
%93
.69%
48.3
7%3.
54%
10.0
9%85
.44%
17.7
5%17
.03%
Kolk
ata
--
--
--
--
--
--
Mal
dah
42.0
4%2.
50%
28.8
5%25
.76%
5.63
%88
.35%
58.8
4%1 9
.28%
4.42
%79
.97%
16.9
0%
12.2
4%
Mur
shid
abad
37.9
1%1.
52%
19.2
1%20
.66%
3.38
%90
.20
%49
.23%
7.27
%8.
58%
61.7
5%18
.56%
13.8
7%
Nad
ia25
.65%
1.11
%8.
66%
19.6
6%1.
35%
84.5
6%32
.26%
12.1
3%4.
30%
60.0
8%9.
16%
7.23
%
No
rth
24 P
arg
anas
23.9
4%1.
08%
14.0
8%10
.54%
4.0
1%87
.87%
32.1
2%8.
37%
2.98
%63
.99%
12.0
2%13
.10
%
Pash
chim
Med
inip
ur42
.61%
1.66
%10
.61%
14.8
6%2.
97%
90.2
1%57
.24%
10.7
9%3.
38%
72.4
7%14
.52%
9.87
%
Purb
a M
edin
ipur
31.7
1%1.
31%
13.6
9%10
.72%
3.0
5%93
.96%
30.0
9%10
.30
%2.
17%
70.7
4%9.
81%
10.4
8%
Puru
liya
63.1
9%3.
29%
19.2
2%19
.84%
3.25
%94
.78%
91.3
0%
39.3
0%
18.8
6%72
.81%
20.6
0%
23.8
8%
Sout
h 24
Par
gan
as34
.35%
2.61
%26
.87%
17.7
7%6.
47%
90.7
7%48
.58%
8.82
%14
.38%
77.5
0%
23.0
6%22
.48%
Utt
ar D
inaj
pur
43.8
9%3.
19%
37.6
5%30
.76%
14.0
5%96
.20
%72
.13%
2.95
%9.
86%
80.7
8%24
.06%
26.2
0%
Unc
enso
red
Hea
dco
unt R
atio
: Rur
alH
ealth
Educ
atio
nSt
and
ard
of L
ivin
g
UT
Dis
tric
tN
utri
tion
Chi
ld &
A
do
lesc
ent
Mo
rtal
ity
Mat
erna
l H
ealth
Year
s o
f Sc
hoo
ling
Scho
ol
Att
end
ance
Co
oki
ng
Fuel
Sani
tatio
nD
rink
ing
Wat
erEl
ectr
icity
Ho
usin
gA
sset
sB
ank
Acc
oun
t
Andaman & Nicobar
Nic
ob
ar14
.48%
0.3
1%12
.16%
3.76
%4.
09%
47.1
0%
13.9
8%0
.01%
0.2
7%75
.54%
10.4
1%1.
61%
No
rth
& M
idd
le A
ndam
an25
.58%
0.9
1%5.
95%
7.68
%0
.46%
56.4
0%
50.2
9%11
.23%
7.43
%69
.23%
15.6
2%2.
70%
Sout
h A
ndam
an26
.22%
1.39
%5.
43%
6.90
%0
.96%
23.7
5%21
.26%
13.3
4%2.
61%
25.1
6%6.
37%
0.6
6%
Cha
ndig
arh
51.5
5%0
.00
%4.
12%
18.5
6%7.
22%
22.6
8%69
.07%
0.0
0%
0.0
0%
15.4
6%1.
03%
1.0
3%
Dad
ra &
Nag
ar H
avel
i58
.04%
3.18
%16
.18%
11.6
2%10
.98%
77.1
2%88
.34%
29.7
1%4.
48%
84.0
2%29
.54%
14.7
6%
Daman & Diu
Dam
an16
.06%
0.3
7%20
.68%
7.33
%6.
12%
8.92
%22
.82%
22.3
1%0
.00
%7.
60%
11.7
0%
16.1
2%
Diu
37.6
5%0
.86%
10.4
7%10
.53%
2.0
9%47
.13%
35.9
8%1.
95%
0.2
7%8.
26%
6.46
%3.
59%
Delhi
Cen
tral
Del
hi-
--
--
--
--
--
-
East
Del
hi-
--
--
--
--
--
-
New
Del
hi-
--
--
--
--
--
-
No
rth
Del
hi13
.43%
0.0
0%
14.9
3%2.
99%
0.0
0%
0.0
0%
2.99
%94
.03%
0.0
0%
0.0
0%
2.99
%31
.34%
No
rth
East
--
--
--
--
--
--
No
rth
Wes
t6.
48%
0.0
0%
2.50
%0
.00
%0
.00
%11
.66%
19.6
3%47
.42%
0.0
0%
13.2
3%5.
14%
8.30
%
Sout
h D
elhi
--
--
--
--
--
--
Sout
h W
est
43.2
7%0
.00
%37
.06%
4.27
%0
.00
%38
.24%
8.0
5%17
.29%
0.0
0%
3.0
2%8.
05%
0.0
0%
Wes
t Del
hi-
--
--
--
--
--
-
Jammu & Kashmir
Ana
ntna
g19
.62%
1.0
3%13
.37%
7.46
%4.
46%
38.9
3%41
.00
%8.
25%
3.81
%19
.56%
18.3
7%6.
14%
Bad
gam
23.2
6%2.
17%
3.74
%9.
62%
4.56
%48
.57%
53.1
6%5.
66%
1.16
%19
.99%
10.1
4%1.
71%
Band
ipo
re22
.95%
2.10
%11
.79%
9.76
%6.
21%
54.9
4%58
.78%
13.4
0%
6.29
%22
.11%
14.1
7%4.
39%
Bara
mul
a28
.56%
2.23
%10
.54%
6.34
%3.
88%
35.7
8%38
.51%
12.2
3%0
.13%
23.0
3%12
.91%
3.51
%
Do
da
30.2
5%2.
66%
33.1
9%10
.98%
10.0
8%90
.59%
55.2
9%15
.85%
6.44
%72
.87%
49.4
4%5.
63%
Gan
der
bal
25.0
8%2.
38%
8.78
%6.
94%
3.99
%40
.77%
43.9
9%8.
14%
0.3
3%18
.08%
9.0
6%3.
94%
Jam
mu
31.2
0%
1.32
%12
.24%
5.98
%1.
88%
50.5
9%50
.34%
8.0
0%
0.2
4%27
.85%
5.40
%3.
46%
Kath
ua31
.76%
2.39
%8.
68%
5.61
%2.
59%
68.7
7%62
.25%
23.0
4%0
.41%
41.6
1%17
.18%
4.0
0%
Kish
twar
29.6
2%3.
41%
24.1
5%13
.19%
7.57
%79
.41%
59.6
8%15
.26%
13.7
6%59
.24%
35.7
9%2.
60%
Kulg
am19
.76%
2.80
%10
.33%
8.92
%4.
36%
60.1
6%47
.62%
3.81
%3.
57%
24.4
2%15
.51%
2.41
%
Kup
war
a37
.00
%3.
28%
18.9
2%5.
66%
4.79
%62
.47%
64.6
4%16
.23%
7.30
%33
.20
%26
.73%
3.34
%
Pulw
ama
18.7
7%1.
88%
5.0
7%4.
51%
1.59
%25
.68%
29.4
0%
5.98
%1.
72%
9.74
%10
.35%
2.34
%
Punc
h35
.16%
2.46
%25
.30
%5.
50%
3.25
%81
.87%
46.3
3%34
.50
%3.
65%
54.6
8%34
.93%
5.27
%
Raj
our
i38
.38%
2.19
%28
.42%
7.34
%5.
29%
72.9
5%63
.78%
43.2
4%6.
36%
48.2
4%29
.89%
9.49
%
Ram
ban
32.2
7%2.
55%
28.9
0%
18.1
1%12
.69%
85.2
8%59
.66%
23.8
0%
11.7
6%70
.03%
45.8
9%3.
68%
Reas
i31
.58%
1.81
%28
.13%
5.15
%3.
22%
86.4
1%59
.10
%34
.57%
10.7
3%60
.70
%22
.34%
3.31
%
Sam
ba
25.7
0%
1.0
9%13
.57%
4.35
%2.
28%
53.7
4%55
.30
%7.
98%
0.7
1%26
.18%
12.8
4%6.
09%
Shup
iyan
21.2
4%1.
39%
7.90
%6.
40%
3.64
%65
.06%
39.2
0%
7.68
%3.
32%
17.5
3%12
.01%
2.37
%
Srin
agar
15.1
2%0
.00
%1.
63%
13.9
2%9.
06%
32.2
6%40
.15%
22.0
6%4.
72%
39.5
7%8.
26%
2.41
%
Ud
ham
pur
39.2
0%
1.96
%12
.71%
8.89
%5.
10%
85.4
9%72
.26%
48.9
8%2.
99%
65.7
9%30
.64%
5.45
%
Ladakh
Karg
il36
.63%
2.70
%20
.66%
5.53
%3.
07%
67.1
7%90
.63%
19.9
0%
3.10
%90
.12%
10.3
2%2.
10%
Leh
(Lad
akh)
15.4
7%1.
56%
5.35
%9.
32%
1.10
%16
.71%
88.0
8%38
.87%
0.2
5%92
.03%
9.42
%0
.92%
Laks
had
wee
p34
.33%
1.93
%6.
95%
2.31
%1.
55%
73.6
4%0
.77%
7.68
%0
.00
%2.
60%
0.9
0%
10.7
2%
Puducherry
Kara
ikal
31.6
6%0
.74%
5.12
%5.
38%
0.6
0%
37.8
1%44
.87%
3.53
%0
.74%
41.5
0%
3.38
%5.
02%
Mah
e-
--
--
--
--
--
-
Pud
uche
rry
20.3
8%0
.85%
6.0
2%2.
86%
1.72
%25
.00
%56
.71%
1.48
%0
.55%
28.5
4%2.
75%
2.79
%
Yana
m-
--
--
--
--
--
-
(CONTD.) DISTrICT-WISe: UNCeNSoreD heADCoUNT rATIo (rUrAl)(CONTD.) DISTrICT-WISe: UNCeNSoreD heADCoUNT rATIo (rUrAl)
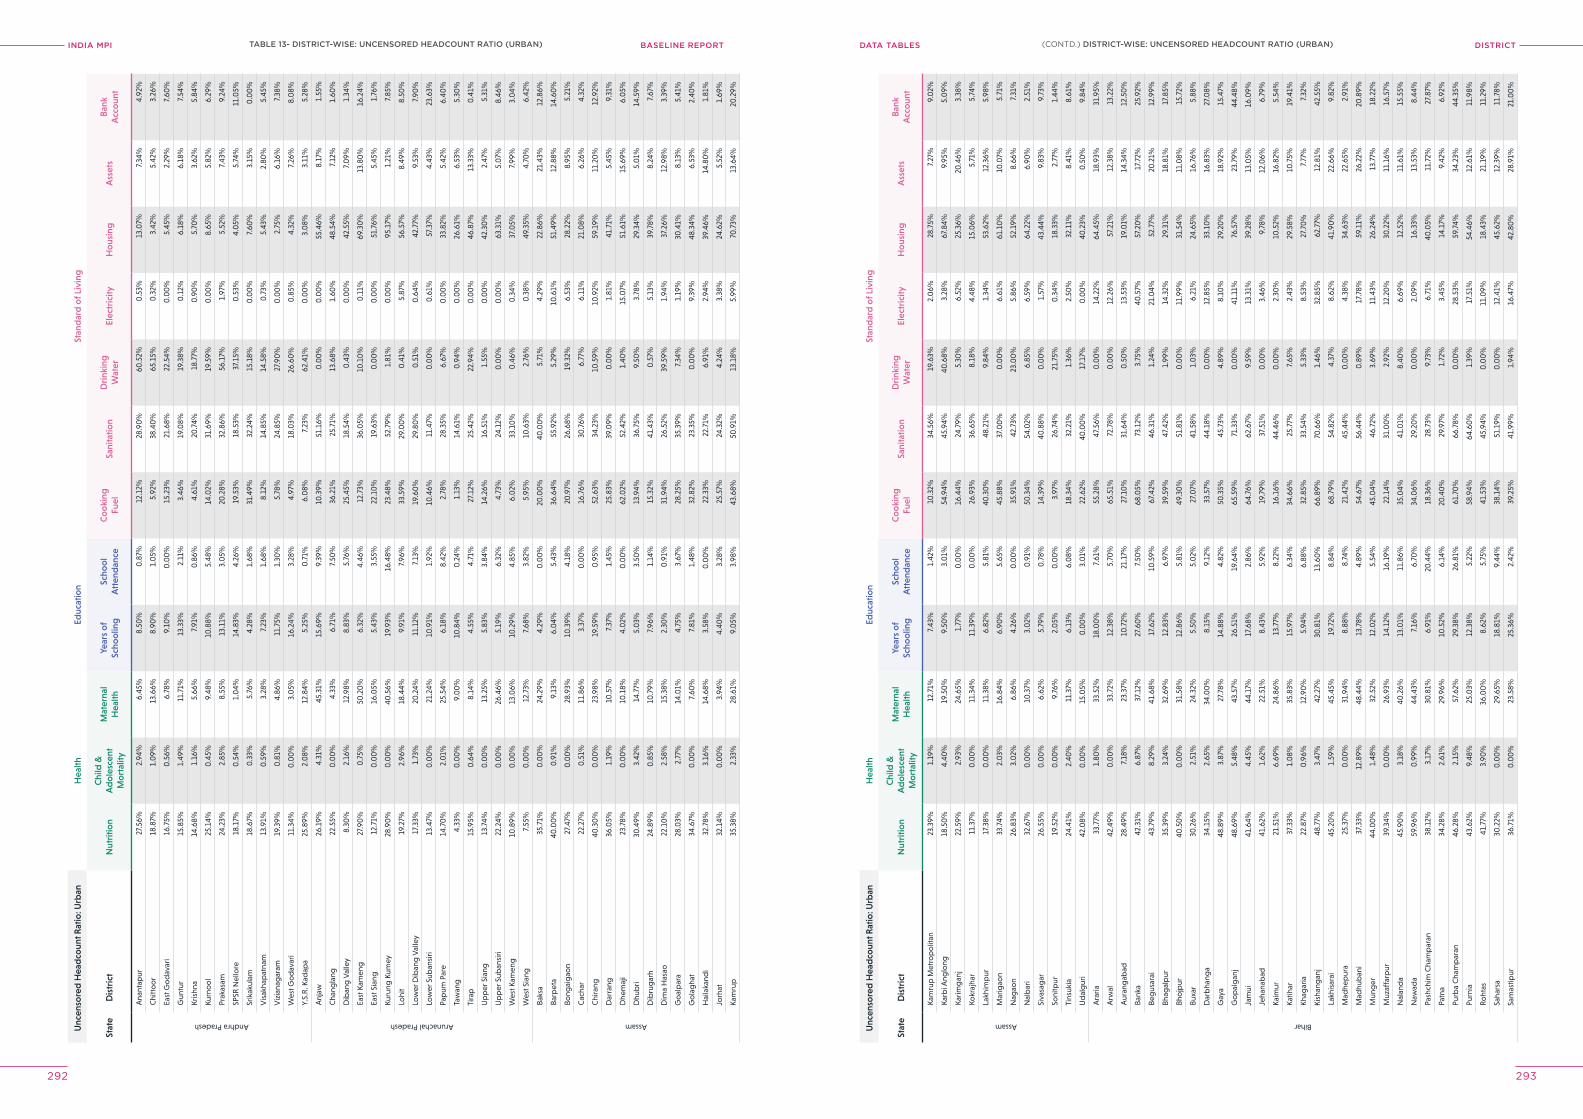
INDIA MPI BASELINE REPORT DISTrICTDATA TABleS
292 293
Unc
enso
red
Hea
dco
unt R
atio
: Urb
anH
ealth
Educ
atio
nSt
and
ard
of L
ivin
g
Stat
eD
istr
ict
Nut
ritio
nC
hild
&
Ad
ole
scen
t M
ort
ality
Mat
erna
l H
ealth
Year
s o
f Sc
hoo
ling
Scho
ol
Att
end
ance
Co
oki
ng
Fuel
Sani
tatio
nD
rink
ing
Wat
erEl
ectr
icity
Ho
usin
gA
sset
sB
ank
Acc
oun
t
Andhra Pradesh
Ana
ntap
ur27
.56%
2.94
%6.
45%
8.50
%0
.87%
12.1
2%28
.90
%60
.52%
0.5
3%13
.07%
7.34
%4.
92%
Chi
tto
or
18.8
7%1.
09%
13.6
6%8.
90%
1.0
5%5.
92%
38.4
0%
65.1
5%0
.32%
3.42
%5.
42%
3.26
%
East
Go
dav
ari
16.7
5%0
.56%
6.78
%9.
10%
0.0
0%
15.2
3%21
.68%
22.5
4%0
.00
%5.
45%
2.29
%7.
60%
Gun
tur
15.8
5%1.
49%
11.7
1%13
.33%
2.11
%3.
46%
19.0
8%19
.38%
0.1
2%6.
18%
6.18
%7.
54%
Kris
hna
14.6
8%1.
16%
5.66
%7.
91%
0.8
6%4.
61%
20.7
4%18
.77%
0.9
0%
5.70
%3.
62%
5.84
%
Kurn
oo
l25
.14%
0.4
5%9.
48%
10.8
8%5.
48%
14.0
2%31
.69%
19.5
9%0
.00
%8.
65%
5.82
%6.
29%
Prak
asam
24.2
3%2.
85%
8.55
%13
.11%
3.0
5%20
.28%
32.8
6%56
.17%
1.97
%5.
52%
7.43
%9.
24%
SPSR
Nel
lore
18.1
7%0
.54%
1.0
4%14
.83%
4.26
%19
.53%
18.5
3%37
.15%
0.5
3%4.
05%
5.74
%11
.05%
Srik
akul
am18
.67%
0.3
3%5.
76%
4.28
%1.
68%
31.4
9%32
.24%
15.1
8%0
.00
%7.
60%
3.15
%0
.00
%
Vis
akha
pat
nam
13.9
1%0
.59%
3.28
%7.
23%
1.68
%8.
12%
14.8
5%14
.58%
0.7
3%5.
43%
2.80
%5.
45%
Viz
iana
gar
am19
.39%
0.8
1%4.
86%
11.7
5%1.
30%
5.78
%24
.85%
27.9
0%
0.0
0%
2.75
%6.
16%
7.38
%
Wes
t Go
dav
ari
11.3
4%0
.00
%3.
05%
16.2
4%3.
28%
4.97
%18
.03%
26.6
0%
0.8
5%4.
32%
7.26
%8.
08%
Y.S.
R. K
adap
a25
.89%
2.0
8%12
.84%
5.25
%0
.71%
6.0
8%7.
23%
62.4
1%0
.00
%3.
08%
3.11
%5.
28%
Arunachal Pradesh
Anj
aw26
.19%
4.31
%45
.31%
15.6
9%9.
39%
10.3
9%51
.16%
0.0
0%
0.0
0%
55.4
6%8.
17%
1.55
%
Cha
ngla
ng22
.55%
0.0
0%
4.33
%6.
71%
7.50
%36
.21%
25.7
1%13
.68%
1.60
%48
.54%
7.12
%1.
60%
Dib
ang
Val
ley
8.30
%2.
16%
12.9
8%8.
83%
5.76
%25
.45%
18.5
4%0
.43%
0.0
0%
42.5
5%7.
09%
1.34
%
East
Kam
eng
27.9
0%
0.7
5%50
.20
%6.
32%
4.46
%12
.73%
36.0
5%10
.10
%0
.11%
69.3
0%
13.8
0%
16.2
4%
East
Sia
ng12
.71%
0.0
0%
16.0
5%5.
43%
3.55
%22
.10
%19
.63%
0.0
0%
0.0
0%
51.7
6%5.
45%
1.76
%
Kuru
ng K
umey
28.9
0%
0.0
0%
40.5
6%19
.93%
16.4
8%23
.48%
52.7
9%1.
81%
0.0
0%
95.1
7%1.
21%
7.85
%
Lohi
t19
.27%
2.96
%18
.44%
9.91
%7.
96%
33.5
9%29
.00
%0
.41%
5.87
%56
.57%
8.49
%8.
50%
Low
er D
iban
g V
alle
y17
.33%
1.73
%20
.24%
11.1
2%7.
13%
19.6
0%
29.8
0%
0.5
1%0
.64%
42.7
7%9.
53%
7.90
%
Low
er S
uban
siri
13.4
7%0
.00
%21
.24%
10.9
1%1.
92%
10.4
6%11
.47%
0.0
0%
0.6
1%57
.37%
4.43
%23
.63%
Pap
um P
are
14.7
0%
2.0
1%25
.54%
6.18
%8.
42%
2.78
%28
.35%
6.67
%0
.00
%33
.82%
5.42
%6.
40%
Taw
ang
4.33
%0
.00
%9.
00
%10
.84%
0.2
4%1.
13%
14.6
1%0
.94%
0.0
0%
26.6
1%6.
53%
5.30
%
Tira
p15
.95%
0.6
4%8.
14%
4.55
%4.
71%
27.1
2%25
.42%
22.9
4%0
.00
%46
.87%
13.3
3%0
.41%
Up
per
Sia
ng13
.74%
0.0
0%
13.2
5%5.
83%
3.84
%14
.26%
16.5
1%1.
55%
0.0
0%
42.3
0%
2.47
%5.
31%
Up
per
Sub
ansi
ri22
.24%
0.0
0%
26.4
6%5.
19%
6.32
%4.
73%
24.1
2%0
.00
%0
.00
%63
.31%
5.0
7%8.
46%
Wes
t Kam
eng
10.8
9%0
.00
%13
.06%
10.2
9%4.
85%
6.0
2%33
.10
%0
.46%
0.3
4%37
.05%
7.99
%3.
04%
Wes
t Sia
ng7.
55%
0.0
0%
12.7
3%7.
68%
3.82
%5.
95%
10.6
3%2.
7 6%
0.3
8%49
.35%
4.70
%6.
42%
Assam
Baks
a35
.71%
0.0
0%
24.2
9%4.
29%
0.0
0%
20.0
0%
40.0
0%
5.71
%4.
29%
22.8
6%21
.43%
12.8
6%
Barp
eta
40.0
0%
0.9
1%9.
13%
6.0
4%5.
43%
36.6
4%55
.92%
5.29
%10
.61%
51.4
9%12
.88%
14.6
0%
Bong
aig
aon
27.4
7%0
.00
%28
.93%
10.3
9%4.
18%
20.9
7%26
.68%
19.3
2%6.
53%
28.2
2%8.
95%
5.21
%
Cac
har
22.2
7%0
.51%
11.8
6%3.
37%
0.0
0%
16.7
6%30
.76%
6.77
%6.
11%
21.0
8%6.
26%
4.32
%
Chi
rang
40.3
0%
0.0
0%
23.9
8%19
.59%
0.9
5%52
.63%
34.2
3%10
.59%
10.9
2%59
.19%
11.2
0%
12.9
2%
Dar
rang
36.0
5%1.
19%
10.5
7%7.
37%
1.45
%25
.83%
39.0
9%0
.00
%1.
81%
41.7
1%5.
45%
9.31
%
Dhe
maj
i23
.78%
0.0
0%
10.1
8%4.
02%
0.0
0%
62.0
2%52
.42%
1.40
%15
.07%
51.6
1%15
.69%
6.0
5%
Dhu
bri
30.4
9%3.
42%
14.7
7%5.
03%
3.50
%13
.94%
36.7
5%9.
50%
3.78
%29
.34%
5.0
1%14
.59%
Dib
rug
arh
24.8
9%0
.85%
10.7
9%7.
96%
1.14
%15
.32%
41.4
3%0
.57%
5.13
%39
.78%
8.24
%7.
67%
Dim
a H
asao
22.1
0%
2.58
%15
.38%
2.30
%0
.91%
31.9
4%26
.52%
39.5
9%1.
94%
37.2
6%12
.98%
3.39
%
Go
alp
ara
28.0
3%2.
77%
14.0
1%4.
75%
3.67
%28
.25%
35.3
9%7.
34%
1.19
%30
.41%
8.13
%5.
41%
Go
lag
hat
34.6
7%0
.00
%7.
60%
7.81
%1.
48%
32.8
2%23
.35%
0.0
0%
9.39
%48
.34%
6.53
%2.
40%
Hai
laka
ndi
32.7
8%3.
16%
14.6
8%3.
58%
0.0
0%
22.3
3%22
.71%
6.91
%2.
94%
39.4
6%14
.80
%1.
81%
Jorh
at32
.14%
0.0
0%
3.94
%4.
40%
3.28
%25
.57%
24.3
2%4.
24%
3.38
%24
.62%
5.52
%1.
69%
Kam
rup
35.3
8%2.
33%
28.6
1%9.
05%
3.98
%43
.68%
50.9
1%13
.18%
5.99
%70
.73%
13.6
4%20
.29%
Unc
enso
red
Hea
dco
unt R
atio
: Urb
anH
ealth
Educ
atio
nSt
and
ard
of L
ivin
g
Stat
eD
istr
ict
Nut
ritio
nC
hild
&
Ad
ole
scen
t M
ort
ality
Mat
erna
l H
ealth
Year
s o
f Sc
hoo
ling
Scho
ol
Att
end
ance
Co
oki
ng
Fuel
Sani
tatio
nD
rink
ing
Wat
erEl
ectr
icity
Ho
usin
gA
sset
sB
ank
Acc
oun
t
Assam
Kam
rup
Met
rop
olit
an23
.39%
1.19
%12
.71%
7.43
%1.
42%
10.3
2%34
.56%
19.6
3%2.
06%
28.7
5%7.
27%
9.0
2%
Karb
i Ang
long
18.5
0%
4.40
%19
.50
%9.
50%
3.0
1%54
.94%
45.9
4%40
.68%
3.28
%67
.84%
9.95
%5.
09%
Karim
gan
j22
.59%
2.93
%24
.65%
1.77
%0
.00
%16
.44%
24.7
9%5.
30%
6.52
%25
.36%
20.4
6%3.
38%
Kokr
ajha
r11
.37%
0.0
0%
11.3
4%11
.39%
0.0
0%
26.9
3%36
.65%
8.18
%4.
48%
15.0
6%5.
71%
5.74
%
Lakh
imp
ur17
.38%
0.0
0%
11.3
8%6.
82%
5.81
%40
.30
%48
.21%
9.84
%1.
34%
53.6
2%12
.36%
5.98
%
Mar
igao
n33
.74%
2.0
3%16
.84%
6.90
%5.
65%
45.8
8%37
.00
%0
.00
%6.
61%
61.1
0%
10.0
7%5.
71%
Nag
aon
26.8
3%3.
02%
6.86
%4.
26%
0.0
0%
35.9
1%42
.73%
23.0
0%
5.86
%52
.19%
8.66
%7.
31%
Nal
bar
i32
.67%
0.0
0%
10.3
7%3.
02%
0.9
1%50
.34%
54.0
2%6.
85%
6.59
%64
.22%
6.90
%2.
51%
Siva
sag
ar26
.55%
0.0
0%
6.62
%5.
79%
0.7
8%14
.39%
40.8
8%0
.00
%1.
57%
43.4
4%9.
83%
9.73
%
Soni
tpur
19.5
2%0
.00
%9.
76%
2.0
5%0
.00
%3.
97%
26.7
4%21
.75%
0.3
4%18
.33%
2.77
%1.
44%
Tins
ukia
24.4
1%2.
40%
11.3
7%6.
13%
6.0
8%18
.34%
32.2
1%1.
36%
2.50
%32
.11%
8.41
%8.
61%
Ud
alg
uri
42.0
8%0
.00
%15
.05%
0.0
0%
3.0
1%22
.62%
40.0
0%
17.1
7%0
.00
%40
.23%
0.5
0%
9.84
%
Bihar
Ara
ria33
.77%
1.80
%33
.52%
18.0
0%
7.61
%55
.28%
47.5
6%0
.00
%14
.22%
64.4
5%18
.93%
31.9
5%
Arw
al42
.49%
0.0
0%
33.7
2%12
.38%
5.70
%65
.51%
72.7
8%0
.00
%12
.26%
57.2
1%12
.38%
13.2
2%
Aur
ang
abad
28.4
9%7.
18%
23.3
7%10
.72%
21.1
7%27
.10
%31
.64%
0.5
0%
13.5
3%19
.01%
14.3
4%12
.50
%
Bank
a42
.31%
6.87
%37
.12%
27.6
0%
7.50
%68
.05%
73.1
2%3.
75%
40.5
7%57
.20
%17
.72%
25.9
2%
Beg
usar
ai43
.79%
8.29
%41
.68%
17.6
2%10
.59%
67.4
2%46
.31%
1.24
%21
.04%
52.7
7%20
.21%
12.9
9%
Bhag
alp
ur35
.39%
3.24
%32
.69%
12.8
3%6.
97%
39.5
9%47
.42%
1.99
%14
.32%
29.3
1%18
.81%
17.8
5%
Bho
jpur
40.5
0%
0.0
0%
31.5
8%12
.86%
5.81
%49
.30
%51
.81%
0.0
0%
11.9
9%31
.54%
11.0
8%15
.72%
Buxa
r30
.26%
2.51
%24
.32%
5.50
%5.
02%
27.0
7%41
.58%
1.0
3%6.
21%
24.6
5%16
.76%
5.88
%
Dar
bha
nga
34.1
5%2.
65%
34.0
0%
8.15
%9.
12%
33.5
7%44
.18%
0.0
0%
12.8
5%33
.10
%16
.83%
27.0
8%
Gay
a48
.89%
3.87
%27
.78%
14.8
8%4.
82%
50.3
5%45
.73%
4.89
%8.
10%
29.2
0%
18.9
2%15
.47%
Go
pal
gan
j48
.69%
5.48
%43
.57%
26.5
1%19
.64%
65.5
9%71
.33%
0.0
0%
41.1
1%76
.57%
23.7
9%44
.48%
Jam
ui41
.64%
4.45
%44
.17%
17.6
8%2.
86%
64.7
6%62
.67%
9.59
%13
.31%
39.2
8%13
.05%
16.0
9%
Jeha
nab
ad41
.62%
1.62
%22
.51%
8.43
%5.
92%
19.7
9%37
.51%
0.0
0%
3.46
%9.
78%
12.0
6%6.
79%
Kaim
ur21
.51%
6.69
%24
.86%
13.7
7%8.
22%
16.1
6%44
.46%
0.0
0%
2.30
%10
.52%
16.8
2%5.
54%
Katih
ar37
.33%
1.0
8%35
.83%
15.9
7%6.
34%
34.6
6%25
.77%
7.65
%2.
43%
29.5
8%10
.75%
19.4
1%
Khag
aria
22.8
7%0
.96%
12.9
0%
5.94
%6.
88%
32.8
5%33
.54%
5.33
%8.
53%
27.7
0%
7.77
%7.
32%
Kish
ang
anj
48.7
7%3.
47%
42.2
7%30
.81%
13.6
0%
66.8
9%70
.66%
1.46
%32
.85%
62.7
7%12
.81%
42.5
5%
Lakh
isar
ai45
.20
%1.
59%
45.4
5%19
.72%
8.84
%68
.79%
54.8
2%4.
37%
8.62
%41
.90
%22
.66%
9.82
%
Mad
hep
ura
25.3
7%0
.00
%31
.94%
8.88
%8.
74%
21.4
2%45
.44%
0.0
0%
4.38
%34
.63%
22.6
5%2.
91%
Mad
hub
ani
37.3
3%12
.89%
48.4
4%13
.78%
4.89
%54
.67%
56.4
4%0
.89%
17.7
8%59
.11%
26.2
2%20
.89%
Mun
ger
44.0
0%
1.48
%32
.52%
12.0
2%5.
54%
45.0
4%46
.72%
3.69
%11
.43%
26.2
4%13
.77%
18.2
2%
Muz
affa
rpur
39.3
4%0
.00
%26
.93%
14.1
2%16
.19%
22.1
4%31
.00
%2.
92%
12.2
0%
30.2
2%11
.16%
16.5
7%
Nal
and
a45
.90
%3.
18%
40.2
6%13
.01%
11.8
6%35
.04%
41.0
1%8.
40%
6.69
%12
.52%
11.6
1%15
.55%
Naw
ada
59.9
6%0
.99%
44.4
3%7.
16%
6.70
%34
.06%
29.2
0%
0.0
0%
2.0
9%16
.33%
13.5
3%8.
44%
Pash
chim
Cha
mp
aran
38.1
2%3.
17%
30.8
1%6.
91%
20.4
4%18
.36%
28.7
3%9.
73%
6.71
%40
.05%
11.7
2%27
.87%
Patn
a34
.28%
2.61
%29
.96%
10.5
2%6.
14%
20.4
0%
29.9
7%1.
72%
3.45
%14
.17%
9.42
%6.
92%
Purb
a C
ham
par
an46
.28%
2.15
%57
.62%
29.3
8%26
.81%
61.7
0%
66.7
8%0
.00
%28
.53%
59.7
4%34
.23%
44.3
5%
Purn
ia43
.62%
9.48
%25
.03%
12.3
8%5.
22%
58.9
4%64
.60
%1.
39%
17.5
1%54
.46%
12.6
1%11
.98%
Roht
as41
.77%
3.90
%36
.00
%8.
62%
5.75
%41
.53%
45.9
4%0
.00
%11
.09%
18.4
3%21
.19%
11.2
9%
Saha
rsa
30.2
2%0
.00
%29
.65%
18.8
1%9.
44%
38.1
4%51
.19%
0.0
0%
12.4
1%45
.62%
12.3
9%11
.78%
Sam
astip
ur36
.71%
0.0
0%
23.5
8%25
.36%
2.42
%39
.25%
41.9
9%1.
94%
16.4
7%42
.80
%28
.91%
21.0
0%
(CONTD.) DISTrICT-WISe: UNCeNSoreD heADCoUNT rATIo (UrBAN)TABle 13- DISTrICT-WISe: UNCeNSoreD heADCoUNT rATIo (UrBAN)
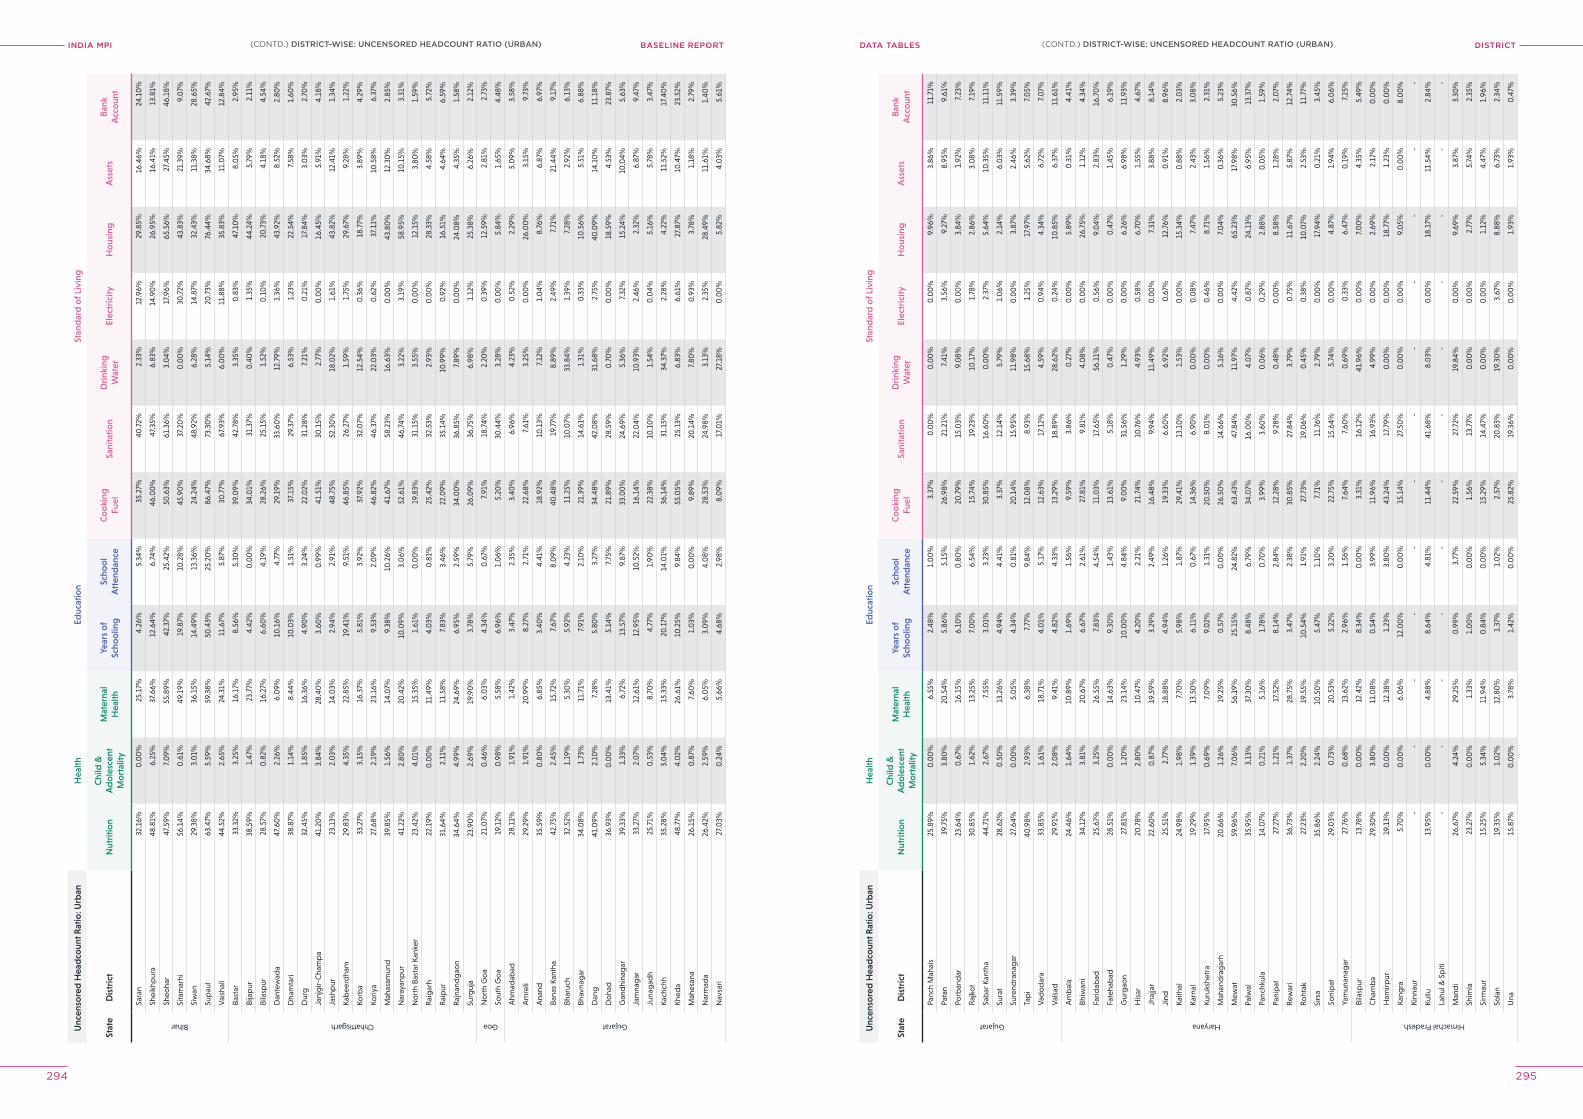
INDIA MPI BASELINE REPORT DISTrICTDATA TABleS
294 295
Unc
enso
red
Hea
dco
unt R
atio
: Urb
anH
ealth
Educ
atio
nSt
and
ard
of L
ivin
g
Stat
eD
istr
ict
Nut
ritio
nC
hild
&
Ad
ole
scen
t M
ort
ality
Mat
erna
l H
ealth
Year
s o
f Sc
hoo
ling
Scho
ol
Att
end
ance
Co
oki
ng
Fuel
Sani
tatio
nD
rink
ing
Wat
erEl
ectr
icity
Ho
usin
gA
sset
sB
ank
Acc
oun
t
Bihar
Sara
n32
.16%
0.0
0%
25.1
7%4.
26%
5.34
%35
.27%
40.7
2%2.
33%
12.9
6%29
.85%
16.4
6%24
.10
%
Shei
khp
ura
48.8
1%6.
25%
37.6
6%12
.64%
6.74
%46
.00
%47
.35%
6.83
%14
.90
%26
.95%
16.4
1%13
.81%
Sheo
har
47.5
9%7.
09%
55.8
9%42
.37%
25.4
2%50
.63%
61.3
6%3.
04%
17.9
6%65
.56%
27.4
5%46
.18%
Sita
mar
hi56
.14%
0.6
1%49
.19%
19.8
7%10
.28%
45.9
0%
37.2
0%
0.0
0%
30.7
2%43
.83%
21.3
9%9.
07%
Siw
an29
.38%
3.0
1%36
.15%
14.4
9%13
.36%
24.2
4%48
.92%
6.28
%14
.87%
32.4
3%11
.38%
28.6
5%
Sup
aul
63.4
7%5.
59%
59.3
8%50
.43%
25.2
0%
86.4
7%73
.30
%5.
14%
20.7
3%76
.44%
34.6
8%42
.67%
Vai
shal
i44
.52%
2.65
%24
.31%
11.6
7%5.
87%
30.7
7%67
.93%
6.0
0%
11.8
8%35
.83%
11.0
7%12
.84%
Chhattisgarh
Bast
ar33
.32%
3.25
%16
.17%
8.56
%5.
30%
39.0
9%42
.78%
3.35
%0
.83%
47.1
0%
8.0
5%2.
95%
Bija
pur
38.5
9%1.
47%
23.7
7%4.
42%
0.0
0%
34.0
1%31
.37%
0.4
0%
1.35
%44
.24%
5.79
%2.
11%
Bila
spur
28.5
7%0
.82%
16.2
7%6.
60%
4.19
%28
.26%
25.1
5%1.
52%
0.1
0%
20.7
3%4.
18%
4.54
%
Dan
tew
ada
47.6
0%
2.26
%6.
09%
10.1
6%4.
77%
29.1
9%33
.60
%12
.79%
1.36
%43
.92%
8.52
%2.
80%
Dha
mta
ri38
.87%
1.14
%8.
44%
10.0
3%1.
51%
37.1
5%29
.37%
6.53
%1.
23%
22.5
4%7.
58%
1.60
%
Dur
g32
.45%
1.85
%16
.36%
4.90
%3.
24%
22.0
2%31
.28%
7.21
%0
.21%
17.8
4%3.
03%
2.70
%
Janj
gir-
Cha
mp
a41
.20
%3.
84%
28.4
0%
3.60
%0
.99%
41.5
1%30
.15%
2.77
%0
.00
%16
.45%
5.91
%4.
18%
Jash
pur
23.1
3%2.
03%
14.0
3%2.
94%
2.91
%48
.75%
52.3
0%
18.0
2%1.
61%
43.8
2%12
.41%
1.34
%
Kab
eerd
ham
29.8
3%4.
35%
22.8
5%19
.41%
9.51
%46
.85%
26.2
7%1.
59%
1.75
%29
.67%
9.28
%1.
22%
Korb
a33
.27%
3.15
%16
.37%
5.81
%3.
92%
37.9
2%32
.07%
12.5
4%0
.36%
18.7
7%3.
89%
4.29
%
Koriy
a27
.68%
2.19
%23
.16%
9.53
%2.
09%
46.8
2%46
.37%
22.0
3%0
.62%
37.1
1%10
.58%
6.37
%
Mah
asam
und
39.8
5%1.
56%
14.0
7%9.
38%
10.2
6%41
.67%
58.2
3%16
.63%
0.0
0%
43.8
0%
12.3
0%
2.85
%
Nar
ayan
pur
41.2
2%2.
80%
20.4
2%10
.09%
3.0
6%52
.61%
46.7
4%3.
22%
3.19
%58
.95%
10.1
5%3.
31%
No
rth
Bast
ar K
anke
r23
.42%
4.0
1%15
.35%
1.61
%0
.00
%19
.83%
31.1
5%3.
55%
0.0
0%
12.1
5%3.
80%
1.59
%
Rai
gar
h22
.19%
0.0
0%
11.4
9%4.
03%
0.8
1%25
.42%
32.5
3%2.
93%
0.0
0%
28.3
3%4.
58%
5.72
%
Rai
pur
31.6
4%2.
11%
11.5
8%7.
83%
3.46
%22
.09%
35.1
4%10
.99%
0.9
2%16
.51%
4.64
%6.
59%
Raj
nand
gao
n34
.64%
4.99
%24
.69%
6.95
%2.
59%
34.0
0%
36.8
5%7.
89%
0.0
0%
24.0
8%4.
35%
1.58
%
Surg
uja
23.9
0%
2.69
%19
.90
%3.
78%
5.79
%26
.09%
36.7
5%6.
98%
1.12
%25
.38%
6.26
%2.
12%
Goa
No
rth
Go
a21
.07%
0.4
6%6.
03%
4.34
%0
.67%
7.91
%18
.74%
2.20
%0
.39%
12.5
9%2.
81%
2.73
%
Sout
h G
oa
19.1
2%0
.98%
5.58
%6.
96%
1.0
6%5.
20%
30.4
4%3.
28%
0.0
0%
5.84
%1.
65%
4.48
%
Gujarat
Ahm
adab
ad28
.11%
1.91
%1.
42%
3.47
%2.
35%
3.40
%6.
96%
4.23
%0
.52%
2.29
%5.
09%
3.58
%
Am
reli
29.2
9%1.
91%
20.9
9%8.
27%
2.71
%22
.68%
7 .61
%3.
25%
0.0
0%
26.0
0%
3.15
%9.
73%
Ana
nd35
.59%
0.8
0%
6.85
%3.
40%
4.41
%18
.92%
10.1
3%7.
12%
1.0
4%8.
76%
6.87
%6.
97%
Bana
s Ka
ntha
42.7
5%2.
45%
15.7
2%7.
67%
8.0
9%40
.48%
19.7
7%8.
89%
2.49
%7.
71%
21.4
4%9.
17%
Bhar
uch
32.5
2%1.
19%
5.30
%5.
92%
4.23
%11
.25%
10.0
7%33
.84%
1.39
%7.
28%
2.92
%6.
13%
Bhav
nag
ar34
.08%
1.73
%11
.71%
7.91
%2.
10%
21.3
9%14
.61%
1.31
%0
.33%
10.5
6%5.
51%
6.88
%
Dan
g41
.09%
2.10
%7.
28%
5.80
%3.
27%
34.4
8%42
.08%
31.6
8%2.
75%
40.0
9%14
.10
%11
.18%
Do
had
36.9
3%0
.00
%13
.41%
5.14
%7.
75%
21.8
9%28
.59%
0.7
0%
0.0
0%
18.5
9%4.
53%
23.8
7%
Gan
dhi
nag
ar39
.33%
1.33
%6.
72%
13.5
7%9.
87%
33.0
0%
24.6
9%5.
36%
7.32
%15
.24%
10.0
4%5.
63%
Jam
nag
ar33
.27%
2.0
7%12
.61%
12.9
5%10
.52%
16.1
4%22
.04%
10.9
3%2.
46%
2.32
%6.
87%
9.47
%
Juna
gad
h25
.71%
0.5
3%8.
70%
4.77
%1.
90%
22.3
8%10
.10
%1.
54%
0.0
4%5.
16%
5.78
%3.
47%
Kach
chh
35.2
8%3.
04%
15.3
3%20
.17%
14.0
1%36
.14%
31.1
5%34
.37%
2.28
%4.
22%
11.5
2%17
.40
%
Khed
a48
.77%
4.0
2%26
.61%
10.2
5%9.
84%
55.0
5%25
.13%
6.83
%6.
61%
27.8
7%10
.47%
23.5
2%
Mah
esan
a26
.15%
0.8
7%7.
60%
1.0
3%0
.00
%9.
89%
20.1
4%7.
80%
0.9
3%3.
78%
1.18
%2.
79%
Nar
mad
a26
.42%
2.59
%6.
05%
3.0
9%4.
08%
28.5
3%24
.98%
3.13
%2.
35%
28.4
9%11
.61%
1.40
%
Nav
sari
27.0
3%0
.24%
5.66
%4.
68%
2.98
%8.
09%
17.0
1%27
.18%
0.0
0%
5.82
%4.
03%
5.61
%
Unc
enso
red
Hea
dco
unt R
atio
: Urb
anH
ealth
Educ
atio
nSt
and
ard
of L
ivin
g
Stat
eD
istr
ict
Nut
ritio
nC
hild
&
Ad
ole
scen
t M
ort
ality
Mat
erna
l H
ealth
Year
s o
f Sc
hoo
ling
Scho
ol
Att
end
ance
Co
oki
ng
Fuel
Sani
tatio
nD
rink
ing
Wat
erEl
ectr
icity
Ho
usin
gA
sset
sB
ank
Acc
oun
t
Gujarat
Panc
h M
ahal
s25
.89%
0.0
0%
6.55
%2.
48%
1.0
0%
3.37
%0
.00
%0
.00
%0
.00
%9.
96%
3.86
%11
.71%
Pata
n39
.75%
3.80
%20
.54%
5.86
%5.
15%
26.9
8%21
.21%
7.41
%3.
56%
9.27
%8.
95%
9.61
%
Porb
and
ar23
.64%
0.6
7%16
.15%
6.10
%0
.80
%20
.79%
15.0
3%9.
08%
0.0
0%
3.84
%1.
92%
7.23
%
Raj
kot
30.8
5%1.
62%
13.2
5%7.
00
%6.
54%
15.7
4%19
.23%
10.1
7%1.
78%
2.86
%3.
08%
7.19
%
Sab
ar K
anth
a44
.71%
2.67
%7.
55%
3.0
1%3.
23%
30.8
5%16
.60
%0
.00
%2.
37%
5.64
%10
.35%
11.1
1%
Sura
t28
.62%
0.5
0%
13.2
6%4.
94%
4.41
%3.
37%
12.1
4%5.
79%
1.0
6%2.
14%
6.0
3%11
.59%
Sure
ndra
nag
ar27
.64%
0.0
0%
5.0
5%4.
34%
0.8
1%20
.14%
15.9
5%11
.98%
0.0
0%
3.87
%2.
46%
3.39
%
Tap
i40
.98%
2.93
%6.
38%
7.77
%9.
84%
12.0
8%8.
93%
15.6
8%1.
25%
17.9
7%5.
62%
7.0
5%
Vad
od
ara
33.8
5%1.
61%
18.7
1%4.
01%
5.17
%12
.63%
17.1
2%4.
59%
0.9
4%4.
34%
6.72
%7.
07%
Val
sad
29.9
1%2.
08%
9.41
%4.
82%
4.33
%13
.29%
18.8
9%28
.62%
0.2
4%10
.85%
6.37
%11
.61%
Haryana
Am
bal
a24
.46%
1.64
%10
.89%
1.69
%1.
56%
9.59
%3.
86%
0.2
7%0
.00
%5.
89%
0.3
1%4.
41%
Bhiw
ani
34.1
2%3.
81%
20.6
7%6.
67%
2.61
%27
.81%
9.81
%4.
08%
0.0
0%
26.7
5%1.
12%
4.34
%
Farid
abad
25.6
7%3.
25%
26.5
5%7.
83%
4.54
%11
.03%
17.6
5%56
.11%
0.5
6%9.
04%
2.83
%16
.70
%
Fate
hab
ad28
.51%
0.0
0%
14.6
3%9.
30%
1.43
%13
.61%
5.18
%0
.47%
0.0
0%
0.4
7%1.
45%
6.19
%
Gur
gao
n27
.81%
1.20
%23
.14%
10.0
0%
4.84
%9.
00
%31
.56%
1.29
%0
.00
%6.
26%
6.98
%11
.93%
His
ar20
.78%
2.80
%10
.47%
4.20
%2.
21%
21.7
4%10
.76%
4.93
%0
.58%
6.70
%1.
55%
4.67
%
Jhaj
jar
22.6
0%
0.8
7%19
.59%
3.29
%2.
49%
16.4
8%9.
94%
11.4
9%0
.00
%7.
31%
3.88
%8.
14%
Jind
25.5
1%2.
77%
18.8
8%4.
94%
1.26
%19
.33%
6.60
%6.
92%
0.6
7%12
.76%
0.9
1%8.
96%
Kaith
al24
.98%
1.98
%7.
70%
5.98
%1.
87%
29.4
1%13
.10
%1.
53%
0.0
0%
15.3
4%0
.88%
2.0
3%
Karn
al19
.29%
1.39
%13
.50
%6.
11%
0.6
7%14
.36%
6.90
%0
.00
%0
.08%
7.47
%2.
43%
3.0
8%
Kuru
kshe
tra
17.9
5%0
.69%
7.0
9%9.
02%
1.31
%20
.50
%8.
01%
0.0
0%
0.4
6%8.
71%
1.56
%2.
31%
Mah
end
rag
arh
20.6
6%1.
26%
19.2
5%0
.57%
0.0
0%
26.5
0%
14.6
6%5.
16%
0.0
0%
7.0
4%0
.36%
5.23
%
Mew
at59
.96%
7.0
6%56
.19%
25.1
5%24
.82%
63.4
3%47
.84%
11.9
7%4.
42%
65.2
3%17
.98%
30.5
6%
Palw
al35
.95%
3.13
%37
.30
%8.
48%
6.79
%34
.07%
16.0
0%
4.0
7%0
.87%
24.1
3%6.
95%
13.3
7%
Panc
hkul
a14
.07%
0.2
1%5.
16%
1.78
%0
.70
%3.
99%
3.60
%0
.06%
0.2
9%2.
88%
0.0
5%1.
59%
Pani
pat
27.2
7%1.
21%
17.5
2%8.
14%
2.84
%12
.28%
9.28
%0
.48%
0.0
0%
8.58
%1.
28%
2.0
7%
Rew
ari
36.7
3%1.
37%
28.7
5%3.
47%
2.38
%30
.85%
27.8
4%3.
79%
0.7
5%11
.67%
5.87
%12
.74%
Roht
ak27
.23%
2.20
%19
.55%
10.5
4%1.
91%
27.7
3%19
.06%
0.4
5%0
.38%
10.0
7%2.
53%
11.7
7%
Sirs
a35
.86%
2.24
%10
.50
%5.
47%
1.10
%7.
71%
11.7
6%2.
79%
0.0
0%
17.9
4%0
.21%
3.45
%
Soni
pat
29.0
3%0
.73%
20.5
3%5.
22%
3.20
%22
.75%
15.6
4%5.
74%
0.0
0%
4.87
%1.
94%
6.0
6%
Yam
unan
agar
27.7
6%0
.68%
13.6
2%2.
96%
1.56
%7.
64%
7.60
%0
.69%
0.3
3%6.
47%
0.1
9%7.
25%
Himachal Pradesh
Bila
spur
13.7
8%0
.00
%12
.42%
8.34
%0
.00
%3.
31%
16.1
2%41
.96%
0.0
0%
7.0
0%
4.35
%5.
49%
Cha
mb
a29
.30
%3.
80%
11.0
8%0
.54%
3.99
%11
.96%
16.9
3%4.
99%
0.0
0%
2.69
%2.
17%
0.0
0%
Ham
irpur
19.1
3%0
.00
%12
.38%
1.23
%3.
80%
43.2
4%17
.79%
0.0
0%
0.0
0%
18.7
7%1.
23%
0.0
0%
Kang
ra5.
70%
0.0
0%
6.0
6%12
.00
%0
.00
%15
.14%
27.5
0%
0.0
0%
0.0
0%
9.0
5%0
.00
%8.
00
%
Kinn
aur
--
--
--
--
--
--
Kullu
13.9
5%0
.00
%4.
88%
8.64
%4.
81%
11.4
4%41
.68%
8.0
3%0
.00
%18
.17%
11.5
4%2.
84%
Lahu
l & S
piti
--
--
--
--
--
--
Man
di
26.6
7%4.
24%
29.2
5%0
.99%
3.77
%22
.59%
27.7
2%19
.84%
0.0
0%
9.69
%3.
87%
3.30
%
Shim
la23
.27%
0.0
0%
1.33
%1.
00
%0
.00
%1.
56%
13.7
7%0
.00
%0
.00
%2.
77%
5.74
%2.
35%
Sirm
aur
15.2
5%5.
34%
11.9
4%0
.84%
0.0
0%
15.2
9%14
.47%
0.0
0%
0.0
0%
1.12
%4.
47%
1.96
%
Sola
n19
.35%
1.0
2%12
.80
%1.
37%
1.0
2%2.
57%
20.8
3%19
.30
%3.
67%
8.88
%6.
73%
2.34
%
Una
15.8
7%0
.00
%3.
78%
1.42
%0
.00
%25
.82%
19.3
6%0
.00
%0
.00
%1.
93%
1.93
%0
.47%
(CONTD.) DISTrICT-WISe: UNCeNSoreD heADCoUNT rATIo (UrBAN)(CONTD.) DISTrICT-WISe: UNCeNSoreD heADCoUNT rATIo (UrBAN)
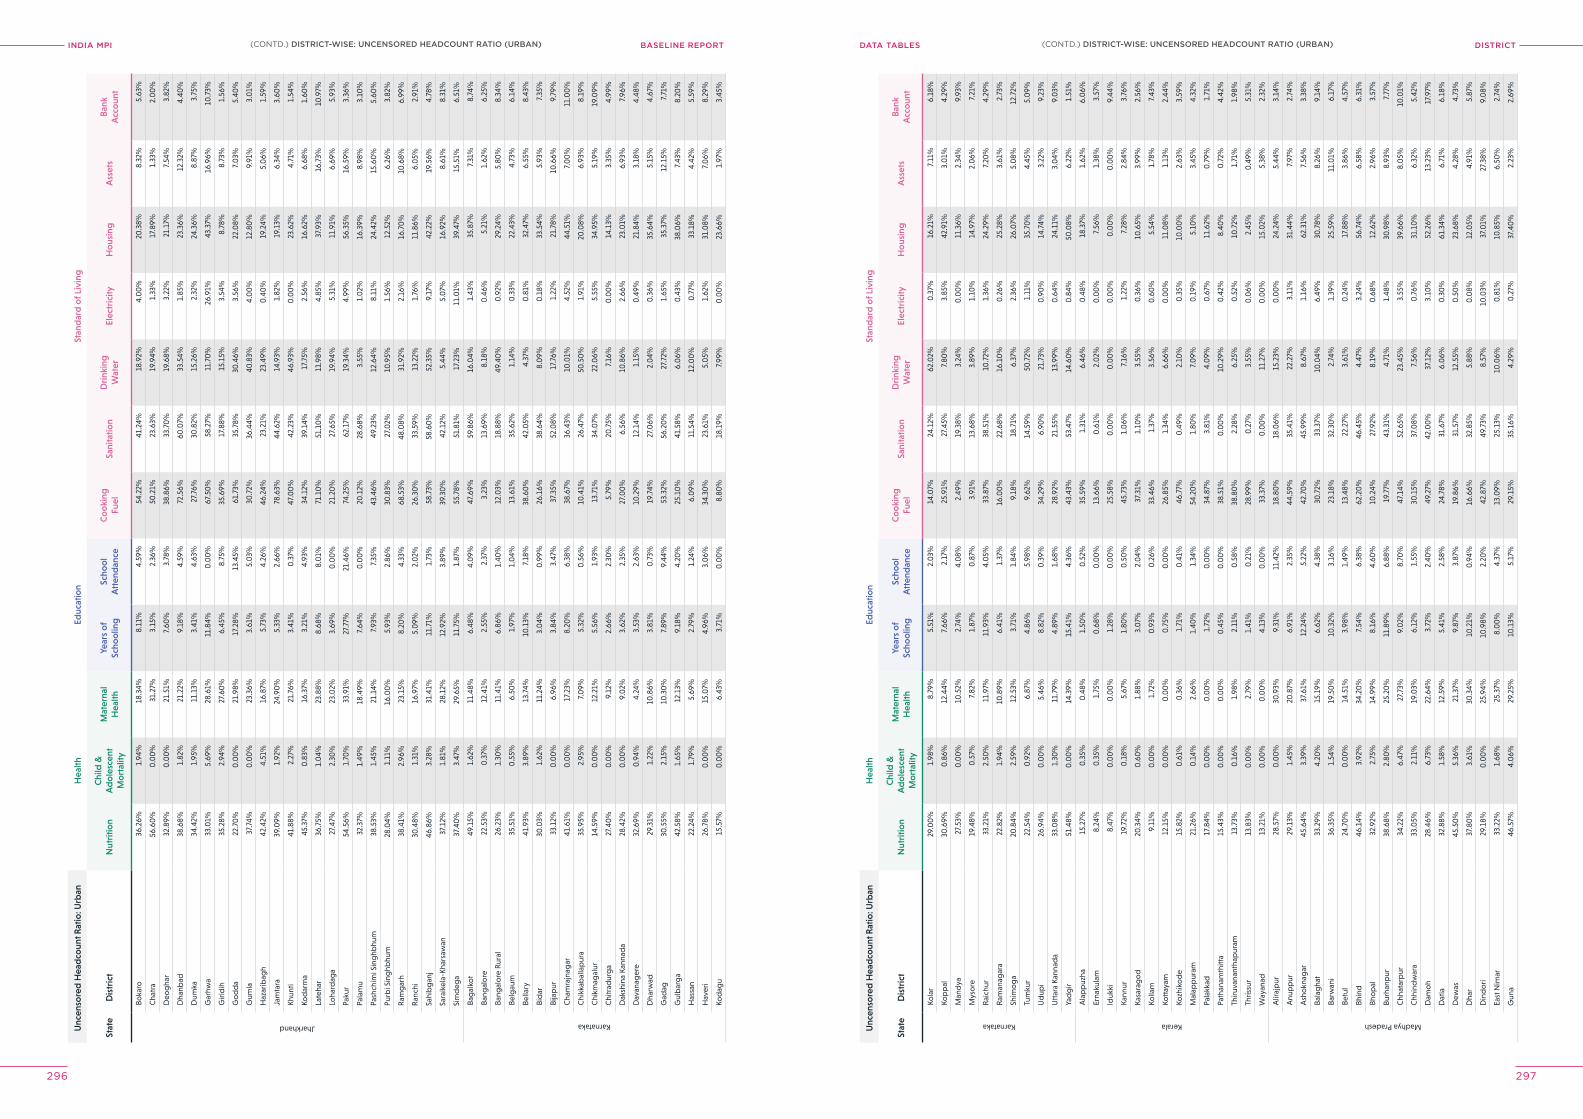
INDIA MPI BASELINE REPORT DISTrICTDATA TABleS
296 297
Unc
enso
red
Hea
dco
unt R
atio
: Urb
anH
ealth
Educ
atio
nSt
and
ard
of L
ivin
g
Stat
eD
istr
ict
Nut
ritio
nC
hild
&
Ad
ole
scen
t M
ort
ality
Mat
erna
l H
ealth
Year
s o
f Sc
hoo
ling
Scho
ol
Att
end
ance
Co
oki
ng
Fuel
Sani
tatio
nD
rink
ing
Wat
erEl
ectr
icity
Ho
usin
gA
sset
sB
ank
Acc
oun
t
Jharkhand
Boka
ro36
.26%
1.94
%18
.34%
8.11
%4.
59%
54.2
2%41
.24%
18.9
2%4.
00
%20
.38%
8.32
%5.
63%
Cha
tra
56.6
0%
0.0
0%
31.2
7%3.
15%
2.36
%50
.21%
23.6
3%19
.94%
1.33
%17
.89%
1.33
%2.
00
%
Deo
gha
r32
.89%
0.0
0%
21.5
1%7.
60%
3.78
%38
.86%
33.7
0%
19.6
8%3.
22%
21.1
7%7.
54%
3.82
%
Dha
nbad
38.6
8%1.
82%
21.2
2%9.
18%
4.59
%72
.56%
60.0
7%33
.54%
1.85
%23
.36%
12.3
2%4.
40%
Dum
ka34
.42%
1.95
%11
.13%
3.41
%4.
63%
27.7
6%30
.82%
15.2
6%2.
32%
24.3
6%8.
87%
3.75
%
Gar
hwa
33.0
1%5.
69%
28.6
1%11
.84%
0.0
0%
67.5
0%
58.2
7%11
.70
%26
.91%
43.3
7%16
.96%
10.7
3%
Giri
dih
35.2
8%2.
94%
27.6
0%
6.45
%8.
75%
35.6
9%17
.88%
15.1
5%3.
54%
8.78
%8.
73%
1.56
%
Go
dd
a22
.70
%0
.00
%21
.98%
17.2
8%13
.45%
61.7
3%35
.78%
30.4
6%3.
56%
22.0
8%7.
03%
5.40
%
Gum
la37
.74%
0.0
0%
23.3
6%3.
61%
5.0
3%30
.72%
36.4
4%40
.83%
4.0
0%
12.8
0%
9.91
%3.
01%
Haz
arib
agh
42.4
2%4.
51%
16.8
7%5.
73%
4.26
%46
.24%
23.2
1%23
.49%
0.4
0%
19.2
4%5.
06%
1.59
%
Jam
tara
39.0
9%1.
92%
24.9
0%
5.33
%2.
66%
78.6
3%44
.62%
14.9
3%1.
82%
19.1
3%6.
34%
3.60
%
Khun
ti41
.88%
2.27
%21
.76%
3.41
%0
.37%
47.0
0%
42.2
3%46
.93%
0.0
0%
23.6
2%4.
71%
1.54
%
Kod
arm
a45
.37%
0.8
3%16
.37%
3.21
%4.
93%
34.1
2%39
.14%
17.7
5%2.
56%
16.6
2%6.
68%
1.60
%
Late
har
36.7
5%1.
04%
23.8
8%8.
68%
8.0
1%71
.10
%51
.10
%11
.98%
4.85
%37
.93%
16.7
3%10
.97%
Loha
rdag
a27
.47%
2.30
%23
.02%
3.69
%0
.00
%21
.20
%27
.65%
19.9
4%5.
31%
11.9
1%6.
69%
5.93
%
Paku
r54
.56%
1.70
%33
.91%
27.7
7%21
.46%
74.2
5%62
.17%
19.3
4%4.
99%
56.3
5%16
.59%
3.36
%
Pala
mu
32.3
7%1.
49%
18.4
9%7.
64%
0.0
0%
20.1
2%28
.68%
3.55
%1.
02%
16.3
9%8.
98%
3.10
%
Pash
chim
i Sin
ghb
hum
38.5
3%1.
45%
21.1
4%7.
93%
7.35
%43
.46%
49.2
3%12
.64%
8.11
%24
.42%
15.6
0%
5.60
%
Purb
i Sin
ghb
hum
28.0
4%1.
11%
16.0
0%
5.93
%2.
86%
30.8
3%27
.02%
10.9
5%1.
56%
12.5
2%6.
26%
3.82
%
Ram
gar
h38
.41%
2.96
%23
.15%
8.20
%4.
33%
68.5
3%48
.08%
31.9
2%2.
16%
16.7
0%
10.6
8%6.
99%
Ran
chi
30.4
8%1.
31%
16.9
7%5.
09%
2.0
2%26
.30
%33
.59%
13.2
2%1.
76%
11.8
6%6.
05%
2.91
%
Sahi
bg
anj
46.8
6%3.
28%
31.4
1%11
.71%
1.73
%58
.73%
58.6
0%
52.3
5%9.
17%
42.2
2%19
.56%
4.78
%
Sara
ikel
a-Kh
arsa
wan
37.1
2%1.
81%
28.1
2%12
.92%
3.89
%39
.30
%42
.12%
5.44
%5.
07%
16.9
2%8.
61%
8.31
%
Sim
deg
a37
.40
%3.
47%
29.6
5%11
.75%
1.87
%55
.78%
51.8
1%17
.23%
11.0
1%39
.47%
15.5
1%6.
51%
Karnataka
Bag
alko
t49
.15%
1.62
%11
.48%
6.48
%4.
09%
47.6
9%59
.86%
16.0
4%1.
43%
35.8
7%7.
31%
8.74
%
Bang
alo
re22
.53%
0.3
7%12
.41%
2.55
%2.
37%
3.23
%13
.69%
8.18
%0
.46%
5.21
%1.
62%
6.25
%
Bang
alo
re R
ural
26.2
3%1.
30%
11.4
1%6.
86%
1.40
%12
.03%
18.8
8%49
.40
%0
.92%
29.2
4%5.
80%
8.34
%
Belg
aum
35.5
1%0
.55%
6.50
%1.
97%
1.0
4%13
.61%
35.6
2%1.
14%
0.3
3%22
.43%
4.73
%6.
14%
Bella
ry41
.93%
3.89
%13
.74%
10.1
3%7.
18%
38.6
0%
42.0
5%4.
37%
0.8
1%32
.47%
6.55
%8.
43%
Bid
ar30
.03%
1.62
%11
.24%
3.0
4%0
.99%
26.1
6%38
.64%
8.0
9%0
.18%
33.5
4%5.
93%
7.35
%
Bija
pur
33.1
2%0
.00
%6.
96%
3.84
%3.
47%
37.3
5%52
.08%
17.7
6%1.
22%
21.7
8%10
.66%
9.79
%
Cha
mra
jnag
ar41
.61%
0.0
0%
17.2
3%8.
20%
6.38
%38
.67%
36.4
3%10
.01%
4.52
%44
.51%
7.0
0%
11.0
0%
Chi
kkab
alla
pur
a35
.95%
2.95
%7.
09%
5.32
%0
.56%
10.4
1%26
.47%
50.5
0%
1.91
%20
.08%
6.93
%8.
19%
Chi
kmag
alur
14.5
9%0
.00
%12
.21%
5.56
%1.
93%
13.7
1%34
.07%
22.0
6%5.
55%
34.9
5%5.
19%
19.0
9%
Chi
trad
urg
a27
.40
%0
.00
%9.
12%
2.66
%2.
30%
5.79
%20
.75%
7.16
%0
.00
%14
.13%
3.35
%4.
99%
Dak
shin
a Ka
nnad
a28
.42%
0.0
0%
9.0
2%3.
62%
2.35
%27
.00
%6.
56%
10.8
6%2.
66%
23.0
1%6.
93%
7.96
%
Dav
anag
ere
32.6
9%0
.94%
4.24
%3.
53%
2.63
%10
.29%
12.1
4%1.
15%
0.4
9%21
.84%
3.18
%4.
48%
Dha
rwad
29.3
1%1.
22%
10.8
6%3.
81%
0.7
3%19
.74%
27.0
6%2.
04%
0.3
6%35
.64%
5.15
%4.
67%
Gad
ag30
.55%
2.15
%10
.30
%7.
89%
9.44
%53
.32%
56.2
0%
27.7
2%1.
65%
35.3
7%12
.15%
7.71
%
Gul
bar
ga
42.5
8%1.
65%
12.1
3%9.
18%
4.20
%25
.10
%41
.58%
6.0
6%0
.43%
38.0
6%7.
43%
8.20
%
Has
san
22.2
4%1.
79%
5.69
%2.
79%
1.24
%6.
09%
11.5
4%12
.00
%0
.77%
33.1
8%4.
42%
5.59
%
Hav
eri
26.7
8%0
.00
%15
.07%
4.96
%3.
06%
34.3
0%
23.6
1%5.
05%
1.62
%31
.08%
7.0
6%8.
29%
Kod
agu
15.5
7%0
.00
%6.
43%
3.71
%0
.00
%8.
80%
18.1
9%7.
99%
0.0
0%
23.6
6%1.
97%
3.45
%
Unc
enso
red
Hea
dco
unt R
atio
: Urb
anH
ealth
Educ
atio
nSt
and
ard
of L
ivin
g
Stat
eD
istr
ict
Nut
ritio
nC
hild
&
Ad
ole
scen
t M
ort
ality
Mat
erna
l H
ealth
Year
s o
f Sc
hoo
ling
Scho
ol
Att
end
ance
Co
oki
ng
Fuel
Sani
tatio
nD
rink
ing
Wat
erEl
ectr
icity
Ho
usin
gA
sset
sB
ank
Acc
oun
t
Karnataka
Kola
r29
.00
%1.
98%
8.79
%5.
51%
2.0
3%14
.07%
24.1
2%62
.02%
0.3
7%16
.21%
7.11
%6.
18%
Kop
pal
30.6
9%0
.86%
12.4
4%7.
66%
2.17
%25
.91%
27.4
5%7.
80%
3.85
%42
.91%
3.0
1%4.
29%
Man
dya
27.5
3%0
.00
%10
.52%
2.74
%4.
08%
2.49
%19
.38%
3.24
%0
.00
%11
.36%
2.34
%9.
93%
Mys
ore
19.4
8%0
.57%
7.82
%1.
87%
0.8
7%3.
91%
13.6
8%3.
89%
1.10
%14
.97%
2.0
6%7.
21%
Rai
chur
33.2
1%2.
50%
11.9
7%11
.93%
4.0
5%33
.87%
38.5
1%10
.72%
1.36
%24
.29%
7.20
%4.
29%
Ram
anag
ara
22.8
2%1.
94%
10.8
9%6.
41%
1.37
%16
.00
%22
.68%
16.1
0%
0.2
6%25
.28%
3.61
%2.
73%
Shim
og
a20
.84%
2.59
%12
.53%
3.71
%1.
84%
9.18
%18
.71%
6.37
%2.
36%
26.0
7%5.
08%
12.7
2%
Tum
kur
22.5
4%0
.92%
6.87
%4.
86%
5.98
%9.
62%
14.5
9%50
.72%
1.11
%35
.70
%4.
45%
5.0
9%
Ud
upi
26.9
4%0
.00
%5.
46%
8.82
%0
.39%
34.2
9%6.
90%
21.7
3%0
.90
%14
.74%
3.22
%9.
23%
Utt
ara
Kann
ada
33.0
8%1.
30%
11.7
9%4.
89%
1.68
%28
.92%
21.5
5%13
.99%
0.6
4%24
.11%
3.0
4%9.
03%
Yad
gir
51.4
8%0
.00
%14
.39%
15.4
1%4.
36%
43.4
3%53
.47%
14.6
0%
0.8
4%50
.08%
6.22
%1.
51%
Kerala
Ala
pp
uzha
15.2
7%0
.35%
0.4
8%1.
50%
0.5
2%35
.59%
1.31
%6.
46%
0.4
8%18
.37%
1.62
%6.
06%
Erna
kula
m8.
24%
0.3
5%1.
75%
0.6
8%0
.00
%13
.66%
0.6
1%2.
02%
0.0
0%
7.56
%1.
38%
3.57
%
Iduk
ki8.
47%
0.0
0%
0.0
0%
1.28
%0
.00
%25
.58%
0.0
0%
0.0
0%
0.0
0%
0.0
0%
0.0
0%
9.44
%
Kann
ur19
.72%
0.1
8%5.
67%
1.80
%0
.50
%45
.73%
1.0
6%7.
16%
1.22
%7.
28%
2.84
%3.
76%
Kasa
rag
od
20.3
4%0
.60
%1.
88%
3.0
7%2.
04%
37.3
1%1.
10%
3.55
%0
.36%
10.6
5%3.
99%
2.56
%
Kolla
m9.
11%
0.0
0%
1.72
%0
.93%
0.2
6%33
.46%
1.37
%3.
56%
0.6
0%
5.54
%1.
78%
7.43
%
Kott
ayam
12.1
5%0
.00
%0
.00
%0
.75%
0.0
0%
26.8
5%1.
34%
6.66
%0
.00
%11
.08%
1.13
%2.
44%
Kozh
iko
de
15.8
2%0
.61%
0.3
6%1.
71%
0.4
1%46
.77%
0.4
9%2.
10%
0.3
5%10
.00
%2.
63%
3.59
%
Mal
app
uram
21.2
6%0
.14%
2.66
%1.
40%
1.34
%54
.20
%1.
80%
7.0
9%0
.19%
5.10
%3.
45%
4.32
%
Pala
kkad
17.8
4%0
.00
%0
.00
%1.
72%
0.0
0%
34.8
7%3.
81%
4.0
9%0
.67%
11.6
2%0
.79%
1.71
%
Path
anam
thitt
a15
.43%
0.0
0%
0.0
0%
0.4
5%0
.00
%38
.51%
0.0
0%
10.2
9%0
.42%
8.40
%0
.72%
4.42
%
Thiru
vana
ntha
pur
am13
.73%
0.1
6%1.
98%
2.11
%0
.58%
38.8
0%
2.28
%6.
25%
0.5
2%10
.72%
1.71
%1.
98%
Thris
sur
13.8
3%0
.00
%2.
79%
1.41
%0
.21%
28.9
9%0
.27%
3.55
%0
.06%
2.45
%0
.49%
5.31
%
Way
anad
13.2
1%0
.00
%0
.00
%4.
13%
0.0
0%
33.3
7%0
.00
%11
.27%
0.0
0%
15.0
2%5.
38%
2.32
%
Madhya Pradesh
Alir
ajp
ur28
.57%
0.0
0%
30.9
3%9.
31%
11.4
2%18
.80
%18
.06%
15.2
3%0
.00
%24
.24%
5.44
%3.
14%
Anu
pp
ur29
.13%
1.45
%20
.87%
6.91
%2.
35%
44.5
9%35
.41%
22.2
7%3.
11%
31.4
4%7.
97%
2.74
%
Ash
okn
agar
45.6
4%3.
39%
37.6
1%12
.24%
5.22
%42
.70
%45
.99%
8.67
%1.
16%
62.3
1%7.
56%
3.38
%
Bala
gha
t33
.29%
4.20
%15
.19%
6.62
%4.
38%
30.7
2%33
.37%
10.0
4%6.
49%
30.7
8%8.
26%
9.14
%
Barw
ani
36.3
5%1.
54%
19.5
0%
10.3
2%3.
16%
23.1
8%32
.30
%2.
74%
1.39
%25
.59%
11.0
1%6.
17%
Betu
l24
.70
%0
.00
%14
.51%
3.98
%1.
49%
13.4
8%22
.27%
3.61
%0
.24%
17.8
8%3.
86%
4.57
%
Bhin
d46
.14%
3.92
%34
.20
%7.
54%
6.38
%62
.20
%46
.45%
4.47
%3.
24%
56.7
4%6.
58%
6.31
%
Bho
pal
32.9
2%2.
75%
14.9
9%8.
16%
4.60
%10
.24%
27.9
2%8.
19%
0.6
8%12
.62%
2.96
%3.
57%
Burh
anp
ur38
.68%
2.80
%25
.20
%11
.89%
6.88
%19
.77%
43.3
1%4.
71%
1.48
%30
.98%
8.93
%7.
77%
Chh
atar
pur
34.2
2%6.
47%
27.7
3%9.
02%
8.70
%47
.14%
52.6
5%23
.45%
3.55
%39
.66%
8.0
5%10
.01%
Chh
ind
war
a33
.05%
2.11
%19
.03%
6.12
%1.
55%
30.1
5%37
.08%
7.56
%0
.76%
31.1
0%
6.32
%5.
42%
Dam
oh
28.4
6%6.
73%
22.6
4%3.
72%
2.40
%49
.27%
42.0
0%
37.1
2%3.
10%
52.2
6%13
.23%
17.9
7%
Dat
ia32
.88%
1.58
%12
.59%
5.41
%2.
58%
24.7
8%31
.67%
6.0
6%0
.30
%61
.34%
6.71
%6.
18%
Dew
as45
.50
%5.
36%
21.3
7%9.
87%
3.87
%19
.86%
31.5
7%12
.55%
0.5
0%
23.6
8%4.
28%
4.73
%
Dha
r37
.80
%3.
61%
30.3
4%10
.21%
0.9
4%16
.66%
32.8
5%5.
88%
0.0
8%12
.05%
4.91
%5.
87%
Din
do
ri29
.18%
0.0
0%
25.9
4%10
.98%
2.20
%42
.87%
49.7
3%8.
57%
10.0
3%37
.01%
27.3
8%9.
08%
East
Nim
ar33
.22%
1.68
%25
.37%
8.0
0%
4.37
%13
.09%
25.1
3%10
.06%
0.8
1%10
.85%
6.50
%2.
74%
Gun
a46
.57%
4.0
6%29
.25%
10.1
3%5.
17%
29.1
5%35
.16%
4.29
%0
.27%
37.4
0%
2.23
%2.
69%
(CONTD.) DISTrICT-WISe: UNCeNSoreD heADCoUNT rATIo (UrBAN)(CONTD.) DISTrICT-WISe: UNCeNSoreD heADCoUNT rATIo (UrBAN)
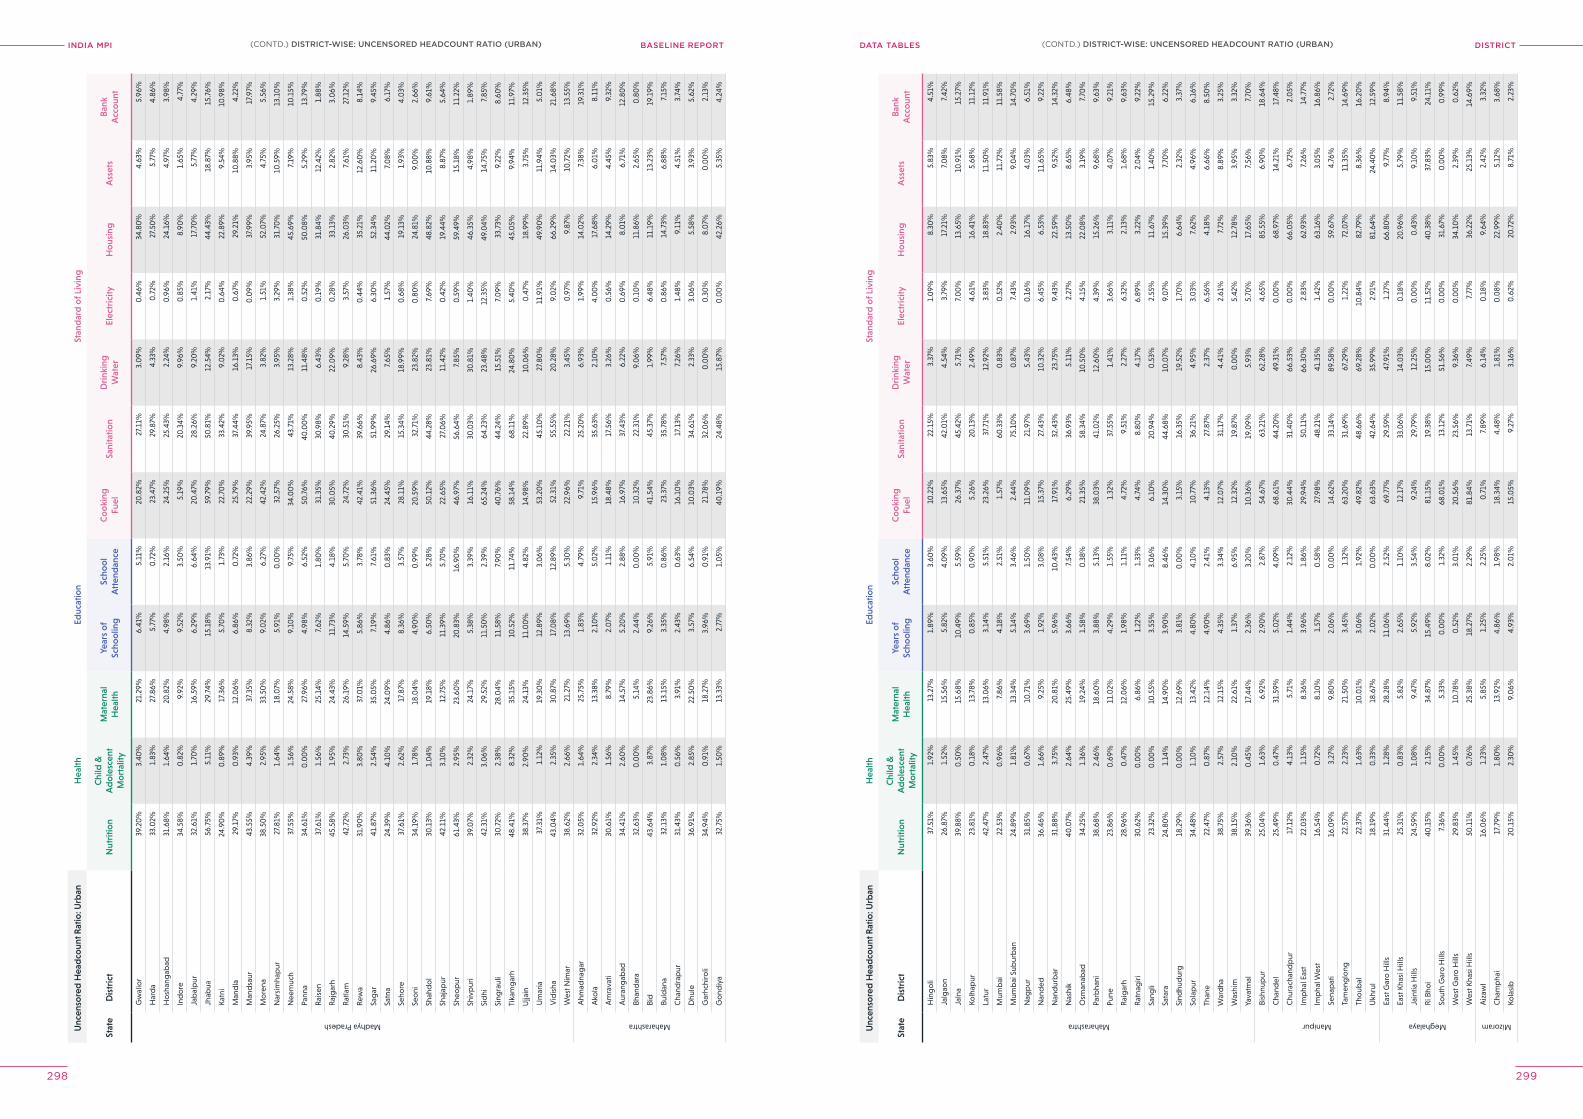
INDIA MPI BASELINE REPORT DISTrICTDATA TABleS
298 299
Unc
enso
red
Hea
dco
unt R
atio
: Urb
anH
ealth
Educ
atio
nSt
and
ard
of L
ivin
g
Stat
eD
istr
ict
Nut
ritio
nC
hild
&
Ad
ole
scen
t M
ort
ality
Mat
erna
l H
ealth
Year
s o
f Sc
hoo
ling
Scho
ol
Att
end
ance
Co
oki
ng
Fuel
Sani
tatio
nD
rink
ing
Wat
erEl
ectr
icity
Ho
usin
gA
sset
sB
ank
Acc
oun
t
Madhya Pradesh
Gw
alio
r39
.20
%3.
40%
21.2
9%6.
41%
5.11
%20
.82%
27.1
1%3.
09%
0.4
6%34
.80
%4.
63%
5.96
%
Har
da
33.0
2%1.
83%
27.8
6%5.
77%
0.7
2%23
.47%
29.8
7%4.
33%
0.7
2%27
.50
%5.
77%
4.86
%
Ho
shan
gab
ad31
.68%
1.64
%20
.82%
4.98
%2.
16%
24.2
5%25
.43%
2.24
%0
.96%
24.1
6%4.
97%
3.98
%
Ind
ore
34.5
8%0
.82%
9.92
%9.
52%
3.50
%5.
19%
20.3
4%9.
96%
0.8
5%8.
90%
1.65
%4.
77%
Jab
alp
ur32
.61%
1.70
%16
.59%
6.29
%6.
64%
20.4
7%28
.26%
9.20
%1.
41%
17.7
0%
5.77
%4.
29%
Jhab
ua56
.75%
5.11
%29
.74%
15.1
8%13
.91%
59.7
9%50
.81%
12.5
4%2.
17%
44.4
3%18
.87%
15.7
6%
Katn
i24
.90
%0
.89%
17.3
6%5.
70%
1.73
%22
.70
%33
.42%
9.0
2%0
.64%
22.8
9%9.
54%
10.9
8%
Man
dla
29.1
7%0
.93%
12.0
6%6.
86%
0.7
2%25
.79%
37.4
4%16
.13%
0.6
7%29
.21%
10.8
8%4.
22%
Man
dsa
ur43
.55%
4.39
%37
.35%
8.32
%3.
86%
22.2
9%39
.95%
17.1
5%0
.09%
37.9
9%3.
95%
17.9
7%
Mo
rena
38.5
0%
2.95
%33
.50
%9.
02%
6.27
%42
.42%
24.8
7%3.
82%
1.51
%52
.07%
4.75
%5.
56%
Nar
sim
hap
ur27
.81%
1.64
%18
.07%
5.91
%0
.00
%32
.57%
26.2
5%3.
95%
3.29
%31
.70
%10
.59%
13.1
0%
Nee
muc
h37
.55%
1.56
%24
.58%
9.10
%9.
75%
34.0
0%
43.7
1%13
.28%
1.38
%45
.69%
7.19
%10
.15%
Pann
a34
.61%
0.0
0%
27.9
6%4.
98%
6.52
%50
.76%
40.0
0%
11.4
8%0
.52%
50.0
8%5.
29%
13.7
9%
Rai
sen
37.6
1%1.
56%
25.1
4%7.
62%
1.80
%31
.35%
30.9
8%6.
43%
0.1
9%31
.84%
12.4
2%1.
88%
Raj
gar
h45
.58%
1.95
%24
.43%
11.7
3%4.
18%
30.0
5%40
.29%
22.0
9%0
.28%
33.1
3%2.
82%
3.0
6%
Rat
lam
42.7
2%2.
73%
26.1
9%14
.59%
5.70
%24
.72%
30.5
1%9.
28%
3.57
%26
.03%
7.61
%27
.12%
Rew
a31
.90
%3.
80%
37.0
1%5.
86%
3.78
%42
.41%
39.6
6%8.
43%
0.4
4%35
.21%
12.6
0%
8.14
%
Sag
ar41
.87%
2.54
%35
.05%
7.19
%7.
61%
51.3
6%51
.99%
26.6
9%6.
30%
52.3
4%11
.20
%9.
45%
Satn
a24
.39%
4.10
%24
.09%
4.86
%0
.83%
24.4
5%29
.14%
7.65
%1.
57%
44.0
2%7.
08%
6.17
%
Seho
re37
.61%
2.62
%17
.87%
8.36
%3.
57%
28.1
1%15
.34%
18.9
9%0
.68%
19.1
3%1.
93%
4.0
3%
Seo
ni34
.19%
1.78
%18
.04%
4.90
%0
.99%
20.5
9%32
.71%
23.8
2%0
.80
%24
.81%
9.0
0%
2.66
%
Shah
do
l30
.13%
1.0
4%19
.18%
6.50
%5.
28%
50.1
2%44
.28%
23.8
1%7.
69%
48.8
2%10
.88%
9.61
%
Shaj
apur
42.1
1%3.
10%
12.7
5%11
.39%
5.70
%22
.65%
27.0
6%11
.42%
0.4
2%19
.44%
8.87
%5.
64%
Sheo
pur
61.4
3%2.
95%
23.6
0%
20.8
3%16
.90
%46
.97%
56.6
4%7.
85%
0.5
9%59
.49%
15.1
8%11
.22%
Shiv
pur
i39
.07%
2.32
%24
.17%
5.38
%3.
39%
16.1
1%30
.03%
30.8
1%1.
40%
46.3
5%4.
98%
1.89
%
Sid
hi42
.31%
3.0
6%29
.52%
11.5
0%
2.39
%65
.24%
64.2
3%23
.48%
12.3
5%49
.04%
14.7
5%7.
85%
Sing
raul
i30
.72%
2.38
%28
.04%
11.5
8%7.
90%
40.7
6%44
.24%
15.5
1%7.
09%
33.7
3%9.
22%
8.60
%
Tika
mg
arh
48.4
1%8.
32%
35.1
5%10
.52%
11.7
4%58
.14%
68.1
1%24
.80
%5.
40%
45.0
5%9.
94%
11.9
7%
Ujja
in38
.37%
2.90
%24
.13%
11.0
0%
4.82
%14
.98%
22.8
9%10
.06%
0.4
7%18
.99%
3.75
%12
.35%
Um
aria
37.3
1%1.
12%
19.3
0%
12.8
9%3.
06%
53.2
0%
45.1
0%
27.8
0%
11.9
1%49
.90
%11
.94%
5.0
1%
Vid
isha
43.0
4%2.
35%
30.8
7%17
.08%
12.8
9%52
.31%
55.5
5%20
.28%
9.0
2%66
.29%
14.0
3%21
.68%
Wes
t Nim
ar38
.62%
2.66
%21
.27%
13.6
9%5.
30%
22.9
6%22
.21%
3.45
%0
.97%
9.87
%10
.72%
13.5
5%
Maharashtra
Ahm
adna
gar
32.0
5%1.
64%
25.7
5%1.
83%
4.79
%9.
71%
25.2
0%
6.93
%1.
99%
14.0
2%7.
38%
19.3
1%
Ako
la32
.92%
2.34
%13
.38%
2.10
%5.
02%
15.9
6%35
.63%
2.10
%4.
00
%17
.68%
6.0
1%8.
11%
Am
rava
ti30
.61%
1.56
%8.
79%
2.0
7%1.
11%
18.4
8%17
.56%
3.26
%0
.56%
14.2
9%4.
45%
9.32
%
Aur
ang
abad
34.4
1%2.
60%
14.5
7%5.
20%
2.88
%16
.97%
37.4
3%6.
22%
0.6
9%8.
01%
6.71
%12
.80
%
Bhan
dar
a32
.63%
0.0
0%
5.14
%2.
44%
0.0
0%
10.3
2%22
.31%
9.0
6%0
.10
%11
.86%
2.65
%0
.80
%
Bid
43.6
4%3.
87%
23.8
6%9.
26%
5.91
%41
.54%
45.3
7%1.
99%
6.48
%11
.19%
13.2
3%19
.19%
Buld
ana
32.1
3%1.
08%
13.1
5%3.
35%
0.8
6%23
.37%
35.7
8%7.
57%
0.8
6%14
.73%
6.88
%7.
15%
Cha
ndra
pur
31.4
3%0
.56%
3.91
%2.
43%
0.6
3%16
.10
%17
.13%
7.26
%1.
48%
9.11
%4.
51%
3.74
%
Dhu
le36
.91%
2.85
%22
.50
%3.
57%
6.54
%10
.03%
34.6
1%2.
33%
3.0
6%5.
58%
3.93
%5.
62%
Gar
hchi
roli
34.9
4%0
.91%
18.2
7%3.
96%
0.9
1%21
.78%
32.0
6%0
.00
%0
.30
%8.
07%
0.0
0%
2.13
%
Go
ndiy
a32
.75%
1.50
%13
.33%
2.77
%1.
05%
40.1
9%24
.48%
15.8
7%0
.00
%42
.26%
5.35
%4.
24%
Unc
enso
red
Hea
dco
unt R
atio
: Urb
anH
ealth
Educ
atio
nSt
and
ard
of L
ivin
g
Stat
eD
istr
ict
Nut
ritio
nC
hild
&
Ad
ole
scen
t M
ort
ality
Mat
erna
l H
ealth
Year
s o
f Sc
hoo
ling
Scho
ol
Att
end
ance
Co
oki
ng
Fuel
Sani
tatio
nD
rink
ing
Wat
erEl
ectr
icity
Ho
usin
gA
sset
sB
ank
Acc
oun
t
Maharashtra
Hin
go
li37
.51%
1.92
%13
.27%
1.89
%3.
60%
10.2
2%22
.15%
3.37
%1.
09%
8.30
%5.
83%
4.51
%
Jalg
aon
26.8
7%1.
52%
15.5
6%5.
82%
4.0
9%13
.65%
42.0
1%4.
54%
3.79
%17
.21%
7.0
8%7.
42%
Jaln
a39
.88%
0.5
0%
15.6
8%10
.49%
5.59
%26
.37%
45.4
2%5.
71%
7.0
0%
13.6
5%10
.91%
15.2
7%
Kolh
apur
23.8
1%0
.18%
13.7
8%0
.85%
0.9
0%
5.26
%20
.13%
2.49
%4.
61%
16.4
1%5.
68%
11.1
2%
Latu
r42
.47%
2.47
%13
.06%
3.14
%5.
51%
23.2
6%37
.71%
12.9
2%3.
83%
18.8
3%11
.50
%11
.91%
Mum
bai
22.5
3%0
.96%
7.86
%4.
18%
2.51
%1.
57%
60.3
3%0
.83%
0.5
2%2.
40%
11.7
2%11
.58%
Mum
bai
Sub
urb
an24
.89%
1.81
%13
.34%
5.14
%3.
46%
2.44
%75
.10
%0
.87%
7.43
%2.
93%
9.0
4%14
.70
%
Nag
pur
31.8
5%0
.67%
10.7
1%3.
69%
1.50
%11
.09%
21.9
7%5.
43%
0.1
6%16
.17%
4.0
3%6.
51%
Nan
ded
36.4
6%1.
66%
9.25
%1.
92%
3.0
8%15
.37%
27.4
3%10
.32%
6.45
%6.
53%
11.6
5%9.
22%
Nan
dur
bar
31.8
8%3.
75%
20.8
1%5.
96%
10.4
3%17
.91%
32.4
3%23
.75%
9.43
%22
.59%
9.52
%14
.32%
Nas
hik
40.0
7%2.
64%
25.4
9%3.
66%
7.54
%6.
29%
36.9
3%5.
11%
2.27
%13
.50
%8.
65%
6.48
%
Osm
anab
ad34
.25%
1.36
%19
.24%
1.58
%0
.38%
21.3
5%58
.34%
10.5
0%
4.15
%22
.08%
3.19
%7.
70%
Parb
hani
38.6
8%2.
46%
18.6
0%
3.88
%5.
13%
38.0
3%41
.02%
12.6
0%
4.39
%15
.26%
9.68
%9.
63%
Pune
23.8
6%0
.69%
11.0
2%4.
29%
1.55
%1.
32%
37.5
5%1.
41%
3.66
%3.
11%
4.0
7%9.
21%
Rai
gar
h28
.96%
0.4
7%12
.06%
1.98
%1.
11%
4.72
%9.
51%
2.27
%6.
32%
2.13
%1.
68%
9.63
%
Rat
nag
iri30
.62%
0.0
0%
6.86
%1.
22%
1.33
%4.
74%
8.80
%4.
17%
6.89
%3.
22%
2.0
4%9.
22%
Sang
li23
.32%
0.0
0%
10.5
5%3.
55%
3.0
6%6.
10%
20.9
4%0
.53%
2.55
%11
.67%
1.40
%15
.29%
Sata
ra24
.80
%1.
14%
14.9
0%
3.90
%8.
46%
14.3
0%
44.6
8%10
.07%
9.0
7%15
.39%
7.70
%6.
22%
Sind
hud
urg
18.2
9%0
.00
%12
.69%
3.81
%0
.00
%3.
15%
16.3
5%19
.52%
1.70
%6.
64%
2.32
%3.
37%
Sola
pur
34.4
8%1.
10%
13.4
2%4.
80%
4.10
%10
.77%
36.2
1%4.
95%
3.0
3%7.
62%
4.96
%6.
16%
Than
e22
.47%
0.8
7%12
.14%
4.90
%2.
41%
4.13
%27
.87%
2.37
%6.
56%
4.18
%6.
66%
8.50
%
War
dha
38.7
5%2.
57%
12.1
5%4.
35%
3.34
%12
.07%
31.1
7%4.
41%
2.61
%7.
72%
8.89
%3.
25%
Was
him
38.1
5%2.
10%
22.6
1%1.
37%
6.95
%12
.32%
19.8
7%0
.00
%5.
42%
12.7
8%3.
95%
3.32
%
Yava
tmal
39.3
6%0
.45%
17.4
4%2.
36%
3.20
%10
.36%
19.0
9%5.
93%
5.70
%17
.65%
7.56
%7.
70%
Manipur
Bish
nup
ur25
.04%
1.63
%6.
92%
2.90
%2.
87%
54.6
7%63
.21%
62.2
8%4.
65%
85.5
5%6.
90%
18.6
4%
Cha
ndel
25.4
9%0
.47%
31.5
9%5.
02%
4.0
9%68
.61%
44.2
0%
49.3
1%0
.00
%68
.97%
14.2
1%17
.48%
Chu
rach
and
pur
17.1
2%4.
13%
5.71
%1.
44%
2.12
%30
.44%
31.4
0%
66.5
3%0
.00
%66
.05%
6.72
%2.
05%
Imp
hal E
ast
22.0
3%1.
15%
8.36
%3.
96%
1.86
%29
.94%
50.1
1%66
.30
%2.
83%
62.9
3%7.
26%
14.7
7%
Imp
hal W
est
16.5
4%0
.72%
8.10
%1.
57%
0.5
8%27
.98%
48.2
1%41
.35%
1.42
%63
.16%
3.0
5%16
.86%
Sena
pat
i16
.09%
3.27
%9.
80%
2.0
6%0
.00
%14
.62%
33.1
4%89
.58%
0.0
0%
59.6
7%4.
76%
2.72
%
Tam
eng
long
22.5
7%2.
23%
21.5
0%
3.45
%1.
32%
63.2
0%
31.6
9%67
.29%
1.22
%72
.07%
11.3
5%14
.69%
Tho
ubal
22.3
7%1.
63%
10.0
1%3.
06%
1.92
%49
.82%
48.6
6%69
.28%
10.8
4%82
.79%
8.36
%16
.20
%
Ukh
rul
18.1
9%0
.33%
18.6
7%2.
02%
0.0
0%
63.6
3%42
.64%
35.9
9%2.
91%
81.6
4%24
.40
%12
.59%
Meghalaya
East
Gar
o H
ills
31.4
4%1.
28%
28.2
8%11
.06%
2.52
%69
.77%
29.5
9%47
.91%
1.27
%66
.80
%9.
77%
8.94
%
East
Kha
si H
ills
25.3
1%0
.83%
5.82
%2.
65%
1.10
%12
.17%
33.0
6%14
.03%
0.1
8%20
.96%
5.79
%11
.58%
Jain
tia H
ills
24.5
9%1.
08%
9.47
%5.
92%
3.54
%9.
24%
29.7
9%12
.25%
0.0
0%
0.4
3%9.
10%
9.51
%
Ri B
hoi
40.1
5%2.
15%
34.8
7%15
.49%
8.0
2%81
.15%
19.3
8%15
.00
%11
.52%
40.3
8%37
.83%
24.1
1%
Sout
h G
aro
Hill
s7.
36%
0.0
0%
5.33
%0
.00
%1.
32%
68.0
1%13
.12%
51.5
6%0
.00
%31
.67%
0.0
0%
0.9
9%
Wes
t Gar
o H
ills
29.8
3%1.
45%
10.7
8%0
.52%
3.0
1%20
.56%
23.5
6%9.
36%
0.0
0%
34.1
0%
2.39
%0
.62%
Wes
t Kha
si H
ills
50.1
1%0
.76%
25.3
8%18
.27%
2.29
%81
.84%
13.7
1%7.
49%
7.77
%36
.22%
25.1
3%14
.69%
Mizoram
Aiz
awl
16.0
6%1.
23%
5.85
%1.
25%
2.25
%0
.71%
7.89
%6.
14%
0.1
8%9.
64%
2.42
%3.
32%
Cha
mp
hai
17.7
9%1.
80%
13.9
2%4.
86%
1.98
%18
.34%
4.48
%1.
81%
0.0
8%22
.99%
5.12
%3.
68%
Kola
sib
20.1
5%2.
30%
9.0
6%4.
93%
2.0
1%15
.05%
9.27
%3.
16%
0.6
2%20
.72%
8.71
%2.
23%
(CONTD.) DISTrICT-WISe: UNCeNSoreD heADCoUNT rATIo (UrBAN)(CONTD.) DISTrICT-WISe: UNCeNSoreD heADCoUNT rATIo (UrBAN)
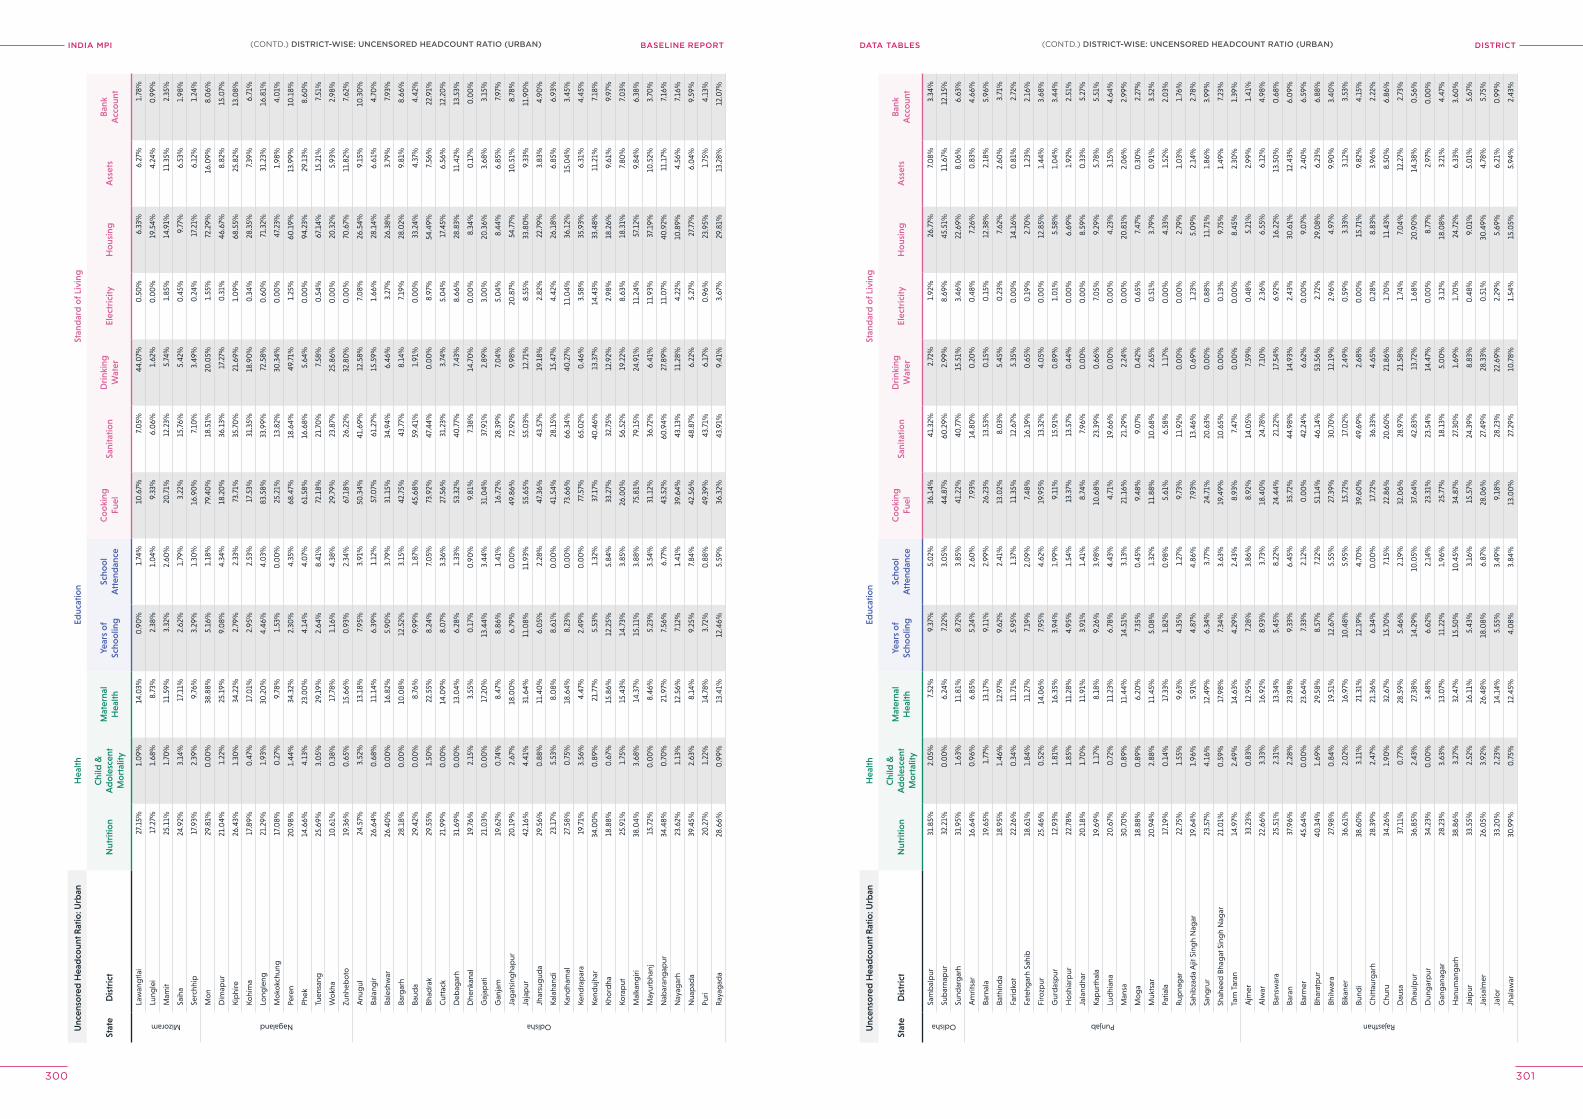
INDIA MPI BASELINE REPORT DISTrICTDATA TABleS
300 301
Unc
enso
red
Hea
dco
unt R
atio
: Urb
anH
ealth
Educ
atio
nSt
and
ard
of L
ivin
g
Stat
eD
istr
ict
Nut
ritio
nC
hild
&
Ad
ole
scen
t M
ort
ality
Mat
erna
l H
ealth
Year
s o
f Sc
hoo
ling
Scho
ol
Att
end
ance
Co
oki
ng
Fuel
Sani
tatio
nD
rink
ing
Wat
erEl
ectr
icity
Ho
usin
gA
sset
sB
ank
Acc
oun
t
Mizoram
Law
ang
tlai
27.1
5%1.
09%
14.0
3%0
.90
%1.
74%
10.6
7%7.
05%
44.0
7%0
.50
%6.
33%
6.27
%1.
78%
Lung
lei
17.2
7%1.
68%
8.73
%2.
38%
1.0
4%9.
33%
6.0
6%1.
62%
0.0
0%
19.5
4%4.
24%
0.9
9%
Mam
it25
.11%
1.70
%11
.59%
3.32
%2.
60%
20.7
1%12
.23%
5.74
%1.
85%
14.9
1%11
.35%
2.35
%
Saih
a24
.92%
3.14
%17
.11%
2.62
%1.
79%
3.22
%15
.76%
5.42
%0
.45%
9.77
%6.
53%
1.98
%
Serc
hhip
17.9
3%2.
39%
9.76
%3.
29%
1.30
%16
.90
%7.
10%
3.49
%0
.24%
17.2
1%6.
12%
1.24
%
Nagaland
Mo
n29
.81%
0.0
0%
38.8
8%5.
16%
1.18
%79
.40
%18
.51%
20.0
5%1.
55%
72.2
9%16
.09%
8.0
6%
Dim
apur
21.0
4%1.
22%
25.1
9%9.
08%
4.34
%18
.20
%36
.13%
17.2
7%0
.31%
46.6
7%8.
82%
15.0
7%
Kip
hire
26.4
3%1.
30%
34.2
2%2.
79%
2.33
%73
.71%
35.7
0%
21.6
9%1.
09%
68.5
5%25
.82%
13.0
8%
Kohi
ma
17.8
9%0
.47%
17.0
1%2.
95%
2.53
%17
.53%
31.3
5%18
.90
%0
.34%
28.3
5%7.
39%
6.71
%
Long
leng
21.2
9%1.
93%
30.2
0%
4.46
%4.
03%
83.5
8%33
.99%
72.5
8%0
.60
%71
.32%
31.2
3%16
.81%
Mo
kokc
hung
17.0
8%0
.27%
9.78
%1.
53%
0.0
0%
25.2
1%13
.82%
30.3
4%0
.00
%47
.23%
1.98
%4.
01%
Pere
n20
.98%
1.44
%34
.32%
2.30
%4.
35%
68.4
7%18
.64%
49.7
1%1.
25%
60.1
9%13
.99%
10.1
8%
Phek
14.6
6%4.
13%
23.0
0%
4.14
%4.
07%
61.5
8%16
.68%
5.64
%0
.00
%94
.23%
29.1
3%8.
60%
Tuen
sang
25.6
9%3.
05%
29.1
9%2.
64%
8.41
%72
.18%
21.7
0%
7.58
%0
.54%
67.1
4%15
.21%
7.51
%
Wo
kha
10.6
1%0
.38%
17.7
8%1.
16%
4.38
%29
.79%
23.8
7%25
.86%
0.0
0%
20.3
2%5.
93%
2.98
%
Zunh
ebo
to19
.36%
0.6
5%15
.66%
0.9
3%2.
34%
67.1
8%26
.22%
32.8
0%
0.0
0%
70.6
7%11
.82%
7.62
%
Odisha
Anu
gul
24.5
7%3.
52%
13.1
8%7.
95%
3.91
%50
.34%
41.6
9%12
.58%
7.0
8%26
.54%
9.15
%10
.30
%
Bala
ngir
26.6
4%0
.68%
11.1
4%6.
39%
1.12
%57
.07%
61.2
7%15
.59%
1.66
%28
.14%
6.61
%4.
70%
Bale
shw
ar26
.40
%0
.00
%16
.82%
5.90
%3.
79%
31.1
5%34
.94%
6.46
%3.
27%
26.3
8%3.
79%
7.93
%
Barg
arh
28.1
8%0
.00
%10
.08%
12.5
2%3.
15%
42.7
5%43
.77%
8.14
%7.
19%
28.0
2%9.
81%
8.66
%
Baud
a29
.42%
0.0
0%
8.76
%9.
99%
1.87
%45
.68%
59.4
1%1.
91%
0.0
0%
33.2
4%4.
37%
4.42
%
Bhad
rak
29.5
5%1.
50%
22.5
5%8.
24%
7.0
5%73
.92%
47.4
4%0
.00
%8.
97%
54.4
9%7.
56%
22.9
1%
Cut
tack
21.9
9%0
.00
%14
.09%
8.0
7%3.
36%
27.5
6%31
.23%
3.74
%5.
04%
17.4
5%6.
56%
12.2
0%
Deb
agar
h31
.69%
0.0
0%
13.0
4%6.
28%
1.33
%53
.32%
40.7
7%7.
43%
8.66
%28
.83%
11.4
2%13
.53%
Dhe
nkan
al19
.76%
2.15
%3.
55%
0.1
7%0
.90
%9.
81%
7.38
%14
.70
%0
.00
%8.
34%
0.1
7%0
.00
%
Gaj
apat
i21
.03%
0.0
0%
17.2
0%
13.4
4%3.
44%
31.0
4%37
.91%
2.89
%3.
00
%20
.36%
3.68
%3.
15%
Gan
jam
19.6
2%0
.74%
8.47
%8.
86%
1.41
%16
.72%
28.3
9%7.
04%
5.0
4%8.
44%
6.85
%7.
97%
Jag
atsi
ngha
pur
20.1
9%2.
67%
18.0
0%
6.79
%0
.00
%49
.86%
72.9
2%9.
98%
20.8
7%54
.77%
10.5
1%8.
78%
Jaja
pur
42.1
6%4.
41%
31.6
4%11
.08%
11.9
3%55
.65%
55. 0
3%12
.71%
8.55
%33
.80
%9.
33%
11.9
0%
Jhar
sug
uda
29.5
6%0
.88%
11.4
0%
6.0
5%2.
28%
47.3
6%43
.57%
19.1
8%2.
82%
22.7
9%3.
83%
4.90
%
Kala
hand
i23
.17%
5.53
%8.
08%
8.61
%0
.00
%41
.54%
28.1
5%15
.47%
4.42
%26
.18%
6.85
%6.
93%
Kand
ham
al27
.58%
0.7
5%18
.64%
8.23
%0
.00
%73
.66%
66.3
4%40
.27%
11.0
4%36
.12%
15.0
4%3.
45%
Kend
rap
ara
19.7
1%3.
56%
4.47
%2.
49%
0.0
0%
77.5
7%65
.02%
0.4
6%3.
58%
35.9
3%6.
31%
4.45
%
Kend
ujha
r34
.00
%0
.89%
21.7
7%5.
53%
1.32
%37
.17%
40.4
6%13
.37%
14.4
3%33
.48%
11.2
1%7.
18%
Kho
rdha
18.8
8%0
.67%
15.8
6%12
.25%
5.84
%33
.27%
32.7
5%12
.92%
2.98
%18
.26%
9.61
%9.
97%
Kora
put
25.9
1%1.
75%
15.4
3%14
.73%
3.85
%26
.00
%56
.52%
19.2
2%8.
63%
18.3
1%7.
80%
7.0
3%
Mal
kang
iri38
.04%
3.68
%14
.37%
15.1
1%3.
88%
75.8
1%79
.15%
24.9
1%11
.24%
57.1
2%9.
84%
6.38
%
May
urb
hanj
15.7
2%0
.00
%8.
46%
5.23
%3.
54%
31.1
2%36
.72%
6.41
%11
.93%
37.1
9%10
.52%
3.70
%
Nab
aran
gap
ur34
.48%
0.7
0%
21.9
7%7.
56%
6.77
%43
.52%
60.9
4%27
.89%
11.0
7%40
.92%
11.1
7%7.
16%
Nay
agar
h23
.62%
1.13
%12
.56%
7.12
%1.
41%
39.6
4%43
.13%
11.2
8%4.
22%
10.8
9%4.
56%
7.16
%
Nua
pad
a39
.45%
2.63
%8.
14%
9.25
%7.
84%
42.5
6%48
.87%
6.22
%5.
27%
27.7
7%6.
04%
9.59
%
Puri
20.2
7%1.
22%
14.7
8%3.
72%
0.8
8%49
.39%
43.7
1%6.
17%
0.9
6%23
.95%
1.75
%4.
13%
Ray
agad
a28
.66%
0.9
9%13
.41%
12.4
6%5.
59%
36.3
2%43
.91%
9.41
%3.
67%
29.8
1%13
.28%
12.0
7%
Unc
enso
red
Hea
dco
unt R
atio
: Urb
anH
ealth
Educ
atio
nSt
and
ard
of L
ivin
g
Stat
eD
istr
ict
Nut
ritio
nC
hild
&
Ad
ole
scen
t M
ort
ality
Mat
erna
l H
ealth
Year
s o
f Sc
hoo
ling
Scho
ol
Att
end
ance
Co
oki
ng
Fuel
Sani
tatio
nD
rink
ing
Wat
erEl
ectr
icity
Ho
usin
gA
sset
sB
ank
Acc
oun
t
Odisha
Sam
bal
pur
31.8
5%2.
05%
7.52
%9.
37%
5.0
2%36
.14%
41.3
2%2.
72%
1.92
%26
.77%
7.0
8%3.
34%
Sub
arna
pur
32.2
1%0
.00
%6.
24%
7.22
%3.
05%
44.8
7%60
.29%
2.99
%8.
69%
45.5
1%11
.67%
12.1
5%
Sund
arg
arh
31.9
5%1.
63%
11.8
1%8.
72%
3.85
%41
.22%
40.7
7%15
.51%
3.46
%22
.69%
8.0
6%6.
63%
Punjab
Am
ritsa
r16
.64%
0.9
6%6.
85%
5.24
%2.
60%
7.93
%14
.80
%0
.20
%0
.48%
7.26
%0
.83%
4.66
%
Barn
ala
19.6
5%1.
77%
13.1
7%9.
11%
2.99
%26
.23%
13.5
3%0
.15%
0.1
5%12
.38%
2.18
%5.
96%
Bath
ind
a18
.95%
1.46
%12
.97%
9.62
%2.
41%
13.0
2%8.
03%
5.45
%0
.23%
7.62
%2.
60%
3.71
%
Farid
kot
22.2
6%0
.34%
11.7
1%5.
95%
1.37
%11
.35%
12.6
7%5.
35%
0.0
0%
14.1
6%0
.81%
2.72
%
Fate
hgar
h Sa
hib
18.6
1%1.
84%
11.2
7%7.
19%
2.0
9%7.
48%
16.1
9%0
.65%
0.1
9%2.
70%
1.23
%2.
16%
Firo
zpur
25.4
6%0
.52%
14.0
6%7.
95%
4.62
%19
.95%
13.3
2%4.
05%
0.0
0%
12.8
5%1.
44%
3.68
%
Gur
das
pur
12.9
3%1.
81%
16.3
5%3.
94%
1.99
%9.
11%
15.9
1%0
.89%
1.0
1%5.
58%
1.0
4%3.
44%
Ho
shia
rpur
22.7
8%1.
85%
11.2
8%4.
95%
1.54
%13
.37%
13.5
7%0
.44%
0.0
0%
6.69
%1.
92%
2.51
%
Jala
ndha
r20
.18%
1.70
%11
.91%
3.91
%1.
41%
8.74
%7.
96%
0.0
0%
0.0
0%
8.59
%0
.33%
5.27
%
Kap
urth
ala
19.6
9%1.
17%
8.18
%9.
26%
3.98
%10
.68%
23.3
9%0
.66%
7.0
5%9.
29%
5.78
%5.
51%
Lud
hian
a20
.67%
0.7
2%11
.23%
6.78
%4.
43%
4.71
%19
.66%
0.0
0%
0.0
0%
4.23
%3.
15%
4.64
%
Man
sa30
.70
%0
.89%
11.4
4%14
.51%
3.13
%21
.16%
21.2
9%2.
24%
0.0
0%
20.8
1%2.
06%
2.99
%
Mo
ga
18.8
8%0
.89%
6.20
%7.
35%
0.4
5%9.
48%
9.0
7%0
.42%
0.6
5%7.
47%
0.3
0%
2.27
%
Muk
tsar
20.9
4%2.
88%
11.4
5%5.
08%
1.32
%11
.88%
10.6
8%2.
65%
0.5
1%3.
79%
0.9
1%3.
52%
Patia
la17
.19%
0.1
4%17
.33%
1.82
%0
.98%
5.61
%6.
58%
1.17
%0
.00
%4.
33%
1.52
%2.
03%
Rup
nag
ar22
.75%
1.55
%9.
63%
4.35
%1.
27%
9.73
%11
.92%
0.0
0%
0.0
0%
2.79
%1.
03%
1.76
%
Sahi
bza
da
Ajit
Sin
gh
Nag
ar19
.64%
1.96
%5.
91%
4.87
%4.
86%
7.93
%13
.46%
0.6
9%1.
23%
5.0
9%2.
14%
2.78
%
Sang
rur
23.5
7%4.
16%
12.4
9%6.
34%
3.77
%24
.71%
20.6
3%0
.00
%0
.88%
11.7
1%1.
86%
3.99
%
Shah
eed
Bha
gat
Sin
gh
Nag
ar21
.01%
0.5
9%17
.98%
7.34
%3.
63%
19.4
9%10
.65%
0.0
0%
0.1
3%9.
75%
1.49
%7.
23%
Tarn
Tar
an14
.97%
2.49
%14
.63%
4.29
%2.
43%
8.93
%7.
47%
0.0
0%
0.0
0%
8.45
%2.
30%
1.39
%
Rajasthan
Ajm
er33
.23%
0.8
3%12
.95%
7.28
%3.
86%
8.92
%14
.05%
7.59
%0
.48%
5.21
%2.
99%
1.41
%
Alw
ar22
.66%
3.33
%16
.92%
8.93
%3.
73%
18.4
0%
24.7
8%7.
10%
2.36
%6.
55%
6.12
%4.
98%
Bans
war
a25
.51%
2.31
%13
.34%
5.45
%8.
22%
24.4
4%21
.22%
17.5
4%6.
92%
16.2
2%13
.50
%0
.68%
Bara
n37
.96%
2.28
%23
.98%
9.33
%6.
45%
35.7
2%44
.98%
14.9
3%2.
43%
30.6
1%12
.43%
6.0
9%
Barm
er45
.64%
0.0
0%
23.6
4%7.
33%
2.12
%0
.00
%42
.24%
6.62
%0
.00
%9.
07%
2.40
%6.
59%
Bhar
atp
ur40
.34%
1.69
%29
.58%
8.57
%7.
22%
51.1
4%46
.14%
53.5
6%2.
72%
29.0
8%6.
23%
6.88
%
Bhilw
ara
27.9
8%0
.84%
19.5
1%12
.67%
5.55
%27
.39%
30.7
0%
12.1
9%2.
96%
4.97
%9.
90%
3.40
%
Bika
ner
36.6
1%2.
02%
16.9
7%10
.48%
5.95
%15
.72%
17.0
2%2.
49%
0.5
9%3.
33%
3.12
%3.
53%
Bund
i38
.60
%3.
11%
21.3
1%12
.19%
4.70
%39
.60
%49
.69%
2.68
%0
.00
%15
.71%
9.82
%4.
15%
Chi
ttau
rgar
h28
.39%
2.47
%21
.36%
6.34
%0
.00
%17
.72%
36.3
3%4.
65%
0.2
8%8.
83%
3.96
%2.
22%
Chu
ru34
.26%
1.90
%32
.67%
15.7
0%
7.15
%22
.86%
20.6
0%
21.8
6%1.
70%
11.4
3%8.
50%
6.86
%
Dau
sa37
.11%
0.7
7%28
.59%
5.46
%2.
19%
32.0
6%28
.97%
21.5
8%1.
74%
7.0
4%12
.27%
2.73
%
Dha
ulp
ur36
.85%
2.43
%27
.38%
14.2
9%10
.05%
37.6
4%42
.83%
13.7
2%1.
68%
20.9
0%
14.3
8%0
.56%
Dun
gar
pur
34.2
3%0
.00
%3.
48%
6.62
%2.
14%
23.3
1%23
.54%
14.4
7%0
.00
%8.
77%
2.97
%0
.00
%
Gan
gan
agar
28.2
3%3.
63%
13.0
7%11
.22%
1.96
%25
.77%
18.1
3%5.
00
%3.
12%
18.0
8%3.
21%
4.47
%
Han
uman
gar
h38
.86%
3.27
%32
.47%
15.5
0%
10.4
5%34
.87%
27.3
0%
1.69
%1.
70%
24.7
2%6.
33%
3.60
%
Jaip
ur33
.55%
2.52
%16
.11%
5.43
%3.
16%
15.5
7%24
.39%
8.83
%0
.48%
9.0
1%5.
01%
5.67
%
Jais
alm
er26
.05%
3.92
%26
.48%
18.0
8%6.
87%
28.0
6%27
.49%
28.3
3%0
.51%
30.4
9%4.
78%
5.75
%
Jalo
r33
.20
%2.
23%
14.1
4%5.
55%
3.49
%9.
18%
28.2
3%22
.69%
2.29
%5.
69%
6.21
%0
.99%
Jhal
awar
30.9
9%0
.75%
12.4
5%4.
08%
3.84
%13
.00
%27
.29%
10.7
8%1.
54%
15.0
5%5.
94%
2.43
%
(CONTD.) DISTrICT-WISe: UNCeNSoreD heADCoUNT rATIo (UrBAN)(CONTD.) DISTrICT-WISe: UNCeNSoreD heADCoUNT rATIo (UrBAN)
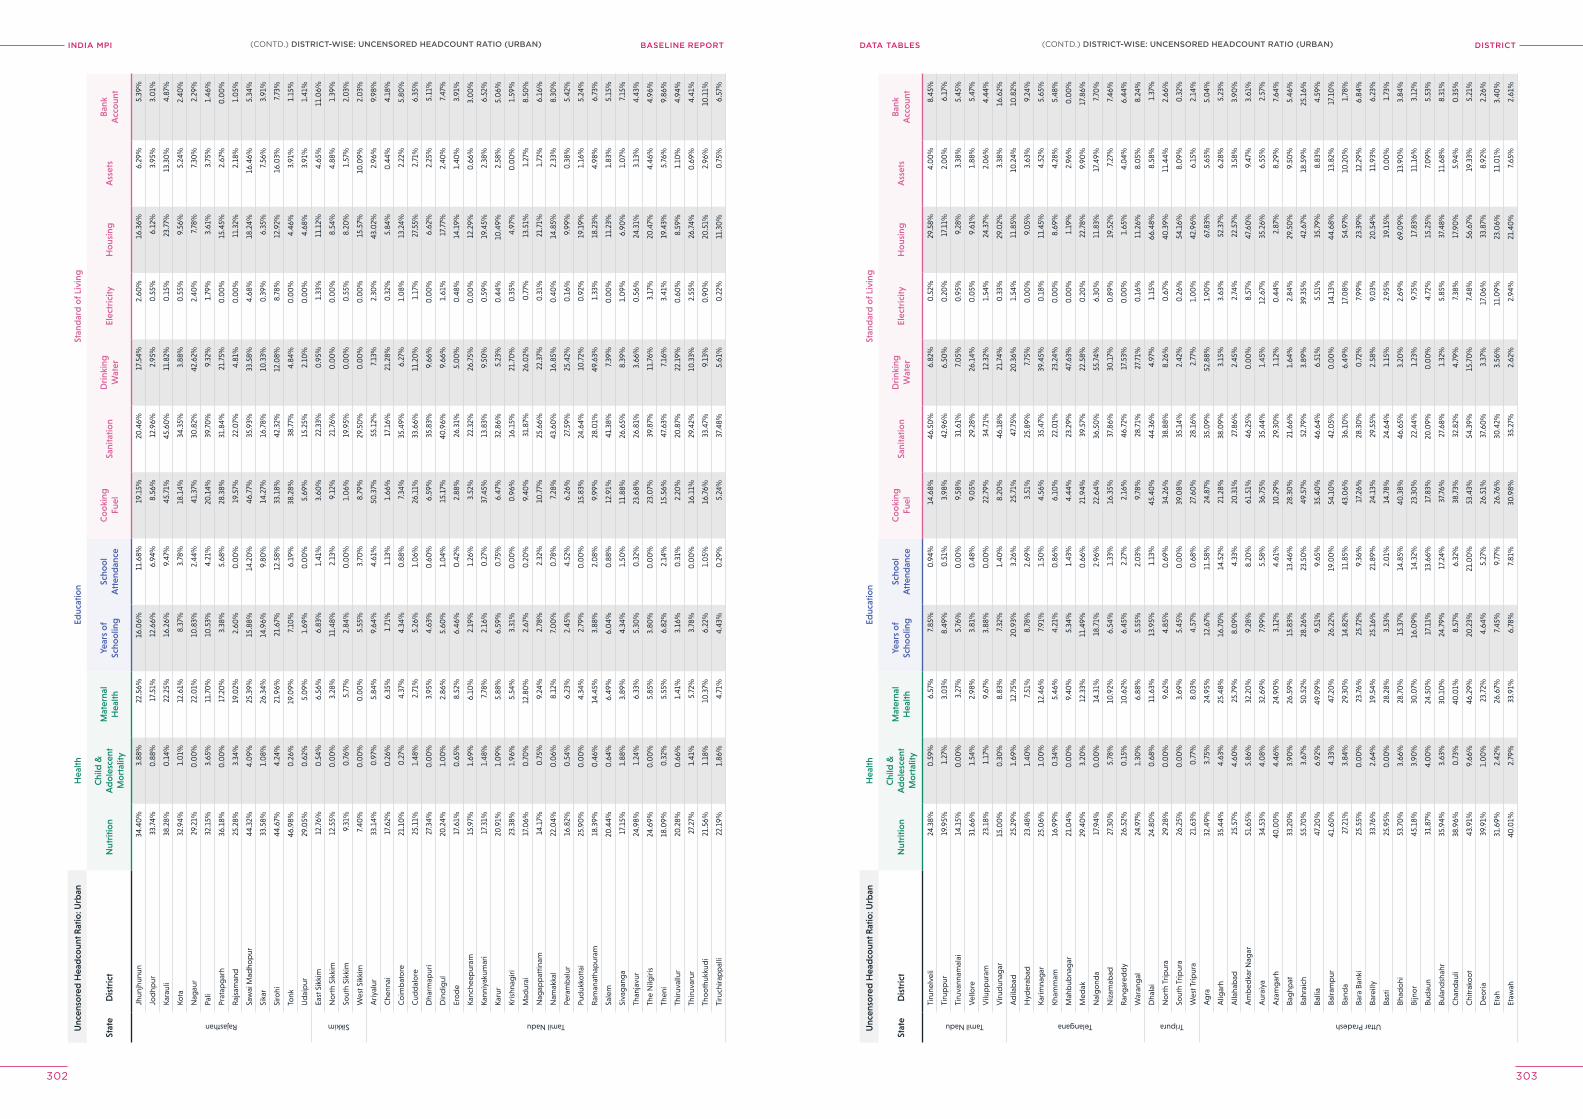
INDIA MPI BASELINE REPORT DISTrICTDATA TABleS
302 303
Unc
enso
red
Hea
dco
unt R
atio
: Urb
anH
ealth
Educ
atio
nSt
and
ard
of L
ivin
g
Stat
eD
istr
ict
Nut
ritio
nC
hild
&
Ad
ole
scen
t M
ort
ality
Mat
erna
l H
ealth
Year
s o
f Sc
hoo
ling
Scho
ol
Att
end
ance
Co
oki
ng
Fuel
Sani
tatio
nD
rink
ing
Wat
erEl
ectr
icity
Ho
usin
gA
sset
sB
ank
Acc
oun
t
Rajasthan
Jhun
jhun
un34
.40
%3.
88%
22.5
6%16
.06%
11.6
8%19
.15%
20.4
6%17
.54%
2.60
%16
.36%
6.29
%5.
39%
Jod
hpur
33.7
4%0
.88%
17.5
1%12
.66%
6.94
%8.
56%
12.9
6%2.
95%
0.5
5%6.
12%
3.95
%3.
01%
Kara
uli
38.2
8%0
.14%
22.2
5%16
.26%
9.47
%45
.71%
45.6
0%
11.8
2%0
.15%
23.7
7%13
.30
%4.
87%
Kota
32.9
4%1.
01%
12.6
1%8.
37%
3.78
%18
.14%
34.3
5%3.
88%
0.5
5%9.
56%
5.24
%2.
40%
Nag
aur
29.2
1%0
.00
%22
.01%
10.8
3%2.
44%
41.3
7%30
.82%
42.6
2%2.
40%
7.78
%7.
30%
2.29
%
Pali
32.1
5%3.
65%
11.7
0%
10.5
3%4.
21%
20.1
4%39
.70
%9.
32%
1.79
%3.
61%
3.75
%1.
46%
Prat
apg
arh
36.1
8%0
.00
%17
.20
%3.
38%
5.68
%28
.38%
31.8
4%21
.75%
0.0
0%
15.4
5%2.
67%
0.0
0%
Raj
sam
and
25.2
8%3.
34%
19.0
2%2.
60%
0.0
0%
19.5
7%22
.07%
4.81
%0
.00
%11
.32%
2.18
%1.
05%
Saw
ai M
adho
pur
44.3
2%4.
09%
25.3
9%15
.88%
14.2
0%
46.7
7%35
.93%
33.5
8%4.
68%
18.2
4%16
.46%
5.34
%
Sika
r33
.58%
1.0
8%26
.34%
14.9
6%9.
80%
14.2
7%16
.78%
10.3
3%0
.39%
6.35
%7.
56%
3.91
%
Siro
hi44
.67%
4.24
%21
.96%
21.6
7%12
.58%
33.1
8%42
.32%
12.0
8%8.
78%
12.9
2%16
.03%
7.73
%
Tonk
46.9
8%0
.26%
19.0
9%7.
10%
6.19
%38
.28%
38.7
7%4.
84%
0.0
0%
4.46
%3.
91%
1.15
%
Ud
aip
ur29
.05%
0.6
2%5.
09%
1.69
%0
.00
%5.
69%
15.2
5%2.
10%
0.0
0%
4.68
%3.
91%
1.41
%
Sikkim
East
Sik
kim
12.7
6%0
.54%
6.56
%6.
83%
1.41
%3.
60%
22.3
3%0
.95%
1.33
%11
.12%
4.65
%11
.06%
No
rth
Sikk
im12
.55%
0.0
0%
3.28
%11
.48%
2.13
%9.
12%
21.7
6%0
.00
%0
.00
%8.
54%
4.88
%1.
39%
Sout
h Si
kkim
9.31
%0
.76%
5.77
%2.
84%
0.0
0%
1.0
6%19
.95%
0.0
0%
0.5
5%8.
20%
1.57
%2.
03%
Wes
t Sik
kim
7.40
%0
.00
%0
.00
%5.
55%
3.70
%8.
79%
29.5
0%
0.0
0%
0.0
0%
15.5
7%10
.09%
2.0
3%
Tamil Nadu
Ariy
alur
33.1
4%0
.97%
5.84
%9.
64%
4.61
%50
.37%
55.1
2%7.
13%
2.30
%43
.02%
2.96
%9.
98%
Che
nnai
17.6
2%0
.26%
6.35
%1.
71%
1.13
%1.
66%
17.1
6%21
.28%
0.3
2%5.
84%
0.4
4%4.
18%
Co
imb
ato
re21
.10
%0
.27%
4.37
%4.
34%
0.8
8%7.
34%
35.4
9%6.
27%
1.0
8%13
.24%
2.22
%5.
80%
Cud
dal
ore
25.1
1%1.
48%
2.71
%5.
26%
1.0
6%26
.11%
33.6
6%11
.20
%1.
17%
27.5
5%2.
71%
6.35
%
Dha
rmap
uri
27.3
4%0
.00
%3.
95%
4.63
%0
.60
%6.
59%
35.8
3%9.
66%
0.0
0%
6.62
%2.
25%
5.11
%
Din
dig
ul20
.24%
1.0
0%
2.86
%5.
60%
1.0
4%15
.17%
40.9
6%9.
66%
1.61
%17
.77%
2.40
%7.
47%
Ero
de
17.6
1%0
.65%
8.52
%6.
46%
0.4
2%2.
88%
26.3
1%5.
00
%0
.48%
14.1
9%1.
40%
3.91
%
Kanc
heep
uram
15.9
7%1.
69%
6.10
%2.
19%
1.26
%3.
52%
22.3
2%26
.75%
0.0
0%
12.2
9%0
.66%
3.0
0%
Kann
iyak
umar
i17
.31%
1.48
%7.
78%
2.16
%0
.27%
37.4
5%13
.83%
9.50
%0
.59%
19.4
5%2.
38%
6.52
%
Karu
r20
.91%
1.0
9%5.
88%
6.59
%0
.75%
6.47
%32
.86%
5.23
%0
.44%
10.4
9%2.
58%
5.0
6%
Kris
hnag
iri23
.38%
1.96
%5.
54%
3.31
%0
.00
%0
.96%
16.1
5%21
.70
%0
.35%
4.97
%0
.00
%1.
59%
Mad
urai
17.0
6%0
.70
%12
.80
%2.
67%
0.2
0%
9.40
%31
.87%
26.0
2%0
.77%
13.5
1%1.
27%
8.50
%
Nag
app
attin
am14
.17%
0.7
5%9.
24%
2.78
%2.
32%
10.7
7%25
.66%
22.3
7%0
.31%
21.7
1%1.
72%
6.16
%
Nam
akka
l22
.04%
0.0
6%8.
12%
7.0
0%
0.7
8%7.
28%
43.6
0%
16.8
5%0
.40
%14
.85%
2.33
%8.
30%
Pera
mb
alur
16.8
2%0
.54%
6.23
%2.
45%
4.52
%6.
26%
27.5
9%25
.42%
0.1
6%9.
99%
0.3
8%5.
42%
Pud
ukko
ttai
25.9
0%
0.0
0%
4.34
%2.
79%
0.0
0%
15.8
3%24
.64%
10.7
2%0
.92%
19.1
9%1.
16%
5.24
%
Ram
anat
hap
uram
18.3
9%0
.46%
14.4
5%3.
88%
2.0
8%9.
99%
28.0
1%49
.63%
1.33
%18
.23%
4.98
%6.
73%
Sale
m20
.44%
0.6
4%6.
49%
6.0
4%0
.88%
12.9
1%41
.38%
7.39
%0
.00
%11
.23%
1.83
%5.
15%
Siva
gan
ga
17.1
5%1.
88%
3.89
%4.
34%
1.50
%11
.88%
26.6
5%8.
39%
1.0
9%6.
90%
1.0
7%7.
15%
Than
javu
r24
.98%
1.24
%6.
33%
5.30
%0
.32%
23.6
8%26
.81%
3.66
%0
.56%
24.3
1%3.
13%
4.43
%
The
Nilg
iris
24.6
9%0
.00
%5.
85%
3.80
%0
.00
%23
.07%
39.8
7%11
.76%
3.17
%20
.47%
4.46
%4.
96%
Then
i18
.09%
0.3
2%5.
55%
6.82
%2.
14%
15.5
6%47
.63%
7.16
%3.
41%
19.4
3%5.
76%
9.86
%
Thiru
vallu
r20
.28%
0.6
6%1.
41%
3.16
%0
.31%
2.20
%20
.87%
22.1
9%0
.60
%8.
59%
1.10
%4.
94%
Thiru
varu
r27
.27%
1.41
%5.
72%
3.78
%0
.00
%16
.11%
29.4
2%10
.33%
2.55
%26
.74%
0.6
9%4.
41%
Tho
oth
ukku
di
21.5
6%1.
18%
10.3
7%6.
22%
1.0
5%16
.76%
33.4
7%9.
13%
0.9
0%
20.5
1%2.
96%
10.1
1%
Tiru
chira
pp
alli
22.1
9%1.
86%
4.71
%4.
43%
0.2
9%5.
24%
37.4
8%5.
61%
0.2
2%11
.30
%0
.75%
6.57
%
Unc
enso
red
Hea
dco
unt R
atio
: Urb
anH
ealth
Educ
atio
nSt
and
ard
of L
ivin
g
Stat
eD
istr
ict
Nut
ritio
nC
hild
&
Ad
ole
scen
t M
ort
ality
Mat
erna
l H
ealth
Year
s o
f Sc
hoo
ling
Scho
ol
Att
end
ance
Co
oki
ng
Fuel
Sani
tatio
nD
rink
ing
Wat
erEl
ectr
icity
Ho
usin
gA
sset
sB
ank
Acc
oun
t
Tamil Nadu
Tiru
nelv
eli
24.3
8%0
.59%
6.57
%7.
85%
0.9
4%14
.68%
46.5
0%
6.82
%0
.52%
29.5
8%4.
00
%8.
45%
Tiru
pp
ur19
.95%
1.27
%3.
03%
8.49
%0
.51%
3.98
%42
.96%
6.50
%0
.20
%17
.11%
2.0
0%
6.17
%
Tiru
vann
amal
ai14
.15%
0.0
0%
3.27
%5.
76%
0.0
0%
9.58
%31
.61%
7.0
5%0
.95%
9.28
%3.
38%
5.45
%
Vel
lore
31.6
6%1.
54%
2.98
%3.
81%
0.4
8%9.
05%
29.2
8%26
.14%
0.0
5%9.
61%
1.88
%5.
47%
Vilu
pp
uram
23.1
8%1.
17%
9.67
%3.
88%
0.0
0%
22.7
9%34
.71%
12.3
2%1.
54%
24.3
7%2.
06%
4.44
%
Viru
dun
agar
15.0
0%
0.3
0%
8.83
%7.
32%
1.40
%8.
20%
46.1
8%21
.74%
0.3
3%29
.02%
3.38
%16
.62%
Telangana
Ad
ilab
ad25
.29%
1.69
%12
.75%
20.9
3%3.
26%
25.7
1%47
.75%
20.3
6%1.
54%
11.8
5%10
.24%
10.8
2%
Hyd
erab
ad23
.48%
1.40
%7.
51%
8.78
%2.
69%
3.51
%25
.89%
7.75
%0
.00
%9.
05%
3.63
%9.
24%
Karim
nag
ar25
.06%
1.0
0%
12.4
6%7.
91%
1.50
%4.
56%
35.4
7%39
.45%
0.1
8%11
.45%
4.52
%5.
65%
Kham
mam
16.9
9%0
.34%
5.46
%4.
21%
0.8
6%6.
10%
22.0
1%23
.24%
0.0
0%
8.69
%4.
28%
5.48
%
Mah
bub
nag
ar21
.04%
0.0
0%
9.40
%5.
34%
1.43
%4.
44%
23.2
9%47
.63%
0.0
0%
1.19
%2.
96%
0.0
0%
Med
ak29
.40
%3.
20%
12.3
3%11
.49%
0.6
6%21
.94%
39.5
7%22
.58%
0.2
0%
22.7
8%9.
90%
17.8
6%
Nal
go
nda
17.9
4%0
.00
%14
.31%
18.7
1%2.
96%
22.6
4%36
.50
%55
.74%
6.30
%11
.83%
17.4
9%7.
70%
Niz
amab
ad27
.30
%5.
78%
10.9
2%6.
54%
1.33
%16
.35%
37.8
6%30
.17%
0.8
9%19
.52%
7.27
%7.
46%
Ran
gar
edd
y26
.52%
0.1
5%10
.62%
6.45
%2.
27%
2.16
%46
.72%
17.5
3%0
.00
%1.
65%
4.0
4%6.
44%
War
ang
al24
.97%
1.30
%6.
88%
5.55
%2.
03%
9.78
%28
.71%
27.7
1%0
.16%
11.2
6%8.
05%
8.24
%
Tripura
Dha
lai
24.8
0%
0.6
8%11
.63%
13.9
5%1.
13%
45.4
0%
44.3
6%4.
97%
1.15
%66
.48%
8.58
%1.
37%
No
rth
Trip
ura
29.2
8%0
.00
%9.
62%
4.85
%0
.69%
34.2
6%38
.88%
8.26
%0
.67%
40.3
9%11
.44%
2.66
%
Sout
h Tr
ipur
a26
.25%
0.0
0%
3.69
%5.
45%
0.0
0%
39.0
8%35
.14%
2.42
%0
.26%
54.1
6%8.
09%
0.3
2%
Wes
t Trip
ura
21.6
3%0
.77%
8.0
3%4.
57%
0.6
8%27
.60
%28
.16%
2.77
%1.
00
%42
.96%
6.15
%2.
14%
Uttar Pradesh
Ag
ra32
.49%
3.75
%24
.95%
12.6
7%11
.58%
24.8
7%35
.09%
52.8
8%1.
90%
67.8
3%5.
65%
5.0
4%
Alig
arh
35.4
4%4.
63%
25.4
8%16
.70
%14
.52%
21.2
8%38
.09%
3.15
%3.
63%
52.3
7%6.
28%
5.23
%
Alla
hab
ad25
.57%
4.60
%25
.79%
8.0
9%4.
33%
20.3
1%27
.86%
2.45
%2.
74%
22.5
7%3.
58%
3.90
%
Am
bed
kar N
agar
51.6
5%5.
86%
32.2
0%
9.28
%8.
20%
61.5
1%46
.25%
0.0
0%
8.57
%47
.60
%9.
47%
3.61
%
Aur
aiya
34.5
3%4.
08%
32.6
9%7.
99%
5.58
%36
.75%
35.4
4%1.
45%
12.6
7%35
.26%
6.55
%2.
57%
Aza
mg
arh
40.0
0%
4.46
%24
.90
%3.
12%
4.61
%10
.29%
29.3
0%
1.12
%0
.44%
2.87
%8.
29%
7.64
%
Bag
hpat
33.2
0%
3.90
%26
.59%
15.8
3%13
.46%
28.3
0%
21.6
6%1.
64%
2.84
%29
.50
%9.
50%
5.46
%
Bahr
aich
55.7
0%
3.67
%50
.52%
28.2
6%23
.50
%49
.57%
52.7
9%3.
89%
39.3
5%42
.67%
18.5
9%25
.16%
Balli
a47
.20
%6.
92%
49.0
9%9.
51%
9.65
%35
.40
%46
.64%
6.51
%5.
51%
35.7
9%8.
83%
4.59
%
Balr a
mp
ur41
.60
%4.
33%
47.2
0%
26.2
2%19
.00
%54
.10
%42
.05%
0.0
0%
14.1
3%44
.68%
13.8
2%17
.10
%
Band
a27
.21%
3.84
%29
.30
%14
.82%
11.8
5%43
.06%
36.1
0%
6.49
%17
.08%
54.9
7%10
.20
%1.
78%
Bara
Ban
ki25
.55%
0.0
0%
23.7
6%25
.72%
9.36
%17
.26%
28.3
0%
0.7
2%7.
99%
23.3
9%12
.29%
6.84
%
Bare
illy
33.7
6%2.
64%
19.5
4%25
.16%
21.8
9%24
.13%
29.5
5%2.
58%
9.0
3%20
.54%
11.9
3%6.
23%
Bast
i25
.95%
0.0
0%
28.2
8%3.
53%
2.0
1%14
.78%
24.6
4%1.
15%
2.95
%19
.15%
0.0
0%
1.73
%
Bhad
ohi
53.7
0%
3.66
%28
.70
%15
.37%
14.8
5%40
.38%
46.6
5%3.
20%
2.69
%69
.09%
13.9
0%
3.84
%
Bijn
or
45.1
8%3.
90%
30.0
7%16
.09%
14.3
2%23
.30
%22
.44%
1.23
%9.
75%
17.8
3%11
.16%
3.12
%
Bud
aun
31.8
7%4.
00
%24
.50
%17
.11%
13.6
6%17
.83%
20.0
9%0
.00
%4.
72%
15.2
5%7.
09%
5.53
%
Bula
ndsh
ahr
35.9
4%3.
63%
30.1
0%
24.7
9%17
.24%
37.7
6%27
.68%
1.32
%5.
85%
37.4
8%11
.68%
8.31
%
Cha
ndau
li38
.96%
0.7
3%40
.01%
8.57
%6.
32%
38.7
3%32
.82%
4.79
%7.
38%
17.9
0%
5.94
%0
.35%
Chi
trak
oo
t43
.91%
9.66
%46
.29%
20.2
3%21
.00
%53
.43%
54.3
9%15
.70
%7.
48%
56.6
7%19
.33%
5.21
%
Deo
ria39
.91%
1.0
0%
23.7
2%4.
64%
5.27
%26
.51%
37.6
0%
3.37
%17
.06%
33.8
7%8.
92%
2.26
%
Etah
31.6
9%2.
42%
26.6
7%7.
45%
9.77
%26
.76%
30.4
2%3.
56%
11.0
9%23
.06%
11.0
1%3.
40%
Etaw
ah40
.01%
2.79
%33
.91%
6.78
%7.
81%
30.9
8%35
.27%
2.62
%2.
94%
21.4
0%
7.65
%2.
61%
(CONTD.) DISTrICT-WISe: UNCeNSoreD heADCoUNT rATIo (UrBAN)(CONTD.) DISTrICT-WISe: UNCeNSoreD heADCoUNT rATIo (UrBAN)
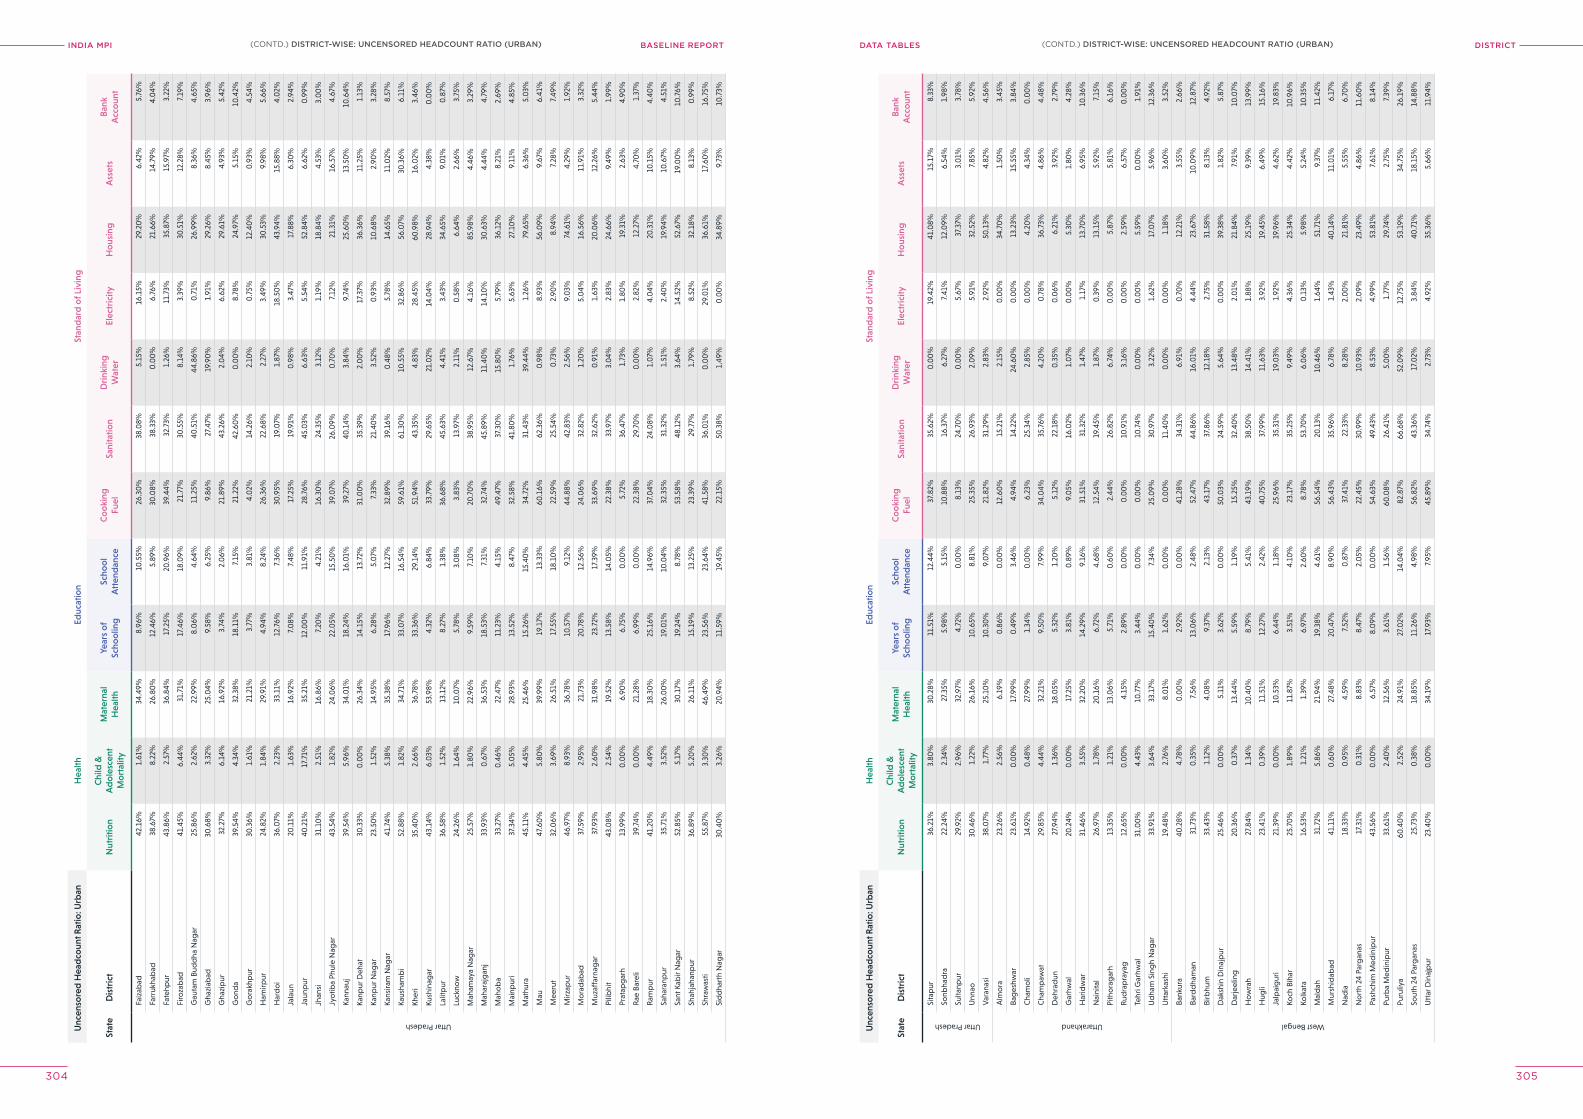
INDIA MPI BASELINE REPORT DISTrICTDATA TABleS
304 305
Unc
enso
red
Hea
dco
unt R
atio
: Urb
anH
ealth
Educ
atio
nSt
and
ard
of L
ivin
g
Stat
eD
istr
ict
Nut
ritio
nC
hild
&
Ad
ole
scen
t M
ort
ality
Mat
erna
l H
ealth
Year
s o
f Sc
hoo
ling
Scho
ol
Att
end
ance
Co
oki
ng
Fuel
Sani
tatio
nD
rink
ing
Wat
erEl
ectr
icity
Ho
usin
gA
sset
sB
ank
Acc
oun
t
Uttar Pradesh
Faiz
abad
42.1
6%1.
61%
34.4
9%8.
96%
10.5
5%26
.30
%38
.08%
5.15
%16
.15%
29.2
0%
6.42
%5.
76%
Farr
ukha
bad
38.6
7%8.
22%
26.8
0%
12.4
6%5.
89%
30.0
8%38
.33%
0.0
0%
6.76
%21
.66%
14.7
9%4.
04%
Fate
hpur
43.8
6%2.
57%
36.8
4%17
.25%
20.9
6%39
.44%
32.7
3%1.
26%
11.7
3%35
.87%
15.9
7%3.
22%
Firo
zab
ad41
.45%
6.44
%31
.71%
17.4
6%18
.09%
21.7
7%30
.55%
8.14
%3.
39%
30.5
1%12
.28%
7.19
%
Gau
tam
Bud
dha
Nag
ar25
.86%
2.62
%22
.99%
8.0
6%4.
64%
11.2
5%40
.51%
44.8
6%0
.71%
26.9
9%8.
36%
4.65
%
Gha
ziab
ad30
.68%
3.32
%25
.04%
9.58
%6.
25%
9.86
%27
.47%
19.9
0%
1.91
%29
.26%
8.45
%3.
96%
Gha
zip
ur32
.27%
6.14
%16
.92%
3.74
%2.
06%
21.8
9%43
.26%
2.0
4%6.
62%
29.6
1%4.
93%
5.42
%
Go
nda
39.5
4%4.
34%
32.3
8%18
.11%
7.15
%21
.22%
42.6
0%
0.0
0%
8.78
%24
.97%
5.15
%10
.42%
Go
rakh
pur
30.3
6%1.
61%
21.2
1%3.
77%
3.81
%4.
02%
14.2
6%2.
10%
0.7
5%12
.40
%0
.93%
4.54
%
Ham
irpur
24.8
2%1.
84%
29.9
1%4.
94%
8.24
%26
.36%
22.6
8%2.
27%
3.49
%30
.53%
9.98
%5.
66%
Har
do
i36
.07%
2.23
%33
.11%
12.7
6%7.
36%
30.9
5%19
.07%
1.87
%18
.50
%43
.94%
15.8
8%4.
02%
Jala
un20
.11%
1.63
%16
.92%
7.0
8%7.
48%
17.2
5%19
.91%
0.9
8%3.
47%
17.8
8%6.
30%
2.94
%
Jaun
pur
40.2
1%17
.71%
35.2
1%12
.00
%11
.91%
28.7
6%45
.03%
6.63
%5.
54%
52.8
4%6.
62%
0.9
9%
Jhan
si31
.10
%2.
51%
16.8
6%7.
20%
4.21
%16
.30
%24
.35%
3.12
%1.
19%
18.8
4%4.
53%
3.0
0%
Jyo
tiba
Phul
e N
agar
43.5
4%1.
82%
24.0
6%22
.05%
15.5
0%
39.0
7%26
.09%
0.7
0%
7.12
%21
.31%
16.5
7%4.
67%
Kann
auj
39.5
4%5.
96%
34.0
1%18
.24%
16.0
1%39
.27%
40.1
4%3.
84%
9.74
%25
.60
%13
.50
%10
.64%
Kanp
ur D
ehat
30.3
3%0
.00
%26
.34%
14.1
5%13
.72%
31.0
0%
35.3
9%2.
00
%17
.37%
36.3
6%11
.25%
1.13
%
Kanp
ur N
agar
23.5
0%
1.52
%14
.95%
6.28
%5.
07%
7.33
%21
.40
%3.
52%
0.9
3%10
.68%
2.90
%3.
28%
Kans
iram
Nag
ar41
.74%
5.38
%35
.38%
17.9
6%12
.27%
32.8
9%39
.16%
0.4
8%5.
78%
14.6
5%11
.02%
8.57
%
Kaus
ham
bi
52.8
8%1.
82%
34.7
1%33
.07%
16.5
4%59
.61%
61.3
0%
10.5
5%32
.86%
56.0
7%30
.36%
6.11
%
Kher
i35
.40
%2.
66%
36.7
8%33
.36%
29.1
4%51
.94%
43.3
5%4.
83%
28.4
5%60
.98%
16.0
2%3.
46%
Kush
inag
ar43
.14%
6.0
3%53
.98%
4.32
%6.
84%
33.7
9%29
.65%
21.0
2%14
.04%
28.9
4%4.
38%
0.0
0%
Lalit
pur
36.5
8%1.
52%
13.1
2%8.
27%
1.38
%36
.68%
45.6
3%4.
41%
3.43
%34
.65%
9.0
1%0
.87%
Luck
now
24.2
6%1.
64%
10.0
7%5.
78%
3.0
8%3.
83%
13.9
7%2.
11%
0.5
8%6.
64%
2.66
%3.
75%
Mah
amay
a N
agar
25.5
7%1.
80%
22.9
6%9.
59%
7.10
%20
.70
%38
.95%
12.6
7%4.
16%
85.9
8%4.
46%
3.29
%
Mah
araj
gan
j33
.93%
0.6
7%36
.53%
18.5
3%7.
31%
32.7
4%45
.89%
11.4
0%
14.1
0%
30.6
3%4.
44%
4.79
%
Mah
ob
a33
.27%
0.4
6%22
.47%
11.2
3%4.
15%
49.4
7%37
.30
%15
.80
%5.
79%
36.1
2%8.
21%
2.69
%
Mai
npur
i37
.34%
5.0
5%28
.93%
13.5
2%8.
47%
32.5
8%41
.80
%1.
76%
5.63
%27
.10
%9.
11%
4.85
%
Mat
hura
45.1
1%4.
45%
25.4
6%15
.26%
15.4
0%
34.7
2%31
.43%
39.4
4%1.
26%
79.6
5%6.
36%
5.0
3%
Mau
47.6
0%
5.80
%39
.99%
19.1
7%13
.33%
60.1
6%62
.36%
0.9
8%8.
93%
56.0
9%9.
67%
6.41
%
Mee
rut
32.0
6%3.
69%
26.5
1%17
.55%
18.1
0%
22.5
9%25
.54%
0.7
3%2.
90%
8.94
%7.
28%
7.49
%
Mirz
apur
46.9
7%8.
93%
36.7
8%10
.57%
9.12
%44
.88%
42.8
3%2.
56%
9.0
3%74
.61%
4.29
%1.
92%
Mo
rad
abad
37.5
9%2.
95%
21.7
3%20
.78%
12.5
6%24
.06%
32.8
2%1.
20%
5.0
4%16
.56%
11.9
1%3.
32%
Muz
affa
rnag
ar37
.93%
2.60
%31
.98%
23.7
2%17
.39%
33.6
9%32
.62%
0.9
1%1.
63%
20.0
6%12
.26%
5.44
%
Pilib
hit
43.0
8%2.
54%
19.5
2%13
.58%
14.0
5%22
.38%
33.9
7%3.
04%
2.83
%24
.66%
9.49
%1.
99%
Prat
apg
arh
13.9
9%0
.00
%6.
90%
6.75
%0
.00
%5.
72%
36.4
7%1.
73%
1.80
%19
.31%
2.63
%4.
90%
Rae
Bar
eli
39.7
4%0
.00
%21
.28%
6.99
%0
.00
%22
.38%
29.7
0%
0.0
0%
2.82
%12
.27%
4.70
%1.
37%
Ram
pur
41.2
0%
4.49
%18
.30
%25
.16%
14.9
6%37
.04%
24.0
8%1.
07%
4.0
4%20
.31%
10.1
5%4.
40%
Saha
ranp
ur35
.71%
3.52
%26
.00
%19
.01%
10.0
4%32
.35%
31.3
2%1.
51%
2.40
%19
.94%
10.6
7%4.
51%
Sant
Kab
ir N
agar
52.8
5%5.
17%
30.1
7%19
.24%
8.78
%53
.58%
48.1
2%3.
64%
14.5
2%52
.67%
19.0
0%
10.7
6%
Shah
jaha
npur
36.8
9%5.
20%
26.1
1%15
.19%
13.2
5%23
.39%
29.7
7%1.
79%
8.52
%32
.18%
8.13
%0
.99%
Shra
was
ti55
.87%
3.30
%46
.49%
23.5
6%23
.64%
41.5
8%36
.01%
0.0
0%
29.0
1%36
.61%
17.6
0%
16.7
5%
Sid
dha
rth
Nag
ar30
.40
%3.
26%
20.9
4%11
.59%
19.4
5%22
.15%
50.3
8%1.
49%
0.0
0%
34.8
9%9.
73%
10.7
3%
Unc
enso
red
Hea
dco
unt R
atio
: Urb
anH
ealth
Educ
atio
nSt
and
ard
of L
ivin
g
Stat
eD
istr
ict
Nut
ritio
nC
hild
&
Ad
ole
scen
t M
ort
ality
Mat
erna
l H
ealth
Year
s o
f Sc
hoo
ling
Scho
ol
Att
end
ance
Co
oki
ng
Fuel
Sani
tatio
nD
rink
ing
Wat
erEl
ectr
icity
Ho
usin
gA
sset
sB
ank
Acc
oun
t
Uttar Pradesh
Sita
pur
36.2
1%3.
80%
30.2
8%11
.51%
12.4
4%37
.82%
35.6
2%0
.00
%19
.42%
41.0
8%15
.17%
8.33
%
Sonb
had
ra22
.24%
2.34
%27
.35%
5.98
%5.
15%
10.8
8%16
.37%
6.27
%7.
41%
12.0
9%6.
54%
1.98
%
Sulta
npur
29.9
2%2.
96%
32.9
7%4.
72%
0.0
0%
8.13
%24
.70
%0
.00
%5.
67%
37.3
7%3.
01%
3.78
%
Unn
ao30
.46%
1.22
%26
.16%
10.6
5%8.
81%
25.3
5%26
.93%
2.0
9%5.
91%
32.5
2%7.
85%
5.92
%
Var
anas
i38
.07%
1.77
%25
.10
%10
.30
%9.
07%
21.8
2%31
.29%
2.83
%2.
92%
50.1
3%4.
82%
4.56
%
Uttarakhand
Alm
ora
23.2
6%2.
56%
6.19
%0
.86%
0.0
0%
12.6
0%
15.2
1%2.
15%
0.0
0%
34.7
0%
1.50
%3.
45%
Bag
eshw
ar23
.61%
0.0
0%
17.9
9%0
.49%
3.46
%4.
94%
14.2
2%24
.60
%0
.00
%13
.23%
15.5
5%3.
84%
Cha
mo
li14
.92%
0.4
8%27
.99%
1.34
%0
.00
%6.
23%
25.3
4%2.
85%
0.0
0%
4.20
%4.
34%
0.0
0%
Cha
mp
awat
29.8
5%4.
44%
32.2
1%9.
50%
7.99
%34
.04%
35.7
6%4.
20%
0.7
8%36
.73%
4.86
%4.
48%
Deh
rad
un27
.94%
1.36
%18
.05%
5.32
%1.
20%
5.12
%22
.18%
0.3
5%0
.06%
6.21
%3.
92%
2.79
%
Gar
hwal
20.2
4%0
.00
%17
.25%
3.81
%0
.89%
9.0
5%16
.02%
1.0
7%0
.00
%5.
30%
1.80
%4.
28%
Har
idw
ar31
.46%
3.55
%32
.20
%14
.29%
9.16
%31
.51%
31.3
2%1.
47%
1.17
%13
.70
%6.
95%
10.3
6%
Nai
nita
l26
.97%
1.78
%20
.16%
6.72
%4.
68%
12.5
4%19
.45%
1.87
%0
.39%
13.1
5%5.
92%
7.15
%
Pith
ora
gar
h13
.35%
1.21
%13
.06%
5.71
%0
.60
%2.
44%
26.8
2%6.
74%
0.0
0%
5.87
%5.
81%
6.16
%
Rud
rap
raya
g12
.65%
0.0
0%
4.15
%2.
89%
0.0
0%
0.0
0%
10.9
1%3.
16%
0.0
0%
2.59
%6.
57%
0.0
0%
Tehr
i Gar
hwal
31.0
0%
4.43
%10
.77%
3.44
%0
.00
%0
.00
%10
.74%
0.0
0%
0.0
0%
5.59
%0
.00
%1.
91%
Ud
ham
Sin
gh
Nag
ar33
.91%
3.64
%33
.17%
15.4
0%
7.34
%25
.09%
30.9
7%3.
22%
1.62
%17
.07%
5.96
%12
.36%
Utt
arka
shi
19.4
8%2.
76%
8.0
1%1.
62%
0.0
0%
0.0
0%
11.4
0%
0.0
0%
0.0
0%
1.18
%3.
60%
3.52
%
West Bengal
Bank
ura
40.2
8%4.
78%
0.0
0%
2.92
%0
.00
%41
.28%
34.3
1%6.
91%
0.7
0%
12.2
1%3.
55%
2.66
%
Bard
dha
man
31.7
3%0
.35%
7.56
%13
.06%
2.48
%52
.47%
44.8
6%16
.01%
4.44
%23
.67%
10.0
9%12
.87%
Birb
hum
33.4
3%1.
12%
4.0
8%9.
37%
2.13
%43
.17%
37.8
6%12
.18%
2.75
%31
.58%
8.13
%4.
92%
Dak
shin
Din
ajp
ur25
.46%
0.0
0%
5.11
%3.
62%
0.0
0%
50.0
3%24
.59%
5.64
%0
.00
%39
.38%
1.82
%5.
87%
Dar
jeel
ing
20.3
6%0
.37%
13.4
4%5.
59%
1.19
%15
.25%
32.4
0%
13.4
8%2.
01%
21.8
4%7.
91%
10.0
7%
Ho
wra
h27
.84%
1.34
%10
.40
%8.
79%
5.41
%43
.19%
38.5
0%
14.4
1%1.
88%
25.1
9%9.
39%
13.9
9%
Hug
li23
.41%
0.3
9%11
.51%
12.2
7%2.
42%
40.7
5%37
.99%
11.6
3%3.
92%
19.4
5%6.
49%
15.1
6%
Jalp
aig
uri
21.3
9%0
.00
%10
.53%
6.44
%1.
18%
25.9
6%35
.31%
19.0
3%1.
92%
19.9
6%4.
62%
19.8
3%
Koch
Bih
ar25
.70
%1.
89%
11.8
7%3.
51%
4.10
%23
.17%
35.2
5%9.
49%
4.36
%25
.34%
4.42
%10
.96%
Kolk
ata
16.5
3%1.
21%
1.39
%6.
97%
2.60
%8.
78%
53.7
0%
6.0
6%0
.13%
5.98
%5.
24%
10.3
5%
Mal
dah
31.7
2%5.
86%
21.9
4%19
.38%
4.61
%56
.54%
20.1
3%10
.46%
1.64
%51
.71%
9.37
%11
.42%
Mur
shid
abad
41.1
1%0
.60
%27
.48%
20.4
7%8.
90%
56.4
3%35
.96%
6.78
%1.
43%
40.1
4%11
.01%
6.17
%
Nad
ia18
.33%
0.9
5%4.
59%
7.52
%0
.87%
37.4
1%22
.33%
8.28
%2.
00
%21
.81%
5.55
%6.
70%
No
rth
24 P
arg
anas
17.3
1%0
.31%
8.83
%8.
47%
2.0
5%22
.45%
30.9
9%10
.93%
2.0
9%23
.49%
4.86
%11
.60
%
Pash
chim
Med
inip
ur43
.56%
0.0
0%
6.57
%8.
09%
0.0
0%
54.6
3%49
.43%
8.53
%4.
99%
53.8
1%7.
61%
8.14
%
Purb
a M
edin
ipur
33.6
1%2.
40%
12.5
6%3.
61%
1.56
%60
.08%
26.4
1%5.
00
%1.
77%
29.7
4%2.
75%
7.39
%
Puru
liya
60.4
0%
2.52
%24
.91%
27.0
2%14
.04%
82.8
7%66
.68%
52.0
9%12
.75%
53.1
9%34
.75%
26.1
9%
Sout
h 24
Par
gan
as25
.73%
0.3
8%18
.85%
11.2
6%4.
98%
56.8
2%43
.36%
17.0
2%3.
84%
40.7
1%18
.15%
14.8
8%
Utt
ar D
inaj
pur
23.4
0%
0.0
0%
34.1
9%17
.93%
7.95
%45
.89%
34.7
4%2.
73%
4.92
%35
.36%
5.66
%11
.94%
(CONTD.) DISTrICT-WISe: UNCeNSoreD heADCoUNT rATIo (UrBAN)(CONTD.) DISTrICT-WISe: UNCeNSoreD heADCoUNT rATIo (UrBAN)
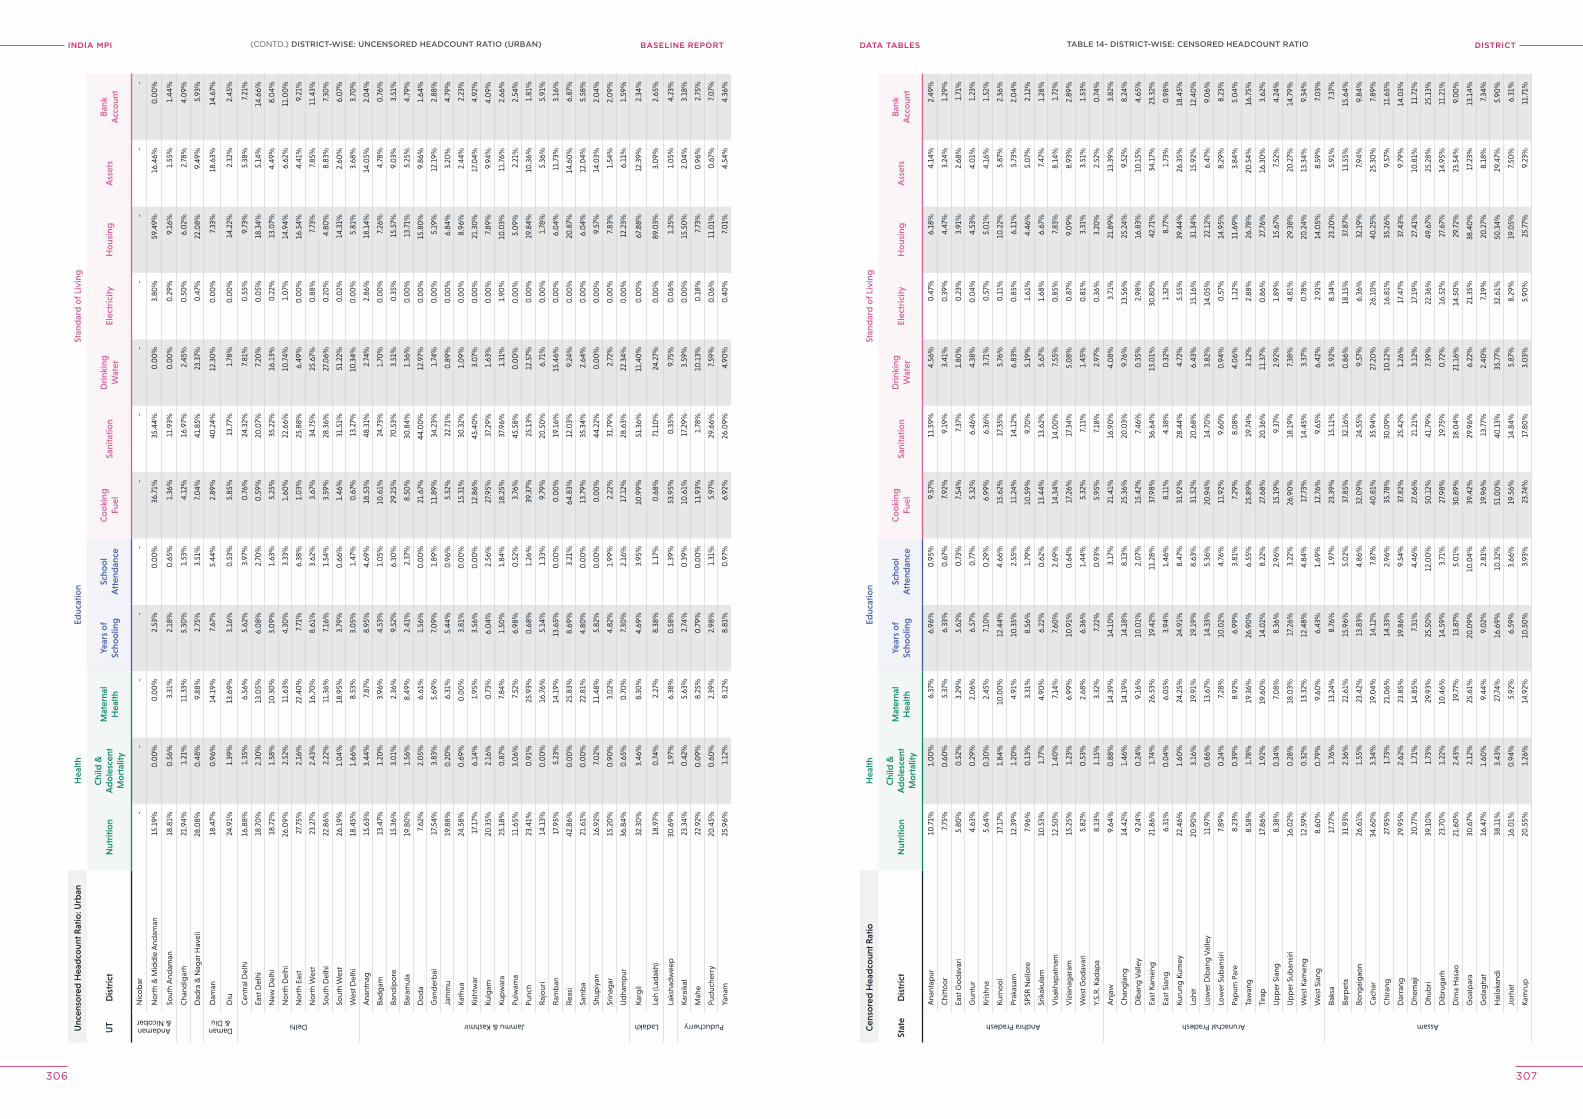
INDIA MPI BASELINE REPORT DISTrICTDATA TABleS
306 307
Unc
enso
red
Hea
dco
unt R
atio
: Urb
anH
ealth
Educ
atio
nSt
and
ard
of L
ivin
g
UT
Dis
tric
tN
utri
tion
Chi
ld &
A
do
lesc
ent
Mo
rtal
ity
Mat
erna
l H
ealth
Year
s o
f Sc
hoo
ling
Scho
ol
Att
end
ance
Co
oki
ng
Fuel
Sani
tatio
nD
rink
ing
Wat
erEl
ectr
icity
Ho
usin
gA
sset
sB
ank
Acc
oun
t
Andaman & Nicobar
Nic
ob
ar-
--
--
--
--
--
-
No
rth
& M
idd
le A
ndam
an15
.19%
0.0
0%
0.0
0%
2.53
%0
.00
%36
.71%
35.4
4%0
.00
%3.
80%
59.4
9%16
.46%
0.0
0%
Sout
h A
ndam
an18
.81%
0.5
6%3.
31%
2.18
%0
.65%
1.36
%11
.93%
0.0
0%
0.2
9%9.
16%
1.55
%1.
44%
Cha
ndig
arh
21.9
4%1.
21%
11.3
3%5.
30%
1.53
%4.
12%
16.9
7%2.
45%
0.5
0%
6.0
2%2.
78%
4.0
9%
Dad
ra &
Nag
ar H
avel
i28
.08%
0.4
8%9.
88%
2.75
%3.
51%
7.0
4%41
.85%
23.3
7%0
.47%
22.0
8%9.
49%
5.93
%
Daman & Diu
Dam
an18
.47%
0.9
6%14
.19%
7.67
%5.
44%
2.89
%40
.24%
12.3
0%
0.0
0%
7.33
%18
.63%
14.6
7%
Diu
24.9
1%1.
39%
13.6
9%3.
16%
0.5
3%5.
85%
13.7
7%1.
78%
0.0
0%
14.2
2%2.
32%
2.45
%
Delhi
Cen
tral
Del
hi16
.88%
1.35
%6.
56%
5.62
%3.
97%
0.7
6%24
.32%
7.81
%0
.55%
9.73
%5.
38%
7.21
%
East
Del
hi18
.70
%2.
30%
13.0
5%6.
08%
2.70
%0
.59%
20.0
7%7.
20%
0.0
5%18
.34%
5.14
%14
.66%
New
Del
hi18
.72%
1.58
%10
.30
%3.
09%
1.63
%5.
25%
35.2
2%16
.13%
0.2
2%13
.07%
4.49
%8.
04%
No
rth
Del
hi26
.09%
2.52
%11
.63%
4.30
%3.
33%
1.60
%22
.66%
10.7
4%1.
07%
14.9
4%6.
62%
11.0
0%
No
rth
East
27.7
5%2.
16%
22.4
0%
7.71
%6.
38%
1.0
3%25
.88%
6.49
%0
.00
%16
.54%
4.41
%9.
21%
No
rth
Wes
t23
.27%
2.43
%16
.70
%8.
61%
3.62
%3.
67%
34.7
5%25
.67%
0.8
8%7.
73%
7.85
%11
.43%
Sout
h D
elhi
22.8
6%2.
22%
11.3
6%7.
16%
1.54
%3.
59%
28.3
6%27
.06%
0.2
0%
4.80
%8.
83%
7.30
%
Sout
h W
est
26.1
9%1.
04%
18.9
5%3.
79%
0.6
6%1.
46%
31.5
1%51
.22%
0.0
2%14
.31%
2.60
%6.
07%
Wes
t Del
hi18
.45%
1.66
%8.
53%
3.0
5%1.
47%
0.6
7%13
.27%
10.3
4%0
.00
%5.
81%
3.68
%3.
70%
Jammu & Kashmir
Ana
ntna
g15
.63%
3.44
%7.
87%
8.95
%4.
69%
18.5
3%48
.31%
2.74
%2.
86%
18.1
4%14
.05%
2.0
4%
Bad
gam
13.4
7%1.
20%
3.96
%4.
53%
1.0
5%10
.61%
24.7
3%1.
70%
0.0
0%
7.26
%4.
78%
0.7
6%
Band
ipo
re15
.36%
3.0
1%2.
36%
9.52
%6.
30%
29.2
5%70
.53%
3.51
%0
.35%
15.5
7%9.
03%
3.51
%
Bara
mul
a19
.80
%1.
56%
8.49
%2.
41%
2.37
%8.
50%
30.8
4%1.
36%
0.0
0%
13.7
1%5.
25%
4.79
%
Do
da
7.62
%2.
05%
6.61
%1.
56%
0.0
0%
21.6
7%44
.00
%12
.97%
0.0
0%
15.8
0%
9.86
%1.
64%
Gan
der
bal
17.5
4%3.
83%
5.69
%7.
09%
1.89
%11
.89%
34.2
3%1.
74%
0.0
0%
5.19
%12
.19%
2.88
%
Jam
mu
19.8
8%0
.20
%6.
31%
5.44
%0
.96%
5.52
%22
.71%
0.8
9%0
.00
%6.
84%
3.20
%4.
79%
Kath
ua24
.58%
0.6
9%0
.00
%3.
81%
0.0
0%
15.3
1%30
.32%
1.0
9%0
.00
%8.
96%
2.44
%2.
23%
Kish
twar
17.1
7%6.
14%
1.95
%3.
56%
0.0
0%
12.8
6%45
.40
%3.
07%
0.0
0%
21.3
0%
17.0
4%4.
92%
Kulg
am20
.35%
2.16
%0
.73%
6.0
4%2.
56%
27.9
5%37
.29%
1.63
%0
.00
%7.
89%
9.94
%4.
09%
Kup
war
a25
.18%
0.8
7%7.
84%
1.50
%1.
84%
18.2
5%37
.96%
1.31
%1.
90%
10.0
3%11
.76%
2.66
%
Pulw
ama
11.6
5%3.
06%
7.52
%6.
98%
0.5
2%3.
76%
45.5
8%0
.00
%0
.00
%5.
09%
2.21
%2.
54%
Punc
h23
.41%
0.9
1%25
.93%
0.6
8%1.
26%
39.3
7%25
.13%
12.5
7%0
.00
%19
.84%
10.3
6%1.
81%
Raj
our
i14
.13%
0.0
0%
16.7
6%5.
14%
1.33
%9.
79%
20.5
0%
6.71
%0
.00
%1.
78%
5.36
%5.
91%
Ram
ban
17.9
5%5.
23%
14.1
9%13
.65%
0.0
0%
0.0
0%
19.1
6%15
.46%
0.0
0%
6.0
4%11
.73%
3.16
%
Reas
i42
.86%
0.0
0%
25.8
3%8.
69%
3.21
%64
.83%
12.0
3%9.
24%
0.0
0%
20.8
7%14
.60
%6.
87%
Sam
ba
21.6
1%0
.00
%22
.81%
4.80
%0
.00
%13
.79%
35.3
4%2.
64%
0.0
0%
6.0
4%12
.04%
5.58
%
Shup
iyan
16.9
2%7.
02%
11.4
8%5.
82%
0.0
0%
0.0
0%
44.2
2%0
.00
%0
.00
%9.
57%
14.0
3%2.
04%
Srin
agar
15.2
0%
0.9
0%
3.0
2%4.
82%
1.99
%2.
22%
31.7
9%2.
72%
0.0
0%
7.83
%1.
54%
2.0
9%
Ud
ham
pur
36.8
4%0
.65%
0.7
0%
7.30
%2.
16%
17.1
2%28
.63%
22.3
4%0
.00
%12
.23%
6.11
%1.
59%
Ladakh
Karg
il32
.30
%3.
46%
8.30
%4.
69%
3.95
%10
.99%
51.3
6%11
.40
%0
.00
%67
.88%
12.3
9%2.
34%
Leh
(Lad
akh)
18.9
7%0
.74%
2.27
%8.
38%
1.17
%0
.68%
71.1
0%
24.2
7%0
.00
%89
.03%
3.0
9%2.
65%
Laks
had
wee
p30
.69%
1.97
%6.
38%
0.5
8%1.
39%
53.9
5%0
.35%
9.75
%0
.06%
1.25
%1.
05%
4.23
%
Puducherry
Kara
ikal
23.3
4%0
.42%
5.63
%2.
74%
0.3
9%10
.61%
17.2
9%3.
59%
0.0
0%
15.5
0%
2.0
4%3.
18%
Mah
e22
.92%
0.0
9%8.
25%
0.7
9%0
.00
%11
.93%
1.78
%10
.13%
0.1
8%7.
73%
0.9
6%2.
75%
Pud
uche
rry
20.4
5%0
.60
%2.
39%
2.98
%1.
31%
5.97
%29
.66%
7.59
%0
.06%
11.0
1%0
.67%
7.0
7%
Yana
m25
.96%
1.12
%8.
12%
8.81
%0
.97%
6.92
%26
.09%
4.90
%0
.40
%7.
01%
4.54
%4.
36%
Cen
sore
d H
ead
coun
t Rat
ioH
ealth
Educ
atio
nSt
and
ard
of L
ivin
g
Stat
eD
istr
ict
Nut
ritio
nC
hild
&
Ad
ole
scen
t M
ort
ality
Mat
erna
l H
ealth
Year
s o
f Sc
hoo
ling
Scho
ol
Att
end
ance
Co
oki
ng
Fuel
Sani
tatio
nD
rink
ing
Wat
erEl
ectr
icity
Ho
usin
gA
sset
sB
ank
Acc
oun
t
Andhra Pradesh
Ana
ntap
ur10
.71%
1.0
0%
6.37
%6.
96%
0.9
5%9.
57%
11.5
9%4.
56%
0.4
7%6.
18%
4.14
%2.
49%
Chi
tto
or
7.75
%0
.60
%5.
37%
6.33
%0
.67%
7.92
%9.
19%
3.41
%0
.39%
4.47
%3.
24%
1.29
%
East
Go
dav
ari
5.80
%0
.52%
3.29
%5.
62%
0.7
3%7.
54%
7.37
%1.
80%
0.2
3%3.
91%
2.68
%1.
71%
Gun
tur
4.63
%0
.29%
2.0
6%6.
57%
0.7
7%5.
32%
6.46
%4.
38%
0.0
4%4.
53%
4.0
1%1.
23%
Kris
hna
5.64
%0
.30
%2.
45%
7.10
%0
.29%
6.99
%6.
36%
3.71
%0
.57%
5.0
1%4.
16%
1.52
%
Kurn
oo
l17
.17%
1.84
%10
.00
%12
.44%
4.66
%15
.62%
17.3
5%5.
76%
0.1
1%10
.22%
5.87
%2.
36%
Prak
asam
12.3
9%1.
20%
4.91
%10
.35%
2.55
%11
.24%
14.1
2%6.
83%
0.8
5%6.
11%
5.73
%2.
04%
SPSR
Nel
lore
7.96
%0
.13%
3.31
%8.
56%
1.79
%10
.59%
9.70
%5.
19%
1.61
%4.
46%
5.0
7%2.
12%
Srik
akul
am10
.53%
1.77
%4.
90%
6.22
%0
.62%
13.4
4%13
.62%
5.67
%1.
68%
6.67
%7.
47%
1.28
%
Vis
akha
pat
nam
12.5
0%
1.40
%7.
14%
7.60
%2.
69%
14.3
4%14
.00
%7.
55%
0.8
5%7.
83%
8.14
%1.
72%
Viz
iana
gar
am15
.25%
1.23
%6.
99%
10.9
1%0
.64%
17.2
6%17
.34%
5.0
8%0
.87%
9.0
9%8.
93%
2.89
%
Wes
t Go
dav
ari
5.82
%0
.53%
2.68
%6.
36%
1.44
%5.
32%
7.11
%1.
45%
0.8
1%3.
31%
3.51
%1.
53%
Y.S.
R. K
adap
a8.
13%
1.15
%3.
32%
7.22
%0
.93%
5.95
%7.
18%
2.97
%0
.36%
3.20
%2.
52%
0.7
4%
Arunachal Pradesh
Anj
aw9.
64%
0.8
8%14
.39%
14.1
0%
3.17
%21
.41%
16.9
0%
4.0
8%3.
71%
21.8
9%13
.39%
3.82
%
Cha
ngla
ng14
.42%
1.46
%14
.19%
14.1
8%8.
13%
25.3
6%20
.03%
9.76
%13
.56%
25.2
4%9.
52%
8.24
%
Dib
ang
Val
ley
9.24
%0
.24%
9.16
%10
.01%
2.0
7%15
.42%
7.46
%0
.35%
2.98
%16
.83%
10.1
5%4.
65%
East
Kam
eng
21.8
6%1.
74%
26.5
3%19
.42%
11.2
8%37
.98%
36.6
4%13
.01%
30.8
0%
42.7
1%34
.17%
23.3
2%
East
Sia
ng6.
31%
0.0
4%6.
05%
3.94
%1.
46%
8.11
%4.
38%
0.3
2%1.
32%
8.77
%1.
73%
0.9
8%
Kuru
ng K
umey
22.4
6%1.
60%
24.2
5%24
.91%
8.47
%31
.92%
28.4
4%4.
72%
5.55
%39
.44%
26.3
5%18
.45%
Lohi
t20
.90
%3.
16%
19.9
1%19
.19%
8.63
%31
.52%
20.6
8%6.
43%
15.1
6%31
.34%
15.9
2%12
.40
%
Low
er D
iban
g V
alle
y11
.97%
0.8
6%13
.67%
14.3
3%5.
36%
20.9
4%14
.70
%3.
82%
14.0
5%22
.12%
6.47
%9.
06%
Low
er S
uban
siri
7.89
%0
.24%
7.28
%10
.02%
4.76
%11
.92%
9.60
%0
.94%
0.5
7%14
.95%
8.29
%8.
23%
Pap
um P
are
8.23
%0
.39%
8.92
%6.
99%
3.81
%7.
29%
8.0
8%4.
06%
1.12
%11
.69%
3.84
%5.
04%
Taw
ang
8.58
%1.
78%
19.3
6%26
.90
%6.
55%
25.8
9%19
.74%
3.12
%2.
88%
26.7
8%20
.54%
16.7
5%
Tira
p17
.86%
1.92
%19
.60
%14
.02%
8.22
%27
.68%
20.3
6%11
.37%
0.8
6%27
.76%
16.3
0%
3.62
%
Up
per
Sia
ng8.
38%
0.3
4%7.
08%
8.36
%2.
96%
15.1
9%9.
37%
2.92
%1.
89%
15.6
7%7.
52%
4.24
%
Up
per
Sub
ansi
ri16
.02%
0.2
8%18
.03%
17.2
6%3.
22%
26.9
0%
18.1
9%7.
38%
4.81
%29
.38%
20.2
7%14
.79%
Wes
t Kam
eng
12.5
9%0
.32%
13.3
2%12
.48%
4.84
%17
.73%
14.4
5%3.
37%
0.7
8%20
.24%
13.3
4%9.
34%
Wes
t Sia
ng8.
60%
0.7
9%9.
60%
6.43
%1.
69%
12.7
6%9.
65%
6.42
%2.
91%
14.0
5%8.
59%
7.0
3%
Assam
Baks
a17
.77%
1.76
%13
.24%
8.76
%1.
97%
23.3
9%15
.11%
5.92
%8.
34%
23.2
0%
5.91
%7.
37%
Barp
eta
31.9
3%2.
36%
22.6
1%15
.96%
5.0
2%37
.85%
32.1
6%0
.86%
18.1
5%37
.87%
13.5
5%15
.64%
Bong
aig
aon
26.6
1%1.
55%
23.4
2%13
.83%
4.86
%32
.09%
24.5
5%9.
57%
6.36
%32
.19%
7.94
%9.
84%
Cac
har
34.6
0%
3.34
%19
.04%
14.1
2%7.
87%
40.8
1%35
.94%
27.2
0%
26.1
0%
40.2
5%25
.30
%7.
89%
Chi
rang
27.9
5%1.
73%
21.0
6%14
.33%
2.96
%35
.78%
30.0
9%10
.12%
16.8
1%35
.26%
9.57
%11
.65%
Dar
rang
29.9
5%2.
62%
23.8
5%19
.86%
9.54
%37
.82%
25.4
2%1.
26%
17.4
7%37
.43%
9.79
%14
.03%
Dhe
maj
i20
.77%
1.71
%14
.85%
7.31
%4.
46%
27.6
6%21
.21%
3.12
%17
.19%
27.4
1%10
.81%
11.7
2%
Dhu
bri
39.1
0%
1.73
%29
.93%
25.5
0%
12.0
0%
50.1
2%41
.79%
7.39
%22
.36%
49.6
7%25
.28%
25.1
3%
Dib
rug
arh
23.7
0%
1.22
%10
.46%
14.5
9%3.
71%
27.9
8%19
.75%
0.7
2%16
.52%
27.6
7%14
.95%
11.2
1%
Dim
a H
asao
21.6
0%
2.43
%19
.77%
13.8
7%5.
01%
30.8
9%18
.04%
21.1
6%14
.50
%29
.72%
23.5
4%9.
00
%
Go
alp
ara
30.6
7%2.
12%
25.6
1%20
.09%
10.0
4%39
.42%
29.9
6%6.
22%
21.3
5%38
.40
%17
.23%
13.1
4%
Go
lag
hat
16.4
7%1.
60%
9.44
%9.
02%
2.81
%19
.96%
13.7
7%2.
40%
7.19
%20
.27%
8.18
%7.
34%
Hai
laka
ndi
38.1
1%3.
43%
27.7
4%16
.69%
10.3
2%51
.00
%40
.13%
35.7
7%32
.61%
50.3
4%29
.47%
5.90
%
Jorh
at16
.01%
0.9
4%5.
92%
6.59
%3.
66%
19.5
6%14
.84%
5.87
%8.
29%
19.0
5%7.
50%
6.31
%
Kam
rup
20.5
5%1.
26%
14.9
2%10
.50
%3.
93%
23.7
4%17
.80
%3.
03%
5.90
%25
.77%
9.23
%11
.71%
TABle 14- DISTrICT-WISe: CeNSoreD heADCoUNT rATIo(CONTD.) DISTrICT-WISe: UNCeNSoreD heADCoUNT rATIo (UrBAN)
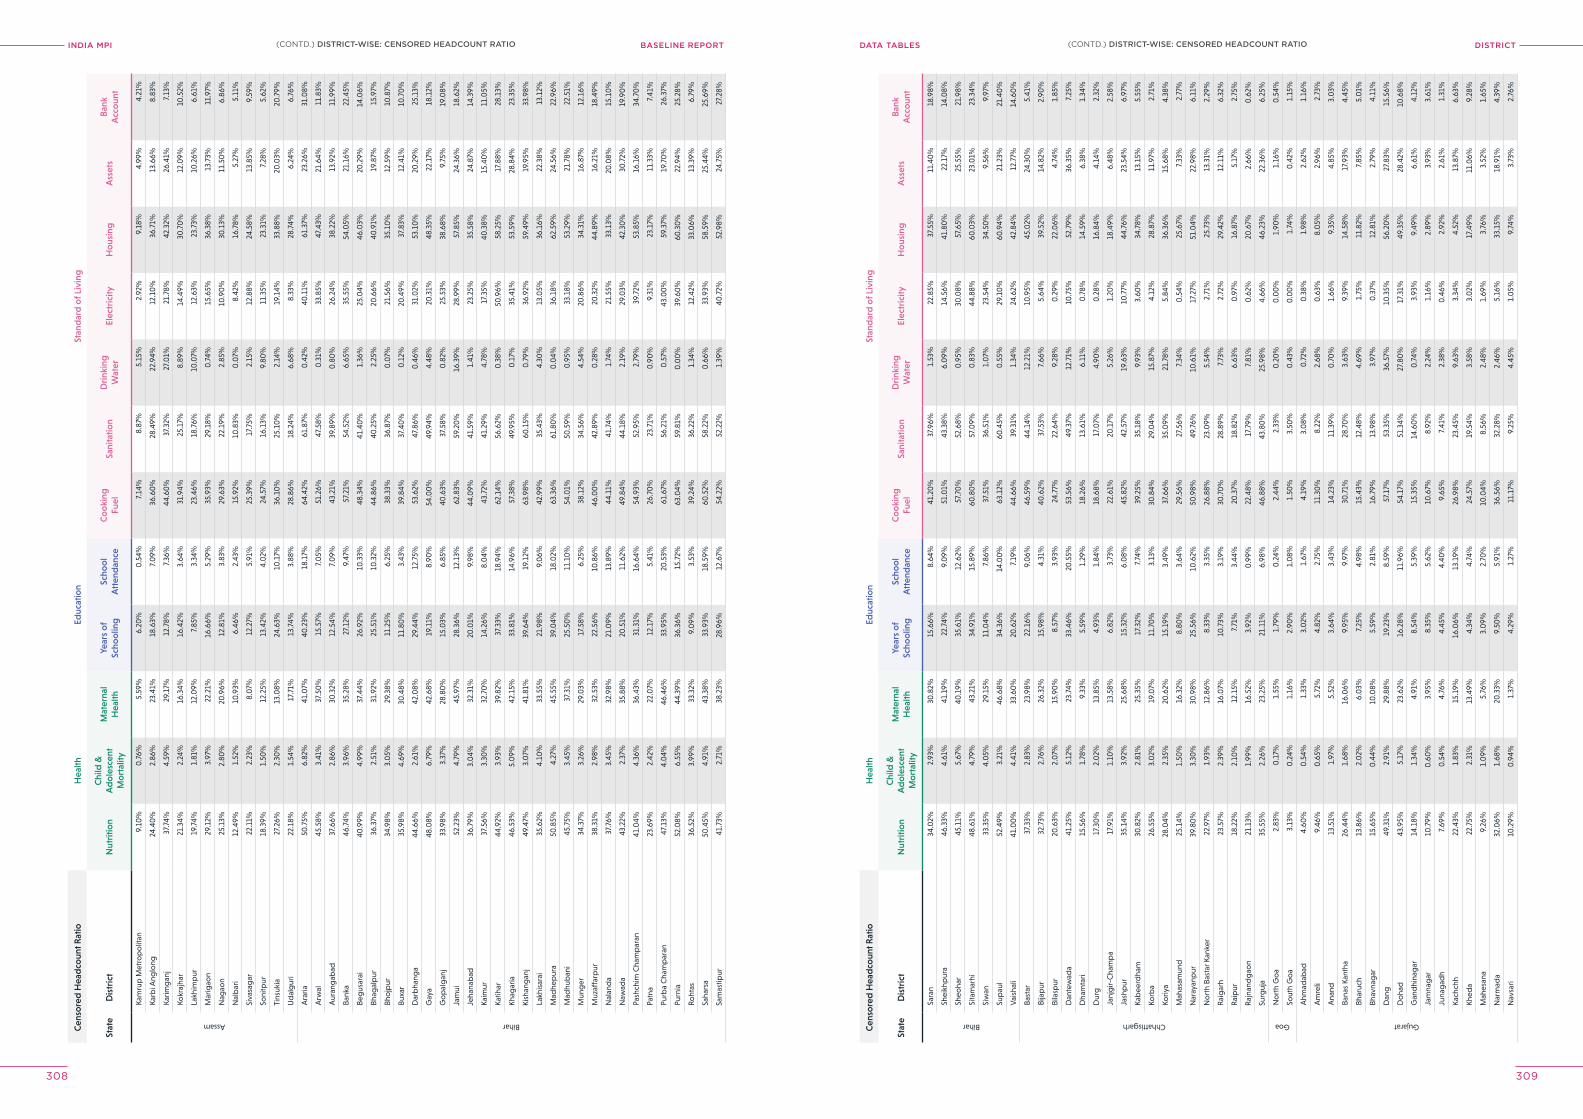
INDIA MPI BASELINE REPORT DISTrICTDATA TABleS
308 309
Cen
sore
d H
ead
coun
t Rat
ioH
ealth
Educ
atio
nSt
and
ard
of L
ivin
g
Stat
eD
istr
ict
Nut
ritio
nC
hild
&
Ad
ole
scen
t M
ort
ality
Mat
erna
l H
ealth
Year
s o
f Sc
hoo
ling
Scho
ol
Att
end
ance
Co
oki
ng
Fuel
Sani
tatio
nD
rink
ing
Wat
erEl
ectr
icity
Ho
usin
gA
sset
sB
ank
Acc
oun
t
Assam
Kam
rup
Met
rop
olit
an9.
10%
0.7
6%5.
59%
6.20
%0
.54%
7.14
%8.
87%
5.15
%2.
92%
9.18
%4.
99%
4.21
%
Karb
i Ang
long
24.4
0%
2.86
%23
.41%
18.6
3%7.
09%
36.6
0%
28.4
9%22
.94%
12.1
0%
36.7
1%13
.66%
8.83
%
Karim
gan
j37
.74%
4.59
%29
.17%
12.7
8%7.
36%
44.6
0%
37.3
2%27
.01%
21.7
8%42
.32%
26.4
1%7.
13%
Kokr
ajha
r21
.34%
2.24
%16
.34%
16.4
2%3.
64%
31.9
4%25
.17%
8.89
%14
.49%
30.7
0%
12.0
9%10
.52%
Lakh
imp
ur19
.74%
1.81
%12
.09%
7.85
%3.
34%
23.4
6%18
.76%
10.0
7%12
.63%
23.7
3%10
.26%
6.61
%
Mar
igao
n29
.12%
3.97
%22
.21%
16.6
6%5.
29%
35.9
3%29
.18%
0.7
4%15
.65%
36.3
8%13
.73%
11.9
7%
Nag
aon
25.1
3%2.
80%
20.9
6%12
.81%
3.83
%29
.63%
22.1
9%2.
85%
10.9
0%
30.1
3%11
.50
%6.
86%
Nal
bar
i12
.49%
1.52
%10
.93%
6.46
%2.
43%
15.9
2%10
.83%
0.0
7%8.
42%
16.7
8%5.
27%
5.11
%
Siva
sag
ar22
.11%
2.23
%8.
07%
12.2
7%5.
91%
25.3
9%17
.75%
2.15
%12
.88%
24.5
8%13
.85%
9.59
%
Soni
tpur
18.3
9%1.
50%
12.2
5%13
.42%
4.0
2%24
.57%
16.1
3%9.
80%
11.3
5%23
.31%
7.28
%5.
62%
Tins
ukia
27.2
6%2.
30%
13.0
8%24
.63%
10.1
7%36
.10
%25
.10
%2.
14%
19.1
4%33
.88%
20.0
3%20
.79%
Ud
alg
uri
22.1
8%1.
54%
17.7
1%13
.74%
3.88
%28
.86%
18.2
4%6.
68%
8.33
%28
.74%
6.24
%6.
76%
Bihar
Ara
ria50
.75%
6.82
%41
.07%
40.2
3%18
.17%
64.4
2%61
.87%
0.4
2%40
.11%
61.3
7%23
.26%
31.0
8%
Arw
al45
.58%
3.41
%37
.50
%15
.57%
7.0
5%51
.26%
47.5
8%0
.31%
33.8
5%47
.43%
21.6
4%11
.83%
Aur
ang
abad
37.6
6%2.
86%
30.3
2%12
.54%
7.0
9%43
.21%
39.8
9%0
.80
%26
.24%
38.2
2%13
.92%
11.9
9%
Bank
a46
.74%
3.96
%35
.28%
27.1
2%9.
47%
57.2
1%54
.52%
6.65
%35
.55%
54.0
5%21
.16%
22.4
5%
Beg
usar
ai40
.99%
4.99
%37
.44%
26.9
2%10
.33%
48.3
4%41
.40
%1.
36%
25.0
4%46
.03%
20.2
9%14
.06%
Bhag
alp
ur36
.37%
2.51
%31
.92%
25.5
1%10
.32%
44.8
6%40
.25%
2.25
%20
.66%
40.9
1%19
.87%
15.9
7%
Bho
jpur
34.9
8%3.
05%
29.3
8%11
.25%
6.25
%38
.33%
36.8
7%0
.07%
21.5
6%35
.10
%12
.59%
10.8
7%
Buxa
r35
.98%
4.69
%30
.48%
11.8
0%
3.43
%39
.84%
37.4
0%
0.1
2%20
.49%
37.8
3%12
.41%
10.7
0%
Dar
bha
nga
44.6
6%2.
61%
42.0
8%29
.44%
12.7
5%53
.62%
47.8
6%0
.46%
31.0
2%53
.10
%20
.29%
25.1
3%
Gay
a48
.08%
6.79
%42
.68%
19.1
1%8.
90%
54.0
0%
49.9
4%4.
48%
20.3
1%48
.35%
22.1
7%18
.12%
Go
pal
gan
j33
.98%
3.37
%28
.80
%15
.03%
6.85
%40
.63%
37.5
8%0
.82%
25.5
3%38
.68%
9.75
%19
.08%
Jam
ui52
.23%
4.79
%45
.97%
28.3
6%12
.13%
62.8
3%59
.20
%16
.39%
28.9
9%57
.85%
24.3
6%18
.62%
Jeha
nab
ad36
.79%
3.0
4%32
.31%
20.0
1%9.
98%
44.0
9%41
.59%
1.41
%23
.25%
35.5
8%24
.87%
14.3
9%
Kaim
ur37
.56%
3.30
%32
.70
%14
.26%
8.0
4%43
.72%
41.2
9%4.
78%
17.3
5%40
.38%
15.4
0%
11.0
5%
Katih
ar44
.92%
3.93
%39
.82%
37.3
3%18
.94%
62.1
4%56
.62%
0.3
8%50
.96%
58.2
5%17
.88%
28.1
3%
Khag
aria
46.5
3%5.
09%
42.1
5%33
.81%
14.9
6%57
.38%
49.9
5%0
.17%
35.4
1%53
.59%
28.8
4%23
.35%
Kish
ang
anj
49.4
7%3.
07%
41.8
1%39
.64%
19.1
2%63
.98%
60.1
5%0
.79%
36.9
2%59
.49%
19.9
5%33
.98%
Lakh
isar
ai35
.62%
4.10
%33
.55%
21.9
8%9.
06%
42.9
9%35
.43%
4.30
%13
.05%
36.1
6%22
.38%
13.1
2%
Mad
hep
ura
50.8
5%4.
27%
45.5
5%39
.04%
18.0
2%63
.36%
61.8
0%
0.0
4%36
.18%
62.5
9%24
.56%
22.9
6%
Mad
hub
ani
45.7
5%3.
45%
37.3
1%25
.50
%11
.10
%54
.01%
50.5
9%0
.95%
33.1
8%53
.29%
21.7
8%22
.51%
Mun
ger
34.3
7%3.
26%
29.0
3%17
.58%
6.25
%38
.12%
34.5
6%4.
54%
20.8
6%34
.31%
16.8
7%12
.16%
Muz
affa
rpur
38.3
1%2.
98%
32.5
3%22
.56%
10.8
6%46
.00
%42
.89%
0.2
8%20
.32%
44.8
9%16
.21%
18.4
9%
Nal
and
a37
.76%
3.45
%32
.98%
21.0
9%13
.89%
44.1
1%41
.74%
1.74
%21
.55%
33.1
3%20
.08%
15.1
0%
Naw
ada
43.2
2%2.
37%
35.8
8%20
.51%
11.6
2%49
.84%
44.1
8%2.
19%
29.0
3%42
.30
%30
.72%
19.9
0%
Pash
chim
Cha
mp
aran
41.0
4%4.
36%
36.4
3%31
.31%
16.6
4%54
.93%
52.9
5%2.
79%
39.7
2%53
.85%
16.1
6%34
.70
%
Patn
a23
.69%
2.42
%22
.07%
12.1
7%5.
41%
26.7
0%
23.7
1%0
.90
%9.
31%
23.1
7%11
.33%
7.41
%
Purb
a C
ham
par
an47
.13%
4.0
4%46
.46%
33.9
5%20
.53%
61.6
7%56
.21%
0.5
7%43
.00
%59
.37%
19.7
0%
26.3
7%
Purn
ia52
.08%
6.55
%44
.39%
36.3
6%15
.72%
63.0
4%59
.81%
0.0
0%
39.6
0%
60.3
0%
22.9
4%25
.28%
Roht
as36
.52%
3.99
%33
.32%
9.0
9%3.
53%
39.2
4%36
.22%
1.34
%12
.42%
33.0
6%13
.39%
6.79
%
Saha
rsa
50.4
5%4.
91%
43.3
8%33
.93%
18.5
9%60
.52%
58.2
2%0
.66%
33.9
3%58
.59%
25.4
4%25
.69%
Sam
astip
ur41
.73%
2.71
%38
.23%
28.9
6%12
.67%
54.2
2%52
.22%
1.39
%40
.72%
52.9
8%24
.75%
27.2
8%
Cen
sore
d H
ead
coun
t Rat
ioH
ealth
Educ
atio
nSt
and
ard
of L
ivin
g
Stat
eD
istr
ict
Nut
ritio
nC
hild
&
Ad
ole
scen
t M
ort
ality
Mat
erna
l H
ealth
Year
s o
f Sc
hoo
ling
Scho
ol
Att
end
ance
Co
oki
ng
Fuel
Sani
tatio
nD
rink
ing
Wat
erEl
ectr
icity
Ho
usin
gA
sset
sB
ank
Acc
oun
t
Bihar
Sara
n34
.02%
2.93
%30
.82%
15.6
6%8.
64%
41.2
0%
37.9
6%1.
53%
22.8
5%37
.55%
11.4
0%
18.9
8%
Shei
khp
ura
46.3
3%4.
61%
41.1
9%22
.74%
9.0
9%51
.01%
43.3
8%6.
09%
14.5
6%41
.80
%22
.17%
14.0
8%
Sheo
har
45.1
1%5.
67%
40.1
9%35
.61%
12.6
2%57
.70
%52
.68%
0.9
5%30
.08%
57.6
5%25
.55%
21.9
8%
Sita
mar
hi48
.61%
4.79
%43
.21%
34.9
1%15
.89%
60.8
0%
57.0
9%0
.83%
44.8
8%60
.03%
23.0
1%23
.34%
Siw
an33
.35%
4.0
5%29
.15%
11.0
4%7.
86%
37.5
1%36
.51%
1.0
7%23
.54%
34.5
0%
9.56
%9.
97%
Sup
aul
52.4
9%3.
21%
46.6
8%34
.36%
14.0
0%
63.1
2%60
.45%
0.5
5%29
.10
%60
.94%
21.2
3%21
.40
%
Vai
shal
i41
.00
%4.
41%
33.6
0%
20.6
2%7.
19%
44.6
6%39
.31%
1.34
%24
.62%
42.8
4%12
.77%
14.6
0%
Chhattisgarh
Bast
ar37
.33%
2.83
%23
.98%
22.1
6%9.
06%
46.5
9%44
.14%
12.2
1%10
.95%
45.0
2%24
.30
%5.
41%
Bija
pur
32.7
3%2.
76%
26.3
2%15
.98%
4.31
%40
.62%
37.5
3%7.
66%
5.64
%39
.52%
14.8
2%2.
90%
Bila
spur
20.6
3%2.
07%
15.9
0%
8.57
%3.
93%
24.7
7%22
.64%
9.28
%0
.29%
22.0
6%4.
74%
1.85
%
Dan
tew
ada
41.2
5%5.
12%
23.7
4%33
.46%
20.5
5%53
.56%
49.3
7%12
.71%
10.7
5%52
.79%
36.3
5%7.
25%
Dha
mta
ri15
.56%
1.78
%9.
33%
5.59
%1.
29%
18.2
6%13
.61%
6.11
%0
.78%
14.5
9%6.
38%
1.34
%
Dur
g17
.30
%2.
02%
13.8
5%4.
93%
1.84
%18
.68%
17.0
7%4.
90%
0.2
8%16
.84%
4.14
%2.
32%
Janj
gir-
Cha
mp
a17
.91%
1.10
%13
.58%
6.82
%3.
73%
22.6
1%20
.17%
5.26
%1.
20%
18.4
9%6.
48%
2.58
%
Jash
pur
35.1
4%3.
92%
25.6
8%15
.32%
6.0
8%45
.82%
42.5
7%19
.63%
10.7
7%44
.76%
23.5
4%6.
97%
Kab
eerd
ham
30.8
2%2.
81%
25.3
5%17
.32%
7.74
%39
.25%
35.1
8%9.
93%
3.60
%34
.78%
13.1
5%5.
55%
Korb
a26
.55%
3.0
2%19
.07%
11.7
0%
3.13
%30
.84%
29.0
4%15
.87%
4.12
%28
.87%
11.9
7%2.
71%
Koriy
a28
.04%
2.35
%20
.62%
15.1
9%3.
49%
37.6
6%35
.09%
21.7
8%5.
84%
36.3
6%15
.68%
4.38
%
Mah
asam
und
25.1
4%1.
50%
16.3
2%8.
80%
3.64
%29
.56%
27.5
6%7.
34%
0.5
4%25
.67%
7.33
%2.
77%
Nar
ayan
pur
39.8
0%
3.30
%30
.98%
25.5
6%10
.62%
50.9
8%49
.76%
10.6
1%17
.27%
51.0
4%22
.98%
6.11
%
No
rth
Bast
ar K
anke
r22
.97%
1.93
%12
.86%
8.33
%3.
35%
26.8
8%23
.09%
5.54
%2.
71%
25.7
3%13
.31%
2.29
%
Rai
gar
h23
.57%
2.39
%16
.07%
10.7
3%3.
19%
30.7
0%
28.8
9%7.
73%
2.72
%29
.42%
12.1
1%6.
32%
Rai
pur
18.2
2%2.
10%
12.1
5%7.
71%
3.44
%20
.37%
18.8
2%6.
63%
0.9
7%16
.87%
5.17
%2.
75%
Raj
nand
gao
n21
.13%
1.99
%16
.52%
3.92
%0
.99%
22.4
8%17
.79%
7.81
%0
.62%
20.6
7%2.
66%
0.6
2%
Surg
uja
35.5
5%2.
26%
23.2
5%21
.11%
6.98
%46
.88%
43.8
0%
25.9
8%4.
66%
46.2
3%22
.36%
6.25
%
Goa
No
rth
Go
a2.
83%
0.1
7%1.
55%
1.79
%0
.24%
2.44
%2.
33%
0.2
0%
0.0
0%
1.90
%1.
16%
0.5
4%
Sout
h G
oa
3.13
%0
.24%
1.16
%2.
90%
1.0
8%1.
50%
3.50
%0
.43%
0.0
0%
1.74
%0
.42%
1.15
%
Gujarat
Ahm
adab
ad4.
60%
0.5
4%1.
33%
3.0
2%1.
67%
4.19
%3.
08%
0.7
2%0
.38%
1.98
%2.
62%
1.16
%
Am
reli
9.46
%0
.65%
5.72
%4.
82%
2.75
%11
.30
%8.
22%
2.68
%0
.63%
8.0
5%2.
96%
2.73
%
Ana
nd13
.51%
1.97
%5.
52%
3.64
%3.
43%
14.2
3%11
.39%
0.7
0%
1.66
%9.
35%
4.85
%3.
03%
Bana
s Ka
ntha
26.4
4%1.
68%
16.0
6%9.
95%
9.97
%30
.71%
28.7
0%
3.63
%9.
39%
14.5
8%17
.93%
4.45
%
Bhar
uch
13.8
6%2.
02%
6.0
3%7.
25%
4.98
%15
.43%
12.4
8%4.
69%
1.75
%11
.82%
7.85
%5.
01%
Bhav
nag
ar15
.65%
0.4
4%10
.08%
5.59
%2.
81%
16.7
9%13
.98%
3.97
%0
.37%
12.8
1%2.
79%
4.11
%
Dan
g49
.31%
2.91
%29
.88%
19.2
3%8.
59%
57.1
7%53
.35%
36.5
7%10
.35%
56.2
0%
27.8
3%15
.56%
Do
had
43.9
5%5.
17%
23.6
2%16
.28%
11.9
6%54
.17%
51.3
4%27
.80
%17
.31%
49.3
5%28
.42%
10.6
8%
Gan
dhi
nag
ar14
.18%
1.34
%4.
91%
8.54
%5.
39%
15.3
5%14
.60
%0
.74%
3.93
%9.
49%
6.61
%4.
12%
Jam
nag
ar10
.79%
0.6
0%
3.95
%8.
35%
5.62
%10
.67%
8.92
%2.
24%
1.16
%2.
89%
3.93
%3.
61%
Juna
gad
h7.
69%
0.5
4%4.
76%
4.45
%4.
40%
9.65
%7.
41%
2.38
%0
.46%
2.92
%2.
61%
1.31
%
Kach
chh
22.4
3%1.
83%
15.1
9%16
.06%
13.1
9%26
.98%
23.4
5%9.
63%
3.34
%4.
52%
13.8
7%6.
63%
Khed
a22
.75%
2.31
%13
.49%
4.34
%4.
74%
24.5
7%19
.54%
3.58
%3.
02%
17.4
9%11
.06%
9.28
%
Mah
esan
a9.
26%
1.0
9%5.
76%
3.0
9%2.
70%
10.0
4%8.
56%
2.48
%1.
69%
3.76
%3.
52%
1.65
%
Nar
mad
a32
.06%
1.68
%20
.33%
9.50
%5.
91%
36.5
6%32
.28%
2.46
%5.
16%
33.1
5%18
.91%
4.39
%
Nav
sari
10.2
9%0
.94%
1.37
%4.
29%
1.27
%11
.17%
9.25
%4.
45%
1.0
5%9.
74%
3.73
%2.
76%
(CONTD.) DISTrICT-WISe: CeNSoreD heADCoUNT rATIo(CONTD.) DISTrICT-WISe: CeNSoreD heADCoUNT rATIo
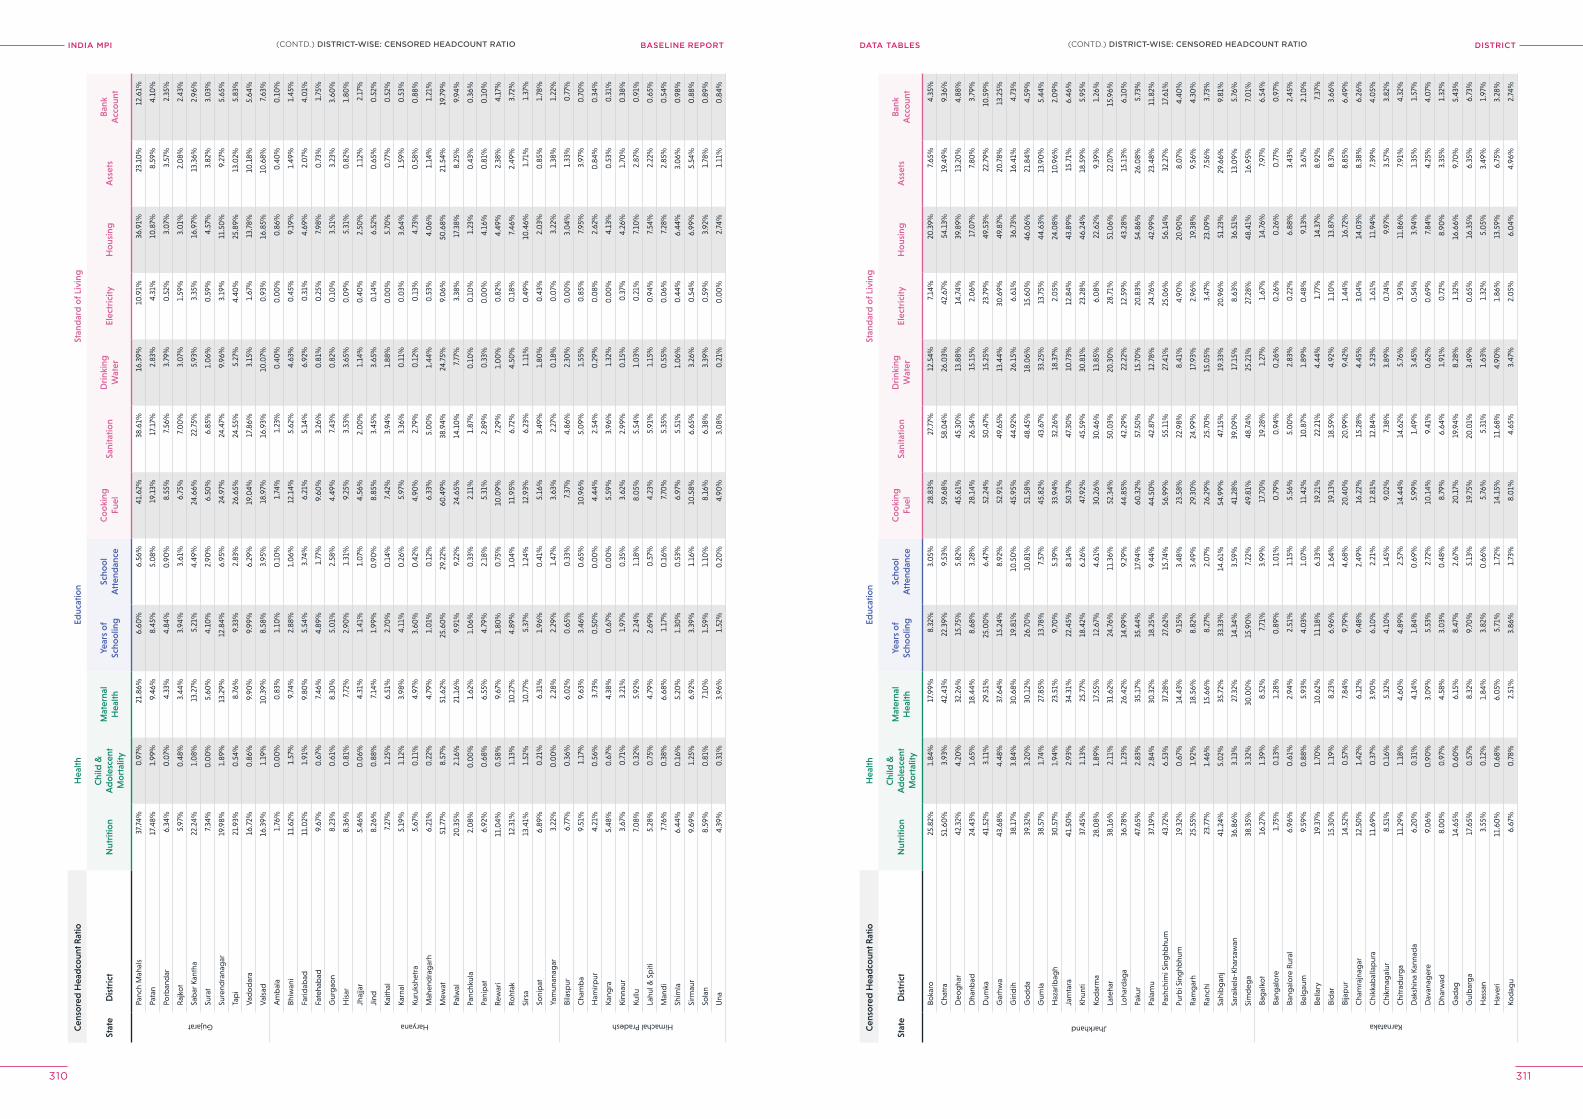
INDIA MPI BASELINE REPORT DISTrICTDATA TABleS
310 311
Cen
sore
d H
ead
coun
t Rat
ioH
ealth
Educ
atio
nSt
and
ard
of L
ivin
g
Stat
eD
istr
ict
Nut
ritio
nC
hild
&
Ad
ole
scen
t M
ort
ality
Mat
erna
l H
ealth
Year
s o
f Sc
hoo
ling
Scho
ol
Att
end
ance
Co
oki
ng
Fuel
Sani
tatio
nD
rink
ing
Wat
erEl
ectr
icity
Ho
usin
gA
sset
sB
ank
Acc
oun
t
Gujarat
Panc
h M
ahal
s37
.74%
0.9
7%21
.86%
6.60
%6.
56%
41.6
2%38
.61%
16.3
9%10
.91%
36.9
1%23
.10
%12
.61%
Pata
n17
.48%
1.99
%9.
46%
8.45
%5.
08%
19.1
3%17
.17%
2.83
%4.
31%
10.8
7%8.
59%
4.10
%
Porb
and
ar6.
34%
0.0
7%4.
33%
4.84
%0
.90
%8.
55%
7.56
%3.
79%
0.5
2%3.
07%
3.57
%2.
35%
Raj
kot
5.97
%0
.48%
3.44
%3.
94%
3.61
%6.
75%
7.0
0%
3.0
7%1.
59%
3.0
1%2.
08%
2.43
%
Sab
ar K
anth
a22
.24%
1.0
8%13
.27%
5.21
%4.
49%
24.6
6%22
.75%
5.93
%3.
35%
16.9
7%13
.36%
2.96
%
Sura
t7.
34%
0.0
0%
5.60
%4.
10%
2.90
%6.
50%
6.85
%1.
06%
0.5
9%4.
57%
3.82
%3.
03%
Sure
ndra
nag
ar19
.98%
1.89
%13
.29%
12.8
4%6.
95%
24.9
7%24
.47%
9.96
%3.
19%
11.5
0%
9.27
%5.
65%
Tap
i21
.93%
0.5
4%8.
76%
9.33
%2.
83%
26.6
5%24
.55%
5.27
%4.
40%
25.8
9%13
.02%
5.83
%
Vad
od
ara
16.7
2%0
.86%
9.90
%9.
99%
6.29
%19
.04%
17.8
6%3.
15%
1.67
%13
.78%
10.1
8%5.
64%
Val
sad
16.3
9%1.
19%
10.3
9%8.
58%
3.95
%18
.97%
16.9
3%10
.07%
0.9
3%16
.85%
10.6
8%7.
63%
Haryana
Am
bal
a1.
76%
0.0
0%
0.8
3%1.
10%
0.1
0%
1.74
%1.
23%
0.4
0%
0.0
0%
0.8
6%0
.40
%0
.10
%
Bhiw
ani
11.6
2%1.
57%
9.74
%2.
88%
1.0
6%12
.14%
5.62
%4.
63%
0.4
5%9.
19%
1.49
%1.
45%
Farid
abad
11.0
2%1.
91%
9.80
%5.
54%
3.74
%6.
21%
5.14
%6.
92%
0.3
1%4.
69%
2.0
7%4.
01%
Fate
hab
ad9.
67%
0.6
7%7.
46%
4.89
%1.
77%
9.60
%3.
26%
0.8
1%0
.25%
7.98
%0
.73%
1.75
%
Gur
gao
n8.
23%
0.6
1%8.
30%
5.0
1%2.
58%
4.49
%7.
43%
0.8
2%0
.10
%3.
51%
3.23
%3.
60%
His
ar8.
36%
0.8
1%7.
72%
2.90
%1.
31%
9.25
%3.
53%
3.65
%0
.09%
5.31
%0
.82%
1.80
%
Jhaj
jar
5.46
%0
.06%
4.31
%1.
41%
1.0
7%4.
56%
2.0
0%
1.14
%0
.40
%2.
50%
1.12
%2.
17%
Jind
8.26
%0
.88%
7.14
%1.
99%
0.9
0%
8.85
%3.
45%
3.65
%0
.14%
6.52
%0
.65%
0.5
2%
Kaith
al7.
27%
1.25
%6.
51%
2.70
%0
.14%
7.42
%3.
94%
1.88
%0
.00
%5.
70%
0.7
7%0
.52%
Karn
al5.
19%
1.12
%3.
98%
4.11
%0
.26%
5.97
%3.
36%
0.1
1%0
.03%
3.64
%1.
59%
0.5
3%
Kuru
kshe
tra
5.67
%0
.11%
4.97
%3.
60%
0.4
2%4.
90%
2.79
%0
.12%
0.1
3%4.
73%
0.5
8%0
.88%
Mah
end
rag
arh
6.21
%0
.22%
4.79
%1.
01%
0.1
2%6.
33%
5.0
0%
1.44
%0
.53%
4.0
6%1.
14%
1.21
%
Mew
at51
.77%
8.57
%51
.62%
25.6
0%
29.2
2%60
.49%
38.9
4%24
.75%
9.0
6%50
.68%
21.5
4%19
.79%
Palw
al20
.35%
2.16
%21
.16%
9.91
%9.
22%
24.6
5%14
.10
%7.
77%
3.38
%17
.38%
8.25
%9.
94%
Panc
hkul
a2.
08%
0.0
0%
1.62
%1.
06%
0.3
3%2.
11%
1.87
%0
.10
%0
.10
%1.
23%
0.4
3%0
.36%
Pani
pat
6.92
%0
.68%
6.55
%4.
79%
2.18
%5.
31%
2.89
%0
.33%
0.0
0%
4.16
%0
.81%
0.1
0%
Rew
ari
11.0
4%0
.58%
9.67
%1.
80%
0.7
5%10
.09%
7.29
%1.
00
%0
.82%
4.49
%2.
38%
4.17
%
Roht
ak12
.31%
1.13
%10
.27%
4.89
%1.
04%
11.9
5%6.
72%
4.50
%0
.18%
7.46
%2.
49%
3.72
%
Sirs
a13
.41%
1.52
%10
.77%
5.37
%1.
24%
12.9
3%6.
23%
1.11
%0
.49%
10.4
6%1.
71%
1.37
%
Soni
pat
6.89
%0
.21%
6.31
%1.
96%
0.4
1%5.
16%
3.49
%1.
80%
0.4
3%2.
03%
0.8
5%1.
78%
Yam
unan
agar
3.22
%0
.00
%2.
28%
2.29
%1.
47%
3.63
%2.
27%
0.1
8%0
.07%
3.22
%1.
38%
1.22
%
Himachal Pradesh
Bila
spur
6.77
%0
.36%
6.0
2%0
.65%
0.3
3%7.
37%
4.86
%2.
30%
0.0
0%
3.0
4%1.
33%
0.7
7%
Cha
mb
a9.
51%
1.17
%9.
63%
3.46
%0
.65%
10.9
6%5.
09%
1.55
%0
.85%
7.95
%3.
97%
0.7
0%
Ham
irpur
4.21
%0
.56%
3.73
%0
.50
%0
.00
%4.
44%
2.54
%0
.29%
0.0
8%2.
62%
0.8
4%0
.34%
Kang
ra5.
48%
0.6
7%4.
38%
0.6
7%0
.00
%5.
59%
3.96
%1.
32%
0.0
0%
4.13
%0
.53%
0.3
1%
Kinn
aur
3.67
%0
.71%
3.21
%1.
97%
0.3
5%3.
62%
2.99
%0
.15%
0.3
7%4.
26%
1.70
%0
.38%
Kullu
7.0
8%0
.32%
5.92
%2.
24%
1.18
%8.
05%
5.54
%1.
03%
0.2
1%7.
10%
2.87
%0
.91%
Lahu
l & S
piti
5.28
%0
.75%
4.79
%2.
69%
0.5
7%4.
23%
5.91
%1.
15%
0.9
4%7.
54%
2.22
%0
.65%
Man
di
7.76
%0
.38%
6.68
%1.
17%
0.1
6%7.
70%
5.35
%0
.55%
0.0
6%7.
28%
2.85
%0
.54%
Shim
la6.
44%
0.1
6%5.
20%
1.30
%0
.53%
6.97
%5.
51%
1.0
6%0
.44%
6.44
%3.
06%
0.9
8%
Sirm
aur
9.69
%1.
25%
6.92
%3.
39%
1.16
%10
.58%
6.65
%3.
26%
0.5
4%6.
99%
5.54
%0
.88%
Sola
n8.
59%
0.8
1%7.
10%
1.59
%1.
10%
8.16
%6.
38%
3.39
%0
.59%
3.92
%1.
78%
0.8
9%
Una
4.39
%0
.31%
3.96
%1.
52%
0.2
0%
4.90
%3.
08%
0.2
1%0
.00
%2.
74%
1.11
%0
.84%
Cen
sore
d H
ead
coun
t Rat
ioH
ealth
Educ
atio
nSt
and
ard
of L
ivin
g
Stat
eD
istr
ict
Nut
ritio
nC
hild
&
Ad
ole
scen
t M
ort
ality
Mat
erna
l H
ealth
Year
s o
f Sc
hoo
ling
Scho
ol
Att
end
ance
Co
oki
ng
Fuel
Sani
tatio
nD
rink
ing
Wat
erEl
ectr
icity
Ho
usin
gA
sset
sB
ank
Acc
oun
t
Jharkhand
Boka
ro25
.82%
1.84
%17
.99%
8.32
%3.
05%
28.8
3%27
.77%
12.5
4%7.
14%
20.3
9%7.
65%
4.35
%
Cha
tra
51.6
0%
3.93
%42
.43%
22.3
9%9.
53%
59.6
8%58
.04%
26.0
3%42
.67%
54.1
3%19
.49%
9.36
%
Deo
gha
r42
.32%
4.20
%32
.26%
15.7
5%5.
82%
45.6
1%45
.30
%13
.88%
14.7
4%39
.89%
13.2
0%
4.88
%
Dha
nbad
24.4
3%1.
65%
18.4
4%8.
68%
3.28
%28
.14%
26.5
4%15
.15%
2.0
6%17
.07%
7.80
%3.
79%
Dum
ka41
.52%
3.11
%29
.51%
25.0
0%
6.47
%52
.24%
50.4
7%15
.25%
23.7
9%49
.53%
22.7
9%10
.59%
Gar
hwa
43.6
8%4.
48%
37.6
4%15
.24%
8.92
%52
.91%
49.6
5%13
.44%
30.6
9%49
.87%
20.7
8%13
.25%
Giri
dih
38.1
7%3.
84%
30.6
8%19
.81%
10.5
0%
45.9
5%44
.92%
26.1
5%6.
61%
36.7
3%16
.41%
4.73
%
Go
dd
a39
.32%
3.20
%30
.12%
26.7
0%
10.8
1%51
.58%
48.4
5%18
.06%
15.6
0%
46.0
6%21
.84%
4.59
%
Gum
la38
.57%
1.74
%27
.85%
13.7
8%7.
57%
45.8
2%43
.67%
33.2
5%13
.75%
44.6
3%13
.90
%5.
44%
Haz
arib
agh
30.5
7%1.
94%
23.5
1%9.
70%
5.39
%33
.94%
32.2
6%18
.37%
2.0
5%24
.08%
10.9
6%2.
09%
Jam
tara
41.5
0%
2.93
%34
.31%
22.4
5%8.
14%
50.3
7%47
.30
%10
.73%
12.8
4%43
.89%
15.7
1%6.
46%
Khun
ti37
.45%
1.13
%25
.77%
18.4
2%6.
26%
47.9
2%45
.59%
30.8
1%23
.28%
46.2
4%18
.59%
5.95
%
Kod
arm
a28
.08%
1.89
%17
.55%
12.6
7%4.
61%
30.2
6%30
.46%
13.8
5%6.
08%
22.6
2%9.
39%
1.26
%
Late
har
38.1
6%2.
11%
31.6
2%24
.76%
11.3
6%52
.34%
50.0
3%20
.30
%28
.71%
51.0
6%22
.07%
15.9
6%
Loha
rdag
a36
.78%
1.23
%26
.42%
14.9
9%9.
29%
44.8
5%42
.29%
22.2
2%12
.59%
43.2
8%15
.13%
6.10
%
Paku
r47
.65%
2.83
%35
.17%
35.4
4%17
.94%
60.3
2%57
.50
%15
.70
%20
.83%
54.8
6%26
.08%
5.73
%
Pala
mu
37.1
9%2.
84%
30.3
2%18
.25%
9.44
%44
.50
%42
.87%
12.7
8%24
.76%
42.9
9%23
.48%
11.8
2%
Pash
chim
i Sin
ghb
hum
43.7
2%6.
53%
37.2
8%27
.62%
15.7
4%56
.99%
55.1
1%27
.41%
25.0
6%56
.14%
32.2
7%17
.61%
Purb
i Sin
ghb
hum
19.3
2%0
.67%
14.4
3%9.
15%
3.48
%23
.58%
22.9
8%8.
41%
4.90
%20
.90
%8.
07%
4.40
%
Ram
gar
h25
.55%
1.92
%18
.56%
8.82
%3.
49%
29.3
0%
24.9
9%17
.93%
2.96
%19
.38%
9.56
%4.
30%
Ran
chi
23.7
7%1.
46%
15.6
6%8.
27%
2.0
7%26
.29%
25.7
0%
15.0
5%3.
47%
23.0
9%7.
56%
3.73
%
Sahi
bg
anj
41.2
4%5.
02%
35.7
2%33
.33%
14.6
1%54
.99%
47.1
5%19
.33%
20.9
6%51
.23%
29.6
6%9.
81%
Sara
ikel
a-Kh
arsa
wan
36.8
6%3.
13%
27.3
2%14
.34%
3.59
%41
.28%
39.0
9%17
.15%
8.63
%36
.51%
13.0
9%5.
76%
Sim
deg
a38
.35%
3.32
%30
.00
%15
.90
%7.
22%
49.8
1%48
.74%
25.2
1%27
.28%
48.4
1%16
.95%
7.0
1%
Karnataka
Bag
alko
t16
.27%
1.39
%8.
52%
7.71
%3.
99%
17.7
0%
19.2
8%1.
27%
1.67
%14
.76%
7.97
%6.
54%
Bang
alo
re1.
75%
0.1
3%1.
28%
0.8
9%1.
01%
0.7
9%0
.94%
0.2
6%0
.26%
0.2
6%0
.77%
0.9
7%
Bang
alo
re R
ural
6.96
%0
.61%
2.94
%2.
51%
1.15
%5.
56%
5.0
0%
2.83
%0
.22%
6.88
%3.
43%
2.45
%
Belg
aum
9.59
%0
.88%
5.93
%4.
03%
1.0
7%11
.42%
10.8
7%1.
89%
0.4
8%9.
13%
3.67
%2.
10%
Bella
ry19
.37%
1.70
%10
.62%
11.1
8%6.
33%
19.2
1%22
.21%
4.44
%1.
77%
14.3
7%8.
92%
7.37
%
Bid
ar15
.30
%1.
19%
8.23
%6.
96%
1.64
%19
.13%
18.5
9%4.
92%
1.10
%13
.87%
8.37
%3.
66%
Bija
pur
14.5
2%0
.57%
7.84
%9.
79%
4.68
%20
.40
%20
.99%
9.42
%1.
44%
16.7
2%8.
85%
6.49
%
Cha
mra
jnag
ar12
.50
%1.
42%
6.12
%9.
48%
2.49
%16
.22%
15.2
8%4.
45%
3.0
4%14
.03%
8.38
%6.
26%
Chi
kkab
alla
pur
a11
.69%
0.3
7%3.
90%
6.10
%2.
21%
12.8
1%12
.84%
5.23
%1.
61%
11.9
4%7.
39%
4.0
5%
Chi
kmag
alur
8.51
%0
.16%
5.32
%4.
10%
1.45
%9.
02%
7.38
%3.
89%
0.7
4%9.
97%
3.57
%3.
82%
Chi
trad
urg
a11
.29%
1.18
%4.
60%
4.89
%2.
57%
14.4
4%14
.62%
5.76
%1.
93%
11.8
6%7.
91%
4.32
%
Dak
shin
a Ka
nnad
a6.
20%
0.3
1%4.
14%
1.84
%0
.69%
5.99
%1.
49%
3.45
%0
.54%
3.94
%1.
35%
1.57
%
Dav
anag
ere
9.0
6%0
.90
%3.
09%
5.53
%2.
72%
10.1
4%9.
41%
0.6
2%0
.69%
7.84
%4.
25%
4.0
7%
Dha
rwad
8.0
0%
0.9
7%4.
58%
3.0
3%0
.48%
8.79
%6.
64%
1.91
%0
.72%
8.90
%3.
35%
1.32
%
Gad
ag14
.65%
0.6
0%
6.15
%8.
47%
2.67
%20
.17%
19.9
4%8.
28%
1.32
%16
.66%
9.70
%5.
43%
Gul
bar
ga
17.6
5%0
.57%
8.32
%9.
70%
5.13
%19
.75%
20.0
1%3.
49%
0.6
5%16
.35%
6.35
%6.
73%
Has
san
3.55
%0
.12%
1.84
%3.
82%
0.6
6%5.
76%
5.31
%1.
63%
1.32
%5.
05%
3.49
%1.
97%
Hav
eri
11.6
0%
0.6
8%6.
05%
5.71
%1.
72%
14.1
5%11
.68%
4.90
%1.
86%
13.5
9%6.
75%
3.28
%
Kod
agu
6.67
%0
.78%
2.51
%3.
86%
1.73
%8.
01%
4.65
%3.
47%
2.0
5%6.
04%
4.96
%2.
74%
(CONTD.) DISTrICT-WISe: CeNSoreD heADCoUNT rATIo(CONTD.) DISTrICT-WISe: CeNSoreD heADCoUNT rATIo
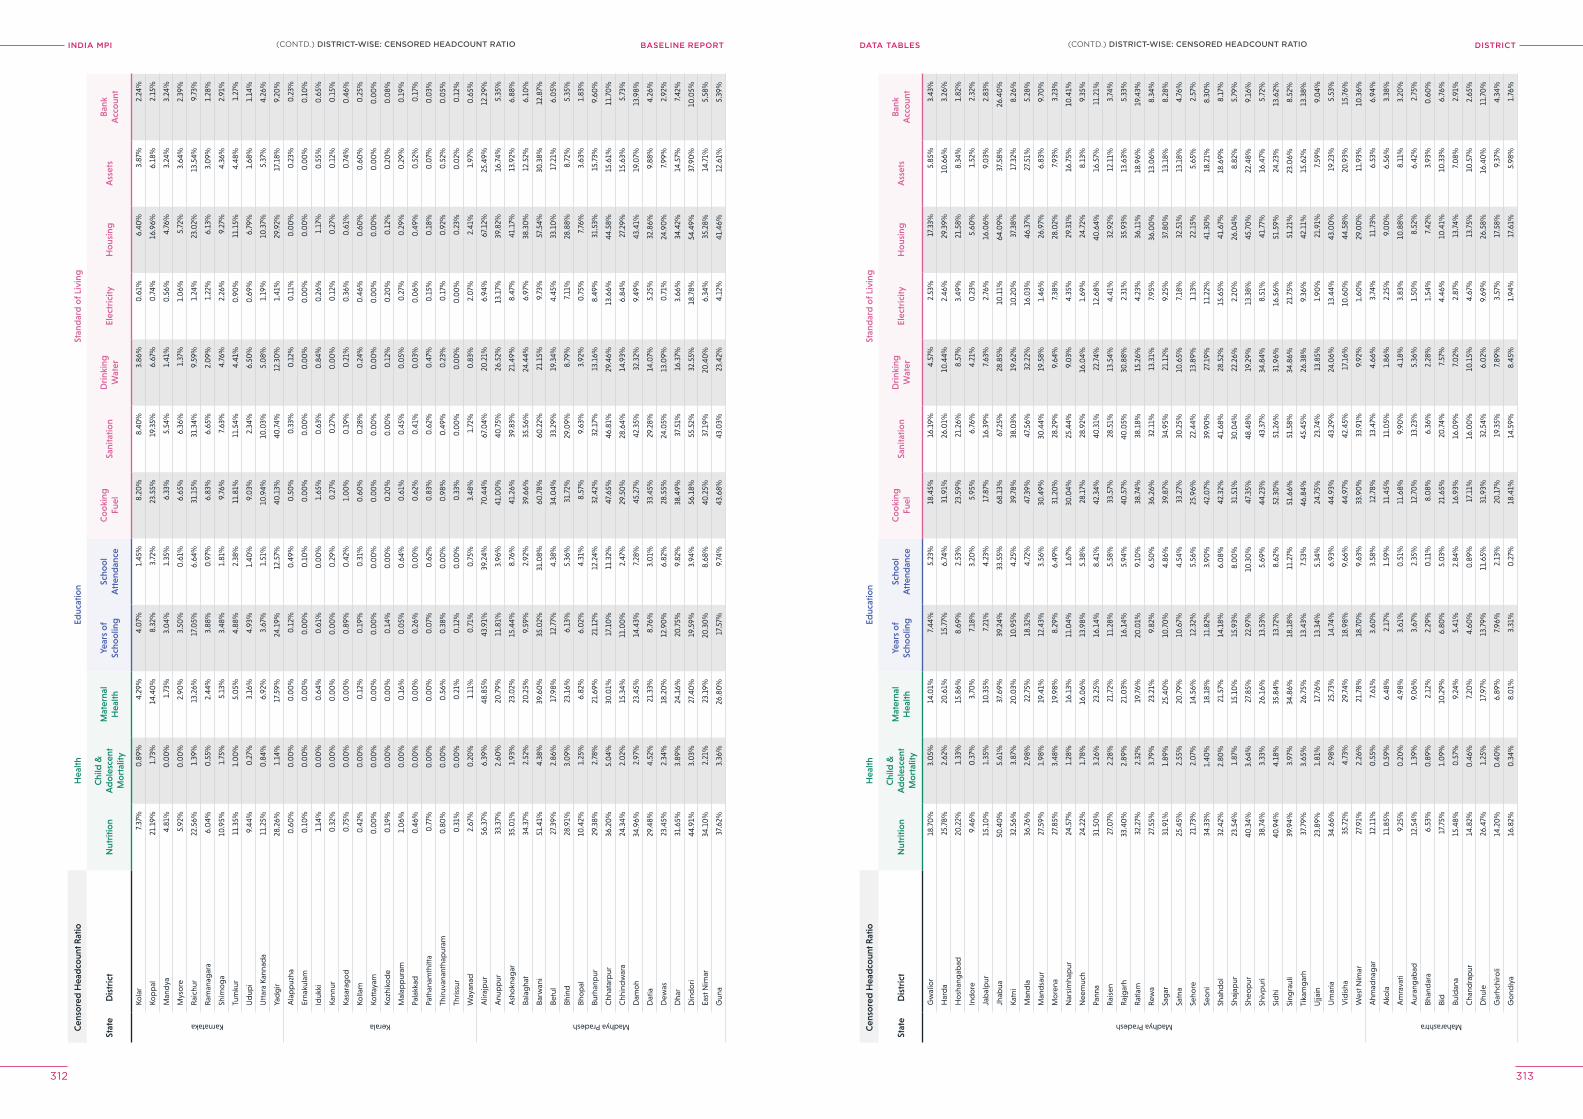
INDIA MPI BASELINE REPORT DISTrICTDATA TABleS
312 313
Cen
sore
d H
ead
coun
t Rat
ioH
ealth
Educ
atio
nSt
and
ard
of L
ivin
g
Stat
eD
istr
ict
Nut
ritio
nC
hild
&
Ad
ole
scen
t M
ort
ality
Mat
erna
l H
ealth
Year
s o
f Sc
hoo
ling
Scho
ol
Att
end
ance
Co
oki
ng
Fuel
Sani
tatio
nD
rink
ing
Wat
erEl
ectr
icity
Ho
usin
gA
sset
sB
ank
Acc
oun
t
Karnataka
Kola
r7.
37%
0.8
9%4.
29%
4.0
7%1.
45%
8.20
%8.
40%
3.86
%0
.61%
6.40
%3.
87%
2.24
%
Kop
pal
21.1
9%1.
73%
14.4
0%
8.32
%3.
72%
23.5
5%19
.35%
6.67
%0
.74%
16.9
6%6.
18%
2.15
%
Man
dya
4.81
%0
.00
%1.
73%
3.0
4%1.
35%
6.33
%5.
54%
1.41
%0
.56%
4.76
%3.
24%
3.24
%
Mys
ore
5.92
%0
.00
%2.
90%
3.50
%0
.61%
6.65
%6.
36%
1.37
%1.
06%
5.72
%3.
64%
2.39
%
Rai
chur
22.5
6%1.
39%
13.2
6%17
.05%
6.64
%31
.15%
31.3
4%9.
59%
1.24
%23
.02%
13.5
4%9.
73%
Ram
anag
ara
6.0
4%0
.55%
2.44
%3.
88%
0.9
7%6.
83%
6.65
%2.
09%
1.22
%6.
13%
3.0
9%1.
28%
Shim
og
a10
.95%
1.75
%5.
13%
3.48
%1.
81%
9.76
%7.
63%
4.76
%2.
26%
9.27
%4.
36%
2.91
%
Tum
kur
11.3
5%1.
00
%5.
05%
4.88
%2.
38%
11.8
1%11
.54%
4.41
%0
.90
%11
.15%
4.48
%1.
27%
Ud
upi
9.44
%0
.27%
3.16
%4.
93%
1.40
%9.
03%
2.34
%6.
50%
0.6
9%6.
79%
1.68
%1.
14%
Utt
ara
Kann
ada
11.2
5%0
.84%
6.92
%3.
67%
1.51
%10
.94%
10.0
3%5.
08%
1.19
%10
.37%
5.37
%4.
26%
Yad
gir
28.2
6%1.
14%
17.5
9%24
.19%
12.5
7%40
.13%
40.7
4%12
.30
%1.
41%
29.9
2%17
.18%
9.20
%
Kerala
Ala
pp
uzha
0.6
0%
0.0
0%
0.0
0%
0.1
2%0
.49%
0.5
0%
0.3
3%0
.12%
0.1
1%0
.00
%0
.23%
0.2
3%
Erna
kula
m0
.10
%0
.00
%0
.00
%0
.00
%0
.10
%0
.00
%0
.00
%0
.00
%0
.00
%0
.00
%0
.00
%0
.10
%
Iduk
ki1.
14%
0.0
0%
0.6
4%0
.61%
0.0
0%
1.65
%0
.63%
0.8
4%0
.26%
1.17
%0
.55%
0.6
5%
Kann
ur0
.32%
0.0
0%
0.0
0%
0.0
0%
0.2
9%0
.27%
0.2
7%0
.00
%0
.12%
0.2
7%0
.12%
0.1
5%
Kasa
rag
od
0.7
5%0
.00
%0
.00
%0
.89%
0.4
2%1.
00
%0
.19%
0.2
1%0
.36%
0.6
1%0
.74%
0.4
6%
Kolla
m0
.42%
0.0
0%
0.1
2%0
.19%
0.3
1%0
.60
%0
.28%
0.2
4%0
.46%
0.6
0%
0.6
0%
0.2
5%
Kott
ayam
0.0
0%
0.0
0%
0.0
0%
0.0
0%
0.0
0%
0.0
0%
0.0
0%
0.0
0%
0.0
0%
0.0
0%
0.0
0%
0.0
0%
Kozh
iko
de
0.1
9%0
.00
%0
.00
%0
.14%
0.0
0%
0.2
0%
0.0
0%
0.1
2%0
.20
%0
.12%
0.2
0%
0.0
8%
Mal
app
uram
1.0
6%0
.00
%0
.16%
0.0
5%0
.64%
0.6
1%0
.45%
0.0
5%0
.27%
0.2
9%0
.29%
0.1
9%
Pala
kkad
0.4
6%0
.00
%0
.00
%0
.26%
0.0
0%
0.6
2%0
.41%
0.0
3%0
.06%
0.4
9%0
.52%
0.1
7%
Path
anam
thitt
a0
.77%
0.0
0%
0.0
0%
0.0
7%0
.62%
0.8
3%0
.62%
0.4
7%0
.15%
0.1
8%0
.07%
0.0
3%
Thiru
vana
ntha
pur
am0
.80
%0
.00
%0
.56%
0.3
8%0
.00
%0
.98%
0.4
9%0
.23%
0.1
7%0
.92%
0.5
2%0
.05%
Thris
sur
0.3
1%0
.00
%0
.21%
0.1
2%0
.00
%0
.33%
0.0
0%
0.0
0%
0.0
0%
0.2
3%0
.02%
0.1
2%
Way
anad
2.67
%0
.20
%1.
11%
0.7
1%0
.75%
3.48
%1.
72%
0.8
3%2.
07%
2.41
%1.
97%
0.6
5%
Madhya Pradesh
Alir
ajp
ur56
.37%
6.39
%48
.85%
43.9
1%39
.24%
70.4
4%67
.04%
20.2
1%6.
94%
67.1
2%25
.49%
12.2
9%
Anu
pp
ur33
.37%
2.60
%20
.79%
11.8
1%3.
96%
41.0
0%
40.7
5%26
.52%
13.1
7%39
.82%
16.7
4%5.
35%
Ash
okn
agar
35.0
1%1.
93%
23.0
2%15
.44%
8.76
%41
.26%
39.8
3%21
.49%
8.47
%41
.17%
13.9
2%6.
88%
Bala
gha
t34
.37%
2.52
%20
.25%
9.59
%2.
92%
39.6
6%35
.56%
2 4.4
4%6.
97%
38.3
0%
12.5
2%6.
10%
Barw
ani
51.4
1%4.
38%
39.6
0%
35.0
2%31
.08%
60.7
8%60
.22%
21.1
5%9.
73%
57.5
4%30
.38%
12.8
7%
Betu
l27
.39%
2.86
%17
.98%
12.7
7%4.
38%
34.0
4%33
.29%
19.3
4%4.
45%
33.1
0%
17.2
1%6.
05%
Bhin
d28
.91%
3.0
9%23
.16%
6.13
%5.
36%
31.7
2%29
.09%
8.79
%7.
11%
28.8
8%8.
72%
5.35
%
Bho
pal
10.4
2%1.
25%
6.82
%6.
02%
4.31
%8.
57%
9.63
%3.
92%
0.7
5%7.
76%
3.63
%1.
83%
Burh
anp
ur29
.38%
2.78
%21
.69%
21.1
2%12
.24%
32.4
2%32
.17%
13.1
6%8.
49%
31.5
3%15
.73%
9.60
%
Chh
atar
pur
36.2
0%
5.0
4%30
.01%
17.1
0%
11.3
2%47
.65%
46.8
1%29
.46%
13.6
6%44
.58%
15.6
1%11
.70
%
Chh
ind
war
a24
.34%
2.0
2%15
.34%
11.0
0%
2.47
%29
.50
%28
.64%
14.9
3%6.
84%
27.2
9%15
.63%
5.73
%
Dam
oh
34.9
6%2.
97%
23.4
5%14
.43%
7.28
%45
.27%
42.3
5%32
.32%
9.49
%43
.41%
19.0
7%13
.98%
Dat
ia29
.48%
4.52
%21
.33%
8.76
%3.
01%
33.4
5%29
.28%
14.0
7%5.
25%
32.8
6%9.
88%
4.26
%
Dew
as23
.45%
2.34
%18
.20
%12
.90
%6.
82%
28.5
5%24
.05%
13.0
9%0
.71%
24.9
0%
7.99
%2.
92%
Dha
r31
.65%
3.89
%24
.16%
20.7
5%9.
82%
38.4
9%37
.51%
16.3
7%3.
66%
34.4
2%14
.57%
7.42
%
Din
do
ri44
.91%
3.0
3%27
.40
%19
.59%
3.94
%56
.18%
55.5
2%32
.55%
18.7
8%54
.49%
37.9
0%
10.0
5%
East
Nim
ar34
.10
%2.
21%
23.1
9%20
.30
%8.
68%
40.2
5%37
.19%
20.4
0%
6.34
%35
.28%
14.7
1%5.
58%
Gun
a37
.62%
3.36
%26
.80
%17
.57%
9.74
%43
.68%
43.0
3%23
.42%
4.12
%41
.46%
12.6
1%5.
39%
Cen
sore
d H
ead
coun
t Rat
ioH
ealth
Educ
atio
nSt
and
ard
of L
ivin
g
Stat
eD
istr
ict
Nut
ritio
nC
hild
&
Ad
ole
scen
t M
ort
ality
Mat
erna
l H
ealth
Year
s o
f Sc
hoo
ling
Scho
ol
Att
end
ance
Co
oki
ng
Fuel
Sani
tatio
nD
rink
ing
Wat
erEl
ectr
icity
Ho
usin
gA
sset
sB
ank
Acc
oun
t
Madhya Pradesh
Gw
alio
r18
.70
%3.
05%
14.0
1%7.
44%
5.23
%18
.45%
16.1
9%4.
57%
2.53
%17
.33%
5.85
%3.
43%
Har
da
25.7
8%2.
62%
20.6
1%15
.77%
6.74
%31
.91%
26.0
1%10
.44%
2.46
%29
.39%
10.6
6%3.
26%
Ho
shan
gab
ad20
.22%
1.33
%15
.86%
8.69
%2.
53%
23.5
9%21
.26%
8.57
%3.
49%
21.5
8%8.
34%
1.82
%
Ind
ore
9.46
%0
.37%
3.70
%7.
18%
3.20
%5.
95%
6.76
%4.
21%
0.2
3%5.
60%
1.52
%2.
32%
Jab
alp
ur15
.10
%1.
35%
10.3
5%7.
21%
4.23
%17
.87%
16.3
9%7.
63%
2.76
%16
.06%
9.0
3%2.
83%
Jhab
ua50
.40
%5.
61%
37.6
9%39
.24%
33.5
5%68
.13%
67.2
5%28
.85%
10.1
1%64
.09%
37.5
8%26
.40
%
Katn
i32
.56%
3.87
%20
.03%
10.9
5%4.
25%
39.7
8%38
.03%
19.6
2%10
.20
%37
.38%
17.3
2%8.
26%
Man
dla
36.7
6%2.
98%
22.7
5%18
.32%
4.72
%47
.39%
47.5
6%32
.22%
16.0
3%46
.37%
27.5
1%5.
28%
Man
dsa
ur27
.59%
1.98
%19
.41%
12.4
3%3.
56%
30.4
9%30
.44%
19.5
8%1.
46%
26.9
7%6.
83%
9.70
%
Mo
rena
27.8
5%3.
48%
19.9
8%8.
29%
6.49
%31
.20
%28
.29%
9.64
%7.
38%
28.0
2%7.
93%
3.23
%
Nar
sim
hap
ur24
.57%
1.28
%16
.13%
11.0
4%1.
67%
30.0
4%25
.44%
9.0
3%4.
35%
29.3
1%16
.75%
10.4
1%
Nee
muc
h24
.22%
1.78
%16
.06%
13.9
8%5.
38%
28.1
7%28
.92%
16.0
4%1.
69%
24.7
2%8.
13%
9.35
%
Pann
a31
.50
%3.
26%
23.2
5%16
.14%
8.41
%42
.34%
40.3
1%22
.74%
12.6
8%40
.64%
16.5
7%11
.21%
Rai
sen
27.0
7%2.
28%
21.7
2%11
.28%
5.58
%33
.57%
28.5
1%13
.54%
4.41
%32
.92%
12.1
1%3.
74%
Raj
gar
h33
.40
%2.
89%
21.0
3%16
.14%
5.94
%40
.57%
40.0
5%30
.88%
2.31
%35
.93%
13.6
3%5.
33%
Rat
lam
32.2
7%2.
32%
19.7
6%20
.01%
9.10
%38
.74%
38.1
8%15
.26%
4.23
%36
.11%
18.9
6%19
.43%
Rew
a27
.55%
3.79
%23
.21%
9.82
%6.
50%
36.2
6%32
.11%
13.3
1%7.
95%
36.0
0%
13.0
6%8.
34%
Sag
ar31
.91%
1.89
%25
.40
%10
.70
%4.
86%
39.8
7%34
.95%
21.1
2%9.
25%
37.8
0%
13.1
8%8.
28%
Satn
a25
.45%
2.55
%20
.79%
10.6
7%4.
54%
33.2
7%30
.25%
10.6
5%7.
18%
32.5
1%13
.18%
4.76
%
Seho
re21
.73%
2.0
7%14
.56%
12.3
2%5.
56%
25.9
6%22
.44%
13.8
9%1.
13%
22.1
5%5.
65%
2.57
%
Seo
ni34
.33%
1.40
%18
.18%
11.8
2%3.
90%
42.0
7%39
.90
%27
.19%
11.2
2%41
.30
%18
.21%
8.30
%
Shah
do
l32
.42%
2.80
%21
.57%
14.1
8%6.
08%
42.3
2%41
.68%
28.5
2%15
.65%
41.6
7%18
.69%
8.17
%
Shaj
apur
23.5
4%1.
87%
15.1
0%
15.9
3%8.
00
%31
.51%
30.0
4%22
.26%
2.20
%26
.04%
8.82
%5.
79%
Sheo
pur
40.3
4%3.
64%
27.8
5%22
.97%
10.3
0%
47.3
5%48
.48%
19.2
9%13
.38%
45.7
0%
22.4
8%9.
16%
Shiv
pur
i38
.74%
3.33
%26
.16%
13.5
3%5.
69%
44.2
3%43
.37%
34.8
4%8.
51%
41.7
7%16
.47%
5.72
%
Sid
hi40
.94%
4.18
%35
.84%
13.7
2%8.
62%
52.3
0%
51.2
6%31
.96%
16.5
6%51
.59%
24.2
3%13
.62%
Sing
raul
i39
.94%
3.97
%34
.86%
18.1
8%11
.27%
51.6
6%51
.58%
34.8
6%21
.75%
51.2
1%23
.06%
8.52
%
Tika
mg
arh
37.7
9%3.
65%
26.7
5%13
.43%
7.53
%46
.84%
45.4
5%26
.38%
9.36
%42
.11%
15.6
2%13
.38%
Ujja
in23
.89%
1.81
%17
.76%
13.3
4%5.
34%
24.7
5%23
.74%
13.8
5%1.
90%
21.9
1%7.
59%
9.0
4%
Um
aria
34.6
6%2.
98%
25.7
3%14
.74%
6.93
%44
.93%
43.2
9%24
.06%
13.4
4%43
.00
%19
.23%
5.53
%
Vid
isha
35.7
2%4.
73%
29.7
4%18
.98%
9.66
%44
.97%
42.4
5%17
.16%
10.6
0%
44.5
8%20
.93%
15.7
6%
Wes
t Nim
ar27
.91%
2.26
%21
.78%
18.7
0%
9.63
%33
.90
%33
.91%
9.92
%1.
60%
29.0
0%
11.9
3%10
.36%
Maharashtra
Ahm
adna
gar
12.1
1%0
.55%
7.61
%3.
60%
3.58
%12
.78%
13.4
7%4.
66%
3.74
%11
.73%
6.53
%6.
94%
Ako
la11
.85%
0.5
9%6.
48%
2.17
%1.
59%
11.4
5%11
.05%
1.86
%2.
25%
9.0
0%
6.56
%3.
38%
Am
rava
ti9.
25%
0.2
0%
4.98
%3.
61%
0.5
1%11
.68%
9.90
%4.
18%
3.83
%10
.88%
8.11
%3.
20%
Aur
ang
abad
12.5
4%1.
39%
9.0
6%3.
67%
2.35
%12
.70
%13
.23%
5.36
%1.
50%
8.52
%6.
42%
2.75
%
Bhan
dar
a6.
53%
0.8
9%2.
12%
2.29
%0
.11%
8.0
8%6.
36%
2.28
%1.
54%
7.42
%3.
93%
0.6
0%
Bid
17.7
5%1.
09%
10.2
9%6.
80%
5.0
3%21
.65%
20.7
4%7.
57%
4.46
%10
.41%
10.3
3%6.
76%
Buld
ana
15.4
8%0
.57%
9.24
%5.
41%
2.84
%16
.93%
16.0
9%7.
02%
2.87
%13
.74%
7.0
8%2.
91%
Cha
ndra
pur
14.8
2%0
.46%
7.20
%4.
60%
0.8
9%17
.11%
16.0
0%
10.1
5%4.
67%
13.7
5%10
.57%
2.65
%
Dhu
le26
.47%
1.25
%17
.97%
13.7
9%11
.65%
31.9
3%32
.54%
6.0
2%9.
69%
26.5
8%16
.40
%11
.70
%
Gar
hchi
roli
14.2
0%
0.4
0%
6.89
%7.
96%
2.13
%20
.17%
19.3
5%7.
89%
3.57
%17
.58%
9.37
%4.
34%
Go
ndiy
a16
.82%
0.3
4%8.
01%
3.31
%0
.27%
18.4
1%14
.59%
8.45
%1.
94%
17.6
1%5.
98%
1.76
%
(CONTD.) DISTrICT-WISe: CeNSoreD heADCoUNT rATIo(CONTD.) DISTrICT-WISe: CeNSoreD heADCoUNT rATIo
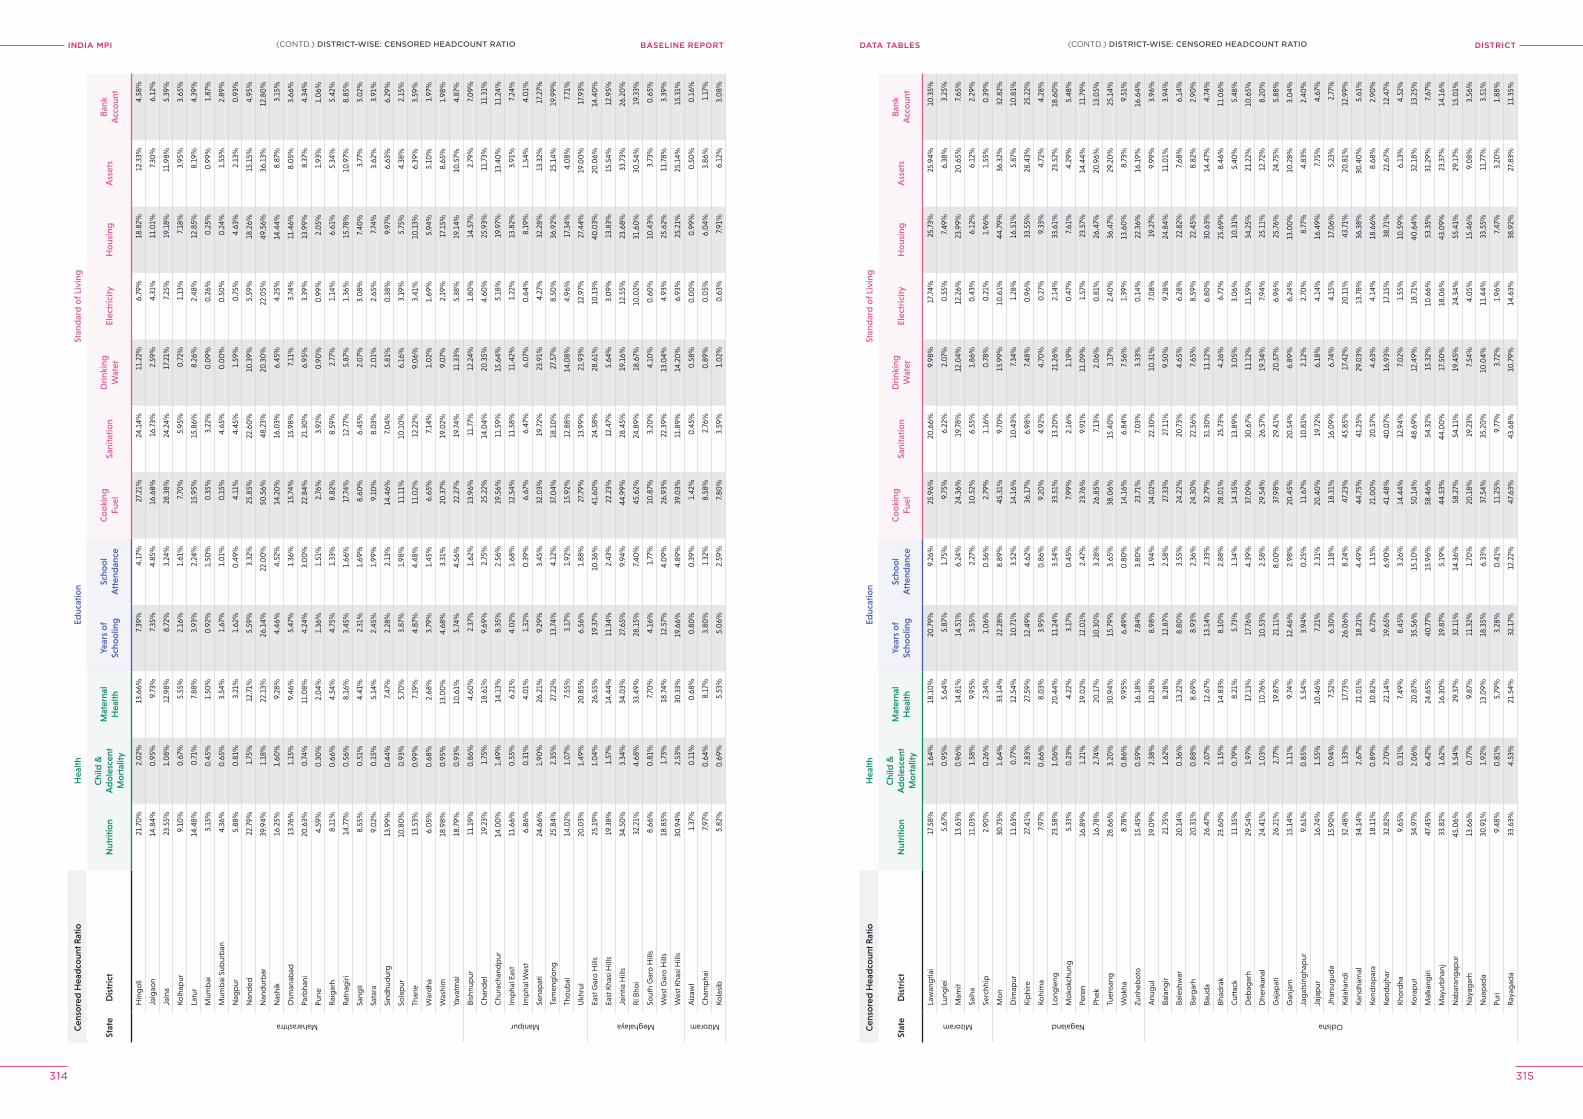
INDIA MPI BASELINE REPORT DISTrICTDATA TABleS
314 315
Cen
sore
d H
ead
coun
t Rat
ioH
ealth
Educ
atio
nSt
and
ard
of L
ivin
g
Stat
eD
istr
ict
Nut
ritio
nC
hild
&
Ad
ole
scen
t M
ort
ality
Mat
erna
l H
ealth
Year
s o
f Sc
hoo
ling
Scho
ol
Att
end
ance
Co
oki
ng
Fuel
Sani
tatio
nD
rink
ing
Wat
erEl
ectr
icity
Ho
usin
gA
sset
sB
ank
Acc
oun
t
Maharashtra
Hin
go
li21
.70
%2.
02%
13.6
6%7.
39%
4.17
%27
.21%
24.1
4%11
.22%
6.79
%18
.82%
12.3
3%4.
58%
Jalg
aon
14.8
4%0
.95%
9.73
%7.
35%
4.85
%16
.68%
16.7
3%2.
59%
4.31
%11
.01%
7.30
%6.
12%
Jaln
a23
.55%
1.0
8%12
.98%
8.72
%3.
24%
28.3
8%24
.24%
17.2
1%7.
25%
19.1
8%11
.98%
5.39
%
Kolh
apur
9.10
%0
.67%
5.55
%2.
16%
1.61
%7.
70%
5.95
%0
.72%
1.13
%7.
18%
3.95
%3.
65%
Latu
r14
.48%
0.7
1%7.
88%
3.93
%2.
24%
15.9
5%15
.86%
8.26
%2.
48%
12.8
5%8.
19%
4.39
%
Mum
bai
3.15
%0
.45%
1.50
%0
.92%
1.50
%0
.35%
3.22
%0
.09%
0.2
6%0
.25%
0.9
9%1.
87%
Mum
bai
Sub
urb
an4.
36%
0.6
5%3.
54%
1.67
%1.
01%
0.1
5%4.
65%
0.0
0%
0.5
0%
0.2
4%1.
55%
2.89
%
Nag
pur
5.88
%0
.81%
3.21
%1.
62%
0.4
9%4.
11%
4.45
%1.
59%
0.7
5%4.
63%
2.13
%0
.93%
Nan
ded
22.7
9%1.
75%
12.7
1%5.
59%
3.32
%25
.85%
22.6
0%
10.3
9%5.
59%
18.2
6%15
.15%
4.95
%
Nan
dur
bar
39.9
4%1.
18%
22.1
3%26
.14%
22.0
0%
50.5
6%48
.23%
20.3
0%
22.0
5%49
.56%
36.1
3%12
.80
%
Nas
hik
16.2
5%1.
60%
9.28
%4.
46%
4.52
%14
.20
%16
.03%
6.45
%4.
25%
14.4
4%8.
87%
3.15
%
Osm
anab
ad13
.76%
1.15
%9.
46%
5.47
%1.
36%
15.7
4%15
.98%
7.11
%3.
74%
11.4
6%8.
05%
3.66
%
Parb
hani
20.6
3%0
.74%
11.0
8%4.
24%
3.0
0%
22.8
4%21
.30
%6.
95%
3.39
%13
.99%
8.37
%4.
34%
Pune
4.59
%0
.30
%2.
04%
1.36
%1.
51%
2.76
%3.
92%
0.9
0%
0.9
9%2.
05%
1.93
%1.
06%
Rai
gar
h8.
11%
0.6
6%4.
54%
4.75
%1.
33%
8.82
%8.
59%
2.77
%1.
14%
6.61
%5.
34%
5.42
%
Rat
nag
iri14
.77%
0.5
6%8.
16%
3.45
%1.
66%
17.7
4%12
.77%
5.87
%1.
36%
15.7
8%10
.97%
8.85
%
Sang
li8.
55%
0.5
1%4.
41%
2.31
%1.
69%
8.60
%6.
45%
2.0
7%3.
08%
7.40
%3.
77%
3.0
2%
Sata
ra9.
02%
0.1
5%5.
14%
2.45
%1.
99%
9.10
%8.
03%
2.0
1%2.
65%
7.74
%3.
62%
3.91
%
Sind
hud
urg
13.9
9%0
.44%
7.47
%2.
28%
2.13
%14
.46%
7.0
4%5.
81%
0.3
8%9.
97%
6.63
%6.
29%
Sola
pur
10.8
0%
0.9
3%5.
70%
3.87
%1.
98%
11.1
1%10
.10
%6.
16%
3.19
%5.
75%
4.38
%2.
15%
Than
e13
.53%
0.9
9%7.
19%
4.87
%4.
48%
11.0
2%12
.22%
9.0
6%3.
41%
10.1
3%6.
39%
3.59
%
War
dha
6.0
5%0
.68%
2.68
%3.
79%
1.45
%6.
65%
7.14
%1.
02%
1.69
%5.
94%
5.10
%1.
97%
Was
him
18.9
8%0
.95%
13.0
0%
4.68
%3.
31%
20.3
7%19
.02%
9.0
7%2.
19%
17.1
5%8.
65%
1.98
%
Yava
tmal
18.7
9%0
.93%
10.6
1%5.
74%
4.56
%22
.27%
19.7
4%11
.33%
5.38
%19
.14%
10.5
7%4.
87%
Manipur
Bish
nup
ur11
.19%
0.8
6%4.
60%
2.37
%1.
62%
13.9
6%11
.77%
12.2
4%1.
80%
14.5
7%2.
79%
7.0
9%
Cha
ndel
19.2
3%1.
75%
18.6
1%9.
69%
2.75
%25
.22%
14.0
4%20
.35%
4.60
%25
.93%
11.7
3%11
.31%
Chu
rach
and
pur
14.0
0%
1.49
%14
.13%
8.35
%2.
56%
19.5
6%11
.59%
15.6
4%5.
18%
19.9
7%13
.40
%11
.24%
Imp
hal E
ast
11.6
6%0
.55%
6.21
%4.
02%
1.68
%12
.54%
11.5
8%11
.42%
1.22
%13
.82%
3.91
%7.
24%
Imp
hal W
est
6.86
%0
.31%
4.0
1%1.
32%
0.3
9%6.
67%
6.47
%6.
07%
0.6
4%8.
19%
1.54
%4.
01%
Sena
pat
i24
.66%
1.90
%26
.21%
9.29
%3.
45%
32.0
3%19
.72%
23.9
1%4.
27%
32.2
8%13
.32%
17.2
7%
Tam
eng
long
25.8
4%2.
35%
27.2
2%13
.74%
4.12
%37
.04%
18.1
0%
27.5
7%8.
50%
36.9
2%25
.14%
19.9
9%
Tho
ubal
14.0
2%1.
07%
7.55
%3.
17%
1.92
%15
.92%
12.8
8%14
.08%
4.96
%17
.34%
4.0
8%7.
71%
Ukh
rul
20.0
3%1.
49%
20.8
5%6.
56%
1.88
%27
.79%
13.9
9%21
.93%
12.9
7%27
.44%
19.0
0%
17.9
3%
Meghalaya
East
Gar
o H
ills
25.1
9%1.
04%
26.5
5%19
.37%
10.3
6%41
.60
%24
.58%
28.6
1%10
.13%
40.0
3%20
.06%
14.4
0%
East
Kha
si H
ills
19.3
8%1.
57%
14.4
4%11
.34%
2.43
%22
.23%
12.4
7%5.
64%
3.0
9%13
.83%
15.5
4%12
.95%
Jain
tia H
ills
34.5
0%
3.34
%34
.03%
27.6
5%9.
94%
44.9
9%28
.45%
19.1
6%12
.55%
23.6
8%33
.73%
26.2
0%
Ri B
hoi
32.2
1%4.
68%
33.4
9%28
.15%
7.40
%45
.62%
24.8
9%18
.67%
10.0
2%31
.60
%30
.54%
19.3
3%
Sout
h G
aro
Hill
s8.
66%
0.8
1%7.
70%
4.16
%1.
77%
10.8
7%3.
20%
4.10
%0
.60
%10
.43%
3.73
%0
.65%
Wes
t Gar
o H
ills
18.8
5%1.
73%
18.7
4%12
.57%
4.0
9%26
.93%
22.3
9%13
.04%
4.93
%25
.62%
11.7
8%3.
39%
Wes
t Kha
si H
ills
30.9
4%2.
53%
30.3
3%19
.66%
4.89
%39
.03%
11.8
9%14
.20
%6.
93%
25.2
1%25
.14%
15.3
1%
Mizoram
Aiz
awl
1.37
%0
.11%
0.6
8%0
.80
%0
.39%
1.42
%0
.45%
0.5
8%0
.00
%0
.99%
0.5
0%
0.1
6%
Cha
mp
hai
7.97
%0
.64%
8.17
%3.
80%
1.32
%8.
58%
2.76
%0
.89%
0.0
5%6.
04%
3.86
%1.
17%
Kola
sib
5.82
%0
.69%
5.53
%5.
06%
2.59
%7.
80%
3.59
%1.
02%
0.6
3%7.
91%
6.12
%3.
08%
Cen
sore
d H
ead
coun
t Rat
ioH
ealth
Educ
atio
nSt
and
ard
of L
ivin
g
Stat
eD
istr
ict
Nut
ritio
nC
hild
&
Ad
ole
scen
t M
ort
ality
Mat
erna
l H
ealth
Year
s o
f Sc
hoo
ling
Scho
ol
Att
end
ance
Co
oki
ng
Fuel
Sani
tatio
nD
rink
ing
Wat
erEl
ectr
icity
Ho
usin
gA
sset
sB
ank
Acc
oun
t
Mizoram
Law
ang
tlai
17.5
8%1.
64%
18.1
0%
20.7
9%9.
26%
25.9
6%20
.66%
9.98
%17
.74%
25.7
3%25
.94%
10.3
5%
Lung
lei
5.67
%0
.95%
5.64
%5.
87%
1.75
%9.
75%
6.22
%2.
07%
0.5
5%7.
49%
6.38
%3.
25%
Mam
it13
.63%
0.9
6%14
.81%
14.5
1%6.
24%
24.3
6%19
.78%
12.0
4%12
.26%
23.9
9%20
.65%
7.65
%
Saih
a11
.03%
1.58
%9.
95%
3.55
%2.
27%
10.5
2%6.
55%
1.86
%0
.43%
6.12
%6.
12%
2.29
%
Serc
hhip
2.90
%0
.26%
2.34
%1.
06%
0.5
6%2.
79%
1.16
%0
.78%
0.2
1%1.
96%
1.55
%0
.39%
Nagaland
Mo
n30
.75%
1.64
%33
.14%
22.2
8%8.
89%
45.3
1%9.
70%
13.9
9%10
.61%
44.7
9%36
.32%
32.8
2%
Dim
apur
11.6
3%0
.77%
12.5
4%10
.71%
3.52
%14
.16%
10.4
3%7.
34%
1.28
%16
.51%
5.87
%10
.81%
Kip
hire
27.4
1%2.
83%
27.5
9%12
.49%
4.62
%36
.17%
6.98
%7.
48%
0.9
6%33
.55%
28.4
3%25
.22%
Kohi
ma
7.97
%0
.66%
8.0
3%3.
95%
0.8
6%9.
20%
4.92
%4.
70%
0.2
7%9.
33%
4.72
%4.
28%
Long
leng
23.5
8%1.
06%
20.4
4%11
.24%
3.54
%33
.51%
13.2
0%
21.2
6%2.
14%
33.6
1%23
.52%
18.6
0%
Mo
kokc
hung
5.33
%0
.23%
4.22
%3.
17%
0.4
5%7.
99%
2.16
%1.
19%
0.4
7%7.
61%
4.29
%5.
48%
Pere
n16
.89%
1.21
%19
.02%
12.0
1%2.
47%
23.7
6%9.
91%
11.0
9%1.
57%
23.5
7%14
.44%
11.7
9%
Phek
16.7
8%2.
74%
20.1
7%10
.30
%3.
28%
26.8
5%7.
13%
2.0
6%0
.81%
26.4
7%20
.96%
13.0
5%
Tuen
sang
28.6
6%3.
20%
30.9
4%15
.79%
3.65
%38
.06%
15.4
0%
3.17
%2.
40%
36.4
7%29
.20
%25
.14%
Wo
kha
8.78
%0
.86%
9.95
%6.
49%
0.8
0%
14.1
6%6.
84%
7.56
%1.
39%
13.6
0%
8.73
%9.
51%
Zunh
ebo
to15
.45%
0.5
9%16
.18%
7.84
%3.
80%
23.7
1%7.
03%
3.33
%0
.14%
22.3
6%16
.19%
16.6
4%
Odisha
Anu
gul
19.0
9%2.
38%
10.2
8%8.
98%
1.94
%24
.02%
22.3
0%
10.3
1%7.
08%
19.2
7%9.
99%
3.96
%
Bala
ngir
21.7
5%1.
62%
8.28
%12
.87%
2.58
%27
.33%
27.1
1%9.
50%
9.28
%24
.84%
11.0
1%3.
94%
Bale
shw
ar20
.14%
0.3
6%13
.22%
8.80
%3.
55%
24.2
2%20
.73%
4.65
%6.
28%
22.8
2%7.
68%
6.14
%
Barg
arh
20.3
1%0
.88%
8.69
%8.
93%
2.36
%24
.30
%22
.56%
7.65
%8.
59%
22.4
5%8.
82%
2.90
%
Baud
a26
.47%
2.0
7%12
.67%
13.1
4%2.
33%
32.7
9%31
.30
%11
.12%
6.80
%30
.63%
14.4
7%4.
74%
Bhad
rak
23.6
0%
1.15
%14
.83%
8.10
%2.
88%
28.0
1%25
.73%
4.26
%6.
72%
25.6
9%8.
46%
11.0
6%
Cut
tack
11.3
5%0
.79%
8.21
%5.
73%
1.34
%14
.35%
13.8
9%3.
05%
3.0
6%10
.31%
5.40
%5.
48%
Deb
agar
h29
.54%
1.97
%17
.13%
17.7
6%4.
39%
37.0
9%30
.67%
11.1
2%11
.59%
34.2
5%21
.22%
10.6
5%
Dhe
nkan
al24
.41%
1.0
3%10
.76%
10.5
3%2.
58%
29.5
4%26
.57%
19.3
4%7.
94%
25.1
1%12
.72%
8.20
%
Gaj
apat
i26
.21%
2.77
%19
.87%
21.1
1%8.
00
%37
.98%
29.4
1%20
.57%
6.96
%25
.76%
24.7
5%5.
88%
Gan
jam
15.1
4%1.
11%
9.74
%12
.46%
2.98
%20
.45%
20.5
4%6.
89%
6.24
%13
.00
%10
.28%
3.0
4%
Jag
atsi
ngha
pur
9.61
%0
.85%
5.54
%3.
94%
0.2
5%11
.67%
10.8
1%2.
12%
2.70
%8.
77%
4.83
%2.
40%
Jaja
pur
16.7
4%1.
55%
10.4
6%7.
21%
2.31
%20
.40
%1 9
.72%
6.18
%4.
14%
16.4
9%7.
75%
4.67
%
Jhar
sug
uda
15.9
0%
0.9
4%7.
52%
6.30
%1.
18%
18.3
1%16
.09%
6.74
%4.
15%
17.0
6%5.
23%
2.77
%
Kala
hand
i32
.48%
1.33
%17
.73%
26.0
6%8.
24%
47.2
3%45
.85%
17.4
2%20
.11%
43.7
1%20
.81%
12.9
9%
Kand
ham
al34
.14%
2.67
%21
.01%
18.2
1%4.
49%
44.7
5%41
.25%
29.0
3%13
.78%
36.3
8%30
.40
%5.
61%
Kend
rap
ara
18.1
1%0
.89%
10.8
2%6.
72%
1.15
%21
.00
%20
.57%
4.63
%4.
14%
18.6
6%8.
68%
2.90
%
Kend
ujha
r32
.82%
2.70
%22
.14%
19.6
5%6.
90%
41.4
8%40
.07%
16.9
3%17
.15%
38.7
1%22
.67%
12.4
7%
Kho
rdha
9.65
%0
.31%
7.49
%8.
45%
3.26
%14
.44%
12.9
4%7.
02%
1.55
%10
.59%
6.13
%4.
52%
Kora
put
34.9
7%2.
06%
20.8
7%35
.56%
15.1
0%
50.1
4%48
.69%
12.4
9%18
.71%
40.6
4%32
.18%
13.2
5%
Mal
kang
iri47
.45%
6.42
%24
.65%
40.7
7%15
.96%
58.4
6%54
.32%
15.3
2%10
.66%
53.3
5%31
.29%
7.67
%
May
urb
hanj
33.8
2%1.
62%
16.3
0%
19.8
7%5.
19%
44.5
3%44
.00
%17
.50
%18
.06%
43.0
9%23
.37%
14.1
6%
Nab
aran
gap
ur45
.06%
3.54
%29
.37%
32.1
1%14
.36%
58.2
7%54
.11%
19.4
5%24
.34%
55.4
1%29
.17%
15.0
1%
Nay
agar
h13
.66%
0.7
7%9.
87%
11.3
2%1.
70%
20.1
8%19
.23%
7.54
%4.
05%
15.4
6%9.
08%
3.56
%
Nua
pad
a30
.91%
1.92
%13
.09%
18.3
5%6.
33%
37.5
4%35
.20
%10
.04%
11.4
4%33
.55%
11.7
7%3.
51%
Puri
9.48
%0
.81%
5.79
%3.
28%
0.4
1%11
.25%
9.77
%3.
72%
1.96
%7.
47%
3.20
%1.
88%
Ray
agad
a33
.63%
4.53
%21
.54%
32.1
7%12
.22%
47.6
3%43
.68%
10.7
9%14
.63%
38.9
2%27
.83%
11.3
5%
(CONTD.) DISTrICT-WISe: CeNSoreD heADCoUNT rATIo(CONTD.) DISTrICT-WISe: CeNSoreD heADCoUNT rATIo
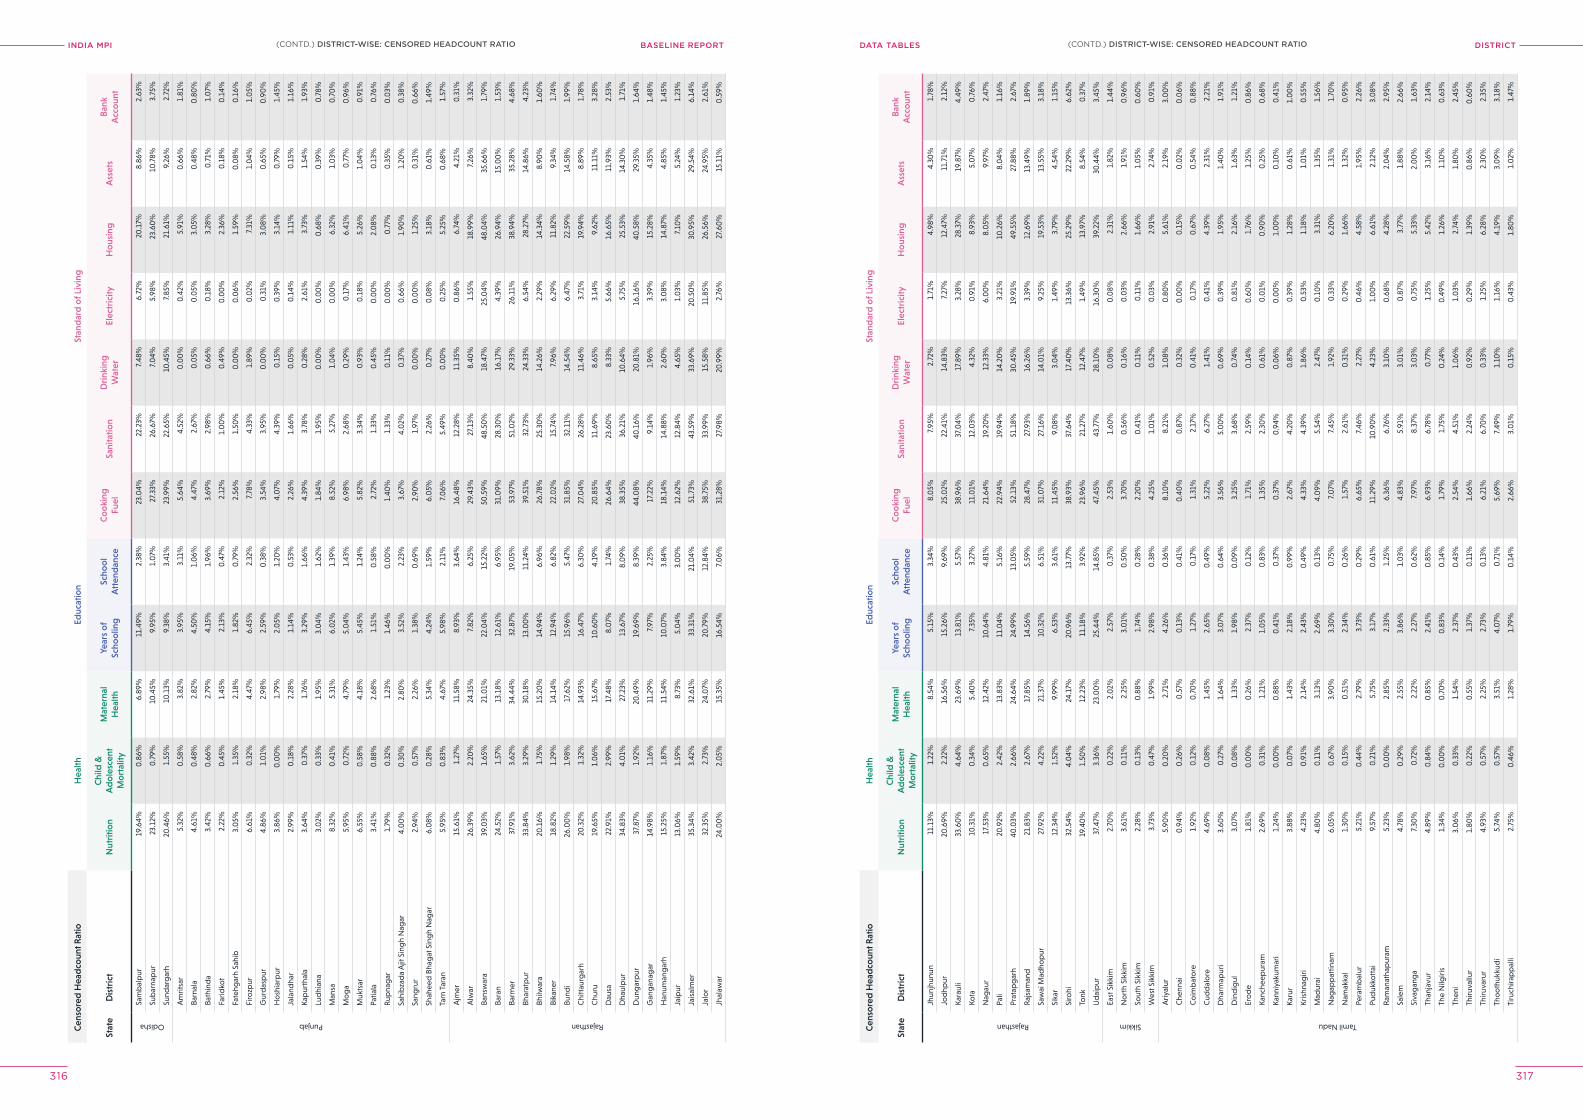
INDIA MPI BASELINE REPORT DISTrICTDATA TABleS
316 317
Cen
sore
d H
ead
coun
t Rat
ioH
ealth
Educ
atio
nSt
and
ard
of L
ivin
g
Stat
eD
istr
ict
Nut
ritio
nC
hild
&
Ad
ole
scen
t M
ort
ality
Mat
erna
l H
ealth
Year
s o
f Sc
hoo
ling
Scho
ol
Att
end
ance
Co
oki
ng
Fuel
Sani
tatio
nD
rink
ing
Wat
erEl
ectr
icity
Ho
usin
gA
sset
sB
ank
Acc
oun
t
Odisha
Sam
bal
pur
19.6
4%0
.86%
6.89
%11
.49%
2.38
%23
.04%
22.2
3%7.
48%
6.72
%20
.17%
8.86
%2.
63%
Sub
arna
pur
23.1
2%0
.79%
10.4
5%9.
95%
1.0
7%27
.33%
26.6
7%7.
04%
5.98
%23
.60
%10
.78%
3.75
%
Sund
arg
arh
20.4
6%1.
55%
10.1
3%9.
38%
3.41
%23
.99%
22.6
5%10
.45%
7.85
%21
.61%
9.26
%2.
72%
Punjab
Am
ritsa
r5.
32%
0.5
8%3.
82%
3.95
%3.
11%
5.64
%4.
52%
0.0
0%
0.4
2%5.
91%
0.6
6%1.
81%
Barn
ala
4.61
%0
.48%
2.82
%4.
50%
1.0
6%4.
47%
2.67
%0
.05%
0.0
5%3.
05%
0.4
8%0
.80
%
Bath
ind
a3.
42%
0.6
6%2.
79%
4.15
%1.
96%
3.69
%2.
98%
0.6
6%0
.18%
3.28
%0
.71%
1.0
7%
Farid
kot
2.22
%0
.45%
1.45
%2.
13%
0.4
7%2.
12%
1.0
0%
0.4
9%0
.00
%2.
36%
0.1
8%0
.14%
Fate
hgar
h Sa
hib
3.0
5%1.
35%
2.18
%1.
82%
0.7
9%2.
56%
1.50
%0
.00
%0
.06%
1.59
%0
.08%
0.1
6%
Firo
zpur
6.61
%0
.32%
4.47
%6.
45%
2.32
%7.
78%
4.33
%1.
89%
0.0
2%7.
31%
1.0
4%1.
05%
Gur
das
pur
4.86
%1.
01%
2.98
%2.
59%
0.3
8%3.
54%
3.95
%0
.00
%0
.31%
3.0
8%0
.65%
0.9
0%
Ho
shia
rpur
3.86
%0
.00
%1.
79%
2.0
5%1.
20%
4.0
7%4.
39%
0.1
5%0
.39%
3.14
%0
.79%
1.45
%
Jala
ndha
r2.
99%
0.1
8%2.
28%
1.14
%0
.53%
2.26
%1.
66%
0.0
5%0
.14%
1.11
%0
.15%
1.16
%
Kap
urth
ala
3.64
%0
.37%
1.76
%3.
29%
1.66
%4.
39%
3.78
%0
.28%
2.61
%3.
73%
1.54
%1.
93%
Lud
hian
a3.
02%
0.3
3%1.
95%
3.0
4%1.
62%
1.84
%1.
95%
0.0
0%
0.0
0%
0.6
8%0
.39%
0.7
8%
Man
sa8.
32%
0.4
1%5.
31%
6.0
2%1.
39%
8.52
%5.
27%
1.0
4%0
.00
%6.
32%
1.0
3%0
.70
%
Mo
ga
5.95
%0
.72%
4.79
%5.
04%
1.43
%6.
98%
2.68
%0
.29%
0.1
7%6.
41%
0.7
7%0
.96%
Muk
tsar
6.55
%0
.58%
4.18
%5.
45%
1.24
%5.
82%
3.34
%0
.93%
0.1
8%5.
26%
1.0
4%0
.91%
Patia
la3.
41%
0.8
8%2.
68%
1.51
%0
.58%
2.72
%1.
33%
0.4
5%0
.00
%2.
08%
0.1
3%0
.76%
Rup
nag
ar1.
79%
0.3
2%1.
23%
1.46
%0
.00
%1.
40%
1.33
%0
.11%
0.0
0%
0.7
7%0
.35%
0.0
3%
Sahi
bza
da
Ajit
Sin
gh
Nag
ar4.
00
%0
.30
%2.
80%
3.52
%2.
23%
3.67
%4.
02%
0.3
7%0
.66%
1.90
%1.
20%
0.3
8%
Sang
rur
2.94
%0
.57%
2.26
%1.
38%
0.6
9%2.
90%
1.97
%0
.00
%0
.00
%1.
25%
0.3
1%0
.66%
Shah
eed
Bha
gat
Sin
gh
Nag
ar6.
08%
0.2
8%5.
34%
4.24
%1.
59%
6.0
5%2.
26%
0.2
7%0
.08%
3.18
%0
.61%
1.49
%
Tarn
Tar
an5.
95%
0.8
3%4.
67%
5.98
%2.
11%
7.0
6%5.
49%
0.0
0%
0.2
5%5.
25%
0.6
8%1.
57%
Rajasthan
Ajm
er15
.61%
1.27
%11
.58%
8.93
%3.
64%
16.4
8%12
.28%
11.3
5%0
.86%
6.74
%4.
21%
0.3
1%
Alw
ar26
.39%
2.20
%24
.35%
7.82
%6.
25%
29.4
3%27
.13%
8.40
%1.
55%
18.9
9%7.
26%
3.32
%
Bans
war
a39
.03%
1.65
%21
.01%
22.0
4%15
.22%
50.5
9%48
.50
%18
.47%
25.0
4%48
.04%
35.6
6%1.
79%
Bara
n24
.52%
1.57
%13
.18%
12.6
1%6.
95%
31.0
9%28
.30
%16
.17%
4.39
%26
.94%
15.0
0%
1.53
%
Barm
er37
.91%
3.62
%34
.44%
32.8
7%19
.05%
53.9
7%51
.02%
29.3
3%26
.11%
38.9
4%35
.28%
4.68
%
Bhar
atp
ur33
.84%
3.29
%30
.18%
13.0
0%
11.2
4%39
.51%
32.7
3%2 4
.33%
6.54
%28
.27%
14.8
6%4.
23%
Bhilw
ara
20.1
6%1.
75%
15.2
0%
14.9
4%6.
96%
26.7
8%25
.30
%14
.26%
2.29
%14
.34%
8.90
%1.
60%
Bika
ner
18.8
2%1.
29%
14.1
4%12
.94%
6.82
%22
.02%
15.7
4%7.
96%
6.29
%11
.82%
9.34
%1.
74%
Bund
i26
.00
%1.
98%
17.6
2%15
.96%
5.47
%31
.85%
32.1
1%14
.54%
6.47
%22
.59%
14.5
8%1.
99%
Chi
ttau
rgar
h20
.32%
1.32
%14
.93%
16.4
7%6.
30%
27.0
4%26
.28%
11.4
6%3.
71%
19.9
4%8.
89%
1.78
%
Chu
ru19
.65%
1.0
6%15
.67%
10.6
0%
4.19
%20
.85%
11.6
9%8.
65%
3.14
%9.
62%
11.1
1%3.
28%
Dau
sa22
.91%
2.99
%17
.48%
8.0
7%1.
74%
26.6
4%23
.60
%8.
33%
5.66
%16
.65%
11.9
3%2.
53%
Dha
ulp
ur34
.83%
4.0
1%27
.23%
13.6
7%8.
09%
38.3
5%36
.21%
10.6
4%5.
75%
25.5
3%14
.30
%1.
71%
Dun
gar
pur
37.8
7%1.
92%
20.4
9%19
.69%
8.39
%44
.08%
40.1
6%20
.81%
16.1
6%40
.58%
29.3
5%1.
64%
Gan
gan
agar
14.9
8%1.
16%
11.2
9%7.
97%
2.25
%17
.22%
9.14
%1.
96%
3.39
%15
.28%
4.35
%1.
48%
Han
uman
gar
h15
.25%
1.87
%11
.54%
10.0
7%3.
84%
18.1
4%14
.88%
2.60
%3.
08%
14.8
7%4.
85%
1.45
%
Jaip
ur13
.06%
1.59
%8.
73%
5.0
4%3.
00
%12
.62%
12.8
4%4.
65%
1.0
3%7.
10%
5.24
%1.
23%
Jais
alm
er35
.34%
3.42
%32
.61%
33.3
1%21
.04%
51.7
3%43
.59%
33.6
9%20
.50
%30
.95%
29.5
4%6.
14%
Jalo
r32
.35%
2.73
%24
.07%
20.7
9%12
.84%
38.7
5%33
.99%
15.5
8%11
.85%
26.5
6%24
.95%
2.61
%
Jhal
awar
24.0
0%
2.0
5%15
.35%
16.5
4%7.
06%
31.2
8%27
.98%
20.9
9%2.
76%
27.6
0%
15.1
1%0
.59%
Cen
sore
d H
ead
coun
t Rat
ioH
ealth
Educ
atio
nSt
and
ard
of L
ivin
g
Stat
eD
istr
ict
Nut
ritio
nC
hild
&
Ad
ole
scen
t M
ort
ality
Mat
erna
l H
ealth
Year
s o
f Sc
hoo
ling
Scho
ol
Att
end
ance
Co
oki
ng
Fuel
Sani
tatio
nD
rink
ing
Wat
erEl
ectr
icity
Ho
usin
gA
sset
sB
ank
Acc
oun
t
Rajasthan
Jhun
jhun
un11
.13%
1.22
%8.
54%
5.15
%3.
34%
8.0
5%7.
95%
2.72
%1.
71%
4.98
%4.
30%
1.78
%
Jod
hpur
20.6
9%2.
22%
16.5
6%15
.26%
9.69
%25
.02%
22.4
1%14
.83%
7.27
%12
.47%
11.7
1%2.
12%
Kara
uli
33.6
0%
4.64
%23
.69%
13.8
1%5.
57%
38.9
6%37
.04%
17.8
9%3.
28%
28.3
7%19
.87%
4.49
%
Kota
10.3
1%0
.34%
5.40
%7.
35%
3.27
%11
.01%
12.0
3%4.
32%
0.9
1%8.
93%
5.0
7%0
.76%
Nag
aur
17.5
3%0
.65%
12.4
2%10
.64%
4.81
%21
.64%
19.2
0%
12.3
3%6.
00
%8.
05%
9.97
%2.
47%
Pali
20.9
2%2.
42%
13.8
3%11
.04%
5.16
%22
.94%
19.9
4%14
.20
%3.
21%
10.2
6%8.
04%
1.16
%
Prat
apg
arh
40.0
3%2.
66%
24.6
4%24
.99%
13.0
5%52
.13%
51.1
8%30
.45%
19.9
1%49
.55%
27.8
8%2.
67%
Raj
sam
and
21.8
3%2.
67%
17.8
5%14
.56%
5.59
%28
.47%
27.9
3%16
.26%
3.39
%12
.69%
13.4
9%1.
89%
Saw
ai M
adho
pur
27.9
2%4.
22%
21.3
7%10
.32%
6.51
%31
.07%
27.1
6%14
.01%
9.25
%19
.53%
13.5
5%3.
18%
Sika
r12
.34%
1.52
%9.
99%
6.53
%3.
61%
11.4
5%9.
08%
3.0
4%1.
49%
3.79
%4.
54%
1.15
%
Siro
hi32
.54%
4.0
4%24
.17%
20.9
6%13
.77%
38.9
3%37
.64%
17.4
0%
13.3
6%25
.29%
22.2
9%6.
62%
Tonk
19.4
0%
1.50
%12
.23%
11.1
8%3.
92%
23.9
6%21
.27%
12.4
7%1.
49%
13.9
7%8.
54%
0.3
7%
Ud
aip
ur37
.47%
3.36
%23
.00
%25
.44%
14.8
5%47
.45%
43.7
7%28
.10
%16
.30
%39
.22%
30.4
4%3.
45%
Sikkim
East
Sik
kim
2.70
%0
.22%
2.0
2%2.
57%
0.3
7%2.
53%
1.60
%0
.08%
0.0
8%2.
31%
1.82
%1.
44%
No
rth
Sikk
im3.
61%
0.1
1%2.
25%
3.0
1%0
.50
%3.
70%
0.5
6%0
.16%
0.0
3%2.
66%
1.91
%0
.96%
Sout
h Si
kkim
2.28
%0
.13%
0.8
8%1.
74%
0.2
8%2.
20%
0.4
1%0
.11%
0.1
1%1.
66%
1.0
5%0
.60
%
Wes
t Sik
kim
3.73
%0
.47%
1.99
%2.
98%
0.3
8%4.
25%
1.0
1%0
.52%
0.0
3%2.
91%
2.74
%0
.91%
Tamil Nadu
Ariy
alur
5.90
%0
.20
%2.
71%
4.26
%0
.36%
8.10
%8.
21%
1.0
8%0
.80
%5.
61%
2.19
%3.
00
%
Che
nnai
0.9
4%0
.26%
0.5
7%0
.13%
0.4
1%0
.40
%0
.87%
0.3
2%0
.00
%0
.15%
0.0
2%0
.06%
Co
imb
ato
re1.
92%
0.1
2%0
.70
%1.
27%
0.1
7%1.
31%
2.17
%0
.41%
0.1
7%0
.67%
0.5
4%0
.88%
Cud
dal
ore
4.69
%0
.08%
1.45
%2.
65%
0.4
9%5.
22%
6.27
%1.
41%
0.4
1%4.
39%
2.31
%2.
21%
Dha
rmap
uri
3.60
%0
.27%
1.64
%3.
07%
0.6
4%3.
56%
5.0
0%
0.6
9%0
.39%
1.95
%1.
40%
1.91
%
Din
dig
ul3.
07%
0.0
8%1.
33%
1.98
%0
.09%
3.25
%3.
68%
0.7
4%0
.81%
2.16
%1.
63%
1.21
%
Ero
de
1.81
%0
.00
%0
.26%
2.37
%0
.12%
1.71
%2.
59%
0.1
4%0
.60
%1.
76%
1.25
%0
.86%
Kanc
heep
uram
2.69
%0
.31%
1.21
%1.
05%
0.8
3%1.
35%
2.30
%0
.61%
0.0
1%0
.90
%0
.25%
0.6
8%
Kann
iyak
umar
i1.
24%
0.0
0%
0.8
8%0
.41%
0.3
7%0
.37%
0.9
4%0
.06%
0.0
0%
1.0
0%
0.1
0%
0.4
1%
Karu
r3.
88%
0.0
7%1.
43%
2.18
%0
.99%
2.67
%4.
20%
0.8
7%0
.39%
1.28
%0
.61%
1.0
0%
Kris
hnag
iri4.
23%
0.9
1%2.
14%
2.43
%0
.49%
4.33
%4.
39%
1.86
%0
.53%
1.18
%1.
01%
0.5
5%
Mad
urai
4.80
%0
.11%
3.13
%2.
69%
0.1
3%4.
09%
5.54
%2.
47%
0.1
0%
3.31
%1.
35%
1.56
%
Nag
app
attin
am6.
05%
0.6
7%3.
90%
3.30
%0
.75%
7.0
7%7.
45%
1.92
%0
.33%
6.20
%1.
31%
1.70
%
Nam
akka
l1.
30%
0.1
5%0
.51%
2.34
%0
.26%
1.57
%2.
61%
0.3
1%0
.29%
1.66
%1.
32%
0.9
5%
Pera
mb
alur
5.21
%0
.44%
2.79
%3.
73%
0.2
9%6.
65%
7.46
%2.
27%
0.4
6%4.
58%
1.95
%2.
26%
Pud
ukko
ttai
9.57
%0
.21%
5.75
%3.
17%
0.6
1%11
.29%
10.9
0%
4.23
%1.
00
%6.
61%
2.12
%3.
08%
Ram
anat
hap
uram
5.23
%0
.00
%2.
85%
2.33
%1.
25%
6.36
%6.
76%
3.10
%0
.68%
4.28
%2.
04%
2.95
%
Sale
m4.
78%
0.2
9%2.
55%
3.86
%1.
03%
4.83
%5.
91%
3.0
1%0
.87%
3.77
%1.
88%
2.66
%
Siva
gan
ga
7.30
%0
.72%
2.22
%2.
27%
0.6
2%7.
97%
8.37
%3.
03%
0.7
5%5.
33%
2.0
0%
1.63
%
Than
javu
r4.
89%
0.8
4%0
.85%
2.41
%0
.85%
6.93
%6.
78%
0.7
7%1.
25%
5.42
%3.
16%
2.14
%
The
Nilg
iris
1.34
%0
.00
%0
.70
%0
.83%
0.1
4%1.
79%
1.75
%0
.24%
0.4
9%1.
26%
1.10
%0
.63%
Then
i3.
06%
0.3
3%1.
54%
2.37
%0
.43%
2.54
%4.
51%
1.0
6%1.
03%
2.74
%1.
80%
2.45
%
Thiru
vallu
r1.
80%
0.2
2%0
.55%
1.37
%0
.11%
1.66
%2.
24%
0.9
2%0
.29%
1.39
%0
.86%
0.6
0%
Thiru
varu
r4.
93%
0.5
7%2.
25%
2.73
%0
.13%
6.21
%6.
70%
0.3
3%1.
25%
6.28
%2.
30%
2.35
%
Tho
oth
ukku
di
5.74
%0
.57%
3.51
%4.
07%
0.7
1%5.
69%
7.49
%1.
10%
1.16
%4.
19%
3.0
9%3.
18%
Tiru
chira
pp
alli
2.75
%0
.46%
1.28
%1.
79%
0.1
4%2.
66%
3.0
1%0
.15%
0.4
3%1.
80%
1.0
2%1.
47%
(CONTD.) DISTrICT-WISe: CeNSoreD heADCoUNT rATIo(CONTD.) DISTrICT-WISe: CeNSoreD heADCoUNT rATIo
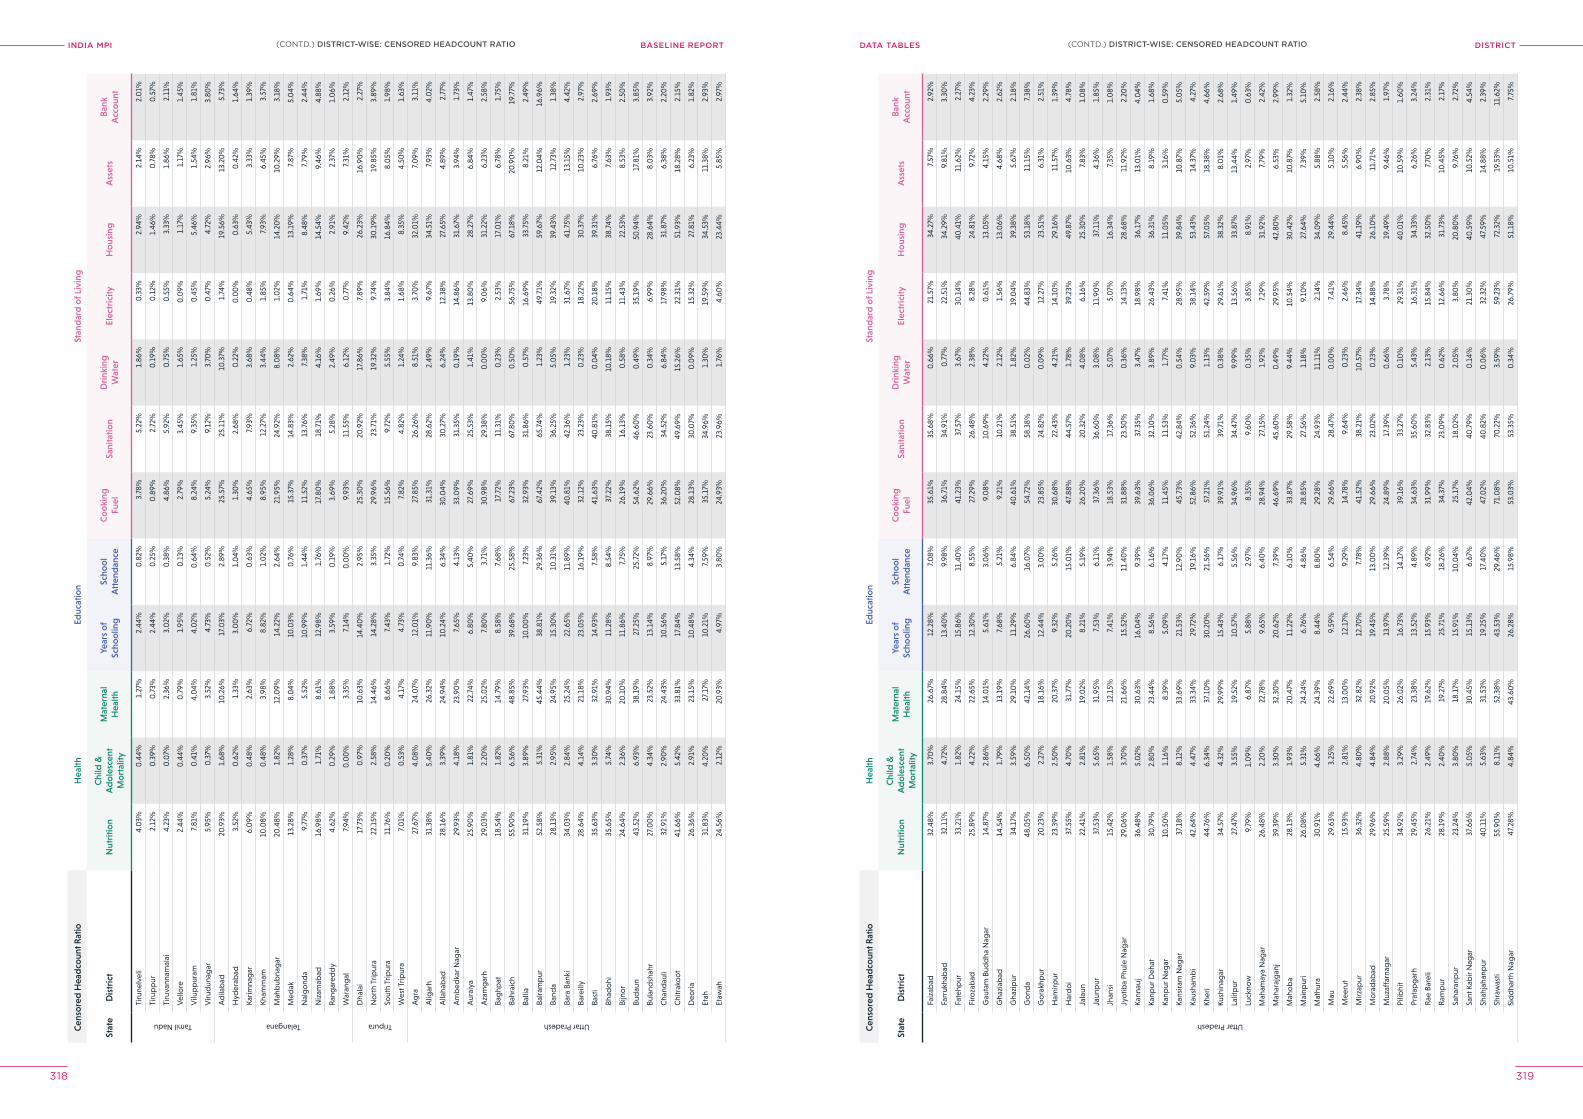
INDIA MPI BASELINE REPORT DISTrICTDATA TABleS
318 319
Cen
sore
d H
ead
coun
t Rat
ioH
ealth
Educ
atio
nSt
and
ard
of L
ivin
g
Stat
eD
istr
ict
Nut
ritio
nC
hild
&
Ad
ole
scen
t M
ort
ality
Mat
erna
l H
ealth
Year
s o
f Sc
hoo
ling
Scho
ol
Att
end
ance
Co
oki
ng
Fuel
Sani
tatio
nD
rink
ing
Wat
erEl
ectr
icity
Ho
usin
gA
sset
sB
ank
Acc
oun
t
Tamil Nadu
Tiru
nelv
eli
4.0
3%0
.44%
1.27
%2.
44%
0.8
2%3.
78%
5.22
%1.
86%
0.3
3%2.
94%
2.14
%2.
01%
Tiru
pp
ur2.
12%
0.3
9%0
.73%
2.44
%0
.25%
0.8
9%2.
72%
0.1
9%0
.12%
1.46
%0
.78%
0.5
7%
Tiru
vann
amal
ai4.
23%
0.0
7%2.
36%
3.0
2%0
.38%
4.86
%5.
92%
0.7
5%0
.55%
3.33
%1.
86%
2.11
%
Vel
lore
2.44
%0
.44%
0.7
9%1.
95%
0.1
3%2.
79%
3.45
%1.
65%
0.0
9%1.
17%
1.17
%1.
45%
Vilu
pp
uram
7.81
%0
.41%
4.0
4%4.
02%
0.6
4%8.
24%
9.35
%1.
25%
0.4
5%5.
46%
1.54
%1.
81%
Viru
dun
agar
5.95
%0
.37%
3.52
%4.
73%
0.5
2%5.
24%
9.12
%3.
70%
0.4
7%4.
72%
2.96
%3.
80%
Telangana
Ad
ilab
ad20
.93%
1.68
%10
.26%
17.0
3%2.
89%
25.5
7%25
.11%
10.3
7%1.
74%
19.5
6%13
.20
%5.
73%
Hyd
erab
ad3.
52%
0.6
2%1.
33%
3.0
0%
1.0
4%1.
30%
2.68
%0
.22%
0.0
0%
0.6
3%0
.42%
1.64
%
Karim
nag
ar6.
09%
0.4
8%2.
63%
6.72
%0
.63%
4.65
%7.
93%
3.68
%0
.48%
5.43
%3.
33%
1.39
%
Kham
mam
10.0
8%0
.48%
3.98
%8.
82%
1.0
2%8.
95%
12.2
7%3.
44%
1.85
%7.
93%
6.45
%3.
57%
Mah
bub
nag
ar20
.48%
1.82
%12
.09%
14.2
2%2.
64%
21.9
5%24
.92%
8.0
8%1.
02%
14.2
0%
10.2
9%3.
18%
Med
ak13
.28%
1.28
%8.
04%
10.0
3%0
.76%
15.3
7%14
.83%
2.62
%0
.64%
13.1
9%7.
87%
5.0
4%
Nal
go
nda
9.77
%0
.37%
5.52
%10
.99%
1.44
%11
.52%
13.7
6%7.
38%
1.71
%8.
48%
7.79
%2.
44%
Niz
amab
ad16
.98%
1.71
%8.
61%
12.9
8%1.
76%
17.8
0%
18.7
1%4.
16%
1.69
%14
.54%
9.46
%4.
88%
Ran
gar
edd
y4.
62%
0.2
9%1.
88%
3.59
%0
.19%
3.69
%5.
28%
2.49
%0
.26%
2.91
%2.
37%
1.0
6%
War
ang
al7.
94%
0.0
0%
3.35
%7.
14%
0.0
0%
9.93
%11
.55%
6.12
%0
.77%
9.42
%7.
31%
2.12
%
Tripura
Dha
lai
17.7
3%0
.97%
10.6
3%14
.40
%2.
95%
25.3
0%
20.9
2%17
.86%
7.89
%26
.23%
16.9
0%
2.27
%
No
rth
Trip
ura
22.1
5%2.
58%
14.4
6%14
.28%
3.35
%29
.96%
23.7
1%19
.32%
9.74
%30
.19%
19.8
5%3.
89%
Sout
h Tr
ipur
a11
.76%
0.2
0%
8.66
%7.
43%
1.72
%15
.56%
9.72
%5.
55%
3.84
%16
.84%
8.0
5%1.
98%
Wes
t Trip
ura
7.0
1%0
.53%
4.17
%4.
73%
0.7
4%7.
82%
4.82
%1.
24%
1.68
%8.
35%
4.50
%1.
63%
Uttar Pradesh
Ag
ra27
.67%
4.0
8%24
.07%
12.0
1%9.
83%
27.8
5%26
.26%
8.51
%3.
70%
32.0
1%7.
09%
3.11
%
Alig
arh
31.3
8%5.
40%
26.3
2%11
.90
%11
.36%
31.3
1%28
.62%
2.49
%9.
67%
34.5
1%7.
93%
4.0
2%
Alla
hab
ad28
.16%
3.39
%24
.94%
10.2
4%6.
34%
30.0
4%30
.27%
6.24
%12
.38%
27.6
5%4.
89%
2.77
%
Am
bed
kar N
agar
29.9
3%4.
18%
23.9
0%
7.65
%4.
13%
33.0
9%31
.35%
0.1
9%14
.86%
31.6
7%3.
94%
1.73
%
Aur
aiya
25.9
0%
1.81
%22
.74%
6.80
%5.
40%
27.6
9%25
.53%
1.41
%13
.80
%28
.27%
6.84
%1.
47%
Aza
mg
arh
29.0
3%2.
20%
25.0
2%7.
80%
3.71
%30
.98%
29.3
8%0
.00
%9.
06%
31.2
2%6.
23%
2.58
%
Bag
hpat
18.5
4%1.
82%
14.7
9%8.
58%
7.68
%17
.72%
11.3
1%0
.23%
2.53
%17
.01%
6.78
%1.
75%
Bahr
aich
55.9
0%
6.56
%48
.85%
39.6
8%25
.58%
67.2
3%67
.80
%0
.50
%56
.75%
67.1
8%20
.90
%19
.77%
Balli
a31
.19%
3.89
%27
.93%
10.0
0%
7.23
%32
. 93%
31.8
6%0
.57%
16.6
9%33
.75%
8.21
%2.
49%
Balra
mp
ur52
.58%
5.31
%45
.44%
38.8
1%29
.36%
67.4
2%65
.74%
1.23
%49
.71%
59.6
7%12
.04%
16.9
6%
Band
a28
.13%
2.95
%24
.95%
15.3
0%
10.3
1%39
.13%
36.2
5%5.
05%
19.3
2%39
.43%
12.7
3%1.
38%
Bara
Ban
ki34
.03%
2.84
%25
.24%
22.6
5%11
.89%
40.8
1%42
.36%
1.23
%31
.67%
41.7
5%13
.15%
4.42
%
Bare
illy
28.6
4%4.
14%
21.1
8%23
.05%
16.1
9%32
.12%
23.2
3%0
.23%
18.2
2%30
.37%
10.2
3%2.
97%
Bast
i35
.63%
3.30
%32
.91%
14.9
3%7.
58%
41.6
3%40
.81%
0.0
4%20
.18%
39.3
1%6.
76%
2.69
%
Bhad
ohi
35.6
5%5.
74%
30.9
4%11
.28%
8.54
%37
.22%
38.1
5%10
.18%
11.1
5%38
.74%
7.63
%1.
93%
Bijn
or
24.6
4%2.
36%
20.1
0%
11.8
6%7.
75%
26.1
9%16
.13%
0.5
8%11
.43%
22.5
3%8.
53%
2.50
%
Bud
aun
43.5
2%6.
93%
38.1
9%27
.25%
25.7
2%54
.62%
46.6
0%
0.4
9%35
.19%
50.9
4%17
.81%
3.85
%
Bula
ndsh
ahr
27.0
0%
4.34
%23
.52%
13.1
4%8.
97%
29.6
6%23
.60
%0
.34%
6.99
%28
.64%
8.0
3%3.
92%
Cha
ndau
li32
.91%
2.90
%24
.43%
10.5
6%5.
17%
36.2
0%
34.5
2%6.
84%
17.9
8%31
.87%
6.38
%2.
20%
Chi
trak
oo
t41
.66%
5.42
%33
.81%
17.8
4%13
.58%
52.0
8%49
.69%
15.2
6%22
.31%
51.9
3%18
.28%
2.15
%
Deo
ria26
.36%
2.91
%23
.15%
10.4
8%4.
34%
28.1
3%30
.07%
0.0
9%15
.32%
27.8
1%6.
23%
1.82
%
Etah
31.8
3%4.
20%
27.1
7%10
.21%
7.59
%35
.17%
34.9
6%1.
30%
19.5
9%34
.53%
11.3
8%2.
93%
Etaw
ah24
.56%
2.12
%20
.93%
4.97
%3.
80%
24.9
3%23
.96%
1.76
%4.
60%
23.4
4%5.
85%
2.97
%
Cen
sore
d H
ead
coun
t Rat
ioH
ealth
Educ
atio
nSt
and
ard
of L
ivin
g
Stat
eD
istr
ict
Nut
ritio
nC
hild
&
Ad
ole
scen
t M
ort
ality
Mat
erna
l H
ealth
Year
s o
f Sc
hoo
ling
Scho
ol
Att
end
ance
Co
oki
ng
Fuel
Sani
tatio
nD
rink
ing
Wat
erEl
ectr
icity
Ho
usin
gA
sset
sB
ank
Acc
oun
t
Uttar Pradesh
Faiz
abad
32.4
8%3.
70%
26.6
7%12
.28%
7.0
8%35
.61%
35.6
8%0
.66%
21.5
7%34
.27%
7.57
%2.
92%
Farr
ukha
bad
32.1
1%4.
72%
28.8
4%13
.40
%9.
98%
36.7
1%34
.91%
0.7
7%22
.51%
34.2
9%9.
81%
3.30
%
Fate
hpur
33.2
1%1.
82%
24.1
5%15
.86%
11.4
0%
41.2
3%37
.57%
3.67
%30
.14%
40.4
1%11
.62%
2.27
%
Firo
zab
ad25
.89%
4.22
%22
.65%
12.3
0%
8.55
%27
.29%
26.4
8%2.
38%
8.28
%24
.81%
9.72
%4.
23%
Gau
tam
Bud
dha
Nag
ar14
.87%
2.86
%14
.01%
5.61
%3.
06%
9.0
8%10
.69%
4.22
%0
.61%
13.0
5%4.
15%
2.29
%
Gha
ziab
ad14
.54%
1.79
%13
.19%
7.68
%5.
21%
9.21
%10
.21%
2.12
%1.
56%
13.0
6%4.
68%
2.62
%
Gha
zip
ur34
.17%
3.59
%29
.10
%11
.29%
6.84
%40
.61%
38.5
1%1.
82%
19.0
4%39
.38%
5.67
%2.
18%
Go
nda
48.0
5%6.
50%
42.1
4%26
.60
%16
.07%
54.7
2%58
.38%
0.0
2%44
.83%
53.1
8%11
.15%
7.38
%
Go
rakh
pur
20.2
3%2.
27%
18.1
6%12
.44%
3.0
0%
23.8
5%24
.82%
0.0
9%12
.27%
23.5
1%6.
31%
2.51
%
Ham
irpur
23.3
9%2.
50%
20.3
7%9.
32%
5.26
%30
.68%
22.4
3%4.
21%
14.1
0%
29.1
6%11
.57%
1.39
%
Har
do
i37
.55%
4.70
%31
.77%
20.2
0%
15.0
1%47
.88%
44.5
7%1.
78%
39.2
3%49
.87%
10.6
3%4.
78%
Jala
un22
.41%
2.81
%19
.02%
8.21
%5.
19%
26.2
0%
20.3
2%4.
08%
6.16
%25
.30
%7.
83%
1.0
8%
Jaun
pur
37.5
3%5.
65%
31.9
5%7.
53%
6.11
%37
.36%
36.6
0%
3.0
8%11
.90
%37
.11%
4.36
%1.
85%
Jhan
si15
.42%
1.58
%12
.15%
7.41
%3.
94%
18.5
3%17
.36%
5.0
7%5.
07%
16.3
4%7.
35%
1.0
8%
Jyo
tiba
Phul
e N
agar
29.0
6%3.
70%
21.6
6%15
.52%
11.4
0%
31.8
8%23
.50
%0
.36%
14.1
3%28
.68%
11.9
2%2.
20%
Kann
auj
36.4
8%5.
02%
30.6
3%16
.04%
9.39
%39
.63%
37.3
5%3.
47%
18.9
8%36
.17%
13.0
1%4.
04%
Kanp
ur D
ehat
30.7
9%2.
80%
23.4
4%8.
56%
6.16
%36
.06%
32.1
0%
3.89
%26
.43%
36.3
1%8.
19%
1.68
%
Kanp
ur N
agar
10.5
0%
1.16
%8.
39%
5.0
9%4.
17%
11.4
5%11
.53%
1.77
%7.
41%
11.0
5%3.
16%
0.5
9%
Kans
iram
Nag
ar37
.18%
8.12
%33
.69%
21.5
3%12
.90
%45
.73%
42.8
4%0
.54%
28.9
5%39
.84%
10.8
7%5.
05%
Kaus
ham
bi
42.6
4%4.
47%
33.3
4%29
.72%
19.1
6%52
.86%
52.3
6%9.
03%
38.1
4%53
.43%
14.3
7%4.
27%
Kher
i44
.76%
6.34
%37
.10
%30
.20
%21
.56%
57.2
1%51
.24%
1.13
%42
.59%
57.0
5%18
.38%
4.66
%
Kush
inag
ar34
.57%
4.32
%29
.99%
15.4
3%6.
17%
39.9
1%39
.71%
0.3
8%29
.61%
38.3
2%8.
01%
2.68
%
Lalit
pur
27.4
7%3.
55%
19.5
2%10
.57%
5.56
%34
.96%
34.4
7%9.
99%
13.5
6%33
.87%
13.4
4%1.
49%
Luck
now
9.79
%1.
09%
6.87
%5.
88%
2.97
%8.
35%
9.60
%0
.35%
3.85
%8.
91%
2.97
%0
.63%
Mah
amay
a N
agar
26.4
8%2.
20%
22.7
8%9.
65%
6.40
%28
.94%
27.1
5%1.
92%
7.29
%31
.92%
7.79
%2.
42%
Mah
araj
gan
j39
.39%
3.30
%32
.30
%20
.62%
7.39
%46
.69%
45.6
0%
0.4
9%29
.95%
42.8
0%
6.53
%2.
99%
Mah
ob
a28
.13%
1.93
%20
.47%
11.2
2%6.
10%
33.8
7%29
.58%
9.44
%10
.54%
30.4
2%10
.87%
1.32
%
Mai
npur
i26
.08%
5.31
%24
.24%
6.76
%4.
86%
28.8
5%27
.56%
1.18
%9.
10%
27.6
4%7.
39%
5.10
%
Mat
hura
30.9
1%4.
66%
24.3
9%8.
44%
8.80
%29
.28%
24.9
3%11
.11%
2.1 4
%34
.09%
5.88
%2.
58%
Mau
29.6
3%3.
25%
22.6
9%9.
59%
6.54
%29
.66%
28.4
7%0
.00
%7.
41%
29.4
4%5.
10%
2.16
%
Mee
rut
15.9
3%2.
81%
13.0
0%
12.1
7%9.
29%
14.7
8%9.
64%
0.2
3%2.
46%
8.45
%5.
56%
2.44
%
Mirz
apur
36.3
2%4.
80%
32.8
2%12
.70
%7.
78%
41.5
2%38
.21%
10.5
7%17
.34%
41.1
9%6.
90%
2.38
%
Mo
rad
abad
29.9
6%4.
84%
20.9
2%19
.45%
13.0
0%
29.6
6%23
.02%
0.2
3%14
.88%
26.1
0%
11.7
1%2.
85%
Muz
affa
rnag
ar25
.59%
2.88
%20
.05%
13.9
7%12
.39%
24.8
9%17
.39%
0.6
6%3.
78%
19.4
9%9.
46%
1.97
%
Pilib
hit
34.9
2%3.
29%
26.0
2%16
.73%
14.1
7%39
.16%
33.2
7%0
.10
%29
.31%
40.0
1%10
.59%
1.60
%
Prat
apg
arh
29.4
5%2.
74%
23.3
8%13
.52%
4.89
%34
.63%
35.6
0%
5.43
%16
.31%
34.3
3%6.
26%
3.24
%
Rae
Bar
eli
26.2
1%2.
49%
19.6
2%15
.93%
6.92
%31
.99%
32.8
3%2.
13%
15.8
4%32
.50
%7.
70%
2.31
%
Ram
pur
28.1
9%2.
40%
19.2
7%25
.71%
18.2
6%34
.37%
23.0
9%0
.62%
12.6
6%31
.73%
10.4
5%2.
17%
Saha
ranp
ur23
.24%
3.80
%18
.17%
15.9
1%10
.04%
25.1
7%18
.02%
2.0
5%3.
80%
20.8
0%
9.76
%2.
72%
Sant
Kab
ir N
agar
37.6
6%5.
05%
30.4
5%15
.13%
6.67
%42
.04%
40.7
9%0
.14%
21.3
0%
40.5
9%10
.52%
4.54
%
Shah
jaha
npur
40.1
1%5.
63%
31.5
3%19
.25%
17.4
0%
47.0
2%40
.82%
0.0
6%32
.32%
47.5
9%14
.88%
2.39
%
Shra
was
ti55
.90
%8.
11%
52.3
8%43
.53%
29.4
6%71
.08%
70.2
2%3.
59%
59.2
3%72
.32%
19.5
3%11
.62%
Sid
dha
rth
Nag
ar47
.28%
4.84
%43
.60
%26
.28%
15.9
8%53
.03%
53.3
5%0
.34%
26.7
9%51
.18%
10.5
1%7.
75%
(CONTD.) DISTrICT-WISe: CeNSoreD heADCoUNT rATIo(CONTD.) DISTrICT-WISe: CeNSoreD heADCoUNT rATIo
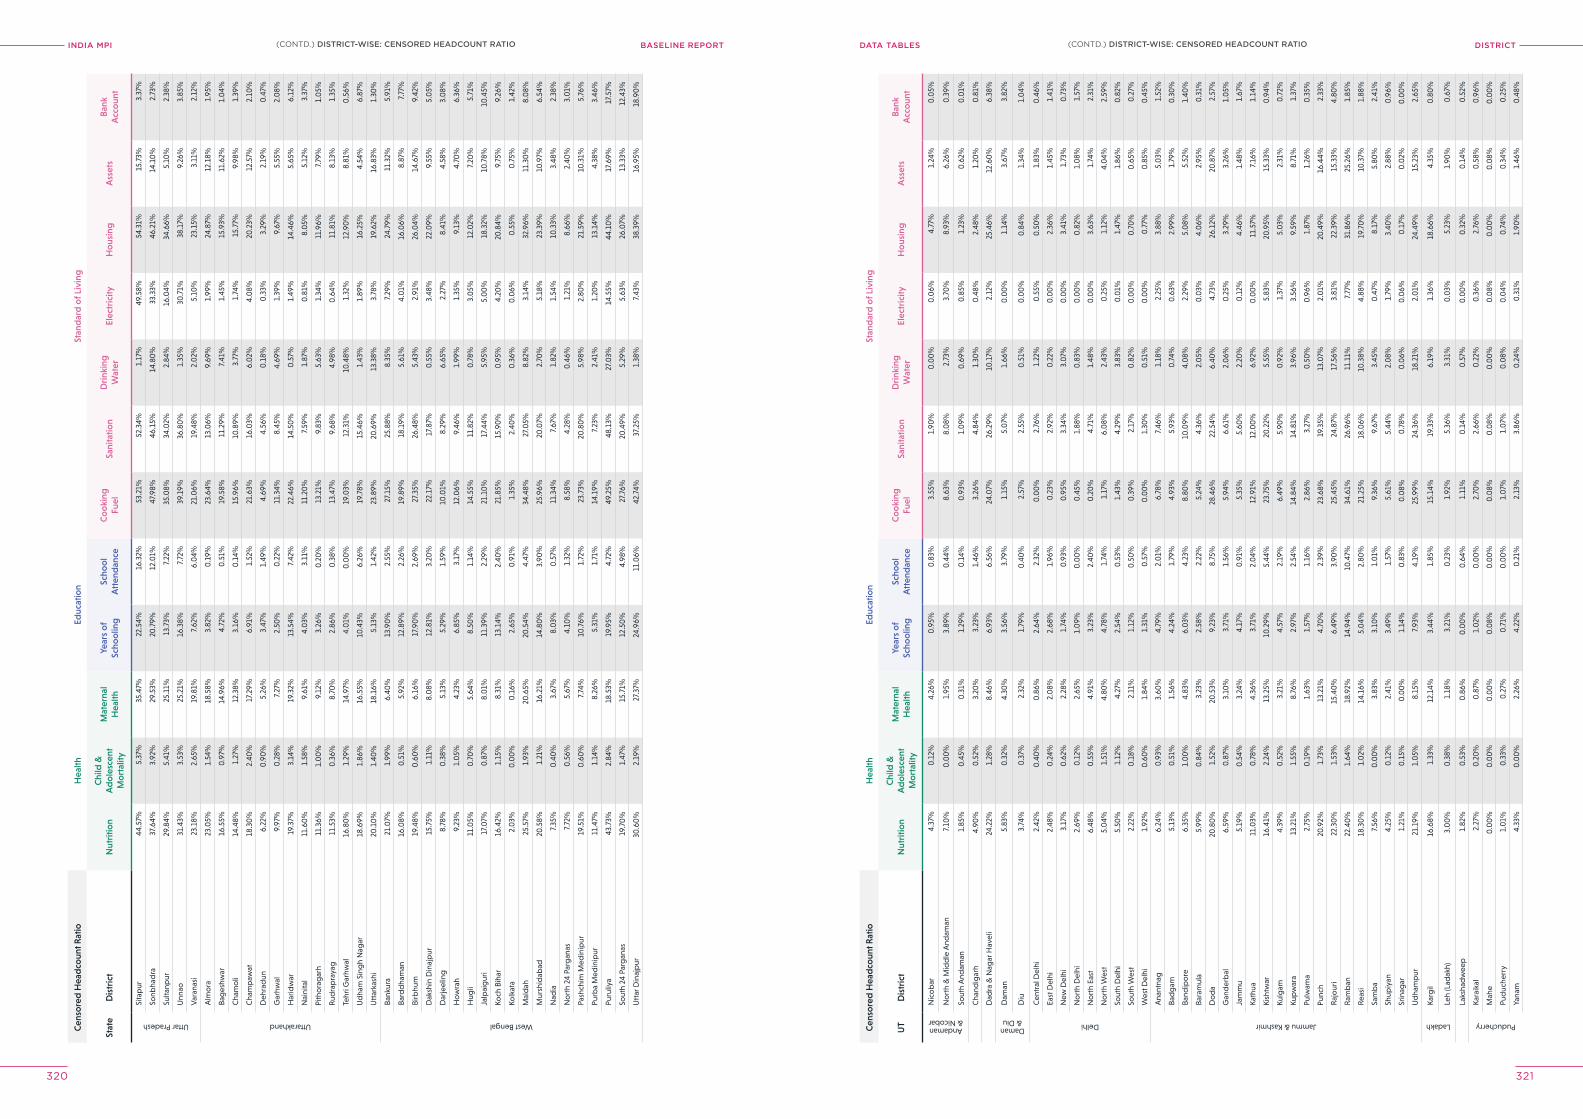
INDIA MPI BASELINE REPORT DISTrICTDATA TABleS
320 321
Cen
sore
d H
ead
coun
t Rat
ioH
ealth
Educ
atio
nSt
and
ard
of L
ivin
g
Stat
eD
istr
ict
Nut
ritio
nC
hild
&
Ad
ole
scen
t M
ort
ality
Mat
erna
l H
ealth
Year
s o
f Sc
hoo
ling
Scho
ol
Att
end
ance
Co
oki
ng
Fuel
Sani
tatio
nD
rink
ing
Wat
erEl
ectr
icity
Ho
usin
gA
sset
sB
ank
Acc
oun
t
Uttar Pradesh
Sita
pur
44.5
7%5.
37%
35.4
7%22
.54%
16.3
2%53
.21%
52.3
4%1.
17%
49.5
8%54
.31%
15.7
3%3.
37%
Sonb
had
ra37
.64%
3.92
%29
.53%
20.7
9%12
.01%
47.9
8%46
.15%
14.8
0%
33.3
3%46
.21%
14.1
0%
2.73
%
Sulta
npur
29.8
4%5.
41%
25.1
1%13
.73%
7.22
%35
.08%
34.0
2%2.
84%
16.0
4%34
.66%
5.10
%2.
38%
Unn
ao31
.43%
3.53
%25
.21%
16.3
8%7.
72%
39.1
9%36
.80
%1.
35%
30.7
1%38
.17%
9.26
%3.
85%
Var
anas
i23
.18%
2.65
%19
.81%
7.62
%6.
04%
21.0
6%19
.48%
2.0
2%5.
10%
23.1
5%3.
11%
2.12
%
Uttarakhand
Alm
ora
23.0
5%1.
54%
18.5
8%3.
82%
0.1
9%23
.64%
13.0
6%9.
69%
1.99
%24
.87%
12.1
8%1.
95%
Bag
eshw
ar16
.55%
0.9
7%14
.96%
4.72
%0
.51%
19.5
8%11
.29%
7.41
%1.
45%
15.9
3%11
.62%
1.0
4%
Cha
mo
li14
.48%
1.27
%12
.38%
3.16
%0
.14%
15.9
6%10
.89%
3.77
%1.
74%
15.7
7%9.
98%
1.39
%
Cha
mp
awat
18.3
0%
2.40
%17
.29%
6.91
%1.
52%
21.6
3%16
.03%
6.0
2%4.
08%
20.2
3%12
.57%
2.10
%
Deh
rad
un6.
22%
0.9
0%
5.26
%3.
47%
1.49
%4.
69%
4.56
%0
.18%
0.3
3%3.
29%
2.19
%0
.47%
Gar
hwal
9.97
%0
.28%
7.27
%2.
50%
0.2
2%11
.34%
8.45
%4.
69%
1.39
%9.
67%
5.55
%2.
08%
Har
idw
ar19
.37%
3.14
%19
.32%
13.5
4%7.
42%
22.4
6%14
.50
%0
.57%
1.49
%14
.46%
5.65
%6.
12%
Nai
nita
l11
.60
%1.
58%
9.61
%4.
03%
3.11
%11
.20
%7.
59%
1.87
%0
.81%
8.0
5%5.
12%
3.37
%
Pith
ora
gar
h11
.36%
1.0
0%
9.12
%3.
26%
0.2
0%
13.2
1%9.
83%
5.63
%1.
34%
11.9
6%7.
79%
1.0
5%
Rud
rap
raya
g11
.53%
0.3
6%8.
70%
2.86
%0
.38%
13.4
7%9.
68%
4.98
%0
.64%
11.8
1%8.
13%
1.35
%
Tehr
i Gar
hwal
16.8
0%
1.29
%14
.97%
4.0
1%0
.00
%19
.03%
12.3
1%10
.48%
1.32
%12
.90
%8.
81%
0.5
6%
Ud
ham
Sin
gh
Nag
ar18
.69%
1.86
%16
.55%
10.4
3%6.
26%
19.7
8%15
.46%
1.43
%1.
89%
16.2
5%4.
54%
6.87
%
Utt
arka
shi
20.1
0%
1.40
%18
.16%
5.13
%1.
42%
23.8
9%20
.69%
13.3
8%3.
78%
19.6
2%16
.83%
1.30
%
West Bengal
Bank
ura
21.0
7%1.
99%
6.40
%13
.90
%2.
55%
27.1
5%25
.88%
8.35
%7.
29%
24.7
9%11
.32%
5.91
%
Bard
dha
man
16.0
8%0
.51%
5.92
%12
.89%
2.26
%19
.89%
18.1
9%5.
61%
4.0
1%16
.06%
8.87
%7.
77%
Birb
hum
19.4
8%0
.60
%6.
16%
17.9
0%
2.69
%27
.35%
26.4
8%5.
43%
2.91
%26
.04%
14.6
7%9.
42%
Dak
shin
Din
ajp
ur15
.75%
1.11
%8.
08%
12.8
1%3.
20%
22.1
7%17
.87%
0.5
5%3.
48%
22.0
9%9.
55%
5.0
5%
Dar
jeel
ing
8.78
%0
.38%
5.13
%5.
29%
1.59
%10
.01%
8.29
%6.
65%
2.27
%8.
41%
4.58
%3.
08%
Ho
wra
h9.
23%
1.0
5%4.
23%
6.85
%3.
17%
12.0
6%9.
46%
1.99
%1.
35%
9.13
%4.
70%
6.36
%
Hug
li11
.05%
0.7
0%
5.64
%8.
50%
1.14
%14
.55%
11.8
2%0
.78%
3.0
5%12
.02%
7.20
%5.
71%
Jalp
aig
uri
17.0
7%0
.87%
8.0
1%11
.39%
2.29
%21
.10
%17
.44%
5.95
%5.
00
%18
.32%
10.7
8%10
.45%
Koch
Bih
ar16
.42%
1.15
%8.
31%
13.1
4%2.
40%
21.8
5%15
.90
%0
.95%
4.20
%20
.84%
9.75
%9.
26%
Kolk
ata
2.0
3%0
.00
%0
.16%
2.65
%0
.91%
1.35
%2.
40%
0.3
6%0
.06%
0.5
5%0
.75%
1.42
%
Mal
dah
25.5
7%1.
93%
20.6
5%20
.54%
4.47
%34
.48%
27.0
5%8.
82%
3.14
%32
.96%
11.3
0%
8.0
8%
Mur
shid
abad
20.5
8%1.
21%
16.2
1%14
.80
%3.
90%
25.9
6%20
.07%
2.70
%5.
18%
23.3
9%10
.97%
6.54
%
Nad
ia7.
35%
0.4
0%
3.67
%8.
03%
0.5
7%11
.34%
7.67
%1.
82%
1.54
%10
.33%
3.48
%2.
38%
No
rth
24 P
arg
anas
7.72
%0
.56%
5.67
%4.
10%
1.32
%8.
58%
4.28
%0
.46%
1.21
%8.
66%
2.40
%3.
01%
Pash
chim
Med
inip
ur19
.51%
0.6
0%
7.74
%10
.76%
1.72
%23
.73%
20.8
0%
5.98
%2.
80%
21.5
9%10
.31%
5.76
%
Purb
a M
edin
ipur
11.4
7%1.
14%
8.26
%5.
31%
1.71
%14
.19%
7.23
%2.
41%
1.20
%13
.14%
4.38
%3.
46%
Puru
liya
43.7
3%2.
84%
18.5
3%19
.95%
4.72
%49
.25%
48.1
3%27
.03%
14.5
5%44
.10
%17
.69%
17.5
7%
Sout
h 24
Par
gan
as19
.70
%1.
47%
15.7
1%12
.50
%4.
98%
27.7
6%20
.49%
5.29
%5.
63%
26.0
7%13
.33%
12.4
3%
Utt
ar D
inaj
pur
30.6
0%
2.19
%27
.37%
24.9
6%11
.06%
42.7
4%37
.25%
1.38
%7.
43%
38.3
9%16
.95%
18.9
0%
Cen
sore
d H
ead
coun
t Rat
ioH
ealth
Educ
atio
nSt
and
ard
of L
ivin
g
UT
Dis
tric
tN
utri
tion
Chi
ld &
A
do
lesc
ent
Mo
rtal
ity
Mat
erna
l H
ealth
Year
s o
f Sc
hoo
ling
Scho
ol
Att
end
ance
Co
oki
ng
Fuel
Sani
tatio
nD
rink
ing
Wat
erEl
ectr
icity
Ho
usin
gA
sset
sB
ank
Acc
oun
t
Andaman & Nicobar
Nic
ob
ar4.
37%
0.1
2%4.
26%
0.9
5%0
.83%
3.55
%1.
90%
0.0
0%
0.0
6%4.
77%
1.24
%0
.05%
No
rth
& M
idd
le A
ndam
an7.
10%
0.0
0%
1.95
%3.
89%
0.4
4%8.
63%
8.0
8%2.
73%
3.70
%8.
93%
6.26
%0
.39%
Sout
h A
ndam
an1.
85%
0.4
5%0
.31%
1.29
%0
.14%
0.9
3%1.
09%
0.6
9%0
.85%
1.23
%0
.62%
0.0
1%
Cha
ndig
arh
4.90
%0
.52%
3.20
%3.
23%
1.46
%3.
26%
4.84
%1.
30%
0.4
8%2.
48%
1.20
%0
.81%
Dad
ra &
Nag
ar H
avel
i24
.22%
1.28
%8.
46%
6.93
%6.
56%
24.0
7%26
.29%
10.1
7%2.
12%
25.4
6%12
.60
%6.
38%
Daman & Diu
Dam
an5.
83%
0.3
2%4.
30%
3.56
%3.
79%
1.15
%5.
07%
1.66
%0
.00
%1.
14%
3.67
%3.
82%
Diu
3.74
%0
.37%
2.32
%1.
79%
0.4
0%
2.57
%2.
55%
0.5
1%0
.00
%0
.84%
1.34
%1.
04%
Delhi
Cen
tral
Del
hi2.
42%
0.4
0%
0.8
6%2.
64%
2.32
%0
.00
%2.
76%
1.22
%0
.55%
0.5
0%
1.83
%0
.46%
East
Del
hi2.
48%
0.2
4%2.
08%
2.68
%1.
96%
0.2
3%2.
92%
0.2
2%0
.00
%2.
36%
1.45
%1.
41%
New
Del
hi3.
17%
0.6
2%2.
28%
1.74
%0
.93%
0.9
5%3.
34%
3.0
7%0
.00
%3.
41%
1.73
%0
.73%
No
rth
Del
hi2.
69%
0.1
2%2.
65%
1.0
9%0
.00
%0
.45%
1.88
%0
.83%
0.0
0%
0.8
2%1.
08%
1.57
%
No
rth
East
6.48
%0
.55%
4.91
%3.
23%
2.40
%0
.20
%4.
71%
1.48
%0
.00
%3.
63%
1.74
%2.
31%
No
rth
Wes
t5.
04%
1.51
%4.
80%
4.78
%1.
74%
1.17
%6.
08%
2.43
%0
.25%
1.12
%4.
04%
2.59
%
Sout
h D
elhi
5.50
%1.
12%
4.27
%2.
54%
0.5
3%1.
43%
4.29
%3.
83%
0.0
1%1.
47%
1.86
%0
.82%
Sout
h W
est
2.22
%0
.18%
2.11
%1.
12%
0.5
0%
0.3
9%2.
17%
0.8
2%0
.00
%0
.70
%0
.65%
0.2
7%
Wes
t Del
hi1.
92%
0.6
0%
1.84
%1.
31%
0.5
7%0
.00
%1.
30%
0.5
1%0
.00
%0
.77%
0.8
5%0
.45%
Jammu & Kashmir
Ana
ntna
g6.
24%
0.9
3%3.
60%
4.79
%2.
01%
6.78
%7.
46%
1.18
%2.
25%
3.88
%5.
03%
1.52
%
Bad
gam
5.13
%0
.51%
1.56
%4.
24%
1.79
%4.
93%
5.93
%0
.74%
0.6
3%2.
99%
1.79
%0
.30
%
Band
ipo
re6.
35%
1.0
0%
4.83
%6.
03%
4.23
%8.
80%
10.0
9%4.
08%
2.29
%5.
08%
5.52
%1.
40%
Bara
mul
a5.
99%
0.8
4%3.
23%
2.58
%2.
22%
5.24
%4.
36%
2.0
5%0
.03%
4.0
6%2.
95%
0.3
1%
Do
da
20.8
0%
1.52
%20
.53%
9.23
%8.
75%
28.4
6%22
.54%
6.40
%4.
73%
26.1
2%20
.87%
2.57
%
Gan
der
bal
6.59
%0
.87%
3.10
%3.
71%
1.56
%5.
94%
6.61
%2.
06%
0.2
5%3.
29%
3.26
%1.
05%
Jam
mu
5.19
%0
.54%
3.24
%4.
17%
0.9
1%5.
35%
5.60
%2.
20%
0.1
2%4.
46%
1.48
%1.
67%
Kath
ua11
.03%
0.7
8%4.
36%
3.71
%2.
04%
12.9
1%12
.00
%6.
92%
0.0
0%
11.5
7%7.
16%
1.14
%
Kish
twar
16.4
1%2.
24%
13.2
5%10
.29%
5.44
%23
.75%
20.2
2%5.
55%
5.83
%20
.95%
15.3
3%0
.94%
Kulg
am4.
39%
0.5
2%3.
21%
4.57
%2.
19%
6.49
%5.
90%
0.9
2%1.
37%
5.0
3%2.
31%
0.7
2%
Kup
war
a13
.21%
1.55
%8.
76%
2.97
%2.
54%
14.8
4%14
.81%
3.96
%3.
56%
9.59
%8.
71%
1.37
%
Pulw
ama
2.75
%0
.19%
1.63
%1.
57%
1.16
%2.
86%
3.27
%0
.50
%0
.96%
1.87
%1.
26%
0.3
5%
Punc
h20
.92%
1.73
%13
.21%
4.70
%2.
39%
23.6
8%19
.35%
13.0
7%2.
01%
20.4
9%16
.44%
2.33
%
Raj
our
i22
.30
%1.
53%
15.4
0%
6.49
%3.
90%
25.4
5%24
.87%
17.5
6%3.
81%
22.3
9%15
.33%
4.80
%
Ram
ban
22.4
0%
1.64
%18
.92%
14.9
4%10
.47%
34.6
1%26
.96%
11.1
1%7.
77%
31.8
6%25
.26%
1.85
%
Reas
i18
.30
%1.
02%
14.1
6%5.
04%
2.80
%21
.25%
18.0
6%10
.38%
4.88
%19
.70
%10
.37%
1.88
%
Sam
ba
7.56
%0
.00
%3.
83%
3.10
%1.
01%
9.36
%9.
67%
3.45
%0
.47%
8.17
%5.
80%
2.41
%
Shup
iyan
4.25
%0
.12%
2.41
%3.
49%
1.57
%5.
61%
5.44
%2.
08%
1.79
%3.
40%
2.88
%0
.96%
Srin
agar
1.21
%0
.15%
0.0
0%
1.14
%0
.83%
0.0
8%0
.78%
0.0
6%0
.06%
0.1
7%0
.02%
0.0
0%
Ud
ham
pur
21.1
9%1.
05%
8.15
%7.
93%
4.19
%25
.99%
24.3
6%18
.21%
2.0
1%24
.49%
15.2
3%2.
65%
Ladakh
Karg
il16
.68%
1.33
%12
.14%
3.44
%1.
85%
15.1
4%19
.33%
6.19
%1.
36%
18.6
6%4.
35%
0.8
0%
Leh
(Lad
akh)
3.0
0%
0.3
8%1.
18%
3.21
%0
.23%
1.92
%5.
36%
3.31
%0
.03%
5.23
%1.
90%
0.6
7%
Laks
had
wee
p1.
82%
0.5
3%0
.86%
0.0
0%
0.6
4%1.
11%
0.1
4%0
.57%
0.0
0%
0.3
2%0
.14%
0.5
2%
Puducherry
Kara
ikal
2.27
%0
.20
%0
.87%
1.0
2%0
.00
%2.
70%
2.66
%0
.22%
0.3
6%2.
76%
0.5
8%0
.96%
Mah
e0
.00
%0
.00
%0
.00
%0
.08%
0.0
0%
0.0
8%0
.08%
0.0
0%
0.0
8%0
.00
%0
.08%
0.0
0%
Pud
uche
rry
1.0
1%0
.33%
0.2
7%0
.71%
0.0
0%
1.0
7%1.
07%
0.0
8%0
.04%
0.7
4%0
.34%
0.2
5%
Yana
m4.
33%
0.0
0%
2.26
%4.
22%
0.2
1%2.
13%
3.86
%0
.24%
0.3
1%1.
90%
1.46
%0
.48%
(CONTD.) DISTrICT-WISe: CeNSoreD heADCoUNT rATIo(CONTD.) DISTrICT-WISe: CeNSoreD heADCoUNT rATIo
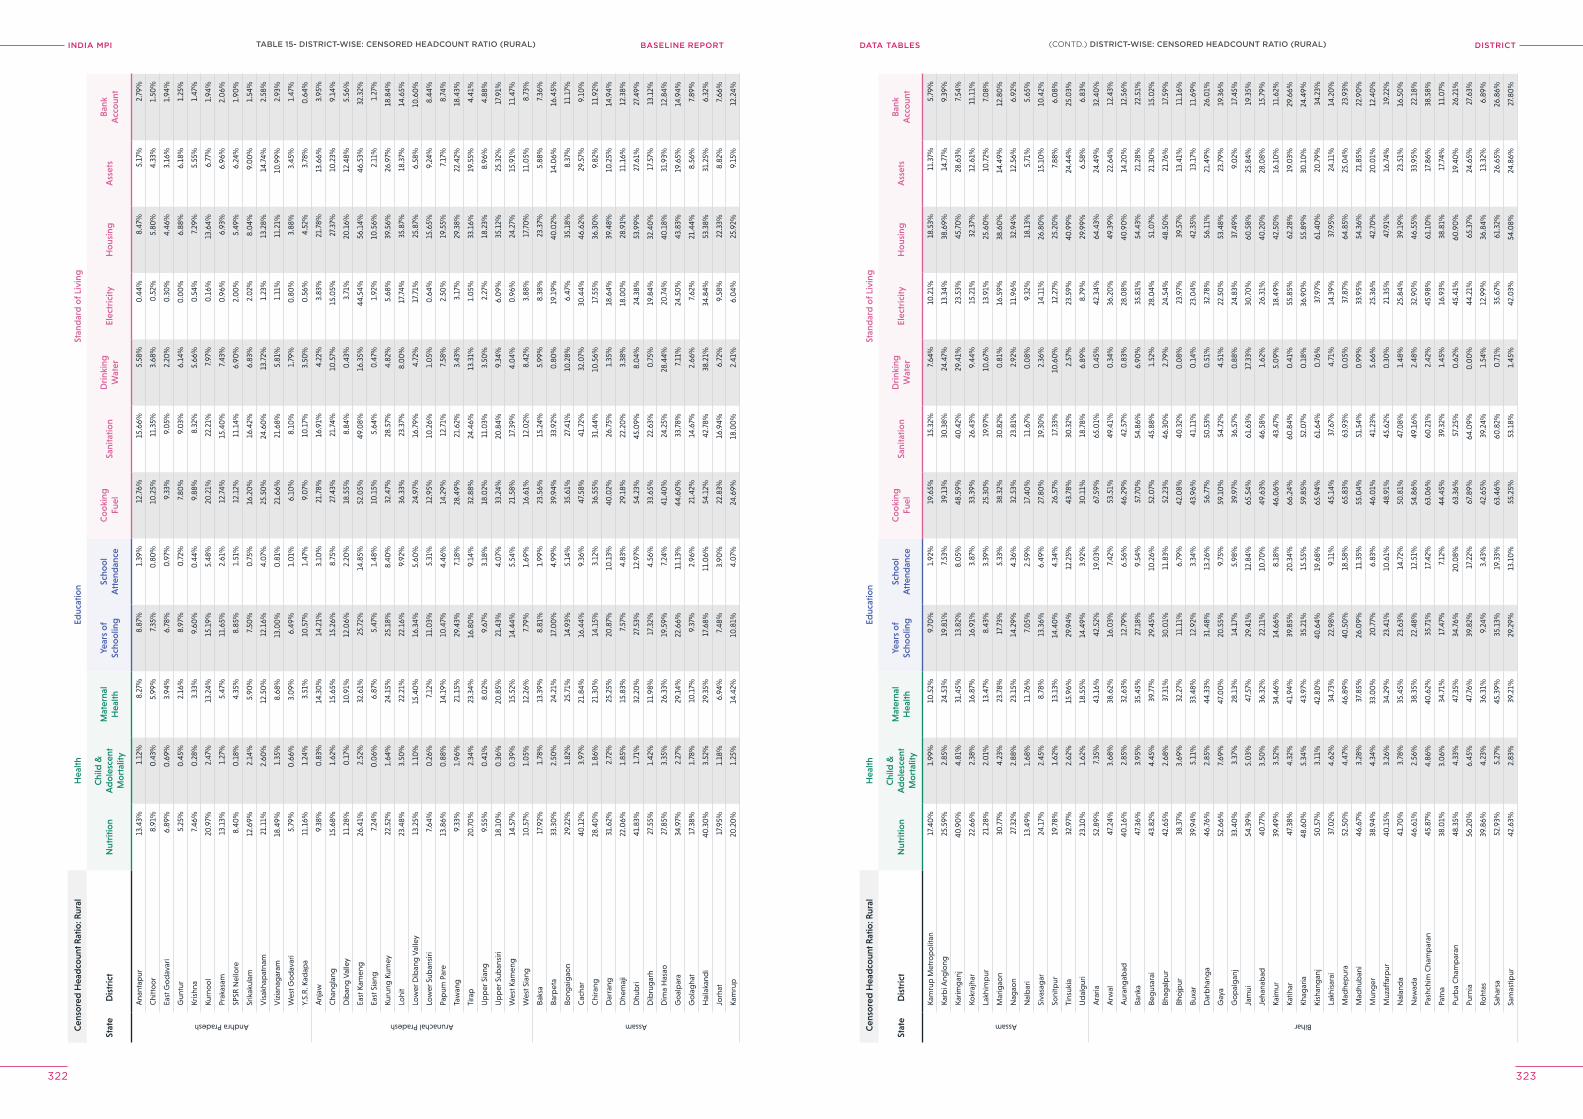
INDIA MPI BASELINE REPORT DISTrICTDATA TABleS
322 323
Cen
sore
d H
ead
coun
t Rat
io: R
ural
Hea
lthEd
ucat
ion
Stan
dar
d o
f Liv
ing
Stat
eD
istr
ict
Nut
ritio
nC
hild
&
Ad
ole
scen
t M
ort
ality
Mat
erna
l H
ealth
Year
s o
f Sc
hoo
ling
Scho
ol
Att
end
ance
Co
oki
ng
Fuel
Sani
tatio
nD
rink
ing
Wat
erEl
ectr
icity
Ho
usin
gA
sset
sB
ank
Acc
oun
t
Andhra Pradesh
Ana
ntap
ur13
.43%
1.12
%8.
27%
8.87
%1.
39%
12.7
6%15
.66%
5.58
%0
.44%
8.47
%5.
17%
2.79
%
Chi
tto
or
8.91
%0
.43%
5.99
%7.
35%
0.8
0%
10.2
5%11
.35%
3.68
%0
.52%
5.80
%4.
33%
1.50
%
East
Go
dav
ari
6.89
%0
.69%
3.94
%6.
78%
0.9
7%9.
33%
9.0
5%2.
20%
0.3
0%
4.46
%3.
16%
1.94
%
Gun
tur
5.25
%0
.45%
2.16
%8.
97%
0.7
2%7.
80%
9.0
3%6.
14%
0.0
0%
6.88
%6.
18%
1.25
%
Kris
hna
7.46
%0
.28%
3.33
%9.
60%
0.4
4%9.
88%
8.32
%5.
66%
0.5
4%7.
29%
5.55
%1.
47%
Kurn
oo
l20
.97%
2.47
%13
.24%
15.1
9%5.
48%
20.2
1%22
.21%
7.97
%0
.16%
13.6
4%6.
77%
1.94
%
Prak
asam
13.1
3%1.
27%
5.47
%11
.65%
2.61
%12
.74%
15.4
0%
7.43
%0
.96%
6.93
%6.
96%
2.0
6%
SPSR
Nel
lore
8.40
%0
.18%
4.35
%8.
85%
1.51
%12
.12%
11.1
4%6.
90%
2.0
0%
5.49
%6.
24%
1.90
%
Srik
akul
am12
.69%
2.14
%5.
90%
7.50
%0
.75%
16.2
0%
16.4
2%6.
83%
2.0
2%8.
04%
9.0
0%
1.54
%
Vis
akha
pat
nam
21.1
1%2.
60%
12.5
0%
12.1
6%4.
07%
25.5
0%
24.6
0%
13.7
2%1.
23%
13.2
8%14
.74%
2.58
%
Viz
iana
gar
am18
.49%
1.35
%8.
68%
13.0
0%
0.8
1%21
.66%
21.6
8%5.
81%
1.11
%11
.21%
10.9
9%2.
93%
Wes
t Go
dav
ari
5.79
%0
.66%
3.0
9%6.
49%
1.0
1%6.
10%
8.10
%1.
79%
0.8
0%
3.88
%3.
45%
1.47
%
Y.S.
R. K
adap
a11
.16%
1.24
%3.
51%
10.5
7%1.
47%
9.0
7%10
.17%
3.50
%0
.56%
4.52
%3.
78%
0.6
4%
Arunachal Pradesh
Anj
aw9.
38%
0.8
3%14
.30
%14
.21%
3.10
%21
.78%
16.9
1%4.
22%
3.83
%21
.78%
13.6
6%3.
95%
Cha
ngla
ng15
.68%
1.62
%15
.65%
15.2
6%8.
75%
27.4
3%21
.74%
10.5
7%15
.05%
27.3
7%10
.23%
9.14
%
Dib
ang
Val
ley
11.2
8%0
.17%
10.9
1%12
.06%
2.20
%18
.55%
8.84
%0
.43%
3.71
%20
.16%
12.4
8%5.
56%
East
Kam
eng
26.4
1%2.
52%
32.6
1%25
.72%
14.8
5%52
.05%
49.0
8%16
.35%
44.5
4%56
.14%
46.5
3%32
.32%
East
Sia
ng7.
24%
0.0
6%6.
87%
5.47
%1.
48%
10.1
5%5.
64%
0.4
7%1.
92%
10.5
6%2.
11%
1.27
%
Kuru
ng K
umey
22.5
2%1.
64%
24.1
5%25
.18%
8.40
%32
.47%
28.5
7%4.
82%
5.68
%39
.56%
26.9
7%18
.84%
Lohi
t23
.48%
3.50
%22
.21%
22.1
6%9.
92%
36.3
3%23
.37%
8.0
0%
17.7
4%35
.87%
18.3
7%14
.65%
Low
er D
iban
g V
alle
y13
.25%
1.10
%15
.40
%16
.34%
5.60
%24
.97%
16.7
9%4.
72%
17.7
1%25
.87%
6.58
%10
.60
%
Low
er S
uban
siri
7.64
%0
.26%
7.12
%11
.03%
5.31
%12
.95%
10.2
6%1.
05%
0.6
4%15
.65%
9.24
%8.
44%
Pap
um P
are
13.8
6%0
.88%
14.1
9%10
.47%
4.46
%14
.29%
12.7
1%7.
58%
2.50
%19
.55%
7.17
%8.
74%
Taw
ang
9.33
%1.
96%
21.1
5%29
.43%
7.18
%28
.49%
21.6
2%3.
43%
3.17
%29
.38%
22.4
2%18
.43%
Tira
p20
.70
%2.
34%
23.3
4%16
.80
%9.
14%
32.8
8%24
.46%
13.3
1%1.
05%
33.1
6%19
.55%
4.41
%
Up
per
Sia
ng9.
55%
0.4
1%8.
02%
9.67
%3.
18%
18.0
2%11
.03%
3.50
%2.
27%
18.2
3%8.
96%
4.88
%
Up
per
Sub
ansi
ri18
.10
%0
.36%
20.8
5%21
.43%
4.0
7%33
.24%
20.8
4%9.
34%
6.0
9%35
.12%
25.3
2%17
.91%
Wes
t Kam
eng
14.5
7%0
.39%
15.5
2%14
.44%
5.54
%21
.58%
17.3
9%4.
04%
0.9
6%24
.27%
15.9
1%11
.47%
Wes
t Sia
ng10
.57%
1.0
5%12
.26%
7.79
%1.
69%
16.6
1%12
.02%
8.42
%3.
88%
17.7
0%
11.0
5%8.
73%
Assam
Baks
a17
.92%
1.78
%13
.39%
8.81
%1.
99%
23.5
6%15
.24%
5.99
%8.
38%
23.3
7%5.
88%
7.36
%
Barp
eta
33.3
0%
2.50
%24
.21%
17.0
0%
4.99
%39
.94%
33.9
2%0
.80
%19
.19%
40.0
2%14
.06%
16.4
5%
Bong
aig
aon
29.2
2%1.
82%
25.7
1%14
.93%
5.14
%35
.61%
27.4
1%10
.28%
6.47
%35
.18%
8.37
%11
.17%
Cac
har
40.1
2%3.
97%
21.8
4%16
.44%
9.36
%47
.58%
41.7
2%32
.07%
30.4
4%46
.62%
29.5
7%9.
10%
Chi
rang
28.4
0%
1.86
%21
.30
%14
.15%
3.12
%36
.55%
31.4
4%10
.56%
17.5
5%36
.30
%9.
82%
11.9
2%
Dar
rang
31.6
2%2.
72%
25.2
5%20
.87%
10.1
3%40
.02%
26.7
5%1.
35%
18.6
4%39
.48%
10.2
5%14
.94%
Dhe
maj
i22
.06%
1.85
%15
.83%
7.57
%4.
83%
29.1
8%22
.20
%3.
38%
18.0
0%
28.9
1%11
.16%
12.3
8%
Dhu
bri
41.8
3%1.
71%
32.2
0%
27.5
3%12
.97%
54.2
3%45
.09%
8.0
4%24
.38%
53.9
9%27
.61%
27.4
9%
Dib
rug
arh
27.5
5%1.
42%
11.9
8%17
.32%
4.56
%33
.65%
22.6
3%0
.75%
19.8
4%32
.40
%17
.57%
13.1
2%
Dim
a H
asao
27.8
5%3.
35%
26.3
3%19
.59%
7.24
%41
.40
%24
.25%
28.4
4%20
.74%
40.1
8%31
.93%
12.8
4%
Go
alp
ara
34.9
7%2.
27%
29.1
4%22
.66%
11.1
3%44
.60
%33
.78%
7.11
%24
.50
%43
.83%
19.6
5%14
.94%
Go
lag
hat
17.3
8%1.
78%
10.1
7%9.
37%
2.96
%21
.42%
14.6
7%2.
66%
7.62
%21
.44%
8.56
%7.
89%
Hai
laka
ndi
40.3
0%
3.52
%29
.35%
17.6
8%11
.06%
54.1
2%42
.78%
38.2
1%34
.84%
53.3
8%31
.25%
6.32
%
Jorh
at17
.95%
1.18
%6.
94%
7.48
%3.
90%
22.8
3%16
.94%
6.72
%9.
58%
22.3
3%8.
82%
7.66
%
Kam
rup
20.2
0%
1.25
%14
.42%
10.8
1%4.
07%
24.6
9%18
.00
%2.
41%
6.0
4%25
.92%
9.15
%12
.24%
Cen
sore
d H
ead
coun
t Rat
io: R
ural
Hea
lthEd
ucat
ion
Stan
dar
d o
f Liv
ing
Stat
eD
istr
ict
Nut
ritio
nC
hild
&
Ad
ole
scen
t M
ort
ality
Mat
erna
l H
ealth
Year
s o
f Sc
hoo
ling
Scho
ol
Att
end
ance
Co
oki
ng
Fuel
Sani
tatio
nD
rink
ing
Wat
erEl
ectr
icity
Ho
usin
gA
sset
sB
ank
Acc
oun
t
Assam
Kam
rup
Met
rop
olit
an17
.40
%1.
99%
10.5
2%9.
70%
1.92
%19
.65%
15.3
2%7.
64%
10.2
1%18
.53%
11.3
7%5.
79%
Karb
i Ang
long
25.5
9%2.
85%
24.5
3%19
.81%
7.53
%39
.13%
30.3
8%24
.47%
13.3
4%38
.69%
14.7
7%9.
39%
Karim
gan
j40
.90
%4.
81%
31.4
5%13
.82%
8.0
5%48
.59%
40.4
2%29
.41%
23.5
3%45
.70
%28
.63%
7.54
%
Kokr
ajha
r22
.66%
2.38
%16
.87%
16.9
1%3.
87%
33.3
9%26
.43%
9.44
%15
.21%
32.3
7%12
.61%
11.1
1%
Lakh
imp
ur21
.28%
2.0
1%13
.47%
8.43
%3.
39%
25.3
0%
19.9
7%10
.67%
13.9
1%25
.60
%10
.72%
7.0
8%
Mar
igao
n30
.77%
4.23
%23
.78%
17.7
3%5.
33%
38.3
2%30
.82%
0.8
1%16
.59%
38.6
0%
14.4
9%12
.80
%
Nag
aon
27.3
2%2.
88%
23.1
5%14
.29%
4.36
%32
.53%
23.8
1%2.
92%
11.9
6%32
.94%
12.5
6%6.
92%
Nal
bar
i13
.49%
1.68
%11
.76%
7.0
5%2.
59%
17.4
0%
11.6
7%0
.08%
9.32
%18
.13%
5.71
%5.
65%
Siva
sag
ar24
.17%
2.45
%8.
78%
13.3
6%6.
49%
27.8
0%
19.3
0%
2.36
%14
.11%
26.8
0%
15.1
0%
10.4
2%
Soni
tpur
19.7
8%1.
62%
13.1
3%14
.40
%4.
34%
26.5
7%17
.33%
10.6
0%
12.2
7%25
.20
%7.
88%
6.0
8%
Tins
ukia
32.9
7%2.
62%
15.9
6%29
.94%
12.2
5%43
.78%
30.3
2%2.
57%
23.5
9%40
.99%
24.4
4%25
.03%
Ud
alg
uri
23.1
0%
1.62
%18
.55%
14.4
9%3.
92%
30.1
1%18
.78%
6.89
%8.
79%
29.9
9%6.
58%
6.83
%
Bihar
Ara
ria52
.89%
7.35
%43
.16%
42.5
2%19
.03%
67.5
9%65
.01%
0.4
5%42
.34%
64.4
3%24
.49%
32.4
0%
Arw
al47
.24%
3.68
%38
.62%
16.0
3%7.
42%
53.5
1%49
.41%
0.3
4%36
.20
%49
.39%
22.6
4%12
.43%
Aur
ang
abad
40.1
6%2.
85%
32.6
3%12
.79%
6.56
%46
.29%
42.5
7%0
.83%
28.0
8%40
.90
%14
.20
%12
.56%
Bank
a47
.36%
3.95
%35
.45%
27.1
8%9.
54%
57.7
0%
54.8
6%6.
90%
35.8
1%54
.43%
21.2
8%22
.51%
Beg
usar
ai43
.82%
4.45
%39
.77%
29.4
5%10
.26%
52.0
7%45
.88%
1.52
%28
.04%
51.0
7%21
.30
%15
.02%
Bhag
alp
ur42
.65%
2.68
%37
.31%
30.0
1%11
.83%
52.2
3%46
.30
%2.
79%
24.5
4%48
.50
%21
.76%
17.5
9%
Bho
jpur
38.3
7%3.
69%
32.2
7%11
.11%
6.79
%42
.08%
40.3
2%0
.08%
23.9
7%39
.57%
13.4
1%11
.16%
Buxa
r39
.94%
5.11
%33
.48%
12.9
2%3.
34%
43.9
6%41
.11%
0.1
4%23
.04%
42.3
5%13
.17%
11.6
9%
Dar
bha
nga
46.7
6%2.
85%
44.3
3%31
.48%
13.2
6%56
.77%
50.5
3%0
.51%
32.7
8%56
.11%
21.4
9%26
.01%
Gay
a52
.66%
7.69
%47
.00
%20
.55%
9.75
%59
.10
%54
.72%
4.51
%22
.50
%53
.48%
23.7
9%19
.36%
Go
pal
gan
j33
.40
%3.
37%
28.1
3%14
.17%
5.98
%39
.97%
36.5
7%0
.88%
24.8
3%37
.49%
9.0
2%17
.45%
Jam
ui54
.39%
5.0
3%47
.57%
29.4
1%12
.84%
65.5
4%61
.63%
17.3
3%30
.70
%60
.58%
25.8
4%19
.35%
Jeha
nab
ad40
.77%
3.50
%36
.32%
22.1
1%10
.70
%49
.63%
46.5
8%1.
62%
26.3
1%40
.20
%28
.08%
15.7
9%
Kaim
ur39
.49%
3.52
%34
.46%
14.6
6%8.
18%
46.0
6%43
.47%
5.0
9%18
.49%
42.5
0%
16.1
0%
11.6
2%
Katih
ar47
.38%
4.32
%41
.94%
39.8
5%20
.34%
66.2
4%60
.84%
0.4
1%55
.85%
62.2
8%19
.03%
29.6
6%
Khag
aria
48.6
0%
5.34
%43
.97%
35.2
1%15
.55%
59.8
5%52
.07%
0.1
8%36
.90
%55
.89%
30.1
0%
24.4
9%
Kish
ang
anj
50.5
7%3.
11%
42.8
0%
40.6
4%19
.68%
65.9
4%61
.64%
0.7
6%37
.97%
61.4
0%
20.7
9%34
.23%
Lakh
isar
ai37
.02%
4.62
%34
.73%
22.9
8%9.
11%
45.1
4%37
.67%
4.71
%14
.39%
37.9
5%24
.11%
14.2
0%
Mad
hep
ura
52.5
0%
4.47
%46
.89%
40.5
0%
18.5
8%65
.83%
63.9
3%0
.05%
37.8
7%64
.85%
25.0
4%23
.93%
Mad
hub
ani
46.6
7%3.
28%
37.8
5%26
.09%
11.3
5%55
.04%
51.5
4%0
.99%
33.9
5%54
.36%
21.8
5%22
.90
%
Mun
ger
38.9
4%4.
34%
33.0
0%
20.7
7%6.
83%
46.0
1%41
.23%
5.66
%25
.36%
42.7
0%
20.0
1%12
.40
%
Muz
affa
rpur
40.1
5%3.
26%
34.2
9%23
.41%
10.6
1%48
.91%
45.6
2%0
.30
%21
.35%
47.9
1%16
.74%
19.2
2%
Nal
and
a41
.70
%3.
78%
35.4
5%23
.63%
14.7
2%50
.81%
47.0
8%1.
48%
25.8
4%39
.19%
23.5
1%16
.50
%
Naw
ada
46.6
1%2.
56%
38.3
5%22
.48%
12.5
1%54
.86%
49.1
6%2.
48%
32.9
0%
46.5
5%33
.95%
22.1
8%
Pash
chim
Cha
mp
aran
45.8
7%4.
86%
40.6
2%35
.71%
17.4
2%63
.06%
60.2
1%2.
42%
45.9
8%61
.10
%17
.86%
38.5
8%
Patn
a38
.01%
3.0
6%34
.71%
17.4
7%7.
12%
44.4
5%39
.32%
1.45
%16
.93%
38.8
1%17
.74%
11.0
7%
Purb
a C
ham
par
an48
.35%
4.33
%47
.35%
34.7
6%20
.08%
63.3
6%57
.25%
0.6
2%45
.41%
60.9
0%
19.4
0%
26.2
1%
Purn
ia56
.20
%6.
45%
47.7
6%39
.82%
17.2
2%67
.89%
64.0
9%0
.00
%44
.21%
65.3
7%24
.65%
27.6
3%
Roht
as39
.86%
4.23
%36
.31%
9.24
%3.
43%
42.6
5%39
.24%
1.54
%12
.99%
36.8
4%13
.32%
6.89
%
Saha
rsa
52.9
3%5.
27%
45.3
9%35
.13%
19.3
3%63
.46%
60.8
2%0
.71%
35.6
7%61
.32%
26.6
5%26
.86%
Sam
astip
ur42
.63%
2.83
%39
.21%
29.2
9%13
.10
%55
.25%
53.1
8%1.
45%
42.0
3%54
.08%
24.8
6%27
.80
%
(CONTD.) DISTrICT-WISe: CeNSoreD heADCoUNT rATIo (rUrAl)TABle 15- DISTrICT-WISe: CeNSoreD heADCoUNT rATIo (rUrAl)
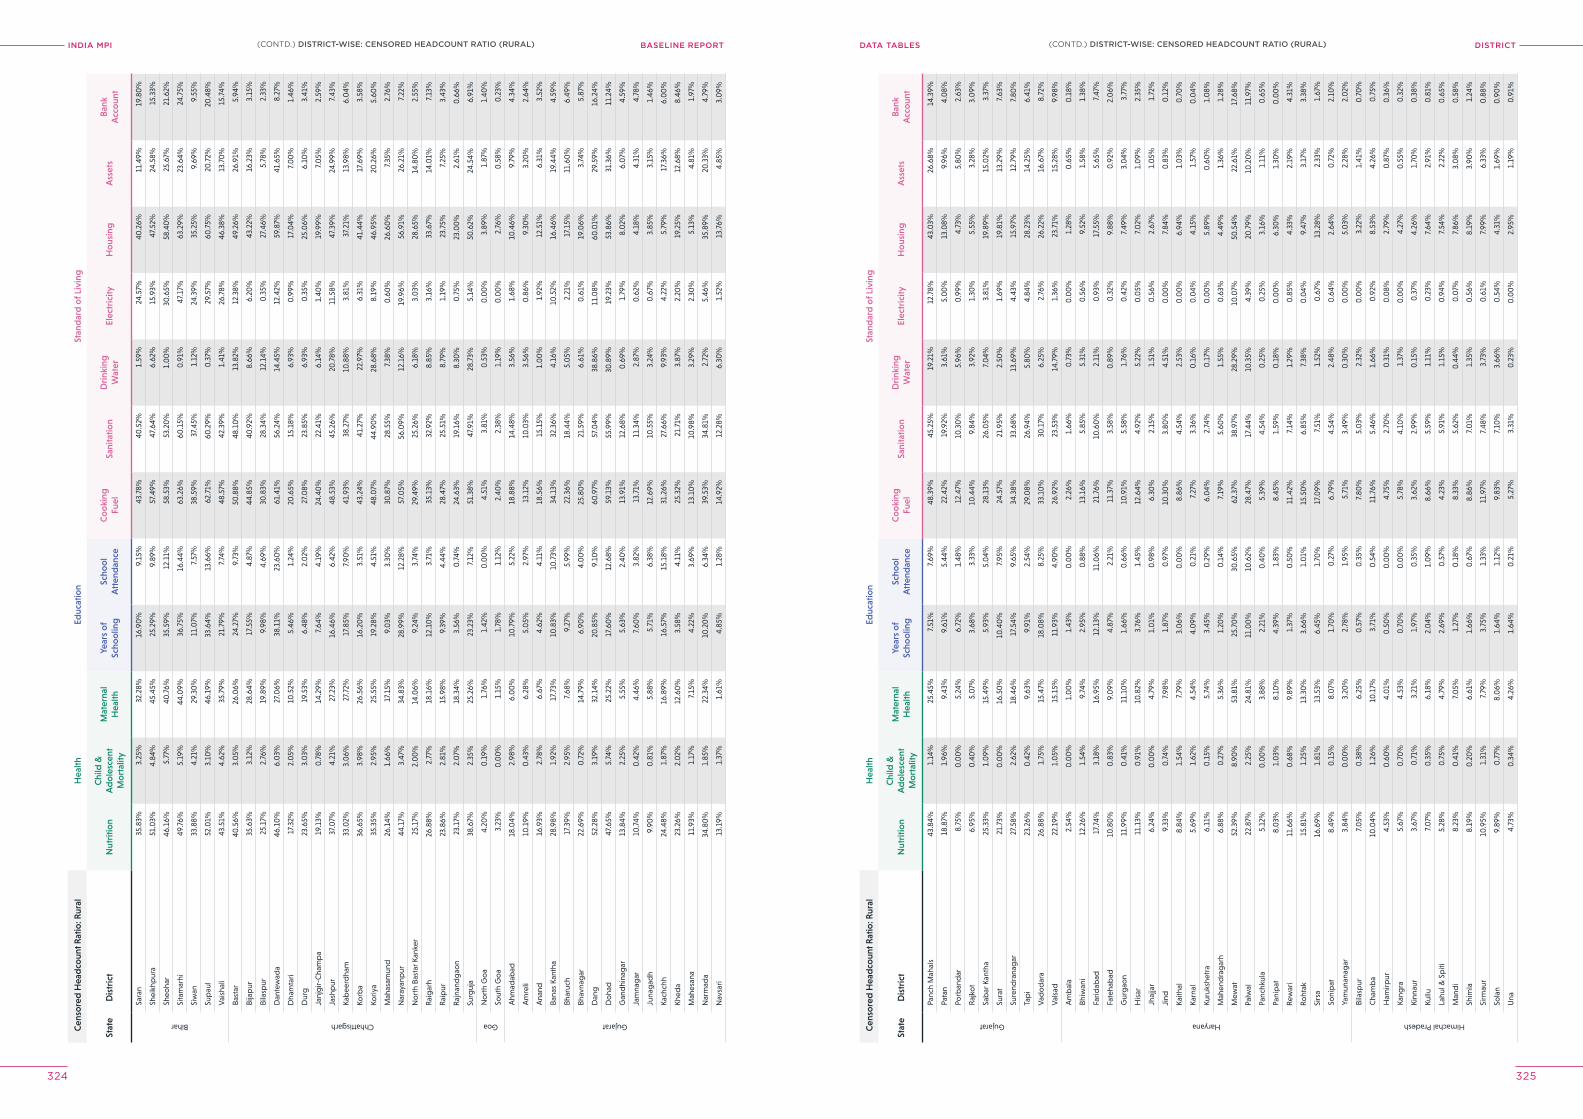
INDIA MPI BASELINE REPORT DISTrICTDATA TABleS
324 325
Cen
sore
d H
ead
coun
t Rat
io: R
ural
Hea
lthEd
ucat
ion
Stan
dar
d o
f Liv
ing
Stat
eD
istr
ict
Nut
ritio
nC
hild
&
Ad
ole
scen
t M
ort
ality
Mat
erna
l H
ealth
Year
s o
f Sc
hoo
ling
Scho
ol
Att
end
ance
Co
oki
ng
Fuel
Sani
tatio
nD
rink
ing
Wat
erEl
ectr
icity
Ho
usin
gA
sset
sB
ank
Acc
oun
t
Bihar
Sara
n35
.83%
3.25
%32
.28%
16.9
0%
9.15
%43
.78%
40.5
2%1.
59%
24.5
7%40
.26%
11.4
9%19
.80
%
Shei
khp
ura
51.0
3%4.
84%
45.4
5%25
.29%
9.89
%57
.49%
47.6
4%6.
62%
15.9
3%47
.52%
24.5
8%15
.33%
Sheo
har
46.1
6%5.
77%
40.7
6%35
.59%
12.1
1%58
.53%
53.2
0%
1.0
0%
30.6
5%58
.40
%25
.67%
21.6
2%
Sita
mar
hi49
.76%
5.19
%44
.09%
36.7
5%16
.44%
63.2
6%60
.15%
0.9
1%47
.17%
63.2
9%23
.64%
24.7
5%
Siw
an33
.88%
4.21
%29
.30
%11
.07%
7.57
%38
.59%
37.4
5%1.
12%
24.3
9%35
.25%
9.69
%9.
55%
Sup
aul
52.0
1%3.
10%
46.1
9%33
.64%
13.6
6%62
.71%
60.2
9%0
.37%
29.5
7%60
.75%
20.7
2%20
.48%
Vai
shal
i43
.51%
4.62
%35
.79%
21.7
9%7.
74%
48.5
7%42
.39%
1.41
%26
.78%
46.3
8%13
.70
%15
.74%
Chhattisgarh
Bast
ar40
.56%
3.0
5%26
.06%
24.2
7%9.
73%
50.8
8%48
.10
%13
.82%
12.3
8%49
.26%
26.9
1%5.
94%
Bija
pur
35.6
3%3.
12%
28.6
4%17
.55%
4.87
%44
.85%
40.9
2%8.
66%
6.20
%43
.22%
16.2
3%3.
15%
Bila
spur
25.1
7%2.
76%
19.8
9%9.
98%
4.69
%30
.83%
28.3
4%12
.14%
0.3
5%27
.46%
5.78
%2.
33%
Dan
tew
ada
46.1
0%
6.0
3%27
.06%
38.1
1%23
.60
%61
.41%
56.2
4%14
.45%
12.4
2%59
.87%
41.6
5%8.
27%
Dha
mta
ri17
.32%
2.0
5%10
.52%
5.46
%1.
24%
20.6
5%15
.18%
6.93
%0
.99%
17.0
4%7.
00
%1.
46%
Dur
g23
.65%
3.0
3%19
.53%
6.48
%2.
02%
27.0
8%23
.85%
6.93
%0
.35%
25.0
6%6.
10%
3.41
%
Janj
gir-
Cha
mp
a19
.13%
0.7
8%14
.29%
7.64
%4.
19%
24.4
0%
22.4
1%6.
14%
1.40
%19
.99%
7.0
5%2.
59%
Jash
pur
37.0
7%4.
21%
27.2
3%16
.46%
6.42
%48
.53%
45.2
6%20
.78%
11.5
8%47
.39%
24.9
9%7.
43%
Kab
eerd
ham
33.0
2%3.
06%
27.7
2%17
.85%
7.90
%41
.93%
38.2
7%10
.88%
3.81
%37
.21%
13.9
8%6.
04%
Korb
a36
.65%
3.98
%26
.56%
16.2
0%
3.51
%43
.24%
41.2
7%22
.97%
6.31
%41
.44%
17.6
9%3.
58%
Koriy
a35
.35%
2.95
%25
.55%
19.2
8%4.
51%
48.0
7%44
.90
%28
.68%
8.19
%46
.95%
20.2
6%5.
60%
Mah
asam
und
26.1
4%1.
66%
17.1
5%9.
03%
3.30
%30
.87%
28.5
5%7.
38%
0.6
0%
26.6
0%
7.35
%2.
76%
Nar
ayan
pur
44.1
7%3.
47%
34.8
3%28
.99%
12.2
8%57
.05%
56.0
9%12
.16%
19.9
6%56
.91%
26.2
1%7.
22%
No
rth
Bast
ar K
anke
r25
.17%
2.0
0%
14.0
6%9.
24%
3.74
%29
.49%
25.2
6%6.
18%
3.0
3%28
.65%
14.8
0%
2.55
%
Rai
gar
h26
.88%
2.77
%18
.16%
12.1
0%
3.71
%35
.13%
32.9
2%8.
85%
3.16
%33
.67%
14.0
1%7.
13%
Rai
pur
23.8
6%2.
81%
15.9
8%9.
39%
4.44
%28
.47%
25.5
1%8.
79%
1.19
%23
.75%
7.25
%3.
43%
Raj
nand
gao
n23
.17%
2.0
7%18
.34%
3.56
%0
.74%
24.6
3%19
.16%
8.30
%0
.75%
23.0
0%
2.61
%0
.66%
Surg
uja
38.6
7%2.
35%
25.2
6%23
.23%
7.12
%51
.38%
47.9
1%28
.73%
5.14
%50
.62%
24.5
4%6.
91%
Goa
No
rth
Go
a4.
20%
0.1
9%1.
76%
1.42
%0
.00
%4.
51%
3.81
%0
.53%
0.0
0%
3.89
%1.
87%
1.40
%
Sout
h G
oa
3.23
%0
.00
%1.
15%
1.78
%1.
12%
2.40
%2.
38%
1.19
%0
.00
%2.
76%
0.5
8%0
.23%
Gujarat
Ahm
adab
ad18
.04%
2.98
%6.
00
%10
.79%
5.22
%18
.88%
14.4
8%3.
56%
1.68
%10
.46%
9.79
%4.
34%
Am
reli
10.1
9%0
.43%
6.28
%5.
05%
2.97
%13
.12%
10.0
3%3.
56%
0.8
6%9.
30%
3.20
%2.
64%
Ana
nd16
.93%
2.78
%6.
67%
4.62
%4.
11%
18.5
6%15
.15%
1.0
0%
1.92
%12
.51%
6.31
%3.
52%
Bana
s Ka
ntha
28.9
8%1.
92%
17.7
3%10
.83%
10.7
3%34
.13%
32.3
6%4.
16%
10.5
2%16
.46%
19.4
4%4.
59%
Bhar
uch
17.3
9%2.
95%
7.68
%9.
27%
5.99
%22
.36%
18.4
4%5.
05%
2.21
%17
.15%
11.6
0%
6.49
%
Bhav
nag
ar22
.69%
0.7
2%14
.79%
6.90
%4.
00
%25
.80
%21
.59%
6.61
%0
.61%
19.0
6%3.
74%
5.87
%
Dan
g52
.28%
3.19
%32
.14%
20.8
5%9.
10%
60.9
7%57
.04%
38.8
6%11
.08%
60.0
1%29
.59%
16.2
4%
Do
had
47.6
5%5.
74%
25.2
2%17
.60
%12
.68%
59.1
3%55
.99%
30.8
9%19
.23%
53.8
6%31
.36%
11.2
4%
Gan
dhi
nag
ar13
.84%
2.25
%5.
55%
5.63
%2.
40%
13.9
1%12
.68%
0.6
9%1.
79%
8.0
2%6.
07%
4.59
%
Jam
nag
ar10
.74%
0.4
2%4.
46%
7.60
%3.
82%
13.7
1%11
.34%
2.87
%0
.62%
4.18
%4.
31%
4.78
%
Juna
gad
h9.
90%
0.8
1%5.
88%
5.71
%6.
38%
12.6
9%10
.55%
3.24
%0
.67%
3.85
%3.
15%
1.46
%
Kach
chh
24.4
8%1.
87%
16.8
9%16
.57%
15.1
8%31
.26%
27.6
6%9.
93%
4.22
%5.
79%
17.3
6%6.
00
%
Khed
a23
.26%
2.0
2%12
.60
%3.
58%
4.11
%25
.32%
21.7
1%3.
87%
2.20
%19
.25%
12.6
8%8.
46%
Mah
esan
a11
.93%
1.17
%7.
15%
4.22
%3.
69%
13.1
0%
10.9
8%3.
29%
2.30
%5.
13%
4.81
%1.
97%
Nar
mad
a34
.80
%1.
85%
22.3
4%10
.20
%6.
34%
39.5
3%34
.81%
2.72
%5.
46%
35.8
9%20
.33%
4.79
%
Nav
sari
13.1
9%1.
37%
1.61
%4.
85%
1.28
%14
.92%
12.2
8%6.
30%
1.52
%13
.76%
4.85
%3.
09%
Cen
sore
d H
ead
coun
t Rat
io: R
ural
Hea
lthEd
ucat
ion
Stan
dar
d o
f Liv
ing
Stat
eD
istr
ict
Nut
ritio
nC
hild
&
Ad
ole
scen
t M
ort
ality
Mat
erna
l H
ealth
Year
s o
f Sc
hoo
ling
Scho
ol
Att
end
ance
Co
oki
ng
Fuel
Sani
tatio
nD
rink
ing
Wat
erEl
ectr
icity
Ho
usin
gA
sset
sB
ank
Acc
oun
t
Gujarat
Panc
h M
ahal
s43
.84%
1.14
%25
.45%
7.51
%7.
69%
48.3
9%45
.25%
19.2
1%12
.78%
43.0
3%26
.68%
14.3
9%
Pata
n18
.87%
1.96
%9.
43%
9.61
%5.
44%
22.4
2%19
.92%
3.61
%5.
00
%13
.08%
9.96
%4.
08%
Porb
and
ar8.
75%
0.0
0%
5.24
%6.
72%
1.48
%12
.47%
10.3
0%
5.96
%0
.99%
4.73
%5.
80%
2.63
%
Raj
kot
6.95
%0
.40
%5.
07%
3.68
%3.
33%
10.4
4%9.
84%
3.92
%1.
30%
5.55
%3.
28%
3.0
9%
Sab
ar K
anth
a25
.33%
1.0
9%15
.49%
5.93
%5.
04%
28.1
3%26
.05%
7.0
4%3.
81%
19.8
9%15
.02%
3.37
%
Sura
t21
.73%
0.0
0%
16.5
0%
10.4
0%
7.95
%24
.57%
21.9
5%2.
50%
1.69
%19
.81%
13.2
9%7.
63%
Sure
ndra
nag
ar27
.58%
2.62
%18
.46%
17.5
4%9.
65%
34.3
8%33
.68%
13.6
9%4.
43%
15.9
7%12
.79%
7.80
%
Tap
i23
.26%
0.4
2%9.
63%
9.91
%2.
54%
29.0
8%26
.94%
5.80
%4.
84%
28.2
3%14
.25%
6.41
%
Vad
od
ara
26.8
8%1.
75%
15.4
7%18
.08%
8.25
%33
.10
%30
.17%
6.25
%2.
76%
26.2
2%16
.67%
8.72
%
Val
sad
22.1
9%1.
05%
15.1
5%11
.93%
4.90
%26
.92%
23.5
3%14
.79%
1.36
%23
.71%
15.2
8%9.
98%
Haryana
Am
bal
a2.
54%
0.0
0%
1.0
0%
1.43
%0
.00
%2.
26%
1.66
%0
.73%
0.0
0%
1.28
%0
.65%
0.1
8%
Bhiw
ani
12.2
6%1.
54%
9.74
%2.
95%
0.8
8%13
.16%
5.85
%5.
31%
0.5
6%9.
52%
1.58
%1.
38%
Farid
abad
17.7
4%3.
18%
16.9
5%12
.13%
11.0
6%21
.76%
10.6
0%
2.11
%0
.93%
17.5
5%5.
65%
7.47
%
Fate
hab
ad10
.80
%0
.83%
9.0
9%4.
87%
2.21
%11
.37%
3.58
%0
.89%
0.3
2%9.
88%
0.9
2%2.
06%
Gur
gao
n11
.99%
0.4
1%11
.10
%1.
66%
0.6
6%10
.91%
5.58
%1.
76%
0.4
2%7.
49%
3.0
4%3.
77%
His
ar11
.13%
0.9
1%10
.82%
3.76
%1.
45%
12.6
4%4.
92%
5.22
%0
.05%
7.0
2%1.
09%
2.35
%
Jhaj
jar
6.24
%0
.00
%4.
79%
1.0
1%0
.98%
6.30
%2.
15%
1.51
%0
.56%
2.67
%1.
05%
1.72
%
Jind
9.33
%0
.74%
7.98
%1.
87%
0.9
7%10
.30
%3.
80%
4.51
%0
.00
%7.
84%
0.8
3%0
.12%
Kaith
al8.
84%
1.54
%7.
79%
3.0
6%0
.00
%8.
86%
4.54
%2.
53%
0.0
0%
6.94
%1.
03%
0.7
0%
Karn
al5.
69%
1.62
%4.
54%
4.0
9%0
.21%
7.27
%3.
36%
0.1
6%0
.04%
4.15
%1.
57%
0.0
4%
Kuru
kshe
tra
6.11
%0
.15%
5.74
%3.
45%
0.2
9%6.
04%
2.74
%0
.17%
0.0
0%
5.89
%0
.60
%1.
08%
Mah
end
rag
arh
6.88
%0
.27%
5.36
%1.
20%
0.1
4%7.
19%
5.60
%1.
55%
0.6
3%4.
49%
1.36
%1.
28%
Mew
at52
.39%
8.90
%53
.81%
25.7
0%
30.6
5%62
.37%
38.9
7%28
.29%
10.0
7%50
.54%
22.6
1%17
.68%
Palw
al22
.87%
2.25
%24
.81%
11.0
0%
10.6
2%28
.47%
17.4
4%10
.35%
4.39
%20
.79%
10.2
0%
11.9
7%
Panc
hkul
a5.
12%
0.0
0%
3.88
%2.
21%
0.4
0%
5.39
%4.
54%
0.2
5%0
.25%
3.16
%1.
11%
0.6
5%
Pani
pat
8.0
3%1.
03%
8.10
%4.
39%
1.83
%8.
45%
1.59
%0
.18%
0.0
0%
6.30
%1.
30%
0.0
0%
Rew
ari
11.6
6%0
.68%
9.89
%1.
37%
0.5
0%
11.4
2%7.
14%
1.29
%0
.85%
4.33
%2.
19%
4.31
%
Roht
ak15
.81%
1.25
%13
.30
%3.
66%
1.0
1%15
.50
%6.
85%
7.38
%0
.04%
9.47
%3.
17%
3.38
%
Sirs
a16
.69%
1.81
%13
.53%
6.45
%1.
70%
17.0
9%7.
51%
1.52
%0
.67%
13.2
8%2.
33%
1.67
%
Soni
pat
8.49
%0
.15%
8.0
7%1.
70%
0.2
7%6.
79%
4.54
%2.
48%
0.6
4%2.
64%
0.7
2%2.
10%
Yam
unan
agar
3.84
%0
.00
%3.
20%
2.78
%1.
95%
5.71
%3.
49%
0.3
0%
0.0
0%
5.0
3%2.
28%
2.0
2%
Himachal Pradesh
Bila
spur
7.0
5%0
.38%
6.25
%0
.57%
0.3
5%7.
80%
5.0
3%2.
32%
0.0
0%
3.22
%1.
41%
0.7
0%
Cha
mb
a10
.04%
1.26
%10
.17%
3.71
%0
.54%
11.7
6%5.
46%
1.66
%0
.92%
8.53
%4.
26%
0.7
5%
Ham
irpur
4.53
%0
.60
%4.
01%
0.5
0%
0.0
0%
4.75
%2.
70%
0.3
1%0
.08%
2.79
%0
.87%
0.3
6%
Kang
ra5.
67%
0.7
0%
4.53
%0
.70
%0
.00
%5.
78%
4.10
%1.
37%
0.0
0%
4.27
%0
.55%
0.3
2%
Kinn
aur
3.67
%0
.71%
3.21
%1.
97%
0.3
5%3.
62%
2.99
%0
.15%
0.3
7%4.
26%
1.70
%0
.38%
Kullu
7.0
7%0
.35%
6.18
%2.
04%
1.0
9%8.
66%
5.59
%1.
11%
0.2
3%7.
64%
2.91
%0
.81%
Lahu
l & S
piti
5.28
%0
.75%
4.79
%2.
69%
0.5
7%4.
23%
5.91
%1.
15%
0.9
4%7.
54%
2.22
%0
.65%
Man
di
8.23
%0
.41%
7.0
5%1.
27%
0.1
8%8.
33%
5.62
%0
.44%
0.0
7%7.
86%
3.0
8%0
.58%
Shim
la8.
19%
0.2
0%
6.61
%1.
66%
0.6
7%8.
86%
7.0
1%1.
35%
0.5
6%8.
19%
3.90
%1.
24%
Sirm
aur
10.9
5%1.
31%
7.79
%3.
75%
1.33
%11
.97%
7.48
%3.
73%
0.6
1%7.
99%
6.33
%0
.88%
Sola
n9.
89%
0.7
7%8.
06%
1.64
%1.
12%
9.83
%7.
10%
3.66
%0
.54%
4.31
%1.
69%
0.9
0%
Una
4.73
%0
.34%
4.26
%1.
64%
0.2
1%5.
27%
3.31
%0
.23%
0.0
0%
2.95
%1.
19%
0.9
1%
(CONTD.) DISTrICT-WISe: CeNSoreD heADCoUNT rATIo (rUrAl)(CONTD.) DISTrICT-WISe: CeNSoreD heADCoUNT rATIo (rUrAl)
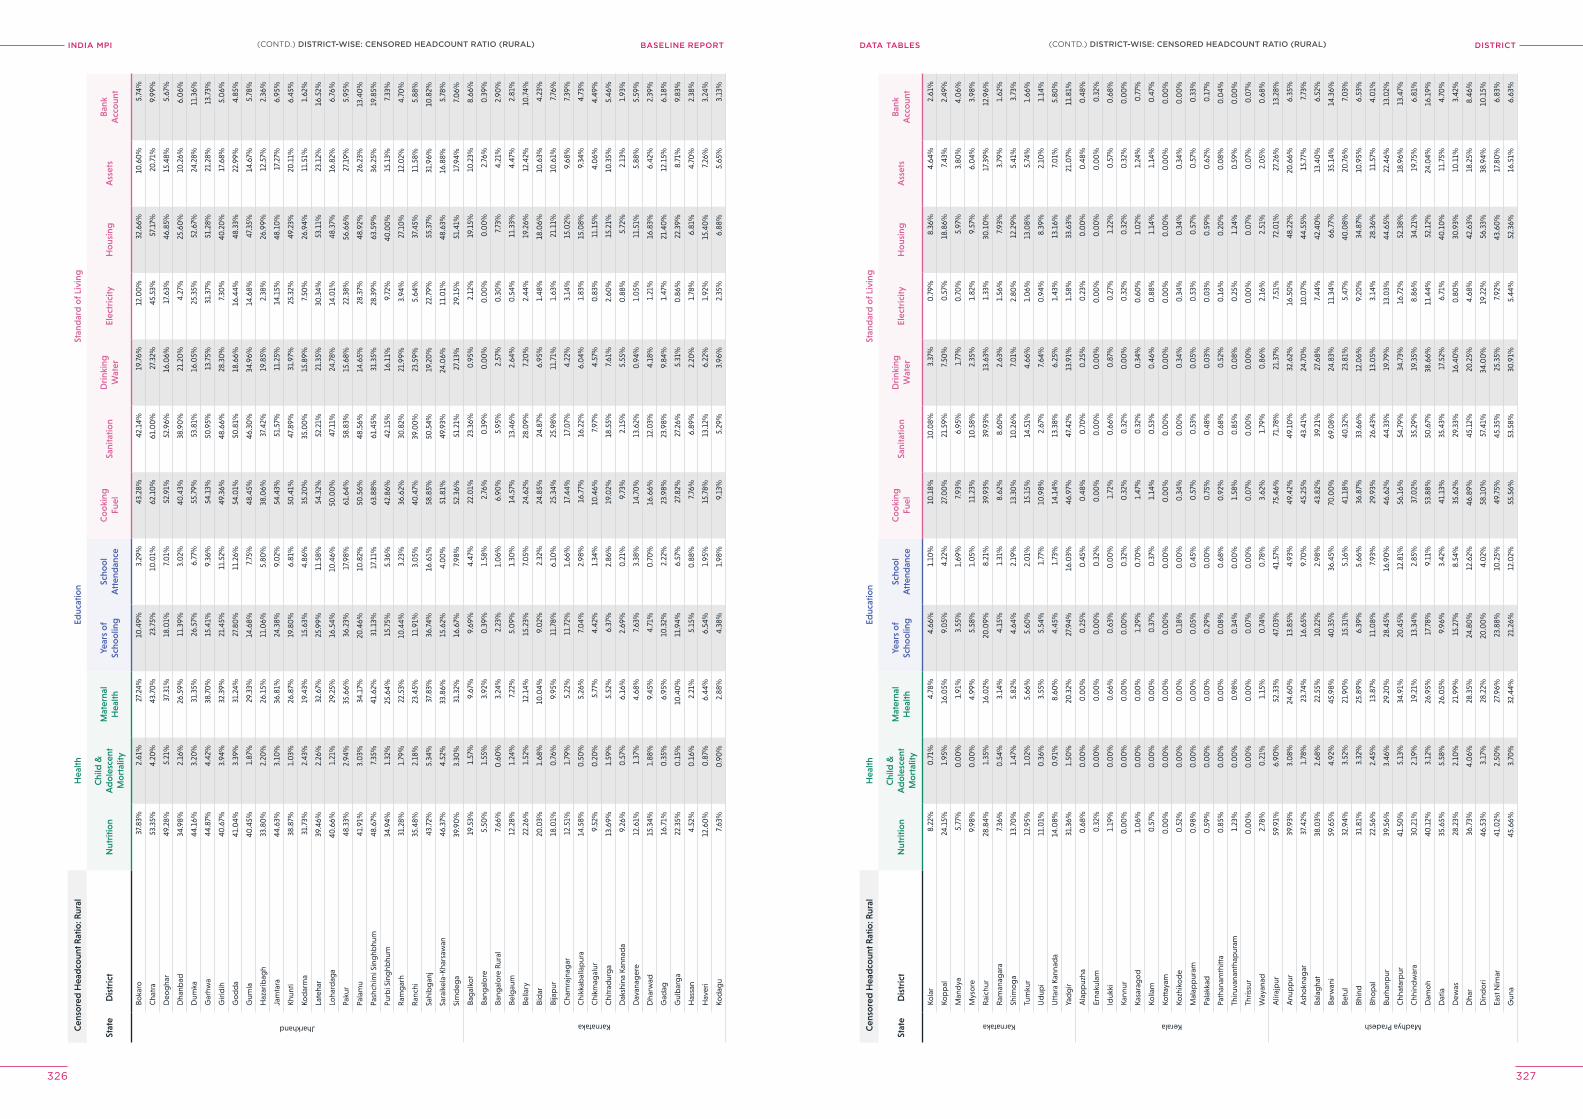
INDIA MPI BASELINE REPORT DISTrICTDATA TABleS
326 327
Cen
sore
d H
ead
coun
t Rat
io: R
ural
Hea
lthEd
ucat
ion
Stan
dar
d o
f Liv
ing
Stat
eD
istr
ict
Nut
ritio
nC
hild
&
Ad
ole
scen
t M
ort
ality
Mat
erna
l H
ealth
Year
s o
f Sc
hoo
ling
Scho
ol
Att
end
ance
Co
oki
ng
Fuel
Sani
tatio
nD
rink
ing
Wat
erEl
ectr
icity
Ho
usin
gA
sset
sB
ank
Acc
oun
t
Jharkhand
Boka
ro37
.83%
2.61
%27
.24%
10.4
9%3.
29%
43.2
8%42
.14%
19.7
6%12
.00
%32
.66%
10.6
0%
5.74
%
Cha
tra
53.3
5%4.
20%
43.7
0%
23.7
5%10
.01%
62.1
0%
61.0
0%
27.3
2%45
.53%
57.1
7%20
.71%
9.99
%
Deo
gha
r49
.28%
5.21
%37
.31%
18.0
1%7.
01%
52.9
1%52
.96%
16.0
6%17
.63%
46.8
5%15
.48%
5.67
%
Dha
nbad
34.9
8%2.
16%
26.5
9%11
.39%
3.0
2%40
.43%
38.9
0%
21.2
0%
4.27
%25
.60
%10
.26%
6.0
6%
Dum
ka44
.16%
3.20
%31
.35%
26.5
7%6.
77%
55.7
9%53
.81%
16.0
5%25
.35%
52.6
7%24
.28%
11.3
6%
Gar
hwa
44.8
7%4.
42%
38.7
0%
15.4
1%9.
36%
54.1
3%50
.95%
13.7
5%31
.37%
51.2
8%21
.28%
13.7
3%
Giri
dih
40.6
7%3.
94%
32.3
9%21
.45%
11.5
2%49
.36%
48.6
6%28
.30
%7.
30%
40.2
0%
17.6
8%5.
06%
Go
dd
a41
.04%
3.39
%31
.24%
27.8
0%
11.2
6%54
.01%
50.8
1%18
.66%
16.4
4%48
.33%
22.9
9%4.
85%
Gum
la40
.45%
1.87
%29
.33%
14.6
8%7.
75%
48.4
5%46
.30
%34
.96%
14.6
8%47
.35%
14.6
7%5.
78%
Haz
arib
agh
33.8
0%
2.20
%26
.15%
11.0
6%5.
80%
38.0
6%37
.42%
19.8
5%2.
38%
26.9
9%12
.57%
2.36
%
Jam
tara
44.6
3%3.
10%
36.8
1%24
.38%
9.0
2%54
.43%
51.5
7%11
.25%
14.1
5%48
.10
%17
.27%
6.95
%
Khun
ti38
.87%
1.0
3%26
.87%
19.8
0%
6.81
%50
.41%
47.8
9%31
.97%
25.3
2%49
.23%
20.1
1%6.
45%
Kod
arm
a31
.73%
2.43
%19
.43%
15.6
3%4.
86%
35.2
0%
35.0
0%
15.8
9%7.
50%
26.9
4%11
.51%
1.62
%
Late
har
39.4
6%2.
26%
32.6
7%25
.99%
11.5
8%54
.32%
52.2
1%21
.35%
30.3
4%53
.11%
23.1
2%16
.52%
Loha
rdag
a40
.66%
1.21
%29
.25%
16.5
4%10
.46%
50.0
0%
47.1
1%24
.78%
14.0
1%48
.37%
16.8
2%6.
76%
Paku
r48
.33%
2.94
%35
.66%
36.2
3%17
.98%
61.6
4%58
.83%
15.6
8%22
.38%
56.6
6%27
.19%
5.95
%
Pala
mu
41.9
1%3.
03%
34.1
7%20
.46%
10.8
2%50
.56%
48.5
6%14
.65%
28.3
7%48
.92%
26.2
3%13
.40
%
Pash
chim
i Sin
ghb
hum
48.6
7%7.
35%
41.6
2%31
.13%
17.1
1%63
.88%
61.4
5%31
.35%
28.3
9%63
.59%
36.2
5%19
.85%
Purb
i Sin
ghb
hum
34.9
4%1.
32%
25.6
4%15
.75%
5.36
%42
.86%
42.1
5%16
.11%
9.72
%40
.00
%15
.13%
7.33
%
Ram
gar
h31
.28%
1.79
%22
.53%
10.4
4%3.
23%
36.6
2%30
.82%
21.9
9%3.
94%
27.1
0%
12.0
2%4.
70%
Ran
chi
35.4
8%2.
18%
23.4
5%11
.91%
3.0
5%40
.47%
39.0
0%
23.5
9%5.
64%
37.4
5%11
.58%
5.88
%
Sahi
bg
anj
43.7
2%5.
34%
37.8
3%36
.74%
16.6
1%58
.85%
50.5
4%19
.20
%22
.79%
55.3
7%31
.96%
10.8
2%
Sara
ikel
a-Kh
arsa
wan
46.3
7%4.
52%
33.8
6%15
.62%
4.0
0%
51.8
1%49
.93%
24.0
6%11
.01%
48.6
3%16
.88%
5.78
%
Sim
deg
a39
.90
%3.
30%
31.3
2%16
.67%
7.98
%52
.36%
51.2
1%27
.13%
29.1
5%51
.41%
17.9
4%7.
06%
Karnataka
Bag
alko
t19
.53%
1.57
%9.
67%
9.69
%4.
47%
22.0
1%23
.36%
0.9
5%2.
12%
19.1
5%10
.23%
8.66
%
Bang
alo
re5.
50%
1.55
%3.
92%
0.3
9%1.
58%
2.76
%0
.39%
0.0
0%
0.0
0%
0.0
0%
2.76
%0
.39%
Bang
alo
re R
ural
7.66
%0
.60
%3.
24%
2.23
%1.
06%
6.90
%5.
95%
2.57
%0
.30
%7.
73%
4.21
%2.
90%
Belg
aum
12.2
8%1.
24%
7.22
%5.
09%
1.30
%14
.57%
13.4
6%2.
64%
0.5
4%11
.33%
4.47
%2.
81%
Bella
ry22
.26%
1.52
%12
.14%
15.2
3%7.
05%
24.6
2%28
.09%
7.20
%2.
44%
19.2
6%12
.42%
10.7
4%
Bid
ar20
.03%
1.68
%10
.04%
9.0
2%2.
32%
24.8
5%24
.87%
6.95
%1.
48%
18.0
6%10
.63%
4.23
%
Bija
pur
18.0
1%0
.76%
9.95
%11
.78%
6.10
%25
.34%
25.9
8%11
.71%
1.63
%21
.11%
10.6
1%7.
76%
Cha
mra
jnag
ar12
.51%
1.79
%5.
22%
11.7
2%1.
66%
17.4
4%17
.07%
4.22
%3.
14%
15.0
2%9.
68%
7.39
%
Chi
kkab
alla
pur
a14
.58%
0.5
0%
5.26
%7.
04%
2.98
%16
.77%
16.2
2%6.
04%
1.83
%15
.08%
9.34
%4.
73%
Chi
kmag
alur
9.52
%0
.20
%5.
77%
4.42
%1.
34%
10.4
6%7.
97%
4.57
%0
.83%
11.1
5%4.
06%
4.49
%
Chi
trad
urg
a13
.69%
1.59
%5.
52%
6.37
%2.
86%
19.0
2%18
.55%
7.61
%2.
60%
15.2
1%10
.35%
5.46
%
Dak
shin
a Ka
nnad
a9.
26%
0.5
7%6.
16%
2.69
%0
.21%
9.73
%2.
15%
5.55
%0
.88%
5.72
%2.
13%
1.93
%
Dav
anag
ere
12.6
1%1.
37%
4.68
%7.
63%
3.38
%14
.70
%13
.62%
0.9
4%1.
05%
11.5
1%5.
88%
5.59
%
Dha
rwad
15.3
4%1.
88%
9.45
%4.
71%
0.7
0%
16.6
6%12
.03%
4.18
%1.
21%
16.8
3%6.
42%
2.39
%
Gad
ag16
.71%
0.3
5%6.
95%
10.3
2%2.
22%
23.9
8%23
.98%
9.84
%1.
47%
21.4
0%
12.1
5%6.
18%
Gul
bar
ga
22.3
5%0
.15%
10.4
0%
11.9
4%6.
57%
27.8
2%27
.26%
5.31
%0
.86%
22.3
9%8.
71%
9.83
%
Has
san
4.52
%0
.16%
2.21
%5.
15%
0.8
8%7.
76%
6.89
%2.
20%
1.78
%6.
81%
4.70
%2.
38%
Hav
eri
12.6
0%
0.8
7%6.
44%
6.54
%1.
95%
15.7
8%13
.12%
6.22
%1.
92%
15.4
0%
7.26
%3.
24%
Kod
agu
7.63
%0
.90
%2.
88%
4.38
%1.
98%
9.13
%5.
29%
3.96
%2.
35%
6.88
%5.
65%
3.13
%
Cen
sore
d H
ead
coun
t Rat
io: R
ural
Hea
lthEd
ucat
ion
Stan
dar
d o
f Liv
ing
Stat
eD
istr
ict
Nut
ritio
nC
hild
&
Ad
ole
scen
t M
ort
ality
Mat
erna
l H
ealth
Year
s o
f Sc
hoo
ling
Scho
ol
Att
end
ance
Co
oki
ng
Fuel
Sani
tatio
nD
rink
ing
Wat
erEl
ectr
icity
Ho
usin
gA
sset
sB
ank
Acc
oun
t
Karnataka
Kola
r8.
22%
0.7
1%4.
78%
4.66
%1.
10%
10.1
8%10
.08%
3.37
%0
.79%
8.36
%4.
64%
2.61
%
Kop
pal
24.1
5%1.
95%
16.0
5%9.
05%
4.22
%27
.00
%21
.59%
7.50
%0
.57%
18.8
6%7.
43%
2.49
%
Man
dya
5.77
%0
.00
%1.
91%
3.55
%1.
69%
7.93
%6.
95%
1.77
%0
.70
%5.
97%
3.80
%4.
06%
Mys
ore
9.98
%0
.00
%4.
99%
5.58
%1.
05%
11.2
3%10
.58%
2.35
%1.
82%
9.57
%6.
04%
3.98
%
Rai
chur
28.8
4%1.
35%
16.0
2%20
.09%
8.21
%39
.93%
39.9
3%13
.63%
1.33
%30
.10
%17
.39%
12.9
6%
Ram
anag
ara
7.36
%0
.54%
3.14
%4.
15%
1.31
%8.
62%
8.60
%2.
63%
1.56
%7.
93%
3.79
%1.
62%
Shim
og
a13
.70
%1.
47%
5.82
%4.
64%
2.19
%13
.30
%10
.26%
7.0
1%2.
80%
12.2
9%5.
41%
3.73
%
Tum
kur
12.9
5%1.
02%
5.66
%5.
60%
2.0
1%15
.15%
14.5
1%4.
66%
1.0
6%13
.08%
5.74
%1.
66%
Ud
upi
11.0
1%0
.36%
3.55
%5.
54%
1.77
%10
.98%
2.67
%7.
64%
0.9
4%8.
39%
2.10
%1.
14%
Utt
ara
Kann
ada
14.0
8%0
.91%
8.60
%4.
45%
1.73
%14
.14%
13.3
8%6.
25%
1.43
%13
.16%
7.0
1%5.
80%
Yad
gir
31.3
6%1.
50%
20.3
2%27
.94%
16.0
3%46
.97%
47.4
2%13
.91%
1.58
%33
.63%
21.0
7%11
.81%
Kerala
Ala
pp
uzha
0.6
8%0
.00
%0
.00
%0
.25%
0.4
5%0
.48%
0.7
0%
0.2
5%0
.23%
0.0
0%
0.4
8%0
.48%
Erna
kula
m0
.32%
0.0
0%
0.0
0%
0.0
0%
0.3
2%0
.00
%0
.00
%0
.00
%0
.00
%0
.00
%0
.00
%0
.32%
Iduk
ki1.
19%
0.0
0%
0.6
6%0
.63%
0.0
0%
1.72
%0
.66%
0.8
7%0
.27%
1.22
%0
.57%
0.6
8%
Kann
ur0
.00
%0
.00
%0
.00
%0
.00
%0
.32%
0.3
2%0
.32%
0.0
0%
0.3
2%0
.32%
0.3
2%0
.00
%
Kasa
rag
od
1.0
6%0
.00
%0
.00
%1.
29%
0.7
0%
1.47
%0
.32%
0.3
4%0
.60
%1.
02%
1.24
%0
.77%
Kolla
m0
.57%
0.0
0%
0.0
0%
0.3
7%0
.37%
1.14
%0
.53%
0.4
6%0
.88%
1.14
%1.
14%
0.4
7%
Kott
ayam
0.0
0%
0.0
0%
0.0
0%
0.0
0%
0.0
0%
0.0
0%
0.0
0%
0.0
0%
0.0
0%
0.0
0%
0.0
0%
0.0
0%
Kozh
iko
de
0.5
2%0
.00
%0
.00
%0
.18%
0.0
0%
0.3
4%0
.00
%0
.34%
0.3
4%0
.34%
0.3
4%0
.00
%
Mal
app
uram
0.9
8%0
.00
%0
.00
%0
.05%
0.4
5%0
.57%
0.5
3%0
.05%
0.5
3%0
.57%
0.5
7%0
.33%
Pala
kkad
0.5
9%0
.00
%0
.00
%0
.29%
0.0
0%
0.7
5%0
.48%
0.0
3%0
.03%
0.5
9%0
.62%
0.1
7%
Path
anam
thitt
a0
.85%
0.0
0%
0.0
0%
0.0
8%0
.68%
0.9
2%0
.68%
0.5
2%0
.16%
0.2
0%
0.0
8%0
.04%
Thiru
vana
ntha
pur
am1.
23%
0.0
0%
0.9
8%0
.34%
0.0
0%
1.58
%0
.85%
0.0
8%0
.25%
1.24
%0
.59%
0.0
0%
Thris
sur
0.0
0%
0.0
0%
0.0
0%
0.0
7%0
.00
%0
.07%
0.0
0%
0.0
0%
0.0
0%
0.0
7%0
.07%
0.0
7%
Way
anad
2.78
%0
.21%
1.15
%0
.74%
0.7
8%3.
62%
1.79
%0
.86%
2.16
%2.
51%
2.0
5%0
.68%
Madhya Pradesh
Alir
ajp
ur59
.91%
6.90
%52
.33%
47.0
3%41
.57%
75.4
6%71
.78%
21.3
7%7.
51%
72.0
1%27
.26%
13.2
8%
Anu
pp
ur39
.93%
3.0
8%24
.60
%13
.85%
4.93
%49
.42%
49.1
0%
32.6
2%16
.50
%48
.22%
20.6
6%6.
35%
Ash
okn
agar
37.4
2%1.
78%
23.7
4%16
.65%
9.70
%45
.25%
43.4
1%24
.70
%10
.07%
44.5
5%15
.77%
7.73
%
Bala
gha
t38
.03%
2.68
%22
.55%
10.2
2%2.
98%
43.8
2%39
.21%
27.6
8%7.
44%
42.4
0%
13.4
0%
6.52
%
Barw
ani
59.6
5%4.
92%
45.9
8%40
.35%
36.4
5%70
.00
%69
.08%
24.8
3%11
.34%
66.7
7%35
.14%
14.3
6%
Betu
l32
.94%
3.52
%21
.90
%15
.31%
5.16
%41
.18%
40.3
2%23
.81%
5.47
%40
.08%
20.7
6%7.
03%
Bhin
d31
.81%
3.32
%25
.89%
6.39
%5.
66%
36.8
7%33
.66%
12.0
6%9.
20%
34.8
7%10
.95%
6.53
%
Bho
pal
22.5
6%2.
45%
13.8
7%11
.08%
7.93
%29
.93%
26.4
3%13
.05%
3.14
%28
.36%
11.5
7%4.
01%
Burh
anp
ur39
.56%
3.46
%29
.20
%28
.45%
16.9
0%
46.6
2%44
.33%
19.7
9%13
.03%
44.6
5%22
.46%
13.0
2%
Chh
atar
pur
41.5
0%
5.13
%34
.91%
20.4
5%12
.81%
56.1
6%54
.79%
34.7
3%16
.72%
52.3
8%18
.96%
13.4
7%
Chh
ind
war
a30
.21%
2.19
%19
.21%
13.3
4%2.
85%
37.0
2%35
.29%
19.3
5%8.
86%
34.2
1%19
.75%
6.81
%
Dam
oh
40.1
2%3.
12%
26.9
5%17
.78%
9.11
%53
.88%
50.6
7%38
.66%
11.4
4%52
.12%
24.0
4%16
.19%
Dat
ia35
.65%
5.58
%26
.05%
9.96
%3.
42%
41.1
3%35
.43%
17.5
2%6.
71%
40.1
0%
11.7
5%4.
70%
Dew
as28
.23%
2.10
%21
.99%
15.2
7%8.
54%
35.6
2%29
.33%
16.4
0%
0.8
0%
30.9
3%10
.11%
3.42
%
Dha
r36
.73%
4.0
6%28
.35%
24.8
0%
12.6
2%46
.89%
45.1
2%20
.25%
4.68
%42
.63%
18.2
5%8.
46%
Din
do
ri46
.53%
3.17
%28
.22%
20.0
0%
4.0
2%58
.10
%57
.41%
34.0
0%
19.2
2%56
.33%
38.9
4%10
.15%
East
Nim
ar41
.02%
2.50
%27
.96%
23.8
8%10
.25%
49.7
5%45
.35%
25.3
5%7.
92%
43.6
0%
17.8
0%
6.83
%
Gun
a45
.66%
3.70
%32
.44%
21.2
6%12
.02%
55.5
6%53
.58%
30.9
1%5.
44%
52.3
6%16
.51%
6.63
%
(CONTD.) DISTrICT-WISe: CeNSoreD heADCoUNT rATIo (rUrAl)(CONTD.) DISTrICT-WISe: CeNSoreD heADCoUNT rATIo (rUrAl)
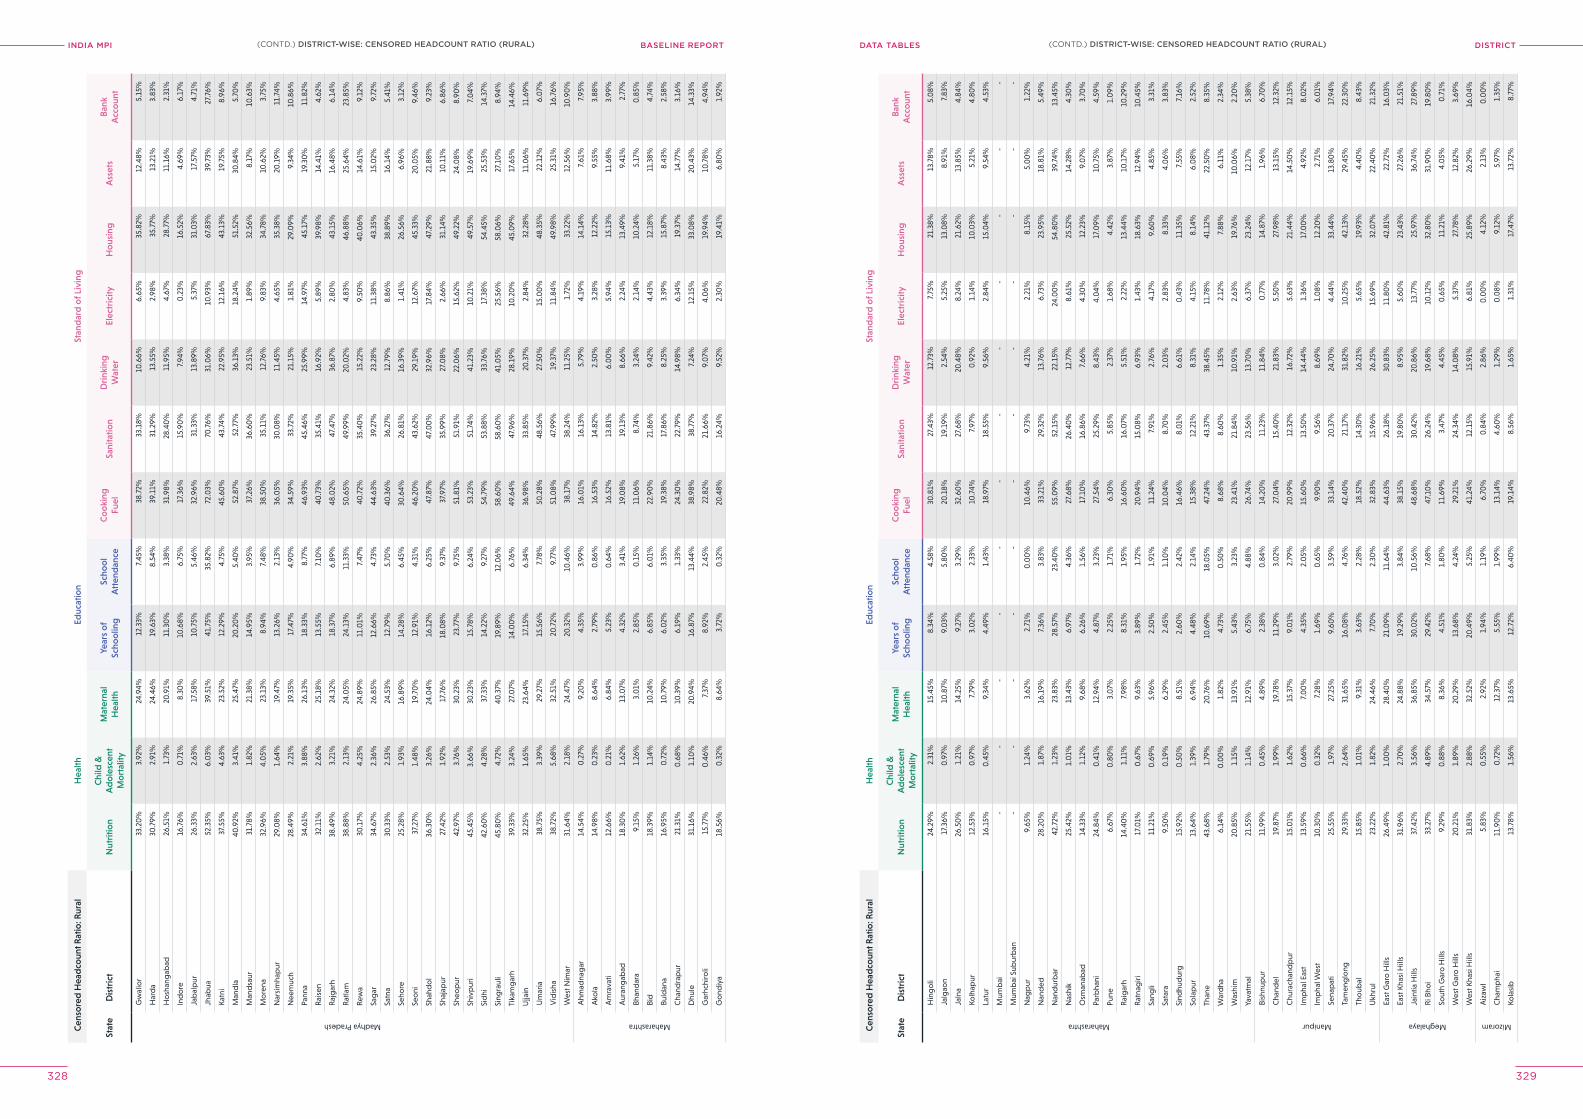
INDIA MPI BASELINE REPORT DISTrICTDATA TABleS
328 329
Cen
sore
d H
ead
coun
t Rat
io: R
ural
Hea
lthEd
ucat
ion
Stan
dar
d o
f Liv
ing
Stat
eD
istr
ict
Nut
ritio
nC
hild
&
Ad
ole
scen
t M
ort
ality
Mat
erna
l H
ealth
Year
s o
f Sc
hoo
ling
Scho
ol
Att
end
ance
Co
oki
ng
Fuel
Sani
tatio
nD
rink
ing
Wat
erEl
ectr
icity
Ho
usin
gA
sset
sB
ank
Acc
oun
t
Madhya Pradesh
Gw
alio
r33
.20
%3.
92%
24.9
4%12
.33%
7.45
%38
.72%
33.1
8%10
.66%
6.65
%35
.82%
12.4
8%5.
15%
Har
da
30.7
9%2.
91%
24.4
6%19
.63%
8.54
%39
.11%
31.2
9%13
.55%
2.98
%35
.77%
13.2
1%3.
83%
Ho
shan
gab
ad26
.51%
1.73
%20
.91%
11.3
0%
3.38
%31
.98%
28.4
0%
11.9
5%4.
67%
28.7
7%11
.16%
2.31
%
Ind
ore
16.7
6%0
.71%
8.30
%10
.68%
6.75
%17
.36%
15.9
0%
7.94
%0
.23%
16.5
2%4.
69%
6.17
%
Jab
alp
ur26
.33%
2.63
%17
.58%
10.7
5%5.
46%
32.9
6%31
.33%
13.8
9%5.
37%
31.0
3%17
.57%
4.71
%
Jhab
ua52
.35%
6.0
3%39
.51%
41.7
5%35
.82%
72.0
3%70
.76%
31.0
6%10
.93%
67.8
3%39
.73%
27.7
6%
Katn
i37
.55%
4.63
%23
.52%
12.2
9%4.
75%
45.6
0%
43.7
4%22
.95%
12.1
6%43
.13%
19.7
5%8.
96%
Man
dla
40.9
2%3.
41%
25.4
7%20
.20
%5.
40%
52.8
7%52
.77%
36.1
3%18
.24%
51.5
2%30
.84%
5.70
%
Man
dsa
ur31
.78%
1.82
%21
.38%
14.9
5%3.
95%
37.2
6%36
.60
%23
.51%
1.89
%32
.56%
8.17
%10
.63%
Mo
rena
32.9
6%4.
05%
23.1
3%8.
94%
7.48
%38
.50
%35
.11%
12.7
6%9.
83%
34.7
8%10
.62%
3.75
%
Nar
sim
hap
ur29
.08%
1.64
%19
.47%
13.2
6%2.
13%
36.0
5%30
.08%
11.4
5%4.
65%
35.3
8%20
.19%
11.7
4%
Nee
muc
h28
.49%
2.21
%19
.35%
17.4
7%4.
90%
34.5
9%33
.72%
21.1
5%1.
81%
29.0
9%9.
34%
10.8
6%
Pann
a34
.61%
3.88
%26
.13%
18.3
3%8.
77%
46.9
3%45
.46%
25.9
9%14
.97%
45.1
7%19
.30
%11
.82%
Rai
sen
32.1
1%2.
62%
25.1
8%13
.55%
7.10
%40
.73%
35.4
1%16
.92%
5.89
%39
.98%
14.4
1%4.
62%
Raj
gar
h38
.49%
3.21
%24
.32%
18.3
7%6.
89%
48.0
2%47
.47%
36.8
7%2.
80%
43.1
5%16
.48%
6.14
%
Rat
lam
38.8
8%2.
13%
24.0
5%24
.13%
11.3
3%50
.65%
49.9
9%20
.02%
4.83
%46
.88%
25.6
4%23
.85%
Rew
a30
.17%
4.25
%24
.89%
11.0
1%7.
47%
40.7
2%35
.40
%15
.22%
9.50
%40
.06%
14.6
1%9.
12%
Sag
ar34
.67%
2.36
%26
.85%
12.6
6%4.
73%
44.6
3%39
.27%
23.2
8%11
.38%
43.3
5%15
.02%
9.72
%
Satn
a30
.33%
2.53
%24
.53%
12.7
9%5.
70%
40.3
6%36
.27%
12.7
9%8.
86%
38.8
9%16
.14%
5.41
%
Seho
re25
.28%
1.93
%16
.89%
14.2
8%6.
45%
30.6
4%26
.81%
16.3
9%1.
41%
26.5
6%6.
96%
3.12
%
Seo
ni37
.27%
1.48
%19
.70
%12
.91%
4.31
%46
.20
%43
.62%
29.1
9%12
.67%
45.3
3%20
.05%
9.46
%
Shah
do
l36
.30
%3.
26%
24.0
4%16
.12%
6.25
%47
.87%
47.0
0%
32.9
6%17
.84%
47.2
9%21
.88%
9.23
%
Shaj
apur
27.4
2%1.
92%
17.7
6%18
.08%
9.37
%37
.97%
35.9
9%27
.08%
2.66
%31
.14%
10.1
1%6.
86%
Sheo
pur
42.9
7%3.
76%
30.2
3%23
.77%
9.75
%51
.81%
51.9
1%22
.06%
15.6
2%49
.22%
24.0
8%8.
90%
Shiv
pur
i45
.45%
3.66
%30
.23%
15.7
8%6.
24%
53.2
3%51
.74%
41.2
3%10
.21%
49.5
7%19
.69%
7.0
4%
Sid
hi42
.60
%4.
28%
37.3
3%14
.22%
9.27
%54
.79%
53.8
8%33
.76%
17.3
8%54
.45%
25.5
3%14
.37%
Sing
raul
i45
.80
%4.
72%
40.3
7%19
.89%
12.0
6%58
.60
%58
.60
%41
.05%
25.5
6%58
.06%
27.1
0%
8.94
%
Tika
mg
arh
39.3
3%3.
24%
27.0
7%14
.00
%6.
76%
49.6
4%47
.96%
28.1
9%10
.20
%45
.09%
17.6
5%14
.46%
Ujja
in32
.25%
1.65
%23
.64%
17.1
5%6.
34%
36.9
8%33
.85%
20.3
7%2.
84%
32.2
8%11
. 06%
11.6
9%
Um
aria
38.7
5%3.
39%
29.2
7%15
.56%
7.78
%50
.28%
48.5
6%27
.50
%15
.00
%48
.35%
22.1
2%6.
07%
Vid
isha
38.7
2%5.
68%
32.5
1%20
.72%
9.77
%51
.08%
47.9
9%19
.37%
11.8
4%49
.98%
25.3
1%16
.76%
Wes
t Nim
ar31
.64%
2.18
%24
.47%
20.3
2%10
.46%
38.1
7%38
.24%
11.2
5%1.
72%
33.2
2%12
.56%
10.9
0%
Maharashtra
Ahm
adna
gar
14.5
4%0
.27%
9.20
%4.
35%
3.99
%16
.01%
16.1
3%5.
79%
4.19
%14
.14%
7.61
%7.
95%
Ako
la14
.98%
0.2
3%8.
64%
2.79
%0
.86%
16.5
3%14
.82%
2.50
%3.
28%
12.2
2%9.
55%
3.88
%
Am
rava
ti12
.66%
0.2
1%6.
84%
5.23
%0
.64%
16.5
2%13
.81%
6.0
0%
5.94
%15
.13%
11.6
8%3.
99%
Aur
ang
abad
18.3
0%
1.62
%13
.07%
4.32
%3.
41%
19.0
8%19
.13%
8.66
%2.
24%
13.4
9%9.
41%
2.77
%
Bhan
dar
a9.
15%
1.26
%3.
01%
2.85
%0
.15%
11.0
6%8.
74%
3.24
%2.
14%
10.2
4%5.
17%
0.8
5%
Bid
18.3
9%1.
14%
10.2
4%6.
85%
6.0
1%22
.90
%21
.86%
9.42
%4.
43%
12.1
8%11
.38%
4.74
%
Buld
ana
16.9
5%0
.72%
10.7
9%6.
02%
3.35
%19
.38%
17.8
6%8.
25%
3.39
%15
.87%
8.43
%2.
58%
Cha
ndra
pur
21.3
1%0
.68%
10.3
9%6.
19%
1.33
%24
.30
%22
.79%
14.9
8%6.
34%
19.3
7%14
.77%
3.16
%
Dhu
le31
.16%
1.10
%20
.94%
16.8
7%13
.44%
38.9
8%38
.77%
7.24
%12
.15%
33.0
8%20
.43%
14.3
3%
Gar
hchi
roli
15.7
7%0
.46%
7.37
%8.
92%
2.45
%22
.82%
21.6
6%9.
07%
4.0
6%19
.94%
10.7
8%4.
94%
Go
ndiy
a18
.56%
0.3
2%8.
64%
3.72
%0
.32%
20.4
8%16
.24%
9.52
%2.
30%
19.4
1%6.
80%
1.92
%
Cen
sore
d H
ead
coun
t Rat
io: R
ural
Hea
lthEd
ucat
ion
Stan
dar
d o
f Liv
ing
Stat
eD
istr
ict
Nut
ritio
nC
hild
&
Ad
ole
scen
t M
ort
ality
Mat
erna
l H
ealth
Year
s o
f Sc
hoo
ling
Scho
ol
Att
end
ance
Co
oki
ng
Fuel
Sani
tatio
nD
rink
ing
Wat
erEl
ectr
icity
Ho
usin
gA
sset
sB
ank
Acc
oun
t
Maharashtra
Hin
go
li24
.29%
2.31
%15
.45%
8.34
%4.
58%
30.8
1%27
.43%
12.7
3%7.
75%
21.3
8%13
.78%
5.0
8%
Jalg
aon
17.3
6%0
.97%
10.8
7%9.
03%
5.80
%20
.18%
19.1
9%2.
54%
5.25
%13
.08%
8.91
%7.
83%
Jaln
a26
.50
%1.
21%
14.2
5%9.
27%
3.29
%32
.60
%27
.68%
20.4
8%8.
24%
21.6
2%13
.85%
4.84
%
Kolh
apur
12.5
3%0
.97%
7.79
%3.
02%
2.33
%10
.74%
7.97
%0
.92%
1.14
%10
.03%
5.21
%4.
80%
Latu
r16
.15%
0.4
5%9.
34%
4.49
%1.
43%
18.9
7%18
.55%
9.56
%2.
84%
15.0
4%9.
54%
4.53
%
Mum
bai
--
--
--
--
--
--
Mum
bai
Sub
urb
an-
--
--
--
--
--
-
Nag
pur
9.65
%1.
24%
3.62
%2.
71%
0.0
0%
10.4
6%9.
73%
4.21
%2.
21%
8.15
%5.
00
%1.
22%
Nan
ded
28.2
0%
1.87
%16
.19%
7.36
%3.
83%
33.2
1%29
.32%
13.7
6%6.
73%
23.9
5%18
.81%
5.49
%
Nan
dur
bar
42.7
2%1.
23%
23.8
3%28
.57%
23.4
0%
55.0
9%52
.15%
22.1
5%24
.00
%54
.80
%39
.74%
13.4
5%
Nas
hik
25.4
2%1.
01%
13.4
3%6.
97%
4.36
%27
.68%
26.4
0%
12.7
7%8.
61%
25.5
2%14
.28%
4.30
%
Osm
anab
ad14
.33%
1.12
%9.
68%
6.26
%1.
56%
17.1
0%
16.8
6%7.
66%
4.30
%12
.23%
9.0
7%3.
70%
Parb
hani
24.8
4%0
.41%
12.9
4%4.
87%
3.23
%27
.54%
25.2
9%8.
43%
4.0
4%17
.09%
10.7
5%4.
59%
Pune
6.67
%0
.80
%3.
07%
2.25
%1.
71%
6.30
%5.
85%
2.37
%1.
68%
4.42
%3.
87%
1.0
9%
Rai
gar
h14
.40
%1.
11%
7.98
%8.
31%
1.95
%16
.60
%16
.07%
5.51
%2.
22%
13.4
4%10
.17%
10.2
9%
Rat
nag
iri17
.01%
0.6
7%9.
63%
3.89
%1.
72%
20.9
4%15
.08%
6.93
%1.
43%
18.6
3%12
.94%
10.4
5%
Sang
li11
.21%
0.6
9%5.
96%
2.50
%1.
91%
11.2
4%7.
91%
2.76
%4.
17%
9.60
%4.
85%
3.31
%
Sata
ra9.
50%
0.1
9%6.
29%
2.45
%1.
10%
10.0
4%8.
70%
2.0
3%2.
83%
8.33
%4.
06%
3.83
%
Sind
hud
urg
15.9
2%0
.50
%8.
51%
2.60
%2.
42%
16.4
6%8.
01%
6.61
%0
.43%
11.3
5%7.
55%
7.16
%
Sola
pur
13.6
4%1.
39%
6.94
%4.
48%
2.14
%15
.38%
12.2
1%8.
31%
4.15
%8.
14%
6.0
8%2.
52%
Than
e43
.68%
1.79
%20
.76%
10.6
9%18
.05%
47.2
4%43
.37%
38.4
5%11
.78%
41.1
2%22
.50
%8.
35%
War
dha
6.14
%0
.00
%1.
82%
4.73
%0
.50
%8.
68%
8.60
%1.
35%
2.12
%7.
88%
6.11
%2.
34%
Was
him
20.8
5%1.
15%
13.9
1%5.
43%
3.23
%23
.41%
21.8
4%10
.91%
2.63
%19
.76%
10.0
6%2.
20%
Yava
tmal
21.5
5%1.
14%
12.9
1%6.
75%
4.88
%26
.74%
23.5
6%13
.70
%6.
37%
23.2
4%12
.17%
5.38
%
Manipur
Bish
nup
ur11
.99%
0.4
5%4.
89%
2.38
%0
.84%
14.2
0%
11.2
3%11
.84%
0.7
7%14
.87%
1.96
%6.
70%
Cha
ndel
19.8
7%1.
99%
19.7
8%11
.29%
3.0
2%27
.04%
15.4
0%
21.8
3%5.
50%
27.9
8%13
.15%
12.3
2%
Chu
rach
and
pur
15.0
1%1.
62%
15.3
7%9.
01%
2.79
%20
.99%
12.3
2%16
.72%
5.63
%21
.44%
14.5
0%
12.1
5%
Imp
hal E
ast
13.5
9%0
.66%
7.0
0%
4.35
%2.
05%
15.6
0%
13.5
0%
14.4
4%1.
36%
17.0
0%
4.92
%8.
02%
Imp
hal W
est
10.3
0%
0.3
2%7.
28%
1.69
%0
.65%
9.90
%9.
56%
8.69
%1.
08%
12.2
0%
2.71
%6.
01%
Sena
pat
i25
.55%
1.97
%27
.25%
9.60
%3.
59%
33.1
4%20
.37%
24.7
0%
4.44
%33
.44%
13.8
0%
17.9
4%
Tam
eng
long
29.3
3%2.
64%
31.6
5%16
.08%
4.76
%42
.40
%21
.17%
31.8
2%10
.25%
42.1
3%29
.45%
22.3
0%
Tho
ubal
15.8
5%1.
01%
9.31
%3.
63%
2.28
%18
.52%
14.3
0%
16.2
1%5.
65%
19.9
3%4.
40%
8.43
%
Ukh
rul
23.2
2%1.
82%
24.4
6%7.
70%
2.30
%32
.83%
15.9
6%26
.25%
15.6
9%32
.07%
22.4
0%
21.3
2%
Meghalaya
East
Gar
o H
ills
26.4
9%1.
00
%28
.40
%21
.09%
11.6
4%44
.63%
26.1
8%30
.83%
11.8
0%
42.8
1%22
.72%
16.0
3%
East
Kha
si H
ills
31.9
6%2.
70%
24.8
8%19
.29%
3.84
%38
.15%
19.8
0%
8.95
%5.
60%
23.4
3%27
.26%
21.5
1%
Jain
tia H
ills
37.4
2%3.
56%
36.8
5%30
.02%
10.5
6%48
.68%
30.4
2%20
.86%
13.7
7%25
.97%
36.7
4%27
.89%
Ri B
hoi
33.2
7%4.
89%
34.5
7%29
.42%
7.68
%47
.10
%26
.24%
19.6
8%10
.12%
32.8
0%
31.9
0%
19.8
0%
Sout
h G
aro
Hill
s9.
29%
0.8
8%8.
36%
4.51
%1.
80%
11.6
9%3.
47%
4.45
%0
.65%
11.2
1%4.
05%
0.7
1%
Wes
t Gar
o H
ills
20.2
1%1.
89%
20.2
9%13
.68%
4.24
%29
.21%
24.3
4%14
.08%
5.37
%27
.78%
12.8
2%3.
69%
Wes
t Kha
si H
ills
31.8
3%2.
88%
32.5
2%20
.49%
5.25
%41
.24%
12.1
5%15
.91%
6.81
%25
.89%
26.2
9%16
.04%
Mizoram
Aiz
awl
5.83
%0
.55%
2.92
%1.
94%
1.19
%6.
70%
0.8
4%2.
86%
0.0
0%
4.12
%2.
13%
0.0
0%
Cha
mp
hai
11.9
0%
0.7
2%12
.37%
5.55
%1.
99%
13.1
4%4.
60%
1.29
%0
.08%
9.12
%5.
97%
1.35
%
Kola
sib
13.7
8%1.
56%
13.6
5%12
.72%
6.40
%19
.14%
8.56
%1.
65%
1.31
%17
.47%
13.7
2%8.
77%
(CONTD.) DISTrICT-WISe: CeNSoreD heADCoUNT rATIo (rUrAl)(CONTD.) DISTrICT-WISe: CeNSoreD heADCoUNT rATIo (rUrAl)
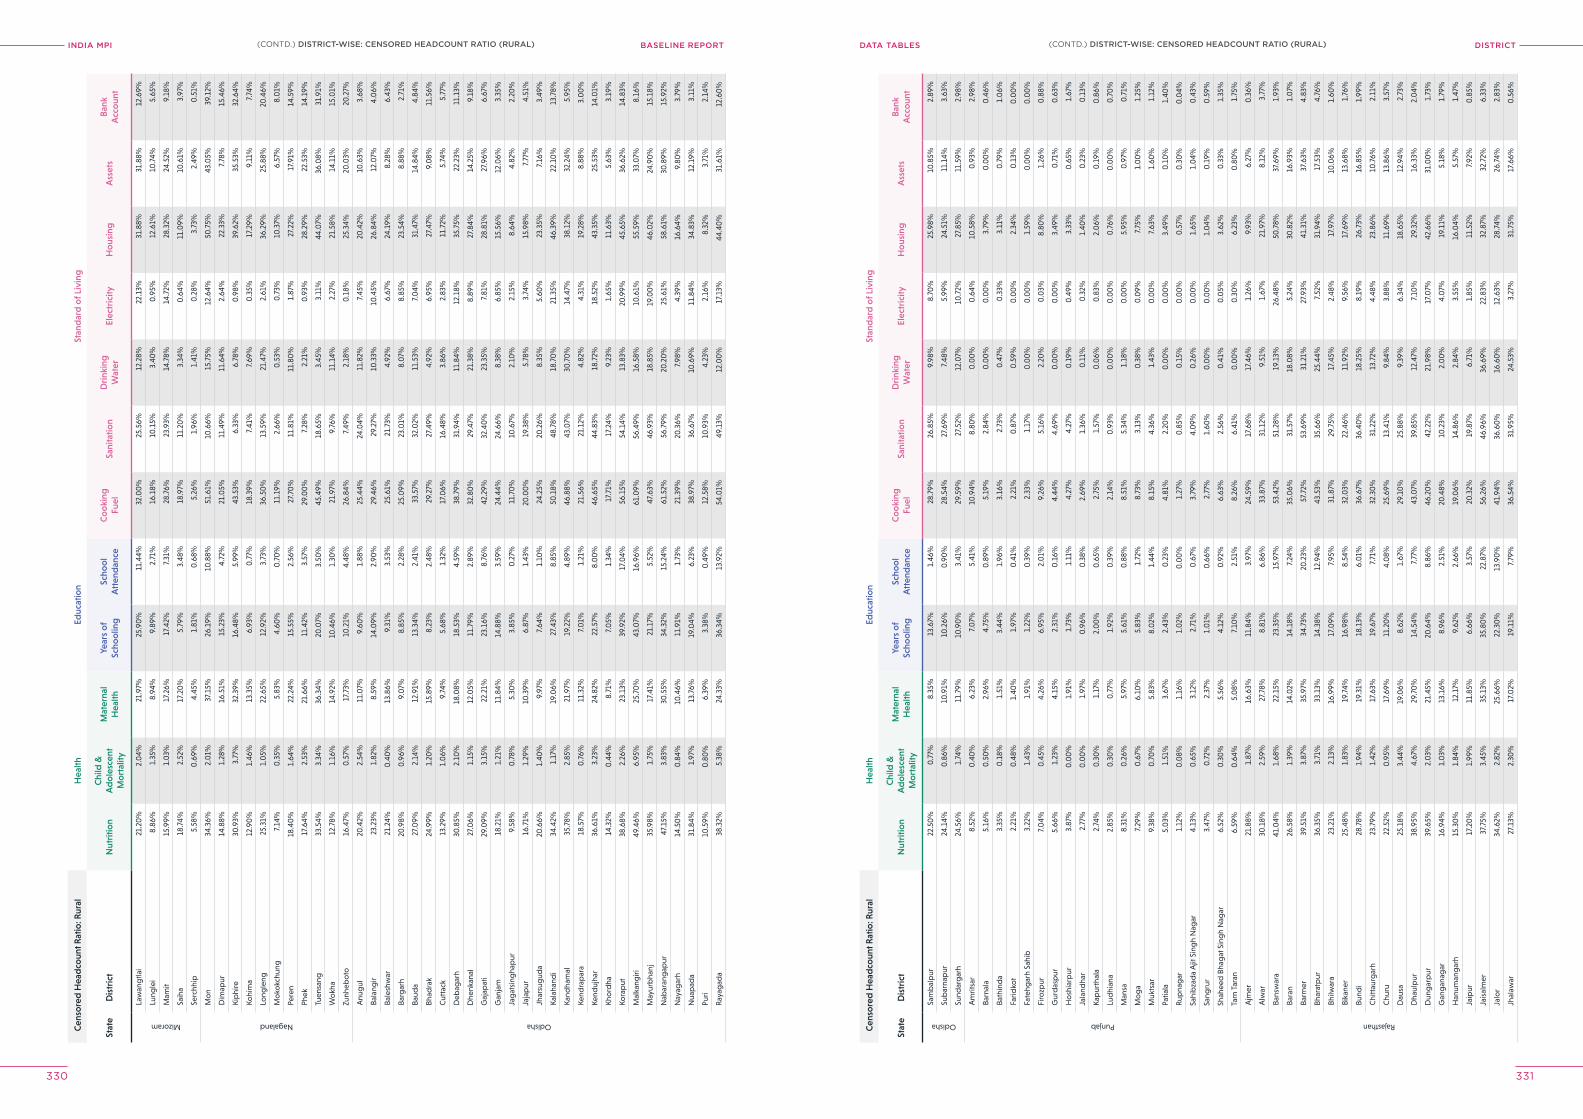
INDIA MPI BASELINE REPORT DISTrICTDATA TABleS
330 331
Cen
sore
d H
ead
coun
t Rat
io: R
ural
Hea
lthEd
ucat
ion
Stan
dar
d o
f Liv
ing
Stat
eD
istr
ict
Nut
ritio
nC
hild
&
Ad
ole
scen
t M
ort
ality
Mat
erna
l H
ealth
Year
s o
f Sc
hoo
ling
Scho
ol
Att
end
ance
Co
oki
ng
Fuel
Sani
tatio
nD
rink
ing
Wat
erEl
ectr
icity
Ho
usin
gA
sset
sB
ank
Acc
oun
t
Mizoram
Law
ang
tlai
21.2
0%
2.0
4%21
.97%
25.9
0%
11.4
4%32
.00
%25
.56%
12.2
8%22
.13%
31.8
8%31
.88%
12.6
9%
Lung
lei
8.86
%1.
35%
8.94
%9.
89%
2.71
%16
.18%
10.1
5%3.
40%
0.9
5%12
.61%
10.7
4%5.
65%
Mam
it15
.99%
1.0
3%17
.26%
17.4
2%7.
31%
28.7
6%23
.93%
14.7
8%14
.72%
28.3
2%24
.52%
9.18
%
Saih
a18
.74%
2.52
%17
.20
%5.
79%
3.48
%18
.97%
11.2
0%
3.34
%0
.64%
11.0
9%10
.61%
3.97
%
Serc
hhip
5.58
%0
.69%
4.45
%1.
81%
0.6
8%5.
26%
1.96
%1.
41%
0.2
8%3.
73%
2.49
%0
.51%
Nagaland
Mo
n34
.36%
2.0
1%37
.15%
26.1
9%10
.88%
51.6
1%10
.66%
15.7
5%12
.64%
50.7
5%43
.05%
39.1
2%
Dim
apur
14.8
8%1.
28%
16.5
1%15
.23%
4.72
%21
.05%
11.4
9%11
.64%
2.64
%22
.33%
7.78
%15
.46%
Kip
hire
30.9
3%3.
77%
32.3
9%16
.48%
5.99
%43
.53%
6.33
%6.
78%
0.9
8%39
.62%
35.5
3%32
.64%
Kohi
ma
12.9
0%
1.46
%13
.35%
6.93
%0
.77%
18.3
9%7.
41%
7.69
%0
.35%
17.2
9%9.
11%
7.74
%
Long
leng
25.3
1%1.
05%
22.6
5%12
.92%
3.73
%36
.50
%13
.59%
21.4
7%2.
61%
36.2
9%25
.88%
20.4
6%
Mo
kokc
hung
7.14
%0
.35%
5.83
%4.
60%
0.7
0%
11.1
9%2.
66%
0.5
3%0
.73%
10.3
7%6.
57%
8.0
1%
Pere
n18
.40
%1.
64%
22.2
4%15
.55%
2.56
%27
.70
%11
.81%
11.8
0%
1.87
%27
.22%
17.9
1%14
.59%
Phek
17.6
4%2.
53%
21.6
6%11
.42%
3.57
%29
.00
%7.
28%
2.21
%0
.93%
28.2
9%22
.53%
14.1
9%
Tuen
sang
33.5
4%3.
34%
36.3
4%20
.07%
3.50
%45
.49%
18.6
5%3.
45%
3.11
%44
.07%
36.0
8%31
.91%
Wo
kha
12.7
8%1.
16%
14.9
2%10
.46%
1.30
%21
.97%
9.76
%11
.14%
2.27
%21
.58%
14.1
1%15
.01%
Zunh
ebo
to16
.47%
0.5
7%17
.73%
10.2
1%4.
48%
26.8
4%7.
49%
2.18
%0
.18%
25.3
4%20
.03%
20.2
7%
Odisha
Anu
gul
20.4
2%2.
54%
11.0
7%9.
60%
1.88
%25
.44%
24.0
4%11
.82%
7.45
%20
.42%
10.6
3%3.
68%
Bala
ngir
23.2
3%1.
82%
8.59
%14
.09%
2.90
%29
.46%
29.2
7%10
.33%
10.4
5%26
.84%
12.0
7%4.
06%
Bale
shw
ar21
.24%
0.4
0%
13.8
6%9.
31%
3.53
%25
.61%
21.7
3%4.
92%
6.67
%24
.19%
8.28
%6.
43%
Barg
arh
20.9
8%0
.96%
9.0
7%8.
85%
2.28
%25
.09%
23.0
1%8.
07%
8.85
%23
.54%
8.88
%2.
71%
Baud
a27
.09%
2.14
%12
.91%
13.3
4%2.
41%
33.5
7%32
.02%
11.5
3%7.
04%
31.4
7%14
.84%
4.84
%
Bhad
rak
24.9
9%1.
20%
15.8
9%8.
23%
2.48
%29
.27%
27.4
9%4.
92%
6.95
%27
.47%
9.0
8%11
.56%
Cut
tack
13.2
9%1.
06%
9.74
%5.
68%
1.32
%17
.06%
16.4
8%3.
86%
2.83
%11
.72%
5.74
%5.
77%
Deb
agar
h30
.85%
2.10
%18
.08%
18.5
3%4.
59%
38.7
9%31
.94%
11.8
4%12
.18%
35.7
5%22
.23%
11.1
3%
Dhe
nkan
al27
.06%
1.15
%12
.05%
11.7
9%2.
89%
32.8
0%
29.4
7%21
.38%
8.89
%27
.84%
14.2
5%9.
18%
Gaj
apat
i29
.09%
3.15
%22
.21%
23.1
6%8.
76%
42.2
9%32
.40
%23
.35%
7.81
%28
.81%
27.9
6%6.
67%
Gan
jam
18.2
1%1.
21%
11.8
4%14
.88%
3.59
%24
.44%
24.6
6%8.
38%
6.85
%15
.56%
12.0
6%3.
35%
Jag
atsi
ngha
pur
9.58
%0
.78%
5.30
%3.
85%
0.2
7%11
.70
%10
.67%
2.10
%2.
15%
8.64
%4.
82%
2.20
%
Jaja
pur
16.7
1%1.
29%
10.3
9%6.
87%
1.43
%20
.00
%1 9
.38%
5.78
%3.
74%
15.9
8%7.
77%
4.51
%
Jhar
sug
uda
20.6
6%1.
40%
9.97
%7.
64%
1.10
%24
.25%
20.2
6%8.
35%
5.60
%23
.35%
7.16
%3.
49%
Kala
hand
i34
.42%
1.17
%19
.06%
27.4
3%8.
85%
50.1
8%48
.78%
18.7
0%
21.3
5%46
.39%
22.1
0%
13.7
8%
Kand
ham
al35
.78%
2.85
%21
.97%
19.2
2%4.
89%
46.8
8%43
.07%
30.7
0%
14.4
7%38
.12%
32.2
4%5.
95%
Kend
rap
ara
18.5
7%0
.76%
11.3
2%7.
01%
1.21
%21
.56%
21.1
2%4.
82%
4.31
%19
.28%
8.88
%3.
00
%
Kend
ujha
r36
.61%
3.23
%24
.82%
22.5
7%8.
00
%46
.65%
44.8
3%18
.72%
18.5
2%43
.35%
25.5
3%14
.01%
Kho
rdha
14.3
2%0
.44%
8.71
%7.
05%
1.34
%17
.71%
17.2
4%9.
23%
1.65
%11
.63%
5.63
%3.
19%
Kora
put
38.6
8%2.
26%
23.1
3%39
.92%
17.0
4%56
.15%
54.1
4%13
.83%
20.9
9%45
.65%
36.6
2%14
.83%
Mal
kang
iri49
.46%
6.95
%25
.70
%43
.07%
16.9
6%61
.09%
56.4
9%16
.58%
10.6
1%55
.59%
33.0
7%8.
16%
May
urb
hanj
35.9
8%1.
75%
17.4
1%21
.17%
5.52
%47
.63%
46.9
3%18
.85%
19.0
0%
46.0
2%24
.90
%15
.18%
Nab
aran
gap
ur47
.15%
3.83
%30
.55%
34.3
2%15
.24%
61.5
2%56
.79%
20.2
0%
25.6
1%58
.61%
30.8
9%15
.92%
Nay
agar
h14
.50
%0
.84%
10.4
6%11
.91%
1.73
%21
.39%
20.3
6%7.
98%
4.39
%16
.64%
9.80
%3.
79%
Nua
pad
a31
.84%
1.97
%13
.76%
19.0
4%6.
23%
38.9
7%36
.67%
10.6
9%11
.84%
34.8
3%12
.19%
3.11
%
Puri
10.5
9%0
.80
%6.
39%
3.38
%0
.49%
12.5
8%10
.93%
4.23
%2.
16%
8.32
%3.
71%
2.14
%
Ray
agad
a38
.32%
5.38
%24
.33%
36.3
4%13
.92%
54.0
1%49
.13%
12.0
0%
17.1
3%44
.40
%31
.61%
12.6
0%
Cen
sore
d H
ead
coun
t Rat
io: R
ural
Hea
lthEd
ucat
ion
Stan
dar
d o
f Liv
ing
Stat
eD
istr
ict
Nut
ritio
nC
hild
&
Ad
ole
scen
t M
ort
ality
Mat
erna
l H
ealth
Year
s o
f Sc
hoo
ling
Scho
ol
Att
end
ance
Co
oki
ng
Fuel
Sani
tatio
nD
rink
ing
Wat
erEl
ectr
icity
Ho
usin
gA
sset
sB
ank
Acc
oun
t
Odisha
Sam
bal
pur
22.5
0%
0.7
7%8.
35%
13.6
7%1.
46%
28.7
9%26
.85%
9.98
%8.
70%
25.9
8%10
.85%
2.89
%
Sub
arna
pur
24.1
4%0
.86%
10.9
1%10
.26%
0.9
0%
28.5
4%27
.69%
7.48
%5.
99%
24.5
1%11
.14%
3.63
%
Sund
arg
arh
24.5
6%1.
74%
11.7
9%10
.90
%3.
41%
29.5
9%27
.52%
12.0
7%10
.72%
27.8
5%11
.59%
2.98
%
Punjab
Am
ritsa
r8.
52%
0.4
0%
6.23
%7.
07%
5.41
%10
.94%
8.80
%0
.00
%0
.64%
10.5
8%0
.93%
2.98
%
Barn
ala
5.16
%0
.50
%2.
96%
4.75
%0
.89%
5.19
%2.
84%
0.0
0%
0.0
0%
3.79
%0
.00
%0
.46%
Bath
ind
a3.
35%
0.1
8%1.
51%
3.44
%1.
96%
3.16
%2.
73%
0.4
7%0
.33%
3.11
%0
.79%
1.0
6%
Farid
kot
2.21
%0
.48%
1.40
%1.
97%
0.4
1%2.
21%
0.8
7%0
.59%
0.0
0%
2.34
%0
.13%
0.0
0%
Fate
hgar
h Sa
hib
3.22
%1.
43%
1.91
%1.
22%
0.3
9%2.
33%
1.17
%0
.00
%0
.00
%1.
59%
0.0
0%
0.0
0%
Firo
zpur
7.0
4%0
.45%
4.26
%6.
95%
2.0
1%9.
26%
5.16
%2.
20%
0.0
3%8.
80%
1.26
%0
.88%
Gur
das
pur
5.66
%1.
23%
4.15
%2.
31%
0.1
6%4.
44%
4.69
%0
.00
%0
.00
%3.
49%
0.7
1%0
.63%
Ho
shia
rpur
3.87
%0
.00
%1.
91%
1.73
%1.
11%
4.27
%4.
27%
0.1
9%0
.49%
3.33
%0
.65%
1.67
%
Jala
ndha
r2.
77%
0.0
0%
1.97
%0
.96%
0.3
8%2.
69%
1.36
%0
.11%
0.3
2%1.
40%
0.2
3%0
.13%
Kap
urth
ala
2.74
%0
.30
%1.
17%
2.0
0%
0.6
5%2.
75%
1.57
%0
.06%
0.8
3%2.
06%
0.1
9%0
.86%
Lud
hian
a2.
85%
0.3
0%
0.7
7%1.
92%
0.3
9%2.
14%
0.9
3%0
.00
%0
.00
%0
.76%
0.0
0%
0.7
0%
Man
sa8.
31%
0.2
6%5.
97%
5.61
%0
.88%
8.51
%5.
34%
1.18
%0
.00
%5.
95%
0.9
7%0
.71%
Mo
ga
7.29
%0
.67%
6.10
%5.
83%
1.72
%8.
73%
3.13
%0
.38%
0.0
9%7.
75%
1.0
0%
1.25
%
Muk
tsar
9.38
%0
.70
%5.
83%
8.0
2%1.
44%
8.15
%4.
36%
1.43
%0
.00
%7.
63%
1.60
%1.
12%
Patia
la5.
03%
1.51
%3.
67%
2.43
%0
.23%
4.81
%2.
20%
0.0
0%
0.0
0%
3.49
%0
.10
%1.
40%
Rup
nag
ar1.
12%
0.0
8%1.
16%
1.0
2%0
.00
%1.
27%
0.8
5%0
.15%
0.0
0%
0.5
7%0
.30
%0
.04%
Sahi
bza
da
Ajit
Sin
gh
Nag
ar4.
13%
0.6
5%3.
12%
2.71
%0
.67%
3.79
%4.
09%
0.2
6%0
.00
%1.
65%
1.0
4%0
.43%
Sang
rur
3.47
%0
.72%
2.37
%1.
01%
0.6
6%2.
77%
1.60
%0
.00
%0
.00
%1.
04%
0.1
9%0
.59%
Shah
eed
Bha
gat
Sin
gh
Nag
ar6.
52%
0.3
0%
5.56
%4.
12%
0.9
2%6.
63%
2.56
%0
.41%
0.0
5%3.
62%
0.3
3%1.
35%
Tarn
Tar
an6.
59%
0.6
4%5.
08%
7.10
%2.
51%
8.26
%6.
41%
0.0
0%
0.3
0%
6.23
%0
.80
%1.
75%
Rajasthan
Ajm
er21
.88%
1.87
%16
.63%
11.8
4%3.
97%
24.5
9%17
.68%
17.4
6%1.
26%
9.93
%6.
27%
0.3
6%
Alw
ar30
.18%
2.59
%27
.78%
8.81
%6.
86%
33.8
7%31
.12%
9.51
%1.
67%
21.9
7%8.
12%
3.77
%
Bans
war
a41
.04%
1.68
%22
.15%
23.3
5%15
.97%
53.4
2%51
.28%
19.1
3%26
.48%
50.7
8%37
.69%
1.93
%
Bara
n26
.58%
1.39
%14
.02%
14.1
8%7.
24%
35.0
6%31
.57%
18.0
8%5.
24%
30.8
2%16
.93%
1.0
7%
Barm
er39
.51%
3.87
%35
.97%
34.7
3%20
.23%
57.7
2%53
.69%
31.2
1%27
.93%
41.3
1%37
.63%
4.83
%
Bhar
atp
ur36
.35%
3.71
%33
.13%
14.3
8%12
.94%
43.5
3%35
.66%
25.4
4%7 .
52%
31.9
4%17
.53%
4.76
%
Bhilw
ara
23.2
1%2.
13%
16.9
9%17
.09%
7.95
%31
.87%
29.7
5%17
.45%
2.48
%17
.97%
10.0
6%1.
60%
Bika
ner
25.4
8%1.
83%
19.7
4%16
.98%
8.54
%32
.03%
22.4
6%11
.92%
9.56
%17
.69%
13.6
8%1.
76%
Bund
i28
.78%
1.94
%19
.31%
18.1
3%6.
01%
36.6
7%36
.40
%18
.25%
8.19
%26
.73%
16.8
5%1.
99%
Chi
ttau
rgar
h23
.79%
1.42
%17
.63%
19.6
7%7.
71%
32.3
0%
31.2
2%13
.72%
4.48
%23
.86%
10.7
6%2.
11%
Chu
ru22
.52%
0.9
5%17
.69%
11.2
0%
4.0
8%25
.69%
13.4
1%9.
84%
3.88
%11
.69%
13.8
6%3.
57%
Dau
sa25
.18%
3.44
%19
.06%
8.62
%1.
67%
29.1
0%
25.8
8%9.
39%
6.34
%18
.65%
12.9
4%2.
73%
Dha
ulp
ur38
.95%
4.67
%29
.70
%14
.54%
7.77
%43
.07%
39.8
5%12
.47%
7.10
%29
.32%
16.3
3%2.
04%
Dun
gar
pur
39.6
5%2.
03%
21.4
5%20
.64%
8.86
%46
.20
%42
.22%
21.9
8%17
.07%
42.6
6%31
.00
%1.
73%
Gan
gan
agar
16.9
4%1.
03%
13.1
6%8.
96%
2.51
%20
.48%
10.2
3%2.
00
%4.
07%
19.1
1%5.
18%
1.79
%
Han
uman
gar
h15
.30
%1.
84%
12.1
7%9.
62%
2.66
%19
.06%
14.8
6%2.
84%
3.55
%16
.04%
5.57
%1.
47%
Jaip
ur17
.20
%1.
99%
11.8
5%6.
66%
3.57
%20
.32%
19.8
7%6.
71%
1.85
%11
.52%
7.92
%0
.85%
Jais
alm
er37
.75%
3.45
%35
.13%
35.8
0%
22.8
7%56
.26%
46.9
6%36
.69%
22.8
3%32
.87%
32.7
2%6.
33%
Jalo
r34
.62%
2.82
%25
.66%
22.3
0%
13.9
0%
41.9
4%36
.60
%16
.60
%12
.63%
28.7
4%26
.74%
2.83
%
Jhal
awar
27.1
3%2.
30%
17.0
2%19
.11%
7.79
%36
.54%
31.9
5%24
.53%
3.27
%31
.75%
17.6
6%0
.56%
(CONTD.) DISTrICT-WISe: CeNSoreD heADCoUNT rATIo (rUrAl)(CONTD.) DISTrICT-WISe: CeNSoreD heADCoUNT rATIo (rUrAl)
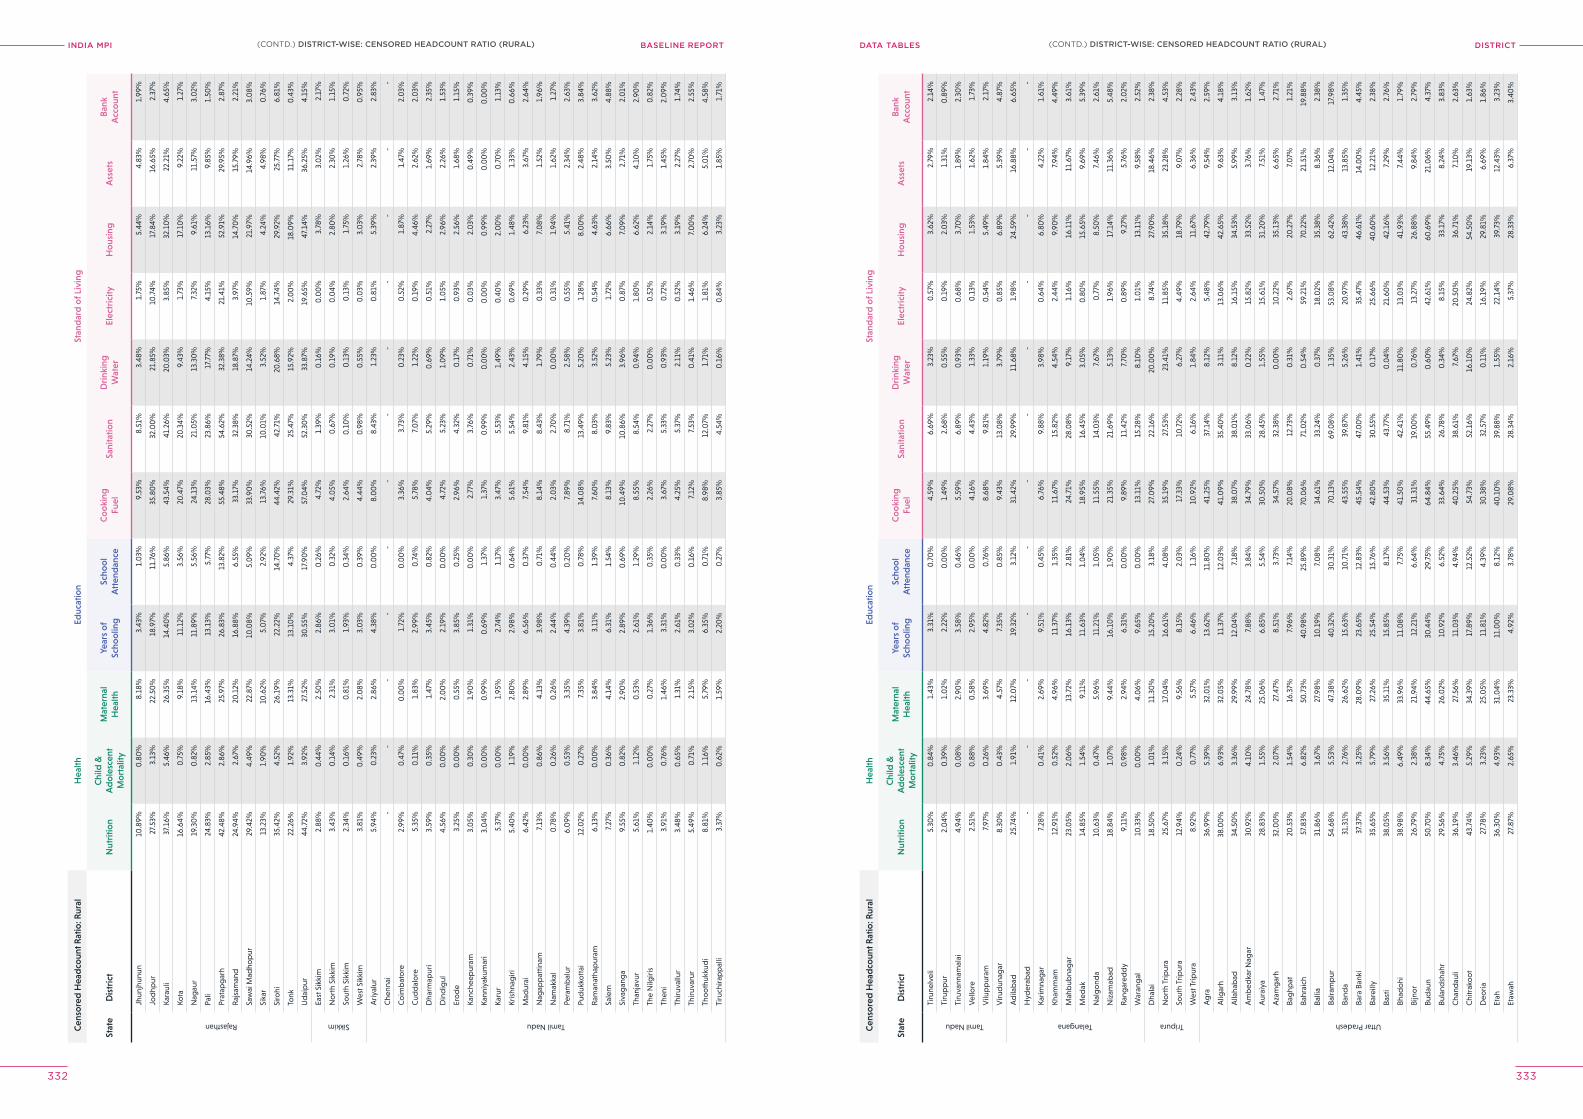
INDIA MPI BASELINE REPORT DISTrICTDATA TABleS
332 333
Cen
sore
d H
ead
coun
t Rat
io: R
ural
Hea
lthEd
ucat
ion
Stan
dar
d o
f Liv
ing
Stat
eD
istr
ict
Nut
ritio
nC
hild
&
Ad
ole
scen
t M
ort
ality
Mat
erna
l H
ealth
Year
s o
f Sc
hoo
ling
Scho
ol
Att
end
ance
Co
oki
ng
Fuel
Sani
tatio
nD
rink
ing
Wat
erEl
ectr
icity
Ho
usin
gA
sset
sB
ank
Acc
oun
t
Rajasthan
Jhun
jhun
un10
.89%
0.8
0%
8.18
%3.
43%
1.0
3%9.
53%
8.51
%3.
48%
1.75
%5.
44%
4.83
%1.
99%
Jod
hpur
27.5
3%3.
13%
22.5
0%
18.9
7%11
.76%
35.8
0%
32.0
0%
21.8
5%10
.74%
17.8
4%16
.65%
2.37
%
Kara
uli
37.1
6%5.
46%
26.3
5%14
.40
%5.
86%
43.5
4%41
.26%
20.0
3%3.
85%
32.1
0%
22.2
1%4.
65%
Kota
16.6
4%0
.75%
9.18
%11
.12%
3.56
%20
.47%
20.3
4%9.
43%
1.73
%17
.10
%9.
22%
1.27
%
Nag
aur
19.3
0%
0.8
2%13
.14%
11.8
9%5.
56%
24.1
3%21
.05%
13.3
0%
7.32
%9.
61%
11.5
7%3.
02%
Pali
24.8
3%2.
85%
16.4
3%13
.13%
5.77
%28
.03%
23.8
6%17
.77%
4.15
%13
.16%
9.85
%1.
50%
Prat
apg
arh
42.4
8%2.
86%
25.9
7%26
.83%
13.8
2%55
.48%
54.6
2%32
.38%
21.4
1%52
.91%
29.9
5%2.
87%
Raj
sam
and
24.9
4%2.
67%
20.1
2%16
.88%
6.55
%33
.17%
32.3
8%18
.87%
3.97
%14
.70
%15
.79%
2.21
%
Saw
ai M
adho
pur
29.4
2%4.
49%
22.8
7%10
.08%
5.0
9%33
.90
%30
.52%
14.2
4%10
.59%
21.9
7%14
.96%
3.0
8%
Sika
r13
.23%
1.90
%10
.62%
5.0
7%2.
92%
13.7
6%10
.01%
3.52
%1.
87%
4.24
%4.
98%
0.7
6%
Siro
hi35
.42%
4.52
%26
.19%
22.2
2%14
.70
%44
.42%
42.7
1%20
.68%
14.7
4%29
.92%
25.7
7%6.
81%
Tonk
22.2
6%1.
92%
13.3
1%13
.10
%4.
37%
29.3
1%25
.47%
15.9
2%2.
00
%18
.09%
11.1
7%0
.43%
Ud
aip
ur44
.72%
3.92
%27
.52%
30.5
5%17
.90
%57
.04%
52.3
0%
33.8
7%19
.65%
47.1
4%36
.25%
4.15
%
Sikkim
East
Sik
kim
2.88
%0
.44%
2.50
%2.
86%
0.2
6%4.
72%
1.39
%0
.16%
0.0
0%
3.78
%3.
02%
2.17
%
No
rth
Sikk
im3.
43%
0.1
4%2.
31%
3.0
1%0
.32%
4.0
5%0
.67%
0.1
9%0
.04%
2.80
%2.
30%
1.15
%
Sout
h Si
kkim
2.34
%0
.16%
0.8
1%1.
93%
0.3
4%2.
64%
0.1
0%
0.1
3%0
.13%
1.75
%1.
26%
0.7
2%
Wes
t Sik
kim
3.81
%0
.49%
2.0
8%3.
03%
0.3
9%4.
44%
0.9
8%0
.55%
0.0
3%3.
03%
2.78
%0
.95%
Tamil Nadu
Ariy
alur
5.94
%0
.23%
2.86
%4.
38%
0.0
0%
8.0
0%
8.43
%1.
23%
0.8
1%5.
39%
2.39
%2.
83%
Che
nnai
--
--
--
--
--
--
Co
imb
ato
re2.
99%
0.4
7%0
.00
%1.
72%
0.0
0%
3.36
%3.
73%
0.2
3%0
.52%
1.87
%1.
47%
2.0
3%
Cud
dal
ore
5.35
%0
.11%
1.83
%2.
99%
0.7
4%5.
78%
7.0
7%1.
22%
0.1
9%4.
46%
2.62
%2.
03%
Dha
rmap
uri
3.59
%0
.35%
1.47
%3.
45%
0.8
2%4.
04%
5.29
%0
.69%
0.5
1%2.
27%
1.69
%2.
35%
Din
dig
ul4.
56%
0.0
0%
2.0
0%
2.19
%0
.00
%4.
72%
5.23
%1.
09%
1.0
5%2.
96%
2.26
%1.
53%
Ero
de
3.25
%0
.00
%0
.55%
3.85
%0
.25%
2.96
%4.
32%
0.1
7%0
.93%
2.56
%1.
68%
1.15
%
Kanc
heep
uram
3.0
5%0
.30
%1.
90%
1.31
%0
.00
%2.
77%
3.76
%0
.71%
0.0
3%2.
03%
0.4
9%0
.39%
Kann
iyak
umar
i3.
04%
0.0
0%
0.9
9%0
.69%
1.37
%1.
37%
0.9
9%0
.00
%0
.00
%0
.99%
0.0
0%
0.0
0%
Karu
r5.
37%
0.0
0%
1.95
%2.
74%
1.17
%3.
47%
5.53
%1.
49%
0.4
0%
2.0
0%
0.7
0%
1.13
%
Kris
hnag
iri5.
40%
1.19
%2.
80%
2.98
%0
.64%
5.61
%5.
54%
2.43
%0
.69%
1.48
%1.
33%
0.6
6%
Mad
urai
6.42
%0
.00
%2.
89%
6.56
%0
.37%
7.54
%9.
81%
4.15
%0
.29%
6.23
%3.
67%
2.64
%
Nag
app
attin
am7.
13%
0.8
6%4.
13%
3.98
%0
.71%
8.14
%8.
43%
1.79
%0
.33%
7.0
8%1.
52%
1.96
%
Nam
akka
l0
.78%
0.2
6%0
.26%
2.44
%0
.44%
2.0
3%2.
70%
0.0
0%
0.3
1%1.
94%
1.62
%1.
27%
Pera
mb
alur
6.0
9%0
.53%
3.35
%4.
39%
0.2
0%
7.89
%8.
71%
2.58
%0
.55%
5.41
%2.
34%
2.63
%
Pud
ukko
ttai
12.0
2%0
.27%
7.35
%3.
81%
0.7
8%14
.08%
13.4
9%5.
20%
1.28
%8.
00
%2.
48%
3.84
%
Ram
anat
hap
uram
6.13
%0
.00
%3.
84%
3.11
%1.
39%
7.60
%8.
03%
3.52
%0
.54%
4.63
%2.
14%
3.62
%
Sale
m7.
27%
0.3
6%4.
14%
6.31
%1.
54%
8.13
%9.
83%
5.23
%1.
72%
6.66
%3.
50%
4.88
%
Siva
gan
ga
9.55
%0
.82%
2.90
%2.
89%
0.6
9%10
.49%
10.8
6%3.
96%
0.8
7%7.
09%
2.71
%2.
01%
Than
javu
r5.
61%
1.12
%0
.53%
2.61
%1.
29%
8.55
%8.
54%
0.9
4%1.
80%
6.62
%4.
10%
2.90
%
The
Nilg
iris
1.40
%0
.00
%0
.27%
1.36
%0
.35%
2.26
%2.
27%
0.0
0%
0.5
2%2.
14%
1.75
%0
.82%
Then
i3.
91%
0.7
6%1.
46%
3.31
%0
.00
%3.
67%
5.33
%0
.93%
0.7
2%3.
19%
1.45
%2.
09%
Thiru
vallu
r3.
48%
0.6
5%1.
31%
2.61
%0
.33%
4.25
%5.
37%
2.11
%0
.52%
3.19
%2.
27%
1.74
%
Thiru
varu
r5.
49%
0.7
1%2.
15%
3.0
2%0
.16%
7.12
%7.
53%
0.4
1%1.
46%
7.0
0%
2.70
%2.
55%
Tho
oth
ukku
di
8.81
%1.
16%
5.79
%6.
35%
0.7
1%8.
98%
12.0
7%1.
71%
1.81
%6.
24%
5.0
1%4.
58%
Tiru
chira
pp
alli
3.37
%0
.62%
1.59
%2.
20%
0.2
7%3.
85%
4.54
%0
.16%
0.8
4%3.
23%
1.85
%1.
71%
Cen
sore
d H
ead
coun
t Rat
io: R
ural
Hea
lthEd
ucat
ion
Stan
dar
d o
f Liv
ing
Stat
eD
istr
ict
Nut
ritio
nC
hild
&
Ad
ole
scen
t M
ort
ality
Mat
erna
l H
ealth
Year
s o
f Sc
hoo
ling
Scho
ol
Att
end
ance
Co
oki
ng
Fuel
Sani
tatio
nD
rink
ing
Wat
erEl
ectr
icity
Ho
usin
gA
sset
sB
ank
Acc
oun
t
Tamil Nadu
Tiru
nelv
eli
5.30
%0
.84%
1.43
%3.
31%
0.7
0%
4.59
%6.
69%
3.23
%0
.57%
3.62
%2.
79%
2.14
%
Tiru
pp
ur2.
04%
0.3
9%1.
02%
2.22
%0
.00
%1.
49%
2.68
%0
.55%
0.1
9%2.
03%
1.31
%0
.89%
Tiru
vann
amal
ai4.
94%
0.0
8%2.
90%
3.58
%0
.46%
5.59
%6.
89%
0.9
3%0
.68%
3.70
%1.
89%
2.30
%
Vel
lore
2.51
%0
.88%
0.5
8%2.
95%
0.0
0%
4.16
%4.
43%
1.33
%0
.13%
1.53
%1.
62%
1.73
%
Vilu
pp
uram
7.97
%0
.26%
3.69
%4.
82%
0.7
6%8.
68%
9.81
%1.
19%
0.5
4%5.
49%
1.84
%2.
17%
Viru
dun
agar
8.30
%0
.43%
4.57
%7.
35%
0.8
5%9.
43%
13.0
8%3.
79%
0.8
5%6.
89%
5.39
%4.
87%
Telangana
Ad
ilab
ad25
.74%
1.91
%12
.07%
19.3
2%3.
12%
31.4
2%29
.99%
11.6
8%1.
98%
24.5
9%16
.88%
6.65
%
Hyd
erab
ad-
--
--
--
--
--
-
Karim
nag
ar7.
28%
0.4
1%2.
69%
9.51
%0
.45%
6.76
%9.
88%
3.98
%0
.64%
6.80
%4.
22%
1.61
%
Kham
mam
12.9
1%0
.52%
4.96
%11
.37%
1.35
%11
.67%
15.8
2%4.
54%
2.44
%9.
90%
7.94
%4.
49%
Mah
bub
nag
ar23
.05%
2.0
6%13
.72%
16.1
3%2.
81%
24.7
1%28
.08%
9.17
%1.
16%
16.1
1%11
.67%
3.61
%
Med
ak14
.85%
1.54
%9.
11%
11.6
3%1.
04%
18.9
5%16
.45%
3.0
5%0
.80
%15
.65%
9.69
%5.
39%
Nal
go
nda
10.6
3%0
.47%
5.96
%11
.21%
1.0
5%11
.55%
14.0
3%7.
67%
0.7
7%8.
50%
7.46
%2.
61%
Niz
amab
ad18
.84%
1.0
7%9.
44%
16.1
0%
1.90
%21
.35%
21.6
9%5.
13%
1.96
%17
.14%
11.3
6%5.
48%
Ran
gar
edd
y9.
11%
0.9
8%2.
94%
6.31
%0
.00
%9.
89%
11.4
2%7.
70%
0.8
9%9.
27%
5.76
%2.
02%
War
ang
al10
.33%
0.0
0%
4.0
6%9.
65%
0.0
0%
13.1
1%15
.28%
8.10
%1.
01%
13.1
1%9.
58%
2.52
%
Tripura
Dha
lai
18.5
0%
1.0
1%11
.30
%15
.20
%3.
18%
27.0
9%22
.16%
20.0
0%
8.74
%27
.90
%18
.46%
2.38
%
No
rth
Trip
ura
25.6
7%3.
15%
17.0
4%16
.61%
4.0
8%35
.19%
27.5
3%23
.41%
11.8
5%35
.18%
23.2
8%4.
53%
Sout
h Tr
ipur
a12
.94%
0.2
4%9.
56%
8.15
%2.
03%
17.3
3%10
.72%
6.27
%4.
49%
18.7
9%9.
07%
2.28
%
Wes
t Trip
ura
8.92
%0
.77%
5.57
%6.
46%
1.16
%10
.92%
6.16
%1.
84%
2.64
%11
.67%
6.36
%2.
43%
Uttar Pradesh
Ag
ra36
.99%
5.39
%32
.01%
13.6
2%11
.80
%41
.25%
37.1
4%8.
12%
5.48
%42
.79%
9.54
%2.
59%
Alig
arh
38.0
0%
6.93
%32
.05%
11.3
7%12
.03%
41.0
9%35
.40
%3.
11%
13.0
6%42
.65%
9.63
%4.
18%
Alla
hab
ad34
.50
%3.
36%
29.9
9%12
.04%
7.18
%38
.07%
38.0
1%8.
12%
16.1
5%34
.53%
5.99
%3.
13%
Am
bed
kar N
agar
30.9
2%4.
10%
24.7
8%7.
88%
3.84
%34
.79%
33.0
6%0
.22%
15.8
2%33
.52%
3.76
%1.
62%
Aur
aiya
28.8
3%1.
55%
25.0
6%6.
85%
5.54
%30
.50
%28
.45%
1.55
%15
.61%
31.2
0%
7.51
%1.
47%
Aza
mg
arh
32.0
0%
2.0
7%27
.47%
8.51
%3.
73%
34.5
7%32
.38%
0.0
0%
10.2
2%35
.13%
6.65
%2.
71%
Bag
hpat
20.5
3%1.
54%
16.3
7%7.
96%
7.14
%20
.08%
12.7
3%0
.31%
2.67
%20
.27%
7.0
7%1.
21%
Bahr
aich
57.8
3%6.
82%
50.7
3%40
.98%
25.8
9%70
.06%
71.0
2%0
.54%
59.2
1%70
.22%
21.5
1%19
.88%
Balli
a31
.86%
3.67
%27
.98%
10.1
9%7.
08%
34.6
1%33
.24%
0.3
7%18
.02%
35.3
8%8.
36%
2.38
%
Balra
mp
ur54
.68%
5.53
%47
.38%
40.3
2%30
.31%
70.1
3%69
.08%
1.35
%53
.08%
62.4
2%12
.04%
17.9
8%
Band
a31
.31%
2.76
%26
.62%
15.6
3%10
.71%
43.5
5%39
.87%
5.26
%20
.97%
43.3
8%13
.85%
1.35
%
Bara
Ban
ki37
.37%
3.25
%28
.09%
23.6
5%12
.83%
45.5
4%47
.00
%1.
41%
35.4
7%46
.61%
14.0
0%
4.45
%
Bare
illy
35.6
5%5.
79%
27.2
6%25
.54%
15.7
6%42
.80
%30
.55%
0.1
7%25
.66%
40.6
0%
12.2
1%2.
38%
Bast
i38
.05%
3.56
%35
.11%
15.8
5%8.
17%
44.5
3%43
.77%
0.0
4%21
.60
%42
.16%
7.29
%2.
76%
Bhad
ohi
38.9
8%6.
49%
33.9
6%11
.08%
7.75
%41
.50
%42
.41%
11.8
0%
13.0
3%41
.93%
7.44
%1.
79%
Bijn
or
26.7
9%2.
38%
21.9
4%12
.21%
6.64
%31
.31%
19.0
0%
0.7
6%13
.27%
26.8
8%9.
84%
2.79
%
Bud
aun
50.7
0%
8.34
%44
.65%
30.4
4%29
.75%
64.8
4%55
.49%
0.6
0%
42.6
1%60
.69%
21.0
6%4.
37%
Bula
ndsh
ahr
29.5
6%4.
75%
26.0
2%10
.92%
6.52
%33
.64%
26.7
8%0
.34%
8.15
%33
.17%
8.24
%3.
83%
Cha
ndau
li36
.19%
3.46
%27
.56%
11.0
3%4.
94%
40.2
5%38
.61%
7.67
%20
.50
%36
.71%
7.10
%2.
63%
Chi
trak
oo
t43
.74%
5.29
%34
.39%
17.8
9%12
.52%
54.7
3%52
.16%
16.1
0%
24.8
2%54
.50
%19
.13%
1.63
%
Deo
ria27
.78%
3.23
%25
.05%
11.8
1%4.
39%
30.3
8%32
.57%
0.1
1%16
.19%
29.8
1%6.
69%
1.86
%
Etah
36.3
0%
4.93
%31
.04%
11.0
0%
8.12
%40
.10
%39
.88%
1.55
%22
.14%
39.7
3%12
.43%
3.23
%
Etaw
ah27
.87%
2.65
%23
.33%
4.92
%3.
78%
29.0
8%28
.34%
2.16
%5.
37%
28.3
3%6.
37%
3.40
%
(CONTD.) DISTrICT-WISe: CeNSoreD heADCoUNT rATIo (rUrAl)(CONTD.) DISTrICT-WISe: CeNSoreD heADCoUNT rATIo (rUrAl)
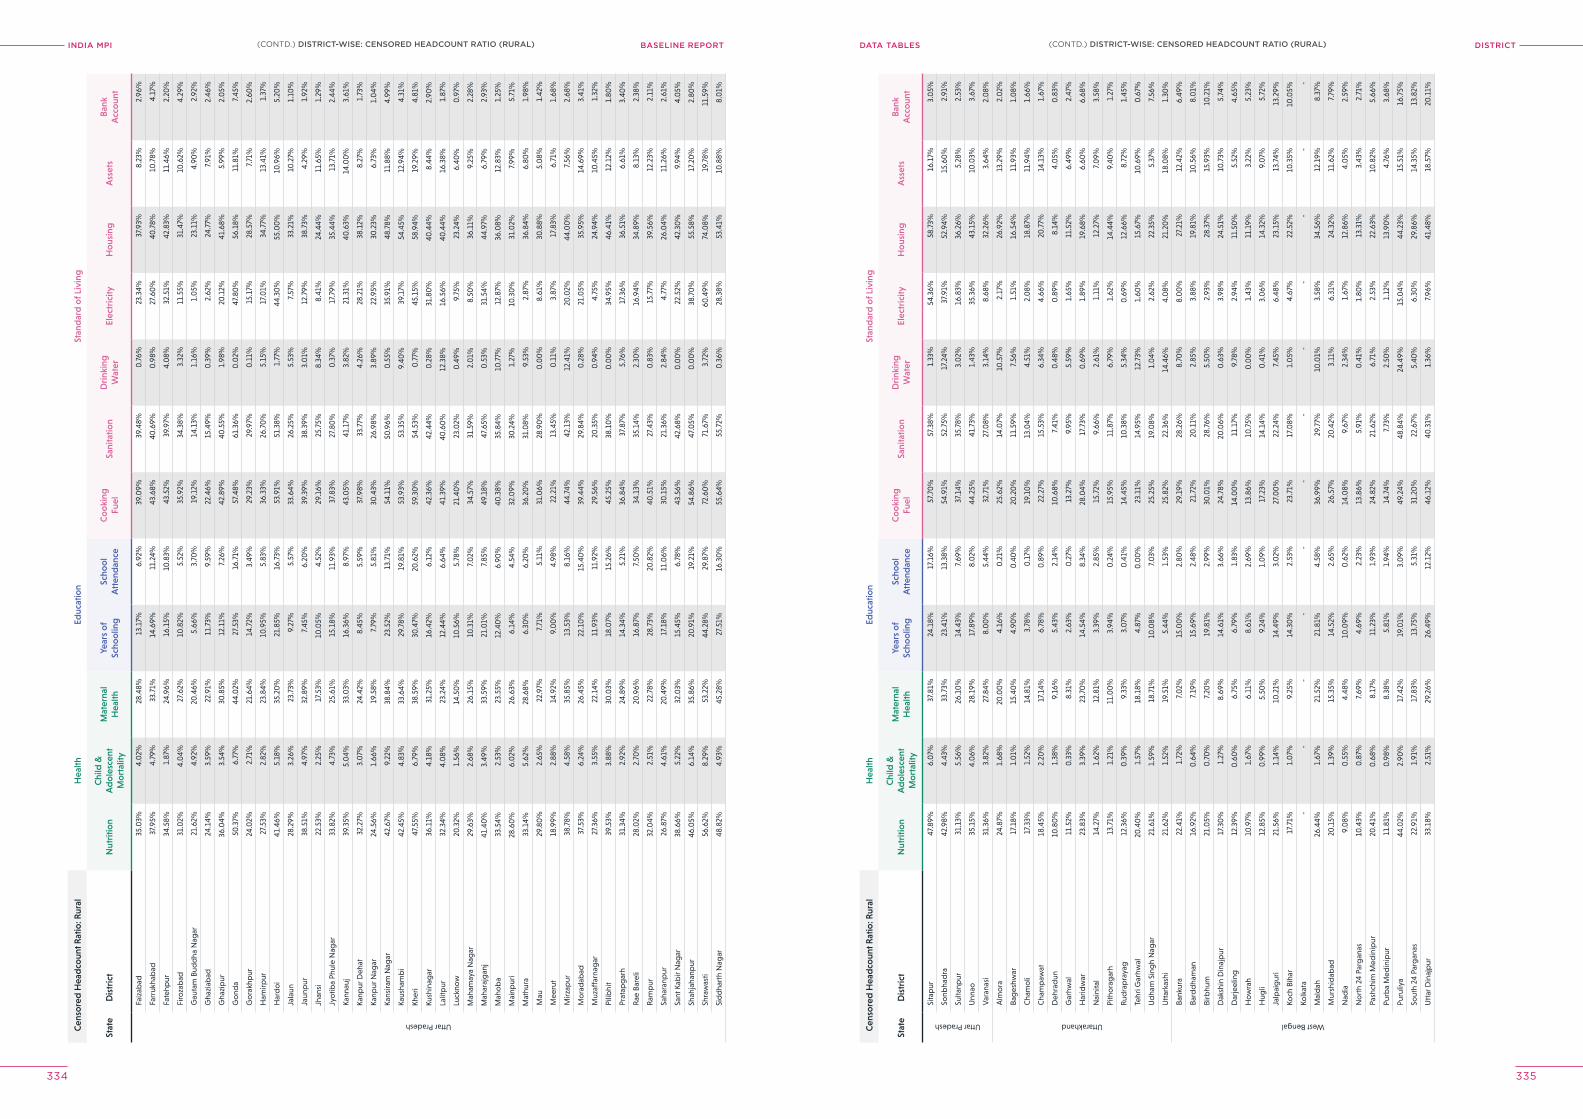
INDIA MPI BASELINE REPORT DISTrICTDATA TABleS
334 335
Cen
sore
d H
ead
coun
t Rat
io: R
ural
Hea
lthEd
ucat
ion
Stan
dar
d o
f Liv
ing
Stat
eD
istr
ict
Nut
ritio
nC
hild
&
Ad
ole
scen
t M
ort
ality
Mat
erna
l H
ealth
Year
s o
f Sc
hoo
ling
Scho
ol
Att
end
ance
Co
oki
ng
Fuel
Sani
tatio
nD
rink
ing
Wat
erEl
ectr
icity
Ho
usin
gA
sset
sB
ank
Acc
oun
t
Uttar Pradesh
Faiz
abad
35.0
3%4.
02%
28.4
8%13
.17%
6.92
%39
.09%
39.4
8%0
.76%
23.3
4%37
.93%
8.23
%2.
96%
Farr
ukha
bad
37.9
5%4.
79%
33.7
1%14
.69%
11.2
4%43
.68%
40.6
9%0
.98%
27.6
0%
40.7
8%10
.78%
4.17
%
Fate
hpur
34.5
8%1.
87%
24.9
6%16
.15%
10.8
3%43
.52%
39.9
7%4.
08%
32.5
1%42
.83%
11.4
6%2.
20%
Firo
zab
ad31
.02%
4.0
4%27
.62%
10.8
2%5.
52%
35.9
2%34
.38%
3.32
%11
.55%
31.4
7%10
.62%
4.29
%
Gau
tam
Bud
dha
Nag
ar21
.62%
4.92
%20
.46%
5.66
%3.
70%
19.1
2%14
.13%
1.16
%1.
05%
23.1
1%4.
90%
2.92
%
Gha
ziab
ad24
.14%
3.59
%22
.91%
11.7
3%9.
59%
22.4
6%15
.49%
0.3
9%2.
62%
24.7
7%7.
91%
2.46
%
Gha
zip
ur36
.04%
3.54
%30
.85%
12.1
1%7.
26%
42.8
9%40
.55%
1.98
%20
.12%
41.6
8%5.
99%
2.0
5%
Go
nda
50.3
7%6.
77%
44.0
2%27
.53%
16.7
1%57
.48%
61.3
6%0
.02%
47.8
0%
56.1
8%11
.81%
7.45
%
Go
rakh
pur
24.0
2%2.
71%
21.6
4%14
.72%
3.49
%29
.23%
29.9
7%0
.11%
15.1
7%28
.57%
7.71
%2.
60%
Ham
irpur
27.5
3%2.
82%
23.8
4%10
.95%
5.83
%36
.33%
26.7
0%
5.15
%17
.01%
34.7
7%13
.41%
1.37
%
Har
do
i41
.46%
5.18
%35
.20
%21
.85%
16.7
3%53
.91%
51.3
8%1.
77%
44.3
0%
55.0
0%
10.9
6%5.
20%
Jala
un28
.29%
3.26
%23
.73%
9.27
%5.
57%
33.6
4%26
.25%
5.53
%7.
57%
33.2
1%10
.27%
1.10
%
Jaun
pur
38.5
1%4.
97%
32.8
9%7.
45%
6.20
%39
.39%
38.3
9%3.
01%
12.7
9%38
.73%
4.29
%1.
92%
Jhan
si22
.53%
2.25
%17
.53%
10.0
5%4.
52%
29.1
6%25
.75%
8.34
%8.
41%
24.4
4%11
.65%
1.29
%
Jyo
tiba
Phul
e N
agar
33.8
2%4.
73%
25.6
1%15
.18%
11.9
3%37
.83%
27.8
0%
0.3
7%17
.79%
35.4
4%13
.71%
2.44
%
Kann
auj
39.3
5%5.
04%
33.0
3%16
.36%
8.97
%43
.05%
41.1
7%3.
82%
21.3
1%40
.63%
14.0
0%
3.61
%
Kanp
ur D
ehat
32.2
7%3.
07%
24.4
2%8.
45%
5.59
%37
.98%
33.7
7%4.
26%
28.2
1%38
.12%
8.27
%1.
73%
Kanp
ur N
agar
24.5
6%1.
66%
19.5
8%7.
79%
5.81
%30
.43%
26.9
8%3.
89%
22.9
5%30
.23%
6.73
%1.
04%
Kans
iram
Nag
ar42
.67%
9.22
%38
.84%
23.5
2%13
.71%
54.1
1%50
.96%
0.5
5%35
.91%
48.7
8%11
.88%
4.99
%
Kaus
ham
bi
42.4
5%4.
83%
33.6
4%29
.78%
19.8
1%53
.93%
53.3
5%9.
40%
39.1
7%54
.45%
12.9
4%4.
31%
Kher
i47
.55%
6.79
%38
.59%
30.4
7%20
.62%
59.3
0%
54.5
3%0
.77%
45.1
5%58
.94%
19.2
9%4.
81%
Kush
inag
ar36
.11%
4.18
%31
.25%
16.4
2%6.
12%
42.3
6%42
.44%
0.2
8%31
.80
%40
.44%
8.44
%2.
90%
Lalit
pur
32.3
4%4.
08%
23.2
4%12
.44%
6.64
%41
.39%
40.6
0%
12.3
8%16
.56%
40.4
4%16
.38%
1.87
%
Luck
now
20.3
2%1.
56%
14.5
0%
10.5
6%5.
78%
21.4
0%
23.0
2%0
.49%
9.75
%23
.24%
6.40
%0
.97%
Mah
amay
a N
agar
29.6
3%2.
68%
26.1
5%10
.31%
7.0
2%34
.57%
31.5
9%2.
01%
8.50
%36
.11%
9.25
%2.
28%
Mah
araj
gan
j41
.40
%3.
49%
33.5
9%21
.01%
7.85
%49
.18%
47.6
5%0
.53%
31.5
4%44
.97%
6.79
%2.
93%
Mah
ob
a33
.54%
2.53
%23
.55%
12.4
0%
6.90
%40
.38%
35.8
4%10
.77%
12.8
7%36
.08%
12.8
3%1.
25%
Mai
npur
i28
.60
%6.
02%
26.6
3%6.
14%
4.54
%32
.09%
30.2
4%1.
27%
10.3
0%
31.0
2%7.
99%
5.71
%
Mat
hura
33.1
4%5.
62%
28.6
8%6.
30%
6.20
%36
.20
%31
.08%
9.53
%2.
87%
36.8
4%6.
80%
1.98
%
Mau
29.8
0%
2.65
%22
.97%
7.71
%5.
11%
31.0
6%28
.90
%0
.00
%8.
61%
30.8
8%5.
08%
1.42
%
Mee
rut
18.9
9%2.
88%
14.9
2%9.
00
%4.
98%
22.2
1%13
.45%
0.1
1%3.
87%
17.8
3%6.
71%
1.68
%
Mirz
apur
38.7
8%4.
58%
35.8
5%13
.53%
8.16
%44
.74%
42.1
3%12
.41%
20.0
2%44
.00
%7.
56%
2.68
%
Mo
rad
abad
37.5
3%6.
24%
26.4
5%22
.10
%15
.40
%39
.44%
29.8
4%0
.28%
21.0
5%35
.95%
14.6
9%3.
41%
Muz
affa
rnag
ar27
.36%
3.55
%22
.14%
11.9
3%11
.92%
29.5
6%20
.35%
0.9
4%4.
75%
24.9
4%10
.45%
1.32
%
Pilib
hit
39.5
3%3.
88%
30.0
3%18
.07%
15.2
6%45
.25%
38.1
0%
0.0
0%
34.9
5%46
.41%
12.1
2%1.
80%
Prat
apg
arh
31.3
4%2.
92%
24.8
9%14
.34%
5.21
%36
.84%
37.8
7%5.
76%
17.3
6%36
.51%
6.61
%3.
40%
Rae
Bar
eli
28.0
2%2.
70%
20.9
6%16
.87%
7.50
%34
.13%
35.1
4%2.
30%
16.9
4%34
.89%
8.13
%2.
38%
Ram
pur
32.0
4%2.
51%
22.7
8%28
.73%
20.8
2%40
.51%
27.4
3%0
.83%
15.7
7%39
.56%
12.2
3%2.
11%
Saha
ranp
ur26
.87%
4.61
%20
.49%
17.1
8%11
.06%
30.1
5%21
.36%
2.84
%4.
77%
26.0
4%11
.26%
2.61
%
Sant
Kab
ir N
agar
38.6
6%5.
22%
32.0
3%15
.45%
6.78
%43
.56%
42.6
8%0
.00
%22
.52%
42.3
0%
9.94
%4.
05%
Shah
jaha
npur
46.0
5%6.
14%
35.8
6%20
.91%
19.2
1%54
.86%
47.0
5%0
.00
%38
.70
%55
.58%
17.2
0%
2.80
%
Shra
was
ti56
.62%
8.29
%53
.22%
44.2
8%29
.87%
72.6
0%
71.6
7%3.
72%
60.4
9%74
.08%
19.7
8%11
.59%
Sid
dha
rth
Nag
ar48
.82%
4.93
%45
.28%
27.5
1%16
.30
%55
.64%
55.7
2%0
.36%
28.3
8%53
.41%
10.8
8%8.
01%
Cen
sore
d H
ead
coun
t Rat
io: R
ural
Hea
lthEd
ucat
ion
Stan
dar
d o
f Liv
ing
Stat
eD
istr
ict
Nut
ritio
nC
hild
&
Ad
ole
scen
t M
ort
ality
Mat
erna
l H
ealth
Year
s o
f Sc
hoo
ling
Scho
ol
Att
end
ance
Co
oki
ng
Fuel
Sani
tatio
nD
rink
ing
Wat
erEl
ectr
icity
Ho
usin
gA
sset
sB
ank
Acc
oun
t
Uttar Pradesh
Sita
pur
47.8
9%6.
07%
37.8
1%24
.18%
17.1
6%57
.70
%57
.38%
1.33
%54
.36%
58.7
3%16
.17%
3.0
5%
Sonb
had
ra42
.98%
4.43
%33
.73%
23.4
1%13
.38%
54.9
1%52
.75%
17.2
4%37
.91%
52.9
4%15
.60
%2.
91%
Sulta
npur
31.1
3%5.
56%
26.1
0%
14.4
3%7.
69%
37.1
4%35
.78%
3.0
2%16
.83%
36.2
6%5.
28%
2.53
%
Unn
ao35
.15%
4.0
6%28
.19%
17.8
9%8.
02%
44.2
5%41
.73%
1.43
%35
.36%
43.1
5%10
.03%
3.67
%
Var
anas
i31
.36%
3.82
%27
.84%
8.0
0%
5.44
%32
.71%
27.0
8%3.
14%
8.68
%32
.26%
3.64
%2.
08%
Uttarakhand
Alm
ora
24.8
7%1.
68%
20.0
0%
4.16
%0
.21%
25.6
2%14
.07%
10.5
7%2.
17%
26.9
2%13
.29%
2.0
2%
Bag
eshw
ar17
.18%
1.0
1%15
.40
%4.
90%
0.4
0%
20.2
0%
11.5
9%7.
56%
1.51
%16
.54%
11.9
3%1.
08%
Cha
mo
li17
.33%
1.52
%14
.81%
3.78
%0
.17%
19.1
0%
13.0
4%4.
51%
2.0
8%18
.87%
11.9
4%1.
66%
Cha
mp
awat
18.4
5%2.
20%
17.1
4%6.
78%
0.8
9%22
.27%
15.5
3%6.
34%
4.66
%20
.77%
14.1
3%1.
67%
Deh
rad
un10
.80
%1.
38%
9.16
%5.
43%
2.14
%10
.68%
7.41
%0
.48%
0.8
9%8.
14%
4.0
5%0
.83%
Gar
hwal
11.5
2%0
.33%
8.31
%2.
63%
0.2
7%13
.27%
9.95
%5.
59%
1.65
%11
.52%
6.49
%2.
47%
Har
idw
ar23
.83%
3.39
%23
.70
%14
.54%
8.34
%28
.04%
17.7
3%0
.69%
1.89
%19
.68%
6.60
%6.
68%
Nai
nita
l14
.27%
1.62
%12
.81%
3.39
%2.
85%
15.7
2%9.
66%
2.61
%1.
11%
12.2
7%7.
09%
3.58
%
Pith
ora
gar
h13
.71%
1.21
%11
.00
%3.
94%
0.2
4%15
.95%
11.8
7%6.
79%
1.62
%14
.44%
9.40
%1.
27%
Rud
rap
raya
g12
.36%
0.3
9%9.
33%
3.0
7%0
.41%
14.4
5%10
.38%
5.34
%0
.69%
12.6
6%8.
72%
1.45
%
Tehr
i Gar
hwal
20.4
0%
1.57
%18
.18%
4.87
%0
.00
%23
.11%
14.9
5%12
.73%
1.60
%15
.67%
10.6
9%0
.67%
Ud
ham
Sin
gh
Nag
ar21
.61%
1.59
%18
.71%
10.0
8%7.
03%
25.2
5%19
.08%
1.0
4%2.
62%
22.3
5%5.
37%
7.56
%
Utt
arka
shi
21.6
2%1.
52%
19.5
1%5.
44%
1.53
%25
.82%
22.3
6%14
.46%
4.0
8%21
.20
%18
.08%
1.30
%
West Bengal
Bank
ura
22.4
1%1.
72%
7.0
2%15
.00
%2.
80%
29.1
9%28
.26%
8.70
%8.
00
%27
.21%
12.4
2%6.
49%
Bard
dha
man
16.9
2%0
.64%
7.19
%15
.69%
2.48
%21
.72%
20.1
1%2.
85%
3.88
%19
.81%
10.5
6%8.
01%
Birb
hum
21.0
5%0
.70
%7.
20%
19.8
1%2.
99%
30.0
1%28
.76%
5.50
%2.
93%
28.3
7%15
.93%
10.2
1%
Dak
shin
Din
ajp
ur17
.30
%1.
27%
8.69
%14
.61%
3.66
%24
.78%
20.0
6%0
.63%
3.98
%24
.51%
10.7
3%5.
74%
Dar
jeel
ing
12.3
9%0
.60
%6.
75%
6.79
%1.
83%
14.0
0%
11.1
7%9.
78%
2.94
%11
.50
%5.
52%
4.65
%
Ho
wra
h10
.97%
1.67
%6.
11%
8.61
%2.
69%
13.8
6%10
.75%
0.0
0%
1.43
%11
.19%
3.22
%5.
23%
Hug
li12
.85%
0.9
9%5.
50%
9.24
%1.
09%
17.2
3%14
.14%
0.4
1%3.
06%
14.3
2%9.
07%
5.72
%
Jalp
aig
uri
21.5
6%1.
14%
10.2
1%14
.49%
3.0
2%27
.00
%22
.24%
7.45
%6.
48%
23.1
5%13
.74%
13.2
9%
Koch
Bih
ar17
.71%
1.0
7%9.
25%
14.3
0%
2.53
%23
.71%
17.0
8%1.
05%
4.67
%22
.52%
10.3
5%10
.05%
Kolk
ata
--
--
--
--
--
--
Mal
dah
26.4
4%1.
67%
21.5
2%21
.81%
4.58
%36
.99%
29.7
7%10
.01%
3.58
%34
.56%
12.1
9%8.
37%
Mur
shid
abad
20.1
5%1.
39%
15.3
5%14
.52%
2.65
%26
.57%
20.4
2%3.
11%
6.31
%24
.32%
11.6
2%7.
79%
Nad
ia9.
08%
0.5
5%4.
48%
10.0
9%0
.62%
14.0
8%9.
67%
2.34
%1.
67%
12.8
6%4.
05%
2.59
%
No
rth
24 P
arg
anas
10.4
3%0
.87%
7.69
%4.
69%
2.23
%13
.86%
5.91
%0
.41%
1.80
%13
.31%
3.43
%2.
71%
Pash
chim
Med
inip
ur20
.41%
0.6
8%8.
17%
11.2
3%1.
93%
24.8
2%21
.62%
6.71
%2.
53%
22.6
3%10
.82%
5.66
%
Purb
a M
edin
ipur
11.8
1%0
.98%
8.38
%5.
81%
1.94
%14
.74%
7.73
%2.
50%
1.12
%13
.90
%4.
76%
3.68
%
Puru
liya
44.0
2%2.
90%
17.4
2%19
.01%
3.0
9%49
.24%
48.8
4%24
.49%
15.0
4%44
.23%
15.5
1%16
.75%
Sout
h 24
Par
gan
as22
.91%
1.91
%17
.83%
13.7
5%5.
31%
31.2
0%
22.6
7%5.
40%
6.30
%29
.86%
14.3
5%13
.82%
Utt
ar D
inaj
pur
33.1
8%2.
51%
29.2
6%26
.49%
12.1
2%46
.12%
40.3
1%1.
36%
7.96
%41
.48%
18.5
7%20
.11%
(CONTD.) DISTrICT-WISe: CeNSoreD heADCoUNT rATIo (rUrAl)(CONTD.) DISTrICT-WISe: CeNSoreD heADCoUNT rATIo (rUrAl)
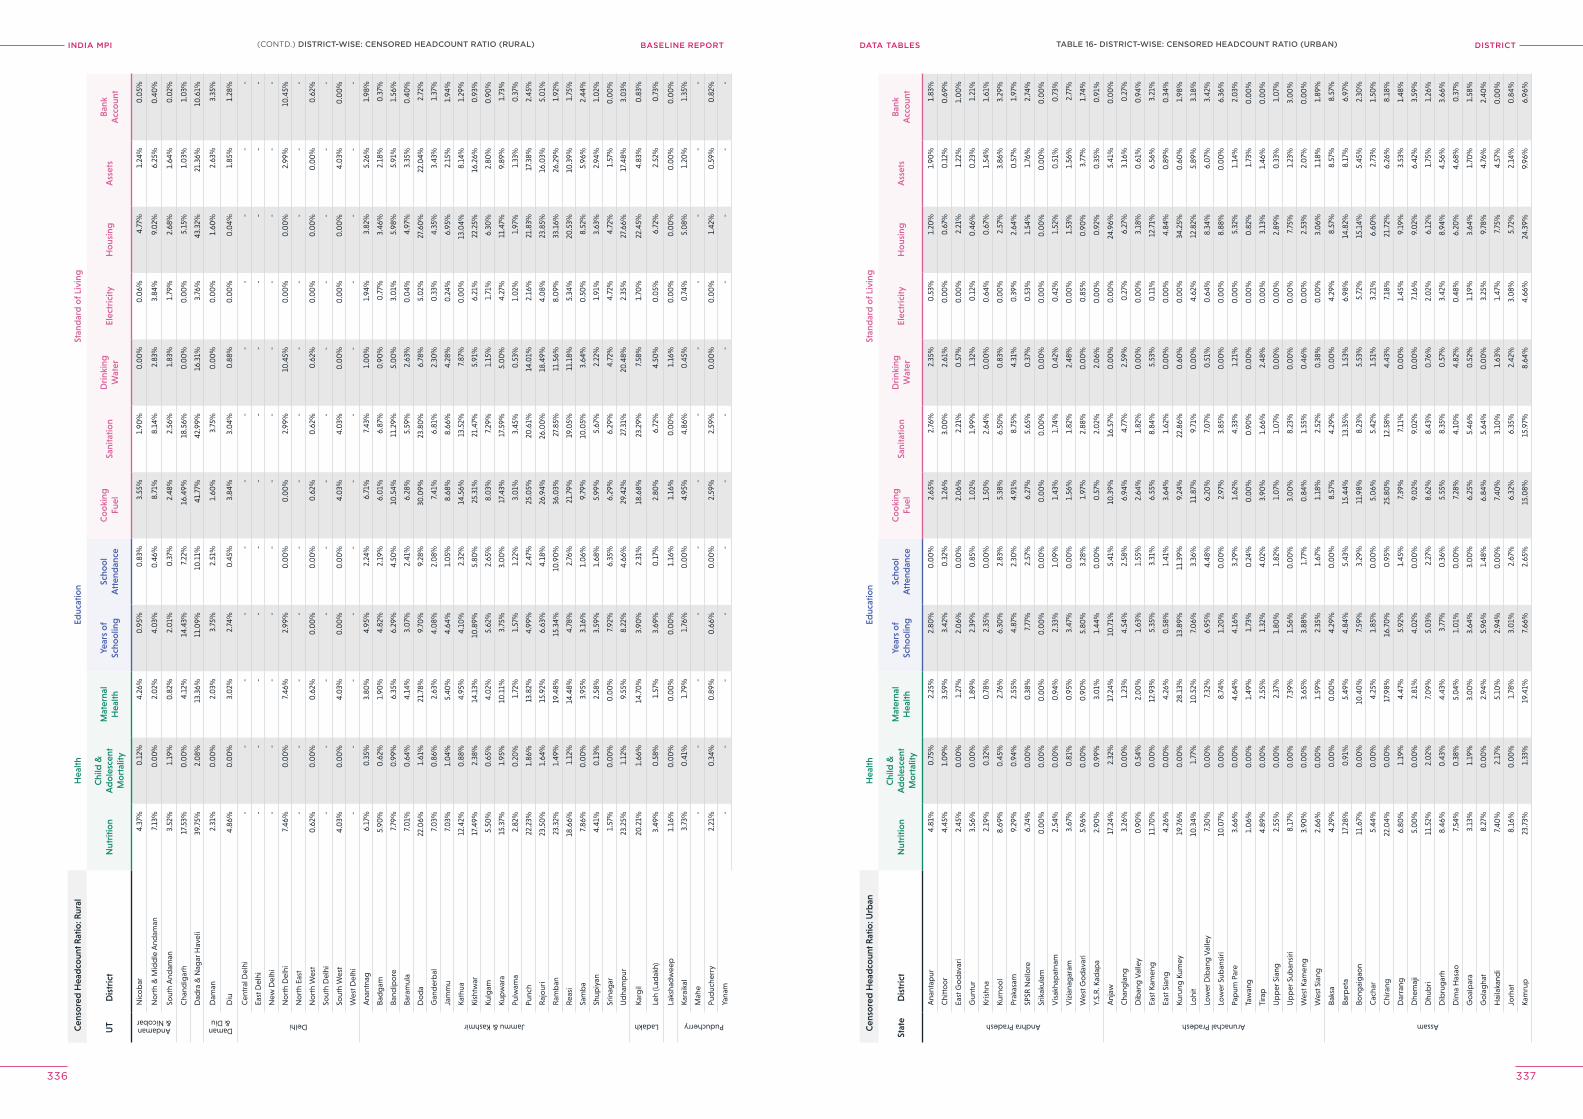
INDIA MPI BASELINE REPORT DISTrICTDATA TABleS
336 337
Cen
sore
d H
ead
coun
t Rat
io: R
ural
Hea
lthEd
ucat
ion
Stan
dar
d o
f Liv
ing
UT
Dis
tric
tN
utri
tion
Chi
ld &
A
do
lesc
ent
Mo
rtal
ity
Mat
erna
l H
ealth
Year
s o
f Sc
hoo
ling
Scho
ol
Att
end
ance
Co
oki
ng
Fuel
Sani
tatio
nD
rink
ing
Wat
erEl
ectr
icity
Ho
usin
gA
sset
sB
ank
Acc
oun
t
Andaman & Nicobar
Nic
ob
ar4.
37%
0.1
2%4.
26%
0.9
5%0
.83%
3.55
%1.
90%
0.0
0%
0.0
6%4.
77%
1.24
%0
.05%
No
rth
& M
idd
le A
ndam
an7.
13%
0.0
0%
2.0
2%4.
03%
0.4
6%8.
71%
8.14
%2.
83%
3.84
%9.
02%
6.25
%0
.40
%
Sout
h A
ndam
an3.
52%
1.19
%0
.82%
2.0
1%0
.37%
2.48
%2.
56%
1.83
%1.
79%
2.68
%1.
64%
0.0
2%
Cha
ndig
arh
17.5
3%0
.00
%4.
12%
14.4
3%7.
22%
16.4
9%18
.56%
0.0
0%
0.0
0%
5.15
%1.
03%
1.0
3%
Dad
ra &
Nag
ar H
avel
i39
.75%
2.0
8%13
.36%
11.0
9%10
.11%
41.7
7%42
.99%
16.3
1%3.
76%
43.3
2%21
.36%
10.6
1%
Daman & Diu
Dam
an2.
31%
0.0
0%
2.0
3%3.
75%
2.51
%1.
60%
3.75
%0
.00
%0
.00
%1.
60%
2.63
%3.
35%
Diu
4.86
%0
.00
%3.
02%
2.74
%0
.45%
3.84
%3.
04%
0.8
8%0
.00
%0
.04%
1.85
%1.
28%
Delhi
Cen
tral
Del
hi-
--
--
--
--
--
-
East
Del
hi-
--
--
--
--
--
-
New
Del
hi-
--
--
--
--
--
-
No
rth
Del
hi7.
46%
0.0
0%
7.46
%2.
99%
0.0
0%
0.0
0%
2.99
%10
.45%
0.0
0%
0.0
0%
2.99
%10
.45%
No
rth
East
--
--
--
--
--
--
No
rth
Wes
t0
.62%
0.0
0%
0.6
2%0
.00
%0
.00
%0
.62%
0.6
2%0
.62%
0.0
0%
0.0
0%
0.0
0%
0.6
2%
Sout
h D
elhi
--
--
--
--
--
--
Sout
h W
est
4.0
3%0
.00
%4.
03%
0.0
0%
0.0
0%
4.0
3%4.
03%
0.0
0%
0.0
0%
0.0
0%
4.0
3%0
.00
%
Wes
t Del
hi-
--
--
--
--
--
-
Jammu & Kashmir
Ana
ntna
g6.
17%
0.3
5%3.
80%
4.95
%2.
24%
6.71
%7.
43%
1.0
0%
1.94
%3.
82%
5.26
%1.
98%
Bad
gam
5.90
%0
.62%
1.90
%4.
82%
2.19
%6.
01%
6.87
%0
.90
%0
.77%
3.46
%2.
18%
0.3
7%
Band
ipo
re7.
79%
0.9
9%6.
35%
6.29
%4.
50%
10.5
4%11
.29%
5.0
0%
3.0
1%5.
98%
5.91
%1.
56%
Bara
mul
a7.
01%
0.6
4%4.
14%
3.0
7%2.
41%
6.28
%5.
59%
2.63
%0
.04%
4.97
%3.
35%
0.4
0%
Do
da
22.0
6%1.
61%
21.7
8%9.
70%
9.28
%30
.09%
23.8
0%
6.78
%5.
02%
27.6
0%
22.0
4%2.
72%
Gan
der
bal
7.0
3%0
.86%
2.63
%4.
08%
2.0
8%7.
41%
6.81
%2.
30%
0.3
3%4.
35%
3.43
%1.
37%
Jam
mu
7.0
3%1.
04%
5.40
%4.
64%
1.0
5%8.
68%
8.66
%4.
28%
0.2
4%6.
95%
2.15
%1.
94%
Kath
ua12
.42%
0.8
8%4.
95%
4.10
%2.
32%
14.5
6%13
.52%
7.87
%0
.00
%13
.04%
8.14
%1.
29%
Kish
twar
17.4
9%2.
38%
14.1
3%10
.89%
5.80
%25
.31%
21.4
7%5.
91%
6.21
%22
.25%
16.2
6%0
.93%
Kulg
am5.
50%
0.6
5%4.
02%
5.62
%2.
65%
8.0
3%7.
29%
1.15
%1.
71%
6.30
%2.
80%
0.9
0%
Kup
war
a15
.37%
1.95
%10
.11%
3.75
%3.
00
%17
.43%
17.5
9%5.
00
%4.
27%
11.4
7%9.
89%
1.73
%
Pulw
ama
2.82
%0
.20
%1.
72%
1.57
%1.
22%
3.0
1%3.
45%
0.5
3%1.
02%
1.97
%1.
33%
0.3
7%
Punc
h22
.23%
1.86
%13
.82%
4.99
%2.
47%
25.0
5%20
.61%
14.0
1%2.
16%
21.8
3%17
.38%
2.45
%
Raj
our
i23
.50
%1.
64%
15.9
2%6.
63%
4.18
%26
.94%
26.0
0%
18.4
9%4.
08%
23.8
5%16
.03%
5.0
1%
Ram
ban
23.3
2%1.
49%
19.4
8%15
.34%
10.9
0%
36.0
3%27
.85%
11.5
6%8.
09%
33.1
6%26
.29%
1.92
%
Reas
i18
.66%
1.12
%14
.48%
4.78
%2.
76%
21.7
9%19
.05%
11.1
8%5.
34%
20.5
3%10
.39%
1.75
%
Sam
ba
7.86
%0
.00
%3.
95%
3.16
%1.
06%
9.79
%10
.05%
3.64
%0
.50
%8.
52%
5.96
%2.
44%
Shup
iyan
4.41
%0
.13%
2.58
%3.
59%
1.68
%5.
99%
5.67
%2.
22%
1.91
%3.
63%
2.94
%1.
02%
Srin
agar
1.57
%0
.00
%0
.00
%7.
92%
6.35
%6.
29%
6.29
%4.
72%
4.72
%4.
72%
1.57
%0
.00
%
Ud
ham
pur
23.2
5%1.
12%
9.55
%8.
22%
4.66
%29
.42%
27.3
1%20
.48%
2.35
%27
.66%
17.4
8%3.
03%
Ladakh
Karg
il20
.21%
1.66
%14
.70
%3.
90%
2.31
%18
.68%
23.2
9%7.
58%
1.70
%22
.45%
4.83
%0
.83%
Leh
(Lad
akh)
3.49
%0
.58%
1.57
%3.
69%
0.1
7%2.
80%
6.72
%4.
50%
0.0
5%6.
72%
2.52
%0
.73%
Laks
had
wee
p1.
16%
0.0
0%
0.0
0%
0.0
0%
1.16
%1.
16%
0.0
0%
1.16
%0
.00
%0
.00
%0
.00
%0
.00
%
Puducherry
Kara
ikal
3.73
%0
.41%
1.79
%1.
76%
0.0
0%
4.95
%4.
86%
0.4
5%0
.74%
5.0
8%1.
20%
1.35
%
Mah
e-
--
--
--
--
--
-
Pud
uche
rry
2.21
%0
.34%
0.8
9%0
.66%
0.0
0%
2.59
%2.
59%
0.0
0%
0.0
0%
1.42
%0
.59%
0.8
2%
Yana
m-
--
--
--
--
--
-
Cen
sore
d H
ead
coun
t Rat
io: U
rban
Hea
lthEd
ucat
ion
Stan
dar
d o
f Liv
ing
Stat
eD
istr
ict
Nut
ritio
nC
hild
&
Ad
ole
scen
t M
ort
ality
Mat
erna
l H
ealth
Year
s o
f Sc
hoo
ling
Scho
ol
Att
end
ance
Co
oki
ng
Fuel
Sani
tatio
nD
rink
ing
Wat
erEl
ectr
icity
Ho
usin
gA
sset
sB
ank
Acc
oun
t
Andhra Pradesh
Ana
ntap
ur4.
81%
0.7
5%2.
25%
2.80
%0
.00
%2.
65%
2.76
%2.
35%
0.5
3%1.
20%
1.90
%1.
83%
Chi
tto
or
4.45
%1.
09%
3.59
%3.
42%
0.3
2%1.
26%
3.0
0%
2.61
%0
.00
%0
.67%
0.1
2%0
.69%
East
Go
dav
ari
2.45
%0
.00
%1.
27%
2.0
6%0
.00
%2.
06%
2.21
%0
.57%
0.0
0%
2.21
%1.
22%
1.0
0%
Gun
tur
3.56
%0
.00
%1.
89%
2.39
%0
.85%
1.0
2%1.
99%
1.32
%0
.12%
0.4
6%0
.23%
1.21
%
Kris
hna
2.19
%0
.32%
0.7
8%2.
35%
0.0
0%
1.50
%2.
64%
0.0
0%
0.6
4%0
.67%
1.54
%1.
61%
Kurn
oo
l8.
69%
0.4
5%2.
76%
6.30
%2.
83%
5.38
%6.
50%
0.8
3%0
.00
%2.
57%
3.86
%3.
29%
Prak
asam
9.29
%0
.94%
2.55
%4.
87%
2.30
%4.
91%
8.75
%4.
31%
0.3
9%2.
64%
0.5
7%1.
97%
SPSR
Nel
lore
6.74
%0
.00
%0
.38%
7.77
%2.
57%
6.27
%5.
65%
0.3
7%0
.53%
1.54
%1.
76%
2.74
%
Srik
akul
am0
.00
%0
.00
%0
.00
%0
.00
%0
.00
%0
.00
%0
.00
%0
.00
%0
.00
%0
.00
%0
.00
%0
.00
%
Vis
akha
pat
nam
2.54
%0
.00
%0
.94%
2.33
%1.
09%
1.43
%1.
74%
0.4
2%0
.42%
1.52
%0
.51%
0.7
3%
Viz
iana
gar
am3.
67%
0.8
1%0
.95%
3.47
%0
.00
%1.
56%
1.82
%2.
48%
0.0
0%
1.53
%1.
56%
2.77
%
Wes
t Go
dav
ari
5.96
%0
.00
%0
.90
%5.
80%
3.28
%1.
97%
2.88
%0
.00
%0
.85%
0.9
0%
3.77
%1.
74%
Y.S.
R. K
adap
a2.
90%
0.9
9%3.
01%
1.44
%0
.00
%0
.57%
2.0
2%2.
06%
0.0
0%
0.9
2%0
.35%
0.9
1%
Arunachal Pradesh
Anj
aw17
.24%
2.32
%17
.24%
10.7
1%5.
41%
10.3
9%16
.57%
0.0
0%
0.0
0%
24.9
6%5.
41%
0.0
0%
Cha
ngla
ng3.
26%
0.0
0%
1.23
%4.
54%
2.58
%6.
94%
4.77
%2.
59%
0.2
7%6.
27%
3.16
%0
.27%
Dib
ang
Val
ley
0.9
0%
0.5
4%2.
00
%1.
63%
1.55
%2.
64%
1.82
%0
.00
%0
.00
%3.
18%
0.6
1%0
.94%
East
Kam
eng
11.7
0%
0.0
0%
12.9
3%5.
35%
3.31
%6.
55%
8.84
%5.
53%
0.1
1%12
.71%
6.56
%3.
21%
East
Sia
ng4.
26%
0.0
0%
4.26
%0
.58%
1.41
%3.
64%
1.62
%0
.00
%0
.00
%4.
84%
0.8
9%0
.34%
Kuru
ng K
umey
19.7
6%0
.00
%28
.13%
13.8
9%11
.39%
9.24
%22
.86%
0.6
0%
0.0
0%
34.2
5%0
.60
%1.
98%
Lohi
t10
.34%
1.77
%10
.52%
7.0
6%3.
36%
11.8
7%9.
71%
0.0
0%
4.62
%12
.82%
5.89
%3.
18%
Low
er D
iban
g V
alle
y7.
30%
0.0
0%
7.32
%6.
95%
4.48
%6.
20%
7.0
7%0
.51%
0.6
4%8.
34%
6.0
7%3.
42%
Low
er S
uban
siri
10.0
7%0
.00
%8.
74%
1.20
%0
.00
%2.
97%
3.85
%0
.00
%0
.00
%8.
88%
0.0
0%
6.36
%
Pap
um P
are
3.66
%0
.00
%4.
64%
4.16
%3.
29%
1.62
%4.
33%
1.21
%0
.00
%5.
32%
1.14
%2.
03%
Taw
ang
1.0
6%0
.00
%1.
49%
1.73
%0
.24%
0.0
0%
0.9
0%
0.0
0%
0.0
0%
0.8
2%1.
73%
0.0
0%
Tira
p4.
89%
0.0
0%
2.55
%1.
32%
4.0
2%3.
90%
1.66
%2.
48%
0.0
0%
3.13
%1.
46%
0.0
0%
Up
per
Sia
ng2.
55%
0.0
0%
2.37
%1.
80%
1.82
%1.
07%
1.0
7%0
.00
%0
.00
%2.
89%
0.3
3%1.
07%
Up
per
Sub
ansi
ri8.
17%
0.0
0%
7.39
%1.
56%
0.0
0%
3.0
0%
8.23
%0
.00
%0
.00
%7.
75%
1.23
%3.
00
%
Wes
t Kam
eng
3.90
%0
.00
%3.
65%
3.88
%1.
77%
0.8
4%1.
55%
0.4
6%0
.00
%2.
53%
2.0
7%0
.00
%
Wes
t Sia
ng2.
66%
0.0
0%
1.59
%2.
35%
1.67
%1.
18%
2.52
%0
.38%
0.0
0%
3.0
6%1.
18%
1.89
%
Assam
Baks
a4.
29%
0.0
0%
0.0
0%
4.29
%0
.00
%8.
57%
4.29
%0
.00
%4.
29%
8.57
%8.
57%
8.57
%
Barp
eta
17.2
8%0
.91%
5.49
%4.
84%
5.43
%15
.44%
13.3
5%1.
53%
6.98
%14
.82%
8.17
%6.
97%
Bong
aig
aon
11.6
7%0
.00
%10
.40
%7.
59%
3.29
%11
.98%
8.23
%5.
53%
5.72
%15
.14%
5.45
%2.
30%
Cac
har
5.44
%0
.00
%4.
25%
1.85
%0
.00
%5.
06%
5.42
%1.
51%
3.21
%6.
60%
2.73
%1.
50%
Chi
rang
22.0
4%0
.00
%17
.98%
16.7
0%
0.9
5%25
.80
%12
.58%
4.43
%7.
18%
21.7
2%6.
26%
8.18
%
Dar
rang
6.80
%1.
19%
4.47
%5.
92%
1.45
%7.
39%
7.11
%0
.00
%1.
45%
9.19
%3.
53%
1.48
%
Dhe
maj
i5.
00
%0
.00
%2.
81%
4.0
2%0
.00
%9.
02%
9.0
2%0
.00
%7.
16%
9.0
2%6.
42%
3.59
%
Dhu
bri
11.5
2%2.
02%
7.0
9%5.
03%
2.27
%8.
62%
8.43
%0
.76%
2.0
2%6.
12%
1.75
%1.
26%
Dib
rug
arh
8.46
%0
.43%
4.43
%3.
77%
0.3
6%5.
55%
8.35
%0
.57%
3.42
%8.
94%
4.56
%3.
66%
Dim
a H
asao
7.54
%0
.38%
5.0
4%1.
01%
0.0
0%
7.28
%4.
10%
4.82
%0
.48%
6.20
%4.
68%
0.3
7%
Go
alp
ara
3.13
%1.
19%
3.0
0%
3.64
%3.
00
%6.
25%
5.46
%0
.52%
1.19
%3.
64%
1.70
%1.
58%
Go
lag
hat
8.27
%0
.00
%2.
94%
5.96
%1.
48%
6.84
%5.
64%
0.0
0%
3.25
%9.
78%
4.76
%2.
40%
Hai
laka
ndi
7.40
%2.
17%
5.10
%2.
94%
0.0
0%
7.40
%3.
10%
1.63
%1.
47%
7.75
%4.
57%
0.0
0%
Jorh
at8.
16%
0.0
0%
1.78
%3.
01%
2.67
%6.
32%
6.35
%2.
42%
3.0
8%5.
72%
2.14
%0
.84%
Kam
rup
23.7
3%1.
33%
19.4
1%7.
66%
2.65
%15
.08%
15.9
7%8.
64%
4.66
%24
.39%
9.96
%6.
96%
TABle 16- DISTrICT-WISe: CeNSoreD heADCoUNT rATIo (UrBAN)(CONTD.) DISTrICT-WISe: CeNSoreD heADCoUNT rATIo (rUrAl)
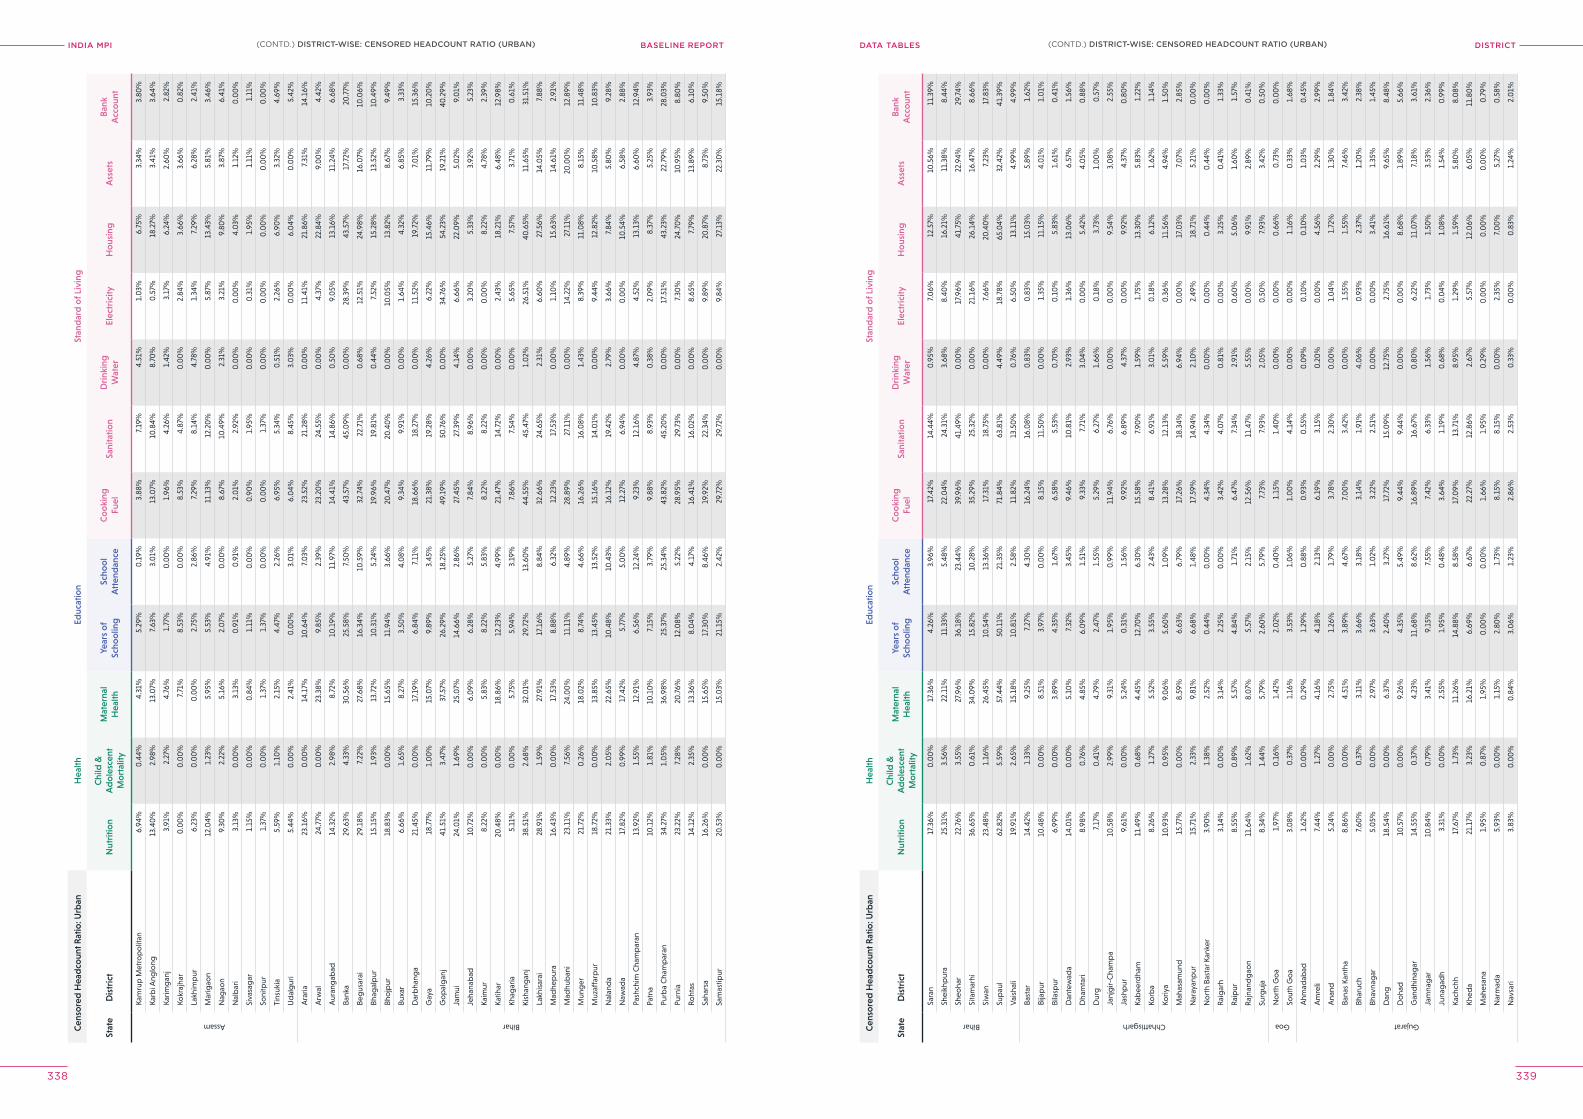
INDIA MPI BASELINE REPORT DISTrICTDATA TABleS
338 339
Cen
sore
d H
ead
coun
t Rat
io: U
rban
Hea
lthEd
ucat
ion
Stan
dar
d o
f Liv
ing
Stat
eD
istr
ict
Nut
ritio
nC
hild
&
Ad
ole
scen
t M
ort
ality
Mat
erna
l H
ealth
Year
s o
f Sc
hoo
ling
Scho
ol
Att
end
ance
Co
oki
ng
Fuel
Sani
tatio
nD
rink
ing
Wat
erEl
ectr
icity
Ho
usin
gA
sset
sB
ank
Acc
oun
t
Assam
Kam
rup
Met
rop
olit
an6.
94%
0.4
4%4.
31%
5.29
%0
.19%
3.88
%7.
19%
4.51
%1.
03%
6.75
%3.
34%
3.80
%
Karb
i Ang
long
13.4
0%
2.98
%13
.07%
7.63
%3.
01%
13.0
7%10
.84%
8.70
%0
.57%
18.2
7%3.
41%
3.64
%
Karim
gan
j3.
91%
2.27
%4.
76%
1.77
%0
.00
%1.
96%
4.26
%1.
42%
3.17
%6.
24%
2.60
%2.
82%
Kokr
ajha
r0
.00
%0
.00
%7.
71%
8.53
%0
.00
%8.
53%
4.87
%0
.00
%2.
84%
3.66
%3.
66%
0.8
2%
Lakh
imp
ur6.
23%
0.0
0%
0.0
0%
2.75
%2.
86%
7.29
%8.
14%
4.78
%1.
34%
7.29
%6.
28%
2.41
%
Mar
igao
n12
.04%
1.23
%5.
95%
5.53
%4.
91%
11.1
3%12
.20
%0
.00
%5.
87%
13.4
3%5.
81%
3.46
%
Nag
aon
9.30
%2.
22%
5.16
%2.
07%
0.0
0%
8.67
%10
.49%
2.31
%3.
21%
9.80
%3.
87%
6.41
%
Nal
bar
i3.
13%
0.0
0%
3.13
%0
.91%
0.9
1%2.
01%
2.92
%0
.00
%0
.00
%4.
03%
1.12
%0
.00
%
Siva
sag
ar1.
15%
0.0
0%
0.8
4%1.
11%
0.0
0%
0.9
0%
1.95
%0
.00
%0
.31%
1.95
%1.
11%
1.11
%
Soni
tpur
1.37
%0
.00
%1.
37%
1.37
%0
.00
%0
.00
%1.
37%
0.0
0%
0.0
0%
0.0
0%
0.0
0%
0.0
0%
Tins
ukia
5.59
%1.
10%
2.15
%4.
47%
2.26
%6.
95%
5.34
%0
.51%
2.26
%6.
90%
3.32
%4.
69%
Ud
alg
uri
5.44
%0
.00
%2.
41%
0.0
0%
3.0
1%6.
04%
8.45
%3.
03%
0.0
0%
6.0
4%0
.00
%5.
42%
Bihar
Ara
ria23
.16%
0.0
0%
14.1
7%10
.64%
7.0
3%23
.52%
21.2
8%0
.00
%11
.41%
21.8
6%7.
31%
14.1
6%
Arw
al24
.77%
0.0
0%
23.3
8%9.
85%
2.39
%23
.20
%24
.55%
0.0
0%
4.37
%22
.84%
9.0
0%
4.42
%
Aur
ang
abad
14.3
2%2.
98%
8.72
%10
.19%
11.9
7%14
.41%
14.8
6%0
.50
%9.
05%
13.1
6%11
.24%
6.68
%
Bank
a29
.63%
4.33
%30
.56%
25.5
8%7.
50%
43.5
7%45
.09%
0.0
0%
28.3
9%43
.57%
17.7
2%20
.77%
Beg
usar
ai29
.18%
7.22
%27
.68%
16.3
4%10
.59%
32.7
4%22
.71%
0.6
8%12
.51%
24.9
8%16
.07%
10.0
6%
Bhag
alp
ur15
.15%
1.93
%13
.72%
10.3
1%5.
24%
19.9
6%19
.81%
0.4
4%7.
52%
15.2
8%13
.52%
10.4
9%
Bho
jpur
18.8
3%0
.00
%15
.65%
11.9
4%3.
66%
20.4
7%20
.40
%0
.00
%10
.05%
13.8
2%8.
67%
9.49
%
Buxa
r6.
66%
1.65
%8.
27%
3.50
%4.
08%
9.34
%9.
91%
0.0
0%
1.64
%4.
32%
6.85
%3.
33%
Dar
bha
nga
21.4
5%0
.00
%17
.19%
6.84
%7.
11%
18.6
6%18
.27%
0.0
0%
11.5
2%19
.72%
7.0
1%15
.36%
Gay
a18
.77%
1.0
0%
15.0
7%9.
89%
3.45
%21
.38%
19.2
8%4.
26%
6.22
%15
.46%
11.7
9%10
.20
%
Go
pal
gan
j41
.51%
3.47
%37
.57%
26.2
9%18
.25%
49.1
9%50
.76%
0.0
0%
34.7
6%54
.23%
19.2
1%40
.29%
Jam
ui24
.01%
1.69
%25
.07%
14.6
6%2.
86%
27.4
5%27
.39%
4.14
%6.
66%
22.0
9%5.
02%
9.0
1%
Jeha
nab
ad10
.72%
0.0
0%
6.0
9%6.
28%
5.27
%7.
84%
8.96
%0
.00
%3.
20%
5.33
%3.
92%
5.23
%
Kaim
ur8.
22%
0.0
0%
5.83
%8.
22%
5.83
%8.
22%
8.22
%0
.00
%0
.00
%8.
22%
4.78
%2.
39%
Katih
ar20
.48%
0.0
0%
18.8
6%12
.23%
4.99
%21
.47%
14.7
2%0
.00
%2.
43%
18.2
1%6.
48%
12.9
8%
Khag
aria
5.11
%0
.00
%5.
75%
5.94
%3.
19%
7.86
%7.
54%
0.0
0%
5.65
%7.
57%
3.71
%0
.61%
Kish
ang
anj
38.5
1%2.
68%
32.0
1%29
.72%
13.6
0%
44.5
5%45
.47%
1.0
2%26
.51%
40.6
5%11
.65%
31.5
1%
Lakh
isar
ai28
.91%
1.59
%27
.91%
17.1
6%8.
84%
32.6
6%24
.65%
2.31
%6.
60%
27.5
6%14
.05%
7.88
%
Mad
hep
ura
16.4
3%0
.00
%17
.53%
8.88
%6.
32%
12.2
3%17
.53%
0.0
0%
1.10
%15
.63%
14.6
1%2.
91%
Mad
hub
ani
23.1
1%7.
56%
24.0
0%
11.1
1%4.
89%
28.8
9%27
.11%
0.0
0%
14.2
2%27
.11%
20.0
0%
12.8
9%
Mun
ger
21.7
2%0
.26%
18.0
2%8.
74%
4.66
%16
.26%
16.0
8%1.
43%
8.39
%11
.08%
8.15
%11
.48%
Muz
affa
rpur
18.7
2%0
.00
%13
.85%
13.4
5%13
.52%
15.1
6%14
.01%
0.0
0%
9.44
%12
.82%
10.5
8%10
.83%
Nal
and
a21
.33%
2.0
5%22
.65%
10.4
8%10
.43%
16.1
2%19
.42%
2.79
%3.
66%
7.84
%5.
80%
9.28
%
Naw
ada
17.8
2%0
.99%
17.4
2%5.
77%
5.0
0%
12.2
7%6.
94%
0.0
0%
0.0
0%
10.5
4%6.
58%
2.88
%
Pash
chim
Cha
mp
aran
13.9
2%1.
55%
12.9
1%6.
56%
12.2
4%9.
23%
12.1
6%4.
87%
4.52
%13
.13%
6.60
%12
.94%
Patn
a10
.12%
1.81
%10
.10
%7.
15%
3.79
%9.
88%
8.93
%0
.38%
2.0
9%8.
37%
5.25
%3.
93%
Purb
a C
ham
par
an34
.27%
1.0
5%36
.98%
25.3
7%25
.34%
43.8
2%45
.20
%0
.00
%17
.51%
43.2
3%22
.79%
28.0
3%
Purn
ia23
.22%
7.28
%20
.76%
12.0
8%5.
22%
28.9
5%29
.73%
0.0
0%
7.30
%24
.70
%10
.95%
8.80
%
Roht
as14
.12%
2.35
%13
.36%
8.0
4%4.
17%
16.4
1%16
.02%
0.0
0%
8.65
%7.
79%
13.8
9%6.
10%
Saha
rsa
16.2
6%0
.00
%15
.65%
17.3
0%
8.46
%19
.92%
22.3
4%0
.00
%9.
89%
20.8
7%8.
73%
9.50
%
Sam
astip
ur20
.53%
0.0
0%
15.0
3%21
.15%
2.42
%29
.72%
29.7
2%0
.00
%9.
84%
27.1
3%22
.30
%15
.18%
Cen
sore
d H
ead
coun
t Rat
io: U
rban
Hea
lthEd
ucat
ion
Stan
dar
d o
f Liv
ing
Stat
eD
istr
ict
Nut
ritio
nC
hild
&
Ad
ole
scen
t M
ort
ality
Mat
erna
l H
ealth
Year
s o
f Sc
hoo
ling
Scho
ol
Att
end
ance
Co
oki
ng
Fuel
Sani
tatio
nD
rink
ing
Wat
erEl
ectr
icity
Ho
usin
gA
sset
sB
ank
Acc
oun
t
Bihar
Sara
n17
.36%
0.0
0%
17.3
6%4.
26%
3.96
%17
.42%
14.4
4%0
.95%
7.0
6%12
.57%
10.5
6%11
.39%
Shei
khp
ura
25.3
1%3.
56%
22.1
1%11
.33%
5.48
%22
.04%
24.3
1%3.
68%
8.40
%16
.21%
11.3
8%8.
44%
Sheo
har
22.7
6%3.
55%
27.9
6%36
.18%
23.4
4%39
.96%
41.4
9%0
.00
%17
.96%
41.7
5%22
.94%
29.7
4%
Sita
mar
hi36
.65%
0.6
1%34
.09%
15.8
2%10
.28%
35.2
9%25
.32%
0.0
0%
21.1
6%26
.14%
16.4
7%8.
66%
Siw
an23
.48%
1.16
%26
.45%
10.5
4%13
.36%
17.3
1%18
.75%
0.0
0%
7.66
%20
.40
%7.
23%
17.8
3%
Sup
aul
62.8
2%5.
59%
57.4
4%50
.11%
21.3
5%71
.84%
63.8
1%4.
49%
18.7
8%65
.04%
32.4
2%41
.39%
Vai
shal
i19
.91%
2.65
%15
.18%
10.8
1%2.
58%
11.8
2%13
.50
%0
.76%
6.50
%13
.11%
4.99
%4.
99%
Chhattisgarh
Bast
ar14
.42%
1.33
%9.
25%
7.27
%4.
30%
16.2
4%16
.08%
0.8
3%0
.83%
15.0
3%5.
89%
1.62
%
Bija
pur
10.4
8%0
.00
%8.
51%
3.97
%0
.00
%8.
15%
11.5
0%
0.0
0%
1.35
%11
.15%
4.0
1%1.
01%
Bila
spur
6.99
%0
.00
%3.
89%
4.35
%1.
67%
6.58
%5.
53%
0.7
0%
0.1
0%
5.83
%1.
61%
0.4
1%
Dan
tew
ada
14.0
1%0
.00
%5.
10%
7.32
%3.
45%
9.46
%10
.81%
2.93
%1.
36%
13.0
6%6.
57%
1.56
%
Dha
mta
ri8.
98%
0.7
6%4.
85%
6.0
9%1.
51%
9.33
%7.
71%
3.0
4%0
.00
%5.
42%
4.0
5%0
.88%
Dur
g7.
17%
0.4
1%4.
79%
2.47
%1.
55%
5.29
%6.
27%
1.66
%0
.18%
3.73
%1.
00
%0
.57%
Janj
gir-
Cha
mp
a10
.58%
2.99
%9.
31%
1.95
%0
.99%
11.9
4%6.
76%
0.0
0%
0.0
0%
9.54
%3.
08%
2.55
%
Jash
pur
9.61
%0
.00
%5.
24%
0.3
1%1.
56%
9.92
%6.
89%
4.37
%0
.00
%9.
92%
4.37
%0
.80
%
Kab
eerd
ham
11.4
9%0
.68%
4.45
%12
.70
%6.
30%
15.5
8%7.
90%
1.59
%1.
75%
13.3
0%
5.83
%1.
22%
Korb
a8.
26%
1.27
%5.
52%
3.55
%2.
43%
8.41
%6.
91%
3.0
1%0
.18%
6.12
%1.
62%
1.14
%
Koriy
a10
.93%
0.9
5%9.
06%
5.60
%1.
09%
13.2
8%12
.13%
5.59
%0
.36%
11.5
6%4.
94%
1.50
%
Mah
asam
und
15.7
7%0
.00
%8.
59%
6.63
%6.
79%
17.2
6%18
.34%
6.94
%0
.00
%17
.03%
7.0
7%2.
85%
Nar
ayan
pur
15.7
1%2.
33%
9.81
%6.
68%
1.48
%17
.59%
14.9
4%2.
10%
2.49
%18
.71%
5.21
%0
.00
%
No
rth
Bast
ar K
anke
r3.
90%
1.38
%2.
52%
0.4
4%0
.00
%4.
34%
4.34
%0
.00
%0
.00
%0
.44%
0.4
4%0
.00
%
Rai
gar
h3.
14%
0.0
0%
3.14
%2.
25%
0.0
0%
3.42
%4.
07%
0.8
1%0
.00
%3.
25%
0.4
1%1.
33%
Rai
pur
8.55
%0
.89%
5.57
%4.
84%
1.71
%6.
47%
7.34
%2.
91%
0.6
0%
5.0
6%1.
60%
1.57
%
Raj
nand
gao
n11
.64%
1.62
%8.
07%
5.57
%2.
15%
12.5
6%11
.47%
5.55
%0
.00
%9.
91%
2.89
%0
.41%
Surg
uja
8.34
%1.
44%
5.79
%2.
60%
5.79
%7.
73%
7.93
%2.
05%
0.5
0%
7.93
%3.
42%
0.5
0%
Goa
No
rth
Go
a1.
97%
0.1
6%1.
42%
2.0
2%0
.40
%1.
15%
1.40
%0
.00
%0
.00
%0
.66%
0.7
3%0
.00
%
Sout
h G
oa
3.0
8%0
.37%
1.16
%3.
53%
1.0
6%1.
00
%4.
14%
0.0
0%
0.0
0%
1.16
%0
.33%
1.68
%
Gujarat
Ahm
adab
ad1.
62%
0.0
0%
0.2
9%1.
29%
0.8
8%0
.93%
0.5
5%0
.09%
0.1
0%
0.1
0%
1.0
3%0
.45%
Am
reli
7.44
%1.
27%
4.16
%4.
18%
2.13
%6.
1 9%
3.15
%0
.20
%0
.00
%4.
56%
2.29
%2.
99%
Ana
nd5.
24%
0.0
0%
2.75
%1.
26%
1.79
%3.
78%
2.30
%0
.00
%1.
04%
1.72
%1.
30%
1.84
%
Bana
s Ka
ntha
8.86
%0
.00
%4.
51%
3.89
%4.
67%
7.0
0%
3.42
%0
.00
%1.
55%
1.55
%7.
46%
3.42
%
Bhar
uch
7.60
%0
.37%
3.11
%3.
66%
3.18
%3.
14%
1.91
%4.
06%
0.9
3%2.
37%
1.20
%2.
38%
Bhav
nag
ar5.
05%
0.0
0%
2.97
%3.
63%
1.0
2%3.
22%
2.51
%0
.00
%0
.00
%3.
41%
1.35
%1.
45%
Dan
g18
.54%
0.0
0%
6.37
%2.
40%
3.27
%17
.72%
15.0
9%12
.75%
2.75
%16
.61%
9.65
%8.
48%
Do
had
10.5
7%0
.00
%9.
26%
4.35
%5.
49%
9.44
%9.
44%
0.0
0%
0.0
0%
8.68
%1.
89%
5.66
%
Gan
dhi
nag
ar14
.55%
0.3
7%4.
23%
11.6
8%8.
62%
16.8
9%16
.67%
0.8
0%
6.22
%11
.07%
7.18
%3.
61%
Jam
nag
ar10
.84%
0.7
9%3.
41%
9.15
%7.
55%
7.42
%6.
33%
1.56
%1.
73%
1.50
%3.
53%
2.36
%
Juna
gad
h3.
31%
0.0
0%
2.55
%1.
95%
0.4
8%3.
64%
1.19
%0
.68%
0.0
4%1.
08%
1.54
%0
.99%
Kach
chh
17.6
7%1.
73%
11.2
6%14
.88%
8.58
%17
.09%
13.7
1%8.
95%
1.29
%1.
59%
5.80
%8.
08%
Khed
a21
.17%
3.23
%16
.21%
6.69
%6.
67%
22.2
7%12
.86%
2.67
%5.
57%
12.0
6%6.
05%
11.8
0%
Mah
esan
a1.
95%
0.8
7%1.
95%
0.0
0%
0.0
0%
1.66
%1.
95%
0.2
9%0
.00
%0
.00
%0
.00
%0
.79%
Nar
mad
a5.
93%
0.0
0%
1.15
%2.
80%
1.73
%8.
15%
8.15
%0
.00
%2.
35%
7.0
0%
5.27
%0
.58%
Nav
sari
3.83
%0
.00
%0
.84%
3.0
6%1.
23%
2.86
%2.
53%
0.3
3%0
.00
%0
.83%
1.24
%2.
01%
(CONTD.) DISTrICT-WISe: CeNSoreD heADCoUNT rATIo (UrBAN)(CONTD.) DISTrICT-WISe: CeNSoreD heADCoUNT rATIo (UrBAN)
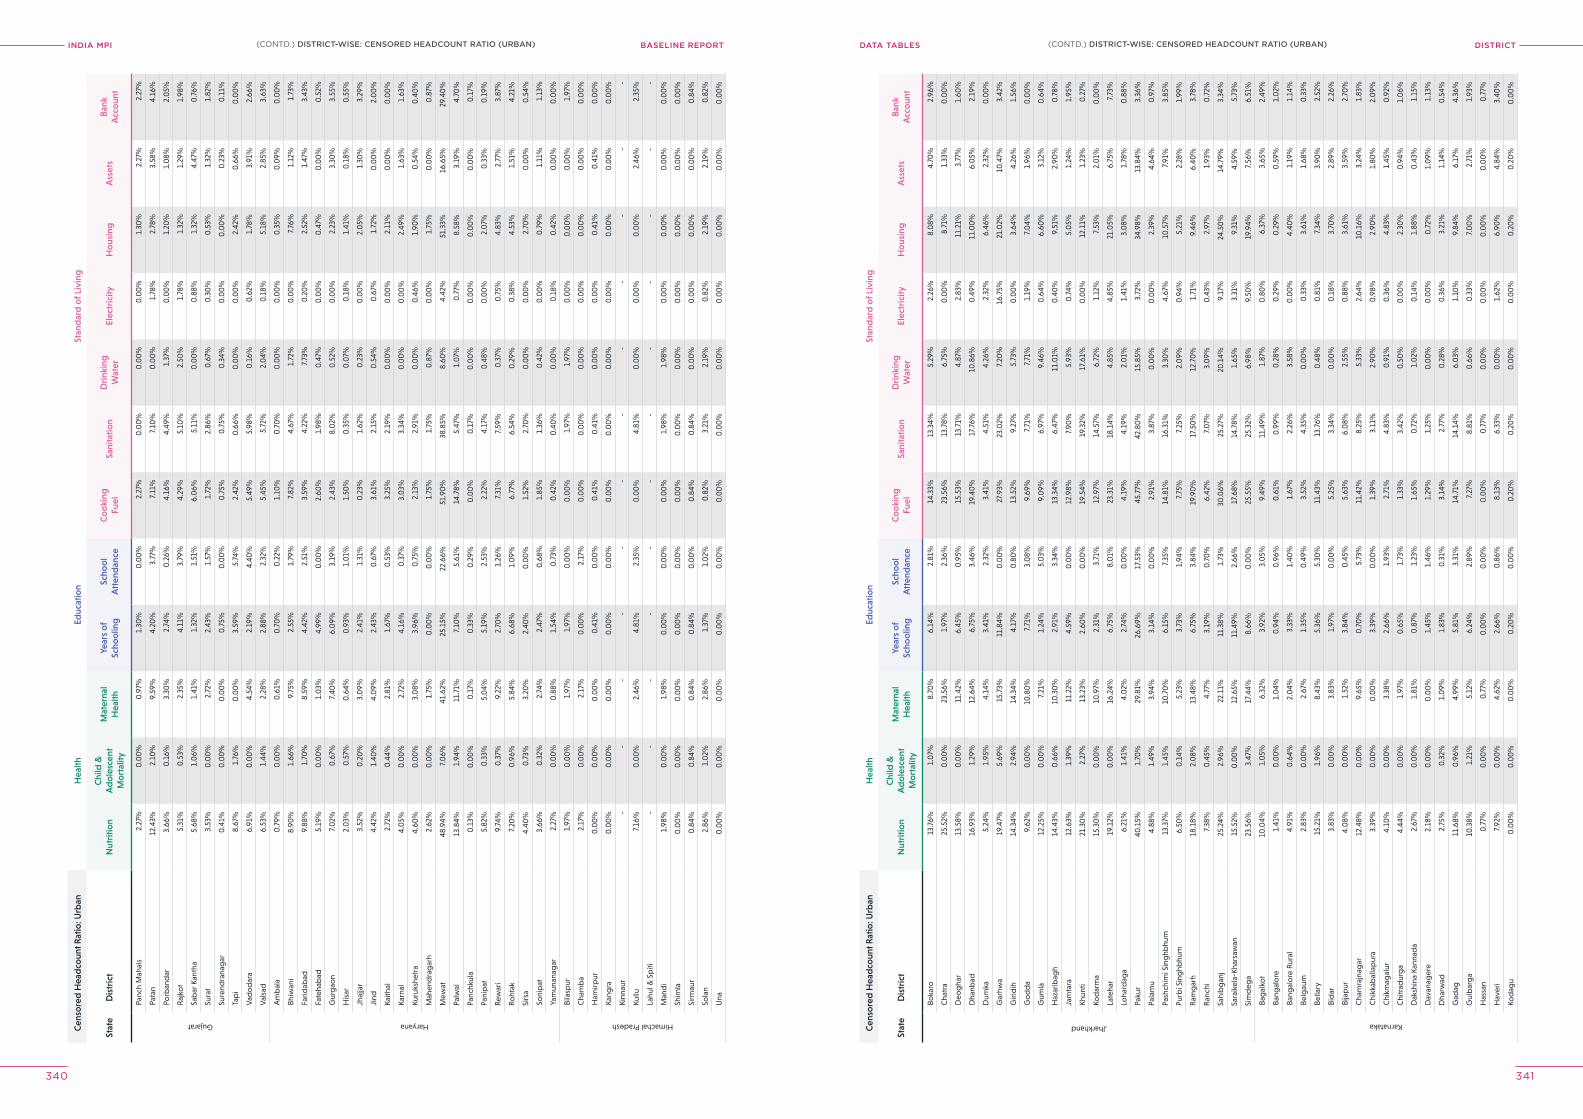
INDIA MPI BASELINE REPORT DISTrICTDATA TABleS
340 341
Cen
sore
d H
ead
coun
t Rat
io: U
rban
Hea
lthEd
ucat
ion
Stan
dar
d o
f Liv
ing
Stat
eD
istr
ict
Nut
ritio
nC
hild
&
Ad
ole
scen
t M
ort
ality
Mat
erna
l H
ealth
Year
s o
f Sc
hoo
ling
Scho
ol
Att
end
ance
Co
oki
ng
Fuel
Sani
tatio
nD
rink
ing
Wat
erEl
ectr
icity
Ho
usin
gA
sset
sB
ank
Acc
oun
t
Gujarat
Panc
h M
ahal
s2.
27%
0.0
0%
0.9
7%1.
30%
0.0
0%
2.27
%0
.00
%0
.00
%0
.00
%1.
30%
2.27
%2.
27%
Pata
n12
.43%
2.10
%9.
59%
4.20
%3.
77%
7.11
%7.
10%
0.0
0%
1.78
%2.
78%
3.58
%4.
16%
Porb
and
ar3.
66%
0.1
6%3.
30%
2.74
%0
.26%
4.16
%4.
49%
1.37
%0
.00
%1.
20%
1.0
8%2.
05%
Raj
kot
5.31
%0
.53%
2.35
%4.
11%
3.79
%4.
29%
5.10
%2.
50%
1.78
%1.
32%
1.29
%1.
98%
Sab
ar K
anth
a5.
68%
1.0
6%1.
41%
1.32
%1.
51%
6.0
6%5.
11%
0.0
0%
0.8
8%1.
32%
4.47
%0
.76%
Sura
t3.
53%
0.0
0%
2.72
%2.
43%
1.57
%1.
72%
2.86
%0
.67%
0.3
0%
0.5
3%1.
32%
1.82
%
Sure
ndra
nag
ar0
.41%
0.0
0%
0.0
0%
0.7
5%0
.00
%0
.75%
0.7
5%0
.34%
0.0
0%
0.0
0%
0.2
3%0
.11%
Tap
i8.
67%
1.76
%0
.00
%3.
59%
5.74
%2.
42%
0.6
6%0
.00
%0
.00
%2.
42%
0.6
6%0
.00
%
Vad
od
ara
6.91
%0
.00
%4.
54%
2.19
%4.
40%
5.49
%5.
98%
0.1
6%0
.62%
1.78
%3.
91%
2.66
%
Val
sad
6.53
%1.
44%
2.28
%2.
88%
2.32
%5.
45%
5.72
%2.
04%
0.1
8%5.
18%
2.85
%3.
63%
Haryana
Am
bal
a0
.79%
0.0
0%
0.6
1%0
.70
%0
.22%
1.10
%0
.70
%0
.00
%0
.00
%0
.35%
0.0
9%0
.00
%
Bhiw
ani
8.90
%1.
66%
9.75
%2.
55%
1.79
%7.
82%
4.67
%1.
72%
0.0
0%
7.76
%1.
12%
1.73
%
Farid
abad
9.88
%1.
70%
8.59
%4.
42%
2.51
%3.
59%
4.22
%7.
73%
0.2
0%
2.52
%1.
47%
3.43
%
Fate
hab
ad5.
19%
0.0
0%
1.0
3%4.
99%
0.0
0%
2.60
%1.
98%
0.4
7%0
.00
%0
.47%
0.0
0%
0.5
2%
Gur
gao
n7.
02%
0.6
7%7.
40%
6.0
9%3.
19%
2.43
%8.
02%
0.5
2%0
.00
%2.
23%
3.30
%3.
55%
His
ar2.
03%
0.5
7%0
.64%
0.9
3%1.
01%
1.50
%0
.35%
0.0
7%0
.18%
1.41
%0
.18%
0.5
5%
Jhaj
jar
3.52
%0
.20
%3.
09%
2.41
%1.
31%
0.2
3%1.
62%
0.2
3%0
.00
%2.
05%
1.30
%3.
29%
Jind
4.42
%1.
40%
4.0
9%2.
43%
0.6
7%3.
61%
2.15
%0
.54%
0.6
7%1.
72%
0.0
0%
2.0
0%
Kaith
al2.
72%
0.4
4%2.
81%
1.67
%0
.53%
3.25
%2.
19%
0.0
0%
0.0
0%
2.11
%0
.00
%0
.00
%
Karn
al4.
05%
0.0
0%
2.72
%4.
16%
0.3
7%3.
03%
3.34
%0
.00
%0
.00
%2.
49%
1.63
%1.
63%
Kuru
kshe
tra
4.60
%0
.00
%3.
08%
3.96
%0
.75%
2.13
%2.
91%
0.0
0%
0.4
6%1.
90%
0.5
4%0
.40
%
Mah
end
rag
arh
2.62
%0
.00
%1.
75%
0.0
0%
0.0
0%
1.75
%1.
75%
0.8
7%0
.00
%1.
75%
0.0
0%
0.8
7%
Mew
at48
.94%
7.0
6%41
.62%
25.1
5%22
.66%
51.9
0%
38.8
5%8.
60%
4.42
%51
.33%
16.6
5%29
.40
%
Palw
al13
.84%
1.94
%11
.71%
7.10
%5.
61%
14.7
8%5.
47%
1.0
7%0
.77%
8.58
%3.
19%
4.70
%
Panc
hkul
a0
.13%
0.0
0%
0.1
7%0
.33%
0.2
9%0
.00
%0
.17%
0.0
0%
0.0
0%
0.0
0%
0.0
0%
0.1
7%
Pani
pat
5.82
%0
.33%
5.0
4%5.
19%
2.53
%2.
22%
4.17
%0
.48%
0.0
0%
2.0
7%0
.33%
0.1
9%
Rew
ari
9.74
%0
.37%
9.22
%2.
70%
1.26
%7.
31%
7.59
%0
.37%
0.7
5%4.
83%
2.77
%3.
87%
Roht
ak7.
20%
0.9
6%5.
84%
6.68
%1.
09%
6.77
%6.
54%
0.2
9%0
.38%
4.53
%1.
51%
4.21
%
Sirs
a4.
40%
0.7
3%3.
20%
2.40
%0
.00
%1.
52%
2.70
%0
.00
%0
.00
%2.
70%
0.0
0%
0.5
4%
Soni
pat
3.66
%0
.32%
2.74
%2.
47%
0.6
8%1.
85%
1.36
%0
.42%
0.0
0%
0.7
9%1.
11%
1.13
%
Yam
unan
agar
2.27
%0
.00
%0
.88%
1.54
%0
.73%
0.4
2%0
.40
%0
.00
%0
.18%
0.4
2%0
.00
%0
.00
%
Himachal Pradesh
Bila
spur
1.97
%0
.00
%1.
97%
1.97
%0
.00
%0
.00
%1.
97%
1.97
%0
.00
%0
.00
%0
.00
%1.
97%
Cha
mb
a2.
17%
0.0
0%
2.17
%0
.00
%2.
17%
0.0
0%
0.0
0%
0.0
0%
0.0
0%
0.0
0%
0.0
0%
0.0
0%
Ham
irpur
0.0
0%
0.0
0%
0.0
0%
0.4
1%0
.00
%0
.41%
0.4
1%0
.00
%0
.00
%0
.41%
0.4
1%0
.00
%
Kang
ra0
.00
%0
.00
%0
.00
%0
.00
%0
.00
%0
.00
%0
.00
%0
.00
%0
.00
%0
.00
%0
.00
%0
.00
%
Kinn
aur
--
--
--
--
--
--
Kullu
7.16
%0
.00
%2.
46%
4.81
%2.
35%
0.0
0%
4.81
%0
.00
%0
.00
%0
.00
%2.
46%
2.35
%
Lahu
l & S
piti
--
--
--
--
--
--
Man
di
1.98
%0
.00
%1.
98%
0.0
0%
0.0
0%
0.0
0%
1.98
%1.
98%
0.0
0%
0.0
0%
0.0
0%
0.0
0%
Shim
la0
.00
%0
.00
%0
.00
%0
.00
%0
.00
%0
.00
%0
.00
%0
.00
%0
.00
%0
.00
%0
.00
%0
.00
%
Sirm
aur
0.8
4%0
.84%
0.8
4%0
.84%
0.0
0%
0.8
4%0
.84%
0.0
0%
0.0
0%
0.0
0%
0.0
0%
0.8
4%
Sola
n2.
86%
1.0
2%2.
86%
1.37
%1.
02%
0.8
2%3.
21%
2.19
%0
.82%
2.19
%2.
19%
0.8
2%
Una
0.0
0%
0.0
0%
0.0
0%
0.0
0%
0.0
0%
0.0
0%
0.0
0%
0.0
0%
0.0
0%
0.0
0%
0.0
0%
0.0
0%
Cen
sore
d H
ead
coun
t Rat
io: U
rban
Hea
lthEd
ucat
ion
Stan
dar
d o
f Liv
ing
Stat
eD
istr
ict
Nut
ritio
nC
hild
&
Ad
ole
scen
t M
ort
ality
Mat
erna
l H
ealth
Year
s o
f Sc
hoo
ling
Scho
ol
Att
end
ance
Co
oki
ng
Fuel
Sani
tatio
nD
rink
ing
Wat
erEl
ectr
icity
Ho
usin
gA
sset
sB
ank
Acc
oun
t
Jharkhand
Boka
ro13
.76%
1.0
7%8.
70%
6.14
%2.
81%
14.3
3%13
.34%
5.29
%2.
26%
8.0
8%4.
70%
2.96
%
Cha
tra
25.5
2%0
.00
%23
.56%
1.97
%2.
36%
23.5
6%13
.78%
6.75
%0
.00
%8.
71%
1.33
%0
.00
%
Deo
gha
r13
.58%
0.0
0%
11.4
2%6.
45%
0.9
5%15
.53%
13.7
1%4.
87%
2.83
%11
.21%
3.77
%1.
60%
Dha
nbad
16.9
3%1.
29%
12.6
4%6.
75%
3.46
%19
.40
%17
.76%
10.8
6%0
.49%
11.0
0%
6.0
5%2.
19%
Dum
ka5.
24%
1.95
%4.
14%
3.41
%2.
32%
3.41
%4.
51%
4.26
%2.
32%
6.46
%2.
32%
0.0
0%
Gar
hwa
19.4
7%5.
69%
15.7
3%11
.84%
0.0
0%
27.9
3%23
.02%
7.20
%16
.75%
21.0
2%10
.47%
3.42
%
Giri
dih
14.3
4%2.
94%
14.3
4%4.
17%
0.8
0%
13.5
2%9.
27%
5.73
%0
.00
%3.
64%
4.26
%1.
56%
Go
dd
a9.
62%
0.0
0%
10.8
0%
7.71
%3.
08%
9.69
%7.
71%
7.71
%1.
19%
7.0
4%1.
96%
0.0
0%
Gum
la12
.25%
0.0
0%
7.21
%1.
24%
5.0
3%9.
09%
6.97
%9.
46%
0.6
4%6.
60%
3.12
%0
.64%
Haz
arib
agh
14.4
3%0
.66%
10.3
0%
2.91
%3.
34%
13.3
4%6.
47%
11.0
1%0
.40
%9.
51%
2.90
%0
.78%
Jam
tara
12.6
3%1.
39%
11.2
2%4.
59%
0.0
0%
12.9
8%7.
90%
5.93
%0
.74%
5.0
5%1.
24%
1.95
%
Khun
ti21
.30
%2.
27%
13.2
3%2.
60%
0.0
0%
19.5
4%19
.32%
17.6
1%0
.00
%12
.11%
1.23
%0
.27%
Kod
arm
a15
.30
%0
.00
%10
.97%
2.31
%3.
71%
12.9
7%14
.57%
6.72
%1.
12%
7.53
%2.
01%
0.0
0%
Late
har
19.1
2%0
.00
%16
.24%
6.75
%8.
01%
23.3
1%18
.14%
4.85
%4.
85%
21.0
5%6.
75%
7.73
%
Loha
rdag
a6.
21%
1.41
%4.
02%
2.74
%0
.00
%4.
19%
4.19
%2.
01%
1.41
%3.
08%
1.78
%0
.88%
Paku
r40
.15%
1.70
%29
.81%
26.6
9%17
.53%
45.7
7%42
.80
%15
.85%
3.72
%34
.98%
13.8
4%3.
36%
Pala
mu
4.88
%1.
49%
3.94
%3.
14%
0.0
0%
2.91
%3.
87%
0.0
0%
0.0
0%
2.39
%4.
64%
0.9
7%
Pash
chim
i Sin
ghb
hum
13.3
7%1.
45%
10.7
0%
6.15
%7.
35%
14.8
1%16
.31%
3.30
%4.
67%
10.5
7%7.
91%
3.85
%
Purb
i Sin
ghb
hum
6.50
%0
.14%
5.23
%3.
73%
1.94
%7.
75%
7.25
%2.
09%
0.9
4%5.
21%
2.28
%1.
99%
Ram
gar
h18
.18%
2.0
8%13
.48%
6.75
%3.
84%
19.9
0%
17.5
0%
12.7
0%
1.71
%9.
46%
6.40
%3.
78%
Ran
chi
7.38
%0
.45%
4.77
%3.
19%
0.7
0%
6.42
%7.
07%
3.0
9%0
.43%
2.97
%1.
93%
0.7
2%
Sahi
bg
anj
25.2
4%2.
96%
22.1
1%11
.38%
1.73
%30
.06%
25.2
7%20
.14%
9.17
%24
.50
%14
.79%
3.34
%
Sara
ikel
a-Kh
arsa
wan
15.5
2%0
.00
%12
.65%
11.4
9%2.
66%
17.6
8%14
.78%
1.65
%3.
31%
9.31
%4.
59%
5.73
%
Sim
deg
a23
.56%
3.47
%17
.44%
8.66
%0
.00
%25
.55%
25.3
2%6.
98%
9.50
%19
.94%
7.56
%6.
51%
Karnataka
Bag
alko
t10
.04%
1.0
5%6.
32%
3.92
%3.
05%
9.49
%11
.49%
1.87
%0
.80
%6.
37%
3.65
%2.
49%
Bang
alo
re1.
41%
0.0
0%
1.0
4%0
.94%
0.9
6%0
.61%
0.9
9%0
.28%
0.2
9%0
.29%
0.5
9%1.
02%
Bang
alo
re R
ural
4.91
%0
.64%
2.0
4%3.
33%
1.40
%1.
67%
2.26
%3.
58%
0.0
0%
4.40
%1.
19%
1.14
%
Belg
aum
2.83
%0
.00
%2.
67%
1.35
%0
.49%
3.52
%4.
35%
0.0
0%
0.3
3%3.
61%
1.68
%0
.33%
Bella
ry15
.21%
1.96
%8.
43%
5.36
%5.
30%
11.4
3%13
.76%
0.4
8%0
.81%
7.34
%3.
90%
2.52
%
Bid
ar3.
83%
0.0
0%
3.83
%1.
97%
0.0
0%
5.25
%3.
34%
0.0
0%
0.1
8%3.
70%
2.89
%2.
26%
Bija
pur
4.0
8%0
.00
%1.
52%
3.84
%0
.45%
5.63
%6.
08%
2.55
%0
.88%
3.61
%3.
59%
2.70
%
Cha
mra
jnag
ar12
.48%
0.0
0%
9.65
%0
.70
%5.
73%
11.4
2%8.
25%
5.33
%2.
64%
10.1
6%3.
24%
1.83
%
Chi
kkab
alla
pur
a3.
39%
0.0
0%
0.0
0%
3.39
%0
.00
%1.
39%
3.11
%2.
90%
0.9
8%2.
90%
1.80
%2.
09%
Chi
kmag
alur
4.10
%0
.00
%3.
38%
2.66
%1.
93%
2.71
%4.
83%
0.9
1%0
.36%
4.83
%1.
45%
0.9
2%
Chi
trad
urg
a4.
44%
0.0
0%
1.97
%0
.65%
1.73
%1.
33%
3.42
%0
.50
%0
.00
%2.
30%
0.9
4%1.
06%
Dak
shin
a Ka
nnad
a2.
67%
0.0
0%
1.81
%0
.87%
1.23
%1.
65%
0.7
2%1.
02%
0.1
4%1.
88%
0.4
3%1.
15%
Dav
anag
ere
2.18
%0
.00
%0
.00
%1.
45%
1.46
%1.
29%
1.25
%0
.00
%0
.00
%0
.72%
1.0
9%1.
13%
Dha
rwad
2.75
%0
.32%
1.0
9%1.
83%
0.3
1%3.
14%
2.77
%0
.28%
0.3
6%3.
21%
1.14
%0
.54%
Gad
ag11
.68%
0.9
6%4.
99%
5.81
%3.
31%
14.7
1%14
.14%
6.0
3%1.
10%
9.84
%6.
17%
4.36
%
Gul
bar
ga
10.3
8%1.
21%
5.12
%6.
24%
2.89
%7.
27%
8.81
%0
.66%
0.3
3%7.
00
%2.
71%
1.93
%
Has
san
0.7
7%0
.00
%0
.77%
0.0
0%
0.0
0%
0.0
0%
0.7
7%0
.00
%0
.00
%0
.00
%0
.00
%0
.77%
Hav
eri
7.92
%0
.00
%4.
62%
2.66
%0
.86%
8.13
%6.
33%
0.0
0%
1.62
%6.
90%
4.84
%3.
40%
Kod
agu
0.0
0%
0.0
0%
0.0
0%
0.2
0%
0.0
0%
0.2
0%
0.2
0%
0.0
0%
0.0
0%
0.2
0%
0.2
0%
0.0
0%
(CONTD.) DISTrICT-WISe: CeNSoreD heADCoUNT rATIo (UrBAN)(CONTD.) DISTrICT-WISe: CeNSoreD heADCoUNT rATIo (UrBAN)
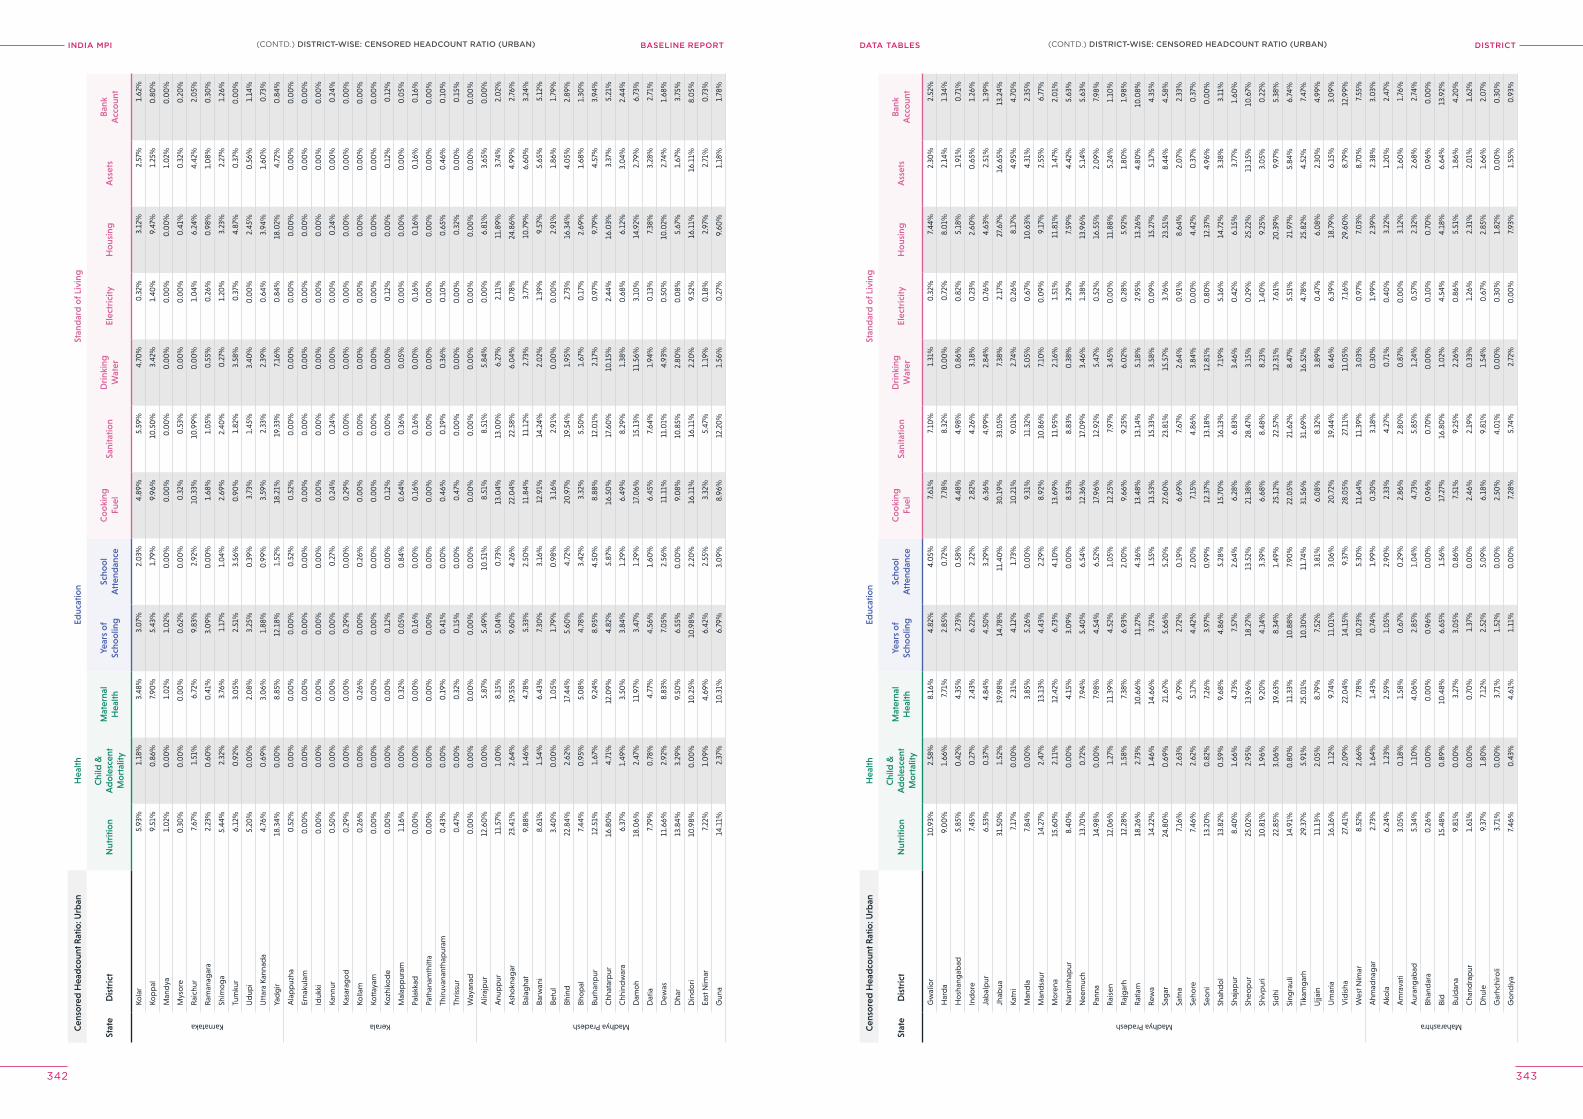
INDIA MPI BASELINE REPORT DISTrICTDATA TABleS
342 343
Cen
sore
d H
ead
coun
t Rat
io: U
rban
Hea
lthEd
ucat
ion
Stan
dar
d o
f Liv
ing
Stat
eD
istr
ict
Nut
ritio
nC
hild
&
Ad
ole
scen
t M
ort
ality
Mat
erna
l H
ealth
Year
s o
f Sc
hoo
ling
Scho
ol
Att
end
ance
Co
oki
ng
Fuel
Sani
tatio
nD
rink
ing
Wat
erEl
ectr
icity
Ho
usin
gA
sset
sB
ank
Acc
oun
t
Karnataka
Kola
r5.
93%
1.18
%3.
48%
3.0
7%2.
03%
4.89
%5.
59%
4.70
%0
.32%
3.12
%2.
57%
1.62
%
Kop
pal
9.51
%0
.86%
7.90
%5.
43%
1.79
%9.
96%
10.5
0%
3.42
%1.
40%
9.47
%1.
25%
0.8
0%
Man
dya
1.0
2%0
.00
%1.
02%
1.0
2%0
.00
%0
.00
%0
.00
%0
.00
%0
.00
%0
.00
%1.
02%
0.0
0%
Mys
ore
0.3
0%
0.0
0%
0.0
0%
0.6
2%0
.00
%0
.32%
0.5
3%0
.00
%0
.00
%0
.41%
0.3
2%0
.20
%
Rai
chur
7.67
%1.
51%
6.72
%9.
83%
2.92
%10
.33%
10.9
9%0
.00
%1.
04%
6.24
%4.
42%
2.0
5%
Ram
anag
ara
2.23
%0
.60
%0
.41%
3.0
9%0
.00
%1.
68%
1.0
5%0
.55%
0.2
6%0
.98%
1.0
8%0
.30
%
Shim
og
a5.
44%
2.32
%3.
76%
1.17
%1.
04%
2.69
%2.
40%
0.2
7%1.
20%
3.23
%2.
27%
1.26
%
Tum
kur
6.12
%0
.92%
3.0
5%2.
51%
3.56
%0
.90
%1.
82%
3.58
%0
.37%
4.87
%0
.37%
0.0
0%
Ud
upi
5.20
%0
.00
%2.
08%
3.25
%0
.39%
3.73
%1.
45%
3.40
%0
.00
%2.
45%
0.5
6%1.
14%
Utt
ara
Kann
ada
4.76
%0
.69%
3.0
6%1.
88%
0.9
9%3.
59%
2.33
%2.
39%
0.6
4%3.
94%
1.60
%0
.73%
Yad
gir
18.3
4%0
.00
%8.
85%
12.1
8%1.
52%
18.2
1%19
.33%
7.16
%0
.84%
18.0
2%4.
72%
0.8
4%
Kerala
Ala
pp
uzha
0.5
2%0
.00
%0
.00
%0
.00
%0
.52%
0.5
2%0
.00
%0
.00
%0
.00
%0
.00
%0
.00
%0
.00
%
Erna
kula
m0
.00
%0
.00
%0
.00
%0
.00
%0
.00
%0
.00
%0
.00
%0
.00
%0
.00
%0
.00
%0
.00
%0
.00
%
Iduk
ki0
.00
%0
.00
%0
.00
%0
.00
%0
.00
%0
.00
%0
.00
%0
.00
%0
.00
%0
.00
%0
.00
%0
.00
%
Kann
ur0
.50
%0
.00
%0
.00
%0
.00
%0
.27%
0.2
4%0
.24%
0.0
0%
0.0
0%
0.2
4%0
.00
%0
.24%
Kasa
rag
od
0.2
9%0
.00
%0
.00
%0
.29%
0.0
0%
0.2
9%0
.00
%0
.00
%0
.00
%0
.00
%0
.00
%0
.00
%
Kolla
m0
.26%
0.0
0%
0.2
6%0
.00
%0
.26%
0.0
0%
0.0
0%
0.0
0%
0.0
0%
0.0
0%
0.0
0%
0.0
0%
Kott
ayam
0.0
0%
0.0
0%
0.0
0%
0.0
0%
0.0
0%
0.0
0%
0.0
0%
0.0
0%
0.0
0%
0.0
0%
0.0
0%
0.0
0%
Kozh
iko
de
0.0
0%
0.0
0%
0.0
0%
0.1
2%0
.00
%0
.12%
0.0
0%
0.0
0%
0.1
2%0
.00
%0
.12%
0.1
2%
Mal
app
uram
1.16
%0
.00
%0
.32%
0.0
5%0
.84%
0.6
4%0
.36%
0.0
5%0
.00
%0
.00
%0
.00
%0
.05%
Pala
kkad
0.0
0%
0.0
0%
0.0
0%
0.1
6%0
.00
%0
.16%
0.1
6%0
.00
%0
.16%
0.1
6%0
.16%
0.1
6%
Path
anam
thitt
a0
.00
%0
.00
%0
.00
%0
.00
%0
.00
%0
.00
%0
.00
%0
.00
%0
.00
%0
.00
%0
.00
%0
.00
%
Thiru
vana
ntha
pur
am0
.43%
0.0
0%
0.1
9%0
.41%
0.0
0%
0.4
6%0
.19%
0.3
6%0
.10
%0
.65%
0.4
6%0
.10
%
Thris
sur
0.4
7%0
.00
%0
.32%
0.1
5%0
.00
%0
.47%
0.0
0%
0.0
0%
0.0
0%
0.3
2%0
.00
%0
.15%
Way
anad
0.0
0%
0.0
0%
0.0
0%
0.0
0%
0.0
0%
0.0
0%
0.0
0%
0.0
0%
0.0
0%
0.0
0%
0.0
0%
0.0
0%
Madhya Pradesh
Alir
ajp
ur12
.60
%0
.00
%5.
87%
5.49
%10
.51%
8.51
%8.
51%
5.84
%0
.00
%6.
81%
3.65
%0
.00
%
Anu
pp
ur11
.57%
1.0
0%
8.15
%5.
04%
0.7
3%13
.04%
13.0
0%
6.27
%2.
11%
11.8
9%3.
74%
2.0
2%
Ash
okn
agar
23.4
1%2.
64%
19.5
5%9.
60%
4.26
%22
.04%
22.5
8%6.
04%
0.7
8%24
.86%
4.99
%2.
76%
Bala
gha
t9.
88%
1.46
%4.
78%
5.33
%2.
50%
11.8
4%11
.12%
2.73
%3.
77%
10.7
9%6.
60%
3.24
%
Barw
ani
8.61
%1.
54%
6.43
%7.
30%
3.16
%12
.91%
14.2
4%2.
02%
1.39
%9.
57%
5.65
%5.
12%
Betu
l3.
40%
0.0
0%
1.0
5%1.
79%
0.9
8%3.
16%
2.91
%0
.00
%0
.00
%2.
91%
1.86
%1.
79%
Bhin
d22
.84%
2.62
%17
.44%
5.60
%4.
72%
20.9
7%19
.54%
1.95
%2.
73%
16.3
4%4.
05%
2.89
%
Bho
pal
7.44
%0
.95%
5.0
8%4.
78%
3.42
%3.
32%
5.50
%1.
67%
0.1
7%2.
69%
1.68
%1.
30%
Burh
anp
ur12
.51%
1.67
%9.
24%
8.95
%4.
50%
8.88
%12
.01%
2.17
%0
.97%
9.79
%4.
57%
3.94
%
Chh
atar
pur
16.8
0%
4.71
%12
.09%
4.82
%5.
87%
16.5
0%
17.6
0%
10.1
5%2.
44%
16.0
3%3.
37%
5.21
%
Chh
ind
war
a6.
37%
1.49
%3.
50%
3.84
%1.
29%
6.49
%8.
29%
1.38
%0
.68%
6.12
%3.
04%
2.44
%
Dam
oh
18.0
6%2.
47%
11.9
7%3.
47%
1.29
%17
.06%
15.1
3%11
.56%
3.10
%14
.92%
2.79
%6.
73%
Dat
ia7.
79%
0.7
8%4.
77%
4.56
%1.
60%
6.45
%7.
64%
1.94
%0
.13%
7.38
%3.
28%
2.71
%
Dew
as11
.66%
2.92
%8.
83%
7.0
5%2.
56%
11.1
1%11
.01%
4.93
%0
.50
%10
.02%
2.74
%1.
68%
Dha
r13
.84%
3.29
%9.
50%
6.55
%0
.00
%9.
08%
10.8
5%2.
80%
0.0
8%5.
67%
1.67
%3.
75%
Din
do
ri10
.98%
0.0
0%
10.2
5%10
.98%
2.20
%16
.11%
16.1
1%2.
20%
9.52
%16
.11%
16.1
1%8.
05%
East
Nim
ar7.
22%
1.0
9%4.
69%
6.42
%2.
55%
3.32
%5.
47%
1.19
%0
.18%
2.97
%2.
71%
0.7
3%
Gun
a14
.11%
2.37
%10
.31%
6.79
%3.
09%
8.96
%12
.20
%1.
56%
0.2
7%9.
60%
1.18
%1.
78%
Cen
sore
d H
ead
coun
t Rat
io: U
rban
Hea
lthEd
ucat
ion
Stan
dar
d o
f Liv
ing
Stat
eD
istr
ict
Nut
ritio
nC
hild
&
Ad
ole
scen
t M
ort
ality
Mat
erna
l H
ealth
Year
s o
f Sc
hoo
ling
Scho
ol
Att
end
ance
Co
oki
ng
Fuel
Sani
tatio
nD
rink
ing
Wat
erEl
ectr
icity
Ho
usin
gA
sset
sB
ank
Acc
oun
t
Madhya Pradesh
Gw
alio
r10
.93%
2.58
%8.
16%
4.82
%4.
05%
7.61
%7.
10%
1.31
%0
.32%
7.44
%2.
30%
2.52
%
Har
da
9.0
0%
1.66
%7.
71%
2.85
%0
.72%
7.78
%8.
32%
0.0
0%
0.7
2%8.
01%
2.14
%1.
34%
Ho
shan
gab
ad5.
85%
0.4
2%4.
35%
2.73
%0
.58%
4.48
%4.
98%
0.8
6%0
.82%
5.18
%1.
91%
0.7
1%
Ind
ore
7.45
%0
.27%
2.43
%6.
22%
2.22
%2.
82%
4.26
%3.
18%
0.2
3%2.
60%
0.6
5%1.
26%
Jab
alp
ur6.
53%
0.3
7%4.
84%
4.50
%3.
29%
6.36
%4.
99%
2.84
%0
.76%
4.63
%2.
51%
1.39
%
Jhab
ua31
.50
%1.
52%
19.9
8%14
.78%
11.4
0%
30.1
9%33
.05%
7.38
%2.
17%
27.6
7%16
.65%
13.2
4%
Katn
i7.
17%
0.0
0%
2.31
%4.
12%
1.73
%10
.21%
9.0
1%2.
74%
0.2
6%8.
17%
4.95
%4.
70%
Man
dla
7.84
%0
.00
%3.
85%
5.26
%0
.00
%9.
31%
11.3
2%5.
05%
0.6
7%10
.63%
4.31
%2.
35%
Man
dsa
ur14
.27%
2.47
%13
.13%
4.43
%2.
29%
8.92
%10
.86%
7.10
%0
.09%
9.17
%2.
55%
6.77
%
Mo
rena
15.6
0%
2.11
%12
.42%
6.73
%4.
10%
13.6
9%11
.95%
2.16
%1.
51%
11.8
1%1.
47%
2.0
1%
Nar
sim
hap
ur8.
40%
0.0
0%
4.15
%3.
09%
0.0
0%
8.53
%8.
83%
0.3
8%3.
29%
7.59
%4.
42%
5.63
%
Nee
muc
h13
.70
%0
.72%
7.94
%5.
40%
6.54
%12
.36%
17.0
9%3.
46%
1.38
%13
.96%
5.14
%5.
63%
Pann
a14
.98%
0.0
0%
7.98
%4.
54%
6.52
%17
.96%
12.9
2%5.
47%
0.5
2%16
.55%
2.0
9%7.
98%
Rai
sen
12.0
6%1.
27%
11.3
9%4.
52%
1.0
5%12
.25%
7.97
%3.
45%
0.0
0%
11.8
8%5.
24%
1.10
%
Raj
gar
h12
.28%
1.58
%7.
38%
6.93
%2.
00
%9.
66%
9.25
%6.
02%
0.2
8%5.
92%
1.80
%1.
98%
Rat
lam
18.2
6%2.
73%
10.6
6%11
.27%
4.36
%13
.48%
13.1
4%5.
18%
2.95
%13
.26%
4.80
%10
.08%
Rew
a14
.22%
1.46
%14
.66%
3.72
%1.
55%
13.5
3%15
.33%
3.58
%0
.09%
15.2
7%5.
17%
4.35
%
Sag
ar24
.80
%0
.69%
21.6
7%5.
66%
5.20
%27
.60
%23
.81%
15.5
7%3.
76%
23.5
1%8.
44%
4.58
%
Satn
a7.
16%
2.63
%6.
79%
2.72
%0
.19%
6.69
%7.
67%
2.64
%0
.91%
8.64
%2.
07%
2.33
%
Seho
re7.
46%
2.62
%5.
17%
4.42
%2.
00
%7.
15%
4.86
%3.
84%
0.0
0%
4.42
%0
.37%
0.3
7%
Seo
ni13
.20
%0
.82%
7.26
%3.
97%
0.9
9%12
.37%
13.1
8%12
.81%
0.8
0%
12.3
7%4.
96%
0.0
0%
Shah
do
l13
.82%
0.5
9%9.
68%
4.86
%5.
28%
15.7
0%
16.1
3%7.
19%
5.16
%14
.72%
3.38
%3.
11%
Shaj
apur
8.40
%1.
66%
4.73
%7.
57%
2.64
%6.
28%
6.83
%3.
46%
0.4
2%6.
15%
3.77
%1.
60%
Sheo
pur
25.0
2%2.
95%
13.9
6%18
.27%
13.5
2%21
.38%
28.4
7%3.
15%
0.2
9%25
.22%
13.1
5%10
.67%
Shiv
pur
i10
.81%
1.96
%9.
20%
4.14
%3.
39%
6.68
%8.
48%
8.23
%1.
40%
9.25
%3.
05%
0.2
2%
Sid
hi22
.85%
3.0
6%19
.63%
8.34
%1.
49%
25.1
2%22
.57%
12.3
1%7.
61%
20.3
9%9.
97%
5.38
%
Sing
raul
i14
.91%
0.8
0%
11.3
3%10
.88%
7.90
%22
.05%
21.6
2%8.
47%
5.51
%21
.97%
5.84
%6.
74%
Tika
mg
arh
29.3
7%5.
91%
25.0
1%10
.30
%11
.74%
31.5
6%31
.69%
16.5
2%4.
78%
25.8
2%4.
52%
7.47
%
Ujja
in11
.13%
2.0
5%8.
79%
7.52
%3.
81%
6.0
8%8.
32%
3.89
%0
.47%
6.0
8%2.
30%
4.99
%
Um
aria
16.1
6%1.
12%
9.74
%11
.01%
3.0
6%20
.72%
19.4
4%8.
46%
6.39
%18
.79%
6.15
%3.
09%
Vid
isha
27.4
1%2.
09%
22.0
4%14
.15%
9.37
%28
.05%
27.1
1%11
.05%
7.16
%29
.60
%8.
79%
12.9
9%
Wes
t Nim
ar8.
52%
2.66
%7.
78%
10.2
3%5.
30%
11.6
4%11
.39%
3.0
3%0
.97%
7.0
3%8.
70%
7.55
%
Maharashtra
Ahm
adna
gar
2.73
%1.
64%
1.43
%0
.74%
1.99
%0
.30
%3.
18%
0.3
0%
1.99
%2.
39%
2.38
%3.
03%
Ako
la6.
24%
1.23
%2.
59%
1.0
5%2.
90%
2.33
%4.
27%
0.7
1%0
.40
%3.
22%
1.20
%2.
47%
Am
rava
ti3.
05%
0.1
8%1.
58%
0.6
7%0
.29%
2.86
%2.
80%
0.8
7%0
.00
%3.
12%
1.60
%1.
76%
Aur
ang
abad
5.34
%1.
10%
4.0
6%2.
85%
1.0
4%4.
73%
5.85
%1.
24%
0.5
7%2.
32%
2.68
%2.
74%
Bhan
dar
a0
.26%
0.0
0%
0.0
0%
0.9
6%0
.00
%0
.96%
0.7
0%
0.0
0%
0.1
0%
0.7
0%
0.9
6%0
.00
%
Bid
15.4
8%0
.89%
10.4
8%6.
65%
1.56
%17
.27%
16.8
0%
1.0
2%4.
54%
4.18
%6.
64%
13.9
2%
Buld
ana
9.81
%0
.00
%3.
27%
3.0
5%0
.86%
7.51
%9.
25%
2.26
%0
.86%
5.51
%1.
86%
4.20
%
Cha
ndra
pur
1.61
%0
.00
%0
.70
%1.
37%
0.0
0%
2.46
%2.
19%
0.3
3%1.
26%
2.31
%2.
01%
1.62
%
Dhu
le9.
37%
1.80
%7.
12%
2.52
%5.
09%
6.18
%9.
81%
1.54
%0
.67%
2.85
%1.
66%
2.0
7%
Gar
hchi
roli
3.71
%0
.00
%3.
71%
1.52
%0
.00
%2.
50%
4.0
1%0
.00
%0
.30
%1.
82%
0.0
0%
0.3
0%
Go
ndiy
a7.
46%
0.4
3%4.
61%
1.11
%0
.00
%7.
28%
5.74
%2.
72%
0.0
0%
7.93
%1.
55%
0.9
3%
(CONTD.) DISTrICT-WISe: CeNSoreD heADCoUNT rATIo (UrBAN)(CONTD.) DISTrICT-WISe: CeNSoreD heADCoUNT rATIo (UrBAN)
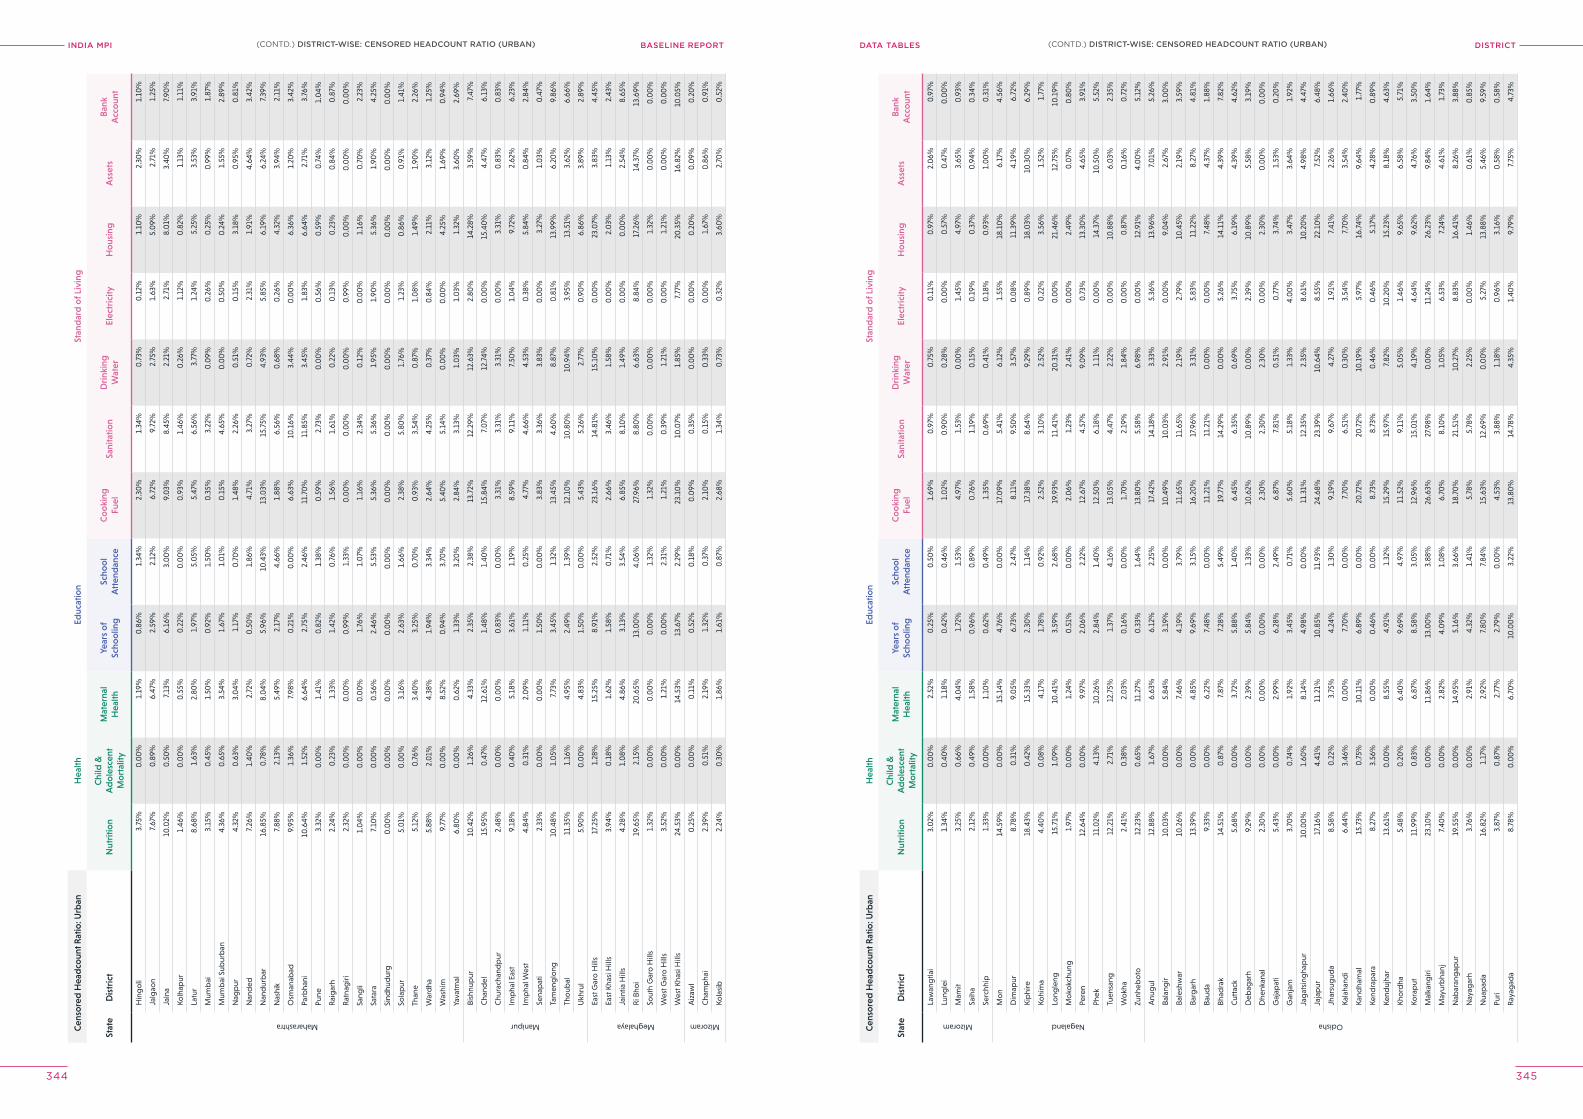
INDIA MPI BASELINE REPORT DISTrICTDATA TABleS
344 345
Cen
sore
d H
ead
coun
t Rat
io: U
rban
Hea
lthEd
ucat
ion
Stan
dar
d o
f Liv
ing
Stat
eD
istr
ict
Nut
ritio
nC
hild
&
Ad
ole
scen
t M
ort
ality
Mat
erna
l H
ealth
Year
s o
f Sc
hoo
ling
Scho
ol
Att
end
ance
Co
oki
ng
Fuel
Sani
tatio
nD
rink
ing
Wat
erEl
ectr
icity
Ho
usin
gA
sset
sB
ank
Acc
oun
t
Maharashtra
Hin
go
li3.
75%
0.0
0%
1.19
%0
.86%
1.34
%2.
30%
1.34
%0
.73%
0.1
2%1.
10%
2.30
%1.
10%
Jalg
aon
7.67
%0
.89%
6.47
%2.
59%
2.12
%6.
72%
9.72
%2.
75%
1.63
%5.
09%
2.71
%1.
25%
Jaln
a10
.02%
0.5
0%
7.13
%6.
16%
3.0
0%
9.0
3%8.
45%
2.21
%2.
71%
8.0
1%3.
40%
7.90
%
Kolh
apur
1.46
%0
.00
%0
.55%
0.2
2%0
.00
%0
.93%
1.46
%0
.26%
1.12
%0
.82%
1.13
%1.
11%
Latu
r8.
68%
1.63
%2.
80%
1.97
%5.
05%
5.47
%6.
56%
3.77
%1.
24%
5.25
%3.
53%
3.91
%
Mum
bai
3.15
%0
.45%
1.50
%0
.92%
1.50
%0
.35%
3.22
%0
.09%
0.2
6%0
.25%
0.9
9%1.
87%
Mum
bai
Sub
urb
an4.
36%
0.6
5%3.
54%
1.67
%1.
01%
0.1
5%4.
65%
0.0
0%
0.5
0%
0.2
4%1.
55%
2.89
%
Nag
pur
4.32
%0
.63%
3.0
4%1.
17%
0.7
0%
1.48
%2.
26%
0.5
1%0
.15%
3.18
%0
.95%
0.8
1%
Nan
ded
7.26
%1.
40%
2.72
%0
.50
%1.
86%
4.71
%3.
27%
0.7
2%2.
31%
1.91
%4.
64%
3.42
%
Nan
dur
bar
16.8
5%0
.78%
8.0
4%5.
96%
10.4
3%13
.03%
15.7
5%4.
93%
5.85
%6.
19%
6.24
%7.
39%
Nas
hik
7.88
%2.
13%
5.49
%2.
17%
4.66
%1.
88%
6.56
%0
.68%
0.2
6%4.
32%
3.94
%2.
11%
Osm
anab
ad9.
95%
1.36
%7.
98%
0.2
1%0
.00
%6.
63%
10.1
6%3.
44%
0.0
0%
6.36
%1.
20%
3.42
%
Parb
hani
10.6
4%1.
52%
6.64
%2.
75%
2.46
%11
.70
%11
.85%
3.45
%1.
83%
6.64
%2.
71%
3.76
%
Pune
3.32
%0
.00
%1.
41%
0.8
2%1.
38%
0.5
9%2.
73%
0.0
0%
0.5
6%0
.59%
0.7
4%1.
04%
Rai
gar
h2.
24%
0.2
3%1.
33%
1.42
%0
.76%
1.56
%1.
61%
0.2
2%0
.13%
0.2
3%0
.84%
0.8
7%
Rat
nag
iri2.
32%
0.0
0%
0.0
0%
0.9
9%1.
33%
0.0
0%
0.0
0%
0.0
0%
0.9
9%0
.00
%0
.00
%0
.00
%
Sang
li1.
04%
0.0
0%
0.0
0%
1.76
%1.
07%
1.16
%2.
34%
0.1
2%0
.00
%1.
16%
0.7
0%
2.23
%
Sata
ra7.
10%
0.0
0%
0.5
6%2.
46%
5.53
%5.
36%
5.36
%1.
95%
1.90
%5.
36%
1.90
%4.
25%
Sind
hud
urg
0.0
0%
0.0
0%
0.0
0%
0.0
0%
0.0
0%
0.0
0%
0.0
0%
0.0
0%
0.0
0%
0.0
0%
0.0
0%
0.0
0%
Sola
pur
5.0
1%0
.00
%3.
16%
2.63
%1.
66%
2.38
%5.
80%
1.76
%1.
23%
0.8
6%0
.91%
1.41
%
Than
e5.
12%
0.7
6%3.
40%
3.25
%0
.70
%0
.93%
3.54
%0
.87%
1.0
8%1.
49%
1.90
%2.
26%
War
dha
5.88
%2.
01%
4.38
%1.
94%
3.34
%2.
64%
4.25
%0
.37%
0.8
4%2.
11%
3.12
%1.
25%
Was
him
9.77
%0
.00
%8.
52%
0.9
4%3.
70%
5.40
%5.
14%
0.0
0%
0.0
0%
4.25
%1.
69%
0.9
4%
Yava
tmal
6.80
%0
.00
%0
.62%
1.33
%3.
20%
2.84
%3.
13%
1.0
3%1.
03%
1.32
%3.
60%
2.69
%
Manipur
Bish
nup
ur10
.42%
1.26
%4.
33%
2.35
%2.
38%
13.7
2%12
.29%
12.6
3%2.
80%
14.2
8%3.
59%
7.47
%
Cha
ndel
15.9
5%0
.47%
12.6
1%1.
48%
1.40
%15
.84%
7.0
7%12
.74%
0.0
0%
15.4
0%
4.47
%6.
13%
Chu
rach
and
pur
2.48
%0
.00
%0
.00
%0
.83%
0.0
0%
3.31
%3.
31%
3.31
%0
.00
%3.
31%
0.8
3%0
.83%
Imp
hal E
ast
9.18
%0
.40
%5.
18%
3.61
%1.
19%
8.59
%9.
11%
7.50
%1.
04%
9.72
%2.
62%
6.23
%
Imp
hal W
est
4.84
%0
.31%
2.0
9%1.
11%
0.2
5%4.
77%
4.66
%4.
53%
0.3
8%5.
84%
0.8
4%2.
84%
Sena
pat
i2.
33%
0.0
0%
0.0
0%
1.50
%0
.00
%3.
83%
3.36
%3.
83%
0.0
0%
3.27
%1.
03%
0.4
7%
Tam
eng
long
10.4
8%1.
05%
7.73
%3.
45%
1.32
%13
.45%
4.60
%8.
87%
0.8
1%13
.99%
6.20
%9.
86%
Tho
ubal
11.3
5%1.
16%
4.95
%2.
49%
1.39
%12
.10
%10
.80
%10
.94%
3.95
%13
.51%
3.62
%6.
66%
Ukh
rul
5.90
%0
.00
%4.
83%
1.50
%0
.00
%5.
43%
5.26
%2.
77%
0.9
0%
6.86
%3.
89%
2.89
%
Meghalaya
East
Gar
o H
ills
17.2
5%1.
28%
15.2
5%8.
91%
2.52
%23
.16%
14.8
1%15
.10
%0
.00
%23
.07%
3.83
%4.
45%
East
Kha
si H
ills
3.94
%0
.18%
1.62
%1.
58%
0.7
1%2.
66%
3.46
%1.
58%
0.0
0%
2.0
3%1.
13%
2.43
%
Jain
tia H
ills
4.28
%1.
08%
4.86
%3.
13%
3.54
%6.
85%
8.10
%1.
49%
0.0
0%
0.0
0%
2.54
%8.
65%
Ri B
hoi
19.6
5%2.
15%
20.6
5%13
.00
%4.
06%
27.9
6%8.
80%
6.63
%8.
84%
17.2
6%14
.37%
13.6
9%
Sout
h G
aro
Hill
s1.
32%
0.0
0%
0.0
0%
0.0
0%
1.32
%1.
32%
0.0
0%
0.0
0%
0.0
0%
1.32
%0
.00
%0
.00
%
Wes
t Gar
o H
ills
3.52
%0
.00
%1.
21%
0.0
0%
2.31
%1.
21%
0.3
9%1.
21%
0.0
0%
1.21
%0
.00
%0
.00
%
Wes
t Kha
si H
ills
24.5
3%0
.00
%14
.53%
13.6
7%2.
29%
23.1
0%
10.0
7%1.
85%
7.77
%20
.35%
16.8
2%10
.05%
Mizoram
Aiz
awl
0.2
5%0
.00
%0
.11%
0.5
2%0
.18%
0.0
9%0
.35%
0.0
0%
0.0
0%
0.2
0%
0.0
9%0
.20
%
Cha
mp
hai
2.39
%0
.51%
2.19
%1.
32%
0.3
7%2.
10%
0.1
5%0
.33%
0.0
0%
1.67
%0
.86%
0.9
1%
Kola
sib
2.24
%0
.30
%1.
86%
1.61
%0
.87%
2.68
%1.
34%
0.7
3%0
.32%
3.60
%2.
70%
0.5
2%
Cen
sore
d H
ead
coun
t Rat
io: U
rban
Hea
lthEd
ucat
ion
Stan
dar
d o
f Liv
ing
Stat
eD
istr
ict
Nut
ritio
nC
hild
&
Ad
ole
scen
t M
ort
ality
Mat
erna
l H
ealth
Year
s o
f Sc
hoo
ling
Scho
ol
Att
end
ance
Co
oki
ng
Fuel
Sani
tatio
nD
rink
ing
Wat
erEl
ectr
icity
Ho
usin
gA
sset
sB
ank
Acc
oun
t
Mizoram
Law
ang
tlai
3.0
2%0
.00
%2.
52%
0.2
5%0
.50
%1.
69%
0.9
7%0
.75%
0.1
1%0
.97%
2.0
6%0
.97%
Lung
lei
1.34
%0
.40
%1.
18%
0.4
2%0
.46%
1.0
2%0
.90
%0
.28%
0.0
0%
0.5
7%0
.47%
0.0
0%
Mam
it3.
25%
0.6
6%4.
04%
1.72
%1.
53%
4.97
%1.
53%
0.0
0%
1.45
%4.
97%
3.65
%0
.93%
Saih
a2.
12%
0.4
9%1.
58%
0.9
6%0
.89%
0.7
6%1.
19%
0.1
5%0
.19%
0.3
7%0
.94%
0.3
4%
Serc
hhip
1.33
%0
.00
%1.
10%
0.6
2%0
.49%
1.35
%0
.69%
0.4
1%0
.18%
0.9
3%1.
00
%0
.31%
Nagaland
Mo
n14
.59%
0.0
0%
15.1
4%4.
76%
0.0
0%
17.0
9%5.
41%
6.12
%1.
55%
18.1
0%
6.17
%4.
56%
Dim
apur
8.78
%0
.31%
9.0
5%6.
73%
2.47
%8.
11%
9.50
%3.
57%
0.0
8%11
.39%
4.19
%6.
72%
Kip
hire
18.4
3%0
.42%
15.3
3%2.
30%
1.14
%17
.38%
8.64
%9.
29%
0.8
9%18
.03%
10.3
0%
6.29
%
Kohi
ma
4.40
%0
.08%
4.17
%1.
78%
0.9
2%2.
52%
3.10
%2.
52%
0.2
2%3.
56%
1.52
%1.
77%
Long
leng
15.7
1%1.
09%
10.4
1%3.
59%
2.68
%19
.93%
11.4
1%20
.31%
0.0
0%
21.4
6%12
.75%
10.1
9%
Mo
kokc
hung
1.97
%0
.00
%1.
24%
0.5
1%0
.00
%2.
06%
1.23
%2.
41%
0.0
0%
2.49
%0
.07%
0.8
0%
Pere
n12
.64%
0.0
0%
9.97
%2.
06%
2.22
%12
.67%
4.57
%9.
09%
0.7
3%13
.30
%4.
65%
3.91
%
Phek
11.0
2%4.
13%
10.2
6%2.
84%
1.40
%12
.50
%6.
18%
1.11
%0
.00
%14
.37%
10.5
0%
5.52
%
Tuen
sang
12.2
1%2.
71%
12.7
5%1.
37%
4.16
%13
.05%
4.47
%2.
22%
0.0
0%
10.8
8%6.
03%
2.35
%
Wo
kha
2.41
%0
.38%
2.0
3%0
.16%
0.0
0%
1.70
%2.
19%
1.84
%0
.00
%0
.87%
0.1
6%0
.72%
Zunh
ebo
to12
.23%
0.6
5%11
.27%
0.3
3%1.
64%
13.8
0%
5.58
%6.
98%
0.0
0%
12.9
1%4.
00
%5.
12%
Odisha
Anu
gul
12.8
8%1.
67%
6.63
%6.
12%
2.25
%17
.42%
14.1
8%3.
33%
5.36
%13
.96%
7.0
1%5.
26%
Bala
ngir
10.0
3%0
.00
%5.
84%
3.19
%0
.00
%10
.49%
10.0
3%2.
91%
0.0
0%
9.0
4%2.
67%
3.0
0%
Bale
shw
ar10
.26%
0.0
0%
7.46
%4.
19%
3.79
%11
.65%
11.6
5%2.
19%
2.79
%10
.45%
2.19
%3.
59%
Barg
arh
13.3
9%0
.00
%4.
85%
9.69
%3.
15%
16.2
0%
17.9
6%3.
31%
5.83
%11
.22%
8.27
%4.
81%
Baud
a9.
33%
0.0
0%
6.22
%7.
48%
0.0
0%
11.2
1%11
.21%
0.0
0%
0.0
0%
7.48
%4.
37%
1.88
%
Bhad
rak
14.5
1%0
.87%
7.87
%7.
28%
5.49
%19
.77%
14.2
9%0
.00
%5.
26%
14.1
1%4.
39%
7.82
%
Cut
tack
5.68
%0
.00
%3.
72%
5.88
%1.
40%
6.45
%6.
35%
0.6
9%3.
75%
6.19
%4.
39%
4.62
%
Deb
agar
h9.
29%
0.0
0%
2.39
%5.
84%
1.33
%10
.62%
10.8
9%0
.00
%2.
39%
10.8
9%5.
58%
3.19
%
Dhe
nkan
al2.
30%
0.0
0%
0.0
0%
0.0
0%
0.0
0%
2.30
%2.
30%
2.30
%0
.00
%2.
30%
0.0
0%
0.0
0%
Gaj
apat
i5.
43%
0.0
0%
2.99
%6.
28%
2.49
%6.
87%
7.81
%0
.51%
0.7
7%3.
74%
1.53
%0
.20
%
Gan
jam
3.70
%0
.74%
1.92
%3.
45%
0.7
1%5.
60%
5.18
%1.
33%
4.0
0%
3.47
%3.
64%
1.92
%
Jag
atsi
ngha
pur
10.0
0%
1.60
%8.
14%
4.98
%0
.00
%11
.31%
12.3
5%2.
35%
8.61
%10
.20
%4.
98%
4.47
%
Jaja
pur
17.1
6%4.
41%
11.2
1%10
.85%
11.9
3%24
.68%
23.3
9%10
.64%
8.55
%22
.10
%7.
52%
6.48
%
Jhar
sug
uda
8.58
%0
.22%
3.75
%4.
24%
1.30
%9.
19%
9.67
%4.
27%
1.91
%7.
41%
2.26
%1.
66%
Kala
hand
i6.
44%
3.46
%0
.00
%7.
70%
0.0
0%
7.70
%6.
51%
0.3
0%
3.54
%7.
70%
3.54
%2.
40%
Kand
ham
al15
.73%
0.7
5%10
.11%
6.89
%0
.00
%20
.72%
20.7
2%10
.19%
5.97
%16
.74%
9.64
%1.
77%
Kend
rap
ara
8.27
%3.
56%
0.0
0%
0.4
6%0
.00
%8.
73%
8.73
%0
.46%
0.4
6%5.
17%
4.28
%0
.89%
Kend
ujha
r13
.61%
0.0
0%
8.55
%4.
91%
1.32
%15
.29%
15.9
7%7.
82%
10.2
0%
15.2
3%8.
18%
4.63
%
Kho
rdha
5.48
%0
.20
%6.
40%
9.69
%4.
97%
11.5
2%9.
11%
5.0
5%1.
46%
9.65
%6.
58%
5.71
%
Kora
put
11.9
9%0
.83%
6.87
%8.
58%
3.0
5%12
.96%
15.0
1%4.
19%
4.64
%9.
62%
4.76
%3.
50%
Mal
kang
iri23
.10
%0
.00
%11
.86%
13.0
0%
3.88
%26
.63%
27.9
8%0
.00
%11
.24%
26.2
3%9.
84%
1.64
%
May
urb
hanj
7.40
%0
.00
%2.
82%
4.0
9%1.
08%
6.70
%8.
10%
1.0
5%6.
53%
7.24
%4.
61%
1.73
%
Nab
aran
gap
ur19
.55%
0.0
0%
14.9
5%5.
16%
3.66
%18
.70
%21
.51%
10.2
7%8.
83%
16.4
1%8.
26%
3.88
%
Nay
agar
h3.
76%
0.0
0%
2.91
%4.
32%
1.41
%5.
78%
5.78
%2.
25%
0.0
0%
1.46
%0
.61%
0.8
5%
Nua
pad
a16
.82%
1.17
%2.
92%
7.80
%7.
84%
15.6
3%12
.69%
0.0
0%
5.27
%13
.88%
5.46
%9.
59%
Puri
3.87
%0
.87%
2.77
%2.
79%
0.0
0%
4.53
%3.
88%
1.18
%0
.96%
3.16
%0
.58%
0.5
8%
Ray
agad
a8.
78%
0.0
0%
6.70
%10
.00
%3.
22%
13.8
0%
14.7
8%4.
35%
1.40
%9.
79%
7.75
%4.
73%
(CONTD.) DISTrICT-WISe: CeNSoreD heADCoUNT rATIo (UrBAN)(CONTD.) DISTrICT-WISe: CeNSoreD heADCoUNT rATIo (UrBAN)
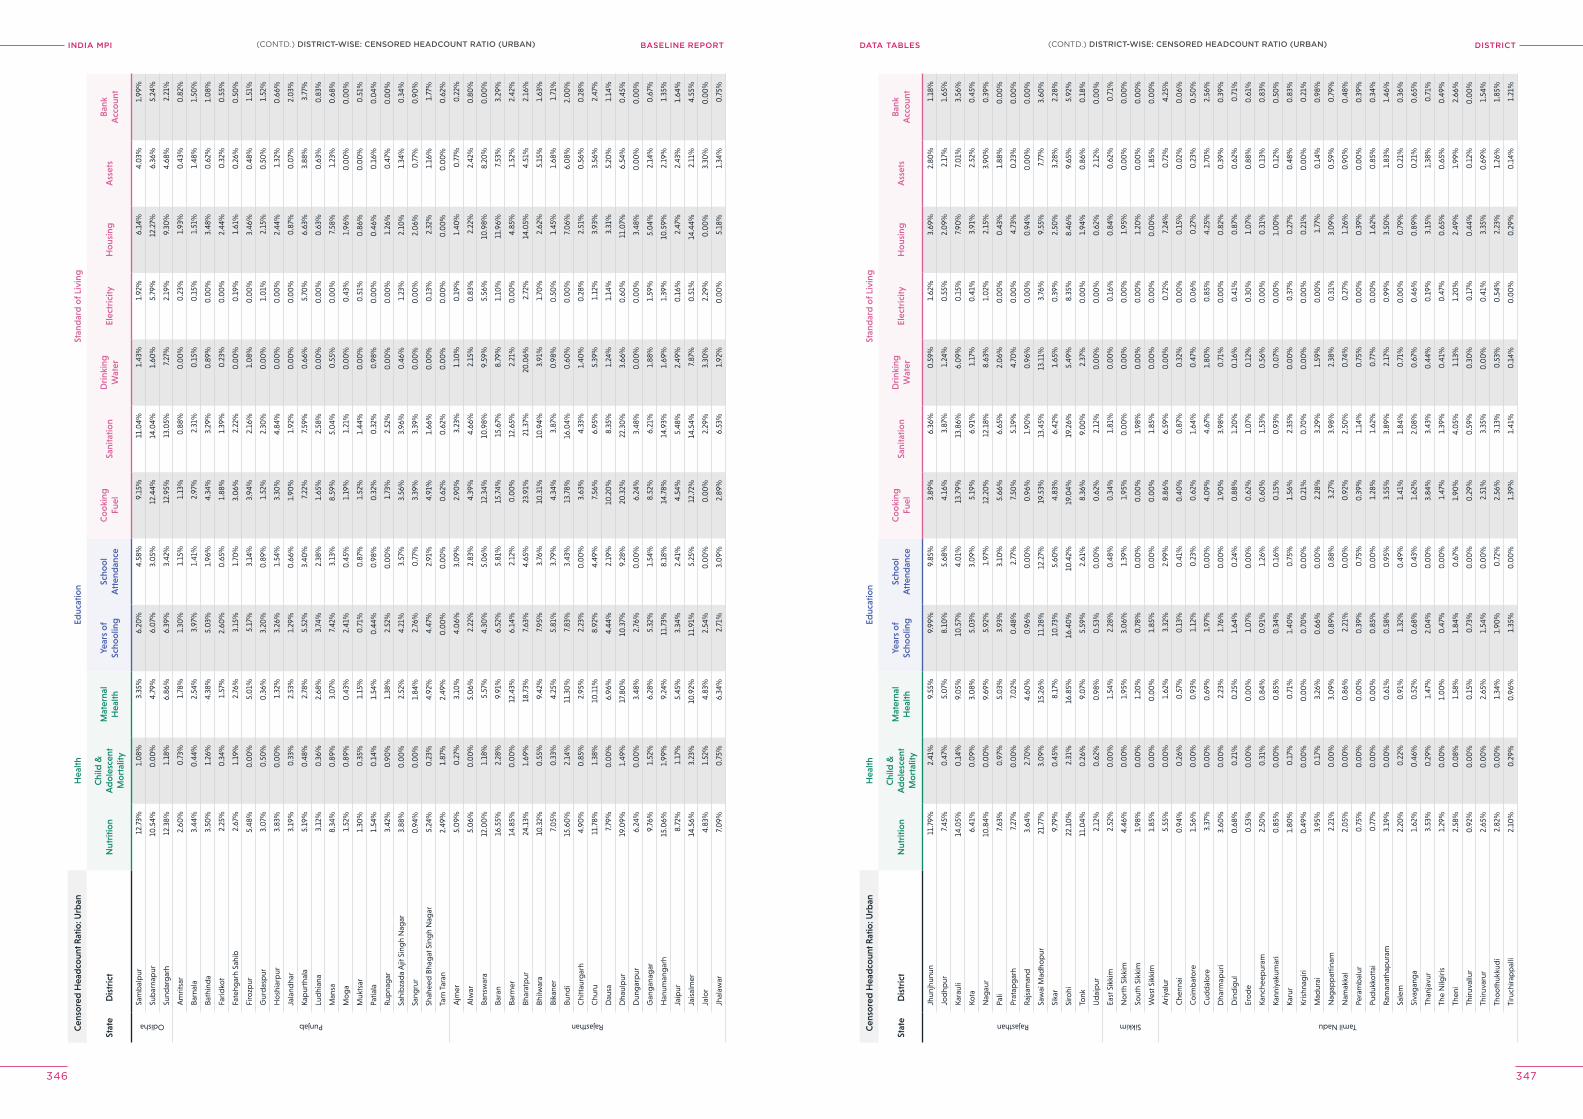
INDIA MPI BASELINE REPORT DISTrICTDATA TABleS
346 347
Cen
sore
d H
ead
coun
t Rat
io: U
rban
Hea
lthEd
ucat
ion
Stan
dar
d o
f Liv
ing
Stat
eD
istr
ict
Nut
ritio
nC
hild
&
Ad
ole
scen
t M
ort
ality
Mat
erna
l H
ealth
Year
s o
f Sc
hoo
ling
Scho
ol
Att
end
ance
Co
oki
ng
Fuel
Sani
tatio
nD
rink
ing
Wat
erEl
ectr
icity
Ho
usin
gA
sset
sB
ank
Acc
oun
t
Odisha
Sam
bal
pur
12.7
3%1.
08%
3.35
%6.
20%
4.58
%9.
15%
11.0
4%1.
43%
1.92
%6.
14%
4.0
3%1.
99%
Sub
arna
pur
10.5
4%0
.00
%4.
79%
6.0
7%3.
05%
12.4
4%14
.04%
1.60
%5.
79%
12.2
7%6.
36%
5.24
%
Sund
arg
arh
12.3
8%1.
18%
6.86
%6.
39%
3.42
%12
.95%
13.0
5%7.
27%
2.19
%9.
30%
4.68
%2.
21%
Punjab
Am
ritsa
r2.
60%
0.7
3%1.
78%
1.30
%1.
15%
1.13
%0
.88%
0.0
0%
0.2
3%1.
93%
0.4
3%0
.82%
Barn
ala
3.44
%0
.44%
2.54
%3.
97%
1.41
%2.
97%
2.31
%0
.15%
0.1
5%1.
51%
1.48
%1.
50%
Bath
ind
a3.
50%
1.26
%4.
38%
5.0
3%1.
96%
4.34
%3.
29%
0.8
9%0
.00
%3.
48%
0.6
2%1.
08%
Farid
kot
2.25
%0
.34%
1.57
%2.
60%
0.6
5%1.
88%
1.39
%0
.23%
0.0
0%
2.44
%0
.32%
0.5
5%
Fate
hgar
h Sa
hib
2.67
%1.
19%
2.76
%3.
15%
1.70
%3.
06%
2.22
%0
.00
%0
.19%
1.61
%0
.26%
0.5
0%
Firo
zpur
5.48
%0
.00
%5.
01%
5.17
%3.
14%
3.94
%2.
16%
1.0
8%0
.00
%3.
46%
0.4
8%1.
51%
Gur
das
pur
3.0
7%0
.50
%0
.36%
3.20
%0
.89%
1.52
%2.
30%
0.0
0%
1.0
1%2.
15%
0.5
0%
1.52
%
Ho
shia
rpur
3.83
%0
.00
%1.
32%
3.26
%1.
54%
3.30
%4.
84%
0.0
0%
0.0
0%
2.44
%1.
32%
0.6
6%
Jala
ndha
r3.
19%
0.3
3%2.
53%
1.29
%0
.66%
1.90
%1.
92%
0.0
0%
0.0
0%
0.8
7%0
.07%
2.0
3%
Kap
urth
ala
5.19
%0
.48%
2.78
%5.
52%
3.40
%7.
22%
7.59
%0
.66%
5.70
%6.
63%
3.88
%3.
77%
Lud
hian
a3.
12%
0.3
6%2.
68%
3.74
%2.
38%
1.65
%2.
58%
0.0
0%
0.0
0%
0.6
3%0
.63%
0.8
3%
Man
sa8.
34%
0.8
9%3.
07%
7.42
%3.
13%
8.59
%5.
04%
0.5
5%0
.00
%7.
58%
1.23
%0
.68%
Mo
ga
1.52
%0
.89%
0.4
3%2.
41%
0.4
5%1.
19%
1.21
%0
.00
%0
.43%
1.96
%0
.00
%0
.00
%
Muk
tsar
1.30
%0
.35%
1.15
%0
.71%
0.8
7%1.
52%
1.44
%0
.00
%0
.51%
0.8
6%0
.00
%0
.51%
Patia
la1.
54%
0.1
4%1.
54%
0.4
4%0
.98%
0.3
2%0
.32%
0.9
8%0
.00
%0
.46%
0.1
6%0
.04%
Rup
nag
ar3.
42%
0.9
0%
1.38
%2.
52%
0.0
0%
1.73
%2.
52%
0.0
0%
0.0
0%
1.26
%0
.47%
0.0
0%
Sahi
bza
da
Ajit
Sin
gh
Nag
ar3.
88%
0.0
0%
2.52
%4.
21%
3.57
%3.
56%
3.96
%0
.46%
1.23
%2.
10%
1.34
%0
.34%
Sang
rur
0.9
4%0
.00
%1.
84%
2.76
%0
.77%
3.39
%3.
39%
0.0
0%
0.0
0%
2.0
6%0
.77%
0.9
0%
Shah
eed
Bha
gat
Sin
gh
Nag
ar5.
24%
0.2
3%4.
92%
4.47
%2.
91%
4.91
%1.
66%
0.0
0%
0.1
3%2.
32%
1.16
%1.
77%
Tarn
Tar
an2.
49%
1.87
%2.
49%
0.0
0%
0.0
0%
0.6
2%0
.62%
0.0
0%
0.0
0%
0.0
0%
0.0
0%
0.6
2%
Rajasthan
Ajm
er5.
09%
0.2
7%3.
10%
4.0
6%3.
09%
2.90
%3.
23%
1.10
%0
.19%
1.40
%0
.77%
0.2
2%
Alw
ar5.
06%
0.0
0%
5.0
6%2.
22%
2.83
%4.
39%
4.66
%2.
15%
0.8
3%2.
22%
2.42
%0
.80
%
Bans
war
a12
.00
%1.
18%
5.57
%4.
30%
5.0
6%12
.34%
10.9
8%9.
59%
5.56
%10
.98%
8.20
%0
.00
%
Bara
n16
.55%
2.28
%9.
91%
6.52
%5.
81%
15.7
4%15
.67%
8.79
%1.
10%
11.9
6%7.
53%
3.29
%
Barm
er14
.85%
0.0
0%
12.4
3%6.
14%
2.12
%0
.00
%12
.65%
2.21
%0
.00
%4.
85%
1.52
%2.
42%
Bhar
atp
ur24
.13%
1.69
%18
.73%
7.63
%4.
65%
23.9
1%21
.37%
20.0
6%2.
72%
14.0
5%4.
51%
2.16
%
Bhilw
ara
10.3
2%0
.55%
9.42
%7.
95%
3.76
%10
.31%
10.9
4%3.
91%
1.70
%2.
62%
5.15
%1.
63%
Bika
ner
7.0
5%0
.33%
4.25
%5.
81%
3.79
%4.
34%
3.87
%0
.98%
0.5
0%
1.45
%1.
68%
1.71
%
Bund
i15
.60
%2.
14%
11.3
0%
7.83
%3.
43%
13.7
8%16
.04%
0.6
0%
0.0
0%
7.0
6%6.
08%
2.0
0%
Chi
ttau
rgar
h4.
90%
0.8
5%2.
95%
2.23
%0
.00
%3.
63%
4.33
%1.
40%
0.2
8%2.
51%
0.5
6%0
.28%
Chu
ru11
.78%
1.38
%10
.11%
8.92
%4.
49%
7.56
%6.
95%
5.39
%1.
12%
3.93
%3.
56%
2.47
%
Dau
sa7.
79%
0.0
0%
6.96
%4.
44%
2.19
%10
.20
%8.
35%
1.24
%1.
14%
3.31
%5.
20%
1.14
%
Dha
ulp
ur19
.09%
1.49
%17
.80
%10
.37%
9.28
%20
.32%
22.3
0%
3.66
%0
.60
%11
.07%
6.54
%0
.45%
Dun
gar
pur
6.24
%0
.00
%3.
48%
2.76
%0
.00
%6.
24%
3.48
%0
.00
%0
.00
%3.
48%
0.0
0%
0.0
0%
Gan
gan
agar
9.76
%1.
52%
6.28
%5.
32%
1.54
%8.
52%
6.21
%1.
88%
1.59
%5.
04%
2.14
%0
.67%
Han
uman
gar
h15
.06%
1.99
%9.
24%
11.7
3%8.
18%
14.7
8%14
.93%
1.69
%1.
39%
10.5
9%2.
19%
1.35
%
Jaip
ur8.
72%
1.17
%5.
45%
3.34
%2.
41%
4.54
%5.
48%
2.49
%0
.16%
2.47
%2.
43%
1.64
%
Jais
alm
er14
.56%
3.23
%10
.92%
11.9
1%5.
25%
12.7
2%14
.54%
7.87
%0
.51%
14.4
4%2.
11%
4.55
%
Jalo
r4.
83%
1.52
%4.
83%
2.54
%0
.00
%0
.00
%2.
29%
3.30
%2.
29%
0.0
0%
3.30
%0
.00
%
Jhal
awar
7.0
9%0
.75%
6.34
%2.
71%
3.0
9%2.
89%
6.53
%1.
92%
0.0
0%
5.18
%1.
34%
0.7
5%
Cen
sore
d H
ead
coun
t Rat
io: U
rban
Hea
lthEd
ucat
ion
Stan
dar
d o
f Liv
ing
Stat
eD
istr
ict
Nut
ritio
nC
hild
&
Ad
ole
scen
t M
ort
ality
Mat
erna
l H
ealth
Year
s o
f Sc
hoo
ling
Scho
ol
Att
end
ance
Co
oki
ng
Fuel
Sani
tatio
nD
rink
ing
Wat
erEl
ectr
icity
Ho
usin
gA
sset
sB
ank
Acc
oun
t
Rajasthan
Jhun
jhun
un11
.79%
2.41
%9.
55%
9.99
%9.
85%
3.89
%6.
36%
0.5
9%1.
62%
3.69
%2.
80%
1.18
%
Jod
hpur
7.45
%0
.47%
5.0
7%8.
10%
5.68
%4.
16%
3.87
%1.
24%
0.5
5%2.
09%
2.17
%1.
65%
Kara
uli
14.0
5%0
.14%
9.0
5%10
.57%
4.0
1%13
.79%
13.8
6%6.
09%
0.1
5%7.
90%
7.0
1%3.
56%
Kota
6.41
%0
.09%
3.0
8%5.
03%
3.0
9%5.
19%
6.91
%1.
17%
0.4
1%3.
91%
2.52
%0
.45%
Nag
aur
10.8
4%0
.00
%9.
69%
5.92
%1.
97%
12.2
0%
12.1
8%8.
63%
1.0
2%2.
15%
3.90
%0
.39%
Pali
7.63
%0
.97%
5.0
3%3.
93%
3.10
%5.
66%
6.65
%2.
06%
0.0
0%
0.4
3%1.
88%
0.0
0%
Prat
apg
arh
7.27
%0
.00
%7.
02%
0.4
8%2.
77%
7.50
%5.
19%
4.70
%0
.00
%4.
73%
0.2
3%0
.00
%
Raj
sam
and
3.64
%2.
70%
4.60
%0
.96%
0.0
0%
0.9
6%1.
90%
0.9
6%0
.00
%0
.94%
0.0
0%
0.0
0%
Saw
ai M
adho
pur
21.7
7%3.
09%
15.2
6%11
.28%
12.2
7%19
.53%
13.4
5%13
.11%
3.76
%9.
55%
7.77
%3.
60%
Sika
r9.
79%
0.4
5%8.
17%
10.7
3%5.
60%
4.83
%6.
42%
1.65
%0
.39%
2.50
%3.
28%
2.28
%
Siro
hi22
.10
%2.
31%
16.8
5%16
.40
%10
.42%
19.0
4%19
.26%
5.49
%8.
35%
8.46
%9.
65%
5.92
%
Tonk
11.0
4%0
.26%
9.0
7%5.
59%
2.61
%8.
36%
9.0
0%
2.37
%0
.00
%1.
94%
0.8
6%0
.18%
Ud
aip
ur2.
12%
0.6
2%0
.98%
0.5
3%0
.00
%0
.62%
2.12
%0
.00
%0
.00
%0
.62%
2.12
%0
.00
%
Sikkim
East
Sik
kim
2.52
%0
.00
%1.
54%
2.28
%0
.48%
0.3
4%1.
81%
0.0
0%
0.1
6%0
.84%
0.6
2%0
.71%
No
rth
Sikk
im4.
46%
0.0
0%
1.95
%3.
06%
1.39
%1.
95%
0.0
0%
0.0
0%
0.0
0%
1.95
%0
.00
%0
.00
%
Sout
h Si
kkim
1.98
%0
.00
%1.
20%
0.7
8%0
.00
%0
.00
%1.
98%
0.0
0%
0.0
0%
1.20
%0
.00
%0
.00
%
Wes
t Sik
kim
1.85
%0
.00
%0
.00
%1.
85%
0.0
0%
0.0
0%
1.85
%0
.00
%0
.00
%0
.00
%1.
85%
0.0
0%
Tamil Nadu
Ariy
alur
5.55
%0
.00
%1.
62%
3.32
%2.
99%
8.86
%6.
59%
0.0
0%
0.7
2%7.
24%
0.7
2%4.
25%
Che
nnai
0.9
4%0
.26%
0.5
7%0
.13%
0.4
1%0
.40
%0
.87%
0.3
2%0
.00
%0
.15%
0.0
2%0
.06%
Co
imb
ato
re1.
56%
0.0
0%
0.9
3%1.
12%
0.2
3%0
.62%
1.64
%0
.47%
0.0
6%0
.27%
0.2
3%0
.50
%
Cud
dal
ore
3.37
%0
.00
%0
.69%
1.97
%0
.00
%4.
09%
4.67
%1.
80%
0.8
5%4.
25%
1.70
%2.
56%
Dha
rmap
uri
3.60
%0
.00
%2.
23%
1.76
%0
.00
%1.
90%
3.98
%0
.71%
0.0
0%
0.8
2%0
.39%
0.3
9%
Din
dig
ul0
.68%
0.2
1%0
.25%
1.64
%0
.24%
0.8
8%1.
20%
0.1
6%0
.41%
0.8
7%0
.62%
0.7
1%
Ero
de
0.5
3%0
.00
%0
.00
%1.
07%
0.0
0%
0.6
2%1.
07%
0.1
2%0
.30
%1.
07%
0.8
8%0
.61%
Kanc
heep
uram
2.50
%0
.31%
0.8
4%0
.91%
1.26
%0
.60
%1.
53%
0.5
6%0
.00
%0
.31%
0.1
3%0
.83%
Kann
iyak
umar
i0
.85%
0.0
0%
0.8
5%0
.34%
0.1
6%0
.15%
0.9
3%0
.07%
0.0
0%
1.0
0%
0.1
2%0
.50
%
Karu
r1.
80%
0.1
7%0
.71%
1.40
%0
.75%
1.56
%2.
35%
0.0
0%
0.3
7%0
.27%
0.4
8%0
.83%
Kris
hnag
iri0
.49%
0.0
0%
0.0
0%
0.7
0%
0.0
0%
0.2
1%0
.70
%0
.00
%0
.00
%0
.21%
0.0
0%
0.2
1%
Mad
urai
3.95
%0
.17%
3.26
%0
.66%
0.0
0%
2.28
%3.
29%
1.59
%0
.00
%1.
77%
0.1
4%0
.98%
Nag
app
attin
am2.
21%
0.0
0%
3.0
9%0
.89%
0.8
8%3.
27%
3.98
%2.
38%
0.3
1%3.
09%
0.5
9%0
.79%
Nam
akka
l2.
05%
0.0
0%
0.8
6%2.
21%
0.0
0%
0.9
2%2.
50%
0.7
4%0
.27%
1.26
%0
.90
%0
.48%
Pera
mb
alur
0.7
5%0
.00
%0
.00
%0
.39%
0.7
5%0
.39%
1.14
%0
.75%
0.0
0%
0.3
9%0
.00
%0
.39%
Pud
ukko
ttai
0.7
7%0
.00
%0
.00
%0
.85%
0.0
0%
1.28
%1.
62%
0.7
7%0
.00
%1.
62%
0.8
5%0
.34%
Ram
anat
hap
uram
3.19
%0
.00
%0
.61%
0.5
8%0
.95%
3.55
%3.
89%
2.17
%0
.99%
3.50
%1.
83%
1.46
%
Sale
m2.
20%
0.2
2%0
.91%
1.32
%0
.49%
1.41
%1.
84%
0.7
1%0
.00
%0
.79%
0.2
1%0
.36%
Siva
gan
ga
1.62
%0
.46%
0.5
2%0
.68%
0.4
3%1.
62%
2.0
8%0
.67%
0.4
6%0
.89%
0.2
1%0
.65%
Than
javu
r3.
53%
0.2
9%1.
47%
2.0
4%0
.00
%3.
84%
3.43
%0
.44%
0.1
9%3.
15%
1.38
%0
.71%
The
Nilg
iris
1.29
%0
.00
%1.
00
%0
.47%
0.0
0%
1.47
%1.
39%
0.4
1%0
.47%
0.6
5%0
.65%
0.4
9%
Then
i2.
58%
0.0
8%1.
58%
1.84
%0
.67%
1.90
%4.
05%
1.13
%1.
20%
2.49
%1.
99%
2.66
%
Thiru
vallu
r0
.92%
0.0
0%
0.1
5%0
.73%
0.0
0%
0.2
9%0
.59%
0.3
0%
0.1
7%0
.44%
0.1
2%0
.00
%
Thiru
varu
r2.
65%
0.0
0%
2.65
%1.
54%
0.0
0%
2.51
%3.
35%
0.0
0%
0.4
1%3.
35%
0.6
9%1.
54%
Tho
oth
ukku
di
2.82
%0
.00
%1.
34%
1.90
%0
.72%
2.56
%3.
13%
0.5
3%0
.54%
2.23
%1.
26%
1.85
%
Tiru
chira
pp
alli
2.10
%0
.29%
0.9
6%1.
35%
0.0
0%
1.39
%1.
41%
0.1
4%0
.00
%0
.29%
0.1
4%1.
21%
(CONTD.) DISTrICT-WISe: CeNSoreD heADCoUNT rATIo (UrBAN)(CONTD.) DISTrICT-WISe: CeNSoreD heADCoUNT rATIo (UrBAN)
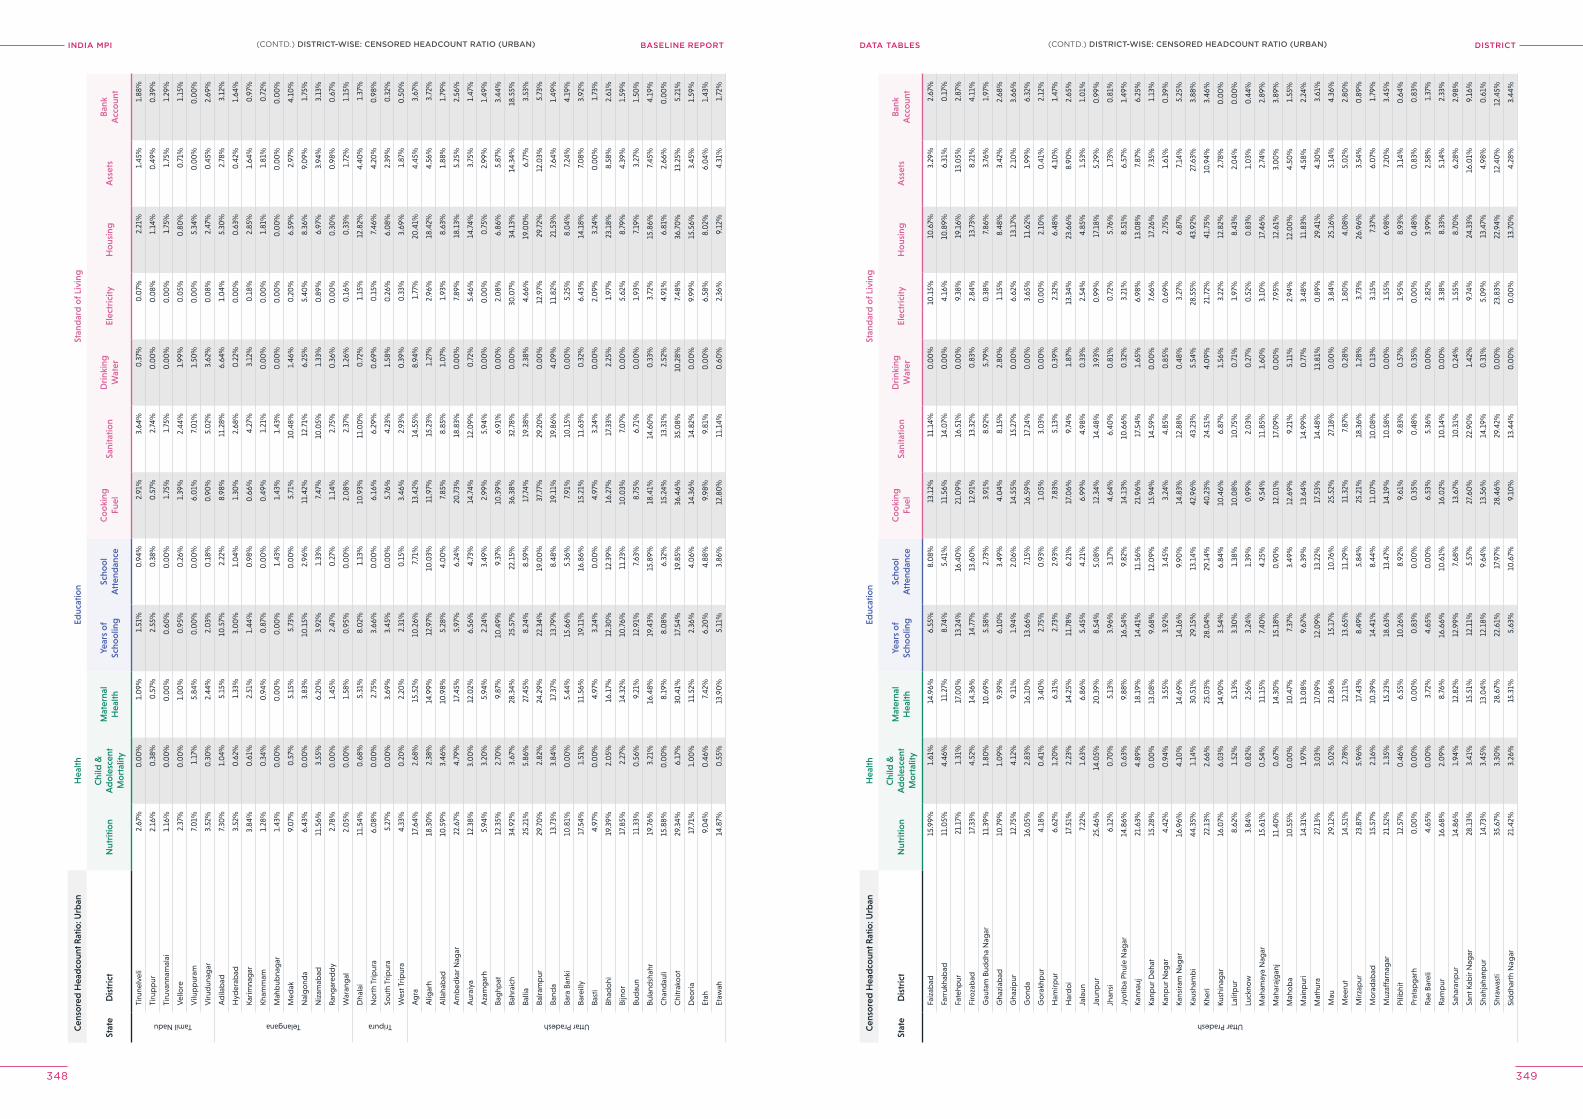
INDIA MPI BASELINE REPORT DISTrICTDATA TABleS
348 349
Cen
sore
d H
ead
coun
t Rat
io: U
rban
Hea
lthEd
ucat
ion
Stan
dar
d o
f Liv
ing
Stat
eD
istr
ict
Nut
ritio
nC
hild
&
Ad
ole
scen
t M
ort
ality
Mat
erna
l H
ealth
Year
s o
f Sc
hoo
ling
Scho
ol
Att
end
ance
Co
oki
ng
Fuel
Sani
tatio
nD
rink
ing
Wat
erEl
ectr
icity
Ho
usin
gA
sset
sB
ank
Acc
oun
t
Tamil Nadu
Tiru
nelv
eli
2.67
%0
.00
%1.
09%
1.51
%0
.94%
2.91
%3.
64%
0.3
7%0
.07%
2.21
%1.
45%
1.88
%
Tiru
pp
ur2.
16%
0.3
8%0
.57%
2.55
%0
.38%
0.5
7%2.
74%
0.0
0%
0.0
8%1.
14%
0.4
9%0
.39%
Tiru
vann
amal
ai1.
16%
0.0
0%
0.0
0%
0.6
0%
0.0
0%
1.75
%1.
75%
0.0
0%
0.0
0%
1.75
%1.
75%
1.29
%
Vel
lore
2.37
%0
.00
%1.
00
%0
.95%
0.2
6%1.
39%
2.44
%1.
99%
0.0
5%0
.80
%0
.71%
1.15
%
Vilu
pp
uram
7.0
1%1.
17%
5.84
%0
.00
%0
.00
%6.
01%
7.0
1%1.
50%
0.0
0%
5.34
%0
.00
%0
.00
%
Viru
dun
agar
3.52
%0
.30
%2.
44%
2.0
3%0
.18%
0.9
0%
5.0
2%3.
62%
0.0
8%2.
47%
0.4
5%2.
69%
Telangana
Ad
ilab
ad7.
30%
1.0
4%5.
15%
10.5
7%2.
22%
8.98
%11
.28%
6.64
%1.
04%
5.30
%2.
78%
3.12
%
Hyd
erab
ad3.
52%
0.6
2%1.
33%
3.0
0%
1.0
4%1.
30%
2.68
%0
.22%
0.0
0%
0.6
3%0
.42%
1.64
%
Karim
nag
ar3.
84%
0.6
1%2.
51%
1.44
%0
.98%
0.6
6%4.
27%
3.12
%0
.18%
2.85
%1.
64%
0.9
7%
Kham
mam
1.28
%0
.34%
0.9
4%0
.87%
0.0
0%
0.4
9%1.
21%
0.0
0%
0.0
0%
1.81
%1.
81%
0.7
2%
Mah
bub
nag
ar1.
43%
0.0
0%
0.0
0%
0.0
0%
1.43
%1.
43%
1.43
%0
.00
%0
.00
%0
.00
%0
.00
%0
.00
%
Med
ak9.
07%
0.5
7%5.
15%
5.73
%0
.00
%5.
71%
10.4
8%1.
46%
0.2
0%
6.59
%2.
97%
4.10
%
Nal
go
nda
6.43
%0
.00
%3.
83%
10.1
5%2.
96%
11.4
2%12
.71%
6.25
%5.
40%
8.36
%9.
09%
1.75
%
Niz
amab
ad11
.56%
3.55
%6.
20%
3.92
%1.
33%
7.47
%10
.05%
1.33
%0
.89%
6.97
%3.
94%
3.13
%
Ran
gar
edd
y2.
78%
0.0
0%
1.45
%2.
47%
0.2
7%1.
14%
2.75
%0
.36%
0.0
0%
0.3
0%
0.9
8%0
.67%
War
ang
al2.
05%
0.0
0%
1.58
%0
.95%
0.0
0%
2.0
8%2.
37%
1.26
%0
.16%
0.3
3%1.
72%
1.15
%
Tripura
Dha
lai
11.5
4%0
.68%
5.31
%8.
02%
1.13
%10
.93%
11.0
0%
0.7
2%1.
15%
12.8
2%4.
40%
1.37
%
No
rth
Trip
ura
6.0
8%0
.00
%2.
75%
3.66
%0
.00
%6.
16%
6.29
%0
.69%
0.1
5%7.
46%
4.20
%0
.98%
Sout
h Tr
ipur
a5.
27%
0.0
0%
3.69
%3.
45%
0.0
0%
5.76
%4.
23%
1.58
%0
.26%
6.0
8%2.
39%
0.3
2%
Wes
t Trip
ura
4.33
%0
.20
%2.
20%
2.31
%0
.15%
3.46
%2.
93%
0.3
9%0
.33%
3.69
%1.
87%
0.5
0%
Uttar Pradesh
Ag
ra17
.64%
2.68
%15
.52%
10.2
6%7.
71%
13.4
2%14
.55%
8.94
%1.
77%
20.4
1%4.
45%
3.67
%
Alig
arh
18.3
0%
2.38
%14
.99%
12.9
7%10
.03%
11.9
7%15
.23%
1.27
%2.
96%
18.4
2%4.
56%
3.72
%
Alla
hab
ad10
.59%
3.46
%10
.98%
5.28
%4.
00
%7.
85%
8.85
%1.
07%
1.93
%8.
63%
1.88
%1.
79%
Am
bed
kar N
agar
22.6
7%4.
79%
17.4
5%5.
97%
6.24
%20
.73%
18.8
3%0
.00
%7.
89%
18.1
3%5.
25%
2.56
%
Aur
aiya
12.3
8%3.
00
%12
.02%
6.56
%4.
73%
14.7
4%12
.09%
0.7
2%5.
46%
14.7
4%3.
75%
1.47
%
Aza
mg
arh
5.94
%3.
20%
5.94
%2.
24%
3.49
%2.
99%
5.94
%0
.00
%0
.00
%0
.75%
2.99
%1.
49%
Bag
hpat
12.3
5%2.
70%
9.87
%10
.49%
9.37
%10
.39%
6.91
%0
.00
%2.
08%
6.86
%5.
87%
3.44
%
Bahr
aich
34.9
2%3.
67%
28.3
4%25
.57%
22.1
5%36
.38%
32.7
8%0
.00
%30
.07%
34.1
3%14
.34%
18.5
5%
Balli
a25
.21%
5.86
%27
.45%
8.24
%8.
59%
17.7
4%19
.38%
2.38
%4.
66%
19.0
0%
6.77
%3.
53%
Balra
mp
ur29
.70
%2.
82%
24.2
9%22
.34%
19.0
0%
37.7
7%29
.20
%0
.00
%12
.97%
29.7
2%12
.03%
5.73
%
Band
a13
.73%
3.84
%17
.37%
13.7
9%8.
48%
19.1
1%19
.86%
4.0
9%11
.82%
21.5
3%7.
64%
1.49
%
Bara
Ban
ki10
.81%
0.0
0%
5.44
%15
.66%
5.36
%7.
91%
10.1
5%0
.00
%5.
25%
8.0
4%7.
24%
4.19
%
Bare
illy
17.5
4%1.
51%
11.5
6%19
.11%
16.8
6%15
.21%
11.6
3%0
.32%
6.43
%14
.18%
7.0
8%3.
92%
Bast
i4.
97%
0.0
0%
4.97
%3.
24%
0.0
0%
4.97
%3.
24%
0.0
0%
2.0
9%3.
24%
0.0
0%
1.73
%
Bhad
ohi
19.3
9%2.
05%
16.1
7%12
.30
%12
.39%
16.2
7%17
.33%
2.25
%1.
97%
23.1
8%8.
58%
2.61
%
Bijn
or
17.8
5%2.
27%
14.3
2%10
.76%
11.2
3%10
.03%
7.0
7%0
.00
%5.
62%
8.79
%4.
39%
1.59
%
Bud
aun
11.3
3%0
.56%
9.21
%12
.91%
7.63
%8.
75%
6.71
%0
.00
%1.
93%
7.19
%3.
27%
1.50
%
Bula
ndsh
ahr
19.7
6%3.
21%
16.4
8%19
.43%
15.8
9%18
.41%
14.6
0%
0.3
3%3.
72%
15.8
6%7.
45%
4.19
%
Cha
ndau
li15
.88%
0.0
0%
8.19
%8.
08%
6.32
%15
.24%
13.3
1%2.
52%
4.91
%6.
81%
2.66
%0
.00
%
Chi
trak
oo
t29
.34%
6.17
%30
.41%
17.5
4%19
.85%
36.4
6%35
.08%
10.2
8%7.
48%
36.7
0%
13.2
5%5.
21%
Deo
ria17
.71%
1.0
0%
11.5
2%2.
36%
4.0
6%14
.36%
14.8
2%0
.00
%9.
99%
15.5
6%3.
45%
1.59
%
Etah
9.0
4%0
.46%
7.42
%6.
20%
4.88
%9.
98%
9.81
%0
.00
%6.
58%
8.0
2%6.
04%
1.43
%
Etaw
ah14
.87%
0.5
5%13
.90
%5.
11%
3.86
%12
.80
%11
.14%
0.6
0%
2.36
%9.
12%
4.31
%1.
72%
Cen
sore
d H
ead
coun
t Rat
io: U
rban
Hea
lthEd
ucat
ion
Stan
dar
d o
f Liv
ing
Stat
eD
istr
ict
Nut
ritio
nC
hild
&
Ad
ole
scen
t M
ort
ality
Mat
erna
l H
ealth
Year
s o
f Sc
hoo
ling
Scho
ol
Att
end
ance
Co
oki
ng
Fuel
Sani
tatio
nD
rink
ing
Wat
erEl
ectr
icity
Ho
usin
gA
sset
sB
ank
Acc
oun
t
Uttar Pradesh
Faiz
abad
15.9
9%1.
61%
14.9
6%6.
55%
8.0
8%13
.12%
11.1
4%0
.00
%10
.15%
10.6
7%3.
29%
2.67
%
Farr
ukha
bad
11.0
5%4.
46%
11.2
7%8.
74%
5.41
%11
.56%
14.0
7%0
.00
%4.
16%
10.8
9%6.
31%
0.1
7%
Fate
hpur
21.1
7%1.
31%
17.0
0%
13.2
4%16
.40
%21
.09%
16.5
1%0
.00
%9.
38%
19.1
6%13
.05%
2.87
%
Firo
zab
ad17
.33%
4.52
%14
.36%
14.7
7%13
.60
%12
.91%
13.3
2%0
.83%
2.84
%13
.73%
8.21
%4.
11%
Gau
tam
Bud
dha
Nag
ar11
.39%
1.80
%10
.69%
5.58
%2.
73%
3.91
%8.
92%
5.79
%0
.38%
7.86
%3.
76%
1.97
%
Gha
ziab
ad10
.79%
1.0
9%9.
39%
6.10
%3.
49%
4.0
4%8.
15%
2.80
%1.
15%
8.48
%3.
42%
2.68
%
Gha
zip
ur12
.75%
4.12
%9.
11%
1.94
%2.
06%
14.5
5%15
.27%
0.0
0%
6.62
%13
.17%
2.10
%3.
66%
Go
nda
16.0
5%2.
83%
16.1
0%
13.6
6%7.
15%
16.5
9%17
.24%
0.0
0%
3.65
%11
.62%
1.99
%6.
32%
Go
rakh
pur
4.18
%0
.41%
3.40
%2.
75%
0.9
3%1.
05%
3.0
3%0
.00
%0
.00
%2.
10%
0.4
1%2.
12%
Ham
irpur
6.62
%1.
20%
6.31
%2.
73%
2.93
%7.
83%
5.13
%0
.39%
2.32
%6.
48%
4.10
%1.
47%
Har
do
i17
.51%
2.23
%14
.25%
11.7
8%6.
21%
17.0
6%9.
74%
1.87
%13
.34%
23.6
6%8.
90%
2.65
%
Jala
un7.
22%
1.63
%6.
86%
5.45
%4.
21%
6.99
%4.
98%
0.3
3%2.
54%
4.85
%1.
53%
1.0
1%
Jaun
pur
25.4
6%14
.05%
20.3
9%8.
54%
5.0
8%12
.34%
14.4
8%3.
93%
0.9
9%17
.18%
5.29
%0
.99%
Jhan
si6.
12%
0.7
0%
5.13
%3.
96%
3.17
%4.
64%
6.40
%0
.81%
0.7
2%5.
76%
1.73
%0
.81%
Jyo
tiba
Phul
e N
agar
14.8
6%0
.63%
9.88
%16
.54%
9.82
%14
.13%
10.6
6%0
.32%
3.21
%8.
51%
6.57
%1.
49%
Kann
auj
21.6
3%4.
89%
18.1
9%14
.41%
11.5
6%21
.96%
17.5
4%1.
65%
6.98
%13
.08%
7.87
%6.
25%
Kanp
ur D
ehat
15.2
8%0
.00
%13
.08%
9.68
%12
.09%
15.9
4%14
.59%
0.0
0%
7.66
%17
.26%
7.35
%1.
13%
Kanp
ur N
agar
4.42
%0
.94%
3.55
%3.
92%
3.45
%3.
24%
4.85
%0
.85%
0.6
9%2.
75%
1.61
%0
.39%
Kans
iram
Nag
ar16
.96%
4.10
%14
.69%
14.1
6%9.
90%
14.8
3%12
.88%
0.4
8%3.
27%
6.87
%7.
14%
5.25
%
Kaus
ham
bi
44.3
5%1.
14%
30.5
1%29
.15%
13.1
4%42
.96%
43.2
3%5.
54%
28.5
5%43
.92%
27.6
3%3.
88%
Kher
i22
.13%
2.66
%25
.03%
28.0
4%29
.14%
40.2
3%24
.51%
4.0
9%21
.72%
41.7
5%10
.94%
3.46
%
Kush
inag
ar16
.07%
6.0
3%14
.90
%3.
54%
6.84
%10
.46%
6.87
%1.
56%
3.22
%12
.82%
2.78
%0
.00
%
Lalit
pur
8.62
%1.
52%
5.13
%3.
30%
1.38
%10
.08%
10.7
5%0
.71%
1.97
%8.
43%
2.0
4%0
.00
%
Luck
now
3.84
%0
.82%
2.56
%3.
24%
1.39
%0
.99%
2.0
3%0
.27%
0.5
2%0
.83%
1.0
3%0
.44%
Mah
amay
a N
agar
15.6
1%0
.54%
11.1
5%7.
40%
4.25
%9.
54%
11.8
5%1.
60%
3.10
%17
.46%
2.74
%2.
89%
Mah
araj
gan
j11
.40
%0
.67%
14.3
0%
15.1
8%0
.90
%12
.01%
17.0
9%0
.00
%7.
95%
12.6
1%3.
00
%3.
89%
Mah
ob
a10
.55%
0.0
0%
10.4
7%7.
37%
3.49
%12
.69%
9.21
%5.
11%
2.94
%12
.00
%4.
50%
1.55
%
Mai
npur
i14
.31%
1.97
%13
.08%
9.67
%6.
39%
13.6
4%14
.99%
0.7
7%3.
48%
11.8
3%4.
58%
2.24
%
Mat
hura
27.1
3%3.
03%
17.0
9%12
.09%
13.2
2%17
.53%
14.4
8%13
.81%
0.8
9%29
.41%
4.30
%3.
61%
Mau
29.1
2%5.
02%
21.8
6%15
.17%
10.7
6%25
.52%
27.1
8%0
.00
%3.
84%
25.1
6%5.
14%
4.36
%
Mee
rut
14.5
1%2.
78%
12.1
1%13
.65%
11.2
9%11
.32%
7.87
%0
.28%
1.80
%4.
08%
5.0
2%2.
80%
Mirz
apur
23.8
7%5.
96%
17.4
3%8.
49%
5.84
%25
.21%
18.3
6%1.
28%
3.73
%26
.96%
3.54
%0
.89%
Mo
rad
abad
15.5
7%2.
16%
10.3
9%14
.41%
8.44
%11
.07%
10.0
8%0
.13%
3.15
%7.
37%
6.0
7%1.
79%
Muz
affa
rnag
ar21
.52%
1.35
%15
.23%
18.6
3%13
.47%
14.1
9%10
.58%
0.0
0%
1.55
%6.
98%
7.20
%3.
45%
Pilib
hit
12.5
7%0
.46%
6.55
%10
.26%
8.92
%9.
61%
9.83
%0
.57%
1.95
%8.
93%
3.14
%0
.64%
Prat
apg
arh
0.0
0%
0.0
0%
0.0
0%
0.8
3%0
.00
%0
.35%
0.4
8%0
.35%
0.0
0%
0.4
8%0
.83%
0.8
3%
Rae
Bar
eli
4.65
%0
.00
%3.
72%
4.65
%0
.00
%6.
53%
5.36
%0
.00
%2.
82%
3.99
%2.
58%
1.37
%
Ram
pur
16.6
8%2.
09%
8.76
%16
.66%
10.6
1%16
.02%
10.1
4%0
.00
%3.
38%
8.33
%5.
14%
2.33
%
Saha
ranp
ur14
.86%
1.94
%12
.82%
12.9
9%7.
68%
13.6
7%10
.31%
0.2
4%1.
55%
8.70
%6.
28%
2.98
%
Sant
Kab
ir N
agar
28.1
3%3.
41%
15.5
1%12
.11%
5.57
%27
.60
%22
.90
%1.
42%
9.74
%24
.33%
16.0
1%9.
16%
Shah
jaha
npur
14.7
3%3.
45%
13.0
4%12
.18%
9.64
%13
.56%
14.1
9%0
.31%
5.0
9%13
.47%
4.98
%0
.61%
Shra
was
ti35
.67%
3.30
%28
.67%
22.6
1%17
.97%
28.4
6%29
.42%
0.0
0%
23.8
3%22
.94%
12.4
0%
12.4
5%
Sid
dha
rth
Nag
ar21
.42%
3.26
%15
.31%
5.63
%10
.67%
9.10
%13
.44%
0.0
0%
0.0
0%
13.7
0%
4.28
%3.
44%
(CONTD.) DISTrICT-WISe: CeNSoreD heADCoUNT rATIo (UrBAN)(CONTD.) DISTrICT-WISe: CeNSoreD heADCoUNT rATIo (UrBAN)
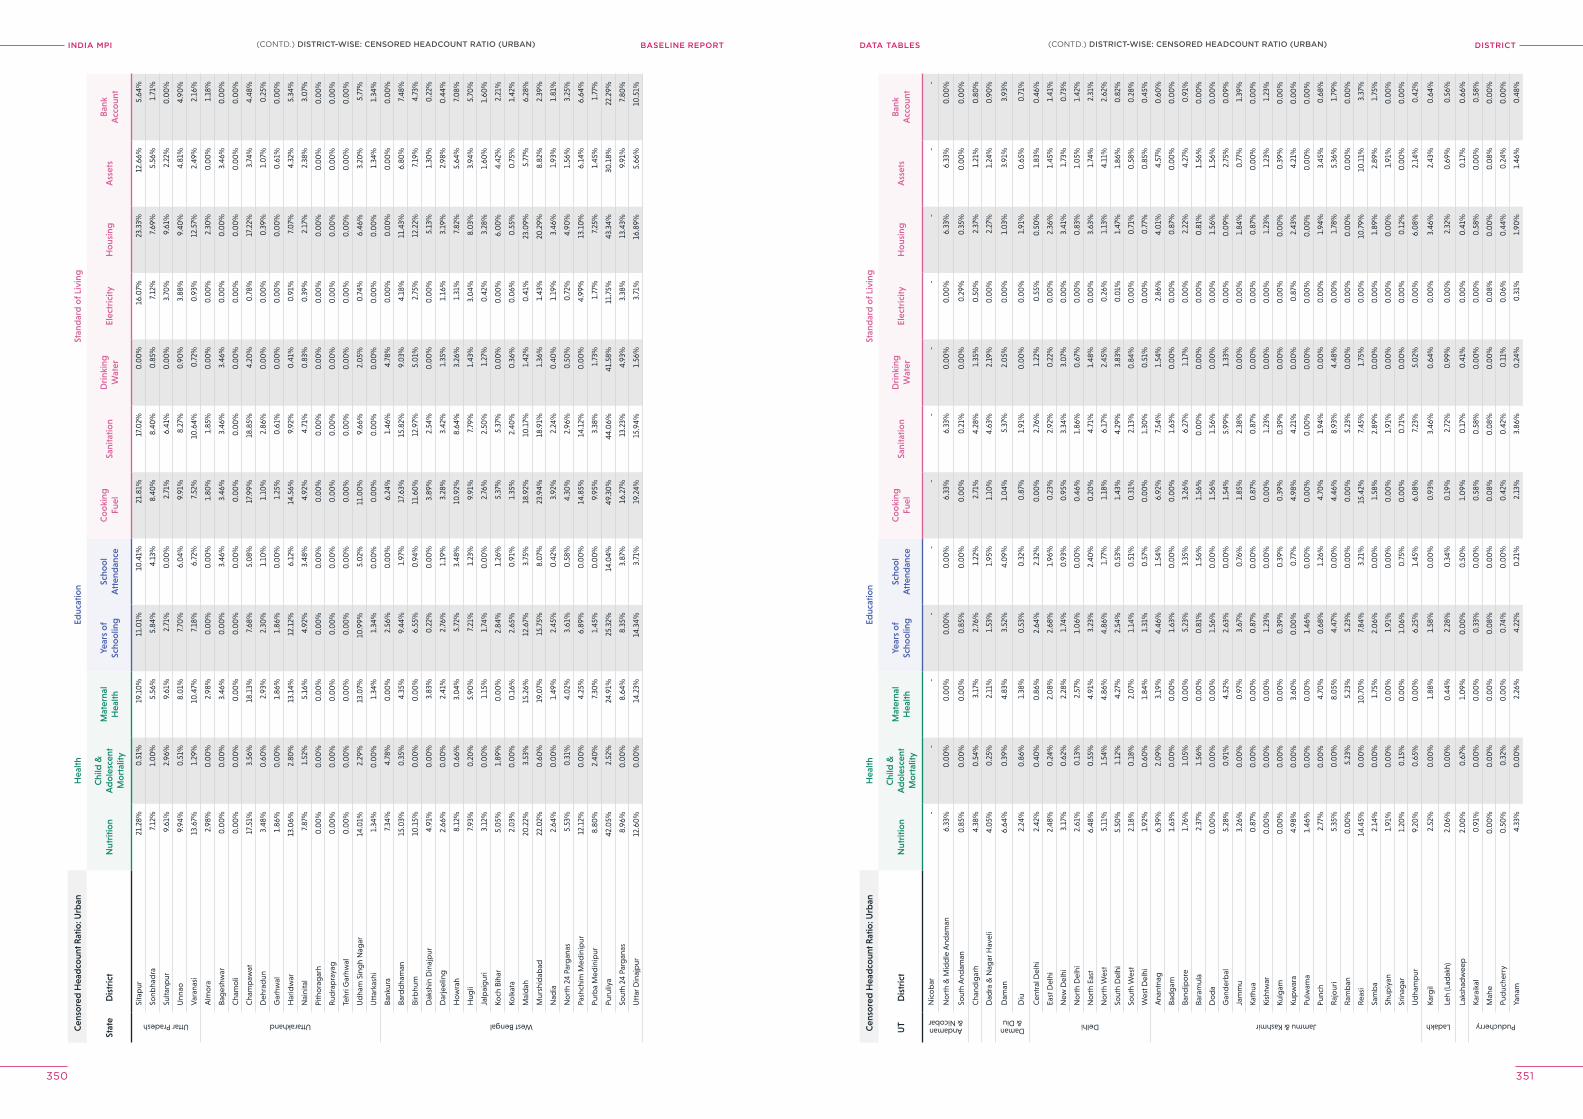
INDIA MPI BASELINE REPORT DISTrICTDATA TABleS
350 351
Cen
sore
d H
ead
coun
t Rat
io: U
rban
Hea
lthEd
ucat
ion
Stan
dar
d o
f Liv
ing
Stat
eD
istr
ict
Nut
ritio
nC
hild
&
Ad
ole
scen
t M
ort
ality
Mat
erna
l H
ealth
Year
s o
f Sc
hoo
ling
Scho
ol
Att
end
ance
Co
oki
ng
Fuel
Sani
tatio
nD
rink
ing
Wat
erEl
ectr
icity
Ho
usin
gA
sset
sB
ank
Acc
oun
t
Uttar Pradesh
Sita
pur
21.2
8%0
.51%
19.1
0%
11.0
1%10
.41%
21.8
1%17
.02%
0.0
0%
16.0
7%23
.33%
12.6
6%5.
64%
Sonb
had
ra7.
12%
1.0
0%
5.56
%5.
84%
4.13
%8.
40%
8.40
%0
.85%
7.12
%7.
69%
5.56
%1.
71%
Sulta
npur
9.61
%2.
96%
9.61
%2.
71%
0.0
0%
2.71
%6.
41%
0.0
0%
3.70
%9.
61%
2.22
%0
.00
%
Unn
ao9.
94%
0.5
1%8.
01%
7.70
%6.
04%
9.91
%8.
27%
0.9
0%
3.88
%9.
40%
4.81
%4.
90%
Var
anas
i13
.67%
1.29
%10
.47%
7.18
%6.
72%
7.52
%10
.64%
0.7
2%0
.93%
12.5
7%2.
49%
2.16
%
Uttarakhand
Alm
ora
2.98
%0
.00
%2.
98%
0.0
0%
0.0
0%
1.80
%1.
85%
0.0
0%
0.0
0%
2.30
%0
.00
%1.
18%
Bag
eshw
ar0
.00
%0
.00
%3.
46%
0.0
0%
3.46
%3.
46%
3.46
%3.
46%
0.0
0%
0.0
0%
3.46
%0
.00
%
Cha
mo
li0
.00
%0
.00
%0
.00
%0
.00
%0
.00
%0
.00
%0
.00
%0
.00
%0
.00
%0
.00
%0
.00
%0
.00
%
Cha
mp
awat
17.5
1%3.
56%
18.1
3%7.
68%
5.0
8%17
.99%
18.8
5%4.
20%
0.7
8%17
.22%
3.74
%4.
48%
Deh
rad
un3.
48%
0.6
0%
2.93
%2.
30%
1.10
%1.
10%
2.86
%0
.00
%0
.00
%0
.39%
1.0
7%0
.25%
Gar
hwal
1.86
%0
.00
%1.
86%
1.86
%0
.00
%1.
25%
0.6
1%0
.00
%0
.00
%0
.00
%0
.61%
0.0
0%
Har
idw
ar13
.06%
2.80
%13
.14%
12.1
2%6.
12%
14.5
6%9.
92%
0.4
1%0
.91%
7.0
7%4.
32%
5.34
%
Nai
nita
l7.
87%
1.52
%5.
16%
4.92
%3.
48%
4.92
%4.
71%
0.8
3%0
.39%
2.17
%2.
38%
3.0
7%
Pith
ora
gar
h0
.00
%0
.00
%0
.00
%0
.00
%0
.00
%0
.00
%0
.00
%0
.00
%0
.00
%0
.00
%0
.00
%0
.00
%
Rud
rap
raya
g0
.00
%0
.00
%0
.00
%0
.00
%0
.00
%0
.00
%0
.00
%0
.00
%0
.00
%0
.00
%0
.00
%0
.00
%
Tehr
i Gar
hwal
0.0
0%
0.0
0%
0.0
0%
0.0
0%
0.0
0%
0.0
0%
0.0
0%
0.0
0%
0.0
0%
0.0
0%
0.0
0%
0.0
0%
Ud
ham
Sin
gh
Nag
ar14
.01%
2.29
%13
.07%
10.9
9%5.
02%
11.0
0%
9.66
%2.
05%
0.7
4%6.
46%
3.20
%5.
77%
Utt
arka
shi
1.34
%0
.00
%1.
34%
1.34
%0
.00
%0
.00
%0
.00
%0
.00
%0
.00
%0
.00
%1.
34%
1.34
%
West Bengal
Bank
ura
7.34
%4.
78%
0.0
0%
2.56
%0
.00
%6.
24%
1.46
%4.
78%
0.0
0%
0.0
0%
0.0
0%
0.0
0%
Bard
dha
man
15.0
3%0
.35%
4.35
%9.
44%
1.97
%17
.63%
15.8
2%9.
03%
4.18
%11
.43%
6.80
%7.
48%
Birb
hum
10.1
5%0
.00
%0
.00
%6.
55%
0.9
4%11
.60
%12
.97%
5.0
1%2.
75%
12.2
2%7.
19%
4.73
%
Dak
shin
Din
ajp
ur4.
91%
0.0
0%
3.83
%0
.22%
0.0
0%
3.89
%2.
54%
0.0
0%
0.0
0%
5.13
%1.
30%
0.2
2%
Dar
jeel
ing
2.66
%0
.00
%2.
41%
2.76
%1.
19%
3.28
%3.
42%
1.35
%1.
16%
3.19
%2.
98%
0.4
4%
Ho
wra
h8.
12%
0.6
6%3.
04%
5.72
%3.
48%
10.9
2%8.
64%
3.26
%1.
31%
7.82
%5.
64%
7.0
8%
Hug
li7.
93%
0.2
0%
5.90
%7.
21%
1.23
%9.
91%
7.79
%1.
43%
3.0
4%8.
03%
3.94
%5.
70%
Jalp
aig
uri
3.12
%0
.00
%1.
15%
1.74
%0
.00
%2.
76%
2.50
%1.
27%
0.4
2%3.
28%
1.60
%1.
60%
Koch
Bih
ar5.
05%
1.89
%0
.00
%2.
84%
1.26
%5.
37%
5.37
%0
.00
%0
.00
%6.
00
%4.
42%
2.21
%
Kolk
ata
2.0
3%0
.00
%0
.16%
2.65
%0
.91%
1.35
%2.
40%
0.3
6%0
.06%
0.5
5%0
.75%
1.42
%
Mal
dah
20.2
2%3.
53%
15.2
6%12
.67%
3.75
%18
.92%
10.1
7%1.
42%
0.4
1%23
.09%
5.77
%6.
28%
Mur
shid
abad
22.0
2%0
.60
%19
.07%
15.7
5%8.
07%
23.9
4%18
.91%
1.36
%1.
43%
20.2
9%8.
82%
2.39
%
Nad
ia2.
64%
0.0
0%
1.49
%2.
45%
0.4
2%3.
92%
2.24
%0
.40
%1.
19%
3.46
%1.
93%
1.81
%
No
rth
24 P
arg
anas
5.53
%0
.31%
4.0
2%3.
61%
0.5
8%4.
30%
2.96
%0
.50
%0
.72%
4.90
%1.
56%
3.25
%
Pash
chim
Med
inip
ur12
.12%
0.0
0%
4.25
%6.
89%
0.0
0%
14.8
5%14
.12%
0.0
0%
4.99
%13
.10
%6.
14%
6.64
%
Purb
a M
edin
ipur
8.80
%2.
40%
7.30
%1.
45%
0.0
0%
9.95
%3.
38%
1.73
%1.
77%
7.25
%1.
45%
1.77
%
Puru
liya
42.0
5%2.
52%
24.9
1%25
.32%
14.0
4%49
.30
%44
.06%
41.5
8%11
.75%
43.3
4%30
.18%
22.2
9%
Sout
h 24
Par
gan
as8.
96%
0.0
0%
8.64
%8.
35%
3.87
%16
.27%
13.2
3%4.
93%
3.38
%13
.43%
9.91
%7.
80%
Utt
ar D
inaj
pur
12.6
0%
0.0
0%
14.2
3%14
.34%
3.71
%19
.24%
15.9
4%1.
56%
3.71
%16
.89%
5.66
%10
.51%
Cen
sore
d H
ead
coun
t Rat
io: U
rban
Hea
lthEd
ucat
ion
Stan
dar
d o
f Liv
ing
UT
Dis
tric
tN
utri
tion
Chi
ld &
A
do
lesc
ent
Mo
rtal
ity
Mat
erna
l H
ealth
Year
s o
f Sc
hoo
ling
Scho
ol
Att
end
ance
Co
oki
ng
Fuel
Sani
tatio
nD
rink
ing
Wat
erEl
ectr
icity
Ho
usin
gA
sset
sB
ank
Acc
oun
t
Andaman & Nicobar
Nic
ob
ar-
--
--
--
--
--
-
No
rth
& M
idd
le A
ndam
an6.
33%
0.0
0%
0.0
0%
0.0
0%
0.0
0%
6.33
%6.
33%
0.0
0%
0.0
0%
6.33
%6.
33%
0.0
0%
Sout
h A
ndam
an0
.85%
0.0
0%
0.0
0%
0.8
5%0
.00
%0
.00
%0
.21%
0.0
0%
0.2
9%0
.35%
0.0
0%
0.0
0%
Cha
ndig
arh
4.38
%0
.54%
3.17
%2.
76%
1.22
%2.
71%
4.28
%1.
35%
0.5
0%
2.37
%1.
21%
0.8
0%
Dad
ra &
Nag
ar H
avel
i4.
05%
0.2
5%2.
11%
1.53
%1.
95%
1.10
%4.
63%
2.19
%0
.00
%2.
27%
1.24
%0
.90
%
Daman & Diu
Dam
an6.
64%
0.3
9%4.
83%
3.52
%4.
09%
1.0
4%5.
37%
2.0
5%0
.00
%1.
03%
3.91
%3.
93%
Diu
2.24
%0
.86%
1.38
%0
.53%
0.3
2%0
.87%
1.91
%0
.00
%0
.00
%1.
91%
0.6
5%0
.71%
Delhi
Cen
tral
Del
hi2.
42%
0.4
0%
0.8
6%2.
64%
2.32
%0
.00
%2.
76%
1.22
%0
.55%
0.5
0%
1.83
%0
.46%
East
Del
hi2.
48%
0.2
4%2.
08%
2.68
%1.
96%
0.2
3%2.
92%
0.2
2%0
.00
%2.
36%
1.45
%1.
41%
New
Del
hi3.
17%
0.6
2%2.
28%
1.74
%0
.93%
0.9
5%3.
34%
3.0
7%0
.00
%3.
41%
1.73
%0
.73%
No
rth
Del
hi2.
61%
0.1
3%2.
57%
1.0
6%0
.00
%0
.46%
1.86
%0
.67%
0.0
0%
0.8
3%1.
05%
1.42
%
No
rth
East
6.48
%0
.55%
4.91
%3.
23%
2.40
%0
.20
%4.
71%
1.48
%0
.00
%3.
63%
1.74
%2.
31%
No
rth
Wes
t5.
11%
1.54
%4.
86%
4.86
%1.
77%
1.18
%6.
17%
2.45
%0
.26%
1.13
%4.
11%
2.62
%
Sout
h D
elhi
5.50
%1.
12%
4.27
%2.
54%
0.5
3%1.
43%
4.29
%3.
83%
0.0
1%1.
47%
1.86
%0
.82%
Sout
h W
est
2.18
%0
.18%
2.0
7%1.
14%
0.5
1%0
.31%
2.13
%0
.84%
0.0
0%
0.7
1%0
.58%
0.2
8%
Wes
t Del
hi1.
92%
0.6
0%
1.84
%1.
31%
0.5
7%0
.00
%1.
30%
0.5
1%0
.00
%0
.77%
0.8
5%0
.45%
Jammu & Kashmir
Ana
ntna
g6.
39%
2.0
9%3.
19%
4.46
%1.
54%
6.92
%7.
54%
1.54
%2.
86%
4.0
1%4.
57%
0.6
0%
Bad
gam
1.63
%0
.00
%0
.00
%1.
63%
0.0
0%
0.0
0%
1.63
%0
.00
%0
.00
%0
.87%
0.0
0%
0.0
0%
Band
ipo
re1.
76%
1.0
5%0
.00
%5.
23%
3.35
%3.
26%
6.27
%1.
17%
0.0
0%
2.22
%4.
27%
0.9
1%
Bara
mul
a2.
37%
1.56
%0
.00
%0
.81%
1.56
%1.
56%
0.0
0%
0.0
0%
0.0
0%
0.8
1%1.
56%
0.0
0%
Do
da
0.0
0%
0.0
0%
0.0
0%
1.56
%0
.00
%1.
56%
1.56
%0
.00
%0
.00
%1.
56%
1.56
%0
.00
%
Gan
der
bal
5.28
%0
.91%
4.52
%2.
63%
0.0
0%
1.54
%5.
99%
1.33
%0
.00
%0
.09%
2.75
%0
.09%
Jam
mu
3.26
%0
.00
%0
.97%
3.67
%0
.76%
1.85
%2.
38%
0.0
0%
0.0
0%
1.84
%0
.77%
1.39
%
Kath
ua0
.87%
0.0
0%
0.0
0%
0.8
7%0
.00
%0
.87%
0.8
7%0
.00
%0
.00
%0
.87%
0.0
0%
0.0
0%
Kish
twar
0.0
0%
0.0
0%
0.0
0%
1.23
%0
.00
%0
.00
%1.
23%
0.0
0%
0.0
0%
1.23
%1.
23%
1.23
%
Kulg
am0
.00
%0
.00
%0
.00
%0
.39%
0.3
9%0
.39%
0.3
9%0
.00
%0
.00
%0
.00
%0
.39%
0.0
0%
Kup
war
a4.
98%
0.0
0%
3.60
%0
.00
%0
.77%
4.98
%4.
21%
0.0
0%
0.8
7%2.
43%
4.21
%0
.00
%
Pulw
ama
1.46
%0
.00
%0
.00
%1.
46%
0.0
0%
0.0
0%
0.0
0%
0.0
0%
0.0
0%
0.0
0%
0.0
0%
0.0
0%
Punc
h2.
77%
0.0
0%
4.70
%0
.68%
1.26
%4.
70%
1.94
%0
.00
%0
.00
%1.
94%
3.45
%0
.68%
Raj
our
i5.
35%
0.0
0%
8.0
5%4.
47%
0.0
0%
4.46
%8.
93%
4.48
%0
.00
%1.
78%
5.36
%1.
79%
Ram
ban
0.0
0%
5.23
%5.
23%
5.23
%0
.00
%0
.00
%5.
23%
0.0
0%
0.0
0%
0.0
0%
0.0
0%
0.0
0%
Reas
i14
.45%
0.0
0%
10.7
0%
7.84
%3.
21%
15.4
2%7.
45%
1.75
%0
.00
%10
.79%
10.1
1%3.
37%
Sam
ba
2.14
%0
.00
%1.
75%
2.0
6%0
.00
%1.
58%
2.89
%0
.00
%0
.00
%1.
89%
2.89
%1.
75%
Shup
iyan
1.91
%0
.00
%0
.00
%1.
91%
0.0
0%
0.0
0%
1.91
%0
.00
%0
.00
%0
.00
%1.
91%
0.0
0%
Srin
agar
1.20
%0
.15%
0.0
0%
1.0
6%0
.75%
0.0
0%
0.7
1%0
.00
%0
.00
%0
.12%
0.0
0%
0.0
0%
Ud
ham
pur
9.20
%0
.65%
0.0
0%
6.25
%1.
45%
6.0
8%7.
23%
5.0
2%0
.00
%6.
08%
2.14
%0
.42%
Ladakh
Karg
il2.
52%
0.0
0%
1.88
%1.
58%
0.0
0%
0.9
3%3.
46%
0.6
4%0
.00
%3.
46%
2.43
%0
.64%
Leh
(Lad
akh)
2.0
6%0
.00
%0
.44%
2.28
%0
.34%
0.1
9%2.
72%
0.9
9%0
.00
%2.
32%
0.6
9%0
.56%
Laks
had
wee
p2.
00
%0
.67%
1.0
9%0
.00
%0
.50
%1.
09%
0.1
7%0
.41%
0.0
0%
0.4
1%0
.17%
0.6
6%
Puducherry
Kara
ikal
0.9
1%0
.00
%0
.00
%0
.33%
0.0
0%
0.5
8%0
.58%
0.0
0%
0.0
0%
0.5
8%0
.00
%0
.58%
Mah
e0
.00
%0
.00
%0
.00
%0
.08%
0.0
0%
0.0
8%0
.08%
0.0
0%
0.0
8%0
.00
%0
.08%
0.0
0%
Pud
uche
rry
0.5
0%
0.3
2%0
.00
%0
.74%
0.0
0%
0.4
2%0
.42%
0.1
1%0
.06%
0.4
4%0
.24%
0.0
0%
Yana
m4.
33%
0.0
0%
2.26
%4.
22%
0.2
1%2.
13%
3.86
%0
.24%
0.3
1%1.
90%
1.46
%0
.48%
(CONTD.) DISTrICT-WISe: CeNSoreD heADCoUNT rATIo (UrBAN)(CONTD.) DISTrICT-WISe: CeNSoreD heADCoUNT rATIo (UrBAN)
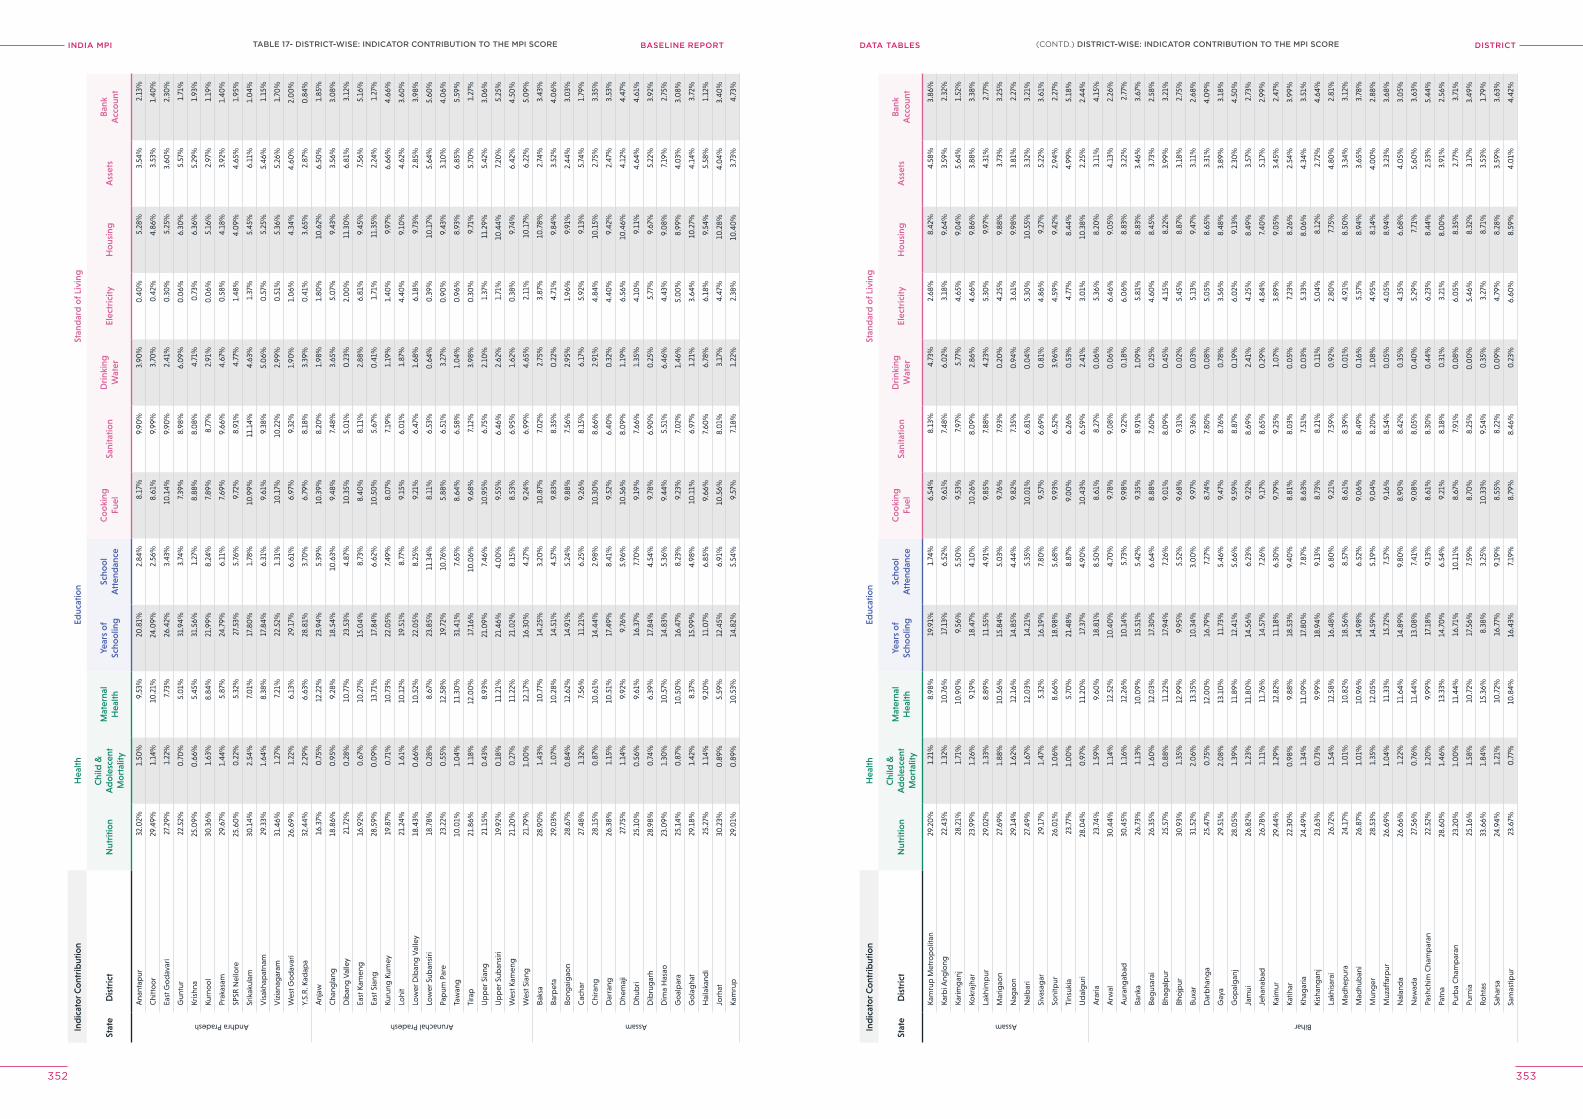
INDIA MPI BASELINE REPORT DISTrICTDATA TABleS
352 353
Ind
icat
or C
ont
rib
utio
nH
ealth
Educ
atio
nSt
and
ard
of L
ivin
g
Stat
eD
istr
ict
Nut
ritio
nC
hild
&
Ad
ole
scen
t M
ort
ality
Mat
erna
l H
ealth
Year
s o
f Sc
hoo
ling
Scho
ol
Att
end
ance
Co
oki
ng
Fuel
Sani
tatio
nD
rink
ing
Wat
erEl
ectr
icity
Ho
usin
gA
sset
sB
ank
Acc
oun
t
Andhra Pradesh
Ana
ntap
ur32
.02%
1.50
%9.
53%
20.8
1%2.
84%
8.17
%9.
90%
3.90
%0
.40
%5.
28%
3.54
%2.
13%
Chi
tto
or
29.4
9%1.
14%
10.2
1%24
.09%
2.56
%8.
61%
9.99
%3.
70%
0.4
2%4.
86%
3.53
%1.
40%
East
Go
dav
ari
27.2
9%1.
22%
7.73
%26
.42%
3.43
%10
.14%
9.90
%2.
41%
0.3
0%
5.25
%3.
60%
2.30
%
Gun
tur
22.5
2%0
.70
%5.
01%
31.9
4%3.
74%
7.39
%8.
98%
6.0
9%0
.06%
6.30
%5.
57%
1.71
%
Kris
hna
25.0
9%0
.66%
5.45
%31
.56%
1.27
%8.
88%
8.0
8%4.
71%
0.7
3%6.
36%
5.29
%1.
93%
Kurn
oo
l30
.36%
1.63
%8.
84%
21.9
9%8.
24%
7.89
%8.
77%
2.91
%0
.06%
5.16
%2.
97%
1.19
%
Prak
asam
29.6
7%1.
44%
5.87
%24
.79%
6.11
%7.
69%
9.66
%4.
67%
0.5
8%4.
18%
3.92
%1.
40%
SPSR
Nel
lore
25.6
0%
0.2
2%5.
32%
27.5
3%5.
76%
9.72
%8.
91%
4.77
%1.
48%
4.0
9%4.
65%
1.95
%
Srik
akul
am30
.14%
2.54
%7.
01%
17.8
0%
1.78
%10
.99%
11.1
4%4.
63%
1.37
%5.
45%
6.11
%1.
04%
Vis
akha
pat
nam
29.3
3%1.
64%
8.38
%17
.84%
6.31
%9.
61%
9.38
%5.
06%
0.5
7%5.
25%
5.46
%1.
15%
Viz
iana
gar
am31
.46%
1.27
%7.
21%
22.5
2%1.
31%
10.1
7%10
.22%
2.99
%0
.51%
5.36
%5.
26%
1.70
%
Wes
t Go
dav
ari
26.6
9%1.
22%
6.13
%29
.17%
6.61
%6.
97%
9.32
%1.
90%
1.0
6%4.
34%
4.60
%2.
00
%
Y.S.
R. K
adap
a32
.44%
2.29
%6.
63%
28.8
1%3.
70%
6.79
%8.
18%
3.39
%0
.41%
3.65
%2.
87%
0.8
4%
Arunachal Pradesh
Anj
aw16
.37%
0.7
5%12
.22%
23.9
4%5.
39%
10.3
9%8.
20%
1.98
%1.
80%
10.6
2%6.
50%
1.85
%
Cha
ngla
ng18
.86%
0.9
5%9.
28%
18.5
4%10
.63%
9.48
%7.
48%
3.65
%5.
07%
9.43
%3.
56%
3.0
8%
Dib
ang
Val
ley
21.7
2%0
.28%
10.7
7%23
.53%
4.87
%10
.35%
5.0
1%0
.23%
2.0
0%
11.3
0%
6.81
%3.
12%
East
Kam
eng
16.9
2%0
.67%
10.2
7%15
.04%
8.73
%8.
40%
8.11
%2.
88%
6.81
%9.
45%
7.56
%5.
16%
East
Sia
ng28
.59%
0.0
9%13
.71%
17.8
4%6.
62%
10.5
0%
5.67
%0
.41%
1.71
%11
.35%
2.24
%1.
27%
Kuru
ng K
umey
19.8
7%0
.71%
10.7
3%22
.05%
7.49
%8.
07%
7.19
%1.
19%
1.40
%9.
97%
6.66
%4.
66%
Lohi
t21
.24%
1.61
%10
.12%
19.5
1%8.
77%
9.15
%6.
01%
1.87
%4.
40%
9.10
%4.
62%
3.60
%
Low
er D
iban
g V
alle
y18
.43%
0.6
6%10
.52%
22.0
5%8.
25%
9.21
%6.
47%
1.68
%6.
18%
9.73
%2.
85%
3.98
%
Low
er S
uban
siri
18.7
8%0
.28%
8.67
%23
.85%
11.3
4%8.
11%
6.53
%0
.64%
0.3
9%10
.17%
5.64
%5.
60%
Pap
um P
are
23.2
2%0
.55%
12.5
8%19
.72%
10.7
6%5.
88%
6.51
%3.
27%
0.9
0%
9.43
%3.
10%
4.0
6%
Taw
ang
10.0
1%1.
04%
11.3
0%
31.4
1%7.
65%
8.64
%6.
58%
1.0
4%0
.96%
8.93
%6.
85%
5.59
%
Tira
p21
.86%
1.18
%12
.00
%17
.16%
10.0
6%9.
68%
7.12
%3.
98%
0.3
0%
9.71
%5.
70%
1.27
%
Up
per
Sia
ng21
.15%
0.4
3%8.
93%
21.0
9%7.
46%
10.9
5%6.
75%
2.10
%1.
37%
11.2
9%5.
42%
3.0
6%
Up
per
Sub
ansi
ri19
.92%
0.1
8%11
.21%
21.4
6%4.
00
%9.
55%
6.46
%2.
62%
1.71
%10
.44%
7.20
%5.
25%
Wes
t Kam
eng
21.2
0%
0.2
7%11
.22%
21.0
2%8.
15%
8.53
%6.
95%
1.62
%0
.38%
9.74
%6.
42%
4.50
%
Wes
t Sia
ng21
.79%
1.0
0%
12.1
7%16
.30
%4.
27%
9.24
%6.
99%
4.65
%2.
11%
10.1
7%6.
22%
5.0
9%
Assam
Baks
a28
.90
%1.
43%
10.7
7%14
.25%
3.20
%10
.87%
7.0
2%2.
75%
3.87
%10
.78%
2.74
%3.
43%
Barp
eta
29.0
3%1.
07%
10.2
8%14
.51%
4.57
%9.
83%
8.35
%0
.22%
4.71
%9.
84%
3.52
%4.
06%
Bong
aig
aon
28.6
7%0
.84%
12.6
2%14
.91%
5.24
%9.
88%
7.56
%2.
95%
1.96
%9.
91%
2.44
%3.
03%
Cac
har
27.4
8%1.
32%
7.56
%11
.21%
6.25
%9.
26%
8.15
%6.
17%
5.92
%9.
13%
5.74
%1.
79%
Chi
rang
28.1
5%0
.87%
10.6
1%14
.44%
2.98
%10
.30
%8.
66%
2.91
%4.
84%
10.1
5%2.
75%
3.35
%
Dar
rang
26.3
8%1.
15%
10.5
1%17
.49%
8.41
%9.
52%
6.40
%0
.32%
4.40
%9.
42%
2.47
%3.
53%
Dhe
maj
i27
.75%
1.14
%9.
92%
9.76
%5.
96%
10.5
6%8.
09%
1.19
%6.
56%
10.4
6%4.
12%
4.47
%
Dhu
bri
25.1
0%
0.5
6%9.
61%
16.3
7%7.
70%
9.19
%7.
66%
1.35
%4.
10%
9.11
%4.
64%
4.61
%
Dib
rug
arh
28.9
8%0
.74%
6.39
%17
.84%
4.54
%9.
78%
6.90
%0
.25%
5.77
%9.
67%
5.22
%3.
92%
Dim
a H
asao
23.0
9%1.
30%
10.5
7%14
.83%
5.36
%9.
44%
5.51
%6.
46%
4.43
%9.
08%
7.19
%2.
75%
Go
alp
ara
25.1
4%0
.87%
10.5
0%
16.4
7%8.
23%
9.23
%7.
02%
1.46
%5.
00
%8.
99%
4.0
3%3.
08%
Go
lag
hat
29.1
8%1.
42%
8.37
%15
.99%
4.98
%10
.11%
6.97
%1.
21%
3.64
%10
.27%
4.14
%3.
72%
Hai
laka
ndi
25.2
7%1.
14%
9.20
%11
.07%
6.85
%9.
66%
7.60
%6.
78%
6.18
%9.
54%
5.58
%1.
12%
Jorh
at30
.23%
0.8
9%5.
59%
12.4
5%6.
91%
10.5
6%8.
01%
3.17
%4.
47%
10.2
8%4.
04%
3.40
%
Kam
rup
29.0
1%0
.89%
10.5
3%14
.82%
5.54
%9.
57%
7.18
%1.
22%
2.38
%10
.40
%3.
73%
4.73
%
Ind
icat
or C
ont
rib
utio
nH
ealth
Educ
atio
nSt
and
ard
of L
ivin
g
Stat
eD
istr
ict
Nut
ritio
nC
hild
&
Ad
ole
scen
t M
ort
ality
Mat
erna
l H
ealth
Year
s o
f Sc
hoo
ling
Scho
ol
Att
end
ance
Co
oki
ng
Fuel
Sani
tatio
nD
rink
ing
Wat
erEl
ectr
icity
Ho
usin
gA
sset
sB
ank
Acc
oun
t
Assam
Kam
rup
Met
rop
olit
an29
.20
%1.
21%
8.98
%19
.91%
1.74
%6.
54%
8.13
%4.
73%
2.68
%8.
42%
4.58
%3.
86%
Karb
i Ang
long
22.4
3%1.
32%
10.7
6%17
.13%
6.52
%9.
61%
7.48
%6.
02%
3.18
%9.
64%
3.59
%2.
32%
Karim
gan
j28
.21%
1.71
%10
.90
%9.
56%
5.50
%9.
53%
7.97
%5.
77%
4.65
%9.
04%
5.64
%1.
52%
Kokr
ajha
r23
.99%
1.26
%9.
19%
18.4
7%4.
10%
10.2
6%8.
09%
2.86
%4.
66%
9.86
%3.
88%
3.38
%
Lakh
imp
ur29
.02%
1.33
%8.
89%
11.5
5%4.
91%
9.85
%7.
88%
4.23
%5.
30%
9.97
%4.
31%
2.77
%
Mar
igao
n27
.69%
1.88
%10
.56%
15.8
4%5.
03%
9.76
%7.
93%
0.2
0%
4.25
%9.
88%
3.73
%3.
25%
Nag
aon
29.1
4%1.
62%
12.1
6%14
.85%
4.44
%9.
82%
7.35
%0
.94%
3.61
%9.
98%
3.81
%2.
27%
Nal
bar
i27
.49%
1.67
%12
.03%
14.2
1%5.
35%
10.0
1%6.
81%
0.0
4%5.
30%
10.5
5%3.
32%
3.21
%
Siva
sag
ar29
.17%
1.47
%5.
32%
16.1
9%7.
80%
9.57
%6.
69%
0.8
1%4.
86%
9.27
%5.
22%
3.61
%
Soni
tpur
26.0
1%1.
06%
8.66
%18
.98%
5.68
%9.
93%
6.52
%3.
96%
4.59
%9.
42%
2.94
%2.
27%
Tins
ukia
23.7
7%1.
00
%5.
70%
21.4
8%8.
87%
9.0
0%
6.26
%0
.53%
4.77
%8.
44%
4.99
%5.
18%
Ud
alg
uri
28.0
4%0
.97%
11.2
0%
17.3
7%4.
90%
10.4
3%6.
59%
2.41
%3.
01%
10.3
8%2.
25%
2.44
%
Bihar
Ara
ria23
.74%
1.59
%9.
60%
18.8
1%8.
50%
8.61
%8.
27%
0.0
6%5.
36%
8.20
%3.
11%
4.15
%
Arw
al30
.44%
1.14
%12
.52%
10.4
0%
4.70
%9.
78%
9.0
8%0
.06%
6.46
%9.
05%
4.13
%2.
26%
Aur
ang
abad
30.4
5%1.
16%
12.2
6%10
.14%
5.73
%9.
98%
9.22
%0
.18%
6.0
6%8.
83%
3.22
%2.
77%
Bank
a26
.73%
1.13
%10
.09%
15.5
1%5.
42%
9.35
%8.
91%
1.0
9%5.
81%
8.83
%3.
46%
3.67
%
Beg
usar
ai26
.35%
1.60
%12
.03%
17.3
0%
6.64
%8.
88%
7.60
%0
.25%
4.60
%8.
45%
3.73
%2.
58%
Bhag
alp
ur25
.57%
0.8
8%11
.22%
17.9
4%7.
26%
9.0
1%8.
09%
0.4
5%4.
15%
8.22
%3.
99%
3.21
%
Bho
jpur
30.9
3%1.
35%
12.9
9%9.
95%
5.52
%9.
68%
9.31
%0
.02%
5.45
%8.
87%
3.18
%2.
75%
Buxa
r31
.52%
2.0
6%13
.35%
10.3
4%3.
00
%9.
97%
9.36
%0
.03%
5.13
%9.
47%
3.11
%2.
68%
Dar
bha
nga
25.4
7%0
.75%
12.0
0%
16.7
9%7.
27%
8.74
%7.
80%
0.0
8%5.
05%
8.65
%3.
31%
4.0
9%
Gay
a29
.51%
2.0
8%13
.10
%11
.73%
5.46
%9.
47%
8.76
%0
.78%
3.56
%8.
48%
3.89
%3.
18%
Go
pal
gan
j28
.05%
1.39
%11
.89%
12.4
1%5.
66%
9.59
%8.
87%
0.1
9%6.
02%
9.13
%2.
30%
4.50
%
Jam
ui26
.82%
1.23
%11
.80
%14
.56%
6.23
%9.
22%
8.69
%2.
41%
4.25
%8.
49%
3.57
%2.
73%
Jeha
nab
ad26
.78%
1.11
%11
.76%
14.5
7%7.
26%
9.17
%8.
65%
0.2
9%4.
84%
7.40
%5.
17%
2.99
%
Kaim
ur29
.44%
1.29
%12
.82%
11.1
8%6.
30%
9.79
%9.
25%
1.0
7%3.
89%
9.0
5%3.
45%
2.47
%
Katih
ar22
.30
%0
.98%
9.88
%18
.53%
9.40
%8.
81%
8.0
3%0
.05%
7.23
%8.
26%
2.54
%3.
99%
Khag
aria
24.4
9%1.
34%
11.0
9%17
.80
%7.
87%
8.63
%7.
51%
0.0
3%5.
33%
8.0
6%4.
34%
3.51
%
Kish
ang
anj
23.6
3%0
.73%
9.99
%18
.94%
9.13
%8.
73%
8.21
%0
.11%
5.0
4%8.
12%
2.72
%4.
64%
Lakh
isar
ai26
.72%
1.54
%12
.58%
16.4
8%6.
80%
9.21
%7.
59%
0.9
2%2.
80%
7.75
%4.
80%
2.81
%
Mad
hep
ura
24.1
7%1.
01%
10.8
2%18
.56%
8.57
%8.
61%
8.39
%0
.01%
4.91
%8.
50%
3.34
%3.
12%
Mad
hub
ani
26.8
7%1.
01%
10.9
6%14
.98%
6.52
%9.
06%
8.49
%0
.16%
5.57
%8.
94%
3.65
%3.
78%
Mun
ger
28.5
3%1.
35%
12.0
5%14
.59%
5.19
%9.
04%
8.20
%1.
08%
4.95
%8.
14%
4.0
0%
2.88
%
Muz
affa
rpur
26.6
9%1.
04%
11.3
3%15
.72%
7.57
%9.
16%
8.54
%0
.05%
4.0
5%8.
94%
3.23
%3.
68%
Nal
and
a26
.66%
1.22
%11
.64%
14.8
9%9.
80%
8.90
%8.
42%
0.3
5%4.
35%
6.68
%4.
05%
3.0
5%
Naw
ada
27.5
6%0
.76%
11.4
4%13
.08%
7.41
%9.
08%
8.0
5%0
.40
%5.
29%
7.71
%5.
60%
3.63
%
Pash
chim
Cha
mp
aran
22.5
2%1.
20%
9.99
%17
.18%
9.13
%8.
61%
8.30
%0
.44%
6.23
%8.
44%
2.53
%5.
44%
Patn
a28
.60
%1.
46%
13.3
3%14
.70
%6.
54%
9.21
%8.
18%
0.3
1%3.
21%
8.0
0%
3.91
%2.
56%
Purb
a C
ham
par
an23
.20
%1.
00
%11
.44%
16.7
1%10
.11%
8.67
%7.
91%
0.0
8%6.
05%
8.35
%2.
77%
3.71
%
Purn
ia25
.16%
1.58
%10
.72%
17.5
6%7.
59%
8.70
%8.
25%
0.0
0%
5.46
%8.
32%
3.17
%3.
49%
Roht
as33
.66%
1.84
%15
.36%
8.38
%3.
25%
10.3
3%9.
54%
0.3
5%3.
27%
8.71
%3.
53%
1.79
%
Saha
rsa
24.9
4%1.
21%
10.7
2%16
.77%
9.19
%8.
55%
8.22
%0
.09%
4.79
%8.
28%
3.59
%3.
63%
Sam
astip
ur23
.67%
0.7
7%10
.84%
16.4
3%7.
19%
8.79
%8.
46%
0.2
3%6.
60%
8.59
%4.
01%
4.42
%
(CONTD.) DISTrICT-WISe: INDICATor CoNTrIBUTIoN To The MpI SCoreTABle 17- DISTrICT-WISe: INDICATor CoNTrIBUTIoN To The MpI SCore
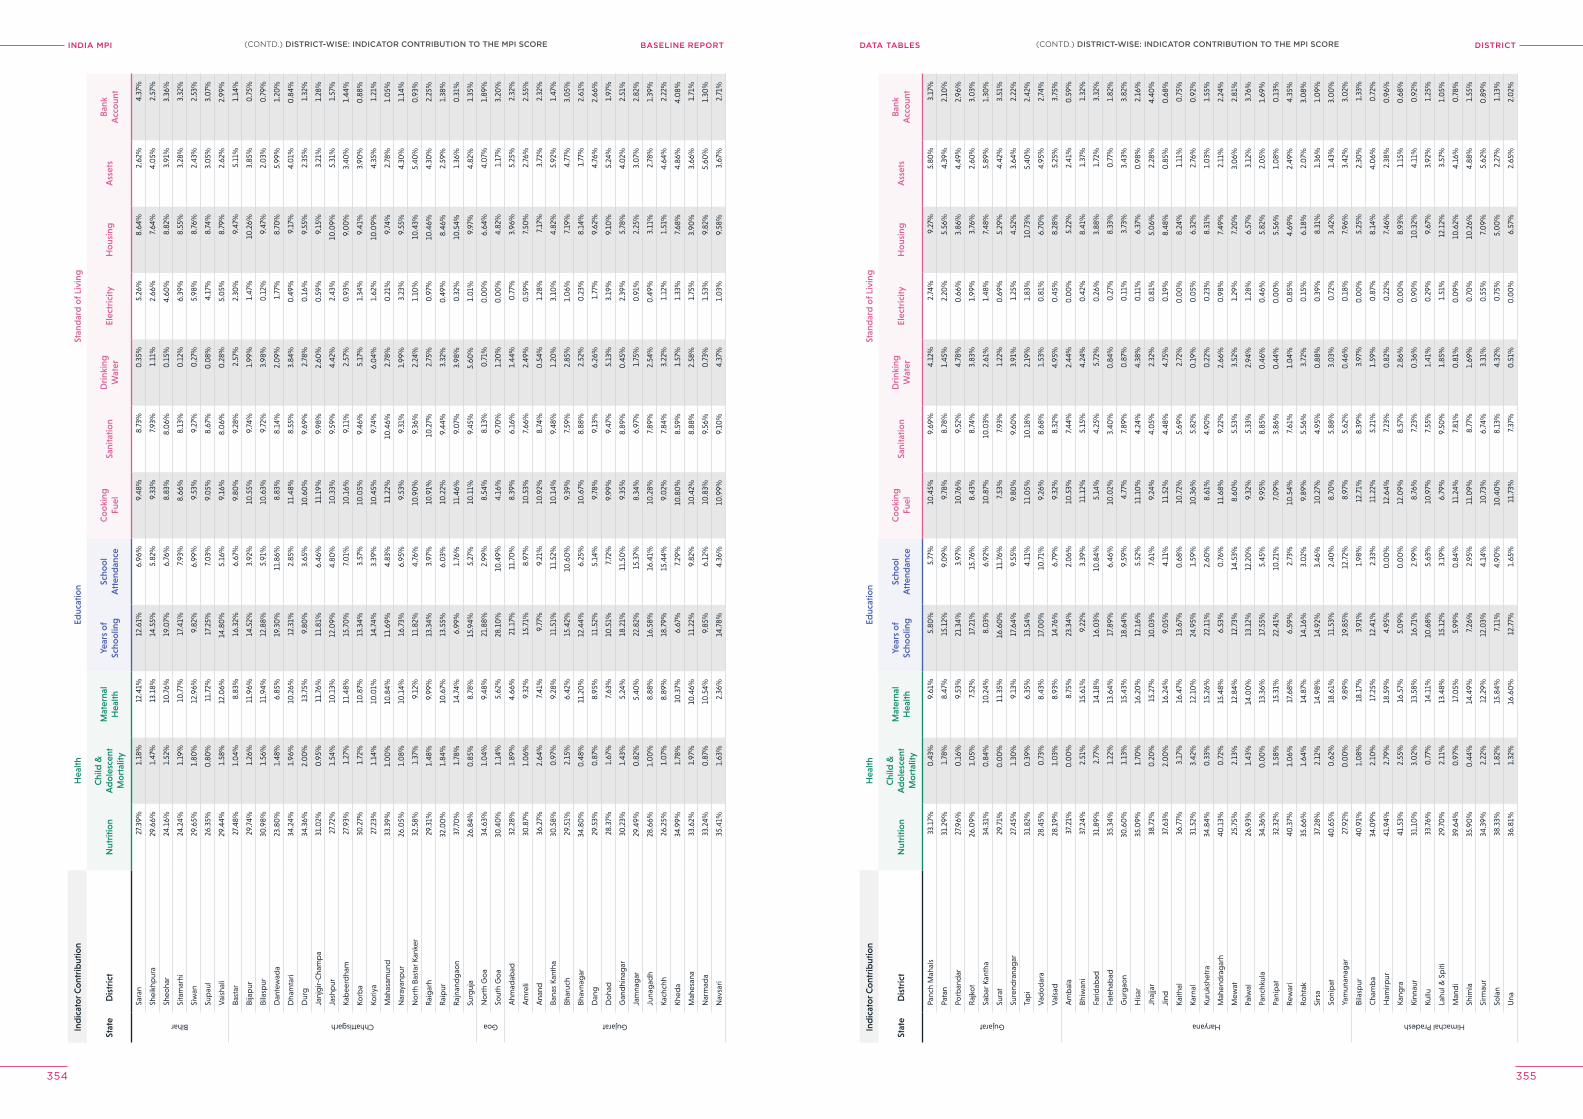
INDIA MPI BASELINE REPORT DISTrICTDATA TABleS
354 355
Ind
icat
or C
ont
rib
utio
nH
ealth
Educ
atio
nSt
and
ard
of L
ivin
g
Stat
eD
istr
ict
Nut
ritio
nC
hild
&
Ad
ole
scen
t M
ort
ality
Mat
erna
l H
ealth
Year
s o
f Sc
hoo
ling
Scho
ol
Att
end
ance
Co
oki
ng
Fuel
Sani
tatio
nD
rink
ing
Wat
erEl
ectr
icity
Ho
usin
gA
sset
sB
ank
Acc
oun
t
Bihar
Sara
n27
.39%
1.18
%12
.41%
12.6
1%6.
96%
9.48
%8.
73%
0.3
5%5.
26%
8.64
%2.
62%
4.37
%
Shei
khp
ura
29.6
6%1.
47%
13.1
8%14
.55%
5.82
%9.
33%
7.93
%1.
11%
2.66
%7.
64%
4.0
5%2.
57%
Sheo
har
24.1
6%1.
52%
10.7
6%19
.07%
6.76
%8.
83%
8.0
6%0
.15%
4.60
%8.
82%
3.91
%3.
36%
Sita
mar
hi24
.24%
1.19
%10
.77%
17.4
1%7.
93%
8.66
%8.
13%
0.1
2%6.
39%
8.55
%3.
28%
3.32
%
Siw
an29
.65%
1.80
%12
.96%
9.82
%6.
99%
9.53
%9.
27%
0.2
7%5.
98%
8.76
%2.
43%
2.53
%
Sup
aul
26.3
5%0
.80
%11
.72%
17.2
5%7.
03%
9.0
5%8.
67%
0.0
8%4.
17%
8.74
%3.
05%
3.0
7%
Vai
shal
i29
.44%
1.58
%12
.06%
14.8
0%
5.16
%9.
16%
8.0
6%0
.28%
5.0
5%8.
79%
2.62
%2.
99%
Chhattisgarh
Bast
ar27
.48%
1.0
4%8.
83%
16.3
2%6.
67%
9.80
%9.
28%
2.57
%2.
30%
9.47
%5.
11%
1.14
%
Bija
pur
29.7
4%1.
26%
11.9
6%14
.52%
3.92
%10
.55%
9.74
%1.
99%
1.47
%10
.26%
3.85
%0
.75%
Bila
spur
30.9
8%1.
56%
11.9
4%12
.88%
5.91
%10
.63%
9.72
%3.
98%
0.1
2%9.
47%
2.0
3%0
.79%
Dan
tew
ada
23.8
0%
1.48
%6.
85%
19.3
0%
11.8
6%8.
83%
8.14
%2.
09%
1.77
%8.
70%
5.99
%1.
20%
Dha
mta
ri34
.24%
1.96
%10
.26%
12.3
1%2.
85%
11.4
8%8.
55%
3.84
%0
.49%
9.17
%4.
01%
0.8
4%
Dur
g34
.36%
2.0
0%
13.7
5%9.
80%
3.65
%10
.60
%9.
69%
2.78
%0
.16%
9.55
%2.
35%
1.32
%
Janj
gir-
Cha
mp
a31
.02%
0.9
5%11
.76%
11.8
1%6.
46%
11.1
9%9.
98%
2.60
%0
.59%
9.15
%3.
21%
1.28
%
Jash
pur
27.7
2%1.
54%
10.1
3%12
.09%
4.80
%10
.33%
9.59
%4.
42%
2.43
%10
.09%
5.31
%1.
57%
Kab
eerd
ham
27.9
3%1.
27%
11.4
8%15
.70
%7.
01%
10.1
6%9.
11%
2.57
%0
.93%
9.0
0%
3.40
%1.
44%
Korb
a30
.27%
1.72
%10
.87%
13.3
4%3.
57%
10.0
5%9.
46%
5.17
%1.
34%
9.41
%3.
90%
0.8
8%
Koriy
a27
.23%
1.14
%10
.01%
14.7
4%3.
39%
10.4
5%9.
74%
6.0
4%1.
62%
10.0
9%4.
35%
1.21
%
Mah
asam
und
33.3
9%1.
00
%10
.84%
11.6
9%4.
83%
11.2
2%10
.46%
2.78
%0
.21%
9.74
%2.
78%
1.0
5%
Nar
ayan
pur
26.0
5%1.
08%
10.1
4%16
.73%
6.95
%9.
53%
9.31
%1.
99%
3.23
%9.
55%
4.30
%1.
14%
No
rth
Bast
ar K
anke
r32
.58%
1.37
%9.
12%
11.8
2%4.
76%
10.9
0%
9.36
%2.
24%
1.10
%10
.43%
5.40
%0
.93%
Rai
gar
h29
.31%
1.48
%9.
99%
13.3
4%3.
97%
10.9
1%10
.27%
2.75
%0
.97%
10.4
6%4.
30%
2.25
%
Rai
pur
32.0
0%
1.84
%10
.67%
13.5
5%6.
03%
10.2
2%9.
44%
3.32
%0
.49%
8.46
%2.
59%
1.38
%
Raj
nand
gao
n37
.70
%1.
78%
14.7
4%6.
99%
1.76
%11
.46%
9.0
7%3.
98%
0.3
2%10
.54%
1.36
%0
.31%
Surg
uja
26.8
4%0
.85%
8.78
%15
.94%
5.27
%10
.11%
9.45
%5.
60%
1.0
1%9.
97%
4.82
%1.
35%
Goa
No
rth
Go
a34
.63%
1.0
4%9.
48%
21.8
8%2.
99%
8.54
%8.
13%
0.7
1%0
.00
%6.
64%
4.0
7%1.
89%
Sout
h G
oa
30.4
0%
1.14
%5.
62%
28.1
0%
10.4
9%4.
16%
9.70
%1.
20%
0.0
0%
4.82
%1.
17%
3.20
%
Gujarat
Ahm
adab
ad32
.28%
1.89
%4.
66%
21.1
7%11
.70
%8.
39%
6.16
%1.
44%
0.7
7%3.
96%
5.25
%2.
32%
Am
reli
30.8
7%1.
06%
9.32
%15
.71%
8.97
%10
.53%
7.66
%2.
49%
0.5
9%7.
50%
2.76
%2.
55%
Ana
nd36
.27%
2.64
%7.
41%
9.77
%9.
21%
10.9
2%8.
74%
0.5
4%1.
28%
7.17
%3.
72%
2.32
%
Bana
s Ka
ntha
30.5
8%0
.97%
9.28
%11
.51%
11.5
2%10
.14%
9.48
%1.
20%
3.10
%4.
82%
5.92
%1.
47%
Bhar
uch
29.5
1%2.
15%
6.42
%15
.42%
10.6
0%
9.39
%7.
59%
2.85
%1.
06%
7.19
%4.
77%
3.0
5%
Bhav
nag
ar34
.80
%0
.48%
11.2
0%
12.4
4%6.
25%
10.6
7%8.
88%
2.52
%0
.23%
8.14
%1.
77%
2.61
%
Dan
g29
.53%
0.8
7%8.
95%
11.5
2%5.
14%
9.78
%9.
13%
6.26
%1.
77%
9.62
%4.
76%
2.66
%
Do
had
28.3
7%1.
67%
7.63
%10
.51%
7.72
%9.
99%
9.47
%5.
13%
3.19
%9.
10%
5.24
%1.
97%
Gan
dhi
nag
ar30
.23%
1.43
%5.
24%
18.2
1%11
.50
%9.
35%
8.89
%0
.45%
2.39
%5.
78%
4.0
2%2.
51%
Jam
nag
ar29
.49%
0.8
2%5.
40%
22.8
2%15
.37%
8.34
%6.
97%
1.75
%0
.91%
2.25
%3.
07%
2.82
%
Juna
gad
h28
.66%
1.0
0%
8.88
%16
.58%
16.4
1%10
.28%
7.89
%2.
54%
0.4
9%3.
11%
2.78
%1.
39%
Kach
chh
26.2
5%1.
07%
8.89
%18
.79%
15.4
4%9.
02%
7.84
%3.
22%
1.12
%1.
51%
4.64
%2.
22%
Khed
a34
.99%
1.78
%10
.37%
6.67
%7.
29%
10.8
0%
8.59
%1.
57%
1.33
%7.
68%
4.86
%4.
08%
Mah
esan
a33
.62%
1.97
%10
.46%
11.2
2%9.
82%
10.4
2%8.
88%
2.58
%1.
75%
3.90
%3.
66%
1.71
%
Nar
mad
a33
.24%
0.8
7%10
.54%
9.85
%6.
12%
10.8
3%9.
56%
0.7
3%1.
53%
9.82
%5.
60%
1.30
%
Nav
sari
35.4
1%1.
63%
2.36
%14
.78%
4.36
%10
.99%
9.10
%4.
37%
1.0
3%9.
58%
3.67
%2.
71%
Ind
icat
or C
ont
rib
utio
nH
ealth
Educ
atio
nSt
and
ard
of L
ivin
g
Stat
eD
istr
ict
Nut
ritio
nC
hild
&
Ad
ole
scen
t M
ort
ality
Mat
erna
l H
ealth
Year
s o
f Sc
hoo
ling
Scho
ol
Att
end
ance
Co
oki
ng
Fuel
Sani
tatio
nD
rink
ing
Wat
erEl
ectr
icity
Ho
usin
gA
sset
sB
ank
Acc
oun
t
Gujarat
Panc
h M
ahal
s33
.17%
0.4
3%9.
61%
5.80
%5.
77%
10.4
5%9.
69%
4.12
%2.
74%
9.27
%5.
80%
3.17
%
Pata
n31
.29%
1.78
%8.
47%
15.1
2%9.
09%
9.78
%8.
78%
1.45
%2.
20%
5.56
%4.
39%
2.10
%
Porb
and
ar27
.96%
0.1
6%9.
53%
21.3
4%3.
97%
10.7
6%9.
52%
4.78
%0
.66%
3.86
%4.
49%
2.96
%
Raj
kot
26.0
9%1.
05%
7.52
%17
.21%
15.7
6%8.
43%
8.74
%3.
83%
1.99
%3.
76%
2.60
%3.
03%
Sab
ar K
anth
a34
.31%
0.8
4%10
.24%
8.0
3%6.
92%
10.8
7%10
.03%
2.61
%1.
48%
7.48
%5.
89%
1.30
%
Sura
t29
.71%
0.0
0%
11.3
5%16
.60
%11
.76%
7.53
%7.
93%
1.22
%0
.69%
5.29
%4.
42%
3.51
%
Sure
ndra
nag
ar27
.45%
1.30
%9.
13%
17.6
4%9.
55%
9.80
%9.
60%
3.91
%1.
25%
4.52
%3.
64%
2.22
%
Tap
i31
.82%
0.3
9%6.
35%
13.5
4%4.
11%
11.0
5%10
.18%
2.19
%1.
83%
10.7
3%5.
40%
2.42
%
Vad
od
ara
28.4
5%0
.73%
8.43
%17
.00
%10
.71%
9.26
%8.
68%
1.53
%0
.81%
6.70
%4.
95%
2.74
%
Val
sad
28.1
9%1.
03%
8.93
%14
.76%
6.79
%9.
32%
8.32
%4.
95%
0.4
5%8.
28%
5.25
%3.
75%
Haryana
Am
bal
a37
.21%
0.0
0%
8.75
%23
.34%
2.0
6%10
.53%
7.44
%2.
44%
0.0
0%
5.22
%2.
41%
0.5
9%
Bhiw
ani
37.2
4%2.
51%
15.6
1%9.
22%
3.39
%11
.12%
5.15
%4.
24%
0.4
2%8.
41%
1.37
%1.
32%
Farid
abad
31.8
9%2.
77%
14.1
8%16
.03%
10.8
4%5.
14%
4.25
%5.
72%
0.2
6%3.
88%
1.72
%3.
32%
Fate
hab
ad35
.34%
1.22
%13
.64%
17.8
9%6.
46%
10.0
2%3.
40%
0.8
4%0
.27%
8.33
%0
.77%
1.82
%
Gur
gao
n30
.60
%1.
13%
15.4
3%18
.64%
9.59
%4.
77%
7.89
%0
.87%
0.1
1%3.
73%
3.43
%3.
82%
His
ar35
.09%
1.70
%16
.20
%12
.16%
5.52
%11
.10
%4.
24%
4.38
%0
.11%
6.37
%0
.98%
2.16
%
Jhaj
jar
38.7
2%0
.20
%15
.27%
10.0
3%7.
61%
9.24
%4.
05%
2.32
%0
.81%
5.0
6%2.
28%
4.40
%
Jind
37.6
3%2.
00
%16
.24%
9.0
5%4.
11%
11.5
2%4.
48%
4.75
%0
.19%
8.48
%0
.85%
0.6
8%
Kaith
al36
.77%
3.17
%16
.47%
13.6
7%0
.68%
10.7
2%5.
69%
2.72
%0
.00
%8.
24%
1.11
%0
.75%
Karn
al31
.52%
3.42
%12
.10
%24
.95%
1.59
%10
.36%
5.82
%0
.19%
0.0
5%6.
32%
2.76
%0
.92%
Kuru
kshe
tra
34.8
4%0
.33%
15.2
6%22
.11%
2.60
%8.
61%
4.90
%0
.22%
0.2
3%8.
31%
1.0
3%1.
55%
Mah
end
rag
arh
40.1
3%0
.72%
15.4
8%6.
53%
0.7
6%11
.68%
9.22
%2.
66%
0.9
8%7.
49%
2.11
%2.
24%
Mew
at25
.75%
2.13
%12
.84%
12.7
3%14
.53%
8.60
%5.
53%
3.52
%1.
29%
7.20
%3.
06%
2.81
%
Palw
al26
.93%
1.43
%14
.00
%13
.12%
12.2
0%
9.32
%5.
33%
2.94
%1.
28%
6.57
%3.
12%
3.76
%
Panc
hkul
a34
.36%
0.0
0%
13.3
6%17
.55%
5.45
%9.
95%
8.85
%0
.46%
0.4
6%5.
82%
2.0
5%1.
69%
Pani
pat
32.3
2%1.
58%
15.3
1%22
.41%
10.2
1%7.
09%
3.86
%0
.44%
0.0
0%
5.56
%1.
08%
0.1
3%
Rew
ari
40.3
7%1.
06%
17.6
8%6.
59%
2.73
%10
.54%
7.61
%1.
04%
0.8
5%4.
69%
2.49
%4.
35%
Roht
ak35
.66%
1.64
%14
.87%
14.1
6%3.
02%
9.89
%5.
56%
3.72
%0
.15%
6.18
%2.
07%
3.0
8%
Sirs
a37
.28%
2.12
%14
.98%
14.9
2%3.
46%
10.2
7%4.
95%
0.8
8%0
.39%
8.31
%1.
36%
1.0
9%
Soni
pat
40.6
5%0
.62%
18.6
1%11
.53%
2.40
%8.
70%
5.88
%3.
03%
0.7
2%3.
42%
1.43
%3.
00
%
Yam
unan
agar
27.9
2%0
.00
%9.
89%
19.8
5%12
.72%
8.97
%5.
62%
0.4
6%0
.18%
7.96
%3.
42%
3.0
2%
Himachal Pradesh
Bila
spur
40.9
1%1.
08%
18.1
7%3.
91%
1.98
%12
.71%
8.39
%3.
97%
0.0
0%
5.25
%2.
30%
1.33
%
Cha
mb
a34
.09%
2.10
%17
.25%
12.4
1%2.
33%
11.2
2%5.
21%
1.59
%0
.87%
8.14
%4.
06%
0.7
2%
Ham
irpur
41.9
4%2.
79%
18.5
9%4.
95%
0.0
0%
12.6
4%7.
23%
0.8
2%0
.22%
7.46
%2.
38%
0.9
6%
Kang
ra41
.53%
2.55
%16
.57%
5.0
9%0
.00
%12
.09%
8.57
%2.
86%
0.0
0%
8.93
%1.
15%
0.6
8%
Kinn
aur
31.1
0%
3.0
2%13
.58%
16.7
1%2.
99%
8.76
%7.
23%
0.3
6%0
.90
%10
.32%
4.11
%0
.92%
Kullu
33.7
6%0
.77%
14.1
1%10
.68%
5.63
%10
.97%
7.55
%1.
41%
0.2
9%9.
67%
3.92
%1.
25%
Lahu
l & S
piti
29.7
0%
2.11
%13
.48%
15.1
2%3.
19%
6.79
%9.
50%
1.85
%1.
51%
12.1
2%3.
57%
1.0
5%
Man
di
39.6
4%0
.97%
17.0
5%5.
99%
0.8
4%11
.24%
7.81
%0
.81%
0.0
9%10
.62%
4.16
%0
.78%
Shim
la35
.90
%0
.44%
14.4
9%7.
26%
2.95
%11
.09%
8.77
%1.
69%
0.7
0%
10.2
6%4.
88%
1.55
%
Sirm
aur
34.3
9%2.
22%
12.2
9%12
.03%
4.14
%10
.73%
6.74
%3.
31%
0.5
5%7.
09%
5.62
%0
.89%
Sola
n38
.33%
1.82
%15
.84%
7.11
%4.
90%
10.4
0%
8.13
%4.
32%
0.7
5%5.
00
%2.
27%
1.13
%
Una
36.8
1%1.
32%
16.6
0%
12.7
7%1.
65%
11.7
3%7.
37%
0.5
1%0
.00
%6.
57%
2.65
%2.
02%
(CONTD.) DISTrICT-WISe: INDICATor CoNTrIBUTIoN To The MpI SCore(CONTD.) DISTrICT-WISe: INDICATor CoNTrIBUTIoN To The MpI SCore
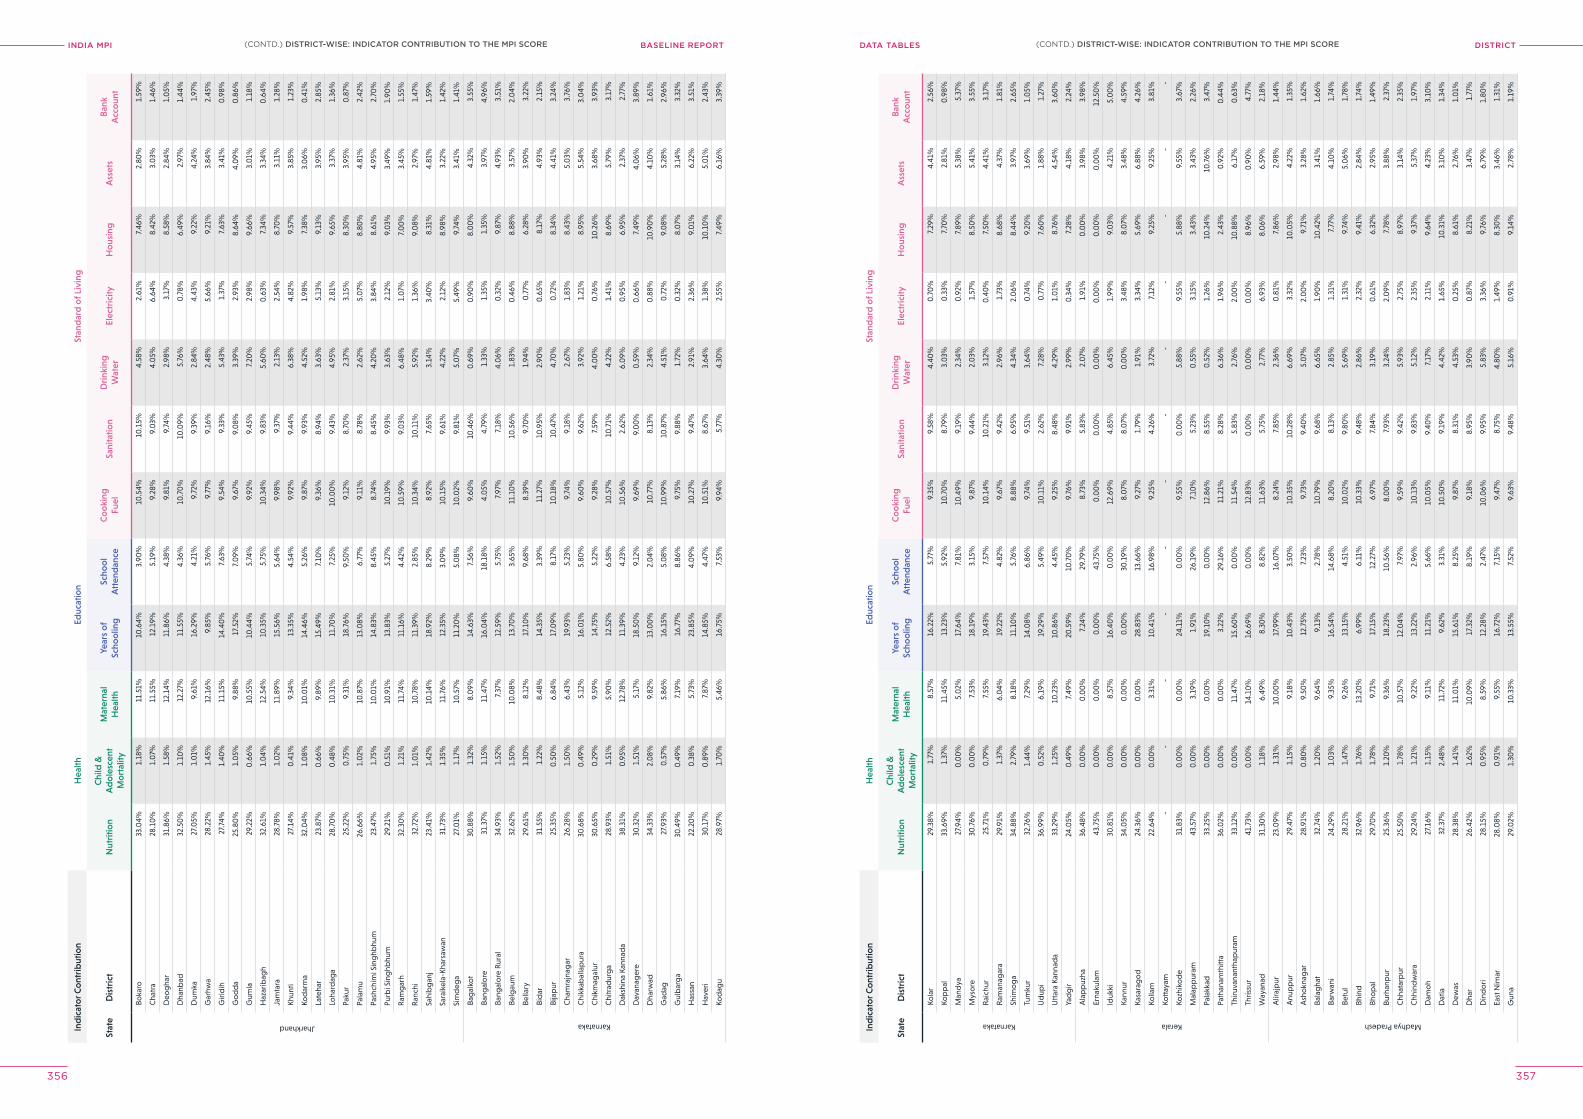
INDIA MPI BASELINE REPORT DISTrICTDATA TABleS
356 357
Ind
icat
or C
ont
rib
utio
nH
ealth
Educ
atio
nSt
and
ard
of L
ivin
g
Stat
eD
istr
ict
Nut
ritio
nC
hild
&
Ad
ole
scen
t M
ort
ality
Mat
erna
l H
ealth
Year
s o
f Sc
hoo
ling
Scho
ol
Att
end
ance
Co
oki
ng
Fuel
Sani
tatio
nD
rink
ing
Wat
erEl
ectr
icity
Ho
usin
gA
sset
sB
ank
Acc
oun
t
Jharkhand
Boka
ro33
.04%
1.18
%11
.51%
10.6
4%3.
90%
10.5
4%10
.15%
4.58
%2.
61%
7.46
%2.
80%
1.59
%
Cha
tra
28.1
0%
1.0
7%11
.55%
12.1
9%5.
19%
9.28
%9.
03%
4.0
5%6.
64%
8.42
%3.
03%
1.46
%
Deo
gha
r31
.86%
1.58
%12
.14%
11.8
6%4.
38%
9.81
%9.
74%
2.98
%3.
17%
8.58
%2.
84%
1.0
5%
Dha
nbad
32.5
0%
1.10
%12
.27%
11.5
5%4.
36%
10.7
0%
10.0
9%5.
76%
0.7
8%6.
49%
2.97
%1.
44%
Dum
ka27
.05%
1.0
1%9.
61%
16.2
9%4.
21%
9.72
%9.
39%
2.84
%4.
43%
9.22
%4.
24%
1.97
%
Gar
hwa
28.2
2%1.
45%
12.1
6%9.
85%
5.76
%9.
77%
9.16
%2.
48%
5.66
%9.
21%
3.84
%2.
45%
Giri
dih
27.7
4%1.
40%
11.1
5%14
.40
%7.
63%
9.54
%9.
33%
5.43
%1.
37%
7.63
%3.
41%
0.9
8%
Go
dd
a25
.80
%1.
05%
9.88
%17
.52%
7.0
9%9.
67%
9.0
8%3.
39%
2.93
%8.
64%
4.0
9%0
.86%
Gum
la29
.22%
0.6
6%10
.55%
10.4
4%5.
74%
9.92
%9.
45%
7.20
%2.
98%
9.66
%3.
01%
1.18
%
Haz
arib
agh
32.6
1%1.
04%
12.5
4%10
.35%
5.75
%10
.34%
9.83
%5.
60%
0.6
3%7.
34%
3.34
%0
.64%
Jam
tara
28.7
8%1.
02%
11.8
9%15
.56%
5.64
%9.
98%
9.37
%2.
13%
2.54
%8.
70%
3.11
%1.
28%
Khun
ti27
.14%
0.4
1%9.
34%
13.3
5%4.
54%
9.92
%9.
44%
6.38
%4.
82%
9.57
%3.
85%
1.23
%
Kod
arm
a32
.04%
1.0
8%10
.01%
14.4
6%5.
26%
9.87
%9.
93%
4.52
%1.
98%
7.38
%3.
06%
0.4
1%
Late
har
23.8
7%0
.66%
9.89
%15
.49%
7.10
%9.
36%
8.94
%3.
63%
5.13
%9.
13%
3.95
%2.
85%
Loha
rdag
a28
.70
%0
.48%
10.3
1%11
.70
%7.
25%
10.0
0%
9.43
%4.
95%
2.81
%9.
65%
3.37
%1.
36%
Paku
r25
.22%
0.7
5%9.
31%
18.7
6%9.
50%
9.12
%8.
70%
2.37
%3.
15%
8.30
%3.
95%
0.8
7%
Pala
mu
26.6
6%1.
02%
10.8
7%13
.08%
6.77
%9.
11%
8.78
%2.
62%
5.0
7%8.
80%
4.81
%2.
42%
Pash
chim
i Sin
ghb
hum
23.4
7%1.
75%
10.0
1%14
.83%
8.45
%8.
74%
8.45
%4.
20%
3.84
%8.
61%
4.95
%2.
70%
Purb
i Sin
ghb
hum
29.2
1%0
.51%
10.9
1%13
.83%
5.27
%10
.19%
9.93
%3.
63%
2.12
%9.
03%
3.49
%1.
90%
Ram
gar
h32
.30
%1.
21%
11.7
4%11
.16%
4.42
%10
.59%
9.0
3%6.
48%
1.0
7%7.
00
%3.
45%
1.55
%
Ran
chi
32.7
2%1.
01%
10.7
8%11
.39%
2.85
%10
.34%
10.1
1%5.
92%
1.36
%9.
08%
2.97
%1.
47%
Sahi
bg
anj
23.4
1%1.
42%
10.1
4%18
.92%
8.29
%8.
92%
7.65
%3.
14%
3.40
%8.
31%
4.81
%1.
59%
Sara
ikel
a-Kh
arsa
wan
31.7
3%1.
35%
11.7
6%12
.35%
3.0
9%10
.15%
9.61
%4.
22%
2.12
%8.
98%
3.22
%1.
42%
Sim
deg
a27
.01%
1.17
%10
.57%
11.2
0%
5.0
8%10
.02%
9.81
%5.
07%
5.49
%9.
74%
3.41
%1.
41%
Karnataka
Bag
alko
t30
.88%
1.32
%8.
09%
14.6
3%7.
56%
9.60
%10
.46%
0.6
9%0
.90
%8.
00
%4.
32%
3.55
%
Bang
alo
re31
.37%
1.15
%11
.47%
16.0
4%18
.18%
4.0
5%4.
79%
1.33
%1.
35%
1.35
%3.
97%
4.96
%
Bang
alo
re R
ural
34.9
3%1.
52%
7.37
%12
.59%
5.75
%7.
97%
7.18
%4.
06%
0.3
2%9.
87%
4.93
%3.
51%
Belg
aum
32.6
2%1.
50%
10.0
8%13
.70
%3.
65%
11.1
0%
10.5
6%1.
83%
0.4
6%8.
88%
3.57
%2.
04%
Bella
ry29
.61%
1.30
%8.
12%
17.1
0%
9.68
%8.
39%
9.70
%1.
94%
0.7
7%6.
28%
3.90
%3.
22%
Bid
ar31
.55%
1.22
%8.
48%
14.3
5%3.
39%
11.2
7%10
.95%
2.90
%0
.65%
8.17
%4.
93%
2.15
%
Bija
pur
25.3
5%0
.50
%6.
84%
17.0
9%8.
17%
10.1
8%10
.47%
4.70
%0
.72%
8.34
%4.
41%
3.24
%
Cha
mra
jnag
ar26
.28%
1.50
%6.
43%
19.9
3%5.
23%
9.74
%9.
18%
2.67
%1.
83%
8.43
%5.
03%
3.76
%
Chi
kkab
alla
pur
a30
.68%
0.4
9%5.
12%
16.0
1%5.
80%
9.60
%9.
62%
3.92
%1.
21%
8.95
%5.
54%
3.0
4%
Chi
kmag
alur
30.6
5%0
.29%
9.59
%14
.75%
5.22
%9.
28%
7.59
%4.
00
%0
.76%
10.2
6%3.
68%
3.93
%
Chi
trad
urg
a28
.93%
1.51
%5.
90%
12.5
2%6.
58%
10.5
7%10
.71%
4.22
%1.
41%
8.69
%5.
79%
3.17
%
Dak
shin
a Ka
nnad
a38
.31%
0.9
5%12
.78%
11.3
9%4.
23%
10.5
6%2.
62%
6.0
9%0
.95%
6.95
%2.
37%
2.77
%
Dav
anag
ere
30.3
2%1.
51%
5.17
%18
.50
%9.
12%
9.69
%9.
00
%0
.59%
0.6
6%7.
49%
4.0
6%3.
89%
Dha
rwad
34.3
3%2.
08%
9.82
%13
.00
%2.
04%
10.7
7%8.
13%
2.34
%0
.88%
10.9
0%
4.10
%1.
61%
Gad
ag27
.93%
0.5
7%5.
86%
16.1
5%5.
08%
10.9
9%10
.87%
4.51
%0
.72%
9.0
8%5.
28%
2.96
%
Gul
bar
ga
30.4
9%0
.49%
7.19
%16
.77%
8.86
%9.
75%
9.88
%1.
72%
0.3
2%8.
07%
3.14
%3.
32%
Has
san
22.2
0%
0.3
8%5.
73%
23.8
5%4.
09%
10.2
7%9.
47%
2.91
%2.
36%
9.0
1%6.
22%
3.51
%
Hav
eri
30.1
7%0
.89%
7.87
%14
.85%
4.47
%10
.51%
8.67
%3.
64%
1.38
%10
.10
%5.
01%
2.43
%
Kod
agu
28.9
7%1.
70%
5.46
%16
.75%
7.53
%9.
94%
5.77
%4.
30%
2.55
%7.
49%
6.16
%3.
39%
Ind
icat
or C
ont
rib
utio
nH
ealth
Educ
atio
nSt
and
ard
of L
ivin
g
Stat
eD
istr
ict
Nut
ritio
nC
hild
&
Ad
ole
scen
t M
ort
ality
Mat
erna
l H
ealth
Year
s o
f Sc
hoo
ling
Scho
ol
Att
end
ance
Co
oki
ng
Fuel
Sani
tatio
nD
rink
ing
Wat
erEl
ectr
icity
Ho
usin
gA
sset
sB
ank
Acc
oun
t
Karnataka
Kola
r29
.38%
1.77
%8.
57%
16.2
2%5.
77%
9.35
%9.
58%
4.40
%0
.70
%7.
29%
4.41
%2.
56%
Kop
pal
33.6
9%1.
37%
11.4
5%13
.23%
5.92
%10
.70
%8.
79%
3.0
3%0
.33%
7.70
%2.
81%
0.9
8%
Man
dya
27.9
4%0
.00
%5.
02%
17.6
4%7.
81%
10.4
9%9.
19%
2.34
%0
.92%
7.89
%5.
38%
5.37
%
Mys
ore
30.7
6%0
.00
%7.
53%
18.1
9%3.
15%
9.87
%9.
44%
2.0
3%1.
57%
8.50
%5.
41%
3.55
%
Rai
chur
25.7
1%0
.79%
7.55
%19
.43%
7.57
%10
.14%
10.2
1%3.
12%
0.4
0%
7.50
%4.
41%
3.17
%
Ram
anag
ara
29.9
1%1.
37%
6.0
4%19
.22%
4.82
%9.
67%
9.42
%2.
96%
1.73
%8.
68%
4.37
%1.
81%
Shim
og
a34
.88%
2.79
%8.
18%
11.1
0%
5.76
%8.
88%
6.95
%4.
34%
2.0
6%8.
44%
3.97
%2.
65%
Tum
kur
32.7
6%1.
44%
7.29
%14
.08%
6.86
%9.
74%
9.51
%3.
64%
0.7
4%9.
20%
3.69
%1.
05%
Ud
upi
36.9
9%0
.52%
6.19
%19
.29%
5.49
%10
.11%
2.62
%7.
28%
0.7
7%7.
60%
1.88
%1.
27%
Utt
ara
Kann
ada
33.2
9%1.
25%
10.2
3%10
.86%
4.45
%9.
25%
8.48
%4.
29%
1.0
1%8.
76%
4.54
%3.
60%
Yad
gir
24.0
5%0
.49%
7.49
%20
.59%
10.7
0%
9.76
%9.
91%
2.99
%0
.34%
7.28
%4.
18%
2.24
%
Kerala
Ala
pp
uzha
36.4
8%0
.00
%0
.00
%7.
24%
29.7
9%8.
73%
5.83
%2.
07%
1.91
%0
.00
%3.
98%
3.98
%
Erna
kula
m43
.75%
0.0
0%
0.0
0%
0.0
0%
43.7
5%0
.00
%0
.00
%0
.00
%0
.00
%0
.00
%0
.00
%12
.50
%
Iduk
ki30
.81%
0.0
0%
8.57
%16
.40
%0
.00
%12
.69%
4.85
%6.
45%
1.99
%9.
03%
4.21
%5.
00
%
Kann
ur34
.05%
0.0
0%
0.0
0%
0.0
0%
30.1
9%8.
07%
8.0
7%0
.00
%3.
48%
8.0
7%3.
48%
4.59
%
Kasa
rag
od
24.3
6%0
.00
%0
.00
%28
.83%
13.6
6%9.
27%
1.79
%1.
91%
3.34
%5.
69%
6.88
%4.
26%
Kolla
m22
.64%
0.0
0%
3.31
%10
.41%
16.9
8%9.
25%
4.26
%3.
72%
7.12
%9.
25%
9.25
%3.
81%
Kott
ayam
--
--
--
--
--
--
Kozh
iko
de
31.8
3%0
.00
%0
.00
%24
.11%
0.0
0%
9.55
%0
.00
%5.
88%
9.55
%5.
88%
9.55
%3.
67%
Mal
app
uram
43.5
7%0
.00
%3.
19%
1.91
%26
.19%
7.10
%5.
23%
0.5
5%3.
15%
3.43
%3.
43%
2.26
%
Pala
kkad
33.2
5%0
.00
%0
.00
%19
.10
%0
.00
%12
.86%
8.55
%0
.52%
1.26
%10
.24%
10.7
6%3.
47%
Path
anam
thitt
a36
.02%
0.0
0%
0.0
0%
3.22
%29
.16%
11.2
1%8.
28%
6.36
%1.
96%
2.43
%0
.92%
0.4
4%
Thiru
vana
ntha
pur
am33
.12%
0.0
0%
11.4
7%15
.60
%0
.00
%11
.54%
5.83
%2.
76%
2.0
0%
10.8
8%6.
17%
0.6
3%
Thris
sur
41.7
3%0
.00
%14
.10
%16
.69%
0.0
0%
12.8
3%0
.00
%0
.00
%0
.00
%8.
96%
0.9
0%
4.77
%
Way
anad
31.3
0%
1.18
%6.
49%
8.30
%8.
82%
11.6
3%5.
75%
2.77
%6.
93%
8.0
6%6.
59%
2.18
%
Madhya Pradesh
Alir
ajp
ur23
.09%
1.31
%10
.00
%17
.99%
16.0
7%8.
24%
7.85
%2.
36%
0.8
1%7.
86%
2.98
%1.
44%
Anu
pp
ur29
.47%
1.15
%9.
18%
10.4
3%3.
50%
10.3
5%10
.28%
6.69
%3.
32%
10.0
5%4.
22%
1.35
%
Ash
okn
agar
28.9
1%0
.80
%9.
50%
12.7
5%7.
23%
9.73
%9.
40%
5.0
7%2.
00
%9.
71%
3.28
%1.
62%
Bala
gha
t32
.74%
1.20
%9.
64%
9.13
%2.
78%
10.7
9%9 .
68%
6.65
%1.
90%
10.4
2%3.
41%
1.66
%
Barw
ani
24.2
9%1.
03%
9.35
%16
.54%
14.6
8%8.
20%
8.13
%2.
85%
1.31
%7.
77%
4.10
%1.
74%
Betu
l28
.21%
1.47
%9.
26%
13.1
5%4.
51%
10.0
2%9.
80%
5.69
%1.
31%
9.74
%5.
06%
1.78
%
Bhin
d32
.96%
1.76
%13
.20
%6.
99%
6.11
%10
.33%
9.48
%2.
86%
2.32
%9.
41%
2.84
%1.
74%
Bho
pal
29.7
0%
1.78
%9.
71%
17.1
5%12
.27%
6.97
%7.
84%
3.19
%0
.61%
6.32
%2.
95%
1.49
%
Burh
anp
ur25
.36%
1.20
%9.
36%
18.2
3%10
.56%
8.0
0%
7.93
%3.
24%
2.0
9%7.
78%
3.88
%2.
37%
Chh
atar
pur
25.5
0%
1.78
%10
.57%
12.0
4%7.
97%
9.59
%9.
42%
5.93
%2.
75%
8.97
%3.
14%
2.35
%
Chh
ind
war
a29
.24%
1.21
%9.
22%
13.2
2%2.
96%
10.1
3%9.
83%
5.12
%2.
35%
9.37
%5.
37%
1.97
%
Dam
oh
27.1
6%1.
15%
9.11
%11
.21%
5.66
%10
.05%
9.40
%7.
17%
2.11
%9.
64%
4.23
%3.
10%
Dat
ia32
.37%
2.48
%11
.72%
9.62
%3.
31%
10.5
0%
9.19
%4.
42%
1.65
%10
.31%
3.10
%1.
34%
Dew
as28
.38%
1.41
%11
.01%
15.6
1%8.
25%
9.87
%8.
31%
4.53
%0
.25%
8.61
%2.
76%
1.0
1%
Dha
r26
.42%
1.62
%10
.09%
17.3
2%8.
19%
9.18
%8.
95%
3.90
%0
.87%
8.21
%3.
47%
1.77
%
Din
do
ri28
.15%
0.9
5%8.
59%
12.2
8%2.
47%
10.0
6%9.
95%
5.83
%3.
36%
9.76
%6.
79%
1.80
%
East
Nim
ar28
.08%
0.9
1%9.
55%
16.7
2%7.
15%
9.47
%8.
75%
4.80
%1.
49%
8.30
%3.
46%
1.31
%
Gun
a29
.02%
1.30
%10
.33%
13.5
5%7.
52%
9.63
%9.
48%
5.16
%0
.91%
9.14
%2.
78%
1.19
%
(CONTD.) DISTrICT-WISe: INDICATor CoNTrIBUTIoN To The MpI SCore(CONTD.) DISTrICT-WISe: INDICATor CoNTrIBUTIoN To The MpI SCore
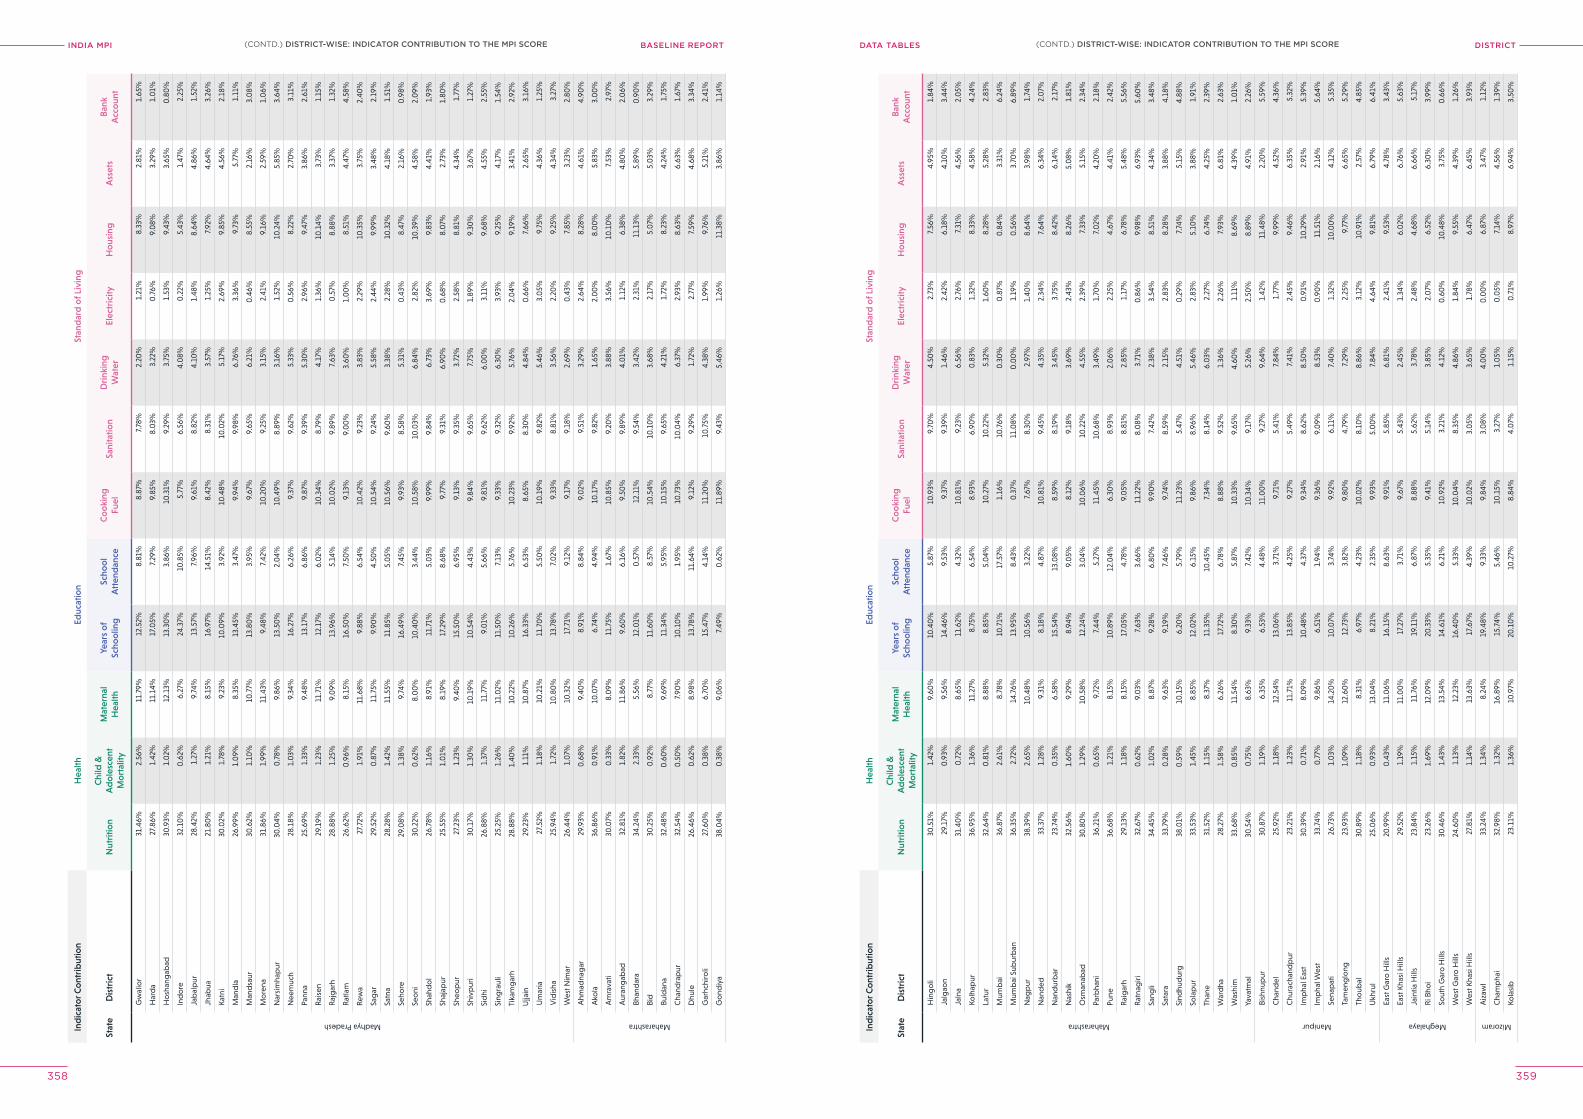
INDIA MPI BASELINE REPORT DISTrICTDATA TABleS
358 359
Ind
icat
or C
ont
rib
utio
nH
ealth
Educ
atio
nSt
and
ard
of L
ivin
g
Stat
eD
istr
ict
Nut
ritio
nC
hild
&
Ad
ole
scen
t M
ort
ality
Mat
erna
l H
ealth
Year
s o
f Sc
hoo
ling
Scho
ol
Att
end
ance
Co
oki
ng
Fuel
Sani
tatio
nD
rink
ing
Wat
erEl
ectr
icity
Ho
usin
gA
sset
sB
ank
Acc
oun
t
Madhya Pradesh
Gw
alio
r31
.46%
2.56
%11
.79%
12.5
2%8.
81%
8.87
%7.
78%
2.20
%1.
21%
8.33
%2.
81%
1.65
%
Har
da
27.8
6%1.
42%
11.1
4%17
.05%
7.29
%9.
85%
8.0
3%3.
22%
0.7
6%9.
08%
3.29
%1.
01%
Ho
shan
gab
ad30
.93%
1.0
2%12
.13%
13.3
0%
3.86
%10
.31%
9.29
%3.
75%
1.53
%9.
43%
3.65
%0
.80
%
Ind
ore
32.1
0%
0.6
2%6.
27%
24.3
7%10
.85%
5.77
%6.
56%
4.0
8%0
.22%
5.43
%1.
47%
2.25
%
Jab
alp
ur28
.42%
1.27
%9.
74%
13.5
7%7.
96%
9.61
%8.
82%
4.10
%1.
48%
8.64
%4.
86%
1.52
%
Jhab
ua21
.80
%1.
21%
8.15
%16
.97%
14.5
1%8.
42%
8.31
%3.
57%
1.25
%7.
92%
4.64
%3.
26%
Katn
i30
.02%
1.78
%9.
23%
10.0
9%3.
92%
10.4
8%10
.02%
5.17
%2.
69%
9.85
%4.
56%
2.18
%
Man
dla
26.9
9%1.
09%
8.35
%13
.45%
3.47
%9.
94%
9.98
%6.
76%
3.36
%9.
73%
5.77
%1.
11%
Man
dsa
ur30
.62%
1.10
%10
.77%
13.8
0%
3.95
%9.
67%
9.65
%6.
21%
0.4
6%8.
55%
2.16
%3.
08%
Mo
rena
31.8
6%1.
99%
11.4
3%9.
48%
7.42
%10
.20
%9.
25%
3.15
%2.
41%
9.16
%2.
59%
1.0
6%
Nar
sim
hap
ur30
.04%
0.7
8%9.
86%
13.5
0%
2.0
4%10
.49%
8.89
%3.
16%
1.52
%10
.24%
5.85
%3.
64%
Nee
muc
h28
.18%
1.0
3%9.
34%
16.2
7%6.
26%
9.37
%9.
62%
5.33
%0
.56%
8.22
%2.
70%
3.11
%
Pann
a25
.69%
1.33
%9.
48%
13.1
7%6.
86%
9.87
%9.
39%
5.30
%2.
96%
9.47
%3.
86%
2.61
%
Rai
sen
29.1
9%1.
23%
11.7
1%12
.17%
6.0
2%10
.34%
8.79
%4.
17%
1.36
%10
.14%
3.73
%1.
15%
Raj
gar
h28
.88%
1.25
%9.
09%
13.9
6%5.
14%
10.0
2%9.
89%
7.63
%0
.57%
8.88
%3.
37%
1.32
%
Rat
lam
26.6
2%0
.96%
8.15
%16
.50
%7.
50%
9.13
%9.
00
%3.
60%
1.0
0%
8.51
%4.
47%
4.58
%
Rew
a27
.72%
1.91
%11
.68%
9.88
%6.
54%
10.4
2%9.
23%
3.83
%2.
29%
10.3
5%3.
75%
2.40
%
Sag
ar29
.52%
0.8
7%11
.75%
9.90
%4.
50%
10.5
4%9.
24%
5.58
%2.
44%
9.99
%3.
48%
2.19
%
Satn
a28
.28%
1.42
%11
.55%
11.8
5%5.
05%
10.5
6%9.
60%
3.38
%2.
28%
10.3
2%4.
18%
1.51
%
Seho
re29
.08%
1.38
%9.
74%
16.4
9%7.
45%
9.93
%8.
58%
5.31
%0
.43%
8.47
%2.
16%
0.9
8%
Seo
ni30
.22%
0.6
2%8.
00
%10
.40
%3.
44%
10.5
8%10
.03%
6.84
%2.
82%
10.3
9%4.
58%
2.0
9%
Shah
do
l26
.78%
1.16
%8.
91%
11.7
1%5.
03%
9.99
%9.
84%
6.73
%3.
69%
9.83
%4.
41%
1.93
%
Shaj
apur
25.5
5%1.
01%
8.19
%17
.29%
8.68
%9.
77%
9.31
%6.
90%
0.6
8%8.
07%
2.73
%1.
80%
Sheo
pur
27.2
3%1.
23%
9.40
%15
.50
%6.
95%
9.13
%9.
35%
3.72
%2.
58%
8.81
%4.
34%
1.77
%
Shiv
pur
i30
.17%
1.30
%10
.19%
10.5
4%4.
43%
9.84
%9.
65%
7.75
%1.
89%
9.30
%3.
67%
1.27
%
Sid
hi26
.88%
1.37
%11
.77%
9.0
1%5.
66%
9.81
%9.
62%
6.0
0%
3.11
%9.
68%
4.55
%2.
55%
Sing
raul
i25
.25%
1.26
%11
.02%
11.5
0%
7.13
%9.
33%
9.32
%6.
30%
3.93
%9.
25%
4.17
%1.
54%
Tika
mg
arh
28.8
8%1.
40%
10.2
2%10
.26%
5.76
%10
.23%
9.92
%5.
76%
2.0
4%9.
19%
3.41
%2.
92%
Ujja
in29
.23%
1.11
%10
.87%
16.3
3%6.
53%
8.65
%8.
30%
4.84
%0
.66%
7.66
%2.
65%
3.16
%
Um
aria
27.5
2%1.
18%
10.2
1%11
.70
%5.
50%
10.1
9%9.
82%
5.46
%3.
05%
9.75
%4.
36%
1.25
%
Vid
isha
25.9
4%1.
72%
10.8
0%
13.7
8%7.
02%
9.33
%8.
81%
3.56
%2.
20%
9.25
%4.
34%
3.27
%
Wes
t Nim
ar26
.44%
1.0
7%10
.32%
17.7
1%9.
12%
9.17
%9.
18%
2.69
%0
.43%
7.85
%3.
23%
2.80
%
Maharashtra
Ahm
adna
gar
29.9
3%0
.68%
9.40
%8.
91%
8.84
%9.
02%
9.51
%3.
29%
2.64
%8.
28%
4.61
%4.
90%
Ako
la36
.86%
0.9
1%10
.07%
6.74
%4.
94%
10.1
7%9.
82%
1.65
%2.
00
%8.
00
%5.
83%
3.0
0%
Am
rava
ti30
.07%
0.3
3%8.
09%
11.7
5%1.
67%
10.8
5%9.
20%
3.88
%3.
56%
10.1
0%
7.53
%2.
97%
Aur
ang
abad
32.8
1%1.
82%
11.8
6%9.
60%
6.16
%9.
50%
9.89
%4.
01%
1.12
%6.
38%
4.80
%2.
06%
Bhan
dar
a34
.24%
2.33
%5.
56%
12.0
1%0
.57%
12.1
1%9.
54%
3.42
%2.
31%
11.1
3%5.
89%
0.9
0%
Bid
30.2
5%0
.92%
8.77
%11
.60
%8.
57%
10.5
4%10
.10
%3.
68%
2.17
%5.
07%
5.0
3%3.
29%
Buld
ana
32.4
8%0
.60
%9.
69%
11.3
4%5.
95%
10.1
5%9.
65%
4.21
%1.
72%
8.23
%4.
24%
1.75
%
Cha
ndra
pur
32.5
4%0
.50
%7.
90%
10.1
0%
1.95
%10
.73%
10.0
4%6.
37%
2.93
%8.
63%
6.63
%1.
67%
Dhu
le26
.46%
0.6
2%8.
98%
13.7
8%11
.64%
9.12
%9.
29%
1.72
%2.
77%
7.59
%4.
68%
3.34
%
Gar
hchi
roli
27.6
0%
0.3
8%6.
70%
15.4
7%4.
14%
11.2
0%
10.7
5%4.
38%
1.99
%9.
76%
5.21
%2.
41%
Go
ndiy
a38
.04%
0.3
8%9.
06%
7.49
%0
.62%
11.8
9%9.
43%
5.46
%1.
26%
11.3
8%3.
86%
1.14
%
Ind
icat
or C
ont
rib
utio
nH
ealth
Educ
atio
nSt
and
ard
of L
ivin
g
Stat
eD
istr
ict
Nut
ritio
nC
hild
&
Ad
ole
scen
t M
ort
ality
Mat
erna
l H
ealth
Year
s o
f Sc
hoo
ling
Scho
ol
Att
end
ance
Co
oki
ng
Fuel
Sani
tatio
nD
rink
ing
Wat
erEl
ectr
icity
Ho
usin
gA
sset
sB
ank
Acc
oun
t
Maharashtra
Hin
go
li30
.51%
1.42
%9.
60%
10.4
0%
5.87
%10
.93%
9.70
%4.
50%
2.73
%7.
56%
4.95
%1.
84%
Jalg
aon
29.1
7%0
.93%
9.56
%14
.46%
9.53
%9.
37%
9.39
%1.
46%
2.42
%6.
18%
4.10
%3.
44%
Jaln
a31
.40
%0
.72%
8.65
%11
.62%
4.32
%10
.81%
9.23
%6.
56%
2.76
%7.
31%
4.56
%2.
05%
Kolh
apur
36.9
5%1.
36%
11.2
7%8.
75%
6.54
%8.
93%
6.90
%0
.83%
1.32
%8.
33%
4.58
%4.
24%
Latu
r32
.64%
0.8
1%8.
88%
8.85
%5.
04%
10.2
7%10
.22%
5.32
%1.
60%
8.28
%5.
28%
2.83
%
Mum
bai
36.8
7%2.
61%
8.78
%10
.71%
17.5
7%1.
16%
10.7
6%0
.30
%0
.87%
0.8
4%3.
31%
6.24
%
Mum
bai
Sub
urb
an36
.35%
2.72
%14
.76%
13.9
5%8.
43%
0.3
7%11
.08%
0.0
0%
1.19
%0
.56%
3.70
%6.
89%
Nag
pur
38.3
9%2.
65%
10.4
8%10
.56%
3.22
%7.
67%
8.30
%2.
97%
1.40
%8.
64%
3.98
%1.
74%
Nan
ded
33.3
7%1.
28%
9.31
%8.
18%
4.87
%10
.81%
9.45
%4.
35%
2.34
%7.
64%
6.34
%2.
07%
Nan
dur
bar
23.7
4%0
.35%
6.58
%15
.54%
13.0
8%8.
59%
8.19
%3.
45%
3.75
%8.
42%
6.14
%2.
17%
Nas
hik
32.5
6%1.
60%
9.29
%8.
94%
9.0
5%8.
12%
9.18
%3.
69%
2.43
%8.
26%
5.0
8%1.
81%
Osm
anab
ad30
.80
%1.
29%
10.5
8%12
.24%
3.0
4%10
.06%
10.2
2%4.
55%
2.39
%7.
33%
5.15
%2.
34%
Parb
hani
36.2
1%0
.65%
9.72
%7.
44%
5.27
%11
.45%
10.6
8%3.
49%
1.70
%7.
02%
4.20
%2.
18%
Pune
36.6
8%1.
21%
8.15
%10
.89%
12.0
4%6.
30%
8.93
%2.
06%
2.25
%4.
67%
4.41
%2.
42%
Rai
gar
h29
.13%
1.18
%8.
15%
17.0
5%4.
78%
9.0
5%8.
81%
2.85
%1.
17%
6.78
%5.
48%
5.56
%
Rat
nag
iri32
.67%
0.6
2%9.
03%
7.63
%3.
66%
11.2
2%8.
08%
3.71
%0
.86%
9.98
%6.
93%
5.60
%
Sang
li34
.45%
1.0
2%8.
87%
9.28
%6.
80%
9.90
%7.
42%
2.38
%3.
54%
8.51
%4.
34%
3.48
%
Sata
ra33
.79%
0.2
8%9.
63%
9.19
%7.
46%
9.74
%8.
59%
2.15
%2.
83%
8.28
%3.
88%
4.18
%
Sind
hud
urg
38.0
1%0
.59%
10.1
5%6.
20%
5.79
%11
.23%
5.47
%4.
51%
0.2
9%7.
74%
5.15
%4.
88%
Sola
pur
33.5
3%1.
45%
8.85
%12
.02%
6.15
%9.
86%
8.96
%5.
46%
2.83
%5.
10%
3.88
%1.
91%
Than
e31
.52%
1.15
%8.
37%
11.3
5%10
.45%
7.34
%8.
14%
6.0
3%2.
27%
6.74
%4.
25%
2.39
%
War
dha
28.2
7%1.
58%
6.26
%17
.72%
6.78
%8.
88%
9.52
%1.
36%
2.26
%7.
93%
6.81
%2.
63%
Was
him
33.6
8%0
.85%
11.5
4%8.
30%
5.87
%10
.33%
9.65
%4.
60%
1.11
%8.
69%
4.39
%1.
01%
Yava
tmal
30.5
4%0
.75%
8.63
%9.
33%
7.42
%10
.34%
9.17
%5.
26%
2.50
%8.
89%
4.91
%2.
26%
Manipur
Bish
nup
ur30
.87%
1.19
%6.
35%
6.53
%4.
48%
11.0
0%
9.27
%9.
64%
1.42
%11
.48%
2.20
%5.
59%
Cha
ndel
25.9
2%1.
18%
12.5
4%13
.06%
3.71
%9.
71%
5.41
%7.
84%
1.77
%9.
99%
4.52
%4.
36%
Chu
rach
and
pur
23.2
1%1.
23%
11.7
1%13
.85%
4.25
%9.
27%
5.49
%7.
41%
2.45
%9.
46%
6.35
%5.
32%
Imp
hal E
ast
30.3
9%0
.71%
8.0
9%10
.48%
4.37
%9.
34%
8.62
%8.
50%
0.9
1%10
.29%
2.91
%5.
39%
Imp
hal W
est
33.7
4%0
.77%
9.86
%6.
51%
1.94
%9.
36%
9.0
9%8.
53%
0.9
0%
11.5
1%2.
16%
5.64
%
Sena
pat
i26
.73%
1.0
3%14
.20
%10
.07%
3.74
%9.
92%
6.11
%7.
40%
1.32
%10
.00
%4.
12%
5.35
%
Tam
eng
long
23.9
3%1.
09%
12.6
0%
12.7
3%3.
82%
9.80
%4.
79%
7.29
%2.
25%
9.77
%6.
65%
5.29
%
Tho
ubal
30.8
9%1.
18%
8.31
%6.
97%
4.23
%10
.02%
8.10
%8.
86%
3.12
%10
.91%
2.57
%4.
85%
Ukh
rul
25.0
6%0
.93%
13.0
4%8.
21%
2.35
%9.
93%
5.0
0%
7.84
%4.
64%
9.81
%6.
79%
6.41
%
Meghalaya
East
Gar
o H
ills
20.9
9%0
.43%
11.0
6%16
.15%
8.63
%9.
91%
5.85
%6.
81%
2.41
%9.
53%
4.78
%3.
43%
East
Kha
si H
ills
29.5
2%1.
19%
11.0
0%
17.2
7%3.
71%
9.67
%5.
43%
2.45
%1.
34%
6.0
2%6.
76%
5.63
%
Jain
tia H
ills
23.8
4%1.
15%
11.7
6%19
.11%
6.87
%8.
88%
5.62
%3.
78%
2.48
%4.
68%
6.66
%5.
17%
Ri B
hoi
23.2
6%1.
69%
12.0
9%20
.33%
5.35
%9.
41%
5.14
%3.
85%
2.0
7%6.
52%
6.30
%3.
99%
Sout
h G
aro
Hill
s30
.46%
1.43
%13
.54%
14.6
1%6.
21%
10.9
2%3.
21%
4.12
%0
.60
%10
.48%
3.75
%0
.66%
Wes
t Gar
o H
ills
24.6
0%
1.13
%12
.23%
16.4
0%
5.33
%10
.04%
8.35
%4.
86%
1.84
%9.
55%
4.39
%1.
26%
Wes
t Kha
si H
ills
27.8
1%1.
14%
13.6
3%17
.67%
4.39
%10
.02%
3.0
5%3.
65%
1.78
%6.
47%
6.45
%3.
93%
Mizoram
Aiz
awl
33.2
4%1.
34%
8.24
%19
.48%
9.33
%9.
84%
3.0
8%4.
00
%0
.00
%6.
87%
3.47
%1.
12%
Cha
mp
hai
32.9
8%1.
32%
16.8
9%15
.74%
5.46
%10
.15%
3.27
%1.
05%
0.0
5%7.
14%
4.56
%1.
39%
Kola
sib
23.1
1%1.
36%
10.9
7%20
.10
%10
.27%
8.84
%4.
07%
1.15
%0
.71%
8.97
%6.
94%
3.50
%
(CONTD.) DISTrICT-WISe: INDICATor CoNTrIBUTIoN To The MpI SCore(CONTD.) DISTrICT-WISe: INDICATor CoNTrIBUTIoN To The MpI SCore
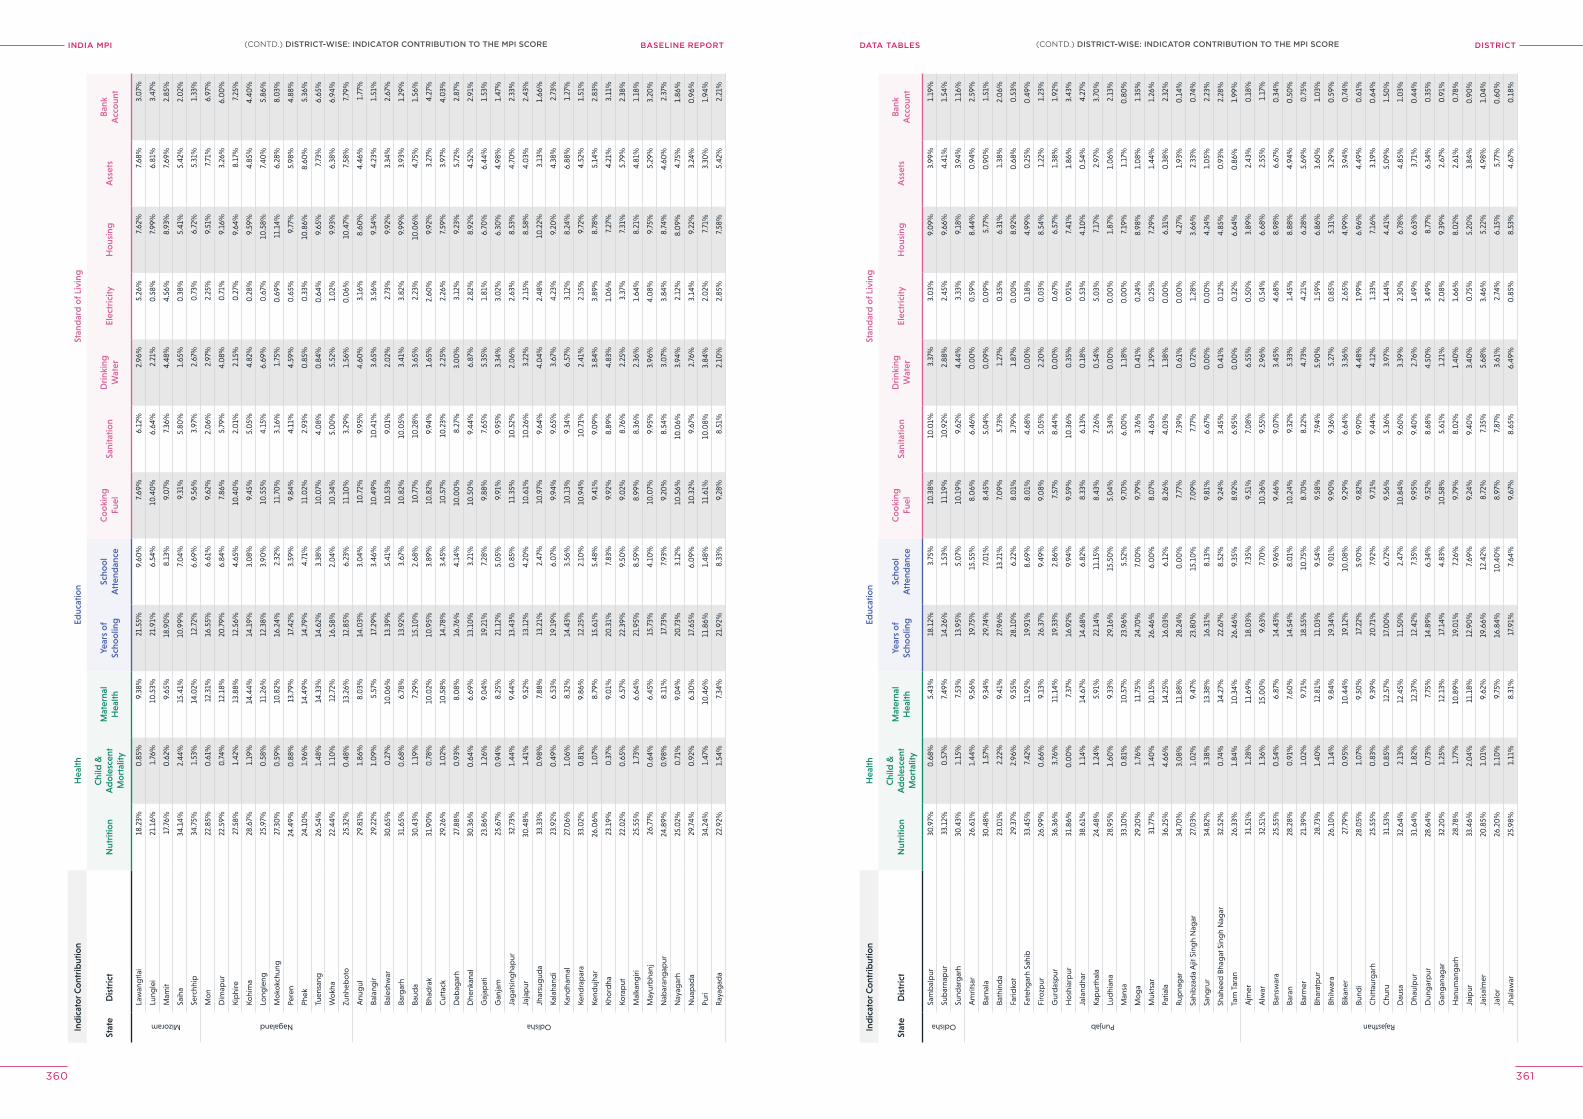
INDIA MPI BASELINE REPORT DISTrICTDATA TABleS
360 361
Ind
icat
or C
ont
rib
utio
nH
ealth
Educ
atio
nSt
and
ard
of L
ivin
g
Stat
eD
istr
ict
Nut
ritio
nC
hild
&
Ad
ole
scen
t M
ort
ality
Mat
erna
l H
ealth
Year
s o
f Sc
hoo
ling
Scho
ol
Att
end
ance
Co
oki
ng
Fuel
Sani
tatio
nD
rink
ing
Wat
erEl
ectr
icity
Ho
usin
gA
sset
sB
ank
Acc
oun
t
Mizoram
Law
ang
tlai
18.2
3%0
.85%
9.38
%21
.55%
9.60
%7.
69%
6.12
%2.
96%
5.26
%7.
62%
7.68
%3.
07%
Lung
lei
21.1
6%1.
76%
10.5
3%21
.91%
6.54
%10
.40
%6.
64%
2.21
%0
.58%
7.99
%6.
81%
3.47
%
Mam
it17
.76%
0.6
2%9.
65%
18.9
0%
8.13
%9.
07%
7.36
%4.
48%
4.56
%8.
93%
7.69
%2.
85%
Saih
a34
.14%
2.44
%15
.41%
10.9
9%7.
04%
9.31
%5.
80%
1.65
%0
.38%
5.41
%5.
42%
2.0
2%
Serc
hhip
34.7
5%1.
53%
14.0
2%12
.72%
6.69
%9.
56%
3.97
%2.
67%
0.7
3%6.
72%
5.31
%1.
33%
Nagaland
Mo
n22
.85%
0.6
1%12
.31%
16.5
5%6.
61%
9.62
%2.
06%
2.97
%2.
25%
9.51
%7.
71%
6.97
%
Dim
apur
22.5
9%0
.74%
12.1
8%20
.79%
6.84
%7.
86%
5.79
%4.
08%
0.7
1%9.
16%
3.26
%6.
00
%
Kip
hire
27.5
8%1.
42%
13.8
8%12
.56%
4.65
%10
.40
%2.
01%
2.15
%0
.27%
9.64
%8.
17%
7.25
%
Kohi
ma
28.6
7%1.
19%
14.4
4%14
.19%
3.0
8%9.
45%
5.0
5%4.
82%
0.2
8%9.
59%
4.85
%4.
40%
Long
leng
25.9
7%0
.58%
11.2
6%12
.38%
3.90
%10
.55%
4.15
%6.
69%
0.6
7%10
.58%
7.40
%5.
86%
Mo
kokc
hung
27.3
0%
0.5
9%10
.82%
16.2
4%2.
32%
11.7
0%
3.16
%1.
75%
0.6
9%11
.14%
6.28
%8.
03%
Pere
n24
.49%
0.8
8%13
.79%
17.4
2%3.
59%
9.84
%4.
11%
4.59
%0
.65%
9.77
%5.
98%
4.88
%
Phek
24.1
0%
1.96
%14
.49%
14.7
9%4.
71%
11.0
2%2.
93%
0.8
5%0
.33%
10.8
6%8.
60%
5.36
%
Tuen
sang
26.5
4%1.
48%
14.3
3%14
.62%
3.38
%10
.07%
4.0
8%0
.84%
0.6
4%9.
65%
7.73
%6.
65%
Wo
kha
22.4
4%1.
10%
12.7
2%16
.58%
2.0
4%10
.34%
5.0
0%
5.52
%1.
02%
9.93
%6.
38%
6.94
%
Zunh
ebo
to25
.32%
0.4
8%13
.26%
12.8
5%6.
23%
11.1
0%
3.29
%1.
56%
0.0
6%10
.47%
7.58
%7.
79%
Odisha
Anu
gul
29.8
1%1.
86%
8.0
3%14
.03%
3.0
4%10
.72%
9.95
%4.
60%
3.16
%8.
60%
4.46
%1.
77%
Bala
ngir
29.2
2%1.
09%
5.57
%17
.29%
3.46
%10
.49%
10.4
1%3.
65%
3.56
%9.
54%
4.23
%1.
51%
Bale
shw
ar30
.65%
0.2
7%10
.06%
13.3
9%5.
41%
10.5
3%9.
01%
2.0
2%2.
73%
9.92
%3.
34%
2.67
%
Barg
arh
31.6
5%0
.68%
6.78
%13
.92%
3.67
%10
.82%
10.0
5%3.
41%
3.82
%9.
99%
3.93
%1.
29%
Baud
a30
.43%
1.19
%7.
29%
15.1
0%
2.68
%10
.77%
10.2
8%3.
65%
2.23
%10
.06%
4.75
%1.
56%
Bhad
rak
31.9
0%
0.7
8%10
.02%
10.9
5%3.
89%
10.8
2%9.
94%
1.65
%2.
60%
9.92
%3.
27%
4.27
%
Cut
tack
29.2
6%1.
02%
10.5
8%14
.78%
3.45
%10
.57%
10.2
3%2.
25%
2.26
%7.
59%
3.97
%4.
03%
Deb
agar
h27
.88%
0.9
3%8.
08%
16.7
6%4.
14%
10.0
0%
8.27
%3.
00
%3.
12%
9.23
%5.
72%
2.87
%
Dhe
nkan
al30
.36%
0.6
4%6.
69%
13.1
0%
3.21
%10
.50
%9.
44%
6.87
%2.
82%
8.92
%4.
52%
2.91
%
Gaj
apat
i23
.86%
1.26
%9.
04%
19.2
1%7.
28%
9.88
%7.
65%
5.35
%1.
81%
6.70
%6.
44%
1.53
%
Gan
jam
25.6
7%0
.94%
8.25
%21
.12%
5.0
5%9.
91%
9.95
%3.
34%
3.0
2%6.
30%
4.98
%1.
47%
Jag
atsi
ngha
pur
32.7
3%1.
44%
9.44
%13
.43%
0.8
5%11
.35%
10.5
2%2.
06%
2.63
%8.
53%
4.70
%2.
33%
Jaja
pur
30.4
8%1.
41%
9.52
%13
.12%
4.20
%10
.61%
10.2
6%3.
22%
2.15
%8.
58%
4.0
3%2.
43%
Jhar
sug
uda
33.3
3%0
.98%
7.88
%13
.21%
2.47
%10
.97%
9.64
%4.
04%
2.48
%10
.22%
3.13
%1.
66%
Kala
hand
i23
.92%
0.4
9%6.
53%
19.1
9%6.
07%
9.94
%9.
65%
3.67
%4.
23%
9.20
%4.
38%
2.73
%
Kand
ham
al27
.06%
1.0
6%8.
32%
14.4
3%3.
56%
10.1
3%9.
34%
6.57
%3.
12%
8.24
%6.
88%
1.27
%
Kend
rap
ara
33.0
2%0
.81%
9.86
%12
.25%
2.10
%10
.94%
10.7
1%2.
41%
2.15
%9.
72%
4.52
%1.
51%
Kend
ujha
r26
.06%
1.0
7%8.
79%
15.6
1%5.
48%
9.41
%9.
09%
3.84
%3.
89%
8.78
%5.
14%
2.83
%
Kho
rdha
23.1
9%0
.37%
9.0
1%20
.31%
7.83
%9.
92%
8.89
%4.
83%
1.0
6%7.
27%
4.21
%3.
11%
Kora
put
22.0
2%0
.65%
6.57
%22
.39%
9.50
%9.
02%
8.76
%2.
25%
3.37
%7.
31%
5.79
%2.
38%
Mal
kang
iri25
.55%
1.73
%6.
64%
21.9
5%8.
59%
8.99
%8.
36%
2.36
%1.
64%
8.21
%4.
81%
1.18
%
May
urb
hanj
26.7
7%0
.64%
6.45
%15
.73%
4.10
%10
.07%
9.95
%3.
96%
4.0
8%9.
75%
5.29
%3.
20%
Nab
aran
gap
ur24
.89%
0.9
8%8.
11%
17.7
3%7.
93%
9.20
%8.
54%
3.0
7%3.
84%
8.74
%4.
60%
2.37
%
Nay
agar
h25
.02%
0.7
1%9.
04%
20.7
3%3.
12%
10.5
6%10
.06%
3.94
%2.
12%
8.0
9%4.
75%
1.86
%
Nua
pad
a29
.74%
0.9
2%6.
30%
17.6
5%6.
09%
10.3
2%9.
67%
2.76
%3.
14%
9.22
%3.
24%
0.9
6%
Puri
34.2
4%1.
47%
10.4
6%11
.86%
1.48
%11
.61%
10.0
8%3.
84%
2.0
2%7.
71%
3.30
%1.
94%
Ray
agad
a22
.92%
1.54
%7.
34%
21.9
2%8.
33%
9.28
%8.
51%
2.10
%2.
85%
7.58
%5.
42%
2.21
%
Ind
icat
or C
ont
rib
utio
nH
ealth
Educ
atio
nSt
and
ard
of L
ivin
g
Stat
eD
istr
ict
Nut
ritio
nC
hild
&
Ad
ole
scen
t M
ort
ality
Mat
erna
l H
ealth
Year
s o
f Sc
hoo
ling
Scho
ol
Att
end
ance
Co
oki
ng
Fuel
Sani
tatio
nD
rink
ing
Wat
erEl
ectr
icity
Ho
usin
gA
sset
sB
ank
Acc
oun
t
Odisha
Sam
bal
pur
30.9
7%0
.68%
5.43
%18
.12%
3.75
%10
.38%
10.0
1%3.
37%
3.0
3%9.
09%
3.99
%1.
19%
Sub
arna
pur
33.1
2%0
.57%
7.49
%14
.26%
1.53
%11
.19%
10.9
2%2.
88%
2.45
%9.
66%
4.41
%1.
54%
Sund
arg
arh
30.4
3%1.
15%
7.53
%13
.95%
5.0
7%10
.19%
9.62
%4.
44%
3.33
%9.
18%
3.94
%1.
16%
Punjab
Am
ritsa
r26
.61%
1.44
%9.
56%
19.7
5%15
.55%
8.0
6%6.
46%
0.0
0%
0.5
9%8.
44%
0.9
4%2.
59%
Barn
ala
30.4
8%1.
57%
9.34
%29
.74%
7.0
1%8.
45%
5.0
4%0
.09%
0.0
9%5.
77%
0.9
0%
1.51
%
Bath
ind
a23
.01%
2.22
%9.
41%
27.9
6%13
.21%
7.0
9%5.
73%
1.27
%0
.35%
6.31
%1.
38%
2.0
6%
Farid
kot
29.3
7%2.
96%
9.55
%28
.10
%6.
22%
8.0
1%3.
79%
1.87
%0
.00
%8.
92%
0.6
8%0
.53%
Fate
hgar
h Sa
hib
33.4
5%7.
42%
11.9
2%19
.91%
8.69
%8.
01%
4.68
%0
.00
%0
.18%
4.99
%0
.25%
0.4
9%
Firo
zpur
26.9
9%0
.66%
9.13
%26
.37%
9.49
%9.
08%
5.0
5%2.
20%
0.0
3%8.
54%
1.22
%1.
23%
Gur
das
pur
36.3
6%3.
76%
11.1
4%19
.33%
2.86
%7.
57%
8.44
%0
.00
%0
.67%
6.57
%1.
38%
1.92
%
Ho
shia
rpur
31.8
6%0
.00
%7.
37%
16.9
2%9.
94%
9.59
%10
.36%
0.3
5%0
.91%
7.41
%1.
86%
3.43
%
Jala
ndha
r38
.61%
1.14
%14
.67%
14.6
8%6.
82%
8.33
%6.
13%
0.1
8%0
.53%
4.10
%0
.54%
4.27
%
Kap
urth
ala
24.4
8%1.
24%
5.91
%22
.14%
11.1
5%8.
43%
7.26
%0
.54%
5.0
3%7.
17%
2.97
%3.
70%
Lud
hian
a28
.95%
1.60
%9.
33%
29.1
6%15
.50
%5.
04%
5.34
%0
.00
%0
.00
%1.
87%
1.0
6%2.
13%
Man
sa33
.10
%0
.81%
10.5
7%23
.96%
5.52
%9.
70%
6.0
0%
1.18
%0
.00
%7.
19%
1.17
%0
.80
%
Mo
ga
29.2
0%
1.76
%11
.75%
24.7
0%
7.0
0%
9.79
%3.
76%
0.4
1%0
.24%
8.98
%1.
08%
1.35
%
Muk
tsar
31.7
7%1.
40%
10.1
5%26
.46%
6.0
0%
8.0
7%4.
63%
1.29
%0
.25%
7.29
%1.
44%
1.26
%
Patia
la36
.25%
4.66
%14
.25%
16.0
3%6.
12%
8.26
%4.
03%
1.38
%0
.00
%6.
31%
0.3
8%2.
32%
Rup
nag
ar34
.70
%3.
08%
11.8
8%28
.24%
0.0
0%
7.77
%7.
39%
0.6
1%0
.00
%4.
27%
1.93
%0
.14%
Sahi
bza
da
Ajit
Sin
gh
Nag
ar27
.03%
1.0
2%9.
47%
23.8
0%
15.1
0%
7.0
9%7.
77%
0.7
2%1.
28%
3.66
%2.
33%
0.7
4%
Sang
rur
34.8
2%3.
38%
13.3
8%16
.31%
8.13
%9.
81%
6.67
%0
.00
%0
.00
%4.
24%
1.0
5%2.
23%
Shah
eed
Bha
gat
Sin
gh
Nag
ar32
.52%
0.7
4%14
.27%
22.6
7%8.
52%
9.24
%3.
45%
0.4
1%0
.12%
4.85
%0
.93%
2.28
%
Tarn
Tar
an26
.33%
1.84
%10
.34%
26.4
6%9.
35%
8.92
%6.
95%
0.0
0%
0.3
2%6.
64%
0.8
6%1.
99%
Rajasthan
Ajm
er31
.51%
1.28
%11
.69%
18.0
3%7.
35%
9.51
%7.
08%
6.55
%0
.50
%3.
89%
2.43
%0
.18%
Alw
ar32
.51%
1.36
%15
.00
%9.
63%
7.70
%10
.36%
9.55
%2.
96%
0.5
4%6.
68%
2.55
%1.
17%
Bans
war
a25
.55%
0.5
4%6.
87%
14.4
3%9.
96%
9.46
%9.
07%
3.45
%4.
68%
8.98
%6.
67%
0.3
4%
Bara
n28
.28%
0.9
1%7.
60%
14.5
4%8.
01%
10.2
4%9.
32%
5.33
%1.
45%
8.88
%4.
94%
0.5
0%
Barm
er21
.39%
1.0
2%9.
71%
18.5
5%10
.75%
8.70
%8.
22%
4.73
%4.
21%
6.28
%5.
69%
0.7
5%
Bhar
atp
ur28
.73%
1.40
%12
.81%
11.0
3%9.
54%
9.58
%7.
94%
5.90
%1.
59%
6.86
%3.
60%
1.0
3%
Bhilw
ara
26.1
0%
1.14
%9.
84%
19.3
4%9.
01%
9.90
%9.
36%
5.27
%0
.85%
5.31
%3.
29%
0.5
9%
Bika
ner
27.7
9%0
.95%
10.4
4%19
.12%
10.0
8%9.
29%
6.64
%3.
36%
2.65
%4.
99%
3.94
%0
.74%
Bund
i28
.05%
1.0
7%9.
50%
17.2
2%5.
90%
9.82
%9.
90%
4.48
%1.
99%
6.96
%4.
49%
0.6
1%
Chi
ttau
rgar
h25
.55%
0.8
3%9.
39%
20.7
1%7.
92%
9.71
%9.
44%
4.12
%1.
33%
7.16
%3.
19%
0.6
4%
Chu
ru31
.53%
0.8
5%12
.57%
17.0
0%
6.72
%9.
56%
5.36
%3.
97%
1.44
%4.
41%
5.0
9%1.
50%
Dau
sa32
.64%
2.13
%12
.45%
11.5
0%
2.47
%10
.84%
9.60
%3.
39%
2.30
%6.
78%
4.85
%1.
03%
Dha
ulp
ur31
.64%
1.82
%12
.37%
12.4
2%7.
35%
9.95
%9.
40%
2.76
%1.
49%
6.63
%3.
71%
0.4
4%
Dun
gar
pur
28.6
4%0
.73%
7.75
%14
.89%
6.34
%9.
52%
8.68
%4.
50%
3.49
%8.
77%
6.34
%0
.35%
Gan
gan
agar
32.2
0%
1.25
%12
.13%
17.1
4%4.
83%
10.5
8%5.
61%
1.21
%2.
08%
9.39
%2.
67%
0.9
1%
Han
uman
gar
h28
.78%
1.77
%10
.89%
19.0
1%7.
26%
9.79
%8.
02%
1.40
%1.
66%
8.0
2%2.
61%
0.7
8%
Jaip
ur33
.46%
2.0
4%11
.18%
12.9
0%
7.69
%9.
24%
9.40
%3.
40%
0.7
5%5.
20%
3.84
%0
.90
%
Jais
alm
er20
.85%
1.0
1%9.
62%
19.6
6%12
.42%
8.72
%7.
35%
5.68
%3.
46%
5.22
%4.
98%
1.0
4%
Jalo
r26
.20
%1.
10%
9.75
%16
.84%
10.4
0%
8.97
%7.
87%
3.61
%2.
74%
6.15
%5.
77%
0.6
0%
Jhal
awar
25.9
8%1.
11%
8.31
%17
.91%
7.64
%9.
67%
8.65
%6.
49%
0.8
5%8.
53%
4.67
%0
.18%
(CONTD.) DISTrICT-WISe: INDICATor CoNTrIBUTIoN To The MpI SCore(CONTD.) DISTrICT-WISe: INDICATor CoNTrIBUTIoN To The MpI SCore
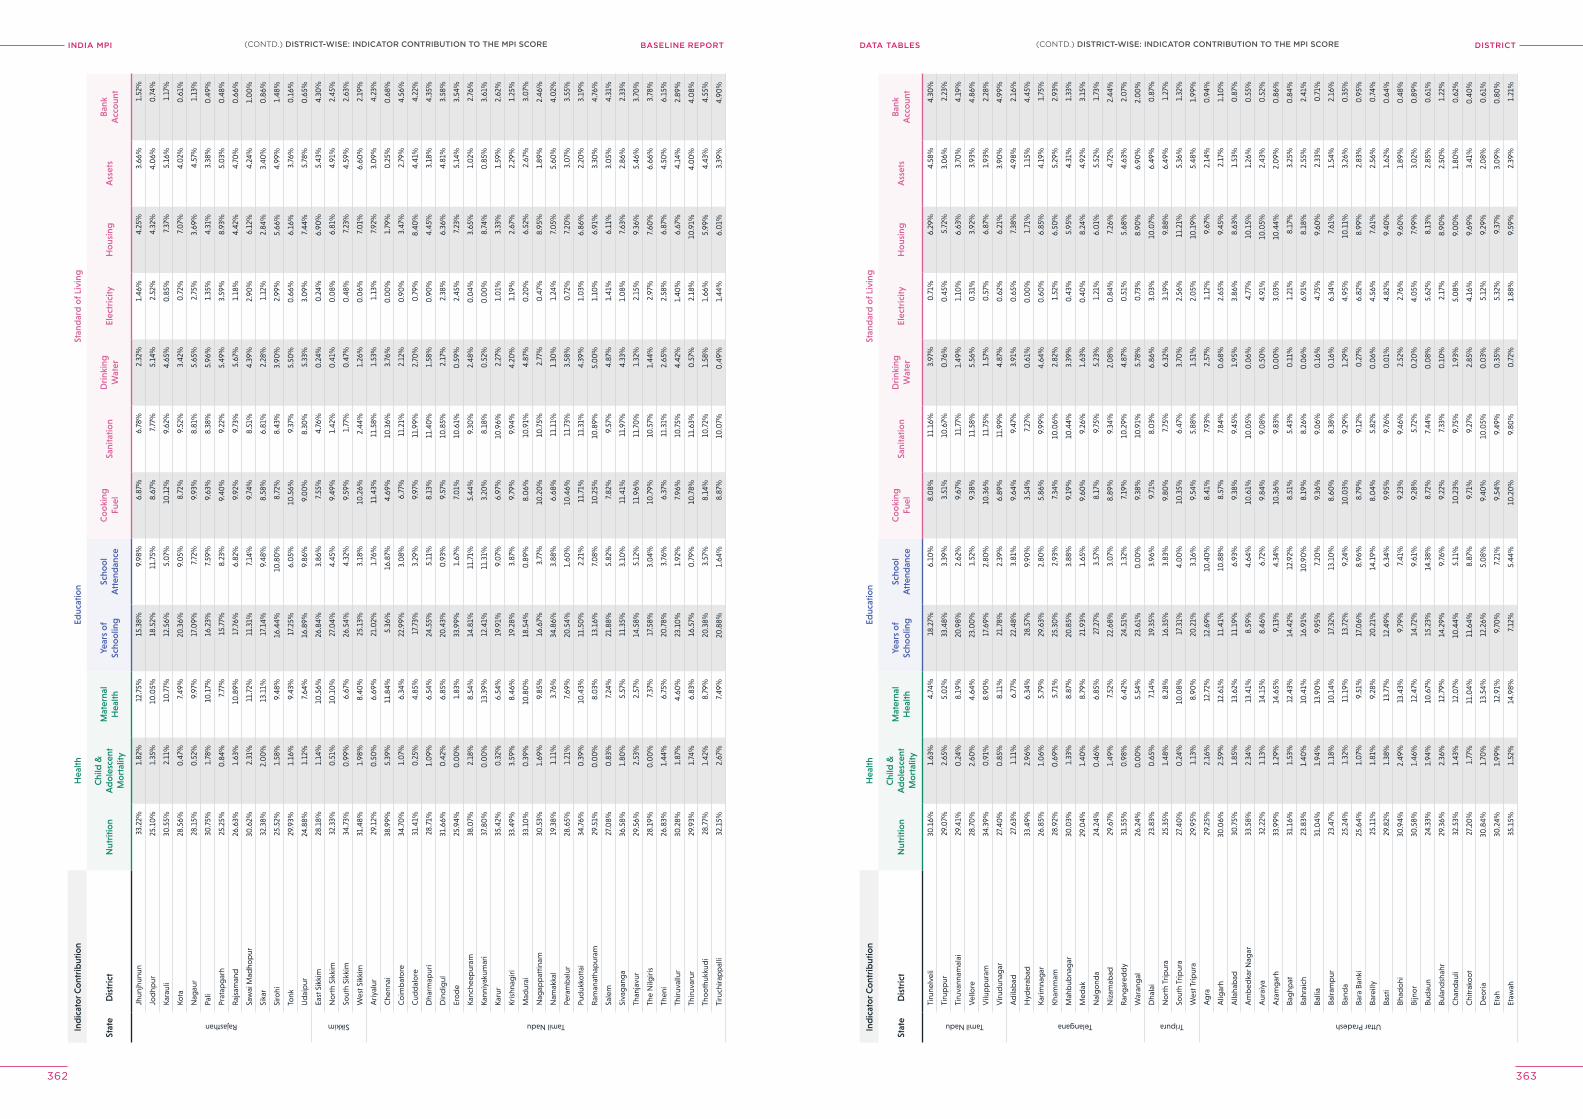
INDIA MPI BASELINE REPORT DISTrICTDATA TABleS
362 363
Ind
icat
or C
ont
rib
utio
nH
ealth
Educ
atio
nSt
and
ard
of L
ivin
g
Stat
eD
istr
ict
Nut
ritio
nC
hild
&
Ad
ole
scen
t M
ort
ality
Mat
erna
l H
ealth
Year
s o
f Sc
hoo
ling
Scho
ol
Att
end
ance
Co
oki
ng
Fuel
Sani
tatio
nD
rink
ing
Wat
erEl
ectr
icity
Ho
usin
gA
sset
sB
ank
Acc
oun
t
Rajasthan
Jhun
jhun
un33
.22%
1.82
%12
.75%
15.3
8%9.
98%
6.87
%6.
78%
2.32
%1.
46%
4.25
%3.
66%
1.52
%
Jod
hpur
25.1
0%
1.35
%10
.05%
18.5
2%11
.75%
8.67
%7.
77%
5.14
%2.
52%
4.32
%4.
06%
0.7
4%
Kara
uli
30.5
5%2.
11%
10.7
7%12
.56%
5.0
7%10
.12%
9.62
%4.
65%
0.8
5%7.
37%
5.16
%1.
17%
Kota
28.5
6%0
.47%
7.49
%20
.36%
9.0
5%8.
72%
9.52
%3.
42%
0.7
2%7.
07%
4.0
2%0
.61%
Nag
aur
28.1
5%0
.52%
9.97
%17
.09%
7.72
%9.
93%
8.81
%5.
65%
2.75
%3.
69%
4.57
%1.
13%
Pali
30.7
5%1.
78%
10.1
7%16
.23%
7.59
%9.
63%
8.38
%5.
96%
1.35
%4.
31%
3.38
%0
.49%
Prat
apg
arh
25.2
5%0
.84%
7.77
%15
.77%
8.23
%9.
40%
9.22
%5.
49%
3.59
%8.
93%
5.0
3%0
.48%
Raj
sam
and
26.6
3%1.
63%
10.8
9%17
.76%
6.82
%9.
92%
9.73
%5.
67%
1.18
%4.
42%
4.70
%0
.66%
Saw
ai M
adho
pur
30.6
2%2.
31%
11.7
2%11
.31%
7.14
%9.
74%
8.51
%4.
39%
2.90
%6.
12%
4.24
%1.
00
%
Sika
r32
.38%
2.0
0%
13.1
1%17
.14%
9.48
%8.
58%
6.81
%2.
28%
1.12
%2.
84%
3.40
%0
.86%
Siro
hi25
.52%
1.58
%9.
48%
16.4
4%10
.80
%8.
72%
8.43
%3.
90%
2.99
%5.
66%
4.99
%1.
48%
Tonk
29.9
3%1.
16%
9.43
%17
.25%
6.0
5%10
.56%
9.37
%5.
50%
0.6
6%6.
16%
3.76
%0
.16%
Ud
aip
ur24
.88%
1.12
%7.
64%
16.8
9%9.
86%
9.0
0%
8.30
%5.
33%
3.0
9%7.
44%
5.78
%0
.65%
Sikkim
East
Sik
kim
28.1
8%1.
14%
10.5
6%26
.84%
3.86
%7.
55%
4.76
%0
.24%
0.2
4%6.
90%
5.43
%4.
30%
No
rth
Sikk
im32
.33%
0.5
1%10
.10
%27
.04%
4.45
%9.
49%
1.42
%0
.41%
0.0
8%6.
81%
4.91
%2.
45%
Sout
h Si
kkim
34.7
3%0
.99%
6.67
%26
.54%
4.32
%9.
59%
1.77
%0
.47%
0.4
8%7.
23%
4.59
%2.
63%
Wes
t Sik
kim
31.4
8%1.
98%
8.40
%25
.13%
3.18
%10
.26%
2.44
%1.
26%
0.0
6%7.
01%
6.60
%2.
19%
Tamil Nadu
Ariy
alur
29.1
2%0
.50
%6.
69%
21.0
2%1.
76%
11.4
3%11
.58%
1.53
%1.
13%
7.92
%3.
09%
4.23
%
Che
nnai
38.9
9%5.
39%
11.8
4%5.
36%
16.8
7%4.
69%
10.3
6%3.
76%
0.0
0%
1.79
%0
.25%
0.6
8%
Co
imb
ato
re34
.70
%1.
07%
6.34
%22
.99%
3.0
8%6.
77%
11.2
1%2.
12%
0.9
0%
3.47
%2.
79%
4.56
%
Cud
dal
ore
31.4
1%0
.25%
4.85
%17
.73%
3.29
%9.
97%
11.9
9%2.
70%
0.7
9%8.
40%
4.41
%4.
22%
Dha
rmap
uri
28.7
1%1.
09%
6.54
%24
.55%
5.11
%8.
13%
11.4
0%
1.58
%0
.90
%4.
45%
3.18
%4.
35%
Din
dig
ul31
.66%
0.4
2%6.
85%
20.4
3%0
.93%
9.57
%10
.85%
2.17
%2.
38%
6.36
%4.
81%
3.58
%
Ero
de
25.9
4%0
.00
%1.
83%
33.9
9%1.
67%
7.0
1%10
.61%
0.5
9%2.
45%
7.23
%5.
14%
3.54
%
Kanc
heep
uram
38.0
7%2.
18%
8.54
%14
.81%
11.7
1%5.
44%
9.30
%2.
48%
0.0
4%3.
65%
1.0
2%2.
76%
Kann
iyak
umar
i37
.80
%0
.00
%13
.39%
12.4
1%11
.31%
3.20
%8.
18%
0.5
2%0
.00
%8.
74%
0.8
5%3.
61%
Karu
r35
.42%
0.3
2%6.
54%
19.9
1%9.
07%
6.97
%10
.96%
2.27
%1.
01%
3.33
%1.
59%
2.62
%
Kris
hnag
iri33
.49%
3.59
%8.
46%
19.2
8%3.
87%
9.79
%9.
94%
4.20
%1.
19%
2.67
%2.
29%
1.25
%
Mad
urai
33.1
0%
0.3
9%10
.80
%18
.54%
0.8
9%8.
06%
10.9
1%4.
87%
0.2
0%
6.52
%2.
67%
3.0
7%
Nag
app
attin
am30
.53%
1.69
%9.
85%
16.6
7%3.
77%
10.2
0%
10.7
5%2.
77%
0.4
7%8.
95%
1.89
%2.
46%
Nam
akka
l19
.38%
1.11
%3.
76%
34.8
6%3.
88%
6.68
%11
.11%
1.30
%1.
24%
7.0
5%5.
60%
4.0
2%
Pera
mb
alur
28.6
5%1.
21%
7.69
%20
.54%
1.60
%10
.46%
11.7
3%3.
58%
0.7
2%7.
20%
3.0
7%3.
55%
Pud
ukko
ttai
34.7
6%0
.39%
10.4
3%11
.50
%2.
21%
11.7
1%11
.31%
4.39
%1.
03%
6.86
%2.
20%
3.19
%
Ram
anat
hap
uram
29.5
1%0
.00
%8.
03%
13.1
6%7.
08%
10.2
5%10
.89%
5.0
0%
1.10
%6.
91%
3.30
%4.
76%
Sale
m27
.08%
0.8
3%7.
24%
21.8
8%5.
82%
7.82
%9.
57%
4.87
%1.
41%
6.11
%3.
05%
4.31
%
Siva
gan
ga
36.5
8%1.
80%
5.57
%11
.35%
3.10
%11
.41%
11.9
7%4.
33%
1.0
8%7.
63%
2.86
%2.
33%
Than
javu
r29
.56%
2.53
%2.
57%
14.5
8%5.
12%
11.9
6%11
.70
%1.
32%
2.15
%9.
36%
5.46
%3.
70%
The
Nilg
iris
28.1
9%0
.00
%7.
37%
17.5
8%3.
04%
10.7
9%10
.57%
1.44
%2.
97%
7.60
%6.
66%
3.78
%
Then
i26
.83%
1.44
%6.
75%
20.7
8%3.
76%
6.37
%11
.31%
2.65
%2.
58%
6.87
%4.
50%
6.15
%
Thiru
vallu
r30
.28%
1.87
%4.
60%
23.1
0%
1.92
%7.
96%
10.7
5%4.
42%
1.40
%6.
67%
4.14
%2.
89%
Thiru
varu
r29
.93%
1.74
%6.
83%
16.5
7%0
.79%
10.7
8%11
.63%
0.5
7%2.
18%
10.9
1%4.
00
%4.
08%
Tho
oth
ukku
di
28.7
7%1.
42%
8.79
%20
.38%
3.57
%8.
14%
10.7
2%1.
58%
1.66
%5.
99%
4.43
%4.
55%
Tiru
chira
pp
alli
32.1
5%2.
67%
7.49
%20
.88%
1.64
%8.
87%
10.0
7%0
.49%
1.44
%6.
01%
3.39
%4.
90%
Ind
icat
or C
ont
rib
utio
nH
ealth
Educ
atio
nSt
and
ard
of L
ivin
g
Stat
eD
istr
ict
Nut
ritio
nC
hild
&
Ad
ole
scen
t M
ort
ality
Mat
erna
l H
ealth
Year
s o
f Sc
hoo
ling
Scho
ol
Att
end
ance
Co
oki
ng
Fuel
Sani
tatio
nD
rink
ing
Wat
erEl
ectr
icity
Ho
usin
gA
sset
sB
ank
Acc
oun
t
Tamil Nadu
Tiru
nelv
eli
30.1
6%1.
63%
4.74
%18
.27%
6.10
%8.
08%
11.1
6%3.
97%
0.7
1%6.
29%
4.58
%4.
30%
Tiru
pp
ur29
.07%
2.65
%5.
02%
33.4
8%3.
39%
3.51
%10
.67%
0.7
6%0
.45%
5.72
%3.
06%
2.23
%
Tiru
vann
amal
ai29
.41%
0.2
4%8.
19%
20.9
8%2.
62%
9.67
%11
.77%
1.49
%1.
10%
6.63
%3.
70%
4.19
%
Vel
lore
28.7
0%
2.60
%4.
64%
23.0
0%
1.52
%9.
38%
11.5
8%5.
56%
0.3
1%3.
92%
3.93
%4.
86%
Vilu
pp
uram
34.3
9%0
.91%
8.90
%17
.69%
2.80
%10
.36%
11.7
5%1.
57%
0.5
7%6.
87%
1.93
%2.
28%
Viru
dun
agar
27.4
0%
0.8
5%8.
11%
21.7
8%2.
39%
6.89
%11
.99%
4.87
%0
.62%
6.21
%3.
90%
4.99
%
Telangana
Ad
ilab
ad27
.63%
1.11
%6.
77%
22.4
8%3.
81%
9.64
%9.
47%
3.91
%0
.65%
7.38
%4.
98%
2.16
%
Hyd
erab
ad33
.49%
2.96
%6.
34%
28.5
7%9.
90%
3.54
%7.
27%
0.6
1%0
.00
%1.
71%
1.15
%4.
45%
Karim
nag
ar26
.85%
1.0
6%5.
79%
29.6
3%2.
80%
5.86
%9.
99%
4.64
%0
.60
%6.
85%
4.19
%1.
75%
Kham
mam
28.9
2%0
.69%
5.71
%25
.30
%2.
93%
7.34
%10
.06%
2.82
%1.
52%
6.50
%5.
29%
2.93
%
Mah
bub
nag
ar30
.03%
1.33
%8.
87%
20.8
5%3.
88%
9.19
%10
.44%
3.39
%0
.43%
5.95
%4.
31%
1.33
%
Med
ak29
.04%
1.40
%8.
79%
21.9
3%1.
65%
9.60
%9.
26%
1.63
%0
.40
%8.
24%
4.92
%3.
15%
Nal
go
nda
24.2
4%0
.46%
6.85
%27
.27%
3.57
%8.
17%
9.75
%5.
23%
1.21
%6.
01%
5.52
%1.
73%
Niz
amab
ad29
.67%
1.49
%7.
52%
22.6
8%3.
07%
8.89
%9.
34%
2.0
8%0
.84%
7.26
%4.
72%
2.44
%
Ran
gar
edd
y31
.55%
0.9
8%6.
42%
24.5
1%1.
32%
7.19
%10
.29%
4.87
%0
.51%
5.68
%4.
63%
2.0
7%
War
ang
al26
.24%
0.0
0%
5.54
%23
.61%
0.0
0%
9.38
%10
.91%
5.78
%0
.73%
8.90
%6.
90%
2.0
0%
Tripura
Dha
lai
23.8
3%0
.65%
7.14
%19
.35%
3.96
%9.
71%
8.0
3%6.
86%
3.0
3%10
.07%
6.49
%0
.87%
No
rth
Trip
ura
25.3
5%1.
48%
8.28
%16
.35%
3.83
%9.
80%
7.75
%6.
32%
3.19
%9.
88%
6.49
%1.
27%
Sout
h Tr
ipur
a27
.40
%0
.24%
10.0
8%17
.31%
4.0
0%
10.3
5%6.
47%
3.70
%2.
56%
11.2
1%5.
36%
1.32
%
Wes
t Trip
ura
29.9
5%1.
13%
8.90
%20
.21%
3.16
%9.
54%
5.88
%1.
51%
2.0
5%10
.19%
5.48
%1.
99%
Uttar Pradesh
Ag
ra29
.25%
2.16
%12
.72%
12.6
9%10
.40
%8.
41%
7.93
%2.
57%
1.12
%9.
67%
2.14
%0
.94%
Alig
arh
30.0
6%2.
59%
12.6
1%11
.41%
10.8
8%8.
57%
7.84
%0
.68%
2.65
%9.
45%
2.17
%1.
10%
Alla
hab
ad30
.75%
1.85
%13
.62%
11.1
9%6.
93%
9.38
%9.
45%
1.95
%3.
86%
8.63
%1.
53%
0.8
7%
Am
bed
kar N
agar
33.5
8%2.
34%
13.4
1%8.
59%
4.64
%10
.61%
10.0
5%0
.06%
4.77
%10
.15%
1.26
%0
.55%
Aur
aiya
32.2
2%1.
13%
14.1
5%8.
46%
6.72
%9.
84%
9.0
8%0
.50
%4.
91%
10.0
5%2.
43%
0.5
2%
Aza
mg
arh
33.9
9%1.
29%
14.6
5%9.
13%
4.34
%10
.36%
9.83
%0
.00
%3.
03%
10.4
4%2.
09%
0.8
6%
Bag
hpat
31.1
6%1.
53%
12.4
3%14
.42%
12.9
2%8.
51%
5.43
%0
.11%
1.21
%8.
17%
3.25
%0
.84%
Bahr
aich
23.8
3%1.
40%
10.4
1%16
.91%
10.9
0%
8.19
%8.
26%
0.0
6%6.
91%
8.18
%2.
55%
2.41
%
Balli
a31
.04%
1.94
%13
.90
%9.
95%
7.20
%9 .
36%
9.0
6%0
.16%
4.75
%9.
60%
2.33
%0
.71%
Balra
mp
ur23
.47%
1.18
%10
.14%
17.3
2%13
.10
%8.
60%
8.38
%0
.16%
6.34
%7.
61%
1.54
%2.
16%
Band
a25
.24%
1.32
%11
.19%
13.7
2%9.
24%
10.0
3%9.
29%
1.29
%4.
95%
10.1
1%3.
26%
0.3
5%
Bara
Ban
ki25
.64%
1.0
7%9.
51%
17.0
6%8.
96%
8.79
%9.
12%
0.2
7%6.
82%
8.99
%2.
83%
0.9
5%
Bare
illy
25.1
1%1.
81%
9.28
%20
.21%
14.1
9%8.
04%
5.82
%0
.06%
4.56
%7.
61%
2.56
%0
.74%
Bast
i29
.82%
1.38
%13
.77%
12.4
9%6.
34%
9.95
%9.
76%
0.0
1%4.
82%
9.40
%1.
62%
0.6
4%
Bhad
ohi
30.9
4%2.
49%
13.4
3%9.
79%
7.41
%9.
23%
9.46
%2.
52%
2.76
%9.
60%
1.89
%0
.48%
Bijn
or
30.5
8%1.
46%
12.4
7%14
.72%
9.61
%9.
28%
5.72
%0
.20
%4.
05%
7.99
%3.
02%
0.8
9%
Bud
aun
24.3
3%1.
94%
10.6
7%15
.23%
14.3
8%8.
72%
7.44
%0
.08%
5.62
%8.
13%
2.85
%0
.61%
Bula
ndsh
ahr
29.3
6%2.
36%
12.7
9%14
.29%
9.76
%9.
22%
7.33
%0
.10
%2.
17%
8.90
%2.
50%
1.22
%
Cha
ndau
li32
.53%
1.43
%12
.07%
10.4
4%5.
11%
10.2
3%9.
75%
1.93
%5.
08%
9.0
0%
1.80
%0
.62%
Chi
trak
oo
t27
.20
%1.
77%
11.0
4%11
.64%
8.87
%9.
71%
9.27
%2.
85%
4.16
%9.
69%
3.41
%0
.40
%
Deo
ria30
.84%
1.70
%13
.54%
12.2
6%5.
08%
9.40
%10
.05%
0.0
3%5.
12%
9.29
%2.
08%
0.6
1%
Etah
30.2
4%1.
99%
12.9
1%9.
70%
7.21
%9.
54%
9.49
%0
.35%
5.32
%9.
37%
3.0
9%0
.80
%
Etaw
ah35
.15%
1.52
%14
.98%
7.12
%5.
44%
10.2
0%
9.80
%0
.72%
1.88
%9.
59%
2.39
%1.
21%
(CONTD.) DISTrICT-WISe: INDICATor CoNTrIBUTIoN To The MpI SCore(CONTD.) DISTrICT-WISe: INDICATor CoNTrIBUTIoN To The MpI SCore
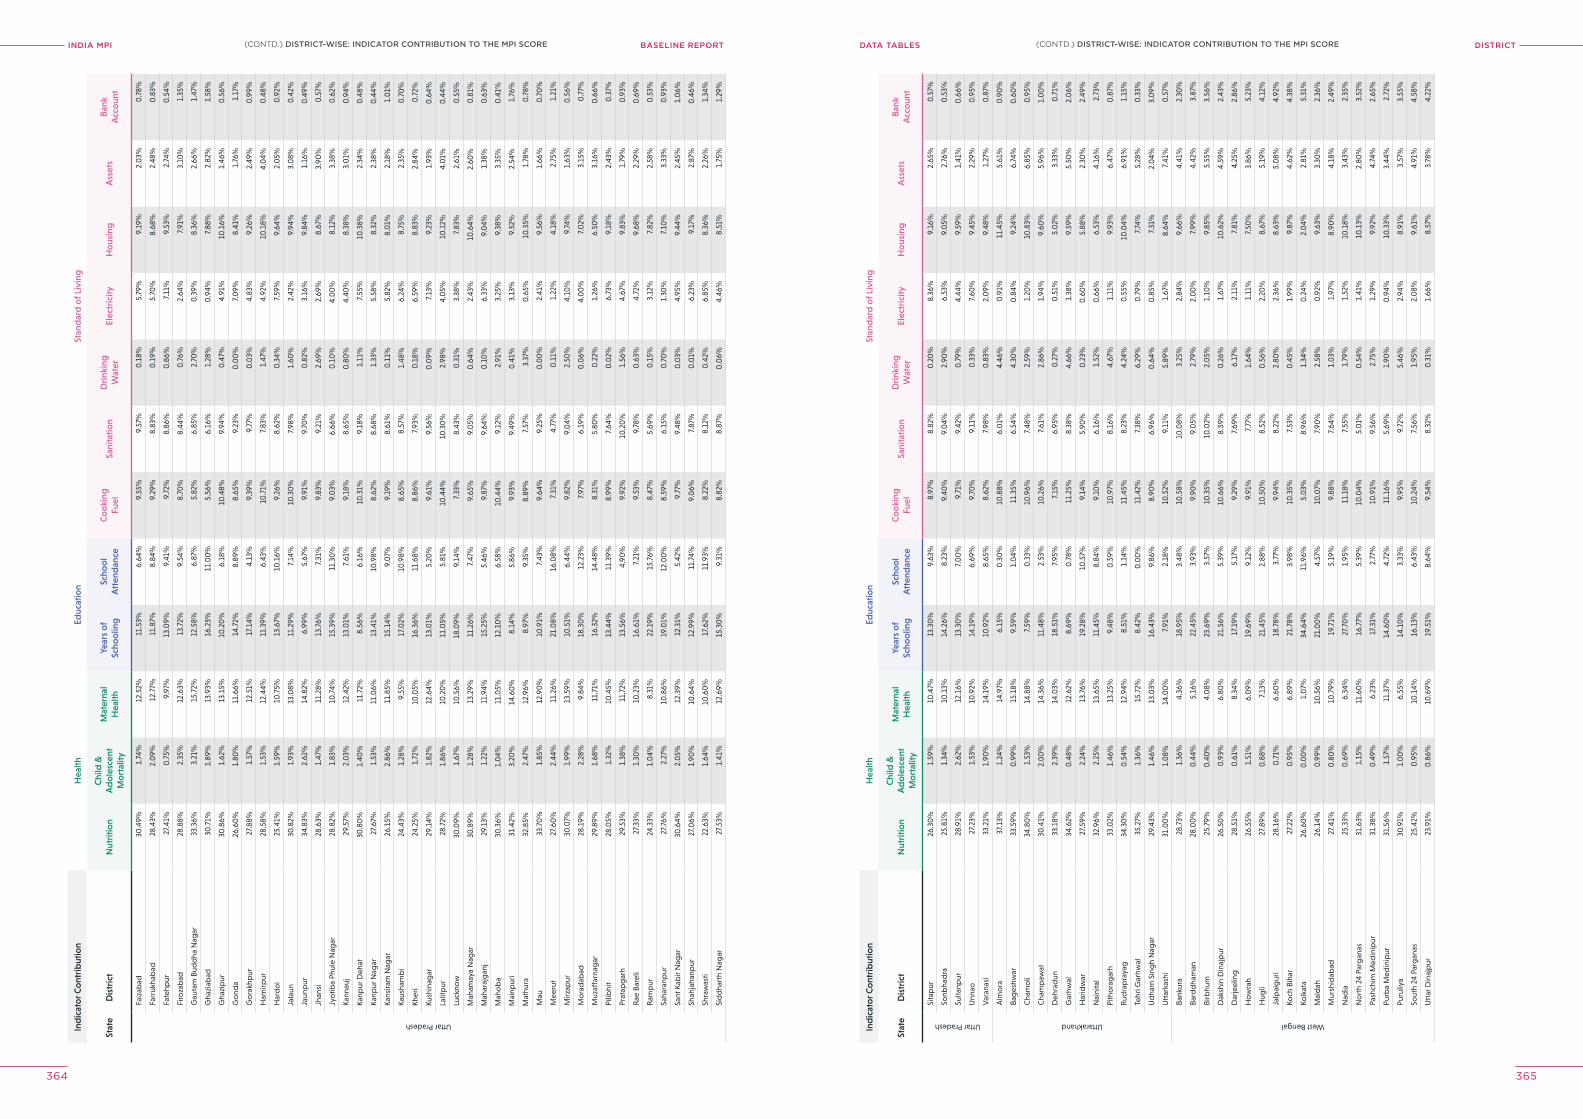
INDIA MPI BASELINE REPORT DISTrICTDATA TABleS
364 365
Ind
icat
or C
ont
rib
utio
nH
ealth
Educ
atio
nSt
and
ard
of L
ivin
g
Stat
eD
istr
ict
Nut
ritio
nC
hild
&
Ad
ole
scen
t M
ort
ality
Mat
erna
l H
ealth
Year
s o
f Sc
hoo
ling
Scho
ol
Att
end
ance
Co
oki
ng
Fuel
Sani
tatio
nD
rink
ing
Wat
erEl
ectr
icity
Ho
usin
gA
sset
sB
ank
Acc
oun
t
Uttar Pradesh
Faiz
abad
30.4
9%1.
74%
12.5
2%11
.53%
6.64
%9.
55%
9.57
%0
.18%
5.79
%9.
19%
2.0
3%0
.78%
Farr
ukha
bad
28.4
3%2.
09%
12.7
7%11
.87%
8.84
%9.
29%
8.83
%0
.19%
5.70
%8.
68%
2.48
%0
.83%
Fate
hpur
27.4
1%0
.75%
9.97
%13
.09%
9.41
%9.
72%
8.86
%0
.86%
7.11
%9.
53%
2.74
%0
.54%
Firo
zab
ad28
.88%
2.35
%12
.63%
13.7
2%9.
54%
8.70
%8.
44%
0.7
6%2.
64%
7.91
%3.
10%
1.35
%
Gau
tam
Bud
dha
Nag
ar33
.36%
3.21
%15
.72%
12.5
8%6.
87%
5.82
%6.
85%
2.70
%0
.39%
8.36
%2.
66%
1.47
%
Gha
ziab
ad30
.71%
1.89
%13
.93%
16.2
3%11
.00
%5.
56%
6.16
%1.
28%
0.9
4%7.
88%
2.82
%1.
58%
Gha
zip
ur30
.86%
1.62
%13
.15%
10.2
0%
6.18
%10
.48%
9.94
%0
.47%
4.91
%10
.16%
1.46
%0
.56%
Go
nda
26.6
0%
1.80
%11
.66%
14.7
2%8.
89%
8.65
%9.
23%
0.0
0%
7.0
9%8.
41%
1.76
%1.
17%
Go
rakh
pur
27.8
8%1.
57%
12.5
1%17
.14%
4.13
%9.
39%
9.77
%0
.03%
4.83
%9.
26%
2.49
%0
.99%
Ham
irpur
28.5
8%1.
53%
12.4
4%11
.39%
6.43
%10
.71%
7.83
%1.
47%
4.92
%10
.18%
4.0
4%0
.48%
Har
do
i25
.41%
1.59
%10
.75%
13.6
7%10
.16%
9.26
%8.
62%
0.3
4%7.
59%
9.64
%2.
05%
0.9
2%
Jala
un30
.82%
1.93
%13
.08%
11.2
9%7.
14%
10.3
0%
7.98
%1.
60%
2.42
%9.
94%
3.0
8%0
.42%
Jaun
pur
34.8
3%2.
62%
14.8
2%6.
99%
5.67
%9.
91%
9.70
%0
.82%
3.16
%9.
84%
1.16
%0
.49%
Jhan
si28
.63%
1.47
%11
.28%
13.7
6%7.
31%
9.83
%9.
21%
2.69
%2.
69%
8.67
%3.
90%
0.5
7%
Jyo
tiba
Phul
e N
agar
28.8
2%1.
83%
10.7
4%15
.39%
11.3
0%
9.0
3%6.
66%
0.1
0%
4.0
0%
8.12
%3.
38%
0.6
2%
Kann
auj
29.5
7%2.
03%
12.4
2%13
.01%
7.61
%9.
18%
8.65
%0
.80
%4.
40%
8.38
%3.
01%
0.9
4%
Kanp
ur D
ehat
30.8
0%
1.40
%11
.72%
8.56
%6.
16%
10.3
1%9.
18%
1.11
%7.
55%
10.3
8%2.
34%
0.4
8%
Kanp
ur N
agar
27.6
7%1.
53%
11.0
6%13
.41%
10.9
8%8.
62%
8.68
%1.
33%
5.58
%8.
32%
2.38
%0
.44%
Kans
iram
Nag
ar26
.15%
2.86
%11
.85%
15.1
4%9.
07%
9.19
%8.
61%
0.1
1%5.
82%
8.0
1%2.
18%
1.0
1%
Kaus
ham
bi
24.4
3%1.
28%
9.55
%17
.02%
10.9
8%8.
65%
8.57
%1.
48%
6.24
%8.
75%
2.35
%0
.70
%
Kher
i24
.25%
1.72
%10
.05%
16.3
6%11
.68%
8.86
%7.
93%
0.1
8%6.
59%
8.83
%2.
84%
0.7
2%
Kush
inag
ar29
.14%
1.82
%12
.64%
13.0
1%5.
20%
9.61
%9.
56%
0.0
9%7.
13%
9.23
%1.
93%
0.6
4%
Lalit
pur
28.7
2%1.
86%
10.2
0%
11.0
5%5.
81%
10.4
4%10
.30
%2.
98%
4.0
5%10
.12%
4.0
1%0
.44%
Luck
now
30.0
9%1.
67%
10.5
6%18
.09%
9.14
%7.
33%
8.43
%0
.31%
3.38
%7.
83%
2.61
%0
.55%
Mah
amay
a N
agar
30.8
9%1.
28%
13.2
9%11
.26%
7.47
%9.
65%
9.0
5%0
.64%
2.43
%10
.64%
2.60
%0
.81%
Mah
araj
gan
j29
.13%
1.22
%11
.94%
15.2
5%5.
46%
9.87
%9.
64%
0.1
0%
6.33
%9.
04%
1.38
%0
.63%
Mah
ob
a30
.36%
1.0
4%11
.05%
12.1
0%
6.58
%10
.44%
9.12
%2.
91%
3.25
%9.
38%
3.35
%0
.41%
Mai
npur
i31
.42%
3.20
%14
.60
%8.
14%
5.86
%9.
93%
9.49
%0
.41%
3.13
%9.
52%
2.54
%1.
76%
Mat
hura
32.8
5%2.
47%
12.9
6%8.
97%
9.35
%8.
89%
7.57
%3.
37%
0.6
5%10
.35%
1.78
%0
.78%
Mau
33.7
0%
1.85
%12
.90
%10
.91%
7.43
%9.
64%
9.25
%0
.00
%2.
41%
9.56
%1.
66%
0.7
0%
Mee
rut
27.6
0%
2.44
%11
.26%
21.0
8%16
.08%
7.31
%4.
77%
0.1
1%1.
22%
4.18
%2.
75%
1.21
%
Mirz
apur
30.0
7%1.
99%
13.5
9%10
.51%
6.44
%9.
82%
9.0
4%2.
50%
4.10
%9.
74%
1.63
%0
.56%
Mo
rad
abad
28.1
9%2.
28%
9.84
%18
.30
%12
.23%
7.97
%6.
19%
0.0
6%4.
00
%7.
02%
3.15
%0
.77%
Muz
affa
rnag
ar29
.89%
1.68
%11
.71%
16.3
2%14
.48%
8.31
%5.
80%
0.2
2%1.
26%
6.50
%3.
16%
0.6
6%
Pilib
hit
28.0
5%1.
32%
10.4
5%13
.44%
11.3
9%8.
99%
7.64
%0
.02%
6.73
%9.
18%
2.43
%0
.37%
Prat
apg
arh
29.5
3%1.
38%
11.7
2%13
.56%
4.90
%9.
92%
10.2
0%
1.56
%4.
67%
9.83
%1.
79%
0.9
3%
Rae
Bar
eli
27.3
3%1.
30%
10.2
3%16
.61%
7.21
%9.
53%
9.78
%0
.63%
4.72
%9.
68%
2.29
%0
.69%
Ram
pur
24.3
3%1.
04%
8.31
%22
.19%
15.7
6%8.
47%
5.69
%0
.15%
3.12
%7.
82%
2.58
%0
.53%
Saha
ranp
ur27
.76%
2.27
%10
.86%
19.0
1%12
.00
%8.
59%
6.15
%0
.70
%1.
30%
7.10
%3.
33%
0.9
3%
Sant
Kab
ir N
agar
30.6
4%2.
05%
12.3
9%12
.31%
5.42
%9.
77%
9.48
%0
.03%
4.95
%9.
44%
2.45
%1.
06%
Shah
jaha
npur
27.0
6%1.
90%
10.6
4%12
.99%
11.7
4%9.
06%
7.87
%0
.01%
6.23
%9.
17%
2.87
%0
.46%
Shra
was
ti22
.63%
1.64
%10
.60
%17
.62%
11.9
3%8.
22%
8.12
%0
.42%
6.85
%8.
36%
2.26
%1.
34%
Sid
dha
rth
Nag
ar27
.53%
1.41
%12
.69%
15.3
0%
9.31
%8.
82%
8.87
%0
.06%
4.46
%8.
51%
1.75
%1.
29%
Ind
icat
or C
ont
rib
utio
nH
ealth
Educ
atio
nSt
and
ard
of L
ivin
g
Stat
eD
istr
ict
Nut
ritio
nC
hild
&
Ad
ole
scen
t M
ort
ality
Mat
erna
l H
ealth
Year
s o
f Sc
hoo
ling
Scho
ol
Att
end
ance
Co
oki
ng
Fuel
Sani
tatio
nD
rink
ing
Wat
erEl
ectr
icity
Ho
usin
gA
sset
sB
ank
Acc
oun
t
Uttar Pradesh
Sita
pur
26.3
0%
1.59
%10
.47%
13.3
0%
9.63
%8.
97%
8.82
%0
.20
%8.
36%
9.16
%2.
65%
0.5
7%
Sonb
had
ra25
.81%
1.34
%10
.13%
14.2
6%8.
23%
9.40
%9.
04%
2.90
%6.
53%
9.0
5%2.
76%
0.5
3%
Sulta
npur
28.9
1%2.
62%
12.1
6%13
.30
%7.
00
%9.
71%
9.42
%0
.79%
4.44
%9.
59%
1.41
%0
.66%
Unn
ao27
.23%
1.53
%10
.92%
14.1
9%6.
69%
9.70
%9.
11%
0.3
3%7.
60%
9.45
%2.
29%
0.9
5%
Var
anas
i33
.21%
1.90
%14
.19%
10.9
2%8.
65%
8.62
%7.
98%
0.8
3%2.
09%
9.48
%1.
27%
0.8
7%
Uttarakhand
Alm
ora
37.1
3%1.
24%
14.9
7%6.
15%
0.3
0%
10.8
8%6.
01%
4.46
%0
.91%
11.4
5%5.
61%
0.9
0%
Bag
eshw
ar33
.59%
0.9
9%15
.18%
9.59
%1.
04%
11.3
5%6.
54%
4.30
%0
.84%
9.24
%6.
74%
0.6
0%
Cha
mo
li34
.80
%1.
53%
14.8
8%7.
59%
0.3
3%10
.96%
7.48
%2.
59%
1.20
%10
.83%
6.85
%0
.95%
Cha
mp
awat
30.4
1%2.
00
%14
.36%
11.4
8%2.
53%
10.2
6%7.
61%
2.86
%1.
94%
9.60
%5.
96%
1.0
0%
Deh
rad
un33
.18%
2.39
%14
.03%
18.5
1%7.
95%
7.15
%6.
95%
0.2
7%0
.51%
5.0
2%3.
33%
0.7
1%
Gar
hwal
34.6
2%0
.48%
12.6
2%8.
69%
0.7
8%11
.25%
8.38
%4.
66%
1.38
%9.
59%
5.50
%2.
06%
Har
idw
ar27
.59%
2.24
%13
.76%
19.2
8%10
.57%
9.14
%5.
90%
0.2
3%0
.60
%5.
88%
2.30
%2.
49%
Nai
nita
l32
.96%
2.25
%13
.65%
11.4
5%8.
84%
9.10
%6.
16%
1.52
%0
.66%
6.53
%4.
16%
2.73
%
Pith
ora
gar
h33
.02%
1.46
%13
.25%
9.48
%0
.59%
10.9
7%8.
16%
4.67
%1.
11%
9.93
%6.
47%
0.8
7%
Rud
rap
raya
g34
.30
%0
.54%
12.9
4%8.
51%
1.14
%11
.45%
8.23
%4.
24%
0.5
5%10
.04%
6.91
%1.
15%
Tehr
i Gar
hwal
35.2
7%1.
36%
15.7
2%8.
42%
0.0
0%
11.4
2%7.
38%
6.29
%0
.79%
7.74
%5.
28%
0.3
3%
Ud
ham
Sin
gh
Nag
ar29
.43%
1.46
%13
.03%
16.4
3%9.
86%
8.90
%6.
96%
0.6
4%0
.85%
7.31
%2.
04%
3.0
9%
Utt
arka
shi
31.0
0%
1.0
8%14
.00
%7.
91%
2.18
%10
.52%
9.11
%5.
89%
1.67
%8.
64%
7.41
%0
.57%
West Bengal
Bank
ura
28.7
3%1.
36%
4.36
%18
.95%
3.48
%10
.58%
10.0
8%3.
25%
2.84
%9.
66%
4.41
%2.
30%
Bard
dha
man
28.0
0%
0.4
4%5.
16%
22.4
5%3.
93%
9.90
%9.
05%
2.79
%2.
00
%7.
99%
4.42
%3.
87%
Birb
hum
25.7
9%0
.40
%4.
08%
23.6
9%3.
57%
10.3
5%10
.02%
2.0
5%1.
10%
9.85
%5.
55%
3.56
%
Dak
shin
Din
ajp
ur26
.50
%0
.93%
6.80
%21
.56%
5.39
%10
.66%
8.59
%0
.26%
1.67
%10
.62%
4.59
%2.
43%
Dar
jeel
ing
28.5
1%0
.61%
8.34
%17
.19%
5.17
%9.
29%
7.69
%6.
17%
2.11
%7.
81%
4.25
%2.
86%
Ho
wra
h26
.55%
1.51
%6.
09%
19.6
9%9.
12%
9.91
%7.
77%
1.64
%1.
11%
7.50
%3.
86%
5.23
%
Hug
li27
.89%
0.8
8%7.
13%
21.4
5%2.
88%
10.5
0%
8.52
%0
.56%
2.20
%8.
67%
5.19
%4.
12%
Jalp
aig
uri
28.1
6%0
.71%
6.60
%18
.78%
3.77
%9.
94%
8.22
%2.
80%
2.36
%8.
63%
5.0
8%4.
92%
Koch
Bih
ar27
.22%
0.9
5%6.
89%
21.7
8%3.
98%
10.3
5%7.
53%
0.4
5%1.
99%
9.87
%4.
62%
4.38
%
Kolk
ata
26.6
0%
0.0
0%
1.0
7%34
.64%
11.9
6%5.
03%
8.96
%1.
34%
0.2
4%2.
04%
2.81
%5.
31%
Mal
dah
26.1
4%0
.99%
10.5
6%21
.00
%4.
57%
10.0
7%7 .
90%
2.58
%0
.92%
9.63
%3.
30%
2.36
%
Mur
shid
abad
27.4
1%0
.80
%10
.79%
19.7
1%5.
19%
9.88
%7.
64%
1.0
3%1.
97%
8.90
%4.
18%
2.49
%
Nad
ia25
.33%
0.6
9%6.
34%
27.7
0%
1.95
%11
.18%
7.55
%1.
79%
1.52
%10
.18%
3.43
%2.
35%
No
rth
24 P
arg
anas
31.6
3%1.
15%
11.6
0%
16.7
7%5.
39%
10.0
4%5.
01%
0.5
4%1.
41%
10.1
3%2.
80%
3.52
%
Pash
chim
Med
inip
ur31
.38%
0.4
9%6.
23%
17.3
1%2.
77%
10.9
1%9.
56%
2.75
%1.
29%
9.92
%4.
74%
2.65
%
Purb
a M
edin
ipur
31.5
6%1.
57%
11.3
7%14
.60
%4.
72%
11.1
6%5.
69%
1.90
%0
.94%
10.3
3%3.
44%
2.72
%
Puru
liya
30.9
1%1.
00
%6.
55%
14.1
0%
3.33
%9.
95%
9.72
%5.
46%
2.94
%8.
91%
3.57
%3.
55%
Sout
h 24
Par
gan
as25
.42%
0.9
5%10
.14%
16.1
3%6.
43%
10.2
4%7.
56%
1.95
%2.
08%
9.61
%4.
91%
4.58
%
Utt
ar D
inaj
pur
23.9
1%0
.86%
10.6
9%19
.51%
8.64
%9.
54%
8.32
%0
.31%
1.66
%8.
57%
3.78
%4.
22%
(CONTD.) DISTrICT-WISe: INDICATor CoNTrIBUTIoN To The MpI SCore(CONTD.) DISTrICT-WISe: INDICATor CoNTrIBUTIoN To The MpI SCore
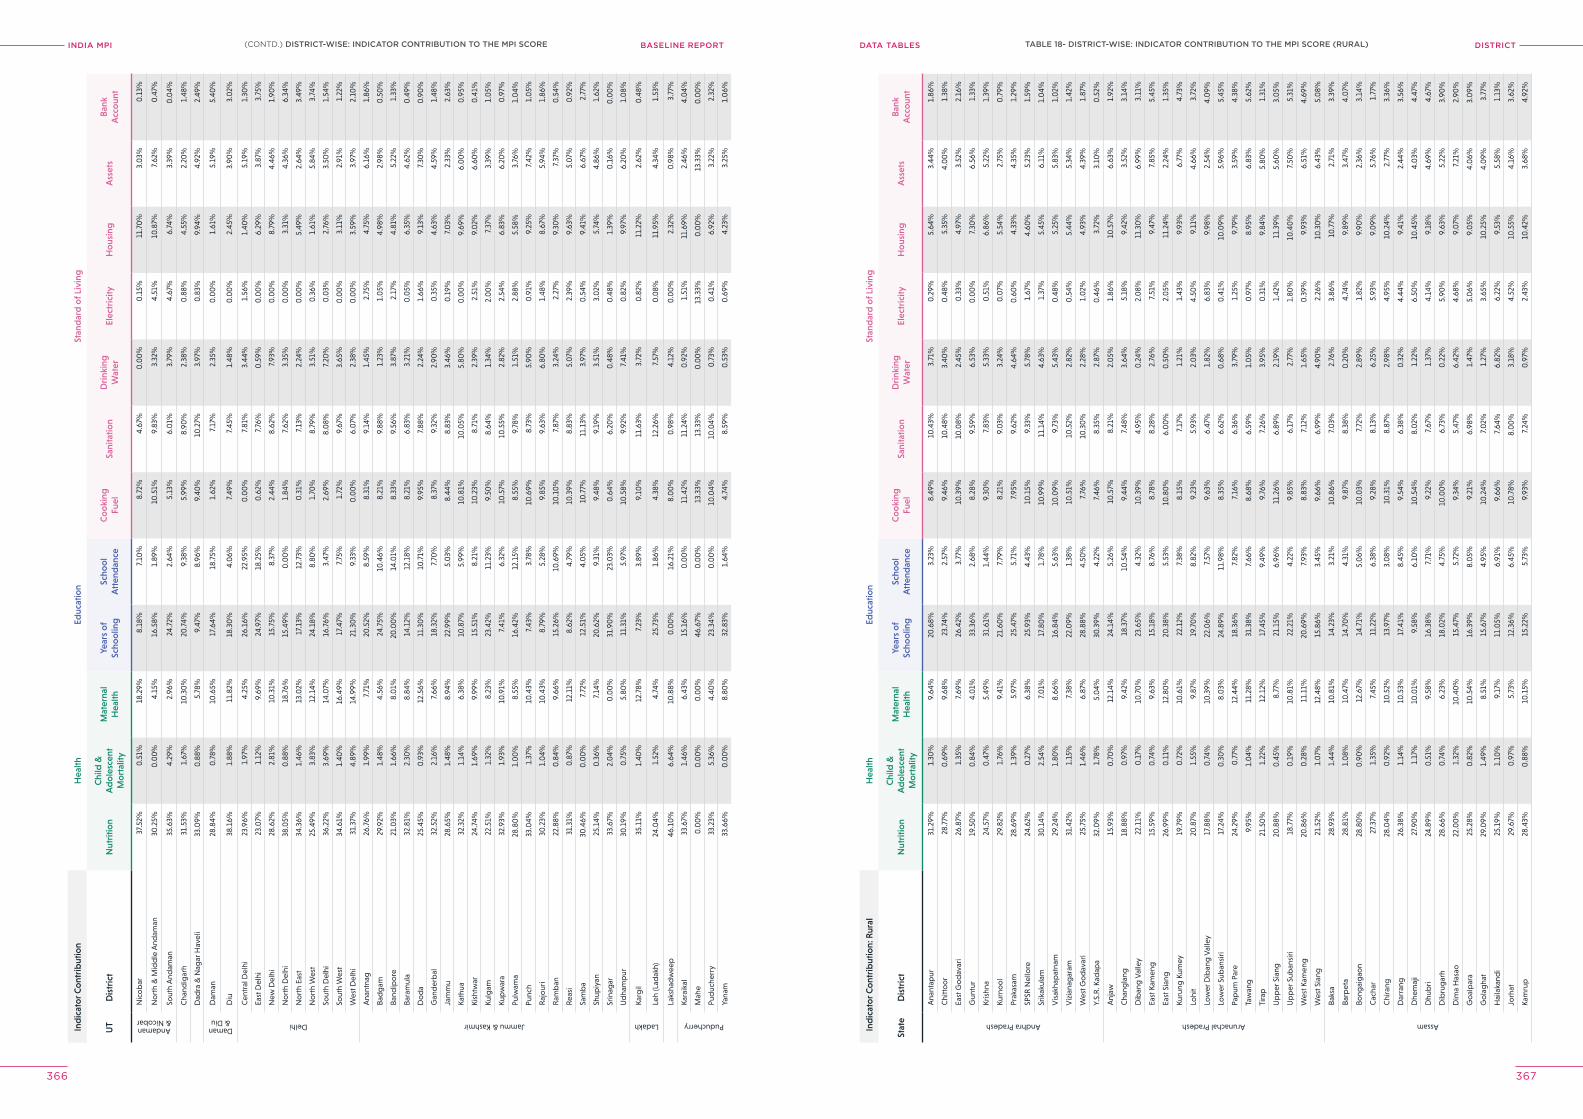
INDIA MPI BASELINE REPORT DISTrICTDATA TABleS
366 367
Ind
icat
or C
ont
rib
utio
nH
ealth
Educ
atio
nSt
and
ard
of L
ivin
g
UT
Dis
tric
tN
utri
tion
Chi
ld &
A
do
lesc
ent
Mo
rtal
ity
Mat
erna
l H
ealth
Year
s o
f Sc
hoo
ling
Scho
ol
Att
end
ance
Co
oki
ng
Fuel
Sani
tatio
nD
rink
ing
Wat
erEl
ectr
icity
Ho
usin
gA
sset
sB
ank
Acc
oun
t
Andaman & Nicobar
Nic
ob
ar37
.52%
0.5
1%18
.29%
8.18
%7.
10%
8.72
%4.
67%
0.0
0%
0.1
5%11
.70
%3.
03%
0.1
3%
No
rth
& M
idd
le A
ndam
an30
.25%
0.0
0%
4.15
%16
.58%
1.89
%10
.51%
9.83
%3.
32%
4.51
%10
.87%
7.62
%0
.47%
Sout
h A
ndam
an35
.63%
4.29
%2.
96%
24.7
2%2.
64%
5.13
%6.
01%
3.79
%4.
67%
6.74
%3.
39%
0.0
4%
Cha
ndig
arh
31.5
3%1.
67%
10.3
0%
20.7
4%9.
38%
5.99
%8.
90%
2.38
%0
.88%
4.55
%2.
20%
1.48
%
Dad
ra &
Nag
ar H
avel
i33
.09%
0.8
8%5.
78%
9.47
%8.
96%
9.40
%10
.27%
3.97
%0
.83%
9.94
%4.
92%
2.49
%
Daman & Diu
Dam
an28
.84%
0.7
8%10
.65%
17.6
4%18
.75%
1.62
%7.
17%
2.35
%0
.00
%1.
61%
5.19
%5.
40%
Diu
38.1
6%1.
88%
11.8
2%18
.30
%4.
06%
7.49
%7.
45%
1.48
%0
.00
%2.
45%
3.90
%3.
02%
Delhi
Cen
tral
Del
hi23
.96%
1.97
%4.
25%
26.1
6%22
.95%
0.0
0%
7.81
%3.
44%
1.56
%1.
40%
5.19
%1.
30%
East
Del
hi23
.07%
1.12
%9.
69%
24.9
7%18
.25%
0.6
2%7.
76%
0.5
9%0
.00
%6.
29%
3.87
%3.
75%
New
Del
hi28
.62%
2.81
%10
.31%
15.7
5%8.
37%
2.44
%8.
62%
7.93
%0
.00
%8.
79%
4.46
%1.
90%
No
rth
Del
hi38
.05%
0.8
8%18
.76%
15.4
9%0
.00
%1.
84%
7.62
%3.
35%
0.0
0%
3.31
%4.
36%
6.34
%
No
rth
East
34.3
6%1.
46%
13.0
2%17
.13%
12.7
3%0
.31%
7.13
%2.
24%
0.0
0%
5.49
%2.
64%
3.49
%
No
rth
Wes
t25
.49%
3.83
%12
.14%
24.1
8%8.
80%
1.70
%8.
79%
3.51
%0
.36%
1.61
%5.
84%
3.74
%
Sout
h D
elhi
36.2
2%3.
69%
14.0
7%16
.76%
3.47
%2.
69%
8.0
8%7.
20%
0.0
3%2.
76%
3.50
%1.
54%
Sout
h W
est
34.6
1%1.
40%
16.4
9%17
.47%
7.75
%1.
72%
9.67
%3.
65%
0.0
0%
3.11
%2.
91%
1.22
%
Wes
t Del
hi31
.37%
4.89
%14
.99%
21.3
0%
9.33
%0
.00
%6.
07%
2.38
%0
.00
%3.
59%
3.97
%2.
10%
Jammu & Kashmir
Ana
ntna
g26
.76%
1.99
%7.
71%
20.5
2%8.
59%
8.31
%9.
14%
1.45
%2.
75%
4.75
%6.
16%
1.86
%
Bad
gam
29.9
2%1.
48%
4.56
%24
.75%
10.4
6%8.
21%
9.88
%1.
23%
1.0
5%4.
98%
2.98
%0
.50
%
Band
ipo
re21
.03%
1.66
%8.
01%
20.0
0%
14.0
1%8.
33%
9.56
%3.
87%
2.17
%4.
81%
5.22
%1.
33%
Bara
mul
a32
.81%
2.30
%8.
84%
14.1
2%12
.18%
8.21
%6.
83%
3.21
%0
.05%
6.35
%4.
62%
0.4
9%
Do
da
25.4
5%0
.93%
12.5
6%11
.30
%10
.71%
9.95
%7.
88%
2.24
%1.
66%
9.13
%7.
30%
0.9
0%
Gan
der
bal
32.5
2%2.
16%
7.66
%18
.32%
7.70
%8.
37%
9.32
%2.
90%
0.3
5%4.
63%
4.59
%1.
48%
Jam
mu
28.6
5%1.
48%
8.94
%22
.99%
5.0
3%8.
44%
8.83
%3.
46%
0.1
9%7.
03%
2.33
%2.
63%
Kath
ua32
.32%
1.14
%6.
38%
10.8
7%5.
99%
10.8
1%10
.05%
5.80
%0
.00
%9.
69%
6.0
0%
0.9
5%
Kish
twar
24.7
4%1.
69%
9.99
%15
.51%
8.21
%10
.23%
8.71
%2.
39%
2.51
%9.
02%
6.60
%0
.41%
Kulg
am22
.51%
1.32
%8.
23%
23.4
2%11
.23%
9.50
%8.
64%
1.34
%2.
00
%7.
37%
3.39
%1.
05%
Kup
war
a32
.93%
1.93
%10
.91%
7.41
%6.
32%
10.5
7%10
.55%
2.82
%2.
54%
6.83
%6.
20%
0.9
7%
Pulw
ama
28.8
0%
1.0
0%
8.55
%16
.42%
12.1
5%8.
55%
9.78
%1.
51%
2.88
%5.
58%
3.76
%1.
04%
Punc
h33
.04%
1.37
%10
.43%
7.43
%3.
78%
10.6
9%8.
73%
5.90
%0
.91%
9.25
%7.
42%
1.0
5%
Raj
our
i30
.23%
1.0
4%10
.43%
8.79
%5.
28%
9.85
%9.
63%
6.80
%1.
48%
8.67
%5.
94%
1.86
%
Ram
ban
22.8
8%0
.84%
9.66
%15
.26%
10.6
9%10
.10
%7.
87%
3.24
%2.
27%
9.30
%7.
37%
0.5
4%
Reas
i31
.31%
0.8
7%12
.11%
8.62
%4.
79%
10.3
9%8.
83%
5.0
7%2.
39%
9.63
%5.
07%
0.9
2%
Sam
ba
30.4
6%0
.00
%7.
72%
12.5
1%4.
05%
10.7
7%11
.13%
3.97
%0
.54%
9.41
%6.
67%
2.77
%
Shup
iyan
25.1
4%0
.36%
7.14
%20
.62%
9.31
%9.
48%
9.19
%3.
51%
3.0
2%5.
74%
4.86
%1.
62%
Srin
agar
33.6
7%2.
04%
0.0
0%
31.9
0%
23.0
3%0
.64%
6.20
%0
.48%
0.4
8%1.
39%
0.1
6%0
.00
%
Ud
ham
pur
30.1
9%0
.75%
5.80
%11
.31%
5.97
%10
.58%
9.92
%7.
41%
0.8
2%9.
97%
6.20
%1.
08%
Ladakh
Karg
il35
.11%
1.40
%12
.78%
7.23
%3.
89%
9.10
%11
.63%
3.72
%0
.82%
11.2
2%2.
62%
0.4
8%
Leh
(Lad
akh)
24.0
4%1.
52%
4.74
%25
.73%
1.86
%4.
38%
12.2
6%7.
57%
0.0
8%11
.95%
4.34
%1.
53%
Laks
had
wee
p46
.10
%6.
64%
10.8
8%0
.00
%16
.21%
8.0
0%
0.9
8%4.
12%
0.0
0%
2.32
%0
.98%
3.77
%
Puducherry
Kara
ikal
33.6
7%1.
46%
6.43
%15
.16%
0.0
0%
11.4
2%11
.24%
0.9
2%1.
51%
11.6
9%2.
46%
4.0
4%
Mah
e0
.00
%0
.00
%0
.00
%46
.67%
0.0
0%
13.3
3%13
.33%
0.0
0%
13.3
3%0
.00
%13
.33%
0.0
0%
Pud
uche
rry
33.2
3%5.
36%
4.40
%23
.34%
0.0
0%
10.0
4%10
.04%
0.7
3%0
.41%
6.92
%3.
22%
2.32
%
Yana
m33
.66%
0.0
0%
8.80
%32
.83%
1.64
%4.
74%
8.59
%0
.53%
0.6
9%4.
23%
3.25
%1.
06%
Ind
icat
or C
ont
rib
utio
n: R
ural
Hea
lthEd
ucat
ion
Stan
dar
d o
f Liv
ing
Stat
eD
istr
ict
Nut
ritio
nC
hild
&
Ad
ole
scen
t M
ort
ality
Mat
erna
l H
ealth
Year
s o
f Sc
hoo
ling
Scho
ol
Att
end
ance
Co
oki
ng
Fuel
Sani
tatio
nD
rink
ing
Wat
erEl
ectr
icity
Ho
usin
gA
sset
sB
ank
Acc
oun
t
Andhra Pradesh
Ana
ntap
ur31
.29%
1.30
%9.
64%
20.6
8%3.
23%
8.49
%10
.43%
3.71
%0
.29%
5.64
%3.
44%
1.86
%
Chi
tto
or
28.7
7%0
.69%
9.68
%23
.74%
2.57
%9.
46%
10.4
8%3.
40%
0.4
8%5.
35%
4.0
0%
1.38
%
East
Go
dav
ari
26.8
7%1.
35%
7.69
%26
.42%
3.77
%10
.39%
10.0
8%2.
45%
0.3
3%4.
97%
3.52
%2.
16%
Gun
tur
19.5
0%
0.8
4%4.
01%
33.3
6%2.
68%
8.28
%9.
59%
6.53
%0
.00
%7.
30%
6.56
%1.
33%
Kris
hna
24.5
7%0
.47%
5.49
%31
.61%
1.44
%9.
30%
7.83
%5.
33%
0.5
1%6.
86%
5.22
%1.
39%
Kurn
oo
l29
.82%
1.76
%9.
41%
21.6
0%
7.79
%8.
21%
9.0
3%3.
24%
0.0
7%5.
54%
2.75
%0
.79%
Prak
asam
28.6
9%1.
39%
5.97
%25
.47%
5.71
%7.
95%
9.62
%4.
64%
0.6
0%
4.33
%4.
35%
1.29
%
SPSR
Nel
lore
24.6
2%0
.27%
6.38
%25
.93%
4.43
%10
.15%
9.33
%5.
78%
1.67
%4.
60%
5.23
%1.
59%
Srik
akul
am30
.14%
2.54
%7.
01%
17.8
0%
1.78
%10
.99%
11.1
4%4.
63%
1.37
%5.
45%
6.11
%1.
04%
Vis
akha
pat
nam
29.2
4%1.
80%
8.66
%16
.84%
5.63
%10
.09%
9.73
%5.
43%
0.4
8%5.
25%
5.83
%1.
02%
Viz
iana
gar
am31
.42%
1.15
%7.
38%
22.0
9%1.
38%
10.5
1%10
.52%
2.82
%0
.54%
5.44
%5.
34%
1.42
%
Wes
t Go
dav
ari
25.7
5%1.
46%
6.87
%28
.88%
4.50
%7.
76%
10.3
0%
2.28
%1.
02%
4.93
%4.
39%
1.87
%
Y.S.
R. K
adap
a32
.09%
1.78
%5.
04%
30.3
9%4.
22%
7.46
%8.
35%
2.87
%0
.46%
3.72
%3.
10%
0.5
2%
Arunachal Pradesh
Anj
aw15
.93%
0.7
0%
12.1
4%24
.14%
5.26
%10
.57%
8.21
%2.
05%
1.86
%10
.57%
6.63
%1.
92%
Cha
ngla
ng18
.88%
0.9
7%9.
42%
18.3
7%10
.54%
9.44
%7.
48%
3.64
%5.
18%
9.42
%3.
52%
3.14
%
Dib
ang
Val
ley
22.1
1%0
.17%
10.7
0%
23.6
5%4.
32%
10.3
9%4.
95%
0.2
4%2.
08%
11.3
0%
6.99
%3.
11%
East
Kam
eng
15.5
9%0
.74%
9.63
%15
.18%
8.76
%8.
78%
8.28
%2.
76%
7.51
%9.
47%
7.85
%5.
45%
East
Sia
ng26
.99%
0.1
1%12
.80
%20
.38%
5.53
%10
.80
%6.
00
%0
.50
%2.
05%
11.2
4%2.
24%
1.35
%
Kuru
ng K
umey
19.7
9%0
.72%
10.6
1%22
.12%
7.38
%8.
15%
7.17
%1.
21%
1.43
%9.
93%
6.77
%4.
73%
Lohi
t20
.87%
1.55
%9.
87%
19.7
0%
8.82
%9.
23%
5.93
%2.
03%
4.50
%9.
11%
4.66
%3.
72%
Low
er D
iban
g V
alle
y17
.88%
0.7
4%10
.39%
22.0
6%7.
57%
9.63
%6.
47%
1.82
%6.
83%
9.98
%2.
54%
4.0
9%
Low
er S
uban
siri
17.2
4%0
.30
%8.
03%
24.8
9%11
.98%
8.35
%6.
62%
0.6
8%0
.41%
10.0
9%5.
96%
5.45
%
Pap
um P
are
24.2
9%0
.77%
12.4
4%18
.36%
7.82
%7.
16%
6.36
%3.
79%
1.25
%9.
79%
3.59
%4.
38%
Taw
ang
9.95
%1.
04%
11.2
8%31
.38%
7.66
%8.
68%
6.59
%1.
05%
0.9
7%8.
95%
6.83
%5.
62%
Tira
p21
.50
%1.
22%
12.1
2%17
.45%
9.49
%9.
76%
7.26
%3.
95%
0.3
1%9.
84%
5.80
%1.
31%
Up
per
Sia
ng20
.88%
0.4
5%8.
77%
21.1
5%6.
96%
11.2
6%6.
89%
2.19
%1.
42%
11.3
9%5.
60%
3.0
5%
Up
per
Sub
ansi
ri18
.77%
0.1
9%10
.81%
22.2
1%4.
22%
9.85
%6.
17%
2.77
%1.
80%
10.4
0%
7.50
%5.
31%
Wes
t Kam
eng
20.8
6%0
.28%
11.1
1%20
.69%
7.93
%8.
83%
7.12
%1.
65%
0.3
9%9.
93%
6.51
%4.
69%
Wes
t Sia
ng21
.52%
1.0
7%12
.48%
15.8
6%3.
45%
9.66
%6.
99%
4.90
%2.
26%
10.3
0%
6.43
%5.
08%
Assam
Baks
a28
.93%
1.44
%10
.81%
14.2
3%3.
21%
10.8
6%7.
03%
2.76
%3.
86%
10.7
7%2.
71%
3.39
%
Barp
eta
28.8
1%1.
08%
10.4
7%14
.70
%4.
31%
9.87
%8.
38%
0.2
0%
4.74
%9.
89%
3.47
%4.
07%
Bong
aig
aon
28.8
0%
0.9
0%
12.6
7%14
.71%
5.0
6%10
.03%
7.72
%2.
89%
1.82
%9.
90%
2.36
%3.
14%
Cac
har
27.3
7%1.
35%
7.45
%11
.22%
6.38
%9.
28%
8.13
%6.
25%
5.93
%9.
09%
5.76
%1.
77%
Chi
rang
28.0
4%0
.92%
10.5
2%13
.97%
3.0
8%10
.31%
8.87
%2.
98%
4.95
%10
.24%
2.77
%3.
36%
Dar
rang
26.3
8%1.
14%
10.5
3%17
.41%
8.45
%9.
54%
6.38
%0
.32%
4.44
%9.
41%
2.44
%3.
56%
Dhe
maj
i27
.90
%1.
17%
10.0
1%9.
58%
6.10
%10
.54%
8.0
2%1.
22%
6.50
%10
.45%
4.0
3%4.
47%
Dhu
bri
24.8
9%0
.51%
9.58
%16
.38%
7.71
%9.
22%
7.67
%1.
37%
4.14
%9.
18%
4.69
%4.
67%
Dib
rug
arh
28.6
6%0
.74%
6.23
%18
.02%
4.75
%10
.00
%6.
73%
0.2
2%5.
90%
9.63
%5.
22%
3.90
%
Dim
a H
asao
22.0
0%
1.32
%10
.40
%15
.47%
5.72
%9.
34%
5.47
%6.
42%
4.68
%9.
07%
7.21
%2.
90%
Go
alp
ara
25.2
8%0
.82%
10.5
4%16
.39%
8.0
5%9.
21%
6.98
%1.
47%
5.0
6%9.
05%
4.0
6%3.
09%
Go
lag
hat
29.0
9%1.
49%
8.51
%15
.67%
4.95
%10
.24%
7.0
2%1.
27%
3.65
%10
.25%
4.0
9%3.
77%
Hai
laka
ndi
25.1
9%1.
10%
9.17
%11
.05%
6.91
%9.
66%
7.64
%6.
82%
6.22
%9.
53%
5.58
%1.
13%
Jorh
at29
.67%
0.9
7%5.
73%
12.3
6%6.
45%
10.7
8%8.
00
%3.
18%
4.52
%10
.55%
4.16
%3.
62%
Kam
rup
28.4
3%0
.88%
10.1
5%15
.22%
5.73
%9.
93%
7.24
%0
.97%
2.43
%10
.42%
3.68
%4.
92%
TABle 18- DISTrICT-WISe: INDICATor CoNTrIBUTIoN To The MpI SCore (rUrAl)(CONTD.) DISTrICT-WISe: INDICATor CoNTrIBUTIoN To The MpI SCore
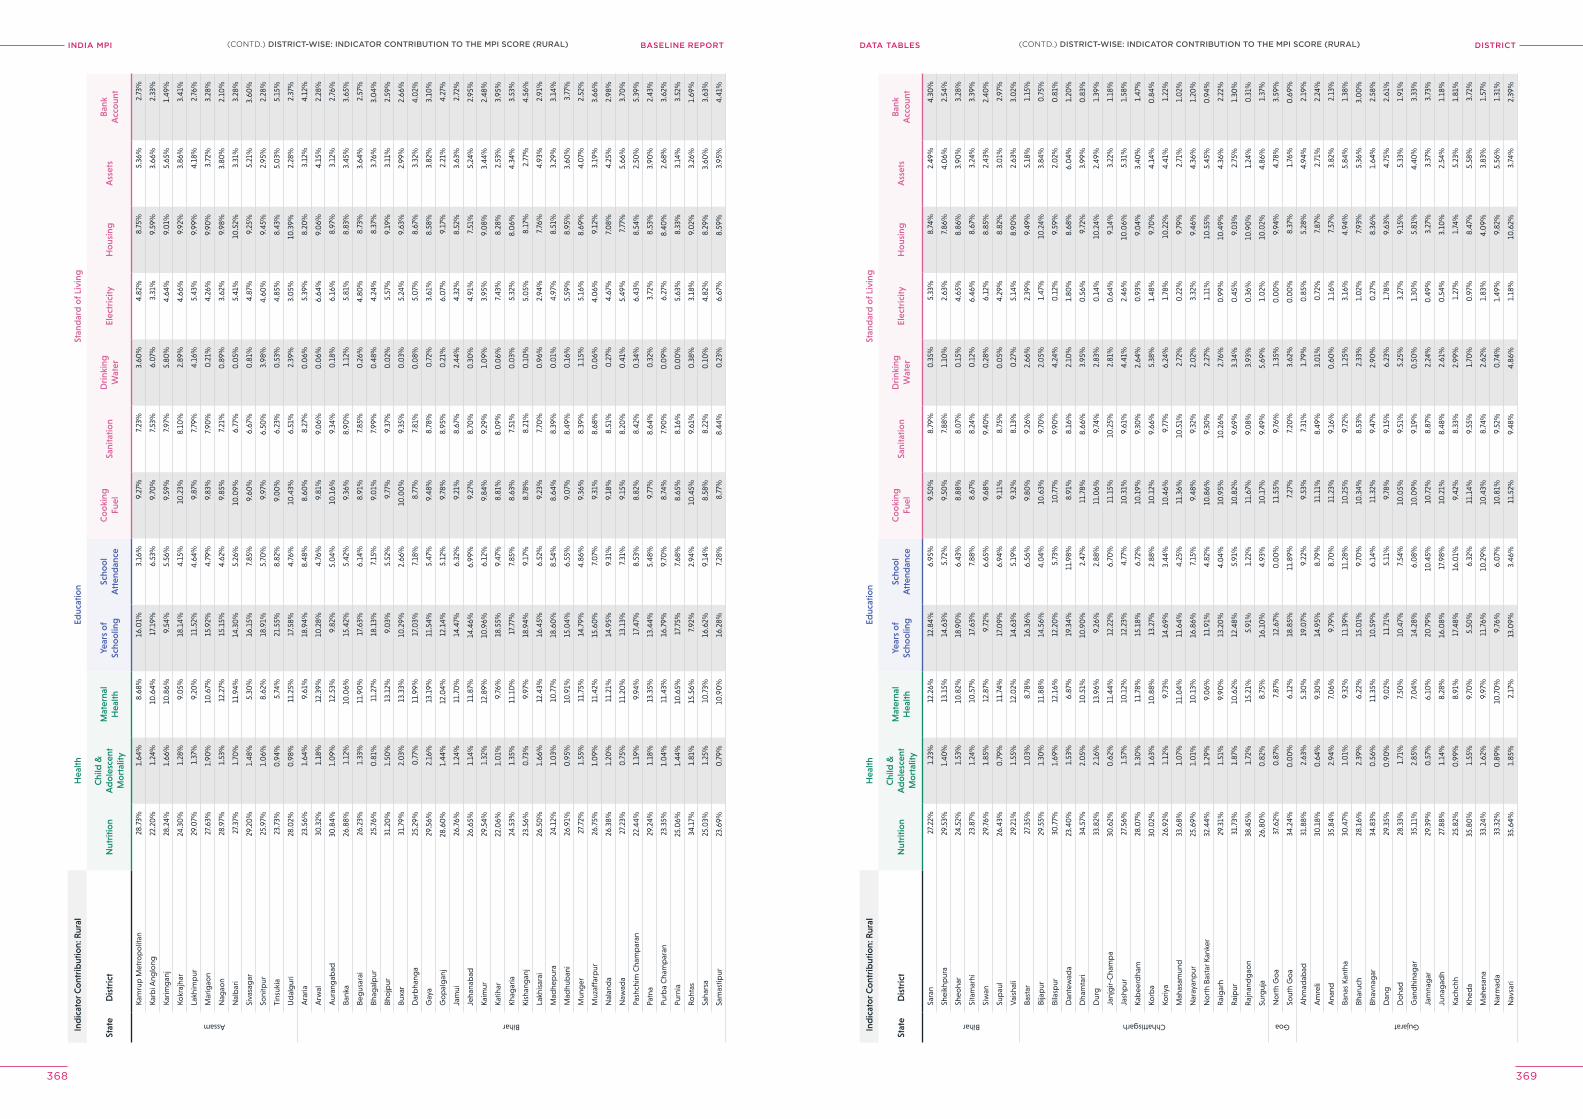
INDIA MPI BASELINE REPORT DISTrICTDATA TABleS
368 369
Ind
icat
or C
ont
rib
utio
n: R
ural
Hea
lthEd
ucat
ion
Stan
dar
d o
f Liv
ing
Stat
eD
istr
ict
Nut
ritio
nC
hild
&
Ad
ole
scen
t M
ort
ality
Mat
erna
l H
ealth
Year
s o
f Sc
hoo
ling
Scho
ol
Att
end
ance
Co
oki
ng
Fuel
Sani
tatio
nD
rink
ing
Wat
erEl
ectr
icity
Ho
usin
gA
sset
sB
ank
Acc
oun
t
Assam
Kam
rup
Met
rop
olit
an28
.73%
1.64
%8.
68%
16.0
1%3.
16%
9.27
%7.
23%
3.60
%4.
82%
8.75
%5.
36%
2.73
%
Karb
i Ang
long
22.2
0%
1.24
%10
.64%
17.1
9%6.
53%
9.70
%7.
53%
6.0
7%3.
31%
9.59
%3.
66%
2.33
%
Karim
gan
j28
.24%
1.66
%10
.86%
9.54
%5.
56%
9.59
%7.
97%
5.80
%4.
64%
9.0
1%5.
65%
1.49
%
Kokr
ajha
r24
.30
%1.
28%
9.0
5%18
.14%
4.15
%10
.23%
8.10
%2.
89%
4.66
%9.
92%
3.86
%3.
41%
Lakh
imp
ur29
.07%
1.37
%9.
20%
11.5
2%4.
64%
9.87
%7.
79%
4.16
%5.
43%
9.99
%4.
18%
2.76
%
Mar
igao
n27
.63%
1.90
%10
.67%
15.9
2%4.
79%
9.83
%7.
90%
0.2
1%4.
26%
9.90
%3.
72%
3.28
%
Nag
aon
28.9
7%1.
53%
12.2
7%15
.15%
4.62
%9.
85%
7.21
%0
.89%
3.62
%9.
98%
3.80
%2.
10%
Nal
bar
i27
.37%
1.70
%11
.94%
14.3
0%
5.26
%10
.09%
6.77
%0
.05%
5.41
%10
.52%
3.31
%3.
28%
Siva
sag
ar29
.20
%1.
48%
5.30
%16
.15%
7.85
%9.
60%
6.67
%0
.81%
4.87
%9.
25%
5.21
%3.
60%
Soni
tpur
25.9
7%1.
06%
8.62
%18
.91%
5.70
%9.
97%
6.50
%3.
98%
4.60
%9.
45%
2.95
%2.
28%
Tins
ukia
23.7
3%0
.94%
5.74
%21
.55%
8.82
%9.
00
%6.
23%
0.5
3%4.
85%
8.43
%5.
03%
5.15
%
Ud
alg
uri
28.0
2%0
.98%
11.2
5%17
.58%
4.76
%10
.43%
6.51
%2.
39%
3.0
5%10
.39%
2.28
%2.
37%
Bihar
Ara
ria23
.56%
1.64
%9.
61%
18.9
4%8.
48%
8.60
%8.
27%
0.0
6%5.
39%
8.20
%3.
12%
4.12
%
Arw
al30
.32%
1.18
%12
.39%
10.2
8%4.
76%
9.81
%9.
06%
0.0
6%6.
64%
9.0
6%4.
15%
2.28
%
Aur
ang
abad
30.8
4%1.
09%
12.5
3%9.
82%
5.0
4%10
.16%
9.34
%0
.18%
6.16
%8.
97%
3.12
%2.
76%
Bank
a26
.88%
1.12
%10
.06%
15.4
2%5.
42%
9.36
%8.
90%
1.12
%5.
81%
8.83
%3.
45%
3.65
%
Beg
usar
ai26
.23%
1.33
%11
.90
%17
.63%
6.14
%8.
91%
7.85
%0
.26%
4.80
%8.
73%
3.64
%2.
57%
Bhag
alp
ur25
.76%
0.8
1%11
.27%
18.1
3%7.
15%
9.0
1%7.
99%
0.4
8%4.
24%
8.37
%3.
76%
3.0
4%
Bho
jpur
31.2
0%
1.50
%13
.12%
9.0
3%5.
52%
9.77
%9.
37%
0.0
2%5.
57%
9.19
%3.
11%
2.59
%
Buxa
r31
.79%
2.0
3%13
.33%
10.2
9%2.
66%
10.0
0%
9.35
%0
.03%
5.24
%9.
63%
2.99
%2.
66%
Dar
bha
nga
25.2
9%0
.77%
11.9
9%17
.03%
7.18
%8.
77%
7.81
%0
.08%
5.0
7%8.
67%
3.32
%4.
02%
Gay
a29
.56%
2.16
%13
.19%
11.5
4%5.
47%
9.48
%8.
78%
0.7
2%3.
61%
8.58
%3.
82%
3.10
%
Go
pal
gan
j28
.60
%1.
44%
12.0
4%12
.14%
5.12
%9.
78%
8.95
%0
.21%
6.0
7%9.
17%
2.21
%4.
27%
Jam
ui26
.76%
1.24
%11
.70
%14
.47%
6.32
%9.
21%
8.67
%2.
44%
4.32
%8.
52%
3.63
%2.
72%
Jeha
nab
ad26
.65%
1.14
%11
.87%
14.4
6%6.
99%
9.27
%8.
70%
0.3
0%
4.91
%7.
51%
5.24
%2.
95%
Kaim
ur29
.54%
1.32
%12
.89%
10.9
6%6.
12%
9.84
%9.
29%
1.0
9%3.
95%
9.0
8%3.
44%
2.48
%
Katih
ar22
.06%
1.0
1%9.
76%
18.5
5%9.
47%
8.81
%8.
09%
0.0
6%7.
43%
8.28
%2.
53%
3.95
%
Khag
aria
24.5
3%1.
35%
11.1
0%
17.7
7%7.
85%
8.63
%7.
51%
0.0
3%5.
32%
8.0
6%4.
34%
3.53
%
Kish
ang
anj
23.5
6%0
.73%
9.97
%18
.94%
9.17
%8.
78%
8.21
%0
.10
%5.
05%
8.17
%2.
77%
4.56
%
Lakh
isar
ai26
.50
%1.
66%
12.4
3%16
.45%
6.52
%9.
23%
7.70
%0
.96%
2.94
%7.
76%
4.93
%2.
91%
Mad
hep
ura
24.1
2%1.
03%
10.7
7%18
.60
%8.
54%
8.64
%8.
39%
0.0
1%4.
97%
8.51
%3.
29%
3.14
%
Mad
hub
ani
26.9
1%0
.95%
10.9
1%15
.04%
6.55
%9.
07%
8.49
%0
.16%
5.59
%8.
95%
3.60
%3.
77%
Mun
ger
27.7
2%1.
55%
11.7
5%14
.79%
4.86
%9.
36%
8.39
%1.
15%
5.16
%8.
69%
4.0
7%2.
52%
Muz
affa
rpur
26.7
5%1.
09%
11.4
2%15
.60
%7.
07%
9.31
%8.
68%
0.0
6%4.
06%
9.12
%3.
19%
3.66
%
Nal
and
a26
.38%
1.20
%11
.21%
14.9
5%9.
31%
9.18
%8.
51%
0.2
7%4.
67%
7.0
8%4.
25%
2.98
%
Naw
ada
27.2
3%0
.75%
11.2
0%
13.1
3%7.
31%
9.15
%8.
20%
0.4
1%5.
49%
7.77
%5.
66%
3.70
%
Pash
chim
Cha
mp
aran
22.4
4%1.
19%
9.94
%17
.47%
8.53
%8.
82%
8.42
%0
.34%
6.43
%8.
54%
2.50
%5.
39%
Patn
a29
.24%
1.18
%13
.35%
13.4
4%5.
48%
9.77
%8.
64%
0.3
2%3.
72%
8.53
%3.
90%
2.43
%
Purb
a C
ham
par
an23
.35%
1.0
4%11
.43%
16.7
9%9.
70%
8.74
%7.
90%
0.0
9%6.
27%
8.40
%2.
68%
3.62
%
Purn
ia25
.06%
1.44
%10
.65%
17.7
5%7.
68%
8.65
%8.
16%
0.0
0%
5.63
%8.
33%
3.14
%3.
52%
Roht
as34
.17%
1.81
%15
.56%
7.92
%2.
94%
10.4
5%9.
61%
0.3
8%3.
18%
9.0
2%3.
26%
1.69
%
Saha
rsa
25.0
3%1.
25%
10.7
3%16
.62%
9.14
%8.
58%
8.22
%0
.10
%4.
82%
8.29
%3.
60%
3.63
%
Sam
astip
ur23
.69%
0.7
9%10
.90
%16
.28%
7.28
%8.
77%
8.44
%0
.23%
6.67
%8.
59%
3.95
%4.
41%
Ind
icat
or C
ont
rib
utio
n: R
ural
Hea
lthEd
ucat
ion
Stan
dar
d o
f Liv
ing
Stat
eD
istr
ict
Nut
ritio
nC
hild
&
Ad
ole
scen
t M
ort
ality
Mat
erna
l H
ealth
Year
s o
f Sc
hoo
ling
Scho
ol
Att
end
ance
Co
oki
ng
Fuel
Sani
tatio
nD
rink
ing
Wat
erEl
ectr
icity
Ho
usin
gA
sset
sB
ank
Acc
oun
t
Bihar
Sara
n27
.22%
1.23
%12
.26%
12.8
4%6.
95%
9.50
%8.
79%
0.3
5%5.
33%
8.74
%2.
49%
4.30
%
Shei
khp
ura
29.5
3%1.
40%
13.1
5%14
.63%
5.72
%9.
50%
7.88
%1.
10%
2.63
%7.
86%
4.0
6%2.
54%
Sheo
har
24.5
2%1.
53%
10.8
2%18
.90
%6.
43%
8.88
%8.
07%
0.1
5%4.
65%
8.86
%3.
90%
3.28
%
Sita
mar
hi23
.87%
1.24
%10
.57%
17.6
3%7.
88%
8.67
%8.
24%
0.1
2%6.
46%
8.67
%3.
24%
3.39
%
Siw
an29
.76%
1.85
%12
.87%
9.72
%6.
65%
9.68
%9.
40%
0.2
8%6.
12%
8.85
%2.
43%
2.40
%
Sup
aul
26.4
3%0
.79%
11.7
4%17
.09%
6.94
%9.
11%
8.75
%0
.05%
4.29
%8.
82%
3.0
1%2.
97%
Vai
shal
i29
.21%
1.55
%12
.02%
14.6
3%5.
19%
9.32
%8.
13%
0.2
7%5.
14%
8.90
%2.
63%
3.0
2%
Chhattisgarh
Bast
ar27
.35%
1.0
3%8.
78%
16.3
6%6.
56%
9.80
%9.
26%
2.66
%2.
39%
9.49
%5.
18%
1.15
%
Bija
pur
29.5
5%1.
30%
11.8
8%14
.56%
4.0
4%10
.63%
9.70
%2.
05%
1.47
%10
.24%
3.84
%0
.75%
Bila
spur
30.7
7%1.
69%
12.1
6%12
.20
%5.
73%
10.7
7%9.
90%
4.24
%0
.12%
9.59
%2.
02%
0.8
1%
Dan
tew
ada
23.4
0%
1.53
%6.
87%
19.3
4%11
.98%
8.91
%8.
16%
2.10
%1.
80%
8.68
%6.
04%
1.20
%
Dha
mta
ri34
.57%
2.0
5%10
.51%
10.9
0%
2.47
%11
.78%
8.66
%3.
95%
0.5
6%9.
72%
3.99
%0
.83%
Dur
g33
.82%
2.16
%13
.96%
9.26
%2.
88%
11.0
6%9.
74%
2.83
%0
.14%
10.2
4%2.
49%
1.39
%
Janj
gir-
Cha
mp
a30
.62%
0.6
2%11
.44%
12.2
2%6.
70%
11.1
5%10
.25%
2.81
%0
.64%
9.14
%3.
22%
1.18
%
Jash
pur
27.5
6%1.
57%
10.1
2%12
.23%
4.77
%10
.31%
9.61
%4.
41%
2.46
%10
.06%
5.31
%1.
58%
Kab
eerd
ham
28.0
7%1.
30%
11.7
8%15
.18%
6.72
%10
.19%
9.30
%2.
64%
0.9
3%9.
04%
3.40
%1.
47%
Korb
a30
.02%
1.63
%10
.88%
13.2
7%2.
88%
10.1
2%9.
66%
5.38
%1.
48%
9.70
%4.
14%
0.8
4%
Koriy
a26
.92%
1.12
%9.
73%
14.6
9%3.
44%
10.4
6%9.
77%
6.24
%1.
78%
10.2
2%4.
41%
1.22
%
Mah
asam
und
33.6
8%1.
07%
11.0
4%11
.64%
4.25
%11
.36%
10.5
1%2.
72%
0.2
2%9.
79%
2.71
%1.
02%
Nar
ayan
pur
25.6
9%1.
01%
10.1
3%16
.86%
7.15
%9.
48%
9.32
%2.
02%
3.32
%9.
46%
4.36
%1.
20%
No
rth
Bast
ar K
anke
r32
.44%
1.29
%9.
06%
11.9
1%4.
82%
10.8
6%9.
30%
2.27
%1.
11%
10.5
5%5.
45%
0.9
4%
Rai
gar
h29
.31%
1.51
%9.
90%
13.2
0%
4.0
4%10
.95%
10.2
6%2.
76%
0.9
9%10
.49%
4.36
%2.
22%
Rai
pur
31.7
3%1.
87%
10.6
2%12
.48%
5.91
%10
.82%
9.69
%3.
34%
0.4
5%9.
03%
2.75
%1.
30%
Raj
nand
gao
n38
.45%
1.72
%15
.21%
5.91
%1.
22%
11.6
7%9.
08%
3.93
%0
.36%
10.9
0%
1.24
%0
.31%
Surg
uja
26.8
0%
0.8
2%8.
75%
16.1
0%
4.93
%10
.17%
9.49
%5.
69%
1.0
2%10
.02%
4.86
%1.
37%
Goa
No
rth
Go
a37
.62%
0.8
7%7.
87%
12.6
7%0
.00
%11
.55%
9.76
%1.
35%
0.0
0%
9.94
%4.
78%
3.59
%
Sout
h G
oa
34.2
4%0
.00
%6.
12%
18.8
5%11
.89%
7.27
%7.
20%
3.62
%0
.00
%8.
37%
1.76
%0
.69%
Gujarat
Ahm
adab
ad31
.88%
2.63
%5.
30%
19.0
7%9.
22%
9.53
%7.
31%
1.79
%0
.85%
5.28
%4.
94%
2.19
%
Am
reli
30.1
8%0
.64%
9.30
%14
.95%
8.79
%11
.11%
8.49
%3.
01%
0.7
2%7.
87%
2.71
%2.
24%
Ana
nd35
.84%
2.94
%7.
06%
9.79
%8.
70%
11.2
3%9.
16%
0.6
0%
1.16
%7.
57%
3.82
%2.
13%
Bana
s Ka
ntha
30.4
7%1.
01%
9.32
%11
.39%
11.2
8%10
.25%
9.72
%1.
25%
3.16
%4.
94%
5.84
%1.
38%
Bhar
uch
28.1
6%2.
39%
6.22
%15
.01%
9.70
%10
.34%
8.53
%2.
33%
1.0
2%7.
93%
5.36
%3.
00
%
Bhav
nag
ar34
.83%
0.5
6%11
.35%
10.5
9%6.
14%
11.3
2%9.
47%
2.90
%0
.27%
8.36
%1.
64%
2.58
%
Dan
g29
.35%
0.9
0%
9.0
2%11
.71%
5.11
%9.
78%
9.15
%6.
23%
1.78
%9.
63%
4.75
%2.
61%
Do
had
28.3
3%1.
71%
7.50
%10
.47%
7.54
%10
.05%
9.51
%5.
25%
3.27
%9.
15%
5.33
%1.
91%
Gan
dhi
nag
ar35
.11%
2.85
%7.
04%
14.2
8%6.
08%
10.0
9%9.
19%
0.5
0%
1.30
%5.
81%
4.40
%3.
33%
Jam
nag
ar29
.39%
0.5
7%6.
10%
20.7
9%10
.45%
10.7
2%8.
87%
2.24
%0
.49%
3.27
%3.
37%
3.73
%
Juna
gad
h27
.88%
1.14
%8.
28%
16.0
8%17
.98%
10.2
1%8.
48%
2.61
%0
.54%
3.10
%2.
54%
1.18
%
Kach
chh
25.8
2%0
.99%
8.91
%17
.48%
16.0
1%9.
42%
8.33
%2.
99%
1.27
%1.
74%
5.23
%1.
81%
Khed
a35
.80
%1.
55%
9.70
%5.
50%
6.32
%11
.14%
9.55
%1.
70%
0.9
7%8.
47%
5.58
%3.
72%
Mah
esan
a33
.24%
1.62
%9.
97%
11.7
6%10
.29%
10.4
3%8.
74%
2.62
%1.
83%
4.0
9%3.
83%
1.57
%
Nar
mad
a33
.32%
0.8
9%10
.70
%9.
76%
6.0
7%10
.81%
9.52
%0
.74%
1.49
%9.
82%
5.56
%1.
31%
Nav
sari
35.6
4%1.
85%
2.17
%13
.09%
3.46
%11
.52%
9.48
%4.
86%
1.18
%10
.62%
3.74
%2.
39%
(CONTD.) DISTrICT-WISe: INDICATor CoNTrIBUTIoN To The MpI SCore (rUrAl)(CONTD.) DISTrICT-WISe: INDICATor CoNTrIBUTIoN To The MpI SCore (rUrAl)
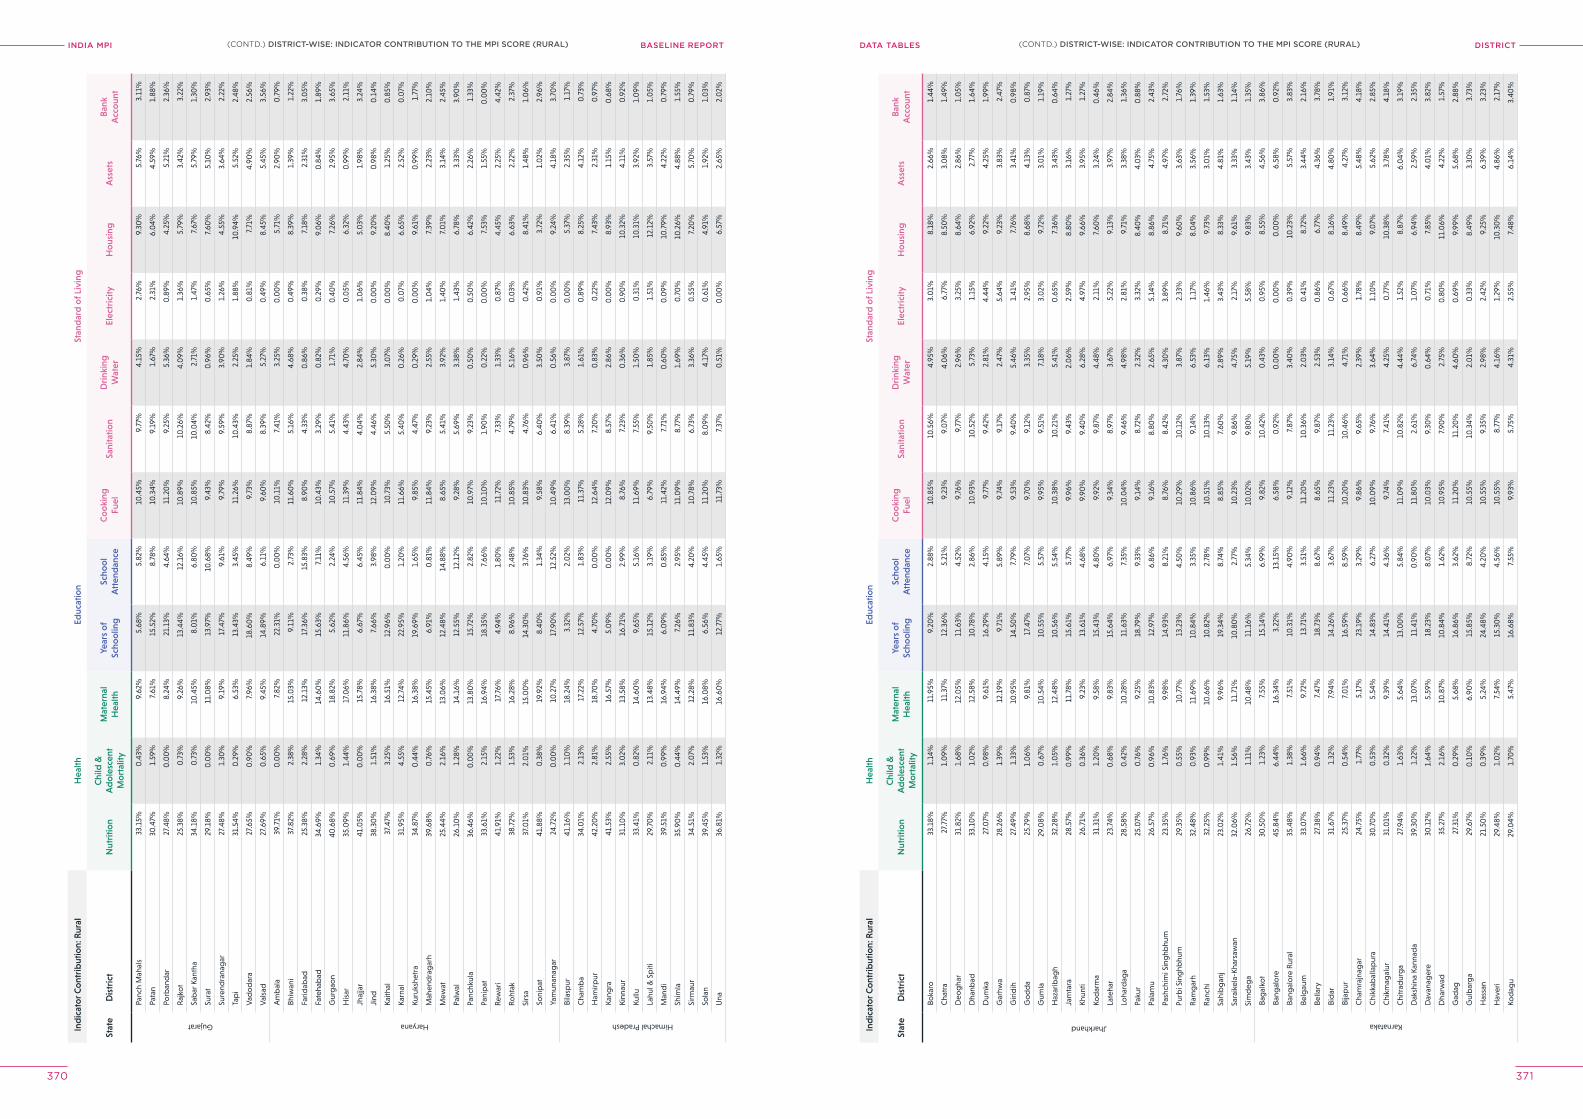
INDIA MPI BASELINE REPORT DISTrICTDATA TABleS
370 371
Ind
icat
or C
ont
rib
utio
n: R
ural
Hea
lthEd
ucat
ion
Stan
dar
d o
f Liv
ing
Stat
eD
istr
ict
Nut
ritio
nC
hild
&
Ad
ole
scen
t M
ort
ality
Mat
erna
l H
ealth
Year
s o
f Sc
hoo
ling
Scho
ol
Att
end
ance
Co
oki
ng
Fuel
Sani
tatio
nD
rink
ing
Wat
erEl
ectr
icity
Ho
usin
gA
sset
sB
ank
Acc
oun
t
Gujarat
Panc
h M
ahal
s33
.15%
0.4
3%9.
62%
5.68
%5.
82%
10.4
5%9.
77%
4.15
%2.
76%
9.30
%5.
76%
3.11
%
Pata
n30
.47%
1.59
%7.
61%
15.5
2%8.
78%
10.3
4%9.
19%
1.67
%2.
31%
6.0
4%4.
59%
1.88
%
Porb
and
ar27
.48%
0.0
0%
8.24
%21
.13%
4.64
%11
.20
%9.
25%
5.36
%0
.89%
4.25
%5.
21%
2.36
%
Raj
kot
25.3
8%0
.73%
9.26
%13
.44%
12.1
6%10
.89%
10.2
6%4.
09%
1.36
%5.
79%
3.42
%3.
22%
Sab
ar K
anth
a34
.18%
0.7
3%10
.45%
8.0
1%6.
80%
10.8
5%10
.04%
2.71
%1.
47%
7.67
%5.
79%
1.30
%
Sura
t29
.18%
0.0
0%
11.0
8%13
.97%
10.6
8%9.
43%
8.42
%0
.96%
0.6
5%7.
60%
5.10
%2.
93%
Sure
ndra
nag
ar27
.48%
1.30
%9.
19%
17.4
7%9.
61%
9.79
%9.
59%
3.90
%1.
26%
4.55
%3.
64%
2.22
%
Tap
i31
.54%
0.2
9%6.
53%
13.4
3%3.
45%
11.2
6%10
.43%
2.25
%1.
88%
10.9
4%5.
52%
2.48
%
Vad
od
ara
27.6
5%0
.90
%7.
96%
18.6
0%
8.49
%9.
73%
8.87
%1.
84%
0.8
1%7.
71%
4.90
%2.
56%
Val
sad
27.6
9%0
.65%
9.45
%14
.89%
6.11
%9.
60%
8.39
%5.
27%
0.4
9%8.
45%
5.45
%3.
56%
Haryana
Am
bal
a39
.71%
0.0
0%
7.82
%22
.31%
0.0
0%
10.1
1%7.
41%
3.25
%0
.00
%5.
71%
2.90
%0
.79%
Bhiw
ani
37.8
2%2.
38%
15.0
3%9.
11%
2.73
%11
.60
%5.
16%
4.68
%0
.49%
8.39
%1.
39%
1.22
%
Farid
abad
25.3
8%2.
28%
12.1
3%17
.36%
15.8
3%8.
90%
4.33
%0
.86%
0.3
8%7.
18%
2.31
%3.
05%
Fate
hab
ad34
.69%
1.34
%14
.60
%15
.63%
7.11
%10
.43%
3.29
%0
.82%
0.2
9%9.
06%
0.8
4%1.
89%
Gur
gao
n40
.68%
0.6
9%18
.82%
5.62
%2.
24%
10.5
7%5.
41%
1.71
%0
.40
%7.
26%
2.95
%3.
65%
His
ar35
.09%
1.44
%17
.06%
11.8
6%4.
56%
11.3
9%4.
43%
4.70
%0
.05%
6.32
%0
.99%
2.11
%
Jhaj
jar
41.0
5%0
.00
%15
.78%
6.67
%6.
45%
11.8
4%4.
04%
2.84
%1.
06%
5.0
3%1.
98%
3.24
%
Jind
38.3
0%
1.51
%16
.38%
7.66
%3.
98%
12.0
9%4.
46%
5.30
%0
.00
%9.
20%
0.9
8%0
.14%
Kaith
al37
.47%
3.25
%16
.51%
12.9
6%0
.00
%10
.73%
5.50
%3.
07%
0.0
0%
8.40
%1.
25%
0.8
5%
Karn
al31
.95%
4.55
%12
.74%
22.9
5%1.
20%
11.6
6%5.
40%
0.2
6%0
.07%
6.65
%2.
52%
0.0
7%
Kuru
kshe
tra
34.8
7%0
.44%
16.3
8%19
.69%
1.65
%9.
85%
4.47
%0
.29%
0.0
0%
9.61
%0
.99%
1.77
%
Mah
end
rag
arh
39.6
8%0
.76%
15.4
5%6.
91%
0.8
1%11
.84%
9.23
%2.
55%
1.0
4%7.
39%
2.23
%2.
10%
Mew
at25
.44%
2.16
%13
.06%
12.4
8%14
.88%
8.65
%5.
41%
3.92
%1.
40%
7.0
1%3.
14%
2.45
%
Palw
al26
.10
%1.
28%
14.1
6%12
.55%
12.1
2%9.
28%
5.69
%3.
38%
1.43
%6.
78%
3.33
%3.
90%
Panc
hkul
a36
.46%
0.0
0%
13.8
0%
15.7
2%2.
82%
10.9
7%9.
23%
0.5
0%
0.5
0%
6.42
%2.
26%
1.33
%
Pani
pat
33.6
1%2.
15%
16.9
4%18
.35%
7.66
%10
.10
%1.
90%
0.2
2%0
.00
%7.
53%
1.55
%0
.00
%
Rew
ari
41.9
1%1.
22%
17.7
6%4.
94%
1.80
%11
.72%
7.33
%1.
33%
0.8
7%4.
45%
2.25
%4.
42%
Roht
ak38
.72%
1.53
%16
.28%
8.96
%2.
48%
10.8
5%4.
79%
5.16
%0
.03%
6.63
%2.
22%
2.37
%
Sirs
a37
.01%
2.0
1%15
.00
%14
.30
%3.
76%
10.8
3%4.
76%
0.9
6%0
.42%
8.41
%1.
48%
1.0
6%
Soni
pat
41.8
8%0
.38%
19.9
2%8.
40%
1.34
%9.
58%
6.40
%3.
50%
0.9
1%3.
72%
1.0
2%2.
96%
Yam
unan
agar
24.7
2%0
.00
%10
.27%
17.9
0%
12.5
2%10
.49%
6.41
%0
.56%
0.0
0%
9.24
%4.
18%
3.70
%
Himachal Pradesh
Bila
spur
41.1
6%1.
10%
18.2
4%3.
32%
2.0
2%13
.00
%8.
39%
3.87
%0
.00
%5.
37%
2.35
%1.
17%
Cha
mb
a34
.01%
2.13
%17
.22%
12.5
7%1.
83%
11.3
7%5.
28%
1.61
%0
.89%
8.25
%4.
12%
0.7
3%
Ham
irpur
42.2
0%
2.81
%18
.70
%4.
70%
0.0
0%
12.6
4%7.
20%
0.8
3%0
.22%
7.43
%2.
31%
0.9
7%
Kang
ra41
.53%
2.55
%16
.57%
5.0
9%0
.00
%12
.09%
8.57
%2.
86%
0.0
0%
8.93
%1.
15%
0.6
8%
Kinn
aur
31.1
0%
3.0
2%13
.58%
16.7
1%2.
99%
8.76
%7.
23%
0.3
6%0
.90
%10
.32%
4.11
%0
.92%
Kullu
33.4
1%0
.82%
14.6
0%
9.65
%5.
16%
11.6
9%7.
55%
1.50
%0
.31%
10.3
1%3.
92%
1.0
9%
Lahu
l & S
piti
29.7
0%
2.11
%13
.48%
15.1
2%3.
19%
6.79
%9.
50%
1.85
%1.
51%
12.1
2%3.
57%
1.0
5%
Man
di
39.5
1%0
.99%
16.9
4%6.
09%
0.8
5%11
.42%
7.71
%0
.60
%0
.09%
10.7
9%4.
22%
0.7
9%
Shim
la35
.90
%0
.44%
14.4
9%7.
26%
2.95
%11
.09%
8.77
%1.
69%
0.7
0%
10.2
6%4.
88%
1.55
%
Sirm
aur
34.5
1%2.
07%
12.2
8%11
.83%
4.20
%10
.78%
6.73
%3.
36%
0.5
5%7.
20%
5.70
%0
.79%
Sola
n39
.45%
1.53
%16
.08%
6.56
%4.
45%
11.2
0%
8.0
9%4.
17%
0.6
1%4.
91%
1.92
%1.
03%
Una
36.8
1%1.
32%
16.6
0%
12.7
7%1.
65%
11.7
3%7.
37%
0.5
1%0
.00
%6.
57%
2.65
%2.
02%
Ind
icat
or C
ont
rib
utio
n: R
ural
Hea
lthEd
ucat
ion
Stan
dar
d o
f Liv
ing
Stat
eD
istr
ict
Nut
ritio
nC
hild
&
Ad
ole
scen
t M
ort
ality
Mat
erna
l H
ealth
Year
s o
f Sc
hoo
ling
Scho
ol
Att
end
ance
Co
oki
ng
Fuel
Sani
tatio
nD
rink
ing
Wat
erEl
ectr
icity
Ho
usin
gA
sset
sB
ank
Acc
oun
t
Jharkhand
Boka
ro33
.18%
1.14
%11
.95%
9.20
%2.
88%
10.8
5%10
.56%
4.95
%3.
01%
8.18
%2.
66%
1.44
%
Cha
tra
27.7
7%1.
09%
11.3
7%12
.36%
5.21
%9.
23%
9.0
7%4.
06%
6.77
%8.
50%
3.0
8%1.
49%
Deo
gha
r31
.82%
1.68
%12
.05%
11.6
3%4.
52%
9.76
%9.
77%
2.96
%3.
25%
8.64
%2.
86%
1.0
5%
Dha
nbad
33.1
0%
1.0
2%12
.58%
10.7
8%2.
86%
10.9
3%10
.52%
5.73
%1.
15%
6.92
%2.
77%
1.64
%
Dum
ka27
.07%
0.9
8%9.
61%
16.2
9%4.
15%
9.77
%9.
42%
2.81
%4.
44%
9.22
%4.
25%
1.99
%
Gar
hwa
28.2
6%1.
39%
12.1
9%9.
71%
5.89
%9.
74%
9.17
%2.
47%
5.64
%9.
23%
3.83
%2.
47%
Giri
dih
27.4
9%1.
33%
10.9
5%14
.50
%7.
79%
9.53
%9.
40%
5.46
%1.
41%
7.76
%3.
41%
0.9
8%
Go
dd
a25
.79%
1.0
6%9.
81%
17.4
7%7.
07%
9.70
%9.
12%
3.35
%2.
95%
8.68
%4.
13%
0.8
7%
Gum
la29
.08%
0.6
7%10
.54%
10.5
5%5.
57%
9.95
%9.
51%
7.18
%3.
02%
9.72
%3.
01%
1.19
%
Haz
arib
agh
32.2
8%1.
05%
12.4
8%10
.56%
5.54
%10
.38%
10.2
1%5.
41%
0.6
5%7.
36%
3.43
%0
.64%
Jam
tara
28.5
7%0
.99%
11.7
8%15
.61%
5.77
%9.
96%
9.43
%2.
06%
2.59
%8.
80%
3.16
%1.
27%
Khun
ti26
.71%
0.3
6%9.
23%
13.6
1%4.
68%
9.90
%9.
40%
6.28
%4.
97%
9.66
%3.
95%
1.27
%
Kod
arm
a31
.31%
1.20
%9.
58%
15.4
3%4.
80%
9.92
%9.
87%
4.48
%2.
11%
7.60
%3.
24%
0.4
6%
Late
har
23.7
4%0
.68%
9.83
%15
.64%
6.97
%9.
34%
8.97
%3.
67%
5.22
%9.
13%
3.97
%2.
84%
Loha
rdag
a28
.58%
0.4
2%10
.28%
11.6
3%7.
35%
10.0
4%9.
46%
4.98
%2.
81%
9.71
%3.
38%
1.36
%
Paku
r25
.07%
0.7
6%9.
25%
18.7
9%9.
33%
9.14
%8.
72%
2.32
%3.
32%
8.40
%4.
03%
0.8
8%
Pala
mu
26.5
7%0
.96%
10.8
3%12
.97%
6.86
%9.
16%
8.80
%2.
65%
5.14
%8.
86%
4.75
%2.
43%
Pash
chim
i Sin
ghb
hum
23.3
5%1.
76%
9.98
%14
.93%
8.21
%8.
76%
8.42
%4.
30%
3.89
%8.
71%
4.97
%2.
72%
Purb
i Sin
ghb
hum
29.3
5%0
.55%
10.7
7%13
.23%
4.50
%10
.29%
10.1
2%3.
87%
2.33
%9.
60%
3.63
%1.
76%
Ram
gar
h32
.48%
0.9
3%11
.69%
10.8
4%3.
35%
10.8
6%9.
14%
6.53
%1.
17%
8.0
4%3.
56%
1.39
%
Ran
chi
32.2
5%0
.99%
10.6
6%10
.82%
2.78
%10
.51%
10.1
3%6.
13%
1.46
%9.
73%
3.0
1%1.
53%
Sahi
bg
anj
23.0
2%1.
41%
9.96
%19
.34%
8.74
%8.
85%
7.60
%2.
89%
3.43
%8.
33%
4.81
%1.
63%
Sara
ikel
a-Kh
arsa
wan
32.0
6%1.
56%
11.7
1%10
.80
%2.
77%
10.2
3%9.
86%
4.75
%2.
17%
9.61
%3.
33%
1.14
%
Sim
deg
a26
.72%
1.11
%10
.48%
11.1
6%5.
34%
10.0
2%9.
80%
5.19
%5.
58%
9.83
%3.
43%
1.35
%
Karnataka
Bag
alko
t30
.50
%1.
23%
7.55
%15
.14%
6.99
%9.
82%
10.4
2%0
.43%
0.9
5%8.
55%
4.56
%3.
86%
Bang
alo
re45
.84%
6.44
%16
.34%
3.22
%13
.15%
6.58
%0
.92%
0.0
0%
0.0
0%
0.0
0%
6.58
%0
.92%
Bang
alo
re R
ural
35.4
8%1.
38%
7.51
%10
.31%
4.90
%9.
12%
7.87
%3.
40%
0.3
9%10
.23%
5.57
%3.
83%
Belg
aum
33.0
7%1.
66%
9.72
%13
.71%
3.51
%11
.20
%10
.36%
2.0
3%0
.41%
8.72
%3.
44%
2.16
%
Bella
ry27
.38%
0.9
4%7.
47%
18.7
3%8.
67%
8.65
%9.
87%
2.53
%0
.86%
6.77
%4.
36%
3.78
%
Bid
ar31
.67%
1.32
%7.
94%
14.2
6%3.
67%
11.2
3%11
.23%
3.14
%0
.67%
8.16
%4.
80%
1.91
%
Bija
pur
25.3
7%0
.54%
7.0
1%16
.59%
8.59
%10
.20
%10
.46%
4.71
%0
.66%
8.49
%4.
27%
3.12
%
Cha
mra
jnag
ar24
.75%
1.77
%5.
17%
23.1
9%3.
29%
9.86
%9.
65%
2.39
%1.
78%
8.49
%5.
48%
4.18
%
Chi
kkab
alla
pur
a30
.70
%0
.53%
5.54
%14
.83%
6.27
%10
.09%
9.76
%3.
64%
1.10
%9.
07%
5.62
%2.
85%
Chi
kmag
alur
31.0
1%0
.32%
9.39
%14
.41%
4.36
%9.
74%
7.41
%4.
25%
0.7
7%10
.38%
3.78
%4.
18%
Chi
trad
urg
a27
.94%
1.63
%5.
64%
13.0
0%
5.84
%11
.09%
10.8
2%4.
44%
1.52
%8.
87%
6.0
4%3.
19%
Dak
shin
a Ka
nnad
a39
.30
%1.
22%
13.0
7%11
.41%
0.9
0%
11.8
0%
2.61
%6.
74%
1.0
7%6.
94%
2.59
%2.
35%
Dav
anag
ere
30.1
2%1.
64%
5.59
%18
.23%
8.0
7%10
.03%
9.30
%0
.64%
0.7
1%7.
85%
4.0
1%3.
82%
Dha
rwad
35.2
7%2.
16%
10.8
7%10
.84%
1.62
%10
.95%
7.90
%2.
75%
0.8
0%
11.0
6%4.
22%
1.57
%
Gad
ag27
.31%
0.2
9%5.
68%
16.8
6%3.
62%
11.2
0%
11.2
0%
4.60
%0
.69%
9.99
%5.
68%
2.88
%
Gul
bar
ga
29.6
7%0
.10
%6.
90%
15.8
5%8.
72%
10.5
5%10
.34%
2.0
1%0
.33%
8.49
%3.
30%
3.73
%
Has
san
21.5
0%
0.3
9%5.
24%
24.4
8%4.
20%
10.5
5%9.
35%
2.98
%2.
42%
9.25
%6.
39%
3.23
%
Hav
eri
29.4
8%1.
02%
7.54
%15
.30
%4.
56%
10.5
5%8.
77%
4.16
%1.
29%
10.3
0%
4.86
%2.
17%
Kod
agu
29.0
4%1.
70%
5.47
%16
.68%
7.55
%9.
93%
5.75
%4.
31%
2.55
%7.
48%
6.14
%3.
40%
(CONTD.) DISTrICT-WISe: INDICATor CoNTrIBUTIoN To The MpI SCore (rUrAl)(CONTD.) DISTrICT-WISe: INDICATor CoNTrIBUTIoN To The MpI SCore (rUrAl)
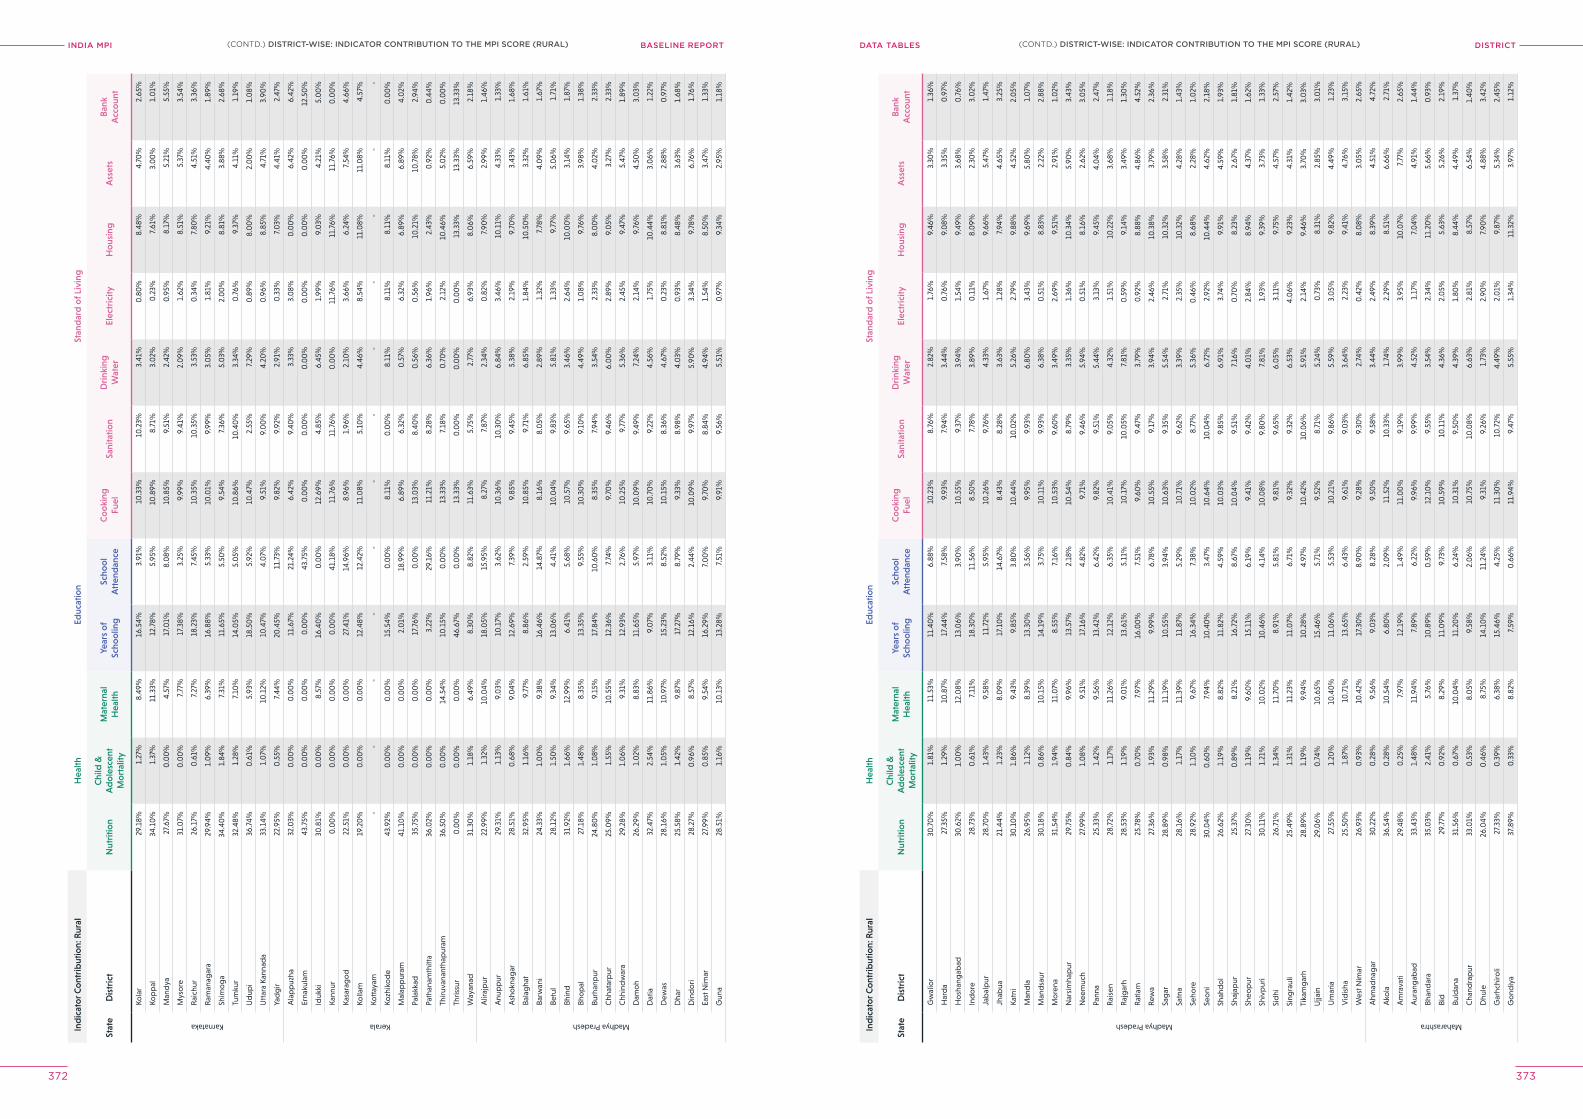
INDIA MPI BASELINE REPORT DISTrICTDATA TABleS
372 373
Ind
icat
or C
ont
rib
utio
n: R
ural
Hea
lthEd
ucat
ion
Stan
dar
d o
f Liv
ing
Stat
eD
istr
ict
Nut
ritio
nC
hild
&
Ad
ole
scen
t M
ort
ality
Mat
erna
l H
ealth
Year
s o
f Sc
hoo
ling
Scho
ol
Att
end
ance
Co
oki
ng
Fuel
Sani
tatio
nD
rink
ing
Wat
erEl
ectr
icity
Ho
usin
gA
sset
sB
ank
Acc
oun
t
Karnataka
Kola
r29
.18%
1.27
%8.
49%
16.5
4%3.
91%
10.3
3%10
.23%
3.41
%0
.80
%8.
48%
4.70
%2.
65%
Kop
pal
34.1
0%
1.37
%11
.33%
12.7
8%5.
95%
10.8
9%8.
71%
3.0
2%0
.23%
7.61
%3.
00
%1.
01%
Man
dya
27.6
7%0
.00
%4.
57%
17.0
1%8.
08%
10.8
5%9.
51%
2.42
%0
.95%
8.17
%5.
21%
5.55
%
Mys
ore
31.0
7%0
.00
%7.
77%
17.3
8%3.
25%
9.99
%9.
41%
2.0
9%1.
62%
8.51
%5.
37%
3.54
%
Rai
chur
26.1
7%0
.61%
7.27
%18
.23%
7.45
%10
.35%
10.3
5%3.
53%
0.3
4%7.
80%
4.51
%3.
36%
Ram
anag
ara
29.9
4%1.
09%
6.39
%16
.88%
5.33
%10
.01%
9.99
%3.
05%
1.81
%9.
21%
4.40
%1.
89%
Shim
og
a34
.40
%1.
84%
7.31
%11
.65%
5.50
%9.
54%
7.36
%5.
03%
2.0
0%
8.81
%3.
88%
2.68
%
Tum
kur
32.4
8%1.
28%
7.10
%14
.05%
5.0
5%10
.86%
10.4
0%
3.34
%0
.76%
9.37
%4.
11%
1.19
%
Ud
upi
36.7
4%0
.61%
5.93
%18
.50
%5.
92%
10.4
7%2.
55%
7.29
%0
.89%
8.0
0%
2.0
0%
1.0
8%
Utt
ara
Kann
ada
33.1
4%1.
07%
10.1
2%10
.47%
4.0
7%9.
51%
9.0
0%
4.20
%0
.96%
8.85
%4.
71%
3.90
%
Yad
gir
22.9
5%0
.55%
7.44
%20
.45%
11.7
3%9.
82%
9.92
%2.
91%
0.3
3%7.
03%
4.41
%2.
47%
Kerala
Ala
pp
uzha
32.0
3%0
.00
%0
.00
%11
.67%
21.2
4%6.
42%
9.40
%3.
33%
3.0
8%0
.00
%6.
42%
6.42
%
Erna
kula
m43
.75%
0.0
0%
0.0
0%
0.0
0%
43.7
5%0
.00
%0
.00
%0
.00
%0
.00
%0
.00
%0
.00
%12
.50
%
Iduk
ki30
.81%
0.0
0%
8.57
%16
.40
%0
.00
%12
.69%
4.85
%6.
45%
1.99
%9.
03%
4.21
%5.
00
%
Kann
ur0
.00
%0
.00
%0
.00
%0
.00
%41
.18%
11.7
6%11
.76%
0.0
0%
11.7
6%11
.76%
11.7
6%0
.00
%
Kasa
rag
od
22.5
1%0
.00
%0
.00
%27
.41%
14.9
6%8.
96%
1.96
%2.
10%
3.66
%6.
24%
7.54
%4.
66%
Kolla
m19
.20
%0
.00
%0
.00
%12
.48%
12.4
2%11
.08%
5.10
%4.
46%
8.54
%11
.08%
11.0
8%4.
57%
Kott
ayam
--
--
--
--
--
--
Kozh
iko
de
43.9
2%0
.00
%0
.00
%15
.54%
0.0
0%
8.11
%0
.00
%8.
11%
8.11
%8.
11%
8.11
%0
.00
%
Mal
app
uram
41.1
0%
0.0
0%
0.0
0%
2.0
1%18
.99%
6.89
%6.
32%
0.5
7%6.
32%
6.89
%6.
89%
4.0
2%
Pala
kkad
35.7
5%0
.00
%0
.00
%17
.76%
0.0
0%
13.0
3%8.
40%
0.5
6%0
.56%
10.2
1%10
.78%
2.94
%
Path
anam
thitt
a36
.02%
0.0
0%
0.0
0%
3.22
%29
.16%
11.2
1%8.
28%
6.36
%1.
96%
2.43
%0
.92%
0.4
4%
Thiru
vana
ntha
pur
am36
.50
%0
.00
%14
.54%
10.1
5%0
.00
%13
.33%
7.18
%0
.70
%2.
12%
10.4
6%5.
02%
0.0
0%
Thris
sur
0.0
0%
0.0
0%
0.0
0%
46.6
7%0
.00
%13
.33%
0.0
0%
0.0
0%
0.0
0%
13.3
3%13
.33%
13.3
3%
Way
anad
31.3
0%
1.18
%6.
49%
8.30
%8.
82%
11.6
3%5.
75%
2.77
%6.
93%
8.0
6%6.
59%
2.18
%
Madhya Pradesh
Alir
ajp
ur22
.99%
1.32
%10
.04%
18.0
5%15
.95%
8.27
%7.
87%
2.34
%0
.82%
7.90
%2.
99%
1.46
%
Anu
pp
ur29
.31%
1.13
%9.
03%
10.1
7%3.
62%
10.3
6%10
.30
%6.
84%
3.46
%10
.11%
4.33
%1.
33%
Ash
okn
agar
28.5
1%0
.68%
9.0
4%12
.69%
7.39
%9.
85%
9.45
%5.
38%
2.19
%9.
70%
3.43
%1.
68%
Bala
gha
t32
.95%
1.16
%9.
77%
8.86
%2.
59%
10.8
5%9 .
71%
6.85
%1.
84%
10.5
0%
3.32
%1.
61%
Barw
ani
24.3
3%1.
00
%9.
38%
16.4
6%14
.87%
8.16
%8.
05%
2.89
%1.
32%
7.78
%4.
09%
1.67
%
Betu
l28
.12%
1.50
%9.
34%
13.0
6%4.
41%
10.0
4%9.
83%
5.81
%1.
33%
9.77
%5.
06%
1.71
%
Bhin
d31
.92%
1.66
%12
.99%
6.41
%5.
68%
10.5
7%9.
65%
3.46
%2.
64%
10.0
0%
3.14
%1.
87%
Bho
pal
27.1
8%1.
48%
8.35
%13
.35%
9.55
%10
.30
%9.
10%
4.49
%1.
08%
9.76
%3.
98%
1.38
%
Burh
anp
ur24
.80
%1.
08%
9.15
%17
.84%
10.6
0%
8.35
%7.
94%
3.54
%2.
33%
8.0
0%
4.0
2%2.
33%
Chh
atar
pur
25.0
9%1.
55%
10.5
5%12
.36%
7.74
%9.
70%
9.46
%6.
00
%2.
89%
9.0
5%3.
27%
2.33
%
Chh
ind
war
a29
.28%
1.0
6%9.
31%
12.9
3%2.
76%
10.2
5%9.
77%
5.36
%2.
45%
9.47
%5.
47%
1.89
%
Dam
oh
26.2
9%1.
02%
8.83
%11
.65%
5.97
%10
.09%
9.49
%7.
24%
2.14
%9.
76%
4.50
%3.
03%
Dat
ia32
.47%
2.54
%11
.86%
9.0
7%3.
11%
10.7
0%
9.22
%4.
56%
1.75
%10
.44%
3.0
6%1.
22%
Dew
as28
.16%
1.0
5%10
.97%
15.2
3%8.
52%
10.1
5%8.
36%
4.67
%0
.23%
8.81
%2.
88%
0.9
7%
Dha
r25
.58%
1.42
%9.
87%
17.2
7%8.
79%
9.33
%8.
98%
4.0
3%0
.93%
8.48
%3.
63%
1.68
%
Din
do
ri28
.27%
0.9
6%8.
57%
12.1
6%2.
44%
10.0
9%9.
97%
5.90
%3.
34%
9.78
%6.
76%
1.76
%
East
Nim
ar27
.99%
0.8
5%9.
54%
16.2
9%7.
00
%9.
70%
8.84
%4.
94%
1.54
%8.
50%
3.47
%1.
33%
Gun
a28
.51%
1.16
%10
.13%
13.2
8%7.
51%
9.91
%9.
56%
5.51
%0
.97%
9.34
%2.
95%
1.18
%
Ind
icat
or C
ont
rib
utio
n: R
ural
Hea
lthEd
ucat
ion
Stan
dar
d o
f Liv
ing
Stat
eD
istr
ict
Nut
ritio
nC
hild
&
Ad
ole
scen
t M
ort
ality
Mat
erna
l H
ealth
Year
s o
f Sc
hoo
ling
Scho
ol
Att
end
ance
Co
oki
ng
Fuel
Sani
tatio
nD
rink
ing
Wat
erEl
ectr
icity
Ho
usin
gA
sset
sB
ank
Acc
oun
t
Madhya Pradesh
Gw
alio
r30
.70
%1.
81%
11.5
3%11
.40
%6.
88%
10.2
3%8.
76%
2.82
%1.
76%
9.46
%3.
30%
1.36
%
Har
da
27.3
5%1.
29%
10.8
7%17
.44%
7.58
%9.
93%
7.94
%3.
44%
0.7
6%9.
08%
3.35
%0
.97%
Ho
shan
gab
ad30
.62%
1.0
0%
12.0
8%13
.06%
3.90
%10
.55%
9.37
%3.
94%
1.54
%9.
49%
3.68
%0
.76%
Ind
ore
28.7
3%0
.61%
7.11
%18
.30
%11
.56%
8.50
%7.
78%
3.89
%0
.11%
8.0
9%2.
30%
3.0
2%
Jab
alp
ur28
.70
%1.
43%
9.58
%11
.72%
5.95
%10
.26%
9.76
%4.
33%
1.67
%9.
66%
5.47
%1.
47%
Jhab
ua21
.44%
1.23
%8.
09%
17.1
0%
14.6
7%8.
43%
8.28
%3.
63%
1.28
%7.
94%
4.65
%3.
25%
Katn
i30
.10
%1.
86%
9.43
%9.
85%
3.80
%10
.44%
10.0
2%5.
26%
2.79
%9.
88%
4.52
%2.
05%
Man
dla
26.9
5%1.
12%
8.39
%13
.30
%3.
56%
9.95
%9.
93%
6.80
%3.
43%
9.69
%5.
80%
1.0
7%
Man
dsa
ur30
.18%
0.8
6%10
.15%
14.1
9%3.
75%
10.1
1%9.
93%
6.38
%0
.51%
8.83
%2.
22%
2.88
%
Mo
rena
31.5
4%1.
94%
11.0
7%8.
55%
7.16
%10
.53%
9.60
%3.
49%
2.69
%9.
51%
2.91
%1.
02%
Nar
sim
hap
ur29
.75%
0.8
4%9.
96%
13.5
7%2.
18%
10.5
4%8.
79%
3.35
%1.
36%
10.3
4%5.
90%
3.43
%
Nee
muc
h27
.99%
1.0
8%9.
51%
17.1
6%4.
82%
9.71
%9.
46%
5.94
%0
.51%
8.16
%2.
62%
3.0
5%
Pann
a25
.33%
1.42
%9.
56%
13.4
2%6.
42%
9.82
%9.
51%
5.44
%3.
13%
9.45
%4.
04%
2.47
%
Rai
sen
28.7
2%1.
17%
11.2
6%12
.12%
6.35
%10
.41%
9.0
5%4.
32%
1.51
%10
.22%
3.68
%1.
18%
Raj
gar
h28
.53%
1.19
%9.
01%
13.6
1%5.
11%
10.1
7%10
.05%
7.81
%0
.59%
9.14
%3.
49%
1.30
%
Rat
lam
25.7
8%0
.70
%7.
97%
16.0
0%
7.51
%9.
60%
9.47
%3.
79%
0.9
2%8.
88%
4.86
%4.
52%
Rew
a27
.36%
1.93
%11
.29%
9.99
%6.
78%
10.5
5%9.
17%
3.94
%2.
46%
10.3
8%3.
79%
2.36
%
Sag
ar28
.89%
0.9
8%11
.19%
10.5
5%3.
94%
10.6
3%9.
35%
5.54
%2.
71%
10.3
2%3.
58%
2.31
%
Satn
a28
.16%
1.17
%11
.39%
11.8
7%5.
29%
10.7
1%9.
62%
3.39
%2.
35%
10.3
2%4.
28%
1.43
%
Seho
re28
.92%
1.10
%9.
67%
16.3
4%7.
38%
10.0
2%8.
77%
5.36
%0
.46%
8.68
%2.
28%
1.0
2%
Seo
ni30
.04%
0.6
0%
7.94
%10
.40
%3.
47%
10.6
4%10
.04%
6.72
%2.
92%
10.4
4%4.
62%
2.18
%
Shah
do
l26
.62%
1.19
%8.
82%
11.8
2%4.
59%
10.0
3%9.
85%
6.91
%3.
74%
9.91
%4.
59%
1.93
%
Shaj
apur
25.3
7%0
.89%
8.21
%16
.72%
8.67
%10
.04%
9.51
%7.
16%
0.7
0%
8.23
%2.
67%
1.81
%
Sheo
pur
27.3
0%
1.19
%9.
60%
15.1
1%6.
19%
9.41
%9.
42%
4.0
1%2.
84%
8.94
%4.
37%
1.62
%
Shiv
pur
i30
.11%
1.21
%10
.02%
10.4
6%4.
14%
10.0
8%9.
80%
7.81
%1.
93%
9.39
%3.
73%
1.33
%
Sid
hi26
.71%
1.34
%11
.70
%8.
91%
5.81
%9.
81%
9.65
%6.
05%
3.11
%9.
75%
4.57
%2.
57%
Sing
raul
i25
.49%
1.31
%11
.23%
11.0
7%6.
71%
9.32
%9.
32%
6.53
%4.
06%
9.23
%4.
31%
1.42
%
Tika
mg
arh
28.8
9%1.
19%
9.94
%10
.28%
4.97
%10
.42%
10.0
6%5.
91%
2.14
%9.
46%
3.70
%3.
03%
Ujja
in29
.06%
0.7
4%10
.65%
15.4
6%5.
71%
9.52
%8.
71%
5.24
%0
.73%
8.31
%2.
85%
3.0
1%
Um
aria
27.5
5%1.
20%
10.4
0%
11.0
6%5.
53%
10.2
1%9.
86%
5.59
%3.
05%
9.82
%4.
49%
1.23
%
Vid
isha
25.5
0%
1.87
%10
.71%
13.6
5%6.
43%
9.61
%9.
03%
3.64
%2.
23%
9.41
%4.
76%
3.15
%
Wes
t Nim
ar26
.93%
0.9
3%10
.42%
17.3
0%
8.90
%9.
28%
9.30
%2.
74%
0.4
2%8.
08%
3.0
5%2.
65%
Maharashtra
Ahm
adna
gar
30.2
2%0
.28%
9.56
%9.
03%
8.28
%9.
50%
9.58
%3.
44%
2.49
%8.
39%
4.51
%4.
72%
Ako
la36
.54%
0.2
8%10
.54%
6.80
%2.
09%
11.5
2%10
.33%
1.74
%2.
29%
8.51
%6.
66%
2.71
%
Am
rava
ti29
.48%
0.2
5%7.
97%
12.1
9%1.
49%
11.0
0%
9.19
%3.
99%
3.95
%10
.07%
7.77
%2.
65%
Aur
ang
abad
33.4
3%1.
48%
11.9
4%7.
89%
6.22
%9.
96%
9.99
%4.
52%
1.17
%7.
04%
4.91
%1.
44%
Bhan
dar
a35
.03%
2.41
%5.
76%
10.8
9%0
.59%
12.1
0%
9.55
%3.
54%
2.34
%11
.20
%5.
66%
0.9
3%
Bid
29.7
7%0
.92%
8.29
%11
.09%
9.73
%10
.59%
10.1
1%4.
36%
2.0
5%5.
63%
5.26
%2.
19%
Buld
ana
31.5
6%0
.67%
10.0
4%11
.20
%6.
24%
10.3
1%9.
50%
4.39
%1.
80%
8.44
%4.
49%
1.37
%
Cha
ndra
pur
33.0
1%0
.53%
8.0
5%9.
58%
2.0
6%10
.75%
10.0
8%6.
63%
2.81
%8.
57%
6.54
%1.
40%
Dhu
le26
.04%
0.4
6%8.
75%
14.1
0%
11.2
4%9.
31%
9.26
%1.
73%
2.90
%7.
90%
4.88
%3.
42%
Gar
hchi
roli
27.3
3%0
.39%
6.38
%15
.46%
4.25
%11
.30
%10
.72%
4.49
%2.
01%
9.87
%5.
34%
2.45
%
Go
ndiy
a37
.89%
0.3
3%8.
82%
7.59
%0
.66%
11.9
4%9.
47%
5.55
%1.
34%
11.3
2%3.
97%
1.12
%
(CONTD.) DISTrICT-WISe: INDICATor CoNTrIBUTIoN To The MpI SCore (rUrAl)(CONTD.) DISTrICT-WISe: INDICATor CoNTrIBUTIoN To The MpI SCore (rUrAl)
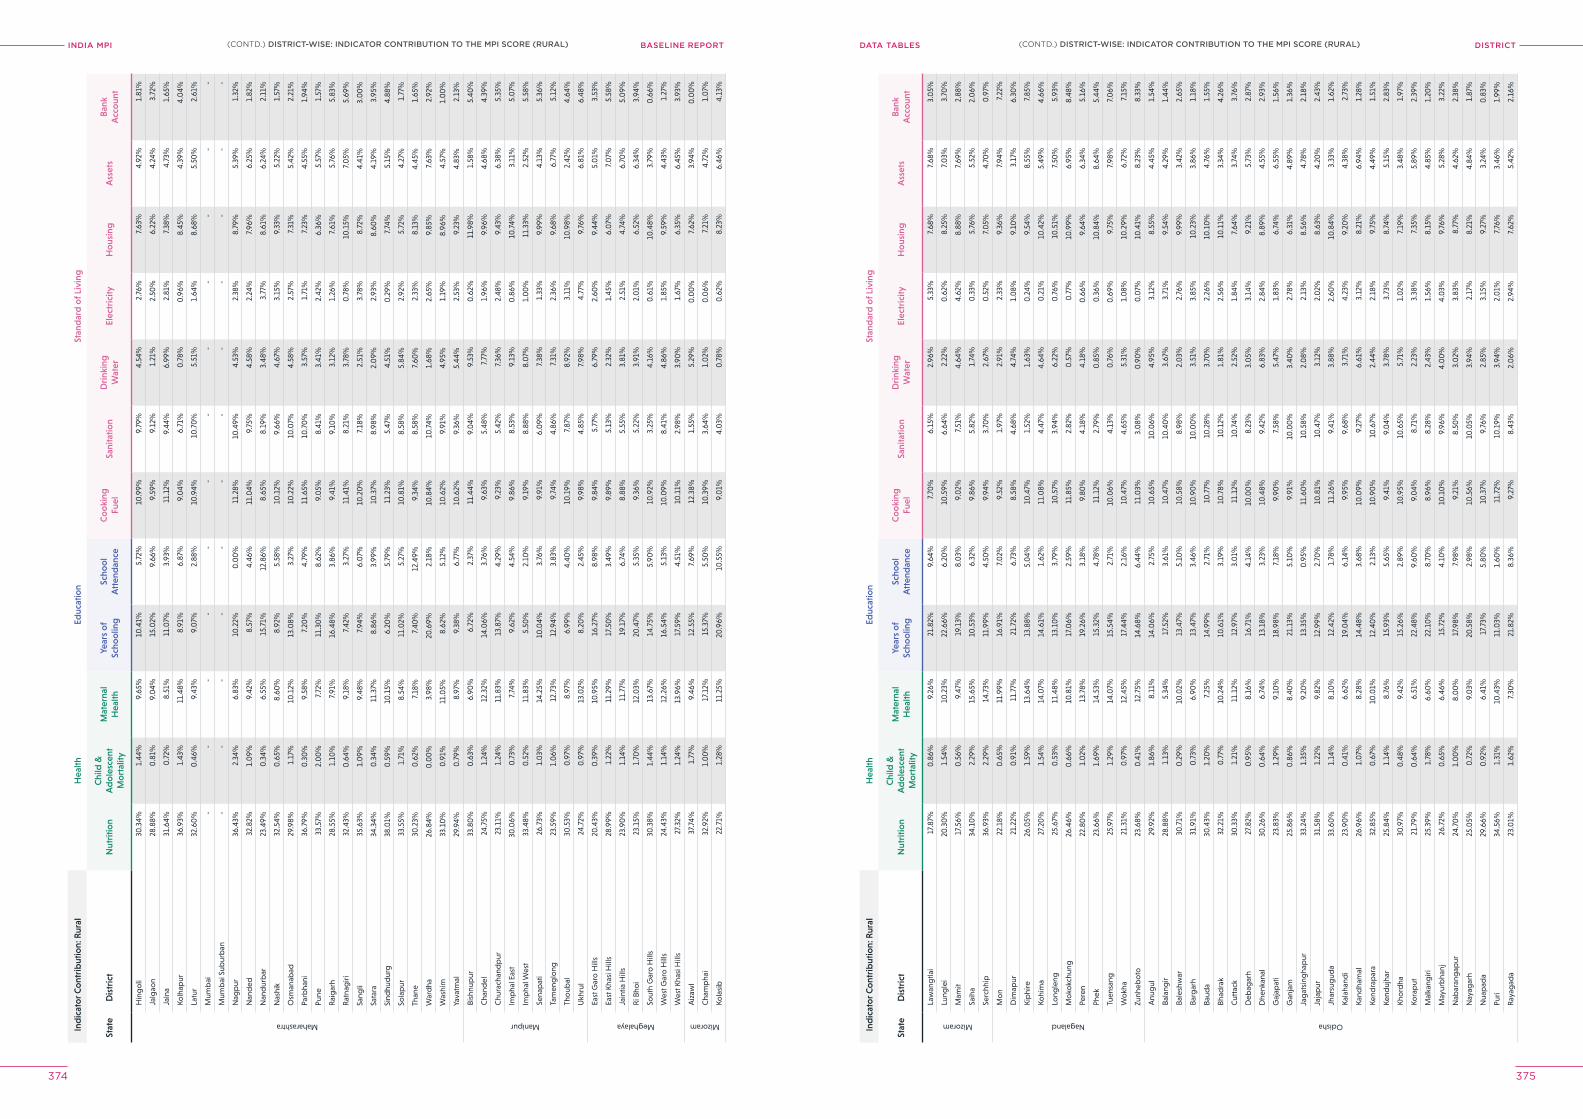
INDIA MPI BASELINE REPORT DISTrICTDATA TABleS
374 375
Ind
icat
or C
ont
rib
utio
n: R
ural
Hea
lthEd
ucat
ion
Stan
dar
d o
f Liv
ing
Stat
eD
istr
ict
Nut
ritio
nC
hild
&
Ad
ole
scen
t M
ort
ality
Mat
erna
l H
ealth
Year
s o
f Sc
hoo
ling
Scho
ol
Att
end
ance
Co
oki
ng
Fuel
Sani
tatio
nD
rink
ing
Wat
erEl
ectr
icity
Ho
usin
gA
sset
sB
ank
Acc
oun
t
Maharashtra
Hin
go
li30
.34%
1.44
%9.
65%
10.4
1%5.
72%
10.9
9%9.
79%
4.54
%2.
76%
7.63
%4.
92%
1.81
%
Jalg
aon
28.8
8%0
.81%
9.0
4%15
.02%
9.66
%9.
59%
9.12
%1.
21%
2.50
%6.
22%
4.24
%3.
72%
Jaln
a31
.64%
0.7
2%8.
51%
11.0
7%3.
93%
11.1
2%9.
44%
6.99
%2.
81%
7.38
%4.
73%
1.65
%
Kolh
apur
36.9
3%1.
43%
11.4
8%8.
91%
6.87
%9.
04%
6.71
%0
.78%
0.9
6%8.
45%
4.39
%4.
04%
Latu
r32
.60
%0
.46%
9.43
%9.
07%
2.88
%10
.94%
10.7
0%
5.51
%1.
64%
8.68
%5.
50%
2.61
%
Mum
bai
--
--
--
--
--
--
Mum
bai
Sub
urb
an-
--
--
--
--
--
-
Nag
pur
36.4
3%2.
34%
6.83
%10
.22%
0.0
0%
11.2
8%10
.49%
4.53
%2.
38%
8.79
%5.
39%
1.32
%
Nan
ded
32.8
2%1.
09%
9.42
%8.
57%
4.46
%11
.04%
9.75
%4.
58%
2.24
%7.
96%
6.25
%1.
82%
Nan
dur
bar
23.4
9%0
.34%
6.55
%15
.71%
12.8
6%8.
65%
8.19
%3.
48%
3.77
%8.
61%
6.24
%2.
11%
Nas
hik
32.5
4%0
.65%
8.60
%8.
92%
5.58
%10
.12%
9.66
%4.
67%
3.15
%9.
33%
5.22
%1.
57%
Osm
anab
ad29
.98%
1.17
%10
.12%
13.0
8%3.
27%
10.2
2%10
.07%
4.58
%2.
57%
7.31
%5.
42%
2.21
%
Parb
hani
36.7
9%0
.30
%9.
58%
7.20
%4.
79%
11.6
5%10
.70
%3.
57%
1.71
%7.
23%
4.55
%1.
94%
Pune
33.5
7%2.
00
%7.
72%
11.3
0%
8.62
%9.
05%
8.41
%3.
41%
2.42
%6.
36%
5.57
%1.
57%
Rai
gar
h28
.55%
1.10
%7.
91%
16.4
8%3.
86%
9.41
%9.
10%
3.12
%1.
26%
7.61
%5.
76%
5.83
%
Rat
nag
iri32
.43%
0.6
4%9.
18%
7.42
%3.
27%
11.4
1%8.
21%
3.78
%0
.78%
10.1
5%7.
05%
5.69
%
Sang
li35
.63%
1.0
9%9.
48%
7.94
%6.
07%
10.2
0%
7.18
%2.
51%
3.78
%8.
72%
4.41
%3.
00
%
Sata
ra34
.34%
0.3
4%11
.37%
8.86
%3.
99%
10.3
7%8.
98%
2.0
9%2.
93%
8.60
%4.
19%
3.95
%
Sind
hud
urg
38.0
1%0
.59%
10.1
5%6.
20%
5.79
%11
.23%
5.47
%4.
51%
0.2
9%7.
74%
5.15
%4.
88%
Sola
pur
33.5
5%1.
71%
8.54
%11
.02%
5.27
%10
.81%
8.58
%5.
84%
2.92
%5.
72%
4.27
%1.
77%
Than
e30
.23%
0.6
2%7.
18%
7.40
%12
.49%
9.34
%8.
58%
7.60
%2.
33%
8.13
%4.
45%
1.65
%
War
dha
26.8
4%0
.00
%3.
98%
20.6
9%2.
18%
10.8
4%10
.74%
1.68
%2.
65%
9.85
%7.
63%
2.92
%
Was
him
33.1
0%
0.9
1%11
.05%
8.62
%5.
12%
10.6
2%9.
91%
4.95
%1.
19%
8.96
%4.
57%
1.0
0%
Yava
tmal
29.9
4%0
.79%
8.97
%9.
38%
6.77
%10
.62%
9.36
%5.
44%
2.53
%9.
23%
4.83
%2.
13%
Manipur
Bish
nup
ur33
.80
%0
.63%
6.90
%6.
72%
2.37
%11
.44%
9.0
4%9.
53%
0.6
2%11
.98%
1.58
%5.
40%
Cha
ndel
24.7
5%1.
24%
12.3
2%14
.06%
3.76
%9.
63%
5.48
%7.
77%
1.96
%9.
96%
4.68
%4.
39%
Chu
rach
and
pur
23.1
1%1.
24%
11.8
3%13
.87%
4.29
%9.
23%
5.42
%7.
36%
2.48
%9.
43%
6.38
%5.
35%
Imp
hal E
ast
30.0
6%0
.73%
7.74
%9.
62%
4.54
%9.
86%
8.53
%9.
13%
0.8
6%10
.74%
3.11
%5.
07%
Imp
hal W
est
33.4
8%0
.52%
11.8
3%5.
50%
2.10
%9.
19%
8.88
%8.
07%
1.0
0%
11.3
3%2.
52%
5.58
%
Sena
pat
i26
.73%
1.0
3%14
.25%
10.0
4%3.
76%
9.91
%6.
09%
7.38
%1.
33%
9.99
%4.
13%
5.36
%
Tam
eng
long
23.5
9%1.
06%
12.7
3%12
.94%
3.83
%9.
74%
4.86
%7.
31%
2.36
%9.
68%
6.77
%5.
12%
Tho
ubal
30.5
3%0
.97%
8.97
%6.
99%
4.40
%10
.19%
7.87
%8.
92%
3.11
%10
.98%
2.42
%4.
64%
Ukh
rul
24.7
2%0
.97%
13.0
2%8.
20%
2.45
%9.
98%
4.85
%7.
98%
4.77
%9.
76%
6.81
%6.
48%
Meghalaya
East
Gar
o H
ills
20.4
3%0
.39%
10.9
5%16
.27%
8.98
%9.
84%
5.77
%6.
79%
2.60
%9.
44%
5.0
1%3.
53%
East
Kha
si H
ills
28.9
9%1.
22%
11.2
9%17
.50
%3.
49%
9.89
%5.
13%
2.32
%1.
45%
6.0
7%7.
07%
5.58
%
Jain
tia H
ills
23.9
0%
1.14
%11
.77%
19.1
7%6.
74%
8.88
%5.
55%
3.81
%2.
51%
4.74
%6.
70%
5.0
9%
Ri B
hoi
23.1
5%1.
70%
12.0
3%20
.47%
5.35
%9.
36%
5.22
%3.
91%
2.0
1%6.
52%
6.34
%3.
94%
Sout
h G
aro
Hill
s30
.38%
1.44
%13
.67%
14.7
5%5.
90%
10.9
2%3.
25%
4.16
%0
.61%
10.4
8%3.
79%
0.6
6%
Wes
t Gar
o H
ills
24.4
3%1.
14%
12.2
6%16
.54%
5.13
%10
.09%
8.41
%4.
86%
1.85
%9.
59%
4.43
%1.
27%
Wes
t Kha
si H
ills
27.3
2%1.
24%
13.9
6%17
.59%
4.51
%10
.11%
2.98
%3.
90%
1.67
%6.
35%
6.45
%3.
93%
Mizoram
Aiz
awl
37.7
4%1.
77%
9.46
%12
.55%
7.69
%12
.38%
1.55
%5.
29%
0.0
0%
7.62
%3.
94%
0.0
0%
Cha
mp
hai
32.9
2%1.
00
%17
.12%
15.3
7%5.
50%
10.3
9%3.
64%
1.0
2%0
.06%
7.21
%4.
72%
1.0
7%
Kola
sib
22.7
1%1.
28%
11.2
5%20
.96%
10.5
5%9.
01%
4.0
3%0
.78%
0.6
2%8.
23%
6.46
%4.
13%
Ind
icat
or C
ont
rib
utio
n: R
ural
Hea
lthEd
ucat
ion
Stan
dar
d o
f Liv
ing
Stat
eD
istr
ict
Nut
ritio
nC
hild
&
Ad
ole
scen
t M
ort
ality
Mat
erna
l H
ealth
Year
s o
f Sc
hoo
ling
Scho
ol
Att
end
ance
Co
oki
ng
Fuel
Sani
tatio
nD
rink
ing
Wat
erEl
ectr
icity
Ho
usin
gA
sset
sB
ank
Acc
oun
t
Mizoram
Law
ang
tlai
17.8
7%0
.86%
9.26
%21
.82%
9.64
%7.
70%
6.15
%2.
96%
5.33
%7.
68%
7.68
%3.
05%
Lung
lei
20.3
0%
1.54
%10
.23%
22.6
6%6.
20%
10.5
9%6.
64%
2.22
%0
.62%
8.25
%7.
03%
3.70
%
Mam
it17
.56%
0.5
6%9.
47%
19.1
3%8.
03%
9.0
2%7.
51%
4.64
%4.
62%
8.88
%7.
69%
2.88
%
Saih
a34
.10
%2.
29%
15.6
5%10
.53%
6.32
%9.
86%
5.82
%1.
74%
0.3
3%5.
76%
5.52
%2.
06%
Serc
hhip
36.9
3%2.
29%
14.7
3%11
.99%
4.50
%9.
94%
3.70
%2.
67%
0.5
2%7.
05%
4.70
%0
.97%
Nagaland
Mo
n22
.18%
0.6
5%11
.99%
16.9
1%7.
02%
9.52
%1.
97%
2.91
%2.
33%
9.36
%7.
94%
7.22
%
Dim
apur
21.2
2%0
.91%
11.7
7%21
.72%
6.73
%8.
58%
4.68
%4.
74%
1.0
8%9.
10%
3.17
%6.
30%
Kip
hire
26.0
5%1.
59%
13.6
4%13
.88%
5.0
4%10
.47%
1.52
%1.
63%
0.2
4%9.
54%
8.55
%7.
85%
Kohi
ma
27.2
0%
1.54
%14
.07%
14.6
1%1.
62%
11.0
8%4.
47%
4.64
%0
.21%
10.4
2%5.
49%
4.66
%
Long
leng
25.6
7%0
.53%
11.4
8%13
.10
%3.
79%
10.5
7%3.
94%
6.22
%0
.76%
10.5
1%7.
50%
5.93
%
Mo
kokc
hung
26.4
6%0
.66%
10.8
1%17
.06%
2.59
%11
.85%
2.82
%0
.57%
0.7
7%10
.99%
6.95
%8.
48%
Pere
n22
.80
%1.
02%
13.7
8%19
.26%
3.18
%9.
80%
4.18
%4.
18%
0.6
6%9.
64%
6.34
%5.
16%
Phek
23.6
6%1.
69%
14.5
3%15
.32%
4.78
%11
.12%
2.79
%0
.85%
0.3
6%10
.84%
8.64
%5.
44%
Tuen
sang
25.9
7%1.
29%
14.0
7%15
.54%
2.71
%10
.06%
4.13
%0
.76%
0.6
9%9.
75%
7.98
%7.
06%
Wo
kha
21.3
1%0
.97%
12.4
5%17
.44%
2.16
%10
.47%
4.65
%5.
31%
1.0
8%10
.29%
6.72
%7.
15%
Zunh
ebo
to23
.68%
0.4
1%12
.75%
14.6
8%6.
44%
11.0
3%3.
08%
0.9
0%
0.0
7%10
.41%
8.23
%8.
33%
Odisha
Anu
gul
29.9
2%1.
86%
8.11
%14
.06%
2.75
%10
.65%
10.0
6%4.
95%
3.12
%8.
55%
4.45
%1.
54%
Bala
ngir
28.8
8%1.
13%
5.34
%17
.52%
3.61
%10
.47%
10.4
0%
3.67
%3.
71%
9.54
%4.
29%
1.44
%
Bale
shw
ar30
.71%
0.2
9%10
.02%
13.4
7%5.
10%
10.5
8%8.
98%
2.0
3%2.
76%
9.99
%3.
42%
2.65
%
Barg
arh
31.9
1%0
.73%
6.90
%13
.47%
3.46
%10
.90
%10
.00
%3.
51%
3.85
%10
.23%
3.86
%1.
18%
Baud
a30
.43%
1.20
%7.
25%
14.9
9%2.
71%
10.7
7%10
.28%
3.70
%2.
26%
10.1
0%
4.76
%1.
55%
Bhad
rak
32.2
1%0
.77%
10.2
4%10
.61%
3.19
%10
.78%
10.1
2%1.
81%
2.56
%10
.11%
3.34
%4.
26%
Cut
tack
30.3
3%1.
21%
11.1
2%12
.97%
3.0
1%11
.12%
10.7
4%2.
52%
1.84
%7.
64%
3.74
%3.
76%
Deb
agar
h27
.82%
0.9
5%8.
16%
16.7
1%4.
14%
10.0
0%
8.23
%3.
05%
3.14
%9.
21%
5.73
%2.
87%
Dhe
nkan
al30
.26%
0.6
4%6.
74%
13.1
8%3.
23%
10.4
8%9.
42%
6.83
%2.
84%
8.89
%4.
55%
2.93
%
Gaj
apat
i23
.83%
1.29
%9.
10%
18.9
8%7.
18%
9.90
%7.
58%
5.47
%1.
83%
6.74
%6.
55%
1.56
%
Gan
jam
25.8
6%0
.86%
8.40
%21
.13%
5.10
%9.
91%
10.0
0%
3.40
%2.
78%
6.31
%4.
89%
1.36
%
Jag
atsi
ngha
pur
33.2
4%1.
35%
9.20
%13
.35%
0.9
5%11
.60
%10
.58%
2.0
8%2.
13%
8.56
%4.
78%
2.18
%
Jaja
pur
31.5
8%1.
22%
9.82
%12
.99%
2.70
%10
.81%
10.4
7%3.
12%
2.0
2%8.
63%
4.20
%2.
43%
Jhar
sug
uda
33.6
0%
1.14
%8.
10%
12.4
2%1.
78%
11.2
6%9.
41%
3.88
%2.
60%
10.8
4%3.
33%
1.62
%
Kala
hand
i23
.90
%0
.41%
6.62
%19
.04%
6.14
%9.
95%
9.68
%3.
71%
4.23
%9.
20%
4.38
%2.
73%
Kand
ham
al26
.96%
1.0
7%8.
28%
14.4
8%3.
68%
10.0
9%9.
27%
6.61
%3.
12%
8.21
%6.
94%
1.28
%
Kend
rap
ara
32.8
5%0
.67%
10.0
1%12
.40
%2.
13%
10.9
0%
10.6
7%2.
44%
2.18
%9.
75%
4.49
%1.
51%
Kend
ujha
r25
.84%
1.14
%8.
76%
15.9
3%5.
65%
9.41
%9.
04%
3.78
%3.
73%
8.74
%5.
15%
2.83
%
Kho
rdha
30.9
7%0
.48%
9.42
%15
.26%
2.89
%10
.95%
10.6
5%5.
71%
1.0
2%7.
19%
3.48
%1.
97%
Kora
put
21.7
9%0
.64%
6.51
%22
.48%
9.60
%9.
04%
8.71
%2.
23%
3.38
%7.
35%
5.89
%2.
39%
Mal
kang
iri25
.39%
1.78
%6.
60%
22.1
0%
8.70
%8.
96%
8.28
%2.
43%
1.56
%8.
15%
4.85
%1.
20%
May
urb
hanj
26.7
2%0
.65%
6.46
%15
.72%
4.10
%10
.10
%9.
96%
4.0
0%
4.0
3%9.
76%
5.28
%3.
22%
Nab
aran
gap
ur24
.70
%1.
00
%8.
00
%17
.98%
7.98
%9.
21%
8.50
%3.
02%
3.83
%8.
77%
4.62
%2.
38%
Nay
agar
h25
.05%
0.7
2%9.
03%
20.5
8%2.
98%
10.5
6%10
.05%
3.94
%2.
17%
8.21
%4.
84%
1.87
%
Nua
pad
a29
.66%
0.9
2%6.
41%
17.7
3%5.
80%
10.3
7%9.
76%
2.85
%3.
15%
9.27
%3.
24%
0.8
3%
Puri
34.5
6%1.
31%
10.4
3%11
.03%
1.60
%11
.72%
10.1
9%3.
94%
2.0
1%7.
76%
3.46
%1.
99%
Ray
agad
a23
.01%
1.62
%7.
30%
21.8
2%8.
36%
9.27
%8.
43%
2.0
6%2.
94%
7.62
%5.
42%
2.16
%
(CONTD.) DISTrICT-WISe: INDICATor CoNTrIBUTIoN To The MpI SCore (rUrAl)(CONTD.) DISTrICT-WISe: INDICATor CoNTrIBUTIoN To The MpI SCore (rUrAl)
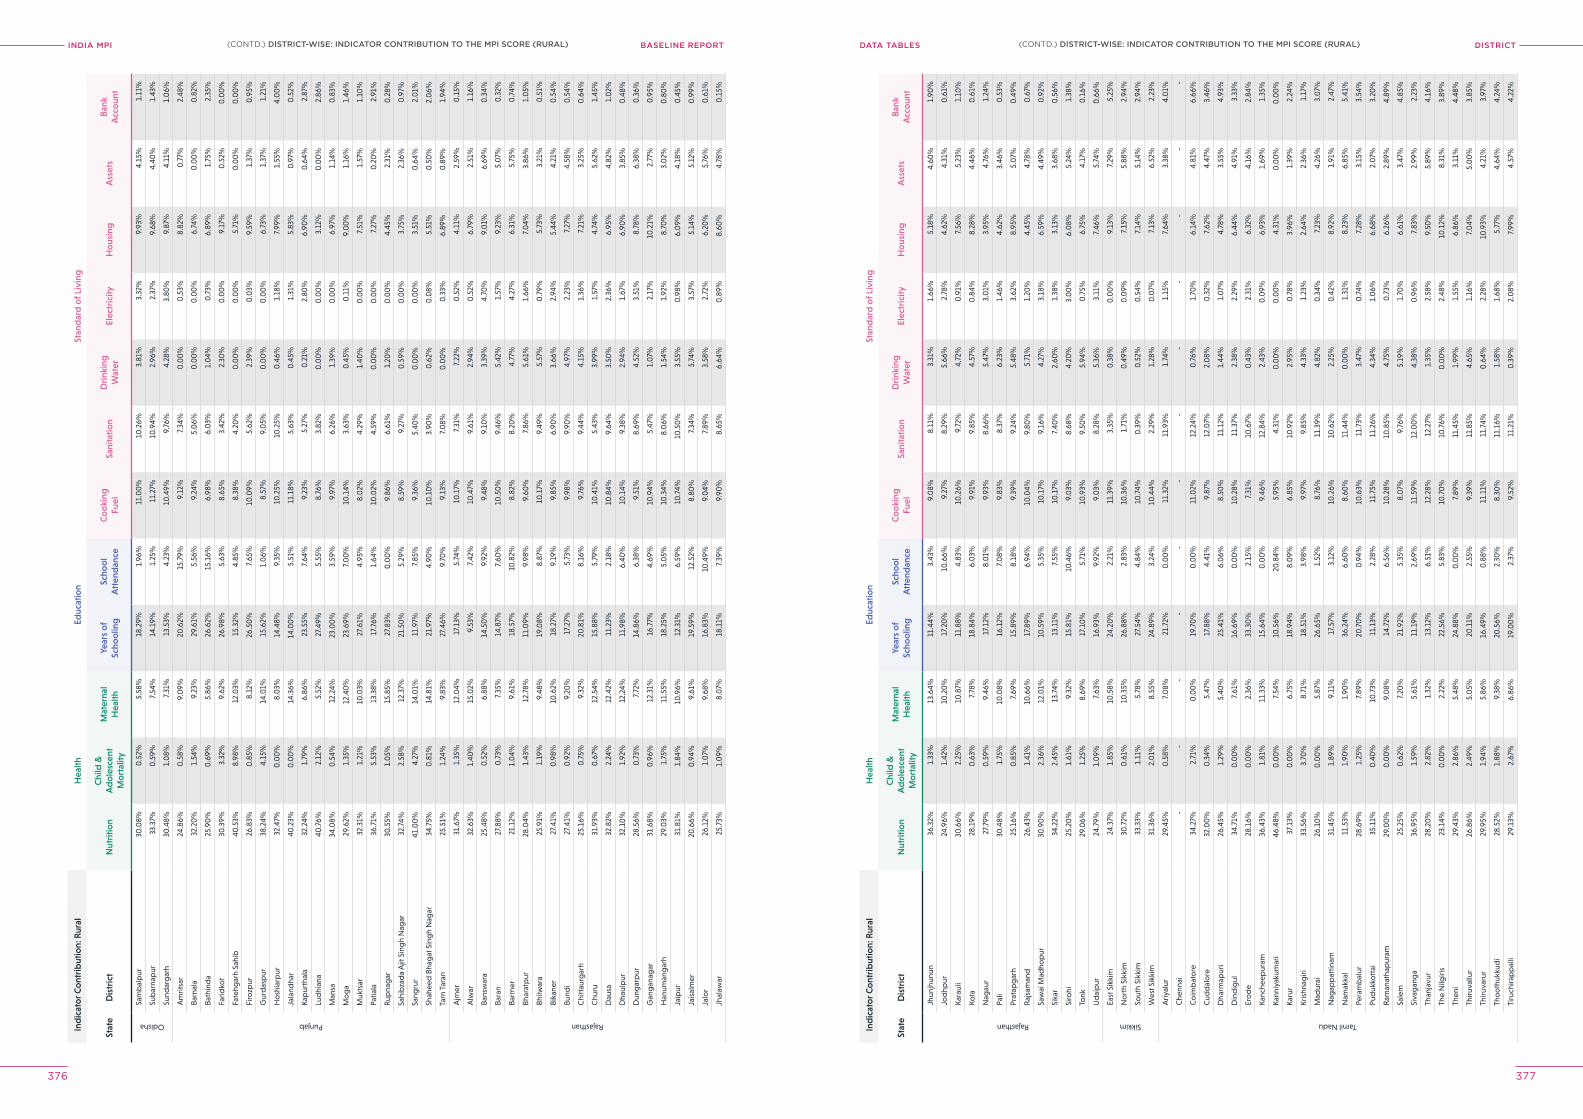
INDIA MPI BASELINE REPORT DISTrICTDATA TABleS
376 377
Ind
icat
or C
ont
rib
utio
n: R
ural
Hea
lthEd
ucat
ion
Stan
dar
d o
f Liv
ing
Stat
eD
istr
ict
Nut
ritio
nC
hild
&
Ad
ole
scen
t M
ort
ality
Mat
erna
l H
ealth
Year
s o
f Sc
hoo
ling
Scho
ol
Att
end
ance
Co
oki
ng
Fuel
Sani
tatio
nD
rink
ing
Wat
erEl
ectr
icity
Ho
usin
gA
sset
sB
ank
Acc
oun
t
Odisha
Sam
bal
pur
30.0
8%0
.52%
5.58
%18
.29%
1.96
%11
.00
%10
.26%
3.81
%3.
32%
9.93
%4.
15%
1.11
%
Sub
arna
pur
33.3
7%0
.59%
7.54
%14
.19%
1.25
%11
.27%
10.9
4%2.
96%
2.37
%9.
68%
4.40
%1.
43%
Sund
arg
arh
30.4
8%1.
08%
7.31
%13
.53%
4.23
%10
.49%
9.76
%4.
28%
3.80
%9.
87%
4.11
%1.
06%
Punjab
Am
ritsa
r24
.86%
0.5
8%9.
09%
20.6
2%15
.79%
9.12
%7.
34%
0.0
0%
0.5
3%8.
82%
0.7
7%2.
48%
Barn
ala
32.2
0%
1.54
%9.
23%
29.6
1%5.
56%
9.24
%5.
06%
0.0
0%
0.0
0%
6.74
%0
.00
%0
.82%
Bath
ind
a25
.90
%0
.69%
5.86
%26
.62%
15.1
6%6.
98%
6.0
3%1.
04%
0.7
3%6.
89%
1.75
%2.
35%
Farid
kot
30.3
9%3.
32%
9.62
%26
.98%
5.63
%8.
65%
3.42
%2.
30%
0.0
0%
9.17
%0
.52%
0.0
0%
Fate
hgar
h Sa
hib
40.5
3%8.
98%
12.0
3%15
.32%
4.85
%8.
38%
4.20
%0
.00
%0
.00
%5.
71%
0.0
0%
0.0
0%
Firo
zpur
26.8
3%0
.85%
8.12
%26
.50
%7.
65%
10.0
9%5.
62%
2.39
%0
.03%
9.59
%1.
37%
0.9
5%
Gur
das
pur
38.2
4%4.
15%
14.0
1%15
.62%
1.0
6%8.
57%
9.0
5%0
.00
%0
.00
%6.
73%
1.37
%1.
21%
Ho
shia
rpur
32.4
7%0
.00
%8.
03%
14.4
8%9.
35%
10.2
5%10
.25%
0.4
6%1.
18%
7.99
%1.
55%
4.0
0%
Jala
ndha
r40
.23%
0.0
0%
14.3
6%14
.00
%5.
51%
11.1
8%5.
63%
0.4
5%1.
31%
5.83
%0
.97%
0.5
2%
Kap
urth
ala
32.2
4%1.
79%
6.86
%23
.55%
7.64
%9.
23%
5.27
%0
.21%
2.80
%6.
90%
0.6
4%2.
87%
Lud
hian
a40
.76%
2.12
%5.
52%
27.4
9%5.
55%
8.76
%3.
82%
0.0
0%
0.0
0%
3.12
%0
.00
%2.
86%
Man
sa34
.08%
0.5
4%12
.24%
23.0
0%
3.59
%9.
97%
6.26
%1.
39%
0.0
0%
6.97
%1.
14%
0.8
3%
Mo
ga
29.6
2%1.
35%
12.4
0%
23.6
9%7.
00
%10
.14%
3.63
%0
.45%
0.1
1%9.
00
%1.
16%
1.46
%
Muk
tsar
32.3
1%1.
21%
10.0
3%27
.61%
4.95
%8.
02%
4.29
%1.
40%
0.0
0%
7.51
%1.
57%
1.10
%
Patia
la36
.71%
5.53
%13
.38%
17.7
6%1.
64%
10.0
2%4.
59%
0.0
0%
0.0
0%
7.27
%0
.20
%2.
91%
Rup
nag
ar30
.55%
1.0
5%15
.85%
27.8
3%0
.00
%9.
86%
6.61
%1.
20%
0.0
0%
4.45
%2.
31%
0.2
8%
Sahi
bza
da
Ajit
Sin
gh
Nag
ar32
.74%
2.58
%12
.37%
21.5
0%
5.29
%8.
59%
9.27
%0
.59%
0.0
0%
3.75
%2.
36%
0.9
7%
Sang
rur
41.0
0%
4.27
%14
.01%
11.9
7%7.
85%
9.36
%5.
40%
0.0
0%
0.0
0%
3.51
%0
.64%
2.0
1%
Shah
eed
Bha
gat
Sin
gh
Nag
ar34
.75%
0.8
1%14
.81%
21.9
7%4.
90%
10.1
0%
3.90
%0
.62%
0.0
8%5.
51%
0.5
0%
2.0
6%
Tarn
Tar
an25
.51%
1.24
%9.
83%
27.4
6%9.
70%
9.13
%7.
08%
0.0
0%
0.3
3%6.
89%
0.8
9%1.
94%
Rajasthan
Ajm
er31
.67%
1.35
%12
.04%
17.1
3%5.
74%
10.1
7%7.
31%
7.22
%0
.52%
4.11
%2.
59%
0.1
5%
Alw
ar32
.63%
1.40
%15
.02%
9.53
%7.
42%
10.4
7%9.
61%
2.94
%0
.52%
6.79
%2.
51%
1.16
%
Bans
war
a25
.48%
0.5
2%6.
88%
14.5
0%
9.92
%9.
48%
9.10
%3.
39%
4.70
%9.
01%
6.69
%0
.34%
Bara
n27
.88%
0.7
3%7.
35%
14.8
7%7.
60%
10.5
0%
9.46
%5.
42%
1.57
%9.
23%
5.0
7%0
.32%
Barm
er21
.12%
1.0
4%9.
61%
18.5
7%10
.82%
8.82
%8.
20%
4.77
%4.
27%
6.31
%5.
75%
0.7
4%
Bhar
atp
ur28
.04%
1.43
%12
.78%
11.0
9%9.
98%
9.60
%7 .
86%
5.61
%1.
66%
7.0
4%3.
86%
1.0
5%
Bhilw
ara
25.9
1%1.
19%
9.48
%19
.08%
8.87
%10
.17%
9.49
%5.
57%
0.7
9%5.
73%
3.21
%0
.51%
Bika
ner
27.4
1%0
.98%
10.6
2%18
.27%
9.19
%9.
85%
6.90
%3.
66%
2.94
%5.
44%
4.21
%0
.54%
Bund
i27
.41%
0.9
2%9.
20%
17.2
7%5.
73%
9.98
%9.
90%
4.97
%2.
23%
7.27
%4.
58%
0.5
4%
Chi
ttau
rgar
h25
.16%
0.7
5%9.
32%
20.8
1%8.
16%
9.76
%9.
44%
4.15
%1.
36%
7.21
%3.
25%
0.6
4%
Chu
ru31
.93%
0.6
7%12
.54%
15.8
8%5.
79%
10.4
1%5.
43%
3.99
%1.
57%
4.74
%5.
62%
1.45
%
Dau
sa32
.82%
2.24
%12
.42%
11.2
3%2.
18%
10.8
4%9.
64%
3.50
%2.
36%
6.95
%4.
82%
1.0
2%
Dha
ulp
ur32
.10
%1.
92%
12.2
4%11
.98%
6.40
%10
.14%
9.38
%2.
94%
1.67
%6.
90%
3.85
%0
.48%
Dun
gar
pur
28.5
6%0
.73%
7.72
%14
.86%
6.38
%9.
51%
8.69
%4.
52%
3.51
%8.
78%
6.38
%0
.36%
Gan
gan
agar
31.6
8%0
.96%
12.3
1%16
.77%
4.69
%10
.94%
5.47
%1.
07%
2.17
%10
.21%
2.77
%0
.95%
Han
uman
gar
h29
.03%
1.75
%11
.55%
18.2
5%5.
05%
10.3
4%8.
06%
1.54
%1.
92%
8.70
%3.
02%
0.8
0%
Jaip
ur31
.81%
1.84
%10
.96%
12.3
1%6.
59%
10.7
4%10
.50
%3.
55%
0.9
8%6.
09%
4.18
%0
.45%
Jais
alm
er20
.66%
0.9
4%9.
61%
19.5
9%12
.52%
8.80
%7.
34%
5.74
%3.
57%
5.14
%5.
12%
0.9
9%
Jalo
r26
.12%
1.0
7%9.
68%
16.8
3%10
.49%
9.0
4%7.
89%
3.58
%2.
72%
6.20
%5.
76%
0.6
1%
Jhal
awar
25.7
3%1.
09%
8.0
7%18
.11%
7.39
%9.
90%
8.65
%6.
64%
0.8
9%8.
60%
4.78
%0
.15%
Ind
icat
or C
ont
rib
utio
n: R
ural
Hea
lthEd
ucat
ion
Stan
dar
d o
f Liv
ing
Stat
eD
istr
ict
Nut
ritio
nC
hild
&
Ad
ole
scen
t M
ort
ality
Mat
erna
l H
ealth
Year
s o
f Sc
hoo
ling
Scho
ol
Att
end
ance
Co
oki
ng
Fuel
Sani
tatio
nD
rink
ing
Wat
erEl
ectr
icity
Ho
usin
gA
sset
sB
ank
Acc
oun
t
Rajasthan
Jhun
jhun
un36
.32%
1.33
%13
.64%
11.4
4%3.
43%
9.0
8%8.
11%
3.31
%1.
66%
5.18
%4.
60%
1.90
%
Jod
hpur
24.9
6%1.
42%
10.2
0%
17.2
0%
10.6
6%9.
27%
8.29
%5.
66%
2.78
%4.
62%
4.31
%0
.61%
Kara
uli
30.6
6%2.
25%
10.8
7%11
.88%
4.83
%10
.26%
9.72
%4.
72%
0.9
1%7.
56%
5.23
%1.
10%
Kota
28.1
9%0
.63%
7.78
%18
.84%
6.0
3%9.
91%
9.85
%4.
57%
0.8
4%8.
28%
4.46
%0
.61%
Nag
aur
27.7
9%0
.59%
9.46
%17
.12%
8.0
1%9.
93%
8.66
%5.
47%
3.0
1%3.
95%
4.76
%1.
24%
Pali
30.4
8%1.
75%
10.0
8%16
.12%
7.0
8%9.
83%
8.37
%6.
23%
1.46
%4.
62%
3.46
%0
.53%
Prat
apg
arh
25.1
6%0
.85%
7.69
%15
.89%
8.18
%9.
39%
9.24
%5.
48%
3.62
%8.
95%
5.0
7%0
.49%
Raj
sam
and
26.4
3%1.
41%
10.6
6%17
.89%
6.94
%10
.04%
9.80
%5.
71%
1.20
%4.
45%
4.78
%0
.67%
Saw
ai M
adho
pur
30.9
0%
2.36
%12
.01%
10.5
9%5.
35%
10.1
7%9.
16%
4.27
%3.
18%
6.59
%4.
49%
0.9
2%
Sika
r34
.22%
2.45
%13
.74%
13.1
1%7.
55%
10.1
7%7.
40%
2.60
%1.
38%
3.13
%3.
68%
0.5
6%
Siro
hi25
.20
%1.
61%
9.32
%15
.81%
10.4
6%9.
03%
8.68
%4.
20%
3.0
0%
6.0
8%5.
24%
1.38
%
Tonk
29.0
6%1.
25%
8.69
%17
.10
%5.
71%
10.9
3%9.
50%
5.94
%0
.75%
6.75
%4.
17%
0.1
6%
Ud
aip
ur24
.79%
1.0
9%7.
63%
16.9
3%9.
92%
9.0
3%8.
28%
5.36
%3.
11%
7.46
%5.
74%
0.6
6%
Sikkim
East
Sik
kim
24.3
7%1.
85%
10.5
8%24
.20
%2.
21%
11.3
9%3.
35%
0.3
8%0
.00
%9.
13%
7.29
%5.
25%
No
rth
Sikk
im30
.72%
0.6
1%10
.35%
26.8
8%2.
83%
10.3
6%1.
71%
0.4
9%0
.09%
7.15
%5.
88%
2.94
%
Sout
h Si
kkim
33.3
3%1.
11%
5.78
%27
.54%
4.84
%10
.74%
0.3
9%0
.52%
0.5
4%7.
14%
5.14
%2.
94%
Wes
t Sik
kim
31.3
6%2.
01%
8.55
%24
.89%
3.24
%10
.44%
2.29
%1.
28%
0.0
7%7.
13%
6.52
%2.
23%
Tamil Nadu
Ariy
alur
29.4
5%0
.58%
7.0
8%21
.72%
0.0
0%
11.3
2%11
.93%
1.74
%1.
15%
7.64
%3.
38%
4.0
1%
Che
nnai
--
--
--
--
--
--
Co
imb
ato
re34
.27%
2.71
%0
.00
%19
.70
%0
.00
%11
.02%
12.2
4%0
.76%
1.70
%6.
14%
4.81
%6.
66%
Cud
dal
ore
32.0
0%
0.3
4%5.
47%
17.8
8%4.
41%
9.87
%12
.07%
2.0
8%0
.32%
7.62
%4.
47%
3.46
%
Dha
rmap
uri
26.4
5%1.
29%
5.40
%25
.41%
6.0
6%8.
50%
11.1
2%1.
44%
1.0
7%4.
78%
3.55
%4.
93%
Din
dig
ul34
.71%
0.0
0%
7.61
%16
.69%
0.0
0%
10.2
8%11
.37%
2.38
%2.
29%
6.44
%4.
91%
3.33
%
Ero
de
28.1
6%0
.00
%2.
36%
33.3
0%
2.15
%7.
31%
10.6
7%0
.43%
2.31
%6.
32%
4.16
%2.
84%
Kanc
heep
uram
36.4
3%1.
81%
11.3
3%15
.64%
0.0
0%
9.46
%12
.84%
2.43
%0
.09%
6.93
%1.
69%
1.35
%
Kann
iyak
umar
i46
.48%
0.0
0%
7.54
%10
.56%
20.8
4%5.
95%
4.31
%0
.00
%0
.00
%4.
31%
0.0
0%
0.0
0%
Karu
r37
.13%
0.0
0%
6.75
%18
.94%
8.0
9%6.
85%
10.9
2%2.
95%
0.7
8%3.
96%
1.39
%2.
24%
Kris
hnag
iri33
.56%
3.70
%8.
71%
18.5
1%3.
98%
9.97
%9.
85%
4.33
%1.
23%
2.64
%2.
36%
1.17
%
Mad
urai
26.1
0%
0.0
0%
5.87
%26
.65%
1.52
%8.
76%
11.3
9%4.
82%
0.3
4%7.
23%
4.26
%3.
07%
Nag
app
attin
am31
.45%
1.89
%9.
11%
17.5
7%3.
12%
10.2
6%10
.62%
2.25
%0
.42%
8.92
%1.
91%
2.47
%
Nam
akka
l11
.53%
1.90
%1.
90%
36.2
4%6.
60%
8.60
%11
.44%
0.0
0%
1.31
%8.
23%
6.85
%5.
41%
Pera
mb
alur
28.6
9%1.
25%
7.89
%20
.70
%0
.94%
10.6
3%11
.73%
3.47
%0
.74%
7.28
%3.
15%
3.54
%
Pud
ukko
ttai
35.1
1%0
.40
%10
.73%
11.1
3%2.
28%
11.7
5%11
.26%
4.34
%1.
06%
6.68
%2.
07%
3.20
%
Ram
anat
hap
uram
29.0
0%
0.0
0%
9.0
8%14
.72%
6.56
%10
.28%
10.8
5%4.
75%
0.7
3%6.
26%
2.89
%4.
89%
Sale
m25
.25%
0.6
2%7.
20%
21.9
2%5.
35%
8.0
7%9.
76%
5.19
%1.
70%
6.61
%3.
47%
4.85
%
Siva
gan
ga
36.9
5%1.
59%
5.61
%11
.19%
2.69
%11
.59%
12.0
0%
4.38
%0
.96%
7.83
%2.
99%
2.23
%
Than
javu
r28
.20
%2.
82%
1.32
%13
.12%
6.51
%12
.28%
12.2
7%1.
35%
2.58
%9.
50%
5.89
%4.
16%
The
Nilg
iris
23.1
4%0
.00
%2.
22%
22.5
6%5.
83%
10.7
0%
10.7
6%0
.00
%2.
48%
10.1
2%8.
31%
3.89
%
Then
i29
.43%
2.86
%5.
48%
24.8
8%0
.00
%7.
89%
11.4
5%1.
99%
1.55
%6.
86%
3.11
%4.
48%
Thiru
vallu
r26
.86%
2.49
%5.
05%
20.1
1%2.
55%
9.39
%11
.85%
4.65
%1.
16%
7.0
4%5.
00
%3.
85%
Thiru
varu
r29
.95%
1.94
%5.
86%
16.4
9%0
.88%
11.1
1%11
.74%
0.6
4%2.
28%
10.9
3%4.
21%
3.97
%
Tho
oth
ukku
di
28.5
2%1.
88%
9.38
%20
.56%
2.30
%8.
30%
11.1
6%1.
58%
1.68
%5.
77%
4.64
%4.
24%
Tiru
chira
pp
alli
29.1
3%2.
67%
6.86
%19
.00
%2.
37%
9.52
%11
.21%
0.3
9%2.
08%
7.99
%4.
57%
4.22
%
(CONTD.) DISTrICT-WISe: INDICATor CoNTrIBUTIoN To The MpI SCore (rUrAl)(CONTD.) DISTrICT-WISe: INDICATor CoNTrIBUTIoN To The MpI SCore (rUrAl)
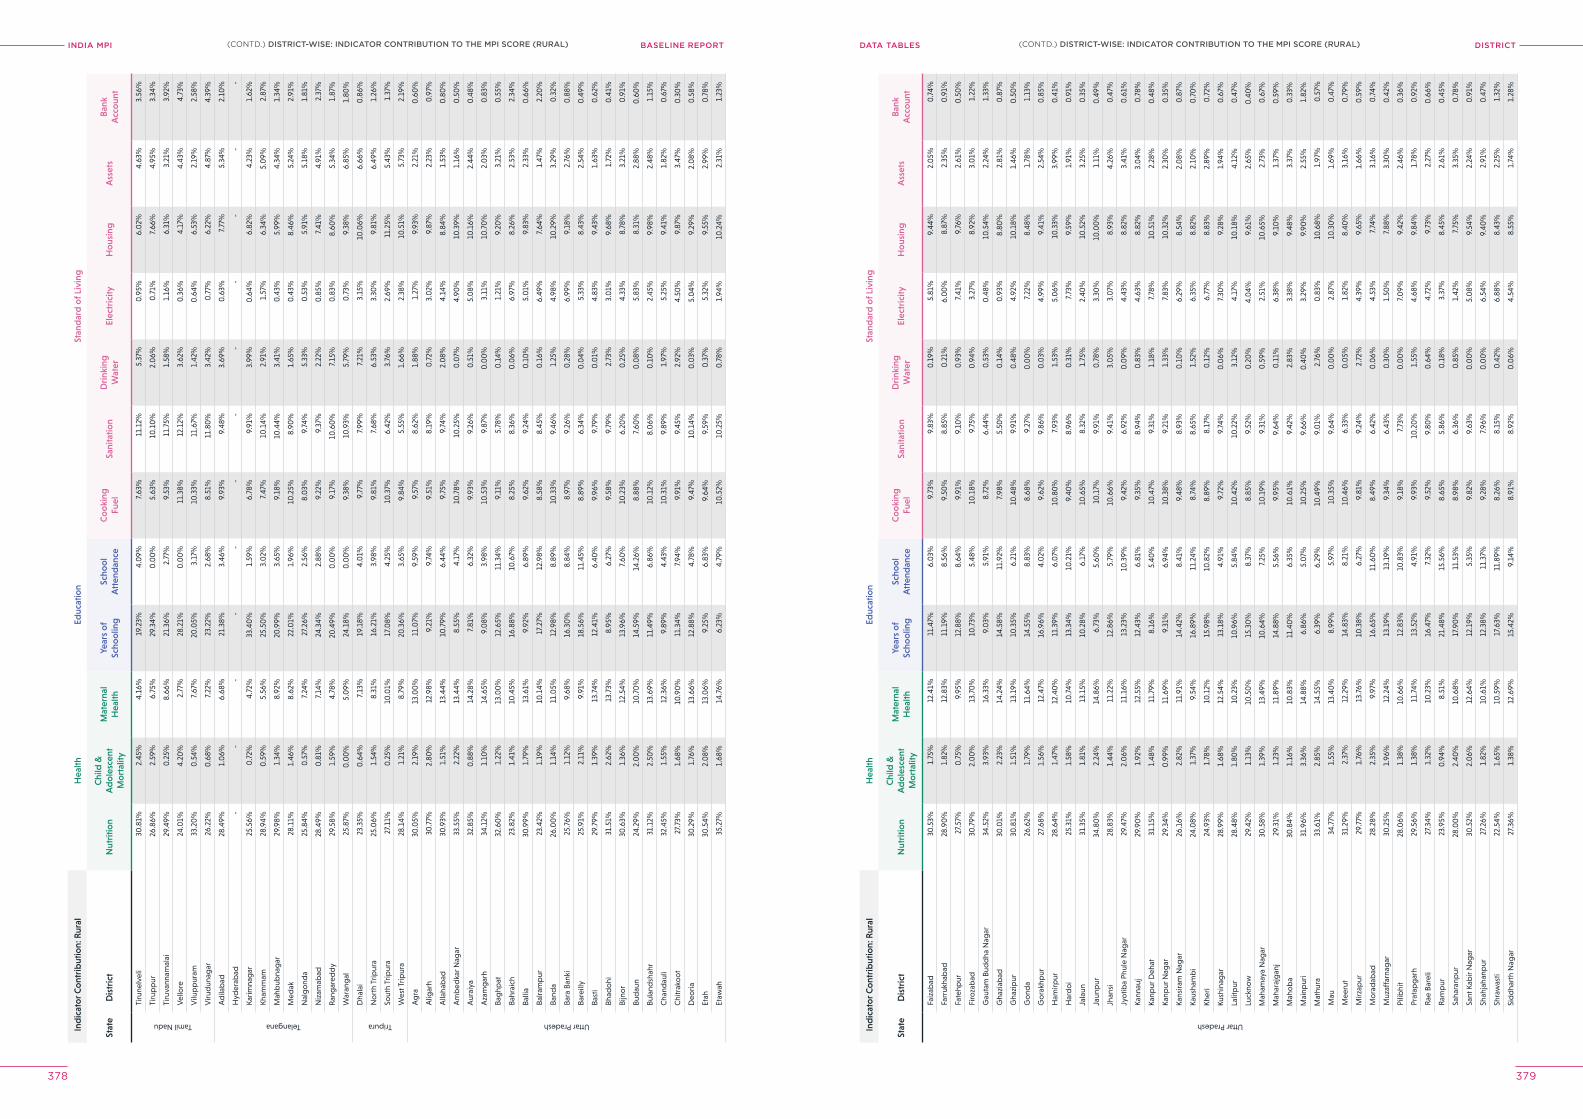
INDIA MPI BASELINE REPORT DISTrICTDATA TABleS
378 379
Ind
icat
or C
ont
rib
utio
n: R
ural
Hea
lthEd
ucat
ion
Stan
dar
d o
f Liv
ing
Stat
eD
istr
ict
Nut
ritio
nC
hild
&
Ad
ole
scen
t M
ort
ality
Mat
erna
l H
ealth
Year
s o
f Sc
hoo
ling
Scho
ol
Att
end
ance
Co
oki
ng
Fuel
Sani
tatio
nD
rink
ing
Wat
erEl
ectr
icity
Ho
usin
gA
sset
sB
ank
Acc
oun
t
Tamil Nadu
Tiru
nelv
eli
30.8
1%2.
45%
4.16
%19
.23%
4.0
9%7.
63%
11.1
2%5.
37%
0.9
5%6.
02%
4.63
%3.
56%
Tiru
pp
ur26
.86%
2.59
%6.
75%
29.3
4%0
.00
%5.
63%
10.1
0%
2.0
6%0
.71%
7.66
%4.
95%
3.34
%
Tiru
vann
amal
ai29
.49%
0.2
5%8.
66%
21.3
6%2.
77%
9.53
%11
.75%
1.58
%1.
16%
6.31
%3.
21%
3.92
%
Vel
lore
24.0
1%4.
20%
2.77
%28
.21%
0.0
0%
11.3
8%12
.12%
3.62
%0
.36%
4.17
%4.
43%
4.73
%
Vilu
pp
uram
33.2
0%
0.5
4%7.
67%
20.0
5%3.
17%
10.3
3%11
.67%
1.42
%0
.64%
6.53
%2.
19%
2.58
%
Viru
dun
agar
26.2
2%0
.68%
7.22
%23
.22%
2.68
%8.
51%
11.8
0%
3.42
%0
.77%
6.22
%4.
87%
4.39
%
Telangana
Ad
ilab
ad28
.49%
1.0
6%6.
68%
21.3
8%3.
46%
9.93
%9.
48%
3.69
%0
.63%
7.77
%5.
34%
2.10
%
Hyd
erab
ad-
--
--
--
--
--
-
Karim
nag
ar25
.56%
0.7
2%4.
72%
33.4
0%
1.59
%6.
78%
9.91
%3.
99%
0.6
4%6.
82%
4.23
%1.
62%
Kham
mam
28.9
4%0
.59%
5.56
%25
.50
%3.
02%
7.47
%10
.14%
2.91
%1.
57%
6.34
%5.
09%
2.87
%
Mah
bub
nag
ar29
.98%
1.34
%8.
92%
20.9
9%3.
65%
9.18
%10
.44%
3.41
%0
.43%
5.99
%4.
34%
1.34
%
Med
ak28
.11%
1.46
%8.
62%
22.0
1%1.
96%
10.2
5%8.
90%
1.65
%0
.43%
8.46
%5.
24%
2.91
%
Nal
go
nda
25.8
4%0
.57%
7.24
%27
.26%
2.56
%8.
03%
9.74
%5.
33%
0.5
3%5.
91%
5.18
%1.
81%
Niz
amab
ad28
.49%
0.8
1%7.
14%
24.3
4%2.
88%
9.22
%9.
37%
2.22
%0
.85%
7.41
%4.
91%
2.37
%
Ran
gar
edd
y29
.58%
1.59
%4.
78%
20.4
9%0
.00
%9.
17%
10.6
0%
7.15
%0
.83%
8.60
%5.
34%
1.87
%
War
ang
al25
.87%
0.0
0%
5.0
9%24
.18%
0.0
0%
9.38
%10
.93%
5.79
%0
.73%
9.38
%6.
85%
1.80
%
Tripura
Dha
lai
23.3
5%0
.64%
7.13
%19
.18%
4.0
1%9.
77%
7.99
%7.
21%
3.15
%10
.06%
6.66
%0
.86%
No
rth
Trip
ura
25.0
6%1.
54%
8.31
%16
.21%
3.98
%9.
81%
7.68
%6.
53%
3.30
%9.
81%
6.49
%1.
26%
Sout
h Tr
ipur
a27
.11%
0.2
5%10
.01%
17.0
8%4.
25%
10.3
7%6.
42%
3.76
%2.
69%
11.2
5%5.
43%
1.37
%
Wes
t Trip
ura
28.1
4%1.
21%
8.79
%20
.36%
3.65
%9.
84%
5.55
%1.
66%
2.38
%10
.51%
5.73
%2.
19%
Uttar Pradesh
Ag
ra30
.05%
2.19
%13
.00
%11
.07%
9.59
%9.
57%
8.62
%1.
88%
1.27
%9.
93%
2.21
%0
.60
%
Alig
arh
30.7
7%2.
80%
12.9
8%9.
21%
9.74
%9.
51%
8.19
%0
.72%
3.0
2%9.
87%
2.23
%0
.97%
Alla
hab
ad30
.93%
1.51
%13
.44%
10.7
9%6.
44%
9.75
%9.
74%
2.0
8%4.
14%
8.84
%1.
53%
0.8
0%
Am
bed
kar N
agar
33.5
5%2.
22%
13.4
4%8.
55%
4.17
%10
.78%
10.2
5%0
.07%
4.90
%10
.39%
1.16
%0
.50
%
Aur
aiya
32.8
5%0
.88%
14.2
8%7.
81%
6.32
%9.
93%
9.26
%0
.51%
5.0
8%10
.16%
2.44
%0
.48%
Aza
mg
arh
34.1
2%1.
10%
14.6
5%9.
08%
3.98
%10
.53%
9.87
%0
.00
%3.
11%
10.7
0%
2.0
3%0
.83%
Bag
hpat
32.6
0%
1.22
%13
.00
%12
.65%
11.3
4%9.
11%
5.78
%0
.14%
1.21
%9.
20%
3.21
%0
.55%
Bahr
aich
23.8
2%1.
41%
10.4
5%16
.88%
10.6
7%8.
25%
8.36
%0
.06%
6.97
%8.
26%
2.53
%2.
34%
Balli
a30
.99%
1.79
%13
.61%
9.92
%6.
89%
9 .62
%9.
24%
0.1
0%
5.0
1%9.
83%
2.33
%0
.66%
Balra
mp
ur23
.42%
1.19
%10
.14%
17.2
7%12
.98%
8.58
%8.
45%
0.1
6%6.
49%
7.64
%1.
47%
2.20
%
Band
a26
.00
%1.
14%
11.0
5%12
.98%
8.89
%10
.33%
9.46
%1.
25%
4.98
%10
.29%
3.29
%0
.32%
Bara
Ban
ki25
.76%
1.12
%9.
68%
16.3
0%
8.84
%8.
97%
9.26
%0
.28%
6.99
%9.
18%
2.76
%0
.88%
Bare
illy
25.9
1%2.
11%
9.91
%18
.56%
11.4
5%8.
89%
6.34
%0
.04%
5.33
%8.
43%
2.54
%0
.49%
Bast
i29
.79%
1.39
%13
.74%
12.4
1%6.
40%
9.96
%9.
79%
0.0
1%4.
83%
9.43
%1.
63%
0.6
2%
Bhad
ohi
31.5
1%2.
62%
13.7
3%8.
95%
6.27
%9.
58%
9.79
%2.
73%
3.0
1%9.
68%
1.72
%0
.41%
Bijn
or
30.6
3%1.
36%
12.5
4%13
.96%
7.60
%10
.23%
6.20
%0
.25%
4.33
%8.
78%
3.21
%0
.91%
Bud
aun
24.2
9%2.
00
%10
.70
%14
.59%
14.2
6%8.
88%
7.60
%0
.08%
5.83
%8.
31%
2.88
%0
.60
%
Bula
ndsh
ahr
31.1
2%2.
50%
13.6
9%11
.49%
6.86
%10
.12%
8.0
6%0
.10
%2.
45%
9.98
%2.
48%
1.15
%
Cha
ndau
li32
.45%
1.55
%12
.36%
9.89
%4.
43%
10.3
1%9.
89%
1.97
%5.
25%
9.41
%1.
82%
0.6
7%
Chi
trak
oo
t27
.73%
1.68
%10
.90
%11
.34%
7.94
%9.
91%
9.45
%2.
92%
4.50
%9.
87%
3.47
%0
.30
%
Deo
ria30
.29%
1.76
%13
.66%
12.8
8%4.
78%
9.47
%10
.14%
0.0
3%5.
04%
9.29
%2.
08%
0.5
8%
Etah
30.5
4%2.
08%
13.0
6%9.
25%
6.83
%9.
64%
9.59
%0
.37%
5.32
%9.
55%
2.99
%0
.78%
Etaw
ah35
.27%
1.68
%14
.76%
6.23
%4.
79%
10.5
2%10
.25%
0.7
8%1.
94%
10.2
4%2.
31%
1.23
%
Ind
icat
or C
ont
rib
utio
n: R
ural
Hea
lthEd
ucat
ion
Stan
dar
d o
f Liv
ing
Stat
eD
istr
ict
Nut
ritio
nC
hild
&
Ad
ole
scen
t M
ort
ality
Mat
erna
l H
ealth
Year
s o
f Sc
hoo
ling
Scho
ol
Att
end
ance
Co
oki
ng
Fuel
Sani
tatio
nD
rink
ing
Wat
erEl
ectr
icity
Ho
usin
gA
sset
sB
ank
Acc
oun
t
Uttar Pradesh
Faiz
abad
30.5
3%1.
75%
12.4
1%11
.47%
6.0
3%9.
73%
9.83
%0
.19%
5.81
%9.
44%
2.0
5%0
.74%
Farr
ukha
bad
28.9
0%
1.82
%12
.83%
11.1
9%8.
56%
9.50
%8.
85%
0.2
1%6.
00
%8.
87%
2.35
%0
.91%
Fate
hpur
27.5
7%0
.75%
9.95
%12
.88%
8.64
%9.
91%
9.10
%0
.93%
7.41
%9.
76%
2.61
%0
.50
%
Firo
zab
ad30
.79%
2.0
0%
13.7
0%
10.7
3%5.
48%
10.1
8%9.
75%
0.9
4%3.
27%
8.92
%3.
01%
1.22
%
Gau
tam
Bud
dha
Nag
ar34
.52%
3.93
%16
.33%
9.0
3%5.
91%
8.72
%6.
44%
0.5
3%0
.48%
10.5
4%2.
24%
1.33
%
Gha
ziab
ad30
.01%
2.23
%14
.24%
14.5
8%11
.92%
7.98
%5.
50%
0.1
4%0
.93%
8.80
%2.
81%
0.8
7%
Gha
zip
ur30
.81%
1.51
%13
.19%
10.3
5%6.
21%
10.4
8%9.
91%
0.4
8%4.
92%
10.1
8%1.
46%
0.5
0%
Go
nda
26.6
2%1.
79%
11.6
4%14
.55%
8.83
%8.
68%
9.27
%0
.00
%7.
22%
8.48
%1.
78%
1.13
%
Go
rakh
pur
27.6
8%1.
56%
12.4
7%16
.96%
4.0
2%9.
62%
9.86
%0
.03%
4.99
%9.
41%
2.54
%0
.85%
Ham
irpur
28.6
4%1.
47%
12.4
0%
11.3
9%6.
07%
10.8
0%
7.93
%1.
53%
5.0
6%10
.33%
3.99
%0
.41%
Har
do
i25
.31%
1.58
%10
.74%
13.3
4%10
.21%
9.40
%8.
96%
0.3
1%7.
73%
9.59
%1.
91%
0.9
1%
Jala
un31
.35%
1.81
%13
.15%
10.2
8%6.
17%
10.6
5%8.
32%
1.75
%2.
40%
10.5
2%3.
25%
0.3
5%
Jaun
pur
34.8
0%
2.24
%14
.86%
6.73
%5.
60%
10.1
7%9.
91%
0.7
8%3.
30%
10.0
0%
1.11
%0
.49%
Jhan
si28
.83%
1.44
%11
.22%
12.8
6%5.
79%
10.6
6%9.
41%
3.0
5%3.
07%
8.93
%4.
26%
0.4
7%
Jyo
tiba
Phul
e N
agar
29.4
7%2.
06%
11.1
6%13
.23%
10.3
9%9.
42%
6.92
%0
.09%
4.43
%8.
82%
3.41
%0
.61%
Kann
auj
29.9
0%
1.92
%12
.55%
12.4
3%6.
81%
9.35
%8.
94%
0.8
3%4.
63%
8.82
%3.
04%
0.7
8%
Kanp
ur D
ehat
31.1
5%1.
48%
11.7
9%8.
16%
5.40
%10
.47%
9.31
%1.
18%
7.78
%10
.51%
2.28
%0
.48%
Kanp
ur N
agar
29.3
4%0
.99%
11.6
9%9.
31%
6.94
%10
.38%
9.21
%1.
33%
7.83
%10
.32%
2.30
%0
.35%
Kans
iram
Nag
ar26
.16%
2.82
%11
.91%
14.4
2%8.
41%
9.48
%8.
93%
0.1
0%
6.29
%8.
54%
2.0
8%0
.87%
Kaus
ham
bi
24.0
8%1.
37%
9.54
%16
.89%
11.2
4%8.
74%
8.65
%1.
52%
6.35
%8.
82%
2.10
%0
.70
%
Kher
i24
.93%
1.78
%10
.12%
15.9
8%10
.82%
8.89
%8.
17%
0.1
2%6.
77%
8.83
%2.
89%
0.7
2%
Kush
inag
ar28
.99%
1.68
%12
.54%
13.1
8%4.
91%
9.72
%9.
74%
0.0
6%7.
30%
9.28
%1.
94%
0.6
7%
Lalit
pur
28.4
8%1.
80%
10.2
3%10
.96%
5.84
%10
.42%
10.2
2%3.
12%
4.17
%10
.18%
4.12
%0
.47%
Luck
now
29.4
2%1.
13%
10.5
0%
15.3
0%
8.37
%8.
85%
9.52
%0
.20
%4.
04%
9.61
%2.
65%
0.4
0%
Mah
amay
a N
agar
30.5
8%1.
39%
13.4
9%10
.64%
7.25
%10
.19%
9.31
%0
.59%
2.51
%10
.65%
2.73
%0
.67%
Mah
araj
gan
j29
.31%
1.23
%11
.89%
14.8
8%5.
56%
9.95
%9.
64%
0.1
1%6.
38%
9.10
%1.
37%
0.5
9%
Mah
ob
a30
.84%
1.16
%10
.83%
11.4
0%
6.35
%10
.61%
9.42
%2.
83%
3.38
%9.
48%
3.37
%0
.33%
Mai
npur
i31
.96%
3.36
%14
.88%
6.86
%5.
07%
10.2
5%9.
66%
0.4
0%
3.29
%9.
90%
2.55
%1.
82%
Mat
hura
33.6
1%2.
85%
14.5
5%6.
39%
6.29
%10
.49%
9.0
1%2.
76%
0.8
3%10
.68%
1.97
%0
.57%
Mau
34.7
7%1.
55%
13.4
0%
8.99
%5.
97%
10.3
5%9.
64%
0.0
0%
2.87
%10
.30
%1.
69%
0.4
7%
Mee
rut
31.2
9%2.
37%
12.2
9%14
.83%
8.21
%10
.46%
6.33
%0
.05%
1.82
%8.
40%
3.16
%0
.79%
Mirz
apur
29.7
7%1.
76%
13.7
6%10
.38%
6.27
%9.
81%
9.24
%2.
72%
4.39
%9.
65%
1.66
%0
.59%
Mo
rad
abad
28.2
8%2.
35%
9.97
%16
.65%
11.6
0%
8.49
%6.
42%
0.0
6%4.
53%
7.74
%3.
16%
0.7
4%
Muz
affa
rnag
ar30
.25%
1.96
%12
.24%
13.1
9%13
.19%
9.34
%6.
43%
0.3
0%
1.50
%7.
88%
3.30
%0
.42%
Pilib
hit
28.0
6%1.
38%
10.6
6%12
.83%
10.8
3%9.
18%
7.73
%0
.00
%7.
09%
9.42
%2.
46%
0.3
6%
Prat
apg
arh
29.5
6%1.
38%
11.7
4%13
.52%
4.91
%9.
93%
10.2
0%
1.55
%4.
68%
9.84
%1.
78%
0.9
2%
Rae
Bar
eli
27.3
4%1.
32%
10.2
3%16
.47%
7.32
%9.
52%
9.80
%0
.64%
4.72
%9.
73%
2.27
%0
.66%
Ram
pur
23.9
5%0
.94%
8.51
%21
.48%
15.5
6%8.
65%
5.86
%0
.18%
3.37
%8.
45%
2.61
%0
.45%
Saha
ranp
ur28
.00
%2.
40%
10.6
8%17
.90
%11
.53%
8.98
%6.
36%
0.8
5%1.
42%
7.75
%3.
35%
0.7
8%
Sant
Kab
ir N
agar
30.5
2%2.
06%
12.6
4%12
.19%
5.35
%9.
82%
9.63
%0
.00
%5.
08%
9.54
%2.
24%
0.9
1%
Shah
jaha
npur
27.2
6%1.
82%
10.6
1%12
.38%
11.3
7%9.
28%
7.96
%0
.00
%6.
54%
9.40
%2.
91%
0.4
7%
Shra
was
ti22
.54%
1.65
%10
.59%
17.6
3%11
.89%
8.26
%8.
15%
0.4
2%6.
88%
8.43
%2.
25%
1.32
%
Sid
dha
rth
Nag
ar27
.36%
1.38
%12
.69%
15.4
2%9.
14%
8.91
%8.
92%
0.0
6%4.
54%
8.55
%1.
74%
1.28
%
(CONTD.) DISTrICT-WISe: INDICATor CoNTrIBUTIoN To The MpI SCore (rUrAl)(CONTD.) DISTrICT-WISe: INDICATor CoNTrIBUTIoN To The MpI SCore (rUrAl)
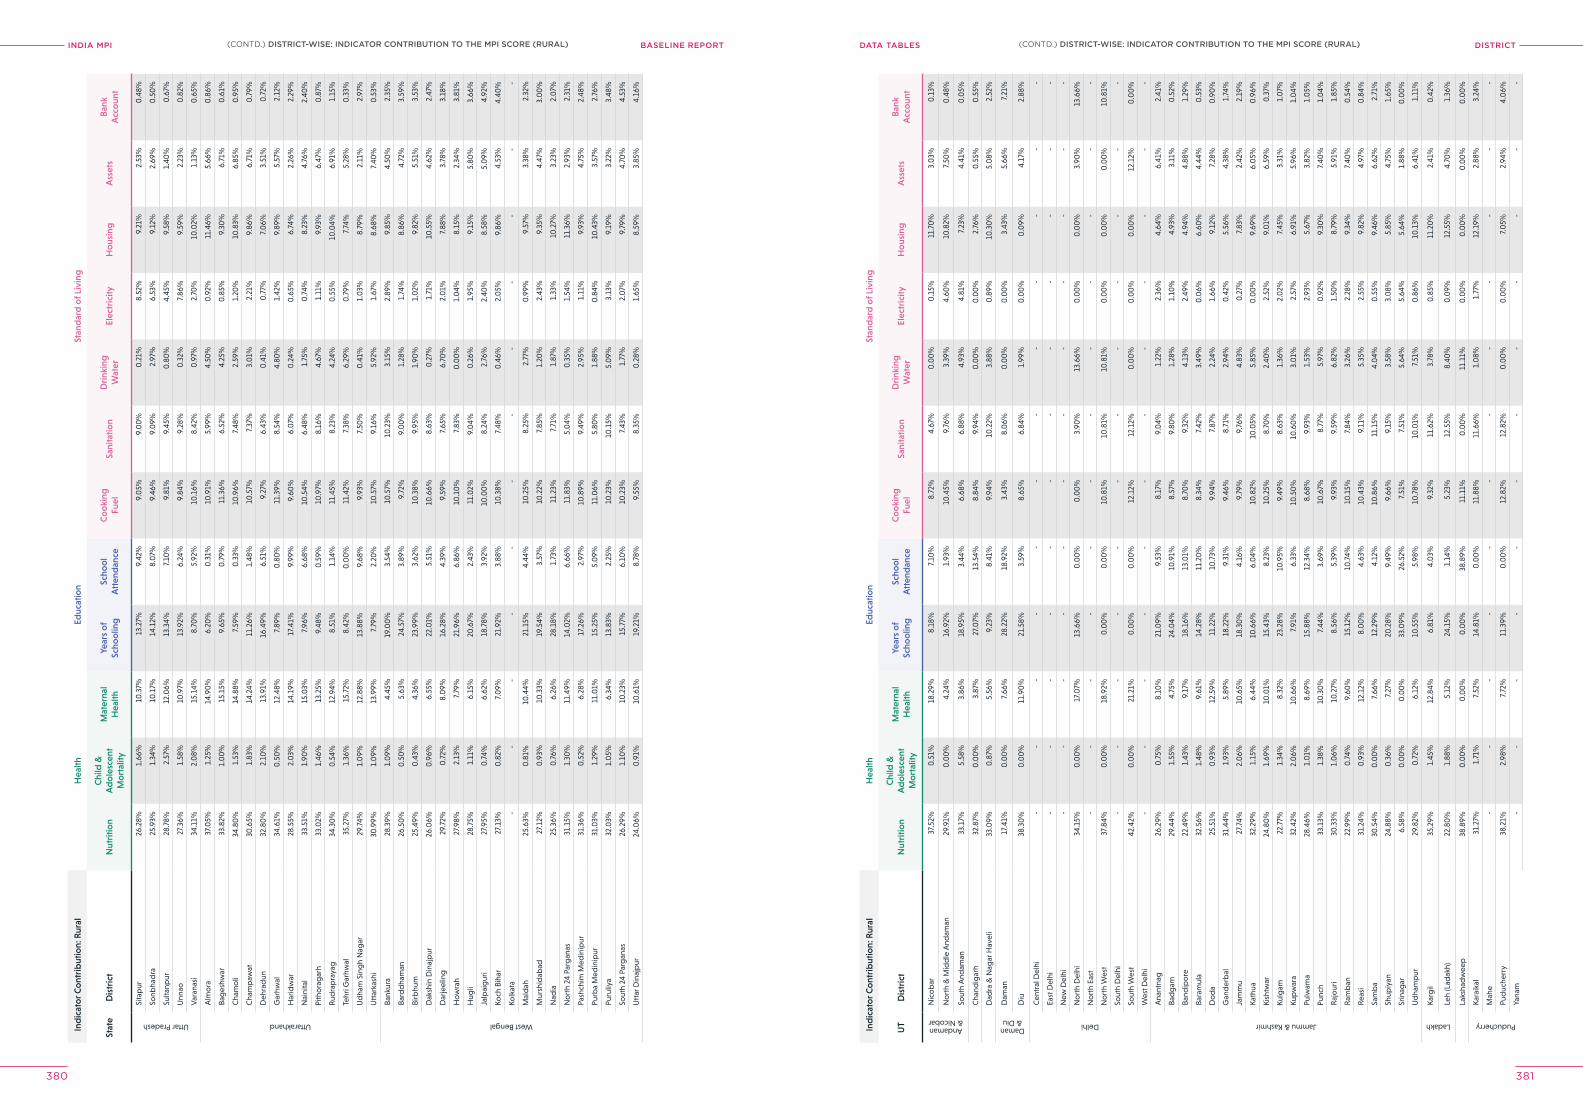
INDIA MPI BASELINE REPORT DISTrICTDATA TABleS
380 381
Ind
icat
or C
ont
rib
utio
n: R
ural
Hea
lthEd
ucat
ion
Stan
dar
d o
f Liv
ing
Stat
eD
istr
ict
Nut
ritio
nC
hild
&
Ad
ole
scen
t M
ort
ality
Mat
erna
l H
ealth
Year
s o
f Sc
hoo
ling
Scho
ol
Att
end
ance
Co
oki
ng
Fuel
Sani
tatio
nD
rink
ing
Wat
erEl
ectr
icity
Ho
usin
gA
sset
sB
ank
Acc
oun
t
Uttar Pradesh
Sita
pur
26.2
8%1.
66%
10.3
7%13
.27%
9.42
%9.
05%
9.0
0%
0.2
1%8.
52%
9.21
%2.
53%
0.4
8%
Sonb
had
ra25
.93%
1.34
%10
.17%
14.1
2%8.
07%
9.46
%9.
09%
2.97
%6.
53%
9.12
%2.
69%
0.5
0%
Sulta
npur
28.7
8%2.
57%
12.0
6%13
.34%
7.10
%9.
81%
9.45
%0
.80
%4.
45%
9.58
%1.
40%
0.6
7%
Unn
ao27
.36%
1.58
%10
.97%
13.9
2%6.
24%
9.84
%9.
28%
0.3
2%7.
86%
9.59
%2.
23%
0.8
2%
Var
anas
i34
.11%
2.0
8%15
.14%
8.70
%5.
92%
10.1
6%8.
42%
0.9
7%2.
70%
10.0
2%1.
13%
0.6
5%
Uttarakhand
Alm
ora
37.0
5%1.
25%
14.9
0%
6.20
%0
.31%
10.9
1%5.
99%
4.50
%0
.92%
11.4
6%5.
66%
0.8
6%
Bag
eshw
ar33
.82%
1.0
0%
15.1
5%9.
65%
0.7
9%11
.36%
6.52
%4.
25%
0.8
5%9.
30%
6.71
%0
.61%
Cha
mo
li34
.80
%1.
53%
14.8
8%7.
59%
0.3
3%10
.96%
7.48
%2.
59%
1.20
%10
.83%
6.85
%0
.95%
Cha
mp
awat
30.6
5%1.
83%
14.2
4%11
.26%
1.48
%10
.57%
7.37
%3.
01%
2.21
%9.
86%
6.71
%0
.79%
Deh
rad
un32
.80
%2.
10%
13.9
1%16
.49%
6.51
%9.
27%
6.43
%0
.41%
0.7
7%7.
06%
3.51
%0
.72%
Gar
hwal
34.6
1%0
.50
%12
.48%
7.89
%0
.80
%11
.39%
8.54
%4.
80%
1.42
%9.
89%
5.57
%2.
12%
Har
idw
ar28
.55%
2.0
3%14
.19%
17.4
1%9.
99%
9.60
%6.
07%
0.2
4%0
.65%
6.74
%2.
26%
2.29
%
Nai
nita
l33
.51%
1.90
%15
.03%
7.96
%6.
68%
10.5
4%6.
48%
1.75
%0
.74%
8.23
%4.
76%
2.40
%
Pith
ora
gar
h33
.02%
1.46
%13
.25%
9.48
%0
.59%
10.9
7%8.
16%
4.67
%1.
11%
9.93
%6.
47%
0.8
7%
Rud
rap
raya
g34
.30
%0
.54%
12.9
4%8.
51%
1.14
%11
.45%
8.23
%4.
24%
0.5
5%10
.04%
6.91
%1.
15%
Tehr
i Gar
hwal
35.2
7%1.
36%
15.7
2%8.
42%
0.0
0%
11.4
2%7.
38%
6.29
%0
.79%
7.74
%5.
28%
0.3
3%
Ud
ham
Sin
gh
Nag
ar29
.74%
1.0
9%12
.88%
13.8
8%9.
68%
9.93
%7.
50%
0.4
1%1.
03%
8.79
%2.
11%
2.97
%
Utt
arka
shi
30.9
9%1.
09%
13.9
9%7.
79%
2.20
%10
.57%
9.16
%5.
92%
1.67
%8.
68%
7.40
%0
.53%
West Bengal
Bank
ura
28.3
9%1.
09%
4.45
%19
.00
%3.
54%
10.5
7%10
.23%
3.15
%2.
89%
9.85
%4.
50%
2.35
%
Bard
dha
man
26.5
0%
0.5
0%
5.63
%24
.57%
3.89
%9.
72%
9.0
0%
1.28
%1.
74%
8.86
%4.
72%
3.59
%
Birb
hum
25.4
9%0
.43%
4.36
%23
.99%
3.62
%10
.38%
9.95
%1.
90%
1.0
2%9.
82%
5.51
%3.
53%
Dak
shin
Din
ajp
ur26
.06%
0.9
6%6.
55%
22.0
1%5.
51%
10.6
6%8.
63%
0.2
7%1.
71%
10.5
5%4.
62%
2.47
%
Dar
jeel
ing
29.7
2%0
.72%
8.0
9%16
.28%
4.39
%9.
59%
7.65
%6.
70%
2.0
1%7.
88%
3.78
%3.
18%
Ho
wra
h27
.98%
2.13
%7.
79%
21.9
6%6.
86%
10.1
0%
7.83
%0
.00
%1.
04%
8.15
%2.
34%
3.81
%
Hug
li28
.75%
1.11
%6.
15%
20.6
7%2.
43%
11.0
2%9.
04%
0.2
6%1.
95%
9.15
%5.
80%
3.66
%
Jalp
aig
uri
27.9
5%0
.74%
6.62
%18
.78%
3.92
%10
.00
%8.
24%
2.76
%2.
40%
8.58
%5.
09%
4.92
%
Koch
Bih
ar27
.13%
0.8
2%7.
09%
21.9
2%3.
88%
10.3
8%7.
48%
0.4
6%2.
05%
9.86
%4.
53%
4.40
%
Kolk
ata
--
--
--
--
--
--
Mal
dah
25.6
3%0
.81%
10.4
4%21
.15%
4.44
%10
.25%
8.25
%2.
77%
0.9
9%9.
57%
3.38
%2.
32%
Mur
shid
abad
27.1
2%0
.93%
10.3
3%19
.54%
3.57
%10
.22%
7.85
%1.
20%
2.43
%9.
35%
4.47
%3.
00
%
Nad
ia25
.36%
0.7
6%6.
26%
28.1
8%1.
73%
11.2
3%7.
71%
1.87
%1.
33%
10.2
7%3.
23%
2.0
7%
No
rth
24 P
arg
anas
31.1
5%1.
30%
11.4
9%14
.02%
6.66
%11
.83%
5.0
4%0
.35%
1.54
%11
.36%
2.93
%2.
31%
Pash
chim
Med
inip
ur31
.36%
0.5
2%6.
28%
17.2
6%2.
97%
10.8
9%9.
49%
2.95
%1.
11%
9.93
%4.
75%
2.48
%
Purb
a M
edin
ipur
31.0
3%1.
29%
11.0
1%15
.25%
5.0
9%11
.06%
5.80
%1.
88%
0.8
4%10
.43%
3.57
%2.
76%
Puru
liya
32.0
3%1.
05%
6.34
%13
.83%
2.25
%10
.23%
10.1
5%5.
09%
3.13
%9.
19%
3.22
%3.
48%
Sout
h 24
Par
gan
as26
.29%
1.10
%10
.23%
15.7
7%6.
10%
10.2
3%7.
43%
1.77
%2.
07%
9.79
%4.
70%
4.53
%
Utt
ar D
inaj
pur
24.0
6%0
.91%
10.6
1%19
.21%
8.78
%9.
55%
8.35
%0
.28%
1.65
%8.
59%
3.85
%4.
16%
Ind
icat
or C
ont
rib
utio
n: R
ural
Hea
lthEd
ucat
ion
Stan
dar
d o
f Liv
ing
UT
Dis
tric
tN
utri
tion
Chi
ld &
A
do
lesc
ent
Mo
rtal
ity
Mat
erna
l H
ealth
Year
s o
f Sc
hoo
ling
Scho
ol
Att
end
ance
Co
oki
ng
Fuel
Sani
tatio
nD
rink
ing
Wat
erEl
ectr
icity
Ho
usin
gA
sset
sB
ank
Acc
oun
t
Andaman & Nicobar
Nic
ob
ar37
.52%
0.5
1%18
.29%
8.18
%7.
10%
8.72
%4.
67%
0.0
0%
0.1
5%11
.70
%3.
03%
0.1
3%
No
rth
& M
idd
le A
ndam
an29
.91%
0.0
0%
4.24
%16
.92%
1.93
%10
.45%
9.76
%3.
39%
4.60
%10
.82%
7.50
%0
.48%
Sout
h A
ndam
an33
.17%
5.58
%3.
86%
18.9
5%3.
44%
6.68
%6.
88%
4.93
%4.
81%
7.23
%4.
41%
0.0
5%
Cha
ndig
arh
32.8
7%0
.00
%3.
87%
27.0
7%13
.54%
8.84
%9.
94%
0.0
0%
0.0
0%
2.76
%0
.55%
0.5
5%
Dad
ra &
Nag
ar H
avel
i33
.09%
0.8
7%5.
56%
9.23
%8.
41%
9.94
%10
.22%
3.88
%0
.89%
10.3
0%
5.0
8%2.
52%
Daman & Diu
Dam
an17
.41%
0.0
0%
7.66
%28
.22%
18.9
2%3.
43%
8.0
6%0
.00
%0
.00
%3.
43%
5.66
%7.
21%
Diu
38.3
0%
0.0
0%
11.9
0%
21.5
8%3.
59%
8.65
%6.
84%
1.99
%0
.00
%0
.09%
4.17
%2.
88%
Delhi
Cen
tral
Del
hi-
--
--
--
--
--
-
East
Del
hi-
--
--
--
--
--
-
New
Del
hi-
--
--
--
--
--
-
No
rth
Del
hi34
.15%
0.0
0%
17.0
7%13
.66%
0.0
0%
0.0
0%
3.90
%13
.66%
0.0
0%
0.0
0%
3.90
%13
.66%
No
rth
East
--
--
--
--
--
--
No
rth
Wes
t37
.84%
0.0
0%
18.9
2%0
.00
%0
.00
%10
.81%
10.8
1%10
.81%
0.0
0%
0.0
0%
0.0
0%
10.8
1%
Sout
h D
elhi
--
--
--
--
--
--
Sout
h W
est
42.4
2%0
.00
%21
.21%
0.0
0%
0.0
0%
12.1
2%12
.12%
0.0
0%
0.0
0%
0.0
0%
12.1
2%0
.00
%
Wes
t Del
hi-
--
--
--
--
--
-
Jammu & Kashmir
Ana
ntna
g26
.29%
0.7
5%8.
10%
21.0
9%9.
53%
8.17
%9.
04%
1.22
%2.
36%
4.64
%6.
41%
2.41
%
Bad
gam
29.4
4%1.
55%
4.75
%24
.04%
10.9
1%8.
57%
9.80
%1.
28%
1.10
%4.
93%
3.11
%0
.52%
Band
ipo
re22
.49%
1.43
%9.
17%
18.1
6%13
.01%
8.70
%9.
32%
4.13
%2.
49%
4.94
%4.
88%
1.29
%
Bara
mul
a32
.56%
1.48
%9.
61%
14.2
8%11
.20
%8.
34%
7.42
%3.
49%
0.0
6%6.
60%
4.44
%0
.53%
Do
da
25.5
1%0
.93%
12.5
9%11
.22%
10.7
3%9.
94%
7.87
%2.
24%
1.66
%9.
12%
7.28
%0
.90
%
Gan
der
bal
31.4
4%1.
93%
5.89
%18
.22%
9.31
%9.
46%
8.71
%2.
94%
0.4
2%5.
56%
4.38
%1.
74%
Jam
mu
27.7
4%2.
06%
10.6
5%18
.30
%4.
16%
9.79
%9.
76%
4.83
%0
.27%
7.83
%2.
42%
2.19
%
Kath
ua32
.29%
1.15
%6.
44%
10.6
6%6.
04%
10.8
2%10
.05%
5.85
%0
.00
%9.
69%
6.0
5%0
.96%
Kish
twar
24.8
0%
1.69
%10
.01%
15.4
3%8.
23%
10.2
5%8.
70%
2.40
%2.
52%
9.0
1%6.
59%
0.3
7%
Kulg
am22
.77%
1.34
%8.
32%
23.2
8%10
.95%
9.49
%8.
63%
1.36
%2.
02%
7.45
%3.
31%
1.0
7%
Kup
war
a32
.42%
2.0
6%10
.66%
7.91
%6.
33%
10.5
0%
10.6
0%
3.0
1%2.
57%
6.91
%5.
96%
1.0
4%
Pulw
ama
28.4
6%1.
01%
8.69
%15
.88%
12.3
4%8.
68%
9.93
%1.
53%
2.93
%5.
67%
3.82
%1.
05%
Punc
h33
.13%
1.38
%10
.30
%7.
44%
3.69
%10
.67%
8.77
%5.
97%
0.9
2%9.
30%
7.40
%1.
04%
Raj
our
i30
.33%
1.0
6%10
.27%
8.56
%5.
39%
9.93
%9.
59%
6.82
%1.
50%
8.79
%5.
91%
1.85
%
Ram
ban
22.9
9%0
.74%
9.60
%15
.12%
10.7
4%10
.15%
7.84
%3.
26%
2.28
%9.
34%
7.40
%0
.54%
Reas
i31
.24%
0.9
3%12
.12%
8.0
0%
4.63
%10
.43%
9.11
%5.
35%
2.55
%9.
82%
4.97
%0
.84%
Sam
ba
30.5
4%0
.00
%7.
66%
12.2
9%4.
12%
10.8
6%11
.15%
4.0
4%0
.55%
9.46
%6.
62%
2.71
%
Shup
iyan
24.8
8%0
.36%
7.27
%20
.28%
9.49
%9.
66%
9.15
%3.
58%
3.0
8%5.
85%
4.75
%1.
65%
Srin
agar
6.58
%0
.00
%0
.00
%33
.09%
26.5
2%7.
51%
7.51
%5.
64%
5.64
%5.
64%
1.88
%0
.00
%
Ud
ham
pur
29.8
2%0
.72%
6.12
%10
.55%
5.98
%10
.78%
10.0
1%7.
51%
0.8
6%10
.13%
6.41
%1.
11%
Ladakh
Karg
il35
.29%
1.45
%12
.84%
6.81
%4.
03%
9.32
%11
.62%
3.78
%0
.85%
11.2
0%
2.41
%0
.42%
Leh
(Lad
akh)
22.8
0%
1.88
%5.
12%
24.1
5%1.
14%
5.23
%12
.55%
8.40
%0
.09%
12.5
5%4.
70%
1.36
%
Laks
had
wee
p38
.89%
0.0
0%
0.0
0%
0.0
0%
38.8
9%11
.11%
0.0
0%
11.1
1%0
.00
%0
.00
%0
.00
%0
.00
%
Puducherry
Kara
ikal
31.2
7%1.
71%
7.52
%14
.81%
0.0
0%
11.8
8%11
.66%
1.0
8%1.
77%
12.1
9%2.
88%
3.24
%
Mah
e-
--
--
--
--
--
-
Pud
uche
rry
38.2
1%2.
98%
7.72
%11
.39%
0.0
0%
12.8
2%12
.82%
0.0
0%
0.0
0%
7.0
5%2.
94%
4.0
6%
Yana
m-
--
--
--
--
--
-
(CONTD.) DISTrICT-WISe: INDICATor CoNTrIBUTIoN To The MpI SCore (rUrAl)(CONTD.) DISTrICT-WISe: INDICATor CoNTrIBUTIoN To The MpI SCore (rUrAl)
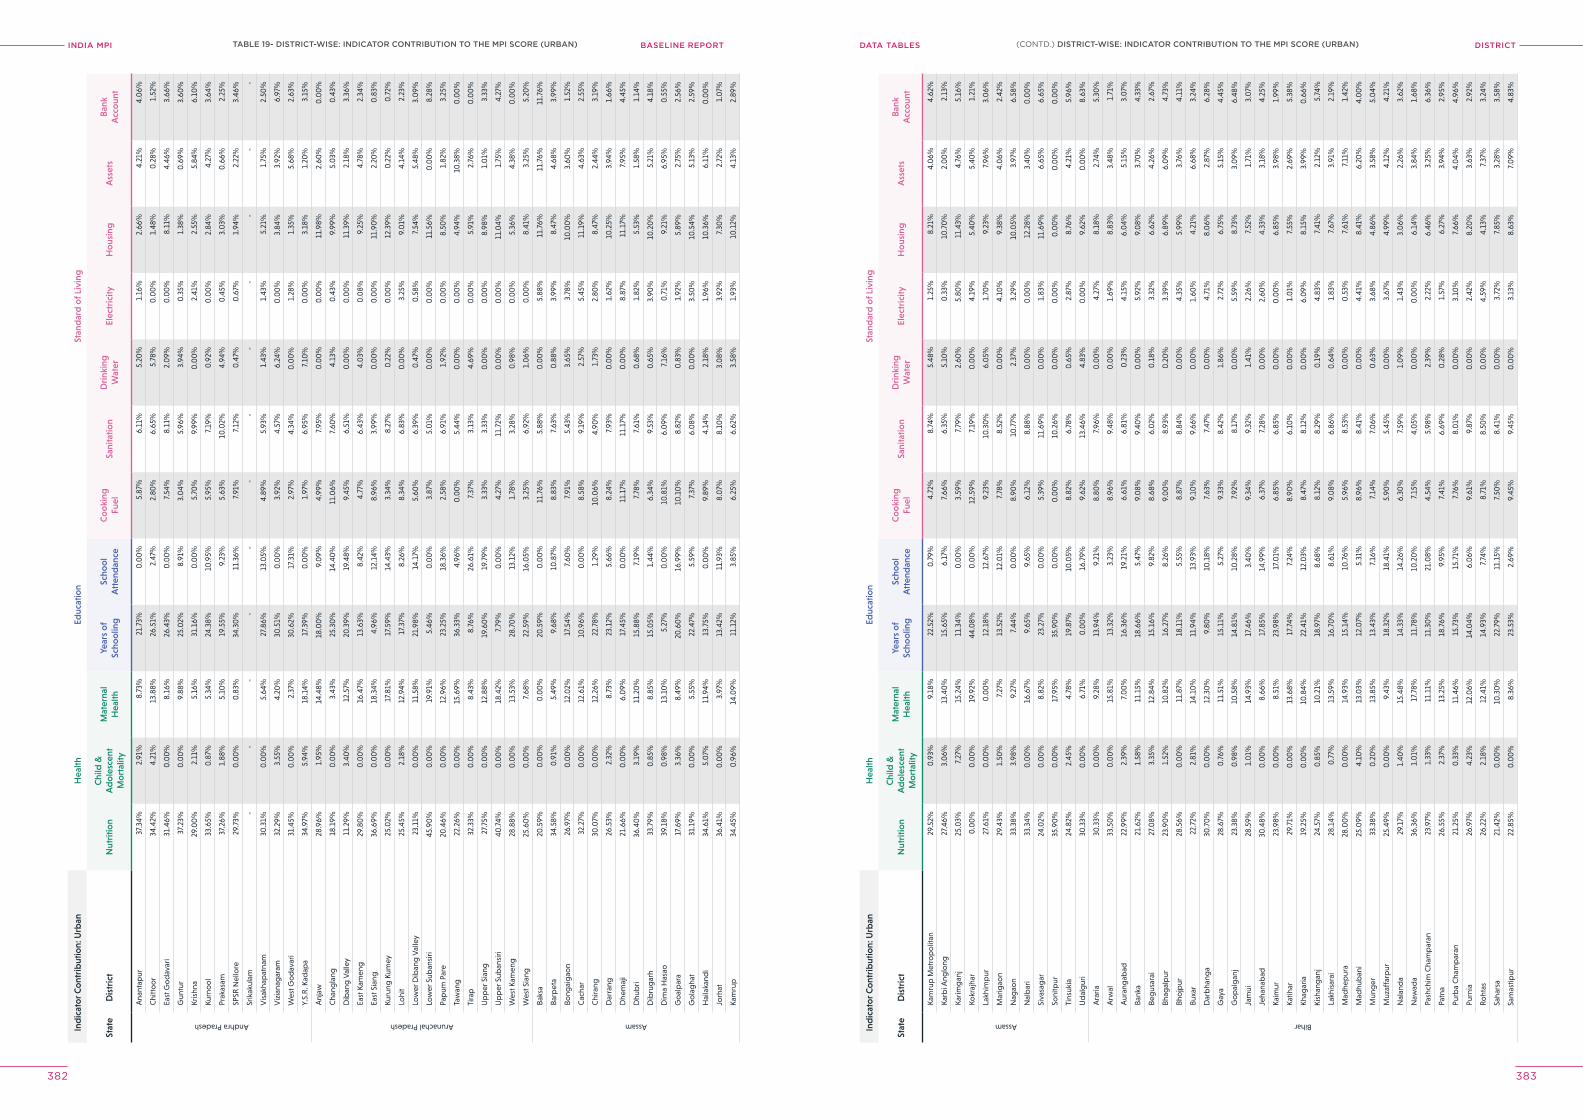
INDIA MPI BASELINE REPORT DISTrICTDATA TABleS
382 383
Ind
icat
or C
ont
rib
utio
n: U
rban
Hea
lthEd
ucat
ion
Stan
dar
d o
f Liv
ing
Stat
eD
istr
ict
Nut
ritio
nC
hild
&
Ad
ole
scen
t M
ort
ality
Mat
erna
l H
ealth
Year
s o
f Sc
hoo
ling
Scho
ol
Att
end
ance
Co
oki
ng
Fuel
Sani
tatio
nD
rink
ing
Wat
erEl
ectr
icity
Ho
usin
gA
sset
sB
ank
Acc
oun
t
Andhra Pradesh
Ana
ntap
ur37
.34%
2.91
%8.
73%
21.7
3%0
.00
%5.
87%
6.11
%5.
20%
1.16
%2.
66%
4.21
%4.
06%
Chi
tto
or
34.4
2%4.
21%
13.8
8%26
.51%
2.47
%2.
80%
6.65
%5.
78%
0.0
0%
1.48
%0
.28%
1.52
%
East
Go
dav
ari
31.4
6%0
.00
%8.
16%
26.4
3%0
.00
%7.
54%
8.11
%2.
09%
0.0
0%
8.11
%4.
46%
3.66
%
Gun
tur
37.2
3%0
.00
%9.
88%
25.0
2%8.
91%
3.0
4%5.
96%
3.94
%0
.35%
1.38
%0
.69%
3.60
%
Kris
hna
29.0
0%
2.11
%5.
16%
31.1
6%0
.00
%5.
70%
9.99
%0
.00
%2.
41%
2.55
%5.
84%
6.10
%
Kurn
oo
l33
.65%
0.8
7%5.
34%
24.3
8%10
.95%
5.95
%7.
19%
0.9
2%0
.00
%2.
84%
4.27
%3.
64%
Prak
asam
37.2
6%1.
88%
5.10
%19
.55%
9.23
%5.
63%
10.0
2%4.
94%
0.4
5%3.
03%
0.6
6%2.
25%
SPSR
Nel
lore
29.7
3%0
.00
%0
.83%
34.3
0%
11.3
6%7.
91%
7.12
%0
.47%
0.6
7%1.
94%
2.22
%3.
46%
Srik
akul
am-
--
--
--
--
--
-
Vis
akha
pat
nam
30.3
1%0
.00
%5.
64%
27.8
6%13
.05%
4.89
%5.
93%
1.43
%1.
43%
5.21
%1.
75%
2.50
%
Viz
iana
gar
am32
.29%
3.55
%4.
20%
30.5
1%0
.00
%3.
92%
4.57
%6.
24%
0.0
0%
3.84
%3.
92%
6.97
%
Wes
t Go
dav
ari
31.4
5%0
.00
%2.
37%
30.6
2%17
.31%
2.97
%4.
34%
0.0
0%
1.28
%1.
35%
5.68
%2.
63%
Y.S.
R. K
adap
a34
.97%
5.94
%18
.14%
17.3
9%0
.00
%1.
97%
6.95
%7.
10%
0.0
0%
3.18
%1.
20%
3.15
%
Arunachal Pradesh
Anj
aw28
.96%
1.95
%14
.48%
18.0
0%
9.0
9%4.
99%
7.95
%0
.00
%0
.00
%11
.98%
2.60
%0
.00
%
Cha
ngla
ng18
.19%
0.0
0%
3.43
%25
.30
%14
.40
%11
.06%
7.60
%4.
13%
0.4
3%9.
99%
5.0
3%0
.43%
Dib
ang
Val
ley
11.2
9%3.
40%
12.5
7%20
.39%
19.4
8%9.
45%
6.51
%0
.00
%0
.00
%11
.39%
2.18
%3.
36%
East
Kam
eng
29.8
0%
0.0
0%
16.4
7%13
.63%
8.42
%4.
77%
6.43
%4.
03%
0.0
8%9.
25%
4.78
%2.
34%
East
Sia
ng36
.69%
0.0
0%
18.3
4%4.
96%
12.1
4%8.
96%
3.99
%0
.00
%0
.00
%11
.90
%2.
20%
0.8
3%
Kuru
ng K
umey
25.0
2%0
.00
%17
.81%
17.5
9%14
.43%
3.34
%8.
27%
0.2
2%0
.00
%12
.39%
0.2
2%0
.72%
Lohi
t25
.45%
2.18
%12
.94%
17.3
7%8.
26%
8.34
%6.
83%
0.0
0%
3.25
%9.
01%
4.14
%2.
23%
Low
er D
iban
g V
alle
y23
.11%
0.0
0%
11.5
8%21
.98%
14.1
7%5.
60%
6.39
%0
.47%
0.5
8%7.
54%
5.48
%3.
09%
Low
er S
uban
siri
45.9
0%
0.0
0%
19.9
1%5.
46%
0.0
0%
3.87
%5.
01%
0.0
0%
0.0
0%
11.5
6%0
.00
%8.
28%
Pap
um P
are
20.4
6%0
.00
%12
.96%
23.2
5%18
.36%
2.58
%6.
91%
1.92
%0
.00
%8.
50%
1.82
%3.
25%
Taw
ang
22.2
6%0
.00
%15
.69%
36.3
3%4.
96%
0.0
0%
5.44
%0
.00
%0
.00
%4.
94%
10.3
8%0
.00
%
Tira
p32
.33%
0.0
0%
8.43
%8.
76%
26.6
1%7.
37%
3.13
%4.
69%
0.0
0%
5.91
%2.
76%
0.0
0%
Up
per
Sia
ng27
.75%
0.0
0%
12.8
8%19
.60
%19
.79%
3.33
%3.
33%
0.0
0%
0.0
0%
8.98
%1.
01%
3.33
%
Up
per
Sub
ansi
ri40
.74%
0.0
0%
18.4
2%7.
79%
0.0
0%
4.27
%11
.72%
0.0
0%
0.0
0%
11.0
4%1.
75%
4.27
%
Wes
t Kam
eng
28.8
8%0
.00
%13
.53%
28.7
0%
13.1
2%1.
78%
3.28
%0
.98%
0.0
0%
5.36
%4.
38%
0.0
0%
Wes
t Sia
ng25
.60
%0
.00
%7.
68%
22.5
9%16
.05%
3.25
%6.
92%
1.0
6%0
.00
%8.
41%
3.25
%5.
20%
Assam
Baks
a20
.59%
0.0
0%
0.0
0%
20.5
9%0
.00
%11
.76%
5.88
%0
.00
%5.
88%
11.7
6%11
.76%
11.7
6%
Barp
eta
34.5
8%0
.91%
5.49
%9.
68%
10.8
7%8.
83%
7.63
%0
.88%
3.99
%8.
47%
4.68
%3.
99%
Bong
aig
aon
26.9
7%0
.00
%12
.02%
17.5
4%7.
60%
7.91
%5.
43%
3.65
%3.
78%
10.0
0%
3.60
%1.
52%
Cac
har
32.2
7%0
.00
%12
.61%
10.9
6%0
.00
%8.
58%
9.19
%2.
57%
5.45
%11
.19%
4.63
%2.
55%
Chi
rang
30.0
7%0
.00
%12
.26%
22.7
8%1.
29%
10.0
6%4.
90%
1.73
%2.
80%
8.47
%2.
44%
3.19
%
Dar
rang
26.5
3%2.
32%
8.73
%23
.12%
5.66
%8.
24%
7.93
%0
.00
%1.
62%
10.2
5%3.
94%
1.66
%
Dhe
maj
i21
.66%
0.0
0%
6.0
9%17
.45%
0.0
0%
11.1
7%11
.17%
0.0
0%
8.87
%11
.17%
7.95
%4.
45%
Dhu
bri
36.4
0%
3.19
%11
.20
%15
.88%
7.19
%7.
78%
7.61
%0
.68%
1.82
%5.
53%
1.58
%1.
14%
Dib
rug
arh
33.7
9%0
.85%
8.85
%15
.05%
1.44
%6.
34%
9.53
%0
.65%
3.90
%10
.20
%5.
21%
4.18
%
Dim
a H
asao
39.1
8%0
.98%
13.1
0%
5.27
%0
.00
%10
.81%
6.0
9%7.
16%
0.7
1%9.
21%
6.95
%0
.55%
Go
alp
ara
17.6
9%3.
36%
8.49
%20
.60
%16
.99%
10.1
0%
8.82
%0
.83%
1.92
%5.
89%
2.75
%2.
56%
Go
lag
hat
31.1
9%0
.00
%5.
55%
22.4
7%5.
59%
7.37
%6.
08%
0.0
0%
3.50
%10
.54%
5.13
%2.
59%
Hai
laka
ndi
34.6
1%5.
07%
11.9
4%13
.75%
0.0
0%
9.89
%4.
14%
2.18
%1.
96%
10.3
6%6.
11%
0.0
0%
Jorh
at36
.41%
0.0
0%
3.97
%13
.42%
11.9
3%8.
07%
8.10
%3.
08%
3.92
%7.
30%
2.72
%1.
07%
Kam
rup
34.4
5%0
.96%
14.0
9%11
.12%
3.85
%6.
25%
6.62
%3.
58%
1.93
%10
.12%
4.13
%2.
89%
Ind
icat
or C
ont
rib
utio
n: U
rban
Hea
lthEd
ucat
ion
Stan
dar
d o
f Liv
ing
Stat
eD
istr
ict
Nut
ritio
nC
hild
&
Ad
ole
scen
t M
ort
ality
Mat
erna
l H
ealth
Year
s o
f Sc
hoo
ling
Scho
ol
Att
end
ance
Co
oki
ng
Fuel
Sani
tatio
nD
rink
ing
Wat
erEl
ectr
icity
Ho
usin
gA
sset
sB
ank
Acc
oun
t
Assam
Kam
rup
Met
rop
olit
an29
.52%
0.9
3%9.
18%
22.5
2%0
.79%
4.72
%8.
74%
5.48
%1.
25%
8.21
%4.
06%
4.62
%
Karb
i Ang
long
27.4
6%3.
06%
13.4
0%
15.6
5%6.
17%
7.66
%6.
35%
5.10
%0
.33%
10.7
0%
2.0
0%
2.13
%
Karim
gan
j25
.03%
7.27
%15
.24%
11.3
4%0
.00
%3.
59%
7.79
%2.
60%
5.80
%11
.43%
4.76
%5.
16%
Kokr
ajha
r0
.00
%0
.00
%19
.92%
44.0
8%0
.00
%12
.59%
7.19
%0
.00
%4.
19%
5.40
%5.
40%
1.21
%
Lakh
imp
ur27
.61%
0.0
0%
0.0
0%
12.1
8%12
.67%
9.23
%10
.30
%6.
05%
1.70
%9.
23%
7.96
%3.
06%
Mar
igao
n29
.43%
1.50
%7.
27%
13.5
2%12
.01%
7.78
%8.
52%
0.0
0%
4.10
%9.
38%
4.0
6%2.
42%
Nag
aon
33.3
8%3.
98%
9.27
%7.
44%
0.0
0%
8.90
%10
.77%
2.37
%3.
29%
10.0
5%3.
97%
6.58
%
Nal
bar
i33
.34%
0.0
0%
16.6
7%9.
65%
9.65
%6.
12%
8.88
%0
.00
%0
.00
%12
.28%
3.40
%0
.00
%
Siva
sag
ar24
.02%
0.0
0%
8.82
%23
.27%
0.0
0%
5.39
%11
.69%
0.0
0%
1.83
%11
.69%
6.65
%6.
65%
Soni
tpur
35.9
0%
0.0
0%
17.9
5%35
.90
%0
.00
%0
.00
%10
.26%
0.0
0%
0.0
0%
0.0
0%
0.0
0%
0.0
0%
Tins
ukia
24.8
2%2.
45%
4.78
%19
.87%
10.0
5%8.
82%
6.78
%0
.65%
2.87
%8.
76%
4.21
%5.
96%
Ud
alg
uri
30.3
3%0
.00
%6.
71%
0.0
0%
16.7
9%9.
62%
13.4
6%4.
83%
0.0
0%
9.62
%0
.00
%8.
63%
Bihar
Ara
ria30
.33%
0.0
0%
9.28
%13
.94%
9.21
%8.
80%
7.96
%0
.00
%4.
27%
8.18
%2.
74%
5.30
%
Arw
al33
.50
%0
.00
%15
.81%
13.3
2%3.
23%
8.96
%9.
48%
0.0
0%
1.69
%8.
83%
3.48
%1.
71%
Aur
ang
abad
22.9
9%2.
39%
7.0
0%
16.3
6%19
.21%
6.61
%6.
81%
0.2
3%4.
15%
6.0
4%5.
15%
3.0
7%
Bank
a21
.62%
1.58
%11
.15%
18.6
6%5.
47%
9.0
8%9.
40%
0.0
0%
5.92
%9.
08%
3.70
%4.
33%
Beg
usar
ai27
.08%
3.35
%12
.84%
15.1
6%9.
82%
8.68
%6.
02%
0.1
8%3.
32%
6.62
%4.
26%
2.67
%
Bhag
alp
ur23
.90
%1.
52%
10.8
2%16
.27%
8.26
%9.
00
%8.
93%
0.2
0%
3.39
%6.
89%
6.0
9%4.
73%
Bho
jpur
28.5
6%0
.00
%11
.87%
18.1
1%5.
55%
8.87
%8.
84%
0.0
0%
4.35
%5.
99%
3.76
%4.
11%
Buxa
r22
.72%
2.81
%14
.10
%11
.94%
13.9
3%9.
10%
9.66
%0
.00
%1.
60%
4.21
%6.
68%
3.24
%
Dar
bha
nga
30.7
0%
0.0
0%
12.3
0%
9.80
%10
.18%
7.63
%7.
47%
0.0
0%
4.71
%8.
06%
2.87
%6.
28%
Gay
a28
.67%
0.7
6%11
.51%
15.1
1%5.
27%
9.33
%8.
42%
1.86
%2.
72%
6.75
%5.
15%
4.45
%
Go
pal
gan
j23
.38%
0.9
8%10
.58%
14.8
1%10
.28%
7.92
%8.
17%
0.0
0%
5.59
%8.
73%
3.0
9%6.
48%
Jam
ui28
.59%
1.0
1%14
.93%
17.4
6%3.
40%
9.34
%9.
32%
1.41
%2.
26%
7.52
%1.
71%
3.0
7%
Jeha
nab
ad30
.48%
0.0
0%
8.66
%17
.85%
14.9
9%6.
37%
7.28
%0
.00
%2.
60%
4.33
%3.
18%
4.25
%
Kaim
ur23
.98%
0.0
0%
8.51
%23
.98%
17.0
1%6.
85%
6.85
%0
.00
%0
.00
%6.
85%
3.98
%1.
99%
Katih
ar29
.71%
0.0
0%
13.6
8%17
.74%
7.24
%8.
90%
6.10
%0
.00
%1.
01%
7.55
%2.
69%
5.38
%
Khag
aria
19.2
5%0
.00
%10
.84%
22.4
1%12
.03%
8.47
%8.
12%
0.0
0%
6.0
9%8.
15%
3.99
%0
.66%
Kish
ang
anj
24.5
7%0
.85%
10.2
1%18
.97%
8.68
%8.
12%
8.29
%0
.19%
4.83
%7.
41%
2.12
%5.
74%
Lakh
isar
ai28
.14%
0.7
7%13
.59%
16.7
0%
8.61
%9.
08%
6.86
%0
.64%
1.83
%7.
67%
3.91
%2.
19%
Mad
hep
ura
28.0
0%
0.0
0%
14.9
3%15
.14%
10.7
6%5.
96%
8.53
%0
.00
%0
.53%
7.61
%7.
11%
1.42
%
Mad
hub
ani
25.0
9%4.
10%
13.0
3%12
.07%
5.31
%8.
96%
8.41
%0
.00
%4.
41%
8.41
%6.
20%
4.0
0%
Mun
ger
33.3
8%0
.20
%13
.85%
13.4
3%7.
16%
7.14
%7.
06%
0.6
3%3.
68%
4.86
%3.
58%
5.0
4%
Muz
affa
rpur
25.4
9%0
.00
%9.
43%
18.3
2%18
.41%
5.90
%5.
45%
0.0
0%
3.67
%4.
99%
4.12
%4.
21%
Nal
and
a29
.17%
1.40
%15
.48%
14.3
3%14
.26%
6.30
%7.
59%
1.0
9%1.
43%
3.0
6%2.
26%
3.62
%
Naw
ada
36.3
6%1.
01%
17.7
8%11
.78%
10.2
0%
7.15
%4.
05%
0.0
0%
0.0
0%
6.14
%3.
84%
1.68
%
Pash
chim
Cha
mp
aran
23.9
7%1.
33%
11.1
1%11
.30
%21
.08%
4.54
%5.
98%
2.39
%2.
22%
6.46
%3.
25%
6.36
%
Patn
a26
.55%
2.37
%13
.25%
18.7
6%9.
95%
7.41
%6.
69%
0.2
8%1.
57%
6.27
%3.
94%
2.95
%
Purb
a C
ham
par
an21
.25%
0.3
3%11
.46%
15.7
3%15
.71%
7.76
%8.
01%
0.0
0%
3.10
%7.
66%
4.0
4%4.
96%
Purn
ia26
.97%
4.23
%12
.06%
14.0
4%6.
06%
9.61
%9.
87%
0.0
0%
2.42
%8.
20%
3.63
%2.
92%
Roht
as26
.22%
2.18
%12
.41%
14.9
3%7.
74%
8.71
%8.
50%
0.0
0%
4.59
%4.
13%
7.37
%3.
24%
Saha
rsa
21.4
2%0
.00
%10
.30
%22
.79%
11.1
5%7.
50%
8.41
%0
.00
%3.
72%
7.85
%3.
28%
3.58
%
Sam
astip
ur22
.85%
0.0
0%
8.36
%23
.53%
2.69
%9.
45%
9.45
%0
.00
%3.
13%
8.63
%7.
09%
4.83
%
(CONTD.) DISTrICT-WISe: INDICATor CoNTrIBUTIoN To The MpI SCore (UrBAN)TABle 19- DISTrICT-WISe: INDICATor CoNTrIBUTIoN To The MpI SCore (UrBAN)
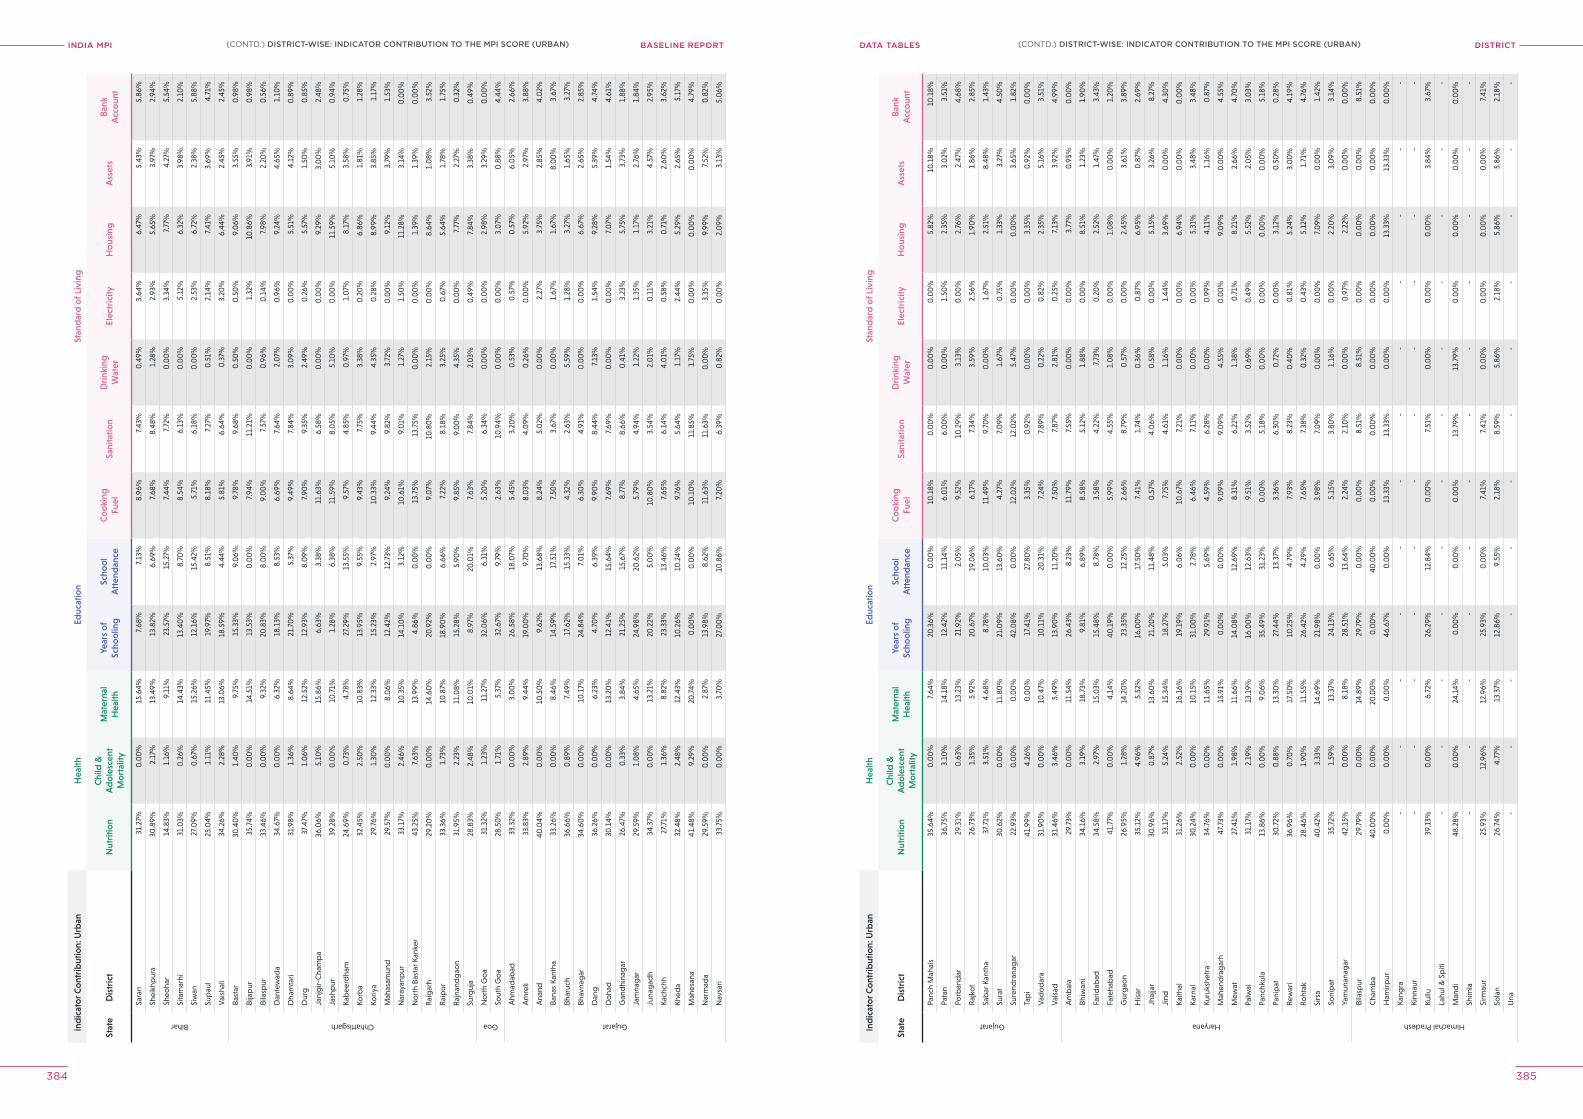
INDIA MPI BASELINE REPORT DISTrICTDATA TABleS
384 385
Ind
icat
or C
ont
rib
utio
n: U
rban
Hea
lthEd
ucat
ion
Stan
dar
d o
f Liv
ing
Stat
eD
istr
ict
Nut
ritio
nC
hild
&
Ad
ole
scen
t M
ort
ality
Mat
erna
l H
ealth
Year
s o
f Sc
hoo
ling
Scho
ol
Att
end
ance
Co
oki
ng
Fuel
Sani
tatio
nD
rink
ing
Wat
erEl
ectr
icity
Ho
usin
gA
sset
sB
ank
Acc
oun
t
Bihar
Sara
n31
.27%
0.0
0%
15.6
4%7.
68%
7.13
%8.
96%
7.43
%0
.49%
3.64
%6.
47%
5.43
%5.
86%
Shei
khp
ura
30.8
9%2.
17%
13.4
9%13
.82%
6.69
%7.
68%
8.48
%1.
28%
2.93
%5.
65%
3.97
%2.
94%
Sheo
har
14.8
3%1.
16%
9.11
%23
.57%
15.2
7%7.
44%
7.72
%0
.00
%3.
34%
7.77
%4.
27%
5.54
%
Sita
mar
hi31
.03%
0.2
6%14
.43%
13.4
0%
8.70
%8.
54%
6.13
%0
.00
%5.
12%
6.32
%3.
98%
2.10
%
Siw
an27
.09%
0.6
7%15
.26%
12.1
6%15
.42%
5.71
%6.
18%
0.0
0%
2.53
%6.
72%
2.38
%5.
88%
Sup
aul
25.0
4%1.
11%
11.4
5%19
.97%
8.51
%8.
18%
7.27
%0
.51%
2.14
%7.
41%
3.69
%4.
71%
Vai
shal
i34
.26%
2.28
%13
.06%
18.5
9%4.
44%
5.81
%6.
64%
0.3
7%3.
20%
6.44
%2.
45%
2.45
%
Chhattisgarh
Bast
ar30
.40
%1.
40%
9.75
%15
.33%
9.0
6%9.
78%
9.68
%0
.50
%0
.50
%9.
06%
3.55
%0
.98%
Bija
pur
35.7
4%0
.00
%14
.51%
13.5
3%0
.00
%7.
94%
11.2
1%0
.00
%1.
32%
10.8
6%3.
91%
0.9
8%
Bila
spur
33.4
6%0
.00
%9.
32%
20.8
3%8.
00
%9.
00
%7.
57%
0.9
6%0
.14%
7.98
%2.
20%
0.5
6%
Dan
tew
ada
34.6
7%0
.00
%6.
32%
18.1
3%8.
53%
6.69
%7.
64%
2.0
7%0
.96%
9.24
%4.
65%
1.10
%
Dha
mta
ri31
.98%
1.36
%8.
64%
21.7
0%
5.37
%9.
49%
7.84
%3.
09%
0.0
0%
5.51
%4.
12%
0.8
9%
Dur
g37
.47%
1.0
6%12
.52%
12.9
3%8.
09%
7.90
%9.
35%
2.49
%0
.26%
5.57
%1.
50%
0.8
5%
Janj
gir-
Cha
mp
a36
.06%
5.10
%15
.86%
6.63
%3.
38%
11.6
3%6.
58%
0.0
0%
0.0
0%
9.29
%3.
00
%2.
48%
Jash
pur
39.2
8%0
.00
%10
.71%
1.28
%6.
38%
11.5
9%8.
05%
5.10
%0
.00
%11
.59%
5.10
%0
.94%
Kab
eerd
ham
24.6
9%0
.73%
4.78
%27
.29%
13.5
5%9.
57%
4.85
%0
.97%
1.0
7%8.
17%
3.58
%0
.75%
Korb
a32
.45%
2.50
%10
.83%
13.9
5%9.
55%
9.43
%7.
75%
3.38
%0
.20
%6.
86%
1.81
%1.
28%
Koriy
a29
.76%
1.30
%12
.33%
15.2
3%2.
97%
10.3
3%9.
44%
4.35
%0
.28%
8.99
%3.
85%
1.17
%
Mah
asam
und
29.5
7%0
.00
%8.
06%
12.4
2%12
.73%
9.24
%9.
82%
3.72
%0
.00
%9.
12%
3.79
%1.
53%
Nar
ayan
pur
33.1
7%2.
46%
10.3
5%14
.10
%3.
12%
10.6
1%9.
01%
1.27
%1.
50%
11.2
8%3.
14%
0.0
0%
No
rth
Bast
ar K
anke
r43
.25%
7.63
%13
.99%
4.86
%0
.00
%13
.75%
13.7
5%0
.00
%0
.00
%1.
39%
1.39
%0
.00
%
Rai
gar
h29
.20
%0
.00
%14
.60
%20
.92%
0.0
0%
9.0
7%10
.80
%2.
15%
0.0
0%
8.64
%1.
08%
3.52
%
Rai
pur
33.3
6%1.
73%
10.8
7%18
.90
%6.
66%
7.22
%8.
18%
3.25
%0
.67%
5.64
%1.
78%
1.75
%
Raj
nand
gao
n31
.95%
2.23
%11
.08%
15.2
8%5.
90%
9.85
%9.
00
%4.
35%
0.0
0%
7.77
%2.
27%
0.3
2%
Surg
uja
28.8
3%2.
48%
10.0
1%8.
97%
20.0
1%7.
63%
7.84
%2.
03%
0.4
9%7.
84%
3.38
%0
.49%
Goa
No
rth
Go
a31
.32%
1.23
%11
.27%
32.0
6%6.
31%
5.20
%6.
34%
0.0
0%
0.0
0%
2.98
%3.
29%
0.0
0%
Sout
h G
oa
28.5
0%
1.71
%5.
37%
32.6
7%9.
79%
2.63
%10
.94%
0.0
0%
0.0
0%
3.0
7%0
.88%
4.44
%
Gujarat
Ahm
adab
ad33
.32%
0.0
0%
3.0
0%
26.5
8%18
.07%
5.45
%3.
20%
0.5
3%0
.57%
0.5
7%6.
05%
2.66
%
Am
reli
33.8
3%2.
89%
9.44
%19
.00
%9.
70%
8.0
3%4.
09%
0.2
6%0
.00
%5.
92%
2.97
%3.
88%
Ana
nd40
.04%
0.0
0%
10.5
0%
9.62
%13
.68%
8.24
%5.
02%
0.0
0%
2.27
%3.
75%
2.85
%4.
02%
Bana
s Ka
ntha
33.2
6%0
.00
%8.
46%
14.5
9%17
.51%
7.50
%3.
67%
0.0
0%
1.67
%1.
67%
8.0
0%
3.67
%
Bhar
uch
36.6
6%0
.89%
7.49
%17
.62%
15.3
3%4.
32%
2.63
%5.
59%
1.28
%3.
27%
1.65
%3.
27%
Bhav
nag
ar34
.60
%0
.00
%10
.17%
24.8
4%7.
01%
6.30
%4.
91%
0.0
0%
0.0
0%
6.67
%2.
65%
2.85
%
Dan
g36
.26%
0.0
0%
6.23
%4.
70%
6.39
%9.
90%
8.44
%7.
13%
1.54
%9.
28%
5.39
%4.
74%
Do
had
30.1
4%0
.00
%13
.20
%12
.41%
15.6
4%7.
69%
7.69
%0
.00
%0
.00
%7.
07%
1.54
%4.
61%
Gan
dhi
nag
ar26
.47%
0.3
3%3.
84%
21.2
5%15
.67%
8.77
%8.
66%
0.4
1%3.
23%
5.75
%3.
73%
1.88
%
Jam
nag
ar29
.59%
1.0
8%4.
65%
24.9
8%20
.62%
5.79
%4.
94%
1.22
%1.
35%
1.17
%2.
76%
1.84
%
Juna
gad
h34
.37%
0.0
0%
13.2
1%20
.22%
5.0
0%
10.8
0%
3.54
%2.
01%
0.1
1%3.
21%
4.57
%2.
95%
Kach
chh
27.7
1%1.
36%
8.82
%23
.33%
13.4
6%7.
65%
6.14
%4.
01%
0.5
8%0
.71%
2.60
%3.
62%
Khed
a32
.48%
2.48
%12
.43%
10.2
6%10
.24%
9.76
%5.
64%
1.17
%2.
44%
5.29
%2.
65%
5.17
%
Mah
esan
a41
.48%
9.29
%20
.74%
0.0
0%
0.0
0%
10.1
0%
11.8
5%1.
75%
0.0
0%
0.0
0%
0.0
0%
4.79
%
Nar
mad
a29
.59%
0.0
0%
2.87
%13
.98%
8.62
%11
.63%
11.6
3%0
.00
%3.
35%
9.99
%7.
52%
0.8
2%
Nav
sari
33.7
5%0
.00
%3.
70%
27.0
0%
10.8
6%7.
20%
6.39
%0
.82%
0.0
0%
2.0
9%3.
13%
5.0
6%
Ind
icat
or C
ont
rib
utio
n: U
rban
Hea
lthEd
ucat
ion
Stan
dar
d o
f Liv
ing
Stat
eD
istr
ict
Nut
ritio
nC
hild
&
Ad
ole
scen
t M
ort
ality
Mat
erna
l H
ealth
Year
s o
f Sc
hoo
ling
Scho
ol
Att
end
ance
Co
oki
ng
Fuel
Sani
tatio
nD
rink
ing
Wat
erEl
ectr
icity
Ho
usin
gA
sset
sB
ank
Acc
oun
t
Gujarat
Panc
h M
ahal
s35
.64%
0.0
0%
7.64
%20
.36%
0.0
0%
10.1
8%0
.00
%0
.00
%0
.00
%5.
82%
10.1
8%10
.18%
Pata
n36
.75%
3.10
%14
.18%
12.4
2%11
.14%
6.0
1%6.
00
%0
.00
%1.
50%
2.35
%3.
02%
3.51
%
Porb
and
ar29
.31%
0.6
3%13
.23%
21.9
2%2.
05%
9.52
%10
.29%
3.13
%0
.00
%2.
76%
2.47
%4.
68%
Raj
kot
26.7
3%1.
35%
5.92
%20
.67%
19.0
6%6.
17%
7.34
%3.
59%
2.56
%1.
90%
1.86
%2.
85%
Sab
ar K
anth
a37
.71%
3.51
%4.
68%
8.78
%10
.03%
11.4
9%9.
70%
0.0
0%
1.67
%2.
51%
8.48
%1.
43%
Sura
t30
.62%
0.0
0%
11.8
0%
21.0
9%13
.60
%4.
27%
7.0
9%1.
67%
0.7
5%1.
33%
3.27
%4.
50%
Sure
ndra
nag
ar22
.93%
0.0
0%
0.0
0%
42.0
8%0
.00
%12
.02%
12.0
2%5.
47%
0.0
0%
0.0
0%
3.65
%1.
82%
Tap
i41
.99%
4.26
%0
.00
%17
.41%
27.8
0%
3.35
%0
.92%
0.0
0%
0.0
0%
3.35
%0
.92%
0.0
0%
Vad
od
ara
31.9
0%
0.0
0%
10.4
7%10
.11%
20.3
1%7.
24%
7.89
%0
.22%
0.8
2%2.
35%
5.16
%3.
51%
Val
sad
31.4
6%3.
46%
5.49
%13
.90
%11
.20
%7.
50%
7.87
%2.
81%
0.2
5%7.
13%
3.92
%4.
99%
Haryana
Am
bal
a29
.73%
0.0
0%
11.5
4%26
.43%
8.23
%11
.79%
7.55
%0
.00
%0
.00
%3.
77%
0.9
5%0
.00
%
Bhiw
ani
34.1
6%3.
19%
18.7
3%9.
81%
6.89
%8.
58%
5.12
%1.
88%
0.0
0%
8.51
%1.
23%
1.90
%
Farid
abad
34.5
8%2.
97%
15.0
3%15
.48%
8.78
%3.
58%
4.22
%7.
73%
0.2
0%
2.52
%1.
47%
3.43
%
Fate
hab
ad41
.77%
0.0
0%
4.14
%40
.19%
0.0
0%
5.99
%4.
55%
1.0
8%0
.00
%1.
08%
0.0
0%
1.20
%
Gur
gao
n26
.95%
1.28
%14
.20
%23
.35%
12.2
5%2.
66%
8.79
%0
.57%
0.0
0%
2.45
%3.
61%
3.89
%
His
ar35
.12%
4.96
%5.
52%
16.0
0%
17.5
0%
7.41
%1.
74%
0.3
6%0
.87%
6.95
%0
.87%
2.69
%
Jhaj
jar
30.9
6%0
.87%
13.6
0%
21.2
0%
11.4
8%0
.57%
4.0
6%0
.58%
0.0
0%
5.15
%3.
26%
8.27
%
Jind
33.1
7%5.
24%
15.3
4%18
.27%
5.0
3%7.
75%
4.61
%1.
16%
1.44
%3.
69%
0.0
0%
4.30
%
Kaith
al31
.26%
2.52
%16
.16%
19.1
9%6.
06%
10.6
7%7.
21%
0.0
0%
0.0
0%
6.94
%0
.00
%0
.00
%
Karn
al30
.24%
0.0
0%
10.1
5%31
.00
%2.
78%
6.46
%7.
11%
0.0
0%
0.0
0%
5.31
%3.
48%
3.48
%
Kuru
kshe
tra
34.7
6%0
.00
%11
.65%
29.9
1%5.
69%
4.59
%6.
28%
0.0
0%
0.9
9%4.
11%
1.16
%0
.87%
Mah
end
rag
arh
47.7
3%0
.00
%15
.91%
0.0
0%
0.0
0%
9.0
9%9.
09%
4.55
%0
.00
%9.
09%
0.0
0%
4.55
%
Mew
at27
.41%
1.98
%11
.66%
14.0
8%12
.69%
8.31
%6.
22%
1.38
%0
.71%
8.21
%2.
66%
4.70
%
Palw
al31
.17%
2.19
%13
.19%
16.0
0%
12.6
3%9.
51%
3.52
%0
.69%
0.4
9%5.
52%
2.0
5%3.
03%
Panc
hkul
a13
.86%
0.0
0%
9.0
6%35
.49%
31.2
3%0
.00
%5.
18%
0.0
0%
0.0
0%
0.0
0%
0.0
0%
5.18
%
Pani
pat
30.7
2%0
.88%
13.3
0%
27.4
4%13
.37%
3.36
%6.
30%
0.7
2%0
.00
%3.
12%
0.5
0%
0.2
8%
Rew
ari
36.9
6%0
.70
%17
.50
%10
.25%
4.79
%7.
93%
8.23
%0
.40
%0
.81%
5.24
%3.
00
%4.
19%
Roht
ak28
.46%
1.90
%11
.55%
26.4
2%4.
29%
7.65
%7.
38%
0.3
2%0
.43%
5.12
%1.
71%
4.76
%
Sirs
a40
.42%
3.33
%14
.69%
21.9
8%0
.00
%3.
98%
7.0
9%0
.00
%0
.00
%7.
09%
0.0
0%
1.42
%
Soni
pat
35.7
2%1.
59%
13.3
7%24
.13%
6.65
%5.
15%
3.80
%1.
16%
0.0
0%
2.20
%3.
09%
3.14
%
Yam
unan
agar
42.1
5%0
.00
%8.
18%
28.5
1%13
.64%
2.24
%2.
10%
0.0
0%
0.9
7%2.
22%
0.0
0%
0.0
0%
Himachal Pradesh
Bila
spur
29.7
9%0
.00
%14
.89%
29.7
9%0
.00
%0
.00
%8.
51%
8.51
%0
.00
%0
.00
%0
.00
%8.
51%
Cha
mb
a40
.00
%0
.00
%20
.00
%0
.00
%40
.00
%0
.00
%0
.00
%0
.00
%0
.00
%0
.00
%0
.00
%0
.00
%
Ham
irpur
0.0
0%
0.0
0%
0.0
0%
46.6
7%0
.00
%13
.33%
13.3
3%0
.00
%0
.00
%13
.33%
13.3
3%0
.00
%
Kang
ra-
--
--
--
--
--
-
Kinn
aur
--
--
--
--
--
--
Kullu
39.1
3%0
.00
%6.
72%
26.2
9%12
.84%
0.0
0%
7.51
%0
.00
%0
.00
%0
.00
%3.
84%
3.67
%
Lahu
l & S
piti
--
--
--
--
--
--
Man
di
48.2
8%0
.00
%24
.14%
0.0
0%
0.0
0%
0.0
0%
13.7
9%13
.79%
0.0
0%
0.0
0%
0.0
0%
0.0
0%
Shim
la-
--
--
--
--
--
-
Sirm
aur
25.9
3%12
.96%
12.9
6%25
.93%
0.0
0%
7.41
%7.
41%
0.0
0%
0.0
0%
0.0
0%
0.0
0%
7.41
%
Sola
n26
.74%
4.77
%13
.37%
12.8
6%9.
55%
2.18
%8.
59%
5.86
%2.
18%
5.86
%5.
86%
2.18
%
Una
--
--
--
--
--
--
(CONTD.) DISTrICT-WISe: INDICATor CoNTrIBUTIoN To The MpI SCore (UrBAN)(CONTD.) DISTrICT-WISe: INDICATor CoNTrIBUTIoN To The MpI SCore (UrBAN)
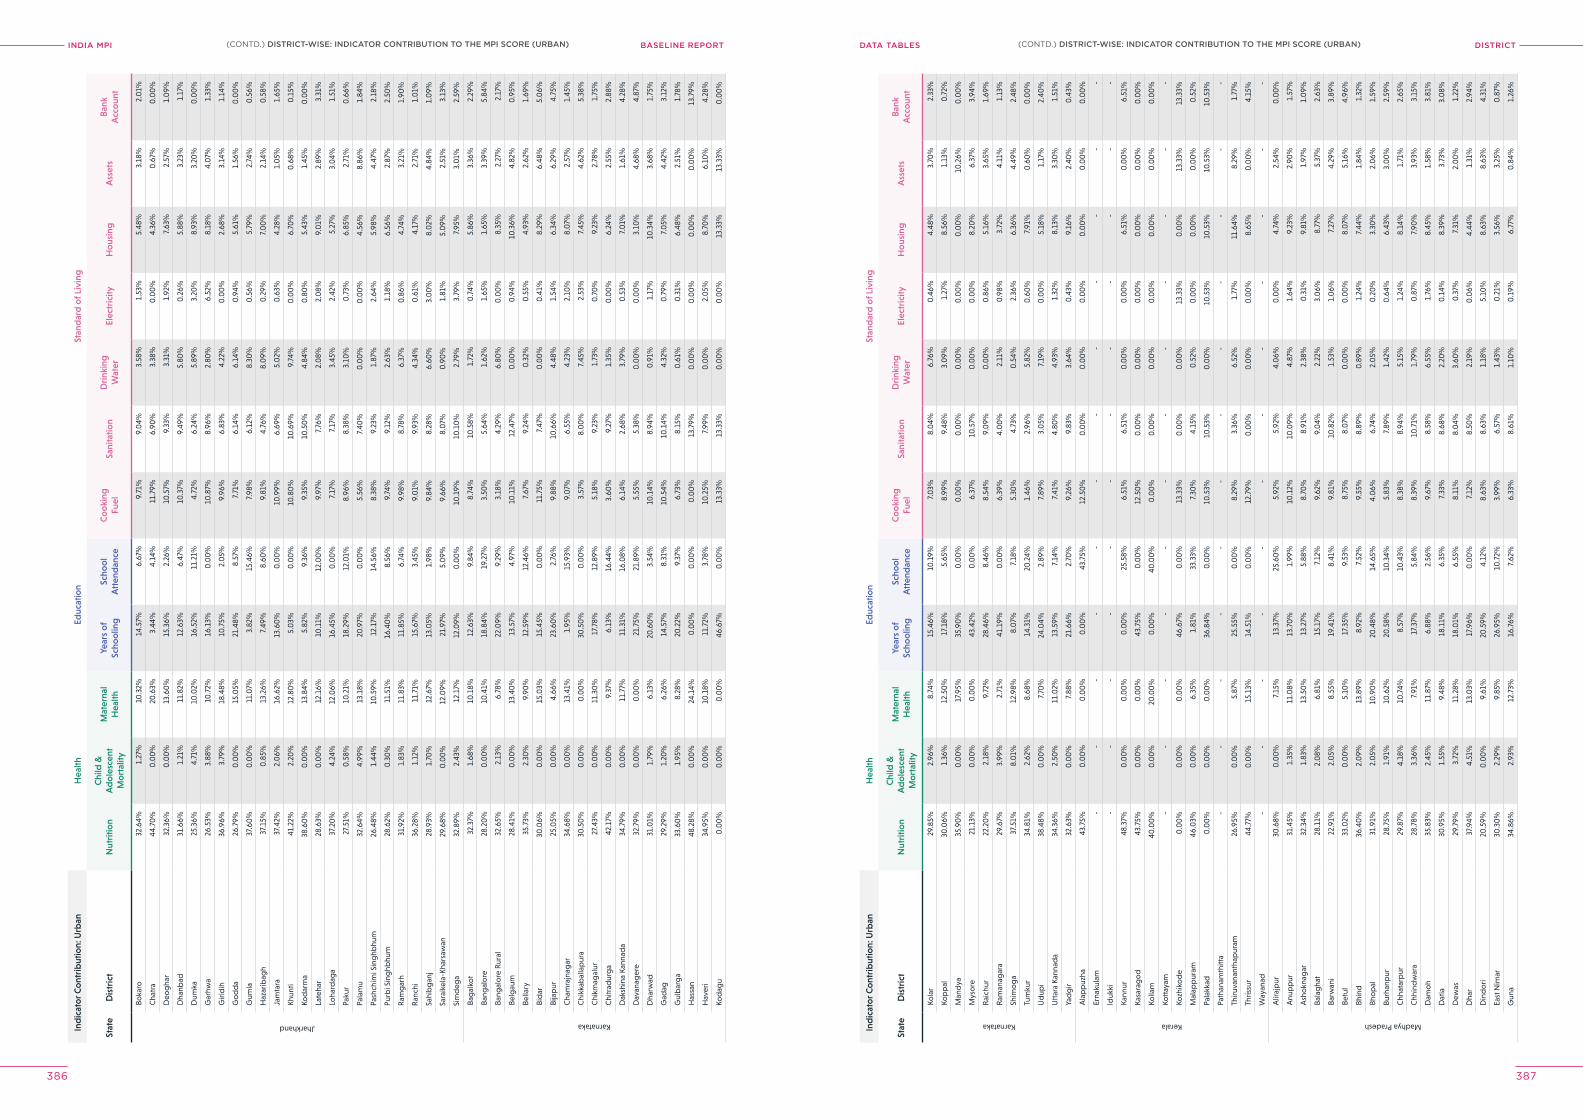
INDIA MPI BASELINE REPORT DISTrICTDATA TABleS
386 387
Ind
icat
or C
ont
rib
utio
n: U
rban
Hea
lthEd
ucat
ion
Stan
dar
d o
f Liv
ing
Stat
eD
istr
ict
Nut
ritio
nC
hild
&
Ad
ole
scen
t M
ort
ality
Mat
erna
l H
ealth
Year
s o
f Sc
hoo
ling
Scho
ol
Att
end
ance
Co
oki
ng
Fuel
Sani
tatio
nD
rink
ing
Wat
erEl
ectr
icity
Ho
usin
gA
sset
sB
ank
Acc
oun
t
Jharkhand
Boka
ro32
.64%
1.27
%10
.32%
14.5
7%6.
67%
9.71
%9.
04%
3.58
%1.
53%
5.48
%3.
18%
2.0
1%
Cha
tra
44.7
0%
0.0
0%
20.6
3%3.
44%
4.14
%11
.79%
6.90
%3.
38%
0.0
0%
4.36
%0
.67%
0.0
0%
Deo
gha
r32
.36%
0.0
0%
13.6
0%
15.3
6%2.
26%
10.5
7%9.
33%
3.31
%1.
92%
7.63
%2.
57%
1.0
9%
Dha
nbad
31.6
6%1.
21%
11.8
2%12
.63%
6.47
%10
.37%
9.49
%5.
80%
0.2
6%5.
88%
3.23
%1.
17%
Dum
ka25
.36%
4.71
%10
.02%
16.5
2%11
.21%
4.72
%6.
24%
5.89
%3.
20%
8.93
%3.
20%
0.0
0%
Gar
hwa
26.5
3%3.
88%
10.7
2%16
.13%
0.0
0%
10.8
7%8.
96%
2.80
%6.
52%
8.18
%4.
07%
1.33
%
Giri
dih
36.9
6%3.
79%
18.4
8%10
.75%
2.0
5%9.
96%
6.83
%4.
22%
0.0
0%
2.68
%3.
14%
1.14
%
Go
dd
a26
.79%
0.0
0%
15.0
5%21
.48%
8.57
%7.
71%
6.14
%6.
14%
0.9
4%5.
61%
1.56
%0
.00
%
Gum
la37
.60
%0
.00
%11
.07%
3.82
%15
.46%
7.98
%6.
12%
8.30
%0
.56%
5.79
%2.
74%
0.5
6%
Haz
arib
agh
37.1
5%0
.85%
13.2
6%7.
49%
8.60
%9.
81%
4.76
%8.
09%
0.2
9%7.
00
%2.
14%
0.5
8%
Jam
tara
37.4
2%2.
06%
16.6
2%13
.60
%0
.00
%10
.99%
6.69
%5.
02%
0.6
3%4.
28%
1.0
5%1.
65%
Khun
ti41
.22%
2.20
%12
.80
%5.
03%
0.0
0%
10.8
0%
10.6
9%9.
74%
0.0
0%
6.70
%0
.68%
0.1
5%
Kod
arm
a38
.60
%0
.00
%13
.84%
5.82
%9.
36%
9.35
%10
.50
%4.
84%
0.8
0%
5.43
%1.
45%
0.0
0%
Late
har
28.6
3%0
.00
%12
.16%
10.1
1%12
.00
%9.
97%
7.76
%2.
08%
2.0
8%9.
01%
2.89
%3.
31%
Loha
rdag
a37
.20
%4.
24%
12.0
6%16
.45%
0.0
0%
7.17
%7.
17%
3.45
%2.
42%
5.27
%3.
04%
1.51
%
Paku
r27
.51%
0.5
8%10
.21%
18.2
9%12
.01%
8.96
%8.
38%
3.10
%0
.73%
6.85
%2.
71%
0.6
6%
Pala
mu
32.6
4%4.
99%
13.1
8%20
.97%
0.0
0%
5.56
%7.
40%
0.0
0%
0.0
0%
4.56
%8.
86%
1.84
%
Pash
chim
i Sin
ghb
hum
26.4
8%1.
44%
10.5
9%12
.17%
14.5
6%8.
38%
9.23
%1.
87%
2.64
%5.
98%
4.47
%2.
18%
Purb
i Sin
ghb
hum
28.6
2%0
.30
%11
.51%
16.4
0%
8.56
%9.
74%
9.12
%2.
63%
1.18
%6.
56%
2.87
%2.
50%
Ram
gar
h31
.92%
1.83
%11
.83%
11.8
5%6.
74%
9.98
%8.
78%
6.37
%0
.86%
4.74
%3.
21%
1.90
%
Ran
chi
36.2
8%1.
12%
11.7
1%15
.67%
3.45
%9.
01%
9.93
%4.
34%
0.6
1%4.
17%
2.71
%1.
01%
Sahi
bg
anj
28.9
3%1.
70%
12.6
7%13
.05%
1.98
%9.
84%
8.28
%6.
60%
3.0
0%
8.0
2%4.
84%
1.0
9%
Sara
ikel
a-Kh
arsa
wan
29.6
8%0
.00
%12
.09%
21.9
7%5.
09%
9.66
%8.
07%
0.9
0%
1.81
%5.
09%
2.51
%3.
13%
Sim
deg
a32
.89%
2.43
%12
.17%
12.0
9%0
.00
%10
.19%
10.1
0%
2.79
%3.
79%
7.95
%3.
01%
2.59
%
Karnataka
Bag
alko
t32
.37%
1.68
%10
.18%
12.6
3%9.
84%
8.74
%10
.58%
1.72
%0
.74%
5.86
%3.
36%
2.29
%
Bang
alo
re28
.20
%0
.00
%10
.41%
18.8
4%19
.27%
3.50
%5.
64%
1.62
%1.
65%
1.65
%3.
39%
5.84
%
Bang
alo
re R
ural
32.6
5%2.
13%
6.78
%22
.09%
9.29
%3.
18%
4.29
%6.
80%
0.0
0%
8.35
%2.
27%
2.17
%
Belg
aum
28.4
1%0
.00
%13
.40
%13
.57%
4.97
%10
.11%
12.4
7%0
.00
%0
.94%
10.3
6%4.
82%
0.9
5%
Bella
ry35
.73%
2.30
%9.
90%
12.5
9%12
.46%
7.67
%9.
24%
0.3
2%0
.55%
4.93
%2.
62%
1.69
%
Bid
ar30
.06%
0.0
0%
15.0
3%15
.45%
0.0
0%
11.7
5%7.
47%
0.0
0%
0.4
1%8.
29%
6.48
%5.
06%
Bija
pur
25.0
5%0
.00
%4.
66%
23.6
0%
2.76
%9.
88%
10.6
6%4.
48%
1.54
%6.
34%
6.29
%4.
75%
Cha
mra
jnag
ar34
.68%
0.0
0%
13.4
1%1.
95%
15.9
3%9.
07%
6.55
%4.
23%
2.10
%8.
07%
2.57
%1.
45%
Chi
kkab
alla
pur
a30
.50
%0
.00
%0
.00
%30
.50
%0
.00
%3.
57%
8.0
0%
7.45
%2.
53%
7.45
%4.
62%
5.38
%
Chi
kmag
alur
27.4
3%0
.00
%11
.30
%17
.78%
12.8
9%5.
18%
9.23
%1.
73%
0.7
0%
9.23
%2.
78%
1.75
%
Chi
trad
urg
a42
.17%
0.0
0%
9.37
%6.
13%
16.4
4%3.
60%
9.27
%1.
35%
0.0
0%
6.24
%2.
55%
2.88
%
Dak
shin
a Ka
nnad
a34
.79%
0.0
0%
11.7
7%11
.31%
16.0
8%6.
14%
2.68
%3.
79%
0.5
3%7.
01%
1.61
%4.
28%
Dav
anag
ere
32.7
9%0
.00
%0
.00
%21
.75%
21.8
9%5.
55%
5.38
%0
.00
%0
.00
%3.
10%
4.68
%4.
87%
Dha
rwad
31.0
1%1.
79%
6.13
%20
.60
%3.
54%
10.1
4%8.
94%
0.9
1%1.
17%
10.3
4%3.
68%
1.75
%
Gad
ag29
.29%
1.20
%6.
26%
14.5
7%8.
31%
10.5
4%10
.14%
4.32
%0
.79%
7.0
5%4.
42%
3.12
%
Gul
bar
ga
33.6
0%
1.95
%8.
28%
20.2
2%9.
37%
6.73
%8.
15%
0.6
1%0
.31%
6.48
%2.
51%
1.78
%
Has
san
48.2
8%0
.00
%24
.14%
0.0
0%
0.0
0%
0.0
0%
13.7
9%0
.00
%0
.00
%0
.00
%0
.00
%13
.79%
Hav
eri
34.9
5%0
.00
%10
.18%
11.7
2%3.
78%
10.2
5%7.
99%
0.0
0%
2.0
5%8.
70%
6.10
%4.
28%
Kod
agu
0.0
0%
0.0
0%
0.0
0%
46.6
7%0
.00
%13
.33%
13.3
3%0
.00
%0
.00
%13
.33%
13.3
3%0
.00
%
Ind
icat
or C
ont
rib
utio
n: U
rban
Hea
lthEd
ucat
ion
Stan
dar
d o
f Liv
ing
Stat
eD
istr
ict
Nut
ritio
nC
hild
&
Ad
ole
scen
t M
ort
ality
Mat
erna
l H
ealth
Year
s o
f Sc
hoo
ling
Scho
ol
Att
end
ance
Co
oki
ng
Fuel
Sani
tatio
nD
rink
ing
Wat
erEl
ectr
icity
Ho
usin
gA
sset
sB
ank
Acc
oun
t
Karnataka
Kola
r29
.85%
2.96
%8.
74%
15.4
6%10
.19%
7.0
3%8.
04%
6.76
%0
.46%
4.48
%3.
70%
2.33
%
Kop
pal
30.0
6%1.
36%
12.5
0%
17.1
8%5.
65%
8.99
%9.
48%
3.0
9%1.
27%
8.56
%1.
13%
0.7
2%
Man
dya
35.9
0%
0.0
0%
17.9
5%35
.90
%0
.00
%0
.00
%0
.00
%0
.00
%0
.00
%0
.00
%10
.26%
0.0
0%
Mys
ore
21.1
3%0
.00
%0
.00
%43
.42%
0.0
0%
6.37
%10
.57%
0.0
0%
0.0
0%
8.20
%6.
37%
3.94
%
Rai
chur
22.2
0%
2.18
%9.
72%
28.4
6%8.
46%
8.54
%9.
09%
0.0
0%
0.8
6%5.
16%
3.65
%1.
69%
Ram
anag
ara
29.6
7%3.
99%
2.71
%41
.19%
0.0
0%
6.39
%4.
00
%2.
11%
0.9
8%3.
72%
4.11
%1.
13%
Shim
og
a37
.51%
8.0
1%12
.98%
8.0
7%7.
18%
5.30
%4.
73%
0.5
4%2.
36%
6.36
%4.
49%
2.48
%
Tum
kur
34.8
1%2.
62%
8.68
%14
.31%
20.2
4%1.
46%
2.96
%5.
82%
0.6
0%
7.91
%0
.60
%0
.00
%
Ud
upi
38.4
8%0
.00
%7.
70%
24.0
4%2.
89%
7.89
%3.
05%
7.19
%0
.00
%5.
18%
1.17
%2.
40%
Utt
ara
Kann
ada
34.3
6%2.
50%
11.0
2%13
.59%
7.14
%7.
41%
4.80
%4.
93%
1.32
%8.
13%
3.30
%1.
51%
Yad
gir
32.6
3%0
.00
%7.
88%
21.6
6%2.
70%
9.26
%9.
83%
3.64
%0
.43%
9.16
%2.
40%
0.4
3%
Kerala
Ala
pp
uzha
43.7
5%0
.00
%0
.00
%0
.00
%43
.75%
12.5
0%
0.0
0%
0.0
0%
0.0
0%
0.0
0%
0.0
0%
0.0
0%
Erna
kula
m-
--
--
--
--
--
-
Iduk
ki-
--
--
--
--
--
-
Kann
ur48
.37%
0.0
0%
0.0
0%
0.0
0%
25.5
8%6.
51%
6.51
%0
.00
%0
.00
%6.
51%
0.0
0%
6.51
%
Kasa
rag
od
43.7
5%0
.00
%0
.00
%43
.75%
0.0
0%
12.5
0%
0.0
0%
0.0
0%
0.0
0%
0.0
0%
0.0
0%
0.0
0%
Kolla
m40
.00
%0
.00
%20
.00
%0
.00
%40
.00
%0
.00
%0
.00
%0
.00
%0
.00
%0
.00
%0
.00
%0
.00
%
Kott
ayam
--
--
--
--
--
--
Kozh
iko
de
0.0
0%
0.0
0%
0.0
0%
46.6
7%0
.00
%13
.33%
0.0
0%
0.0
0%
13.3
3%0
.00
%13
.33%
13.3
3%
Mal
app
uram
46.0
3%0
.00
%6.
35%
1.81
%33
.33%
7.30
%4.
15%
0.5
2%0
.00
%0
.00
%0
.00
%0
.52%
Pala
kkad
0.0
0%
0.0
0%
0.0
0%
36.8
4%0
.00
%10
.53%
10.5
3%0
.00
%10
.53%
10.5
3%10
.53%
10.5
3%
Path
anam
thitt
a-
--
--
--
--
--
-
Thiru
vana
ntha
pur
am26
.95%
0.0
0%
5.87
%25
.55%
0.0
0%
8.29
%3.
36%
6.52
%1.
77%
11.6
4%8.
29%
1.77
%
Thris
sur
44.7
7%0
.00
%15
.13%
14.5
1%0
.00
%12
.79%
0.0
0%
0.0
0%
0.0
0%
8.65
%0
.00
%4.
15%
Way
anad
--
--
--
--
--
--
Madhya Pradesh
Alir
ajp
ur30
.68%
0.0
0%
7.15
%13
.37%
25.6
0%
5.92
%5.
92%
4.0
6%0
.00
%4.
74%
2.54
%0
.00
%
Anu
pp
ur31
.45%
1.35
%11
.08%
13.7
0%
1.99
%10
.12%
10.0
9%4.
87%
1.64
%9.
23%
2.90
%1.
57%
Ash
okn
agar
32.3
4%1.
83%
13.5
0%
13.2
7%5.
88%
8.70
%8.
91%
2.38
%0
.31%
9.81
%1.
97%
1.0
9%
Bala
gha
t28
.11%
2.0
8%6.
81%
15.1
7%7.
12%
9.62
%9 .
04%
2.22
%3.
06%
8.77
%5.
37%
2.63
%
Barw
ani
22.9
1%2.
05%
8.55
%19
.41%
8.41
%9.
81%
10.8
2%1.
53%
1.0
6%7.
27%
4.29
%3.
89%
Betu
l33
.02%
0.0
0%
5.10
%17
.35%
9.53
%8.
75%
8.0
7%0
.00
%0
.00
%8.
07%
5.16
%4.
96%
Bhin
d36
.40
%2.
09%
13.8
9%8.
92%
7.52
%9.
55%
8.89
%0
.89%
1.24
%7.
44%
1.84
%1.
32%
Bho
pal
31.9
1%2.
05%
10.9
0%
20.4
8%14
.65%
4.0
6%6.
74%
2.0
5%0
.20
%3.
30%
2.0
6%1.
59%
Burh
anp
ur28
.75%
1.91
%10
.62%
20.5
8%10
.34%
5.83
%7.
89%
1.42
%0
.64%
6.43
%3.
00
%2.
59%
Chh
atar
pur
29.8
7%4.
18%
10.7
4%8.
57%
10.4
3%8.
38%
8.94
%5.
15%
1.24
%8.
14%
1.71
%2.
65%
Chh
ind
war
a28
.78%
3.36
%7.
91%
17.3
7%5.
84%
8.39
%10
.71%
1.79
%0
.87%
7.90
%3.
93%
3.15
%
Dam
oh
35.8
3%2.
45%
11.8
7%6.
88%
2.56
%9.
67%
8.58
%6.
55%
1.76
%8.
45%
1.58
%3.
81%
Dat
ia30
.95%
1.55
%9.
48%
18.1
1%6.
35%
7.33
%8.
68%
2.20
%0
.14%
8.39
%3.
73%
3.0
8%
Dew
as29
.79%
3.72
%11
.28%
18.0
1%6.
55%
8.11
%8.
04%
3.60
%0
.37%
7.31
%2.
00
%1.
22%
Dha
r37
.94%
4.51
%13
.03%
17.9
6%0
.00
%7.
12%
8.50
%2.
19%
0.0
6%4.
44%
1.31
%2.
94%
Din
do
ri20
.59%
0.0
0%
9.61
%20
.59%
4.12
%8.
63%
8.63
%1.
18%
5.10
%8.
63%
8.63
%4.
31%
East
Nim
ar30
.30
%2.
29%
9.85
%26
.95%
10.7
2%3.
99%
6.57
%1.
43%
0.2
1%3.
56%
3.25
%0
.87%
Gun
a34
.86%
2.93
%12
.73%
16.7
6%7.
62%
6.33
%8.
61%
1.10
%0
.19%
6.77
%0
.84%
1.26
%
(CONTD.) DISTrICT-WISe: INDICATor CoNTrIBUTIoN To The MpI SCore (UrBAN)(CONTD.) DISTrICT-WISe: INDICATor CoNTrIBUTIoN To The MpI SCore (UrBAN)
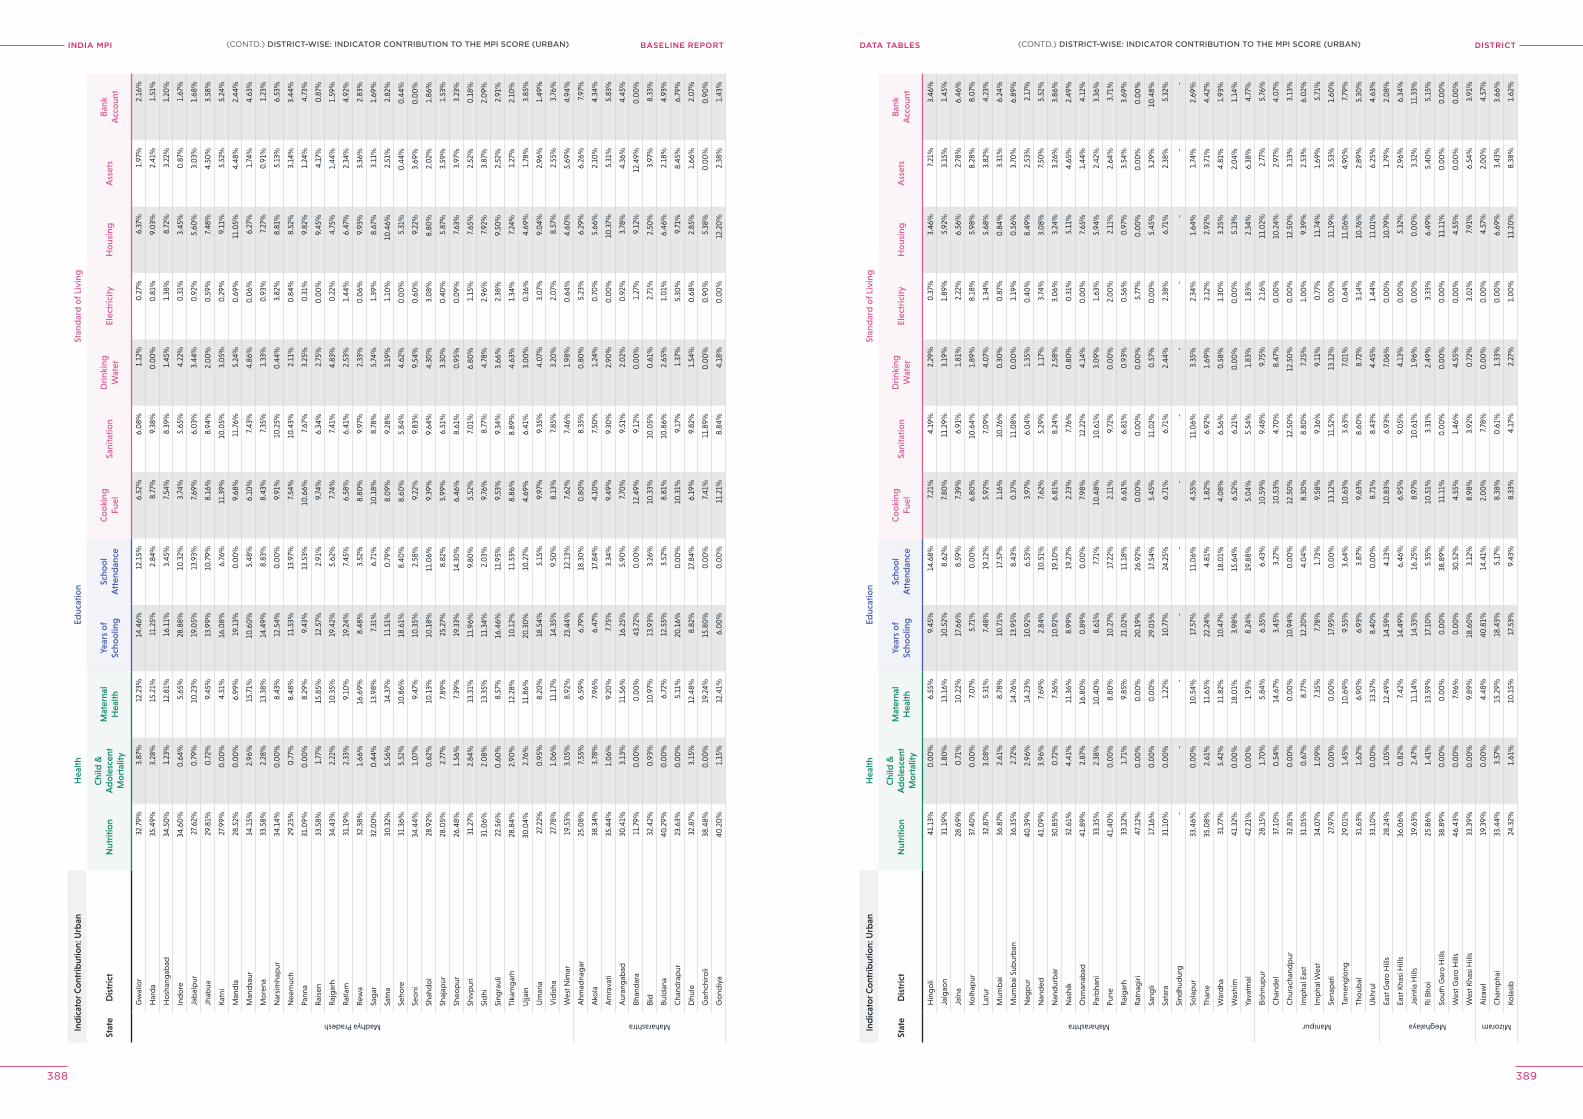
INDIA MPI BASELINE REPORT DISTrICTDATA TABleS
388 389
Ind
icat
or C
ont
rib
utio
n: U
rban
Hea
lthEd
ucat
ion
Stan
dar
d o
f Liv
ing
Stat
eD
istr
ict
Nut
ritio
nC
hild
&
Ad
ole
scen
t M
ort
ality
Mat
erna
l H
ealth
Year
s o
f Sc
hoo
ling
Scho
ol
Att
end
ance
Co
oki
ng
Fuel
Sani
tatio
nD
rink
ing
Wat
erEl
ectr
icity
Ho
usin
gA
sset
sB
ank
Acc
oun
t
Madhya Pradesh
Gw
alio
r32
.79%
3.87
%12
.23%
14.4
6%12
.15%
6.52
%6.
08%
1.12
%0
.27%
6.37
%1.
97%
2.16
%
Har
da
35.4
9%3.
28%
15.2
1%11
.25%
2.84
%8.
77%
9.38
%0
.00
%0
.81%
9.0
3%2.
41%
1.51
%
Ho
shan
gab
ad34
.50
%1.
23%
12.8
1%16
.11%
3.45
%7.
54%
8.39
%1.
45%
1.38
%8.
72%
3.22
%1.
20%
Ind
ore
34.6
0%
0.6
4%5.
65%
28.8
8%10
.32%
3.74
%5.
65%
4.22
%0
.31%
3.45
%0
.87%
1.67
%
Jab
alp
ur27
.62%
0.7
9%10
.23%
19.0
5%13
.93%
7.69
%6.
03%
3.44
%0
.92%
5.60
%3.
03%
1.68
%
Jhab
ua29
.81%
0.7
2%9.
45%
13.9
9%10
.79%
8.16
%8.
94%
2.0
0%
0.5
9%7.
48%
4.50
%3.
58%
Katn
i27
.99%
0.0
0%
4.51
%16
.08%
6.76
%11
.39%
10.0
5%3.
05%
0.2
9%9.
11%
5.52
%5.
24%
Man
dla
28.5
2%0
.00
%6.
99%
19.1
3%0
.00
%9.
68%
11.7
6%5.
24%
0.6
9%11
.05%
4.48
%2.
44%
Man
dsa
ur34
.15%
2.96
%15
.71%
10.6
0%
5.48
%6.
10%
7.43
%4.
86%
0.0
6%6.
27%
1.74
%4.
63%
Mo
rena
33.5
8%2.
28%
13.3
8%14
.49%
8.83
%8.
43%
7.35
%1.
33%
0.9
3%7.
27%
0.9
1%1.
23%
Nar
sim
hap
ur34
.14%
0.0
0%
8.43
%12
.54%
0.0
0%
9.91
%10
.25%
0.4
4%3.
82%
8.81
%5.
13%
6.53
%
Nee
muc
h29
.25%
0.7
7%8.
48%
11.5
3%13
.97%
7.54
%10
.43%
2.11
%0
.84%
8.52
%3.
14%
3.44
%
Pann
a31
.09%
0.0
0%
8.29
%9.
43%
13.5
3%10
.66%
7.67
%3.
25%
0.3
1%9.
82%
1.24
%4.
73%
Rai
sen
33.5
8%1.
77%
15.8
5%12
.57%
2.91
%9.
74%
6.34
%2.
75%
0.0
0%
9.45
%4.
17%
0.8
7%
Raj
gar
h34
.43%
2.22
%10
.35%
19.4
2%5.
62%
7.74
%7.
41%
4.83
%0
.22%
4.75
%1.
44%
1.59
%
Rat
lam
31.1
9%2.
33%
9.10
%19
.24%
7.45
%6.
58%
6.41
%2.
53%
1.44
%6.
47%
2.34
%4.
92%
Rew
a32
.38%
1.66
%16
.69%
8.48
%3.
52%
8.80
%9.
97%
2.33
%0
.06%
9.93
%3.
36%
2.83
%
Sag
ar32
.00
%0
.44%
13.9
8%7.
31%
6.71
%10
.18%
8.78
%5.
74%
1.39
%8.
67%
3.11
%1.
69%
Satn
a30
.32%
5.56
%14
.37%
11.5
1%0
.79%
8.0
9%9.
28%
3.19
%1.
10%
10.4
6%2.
51%
2.82
%
Seho
re31
.36%
5.52
%10
.86%
18.6
1%8.
40%
8.60
%5.
84%
4.62
%0
.00
%5.
31%
0.4
4%0
.44%
Seo
ni34
.44%
1.0
7%9.
47%
10.3
5%2.
58%
9.22
%9.
83%
9.54
%0
.60
%9.
22%
3.69
%0
.00
%
Shah
do
l28
.92%
0.6
2%10
.13%
10.1
8%11
.06%
9.39
%9.
64%
4.30
%3.
08%
8.80
%2.
02%
1.86
%
Shaj
apur
28.0
5%2.
77%
7.89
%25
.27%
8.82
%5.
99%
6.51
%3.
30%
0.4
0%
5.87
%3.
59%
1.53
%
Sheo
pur
26.4
8%1.
56%
7.39
%19
.33%
14.3
0%
6.46
%8.
61%
0.9
5%0
.09%
7.63
%3.
97%
3.23
%
Shiv
pur
i31
.27%
2.84
%13
.31%
11.9
6%9.
80%
5.52
%7.
01%
6.80
%1.
15%
7.65
%2.
52%
0.1
8%
Sid
hi31
.06%
2.0
8%13
.35%
11.3
4%2.
03%
9.76
%8.
77%
4.78
%2.
96%
7.92
%3.
87%
2.0
9%
Sing
raul
i22
.56%
0.6
0%
8.57
%16
.46%
11.9
5%9.
53%
9.34
%3.
66%
2.38
%9.
50%
2.52
%2.
91%
Tika
mg
arh
28.8
4%2.
90%
12.2
8%10
.12%
11.5
3%8.
86%
8.89
%4.
63%
1.34
%7.
24%
1.27
%2.
10%
Ujja
in30
.04%
2.76
%11
.86%
20.3
0%
10.2
7%4.
69%
6.41
%3.
00
%0
.36%
4.69
%1.
78%
3.85
%
Um
aria
27.2
2%0
.95%
8.20
%18
.54%
5.15
%9.
97%
9.35
%4.
07%
3.0
7%9.
04%
2.96
%1.
49%
Vid
isha
27.7
8%1.
06%
11.1
7%14
.35%
9.50
%8.
13%
7.85
%3.
20%
2.0
7%8.
57%
2.55
%3.
76%
Wes
t Nim
ar19
.53%
3.0
5%8.
92%
23.4
4%12
.13%
7.62
%7.
46%
1.98
%0
.64%
4.60
%5.
69%
4.94
%
Maharashtra
Ahm
adna
gar
25.0
8%7.
55%
6.59
%6.
79%
18.3
0%
0.8
0%
8.35
%0
.80
%5.
23%
6.29
%6.
26%
7.97
%
Ako
la38
.34%
3.78
%7.
96%
6.47
%17
.84%
4.10
%7.
50%
1.24
%0
.70
%5.
66%
2.10
%4.
34%
Am
rava
ti35
.44%
1.0
6%9.
20%
7.75
%3.
34%
9.49
%9.
30%
2.90
%0
.00
%10
.37%
5.31
%5.
83%
Aur
ang
abad
30.4
1%3.
13%
11.5
6%16
.25%
5.90
%7.
70%
9.51
%2.
02%
0.9
2%3.
78%
4.36
%4.
45%
Bhan
dar
a11
.79%
0.0
0%
0.0
0%
43.7
2%0
.00
%12
.49%
9.12
%0
.00
%1.
27%
9.12
%12
.49%
0.0
0%
Bid
32.4
2%0
.93%
10.9
7%13
.93%
3.26
%10
.33%
10.0
5%0
.61%
2.71
%2.
50%
3.97
%8.
33%
Buld
ana
40.2
9%0
.00
%6.
72%
12.5
5%3.
52%
8.81
%10
.86%
2.65
%1.
01%
6.46
%2.
18%
4.93
%
Cha
ndra
pur
23.6
3%0
.00
%5.
11%
20.1
6%0
.00
%10
.31%
9.17
%1.
37%
5.30
%9.
71%
8.45
%6.
79%
Dhu
le32
.87%
3.15
%12
.48%
8.82
%17
.84%
6.19
%9.
82%
1.54
%0
.68%
2.85
%1.
66%
2.0
7%
Gar
hchi
roli
38.4
8%0
.00
%19
.24%
15.8
0%
0.0
0%
7.41
%11
.89%
0.0
0%
0.9
0%
5.38
%0
.00
%0
.90
%
Go
ndiy
a40
.20
%1.
15%
12.4
1%6.
00
%0
.00
%11
.21%
8.84
%4.
18%
0.0
0%
12.2
0%
2.38
%1.
43%
Ind
icat
or C
ont
rib
utio
n: U
rban
Hea
lthEd
ucat
ion
Stan
dar
d o
f Liv
ing
Stat
eD
istr
ict
Nut
ritio
nC
hild
&
Ad
ole
scen
t M
ort
ality
Mat
erna
l H
ealth
Year
s o
f Sc
hoo
ling
Scho
ol
Att
end
ance
Co
oki
ng
Fuel
Sani
tatio
nD
rink
ing
Wat
erEl
ectr
icity
Ho
usin
gA
sset
sB
ank
Acc
oun
t
Maharashtra
Hin
go
li41
.13%
0.0
0%
6.55
%9.
45%
14.6
8%7.
21%
4.19
%2.
29%
0.3
7%3.
46%
7.21
%3.
46%
Jalg
aon
31.1
9%1.
80%
13.1
6%10
.52%
8.62
%7.
80%
11.2
9%3.
19%
1.89
%5.
92%
3.15
%1.
45%
Jaln
a28
.69%
0.7
1%10
.22%
17.6
6%8.
59%
7.39
%6.
91%
1.81
%2.
22%
6.56
%2.
78%
6.46
%
Kolh
apur
37.4
0%
0.0
0%
7.0
7%5.
71%
0.0
0%
6.80
%10
.64%
1.89
%8.
18%
5.98
%8.
28%
8.0
7%
Latu
r32
.87%
3.0
8%5.
31%
7.48
%19
.12%
5.92
%7.
09%
4.0
7%1.
34%
5.68
%3.
82%
4.23
%
Mum
bai
36.8
7%2.
61%
8.78
%10
.71%
17.5
7%1.
16%
10.7
6%0
.30
%0
.87%
0.8
4%3.
31%
6.24
%
Mum
bai
Sub
urb
an36
.35%
2.72
%14
.76%
13.9
5%8.
43%
0.3
7%11
.08%
0.0
0%
1.19
%0
.56%
3.70
%6.
89%
Nag
pur
40.3
9%2.
96%
14.2
3%10
.92%
6.53
%3.
97%
6.0
4%1.
35%
0.4
0%
8.49
%2.
53%
2.17
%
Nan
ded
41.0
9%3.
96%
7.69
%2.
84%
10.5
1%7.
62%
5.29
%1.
17%
3.74
%3.
08%
7.50
%5.
52%
Nan
dur
bar
30.8
5%0
.72%
7.36
%10
.92%
19.1
0%
6.81
%8.
24%
2.58
%3.
06%
3.24
%3.
26%
3.86
%
Nas
hik
32.6
1%4.
41%
11.3
6%8.
99%
19.2
7%2.
23%
7.76
%0
.80
%0
.31%
5.11
%4.
65%
2.49
%
Osm
anab
ad41
.89%
2.87
%16
.80
%0
.89%
0.0
0%
7.98
%12
.22%
4.14
%0
.00
%7.
65%
1.44
%4.
12%
Parb
hani
33.3
5%2.
38%
10.4
0%
8.61
%7.
71%
10.4
8%10
.61%
3.0
9%1.
63%
5.94
%2.
42%
3.36
%
Pune
41.4
0%
0.0
0%
8.80
%10
.27%
17.2
2%2.
11%
9.72
%0
.00
%2.
00
%2.
11%
2.64
%3.
71%
Rai
gar
h33
.12%
1.71
%9.
85%
21.0
2%11
.18%
6.61
%6.
81%
0.9
3%0
.56%
0.9
7%3.
54%
3.69
%
Rat
nag
iri47
.12%
0.0
0%
0.0
0%
20.1
9%26
.92%
0.0
0%
0.0
0%
0.0
0%
5.77
%0
.00
%0
.00
%0
.00
%
Sang
li17
.16%
0.0
0%
0.0
0%
29.0
5%17
.54%
5.45
%11
.02%
0.5
7%0
.00
%5.
45%
3.29
%10
.48%
Sata
ra31
.10
%0
.00
%1.
22%
10.7
7%24
.25%
6.71
%6.
71%
2.44
%2.
38%
6.71
%2.
38%
5.32
%
Sind
hud
urg
--
--
--
--
--
--
Sola
pur
33.4
6%0
.00
%10
.54%
17.5
7%11
.06%
4.55
%11
.06%
3.35
%2.
34%
1.64
%1.
74%
2.69
%
Than
e35
.08%
2.61
%11
.65%
22.2
4%4.
81%
1.82
%6.
92%
1.69
%2.
12%
2.92
%3.
71%
4.42
%
War
dha
31.7
7%5.
42%
11.8
2%10
.47%
18.0
1%4.
08%
6.56
%0
.58%
1.30
%3.
25%
4.81
%1.
93%
Was
him
41.3
2%0
.00
%18
.01%
3.98
%15
.64%
6.52
%6.
21%
0.0
0%
0.0
0%
5.13
%2.
04%
1.14
%
Yava
tmal
42.2
1%0
.00
%1.
93%
8.24
%19
.88%
5.0
4%5.
54%
1.83
%1.
83%
2.34
%6.
38%
4.77
%
Manipur
Bish
nup
ur28
.15%
1.70
%5.
84%
6.35
%6.
43%
10.5
9%9.
48%
9.75
%2.
16%
11.0
2%2.
77%
5.76
%
Cha
ndel
37.1
0%
0.5
4%14
.67%
3.45
%3.
27%
10.5
3%4.
70%
8.47
%0
.00
%10
.24%
2.97
%4.
07%
Chu
rach
and
pur
32.8
1%0
.00
%0
.00
%10
.94%
0.0
0%
12.5
0%
12.5
0%
12.5
0%
0.0
0%
12.5
0%
3.13
%3.
13%
Imp
hal E
ast
31.0
5%0
.67%
8.77
%12
.20
%4.
04%
8.30
%8.
80%
7.25
%1.
00
%9.
39%
2.53
%6.
02%
Imp
hal W
est
34.0
7%1.
09%
7.35
%7.
78%
1.73
%9.
58%
9.36
%9.
11%
0.7
7%11
.74%
1.69
%5.
71%
Sena
pat
i27
.97%
0.0
0%
0.0
0%
17.9
5%0
.00
%13
.12%
11.5
2%13
.12%
0.0
0%
11.1
9%3.
53%
1.60
%
Tam
eng
long
29.0
1%1.
45%
10.6
9%9.
55%
3.64
%10
.63%
3.63
%7.
01%
0.6
4%11
.06%
4.90
%7.
79%
Tho
ubal
31.6
3%1.
62%
6.90
%6.
93%
3.87
%9.
63%
8.60
%8.
72%
3.14
%10
.76%
2.89
%5.
30%
Ukh
rul
33.1
0%
0.0
0%
13.5
7%8.
40%
0.0
0%
8.71
%8.
43%
4.45
%1.
44%
11.0
1%6.
25%
4.63
%
Meghalaya
East
Gar
o H
ills
28.2
4%1.
05%
12.4
9%14
.59%
4.13
%10
.83%
6.93
%7.
06%
0.0
0%
10.7
9%1.
79%
2.0
8%
East
Kha
si H
ills
36.0
6%0
.82%
7.42
%14
.49%
6.46
%6.
95%
9.0
5%4.
13%
0.0
0%
5.32
%2.
96%
6.34
%
Jain
tia H
ills
19.6
3%2.
47%
11.1
4%14
.33%
16.2
5%8.
97%
10.6
1%1.
96%
0.0
0%
0.0
0%
3.32
%11
.33%
Ri B
hoi
25.8
6%1.
41%
13.5
9%17
.10
%5.
35%
10.5
1%3.
31%
2.49
%3.
33%
6.49
%5.
40%
5.15
%
Sout
h G
aro
Hill
s38
.89%
0.0
0%
0.0
0%
0.0
0%
38.8
9%11
.11%
0.0
0%
0.0
0%
0.0
0%
11.1
1%0
.00
%0
.00
%
Wes
t Gar
o H
ills
46.4
3%0
.00
%7.
96%
0.0
0%
30.5
2%4.
55%
1.46
%4.
55%
0.0
0%
4.55
%0
.00
%0
.00
%
Wes
t Kha
si H
ills
33.3
9%0
.00
%9.
89%
18.6
0%
3.12
%8.
98%
3.92
%0
.72%
3.0
2%7.
91%
6.54
%3.
91%
Mizoram
Aiz
awl
19.3
9%0
.00
%4.
48%
40.8
1%14
.41%
2.0
0%
7.78
%0
.00
%0
.00
%4.
57%
2.0
0%
4.57
%
Cha
mp
hai
33.4
4%3.
57%
15.2
9%18
.43%
5.17
%8.
38%
0.6
1%1.
33%
0.0
0%
6.69
%3.
43%
3.66
%
Kola
sib
24.3
2%1.
61%
10.1
5%17
.53%
9.43
%8.
33%
4.17
%2.
27%
1.0
0%
11.2
0%
8.38
%1.
62%
(CONTD.) DISTrICT-WISe: INDICATor CoNTrIBUTIoN To The MpI SCore (UrBAN)(CONTD.) DISTrICT-WISe: INDICATor CoNTrIBUTIoN To The MpI SCore (UrBAN)
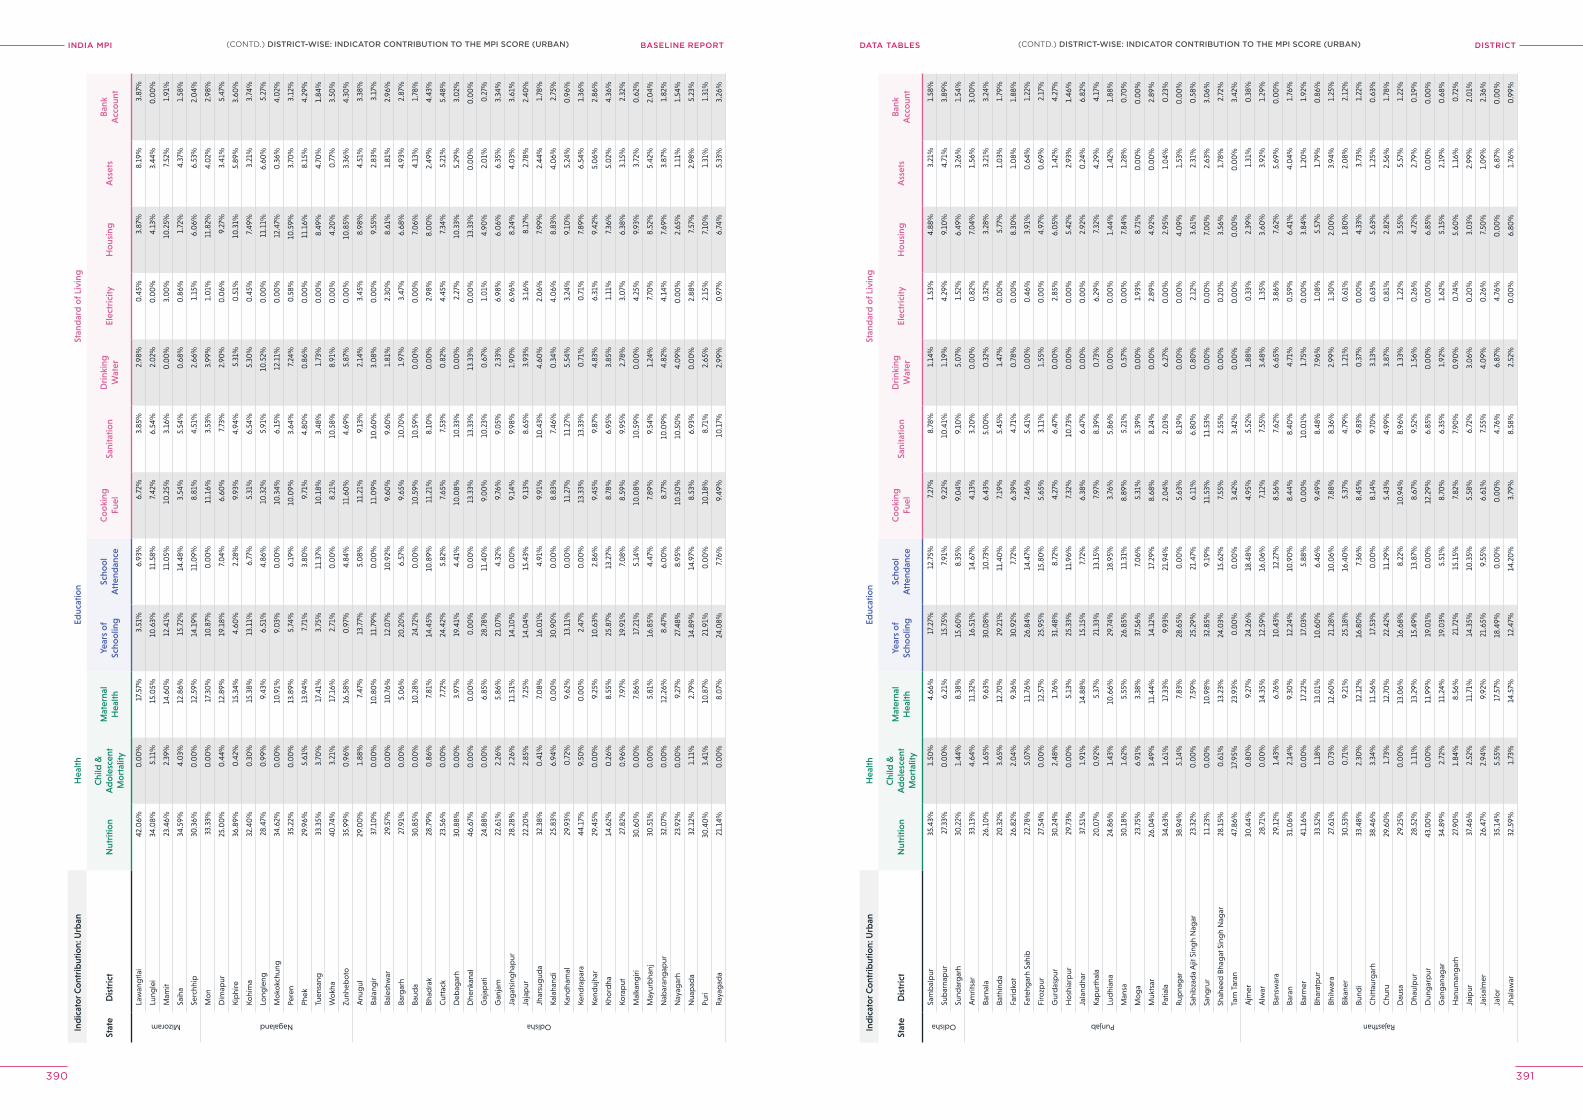
INDIA MPI BASELINE REPORT DISTrICTDATA TABleS
390 391
Ind
icat
or C
ont
rib
utio
n: U
rban
Hea
lthEd
ucat
ion
Stan
dar
d o
f Liv
ing
Stat
eD
istr
ict
Nut
ritio
nC
hild
&
Ad
ole
scen
t M
ort
ality
Mat
erna
l H
ealth
Year
s o
f Sc
hoo
ling
Scho
ol
Att
end
ance
Co
oki
ng
Fuel
Sani
tatio
nD
rink
ing
Wat
erEl
ectr
icity
Ho
usin
gA
sset
sB
ank
Acc
oun
t
Mizoram
Law
ang
tlai
42.0
6%0
.00
%17
.57%
3.51
%6.
93%
6.72
%3.
85%
2.98
%0
.45%
3.87
%8.
19%
3.87
%
Lung
lei
34.0
8%5.
11%
15.0
5%10
.63%
11.5
8%7.
42%
6.54
%2.
02%
0.0
0%
4.13
%3.
44%
0.0
0%
Mam
it23
.46%
2.39
%14
.60
%12
.41%
11.0
5%10
.25%
3.16
%0
.00
%3.
00
%10
.25%
7.52
%1.
91%
Saih
a34
.59%
4.0
3%12
.86%
15.7
2%14
.48%
3.54
%5.
54%
0.6
8%0
.86%
1.72
%4.
37%
1.58
%
Serc
hhip
30.3
6%0
.00
%12
.59%
14.1
9%11
.09%
8.81
%4.
51%
2.66
%1.
15%
6.0
6%6.
53%
2.0
4%
Nagaland
Mo
n33
.33%
0.0
0%
17.3
0%
10.8
7%0
.00
%11
.16%
3.53
%3.
99%
1.0
1%11
.82%
4.0
2%2.
98%
Dim
apur
25.0
0%
0.4
4%12
.89%
19.1
8%7.
04%
6.60
%7.
73%
2.90
%0
.06%
9.27
%3.
41%
5.47
%
Kip
hire
36.8
9%0
.42%
15.3
4%4.
60%
2.28
%9.
93%
4.94
%5.
31%
0.5
1%10
.31%
5.89
%3.
60%
Kohi
ma
32.4
0%
0.3
0%
15.3
8%13
.11%
6.77
%5.
31%
6.54
%5.
30%
0.4
5%7.
49%
3.21
%3.
74%
Long
leng
28.4
7%0
.99%
9.43
%6.
51%
4.86
%10
.32%
5.91
%10
.52%
0.0
0%
11.1
1%6.
60%
5.27
%
Mo
kokc
hung
34.6
2%0
.00
%10
.91%
9.0
3%0
.00
%10
.34%
6.15
%12
.11%
0.0
0%
12.4
7%0
.36%
4.0
2%
Pere
n35
.22%
0.0
0%
13.8
9%5.
74%
6.19
%10
.09%
3.64
%7.
24%
0.5
8%10
.59%
3.70
%3.
12%
Phek
29.9
6%5.
61%
13.9
4%7.
71%
3.80
%9.
71%
4.80
%0
.86%
0.0
0%
11.1
6%8.
15%
4.29
%
Tuen
sang
33.3
5%3.
70%
17.4
1%3.
75%
11.3
7%10
.18%
3.48
%1.
73%
0.0
0%
8.49
%4.
70%
1.84
%
Wo
kha
40.7
4%3.
21%
17.1
6%2.
71%
0.0
0%
8.21
%10
.58%
8.91
%0
.00
%4.
20%
0.7
7%3.
50%
Zunh
ebo
to35
.99%
0.9
6%16
.58%
0.9
7%4.
84%
11.6
0%
4.69
%5.
87%
0.0
0%
10.8
5%3.
36%
4.30
%
Odisha
Anu
gul
29.0
0%
1.88
%7.
47%
13.7
7%5.
08%
11.2
1%9.
13%
2.14
%3.
45%
8.98
%4.
51%
3.38
%
Bala
ngir
37.1
0%
0.0
0%
10.8
0%
11.7
9%0
.00
%11
.09%
10.6
0%
3.0
8%0
.00
%9.
55%
2.83
%3.
17%
Bale
shw
ar29
.57%
0.0
0%
10.7
6%12
.07%
10.9
2%9.
60%
9.60
%1.
81%
2.30
%8.
61%
1.81
%2.
96%
Barg
arh
27.9
1%0
.00
%5.
06%
20.2
0%
6.57
%9.
65%
10.7
0%
1.97
%3.
47%
6.68
%4.
93%
2.87
%
Baud
a30
.85%
0.0
0%
10.2
8%24
.72%
0.0
0%
10.5
9%10
.59%
0.0
0%
0.0
0%
7.0
6%4.
13%
1.78
%
Bhad
rak
28.7
9%0
.86%
7.81
%14
.45%
10.8
9%11
.21%
8.10
%0
.00
%2.
98%
8.0
0%
2.49
%4.
43%
Cut
tack
23.5
6%0
.00
%7.
72%
24.4
2%5.
82%
7.65
%7.
53%
0.8
2%4.
45%
7.34
%5.
21%
5.48
%
Deb
agar
h30
.88%
0.0
0%
3.97
%19
.41%
4.41
%10
.08%
10.3
3%0
.00
%2.
27%
10.3
3%5.
29%
3.0
2%
Dhe
nkan
al46
.67%
0.0
0%
0.0
0%
0.0
0%
0.0
0%
13.3
3%13
.33%
13.3
3%0
.00
%13
.33%
0.0
0%
0.0
0%
Gaj
apat
i24
.88%
0.0
0%
6.85
%28
.78%
11.4
0%
9.0
0%
10.2
3%0
.67%
1.0
1%4.
90%
2.0
1%0
.27%
Gan
jam
22.6
1%2.
26%
5.86
%21
.07%
4.32
%9.
76%
9.0
5%2.
33%
6.98
%6.
06%
6.35
%3.
34%
Jag
atsi
ngha
pur
28.2
8%2.
26%
11.5
1%14
.10
%0
.00
%9.
14%
9.98
%1.
90%
6.96
%8.
24%
4.0
3%3.
61%
Jaja
pur
22.2
0%
2.85
%7.
25%
14.0
4%15
.43%
9.13
%8.
65%
3.93
%3.
16%
8.17
%2.
78%
2.40
%
Jhar
sug
uda
32.3
8%0
.41%
7.0
8%16
.01%
4.91
%9.
91%
10.4
3%4.
60%
2.0
6%7.
99%
2.44
%1.
78%
Kala
hand
i25
.83%
6.94
%0
.00
%30
.90
%0
.00
%8.
83%
7.46
%0
.34%
4.0
6%8.
83%
4.0
6%2.
75%
Kand
ham
al29
.93%
0.7
2%9.
62%
13.1
1%0
.00
%11
.27%
11.2
7%5.
54%
3.24
%9.
10%
5.24
%0
.96%
Kend
rap
ara
44.1
7%9.
50%
0.0
0%
2.47
%0
.00
%13
.33%
13.3
3%0
.71%
0.7
1%7.
89%
6.54
%1.
36%
Kend
ujha
r29
.45%
0.0
0%
9.25
%10
.63%
2.86
%9.
45%
9.87
%4.
83%
6.31
%9.
42%
5.0
6%2.
86%
Kho
rdha
14.6
2%0
.26%
8.55
%25
.87%
13.2
7%8.
78%
6.95
%3.
85%
1.11
%7.
36%
5.0
2%4.
36%
Kora
put
27.8
2%0
.96%
7.97
%19
.91%
7.0
8%8.
59%
9.95
%2.
78%
3.0
7%6.
38%
3.15
%2.
32%
Mal
kang
iri30
.60
%0
.00
%7.
86%
17.2
1%5.
14%
10.0
8%10
.59%
0.0
0%
4.25
%9.
93%
3.72
%0
.62%
May
urb
hanj
30.5
1%0
.00
%5.
81%
16.8
5%4.
47%
7.89
%9.
54%
1.24
%7.
70%
8.52
%5.
42%
2.0
4%
Nab
aran
gap
ur32
.07%
0.0
0%
12.2
6%8.
47%
6.0
0%
8.77
%10
.09%
4.82
%4.
14%
7.69
%3.
87%
1.82
%
Nay
agar
h23
.92%
0.0
0%
9.27
%27
.48%
8.95
%10
.50
%10
.50
%4.
09%
0.0
0%
2.65
%1.
11%
1.54
%
Nua
pad
a32
.12%
1.11
%2.
79%
14.8
9%14
.97%
8.53
%6.
93%
0.0
0%
2.88
%7.
57%
2.98
%5.
23%
Puri
30.4
0%
3.41
%10
.87%
21.9
1%0
.00
%10
.18%
8.71
%2.
65%
2.15
%7.
10%
1.31
%1.
31%
Ray
agad
a21
.14%
0.0
0%
8.0
7%24
.08%
7.76
%9.
49%
10.1
7%2.
99%
0.9
7%6.
74%
5.33
%3.
26%
Ind
icat
or C
ont
rib
utio
n: U
rban
Hea
lthEd
ucat
ion
Stan
dar
d o
f Liv
ing
Stat
eD
istr
ict
Nut
ritio
nC
hild
&
Ad
ole
scen
t M
ort
ality
Mat
erna
l H
ealth
Year
s o
f Sc
hoo
ling
Scho
ol
Att
end
ance
Co
oki
ng
Fuel
Sani
tatio
nD
rink
ing
Wat
erEl
ectr
icity
Ho
usin
gA
sset
sB
ank
Acc
oun
t
Odisha
Sam
bal
pur
35.4
3%1.
50%
4.66
%17
.27%
12.7
5%7.
27%
8.78
%1.
14%
1.53
%4.
88%
3.21
%1.
58%
Sub
arna
pur
27.3
3%0
.00
%6.
21%
15.7
5%7.
91%
9.22
%10
.41%
1.19
%4.
29%
9.10
%4.
71%
3.89
%
Sund
arg
arh
30.2
2%1.
44%
8.38
%15
.60
%8.
35%
9.0
4%9.
10%
5.0
7%1.
52%
6.49
%3.
26%
1.54
%
Punjab
Am
ritsa
r33
.13%
4.64
%11
.32%
16.5
1%14
.67%
4.13
%3.
20%
0.0
0%
0.8
2%7.
04%
1.56
%3.
00
%
Barn
ala
26.1
0%
1.65
%9.
63%
30.0
8%10
.73%
6.43
%5.
00
%0
.32%
0.3
2%3.
28%
3.21
%3.
24%
Bath
ind
a20
.32%
3.65
%12
.70
%29
.21%
11.4
0%
7.19
%5.
45%
1.47
%0
.00
%5.
77%
1.0
3%1.
79%
Farid
kot
26.8
2%2.
04%
9.36
%30
.92%
7.72
%6.
39%
4.71
%0
.78%
0.0
0%
8.30
%1.
08%
1.88
%
Fate
hgar
h Sa
hib
22.7
8%5.
07%
11.7
6%26
.84%
14.4
7%7.
46%
5.41
%0
.00
%0
.46%
3.91
%0
.64%
1.22
%
Firo
zpur
27.5
4%0
.00
%12
.57%
25.9
5%15
.80
%5.
65%
3.11
%1.
55%
0.0
0%
4.97
%0
.69%
2.17
%
Gur
das
pur
30.2
4%2.
48%
1.76
%31
.48%
8.72
%4.
27%
6.47
%0
.00
%2.
85%
6.0
5%1.
42%
4.27
%
Ho
shia
rpur
29.7
3%0
.00
%5.
13%
25.3
3%11
.96%
7.32
%10
.73%
0.0
0%
0.0
0%
5.42
%2.
93%
1.46
%
Jala
ndha
r37
.51%
1.91
%14
.88%
15.1
5%7.
72%
6.38
%6.
47%
0.0
0%
0.0
0%
2.92
%0
.24%
6.82
%
Kap
urth
ala
20.0
7%0
.92%
5.37
%21
.33%
13.1
5%7.
97%
8.39
%0
.73%
6.29
%7.
32%
4.29
%4.
17%
Lud
hian
a24
.86%
1.43
%10
.66%
29.7
4%18
.95%
3.76
%5.
86%
0.0
0%
0.0
0%
1.44
%1.
42%
1.88
%
Man
sa30
.18%
1.62
%5.
55%
26.8
5%11
.31%
8.89
%5.
21%
0.5
7%0
.00
%7.
84%
1.28
%0
.70
%
Mo
ga
23.7
5%6.
91%
3.38
%37
.56%
7.0
6%5.
31%
5.39
%0
.00
%1.
93%
8.71
%0
.00
%0
.00
%
Muk
tsar
26.0
4%3.
49%
11.4
4%14
.12%
17.2
9%8.
68%
8.24
%0
.00
%2.
89%
4.92
%0
.00
%2.
89%
Patia
la34
.63%
1.61
%17
.33%
9.93
%21
.94%
2.0
4%2.
03%
6.27
%0
.00
%2.
95%
1.0
4%0
.23%
Rup
nag
ar38
.94%
5.14
%7.
83%
28.6
5%0
.00
%5.
63%
8.19
%0
.00
%0
.00
%4.
09%
1.53
%0
.00
%
Sahi
bza
da
Ajit
Sin
gh
Nag
ar23
.32%
0.0
0%
7.59
%25
.29%
21.4
7%6.
11%
6.80
%0
.80
%2.
12%
3.61
%2.
31%
0.5
8%
Sang
rur
11.2
3%0
.00
%10
.98%
32.8
5%9.
19%
11.5
3%11
.53%
0.0
0%
0.0
0%
7.0
0%
2.63
%3.
06%
Shah
eed
Bha
gat
Sin
gh
Nag
ar28
.15%
0.6
1%13
.23%
24.0
3%15
.62%
7.55
%2.
55%
0.0
0%
0.2
0%
3.56
%1.
78%
2.72
%
Tarn
Tar
an47
.86%
17.9
5%23
.93%
0.0
0%
0.0
0%
3.42
%3.
42%
0.0
0%
0.0
0%
0.0
0%
0.0
0%
3.42
%
Rajasthan
Ajm
er30
.44%
0.8
0%
9.27
%24
.26%
18.4
8%4.
95%
5.52
%1.
88%
0.3
3%2.
39%
1.31
%0
.38%
Alw
ar28
.71%
0.0
0%
14.3
5%12
.59%
16.0
6%7.
12%
7.55
%3.
48%
1.35
%3.
60%
3.92
%1.
29%
Bans
war
a29
.12%
1.43
%6.
76%
10.4
3%12
.27%
8.56
%7.
62%
6.65
%3.
86%
7.62
%5.
69%
0.0
0%
Bara
n31
.06%
2.14
%9.
30%
12.2
4%10
.90
%8.
44%
8.40
%4.
71%
0.5
9%6.
41%
4.0
4%1.
76%
Barm
er41
.16%
0.0
0%
17.2
2%17
.03%
5.88
%0
.00
%10
.01%
1.75
%0
.00
%3.
84%
1.20
%1.
92%
Bhar
atp
ur33
.52%
1.18
%13
.01%
10.6
0%
6.46
%9.
49%
8.48
%7 .
96%
1.0
8%5.
57%
1.79
%0
.86%
Bhilw
ara
27.6
1%0
.73%
12.6
0%
21.2
8%10
.06%
7.88
%8.
36%
2.99
%1.
30%
2.0
0%
3.94
%1.
25%
Bika
ner
30.5
3%0
.71%
9.21
%25
.18%
16.4
0%
5.37
%4.
79%
1.21
%0
.61%
1.80
%2.
08%
2.12
%
Bund
i33
.48%
2.30
%12
.12%
16.8
0%
7.36
%8.
45%
9.83
%0
.37%
0.0
0%
4.33
%3.
73%
1.22
%
Chi
ttau
rgar
h38
.46%
3.34
%11
.56%
17.5
3%0
.00
%8.
14%
9.70
%3.
13%
0.6
3%5.
63%
1.25
%0
.63%
Chu
ru29
.60
%1.
73%
12.7
0%
22.4
2%11
.29%
5.43
%4.
99%
3.87
%0
.81%
2.82
%2.
56%
1.78
%
Dau
sa29
.25%
0.0
0%
13.0
6%16
.68%
8.22
%10
.94%
8.96
%1.
33%
1.22
%3.
55%
5.57
%1.
22%
Dha
ulp
ur28
.52%
1.11
%13
.29%
15.4
9%13
.87%
8.67
%9.
52%
1.56
%0
.26%
4.72
%2.
79%
0.1
9%
Dun
gar
pur
43.0
0%
0.0
0%
11.9
9%19
.01%
0.0
0%
12.2
9%6.
85%
0.0
0%
0.0
0%
6.85
%0
.00
%0
.00
%
Gan
gan
agar
34.8
9%2.
72%
11.2
4%19
.03%
5.51
%8.
70%
6.35
%1.
92%
1.62
%5.
15%
2.19
%0
.68%
Han
uman
gar
h27
.90
%1.
84%
8.56
%21
.72%
15.1
5%7.
82%
7.90
%0
.90
%0
.74%
5.60
%1.
16%
0.7
2%
Jaip
ur37
.46%
2.52
%11
.71%
14.3
5%10
.35%
5.58
%6.
72%
3.0
6%0
.20
%3.
03%
2.99
%2.
01%
Jais
alm
er26
.47%
2.94
%9.
92%
21.6
5%9.
55%
6.61
%7.
55%
4.0
9%0
.26%
7.50
%1.
09%
2.36
%
Jalo
r35
.14%
5.55
%17
.57%
18.4
9%0
.00
%0
.00
%4.
76%
6.87
%4.
76%
0.0
0%
6.87
%0
.00
%
Jhal
awar
32.5
9%1.
73%
14.5
7%12
.47%
14.2
0%
3.79
%8.
58%
2.52
%0
.00
%6.
80%
1.76
%0
.99%
(CONTD.) DISTrICT-WISe: INDICATor CoNTrIBUTIoN To The MpI SCore (UrBAN)(CONTD.) DISTrICT-WISe: INDICATor CoNTrIBUTIoN To The MpI SCore (UrBAN)
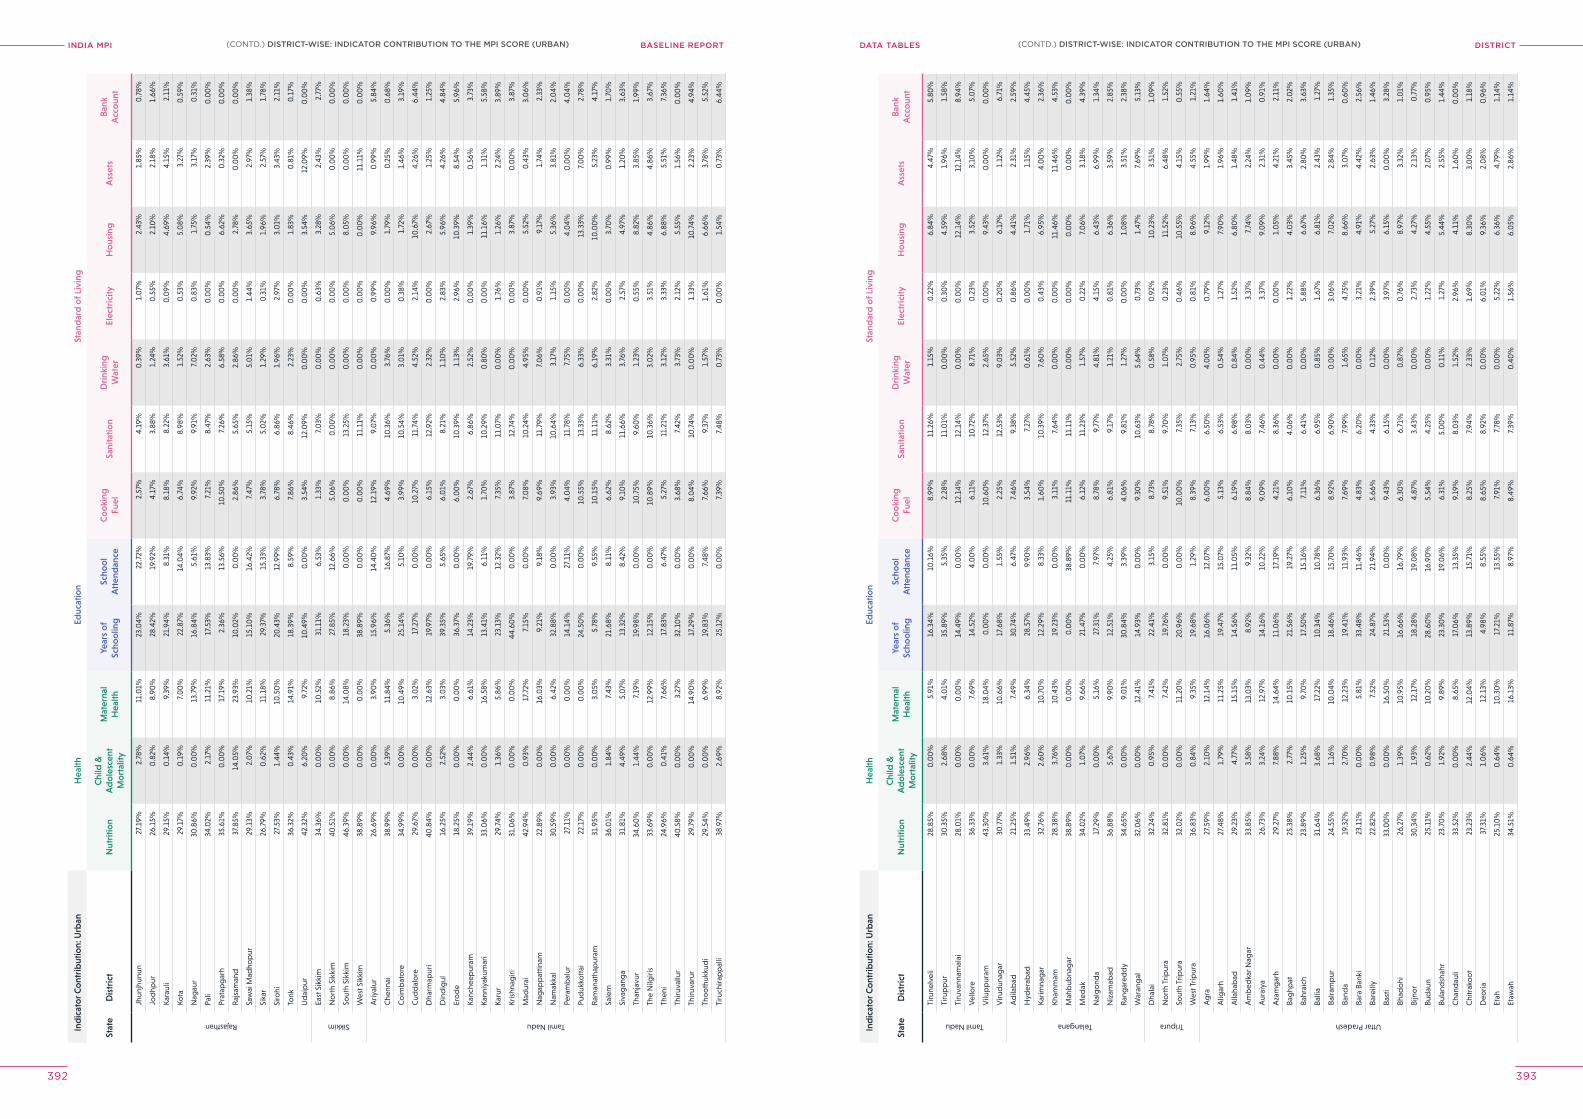
INDIA MPI BASELINE REPORT DISTrICTDATA TABleS
392 393
Ind
icat
or C
ont
rib
utio
n: U
rban
Hea
lthEd
ucat
ion
Stan
dar
d o
f Liv
ing
Stat
eD
istr
ict
Nut
ritio
nC
hild
&
Ad
ole
scen
t M
ort
ality
Mat
erna
l H
ealth
Year
s o
f Sc
hoo
ling
Scho
ol
Att
end
ance
Co
oki
ng
Fuel
Sani
tatio
nD
rink
ing
Wat
erEl
ectr
icity
Ho
usin
gA
sset
sB
ank
Acc
oun
t
Rajasthan
Jhun
jhun
un27
.19%
2.78
%11
.01%
23.0
4%22
.72%
2.57
%4.
19%
0.3
9%1.
07%
2.43
%1.
85%
0.7
8%
Jod
hpur
26.1
5%0
.82%
8.90
%28
.42%
19.9
2%4.
17%
3.88
%1.
24%
0.5
5%2.
10%
2.18
%1.
66%
Kara
uli
29.1
5%0
.14%
9.39
%21
.94%
8.31
%8.
18%
8.22
%3.
61%
0.0
9%4.
69%
4.15
%2.
11%
Kota
29.1
7%0
.19%
7.0
0%
22.8
7%14
.04%
6.74
%8.
98%
1.52
%0
.53%
5.0
8%3.
27%
0.5
9%
Nag
aur
30.8
6%0
.00
%13
.79%
16.8
4%5.
61%
9.92
%9.
91%
7.0
2%0
.83%
1.75
%3.
17%
0.3
1%
Pali
34.0
2%2.
17%
11.2
1%17
.53%
13.8
3%7.
21%
8.47
%2.
63%
0.0
0%
0.5
4%2.
39%
0.0
0%
Prat
apg
arh
35.6
1%0
.00
%17
.19%
2.36
%13
.56%
10.5
0%
7.26
%6.
58%
0.0
0%
6.62
%0
.32%
0.0
0%
Raj
sam
and
37.8
5%14
.05%
23.9
3%10
.02%
0.0
0%
2.86
%5.
65%
2.86
%0
.00
%2.
78%
0.0
0%
0.0
0%
Saw
ai M
adho
pur
29.1
3%2.
07%
10.2
1%15
.10
%16
.42%
7.47
%5.
15%
5.0
1%1.
44%
3.65
%2.
97%
1.38
%
Sika
r26
.79%
0.6
2%11
.18%
29.3
7%15
.33%
3.78
%5.
02%
1.29
%0
.31%
1.96
%2.
57%
1.78
%
Siro
hi27
.53%
1.44
%10
.50
%20
.43%
12.9
9%6.
78%
6.86
%1.
96%
2.97
%3.
01%
3.43
%2.
11%
Tonk
36.3
2%0
.43%
14.9
1%18
.39%
8.59
%7.
86%
8.46
%2.
23%
0.0
0%
1.83
%0
.81%
0.1
7%
Ud
aip
ur42
.32%
6.20
%9.
72%
10.4
9%0
.00
%3.
54%
12.0
9%0
.00
%0
.00
%3.
54%
12.0
9%0
.00
%
Sikkim
East
Sik
kim
34.3
6%0
.00
%10
.52%
31.1
1%6.
53%
1.33
%7.
03%
0.0
0%
0.6
3%3.
28%
2.43
%2.
77%
No
rth
Sikk
im40
.51%
0.0
0%
8.86
%27
.85%
12.6
6%5.
06%
0.0
0%
0.0
0%
0.0
0%
5.0
6%0
.00
%0
.00
%
Sout
h Si
kkim
46.3
9%0
.00
%14
.08%
18.2
3%0
.00
%0
.00
%13
.25%
0.0
0%
0.0
0%
8.0
5%0
.00
%0
.00
%
Wes
t Sik
kim
38.8
9%0
.00
%0
.00
%38
.89%
0.0
0%
0.0
0%
11.1
1%0
.00
%0
.00
%0
.00
%11
.11%
0.0
0%
Tamil Nadu
Ariy
alur
26.6
9%0
.00
%3.
90%
15.9
6%14
.40
%12
.19%
9.0
7%0
.00
%0
.99%
9.96
%0
.99%
5.84
%
Che
nnai
38.9
9%5.
39%
11.8
4%5.
36%
16.8
7%4.
69%
10.3
6%3.
76%
0.0
0%
1.79
%0
.25%
0.6
8%
Co
imb
ato
re34
.99%
0.0
0%
10.4
9%25
.14%
5.10
%3.
99%
10.5
4%3.
01%
0.3
8%1.
72%
1.46
%3.
19%
Cud
dal
ore
29.6
7%0
.00
%3.
02%
17.2
7%0
.00
%10
.27%
11.7
4%4.
52%
2.14
%10
.67%
4.26
%6.
44%
Dha
rmap
uri
40.8
4%0
.00
%12
.63%
19.9
7%0
.00
%6.
15%
12.9
2%2.
32%
0.0
0%
2.67
%1.
25%
1.25
%
Din
dig
ul16
.25%
2.52
%3.
03%
39.3
5%5.
65%
6.0
1%8.
21%
1.10
%2.
83%
5.96
%4.
26%
4.84
%
Ero
de
18.2
5%0
.00
%0
.00
%36
.37%
0.0
0%
6.0
0%
10.3
9%1.
13%
2.96
%10
.39%
8.54
%5.
96%
Kanc
heep
uram
39.1
9%2.
44%
6.61
%14
.23%
19.7
9%2.
67%
6.86
%2.
52%
0.0
0%
1.39
%0
.56%
3.73
%
Kann
iyak
umar
i33
.06%
0.0
0%
16.5
8%13
.41%
6.11
%1.
70%
10.2
9%0
.80
%0
.00
%11
.16%
1.31
%5.
58%
Karu
r29
.74%
1.36
%5.
86%
23.1
3%12
.32%
7.35
%11
.07%
0.0
0%
1.76
%1.
26%
2.24
%3.
89%
Kris
hnag
iri31
.06%
0.0
0%
0.0
0%
44.6
0%
0.0
0%
3.87
%12
.74%
0.0
0%
0.0
0%
3.87
%0
.00
%3.
87%
Mad
urai
42.9
4%0
.93%
17.7
2%7.
15%
0.0
0%
7.0
8%10
.24%
4.95
%0
.00
%5.
52%
0.4
3%3.
06%
Nag
app
attin
am22
.89%
0.0
0%
16.0
3%9.
21%
9.18
%9.
69%
11.7
9%7.
06%
0.9
1%9.
17%
1.74
%2.
33%
Nam
akka
l30
.59%
0.0
0%
6.42
%32
.88%
0.0
0%
3.93
%10
.64%
3.17
%1.
15%
5.36
%3.
81%
2.0
4%
Pera
mb
alur
27.1
1%0
.00
%0
.00
%14
.14%
27.1
1%4.
04%
11.7
8%7.
75%
0.0
0%
4.0
4%0
.00
%4.
04%
Pud
ukko
ttai
22.1
7%0
.00
%0
.00
%24
.50
%0
.00
%10
.55%
13.3
3%6.
33%
0.0
0%
13.3
3%7.
00
%2.
78%
Ram
anat
hap
uram
31.9
5%0
.00
%3.
05%
5.78
%9.
55%
10.1
5%11
.11%
6.19
%2.
82%
10.0
0%
5.23
%4.
17%
Sale
m36
.01%
1.84
%7.
43%
21.6
8%8.
11%
6.62
%8.
62%
3.31
%0
.00
%3.
70%
0.9
9%1.
70%
Siva
gan
ga
31.8
1%4.
49%
5.0
7%13
.32%
8.42
%9.
10%
11.6
6%3.
76%
2.57
%4.
97%
1.20
%3.
63%
Than
javu
r34
.60
%1.
44%
7.19
%19
.98%
0.0
0%
10.7
5%9.
60%
1.23
%0
.55%
8.82
%3.
85%
1.99
%
The
Nilg
iris
33.6
9%0
.00
%12
.99%
12.1
5%0
.00
%10
.89%
10.3
6%3.
02%
3.51
%4.
86%
4.86
%3.
67%
Then
i24
.96%
0.4
1%7.
66%
17.8
3%6.
47%
5.27
%11
.21%
3.12
%3.
33%
6.88
%5.
51%
7.36
%
Thiru
vallu
r40
.58%
0.0
0%
3.27
%32
.10
%0
.00
%3.
68%
7.42
%3.
73%
2.12
%5.
55%
1.56
%0
.00
%
Thiru
varu
r29
.79%
0.0
0%
14.9
0%
17.2
9%0
.00
%8.
04%
10.7
4%0
.00
%1.
33%
10.7
4%2.
23%
4.94
%
Tho
oth
ukku
di
29.5
4%0
.00
%6.
99%
19.8
3%7.
48%
7.66
%9.
37%
1.57
%1.
61%
6.66
%3.
78%
5.52
%
Tiru
chira
pp
alli
38.9
7%2.
69%
8.92
%25
.12%
0.0
0%
7.39
%7.
48%
0.7
3%0
.00
%1.
54%
0.7
3%6.
44%
Ind
icat
or C
ont
rib
utio
n: U
rban
Hea
lthEd
ucat
ion
Stan
dar
d o
f Liv
ing
Stat
eD
istr
ict
Nut
ritio
nC
hild
&
Ad
ole
scen
t M
ort
ality
Mat
erna
l H
ealth
Year
s o
f Sc
hoo
ling
Scho
ol
Att
end
ance
Co
oki
ng
Fuel
Sani
tatio
nD
rink
ing
Wat
erEl
ectr
icity
Ho
usin
gA
sset
sB
ank
Acc
oun
t
Tamil Nadu
Tiru
nelv
eli
28.8
5%0
.00
%5.
91%
16.3
4%10
.16%
8.99
%11
.26%
1.15
%0
.22%
6.84
%4.
47%
5.80
%
Tiru
pp
ur30
.35%
2.68
%4.
01%
35.8
9%5.
35%
2.28
%11
.01%
0.0
0%
0.3
0%
4.59
%1.
96%
1.58
%
Tiru
vann
amal
ai28
.01%
0.0
0%
0.0
0%
14.4
9%0
.00
%12
.14%
12.1
4%0
.00
%0
.00
%12
.14%
12.1
4%8.
94%
Vel
lore
36.3
3%0
.00
%7.
69%
14.5
2%4.
00
%6.
11%
10.7
2%8.
71%
0.2
3%3.
52%
3.10
%5.
07%
Vilu
pp
uram
43.3
0%
3.61
%18
.04%
0.0
0%
0.0
0%
10.6
0%
12.3
7%2.
65%
0.0
0%
9.43
%0
.00
%0
.00
%
Viru
dun
agar
30.7
7%1.
33%
10.6
6%17
.68%
1.55
%2.
25%
12.5
3%9.
03%
0.2
0%
6.17
%1.
12%
6.71
%
Telangana
Ad
ilab
ad21
.25%
1.51
%7.
49%
30.7
4%6.
47%
7.46
%9.
38%
5.52
%0
.86%
4.41
%2.
31%
2.59
%
Hyd
erab
ad33
.49%
2.96
%6.
34%
28.5
7%9.
90%
3.54
%7.
27%
0.6
1%0
.00
%1.
71%
1.15
%4.
45%
Karim
nag
ar32
.76%
2.60
%10
.70
%12
.29%
8.33
%1.
60%
10.3
9%7.
60%
0.4
3%6.
95%
4.0
0%
2.36
%
Kham
mam
28.3
8%3.
76%
10.4
3%19
.23%
0.0
0%
3.11
%7.
64%
0.0
0%
0.0
0%
11.4
6%11
.46%
4.53
%
Mah
bub
nag
ar38
.89%
0.0
0%
0.0
0%
0.0
0%
38.8
9%11
.11%
11.1
1%0
.00
%0
.00
%0
.00
%0
.00
%0
.00
%
Med
ak34
.02%
1.0
7%9.
66%
21.4
7%0
.00
%6.
12%
11.2
3%1.
57%
0.2
2%7.
06%
3.18
%4.
39%
Nal
go
nda
17.2
9%0
.00
%5.
16%
27.3
1%7.
97%
8.78
%9.
77%
4.81
%4.
15%
6.43
%6.
99%
1.34
%
Niz
amab
ad36
.88%
5.67
%9.
90%
12.5
1%4.
25%
6.81
%9.
17%
1.21
%0
.81%
6.36
%3.
59%
2.85
%
Ran
gar
edd
y34
.65%
0.0
0%
9.0
1%30
.84%
3.39
%4.
06%
9.81
%1.
27%
0.0
0%
1.0
8%3.
51%
2.38
%
War
ang
al32
.06%
0.0
0%
12.4
1%14
.93%
0.0
0%
9.30
%10
.63%
5.64
%0
.73%
1.47
%7.
69%
5.13
%
Tripura
Dha
lai
32.2
4%0
.95%
7.41
%22
.41%
3.15
%8.
73%
8.78
%0
.58%
0.9
2%10
.23%
3.51
%1.
09%
No
rth
Trip
ura
32.8
1%0
.00
%7.
42%
19.7
6%0
.00
%9.
51%
9.70
%1.
07%
0.2
3%11
.52%
6.48
%1.
52%
Sout
h Tr
ipur
a32
.02%
0.0
0%
11.2
0%
20.9
6%0
.00
%10
.00
%7.
35%
2.75
%0
.46%
10.5
5%4.
15%
0.5
5%
Wes
t Trip
ura
36.8
3%0
.84%
9.35
%19
.68%
1.29
%8.
39%
7.13
%0
.95%
0.8
1%8.
96%
4.55
%1.
21%
Uttar Pradesh
Ag
ra27
.59%
2.10
%12
.14%
16.0
6%12
.07%
6.0
0%
6.50
%4.
00
%0
.79%
9.12
%1.
99%
1.64
%
Alig
arh
27.4
8%1.
79%
11.2
5%19
.47%
15.0
7%5.
13%
6.53
%0
.54%
1.27
%7.
90%
1.96
%1.
60%
Alla
hab
ad29
.23%
4.77
%15
.15%
14.5
6%11
.05%
6.19
%6.
98%
0.8
4%1.
52%
6.80
%1.
48%
1.41
%
Am
bed
kar N
agar
33.8
5%3.
58%
13.0
3%8.
92%
9.32
%8.
84%
8.0
3%0
.00
%3.
37%
7.74
%2.
24%
1.0
9%
Aur
aiya
26.7
3%3.
24%
12.9
7%14
.16%
10.2
2%9.
09%
7.46
%0
.44%
3.37
%9.
09%
2.31
%0
.91%
Aza
mg
arh
29.2
7%7.
88%
14.6
4%11
.06%
17.1
9%4.
21%
8.36
%0
.00
%0
.00
%1.
05%
4.21
%2.
11%
Bag
hpat
25.3
8%2.
77%
10.1
5%21
.56%
19.2
7%6.
10%
4.0
6%0
.00
%1.
22%
4.0
3%3.
45%
2.0
2%
Bahr
aich
23.8
9%1.
25%
9.70
%17
.50
%15
.16%
7.11
%6.
41%
0.0
0%
5.88
%6.
67%
2.80
%3.
63%
Balli
a31
.64%
3.68
%17
.22%
10.3
4%10
.78%
6.36
%6.
95%
0.8
5%1.
67%
6.81
%2.
43%
1.27
%
Balra
mp
ur24
.55%
1.16
%10
.04%
18.4
6%15
.70
%8.
92%
6.90
%0
.00
%3.
06%
7.0
2%2.
84%
1.35
%
Band
a19
.32%
2.70
%12
.23%
19.4
1%11
.93%
7.69
%7.
99%
1.65
%4.
75%
8.66
%3.
07%
0.6
0%
Bara
Ban
ki23
.11%
0.0
0%
5.81
%33
.48%
11.4
6%4.
83%
6.20
%0
.00
%3.
21%
4.91
%4.
42%
2.56
%
Bare
illy
22.8
2%0
.98%
7.52
%24
.87%
21.9
4%5.
66%
4.33
%0
.12%
2.39
%5.
27%
2.63
%1.
46%
Bast
i33
.00
%0
.00
%16
.50
%21
.53%
0.0
0%
9.43
%6.
15%
0.0
0%
3.97
%6.
15%
0.0
0%
3.28
%
Bhad
ohi
26.2
7%1.
39%
10.9
5%16
.66%
16.7
9%6.
30%
6.71
%0
.87%
0.7
6%8.
97%
3.32
%1.
01%
Bijn
or
30.3
4%1.
93%
12.1
7%18
.28%
19.0
8%4.
87%
3.43
%0
.00
%2.
73%
4.27
%2.
13%
0.7
7%
Bud
aun
25.1
1%0
.62%
10.2
0%
28.6
0%
16.9
0%
5.54
%4.
25%
0.0
0%
1.22
%4.
55%
2.0
7%0
.95%
Bula
ndsh
ahr
23.7
0%
1.92
%9.
89%
23.3
0%
19.0
6%6.
31%
5.0
0%
0.1
1%1.
27%
5.44
%2.
55%
1.44
%
Cha
ndau
li33
.52%
0.0
0%
8.65
%17
.06%
13.3
5%9.
19%
8.0
3%1.
52%
2.96
%4.
11%
1.60
%0
.00
%
Chi
trak
oo
t23
.23%
2.44
%12
.04%
13.8
9%15
.71%
8.25
%7.
94%
2.33
%1.
69%
8.30
%3.
00
%1.
18%
Deo
ria37
.31%
1.0
6%12
.13%
4.98
%8.
55%
8.65
%8.
92%
0.0
0%
6.0
1%9.
36%
2.0
8%0
.96%
Etah
25.1
0%
0.6
4%10
.30
%17
.21%
13.5
5%7.
91%
7.78
%0
.00
%5.
22%
6.36
%4.
79%
1.14
%
Etaw
ah34
.51%
0.6
4%16
.13%
11.8
7%8.
97%
8.49
%7.
39%
0.4
0%
1.56
%6.
05%
2.86
%1.
14%
(CONTD.) DISTrICT-WISe: INDICATor CoNTrIBUTIoN To The MpI SCore (UrBAN)(CONTD.) DISTrICT-WISe: INDICATor CoNTrIBUTIoN To The MpI SCore (UrBAN)
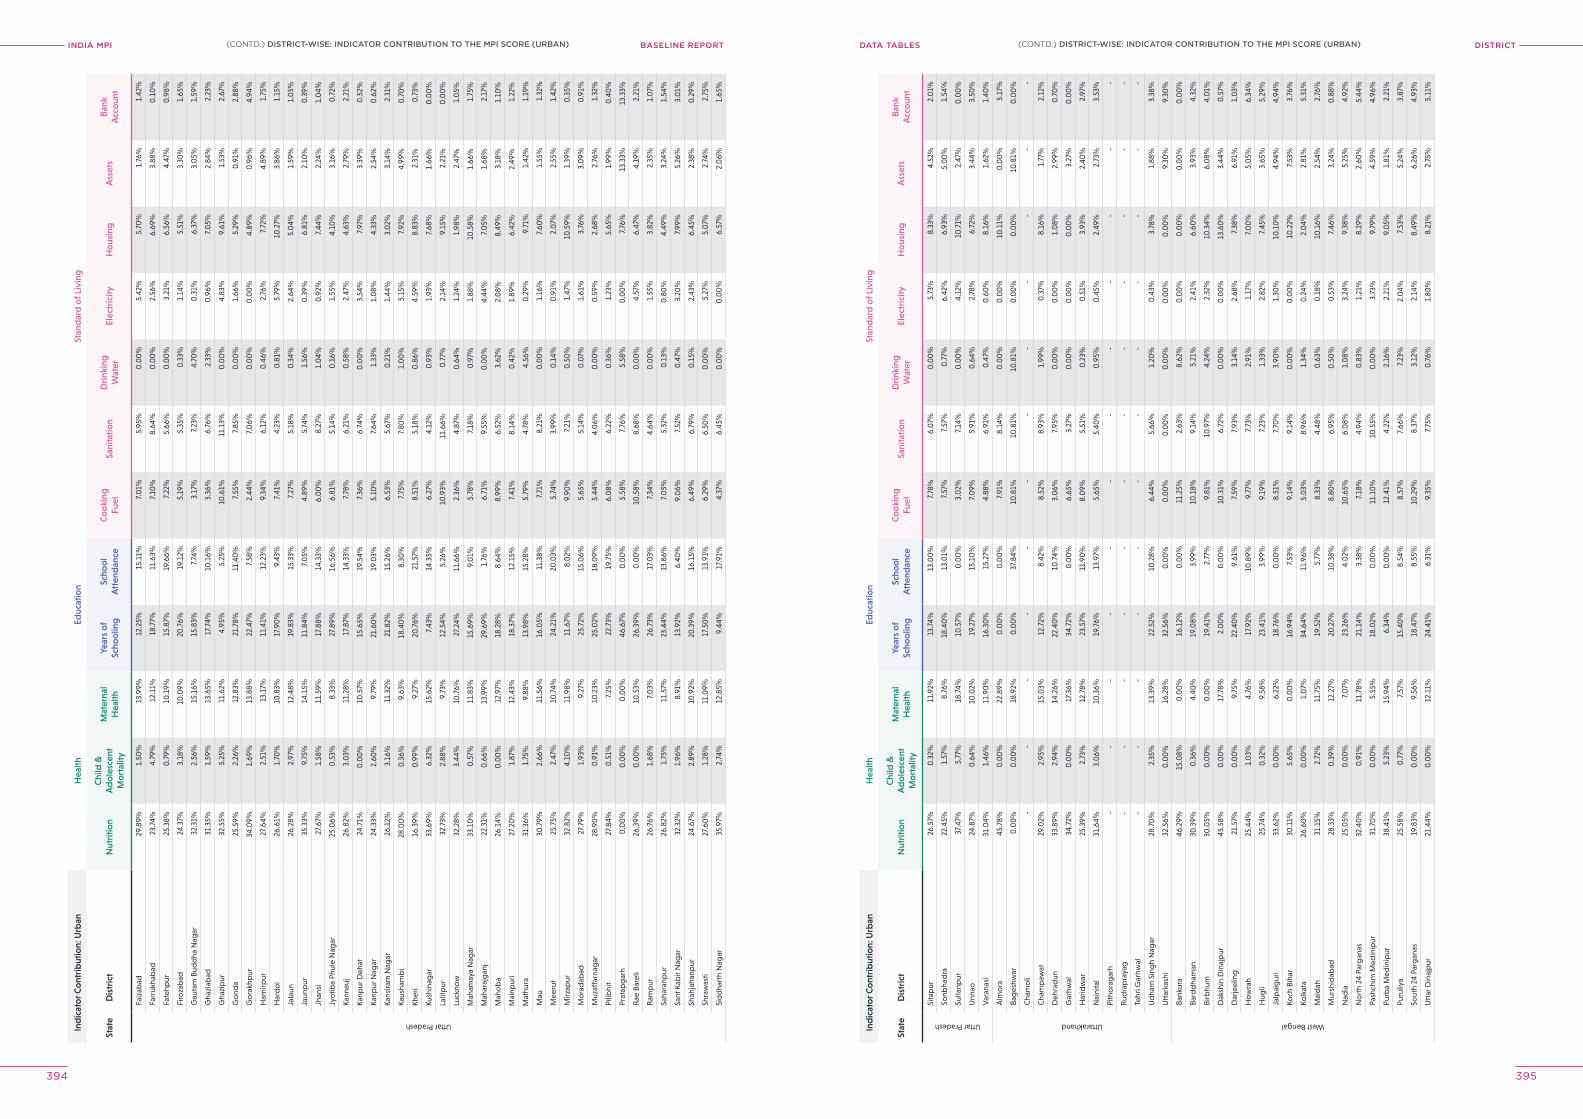
INDIA MPI BASELINE REPORT DISTrICTDATA TABleS
394 395
Ind
icat
or C
ont
rib
utio
n: U
rban
Hea
lthEd
ucat
ion
Stan
dar
d o
f Liv
ing
Stat
eD
istr
ict
Nut
ritio
nC
hild
&
Ad
ole
scen
t M
ort
ality
Mat
erna
l H
ealth
Year
s o
f Sc
hoo
ling
Scho
ol
Att
end
ance
Co
oki
ng
Fuel
Sani
tatio
nD
rink
ing
Wat
erEl
ectr
icity
Ho
usin
gA
sset
sB
ank
Acc
oun
t
Uttar Pradesh
Faiz
abad
29.8
9%1.
50%
13.9
9%12
.25%
15.1
1%7.
01%
5.95
%0
.00
%5.
42%
5.70
%1.
76%
1.42
%
Farr
ukha
bad
23.7
4%4.
79%
12.1
1%18
.77%
11.6
3%7.
10%
8.64
%0
.00
%2.
56%
6.69
%3.
88%
0.1
0%
Fate
hpur
25.3
8%0
.79%
10.1
9%15
.87%
19.6
6%7.
22%
5.66
%0
.00
%3.
21%
6.56
%4.
47%
0.9
8%
Firo
zab
ad24
.37%
3.18
%10
.09%
20.7
6%19
.12%
5.19
%5.
35%
0.3
3%1.
14%
5.51
%3.
30%
1.65
%
Gau
tam
Bud
dha
Nag
ar32
.31%
2.56
%15
.16%
15.8
3%7.
74%
3.17
%7.
23%
4.70
%0
.31%
6.37
%3.
05%
1.59
%
Gha
ziab
ad31
.35%
1.59
%13
.65%
17.7
4%10
.16%
3.36
%6.
76%
2.33
%0
.96%
7.0
5%2.
84%
2.23
%
Gha
zip
ur32
.55%
5.25
%11
.62%
4.95
%5.
25%
10.6
1%11
.13%
0.0
0%
4.83
%9.
61%
1.53
%2.
67%
Go
nda
25.5
9%2.
26%
12.8
3%21
.78%
11.4
0%
7.55
%7.
85%
0.0
0%
1.66
%5.
29%
0.9
1%2.
88%
Go
rakh
pur
34.0
9%1.
69%
13.8
8%22
.47%
7.58
%2.
44%
7.0
6%0
.00
%0
.00
%4.
89%
0.9
6%4.
94%
Ham
irpur
27.6
4%2.
51%
13.1
7%11
.41%
12.2
3%9.
34%
6.12
%0
.46%
2.76
%7.
72%
4.89
%1.
75%
Har
do
i26
.61%
1.70
%10
.83%
17.9
0%
9.43
%7.
41%
4.23
%0
.81%
5.79
%10
.27%
3.86
%1.
15%
Jala
un26
.28%
2.97
%12
.48%
19.8
3%15
.33%
7.27
%5.
18%
0.3
4%2.
64%
5.0
4%1.
59%
1.0
5%
Jaun
pur
35.3
3%9.
75%
14.1
5%11
.84%
7.0
5%4.
89%
5.74
%1.
56%
0.3
9%6.
81%
2.10
%0
.39%
Jhan
si27
.67%
1.58
%11
.59%
17.8
8%14
.33%
6.0
0%
8.27
%1.
04%
0.9
2%7.
44%
2.24
%1.
04%
Jyo
tiba
Phul
e N
agar
25.0
6%0
.53%
8.33
%27
.89%
16.5
6%6.
81%
5.14
%0
.16%
1.55
%4.
10%
3.16
%0
.72%
Kann
auj
26.8
2%3.
03%
11.2
8%17
.87%
14.3
3%7.
78%
6.21
%0
.58%
2.47
%4.
63%
2.79
%2.
21%
Kanp
ur D
ehat
24.7
1%0
.00
%10
.57%
15.6
5%19
.54%
7.36
%6.
74%
0.0
0%
3.54
%7.
97%
3.39
%0
.52%
Kanp
ur N
agar
24.3
3%2.
60%
9.79
%21
.60
%19
.03%
5.10
%7.
64%
1.33
%1.
08%
4.33
%2.
54%
0.6
2%
Kans
iram
Nag
ar26
.12%
3.16
%11
.32%
21.8
2%15
.26%
6.53
%5.
67%
0.2
1%1.
44%
3.0
2%3.
14%
2.31
%
Kaus
ham
bi
28.0
0%
0.3
6%9.
63%
18.4
0%
8.30
%7.
75%
7.80
%1.
00
%5.
15%
7.92
%4.
99%
0.7
0%
Kher
i16
.39%
0.9
9%9.
27%
20.7
6%21
.57%
8.51
%5.
18%
0.8
6%4.
59%
8.83
%2.
31%
0.7
3%
Kush
inag
ar33
.69%
6.32
%15
.62%
7.43
%14
.35%
6.27
%4.
12%
0.9
3%1.
93%
7.68
%1.
66%
0.0
0%
Lalit
pur
32.7
3%2.
88%
9.73
%12
.54%
5.26
%10
.93%
11.6
6%0
.77%
2.14
%9.
15%
2.21
%0
.00
%
Luck
now
32.2
8%3.
44%
10.7
6%27
.24%
11.6
6%2.
36%
4.87
%0
.64%
1.24
%1.
98%
2.47
%1.
05%
Mah
amay
a N
agar
33.1
0%
0.5
7%11
.83%
15.6
9%9.
01%
5.78
%7.
18%
0.9
7%1.
88%
10.5
8%1.
66%
1.75
%
Mah
araj
gan
j22
.31%
0.6
6%13
.99%
29.6
9%1.
76%
6.71
%9.
55%
0.0
0%
4.44
%7.
05%
1.68
%2.
17%
Mah
ob
a26
.14%
0.0
0%
12.9
7%18
.28%
8.64
%8.
99%
6.52
%3.
62%
2.0
8%8.
49%
3.18
%1.
10%
Mai
npur
i27
.20
%1.
87%
12.4
3%18
.37%
12.1
5%7.
41%
8.14
%0
.42%
1.89
%6.
42%
2.49
%1.
22%
Mat
hura
31.3
6%1.
75%
9.88
%13
.98%
15.2
8%5.
79%
4.78
%4.
56%
0.2
9%9.
71%
1.42
%1.
19%
Mau
30.7
9%2.
66%
11.5
6%16
.05%
11.3
8%7.
71%
8.21
%0
.00
%1.
16%
7.60
%1.
55%
1.32
%
Mee
rut
25.7
5%2.
47%
10.7
4%24
.21%
20.0
3%5.
74%
3.99
%0
.14%
0.9
1%2.
07%
2.55
%1.
42%
Mirz
apur
32.8
2%4.
10%
11.9
8%11
.67%
8.0
2%9.
90%
7.21
%0
.50
%1.
47%
10.5
9%1.
39%
0.3
5%
Mo
rad
abad
27.7
9%1.
93%
9.27
%25
.72%
15.0
6%5.
65%
5.14
%0
.07%
1.61
%3.
76%
3.0
9%0
.91%
Muz
affa
rnag
ar28
.90
%0
.91%
10.2
3%25
.02%
18.0
9%5.
44%
4.0
6%0
.00
%0
.59%
2.68
%2.
76%
1.32
%
Pilib
hit
27.8
4%0
.51%
7.25
%22
.73%
19.7
5%6.
08%
6.22
%0
.36%
1.23
%5.
65%
1.99
%0
.40
%
Prat
apg
arh
0.0
0%
0.0
0%
0.0
0%
46.6
7%0
.00
%5.
58%
7.76
%5.
58%
0.0
0%
7.76
%13
.33%
13.3
3%
Rae
Bar
eli
26.3
9%0
.00
%10
.53%
26.3
9%0
.00
%10
.58%
8.68
%0
.00
%4.
57%
6.47
%4.
19%
2.21
%
Ram
pur
26.7
6%1.
68%
7.0
3%26
.73%
17.0
3%7.
34%
4.64
%0
.00
%1.
55%
3.82
%2.
35%
1.0
7%
Saha
ranp
ur26
.82%
1.75
%11
.57%
23.4
4%13
.86%
7.0
5%5.
32%
0.1
3%0
.80
%4.
49%
3.24
%1.
54%
Sant
Kab
ir N
agar
32.3
2%1.
96%
8.91
%13
.92%
6.40
%9.
06%
7.52
%0
.47%
3.20
%7.
99%
5.26
%3.
01%
Shah
jaha
npur
24.6
7%2.
89%
10.9
2%20
.39%
16.1
5%6.
49%
6.79
%0
.15%
2.43
%6.
45%
2.38
%0
.29%
Shra
was
ti27
.60
%1.
28%
11.0
9%17
.50
%13
.91%
6.29
%6.
50%
0.0
0%
5.27
%5.
07%
2.74
%2.
75%
Sid
dha
rth
Nag
ar35
.97%
2.74
%12
.85%
9.44
%17
.91%
4.37
%6.
45%
0.0
0%
0.0
0%
6.57
%2.
06%
1.65
%
Ind
icat
or C
ont
rib
utio
n: U
rban
Hea
lthEd
ucat
ion
Stan
dar
d o
f Liv
ing
Stat
eD
istr
ict
Nut
ritio
nC
hild
&
Ad
ole
scen
t M
ort
ality
Mat
erna
l H
ealth
Year
s o
f Sc
hoo
ling
Scho
ol
Att
end
ance
Co
oki
ng
Fuel
Sani
tatio
nD
rink
ing
Wat
erEl
ectr
icity
Ho
usin
gA
sset
sB
ank
Acc
oun
t
Uttar Pradesh
Sita
pur
26.5
7%0
.32%
11.9
2%13
.74%
13.0
0%
7.78
%6.
07%
0.0
0%
5.73
%8.
33%
4.52
%2.
01%
Sonb
had
ra22
.45%
1.57
%8.
76%
18.4
0%
13.0
1%7.
57%
7.57
%0
.77%
6.42
%6.
93%
5.0
0%
1.54
%
Sulta
npur
37.4
7%5.
77%
18.7
4%10
.57%
0.0
0%
3.0
2%7.
14%
0.0
0%
4.12
%10
.71%
2.47
%0
.00
%
Unn
ao24
.87%
0.6
4%10
.02%
19.2
7%15
.10
%7.
09%
5.91
%0
.64%
2.78
%6.
72%
3.44
%3.
50%
Var
anas
i31
.04%
1.46
%11
.90
%16
.30
%15
.27%
4.88
%6.
91%
0.4
7%0
.60
%8.
16%
1.62
%1.
40%
Uttarakhand
Alm
ora
45.7
8%0
.00
%22
.89%
0.0
0%
0.0
0%
7.91
%8.
14%
0.0
0%
0.0
0%
10.1
1%0
.00
%5.
17%
Bag
eshw
ar0
.00
%0
.00
%18
.92%
0.0
0%
37.8
4%10
.81%
10.8
1%10
.81%
0.0
0%
0.0
0%
10.8
1%0
.00
%
Cha
mo
li-
--
--
--
--
--
-
Cha
mp
awat
29.0
2%2.
95%
15.0
3%12
.72%
8.42
%8.
52%
8.93
%1.
99%
0.3
7%8.
16%
1.77
%2.
12%
Deh
rad
un33
.89%
2.94
%14
.26%
22.4
0%
10.7
4%3.
06%
7.95
%0
.00
%0
.00
%1.
08%
2.99
%0
.70
%
Gar
hwal
34.7
2%0
.00
%17
.36%
34.7
2%0
.00
%6.
65%
3.27
%0
.00
%0
.00
%0
.00
%3.
27%
0.0
0%
Har
idw
ar25
.39%
2.73
%12
.78%
23.5
7%11
.90
%8.
09%
5.51
%0
.23%
0.5
1%3.
93%
2.40
%2.
97%
Nai
nita
l31
.64%
3.0
6%10
.36%
19.7
6%13
.97%
5.65
%5.
40%
0.9
5%0
.45%
2.49
%2.
73%
3.53
%
Pith
ora
gar
h-
--
--
--
--
--
-
Rud
rap
raya
g-
--
--
--
--
--
-
Tehr
i Gar
hwal
--
--
--
--
--
--
Ud
ham
Sin
gh
Nag
ar28
.70
%2.
35%
13.3
9%22
.52%
10.2
8%6.
44%
5.66
%1.
20%
0.4
3%3.
78%
1.88
%3.
38%
Utt
arka
shi
32.5
6%0
.00
%16
.28%
32.5
6%0
.00
%0
.00
%0
.00
%0
.00
%0
.00
%0
.00
%9.
30%
9.30
%
West Bengal
Bank
ura
46.2
9%15
.08%
0.0
0%
16.1
2%0
.00
%11
.25%
2.63
%8.
62%
0.0
0%
0.0
0%
0.0
0%
0.0
0%
Bard
dha
man
30.3
9%0
.36%
4.40
%19
.08%
3.99
%10
.18%
9.14
%5.
21%
2.41
%6.
60%
3.93
%4.
32%
Birb
hum
30.0
5%0
.00
%0
.00
%19
.41%
2.77
%9.
81%
10.9
7%4.
24%
2.32
%10
.34%
6.0
8%4.
01%
Dak
shin
Din
ajp
ur45
.58%
0.0
0%
17.7
8%2.
00
%0
.00
%10
.31%
6.72
%0
.00
%0
.00
%13
.60
%3.
44%
0.5
7%
Dar
jeel
ing
21.5
7%0
.00
%9.
75%
22.4
0%
9.61
%7.
59%
7.93
%3.
14%
2.68
%7.
38%
6.91
%1.
03%
Ho
wra
h25
.44%
1.0
3%4.
76%
17.9
2%10
.89%
9.77
%7.
73%
2.91
%1.
17%
7.0
0%
5.0
5%6.
34%
Hug
li25
.74%
0.3
2%9.
58%
23.4
1%3.
99%
9.19
%7.
23%
1.33
%2.
82%
7.45
%3.
65%
5.29
%
Jalp
aig
uri
33.6
2%0
.00
%6.
22%
18.7
6%0
.00
%8.
51%
7.70
%3.
90%
1.30
%10
.10
%4.
94%
4.94
%
Koch
Bih
ar30
.11%
5.65
%0
.00
%16
.94%
7.53
%9.
14%
9.14
%0
.00
%0
.00
%10
.22%
7.53
%3.
76%
Kolk
ata
26.6
0%
0.0
0%
1.0
7%34
.64%
11.9
6%5.
03%
8.96
%1.
34%
0.2
4%2.
04%
2.81
%5.
31%
Mal
dah
31.1
5%2.
72%
11.7
5%19
.52%
5.77
%8.
33%
4.48
%0
.63%
0.1
8%10
.16%
2.54
%2.
76%
Mur
shid
abad
28.3
3%0
.39%
12.2
7%20
.27%
10.3
8%8.
80%
6.95
%0
.50
%0
.53%
7.46
%3.
24%
0.8
8%
Nad
ia25
.05%
0.0
0%
7.0
7%23
.26%
4.0
2%10
.65%
6.0
8%1.
08%
3.24
%9.
38%
5.25
%4.
92%
No
rth
24 P
arg
anas
32.4
0%
0.9
1%11
.78%
21.1
4%3.
38%
7.18
%4.
94%
0.8
3%1.
21%
8.19
%2.
60%
5.44
%
Pash
chim
Med
inip
ur31
.70
%0
.00
%5.
55%
18.0
2%0
.00
%11
.10
%10
.55%
0.0
0%
3.73
%9.
79%
4.59
%4.
96%
Purb
a M
edin
ipur
38.4
1%5.
23%
15.9
4%6.
34%
0.0
0%
12.4
1%4.
22%
2.16
%2.
21%
9.0
5%1.
81%
2.21
%
Puru
liya
25.5
8%0
.77%
7.57
%15
.40
%8.
54%
8.57
%7.
66%
7.23
%2.
04%
7.53
%5.
24%
3.87
%
Sout
h 24
Par
gan
as19
.83%
0.0
0%
9.56
%18
.47%
8.55
%10
.29%
8.37
%3.
12%
2.14
%8.
49%
6.26
%4.
93%
Utt
ar D
inaj
pur
21.4
4%0
.00
%12
.11%
24.4
1%6.
31%
9.35
%7.
75%
0.7
6%1.
80%
8.21
%2.
75%
5.11
%
(CONTD.) DISTrICT-WISe: INDICATor CoNTrIBUTIoN To The MpI SCore (UrBAN)(CONTD.) DISTrICT-WISe: INDICATor CoNTrIBUTIoN To The MpI SCore (UrBAN)
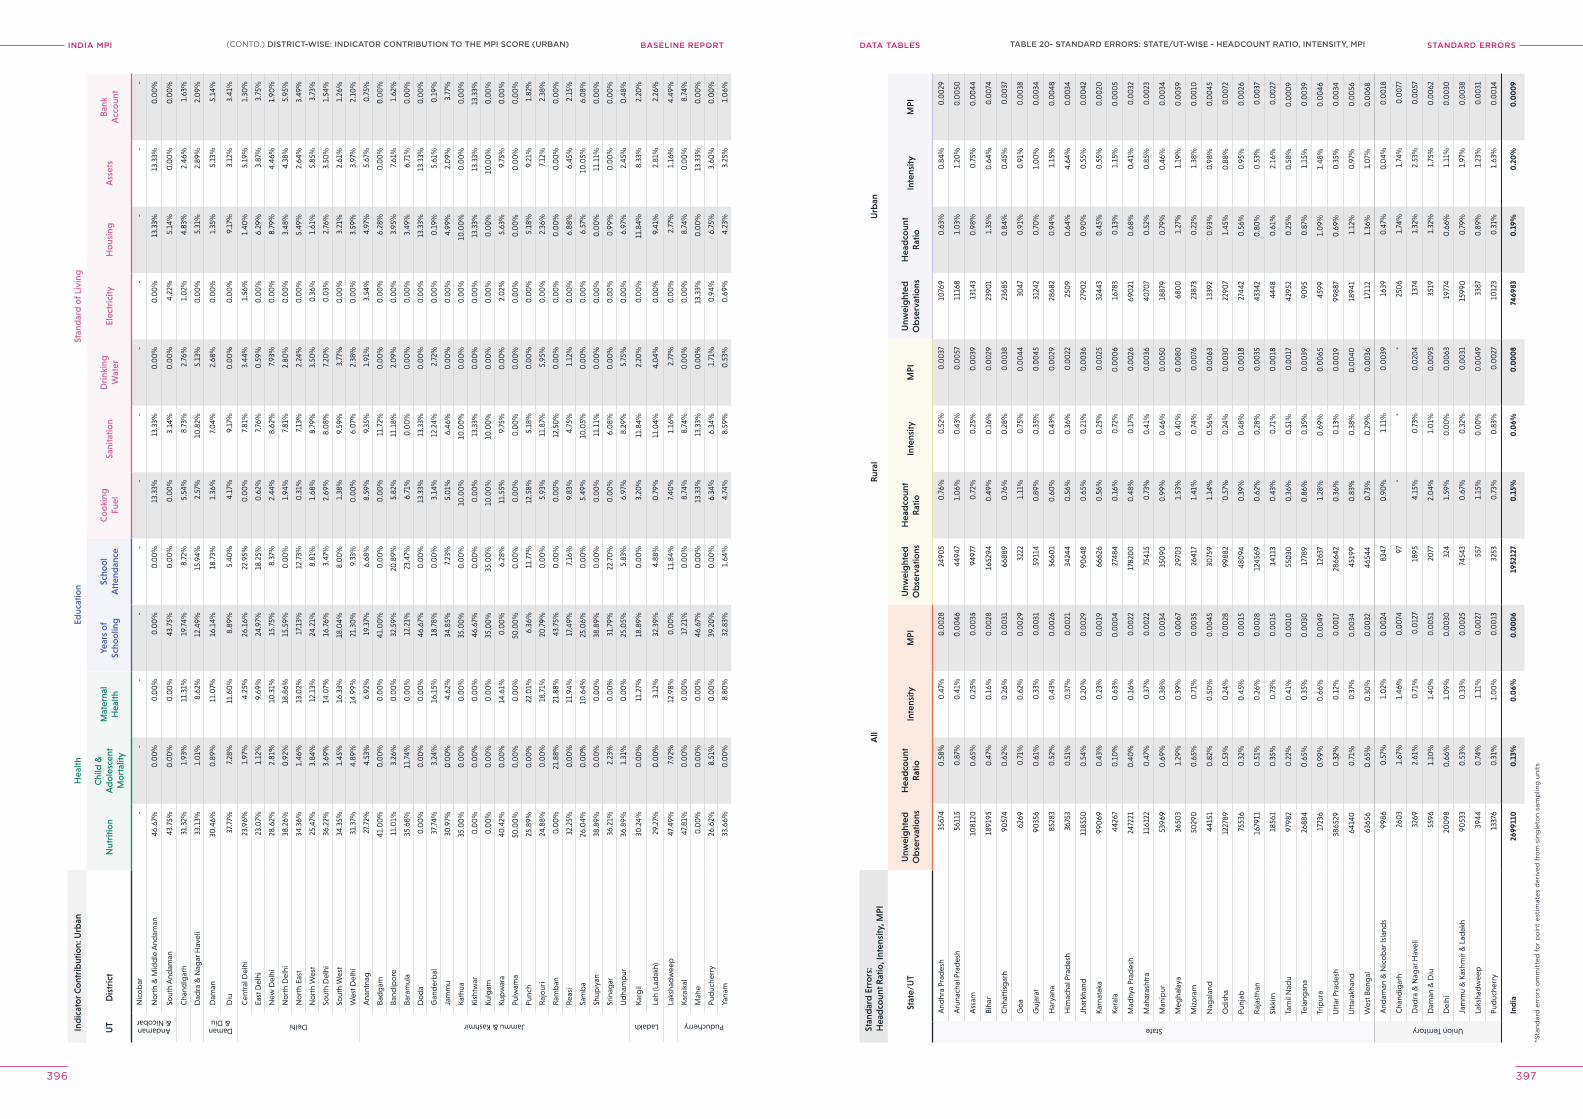
INDIA MPI BASELINE REPORT STANDArD errorSDATA TABleS
396 397
Ind
icat
or C
ont
rib
utio
n: U
rban
Hea
lthEd
ucat
ion
Stan
dar
d o
f Liv
ing
UT
Dis
tric
tN
utri
tion
Chi
ld &
A
do
lesc
ent
Mo
rtal
ity
Mat
erna
l H
ealth
Year
s o
f Sc
hoo
ling
Scho
ol
Att
end
ance
Co
oki
ng
Fuel
Sani
tatio
nD
rink
ing
Wat
erEl
ectr
icity
Ho
usin
gA
sset
sB
ank
Acc
oun
t
Andaman & Nicobar
Nic
ob
ar-
--
--
--
--
--
-
No
rth
& M
idd
le A
ndam
an46
.67%
0.0
0%
0.0
0%
0.0
0%
0.0
0%
13.3
3%13
.33%
0.0
0%
0.0
0%
13.3
3%13
.33%
0.0
0%
Sout
h A
ndam
an43
.75%
0.0
0%
0.0
0%
43.7
5%0
.00
%0
.00
%3.
14%
0.0
0%
4.22
%5.
14%
0.0
0%
0.0
0%
Cha
ndig
arh
31.3
2%1.
93%
11.3
1%19
.74%
8.72
%5.
54%
8.73
%2.
76%
1.0
2%4.
83%
2.46
%1.
63%
Dad
ra &
Nag
ar H
avel
i33
.13%
1.0
1%8.
62%
12.4
9%15
.94%
2.57
%10
.82%
5.13
%0
.00
%5.
31%
2.89
%2.
09%
Daman & Diu
Dam
an30
.46%
0.8
9%11
.07%
16.1
4%18
.73%
1.36
%7.
04%
2.68
%0
.00
%1.
35%
5.13
%5.
14%
Diu
37.7
7%7.
28%
11.6
0%
8.89
%5.
40%
4.17
%9.
17%
0.0
0%
0.0
0%
9.17
%3.
12%
3.41
%
Delhi
Cen
tral
Del
hi23
.96%
1.97
%4.
25%
26.1
6%22
.95%
0.0
0%
7.81
%3.
44%
1.56
%1.
40%
5.19
%1.
30%
East
Del
hi23
.07%
1.12
%9.
69%
24.9
7%18
.25%
0.6
2%7.
76%
0.5
9%0
.00
%6.
29%
3.87
%3.
75%
New
Del
hi28
.62%
2.81
%10
.31%
15.7
5%8.
37%
2.44
%8.
62%
7.93
%0
.00
%8.
79%
4.46
%1.
90%
No
rth
Del
hi38
.26%
0.9
2%18
.86%
15.5
9%0
.00
%1.
94%
7.81
%2.
80%
0.0
0%
3.48
%4.
38%
5.95
%
No
rth
East
34.3
6%1.
46%
13.0
2%17
.13%
12.7
3%0
.31%
7.13
%2.
24%
0.0
0%
5.49
%2.
64%
3.49
%
No
rth
Wes
t25
.47%
3.84
%12
.13%
24.2
1%8.
81%
1.68
%8.
79%
3.50
%0
.36%
1.61
%5.
85%
3.73
%
Sout
h D
elhi
36.2
2%3.
69%
14.0
7%16
.76%
3.47
%2.
69%
8.0
8%7.
20%
0.0
3%2.
76%
3.50
%1.
54%
Sout
h W
est
34.3
5%1.
45%
16.3
3%18
.04%
8.0
0%
1.38
%9.
59%
3.77
%0
.00
%3.
21%
2.61
%1.
26%
Wes
t Del
hi31
.37%
4.89
%14
.99%
21.3
0%
9.33
%0
.00
%6.
07%
2.38
%0
.00
%3.
59%
3.97
%2.
10%
Jammu & Kashmir
Ana
ntna
g27
.72%
4.53
%6.
92%
19.3
7%6.
68%
8.59
%9.
35%
1.91
%3.
54%
4.97
%5.
67%
0.7
5%
Bad
gam
41.0
0%
0.0
0%
0.0
0%
41.0
0%
0.0
0%
0.0
0%
11.7
2%0
.00
%0
.00
%6.
28%
0.0
0%
0.0
0%
Band
ipo
re11
.01%
3.26
%0
.00
%32
.59%
20.8
9%5.
82%
11.1
8%2.
09%
0.0
0%
3.95
%7.
61%
1.62
%
Bara
mul
a35
.68%
11.7
4%0
.00
%12
.21%
23.4
7%6.
71%
0.0
0%
0.0
0%
0.0
0%
3.49
%6.
71%
0.0
0%
Do
da
0.0
0%
0.0
0%
0.0
0%
46.6
7%0
.00
%13
.33%
13.3
3%0
.00
%0
.00
%13
.33%
13.3
3%0
.00
%
Gan
der
bal
37.7
4%3.
24%
16.1
5%18
.78%
0.0
0%
3.14
%12
.24%
2.72
%0
.00
%0
.19%
5.61
%0
.19%
Jam
mu
30.9
7%0
.00
%4.
62%
34.8
5%7.
23%
5.0
1%6.
46%
0.0
0%
0.0
0%
4.99
%2.
09%
3.77
%
Kath
ua35
.00
%0
.00
%0
.00
%35
.00
%0
.00
%10
.00
%10
.00
%0
.00
%0
.00
%10
.00
%0
.00
%0
.00
%
Kish
twar
0.0
0%
0.0
0%
0.0
0%
46.6
7%0
.00
%0
.00
%13
.33%
0.0
0%
0.0
0%
13.3
3%13
.33%
13.3
3%
Kulg
am0
.00
%0
.00
%0
.00
%35
.00
%35
.00
%10
.00
%10
.00
%0
.00
%0
.00
%0
.00
%10
.00
%0
.00
%
Kup
war
a40
.42%
0.0
0%
14.6
1%0
.00
%6.
28%
11.5
5%9.
75%
0.0
0%
2.0
2%5.
63%
9.75
%0
.00
%
Pulw
ama
50.0
0%
0.0
0%
0.0
0%
50.0
0%
0.0
0%
0.0
0%
0.0
0%
0.0
0%
0.0
0%
0.0
0%
0.0
0%
0.0
0%
Punc
h25
.89%
0.0
0%
22.0
1%6.
36%
11.7
7%12
.58%
5.18
%0
.00
%0
.00
%5.
18%
9.21
%1.
82%
Raj
our
i24
.88%
0.0
0%
18.7
1%20
.79%
0.0
0%
5.93
%11
.87%
5.95
%0
.00
%2.
36%
7.12
%2.
38%
Ram
ban
0.0
0%
21.8
8%21
.88%
43.7
5%0
.00
%0
.00
%12
.50
%0
.00
%0
.00
%0
.00
%0
.00
%0
.00
%
Reas
i32
.25%
0.0
0%
11.9
4%17
.49%
7.16
%9.
83%
4.75
%1.
12%
0.0
0%
6.88
%6.
45%
2.15
%
Sam
ba
26.0
4%0
.00
%10
.64%
25.0
6%0
.00
%5.
49%
10.0
5%0
.00
%0
.00
%6.
57%
10.0
5%6.
08%
Shup
iyan
38.8
9%0
.00
%0
.00
%38
.89%
0.0
0%
0.0
0%
11.1
1%0
.00
%0
.00
%0
.00
%11
.11%
0.0
0%
Srin
agar
36.2
1%2.
23%
0.0
0%
31.7
9%22
.70
%0
.00
%6.
08%
0.0
0%
0.0
0%
0.9
9%0
.00
%0
.00
%
Ud
ham
pur
36.8
9%1.
31%
0.0
0%
25.0
5%5.
83%
6.97
%8.
29%
5.75
%0
.00
%6.
97%
2.45
%0
.48%
Ladakh
Karg
il30
.24%
0.0
0%
11.2
7%18
.89%
0.0
0%
3.20
%11
.84%
2.20
%0
.00
%11
.84%
8.33
%2.
20%
Leh
(Lad
akh)
29.2
7%0
.00
%3.
12%
32.3
9%4.
88%
0.7
9%11
.04%
4.0
4%0
.00
%9.
41%
2.81
%2.
26%
Laks
had
wee
p47
.49%
7.92
%12
.98%
0.0
0%
11.8
4%7.
40%
1.16
%2.
77%
0.0
0%
2.77
%1.
16%
4.49
%
Puducherry
Kara
ikal
47.8
1%0
.00
%0
.00
%17
.21%
0.0
0%
8.74
%8.
74%
0.0
0%
0.0
0%
8.74
%0
.00
%8.
74%
Mah
e0
.00
%0
.00
%0
.00
%46
.67%
0.0
0%
13.3
3%13
.33%
0.0
0%
13.3
3%0
.00
%13
.33%
0.0
0%
Pud
uche
rry
26.6
2%8.
51%
0.0
0%
39.2
0%
0.0
0%
6.34
%6.
34%
1.71
%0
.94%
6.75
%3.
60%
0.0
0%
Yana
m33
.66%
0.0
0%
8.80
%32
.83%
1.64
%4.
74%
8.59
%0
.53%
0.6
9%4.
23%
3.25
%1.
06%
Stan
dar
d E
rro
rs:
Hea
dco
unt R
atio
, Int
ensi
ty, M
PIA
llR
ural
Urb
an
Stat
e/U
TU
nwei
ght
edO
bse
rvat
ions
Hea
dco
unt
Rat
ioIn
tens
ityM
PIU
nwei
ght
edO
bse
rvat
ions
Hea
dco
unt
Rat
ioIn
tens
ityM
PIU
nwei
ght
edO
bse
rvat
ions
Hea
dco
unt
Rat
ioIn
tens
ityM
PI
State
And
hra
Prad
esh
3567
40
.58%
0.4
7%0
.00
2824
905
0.7
6%0
.52%
0.0
037
1076
90
.63%
0.8
4%0
.00
29
Aru
nach
al P
rad
esh
5611
50
.87%
0.4
1%0
.00
4644
947
1.0
6%0
.43%
0.0
057
1116
81.
03%
1.20
%0
.00
50
Ass
am10
8120
0.6
5%0
.25%
0.0
035
9497
70
.72%
0.2
5%0
.00
3913
143
0.9
8%0
.75%
0.0
044
Biha
r18
9195
0.4
7%0
.16%
0.0
028
1652
940
.49%
0.1
6%0
.00
2923
901
1.35
%0
.64%
0.0
074
Chh
attis
gar
h90
574
0.6
2%0
.26%
0.0
031
6688
90
.76%
0.2
8%0
.00
3823
685
0.8
4%0
.45%
0.0
037
Go
a62
690
.71%
0.6
2%0
.00
2932
221.
11%
0.7
5%0
.00
4430
470
.91%
0.9
1%0
.00
38
Guj
arat
9035
60
.61%
0.3
3%0
.00
3159
114
0.8
9%0
.35%
0.0
045
3124
20
.70
%1.
00
%0
.00
34
Har
yana
8528
30
.52%
0.4
3%0
.00
2656
601
0.6
0%
0.4
3%0
.00
2928
682
0.9
4%1.
15%
0.0
048
Him
acha
l Pra
des
h36
753
0.5
1%0
.37%
0.0
021
3424
40
.56%
0.3
6%0
.00
2225
09
0.6
4%4.
64%
0.0
034
Jhar
khan
d11
8550
0.5
4%0
.20
%0
.00
2990
648
0.6
5%0
.21%
0.0
036
2790
20
.90
%0
.55%
0.0
042
Karn
atak
a99
069
0.4
3%0
.23%
0.0
019
6662
60
.56%
0.2
5%0
.00
2532
443
0.4
5%0
.55%
0.0
020
Kera
la44
267
0.1
0%
0.6
3%0
.00
04
2748
40
.16%
0.7
2%0
.00
06
1678
30
.13%
1.15
%0
.00
05
Mad
hya
Prad
esh
2472
210
.40
%0
.16%
0.0
022
1782
00
0.4
8%0
.17%
0.0
026
690
210
.68%
0.4
1%0
.00
32
Mah
aras
htra
1161
220
.47%
0.3
7%0
.00
2275
415
0.7
3%0
.41%
0.0
036
4070
70
.52%
0.8
5%0
.00
23
Man
ipur
5396
90
.69%
0.3
8%0
.00
3435
090
0.9
9%0
.46%
0.0
050
1887
90
.79%
0.4
6%0
.00
34
Meg
hala
ya36
503
1.29
%0
.39%
0.0
067
2970
31.
53%
0.4
0%
0.0
080
680
01.
27%
1.19
%0
.00
59
Miz
ora
m50
290
0.6
5%0
.71%
0.0
035
2641
71.
41%
0.7
4%0
.00
7623
873
0.2
2%1.
38%
0.0
010
Nag
alan
d44
151
0.8
2%0
.50
%0
.00
4530
759
1.14
%0
.56%
0.0
063
1339
20
.93%
0.9
8%0
.00
45
Od
isha
1227
890
.53%
0.2
4%0
.00
2899
882
0.5
7%0
.24%
0.0
030
2290
71.
45%
0.8
8%0
.00
72
Punj
ab75
536
0.3
2%0
.45%
0.0
015
480
940
.39%
0.4
8%0
.00
1827
442
0.5
6%0
.95%
0.0
026
Raj
asth
an16
7911
0.5
1%0
.26%
0.0
028
1245
690
.62%
0.2
8%0
.00
3543
342
0.8
0%
0.5
3%0
.00
37
Sikk
im18
561
0.3
5%0
.73%
0.0
015
1411
30
.43%
0.7
1%0
.00
1844
480
.61%
2.16
%0
.00
27
Tam
il N
adu
9798
20
.22%
0.4
1%0
.00
1055
030
0.3
6%0
.51%
0.0
017
4295
20
.25%
0.5
8%0
.00
09
Tela
ngan
a26
884
0.6
5%0
.35%
0.0
030
1778
90
.86%
0.3
5%0
.00
3990
950
.87%
1.15
%0
.00
39
Trip
ura
1723
60
.99%
0.6
6%0
.00
4912
637
1.28
%0
.69%
0.0
065
4599
1.0
9%1.
48%
0.0
046
Utt
ar P
rad
esh
3865
290
.32%
0.1
2%0
.00
1728
6642
0.3
6%0
.13%
0.0
019
9988
70
.69%
0.3
5%0
.00
34
Utt
arak
hand
6414
00
.71%
0.3
7%0
.00
3445
199
0.8
3%0
.38%
0.0
040
1894
11.
12%
0.9
7%0
.00
56
Wes
t Ben
gal
6365
60
.65%
0.3
0%
0.0
032
4654
40
.73%
0.2
9%0
.00
3617
112
1.36
%1.
07%
0.0
068
Union Territory
And
aman
& N
ico
bar
Isla
nds
9986
0.5
7%1.
02%
0.0
024
8347
0.9
0%
1.11
%0
.00
3916
390
.47%
0.0
4%0
.00
18
Cha
ndig
arh
260
31.
67%
1.46
%0
.00
7497
**
*25
06
1.74
%1.
74%
0.0
077
Dad
ra &
Nag
ar H
avel
i32
692.
61%
0.7
1%0
.012
718
954.
15%
0.7
3%0
.020
413
741.
32%
2.53
%0
.00
57
Dam
an &
Diu
5596
1.10
%1.
40%
0.0
051
2077
2.0
4%1.
01%
0.0
095
3519
1.32
%1.
75%
0.0
062
Del
hi20
098
0.6
6%1.
09%
0.0
030
324
1.59
%0
.00
%0
.00
6319
774
0.6
6%1.
11%
0.0
030
Jam
mu
& K
ashm
ir &
Lad
akh
9053
30
.53%
0.3
3%0
.00
2574
543
0.6
7%0
.32%
0.0
031
1599
00
.79%
1.97
%0
.00
38
Laks
had
wee
p39
440
.74%
1.11
%0
.00
2755
71.
15%
0.0
0%
0.0
049
3387
0.8
9%1.
23%
0.0
031
Pud
uche
rry
1337
60
.31%
1.0
0%
0.0
013
3253
0.7
3%0
.83%
0.0
027
1012
30
.31%
1.63
%0
.00
14
Ind
ia26
9911
00
.13%
0.0
6%0
.00
06
1952
127
0.1
5%0
.06%
0.0
00
874
6983
0.1
9%0
.20
%0
.00
09
*Sta
ndar
d e
rro
rs o
mm
itte
d f
or
po
int
esti
mat
es d
eriv
ed f
rom
sin
gle
ton
sam
plin
g u
nits
(CONTD.) DISTrICT-WISe: INDICATor CoNTrIBUTIoN To The MpI SCore (UrBAN) TABle 20- STANDArD errorS: STATe/UT-WISe - heADCoUNT rATIo, INTeNSITy, MpI
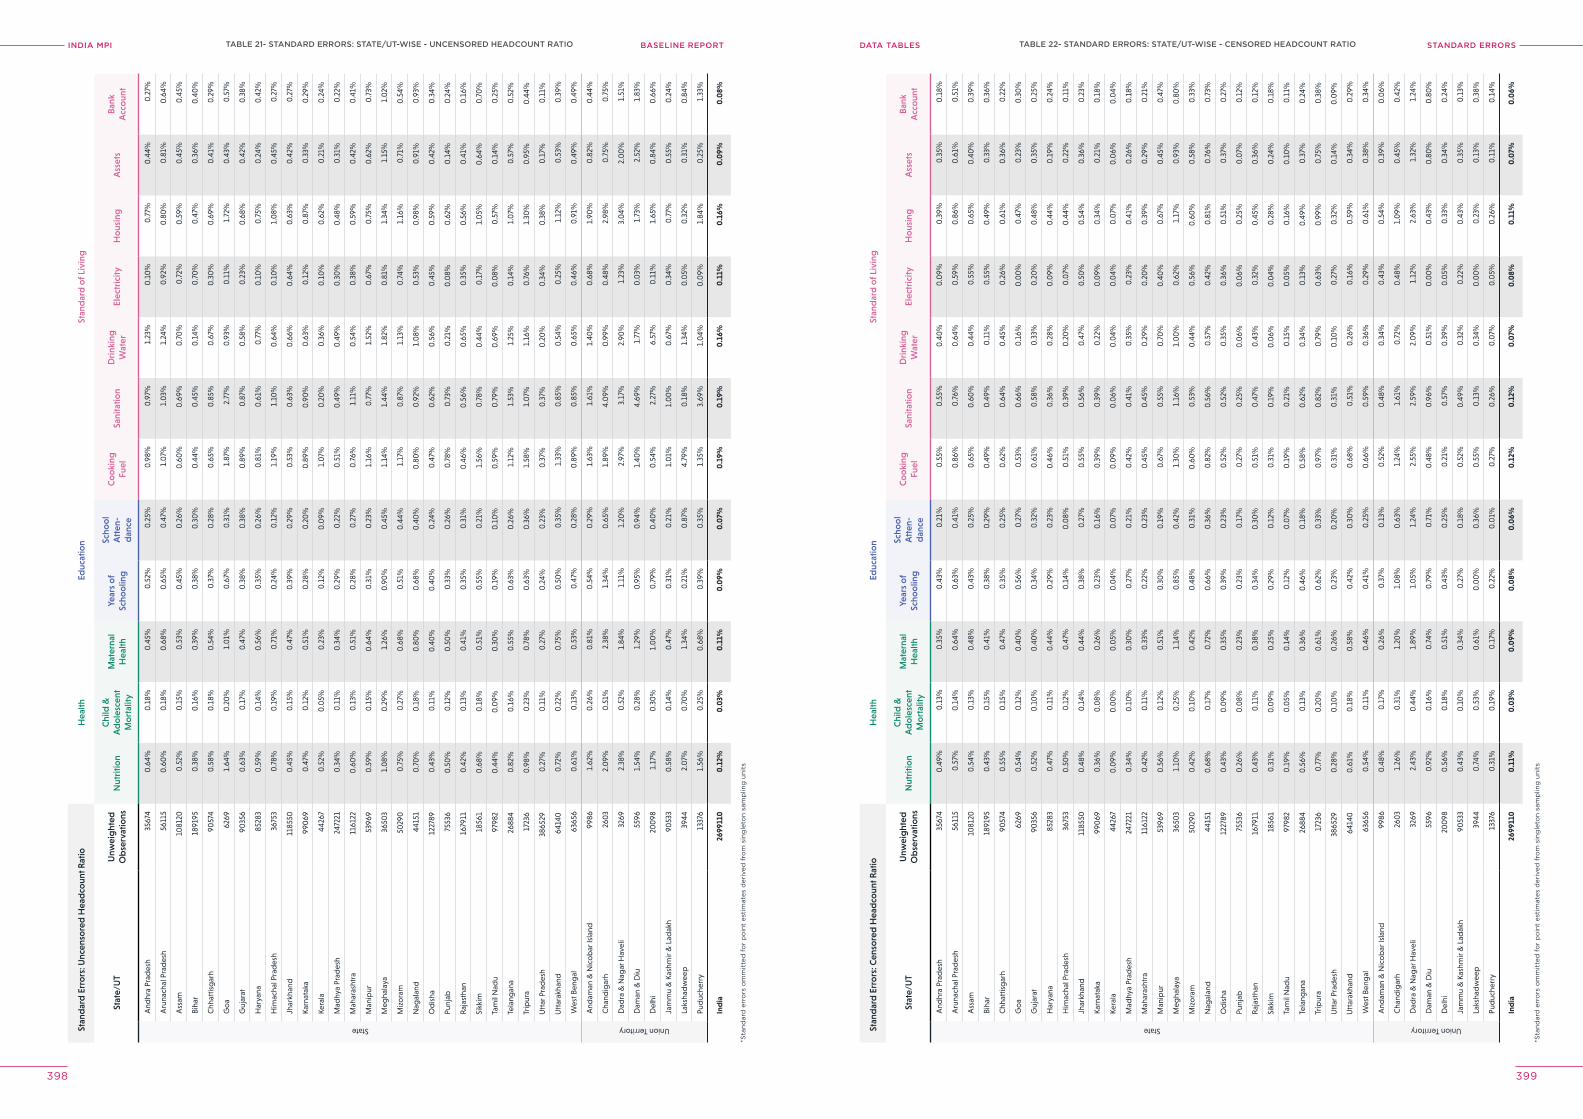
INDIA MPI BASELINE REPORT STANDArD errorSDATA TABleS
398 399
Stan
dar
d E
rro
rs: U
ncen
sore
d H
ead
coun
t Rat
ioH
ealth
Educ
atio
nSt
and
ard
of L
ivin
g
Stat
e/U
TU
nwei
ght
edO
bse
rvat
ions
Nut
ritio
nC
hild
&
Ad
ole
scen
t M
ort
ality
Mat
erna
l H
ealth
Year
s o
f Sc
hoo
ling
Scho
ol
Att
en-
dan
ce
Co
oki
ng
Fuel
Sani
tatio
nD
rink
ing
Wat
erEl
ectr
icity
Ho
usin
gA
sset
sB
ank
Acc
oun
t
State
And
hra
Prad
esh
3567
40
.64%
0.1
8%0
.45%
0.5
2%0
.25%
0.9
8%0
.97%
1.23
%0
.10
%0
.77%
0.4
4%0
.27%
Aru
nach
al P
rad
esh
5611
50
.60
%0
.18%
0.6
8%0
.65%
0.4
7%1.
07%
1.0
3%1.
24%
0.9
2%0
.80
%0
.81%
0.6
4%
Ass
am10
8120
0.5
2%0
.15%
0.5
3%0
.45%
0.2
6%0
.60
%0
.69%
0.7
0%
0.7
2%0
.59%
0.4
5%0
.45%
Biha
r18
9195
0.3
8%0
.16%
0.3
9%0
.38%
0.3
0%
0.4
4%0
.45%
0.1
4%0
.70
%0
.47%
0.3
6%0
.40
%
Chh
attis
gar
h90
574
0.5
8%0
.18%
0.5
4%0
.37%
0.2
8%0
.65%
0.8
5%0
.67%
0.3
0%
0.6
9%0
.41%
0.2
9%
Go
a62
691.
64%
0.2
0%
1.0
1%0
.67%
0.3
1%1.
87%
2.77
%0
.93%
0.1
1%1.
72%
0.4
3%0
.57%
Guj
arat
9035
60
.63%
0.1
7%0
.47%
0.3
8%0
.38%
0.8
9%0
.87%
0.5
8%0
.23%
0.6
8%0
.42%
0.3
8%
Har
yana
8528
30
.59%
0.1
4%0
.56%
0.3
5%0
.26%
0.8
1%0
.61%
0.7
7%0
.10
%0
.75%
0.2
4%0
.42%
Him
acha
l Pra
des
h36
753
0.7
8%0
.19%
0.7
1%0
.24%
0.1
2%1.
19%
1.10
%0
.64%
0.1
0%
1.0
8%0
.45%
0.2
7%
Jhar
khan
d11
8550
0.4
5%0
.15%
0.4
7%0
.39%
0.2
9%0
.53%
0.6
3%0
.66%
0.6
4%0
.63%
0.4
2%0
.27%
Karn
atak
a99
069
0.4
7%0
.12%
0.5
1%0
.28%
0.2
0%
0.8
9%0
.90
%0
.63%
0.1
2%0
.87%
0.3
3%0
.29%
Kera
la44
267
0.5
2%0
.05%
0.2
3%0
.12%
0.0
9%1.
07%
0.2
0%
0.3
6%0
.10
%0
.62%
0.2
1%0
.24%
Mad
hya
Prad
esh
2472
210
.34%
0.1
1%0
.34%
0.2
9%0
.22%
0.5
1%0
.49%
0.4
9%0
.30
%0
.48%
0.3
1%0
.22%
Mah
aras
htra
1161
220
.60
%0
.13%
0.5
1%0
.28%
0.2
7%0
.76%
1.11
%0
.54%
0.3
8%0
.59%
0.4
2%0
.41%
Man
ipur
5396
90
.59%
0.1
5%0
.64%
0.3
1%0
.23%
1.16
%0
.77%
1.52
%0
.67%
0.7
5%0
.62%
0.7
3%
Meg
hala
ya36
503
1.0
8%0
.29%
1.26
%0
.90
%0
.45%
1.14
%1.
44%
1.82
%0
.81%
1.34
%1.
15%
1.0
2%
Miz
ora
m50
290
0.7
5%0
.27%
0.6
8%0
.51%
0.4
4%1.
17%
0.8
7%1.
13%
0.7
4%1.
16%
0.7
1%0
.54%
Nag
alan
d44
151
0.7
0%
0.1
8%0
.80
%0
.68%
0.4
0%
0.8
0%
0.9
2%1.
08%
0.5
3%0
.98%
0.9
1%0
.93%
Od
isha
1227
890
.43%
0.1
1%0
.40
%0
.40
%0
.24%
0.4
7%0
.62%
0.5
6%0
.45%
0.5
9%0
.42%
0.3
4%
Punj
ab75
536
0.5
0%
0.1
2%0
.50
%0
.33%
0.2
6%0
.78%
0.7
3%0
.21%
0.0
8%0
.62%
0.1
4%0
.24%
Raj
asth
an16
7911
0.4
2%0
.13%
0.4
1%0
.35%
0.3
1%0
.46%
0.5
6%0
.65%
0.3
5%0
.56%
0.4
1%0
.16%
Sikk
im18
561
0.6
8%0
.18%
0.5
1%0
.55%
0.2
1%1.
56%
0.7
8%0
.44%
0.1
7%1.
05%
0.6
4%0
.70
%
Tam
il N
adu
9798
20
.44%
0.0
9%0
.30
%0
.19%
0.1
0%
0.5
9%0
.79%
0.6
9%0
.08%
0.5
7%0
.14%
0.2
5%
Tela
ngan
a26
884
0.8
2%0
.16%
0.5
5%0
.63%
0.2
6%1.
12%
1.53
%1.
25%
0.1
4%1.
07%
0.5
7%0
.52%
Trip
ura
1723
60
.98%
0.2
3%0
.78%
0.6
3%0
.36%
1.58
%1.
07%
1.16
%0
.76%
1.30
%0
.95%
0.4
4%
Utt
ar P
rad
esh
3865
290
.27%
0.1
1%0
.27%
0.2
4%0
.23%
0.3
7%0
.37%
0.2
0%
0.3
4%0
.38%
0.1
7%0
.11%
Utt
arak
hand
6414
00
.72%
0.2
2%0
.75%
0.5
0%
0.3
5%1.
33%
0.8
5%0
.54%
0.2
5%1.
12%
0.5
3%0
.39%
Wes
t Ben
gal
6365
60
.61%
0.1
3%0
.53%
0.4
7%0
.28%
0.8
9%0
.85%
0.6
5%0
.46%
0.9
1%0
.49%
0.4
9%
Union Territory
And
aman
& N
ico
bar
Isla
nd99
861.
62%
0.2
6%0
.81%
0.5
4%0
.29%
1.63
%1.
61%
1.40
%0
.68%
1.90
%0
.82%
0.4
4%
Cha
ndig
arh
260
32.
09%
0.5
1%2.
38%
1.34
%0
.65%
1.89
%4.
09%
0.9
9%0
.48%
2.98
%0
.75%
0.7
5%
Dad
ra &
Nag
ar H
avel
i32
692.
38%
0.5
2%1.
84%
1.11
%1.
20%
2.97
%3.
17%
2.90
%1.
23%
3.0
4%2.
00
%1.
51%
Dam
an &
Diu
5596
1.54
%0
.28%
1.29
%0
.95%
0.9
4%1.
40%
4.69
%1.
77%
0.0
3%1.
73%
2.52
%1.
83%
Del
hi20
098
1.17
%0
.30
%1.
00
%0
.79%
0.4
0%
0.5
4%2.
27%
6.57
%0
.11%
1.65
%0
.84%
0.6
6%
Jam
mu
& K
ashm
ir &
Lad
akh
9053
30
.58%
0.1
4%0
.47%
0.3
1%0
.21%
1.0
1%1.
00
%0
.67%
0.3
4%0
.77%
0.5
5%0
.24%
Laks
had
wee
p39
442.
07%
0.7
0%
1.34
%0
.21%
0.8
7%4.
79%
0.1
8%1.
34%
0.0
5%0
.32%
0.3
1%0
.84%
Pud
uche
rry
1337
61.
56%
0.2
5%0
.68%
0.3
9%0
.35%
1.35
%3.
69%
1.0
4%0
.09%
1.84
%0
.25%
1.33
%
Ind
ia26
9911
00
.12%
0.0
3%0
.11%
0.0
9%0
.07%
0.1
9%0
.19%
0.1
6%0
.11%
0.1
6%0
.09%
0.0
8%
*Sta
ndar
d e
rro
rs o
mm
itte
d f
or
po
int
esti
mat
es d
eriv
ed f
rom
sin
gle
ton
sam
plin
g u
nits
*Sta
ndar
d e
rro
rs o
mm
itte
d f
or
po
int
esti
mat
es d
eriv
ed f
rom
sin
gle
ton
sam
plin
g u
nits
Stan
dar
d E
rro
rs: C
enso
red
Hea
dco
unt R
atio
Hea
lthEd
ucat
ion
Stan
dar
d o
f Liv
ing
Stat
e/U
TU
nwei
ght
edO
bse
rvat
ions
Nut
ritio
nC
hild
&
Ad
ole
scen
t M
ort
ality
Mat
erna
l H
ealth
Year
s o
f Sc
hoo
ling
Scho
ol
Att
en-
dan
ce
Co
oki
ng
Fuel
Sani
tatio
nD
rink
ing
Wat
erEl
ectr
icity
Ho
usin
gA
sset
sB
ank
Acc
oun
t
State
And
hra
Prad
esh
3567
40
.49%
0.1
3%0
.35%
0.4
3%0
.21%
0.5
5%0
.55%
0.4
0%
0.0
9%0
.39%
0.3
5%0
.18%
Aru
nach
al P
rad
esh
5611
50
.57%
0.1
4%0
.64%
0.6
3%0
.41%
0.8
6%0
.76%
0.6
4%0
.59%
0.8
6%0
.61%
0.5
1%
Ass
am10
8120
0.5
4%0
.13%
0.4
8%0
.43%
0.2
5%0
.65%
0.6
0%
0.4
4%0
.55%
0.6
5%0
.40
%0
.39%
Biha
r18
9195
0.4
3%0
.15%
0.4
1%0
.38%
0.2
9%0
.49%
0.4
9%0
.11%
0.5
5%0
.49%
0.3
3%0
.36%
Chh
attis
gar
h90
574
0.5
5%0
.15%
0.4
7%0
.35%
0.2
5%0
.62%
0.6
4%0
.45%
0.2
6%0
.61%
0.3
6%0
.22%
Go
a62
690
.54%
0.1
2%0
.40
%0
.56%
0.2
7%0
.53%
0.6
6%0
.16%
0.0
0%
0.4
7%0
.23%
0.3
0%
Guj
arat
9035
60
.52%
0.1
0%
0.4
0%
0.3
4%0
.32%
0.6
1%0
.58%
0.3
3%0
.20
%0
.48%
0.3
5%0
.25%
Har
yana
8528
30
.47%
0.1
1%0
.44%
0.2
9%0
.23%
0.4
6%0
.36%
0.2
8%0
.09%
0.4
4%0
.19%
0.2
4%
Him
acha
l Pra
des
h36
753
0.5
0%
0.1
2%0
.47%
0.1
4%0
.08%
0.5
1%0
.39%
0.2
0%
0.0
7%0
.44%
0.2
2%0
.11%
Jhar
khan
d11
8550
0.4
8%0
.14%
0.4
4%0
.38%
0.2
7%0
.55%
0.5
6%0
.47%
0.5
0%
0.5
4%0
.36%
0.2
3%
Karn
atak
a99
069
0.3
6%0
.08%
0.2
6%0
.23%
0.1
6%0
.39%
0.3
9%0
.22%
0.0
9%0
.34%
0.2
1%0
.18%
Kera
la44
267
0.0
9%0
.00
%0
.05%
0.0
4%0
.07%
0.0
9%0
.06%
0.0
4%0
.04%
0.0
7%0
.06%
0.0
4%
Mad
hya
Prad
esh
2472
210
.34%
0.1
0%
0.3
0%
0.2
7%0
.21%
0.4
2%0
.41%
0.3
5%0
.23%
0.4
1%0
.26%
0.1
8%
Mah
aras
htra
1161
220
.42%
0.1
1%0
.33%
0.2
2%0
.23%
0.4
5%0
.45%
0.2
9%0
.20
%0
.39%
0.2
9%0
.21%
Man
ipur
5396
90
.56%
0.1
2%0
.51%
0.3
0%
0.1
9%0
.67%
0.5
5%0
.70
%0
.40
%0
.67%
0.4
5%0
.47%
Meg
hala
ya36
503
1.10
%0
.25%
1.14
%0
.85%
0.4
2%1.
30%
1.16
%1.
00
%0
.62%
1.17
%0
.93%
0.8
0%
Miz
ora
m50
290
0.4
2%0
.10
%0
.42%
0.4
8%0
.31%
0.6
0%
0.5
3%0
.44%
0.5
6%0
.60
%0
.58%
0.3
3%
Nag
alan
d44
151
0.6
8%0
.17%
0.7
2%0
.66%
0.3
6%0
.82%
0.5
6%0
.57%
0.4
2%0
.81%
0.7
6%0
.73%
Od
isha
1227
890
.43%
0.0
9%0
.35%
0.3
9%0
.23%
0.5
2%0
.52%
0.3
5%0
.36%
0.5
1%0
.37%
0.2
7%
Punj
ab75
536
0.2
6%0
.08%
0.2
3%0
.23%
0.1
7%0
.27%
0.2
5%0
.06%
0.0
6%0
.25%
0.0
7%0
.12%
Raj
asth
an16
7911
0.4
3%0
.11%
0.3
8%0
.34%
0.3
0%
0.5
1%0
.47%
0.4
3%0
.32%
0.4
5%0
.36%
0.1
2%
Sikk
im18
561
0.3
1%0
.09%
0.2
5%0
.29%
0.1
2%0
.31%
0.1
9%0
.06%
0.0
4%0
.28%
0.2
4%0
.18%
Tam
il N
adu
9798
20
.19%
0.0
5%0
.14%
0.1
2%0
.07%
0.1
9%0
.21%
0.1
5%0
.05%
0.1
6%0
.10
%0
.11%
Tela
ngan
a26
884
0.5
6%0
.13%
0.3
6%0
.46%
0.1
8%0
.58%
0.6
2%0
.34%
0.1
3%0
.49%
0.3
7%0
.24%
Trip
ura
1723
60
.77%
0.2
0%
0.6
1%0
.62%
0.3
3%0
.97%
0.8
2%0
.79%
0.6
3%0
.99%
0.7
5%0
.38%
Utt
ar P
rad
esh
3865
290
.28%
0.1
0%
0.2
6%0
.23%
0.2
0%
0.3
1%0
.31%
0.1
0%
0.2
7%0
.32%
0.1
4%0
.09%
Utt
arak
hand
6414
00
.61%
0.1
8%0
.58%
0.4
2%0
.30
%0
.68%
0.5
1%0
.26%
0.1
6%0
.59%
0.3
4%0
.29%
Wes
t Ben
gal
6365
60
.54%
0.1
1%0
.46%
0.4
1%0
.25%
0.6
6%0
.59%
0.3
6%0
.29%
0.6
1%0
.38%
0.3
4%
Union Territory
And
aman
& N
ico
bar
Isla
nd99
860
.48%
0.1
7%0
.26%
0.3
7%0
.13%
0.5
2%0
.48%
0.3
4%0
.43%
0.5
4%0
.39%
0.0
6%
Cha
ndig
arh
260
31.
26%
0.3
1%1.
20%
1.0
8%0
.63%
1.24
%1.
61%
0.7
2%0
.48%
1.0
9%0
.45%
0.4
2%
Dad
ra &
Nag
ar H
avel
i32
692.
43%
0.4
4%1.
89%
1.0
5%1.
24%
2.55
%2.
59%
2.0
9%1.
12%
2.63
%1.
32%
1.24
%
Dam
an &
Diu
5596
0.9
2%0
.16%
0.7
4%0
.79%
0.7
1%0
.48%
0.9
6%0
.51%
0.0
0%
0.4
3%0
.80
%0
.80
%
Del
hi20
098
0.5
6%0
.18%
0.5
1%0
.43%
0.2
5%0
.21%
0.5
7%0
.39%
0.0
5%0
.33%
0.3
4%0
.24%
Jam
mu
& K
ashm
ir &
Lad
akh
9053
30
.43%
0.1
0%
0.3
4%0
.27%
0.1
8%0
.52%
0.4
9%0
.32%
0.2
2%0
.43%
0.3
5%0
.13%
Laks
had
wee
p39
440
.74%
0.5
3%0
.61%
0.0
0%
0.3
6%0
.55%
0.1
3%0
.34%
0.0
0%
0.2
3%0
.13%
0.3
8%
Pud
uche
rry
1337
60
.31%
0.1
9%0
.17%
0.2
2%0
.01%
0.2
7%0
.26%
0.0
7%0
.05%
0.2
6%0
.11%
0.1
4%
Ind
ia26
9911
00
.11%
0.0
3%0
.09%
0.0
8%0
.06%
0.1
2%0
.12%
0.0
7%0
.08%
0.1
1%0
.07%
0.0
6%
TABle 22- STANDArD errorS: STATe/UT-WISe - CeNSoreD heADCoUNT rATIoTABle 21- STANDArD errorS: STATe/UT-WISe - UNCeNSoreD heADCoUNT rATIo
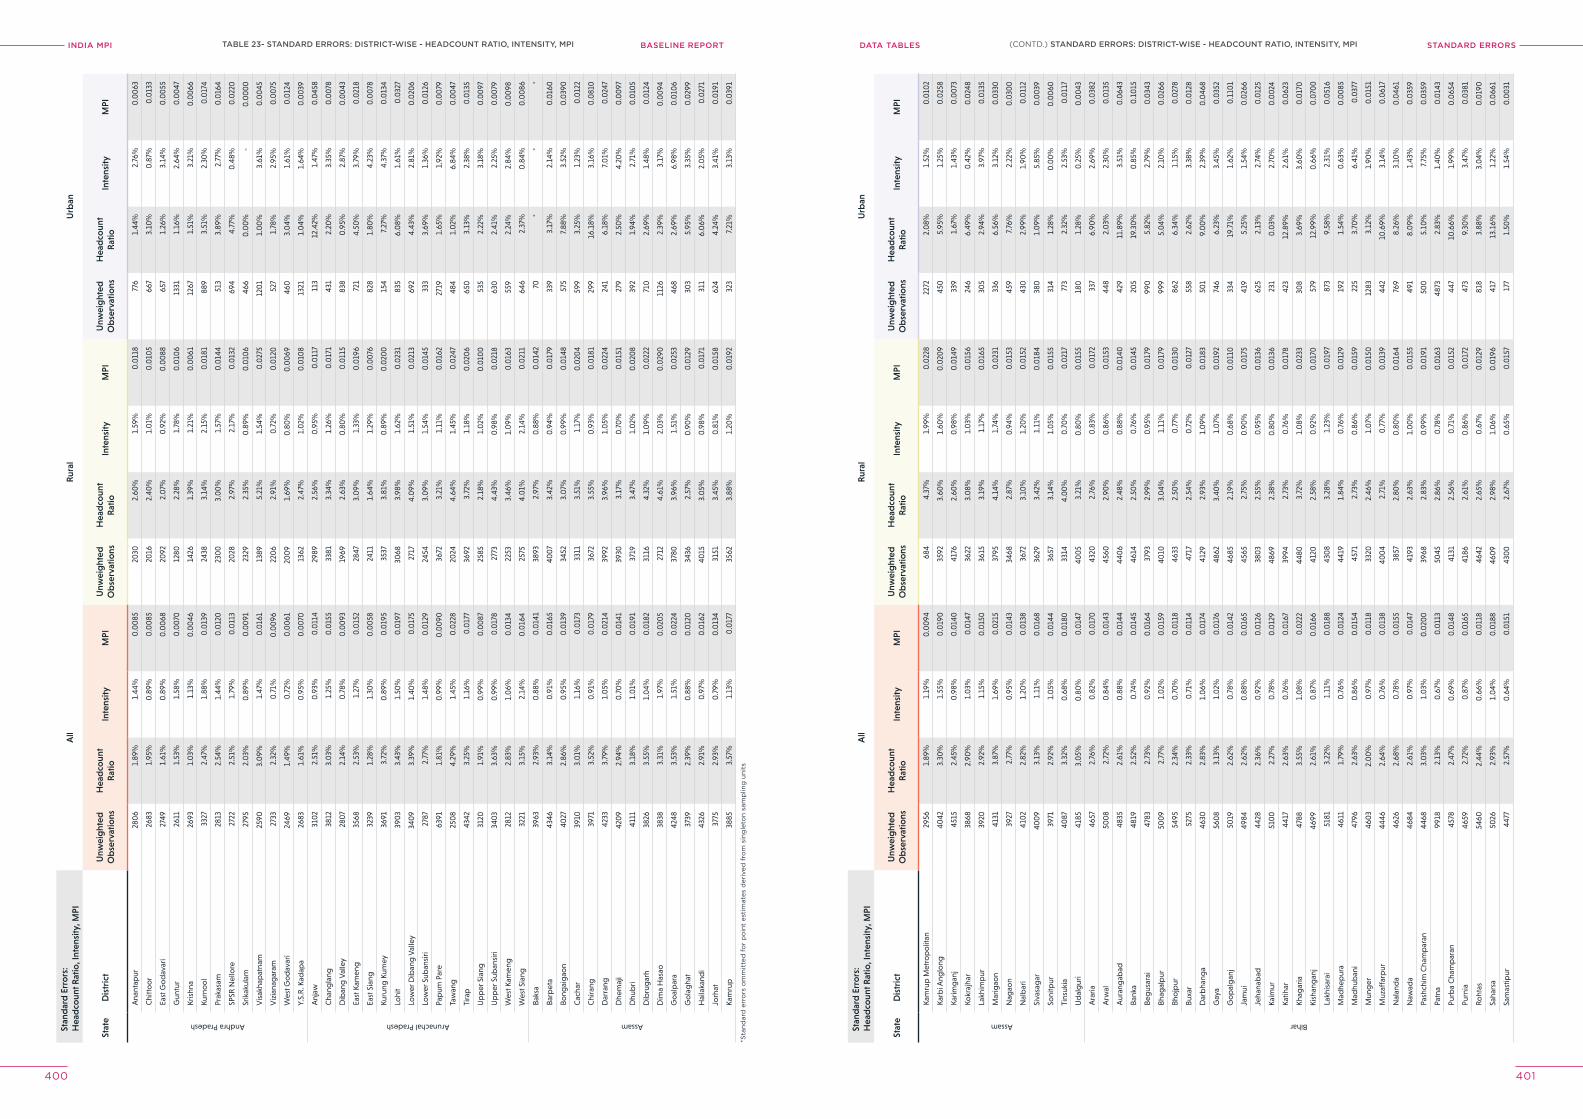
INDIA MPI BASELINE REPORT STANDArD errorSDATA TABleS
400 401
Stan
dar
d E
rro
rs:
Hea
dco
unt R
atio
, Int
ensi
ty, M
PIA
llR
ural
Urb
an
Stat
eD
istr
ict
Unw
eig
hted
Ob
serv
atio
nsH
ead
coun
tR
atio
Inte
nsity
MPI
Unw
eig
hted
Ob
serv
atio
nsH
ead
coun
tR
atio
Inte
nsity
MPI
Unw
eig
hted
Ob
serv
atio
nsH
ead
coun
tR
atio
Inte
nsity
MPI
Andhra Pradesh
Ana
ntap
ur28
06
1.89
%1.
44%
0.0
085
2030
2.60
%1.
59%
0.0
118
776
1.44
%2.
76%
0.0
063
Chi
tto
or
2683
1.95
%0
.89%
0.0
085
2016
2.40
%1.
01%
0.0
105
667
3.10
%0
.87%
0.0
133
East
Go
dav
ari
2749
1.61
%0
.89%
0.0
068
2092
2.0
7%0
.92%
0.0
088
657
1.26
%3.
14%
0.0
055
Gun
tur
2611
1.53
%1.
58%
0.0
070
1280
2.28
%1.
78%
0.0
106
1331
1.16
%2.
64%
0.0
047
Kris
hna
2693
1.0
3%1.
13%
0.0
046
1426
1.39
%1.
21%
0.0
061
1267
1.51
%3.
21%
0.0
066
Kurn
oo
l33
272.
47%
1.88
%0
.013
924
383.
14%
2.15
%0
.018
188
93.
51%
2.30
%0
.017
4
Prak
asam
2813
2.54
%1.
44%
0.0
120
230
03.
00
%1.
57%
0.0
144
513
3.89
%2.
77%
0.0
164
SPSR
Nel
lore
2722
2.51
%1.
79%
0.0
113
2028
2.97
%2.
17%
0.0
132
694
4.77
%0
.48%
0.0
220
Srik
akul
am27
952.
03%
0.8
9%0
.00
9123
292.
35%
0.8
9%0
.010
646
60
.00
%-
0.0
00
0
Vis
akha
pat
nam
2590
3.0
9%1.
47%
0.0
161
1389
5.21
%1.
54%
0.0
275
120
11.
00
%3.
61%
0.0
045
Viz
iana
gar
am27
332.
32%
0.7
1%0
.00
9622
06
2.91
%0
.72%
0.0
120
527
1.78
%2.
95%
0.0
075
Wes
t Go
dav
ari
2469
1.49
%0
.72%
0.0
061
200
91.
69%
0.8
0%
0.0
069
460
3.0
4%1.
61%
0.0
124
Y.S.
R. K
adap
a26
831.
61%
0.9
5%0
.00
7013
622.
47%
1.0
2%0
.010
813
211.
04%
1.64
%0
.00
39
Arunachal Pradesh
Anj
aw31
02
2.51
%0
.93%
0.0
114
2989
2.56
%0
.95%
0.0
117
113
12.4
2%1.
47%
0.0
458
Cha
ngla
ng38
123.
03%
1.25
%0
.015
533
813.
34%
1.26
%0
.017
143
12.
20%
3.35
%0
.00
78
Dib
ang
Val
ley
280
72.
14%
0.7
8%0
.00
9319
692.
63%
0.8
0%
0.0
115
838
0.9
5%2.
87%
0.0
043
East
Kam
eng
3568
2.53
%1.
27%
0.0
152
2847
3.0
9%1.
33%
0.0
196
721
4.50
%3.
79%
0.0
218
East
Sia
ng32
391.
28%
1.30
%0
.00
5824
111.
64%
1.29
%0
.00
7682
81.
80%
4.23
%0
.00
78
Kuru
ng K
umey
3691
3.72
%0
.89%
0.0
195
3537
3.81
%0
.89%
0.0
200
154
7.27
%4.
37%
0.0
134
Lohi
t39
03
3.43
%1.
50%
0.0
197
3068
3.98
%1.
62%
0.0
231
835
6.0
8%1.
61%
0.0
327
Low
er D
iban
g V
alle
y34
09
3.39
%1.
40%
0.0
175
2717
4.0
9%1.
51%
0.0
213
692
4.43
%2.
81%
0.0
206
Low
er S
uban
siri
2787
2.77
%1.
48%
0.0
129
2454
3.0
9%1.
54%
0.0
145
333
3.69
%1.
36%
0.0
126
Pap
um P
are
6391
1.81
%0
.99%
0.0
090
3672
3.21
%1.
11%
0.0
162
2719
1.65
%1.
92%
0.0
079
Taw
ang
250
84.
29%
1.45
%0
.022
820
244.
64%
1.45
%0
.024
748
41.
02%
6.84
%0
.00
47
Tira
p43
423.
25%
1.16
%0
.017
736
923.
72%
1.18
%0
.020
665
03.
13%
2.38
%0
.013
5
Up
per
Sia
ng31
201.
91%
0.9
9%0
.00
8725
852.
18%
1.0
2%0
.010
053
52.
22%
3.18
%0
.00
97
Up
per
Sub
ansi
ri34
03
3.63
%0
.99%
0.0
178
2773
4.43
%0
.98%
0.0
218
630
2.41
%2.
25%
0.0
079
Wes
t Kam
eng
2812
2.83
%1.
06%
0.0
134
2253
3.46
%1.
09%
0.0
163
559
2.24
%2.
84%
0.0
098
Wes
t Sia
ng32
213.
15%
2.14
%0
.016
425
754.
01%
2.14
%0
.021
164
62.
37%
0.8
4%0
.00
86
Assam
Baks
a39
632.
93%
0.8
8%0
.014
138
932.
97%
0.8
8%0
.014
270
**
*
Barp
eta
4346
3.14
%0
.91%
0.0
165
400
73.
42%
0.9
4%0
.017
933
93.
17%
2.14
%0
.016
0
Bong
aig
aon
4027
2.86
%0
.95%
0.0
139
3452
3.0
7%0
.99%
0.0
148
575
7.88
%3.
52%
0.0
390
Cac
har
3910
3.0
1%1.
16%
0.0
173
3311
3.51
%1.
17%
0.0
204
599
3.25
%1.
23%
0.0
122
Chi
rang
3971
3.52
%0
.91%
0.0
179
3672
3.55
%0
.93%
0.0
181
299
16.1
8%3.
16%
0.0
810
Dar
rang
4233
3.79
%1.
05%
0.0
214
3992
3.96
%1.
05%
0.0
224
241
6.18
%7.
01%
0.0
247
Dhe
maj
i42
09
2.94
%0
.70
%0
.014
139
303.
17%
0.7
0%
0.0
151
279
2.50
%4.
20%
0.0
097
Dhu
bri
4111
3.18
%1.
01%
0.0
191
3719
3.47
%1.
02%
0.0
208
392
1.94
%2.
71%
0.0
105
Dib
rug
arh
3826
3.55
%1.
04%
0.0
182
3116
4.32
%1.
09%
0.0
222
710
2.69
%1.
48%
0.0
124
Dim
a H
asao
3838
3.31
%1.
97%
0.0
205
2712
4.61
%2.
03%
0.0
290
1126
2.39
%3.
17%
0.0
094
Go
alp
ara
4248
3.53
%1.
51%
0.0
224
3780
3.96
%1.
51%
0.0
253
468
2.69
%6.
98%
0.0
106
Go
lag
hat
3739
2.39
%0
.88%
0.0
120
3436
2.57
%0
.90
%0
.012
930
35.
95%
3.35
%0
.029
9
Hai
laka
ndi
4326
2.91
%0
.97%
0.0
162
4015
3.0
5%0
.98%
0.0
171
311
6.0
6%2.
05%
0.0
271
Jorh
at37
752.
93%
0.7
9%0
.013
431
513.
45%
0.8
1%0
.015
862
44.
24%
3.41
%0
.019
1
Kam
rup
3885
3.57
%1.
13%
0.0
177
3562
3.88
%1.
20%
0.0
192
323
7.21
%3.
13%
0.0
391
*Sta
ndar
d e
rro
rs o
mm
itte
d f
or
po
int
esti
mat
es d
eriv
ed f
rom
sin
gle
ton
sam
plin
g u
nits
Stan
dar
d E
rro
rs:
Hea
dco
unt R
atio
, Int
ensi
ty, M
PIA
llR
ural
Urb
an
Stat
eD
istr
ict
Unw
eig
hted
Ob
serv
atio
nsH
ead
coun
tR
atio
Inte
nsity
MPI
Unw
eig
hted
Ob
serv
atio
nsH
ead
coun
tR
atio
Inte
nsity
MPI
Unw
eig
hted
Ob
serv
atio
nsH
ead
coun
tR
atio
Inte
nsity
MPI
Assam
Kam
rup
Met
rop
olit
an29
561.
89%
1.19
%0
.00
9468
44.
37%
1.99
%0
.022
822
722.
08%
1.52
%0
.010
2
Karb
i Ang
long
4042
3.30
%1.
55%
0.0
190
3592
3.60
%1.
60%
0.0
209
450
5.95
%1.
25%
0.0
258
Karim
gan
j45
152.
45%
0.9
8%0
.014
041
762.
60%
0.9
8%0
.014
933
91.
67%
1.43
%0
.00
73
Kokr
ajha
r38
682.
90%
1.0
3%0
.014
736
223.
08%
1.0
3%0
.015
624
66.
49%
0.4
2%0
.024
8
Lakh
imp
ur39
202.
92%
1.15
%0
.015
036
153.
19%
1.17
%0
.016
530
52.
94%
3.97
%0
.013
5
Mar
igao
n41
313.
87%
1.69
%0
.021
537
954.
14%
1.74
%0
.023
133
66.
56%
3.12
%0
.033
0
Nag
aon
3927
2.77
%0
.95%
0.0
143
3468
2.87
%0
.94%
0.0
153
459
7.76
%2.
22%
0.0
300
Nal
bar
i41
02
2.82
%1.
20%
0.0
138
3672
3.10
%1.
20%
0.0
152
430
2.99
%1.
90%
0.0
112
Siva
sag
ar40
09
3.13
%1.
11%
0.0
168
3629
3.42
%1.
11%
0.0
184
380
1.0
9%5.
85%
0.0
039
Soni
tpur
3971
2.92
%1.
05%
0.0
144
3657
3.14
%1.
05%
0.0
155
314
1.28
%0
.00
%0
.00
60
Tins
ukia
4087
3.32
%0
.68%
0.0
180
3314
4.0
0%
0.7
0%
0.0
217
773
2.32
%2.
53%
0.0
117
Ud
alg
uri
4185
3.0
5%0
.80
%0
.014
740
05
3.21
%0
.80
%0
.015
518
01.
28%
0.2
5%0
.00
43
Bihar
Ara
ria46
572.
76%
0.8
2%0
.017
043
202.
76%
0.8
3%0
.017
233
76.
90%
2.69
%0
.038
2
Arw
al50
08
2.72
%0
.84%
0.0
143
4560
2.90
%0
.86%
0.0
153
448
2.0
3%2.
30%
0.0
135
Aur
ang
abad
4835
2.61
%0
.88%
0.0
144
440
62.
48%
0.8
8%0
.014
042
911
.89%
3.51
%0
.064
3
Bank
a48
192.
52%
0.7
4%0
.014
546
142.
50%
0.7
6%0
.014
520
519
.30
%0
.85%
0.1
015
Beg
usar
ai47
832.
73%
0.9
2%0
.016
437
932.
99%
0.9
5%0
.017
999
05.
82%
2.79
%0
.034
3
Bhag
alp
ur50
09
2.77
%1.
02%
0.0
159
4010
3.0
4%1.
11%
0.0
179
999
5.0
4%2.
10%
0.0
266
Bho
jpur
5495
2.34
%0
.70
%0
.011
846
332.
50%
0.7
7%0
.013
086
26.
34%
1.15
%0
.027
8
Buxa
r52
752.
33%
0.7
1%0
.011
447
172.
54%
0.7
2%0
.012
755
82.
62%
3.38
%0
.012
8
Dar
bha
nga
4630
2.83
%1.
06%
0.0
174
4129
2.93
%1.
09%
0.0
183
501
9.0
0%
2.39
%0
.046
8
Gay
a56
08
3.13
%1.
02%
0.0
176
4862
3.40
%1.
07%
0.0
192
746
6.23
%3.
45%
0.0
352
Go
pal
gan
j50
192.
62%
0.7
8%0
.014
246
852.
19%
0.6
8%0
.011
033
419
.71%
1.62
%0
.110
1
Jam
ui49
842.
62%
0.8
8%0
.016
545
652.
75%
0.9
0%
0.0
175
419
5.25
%1.
54%
0.0
266
Jeha
nab
ad44
282.
36%
0.9
2%0
.012
638
03
2.55
%0
.95%
0.0
136
625
2.13
%2.
74%
0.0
125
Kaim
ur51
00
2.27
%0
.78%
0.0
129
4869
2.38
%0
.80
%0
.013
623
10
.03%
2.70
%0
.00
24
Katih
ar44
172.
63%
0.7
6%0
.016
739
942.
73%
0.7
6%0
.017
842
312
.89%
2.61
%0
.062
3
Khag
aria
4788
3.55
%1.
08%
0.0
222
4480
3.72
%1.
08%
0.0
233
308
3.69
%3.
60%
0.0
170
Kish
ang
anj
4699
2.61
%0
.87%
0.0
166
4120
2.58
%0
.92%
0.0
170
579
12.9
9%0
.66%
0.0
700
Lakh
isar
ai51
813.
22%
1.11
%0
.018
843
08
3.28
%1.
23%
0.0
197
873
9.58
%2.
31%
0.0
516
Mad
hep
ura
4611
1.79
%0
.76%
0.0
124
4419
1.84
%0
.76%
0.0
129
192
1.54
%0
.63%
0.0
085
Mad
hub
ani
4796
2.63
%0
.86%
0.0
154
4571
2.73
%0
.86%
0.0
159
225
3.70
%6.
41%
0.0
377
Mun
ger
460
32.
00
%0
.97%
0.0
118
3320
2.46
%1.
07%
0.0
150
1283
3.12
%1.
90%
0.0
151
Muz
affa
rpur
4446
2.64
%0
.76%
0.0
138
400
42.
71%
0.7
7%0
.013
944
210
.69%
3.14
%0
.061
7
Nal
and
a46
262.
68%
0.7
8%0
.015
538
572.
80%
0.8
0%
0.0
164
769
8.26
%3.
10%
0.0
461
Naw
ada
4684
2.61
%0
.97%
0.0
147
4193
2.63
%1.
00
%0
.015
549
18.
09%
1.43
%0
.035
9
Pash
chim
Cha
mp
aran
4468
3.0
3%1.
03%
0.0
200
3968
2.83
%0
.99%
0.0
191
500
5.10
%7.
75%
0.0
359
Patn
a99
182.
13%
0.6
7%0
.011
350
452.
86%
0.7
8%0
.016
348
732.
83%
1.40
%0
.014
3
Purb
a C
ham
par
an45
782.
47%
0.6
9%0
.014
841
312.
56%
0.7
1%0
.015
244
710
.66%
1.99
%0
.065
4
Purn
ia46
592.
72%
0.8
7%0
.016
541
862.
61%
0.8
6%0
.017
247
39.
30%
3.47
%0
.038
1
Roht
as54
602.
44%
0.6
6%0
.011
846
422.
65%
0.6
7%0
.012
981
83.
88%
3.0
4%0
.019
0
Saha
rsa
5026
2.93
%1.
04%
0.0
188
460
92.
98%
1.0
6%0
.019
641
713
.16%
1.22
%0
.066
1
Sam
astip
ur44
772.
57%
0.6
4%0
.015
143
00
2.67
%0
.65%
0.0
157
177
1.50
%1.
54%
0.0
031
TABle 23- STANDArD errorS: DISTrICT-WISe - heADCoUNT rATIo, INTeNSITy, MpI (CONTD.) STANDArD errorS: DISTrICT-WISe - heADCoUNT rATIo, INTeNSITy, MpI
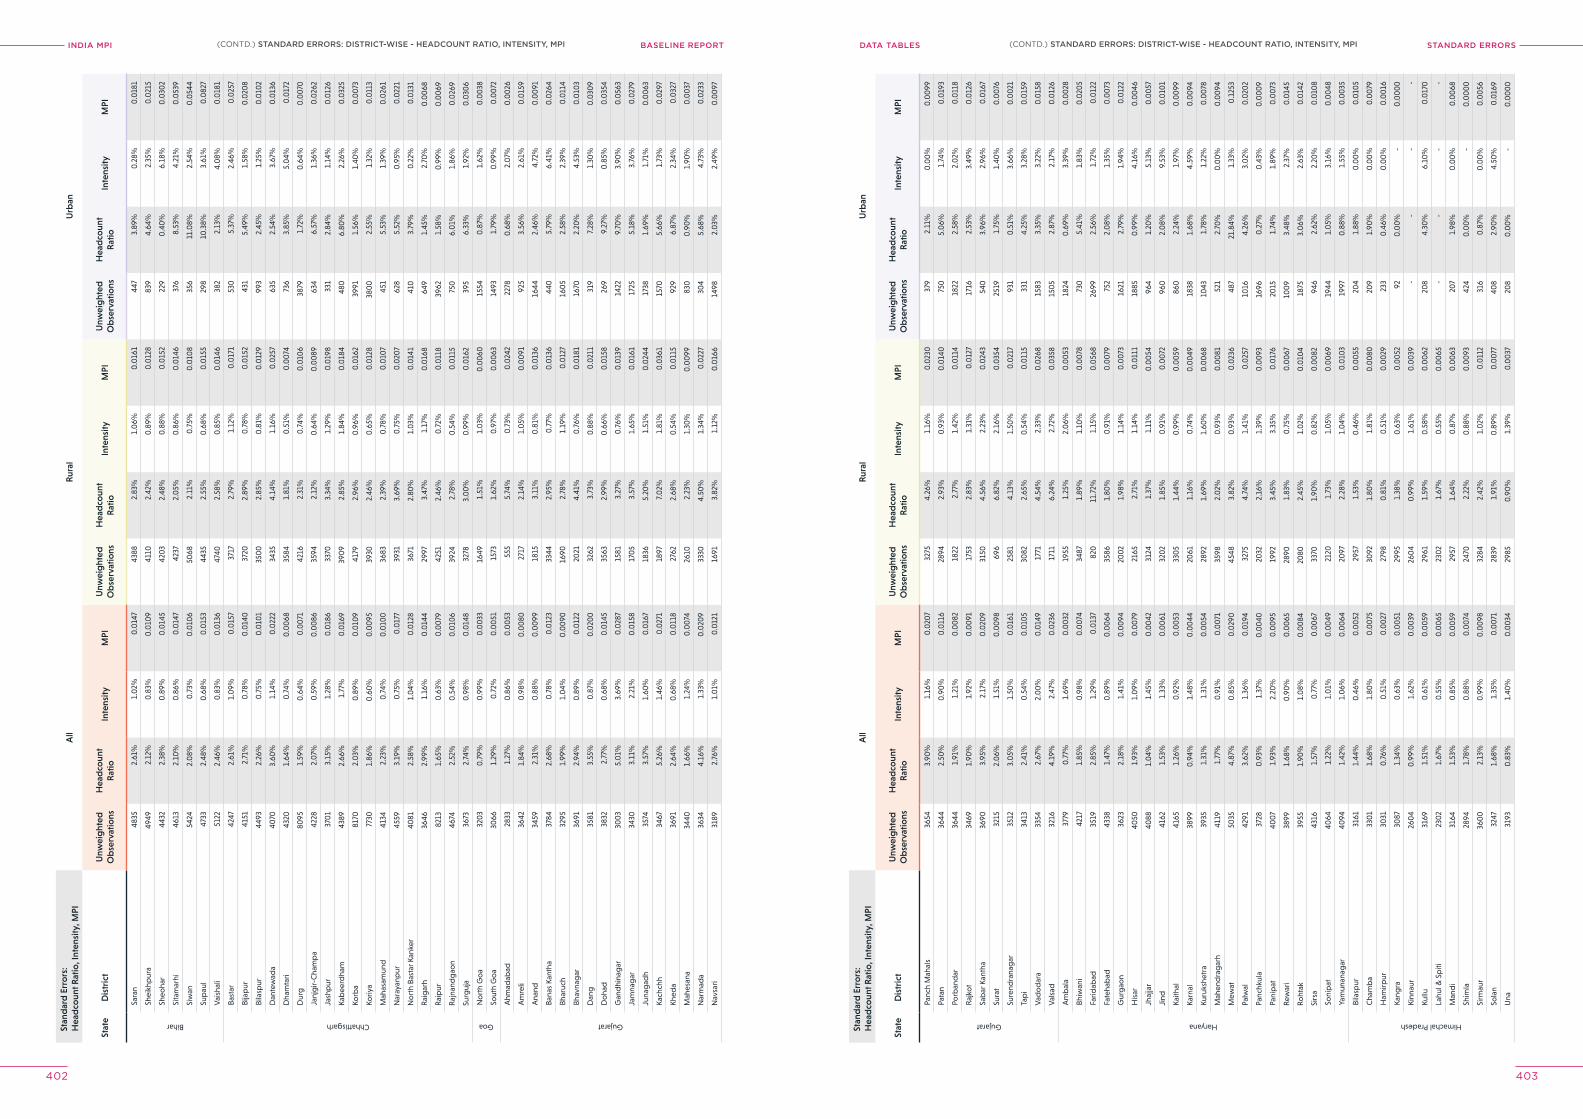
INDIA MPI BASELINE REPORT STANDArD errorSDATA TABleS
402 403
Stan
dar
d E
rro
rs:
Hea
dco
unt R
atio
, Int
ensi
ty, M
PIA
llR
ural
Urb
an
Stat
eD
istr
ict
Unw
eig
hted
Ob
serv
atio
nsH
ead
coun
tR
atio
Inte
nsity
MPI
Unw
eig
hted
Ob
serv
atio
nsH
ead
coun
tR
atio
Inte
nsity
MPI
Unw
eig
hted
Ob
serv
atio
nsH
ead
coun
tR
atio
Inte
nsity
MPI
Bihar
Sara
n48
352.
61%
1.0
2%0
.014
743
882.
83%
1.0
6%0
.016
144
73.
89%
0.2
8%0
.018
1
Shei
khp
ura
4949
2.12
%0
.83%
0.0
109
4110
2.42
%0
.89%
0.0
128
839
4.64
%2.
35%
0.0
215
Sheo
har
4432
2.38
%0
.89%
0.0
145
420
32.
48%
0.8
8%0
.015
222
90
.40
%6.
18%
0.0
302
Sita
mar
hi46
132.
10%
0.8
6%0
.014
742
372.
05%
0.8
6%0
.014
637
68.
53%
4.21
%0
.053
9
Siw
an54
242.
08%
0.7
3%0
.010
650
682.
11%
0.7
5%0
.010
835
611
.08%
2.54
%0
.054
4
Sup
aul
4733
2.48
%0
.68%
0.0
153
4435
2.55
%0
.68%
0.0
155
298
10.3
8%3.
61%
0.0
827
Vai
shal
i51
222.
46%
0.8
3%0
.013
647
402.
58%
0.8
5%0
.014
638
22.
13%
4.0
8%0
.018
1
Chhattisgarh
Bast
ar42
472.
61%
1.0
9%0
.015
737
172.
79%
1.12
%0
.017
153
05.
37%
2.46
%0
.025
7
Bija
pur
4151
2.71
%0
.78%
0.0
140
3720
2.89
%0
.78%
0.0
152
431
5.49
%1.
58%
0.0
208
Bila
spur
4493
2.26
%0
.75%
0.0
101
350
02.
85%
0.8
1%0
.012
999
32.
45%
1.25
%0
.010
2
Dan
tew
ada
4070
3.60
%1.
14%
0.0
222
3435
4.14
%1.
16%
0.0
257
635
2.54
%3.
67%
0.0
136
Dha
mta
ri43
201.
64%
0.7
4%0
.00
6835
841.
81%
0.5
1%0
.00
7473
63.
85%
5.0
4%0
.017
2
Dur
g80
951.
59%
0.6
4%0
.00
7142
162.
31%
0.7
4%0
.010
638
791.
72%
0.6
4%0
.00
70
Janj
gir-
Cha
mp
a42
282.
07%
0.5
9%0
.00
8635
942.
12%
0.6
4%0
.00
8963
46.
57%
1.36
%0
.026
2
Jash
pur
370
13.
15%
1.28
%0
.018
633
703.
34%
1.29
%0
.019
833
12.
84%
1.14
%0
.012
6
Kab
eerd
ham
4389
2.66
%1.
77%
0.0
169
390
92.
85%
1.84
%0
.018
448
06.
80%
2.26
%0
.032
5
Korb
a81
702.
03%
0.8
9%0
.010
941
792.
96%
0.9
6%0
.016
239
911.
56%
1.40
%0
.00
73
Koriy
a77
301.
86%
0.6
0%
0.0
095
3930
2.46
%0
.65%
0.0
128
380
02.
55%
1.32
%0
.011
3
Mah
asam
und
4134
2.23
%0
.74%
0.0
100
3683
2.39
%0
.78%
0.0
107
451
5.53
%1.
39%
0.0
261
Nar
ayan
pur
4559
3.19
%0
.75%
0.0
177
3931
3.69
%0
.75%
0.0
207
628
5.52
%0
.95%
0.0
221
No
rth
Bast
ar K
anke
r40
812.
58%
1.0
4%0
.012
836
712.
80%
1.0
3%0
.014
141
03.
79%
0.2
2%0
.013
1
Rai
gar
h36
462.
99%
1.16
%0
.014
429
973.
47%
1.17
%0
.016
864
91.
45%
2.70
%0
.00
68
Rai
pur
8213
1.65
%0
.63%
0.0
079
4251
2.46
%0
.72%
0.0
118
3962
1.58
%0
.99%
0.0
069
Raj
nand
gao
n46
742.
52%
0.5
4%0
.010
639
242.
78%
0.5
4%0
.011
575
06.
01%
1.86
%0
.026
9
Surg
uja
3673
2.74
%0
.98%
0.0
148
3278
3.0
0%
0.9
9%0
.016
239
56.
33%
1.92
%0
.030
6
Goa
No
rth
Go
a32
03
0.7
9%0
.99%
0.0
033
1649
1.51
%1.
03%
0.0
060
1554
0.8
7%1.
62%
0.0
038
Sout
h G
oa
3066
1.29
%0
.72%
0.0
051
1573
1.62
%0
.97%
0.0
063
1493
1.79
%0
.99%
0.0
072
Gujarat
Ahm
adab
ad28
331.
27%
0.8
6%0
.00
5355
55.
74%
0.7
3%0
.024
222
780
.68%
2.0
7%0
.00
26
Am
reli
3642
1.84
%0
.98%
0.0
080
2717
2.14
%1.
05%
0.0
091
925
3.56
%2.
61%
0.0
159
Ana
nd34
592.
31%
0.8
8%0
.00
9918
153.
11%
0.8
1%0
.013
616
442.
46%
4.72
%0
.00
91
Bana
s Ka
ntha
3784
2.68
%0
.78%
0.0
123
3344
2.95
%0
.77%
0.0
136
440
5.79
%6.
41%
0.0
264
Bhar
uch
3295
1.99
%1.
04%
0.0
090
1690
2.78
%1.
19%
0.0
127
160
52.
58%
2.39
%0
.011
4
Bhav
nag
ar36
912.
94%
0.8
9%0
.012
220
214.
41%
0.7
6%0
.018
116
702.
20%
4.53
%0
.010
3
Dan
g35
813.
55%
0.8
7%0
.020
032
623.
73%
0.8
8%0
.021
131
97.
28%
1.30
%0
.030
9
Do
had
3832
2.77
%0
.68%
0.0
145
3563
2.99
%0
.66%
0.0
158
269
9.27
%0
.85%
0.0
354
Gan
dhi
nag
ar30
03
5.0
1%3.
69%
0.0
287
1581
3.27
%0
.76%
0.0
139
1422
9.70
%3.
90%
0.0
563
Jam
nag
ar34
303.
11%
2.21
%0
.015
817
05
3.57
%1.
65%
0.0
161
1725
5.18
%3.
76%
0.0
279
Juna
gad
h35
743.
57%
1.60
%0
.016
718
365.
20%
1.51
%0
.024
417
381.
69%
1.71
%0
.00
63
Kach
chh
3467
5.26
%1.
46%
0.0
271
1897
7.0
2%1.
81%
0.0
361
1570
5.66
%1.
73%
0.0
297
Khed
a36
912.
64%
0.6
8%0
.011
827
622.
68%
0.5
4%0
.011
592
96.
87%
2.34
%0
.032
7
Mah
esan
a34
401.
66%
1.24
%0
.00
7426
102.
23%
1.30
%0
.00
9983
00
.90
%1.
90%
0.0
037
Nar
mad
a36
344.
16%
1.33
%0
.020
933
304.
50%
1.34
%0
.022
730
45.
68%
4.73
%0
.023
3
Nav
sari
3189
2.76
%1.
01%
0.0
121
1691
3.82
%1.
12%
0.0
166
1498
2.0
3%2.
49%
0.0
097
Stan
dar
d E
rro
rs:
Hea
dco
unt R
atio
, Int
ensi
ty, M
PIA
llR
ural
Urb
an
Stat
eD
istr
ict
Unw
eig
hted
Ob
serv
atio
nsH
ead
coun
tR
atio
Inte
nsity
MPI
Unw
eig
hted
Ob
serv
atio
nsH
ead
coun
tR
atio
Inte
nsity
MPI
Unw
eig
hted
Ob
serv
atio
nsH
ead
coun
tR
atio
Inte
nsity
MPI
Gujarat
Panc
h M
ahal
s36
543.
90%
1.16
%0
.020
732
754.
26%
1.16
%0
.023
037
92.
11%
0.0
0%
0.0
099
Pata
n36
442.
50%
0.9
0%
0.0
116
2894
2.93
%0
.93%
0.0
140
750
5.0
6%1.
74%
0.0
193
Porb
and
ar36
441.
91%
1.21
%0
.00
8218
222.
77%
1.42
%0
.011
418
222.
58%
2.0
2%0
.011
8
Raj
kot
3469
1.90
%1.
92%
0.0
091
1753
2.83
%1.
31%
0.0
127
1716
2.53
%3.
49%
0.0
126
Sab
ar K
anth
a36
903.
95%
2.17
%0
.020
931
504.
56%
2.23
%0
.024
354
03.
96%
2.96
%0
.016
7
Sura
t32
152.
06%
1.51
%0
.00
9869
66.
82%
2.16
%0
.035
425
191.
75%
1.40
%0
.00
76
Sure
ndra
nag
ar35
123.
05%
1.50
%0
.016
125
814.
13%
1.50
%0
.021
793
10
.51%
3.66
%0
.00
21
Tap
i34
132.
41%
0.5
4%0
.010
530
822.
65%
0.5
4%0
.011
533
14.
25%
3.28
%0
.015
9
Vad
od
ara
3354
2.67
%2.
00
%0
.014
917
714.
54%
2.33
%0
.026
815
833.
35%
3.22
%0
.015
8
Val
sad
3216
4.19
%2.
47%
0.0
236
1711
6.24
%2.
72%
0.0
358
150
52.
87%
2.17
%0
.012
6
Haryana
Am
bal
a37
790
.77%
1.69
%0
.00
3219
551.
25%
2.0
6%0
.00
5318
240
.69%
3.39
%0
.00
28
Bhiw
ani
4217
1.85
%0
.98%
0.0
074
3487
1.89
%1.
10%
0.0
078
730
5.41
%1.
83%
0.0
205
Farid
abad
3519
2.85
%1.
29%
0.0
137
820
11.7
2%1.
15%
0.0
568
2699
2.56
%1.
72%
0.0
122
Fate
hab
ad43
381.
47%
0.8
9%0
.00
6435
861.
80%
0.9
1%0
.00
7975
22.
08%
1.35
%0
.00
73
Gur
gao
n36
232.
18%
1.41
%0
.00
9420
02
1.98
%1.
14%
0.0
073
1621
2.79
%1.
94%
0.0
122
His
ar40
501.
93%
1.0
9%0
.00
7921
652.
71%
1.14
%0
.011
118
850
.99%
4.16
%0
.00
46
Jhaj
jar
4088
1.0
4%1.
45%
0.0
042
3124
1.37
%1.
11%
0.0
054
964
1.20
%5.
13%
0.0
057
Jind
4162
1.53
%1.
33%
0.0
061
320
21.
85%
0.9
1%0
.00
7296
02.
08%
9.53
%0
.010
1
Kaith
al41
651.
26%
0.9
2%0
.00
5333
05
1.44
%0
.99%
0.0
059
860
2.24
%1.
97%
0.0
099
Karn
al38
990
.94%
1.48
%0
.00
4420
611.
16%
0.7
4%0
.00
4918
381.
68%
4.59
%0
.00
94
Kuru
kshe
tra
3935
1.31
%1.
31%
0.0
054
2892
1.69
%1.
60%
0.0
068
1043
1.78
%1.
22%
0.0
078
Mah
end
rag
arh
4119
1.77
%0
.91%
0.0
071
3598
2.0
2%0
.93%
0.0
081
521
2.70
%0
.00
%0
.00
94
Mew
at50
354.
87%
0.8
5%0
.029
045
483.
82%
0.9
3%0
.023
648
721
.84%
1.33
%0
.125
3
Palw
al42
913.
62%
1.36
%0
.019
432
754.
74%
1.41
%0
.025
710
164.
26%
3.0
2%0
.020
2
Panc
hkul
a37
280
.93%
1.37
%0
.00
4020
322.
16%
1.39
%0
.00
9316
960
.27%
0.4
3%0
.00
09
Pani
pat
400
71.
93%
2.20
%0
.00
9519
923.
45%
3.35
%0
.017
620
151.
74%
1.89
%0
.00
73
Rew
ari
3899
1.68
%0
.90
%0
.00
6528
901.
83%
0.7
5%0
.00
6710
09
3.48
%2.
37%
0.0
145
Roht
ak39
551.
90%
1.0
8%0
.00
8420
802.
45%
1.0
2%0
.010
418
753.
06%
2.63
%0
.014
2
Sirs
a43
161.
57%
0.7
7%0
.00
6733
701.
90%
0.8
2%0
.00
8294
62.
62%
2.20
%0
.010
8
Soni
pat
4064
1.22
%1.
01%
0.0
049
2120
1.73
%1.
05%
0.0
069
1944
1.0
5%3.
16%
0.0
048
Yam
unan
agar
4094
1.42
%1.
06%
0.0
064
2097
2.28
%1.
04%
0.0
103
1997
0.8
8%1.
55%
0.0
035
Himachal Pradesh
Bila
spur
3161
1.44
%0
.46%
0.0
052
2957
1.53
%0
.46%
0.0
055
204
1.88
%0
.00
%0
.010
5
Cha
mb
a33
01
1.68
%1.
80%
0.0
075
3092
1.80
%1.
81%
0.0
080
209
1.90
%0
.00
%0
.00
79
Ham
irpur
3031
0.7
6%0
.51%
0.0
027
2798
0.8
1%0
.51%
0.0
029
233
0.4
6%0
.00
%0
.00
16
Kang
ra30
871.
34%
0.6
3%0
.00
5129
951.
38%
0.6
3%0
.00
5292
0.0
0%
-0
.00
00
Kinn
aur
260
40
.99%
1.62
%0
.00
3926
04
0.9
9%1.
61%
0.0
039
--
--
Kullu
3169
1.51
%0
.61%
0.0
059
2961
1.59
%0
.58%
0.0
062
208
4.30
%6.
10%
0.0
170
Lahu
l & S
piti
230
21.
67%
0.5
5%0
.00
6523
02
1.67
%0
.55%
0.0
065
--
--
Man
di
3164
1.53
%0
.85%
0.0
059
2957
1.64
%0
.87%
0.0
063
207
1.98
%0
.00
%0
.00
68
Shim
la28
941.
78%
0.8
8%0
.00
7424
702.
22%
0.8
8%0
.00
9342
40
.00
%-
0.0
00
0
Sirm
aur
360
02.
13%
0.9
9%0
.00
9832
842.
42%
1.0
2%0
.011
231
60
.87%
0.0
0%
0.0
056
Sola
n32
471.
68%
1.35
%0
.00
7128
391.
91%
0.8
9%0
.00
7740
82.
90%
4.50
%0
.016
9
Una
3193
0.8
3%1.
40%
0.0
034
2985
0.9
0%
1.39
%0
.00
3720
80
.00
%-
0.0
00
0
(CONTD.) STANDArD errorS: DISTrICT-WISe - heADCoUNT rATIo, INTeNSITy, MpI(CONTD.) STANDArD errorS: DISTrICT-WISe - heADCoUNT rATIo, INTeNSITy, MpI
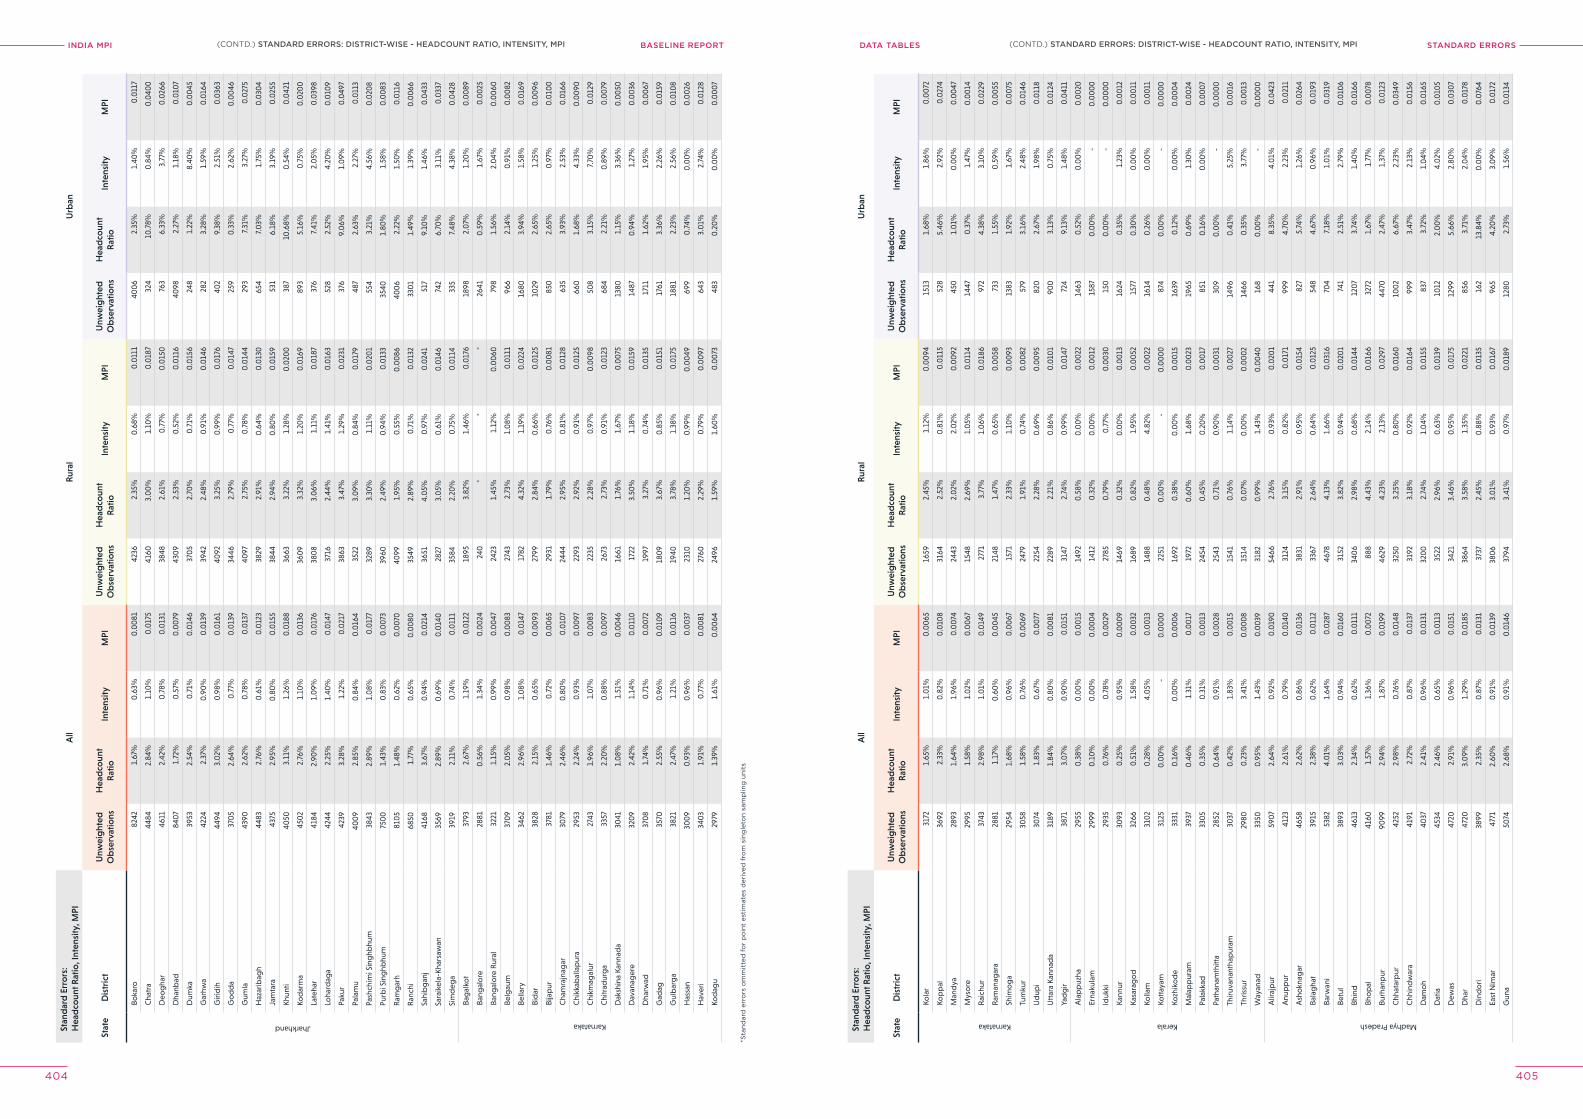
INDIA MPI BASELINE REPORT STANDArD errorSDATA TABleS
404 405
Stan
dar
d E
rro
rs:
Hea
dco
unt R
atio
, Int
ensi
ty, M
PIA
llR
ural
Urb
an
Stat
eD
istr
ict
Unw
eig
hted
Ob
serv
atio
nsH
ead
coun
tR
atio
Inte
nsity
MPI
Unw
eig
hted
Ob
serv
atio
nsH
ead
coun
tR
atio
Inte
nsity
MPI
Unw
eig
hted
Ob
serv
atio
nsH
ead
coun
tR
atio
Inte
nsity
MPI
Jharkhand
Boka
ro82
421.
67%
0.6
3%0
.00
8142
362.
35%
0.6
8%0
.011
140
06
2.35
%1.
40%
0.0
117
Cha
tra
4484
2.84
%1.
10%
0.0
175
4160
3.0
0%
1.10
%0
.018
732
410
.78%
0.8
4%0
.040
0
Deo
gha
r46
112.
42%
0.7
8%0
.013
138
482.
61%
0.7
7%0
.015
076
36.
33%
3.77
%0
.026
6
Dha
nbad
840
71.
72%
0.5
7%0
.00
7943
09
2.53
%0
.52%
0.0
116
4098
2.27
%1.
18%
0.0
107
Dum
ka39
532.
54%
0.7
1%0
.014
637
05
2.70
%0
.71%
0.0
156
248
1.22
%8.
40%
0.0
045
Gar
hwa
4224
2.37
%0
.90
%0
.013
939
422.
48%
0.9
1%0
.014
628
23.
28%
1.59
%0
.016
4
Giri
dih
4494
3.0
2%0
.98%
0.0
161
4092
3.25
%0
.99%
0.0
176
402
9.38
%2.
51%
0.0
363
Go
dd
a37
05
2.64
%0
.77%
0.0
139
3446
2.79
%0
.77%
0.0
147
259
0.3
3%2.
62%
0.0
046
Gum
la43
902.
62%
0.7
8%0
.013
740
972.
75%
0.7
8%0
.014
429
37.
31%
3.27
%0
.027
5
Haz
arib
agh
4483
2.76
%0
.61%
0.0
123
3829
2.91
%0
.64%
0.0
130
654
7.0
3%1.
75%
0.0
304
Jam
tara
4375
2.95
%0
.80
%0
.015
538
442.
94%
0.8
0%
0.0
159
531
6.18
%3.
19%
0.0
255
Khun
ti40
503.
11%
1.26
%0
.018
836
633.
22%
1.28
%0
.020
038
710
.68%
0.5
4%0
.042
1
Kod
arm
a45
02
2.76
%1.
10%
0.0
136
360
93.
32%
1.20
%0
.016
989
35.
16%
0.7
5%0
.020
0
Late
har
4184
2.90
%1.
09%
0.0
176
380
83.
06%
1.11
%0
.018
737
67.
41%
2.0
5%0
.039
8
Loha
rdag
a42
442.
25%
1.40
%0
.014
737
162.
44%
1.41
%0
.016
352
82.
52%
4.20
%0
.010
9
Paku
r42
393.
28%
1.22
%0
.021
738
633.
47%
1.29
%0
.023
137
69.
06%
1.0
9%0
.049
7
Pala
mu
400
92.
85%
0.8
4%0
.016
435
223.
09%
0.8
4%0
.017
948
72.
63%
2.27
%0
.011
3
Pash
chim
i Sin
ghb
hum
3843
2.89
%1.
08%
0.0
177
3289
3.30
%1.
11%
0.0
201
554
3.21
%4.
56%
0.0
208
Purb
i Sin
ghb
hum
750
01.
43%
0.8
3%0
.00
7339
602.
49%
0.9
4%0
.013
335
401.
80%
1.58
%0
.00
83
Ram
gar
h81
05
1.48
%0
.62%
0.0
070
4099
1.95
%0
.55%
0.0
086
400
62.
22%
1.50
%0
.011
6
Ran
chi
6850
1.77
%0
.65%
0.0
080
3549
2.89
%0
.71%
0.0
132
330
11.
49%
1.39
%0
.00
66
Sahi
bg
anj
4168
3.67
%0
.94%
0.0
214
3651
4.0
5%0
.97%
0.0
241
517
9.10
%1.
46%
0.0
433
Sara
ikel
a-Kh
arsa
wan
3569
2.89
%0
.69%
0.0
140
2827
3.0
5%0
.61%
0.0
146
742
6.70
%3.
11%
0.0
337
Sim
deg
a39
192.
11%
0.7
4%0
.011
135
842.
20%
0.7
5%0
.011
433
57.
48%
4.38
%0
.042
8
Karnataka
Bag
alko
t37
932.
67%
1.19
%0
.012
218
953.
82%
1.46
%0
.017
618
982.
07%
1.20
%0
.00
89
Bang
alo
re28
810
.56%
1.34
%0
.00
2424
0*
**
2641
0.5
9%1.
67%
0.0
025
Bang
alo
re R
ural
3221
1.15
%0
.99%
0.0
047
2423
1.45
%1.
12%
0.0
060
798
1.56
%2.
04%
0.0
060
Belg
aum
370
92.
05%
0.9
8%0
.00
8327
432.
73%
1.0
8%0
.011
196
62.
14%
0.9
1%0
.00
82
Bella
ry34
622.
96%
1.0
8%0
.014
717
824.
32%
1.19
%0
.022
416
803.
94%
1.58
%0
.016
9
Bid
ar38
282.
15%
0.6
5%0
.00
9327
992.
84%
0.6
6%0
.012
510
292.
65%
1.25
%0
.00
96
Bija
pur
3781
1.46
%0
.72%
0.0
065
2931
1.79
%0
.76%
0.0
081
850
2.65
%0
.97%
0.0
100
Cha
mra
jnag
ar30
792.
46%
0.8
0%
0.0
107
2444
2.95
%0
.81%
0.0
128
635
3.93
%2.
53%
0.0
166
Chi
kkab
alla
pur
a29
532.
24%
0.9
3%0
.00
9722
932.
92%
0.9
1%0
.012
566
01.
68%
4.33
%0
.00
90
Chi
kmag
alur
2743
1.96
%1.
07%
0.0
083
2235
2.28
%0
.97%
0.0
098
508
3.15
%7.
70%
0.0
129
Chi
trad
urg
a33
572.
20%
0.8
8%0
.00
9726
732.
73%
0.9
1%0
.012
368
42.
21%
0.8
9%0
.00
79
Dak
shin
a Ka
nnad
a30
411.
08%
1.51
%0
.00
4616
611.
76%
1.67
%0
.00
7513
801.
15%
3.36
%0
.00
50
Dav
anag
ere
320
92.
42%
1.14
%0
.011
017
223.
50%
1.18
%0
.015
914
870
.94%
1.27
%0
.00
36
Dha
rwad
370
81.
74%
0.7
1%0
.00
7219
973.
27%
0.7
4%0
.013
517
111.
62%
1.95
%0
.00
67
Gad
ag35
702.
55%
0.9
6%0
.010
918
09
3.67
%0
.85%
0.0
151
1761
3.36
%2.
26%
0.0
159
Gul
bar
ga
3821
2.47
%1.
21%
0.0
116
1940
3.78
%1.
38%
0.0
175
1881
2.23
%2.
56%
0.0
108
Has
san
300
90
.93%
0.9
6%0
.00
3723
101.
20%
0.9
9%0
.00
4969
90
.74%
0.0
0%
0.0
026
Hav
eri
340
31.
91%
0.7
7%0
.00
8127
602.
29%
0.7
9%0
.00
9764
33.
01%
2.74
%0
.012
8
Kod
agu
2979
1.39
%1.
61%
0.0
064
2496
1.59
%1.
60%
0.0
073
483
0.2
0%
0.0
0%
0.0
00
7
*Sta
ndar
d e
rro
rs o
mm
itte
d f
or
po
int
esti
mat
es d
eriv
ed f
rom
sin
gle
ton
sam
plin
g u
nits
Stan
dar
d E
rro
rs:
Hea
dco
unt R
atio
, Int
ensi
ty, M
PIA
llR
ural
Urb
an
Stat
eD
istr
ict
Unw
eig
hted
Ob
serv
atio
nsH
ead
coun
tR
atio
Inte
nsity
MPI
Unw
eig
hted
Ob
serv
atio
nsH
ead
coun
tR
atio
Inte
nsity
MPI
Unw
eig
hted
Ob
serv
atio
nsH
ead
coun
tR
atio
Inte
nsity
MPI
Karnataka
Kola
r31
721.
65%
1.0
1%0
.00
6516
592.
45%
1.12
%0
.00
9415
131.
68%
1.86
%0
.00
72
Kop
pal
3692
2.33
%0
.82%
0.0
108
3164
2.52
%0
.81%
0.0
115
528
5.46
%2.
92%
0.0
274
Man
dya
2893
1.64
%1.
96%
0.0
074
2443
2.0
2%2.
02%
0.0
092
450
1.0
1%0
.00
%0
.00
47
Mys
ore
2995
1.58
%1.
02%
0.0
067
1548
2.69
%1.
05%
0.0
114
1447
0.3
7%1.
47%
0.0
014
Rai
chur
3743
2.98
%1.
01%
0.0
149
2771
3.77
%1.
06%
0.0
186
972
4.38
%3.
10%
0.0
229
Ram
anag
ara
2881
1.17
%0
.60
%0
.00
4521
481.
47%
0.6
5%0
.00
5873
31.
55%
0.5
9%0
.00
55
Shim
og
a29
541.
68%
0.9
6%0
.00
6715
712.
33%
1.10
%0
.00
9313
831.
92%
1.67
%0
.00
75
Tum
kur
3058
1.58
%0
.76%
0.0
069
2479
1.91
%0
.74%
0.0
082
579
3.16
%2.
48%
0.0
146
Ud
upi
3074
1.83
%0
.67%
0.0
077
2254
2.28
%0
.69%
0.0
095
820
2.67
%1.
98%
0.0
118
Utt
ara
Kann
ada
3189
1.84
%0
.80
%0
.00
8122
892.
21%
0.8
6%0
.010
190
03.
13%
0.7
5%0
.012
4
Yad
gir
3871
3.0
7%0
.90
%0
.015
131
472.
74%
0.9
9%0
.014
772
49.
13%
1.48
%0
.041
1
Kerala
Ala
pp
uzha
2955
0.3
8%0
.00
%0
.00
1514
920
.58%
0.0
0%
0.0
022
1463
0.5
2%0
.00
%0
.00
20
Erna
kula
m29
990
.10
%0
.00
%0
.00
04
1412
0.3
2%0
.00
%0
.00
1215
870
.00
%-
0.0
00
0
Iduk
ki29
350
.76%
0.7
8%0
.00
2927
850
.79%
0.7
7%0
.00
3015
00
.00
%-
0.0
00
0
Kann
ur30
930
.25%
0.9
5%0
.00
09
1469
0.3
2%0
.00
%0
.00
1316
240
.35%
1.23
%0
.00
12
Kasa
rag
od
3266
0.5
1%1.
58%
0.0
032
1689
0.8
2%1.
95%
0.0
052
1577
0.3
0%
0.0
0%
0.0
011
Kolla
m31
02
0.2
8%4.
05%
0.0
013
1488
0.4
8%4.
82%
0.0
022
1614
0.2
6%0
.00
%0
.00
11
Kott
ayam
3125
0.0
0%
-0
.00
00
2251
0.0
0%
-0
.00
00
874
0.0
0%
-0
.00
00
Kozh
iko
de
3331
0.1
6%0
.00
%0
.00
06
1692
0.3
8%0
.00
%0
.00
1516
390
.12%
0.0
0%
0.0
00
4
Mal
app
uram
3937
0.4
6%1.
31%
0.0
017
1972
0.6
0%
1.68
%0
.00
2319
650
.69%
1.30
%0
.00
24
Pala
kkad
330
50
.35%
0.3
1%0
.00
1324
540
.45%
0.2
0%
0.0
017
851
0.1
6%0
.00
%0
.00
07
Path
anam
thitt
a28
520
.64%
0.9
1%0
.00
2825
430
.71%
0.9
0%
0.0
031
309
0.0
0%
-0
.00
00
Thiru
vana
ntha
pur
am30
370
.42%
1.83
%0
.00
1515
410
.76%
1.14
%0
.00
2714
960
.41%
5.25
%0
.00
16
Thris
sur
2980
0.2
3%3.
41%
0.0
00
815
140
.07%
0.0
0%
0.0
00
214
660
.35%
3.77
%0
.00
13
Way
anad
3350
0.9
5%1.
43%
0.0
039
3182
0.9
9%1.
43%
0.0
040
168
0.0
0%
-0
.00
00
Madhya Pradesh
Alir
ajp
ur59
07
2.64
%0
.92%
0.0
190
5466
2.76
%0
.93%
0.0
201
441
8.35
%4.
01%
0.0
423
Anu
pp
ur41
232.
61%
0.7
9%0
.014
031
243.
15%
0.8
2%0
.017
199
94.
70%
2.23
%0
.021
1
Ash
okn
agar
4658
2.62
%0
.86%
0.0
136
3831
2.91
%0
.95%
0.0
154
827
5.74
%1.
26%
0.0
264
Bala
gha
t39
152.
38%
0.6
2%0
.011
233
672.
64%
0.6
4%0
.012
554
84.
6 7%
0.9
6%0
.019
3
Barw
ani
5382
4.0
1%1.
64%
0.0
287
4678
4.13
%1.
66%
0.0
316
704
7.18
%1.
01%
0.0
319
Betu
l38
933.
03%
0.9
4%0
.016
031
523.
82%
0.9
4%0
.020
174
12.
51%
2.79
%0
.010
6
Bhin
d46
132.
34%
0.6
2%0
.011
134
06
2.98
%0
.68%
0.0
144
120
73.
74%
1.40
%0
.016
6
Bho
pal
4160
1.57
%1.
36%
0.0
072
888
4.43
%2.
14%
0.0
166
3272
1.67
%1.
77%
0.0
078
Burh
anp
ur90
992.
94%
1.87
%0
.019
946
294.
23%
2.13
%0
.029
744
702.
47%
1.37
%0
.012
3
Chh
atar
pur
4252
2.98
%0
.76%
0.0
148
3250
3.25
%0
.80
%0
.016
010
02
6.67
%2.
23%
0.0
349
Chh
ind
war
a41
912.
72%
0.8
7%0
.013
731
923.
18%
0.9
2%0
.016
499
93.
47%
2.13
%0
.015
6
Dam
oh
4037
2.41
%0
.96%
0.0
131
320
02.
74%
1.0
4%0
.015
583
73.
72%
1.0
4%0
.016
5
Dat
ia45
342.
46%
0.6
5%0
.011
335
222.
96%
0.6
3%0
.013
910
122.
00
%4.
02%
0.0
105
Dew
as47
202.
91%
0.9
6%0
.015
134
213.
46%
0.9
5%0
.017
512
995.
66%
2.80
%0
.030
7
Dha
r47
203.
09%
1.29
%0
.018
538
643.
58%
1.35
%0
.022
185
63.
71%
2.0
4%0
.017
8
Din
do
ri38
992.
35%
0.8
7%0
.013
137
372.
45%
0.8
8%0
.013
516
213
.84%
0.0
0%
0.0
764
East
Nim
ar47
712.
60%
0.9
1%0
.013
938
06
3.0
1%0
.93%
0.0
167
965
4.20
%3.
09%
0.0
172
Gun
a50
742.
68%
0.9
1%0
.014
637
943.
41%
0.9
7%0
.018
912
802.
73%
1.56
%0
.013
4
(CONTD.) STANDArD errorS: DISTrICT-WISe - heADCoUNT rATIo, INTeNSITy, MpI(CONTD.) STANDArD errorS: DISTrICT-WISe - heADCoUNT rATIo, INTeNSITy, MpI
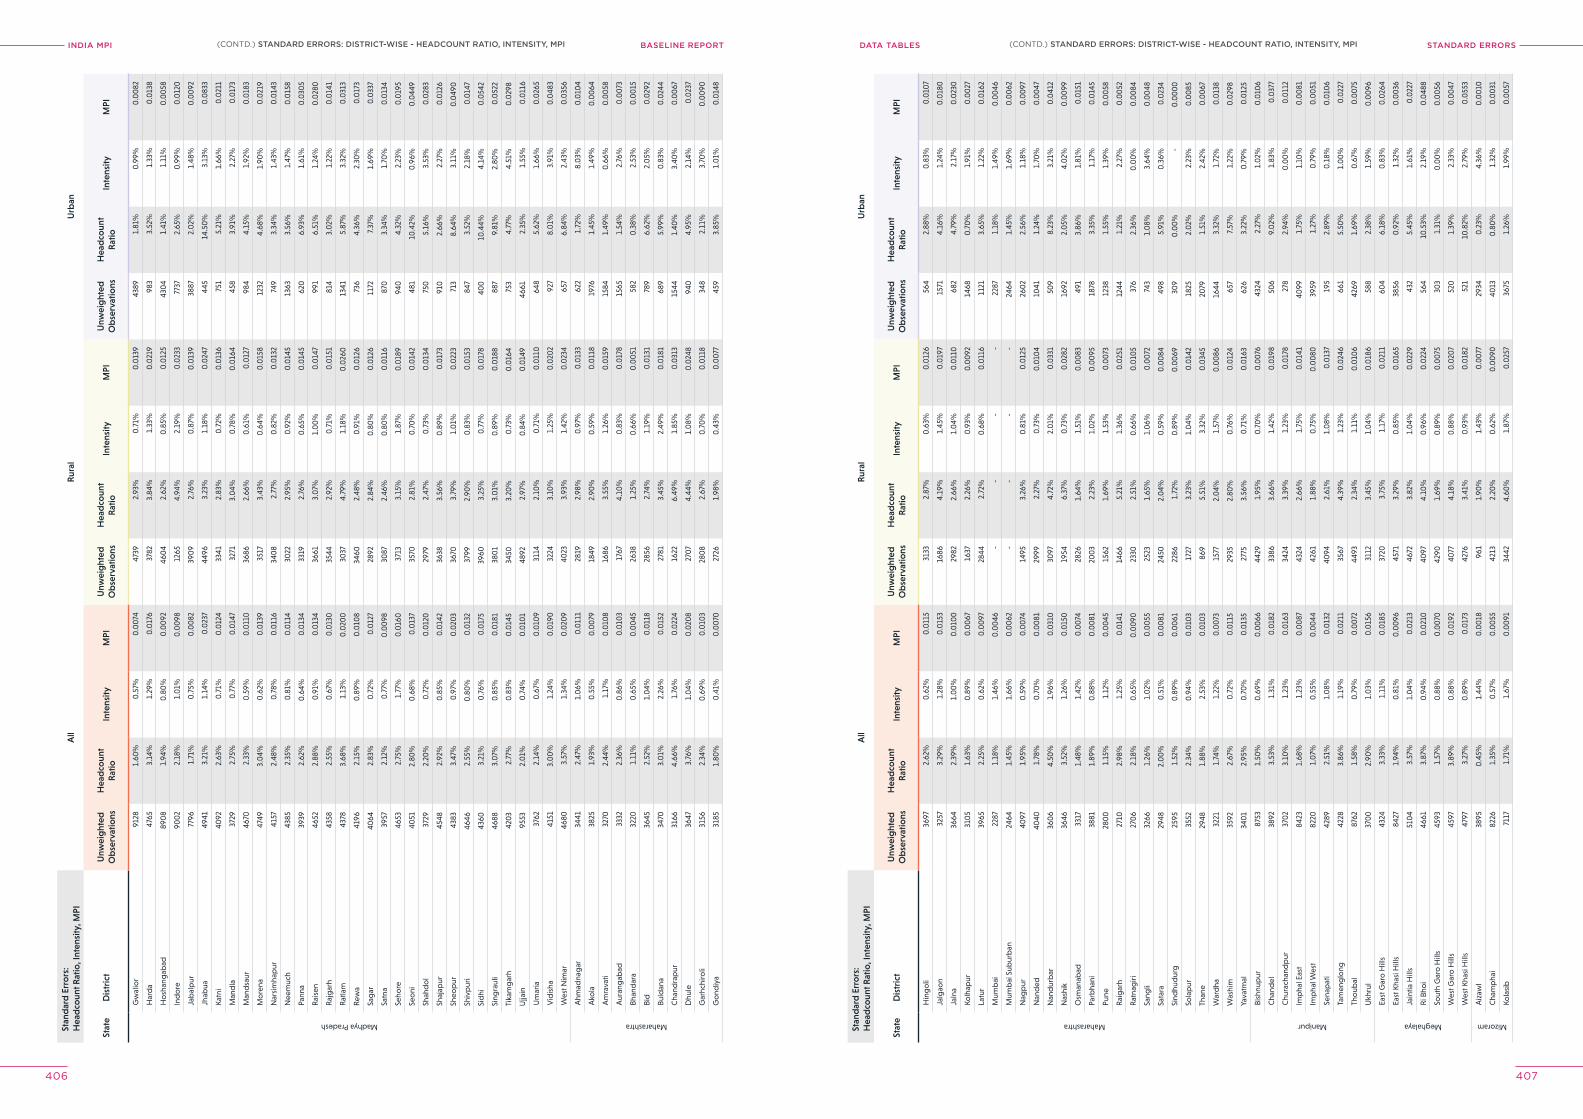
INDIA MPI BASELINE REPORT STANDArD errorSDATA TABleS
406 407
Stan
dar
d E
rro
rs:
Hea
dco
unt R
atio
, Int
ensi
ty, M
PIA
llR
ural
Urb
an
Stat
eD
istr
ict
Unw
eig
hted
Ob
serv
atio
nsH
ead
coun
tR
atio
Inte
nsity
MPI
Unw
eig
hted
Ob
serv
atio
nsH
ead
coun
tR
atio
Inte
nsity
MPI
Unw
eig
hted
Ob
serv
atio
nsH
ead
coun
tR
atio
Inte
nsity
MPI
Madhya Pradesh
Gw
alio
r91
281.
60%
0.5
7%0
.00
7447
392.
93%
0.7
1%0
.013
943
891.
81%
0.9
9%0
.00
82
Har
da
4765
3.14
%1.
29%
0.0
176
3782
3.84
%1.
33%
0.0
219
983
3.52
%1.
33%
0.0
138
Ho
shan
gab
ad89
08
1.94
%0
.80
%0
.00
9246
04
2.62
%0
.85%
0.0
125
430
41.
41%
1.11
%0
.00
58
Ind
ore
900
22.
18%
1.0
1%0
.00
9812
654.
94%
2.19
%0
.023
377
372.
65%
0.9
9%0
.012
0
Jab
alp
ur77
961.
71%
0.7
5%0
.00
8239
09
2.76
%0
.87%
0.0
139
3887
2.0
2%1.
48%
0.0
092
Jhab
ua49
413.
21%
1.14
%0
.023
744
963.
23%
1.18
%0
.024
744
514
.50
%3.
13%
0.0
833
Katn
i40
922.
63%
0.7
1%0
.012
433
412.
83%
0.7
2%0
.013
675
15.
21%
1.66
%0
.021
1
Man
dla
3729
2.75
%0
.77%
0.0
147
3271
3.0
4%0
.78%
0.0
164
458
3.91
%2.
27%
0.0
173
Man
dsa
ur46
702.
33%
0.5
9%0
.011
036
862.
66%
0.6
1%0
.012
798
44.
15%
1.92
%0
.018
3
Mo
rena
4749
3.0
4%0
.62%
0.0
139
3517
3.43
%0
.64%
0.0
158
1232
4.68
%1.
90%
0.0
219
Nar
sim
hap
ur41
572.
48%
0.7
8%0
.011
634
08
2.77
%0
.82%
0.0
132
749
3.34
%1.
43%
0.0
143
Nee
muc
h43
852.
35%
0.8
1%0
.011
430
222.
95%
0.9
2%0
.014
513
633.
56%
1.47
%0
.015
8
Pann
a39
392.
62%
0.6
4%0
.013
433
192.
76%
0.6
5%0
.014
562
06.
93%
1.61
%0
.030
5
Rai
sen
4652
2.88
%0
.91%
0.0
134
3661
3.0
7%1.
00
%0
.014
799
16.
51%
1.24
%0
.028
0
Raj
gar
h43
582.
55%
0.6
7%0
.013
035
442.
92%
0.7
1%0
.015
181
43.
02%
1.22
%0
.014
1
Rat
lam
4378
3.68
%1.
13%
0.0
200
3037
4.79
%1.
18%
0.0
260
1341
5.87
%3.
32%
0.0
313
Rew
a41
962.
15%
0.8
9%0
.010
834
602.
48%
0.9
1%0
.012
673
64.
36%
2.30
%0
.017
3
Sag
ar40
642.
83%
0.7
2%0
.012
728
922.
84%
0.8
0%
0.0
126
1172
7.37
%1.
69%
0.0
337
Satn
a39
572.
12%
0.7
7%0
.00
9830
872.
46%
0.8
0%
0.0
116
870
3.34
%1.
70%
0.0
134
Seho
re46
532.
75%
1.77
%0
.016
037
133.
15%
1.87
%0
.018
994
04.
32%
2.23
%0
.019
5
Seo
ni40
512.
80%
0.6
8%0
.013
735
702.
81%
0.7
0%
0.0
142
481
10.4
2%0
.96%
0.0
449
Shah
do
l37
292.
20%
0.7
2%0
.012
029
792.
47%
0.7
3%0
.013
475
05.
16%
3.53
%0
.028
3
Shaj
apur
4548
2.92
%0
.85%
0.0
142
3638
3.56
%0
.89%
0.0
173
910
2.66
%2.
27%
0.0
126
Sheo
pur
4383
3.47
%0
.97%
0.0
203
3670
3.79
%1.
01%
0.0
223
713
8.64
%3.
11%
0.0
490
Shiv
pur
i46
462.
55%
0.8
0%
0.0
132
3799
2.90
%0
.83%
0.0
153
847
3.52
%2.
18%
0.0
147
Sid
hi43
603.
21%
0.7
6%0
.017
539
603.
25%
0.7
7%0
.017
840
010
.44%
4.14
%0
.054
2
Sing
raul
i46
883.
07%
0.8
5%0
.018
138
01
3.0
1%0
.89%
0.0
188
887
9.81
%2.
80%
0.0
522
Tika
mg
arh
420
32.
77%
0.8
3%0
.014
534
503.
20%
0.7
3%0
.016
475
34.
77%
4.51
%0
.029
8
Ujja
in95
532.
01%
0.7
4%0
.010
148
922.
97%
0.8
4%0
.014
946
612.
35%
1.55
%0
.011
6
Um
aria
3762
2.14
%0
.67%
0.0
109
3114
2.10
%0
.71%
0.0
110
648
5.62
%1.
66%
0.0
265
Vid
isha
4151
3.0
0%
1.24
%0
.019
032
243.
10%
1.25
%0
.020
292
78.
01%
3.91
%0
.048
3
Wes
t Nim
ar46
803.
57%
1.34
%0
.020
940
233.
93%
1.42
%0
.023
465
76.
84%
2.43
%0
.035
6
Maharashtra
Ahm
adna
gar
3441
2.47
%1.
06%
0.0
111
2819
2.98
%0
.97%
0.0
133
622
1.72
%8.
03%
0.0
104
Ako
la38
251.
93%
0.5
5%0
.00
7918
492.
90%
0.5
9%0
.011
819
761.
45%
1.49
%0
.00
64
Am
rava
ti32
702.
44%
1.17
%0
.010
816
863.
55%
1.26
%0
.015
915
841.
49%
0.6
6%0
.00
58
Aur
ang
abad
3332
2.36
%0
.86%
0.0
103
1767
4.10
%0
.83%
0.0
178
1565
1.54
%2.
76%
0.0
073
Bhan
dar
a32
201.
11%
0.6
5%0
.00
4526
381.
25%
0.6
6%0
.00
5158
20
.38%
2.53
%0
.00
15
Bid
3645
2.52
%1.
04%
0.0
118
2856
2.74
%1.
19%
0.0
131
789
6.62
%2.
05%
0.0
292
Buld
ana
3470
3.0
1%2.
26%
0.0
152
2781
3.45
%2.
49%
0.0
181
689
5.99
%0
.83%
0.0
244
Cha
ndra
pur
3166
4.66
%1.
76%
0.0
224
1622
6.49
%1.
85%
0.0
313
1544
1.40
%3.
40%
0.0
067
Dhu
le36
473.
76%
1.0
4%0
.020
827
07
4.44
%1.
08%
0.0
248
940
4.95
%2.
14%
0.0
237
Gar
hchi
roli
3156
2.34
%0
.69%
0.0
103
280
82.
67%
0.7
0%
0.0
118
348
2.11
%3.
70%
0.0
090
Go
ndiy
a31
851.
80%
0.4
1%0
.00
7027
261.
98%
0.4
3%0
.00
7745
93.
85%
1.0
1%0
.014
8
Stan
dar
d E
rro
rs:
Hea
dco
unt R
atio
, Int
ensi
ty, M
PIA
llR
ural
Urb
an
Stat
eD
istr
ict
Unw
eig
hted
Ob
serv
atio
nsH
ead
coun
tR
atio
Inte
nsity
MPI
Unw
eig
hted
Ob
serv
atio
nsH
ead
coun
tR
atio
Inte
nsity
MPI
Unw
eig
hted
Ob
serv
atio
nsH
ead
coun
tR
atio
Inte
nsity
MPI
Maharashtra
Hin
go
li36
972.
62%
0.6
2%0
.011
531
332.
87%
0.6
3%0
.012
656
42.
88%
0.8
3%0
.010
7
Jalg
aon
3257
3.29
%1.
28%
0.0
153
1686
4.19
%1.
45%
0.0
197
1571
4.16
%1.
24%
0.0
180
Jaln
a36
642.
39%
1.0
0%
0.0
100
2982
2.66
%1.
04%
0.0
110
682
4.79
%2.
17%
0.0
230
Kolh
apur
310
51.
63%
0.8
9%0
.00
6716
372.
26%
0.9
3%0
.00
9214
680
.70
%1.
91%
0.0
027
Latu
r39
652.
25%
0.6
2%0
.00
9728
442.
72%
0.6
8%0
.011
611
213.
65%
1.22
%0
.016
2
Mum
bai
2287
1.18
%1.
46%
0.0
046
--
--
2287
1.18
%1.
49%
0.0
046
Mum
bai
Sub
urb
an24
641.
45%
1.66
%0
.00
62-
--
-24
641.
45%
1.69
%0
.00
62
Nag
pur
4097
1.95
%0
.59%
0.0
074
1495
3.26
%0
.81%
0.0
125
260
22.
56%
1.18
%0
.00
97
Nan
ded
4040
1.78
%0
.70
%0
.00
8129
992.
27%
0.7
3%0
.010
410
411.
24%
1.70
%0
.00
47
Nan
dur
bar
360
64.
50%
1.96
%0
.031
030
974.
72%
2.0
1%0
.033
150
98.
23%
3.21
%0
.041
2
Nas
hik
3646
3.52
%1.
26%
0.0
150
1954
6.37
%0
.73%
0.0
282
1692
2.0
5%4.
02%
0.0
099
Osm
anab
ad33
171.
48%
1.42
%0
.00
7428
261.
64%
1.51
%0
.00
8349
13.
86%
1.81
%0
.015
1
Parb
hani
3881
1.89
%0
.88%
0.0
081
200
32.
23%
1.0
2%0
.00
9518
783.
35%
1.17
%0
.014
5
Pune
280
01.
15%
1.12
%0
.00
4515
621.
69%
1.53
%0
.00
7312
381.
55%
1.39
%0
.00
58
Rai
gar
h27
102.
98%
1.25
%0
.014
114
665.
21%
1.36
%0
.025
112
441.
21%
2.27
%0
.00
52
Rat
nag
iri27
06
2.18
%0
.65%
0.0
090
2330
2.51
%0
.66%
0.0
105
376
2.36
%0
.00
%0
.00
84
Sang
li32
661.
26%
1.0
2%0
.00
5525
231.
65%
1.0
6%0
.00
7274
31.
08%
3.64
%0
.00
48
Sata
ra29
482.
00
%0
.51%
0.0
081
2450
2.0
4%0
.59%
0.0
084
498
5.91
%0
.36%
0.0
234
Sind
hud
urg
2595
1.52
%0
.89%
0.0
061
2286
1.72
%0
.89%
0.0
069
309
0.0
0%
-0
.00
00
Sola
pur
3552
2.34
%0
.94%
0.0
103
1727
3.23
%1.
04%
0.0
142
1825
2.0
2%2.
23%
0.0
085
Than
e29
481.
88%
2.53
%0
.010
386
95.
51%
3.32
%0
.034
520
791.
51%
2.42
%0
.00
67
War
dha
3221
1.74
%1.
22%
0.0
073
1577
2.0
4%1.
57%
0.0
086
1644
3.32
%1.
72%
0.0
138
Was
him
3592
2.67
%0
.72%
0.0
115
2935
2.80
%0
.76%
0.0
124
657
7.57
%1.
22%
0.0
298
Yava
tmal
340
12.
95%
0.7
0%
0.0
135
2775
3.56
%0
.71%
0.0
163
626
3.22
%0
.79%
0.0
125
Manipur
Bish
nup
ur87
531.
50%
0.6
9%0
.00
6644
291.
95%
0.7
0%
0.0
076
4324
2.27
%1.
02%
0.0
106
Cha
ndel
3892
3.53
%1.
31%
0.0
182
3386
3.66
%1.
42%
0.0
198
506
9.0
2%1.
83%
0.0
377
Chu
rach
and
pur
370
23.
10%
1.23
%0
.016
334
243.
39%
1.23
%0
.017
827
82.
94%
0.0
0%
0.0
112
Imp
hal E
ast
8423
1.68
%1.
23%
0.0
087
4324
2.66
%1.
75%
0.0
141
4099
1.75
%1.
10%
0.0
081
Imp
hal W
est
8220
1.0
7%0
.55%
0.0
044
4261
1.88
%0
.75%
0.0
080
3959
1.27
%0
.79%
0.0
051
Sena
pat
i42
892.
51%
1.0
8%0
.013
240
942.
61%
1.0
8%0
.013
719
52.
89%
0.1
8%0
.010
6
Tam
eng
long
4228
3.86
%1.
19%
0.0
211
3567
4.39
%1.
23%
0.0
246
661
5.50
%1.
00
%0
.022
7
Tho
ubal
8762
1.58
%0
.79%
0.0
072
4493
2.34
%1.
11%
0.0
106
4269
1.69
%0
.67%
0.0
075
Ukh
rul
370
02.
90%
1.0
3%0
.015
631
123.
45%
1.0
4%0
.018
658
82.
38%
1.59
%0
.00
96
Meghalaya
East
Gar
o H
ills
4324
3.33
%1.
11%
0.0
185
3720
3.75
%1.
17%
0.0
211
604
6.18
%0
.83%
0.0
264
East
Kha
si H
ills
8427
1.94
%0
.81%
0.0
096
4571
3.29
%0
.85%
0.0
165
3856
0.9
2%1.
32%
0.0
036
Jain
tia H
ills
510
43.
57%
1.0
4%0
.021
346
723.
82%
1.0
4%0
.022
943
25.
45%
1.61
%0
.022
7
Ri B
hoi
4661
3.87
%0
.94%
0.0
210
4097
4.10
%0
.96%
0.0
224
564
10.5
3%2.
19%
0.0
488
Sout
h G
aro
Hill
s45
931.
57%
0.8
8%0
.00
7042
901.
69%
0.8
9%0
.00
7530
31.
31%
0.0
0%
0.0
056
Wes
t Gar
o H
ills
4597
3.89
%0
.88%
0.0
192
4077
4.18
%0
.88%
0.0
207
520
1.39
%2.
33%
0.0
047
Wes
t Kha
si H
ills
4797
3.27
%0
.89%
0.0
173
4276
3.41
%0
.93%
0.0
182
521
10.8
2%2.
79%
0.0
553
Mizoram
Aiz
awl
3895
0.4
5%1.
44%
0.0
018
961
1.90
%1.
43%
0.0
077
2934
0.2
3%4.
36%
0.0
010
Cha
mp
hai
8226
1.35
%0
.57%
0.0
055
4213
2.20
%0
.62%
0.0
090
4013
0.8
0%
1.32
%0
.00
31
Kola
sib
7117
1.71
%1.
67%
0.0
091
3442
4.60
%1.
87%
0.0
257
3675
1.26
%1.
99%
0.0
057
(CONTD.) STANDArD errorS: DISTrICT-WISe - heADCoUNT rATIo, INTeNSITy, MpI(CONTD.) STANDArD errorS: DISTrICT-WISe - heADCoUNT rATIo, INTeNSITy, MpI
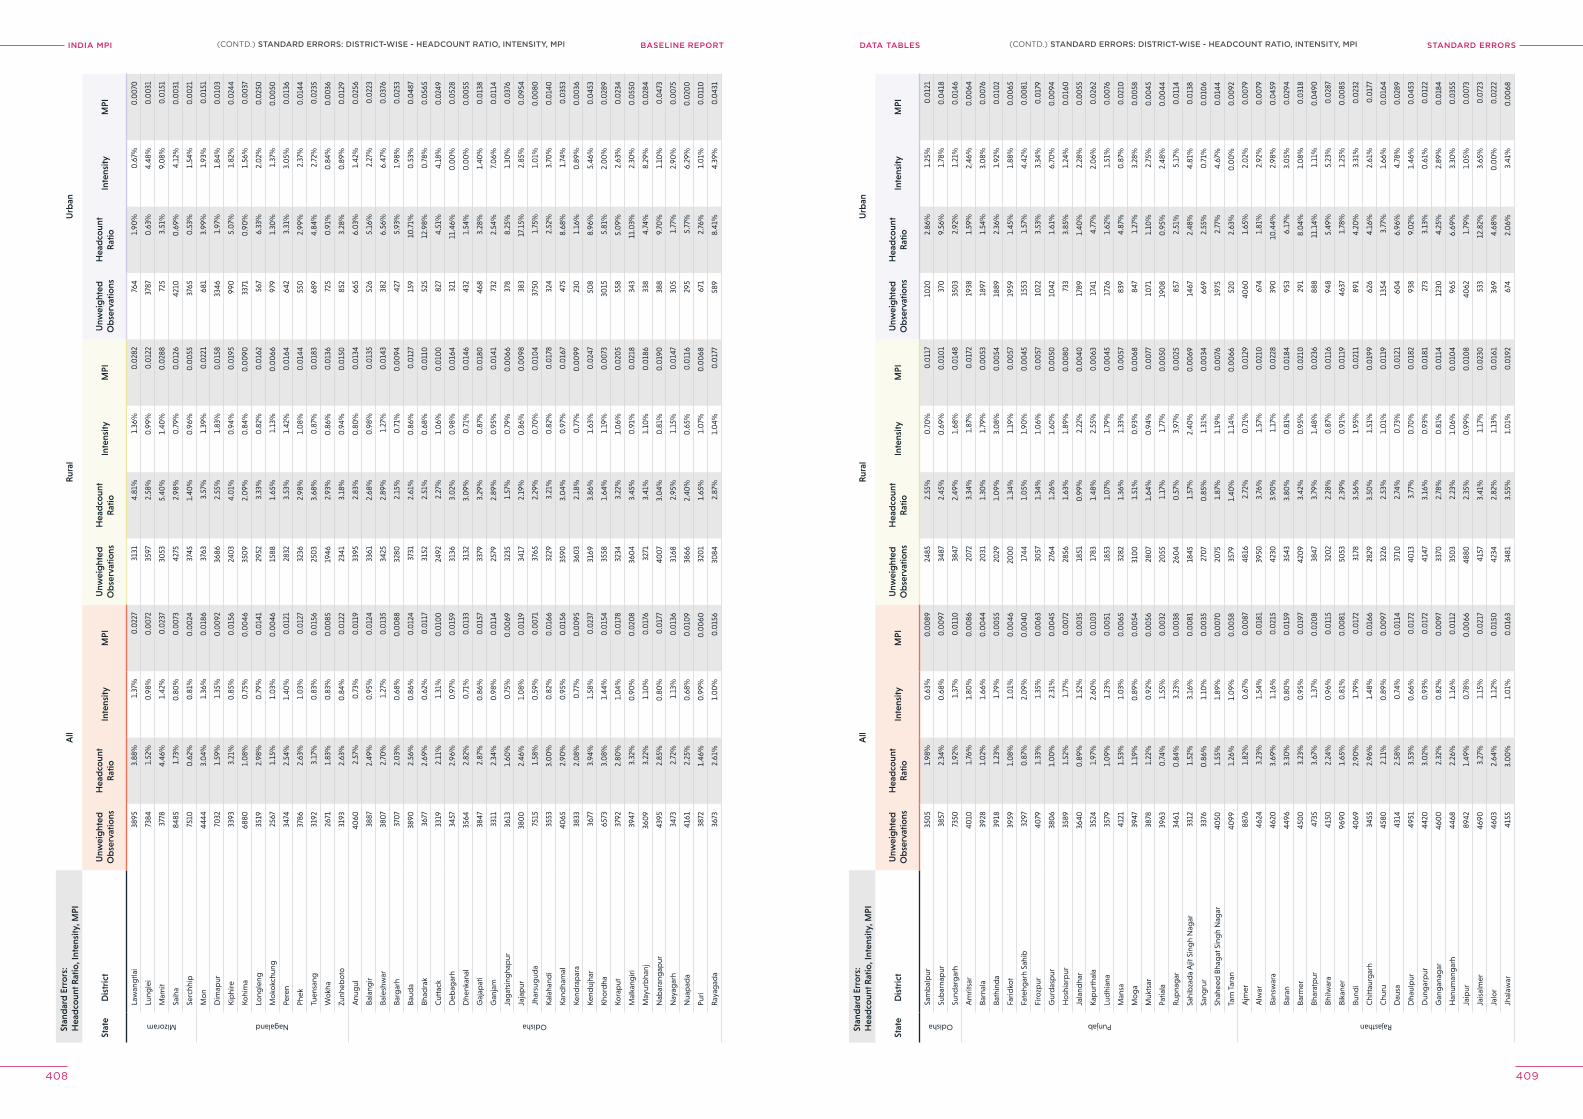
INDIA MPI BASELINE REPORT STANDArD errorSDATA TABleS
408 409
Stan
dar
d E
rro
rs:
Hea
dco
unt R
atio
, Int
ensi
ty, M
PIA
llR
ural
Urb
an
Stat
eD
istr
ict
Unw
eig
hted
Ob
serv
atio
nsH
ead
coun
tR
atio
Inte
nsity
MPI
Unw
eig
hted
Ob
serv
atio
nsH
ead
coun
tR
atio
Inte
nsity
MPI
Unw
eig
hted
Ob
serv
atio
nsH
ead
coun
tR
atio
Inte
nsity
MPI
Mizoram
Law
ang
tlai
3895
3.88
%1.
37%
0.0
227
3131
4.81
%1.
36%
0.0
282
764
1.90
%0
.67%
0.0
070
Lung
lei
7384
1.52
%0
.98%
0.0
072
3597
2.58
%0
.99%
0.0
122
3787
0.6
3%4.
48%
0.0
031
Mam
it37
784.
46%
1.42
%0
.023
730
535.
40%
1.40
%0
.028
872
53.
51%
9.0
8%0
.015
1
Saih
a84
851.
73%
0.8
0%
0.0
073
4275
2.98
%0
.79%
0.0
126
4210
0.6
9%4.
12%
0.0
031
Serc
hhip
7510
0.6
2%0
.81%
0.0
024
3745
1.40
%0
.96%
0.0
055
3765
0.5
3%1.
54%
0.0
021
Nagaland
Mo
n44
443.
04%
1.36
%0
.018
637
633.
57%
1.39
%0
.022
168
13.
99%
1.93
%0
.015
1
Dim
apur
7032
1.59
%1.
35%
0.0
092
3686
2.55
%1.
83%
0.0
158
3346
1.97
%1.
84%
0.0
103
Kip
hire
3393
3.21
%0
.85%
0.0
156
240
34.
01%
0.9
4%0
.019
599
05.
07%
1.82
%0
.024
4
Kohi
ma
6880
1.0
8%0
.75%
0.0
046
350
92.
09%
0.8
4%0
.00
9033
710
.90
%1.
56%
0.0
037
Long
leng
3519
2.98
%0
.79%
0.0
141
2952
3.33
%0
.82%
0.0
162
567
6.33
%2.
02%
0.0
250
Mo
kokc
hung
2567
1.15
%1.
03%
0.0
046
1588
1.65
%1.
13%
0.0
066
979
1.30
%1.
37%
0.0
050
Pere
n34
742.
54%
1.40
%0
.012
128
323.
53%
1.42
%0
.016
464
23.
31%
3.0
5%0
.013
6
Phek
3786
2.63
%1.
03%
0.0
127
3236
2.98
%1.
08%
0.0
144
550
2.99
%2.
37%
0.0
144
Tuen
sang
3192
3.17
%0
.83%
0.0
156
250
33.
68%
0.8
7%0
.018
368
94.
84%
2.72
%0
.023
5
Wo
kha
2671
1.83
%0
.83%
0.0
085
1946
2.93
%0
.86%
0.0
136
725
0.9
1%0
.84%
0.0
036
Zunh
ebo
to31
932.
63%
0.8
4%0
.012
223
413.
18%
0.9
4%0
.015
085
23.
28%
0.8
9%0
.012
9
Odisha
Anu
gul
4060
2.57
%0
.73%
0.0
119
3395
2.83
%0
.80
%0
.013
466
56.
03%
1.42
%0
.025
6
Bala
ngir
3887
2.49
%0
.95%
0.0
124
3361
2.68
%0
.98%
0.0
135
526
5.16
%2.
27%
0.0
223
Bale
shw
ar38
07
2.70
%1.
27%
0.0
135
3425
2.89
%1.
27%
0.0
143
382
6.56
%6.
47%
0.0
376
Barg
arh
370
72.
03%
0.6
8%0
.00
8832
802.
15%
0.7
1%0
.00
9442
75.
93%
1.98
%0
.025
3
Baud
a38
902.
56%
0.8
6%0
.012
437
312.
61%
0.8
6%0
.012
715
910
.71%
0.5
3%0
.048
7
Bhad
rak
3677
2.69
%0
.62%
0.0
117
3152
2.51
%0
.68%
0.0
110
525
12.9
8%0
.78%
0.0
565
Cut
tack
3319
2.11
%1.
31%
0.0
100
2492
2.27
%1.
06%
0.0
100
827
4.51
%4.
18%
0.0
249
Deb
agar
h34
572.
96%
0.9
7%0
.015
931
363.
02%
0.9
8%0
.016
432
111
.46%
0.0
0%
0.0
528
Dhe
nkan
al35
642.
82%
0.7
1%0
.013
331
323.
09%
0.7
1%0
.014
643
21.
54%
0.0
0%
0.0
055
Gaj
apat
i38
472.
87%
0.8
6%0
.015
733
793.
29%
0.8
7%0
.018
046
83.
28%
1.40
%0
.013
8
Gan
jam
3311
2.34
%0
.98%
0.0
114
2579
2.89
%0
.95%
0.0
141
732
2.54
%7.
06%
0.0
114
Jag
atsi
ngha
pur
3613
1.60
%0
.75%
0.0
069
3235
1.57
%0
.79%
0.0
066
378
8.25
%1.
30%
0.0
376
Jaja
pur
380
02.
46%
1.0
8%0
.011
934
172.
19%
0.8
6%0
.00
9838
317
.15%
2.85
%0
.095
4
Jhar
sug
uda
7515
1.58
%0
.59%
0.0
071
3765
2.29
%0
.70
%0
.010
437
501.
75%
1.0
1%0
.00
80
Kala
hand
i35
533.
00
%0
.82%
0.0
166
3229
3.21
%0
.82%
0.0
178
324
2.52
%3.
70%
0.0
140
Kand
ham
al40
652.
90%
0.9
5%0
.015
635
903.
04%
0.9
7%0
.016
747
58.
68%
1.74
%0
.035
3
Kend
rap
ara
3833
2.0
8%0
.77%
0.0
095
360
32.
18%
0.7
7%0
.00
9923
01.
16%
0.8
9%0
.00
36
Kend
ujha
r36
773.
94%
1.58
%0
.023
731
693.
86%
1.63
%0
.024
750
88.
96%
5.46
%0
.045
3
Kho
rdha
6573
3.0
8%1.
44%
0.0
154
3558
1.64
%1.
19%
0.0
073
3015
5.81
%2.
00
%0
.028
9
Kora
put
3792
2.80
%1.
04%
0.0
178
3234
3.22
%1.
06%
0.0
205
558
5.0
9%2.
63%
0.0
234
Mal
kang
iri39
473.
32%
0.9
0%
0.0
208
360
43.
45%
0.9
1%0
.021
834
311
.03%
2.30
%0
.055
0
May
urb
hanj
360
93.
22%
1.10
%0
.017
632
713.
41%
1.10
%0
.018
633
84.
74%
8.29
%0
.028
4
Nab
aran
gap
ur43
952.
85%
0.8
0%
0.0
177
400
73.
04%
0.8
1%0
.019
038
89.
70%
1.10
%0
.047
3
Nay
agar
h34
732.
72%
1.13
%0
.013
631
682.
95%
1.15
%0
.014
730
51.
77%
2.90
%0
.00
75
Nua
pad
a41
612.
25%
0.6
8%0
.010
938
662.
40%
0.6
5%0
.011
629
55.
77%
6.29
%0
.020
0
Puri
3872
1.46
%0
.99%
0.0
060
320
11.
65%
1.0
7%0
.00
6867
12.
76%
1.0
1%0
.011
0
Ray
agad
a36
732.
61%
1.0
0%
0.0
156
3084
2.87
%1.
04%
0.0
177
589
8.41
%4.
39%
0.0
431
Stan
dar
d E
rro
rs:
Hea
dco
unt R
atio
, Int
ensi
ty, M
PIA
llR
ural
Urb
an
Stat
eD
istr
ict
Unw
eig
hted
Ob
serv
atio
nsH
ead
coun
tR
atio
Inte
nsity
MPI
Unw
eig
hted
Ob
serv
atio
nsH
ead
coun
tR
atio
Inte
nsity
MPI
Unw
eig
hted
Ob
serv
atio
nsH
ead
coun
tR
atio
Inte
nsity
MPI
Odisha
Sam
bal
pur
350
51.
98%
0.6
3%0
.00
8924
852.
55%
0.7
0%
0.0
117
1020
2.86
%1.
25%
0.0
121
Sub
arna
pur
3857
2.34
%0
.68%
0.0
097
3487
2.45
%0
.69%
0.0
101
370
9.56
%1.
78%
0.0
418
Sund
arg
arh
7350
1.92
%1.
37%
0.0
110
3847
2.49
%1.
68%
0.0
148
350
32.
92%
1.21
%0
.014
6
Punjab
Am
ritsa
r40
101.
76%
1.80
%0
.00
8620
723.
34%
1.87
%0
.017
219
381.
59%
2.46
%0
.00
64
Barn
ala
3928
1.0
2%1.
66%
0.0
044
2031
1.30
%1.
79%
0.0
053
1897
1.54
%3.
08%
0.0
076
Bath
ind
a39
181.
23%
1.79
%0
.00
5520
291.
09%
3.0
8%0
.00
5418
892.
36%
1.92
%0
.010
2
Farid
kot
3959
1.0
8%1.
01%
0.0
046
200
01.
34%
1.19
%0
.00
5719
591.
45%
1.88
%0
.00
65
Fate
hgar
h Sa
hib
3297
0.8
7%2.
09%
0.0
040
1744
1.0
5%1.
90%
0.0
045
1553
1.57
%4.
42%
0.0
081
Firo
zpur
4079
1.33
%1.
35%
0.0
063
3057
1.34
%1.
06%
0.0
057
1022
3.53
%3.
34%
0.0
179
Gur
das
pur
380
61.
00
%2.
31%
0.0
045
2764
1.26
%1.
60%
0.0
050
1042
1.61
%6.
70%
0.0
094
Ho
shia
rpur
3589
1.52
%1.
77%
0.0
072
2856
1.63
%1.
89%
0.0
080
733
3.85
%1.
24%
0.0
160
Jala
ndha
r36
400
.89%
1.52
%0
.00
3518
510
.99%
2.22
%0
.00
4017
891.
40%
2.28
%0
.00
55
Kap
urth
ala
3524
1.97
%2.
60%
0.0
103
1783
1.48
%2.
55%
0.0
063
1741
4.77
%2.
06%
0.0
262
Lud
hian
a35
791.
09%
1.23
%0
.00
5118
531.
07%
1.79
%0
.00
4517
261.
62%
1.51
%0
.00
76
Man
sa41
211.
53%
1.0
3%0
.00
6532
821.
36%
1.33
%0
.00
5783
94.
87%
0.8
7%0
.021
0
Mo
ga
3947
1.19
%0
.89%
0.0
054
310
01.
51%
0.9
3%0
.00
6884
71.
27%
3.28
%0
.00
58
Muk
tsar
3878
1.22
%0
.92%
0.0
056
280
71.
64%
0.9
4%0
.00
7710
711.
10%
2.75
%0
.00
45
Patia
la39
630
.74%
1.55
%0
.00
3220
551.
17%
1.77
%0
.00
5019
08
0.9
5%2.
48%
0.0
044
Rup
nag
ar34
610
.84%
3.23
%0
.00
3826
04
0.5
7%3.
97%
0.0
025
857
2.51
%5.
17%
0.0
114
Sahi
bza
da
Ajit
Sin
gh
Nag
ar33
121.
52%
3.16
%0
.00
8118
451.
57%
2.40
%0
.00
6914
672.
48%
4.81
%0
.013
8
Sang
rur
3376
0.8
6%1.
10%
0.0
035
270
70
.85%
1.31
%0
.00
3466
92.
55%
0.7
1%0
.010
6
Shah
eed
Bha
gat
Sin
gh
Nag
ar40
501.
55%
1.89
%0
.00
7020
751.
87%
1.19
%0
.00
7619
752.
77%
4.67
%0
.014
4
Tarn
Tar
an40
991.
26%
1.0
9%0
.00
5835
791.
40%
1.14
%0
.00
6652
02.
63%
0.0
0%
0.0
092
Rajasthan
Ajm
er88
761.
82%
0.6
7%0
.00
8748
162.
72%
0.7
1%0
.012
940
601.
65%
2.0
2%0
.00
79
Alw
ar46
243.
23%
1.54
%0
.018
139
503.
76%
1.57
%0
.021
067
41.
81%
2.92
%0
.00
79
Bans
war
a46
203.
69%
1.16
%0
.021
542
303.
90%
1.17
%0
.022
839
010
.44%
2.98
%0
.045
9
Bara
n44
963.
30%
0.8
0%
0.0
159
3543
3.80
%0
.81%
0.0
184
953
6.17
%3.
05%
0.0
294
Barm
er45
00
3.23
%0
.95%
0.0
197
420
93.
42%
0.9
5%0
.021
029
18.
04%
1.0
8%0
.031
8
Bhar
atp
ur47
353.
67%
1.37
%0
.020
838
473.
79%
1.48
%0
.023
688
811
.14%
1.11
%0
.049
0
Bhilw
ara
4150
2.24
%0
.96%
0.0
115
320
22.
28%
0.8
7%0
.011
694
85.
49%
5.23
%0
.028
7
Bika
ner
9690
1.65
%0
.81%
0.0
081
5053
2.39
%0
.91%
0.0
119
4637
1.78
%1.
25%
0.0
085
Bund
i40
692.
90%
1.79
%0
.017
231
783.
56%
1.95
%0
.021
189
14.
20%
3.31
%0
.023
2
Chi
ttau
rgar
h34
552.
96%
1.48
%0
.016
628
293.
50%
1.51
%0
.019
962
64.
16%
2.61
%0
.017
7
Chu
ru45
802.
11%
0.8
9%0
.00
9732
262.
53%
1.0
1%0
.011
913
543.
77%
1.66
%0
.016
4
Dau
sa43
142.
58%
0.7
4%0
.011
437
102.
74%
0.7
3%0
.012
160
46.
96%
4.78
%0
.028
9
Dha
ulp
ur49
513.
53%
0.6
6%0
.017
240
133.
77%
0.7
0%
0.0
182
938
9.0
2%1.
46%
0.0
453
Dun
gar
pur
4420
3.0
2%0
.93%
0.0
172
4147
3.16
%0
.93%
0.0
181
273
3.13
%0
.61%
0.0
122
Gan
gan
agar
460
02.
32%
0.8
2%0
.00
9733
702.
78%
0.8
1%0
.011
412
304.
25%
2.89
%0
.018
4
Han
uman
gar
h44
682.
26%
1.16
%0
.011
235
03
2.23
%1.
06%
0.0
104
965
6.69
%3.
30%
0.0
355
Jaip
ur89
421.
49%
0.7
8%0
.00
6648
802.
35%
0.9
9%0
.010
840
621.
79%
1.0
5%0
.00
73
Jais
alm
er46
903.
27%
1.15
%0
.021
741
573.
41%
1.17
%0
.023
053
312
.82%
3.65
%0
.072
3
Jalo
r46
03
2.64
%1.
12%
0.0
150
4234
2.82
%1.
13%
0.0
161
369
4.68
%0
.00
%0
.022
2
Jhal
awar
4155
3.0
0%
1.0
1%0
.016
334
813.
55%
1.0
1%0
.019
267
42.
06%
3.41
%0
.00
68
(CONTD.) STANDArD errorS: DISTrICT-WISe - heADCoUNT rATIo, INTeNSITy, MpI(CONTD.) STANDArD errorS: DISTrICT-WISe - heADCoUNT rATIo, INTeNSITy, MpI
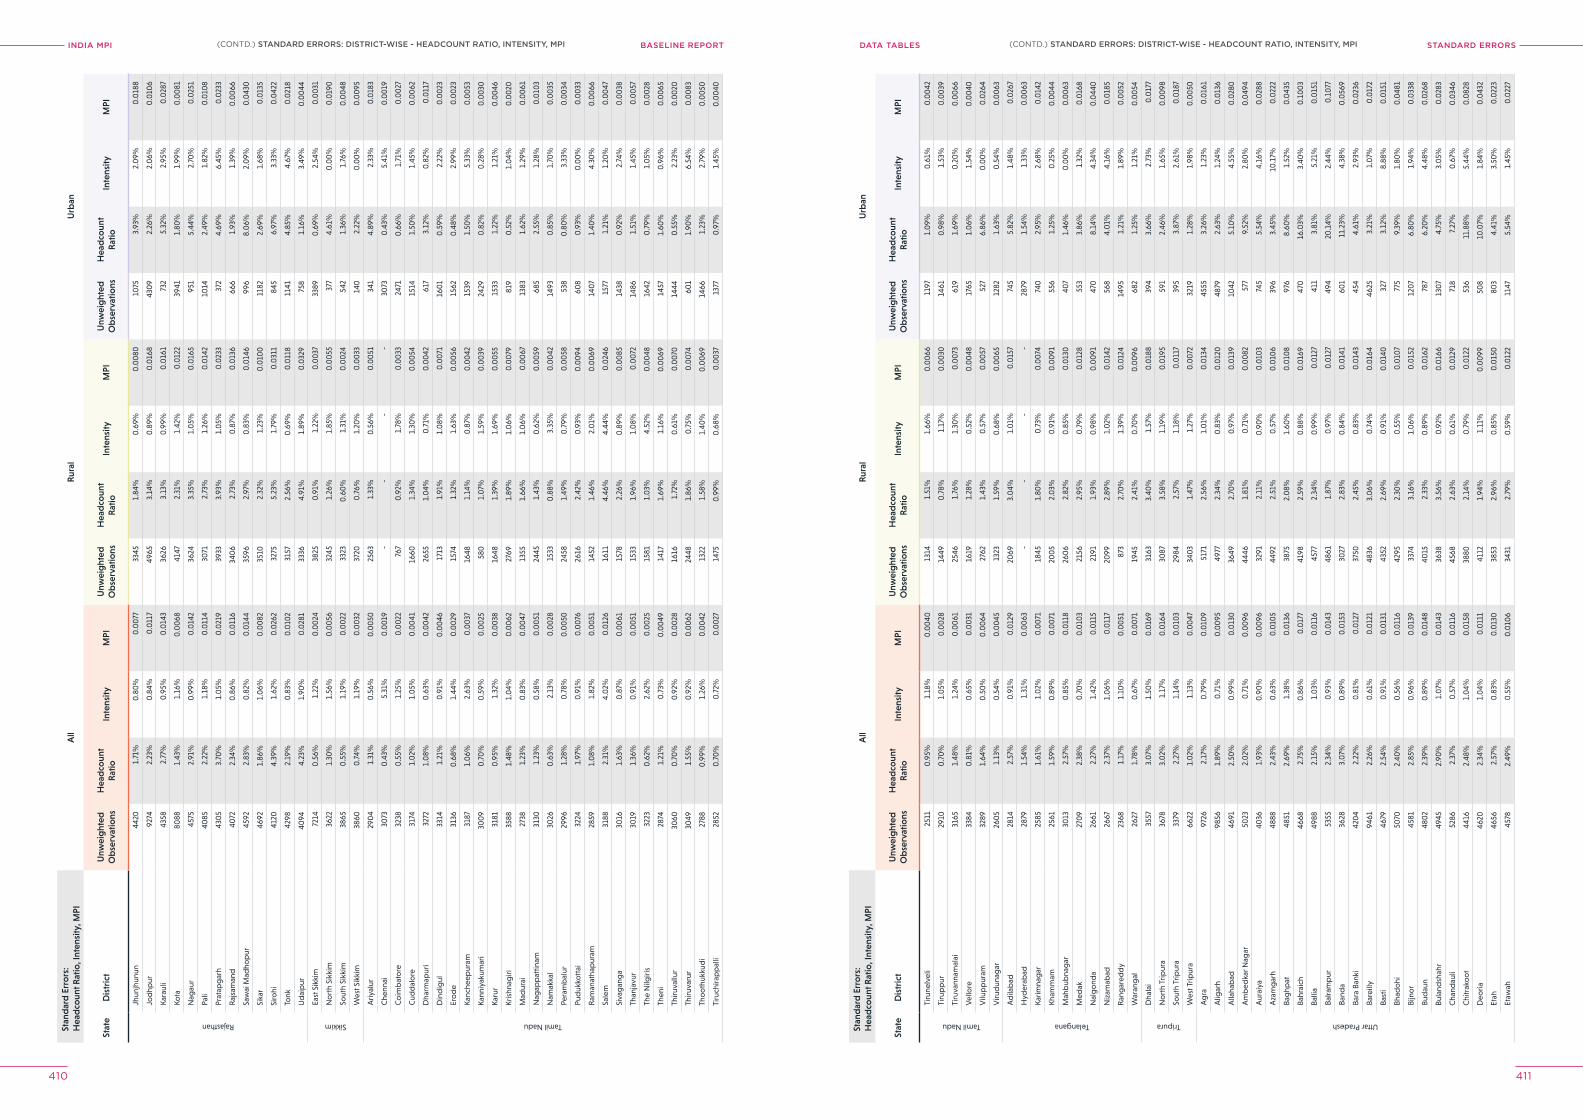
INDIA MPI BASELINE REPORT STANDArD errorSDATA TABleS
410 411
Stan
dar
d E
rro
rs:
Hea
dco
unt R
atio
, Int
ensi
ty, M
PIA
llR
ural
Urb
an
Stat
eD
istr
ict
Unw
eig
hted
Ob
serv
atio
nsH
ead
coun
tR
atio
Inte
nsity
MPI
Unw
eig
hted
Ob
serv
atio
nsH
ead
coun
tR
atio
Inte
nsity
MPI
Unw
eig
hted
Ob
serv
atio
nsH
ead
coun
tR
atio
Inte
nsity
MPI
Rajasthan
Jhun
jhun
un44
201.
71%
0.8
0%
0.0
077
3345
1.84
%0
.69%
0.0
080
1075
3.93
%2.
09%
0.0
188
Jod
hpur
9274
2.23
%0
.84%
0.0
117
4965
3.14
%0
.89%
0.0
168
430
92.
26%
2.0
6%0
.010
6
Kara
uli
4358
2.77
%0
.95%
0.0
143
3626
3.13
%0
.99%
0.0
161
732
5.32
%2.
95%
0.0
287
Kota
8088
1.43
%1.
16%
0.0
068
4147
2.31
%1.
42%
0.0
122
3941
1.80
%1.
99%
0.0
081
Nag
aur
4575
2.91
%0
.99%
0.0
142
3624
3.35
%1.
05%
0.0
165
951
5.44
%2.
70%
0.0
251
Pali
4085
2.22
%1.
18%
0.0
114
3071
2.73
%1.
26%
0.0
142
1014
2.49
%1.
82%
0.0
108
Prat
apg
arh
430
53.
70%
1.0
5%0
.021
939
333.
93%
1.0
5%0
.023
337
24.
69%
6.45
%0
.023
3
Raj
sam
and
4072
2.34
%0
.86%
0.0
116
340
62.
73%
0.8
7%0
.013
666
61.
93%
1.39
%0
.00
66
Saw
ai M
adho
pur
4592
2.83
%0
.82%
0.0
144
3596
2.97
%0
.83%
0.0
146
996
8.0
6%2.
09%
0.0
430
Sika
r46
921.
86%
1.0
6%0
.00
8235
102.
32%
1.23
%0
.010
011
822.
69%
1.68
%0
.013
5
Siro
hi41
204.
39%
1.62
%0
.026
232
755.
23%
1.79
%0
.031
184
56.
97%
3.33
%0
.042
2
Tonk
4298
2.19
%0
.83%
0.0
102
3157
2.56
%0
.69%
0.0
118
1141
4.85
%4.
67%
0.0
218
Ud
aip
ur40
944.
23%
1.90
%0
.028
133
364.
91%
1.89
%0
.032
975
81.
16%
3.49
%0
.00
44
Sikkim
East
Sik
kim
7214
0.5
6%1.
22%
0.0
024
3825
0.9
1%1.
22%
0.0
037
3389
0.6
9%2.
54%
0.0
031
No
rth
Sikk
im36
221.
30%
1.56
%0
.00
5632
451.
26%
1.85
%0
.00
5537
74.
61%
0.0
0%
0.0
190
Sout
h Si
kkim
3865
0.5
5%1.
19%
0.0
022
3323
0.6
0%
1.31
%0
.00
2454
21.
36%
1.76
%0
.00
48
Wes
t Sik
kim
3860
0.7
4%1.
19%
0.0
032
3720
0.7
6%1.
20%
0.0
033
140
2.22
%0
.00
%0
.00
95
Tamil Nadu
Ariy
alur
290
41.
31%
0.5
6%0
.00
5025
631.
33%
0.5
6%0
.00
5134
14.
89%
2.33
%0
.018
3
Che
nnai
3073
0.4
3%5.
31%
0.0
019
--
--
3073
0.4
3%5.
41%
0.0
019
Co
imb
ato
re32
380
.55%
1.25
%0
.00
2276
70
.92%
1.78
%0
.00
3324
710
.66%
1.71
%0
.00
27
Cud
dal
ore
3174
1.0
2%1.
05%
0.0
041
1660
1.34
%1.
30%
0.0
054
1514
1.50
%1.
45%
0.0
062
Dha
rmap
uri
3272
1.0
8%0
.63%
0.0
042
2655
1.0
4%0
.71%
0.0
042
617
3.12
%0
.82%
0.0
117
Din
dig
ul33
141.
21%
0.9
1%0
.00
4617
131.
91%
1.0
8%0
.00
7116
01
0.5
9%2.
22%
0.0
023
Ero
de
3136
0.6
8%1.
44%
0.0
029
1574
1.32
%1.
63%
0.0
056
1562
0.4
8%2.
99%
0.0
023
Kanc
heep
uram
3187
1.0
6%2.
63%
0.0
037
1648
1.14
%0
.87%
0.0
042
1539
1.50
%5.
33%
0.0
053
Kann
iyak
umar
i30
09
0.7
0%
0.5
9%0
.00
2558
01.
07%
1.59
%0
.00
3924
290
.82%
0.2
8%0
.00
30
Karu
r31
810
.95%
1.32
%0
.00
3816
481.
39%
1.69
%0
.00
5515
331.
22%
1.21
%0
.00
46
Kris
hnag
iri35
881.
48%
1.0
4%0
.00
6227
691.
89%
1.0
6%0
.00
7981
90
.52%
1.0
4%0
.00
20
Mad
urai
2738
1.23
%0
.83%
0.0
047
1355
1.66
%1.
06%
0.0
067
1383
1.62
%1.
29%
0.0
061
Nag
app
attin
am31
301.
23%
0.5
8%0
.00
5124
451.
43%
0.6
2%0
.00
5968
52.
55%
1.28
%0
.010
3
Nam
akka
l30
260
.63%
2.13
%0
.00
2815
330
.88%
3.35
%0
.00
4214
930
.85%
1.70
%0
.00
35
Pera
mb
alur
2996
1.28
%0
.78%
0.0
050
2458
1.49
%0
.79%
0.0
058
538
0.8
0%
3.33
%0
.00
34
Pud
ukko
ttai
3224
1.97
%0
.91%
0.0
076
2616
2.42
%0
.93%
0.0
094
608
0.9
3%0
.00
%0
.00
33
Ram
anat
hap
uram
2859
1.0
8%1.
82%
0.0
051
1452
1.46
%2.
01%
0.0
069
140
71.
40%
4.30
%0
.00
66
Sale
m31
882.
31%
4.0
2%0
.012
616
114.
46%
4.44
%0
.024
615
771.
21%
1.20
%0
.00
47
Siva
gan
ga
3016
1.63
%0
.87%
0.0
061
1578
2.26
%0
.89%
0.0
085
1438
0.9
2%2.
74%
0.0
038
Than
javu
r30
191.
36%
0.9
1%0
.00
5115
331.
96%
1.0
8%0
.00
7214
861.
51%
1.45
%0
.00
57
The
Nilg
iris
3223
0.6
2%2.
62%
0.0
025
1581
1.0
3%4.
52%
0.0
048
1642
0.7
9%1.
05%
0.0
028
Then
i28
741.
21%
0.7
3%0
.00
4914
171.
69%
1.16
%0
.00
6914
571.
60%
0.9
6%0
.00
65
Thiru
vallu
r30
600
.70
%0
.92%
0.0
028
1616
1.72
%0
.61%
0.0
070
1444
0.5
5%2.
23%
0.0
020
Thiru
varu
r30
491.
55%
0.9
2%0
.00
6224
481.
86%
0.7
5%0
.00
7460
11.
90%
6.54
%0
.00
83
Tho
oth
ukku
di
2788
0.9
9%1.
26%
0.0
042
1322
1.58
%1.
40%
0.0
069
1466
1.23
%2.
79%
0.0
050
Tiru
chira
pp
alli
2852
0.7
0%
0.7
2%0
.00
2714
750
.99%
0.6
8%0
.00
3713
770
.97%
1.45
%0
.00
40
Stan
dar
d E
rro
rs:
Hea
dco
unt R
atio
, Int
ensi
ty, M
PIA
llR
ural
Urb
an
Stat
eD
istr
ict
Unw
eig
hted
Ob
serv
atio
nsH
ead
coun
tR
atio
Inte
nsity
MPI
Unw
eig
hted
Ob
serv
atio
nsH
ead
coun
tR
atio
Inte
nsity
MPI
Unw
eig
hted
Ob
serv
atio
nsH
ead
coun
tR
atio
Inte
nsity
MPI
Tamil Nadu
Tiru
nelv
eli
2511
0.9
5%1.
18%
0.0
040
1314
1.51
%1.
66%
0.0
066
1197
1.0
9%0
.61%
0.0
042
Tiru
pp
ur29
100
.70
%1.
05%
0.0
028
1449
0.7
8%1.
17%
0.0
030
1461
0.9
8%1.
53%
0.0
039
Tiru
vann
amal
ai31
651.
48%
1.24
%0
.00
6125
461.
76%
1.30
%0
.00
7361
91.
69%
0.2
0%
0.0
066
Vel
lore
3384
0.8
1%0
.65%
0.0
031
1619
1.28
%0
.52%
0.0
048
1765
1.0
6%1.
54%
0.0
040
Vilu
pp
uram
3289
1.64
%0
.50
%0
.00
6427
621.
43%
0.5
7%0
.00
5752
76.
86%
0.0
0%
0.0
264
Viru
dun
agar
260
51.
13%
0.5
4%0
.00
4513
231.
59%
0.6
8%0
.00
6512
821.
63%
0.5
4%0
.00
63
Telangana
Ad
ilab
ad28
142.
57%
0.9
1%0
.012
920
693.
04%
1.0
1%0
.015
774
55.
82%
1.48
%0
.026
7
Hyd
erab
ad28
791.
54%
1.31
%0
.00
63-
--
-28
791.
54%
1.33
%0
.00
63
Karim
nag
ar25
851.
61%
1.0
2%0
.00
7118
451.
80%
0.7
3%0
.00
7474
02.
95%
2.68
%0
.014
2
Kham
mam
2561
1.59
%0
.89%
0.0
071
200
52.
03%
0.9
1%0
.00
9155
61.
25%
0.2
5%0
.00
44
Mah
bub
nag
ar30
132.
57%
0.8
5%0
.011
826
06
2.82
%0
.85%
0.0
130
407
1.46
%0
.00
%0
.00
63
Med
ak27
09
2.38
%0
.70
%0
.010
321
562.
95%
0.7
9%0
.012
855
33.
86%
1.32
%0
.016
8
Nal
go
nda
2661
2.27
%1.
42%
0.0
115
2191
1.93
%0
.98%
0.0
091
470
8.14
%4.
34%
0.0
440
Niz
amab
ad26
672.
37%
1.0
6%0
.011
720
992.
89%
1.0
2%0
.014
256
84.
01%
4.16
%0
.018
5
Ran
gar
edd
y23
681.
17%
1.10
%0
.00
5187
32.
70%
1.39
%0
.012
414
951.
21%
1.89
%0
.00
52
War
ang
al26
271.
78%
0.6
7%0
.00
7119
452.
41%
0.7
0%
0.0
096
682
1.25
%1.
21%
0.0
054
Tripura
Dha
lai
3557
3.0
7%1.
50%
0.0
169
3163
3.40
%1.
57%
0.0
188
394
3.66
%2.
73%
0.0
177
No
rth
Trip
ura
3678
3.0
2%1.
17%
0.0
164
3087
3.58
%1.
19%
0.0
195
591
2.46
%1.
65%
0.0
098
Sout
h Tr
ipur
a33
792.
27%
1.14
%0
.010
329
842.
57%
1.18
%0
.011
739
53.
87%
2.61
%0
.018
7
Wes
t Trip
ura
6622
1.0
2%1.
13%
0.0
047
340
31.
47%
1.27
%0
.00
7232
191.
28%
1.98
%0
.00
50
Uttar Pradesh
Ag
ra97
262.
17%
0.7
9%0
.010
951
712.
56%
1.0
1%0
.013
445
553.
26%
1.23
%0
.016
1
Alig
arh
9856
1.89
%0
.71%
0.0
095
4977
2.34
%0
.83%
0.0
120
4879
2.63
%1.
24%
0.0
136
Alla
hab
ad46
912.
50%
0.9
9%0
.013
036
492.
70%
0.9
7%0
.013
910
425.
10%
4.55
%0
.028
0
Am
bed
kar N
agar
5023
2.0
2%0
.71%
0.0
096
4446
1.81
%0
.71%
0.0
082
577
9.52
%2.
80%
0.0
494
Aur
aiya
4036
1.93
%0
.90
%0
.00
9632
912.
11%
0.9
0%
0.0
103
745
5.54
%4.
16%
0.0
288
Aza
mg
arh
4888
2.43
%0
.63%
0.0
105
4492
2.51
%0
.57%
0.0
106
396
3.45
%10
.17%
0.0
222
Bag
hpat
4851
2.69
%1.
38%
0.0
136
3875
2.0
8%1.
60%
0.0
108
976
8.60
%1.
52%
0.0
435
Bahr
aich
4668
2.75
%0
.86%
0.0
177
4198
2.59
%0
.88%
0.0
169
470
16.0
3%3.
40%
0.1
00
3
Balli
a49
882.
15%
1.0
3%0
.011
645
772.
34%
0.9
9%0
.012
741
13.
81%
5.21
%0
.015
1
Balra
mp
ur53
552.
34%
0.9
3%0
.014
348
611.
87%
0.9
7%0
.012
749
420
.14%
2.44
%0
.10
77
Band
a36
283.
07%
0.8
9%0
.015
330
272.
83%
0.8
4%0
.014
160
111
.23%
4.38
%0
.056
9
Bara
Ban
ki42
04
2.22
%0
.81%
0.0
127
3750
2.45
%0
.83%
0.0
143
454
4.61
%2.
93%
0.0
236
Bare
illy
9461
2.26
%0
.61%
0.0
121
4836
3.0
6%0
.74%
0.0
164
4625
3.21
%1.
07%
0.0
172
Bast
i46
792.
54%
0.9
1%0
.013
143
522.
69%
0.9
1%0
.014
032
73.
12%
8.88
%0
.015
1
Bhad
ohi
5070
2.40
%0
.56%
0.0
116
4295
2.30
%0
.55%
0.0
107
775
9.39
%1.
80%
0.0
481
Bijn
or
4581
2.85
%0
.96%
0.0
139
3374
3.16
%1.
06%
0.0
152
120
76.
80%
1.94
%0
.033
8
Bud
aun
480
22.
39%
0.8
9%0
.014
840
152.
33%
0.8
9%0
.016
278
76.
20%
4.48
%0
.026
8
Bula
ndsh
ahr
4945
2.90
%1.
07%
0.0
143
3638
3.56
%0
.92%
0.0
166
130
74.
75%
3.0
5%0
.028
3
Cha
ndau
li52
862.
37%
0.5
7%0
.011
645
682.
63%
0.6
1%0
.012
971
87.
27%
0.6
7%0
.034
6
Chi
trak
oo
t44
162.
48%
1.0
4%0
.015
838
802.
14%
0.7
9%0
.012
253
611
.88%
5.44
%0
.082
8
Deo
ria46
202.
34%
1.0
4%0
.011
141
121.
94%
1.11
%0
.00
9950
810
.07%
1.84
%0
.043
2
Etah
4656
2.57
%0
.83%
0.0
130
3853
2.96
%0
.85%
0.0
150
803
4.41
%3.
50%
0.0
223
Etaw
ah45
782.
49%
0.5
5%0
.010
634
312.
79%
0.5
9%0
.012
211
475.
54%
1.45
%0
.022
7
(CONTD.) STANDArD errorS: DISTrICT-WISe - heADCoUNT rATIo, INTeNSITy, MpI(CONTD.) STANDArD errorS: DISTrICT-WISe - heADCoUNT rATIo, INTeNSITy, MpI
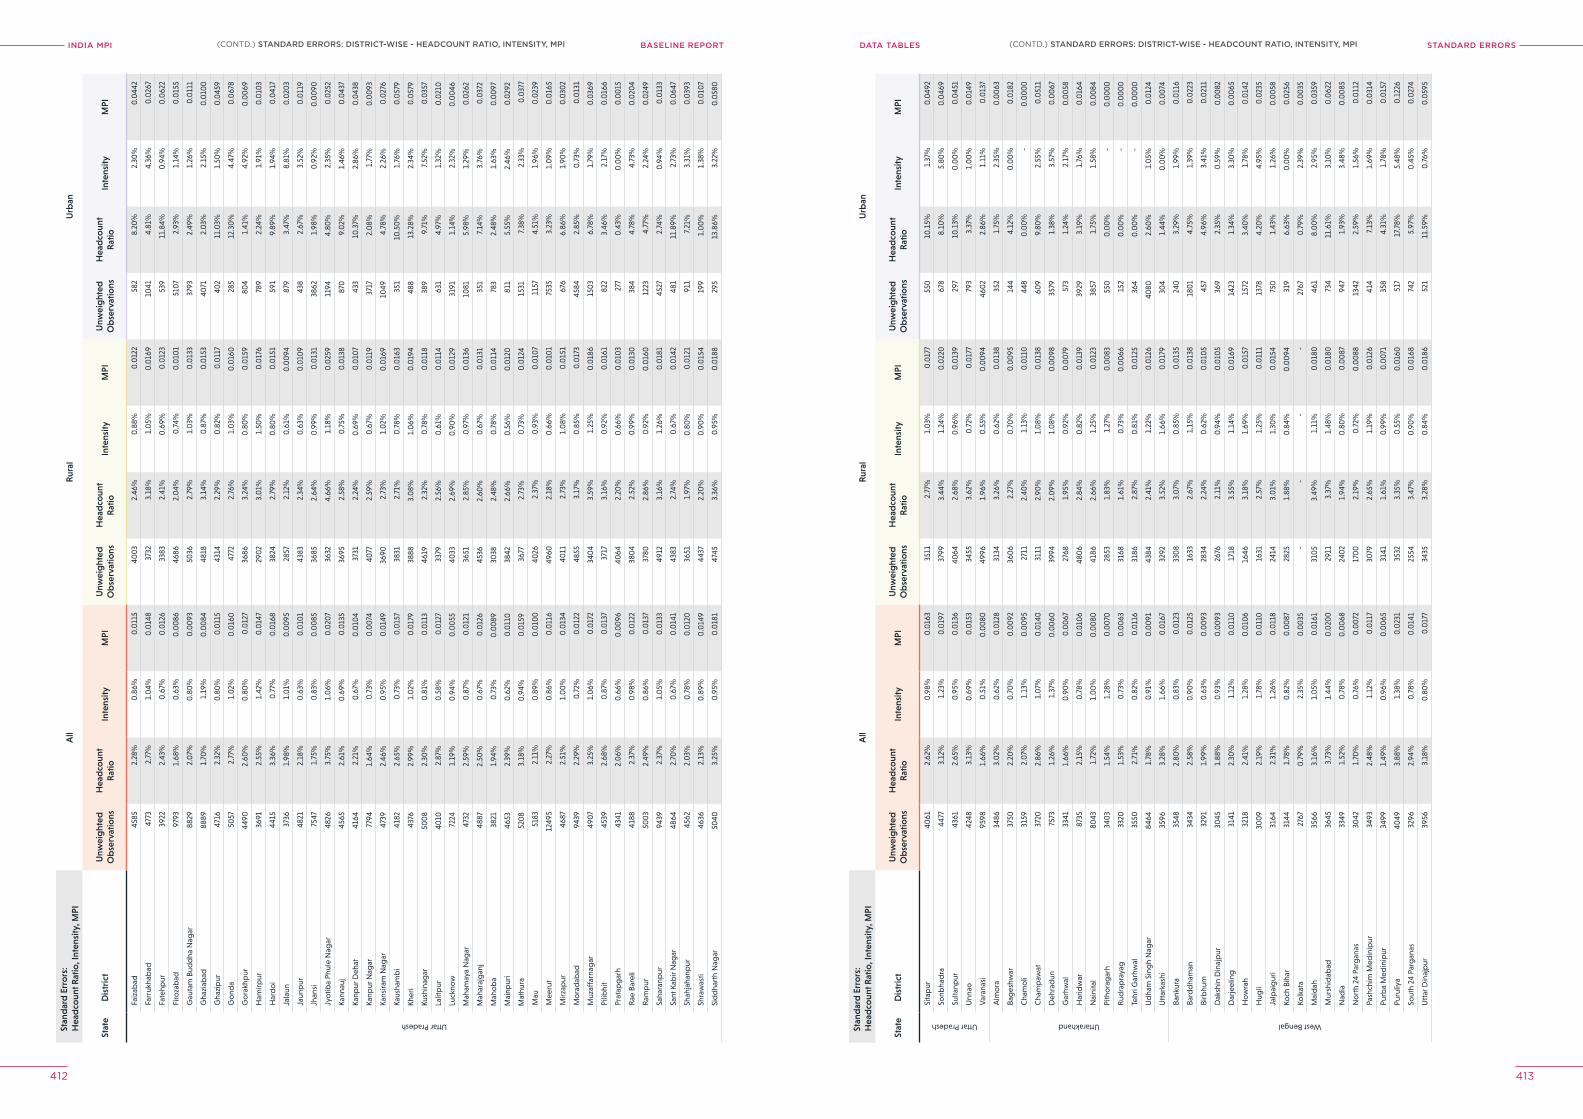
INDIA MPI BASELINE REPORT STANDArD errorSDATA TABleS
412 413
Stan
dar
d E
rro
rs:
Hea
dco
unt R
atio
, Int
ensi
ty, M
PIA
llR
ural
Urb
an
Stat
eD
istr
ict
Unw
eig
hted
Ob
serv
atio
nsH
ead
coun
tR
atio
Inte
nsity
MPI
Unw
eig
hted
Ob
serv
atio
nsH
ead
coun
tR
atio
Inte
nsity
MPI
Unw
eig
hted
Ob
serv
atio
nsH
ead
coun
tR
atio
Inte
nsity
MPI
Uttar Pradesh
Faiz
abad
4585
2.28
%0
.86%
0.0
115
400
32.
46%
0.8
8%0
.012
258
28.
20%
2.30
%0
.044
2
Farr
ukha
bad
4773
2.77
%1.
04%
0.0
148
3732
3.18
%1.
05%
0.0
169
1041
4.81
%4.
36%
0.0
267
Fate
hpur
3922
2.43
%0
.67%
0.0
126
3383
2.41
%0
.69%
0.0
123
539
11.8
4%0
.94%
0.0
622
Firo
zab
ad97
931.
68%
0.6
3%0
.00
8646
862.
04%
0.7
4%0
.010
151
07
2.93
%1.
14%
0.0
155
Gau
tam
Bud
dha
Nag
ar88
292.
07%
0.8
0%
0.0
093
5036
2.79
%1.
03%
0.0
133
3793
2.49
%1.
26%
0.0
111
Gha
ziab
ad88
891.
70%
1.19
%0
.00
8448
183.
14%
0.8
7%0
.015
340
712.
03%
2.15
%0
.010
0
Gha
zip
ur47
162.
32%
0.8
0%
0.0
115
4314
2.29
%0
.82%
0.0
117
402
11.0
3%1.
50%
0.0
459
Go
nda
5057
2.77
%1.
02%
0.0
160
4772
2.76
%1.
03%
0.0
160
285
12.3
0%
4.47
%0
.067
8
Go
rakh
pur
4490
2.60
%0
.80
%0
.012
736
863.
24%
0.8
0%
0.0
159
804
1.41
%4.
92%
0.0
069
Ham
irpur
3691
2.55
%1.
42%
0.0
147
290
23.
01%
1.50
%0
.017
678
92.
24%
1.91
%0
.010
3
Har
do
i44
153.
36%
0.7
7%0
.016
838
242.
79%
0.8
0%
0.0
151
591
9.89
%1.
94%
0.0
417
Jala
un37
361.
98%
1.0
1%0
.00
9528
572.
12%
0.6
1%0
.00
9487
93.
47%
8.81
%0
.020
3
Jaun
pur
4821
2.18
%0
.63%
0.0
101
4383
2.34
%0
.63%
0.0
109
438
2.67
%3.
52%
0.0
119
Jhan
si75
471.
75%
0.8
3%0
.00
8536
852.
64%
0.9
9%0
.013
138
621.
98%
0.9
2%0
.00
90
Jyo
tiba
Phul
e N
agar
4826
3.75
%1.
06%
0.0
207
3632
4.66
%1.
18%
0.0
259
1194
4.80
%2.
35%
0.0
252
Kann
auj
4565
2.61
%0
.69%
0.0
135
3695
2.58
%0
.75%
0.0
138
870
9.0
2%1.
46%
0.0
437
Kanp
ur D
ehat
4164
2.21
%0
.67%
0.0
104
3731
2.24
%0
.69%
0.0
107
433
10.3
7%2.
86%
0.0
438
Kanp
ur N
agar
7794
1.64
%0
.73%
0.0
074
4077
2.59
%0
.67%
0.0
119
3717
2.0
8%1.
77%
0.0
093
Kans
iram
Nag
ar47
392.
46%
0.9
5%0
.014
936
902.
73%
1.0
2%0
.016
910
494.
78%
2.26
%0
.027
6
Kaus
ham
bi
4182
2.65
%0
.73%
0.0
157
3831
2.71
%0
.78%
0.0
163
351
10.5
0%
1.76
%0
.057
9
Kher
i43
762.
99%
1.0
2%0
.017
938
883.
08%
1.0
6%0
.019
448
813
.28%
2.34
%0
.057
9
Kush
inag
ar50
08
2.30
%0
.81%
0.0
113
4619
2.32
%0
.78%
0.0
118
389
9.71
%7.
52%
0.0
357
Lalit
pur
4010
2.87
%0
.58%
0.0
127
3379
2.56
%0
.61%
0.0
114
631
4.97
%1.
32%
0.0
210
Luck
now
7224
1.19
%0
.94%
0.0
055
4033
2.69
%0
.90
%0
.012
931
911.
14%
2.32
%0
.00
46
Mah
amay
a N
agar
4732
2.59
%0
.87%
0.0
121
3651
2.85
%0
.97%
0.0
136
1081
5.98
%1.
29%
0.0
262
Mah
araj
gan
j48
872.
50%
0.6
7%0
.012
645
362.
60%
0.6
7%0
.013
135
17.
14%
3.76
%0
.037
2
Mah
ob
a38
211.
94%
0.7
3%0
.00
8930
382.
48%
0.7
8%0
.011
478
32.
48%
1.63
%0
.00
97
Mai
npur
i46
532.
39%
0.6
2%0
.011
038
422.
66%
0.5
6%0
.012
081
15.
55%
2.46
%0
.029
2
Mat
hura
520
83.
18%
0.9
4%0
.015
936
772.
73%
0.7
3%0
.012
415
317.
38%
2.33
%0
.037
7
Mau
5183
2.11
%0
.89%
0.0
100
4026
2.37
%0
.93%
0.0
107
1157
4.51
%1.
96%
0.0
239
Mee
rut
1249
52.
27%
0.8
6%0
.011
649
602.
18%
0.6
6%0
.010
175
353.
23%
1.0
9%0
.016
5
Mirz
apur
4687
2.51
%1.
00
%0
.013
440
112.
73%
1.0
8%0
.015
167
66.
86%
1.90
%0
.030
2
Mo
rad
abad
9439
2.29
%0
.72%
0.0
122
4855
3.17
%0
.85%
0.0
173
4584
2.85
%0
.73%
0.0
131
Muz
affa
rnag
ar49
07
3.25
%1.
06%
0.0
172
340
43.
59%
1.25
%0
.018
615
03
6.78
%1.
79%
0.0
369
Pilib
hit
4539
2.68
%0
.87%
0.0
137
3717
3.16
%0
.92%
0.0
161
822
3.46
%2.
17%
0.0
166
Prat
apg
arh
4341
2.0
6%0
.66%
0.0
096
4064
2.20
%0
.66%
0.0
103
277
0.4
3%0
.00
%0
.00
15
Rae
Bar
eli
4188
2.37
%0
.98%
0.0
122
380
42.
52%
0.9
9%0
.013
038
44.
78%
4.73
%0
.020
4
Ram
pur
500
32.
49%
0.8
6%0
.013
737
802.
86%
0.9
2%0
.016
012
234.
77%
2.24
%0
.024
9
Saha
ranp
ur94
392.
37%
1.0
5%0
.013
349
123.
16%
1.26
%0
.018
145
272.
74%
0.9
4%0
.013
3
Sant
Kab
ir N
agar
4864
2.70
%0
.67%
0.0
141
4383
2.74
%0
.67%
0.0
142
481
11.8
9%2.
73%
0.0
647
Shah
jaha
npur
4562
2.0
3%0
.78%
0.0
120
3651
1.97
%0
.80
%0
.012
191
17.
21%
3.31
%0
.039
3
Shra
was
ti46
362.
13%
0.8
9%0
.014
944
372.
20%
0.9
0%
0.0
154
199
1.0
0%
1.38
%0
.010
7
Sid
dha
rth
Nag
ar50
403.
25%
0.9
5%0
.018
147
453.
36%
0.9
5%0
.018
829
513
.86%
3.22
%0
.058
0
Stan
dar
d E
rro
rs:
Hea
dco
unt R
atio
, Int
ensi
ty, M
PIA
llR
ural
Urb
an
Stat
eD
istr
ict
Unw
eig
hted
Ob
serv
atio
nsH
ead
coun
tR
atio
Inte
nsity
MPI
Unw
eig
hted
Ob
serv
atio
nsH
ead
coun
tR
atio
Inte
nsity
MPI
Unw
eig
hted
Ob
serv
atio
nsH
ead
coun
tR
atio
Inte
nsity
MPI
Uttar Pradesh
Sita
pur
4061
2.62
%0
.98%
0.0
163
3511
2.77
%1.
03%
0.0
177
550
10.1
5%1.
37%
0.0
492
Sonb
had
ra44
773.
12%
1.23
%0
.019
737
993.
44%
1.24
%0
.022
067
88.
10%
5.80
%0
.046
9
Sulta
npur
4361
2.65
%0
.95%
0.0
136
4064
2.68
%0
.96%
0.0
139
297
10.1
3%0
.00
%0
.045
1
Unn
ao42
483.
13%
0.6
9%0
.015
334
553.
62%
0.7
2%0
.017
779
33.
37%
1.0
0%
0.0
149
Var
anas
i95
981.
66%
0.5
1%0
.00
8049
961.
96%
0.5
5%0
.00
9446
02
2.86
%1.
11%
0.0
137
Uttarakhand
Alm
ora
3486
3.0
2%0
.62%
0.0
128
3134
3.26
%0
.62%
0.0
138
352
1.75
%2.
35%
0.0
063
Bag
eshw
ar37
502.
20%
0.7
0%
0.0
092
360
62.
27%
0.7
0%
0.0
095
144
4.12
%0
.00
%0
.018
2
Cha
mo
li31
592.
07%
1.13
%0
.00
9527
112.
40%
1.13
%0
.011
044
80
.00
%-
0.0
00
0
Cha
mp
awat
3720
2.86
%1.
07%
0.0
140
3111
2.90
%1.
08%
0.0
138
609
9.80
%2.
55%
0.0
511
Deh
rad
un75
731.
26%
1.37
%0
.00
6039
942.
09%
1.0
8%0
.00
9835
791.
38%
3.57
%0
.00
67
Gar
hwal
3341
1.66
%0
.90
%0
.00
6727
681.
95%
0.9
2%0
.00
7957
31.
24%
2.17
%0
.00
58
Har
idw
ar87
352.
15%
0.7
8%0
.010
648
06
2.84
%0
.82%
0.0
139
3929
3.19
%1.
76%
0.0
164
Nai
nita
l80
431.
72%
1.0
0%
0.0
080
4186
2.66
%1.
25%
0.0
123
3857
1.75
%1.
58%
0.0
084
Pith
ora
gar
h34
03
1.54
%1.
28%
0.0
070
2853
1.83
%1.
27%
0.0
083
550
0.0
0%
-0
.00
00
Rud
rap
raya
g33
201.
53%
0.7
3%0
.00
6331
681.
61%
0.7
3%0
.00
6615
20
.00
%-
0.0
00
0
Tehr
i Gar
hwal
3550
2.71
%0
.82%
0.0
116
3186
2.87
%0
.81%
0.0
125
364
0.0
0%
-0
.00
00
Ud
ham
Sin
gh
Nag
ar84
641.
78%
0.9
1%0
.00
9143
842.
41%
1.22
%0
.012
640
802.
60%
1.0
5%0
.012
4
Utt
arka
shi
3596
3.28
%1.
66%
0.0
167
3292
3.52
%1.
66%
0.0
179
304
1.44
%0
.00
%0
.00
74
West Bengal
Bank
ura
3548
2.80
%0
.83%
0.0
123
330
83.
07%
0.8
5%0
.013
524
03.
29%
1.99
%0
.011
6
Bard
dha
man
3434
2.58
%0
.90
%0
.012
516
332.
67%
1.15
%0
.013
818
01
4.75
%1.
39%
0.0
223
Birb
hum
3291
1.99
%0
.63%
0.0
093
2834
2.24
%0
.62%
0.0
105
457
4.96
%3.
41%
0.0
211
Dak
shin
Din
ajp
ur30
451.
88%
0.9
3%0
.00
9326
762.
11%
0.9
4%0
.010
536
92.
35%
0.5
9%0
.00
82
Dar
jeel
ing
3141
2.30
%1.
12%
0.0
110
1718
3.55
%1.
14%
0.0
169
1423
1.34
%3.
30%
0.0
065
Ho
wra
h32
182.
41%
1.28
%0
.010
616
463.
18%
1.69
%0
.015
715
723.
40%
1.78
%0
.014
2
Hug
li30
09
2.19
%1.
78%
0.0
110
1631
2.57
%1.
25%
0.0
111
1378
4.20
%4.
95%
0.0
235
Jalp
aig
uri
3164
2.31
%1.
26%
0.0
118
2414
3.0
1%1.
30%
0.0
154
750
1.43
%1.
26%
0.0
058
Koch
Bih
ar31
441.
78%
0.8
2%0
.00
8728
251.
88%
0.8
4%0
.00
9431
96.
63%
0.0
0%
0.0
256
Kolk
ata
2767
0.7
9%2.
35%
0.0
035
--
--
2767
0.7
9%2.
39%
0.0
035
Mal
dah
3566
3.16
%1.
05%
0.0
161
310
53.
49%
1.11
%0
.018
046
18.
00
%2.
95%
0.0
359
Mur
shid
abad
3645
3.73
%1.
44%
0.0
200
2911
3.37
%1.
48%
0.0
180
734
11.6
1%3.
10%
0.0
622
Nad
ia33
491.
52%
0.7
8%0
.00
6824
02
1.94
%0
.80
%0
.00
8794
71.
93%
3.48
%0
.00
85
No
rth
24 P
arg
anas
3042
1.70
%0
.76%
0.0
072
170
02.
19%
0.7
2%0
.00
8813
422.
59%
1.56
%0
.011
2
Pash
chim
Med
inip
ur34
932.
48%
1.12
%0
.011
730
792.
65%
1.19
%0
.012
641
47.
13%
1.69
%0
.031
4
Purb
a M
edin
ipur
3499
1.49
%0
.96%
0.0
065
3141
1.61
%0
.99%
0.0
071
358
4.31
%1.
78%
0.0
157
Puru
liya
4049
3.88
%1.
38%
0.0
231
3532
3.35
%0
.55%
0.0
160
517
17.7
8%5.
48%
0.1
226
Sout
h 24
Par
gan
as32
962.
94%
0.7
8%0
.014
125
543.
47%
0.9
0%
0.0
168
742
5.97
%0
.45%
0.0
274
Utt
ar D
inaj
pur
3956
3.18
%0
.80
%0
.017
734
353.
28%
0.8
4%0
.018
652
111
.59%
0.7
6%0
.059
5
(CONTD.) STANDArD errorS: DISTrICT-WISe - heADCoUNT rATIo, INTeNSITy, MpI(CONTD.) STANDArD errorS: DISTrICT-WISe - heADCoUNT rATIo, INTeNSITy, MpI
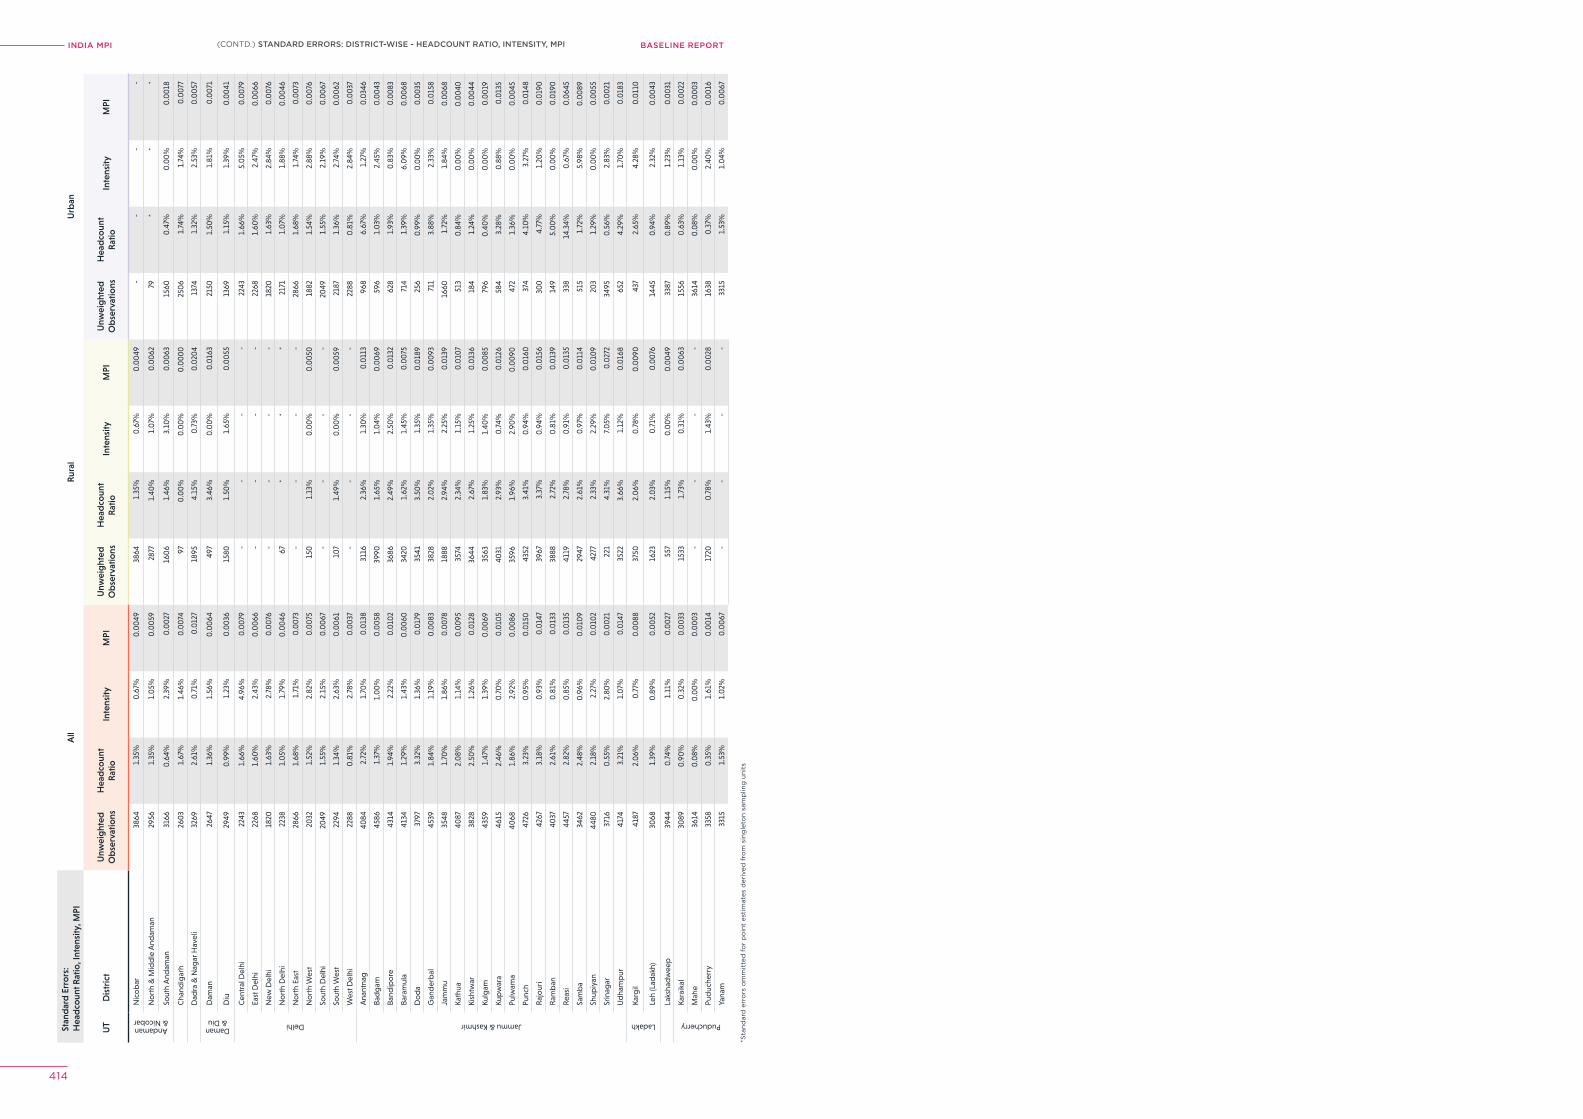
INDIA MPI BASELINE REPORT
414
Stan
dar
d E
rro
rs:
Hea
dco
unt R
atio
, Int
ensi
ty, M
PIA
llR
ural
Urb
an
UT
Dis
tric
tU
nwei
ght
edO
bse
rvat
ions
Hea
dco
unt
Rat
ioIn
tens
ityM
PIU
nwei
ght
edO
bse
rvat
ions
Hea
dco
unt
Rat
ioIn
tens
ityM
PIU
nwei
ght
edO
bse
rvat
ions
Hea
dco
unt
Rat
ioIn
tens
ityM
PI
Andaman & Nicobar
Nic
ob
ar38
641.
35%
0.6
7%0
.00
4938
641.
35%
0.6
7%0
.00
49-
--
-
No
rth
& M
idd
le A
ndam
an29
561.
35%
1.0
5%0
.00
5928
771.
40%
1.0
7%0
.00
6279
**
*
Sout
h A
ndam
an31
660
.64%
2.39
%0
.00
2716
06
1.46
%3.
10%
0.0
063
1560
0.4
7%0
.00
%0
.00
18
Cha
ndig
arh
260
31.
67%
1.46
%0
.00
7497
0.0
0%
0.0
0%
0.0
00
025
06
1.74
%1.
74%
0.0
077
Dad
ra &
Nag
ar H
avel
i32
692.
61%
0.7
1%0
.012
718
954.
15%
0.7
3%0
.020
413
741.
32%
2.53
%0
.00
57
Daman & Diu
Dam
an26
471.
36%
1.56
%0
.00
6449
73.
46%
0.0
0%
0.0
163
2150
1.50
%1.
81%
0.0
071
Diu
2949
0.9
9%1.
23%
0.0
036
1580
1.50
%1.
65%
0.0
055
1369
1.15
%1.
39%
0.0
041
Delhi
Cen
tral
Del
hi22
431.
66%
4.96
%0
.00
79-
--
-22
431.
66%
5.0
5%0
.00
79
East
Del
hi22
681.
60%
2.43
%0
.00
66-
--
-22
681.
60%
2.47
%0
.00
66
New
Del
hi18
201.
63%
2.78
%0
.00
76-
--
-18
201.
63%
2.84
%0
.00
76
No
rth
Del
hi22
381.
05%
1.79
%0
.00
4667
**
*21
711.
07%
1.88
%0
.00
46
No
rth
East
2866
1.68
%1.
71%
0.0
073
--
--
2866
1.68
%1.
74%
0.0
073
No
rth
Wes
t20
321.
52%
2.82
%0
.00
7515
01.
13%
0.0
0%
0.0
050
1882
1.54
%2.
88%
0.0
076
Sout
h D
elhi
2049
1.55
%2.
15%
0.0
067
--
--
2049
1.55
%2.
19%
0.0
067
Sout
h W
est
2294
1.34
%2.
63%
0.0
061
107
1.49
%0
.00
%0
.00
5921
871.
36%
2.74
%0
.00
62
Wes
t Del
hi22
880
.81%
2.78
%0
.00
37-
--
-22
880
.81%
2.84
%0
.00
37
Jammu & Kashmir
Ana
ntna
g40
842.
72%
1.70
%0
.013
831
162.
36%
1.30
%0
.011
396
86.
67%
1.27
%0
.034
6
Bad
gam
4586
1.37
%1.
00
%0
.00
5839
901.
65%
1.0
4%0
.00
6959
61.
03%
2.45
%0
.00
43
Band
ipo
re43
141.
94%
2.22
%0
.010
236
862.
49%
2.50
%0
.013
262
81.
93%
0.8
3%0
.00
83
Bara
mul
a41
341.
29%
1.43
%0
.00
6034
201.
62%
1.45
%0
.00
7571
41.
39%
6.0
9%0
.00
68
Do
da
3797
3.32
%1.
36%
0.0
179
3541
3.50
%1.
35%
0.0
189
256
0.9
9%0
.00
%0
.00
35
Gan
der
bal
4539
1.84
%1.
19%
0.0
083
3828
2.0
2%1.
35%
0.0
093
711
3.88
%2.
33%
0.0
158
Jam
mu
3548
1.70
%1.
86%
0.0
078
1888
2.94
%2.
25%
0.0
139
1660
1.72
%1.
84%
0.0
068
Kath
ua40
872.
08%
1.14
%0
.00
9535
742.
34%
1.15
%0
.010
751
30
.84%
0.0
0%
0.0
040
Kish
twar
3828
2.50
%1.
26%
0.0
128
3644
2.67
%1.
25%
0.0
136
184
1.24
%0
.00
%0
.00
44
Kulg
am43
591.
47%
1.39
%0
.00
6935
631.
83%
1.40
%0
.00
8579
60
.40
%0
.00
%0
.00
19
Kup
war
a46
152.
46%
0.7
0%
0.0
105
4031
2.93
%0
.74%
0.0
126
584
3.28
%0
.88%
0.0
135
Pulw
ama
4068
1.86
%2.
92%
0.0
086
3596
1.96
%2.
90%
0.0
090
472
1.36
%0
.00
%0
.00
45
Punc
h47
263.
23%
0.9
5%0
.015
043
523.
41%
0.9
4%0
.016
037
44.
10%
3.27
%0
.014
8
Raj
our
i42
673.
18%
0.9
3%0
.014
739
673.
37%
0.9
4%0
.015
630
04.
77%
1.20
%0
.019
0
Ram
ban
4037
2.61
%0
.81%
0.0
133
3888
2.72
%0
.81%
0.0
139
149
5.0
0%
0.0
0%
0.0
190
Reas
i44
572.
82%
0.8
5%0
.013
541
192.
78%
0.9
1%0
.013
533
814
.34%
0.6
7%0
.064
5
Sam
ba
3462
2.48
%0
.96%
0.0
109
2947
2.61
%0
.97%
0.0
114
515
1.72
%5.
98%
0.0
089
Shup
iyan
4480
2.18
%2.
27%
0.0
102
4277
2.33
%2.
29%
0.0
109
203
1.29
%0
.00
%0
.00
55
Srin
agar
3716
0.5
5%2.
80%
0.0
021
221
4.31
%7.
05%
0.0
272
3495
0.5
6%2.
83%
0.0
021
Ud
ham
pur
4174
3.21
%1.
07%
0.0
147
3522
3.66
%1.
12%
0.0
168
652
4.29
%1.
70%
0.0
183
Ladakh
Karg
il41
872.
06%
0.7
7%0
.00
8837
502.
06%
0.7
8%0
.00
9043
72.
65%
4.28
%0
.011
0
Leh
(Lad
akh)
3068
1.39
%0
.89%
0.0
052
1623
2.0
3%0
.71%
0.0
076
1445
0.9
4%2.
32%
0.0
043
Laks
had
wee
p39
440
.74%
1.11
%0
.00
2755
71.
15%
0.0
0%
0.0
049
3387
0.8
9%1.
23%
0.0
031
Puducherry
Kara
ikal
3089
0.9
0%
0.3
2%0
.00
3315
331.
73%
0.3
1%0
.00
6315
560
.63%
1.13
%0
.00
22
Mah
e36
140
.08%
0.0
0%
0.0
00
3-
--
-36
140
.08%
0.0
0%
0.0
00
3
Pud
uche
rry
3358
0.3
5%1.
61%
0.0
014
1720
0.7
8%1.
43%
0.0
028
1638
0.3
7%2.
40%
0.0
016
Yana
m33
151.
53%
1.0
2%0
.00
67-
--
-33
151.
53%
1.0
4%0
.00
67
*Sta
ndar
d e
rro
rs o
mm
itte
d f
or
po
int
esti
mat
es d
eriv
ed f
rom
sin
gle
ton
sam
plin
g u
nits
(CONTD.) STANDArD errorS: DISTrICT-WISe - heADCoUNT rATIo, INTeNSITy, MpI
DATA TABleSSECTION
417NITI Aayog | 2021
Related Documents