Welcome message from author
This document is posted to help you gain knowledge. Please leave a comment to let me know what you think about it! Share it to your friends and learn new things together.
Transcript

THE SOUTH AFRICAN NATIONAL LOTTERY: PARTICIPATION ANDATTITUDES, 2011
Compiled by
Prof AA Ligthelm
BUREAU OF MARKET RESEARCHCollege of Economic and Management Sciences
University of South Africa

ACKNOWLEDGEMENTS
The Project Steering Commi� ee consis� ng of Prof Vevek Ram, Dr Bongani Khumalo, Ms Thembi Tulwana and Mr Sershan Naidoo supplied valuable guidance in the planning and structuring of the study.
The manuscript was prepared by Ms Erna Koekemoer. Kutu Consul� ng acted as fi eld manager of the survey and was also responsible for all the follow-up contacts with respondents. Computer analysis was conducted by Ms Marietjie Coetzee and Ms Erna Koekemoer. The report was edited by Ms Cherryl Kemp.

i
TABLE OF CONTENTS
Page
LIST OF TABLES AND FIGURES .................................................................................................vi
EXECUTIVE SUMMARY .......................................................................................................... xiii
CHAPTER 1: INTRODUCTION AND OBJECTIVE OF THE STUDY
1.1 BACKGROUND ........................................................................................................... 1
1.2 OBJECTIVE OF THE STUDY ......................................................................................... 2
1.3 METHODOLOGY ........................................................................................................ 2
1.4 LAYOUT OF THE REPORT ........................................................................................... 3
CHAPTER 2: RESEARCH METHODOLOGY: COMMUNITY SURVEY
2.1 INTRODUCTION ......................................................................................................... 4
2.2 SCOPE OF THE SURVEY ............................................................................................. 4
2.3 TELEPHONE SUBSURVEY ........................................................................................... 4
2.3.1 Scope of the telephone survey ................................................................................. 52.3.2 Sample size and sampling ......................................................................................... 52.3.3 Ques� onnaire ........................................................................................................... 62.3.4 Interviewing .............................................................................................................. 62.3.5 Time schedule ........................................................................................................... 6
2.4 PERSONAL INTERVIEWS ............................................................................................ 8
2.4.1 Introduc� on .............................................................................................................. 82.4.2 Study areas ............................................................................................................... 82.4.3 Sample size and sampling ......................................................................................... 82.4.4 Ques� onnaire ......................................................................................................... 112.4.5 Interviewing ............................................................................................................ 112.4.6 Checkbacks .............................................................................................................. 11
2.5 WEIGHTING ............................................................................................................. 12
2.6 PARTICIPATION ........................................................................................................ 12
2.7 ACCESS TO RETAIL OUTLETS .................................................................................... 13

ii
2.8 VALIDITY OF THE RESULTS ...................................................................................... 13
2.8.1 Sample error ........................................................................................................... 132.8.2 Interviewer errors ................................................................................................... 142.8.3 Repor� ng errors ...................................................................................................... 152.8.4 Processing errors .................................................................................................... 152.8.5 Nonresponse ........................................................................................................... 15
2.9 LONGITUDINAL COMPARISONS .............................................................................. 16
CHAPTER 3: SURVEY FINDINGS
3.1 INTRODUCTION ....................................................................................................... 17
3.2 PARTICIPATION IN LOTTERY GAMES ....................................................................... 17
3.2.1 Par� cipa� on by age group ...................................................................................... 183.2.2 Par� cipa� on by employment status ...................................................................... 193.2.3 Par� cipa� on by educa� onal level .......................................................................... 213.2.4 Par� cipa� on by popula� on group ......................................................................... 213.2.5 Par� cipa� on by gender .......................................................................................... 233.2.6 Par� cipa� on by personal income category ............................................................ 243.2.7 Longitudinal pa� erns .............................................................................................. 25
3.3 REASONS FOR NONPARTICIPATION IN LOTTERY GAMES ....................................... 26
3.3.1 Nonpar� cipa� on by age group ............................................................................... 273.3.2 Nonpar� cipa� on by employment status ............................................................... 283.3.3 Nonpar� cipa� on by educa� onal level ................................................................... 293.3.4 Nonpar� cipa� on by popula� on group .................................................................. 303.3.5 Nonpar� cipa� on by gender ................................................................................... 313.3.6 Nonpar� cipa� on by personal income category ..................................................... 313.3.7 Longitudinal comparisons ...................................................................................... 32
3.4 MOTIVATIONAL FACTORS FOR ENGAGING IN LOTTERY GAMES ............................ 33
3.5 PERSONAL VIEWS ON LOTTERY GAMES ................................................................. 35
3.6 ATTITUDES TOWARDS LOTTERY GAMES ................................................................. 37
3.7 NATIONAL LOTTERY OUTLETS ................................................................................. 38
3.8 UNDER-AGE PARTICIPATION IN LOTTERY GAMES .................................................. 393.9 BUYING OF LOTTO AND LOTTO PLUS TICKETS ........................................................ 40
3.9.1 Buying of LOTTO/LOTTO Plus � ckets by age group ................................................ 42

iii
3.9.2 Buying of LOTTO/LOTTO Plus � ckets by employment status ................................ 423.9.3 Buying of LOTTO/LOTTO Plus � ckets by educa� onal level .................................... 433.9.4 Buying of LOTTO/LOTTO Plus � ckets by popula� on group .................................... 443.9.5 Buying of LOTTO/LOTTO Plus � ckets by gender ..................................................... 443.9.6 Buying of LOTTO/LOTTO Plus � ckets by personal income category ...................... 45
3.10 BUYING OF WINA MANJE SCRATCH CARDS ........................................................... 46
3.11 PARTICIPATING IN SPORTSTAKE .............................................................................. 48
3.12 BUYING OF POWERBALL TICKETS ........................................................................... 49
3.12.1 Buying of PowerBall � ckets by age group .............................................................. 503.12.2 Buying of PowerBall � ckets by employment status ............................................... 503.12.3 Buying of PowerBall � ckets by educa� onal level .................................................. 513.12.4 Buying of PowerBall � ckets by popula� on group .................................................. 513.12.5 Buying of PowerBall � ckets by gender ................................................................... 523.12.6 Buying of PowerBall � ckets by personal income group ......................................... 52
3.13 LOTTERY PLAYERS: DEMOGRAPHIC COMPARISONS ............................................. 53
3.14 ALLOCATION OF WINNINGS .................................................................................... 57
3.15 EXPENDITURE ON LOTTERY GAMES ....................................................................... 59
3.15.1 Expenditure by age group ....................................................................................... 613.15.2 Expenditure by employment status ....................................................................... 613.15.3 Expenditure by educa� onal level ........................................................................... 623.15.4 Expenditure by popula� on group .......................................................................... 633.15.5 Expenditure by gender ........................................................................................... 633.15.6 Expenditure by personal income category ............................................................. 64
3.16 BUDGET BEHAVIOUR REGARDING LOTTERY GAMES ............................................. 65
3.17 IMPACT OF BIG JACKPOTS ON LOTTO AND POWERBALL EXPENDITURE ............... 69
3.18 EXPENDITURE DISPLACEMENT ............................................................................... 73
3.18.1 Expenditure displacement by age group ................................................................ 763.18.2 Expenditure displacement by employment status ................................................ 773.18.3 Expenditure displacement by educa� onal level .................................................... 773.18.4 Expenditure by popula� on group .......................................................................... 783.18.5 Expenditure by gender ........................................................................................... 793.18.6 Expenditure displacement by personal income category ...................................... 79
3.19 SPENDING ON LOTTO AND POWERBALL TICKETS .................................................. 80

iv
3.19.1 Spending on LOTTO � ckets: Wednesdays and Saturdays ..................................... 803.19.2 Spending on PowerBall � ckets: Tuesdays and Fridays .......................................... 81
3.20 PERCEPTIONS OF WINNING .................................................................................... 82
3.20.1 Winning LOTTO/LOTTO Plus ................................................................................... 833.20.2 Winning PowerBall ................................................................................................. 843.20.3 Selec� ng numbers .................................................................................................. 85
3.21 PLAYING LOTTO AND POWERBALL ......................................................................... 89
3.21.1 Expenditure on LOTTO � ckets: 2007 and 2010 ..................................................... 893.21.2 Probability of winning LOTTO ................................................................................. 903.21.3 Probability of winning PowerBall ........................................................................... 923.21.4 Addi� onal playing alterna� ves .............................................................................. 93
3.22 ALTERNATIVE PLAYING METHODS .......................................................................... 95
3.23 IMPACT OF GAMBLING ........................................................................................... 96
3.24 PARTICIPATION IN THE MODES OF GAMBLING ...................................................... 97
3.25 RETAIL OUTLETS ...................................................................................................... 99
3.26 NATIONAL LOTTERIES DISTRIBUTION TRUST FUND (NLDTF) ............................... 102
3.26.1 NLDTF: Ac� vi� es and funding ............................................................................. 1023.26.2 Type of organisa� on supported by the NLDTF ..................................................... 103
3.27 SUMMARY ............................................................................................................. 104
CHAPTER 4: PROBLEM GAMBLING
4.1 INTRODUCTION ..................................................................................................... 107
4.2 PROBLEM GAMBLING ........................................................................................... 107
4.3 INSTRUMENT USED IN THIS STUDY ...................................................................... 109
4.4 IDENTIFICATION OF THE PROBLEM GAMBLER IN THE NATIONAL LOTTERY ........ 111
4.5 CONCLUSION ......................................................................................................... 115
CHAPTER 5: PROPENSITY TO BUY LOTTERY TICKETS
5.1 INTRODUCTION ..................................................................................................... 116

v
5.2 HOUSEHOLD EXPENDITURE PERSPECTIVE ........................................................... 116
5.3 PROPENSITY TO BUY LOTTERY TICKETS ................................................................ 118
5.3.1 Household expenditure ........................................................................................ 1185.3.2 Expenditure on lo� ery games at current and constant prizes ............................ 1195.3.3 Defi ni� on of propensity to buy lo� ery � ckets ..................................................... 1245.3.4 Calcula� on of propensity to gamble .................................................................... 1245.3.5 Redistribu� onal eff ects ......................................................................................... 126
5.4 SUMMARY ............................................................................................................. 129
LIST OF REFERENCES ........................................................................................................... 130

vi
LIST OF TABLES AND FIGURES
Tables Page
2.1 DISTRIBUTION OF SAMPLE ELEMENTS BY TELEPHONE DIRECTORY ........................ 5
2.2 LOTTO AND POWERBALL TICKET SALES AND PRIZE POOL, 26 JANUARY 2010- 27 FEBRUARY 2010 ................................................................................................... 7
2.3 AREAS SELECTED FOR FACE-TO-FACE INTERVIEWS .................................................. 9
2.4 INTERVAL ESTIMATES FOR PARTICIPATION IN LOTTERY GAMES, 2010 .................. 14
3.1 PARTICIPATION IN LOTTERY GAMES BY AGE GROUP, 2010 .................................... 19
3.2 PARTICIPATION IN LOTTERY GAMES BY EMPLOYMENT STATUS, 2010 .................. 20
3.3 PARTICIPATION IN LOTTERY GAMES BY EDUCATIONAL LEVEL, 2010 ..................... 21
3.4 PARTICIPATION IN LOTTERY GAMES BY POPULATION GROUP, 2010 ..................... 22
3.5 PARTICIPATION IN LOTTERY GAMES BY GENDER, 2010 ......................................... 23
3.6 PROPENSITY TO PARTICIPATE IN LOTTERY GAMES BY MONTHLY PERSONAL INCOME CATEGORY, 2010 ....................................................................................... 24
3.7 PLAYING LOTTERY GAMES: LONGITUDINAL COMPARISONS, 2003-2010 ............. 25
3.8 CHANGE IN THE SOCIODEMOGRAPHIC PROFILE OF LOTTERY PLAYERS, 2003 TO 2010 .......................................................................................................... 26
3.9 REASONS FOR NONPARTICIPATION IN LOTTERY GAMES BY AGE GROUP, 2010 .... 28
3.10 REASONS FOR NONPARTICIPATION IN LOTTERY GAMES BY EMPLOYMENT STATUS, 2010 ........................................................................................................... 29
3.11 REASONS FOR NONPARTICIPATION IN LOTTERY GAMES BY EDUCATIONAL LEVEL, 2010 ............................................................................................................. 30
3.12 REASONS FOR NONPARTICIPATION IN LOTTERY GAMES BY POPULATION GROUP, 2010 ........................................................................................................... 31
3.13 REASONS FOR NONPARTICIPATION IN LOTTERY GAMES BY GENDER, 2010 ......... 31
3.14 REASONS FOR NONPARTICIPATION IN LOTTERY GAMES BY MONTHLY PERSONAL INCOME CATEGORY, 2010 ..................................................................... 32

vii
3.15 COMPARISON OF REASONS FOR NOT PARTICIPATING IN LOTTERY GAMES, 2003 AND 2010 ....................................................................................................... 33
3.16 RESPONSE TO THE QUESTION: ‘WOULD THE FOLLOWING MEANS OF ACCESSING LOTTERY GAMES MOTIVATE YOU TO PARTICIPATE?’ .......................... 34
3.17 PERSONAL VIEWS ON THE NATIONAL LOTTERY, 2010 ........................................... 38
3.18 FREQUENCY OF BUYING LOTTO/LOTTO PLUS TICKETS: COMPARING 2003 WITH 2010 ...................................................................................................... 42
3.19 FREQUENCY OF BUYING LOTTO/LOTTO PLUS TICKETS BY AGE GROUP, 2010 ....... 42
3.20 FREQUENCY OF BUYING LOTTO/LOTTO PLUS TICKETS BY EMPLOYMENT STATUS, 2010 ........................................................................................................... 43
3.21 FREQUENCY OF BUYING LOTTO/LOTTO PLUS TICKETS BY EDUCATIONAL LEVEL, 2010 ............................................................................................................. 44
3.22 FREQUENCY OF BUYING LOTTO/LOTTO PLUS TICKETS BY POPULATION GROUP, 2010 ........................................................................................................... 44
3.23 FREQUENCY OF BUYING LOTTO/LOTTO PLUS TICKETS BY GENDER, 2010 ............. 45
3.24 FREQUENCY OF BUYING LOTTO/LOTTO PLUS TICKETS BY PERSONAL INCOME CATEGORY, 2010 ...................................................................................................... 46
3.25 FREQUENCY OF BUYING SCRATCH CARDS: COMPARING 2003 WITH 2010 ............................................................................................................... 47
3.26 FREQUENCY OF BUYING POWERBALL TICKETS BY AGE GROUP, 2010 ................... 50
3.27 FREQUENCY OF BUYING POWERBALL TICKETS BY EMPLOYMENT STATUS, 2010 .. 51
3.28 FREQUENCY OF BUYING POWERBALL TICKETS BY EDUCATIONAL LEVEL, 2010 .... 51
3.29 FREQUENCY OF BUYING POWERBALL TICKETS BY POPULATION GROUP, 2010 .... 52
3.30 FREQUENCY OF BUYING POWERBALL TICKETS BY GENDER .................................. 52
3.31 FREQUENCY OF BUYING POWERBALL TICKETS BY PERSONAL INCOME CATEGORY, 2010 ...................................................................................................... 53
3.32 PROFILE OF LOTTERY PLAYERS, 2010 ...................................................................... 56

viii
3.33 EXPENDITURE ON LOTTERY GAMES BY EXPENDITURE CATEGORY, 2003 AND 2010 ................................................................................................................ 61
3.34 EXPENDITURE ON LOTTERY GAMES BY AGE GROUP, 2010 .................................... 61
3.35 EXPENDITURE ON LOTTERY GAMES BY EMPLOYMENT STATUS, 2010 ................... 62
3.36 EXPENDITURE ON LOTTERY GAMES BY EDUCATIONAL LEVEL, 2010 ..................... 62
3.37 EXPENDITURE ON LOTTERY GAMES BY POPULATION GROUP, 2010 ..................... 63
3.38 EXPENDITURE ON LOTTERY GAMES BY GENDER, 2010 .......................................... 64
3.39 EXPENDITURE ON LOTTERY GAMES BY PERSONAL INCOME CATEGORY ............... 65
3.40 HOUSEHOLD BUDGETARY PROVISION FOR EXPENDITURE ON LOTTERY GAMES, 2003 AND 2010 ....................................................................................................... 66
3.41 INTENSITY OF IMPULSIVE SPENDING ON LOTTERY GAMES, 2003 AND 2010 ....... 68
3.42 BUYING BEHAVIOUR WHEN BIG JACKPOTS ARE AT STAKE, 2003 AND 2010 ......... 70
3.43 INCREASE IN EXPENDITURE BY REGULAR PLAYERS IF BIG JACKPOTS ARE AT STAKE, 2003 AND 2010 ...................................................................................... 72
3.44 ITEMS FROM WHICH LOTTERY MONEY IS DISPLACED, 2003 AND 2010 ................ 76
3.45 EXPENDITURE DISPLACEMENT TO LOTTERY GAMES BY AGE GROUP, 2010 .......... 76
3.46 EXPENDITURE DISPLACEMENT TO LOTTERY GAMES BY EMPLOYMENT STATUS, 2010 ........................................................................................................... 77
3.47 EXPENDITURE DISPLACEMENT TO LOTTERY GAMES BY EDUCATIONAL LEVEL, 2010 ............................................................................................................. 78
3.48 EXPENDITURE DISPLACEMENT TO LOTTERY GAMES BY POPULATION GROUP, 2010 ......................................................................................................................... 78
3.49 EXPENDITURE DISPLACEMENT TO LOTTERY GAMES BY GENDER, 2010 ................ 79
3.50 EXPENDITURE DISPLACEMENT TO LOTTERY GAMES BY PERSONAL INCOME CATEGORY, 2010 ...................................................................................................... 80
3.51 PERCEPTIONS THAT ALL 49 NUMBERS IN THE LOTTO/LOTTO PLUS HAVE THE SAME CHANCE TO BE SELECTED WITH EACH DRAW, 2003 AND 2010 ................... 84

ix
3.52 CHANCES OF DRAWING THE COMINATION 1 2 3 4 5 6 OR THE COMBINATION 13 39 23 7 11 42 ...................................................................................................... 86
3.53 PERCEIVED CHANCES OF WINNING THE LOTTO, 2003 AND 2010 .......................... 91
3.54 USAGE OF AND SATISFACTION LEVELS FOR A SELECTION OF LOTTERY PLAYING METHODS, 2010 ....................................................................................... 96
3.55 LEVEL OF AGREEMENT WITH STATEMENTS ON THE IMPACT OF LOTTERY GAMES, 2010 .......................................................................................................... 97
3.56 SATISFACTION LEVELS AND DISSATISFIED RESPONDENTS, 2010 ......................... 102
3.57 NLDTF ACTIVITIES AND FUNDING, 2010 ............................................................... 103
4.1 FREQUENCY COUNT OF AFFIRMATIVE RESPONSES FOR NATIONAL LOTTERY PLAYERS, 2010 ........................................................................................ 112
4.2 FREQUENCY COUNT OF AFFIRMATIVE RESPONSES FOR NATIONAL LOTTERY PLAYERS, 2003 AND 2010 ...................................................................... 113
4.3 FREQUENCY COUNT OF AFFIRMATIVE RESPONSES FOR LOTTERY GAMES PLAYERS, 2010 ....................................................................................................... 114
5.1 TOTAL ANNUAL HOUSEHOLD CASH EXPENDITURE BY MAIN EXPENDITURE GROUP, 2009 ........................................................................................................ 119
5.2 TOTAL TICKET SALES OF AND PRIZES PAID OUT ON LOTTERY GAMES, 2000-2010 (EXCLUDING SCRATCH CARD SALES FROM 2003-2010) ........................................ 121
5.3 EXPENDITURE ON LOTTERY GAMES AT CONSTANT (2008 PRICES) AND CURRENT VALUES, 2000-2009 .............................................................................. 122
5.4 AVERAGE PER CAPITA EXPENDITURE BY THE POPULATION (18+ YEARS) AND LOTTERY PLAYERS, 2009 (CURRENT PRICES) ........................................................ 124
5.5 PROPENSITY TO PLAY LOTTERY GAMES, 2009 ...................................................... 125
5.6 PROPENSITY TO BUY LOTTERY TICKETS BY LOTTERY MODE, 2009 ...................... 126
5.7 TOTAL LOTTO TICKET SALES AND PRIZE POOL, SATURDAY 6 MARCH 2010 ......... 128
5.8 TOTAL POWERBALL TICKET SALES AND PRIZE POOL, FRIDAY 23 APRIL 2010 ...... 129

x
FIGURES
Figure Page
3.1 PARTICIPATION IN LOTTERY ACTIVITIES DURING THE MONTH PRECEDING THE SURVEY, 2010 ................................................................................................... 18
3.2 DISTRIBUTION OF PARTICIPANTS BUYING LOTTO TICKETS BY EMPLOYMENT STATUS, 2010 ........................................................................................................... 20
3.3 SHARE IN LOTTERY GAMES BY POPULATION GROUP, 2010 ................................... 23
3.4 REASONS ADVANCED BY RESPONDENTS FOR NOT PARTICIPATING IN LOTTERY GAMES, 2010 ........................................................................................... 27
3.5 PERSONAL VIEWS ON PARTICIPATING IN LOTTERY GAMES, 2010 ......................... 36
3.6 ADEQUACY OF NATIONAL LOTTERY OUTLETS, 2010 .............................................. 39
3.7 LEVEL OF AWARENESS OF UNDER-AGE PARTICIPATION IN LOTTERY GAMES ........ 40
3.8 FREQUENCY OF BUYING LOTTO AND LOTTO PLUS TICKETS, 2010 ......................... 41
3.9 FREQUENCY OF BUYING SCRATCH CARDS, 2010 .................................................... 46
3.10 FREQUENCY OF PLAYING SPORTSTAKE, 2010 ......................................................... 48
3.11 FREQUENCY OF BUYING POWERBALL TICKETS, 2010 ............................................ 49
3.12 ALLOCATION OF NATIONAL LOTTERY WINNINGS, 2010 ........................................ 57
3.13 EXPENDITURE PER MONTH ON LOTTERY GAMES, 2010 ........................................ 59
3.14 HOUSEHOLD BUDGETARY PROVISION FOR EXPENDITURE ON LOTTERY GAMES, 2010 .......................................................................................................... 66
3.15 INTENSITY OF IMPULSIVE SPENDING ON LOTTERY GAMES, 2010 ......................... 68
3.16 BUYING BEHAVIOUR OF RESPONDENTS WHEN BIG JACKPOTS ARE AT STAKE, 2010 ............................................................................................................. 70
3.17 INCREASE IN EXPENDITURE BY REGULAR PLAYERS IF BIG JACKPOTS ARE AT STAKE, 2010 ........................................................................................................ 72
3.18 ADDITIONAL SPENDING WITH HIGH JACKPOT PRIZES, 2010 ................................. 73

xi
3.19 ITEMS FROM WHICH LOTTERY MONEY IS DISPLACED, 2010 ................................. 74
3.20 PERCENTAGE OF EXPENDITURE ON LOTTO TICKETS FOR THE SATURDAY DRAW, 2010 ............................................................................................................ 81
3.21 PERCENTAGE OF EXPENDITURE ON POWERBALL TICKETS FOR THE FRIDAY DRAW, 2010 ................................................................................................ 82
3.22 RESPONSE TO: ‘DO YOU THINK THAT ALL 49 NUMBERS HAVE EXACTLY THE SAME CHANCE TO BE SELECTED WITH EACH DRAW?’, 2010 .................................. 83
3.23 RESPONSE TO: ‘DO YOU THINK THAT ALL 65 NUMBERS IN THE POWERBALL DRAW HAVE EXACTLY THE SAME CHANCE TO BE SELECTED WITH EACH DRAW?’ 2010 ......................................................................................................................... 85
3.24 RESPONSE TO: ‘DO YOU THINK THAT IN ANY DRAW, THE CHANCES OF DRAWING THE COMBINATION 1 2 3 4 5 6 ARE BETTER THAN THE CHANCES OF DRAWING 13 39 23 7 11 42?’ ................................................................................. 86
3.25 PERCENTAGE OF RESPONDENTS THAT PERCEIVED A BETTER CHANCE OF WINNING WHEN CHOOSING OWN NUMBERS RATHER THAN QUICK PICK, 2010 ......................................................................................................................... 87
3.26 DO YOU THINK THAT YOUR CHANCES OF GETTING 4 NUMBERS RIGHT IN THE NEXT DRAW ARE: (2010 FINDINGS) ....................................................................... 88
3.27 INCREASE IN EXPENDITURE ON LOTTO TICKETS DURING THE PAST THREE YEARS FROM 2007-2010 ......................................................................................... 89
3.28 PERCEIVED CHANCES OF WINNING THE LOTTO, 2010 ........................................... 90
3.29 PERCEIVED CHANCES OF WINNING POWERBALL, 2010 ........................................ 93
3.30 PERCENTAGE OF RESPONDENTS PARTICIPATING IN POWERBALL SINCE IT’S INTRODUCTION, 2010 ............................................................................................. 93
3.31 POSSIBILITY OF PARTICIPATING IN NEW LOTTERY GAMES SHOULD SUCH ALTERNATIVES BE INTRODUCED, 2010 ................................................................... 94
3.32 ORIGIN OF MONEY FOR PLAYING NEW LOTTERY GAMES SHOULD SUCH ALTERNATIVES BE INTRODUCED, 2010 ................................................................... 95
3.33 PERCENTAGE OF LOTTERY PLAYERS ALSO PARTICIPATING IN OTHER MODES OF GAMBLING ......................................................................................................... 98

xii
3.34 OTHER GAMBLING ACTIVITIES ENGAGED IN BY LOTTERY PLAYERS (1 MONTH PRIOR TO INTERVIEW), 2010 .................................................................................. 98
3.35 OUTLETS USED TO PROCURE LOTTERY TICKETS/SCRATCH CARDS, 2010 .............. 99
3.36 TYPE OF ORGANISATION SUPPORTED BY THE NLDTF .......................................... 104

xiii
EXECUTIVE SUMMARY
THE SOUTH AFRICAN NATIONAL LOTTERY: COMMUNITY PARTICIPATION AND ATTITUDES
1. INTRODUCTION
The Lo� eries Act 57 of 1997 (as amended) was promulgated to promote regula� on and
coordina� on of all ac� vi� es rela� ng to the Na� onal Lo� ery and other ancillary ma� ers.
The Na� onal Lo� eries Board (NLB) was established in October 1998 to act as na� onal
regulator. The fi rst Na� onal Lo� ery license was allocated to Uthingo Management in
July 1999 and the second to Gidani (Pty) Ltd in 2007. Since the fi rst LOTTO � ckets were
sold in March 2000, lo� ery games have entrenched themselves as a popular South
African commodity. Both the NLB and Gidani are commi� ed to ensuring responsible
par� cipa� on in the Na� onal Lo� ery. In order to ascertain the impact of the Na� onal
Lo� ery, Gidani and the NLB decided to commission a study on the playing pa� erns of
par� cipants. This is a follow-up study on a similar study conducted in 2003.
The research sought to establish:
• community behaviour and par� cipa� on in lo� ery games
• the extent of problem gambling
• propensity to spend on lo� ery games
2. COMMUNITY BEHAVIOUR AND PARTICIPATION
2.1 THE SAMPLE
A na� onal survey was conducted among a sample of 2 500 respondents over the
age of 18 years from January to March 2010. The sample comprised 800 households
selected randomly for telephone interviews and 1 700 households without in-house
Telkom telephones living in townships, informal se� lements and rural villages for
personal interviews. The results were weighted to portray the structure of the South
African popula� on with regard to access to in-house Telkom telephones. Due to

xiv
cost considera� ons, communi� es without Telkom telephones located in commercial
agricultural areas characterised by a dispersed loca� on pa� ern were excluded from
the face-to-face interviews.
2.2 PARTICIPATION IN LOTTERY GAMES
Par� cipa� on in lo� ery games during the month preceding the survey was recorded as
follows:
• 39.3 % played lo� ery games
• 60.7 % abstained from par� cipa� ng in any lo� ery games
Those that par� cipated recorded the following ac� vi� es:
• 32.3 bought LOTTO � ckets
• 26.3 % bought LOTTO Plus � ckets
• 16.4 % played PowerBall
• 6.2 % bought Scratch Cards
• 3.3 % par� cipated in SportStake
The propensity of the South African popula� on (18 years and older) to par� cipate in
lo� ery games declined from 2003 to 2010:
• abstaining from lo� ery games increased from 30.6 % to 60.7 % of the adult
popula� on
• LOTTO � cket buyers decreased from 69.1 % to 32.3 %
• Scratch Card players decreased from 12.6 % to 6.2 %
Concomitantly, the sociodemographic profi le of lo� ery players changed as follows from
2003 to 2010:

xv
• average age: 37.2 years to 35.1 years
• unemployed as % of players: 36.9 % to 23.0 %
• persons with primary educa� on as % of players: 17.9 % to 11.7 %
• Africans as % of players: 75.5 % to 76.3 %
• males as % of players: 46.7 % to 48.2 %
• less affl uent income (less than R1 000 per month) as % of players: 60.5 % to
34.7 %
The above confi rms a substan� al decline in the par� cipa� on of the less affl uent in
Na� onal Lo� ery games.
2.3 REASONS FOR NONPARTICIPATION IN LOTTERY GAMES
The three in every fi ve (60.7 %) respondents, who did not par� cipate in any lo� ery
games, advanced the following reasons:
• 38.7 % were not interested (33.3 % in 2003)
• 21.9 % do not gamble at all (9.9 % in 2003)
• 18.1 % experienced a lack of money (27.6 % in 2003)
• 10.8 % advanced religious beliefs (18.0 % in 2003)
• 2.3 % had no access to retail outlets (1.0 % in 2003)
‘Not interested’ and ‘do not gamble at all’ became much more prominent in 2010
compared to 2003 while ‘lack of money’ and ‘religious beliefs’ declined as reasons for
absten� on.
2.4 MOTIVATIONAL FACTORS FOR ENGAGING IN LOTTERY GAMES
Only a small percentage of those not par� cipa� ng in lo� ery games would be mo� vated
to engage in lo� ery games should they become aware of the following ways of accessing
lo� ery games:

xvi
• 3.6 % through a bank ATM
• 4.3 % through online banking
• 10.4 % through a cellphone
• 16.9 % at � ll points in supermarkets
2.5 VIEWS ON LOTTERY GAMES
Personal views of respondents on par� cipa� ng in lo� ery games reveal that:
• 57.3 % fi nd it acceptable
• 19.8 % fi nd it unacceptable
• 22.9 % do not approve of lo� ery games personally but have no objec� on to
par� cipa� on by others
2.6 ATTITUDES TOWARDS LOTTERY GAMES
Percentage agreement with the following statements:
• 52.1 % - ‘I am aware of the NLB’
• 45.0 % - ‘I am aware of Gidani (Pty) Ltd’
• 59.1 % - ‘I am aware of good cause monies distributed by the NLDTF’
• 59.7 % - ‘On balance, the Na� onal Lo� ery is good for society’
• 49.2 % - ‘Most people play the lo� ery sensibly’
• 17.6 % - ‘People should be discouraged from playing lo� ery games’
2.7 ADEQUACY OF NATIONAL LOTTERY OUTLETS
Respondent reac� on on the adequacy of lo� ery outlets:
• 15.5 % think there are too many outlets
• 32.8 % think there are not enough
• 51.6 % think there are enough outlets

xvii
2.8 AWARENESS OF UNDER-AGE PARTICIPATION IN THE LOTTERY
Level of awareness of under-age par� cipa� on in:
• LOTTO/LOTTO Plus : 11.8 % of respondents
• Scratch Cards : 10.3 % of respondents
• PowerBall : 7.1 % of respondents
• SportStake : 6.7 % of respondents
2.9 BUYING OF LOTTO/LOTTO PLUS TICKETS
The frequency of buying LOTTO/LOTTO Plus � ckets is as follows:
• 51.8 % buy LOTTO/LOTTO Plus � ckets twice a week (53.4 % in 2003)
• 30.7 % buy LOTTO/LOTTO Plus � ckets once a week (30.1 % in 2003)
• 5.2 % buy LOTTO/LOTTO Plus � ckets once every two weeks (6.3 % in 2003)
• 7.4 % buy LOTTO/LOTTO Plus � ckets once a month (6.0 % in 2003)
• 4.9 % buy LOTTO/LOTTO Plus � ckets less o� en (4.2 % in 2003)
Notwithstanding the substan� al decline in the level of par� cipa� on, the frequency
pa� erns remain unchanged.
2.10 BUYING OF WINA MANJE SCRATCH CARDS
The frequency of buying Scratch Cards shows the following pa� ern:
• 5.6 % buy Scratch Cards every day (6.9 % in 2003)
• 43.9 % buy Scratch Cards every week (once or more) (35.4 % in 2003)
• 13.8 % buy Scratch Cards once every two weeks (16.0 % in 2003)
• 17.6 % buy Scratch Cards once a month (20.1 % in 2003)
• 19.0 % buy Scratch Cards less o� en (21.6 % in 2003)

xviii
2.11 PARTICIPATING IN SPORTSTAKE
The frequency of par� cipa� ng in SportStake is as follows:
• 24.0 % play twice a week
• 61.1 % play once a week
• 5.6 % play once every two weeks
• 5.6 % play once a month
• 3.6 % play less o� en
2.12 BUYING OF POWERBALL TICKETS
The frequency of buying PowerBall � ckets shows the following pa� ern:
• 46.2 % buy twice a week
• 33.4 % buy once a week
• 5.8 % buy once every two weeks
• 8.2 % buy once a month
• 19.0 % buy less o� en
2.13 PROFILE OF LOTTERY PLAYERS
Table 3.22 shows the profi le of typical lo� ery players by type of game. For example, a
typical LOTTO/LOTTO Plus player is:
• between 18 and 50 years (82.3 % of players)
• holds full-� me work (43.4 % of players)
• has a secondary school qualifi ca� on (70.5 % of players)
• earns less than R5 000 per month (73.2 % of players)
There is also limited varia� on by gender (52.1 % female) among LOTTO/LOTTO Plus
players.

xix
2.14 ALLOCATION OF WINNINGS
The response to the ques� on: ‘If you win money today, on what would you spend it?’
reveals that:
• 58.3 % would save it
• 40.9 % would purchase items for basic needs
• 39.9 % would purchase luxury items
• 30.2 % would pay off a debt/bond
• 14.7 % would spend it on entertainment
• 9.8 % would spend it on gambling or buying lo� ery � ckets
Note that respondents were invited to men� on more than one item. The above
percentages are therefore not indica� ve of the rela� ve amounts that winners would
spend on items. The percentages refer merely to the propor� on of respondents who
would spend some of their winnings on a par� cular item. In rela� on to 2003, more
respondents in 2010 advanced ‘savings’ and the ‘purchasing of luxury items’.
2.15 EXPENDITURE ON LOTTERY GAMES
The distribu� on of monthly expenditure on lo� ery games shows that:
• 24.0 % spent less than R20 (46.7 % in 2003)
• 37.9 % spent R21 – R50 (32.9 % in 2003)
• 26.5 % spent R51 – R150 (16.2 % in 2003)
• 8.6 % spent R151 – R300 (3.2 % in 2003)
• 1.9 % spent R301 – R500 (0.9 % in 2003)
• 1.1 % spent R500 to R1 000 (0.1 % in 2003)
The percentages show a substan� al increase in the percentage of respondents in the
higher expenditure brackets. Respondents in the ‘less than R20 per month’ category

xx
decreased from 46.7 % in 2003 to 24.0 % in 2010 while respondents in the expenditure
category exceeding R50 a month increased from 20.4 % of respondents in 2003 to
38.1 % in 2010. (Readers should be reminded that the income brackets in the two
survey years remained unaltered while a total infl a� on rate of 30.5 % was recorded
between the 2003 and 2010 surveys.)
2.16 HOUSEHOLD BUDGET BEHAVIOUR
The alloca� on of household funds to lo� ery games shows the following budgetary
behaviour:
• Only a third (33.2 %) of all respondents made provision in their budgets for
playing lo� ery games (33.3 % in 2003).
• Those that did not budget (66.8 %), confi rmed their impulsive buying behaviour.
Just more than half (57.2 %) are impulsive buyers on a regular basis and less
than half (42.8 %) are impulsive buyers on an occasional basis (corresponding
percentages for 2003 were 56.5 % and 43.5 %).
2.17 IMPACT OF BIG JACKPOTS ON LOTTERY EXPENDITURE
Just more than one in every 10 respondents (13.3 %) reported that lo� ery � ckets are
procured only if big jackpots are at stake. Nine in every 10 (86.7 %) are more regular
buyers and are not par� cularly mo� vated to buy LOTTO and PowerBall � ckets with big
jackpots. Similar fi gures were reported in 2003, namely 10.7 % and 89.3 % respec� vely.
One in every fi ve (21.5 %) respondents spent more on LOTTO and PowerBall � ckets
when big jackpots are at stake. (This percentage amounted to 10.7 % in 2003). The
addi� onal spending is not that excessive. No less than 86.8 % reported an addi� onal
expenditure of double or just less than double their normal expenditure.

xxi
2.18 EXPENDITURE DISPLACEMENT
Forfeiture of expenditure on other household items in favour of buying lo� ery � ckets
may range from small pro-rata cuts on expenditure on various items to the subs� tu� on
of one item with lo� ery games.
Household budget behaviour o� en consists of small cuts on discre� onary items rather
than one large subs� tu� on.
The following expenditure displacement eff ect was reported by respondents in the
survey:
• 71.1 % from household necessi� es
• 19.1 % from savings
• 17.8 % from other entertainment
• 6.5 % from luxury items
• 5.7 % from other items
It is important to men� on that, since most respondents men� oned more than one item
and did not indicate which percentage of money would be sourced from which item, it
was not possible to determine the rela� ve importance of the items. The response to
this ques� on therefore provides only the items from which displacement takes place
and not the propor� on of lo� ery money sourced from the various items men� oned.
Sec� on 4.1 of the execu� ve summary shows that, on average, less than 0.2 % (ie R2
in every R1 000) of household expenditure was allocated to lo� ery games in 2009,
implying a rela� vely small displacement eff ect.

xxii
2.19 EXPENDITURE: WEDNESDAY/SATURDAY (LOTTO) AND TUESDAY/FRIDAY
(POWERBALL)
Just less than half (43.8 %) the LOTTO players reported an equal distribu� on of LOTTO/
LOTTO Plus expenditure between Wednesday and Saturday. Just less than a third (32.0
%) indicated that they buy LOTTO � ckets only on Saturdays.
With regard to PowerBall, 55.4 % of respondents reported an equal distribu� on while
24.3 % reported the procurement of PowerBall � ckets only on Fridays.
2.20 PERCEPTIONS OF WINNING
Several ques� ons enquired on the LOTTO player’s percep� ons of the Na� onal Lo� ery
and their chances of winning. The following emerged:
• Only 57.0 % of players expressed the opinion that all LOTTO numbers (49)
have the same chance of being selected in each draw. This percentage stood
at 41.7 % for PowerBall, namely that the 65 numbers have exactly the same
chance of selec� on with each draw.
• 29.4 % expressed the opinion that the chances of drawing the numbers 13 39
23 7 11 42 are be� er than the chances of drawing 1 2 3 4 5 6 (this percentage
was 27.0 % in 2003). Only 42.7 % think that the two combina� ons have an
equal chance of being drawn. This clearly confi rms a lack of insight into the
probability principle.
• 76.2 % of respondents were of the opinion that the chances of winning are
enhanced by choosing one’s own numbers while 23.8 % felt the quick pick
method enhances their chances of winning. (These percentages were 81.9 %
and 18.1 % respec� vely in 2003).
• 33.0 % of lo� ery � cket buyers expressed the view that their chances of ge� ng
four numbers right in the next draw are be� er if previous draws showed some
correct numbers (2003 percentage was 33.0 %). These par� cipants perceived

xxiii
the lo� ery as a con� nuum, with their chances of winning improving if previously
selected numbers were correct.
• Although the chances of winning LOTTO or PowerBall are very slim, 53.9 % of
LOTTO and 44.7 % of PowerBall � cket buyers perceived their chances of winning
as ‘average’, ‘good’ or ‘very good’. The corresponding fi gure for LOTTO stood at
61.7 % in 2003.
The above fi ndings confi rm a clear lack of insight into aspects such as chances of
winning, randomness and the fact that each draw is a discrete event. It also seems
that the 2010 percep� ons show only a limited devia� on from the 2003 percep� ons.
2.21 EXPENDITURE/BUYING BEHAVIOUR
Respondents recorded the following in response to the ques� on: ‘Do you spend more
on lo� ery � ckets now (2010) compared to 2007?’
• 32.7 % yes
• 62.5 % no
• 4.8 % don’t know
On the impact of visible assistance of the Na� onal Lo� ery to good causes on the
amount spent on lo� ery games, the following response was recorded:
• 57.5 % will spend more
• 42.5 % not infl uenced by good cause support
Since the introduc� on of PowerBall on 16 October 2009:
• 47.2 % of lo� ery players have bought PowerBall � ckets
• 52.8 % have not par� cipated

xxiv
On the possibility of playing new lo� ery games should addi� onal playing alterna� ves
be introduced (ie in addi� on to LOTTO/LOTTO Plus, Scratch Cards, SportStake and
PowerBall), respondents responded as follows:
• 55.3 % yes
• 27.5 % no
• 17.2 % don’t know
The above 55.3 % confi rming the possibility of partaking in new alterna� ve games
recorded that:
• 42.9 % will redistribute exis� ng lo� ery money to new games
• 57.1 % will allocate addi� onal money
The crea� on of new methods of easing the eff ort to par� cipate in lo� ery games has
resulted in limited usage of such methods. The following percentages of respondents
recorded the usage of such methods:
• 0.4 % use a bank ATM
• 0.8 % play through on-line banking
• 1.9 % use their cellphones
• 34.2 % use � ll points in supermarkets
Those that use the above methods were requested to provide sa� sfac� on ra� ngs for
these methods (where 1 = very dissa� sfi ed and 10 is very sa� sfi ed). The following
mean (average) sa� sfac� on scores were calculated:
• 4.95 (out of 10) for bank ATMs
• 7.23 (out of 10) for on-line banking
• 7.33 (out of 10) for cellphones
• 8.23 (out of 10) for supermarket � ll points

xxv
2.22 IMPACT OF GAMBLING
Several statements on lo� ery games with regard to their fi nancial impact as well as the
awareness of problem gambling were put to lo� ery players. The following levels of
agreement were recorded:
• 53.4 % indicated that winnings from lo� ery games helped them fi nancially
• 70.3 % lost more than they won
• 8.3 % borrowed money to play lo� ery games
• 23.6 % confi rmed that they spent more money on lo� ery games than intended
• 16.2 % were cri� cised by others about spending too much on lo� ery games
• 77.3 % were aware of the risks of playing lo� ery games
• 52.5 % were aware of programmes to assist problem gamblers
• 17.3 % of lo� ery players also par� cipate in other modes of gambling, specifi cally
casino gambling
2.23 RETAIL OUTLETS
Main source of procuring lo� ery � ckets:
• 73.5 % bought from local supermarket
• 39.8 % bought from small local grocery store
• 33.5 % bought from garage/convenience shop
• 27.6 % bought from post offi ce
• 3.6 % bought elsewhere
Level of sa� sfac� on with services rendered by lo� ery retail outlets (where 1 = very
dissa� sfi ed and 10 = very sa� sfi ed):

xxvi
• 8.45 (out of 10) for a� tude of staff
• 8.35 for courtesy of staff
• 8.28 for empathy of staff
• 8.54 for printout of lo� ery results
• 8.50 for payment of prizes
• 8.63 for availability of pay slips/coupons
• 7.82 for systems always on-line
• 7.91 for the availability of a wri� ng surface
The above confi rms a fairly high level of sa� sfac� on with retail outlets. Only the fact
that systems are o� en off -line and the availability of a wri� ng surface scored below 8.0
(out of 10).
2.24 NLDTF ACTIVITIES AND FUNDING
The following views were expressed by lo� ery players on the NLDTF:
• 65.0 % think that players should have a say in who gets NLDTF funding
• 25.8 % confi rmed that ‘good causes’ aff ect their playing pa� erns (spend and/or
play more)
• 48.8 % would stop playing if money is not fairly distributed
• 42.3 % confi rmed their awareness of organisa� ons that have received lo� ery
funding
• 11.1 % confi rmed their awareness of organisa� ons in their immediate area that
have received lo� ery funding
The following are the most preferred NLDTF benefi ciaries:
• 89.4 % - chari� es
• 28.5 % - sport and recrea� on

xxvii
• 23.57 % - arts, culture and na� onal heritage
• 8.52 % - other
3. PROBLEM GAMBLING
3.1 EXTENT OF PROBLEM GAMBLING
This study applied the 20 Gamblers Anonymous ques� ons to determine the extent of
problem gambling. The survey put the 20 ques� ons to all respondents who play lo� ery
games at least twice a week. The results show that:
• 0.1 % of those buying lo� ery � ckets at least twice a week can be classifi ed as
problem gamblers. (Only one respondent recording 14 affi rma� ve responses to
the Gamblers Anonymous ques� ons was iden� fi ed in the sample popula� on.)
The result of the survey suggests virtually no addic� ve or pathological conduct among
Na� onal Lo� ery players.
4. EXPENDITURE ON LOTTERY GAMES
4.1 PROPENSITY TO BUY LOTTERY TICKETS
The propensity to buy lo� ery � ckets is defi ned as the percentage of household
expenditure allocated to lo� ery games. This is calculated at 0.18 % for 2009 compared
to the 0.45 % for 2002. This implies that households, on average, spent 18 cents out
of every R100 of household expenditure on lo� ery games in 2010 – less than half
compared to 2002. Lo� ery � cket sales amounted to R3.6 billion in 2001 and R4.1
billion in 2009 at current prices. At constant (2008) prices, sales declined from R5.5
billion in 2001 to R3.8 billion in 2009. Prize money at current prices to the value of R1.8
billion and R1.9 billion was paid out in 2001 and 2009 respec� vely. The prize money
allocated to patrons reverts back to household income and the expenditure stream
and is excluded from the calcula� on of the propensity to play lo� ery games. Only the
household money forfeited in favour of Gidani, the NLDTF and commission to retailers

xxviii
is regarded as money extracted from the aggregate household income and expenditure
stream.
The propensity to buy lo� ery � ckets, ie the percentage of household expenditure spent
on lo� ery � ckets minus prize money, shows the following propor� ons by type of game
for 2009:
Propensity Share per R100 spent
on games
• Lo� o 0.10 % R56
• Lo� o Plus 0.03 % R16
• SportStake 0.01 % R6
• PowerBall 0.04 % R22
• Scratch Cards 0.04 % R22
• Total 0.18 % R100
4.2 REDISTRIBUTIONAL EFFECTS
Average annual per capita expenditure on the lo� ery amounted to approximately R140
per person 18 years and older and approximately R356 for those persons who actually
bought lo� ery � ckets in 2009. It is assumed that the average amount spent per buyer
per draw amounted to approximately R10 (range between R9.89 for LOTTO and R13.90
for PowerBall).
The redistribu� onal eff ect of the LOTTO � cket sales of 6 March 2010 to the value of
R26.0 million (average expenditure of R10 each by 2.6 million people) is as follows (this
example is only used to illustrate the magnitude of redistribu� on):
• 4.6 % (118 731 players) received prizes
• One person received R13.8 million, 3 received R156 215 each and 101 received
R10 440 each

xxix
• 88.5 % of the prize winners each received R40
• 95.4 % of players received no prizes
On average, an extremely large number of people (2.6 million) each spent a small
amount while the prizes were heavily concentrated in only 105 people (division-1 to
division-3 prizes). This suggests an immense household redistribu� onal eff ect among
par� cipants in lo� ery games.
5. CONCLUSION
The fi ndings of the study confi rm a substan� al decline in adult par� cipa� on in lo� ery
games between 2003 and 2010 – from close to 70 % of the adult popula� on in 2003
to just less than 40 % in 2010. Sociodemographic changes of lo� ery players were also
evident. Although the less affl uent are s� ll ac� ve lo� ery players, their share in lo� ery
gaming shows a marked decline. The unemployed as percentage of lo� ery players
declined from 36.9 % in 2003 to 23.0 % in 2010 and those earning a monthly income
of less than R1 000 per month declined from 60.5 % to 34.7 %. The gender, popula� on
group and age composi� on of 2010 players was similar to that of 2003.
The general decline in lo� ery par� cipa� on is also evident from the increased percentage
of the adult popula� on who did not gamble at all. Abstainers seem to feel fairly strongly
about refraining from gambling, as is evident from the limited mo� va� onal appeal
reported on alterna� ve means of accessing lo� ery games. Access to lo� ery outlets is
also well established – a further rollout of facili� es would not necessarily extend the
number of players.
The general pa� ern emerging from the fi ndings is a much more stable and mature
lo� ery market with almost no occurrence of problem lo� ery gambling. Future growth
may result from the introduc� on of new games, with the possibility of alloca� ng
addi� onal money to lo� ery games. This is illustrated by the reac� on forthcoming from
the launching of PowerBall in October 2009. The support of ‘good causes’ by lo� ery
money remains an important mo� va� on for suppor� ng the Na� onal Lo� ery.

xxx
The decline in the propensity to buy lo� ery � ckets (ie the percentage of household
expenditure allocated to lo� ery � ckets) confi rms the new lower level of lo� ery ac� vity
among the South African popula� on. The propensity declined from 0.45 % (45c per
R100 household expenditure in 2002) to 0.18 % (18c per R100 in 2009). A propensity
of approximately 0.20 % (20c per R100) can probably be set as indica� ve of a lo� ery
market size for the near future. This implies a lo� ery market growth closely related
to the growth in labour remunera� on. However, the lo� ery market may be extended
somewhat with the introduc� on of new games.

1
CHAPTER 1
INTRODUCTION AND OBJECTIVE OF THE STUDY
1.1 BACKGROUND
Regulated gambling in South Africa was extended in 1994, from horse racing to include
several other modes of gambling. The Na� onal Government promulgated the Lo� eries
Act 57 of 1997 to promote regula� on and coordina� on of all the ac� vi� es rela� ng to
the Na� onal Lo� ery and other ancillary ma� ers. The Na� onal Lo� eries Board (NLB)
was established in October 1998 to act as na� onal regulator. The fi rst Na� onal Lo� ery
Licence was allocated to Uthingo in July 1999 for a period of seven years. The fi rst
LOTTO � ckets were sold on 2 March 2000 and those of Scratch Card compe� � ons on
16 October 2000. Gidani (Pty) Ltd was the successful bidder for the second seven year
period and started with its opera� ons in September 2007. Gidani, as the Na� onal
Lo� ery’s operator, works in close collabora� on with the NLB to ensure that the
most eff ec� ve service is off ered to South African players. Gidani has become fi rmly
established during the past three years and has decided to conduct a socioeconomic
inves� ga� on on lo� ery ac� vi� es among the South African popula� on in line with its
licence commitment.
In 2003, a study was commissioned to inves� gate community a� tudes towards and
community conduct in rela� on to the Na� onal Lo� ery. A study en� tled The South
African Na� onal Lo� ery: Community a� tudes, behaviour and par� cipa� on was
published in 2003. Since the comple� on of the above study almost seven years ago,
several changes have been experienced in the Na� onal Lo� ery market place. Some of
these include the change of operator from Uthingo to Gidani, a more gambling-matured
South African popula� on, considerable changes in the personal income distribu� on in
South Africa and structural changes in the household expenditure profi le. As a result
of the above, and the expressed objec� ve of Gidani to establish the socioeconomic
impact of the Na� onal Lo� ery within three years of becoming the lo� ery operator, the

2
Bureau of Market Research of Unisa was appointed by Gidani, in close coopera� on with
the NLB, to conduct a socio-economic analysis of the impact of the Na� onal Lo� ery on
the South African popula� on.
1.2 OBJECTIVE OF THE STUDY
The purpose of the study is to establish community a� tudes and behaviour towards as
well as the par� cipa� on of the South African popula� on in the Na� onal Lo� ery. The
study will also gauge the public’s awareness of Gidani as the Na� onal Lo� ery operator
as well as the community’s percep� on of ‘good causes’ supported by the Na� onal
Lo� ery. The specifi c objec� ves of the study include, inter alia:
• par� cipa� on in lo� ery games
• reason for abstaining from lo� ery par� cipa� on
• frequency of par� cipa� on in lo� ery games
• expenditure on lo� ery games
• household budget behaviour regarding lo� ery games
• percep� on/chances of winning lo� ery games
• infl uence of ‘good cause’ expenditure on lo� ery games par� cipa� on
• extent of ‘problem gambling’ with regard to lo� ery games
Several of the above issues were also enquired upon in the 2003 Na� onal Lo� ery study.
Responses will be used for longitudinal comparisons.
1.3 METHODOLOGY
Due to the wide spectrum of calcula� ons conducted in the study, various methodologies
were applied to generate the desired output. The most prominent was a community
survey among a sample of the South African popula� on at large.
This was supplemented by an analysis of secondary data to calculate na� onal aggregates
such as propensity to play lo� ery games and expenditure displacement eff ects.
A� en� on was also given to literature research, especially with a view to verifying the

3
reliability of the survey fi ndings with similar research conducted in South Africa. The
relevant research methodologies applied are addressed in each chapter or sec� on
relevant to the specifi c data analysed in the specifi c chapter or sec� on of the report.
1.4 LAYOUT OF THE REPORT
The fi rst chapter provides background to the study, its objec� ves and an outline of the
report. A detailed descrip� on of the methodology of the community survey is provided
in chapter 2. Chapter 3 contains a detailed exposi� on of the fi ndings of the na� onal
survey. These data are supplemented with the fi ndings of similar surveys as verifi ca� on
totals as well as data from secondary sources to provide some aggregate totals for
South Africa as a whole. Chapter 4 discusses the profi le of respondents indulging
in lo� ery par� cipa� on at least twice a week with a view to establishing tendencies
towards compulsive gambling. The propensity to expand on lo� ery games is calculated
in chapter 5. The survey fi ndings are summarised in the execu� ve summary contained
at the beginning of the report.

4
CHAPTER 2
RESEARCH METHODOLOGY: COMMUNITY SURVEY
2.1 INTRODUCTION
In order for Gidani and the NLB to eff ec� vely exercise their responsibili� es as operator
and regulatory authority respec� vely, a well-founded comprehension of the Na� onal
Lo� ery and its impact on the economy and society is impera� ve. These impacts
were determined through primary survey research and quan� ta� ve informa� on was
collected through a na� onal household survey. The discussion in this chapter provides
the basis for the scien� fi c founda� on of the study and hence the quality, validity and
reliability of the data.
2.2 SCOPE OF THE SURVEY
The scope of the survey extended across all households in South Africa. For purposes
of this study the survey was divided into two separate categories. The fi rst was a
Telkom telephone survey (800 households) among the South African popula� on at
large. Since this survey excluded non-Telkom subscribers, it was subsequently decided
to extend the survey with personal face-to-face interviews in areas with the lowest
Telkom telephone penetra� on (1 700 households). The majority of these areas are
located in the rela� vely low-income areas in informal housing se� lements as well as
villages in tradi� onal rural areas. Due to cost considera� ons, agricultural communi� es
located in typical rural areas, o� en characterised by a dispersed loca� onal pa� ern,
were excluded from the personal interviews. However, dispersed rural households in
agricultural areas with in-house access to Telkom telephones had the same chance as
all other households with Telkom telephones, for inclusion in the telephone subsurvey.
2.3 TELEPHONE SUBSURVEY
The following survey methodology was applied in the telephone subsurvey.

5
2.3.1 Scope of the telephone survey
The random selec� on of respondents with in-home access to Telkom telephones
ensured the inclusion of inhabitants all over South Africa, irrespec� ve of their loca� on.
The telephone survey, therefore, included respondents living in metropolitan, urban
and rural areas in propor� on to the Telkom telephone distribu� on in South Africa.
2.3.2 Sample size and sampling
The survey was conducted among 800 households. The 19 South African telephone
directories were used as a sample frame to randomly select households to be
interviewed. Table 2.1 shows that the alloca� on of sample elements was propor� onal
to the distribu� on of residen� al entries in the directories.
TABLE 2.1
DISTRIBUTION OF SAMPLE ELEMENTS BY TELEPHONE DIRECTORY
Telephone directory Sample distribu� on1)
% Distribu� on of sample
Boland & West Coast 5.7 45Cape Peninsula 13.9 110Durban and surrounding areas 9.2 75East London & Border 3.2 25East Rand 7.5 60Free State 4.9 40Johannesburg 11.5 90KwaZulu-Natal North Coast 2.3 20KwaZulu-Natal South Coast 1.2 10Mpumalanga 4.9 40North West 4.0 30Limpopo 2.9 25Northern Cape and Namaqualand 2.2 20Port Elizabeth and Eastern Cape 5.2 40Pietermaritzburg and KwaZulu-Natal 4.0 30Pretoria and surrounding areas 6.9 55Southern Cape and Karoo 2.8 20Vaal Triangle 2.3 20West Rand 5.4 45Total 100.0 800
1) The sample alloca� on was based on the distribu� on of entries by telephone directory.

6
2.3.3 Ques� onnaire
A prestructured ques� onnaire was used for the collec� on of data. The ques� onnaire
was submi� ed to the NLB and Gidani for approval. The majority of ques� ons were
previously used in the 2003 survey. However, ques� ons were also extended or added
to accommodate addi� onal needs expressed by the NLB and Gidani.
2.3.4 Interviews
The telephone interviews were conducted by well-trained interviewers. During training
sessions interviewers were trained with regard to aspects such as general background
to the study, informa� on on the type of survey, approach towards respondents, asking
of ques� ons, recording of answers and probing.
The majority of telephonic contacts were made with households a� er 17h00 on
weekdays or during weekends to ensure randomness in the gender composi� on and
work status of respondents. The � me schedule prescribed to fi eldworkers was as
follows:
• maximum of 25 % of interviews during the day (8h00-17h00)
• maximum of 25 % of interviews a� er-hours (17h00-21h00)
• at least 50 % during weekends
Confi rma� on was requested from respondents to ensure that only persons 18 years
and older par� cipated in the survey.
2.3.5 Time schedule
The ques� onnaires were completed from the second half of January to the second
week of March 2010. Table 2.2 depicts expenditure and jackpot prizes during this
period, sugges� ng possible higher spending coinciding with higher jackpot prizes for
LOTTO on 27 January 2010 and PowerBall on 26 January 2010. Saturday’s division-1
prize during the interview period ranged from R1 722 082 to R13 797 494 for LOTTO

7
and the Friday division-1 prize for PowerBall from R5 328 910 to R91 068 427 (division
1 prizes are only indicated for days when division 1 prizes were won).
TABLE 2.2
LOTTO AND POWERBALL TICKET SALES AND PRIZE POOL, 26 JANUARY 2010 – 27 FEBRUARY 2010
Date
Division 1prize
R
Total prize pool
R
Total sales
RLOTTO
Wednesday 27 January 2010 No winner 6 586 760 18 092 193Saturday 30 January 2010 No winner 9 824 867 27 048 693Wednesday 3 February 2010 8 588 266 15 824 756 19 854 404Saturday 6 February 2010 No winner 8 777 905 23 997 435Wednesday 10 February 2010 No winner 6 185 948 16 926 406Saturday 13 February 2010 2 591 528 13 299 549 22 187 956Wednesday 17 February 2010 1 250 220 6 831 488 15 223 387Saturday 20 February 2010 1 741 422 9 462 562 21 204 536Wednesday 24 February 2010 No winner 5 516 213 15 049 349Saturday 27 February 2010 No winner 12 463 088 34 327 044Wednesday 3 March 2010 No winner 7 362 417 20 204 439Saturday 6 March 2010 13 797 494 23 353 601 26 035 978Wednesday 10 March 2010 1 313 271 7 143 968 15 991 129Saturday 13 March 2010 1 722 081 9 399 730 20 969 025
PowerBall
Tuesday 26 January 2010 No winner 7 544 103 29 494 920Friday 29 January 2010 No winner 9 273 053 36 243 011Tuesday 2 February 2010 No winner 10 131 254 39 430 352Friday 5 February 2010 No winner 11 313 636 44 110 346Tuesday 9 February 2010 No winner 11 310 302 43 760 563Friday 12 February 2010 91 068 427 104 229 507 50 425 136Tuesday 16 February 2010 5 000 000 9 121 868 16 233 931Friday 19 February 2010 No winner 5 192 374 20 279 031Tuesday 23 February 2010 No winner 4 633 993 18 192 979Friday 26 February 2010 No winner 5 931 275 22 884 386Tuesday 3 March 2010 15 604 303 20 985 969 21 068 680Friday 5 March 2010 No winner 4 992 764 19 803 185Tuesday 9 March 2010 No winner 4 637 893 17 952 669Friday 12 March 2010 5 328 910 15 376 161 18 540 900

8
2.4 PERSONAL INTERVIEWS
2.4.1 Introduc� on
As implied in sec� on 2.2, the telephone survey, u� lising telephone directories as sample
frames, excluded non-Telkom subscribers from the survey. To ensure the inclusion
of respondents without Telkom subscrip� on in the personal interview subsurvey, the
following screening ques� on was asked at the beginning of the interview: ‘Do you
have a Telkom telephone at home?’ A nega� ve response to this ques� on ensured
con� nua� on with a personal face-to-face interview with the respondent.
2.4.2 Study areas
It was assumed that the majority of households without in-home Telkom telephone
access were located in formal township areas, informal se� lements in urban areas
and villages in rural areas. (The majority of formal houses in urban areas have direct
access to Telkom telephones, implying the possibility of their inclusion in the telephone
subsurvey.) As men� oned in sec� on 2.2, agricultural communi� es located in typical
rural areas characterised by a dispersed loca� onal pa� ern, were excluded from the
personal interview survey.
2.4.3 Sample size and sampling
The survey was conducted among 1 700 households, living primarily in formal and
informal townships and villages. Table 2.3 shows the areas selected in each of the
provinces that were visited for personal interviews.

9
TABLE 2.3
AREAS SELECTED FOR FACE-TO-FACE INTERVIEWS
Province Selected areasEastern Cape Motherwell, Ibhayi and BizanaFree State Mangaung and Boshabelo
Gauteng Duduza (Nigel), Soweto, Orange Farm, A� ridgeville and Soshanguve
KwaZulu-Natal Umlazi, Chatsworth, KwaMashu and UlundiLimpopo Seshego, Lebowakgomo and GiyaniMpumalanga KwaGuga (Witbank) and KanyamazaneNorthern Cape GalasheweNorth West Thabane and MogaleWestern Cape Khayalitsha, Langa and Mitchells Plain
The face-to-face sample included metropolitan areas, urban se� lements and villages/
nonurban areas. The sample distribu� on by type of area is as follows:
• Metropolitan areas: 51.8 %
• Other urban areas: 22.9 %
• Villages/nonurban: 25.3 %
The following procedure was prescribed to fi eldworkers in selec� ng houses (sample
units) and the specifi c respondent within each selected house (sample element). The
procedure was specifi cally aimed at adhering to the principle of random probability
sampling.
Selec� on procedure for houses:
• Residen� al area with street names and numbers
Any house with a street number that was divisible by 15 (for instance 15, 30,
45, 150 or 180) in a street (for example, Main Street) could be selected. Only
one house could be selected from a specifi c street in a suburb for purposes

10
of interviewing. In other words, a second address could not be selected from
Main Street.
• Residen� al areas with stand numbers
Any house with a stand number divisible by 25 (for instance 25, 50, 75, 200,
1 650, et cetera) could be selected.
• Informal dwellings, squa� er areas or villages
If the informal dwellings did not fall into a planned township but numbers
were painted on the dwellings, dwellings with numbers divisible by 15 could be
selected. If there were no numbers, the interviewer started with any house in
the area and then selected every 10th house therea� er for interviewing. The
address, as indicated on the ques� onnaire, had to be clear enough to permit
return visits to the informal dwelling for control purposes.
The following procedure was followed in selec� ng the respondent in each house:
• Submission of the le� er of introduc� on to the head of the household.
• Recording of birthdays of all household members aged 18 years and older,
whether they were present during the visit or not. The interview was conducted
with the person whose birthday was the closest to the day of the fi rst visit to
the household.
• If the selected person was not available immediately or during subsequent
visits, the household member second on the birthday list was interviewed.
• If the residents of the house refused to par� cipate, any of the houses directly
neighbouring the ini� ally selected house was approached.
The following could have infl uenced the fi ndings of the face-to-face subsurvey to some
extent:
• During the sample element selec� on process within the household, household
members tended to nominate a member who par� cipates in lo� ery games to

11
act as respondent. Non� cket buyers o� en refused to be selected as respondents
on the grounds that the subject ma� er of the interview relates more to the
experience and knowledge of lo� ery � cket buyers. This behaviour may have
resulted in a degree of overes� ma� ng the par� cipa� on rate. However, the
prescribed ‘birthday’ approach described above largely eliminated this possible
bias towards LOTTO par� cipants in the sample.
• Household members also tended to nominate the household head or those with
the highest qualifi ca� on to be interviewed. To the extent that this occurred, the
gender, work status, income and educa� onal profi le of the sample popula� on
could have been aff ected.
• Some fi eldworkers reported that interviews were conducted during the day
due to security risks at night. This applied par� cularly to female fi eldworkers.
A large percentage of face-to-face interviews was conducted in informal areas,
which frequently have no street ligh� ng. This may have created some bias
towards females and unemployed respondents usually at home during the
day. This problem was largely countered by instruc� ng fi eldworks to conduct
as many interviews as possible during weekends. This naturally caused some
delay in the comple� on of the survey.
2.4.4 Ques� onnaire
The ques� onnaire was exactly the same as that used in the telephone survey.
2.4.5 Interviewing
Interviewers were trained, ensuring comprehension of all ques� ons by interviewers.
The ques� onnaires for the study were completed from the la� er half of January to the
fi rst half of March 2010.

12
2.4.6 Checkbacks
Checkbacks to ensure the reliability of survey fi ndings proved an extremely
cumbersome procedure as the absence of Telkom telephone access was the qualifying
condi� on in the face-to-face subsurvey. Respondents supplying cellphone numbers or
work telephone numbers were contacted telephonically. Personal checkbacks were
conducted in some areas. Where possible, fi eld supervisors were also requested to
do checkbacks. The edi� ng and data cleaning processes were par� cularly rigorous.
Ques� onnaires of respondents were edited simultaneously to detect any standard
response. If any suspicion arose, further checkbacks were ini� ated.
2.5 WEIGHTING
The composi� on of the total sample shows a small bias towards households with in-
home Telkom telephones. The All Media and Products Survey (AMPS) shows that just
more than 20 % of the approximately 11 million households in South Africa have access
to in-house Telkom telephones while households with Telkom telephones cons� tuted
32.0 % of the total sample. Consequently, weights were applied in the dataset to
ensure pro-rata representa� on. The weights applied were as follows:
• 0.64 for personal interviews
• 0.36 for telephone interviews
The alloca� on of the above weights to the samples ensured that the total sample
largely refl ected the same distribu� on as the popula� on at large with regard to in-
home access to Telkom telephones, which also served as a proxy for household income
levels. Survey results confi rm that household income among Telkom telephone owners
was substan� ally higher than among non-Telkom telephone owners.

13
2.6.1 PARTICIPATION
Generally, respondents were not nega� ve about any of the ques� ons. However, the
ques� on on personal and household income levels was experienced as sensi� ve and
14.4 % of respondents did not want to divulge their income levels, especially in the
telephone (high income) subsurvey.
2.7 ACCESS TO RETAIL OUTLETS
Although access to retail outlets selling lo� ery � ckets was never a deliberate criteria
for selec� ng sample elements, a small percentage (2.3 %) of respondents advanced
lack of access to retail outlets as the main reason for abstaining from par� cipa� ng in
lo� ery games.
2.8 VALIDITY OF THE RESULTS
Properly conducted sample surveys yield useful es� mates but not exact values. Errors
may arise from sampling, nonresponse, repor� ng and processing. The nature and
scope of these errors are discussed below.
2.8.1 Sample error
Sample error arises because only a small por� on of the popula� on is interviewed. As
the data collected in these subsurveys are based on representa� ve samples drawn
through a probability method, the size of the sample errors can be calculated. However,
despite the existence of sta� s� cal techniques for calcula� ng the extent of sample
errors, it is hardly prac� cal to compute the sample error of every average calculated
in the study. Sample errors are computed from the standard devia� on of sampling
means. The func� on of the sample error is to provide an interval within which the
sample mean may have deviated from the true popula� on mean as a result of random
sampling varia� ons. This interval is termed the confi dence region.

14
The following formula is used to calculate the sample error for propor� onate data:
=
where p = percentage of respondents who possess the characteris� cs of interest
n = number of observa� ons
Table 2.4 shows the interval es� mates of the total popula� on at a 95 % level of
confi dence for the par� cipa� on of the popula� on in lo� ery games.
TABLE 2.4
INTERVAL ESTIMATES FOR PARTICIPATION IN LOTTERY GAMES, 2010
Modes % par� cipa� onInterval es� mates
Low (%) High (%)LOTTO 32.3 30.5 34.2LOTTO Plus 26.3 24.6 28.0Scratch Cards 6.2 5.3 7.2SportStake 3.3 2.6 4.0PowerBall 16.4 14.9 17.8None of the above 60.7 58.8 62.6
It is clear from the table that the survey fi ndings show a LOTTO par� cipa� on rate of
32.3 %. Based on a 95 % level of confi dence, a percentage as low as 30.5 % and as high
as 34.2 % are probabili� es for LOTTO par� cipa� on of the South African popula� on.
It can therefore be stated that the percentage of the popula� on who procure lo� ery
� ckets will not deviate more than 3.7 % from the 32.3 % resul� ng from the survey at a
95 % confi dence level. The percentage buying LOTTO � ckets will, therefore, not be less
than 30.5 % (ie 32.3 % - 1.8 %) or more than 34.2 % (ie 32.3 % + 1.9 %). For those that
abstained from lo� ery games the interval es� mates may vary between a low of 58.8
% and a high of 62.6 %. The above example serves as an indica� on of the confi dence
region for par� cipa� on in lo� ery games. The same calcula� on can be eff ected for
−pσn
pp )100( −

15
other survey fi ndings as well. The conclusion emana� ng from the above calcula� on is
that the confi dence level for the survey is high due to rela� vely small interval levels.
2.8.2 Interviewer errors
Three types of error can be caused by an interviewer’s behaviour, namely errors in
asking ques� ons, errors in recording answers and errors due to chea� ng. Although
interviewers were well trained it is possible that these types of mistakes may have
a nega� ve infl uence on the survey results. Checkbacks revealed chea� ng by a few
interviewers whose work had to be redone.
2.8.3 Repor� ng errors
It is virtually impossible to eliminate repor� ng errors completely. Every possible
precau� on was taken in the construc� on of the ques� onnaire and the training and
supervision of the interviewers to minimise these errors. The fact remains, however,
that respondents tend to overstate status items such as level of training and income
level. The opposite occurs for commitments such as possible fi nancial responsibili� es
and other aspects perceived by respondents to be nega� ve behaviour such as smoking,
alcohol consump� on and gambling, especially addic� ve gambling.
2.8.4 Processing errors
Errors of calcula� on are not uncommon in the processing of data. Measures taken in
this study to keep such errors to a minimum include sequence tests, which show up
duplica� on of data on computer databases, and minimum- and maximum-value tests,
which iden� fy impossible and improbable values. Extensive crosschecking was also
conducted to verify data stability where possible.
2.8.5 Nonresponse
As indicated previously, two procedures were applied in cases of nonresponse.
Telephone interviewers were supplied with a selec� on of pages of telephone

16
directories. Interviewers were instructed to select the fi rst household in the second
column of each selected page. If this call failed to result in a successful interview,
the rest of the household entries on the page could be regarded as subs� tutes. In
the case of personal interviews, a specifi c procedure was prescribed. Whenever there
were problems such as refusals, nobody at the dwelling or respondents refusing to
con� nue with the interviews, the households were subs� tuted with the next dwelling.
Generally, par� cipa� on in the survey was very good. Subs� tu� on in the telephone
survey was mainly caused by contact failures, notwithstanding the usage of the most
recent telephone directories. Subs� tu� on in the personal interview subsurvey was
almost non-existent and where this occurred, it was caused by factors such as nobody
at the dwelling or refusal to par� cipate.
2.9 LONGITUDINAL COMPARISONS
Where applicable, the 2003 survey fi ndings are incorporated in the analysis. This
will allow detec� on of changes in the lo� ery gambling behaviour of the popula� on
between 2003 and 2010. The approach followed in the report is to fi rst provide a
detailed descrip� on of the 2010 survey fi ndings, followed by iden� fi ca� on of any
behavioural or trend changes evident since 2003.

17
CHAPTER 3
SURVEY FINDINGS
3.1 INTRODUCTION
This chapter discusses the fi ndings of the community survey. Community behaviour
and a� tudes are crosstabulated by sociodemographic variable to portray the profi le of
the South African popula� on (18 years and older) regarding their par� cipa� on in lo� ery
games. Where possible, longitudinal trends through 2003 and 2010 comparisons are
provided at the end of each sec� on. Sec� ons 3.2 to 3.8 analyse the responses of the
whole sample popula� on while sec� ons 3.9 to 3.26analyse the responses of only those
who confi rmed their par� cipa� on in lo� ery games. The analysis con� nuously alerts
the reader to the specifi c sample/subsample popula� on under discussion.
3.2 PARTICIPATION IN LOTTERY GAMES
The response to the ques� on ‘Have you par� cipated in any of the following Na� onal
Lo� ery ac� vi� es during the past month?’ is shown in fi gure 3.1. Just less than a third
(32.3 %) of respondents confi rmed that LOTTO � ckets were bought during the one
month preceding the survey. This is followed by a par� cipa� on rate of 26.3 % for
LOTTO Plus and 16.4 % for PowerBall. Buying Wina Manje Scratch Cards was far less
popular as only 6.2 % of the respondents confi rmed their buying of Scratch Cards. The
lowest propensity was recorded for SportStake at 3.3 % of the popula� on 18 years and
older. Three in every fi ve (60.7 %) of the sample popula� on indicated that they did not
par� cipate in any lo� ery games during the month prior to the survey. This confi rms
that almost two in every fi ve (39.7 %) of all South African adults (18 years) par� cipated
at least once in lo� ery games during the month preceding their interview.

18
FIGURE 3.1
PARTICIPATION IN LOTTERY GAMES DURING THE MONTH PRECEDING THE SURVEY, 2010
The rest of sec� on 3.2 disaggregates par� cipa� on in lo� ery games by sociodemographic
variable.
3.2.1 Par� cipa� on by age group
Table 3.1 shows the par� cipa� on of the popula� on in lo� ery games by age group. The
table confi rms that the propensity to play LOTTO is the lowest among people older
than 60 years and younger than 30 years (22.1 % and 29.7 %) respec� vely. Par� cipa� on
levels are the highest in the age groups 31 to 40 years (36.4 %) and 41 to 50 years
(37.6 %). The same pa� ern is evident with regard to the other lo� ery games as well
– lowest par� cipa� on rate in the oldest and youngest age categories with somewhat
higher rates among the middle-age groups. Percentage for those not par� cipa� ng in
lo� ery games at all ranged from 72.5 % among the 60 years and older group to just
more than 50.0 % of the 31-to-50 year age group.
SportStake
Scratch Cards
PowerBall
LOTTO Plus
Lo� o
No par� cipa� on
3.3
6.2
16.4
26.3
32.3
60.7
0 10 20 30 40 50 60 70
Percentage

19
TABLE 3.1
PARTICIPATION IN LOTTERY GAMES BY AGE GROUP, 2010
Lo� ery games 18-30 years%
31-40 years%
41-50 years%
51-60 years%
Older than 60%
Total%
LOTTO 29.7 36.4 37.6 32.2 22.1 32.4LOTTO Plus 21.5 30.9 34.8 24.2 17.9 26.3Scratch Cards 6.3 8.0 7.2 4.7 1.8 6.2SportStake 3.9 4.6 3.2 1.9 0.0 3.3PowerBall 12.9 19.0 20.4 15.3 15.1 16.4None of the above 63.9 55.9 52.9 63.9 72.5 60.7
3.2.2 Par� cipa� on by employment status
Table 3.2 shows par� cipa� on levels of respondents by employment status. The general
pa� ern across all lo� ery games emerging from the survey fi ndings is rela� vely low
propensi� es to play lo� ery games among re� rees/nonworkers and the unemployed
and much higher par� cipa� on levels among workers (both full � me and part � me).
In the case of LOTTO, for example, par� cipa� on rates of re� rees/nonworkers and the
unemployed stood at 21.4 % and 26.8 % respec� vely compared to the 39.8% and 36.5
% of full-� me and part-� me workers respec� vely.
This pa� ern is also clearly evident among those not playing any lo� ery games during the
month preceding the survey. Nonpar� cipa� on stood at 73.6 % of re� rees/nonworkers
and 67.2 % of unemployed while just more than half the workers (part- and full � me)
confi rmed their nonpar� cipa� on.
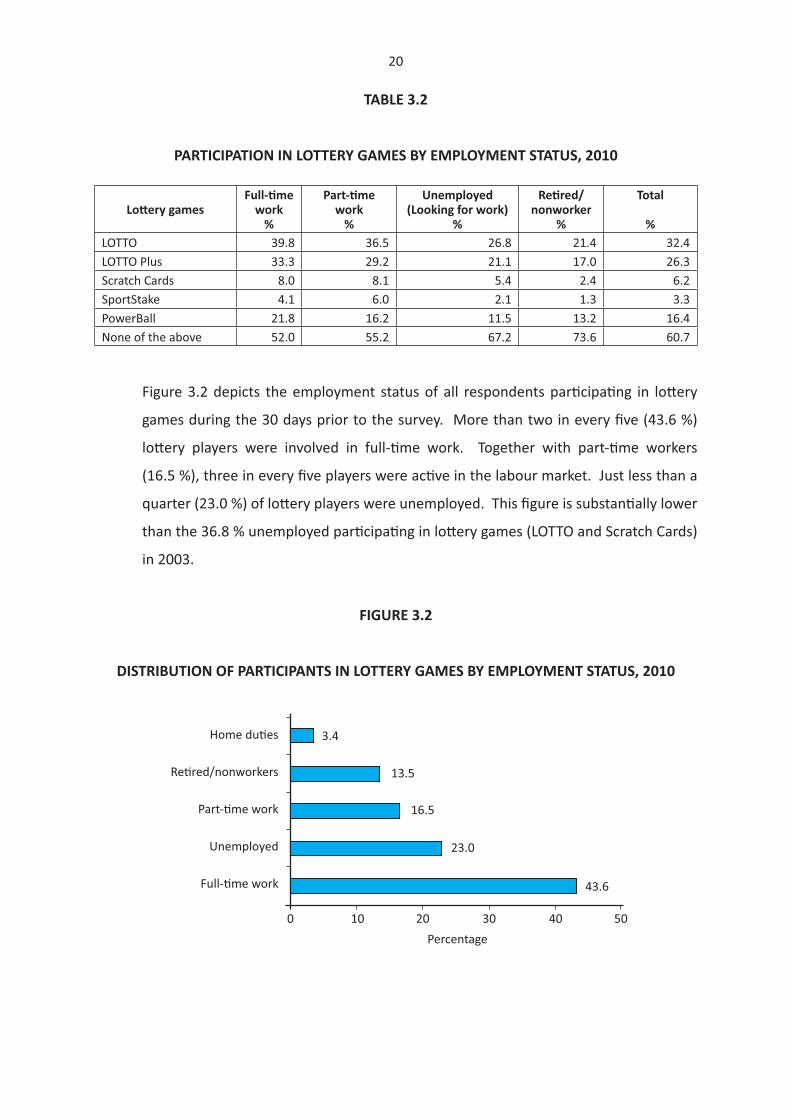
20
TABLE 3.2
PARTICIPATION IN LOTTERY GAMES BY EMPLOYMENT STATUS, 2010
Lo� ery gamesFull-� me
work%
Part-� me work
%
Unemployed (Looking for work)
%
Re� red/nonworker
%
Total
%LOTTO 39.8 36.5 26.8 21.4 32.4LOTTO Plus 33.3 29.2 21.1 17.0 26.3Scratch Cards 8.0 8.1 5.4 2.4 6.2SportStake 4.1 6.0 2.1 1.3 3.3PowerBall 21.8 16.2 11.5 13.2 16.4None of the above 52.0 55.2 67.2 73.6 60.7
Figure 3.2 depicts the employment status of all respondents par� cipa� ng in lo� ery
games during the 30 days prior to the survey. More than two in every fi ve (43.6 %)
lo� ery players were involved in full-� me work. Together with part-� me workers
(16.5 %), three in every fi ve players were ac� ve in the labour market. Just less than a
quarter (23.0 %) of lo� ery players were unemployed. This fi gure is substan� ally lower
than the 36.8 % unemployed par� cipa� ng in lo� ery games (LOTTO and Scratch Cards)
in 2003.
FIGURE 3.2
DISTRIBUTION OF PARTICIPANTS IN LOTTERY GAMES BY EMPLOYMENT STATUS, 2010
Home du� es
Re� red/nonworkers
Part-� me work
Unemployed
Full-� me work
3.4
13.5
16.5
23.0
0 10 20 30 40 50
43.6
Percentage

21
3.2.3 Par� cipa� on by educa� onal level
The general pa� ern is that the propensity to play lo� ery games is the lowest among
those without formal schooling. Almost eight in every 10 respondents (82.4 %) with
no formal schooling abstained from lo� ery games. This percentage dropped to 57.1
% among those with secondary schooling. The pa� erns by type of lo� ery game show
the following tendency:
• LOTTO, LOTTO Plus and Scratch Cards are the most popular among those with
secondary schooling followed by primary school leavers.
• SportStake is propor� onally the most popular among those with secondary and
ter� ary qualifi ca� ons – in fact those with no formal schooling did not par� cipate
in SportStake at all.
• PowerBall shows more or less the same popularity across all educa� onal
categories.
TABLE 3.3
PARTICIPATION IN LOTTERY GAMES BY EDUCATIONAL LEVEL, 2010
Lo� ery gamesNo formal schooling
%
Primary (Grade 1-7)
%
Secondary (Grade 8-12)
%
Ter� ary (Post matric)
%
Total
%LOTTO 17.6 30.3 34.7 27.4 32.3LOTTO Plus 14.2 24.9 29.6 18.0 26.3Scratch Cards 0.0 4.5 7.6 3.5 6.2SportStake 0.0 1.8 3.6 3.3 3.3PowerBall 15.7 14.1 17.2 15.1 16.4None of the above 82.4 65.3 57.1 67.5 60.7
3.2.4 Par� cipa� on by popula� on group
Par� cipa� on levels of especially the Indian/Asian and Coloured popula� on groups
were substan� ally higher than the other two groups. Table 3.4 shows that only 41.1
% of Indian/Asian and 54.6 % of Coloured respondents did not play any lo� ery games

22
during the one month preceding the survey. The percentage of Africans that did not
play stood at 61.9 % and that of Whites at 70.9 %. The following is also evident from
the table:
• Par� cipa� on in Wina Manje Scratch Cards and SportStake is virtually negligible
among Whites.
• Indian/Asian par� cipa� on shows rela� vely high levels in all lo� ery games,
especially Scratch Cards and SportStake.
TABLE 3.4
PARTICIPATION IN LOTTERY GAMES BY POPULATION GROUP, 2010
Lo� ery games African%
Indian/Asian%
Coloured%
Whites%
Total%
LOTTO 30.4 58.2 40.5 22.6 32.3LOTTO Plus 25.2 52.3 30.4 12.3 26.3Scratch Cards 6.4 11.5 5.6 0.3 6.2SportStake 3.4 8.6 0.0 0.3 3.3PowerBall 14.5 31.3 18.3 21.3 16.4None of the above 61.9 41.1 54.6 70.9 60.7
Although the par� cipa� on rates of Indians/Asians and Coloureds were fairly high, their
shares in total lo� ery par� cipa� on are fairly small due to their rela� vely small shares in
the total popula� on. Figure 3.3 shows the composi� on of lo� ery players by popula� on
group (ie not the par� cipa� on levels within a par� cular popula� on group but the share
of all par� cipants). Of all the lo� ery par� cipants, three in every four (76.3 %) were
Africans, followed by Indians/Asians (9.8 %), Coloureds (8.1 %) and Whites (only 5.8 %).

23
FIGURE 3.3
SHARE IN LOTTERY GAMES BY POPULATION GROUP, 2010
The above dominance of Africans in lo� ery games implies that all the pa� erns and
tendencies detected in the survey fi ndings are largely dictated by those of the African
popula� on group.
3.2.5 Par� cipa� on by gender
Males show a considerably higher propensity to play lo� ery games than females.
Only half (49.8 %) the males abstained from lo� ery games in the month preceding
the survey. The percentage for females amounted to 67.3 % (table 3.5). The smallest
diff eren� al by gender is for Scratch Cards and the largest is for SportStake.
TABLE 3.5
PARTICIPATION IN LOTTERY GAMES BY GENDER, 2010
Lo� ery games Male%
Female%
Total%
LOTTO 41.0 27.1 32.3LOTTO Plus 33.2 22.2 26.3Scratch Cards 6.7 5.9 6.2SportStake 6.6 1.3 3.3PowerBall 21.4 13.3 16.4None of the above 49.8 67.3 60.7
Africans
Indians/Asians
Coloureds
Whites
76.3
9.8
8.1
5.8
0 20 40 60 80 100
Percentage

24
3.2.6 Par� cipa� on by personal income category
Table 3.6 crosstabulates par� cipa� on in lo� ery games according to monthly personal
income. The table confi rms a largely posi� ve correla� on between level of personal
income and propensity to play lo� ery games – generally it seems that par� cipa� on
levels increase with higher income levels. Of those earning less than R500 a month,
67.2 % did not par� cipate in lo� ery games in the month prior to the survey. This
percentage amounted to 42.6 % for those earning in access of R20 000 per month.
This correla� on is clearly evident in the buying of LOTTO � ckets – par� cipa� on rates
increased from 25.8 % among those earning less than R500 per month to 50.6 % among
those earning an income above R20 000 per month. Par� cipa� on in Wina Manje
Scratch Cards shows a rela� vely low propensity among the lowest income categories,
a gradual increase among middle-income categories and then a decline again to even
0 % among the most affl uent.
TABLE 3.6
PROPENSITY TO PARTICIPATE IN LOTTERY GAMES BY MONTHLY PERSONAL INCOME
CATEGORY, 2010
Lo� ery gamesLess than R500
%
Between R501-R1 000
%
Between R1 001-R2 000
%
Between R2 001-R5 000
%
Between R5 001-R10 000
%
Between R10 001-R20 000
%
More than
R20 000%
Do not want to disclose
%
Total
%LOTTO 25.8 33.1 31.5 45.7 42.2 25.7 50.6 24.8 32.4
LOTTO Plus 20.5 22.8 28.6 38.8 34.5 24.5 30.1 19.0 26.3
Scratch Cards 4.6 5.8 7.5 9.7 6.7 4.3 0.0 5.6 6.3
SportStake 2.8 3.8 2.5 4.6 6.4 0.0 4.0 2.3 3.3
PowerBall 11.8 13.8 17.2 22.3 24.7 16.2 39.8 13.1 16.4
None of the above 67.2 61.7 60.4 46.3 52.3 64.8 42.6 68.7 60.6
The above-men� oned posi� ve correla� on between personal income levels and
lo� ery par� cipa� on clearly diff ers from the 2003 survey fi ndings. In 2003 a nega� ve
correla� on was detected, implying a fairly high propensity to play lo� ery games among
the less affl uent group. This tendency confi rms that the large decline in par� cipa� on
rates is primarily among the less affl uent income groups.

25
3.2.7 Longitudinal pa� erns
The propensity of the South African popula� on (18 years and older) to par� cipate in
lo� ery games from 2003 to 2010 is shown in table 3.7. Par� cipa� on in lo� ery games
has declined substan� ally since the introduc� on of the Na� onal Lo� ery. Those that
abstained from lo� ery games increased from 30.6 % in 2003 to 60.7 % in 2010. This
implies that the percentage of the popula� on par� cipa� ng in lo� ery games in 2010 is
less than half of what it was in 2003. Par� cipa� on in LOTTO, for example, decreased
from 69.1 % in 2003 to 32.3 % in 2010. The same holds true for Scratch Cards, with
par� cipa� on declining from 12.6 % in 2003 to 6.2 % of the adult popula� on in 2010.
The rela� vely low level of 29.2 % in 2009 rela� ve to the 2010 fi gures may largely be
ascribed to the global recession stretching from the second half of 2008 to late in 2009
when the fi rst signs of economic recovery started to appear.
TABLE 3.7
PLAYING LOTTERY GAMES: LONGITUDINAL COMPARISONS, 2003-2010
Lo� ery games
2003Uthingo/NLB
study%
2005NGB study
%
2009NGB study
%
2010Gidani/NLB study
%LOTTO 69.1 45.8 29.2 32.3LOTTO Plus - - - 26.3PowerBall - - - 16.4Scratch Cards 12.6 7.8 6.4 6.2SportStake - - - 3.3None of the above 30.6 - - 60.7
Sources: Ligthelm 2003; Ligthelm, Mango & Jonkheid 2005; Ligthelm & Jonkheid 2009
Table 3.8 shows some of the changes in the demographic profi le of lo� ery players
occurring from 2003 to 2010. The average age of lo� ery players remained fairly
constant – an average of 37.2 years in 2003 and 38.1 years in 2010. The stability is also
evident with regard to the African popula� on group as percentage of all lo� ery players

26
(75.5 % in 2003 and 76.3 % in 2010) and the gender divide (males amounted to 46.7 %
in 2003 and 48.2 % in 2010).
However, the fi gures also show substan� al changes with regard to the share of the
unemployed (declined from 36.9 % in 2003 to 23.0 % in 2010), educa� onal level
(primary school and less qualifi eds decreased from 17.9 % in 2003 to 11.7 % in 2010)
and par� cularly the level of income (players earning less than R1 000 per month
declined from 60.5 % in 2003 to 34.7 % in 2010). The above suggests that the most
marked decline in the propensity to play lo� ery games is largely among the ranks of
the less affl uent (ie the unemployed, low qualifi eds and those at the lower end of the
income scale).
TABLE 3.8
CHANGE IN THE SOCIODEMOGRAPHIC PROFILE OF LOTTERY PLAYERS, 2003 TO 2010
Demographic variable Measurement 2003 2010
Average age years 37.2 38.1
Unemployed as % of total players % 36.9 23.0
Primary educa� on as % of players % 17.9 11.7
Africans as % of players % 75.5 76.3
Males as % of players % 46.7 48.2Players earning less than R1 000 per month as % of players % 60.5 34.7
3.3 REASONS FOR NONPARTICIPATION IN LOTTERY GAMES
The three in every fi ve (60.7 %) respondents who indicated that they had not
par� cipated in any lo� ery games during the month preceding the interview, were
asked to indicate the main reason for their nonpar� cipa� on. Figure 3.4 shows that the
following reasons, in order of importance, explain their nonpar� cipa� on:

27
• Not interested 38.7 %
• Don’t gamble at all 21.9 %
• Lack of money 18.1 %
• Against religious beliefs 10.8 %
It is interes� ng to note that only 2.3 % of the respondents men� oned a lack of access
to retail facili� es selling lo� ery � ckets as their main reason for abstaining from playing
lo� ery games.
FIGURE 3.4
REASONS ADVANCED BY RESPONDENTS FOR NOT PARTICIPATING IN LOTTERY GAMES, 2010
The rest of this sec� on disaggregates the reasons for nonpar� cipa� on in lo� ery games
by various sociodemographic variables.
3.3.1 Nonpar� cipa� on by age group
Table 3.9 shows the reasons advanced for nonpar� cipa� on in lo� ery games by age
group. With some minor devia� ons the reasons for abstaining are largely similar across
age groups. The following is evident from table 3.9:
No accesss to outlets
Against religious beliefs
Lack of money
Don’t gamble at all
Not interested
Other
2.3
18.1
10.8
8.3
0 10 20 30 40 50
21.9
38.7
Percentage

28
• The percentage of respondents that advanced religious beliefs as reason for
nonpar� cipa� on increased in the higher age categories.
• Lack of money as a reason for abstaining from par� cipa� on is more prominent
in the middle age groups.
• ‘Don’t gamble at all’ is more prominent among the younger age groups.
TABLE 3.9
REASONS FOR NONPARTICIPATION IN LOTTERY GAMES BY AGE GROUP, 2010
Reasons for nonpar� cipa� on18-30 years
%
31-40 years
%
41-50 years
%
51-60 years
%
Older than 60
%
Total
% Lack of money 15.4 18.4 19.4 27.0 15.0 18.1 Against religious beliefs 6.5 11.8 14.8 14.1 12.7 10.8
Don’t gamble at all 26.5 21.7 20.1 13.9 18.9 21.9 No access to outlets selling LOTTO � ckets/Scratch Cards 1.7 2.6 2.8 2.7 2.3 2.3
Not interested 44.7 37.3 30.5 34.7 38.1 38.6 Other 5.1 8.3 12.4 7.6 13.0 8.4
Total 100.0 100.0 100.0 100.0 100.0 100.0
3.3.2 Nonpar� cipa� on by employment status
Table 3.10 shows the reasons advanced for nonpar� cipa� on in lo� ery games by
employment status. In the case of all employment groups, ‘not interested in gambling’
and ‘don’t gamble at all’ played dominant roles. ‘Lack of money’ was of par� cular
importance among the unemployed. ‘Against religious beliefs’ was more prominent
in the case of full-� me workers and re� red/nonworkers compared to the other
employment groups.

29
TABLE 3.10
REASONS FOR NONPARTICIPATION IN LOTTERY GAMES BY EMPLOYMENT STATUS, 2010
Reasons for nonpar� cipa� on
Full-� me work
%
Part-� me work
%
Unemployed (Looking for
work)%
Re� red/nonworker
%
Other
%
Total
%
Lack of money 10.0 18.9 26.0 18.0 15.2 18.1
Against religious beliefs 14.5 8.9 6.8 11.7 19.5 10.8
Don't gamble at all 21.6 26.5 20.9 20.6 23.2 21.8
No access to outlets selling LOTTO � ckets/Scratch Cards 1.2 4.4 2.4 2.4 0.0 2.3
Not interested 42.6 36.2 37.2 37.8 29.0 38.7
Other 10.2 5.1 6.8 9.4 13.0 8.3
Total 100.0 100.0 100.0 100.0 100.0 100.0
3.3.3 Nonpar� cipa� on by educa� onal level
Table 3.11 confi rms a posi� ve correla� on between level of educa� on and abstaining
from gambling. This implies that the higher the level of educa� on, the higher the
percentage of respondents not interested in gambling. The ‘not interested’ category
increased from 23.8 % among those with no formal educa� on to 47.5 % among the
ter� ary qualifi eds.
On the other hand, as may be expected, there is a nega� ve correla� on between
educa� onal level and the availability of money for par� cipa� ng in lo� ery games. Lack
of money as a reason for nonpar� cipa� on is advanced by 42.3 % of those without
any schooling while only 8.0 % of the respondents with post-matric qualifi ca� ons
men� oned this reason. This refl ects a lack of adequate disposable income among
those with no or only primary educa� on.

30
TABLE 3.11
REASONS FOR NONPARTICIPATION IN LOTTERY GAMES BY EDUCATIONAL LEVEL, 2010
Reasons for nonpar� cipa� onNo formal schooling
%
Primary (Grade 1-7)
%
Secondary (Grade 8-12)
%
Ter� ary (Post matric)
%
Total
%Lack of money 42.3 29.4 18.8 8.0 18.1
Against religious beliefs 4.2 12.2 10.4 11.4 10.8
Don't gamble at all 14.9 15.3 24.0 20.8 21.9No access to outlets selling LOTTO � ckets/Scratch Cards 4.2 2.3 1.9 2.9 2.3
Not interested 23.8 29.8 37.7 47.5 38.7
Other 10.7 11.0 7.3 9.3 8.3
Total 100.0 100.0 100.0 100.0 100.0
3.3.4 Nonpar� cipa� on by popula� on group
The reasons advanced for abstaining from par� cipa� on in lo� ery games diff er
substan� ally across popula� on groups. The following is evident from table 3.12:
• Lack of money is men� oned by 20.1 % of the African popula� on while it is a
minor reason in the case of Whites (5.3 %).
• Against religious beliefs is very prominent among nongambling Indians/Asians
(35.6 %) and Coloureds (33.2 %) but plays a less important role among Whites
and especially Africans (7.2 %).
• Not interested in par� cipa� ng in lo� ery games is advanced as the most
important reason by White respondents (47.8 %) and Africans (38.8 %).

31
TABLE 3.12
REASONS FOR NONPARTICIPATION IN LOTTERY GAMES BY POPULATION GROUP, 2010
Reasons for nonpar� cipa� on African%
Indian/Asian%
Coloured%
White% Total
Lack of money 20.1 11.9 14.3 5.3 18.1
Against religious beliefs 7.2 35.6 33.2 14.5 10.8
Don't gamble at all 22.5 11.9 18.6 23.7 21.9
No access to outlets selling LOTTO � ckets/Scratch Cards 2.6 1.0 1.2 1.0 2.3
Not interested 38.8 32.7 28.8 47.8 38.7Other 8.8 6.9 3.9 7.7 8.3Total 100.0 100.0 100.0 100.0 100.0
3.3.5 Nonpar� cipa� on by gender
A lack of money as reason for nonpar� cipa� on in lo� ery games is slightly more
important for males (20.8 %) than for females (16.9 %). About one fi � h of both genders
reported that they don’t gamble at all. A large percentage of both genders indicated
that they are not interested in lo� ery games at all (males 37.1 % and females 39.5 %).
TABLE 3.13
REASONS FOR NONPARTICIPATION IN LOTTERY GAMES BY GENDER, 2010
Reasons for nonpar� cipa� on Male
%Female
%Total
%
Lack of money 20.8 16.9 18.1
Against religious beliefs 13.7 9.4 10.7
Don't gamble at all 21.4 22.1 21.9
No access to outlets selling LOTTO � ckets/Scratch Cards 1.3 2.7 2.3
Not interested 37.1 39.5 38.7
Other 5.8 9.5 8.3
Total 100.0 100.0 100.0
3.3.6 Nonpar� cipa� on by personal income category
Nonpar� cipa� on in lo� ery games by income category (table 3.14) confi rms that a
large percentage of respondents with high incomes advanced religious beliefs for their

32
absten� on from gambling (6.9 % in the less than R500 per month income category
and almost 20.0 % in both the R5 001-R10 000 and R10 001-R20 000 categories). The
table also confi rms a posi� ve correla� on between income level and a lack of interest in
playing lo� ery games. While 39.3 % in the less than R500 income category indicated
that they are not interested, more than half (52.0 %) in the R20 000 plus income
category advanced this reason for absten� on. As could be expected, a lack of money
correlated nega� vely with income as reason for abstaining from playing lo� ery games.
TABLE 3.14
REASONS FOR NONPARTICIPATION IN LOTTERY GAMES BY MONTHLY PERSONAL INCOME
CATEGORY, 2010
Reasons for nonpar� cipa� on
Less than R500
%
Between R501-R1 000
%
Between R1 001-R2 000
%
Between R2 001-R5 000
%
Between R5 001-R10 000
%
Between R10 001-R20 000
%
More than
R20 000%
Do not want to disclose
%
Total
%Lack of money 22.9 23.6 17.0 15.4 8.7 3.7 5.3 16.1 18.1Against religious beliefs 6.9 9.7 6.9 9.6 19.1 21.2 10.7 18.2 10.9
Don't gamble at all 21.5 19.6 29.4 21.4 26.7 15.3 10.7 16.8 21.9No access to outlets selling LOTTO � ckets/Scratch Cards
2.8 3.5 2.2 1.9 3.0 1.2 5.3 0.0 2.2
Not interested 39.3 33.9 33.3 41.4 36.0 42.1 52.0 43.1 38.6
Other 6.6 9.6 11.3 10.3 6.6 16.5 16.0 5.8 8.4
Total 100.0 100.0 100.0 100.0 100.0 100.0 100.0 100.0 100.0
3.3.7 Longitudinal comparisons
Table 3.15 compares the reasons for not par� cipa� ng in lo� ery games in 2003 and
2010. The table suggests a change of mo� va� on for nonpar� cipa� on during the past
seven years. The following changes are evident:
• Lack of money (27.6 % in 2003 and 18.1 % in 2010) was recorded by substan� ally
fewer respondents in 2010. This may be due to household income growth
and/or a smaller share of the less affl uent par� cipa� ng in lo� ery games (see

33
below). As discussed in sec� on 3.2.7, the less marked decline in the levels of
par� cipa� on of the less affl uent largely explains this phenomenon.
• ‘Against religious beliefs’ as mo� va� onal factor for nonpar� cipa� on declined
from 18.0 % in 2003 to 10.8 % in 2010.
• ‘Don’t gamble at all’ more than doubled as reason from 9.9 % in 2003 to 21.9
% in 2010 while ‘not interested’ increased from 33.3 % to 38.7 %. Both these
reasons confi rmed a substan� al decline in the percentage of the adult South
African popula� on par� cipa� ng in lo� ery games.
TABLE 3.15
COMPARISON OF REASONS FOR NOT PARTICIPATING IN LOTTERY GAMES, 2003 AND 2010
Reasons for abstaining 2003 %
2010%
Not interested 33.3 38.7
Lack of money 27.6 18.1
Against religious beliefs 18.0 10.8
Don’t gamble at all 9.9 21.9
No access to outlets 1.0 2.3
3.4 MOTIVATIONAL FACTORS FOR ENGAGING IN LOTTERY GAMES
The 60.7 % of respondents that did not par� cipate in lo� ery games in the month
preceding their interview were asked if the following means of accessing lo� ery games
would mo� vate them to par� cipate:
• online banking
• playing lo� ery games through a cellphone
• using a bank ATM to play lo� ery games
• playing lo� ery games at � ll points in supermarkets
Table 3.16 reveals that alterna� ve means of accessing lo� ery games provide fairly

34
limited incen� ve. Only 3.6 % and 4.3 % respec� vely confi rmed the possibility of their
par� cipa� on should they become aware of par� cipa� on via ATMs and on-line banking.
However, somewhat higher mo� va� onal incen� ve was a� ached to cellphone (10.4 %)
and � ll point (16.9 %) access in supermarkets.
TABLE 3.16
RESPONSE TO THE QUESTION: ‘WOULD THE FOLLOWING MEANS OF ACCESSING
LOTTERY GAMES MOTIVATE YOU TO PARTICIPATE?’
Means of accessing lo� ery games
Yes%
No%
Total%
Through online banking 4.3 95.7 100.0
Through a cellphone 10.4 89.6 100.0
Through a bank ATM 3.6 96.4 100.0
At � ll points in supermarkets 16.9 83.1 100.0
Although fairly limited support was expressed for alterna� ve means of accessing lo� ery
games, the following provides some insight into the characteris� cs of the respondents
expressing interest in the alterna� ve means.
Those that responded posi� vely on online banking as an alterna� ve means of accessing
lo� ery games, show the following characteris� cs:
• between 18-30 years (youngest age category)
• part-� me and full-� me workers
• with ter� ary educa� onal qualifi ca� ons
• White popula� on group
• no gender diff eren� a� on
• highest income categories
Those that responded posi� vely to playing lo� ery games through a cellphone, show
the following characteris� cs:
35
• youngest age group (18-30 years)
• part-� me and full-� me workers
• with ter� ary qualifi ca� ons
• Indian/Asian, Coloured and White popula� on groups
• no gender diff eren� a� on
• highest income category
Those that responded posi� vely to playing lo� ery games through a bank ATM show the
following characteris� cs:
• age groups between 18-60 years
• part-� me and full-� me workers
• with ter� ary qualifi ca� ons
• White popula� on group
• males
• middle and higher income categories
Those that responded posi� vely to playing lo� ery games at � ll points in supermarkets
show the following characteris� cs:
• all age groups
• re� red/nonworkers and the unemployed
• with no formal schooling
• African and White popula� on group
• no gender diff eren� a� on
• lowest and middle income categories

36
3.5 PERSONAL VIEWS ON LOTTERY GAMES
A ques� on was addressed to all respondents enquiring on their personal views on
par� cipa� ng in lo� ery games. The following three choices were put to respondents:
• acceptable to me
• not acceptable to me but have no objec� ons to others par� cipa� ng
• not acceptable to me
Figure 3.5 shows that 57.3 % of the respondents confi rm that par� cipa� ng in lo� ery
games is acceptable to them. Just less than one in every fi ve (19.8 %) respondents fi nd
lo� ery games unacceptable while the rest do not par� cipate in lo� ery games but have
no objec� ons if others par� cipate (22.9 %).
FIGURE 3.5
PERSONAL VIEWS ON PARTICIPATING IN LOTTERY GAMES, 2010
The respondents (19.8 %) that indicated that par� cipa� on in lo� ery games is not
acceptable to them portray the following characteris� cs:
Acceptable to me 57.3
19.8
0 20 40 60 80
22.9Not acceptable to me but
have no objec� ons if others par� cipate
Not acceptable to me
Percentage

37
• fairly equally spread across all age groups
• part-� me workers and re� red/nonworkers (albeit a somewhat lower level of
acceptance)
• fairly equally spread across all educa� onal levels
• Africans and Whites (albeit a somewhat lower level of acceptance)
• No marked diff eren� a� on between gender groups
• Fairly equally spread across all income groups
The percentage of respondents expressing approval of lo� ery games in 2010 (57.3 %)
is almost 10.0 % higher than the 48.7 % who indicated that gambling is acceptable to
them during an NGB survey in 2009 (NGB 2009:33).
3.6 ATTITUDES TOWARDS LOTTERY GAMES
All respondents were asked to present their views (opinions) on six statements
exploring their knowledge of lo� ery ins� tu� ons and their a� tudes towards lo� ery
games. Respondents were presented with three alterna� ves, namely ‘agree’, ‘disagree’
or ‘don’t know’. The results are depicted in table 3.17.
Awareness of the existence of the NLB and Gidani among the adult South African
popula� on seems to be average. Just more than half (52.1 %) the respondents were
aware of the NLB and 45.0 % of Gidani. Almost three in every fi ve (59.1 %) confi rmed
their awareness of ‘good cause’ money distributed from the money generated by the
Na� onal Lo� ery (Na� onal Lo� ery Distribu� on Trust Fund – NLDTF). Almost the same
percentage of respondents (59.7 %) expressed their agreement that the Na� onal
Lo� ery is good for South African society.
Almost half (49.2 %) the respondents confi rmed the view that most people play the
lo� ery sensibly and a small minority (17.6 %) felt that people should be discouraged
from playing lo� ery games. This reac� on confi rms strong support for freedom of

38
choice – even in view of the fact that almost a third (30.6 %) of respondents disagreed
with the view that most people play the lo� ery sensibly.
TABLE 3.17
PERSONAL VIEWS ON THE NATIONAL LOTTERY, 2010
Statements Agree%
Disagree%
Don’t know%
Total%
I am aware of the Na� onal Lo� eries Board (NLB) 52.1 39.1 8.8 100.0
I am aware of Gidani as the Na� onal Lo� ery Operator 45.0 44.5 10.5 100.0I am aware of the ‘good cause’ monies distributed by the NLDTF 59.1 31.5 9.4 100.0On balance, the Na� onal Lo� ery is good for society 59.7 26.7 13.6 100.0Most people play the lo� ery sensibly 49.2 30.6 20.2 100.0
People should be discouraged from playing lo� ery games 17.6 70.7 11.6 100.0
3.7 NATIONAL LOTTERY OUTLETS
All respondents were requested to express their opinion on the adequacy of na� onal
lo� ery outlets. Figure 3.6 shows that just more than half (51.6 %) the respondents
were of the opinion that there are enough Na� onal Lo� ery outlets. 15.5 % expressed
the view that there are too many outlets while just less than a third (32.8 %) thought
that there are not enough outlets. The fi nding that almost a third of the respondents
expressed the view that there are not enough outlets should be viewed against the fact
that only 2.3 % of nonpar� cipants advanced a lack of access to gambling facili� es as a
reason for abstaining from playing lo� ery games. It would therefore appear that the
respondents who indicated that there are not enough outlets referred more to a need
for more convenient/easier access rather than an outright lack of access to Na� onal
Lo� ery outlets.

39
FIGURE 3.6
ADEQUACY OF NATIONAL LOTTERY OUTLETS, 2010
The demographic characteris� cs of the 32.8 % respondents who reported inadequate
gambling outlets are the following:
• the younger age groups (18-30 and 31-40 years)
• part-� me workers and the unemployed
• respondents with primary and secondary school qualifi ca� ons
• the African popula� on group
• the less affl uent income categories (below an income of R5 000 per month)
3.8 UNDER-AGE PARTICIPATION IN LOTTERY GAMES
The involvement of persons below the age of 18 years in lo� ery games is a ma� er
of concern. This aspect is prominently addressed in Gidani’s promo� ons and
adver� sements. The ques� onnaire enquired on the awareness among all respondents
of under-age par� cipa� on in lo� ery games. Figure 3.7 confi rms a rela� vely low
awareness of this phenomenon. Almost one in every 10 respondents confi rmed their
awareness of under-age par� cipa� on in LOTTO/LOTTO Plus (11.8 %) and the buying
of Scratch Cards (10.3 %). Awareness of under-age involvement in PowerBall and
SportStake is somewhat lower at 7.1 % and 6.7 % respec� vely.
Too many
Not enough
Enough
15.5
51.6
0 20 40 60
32.8
Percentage

40
FIGURE 3.7
LEVEL OF AWARENESS OF UNDER-AGE PARTICIPATION IN LOTTERY GAMES
By sociodemographic variables, awareness of under-age gambling was par� cularly
prevalent among respondents in the following categories:
• Age group : 18-30 years
• Work status : Unemployed and full-� me workers
• Level of educa� on : Secondary school qualifi eds
• Popula� on group : African popula� on
• Gender : Female
• Income : Lowest income category
3.9 BUYING OF LOTTO AND LOTTO PLUS TICKETS
Respondents who confi rmed their par� cipa� on in LOTTO and LOTTO Plus during the
month preceding the survey were requested to indicate how o� en they buy LOTTO/
LOTTO Plus � ckets. Percentages in this sec� on are therefore calculated on the number
of respondents who buy LOTTO/LOTTO Plus � ckets and not the total popula� on
interviewed. Figure 3.8 reveals that just more than half (51.8 %) buy LOTTO/LOTTO
Plus � ckets twice a week. This is followed by a further 30.7 % that buy LOTTO/LOTTO
SportStakes
Powerball
Scratch cards
Lo� o/Lo� o plus
6.7
0 5 10 15
7.1
10.3
11.8
Percentage
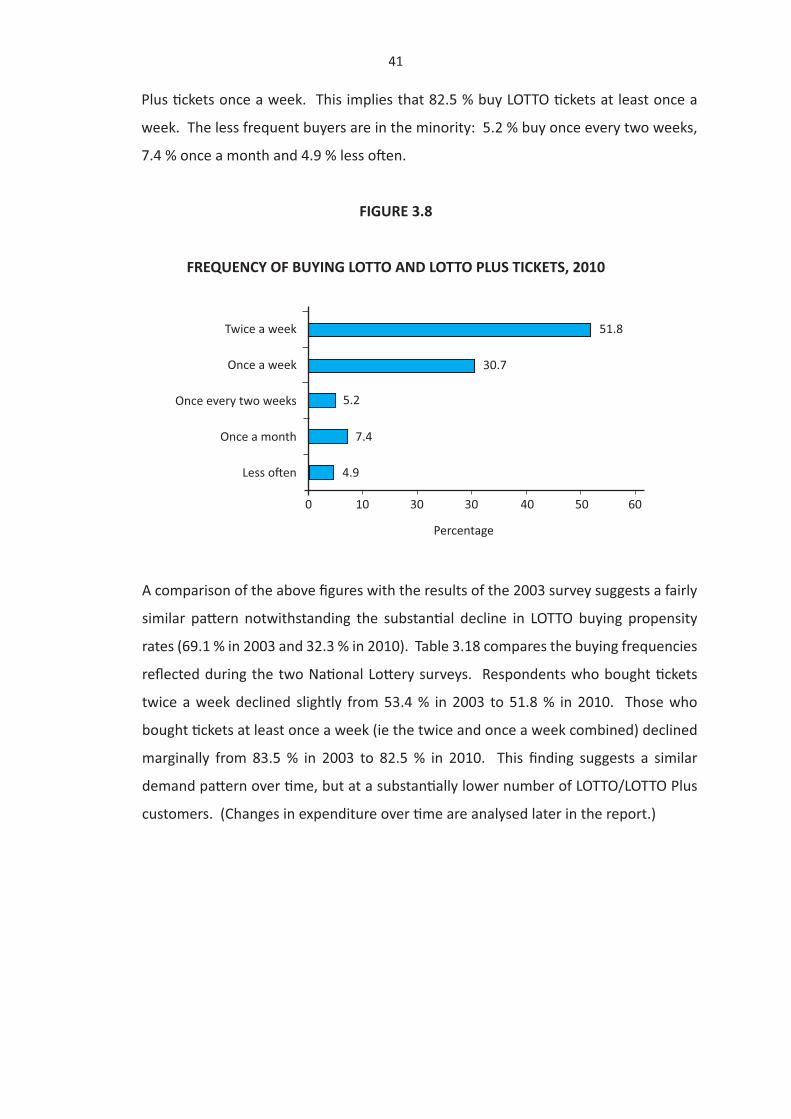
41
Plus � ckets once a week. This implies that 82.5 % buy LOTTO � ckets at least once a
week. The less frequent buyers are in the minority: 5.2 % buy once every two weeks,
7.4 % once a month and 4.9 % less o� en.
FIGURE 3.8
FREQUENCY OF BUYING LOTTO AND LOTTO PLUS TICKETS, 2010
A comparison of the above fi gures with the results of the 2003 survey suggests a fairly
similar pa� ern notwithstanding the substan� al decline in LOTTO buying propensity
rates (69.1 % in 2003 and 32.3 % in 2010). Table 3.18 compares the buying frequencies
refl ected during the two Na� onal Lo� ery surveys. Respondents who bought � ckets
twice a week declined slightly from 53.4 % in 2003 to 51.8 % in 2010. Those who
bought � ckets at least once a week (ie the twice and once a week combined) declined
marginally from 83.5 % in 2003 to 82.5 % in 2010. This fi nding suggests a similar
demand pa� ern over � me, but at a substan� ally lower number of LOTTO/LOTTO Plus
customers. (Changes in expenditure over � me are analysed later in the report.)
Twice a week
Once a week
Once every two weeks
Once a month
Less o� en
51.8
5.2
0 10 30 30 40 50 60
30.7
7.4
4.9
Percentage

42
TABLE 3.18
FREQUENCY OF BUYING LOTTO/LOTTO PLUS TICKETS: COMPARING 2003 WITH 2010
Frequency 2003%
2010%
Twice a week 53.4 51.8Once a week 30.1 30.7Once every two weeks 6.3 5.2Once a month 6.0 7.4
Less o� en 4.2 4.9Total 100.0 100.0
3.9.1 Buying of LOTTO/LOTTO Plus � ckets by age group
The frequency of buying LOTTO/LOTTO Plus � ckets is refl ected by age group in table
3.19. The buying pa� erns across age groups are fairly similar with a slightly lower
frequency rate among the youngest and highest age groups. The largest percentage
(close to or more than half the respondents) buy � ckets twice a week, followed by
more or less a third of the popula� on that buy � ckets once a week.
TABLE 3.19
FREQUENCY OF BUYING LOTTO/LOTTO PLUS TICKETS BY AGE GROUP, 2010
Frequency18-30 years
%
31-40 years
%
41-50 years
%
51-60 years
%
Older than 60
%
Total
%Twice a week 41.1 53.9 61.2 58.8 48.1 51.8Once a week 35.6 32.7 25.0 24.4 31.3 30.8Once every two weeks 6.0 5.6 4.0 4.8 3.8 5.1Once a month 9.1 6.1 6.0 6.5 12.0 7.4Less o� en 8.2 1.7 3.9 5.5 4.8 4.9Total 100.0 100.0 100.0 100.0 100.0 100.0
3.9.2 Buying of LOTTO/LOTTO Plus � ckets by employment status
Table 3.20 refl ects no substan� al diff erences in the buying of LOTTO/LOTTO Plus � ckets
by employment status. The following minor behavioural diff erences are evident.
Respondents involved in full-� me work reported a slightly higher percentage with
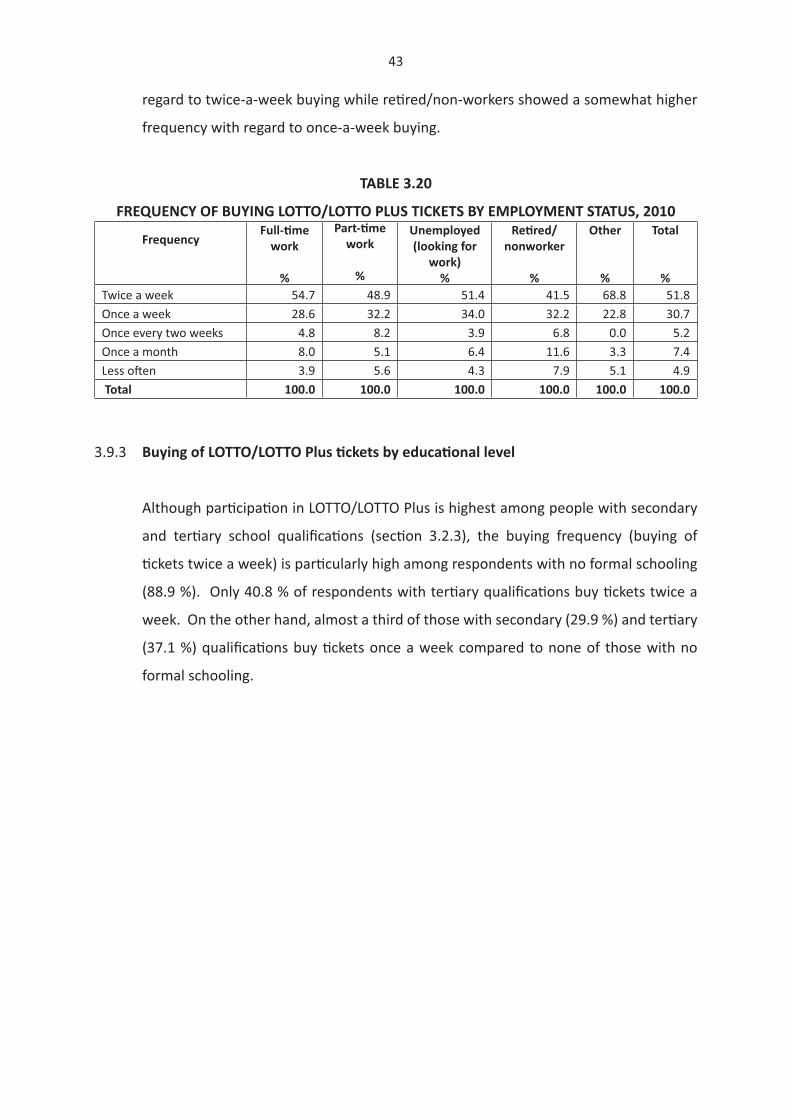
43
regard to twice-a-week buying while re� red/non-workers showed a somewhat higher
frequency with regard to once-a-week buying.
TABLE 3.20
FREQUENCY OF BUYING LOTTO/LOTTO PLUS TICKETS BY EMPLOYMENT STATUS, 2010
FrequencyFull-� me
work
%
Part-� me work
%
Unemployed (looking for
work)%
Re� red/nonworker
%
Other
%
Total
%Twice a week 54.7 48.9 51.4 41.5 68.8 51.8Once a week 28.6 32.2 34.0 32.2 22.8 30.7Once every two weeks 4.8 8.2 3.9 6.8 0.0 5.2Once a month 8.0 5.1 6.4 11.6 3.3 7.4Less o� en 3.9 5.6 4.3 7.9 5.1 4.9 Total 100.0 100.0 100.0 100.0 100.0 100.0
3.9.3 Buying of LOTTO/LOTTO Plus � ckets by educa� onal level
Although par� cipa� on in LOTTO/LOTTO Plus is highest among people with secondary
and ter� ary school qualifi ca� ons (sec� on 3.2.3), the buying frequency (buying of
� ckets twice a week) is par� cularly high among respondents with no formal schooling
(88.9 %). Only 40.8 % of respondents with ter� ary qualifi ca� ons buy � ckets twice a
week. On the other hand, almost a third of those with secondary (29.9 %) and ter� ary
(37.1 %) qualifi ca� ons buy � ckets once a week compared to none of those with no
formal schooling.

44
TABLE 3.21
FREQUENCY OF BUYING LOTTO/LOTTO PLUS TICKETS BY EDUCATIONAL LEVEL, 2010
FrequencyNo formal schooling
%
Primary (Grade 1-7)
%
Secondary (Grade 8-12)
%
Ter� ary (Post matric)
%
Total
%Twice a week 88.9 55.7 53.5 40.8 51.8Once a week 0.0 27.7 29.9 37.1 30.7Once every two weeks 0.0 6.1 5.1 5.2 5.2Once a month 0.0 6.1 7.0 10.4 7.4Less o� en 11.1 4.4 4.5 6.5 4.9Total 100.0 100.0 100.0 100.0 100.0
3.9.4 Buying of LOTTO/LOTTO Plus � ckets by popula� on group
Major diff erences are evident in the frequency of procuring LOTTO � ckets across
popula� on groups, which is par� cularly high in the case of Africans, Indians/Asians
and Coloureds, where 53.8 %, 50.0 % and 51.6 % buy LOTTO � ckets at least twice a
week (table 3.22). The percentage for Whites drops to 25.7 %. The once-every-week
and less o� en frequencies are par� cularly prominent among Whites rela� ve to other
popula� on groups.
TABLE 3.22
FREQUENCY OF BUYING LOTTO/LOTTO PLUS TICKETS BY POPULATION GROUP, 2010
FrequencyAfrican
%Indian/Asian
%Coloured
%White
%Total
%
Twice a week 53.8 50.0 51.6 25.7 51.8
Once a week 32.0 17.8 27.4 42.9 30.7
Once every two weeks 4.9 9.7 3.1 4.3 5.2
Once a month 4.6 18.2 13.9 17.1 7.4
Less o� en 4.7 4.3 3.9 10.0 4.9
Total 100.0 100.0 100.0 100.0 100.0

45
3.9.5 Buying of LOTTO/LOTTO Plus � ckets by gender
The frequency of buying LOTTO � ckets is virtually equal among males and females (table
3.23). The twice-a-week frequency is slightly higher for males (55.6 %) compared to
females (48.2 %) while the once-a-week frequency is higher for females (34.2 %) than
for males (27.0 %). Once-every-two-weeks purchasing is also slightly higher for males
while more females than males buy LOTTO/LOTTO Plus � ckets once a month.
TABLE 3.23
FREQUENCY OF BUYING LOTTO/LOTTO PLUS TICKETS BY GENDER, 2010
Frequency Male%
Female%
Total%
Twice a week 55.6 48.2 51.7Once a week 27.0 34.2 30.7Once every two weeks 6.0 4.5 5.2Once a month 6.7 8.1 7.4Less o� en 4.7 5.0 4.9Total 100.0 100.0 100.0
3.9.6 Buying of LOTTO/LOTTO Plus � ckets by personal income category
Par� cipa� on in LOTTO/LOTTO Plus by income group suggests a more ac� ve par� cipa� on
by the middle income groups (table 3.24). Twice-a-week buyers are the most prominent
in the R2 001-R5 000 (60.2 %) and R5 001-R10 000 (59.2 %) income categories. This
drops to 46.5 % in the less than R500 per month category and 40.6 % and 44.1 % in the
income categories exceeding a monthly income of R10 000 per month.

46
TABLE 3.24
FREQUENCY OF BUYING LOTTO/LOTTO PLUS TICKETS BY PERSONAL INCOME CATEGORY, 2010
Frequency
Less than R500
%
Between R501-R1 000
%
Between R1 001-R2 000
%
Between R2 001-R5 000
%
Between R5 001-R10 000
%
Between R10 001-R20 000
%
More than
R20 000%
Do not want to disclose
%
Total
%Twice a week 46.5 54.2 45.5 60.2 59.2 40.6 44.1 51.4 52.0
Once a week 36.7 27.2 35.7 27.1 22.9 33.5 12.9 29.8 30.5Once every two weeks 3.6 6.6 8.0 3.4 5.2 .0 4.3 8.0 5.2
Once a month 6.7 3.1 8.7 7.3 7.5 18.7 25.8 6.5 7.5
Less o� en 6.6 9.0 2.0 2.0 5.2 7.1 12.9 4.2 4.8
Total 100.0 100.0 100.0 100.0 100.0 100.0 100.0 100.0 100.0
3.10 BUYING OF WINA MANJE SCRATCH CARDS
Respondents buying Scratch Cards during the month preceding the interview represent
6.2 % of the sample popula� on. They were requested to indicate how o� en they buy
the cards. Figure 3.9 refl ects that just more than two in every fi ve (43.9 %) buy Scratch
Cards every week (once or more). A further 13.8 % of the respondents reported a
frequency of once every two weeks and 17.6 % once a month. One in every 20 (5.6 %)
buy Scratch Cards on a daily basis.
FIGURE 3.9
FREQUENCY OF BUYING SCRATCH CARDS, 2010
Daily
Every week (once or more)
Once every two weeks
Once a month
Less o� en
5.6
0 10 20 30 40 50
13.8
17.6
19.0
Percentage
43.9

47
A comparison of the above 2010 frequencies with the results of the 2003 Na� onal
Lo� ery survey suggests a fairly similar pa� ern. The percentage buying Scratch Cards
every week increased slightly from 35.4 % in 2003 to 43.9 % in 2010 while marginal
declines were reported by those that bought cards on a daily basis (from 6.9 % to 5.6
%), once every two weeks (16.0 % to 13.8 %) and once a month (20.1 % to 17.6 %).
TABLE 3.25
FREQUENCY OF BUYING SCRATCH CARDS: COMPARING 2003 WITH 2010
Frequency 2003%
2010%
Daily 6.9 5.6
Every week (once or more) 35.4 43.9
Once every two weeks 16.0 13.8
Once a month 20.1 17.6
Less o� en 21.6 19.0Total 100.0 100.0
The ques� on on the frequency of buying Scratch Cards was only put to respondents
who buy Scratch Cards. The responses are therefore fairly limited (156 respondents),
implying that disaggrega� on of the data in terms of sociodemographic categories will
result in an even smaller number of observa� ons per cell. It was therefore decided
to only present broad indica� ons of the demographic profi le of those buying Scratch
Cards.
• High frequency buyers (at least once a week) were strongly represented in
the lower age categories (18-40 years). Lower buying frequencies were more
prominent in higher age categories: 41-50-year-olds generally bought cards
every two weeks, 51-60-year-olds once a month and those older than 60 years
less o� en.
• With regard to employment status, the following categories reported rela� vely
high buying frequencies: re� red/nonworkers and full-� me workers. The
unemployed and re� red/nonworkers recorded the lowest frequencies.

48
• The highest buying frequency was reported by those with secondary and
ter� ary qualifi ca� ons. The lowest buying frequency was among primary school
qualifi eds and those without any formal school qualifi ca� ons.
• Africans and Coloureds were the major supporters of Scratch Cards with
rela� vely high buying frequencies.
• No substan� al diff erences in buying behaviour were evident by gender.
• The lower income groups (below R5 000 personal income per month) showed
the highest buying frequency. Higher and higher-middle income earners
showed very low (if any) buying frequencies of Scratch Cards.
3.11 PARTICIPATING IN SPORTSTAKE
Respondents par� cipa� ng in SportStake during the month preceding the interviews
represent 3.3 % of the sample popula� on. They were requested to indicate their
frequency of playing SportStake. Figure 3.10 shows that almost a quarter of par� cipants
in SportStake played twice a week (ie Saturday and Wednesday draws). However, the
majority played once a week (61.1 %).
FIGURE 3.10
FREQUENCY OF PLAYING SPORTSTAKE, 2010
Twice a week
Once a week
Once every two weeks
Once a month
Less o� en
5.6
0 20 40 60 80
5.6
5.6
3.6
Percentage
24.0
61.1

49
Only 82 SportStake players (3.3 % of the sample popula� on) were captured in the
survey. The demographic characteris� cs of these players are the following:
• No substan� al diff erences in buying behaviour by age group are evident.
• All employment groups, with the excep� on of re� red/nonworkers, showed
rela� vely high buying frequencies.
• No substan� al diff erences by educa� on level are evident.
• The African popula� on group recorded the highest buying frequency.
• Males are more ac� ve players than females
• Limited diff erences by income group are detectable.
3.12 BUYING OF POWERBALL TICKETS
The 16.4 % of respondents playing PowerBall were requested to report their frequency
of buying � ckets. Figure 3.11 confi rmed very ac� ve involvement of PowerBall players.
Just less than half (46.2 %) bought PowerBall � ckets twice a week and a third (33.4 %)
once a week. This implies that only 20.4 % of PowerBall players bought � ckets less
o� en than once a week.
FIGURE 3.11
FREQUENCY OF BUYING POWERBALL TICKETS, 2010
Twice a week
Once a week
Once every two weeks
Once a month
Less o� en
5.6
0 10 20 30 40 50
5.8
8.2
19.0
Percentage
46.2
33.4

50
3.12.1 Buying of PowerBall � ckets by age group
Table 3.26 shows marginal varia� ons of the frequency in par� cipa� ng in PowerBall
games by age category. The twice-a-week players ranged from 41.5 % in the 31-40-
year age group to 53.4 % in the 51-60 age group. Similarly, the once-a-week buyers
ranged from 27.4 % of those older than 60 years to 35.9 % in the 31-40-year age group.
Combining the twice- and once-a-week buyers shows that almost eight in every 10
players in each of the age groups bought PowerBall � ckets at least once a week.
TABLE 3.26
FREQUENCY OF BUYING POWERBALL TICKETS BY AGE GROUP, 2010
Frequency18-30 years
%
31-40 years
%
41-50 years
%
51-60 years
%
Older than 60%
Total
%Twice a week 44.1 41.5 50.6 53.4 48.1 46.3Once a week 30.4 35.9 35.8 35.1 27.4 33.5Once every two weeks 5.4 7.8 2.3 2.8 11.0 5.6Once a month 11.6 9.7 4.9 2.8 8.4 8.2Less o� en 8.5 5.1 6.5 6.0 5.1 6.4Total 100.0 100.0 100.0 100.0 100.0 100.0
3.12.2 Buying of PowerBall � ckets by employment status
Employment status exercised a small infl uence on the frequency of buying PowerBall
� ckets. Table 3.27, for example, shows that all employment groups tend to buy � ckets
at least once a week. The only notable diff erences are among the unemployed – their
twice-a-week frequency is lower than their once-a-week frequency while the opposite
prevails in the other employment groups.

51
TABLE 3.27
FREQUENCY OF BUYING POWERBALL TICKETS BY EMPLOYMENT STATUS, 2010
FrequencyFull-time
work%
Part-time work
%
Unemployed (Looking for work)
%
Retired/nonworker
%
Total
%Twice a week 45.8 45.8 39.6 56.3 46.2Once a week 32.3 28.2 43.2 24.8 33.4Once every two weeks 4.6 4.0 9.0 8.2 5.8Once a month 11.1 13.0 2.3 4.0 8.2Less often 6.2 9.0 5.9 6.7 6.4Total 100.0 100.0 100.0 100.0 100.0
3.12.3 Buying of PowerBall � ckets by educa� onal level
Table 3.28 shows a rela� vely high twice-a-week and once-a-week buying frequency
among respondents across all educa� onal levels.
TABLE 3.28
FREQUENCY OF BUYING POWERBALL TICKETS BY EDUCATIONAL LEVEL, 2010
FrequencyNo formal schooling
%
Primary(Grade 1-7)
%
Secondary (Grade 8-12)
%
Tertiary(Post matric)
%
Total
%Twice a week 65.7 47.9 48.9 34.7 46.2Once a week 21.9 31.8 31.9 40.0 33.4Once every two weeks 0.0 5.2 5.8 6.7 5.8Once a month 0.0 8.2 7.7 10.4 8.2Less often 12.5 6.7 5.8 8.2 6.4Total 100.0 100.0 100.0 100.0 100.0
3.12.4 Buying of PowerBall � ckets by popula� on group
Table 3.29 confi rms a rela� vely high frequency of PowerBall par� cipa� on by all
popula� on groups. However, the twice-a-week buying frequency of Whites is
somewhat lower than that of the other three groups while their once-a-week buying
frequency is higher.

52
TABLE 3.29
FREQUENCY OF BUYING POWERBALL TICKETS BY POPULATION GROUP, 2010
Frequency African%
Indian/Asian%
Coloured%
White%
Total%
Twice a week 50.2 42.7 44.1 24.2 46.2Once a week 33.2 26.4 35.4 41.9 33.4Once every two weeks 6.0 8.1 2.0 4.8 5.8Once a month 4.3 20.5 12.8 16.1 8.2Less o� en 6.3 2.3 5.6 12.9 6.4Total 100.0 100.0 100.0 100.0 100.0
3.12.5 Buying of PowerBall � ckets by gender
The frequency of buying PowerBall � ckets is higher among males than females (table
3.30). The twice-a-week frequency was 51.8 % for males and 40.8 % for females.
Slightly more females bought � ckets once a week (35.2 %) compared to males (31.5 %).
TABLE 3.30
FREQUENCY OF BUYING POWERBALL TICKETS BY GENDER, 2010
Frequency Male%
Female%
Total%
Twice a week 51.8 40.8 46.2Once a week 31.5 35.2 33.4Once every two weeks 5.4 6.2 5.8Once a month 6.5 9.8 8.2Less o� en 4.8 8.1 6.4Total 100.0 100.0 100.0
3.12.6 Buying of PowerBall � ckets by personal income category
Table 3.31 refl ects no substan� al varia� on of � cket sales by personal income group.
The frequencies were rela� vely high across all income groups with a marginally lower
frequency among players earning in access of R10 000 per month.

53
TABLE 3.31
FREQUENCY OF BUYING POWERBALL TICKETS BY PERSONAL INCOME CATEGORY, 2010
Frequency
Less than R500
%
Between R501-R1 000
%
Between R1 001-R2 000
%
Between R2 001-R5 000
%
Between R5 001-R10 000
%
Between R10 001-R20 000
%
More than
R20 000%
Do not want to disclose
%
Total
%Twice a week 47.6 48.7 46.2 43.3 51.4 47.5 54.3 41.5 46.5Once a week 39.7 35.5 31.3 35.8 25.8 25.0 17.1 34.3 33.4Once every two weeks 4.2 6.6 8.8 2.0 6.4 0.0 5.7 10.4 5.6
Once a month 2.2 6.1 10.3 13.0 10.0 18.8 11.4 2.8 8.3Less o� en 6.3 3.1 3.4 5.8 6.4 8.8 11.4 11.1 6.2Total 100.0 100.0 100.0 100.0 100.0 100.0 100.0 100.0 100.0
3.13 LOTTERY PLAYERS: DEMOGRAPHIC COMPARISONS
Table 3.32 shows the demographic profi le of lo� ery players by type of lo� ery game.
Although the popula� on profi le does not diff er substan� ally by type of lo� ery game,
some minor diff eren� a� ons are detectable.
The age profi le of LOTTO/LOTTO Plus and PowerBall players is fairly similar with almost
a third younger than 30 years, one quarter between 31 and 40 years and one quarter
between 41 and 50 years. Popularity of these games decline substan� ally a� er age
50 with approximately 10 % of the players between 51 and 60 years and less than
10 % older than 60 years. Wina Manje Scratch Cards are the most popular among
the younger age groups with almost two thirds (65.4 %) younger than 40 years. This
phenomenon is even more prominent with those par� cipa� ng in SportStake with
almost three quarters (74.4 %) younger than 40 years. The 18-30-olds (the youngest
age group) are the most ac� ve SportStake players.
With regard to work status, the overwhelming majority of lo� ery players are involved
in full-� me and part-� me work. These two groups represent the following percentages
of players according to lo� ery game:

54
• LOTTO/LOTTO Plus : 59.6 %
• Scratch Cards : 64.1 %
• SportStake : 70.7 %
• PowerBall : 61.6 %
Unemployed people also represent a fairly substan� al por� on of lo� ery players. The
percentages are:
• LOTTO/LOTTO Plus : 23.3 %
• Scratch Cards : 23.7 %
• SportStake : 18.3 %
• PowerBall : 19.3 %
PowerBall and LOTTO/LOTTO Plus are the most popular games among the re� red/
nonworker category. They represent 16.4 % of PowerBall players and 13.2 % of LOTTO/
LOTTO Plus players.
With regard to educa� onal level, the following is evident from table 3.32:
• Par� cipa� on of people with no formal schooling in lo� ery games is virtually
negligible.
• Close to seven out of 10 lo� ery par� cipants have completed their secondary
educa� on.
• SportStake and PowerBall are the most popular games among persons with
a ter� ary qualifi ca� on. Their par� cipa� on in Scratch Cards is much lower
compared to other games.
With regard to popula� on group the following diff eren� a� ons are evident:

55
• Africans are the most prominent players regarding Scratch Cards and SportStake
with greater than 80 % representa� on in both games. This drops to just below
70 % in PowerBall.
• The share of Indians/Asians in lo� ery games is the most prominent in SportStake
and the lowest in LOTTO/LOTTO Plus.
• Coloureds show the strongest representa� on in LOTTO/LOTTO Plus and
PowerBall with no par� cipa� on in SportStake.
• Whites are fairly inac� ve regarding Scratch Cards and SportStake but rela� vely
prominent in PowerBall.
With regard to gender, males are very prominent in SportStake while females are
dominant in Scratch Cards.
An analysis of lo� ery players by personal income group suggests the following pa� erns:
• Poor people (earning less than R500 per month) are ac� ve lo� ery players.
Just less than a quarter of players in each lo� ery game earn an income of less
than R500 per month. SportStake (24.4 %) and LOTTO/LOTTO Plus (23.4 %)
are somewhat more popular than PowerBall (20.5 %) and Scratch Cards (21.2
%). Adding together the three lowest income categories (ie people earning
less than R2 000 per month) the above phenomenon is more prominently
illustrated.
- LOTTO/LOTTO Plus : 50.3 %
- Scratch Cards : 50.7 %
- SportStake : 48.8 %
- PowerBall : 36.7 %

56
TABLE 3.32
PROFILE OF LOTTERY PLAYERS, 2010
Demographic variable LOTTO/LOTTO Plus
%
Scratch Cards%
SportStake%
PowerBall%
1. Age categories• 18-30 years 30.9 34.6 40.3 27.2• 31-40 years 27.3 30.8 34.1 27.9• 41-50 years 24.1 23.1 19.5 25.0• 51-60 years 10.6 8.3 6.1 10.2• Older than 60 years 7.1 3.2 0.0 9.7• Total 100.0 100.0 100.0 100.0
2. Work status• Full-� me work 43.4 45.5 43.9 47.2• Part-� me work 16.2 18.6 26.8 14.4• Unemployed (looking for work) 23.3 23.7 18.3 19.3• Re� red/nonworker 13.2 7.7 7.3 16.4• Other (eg students) 3.9 3.8 3.7 2.9• Total 100.0 100.0 100.0 100.0
3. Educa� onal level• No formal schooling 0.7 0.0 0.0 1.2• Primary (Grade 1-7) 11.5 9.0 7.2 10.8• Secondary (Grade 8-12) 70.5 78.8 71.1 68.2• Ter� ary (Post matric) 17.3 12.2 21.7 19.8• Total 100.0 100.0 100.0 100.0
4. Popula� on group• African 76.3 80.8 81.9 69.7• Indian/Asian 10.4 12.2 16.9 12.5• Coloured 8.3 6.4 0.0 7.8• White 5.0 0.6 1.2 10.0• Total 100.0 100.0 100.0 100.0
5. Gender• Male 47.9 40.6 75.6 49.4• Female 52.1 59.4 24.4 50.6• Total 100.0 100.0 100.0 100.0
6. Personal income category (per month)• Less than R500 23.4 21.2 24.4 20.5• Between R501-R1 000 10.8 10.3 12.2 9.4• Between R1 001-R2 000 16.1 19.2 12.2 16.8• Between R2 001-R5 000 22.9 25.0 23.2 22.4• Between R5 001-R10 000 11.1 9.6 17.1 13.3• Between R10 001-R20 000 2.9 1.9 0.0 3.2• More than R20 000 1.7 0.0 1.2 3.0• Do not want to disclose 11.1 12.8 9.7 11.4• Total 100.0 100.0 100.0 100.0

57
3.14 ALLOCATION OF WINNINGS
The results of the response to the ques� on: ‘If you win money in lo� ery games today,
on what would you spend it?’ are contained in fi gure 3.12. These responses are
indica� ve of the possible applica� on of winnings from lo� ery games. It should be kept
in mind that this is a hypothe� cal ques� on to all lo� ery par� cipants and not only to
those respondents who actually had won prizes in the past. The following were the
items mostly men� oned by respondents:
• Save 58.3 %
• Purchase of necessi� es 40.9 %
• Purchase of luxury items 39.9 %
• Payment of bond/debt 30.2 %
The 27.0 % ‘other’ include, inter alia, the following: job crea� on, building a house, pay
school fees, give to family and give to charity.
FIGURE 3.12
ALLOCATION OF NATIONAL LOTTERY WINNINGS, 2010
Save
Purchase of items for basic needs
Purchase of luxury items
Payment of bond/debit
Other
Entertainment
Gamble/buying lo� ery � ckets
Don’t know
30.2
0 10 20 30 40 50 60 70
14.7
9.8
3.3
Percentage
39.9
27.0
40.9
58.3

58
Respondents were invited to men� on more than one item on which they would
spend their winnings. Percentages allocated to the above items are therefore not
necessarily indica� ve of the rela� ve amounts that winners would spend on the items.
A respondent men� oning, for example, savings and purchase of basic necessi� es would
not necessarily allocate equal amounts to the men� oned items. The percentages
merely refer to the propor� on of respondents who would spend some (or all) of their
winnings on a par� cular item.
Sociodemographic characteris� cs emana� ng from the survey regarding the possible
alloca� on of winnings are the following:
• The payment of debt increased in importance as age increased; purchasing of
luxury items is of par� cular importance among the younger age groups and
savings remain the most or second most important item among all age groups.
Purchases of household necessi� es become less important among the 60 plus
age group.
• The procurement of necessi� es is of par� cular importance to the unemployed
while savings is the most frequent item men� oned by full-� me and part-� me
workers.
• Purchases of household necessi� es from winnings are of par� cular importance
to respondents with primary and secondary schooling. Savings is important in
all educa� onal categories.
• Close to one third of the African and Indian/Asian popula� on groups recorded
payment of debt as an important item for the alloca� on of winnings. Purchasing
of basic necessi� es is the most important item men� oned by Coloureds while
savings is of par� cular importance to the African and Indian/Asian popula� on
groups.
• Alloca� on pa� erns by gender are fairly similar. Females are slightly more
inclined to allocate a higher priority to household necessi� es.
• The lower income groups tend to priori� se the purchase of household
necessi� es while savings are recorded as important by all income groups.

59
3.15 EXPENDITURE ON LOTTERY GAMES
Figure 3.13 shows the distribu� on of monthly expenditure on lo� ery games by
expenditure category. The fi gure shows that close to a quarter (24.0 %) of the
popula� on spent less than R20 per month while a further third (37.9 %) spent between
R21 and R50. This implies that three out of every fi ve lo� ery players (61.9 %) spent less
than R50 per month. The fi gure also shows that 26.5 % spent between R51 and R150
and 3.0 % spent more than R300 per month on lo� ery games.
FIGURE 3.13
EXPENDITURE PER MONTH ON LOTTERY GAMES, 2010
In interpre� ng the expenditure provided by respondents, the following should be
considered:
(a) Enquiry on individual expenditure items o� en results in overrepor� ng since the
procedure does not allow for balancing expenditure with disposable income. In
this survey, expenditure fi gures were only requested for lo� ery games, which
may result in a degree of overrepor� ng.
<R20
R21-R50
R51-R150
R151-R300
R301-R500
R500 plus
37.9
0 10 20 30 40
8.6
1.9
1.1
Percentage
24.0
26.5

60
(b) The extent to which respondents perceive expenditure on lo� ery games
as nega� ve, neutral or posi� ve may also infl uence the extent of over- or
underrepor� ng. Expenditure on gambling is o� en perceived as nega� ve, which
might lead to a degree of underrepor� ng.
This aspect will be explored further during the calcula� on of the propensity to buy
lo� ery � ckets.
Table 3.33 shows the lo� ery games expenditure profi le of the 2003 and 2010 surveys.
In interpre� ng the data, the reader should note that the spending categories remained
unchanged during the two survey years, ranging from less than R20 (fi rst category) to
R500 plus (last category). Due to infl a� on of 30.5 % during the 2001 to 2010 period,
the 2010 rand values should be infl ated with approximately a third to equalize the
2010 spending power of those of 2003. For example, the less-than-R20-category in
2003 should be increased to approximately ‘less than R26’ to compensate for the
infl a� onary deple� on of purchasing power of the rand. During this period the costs of
LOTTO � ckets also increased from R2.50 per � cket in 2003 to R3.50 in 2009. However,
it is important to note that the R1.00 increase in the LOTTO � cket prize on 26 March
2009 was the fi rst � cket increase since the incep� on of the Na� onal Lo� ery in 2000.
Table 3.33 shows that the percentage of respondents spending less than R20 per
month decreased from 46.7 % in 2003 to 24.0 % in 2010. Those that spent between
R21 and R50 increased from 32.9 % to 37.9 % and between R51 and R150 from 16.2 %
to 26.5 %).

61
TABLE 3.33
EXPENDITURE ON LOTTERY GAMES BY EXPENDITURE CATEGORY, 2003 AND 2010
Expenditure category 2003%
2010%
<R20 46.7 24.0R21-R50 32.9 37.9R51-R150 16.2 26.5R151-R300 3.2 8.6R301-R500 0.9 1.9R500 plus 0.1 1.1Total 100.0 100.0
3.15.1 Expenditure by age group
Table 3.34 refl ects a lower expenditure level among the youngest (18-30 years) and
highest (60 years plus) age categories. The majority of the middle age groups spent
from R21 to R50 and from R51 to R150.
TABLE 3.34
EXPENDITURE ON LOTTERY GAMES BY AGE GROUP, 2010
Expenditure18-30 years
%
31-40 years
%
41-50 years
%
51-60 years
%
Older than 60
%
Total
%Less than R20 33.6 16.0 17.0 23.3 35.7 24.0R21-R50 39.8 37.8 35.8 35.8 38.3 37.8R51-R150 20.0 28.8 33.8 30.0 18.1 26.6R151-R300 4.5 13.8 10.0 10.3 0.9 8.7R301-R500 1.7 2.2 2.0 0.7 2.6 1.9R500 plus 0.4 1.4 0.4 0.0 2.8 1.1Do not want to disclose 0.0 0.0 0.0 0.0 1.6 0.1Total 100.0 100.0 100.0 100.0 100.0 100.0
3.15.2 Expenditure by employment status
Expenditure on lo� ery games by employment status confi rms that considerably more
full-� me employees spent in excess of R50 per month than persons in the other
employment categories (table 3.35). Only 18.0 % of full-� me employees spent less

62
than R20 per month while 33.4 % and 30.8 % of re� red/nonworker and unemployed
respec� vely spent less than R20.
TABLE 3.35
EXPENDITURE ON LOTTERY GAMES BY EMPLOYMENT STATUS, 2010
ExpenditureFull-time
work
%
Part-time work
%
Unemployed(Looking for
work)%
Retired/Nonworker
%
Other
%
Total
%Less than R20 18.0 25.9 30.8 33.4 9.3 24.0R21-R50 38.4 39.8 37.8 34.7 34.5 37.8R51-R150 26.5 26.3 27.0 22.3 38.9 26.5R151-R300 13.1 5.8 3.4 4.5 17.3 8.6R301-R500 2.9 0.7 1.0 1.9 0.0 1.9R500 plus 1.1 1.5 0.0 2.3 0.0 1.1Do not want to disclose 0.0 0.0 0.0 0.9 0.0 0.1Total 100.0 100.0 100.0 100.0 100.0 100.0
3.15.3 Expenditure by educa� onal level
Level of schooling does not seem to aff ect expenditure on lo� ery games signifi cantly
(table 3.36). Almost three in fi ve (60.0 %) of all educa� onal groups spent less than R50
per month on lo� ery games.
TABLE 3.36
EXPENDITURE ON LOTTERY GAMES BY EDUCATIONAL LEVEL, 2010
ExpenditureNo formal schooling
%
Primary (Grade 1-7)
%
Secondary (Grade 8-12)
%
Ter� ary (Post matric)
%
Total
%Less than R20 11.1 23.2 23.4 27.3 24.0R21-R50 50.0 34.5 38.8 35.6 37.8R51-R150 19.5 33.6 26.9 20.9 26.5R151-R300 19.5 4.4 8.4 11.8 8.6R301-R500 0.0 2.1 1.5 3.0 1.9R500 plus 0.0 1.1 1.0 1.4 1.1Do not want to disclose 0.0 1.1 0.0 0.0 0.1Total 100.0 100.0 100.0 100.0 100.0

63
3.15.4 Expenditure by popula� on group
The expenditure pa� ern diff ers to some extent among the diff erent popula� on groups.
Almost a third of Whites spent less than R20 per month. This percentage is almost one
quarter for Africans and Coloureds and only 15.4 % for Indians/Asians. Almost half the
Indians/Asians fall into the R21 to R50 category.
TABLE 3.37
EXPENDITURE ON LOTTERY GAMES BY POPULATION GROUP, 2010
Expenditure African%
Indian/Asian%
Coloured%
White%
Total%
Less than R20 24.2 15.4 27.1 31.8 24.0R21-R50 36.5 46.7 38.5 40.0 37.8R51-R150 26.9 26.1 27.8 20.0 26.5R151-R300 9.8 7.4 3.7 2.4 8.6R301-R500 1.7 3.1 1.5 2.4 1.9R500 plus 0.9 2.3 0.0 3.4 2.1Do not want to disclose 0.0 0.0 1.5 0.0 0.1Total 100.0 100.0 100.0 100.0 100.0
3.15.5 Expenditure by gender
Table 3.38 confi rms slightly higher expenditure on lo� ery � ckets among males than
females. Almost a quarter of females (27.8 %) spent less than R20 compared to 19.8
% of males. On the other hand 11.9 % of males spent between R151-R300 compared
to 5.6 % of females.

64
TABLE 3.38
EXPENDITURE ON LOTTERY GAMES BY GENDER, 2010
Expenditure Male%
Female%
Total%
Less than R20 19.8 27.8 24.0R21-R50 36.2 39.4 37.9R51-R150 28.5 24.7 26.5R151-R300 11.9 5.6 8.6R301-R500 2.2 1.5 1.9R500 plus 1.4 0.8 1.0Do not want to disclose 0.0 0.2 0.1Total 100.0 100.0 100.0
3.15.6 Expenditure by personal income category
Table 3.39 depicts lo� ery expenditure by personal income category. Generally speaking,
expenditure on lo� ery games is nega� vely correlated with personal income. The
propensity to spend declines as income increases. Seven in every 10 (70.2 %) of those
earning less than R500 per month spent less than R50 per month. This percentage
decreased to 55.4 % of those earning in excess of R20 000 per month. However, the
table also confi rms that sizeable percentages of higher income groups spent large
amounts on lo� ery games.

65
TABLE 3.39
EXPENDITURE ON LOTTERY GAMES BY PERSONAL INCOME CATEGORY, 2010
Expenditure
Less than R500
%
Between R501-R1 000
%
Between R1 001-R2 000
%
Between R2 001-R5 000
%
Between R5 001-R10 000
%
Between R10 001-R20 000
%
More than
R20 000%
Do not want to disclose
%
Total
%Less than R20 33.0 28.4 24.5 15.0 14.5 36.2 19.8 22.2 23.7R21-R50 37.2 29.7 40.3 42.2 37.9 32.2 35.6 37.5 37.9R51-R150 25.5 32.9 21.7 31.3 21.3 12.6 18.8 30.0 26.6R151-R300 2.8 6.2 11.7 7.7 23.5 19.0 0.0 6.1 8.7R301-R500 1.0 2.8 1.2 2.7 1.1 0.0 10.9 2.1 1.9R500 plus 0.5 0.0 0.7 1.0 1.7 0.0 14.9 1.0 1.0Do not want to disclose 0.0 0.0 0.0 0.0 0.0 0.0 0.0 1.0 0.1
Total 100.0 100.0 100.0 100.0 100.0 100.0 100.0 100.0 100.0
3.16 BUDGET BEHAVIOUR REGARDING LOTTERY GAMES
In order to establish the behaviour of households regarding the budgetary provision
for expenditure on lo� ery games, the following ques� on was put to respondents: ‘Is
money used for lo� ery games:
(a) a specifi c amount budgeted for in your household budget; or
(b) not budgeted for?
Figure 3.14 confi rms that only one in every three respondents (33.2 %) made provision
in their budgets for lo� ery games. Two thirds (66.8 %) did not make any provision. The
ques� on is: To what extent does this behaviour correspond with general budgetary
behaviour, ie what percentage of households does not compile monthly household
budgets at all – is it more or less than a third of households? Whatever the answer,
the response is nevertheless alarming considering the fact that expenditure on lo� ery
games might be impulsive and easily infl uenced by adver� sing and promo� ons,
especially large jackpots.

66
FIGURE 3.14
H OUSEHOLD BUDGETARY PROVISION FOR EXPENDITURE ON LOTTERY GAMES, 2010
These fi gures fully correspond with the fi ndings of the 2003 survey (see table 3.40).
TABLE 3.40
HOUSEHOLD BUDGETARY PROVISION FOR EXPENDITURE ON LOTTERY GAMES,
2003 AND 2010
Budget behaviour 2003%
2010%
Specifi c amount budgeted for 33.3 33.2Not budgeted for 66.7 66.8Total 100.0 100.0
The characteris� cs of the respondents with regard to budgetary behaviour are the
following:
(a) A lack of budgetary provision for expenses on lo� ery games correlates posi� vely
with age group. The younger age groups tend to neglect budgetary provision
more than the older groups. No less than 75.4 % of the youngest age group
(18-30 years) do not budget for lo� ery games. This percentage declines to 55.0
% amongst those older than 60 years.
(b) Employment status does not impact signifi cantly on this behaviour. Between
one third and one quarter of all the employment categories, excluding re� red/
Specifi c amountbudgeted for
0 20 40 60 80
33.2
66.8Not budgeted for
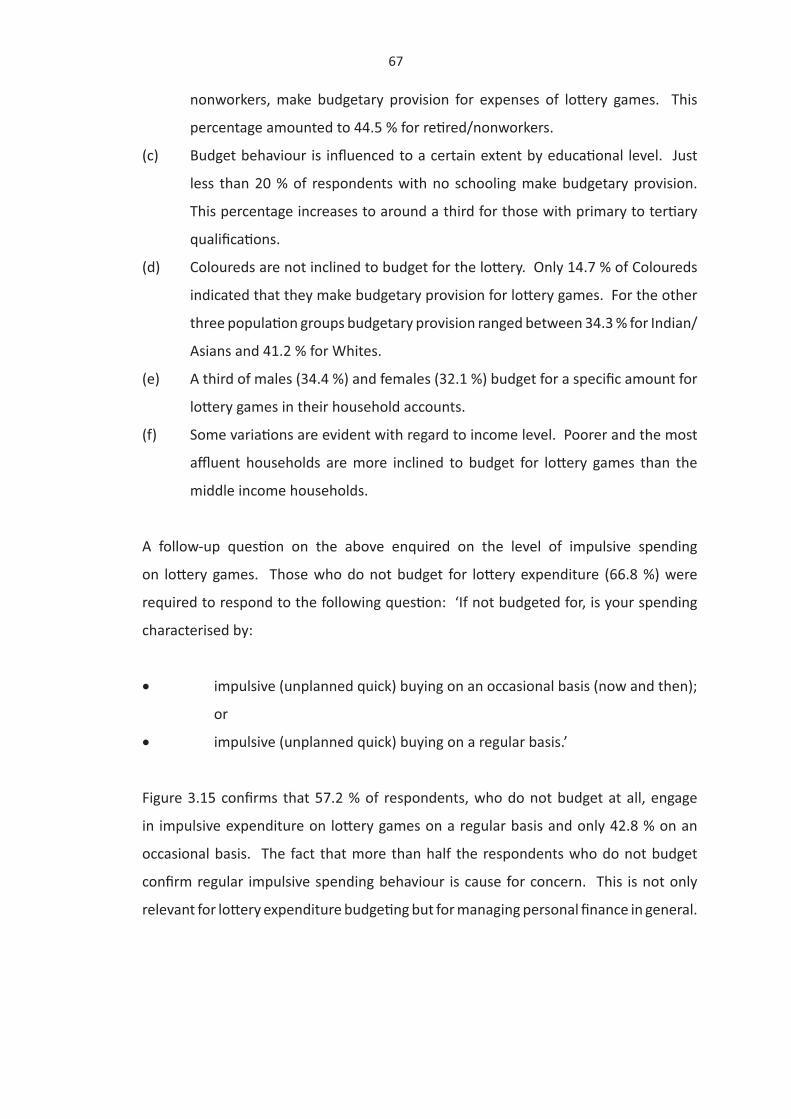
67
nonworkers, make budgetary provision for expenses of lo� ery games. This
percentage amounted to 44.5 % for re� red/nonworkers.
(c) Budget behaviour is infl uenced to a certain extent by educa� onal level. Just
less than 20 % of respondents with no schooling make budgetary provision.
This percentage increases to around a third for those with primary to ter� ary
qualifi ca� ons.
(d) Coloureds are not inclined to budget for the lo� ery. Only 14.7 % of Coloureds
indicated that they make budgetary provision for lo� ery games. For the other
three popula� on groups budgetary provision ranged between 34.3 % for Indian/
Asians and 41.2 % for Whites.
(e) A third of males (34.4 %) and females (32.1 %) budget for a specifi c amount for
lo� ery games in their household accounts.
(f) Some varia� ons are evident with regard to income level. Poorer and the most
affl uent households are more inclined to budget for lo� ery games than the
middle income households.
A follow-up ques� on on the above enquired on the level of impulsive spending
on lo� ery games. Those who do not budget for lo� ery expenditure (66.8 %) were
required to respond to the following ques� on: ‘If not budgeted for, is your spending
characterised by:
• impulsive (unplanned quick) buying on an occasional basis (now and then);
or
• impulsive (unplanned quick) buying on a regular basis.’
Figure 3.15 confi rms that 57.2 % of respondents, who do not budget at all, engage
in impulsive expenditure on lo� ery games on a regular basis and only 42.8 % on an
occasional basis. The fact that more than half the respondents who do not budget
confi rm regular impulsive spending behaviour is cause for concern. This is not only
relevant for lo� ery expenditure budge� ng but for managing personal fi nance in general.

68
FIGURE 3.15
INTENSITY OF IMPULSIVE SPENDING ON LOTTERY GAMES, 2010
This pa� ern of impulsive spending on lo� ery games is similar to the 2003 fi nding. Table
3.41 shows that regular impulsive buying changed marginally from 56.5 % in 2003 to
57.2 % in 2010.
TABLE 3.41
INTENSITY OF IMPULSIVE SPENDING ON LOTTERY GAMES, 2003 AND 2010
Intensity 2003%
2010%
Regular impulsive buying 56.5 57.2Occasional impulsive buying 43.5 42.8Total 100.0 100.0
Impulsive behaviour by sociodemographic variable reveals the following:
(a) No marked diff eren� a� on in impulsive buying is evident by age group. However,
it would seem that members of the oldest group (60 years plus) are somewhat
more impulsive in their buying behaviour than the groups just younger than
them.
(b) A similar pa� ern is evident by work status with close to two in every fi ve of all
groups engaging in occasional impulsive buying.
70
60
50
40
30
20
10
0Impulsive buying: Regularly Impulsive buying: Occasionally
57.2
42.8
Percentage

69
(c) Impulsive engagement in lo� ery games seems somewhat more prevalent
among primary and secondary qualifi eds than among ter� ary qualifi eds and
those without any formal schooling.
(d) Africans show the highest level of regular impulsive buying (64.0 %) and Whites
the lowest (24.0 %).
(e) Males and females recorded similar levels of regular impulsive buying (56.5 %
and 57.7 % respec� vely).
(f) Regular compulsive buying correlates nega� vely with income. The higher the
income the less regular compulsive buying becomes.
3.17 IMPACT OF BIG JACKPOTS ON LOTTO AND POWERBALL EXPENDITURE
Three ques� ons were posed to respondents on their conduct when big jackpots are at
stake. This sec� on briefl y explores their responses.
The fi rst ques� on was: ‘Do you only buy LOTTO or PowerBall � ckets when big jackpots
(eg R10 million or more) are at stake?’ Figure 3.16 confi rms that one in every 10 (13.3 %)
respondents buy LOTTO and PowerBall � ckets only if big jackpots are available. The
other (86.7 %) respondents are more regular buyers and are not mo� vated to buy
LOTTO and PowerBall � ckets with big jackpots.

70
FIGURE 3.16
BUYING BEHAVIOUR OF RESPONDENTS WHEN BIG JACKPOTS ARE AT STAKE, 2010
The above buying behaviour closely corresponds with the 2003 survey fi ndings. Table
3.42 shows that par� cipa� on in LOTTO and PowerBall only when big jackpots are at
stake, increased marginally from 10.7 % in 2003 to 13.3 in 2010.
TABLE 3.42
BUYING BEHAVIOUR WHEN BIG JACKPOTS ARE AT STAKE, 2003 AND 2010
Behaviour 2003%
2010%
Buy only when big jackpots are at stake 10.7 13.3
Regular buying 89.3 86.7
Total 100.0 100.0
A further analysis of the above conduct by sociodemographic variable reveals the
following:
(a) Middle-aged respondents (41-60 years) are less inclined to be infl uenced by
large jackpots while the eldest age category (60 years plus) are mo� vated to
buy LOTTO and PowerBall � ckets by large jackpots.
(b) Part-� me workers and the unemployed conform to the average as about one
in every 10 par� cipates only during big jackpots. A slightly higher percentage
100
80
60
40
20
0Buy only when jackpots are at
stakeRegular buyer
13.3
86.7
Percentage

71
of full-� me workers (14.9 %) and re� red/nonworkers (17.6 %) par� cipate only
during big stakes.
(c) Diff erences are evident with regard to level of educa� on. Respondents with
no formal schooling or secondary educa� on conform to the average (just more
than one in every 10 par� cipate only during the availability of big prizes) while
a larger percentage (25.4 %) of ter� ary qualifi ed persons indicated irregular
par� cipa� on. This percentage is only 5.5 % in the case of primary school
qualifi eds.
(d) About one in every 10 Africans, Indians/Asians and Coloureds par� cipate only
during big stakes while this propor� on increases to 40.0 % in the case of Whites.
(e) No diff erence is evident between the two genders - one in every eight males
and females par� cipate only during big stakes.
(f) Approximately 10 % of the lower and middle income groups par� cipate only
when big jackpots are at stake while the percentage increases to almost 40 %
for the highest income group. Higher income groups are therefore slightly less
regular in their behaviour with regard to the buying of LOTTO and PowerBall
� ckets.
A follow-up ques� on was posed to establish whether respondents normally spend
more on LOTTO and PowerBall � ckets when there is a big jackpot at stake. Figure 3.17
shows that one in every fi ve respondents (21.5 %) confi rms higher spending while the
rest (78.5 %) remain within their set pa� ern.

72
FIGURE 3.17
INCREASE IN EXPENDITURE BY REGULAR PLAYERS IF BIG JACKPOTS ARE AT STAKE, 2010
Table 3.43 shows that the percentage of respondents confi rming that larger amounts
are spent on LOTTO and PowerBall when there are big jackpots at stake declined from
32.7 % in 2003 to 21.5 % in 2010.
TABLE 3.43
INCREASE IN EXPENDITURE BY REGULAR PLAYERS IF BIG JACKPOTS ARE AT STAKE,
2003 AND 2010
2003%
2010%
Yes 32.7 21.5No 67.3 78.5Total 100.0 100.0
The following varia� ons from the average are evident by sociodemographic variable:
(a) No marked diff eren� a� on across age groups is evident.
(b) Compared to other employment groups, a smaller percentage of unemployed
are inclined to increase expenditure when big jackpots are at stake.
(c) Increased expenditure on LOTTO and PowerBall with big stakes is posi� vely
correlated with level of educa� on. Slightly higher percentages of regular
100
80
60
40
20
0Yes No
21.5
78.5
Percentage

73
players engaged in addi� onal expenditure as educa� onal level increases.
(d) Limited varia� on is evident by popula� on group. Higher expenditure ranges
from 20.9 % of Africans to 24.9 % of Indians/Asians.
(e) No diff erences were reported between genders.
(f) No major diff erences were reported across personal income categories.
Those who confi rmed higher spending (21.5 %) when high jackpot prizes are at
stake, were requested to indicate approximately how much more they spend on such
occasions. Figure 3.18 reveals that addi� onal spending is not excessive. Almost nine
in every 10 (86.8 %) recorded expenditure of around double the normal amount. Just
less than one in every 10 respondents (8.3 %) indicated that they spend three � mes
more at such occasions.
FIGURE 3.18
ADDITIONAL SPENDING WITH HIGH JACKPOT PRIZES, 2010
3.18 EXPENDITURE DISPLACEMENT
The ques� on to determine the possible displacement eff ect read as follows: ‘If you
were not playing lo� ery games, on what would you have spent the amount allocated
to the lo� ery instead?’ Although various responses, such as ‘household necessi� es
(food, soap, etc)’, ‘luxury items’, ‘savings’, and ‘other entertainment’ were provided in
the ques� onnaire, interviewers were requested not to read out these alterna� ves, so
as not to infl uence the response of patrons.
Twice as much or less
Three � mes more
Four � mes more
Five � mes more
86.8
8.3
1.1
2.3
0 20 40 60 80 100Percentage

74
It should be noted that the result of the above procedure provides only a rough
approxima� on of expenditure displacement. Respondents tend to men� on only one
or two items from which displacement would have been eff ected. In reality, household
budget alloca� ons do not always func� on in this manner. Respondents may displace
small amounts from a large number of items rather than redirect funds from only one
item (say luxury goods or savings).
The results of the response to the ques� on are shown in fi gure 3.19. The following
were dominant items on which lo� ery money would have been spent if not on lo� ery
games: household necessi� es (71.1 %), savings (19.1 %) and other entertainment
(11.0 %).
FIGURE 3.19
ITEMS FROM WHICH LOTTERY MONEY IS DISPLACED, 2010
Most respondents men� oned more than one item. This procedure does not allow
for determining the rela� ve importance of the items, as respondents did not men� on
which percentage of money would be allocated to which item. The above fi gure should
therefore be seen as merely refl ec� ng the items men� oned by respondents without
necessarily portraying the rela� ve alloca� on of lo� ery money.
Household necessi� es
Savings
Other entertainment
Luxury items
Other
Don’t know
71.1
19.1
5.7
2.5
0 10 20 30 40 50 60 70 80Percentage
17.8
6.5

75
Any calcula� on of expenditure displacement should be treated with extreme cau� on.
Households (gamblers) fi nd it diffi cult to indicate what household items are forfeited
in favour of lo� ery games. Furthermore, when asked about displacement, reference is
normally made to only one or two items forfeited while there could have been several
small cuts with regard to various items. Household budget behaviour o� en consists
of small cuts on various discre� onary expenditure items rather than subs� tu� on of
one item by gambling. Playing of lo� ery games could also result in dissaving, implying
no immediate displacement but the postponement of the purchase of durable goods,
frequently funded from accumulated savings.
It is also important to keep in mind that gambling represents an expenditure item for
households as well as an income fl ow resul� ng from winnings. However, a large number
of persons spend numerous (small) amounts on gambling while the income stream is
concentrated in one or two large amounts and payouts to a far smaller number of
persons than originally par� cipa� ng in gambling expenditure.
It is calculated in chapter 5 that the propensity to buy lo� ery � ckets amounted to 0.18 %
of household expenditure. In monetary terms, households in South Africa spend, on
average, only 18 cents on lo� ery games for every R100 household expenditure.
Table 3.44 shows a comparison of the 2003 and 2010 responses on expenditure
displacement. Although the table confi rms some small varia� on by item, the rela� ve
order and magnitude of items remains largely unchanged in 2010.
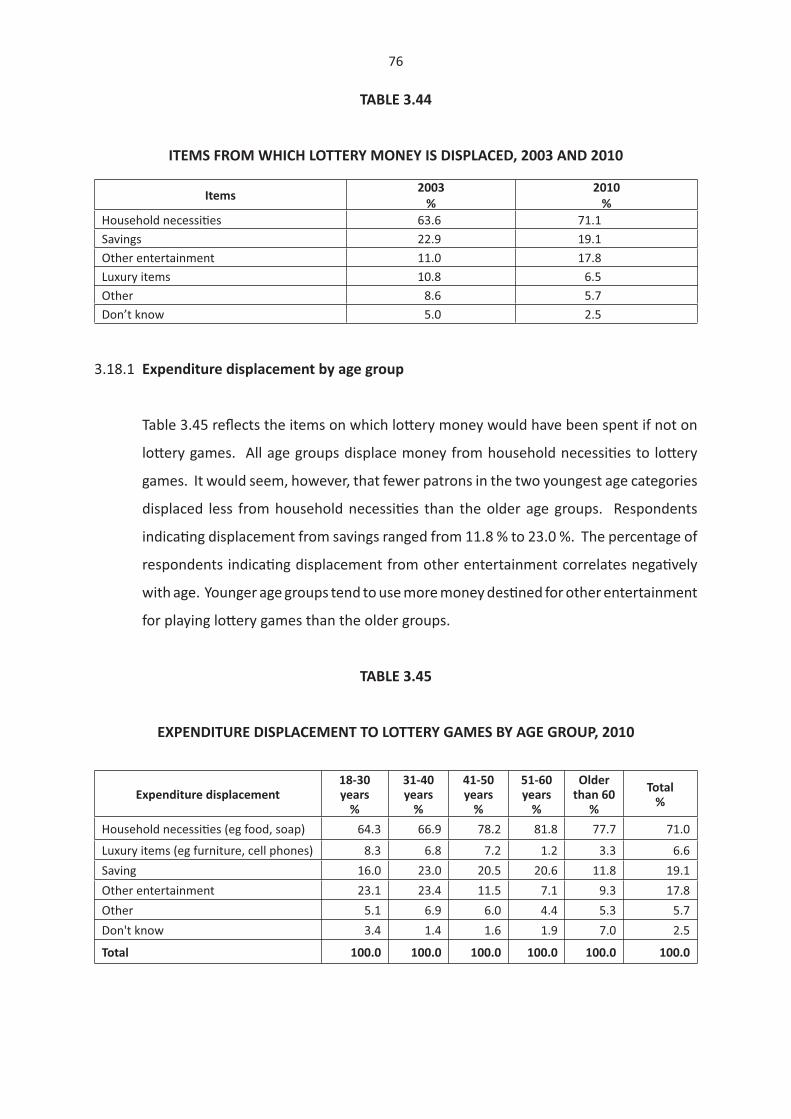
76
TABLE 3.44
ITEMS FROM WHICH LOTTERY MONEY IS DISPLACED, 2003 AND 2010
Items 2003%
2010%
Household necessi� es 63.6 71.1Savings 22.9 19.1Other entertainment 11.0 17.8Luxury items 10.8 6.5Other 8.6 5.7Don’t know 5.0 2.5
3.18.1 Expenditure displacement by age group
Table 3.45 refl ects the items on which lo� ery money would have been spent if not on
lo� ery games. All age groups displace money from household necessi� es to lo� ery
games. It would seem, however, that fewer patrons in the two youngest age categories
displaced less from household necessi� es than the older age groups. Respondents
indica� ng displacement from savings ranged from 11.8 % to 23.0 %. The percentage of
respondents indica� ng displacement from other entertainment correlates nega� vely
with age. Younger age groups tend to use more money des� ned for other entertainment
for playing lo� ery games than the older groups.
TABLE 3.45
EXPENDITURE DISPLACEMENT TO LOTTERY GAMES BY AGE GROUP, 2010
Expenditure displacement18-30 years
%
31-40 years
%
41-50 years
%
51-60 years
%
Older than 60
%
Total%
Household necessi� es (eg food, soap) 64.3 66.9 78.2 81.8 77.7 71.0
Luxury items (eg furniture, cell phones) 8.3 6.8 7.2 1.2 3.3 6.6Saving 16.0 23.0 20.5 20.6 11.8 19.1Other entertainment 23.1 23.4 11.5 7.1 9.3 17.8Other 5.1 6.9 6.0 4.4 5.3 5.7Don't know 3.4 1.4 1.6 1.9 7.0 2.5
Total 100.0 100.0 100.0 100.0 100.0 100.0

77
3.18.2 Expenditure displacement by employment status
Table 3.46 confi rms some diff erences in expenditure displacement by employment
status. The unemployed (78.1 %) and re� red/nonworkers (73.3 %) displaced more
expenditure from household necessi� es compared to those engaged in full- (68.7 %)
and part-� me work (6.2 %). A larger percentage of full- and part-� me workers also
dissave more than the unemployed and re� red/nonworkers.
TABLE 3.46
EXPENDITURE DISPLACEMENT TO LOTTERY GAMES BY EMPLOYMENT STATUS, 2010
Expenditure displacement Full-� me work
Part-� me work
Unemployed (Looking for
work)
Re� red/nonworker Other Total
Household necessi� es (eg food, soap) 68.7 62.2 78.1 73.3 85.8 71.1
Luxury items (eg furniture, cell phones) 8.2 7.2 5.7 3.5 0.0 6.5
Saving 21.2 26.2 12.3 16.0 15.5 19.1Other entertainment 19.5 20.8 15.0 13.8 15.5 17.8Other 6.7 4.1 4.5 7.0 4.9 5.7Don't know 3.2 0.7 1.3 5.1 0.0 2.5Total 100.0 100.0 100.0 100.0 100.0 100.0
3.18.3 Expenditure displacement by educa� onal level
Table 3.47 shows that a nega� ve correla� on prevails between displacement of funds
from household necessi� es and level of educa� on. No less than eight in every 10
(82.8 %) respondents with primary school qualifi ca� ons transfer some of their money
for household necessi� es to lo� ery games. The largest dissaving is reported by
secondary qualifi eds. The be� er educated tend to displace more money from other
entertainment to lo� ery expenditure.

78
TABLE 3.47
EXPENDITURE DISPLACEMENT TO LOTTERY GAMES BY EDUCATIONAL LEVEL, 2010
Expenditure displacement
No formal
schooling%
Primary (Grade 1-7)
%
Secondary (Grade 8-12)
%
Ter� ary (Post matric)
%
Total
%
Household necessi� es (eg food, soap) 100.0 82.8 71.8 59.8 71.1Luxury items (eg furniture, cell phones) 0.0 6.4 6.8 5.8 6.5Saving 0.0 12.3 20.8 17.0 19.1Other entertainment 0.0 9.6 19.2 17.9 17.8Other 0.0 5.6 4.8 9.7 5.7Don't know 0.0 3.2 1.9 4.6 2.5Total 100.0 100.0 100.0 100.0 100.0
3.18.4 Expenditure displacement by popula� on group
Rela� ve to other popula� on groups, Africans reported the highest displacement of
money from household necessi� es. Dissavings (decline in savings) are of par� cular
importance as a source of lo� ery money among the Indian/Asian popula� on group
(table 3.48).
TABLE 3.48
EXPENDITURE DISPLACEMENT TO LOTTERY GAMES BY POPULATION GROUP, 2010
Expenditure displacement African%
Indian/Asian%
Coloured%
White%
Total%
Household necessi� es (eg food, soap) 73.3 59.2 67.9 65.9 71.1Luxury items (eg furniture, cell phones) 6.4 8.5 10.2 0.0 6.5Saving 19.7 27.9 6.6 12.9 19.1Other entertainment 17.4 21.3 26.9 3.5 17.8Other 4.0 12.8 7.2 14.1 5.7Don't know 2.2 1.9 1.5 9.4 2.5Total 100.0 100.0 100.0 100.0 100.0

79
3.18.5 Expenditure displacement by gender
Table 3.49 shows some varia� on in displacement behaviour by gender. Males (67.2
%) indicated a smaller displacement from household necessi� es than females (74.6
%). A larger percentage of males, on the other hand, displace income from other
entertainment than females (22.1 % compared to 13.7 %).
TABLE 3.49
EXPENDITURE DISPLACEMENT TO LOTTERY GAMES BY GENDER, 2010
Expenditure displacement Male%
Female%
Total%
Household necessi� es (eg food, soap) 67.2 74.6 71.1Luxury items (eg furniture, cell phones) 7.8 5.4 6.5Saving 20.4 17.8 19.1Other entertainment 22.1 13.7 17.8Other 5.4 6.0 5.7Don't know 1.8 3.2 2.5Total 100.0 100.0 100.0
3.18.6 Expenditure displacement by personal income category
As could be expected, displacement from household necessi� es to lo� ery games
correlates nega� vely with personal income level. The higher the income the lower the
need to use money intended for basic needs for the lo� ery.

80
TABLE 3.50
EXPENDITURE DISPLACEMENT TO LOTTERY GAMES BY PERSONAL INCOME CATEGORY, 2010
Expenditure displacement
Less than R500
%
Between R501-R1 000
%
Between R1 001-R2 000
%
Between R2 001-R5 000
%
Between R5 001-R10 000
%
Between R10 001-R20 000
%
More than
R20 000%
Do not want to disclose
%
Total
%
Household necessi� es (eg food, soap)
80.5 70.8 68.0 73.4 59.7 64.4 61.4 67.0 71.3
Luxury items (eg furniture, cell phones)
5.5 7.8 5.2 6.7 9.9 0.0 0.0 7.9 6.5
Saving 10.3 21.4 22.0 22.7 26.2 2.3 18.8 21.5 19.1
Other entertainment 14.9 18.5 10.8 28.3 18.3 20.2 24.8 10.3 17.8
Other 4.0 5.7 5.1 3.9 11.8 12.6 15.8 5.1 5.8
Don't know 1.8 0.0 3.4 1.4 1.7 4.6 4.0 7.6 2.5
Total 100.0 100.0 100.0 100.0 100.0 100.0 100.0 100.0 100.0
3.19 SPENDING ON LOTTO AND POWERBALL TICKETS
The research instrument enquires on the distribu� on of � cket buying between midweek
and weekend draws for both LOTTO and PowerBall � ckets.
3.19.1 Spending on LOTTO � ckets: Wednesdays and Saturdays
Figure 3.20 shows the percentage of respondents who spend a por� on or all of their
expenditure intended for the procurement of LOTTO � ckets on Saturdays. Just more
than two in every fi ve (43.8 %) of the respondents confi rm an equal distribu� on of
expenditure between Saturday and Wednesday draws. Just less than a third (32.0 %)
of respondents indicated that they buy � ckets only for the Saturday draw. Only 4.4 %
of respondents (ie the sum of the percentage of households who spend between 0 %
and 40 % on Saturdays) spend more for the Wednesday than Saturday draw and 51.7
% (ie the sum of the percentage of households who spend between 51 % and 100 %
for the Saturday draw) confi rmed that they spend more for the Saturday draw than the

81
Wednesday draw. This fi nding correlates closely with the Saturday-Wednesday divide
of expenditure established during the 2003 survey.
FIGURE 3.20
PERCENTAGE OF EXPENDITURE ON LOTTO TICKETS FOR THE SATURDAY DRAW, 2010
3.19.2 Spending on PowerBall � ckets: Tuesdays and Fridays
Figure 3.21 shows the percentage of respondents who spend a por� on or all of their
expenditure on PowerBall � ckets on Fridays. The following pa� ern emerges from the
table:
• Buying for Friday draw only : 24.3 %
• % who buy more for the Friday than Tuesday draw : 8.1 %
• % who buy more for the Tuesday than Friday draw : 12.3 %
• Equal distribu� on between Friday and Tuesday draws : 55.4 %
0-10
11-20
21-30
31-40
41-50
51-60
61-70
71-80
81-90
91-100
2.8
0.0
1.4
43.8
0 10 20 30 40 50
% of households
0.2
6.8
8.1
4.4
0.4
32.0
% expenditureon Saturdays

82
FIGURE 3.21
PERCENTAGE OF EXPENDITURE ON POWERBALL TICKETS FOR THE FRIDAY DRAW, 2010
3.20 PERCEPTIONS OF WINNING
Several ques� ons were posed to respondents to establish their percep� ons of the lo� ery
process as well as their chances of winning LOTTO and PowerBall. Understanding of
concepts such as randomness, probability and discrete events and players’ percep� ons
of their chances of winning were tested.
Randomness is a theore� cal concept, which can be defi ned in terms of probability. It
refers to the chance that something will happen. The descrip� on ‘random’ usually
implies equal probabili� es. In probability selec� on (of numbers), each unit (ball) has
a known, nonzero probability of being selected. Probability selec� on implies the use
of a random selec� on mechanism. Discrete events refer to the lack of any con� nuum.
Each draw is an event in itself and does not infl uence any follow-up draw (Mar� ns et al
1996 and Bless & Kathuria 1993).
0-10
11-20
21-30
31-40
41-50
51-60
61-70
71-80
81-90
91-100
0.0
0.2
55.4
0 10 20 30 40 50 60
% of households
1.4
3.1
4.1
0.9
0.0
24.3
% expenditureon Fridays
10.7

83
3.20.1 Winning LOTTO/LOTTO Plus
The fi rst ques� on on percep� ons of winning LOTTO/LOTTO Plus was formulated as
follows: ‘Do you think that all 49 numbers in LOTTO/LOTTO Plus draw have exactly
the same chance to be selected with each draw?’ Figure 3.22 shows that 57.0 % of
respondents expressed the opinion that all the numbers have the same chance of
selec� on at each draw. Interes� ngly, just less than a third (30.2 %) of respondents felt
that all the numbers do not have the same chance of selec� on at each draw.
FIGURE 3.22
RESPONSE TO: ‘DO YOU THINK THAT ALL 49 NUMBERS HAVE EXACTLY THE SAME CHANCE
TO BE SELECTED WITH EACH DRAW?’, 2010
Table 3.51 shows the fi ndings of the 2003 and 2010 surveys with regard to the above
ques� on. Unfortunately, the 2003 ques� on did not allow for a ‘don’t know’ alterna� ve.
It can probably be assumed that the ‘no’ response in 2003 may also include the ‘don’t
know’ alterna� ve. The table refl ects limited changes in the percep� ons of winning
LOTTO/LOTTO Plus during the past seven years. The percentages of those thinking
that all 49 numbers have exactly the same chance of selec� on with each draw remain
almost the same – 60.0 % in 2003 and 57.0 % in 2010. Those that doubt an even
chance for all numbers may be in the vicinity of a third of the popula� on.
57.0
12.8
0 10 20 30 40 50 60
30.2
Yes
No
Don’t know
Percentage
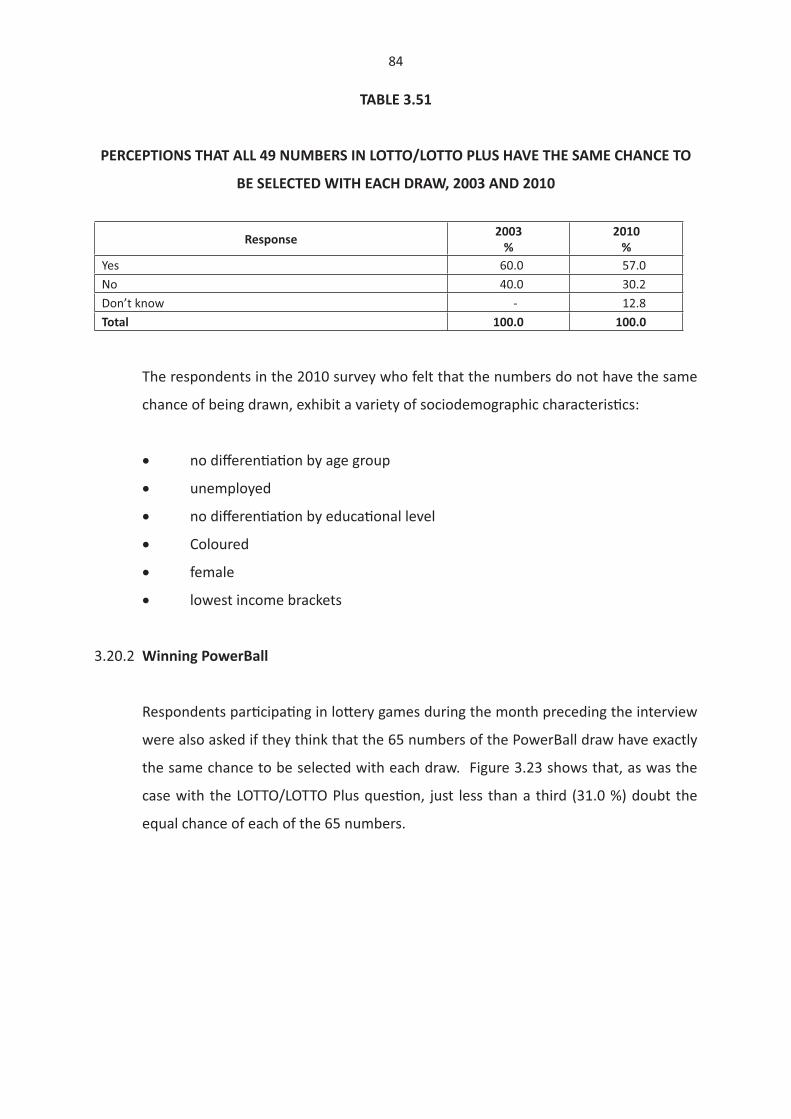
84
TABLE 3.51
PERCEPTIONS THAT ALL 49 NUMBERS IN LOTTO/LOTTO PLUS HAVE THE SAME CHANCE TO
BE SELECTED WITH EACH DRAW, 2003 AND 2010
Response 2003%
2010%
Yes 60.0 57.0No 40.0 30.2Don’t know - 12.8Total 100.0 100.0
The respondents in the 2010 survey who felt that the numbers do not have the same
chance of being drawn, exhibit a variety of sociodemographic characteris� cs:
• no diff eren� a� on by age group
• unemployed
• no diff eren� a� on by educa� onal level
• Coloured
• female
• lowest income brackets
3.20.2 Winning PowerBall
Respondents par� cipa� ng in lo� ery games during the month preceding the interview
were also asked if they think that the 65 numbers of the PowerBall draw have exactly
the same chance to be selected with each draw. Figure 3.23 shows that, as was the
case with the LOTTO/LOTTO Plus ques� on, just less than a third (31.0 %) doubt the
equal chance of each of the 65 numbers.
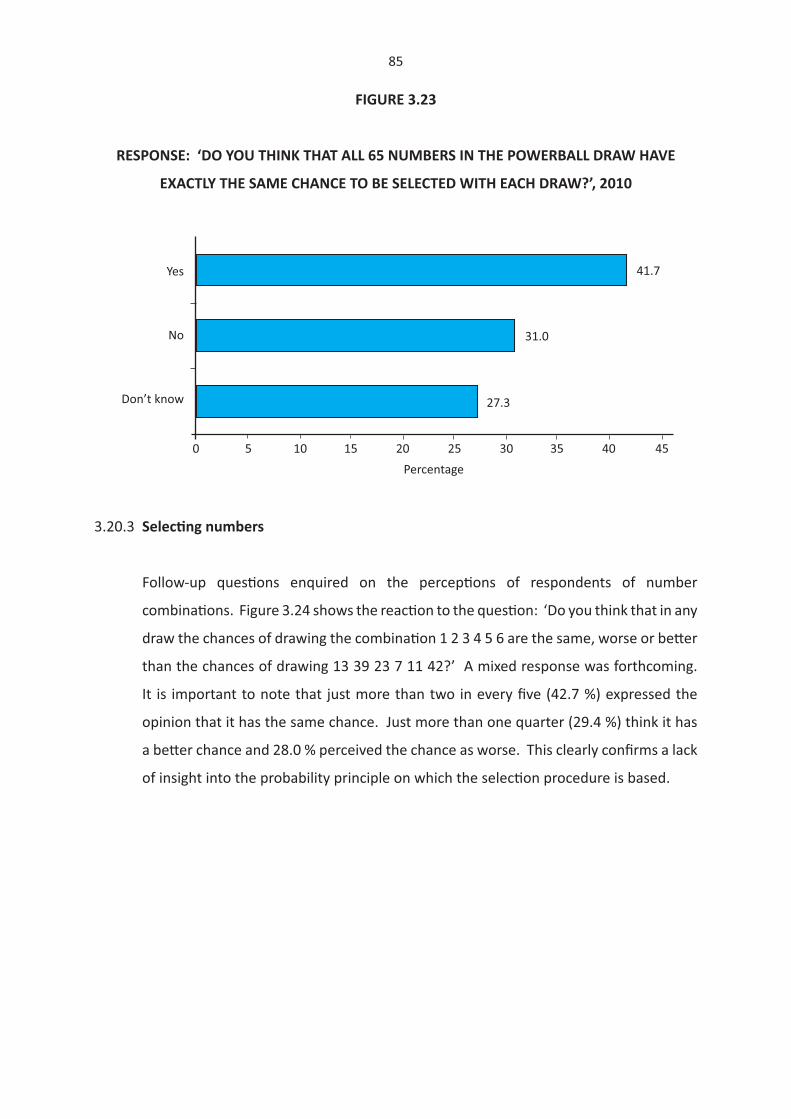
85
FIGURE 3.23
RESPONSE: ‘DO YOU THINK THAT ALL 65 NUMBERS IN THE POWERBALL DRAW HAVE
EXACTLY THE SAME CHANCE TO BE SELECTED WITH EACH DRAW?’, 2010
3.20.3 Selec� ng numbers
Follow-up ques� ons enquired on the percep� ons of respondents of number
combina� ons. Figure 3.24 shows the reac� on to the ques� on: ‘Do you think that in any
draw the chances of drawing the combina� on 1 2 3 4 5 6 are the same, worse or be� er
than the chances of drawing 13 39 23 7 11 42?’ A mixed response was forthcoming.
It is important to note that just more than two in every fi ve (42.7 %) expressed the
opinion that it has the same chance. Just more than one quarter (29.4 %) think it has
a be� er chance and 28.0 % perceived the chance as worse. This clearly confi rms a lack
of insight into the probability principle on which the selec� on procedure is based.
41.7
27.3
0 5 10 15 20 25 30 35 40 45
31.0
Yes
No
Don’t know
Percentage

86
FIGURE 3.24
RESPONSE TO: ‘DO YOU THINK THAT IN ANY DRAW, THE CHANCES OF DRAWING THECOMBINATION 1 2 3 4 5 6 ARE BETTER THAN THE CHANCES OF DRAWING 13 39 23 7 11 42?’,
2010
Table 3.52, showing a comparison of the 2010 fi ndings with the 2003 results, confi rms
the same lack of insight into the probability principle in 2010 as was the case in 2003.
Only two in every fi ve (36.5 % in 2003 and 42.7 % in 2010) felt that the chance of
drawing the combina� on 1 2 3 4 5 and 6 is the same as drawing the combina� on of 13
39 23 7 11 and 42.
TABLE 3.52
CHANCES OF DRAWING THE COMBINATION 1 2 3 4 5 6 OR THE COMBINATION13 39 23 7 11 42, 2003 AND 2010
Response 2003%
2010%
Be� er 27.0 29.4The same 36.5 42.7Worse 36.5 28.0Total 100.0 100.0
A further ques� on posed was to establish the perceived diff erence between own
choice and the use of a quick pick. The ques� on read: ‘Do you think that you have
a be� er chance of winning if you choose your own numbers or, alterna� vely, use a
quick pick?’ Again, respondents expressed a preference for one of the two methods,
29.4
28.0
0 10 20 30 40 50
42.7
Be� er
The same
Worse
Percentage

87
implying a perceived diff erence in the chances of winning depending on the selec� on
method. Figure 3.25 shows that almost eight in every 10 (76.2 %) respondents were
of the opinion that the chances of winning were enhanced by choosing one’s own
numbers while almost one in every fi ve (23.8 %) felt the quick pick method enhanced
their chances of winning. These fi ndings closely resembled the 2003 fi ndings that were
as follows: be� er chance when choosing own numbers – 81.9 % and quick pick – 23.8 %.
FIGURE 3.25
PERCENTAGE OF RESPONDENTS THAT PERCEIVED A BETTER CHANCE OF WINNING WHEN
CHOOSING OWN NUMBERS RATHER THAN QUICK PICK, 2010
The sociodemographic features of those favouring the quick pick to enhance their
chances of winning are as follows:
• middle to older age groups
• re� red/nonworkers
• ter� ary qualifi eds
• Indian/Asian and White
• no gender diff eren� a� on
• higher income categories
76.2
23.8
0 30 60 90
Choose own numbers
Quick pick
Percentage

88
In rela� on to the issue of discrete events, the ques� on concerned read: ‘Do you think
that your chances of ge� ng four numbers right in the next draw are: (a) be� er if
you got three numbers right in the last draw and two numbers right in the previous
draw, or (b) the same as always?’ Figure 3.26 shows that one in every three lo� ery
players expressed the view that their chances of ge� ng four numbers right in a next
draw are be� er if previous draws showed some correct numbers. These par� cipants
perceived the selec� on of numbers for lo� ery games as a con� nuum improving their
winning chances if previously selected numbers were right. Virtually the same fi ndings
were recorded in 2003: 33.8 % (33.0 % in 2010) and 66.2 % (67.0 % in 2010).
FIGURE 3.26
DO YOU THINK THAT YOUR CHANCES OF GETTING 4 NUMBERS RIGHT IN THE NEXT DRAWARE: (2010 FINDINGS)
The sociodemographic characteris� cs of respondents believing in improved chances
during successive draws are the following:
• younger than 40 years
• limited diff eren� a� on by employment status
• no formal schooling or ter� ary qualifi eds
• Indian/Asians
• female
• limited varia� ons by personal income category
33.0
67.0
0 20 40 60 80
Be� er if you got 3 numbers right in the lastdraw and 2 numbers right in the previous
draw
The same as always
Percentage

89
3.21 PLAYING LOTTO AND POWERBALL
Several ques� ons were posed to respondents on their chances of winning LOTTO/
LOTTO Plus or PowerBall and the eff ect of introducing new games on lo� ery gaming
behaviour.
3.21.1 Expenditure on LOTTO � ckets: 2007 and 2010
Respondents par� cipa� ng in LOTTO during the month preceding their interview were
asked the following ques� on: ‘Do you spend more on LOTTO � ckets now compared
to 2007 (three years ago)? This ques� on was introduced in the research design to
determine the spending behaviour of LOTTO players since the introduc� on of Gidani
and PowerBall. It is recommended that future ques� onnaires should rather refer
to changes in expenditure behaviour for ‘lo� ery games’ in general rather than only
‘LOTTO � ckets’ per se.
Figure 3.27 refl ects the percentages of respondents who increased/decreased their
expenditure on LOTTO � ckets since the commencement of Gidani opera� ons in 2007.
One third (32.7 %) of respondents confi rmed that they spent more (in 2010) on LOTTO
� ckets than in 2007.
FIGURE 3.27
INCREASE IN EXPENDITURE ON LOTTO TICKETS DURING THE PAST THREE YEARSFROM 2007 – 2010
32.7
62.5
0 20 40 60 80
Yes
No
Don’t know
Percentage
4.8

90
3.21.2 Probability of winning LOTTO
A ques� on was also included on the perceived odds of winning LOTTO. The ques� on
was formulated as follows: ‘What, in your opinion, are the chances (probability) of
winning LOTTO?
• very good (say a chance of 1 in 40)
• good
• average
• slim
• very slim (say a chance of 1 in 13 million)’
The results of the response to this ques� on are contained in fi gure 3.28. Although
the chances of winning LOTTO are very slim, the fi gure shows that one in every fi ve
(22.6 %) LOTTO � cket buyers perceived their chances of winning as ‘good’ and ‘very
good’. Together with the ‘average’ group (31.3 %), just more than half (53.9 %) the
LOTTO par� cipants regarded their chances of winning as ranging from ‘average’ to
‘very good’. The table confi rms that only one in every fi ve (18.1 %) respondents has a
realis� c view of the chances of winning, namely ‘very slim’.
FIGURE 3.28
PERCEIVED CHANCES OF WINNING LOTTO, 2010
32.7
28.0
0 5 10 15 20 25 30 35
Very good
Good
Average
Slim
Very slim
Percentage
18.1
31.3
17.7
4.9

91
The 2010 fi ndings diff er only marginally from those of 2003. Table 3.53 shows that the
‘good’ and ‘very good’ categories declined from 32.1 % in 2003 to 22.6 % in 2010 while
the ‘very slim’ category (1 in 13 million chance) declined only from 19.7 % to 18.1 % of
lo� ery game players.
TABLE 3.53
PERCEIVED CHANCES OF WINNING LOTTO, 2003 AND 2010
Chances 2003%
2010%
Very good 7.6 4.9Good 24.5 17.7Average 29.6 31.3Slim 18.6 28.0Very slim 19.7 18.1Total 100.0 100.0
The sociodemographic characteris� cs of the ‘realis� c’ group regarding the odds of
winning as very slim, are as follows:
• older than 60 years
• re� red/nonworkers
• ter� ary qualifi eds
• White popula� on group
• not gender specifi c
• earn more than R10 000 per month
The facts are:
• The odds of winning are one in 13 million
• Every draw of the winning numbers is an independent chance event
• Past outcomes have no infl uence on the next outcome.

92
• It doesn’t ma� er if you play the same or diff erent numbers each � me.
The odds of winning are always the same.
• The odds of winning are not infl uenced by the number of � ckets sold.
3.21.3 Probability of winning PowerBall
The same ques� on on the perceived odds of winning PowerBall was included in the
ques� onnaire. The ques� on was formulated as follows: ‘What, in your opinion, are
the chances (probability) of winning PowerBall?’
• very good (say a chance of 1 in 40)
• good
• average
• slim
• very slim (say a chance of 1 in 24 million)
Figure 3.29 shows that just more than half (55.3 %) the respondents saw their chances
as slim or very slim. The rest (44.7 %) regarded their chances as ranging between very
good and average. Although PowerBall players evaluated their chances of winning
somewhat more realis� cally than their chances of winning LOTTO, a large percentage
s� ll regard their chances as unrealis� cally high.

93
FIGURE 3.29
PERCEIVED CHANCES OF WINNING POWERBALL, 2010
3.21.4 Addi� onal playing alterna� ves
Respondents were asked whether they had played PowerBall since its introduc� on on
16 October 2009. Figure 3.30 shows that close to half of the respondents (47.2 %)
confi rmed their par� cipa� on in PowerBall since its introduc� on.
FIGURE 3.30
PERCENTAGE OF RESPONDENTS PARTICIPATING IN POWERBALL SINCEIT’S INTRODUCTION, 2010
Of those that confi rmed playing PowerBall since its introduc� on, nine in every 10
(88.3 %) also bought PowerBall � ckets during the 30 days preceding the survey.
27.3
0 5 10 15 20 25 30
Very good
Good
Average
Slim
Very slim
Percentage
28.0
26.8
13.7
4.2
47.2
52.8
0 10 20 30 40 50 60
Yes
No
Percentage

94
Respondents were also probed on their willingness to par� cipate in more playing
alterna� ves than LOTTO/LOTTO Plus, Scratch Cards, SportStake and PowerBall, should
the Na� onal Lo� ery decide to introduce such alterna� ves. Figure 3.31 shows that just
more than half the respondents (55.3 %) confi rmed their willingness to par� cipate in
such new alterna� ves; just more than a quarter (27.5 %) would not par� cipate while
17.2 % were uncertain.
FIGURE 3.31
POSSIBILITY OF PARTICIPATING IN NEW LOTTERY GAMES SHOULD SUCH ALTERNATIVES BE INTRODUCED, 2010
A follow-up ques� on was set to the 55.3 % who affi rmed their inten� on to par� cipate
in new games, enquiring on the origin of the money for such games – would they
use addi� onal money or redistribute the exis� ng amount among a larger number
of games? Figure 3.32 shows that 42.9 % of respondents would simply redistribute
exis� ng amounts and 57.1 % would allocate addi� onal moneys to the new gaming
alterna� ves.
55.3
27.5
0 10 20 30 40 50 60
Yes
No
Don’t know
Percentage
17.2
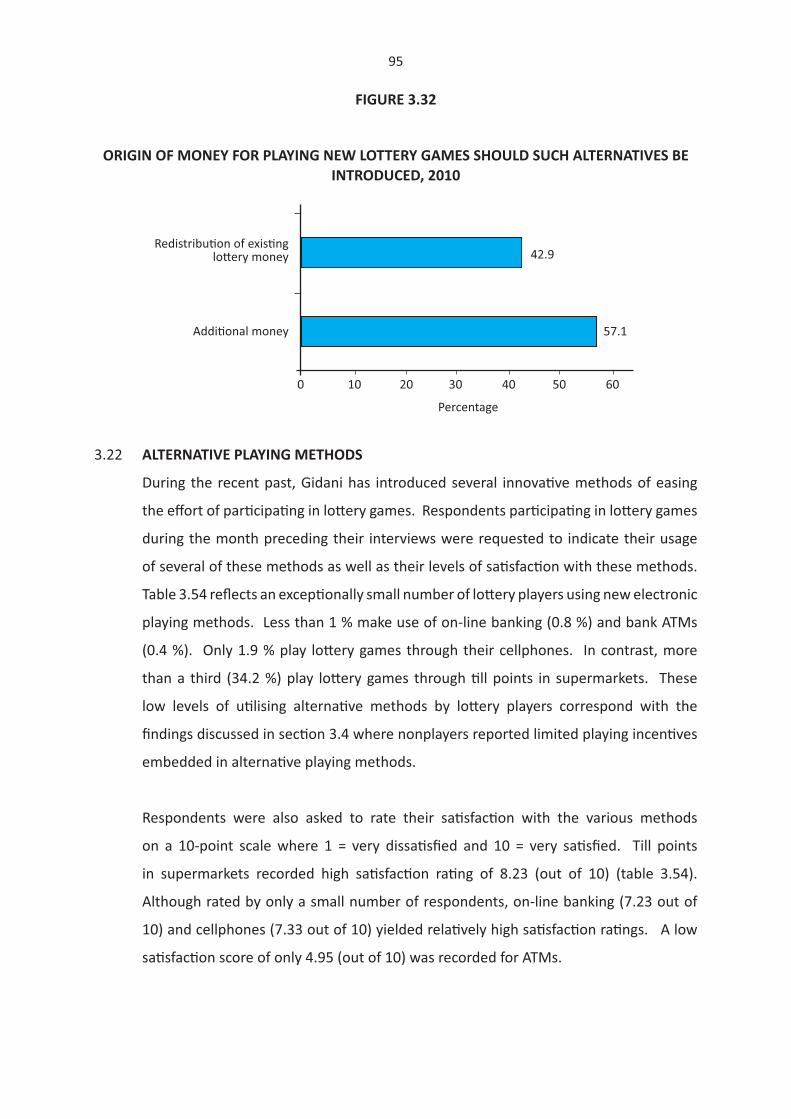
95
FIGURE 3.32
ORIGIN OF MONEY FOR PLAYING NEW LOTTERY GAMES SHOULD SUCH ALTERNATIVES BE INTRODUCED, 2010
3.22 ALTERNATIVE PLAYING METHODS
During the recent past, Gidani has introduced several innova� ve methods of easing
the eff ort of par� cipa� ng in lo� ery games. Respondents par� cipa� ng in lo� ery games
during the month preceding their interviews were requested to indicate their usage
of several of these methods as well as their levels of sa� sfac� on with these methods.
Table 3.54 refl ects an excep� onally small number of lo� ery players using new electronic
playing methods. Less than 1 % make use of on-line banking (0.8 %) and bank ATMs
(0.4 %). Only 1.9 % play lo� ery games through their cellphones. In contrast, more
than a third (34.2 %) play lo� ery games through � ll points in supermarkets. These
low levels of u� lising alterna� ve methods by lo� ery players correspond with the
fi ndings discussed in sec� on 3.4 where nonplayers reported limited playing incen� ves
embedded in alterna� ve playing methods.
Respondents were also asked to rate their sa� sfac� on with the various methods
on a 10-point scale where 1 = very dissa� sfi ed and 10 = very sa� sfi ed. Till points
in supermarkets recorded high sa� sfac� on ra� ng of 8.23 (out of 10) (table 3.54).
Although rated by only a small number of respondents, on-line banking (7.23 out of
10) and cellphones (7.33 out of 10) yielded rela� vely high sa� sfac� on ra� ngs. A low
sa� sfac� on score of only 4.95 (out of 10) was recorded for ATMs.
42.9
57.1
0 10 20 30 40 50 60
Redistribu� on of exis� nglo� ery money
Addi� onal money
Percentage

96
TABLE 3.54
USAGE OF AND SATISFACTION LEVELS FOR A SELECTION OF LOTTERYPLAYING METHODS, 2010
Method Usage(% of players)
Sa� sfac� on ra� ng(Out of 10)
Through on-line banking 0.8 7.23Through a cellphone 1.9 7.33Using a bank ATM 0.4 4.95Through � ll points in supermarkets 34.2 8.23
3.22 IMPACT OF GAMBLING
Several statements on lo� ery games were put to lo� ery players reques� ng them to
indicate whether they agree or disagree with the statements. A ‘don’t know’ alterna� ve
was also allowed. The statements with the percentage of respondents in agreement
with them are shown in table 3.55.
The fi ve statements rela� ng to the fi nancial impact of lo� ery games reveal the following:
• 53.4 % of respondents indicated that winnings from lo� ery games had helped
them fi nancially
• 70.3 % had lost more than they had won
• 8.3 % had borrowed money to play lo� ery games
• 23.6 % confi rmed that they had spent more money on lo� ery games than
intended
• 16.2 % were cri� cised by others about spending too much on lo� ery games
The above suggests some nega� ve eff ects on the fi nancial situa� on of respondents.
The intensity of these nega� ve eff ects is measured in chapter 4. However, the table
confi rms that 77.3 % of respondents were aware of the risks of playing lo� ery games
and 52.3 % were aware of programmes to assist people spending excessively on lo� ery
games.

97
TABLE 3.55
LEVEL OF AGREEMENT WITH STATEMENTS ON THE IMPACT OF LOTTERY GAMES, 2010
Statements Agree Disagree Don’t know Total
Winning with lo� ery games helped me fi nancially 53.4 43.3 3.3 100.0
I have lost more than I have won with lo� ery games 70.3 26.7 3.0 100.0
I have borrowed money to play lo� ery games 8.3 90.2 1.4 100.0
I have spent more money on lo� ery games than intended 23.6 75.4 1.1 100.0
People have cri� cised me about spending too much money on lo� ery games 16.2 82.2 1.7 100.0I am aware of the risks of playing lo� ery games 77.3 20.0 2.7 100.0I am aware of programmes to assist problem gamblers 52.5 40.9 6.6 100.0
3.24 PARTICIPATION IN THE MODES OF GAMBLING
In an eff ort to establish the par� cipa� on of lo� ery players in other modes of gambling,
respondents were asked to indicate their par� cipa� on in other modes of gambling in
addi� on to lo� ery games. Figure 3.33 shows that only 17.3 % of lo� ery players also
par� cipated in other modes of gambling during the month preceding their interviews.
This implies that more than eight in every 10 (82.7 %) lo� ery players did not par� cipate
in any other gambling ac� vi� es during the month preceding their interviews.

98
FIGURE 3.33
PERCENTAGE OF LOTTERY PLAYERS ALSO PARTICIPATING IN OTHER MODESOF GAMBLING, 2010
Those par� cipa� ng in other modes of gambling (17.3 % or 170 respondents) were
required to iden� fy the other gambling modes in which they engage. Figure 3.34
reveals that 69.8 % frequented casinos, 27.5 % be� ed on horses/sports events and
10.6 % par� cipated in gaming compe� � ons.
FIGURE 3.34
OTHER GAMBLING ACTIVITIES ENGAGED IN BY LOTTERY PLAYERS (1 MONTH PRIOR TO INTERVIEW), 2010
17.3
82.7
0 20 40 60 80 100
Yes
No
Percentage
2.5
0 20 40 60 80 100
Casino gambling
Horse/sports be� ng
Gaming compe� � ons
Bingo
Limited Payout Machines
On-line gambling
Other
Percentage
2.4
69.8
10.6
27.5
1.4
3.1

99
3.25 RETAIL OUTLETS
No less than 8 448 retail outlets are accredited to sell lo� ery � ckets. Respondents
were requested to name the type of outlet normally used to buy their lo� ery � ckets
or Scratch Cards. Figure 3.35 depicts the outlets most o� en used. Note that the
percentages add up to more than 100 %, implying that some of the respondents named
more than one type of outlet. Almost three in every four respondents (73.5 %) buy
their LOTTO � ckets/Scratch Cards from their local supermarket. This is followed by
small local grocery stores (39.8 %), garage/convenience shops (33.5 %) and post offi ces
(27.6 %).
FIGURE 3.35
OUTLETS USED TO PROCURE LOTTERY TICKETS/SCRATCH CARDS, 2010
Respondents (only those playing lo� ery games) were requested to rate their sa� sfac� on
with several aspects at the retail outlets on a 10-point scale where 1 is poor and 10
excellent. Respondents were also requested to provide the major reason for their
dissa� sfac� on.
Table 3.56 shows the mean (average) sa� sfac� on ra� ng. All the sa� sfac� on ra� ngs
yielded mean scores above 7.5 (out of 10), signalling a very high level of sa� sfac� on
33.5
0 20 40 60 80 100
Local supermarket
Small local grocery store
Garage/convenience shop
Post Offi ce
Other
Percentage
73.5
39.8
27.6
3.6

100
with services rendered by retailers. The following aspects received ra� ngs above eight,
which are excep� onally high mean sa� sfac� on ra� ngs:
• availability of payslips/coupons (8.63 out of 10)
• printouts of LOTTO/LOTTO Plus results (8.54 out of 10)
• payment of prizes by retailers (8.50 out of 10)
• a� tude of staff (8.45 out of 10)
• courtesy of staff (8.35 out of 10)
• empathy of staff (8.26 out of 10)
The following two aspects, although receiving rela� vely high ra� ngs, scored just less
than 8.0 (out of 10):
• systems always being on-line (7.82 out of 10)
• availability of a wri� ng surface (7.91 out of 10)
The above high sa� sfac� on ra� ngs are confi rmed by the rela� vely low percentage of
dissa� sfi ed clients (ie those alloca� ng a ra� ng of less than 6 out of 10). Table 3.56
shows that dissa� sfi ed clients amounted to less than 5 % for all services except systems
always being on-line and the availability of a wri� ng surface. Almost one in every 10
respondents was dissa� sfi ed with the con� nuous off -line of systems (9.8 %) and the
availability of a wri� ng surface (10.9 %).
The following were recorded as reasons for dissa� sfac� on with the aspects measured
in this ques� on.
(a) Availability of wri� ng space (10.9 % dissa� sfi ed respondents)
• need more space/limited space/no space
• available space crowded by people
• no pens available
• queues too long

101
(b) Systems always being off -line (9.8 % dissa� sfi ed respondents)
• electricity
• some� mes off -line
• network problems
• causes inconvenience when off -line
• have to travel 8 km to retailers – if off -line have to revisit
(c) Printout of LOTTO results (4.5 % dissa� sfi ed respondents)
• current results not available
• not willing to help/short tempered
• only recent results are printed out
• too busy to assist
(d) A� tude of staff (3.0 % dissa� sfi ed respondents)
• not enough a� en� on paid to customers
• not willing to help
• slow at � mes
• poor service
• don’t know how to use machines
• impa� ent
(e) Empathy of staff (2.4 % dissa� sfi ed respondents)
• not concerned
• slow service
• long queues
• staff get irritated
• don’t a� end to LOTTO – only caring for own shop
(f) Payment of prizes by retailers (2.4 % dissa� sfi ed respondents)
• sent elsewhere for certain amounts
• sent to post offi ce
• some� mes no money available
• payment on certain days only

102
(g) Availability of pay slips/coupons (2.3 % dissa� sfi ed respondents)
• not available
• poor standard of machines/must be improved
• not always enough
(h) Courtesy of staff (1.9 % dissa� sfi ed respondents)
• staff are rude
• bad treatment
• not friendly
• always bored and � red
• don’t provide pens
TABLE 3.56
SATISFACTION LEVELS AND DISSATISFIED RESPONDENTS, 2010
Variable Sa� sfac� on ra� ng(out of 10)
% of dissa� sfi ed respondents(ra� ng below 6)
A� tude of staff 8.45 3.0Courtesy of staff 8.35 1.9Empathy of staff 8.28 2.4Printout of lo� ery results 8.54 4.5Payment of prizes by retailers 8.50 2.4Systems always being on-line 7.82 9.8Availability of pay slips/coupons 8.63 2.3Availability of a wri� ng surface 7.91 10.9
3.26 NATIONAL LOTTERIES DISTRIBUTION TRUST FUND (NLDTF)
Several ques� ons were asked on the NLDTF’s ac� vi� es and funding strategies. This
sec� on portrays the response to these ques� ons.
3.26.1 NLDTF ac� vi� es and funding
Table 3.57 shows the response to fi ve ques� ons concerning the NLDTF. In the fi rst
ques� on, respondents (lo� ery players) were asked if they think that players should

103
have a say in who gets ‘good cause’ funding. Almost two thirds (65.0 %) expressed the
opinion that players should have a say, 25.2 % opposed this view and 9.8 % don’t know.
In response to the ques� on on the extent to which the funding of good causes aff ects
playing behaviour, only a quarter (25.8 %) of respondents confi rmed that ‘good cause’
funding has an eff ect on playing behaviour, such as the amount of money spent on
lo� ery games and the frequency of engagement in lo� ery playing.
Table 3.32 shows that almost half the lo� ery players (48.8 %) indicated that they would
stop playing if money was not fairly distributed to benefi ciaries.
Almost two in every fi ve respondents (42.8 %) affi rmed their awareness of organisa� ons
having received lo� ery funding while only one in every 10 (11.1 %) affi rmed awareness
of organisa� ons in their immediate area that had benefi ted from lo� ery funding.
TABLE 3.57
NLDTF ACTIVITIES AND FUNDING, 2010
Statements Agree Disagree Don’t know Total
Do you think that players should have a say in who gets good cause (NLDTF) funding? 65.0 25.2 9.8 100.0
Does the funding of good causes aff ect your playing pa� erns? 25.8 69.7 4.5 100.0Would you stop playing if money was not fairly distributed? 48.8 41.1 10.0 100.0Are you aware of any organisa� ons that have received lo� ery funding? 42.3 57.7 - 100.0Are you aware of any organisa� ons in your area that have received lo� ery funding? 11.1 88.9 - 100.0
3.26.2 Type of organisa� on supported by the NLDTF
Lo� ery players were asked their opinion on what type of organisa� ons the lo� ery
should support. Figure 3.36 shows that the overwhelming majority (89.5 %) favoured
the support of chari� es. This is followed by sport and recrea� on (28.5 %) and arts,

104
culture and na� onal heritage (23.5 % of respondents). The ‘other’ men� oned by 8.6 %
of respondents include, inter alia, the following (which are also linked to charity): old
age homes, abused women and children, clinic schools, rehabilita� on centres, students
in need, disabled children, HIV/AIDS orphans, unemployed and cancer pa� ents.
FIGURE 3.36
TYPE OF ORGANISATION SUPPORTED BY THE NLDTF
3.27 SUMMARY
The fi ndings of the survey clearly confi rm substan� al changes in the sociodemographic
profi le of lo� ery players between the 2003 and 2010 lo� ery surveys. These changes
suggest a more mature and stable lo� ery-playing community with fewer irregular and
novelty players. The fi ndings also suggest a smaller par� cipa� on of the less affl uent in
lo� ery games. The following serves to illustrate these changes:
(a) The propensity to play lo� ery games declined from 69.4 % of the adult South
African popula� on (18 years and older) in 2003 to 39.3 % in 2010.
(b) Although the less affl uent are s� ll ac� ve lo� ery players, their share in lo� ery
gaming shows a marked decline. The unemployed, as a percentage of lo� ery
players, declined from 36.9 % in 2003 to 23.0 % in 2010 and those earning a
monthly income of less than R1 000 from 60.5 % in 2003 to 34.7 % in 2010.
0 20 40 60 80 100
Chari� es
Sport and recrea� on
Arts, culture and na� onal heritage
Other
Percentage
89.4
28.5
23.5
8.5

105
(c) The general decline in lo� ery par� cipa� on of the South African popula� on is also
evident from the increased percentage of the popula� on who do not gamble
at all. Abstainers seem to feel fairly strongly about refraining from gambling as
is evident from the limited mo� va� onal appeal reported on alterna� ve means
of accessing lo� ery games (eg on-line banking facili� es, cellphone and bank
ATMs). Fewer than 10 % of nonplayers confi rmed that the la� er methods would
not encourage them to par� cipate in lo� ery games.
The above lo� ery playing conduct does not seem to originate from nega� ve percep� ons
of the Na� onal Lo� ery. Three in every fi ve respondents regarded the Na� onal Lo� ery
as good for society and almost eight in every 10 expressed the opinion that people
should not be discouraged from playing lo� ery games.
Par� cipa� on in lo� ery games varies substan� ally by type of game. It ranges from an
adult par� cipa� on rate of 32.3 % in LOTTO to only 3.3 % in SportStake. LOTTO Plus
stood at 26.3 % and PowerBall at 16.4 % in 2010. Very high playing frequencies are
recorded. Close to 80 % of par� cipants play at least once a week (with the excep� on
of Scratch Cards, which stood at almost 50 %). The spending pa� erns on lo� ery games
suggest that although the number of lo� ery players has declined, their per capita
expenditure showed a marked increase between 2003 and 2010. Those that spent less
than R50 per month decreased from 89.6 % in 2003 to 61.9 % in 2010.
It would seem that the above rela� vely high par� cipa� on levels are strongly mo� vated
by the mo� ve to win. Several ques� ons were posed to respondents to gauge their
percep� ons of their chances of winning and their understanding of the dynamics on
which the lo� ery process is based. The following was evident in this regard:
• A lack of understanding of the principle of randomness. Almost a third of
respondents expressed the opinion that the 49 numbers in LOTTO and 65 in
PowerBall do not have the same chance of being selected with each draw. The
majority of respondents also expressed the view that the chances of drawing

106
some combina� ons are be� er than those of other combina� ons.
• A third expressed the view that their chances of selec� ng the winning numbers
improve if previous draws show some numbers selected previously. The
percep� on is, therefore, that past posi� ve outcomes infl uence future chances
and that every draw is not an independent chance event.
• Perceived chances of winning lo� ery games are extremely high. One in every
fi ve par� cipants regard their chances of winning LOTTO and PowerBall as good
or very good. Together with those perceiving their chances as average, half the
par� cipants regard their chances of winning as ranging from average to very
good.
The respondents who express unrealis� cally high expecta� ons of winning the lo� ery
and exhibit a lack of understanding of concepts such as randomness and discrete events
are generally from the poorer segments of the South African popula� on.

107
CHAPTER 4
PROBLEM GAMBLING
4.1 INTRODUCTION
Gidani and the Na� onal Lo� eries Board requested the BMR to inves� gate problem
gambling and problem gamblers as part of this study. It is not the inten� on of this
chapter to dwell on the conceptual issues of problem gambling but purely to report on
the survey fi ndings. However, reference is also made to aspects concerning problem
gambling as summarised in the reports of the Na� onal Centre for the Study of Gambling
(NCSG), the booklet published by the South African Responsible Gaming Trust (SARGT),
and the Website maintained by the SARGT.
4.2 PROBLEM GAMBLING
Gambling is defi ned as staking something valuable in the hope of winning a prize where
the outcome is unknown to the par� cipants. Playing lo� ery games is regarded as a
gambling ac� vity.
Whether gambling is regarded as a vice or a form of recrea� on depends on moral
judgements, which vary in diff erent cultures, at diff erent points in history and among
diff erent individuals. Recrea� onal gambling, which is benign from the point of view of
the gambler, provides at least the following pleasures:
• playing games
• fantasising about winning large sums of money
• feeling ar� fi cially endangered
• being in a s� mula� ng environment
Gambling behaviour should be viewed as problema� c when gamblers are:

108
• gambling excessively and thereby causing signifi cant harm to themselves and
to others, and
• failing to control this excessive behaviour by themselves and without assistance.
A problem gambler is somebody whose gambling ac� vi� es nega� vely infl uence other
parts of his/her life such as his/her work, family life, fi nancial welfare and/or studies.
Based on the above, the NCSG recognises three diff erent classes of gambling behaviour.
While each may be diffi cult to dis� nguish at � mes, most of the authori� es worldwide
now recognise these three groups.
(a) Recrea� onal gamblers gamble on social occasions with friends or colleagues.
They have pre-determined acceptable losses and, by and large, their gambling
ac� vi� es cause li� le harm and their behaviour is associated with minimal guilt.
They simply require informa� on and educa� on on gambling behaviour in order
to make sensible decisions.
(b) Problem gamblers spend too much � me and money gambling. Their behaviour
causes harm both to themselves and others and may be associated with much
guilt. Most NCSG pa� ents requiring treatment fall into this group and they very
o� en respond posi� vely to the interven� on.
(c) Compulsive and pathological gamblers have a psychiatric disorder diagnosable
by strict criteria. It is regarded as a disorder of impulse control and has a very
poor prognosis. Such gamblers are unable to control their gambling, with
consequent signifi cant damage to themselves and others, and they are very
diffi cult to treat. They normally cons� tute a minute percentage of gamblers
(SARGT 2001:2).
Compulsive expenditure is not peculiar to gambling. Studies have shown that between
1 % and 2 % of adults have some compulsive shopping tendencies. Psychiatrists in
Britain, for example, have cau� oned compulsive shoppers that retail therapy could
soon be offi cially recognised as a psychiatric disorder. This addic� on is expected to be

109
entered in the next edi� on of the Diagnos� c and Sta� s� cal Manual of Mental Disorders
(DSM) and can then be claimed from medical aid funds (news24 2003).
The NCSG states that there are severe methodological diffi cul� es surrounding a� empts
to measure the incidence of problem gambling, most of which apply to all studies of
this kind but some of which are peculiar to, or apply with especial force in South Africa.
Consequently, all fi gures for prevalence should be treated only as rough es� mates.
4.3 INSTRUMENT USED IN THIS STUDY
Instruments for measuring problem gambling invite respondents to iden� fy themselves
as having or not having par� cular symptoms of problema� c behaviour. These symptoms
vary in their severity and in the degree to which they manifest with people not
iden� fi ed as having a problem. All cut-off points, dis� nguishing between compulsive
and noncompulsive gamblers, are therefore to some extent arbitrary (Collins & Barr
2001:7). This chapter looks at the results of applying the 20 Gamblers Anonymous
(GA) ques� ons to determine the extent of problem gambling.
Gamblers Anonymous (GA) off ers the following ques� ons to anyone who may have
a gambling problem. Their 20 ques� ons are provided to help the individual decide
whether he or she is a compulsive gambler and wants to stop gambling. They read as
follows (adjusted to refer to Na� onal Lo� ery games):
GA1 Have you ever lost � me from work due to par� cipa� on in Na� onal Lo� ery
games?
GA2 Has par� cipa� on in Na� onal lo� ery games ever made your home life unhappy?
GA3 Has par� cipa� on in Na� onal Lo� ery games aff ected your reputa� on (the way
others see you)?
GA4 Have you ever felt remorse a� er par� cipa� on in Na� onal Lo� ery games?
GA5 Have you ever par� cipated in Na� onal Lo� ery games to get money with which
to pay debts or otherwise solve fi nancial diffi cul� es?

110
GA6 Has par� cipa� on in Na� onal Lo� ery games caused a decrease in your ambi� on
or effi ciency (drive to succeed in life)?
GA7 A� er losing have you felt you must return as soon as possible and win back your
losses?
GA8 A� er a win with lo� ery games, have you felt a strong urge to return and win
more?
GA9 Have you o� en par� cipated in Na� onal Lo� ery games un� l your last rand was
spent?
GA10 Have you ever borrowed to fi nance your playing lo� ery games?
GA11 Have you ever sold anything to fi nance par� cipa� on in Na� onal Lo� ery games?
GA12 Are you reluctant to use money earmarked for lo� ery games for normal
expenditures?
GA13 Does par� cipa� on in Na� onal Lo� ery games make you careless of yourself or
your family?
GA14 Do you par� cipate in Na� onal Lo� ery games more than you had planned?
GA15 Do you ever par� cipate in Na� onal Lo� ery to escape worry or trouble?
GA16 Have you ever commi� ed or considered commi� ng an illegal act to fi nance
lo� ery games?
GA17 Does par� cipa� on in lo� ery games cause you to have diffi culty in sleeping?
GA18 Do arguments, disappointments or frustra� ons cause you to par� cipate in
lo� ery games?
GA19 Do you have an urge to celebrate any good fortune by a few hours of gambling?
GA20 Have you ever considered self-destruc� on as a result of your par� cipa� on in
Na� onal Lo� ery games?
A study by the NCSG (Collins & Barr 2001) contains a very comprehensive analysis of
measuring compulsive gambling. They applied not only the GA ques� onnaire but also
other methodologies such as the SOGS ques� onnaire (South Oaks Gambling Screen)
and the 10 ques� ons based on the Harvard DSM IV criteria as used in a UK prevalence
study in 2000 (Sproston, Erens & Orford 2000).

111
In applying the above methodologies, the NCSG established a benchmark by ques� oning
respondents who were already in a treatment programme. These were people who
iden� fi ed themselves and were iden� fi ed by others as having problems with gambling.
They were asked to complete the SOGS ques� onnaire and the 10 ques� ons based on
the Harvard DSM IV criteria in addi� on to the 20 GA ques� ons. They were requested to
answer on the basis of what was applicable to them before they came into treatment.
On the basis of the above, the NCSG established that 14 or more affi rma� ves to the
20 GA ques� ons cons� tute a conserva� ve cut-off point for iden� fying addic� ve or
pathological gamblers (Collins & Barr 2001:72).
The 2010 survey put the above 20 GA ques� ons to all respondents who par� cipate
in lo� ery games at least twice a week. The assump� on was made that compulsive
gambling implies excessive spending, which, in turn, could be equated with lo� ery
par� cipa� on at least twice a week. The frequency of gambling can be regarded as the
best indicator of problem gambling.
The following aspects are covered in the rest of the chapter:
• the number of affi rma� ves with regard to the GA ques� ons;
• the risk profi le of problem gamblers
4.4 IDENTIFICATION OF THE PROBLEM GAMBLER IN THE NATIONAL LOTTERY
Table 4.1 refl ects the percentage of respondents according to the number of
affi rma� ve (‘yes’) responses to the 20 GA ques� ons. Readers should be reminded that
the percentages refer only to those who buy lo� ery � ckets at least twice a week (531
respondents or 54 % of those playing lo� ery games during the one month preceding
the survey).
The table shows that almost one third of respondents (31.0 %) recorded no affi rma� ves
at all and therefore experience no addic� ve problems whatsoever. The percentage

112
distribu� on of affi rma� ve responses tends to decline as the number of ‘yes’ counts
increases. For example, 18.2 % of the respondents gave two affi rma� ve responses while
only 1.1 % recorded 10 affi rma� ve responses. As indicated in the NCSG survey, those
with a score of 14 or more affi rma� ves can be classifi ed as addic� ve or pathological
gamblers. According to the table, 0.1 % of those playing lo� ery games at least twice a
week fall into this category. In terms of a number of respondents, only one of the 531
high frequency players recorded 14 affi rma� ve responses to the 20 GA ques� ons. This
represents less than 0.1 % of the lo� ery players captured in the survey.
TABLE 4.1
FREQUENCY COUNT OF AFFIRMATIVE RESPONSES FOR NATIONAL LOTTERY PLAYERS, 2010
Number of affi rma� ves to GA ques� ons % distribu� on Cumula� ve %
0 31.0 31.01 18.2 49.32 16.5 65.83 10.3 76.14 7.9 84.05 5.2 89.16 4.4 93.67 3.3 96.98 0.7 97.59 0.6 98.1
10 1.1 99.211 0.2 99.412 0.2 99.613 0.2 99.914 0.1 100.0
Total 100.0 -
Table 4.2 shows the cumula� ve frequency count of affi rma� ve responses of lo� ery
players in 2003 and 2010 to the 20 GA ques� ons. The table clearly suggests a substan� al
decline in the ‘yes’ responses to the GA ques� ons, implying a decline in the problems
experienced by lo� ery players. The percentage with only one ‘yes’ response increased
from 30.0 % in 2003 to 49.3 %, the percentage with fi ve from 66.1 % to 89.1 % and
the percentage with 10 from 93.2 % to 99.2 %. Of par� cular signifi cance is that the

113
percentage with 14 or more ‘yes’ responses (ie the problem gamblers) declined from
2.5 % to 0.1 %.
TABLE 4.2
FREQUENCY COUNT OF AFFIRMATIVE RESPONSES FOR NATIONAL LOTTERY PLAYERS, 2003 AND 2010
Number of affi rma� ves to GA ques� ons
Cumula� ve %2003
Cumula� ve %2010
0 20.3 31.01 30.0 49.32 39.9 65.83 50.0 76.14 58.9 84.05 66.1 89.16 73.9 93.67 81.0 96.98 86.3 97.59 89.7 98.1
10 93.2 99.211 94.8 99.412 96.6 99.613 97.5 99.914 98.7 100.015 98.916 99.618 100.0
Table 4.3 shows the percentage of affi rma� ves among lo� ery players per GA ques� on
as well as the ranking of the ques� ons. The table confi rms that the following fi ve issues
recorded the most affi rma� ves with regard to the lo� ery:
• GA8 – 46.2 % of respondents buying lo� ery � ckets twice a week: A� er a win
with lo� ery games, have you felt a strong urge to return and win more?
• GA7 – 35.0 %: A� er losing have you felt you must return as soon as possible
and win back your losses?
• GA5 – 24.7 %: Have you ever par� cipated in lo� ery games to get money with
which to pay debts or otherwise solve fi nancial diffi cul� es?
• GA14 – 20.1 %: Do you ever par� cipate in lo� ery games more than you had
planned?

114
• GA19 – 18.6 %: Do you have an urge to celebrate any good fortune by a few
hours of gambling?
The above shows that the most affi rma� ves centred largely around reac� ons a� er
winning or losing money. As could be expected, since the mo� ve of winning captured
the imagina� on of the majority of high frequency players, cri� cal ques� ons such as
GA 16 (commi� ng illegal acts to fi nance lo� ery games), GA11 (selling of something
to fi nance lo� ery games), GA18 (nega� ve eff ect on player’s reputa� on), GA17
(considera� on of self-destruc� on), GA13 (careless of family) and GA15 (losing � me
from work) yielded minimal affi rma� ve responses.
TABLE 4.3
FREQUENCY COUNT OF AFFIRMATIVE RESPONSES FOR LOTTERY GAMES PLAYERS
GA ques� ons Lo� ery affi rma� ves % RankGA1 4.3 15GA2 4.9 11GA3 2.7 18GA4 4.6 14GA5 24.7 3GA6 7.0 9GA7 35.0 2GA8 46.2 1GA9 10.1 7
GA10 4.9 11GA11 1.2 19GA12 12.0 6GA13 4.1 16GA14 20.1 4GA15 8.9 8GA16 0.9 20GA17 7.0 9GA18 4.9 11GA19 18.6 5GA20 3.0 17

115
4.5 CONCLUSION
The result of the survey suggests virtually no addic� ve or pathological conduct among
Na� onal Lo� ery players. This is of par� cular signifi cance, given the rela� vely high
par� cipa� on frequency of lo� ery players.

116
CHAPTER 5
PROPENSITY TO BUY LOTTERY TICKETS
5.1 INTRODUCTION
This chapter focuses on the propensity to buy lo� ery � ckets as well as the welfare
impact on households resul� ng from alloca� ng a por� on of household budgets to
lo� ery games. The redistribu� onal eff ect of the money spent on lo� ery games is also
addressed.
The calcula� ons are made for 2009 with some references to 2010. Where available,
historical fi gures are quoted since the incep� on of the Na� onal Lo� ery in 2000.
5.2 HOUSEHOLD EXPENDITURE PERSPECTIVE
When considering the alloca� on of household expenditure to lo� ery games, it should be
kept in mind that immense structural changes have emerged in household expenditure
pa� erns over the past few years. Apart from the crea� on of an alterna� ve expenditure
avenue with the introduc� on of the lo� ery, other expenditure changes have also
occurred. The general trend suggested by household expenditure calcula� ons over the
past 25 years is a considerable increase in expenditure on services (eg communica� on,
educa� on and health) and a corresponding decrease in expenditure on goods (eg
food and clothing). Figure 5.1 shows the changes in the percentage of household
expenditure on a number of items from 1993 to 2003 (Mar� ns 2003).
The percentage of household expenditure on educa� on increased by 465.4 % and that
on fuel and power by 113.9 % while the percentage allocated to food increased by only
42.5 % and that allocated to furniture and equipment by only 7.6 %.

117
FIGURE 5.1
GROWTH OF HOUSEHOLD EXPENDITURE ALLOCATED TO SELECTED ITEMS, 1993 – 2003
(CURRENT PRICES)
The above fi gure highlights the changes in expenditure pa� erns of only a few products
and services. However, these examples suffi ce to illustrate that major structural
changes in household expenditure pa� erns coincided with the establishment of
gambling and other services in South Africa. Although these changes are evident
from the middle of the 1990s, they accelerated towards the end of the 1990s due to,
inter alia, the introduc� on of new communica� on and computer technology as well as
changed government expenditure priori� es, that resulted in large private contribu� ons
to services such as educa� on and health. The World Bank (2001:224) also confi rms
that, interna� onally, the urbanisa� on process tends to produce lower-than-average
shares of expenditure on retail items, such as food and clothing, and higher-than-
average shares for services, such as transport, educa� on and communica� on. All
these changes may contribute to decreased retail sales. It would be inappropriate to
single out one item such as lo� ery games, cellphones or educa� on as the sole culprit
for lower expenditure on other retail items.
0 100 200 300 400 500
Educa� on
Fuel & power
Transport
Communica� on
Food
Furniture & equipment
Total
Percentage
465.4
113.9
53.0
50.4
42.5
7.6
3.1

118
5.3 PROPENSITY TO BUY LOTTERY TICKETS
This sec� on highlights the methodology used in calcula� ng the propensity to buy
lo� ery � ckets. In evalua� ng expenditure tendencies, several environmental issues
such as the worldwide economic recession, household fi nancial debt and fi nancial
vulnerability issues, changed household expenditure profi les and the structural change
in the sociodemographic profi le of lo� ery players should be considered.
5.3.1 Household expenditure
Table 5.1 contains the household cash expenditure in South Africa by main expenditure
group for 2009. Total cash expenditure amounted to R1 478.3 billion in 2009. (This
amount excludes an amount of R177.9 billion allocated by households to income tax.)
Expenditure on gambling is included in the ‘miscellaneous’ expenditure group that
amounted to R64.1 billion. Expenditure items included in this expenditure group
(‘miscellaneous’) are, apart from gambling, inter alia, the following: membership fees of
organisa� ons; professional fees; lawyer’s fees and bank charges/interests; and fi nancial
expenses and contribu� ons. The table shows that the share of this expenditure group
amounted to 4.3 % of household expenditure, of which a small por� on originates from
expenditure on lo� ery games.

119
TABLE 5.1
TOTAL ANNUAL HOUSEHOLD CASH EXPENDITURE BY MAIN EXPENDITURE GROUP, 2009
Main expenditure group2009
R million %Food 380 716 25.8Clothing, footwear and accessories 90 105 6.1Housing and electricity 215 561 14.6Household fuel & light 89 091 1.9Transport 118 992 8.0Medical and dental 106 669 7.2Educa� on 62 166 4.2Insurance and funds 63 534 4.3Recrea� on, entertainment and sport 42 081 2.8Furniture and household equipment 50 139 3.4Alcoholic beverages 46 944 3.2Cigare� es and tobacco 21 928 1.5Washing and cleaning materials 12 652 0.9Personal care 48 031 3.2Communica� on 34 324 2.3Reading ma� er and sta� onery 7 341 0.5Domes� c workers 10 307 0.7Support of rela� ves 17 149 1.2Holiday/weekend (excluding transport) 9 617 0.7Miscellaneous 64 063 4.3Savings 47 855 3.2Total - tax 1 478 277 100.0
Source: BMR, Unpublished informa� on
5.3.2 Expenditure on lo� ery games at current and constant prices
Table 5.2 shows the expenditure on lo� ery games at current prices as well as the value
of prizes paid out since the establishment of the lo� ery. The value of lo� ery � cket
sales (all lo� ery modes) increased from R2.4 billion in 2000 (March to December) to
R4.2 billion in 2009. Expenditure shows some varia� on over � me. It increased to
R4.3 billion in 2002 and declined gradually to R4.0 billion in 2006. With the six-month
interrup� on during the license change from Uthingo to Gidani, lo� ery � cket sales
dropped to R1.7 billion in 2007 and picked up again to R4.2 billion in 2009. Total prizes
paid out represented 48.9 % of total sales over the en� re 2000 to 2010 period, ranging

120
from R1.1 billion in 2000 to R2.0 billion in 2009 (and R0.7 billion for the fi rst 3 months
of 2010).
The contribu� on to total � cket sales by lo� ery mode is as follows for 2009:
• LOTTO : 62.8 %
• LOTTO Plus : 22.6 %
• SportStake : 6.0 %
• PowerBall : 5.6 %
• Scratch Cards : 3.0 %
In interpre� ng the above shares by type of game, it should be remembered that
PowerBall was introduced only in October 2009 and had thus been in opera� on for
less than three months in 2009. The rela� ve shares of the lo� ery games for the fi rst
three months of 2010 are as follows:
• LOTTO : 38.9 %
• LOTTO Plus : 14.3 %
• SportStake : 4.1 %
• PowerBall : 41.1 %
• Scratch Cards : 4.4 %
The above clearly shows the popularity of PowerBall during January to March 2010,
with it clearly becoming the most popular lo� ery mode. This may be infl uenced by the
rela� vely large jackpots off ered by PowerBall and the fact that it is a new lo� ery game.
The popularity may decline over � me as the novelty eff ect normally a� ached to new
experiences wears off .

121
TABLE 5.2
Lo�
ery
gam
es
Mar
ch-
Dec
2000
Rm
Jan-
Dec
2001
Rm
Jan-
Dec
2002
Rm
Jan-
Dec
2003
Rm
Jan-
Dec
2004
Rm
Jan-
Dec
2005
Rm
Jan-
Dec
2006
Rm
Jan-
Mar
ch/
Oct
-Dec
20
07Rm
Jan-
Dec
2008
Rm
Jan-
Dec
2009
Rm
Jan-
Mar
ch
2010
RmLO
TTO •
Sale
s
2 28
1.5
3 49
1.9
4 20
2.7
4 12
3.5
3 27
9.0
3 16
8.5
3 10
6.7
1 25
8.2
2 57
2.4
2 65
3.2
541.
4•
Prize
poo
l1
032.
11
690.
22
061.
32
025.
11
648.
71
527.
31
602.
463
8.8
1 24
7.2
1 21
9.1
265.
5LO
TTO
plu
s1)
• Sa
les
-
--
-85
2.6
919.
695
5.5
401.
885
7.3
953.
519
8.5
• Pr
ize p
ool
--
--
435.
444
3.1
482.
519
6.2
427.
747
7.4
99.1
Spor
tSta
ke2)
• Sa
les
-
--
--
--
-89
.625
4.6
57.0
• Pr
ize p
ool
--
--
--
--
44.4
128.
830
.5Po
wer
Ball3)
• Sa
les
-
--
--
--
--
234.
857
2.1
• Pr
ize p
ool
--
--
--
--
-11
6.8
272.
2Sc
ratc
h Ca
rds4)
• Sa
les
11
0.0
133.
310
4.0
....
....
27.9
180.
012
8.7
22.7
• Pr
ize p
ool
54.4
74.4
60.9
....
....
12.7
71.8
60.4
9.8
Tota
l • Sa
les
2
391.
53
625.
24
306.
74
123.
54
131.
64
088.
14
062.
21
687.
93
699.
34
224.
81
391.
7•
Prize
poo
l1
083.
51
764.
62
122.
22
025.
12
084.
11
970.
42
084.
984
7.7
1 79
1.1
2 00
2.5
677.
2
TABL
E 5.
2
TOTA
L TI
CKET
SAL
ES O
F AN
D PR
IZES
PAI
D O
UT
ON
LO
TTER
Y G
AMES
, 200
0-20
10(E
XCLU
DIN
G S
CRAT
CH C
ARD
SALE
S FR
OM
200
3-20
10)
1)
Intr
oduc
ed Ja
nuar
y 20
042)
In
trod
uced
Aug
ust 2
008
3)
Intr
oduc
ed O
ctob
er 2
009
4)
Scra
tch
Card
info
rma�
on
not a
vaila
ble
for 2
003
to 2
006
and
Janu
ary-
Dece
mbe
r 200
7
Sour
ce:
(a)
Na�
ona
l Lo�
ery
201
0
(b)
G
idan
i (Pt
y) Lt
d, U
npub
lishe
d in
form
a� o
n
(c)
Li
gthe
lm 2
003

122
Table 5.3 shows the expenditure on lo� ery games at constant prices (2008 prices).
This means that the infl a� on factor is removed from the rand values during the en� re
period and values are expressed at constant or real prices. Real expenditure shows an
ini� al increase in lo� ery expenditure from its incep� on in 2000 (R3.8 billion) to a high
point of almost R6.0 billion in 2002. From 2003 a gradual decline is evident to 2008
with a slight increase again from 2008 to 2009 from R3.7 billion to R3.9 billion. The
R3.9 billion in 2009 is a third (29.2 %) lower than the R6.0 billion in 2002. The 2007
sales of R1.9 billion are atypical due to the suspension of lo� ery games for almost six
months during that year.
TABLE 5.3
EXPENDITURE ON LOTTERY GAMES AT CONSTANT (2008 PRICES) AND CURRENT VALUES,
2000-2009
Year Average CPI indexLo� ery sales
Current valuesRm
Constant 2008 pricesRm
2000 62.5 2 391.5 3 826.42001 66.1 3 625.2 5 484.42002 72.1 4 306.7 5 973.22003 76.3 4 123.5 5 404.32004 77.4 4 131.6 5 337.92005 80.0 4 088.1 5 110.12006 83.7 4 062.2 4 853.22007 89.7 1 687.9 1 881.72008 100.0 3 699.3 3 699.3
2009 107.1 4 223.8 3 943.8
Source: Stats SA 2010 (CPI)
Considering the household expenditure trend on lo� ery games from the fi rst full year
in 2001 to the last full year in 2009, the following is evident:
• Average percentage growth at current prices : 1.5 %
• Average percentage decline at constant prices : -4.2 %
• Total percentage growth at current prices : 16.5 %
• Total percentage decline at constant prices : -28.4 %

123
The above fi gures confi rm a slight increase in lo� ery expenditure at current prices but
a substan� al decline at constant prices between 2001 and 2009.
It seems from the above that the Na� onal Lo� ery in South Africa is star� ng to show a
level of maturity and stability at round about R4 billion. This could increase in future
should new lo� ery games be introduced. Almost half the lo� ery players indicated that
they should consider alterna� ve games posi� vely. Almost 57 % of the respondents
indicated that they would allocate addi� onal money to these games. The high level of
stability and maturity in the lo� ery market place is probably due to the fact that the
novelty eff ect has worn off (with the excep� on of PowerBall) and that retail outlets are
well developed to service the whole South African community.
Table 5.4 shows the per capita expenditure on lo� ery games by the South African
popula� on (18 years and older) and lo� ery players for 2009 at current prices. The
average per capita expenditure for lo� ery players amounted to R368 in 2009.
Subtrac� ng the average per capita prize money of R174 results in an average amount of
R194 forfeited by lo� ery players in favour of the Na� onal Lo� ery. For the South African
popula� on as a whole (18 years and older), the average amount spent on lo� ery games
amounted to R145 in 2009. An average amount of R69 fl ows back into the household
income and expenditure stream, resul� ng in the forfeiture of an average amount of
R76 per capita by all adult South Africans.

124
TABLE 5.4
AVERAGE PER CAPITA EXPENDITURE BY THE POPULATION (18+ YEARS) AND LOTTERY PLAYERS, 2009 (CURRENT PRICES)
VariablePer capita expenditure by
popula� on 18+yearsR
Per capita expenditure by lo� ery players
RTotal expenditure 145 368Prize money 69 174Amount forfeited 76 194
Source: Derived from table 5.2 and unpublished BMR data
5.3.3 Defi ni� on of propensity to buy lo� ery � ckets
Propensity to buy lo� ery � ckets is defi ned as the percentage of household cash
expenditure allocated to all fi ve lo� ery games. The amount of household budgets
allocated to lo� ery games is calculated as follows:
Total amount spent by lo� ery players
- (minus) amount returned to players
= (equals) gross revenue of the Na� onal Lo� ery
÷ (divided) by total household expenditure
= (equals) propensity to gamble (or percentage of expenditure forfeited by
households)
The above calcula� on implies that the prize money allocated to lo� ery players by the
Na� onal Lo� ery reverts back to households as part of their income and expenditure
stream. However, it should be noted that the alloca� on of prize money is largely
concentrated in a few households while gambling expenditure is eff ected by a large
number of households. This redistribu� onal eff ect is discussed in sec� on 5.3.5.
5.3.4 Calcula� on of propensity to gamble
Table 5.5 shows the propensity to buy lo� ery � ckets, ie the amount of household
budgets allocated to the Na� onal Lo� ery, in 2009. The table shows that close to

125
R2.0 billion (47.4 %) of the total value of sales of R4.2 billion was paid out as prizes to
lo� ery players. This implies that an amount of R2.2 billion was forfeited in favour of
the Na� onal Lo� ery for distribu� on to good causes, Gidani opera� ons and commission
to retailers. Dividing this amount (R2.2 billion) into total disposable household income
of R1 453.3 billion resulted in a propensity to buy lo� ery � ckets of 0.15 %. This implies
that an amount of 15c in each R100 spent by households was allocated to lo� ery games
in 2009. It may be argued that the percentage of household expenditure allocated to
lo� ery games can be slightly higher due to the fact that Powerball was only introduced
on 16 October 2009 and therefore played for just less than three months during the
year. On the assump� on that spending and prize levels would remain constant even if
PowerBall had been available for the full year and that spending on PowerBall was not
displaced from other games (was therefore new money), the es� mated propensity to
gamble would increase from 0.15 % to 0.18 %.
TABLE 5.5
PROPENSITY TO PLAY LOTTERY GAMES, 2009
Propensity to play lo� ery games 2009Total value of sales R4 096 090 840Prizes returned to players R1 942 098 431Amount forfeited by players (a)-(b) R2 153 992 409Total household expenditure R1 453 268 754 096Propensity to play lo� ery games (e)÷(d) 0.15 %Propensity adjusted for full PowerBall year 0.18 %
The propensity to buy lo� ery � ckets was calculated at 0.45 % for 2002. This implies
a substan� al decline to only 0.18 % for 2009. Per R100 household expenditure, the
amount allocated by households to lo� ery � ckets declined from 45c in 2002 to only
18c in 2009. This resulted in a decline of almost 60 % in the por� on of household
expenditure allocated to lo� ery games.
Table 5.6 shows the propensity to play the various lo� ery games as well as the
distribu� on amongst the games for every R100 spent on lo� ery games. The propensity
to buy lo� ery � ckets ranges from a low of 0.005 % for Scratch Cards to 0.099 % for
LOTTO � ckets. The table also shows that, for every R100 spent on lo� ery games, R55

126
will be allocated to LOTTO, R18 to LOTTO Plus and R20 to PowerBall. (The la� er is on
the assump� on of a full year’s access to PowerBall � ckets.) Only R4 out of each R100
will be spent on SportStake and R3 on Scratch Cards.
TABLE 5.6
PROPENSITY TO BUY LOTTERY TICKETS BY LOTTERY MODE, 2009
Lo� ery games Propensity%
Alloca� on of each R100 spent on lo� ery gamesR
LOTTO 0.099 55LOTTO Plus 0.033 18SportStake 0.008 4PowerBall1) 0.035 20Scratch Cards 0.005 3Total 0.165 100
1) Based on a full year
5.3.5 Redistribu� onal eff ects
Par� cipa� on in lo� ery games gives eff ect to a signifi cant redistribu� onal eff ect of
lo� ery money among players through prizes. This sec� on illustrates this eff ect with
regard to LOTTO and PowerBall. However, the magnitude of redistribu� on diff ers by
type of game – with a larger eff ect in the case of LOTTO and PowerBall compared to
other lo� ery games.
The contract with Gidani s� pulates that, over the license period, money generated by
the sale of LOTTO and PowerBall � ckets should be allocated as follows:
• Prizes : 45 %
• Distribu� on to good causes : 34 %
• Opera� ons, including salaries,
adver� sing, overheads of Gidani : 15 %
• Commission to retailers : 6 %

127
The license contract further s� pulates that the 45 % allocated to LOTTO and PowerBall
prizes should, over the license period, be divided as follows:
LOTTO PowerBall
• Division-1 prize (jackpot) : 18.25 % 42.07 %
• Division-2 prize : 4.00 % 13.33 %
• Division-3 prize : 9.00 % 9.36 %
• Division-4 prize : 5.00 % 3.56 %
• Division-5 prize : 16.75 % 7.30 %
• Division-6 prize : 11.00 % 6.94 %
• Division-7 prize : 36.00 % 4.62 %
• Division-8 prize : - 12.82 %
• Total : 100.00 % 100.00 %
The redistribu� onal eff ect of the above is shown in tables 5.7 for LOTTO and 5.8 for
PowerBall. The tables illustrate the total � cket sales and prize pool for the Saturday 6
March 2010 draw (LOTTO) and the Friday 23 April 2010 draw (PowerBall).
On the basis of an assump� on of an average expenditure of R10 per draw, table 5.7
shows that approximately 2.6 million people contributed to the � cket sales of R26.0
million for the Saturday 6 March 2010 LOTTO draw. [As shown in sec� on 3.17 almost
one in every fi ve (21.5 %) respondents indicated higher expenditure during large
jackpot prizes, implying that the average expenditure per draw might be slightly higher
if large jackpots are available.] Of these 2.6 million people, only 4.6 % (118 731 players)
received anything back in the form of prizes. One person received R13.8 million, 13
persons received R156 215 each and 101 received division-3 prizes to the amount of
R10 440 each. No less than nine in every 10 winners (88.6 %) each received R40. On
average, an extremely large number of people (2.6 million) each spent small amounts
while the prizes were heavily concentrated in only 105 people (division 1 to 3 prizes).

128
The same pa� ern emerges in table 5.8, illustra� ng the redistribu� onal eff ects of the
PowerBall draw of Friday 23 April 2010. Approximately 1.4 million punters bought
PowerBall � ckets while only 8.4 % shared in the prize pool. One person received the
jackpot of R10.9 million and 69 901 received division 8 prizes to the amount of R11.00
each.
TABLE 5.7
TOTAL LOTTO TICKET SALES AND PRIZE POOL, SATURDAY 6 MARCH 2010
Total amount Total number of Individual payoutR par� cipants/winners R
Total � cket sales 26 035 978 2 603 5981) -
Total prize pool 23 353 601 118 731 -
Division 1 13 797 494 1 13 797 494
Division 2 468 645 3 156 215
Division 3 1 054 440 101 10 440
Division 4 585 760 224 2 615
Division 5 1 958 704 5 744 341
Division 6 1 282 158 7 498 171
Division 7 4 206 400 105 160 40
1) Based on an assump� on of an average expenditure of R10 for this draw

129
TABLE 5.8
TOTAL POWERBALL TICKET SALES AND PRIZE POOL, FRIDAY 23 APRIL 2010
Total amount Total number of Individual payoutR par� cipants/winners R
Total � cket sales 13 884 272 1 388 4271) -Total prize pool 13 961 037 116 311 -Division 1 10 933 745 1 10 933 745Division 2 832 848 1 832 848Division 3 584 780 35 16 708Division 4 222 171 719 309Division 5 455 504 1 328 343Division 6 423 480 28 232 15Division 7 273 598 16 094 17Division 8 768 911 69 901 11
1) Based on an assump� on of an average expenditure of R10 for this draw
The above confi rms the large redistribu� onal eff ect resul� ng from par� cipa� ng in
lo� ery games.
5.4 SUMMARY
Although par� cipa� on in lo� ery games is o� en accused of being responsible for
substan� al household expenditure displacement, calcula� ons show that only 0.18%
(ie 18 cents in every R100 spent by households) is allocated to lo� ery games. However,
this average propensity to play lo� ery games may diff er substan� ally by household
income level. Poor households spending even a small amount on the lo� ery may
forfeit a sizeable percentage of their income while the same or even a larger amount
may be negligible in the case of affl uent households. LOTTO also has a substan� al
redistribu� onal eff ect. Millions of patrons spend small average amounts per person
per draw while less than one in every 10 receives anything back. Only 0.1 % of players
receive substan� al prize money from LOTTO and PowerBall. Although all the winnings
from lo� ery games revert back to the household income stream, large jackpot prizes
are normally invested and do not, therefore, form part of the normal day to day
household expenditure cycle.

130
LIST OF REFERENCES
Bless, C & Kathuria, R. 1993. Fundamentals of social sta� s� cs: An African perspec� ve. Cape Town: Juta and Co.
Collins, P & Barr, G. 2001. Gaming and problem gambling in South Africa: A na� onal study. Cape Town: Na� onal Centre for the Study of Gambling.
Ligthelm, AA. 2003. The South African Na� onal Lo� ery: Community a� tudes, behaviour and par� cipa� on. Pretoria: Na� onal Lo� eries Board.
Ligthelm, AA, Mango, T, & Jonkheid, E. 2005. Socio-economic impact of legalised gambling in South Africa. Pretoria: Na� onal Gambling Board.
Ligthelm, AA & Jonkheid, E. 2009. Socio-economic impact of legalised gambling in South Africa. Pretoria: Na� onal Gambling Board.
Mar� ns, JH. 2003. Total household expenditure in South Africa by province, popula� on group and product, 2003. Pretoria: Unisa, Bureau of Market Research. (Research Report no 322.)
Mar� ns, JH, Loubser, M & Van Wyk, H de J. 1996. Marke� ng research: A South African approach. Pretoria: Unisa Press.
Na� onal Lo� ery. 2010. [Online]. Available: h� p://www.na� onallo� ery.co.za/downloads.asp
News24. 2003. [Online]. Available: h� p://www.news24.co.za
SARGT, see South African Responsible Gambling Trust.
South African Responsible Gambling Trust. 2001. [Online]. Available: h� p://www.responsiblegaming.co.za
Sproston, K, Erens, B & Orford, J. 2000. Gambling behaviour in Britain: Results from the Bri� sh gambling prevalence survey. London: Na� onal Centre for Social Research.
World Bank. 2002. World development indicators, 2002. Washington: World Bank.
Related Documents