Page | 1 THE REPUBLIC OF UGANDA UGANDA BUREAU OF STATISTICS NATIONAL LABOUR FORCE SURVEY 2016/17 (MAIN REPORT) UGANDA BUREAU OF STATISTICS Plot 9, Colville Street P. O. Box 7186, Kampala (U) Tel: 256 414 706 000 Fax: 256 414 237 553 Website: www.ubos.org Email: [email protected] JUNE 2018

Welcome message from author
This document is posted to help you gain knowledge. Please leave a comment to let me know what you think about it! Share it to your friends and learn new things together.
Transcript

Page | 1
THE REPUBLIC OF UGANDA
UGANDA BUREAU OF STATISTICS
NATIONAL LABOUR FORCE SURVEY 2016/17
(MAIN REPORT)
UGANDA BUREAU OF STATISTICS Plot 9, Colville Street P. O. Box 7186, Kampala (U) Tel: 256 414 706 000 Fax: 256 414 237 553 Website: www.ubos.org Email: [email protected]
JUNE 2018

Page | i
This report presents findings of the National Labour Force Survey 2016/17 undertaken by the Uganda
Bureau of Statistics (UBOS). Additional information about the Survey may be obtained from the
UBOS Head Office, Statistics House. Plot 9 Colville Street, P. O. Box 7186, Kampala, Uganda;
Telephone: +256-414 706000 Fax: +256-414 237553; E-mail: [email protected]; Website: www.ubos.org Recommended Citation
Uganda Bureau of Statistics 2018, The National Labour Force Survey 2016/17 – Main Report,
Kampala, Uganda.

Page | i
FOREWORD
This report presents the findings of the National Labour Force Survey (NLFS), a nationwide
survey carried out between November 2016 and July 2017. The results from the survey provide
an opportunity to update labour market indicators in the country in addition to observing the
trends in the labour market conditions.
The last such survey was carried out during the period 2011/12. In addition, there have been
Annual Urban Labour Force Surveys implemented by UBOS since 2009 covering Kampala and
the surrounding areas. The Urban Labour Force Survey (ULFS) has been expanded into Annual
Labour Force Surveys (ALFSs) with an additional coverage of the rural areas starting with the
financial year 2017/18. Eventually, the labour force surveys will be more regularised into
quarterly surveys. The main objective of these surveys is to collect regular, high quality and
consistent information on the labour force and the earnings characteristics of individuals in
accordance with prevailing international and national standards.
The 2016/17 NLFS results will enhance monitoring and evaluation of the national and
international development frameworks such as NDPII, Africa Agenda 2063 and SDGs with a
view of improving the welfare of Ugandans. The 2016/17 NLFS also included two separate
modules on Crime Victims and Culture participation whose results will be presented in separate
reports.
We wish to extend our sincere gratitude to various persons/institutions for their efforts which
contributed to the successful completion of the 2016/17 NLFS. Special thanks go to the
Government of Uganda for the financial support that enabled the successful implementation of
the Survey. We are also grateful to the 2016/17 NLFS Technical Working Group for their close
supervision in all stages of implementation of the survey including; pre-enumeration,
enumeration and post-enumeration phases. Our gratitude is also extended to all the field staff
who worked hard to successfully implement the data collection phase of the survey. Last but
not least, we are grateful to the Local Governments for the support given to the field teams
during field work and the general public for sparing their time and participating in the interviews
to provide useful information that has enabled UBOS to produce this report.
It is our sincere hope that this report will be used for informed planning and decision making.

Page | ii
SELECTED LABOUR MARKET INDICATORS
Selected Indicators Male Female Rural Urban Total
Total population (number ‘000) 18,379 19,351 28,822 8,907 37,730 Working age population (number ‘000) 8,992 9,851 13,701 5,142 18,843 Proportion of working age population to total population (percent)
48.9 50.9 47.5 57.7 49.9
Size of working population (number '000) 7,528 7,761 11,525 3,765 15,290 Working population as a proportion of working age population (Percent)
83.7 78.8 84.1 73.2 81.1
Number of working age population in purely subsistence agriculture, forestry and fishing
2,438 3,815 5,640 613 6,253
Proportion of working age population in purely subsistence agriculture, forestry and fishing
27.1 38.7 41.2 11.9 33.2
Employment
Size of the employed population (number '000) 5,053 3,921 5,861 3,113 8,973
Employment-to-population ratio (EPR) 56.2 39.8 42.8 60.5 47.6
Youth (18-30 years) EPR 58.9 42.4 45.2 60.0 49.8
Labour force
Size of the labour force (number '000) 5,505 4,427 6,508 3,424 9,932
Labour Force Participation Rate (LFPR) 61.2 44.9 47.5 66.6 52.7
Youth (18-30 years) LFPR 66.4 49.7 52.2 68.2 57.3
Status in employment
Paid employee 40.8 26.3 27.4 47.8 34.5
Employer 4.0 1.7 2.3 4.4 3.0
Own account worker 48.8 57.8 58.4 42.1 52.8
Contributing family workers 6.4 14.1 11.9 5.8 9.8
Total 100 100 100 100 100
Industry (sector) of employment Agriculture, forestry and fishing 40.0 42.8 56.2 12.9 41.2
Production 20.2 11.4 14.3 20.2 16.4
Services 39.8 45.8 29.4 66.9 42.4
Total 100 100 100 100 100
Occupation in the main job Skilled agricultural, forestry and fishery workers
29.2 34.1 43.3 8.7 31.3
Service and sales workers 17.5 30.6 17.8 33.4 23.2
Elementary occupations 15.3 14.6 15.4 14.2 15.0
Craft and related trades workers 16.1 8.6 11.8 14.7 12.8
Plant and machine operators and assemblers 10.2 1.8 4.6 10.2 6.5
Professionals 6.0 6.0 3.8 10.1 6.0
Technicians and associate professionals 3.4 2.4 2.1 4.5 2.9
Others* 2.4 1.9 1.2 4.1 2.2
Total 100 100 100 100 100
Average daily usual hours of work on main job 7.7 7.0 6.6 8.8 7.4
Median monthly cash earnings for persons in paid employment on the main job ('000)
240 120 120 250 190
Proportion in informal employment outside agriculture (percent)
84.5 85.6 89.6 80.5 84.9
Proportion of youth (18-30 years) in informal employment outside agriculture (percent)
91.0 89.9 94.3 87.5 90.5
Note*: Others include managers and clerical support workers
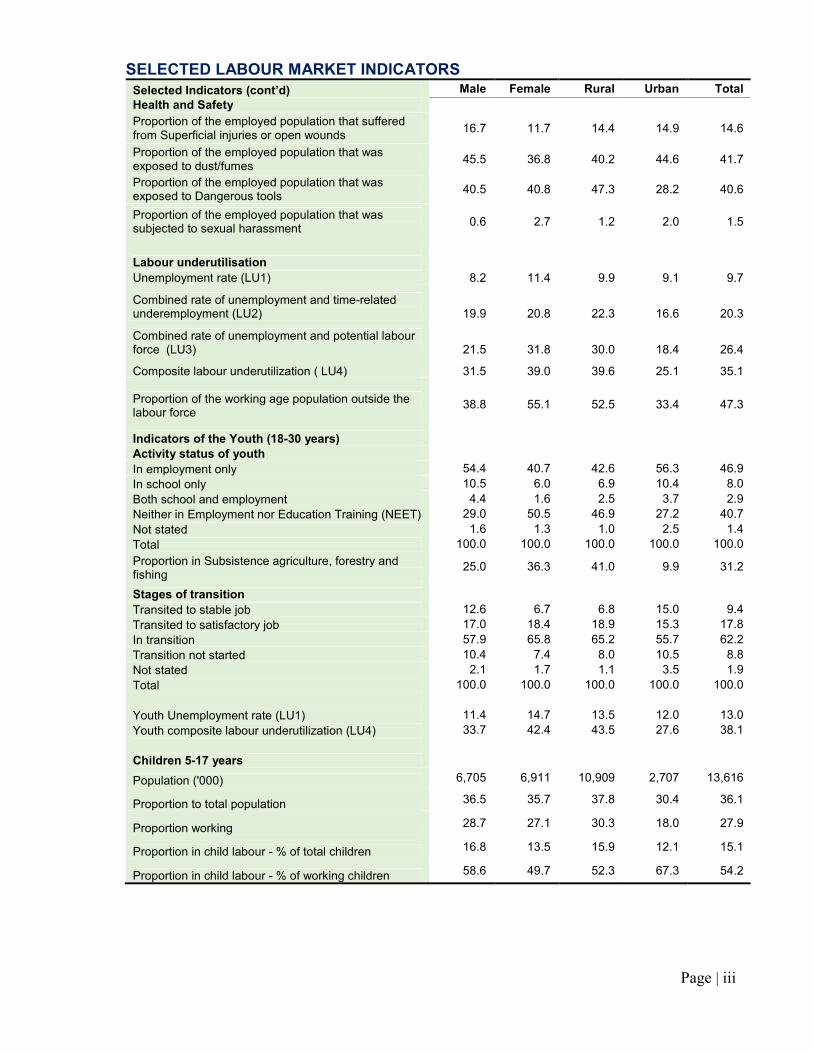
Page | iii
SELECTED LABOUR MARKET INDICATORS
Selected Indicators (cont’d) Male Female Rural Urban Total
Health and Safety
Proportion of the employed population that suffered from Superficial injuries or open wounds
16.7 11.7 14.4 14.9 14.6
Proportion of the employed population that was exposed to dust/fumes
45.5 36.8 40.2 44.6 41.7
Proportion of the employed population that was exposed to Dangerous tools
40.5 40.8 47.3 28.2 40.6
Proportion of the employed population that was subjected to sexual harassment
0.6 2.7 1.2 2.0 1.5
Labour underutilisation
Unemployment rate (LU1) 8.2 11.4 9.9 9.1 9.7
Combined rate of unemployment and time-related underemployment (LU2) 19.9 20.8 22.3 16.6 20.3
Combined rate of unemployment and potential labour force (LU3) 21.5 31.8 30.0 18.4 26.4
Composite labour underutilization ( LU4) 31.5 39.0 39.6 25.1 35.1 Proportion of the working age population outside the labour force
38.8 55.1 52.5 33.4 47.3
Indicators of the Youth (18-30 years)
Activity status of youth
In employment only 54.4 40.7 42.6 56.3 46.9
In school only 10.5 6.0 6.9 10.4 8.0
Both school and employment 4.4 1.6 2.5 3.7 2.9
Neither in Employment nor Education Training (NEET) 29.0 50.5 46.9 27.2 40.7
Not stated 1.6 1.3 1.0 2.5 1.4
Total 100.0 100.0 100.0 100.0 100.0
Proportion in Subsistence agriculture, forestry and fishing
25.0 36.3 41.0 9.9 31.2
Stages of transition
Transited to stable job 12.6 6.7 6.8 15.0 9.4
Transited to satisfactory job 17.0 18.4 18.9 15.3 17.8
In transition 57.9 65.8 65.2 55.7 62.2
Transition not started 10.4 7.4 8.0 10.5 8.8
Not stated 2.1 1.7 1.1 3.5 1.9
Total 100.0 100.0 100.0 100.0 100.0
Youth Unemployment rate (LU1) 11.4 14.7 13.5 12.0 13.0
Youth composite labour underutilization (LU4) 33.7 42.4 43.5 27.6 38.1
Children 5-17 years
Population ('000) 6,705 6,911 10,909 2,707 13,616
Proportion to total population 36.5 35.7 37.8 30.4 36.1
Proportion working 28.7 27.1 30.3 18.0 27.9
Proportion in child labour - % of total children 16.8 13.5 15.9 12.1 15.1
Proportion in child labour - % of working children 58.6 49.7 52.3 67.3 54.2
Page | iv
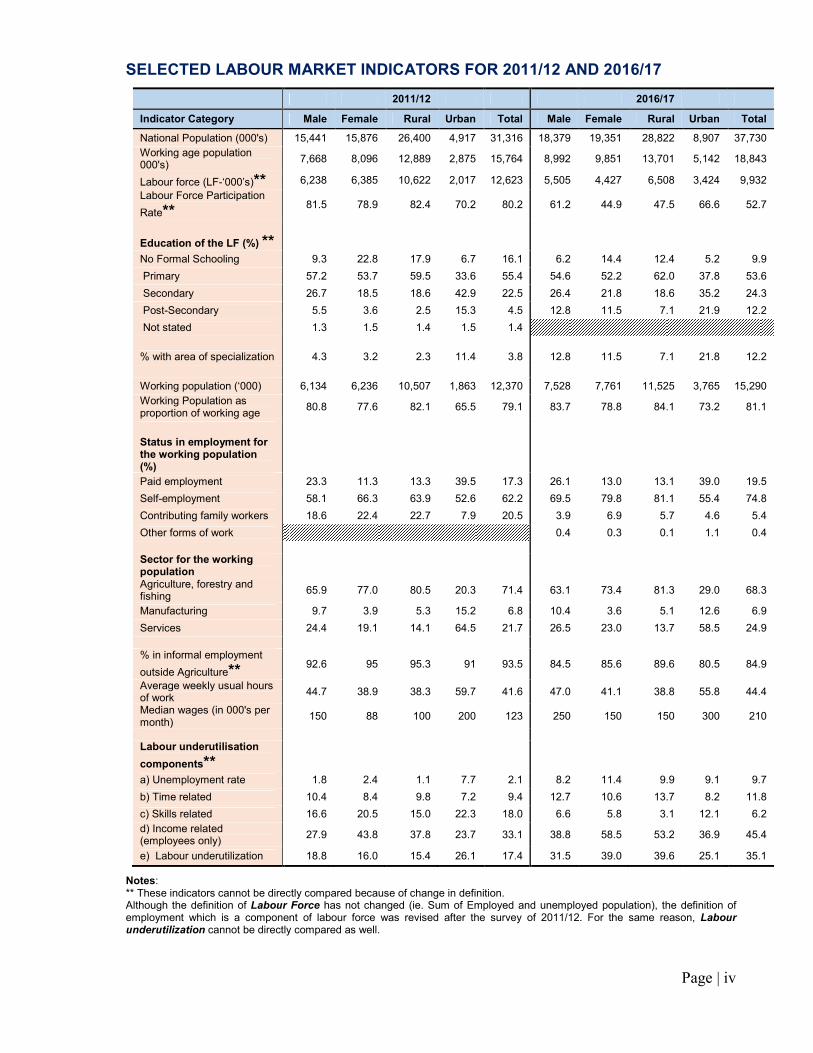
SELECTED LABOUR MARKET INDICATORS FOR 2011/12 AND 2016/17
2011/12 2016/17
Indicator Category Male Female Rural Urban Total Male Female Rural Urban Total
National Population (000's) 15,441 15,876 26,400 4,917 31,316 18,379 19,351 28,822 8,907 37,730
Working age population 000's)
7,668 8,096 12,889 2,875 15,764 8,992 9,851 13,701 5,142 18,843
Labour force (LF-‘000’s)** 6,238 6,385 10,622 2,017 12,623 5,505 4,427 6,508 3,424 9,932
Labour Force Participation
Rate** 81.5 78.9 82.4 70.2 80.2 61.2 44.9 47.5 66.6 52.7
Education of the LF (%) **
No Formal Schooling 9.3 22.8 17.9 6.7 16.1 6.2 14.4 12.4 5.2 9.9
Primary 57.2 53.7 59.5 33.6 55.4 54.6 52.2 62.0 37.8 53.6
Secondary 26.7 18.5 18.6 42.9 22.5 26.4 21.8 18.6 35.2 24.3
Post-Secondary 5.5 3.6 2.5 15.3 4.5 12.8 11.5 7.1 21.9 12.2
Not stated 1.3 1.5 1.4 1.5 1.4
% with area of specialization 4.3 3.2 2.3 11.4 3.8 12.8 11.5 7.1 21.8 12.2
Working population (‘000) 6,134 6,236 10,507 1,863 12,370 7,528 7,761 11,525 3,765 15,290
Working Population as proportion of working age
80.8 77.6 82.1 65.5 79.1 83.7 78.8 84.1 73.2 81.1
Status in employment for the working population (%)
Paid employment 23.3 11.3 13.3 39.5 17.3 26.1 13.0 13.1 39.0 19.5
Self-employment 58.1 66.3 63.9 52.6 62.2 69.5 79.8 81.1 55.4 74.8
Contributing family workers 18.6 22.4 22.7 7.9 20.5 3.9 6.9 5.7 4.6 5.4
Other forms of work 0.4 0.3 0.1 1.1 0.4
Sector for the working population
Agriculture, forestry and fishing
65.9 77.0 80.5 20.3 71.4 63.1 73.4 81.3 29.0 68.3
Manufacturing 9.7 3.9 5.3 15.2 6.8 10.4 3.6 5.1 12.6 6.9
Services 24.4 19.1 14.1 64.5 21.7 26.5 23.0 13.7 58.5 24.9
% in informal employment
outside Agriculture** 92.6 95 95.3 91 93.5 84.5 85.6 89.6 80.5 84.9
Average weekly usual hours of work
44.7 38.9 38.3 59.7 41.6 47.0 41.1 38.8 55.8 44.4
Median wages (in 000's per month)
150 88 100 200 123 250 150 150 300 210
Labour underutilisation
components**
a) Unemployment rate 1.8 2.4 1.1 7.7 2.1 8.2 11.4 9.9 9.1 9.7
b) Time related 10.4 8.4 9.8 7.2 9.4 12.7 10.6 13.7 8.2 11.8
c) Skills related 16.6 20.5 15.0 22.3 18.0 6.6 5.8 3.1 12.1 6.2
d) Income related (employees only)
27.9 43.8 37.8 23.7 33.1 38.8 58.5 53.2 36.9 45.4
e) Labour underutilization 18.8 16.0 15.4 26.1 17.4 31.5 39.0 39.6 25.1 35.1
Notes: ** These indicators cannot be directly compared because of change in definition. Although the definition of Labour Force has not changed (ie. Sum of Employed and unemployed population), the definition of employment which is a component of labour force was revised after the survey of 2011/12. For the same reason, Labour underutilization cannot be directly compared as well.

Page | v
TABLE OF CONTENT
FOREWORD ............................................................................................................................................... i
SELECTED LABOUR MARKET INDICATORS ......................................................................................... ii
SELECTED LABOUR MARKET INDICATORS FOR 2011/12 AND 2016/17 .......................................... iv
TABLE OF CONTENT ............................................................................................................................... v
LIST OF TABLES ...................................................................................................................................... ix
LIST OF FIGURES ................................................................................................................................... xi
EXECUTIVE SUMMARY .......................................................................................................................... xii
LIST OF ACRONYMS .............................................................................................................................. xv
CHAPTER ONE: INTRODUCTION ........................................................................................................... 1
1.0 Background ................................................................................................................................ 1
1.1 Survey objectives ....................................................................................................................... 1
1.2 Policy Environment .................................................................................................................... 1
1.3 Sample design ........................................................................................................................... 3
1.3.1 Sample Size and allocation ................................................................................................................. 3
1.3.2 Sample selection procedures .............................................................................................................. 5
1.3.3 Scope and Coverage ............................................................................................................................ 6
1.4 Survey Implementation .............................................................................................................. 8
1.4.1 Questionnaire design and Pre-test ..................................................................................................... 8
1.4.2 Field Staff Training ................................................................................................................................ 8
1.4.3 Data collection ....................................................................................................................................... 9
1.4.4 Publicity .................................................................................................................................................. 9
1.5 Data management ..................................................................................................................... 9
1.6 Response rate ............................................................................................................................ 9
1.7 Challenges ............................................................................................................................... 10
1.7.1 Sample Survey .................................................................................................................................... 10
1.7.2 Coverage .............................................................................................................................................. 10
1.7.3 Administratively ................................................................................................................................... 10
1.8 Report structure ....................................................................................................................... 11
CHAPTER TWO: BACKGROUND CHARACTERISTICS ...................................................................... 12
2.0 Introduction .............................................................................................................................. 12
2.1 Population size ......................................................................................................................... 12
2.1.1 Disability status of the population (5+ Years) ................................................................................. 13
2.1.2 Population Distribution by Age and Sex .......................................................................................... 13
2.1.3 Socio-economic characteristics of the Population .......................................................................... 15
2.2 Household Composition ........................................................................................................... 15
2.2.1 Household Headship .......................................................................................................................... 15
2.2.2 Household size by Socio economic characteristics ....................................................................... 16
2.2.3 Age Dependency Ratios .................................................................................................................... 17
2.2.4 Summary Findings .............................................................................................................................. 18
CHAPTER THREE: THE WORKING-AGE POPULATION (WAP) .......................................................... 19
3.0 Introduction .............................................................................................................................. 19
3.1 Characteristics of the Working Age Population ....................................................................... 19
3.2 Activity status of the working age population ........................................................................... 21
3.3 The mean age of the Working age population ......................................................................... 22
3.4 Summary Findings ................................................................................................................... 23

Page | vi
CHAPTER FOUR: THE WORKING POPULATION ................................................................................ 24
4.0 Introduction .............................................................................................................................. 24
4.1 Composition of the working population .................................................................................... 24
4.2 Distribution of the Working Population ..................................................................................... 25
4.3 Status in Employment for the working population .................................................................... 26
4.4 Industry of the working population ........................................................................................... 26
4.5 Occupation of the working population ...................................................................................... 27
4.6 Employment form of work ........................................................................................................ 29
4.6.1 Age groups of the employed population .......................................................................................... 29
4.6.2 Education level attained ..................................................................................................................... 29
4.6.3 Proportion with secondary job ........................................................................................................... 30
4.6.4 Employment-to-Population Ratio ...................................................................................................... 31
4.6.5 Status in employment ......................................................................................................................... 32
4.6.6 Industry and sector of the main job .................................................................................................. 34
4.6.6.1 Sector of the secondary job ............................................................................................................... 35
4.6.7 Occupation of the main job ................................................................................................................ 36
4.6.8 Place of work of the employed population ....................................................................................... 37
4.6.9 Actual daily hours worked on the main job ...................................................................................... 38
4.6.9.1 Actual hours worked on the secondary job .................................................................................... 39
4.6.10 Earnings from paid Employment ....................................................................................................... 40
4.6.11 Membership to Trade Unions and similar associations ................................................................. 43
4.6.12 Type of employment agreement for persons in paid employment ............................................... 44
4.6.13 Entitlements for persons in paid employment ................................................................................. 45
4.6.14 Informal employment outside agriculture ......................................................................................... 46
4.6.15 Characteristics of the self-employed ................................................................................................ 48
4.6.15.1 Main reasons for being self-employed ................................................................................ 48
4.6.15.2 Source of Start-up Capital ..................................................................................................... 49
4.6.15.3 Problems faced by the self-employed ................................................................................. 49
4.6.16 Health and Safety of the employed population ............................................................................... 50
4.7 Workers in Subsistence Agriculture ......................................................................................... 53
4.7.1 Characteristics of the working age population in subsistence Agriculture .................................. 53
4.7.2 Distribution of working age population in subsistence Agriculture ............................................... 53
4.7.3 Availability for employment for persons in subsistence agriculture ............................................. 55
4.7.4 Degree of satisfaction by Persons engaged in Subsistence agriculture ..................................... 56
4.7.5 Desire to change from Subsistence agriculture to employment ................................................... 56
4.7.6 Weekly hours of work for subsistence agriculture workers ........................................................... 57
4.7.7 Subsistence agriculture workers involved in household chores ................................................... 58
4.8 Summary of findings ................................................................................................................ 59
CHAPTER FIVE: LABOUR UNDERUTILISATION .................................................................................. 61
5.0 Introduction .............................................................................................................................. 61
5.1 Unemployment Rate (LU1) ...................................................................................................... 61
5.2 Time Related Underemployment ............................................................................................. 62
5.3 Combined Rate of Unemployment and Time related Underemployment (LU2) ...................... 64
5.4 Combined Rate of Unemployment and Potential Labour Force (LU3) .................................... 65
5.5 Composite measure of labour underutilization (LU4) .............................................................. 66
5.6 Inadequate Employment Situations ......................................................................................... 68
5.6.1 Skill/qualification Related Inadequate Employment ....................................................................... 68
5.6.2 Income Related Inadequate Employment ....................................................................................... 69
5.7 Summary of findings ................................................................................................................ 71
CHAPTER SIX: POPULATION IN AND OUTSIDE THE LABOUR FORCE ........................................... 72

Page | vii
6.0 Population in the Labour Force ................................................................................................ 72
6.1 Labour Force Participation Rate (LFPR) ................................................................................. 73
6.2 Population outside the labour force ......................................................................................... 74
6.2.1 Introduction .......................................................................................................................................... 74
6.2.2 Proportion of the population outside the labour force .................................................................... 74
6.2.3 Characteristics of the population outside the labour force ............................................................ 76
6.2.4 Reasons for being outside the labour force .................................................................................... 77
6.2.4.1 Reasons for not seeking employment for those who were available .......................................... 77
6.2.4.2 Reasons for not seeking and not being available for employment .............................................. 78
6.3 Summary Findings ................................................................................................................... 80
CHAPTER SEVEN: UNPAID CARE WORK ............................................................................................ 81
7.0 Introduction .............................................................................................................................. 81
7.1 Characteristics of persons engaged in UCW ........................................................................... 81
7.2 Distribution of UCW ................................................................................................................. 83
7.3 Average number of hours per week spent on UCW ................................................................ 83
7.4 Activity status of persons engaged in UCW ............................................................................. 84
7.5 Main jobs of persons engaged in UCW ................................................................................... 85
7.6 Engagement in UCW by persons out of the labour force ........................................................ 86
7.7 Summary of findings ................................................................................................................ 86
CHAPTER EIGHT: YOUTH EMPLOYMENT ........................................................................................... 87
8.0 Introduction .............................................................................................................................. 87
8.1 Characteristics of the Youth Population ................................................................................... 87
8.2 Youth Activity status ................................................................................................................. 88
8.3 Youth in employment ............................................................................................................... 89
8.3.1 Youth Employment–to-Population Ratio .......................................................................................... 89
8.3.2 Industry of the Youths in Employment ............................................................................................. 90
8.3.3 Occupation of the Youths in Employment ....................................................................................... 91
8.3.4 Status in employment of the youth ................................................................................................... 92
8.3.5 Nature of employment and Job Satisfaction ................................................................................... 93
8.3.6 Basis of employment .......................................................................................................................... 94
8.3.7 Education mismatch of the employed youth ................................................................................... 96
8.4 Youth Labour Under-utilisation ................................................................................................ 97
8.5 Youth in the Labour Force ....................................................................................................... 98
8.5.1 Youth Labour Force Participation Rate .......................................................................................... 100
8.6 Youth in subsistence agriculture ............................................................................................ 102
8.7 Youth Transition to Employment ............................................................................................ 103
8.7.1 Stages of transition ........................................................................................................................... 103
8.7.2 Occupation of the youth who transited........................................................................................... 105
8.8 Summary Findings ................................................................................................................. 106
CHAPTER NINE: CHILDREN’S ACTIVITIES IN UGANDA ................................................................... 107
9.0 Introduction ............................................................................................................................ 107
9.1 Characteristics of children by sex .......................................................................................... 108
9.1.1 Schooling and disability status of children (5-17 years) .............................................................. 108
9.1.2 Orphan-hood and Foster-hood of Children ................................................................................... 108
9.2 Activities of children 6-17 years ............................................................................................. 109

Page | viii
9.2.1 Children engagement in household chores ................................................................................... 112
9.2.2 Involvement in Work, Household Chores and Schooling ............................................................ 113
9.3 Working children 5-17 years .................................................................................................. 114
9.3.1 Proportion of working children 5-17 years ..................................................................................... 114
9.3.2 Status in Employment for working children ................................................................................... 115
9.3.3 Working children by sector and occupation .................................................................................. 115
9.4 Child labour ............................................................................................................................ 116
9.4.1 Child labour estimate ........................................................................................................................ 117
9.4.2 Comparison of child labour with 2011/12 Survey ......................................................................... 118
9.4.3 Components Contribution to Child Labour Measurement ........................................................... 119
9.5 Summary findings .................................................................................................................. 121
APPENDICES ........................................................................................................................................ 122
Definition of concepts ........................................................................................................................ 122
Table A3.1: Median Monthly Income in the secondary job (‘000 Shs) .......................................... 124
Table A3.2: Informal employment by Industry and occupation, Percent ....................................... 125
Table A4.1: Industry of the employed population, Percent ............................................................ 126
Table A4.2: Occupation of the employed population, Percent ...................................................... 127
Table A4.3: Distribution of Place of work of the employed population by selected characteristics, Percent ....................................................................................................................... 128
Table A4.4: Usual hours of work by employed population in the secondary job and for primary and secondary jobs combined by selected characteristics ............................................... 129
Table A4.5: Proportion in Informal employment including persons employed in Agriculture, forestry and fishing, percent .................................................................................................... 130
Table A4.6: Distribution of Employment in the Informal sector including persons employed in Agriculture, forestry and fishing, percent ................................................................... 131
NLFS 2016/17 -Survey Errors ........................................................................................................... 132
QUESTIONNAIRES .......................................................................................................................... 141
NATIONAL LABOUR FORCE SURVEY, 2016/17 ............................................................................ 141
APPENDIX 5: CODES FOR CURRENT SCHOOLING LEVEL ............................................................. 184
APPENDIX 6: CODES FOR FIELD OF SPECIALISATION .................................................................. 185
List of Contributors to the Survey ...................................................................................................... 187

Page | ix
LIST OF TABLES
Table 1.1: Expected Precision for reference indicators ............................................................................. 4
Table 1.2: Composition of Kampala and Peri-Urban Kampala .................................................................. 5
Table 1.3 Measure of size .......................................................................................................................... 6
Table 1.4: Household response rate ........................................................................................................ 10
Table 2.1: Population Distribution by Residence, Region, Age and Sex ................................................. 12
Table 2.2: Disability status of the Population (5+ years) by selected background characteristics .......... 13
Table 2.3: Distribution of the Population (10 years and above) by Education and Marital Status .......... 15
Table 2.4 Household headship by selected Background Characteristics (10 years and above) ............ 16
Table 2.5 Mean number of Household members by selected Characteristics ........................................ 17
Table 3.1: Distribution of the working age population (14-64 years) ....................................................... 20
Table 3.2: Migration status of the working age population (14-64 years) ................................................ 21
Table 3.3: Activity status of the working age population (14-64 years) ................................................... 22
Table 4.1: Distribution of the Working Population by Sex, Residence and Age, 2016/17 ....................... 25
Table 4.2: Status in employment of the main job for working population by sex and residence ............. 26
Table 4.3: Industry of the main job for working population by sex and residence ................................... 27
Table 4.4: Occupation of the main job for working population by sex and residence ............................. 28
Table 4.5: The proportion of the Employed Population by age groups, percent ..................................... 29
Table 4.6 Education of the employed population by sex and residence, percent ................................... 30
Table 4.7: Employment-to-population ratio by selected background characteristics .............................. 32
Table 4.8: Status in employment by selected Characteristics, Percent .................................................. 33
Table 4.9 Sector of employment by selected characteristics, percent .................................................... 35
Table 4.10: Occupation of the employed population by sex and Residence, percent............................. 37
Table 4.11: Place of work of the employed population by sex, and Residence ...................................... 37
Table 4.12: Average daily actual hours of work for employed persons ................................................... 38
Table 4.13: Classes of actual hours worked per day by selected background characteristics ............... 39
Table 4.14: Median monthly earnings for persons in paid employment on the main job ........................ 41
Table 4.15: Median monthly earnings for persons in paid employment in the main job.......................... 43
Table 4.16: Entitlements for persons in paid employment ....................................................................... 46
Table 4.17: Informal employment outside agriculture by sex, residence, regions, education and age groups, percent ........................................................................................................................................ 47
Table 4.18: Informal employment outside agriculture by status in employment, sector and occupation, percent ..................................................................................................................................................... 48
Table 4.19: Main reasons for being self-employed .................................................................................. 48
Table 4.20: Sources of Start-up Capital ................................................................................................... 49
Table 4.21: Main problems faced by the self-employed, percent ............................................................ 50
Table 4.22: Proportion that suffered from occupational injuries or illnesses, percent ............................. 51
Table 4.23: Proportion exposed to harmful working conditions, percent ................................................. 52
Table 4.24: Proportion subjected to physical or emotional abuse at work place, percent ...................... 52
Table 4.25: Characteristics of the working age population in subsistence agricultural ........................... 53
Table 4.26: Distribution of the working age population in subsistence agricultural ................................. 54
Page | x
Table 4.27: Proportion of persons in subsistence agriculture available for employment ........................ 55
Table 5.1: Unemployment Rate (LU1) by Selected Back ground Characteristics, 2016/17 .................... 62
Table 5.2: Time related Underemployment Rate for Employed Persons (14-64 years) ......................... 63
Table 5.3: Combined Rate of Unemployment and Time Related Underemployment (LU2) ................... 64
Table 5.4: Combined Rate of Unemployment and Potential Labour Force ............................................. 66
Table 5.5: The Composite measure of labour underutilization ................................................................ 67
Table 5.6: Income related Inadequate Employment Rate ....................................................................... 70
Table 6.1: Distribution of the Labour Force by background characteristics, Percent .............................. 72
Table 6.2: Labour Force participation rates by selected background characteristics, Percent ............... 73
Table 6.3: Characteristics of the population outside the labour force by background characteristics ..... 76
Table 6.4: Reasons for not seeking employment for those who were available, percent ....................... 78
Table 6.5: Reasons for not seeking and not being available for employment ......................................... 79
Table 7.1: Proportion of persons engaged in UCW by background characteristics, (5+ years) ............. 82
Table 7.2: Average weekly number of hours spent on UCW by background characteristics (5+ years) 84
Table 7.3: Persons engaged in UCW who did not seek for work, and were either available or not. (5+ years, percent) ......................................................................................................................................... 86
Table 8.1: The Youth (18-30 years) population by background characteristics ...................................... 87
Table 8.2: Percentage distribution of youth (18-30 years) ....................................................................... 88
Table 8.3: Distribution of the Employed Youth by sex ............................................................................. 89
Table 8.4: Employment-to-Population Ratio of the Youth (18-30 years) ................................................ 90
Table 8.5: Industry of Employment of the youth by Residence and Sex, Percent .................................. 91
Table 8.6: Occupations of the Youths by Sex and Residence, Percent .................................................. 92
Table 9.7: Status in employment of the Youths by background characteristics (%) ............................... 93
Table 8.8: Nature of Employment and Job Satisfaction of the Youth in Employment in the main job by Selected Background Characteristics, 2016 ............................................................................................ 94
Table 8.9: Percentage distribution of youths (18-30) by status in employment and selected background characteristics .......................................................................................................................................... 95
Table 8.10: Education Mismatch of the Youth in Employment ................................................................ 96
Table 8.11: Measures of Labour Under-utilisation by background characteristics .................................. 98
Table 8.12: Distribution of Youth in the Labour Force by background characteristics, 2016 ................ 100
Table 8.13: Youth Labour Force Participation Rates by selected Background Characteristics ............ 101
Table 8.14: Stages of transition of the Youth by Sex and Residence ................................................... 105
Table 8.15: Share of young people who “Transited” by sub-category and occupation, (Percent) ........ 106
Table 9.1: Children Schooling and disability status by background characteristics .............................. 108
Table 9.2: Orphan hood and Foster hood of Children (5-17 Years) by background characteristics ..... 109
Table 9.3: Children (6-17 years) activities by Selected Background Characteristics ............................ 110
Table 9.4: Children in School and at Work by Background Characteristics (6-17 years), percent ....... 111
Table 9.5: Status in employment of working children ............................................................................ 115
Table 9.6: Proportion of working children (5-17 Years) by sector and occupation, 2016/17 & 2011/12 116
Table 9.7: Child Labour by Age of the Child, Percent of total children ................................................. 118
Table 9.8: Estimate of child labour 2011/12 and 2016/17, percent of total children ............................. 119

Page | xi
LIST OF FIGURES
Figure 1: Map showing the 7 Domains of the NLFS 2016/17 .................................................................... 7
Figure 2.1: Population pyramid based on the Age-Sex structure of the population ................................ 14
Figure 2.2: Sex Ratios by five year age groups ....................................................................................... 14
Figure 2.3 : Dependency Ratios by sex of household head, residence and regions, 2016/17 ............... 18
Figure 2.4: Dependency Ratio by Survey Years...................................................................................... 18
Figure 3.1: Mean Age of the working Age population by Activity Status, 2016/17 .................................. 23
Figure 4.1: Forms of work among the Working Population, Percentage share ....................................... 24
Figure 4.2: Proportion of the employed population with secodary jobs ................................................... 31
Figure 4.3: Proportion with secondary job by status in employment ....................................................... 33
Figure 4.4: Sectors of employment by sex and residence, percent......................................................... 34
Figure 4.5: Proportion with secondary job by status in employment ....................................................... 36
Figure 4.6: Distribution of the sector of the secondary job for employed persons by sex and residence 36
Figure 4.7: Average actual daily hour of work by sex, residence and sector .......................................... 40
Figure 4.8: Map showing regional variation in median monthly income by sex ...................................... 42
Figure 4.9: Membership to Trade Unions or Similar Employee Associations, Percent ........................... 44
Figure 4.10: Type of employment agreement for persons in paid employment ...................................... 44
Figure 4.11: Proportion of persons in paid employment with written contract ......................................... 45
Figure 4.12: Proportion of persons in subsistence agriculture satisfied with their work .......................... 56
Figure 4.13: Proportion of subsistence agriculture workers who liked to change to employment jobs ... 57
Figure 4.14: Average weekly hours of work for subsistence foodstuff producers ................................... 57
Figure 4.15: Average weekly hours of work for subsistence agriculture producers by region ................ 58
Figure 4.16: Proportion of subsistence agriculture workers involved in other non-economic activities .. 59
Figure 5.1: Rate of Potential Labour Force (PLF).................................................................................... 65
Figure 5.2: Regional Labour Underutilisation Rate by sex ...................................................................... 68
Figure 5.3: Skill related Inadequate Employment rate by selected Background Characteristics ............ 69
Figure 6.1: Proportion of the working age population outside the labour force (14-64 years) ................ 75
Figure 6.2: Map showing variations in the proportion of the working age population outside the labour 75
Figure 6.3: The Labour force framework, 2016/17 (Numbers, ‘000) ....................................................... 80
Figure 7.1: Proportion of persons engaged in UCW by sex and age group, (5+ years) ......................... 82
Figure 7.2: Distribution of UCW by type and sex, (5+ years, Percent) .................................................... 83
Figure 7.3: Activity status of persons engaged in UCW (5+ years, percent) ........................................... 85
Figure 8.1: Industry of the main job of the employed youth (18-30 years) by sex ................................... 91
Figure 8.2: Percentage distribution of Youth by basis of employment .................................................... 95
Figure 8.3: Labour Force status of the Youth population (18-30 years) by sex and residence ............... 99
Figure 8.4: Youth Labour Force Framework .......................................................................................... 102
Figure 8.5: Proportion of youth in subsistence agriculture production only by sex and residence (%) . 103
Figure 9.1: Working and Schooling status by age ................................................................................. 112
Figure 9.2: Children Involvement in household Chores by Sex and Residence ................................... 112
Figure 9.3: Children Involvement in household chores by regions ........................................................ 113
Figure 9.4: Distribution of children’ involvement in work, household chores and schooling ................. 113
Figure 9.5: Proportion of working children 5-17 years ........................................................................... 114
Figure 9.6:Distinction between child labour and other forms of work .................................................... 116
Figure 9.7: Components of child labour (12-17 years) .......................................................................... 120
Figure 9.8: Child Work and Child Labour Framework (5-17 Years) ...................................................... 120

Page | xii
EXECUTIVE SUMMARY
The National Labour Force Survey (NLFS) 2016/17 aimed at generating high quality data on
Labour Market Indicators in Uganda following current international standards. Specifically, the
survey was to provide information on the labour force status of the population; provide measures
of under-utilisation, nature of employment (whether formal or informal) and to generate and
build trend on labour market indicators over time. This survey adopted the 2013 resolution
concerning statistics of work, employment and labour underutilization by the 19th International
Conference of Labour Statisticians (ICLS) which had significant adjustments in the
measurement of employment and unemployment statistics. However, the measurement of
activities of children including child labour was based on the old concepts of work statistics
(especially, the 13th & 16th ICLS resolutions). The NLFS 2016/17 stratified the country into seven
statistical regions.
The NLFS 2016/17 estimated the total population of Uganda at nearly 38 million people, with a
proportion of females at 51 percent. The biggest proportion of the population were children aged
0-17 years who accounted for 56 percent. The survey estimated prevalence of disability among
all persons aged five years and above at about 19 percent. The working age population (14-64
years) was estimated at nearly 19 million with more females than males (52 and 48 percent
respectively). Among the working age population, 81 percent were engaged in at least some
form of work while 19 percent were not engaged in any form of work. About 27 percent were in
purely subsistence agriculture work. The mean age of the working age population was 30 years
and about the same for males and females.
Employed population was about 9.0 million, indicating that total Employment-to-Population
Ratio (EPR) was about 48 percent with about 16 percentage point difference between the
proportion of males and females who were employed. The population engaged in subsistence
agriculture work was about 41 percent of the working population. About 10 percent of the
employed population did not possess any formal education while 67 percent did not have any
trade or technical skills or specialisation. Status in employment showed that Self-employment
which constitutes own account workers, employers and contributing family workers formed the
majority of the employed, with a proportion of 56 percent.
Services and Agriculture, forestry and fishing industry provided about the same employment
share of 42 percent and 41 percent respectively while Production employed about 16 percent.
By occupation, most people were employed as skilled agricultural, forestry and fisheries workers
(31 percent) followed by Service work (23 percent). About six percent of the employed
population was holding professional jobs. On average, the daily actual hours worked by
employed persons on their main job was seven hours while those employed on secondary jobs
had five hours.
The median monthly earnings of persons in cash paid employment was 190,000/= (one hundred
ninety thousand shillings only). The median monthly earnings for males was 240,000/= and that
of females was 120,000/=. Elementary occupation workers and Agriculture workers were the
least paid, with median monthly salaries/wages at 96,000/= and 100,000/= respectively.

Page | xiii
Informal employment outside Agriculture was 85 percent. Although, the region with the highest
proportion of informal employment was Central (77%), all other regions exhibited over 80
percent informal employment.
Persons in self-employment faced a number of challenges, mostly hash weather (26 percent)
followed by limited financial resources (25 percent).
Labour under-utilisation manifests itself with a number of components. However, the composite
measure of labour under-utilisation (LU4) which is composed of the sum of the population in
time-related underemployment, unemployment and the potential labour force as proportion of
the extended labour force was 35 percent. The four components of under-utilisation include:
The unemployment rate (LU1) which was about 10 percent with female unemployment rate (11
percent) being higher than that of the male population (eight percent); Out of the 9.0 million
employed persons, 12 percent (about 1.1 million in absolute numbers) were in time related
underemployment. The combined rate of unemployment and persons classified in time related
underemployment as a proportion of the labour force (LU2) was found to be 20 percent.
When unemployment and potential labour force is combined and expressed as a proportion of
the extended labour force, the result is LU3 which was estimated to be 18 percent countrywide
but higher in rural areas (22 percent) than in urban areas (10 percent).
The survey estimated total labour force of about 9.9 million people of which 55 percent were
males and 66 percent were resident in rural areas. The overall Labour Force Participation Rate
(LFPR) was 53 percent.
Out of the population of about 19 million aged 14-64 years, about 45 percent (9.9 million people)
were not in the labour force (economically inactive). Among females, the proportion was 55
percent while among males it was 39 percent. Inactivity can be as a result of not seeking work,
not being available for work or both. Discouragement was the main reason reported by the
inactive population for not being available for work with a proportion of 60 percent, where as the
main reason for not seeking work was being in school or training (33 percent).
The NLFS 2016/17 made deliberate effort to recognize UCW and its contribution to the economy
by analysing, producing and disseminating statistics on UCW by both women and men, making
gender inequalities in UCW visible. About nine in every ten females (88 percent) were engaged
in UCW compared to six in every ten males (64 percent). Overall, the population aged 5 years
and above spent an average of 16 hours a week on UCW. However, the female youth spent an
average of 26 hours a week compared with 11 hours for their male counterparts.
Uganda has a sizable proportion of the youth population (18-30 years). Youth population was
about 7.7 million (21 percent of total population) of which 11 percent were currently attending
school.
About 50 percent of the youth were employed with more males (60 percent) than females (45
percent) in employment including only three percent of the youth combining employment and
schooling. The youth Labour Force Participation Rate (LFPR) was 59 percent with higher

Page | xiv
proportion of males (68 percent) than females (52 percent). This is the measure of the extent to
which the current youth population is economically active.
The youth EPR which is the proportion of youth aged 18-30 years that was employed. The youth
EPR was 50 percent, with males accounting for 59 percent and females for 42 percent. The
largest proportion (46 percent) of the employed youth were working in the service industry. By
occupation, the proportion of youth employed as professionals was about six percent. Among
the employed youth, 91 Percent were in informal employment while 69 percent were satisfied
with their current main jobs. The majority of the youth (79 percent) were employed on the basis
of oral agreement.
Youth unemployment rate (LU1) was 13 percent while the aggregate under-utilisation rate (LU4)
was 38 percent. The Proportion of the youth population outside the labour force was 43 percent
Labour market transition which is the passage of a young person from the end of schooling (or
entry to first economic activity) to the first stable or satisfactory job was measured during the
survey. About 27 percent of the youth had transited into the labour market either in satisfactory
employment (19 percent) or stable employment (nine percent). Majority of the youths (62
percent) were in transition and nine percent had not started the transition.
Understanding children’s activities in the labour is essential for policy. The survey estimated a
population of about 12.5 million children (aged 6-17 years). Among these, six percent were
exclusively engaged in work activities and 60 percent were exclusively attending school.
However, children engaged in child labour was estimated to be a total of 2,059,000, constituting
15 percent of all children nationally. About 2.0 million were children aged 5-11 years. It should
be noted that these estimates are lower bound estimates because they do not include children
involved in the "unconditional worst forms" of child labour. However, looking at contributors of
child labour, Hazardous work contributed 22 percent of child labour for children 12-17 years.

Page | xv
LIST OF ACRONYMS
BTVET Business, Technical, Vocational Education and Training
EA Enumeration Area
EPR Employment-to-Population Ratio
HH Households
ICLS International Conference of Labour Statisticians
ILO International Labour Organisation
ISCO International Standard Classification of Occupations
ISIC International Standards Industrial Classifications
LU Labour Underutilisation
LFPR Labour Force Participation Rate
NLFS National Labour Force Survey
NLF&CAS National Labour Force and Child Activities Survey
NPHC National Population and Housing Census
SDGs Sustainable Development Goals
SNA System of National Accounts
UBOS Uganda Bureau of Statistics
UCW Unpaid Care Work
ULFS Urban Labour Force Survey
UNHS Uganda National Household Surveys
URSB Uganda Registration Services Bureau
Page | 1
CHAPTER ONE: INTRODUCTION
1.0 Background
Statistics on Labour are critical in the measurement of economic growth and
development of a country. These statistics provide indicators of the labour market
that support detailed analysis of the relationships between employment, income and
other socio-economic variables necessary for planning and monitoring Government
programmes on employment, training and the general livelihood of the population.
Information on wages collected from the labour force survey is essential to evaluate
the living standards and conditions of work and life of persons in paid employment.
To support generation of detailed labour market indicators, the Uganda Bureau of
Statistics (UBOS) initiated a stand-alone National Labour Force Surveys (NLFSs) in
2011/12. Before then, the main source of labour market indicators was the National
Population and Housing Census, the Annual Urban Labour Force Surveys – ULFS
(only for the greater Kampala area) and labour force modules in the Uganda National
Household Surveys (UNHS). However, the 2016/17 NLFS was the second National
Labour Force Survey after the NLFS 2011/12. The 2016/17 survey adopted the 2013
resolution concerning statistics of work, employment and labour underutilization by
the 19th International Conference of Labour Statisticians (ICLS) which had significant
adjustments in the measurement of employment and unemployment statistics.
1.1 Survey objectives
The NLFS 2016/17 aimed at generating quality data on Labour Market Indicators in
Uganda in accordance with current international standards.
The specific objectives of the survey were:
a) to provide information on the labour force status of the population;
b) to measure underutilisation, formal and informal employment; and
c) to generate and build a trend on – labour market indicators over time.
1.2 Policy Environment
The Second National Development Plan (NDP II) for Uganda identifies non-stable
sources of income and the high level of urban unemployment as some of the binding
constraints hindering the growth and development of the country to a middle income
status by 2020. In order to address these Labour market concerns, the Bureau found
it important to evaluate the public’s knowledge of the various laws and exiting
policies for monitoring changes in the welfare of the population overtime. Hence, the
2016/17 NLFS collected data on some of these laws and policies that have strong
bearing to the Labour Market Conditions in the country, including:
Page | 2
(a) Employment Act No. 6 of 2006
The Uganda Employment Act 2006 was “to revise and consolidate the laws
governing individual employment relationships, and to provide for other connected
matters”. A bill from this act is before the 10th Parliament for approval.
(b) The Workers Compensation Act Cap. 225 of 2000
The Workers Compensation Act Cap. 225 gives employees automatic compensation
for any personal injury from an accident arising out and in the course of his work.
The Act further details that, for an injury that leads to death, the compensation should
be equivalent to an employer’s monthly pay multiplied by 60 months. Based on the
act, compensation in case of occupational injury is automatic.
(c) The Occupational Safety and Health Act No. 9 of 2006
The Act applies health and safety measures to every workplace or working
environment as defined in Section 2 of the Act and covers both the private and public
sector Employers. The Act necessitates that the Employer provides compensation
for any injuries sustained, diseases contracted or death suffered in the course of and
as a result of employment. It also provides for general health and welfare provisions,
including the provision of sound construction sites, proper ventilation of working
environment, cleanliness, proper lighting, water, toilet services and first aid facilities
for the workers. The Act applies to all Workers and Employers but excludes Men and
Officers of the Armed Forces.
(d) The Labour Unions Act No. 7 of 2006
Under the Labour Unions Act No. 7 of 2006, employees are granted the right to
organise themselves into Labour Unions and participate in the management of the
said unions; collectively bargain; engage in other lawful activities for the purpose of
collective bargaining or any other mutual aid practice; and withdraw their labour and
take industrial action. Employers are also prohibited from interfering with the right of
association of the different Unions; contravention of this legal position is an offence
on the part of the Employer according to Section 5 of the Act.
(e) The Labour Disputes (Arbitration & Settlement) Act No. 8 of 2006
The main purpose of this Act is to provide for avenues of resolving disputes involving
workers. The Act provides for the establishment of the Industrial Court, which is
mandated to arbitrate on labour disputes and to adjudicate upon questions of Law
and fact arising from references to the Industrial Court by any other Law. The Act
also provides for other dispute resolution mechanisms such as references to the
Labour Officer or a board of inquiry.

Page | 3
(f) The Minimum Wages Advisory Boards and Wages Councils Act
Cap.164 of 1964
This Act provides for the establishment of Minimum Wages Advisory Boards and
Wage Councils, and for the regulation of the remuneration and conditions of
employment of Employees.
(g)Business, Technical, Vocational Education and Training (BTVET) Act
2008
The BTVET Act was put in place to address the redundancy of the different
institutions for vocational training in Uganda and unemployment that was resultant
from the scholar-oriented education system that provided minimal or no practical
skills for students.
(h) The Employment (Recruitment of Ugandan Migrant Workers
Abroad) Regulations, No. 62 of 2005
The main objectives of these regulations as per Section 2 are to promote full
employment and equality of employment opportunities for all and to uphold the
dignity and rights of Ugandan migrant workers; to allow deployment of Ugandans to
countries which have existing labour and social laws or are signatories to
international agreements protecting the rights of migrants; to protect every Ugandan
desiring to work abroad by securing the best possible terms and conditions of
employment; to provide a mechanism for issuing licenses to recruitment agencies.
(i) National Youth Policy, 2001
The Policy recognises the right of youth to seek meaningful employment without
discrimination.
(j) National Employment Policy, 2011
The Policy sets to stimulate Government objectives and processes for generating
jobs and ensuring a better employment environment for all workers.
(k) National Development Plan II
The National Development Plan (NDP) II prioritised the question of job creation and
employment. Evidence of this is shown by the theme of the development plan which
is “Growth, Employment and Socio-Economic Transformation for Prosperity”.
1.3 Sample design
1.3.1 Sample Size and allocation
The survey based on two key variables for the design. The variables are the
unemployment rate and the proportion of persons in paid employment. Based on the

Page | 4
available information; the design used a conservative Deft of 1.6 for the national and
regional samples (except for North Eastern where Deft of 1 was used) for
unemployment and Deft of 2 for proportion in paid employment. The Deft shows how
much the sample standard error, and consequently the confidence intervals,
increases. Thus, how many times as large as they would for a simple random
sample.
As noted by Vijay VERMA (Sampling elusive populations: Applications to studies of
child labour, 2013), using fewer larger areas tends to reduce efficiency of the sample
(larger design effects). However, in general, for a well-designed study, the design
effect usually ranges from 1 to 3 (Gene Shackman, 2001).
A sample size of 360 EAs was selected for the survey. A sample of 15 HHs per EA
was used with power allocation (power of 0.2) adjusted for Kampala & Peri-Urban
Kampala. The number of households in each region (from NPHC 2014) was the
measure of size per stratum resulting to 5400HHs and 4105 expected completed
cases of individuals aged 14-64 years nationally. The sample allocation per stratum
as well as the expected precision levels are presented in the table below;
Table 1.1: Expected Precision for reference indicators
Sample Allocation
Expected Precision for unemployment rate
Expected Precision for proportion in paid employment
SN Strata
No. of
EAs Sample
HHs
Expected Individuals
14-64
Expected RSE for UNEMP LCL UCL
Expected RSE for Pd
EMP LCL UCL
1 Kampala 50 750 570 20.7 5.6 13.4 7.3 48.3 64.9
2 Peri-Urban Kampala
50 750 570 27.5 2.5 8.7 9.1 37.5 54.1
3 Central* 54 810 616 16.7 8.7 17.3 9.6 33.3 49.1
4 Eastern 58 870 662 19.8 5.4 12.6 7.3 45.4 61.0
5 Northern** 53 795 604 20.6 5.4 12.8 9.0 37.1 53.3
6 Karamoja 36 540 410 29.1 1.2 4.4 14.1 23.7 42.3
7 Western 59 885 673 18.2 6.6 14 7.8 41.9 57.3
Uganda 360 5400 4105 7.8 7.9 10.9 3.3 44.3 50.5
*The Central region excludes Kampala and the Peri-Urban Kampala; ** Northern region excludes Karamoja region
The composition of the two regions of Kampala and Peri-Urban Kampala are based
on the two strata usually covered under the Urban Labour Force Surveys, as shown
in Table 1.2. As such, the Central region includes all districts in Central Uganda
except Kampala and Peri-Urban Kampala. Similarly, the Northern region excludes
all the districts that form Karamoja region. The detailed composition of each region
as of 2016/17 is presented as a map in Figure 1.

Page | 5
Table 1.2: Composition of Kampala and Peri-Urban Kampala
Stratum Districts Sub-counties/Divisions
Kampala City Kampala All Divisions
Peri-Urban Kampala Wakiso Katabi
Wakiso Nsangi
Wakiso Ssisa
Wakiso Wakiso
Wakiso Wakiso T.C.
Wakiso Entebbe Division A
Wakiso Entebbe Division B
Wakiso Kiira
Wakiso Nabweru
Wakiso Nangabo
Wakiso Ssabagabo-Makindye
Mukono Goma
Mukono Mukono Town. Council.
Mukono Nama
1.3.2 Sample selection procedures
The primary indicator used for selection in the Labour force Surveys is usually the
unemployment rate. However, a labour force survey is a multi-indicator survey and
a number of indicators should be considered in determining the sample size. In
addition, the desired domains of the study should be considered putting into account
the precision requirements, cost considerations and the implementation
infrastructure available.
However, to achieve the final sample size, non-response should also be taken into
account. During the National Labour force Survey 2016/17, the following were the
key considerations in determining the sample size;
i. Seven domains as strata with implicit stratification for residence (rural /urban);
ii. Two reference indicators, namely; the Proportion of the population in paid
employment and Unemployment rate for the population aged 14-64 years;
and
iii. The measure of size (Household distribution by strata) ranging between 2.3
percent and 26.2 percent.

Page | 6
Table 1.3 Measure of size
STRATA PROPORTION*
Kampala 0.057
Peri-Urban Kampala 0.088
Central 0.170
Eastern 0.239
Northern 0.161
Karamoja 0.023
Western 0.262
Total 1.000
*Measure of size is the number of households in the strata (from NPHC 2014).
Kampala and Peri-Urban Kampala are desired for comparison with previous 2011/12
National Labour Force & Child Activities Survey as well as the Annual Urban Labour
Force Surveys.
1.3.3 Scope and Coverage
The NLFS 2016/17 covered the entire country. The sample was nationally
representative and scientifically chosen using probability proportional to size to
determine the distribution of the sample in each stratum.
In 2011/12, the sample size was 600 EAs from which 7,200 households were
expected. The survey was designed to allow for estimation of key labour market
indicators for 8 Statistical domains of study. In order to facilitate comparability with
the 2016/17 Labour market indicators, some of the domains of the NLFS 2011/12
were merged to form seven domains which are consistent. Therefore, the NLFS
2016/17 results were disaggregated using the following 7 domains; Kampala, Peri-
Urban Kampala, Eastern, Central, Northern, Karamoja and Western, as indicated in
figure 1 below.

Page | 7
Figure 1: Map showing the 7 Domains of the NLFS 2016/17
Page | 8
1.4 Survey Implementation
A centralized approach was employed during data collection whereby nine field
teams hired at the headquarters were dispatched to different sampled areas. Each
team comprised of one Supervisor, three to four Enumerators and a Driver. The field
interviewers were recruited based on fluency of local language spoken in the
respective regions of deployment. The field data collection commenced in the month
of November 2016 and was completed in June 2017
1.4.1 Questionnaire design and Pre-test
The NLFS used both detailed paper questionnaire and CAPI (Computer Aided
Personal interviews). CAPI was the main mode of interviews adopted. The
questionnaire was developed by UBOS in consultation with other stakeholders in the
sector. The instruments alongside the programmes on the CAPI devices were pre-
tested to ensure logical understanding of both the questions and the coding system
hence collect the desired information. The 2016/17 NLFS questionnaire collected
information on the following broad topics;
i. Identification particulars and eligibility of household members
ii. Household characteristics
iii. Personal and household information
iv. Identification of persons currently employed
v. Characteristics of main job/activity
vi. Multiple job holders and characteristics of secondary activity
vii. Income from employment
viii. Hours of work for employed persons
ix. Time related underemployment and inadequate employment
x. Unemployed and persons not in the labour force
xi. Usual activity status
xii. Health and safety issues
xiii. household Chores and
xiv. Non-cropping household enterprises/activities
xv. Labour outflows
The reference period for work was one week, that is, seven days prior to the date of
interview. However, some questions required recall over longer periods, such as job
search activity in the past four weeks, duration of unemployment, and usual activity
with a reference period of the previous 12 months.
1.4.2 Field Staff Training
Upon finalisation of the recruitment process, a team of 36 field staff were identified
for the NLFS. Most of them were experienced interviewers in survey data collection.
A 15 day rigorous training was conducted for all the field staff. A number of training
approaches were used and these included: lectures and presentations in which

Page | 9
survey objectives and key definitions and concepts were discussed. Questionnaire
item verifications and cross-linkages with the instruction manual; guest speaker
presentations of the need for data for existing government programmes and
descriptions of the current situations; open discussions including translations; field
practice and pretesting. As part of training, a field practice exercise was conducted
in selected EAs of Kampala and Entebbe.
1.4.3 Data collection
Having completed training of field staff, logistics were assembled in preparation for
data collection. The data collection lasted a period of eight months (November 2016-
June 2017). Data collection was done through face to face interviews with the use
of computer assisted personal interview (CAPI).
1.4.4 Publicity
The NLFS was widely publicized by the Bureau in preparation for the actual data
collection. Publicity was done through both radio and TV talk shows in addition to
organizing publicity field trips were the local leadership in which the sample fell were
briefed and given detailed information about the survey. This was conducted before
the arrival of the data collection teams in the Enumeration Areas.
1.5 Data management
The 2016/17 NLFS used a computerized system of data collection whereby field staff
directly captured information using CAPI during data collection. A data entry platform
developed in CSPro was up loaded on the CAPI with inbuilt range and consistency
checks to ensure good quality data. Once data collection for a household was
completed, it was verified by the field supervisors and synchronized to the UBOS
server for storage.
Data cleaning and validation was adequately done from office were characters that
had been wrongly captured in the data were corrected using editing guidelines
provided by the flow charts on analysing labour indicators in the revised framework.
All the data verification was done using the STATA Statistical Software. The data
was finally analysed and generation of statistical tables was conducted to facilitate
the report writing process.
1.6 Response rate
A summary of response rates from the household interviews is shown in Table 1.4.
Out of the 360 Enumeration Areas (EAs) sampled, three of them were not covered
leaving 357 EAs in the sample with sampled households of 5,355. Interviews were
fully completed in 4,838 households and partially done in 49 households. These
formed an adequate number for analysis resulting in a household response rate of
91 percent. In urban areas, interviews were completed in 1,940 households while in
30 households’ interviews were partially done giving a response rate of 85 percent.
In rural areas, interviews were fully completed in 2,898 households and partially

Page | 10
completed in 19 households resulting in a response rate of 96 percent in rural areas.
The main reason for non-response was failure by interviewer to find respondents at
home after at least three visits to the household.
Table 1.4: Household response rate
Response Number Proportions
Rural Urban Total Rural Urban Total
Completed (fully responded) 2898 1940 4838 97.4 93.2 90.3
Partly completed 19 30 49 0.6 1.4 0.9
Non-contact 96 278 374 3.2 13.4 7.0
Refused
24 27 0.1 1.2 0.5
Temporarily absent 17 19 36 0.6 0.9 0.7
Vacant or demolished dwelling 11 6 17 0.4 0.3 0.3
Listing error 2 5 7 0.1 0.2 0.1
Other reasons: 5 2 7 0.2 0.1 0.1
Total 2,974 2,081 5,355 100 100 100
1.7 Challenges
The 2016/17 NLFS had a few limitations as presented below:
1.7.1 Sample Survey
A sample survey cannot generate district level estimates. To obtain estimates at
district level, the survey would have required about 10 times the size of the current
sample. The results are, therefore, representative up to seven regions. The regions
are Northern, Karamoja, Eastern, Western, Buganda, Kampala and Peri-Urban
Kampala.
1.7.2 Coverage
The survey was limited to only the household population and did not cover
institutions and persons with no fixed locations of residence.
1.7.3 Administratively
The survey was fully funded by the Government of Uganda. The main challenge
was that competing activities in the Bureau also required vehicles, hence slowing
down data collection phase.
Despite the challenges, the survey findings present reliable indicators on the existing
labour market situation in the country.

Page | 11
1.8 Report structure
This report presents findings on the current labour market situation based on the
data from the 2016/17 NLFS. The report is structured into ten chapters. Chapter 1
presents the background of the survey alongside the sample allocation procedure
used during the survey implementation. Chapter 2 provides information on the
characteristics of the population and the households. Characteristics of the working
age population (14-64 years) are provided in Chapter 3. Chapter 4 details survey
findings of the working population while showing their characteristics including the
characteristics of their working environment. The concept that sets the framework
for labour force is employment and given that employment is one form of work, it is
presented as part of Chapter 4 of this report. Labour under-utilisation (LU) which
refers to the mismatches between labour supply and demand is detailed in the
5thchapter with its four components. The employed population together with the
unemployed population is referred to us the Labour force and statistics about the
labour force is presented in Chapter 6. In addition Chapter 6 also discusses
characteristics of the population which was outside the labour force. This is followed
by a discussion of unpaid care work in Chapter 7. Part of the working age population
which is very vibrant but that requires proper planning to harness their potential is
the youth population. The labour conditions of the youth population (18-30 years)
are discussed in Chapter 8 followed by a concluding chapter on activities of children
(5-17 years) presented in Chapter 9 including child labour. Gender issues have been
discussed as cross-cutting variable within the different chapters of the report.

Page | 12
CHAPTER TWO: BACKGROUND CHARACTERISTICS
2.0 Introduction
This chapter covers the characteristics and distribution of the general population of
Uganda.
2.1 Population size
According to the National Labour Force Survey (NLFS) 2016/17, the total population
of Uganda was estimated at nearly 38 million people. As presented in Table 2.1,
seventy six percent (76 Percent) of the population lived in rural areas. Only four
percent of the total population was resident in Kampala.
The biggest proportion of the population was children aged 0-17 years who
accounted for 56 percent. The proportion of male children were slightly higher (57
percent) compared to the proportion of female children (54 percent).
The findings further revealed that 17 percent of the population was aged 15-24 years
and the proportions among males and females were nearly the same.
Table 2.1: Population Distribution by Residence, Region, Age and Sex
Background Characteristic Male Female Total Number (‘000)
Residence
Rural 76.8 76.0 76.4 28,822
Urban 23.2 24.0 23.6 8,907
Region
Kampala 4.4 4.2 4.3 1,610
Peri-urban Kampala 4.3 4.6 4.5 1,685
Central 19.9 18 18.9 7,143
Eastern 20.6 20.8 20.7 7,820
Karamoja 4.2 4.6 4.4 1,669
Northern 21.8 21.5 21.7 8,169
Western 24.7 26.3 25.5 9,633
Age-groups
0-17 56.8 54.3 55.5 20,957
18-30 19.1 21.9 20.5 7,741
31-59 19.8 19.1 19.4 7,336
60+ 4.2 4.7 4.5 1,696
15-24 16.8 17.7 17.3 6,514
15-35 30.9 32.7 31.9 12,018
14-64 41.7 41.8 41.8 18,843
Disability status
With Disability 17.3 19.8 18.6 5,551
Without Disability 82.7 80.2 81.4 24,335
Total (Percent) 48.7 51.3 100
Total Population ('000) 18,379 19,351 37,730
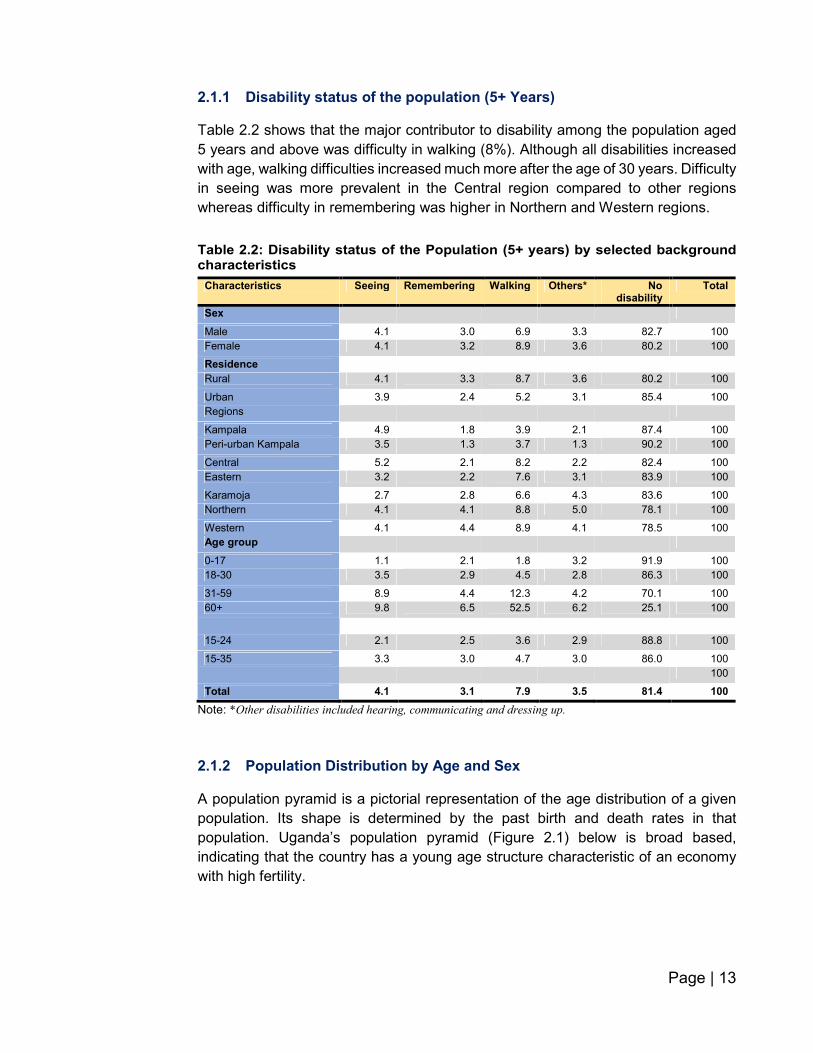
Page | 13
2.1.1 Disability status of the population (5+ Years)
Table 2.2 shows that the major contributor to disability among the population aged
5 years and above was difficulty in walking (8%). Although all disabilities increased
with age, walking difficulties increased much more after the age of 30 years. Difficulty
in seeing was more prevalent in the Central region compared to other regions
whereas difficulty in remembering was higher in Northern and Western regions.
Table 2.2: Disability status of the Population (5+ years) by selected background characteristics
Characteristics Seeing Remembering Walking Others* No disability
Total
Sex
Male 4.1 3.0 6.9 3.3 82.7 100
Female 4.1 3.2 8.9 3.6 80.2 100
Residence
Rural 4.1 3.3 8.7 3.6 80.2 100
Urban 3.9 2.4 5.2 3.1 85.4 100 Regions
Kampala 4.9 1.8 3.9 2.1 87.4 100 Peri-urban Kampala 3.5 1.3 3.7 1.3 90.2 100
Central 5.2 2.1 8.2 2.2 82.4 100 Eastern 3.2 2.2 7.6 3.1 83.9 100
Karamoja 2.7 2.8 6.6 4.3 83.6 100 Northern 4.1 4.1 8.8 5.0 78.1 100
Western 4.1 4.4 8.9 4.1 78.5 100 Age group
0-17 1.1 2.1 1.8 3.2 91.9 100 18-30 3.5 2.9 4.5 2.8 86.3 100
31-59 8.9 4.4 12.3 4.2 70.1 100 60+ 9.8 6.5 52.5 6.2 25.1 100
15-24 2.1 2.5 3.6 2.9 88.8 100
15-35 3.3 3.0 4.7 3.0 86.0 100 100
Total 4.1 3.1 7.9 3.5 81.4 100
Note: *Other disabilities included hearing, communicating and dressing up.
2.1.2 Population Distribution by Age and Sex
A population pyramid is a pictorial representation of the age distribution of a given
population. Its shape is determined by the past birth and death rates in that
population. Uganda’s population pyramid (Figure 2.1) below is broad based,
indicating that the country has a young age structure characteristic of an economy
with high fertility.

Page | 14
Figure 2.1: Population pyramid based on the Age-Sex structure of the population
According to Figure 2.2 there are more boys for the age group 0-4, meaning more
boys are born compared to girls. However from age group 5-9 there are more
females than males, meaning more females survive beyond age five.
Figure 2.2: Sex Ratios by five year age groups
12 10 8 6 4 2 0 2 4 6 8 10 12
0-4
5-9
10-14
15-19
20-24
25-29
30-34
35-39
40-44
45-49
50-54
55-59
60-64
65-69
70-74
75-79
80+
Male Female
96.2 101.9
105.7 103.7
121.5 120.9
101.5
113.0
90.4 92.4
130.6
105.3
95.2
140.4
109.5
142.2
115.4 121.8
161.7
-
30.0
60.0
90.0
120.0
150.0
180.0
Sex r
atio
Age groups
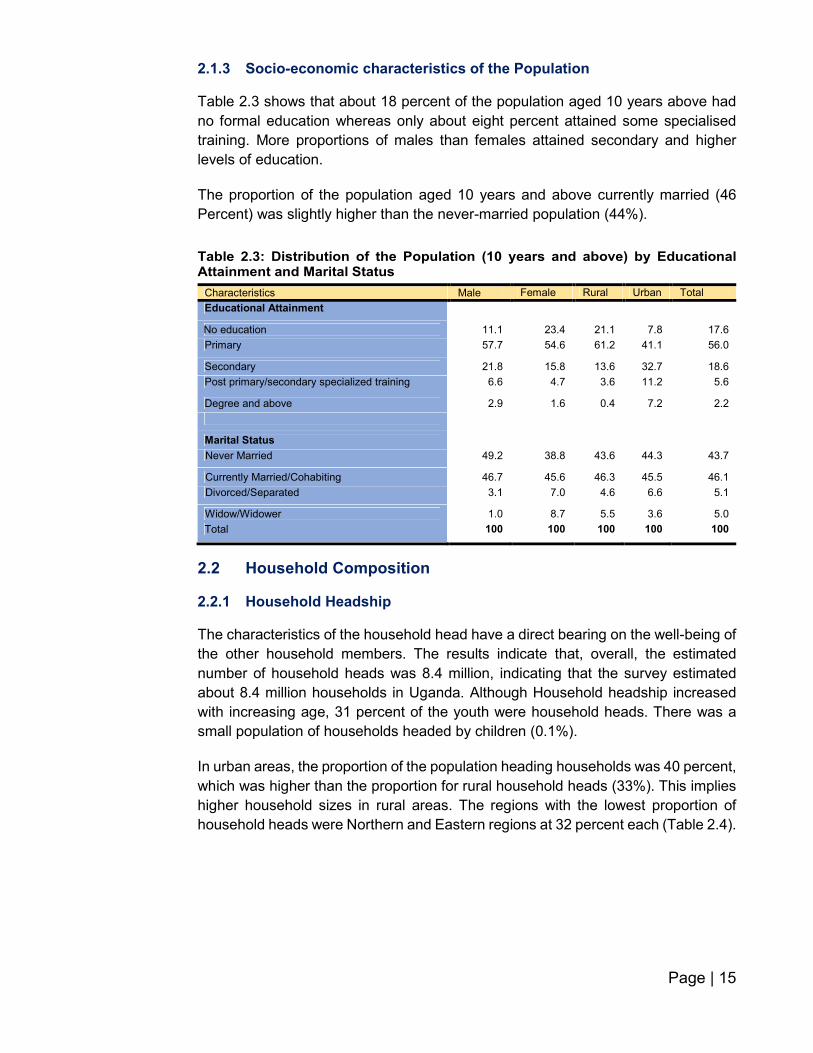
Page | 15
2.1.3 Socio-economic characteristics of the Population
Table 2.3 shows that about 18 percent of the population aged 10 years above had
no formal education whereas only about eight percent attained some specialised
training. More proportions of males than females attained secondary and higher
levels of education.
The proportion of the population aged 10 years and above currently married (46
Percent) was slightly higher than the never-married population (44%).
Table 2.3: Distribution of the Population (10 years and above) by Educational Attainment and Marital Status
Characteristics Male Female Rural Urban Total
Educational Attainment
No education 11.1 23.4 21.1 7.8 17.6
Primary 57.7 54.6 61.2 41.1 56.0
Secondary 21.8 15.8 13.6 32.7 18.6
Post primary/secondary specialized training 6.6 4.7 3.6 11.2 5.6
Degree and above 2.9 1.6 0.4 7.2 2.2
Marital Status
Never Married 49.2 38.8 43.6 44.3 43.7
Currently Married/Cohabiting 46.7 45.6 46.3 45.5 46.1
Divorced/Separated 3.1 7.0 4.6 6.6 5.1
Widow/Widower 1.0 8.7 5.5 3.6 5.0
Total 100 100 100 100 100
2.2 Household Composition
2.2.1 Household Headship
The characteristics of the household head have a direct bearing on the well-being of
the other household members. The results indicate that, overall, the estimated
number of household heads was 8.4 million, indicating that the survey estimated
about 8.4 million households in Uganda. Although Household headship increased
with increasing age, 31 percent of the youth were household heads. There was a
small population of households headed by children (0.1%).
In urban areas, the proportion of the population heading households was 40 percent,
which was higher than the proportion for rural household heads (33%). This implies
higher household sizes in rural areas. The regions with the lowest proportion of
household heads were Northern and Eastern regions at 32 percent each (Table 2.4).

Page | 16
Table 2.4 Household headship by selected Background Characteristics (10 years and above)
Background Characteristics Household head
Not household head Total
Sex
Male 50.9 49.1 100
Female 19.7 80.3 100
Residence
Rural 32.8 67.2 100
Urban 40.0 60.0 100
Age group
0-17 0.1 99.9 100
18-30 31.4 68.6 100
31-59 63.8 36.2 100
60+ 77.6 22.4 100
Region
Kampala 41.1 58.9 100
Peri-urban Kampala 44.4 55.6 100
Central 38.3 61.7 100
Eastern 32.2 67.8 100
Karamoja 35.5 64.5 100
Northern 31.5 68.5 100
Western 33.3 66.7 100
Total (Percent) 34.6 65.4 100
Total (‘000) 8,431 15,918 24,349
2.2.2 Household size by Socio economic characteristics
The survey results showed that the average household size for the de jure population
(usual household residents) in Uganda was 4.5 persons as indicated in Table 2.5
below. The male headed households have a slightly higher average household size
of 4.8 persons compared to the female headed households with 3.9 persons. The
children (0-17 years) had a bigger composition of average household size compared
to those in the other age groups.
Rural households had higher average household size compared to households in
the urban areas. At the regional level, Karamoja had the highest average household
size of 5.4 persons while Peri-urban Kampala had the least size of 3.3 persons.

Page | 17
Table 2.5 Mean number of Household members by selected Characteristics
Age of Household Members
Characteristics 0-17 18-30 31-59 60+ Household size
Sex of head
Male 2.6 1.0 1.0 0.2 4.8
Female 2.3 0.7 0.7 0.3 3.9
Residence of head
Rural 2.8 0.9 0.9 0.2 4.8
Urban 1.8 1.1 0.8 0.1 3.8
Age of head
0-17 1.1 0.1 0.0 0.0 1.2
18-30 1.6 1.7 0.0 0.0 3.4
31-59 3.1 0.6 1.4 0.0 5.2
60+ 2.0 0.6 0.5 1.2 4.3
Region of head
Kampala 1.5 1.4 0.9 0.1 3.9
Peri-urban Kampala 1.4 1.0 0.8 0.1 3.3
Central 2.2 0.8 0.9 0.2 4.0
Eastern 2.8 0.9 0.9 0.3 4.9
Karamoja 3.4 0.9 0.8 0.3 5.4
Northern 2.9 1.0 0.9 0.2 5.0
Western 2.7 0.9 0.9 0.2 4.7
Total 2.5 0.9 0.9 0.2 4.5
2.2.3 Age Dependency Ratios
The Age Dependency Ratio is an age-population ratio of those not in the working
age group (the dependent ages less than 14and 65+ years) to those in the working
age group (the productive portion of the population, aged 14to 64). This ratio shows
the economic burden of dependency on the productive population.
The overall Age Dependency Ratio was 100.2 per 100 persons aged 14-64 years as
indicated in Figure 2.3. The dependency ratio was much higher in rural (110.4%)
areas than urban areas (73.2%). Regional variations indicate that the Age
Dependency Ration was highest in Karamoja (151.6%) and lowest in Kampala
(48.8%).

Page | 18
Figure 2.3 : Dependency Ratios by sex of household head, residence and regions, 2016/17
The overall dependency ratio almost remained the same the survey years. This
suggests that there was no increase in the working age population to support some
dependents over time.
Figure 2.4: Dependency Ratio by Survey Years
2.2.4 Summary Findings
Total population of Uganda was estimated at nearly 38 million people of which 51
percent were females and 76 percent of the population were rural residents. The
higher proportion of the population were children aged 0-17 years who accounted
for 56 percent which is a characteristic of an economy with high fertility.
The prevalence of disability among persons aged five years and above was about
19 percent. The males had a higher disability prevalence of 20 percent compared to
the females at 17 percent.
95.9
114.1 110.4
73.2
48.861.4
99.4107.3
151.6
107.0 102.7 100.2
0.0
40.0
80.0
120.0
160.0
Ma
le
Fe
ma
le
Rura
l
Urb
an
Ka
mpa
la
Pe
ri-u
rba
n K
am
pa
la
Cen
tra
l
Ea
ste
rn
Ka
ram
oja
Nort
he
rn
Weste
rn
Sex of head Residence Regions Total
100.0
100.2
99.0
100.0
101.0
2011/12 2016/17
Dependency R
atio
Survey year

Page | 19
CHAPTER THREE: THE WORKING-AGE POPULATION (WAP)
3.0 Introduction
The 19thInternational Conference of Labour Statisticians (ICLS) resolutions of 2013
recognise the fact that although the national system of work statistics should cover
the work activities of the population in all age groups, separate statistics are needed
for the working-age population to serve different policy concerns. The working-age
population is the population at the legal working age and above. The lower age limit
is recommended to be set taking into consideration the minimum age for
employment and exceptions specified in national laws or regulations, or the age of
completion of compulsory schooling. For international comparability, the working-
age population is often defined as all persons aged 15 and older but varying
according to country practices and national laws. However, in Uganda like many
developing countries, people start to work at an early age. Putting these factors into
consideration, the working-age for Uganda was set at 14-64 years. However, during
the NLFS 2016/17 implementation, data was collected from all persons aged 5 years
and above to enable compilation of child labour statistics.
3.1 Characteristics of the Working Age Population
As shown in Table 3.1, Uganda’s working age population was estimated at nearly
19 million compared to 15 million in 2011/12. In both years, there were more females
than males (52% of females in 2016/17 and 51% in 2011/12). The biggest proportion
(73%) of the working age population was resident in rural areas in 2016/17.
The proportion of children was 17 percent in 2016/17 lower than it was in 2011/12
(22%).
About 73% of the working age population was residing in rural areas
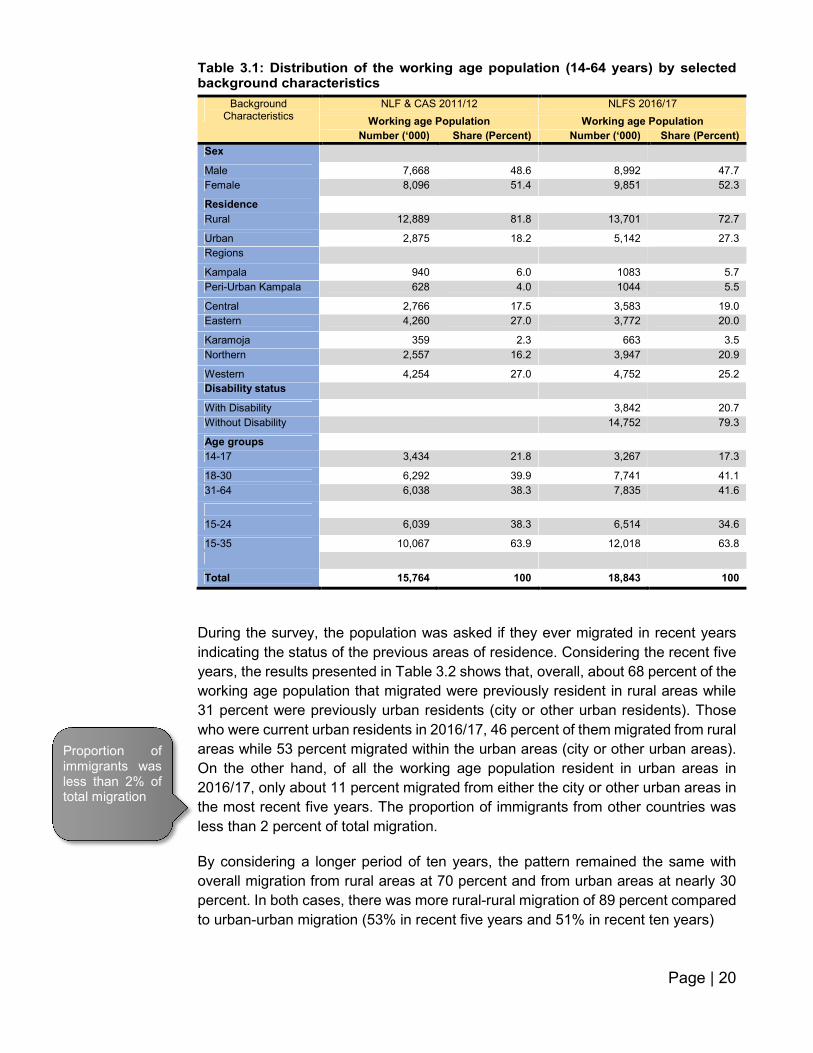
Page | 20
Table 3.1: Distribution of the working age population (14-64 years) by selected background characteristics
Background Characteristics
NLF & CAS 2011/12 NLFS 2016/17
Working age Population Working age Population
Number (‘000) Share (Percent) Number (‘000) Share (Percent)
Sex
Male 7,668 48.6 8,992 47.7
Female 8,096 51.4 9,851 52.3
Residence
Rural 12,889 81.8 13,701 72.7
Urban 2,875 18.2 5,142 27.3
Regions
Kampala 940 6.0 1083 5.7
Peri-Urban Kampala 628 4.0 1044 5.5
Central 2,766 17.5 3,583 19.0
Eastern 4,260 27.0 3,772 20.0
Karamoja 359 2.3 663 3.5
Northern 2,557 16.2 3,947 20.9
Western 4,254 27.0 4,752 25.2
Disability status
With Disability 3,842 20.7
Without Disability 14,752 79.3
Age groups
14-17 3,434 21.8 3,267 17.3
18-30 6,292 39.9 7,741 41.1
31-64 6,038 38.3 7,835 41.6
15-24 6,039 38.3 6,514 34.6
15-35 10,067 63.9 12,018 63.8
Total 15,764 100 18,843 100
During the survey, the population was asked if they ever migrated in recent years
indicating the status of the previous areas of residence. Considering the recent five
years, the results presented in Table 3.2 shows that, overall, about 68 percent of the
working age population that migrated were previously resident in rural areas while
31 percent were previously urban residents (city or other urban residents). Those
who were current urban residents in 2016/17, 46 percent of them migrated from rural
areas while 53 percent migrated within the urban areas (city or other urban areas).
On the other hand, of all the working age population resident in urban areas in
2016/17, only about 11 percent migrated from either the city or other urban areas in
the most recent five years. The proportion of immigrants from other countries was
less than 2 percent of total migration.
By considering a longer period of ten years, the pattern remained the same with
overall migration from rural areas at 70 percent and from urban areas at nearly 30
percent. In both cases, there was more rural-rural migration of 89 percent compared
to urban-urban migration (53% in recent five years and 51% in recent ten years)
Proportion of immigrants was less than 2% of total migration
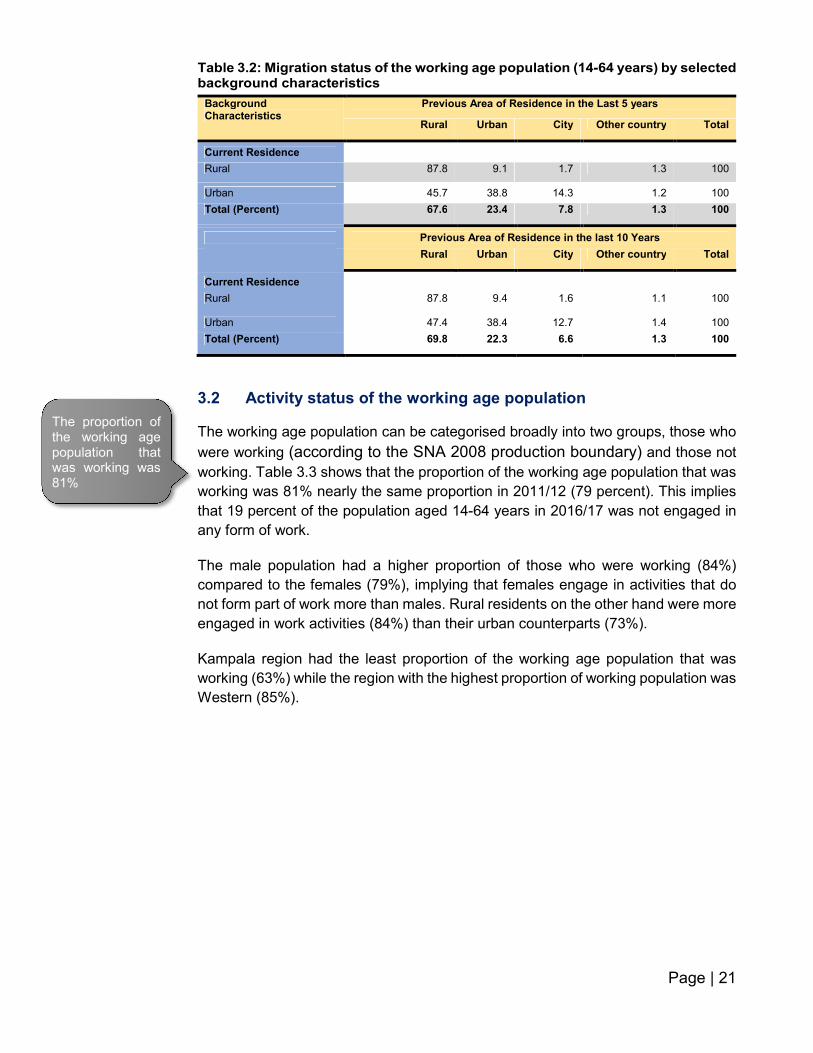
Page | 21
Table 3.2: Migration status of the working age population (14-64 years) by selected background characteristics
Background Characteristics
Previous Area of Residence in the Last 5 years
Rural Urban City Other country Total
Current Residence
Rural 87.8 9.1 1.7 1.3 100
Urban 45.7 38.8 14.3 1.2 100
Total (Percent) 67.6 23.4 7.8 1.3 100
Previous Area of Residence in the last 10 Years
Rural Urban City Other country Total
Current Residence
Rural 87.8 9.4 1.6 1.1 100
Urban 47.4 38.4 12.7 1.4 100
Total (Percent) 69.8 22.3 6.6 1.3 100
3.2 Activity status of the working age population
The working age population can be categorised broadly into two groups, those who
were working (according to the SNA 2008 production boundary) and those not
working. Table 3.3 shows that the proportion of the working age population that was
working was 81% nearly the same proportion in 2011/12 (79 percent). This implies
that 19 percent of the population aged 14-64 years in 2016/17 was not engaged in
any form of work.
The male population had a higher proportion of those who were working (84%)
compared to the females (79%), implying that females engage in activities that do
not form part of work more than males. Rural residents on the other hand were more
engaged in work activities (84%) than their urban counterparts (73%).
Kampala region had the least proportion of the working age population that was
working (63%) while the region with the highest proportion of working population was
Western (85%).
The proportion of the working age population that was working was 81%

Page | 22
Table 3.3: Activity status of the working age population (14-64 years) by selected background characteristics
NLF & CAS 2011/12 NLFS 2016/17
Background Characteristics
Working age Population
Working Population Working age Population
Working Population
Number (‘000) Number
(‘000) Proportion (Percent)
Number (‘000)
Number (‘000)
Proportion (Percent)
Sex
Male 7,668 6,134 80.0 8,992 7,528 83.7
Female 8,096 6,236 77.0 9,851 7,761 78.8
Residence
Rural 12,889 10,507 81.5 13,701 11,525 84.1
Urban 2,875 1,863 64.8 5,142 3,765 73.2
Regions
Kampala 940 585 62.2 1,083 677 62.5
Peri-Urban Kampala 628 399 63.6 1,044 720 69
Central 2,766 2,309 83.5 3,583 2,994 83.6
Eastern 4,260 3,348 78.6 3,772 3,162 83.8
Karamoja 359 274 76.3 663 527 79.4
Northern 2,557 1,959 76.6 3,947 3,169 80.3
Western 4,254 3,495 82.2 4,752 4,041 85
Age groups
14-17 3,434 1,928 56.2 3,267 1,808 55.3
18-30 6,292 4,881 77.6 7,741 6,306 81.5
31-64 6,038 5,561 92.1 7,835 7,176 91.6
15-24 6,039 3,933 65.1 6,514 4,573 70.2
15-35 10,067 7,539 74.9 12,018 9,442 78.6
Total 15,764 12,370 78.5 18,843 15,290 81.1
3.3 The mean age of the Working age population
Figure 3.1 shows that the overall mean age of the working age population was 30
years indicating that the working age population is constituted of mostly the young
people. The mean age of the working population was higher than for the non-working
population indicating that most of the population not working is made of much
younger people. The mean age for working males and females were about the same
(32 years). However, the mean age for non-working females (24 years) was higher
than for non-working males (22 years).
The mean age of the working age population was 30 years, indicating that majority of the working age population are young people

Page | 23
Figure 3.1: Mean Age of the working Age population by Activity Status, 2016/17
3.4 Summary Findings
The population of Uganda that was within the working age group (14-64 years) was
estimated at 19 million people of which 52 percent were female and 48 percent were
male.
The survey findings revealed that about 19 percent of the working age population
(14-64 years) was engaged in some form of work.
The mean age of the working age population was 30 years with the mean age of
non-working females (24 years) higher than for non-working males (22 years).
22.424.2 23.4 23.5 23.5
32.1 31.7 31.9 32 31.930.5 30.1 30.5 29.7 30.3
0
15
30
45
Male Female Rural Urban
Sex Residence Total
Not working Working Total
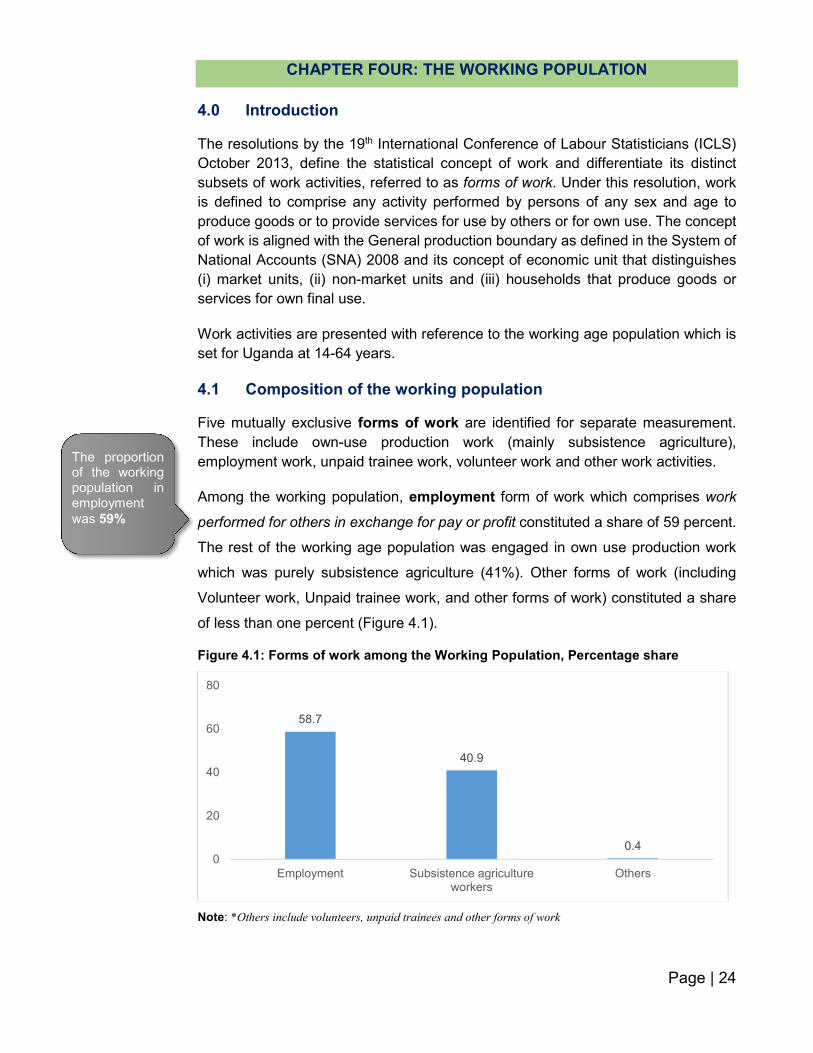
Page | 24
CHAPTER FOUR: THE WORKING POPULATION
4.0 Introduction
The resolutions by the 19th International Conference of Labour Statisticians (ICLS)
October 2013, define the statistical concept of work and differentiate its distinct
subsets of work activities, referred to as forms of work. Under this resolution, work
is defined to comprise any activity performed by persons of any sex and age to
produce goods or to provide services for use by others or for own use. The concept
of work is aligned with the General production boundary as defined in the System of
National Accounts (SNA) 2008 and its concept of economic unit that distinguishes
(i) market units, (ii) non-market units and (iii) households that produce goods or
services for own final use.
Work activities are presented with reference to the working age population which is
set for Uganda at 14-64 years.
4.1 Composition of the working population
Five mutually exclusive forms of work are identified for separate measurement.
These include own-use production work (mainly subsistence agriculture),
employment work, unpaid trainee work, volunteer work and other work activities.
Among the working population, employment form of work which comprises work
performed for others in exchange for pay or profit constituted a share of 59 percent.
The rest of the working age population was engaged in own use production work
which was purely subsistence agriculture (41%). Other forms of work (including
Volunteer work, Unpaid trainee work, and other forms of work) constituted a share
of less than one percent (Figure 4.1).
Figure 4.1: Forms of work among the Working Population, Percentage share
Note: *Others include volunteers, unpaid trainees and other forms of work
58.7
40.9
0.40
20
40
60
80
Employment Subsistence agricultureworkers
Others
The proportion of the working population in employment
was 59%
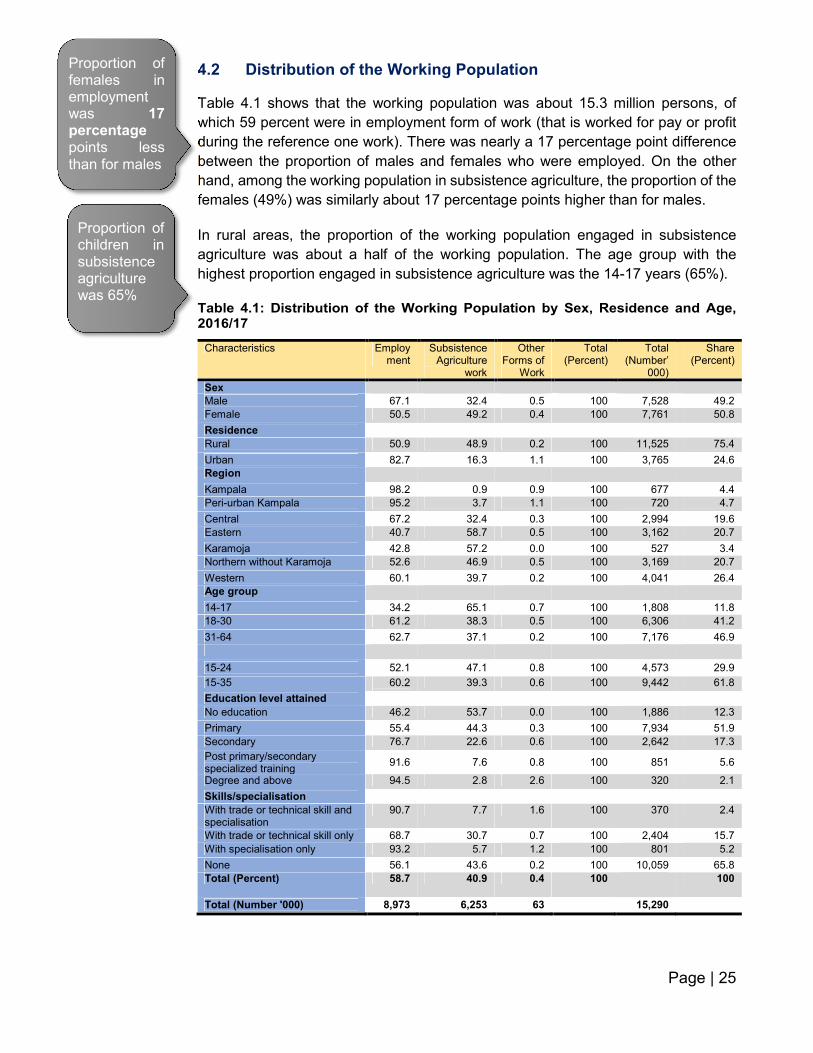
Page | 25
4.2 Distribution of the Working Population
Table 4.1 shows that the working population was about 15.3 million persons, of
which 59 percent were in employment form of work (that is worked for pay or profit
during the reference one work). There was nearly a 17 percentage point difference
between the proportion of males and females who were employed. On the other
hand, among the working population in subsistence agriculture, the proportion of the
females (49%) was similarly about 17 percentage points higher than for males.
In rural areas, the proportion of the working population engaged in subsistence
agriculture was about a half of the working population. The age group with the
highest proportion engaged in subsistence agriculture was the 14-17 years (65%).
Table 4.1: Distribution of the Working Population by Sex, Residence and Age, 2016/17
Characteristics Employment
Subsistence Agriculture
work
Other Forms of
Work
Total (Percent)
Total (Number’
000)
Share (Percent)
Sex
Male 67.1 32.4 0.5 100 7,528 49.2
Female 50.5 49.2 0.4 100 7,761 50.8
Residence
Rural 50.9 48.9 0.2 100 11,525 75.4
Urban 82.7 16.3 1.1 100 3,765 24.6
Region
Kampala 98.2 0.9 0.9 100 677 4.4
Peri-urban Kampala 95.2 3.7 1.1 100 720 4.7
Central 67.2 32.4 0.3 100 2,994 19.6
Eastern 40.7 58.7 0.5 100 3,162 20.7
Karamoja 42.8 57.2 0.0 100 527 3.4
Northern without Karamoja 52.6 46.9 0.5 100 3,169 20.7
Western 60.1 39.7 0.2 100 4,041 26.4
Age group
14-17 34.2 65.1 0.7 100 1,808 11.8
18-30 61.2 38.3 0.5 100 6,306 41.2
31-64 62.7 37.1 0.2 100 7,176 46.9
15-24 52.1 47.1 0.8 100 4,573 29.9
15-35 60.2
39.3 0.6 100 9,442 61.8
Education level attained
No education 46.2 53.7 0.0 100 1,886 12.3
Primary 55.4 44.3 0.3 100 7,934 51.9
Secondary 76.7 22.6 0.6 100 2,642 17.3
Post primary/secondary specialized training
91.6 7.6 0.8 100 851 5.6
Degree and above 94.5 2.8 2.6 100 320 2.1
Skills/specialisation
With trade or technical skill and specialisation
90.7 7.7 1.6 100 370 2.4
With trade or technical skill only 68.7 30.7 0.7 100 2,404 15.7
With specialisation only 93.2 5.7 1.2 100 801 5.2
None 56.1 43.6 0.2 100 10,059 65.8
Total (Percent) 58.7 40.9 0.4 100 100
Total (Number '000) 8,973 6,253 63 15,290
Proportion of females in employment was 17 percentage points less than for males
Proportion of children in subsistence agriculture was 65%
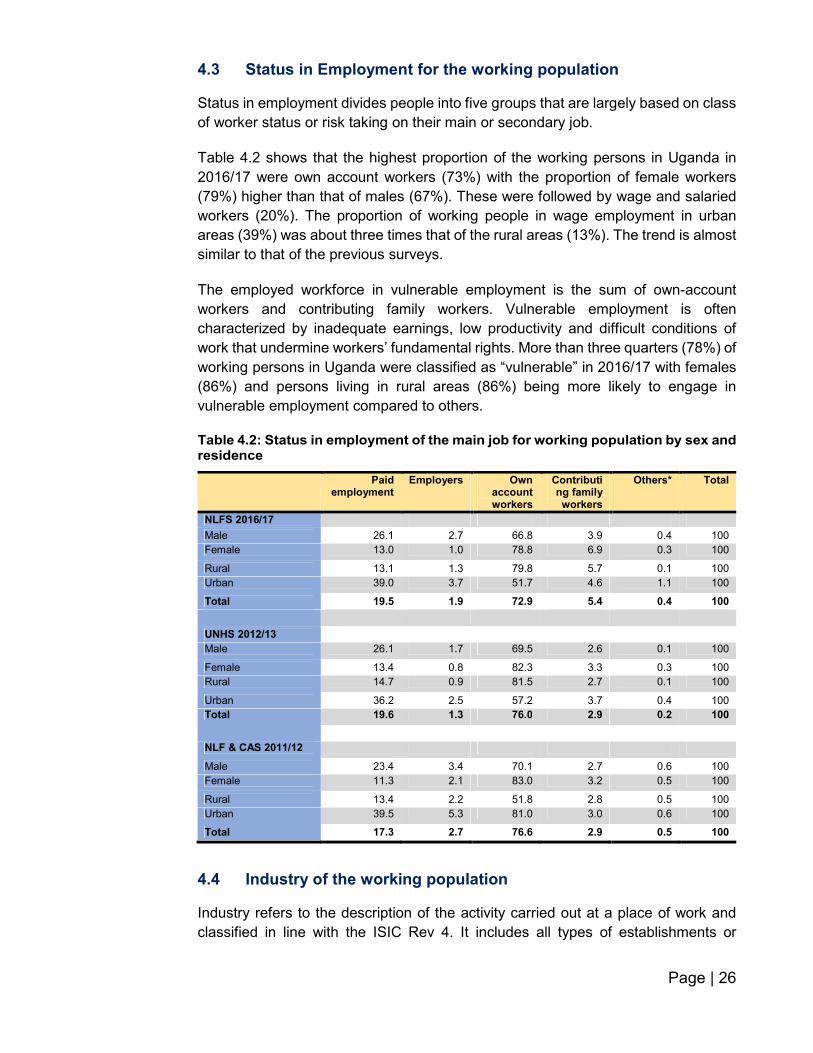
Page | 26
4.3 Status in Employment for the working population
Status in employment divides people into five groups that are largely based on class
of worker status or risk taking on their main or secondary job.
Table 4.2 shows that the highest proportion of the working persons in Uganda in
2016/17 were own account workers (73%) with the proportion of female workers
(79%) higher than that of males (67%). These were followed by wage and salaried
workers (20%). The proportion of working people in wage employment in urban
areas (39%) was about three times that of the rural areas (13%). The trend is almost
similar to that of the previous surveys.
The employed workforce in vulnerable employment is the sum of own-account
workers and contributing family workers. Vulnerable employment is often
characterized by inadequate earnings, low productivity and difficult conditions of
work that undermine workers’ fundamental rights. More than three quarters (78%) of
working persons in Uganda were classified as “vulnerable” in 2016/17 with females
(86%) and persons living in rural areas (86%) being more likely to engage in
vulnerable employment compared to others.
Table 4.2: Status in employment of the main job for working population by sex and residence
Paid employment
Employers Own account workers
Contributing family workers
Others* Total
NLFS 2016/17
Male 26.1 2.7 66.8 3.9 0.4 100
Female 13.0 1.0 78.8 6.9 0.3 100
Rural 13.1 1.3 79.8 5.7 0.1 100
Urban 39.0 3.7 51.7 4.6 1.1 100
Total 19.5 1.9 72.9 5.4 0.4 100
UNHS 2012/13
Male 26.1 1.7 69.5 2.6 0.1 100
Female 13.4 0.8 82.3 3.3 0.3 100
Rural 14.7 0.9 81.5 2.7 0.1 100
Urban 36.2 2.5 57.2 3.7 0.4 100
Total 19.6 1.3 76.0 2.9 0.2 100
NLF & CAS 2011/12
Male 23.4 3.4 70.1 2.7 0.6 100
Female 11.3 2.1 83.0 3.2 0.5 100
Rural 13.4 2.2 51.8 2.8 0.5 100
Urban 39.5 5.3 81.0 3.0 0.6 100
Total 17.3 2.7 76.6 2.9 0.5 100
4.4 Industry of the working population
Industry refers to the description of the activity carried out at a place of work and
classified in line with the ISIC Rev 4. It includes all types of establishments or
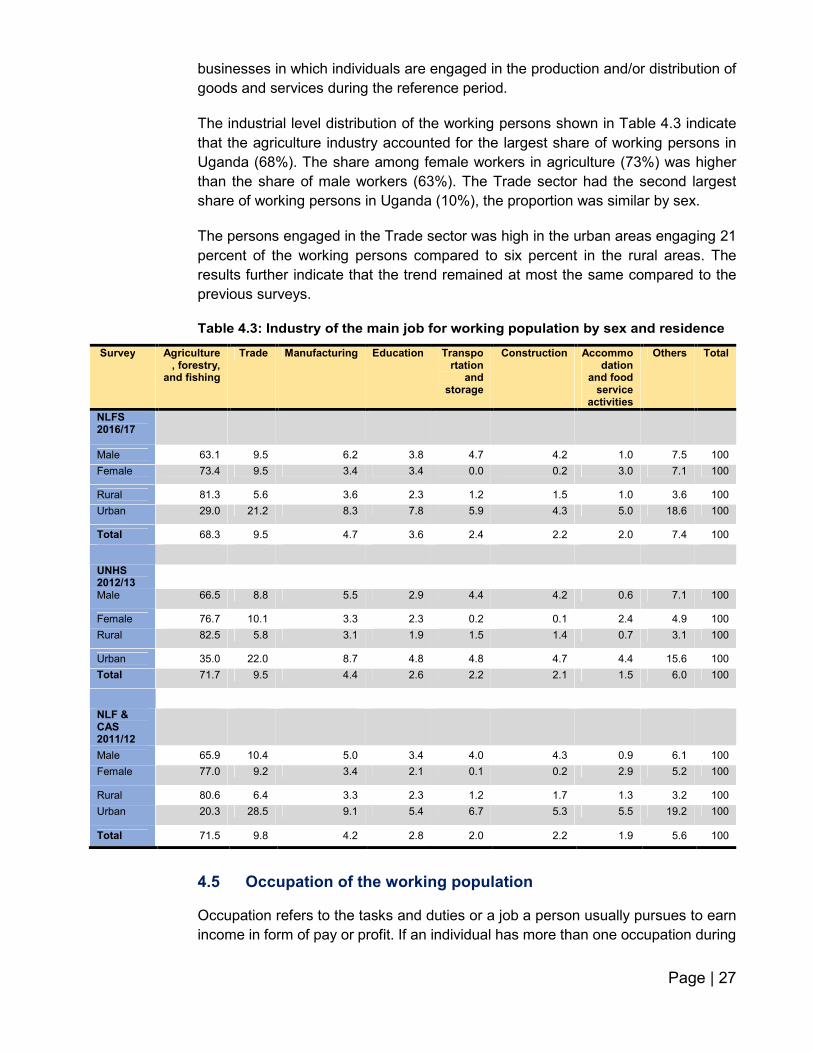
Page | 27
businesses in which individuals are engaged in the production and/or distribution of
goods and services during the reference period.
The industrial level distribution of the working persons shown in Table 4.3 indicate
that the agriculture industry accounted for the largest share of working persons in
Uganda (68%). The share among female workers in agriculture (73%) was higher
than the share of male workers (63%). The Trade sector had the second largest
share of working persons in Uganda (10%), the proportion was similar by sex.
The persons engaged in the Trade sector was high in the urban areas engaging 21
percent of the working persons compared to six percent in the rural areas. The
results further indicate that the trend remained at most the same compared to the
previous surveys.
Table 4.3: Industry of the main job for working population by sex and residence
Survey Agriculture, forestry,
and fishing
Trade Manufacturing Education Transportation
and storage
Construction Accommodation
and food service
activities
Others Total
NLFS 2016/17
Male 63.1 9.5 6.2 3.8 4.7 4.2 1.0 7.5 100
Female 73.4 9.5 3.4 3.4 0.0 0.2 3.0 7.1 100
Rural 81.3 5.6 3.6 2.3 1.2 1.5 1.0 3.6 100
Urban 29.0 21.2 8.3 7.8 5.9 4.3 5.0 18.6 100
Total 68.3 9.5 4.7 3.6 2.4 2.2 2.0 7.4 100
UNHS 2012/13 Male 66.5 8.8 5.5 2.9 4.4 4.2 0.6 7.1 100
Female 76.7 10.1 3.3 2.3 0.2 0.1 2.4 4.9 100
Rural 82.5 5.8 3.1 1.9 1.5 1.4 0.7 3.1 100
Urban 35.0 22.0 8.7 4.8 4.8 4.7 4.4 15.6 100
Total 71.7 9.5 4.4 2.6 2.2 2.1 1.5 6.0 100
NLF & CAS 2011/12
Male 65.9 10.4 5.0 3.4 4.0 4.3 0.9 6.1 100
Female 77.0 9.2 3.4 2.1 0.1 0.2 2.9 5.2 100
Rural 80.6 6.4 3.3 2.3 1.2 1.7 1.3 3.2 100
Urban 20.3 28.5 9.1 5.4 6.7 5.3 5.5 19.2 100
Total 71.5 9.8 4.2 2.8 2.0 2.2 1.9 5.6 100
4.5 Occupation of the working population
Occupation refers to the tasks and duties or a job a person usually pursues to earn
income in form of pay or profit. If an individual has more than one occupation during

Page | 28
the reference period, the occupation in which the maximum working hours are spent
is considered to be his/her main occupation. If equal time is spent in the two
occupations, the one that provides the larger share of income is designated as the
main occupation.
The distribution of the working persons aged 14-64 years by occupations presented
in Table 4.4 shows that 64 percent of the working persons were agricultural, forestry
and fishery workers during 2016/17, almost the same proportion reported in the
previous two surveys. The results also indicate that another 12 percent were service
and sales workers while eight percent were elementary occupations workers.
The findings further revealed that there were more female workers (71%) who were
agricultural, forestry and fishery workers than the males (58%). Similarly, there were
slightly more females working as service and sales workers (14%) than males (10%).
The craft and related workers were dominated by males with the male workers (9%)
being more than four times that of employed females (3%). The results further
showed that the proportion of working persons in occupations requiring high
qualifications like professional and managerial occupations, was low with no gender
disparity observed.
Table 4.4: Occupation of the main job for working population by sex and residence
Survey Professionals
Technicians and
associate professionals
Service and
sales workers
Skilled agricultural, forestry
and fishery
workers
Craft and
related trades
workers
Plant and machine operators
and assemblers
Elementar
y occupatio
ns
Others*
Total
NLFS 2016/17
Male 4.1 2.1 10.3 57.7 9.1 6.0 9.3 1.5 100 Female 3.1 1.2 13.8 70.5 3.0 0.6 6.8 1.0 100
Rural 2.0 0.9 7.0 76.5 4.3 1.9 7.0 0.5 100 Urban 8.5 3.9 27.7 26.5 11.2 7.6 11.3 3.4 100
Total 3.6 1.6 12.1 64.2 6.0 3.3 8.0 1.2 100
UNHS 2012/13
Male 1.2 3.3 9.8 58.7 7.8 4.2 14.0 1.1 100
Female 0.7 2.3 12.7 70.3 2.7 0.1 10.7 0.5 100 Rural 0.4 1.7 6.2 74.5 3.9 1.2 11.8 0.3 100
Urban 2.9 6.4 28.3 31.1 9.7 5.1 14.1 2.5 100 Total 1.0 2.8 11.2 64.6 5.2 2.1 12.3 0.8 100
NLF & CAS 2011/12
Male 3.8 1.4 11.0 59.1 9.8 4.5 9.6 0.9 100 Female 2.0 0.9 14.5 73.1 3.5 0.3 5.2 0.4 100
Rural 2.1 0.7 8.3 74.7 5.4 1.4 7.0 0.4 100 Urban 7.5 3.7 37.8 18.2 13.5 7.6 9.3 2.5 100
Total 2.9 1.2 12.8 66.1 6.7 2.3 7.4 0.7 100
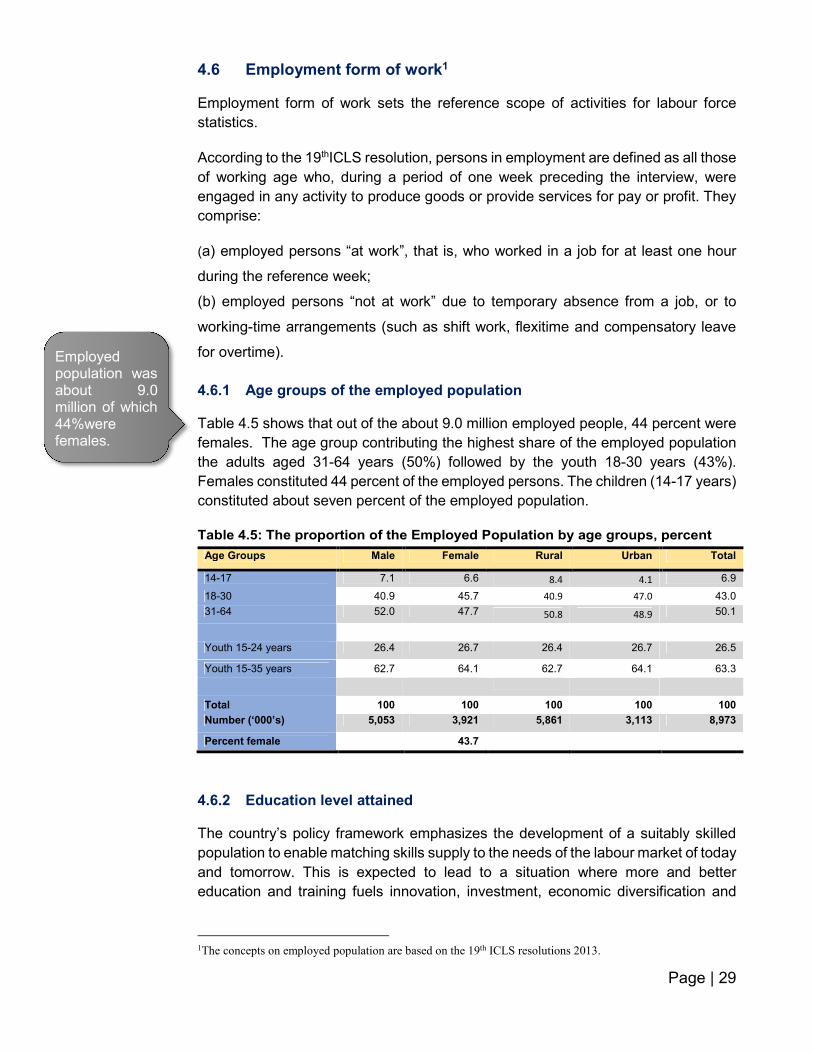
Page | 29
4.6 Employment form of work1
Employment form of work sets the reference scope of activities for labour force
statistics.
According to the 19thICLS resolution, persons in employment are defined as all those
of working age who, during a period of one week preceding the interview, were
engaged in any activity to produce goods or provide services for pay or profit. They
comprise:
(a) employed persons “at work”, that is, who worked in a job for at least one hour
during the reference week;
(b) employed persons “not at work” due to temporary absence from a job, or to
working-time arrangements (such as shift work, flexitime and compensatory leave
for overtime).
4.6.1 Age groups of the employed population
Table 4.5 shows that out of the about 9.0 million employed people, 44 percent were
females. The age group contributing the highest share of the employed population
the adults aged 31-64 years (50%) followed by the youth 18-30 years (43%).
Females constituted 44 percent of the employed persons. The children (14-17 years)
constituted about seven percent of the employed population.
Table 4.5: The proportion of the Employed Population by age groups, percent
Age Groups Male Female Rural Urban Total
14-17 7.1 6.6 8.4 4.1 6.9
18-30 40.9 45.7 40.9 47.0 43.0
31-64 52.0 47.7 50.8 48.9 50.1
Youth 15-24 years 26.4 26.7 26.4 26.7 26.5
Youth 15-35 years 62.7 64.1 62.7 64.1 63.3
Total 100 100 100 100 100
Number (‘000’s) 5,053 3,921 5,861 3,113 8,973
Percent female 43.7
4.6.2 Education level attained
The country’s policy framework emphasizes the development of a suitably skilled
population to enable matching skills supply to the needs of the labour market of today
and tomorrow. This is expected to lead to a situation where more and better
education and training fuels innovation, investment, economic diversification and
1The concepts on employed population are based on the 19th ICLS resolutions 2013.
Employed population was about 9.0 million of which 44%were females.
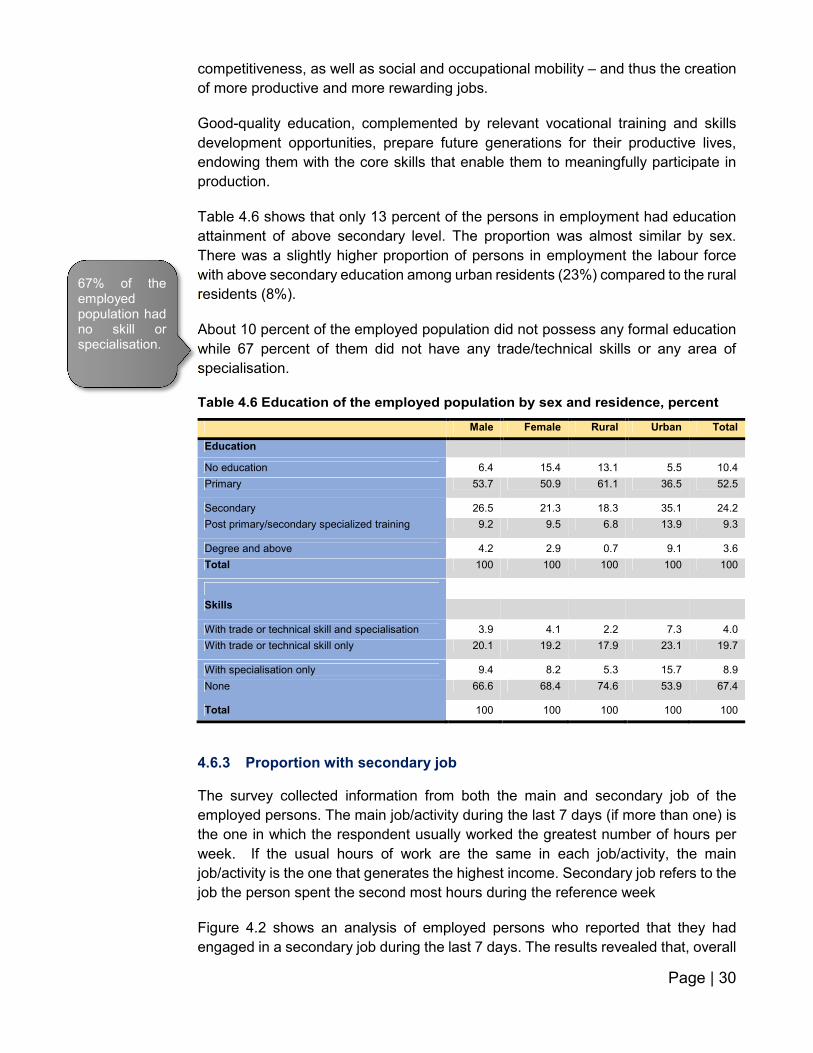
Page | 30
competitiveness, as well as social and occupational mobility – and thus the creation
of more productive and more rewarding jobs.
Good-quality education, complemented by relevant vocational training and skills
development opportunities, prepare future generations for their productive lives,
endowing them with the core skills that enable them to meaningfully participate in
production.
Table 4.6 shows that only 13 percent of the persons in employment had education
attainment of above secondary level. The proportion was almost similar by sex.
There was a slightly higher proportion of persons in employment the labour force
with above secondary education among urban residents (23%) compared to the rural
residents (8%).
About 10 percent of the employed population did not possess any formal education
while 67 percent of them did not have any trade/technical skills or any area of
specialisation.
Table 4.6 Education of the employed population by sex and residence, percent
Male Female Rural Urban Total
Education
No education 6.4 15.4 13.1 5.5 10.4
Primary 53.7 50.9 61.1 36.5 52.5
Secondary 26.5 21.3 18.3 35.1 24.2
Post primary/secondary specialized training 9.2 9.5 6.8 13.9 9.3
Degree and above 4.2 2.9 0.7 9.1 3.6
Total 100 100 100 100 100
Skills
With trade or technical skill and specialisation 3.9 4.1 2.2 7.3 4.0
With trade or technical skill only 20.1 19.2 17.9 23.1 19.7
With specialisation only 9.4 8.2 5.3 15.7 8.9
None 66.6 68.4 74.6 53.9 67.4
Total 100 100 100 100 100
4.6.3 Proportion with secondary job
The survey collected information from both the main and secondary job of the
employed persons. The main job/activity during the last 7 days (if more than one) is
the one in which the respondent usually worked the greatest number of hours per
week. If the usual hours of work are the same in each job/activity, the main
job/activity is the one that generates the highest income. Secondary job refers to the
job the person spent the second most hours during the reference week
Figure 4.2 shows an analysis of employed persons who reported that they had
engaged in a secondary job during the last 7 days. The results revealed that, overall
67% of the employed population had no skill or specialisation.

Page | 31
13 percent of the employed population had a secondary job outside subsistence
agriculture (equivalent to 1.2 million persons in absolute terms). The proportion was
similar by gender, but with variations by residents. Rural residents were more likely
to have secondary jobs outside subsistence agriculture (15%) compared to urban
residents (9%).
Figure 4.2: Proportion of the employed population with secodary jobs by sex and residence, percentage share
4.6.4 Employment-to-Population Ratio
The Employment-to-Population Ratio (EPR) is the proportion of the working age
population that is employed. It refers to the total number of employed persons
expressed as a proportion of the population of the same age group. The
employment-to-population ratio (EPR) provides a good indication of the degree to
which the economy is utilising its key productive labour resource.
As presented in Table 4.7, the overall Employment-to-Population Ratio (EPR) was
about 48 percent with a higher ratio in the urban areas (61%) compared to rural
areas (43%) indicating a more active involvement in gainful work by the population
in the urban areas compared to those in the rural areas. The male population was
more likely to be employed with EPR of 56 percent compared to the females at 40
percent.
Among the adult population (31-64 years), 57 percent was employed which means
that 43 percent of the adult population (31-64 years) was not engaged in gainful
work.
Considering the level of formal education completed, the results show increasing
EPR with increasing levels of education completed rising from 50 percent for those
who completed primary education to about 85 percent for those with post
primary/secondary specialised training. This indicates that more active involvement
13.2 12.8 15.2 9.0 13.0
17.3 16.121.7
7.516.8
69.5 71.163.2
83.570.2
0.0
20.0
40.0
60.0
80.0
100.0
120.0
Male Female Rural Urban Total
With secondary job out subsistence agriculture With secondary job in subsistence agriculture
No secondary job
EPR was increasing with increasing level of education completed

Page | 32
in gainful work can be achieved with higher education but especially specialised
training.
Table 4.7: Employment-to-population ratio by selected background characteristics
Employment to population ratio Male Female Total
Residence
Rural 50.7 35.4 42.8
Urban 71.4 51.1 60.5
Region
Kampala City 71.0 52.3 61.4
Peri-Urban Kampala 78.6 54.9 65.7
Central 64.7 47.6 56.2
Eastern 44.9 24.1 34.2
Karamoja 34.2 33.8 34.0
Northern 49.0 36.3 42.3
Western 59.2 44.1 51.1
Age groups
14-17 22.7 15.4 18.9
18-30 58.9 42.4 49.8
31-64 67.4 47.5 57.4
15-24 43.3 30.5 36.6
15-35 55.7 39.7 47.3
Level of Education Completed
No formal schooling 48.6 36.0 39.5
Primary 60.1 40.6 49.8
Secondary 75.5 57.1 67.0
Post primary/Secondary specialised training 86.1 83.9 85.1
Degree and above 89.4 76.4 84.3
Total 56.2 39.8 47.6
4.6.5 Status in employment
Table 4.8 shows that self-employment which constitutes own account workers,
employers and contributing family workers formed the bulk of the employed with a
combined proportion of percent. The category of employers and own account
workers with a combined proportion of about 56 percent provides an indication of
entrepreneurial levels within the country. The proportion of females who were
contributing family workers (14 %) was slightly more than double that of males (6 %)
where as more males were in paid employment (41 %) compared to females (26 %).
Paid employees were more predominant in urban areas (48 %) compared to rural
areas (27 %). Kampala had the highest proportion of the employed persons in paid
employment (53 %) followed by Peri-urban Kampala (52 %). Karamoja region had
the lowest proportion (18%).
Majority of the employed population was in Self-employment (66%)

Page | 33
Table 4.8: Status in employment by selected Characteristics, Percent
Characteristics Paid employee
Employer Own account worker
Contributing family
workers
Total
Sex
Male 40.8 4.0 48.8 6.4 100
Female 26.3 1.7 57.8 14.1 100
Residence
Rural 27.4 2.3 58.4 11.9 100
Urban 47.8 4.4 42.1 5.8 100
Regions
Kampala City 53.1 3.2 40.4 3.4 100
Peri-Urban Kampala 51.7 6.1 37.9 4.2 100
Central 30.8 4.9 47.6 16.6 100
Eastern 39.6 2.0 49.4 9.0 100
Karamoja 18.0 0.2 73.8 8.1 100
Northern 28.4 1.5 58.1 12.0 100
Western 30.5 2.2 60.8 6.5 100
Age Groups
14-17 26.5 0.3 40.0 33.2 100
18-30 39.5 2.2 48.0 10.4 100
31-64 31.2 4.0 58.7 6.1 100
15-24 37.0 1.4 44.4 17.2 100
15-35 38.5 2.2 48.3 11.0 100
Education level attained
No education 23.1 1.0 66.3 9.6 100
Primary 27.9 2.7 59.8 9.7 100
Secondary 38.0 4.1 50.7 7.2 100
Post primary/secondary specialized training 70.2 4.2 22.8 2.8 100
Degree and above 70.9 8.6 19.9 0.6 100
Total (Percent) 34.5 3.0 52.8 9.8 100
Number (‘000’s) 3,079 267 4,713 873 8,933
4.6.5.1 Status in employment of secondary job
Figure 4.3 indicates that of the persons in employment, employers were more likely
to engage in secondary activities while those in paid employment had the least
proportion of being engaged in secondary activities.
Figure 4.3: Proportion with secondary job by status in employment
7.3
23.9
16.7
10.3
13.0
0
5
10
15
20
25
30
Paid employment Employers Own accountworkers
Contributingfamily workers
Total
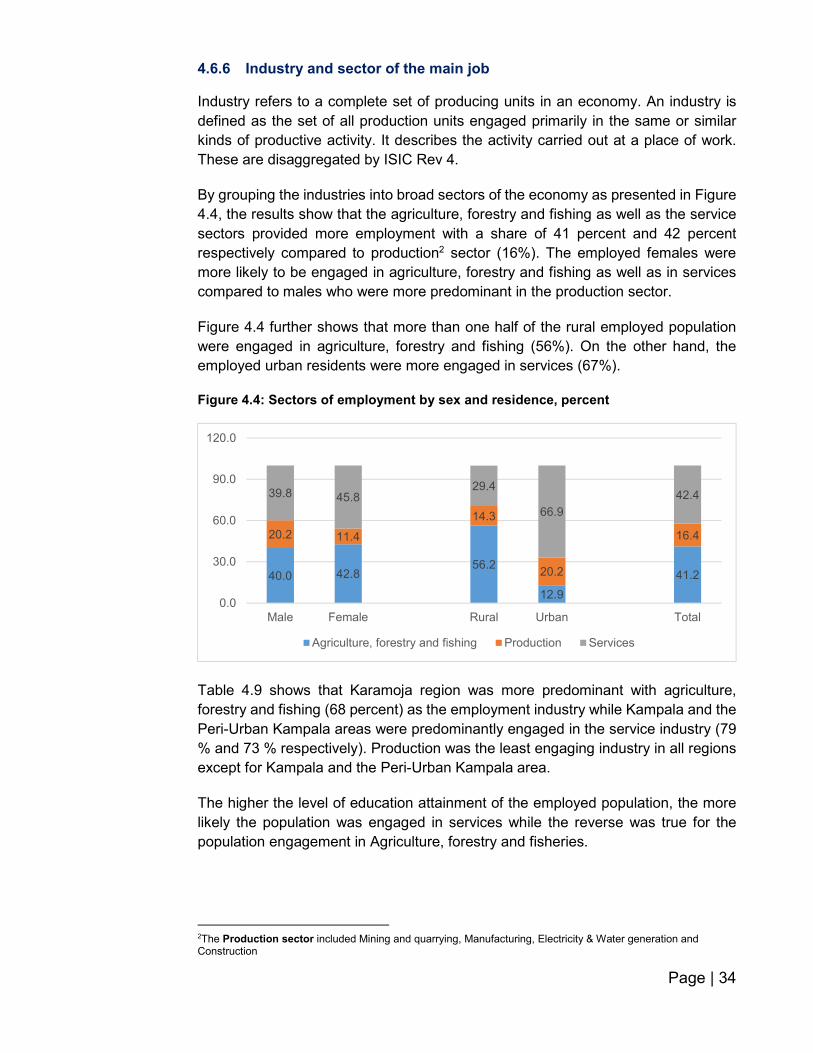
Page | 34
4.6.6 Industry and sector of the main job
Industry refers to a complete set of producing units in an economy. An industry is
defined as the set of all production units engaged primarily in the same or similar
kinds of productive activity. It describes the activity carried out at a place of work.
These are disaggregated by ISIC Rev 4.
By grouping the industries into broad sectors of the economy as presented in Figure
4.4, the results show that the agriculture, forestry and fishing as well as the service
sectors provided more employment with a share of 41 percent and 42 percent
respectively compared to production2 sector (16%). The employed females were
more likely to be engaged in agriculture, forestry and fishing as well as in services
compared to males who were more predominant in the production sector.
Figure 4.4 further shows that more than one half of the rural employed population
were engaged in agriculture, forestry and fishing (56%). On the other hand, the
employed urban residents were more engaged in services (67%).
Figure 4.4: Sectors of employment by sex and residence, percent
Table 4.9 shows that Karamoja region was more predominant with agriculture,
forestry and fishing (68 percent) as the employment industry while Kampala and the
Peri-Urban Kampala areas were predominantly engaged in the service industry (79
% and 73 % respectively). Production was the least engaging industry in all regions
except for Kampala and the Peri-Urban Kampala area.
The higher the level of education attainment of the employed population, the more
likely the population was engaged in services while the reverse was true for the
population engagement in Agriculture, forestry and fisheries.
2The Production sector included Mining and quarrying, Manufacturing, Electricity & Water generation and Construction
40.0 42.856.2
12.9
41.2
20.2 11.4
14.3
20.2
16.4
39.8 45.829.4
66.9
42.4
0.0
30.0
60.0
90.0
120.0
Male Female Rural Urban Total
Agriculture, forestry and fishing Production Services
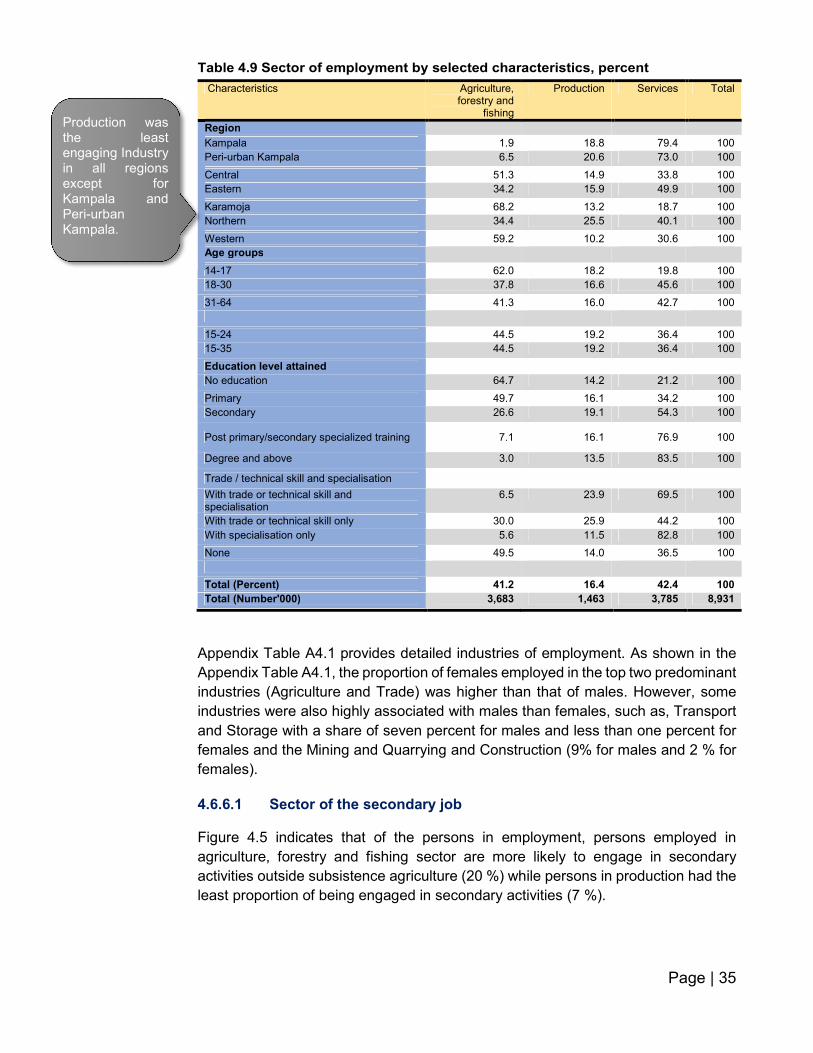
Page | 35
Table 4.9 Sector of employment by selected characteristics, percent
Characteristics Agriculture, forestry and
fishing
Production Services Total
Region
Kampala 1.9 18.8 79.4 100
Peri-urban Kampala 6.5 20.6 73.0 100
Central 51.3 14.9 33.8 100
Eastern 34.2 15.9 49.9 100
Karamoja 68.2 13.2 18.7 100
Northern 34.4 25.5 40.1 100
Western 59.2 10.2 30.6 100
Age groups
14-17 62.0 18.2 19.8 100
18-30 37.8 16.6 45.6 100
31-64 41.3 16.0 42.7 100
15-24 44.5 19.2 36.4 100
15-35 44.5 19.2 36.4 100
Education level attained
No education 64.7 14.2 21.2 100
Primary 49.7 16.1 34.2 100
Secondary 26.6 19.1 54.3 100
Post primary/secondary specialized training 7.1 16.1 76.9 100
Degree and above 3.0 13.5 83.5 100
Trade / technical skill and specialisation
With trade or technical skill and specialisation
6.5 23.9 69.5 100
With trade or technical skill only 30.0 25.9 44.2 100
With specialisation only 5.6 11.5 82.8 100
None 49.5 14.0 36.5 100
Total (Percent) 41.2 16.4 42.4 100
Total (Number'000) 3,683 1,463 3,785 8,931
Appendix Table A4.1 provides detailed industries of employment. As shown in the
Appendix Table A4.1, the proportion of females employed in the top two predominant
industries (Agriculture and Trade) was higher than that of males. However, some
industries were also highly associated with males than females, such as, Transport
and Storage with a share of seven percent for males and less than one percent for
females and the Mining and Quarrying and Construction (9% for males and 2 % for
females).
4.6.6.1 Sector of the secondary job
Figure 4.5 indicates that of the persons in employment, persons employed in
agriculture, forestry and fishing sector are more likely to engage in secondary
activities outside subsistence agriculture (20 %) while persons in production had the
least proportion of being engaged in secondary activities (7 %).
Production was the least engaging Industry in all regions except for Kampala and Peri-urban Kampala.

Page | 36
Figure 4.5: Proportion with secondary job by status in employment
The Figure 4.6 indicates that 44 percent of the persons in employment who had a
secondary occupation outside subsistence agriculture were in services. The
proportion was slightly higher for males (46 %) compared to that of females (41 %).
Sixty one percent of the persons in employment who had a secondary occupation
outside subsistence agriculture residing in urban areas had a secondary job in
service sector compared to 38 percent of their rural counterparts.
Figure 4.6: Distribution of the sector of the secondary job for employed persons by sex and residence
4.6.7 Occupation of the main job
An occupation is defined as a set of jobs whose main tasks and duties are
characterised by a high degree of similarity. A person may be associated with an
occupation through the main job currently held, a second job or a job previously held.
The survey obtained information on occupation of the main and secondary jobs.
Table 4.10 presents findings on occupation of the main job grouping according to on
ISCO-08. The main job is the one in which a person worked the most number of
hours during the reference week. In general, most people were employed as skilled
agricultural, forestry and fisheries workers (31%) followed by Service and sales work
19.9
6.98.8
13.0
0.0
12.0
24.0
Agriculture, forestryand fishing
Production Services Total
39.7 43.9 47.2
23.3
41.5
14.315.1 14.4
15.4
14.7
46.0 40.9 38.4
61.3
43.9
0.0
20.0
40.0
60.0
80.0
100.0
120.0
Male Female Rural Urban Total
Agriculturte, forestry and fishing Production Services
The leading occupation is skilled agricultural, forestry and fisheries workers with a share of 31 %.

Page | 37
(23%). These were also the occupations where most females than males were
employed. However, the jobs in which most males were employed than females
included elementary occupation, crafts and related works and plant and machine
operations. There were nearly no gender disparity among professionals but a wide
disparity among managers with a proportion of two percent of males against one
percent of females.
The findings further showed that one in every three of employed urban residents was
working as service worker. Occupation of the employed population by other
characteristics is presented in appendix table A4.2.
Table 4.10: Occupation of the employed population by sex and Residence, percent
Sex Residence
Occupations of the main job Male Female Rural Urban Total
Skilled agricultural, forestry and fishery workers
29.2 34.1 43.3 8.7 31.3
Service and sales workers 17.5 30.6 17.8 33.4 23.2
Elementary occupations 15.3 14.6 15.4 14.2 15.0
Craft and related trades workers 16.1 8.6 11.8 14.7 12.8
Plant and machine operators and assemblers
10.2 1.8 4.6 10.2 6.5
Professionals 6.0 6.0 3.8 10.1 6.0
Technicians and associate professionals 3.4 2.4 2.1 4.5 2.9
Others 2.4 1.9 1.2 4.1 2.2
Total 100 100 100 100 100
Number (‘000) 5,033 3,896 5,842 3,088 8,930
Note: Others include managers and clerical support staff
4.6.8 Place of work of the employed population
Majority of the employed population work a farm or agricultural plot (38 %). One in
every four employed persons worked in enterprises with fixed locations separate
from their homesteads or a fixed stall in the market. On the other hand, about 10
percent of the employed persons did not have fixed locations for their main job (Table
4.11). As detailed in appendix table A4.3, two out of every three employed children
were working on agriculture farms or plots.
Table 4.11: Place of work of the employed population by sex, and Residence
Sex Residence Total
Place of work Male Female Rural Urban (Percent) (Number '000)
On farm or Agric. plot 36.5 40.7 54.5 10.0 38.3 3,133
Enterprise** 28.4 26.2 16.3 47.0 27.4 2,245
Own home/structure attached to own home
7.1 15.8 11.0 10.6 10.8 891
Without fixed location/open place
14.5 5.0 8.1 14.2 10.3 842
Fixed stall in the market/street
4.2 7.2 4.2 7.9 5.5 453
Others 9.3 5.2 6.0 10.3 7.5 616
Total 100 100 100 100 100 8,180
**Note: Enterprise include: plant, factory, office, shop, workshop etc. (separate from residence)
One in every ten employed persons are mobile or do not have fixed places of work.
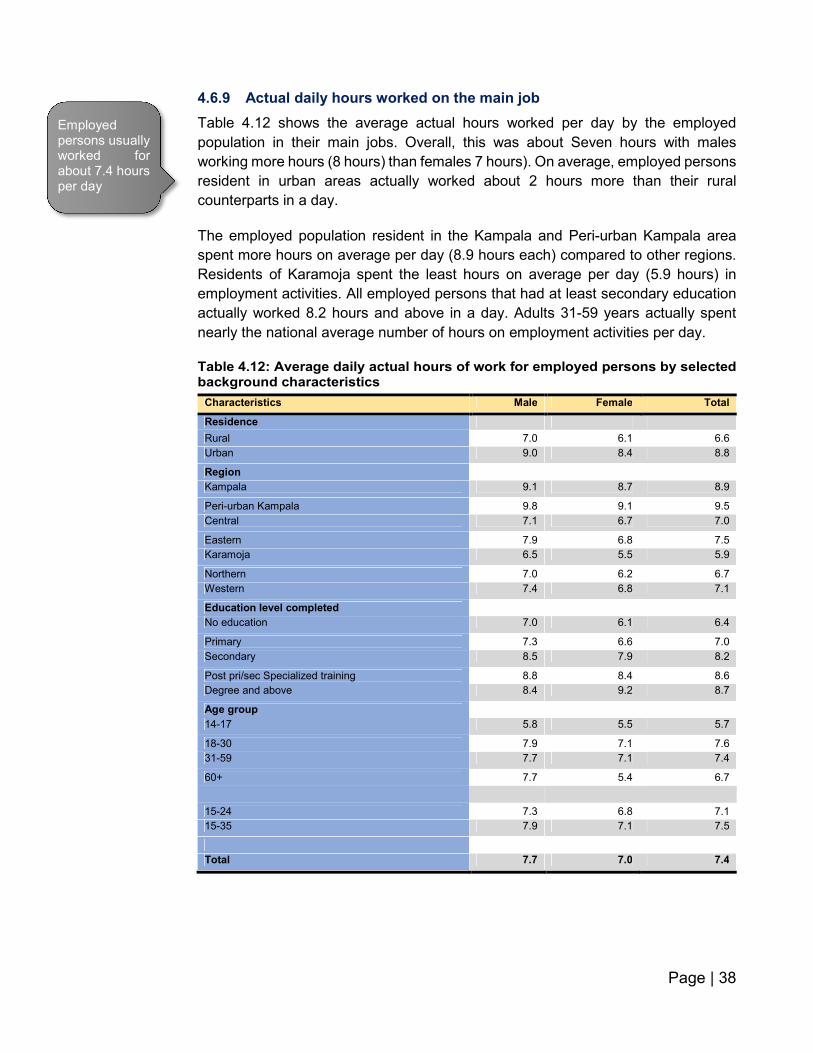
Page | 38
4.6.9 Actual daily hours worked on the main job
Table 4.12 shows the average actual hours worked per day by the employed
population in their main jobs. Overall, this was about Seven hours with males
working more hours (8 hours) than females 7 hours). On average, employed persons
resident in urban areas actually worked about 2 hours more than their rural
counterparts in a day.
The employed population resident in the Kampala and Peri-urban Kampala area
spent more hours on average per day (8.9 hours each) compared to other regions.
Residents of Karamoja spent the least hours on average per day (5.9 hours) in
employment activities. All employed persons that had at least secondary education
actually worked 8.2 hours and above in a day. Adults 31-59 years actually spent
nearly the national average number of hours on employment activities per day.
Table 4.12: Average daily actual hours of work for employed persons by selected background characteristics
Characteristics Male Female Total
Residence
Rural 7.0 6.1 6.6
Urban 9.0 8.4 8.8
Region
Kampala 9.1 8.7 8.9
Peri-urban Kampala 9.8 9.1 9.5
Central 7.1 6.7 7.0
Eastern 7.9 6.8 7.5
Karamoja 6.5 5.5 5.9
Northern 7.0 6.2 6.7
Western 7.4 6.8 7.1
Education level completed
No education 7.0 6.1 6.4
Primary 7.3 6.6 7.0
Secondary 8.5 7.9 8.2
Post pri/sec Specialized training 8.8 8.4 8.6
Degree and above 8.4 9.2 8.7
Age group
14-17 5.8 5.5 5.7
18-30 7.9 7.1 7.6
31-59 7.7 7.1 7.4
60+ 7.7 5.4 6.7
15-24 7.3 6.8 7.1
15-35 7.9 7.1 7.5
Total 7.7 7.0 7.4
Employed persons usually worked for about 7.4 hours per day

Page | 39
The average actual hours worked per week by employed persons were grouped into
three categories representing the normal average (8-11 hours), less than normal
(less than 7 hours) and excessive hours (over 11 hours). As presented in Table 4.13,
about one third (33 %) of the employed population actually worked normal average
hours per day.
Majority of salary or wage earners and employers actually worked on average
normal hours per day (46 %). On the other hand, most of the contributing family
workers usually worked on average for less than normal hours (79 %). Eighty five
percent of the skilled agricultural, forestry and fisheries workers actually spent an
average of less than 8 hours per day in employment of the main job. The occupations
in which most workers actually spent excessive hours on average per day were plant
and machine operators and assemblers (30 %) followed by the service and sales
workers (25 %).
Table 4.13: Classes of actual hours worked per day by selected background characteristics
Characteristics 1-7 hours 8-11 hours
12 and more hours
Total
Sex
Male 50.8 35.3 13.9 100
Female 61.5 28.8 9.6 100
Residence
Rural 67.7 25.0 7.3 100
Urban 32.7 46.3 21 100
Status in employment
Paid employment 36.5 46.4 17.1 100
Employers 43.2 41.5 15.3 100
Own-account workers 64.3 25.4 10.3 100
Contributing family workers 78.7 18.6 2.8 100
Industry of the main job
Agriculture, forestry and fishing 84.6 13.8 1.6 100
Production 43.1 45.2 11.7 100
Services 32.5 45.4 22.1 100
Occupations of main job
Managers 27.9 47.9 24.2 100
Professionals 23.6 72.2 4.2 100
Technicians and associate professionals 34.6 54.7 10.7 100
Clerical Support Workers 10.4 74.3 15.3 100
Service and sales workers 36.8 38.6 24.6 100
Skilled agricultural, forestry and fishery workers 86.3 12.7 1.1 100
Craft and related trades workers 44.5 42.3 13.2 100
Plant and machine operators and assemblers 29.9 40.4 29.7 100
Elementary occupations 62.0 29.1 8.9 100
Total 55.4 32.5 12.1 100
4.6.9.1 Actual hours worked on the secondary job
Considering the average actual hours worked during the reference period per day,
the overall average hours worked by employed persons in their secondary jobs was
4.9 hours per day. There are no major differentials by sex, residence and sector.
33% of the employed persons actually worked normal average hours per day
The average actual daily hours of work was 4.9 hours

Page | 40
Figure 4.7: Average actual daily hour of work by sex, residence and sector
4.6.10 Earnings from paid Employment
Table 4.14 shows the median monthly income in the main job for persons in paid
employment. Overall, the median cash monthly earnings of persons in paid
employment was 190,000/= (one hundred ninety thousand shillings only). The
median cash monthly earnings for males was 240,000/= and that of females was
120,000/=. Urban residents were earning twice as much as the cash earnings of
rural residents.
The results also show that investing in education brings a clear pay-off in terms of
higher wage potential. The median cash monthly wage increased with the level of
education with the highest impact felt at post primary/secondary specialized training
and above. Persons in paid employment with post primary/secondary specialized
training education earned almost four times more than those with no education.
5.0
4.9
4.9
5.1
5.2
4.7
4.6
4.9
4.3 4.4 4.5 4.6 4.7 4.8 4.9 5.0 5.1 5.2 5.3
Male
Female
Rural
Urban
Agriculture, forestry and fishing
Production
Services
Total
The median monthly cash income of persons in paid employment in the main job was 190,000/=

Page | 41
Table 4.14: Median monthly earnings for persons in paid employment on the main job by sex, residence, regions, education and age (‘000 Shs)
Background characteristics Cash payments Payment in-
kind Total
Sex
Male 240 80 250
Female 120 70 150
Residence
Rural 120 58 150
Urban 250 98 290
Region
Kampala 270 100 300
Peri-urban Kampala 300 96 300
Central 160 96 200
Eastern 160 56 200
Karamoja 150 40 150
Northern 240 60 250
Western 120 72 128
Level of education completed
No education 90 100 100
Primary 100 70 120
Secondary 200 84 230
Post primary/secondary specialized training 370 60 400
Degree and above 600 150 720
Age groups
14-17 60 84 72
18-30 150 70 170
31-64 260 95 300
15-24 120 60 140
15-35 150 70 195
Total 190 72 200
Table 4.14 further shows that Kampala and Peri-Urban Kampala regions recorded
the highest cash median monthly earnings (270,000/= and 300,000/= respectively)
and the region with the least median monthly earning was Karamoja with 150,000/=.
Figure 4.8 indicates that Karamoja had the widest variation in median monthly
earnings between males and females with males earning three times the females

Page | 42
Figure 4.8: Map showing regional variation in median cash monthly income by sex
Disaggregation of the median cash monthly income of persons in paid employment
by occupation indicated that the amount for the least paying occupation was
elementary occupation with its median cash monthly income at Shs. 96,000 as
indicated in Table 4.15.
The findings also indicated that paid employees in the public sector earned about
2.7 times those of employees in the private sector. The findings further revealed that
while there were relatively small differences in the earnings between the males and
females in the public sector the earnings of the males in the private sector was 1.9
times that of females.
On the other hand, the median cash earning of persons who were formally employed
earned more than twice than those who were in informal employment depicting the
disadvantage the Uganda paid employees are at given that nearly 85 percent were
in informal employment.
Male Female

Page | 43
Table 4.15: Median monthly cash earnings for persons in paid employment in the main job by sex, occupation, institution, and sector (‘000 Shs)
Background characteristics Male Female Total
Occupations
Managers 700 500 600
Professionals 430 300 400
Technicians and associate professionals 500 350 400
Service and sales workers 200 150 180
Craft and related trades workers 250 120 240
Plant and machine operators and assemblers 300 260 300
Elementary occupations 100 72 96
Industry
Agriculture, forestry and fishing 96 72 80
Production 250 140 240
Services 300 160 190
Type of Institution
Private 192 100 150
Public 450 400 400
Sector
Formal sector 420 400 400
Informal sector 240 150 200
Private household 140 60 70
Informal employment excluding agriculture
Formal employment 480 408 450
Informal employment 250 130 200
Total 240 120 190
4.6.11 Membership to Trade Unions and similar associations
Results presented in Figure 4.9 show that membership in trade unions or similar
employee/trade associations by employed persons was about six percent (about
three percent membership in trade unions and in similar trade/employee
associations. Majority of the employed population (85 %) did not belong to any trade
union or similar employee/trade association with no major sex differentials.
85% of the employed population were not members in any trade unions or similar associations.

Page | 44
Figure 4.9: Membership to Trade Unions or Similar Employee Associations, Percent
4.6.12 Type of employment agreement for persons in paid employment
Results in Figure 4.10 about the type of contracts held by persons in paid
employment show that seven in every ten (70 %) of the persons in paid employment
were engaged on an oral agreement. The proportion of females with a written
contract (31 %) was almost similar to that of males. Persons in paid employment
living in urban areas were more likely to have written contracts (38%) compared to
those living in the rural areas (23 %).
Figure 4.10: Type of employment agreement for persons in paid employment
Results in Figure 4.11 show that about three quarters of the managers, professionals
and technicians in paid employment had written contracts compared to only 4
percent of the skilled agricultural, forestry and fishery workers as well as those in
elementary occupations (only 4% each). The results further reveal that the
3.6 3.4
85.3
7.82.2 2.2
83.5
12.0
3.0 2.9
84.5
9.6
0.0
10.0
20.0
30.0
40.0
50.0
60.0
70.0
80.0
90.0
Yes, member of TradeUnion
Yes, member ofEmployee/Trade
Association
No Don't know
Male Female Total
29.0 31.023.3
37.5
1.9
20.8
42.729.7
71.0 69.076.7
62.5
98.1
79.2
57.370.3
0.0
20.0
40.0
60.0
80.0
100.0
120.0
Male Female Rural Urban 14-17 18-30 31-64
Sex Residence Age groups Total
A written contract An oral agreement

Page | 45
proportion of persons in paid employment with written contracts increased with the
increase with the level of education with the highest impact felt with those with post
primary/secondary specialised training (75%).
Figure 4.11: Proportion of persons in paid employment with written contract by education and occupation
4.6.13 Entitlements for persons in paid employment
Table 4.16 presents information on access to selected entitlement by persons in paid
employment. The results show that maternity or paternity leave (19 %) was the most
common entitlement among persons in paid employment followed by paid sick leave.
The results also show that more than 1.5 times female employees were entitled to
maternity or paternity leave and paid sick leave (about 26 % and 22 % respectively)
than males (16 % each). This disparity between male employees and female
employees can partly be explained by the different sectors where the majority of
young men and women are employed. There exist wide variations by residence.
The results further indicate that, overall, 28 percent of the persons in paid
employment were entitled to at least one of the four selected entitlements. However,
the proportion with all the selected entitles was minimal at four percent only.
4.9
6.6
23.0
74.6
71.4
74.4
76.1
73.3
27.2
4.0
7.7
18.7
4.3
29.7
0.0 10.0 20.0 30.0 40.0 50.0 60.0 70.0 80.0
No education
Primary
Secondary
Post pri/sec specialized training
Degree and above
Managers
Professionals
Technicians and associate professionals
Service and sales workers
Skilled agricultural, forestry and fishery workers
Craft and related trades workers
Plant and machine operators and assemblers
Elementary occupations
Total
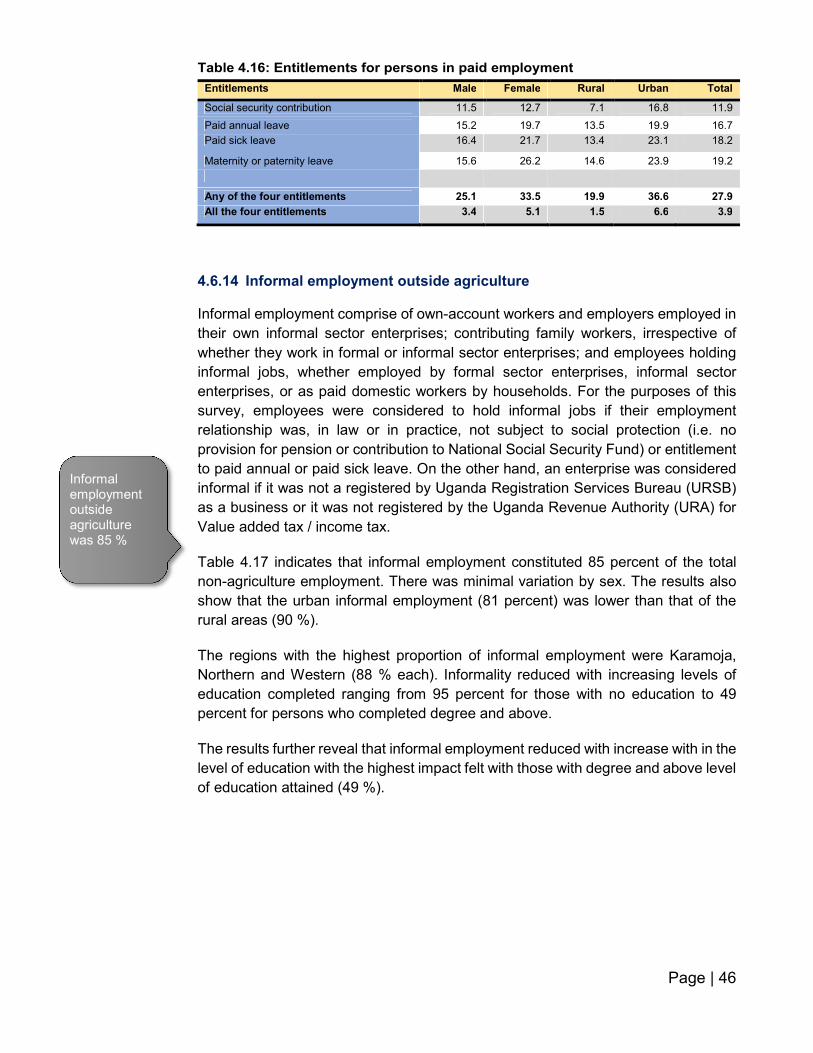
Page | 46
Table 4.16: Entitlements for persons in paid employment
Entitlements Male Female Rural Urban Total
Social security contribution 11.5 12.7 7.1 16.8 11.9
Paid annual leave 15.2 19.7 13.5 19.9 16.7
Paid sick leave 16.4 21.7 13.4 23.1 18.2
Maternity or paternity leave 15.6 26.2 14.6 23.9 19.2
Any of the four entitlements 25.1 33.5 19.9 36.6 27.9
All the four entitlements 3.4 5.1 1.5 6.6 3.9
4.6.14 Informal employment outside agriculture
Informal employment comprise of own-account workers and employers employed in
their own informal sector enterprises; contributing family workers, irrespective of
whether they work in formal or informal sector enterprises; and employees holding
informal jobs, whether employed by formal sector enterprises, informal sector
enterprises, or as paid domestic workers by households. For the purposes of this
survey, employees were considered to hold informal jobs if their employment
relationship was, in law or in practice, not subject to social protection (i.e. no
provision for pension or contribution to National Social Security Fund) or entitlement
to paid annual or paid sick leave. On the other hand, an enterprise was considered
informal if it was not a registered by Uganda Registration Services Bureau (URSB)
as a business or it was not registered by the Uganda Revenue Authority (URA) for
Value added tax / income tax.
Table 4.17 indicates that informal employment constituted 85 percent of the total
non-agriculture employment. There was minimal variation by sex. The results also
show that the urban informal employment (81 percent) was lower than that of the
rural areas (90 %).
The regions with the highest proportion of informal employment were Karamoja,
Northern and Western (88 % each). Informality reduced with increasing levels of
education completed ranging from 95 percent for those with no education to 49
percent for persons who completed degree and above.
The results further reveal that informal employment reduced with increase with in the
level of education with the highest impact felt with those with degree and above level
of education attained (49 %).
Informal employment outside agriculture was 85 %
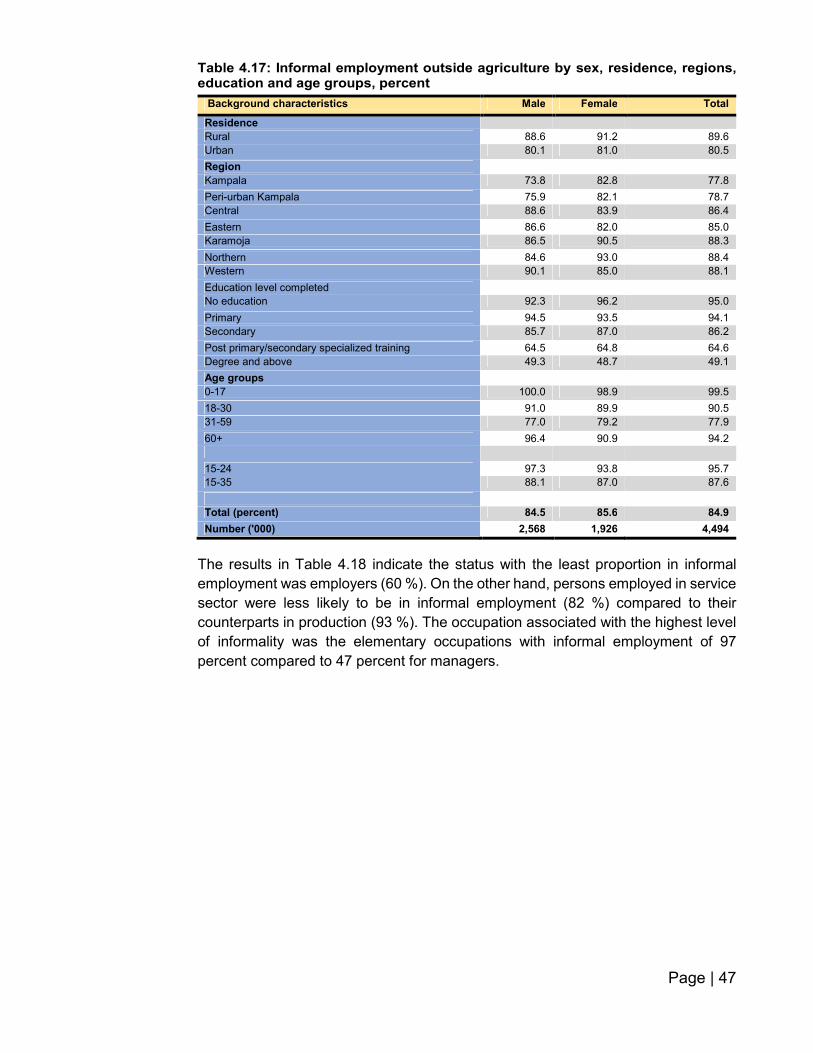
Page | 47
Table 4.17: Informal employment outside agriculture by sex, residence, regions, education and age groups, percent
Background characteristics Male Female Total
Residence
Rural 88.6 91.2 89.6
Urban 80.1 81.0 80.5
Region
Kampala 73.8 82.8 77.8
Peri-urban Kampala 75.9 82.1 78.7
Central 88.6 83.9 86.4
Eastern 86.6 82.0 85.0
Karamoja 86.5 90.5 88.3
Northern 84.6 93.0 88.4
Western 90.1 85.0 88.1
Education level completed
No education 92.3 96.2 95.0
Primary 94.5 93.5 94.1
Secondary 85.7 87.0 86.2
Post primary/secondary specialized training 64.5 64.8 64.6
Degree and above 49.3 48.7 49.1
Age groups
0-17 100.0 98.9 99.5
18-30 91.0 89.9 90.5
31-59 77.0 79.2 77.9
60+ 96.4 90.9 94.2
15-24 97.3 93.8 95.7
15-35 88.1 87.0 87.6
Total (percent) 84.5 85.6 84.9
Number ('000) 2,568 1,926 4,494
The results in Table 4.18 indicate the status with the least proportion in informal
employment was employers (60 %). On the other hand, persons employed in service
sector were less likely to be in informal employment (82 %) compared to their
counterparts in production (93 %). The occupation associated with the highest level
of informality was the elementary occupations with informal employment of 97
percent compared to 47 percent for managers.

Page | 48
Table 4.18: Informal employment outside agriculture by status in employment, sector and occupation, percent
Background characteristics Male Female Total I
Status in employment
Paid employment 83.5 80.5 82.5
An employer 61.2 56.6 60.0
An own-account worker 86.9 87.5 87.2
Contributing family worker 100 100 100
Sector
Production 92.5 93.4 92.8
Services 80.2 83.5 81.7
Occupations
Managers 46.2 48.2 46.9
Professionals 56.5 63.2 59.5
Technicians and associate professionals 73.2 67.9 71.2
Clerical Support Workers 58.3 58.9 58.7
Service and sales workers 81.1 87.5 84.8
Craft and related trades workers 95.4 91.8 94.4
Plant and machine operators assemblers 94 99.3 94.7
Elementary occupations 94.9 98.6 96.6
Total 84.5 85.6 84.9
Number ('000) 2,568 1,926 4,494
In the statistical Appendix Table A4.5, results are presented for informal employment
inclusive of the agriculture sector. The results indicate that 86 percent of the
population are engaged in the informal sector (a three-percentage point difference
with informality levels excluding those employed in agriculture industry). For
employment in the informal sector, details are provided in Appendix Table A4.6.
4.6.15 Characteristics of the self-employed
4.6.15.1 Main reasons for being self-employed
During the survey, persons who were employers and own account workers were
asked why they were in self-employment. Table 4.19 shows that the highest
proportion (41%) indicated lack of wage or salaried jobs as their main reason. Some
13 percent of the self-employed were as a result of family requirement, with wide
sex variation (5 % males and 22% females).
Table 4.19: Main reasons for being self-employed
Main reasons Male Female Rural Urban Total Total
Could not find a wage or salary job 44.1 38.1 42.9 36.7 41.2 2,417
Greater independence 29.9 24.6 24.3 36.1 27.4 1,605
More flexible hours of work 6.1 5.7 5.6 6.7 5.9 346
Higher income level 11.5 6.9 9.6 8.5 9.3 545
Required by the family 5.3 22.2 14.9 9.1 13.4 784
Other reasons 3.1 2.6 2.8 3.0 2.8 165
Total 100 100 100 100 100 5,861

Page | 49
4.6.15.2 Source of Start-up Capital
Table 4.20 highlights the major source of start-up capital for persons who were self-
employed. The proportion of those who started their activities using own savings was
59 percent while 28 percent did not need any form of financial capital. Borrowing as
a source of financial capital is still very low, with all forms of loans accounting for
only about four percent of start-up capital for the self-employed.
Table 4.20: Sources of Start-up Capital
Main source of capital
No money needed
Own savings
Money from family or friends
within the country Loans* Others Total
Male 23.4 67.0 5.2 3.9 0.5 100
Female 32.7 50.1 12.7 3.5 1.1 100
Rural 32.9 57.2 6.2 3.1 0.7 100
Urban 13.4 63.9 16.1 5.5 1.0 100
region
Kampala 4.0 61.4 25.1 7.4 2.2 100
Peri-urban Kampala 5.2 69.3 16.2 7.3 1.9 100
Central 19.6 63.2 12.6 4.0 0.6 100
Eastern 42.2 49.1 5.3 3.0 0.4 100
Karamoja 65.3 25.7 3.8 0.6 4.6 100
Northern 37.2 47.5 9.9 4.6 0.7 100
Western 25.8 67.0 4.3 2.7 0.3 100
Education level attained
No education 42.3 50.4 4.2 2.1 1.0 100
Primary 28.9 59.7 7.1 3.7 0.7 100
Secondary 17.3 63.3 14.8 4.3 0.4 100
Post primary/secondary specialized training
17.0 63.2 14.1 4.1 1.6 100
Degree and above 1.9 70.4 15.1 11.0 1.6 100
Age group
0-17 55.0 23.7 18.7 0.0 2.6 100
18-30 28.9 56.1 11.2 3.0 0.8 100
31-59 25.9 61.8 7.2 4.3 0.7 100
60+ 31.5 64.0 2.2 2.3 0.0 100
15-24 32.9 51.1 15.0 0.6 0.5 100
Industry
Agriculture, forestry and fishing 39.3 54.1 4.2 1.7 0.7 100
Production 18.4 63.4 15.5 2.7 0.0 100
Services 5.4 68.2 16.8 8.3 1.2 100
Total (Percent) 27.8 59.0 8.8 3.7 0.8 100
Total (Number ‘000) 1,632 3,455 514 216 45 5,861
Note: *Loans included loans from microfinance institutions (including cooperatives), loans from commercial banks and loans from informal financial operators (money lenders and saving collectors)
4.6.15.3 Problems faced by the self-employed
The main problem facing persons in self-employment was hash weather (43%)
followed by limited financial resources (18%) (Table 4.21). The proportion that
reported limited financial resources was 18 percent although very small proportions
All forms of borrowing (loans) contributed about four percent to start-up capital

Page | 50
accessed loans for start-up capital as noted in Table 4.20 above. This could be as a
result of lack of services or existence of prohibiting conditions. In urban areas, 28
percent noted limited financial resources as their main problem.
Table 4.21: Main problems faced by the self-employed, percent
Main Problems Male Female Rural Urban Total Total
Hash weather (draught or floods) 39.5 46.5 51.5 18.6 42.8 2,511
Limited financial resources 19.4 16.6 14.6 28.0 18.1 1,059
Competition in market 9.4 10.7 6.8 19.1 10.1 589
Shortages in raw materials 2.6 3.6 2.9 3.6 3.1 180
Other reasons 29.1 22.6 24.2 30.7 25.9 1,521
Total 100 100 100 100 100 5,860
4.6.16 Health and Safety of the employed population
Health and safety issues together with social protection provide some parameters to
measure the extent to which workers are engaged in decent work. The ILO
acknowledges decent work as being central to sustainable poverty reduction and as
a means for achieving equitable, inclusive and sustainable development.
During the survey, information was collected concerning occupational injuries to
working persons and whether any of the selected occupational injuries, diseases or
conditions occurred to working persons during the last 12 months prior to the survey
because of the nature of their work.
The results presented in Table 3.22 show the proportion of the employed population
that experienced selected occupational injuries, sickness or condition due to the
nature of the work. The greatest effect was extreme fatigue which was experienced
by nearly 22 percent of the employed population followed by superficial injuries or
open wounds (15%). For all the listed conditions, urban residents were more affected
than rural residents.
By sector, the highest proportion of the employed persons that experienced most
conditions were in production. For instance, 24 percent experienced superficial
injuries or open wounds, seven percent experienced eye problems, eight percent
experienced skin problems and 30 percent experienced extreme fatigue.
6% of the self-employed persons are faced with challenges of Hash weather and limited financial resources form
The employed population mostly suffered from Extreme fatigue (22%) and superficial injuries or open wounds (15%)
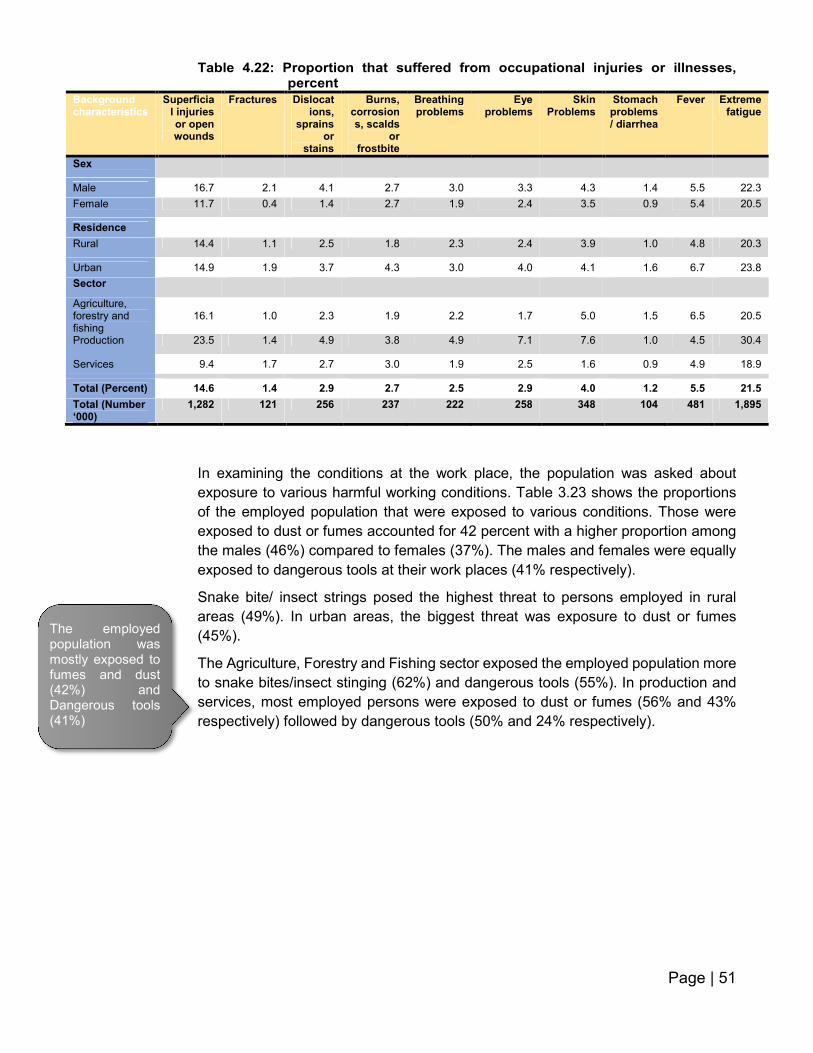
Page | 51
Table 4.22: Proportion that suffered from occupational injuries or illnesses, percent
Background characteristics
Superficial injuries or open wounds
Fractures Dislocations,
sprains or
stains
Burns, corrosions, scalds
or frostbite
Breathing problems
Eye problems
Skin Problems
Stomach problems / diarrhea
Fever Extreme fatigue
Sex
Male 16.7 2.1 4.1 2.7 3.0 3.3 4.3 1.4 5.5 22.3
Female 11.7 0.4 1.4 2.7 1.9 2.4 3.5 0.9 5.4 20.5
Residence
Rural 14.4 1.1 2.5 1.8 2.3 2.4 3.9 1.0 4.8 20.3
Urban 14.9 1.9 3.7 4.3 3.0 4.0 4.1 1.6 6.7 23.8
Sector
Agriculture, forestry and fishing
16.1 1.0 2.3 1.9 2.2 1.7 5.0 1.5 6.5 20.5
Production 23.5 1.4 4.9 3.8 4.9 7.1 7.6 1.0 4.5 30.4
Services 9.4 1.7 2.7 3.0 1.9 2.5 1.6 0.9 4.9 18.9
Total (Percent) 14.6 1.4 2.9 2.7 2.5 2.9 4.0 1.2 5.5 21.5
Total (Number ‘000)
1,282 121 256 237 222 258 348 104 481 1,895
In examining the conditions at the work place, the population was asked about
exposure to various harmful working conditions. Table 3.23 shows the proportions
of the employed population that were exposed to various conditions. Those were
exposed to dust or fumes accounted for 42 percent with a higher proportion among
the males (46%) compared to females (37%). The males and females were equally
exposed to dangerous tools at their work places (41% respectively).
Snake bite/ insect strings posed the highest threat to persons employed in rural
areas (49%). In urban areas, the biggest threat was exposure to dust or fumes
(45%).
The Agriculture, Forestry and Fishing sector exposed the employed population more
to snake bites/insect stinging (62%) and dangerous tools (55%). In production and
services, most employed persons were exposed to dust or fumes (56% and 43%
respectively) followed by dangerous tools (50% and 24% respectively).
The employed population was mostly exposed to fumes and dust (42%) and Dangerous tools (41%)

Page | 52
Table 4.23: Proportion exposed to harmful working conditions, percent
Background characteristics Dust or fumes
Fire, gas,
flames.
Loud noise or
vibration
Snake bite/ insect stringing
(poisonous)
Dangerous tools (knives etc)
Chemicals (pesticides, glues, etc.)
Sex Male 45.5 10.4 17.7 36.8 40.5 12.2
Female 36.8 12.9 11.5 37.8 40.8 10.4
Residence Rural 40.2 10.0 10.5 48.7 47.3 13.4
Urban 44.6 14.3 23.4 15.7 28.2 7.8
Sector Agriculture, forestry and fishing
34.0 7.2 4.2 62.3 54.6 18.1
Production 56.1 22.1 29.6 30.3 49.5 10.5
Services 43.4 11.6 19.9 15.3 23.6 5.4
Total (Percent) 41.7 11.5 15.0 37.2 40.6 11.4
Total (Number ‘000) 3,676 1,013 1,320 3,277 3,577 1,006
Physical and emotional abuse can affect performance at work place. Table 4.24
shows that the proportion of the employed population that was constantly shouted
at was about nine percent, with minimal variations by sex. On the other hand, the
proportion of the employed population that was repeatedly insulted was about seven
percent while nearly two percent of the employed population was sexually abused.
The younger employed persons experienced more abuses than older persons.
Although more males were constantly shouted at of insulted than females, more
females were sexually abused compared to males. The sector with more sexual
abuse was services.
Table 4.24: Proportion subjected to physical or emotional abuse at work place, percent
Background characteristics Constantly shouted at
Repeatedly insulted
Sexually abused
Sex
Male 9.2 7.0 0.6 Female 8.2 6.7 2.7
Residence
Rural 6.6 5.4 1.2
Urban 12.8 9.6 2.0
Age group
14-17 11.4 10.7 2.3 18-30 10.1 7.6 1.7
31-64 7.3 5.8 1.2
15-24 9.4 8.2 1.8
15-35 9.8 7.7 1.6
Sector
Agriculture, forestry and fishing 5.9 5.7 1.4 Production 11.6 8.7 0.4
Services 10.5 7.4 2.0
Total (Percent) 8.8 6.9 1.5 Total (Number ‘000) 771 605 131
The proportion of the employed population that suffered from sexual abuse was less than 2%

Page | 53
4.7 Workers in Subsistence Agriculture
For purposes of monitoring conditions of labour market performance as related to
insufficient access to, or integration in, markets, or to other factors of production,
statistics on subsistence agriculture is here identified and reported separately to
serve policy needs.
4.7.1 Characteristics of the working age population in subsistence Agriculture
Table 4.25 shows that, overall, one third (33%) of the working age population was
engaged in only subsistence agriculture production. The results further indicate that
the proportion was higher for females (39%) than males (27%). On the other hand,
the proportion in rural areas was almost four times that in urban areas.
By region disaggregation, Eastern had the highest proportion (49%) of the working
age population in subsistence agriculture production only. In Kampala district and
Peri-urban Kampala the proportion was negligible.
Table 4.25: Characteristics of the working age population in subsistence agricultural
Background characteristics
Working age population In Purely Subsistence Agriculture
Number (‘000) Number (‘000) Proportion (Percent)
Sex
Male 8,992 2,438 27.1
Female 9,851 3,815 38.7
Residence
Rural 13,701 5,640 41.2
Urban 5,142 613 11.9
Regions
Kampala & Peri-Urban Kampala 2,127 32 3.1
Central 3,583 971 27.1
Eastern 3,772 1,855 49.2
Karamoja 663 301 45.4
Other Northern 3,947 1,487 37.7
Western 4,752 1,605 33.8
Age group
14-17 3,267 1,177 36.0
18-30 7,741 2,415 31.2
31-64 7,835 2,661 34.0
15-24 6,514 2,155 33.1
15-35 12,018
3,710 30.9
Total 18,843 6,253 33.2
4.7.2 Distribution of working age population in subsistence Agriculture
The distribution of Uganda’s working age population which was in subsistence
agriculture only is presented in Table 4.26. The total working age population that
was purely in subsistence agriculture was estimated at 6.3 million people which is a
proportion of 33 percent. The survey found that every nine in ten (90 percent) of the
The proportion of working age population engaged exclusively in subsistence agriculture was 33%

Page | 54
working population in subsistence agriculture was resident in the rural areas. The
regional disaggregation of the working age population in subsistence agriculture
shows Eastern region having the highest share (30%), while peri-urban Kampala
and Kampala had the lowest (less than 1%).
Education is an essential part of one’s life both personally and socially. Through
education, persons especially young people become economically independent
which is a stepping stone to national economic growth, adapt to newer techniques
of production, increase their employability potential, among others.
The results further indicate that for person in subsistence agriculture who were out
of school, those with either no formal education or primary level education
constituted 87 percent of the working age population involved in subsistence
agriculture only. The proportion was higher for females (90%) than the males (82%).
The working age population with neither trade, technical skill nor specialisation
constituted 84 percent of the population involved in subsistence agriculture only.
Table 4.26: Distribution of the working age population in subsistence agricultural by background characteristics
Background characteristics Male Female Total
Residence Rural 91.6 89.3 90.2
Urban 8.4 10.7 9.8
Region
Kampala & Peri-urban Kampala 0.5 0.6 0.5
Central 15.6 15.5 15.5
Eastern 29.8 29.6 29.7
Karamoja 5.2 4.6 4.8
Northern 23.7 23.9 23.8
Western 25.2 26.0 25.7
Age groups
14-17 22.1 16.7 18.8
18-30 36.0 40.3 38.6
31-64 41.9 43.0 42.6
15-24 35.7 33.7 34.5
15-35 39.0 61.0 59.3
Education attainment
No education 11.3 24.3 19.5
Primary 70.7 65.7 67.6
Secondary 15.6 9.1 11.5
Post primary/secondary specialized training 1.9 0.9 1.3
Degree and above 0.5 0 0.2
Trade/Technical Skills
With trade or technical skill and specialisation 0.6 0.5 0.5
With trade or technical skill only 10.9 16.1 14.2
With specialisation only 1.7 0.4 0.9
None 86.8 83 84.4
Total 100 100 100
Number ('000) 2,438 3,815 6,253
Among the working age population engaged exclusively in subsistence agriculture, 90% were resident in rural areas

Page | 55
4.7.3 Availability for employment for persons in subsistence agriculture
The results in Table 4.27 indicate that only one in ten (10%) of the persons in
subsistence agriculture was unemployed, that is, looked for employment and were
available for employment during the last four weeks preceding the survey. The
proportion of males was higher than that of females. The proportion was higher for
urban residents (15%) than rural residents (9%). The proportion was higher for the
youth (14%) compared to other age groups.
Almost one third (32%) of the persons in subsistence agriculture did not look for
employment although they were available for employment (potential labour force),
implying that there more subsistence agriculture workers who were available for
work but not actively seek work than those who actively looked for work. The
proportion was higher for males (37%) than females (28%). The proportion was also
higher among urban residents (39%) than rural residents (31%) as well as for the
youth (38%) compared to other age groups.
Table 4.27: Proportion of persons in subsistence agriculture available for employment by background characteristics
Background characteristics Looked for and available for employment
Did not look for but were
available for employment
Did not look for and were not available for employment
Total
Male 12.6 36.8 50.5 100
Female 8.1 28.3 63.6 100
Rural 9.3 30.9 59.8 100
Urban 14.8 38.8 46.4 100
Kampala 48.0 0.0 52.0 100
Peri-urban Kampala 10.6 31.2 58.2 100
Central 9.0 35.3 55.7 100
Eastern 9.3 33.5 57.2 100
Karamoja 3.1 45.3 51.6 100
Northern 14.8 33.5 51.8 100
Western 7.6 23.2 69.2 100
14-17 3.8 21.4 74.8 100
18-30 14.4 37.5 48.2 100
31-64 8.4 30.9 60.6 100
Youth 15-24 11.2 33.0 55.8 100
No education 2.7 25.5 71.8 100
Primary 12.4 35.4 52.2 100
Secondary 19.9 42.6 37.5 100
Post primary/secondary specialized training
18.8 40.9 40.4 100
Degree and above 61.6 18.9 19.6 100
Total 9.9 31.7 58.5 100
Number ('000) 617 1,979 3,657 6,253
Among the working age population engaged exclusively in subsistence agriculture, 90% was not economically active

Page | 56
4.7.4 Degree of satisfaction by Persons engaged in Subsistence agriculture
The survey examined the degree of satisfaction of the people with their present work.
The findings in Figure 4.12 reveal that almost two thirds (65%) of the persons in only
subsistence agriculture were either somewhat satisfied or very satisfied with their
work.
The proportion was almost similar by gender. More rural residents were satisfied
with the subsistence agriculture production (66%) compared to the urban residents
(59%). The proportion was highest in Eastern region compared to other regions
whereby every 8 in ten of the subsistence agriculture workers were satisfied with
their work.
Figure 4.12: Proportion of persons in subsistence agriculture satisfied with their work by background characteristics
4.7.5 Desire to change from Subsistence agriculture to employment
The survey examined the degree of satisfaction among persons engaged in
subsistence agriculture and their need to change. About 40 percent of all persons
engaged in subsistence agriculture expressed the desire to change their work
situation at the time of the survey as shown in Figure 4.13.
More males than females wanted to change their jobs, 48 percent and 35 percent
respectively. The proportion was higher for urban residents (52%) than rural
residents (38%).
64.4
65.3
65.6
58.9
17.9
64.6
77.3
80.6
70.8
48.2
54.1
54.9
63.1
71.1
65.0
0.0 10.0 20.0 30.0 40.0 50.0 60.0 70.0 80.0 90.0
Male
Female
Rural
Urban
Kampala
Peri-urban Kampala
Central
Eastern
Karamoja
Northern
Western
14-17
18-30
31-64
Total
65% of the working age population engaged exclusively in subsistence agriculture was satisfied with it.
About 40 percent of the subsistence agriculture workers liked to change to employment work

Page | 57
Figure 4.13: Proportion of subsistence agriculture workers who liked to change to employment jobs by sex, residence and regions
4.7.6 Weekly hours of work for subsistence agriculture workers
Figure 4.14 shows the average usual and actual weekly hours spent by subsistence
agriculture workers at work. The results indicate that, overall, subsistence agriculture
workers usually spent an average of 28 hours a week at work. The actual mean
weekly hours were 24 hours. There were minimal variations of average weekly hours
both in the usual and actual hours spent on subsistence agriculture by sex and
residence. The average weekly usual and actual hours spent on subsistence
agriculture increased with the increase in age.
Figure 4.14: Average weekly hours of work for subsistence foodstuff producers by sex, residence and age
47.0
34.738.1
52.2
34.139.2
43.0 39.747.8 46.3
29.324.5
49.1
37.4 39.5
0.0
25.0
50.0
75.0
100.0
Male
Fem
ale
Rura
l
Urb
an
Ka
mpala
Pe
ri-u
rban K
am
pala
Oth
er
centr
al
Ea
ste
rn
Ka
ram
oja
Nort
hern
Weste
rn
14-1
7
18-3
0
31-6
4
Sex Residence Regions Age groups Total
28.527.1 27.9
25.7
15.7
28.9
31.6
27.7
24.623.3 24.0
22.3
13.3
24.8
27.5
23.8
0.0
5.0
10.0
15.0
20.0
25.0
30.0
35.0
Male Female Rural Urban 14-17 18-30 31-64
Sex Residence Age group Total
Usual hours Actual hours
Persons in subsistence agriculture workers usually spent an average of 28 hours a week on their work.
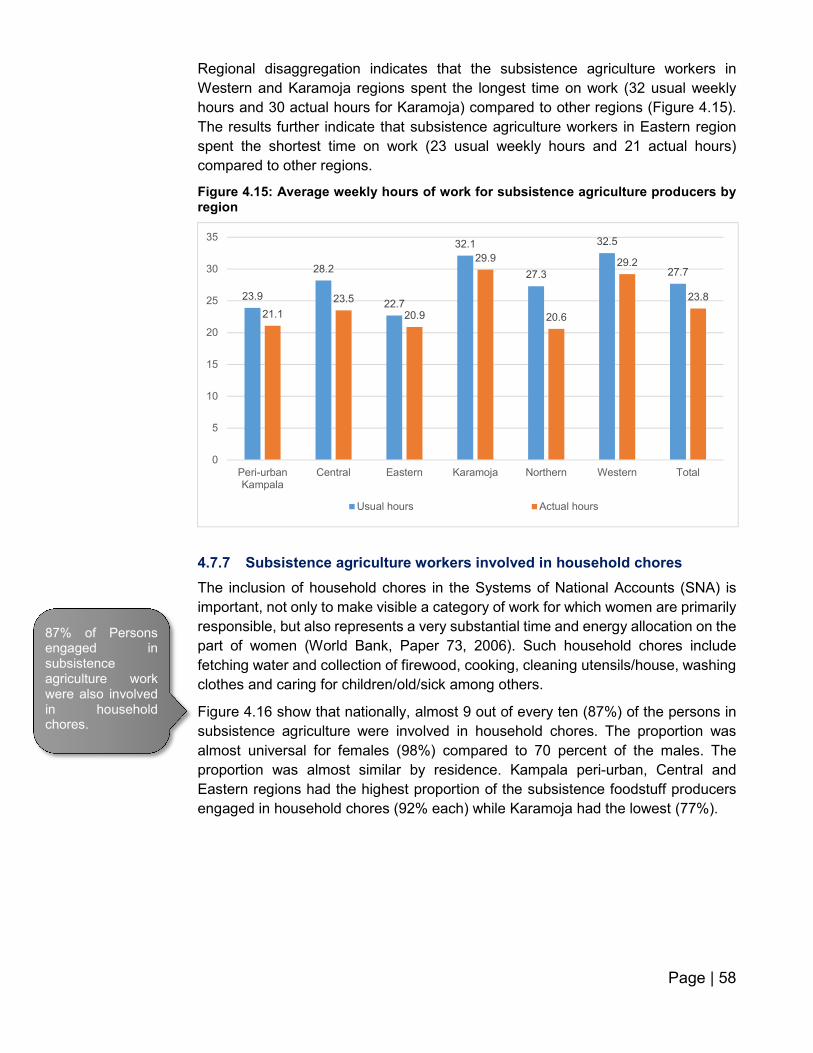
Page | 58
Regional disaggregation indicates that the subsistence agriculture workers in
Western and Karamoja regions spent the longest time on work (32 usual weekly
hours and 30 actual hours for Karamoja) compared to other regions (Figure 4.15).
The results further indicate that subsistence agriculture workers in Eastern region
spent the shortest time on work (23 usual weekly hours and 21 actual hours)
compared to other regions.
Figure 4.15: Average weekly hours of work for subsistence agriculture producers by region
4.7.7 Subsistence agriculture workers involved in household chores
The inclusion of household chores in the Systems of National Accounts (SNA) is
important, not only to make visible a category of work for which women are primarily
responsible, but also represents a very substantial time and energy allocation on the
part of women (World Bank, Paper 73, 2006). Such household chores include
fetching water and collection of firewood, cooking, cleaning utensils/house, washing
clothes and caring for children/old/sick among others.
Figure 4.16 show that nationally, almost 9 out of every ten (87%) of the persons in
subsistence agriculture were involved in household chores. The proportion was
almost universal for females (98%) compared to 70 percent of the males. The
proportion was almost similar by residence. Kampala peri-urban, Central and
Eastern regions had the highest proportion of the subsistence foodstuff producers
engaged in household chores (92% each) while Karamoja had the lowest (77%).
23.9
28.2
22.7
32.1
27.3
32.5
27.7
21.1
23.5
20.9
29.9
20.6
29.2
23.8
0
5
10
15
20
25
30
35
Peri-urbanKampala
Central Eastern Karamoja Northern Western Total
Usual hours Actual hours
87% of Persons engaged in subsistence agriculture work were also involved in household chores.
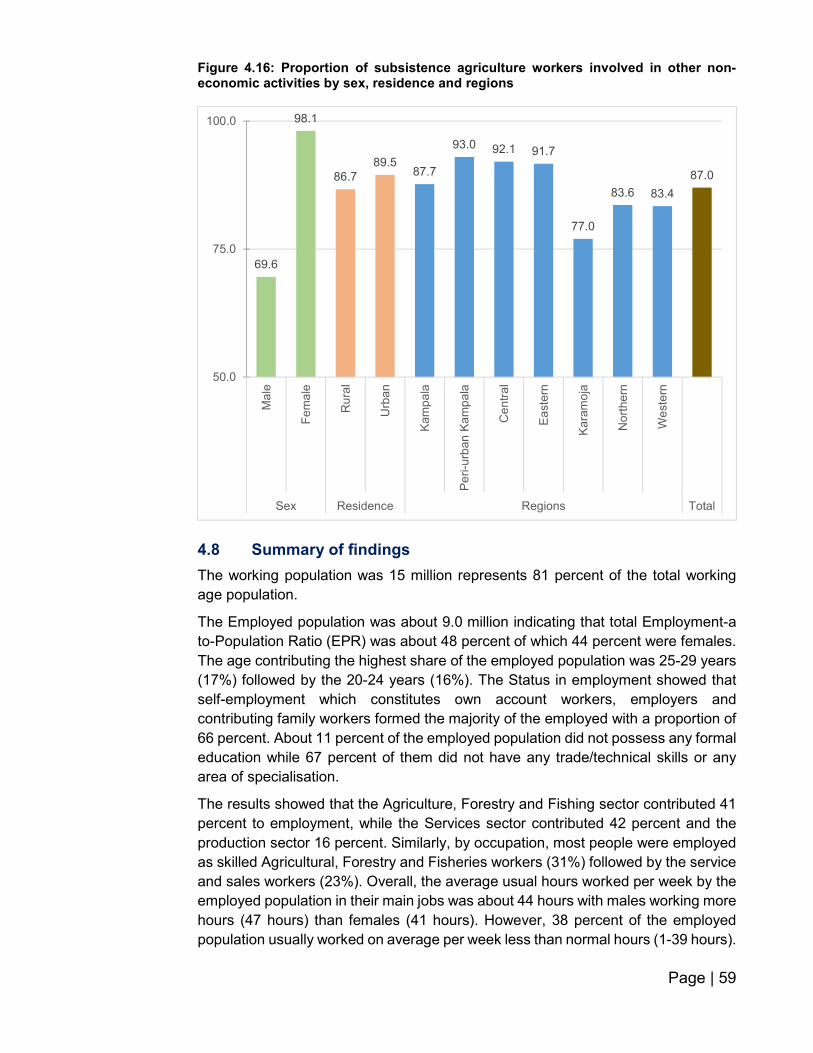
Page | 59
Figure 4.16: Proportion of subsistence agriculture workers involved in other non-economic activities by sex, residence and regions
4.8 Summary of findings
The working population was 15 million represents 81 percent of the total working
age population.
The Employed population was about 9.0 million indicating that total Employment-a
to-Population Ratio (EPR) was about 48 percent of which 44 percent were females.
The age contributing the highest share of the employed population was 25-29 years
(17%) followed by the 20-24 years (16%). The Status in employment showed that
self-employment which constitutes own account workers, employers and
contributing family workers formed the majority of the employed with a proportion of
66 percent. About 11 percent of the employed population did not possess any formal
education while 67 percent of them did not have any trade/technical skills or any
area of specialisation.
The results showed that the Agriculture, Forestry and Fishing sector contributed 41
percent to employment, while the Services sector contributed 42 percent and the
production sector 16 percent. Similarly, by occupation, most people were employed
as skilled Agricultural, Forestry and Fisheries workers (31%) followed by the service
and sales workers (23%). Overall, the average usual hours worked per week by the
employed population in their main jobs was about 44 hours with males working more
hours (47 hours) than females (41 hours). However, 38 percent of the employed
population usually worked on average per week less than normal hours (1-39 hours).
69.6
98.1
86.7
89.587.7
93.0 92.1 91.7
77.0
83.6 83.4
87.0
50.0
75.0
100.0
Ma
le
Fe
ma
le
Ru
ral
Urb
an
Ka
mp
ala
Pe
ri-u
rban
Ka
mp
ala
Ce
ntr
al
Ea
ste
rn
Ka
ram
oja
No
rthe
rn
We
ste
rn
Sex Residence Regions Total

Page | 60
The median cash monthly earnings of persons in paid employment was 190,000/=
(one hundred ninety thousand shillings only). The median cash monthly earnings for
males was 240,000/= and that of females was 120,000/=. Elementary occupation
workers were the least paid with median monthly salaries/wages at 96,000/=.
Informal employment outside agriculture was 85 percent, with Eastern and Karamoja
regions having the highest proportion of informal employment outside agriculture
(88%)
Persons in self-employment faced a number of challenges but the main ones being
hash weather (43%) followed by limited financial resources (18%).
The total working age population that was exclusively in subsistence agriculture was
estimated at 6.2 million people. This constituted one third (33%) of the working age
population. The proportion was higher for females (39 percent) than males (27%).
On the other hand, the proportion of rural areas was almost four times than urban
areas.
About one third (32%) of the persons in subsistence agriculture did not look for
employment but were available for employment, implying that there more
subsistence agriculture workers who were available for work but not actively seek
work than those who actively looked for work.
Almost two thirds of the persons in subsistence agriculture were either somewhat
satisfied or very satisfied with their job. But despite the stated subsistence agriculture
satisfaction rate of 65 percent, about 40 percent of them expressed the desire to
change their present employment situation.

Page | 61
CHAPTER FIVE: LABOUR UNDERUTILISATION
5.0 Introduction
Labour Underutilisation (LU) refers to mismatches between labour supply and
demand i.e. unmet need for employment. It is therefore comprised of unemployed
persons, potential labour force and persons in employment but with unmet need.
Labour underutilisation focuses on issues of insufficient labour absorption and gives
information that is necessary in broader labour market monitoring. The chapter
presents the following 4 measures of Labour Underutilisation (LU):
(i) The Unemployment rate (LU1);
(ii) The Combined rate of time-related underemployment and unemployment
(LU2);
(iii) The Combined rate of unemployment and potential labour force (LU3);
(iv) The Composite measure of labour underutilization (LU4).
To supplement the above measures in the labour market monitoring, information on
skill related and income related inadequate employment situations is also included.
The measurement of Labour Underutilisation (LU) presented in this chapter is based
on the 19thICLS resolutions of 2013 on work statistics concepts.
5.1 Unemployment Rate (LU1)
The unemployment rate is the proportion of the unemployed population to the total
labour force. Table 5.1 shows that about 10 percent (959,000 in absolute terms) of
the population aged 14-64 years were unemployed during 2016/17. The
unemployment rate of the female population (11%) was higher than that of the male
population (8%). The results also show that the unemployment rate of the working
age population in rural areas of 10 percent was slightly higher than for urban
residents (9%).
The eastern and northern regions had the highest unemployment rate (about 15%
and 14% respectively) and Western Region the lowest of six percent. By education,
the lowest unemployment rate was observed among persons with post primary/post-
secondary specialised training (3%) and highest among persons with Primary
education (about 12%). Persons with specialisation had lower unemployment rate
(5%) compared to those with skills only (10%). The results also indicate that the
unemployment rate of the young population was high (15% for 15-24-year olds, 13%
for 18-30 and 12 for 15-35) (Table 5.1).
The unemployment rate was about 9.7%

Page | 62
Table 5.1: Unemployment Rate (LU1) by Selected Back ground Characteristics, 2016/17
Background Characteristic
Unemployment Rate (LU1)
Male Female Total
Residence
Rural 9.2 10.9 9.9
Urban 6.2 12.4 9.1
Region
Kampala 8.4 13.6 10.7
Peri-urban Kampala 5.4 14.7 9.9
Central 5.0 9.3 6.9
Eastern 12.2 20.3 15.3
Karamoja 9.1 4.8 6.8
Northern 12.4 14.9 13.5
Western 5.9 5.4 5.6
Education Attainment
No education 4.3 5.6 5.2
Primary 9.8 14.0 11.6
Secondary 8.0 13.7 10.3
Post primary/secondary specialized training 3.7 3.0 3.4
Degree and above 5.8 11.6 8.0
With Skill or specialisation
With trade or technical skill and specialisation 3.0 4.0 3.4
With trade or technical skill only 6.2 13.6 9.5
With specialisation only 4.9 5.8 5.3
None 9.6 12.2 10.8
Disability status With Disability 8.6 9.5 9.0
Without Disability 8.1 12.1 9.8
Age Group
14-17 10.0 13.2 11.4
18-30 11.4 14.7 13.0
31-64 5.3 7.8 6.3
15-24 12.7 17.3 14.8
15-35 9.8 13.8 11.6
Total 8.2 11.4 9.7
Number ('000) 452 507 959
5.2 Time Related Underemployment
Persons are considered to be in time related underemployment if they are employed
but with insufficient working time and wanting and available to work more hours. The
indicator is among those indicators that are used to supplement the unemployment
rate to help in enriching the analysis of the efficiency of the labour market in terms
of the ability of the country to provide full employment to its population. At the national
level the indicator captures the employed population that worked for less than 40

Page | 63
hours during the reference period of one week and were willing and available to work
for more hours either in the current or other employment situation.
Table 5.2 shows the time related underemployment rates by selected Background
characteristics. The findings indicate that out of about 9.0 million employed persons
shown in table 4.5 above, 12 percent (about 1.0million persons in absolute numbers)
were in time related underemployment. The time-related underemployment rate in
the rural areas of 14 percent was higher than that of the urban areas (8%). The
Males recorded higher time-related underemployment rate (13%) compared to
females (11%).
Comparisons within regions indicate that Karamoja region recorded the highest time-
related underemployment rate of about 20 percent, while the Peri-urban Kampala,
Kampala and Western regions recorded the lowest time-related underemployment
rates of eight percent respectively. The level of this underemployment was inversely
proportional to the level of education reducing from 15 percent among those with no
formal education to five percent among those holding University degrees and above.
Table 5.2 further shows substantial variations in time related underemployment rates
by sex for persons with disability. The time related underemployment rate of male
persons with disabilities of 17 percent was higher than that for females (11%).
Table 5.2: Time related Underemployment Rate for Employed Persons (14-64 years) by Selected Background Characteristics, Uganda 2016/17
Background Characteristic Male Female Total
Residence
Rural 15.0 12.0 13.7 Urban 8.4 8.1 8.2
Region
Kampala 8.4 7.7 8.1
Peri-urban Kampala 6.4 9.5 7.8
Central 18.7 13.4 16.5
Eastern 9.8 9.6 9.7 Karamoja 20.6 19.2 19.8
Northern 15.5 16.8 16.1
Western 9.8 4.7 7.5
Education Attainment
No education 23.3 11.0 15.2
Primary 15.0 12.4 13.9 Secondary 11.0 9.9 10.6
Post primary/secondary specialized training 4.1 8.1 5.9
Degree and above 6.9 2.5 5.3
With Skill or specialisation
With trade or technical skill and specialisation 6.3 5.8 6.1
With trade or technical skill only 13.7 13.9 13.8 With specialisation only 4.4 7.3 5.6
None 14.6 10.8 12.9 Disability status
With Disability 17.1 10.5 13.9
Without Disability 11.7 10.7 11.3
Age group
14-17 8.7 10.9 9.6
18-30 12.3 11.1 11.7
31-64 13.7 10.1 12.2
15-24 12.0 9.9 11.1
15-35 11.2 11.3 11.2 Total 12.7 10.6 11.8
Number (000’s) 644.2 415.4 1,059.50
Time related underemployment rate was
about 12%

Page | 64
5.3 Combined Rate of Unemployment and Time related Underemployment (LU2)
The combined rate of unemployment and time related underemployment is the sum
of the unemployed population and the persons classified in time related
underemployment as a proportion of the labour force. Table 5.3 shows that one fifth
of the labour force in Uganda was either unemployed or were employed for less than
40 hours in a week and willing and available to work for more hours. The combined
rate of unemployment and time related underemployment was nearly the same
among males and females at 20 percent. It was, however, higher among residents
of rural areas (22%) compared to urban residents (17%). Disaggregation by regions
revealed that the highest combined rate of unemployment and time related
underemployment was in Northern region (28%) which was more than two times the
lowest rate observed in Western Region (13%) indicating high levels of
underutilisation among residents in Northern area relative to other regions in the
country.
Table 5.3: Combined Rate of Unemployment and Time Related Underemployment (LU2) by Selected Background Characteristics, Uganda 2016/17
Background Characteristic Male Female Total
Residence Rural 22.8 21.6 22.3
Urban 14.0 19.5 16.6
Region
Kampala 16.1 20.2 18
Peri-urban Kampala 11.5 22.8 16.9
Central 22.8 21.5 22.2
Eastern 20.9 27.9 23.6
Karamoja 27.9 23.1 25.3
Northern 26 29.2 27.5
Western 15.1 9.9 12.7
Education Attainment
No education 26.6 16.0 19.6
Primary 23.3 24.6 23.9
Secondary 18.1 22.2 19.8
Post primary/secondary specialized training 7.6 10.9 9.1
Degree and above 12.3 13.8 12.9
With Skill or specialisation
With trade or technical skill and specialisation 9.1 9.6 9.3
With trade or technical skill only 19.1 25.5 22.0
With specialisation only 9.1 12.7 10.6
None 22.8 21.8 22.3
Disability status
With Disability 24.2 18.9 21.7
Without Disability 18.9 21.4 20.0
Age group
14-17 17.8 22.6 19.9
18-30 22.3 24.1 23.2
31-64 18.2 17.2 17.8
15-24 23.2 25.5 24.3
15-35 19.9 23.5 21.5
Total 19.9 20.8 20.3
Number (000’s) 1096 922 2018
LU2 was estimated to be 20% and nearly the same for males and females.

Page | 65
5.4 Combined Rate of Unemployment and Potential Labour Force (LU3)
Potential Labour Force (PLF) refers to persons not in employment who expressed
an interest in this form of work but for whom existing conditions limit their active
job search and/or their availability. This represents the population that was outside
the labour but expressed desire for employment despite limiting factors for search
or availability expressed as a proportion of the extended labour force. Extended
labour force refers to the total population in the labour force (employed and
unemployed persons) and the potential labour force.
As presented in Figure 5.1, the rate of potential Labour Force was about 19 percent
representing a population of nearly 2.3 million people. The rate of potential labour
force among females (23%) was much higher than among males (15%). In rural
areas, the rate of potential labour force was double the rate in urban areas.
Figure 5.1: Rate of Potential Labour Force (PLF)
The combined rate of unemployment and potential labour force is the sum of the
working age population that is unemployed and the potential labour force expressed
as a proportion of the extended labour force.
Table 5.4 shows the combined rate of unemployment and the potential labour force
by selected background characteristics. Overall the combined rate of unemployment
and the potential labour force was 26 percent. The population living in rural areas
had a higher rate of LU3 of 30 percent compared to those in urban areas (18%). The
rate for the females of 32 percent was higher than that for males, 22 percent. The
combined rate of unemployment and potential labour force was highest in the
Eastern Region (48 percent) and lowest in the Western Region (16 percent).
14.5
22.9 22.3
10.2
27.2
19.4
16.2
18.5
0
5
10
15
20
25
30
Male Female Rural Urban 14-17 18-30 31-64 Total
The proportion of LU3 was 26 but higher in rural areas (30%) than urban (18%)
The proportion in potential
labour force
was19%
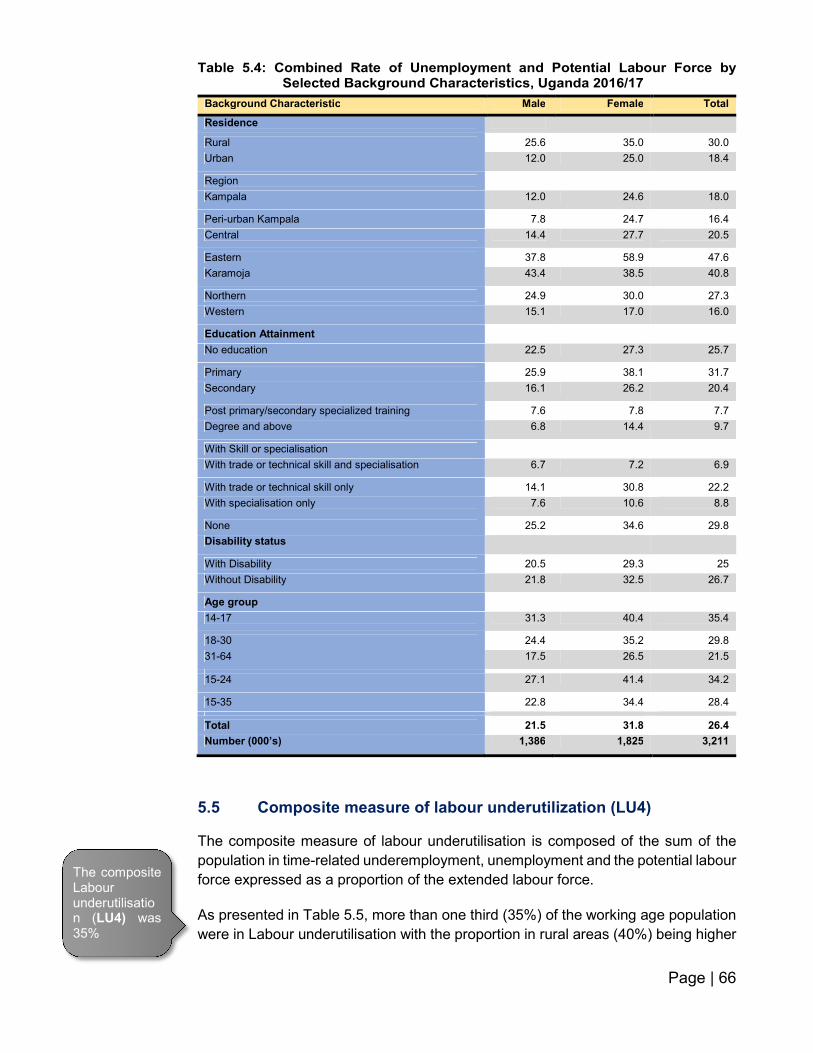
Page | 66
Table 5.4: Combined Rate of Unemployment and Potential Labour Force by Selected Background Characteristics, Uganda 2016/17
Background Characteristic Male Female Total
Residence
Rural 25.6 35.0 30.0
Urban 12.0 25.0 18.4
Region
Kampala 12.0 24.6 18.0
Peri-urban Kampala 7.8 24.7 16.4
Central 14.4 27.7 20.5
Eastern 37.8 58.9 47.6
Karamoja 43.4 38.5 40.8
Northern 24.9 30.0 27.3
Western 15.1 17.0 16.0
Education Attainment
No education 22.5 27.3 25.7
Primary 25.9 38.1 31.7
Secondary 16.1 26.2 20.4
Post primary/secondary specialized training 7.6 7.8 7.7
Degree and above 6.8 14.4 9.7
With Skill or specialisation
With trade or technical skill and specialisation 6.7 7.2 6.9
With trade or technical skill only 14.1 30.8 22.2
With specialisation only 7.6 10.6 8.8
None 25.2 34.6 29.8
Disability status
With Disability 20.5 29.3 25
Without Disability 21.8 32.5 26.7
Age group
14-17 31.3 40.4 35.4
18-30 24.4 35.2 29.8
31-64 17.5 26.5 21.5
15-24 27.1 41.4 34.2
15-35 22.8 34.4 28.4
Total 21.5 31.8 26.4
Number (000’s) 1,386 1,825 3,211
5.5 Composite measure of labour underutilization (LU4)
The composite measure of labour underutilisation is composed of the sum of the
population in time-related underemployment, unemployment and the potential labour
force expressed as a proportion of the extended labour force.
As presented in Table 5.5, more than one third (35%) of the working age population
were in Labour underutilisation with the proportion in rural areas (40%) being higher
The composite Labour underutilisation (LU4) was 35%
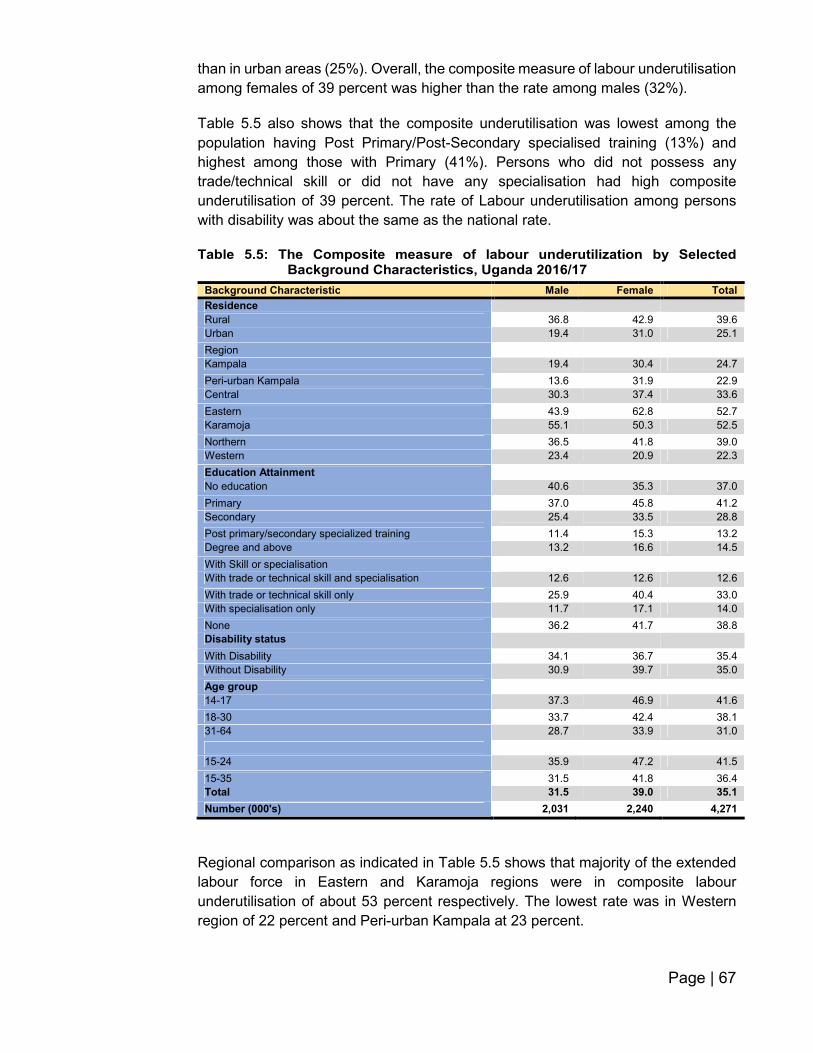
Page | 67
than in urban areas (25%). Overall, the composite measure of labour underutilisation
among females of 39 percent was higher than the rate among males (32%).
Table 5.5 also shows that the composite underutilisation was lowest among the
population having Post Primary/Post-Secondary specialised training (13%) and
highest among those with Primary (41%). Persons who did not possess any
trade/technical skill or did not have any specialisation had high composite
underutilisation of 39 percent. The rate of Labour underutilisation among persons
with disability was about the same as the national rate.
Table 5.5: The Composite measure of labour underutilization by Selected Background Characteristics, Uganda 2016/17
Background Characteristic Male Female Total
Residence
Rural 36.8 42.9 39.6
Urban 19.4 31.0 25.1
Region
Kampala 19.4 30.4 24.7
Peri-urban Kampala 13.6 31.9 22.9
Central 30.3 37.4 33.6
Eastern 43.9 62.8 52.7
Karamoja 55.1 50.3 52.5
Northern 36.5 41.8 39.0
Western 23.4 20.9 22.3
Education Attainment
No education 40.6 35.3 37.0
Primary 37.0 45.8 41.2
Secondary 25.4 33.5 28.8
Post primary/secondary specialized training 11.4 15.3 13.2
Degree and above 13.2 16.6 14.5
With Skill or specialisation
With trade or technical skill and specialisation 12.6 12.6 12.6
With trade or technical skill only 25.9 40.4 33.0
With specialisation only 11.7 17.1 14.0
None 36.2 41.7 38.8
Disability status
With Disability 34.1 36.7 35.4
Without Disability 30.9 39.7 35.0
Age group
14-17 37.3 46.9 41.6
18-30 33.7 42.4 38.1
31-64 28.7 33.9 31.0
15-24 35.9 47.2 41.5
15-35 31.5 41.8 36.4
Total 31.5 39.0 35.1
Number (000's) 2,031 2,240 4,271
Regional comparison as indicated in Table 5.5 shows that majority of the extended
labour force in Eastern and Karamoja regions were in composite labour
underutilisation of about 53 percent respectively. The lowest rate was in Western
region of 22 percent and Peri-urban Kampala at 23 percent.

Page | 68
Sex variations indicated in Figure 5.2 shows that Karamoja had the highest rate of
males in underutilisation (43%) while the rate for females was highest in Eastern
(59%). In Kampala, underutilisation rate (LU4) among females (25%) was double the
rate for males (12%). The variation was even wider for Peri-Urban Kampala (8 for
males and 25 for females).
Figure 5.2: Regional Labour Underutilisation Rate by sex
5.6 Inadequate Employment Situations
This section presents findings on skills/qualification related inadequate employment
and income-related inadequate employment.
5.6.1 Skill/qualification Related Inadequate Employment
The working age population categorised in skill/qualification related inadequate
employment was that which during the reference period of one week were employed
and not already categorized as time-related underemployed but whose educational
attainment were higher than the educational level required by their current main jobs.
This category of the working age population was also wanting or seeking to change
their current work situation in order to use their current occupational skills more fully
and was always available to do so. The minimum education level used to categorise
someone to be in skill-related inadequate employment in this survey was senior four.
Figure 5.3 shows that the skill related inadequate employment rate was about six
percent with the likelihood of employed persons in urban areas (12%) being nearly
four times to be categorised in skill related inadequate employment relative to that
of the rural areas (3%). Among the sectors, Agriculture had the lowest rate of skill
related inadequate employment rate (3%) while the other two sectors almost had the
same rate (9% for services and 10% for the production sector). This finding can be
partly explained by the shying away of the highly educated population from working
in the Agriculture sector. The skill related inadequate employment rate was lowest
Skill related inadequate employment rate was about 6%
Female Male
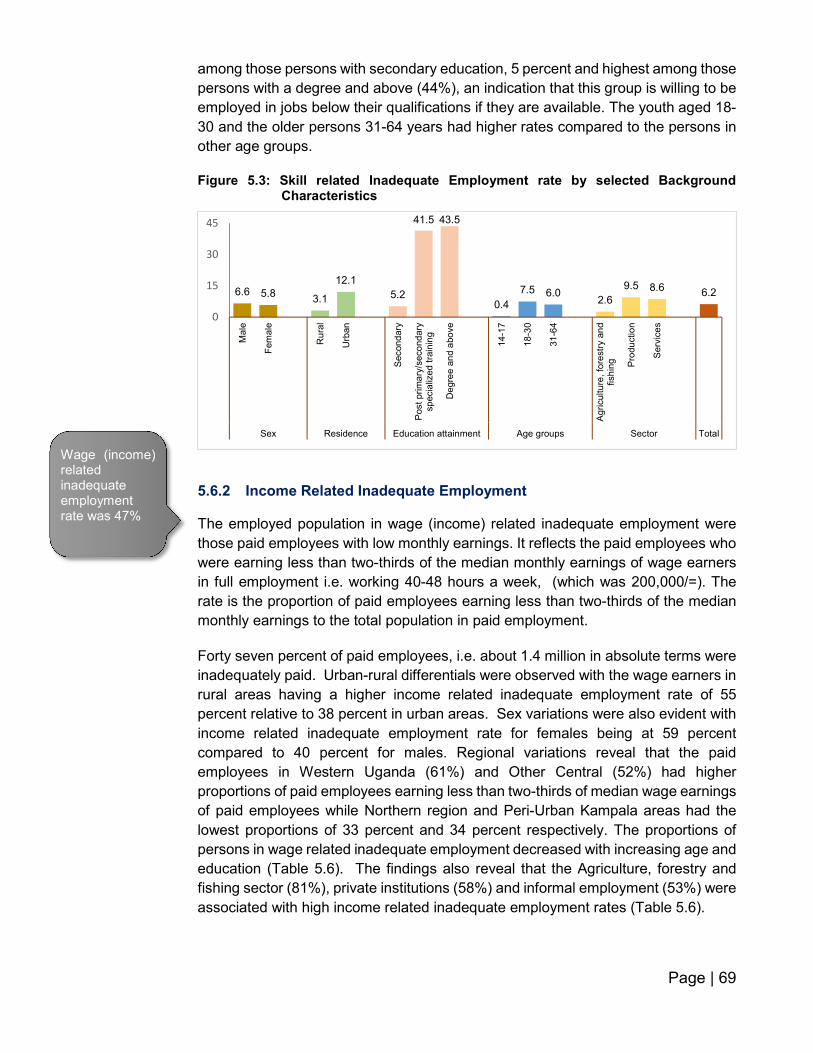
Page | 69
among those persons with secondary education, 5 percent and highest among those
persons with a degree and above (44%), an indication that this group is willing to be
employed in jobs below their qualifications if they are available. The youth aged 18-
30 and the older persons 31-64 years had higher rates compared to the persons in
other age groups.
Figure 5.3: Skill related Inadequate Employment rate by selected Background Characteristics
5.6.2 Income Related Inadequate Employment
The employed population in wage (income) related inadequate employment were
those paid employees with low monthly earnings. It reflects the paid employees who
were earning less than two-thirds of the median monthly earnings of wage earners
in full employment i.e. working 40-48 hours a week, (which was 200,000/=). The
rate is the proportion of paid employees earning less than two-thirds of the median
monthly earnings to the total population in paid employment.
Forty seven percent of paid employees, i.e. about 1.4 million in absolute terms were
inadequately paid. Urban-rural differentials were observed with the wage earners in
rural areas having a higher income related inadequate employment rate of 55
percent relative to 38 percent in urban areas. Sex variations were also evident with
income related inadequate employment rate for females being at 59 percent
compared to 40 percent for males. Regional variations reveal that the paid
employees in Western Uganda (61%) and Other Central (52%) had higher
proportions of paid employees earning less than two-thirds of median wage earnings
of paid employees while Northern region and Peri-Urban Kampala areas had the
lowest proportions of 33 percent and 34 percent respectively. The proportions of
persons in wage related inadequate employment decreased with increasing age and
education (Table 5.6). The findings also reveal that the Agriculture, forestry and
fishing sector (81%), private institutions (58%) and informal employment (53%) were
associated with high income related inadequate employment rates (Table 5.6).
6.6 5.83.1
12.1
5.2
41.5 43.5
0.4
7.5 6.02.6
9.5 8.66.2
0
15
30
45
Male
Fem
ale
Ru
ral
Urb
an
Second
ary
Post pri
ma
ry/s
eco
nd
ary
sp
ecia
lized
tra
inin
g
De
gre
e a
nd a
bo
ve
14
-17
18
-30
31
-64
Agri
culture
, fo
restr
y a
nd
fish
ing Pro
du
ctio
n
Serv
ice
s
Sex Residence Education attainment Age groups Sector Total
Wage (income) related inadequate employment rate was 47%

Page | 70
Table 5.6: Income related Inadequate Employment Rate by Selected Background Characteristics, Uganda 2016/17
Background Characteristic Male Female Total
Residence
Rural 48.9 70.9 55.0
Urban 29.6 50.1 37.6
Region
Kampala 29.6 44.5 35.7
Peri-urban Kampala 20.7 53.5 34.1
Central 46.1 64.3 51.7
Eastern 42.0 52.9 47.8
Karamoja 45.9 41.3 44.9
Northern 27.0 48.3 33.3
Western 52.6 77.4 61.0
Education Attainment
No education 57.9 68.2 62.4
Primary 57.1 83.2 64.6
Secondary 34.6 68.5 44.4
Post primary/secondary specialized training 11.0 3.6 21.2
Degree and above 3.6 4.2 3.6
With Skill or specialisation
With trade or technical skill and specialisation 5.1 24.1 13.5
With trade or technical skill only 38.2 80.2 50.9
With specialisation only 9.9 27.0 17.3
None 52.6 75.0 59.3
Age group
14-17 82.0 85.7 83.4
18-30 46.3 64.6 53.1
31-64 30.3 47.7 35.3
15-24 58.5 73.2 64.1
15-35 43.3 63.0 50.1
Sector
Agriculture, forestry and fishing 76.1 89.1 80.5
Production 30.4 48.3 32.9
Services 29.0 49.9 37.5
Institution
Private 49.5 73.3 57.5
Public 12.2 20.2 15.0
Informality in Employment
Formal employment 1.8 9.1 4.5
Informal employment 46.0 68.3 53.3
Total 40.4 59.1 46.6
Number(000’s) 826 599 1,425

Page | 71
5.7 Summary of findings
The unemployment rate was 9.7 percent, arising from about 959,000 of the working
age population that were without a job, actively looking for employment and available
for work during the reference period. The unemployment rate of the female
population of 11 percent was higher than that of the male population (8%). Regional
variations were also observed in the employment rates with the eastern and northern
regions having the highest unemployment rates of 15 percent and 14 percent
respectively with the western region recording the lowest of six percent.
Time related underemployment rate 12 percent of the employed population with the
rates for the rural areas of 14 percent being higher than that of the urban areas of 8
percent. Additionally, about a fifth of the labour force in Uganda was either
unemployed or were employed for less than 40 hours in a week and willing and
available to work for more hours. The combined rate of unemployment and the
potential labour force was 20 percent; with the extended labour force living in rural
areas having a higher rate of 22 percent compared to those in urban areas of 17
percent. The combined rate of unemployment and the potential labour force for the
females of 21 percent was nearly the same as that for the males, 20 percent.
The composite measure of labour underutilisation was 35 percent of the extended
labour force with the rate for persons living in rural areas (40%) being higher than
that of the urban areas of 25 percent. The skill related inadequate employment rate
was about 6 percent, higher in urban areas (12%) and nearly four times the rate in
rural areas (3%). The findings further revealed that 47 percent of the paid employees
were categorized in income related inadequate employment with those in the
agriculture, forestry and fishing sector having a rate of 81 percent being more than
twice the rate in other sectors of production (33 percent) and services (38%).

Page | 72
CHAPTER SIX: POPULATION IN AND OUTSIDE THE LABOUR FORCE
6.0 Population in the Labour Force
The labour force refers to the active section of the working age population and
includes the sum of persons in employment and persons in unemployment. The two
groups of the population represent the current supply of labour for the production of
goods and services in the country through market transactions in exchange for
remuneration.
The survey estimated total labour force of about 9.9 million people of which 55
percent were males and 66 percent were resident in rural areas. Majority of the
labour force (54%) had attained primary education as the highest level. Only about
four percent had both trade/technical skills and specialisation and 68 percent did not
possess any trade/technical skills or specialisation (Table 6.1).
Table 6.1: Distribution of the Labour Force by background characteristics, Percent
Characteristics Male Female Total
Residence
Rural 67.0 63.7 65.5
Urban 33.0 36.3 34.5
Age groups
14-17 7.3 6.8 7.0
18-30 42.4 47.5 44.6
31-64 50.4 45.8 48.3
15-24 27.8 28.6 28.1
15-35 63.8 65.8 64.7
Education Attainment
No education 6.2 14.4 9.9
Primary 54.6 52.2 53.6
Secondary 26.4 21.8 24.3
Post primary/secondary specialized training 8.7 8.6 8.7
Degree and above 4.1 2.9 3.5
Trade/technical skills and specialisation
With trade or technical skill and specialisation 3.7 3.8 3.7
With trade or technical skill only 19.6 19.7 19.6
With specialisation only 9.1 7.7 8.5
With None 67.6 68.8 68.1
Total (Percent) 100 100 100
Total (Number '000) 5,505 4,427 9,932
Percentage Share 54.8 45.2 100
The working age population in the labour force was about 10 million

Page | 73
6.1 Labour Force Participation Rate (LFPR)
The population in the labour force (the employed and unemployed) expressed as a
percentage of the working age population is referred to as the Labour Force
Participation Rate (LFPR). The results presented in Table 6.2 show that the overall
Labour Force Participation Rate (LFPR) was 53 percent. It was higher in urban areas
(67%) than rural areas (48%) implying a more active participation of the urban
population in the labour market than the rural population. The LFPR was generally
higher for males than females in both rural and urban areas.
The adult population (31-64 years) had a higher labour participation rate (63%)
compared to the children (14-17 years) and the youth (18-30 years).
The results further show that labour force participation rate increases with increasing
level of education attainment for both the males and the females. It was also high for
the population with a trade/technical skill and/or specialization (90%).
Table 6.2: Labour Force participation rates by selected background characteristics, Percent
Characteristics Male Female Total
Residence
Rural 55.8 39.7 47.5
Urban 76.1 58.4 66.6
Region
Kampala 77.5 60.5 68.8
Peri-urban Kampala 83.1 64.4 72.9
Central 68.1 52.4 60.3
Eastern 51.1 30.2 40.3
Karamoja 37.7 35.5 36.4
Northern 55.9 42.6 48.9
Western 62.9 46.6 54.2
Age groups
14-17 25.2 17.7 21.4
18-30 66.4 49.7 57.3
31-64 71.1 51.5 61.3
15-24 49.6 36.9 42.9
15-35 61.7 46.0 53.5
Education Attainment
No education 50.7 38.2 41.7
Primary 66.6 47.1 56.3
Secondary 82.0 66.2 74.7
Post primary/secondary specialized training 89.4 86.5 88.1
Degree and above 94.9 86.4 91.6
Trade/technical Skills and Specialisation
With trade or technical skill and Specialisation 89.9 90.0 89.9
With trade or technical skill only 84.5 59.2 70.8
With specialization only 91.6 84.9 88.7
With None 65.5 46.4 55.1
Total 61.2 44.9 52.7
The labour force participation rate was 53 percent

Page | 74
6.2 Population outside the labour force
6.2.1 Introduction
This section presents some of the major findings of the survey on the economically
inactive population as measured using the current status approach. The population
not economically active or, equivalently, persons not in the labour force, comprises
of persons aged 14-64 years who were neither employed nor unemployed for the
production of goods and services in the seven day period prior to the survey. This
population may have sought employment in the past but was not available to work
during the reference period, or did not seek employment but available or did not seek
employment and was not available to take up one. In this chapter, highlights on the
population outside the labour force, detailing reasons for not being available for
employment or for not seeking employment (for the unemployed) in the seven days
before the survey are provided.
6.2.2 Proportion of the population outside the labour force
Figure 6.1 shows that, overall, about 47 percent of the working age population (14 -
64 years) were outside the labour force (neither in employment nor unemployed).
This represented a population of about 8.9 million persons. This implies that 47
percent of the population aged 14 to 64 years not only lacked gainful work (i.e. work
for pay or profit) but also did not engage actively in the labour market to find or start
gainful work. Among females, the percentage was 55 percent while among males it
was 39 percent. More than one half (52%) of the working age population in rural
areas was outside the labour force and among urban residents it was about one third
(33%).
The education attainment of the inactive population shows that the higher the level
of education completed, the lower the inactivity, with the proportion among persons
who never attended formal education as high as 58 percent compared to eight
percent for persons with university degree and above. Among adults (18 years and
above), the age group with the highest proportion of the persons outside the labour
force was the 14-17 years (79%).
The proportion of the working age population that was outside the labour force was 47%

Page | 75
Figure 6.1: Proportion of the working age population outside the labour force (14-64 years) by background characteristics
Figure 6.2 shows the regional variations in the proportion of the population outside
the labour force. The highest proportion of the population outside the labour force of
64 percent was in Karamoja region followed by Eastern region (60 percent) while
the least was of 27 percent in the Peri-Urban Kampala region.
Figure 6.2: Map showing regional variations in the proportion of the working age population outside the labour
38.8
55.1 52.5
33.4
58.3
43.7
25.3
11.98.4
78.6
42.737.6
55.1
47.3
0
20
40
60
80
100
Male
Fem
ale
Ru
ral
Urb
an
No
ed
uca
tion
Prim
ary
Second
ary
Post pri
ma
ry/s
eco
nd
ary
sp
ecia
lized
tra
inin
g
De
gre
e a
nd a
bo
ve
14
-17
18
-30
31
-59
60
+
Tota
l
Sex Residence Education attainment Age groups Total

Page | 76
6.2.3 Characteristics of the population outside the labour force
The persons outside the labour force were categorized into two, that is, those who
did not actively look for work during the last 30 days preceding the survey but were
available for work and those who did not look for work and were also not available
for work.
The results in Table 6.3 indicate that, overall, about one out of every four of the
persons outside the labour force were available for work but did not actively look for
work during the 30 days preceding the survey. The proportion was slightly higher for
males (27%) compared to females (24%). The proportion was also higher for rural
residents (26%) compared to urban residents (23%). About 72 percent of all persons
outside the labour force were not available for employment.
Eastern region had the highest proportion of the persons outside the labour force
who were available for work but did not actively look for work during the last 30 days
preceding the survey (42%) while Western region had the lowest (15%).
Table 6.3: Characteristics of the population outside the labour force by background characteristics
Available but did not look for work
Did not look for work and not available for
work
Missing Total
Sex
Male 26.8 69.4 3.8 100
Female 24.2 73.3 2.5 100
Residence
Rural 25.9 72.2 1.9 100
Urban 22.5 69.9 7.6 100
Regions
Kampala 19.1 62.9 18.0 100
Peri-urban Kampala 20.9 72.3 6.8 100
Central 26.1 72.1 1.8 100
Eastern 41.6 57.2 1.2 100
Karamoja 32.9 64.6 2.5 100
Northern 18.0 77.8 4.2 100
Western 14.5 83.6 1.9 100
Age groups
14-17 10.1 87.5 2.3 100
18-30 32.1 64.0 3.9 100
31-59 31.5 65.8 2.8 100
60+ 20.6 77.4 2.0 100
15-24 22.0 75.2 2.8 100
15-35 26.9 69.7 3.3 100
Total 25.2 71.7 3.0 100
Number ('000) 2,249 6,393 269 8,911
One quarter of persons outside the labour force did not look for work but was available for work

Page | 77
6.2.4 Reasons for being outside the labour force
During the survey, all persons who were not employed were asked whether they
looked for employment work and made any steps to start a business (job search).
For those who did not, the survey determined whether they were available for
employment work despite the fact that they did search for any. Reasons were
obtained for both not searching and not being available or for not searching despite
being available for employment work.
6.2.4.1 Reasons for not seeking employment for those who were available
Table 7.2 highlights different reasons provided by persons who were available to
take up employment but did not actively look for any during the 30 days preceding
the survey. The main reason reported was discouragement which accounted for 58
percent. More rural residents were discouraged (61%) compared to urban residents
(47%). About 19 percent of persons who did not seek employment but were available
cited family responsibilities as their main reason with wide gender disparity of 30
percent among females and four percent among males.
The results further show that the main reason given for not being available for work
in all regions was discouragement but in varying proportions. The regions with most
discouraged persons were Karamoja (72%) and Western (71%). On the other hand,
the region most affected by seasonal work was Northern (14%).
By age groups, the results indicated that discouragement as a reason for inactivity
increased with increasing age from 47 percent among children (14-17 Years) to 71
percent among older persons (60 years and above). However, family responsibility
as a deterrent factor to economic activity was more prevalent among the youth and
the adult population (21% respectively).
The proportion of the population that was inactive due to family responsibilities was 19%

Page | 78
Table 6.4: Reasons for not seeking employment for those who were available, percent
Discouraged* Family responsibil
ities or housework
Attended school or training courses
Awaiting the
season for work
Other reasons
Total
Sex
Male 73.0 3.5 8.1 6.7 8.7 100
Female 47.7 30.2 5.7 5.5 10.9 100
Residence
Rural 60.7 17.8 5.1 7.0 9.4 100
Urban 46.5 25.4 13.9 1.2 13.0 100
Region
Kampala 37.6 18.9 29.4 0.0 14.1 100
Peri-urban Kampala 47.1 23.9 8.0 4.0 17.0 100
Central 54.5 21.6 5.7 0.8 17.4 100
Eastern 56.2 19.7 7.2 7.9 9.0 100
Karamoja 71.5 15.5 2.4 1.6 9.0 100
Northern 57.0 19.0 1.9 14.4 7.7 100
Western 70.8 15.5 8.3 0.6 4.8 100
Age
14-17 47.0 8.6 33.7 5.8 4.9 100
18-30 57.8 21.3 5.6 4.0 11.3 100
31-59 61.3 20.6 0.2 8.1 9.8 100
60+ 71.1 3.9 0.0 12.2 12.8 100
15-24 52.8 18.4 14.6 5.2 9.0 100
15-35 58.3 19.1 6.6 6.0 10.0 100
Total (Percent) 58.3 19.1 6.7 6.0 9.9 100
Number (‘000) 1,310 430 149 135 225 2,249
*Note: Discouraged persons included persons who did not know how and where to look for work, unable to find work for their skills, had looked for job(s) before but had not found any, felt too young or too old to find a job and believed no jobs were available for them or there were none for which they would qualify for in their respective areas/districts.
6.2.4.2 Reasons for not seeking and not being available for employment
Part of the inactivate population did not seek employment nor was available to take
up any. As indicated in Table 7.3, their main reason was attending school or training
(33%) with proportion for males more than for females (44% of males and 28% of
females).
Among the different reasons, there were big variations observed between rural and
urban residents in the proportions of those who were inactive due to
schooling/training (higher proportion in urban areas) and those satisfied with
subsistence agriculture work (higher proportion in rural areas). In Karamoja region,
unlike other regions, the main reason for not seeking employment nor being
available was family responsibility with a proportion of 37 percent. In Central and
About 25% of persons who neither sought employment nor were available was due to satisfaction with subsistence agriculture work

Page | 79
Western, the highest proportions were satisfied with subsistence agriculture work
(32% and 34%) respectively.
The reasons provided according to age groups were varying. The main reason for
the younger population was being in school or training while the older persons were
mainly satisfied with subsistence agriculture or family responsibilities or housework.
Table 6.5: Reasons for not seeking and not being available for employment by sex and residence, percent
In school or training
Satisfied with
subsistence Agriculture
Family responsibi
lities or housework
Illness, injury or disability
Others Total
Sex
Male 44.1 26.1 7.2 8.5 14.1 100
Female 26.7 23.5 28.3 7.3 14.2 100
Residence
Rural 29.7 27.9 19.9 8.2 14.3 100
Urban 48.8 9.7 22.0 5.9 13.6 100
Regions
Kampala 56.5 0.6 17.1 5.4 20.4 100
Peri-urban Kampala 52.8 3.1 27.7 5.1 11.3 100
Central 27.1 31.8 18.6 7.6 14.9 100
Eastern 43.3 18.4 18.7 7.7 11.9 100
Karamoja 11.5 21.6 36.6 5.9 24.4 100
Northern 35.3 19.8 24.1 8.1 12.7 100
Western 26.2 34.2 16.3 8.5 14.8 100
Age
14-17 72.9 3.6 7.1 4.6 11.8 100
18-30 22.8 26.1 29.4 6.9 14.8 100
31-59 0.1 47.0 27.4 11.6 13.9 100
60+ 0.0 36.6 9.5 17.3 36.6 100
Total (Percent) 33.2 24.5 20.3 7.8 14.2 100
Number (‘000) 2,124 1,563 1,299 496 908 6,390

Page | 80
Figure 6.3: The Labour force framework, 2016/17 (Numbers, ‘000)
6.3 Summary Findings
Out of the working age population of nearly 19 million (14-64 years), about 53
percent were in the Labour Force while about 47 percent (8.9 million people) were
not in the labour force (economically inactive). Among females, the proportion not in
the labour force was 55 percent while among males it was 39 percent. Inactivity can
be as a result of not seeking work, not being available for work or both.
Discouragement was the main reason reported by the inactive population for not
being available for work with a proportion of 60 percent, where as the main reason
for not seeking work was being in school or training (33%).
The rate of labour underutilisation was about 35 percent representing a population
of about 4.3 million. The unemployment rate, which is a component of labour
underutilisation, was 9.7 percent.
Labour force 9,932 (53 %)
Outside labour force
8,911 (47 %)
Employed
(For pay or profit) 8,973
Unemployed
959
Time related underemployment
1,060
Potential labour force
2,252
Do not want employment
6,659
Labour underutilization (Unmet need for
employment) 4,271
Total population 37,730
Working Age population
18,843
Age Dependent population
18,887
Subsistence agriculture, forestry and fisheries
workers (6,253)

Page | 81
CHAPTER SEVEN: UNPAID CARE WORK
7.0 Introduction
Unpaid Care Work (UCW) is a critical, yet hidden dimension of our well-being that
provides essential domestic services within households, for other households and to
community members. This work is carried out in the person’s own home and is
unpaid. Unpaid means the person doing the activity does not receive a wage, and
their work is therefore not counted in GDP calculations. Care means serving people
and their well-being; it includes both personal care and care-related activities, such
as cooking, cleaning and washing clothes. Work means it entails expenditures of
time and energy.
In the measurement of GDP, anything that you could theoretically pay someone else
to do for you, e.g. teaching, nursing, cooking, caring for children, etc. is included.
Therefore, the SNA (2008) definition excludes services produced for own use by a
household, such as fuel and water collection, child care, elderly care, etc.
Furthermore, the ILO uses SNA definitions to define employment, so services that
are not counted in GDP, are also not counted as employment. As a result: a lot of
“work” is not counted and, therefore excluded from GDP. Because of this invisibility
in national statistics and less valuation, the relevant local and national authorities fail
to design social and economic policies that can recognize, reduce and redistribute
the overall responsibility for UCW.
The 2016 NLFS made deliberate effort to recognize UCW and its contribution to the
economy by analysing, producing and disseminating statistics on UCW by both
women and men, making any gender inequalities in UCW visible.
7.1 Characteristics of persons engaged in UCW
Findings presented in figure 7.1 show that about nine in every ten females (88%)
were engaged in UCW compared to six in every ten males (64%). There were more
female youth and adults (about 95%) engaged in UCW than girls (81%). On the
contrary, more boys (73%) were engaged in UCW than the male youth and adults.

Page | 82
Figure 7.1: Proportion of persons engaged in UCW by sex and age group, (5+ years)
The results in table 7.1 show that males in the rural areas (66%) were more engaged
in UCW than those in the urban areas (61%). There was no marked difference in
engagement of UCW by females in both urban and rural areas. Karamoja, and
Northern region in general had the least proportion of the population engaged in
UCW (71%) while the East and Central regions had the highest proportions of the
population engaged in UCW.
Table 7.1: Proportion of persons engaged in UCW by background characteristics, (5+ years)
Background Characteristics Male Female Total
Residence
Rural 65.6 87.6 76.9
Urban 60.5 88.4 75.2
Region
Kampala 61.8 84.3 73.2
Peri-urban Kampala 60.5 85.8 74.2
Central 73.3 88.7 80.9
Eastern 74.9 89.1 82.3
Karamoja 53.5 85.9 70.9
Northern 55.2 86.3 71.4
Western 59.1 88.4 74.7
Education level attained
No education 44.8 79.2 67.3
Primary 58.4 94.7 77.3
Secondary 60.1 95.9 76.3
Post primary/Secondary specialized training 51.1 92.4 69.7
Degree and above 53.0 86.4 65.9
Disability Status
With Disability 53.6 87.1 72.1
Without Disability 66.6 87.9 77.5
Total (Percent), 2016/17 64.4 87.8 76.5
Total (Percent), 2011/12 54.8 78.3 66.7
73 70
48
39
77
64
81
9596
76
94
88
77
84
72
59
86
77
20
40
60
80
100
5-17 18-30 31-59 60+ 15-24 Total
Male Female Total
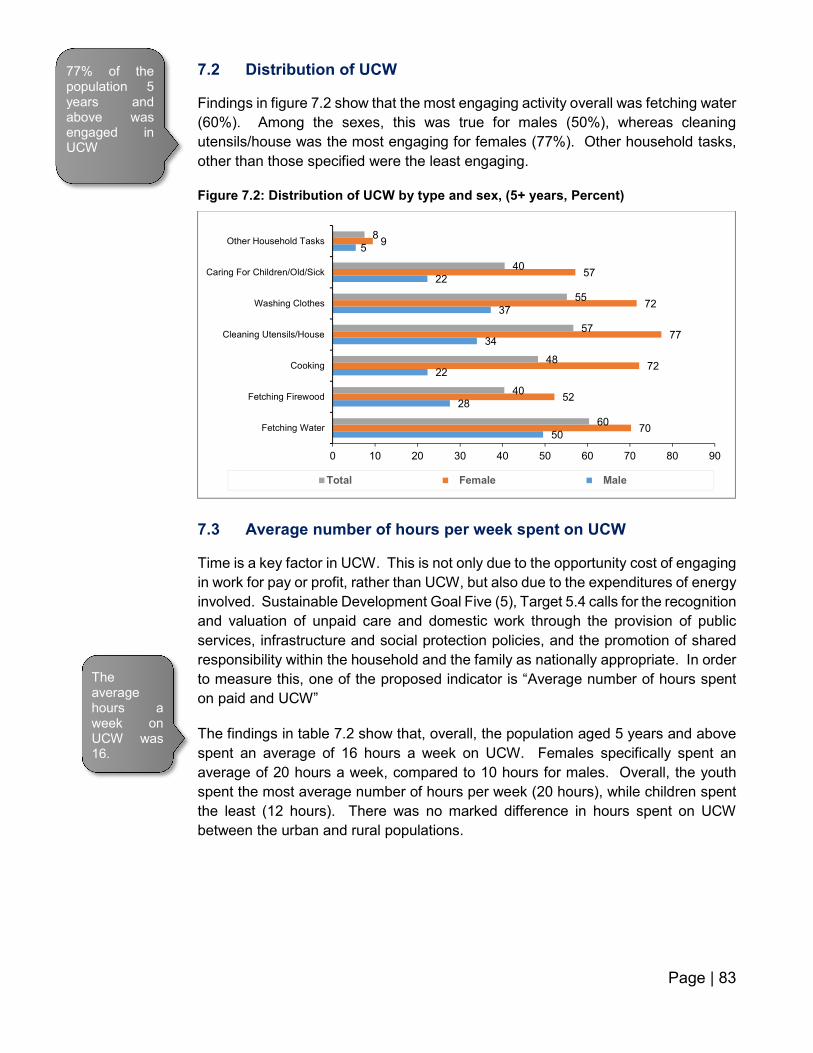
Page | 83
7.2 Distribution of UCW
Findings in figure 7.2 show that the most engaging activity overall was fetching water
(60%). Among the sexes, this was true for males (50%), whereas cleaning
utensils/house was the most engaging for females (77%). Other household tasks,
other than those specified were the least engaging.
Figure 7.2: Distribution of UCW by type and sex, (5+ years, Percent)
7.3 Average number of hours per week spent on UCW
Time is a key factor in UCW. This is not only due to the opportunity cost of engaging
in work for pay or profit, rather than UCW, but also due to the expenditures of energy
involved. Sustainable Development Goal Five (5), Target 5.4 calls for the recognition
and valuation of unpaid care and domestic work through the provision of public
services, infrastructure and social protection policies, and the promotion of shared
responsibility within the household and the family as nationally appropriate. In order
to measure this, one of the proposed indicator is “Average number of hours spent
on paid and UCW”
The findings in table 7.2 show that, overall, the population aged 5 years and above
spent an average of 16 hours a week on UCW. Females specifically spent an
average of 20 hours a week, compared to 10 hours for males. Overall, the youth
spent the most average number of hours per week (20 hours), while children spent
the least (12 hours). There was no marked difference in hours spent on UCW
between the urban and rural populations.
50
28
22
34
37
22
5
70
52
72
77
72
57
9
60
40
48
57
55
40
8
0 10 20 30 40 50 60 70 80 90
Fetching Water
Fetching Firewood
Cooking
Cleaning Utensils/House
Washing Clothes
Caring For Children/Old/Sick
Other Household Tasks
Total Female Male
77% of the population 5 years and above was engaged in UCW
The average hours a week on UCW was 16.

Page | 84
Table 7.2: Average weekly number of hours spent on UCW by background characteristics (5+ years)
Background Characteristics Male Female Total
Residence
Rural 10.5 20.0 16.1
Urban 9.6 19.6 15.8
Age
5-17 10.7 13.7 12.3
18-30 10.5 25.9 20.1
31-59 9.4 22.8 18.4
60+ 9.5 18.2 15.7
15-24 11.4 23.6 18.4
Region
Kampala 10.1 22.1 17.1
Peri-urban Kampala 10.4 20.2 16.6
Central 11.9 19.6 16.1
Eastern 9.6 19.7 15.3
Karamoja 11.4 21.0 17.6
Northern 10.4 21.6 17.5
Western 9.3 18.3 15.0
Education level attained
No education 11.0 21.4 19.0
Primary 10.3 25.0 19.8
Secondary 9.5 24.8 18.3
Post primary/secondary specialized training 10.0 21.7 17.0
Degree and above 9.7 17.1 13.4
Total Average (Hours), 2016/17 10.3 19.9 16.1
Total Average (Hours), 2011/12 11.9 23.1 18.6
7.4 Activity status of persons engaged in UCW
While UCW, has a number of benefits including: preparing people for work during
the day, ensuring the household's well-being, raising children to assume their
household and social responsibilities, and building human and social capital; it has
the opportunity cost of working. This implies that there will always be a trade-off
between work and UCW. The activity status of persons engaged in UCW was
therefore captured to obtain information in this regard.
The findings in figure 7.3 show that the population in subsistence agriculture was
most engaged in UCW (88%), while those not working were least engaged (70%).
Nine in every ten working women, volunteers and those engaged in subsistence
agriculture were found to be engaged in UCW. On the contrary, working men were
found to be least engaged (59%).
Female youth spent an average of 26 hours in UCW a week
Subsistence agriculture workers were the most engaged in UCW (88%)

Page | 85
Figure 7.3: Activity status of persons engaged in UCW (5+ years, percent)
7.5 Main jobs of persons engaged in UCW
Engagement in UCW leads to wage differentials and occupational segregation. This
specifically implies that wages are foregone, labour supply is reduced and
occupational choices, earnings and leisure are affected. In cases, where one
chooses to combine UCW with paid work, flexible (closer proximity and less hours)
work/jobs are chosen, which are usually less paying. The 2016/17 collected
information on the main and secondary jobs of persons engaged in UCW.
The findings in figure 7.4 show that among persons having at least a main job, eight
in every ten were engaged in UCW. Skilled agricultural, forestry and fisheries
workers were most likely to be engaged in UCW (85%), while the least proportion
was among the plant and machine operators (55%).
Figure 7.4: Occupation of main job for persons engaged in UCW, (5+ years, percent)
59
6773
64
9590
98
767578
88
70
0
25
50
75
100
Working Volunteer or unpaidtrainee worker
Subsistence agriculture Not working
Male Female Total
71.4
75.4
69.1
77.9
84.6
63.7
54.7
78.4
80.8
0 20 40 60 80 100
Professionals
Technicians and Associate Professionals
Clerks
Service workers
Skilled agricultural, forestry and fisheries workers
Craft and related workers
Plant and machine operators
Elementary occupations
Total

Page | 86
7.6 Engagement in UCW by persons out of the labour force
The findings in table 7.3 show that among persons outside the labour force who were
engaged in UCW, 15 percent were those who were available but did not seek work
while. Eastern region had the highest proportion of the population available but did
not seek work (25%), while Western region had the least (7%). On the hand, 85
percent did not seek work and were not available for work.
Table 7.3: Persons engaged in UCW who did not seek for work, and were either available or not. (5+ years, percent)
Background Characteristics Available but did not seek
Did not seek and not available
Missing Total
Sex Male 14.4 85.3 0.3 100.0
Female 15.2 84.6 0.2 100.0
Age
5-17 4.2 95.7 0.1 100.0
18-30 35.4 64.1 0.5 100.0
31-59 34.0 65.5 0.5 100.0
60+ 14.2 85.0 0.8 100.0
Residence
Rural 15.1 84.7 0.2 100.0
Urban 13.8 85.6 0.6 100.0
Region
Kampala 16.1 83.3 0.6 100.0
Peri-urban Kampala 12.7 86.8 0.5 100.0
Central 14.1 85.8 0.1 100.0
Eastern 25.2 74.5 0.3 100.0
Karamoja 20.6 79.3 0.0 100.0
Northern 10.7 88.9 0.5 100.0
Western 7.2 92.8 0.1 100.0
Education level attained
No education 14.2 85.5 0.3 100.0
Primary 38.0 61.7 0.3 100.0
Secondary 38.0 61.2 0.9 100.0
Post primary/secondary specialized training 41.7 56.5 1.8 100.0
Degree and above 27.2 43.1 29.7 100.0
Total 14.9 84.9 0.3 100.0
7.7 Summary of findings
Findings from the 2016/17 NLFS show that 77 percent of the population aged 5 years
and above was engaged in UCW. Of these, there were more females (88%)
compared to males (64%). Engagement in UCW was found to be lower for girls
(81%), and increased with age up to 31-59 years, while it was higher for boys (73%)
and reduced with age.
The most engaging activities were fetching water among the males (50%), and
cleaning utensils/house among females (77%). Overall, the population aged 5 years
and above spent 16 hours a day on UCW. Females specifically spent 20 hours a
day on UCW compared to 10 hours for males. Working women were found to be
overly engaged in UCW (95%) compared to working men (59%). Eight in every ten
persons with a main job was engaged in UCW.

Page | 87
CHAPTER EIGHT: YOUTH EMPLOYMENT
8.0 Introduction
Youth is a socially constructed intermediary phase that stands between childhood
and adulthood. The UN defines a Youth as someone between the ages of 15 and
24 years old. In Uganda, the Ministry of Gender Labour and Social Development
defines Youth as persons aged between 18-30 years. This chapter therefore
presents the findings of the National Labour Force Survey 2016/17 about the Youth
aged 18-30 unless otherwise stated.
8.1 Characteristics of the Youth Population
As presented in Table 8.1, the population of the youth was estimated to be 7.7 million
which was 21 percent of the total population estimated. The females were more than
the males by about 719,000. Most of the youth (69%) lived in rural areas. The
Western region had the highest proportion of youths (24%) and about 14 percent of
the youth had a disability.
Majority of the youth (58%) had attained primary education while only two percent
had a degree and above. The proportion of the youth currently attending school was
11 percent with the proportion of males double that of females.
Table 8.1: The Youth (18-30 years) population by background characteristics
Background characteristic Male Female Total
Age Group 18-19 17.0 15.6 16.3
20-24 38.7 39.0 38.9
25-30 44.3 45.3 44.8
Residence
Rural 70.1 67.2 68.5
Urban 29.9 32.8 31.5
Region
Kampala 8.0 7.4 7.7
Peri-urban Kampala 6.3 7.6 7.0
Central 18.8 17.0 17.8
Eastern 20.6 18.4 19.4
Karamoja 3.2 3.9 3.6
Northern 20.0 20.8 20.4
Western 23.1 24.9 24.1
Disability Status
With Disability 13.1 14.2 13.7
Without Disability 86.9 85.8 86.3 Education Attainment
No education 5.6 9.6 7.9
Primary 58.2 58.3 58.2
Secondary 27.5 24.2 25.6
Post primary/secondary Specialized training 5.6 5.9 5.8
Degree and above 3.0 2.0 2.4 Current schooling status
Attending school 15.2 7.7 11.1
Out of school 80.0 83.6 82.0
Never been to school 4.8 8.7 6.9
Total 100 100 100
Number (000's) 3,511 4,230 7,741
Youth population was about 7.7 million of which 11% were currently attending school

Page | 88
8.2 Youth Activity status
Youth activity status shown in Table 8.2 revealed that almost half (47%) of the youth
were in employment with more males (54%) than the females (41%). Eight percent
of the youths were exclusively in school with about three percent combining school
and employment. It can be noted that 41 percent of the youth were Neither in
Employment nor Education nor Training (NEET) with more females (51%) than
males (29%). The proportion of the youth engaged in subsistence agriculture was
31 percent.
Table 8.2: Percentage distribution of youth (18-30 years) by activity status and selected background characteristics
Background characteristics
In employment only
In scho
ol only*
Both school
and employment
Neither in Employment
nor Education Training (NEET)
Not stated
Total Proportion in Subsistence Agriculture *
Sex
Male 54.4 10.5 4.4 29.0 1.6 100 25.0
Female 40.7 6.0 1.6 50.5 1.3 100 36.3
Age group
18-19 27.1 26.4 6.3 38.8 1.5 100 35.7
20-24 45.3 8.2 3.6 41.6 1.2 100 31.0
25-30 55.6 1.2 1.1 40.5 1.6 100 29.8
Residence
Rural 42.6 6.9 2.5 46.9 1.0 100 41.0
Urban 56.3 10.4 3.7 27.2 2.5 100 9.9
Region
Kampala 53.9 15.4 3.9 20.6 6.1 100 0.3
Peri-urban Kampala 61.3 9.8 2.2 24.6 2.1 100 1.9
Central 58.1 5.9 1.4 34.5 0.2 100 23.9
Eastern 34.3 11.5 3.3 50.7 0.2 100 47.9
Karamoja 34.9 3.2 0.7 59.3 1.8 100 45.6
Northern 41.2 6.3 2.3 48.4 1.8 100 39.2
Western 49.2 6.2 4.4 39.0 1.2 100 32.5
Total 46.9 8.0 2.9 40.7 1.4 100 31.2
Number (‘000) 3,634 621 224 3,150 111 7,741 2,415
Note: *The proportion in subsistence agriculture includes those combining schooling and subsistence agriculture. Likewise, the youth in school only also include those combining schooling with subsistence agriculture.
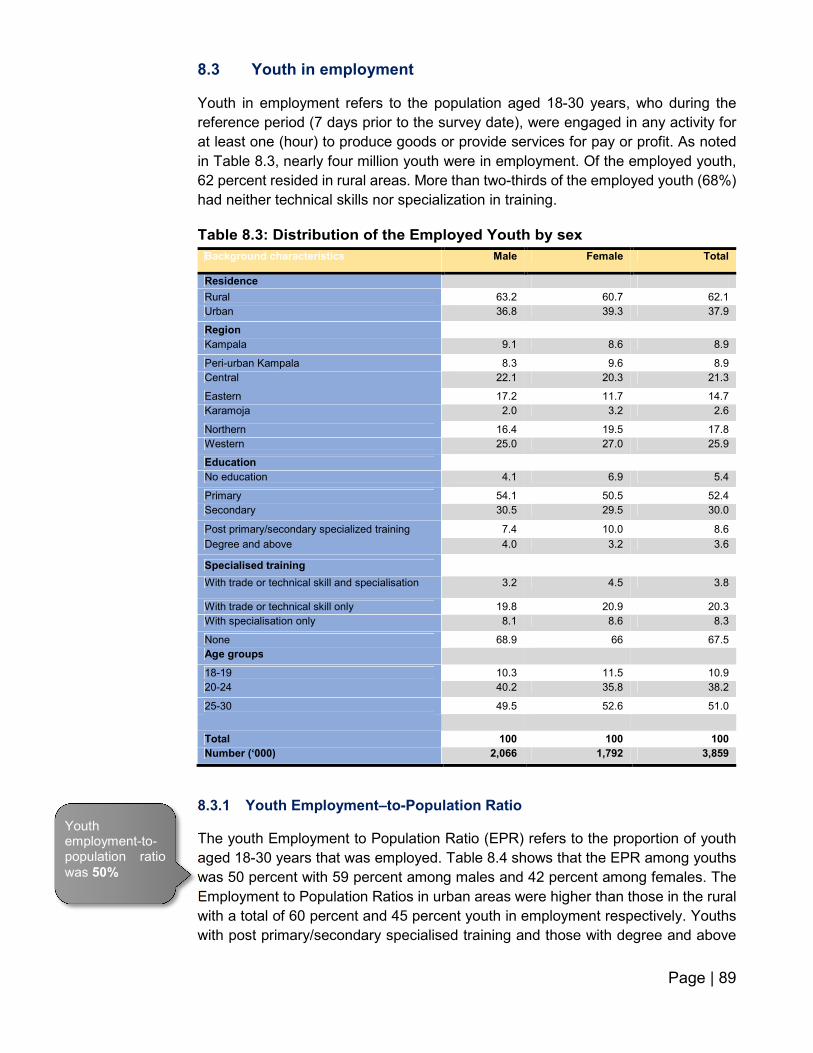
Page | 89
8.3 Youth in employment
Youth in employment refers to the population aged 18-30 years, who during the
reference period (7 days prior to the survey date), were engaged in any activity for
at least one (hour) to produce goods or provide services for pay or profit. As noted
in Table 8.3, nearly four million youth were in employment. Of the employed youth,
62 percent resided in rural areas. More than two-thirds of the employed youth (68%)
had neither technical skills nor specialization in training.
Table 8.3: Distribution of the Employed Youth by sex
Background characteristics Male Female Total
Residence
Rural 63.2 60.7 62.1
Urban 36.8 39.3 37.9
Region
Kampala 9.1 8.6 8.9
Peri-urban Kampala 8.3 9.6 8.9
Central 22.1 20.3 21.3
Eastern 17.2 11.7 14.7
Karamoja 2.0 3.2 2.6
Northern 16.4 19.5 17.8
Western 25.0 27.0 25.9
Education
No education 4.1 6.9 5.4
Primary 54.1 50.5 52.4
Secondary 30.5 29.5 30.0
Post primary/secondary specialized training 7.4 10.0 8.6
Degree and above 4.0 3.2 3.6
Specialised training
With trade or technical skill and specialisation 3.2 4.5 3.8
With trade or technical skill only 19.8 20.9 20.3
With specialisation only 8.1 8.6 8.3
None 68.9 66 67.5
Age groups
18-19 10.3 11.5 10.9
20-24 40.2 35.8 38.2
25-30 49.5 52.6 51.0
Total 100 100 100
Number (‘000) 2,066 1,792 3,859
8.3.1 Youth Employment–to-Population Ratio
The youth Employment to Population Ratio (EPR) refers to the proportion of youth
aged 18-30 years that was employed. Table 8.4 shows that the EPR among youths
was 50 percent with 59 percent among males and 42 percent among females. The
Employment to Population Ratios in urban areas were higher than those in the rural
with a total of 60 percent and 45 percent youth in employment respectively. Youths
with post primary/secondary specialised training and those with degree and above
Youth employment-to-population ratio
was 50%

Page | 90
had the highest EPR of 80 percent and 79 percent respectively while those with no
education had the least ratio of 37 percent.
Table 8.4: Employment-to-Population Ratio of the Youth (18-30 years) by selected background characteristics, Percent
Background characteristic Male Female Total
Residence
Rural 53.1 38.3 45.2
Urban 72.4 50.7 60.0
Region
Kampala 67.6 49.1 57.8
Peri-urban Kampala 77.6 53.8 63.5
Central 69.0 50.6 59.4
Eastern 49.1 27.0 37.6
Karamoja 36.7 35.0 35.7
Northern 48.1 39.8 43.5
Western 63.5 45.9 53.6
Education Attainment
No education 47.8 31.9 36.8
Primary 60.7 38.7 48.2
Secondary 72.3 54.5 62.7
Post primary/secondary specialized training 85.1 75.5 79.5
Degree and above 85.2 70.8 78.5
Age Group
18-19 35.6 31.3 33.3
20-24 61.1 38.9 48.9
25-30 65.9 49.2 56.7
Specialised training
With trade or technical skill and specialisation 90.1 76.4 81.9
With trade or technical skill only 77.0 52.7 62.9
With specialisation only 83.3 73.3 78.1
None 60.4 39.6 48.6
Total 58.9 42.4 49.8
8.3.2 Industry of the Youths in Employment
Industry describes the activity carried out in the place where employed youths
perform their work. In order to capture the right industry, during the survey,
respondents were asked what their place of work produces or what its function was.
Figure 8.1 shows that the largest proportion (46%) of the employed youth were
working as service workers followed by Agricultural, forestry and fishing (38%). More
females than males were engaged in Services and agriculture while more males
than females were engaged in production.
38% of the employed youth were working in the agricultural industry
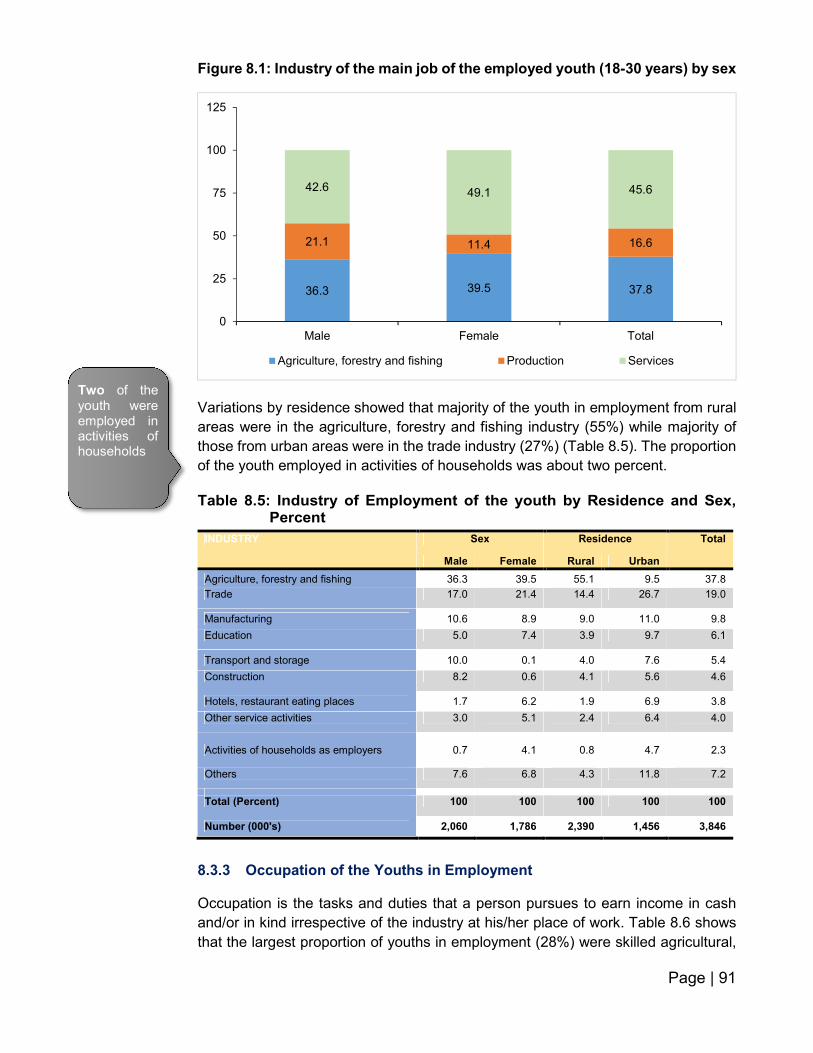
Page | 91
Figure 8.1: Industry of the main job of the employed youth (18-30 years) by sex
Variations by residence showed that majority of the youth in employment from rural
areas were in the agriculture, forestry and fishing industry (55%) while majority of
those from urban areas were in the trade industry (27%) (Table 8.5). The proportion
of the youth employed in activities of households was about two percent.
Table 8.5: Industry of Employment of the youth by Residence and Sex, Percent
INDUSTRY Sex Residence Total
Male Female Rural Urban
Agriculture, forestry and fishing 36.3 39.5 55.1 9.5 37.8
Trade 17.0 21.4 14.4 26.7 19.0
Manufacturing 10.6 8.9 9.0 11.0 9.8
Education 5.0 7.4 3.9 9.7 6.1
Transport and storage 10.0 0.1 4.0 7.6 5.4
Construction 8.2 0.6 4.1 5.6 4.6
Hotels, restaurant eating places 1.7 6.2 1.9 6.9 3.8
Other service activities 3.0 5.1 2.4 6.4 4.0
Activities of households as employers 0.7 4.1 0.8 4.7 2.3
Others 7.6 6.8 4.3 11.8 7.2
Total (Percent) 100 100 100 100 100
Number (000's) 2,060 1,786 2,390 1,456 3,846
8.3.3 Occupation of the Youths in Employment
Occupation is the tasks and duties that a person pursues to earn income in cash
and/or in kind irrespective of the industry at his/her place of work. Table 8.6 shows
that the largest proportion of youths in employment (28%) were skilled agricultural,
36.3 39.5 37.8
21.1 11.4 16.6
42.6 49.1 45.6
0
25
50
75
100
125
Male Female Total
Agriculture, forestry and fishing Production Services
Two of the youth were employed in activities of households
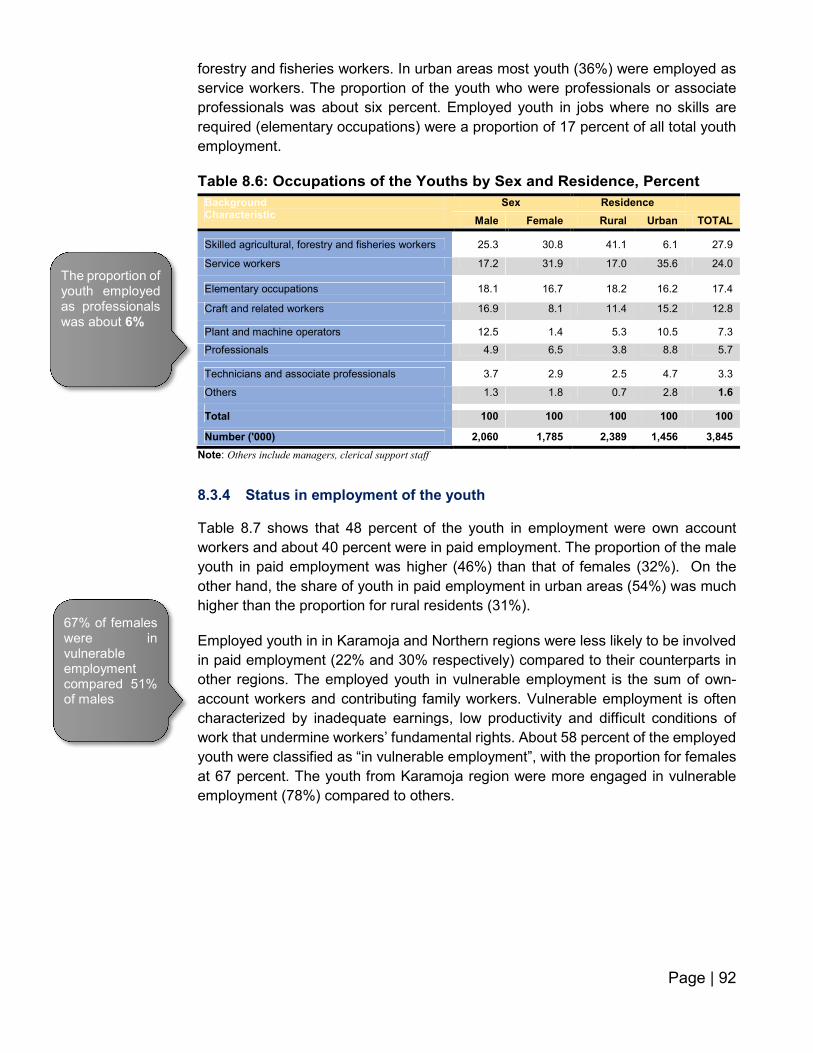
Page | 92
forestry and fisheries workers. In urban areas most youth (36%) were employed as
service workers. The proportion of the youth who were professionals or associate
professionals was about six percent. Employed youth in jobs where no skills are
required (elementary occupations) were a proportion of 17 percent of all total youth
employment.
Table 8.6: Occupations of the Youths by Sex and Residence, Percent
Background Characteristic
Sex Residence
Male Female Rural Urban TOTAL
Skilled agricultural, forestry and fisheries workers 25.3 30.8 41.1 6.1 27.9
Service workers 17.2 31.9 17.0 35.6 24.0
Elementary occupations 18.1 16.7 18.2 16.2 17.4
Craft and related workers 16.9 8.1 11.4 15.2 12.8
Plant and machine operators 12.5 1.4 5.3 10.5 7.3
Professionals 4.9 6.5 3.8 8.8 5.7
Technicians and associate professionals 3.7 2.9 2.5 4.7 3.3
Others 1.3 1.8 0.7 2.8 1.6
Total 100 100 100 100 100
Number ('000) 2,060 1,785 2,389 1,456 3,845
Note: Others include managers, clerical support staff
8.3.4 Status in employment of the youth
Table 8.7 shows that 48 percent of the youth in employment were own account
workers and about 40 percent were in paid employment. The proportion of the male
youth in paid employment was higher (46%) than that of females (32%). On the
other hand, the share of youth in paid employment in urban areas (54%) was much
higher than the proportion for rural residents (31%).
Employed youth in in Karamoja and Northern regions were less likely to be involved
in paid employment (22% and 30% respectively) compared to their counterparts in
other regions. The employed youth in vulnerable employment is the sum of own-
account workers and contributing family workers. Vulnerable employment is often
characterized by inadequate earnings, low productivity and difficult conditions of
work that undermine workers’ fundamental rights. About 58 percent of the employed
youth were classified as “in vulnerable employment”, with the proportion for females
at 67 percent. The youth from Karamoja region were more engaged in vulnerable
employment (78%) compared to others.
The proportion of youth employed as professionals was about 6%
67% of females were in vulnerable employment compared 51% of males

Page | 93
Table 9.7: Status in employment of the Youths by background characteristics (%)
Background characteristics
Paid employees
Employers Own account workers
Contributing family
workers
Total
Sex
Male 46.3 2.7 44.3 6.8 100
Female 31.7 1.7 52.2 14.5 100
Residence
Rural 31.0 1.8 54.1 13.2 100
Urban 53.5 2.9 38.0 5.7 100
Region
Kampala 61.8 2.9 31.1 4.3 100
Peri-urban Kampala 58.3 2.3 34.2 5.2 100
Central 36.9 3.7 39.5 19.9 100
Eastern 42.9 2.3 43.5 11.3 100
Karamoja 22.4 0.0 70.7 6.9 100
Northern 29.6 1.1 58.8 10.5 100
Western 34.0 1.6 58.3 6.1 100
Total 39.5 2.2 48.0 10.4 100
Number ('000) 1,519 85 1,844 398 3,846
8.3.5 Nature of employment and Job Satisfaction
Informal employment is a broader, jobs-based concept comprising of the total
number of informal jobs, whether carried out in formal sector enterprises, informal
sector enterprises, or households, during a given reference period3. In Table 8.8, it
can be observed that majority of the youth were in Informal employment (91%).
Regular employment on the other hand refers someone who is hired into a position
with a predetermined duration of six months or greater and does his/her work in a
usual/continuing manner. The Table further reveals that majority of the youths (70%)
were in irregular employment. Results on education attainment showed that the
higher the education level, the more likely a youth was engaged in regular
employment. For example, only 20 percent of youth with no formal education and
about 52 percent with a degree and above were in regular employment. Despite the
informality and irregular nature of jobs by the youth, most youths (69%) were
satisfied with their current jobs.
317th International Conference of Labour Statisticians
91% of the employed Youth were in informal employment

Page | 94
Table 8.8: Nature of Employment and Job Satisfaction of the Youth in Employment in the main job by Selected Background Characteristics, 2016
Background characteristics
Formality of employment (outside
agriculture)
Type of employment
Job Satisfaction Total
Formal Informal Regular Irregular Satisfactory Not Satisfactory
Sex
Male 9.0 91.0 34.1 65.9 68.9 31.1 100.0
Female 10.1 89.9 24.3 75.7 68.8 31.2 100.0
Residence
Rural 5.7 94.3 20.4 79.6 68.0 32.0 100.0
Urban 12.5 87.5 44.3 55.7 70.4 29.6 100.0
Region
Kampala 16.6 83.4 48.7 51.3 67.7 32.3 100.0
Peri-urban Kampala 12.7 87.3 53.5 46.5 78.1 21.9 100.0
Central 9.2 90.8 27.9 72.1 78.1 21.9 100.0
Eastern 7.7 92.3 35.4 64.6 86.7 13.3 100.0
Karamoja 6.1 93.9 13.8 86.2 77.4 22.6 100.0
Northern 4.6 95.4 15.5 84.5 64.2 35.8 100.0
Western 8.5 91.5 23.5 76.5 50.8 49.2 100.0
Education attainment
No education 6.4 93.6 20.3 79.7 72.3 27.7 100.0
Primary 3.8 96.2 21.2 78.8 67.8 32.2 100.0
Secondary 8.9 91.1 36.3 63.7 70.8 29.2 100.0
Post primary/secondary 17.5 82.5 57.0 43.0 72.5 27.5 100.0
Degree and above 34.2 65.8 52.0 48.0 75.6 24.4 100.0
Total 9.5 90.5 29.6 70.4 68.9 31.1 100.0
8.3.6 Basis of employment
The basis of employment in this case refers to agreement for the main job which was
categorised into written and oral agreement. Figure 8.2 shows that only two out of
10 employed youths were working on the basis of written contracts while the majority
(79%) were working on oral agreements with a higher proportion among males
(83%) than males (73%). As the age increased, the proportion of those with written
contracts increased.
79% of the employed youth had oral agreements
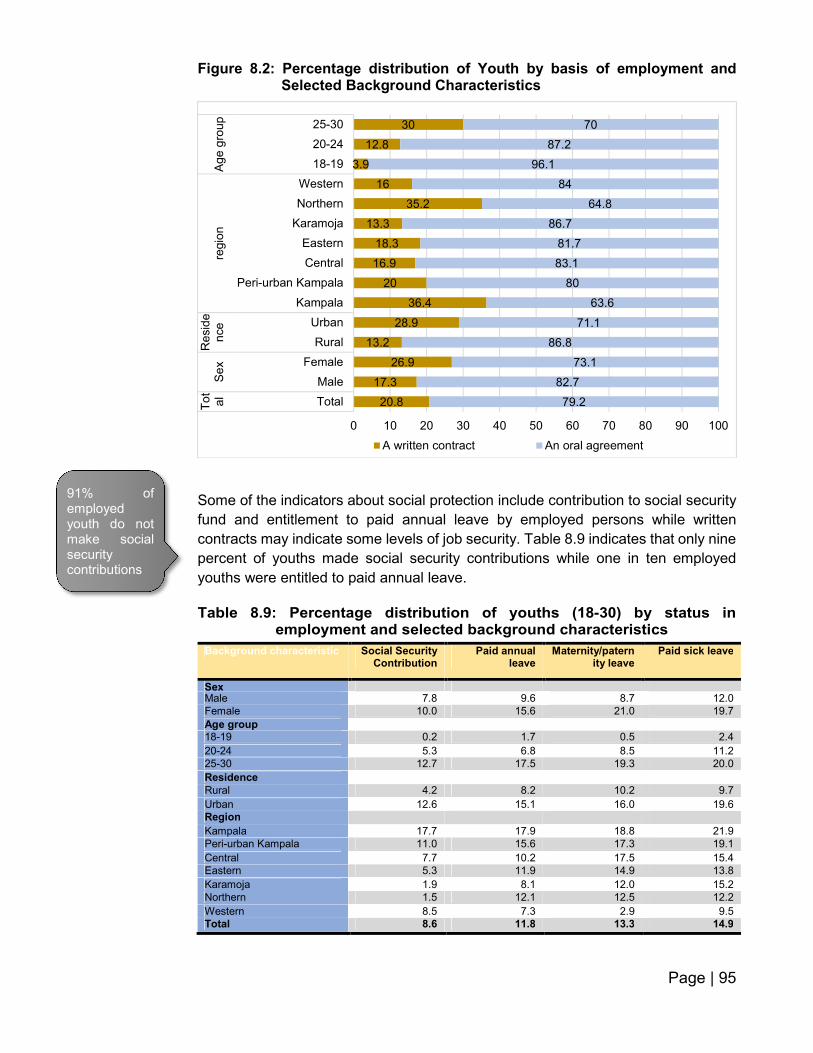
Page | 95
Figure 8.2: Percentage distribution of Youth by basis of employment and Selected Background Characteristics
Some of the indicators about social protection include contribution to social security
fund and entitlement to paid annual leave by employed persons while written
contracts may indicate some levels of job security. Table 8.9 indicates that only nine
percent of youths made social security contributions while one in ten employed
youths were entitled to paid annual leave.
Table 8.9: Percentage distribution of youths (18-30) by status in employment and selected background characteristics
Background characteristic Social Security Contribution
Paid annual leave
Maternity/paternity leave
Paid sick leave
Sex Male 7.8 9.6 8.7 12.0
Female 10.0 15.6 21.0 19.7
Age group
18-19 0.2 1.7 0.5 2.4
20-24 5.3 6.8 8.5 11.2
25-30 12.7 17.5 19.3 20.0
Residence
Rural 4.2 8.2 10.2 9.7
Urban 12.6 15.1 16.0 19.6
Region
Kampala 17.7 17.9 18.8 21.9
Peri-urban Kampala 11.0 15.6 17.3 19.1
Central 7.7 10.2 17.5 15.4
Eastern 5.3 11.9 14.9 13.8
Karamoja 1.9 8.1 12.0 15.2
Northern 1.5 12.1 12.5 12.2
Western 8.5 7.3 2.9 9.5
Total 8.6 11.8 13.3 14.9
20.8
17.3
26.9
13.2
28.9
36.4
20
16.9
18.3
13.3
35.2
16
3.9
12.8
30
79.2
82.7
73.1
86.8
71.1
63.6
80
83.1
81.7
86.7
64.8
84
96.1
87.2
70
0 10 20 30 40 50 60 70 80 90 100
Total
Male
Female
Rural
Urban
Kampala
Peri-urban Kampala
Central
Eastern
Karamoja
Northern
Western
18-19
20-24
25-30
To
ta
lS
ex
Re
sid
en
ce
regio
nA
ge g
roup
A written contract An oral agreement
91% of employed youth do not make social security contributions

Page | 96
8.3.7 Education mismatch of the employed youth
Education mismatch is a situation in the labour market where the level of Education
of individuals do not match the level of education required in the jobs. Almost one
half of the youths (48%) were under educated for the jobs in the market and 42
percent had matching education and job requirements. More females than males
were over educated and under educated in comparison to their job requirements
while more males than females had matching skills required in the main job (Table
8.10).
Table 8.10: Education Mismatch of the Youth in Employment by Selected Background Characteristics
Background characteristic Matching Over educated Under educated
Total
Sex
Male 44.5 8.8 46.7 100
Female 39.9 10.4 49.7 100
Residence
Rural 37.0 5.5 57.5 100
Urban 51.4 16.6 32.1 100
Region
Kampala 56.2 21.9 21.9 100
Peri-urban Kampala 59.5 19.2 21.3 100
Central 41.5 8.9 49.5 100
Eastern 40.0 6.6 53.3 100
Karamoja 43.9 2.8 53.4 100
Northern 33.3 6.7 60.0 100
Western 39.6 7.1 53.2 100
Education Attainment
No education 29.4 - 70.6 100
Primary 20.0 - 80.0 100
Secondary 79.0 14.1 6.9 100
Post primary/secondary specialized training 54.2 45.8 0.0 100
Degree and above 54.3 45.7 0.0 100
Sector of employment
Agriculture, forestry and fishing 35.9 4.4 59.8 100
Production 40.7 15.6 43.7 100
Services 48.6 12.0 39.4 100
Total 42.3 9.6 48.2 100
Number ('000) 1,585 359 1,805 3,748
Almost half (48%) of employed youth were under-educated for the job they were performing
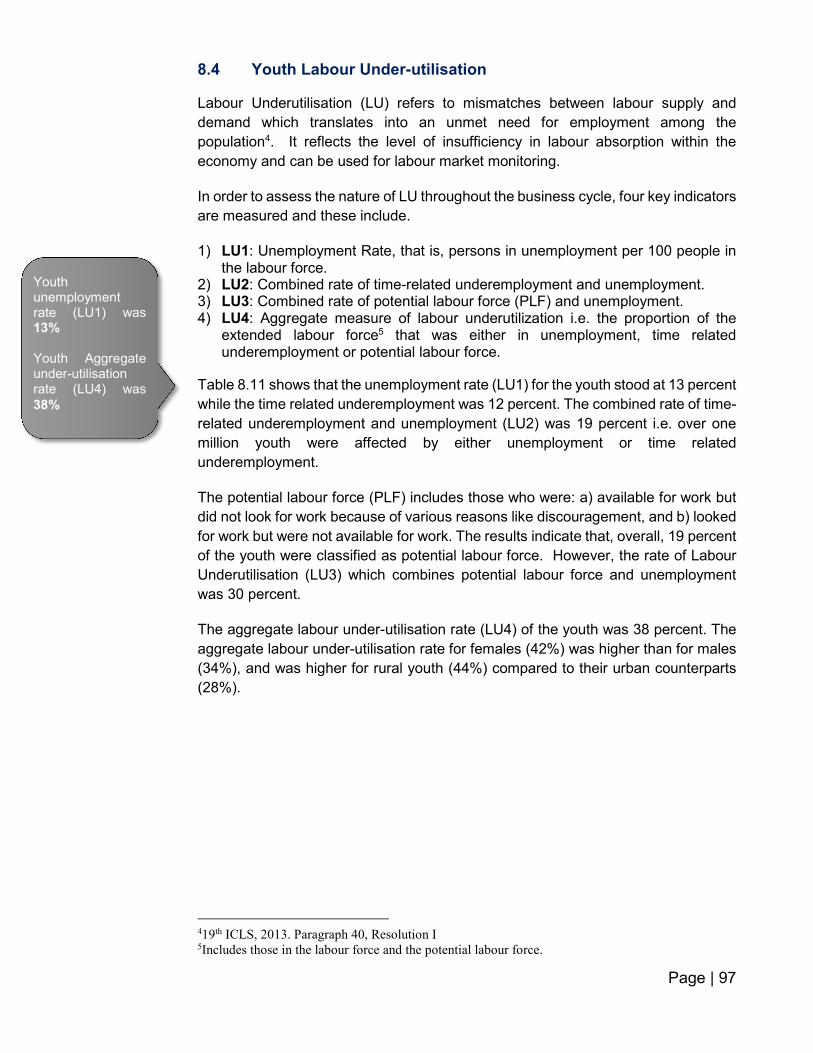
Page | 97
8.4 Youth Labour Under-utilisation
Labour Underutilisation (LU) refers to mismatches between labour supply and
demand which translates into an unmet need for employment among the
population4. It reflects the level of insufficiency in labour absorption within the
economy and can be used for labour market monitoring.
In order to assess the nature of LU throughout the business cycle, four key indicators
are measured and these include.
1) LU1: Unemployment Rate, that is, persons in unemployment per 100 people in the labour force.
2) LU2: Combined rate of time-related underemployment and unemployment. 3) LU3: Combined rate of potential labour force (PLF) and unemployment. 4) LU4: Aggregate measure of labour underutilization i.e. the proportion of the
extended labour force5 that was either in unemployment, time related underemployment or potential labour force.
Table 8.11 shows that the unemployment rate (LU1) for the youth stood at 13 percent
while the time related underemployment was 12 percent. The combined rate of time-
related underemployment and unemployment (LU2) was 19 percent i.e. over one
million youth were affected by either unemployment or time related
underemployment.
The potential labour force (PLF) includes those who were: a) available for work but
did not look for work because of various reasons like discouragement, and b) looked
for work but were not available for work. The results indicate that, overall, 19 percent
of the youth were classified as potential labour force. However, the rate of Labour
Underutilisation (LU3) which combines potential labour force and unemployment
was 30 percent.
The aggregate labour under-utilisation rate (LU4) of the youth was 38 percent. The
aggregate labour under-utilisation rate for females (42%) was higher than for males
(34%), and was higher for rural youth (44%) compared to their urban counterparts
(28%).
419th ICLS, 2013. Paragraph 40, Resolution I 5Includes those in the labour force and the potential labour force.
Youth unemployment rate (LU1) was 13% Youth Aggregate under-utilisation rate (LU4) was
38%

Page | 98
Table 8.11: Measures of Labour Under-utilisation by background characteristics
Background characteristics LU1 TRUEMP LU2 PLF LU3 LU4
Sex
Male 11.4 12.3 19.0 14.7 24.4 33.7
Female 14.7 11.1 19.0 24.1 35.2 42.4
Residence
Rural 13.5 14.5 24.1 23.5 33.9 43.5
Urban 12.0 7.1 9.9 11.5 22.1 27.6
Region
Kampala 15.8 7.5 7.9 9.6 23.9 29.6
Peri-urban Kampala 12.3 7.0 7.1 9.8 20.8 26.4
Central 9.4 17.2 20.6 15.2 23.1 36.4
Eastern 19.7 7.0 21.2 37.0 49.4 52.9
Karamoja 7.6 20.8 24.0 37.4 42.2 54.2
Northern 16.5 18.6 30.8 19.9 33.1 45.6
Western 8.7 7.3 14.4 11.2 18.9 24.8
Education
No education 7.5 17.4 20.3 24.1 29.8 42.0
Primary 14.3 13.8 23.1 24.1 35.0 43.9
Secondary 14.1 10.3 17.4 12.5 24.8 32.5
Post primary/secondary specialized training
3.5 5.3 6.6 8.0 11.2 15.9
Degree and above 14.8 3.1 7.1 1.6 16.2 18.8
Total 13.0 11.7 19.0 19.4 29.8 38.1
Total (Number ‘000) 575 452 1,027 1,067 1,642 2,094
8.5 Youth in the Labour Force
The classification of current economic activity status of persons has three categories
namely employed, unemployed and outside the labour force. The employed and
unemployed added together form the labour force.
Figure 9.3 shows that about 50 percent of the youth were employed with more males
(59%) than females (42%) in employment. About 43 percent of the youth were
outside the labour force with a higher share of females (50%) than that of males
(34%).
Proportion of the youth population outside the labour force
was 43%

Page | 99
Figure 8.3: Labour Force status of the Youth population (18-30 years) by sex and residence
Labour Force refers to the current supply of labour for the production of goods and
services in exchange for pay or profit. Therefore, for one to be in the labour force,
s/he is either employed or unemployed.
Table 8.12 shows that the population of the youth in the labour force was 4.4 million
youths of these53 percent were males while 47 percent were females. The older the
youth the higher the percentage in the labour force. Majority of the youths in the
labour force (63%) resided in rural areas. A small proportion of the youth in the labour
force was attending school (6%) while majority (90%) had left school. Despite the
high proportion that left school, a big proportion of youth in the labour force (68%)
did not have any technical skills or specialized training.
58.9
42.445.2
60.0
49.8
7.5 7.4 7.1 8.2 7.4
33.6
50.347.8
31.7
42.8
0.0
20.0
40.0
60.0
80.0
Male Female Rural Urban Total
Sex Residence
Employed Unemployed Not In Labour Force
68% of the Youth in the Labour Force lacked technical skills or specialisation

Page | 100
Table 8.12: Distribution of Youth in the Labour Force by background characteristics, 2016
Background characteristic Male Female Total
Age group
18-19 11.1 11.4 11.2
20-24 40.5 38.1 39.3
25-30 48.4 50.5 49.4
Residence
Rural 64.4 60.3 62.5
Urban 35.6 39.7 37.5
Region
Kampala 9.2 9.2 9.2
Peri-urban Kampala 7.9 9.9 8.9
Central 21.2 19.6 20.4
Eastern 18.2 13.3 15.9
Karamoja 2.0 2.9 2.4
Northern 17.5 19.7 18.6
Western 24.1 25.3 24.7
Current Schooling status
Never 3.5 6 4.7
Left School 88.9 90.2 89.6
At school 7.5 3.7 5.7
Education attainment
No education 3.8 6.5 5.1
Primary (p1-p7) 54.9 51.2 53.1
Secondary (s1-s6) 30.7 30.0 30.4
Post pri./sec specialised training 6.6 8.9 7.7
Degree and above 4.0 3.3 3.7
Specialised training
With trade or technical skill and specialization 2.9 4.2 3.5
With trade or technical skill only 19.7 21.2 20.4
With specialization only 7.7 8.1 7.9
None 69.7 66.6 68.2
Total (Percent) 52.6 47.4 100
Total (Number ‘000) 2,333 2,101 4,434
8.5.1 Youth Labour Force Participation Rate
The Labour Force Participation Rate is a measure of the extent to which the current
working age population is economically active. Youth labour force participation rate
indicates the proportion of the youth either currently employed or seeking
employment. Table 8.13 shows that the youth Labour Force Participation Rate was
57 percent with higher proportion for males (66%) than females (50%).
Youth from urban areas had a higher participation rate (68%) than those from rural
areas (52%). The LFPR increased with increase in the age groups. The higher the
level of education attained, the higher the Labour Force Participation Rates (LFPR).
Peri-urban Kampala had the highest proportion of youth LFPR of 72 percent while
Karamoja had the least (39%).
Youth Labour Force Participation
rate was 57%
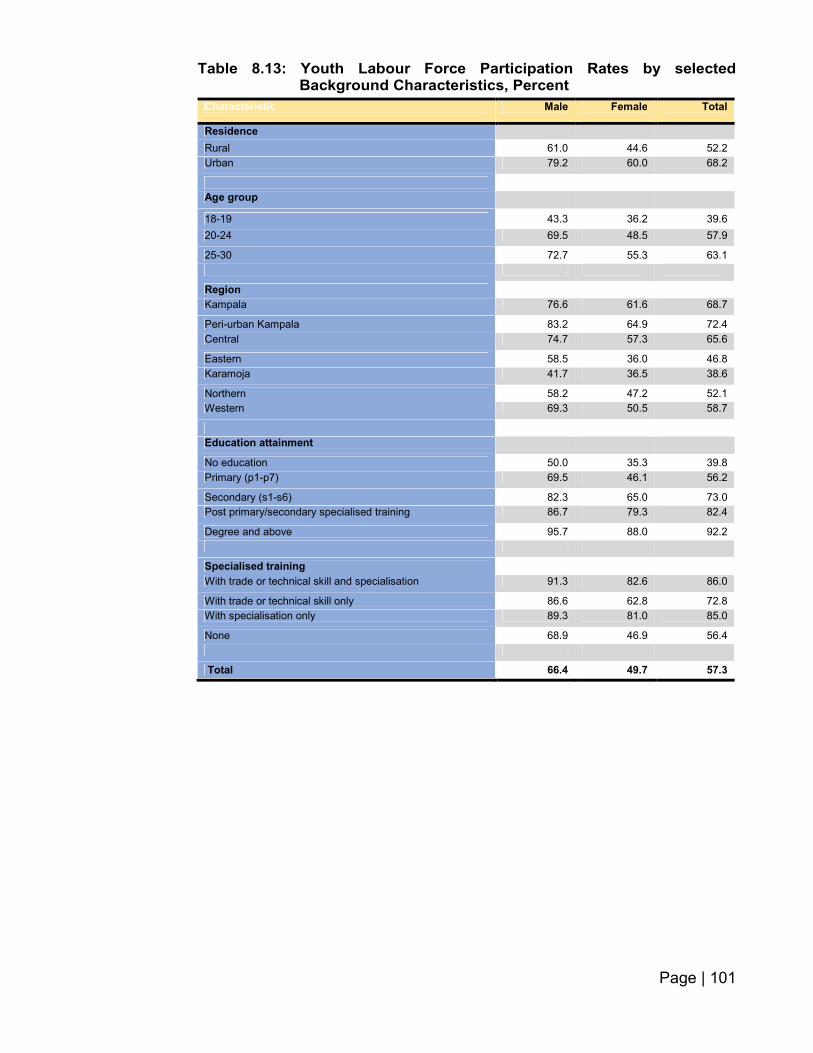
Page | 101
Table 8.13: Youth Labour Force Participation Rates by selected Background Characteristics, Percent
Characteristic Male Female Total
Residence
Rural 61.0 44.6 52.2
Urban 79.2 60.0 68.2
Age group
18-19 43.3 36.2 39.6
20-24 69.5 48.5 57.9
25-30 72.7 55.3 63.1
Region
Kampala 76.6 61.6 68.7
Peri-urban Kampala 83.2 64.9 72.4
Central 74.7 57.3 65.6
Eastern 58.5 36.0 46.8
Karamoja 41.7 36.5 38.6
Northern 58.2 47.2 52.1
Western 69.3 50.5 58.7
Education attainment
No education 50.0 35.3 39.8
Primary (p1-p7) 69.5 46.1 56.2
Secondary (s1-s6) 82.3 65.0 73.0
Post primary/secondary specialised training 86.7 79.3 82.4
Degree and above 95.7 88.0 92.2
Specialised training
With trade or technical skill and specialisation 91.3 82.6 86.0
With trade or technical skill only 86.6 62.8 72.8
With specialisation only 89.3 81.0 85.0
None 68.9 46.9 56.4
Total 66.4 49.7 57.3

Page | 102
Figure 8.4: Youth Labour Force Framework
8.6 Youth in subsistence agriculture
Figure 8.5 shows that, overall, 31 percent of the total youth population was engaged
exclusively in subsistence agriculture production only. The results further indicate a
higher proportion of females (36%) than males (25%). On the other hand, the
proportion of rural youth was about four times than urban youth. By regional
disaggregation, Eastern and Karamoja had the highest proportion of youth in
subsistence agriculture (48% and 46% respectively) compared to the rest of the
regions.
Youth population 7,741
Labour force 4,434 (57.3%)
Outside labour force
3,307 (42.7%)
Employed (For pay or profit)
3,859
Unemployed 575
Time related underemployment
452
Potential labour force 1,067
Not available for employment
2,240
Labour underutilization (Unmet need for
employment) 2,094
Youth in Subsistence Agriculture
2,415
31% of the youth were engaged in subsistence agriculture

Page | 103
Figure 8.5: Proportion of youth in subsistence agriculture production only by sex and residence (%)
8.7 Youth Transition to Employment
Upon completing or leaving school, one is expected to find work from which s/he can
earn a living and support themselves including those under their care. The
International Labour Organisation defines labour market transition as the passage
of a young person from the end of schooling (or entry to first economic activity) to
the first stable or satisfactory job. The basic criteria for stability of any employment
are that it should be based on written contract of duration greater than 12 months or
oral agreement with likelihood of retention or has attained a satisfactory temporary
job judged on the young respondent’s willingness to stay there. All current students
are counted among those “in transition”.
8.7.1 Stages of transition
The stages of transition to employment are categorised into three broad groups
namely; transited, in transition and not yet started transition. These are defined in
detail below.
1) Transited – A young person who has “transited” is one who is currently
employed and not in school and in:
25.0
36.3
41
9.9
0.3
1.9
23.9
47.9
45.6
39.2
32.5
35.7
31.0
29.8
31.2
0.0 10.0 20.0 30.0 40.0 50.0 60.0
Male
Female
Rural
Urban
Kampala
Peri-urban Kampala
Central
Eastern
Karamoja
Northern
Western
18-19
20-24
25-30
sex
Resid
ence
Regio
ns
Ag
e g
roups
Tota
l

Page | 104
a. a stable job that is based on a written contract of duration at least 12
months, or based on an oral agreement and likely to keep the job over
the next 12 months;
b. a satisfactory temporary job based on a written contract of duration less
than 12 months and the holder does not want to change the job, or based
on an oral agreement with no certainty to keep the job over the next 12
months but the holder does not want to change the job; or
c. Satisfactory self-employment (in self-employed status and does not want
to change the job).
2) In transition – A young person still “in transition” is one who is currently:
a. an active student (employed or unemployed);
b. unemployed (non-student, relaxed definition);
c. employed in a temporary and non-satisfactory job
i. based on a written contract of duration less than 12 months and
wants to change the job, or
ii. based on an oral agreement; not certain to keep the job over the
next 12 months and wants to change the job;
d. in non-satisfactory self-employment
(In self-employed status and wants to change the job); or
e. inactive and not in education or training, with the aim of looking for work
later.
3) Transition not yet started – A young person whose “transition has not yet
started” is one who is currently:
a. still in school and inactive (inactive student); or
b. inactive and not in education or training (inactive non-student), with no
intention of looking for work.
Table 8.14 shows that about 27 percent of the youth had transited into employment either in satisfactory (18%) or stable jobs (9%). This shows that there is inadequate stable or satisfactory employment for working youth in Uganda. The results further indicate that more females than males had transited to satisfactory jobs while more males than females had transited to stable jobs. Transition into stable job increased with increasing levels of education attained up Post primary/secondary specialized training. Majority of the youths (62%) were in transition and nine percent had not started the transition.
The proportion of youth who transited either to stable or satisfactory
jobs was 27%

Page | 105
Table 8.14: Stages of transition of the Youth by Sex and Residence
Characteristic Transited to stable
job
Transited to satisfactory
job
In transition
Transition not started
Not stated
Total
Sex
Male 12.6 17.0 57.9 10.4 2.1 100
Female 6.7 18.4 65.8 7.4 1.7 100
Age
18-19 5.7 11.2 51.9 29.0 2.2 100
20-24 8.9 18.6 57.2 13.9 1.4 100
25-30 11.2 21.7 54.4 10.9 1.7 100
Residence
Rural 6.8 18.9 65.2 8.0 1.1 100
Urban 15.0 15.3 55.7 10.5 3.5 100
Region
Kampala 15.9 8.5 52.5 15.3 7.8 100
Peri-urban Kampala 17.7 14.9 55.2 9.6 2.7 100
Central 12.0 20.3 61.6 5.6 0.5 100
Eastern 7.9 11.5 70.1 9.8 0.7 100
Karamoja 3.7 13.2 75.7 5.6 1.8 100
Northern 5.1 15.9 68.7 7.8 2.5 100
Western 8.7 26.9 53.9 9.2 1.3 100
Education attainment
No education 4.3 20.6 64.2 10.9 0.0 100
Primary 7.5 19.7 71.0 1.4 0.4 100
Secondary 13.0 22.8 62.2 1.5 0.5 100
Post primary/secondary specialized training
34.4 14.1 50.4 0.7 0.4 100
Degree and above 27.5 18.7 48.1 2.3 3.4 100
Total 9.4 17.8 62.2 8.8 1.9 100
Number ('000) 728 1,374 4,814 678 147 7,741
8.7.2 Occupation of the youth who transited
Overall, 65 percent of the youth transited to satisfactory jobs while 35 percent
transited to stable jobs. Table 8.15 shows that the youth who were professionals had
a higher likelihood of transiting to stable jobs (79%) followed by those in elementary
occupations (75%). On the other hand, almost all the skilled agricultural, forestry and
fisheries workers had transited to satisfactory jobs. The occupation with the highest
share of transited youth was skilled agricultural, forestry and fishery workers (27%).
Majority of the youth transited to satisfactory employment in all industries. However,
the highest proportion that transited to stable employment was in production (47%)
which also had the least overall share of all transited youth (16%).
The proportion of the youth who transited in Agriculture was 38%
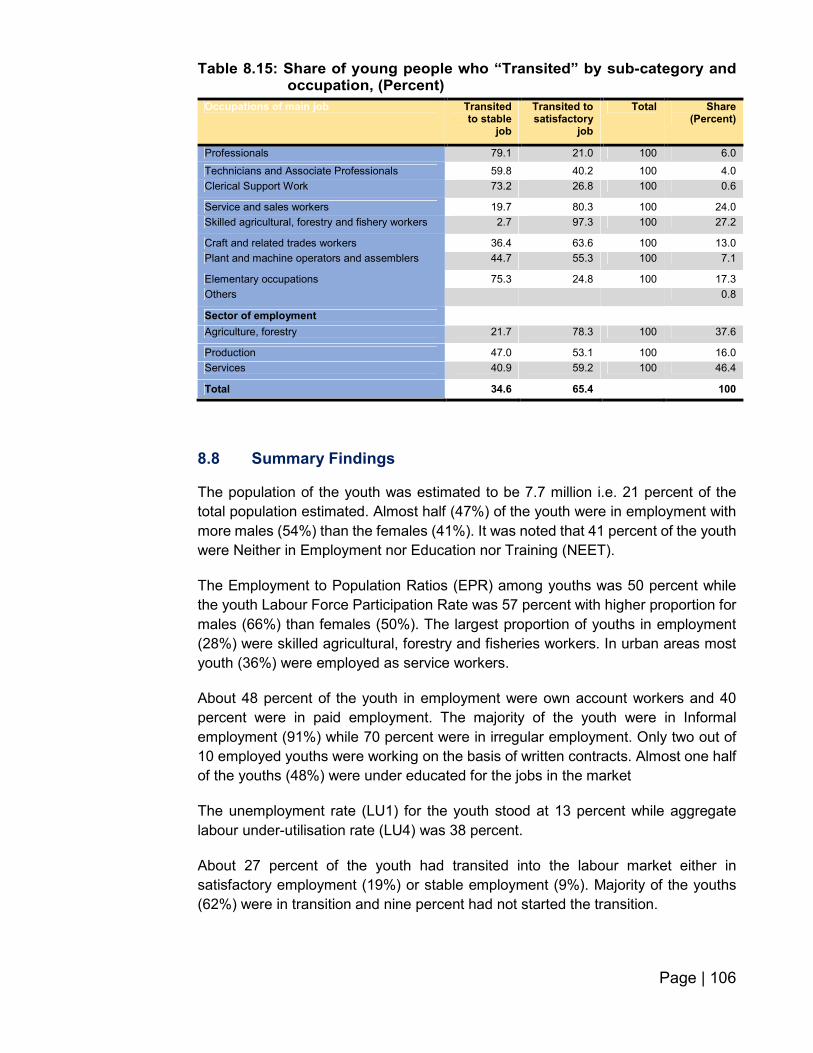
Page | 106
Table 8.15: Share of young people who “Transited” by sub-category and occupation, (Percent)
Occupations of main job Transited to stable
job
Transited to satisfactory
job
Total Share (Percent)
Professionals 79.1 21.0 100 6.0
Technicians and Associate Professionals 59.8 40.2 100 4.0
Clerical Support Work 73.2 26.8 100 0.6
Service and sales workers 19.7 80.3 100 24.0
Skilled agricultural, forestry and fishery workers 2.7 97.3 100 27.2
Craft and related trades workers 36.4 63.6 100 13.0
Plant and machine operators and assemblers 44.7 55.3 100 7.1
Elementary occupations 75.3 24.8 100 17.3
Others 0.8
Sector of employment
Agriculture, forestry 21.7 78.3 100 37.6
Production 47.0 53.1 100 16.0
Services 40.9 59.2 100 46.4
Total 34.6 65.4 100
8.8 Summary Findings
The population of the youth was estimated to be 7.7 million i.e. 21 percent of the
total population estimated. Almost half (47%) of the youth were in employment with
more males (54%) than the females (41%). It was noted that 41 percent of the youth
were Neither in Employment nor Education nor Training (NEET).
The Employment to Population Ratios (EPR) among youths was 50 percent while
the youth Labour Force Participation Rate was 57 percent with higher proportion for
males (66%) than females (50%). The largest proportion of youths in employment
(28%) were skilled agricultural, forestry and fisheries workers. In urban areas most
youth (36%) were employed as service workers.
About 48 percent of the youth in employment were own account workers and 40
percent were in paid employment. The majority of the youth were in Informal
employment (91%) while 70 percent were in irregular employment. Only two out of
10 employed youths were working on the basis of written contracts. Almost one half
of the youths (48%) were under educated for the jobs in the market
The unemployment rate (LU1) for the youth stood at 13 percent while aggregate
labour under-utilisation rate (LU4) was 38 percent.
About 27 percent of the youth had transited into the labour market either in
satisfactory employment (19%) or stable employment (9%). Majority of the youths
(62%) were in transition and nine percent had not started the transition.

Page | 107
CHAPTER NINE: CHILDREN’S ACTIVITIES IN UGANDA
9.0 Introduction6
Child work refers to engaging children in activities to produce goods or services for
use by themselves, their households or other households. Children, like any other
person, may be engaged in any of the five forms of work: Employment, Volunteer,
Unpaid trainee, Own-use production or other forms of work.
Child labour constitutes a key obstacle to achieving the Sustainable Development
Goals in Uganda such as Ensuring inclusive and equitable quality education and
promoting lifelong learning opportunities for all through Universal Primary Education.
It not only harms the welfare of individual children, but also slows broader national
poverty reduction and development efforts. Children forced out of school and into
labour to help their families make ends meet are denied the opportunity to acquire
the knowledge and skills needed for gainful future employment, thereby perpetuating
the cycle of poverty. The worst of child labourers face immediate threats to their
safety and well-being, and therefore constitute an urgent policy priority.
The Government of Uganda has been committed to efforts to eliminate child labour
especially its worst forms. Child labour manifests itself in different sectors of the
economy presenting grave situations, potential hazards, exploitation, deprivation
and abuse to the victims.
This chapter presents key findings on main activities of children in Uganda, focusing
on the extent of children’s involvement in economic activities, non-economic
activities and schooling. Ideally children aged 6-17 years are expected to be
attending school in either primary or secondary schools. In addition the
characteristics of work the children aged 5-17 years were engaged in during the
survey are presented. This includes; sector of employment, status in employment,
children occupations, intensity of children work, involvement of children in household
chores among others. The extent to which children’s work constitutes child labour,
relevant information for policy design and targeting purposes is also presented in
this chapter. Estimates of child labour are presented based to the extent possible on
the national child labour legislation.
6In discussing children’s activities, the concepts of work statistics are based on the resolutions of the
13th International Conference of Labour Statisticians (1982).

Page | 108
9.1 Characteristics of children by sex
9.1.1 Schooling and disability status of children (5-17 years)
Table 9.1 shows that among children (5-17 years), about 16 percent were not at
school. In rural areas, the proportion (16%) was higher than urban (12%). Majority
of the children in Karamoja region (63%) were not schooling.
The proportion of children with a disability was about 8 percent and higher in the
regions of Western (11%) and Northern (10%).
Table 9.1: Children Schooling and disability status by background characteristics
Background Characteristics
Schooling status Disability Status
Total Children
In school Out of school
With Disability
Without disability
Total
Sex
Male 6,563 83.7 16.3 7.6 92.4 100
Female 6,757 84.4 15.6 8.6 91.4 100
Residence
Rural 10,712 83.1 16.9 8.3 91.7 100
Urban 2,608 88.0 12.0 7.1 92.9 100
Region
Kampala 348 87.4 12.6 5.5 94.5 100
Peri-urban Kampala 393 92.0 8.0 4.3 95.7 100
Central 2,492 88.8 11.2 5.1 94.9 100
Eastern 2,958 89.1 10.9 5.8 94.2 100
Karamoja 549 37.3 62.7 5.6 94.4 100
Northern 3,150 78.0 22.0 10.2 89.8 100
Western 3,431 88.0 12.0 11.4 88.6 100
Age group
5-11 7,965 85.3 14.7 7.4 92.6 100
12-13 2,145 94.5 5.5 7.4 92.6 100
14-17 3,210 73.9 26.1 10.3 89.7 100
Total (Percent) 100 84.1 15.9 8.1 91.9 100
Total Number ('000) 13,320 11,196 2,124 1,077 12,239 13,320
9.1.2 Orphan-hood and Foster-hood of Children
The proportion of children (5 to 17 years) with at least one of their parents deceased
was about 13 percent including two percent who were total orphans (both parents
deceased). The proportion of children with single parents was higher for those with
surviving mothers (8%) than fathers (2%). Although 87 percent of children had both
parents alive, only 66 percent were living with both parents. About 16 percent of the
children lived with neither of their parents (Table 9.2).
2% of children were total orphans while 16% lived with neither of their parents
The proportion of children out of school was 16 percent. It was 63% for Karamoja region

Page | 109
Table 9.2: Orphan hood and Foster hood of Children (5-17 Years) by background characteristics, Percent
Background Characteristics
Orphan hood status Foster hood status
Total Number
of Children
(‘000)
Both parents
alive
Mother alive and
father dead
Father alive and
mother dead
Both parents
dead
Living with both
parents
Living with
mother only
Living with
father only
Living with
neither parent
Total (Percent)
Sex Male 6,638 87.2 8.6 2.2 2.1 66.9 12.3 6.1 14.8 100
Female 6,846 87.7 8.1 2.0 2.2 65.2 12.3 5.4 17.1 100
Residence Rural 10,795 87.7 8.0 2.1 2.1 68.4 10.8 5.7 15.1 100
Urban 2,689 86.1 9.9 1.8 2.2 56.3 18.4 5.8 19.5 100
Region Kampala 382 83.9 10.5 2.0 3.5 51.6 21.2 5.6 21.6 100
Peri-urban Kampala 407 90.8 6.2 1.7 1.2 52.3 22.6 4.6 20.5 100
Central 2,528 86.7 8.3 2.9 2.1 58.3 14.2 9.8 17.7 100
Eastern 2,976 90.2 7.2 1.7 0.9 64.0 12.3 5.2 18.5 100
Karamoja 565 84.7 8.8 1.9 4.5 78.7 9.9 1.5 9.9 100
Northern 3,199 82.1 12.6 2.5 2.8 66.9 11.7 5.9 15.5 100
Western 3,426 91.0 5.4 1.5 2.2 73.7 9.7 4.0 12.7 100
Age group
5-11 8,081 91.0 6.1 1.5 1.4 68.1 12.6 5.0 14.3 100
12-13 2,157 85.2 9.2 2.6 3.0 61.2 12.2 7.0 19.5 100
14-17 3,246 80.1 13.4 3.1 3.5 63.5 11.5 7.0 18.0 100
Total(Percent) 87.4 8.4 2.1 2.2 66.1 12.3 5.7 15.9 100
Total Number ('000) 13,484 11,788 1,126 279 290 7,773 1,445 673.7514 1,876
9.2 Activities of children 6-17 years
The survey estimated a population of about 12.5 million children (aged 6-17 years)
in 2016/17 as indicated in Table 9.3. This represented 33 percent to the total
population. The results showed that more than one half (60%) of all children aged 6-
17 years attended school exclusively, while another one quarter (24%) combined
working and attending school at the same time. The findings also reveal that a further
10 percent of children 6-17 year-olds were neither involved in employment nor in
schooling.
The activity patterns differed with the age of children. As age increased, a smaller
share got involved in school exclusively and a greater share was in employment
exclusively. Exclusive school involvement among children aged 6-11 years was
about 74 percent, for the age group 12-13 years, the share was 52 percent and for
the age group 14-17 years was 36 percent. The corresponding proportions for those
in employment exclusively were one percent, three percent and 19 percent
respectively. More female children aged 6-17 years (61%) were involved in only
schooling compared to males (59%).
The proportion of children (6-17 years) exclusively engaged in work was 6%

Page | 110
Table 9.3: Children (6-17 years) activities by Selected Background Characteristics
Background characteristic
Work only School only
Both school and
work
Neither school
nor work
Total
Sex
Male 6.6 59.3 24.7 9.4 100
Female 5.7 61.0 23.7 9.7 100
Residence
Rural 6.5 57.5 26.5 9.5 100
Urban 4.8 70.7 14.9 9.6 100
Region
Central 6.0 66.8 21.0 6.3 100
Eastern 4.0 56.9 33.4 5.6 100
Karamoja 18.4 29.6 7.4 44.7 100
Northern 6.0 58.2 21.3 14.5 100
Western 6.3 63.3 24.6 5.9 100
Age group
6-11 1.0 73.5 13.6 11.9 100
12-13 3.2 52.4 40.5 3.9 100
14-17 19.1 36.4 36.3 8.2 100
Total (Percent), 2016/17 6.1 60.1 24.2 9.5 100
Total (Number ‘000), 2016/17 768 7,524 3,025 1,194 12,512
Total (Percent), 2011/112 5.4 55.4 33.4 5.7 100
Total (Number ‘000), 2011/12 605 6,197 3,736 639 11,448
Another way of viewing children’s involvement in work and schooling is by
disaggregating the child population into two categories; the total involved in
schooling and the total involved in work. It is worth noting that working relates only
to engagement in economic activities and excludes the other productive activities
i.e. household chores performed within one’s own home, where girls tend to be
heavily involved.
As shown in Table 9.4, about 3.8 million children aged 6-17 (30%) were involved in
work. These very young child workers constitute a particular policy concern, as they
are most vulnerable to workplace abuses, and most at risk of work-related ill-health
or injury. They are also most affected by compromised education. The results further
indicate that about 10.5 million (86%) children aged 6-17 were attending school.
There were no major differences in children’s involvement in employment by sex,
suggesting that gender considerations did not play an important role in the
assignment of children to economic activities in Uganda.
The level of children’s involvement in work was closely linked to residence, 33
percent of children aged 6-17 from rural areas were involved in work compared to
20 percent from urban areas. Rural children’s greater involvement in employment
did not however translate into greater disadvantage in terms of school attendance;
the proportion of children aged 6-17 attending school in 2016/17 was almost similar
3.8 million Children (30%) were involved in work including 24% combining work with school

Page | 111
for rural and urban areas (85% and 89% respectively). The results also revealed
regional differences with the Eastern region having the highest proportion of children
involved in work (37%) compared to other regions. There existed major differences
observed in children school attendance by region with the Eastern having the highest
proportion (92%) and Karamoja region the lowest (38%).
Table 9.4: Children in School and at Work by Background Characteristics (6-17 years), percent
Background characteristics Total working (Percentage)
Total in school (Percentage)
Sex
Male 31.3 85.7
Female 29.4 86.4
Residence
Rural 32.9 85.4
Urban 19.7 88.5
Region
Central 27.0 90.2
Eastern 37.4 91.5
Karamoja 25.8 38.0
Northern 27.3 81.4
Western 30.9 89.2
Age
6-11 14.6 89.0
12-13 43.7 94.5
14-17 55.4 73.9
Total (Percent), 2016/17 30.3 86.0
Total Number (‘000), 2016/17 3,794 10,549
Total (Percent), 2011/12 38.8 88.9
Total Number (‘000), 2011/12 4,341 9,933
Figure 9.1 illustrates children’s working status and schooling status for children 6-17
years by single years. About 79 percent of the children aged 6-17 were enrolled in
school at the age six years, the official age for primary school entrance, pointing to
substantial levels of late entry. School attendance rose (i.e. late entrants exceeded
early drop-outs) in the subsequent ages, reaching 97 percent at the age of 11 years
and slowly declining thereafter.
About two percent of children were already working at the age of six years, and more
than one half were working by the age of 14 years, the recommended minimum age
for entering the job market. Involvement in employment increased steadily reaching
62 percent at the age of 17 years. The results further indicate that between ages 16
and 17, the proportions working and schooling are similar at about 60 percent.
About 2% of children were already working by the age of 6.
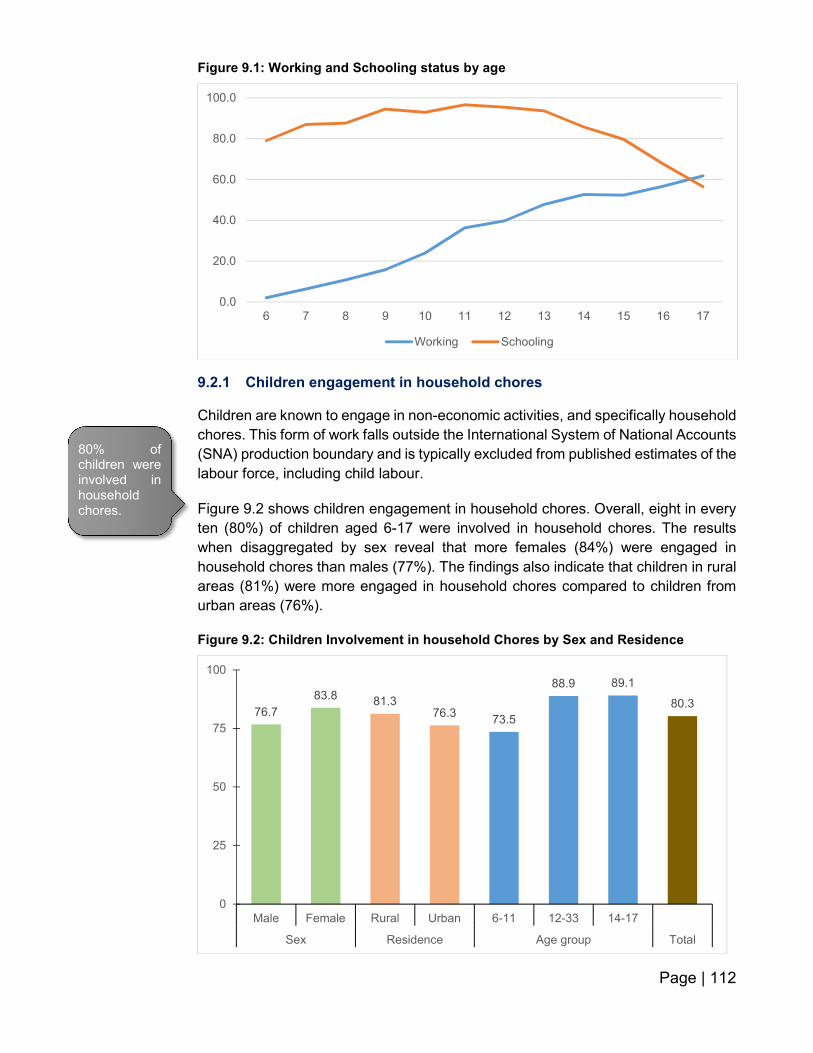
Page | 112
Figure 9.1: Working and Schooling status by age
9.2.1 Children engagement in household chores
Children are known to engage in non-economic activities, and specifically household
chores. This form of work falls outside the International System of National Accounts
(SNA) production boundary and is typically excluded from published estimates of the
labour force, including child labour.
Figure 9.2 shows children engagement in household chores. Overall, eight in every
ten (80%) of children aged 6-17 were involved in household chores. The results
when disaggregated by sex reveal that more females (84%) were engaged in
household chores than males (77%). The findings also indicate that children in rural
areas (81%) were more engaged in household chores compared to children from
urban areas (76%).
Figure 9.2: Children Involvement in household Chores by Sex and Residence
0.0
20.0
40.0
60.0
80.0
100.0
6 7 8 9 10 11 12 13 14 15 16 17
Working Schooling
76.7
83.881.3
76.373.5
88.9 89.1
80.3
0
25
50
75
100
Male Female Rural Urban 6-11 12-33 14-17
Sex Residence Age group Total
80% of children were involved in household chores.

Page | 113
Regional variations indicate that the Eastern region registered the highest proportion
(86%) of children involved in household chores while Northern region had the lowest
(74%) (Figure 9.3).
Figure 9.3: Children Involvement in household chores by regions
9.2.2 Involvement in Work, Household Chores and Schooling
Figure 9.4 shows that, overall, 24 percent of all children aged 6-17 years were
involved in all the three activities namely, employment, schooling and household
chores. This could have consequences on their time for study, rest and leisure. An
additional 47 percent of children combined working and household chores. Only 14
percent of the children aged 6-17 were able to attend school unencumbered by any
form of work responsibilities. Approximately four percent of children were completely
inactive, i.e., neither attending school nor performing any form of productive activity.
Figure 9.4: Distribution of children’ involvement in work, household chores and schooling
82.385.6
76.974.2
80.2 80.3
0
25
50
75
100
Central Eastern Karamoja Northern Western Total
0.9
4.2
14.2
1.1
5.4
47.2
23.5
3.5
0 5 10 15 20 25 30 35 40 45 50
Work only
Household chores only
School only
Work and school
Household chores and work
Household chores and school
Work and school and HH chores
None
24% of all children aged 6-17 years were involved in work, schooling and household chores concurrently.

Page | 114
9.3 Working children 5-17 years
The concept of work used for this survey is the one adopted by the thirteenth International Conference of Labour Statisticians. It is defined broadly in terms of the production of goods and services as set forth in the System of National Accounts (SNA). Persons are considered working if (and only if) they contribute to the production of goods and services falling within the SNA production boundary. The SNA production boundary includes production of all services by market enterprises, government and non-profit institutions (religious institutions and charities). An important exception is domestic and personal services produced by employing paid domestic staff, which is included within the SNA production boundary. Working persons are those engaged in economic activities for a specified time period and they fall into two categories:
(a) Those working during the reference week (b) Those not working during the reference week but with an attachment to a job or with an enterprise that continues to exist.
9.3.1 Proportion of working children 5-17 years
The results in Figure 9.5 shows that, overall, 28 percent of children aged 5-17 were working. This represents about 3.8 million children. The results further indicate that the proportion of working children was almost similar by sex. The proportion of working children was higher for children residing in rural areas (30%) compared to urban children (18%).
By region disaggregation, Eastern had the highest proportion of working children (34%) and Karamoja had the lowest (23%). Children out of school are more likely to be working (36%) compared to those attending school (27%). The proportion of working children increased with the increase in age.
Figure 9.5: Proportion of working children 5-17 years
28.727.1
30.3
18.0
24.3
34.4
23.025.4
28.827.0
36.2
12.6
43.7
55.4
27.9
0.0
20.0
40.0
60.0

Page | 115
9.3.2 Status in Employment for working children
The results reveal that, overall, majority of the working children in Uganda were
predominantly own account workers accounting for 83 percent. The results further
show that only six percent of the working children were in paid employment. Male
children (7%) were about two times likely to be involved in paid employment
compared to the females (4%). Working children residing in urban areas were almost
three times (12%) more likely to be involved here compared to their rural
counterparts (5%) (Table 9.5).
Table 9.5: Status in employment of working children
Background characteristics
Paid employment
Own account workers
Contributing family
workers
Others Total
Sex
Male 7.3 81.2 10.9 0.6 100
Female 3.8 84.9 10.4 0.8 100
Residence
Rural 4.6 85.5 9.4 0.5 100
Urban 12.2 66.2 19.0 2.5 100
Age
6-11 1.8 86.4 11.5 0.4 100
12-13 3.5 85.9 9.7 1.0 100
14-17 8.9 79.7 10.7 0.8 100
Total 5.6 83.0 10.7 0.7 100
Number (‘000) 212 3,151 404 27 3,794
9.3.3 Working children by sector and occupation
Table 9.6 indicates that nine in every ten (92%) of the working children were
engaged in agriculture sector (includes agriculture, forestry and fishing). This is not
surprising given Uganda’s economy is predominately agricultural in nature and the
majority of the working population is engaged in that sector. Overall, the proportion
of male and female children found in the agriculture sector is similar. The proportion
of males in the production sector was slightly higher than for females. However, the
proportion of females in service sector was higher for females than males.
Occupation refers to the actual tasks and duties performed by an individual or the
job description. Table 9.6 shows that almost nine in every 10 (89%) working children
were agricultural and fishery workers with a slightly higher proportion of girls
compared to that of boys. The other categories which engaged a small proportion of
children i.e. the elementary occupations and service workers (4% and 3%
respectively).
Nine in every ten of the working children aged 6-17 years were involved in the agriculture sector.
83% of the working children were own account workers.

Page | 116
Table 9.6: Proportion of working children (5-17 Years) by sector and occupation, 2016/17 & 2011/12
Sector and Occupation 2016/17 Total 2011/12
Male Female Rural Urban Total
Sector
Agriculture, forestry and fishing 91.9 92.0 94.4 74.9 91.9 93.0
Production 4.6 1.7 2.9 5.2 3.2 2.3
Services 3.5 6.3 2.7 19.9 4.9 4.7
Occupation
Service workers 2.0 4.6 1.9 13.1 3.3 3.0
Skilled agricultural, forestry and fisheries workers
88.7 90.1 91.7 73.6 89.4 90.0
Elementary occupations 5.1 3.7 4.0 7.2 4.4 4.6
Others 4.2 1.6 2.4 6.0 2.9 2.4
Total 100 100 100 100 100 100
9.4 Child labour
This section looks at the extent to which children’s work constitutes child labour and the estimates are presented based to the extent possible on the national child labour legislation. For the purposes of this report children are child labourers if they satisfy the following conditions:
a) They are aged 5-11 years and they are at work but not expected to work. b) They are aged 12-13 years doing work other than ‘light work’ or do work
beyond 14 hours a week. c) Aged 14-17 years involved in hazardous forms of labour or working for an
equivalent of 43 hours in a week or beyond.
Figure 9.6:Distinction between child labour and other forms of work
AGE GROUPS
FORMS OF WORK
Non-hazardous work (in non-hazardous industries and occupations and not for excessive hours)
Hazardous work (in specified hazardous industries and occupations) or excessive hours
Light work
Regular (“non-light”) work
5-11 years
12-13 years
14-17 years
Source: ILO/IPEC
The NLFS 2016/17, being a household-based survey measured only the worst forms
of child labour constituting “work which by its nature or the circumstances in which it
is carried out, is likely to harm the health, safety or morals of children”. This category
CHILD LABOUR
THAT MUST BE ELIMINATED
ONLY PERMITTED FORMS OF
WORK

Page | 117
is also called hazardous work by children. It may be noted that some economic
activities that children engage in are generally acceptable but may become
hazardous if certain conditions are not met.
According to the Employment Act No. 6, 2006, hazardous work by children includes;
• Children working in industries gazetted as hazardous
• Children working in occupations gazetted as hazardous
• Children aged 14-17 working for long hours i.e. more than 43 hours a week in non-hazardous work
• Children aged 12-13 working for more than 14 hours a week in non-hazardous work
• Working conditions e.g. working at night, carrying heavy loads
Other child labour includes;
• Children aged 5-11 working in non-hazardous work
Therefore an estimate of child labour in this report (in accordance with national
legislation), includes all at-work 5-11 year-olds, work for 12-13 year-olds except
those in light work, and all 14-17 year olds in hazardous work or working excessive
hours7.
It is here emphasized that this child labour estimate is a lower bound estimate
because it does not include children involvement in the "unconditional worst forms"
of child labour such as child trafficking and children involved in obscure non-
economic activities.
9.4.1 Child labour estimate
Based on the above definition, a total of 2 million children were engaged in some
form of child labour (Table 9.7). These constituted 15 percent of all children
nationally. The results further indicate that of the total children engaged in child
labour, about 1,031,000 were children aged 5-11 years engaged in child work. The
proportion of the 5-11 year olds involved in work was almost similar by gender (13%
for males and 12% for females) but there was a wide variation by residence and
regions.
Overall about 476,000 children (22%) aged 12-13 year-old were in non-light economic activity below the minimum age for this type of work or hazardous work. The proportion was slightly higher for males (24 %) compared to that of females (20%) and also higher in rural areas (23%) compared to urban areas (16%). Regional comparisons depict that Karamoja region had the highest proportion of working children aged 12-13 years who were in non-light economic activity or hazardous work (34%) compared to other regions. The results further indicate that 550,000 children (17%) aged 14-17 year-old were hazardous work or working excessive hours. The proportion was slightly higher for
7A list of hazardous forms of labour was compiled following the adoption of the National Labour
Policy in 2006.
About 2 million children (15%) were engaged in child labour

Page | 118
males (21%) compared to that of females (13%) and was almost similar by residence. Regional comparisons depict that Central and Northern regions had the highest proportion of working children aged 14-17 years who were in non-light economic activity or hazardous work (21% each) compared to 12 percent in Eastern region.
Table 9.7: Child Labour by Age of the Child, Percent of total children
2016/17 Proportion as percent of Total children
Sex, Residence and Region Working Children aged 5-
11
Working Children aged 12-13 excluding
those in light economic activity
Children aged 14-17 years in hazardous
work or working excessive hours(ii)
Total in child labour, 5-17
years
Sex
Male 13.4 24.1 20.7 16.8
Female 11.9 19.6 13.2 13.5
Residence
Rural 13.6 23.1 16.6 15.9
Urban 8.8 15.8 17.7 12.1
Region
Central 10.6 21.8 21.1 14.9
Eastern 17.7 12.8 11.9 15.5
Karamoja 12.9 34.0 17.6 16.2
Northern 9.1 26.9 21.0 14.9
Western 13.4 23.8 12.8 15.0
Total (Percent), 2016/17 12.6 21.8 16.8 15.1
Total (Number ‘000), 2016/17 1,031 476 550 2,057
9.4.2 Comparison of child labour with 2011/12 Survey
The results in Table 9.8 indicate that, overall, the total number of children that were
estimated to have been engaged in child labour has remained at about 2 million
during the 2016/17 and 2011/2012 surveys respectively. These represented 15
percent and 16 percent during the 2016/17 and 2011/12 surveys respectively. The
number of children aged 5 – 11 working but not supposed to work decreased in
absolute numbers from 1,450,000 in 2011/12 survey to 1,029,000 in 2016/17 survey,
indicating a decrease from 21 percent to 13 percent.
The number of children aged 12-13 years engaged in economic activities excluding
those in light economic activities increased from about 252,000 (12%) to 476,000
(22%) of all the children in the age group.
On the other hand the number of children aged 14 -17 years engaged in hazardous
work or working excessive hours increased from about 307,000 to about 550,000.
The same proportion has increased from nine to 17 percent.
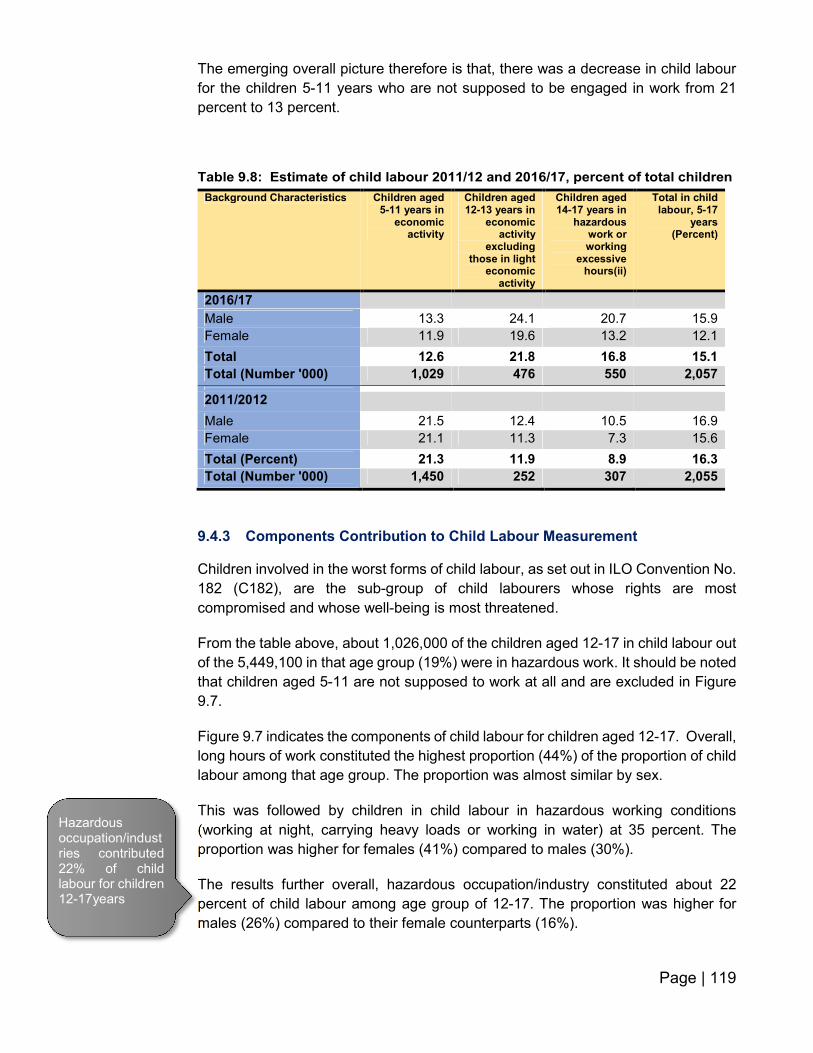
Page | 119
The emerging overall picture therefore is that, there was a decrease in child labour
for the children 5-11 years who are not supposed to be engaged in work from 21
percent to 13 percent.
Table 9.8: Estimate of child labour 2011/12 and 2016/17, percent of total children
Background Characteristics Children aged 5-11 years in
economic activity
Children aged 12-13 years in
economic activity
excluding those in light
economic activity
Children aged 14-17 years in
hazardous work or working
excessive hours(ii)
Total in child labour, 5-17
years (Percent)
2016/17
Male 13.3 24.1 20.7 15.9
Female 11.9 19.6 13.2 12.1
Total 12.6 21.8 16.8 15.1
Total (Number '000) 1,029 476 550 2,057
2011/2012
Male 21.5 12.4 10.5 16.9
Female 21.1 11.3 7.3 15.6
Total (Percent) 21.3 11.9 8.9 16.3
Total (Number '000) 1,450 252 307 2,055
9.4.3 Components Contribution to Child Labour Measurement
Children involved in the worst forms of child labour, as set out in ILO Convention No.
182 (C182), are the sub-group of child labourers whose rights are most
compromised and whose well-being is most threatened.
From the table above, about 1,026,000 of the children aged 12-17 in child labour out
of the 5,449,100 in that age group (19%) were in hazardous work. It should be noted
that children aged 5-11 are not supposed to work at all and are excluded in Figure
9.7.
Figure 9.7 indicates the components of child labour for children aged 12-17. Overall,
long hours of work constituted the highest proportion (44%) of the proportion of child
labour among that age group. The proportion was almost similar by sex.
This was followed by children in child labour in hazardous working conditions
(working at night, carrying heavy loads or working in water) at 35 percent. The
proportion was higher for females (41%) compared to males (30%).
The results further overall, hazardous occupation/industry constituted about 22
percent of child labour among age group of 12-17. The proportion was higher for
males (26%) compared to their female counterparts (16%).
Hazardous occupation/industries contributed 22% of child labour for children 12-17years

Page | 120
Figure 9.7: Components of child labour (12-17 years)
Figure 9.8: Child Work and Child Labour Framework (5-17 Years)
25.916.4 18.2
37.821.8
44.2
42.8 44.7
38.5
43.6
29.940.8 37.1
23.634.6
0
20
40
60
80
100
120
Male Female Rural Urban Total
Hazardous occupation or industry Long hours of work Working conditions
Children 5-17 years 13,616
Working children (5-17) 3,794 (27.9%)
Not working (5-17) 9,822 (72.1%)
Working children (12-13 years) 954 (43.7%)
Working children (5-11 years)
1,031 (12.6%)
Working children (14-17 years) 1,809 (55.4%)
In light work
478 (21.9%) In non-light work
476 (21.8%)
In hazardous or work
excessive hours
550 (16.8%)
In none hazardous work
1,259 (38.5)
Child labour = 2,057
(15.1%)
Acceptable child work
1,737 (31.9%)

Page | 121
9.5 Summary findings
Overall, 3.8 million (30%) children aged 6-17 were involved in work. These very
young child workers constitute a particular policy concern, as they are most
vulnerable to workplace abuses, and most at risk of work-related ill-health or injury.
They are also most affected by compromised education. The results further indicate
that about 10.5 million (86%) children aged 6-17 were attending school
A total of about 3,794,000 (28%) children aged 5-17 years were working. The
children engaged in the primary sector accounted for about 92 percent of the total
working children. Almost 83 percent of the working children were own account
workers.
About 2,057,000 children (15%) were in child labour. On the other hand, about 1,031,000 children (13%) who were in child labour were aged 5-11 years, and this age group is not supposed to work at all. However, almost all of them were in agriculture. Furthermore, about 1,026,000 (19%) of children aged 12-17 out of the 5,449,000 children in that age group were in hazardous work.
Page | 122
APPENDICES
Definition of concepts
Dependency Ratio: The Age Dependency Ratio is an age-population ratio of those not in the
working age group (the dependent ages less than 14 and 65+ years) to those in the working age
group (the productive portion of the population, aged 14 to 64).
Working-age Population: The working-age population is the population from the minimum legal
working age. For Uganda, the minimum legal working age is 14 years. For statistical purposes, the
working age for Uganda is set at 14-64 years.
Work: This is the production process as described in the System of National Accounts (SNA) which can be described in general terms as an activity in which an enterprise uses inputs to produce outputs, mainly goods or services.
Working population: This is the population that is engaged in the production of goods and services within the SNA production boundary.
Industry: This is a description of the activity carried out at a place of work. It may be an establishment or business in which individuals are engaged in the production and/or distribution of goods and services.
Occupation: It refers to the tasks or duties or job a person usually pursues to earn income in form of pay or profit.
Main Job: In case of more than one job, the main job/activity during the reference period is the
one in which the respondent usually worked the greatest number of hours. If the usual hours
worked are the same, the main job/activity is the one that generates the highest income. Secondary
job refers to the job the person spent the second most hours during the reference week
Employment: Employed persons are those of working age who, during a period of one week
preceding the interview, were engaged in any activity to produce goods or provide services for pay
or profit for at least one hour. It includes employed persons “at work” and those “not at work” due
to temporary absence.
Employment-to-Population Ratio (EPR): This refers to the proportion of the working age
population that is employed. By age group, it refers to the total number of employed persons
expressed as a proportion of the population of the same age group.
Persons in Unemployment: Refers to all those of working age who were not in employment,
carried out activities to seek employment during a specified recent period and were currently
available to take up employment given a job opportunity.
Labour Force: This refers to the current supply of labour for the production of goods and services
in exchange for pay or profit. The sum of persons in employment and in unemployment equals the
labour force.

Page | 123
Labour Force Participation Rate (LFPR): This is the proportion of the working age population in
the labour force. The labour force (employed and unemployed persons) expressed as a
percentage of the working age population is the Labour Force Participation Rate (LFPR).
Potential Labour Force (PLF) refers to persons not in employment who expressed an interest in
employment but for whom existing conditions limited their active job search and/or their availability.
This is expressed as a proportion of the extended labour force which is the total population in the
labour force and the potential labour force.
Persons outside the labour force: These are persons of working age who were neither in employment nor in unemployment in the short reference period.
Unpaid Care Work (UCW): This is work carried out in the person’s own home and is unpaid and
does not contribute to GDP. It includes both personal care work and care-related activities, such
as cooking, cleaning and washing clothes.
Transition to employment: This refers to the passage of a young person from the end of
schooling (or entry to first economic activity) to the first stable or satisfactory job.
Stable job: This is a job based on a written contract of duration at least 12 months, or based on
an oral agreement and likely to be kept over the next 12 months.
Satisfactory temporary job: This is a job based on a written contract of duration less than 12
months and the holder does not want to change the job, or based on an oral agreement and the
holder is not certain to be kept over the next 12 months but does not want to change the job.
Satisfactory self-employment: Refers to a self-employment job in which the holder does not
want to change the job.
Child Labour: This refers to Children 5-11 years engaged in any economic activity; or children 12-13 years doing work other than ‘light work’ or do work beyond 14 hours a week; or children 14-17 years involved in hazardous forms of labour or working for an equivalent of 43 hours in a week or beyond.

Page | 124
Table A3.1: Median Monthly Income in the secondary job (‘000 Shs) In the Secondary job Combined Main and Secondary
jobs Characteristics Male Female Total Male Female Total
Residence
Rural 66 66 66 132 88 110
Urban 110 66 100 300 180 251
Region
Kampala 100 170 100 350 240 300
Peri-urban Kampala 400 50 330 350 244 300
Central 66 88 88 200 110 165
Eastern 100 66 80 198 150 165
Karamoja 50 44 50 150 66 110
Northern 81 2 60 200 66 150
Western 88 77 77 132 100 110
Level of education completed
No education 14 66 55 88 70 88
Primary 87 42 66 110 70 100
Secondary 110 66 83 263 120 214
Post primary/secondary specialized training 250 100 250 440 300 400
Degree and above 200 500 500 750 600 713
Age group
14-17 55 60 60 66 50 55
18-30 66 50 66 176 116 150
31-64 90 66 77 300 150 250
15-24 55 60 60 120 100 110
15-29 66 55 66 154 110 132
Sector of the job
Agriculture, forestry and fishing 66 60 66 88 66 77
Production 150 60 110 264 120 250
Services 110 60 80 300 190 270
Occupations of the job
Legislators, Managers, etc 83 288 200 795 510 600
Professionals 80 85 80 450 350 424
Technicians and Associate Professionals 66 45 60 480 350 400
Clerks 66 - 55 300 440 300
Service workers 110 3 110 250 150 200
Skilled agricultural, forestry and fisheries workers
154 - 154 90 66 88
Craft and related workers 66 66 66 280 110 264
Plant and machine operators 0 2 2 300 260 300
Elementary occupations 66 60 66 100 70 88
Institution
Private 66 60 66 176 100 132
Public - 55 - 450 408 450
Informal employment on the job
Formal employment 200 550 200 610 520 530
Informal employment 66 60 66 200 110 150
Total 66 60 66 200 120 157

Page | 125
Table A3.2: Informal employment by Industry and occupation, Percent
Industry Formal employment
Informal employment
Total
Activities of household employers - 100.0 100.0
Mining and quarrying 0.6 99.4 100.0
Manufacturing 3.7 96.3 100.0
Construction 4.1 95.9 100.0
Transport and storage 4.5 95.5 100.0
Hotels , restaurant eating places 5.7 94.3 100.0
Electricity generation 5.8 94.2 100.0
Other service activities 6.6 93.4 100.0
Total 7.7 92.3 100.0
Trade 8.4 91.6 100.0
Education 9.2 90.8 100.0
Human health and social work activities 11.2 88.8 100.0
Water generation 12.6 87.4 100.0
Arts, entertainment and recreation 16.6 83.4 100.0
Public administration 18.6 81.4 100.0
Professional, scientific and technical activities 19.4 80.6 100.0
Administrative and support activities 23.0 77.0 100.0
Activities of extra-territorial organisations and bodies 30.1 69.9 100.0
Information and communications 40.9 59.1 100.0
Real estate activities 51.2 48.8 100.0
Financial and Insurance activities 56.5 43.5 100.0
Occupation
Skilled agricultural, forestry and fishery workers - 100.0 100.0
Elementary occupations 1.4 98.6 100.0
Craft and related trades workers 2.5 97.5 100.0
Plant and machine operators and assemblers 3.5 96.5 100.0
Service and sales workers 9.4 90.6 100.0
Technicians and Associate Professionals 13.0 87.0 100.0
Clerical Support Workers 14.3 85.7 100.0
Professionals 15.7 84.3 100.0
Managers 22.3 77.7 100.0
Others 6.2 93.8 100.0
Total (Percent) 7.7 92.3 100.0
Total (Number '000) 362 4,311 4,672
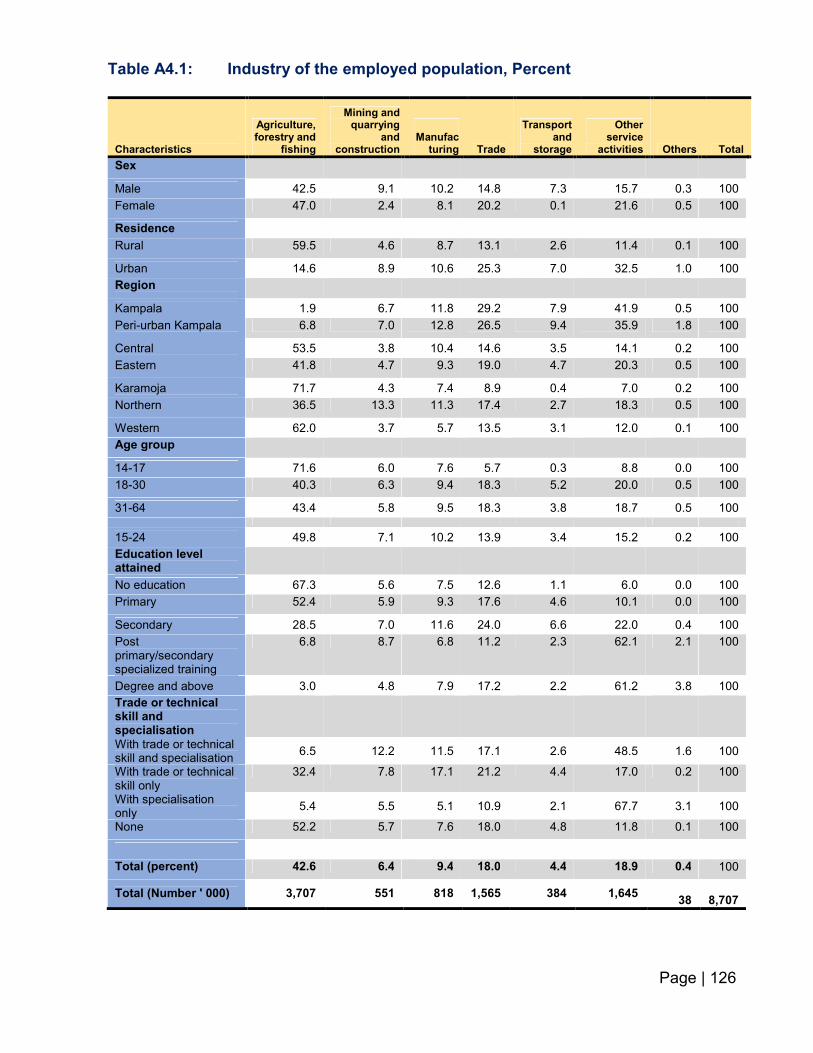
Page | 126
Table A4.1: Industry of the employed population, Percent
Characteristics
Agriculture, forestry and
fishing
Mining and quarrying
and construction
Manufac
turing Trade
Transport and
storage
Other service
activities Others Total
Sex
Male 42.5 9.1 10.2 14.8 7.3 15.7 0.3 100
Female 47.0 2.4 8.1 20.2 0.1 21.6 0.5 100
Residence
Rural 59.5 4.6 8.7 13.1 2.6 11.4 0.1 100
Urban 14.6 8.9 10.6 25.3 7.0 32.5 1.0 100
Region
Kampala 1.9 6.7 11.8 29.2 7.9 41.9 0.5 100
Peri-urban Kampala 6.8 7.0 12.8 26.5 9.4 35.9 1.8 100
Central 53.5 3.8 10.4 14.6 3.5 14.1 0.2 100
Eastern 41.8 4.7 9.3 19.0 4.7 20.3 0.5 100
Karamoja 71.7 4.3 7.4 8.9 0.4 7.0 0.2 100
Northern 36.5 13.3 11.3 17.4 2.7 18.3 0.5 100
Western 62.0 3.7 5.7 13.5 3.1 12.0 0.1 100
Age group
14-17 71.6 6.0 7.6 5.7 0.3 8.8 0.0 100
18-30 40.3 6.3 9.4 18.3 5.2 20.0 0.5 100
31-64 43.4 5.8 9.5 18.3 3.8 18.7 0.5 100
15-24 49.8 7.1 10.2 13.9 3.4 15.2 0.2 100
Education level attained
No education 67.3 5.6 7.5 12.6 1.1 6.0 0.0 100
Primary 52.4 5.9 9.3 17.6 4.6 10.1 0.0 100
Secondary 28.5 7.0 11.6 24.0 6.6 22.0 0.4 100
Post primary/secondary specialized training
6.8 8.7 6.8 11.2 2.3 62.1 2.1 100
Degree and above 3.0 4.8 7.9 17.2 2.2 61.2 3.8 100
Trade or technical skill and specialisation
With trade or technical skill and specialisation
6.5 12.2 11.5 17.1 2.6 48.5 1.6 100
With trade or technical skill only
32.4 7.8 17.1 21.2 4.4 17.0 0.2 100
With specialisation only
5.4 5.5 5.1 10.9 2.1 67.7 3.1 100
None 52.2 5.7 7.6 18.0 4.8 11.8 0.1 100
Total (percent) 42.6 6.4 9.4 18.0 4.4 18.9 0.4 100
Total (Number ' 000) 3,707 551 818 1,565 384 1,645
38
8,707
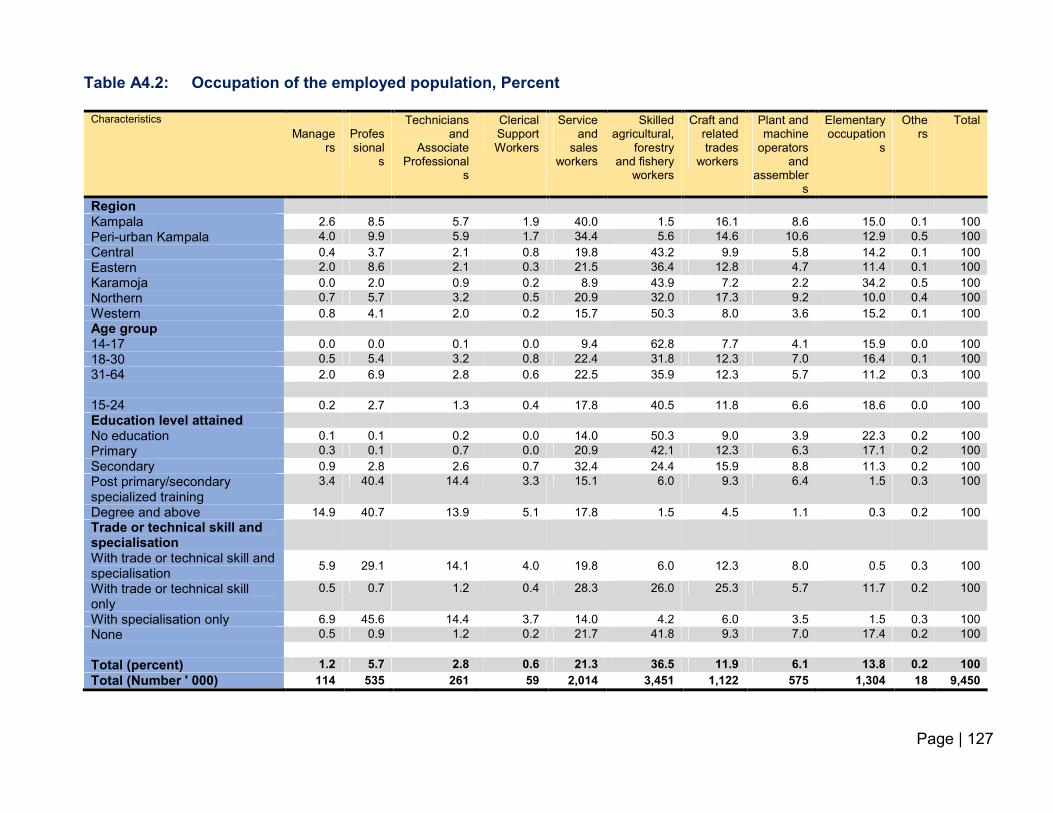
Page | 127
Table A4.2: Occupation of the employed population, Percent
Characteristics Manage
rs
Professional
s
Technicians and
Associate Professional
s
Clerical Support Workers
Service and
sales workers
Skilled agricultural,
forestry and fishery
workers
Craft and related trades
workers
Plant and machine
operators and
assemblers
Elementary occupation
s
Others
Total
Region
Kampala 2.6 8.5 5.7 1.9 40.0 1.5 16.1 8.6 15.0 0.1 100
Peri-urban Kampala 4.0 9.9 5.9 1.7 34.4 5.6 14.6 10.6 12.9 0.5 100
Central 0.4 3.7 2.1 0.8 19.8 43.2 9.9 5.8 14.2 0.1 100
Eastern 2.0 8.6 2.1 0.3 21.5 36.4 12.8 4.7 11.4 0.1 100
Karamoja 0.0 2.0 0.9 0.2 8.9 43.9 7.2 2.2 34.2 0.5 100
Northern 0.7 5.7 3.2 0.5 20.9 32.0 17.3 9.2 10.0 0.4 100
Western 0.8 4.1 2.0 0.2 15.7 50.3 8.0 3.6 15.2 0.1 100
Age group
14-17 0.0 0.0 0.1 0.0 9.4 62.8 7.7 4.1 15.9 0.0 100
18-30 0.5 5.4 3.2 0.8 22.4 31.8 12.3 7.0 16.4 0.1 100
31-64 2.0 6.9 2.8 0.6 22.5 35.9 12.3 5.7 11.2 0.3 100
15-24 0.2 2.7 1.3 0.4 17.8 40.5 11.8 6.6 18.6 0.0 100
Education level attained
No education 0.1 0.1 0.2 0.0 14.0 50.3 9.0 3.9 22.3 0.2 100
Primary 0.3 0.1 0.7 0.0 20.9 42.1 12.3 6.3 17.1 0.2 100
Secondary 0.9 2.8 2.6 0.7 32.4 24.4 15.9 8.8 11.3 0.2 100
Post primary/secondary specialized training
3.4 40.4 14.4 3.3 15.1 6.0 9.3 6.4 1.5 0.3 100
Degree and above 14.9 40.7 13.9 5.1 17.8 1.5 4.5 1.1 0.3 0.2 100
Trade or technical skill and specialisation
With trade or technical skill and specialisation
5.9 29.1 14.1 4.0 19.8 6.0 12.3 8.0 0.5 0.3 100
With trade or technical skill only
0.5 0.7 1.2 0.4 28.3 26.0 25.3 5.7 11.7 0.2 100
With specialisation only 6.9 45.6 14.4 3.7 14.0 4.2 6.0 3.5 1.5 0.3 100
None 0.5 0.9 1.2 0.2 21.7 41.8 9.3 7.0 17.4 0.2 100
Total (percent) 1.2 5.7 2.8 0.6 21.3 36.5 11.9 6.1 13.8 0.2 100
Total (Number ' 000) 114 535 261 59 2,014 3,451 1,122 575 1,304 18 9,450

Page | 128
Table A4.3: Distribution of Place of work of the employed population by selected characteristics, Percent
Characteristics Own home/structure
attached to own home
Client’s or employer’s
home
Enterprise, plant, factory,
office, shop, workshop
etc. (separate from house)
On a farm or
agricultural plot
Construction site
Fixed stall in the
market/street
Without fixed
location/ mobile/
open space
Others Total
Region Kampala 9.5 5.5 53.7 1.5 3.3 10.3 15.7 0.5 100 Peri-urban Kampala 10.2 5.6 51.2 5.9 5.1 6.8 13.8 1.3 100 Central 16.0 2.9 20.5 47.2 2.0 3.3 6.7 1.5 100 Eastern 8.6 2.8 29.1 39.9 3.1 5.9 10.2 0.5 100 Karamoja 9.1 1.9 8.9 32.1 2.0 6.8 34.6 4.7 100 Northern 12.5 0.8 24.2 35.6 6.1 9.1 10.6 1.0 100 Western 7.2 1.2 16.3 62.4 1.8 2.4 6.4 2.4 100 Age group 14-17 10.7 4.1 7.6 67.9 2.0 2.7 4.7 0.3 100 18-30 10.4 3.2 27.8 37.5 3.9 5.4 10.3 1.6 100 31-64 11.0 1.5 27.4 40.3 2.6 5.5 10.0 1.7 100 0.0 15-24 10.5 4.8 19.1 47.9 3.8 4.5 8.2 1.1 100 Education level attained No education 14.1 3.3 5.0 57.8 0.6 3.8 12.7 2.6 100 Primary 11.0 2.9 14.0 51.4 2.9 6.1 10.6 1.2 100 Secondary 10.9 2.8 36.5 26.2 4.6 6.3 11.6 1.1 100 Post primary/secondary specialized training
6.9 0.8 72.9 5.4 3.9 1.5 5.0 3.5 100
Degree and above 1.9 0.7 83.1 1.1 2.3 3.9 4.2 2.8 100 Trade or technical skill and specialisation
With trade or technical skill and specialisation
6.8 0.7 66.7 5.1 5.4 3.5 4.8 7.0 100
With trade or technical skill only 15.1 1.7 30.4 31.6 5.1 4.7 9.7 1.8 100 With pecialisation only 5.0 0.8 79.9 3.8 2.5 1.6 4.7 1.6 100 None 10.2 3.3 16.0 49.1 2.5 6.3 11.5 1.2 100
Total (percent) 10.7 2.5 25.8 41.6 3.1 5.2 9.6 1.5 100 Total (Number ' 000) 933 214 2,247 3,623 268 453 839 132 8,709

Page | 129
Table A4.4: Usual hours of work by employed population in the secondary job and for primary and secondary jobs combined by selected characteristics
Average weekly usual hours in Secondary job Average weekly usual hours in Primary and Secondary Jobs combined
Characteristics Male Female Total Male Female Total
Residence
Rural 23.3 21.4 22.5 45.0 37.6 41.8
Urban 22.6 21.9 22.3 61.2 53.5 57.6
region
Kampala 18.0 54.0 24.1 62.5 59.2 61.2
Peri-urban Kampala 21.0 20.4 20.8 63.8 58.5 61.4
Central 22.3 21.8 22.1 50.6 43.8 47.6
Eastern 21.7 18.1 20.7 52.1 37.7 46.3
Karamoja 16.6 20.7 19.1 36.2 30.9 33.2
Northern 22.8 20.0 21.6 43.3 36.9 40.3
Western 25.4 23.2 24.4 47.6 43.4 45.6
Education level completed
No education 22.3 18.7 19.3 40.8 36.2 37.6
Primary 24.8 23.1 24.2 50.8 42.7 47.2
Secondary 23.1 19.0 21.8 58.7 51.1 55.6
Post pri/Sec Specialized training
13.0 21.0 17.3 53.7 54.5 54.0
Degree and above 21.5 8.9 18.8 56.3 51.7 54.7
Age group
14-17 19.6 14.5 18.2 25.5 24.0 24.8
18-30 23.4 21.7 22.7 53.6 44.2 49.0
31-59 23.2 22.2 22.8 51.7 45.7 49.2
60+ 24.0 11.1 17.7 50.7 32.8 43.3
Special age groups
15-24 23.7 20.4 22.3 44.0 39.9 42.0
Total 23.1 21.5 22.5 49.9 42.8 46.7

Page | 130
Table A4.5: Proportion in Informal employment including persons employed in Agriculture, forestry and fishing, percent Characteristics Formal
employment Informal
employment Total Characteristics Formal
employment Informal
employment Total
Sex
Male 12.9 87.1 100
Status in employment
Female 15.3 84.7 100 Paid employee 13.7 86.3 100
Residence
Rural 11.2 88.8 100 Sector
Urban 16.3 83.7 100
Agriculture, forestry and fishing 1.5 98.5 100
Region Production 6.1 93.9 100
Kampala 18.0 82.0 100
Services 22.1 77.9 100
Peri-urban Kampala 17.8 82.2 100
Central 10.5 89.5 100
occupation
Eastern 15.9 84.1 100 Managers 46.7 53.3 100
Karamoja 13.5 86.5 100
Professionals 40.1 59.9 100
Northern 15.9 84.1 100 Technicians and Associate Professionals
28.4 71.6 100
Western 9.3 90.7 100
Clerical Support Workers 40.8 59.2 100
Education level completed Service and sales workers 12.3 87.7 100
No education 0.7 99.3 100
Skilled agricultural, forestry and fishery workers
0.7 99.3 100
Primary 1.7 98.3 100 Craft and related trades workers 1.6 98.4 100
Secondary 8.0 92.0 100
Plant and machine operators and assemblers
8.0 92.0 100
Post primary/secondary specialized training
38.2 61.8 100 Elementary occupations 2.0 98.0 100
Degree and above 47.2 52.8 100
Age groups Total (Percent) 13.7 86.3 100
0-17 0.0 100.0 100
Total (Number ‘ 000) 421 2,658 3,079
18-30 7.1 92.9 100
31-59 23.1 76.9 100
60+ 2.0 98.0 100
15-24 1.6 98.4 100

Page | 131
Table A4.6: Distribution of Employment in the Informal sector including persons employed in Agriculture, forestry and fishing, percent
Characteristics Formal
sector Informal sector
Private Households
Total Characteristics Formal employ
ment
Informal employment
Private Househ
olds
Total
Sex
Male 13.7 85.9 0.4 100
Status in employment
Female 10.2 86.9 2.9 100 Paid employee 23.8 71.5 4.7 100
Residence
Employer 34.1 65.9 0.0 100
Rural 7.1 92.3 0.5 100 Own account worker 6.2 93.8 0.0 100
Urban 22.3 74.2 3.5 100
Contributing family workers 0.0 100.0 0.0 100
Region Member of producer cooperative 100.0 0.0 0.0 100
Kampala 28.5 66.0 5.5 100
Peri-urban Kampala 22.9 71.6 5.5 100 Sector
Central 10.9 88.1 1.0 100
Agriculture, forestry and fishing 0.9 99.1 0.0 100
Eastern 12.7 85.7 1.6 100 Production 12.4 87.6 0.0 100
Karamoja 6.2 92.9 0.9 100
Services 24.6 71.6 3.8 100
Northern 12.8 86.4 0.7 100
Western 6.0 93.5 0.5 100
occupation
Education level completed Managers 58.4 41.6 0.0 100
No education 2.8 96.0 1.2 100
Professionals 62.6 37.4 0.0 100
Primary 4.3 93.8 1.9 100 Technicians and Associate Professionals
49.8 50.2 0.0 100
Secondary 14.1 84.1 1.8 100
Clerical Support Workers 65.9 34.1 0.0 100
Post primary/secondary specialized training
49.5 50.3 0.2 100 Service and sales workers 17.5 82.0 0.4 100
Degree and above 62.5 36.5 1.1 100
Skilled agricultural, forestry and fishery workers
0.9 99.1 0.0 100
Age groups Craft and related trades workers 6.6 93.4 0.0 100
0-17 0.3 96.4 3.3 100
Plant and machine operators and assemblers
9.6 89.6 0.7 100
18-30 9.0 88.8 2.2 100 Elementary occupations 3.8 86.1 10.1 100
31-59 17.5 82.0 0.5 100
Others 87.0 13.0 0.0 100
60+ 5.8 90.7 3.5 100
Total (Percent) 12.1 86.3 1.5 100
15-24 4.2 92.5 3.3 100 Total (Number ‘ 000) 1,149 8,166 145 9,459

NLFS 2016/17 -Survey Errors
Confidence interval
Estimate
Standard error CV Lower Upper
Chapter 2
Population
Total 37,700,000 1,544,847 4.09 34,700,000 40,800,000
Male 18,400,000 785,603 4.27 16,800,000 19,900,000
Female 19,400,000 786,764 4.07 17,800,000 20,900,000
Rural 28,800,000 1,671,874 5.80 25,500,000 32,100,000
Urban 8,907,400 838,211 9.41 7,258,804 10,600,000
Kampala 1,610,279 138,791 8.62 1,337,303 1,883,254
Peri-urban Kampala 1,685,071 124,046 7.36 1,441,096 1,929,046
Central 7,143,016 524,434 7.34 6,111,558 8,174,474
Eastern 7,820,499 366,323 4.68 7,100,014 8,540,985
Karamoja 1,668,892 239,489 14.35 1,197,865 2,139,920
Northern 8,168,632 567,543 6.95 7,052,386 9,284,878
Western 9,633,275 1,250,288 12.98 7,174,203 12,100,000
0-17 21,000,000 1,002,342 4.78 19,000,000 22,900,000
18-30 7,740,668 291,209 3.76 7,167,916 8,313,419
31-59 7,335,975 263,384 3.59 6,817,951 7,853,999
60+ 1,695,819 94,219 5.56 1,510,509 1,881,128
15-24 6,513,648 271,707 4.17 5,979,254 7,048,043
15-35 12,000,000 457,861 3.81 11,100,000 12,900,000
Proportion to total population
Male 0.487 0.004 0.80 0.479 0.495
Female 0.513 0.004 0.76 0.505 0.521
Rural 0.764 0.023 3.04 0.715 0.806
Urban 0.236 0.023 9.83 0.194 0.285
Kampala 0.043 0.004 9.20 0.036 0.051
Peri-urban Kampala 0.045 0.004 8.13 0.038 0.052
Central 0.189 0.013 7.09 0.164 0.217
Eastern 0.207 0.011 5.44 0.186 0.230
Karamoja 0.044 0.006 14.30 0.033 0.058
Northern 0.217 0.014 6.64 0.190 0.246
Western 0.255 0.025 9.96 0.209 0.308
0-17 0.555 0.005 0.96 0.545 0.566

Page | 133
Confidence interval
Estimate
Standard error CV Lower Upper Observations
18-30 0.205 0.004 1.82 0.198 0.213 21,105
31-59 0.194 0.003 1.58 0.188 0.201 21,105
60+ 0.045 0.002 4.86 0.041 0.049 21,105
15-24 0.173 0.004 2.06 0.166 0.180 21,105
15-35 0.319 0.004 1.39 0.310 0.327 21,105
Education attainment for 10 years and above
No education 0.176 0.007 4.11 0.163 0.191 9,610
Primary 0.560 0.010 1.80 0.540 0.580 9,610
Secondary 0.186 0.007 3.96 0.172 0.200 9,610 Post primary/secondary specialized training 0.056 0.004 7.79 0.048 0.065 9,610
Degree and above 0.022 0.002 11.10 0.018 0.027 9,610
Marital status for 10 years and above
Never Married 0.437 0.006 1.35 0.426 0.449 13,646
Currently Married/Cohabiting 0.461 0.006 1.33 0.449 0.473 13,646
Divorced/Separated 0.051 0.003 5.84 0.046 0.057 13,646
Widow/Widower 0.050 0.003 5.86 0.045 0.057 13,646
Proportion of household heads for 10 years and above
Total 0.346 0.005 1.50 0.336 0.357 13,650
Male 0.509 0.008 1.55 0.494 0.525 6,480
Female 0.197 0.007 3.50 0.183 0.211 7,170
Rural 0.328 0.005 1.65 0.318 0.339 8,794
Urban 0.400 0.010 2.57 0.380 0.420 4,856
10-17 0.001 0.001 40.25 0.001 0.003 3,956
18-30 0.314 0.009 2.84 0.297 0.332 4,640
31-59 0.638 0.007 1.06 0.624 0.651 4,149
60+ 0.776 0.016 2.04 0.743 0.805 905
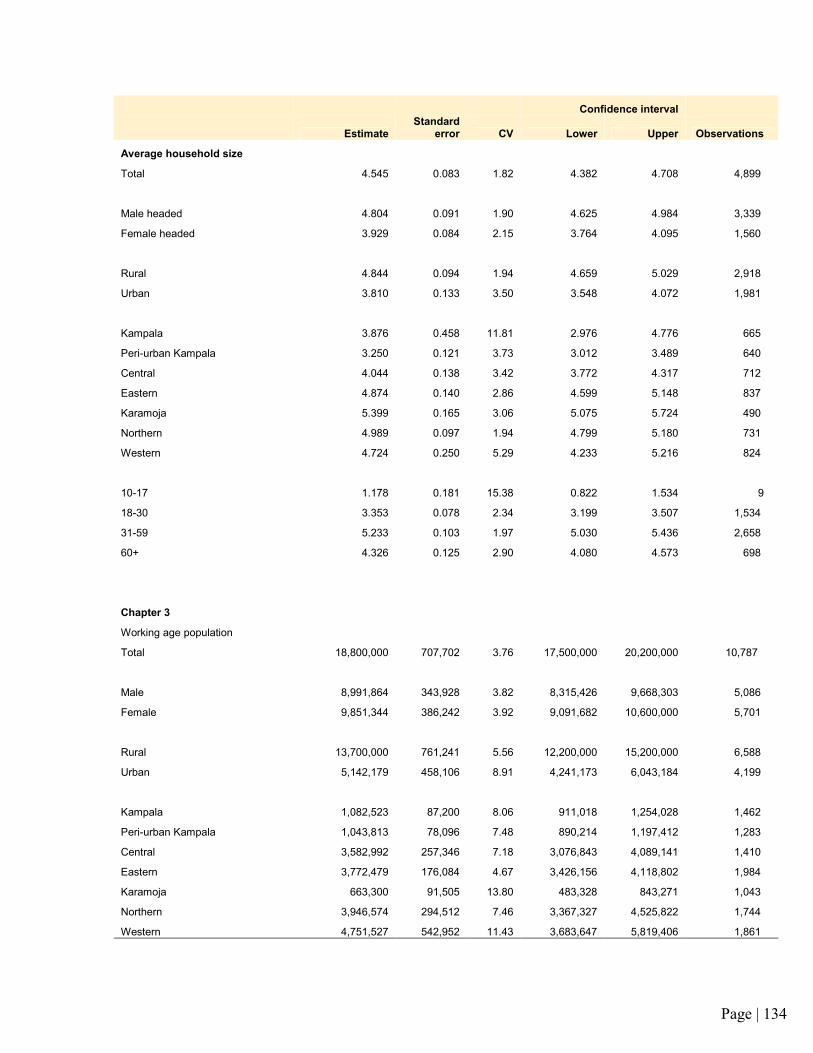
Page | 134
Confidence interval
Estimate
Standard error CV Lower Upper Observations
Average household size
Total 4.545 0.083 1.82 4.382 4.708 4,899
Male headed 4.804 0.091 1.90 4.625 4.984 3,339
Female headed 3.929 0.084 2.15 3.764 4.095 1,560
Rural 4.844 0.094 1.94 4.659 5.029 2,918
Urban 3.810 0.133 3.50 3.548 4.072 1,981
Kampala 3.876 0.458 11.81 2.976 4.776 665
Peri-urban Kampala 3.250 0.121 3.73 3.012 3.489 640
Central 4.044 0.138 3.42 3.772 4.317 712
Eastern 4.874 0.140 2.86 4.599 5.148 837
Karamoja 5.399 0.165 3.06 5.075 5.724 490
Northern 4.989 0.097 1.94 4.799 5.180 731
Western 4.724 0.250 5.29 4.233 5.216 824
10-17 1.178 0.181 15.38 0.822 1.534 9
18-30 3.353 0.078 2.34 3.199 3.507 1,534
31-59 5.233 0.103 1.97 5.030 5.436 2,658
60+ 4.326 0.125 2.90 4.080 4.573 698
Chapter 3
Working age population
Total 18,800,000 707,702 3.76 17,500,000 20,200,000 10,787
Male 8,991,864 343,928 3.82 8,315,426 9,668,303 5,086
Female 9,851,344 386,242 3.92 9,091,682 10,600,000 5,701
Rural 13,700,000 761,241 5.56 12,200,000 15,200,000 6,588
Urban 5,142,179 458,106 8.91 4,241,173 6,043,184 4,199
Kampala 1,082,523 87,200 8.06 911,018 1,254,028 1,462
Peri-urban Kampala 1,043,813 78,096 7.48 890,214 1,197,412 1,283
Central 3,582,992 257,346 7.18 3,076,843 4,089,141 1,410
Eastern 3,772,479 176,084 4.67 3,426,156 4,118,802 1,984
Karamoja 663,300 91,505 13.80 483,328 843,271 1,043
Northern 3,946,574 294,512 7.46 3,367,327 4,525,822 1,744
Western 4,751,527 542,952 11.43 3,683,647 5,819,406 1,861

Page | 135
Confidence interval
Estimate
Standard error CV Lower Upper Observations
Chapter 4
Working population
Total 15,300,000 622,624 4.07 14,100,000 16,500,000 8,416
Male 7,528,056 308,522 4.10 6,921,253 8,134,859 4,151
Female 7,761,495 336,556 4.34 7,099,556 8,423,434 4,265
Rural 11,500,000 664,753 5.77 10,200,000 12,800,000 5,481
Urban 3,765,017 361,150 9.59 3,054,706 4,475,327 2,935
Kampala 676,552 53,667 7.93 571,000 782,104 921
Peri-urban Kampala 720,311 51,492 7.15 619,037 821,586 889
Central 2,994,352 217,992 7.28 2,565,605 3,423,098 1,176
Eastern 3,162,176 175,133 5.54 2,817,724 3,506,628 1,635
Karamoja 526,572 71,377 13.56 386,187 666,958 829
Northern 3,168,722 258,496 8.16 2,660,311 3,677,132 1,390
Western 4,040,867 481,688 11.92 3,093,481 4,988,252 1,576
Components of working
Employment 0.587 0.016 2.79 0.554 0.619 8,416
Other forms of work 0.004 0.001 19.65 0.003 0.006 8,416
Subsistence agriculture 0.409 0.017 4.04 0.377 0.442 8,416
Status in employment of working population
Paid employment 0.195 0.012 5.98 0.173 0.219 8,316
Employer 0.018 0.002 12.52 0.014 0.024 8,316
Own account worker 0.729 0.013 1.75 0.703 0.753 8,316
Contributing family worker 0.054 0.006 10.44 0.044 0.067 8,316
Others 0.004 0.001 20.07 0.002 0.005 8,316
Industry of the main job
Agriculture, forestry, and fishing 0.683 0.018 2.58 0.648 0.717 8,316
Trade 0.047 0.005 10.79 0.038 0.059 8,316
Manufacturing 0.022 0.002 10.47 0.018 0.027 8,316
Education 0.095 0.007 6.97 0.083 0.109 8,316
Transportation and storage 0.023 0.002 9.00 0.020 0.028 8,316
Construction 0.020 0.002 10.73 0.016 0.025 8,316 Accommodation and food service activities 0.036 0.004 10.60 0.029 0.044 8,316
Others 0.073 0.006 8.31 0.062 0.086 8,316

Page | 136
Confidence interval
Estimate
Standard error CV Lower Upper Observations
Occupation of the main job
Professionals 0.035 0.004 10.61 0.029 0.044 8,316 Technicians and associate professionals 0.016 0.002 11.52 0.013 0.020 8,316
Service and sales workers 0.120 0.008 6.47 0.106 0.136 8,316 Skilled agricultural, forestry and fishery workers 0.637 0.019 2.91 0.600 0.673 8,316
Craft and related trades workers 0.060 0.004 6.94 0.052 0.069 8,316 Plant and machine operators and assemblers 0.032 0.004 13.04 0.025 0.042 8,316
Elementary occupations 0.080 0.005 6.84 0.070 0.091 8,316
Others* 0.019 0.002 10.39 0.015 0.023 8,316
Population in employment
Total 8,973,272 343,019 3.82 8,298,620 9,647,924 5,290
Male 5,052,744 196,907 3.90 4,665,467 5,440,021 2,933
Female 3,920,529 176,205 4.49 3,573,969 4,267,088 2,357
Rural 5,860,743 334,367 5.71 5,203,110 6,518,377 2,692
Urban 3,112,529 272,773 8.76 2,576,039 3,649,019 2,598
Kampala 664,622 53,040 7.98 560,302 768,942 905
Peri-urban Kampala 685,853 47,274 6.89 592,874 778,831 850
Central 2,012,920 177,063 8.80 1,664,671 2,361,168 769
Eastern 1,288,531 108,683 8.43 1,074,772 1,502,289 675
Karamoja 225,424 36,549 16.21 153,540 297,308 352
Northern 1,667,693 199,348 11.95 1,275,615 2,059,772 731
Western 2,428,230 168,450 6.94 2,096,922 2,759,539 1,008
Education of the persons in employment
No education 0.104 0.008 7.34 0.090 0.120 4,977
Primary 0.525 0.013 2.44 0.500 0.550 4,977
Secondary 0.242 0.010 3.95 0.224 0.261 4,977 Post primary/secondary specialized training 0.093 0.007 7.48 0.080 0.108 4,977
Degree and above 0.036 0.004 11.57 0.029 0.045 4,977
Skills of the persons in employment With trade or technical skill and specialisation 0.040 0.004 10.47 0.033 0.049 4,976
With trade or technical skill only 0.197 0.008 4.09 0.182 0.213 4,976
With specialisation only 0.089 0.007 7.31 0.077 0.103 4,976
None 0.674 0.013 1.86 0.649 0.698 4,976

Page | 137
Confidence interval
Estimate
Standard error CV Lower Upper Observations
Employment - to - Population Ratio (EPR)
Total 0.476 0.012 2.57 0.452 0.500 10,787
Male 0.562 0.015 2.74 0.531 0.592 5,086
Female 0.398 0.012 2.99 0.375 0.422 5,701
Rural 0.428 0.015 3.40 0.399 0.457 6,588
Urban 0.605 0.014 2.24 0.578 0.632 4,199
Kampala 0.614 0.018 2.99 0.577 0.649 1,462
Peri-urban Kampala 0.657 0.019 2.92 0.618 0.694 1,462
Central 0.562 0.027 4.78 0.508 0.614 1,462
Eastern 0.342 0.023 6.66 0.298 0.388 1,462
Karamoja 0.340 0.038 11.21 0.269 0.418 1,462
Northern 0.423 0.030 7.21 0.364 0.483 1,462
Western 0.511 0.033 6.53 0.446 0.576 1,462
Status in employment of the persons in employment
Paid employee 0.345 0.014 4.20 0.317 0.374 5,261
Employer 0.030 0.004 11.83 0.024 0.038 5,261
Own account worker 0.528 0.013 2.44 0.502 0.553 5,261
Contributing family workers 0.098 0.010 9.98 0.080 0.119 5,261
Sector of the persons in employment
Agriculture, forestry and fishing 0.412 0.021 5.06 0.372 0.454 5,257
Production 0.164 0.014 8.84 0.137 0.194 5,257
Services 0.424 0.018 4.32 0.388 0.460 5,257
Occupation of the persons in employment
Professionals 0.060 0.006 9.63 0.050 0.072 5,257
Technicians and Associate Profes 0.029 0.003 10.25 0.024 0.036 5,257
Service and sales workers 0.232 0.011 4.76 0.211 0.254 5,257
Skilled agricultural, forestry a 0.313 0.021 6.58 0.274 0.355 5,257
Craft and related trades workers 0.128 0.007 5.26 0.115 0.142 5,257
Plant and machine operators and 0.065 0.011 17.28 0.046 0.092 5,257
Elementary occupations 0.150 0.008 5.52 0.134 0.167 5,257
Others 0.021 0.003 11.73 0.017 0.027 5,257
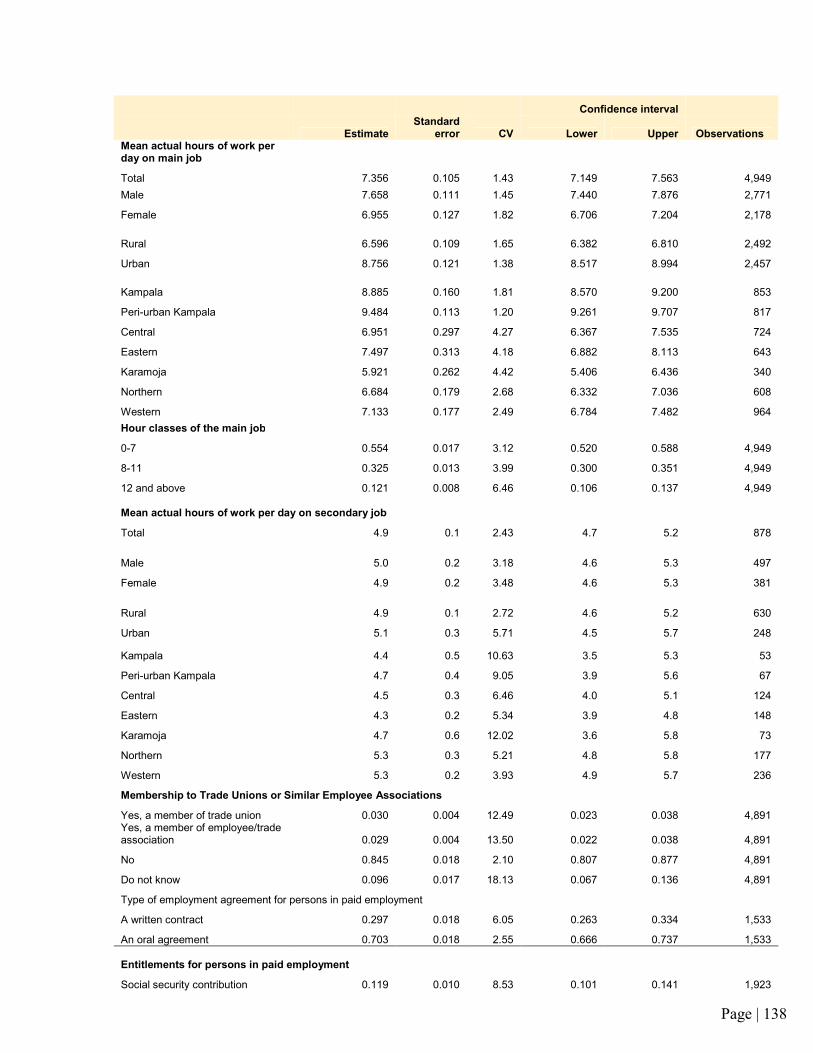
Page | 138
Confidence interval
Estimate
Standard error CV Lower Upper Observations
Mean actual hours of work per day on main job
Total 7.356 0.105 1.43 7.149 7.563 4,949
Male 7.658 0.111 1.45 7.440 7.876 2,771
Female 6.955 0.127 1.82 6.706 7.204 2,178
Rural 6.596 0.109 1.65 6.382 6.810 2,492
Urban 8.756 0.121 1.38 8.517 8.994 2,457
Kampala 8.885 0.160 1.81 8.570 9.200 853
Peri-urban Kampala 9.484 0.113 1.20 9.261 9.707 817
Central 6.951 0.297 4.27 6.367 7.535 724
Eastern 7.497 0.313 4.18 6.882 8.113 643
Karamoja 5.921 0.262 4.42 5.406 6.436 340
Northern 6.684 0.179 2.68 6.332 7.036 608
Western 7.133 0.177 2.49 6.784 7.482 964
Hour classes of the main job
0-7 0.554 0.017 3.12 0.520 0.588 4,949
8-11 0.325 0.013 3.99 0.300 0.351 4,949
12 and above 0.121 0.008 6.46 0.106 0.137 4,949
Mean actual hours of work per day on secondary job
Total 4.9 0.1 2.43 4.7 5.2 878
Male 5.0 0.2 3.18 4.6 5.3 497
Female 4.9 0.2 3.48 4.6 5.3 381
Rural 4.9 0.1 2.72 4.6 5.2 630
Urban 5.1 0.3 5.71 4.5 5.7 248
Kampala 4.4 0.5 10.63 3.5 5.3 53
Peri-urban Kampala 4.7 0.4 9.05 3.9 5.6 67
Central 4.5 0.3 6.46 4.0 5.1 124
Eastern 4.3 0.2 5.34 3.9 4.8 148
Karamoja 4.7 0.6 12.02 3.6 5.8 73
Northern 5.3 0.3 5.21 4.8 5.8 177
Western 5.3 0.2 3.93 4.9 5.7 236
Membership to Trade Unions or Similar Employee Associations
Yes, a member of trade union 0.030 0.004 12.49 0.023 0.038 4,891 Yes, a member of employee/trade association 0.029 0.004 13.50 0.022 0.038 4,891
No 0.845 0.018 2.10 0.807 0.877 4,891
Do not know 0.096 0.017 18.13 0.067 0.136 4,891
Type of employment agreement for persons in paid employment
A written contract 0.297 0.018 6.05 0.263 0.334 1,533
An oral agreement 0.703 0.018 2.55 0.666 0.737 1,533
Entitlements for persons in paid employment
Social security contribution 0.119 0.010 8.53 0.101 0.141 1,923

Page | 139
Confidence interval
Estimate
Standard error CV Lower Upper Observations
Paid annual leave 0.167 0.015 8.71 0.140 0.198 1,923
Paid sick leave 0.182 0.016 8.60 0.153 0.215 1,923
Maternity or paternity leave 0.192 0.014 7.32 0.166 0.221 1,923
Any of the four entitlements 0.279 0.020 7.21 0.241 0.320 2,010
All the four entitlements 0.039 0.005 13.46 0.030 0.051 2,010
Informal employment outside agriculture
Total 0.849 0.010 1.16 0.829 0.868 3,541
Male 0.845 0.011 1.30 0.822 0.865 1,987
Female 0.856 0.014 1.67 0.825 0.882 1,554
Rural 0.896 0.011 1.26 0.872 0.917 1,191
Urban 0.805 0.015 1.81 0.775 0.832 2,350
Kampala 0.778 0.020 2.56 0.736 0.815 887
Peri-urban Kampala 0.787 0.018 2.31 0.749 0.820 803
Central 0.864 0.020 2.32 0.819 0.899 389
Eastern 0.850 0.030 3.50 0.781 0.899 424
Karamoja 0.883 0.041 4.68 0.775 0.944 132
Northern 0.884 0.025 2.83 0.825 0.925 482
Western 0.881 0.021 2.39 0.833 0.917 424
Workers in Subsistence Agriculture
Number
Total 6,252,615 417,841 6.68 5,429,694 7,075,536 3,080
Male 2,437,839 199,327 8.18 2,045,272 2,830,407 1,192
Female 3,814,776 235,489 6.17 3,350,990 4,278,561 1,888
Rural 5,639,638 428,115 7.59 4,796,483 6,482,793 2,776
Urban 612,977 122,878 20.05 370,973 854,981 304
Kampala & Peri-urban Kampala 32,622 7,097 21.76 18,645 46,599 34
Central 971,432 108,310 11.15 758,120 1,184,744 404
Eastern 1,855,374 147,675 7.96 1,564,533 2,146,215 950
Karamoja 300,996 52,253 17.36 198,085 403,906 476
Northern 1,487,179 136,401 9.17 1,218,543 1,755,816 652
Western 1,605,012 345,928 21.55 923,721 2,286,303 564
Subsistence agriculture rate
Total 0.332 0.015 4.45 0.303 0.362 10,787

Page | 140
Confidence interval
Estimate
Standard error CV Lower Upper Observations
Male 0.271 0.016 5.99 0.240 0.304 5,086
Female 0.387 0.016 4.06 0.357 0.419 5,701
Rural 0.412 0.016 3.97 0.380 0.444 6,588
Urban 0.119 0.018 15.07 0.088 0.159 4,199
Kampala & Peri-urban Kampala 0.015 0.004 27.98 0.009 0.027 2,745
Central 0.271 0.027 10.10 0.221 0.328 1,410
Eastern 0.492 0.033 6.73 0.427 0.557 1,984
Karamoja 0.454 0.051 11.29 0.356 0.555 1,043
Northern 0.377 0.030 7.99 0.320 0.438 1,744
Western 0.338 0.039 11.42 0.267 0.417 1,861
Chapter 5
Labour underutilisation
Unemployment rate (LU1) 0.097 0.006 6.13 0.086 0.109 5,870
Time related underemployment 0.118 0.007 6.07 0.105 0.133 5,290 Combined rate of unemployment and time related uneremployment (LU2) 0.203 0.008 4.14 0.187 0.220 5,870 Combined rate of unemployment and potential labour force (LU3) 0.264 0.011 4.24 0.242 0.286 7,145 Composite labour underutilisation (%) 0.351 0.012 3.32 0.328 0.374 7,145 Composite labour underutilisation (Number) 4,270,695 172,863 4.05 3,930,694 4,610,696 2,453
Inadequate employment situations Skill related inadequate employment 0.062 0.005 8.51 0.053 0.074 5,290 Income related inadequate employment 0.454 0.018 4.04 0.418 0.490 2,010
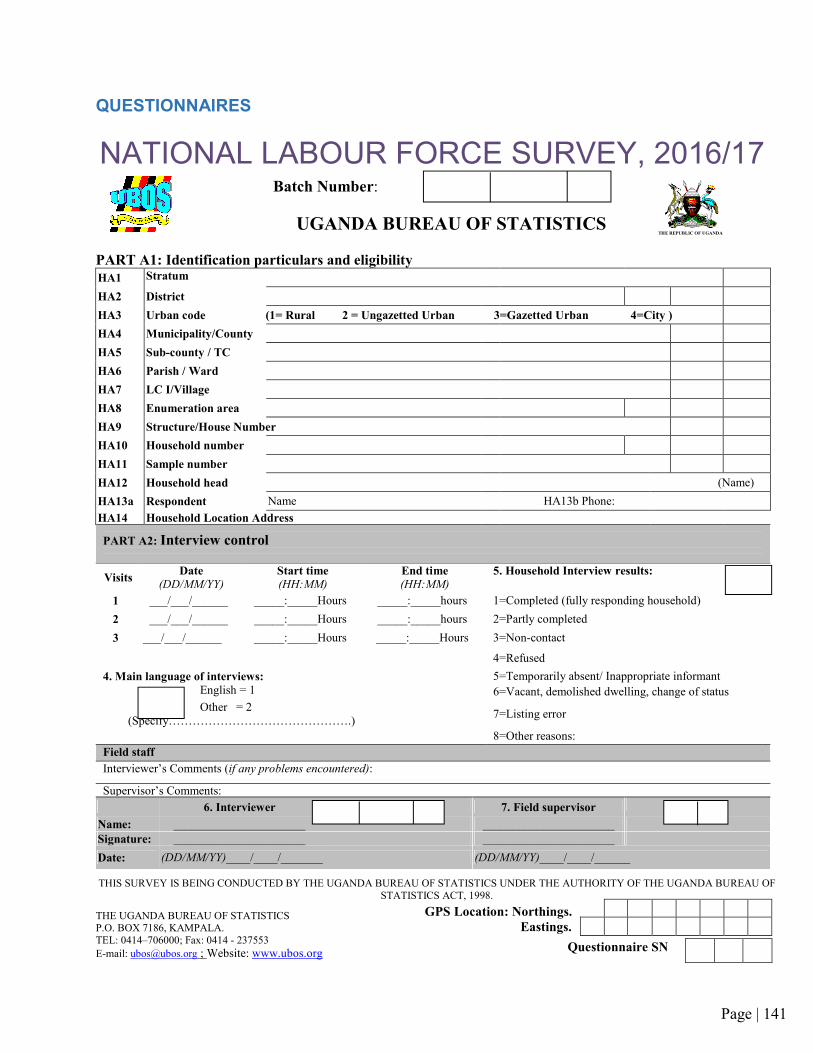
Page | 141
QUESTIONNAIRES
THE REPUBLIC OF UGANDA
UGANDA BUREAU OF STATISTICS
PART A1: Identification particulars and eligibility
HA1 Stratum
HA2 District
HA3 Urban code (1= Rural 2 = Ungazetted Urban 3=Gazetted Urban 4=City )
HA4 Municipality/County
HA5 Sub-county / TC
HA6 Parish / Ward
HA7 LC I/Village
HA8 Enumeration area
HA9 Structure/House Number
HA10 Household number
HA11 Sample number
HA12 Household head (Name)
HA13a Respondent Name HA13b Phone:
HA14 Household Location Address
PART A2: Interview control
Visits Date
(DD/MM/YY) Start time
(HH:MM) End time
(HH:MM) 5. Household Interview results:
1 ___/___/______ _____:_____Hours _____:_____hours 1=Completed (fully responding household)
2 ___/___/______ _____:_____Hours _____:_____hours 2=Partly completed
3 ___/___/______ _____:_____Hours _____:_____Hours 3=Non-contact
4=Refused
4. Main language of interviews: 5=Temporarily absent/ Inappropriate informant
English = 1 6=Vacant, demolished dwelling, change of status
Other = 2
(Specify……………………………………….) 7=Listing error
8=Other reasons:
Field staff
Interviewer’s Comments (if any problems encountered):
Supervisor’s Comments:
6. Interviewer 7. Field supervisor
Name: ______________________ ______________________
Signature: ______________________ ______________________
Date: (DD/MM/YY)____/____/_______ (DD/MM/YY)____/____/______
THIS SURVEY IS BEING CONDUCTED BY THE UGANDA BUREAU OF STATISTICS UNDER THE AUTHORITY OF THE UGANDA BUREAU OF
STATISTICS ACT, 1998.
THE UGANDA BUREAU OF STATISTICS P.O. BOX 7186, KAMPALA.
TEL: 0414–706000; Fax: 0414 - 237553
E-mail: [email protected] ; Website: www.ubos.org
NATIONAL LABOUR FORCE SURVEY, 2016/17 Batch Number:
Questionnaire SN
GPS Location: Northings.
Eastings.

Page | 142
PART B: HOUSEHOLD SCHEDULE: Complete List of Household Members (Usual and regular residents)
Names
Sex Relationship Age Residential
status
Marital status (For
those aged 10 years and
above)
For those below 18 years
P
E
R
S
O
N
I
D
A. What is the name of the head of
this household? (This is usually the
person who is the main decision
maker, who manages the
income/expenses of the household,
or who owns or rents the house.)
B. What are the names of the other
members of this household?
C. Are there any other members of
this household who we have missed
like babies, students at boarding
school, or people temporarily away
for work? What are their names?
READ IF NECESSA
RY:
What is
[NAME’S]
sex?
1=Male
2=Female
What is
[NAME’S]
relationship to
the head of
household??
1= Household
head
2= Spouse
3==Child
4= Step
child/Adopted
child to head
5=Grandchild
6= Parent of
head or spouse
7= Other
Relative
8= Non
relative
What is
[NAME’S]
age in
completed
years?
IF LESS
THAN
ONE
WRITE 0
What is the
residential status
of [NAME]
1=Usual member
present
2=Usual member
absent
3=Regular
member present
4=Regular
member absent
5=Guest
IF CODE 5,
ASK NO
FURTHER
QUESTIONS
FOR THAT
PERSON
HB7a. What is
[NAME’S]
marital status?
1= Currently
married/Cohabiti
ng
2= Divorced
3=Separated
4= Widow/
Widower
5= Never
married
9=N/A (for
those less than
10 years).
SKIP
TO
HB8A
For
CODES:
1-4
What was
your
[NAME’S]
Age at first
marriage?
Is the
mother of
[NAME]
still alive?
1=Yes
2=No
8=Don’t
know
9=N/A
(for
persons
18 years &
above)
SKIP TO
HB9A
Indicate the
mother’s
serial number.
(Write 99 if
absent or not
applicable).
Is the
father of
[NAME]
still alive?
1=Yes
2=No
8=Don’t
know
9=N/A
(for
persons
18 years &
above)
SKIP TO
HB10
Indicate
the
Father’s
serial
number.
(Write 99
if absent
or not
applicabl
e).
IS HB8A=1?
Yes>>HB10
No>>HB11
HB10: Has (NAME’S)
mother been very sick
for at least 3 months
during the past 12
months, that she was
too sick to work or do
normal activities?
HB11: IS HB9A=1?
Yes>>HB11
No>>GO TO NEXT PERSON
HB11: Has (NAME’S)
father been very sick
for at least 3 months
during the past 12
months, that he was too
sick to work or do
normal activities?
CODES for HB10
HB11 1=Yes
2=No
8=Don’t know
Mother Father
HB0 HB1 HB3 HB4 HB5 HB6 HB7a HB7b HB8A HB8B HB9A HB9B HB10 HB11
1
2
3
4
5
6
HB 12: [ID of person reporting] which household member is providing data on the household schedule? (Write serial number from HB0))

Page | 143
PART B: HOUSEHOLD SCHEDULE: Complete List of Household Members (Usual and regular residents)
Names
Sex Relationshi
p Age
Residential
status
Marital status (For
those aged 10 years and
above)
For those below 18 years
P
E
R
S
O
N
I
D
A. What is the name of the head of this
household? (This is usually the person
who is the main decision maker, who
manages the income/expenses of the
household, or who owns or rents the
house.)
B. What are the names of the other
members of this household?
C. Are there any other members of this
household who we have missed like
babies, students at boarding school, or
people temporarily away for work?
What are their names?
READ IF
NECESSAR
Y:
What is
[NAME’S]
sex?
1=Male
2=Female
What is
[NAME’S]
relationship
to the head
of
household??
1=
Household
head
2= Spouse
3==Child
4= Step child
5=Grandchil
d
6= Parent of
head or
spouse
7= Other
Relative
8= Non
relative
What is
[NAME’S
] age in
completed
years?
IF LESS
THAN
ONE
WRITE
0
What is the
residential status
of [NAME]
1=Usual
member present
2=Usual
member absent
3=Regular
member present
4=Regular
member absent
5=Guest
IF CODE 5,
ASK NO
FURTHER
QUESTIONS
FOR THAT
PERSON
HB7a. What is
[NAME’S]
marital status?
1= Currently
married/Cohabiti
ng
2= Divorced
3=Separated
4= Widow/
Widower
5= Never
married
9=N/A (for
those less than
10 years).
SKIP
TO
HB8A
For
CODES:
1-4
What was
your
[NAME’S]
Age at first
marriage?
Is the
mother of
[NAME]
still alive?
1=Yes
2=No
8=Don’t
know
9=N/A
(for
persons
18 years &
above)
SKIP TO
HB9A
Indicate the
mother’s
serial number.
(Write 99 if
absent or not
applicable).
Is the
father of
[NAME]
still alive?
1=Yes
2=No
8=Don’t
know
9=N/A
(for
persons
18 years &
above)
SKIP TO
HB10
Indicate
the
Father’s
serial
number.
(Write 99
if absent
or not
applicabl
e).
IS HB8A=1?
Yes>>HB10
No>>HB11
HB10: Has (NAME’S)
mother been very sick
for at least 3 months
during the past 12
months, that she was too
sick to work or do
normal activities?
IS HB9A=1?
Yes>>HB11
No>> GO TO NEXT PERSON
HB11: Has (NAME’S)
father been very sick for
at least 3 months during
the past 12 months, that
he was too sick to work
or do normal activities?
CODES for HB10
HB11 1=Yes
2=No
8=Don’t know
Mother Father
HB0 HB1 HB3 HB4 HB5 HB6 HB7a HB7b HB8A HB8B HB9A HB9B HB10 HB11
7
8
9
10
11
12
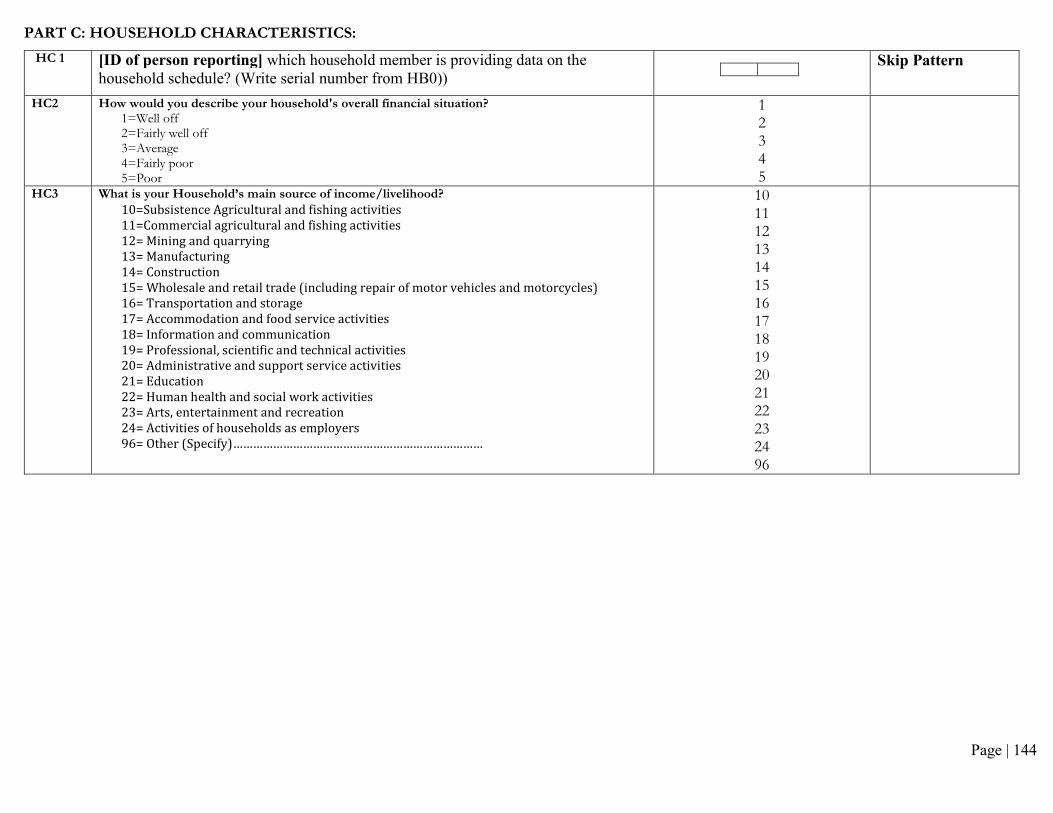
Page | 144
PART C: HOUSEHOLD CHARACTERISTICS:
HC 1 [ID of person reporting] which household member is providing data on the
household schedule? (Write serial number from HB0))
Skip Pattern
HC2 How would you describe your household's overall financial situation? 1=Well off 2=Fairly well off 3=Average 4=Fairly poor 5=Poor
1 2 3 4 5
HC3
What is your Household’s main source of income/livelihood?
10=Subsistence Agricultural and fishing activities
11=Commercial agricultural and fishing activities
12= Mining and quarrying
13= Manufacturing
14= Construction
15= Wholesale and retail trade (including repair of motor vehicles and motorcycles)
16= Transportation and storage
17= Accommodation and food service activities
18= Information and communication
19= Professional, scientific and technical activities
20= Administrative and support service activities
21= Education
22= Human health and social work activities
23= Arts, entertainment and recreation
24= Activities of households as employers
96= Other (Specify)…………………………………………………………………
10 11 12 13 14 15 16 17 18 19 20 21 22 23 24 96

Page | 145
PART C: HOUSEHOLD CHARACTERISTICS: HC 1 [ID of person reporting] which household member is providing data on the
household schedule? (Write serial number from HB0))
Skip Pattern
HC4 Are you aware of the following government programmes? a. Operation Wealth Creation/NAADS
b. Universal Primary Education (UPE)
c. Universal Secondary Education (USE)
d. Decent Country Work Programme
e. National Youth Livelihoods
f. Uganda Women Entrepreneurship Programme
g. East African Community Common Market Protocol
h. Common Market for East and Southern Africa Free Trade Agreement (COMESA)
i. Africa Growth and Opportunities Act (AGOA)
j. COMESA-EAC-SADC Tripartite Free Trade Agreement
Yes=1; No=2]
1 : 2
1 : 2
1 : 2
1 : 2
1 : 2
1 : 2
1 : 2
1 : 2
1 : 2
1 : 2
HC5 Have you ever read or heard about any of the following laws [1=Yes, read; 2=Yes, heard not read; 3=Not seen or heard] a. The Constitution of the Republic of Uganda, 1995; (article 40); b. Employment Act, No. 6, 2006; c. Occupational Safety & Health Act, No. 9, 2006; d. Workers’ Compensation Act, No. 5, 2000; e. Labour Disputes (Arbitration and Settlement) Act, No. 7, 2006; f. Labour Unions Act, 2006; g. Children Act, 1997 (Cap. 59 Laws of Uganda); h. Minimum Wages Boards and Wages Councils Act, 2000; i. Prevention of Trafficking in Human Persons Act, 2009;
j. Equal Opportunities Act, 2005;
1 : 2 : 3
1 : 2 : 3
1 : 2 : 3
1 : 2 : 3
1 : 2 : 3
1 : 2 : 3
1 : 2 : 3
1 : 2 : 3
1 : 2 : 3
1 : 2 : 3

Page | 146
SECTION A: PERSONAL AND HOUSEHOLD INFORMATION FOR ALL AGED 5+ YEARS
HB0i Serial number in HH Roster Skip Pattern HB1i Name of household member
HB5i Age of household member
A0 Serial number of the person providing information about the individual
A1 As you may be aware, many times people move from one place and settle in another for a number of reasons. They may move within the sub-county, district or to another district. Have you [NAME] always lived in this administrative area (LC)? 1=Yes 2=No
1
2
1
2
1
2
1
2
1
2
If 1>>A5
A2 When did You / [Name] move to this administrative area? Month(MM) (If Don’t Know Month, indicate 98 for Month) Year (YYYY)
A3 Describe the administrative area that YOU/[NAME] resided in previously: 1=Rural area 2=Ungazetted Urban areas (Trading Centres) 3=Gazetted Urban areas (Town board/Town Council/Municipality) 4=City 6=Other country
1
2
3
4
6
1
2
3
4
6
1
2
3
4
6
1
2
3
4
6
1
2
3
4
6
A4 What was the main reason for moving to your current residence? 10=To accompany family 11=Education/training 12=Marriage 13=To work/for employment-related reasons 14=War 15=Land slides 16=Farming 17=Drought 96=Other reasons (Specify)_________ ________________________
10
11
12
13
14
15
16
17
96
10
11
12
13
14
15
16
17
96
10
11
12
13
14
15
16
17
96
10
11
12
13
14
15
16
17
96
10
11
12
13
14
15
16
17
96

Page | 147
SECTION A: INDIVIDUAL INFORMATION FOR ALL AGED 5+ YEARS
HB0i Serial number in HH Roster Skip Pattern HB1i Name of household member
HB5i Age of household member
A0 Serial number of the person providing information about the individual
DISABILITY
1 = No Difficulty 2 = Some Difficulty 3 = A Lot Of Difficulty 4 = Cannot At All 8 = Don't Know
1 = No Difficulty 2 = Some Difficulty 3 = A Lot Of Difficulty 4 = Cannot At All 8 = Don't Know
1 = No Difficulty 2 = Some Difficulty 3 = A Lot Of Difficulty 4 = Cannot At All 8 = Don't Know
1 = No Difficulty 2 = Some Difficulty 3 = A Lot Of Difficulty 4 = Cannot At All 8 = Don't Know
1 = No Difficulty 2 = Some Difficulty 3 = A Lot Of Difficulty 4 = Cannot At All 8 = Don't Know
A5 I would like to know if (NAME) has difficulty seeing even when wearing glasses or contact lenses. Would you say that (NAME) has no difficulty seeing, some difficulty, a lot of difficultly, or cannot see at all?
1 2 3 4 8
1 2 3 4 8
1 2 3 4 8
1 2 3 4 8
1 2 3 4 8
A6 I would like to know if (NAME) has difficulty hearing even when using a hearing aid. Would you say that (NAME) has no difficulty hearing, some difficulty, a lot of difficultly, or cannot hear at all?
1 2 3 4 8
1 2 3 4 8
1 2 3 4 8
1 2 3 4 8
1 2 3 4 8
A7 I would like to know if (NAME) has difficulty communicating when using his/her usual language. Would you say that (NAME) has no difficulty understanding or being understood, some difficulty, a lot of difficulty, or cannot communicate at all?
1 2 3 4 8
1 2 3 4 8
1 2 3 4 8
1 2 3 4 8
1 2 3 4 8
A8 I would like to know if (NAME) has difficulty remembering or concentrating. Would you say that (NAME) has no difficulty remembering or concentrating, some difficulty, a lot of difficulty, or cannot remember or concentrate at all?
1 2 3 4 8
1 2 3 4 8
1 2 3 4 8
1 2 3 4 8
1 2 3 4 8
A9 I would like to know if (NAME) has difficulty washing all over or dressing. Would you say that (NAME) has no difficulty washing all over or dressing, some difficulty, a lot of difficultly, or cannot wash all over or dress at all?
1 2 3 4 8
1 2 3 4 8
1 2 3 4 8
1 2 3 4 8
1 2 3 4 8
A10 I would like to know if (NAME) has difficulty walking or climbing steps. Would you say that (NAME) has no difficulty walking or climbing steps, some difficulty, a lot of difficulty, or cannot walk or climb steps at all?
1 2 3 4 8
1 2 3 4 8
1 2 3 4 8
1 2 3 4 8
1 2 3 4 8

Page | 148
SECTION A: INDIVIDUAL INFORMATION FOR ALL AGED 5+ YEARS
HB0i Serial number in HH Roster Skip Pattern HB1i Name of household member
HB5i Age of household member
A0 Serial number of the person providing information about the individual
EDUCATION
A11 Have you [NAME] ever attended formal school/training program? 1=Yes 2=No
1 2
1 2
1 2
1 2
1 2
If 1>>A13
A12 What was the main reason for never starting your education/training? (SEE APPENDIX 2 and ENTER RELEVANT CODE)
>> A26
A13 Is (NAME] currently attending school or pre-school? 1=Yes 2=Yes, Special Needs Education 3=No
1
2
3
1
2
3
1
2
3
1
2
3
1
2
3
IF 3>>A22
CURRENT STUDENTS (5 years and above)
A14 At what age did (NAME) begin primary school? [00 IF IN PRE-PRIMARY]
A15 In which district is [NAME] schooling? A15A: Name A15B: District/country code
A16 What is the highest level of education that You have/[NAME] has successfully completed? (SEE APPENDIX 4: CODES 09-99)
A17 At what level are you/[NAME] currently studying / learning? (SEE APPENDIX 5: CODES 01-99)
A18 What level of education would you/[NAME] wish to complete? (SEE APPENDIX 4: CODES 09-99)
A19 [ASK IF A16 >= 41] In what area did (you/Name) specialise? (SEE APPENDIX 6: CODES 09-99)
A20 Ideally, what type of work would you like to do? (SEE APPENDIX 8: FOR OCCUPATION)
If Don’t Know write DK in A20A and Enter Code 9998 in A20B
A20A: Description A20B: ISCO Code
A21 Ideally, who would (you/NAME) like to work for? (Select main preference only) 10=Myself (Own business farm) 11=Government/Public sector 12=A private company 13=An international or non-profit organization 14=Family business/farm 15=Do not wish to work 96=Others (specify…………………………………………………………)
10 11 12 13 14 15 96
10 11 12 13 14 15 96
10 11 12 13 14 15 96
10 11 12 13 14 15 96
10 11 12 13 14 15 96
>>A26

Page | 149
SECTION A: INDIVIDUAL INFORMATION FOR ALL AGED 5+ YEARS
PERSONS WHO LEFT EDUCATION/TRAINING
HB0i Serial number in HH Roster Skip Pattern HB1i Name of household member
HB5i Age of household member
A0 Serial number of the person providing information about the individual
A22 What was the main reason for stopping your education/training? (SEE APPENDIX 3)
A23 At what age did you/ (NAME) begin primary school?
A24 What is your / [NAME’S] highest level of completed formal education/training? (SEE APPENDIX 4: CODES 09-99)
A25 What field did you/ [NAME] study? (REFER TO APPENDIX 6: CODES 09-99)
A26 Has (NAME) ever learnt or ever participated in any trade, technical, business, entrepreneurship, or microenterprise skills development training? 1=Yes 2=No
1 2
1 2
1 2
1 2
1 2
If 2>>A28
A27 What was the most recent type of skill that (you/Name) learned? (SEE CODES FOR SKILLS BELOW)
A28 What financial services do you personally use? (Multiple answers are possible) A=None B=Loans C=Savings D=Money transfer services/Mobile Money Services E=Other service (SPECIFY) ………………………………………
A
B
C
D
E
A
B
C
D
E
A
B
C
D
E
A
B
C
D
E
A
B
C
D
E
A29 What are your main sources of financial intermediaries?
A=Bank B=Insurance company C=Microfinance Institution (including Cooperatives) D=Money transfer operators (Money Gram, Western Union, etc…) E=Informal financial operators (Money Lenders,) F=Friends and Relatives G=SACCOs H=Informal Saving Group I=Mobile Money Operators Z=Other service (SPECIFY)…………. ………………………………………
A
B
C
D
E
F
G
H
I
Z
A
B
C
D
E
F
G
H
I
Z
A
B
C
D
E
F
G
H
I
Z
A
B
C
D
E
F
G
H
I
Z
A
B
C
D
E
F
G
H
I
Z
CODES FOR SKILLS (A27): SKILLS CODES 10=Welding 14=Electrician 18=Sewing/Tailoring/Textiles 22=Beautician/Hair/Nails 26= Book Keeping 11=Carpentry 15=Plumbing 19=Crafts/Basket Weaving 23=Health care/Traditional Medicine 27=Business/Entrepreneurship
12=Construction 16=IT or Computer Repair 20=Catering/Food Service 24=Massage/Reflexology 28=Foreign Language 13=Masonry 17=Phone Repair 21=Laundry/Dry Cleaning 25=Agriculture/Land Management/Fishery 96=Other (Specify………………..)

Page | 150
SECTION B: IDENTIFICATION OF PERSONS CURRENTLY EMPLOYED SECTION B: IDENTIFICATION OF PERSONS CURRENTLY EMPLOYED SECTION B: IDENTIFICATION OF PERSONS CURRENTLY EMPLOYED SECTION B: IDENTIFICATION OF PERSONS CURRENTLY EMPLOYED (FOR PERSONS AGED 5YEARS AND ABOVE) HB0i Serial number in HH Roster
Skip Pattern HB1i Name of household member
HB5i Age of household member
B0 Serial Number of person providing data on the Individual B1a(i) In the last week, did you work for a wage, salary, commission or any
payment in kind, including doing paid domestic work, even if it was for only one hour OR did you have such work, from which you were temporarily absent and to which you will definitely return to? Examples: a regular job, contract, casual or piece work for pay, work in exchange for food or housing, paid domestic work. 1=Yes, Worked 2=Yes, but was absent from work 3=No
1 2 3
1 2 3
1 2 3
1 2 3
1 2 3
If 1>>B1b(i) If 3>>B1b(i)
B1a(ii) Why were you absent from work last week? 10=Vacation, holidays, annual leave 11=Illness, injury, temporary disability 12=Maternity, paternity leave 13=Temporary slack work for technical or economic reasons 14=Bad weather 15=Strike or labour dispute 16=Off season (self-employment) 17=Off season (wage employment) 18=Education or training 19=Family/community responsibilities
96=Other (specify): _____________________________________
10 11 12 13 14 15 16 17 18 19 96
10 11 12 13 14 15 16 17 18 19 96
10 11 12 13 14 15 16 17 18 19 96
10 11 12 13 14 15 16 17 18 19 96
10 11 12 13 14 15 16 17 18 19 96
B1a(iii) Check B1a (ii): If code is 10-15 or 18-19 then circle 1; Otherwise circle 2.
1 2
1 2
1 2
1 2
1 2
B1b(i) In the last week, did you run a business of any size, for yourself or with one or more partners, even if it was for only one hour OR did you have such work, from which you were temporarily absent and to which you will definitely return to? Examples: Commercial farming, selling things, making things for sale, construction, repairing things, brewing beer for sale, collecting wood or water for sale, hairdressing, crèche businesses, having a legal or medical practice, performing, having a public phone shop. 1=Yes, Worked 2=Yes, but was absent from work 3=No
1 2 3
1 2 3
1 2 3
1 2 3
1 2 3
If 1>>B1c(i) If 3>>B1c(i)

Page | 151
SECTION B: IDENTIFICATION OF PERSONS CURRENTLY EMPLOYED SECTION B: IDENTIFICATION OF PERSONS CURRENTLY EMPLOYED SECTION B: IDENTIFICATION OF PERSONS CURRENTLY EMPLOYED SECTION B: IDENTIFICATION OF PERSONS CURRENTLY EMPLOYED (FOR PERSONS AGED 5YEARS AND ABOVE) HB0i Serial number in HH Roster HB1i Name of household member HB5i Age of household member B0 Serial Number of person providing data on the Individual
B1b(ii) Why were you absent from work last week? 10=Vacation, holidays, annual leave 11=Illness, injury, temporary disability 12=Maternity, paternity leave 13=Temporary slack work for technical or economic reasons 14=Bad weather 15=Strike or labour dispute
16=Off season (self-employment) 17=Off season (wage employment)
18=Education or training 19=Family/community responsibilities
96=Other (specify): _____________________________________
10 11 12 13 14 15
16 17
18 19 96
10 11 12 13 14 15
16 17
18 19 96
10 11 12 13 14 15
16 17
18 19 96
10 11 12 13 14 15
16 17
18 19 96
10 11 12 13 14 15
16 17
18 19 96
B1b(iii) Check B1b(ii): If code is 10-15 or 18-19 then circle 1; Otherwise circle 2.
1 2
1 2
1 2
1 2
1 2
B1c(i) In the last week, did you help without being paid in any kind of business run by your household, even if it was only for one hour OR did you have such work, from which you were temporarily absent and to which you will definitely return to? Examples: help to sell things, make things for sale or exchange, doing the accounts, cleaning up for the business, etc. 1=Yes, Worked 2=Yes, but was absent from work 3=No
1 2 3
1 2 3
1 2 3
1 2 3
1 2 3
If 1>>B1d(i) If 3>>B1d(i)
B1c(ii) Why were you absent from work last week? 10=Vacation, holidays, annual leave 11=Illness, injury, temporary disability 12=Maternity, paternity leave 13=Temporary slack work for technical or economic reasons 14=Bad weather 15=Strike or labour dispute
16=Off season (self-employment) 17=Off season (wage employment)
18=Education or training 19=Family/community responsibilities
96=Other (specify): _____________________________________
10 11 12 13 14 15
16 17
18 19 96
10 11 12 13 14 15
16 17
18 19 96
10 11 12 13 14 15
16 17
18 19 96
10 11 12 13 14 15
16 17
18 19 96
10 11 12 13 14 15
16 17
18 19 96
B1c(iii) Check B1c(ii): If code is 10-15 or 18-19 then circle 1; Otherwise circle 2.
1 2
1 2
1 2
1 2
1 2

Page | 152
SECTION B: IDENTIFICATION OF PERSONS CURRENTLY EMPLOYED SECTION B: IDENTIFICATION OF PERSONS CURRENTLY EMPLOYED SECTION B: IDENTIFICATION OF PERSONS CURRENTLY EMPLOYED SECTION B: IDENTIFICATION OF PERSONS CURRENTLY EMPLOYED (FOR PERSONS AGED 5YEARS AND ABOVE)
HB0i Serial number in HH Roster
HB1i Name of household member
HB5i Age of household member
C0 Serial Number of person providing data on the Individual
B1d(i) In the last week, were you an apprentice OR did you have such work, from which you were temporarily absent and to which you will definitely return to? (INCLUDE APPRENTICESHIPS THAT ARE PAID, OR FOR WHICH THE APPRENTICE PAYS TO PARTICIPATE.) 1=Yes (paid), Worked 2=Yes (paid), but was absent from work 3=Yes, not paid 4=No
1
2
3 4
1
2
3 4
1
2
3 4
1
2
3 4
1
2
3 4
If 1>>B2 If 3>>B2 If 4>>B2
B1d(ii) Why were you absent from work last week? 10=Vacation, holidays, annual leave 11=Illness, injury, temporary disability 12=Maternity, paternity leave 13=Temporary slack work for technical or economic reasons 14=Bad weather 15=Strike or labour dispute
16=Off season (self-employment) 17=Off season (wage employment)
18=Education or training 19=Family/community responsibilities
96=Other (specify): _____________________________________
10 11 12 13 14 15
16 17
18 19 96
10 11 12 13 14 15
16 17
18 19 96
10 11 12 13 14 15
16 17
18 19 96
10 11 12 13 14 15
16 17
18 19 96
10 11 12 13 14 15
16 17
18 19 96
B1d(iii) Check B1c(ii): If code is 10-15 or 18-19 then circle 1; Otherwise circle 2.
1 2
1 2
1 2
1 2
1 2
B2 In the last week, did you work as a volunteer, even if it was for only one hour? 1=Yes 2=No
1 2
1 2
1 2
1 2
1 2

Page | 153
SECTION B: IDENTIFICATION OF PERSONS CURRENTLY EMPLOYED SECTION B: IDENTIFICATION OF PERSONS CURRENTLY EMPLOYED SECTION B: IDENTIFICATION OF PERSONS CURRENTLY EMPLOYED SECTION B: IDENTIFICATION OF PERSONS CURRENTLY EMPLOYED (FOR PERSONS AGED 5YEARS AND ABOVE) HB0i Serial number in HH Roster
HB1i Name of household member
HB5i Age of household member
C0 Serial Number of person providing data on the Individual
B3(i) In the last week, did you work on your household's farm/forest/fish/hunt OR did you have such work, from which you were temporarily absent and to which you will definitely return to? (Examples: tending crops, feeding animals, collecting eggs, milking cows, repairing tools, weeding) 1=Yes, Worked 2=Yes, but was absent from work 3=No
1 2 3
1 2 3
1 2 3
1 2 3
1 2 3
If 1>>B4 If 3>>CHK1
B3(ii) Why were you absent from work last week? 10=Vacation, holidays, annual leave 11=Illness, injury, temporary disability 12=Maternity, paternity leave 13=Temporary slack work for technical or economic reasons 14=Bad weather 15=Strike or labour dispute
16=Off season (self-employment) 17=Off season (wage employment)
18=Education or training 19=Family/community responsibilities
96=Other (specify): _____________________________________
10 11 12 13 14 15
16 17
18 19 96
10 11 12 13 14 15
16 17
18 19 96
10 11 12 13 14 15
16 17
18 19 96
10 11 12 13 14 15
16 17
18 19 96
10 11 12 13 14 15
16 17
18 19 96
B3(iii) Check B1c(ii): If code is 10-15 or 18-19 then circle 1; Otherwise circle 2.
1 2
1 2
1 2
1 2
1 2
If 2>>CHK1
B4 In general, are the products obtained from this land for sale/barter or mainly for your own family consumption? 1=Only for sale/barter 2=Mainly for sale/barter but partly for own or family use 3=Mainly for own or family use but partly for sale/barter 4=Only for own or family use
1 2 3 4
1 2 3 4
1 2 3 4
1 2 3 4
1 2 3 4
CHK1 CKECK If any response is code 1 in B1a(i) or B1a(iii) or B1b(i) or B1b(iii) or B1c(i) or B1c(iii) or B1d(i) or B1d(iii) OR response is codes 1 or 2 in B4, T hen Circle 1, If response is code 2 in B1d or response is code 1 in B2 or response is code (3 or 4) in B4, Then Circle 2, Otherwise circle 3.
1
2
3
1
2
3
1
2
3
1
2
3
1
2
3
1 or 2 >>C1
3>>SEC I

Page | 154
SECTION C:SECTION C:SECTION C:SECTION C: CHARACTERISTICS OF MAIN JOB/ACTIVITY FOR PERSONS AGED 5 YEARS AND ABOVECHARACTERISTICS OF MAIN JOB/ACTIVITY FOR PERSONS AGED 5 YEARS AND ABOVECHARACTERISTICS OF MAIN JOB/ACTIVITY FOR PERSONS AGED 5 YEARS AND ABOVECHARACTERISTICS OF MAIN JOB/ACTIVITY FOR PERSONS AGED 5 YEARS AND ABOVE The following questions refer to the respondent’s main job/activity (if more than one) during the last week. The main job/activity is the one in which the respondent usually works the
greatest number of hours per week. If the usual hours of work are the same in each job/activity, the main job/activity is the one that generates the highest income.
HB0i Serial number in HH Roster Skip Pattern HB1i Name of household member
HB5i Age of household member
C0 Serial Number of person providing data on the Individual
C1 What kind of work do you usually do in the MAIN job/activity that you had last week or from which you were absent? DESCRIBE THE OCCUPATION AND MAIN TASKS OR DUTIES IN AT LEAST 2 WORDS. Examples: street seller, subsistence farmer, primary school teacher, registered nurse, domestic worker, truck driver
Occupational title
C2 What are your main tasks or duties? Short description of the main tasks or duties:
ISCO Code
C3 What kind of industry, business or service is carried out at your place of work? Write the main industry, business or service which may be business or service of the person’s employer or company Examples: supermarket, police service. If self-employed, write the activity of the person (e.g. subsistence farming, fishing). If paid domestic work in private household, write Domestic Service
C4 What are the main goods or services produced at your place of work or its main functions? Examples: selling fish, raising cattle, teaching in primary school, caring for the sick, manufacture of shoes.
ISIC Code

Page | 155
C5 What is your status in employment on this job/activity? READ 1=Employee (working for pay in cash or in kind) 8
2=An employer (a person who pays one or more people to work for him) 3=An own-account worker (a person running a business with no employees) 4=Contributing family worker in a household 5=Members of Producers’ cooperatives 6=Volunteer (Unpaid workers) 7=Unpaid trainee worker
1 2 3 4 5 6 7
1 2 3 4 5 6 7
1 2 3 4 5 6 7
1 2 3 4 5 6 7
1 2 3 4 5 6 7
IF 2or3 >>C22
If
4>>C28 If
5>>C22 If
6>>C28 If
7>>C28
8 Include paid domestic workers, paid workers in household businesses, gardeners, security guards, etc. Payment may be in cash or in kind (eg. Fod, accommodation, etc). This category includes all
employees: part-time, casual worker and piecework.

Page | 156
SECTION SECTION SECTION SECTION CCCC: CHARACTERISTICS OF MAIN JOB/ACTIVITY FOR PERSONS AGED 5 YEARS AND ABOVE: CHARACTERISTICS OF MAIN JOB/ACTIVITY FOR PERSONS AGED 5 YEARS AND ABOVE: CHARACTERISTICS OF MAIN JOB/ACTIVITY FOR PERSONS AGED 5 YEARS AND ABOVE: CHARACTERISTICS OF MAIN JOB/ACTIVITY FOR PERSONS AGED 5 YEARS AND ABOVE HB0i Serial number in HH Roster
Skip Pattern
HB1i Name of household member
HB5i Age of household member
C0 Serial Number of person providing data on the Individual
FOR EMPLOYEES (IF CODE 1 IN B5)
C6a Are you currently employed on the basis of? 1=A written contract 2=An oral agreement
1 2
1 2
1 2
1 2
1 2
C6b Is your contract or agreement of? 1=Unlimited duration 2=Limited duration
1 2
1 2
1 2
1 2
1 2
IF 1>>C9
C7 Why is your contract or agreement of limited duration? 10=On the job training, internship 11=Probation period 12=Seasonal work 13=Occasional/daily work 14=Work as a replacement/substitute 15=Public employment programme 16=Specific service or task 96=Other reason (SPECIFY)…………………………………
10
11
12
13
14
15
16
96
10
11
12
13
14
15
16
96
10
11
12
13
14
15
16
96
10
11
12
13
14
15
16
96
10
11
12
13
14
15
16
96
C8 What is the duration of your contract or agreement? 1=Less than 12 months 2=12 months to 36 months 3=More than 36 months 8=Don’t know
1 2 3 8
1 2 3 8
1 2 3 8
1 2 3 8
1 2 3 8
C9 In your current job, can you benefit from the following?
C9a Social security contribution? 1=Yes 2=No 8=Don’t know
1 2 8
1 2 8
1 2 8
1 2 8
1 2 8
C9b Transport or transport allowance 1=Yes 2=No 8=Don’t Know
1 2 8
1 2 8
1 2 8
1 2 8
1 2 8
C9c Meals or meal allowance 1=Yes 2=No 8=Don’t Know
1 2 8
1 2 8
1 2 8
1 2 8
1 2 8
C9d Paid annual leave (holiday time) 1=Yes 2=No 8=Don’t Know
1 2 8
1 2 8
1 2 8
1 2 8
1 2 8
C9e Paid sick leave 1=Yes 2=No 8=Don’t Know
1 2 8
1 2 8
1 2 8
1 2 8
1 2 8
C9f Pension/old age insurance schemes 1=Yes 2=No 8=Don’t Know
1 2 8
1 2 8
1 2 8
1 2 8
1 2 8

Page | 157
SECTION SECTION SECTION SECTION CCCC: CHARACTERISTICS OF MAIN JOB/ACTIVITY FOR PERSONS AGED 5 YEARS AND ABOVE: CHARACTERISTICS OF MAIN JOB/ACTIVITY FOR PERSONS AGED 5 YEARS AND ABOVE: CHARACTERISTICS OF MAIN JOB/ACTIVITY FOR PERSONS AGED 5 YEARS AND ABOVE: CHARACTERISTICS OF MAIN JOB/ACTIVITY FOR PERSONS AGED 5 YEARS AND ABOVE HB0i Serial number in HH Roster
Skip Pattern
HB1i Name of household member
HB5i Age of household member
C0 Serial Number of person providing data on the Individual
C9g Severance/end of service payment 1=Yes 2=No 8=Don’t Know
1 2 8
1 2 8
1 2 8
1 2 8
1 2 8
C9h Overtime pay 1=Yes 2=No 8=Don’t Know
1 2 8
1 2 8
1 2 8
1 2 8
1 2 8
C9i Medical insurance coverage 1=Yes 2=No 8=Don’t Know
1 2 8
1 2 8
1 2 8
1 2 8
1 2 8
C9j Bonus/reward for good performance 1=Yes 2=No 8=Don’t Know
1 2 8
1 2 8
1 2 8
1 2 8
1 2 8
C9k Educational or training courses 1=Yes 2=No 8=Don’t Know
1 2 8
1 2 8
1 2 8
1 2 8
1 2 8
C9l Occupational safety/protective equipment or clothing 1=Yes 2=No 8=Don’t Know
1 2 8
1 2 8
1 2 8
1 2 8
1 2 8
C9m Childcare facilities 1=Yes 2=No 8=Don’t Know
1 2 8
1 2 8
1 2 8
1 2 8
1 2 8
C10 In your current job, can you benefit from Maternity/ paternity leave
1=Yes 2=No 8=Don’t Know
1 2 8
1 2 8
1 2 8
1 2 8
1 2 8
C11 In your current job, can you benefit from Housing allowance/benefits
1=Yes 2=No 8=Don’t Know
1 2 8
1 2 8
1 2 8
1 2 8
1 2 8
C12 On this job, does your employer deduct income tax from your salary/wages? 1=Yes 2=No 8=Don’t Know
1
2
8
1
2
8
1
2
8
1
2
8
1
2
8
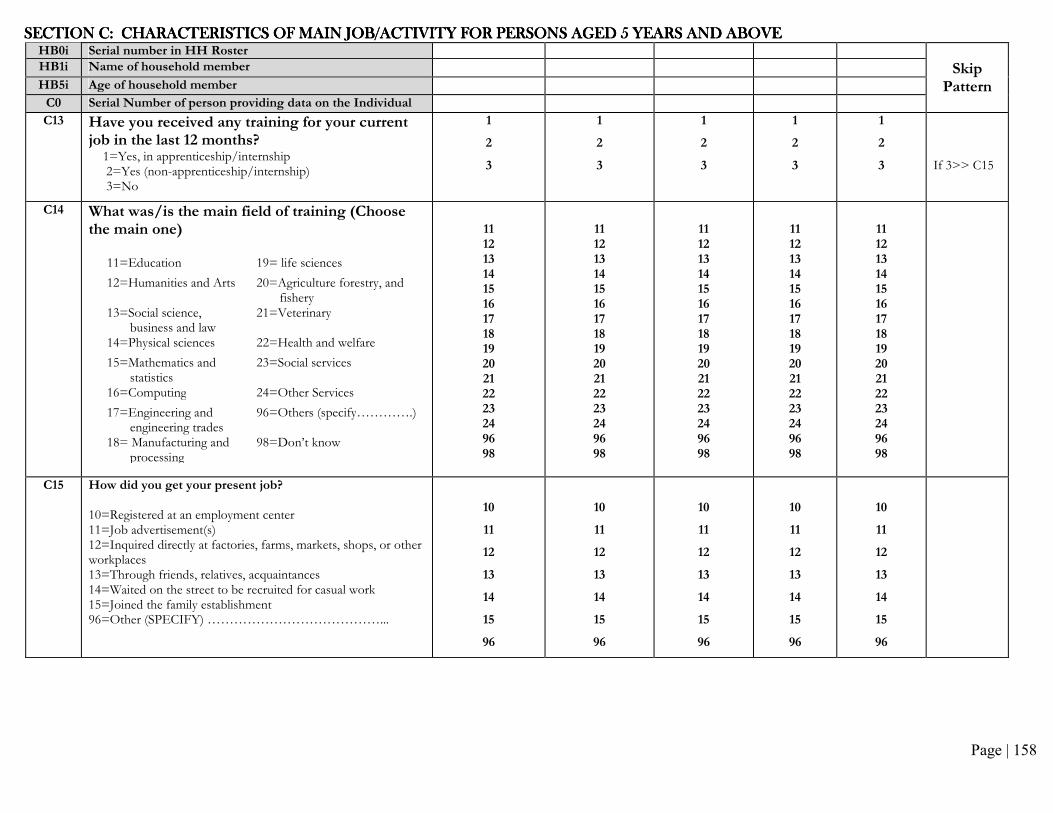
Page | 158
SECTION SECTION SECTION SECTION CCCC: CHARACTERISTICS OF MAIN JOB/ACTIVITY FOR PERSONS AGED 5 YEARS AND ABOVE: CHARACTERISTICS OF MAIN JOB/ACTIVITY FOR PERSONS AGED 5 YEARS AND ABOVE: CHARACTERISTICS OF MAIN JOB/ACTIVITY FOR PERSONS AGED 5 YEARS AND ABOVE: CHARACTERISTICS OF MAIN JOB/ACTIVITY FOR PERSONS AGED 5 YEARS AND ABOVE HB0i Serial number in HH Roster
Skip Pattern
HB1i Name of household member
HB5i Age of household member
C0 Serial Number of person providing data on the Individual
C13 Have you received any training for your current job in the last 12 months?
1=Yes, in apprenticeship/internship 2=Yes (non-apprenticeship/internship) 3=No
1
2
3
1
2
3
1
2
3
1
2
3
1
2
3
If 3>> C15
C14 What was/is the main field of training (Choose the main one)
11 12 13 14 15 16 17 18 19 20 21 22 23 24 96 98
11 12 13 14 15 16 17 18 19 20 21 22 23 24 96 98
11 12 13 14 15 16 17 18 19 20 21 22 23 24 96 98
11 12 13 14 15 16 17 18 19 20 21 22 23 24 96 98
11 12 13 14 15 16 17 18 19 20 21 22 23 24 96 98
C15 How did you get your present job? 10=Registered at an employment center 11=Job advertisement(s) 12=Inquired directly at factories, farms, markets, shops, or other workplaces 13=Through friends, relatives, acquaintances 14=Waited on the street to be recruited for casual work 15=Joined the family establishment 96=Other (SPECIFY) …………………………………...
10
11
12
13
14
15
96
10
11
12
13
14
15
96
10
11
12
13
14
15
96
10
11
12
13
14
15
96
10
11
12
13
14
15
96
11=Education 19= life sciences
12=Humanities and Arts 20=Agriculture forestry, and fishery
13=Social science, business and law
21=Veterinary
14=Physical sciences 22=Health and welfare
15=Mathematics and statistics
23=Social services
16=Computing 24=Other Services
17=Engineering and engineering trades
96=Others (specify………….)
18= Manufacturing and processing
98=Don’t know

Page | 159
SECTION SECTION SECTION SECTION CCCC: CHARACTERISTICS OF MAIN JOB/ACTIVITY FOR PERSONS AGED 5 YEARS AND ABOVE: CHARACTERISTICS OF MAIN JOB/ACTIVITY FOR PERSONS AGED 5 YEARS AND ABOVE: CHARACTERISTICS OF MAIN JOB/ACTIVITY FOR PERSONS AGED 5 YEARS AND ABOVE: CHARACTERISTICS OF MAIN JOB/ACTIVITY FOR PERSONS AGED 5 YEARS AND ABOVE HB0i Serial number in HH Roster
Skip Pattern
HB1i Name of household member
HB5i Age of household member
C0 Serial Number of person providing data on the Individual
C16 What kind of assistance did you receive from an employment office? 1=None 2=Advice on how to search for a job 3=Information on vacancies 4=Guidance on education and training opportunities 5=Placement in education or training programmes 6=Other (SPECIFY……………………………………
1
2
3
4
5
6
1
2
3
4
5
6
1
2
3
4
5
6
1
2
3
4
5
6
1
2
3
4
5
6
C17 How long were you available and actively looking for work before finding your current job (or establishing your current business)? 1=0 days (Got the job immediately without waiting) 2=Less than a week 3=1 week to less than 1 month 4=1 month to less than 3 months 5=3 to less than 6 months 6=6 months to less than 1 year 7=1 year to less than 2 years 8=2 years or more
1
2
3
4
5
6
7
8
1
2
3
4
5
6
7
8
1
2
3
4
5
6
7
8
1
2
3
4
5
6
7
8
1
2
3
4
5
6
7
8

Page | 160
SECTION SECTION SECTION SECTION CCCC: CHARACTERISTICS OF MAIN JOB/ACTIVITY FOR PERSONS AGED 5 YEARS AND ABOVE: CHARACTERISTICS OF MAIN JOB/ACTIVITY FOR PERSONS AGED 5 YEARS AND ABOVE: CHARACTERISTICS OF MAIN JOB/ACTIVITY FOR PERSONS AGED 5 YEARS AND ABOVE: CHARACTERISTICS OF MAIN JOB/ACTIVITY FOR PERSONS AGED 5 YEARS AND ABOVE HB0i Serial number in HH Roster
Skip Pattern
HB1i Name of household member
HB5i Age of household member
C0 Serial Number of person providing data on the Individual
C18 Have you ever refused a job that was offered to you?
1=Yes 2=No
1 2
1 2
1 2
1 2
1 2
If 2>>C20
C19 Why did you refuse? (Select the main reason) 10=Wages/salary offered were too low 11=Work was not interesting 12=Location was not convenient 13=Work would not match my level of qualifications 14=Work would require too few hours 15=Work would require too many hours 16=Family did not approve of the job offered 17=Waiting for a better job offer 18=There was no contract length offered or contract length
was too short 19=Saw no possibilities for advancement 20=Business was about to close 96=Others (Specify)………………… ……………
10
11
12
13
14
15
16
17
18
19
20
96
10
11
12
13
14
15
16
17
18
19
20
96
10
11
12
13
14
15
16
17
18
19
20
96
10
11
12
13
14
15
16
17
18
19
20
96
10
11
12
13
14
15
16
17
18
19
20
96
C20 Was there a minimum level of income per month below which you would not accept a job?
1=Yes 2=No
1
2
1
2
1
2
1
2
1
2
If 2>>C28
C21 How much was it?
ENTER AMOUNT IN UGANDA SHILLINGS
>>C28

Page | 161
SECTION SECTION SECTION SECTION CCCC: CHARACTERISTICS OF MAIN JOB/ACTIVITY FOR PERSONS AGED 5 YEARS AND ABOVE: CHARACTERISTICS OF MAIN JOB/ACTIVITY FOR PERSONS AGED 5 YEARS AND ABOVE: CHARACTERISTICS OF MAIN JOB/ACTIVITY FOR PERSONS AGED 5 YEARS AND ABOVE: CHARACTERISTICS OF MAIN JOB/ACTIVITY FOR PERSONS AGED 5 YEARS AND ABOVE HB0i Serial number in HH Roster Skip
Pattern HB1i Name of household member
HB5i Age of household member
C0 Serial Number of person providing data on the Individual
FOR EMPLOYERS, OWN ACCOUNT WORKERS AND MEMBERS’ OF PRODUCER COOPERATIVE (CODES 2,3 and 5 IN C5)
C22 Why did you choose to be self-employed rather than to work for someone else as a wage & salaried worker? 1=Could not find a wage or salary job 2=Greater independence 3=More flexible hours of work 4=Higher income level 5=Required by the family 6=Other SPECIFY)…………………………………………………………
1
2
3
4
5
6
1
2
3
4
5
6
1
2
3
4
5
6
1
2
3
4
5
6
1
2
3
4
5
6
C23 What was your main source of funding for
starting your current activity?
11=No money needed
12=Own savings
13=Money from family or friends within the country
14=Loan from microfinance institutions (including cooperative
15=Loan from bank
16=Loan from an informal financial operator (money lender,
pawn shop, saving collector)
17=Loan/assistance from government institution
18=Loan/assistance from NGO, donor project, etc
19=Remittances from abroad
96=Other (SPECIFY)…………… …… …………………
11
12
13
14
15
16
17
18
19
96
11
12
13
14
15
16
17
18
19
96
11
12
13
14
15
16
17
18
19
96
11
12
13
14
15
16
17
18
19
96
11
12
13
14
15
16
17
18
19
96

Page | 162
SECTION SECTION SECTION SECTION CCCC: CHARACTERISTICS OF MAIN JOB/ACTIVITY FOR PERSONS AGED 5 YEARS AND ABOVE: CHARACTERISTICS OF MAIN JOB/ACTIVITY FOR PERSONS AGED 5 YEARS AND ABOVE: CHARACTERISTICS OF MAIN JOB/ACTIVITY FOR PERSONS AGED 5 YEARS AND ABOVE: CHARACTERISTICS OF MAIN JOB/ACTIVITY FOR PERSONS AGED 5 YEARS AND ABOVE HB0i Serial number in HH Roster Skip
Pattern HB1i Name of household member
HB5i Age of household member
C0 Serial Number of person providing data on the Individual C24 What is the most pressing problem you face in
engaging in your economic activity? 10= Limited Financial resources 11= Labour shortage 12= Insufficient Quality Staff 13=Legal regulations 14=Shortages in raw materials (breakdowns in the supply
chain) 15= Limited Entrepreneurial Skills 16=Political uncertainties 17=Access to technology 18=Product development 19=Competition in the market 20=Taxes 21=Hash Weather (Draught or Floods) 96=Other (SPECIFY).……………………………………
10 11 12 13 14 15 16 17 18 19 20 21 96
10 11 12 13 14 15 16 17 18 19 20 21 96
10 11 12 13 14 15 16 17 18 19 20 21 96
10 11 12 13 14 15 16 17 18 19 20 21 96
10 11 12 13 14 15 16 17 18 19 20 21 96
C25 What is the type of ownership of your business/farm? 1=Individual owner (or with other household members) 2=Partnership with members of other households 3=Incorporated enterprise (Private Limited Co., Public Limited
Co. Inc.) 6=Other (specify):_________________________________
1
2
3
6
1
2
3
6
1
2
3
6
1
2
3
6
1
2
3
6
C26a Is your business registered for VAT? 1=Yes 2=No 8=Don’t know 9=refused
1 2 8 9
1 2 8 9
1 2 8 9
1 2 8 9
1 2 8 9
C26b
Is your business/farm registered for income tax? 1=Yes 2=No 8=Don’t know 9=refused
1 2 8 9
1 2 8 9
1 2 8 9
1 2 8 9
1 2 8 9
C27 Does your business/farm keep a complete record of accounts (assets and expenditures)? 1=Yes 2=No 8=Don’t know
1
2
8
1
2
8
1
2
8
1
2
8
1
2
8
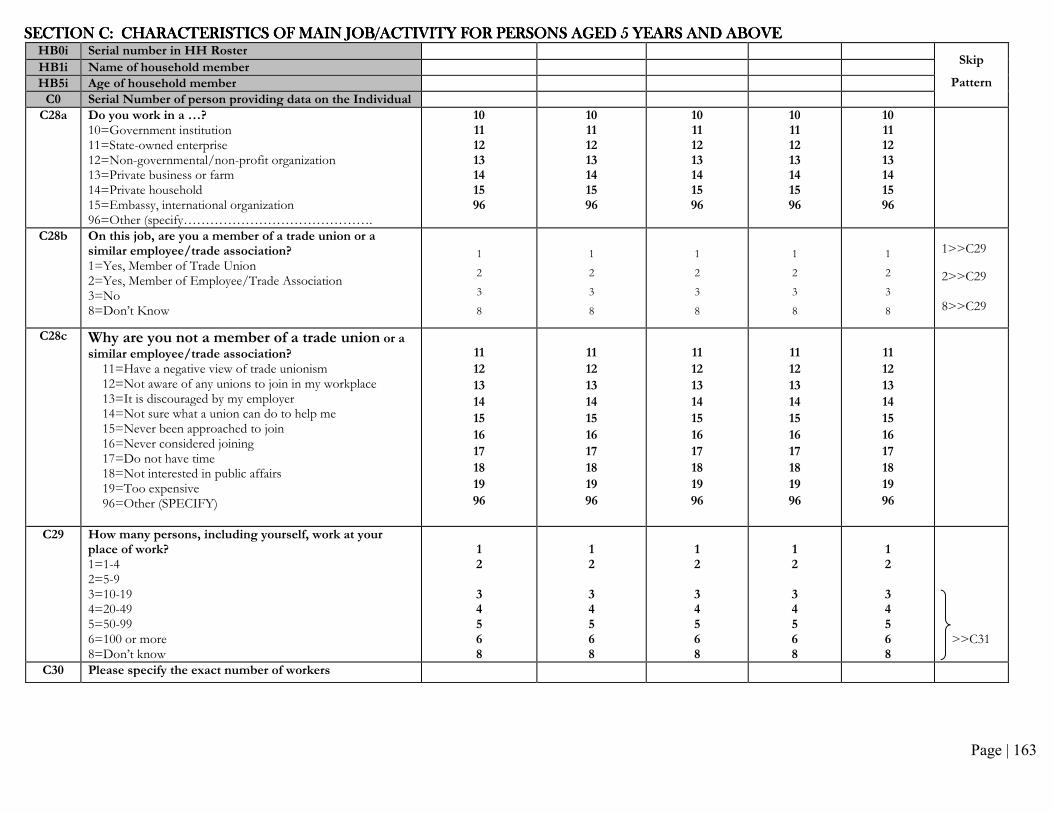
Page | 163
SECTION SECTION SECTION SECTION CCCC: CHARACTERISTICS OF MAIN JOB/ACTIVITY FOR PERSONS AGED 5 YEARS AND ABOVE: CHARACTERISTICS OF MAIN JOB/ACTIVITY FOR PERSONS AGED 5 YEARS AND ABOVE: CHARACTERISTICS OF MAIN JOB/ACTIVITY FOR PERSONS AGED 5 YEARS AND ABOVE: CHARACTERISTICS OF MAIN JOB/ACTIVITY FOR PERSONS AGED 5 YEARS AND ABOVE HB0i Serial number in HH Roster
Skip
Pattern HB1i Name of household member
HB5i Age of household member
C0 Serial Number of person providing data on the Individual
C28a Do you work in a …? 10=Government institution 11=State-owned enterprise 12=Non-governmental/non-profit organization 13=Private business or farm 14=Private household 15=Embassy, international organization 96=Other (specify…………………………………….
10 11 12 13 14 15 96
10 11 12 13 14 15 96
10 11 12 13 14 15 96
10 11 12 13 14 15 96
10 11 12 13 14 15 96
C28b On this job, are you a member of a trade union or a similar employee/trade association? 1=Yes, Member of Trade Union 2=Yes, Member of Employee/Trade Association 3=No 8=Don’t Know
1
2
3
8
1
2
3
8
1
2
3
8
1
2
3
8
1
2
3
8
1>>C29
2>>C29 8>>C29
C28c Why are you not a member of a trade union or a similar employee/trade association?
11=Have a negative view of trade unionism 12=Not aware of any unions to join in my workplace 13=It is discouraged by my employer 14=Not sure what a union can do to help me 15=Never been approached to join 16=Never considered joining 17=Do not have time 18=Not interested in public affairs 19=Too expensive 96=Other (SPECIFY)
11
12
13
14
15
16
17
18
19
96
11
12
13
14
15
16
17
18
19
96
11
12
13
14
15
16
17
18
19
96
11
12
13
14
15
16
17
18
19
96
11
12
13
14
15
16
17
18
19
96
C29 How many persons, including yourself, work at your place of work? 1=1-4 2=5-9 3=10-19 4=20-49 5=50-99 6=100 or more 8=Don’t know
1 2 3 4 5 6 8
1 2 3 4 5 6 8
1 2 3 4 5 6 8
1 2 3 4 5 6 8
1 2 3 4 5 6 8
>>C31
C30 Please specify the exact number of workers
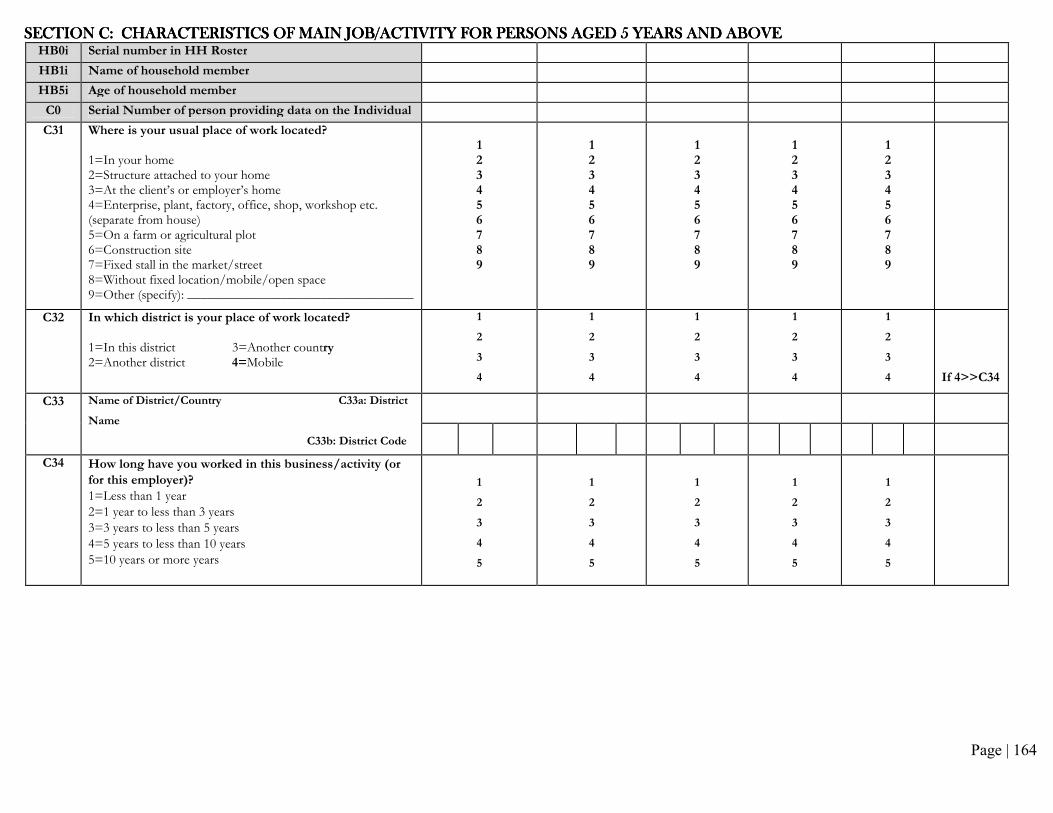
Page | 164
SECTION SECTION SECTION SECTION CCCC: CHARACTERISTICS OF MAIN JOB/ACTIVITY FOR PERSONS AGED 5 YEARS AND ABOVE: CHARACTERISTICS OF MAIN JOB/ACTIVITY FOR PERSONS AGED 5 YEARS AND ABOVE: CHARACTERISTICS OF MAIN JOB/ACTIVITY FOR PERSONS AGED 5 YEARS AND ABOVE: CHARACTERISTICS OF MAIN JOB/ACTIVITY FOR PERSONS AGED 5 YEARS AND ABOVE HB0i Serial number in HH Roster
HB1i Name of household member
HB5i Age of household member
C0 Serial Number of person providing data on the Individual
C31 Where is your usual place of work located? 1=In your home 2=Structure attached to your home 3=At the client’s or employer’s home 4=Enterprise, plant, factory, office, shop, workshop etc. (separate from house) 5=On a farm or agricultural plot 6=Construction site 7=Fixed stall in the market/street 8=Without fixed location/mobile/open space 9=Other (specify): __________________________________
1 2 3 4 5 6 7 8 9
1 2 3 4 5 6 7 8 9
1 2 3 4 5 6 7 8 9
1 2 3 4 5 6 7 8 9
1 2 3 4 5 6 7 8 9
C32 In which district is your place of work located? 1=In this district 3=Another country 2=Another district 4=Mobile
1
2
3
4
1
2
3
4
1
2
3
4
1
2
3
4
1
2
3
4
If 4>>C34
C33 Name of District/Country C33a: District
Name
C33b: District Code
C34 How long have you worked in this business/activity (or
for this employer)?
1=Less than 1 year
2=1 year to less than 3 years
3=3 years to less than 5 years
4=5 years to less than 10 years
5=10 years or more years
1
2
3
4
5
1
2
3
4
5
1
2
3
4
5
1
2
3
4
5
1
2
3
4
5

Page | 165
SECTION SECTION SECTION SECTION DDDD: MULTIPLE JOB HOLDERS AND CHARACTERISTICS OF SECONDARY ACTIVITY FOR PERSONS AGED 5 YEARS AND ABOVE: MULTIPLE JOB HOLDERS AND CHARACTERISTICS OF SECONDARY ACTIVITY FOR PERSONS AGED 5 YEARS AND ABOVE: MULTIPLE JOB HOLDERS AND CHARACTERISTICS OF SECONDARY ACTIVITY FOR PERSONS AGED 5 YEARS AND ABOVE: MULTIPLE JOB HOLDERS AND CHARACTERISTICS OF SECONDARY ACTIVITY FOR PERSONS AGED 5 YEARS AND ABOVE
The following questions refer to the respondent’s secondary job/activity, if any, during the last week.
HB0i Serial number in HH Roster Skip
Pattern HB1i Name of household member
HB5i Age of household member
D0 Serial Number of person providing data on the Individual
D1 Last week, did you have any secondary job/activity from which you or your households obtain any income in cash or in kind? 1=Yes 2=No
1 2
1 2
1 2
1 2
1 2
If 2>>SEC E
D2 What kind of work do you usually do in this secondary job/activity? DESCRIBE THE OCCUPATION AND MAIN TASKS OR DUTIES IN AT LEAST 2 WORDS. Examples: street seller, subsistence farmer, primary school teacher, registered nurse, domestic worker, truck driver Occupational title
D3 What are your main tasks or duties? Short description of the main tasks or duties:
ISCO Code:
D4 What kind of industry, business, service or activity is carried out at your place of work where you had your secondary job/activity? Examples: Write the main industry, economic activity, product or service of the person’s employer or company (e.g. supermarket, police service). If self-employed, write the activity of the person (e.g. subsistence farming, fishing). If paid domestic work in private household, write Domestic Service
D5 What are the main goods or services produced at this place of work or its main functions? D5(a) Description Examples: selling fish, raising cattle, teaching children
D5(b) ISIC Code
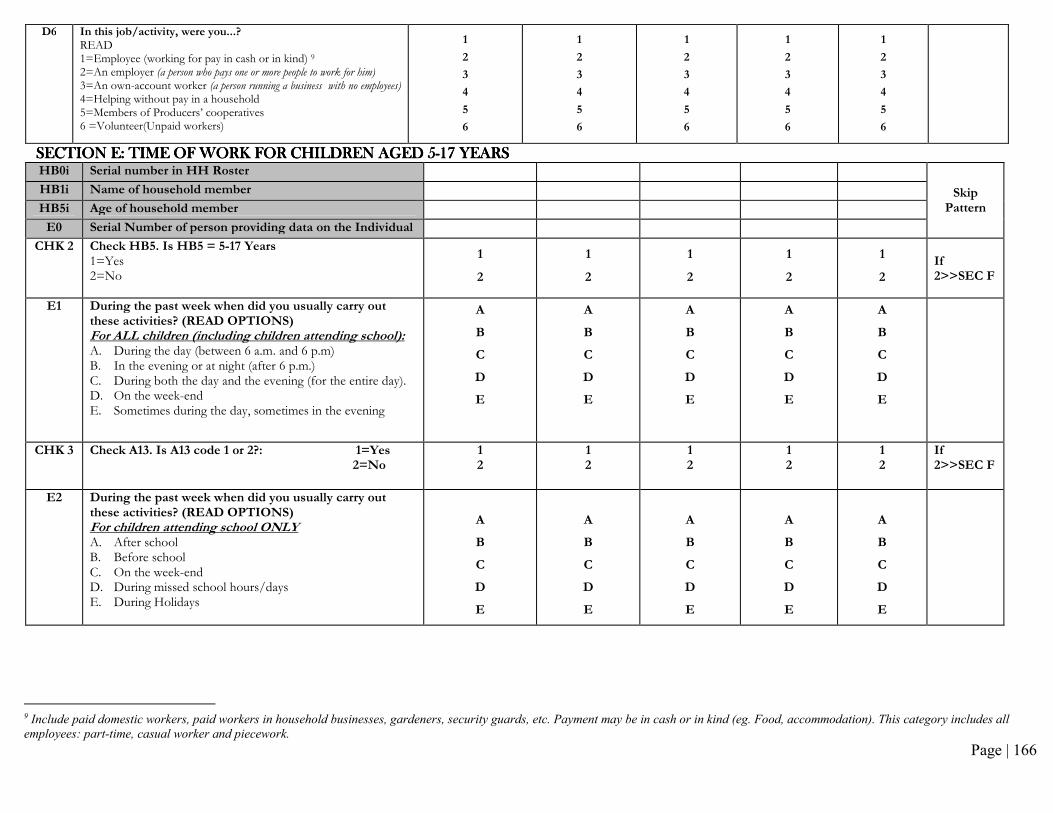
Page | 166
D6 In this job/activity, were you...? READ 1=Employee (working for pay in cash or in kind) 9
2=An employer (a person who pays one or more people to work for him) 3=An own-account worker (a person running a business with no employees) 4=Helping without pay in a household 5=Members of Producers’ cooperatives 6 =Volunteer(Unpaid workers)
1
2
3
4
5
6
1
2
3
4
5
6
1
2
3
4
5
6
1
2
3
4
5
6
1
2
3
4
5
6
SECTION SECTION SECTION SECTION EEEE: TIME OF WORK FOR CHILDREN AGED 5: TIME OF WORK FOR CHILDREN AGED 5: TIME OF WORK FOR CHILDREN AGED 5: TIME OF WORK FOR CHILDREN AGED 5----17171717 YEARSYEARSYEARSYEARS HB0i Serial number in HH Roster
Skip Pattern
HB1i Name of household member
HB5i Age of household member
E0 Serial Number of person providing data on the Individual
CHK 2 Check HB5. Is HB5 = 5-17 Years 1=Yes 2=No
1
2
1
2
1
2
1
2
1
2
If 2>>SEC F
E1 During the past week when did you usually carry out these activities? (READ OPTIONS) For ALL children (including children attending school): A. During the day (between 6 a.m. and 6 p.m) B. In the evening or at night (after 6 p.m.) C. During both the day and the evening (for the entire day). D. On the week-end E. Sometimes during the day, sometimes in the evening
A
B
C
D
E
A
B
C
D
E
A
B
C
D
E
A
B
C
D
E
A
B
C
D
E
CHK 3 Check A13. Is A13 code 1 or 2?: 1=Yes 2=No
1 2
1 2
1 2
1 2
1 2
If 2>>SEC F
E2 During the past week when did you usually carry out these activities? (READ OPTIONS) For children attending school ONLY A. After school B. Before school C. On the week-end D. During missed school hours/days E. During Holidays
A
B
C
D
E
A
B
C
D
E
A
B
C
D
E
A
B
C
D
E
A
B
C
D
E
9 Include paid domestic workers, paid workers in household businesses, gardeners, security guards, etc. Payment may be in cash or in kind (eg. Food, accommodation). This category includes all
employees: part-time, casual worker and piecework.
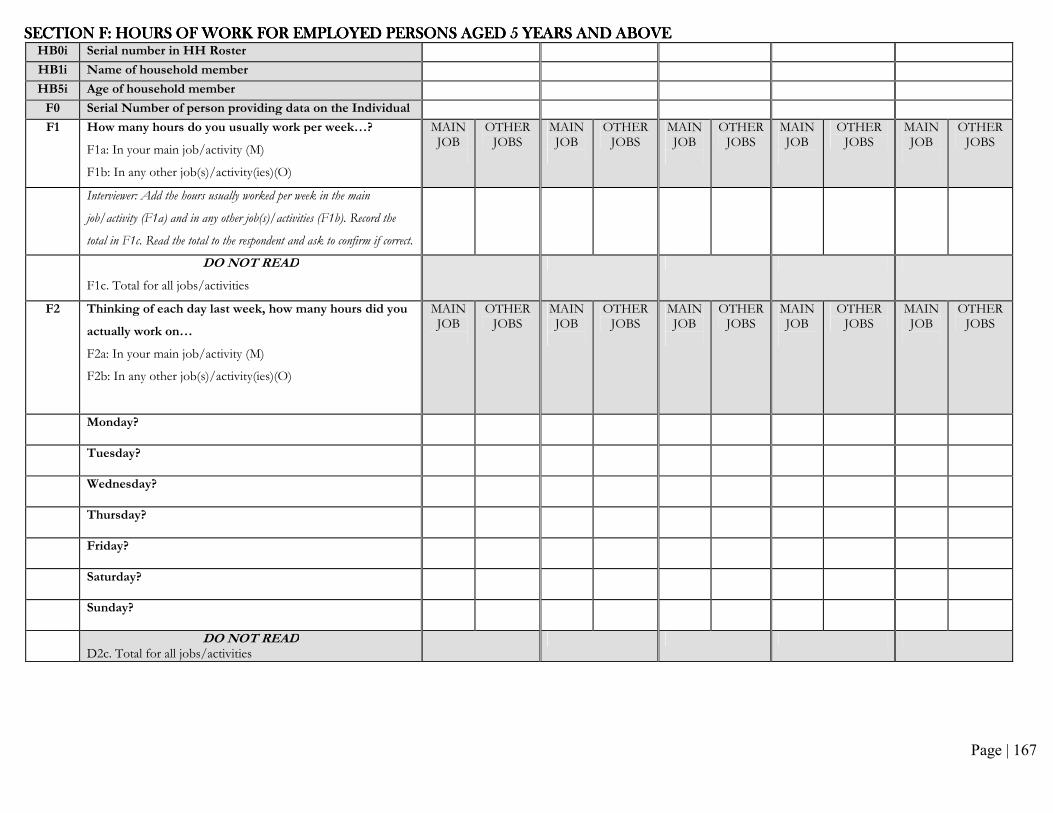
Page | 167
SECTIONSECTIONSECTIONSECTION FFFF: HOURS OF WORK FOR EMPLOYED PERSONS AGED 5 YEARS AND ABOVE: HOURS OF WORK FOR EMPLOYED PERSONS AGED 5 YEARS AND ABOVE: HOURS OF WORK FOR EMPLOYED PERSONS AGED 5 YEARS AND ABOVE: HOURS OF WORK FOR EMPLOYED PERSONS AGED 5 YEARS AND ABOVE HB0i Serial number in HH Roster
HB1i Name of household member
HB5i Age of household member
F0 Serial Number of person providing data on the Individual
F1 How many hours do you usually work per week…?
F1a: In your main job/activity (M)
F1b: In any other job(s)/activity(ies)(O)
MAIN JOB
OTHER JOBS
MAIN JOB
OTHER JOBS
MAIN JOB
OTHER JOBS
MAIN JOB
OTHER JOBS
MAIN JOB
OTHER JOBS
Interviewer: Add the hours usually worked per week in the main
job/activity (F1a) and in any other job(s)/activities (F1b). Record the
total in F1c. Read the total to the respondent and ask to confirm if correct.
DO NOT READ
F1c. Total for all jobs/activities
F2 Thinking of each day last week, how many hours did you
actually work on…
F2a: In your main job/activity (M)
F2b: In any other job(s)/activity(ies)(O)
MAIN JOB
OTHER JOBS
MAIN JOB
OTHER JOBS
MAIN JOB
OTHER JOBS
MAIN JOB
OTHER JOBS
MAIN JOB
OTHER JOBS
Monday?
Tuesday?
Wednesday?
Thursday?
Friday?
Saturday?
Sunday?
DO NOT READ D2c. Total for all jobs/activities
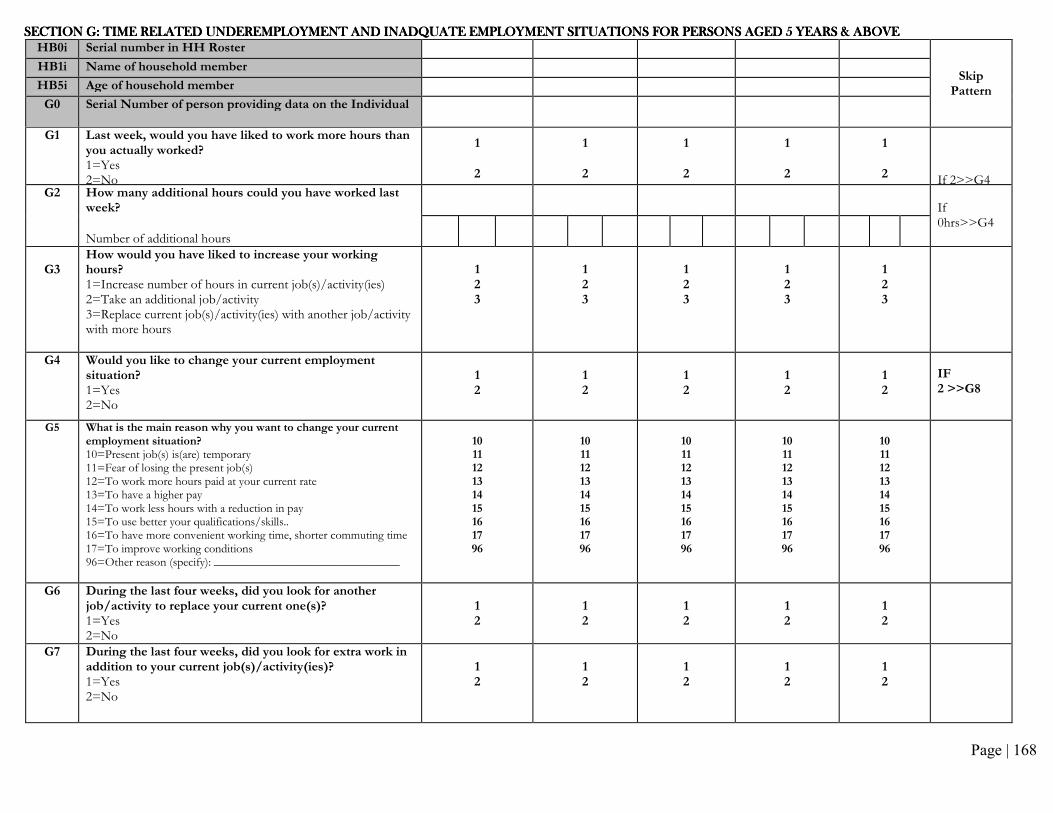
Page | 168
SECTION G: TIME RELATED UNDEREMPLOYMENT AND INADQUATE EMPLOYMENT SITUATIONS FOR PERSONS AGED 5 YEARS & ABOVESECTION G: TIME RELATED UNDEREMPLOYMENT AND INADQUATE EMPLOYMENT SITUATIONS FOR PERSONS AGED 5 YEARS & ABOVESECTION G: TIME RELATED UNDEREMPLOYMENT AND INADQUATE EMPLOYMENT SITUATIONS FOR PERSONS AGED 5 YEARS & ABOVESECTION G: TIME RELATED UNDEREMPLOYMENT AND INADQUATE EMPLOYMENT SITUATIONS FOR PERSONS AGED 5 YEARS & ABOVE
HB0i Serial number in HH Roster
Skip Pattern
HB1i Name of household member
HB5i Age of household member
G0 Serial Number of person providing data on the Individual
G1 Last week, would you have liked to work more hours than you actually worked? 1=Yes 2=No
1
2
1
2
1
2
1
2
1
2
If 2>>G4
G2 How many additional hours could you have worked last week?
If 0hrs>>G4
Number of additional hours
G3
How would you have liked to increase your working hours? 1=Increase number of hours in current job(s)/activity(ies) 2=Take an additional job/activity 3=Replace current job(s)/activity(ies) with another job/activity with more hours
1 2 3
1 2 3
1 2 3
1 2 3
1 2 3
G4 Would you like to change your current employment situation? 1=Yes 2=No
1 2
1 2
1 2
1 2
1 2
IF 2 >>G8
G5 What is the main reason why you want to change your current employment situation? 10=Present job(s) is(are) temporary 11=Fear of losing the present job(s) 12=To work more hours paid at your current rate 13=To have a higher pay 14=To work less hours with a reduction in pay 15=To use better your qualifications/skills.. 16=To have more convenient working time, shorter commuting time 17=To improve working conditions 96=Other reason (specify): _______________________________
10 11 12 13 14 15 16 17 96
10 11 12 13 14 15 16 17 96
10 11 12 13 14 15 16 17 96
10 11 12 13 14 15 16 17 96
10 11 12 13 14 15 16 17 96
G6 During the last four weeks, did you look for another job/activity to replace your current one(s)? 1=Yes 2=No
1 2
1 2
1 2
1 2
1 2
G7 During the last four weeks, did you look for extra work in addition to your current job(s)/activity(ies)? 1=Yes 2=No
1 2
1 2
1 2
1 2
1 2

Page | 169
HB0i Serial number in HH Roster Skip Pattern
HB1i Name of household member
HB5i Age of household member
G0 Serial Number of person providing data on the Individual
G8 Thinking about the next 12 months, how likely do you believe it is that you will be able to keep your main job if you want to?
1=Very likely 2=Likely, but not certain 3=Not likely 8=Do not know
1 2 3 8
1 2 3 8
1 2 3 8
1 2 3 8
1 2 3 8
G9 To what extent are you satisfied with this job? 1=Very satisfied 2=Somewhat satisfied 3=Somewhat unsatisfied 4=Very unsatisfied
1 2 3 4
1 2 3 4
1 2 3 4
1 2 3 4
1 2 3 4
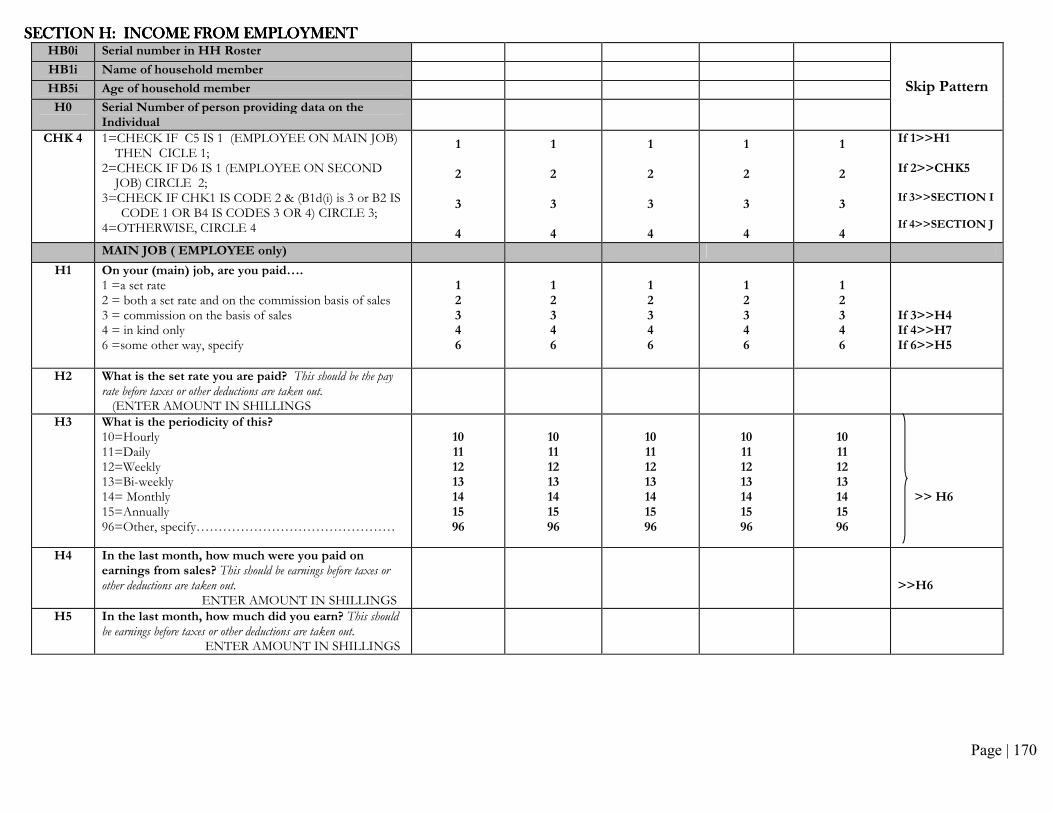
Page | 170
SECTION SECTION SECTION SECTION HHHH: INCOME FROM EMPLOYMENT: INCOME FROM EMPLOYMENT: INCOME FROM EMPLOYMENT: INCOME FROM EMPLOYMENT HB0i Serial number in HH Roster
Skip Pattern HB1i Name of household member
HB5i Age of household member
H0 Serial Number of person providing data on the Individual
CHK 4 1=CHECK IF C5 IS 1 (EMPLOYEE ON MAIN JOB) THEN CICLE 1;
2=CHECK IF D6 IS 1 (EMPLOYEE ON SECOND JOB) CIRCLE 2;
3=CHECK IF CHK1 IS CODE 2 & (B1d(i) is 3 or B2 IS CODE 1 OR B4 IS CODES 3 OR 4) CIRCLE 3;
4=OTHERWISE, CIRCLE 4
1
2
3
4
1
2
3
4
1
2
3
4
1
2
3
4
1
2
3
4
If 1>>H1
If 2>>CHK5
If 3>>SECTION I
If 4>>SECTION J
MAIN JOB ( EMPLOYEE only)
H1 On your (main) job, are you paid…. 1 =a set rate 2 = both a set rate and on the commission basis of sales 3 = commission on the basis of sales 4 = in kind only 6 =some other way, specify
1 2 3 4 6
1 2 3 4 6
1 2 3 4 6
1 2 3 4 6
1 2 3 4 6
If 3>>H4 If 4>>H7 If 6>>H5
H2 What is the set rate you are paid? This should be the pay rate before taxes or other deductions are taken out. (ENTER AMOUNT IN SHILLINGS
H3 What is the periodicity of this? 10=Hourly 11=Daily 12=Weekly 13=Bi-weekly 14= Monthly 15=Annually 96=Other, specify………………………………………
10 11 12 13 14 15 96
10 11 12 13 14 15 96
10 11 12 13 14 15 96
10 11 12 13 14 15 96
10 11 12 13 14 15 96
>> H6
H4 In the last month, how much were you paid on earnings from sales? This should be earnings before taxes or other deductions are taken out. ENTER AMOUNT IN SHILLINGS
>>H6
H5 In the last month, how much did you earn? This should be earnings before taxes or other deductions are taken out. ENTER AMOUNT IN SHILLINGS
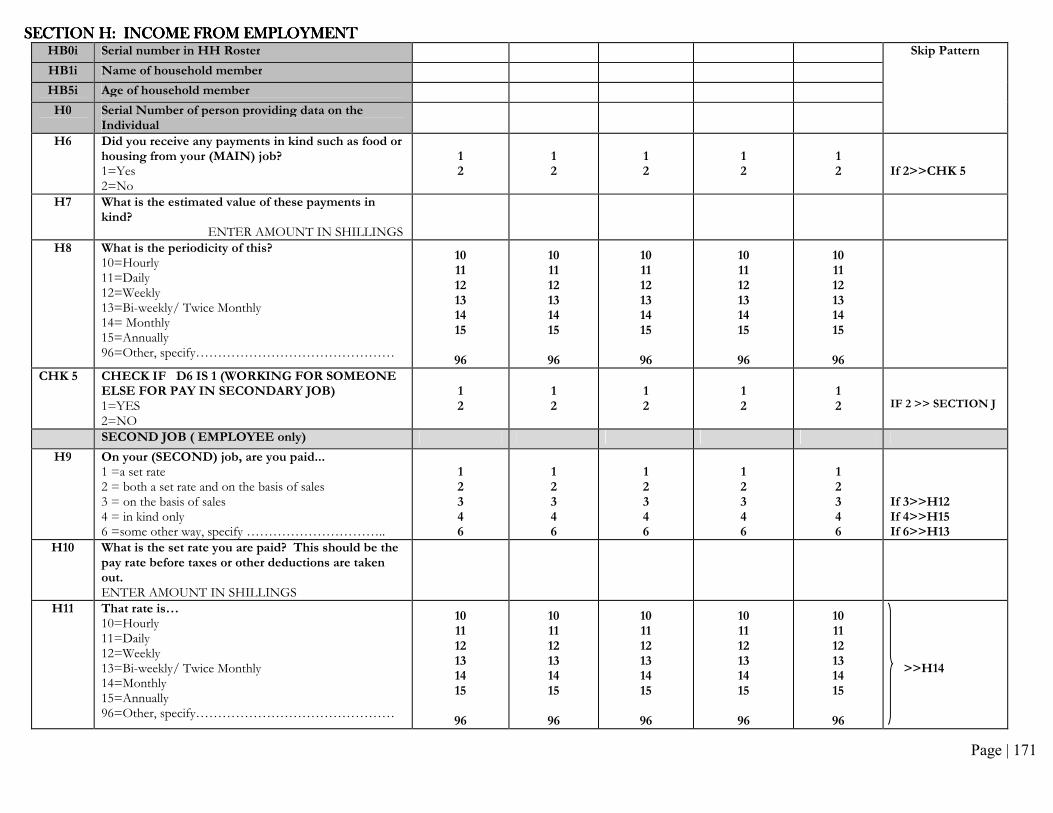
Page | 171
SECTION SECTION SECTION SECTION HHHH: INCOME FROM EMPLOYMENT: INCOME FROM EMPLOYMENT: INCOME FROM EMPLOYMENT: INCOME FROM EMPLOYMENT HB0i Serial number in HH Roster Skip Pattern
HB1i Name of household member
HB5i Age of household member
H0 Serial Number of person providing data on the Individual
H6 Did you receive any payments in kind such as food or housing from your (MAIN) job? 1=Yes 2=No
1 2
1 2
1 2
1 2
1 2
If 2>>CHK 5
H7 What is the estimated value of these payments in kind? ENTER AMOUNT IN SHILLINGS
H8 What is the periodicity of this? 10=Hourly 11=Daily 12=Weekly 13=Bi-weekly/ Twice Monthly 14= Monthly 15=Annually 96=Other, specify………………………………………
10 11 12 13 14 15 96
10 11 12 13 14 15 96
10 11 12 13 14 15 96
10 11 12 13 14 15 96
10 11 12 13 14 15 96
CHK 5 CHECK IF D6 IS 1 (WORKING FOR SOMEONE ELSE FOR PAY IN SECONDARY JOB) 1=YES 2=NO
1 2
1 2
1 2
1 2
1 2
IF 2 >> SECTION J
SECOND JOB ( EMPLOYEE only)
H9 On your (SECOND) job, are you paid... 1 =a set rate 2 = both a set rate and on the basis of sales 3 = on the basis of sales 4 = in kind only 6 =some other way, specify …………………………..
1 2 3 4 6
1 2 3 4 6
1 2 3 4 6
1 2 3 4 6
1 2 3 4 6
If 3>>H12 If 4>>H15 If 6>>H13
H10 What is the set rate you are paid? This should be the pay rate before taxes or other deductions are taken out. ENTER AMOUNT IN SHILLINGS
H11 That rate is… 10=Hourly 11=Daily 12=Weekly 13=Bi-weekly/ Twice Monthly 14=Monthly 15=Annually 96=Other, specify………………………………………
10 11 12 13 14 15 96
10 11 12 13 14 15 96
10 11 12 13 14 15 96
10 11 12 13 14 15 96
10 11 12 13 14 15 96
>>H14
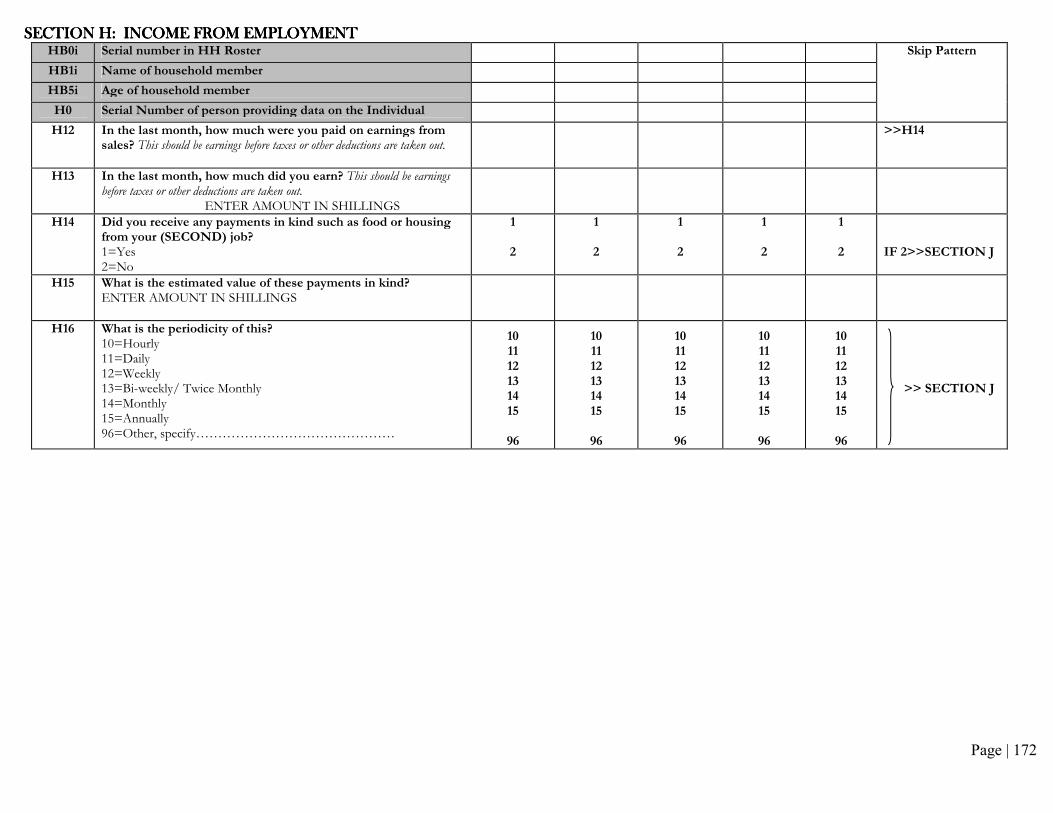
Page | 172
SECTION SECTION SECTION SECTION HHHH: INCOME FROM EMPLOYMENT: INCOME FROM EMPLOYMENT: INCOME FROM EMPLOYMENT: INCOME FROM EMPLOYMENT HB0i Serial number in HH Roster Skip Pattern
HB1i Name of household member
HB5i Age of household member
H0 Serial Number of person providing data on the Individual
H12 In the last month, how much were you paid on earnings from sales? This should be earnings before taxes or other deductions are taken out.
>>H14
H13 In the last month, how much did you earn? This should be earnings before taxes or other deductions are taken out. ENTER AMOUNT IN SHILLINGS
H14 Did you receive any payments in kind such as food or housing from your (SECOND) job? 1=Yes 2=No
1 2
1 2
1 2
1 2
1 2
IF 2>>SECTION J
H15 What is the estimated value of these payments in kind? ENTER AMOUNT IN SHILLINGS
H16 What is the periodicity of this? 10=Hourly 11=Daily 12=Weekly 13=Bi-weekly/ Twice Monthly 14=Monthly 15=Annually 96=Other, specify………………………………………
10 11 12 13 14 15 96
10 11 12 13 14 15 96
10 11 12 13 14 15 96
10 11 12 13 14 15 96
10 11 12 13 14 15 96
>> SECTION J

Page | 173
SECTION SECTION SECTION SECTION IIII: UNEMPLOYED AND PERSONS NOT IN THE LABOUR FORCE AGED 5 YEARS AND ABOVE : UNEMPLOYED AND PERSONS NOT IN THE LABOUR FORCE AGED 5 YEARS AND ABOVE : UNEMPLOYED AND PERSONS NOT IN THE LABOUR FORCE AGED 5 YEARS AND ABOVE : UNEMPLOYED AND PERSONS NOT IN THE LABOUR FORCE AGED 5 YEARS AND ABOVE HB0i Serial number in HH Roster
Skip Pattern HB1i Name of household member
HB5i Age of household member
I0 Serial Number of person providing data on the Individual
CHK6 Check if CHK1 is code 1? Yes=1; No=2 1 2
1 2
1 2
1 2
1 2
If 1>>SEC J
I1a In the last four weeks, were you looking for a job? 1=Yes 2=No
1 2
1 2
1 2
1 2
1 2
1>>I2
I1b In the last four weeks, were you trying to start a business? 1=Yes 2=No
1 2
1 2
1 2
1 2
1 2
2>>I3a
I2 In the last four weeks, what have you done to look for work or to start a business? A=Registered at an employment centre B=Placed /answered job advertisement(s) C=Inquired directly at factories, farms, markets, shops, or other workplaces D=Took a test or interview E=Asked friends, relatives, acquaintances F=Waited on the street to be recruited for casual work G=Sought financial assistance to look for work or start a business H=Looked for land, building, equipment, machinery to start own business or farming I=Applied for permit or license to start a business J=Other (specify): _______________________________________ K=No method
A B C D E F G H I J K
A B C D E F G H I J K
A B C D E F G H I J K
A B C D E F G H I J K
A B C D E F G H I J K
>>I7
I3a Was this because you have already found a job to start at a later date? 1=Yes 2=No
1 2
1 2
1 2
1 2
1 2
IF 1>>I7
I3b Was this because you have undertaken all necessary steps to start a business at a later date? 1=Yes 2=No
1 2
1 2
1 2
1 2
1 2
IF 1>>I7
I4 Last week, would you have liked to work if there had been an opportunity to work? 1=Yes 2=No
1 2
1 2
1 2
1 2
1 2
IF 2 >>I9

Page | 174
SECTION SECTION SECTION SECTION IIII: UNEMPLOYED AND PERSONS NOT IN THE LABOUR FORCE AGED 5 YEARS AND ABOVE : UNEMPLOYED AND PERSONS NOT IN THE LABOUR FORCE AGED 5 YEARS AND ABOVE : UNEMPLOYED AND PERSONS NOT IN THE LABOUR FORCE AGED 5 YEARS AND ABOVE : UNEMPLOYED AND PERSONS NOT IN THE LABOUR FORCE AGED 5 YEARS AND ABOVE
HB0i Serial number in HH Roster
Skip Pattern HB1i Name of household member
HB5i Age of household member
I0 Serial Number of person providing data on the Individual
I5 What was the main reason why you did not seek work or try to start a business in the last four weeks? 10=Was waiting for the results of a vacancy competition or an
interview 11=Awaiting the season for work 12=Attended school or training courses 13=Family responsibilities or housework 14=Pregnancy 15=Illness, injury or disability 16=Does not know how and where to look for work 17=Unable to find work for his/her skills 18=Had looked for job(s) before but had not found any 19=Too young or too old to find a job 20=No jobs available in the area/district 96=Other reason (specify): ________________________________
10 11 12 13 14 15 16 17 18 19 20 96
10 11 12 13 14 15 16 17 18 19 20 96
10 11 12 13 14 15 16 17 18 19 20 96
10 11 12 13 14 15 16 17 18 19 20 96
10 11 12 13 14 15 16 17 18 19 20 96
If 10>>I8a If 11>>I8a If 12>>I8a If 13>>I8a If 14>>I8a If 15>>I8a If 16>>I8a 96>>I8a
I6 During the last 12 months, did you do anything to look for work or to start a business? 1=Yes 2=No
1 2
1 2
1 2
1 2
1 2
>>I8a
I7 For how long have you been without work and trying to find a job or start a business? 1=Less than 3 months 2=3 months to less than 6 months 3=6 months to less than 1 year 4=1 year to less than 3 years 5=3 years to less than 5 years 6=5 years or more 8=Don’t know
1 2 3 4 5 6 8
1 2 3 4 5 6 8
1 2 3 4 5 6 8
1 2 3 4 5 6 8
1 2 3 4 5 6 8
I8a Last week, could you have started to work if a job had been offered to you? 1=Yes 2=No
1 2
1 2
1 2
1 2
1 2
If 1>>J1
I8b Last week, could you have started to work if an opportunity to open a business had been offered to you? 1=Yes 2=No
1 2
1 2
1 2
1 2
1 2
If 1>>J1
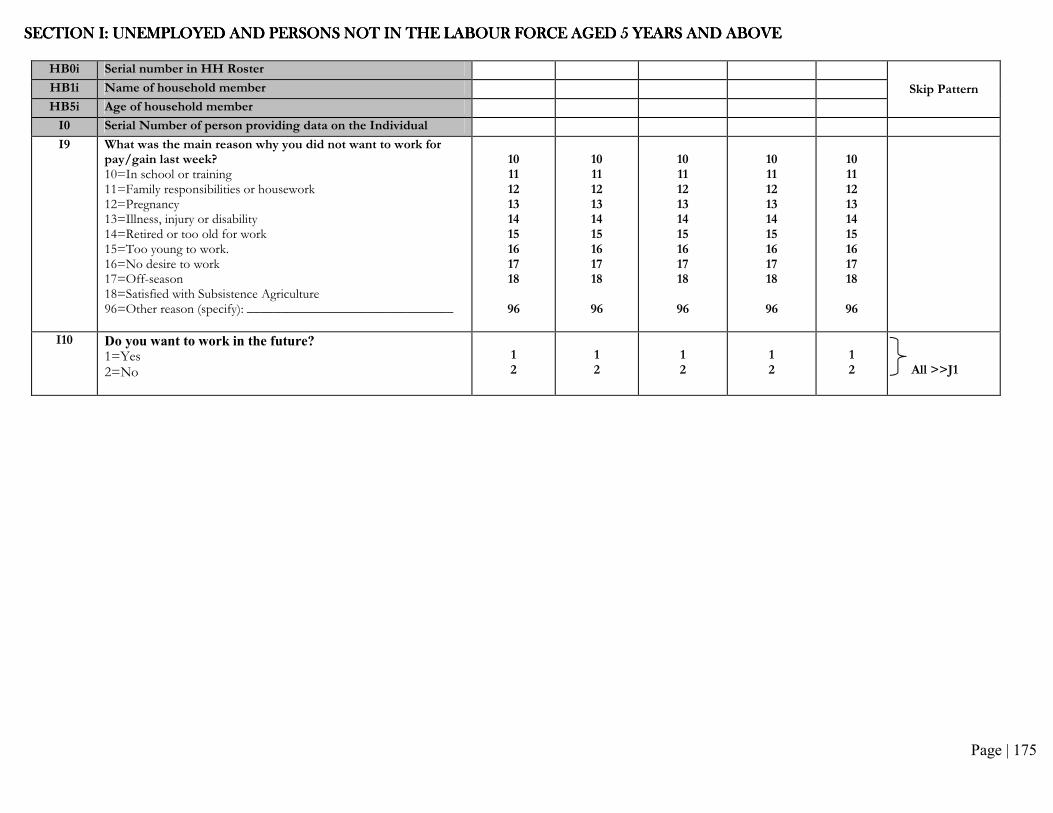
Page | 175
SECTION SECTION SECTION SECTION IIII: UNEMPLOYED AND PERSONS NOT IN THE LABOUR FORCE AGED 5 YEARS AND ABOVE : UNEMPLOYED AND PERSONS NOT IN THE LABOUR FORCE AGED 5 YEARS AND ABOVE : UNEMPLOYED AND PERSONS NOT IN THE LABOUR FORCE AGED 5 YEARS AND ABOVE : UNEMPLOYED AND PERSONS NOT IN THE LABOUR FORCE AGED 5 YEARS AND ABOVE
HB0i Serial number in HH Roster
Skip Pattern HB1i Name of household member
HB5i Age of household member
I0 Serial Number of person providing data on the Individual
I9 What was the main reason why you did not want to work for pay/gain last week? 10=In school or training 11=Family responsibilities or housework 12=Pregnancy 13=Illness, injury or disability 14=Retired or too old for work 15=Too young to work. 16=No desire to work 17=Off-season 18=Satisfied with Subsistence Agriculture 96=Other reason (specify): _______________________________
10 11 12 13 14 15 16 17 18 96
10 11 12 13 14 15 16 17 18 96
10 11 12 13 14 15 16 17 18 96
10 11 12 13 14 15 16 17 18 96
10 11 12 13 14 15 16 17 18 96
I10 Do you want to work in the future? 1=Yes 2=No
1 2
1 2
1 2
1 2
1 2
All >>J1

Page | 176
SECTION SECTION SECTION SECTION JJJJ: USUAL ACTIVITY STATUS : USUAL ACTIVITY STATUS : USUAL ACTIVITY STATUS : USUAL ACTIVITY STATUS FOR PERSONS FOR PERSONS FOR PERSONS FOR PERSONS AGED 5 YEARS AND ABOVEAGED 5 YEARS AND ABOVEAGED 5 YEARS AND ABOVEAGED 5 YEARS AND ABOVE HB0i Serial number in HH Roster Skip Pattern
HB1i Name of household member
HB5i Age of household member
J0 Serial Number of person providing data on the Individual
PRE J Now I'd like to ask about the income generating activity you spent the most time doing in the past 12 months. This could be work at a job, your own business, a household enterprise, or a farm. It could be work that you still do or work that you have stopped doing.
J1 You have told me that last week you were doing ………, Is it the same task that you spent most time in the past 12 months?
(READ) 1= Main job last week (C1) 2=Second job last week (D1) 3= Other economic activity/work 4=Has never worked at all
1
2
3
4
1
2
3
4
1
2
3
4
1
2
3
4
1
2
3
4
If 1>>SEC K If 2>>SEC K
If 4>>SEC L
J2 What were the main goods or services produced at that
workplace or its main functions? Examples: selling fish, raising cattle, teaching children, caring for the sick
J2B: ISIC Code
J3 What kind of work did you do in your last job/activity? Examples: street trader, subsistence farmer, school teacher, registered nurse, domestic worker, truck driver …
Occupational title:
J4 What were your main tasks or duties in this work? Short description of the main tasks or duties:
J4B: ISCO Code
J5 In this job/activity, were you...? READ 1=Employee (working for pay in cash or in kind) 10
2=An employer (a person who pays one or more people to work for him) 3=An own-account worker (a person running a business with no employees) 4=Helping without pay in a household 5=Members of Producers’ cooperatives 6 =Volunteer(Unpaid workers)
1 2 3 4 5 6
1 2 3 4 5 6
1 2 3 4 5 6
1 2 3 4 5 6
1 2 3 4 5 6
10 Include paid domestic workers, paid workers in household businesses, gardeners, security guards, etc. Payment may be in cash or in kind (eg. Food, accommodation0. This category includes all
employees: part-time, casual worker and piecework.
J2A: Activity description
J4A: Activity description

Page | 177
SECTION SECTION SECTION SECTION KKKK: HEALTH AND SAFETY ISSUES : HEALTH AND SAFETY ISSUES : HEALTH AND SAFETY ISSUES : HEALTH AND SAFETY ISSUES FOR PERSONS AGED 5 YEARS AND ABOVEFOR PERSONS AGED 5 YEARS AND ABOVEFOR PERSONS AGED 5 YEARS AND ABOVEFOR PERSONS AGED 5 YEARS AND ABOVE HB0i Serial number in HH Roster Skip Pattern
HB1i Name of household member
HB5i Age of household member
K0 Serial Number of person providing data on the Individual
K1 Did you have any of the following in the past 12 months because of your work? (Read each of the following options and mark “Yes=1” or “No=2” for all options) 01.Superficial injuries or open wounds 02. Fractures 03. Dislocations, sprains or stains 04. Burns, corrosions, scalds or frostbite 05. Breathing problems. 06. Eye problems. 07. Skin problems 08. Stomach problems / diarrhea 09. Fever. 10. Extreme fatigue 96. Other (specify)……………………………………………………………
1=Yes 2=No
01|..….| 02|…...| 03|…...| 04|…...| 05|…...| 06|…...| 07|…...| 08|…...| 09|…...| 10|…...| 96|…...|
1=Yes 2=No
01|..….| 02|…...| 03|…...| 04|…...| 05|…...| 06|…...| 07|…...| 08|…...| 09|…...| 10|…...| 96|…...|
1=Yes 2=No
01|..….| 02|…...| 03|…...| 04|…...| 05|…...| 06|…...| 07|…...| 08|…...| 09|…...| 10|…...| 96|…...|
1=Yes 2=No
01|..….| 02|…...| 03|…...| 04|…...| 05|…...| 06|…...| 07|…...| 08|…...| 09|…...| 10|…...| 96|…...|
1=Yes 2=No
01|..….| 02|…...| 03|…...| 04|…...| 05|…...| 06|…...| 07|…...| 08|…...| 09|…...| 10|…...| 96|…...|
If 2 in ALL>>K4
K2 Think about your most serious illness/injury, how did this/these affect your work/schooling? 1=Not serious- did not stop work/schooling. 2=Stopped work or school for a short time 3=Stopped work or school completely.
1 2 3
1 2 3
1 2 3
1 2 3
1 2 3
K3a Think about your most serious illness/injury, what were you doing when this happened?
Job/Task description
K3b Enter ISCO CODE
K4 Do you carry heavy loads at work? 1=Yes 2=No
1
2
1
2
1
2
1
2
1
2
K5 Do you operate any machinery/heavy equipment at work? 1=Yes 2=No
1 2
1 2
1 2
1 2
1 2
If 2>>K7

Page | 178
SECTION SECTION SECTION SECTION LLLL: HEALTH AND SAFETY ISSUES : HEALTH AND SAFETY ISSUES : HEALTH AND SAFETY ISSUES : HEALTH AND SAFETY ISSUES FOR PERSONS AGED 5 YEARS AND ABOVEFOR PERSONS AGED 5 YEARS AND ABOVEFOR PERSONS AGED 5 YEARS AND ABOVEFOR PERSONS AGED 5 YEARS AND ABOVE HB0i Serial number in HH Roster Skip Pattern
HB1i Name of household member
HB5i Age of household member
K0 Serial Number of person providing data on the Individual
K6 What type of tools, equipment or machines do you usually use at work? (Write down 2 mostly used) (Refer to Codelist K6 for List of tools, equipment and machines)
1……….
2………
1……….
2………
1……….
2………
1……….
2………
1……….
2………
K7 Are you exposed to any of the following at work? (Read each of the following options and mark “1=YES” or “2=NO” for all options)
01. Dust, fumes,
02. Fire, gas, flames. 03. Loud noise or vibration
04. Snake bite/ insect stringing(poisonous )
05. Dangerous tools (knives etc)
06. Work underground 07. Work at heights
08. Work in water/lake/pond/river
09. Workplace too dark or confined 10. Insufficient ventilation
11. Chemicals (pesticides, glues, etc.)
12. Explosives 96. Other things, processes or conditions bad for your health or safety (specify)…………………………………………………………….
1=Yes 2=No
01|….| 02|….| 03|….| 04|….| 05|….| 06|….| 07|….| 08|….| 09|….| 10|….| 11|….| 12|….| 96|….|
1=Yes 2=No
01|….| 02|….| 03|….| 04|….| 05|….| 06|….| 07|….| 08|….| 09|….| 10|….| 11|….| 12|….| 96|….|
1=Yes 2=No
01|….| 02|….| 03|….| 04|….| 05|….| 06|….| 07|….| 08|….| 09|….| 10|….| 11|….| 12|….| 96|….|
1=Yes 2=No
01|….| 02|….| 03|….| 04|….| 05|….| 06|….| 07|….| 08|….| 09|….| 10|….| 11|….| 12|….| 96|….|
1=Yes 2=No
01|….| 02|….| 03|….| 04|….| 05|….| 06|….| 07|….| 08|….| 09|….| 10|….| 11|….| 12|….| 96|….|
K8 Have you ever been subjected to the following at work? (Read each of the following options and mark “YES” or “NO” for all options)
1. Constantly shouted at 2. Repeatedly insulted 3. Beaten /physically hurt 4. Sexually abused (touched or done things to you that you did
not want) 6. Other (Specify)……………………………………………
1=Yes 2=No
1|….| 2|….| 3|….| 4|….| 6|….|
1=Yes 2=No
1|….| 2|….| 3|….| 4|….| 6|….|
1=Yes 2=No
1|….| 2|….| 3|….| 4|….| 6|….|
1=Yes 2=No
1|….| 2|….| 3|….| 4|….| 6|….|
1=Yes 2=No
1|….| 2|….| 3|….| 4|….| 6|….|
CODELIST K6: Dangerous tools and equipment A. Hand-held manual tools B. Portable Abrasive Wheel Tools C. Powder-Actuated Tools
D. Hand-held power tools E. Pneumatic Tools F. Hydraulic Power Tools
G. Electric Tools: All electric tools H. Liquid Fuel Tools

Page | 179
SECTION SECTION SECTION SECTION LLLL: HOUSEHOLD ACTIVITIES: HOUSEHOLD ACTIVITIES: HOUSEHOLD ACTIVITIES: HOUSEHOLD ACTIVITIES FOR PERSONS AGED 5 YEARS AND ABOVEFOR PERSONS AGED 5 YEARS AND ABOVEFOR PERSONS AGED 5 YEARS AND ABOVEFOR PERSONS AGED 5 YEARS AND ABOVE HB0i Serial number in HH Roster Skip Pattern
HB1i Name of household member
HB5i Age of household member
L0 Serial Number of person providing data on the Individual
L1 During the past week did you do any of the tasks indicated below for this household?(Read each of the following options and mark “YES” or “NO” for all options) 1. Fetching water 2. Fetching firewood 3. Cooking 4. Cleaning utensils/house 5. Washing clothes 6. Caring for children/old/sick 7. Other household tasks.
1=Yes 2=No
1|….| 2|….| 3|….| 4|….| 5|….| 6|….| 7|….|
1=Yes 2=No
1|….| 2|….| 3|….| 4|….| 5|….| 6|….| 7|….|
1=Yes 2=No
1|….| 2|….| 3|….| 4|….| 5|….| 6|….| 7|….|
1=Yes 2=No
1|….| 2|….| 3|….| 4|….| 5|….| 6|….| 7|….|
1=Yes 2=No
1|….| 2|….| 3|….| 4|….| 5|….| 6|….| 7|….|
If any 1>>L2 If 2 in All>>L3
L2 During each day of the past week how many hours did you do such household tasks?(Record for each day separately)
1 .Monday
2. Tuesday
3. Wednesday
4. Thursday
5.Friday
6.Saturday
7.Sunday
L3 [FOR CHILDREN AGED 5-17 YEARS ] Has (NAME) been interviewed in the company of an adult or an older child? 1=Yes 2=No 3=Proxy Interview
1
2
3
1
2
3
1
2
3
1
2
3
1
2
3
L4 INDIVIDUAL INTERVIEW RESULT
1=Completed (fully responding Individual)
2=Partly completed
3=Non-contact
4=Refused
5=Temporarily absent, inadequate informant
1 2 3 4 5
1 2 3 4 5
1 2 3 4 5
1 2 3 4 5
1 2 3 4 5
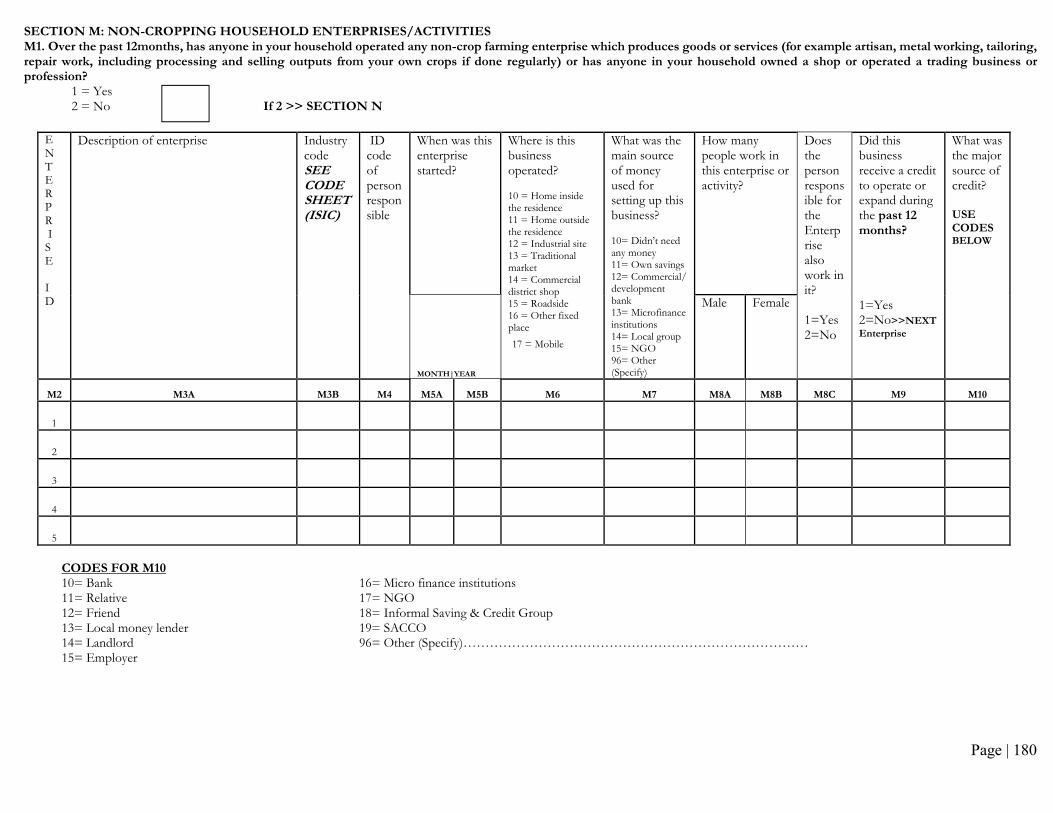
Page | 180
SECTION M: NON-CROPPING HOUSEHOLD ENTERPRISES/ACTIVITIES M1. Over the past 12months, has anyone in your household operated any non-crop farming enterprise which produces goods or services (for example artisan, metal working, tailoring, repair work, including processing and selling outputs from your own crops if done regularly) or has anyone in your household owned a shop or operated a trading business or profession?
1 = Yes 2 = No If 2 >> SECTION N
E N T E R P R I S E I D
Description of enterprise Industry code SEE CODE SHEET (ISIC)
ID code of person responsible
When was this enterprise started?
Where is this business operated? 10 = Home inside the residence 11 = Home outside the residence 12 = Industrial site 13 = Traditional market 14 = Commercial district shop 15 = Roadside 16 = Other fixed place
17 = Mobile
What was the main source of money used for setting up this business? 10= Didn’t need any money 11= Own savings 12= Commercial/ development bank 13= Microfinance institutions 14= Local group 15= NGO 96= Other (Specify)
How many people work in this enterprise or activity?
Does the person responsible for the Enterprise also work in it? 1=Yes 2=No
Did this business receive a credit to operate or expand during the past 12 months?
1=Yes 2=No>>NEXT
Enterprise
What was the major source of credit? USE CODES BELOW
MONTH|YEAR
Male Female
M2 M3A M3B M4 M5A M5B M6 M7 M8A M8B M8C M9 M10
1
2
3
4
5
CODES FOR M10 10= Bank 16= Micro finance institutions 11= Relative 17= NGO 12= Friend 18= Informal Saving & Credit Group 13= Local money lender 19= SACCO 14= Landlord 96= Other (Specify)…………………………………………………………………… 15= Employer

Page | 181
SECTION SECTION SECTION SECTION NNNN: LABOUR OUTFLOWS (All persons aged 14 years and above): LABOUR OUTFLOWS (All persons aged 14 years and above): LABOUR OUTFLOWS (All persons aged 14 years and above): LABOUR OUTFLOWS (All persons aged 14 years and above)
N0. Are there any persons N0. Are there any persons N0. Are there any persons N0. Are there any persons aged 14 years and above who used to be usual members of this household for at least six months, and left the country to live
outside Uganda, since Jan 2011. 1=Yes 2=No if 2>>N21
N0 Person Number
1 2 3 4 5
N1
Could you give me the names of all persons who were members of this
household who left to live abroad since Jan 2011?
Write the names of all persons
N2
What was [NAME’s] residential status before s/he left to live abroad?
1=Usual member
2=Regular Member
1
2
1
2
1
2
1
2
1
2
N3
What is the relationship of (NAME) to the head of household?
1. Spouse
2. Son/Daughter
3. Brother/Sister
4. Nephew/Niece/Cousin
5. Grand child
6. Parent
7. Other relative
8. Not related
9. DK
1
2
3
4
5
6
7
8
9
1
2
3
4
5
6
7
8
9
1
2
3
4
5
6
7
8
9
1
2
3
4
5
6
7
8
9
1
2
3
4
5
6
7
8
9
N4 Is (NAME) male or female
Male……… 1
Female ….. 2
Male……… 1
Female ….. 2
Male……… 1
Female ….. 2
Male……… 1
Female ….. 2
Male……… 1
Female ….. 2
Now, I would like to ask you some questions relating to all persons aged 14 years and above who used to be members of this household for at least six
months, and left the country to live outside Uganda, since Jan 2011. The data will help provide information on the number of persons who left Uganda
and what they are doing outside the country.
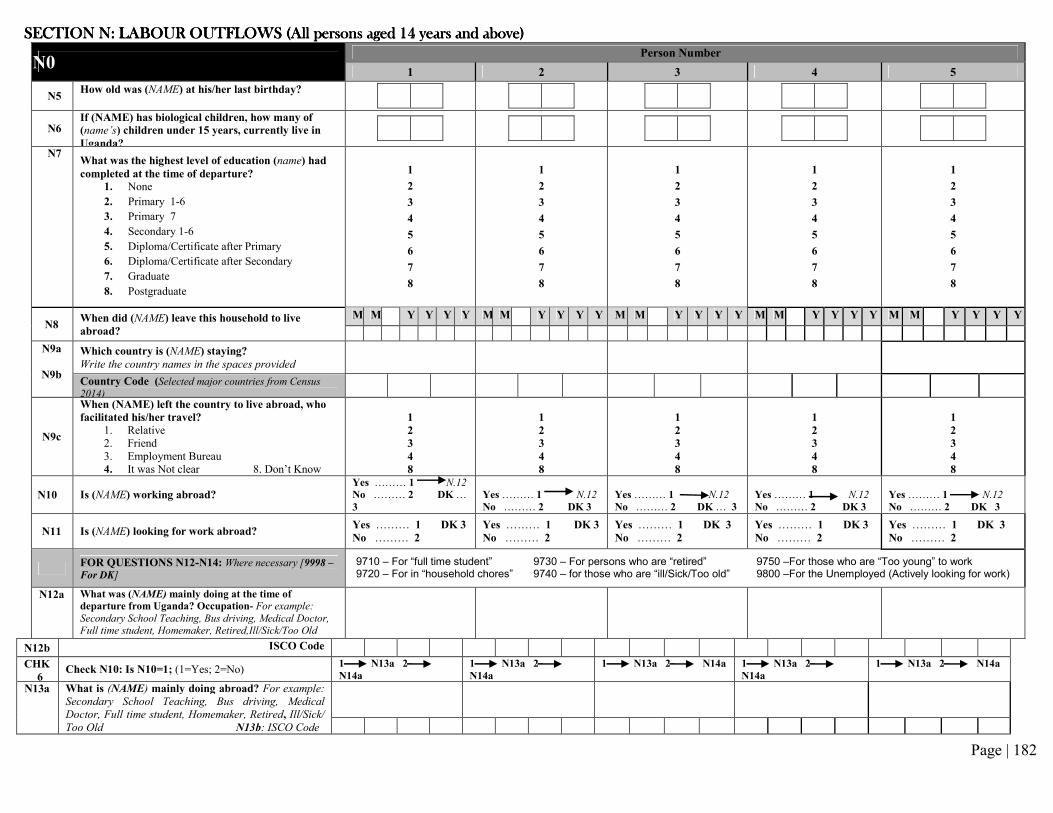
Page | 182
SECTION SECTION SECTION SECTION NNNN: : : : LABOUR OUTFLOWS (All persons aged 14 years and above)LABOUR OUTFLOWS (All persons aged 14 years and above)LABOUR OUTFLOWS (All persons aged 14 years and above)LABOUR OUTFLOWS (All persons aged 14 years and above)
N0 Person Number
1 2 3 4 5
N5 How old was (NAME) at his/her last birthday?
N6 If (NAME) has biological children, how many of
(name’s) children under 15 years, currently live in
Uganda?
N7 What was the highest level of education (name) had
completed at the time of departure?
1. None
2. Primary 1-6
3. Primary 7
4. Secondary 1-6
5. Diploma/Certificate after Primary
6. Diploma/Certificate after Secondary
7. Graduate
8. Postgraduate
1
2
3
4
5
6
7
8
1
2
3
4
5
6
7
8
1
2
3
4
5
6
7
8
1
2
3
4
5
6
7
8
1
2
3
4
5
6
7
8
N8 When did (NAME) leave this household to live
abroad?
M M Y Y Y Y M M Y Y Y Y M M Y Y Y Y M M Y Y Y Y M M Y Y Y Y
N9a
N9b
Which country is (NAME) staying?
Write the country names in the spaces provided Country Code (Selected major countries from Census 2014)
N9c
When (NAME) left the country to live abroad, who
facilitated his/her travel?
1. Relative
2. Friend
3. Employment Bureau
4. It was Not clear 8. Don’t Know
1
2
3
4
8
1
2
3
4
8
1
2
3
4
8
1
2
3
4
8
1
2
3
4
8
N10 Is (NAME) working abroad? Yes ……… 1 N.12
No ……… 2 DK …
3
Yes ……… 1 N.12
No ……… 2 DK 3
Yes ……… 1 N.12
No ……… 2 DK … 3
Yes ……… 1 N.12
No ……… 2 DK 3
Yes ……… 1 N.12
No ……… 2 DK 3
N11 Is (NAME) looking for work abroad?
Yes ……… 1 DK 3
No ……… 2
Yes ……… 1 DK 3
No ……… 2
Yes ……… 1 DK 3
No ……… 2
Yes ……… 1 DK 3
No ……… 2
Yes ……… 1 DK 3
No ……… 2
FOR QUESTIONS N12-N14: Where necessary [9998 – For DK]
N12a
What was (NAME) mainly doing at the time of
departure from Uganda? Occupation- For example:
Secondary School Teaching, Bus driving, Medical Doctor, Full time student, Homemaker, Retired,Ill/Sick/Too Old
N12b ISCO Code
CHK
6 Check N10: Is N10=1; (1=Yes; 2=No)
1 N13a 2
N14a
1 N13a 2
N14a
1 N13a 2 N14a 1 N13a 2
N14a
1 N13a 2 N14a
N13a
What is (NAME) mainly doing abroad? For example:
Secondary School Teaching, Bus driving, Medical
Doctor, Full time student, Homemaker, Retired, Ill/Sick/
Too Old N13b: ISCO Code
9710 – For “full time student” 9720 – For in “household chores”
9730 – For persons who are “retired” 9740 – for those who are “ill/Sick/Too old”
9750 –For those who are “Too young” to work 9800 –For the Unemployed (Actively looking for work)
Page | 183
SECTION SECTION SECTION SECTION NNNN: : : : LABOUR OUTFLOWS (All persons aged 14 years and above)LABOUR OUTFLOWS (All persons aged 14 years and above)LABOUR OUTFLOWS (All persons aged 14 years and above)LABOUR OUTFLOWS (All persons aged 14 years and above)
No Person Number
1 2 3 4 5
N14 Check N11: If code1, then ask then ask What work is
[NAME] looking for abroad? Occupation - For
example: Secondary School Teaching, Bus driving,
Medical Doctor, Full time student, Homemaker,
Retired, Ill/Sick/ Too Old
N14b: ISCO Code
N15
What was the main reason why (name) decided to
go abroad?
1. Job transfer
2. To increase income of the household
3. To gain experience and career advancement
4. Study
5. Poor working conditions in Uganda
6. Family reasons (reunite family, follow spouse,
marriage, etc.)
7. Lack of work opportunities in Uganda
8. Desire to live abroad
9. Don’t Know
10. Other (Specify)…………………………………
1
2
3
4
5
6
7
8
9
10
1
2
3
4
5
6
7
8
9
10
1
2
3
4
5
6
7
8
9
10
1
2
3
4
5
6
7
8
9
10
1
2
3
4
5
6
7
8
9
10 N16 Is (name) planning to return to Uganda on a
permanent basis within the next 12 months?
Yes ……… 1 No ….…… 2 DK …..…… 3
Yes ……… 1 No ….…… 2 DK …..…… 3
Yes ……… 1 No ….…… 2 DK …..…… 3
Yes ……… 1 No ….…… 2 DK …..…… 3
Yes ……… 1 No ….…… 2 DK …..…… 3
N17 Since (name) left, has he/she sent any money or
goods back to this household?
1. Yes, money only
2. Yes, goods only
3. Yes, money and goods
4. No ‘If no, go to next person’
1
2
3
4
1
2
3
4
1
2
3
4
1
2
3
4
1
2
3
4
N18 How often did/has (name) assisted/supported with
money or goods back to the household?
1. Weekly
2. Bi-weekly/twice a month
3. Monthly
4. Quarterly 5. Annually 6. Other (specify)……………………..…
1
2
3
4
5
6
1
2
3
4
5
6
1
2
3
4
5
6
1
2
3
4
5
6
1
2
3
4
5
6
N19
Check N16: If code 2 in question 16, write N/A
During the last 12 months, how much money did
(name) assist/ support the household with? (write
the amount in USD)
N20 Migration Outflow Individual Interview Result
1=Completed (fully responding Individual)
2=Partly completed
3=Non-contact
4=Refused
5=Temporarily absent, inadequate informant
1 2 3 4 5
1 2 3 4 5
1 2 3 4 5
1 2 3 4 5
1 2 3 4 5
N21: END TIME: (HH:MM)

Page | 184
CODEBOOK
APPENDIX 3: CODES FOR THE MAIN REASON FOR STOPPING EDUCATION/TRAINING 10= Completed desired schooling 11= Further schooling not available 12= Too expensive 13= Too far away 14= Had to help at home 15= Had to help with farm work 16= Had to help with family business 17= Poor school quality 18= Parents did not want 19= Not willing to attend further 20= Poor academic progress 21= Sickness or calamity in family 22= Pregnancy 96= Other (specify)
APPENDIX 2: CODES FOR MAIN REASON FOR NEVER STARTING EDUCATION/TRAINING
1= Too expensive 2= Too far away 3= Poor school quality 4= Had to help at home 5= Had to help with farm work 6= Had to help with family business 7= Education not useful 8= Parents did not want 9= Not willing to attend 10= Too young 11= Orphaned 12= Displaced 13= Disabled 14= Insecurity 96= Other (specify)
APPENDIX 5: CODES FOR CURRENT SCHOOLING LEVEL
Attending nursery, kindergarten etc (lower than P.1) TTTTTTTTTT 01
Attending P.1.......TTTTTTTTTTTTTTTTTTTTTTTTT.. 10
Attending P.2........TTTTTTTTTTTTTTTTTTTTTTTTT. 11
Attending P.3.......TTTTTTTTTTTTTTTTTTTTTTTTT.. 12
Attending P.4..TTTTTTTTTTTTTTTTTTTTTTTTTTT. 13
Attending P.5...............................................TTTTTTTTTTTTT..... 14
Attending P.6...............................................TTTTTTTTTTTTT..... 15
Attending P.7...............................................TTTTTTTTTTTTTT.. 16
Attending S.1...............................................TTTTTTTTTTTTTTT 30
Attending S.2...............................................TTTTTTTTTTTTTT.. 31
Attending S.3...............................................TTTTTTTTTTTTTTT. 32
Attending S.4...........TTTTTTTTTTTTTTTTTTTTTTT....... 33
Attending S.5...............................................TTTTTTTTTTTTTT. 34
Attending S.6...............................................TTTTTTTTTTTTTTT 35
Attending post primary/junior specialized training or certificate or diplomaT. . 40
Attending Post secondary Specialized training or diplomaTTTTTTTT 50
Attending Degree and aboveTTTTTTTTTTTTTTTTTTTTT 61
Don't KnowTTTTTTTTTTTTTTTTTTTTTTTTTTTTT 99
APPENDIX 4: CODES FOR HIGHEST LEVEL OF EDUCATION SUCCESSFULLY COMPLETED
NoneTTTTTTTTTTTTTTTTTTTTTTTTTT 09
Some schooling but not Completed P.1TTTTTTTTTTT 10
Completed P.1.......TTTTTTTTTTTTTTTTTTTT 11
Completed P.2........TTTTTTTTTTTTTTTTTTTT 12
Completed P.3.......TTTTTTTTTTTTTTTTTTTT 13
Completed P.4..TTTTTTTTTTTTTTTTTTTTT 14
Completed P.5...............................................TTTTTTTT 15
Completed P.6...............................................TTTTTTTT 16
Completed P.7...............................................TTTTTTT 17
Completed J.1...............................................TTTTTTTT 21
Completed J.2...............................................TTTTTTTT 22
Completed J.3...............................................TTTTTTTT 23
Completed S.1...............................................TTTTTTTT 31
Completed S.2...............................................TTTTTTTT 32
Completed S.3...............................................TTTTTTTT 33
Completed S.4...........TTTTTTTTTTTTTTTTTTT 34
Completed S.5...............................................TTTTTTTT 35
Completed S.6...............................................TTTTTTTT 36
Completed Post primary Specialized training or CertificateTTT 41
Completed Post secondary Specialized training or diplomaTTT 51
Completed Degree and aboveTTTTTTTTTTTTTTTTTTTTTTTTTT
61
Don't KnowTTTTTTTTTTTTTTTTTTTTTTTT 99

Page | 185
APPENDIX 6: CODES FOR FIELD OF
SPECIALISATION
09 = General Education 10 =Health Sciences 11= Life & Biological Sciences 12 =Animal Sciences 13=Physical/Natural Sciences 14= Sport Sciences 15= Engineering 16 =Social Sciences & History 17 =Agriculture 18= Computer & Information Sciences 19 =Arts 20 =Food sciences 21= Business Studies 22 =Mathematics 23 =Economics 24 =Demography and Population 25 =Community and Development studies 26= Languages & Literature 27 =Education 28 =Gender Studies 29 =Psychology 30 =Sociology 31 =Special Needs Education 32= Peace and conflict studies 33= Law & Legal Studies 34 =Visual & Performing Arts 35 =Commerce 36 =Procurement and Supply Mgt 37 =Administration and Human Resource 38 =Communications and Journalism 40 =Philosophy & Religion 41 =Architecture & Physical Planning 42 =Home Economics 43 =Library and Archives Sciences 44 =Tourism and hospitality 45 =Statistics 46 =Ethnic Studies 96 =Other specifyTTTTTTTTTT.
APPENDIX 7: District Codes
Central Region Eastern Region Northern Region Western Region
Code District Code District Code District Code District
101 KALANGALA 201 BUGIRI 301 ADJUMANI 401 BUNDIBUGYO
102 KAMPALA 202 BUSIA 302 APAC 402 BUSHENYI
103 KIBOGA 203 IGANGA 303 ARUA 403 HOIMA
104 LUWERO 204 JINJA 304 GULU 404 KABALE
105 MASAKA 205 KAMULI 305 KITGUM 405 KABAROLE
106 MPIGI 206 KAPCHORWA 306 KOTIDO 406 KASESE
107 MUBENDE 207 KATAKWI 307 LIRA 407 KIBAALE
108 MUKONO 208 KUMI 308 MOROTO 408 KISORO
109 NAKASONGOLA 209 MBALE 309 MOYO 409 MASINDI
110 RAKAI 210 PALLISA 310 NEBBI 410 MBARARA
111 SEMBABULE 211 SOROTI 311 NAKAPIRIPIRIT 411 NTUNGAMO
112 KAYUNGA 212 TORORO 312 PADER 412 RUKUNGIRI
113 WAKISO 213 KABERAMAIDO 313 YUMBE 413 KAMWENGE
114 LYANTONDE 214 MAYUGE 314 ABIM 414 KANUNGU
115 MITYANA 215 SIRONKO 315 AMOLATAR 415 KYENJOJO
116 NAKASEKE 216 AMURIA 316 AMURU 416 BULIISA
117 BUIKWE 217 BUDAKA 317 DOKOLO 417 IBANDA
118 BUKOMASIMBI 218 BUDUDA 318 KAABONG 418 ISINGIRO
119 BUTAMBALA 219 BUKEDEA 319 KOBOKO 419 KIRUHURA
120 BUVUMA 220 BUKWO 320 MARACHA 420 BUHWEJU
121 GOMBA 221 BUTALEJA 321 OYAM 421 KIRYANDONGO
122 KALUNGU 222 KALIRO 322 AGAGO 422 KYEGEGWA
123 KYANKWANZI 223 MANAFWA 323 ALEBTONG 423 LWENGO
224 NAMUTUMBA 324 AMUDAT 424 MITOOMA
225 BULAMBULI 325 KOLE 425 NTOROKO
226 BUYENDE 326 LAMWO 426 RUBIRIZI
227 KIBUKU 327 NAPAK 427 SHEEMA
228 KWEEN 328 NWOYA 428 KAGADI
229 LUUKA 329 OTUKE 429 KAKUMIRO
230 NAMAYINGO 330 ZOMBO 430 RUBANDA
231 NGORA 331 OMORO
232 SERERE
OUTSIDE UGANDA 501

Page | 186
APPENDIX 1: AGE/BIRTH-DATE CONSISTENCY CHART
Current age
Has not had birthday in
2016
Has already had birthday
in 2016
Current age
Has not had birthday in
2016
Has already had birthday
in 2016
0 2015 47 1968 1969
1 2014 2015 48 1967 1968
2 2013 2014 49 1966 1967
3 2012 2013 50 1965 1966
4 2011 2012 51 1964 1965
5 2010 2011 52 1963 1964
6 2009 2010 53 1962 1963
7 2008 2009 54 1961 1962
8 2007 2008 55 1960 1961
9 2006 2007 56 1959 1960
10 2005 2006 57 1958 1959
11 2004 2005 58 1957 1958
12 2003 2004 59 1956 1957
13 2002 2003 60 1955 1956
14 2001 2002 61 1954 1955
15 2000 2001 62 1953 1954
16 1999 2000 63 1952 1953
17 1998 1999 64 1951 1952
18 1997 1998 65 1950 1951
19 1996 1997 66 1949 1950
20 1995 1996 67 1948 1949
21 1994 1995 68 1947 1948
22 1993 1994 69 1946 1947
23 1992 1993 70 1945 1946
24 1991 1992 71 1944 1945
25 1990 1991 72 1943 1944
26 1989 1990 73 1942 1943
27 1988 1989 74 1941 1942
28 1987 1988 75 1940 1941
29 1986 1987 76 1939 1940
30 1985 1986 77 1938 1939
31 1984 1985 78 1937 1938
32 1983 1984 79 1936 1937
33 1982 1983 80 1935 1936
34 1981 1982 81 1934 1935
35 1980 1981 82 1933 1934
36 1979 1980 83 1932 1933
37 1978 1979 84 1931 1932
38 1977 1978 85 1930 1931
39 1976 1977 86 1929 1930
40 1975 1976 87 1928 1929
41 1974 1975 88 1927 1928
42 1973 1974 89 1926 1927
43 1972 1973 90 1925 1926
44 1971 1972 91 1924 1925
45 1970 1971 92 1923 1924
46 1969 1970 93 1922 1923

List of Contributors to the Survey
Uganda Bureau of Statistics Management
Ben Paul Mungyereza, Executive Director Imelda Magdalene Atai, Deputy Executive Director/Statistical Production & Development (SPD) Vitus Mulindwa Kato, Deputy Executive Director/Corporate Services Andrew Mukulu, Director Population and Social Statistics (Former) Helen Namirembe Nviiri, Director Population and Social Statistics
Report Authors Wilson Nyegenye, Principal Statistician Michael Ogen Sijje, Senior Statistician Dorcas Nabukwasi Halango, Senior Statistician Diana Byanjeru, Senior Statistician George William Mukasa, Senior Statistician Simon Kyewalyanga, Statistician Sharon Apio, Statistician Report Reviewers Imelda Magdalene Atai, Deputy Executive Director/SPD Helen Namirembe Nviiri, Director Population and Social Statistics Ronald Ssombwe, Principal Statistician Alfred Geresom Musamali, Senior Officer for Editing Data Analysis Simon Kyewalyanga, Statistician Michael Ogen Sijje, Senior Statistician Sampling Vincent Fred Ssennono, Principal Statistician Michael Ogen Sijje, Senior Statistician GIS Specialist Charles Adriku, Senior GIS Officer Design and Type Setting Deogracious Mutyaba, IT Officer Michael Ogen Sijje, Senior Statistician Statistical support Dan Wagidoso, Statistical Assistant Racheal Musulube, Statistical Assistant Charles Tebandeke, Statistical Assistant IT Support/Programming Kayondo Francis, IT Officer Ariko Haron, IT Officer Mugula Lawrence, IT Officer Asasira Caroline, IT Officer
Field Supervisors
Name Sex
Kavuma Patrick M
Birungi Sarah F
Ntambi Brian Jovan M
Oketcho Richard Oketcho
M
Adong Jovia F
Driwaru Maurine F
Okia Xavier M
Agaba B Catherine F
Kyomuhangi Annet F
Field Interviewers
Name Sex Name
Binen Alfred M Ahurira Faith
EletuEkwau Samuel Amiri
M Ainomugisha Annita Agaba
Isabirye Joel M Aluonzi Martin
Isomet Francis M Amulen Prossy
Kasalirwe Francis M Atuhairwe Mercy
Kisuule Evelyn F Draru Holda
Makonje Grace F Kiiza Innocent Byabashaija
Muyonga Musa M Kyomuhendo Carolyne
Nassiwa Josephine Patience
F Muno Ceaser
Nyadoi Faith Lydia F Okoromit Simon
Obuya Patrick M Opifeni Faith
Ojiambo Milton M Sendagire Ivan
Olwala Nelson M Wadero Mourice
Sekite Kizito M
Field Listers Name
Abigaba Victoria
Abuo Molly
Abutanula Joel
Ashat Grace
Bako Dorcas
Isomet Francis
Isout Julius
Khasalamwa Doreen
Kiconco Emilly
Matua Samson
Mayende Anthony
Mugera Herman
Mukas Joseph
Muyingo Samuel
Okello Daniel
Oscar David Wambogo
Otim Jackson Oyugi
Tusabe Ritah
Related Documents