www.nuigalway.ie/cisc CISC Working Paper No.8 October 2003 National Innovation Systems and Entrepreneurship Dr. Willie Golden 1 Eoin Higgins 2 Soo Hee Lee 3 1 Centre for Innovation & Structural Change, National University of Ireland, Galway, Ireland. [email protected] 2 Centre for Innovation & Structural Change, National University of Ireland, Galway, Ireland. [email protected] 3 [email protected]

Welcome message from author
This document is posted to help you gain knowledge. Please leave a comment to let me know what you think about it! Share it to your friends and learn new things together.
Transcript

www.nuigalway.ie/cisc
CISC Working Paper No.8 October 2003
National Innovation Systems and Entrepreneurship
Dr. Willie Golden1
Eoin Higgins 2 Soo Hee Lee3
1 Centre for Innovation & Structural Change, National University of Ireland, Galway, Ireland. [email protected] 2 Centre for Innovation & Structural Change, National University of Ireland, Galway, Ireland. [email protected] 3 [email protected]

Abstract:
Porter (1990) argues that the future battles for competitiveness will not be fought just between organisations but also between nations. Looking at the nation as the unit of analysis, one way to become more competitive is to be innovative. Nelson (1993) directly addresses the innovativeness of nations using the concept of National Systems of Innovation (NSI). These are defined as “a set of institutions whose interactions determine the innovative performance…….of national firms” (Nelson, 1993). The main premise of this concept is that innovation is central to competitiveness, and the key driver of innovation is knowledge, “the most fundamental resource in the modern economy” (Lundvall, 1992). NSI serve to stimulate the creation of knowledge. In the process they also stimulate economies, essentially taking on the role of a modern national production system.
In tandem with NSI is the concept of entrepreneurship, which “involves identifying and exploiting opportunities in the external environment” (Hitt et al. 2000), such as the opportunity to commercialise innovation. Given that National Systems of Innovation seek to foster innovation, and entrepreneurship has innovation as a central component, this paper proposes that the existence of a NSI should promote entrepreneurship within an economy. To date, academic research to support this conclusion has been lacking. As a result, this paper offers a preliminary investigation into the relationship between the strength of the national system of innovation within an economy and the level of entrepreneurship occurring within that economy.
Keywords: National Systems of Innovation; Entrepreneurship;

1. INTRODUCTION
National Systems of Innovation are responsible for innovation primarily through the
creation and application of new knowledge. During this process, NSI have the
positive side effect of stimulating economic growth, and often show potential as
national production systems. The main economic stimulus is the application of new
knowledge, i.e. the commercialisation of innovation, or, as it is better known,
entrepreneurship. This paper proposes that the existence of an NSI should promote
entrepreneurship in an economy.
To accomplish this, a three-country comparative case study was undertaken. For each
country, the strength of the NSI was estimated by examining elements of economic
activity critical to NSI. Levels of entrepreneurial activity were measured using criteria
provided by a number of OECD studies (2000, 2001, 2002, 2002b). A number of
analytical frameworks (Guillen and Suarez, 2001, Peng and Lee, 2002) were then
applied to the results of the case studies to determine any correspondence between the
factors involved.
From the evidence available, it is difficult to draw any correlation between NSI and
entrepreneurship. However, this study has taken an initial step towards defining a
framework for analysis of National Systems of Innovation that may be built upon to
define a more detailed and elaborate research method.
2. LITERATURE REVIEW
2.1 National Systems of Innovation
Using National Systems of Innovation (NSI) as a means of explaining the competitive
advantage of nations is relatively new, having only appeared in the last two decades.
Coming from a practical rather than a theoretical background and based on research
into social and economic occurrences, it appears to provide a guideline for economic
success in the current information age.

Regarding economic success in the previous century, the predominant ideology was
based upon the Fordist mass production model (production models are
microeconomic concepts for managing industrial organisations, competition and
relations, but also assist with macroeconomic industrial regulation (Boyer and Durant,
1993, p. 7), in effect graduating from industrial production models to national
production models). Delivering the maximum number of standardised products while
incurring minimum production costs, Fordism was “compatible with the
macroeconomic dynamics of the post-war period” (Boyer and Durant, 1993, p. 3).
However, as the economic climate changed Fordism could no longer cope, and “by
the 1980’s almost all its elements appeared to be hampering competitiveness” (Boyer
and Durant, 1993, pp. 12-19). Meanwhile, the Japanese economy, with its emphasis
on flexible specialisation and research and development (R&D), was extremely
successful, prompting the realisation that “qualitative factors affecting the national
systems had to be taken into account as well as the purely quantitative ones”
(Freeman, 1995) in order to account for the unsatisfactory results that the linear
production model was providing. Freeman accomplished this in his book
“Technology Policy and Economic Performance: Lessons from Japan” (Freeman,
1987), where, according to Kern (2000), he “identified several major elements in the
Japanese system of innovation to which its economic and innovative success could be
attributed”. It was also within this work that he introduced the phrase “National
System of Innovation”.
Lundvall (1992) went into more detail in his book “National Systems of Innovation”.
His perspective was based on two assumptions, that “the most fundamental resource
in the modern economy is knowledge, and, accordingly, that the most important
process is learning” and that learning “is a social process which cannot be understood
without taking into consideration its institutional and social context” (Lundvall, 1992,
p. 1). Through analysis into the theoretical framework and institutional elements
involved in NSI he determined that national systems of innovation are “constituted by
elements and relationships which interact in the production diffusion and use of new,
and economically useful, knowledge and that a national system encompasses elements
and relationships, either located within or rooted inside the borders of a nation state”
(Lundvall, 1992, p. 2).

The most significant factors of such a system are the relationships mentioned.
Occurring between the actors and institutions within a system, they create
heterogeneous economic environments, the implication being that there is no single
best way of stimulating an economy using the National System of Innovation. There
are, however, common elements to each NSI that can be treated in a similar manner
despite national differences.
2.2 Entrepreneurship
There is a problem with the common perception of entrepreneurship, as it is thought
to be solely concerned with the creation of new ventures by adventurous capitalists.
This is somewhat limiting. Drucker (1985, p. 23), expanding Schumpeter’s (1949, p.
268) assertion that “when we speak of the entrepreneur we do not mean so much a
physical person as we do a function”, describes entrepreneurship as being a
“behaviour rather than a personality trait”. These definitions allow for the full scope
of actions that can easily be considered entrepreneurial. It is important to make this
distinction between perception and definition, as studies of entrepreneurial activity are
often limited to examinations of the rate of new firm creation within an economy,
which while important, also suggests limits to the extent of entrepreneurial influence
on the condition of the economy that fall far short of reality. For example, the OECD
directorate for Science, Technology and Industry (OECD 2002b, p. 3) informs us that
entrepreneurial failure is a considerable boon to economic success as “this dynamism
in firm turnover (i.e. entry and exit) reflect the ability of countries to expand the
boundaries of economic activity, shift resources and adjust the structure of production
to meet customers’ changing needs”. Regardless of success or failure, the overall
result when judging the significance of entrepreneurship within an economy is that
“increases in entrepreneurial activity tends to result in higher subsequent growth rates
and a reduction of unemployment” (OECD 2002b, p. 3).
The OECD SME Outlook (2000, p. 42) informs us that “entrepreneurship is
frequently associated with the process of business start-ups and business creation” and
that “de-novo entrants are nearly always small”. Also, as SME’s make up 60% to
70% of employment in most OECD countries (OECD, 1998, p. 3), their significance
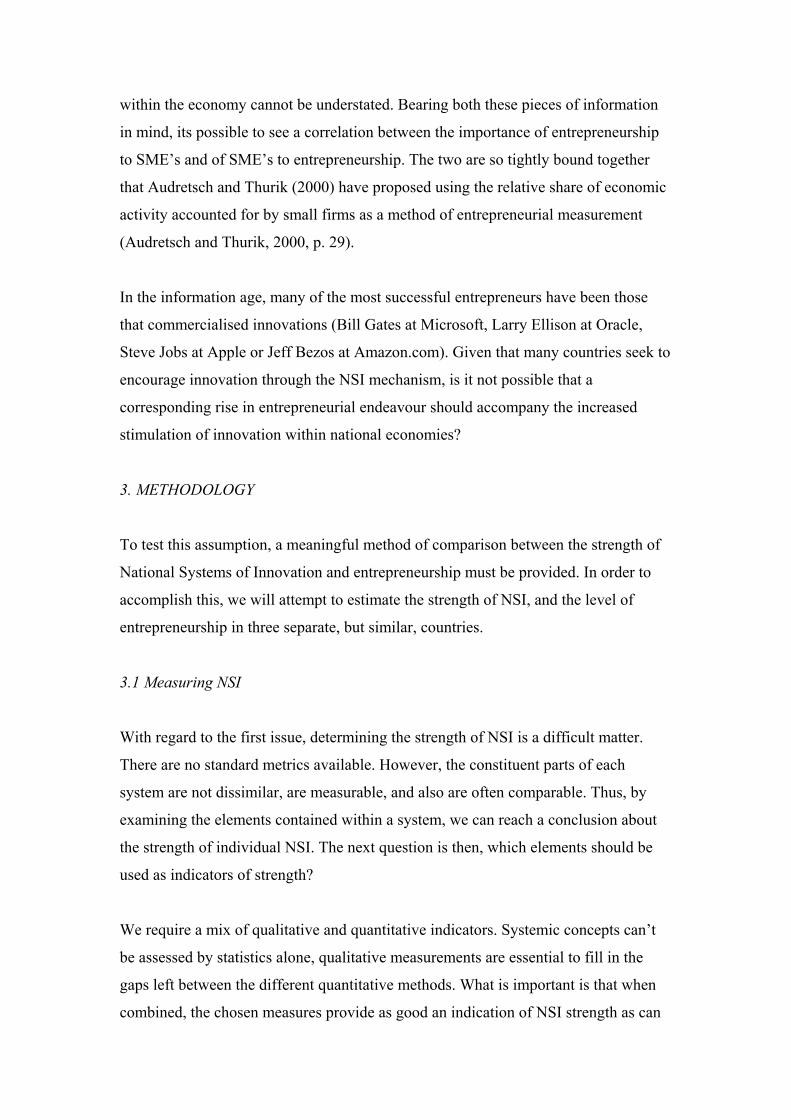
within the economy cannot be understated. Bearing both these pieces of information
in mind, its possible to see a correlation between the importance of entrepreneurship
to SME’s and of SME’s to entrepreneurship. The two are so tightly bound together
that Audretsch and Thurik (2000) have proposed using the relative share of economic
activity accounted for by small firms as a method of entrepreneurial measurement
(Audretsch and Thurik, 2000, p. 29).
In the information age, many of the most successful entrepreneurs have been those
that commercialised innovations (Bill Gates at Microsoft, Larry Ellison at Oracle,
Steve Jobs at Apple or Jeff Bezos at Amazon.com). Given that many countries seek to
encourage innovation through the NSI mechanism, is it not possible that a
corresponding rise in entrepreneurial endeavour should accompany the increased
stimulation of innovation within national economies?
3. METHODOLOGY
To test this assumption, a meaningful method of comparison between the strength of
National Systems of Innovation and entrepreneurship must be provided. In order to
accomplish this, we will attempt to estimate the strength of NSI, and the level of
entrepreneurship in three separate, but similar, countries.
3.1 Measuring NSI
With regard to the first issue, determining the strength of NSI is a difficult matter.
There are no standard metrics available. However, the constituent parts of each
system are not dissimilar, are measurable, and also are often comparable. Thus, by
examining the elements contained within a system, we can reach a conclusion about
the strength of individual NSI. The next question is then, which elements should be
used as indicators of strength?
We require a mix of qualitative and quantitative indicators. Systemic concepts can’t
be assessed by statistics alone, qualitative measurements are essential to fill in the
gaps left between the different quantitative methods. What is important is that when
combined, the chosen measures provide as good an indication of NSI strength as can

be provided. The indicators chosen combine to provide a holistic picture of the state
of an NSI, and are listed below:
Innovation. Despite the fact that it is an individual measurement, production
of innovations is the ultimate goal of NSI and so it must be included. To
estimate the level of innovation being produced, we will follow OECD
directions. Typically, input measures are concerned with expenditure on
innovation while outputs are considered to be at least one technically new or
improved product or process from a firm (OECD 2002, A.11). We will also
include the amount of patents applied for from the European Patent Office and
the production of scientific publications as evidence of the production of
innovations.
Knowledge Flows. They can be viewed as the lifeblood of the system. The
creation and diffusion of knowledge throughout the system is required in order
to aid in the creation of further knowledge from the stock currently available.
This touches upon all elements within the system. To analyse this will require
an examination of statistics concerning R&D, human resource aspects,
linkages between institutions and the technical balance of payments.
Policies. Policy cannot be measured statistically but are vital to our estimation
of the NSI as a process. Also, policies provide an insight into what
governmental priorities are and how governments attempt to dictate
institutional behaviour to guide the system. Implicit in reviewing policy is the
concept of path dependency, as policy can be viewed as the steps governments
take to guide an economy from one position to another. As NSI are a relatively
new concept, it is best only to look at recent policy implementations that
directly affect constituent elements of the individual national systems of
innovation.
Industrial Clusters. In the NSI context, clusters allow us to view the
functionality of the system in operation. Encompassing institutional
mechanisms, the production of knowledge, knowledge flow and diffusion,
path dependency (including the breaking of any dependency) and innovation,
the cluster view provides an example of the NSI elements in concert. There is
no universal agreement on direct measurements of cluster productivity.
Analysis of clusters in each country will be qualitative, focussing on the
existence, purpose and apparent success of clusters rather than their adherence
to theoretical models (as not all identifiable clusters in each country adhere to
the definitions provided by theoretical models).
3.2 Measuring Entrepreneurship
It is widely acknowledged that measuring entrepreneurship is a difficult task, given
the limitations of measurement instruments (Audretsch and Thurik; OECD 2000b).
As a result, measurements adopted by this paper will draw on previous work by the
OECD (2000, 2001b, 2002, 2002b) that provides guidance for assessment of, and
statistical information about, entrepreneurial activity in national economies, and will
include statistics about the percentage of self-employed people in an economy (where
available), the share of SME’s among the total firms in the economy and also the
productivity of these firms as a percentage of total productivity. Much
entrepreneurship is associated with SME’s, a healthy SME population should have
positive correlations with levels of entrepreneurship.
The purpose of entrepreneurial policy is best described as being an attempt to instil a
culture of entrepreneurship within a nation. Successful entrepreneurial cultures
encourage people to attempt to create new ventures and don’t seek to punish failure.
With this in mind, a number of policy areas regarding firm entry and exit to markets,
and access to venture capital will be examined. This includes regulations concerning
institutional investors (I refer to investments by pension funds, insurance companies
and other institutions that provide large amounts of venture capital), and procedures
for firm entry and exit into markets (easy entry and exit encourage entrepreneurship).
4.0 RESULTS
4.1 Ireland
Knowledge Flow
Although Irish R&D is low, its significance within the economy is increasing. R&D
intensity (business enterprise sector R&D expenditure as a percentage of domestic
product of industry) has risen from 0.8 per cent in 1991, to 1.34 per cent in 1997. This

represents an average annual growth rate of approximately 17 per cent for the period
1991 to 1997, third highest among recorded OECD countries.
Ireland compares very poorly to other OECD nations when it comes to independent
research financed by government or higher education facilities. Research amounting
to 0.09% of GDP is funded by the government and higher education does work
equivalent to 0.26% GDP.
In the area of human resources and knowledge creation, the percentage of scientists
and engineers employed as a percentage of the work force in Ireland is very high
(17.3%). Regarding internationalization, Ireland’s inward share of FDI as a
percentage of GDP is 1.77%, which is above average for EU states.
Innovation
Irelands expenditure on innovation falls below the European average in both
manufacturing and services, being 3.3 % (EU average is 3.7%) and 2.1% (EU average
is 2.8%) respectively. However, innovation statistics are high, with 73% of
manufacturing firms and 71% of services firms are producing innovations.
Patent applications from Ireland to the European Patent Office are very low,
averaging a share of less than 0.15% of applications annually. Although the patent
application figures are low, it is worth bearing in mind that there are a significant
number of other nations producing similar numbers. The average is distorted by the
disproportionate amount of applications from larger countries like Germany, France,
the United States and Japan.
Scientific publications, at 0.3% of all OECD scientific publications, or 401 articles
per million population, are slightly below the EU average.
Clusters
According to a report by the Irish Spatial Planning Unit (SPU, 2000, p. 56) “clusters
of multinational software companies have successfully developed in Dublin, Galway,
Limerick and Cork” with major IT hardware multinationals also springing up in the

same regions. This is related to the supply of qualified staff available, as all the cities
mentioned contain a number of third level institutions.
Green et al (2001, p. 51) provide more information on the structure of the Irish ICT
clusters, “the electronics sector continues to be dominated by large multinational
companies – with significant technology and skills transfer – employment in software
products and services is more evenly divided between overseas and Irish companies,
which consist mainly of small and medium sized enterprises”.
Policy
Irish NSI policy has been built upon, and is still heavily dependent on, the strategy of
encouraging Foreign Direct Investment. An institutional structure is in place to
accomplish this. The Industrial Development Agency (IDA) is “in charge of
promoting foreign investment through some of the most attractive incentive packages
in Europe” (Guillen and Suarez, 2001, p. 359), and Enterprise Ireland (EI) is
responsible for promoting growth in indigenous industry through support for R&D,
the commercialisation of innovations and maintaining the feedback/flow of
knowledge from industry to research organisations.
THE NETHERLANDS
Knowledge Flows
Dutch expenditure on R&D is approximately 2% of GDP, which is in the top half of
OECD countries measured. Although the percentage of firms funding government
research is very high (18.4%), less than 12% have an actual co-operative agreement
with the government.
One third of the Dutch labour force is employed in the science and technology sector.
Foreign Direct Investment plays an important part in the Netherlands. As home to a
number of multinational firms that invest extensively abroad, outward direct
investment flows (constantly increasing throughout the 1990’s) are significantly
higher than inward flows, making the Netherlands a net exporter of innovation,

Innovation
Spending on innovation in the Dutch manufacturing sector was at 3.8% of total sales
in 1998. This is over twice the service sector expenditure on innovation (1.6%). These
figures are not exceptional though, as the manufacturing expenditure is just above the
EU average, while spending in the service sector is just below.
75% of manufacturing firms introduced a new product or process to the market
between 1994 and 1996. A very high figure, this ranked third in OECD measurements
over that time period. In the services sector, over 55% of firms have introduced
innovations to the market a reasonably high proportion of innovative firms.
The share of EPO applications coming from the Netherlands is very high (2.8% -
2367 applications), and they also have one of the highest percentages of scientific
publications in the OECD (2.7%).
Clusters
The concept of knowledge clusters have been a focus of the Dutch governmental
approach since the mid 1990’s, in an attempt to “improve the Dutch economy’s
knowledge intensity to guarantee long term competitiveness in the international
context” (Kern, 2000, p. 14). Crucial to this policy was “co-operation between firms
and the knowledge infrastructure” (Kern, 2000, p. 14). Hampering the goals of cluster
policy was a lack of seed capital for new ventures throughout the 1990’s and a lack of
entrepreneurship among the domestic population (Kern, 2000).
Policy
1979 saw the beginnings of the Dutch system of innovation, as governmental policy
changed focus from linear innovation development to one that emphasised
“reinforcement of innovation activities with industry and R&D institutes and a better
allocation and use of existing technological knowledge” (Kern, 2000, p. 9). This
prompted the government to set up institutions for the transfer of knowledge from
universities to industry, showing early understanding of the importance of diffusion in
the innovation process. However, it has not all been success, as Den Hertog, Maltha
and Brouwer (2001, p. 146) imply that the Dutch government could do more to help

the functioning of clusters and could also play a greater role as leading technology
procurer.
FINLAND
Knowledge Flows
Finnish business R&D doubled to 3.4% throughout the 1990’s. Finland also spent the
largest share of GDP on ICT R&D in the manufacturing sector in 1999 (1.08%). Non-
industry R&D is particularly strong in Finland ranking second in OECD research for
1999. Government and higher educational facilities spent 0.99% of GDP on research
Of the R&D done by the Finnish government, 14% of the research is paid for by
Finnish industry. Over 38% of Finnish firms have co-operative arrangements with
government, (an extremely high amount). However, Finnish industry sponsored a
very small proportion of the higher educational research (4.7%). Links between
industry and Finnish third level institutions are quite weak.
The share of scientists and engineers among the employed population is very high
(7.6%), representing a small subset of the high share of labour force employed in the
science and technology industry (29.9%).
Inward flows of foreign investment are quite low (0.05% GDP) and exceeded by
outflows of 0.08% GDP.
Innovation
Spending on innovation amounts to approximately 4% of total sales in the
manufacturing sector and 2.4% of sales in the services sector. 54% of firms in the
manufacturing sector brought new innovations to the market and 40% of firms in the
service sector doing likewise.
Finland’s patent applications account for1% of applications to the EPO, which is
good in relation to population size. Scientific publications of Finnish origin seem to
share this rule of moderation, being below average in absolute figures, but high in
terms of population size.

Clusters
According to Paija (2001, p. 20) the ICT cluster is oriented towards
telecommunications, having both service and manufacturing sectors as key industries
and surrounding these key industries with complementary supporting industries (e.g.
education and R&D). However, the Finnish ICT cluster is overly dependant on Nokia
to supply its core strength, proven in her statement that “Nokia has acted as an
effective catalyst and forerunner in creating ‘new generation’ relationships” (Paija,
2001, p. 35)
Policy
The historical structure of the Finnish ICT industry encouraged government policy to
recognise and encourage innovation, thus providing a strong basis for current policies
in the national system of innovation. Paija (2001) points to the Finnish government as
having assumed the role of facilitator and co-ordinator in the national system of
innovation. Schienstock and Hamalainen (2001, p. 44) reinforce this by describing the
Science and Technology Policy Council of Finland as the “dominant coordination
mechanism” within the innovation system.
ENTREPRENEURSHIP DATA
Ireland
Ireland is above the OECD average in entrepreneurship measures, having 11% of the
adult population engaged in start-ups and 12.9% self-employed (OECD, 2002b, p.
25).
SME’s make up 99.4% of the total number of firms in Ireland, slightly below the
European average of 99.8% (OECD, 2000, p. 135), though growth of small firms is
outstripping that of large (8.1% relative to 7.5%).
Firm entry in Ireland is not a particularly difficult matter. Setting up a corporation in
Ireland cost 650 ECU’s, took a maximum of four weeks using three services and
involving only six procedures (OECD, 2000, p. 99).

Venture capital funding from institutions is below the EU average (60%) in Ireland
(OECD, 2002b). Banks and insurance companies account for 25% while pension
funds make up 20%, not a very liberal market.
Also, firm exit appears to be a disincentive in Ireland. Creditors have claims on
bankrupt firms assets for up to twelve years (OECD, 2001b, p. 107).
The Netherlands
Just above 6% of the Dutch population are engaged in start-ups, with only 10% are
registered as being self-employed.
SME activity in the Netherlands is very healthy, accounting for 99.5% of firms (EU
average is 99.8%). Firm entry in the Netherlands is more difficult than in Ireland or
Finland. The formalities involved in establishing a corporation are more inconvenient.
It takes up to twelve weeks, costs 1400 ECU’s (more than both Ireland and Finland)
and while you only have to use one service, there’s at least seven different procedures
to go through (OECD, 2002b, p. 99). There are also significant administrative
regulatory barriers to entrepreneurship (OECD, 2002b, p. 100). Venture capital
funding does not appear to have been liberalised in the Netherlands. Banks and
insurance companies are the primary source of capital, supplying approximately 65%
of the market, with pension funds supplying less than 10%.
Firm exit is not a disincentive however, as the Netherlands only makes bankrupt firms
liable to creditors for three years (OECD, 2001b, p. 107),
Finland
SME activity is high in Finland, accounting for 99% of firms in the Finnish sectors of
manufacturing, utilities and services. Firm entry to markets is not difficult. It costs
1050 ECU’s to form a corporation, and takes a maximum of six weeks. There is only
one service to use, but a minimum of seven procedures to perform before
incorporation is guaranteed. However, regulatory barriers to entrepreneurship are
reasonably high, with significant amount of administrative burdens on start-ups and a
large amount of regulatory and administrative opacity (OECD, 2001b, p. 101

Banks and insurance companies supply a large percentage of venture capital (30%
from pension funds and 40% from banks and insurance companies) (OECD, 2002b, p.
15) and Finnish law regulates that creditors have claims on bankrupt firms assets for
up to ten years (OECD, 2001b, p. 107)
5. DISCUSSION
It is possible to represent the measurements of the four NSI indicators with the
following table, where Finland, Holland and Ireland are each represented by the
abbreviations Fi, Nl and Irl respectively.
Strong Average Weak
Knowledge Flow Nl, Fi Irl
Innovation Nl Irl, Fi
Clusters Fi Nl Irl
Policies Nl, Fi Irl
The Irish NSI is considered to have weak knowledge flows resulting from low levels
of R&D, poor diffusion of knowledge and a heavy dependence on FDI. The amount
of innovation occurring appears high, but is not backed by significant expenditure or
academic results, earning an average rating. Though Irish clusters are currently
productive, their dependence on foreign firms as focal points is too high causing
severe doubts about their independence, strength and potential longevity and so
earning a weak rating. Finally, Irish policies are moving in the right direction, but still
emphasise FDI as the main stimulus, weakening the NSI and resulting in an average
rating on this scale. Overall, the Irish NSI must be considered weak until the
dependence on foreign investment is overcome.
The Dutch NSI is in much better condition. Extensive knowledge flows garner the
highest rating on this scale. A high degree of innovations, both industrial and
academic results in the Innovation indicator also being considered strong. Though
policies encourage Dutch firms to cluster, the implementation of the policy is

questioned, leaving the Cluster indicator with an average rating. Some policy
implementations are questionable, but overall Dutch policy in relation to NSI is
nothing if not progressive. In all returning a strong rating for the Dutch policy
indicator.
Finland’s NSI appears to be equal to that of Holland’s according to our indicators.
Though innovation levels are moderate, knowledge flows in the Finnish system are
excellent as is the productivity of Finnish clusters and the guidance of Finnish
governmental policy – all of which is reflected in the indicators related to each topic.
As with the Netherlands, the Finnish NSI must be considered to be very strong.
Entrepreneurial activity in these countries does not appear to be as successful as NSI.
The overall impression of Irish entrepreneurial endeavour is that it is average. While
self-employment and start-up businesses are in evidence, venture capital funding is
not very strong and regulations regarding firm exit of markets act as a disincentive to
new ventures, however, firm entry is relatively easy in Ireland.
Dutch entrepreneurship does not look any better. The SME population is quite strong,
but regulation hampers firm entry to markets and access to capital is poor. This
appears to be a weak entrepreneurial system producing weak entrepreneurial
endeavour.
Finland’s SME activity is high, and firm entry to markets is not difficult. However,
regulation of entry and exit could be perceived as stifling and access to capital is not
great. Overall, Finnish entrepreneurial indicators merit an average rating.
Strong Average Weak
Entrepreneurship Fi, Irl Nl
On direct examination there appears to be little correlation between the strength of a
National System of Innovation and entrepreneurship levels. Holland has a strong NSI
overall, but shows weak entrepreneurship levels, Finland also has a strong NSI, but
only shows average entrepreneurship levels. Ireland has a weak NSI but shows

average levels of entrepreneurship. No conclusions can be drawn about the
relationships between National Systems of Innovation and Entrepreneurship.
Entrepreneurship
Strong Average Weak
NSI Nl, Fi Fi, Irl Irl Nl
Guillen and Suarez (2001) described a broad framework for country comparison at
institutional level that we will adopt here. Removing the indicators for innovation and
clusters we are left with Knowledge Flows (the representation of institutional
functionality) and Policies (the definition for institutional functionality) against which
we shall compare the entrepreneurship results.
Entrepreneurial Endeavour
Knowledge Flow &
Policy
Strong Weak
Strong Fi Nl
Weak Irl
Reflecting the initial examination of our indicators, this further examination using
only institutional indicators proves inconclusive. There is no apparent correlation
between the institutional indicators and the level of entrepreneurial activity
represented by the entrepreneurship indicators.
Peng and Lee (2002), in their paper presented to the Academy of Management
Annual Conference, suggest the “real options” policy perspective as a framework
under which to examine the level of entrepreneurial endeavour in a country. Their
paper encourages governments to maximize the variance between policies, creating a
policy bundle that maximise positive gains while minimising negative losses. They
suggest a number of policy domains that can be seen as such a bundle. Using some of
these domains as comparative material, it may be possible to make a connection
between some of the policy issues arising in both the NSI policy indicators and the

policy discussions on each countries entrepreneurial activity and the entrepreneurial
activity statistics themselves.
Policy Domains
Maximise Upside
Gains
1. Government policies toward reducing industry entry
barriers will encourage entrepreneurship
development by facilitating new entries by start-up
firms and enhancing the competitiveness of
incumbent firms.
2. Strong enforcement of antitrust regulations will
encourage entrepreneurship development by
encouraging competition, maximizing variance, and
increasing upside gains for an industry.
3. Government deregulation policies will encourage
entrepreneurship development by facilitating new
entries by start-up firms and enhancing the
competitiveness of incumbent firms.
Curtail Downside
Losses
1. Enacting and enforcing entrepreneur-friendly
bankruptcy legislations, which ease the exit process
for bankrupt business owners, will encourage
entrepreneurship development by curtailing the
downside risk of entrepreneurs.
2. Moving away from traditional industrial targeting
and protection will encourage entrepreneurship
development by curtailing the downside risk
associated with failing firms and industries and
enhancing the option value of the bundle of a
country’s entrepreneurial assets.
According to the policy data collected in both the NSI and entrepreneurship data
sections, the Irish government offer a policy bundle that contains the initial three

points that are suggested to help maximise upside gains (adherence to point two is
implied in point three, and market deregulation is a lynchpin of Irish competitive
strategy) and one of the policies that should help curb downside losses (deregulation
implies that traditional industrial protectionism is now out of favour in Ireland).
However, as was mentioned in the entrepreneurship policy section, Irish bankruptcy
legislation is a disincentive to the creation of new ventures.
Similarly, policy in the Netherlands follows four of the five dictates from Peng and
Lee (2002) that are associated with our set of countries. In this case, the high barrier
to entry is the only dissimilar policy in comparison to the proposals mentioned.
Finland’s policy structure is similar to Irelands, given the low barrier to entry and
high barrier to exit. The decentralised telecommunications system suggests that
antitrust and deregulation have played a small part in Finnish industry.
Examining the three countries policies under the guidance of Peng and Lee’s (2002)
real options framework does not shed any new light on the relationship between the
countries policy efforts and entrepreneurial rewards. Ireland and Finland have almost
identical policy set-ups, but reap different entrepreneurial gains. Holland has some
significant differences with Ireland (regarding barriers of entry and exit to markets)
and yet has a similar entrepreneurial performance.
6. Conclusion
The purpose of this paper is to investigate any potential relationship between the
concept of national systems of innovation and entrepreneurial endeavour. To
accomplish this, we have provided background information on NSI and determined a
novel method of comparative analysis. This has resulted in an original and
informative contribution to the literature, extending Freeman’s national descriptions
by attempting direct comparisons between countries, providing a new model of
analysis for national systems of innovation, and also a potential model of comparative
analysis between NSI and entrepreneurship. These models have potential for further
use, albeit with an increased focal specificity. This paper has further contributed to the
literature by highlighting some of the flaws of current economic measurements in
areas relating to both national systems of innovation and entrepreneurship. Future

studies in the area would benefit by narrowing the focal points of the comparison and
also changing the direction of the study slightly towards a more policy based bias, as
it appears that the most important areas of study were related to the policies
implemented in different countries. Though the results were inconclusive, the thesis
remains valid and worthy of further examination so that the relationship between NSI
and entrepreneurial endeavour can be fully determined.

Bibliography:
Audretsch, D. and Thurik, R. (2000), “Linking Entrepreneurship to Growth”, STI
Working Paper Series, OECD, Paris.
http;//www.oecd.org/dsti/sti/prod/sti_wp.htm
Boyer, R. and Durand, J. (1993), “After Fordism”, Macmillan Business, London.
Den Hertog, P., Maltha, S., Brouwer, E. (2001), “Innovation in an Adolescent Cluster:
The Dutch Multimedia Cluster”, in OECD (2001), Innovative Clusters, Drivers of
National Innovation Systems, Paris.
Drucker, P. (1985), “Innovation and Entrepreneurship”, Butterworth-Heinemann Ltd,
Oxford.
Freeman, C. (1987), “Technology Policy and Economic Performance; Lessons from
Japan”, Pinter, London.
Freeman, C. (1995), “The ‘National System of Innovation’ in historical perspective”,
Cambridge Journal of Economics, 19, 5-24.
Green, R., Cunningham, J., Duggan, I., Giblin, M., Moroney, M., Smyth, L. (2001),
“The Boundaryless Cluster: Information and Communications Technology in Ireland”
in OECD (2001), Innovative Clusters, Drivers of National Innovation Systems, Paris.
Guillen, M.F. and Suarez, S.L. (2001), “Developing the Internet: entrepreneurship and
public policy in Ireland, Singapore, Argentina, and Spain”, Telecommunications
Policy 25 (2001) 349-371.
Hitt, M., et al., Strategic Entrepreneurship: Entrepreneurial Strategies for Wealth
Creation. Strategic Management Journal, 2000. 22: p. 479-491
Kern, S. (2000), “Dutch Innovation Policies for the Networked Economy: a new
approach?”, TNO Strategy, Technology and Policy, Delft, Holland.
Lundvall, B-A, (1992), “National Systems of Innovation”, Pinter, London.
Nelson, R. (1993), “National Innovation Systems”, Oxford University Press, New
York.
OECD, (1997), “National Innovation Systems”, Paris, France.
OECD, (1998), “Small Businesses, Job Creation and Growth: Facts, Obstacles and
Best Practices”, Paris.
OECD, (2000), “OECD Small and Medium Enterprise Outlook”, Paris.
OECD, (2001), “Innovative Clusters: Drivers of National Innovation Systems”, Paris,
France.
OECD, (2001b), “Drivers of Growth: Information Technology, Innovation and
Entrepreneurship”, Paris.
OECD, (2002), “Science, Technology and Innovation Scoreboard”, Paris.
OECD, (2002b), “Benchmarking: Fostering Firms Creation and Entrepreneurship”,
Paris.
Paija, L. (2001), “The ICT Cluster: the engine of knowledge driven growth in
Finland”, in OECD (2001), Innovative Clusters, Drivers of National Innovation
Systems, Paris.
Peng, M. and Lee, S. (2002), “Governments, Entrepreneurs, and Positive
Externalities: A Real Options Perspective”, presented to the Academy of Management
Annual Conference, Denver, Colorado, USA, 9-14 August 2002.
Porter, M. (1990), “The Competitive Advantage of Nations”, Harvard Business
Review, Vol. 68, Issue 2, pp. 73-94.

SPU, (2000), “Report On Information Technology Infrastructure”, Spatial Planning
Unit, Department of the Environment & Local Government, Ireland, November 2000.
Schienstock, G. Hamalainen, T, (2001), “Transformation of the Finnish Innovation
System: A Networked Approach”, Sitra, Helsinki, www.sitra.fi.
Schumpeter, J. (1949), “Economic Theory and Entrepreneurial History”, in History of
Management Thought: Entrepreneurship, 1998, Ashgate, Dartmouth.

About CISC
The Centre for Innovation & Structural Change (CISC) is a multidisciplinary research centre which undertakes programmes of research and research training related to the innovation processes and policies that underpin the knowledge-based economy and society. CISC is based at NUI Galway is partnered with DCU Business School and the Michael Smurfit Graduate School of Business at UCD, with other national and international collaborative arrangements. The origins and consequences of innovation and technological change can be interrogated at many levels, and interpreted from different perspectives. Thus, CISC’s research is interdisciplinary and its structure collaborative. The complexity of innovation and structural change motivates CISC’s disciplinary openness and methodological diversity within the community of scholarship. Participants include economists, geographers, management scientists, as well as specialists in industrial relations, human resource management, and information systems. Research at CISC is structured into five priority research areas: Systems of innovation. Industry clustering Internationally traded services Inter-organisational systems High performance work systems
CISC Working Papers Series CISC Working Papers represent work in progress by CISC personnel and their co-authors, and as such, do not represent final conclusions. It is requested to check with authors before quotation. Working papers are available online from our web site (see below) Contact Details For further information, please visit www.nuigalway.ie/cisc or contact:
Angela Sice Development Officer [email protected] Tel: +353 (0)91 512363
Dr Aidan Kane Director [email protected] Tel: +353 (0)91 512362

Related Documents