NATIONAL GRID Market Evolution in Ireland APEX 2004 Annual Conference Ann Scully Manager, Market Operations ESB National Grid

NATIONAL GRID Market Evolution in Ireland APEX 2004 Annual Conference Ann Scully Manager, Market Operations ESB National Grid.
Dec 23, 2015
Welcome message from author
This document is posted to help you gain knowledge. Please leave a comment to let me know what you think about it! Share it to your friends and learn new things together.
Transcript

NATIONAL GRID
Market Evolution in Ireland
APEX 2004 Annual Conference
Ann Scully
Manager, Market OperationsESB National Grid
NATIONAL GRID
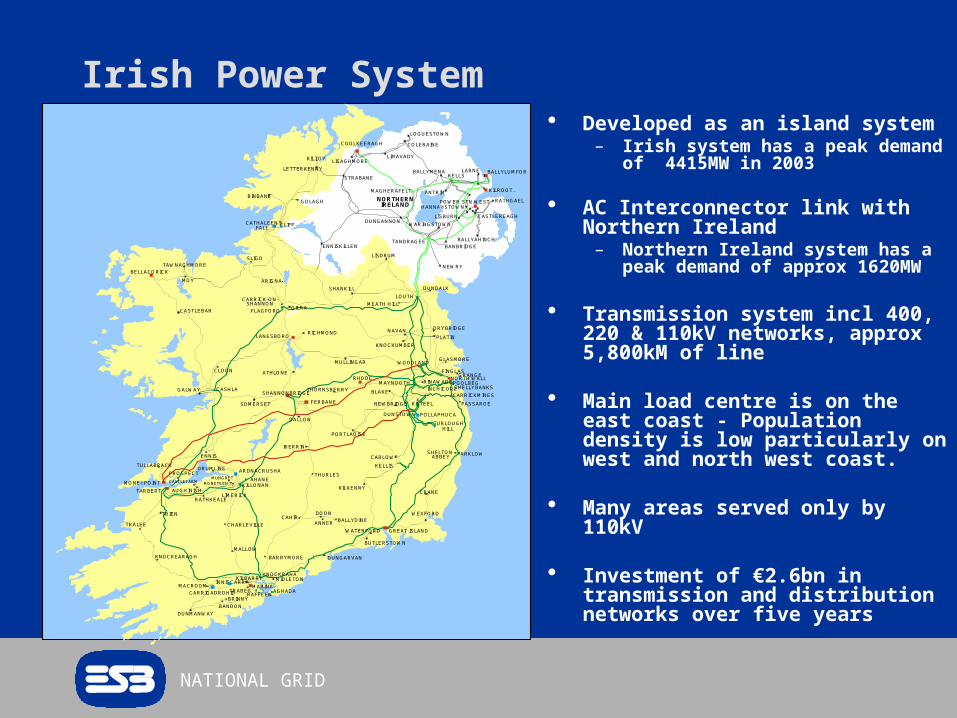
Irish Power System Developed as an island system
– Irish system has a peak demand of 4415MW in 2003
AC Interconnector link with Northern Ireland
– Northern Ireland system has a peak demand of approx 1620MW
Transmission system incl 400, 220 & 110kV networks, approx 5,800kM of line
Main load centre is on the east coast - Population density is low particularly on west and north west coast.
Many areas served only by 110kV
Investment of €2.6bn in transmission and distribution networks over five years
NORTHERNIRELAND
TARBERT
DUNMANWAY
RAFFEEN
CARRICK-ON-SHANNON
TURLOUGHHILL
CARRICKMINES
FASSAROE
MOY
TAWNAGHMORE
CAHIR
CLOON
GILRA
BLAKE
WOODLAND
MUNGRET
LIMERICK
BUTLERSTOWN
WATERFORD
FLAGFORD
GALWAY
GRANGEFINGLAS
INCHICORE
NORTH WALLPOOLBEGSHELLYBANKS
MAYNOOTH
CARLOWSHELTON
ABBEY
DUNSTOWN
KILTEELNEWBRIDGE
ANNER
BANDON
MACROOM
CARRIGADROHID
KILBARRYINNISCARRA
TRABEGMARINA
TRALEE
MONETEEN
RATHKEALE
CASTLEFARM
AUGHINISH
DRUMLINE
ENNIS
MONEYPOINT
TULLABRACK
DALLOW
PORTLAOISE
KILKENNY
IKERRIN
KILTOY
LETTERKENNY
STRABANE
BELLACORICK
LOUTH
SHANKILL
NAVAN
KNOCKUMBER
MULLINGAR
ATHLONE
LANESBORO
KNOCKRAHA
RINAWADE
CATHALEEN'SFALL
ENNISKILLEN
CLIFF
SLIGO
DUNGARVAN
CASTLEBAR
RICHMONDPLATIN
GLASMORE
ARKLOW
CRANE
WEXFORD
THURLES
DOONBALLYDINE
GREAT ISLAND
BARRYMORE
MALLOW
KNOCKEARAGH
KILLONAN
BRINNY
TANDRAGEE
LISDRUM
DUNDALK
FERBANE
SHANNONBRIDGECASHLA
MIDLETON
CHARLEVILLE
POLLAPHUCA
AHANE
DRYBRIDGE
RHODE
PROSPECT
TRIEN
AGHADA
ARDNACRUSHA
SOMERSET
BINBANE
ARIGNA
GOLAGH
MEATH HILL
THORNSBERRY
KELLIS
BANBRIDGE
NEWRY
BALLYAHINCH
WARINGSTOWN
MAGHERAFELT
DUNGANNON
ANTRIM
LOGUESTOWN
COLERAINE
LIMAVADY
COOLKEERAGH
LISAGHMORE
BALLYMENAKELLS
LARNE BALLYLUMFOR
KILROOT.
RATHGAEL
CASTLEREAGH
POWER STN WESTHANNAHSTOWN
LISBURN
NATIONAL GRID
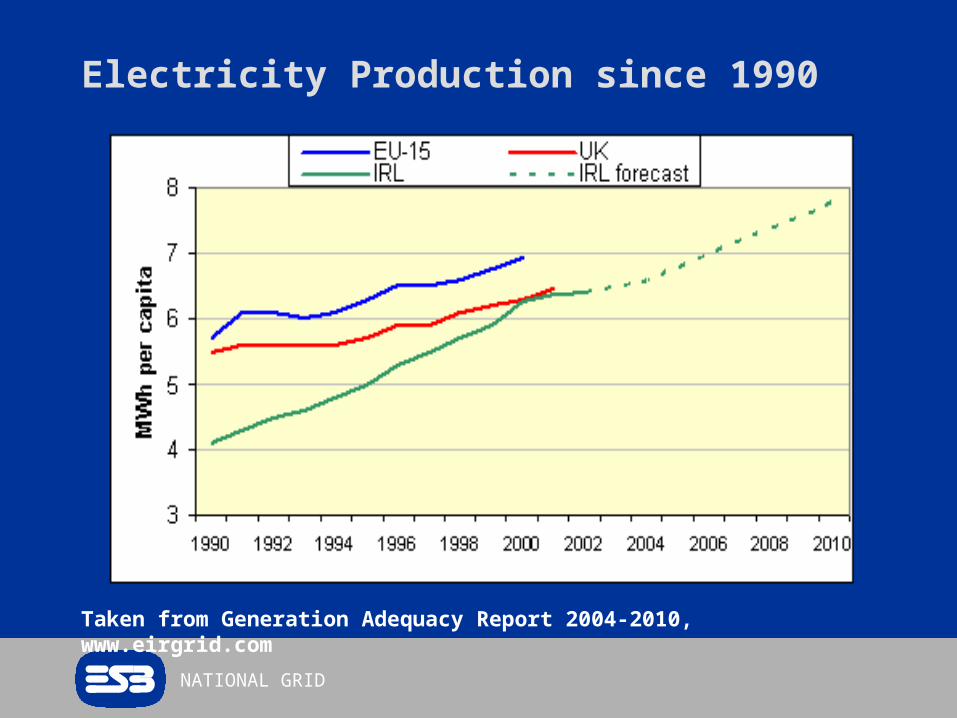
Electricity Production since 1990
Taken from Generation Adequacy Report 2004-2010, www.eirgrid.com
NATIONAL GRID
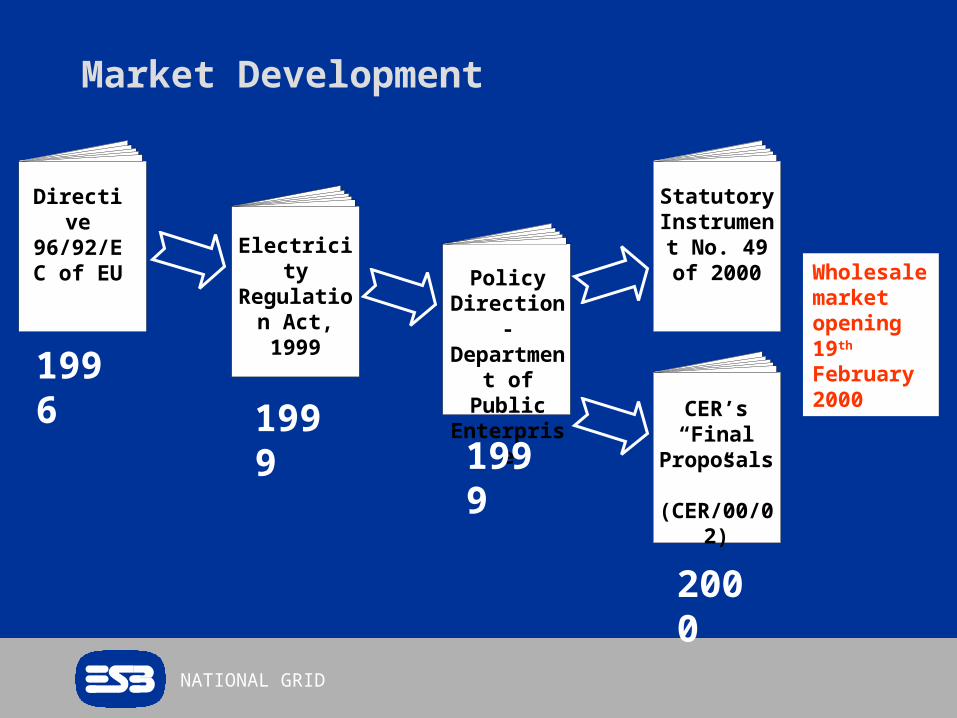
Market Development
Policy Direction -
Department of Public
EnterpriseCER’s “Final
Proposals” (CER/00/02)
Statutory Instrument No. 49 of
2000
Directive 96/92/EC
of EU Electricity Regulation Act, 1999
1996
19991999
2000
Wholesale market opening 19th February 2000
NATIONAL GRID
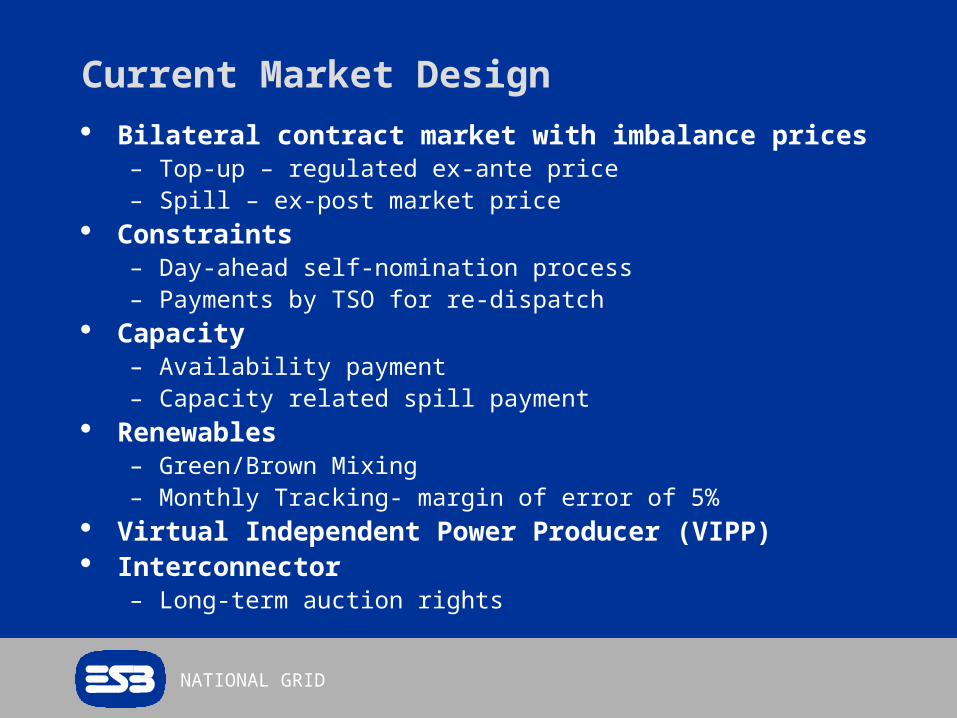
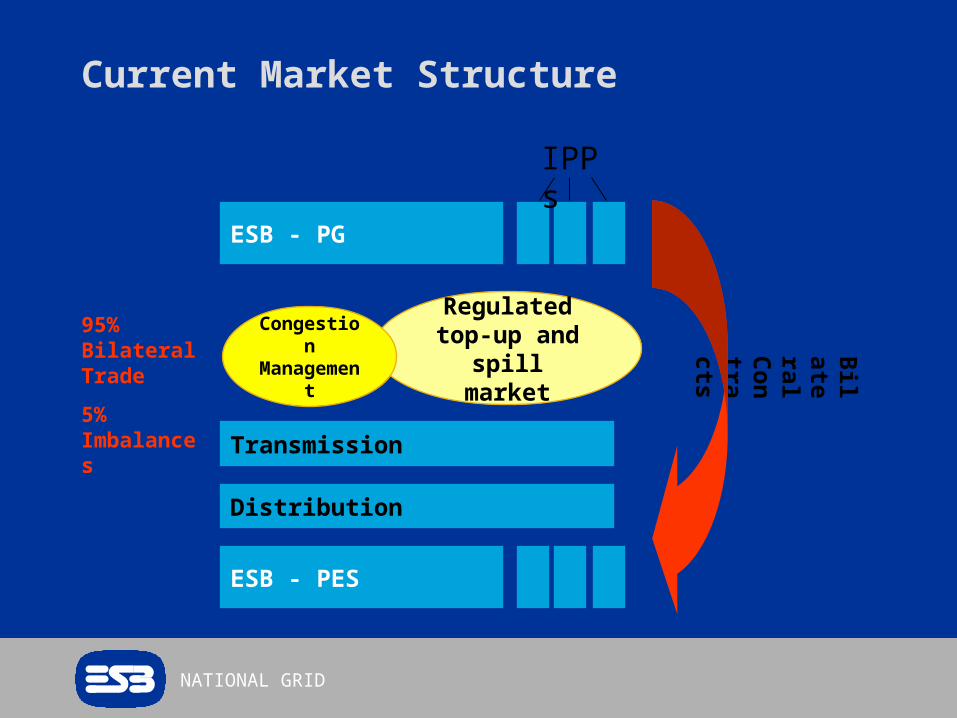
Current Market Design
Bilateral contract market with imbalance prices– Top-up – regulated ex-ante price – Spill – ex-post market price
Constraints– Day-ahead self-nomination process– Payments by TSO for re-dispatch
Capacity – Availability payment– Capacity related spill payment
Renewables– Green/Brown Mixing– Monthly Tracking- margin of error of 5%
Virtual Independent Power Producer (VIPP) Interconnector
– Long-term auction rights
NATIONAL GRID
Current Market Structure
ESB - PES
Distribution
ESB - PG
Transmission
Regulated top-up and spill
market
Congestion Managemen
t
Bila
teral C
on
tracts
95% Bilateral Trade
5% Imbalances
IPPs

NATIONAL GRID
New Participants
0
1
2
3
4
5
6
7
8
9
1999 2000 2001 2002 2003 2004
Number of Suppliers joining market Number of Generators joining market
2000- 28% of market open
2002- 40% of market open
2004- 56% of market open
Full retail opening on 19th February 2005

NATIONAL GRID
Price Setting for Apr-June 2004
679
542 538
468
353
249 245
190165
145 13499 83 78 65 62 58 57 51 43 30 27
5 20
100
200
300
400
500
600
700
TB3 MP3 AD1 PB3 MP2 PBC PB2 MP1 MRT GI3 AT1 AT4 PB1 NW5 AP5 AT2 GI2 NW4 HNC ED1 DB1 TP1 GI1 None
99% of time spill price is set by single player

NATIONAL GRID
Increases in Wind Capacity
0100200300400500600700800900
10001
99
2
19
93
19
94
19
95
19
96
19
97
19
98
19
99
20
00
20
01
20
02
20
03
20
04
20
05
20
06
20
07
20
08
20
09
20
10
Year
MW
NATIONAL GRID
Developments since 2000
Market Rules changes
Response to rises in Peak Demand– Winter Peak Demand Reduction Scheme (WPDRS) – 80MW
Interconnector– Superpositioning on North-South Interconnector
– Proposed East-West Interconnector (2 x 500MW)
Electricity Prices– Increase of 40% to end user in the last 4 years
Forecasted Capacity Shortage for 2005 onwards– Peaking plant bought by ESB
– Competition for new generation led by regulator (150MW, 382MW)
NATIONAL GRID
Market Review 2003
Highlighted issues– Dominance (>90% in generation, 60% supply, monopoly in
transmission and distribution)– Lack of liquidity and transparency in price– Spill price 99% of time set by dominant player– Constraints payments
New Market Design proposed by regulator – ‘MAE’– Locational Marginal Pricing with Financial Transmission
Rights– No capacity payments– Re-bidding up to real-time– Self commitment
NATIONAL GRID
MAE – Under Review
June 2004 - Decision to review MAE
ESBNG response to CER questionnaire - How would a Gross
Pool design work in Republic? – Simple, single price, gross pool
– Unconstrained unit commitment
– Minimal change to existing systems
– Does not increase barriers to all-island market
August 2004 – All-Island Context– Policy statement by Ministers in Northern Ireland and Republic
– Memorandum of Agreement signed by Regulators
– Agreement to harmonise the trading arrangements

NATIONAL GRID
All-Island Energy Market
Joint consultation process on All Island Framework
ESBNG response:
– Development programme should:
– Include feasible timetable with key interim goals
– Contain a workable and efficient project implementation structure
Key priorities:
– Harmonise trading arrangements
– Connection policy & transmission tariffs
An all-island market should provide for a competitive, sustainable and reliable markets in electricity and natural gas on the Island of Ireland at minimum cost necessary.
All-Island Energy Development Framework, 21 June 2004
NATIONAL GRID
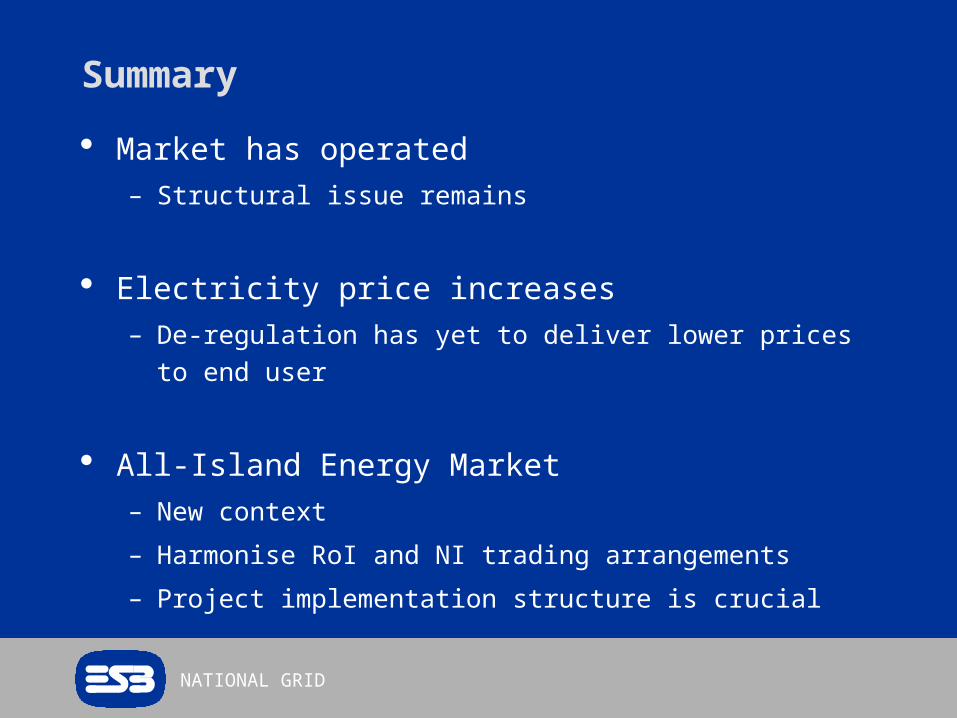
Summary
Market has operated– Structural issue remains
Electricity price increases – De-regulation has yet to deliver lower prices to end user
All-Island Energy Market – New context
– Harmonise RoI and NI trading arrangements
– Project implementation structure is crucial

NATIONAL GRID
New Capacity since 2000
0
100
200
300
400
500
600
700
800
MW
2000 2001 2002 2003 2004 to date
Brown Green CHP
NATIONAL GRID
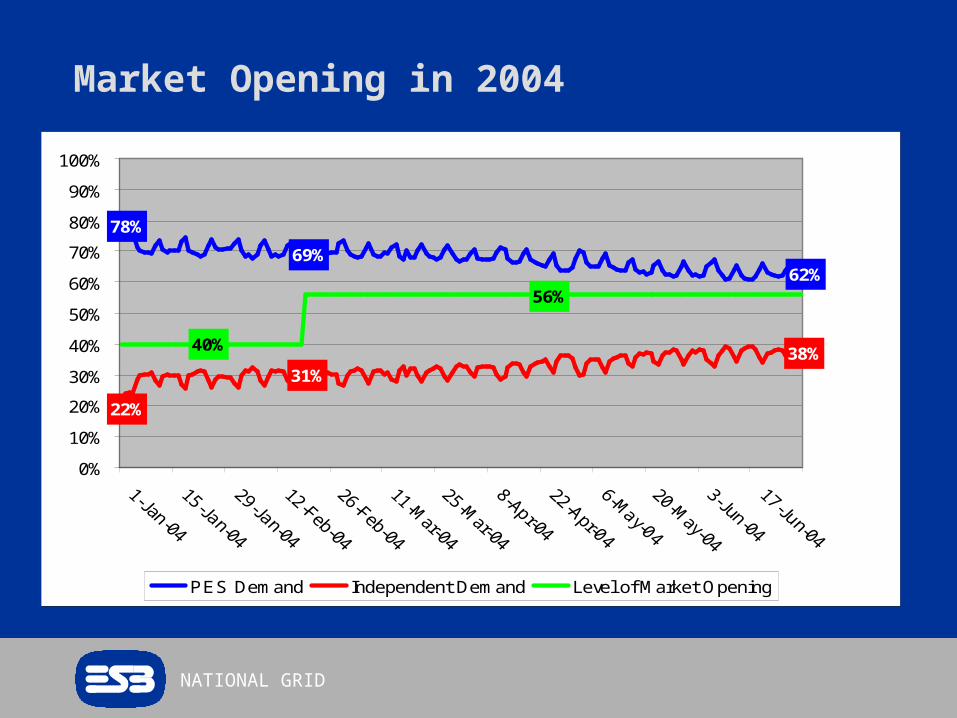
Market Opening in 2004
69%62%
78%
31%
22%
38%40%
56%
0%
10%
20%
30%
40%
50%
60%
70%
80%
90%
100%
PES Demand Independent Demand Level of Market Opening
NATIONAL GRID
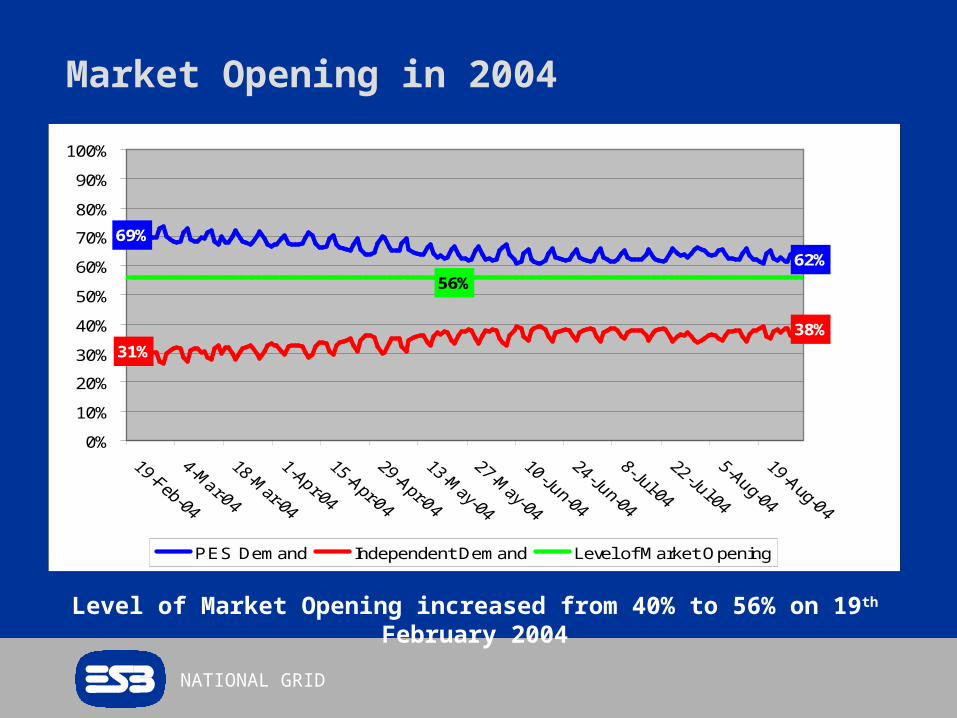
Market Opening in 2004
Level of Market Opening increased from 40% to 56% on 19th February 2004
69%
62%
31%38%
56%
0%
10%
20%
30%
40%
50%
60%
70%
80%
90%
100%
PES Demand Independent Demand Level of Market Opening
Related Documents


![[Smart Grid Market Research] Brazil: The Smart Grid Network, Zpryme Smart Grid Insights, October 2011](https://static.cupdf.com/doc/110x72/577d20871a28ab4e1e931ff6/smart-grid-market-research-brazil-the-smart-grid-network-zpryme-smart-grid.jpg)