CAMPBELL RESEARCH & CONSULTING PTY LTD ACN 073 813 144 ABN 29 073 813 144 SUITE 2, 45 WATKINS STREET, NORTH FITZROY, VICTORIA 3068 PO BOX 441, CLIFTON HILL, VICTORIA 3068 PHONE (03) 9482 4216 FAX (03) 9482 6799 [email protected] A report of two Australian surveys of food businesses across the States and Territories of Australia prepared for The Australia New Zealand Food Authority National Food Handling Benchmark 2000/2001 Report December 2001

Welcome message from author
This document is posted to help you gain knowledge. Please leave a comment to let me know what you think about it! Share it to your friends and learn new things together.
Transcript
CAMPBELL RESEARCH & CONSULTING PTY LTD ACN 073 813 144 ABN 29 073 813 144SUITE 2, 45 WATKINS STREET, NORTH FITZROY, VICTORIA 3068 PO BOX 441, CLIFTON HILL, VICTORIA 3068
PHONE (03) 9482 4216 FAX (03) 9482 6799 [email protected]
A report of two Australian surveys of food businessesacross the States and Territories of Australia
prepared for
The Australia New Zealand Food Authority
National Food Handling Benchmark
2000/2001
Report
December 2001

2000/2001 National Food Safety Report CR&C 0413Australia New Zealand Food Authority
Table of Contents1 Executive Summary .......................................................................................................... i2 Interpretive Summary of Findings ................................................................................... ii
2.1 Telephone (CATI) survey of food businesses ........................................................................... iii2.1.1 Temperature control ........................................................................................................... iii2.1.2 Receiving food ..................................................................................................................... iv2.1.3 Temperature probes............................................................................................................ iv2.1.4 Storing chilled food............................................................................................................. iv2.1.5 Holding hot food................................................................................................................. iv2.1.6 Cooling cooked food .......................................................................................................... iv2.1.7 Protecting food from contamination................................................................................. v2.1.8 Personal hygiene and staff illness....................................................................................... v2.1.9 Cleaning and sanitation........................................................................................................ v2.1.10Washing containers and utensils ........................................................................................ v2.1.11Chemical sanitisers .............................................................................................................. vi2.1.12Staff training and food safety information ...................................................................... vi2.1.13The new Food Safety Standards........................................................................................ vi
2.2 EHO/PHU On-site surveys among food businesses............................................................... vi2.2.1 Temperature control .......................................................................................................... vii2.2.2 Transporting potentially hot hazardous food................................................................ viii2.2.3 Protecting food from contamination.............................................................................. viii2.2.4 Personal hygiene .................................................................................................................. ix2.2.5 Staff illness............................................................................................................................. x2.2.6 Cleaning and sanitising ........................................................................................................ x2.2.7 General assessment of food businesses ............................................................................ x2.2.8 Food recall plans.................................................................................................................. xi2.2.9 Food safety programs ......................................................................................................... xi
2.3 Comparison between the two survey sample groups ............................................................... xi2.3.1 Business type ........................................................................................................................ xi
3 Reading this report......................................................................................................... xii3.1 Acronyms used in this report ..................................................................................................... xiii3.2 References ..................................................................................................................................... xiii
4 Background and Objectives of the Project .......................................................................14.1 Background to the Project ............................................................................................................. 14.2 Objectives of the Project ............................................................................................................... 24.3 Questionnaire development........................................................................................................... 24.4 Pilot ................................................................................................................................................... 3
5 Introduction to the project ............................................................................................... 45.1 Overview .......................................................................................................................................... 4
5.1.1 Telephone surveys................................................................................................................ 4
2000/2001 National Food Safety Report CR&C 0413Australia New Zealand Food Authority
5.1.2 On-site food business surveys ............................................................................................ 45.2 Methodology .................................................................................................................................... 4
5.2.1 Sample selection ................................................................................................................... 45.2.2 ANZFA involvement .......................................................................................................... 65.2.3 Telephone survey methodology ......................................................................................... 65.2.4 Telephone survey response rate results............................................................................. 65.2.5 EHO survey methodology.................................................................................................. 85.2.6 EHO survey response rates ................................................................................................ 95.2.7 Classification of Business Food Safety Risk (low, medium & high)........................... 10
5.3 Sampling error ............................................................................................................................... 11
6 Businesses involved in the National Food Handling Benchmark survey......................126.1.1 Business type ....................................................................................................................... 126.1.2 Manufacturing, processing, catering and transport food businesses .......................... 136.1.3 Food safety business classification................................................................................... 136.1.4 Food supplied off-site........................................................................................................ 146.1.5 Food types ........................................................................................................................... 156.1.6 Providing food to “at risk” consumer groups................................................................ 176.1.7 Location of business .......................................................................................................... 196.1.8 Business size ........................................................................................................................ 226.1.9 Risk classification and business type................................................................................ 246.1.10Type of respondent ............................................................................................................ 26
7 Telephone survey among food businesses .....................................................................277.1 Temperature control ..................................................................................................................... 27
7.1.1 Receiving hot and chilled food......................................................................................... 277.1.2 Thermometers..................................................................................................................... 297.1.3 Temperature check by business classification and business size................................. 307.1.4 Temperature controlled storage ....................................................................................... 357.1.5 Hot holding of food........................................................................................................... 387.1.6 Cooling................................................................................................................................. 407.1.7 Holding food at room temperature ................................................................................. 437.1.8 Ready to eat foods requiring refrigeration ...................................................................... 44
7.2 Protecting food from contamination ......................................................................................... 467.2.1 Food handling ..................................................................................................................... 46
7.3 Personal hygiene and staff illness................................................................................................ 497.3.1 Food handling ..................................................................................................................... 50
7.4 Cleaning and sanitation ................................................................................................................ 517.4.1 Washing containers and utensils ...................................................................................... 517.4.2 Chemical sanitisers ............................................................................................................. 52
7.5 Staff training................................................................................................................................... 547.6 Source of food safety information.............................................................................................. 57
7.6.1 Information about food safety ......................................................................................... 57

2000/2001 National Food Safety Report CR&C 0413Australia New Zealand Food Authority
8 EHO/PHU On-site surveys among food businesses ....................................................628.1 Temperature control ..................................................................................................................... 62
8.1.1 Receiving food .................................................................................................................... 638.1.2 Thermometers and checking temperature of food........................................................ 638.1.3 Checking food temperature .............................................................................................. 668.1.4 Temperature controlled storage of potentially hazardous food .................................. 678.1.5 Cooking potentially hazardous food................................................................................ 698.1.6 Hot holding of potentially hazardous food .................................................................... 708.1.7 Cooling cooked potentially hazardous food to correct temperature .......................... 728.1.8 Reheating cooked and cooled potentially hazardous food........................................... 738.1.9 Display ................................................................................................................................. 748.1.10Transport of potentially hazardous food ........................................................................ 75
8.2 Protecting food from contamination ......................................................................................... 788.2.1 Receiving food and protection from contamination..................................................... 798.2.2 Food storage and protection from contamination ........................................................ 808.2.3 Display and protection from contamination.................................................................. 818.2.4 Processing of food and protection from contamination .............................................. 838.2.5 Transport and protection from contamination.............................................................. 84
8.3 Personal hygiene and staff illness................................................................................................ 858.3.1 Hand washing facilities ...................................................................................................... 858.3.2 Clothing ............................................................................................................................... 908.3.3 Staff sickness policies......................................................................................................... 91
8.4 Cleaning and sanitising ................................................................................................................. 928.4.1 Commercial dishwashers ................................................................................................... 928.4.2 Domestic dishwashers ....................................................................................................... 938.4.3 Glass washers ...................................................................................................................... 948.4.4 Chemical sanitisers ............................................................................................................. 948.4.5 Manually sanitising using hot water ................................................................................. 95
8.5 General assessment ....................................................................................................................... 968.5.1 Equipment........................................................................................................................... 968.5.2 Cleaning & sanitation......................................................................................................... 978.5.3 Lighting & ventilation........................................................................................................ 988.5.4 Pest control.......................................................................................................................... 998.5.5 Chemical storage............................................................................................................... 100
8.6 Food recall plans ......................................................................................................................... 1018.7 Food safety programs ................................................................................................................. 102

2000/2001 National Food Safety Report CR&C 0413Australia New Zealand Food Authority
AppendicesAppendix A ...............................................................................................CATI questionnaireAppendix B............................................................... EHO questionnaire with briefing notesAppendix C ......................................................................... Attachments to the Survey: EHOAppendix D ......................................................Risk classification for specialised businessesAppendix E............................................................................................................ Pilot ReportAppendix F ..................................Sample procedures and Yellow Pages business categories
\\ironbark2\crc\jobs\413 food handling\reports\final report\413 food safety final ver26 with es.doc
2000/2001 National Food Safety Report CR&C 0413Australia New Zealand Food Authority
Index of TablesTable 1: Survey estimates of 50%, 60%, 80% and 90% at 95% confidence interval (CI) ........... 11
Table 2: Food type by business classification ..................................................................................... 16
Table 3: Providing food to “at risk” consumer groups by business classification ........................ 18
Table 4: Business types by regional location....................................................................................... 20
Table 5: Business classification by regional location.......................................................................... 20
Table 6: Regional location by state ....................................................................................................... 21
Table 7: Business type by state.............................................................................................................. 22
Table 8: Business type by business size ............................................................................................... 23
Table 9: Business size by regional location ......................................................................................... 24
Table 10: Business type by business classification................................................................................ 24
Table 11: State/ Territory by business classification............................................................................ 25
Table 12: Check temperature of delivered food by business classification and business size ....... 30
Table 13: Check temperature of delivered food by use of temperature probe................................ 31
Table 14: Temperature control for different types of food by business classification andbusiness size.............................................................................................................................. 33
Table 15: Check temperature of delivered food by staff knowledge and gender ofrespondent ................................................................................................................................ 34
Table 16: Temperature for chilled food storage by business classification and business size ....... 36
Table 17: Temperature for chilled food storage by staff knowledge and gender ofrespondent ................................................................................................................................ 37
Table 18: Temperature control for holding hot food by business classification andbusiness size.............................................................................................................................. 39
Table 19: Temperature for holding hot food by staff knowledge and gender................................. 39
Table 20: Cooling/Chilling cooked food by staff knowledge and gender........................................ 42
Table 21: Potentially hazardous food needing refrigeration by gender and region......................... 45
Table 22: Storing chilled potentially hazardous food by business classification and businesssize.............................................................................................................................................. 68
Table 23: Holding hot potentially hazardous food by risk classification and business size ........... 71
Table 24: Holding hot potentially hazardous food by temperature probe, region andwritten food safety program................................................................................................... 71
Table 25: Hand wash facilities by business classification and business size ..................................... 86
Table 26: Preparation and processing raw food by safety program, sickness policies andregion ....................................................................................................................................... 103

2000/2001 National Food Safety Report CR&C 0413Australia New Zealand Food Authority
Index of FiguresFigure 1: Description of business........................................................................................................... 12
Figure 2: Manufacturing or processing of food ................................................................................... 13
Figure 3: Business classification ............................................................................................................. 14
Figure 4: Business supplies food off-site............................................................................................... 14
Figure 5: Providing food to “at risk” consumer groups ..................................................................... 17
Figure 6: State location of business........................................................................................................ 19
Figure 7: Rural/regional and metro ....................................................................................................... 19
Figure 8: Small business........................................................................................................................... 23
Figure 9: Title of respondent .................................................................................................................. 26
Figure 10: Delivery of temperature sensitive food ................................................................................ 28
Figure 11: Frequency of checking temperature of delivered food ...................................................... 28
Figure 12: Temperature probe.................................................................................................................. 29
Figure 13: Method for checking temperature of delivered food ......................................................... 32
Figure 14: Food types to check temperature when delivered .............................................................. 32
Figure 15: Storing chilled food ................................................................................................................. 35
Figure 16: Temperature for storing chilled food.................................................................................... 35
Figure 17: Holding hot food ..................................................................................................................... 38
Figure 18: Temperature for holding hot food........................................................................................ 38
Figure 19: Cooking food and cooling for re-use.................................................................................... 40
Figure 20: Temperature and time for safely cooling cooked food...................................................... 41
Figure 21: Safely cooling large amounts of cooked food ..................................................................... 41
Figure 22: Safely leaving potentially hazardous food at room temperature....................................... 43
Figure 23: Ready-to-eat foods needing refrigeration............................................................................. 44
Figure 24: Gloves and food handling ...................................................................................................... 46
Figure 25: Wearing gloves for multiple food handling tasks................................................................ 47
Figure 26: Handling raw vegetables and cooked food.......................................................................... 48
Figure 27: Food handling: touching food and cleaning utensils.......................................................... 49
Figure 28: Safe food handling and staff illness....................................................................................... 50
Figure 29: Method of washing containers and utensils......................................................................... 51
Figure 30: Temperature of final rinse in dishwasher............................................................................. 52
Figure 31: Hand washing and food safety............................................................................................... 52
Figure 32: Use chemical sanitiser ............................................................................................................. 53
Figure 33: Mixing chemical sanitisers ...................................................................................................... 53
Figure 34: Detergent and micro-organisms ............................................................................................ 54

2000/2001 National Food Safety Report CR&C 0413Australia New Zealand Food Authority
Figure 35: Sanitising chopping boards..................................................................................................... 54
Figure 36: Staff training ............................................................................................................................. 55
Figure 37: Type of staff training............................................................................................................... 55
Figure 38: Sources of food safety information....................................................................................... 57
Figure 39: Ease of locating food safety information............................................................................. 58
Figure 40: Usefulness of information about food safety ...................................................................... 59
Figure 41: Informed about current food safety regulation................................................................... 60
Figure 42: Awareness of new Food Safety Standards ........................................................................... 60
Figure 43: Food delivered outside business hours................................................................................. 63
Figure 44: Probe thermometer ................................................................................................................. 64
Figure 45: Use of probe thermometer..................................................................................................... 64
Figure 46: Methods for checking food temperature.............................................................................. 65
Figure 47: Staff checks the temperature of potentially hazardous food delivered to thebusiness ..................................................................................................................................... 66
Figure 48: Potentially hazardous frozen food is frozen upon delivery............................................... 66
Figure 49: Chilled potentially hazardous food stored at or below 5°C .............................................. 67
Figure 50: Adequate space for potentially hazardous food in cool room.......................................... 68
Figure 51: Potentially hazardous food cooked at correct temp for correct amount of time........... 69
Figure 52: Hot potentially hazardous food held at correct temperature ............................................ 70
Figure 53: Appropriate equipment for holding hot potentially hazardous food............................... 70
Figure 54: Cooling cooked potentially hazardous food to correct temperature ............................... 72
Figure 55: Cooked and cooled potentially hazardous food is reheated rapidly................................. 73
Figure 56: Potentially hazardous food on display is held at the correct temperature....................... 74
Figure 57: Potentially hazardous food transported................................................................................ 75
Figure 58: Type of potentially hazardous food transported................................................................. 75
Figure 59: Method of transporting chilled potentially hazardous food ................................................ 76
Figure 60: Maximum time of transporting chilled potentially hazardous food ................................... 76
Figure 61: Method for transporting hot potentially hazardous food ................................................... 77
Figure 62: Maximum time for transporting hot potentially hazardous food ...................................... 77
Figure 63: Potentially hazardous food transported at appropriate temperature ............................... 78
Figure 64: Delivery of food outside business hours.............................................................................. 79
Figure 65: Protecting delivered food from contamination................................................................... 79
Figure 66: Raw food separated in cool room ......................................................................................... 80
Figure 67: Adequate space for potentially hazardous food in cool room.......................................... 80
Figure 68: Protected from contamination in cool room....................................................................... 80
Figure 69: Dry goods protected from contamination ........................................................................... 81

2000/2001 National Food Safety Report CR&C 0413Australia New Zealand Food Authority
Figure 70: Dry goods free from pests...................................................................................................... 81
Figure 71: Protection of displayed food.................................................................................................. 81
Figure 72: Displayed ready-to-eat food supervised by staff ................................................................. 82
Figure 73: Food removed from display mixed with new food ............................................................ 82
Figure 74: Separate equipment used for raw & ready-to-eat food?..................................................... 83
Figure 75: Hands are not used to handle food....................................................................................... 83
Figure 76: Gloves are changed ................................................................................................................. 83
Figure 77: Hand washing........................................................................................................................... 84
Figure 78: Wound covering....................................................................................................................... 84
Figure 79: Transport of food .................................................................................................................... 84
Figure 80: Sufficient hand washing facilities........................................................................................... 85
Figure 81: Accessible hand washing ........................................................................................................ 85
Figure 82: Staff wash their hands in designated facilities ..................................................................... 87
Figure 83: Soap or hand cleanser supplied ............................................................................................. 88
Figure 84: Warm running water available ............................................................................................... 88
Figure 85: Single use towels supplied ...................................................................................................... 89
Figure 86: Recent use of hand washing facilities ................................................................................... 89
Figure 87: Staff wash & dry hands correctly........................................................................................... 90
Figure 88: Staff wear clean outer clothing .............................................................................................. 90
Figure 89: Personal clothing storage........................................................................................................ 90
Figure 90: Policy for unwell staff ............................................................................................................. 91
Figure 91: Use commercial dishwasher to wash and sanitise............................................................... 92
Figure 92: Correct sanitising temperature ............................................................................................... 92
Figure 93: Domestic dishwasher to sanitise eating & drinking utensils ............................................. 93
Figure 94: Domestic dishwasher at correct temp .................................................................................. 93
Figure 95: Glass washer to sanitise eating & drinking utensils ............................................................ 94
Figure 96: Glass washers operate at correct temperature ..................................................................... 94
Figure 97: Chemical sanitisers used ......................................................................................................... 94
Figure 98: Appropriate use of sanitisers.................................................................................................. 94
Figure 99: All equipment sanitised manually .......................................................................................... 95
Figure 100: Sanitising temperature is 77°C or above ............................................................................. 95
Figure 101: Record of temperature ............................................................................................................ 95
Figure 102: Adequate equipment for food preparation .......................................................................... 96
Figure 103: Utensils are clean & sanitised................................................................................................. 97
Figure 104: Overall business is clean ......................................................................................................... 98
Figure 105: Identify problem areas ............................................................................................................ 98

2000/2001 National Food Safety Report CR&C 0413Australia New Zealand Food Authority
Figure 106: Adequate lighting for food preparation................................................................................ 98
Figure 107: Adequate ventilation for food preparation .......................................................................... 98
Figure 108: Premises free of pests.............................................................................................................. 99
Figure 109: Has pest control ....................................................................................................................... 99
Figure 110: Chemicals are stored safely................................................................................................... 100
Figure 111: Wholesale/ Manufacturers/ Importers have food recall plan ........................................ 101
Figure 112: Has written food safety program......................................................................................... 102

2000/2001 National Food Safety Benchmark CR&C 0413Australia New Zealand Food Authority Page i
1 Executive SummaryThis National Food Handling Benchmark study documents research on the awareness and knowledgeof safe food handling practices and actual food handling practices by food businesses within Australia.The Australia New Zealand Food Authority (ANZFA) commissioned Campbell Research &Consulting to conduct the benchmark study, which was undertaken between February and May 2001.
The National Food Handling Benchmark study was conducted to support one of six activitiesidentified in the ANZFA Evaluation Strategy. These activities aim to collect baseline data either priorto adoption of new food standards or during the transition period from the old Food Standards Codeto the new Australia New Zealand Food Standards Code (new Code). These baseline data will be usedby ANZFA as a benchmark to evaluate the impact of implementing new regulatory measures on keystakeholders.
The Australia New Zealand Food Standards Council agreed in July 2000 that three national FoodSafety Standards be included in the new Code. Previously, each State and Territory had their ownregulations. The Australian States and Territories are currently adopting these standards into theirlegislation. At the time of this survey, no State or Territory had adopted the new standards. The FoodSafety Standards do not apply in New Zealand.
The National Food Handling Benchmark study was undertaken by means of telephone survey ofmanagers of food businesses and an observational on-site survey of food businesses by environmentalhealth officers and public health unit officers. Questionnaires for each survey were developed aroundkey result areas identified in the new Food Safety Standards such as temperature control, preventingcontamination, cleaning and sanitation and personal hygiene and health of food handlers. In addition,data were sought on common sources of information and training on safe food handling practices, aswell as on the use of written food recall plans and food safety programs.
An interpretative summary of results from the telephone survey and observational survey is presented,followed by the results from each survey. Results have been analysed against a number of variables,including the priority classification of the business (level of risk relating to handling of potentiallyhazardous food and the customer base).
The research indicates that there is a relatively high level of awareness and knowledge of basic safefood handling practices in food businesses, though the theoretical knowledge did not always matchactual practices on–site. Food businesses with written food safety programs more often undertookcorrect safe food handling procedures than those with no written program. The businesses withwritten programs tended to be large, high risk businesses. Results in the key areas of protection offood from contamination and personal hygiene indicate that there is a significant minority ofbusinesses that lack knowledge on these issues, particularly amongst medium or low risk businessesand small businesses.
2000/2001 National Food Safety Benchmark CR&C 0413Australia New Zealand Food Authority Page ii
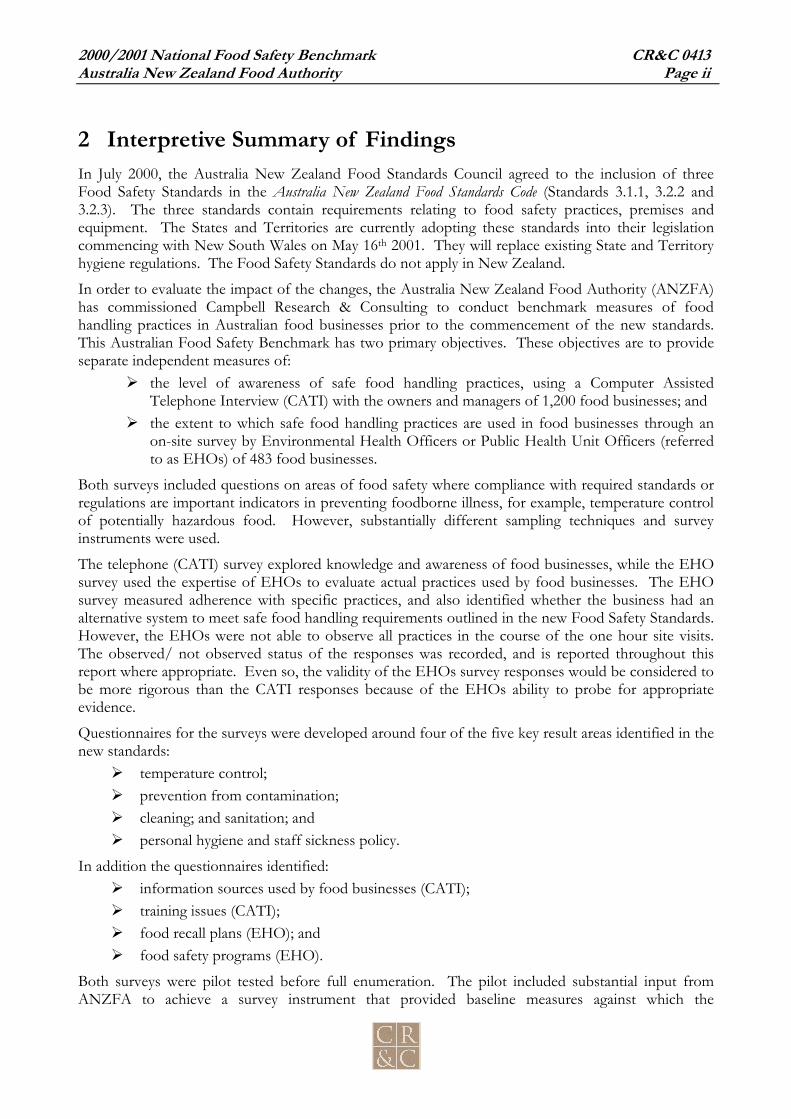
2 Interpretive Summary of FindingsIn July 2000, the Australia New Zealand Food Standards Council agreed to the inclusion of threeFood Safety Standards in the Australia New Zealand Food Standards Code (Standards 3.1.1, 3.2.2 and3.2.3). The three standards contain requirements relating to food safety practices, premises andequipment. The States and Territories are currently adopting these standards into their legislationcommencing with New South Wales on May 16th 2001. They will replace existing State and Territoryhygiene regulations. The Food Safety Standards do not apply in New Zealand.
In order to evaluate the impact of the changes, the Australia New Zealand Food Authority (ANZFA)has commissioned Campbell Research & Consulting to conduct benchmark measures of foodhandling practices in Australian food businesses prior to the commencement of the new standards.This Australian Food Safety Benchmark has two primary objectives. These objectives are to provideseparate independent measures of:
the level of awareness of safe food handling practices, using a Computer AssistedTelephone Interview (CATI) with the owners and managers of 1,200 food businesses; and
the extent to which safe food handling practices are used in food businesses through anon-site survey by Environmental Health Officers or Public Health Unit Officers (referredto as EHOs) of 483 food businesses.
Both surveys included questions on areas of food safety where compliance with required standards orregulations are important indicators in preventing foodborne illness, for example, temperature controlof potentially hazardous food. However, substantially different sampling techniques and surveyinstruments were used.
The telephone (CATI) survey explored knowledge and awareness of food businesses, while the EHOsurvey used the expertise of EHOs to evaluate actual practices used by food businesses. The EHOsurvey measured adherence with specific practices, and also identified whether the business had analternative system to meet safe food handling requirements outlined in the new Food Safety Standards.However, the EHOs were not able to observe all practices in the course of the one hour site visits.The observed/ not observed status of the responses was recorded, and is reported throughout thisreport where appropriate. Even so, the validity of the EHOs survey responses would be considered tobe more rigorous than the CATI responses because of the EHOs ability to probe for appropriateevidence.
Questionnaires for the surveys were developed around four of the five key result areas identified in thenew standards:
temperature control; prevention from contamination; cleaning; and sanitation; and personal hygiene and staff sickness policy.
In addition the questionnaires identified: information sources used by food businesses (CATI); training issues (CATI); food recall plans (EHO); and food safety programs (EHO).
Both surveys were pilot tested before full enumeration. The pilot included substantial input fromANZFA to achieve a survey instrument that provided baseline measures against which the

2000/2001 National Food Safety Benchmark CR&C 0413Australia New Zealand Food Authority Page iii
implementation of the new standards could be evaluated, as well as providing relevant information forjurisdictions and EHOs.
Businesses in both surveys were classified using the Priority Classification System (PCS) to enableanalysis of results by high, medium or low risk business. The PCS has been developed by ANZFA inconsultation with Senior Food Officers from each State and Territory. The PCS classifies foodbusinesses into priority ratings based on the risk that the business presents to public health and safety.The system was intended for use by EHOs in the field and uses a short cut manual assignment ofpriority rating according to a table of business types. The PCS classified businesses as high, mediumor low risk according to a scoring system based on the food type, intended customer use, activity ofthe business, method of processing and customer base. The PCS also specifies criteria for classifyingbusinesses as ‘large’ or ‘small’.
This was the first time the PCS had been trialed in a survey where results were electronically coded.Some modifications to the questions were required for this purpose.
It is important that the classification system be applied consistently in all jurisdictions once Standard3.2.1 Food Safety Programs is implemented in States and Territories in Australia.
Some comparison has been made to provide a contrasting perspective. However, comparisons between the two surveysshould be used with caution because there were different instruments, modes of enumeration, sample frames and samplesizes.The benchmark measures in this report are pre-implementation measures. The CATI survey wasconducted in February 2001 and the EHO survey from February- May 2001, prior to adoption by anyState or Territory of the new Food Safety Standards. Evaluation of the effectiveness of the FoodSafety Standards and the impact of the strategies developed to improve awareness of safe foodhandling in Australian food businesses will be undertaken by ANZFA at a later date.
2.1 Telephone (CATI) survey of food businesses
The CATI survey measured awareness of food safety practices in food businesses and the extent ofknowledge of persons in supervisory positions in these businesses. There were four key areas of foodsafety that were the focus of the survey:
temperature control and knowledge of temperatures and times for safe food handlingpractices;
protection of food from contamination; personal hygiene and staff illness; and cleaning and sanitation.
Most food businesses knew about, and implemented, safe food handling practices. However, therewas a small, but substantial, proportion of businesses (between 10% and 20%) that did not knowcorrect food handling practices or were not implementing the practices. The majority of this groupcomprised persons who did not know the answer to the detailed questions. The proportion that gaveincorrect answers (in contrast to “did not know”) was relatively low (around 5% of businesses).
Personal hygiene and approaches to staff illness were the areas of most concern.
2.1.1 Temperature controlKnowledge of temperature control during the transport, preparation and storage of food is critical inmaintaining safe food practices. The survey identified the proportion of food businesses engaged in

2000/2001 National Food Safety Benchmark CR&C 0413Australia New Zealand Food Authority Page iv
these different activities. Further, the survey tested knowledge using a number of specific questionsthat identified awareness of measures and conditions associated with unsafe practices.
Knowledge of specific temperatures and times for storage or cooking of potentially hazardous foodindicated room for improvement. Mostly, respondents did not know the detail of specific temperatureand times required for safe food handling and some also gave incorrect responses. For example, one infive (21%) food businesses did not know (15%) or incorrectly stated (6%) the temperature at whichchilled food should be stored.
However, the EHO survey found businesses were generally using practices in receiving, storing,cooking, displaying and holding hazardous food that provided safe systems for temperature and time.The EHOs found that only 7% did not have a system in place for ensuring that chilled food wasstored safely.
This suggests that specific knowledge is not necessarily a good indicator of adherence to safe foodhandling practices.
It should be kept in mind when considering the low levels of awareness of specific technicalinformation reported in the CATI survey, that the EHO survey found that safe practices were beingimplemented.
2.1.2 Receiving foodNearly all (87%) businesses had temperature sensitive foods delivered to their premises. Most (77%)of these businesses at least occasionally checked the temperature of foods delivered. Larger foodbusinesses, which tended to be higher risk, were more likely to check food temperature.
2.1.3 Temperature probesHaving a temperature probe was an indicator that businesses had a higher awareness of the need tocheck temperatures of delivered food, and was associated with a higher likelihood of appropriate safepractice. One quarter (24%) of businesses that had temperature sensitive food delivered, and whoreported that they checked the temperature of food that was delivered, did not have a probethermometer. Large high-risk businesses were more likely to have a probe thermometer. Businesseswere much more likely to check the temperature of chilled or frozen items delivered than hot foods.
2.1.4 Storing chilled foodNearly all food businesses (92%) store chilled food. One in five businesses storing chilled food eitherdid not know the temperature at which chilled food should be stored or incorrectly reported thatchilled food should be stored higher than 5ºC. Businesses were more likely not to know (15%) than tore give a wrong temperature answer (5%).
2.1.5 Holding hot foodFour in ten (38%) businesses needed to hold hot food for periods of time. One quarter (23%) ofthese businesses, either “did not know” the correct temperature (19%) or stated a temperature lowerthan 60ºC (4%) (temperatures below 60ºC are too low for safely holding hot food). One in five (17%)businesses did not know how long cooked potentially hazardous food (meant to be served hot) couldbe safely left at room temperature. Only 1% mentioned a time that was not safe.
2.1.6 Cooling cooked foodThree in ten (31%) businesses reported that they cooked food and cooled it for later re-use. One inten (10%) businesses that cooled cooked food for later re-use did not know that large amounts of foodshould be placed in small containers and put in a cool room or refrigerator for cooling. A further two

2000/2001 National Food Safety Benchmark CR&C 0413Australia New Zealand Food Authority Page v
in ten (19%) incorrectly said that this should not be done. A separate question about cooked riceidentified that two in ten (19%) did not consider it necessary to keep cooked rice in the refrigerator.
2.1.7 Protecting food from contaminationPoor staff hygiene and lack of policies about staff illness are the aspects of food handling thatultimately lead to high risk of contamination. There was a relatively high proportion of staff whoperceived that they could safely touch some forms of food. Two in ten (21%) businesses surveyedincorrectly believed that it was safe for food handlers to directly touch bread. These were more likelyto be low risk businesses (29%), and businesses where staff training was not implemented (30%). Thisfinding was supported by the EHO survey. Food handlers may wear gloves to prevent foodcontamination, but wearing gloves is not an assurance of safe food handling practices. A relativelyhigh proportion of staff did not wear gloves (22%). Very few (2% - 4%) indicated that gloves werenot changed between different tasks.
General knowledge about safe food handling practices was directly proportional to the level of stafftraining and risk category of the business. High risk businesses that catered to vulnerable populationswere more likely to have staff training programs, to have displayed correct knowledge about foodsafety issues and to have implemented safe food handling practices (e.g. were more likely to have useda temperature probe).
Some gender differences were also observed. Females, who were more likely to be holding juniorpositions within food businesses, had a lower level of knowledge about safe food handling practices.
2.1.8 Personal hygiene and staff illnessThere were poor practices and knowledge of washing and sanitising procedures. Half of foodbusinesses thought it would be acceptable for employees experiencing diarrhoea to undertake foodhandling tasks such as “handling unpackaged food”, “serving food” or “setting the table”.
2.1.9 Cleaning and sanitationThe CATI survey identified poor knowledge and practices of cleaning and sanitising. The EHOsurvey identified a higher proportion of unsafe practices in regard to cleaning and sanitising thanidentified in the CATI survey. This was an exception to the general findings that safe practices werebeing implemented despite an apparent lack of awareness and knowledge from the CATI survey forsome businesses.
2.1.10 Washing containers and utensilsThe most frequent method of cleaning containers and utensils was washing by hand. The majority ofbusinesses (59%) only washed by hand, while a further quarter (24%) used a dishwasher in combinationwith hand washing.
There was a high proportion of businesses with poor knowledge of temperatures for safe washingpractices. This was the case for both hand and machine washing.
One third (36%) of businesses that used hand washing for food preparation materials did not knowthe temperature at which hot water would kill bacteria on utensils. One quarter of business reportedhand washing at temperatures below 70°C, though it should be noted that using hot water above 70°Chand washing has occupational health and safety implications. Use of a dishwasher is preferable.
There was a substantial proportion that did not know key elements of safe practices for the use ofdishwashers. One third (35%) did not know the temperature of the final rinse of their dishwasher.One in ten (9%) reported temperatures below 70°C.
2000/2001 National Food Safety Benchmark CR&C 0413Australia New Zealand Food Authority Page vi
2.1.11 Chemical sanitisersBusinesses are required under the new Food Safety Standards to ensure utensils and food contactsurfaces are clean and sanitary. Chemical sanitisers may be used to achieve this outcome. One quarter(24%) of businesses “never” used a chemical sanitiser for washing cups, plates and eating utensils.Three in ten (30%) believed that all chemical sanitisers should be mixed with hot water and one half(51%) correctly indicated this was false. Two in ten (18%) businesses incorrectly believed that“detergent would kill micro-organisms”.
2.1.12 Staff training and food safety informationOne quarter (26%) of businesses reported that they did not provide training for staff on food handlingsafety. Businesses that were less likely to provide staff training external to the workplace were morelikely to be low risk, rural and not supplying to vulnerable groups.
One quarter (24%) of businesses did not find it easy to locate information on food safety.
The majority of food businesses used their “local council” (47%) or “State and Territory HealthDepartment” (42%) when they needed information about food safety issues. The third mostfrequently mentioned point of call was “industry associations and specialist consultants” (24%).
Neither ANZFA nor the Internet was identified as sources of food safety information.
One third of businesses reported the “most useful” information came from “food safety authorities”(30%), including food safety inspectors, or “food safety brochures and magazines” (27%).
Most (80%) of businesses felt informed about current food safety regulations. Few businesses (5%)reported they felt they were “not informed” about food safety.
2.1.13 The new Food Safety StandardsThree in five (57%) businesses were aware of the new Food Safety Standards.
2.2 EHO/PHU On-site surveys among food businesses
While the CATI survey measured knowledge and awareness of the businesses, the EHO surveymeasured actual practice, based on observation during a site visit. The observation provided strongervalidity measures by using the skills of the experienced Environmental Health and Public Health UnitOfficers to establish the baseline measures. These personnel are trained in food hygiene and conductinspections of food practice as part of their everyday work.

2000/2001 National Food Safety Benchmark CR&C 0413Australia New Zealand Food Authority Page vii
The EHO Survey included the four key areas covered by the CATI survey: temperature control; protection of food from contamination; personal hygiene and staff illness; and cleaning and sanitation.
In addition the EHOs made a general assessment of each business and identified the extent to whichformal policies were in place for food safety and recall of unsafe food.
2.2.1 Temperature controlThe key measures assessed by EHOs for safe practices relating to temperature control related to:
receiving food; storing chilled and holding hot food; cooking food; cooling cooked food; reheating cooled food; transporting food; and displaying food.
The EHO survey was also able to identify where businesses had alternative systems to ensure safefood handling practices.
ThermometersTemperature checking was frequently done using “practical” or “common sense” approaches ratherthan formally checking. This is reflected in the relatively low proportion of businesses (39%) withprobe thermometers.
Six in ten (60%) businesses handling food that should be checked with a probe thermometer did nothave a probe thermometer. Staff did not know how to use a temperature probe thermometer in onein ten (9%) businesses that reported they had a probe thermometer. Six in ten (57%) businesses used“sight” when assessing food temperatures. Four in ten (43%) businesses used “touch” as a methodfor checking the temperature of food.
In spite of the lack of formal measures, businesses were generally found to have safe food handlingpractices in regard to temperature control. A small proportion of businesses were not assessed ashaving safe food handling practices. Apart from checking the temperature of received food, theproportion of businesses without a safe system was less than 10%. It is these businesses that shouldbe the focus of any campaign to improve food-handling practices. Specific areas of concern identifiedinclude:
Receiving food. Nearly all businesses evaluated by the EHOs received potentially hazardousfood. One in three (35%) of businesses checked the temperature of potentially hazardousfood delivered to their businesses, four in ten (39%) used an alternative system to ensurethat food delivered to their business was safe while two in ten (21%) did not check thetemperature or use an alternative system.
Storing chilled food. One in ten businesses (7%) neither stored their chilled food at or below5°C or had an alternative system High risk businesses were more likely to store chilled foodat the correct temperature than medium risk businesses.

2000/2001 National Food Safety Benchmark CR&C 0413Australia New Zealand Food Authority Page viii
Holding hot food. One in ten (8%) businesses, where hot food was held, did not holdpotentially hazardous food at the correct temperature. Few (4%) businesses holding hotfood lacked the adequate equipment for holding hot food.
Cooking potentially hazardous food. Most food businesses checked that potentially hazardousfood was cooked at the correct temperature for the correct time (53%) or had an alternativesystem in place (33%). One in ten had no system at all.
Cooling cooked food. 10% did not have a system for cooling cooked food safely.
Reheating cooled food. 6% had no system for ensuring that cooked food is reheated safely.
Displaying food. One in ten (9%) businesses displaying potentially hazardous food did nothave it held at the correct temperature or have an alternative system for ensuring foodsafety.
2.2.2 Transporting potentially hazardous foodA total of seven in ten (72%) businesses surveyed transported food. Three in ten (28%) of businessestransporting food also transported potentially hazardous food. Chilled food was more likely to betransported. Eight in ten (81%) businesses transporting potentially hazardous food carried chilledfood; and half (51%) carried hot food – one third (34%) transported both hot and cold food.Three in ten (29%) businesses transporting chilled potentially hazardous food used a “refrigeratedvehicle” and one quarter (25%) used “eskies with ice”. Very few (3%) did not use a temperature-controlled vehicle or other device that would keep the food at 5ºC or below. Most businessestransporting chilled food did so for short periods of time with only one in ten (10%) transporting foodfor longer than four hours.In contrast, there was a high proportion of businesses that transported hot food without using a“temperature controlled vehicle” or “temperature controlling tools” (42%). Hot food was transportedfor shorter periods than chilled foods. 94% of hot food was transported for less than one hour whileonly 75% of chilled food was transported for less than one hour.One in ten (12%) businesses transporting potentially hazardous foods (chilled or hot) were not doingso at the correct temperature and did not have an alternative system in place. These alternativesystems may use time as a control. For example, restricting the time taken to transport food.
2.2.3 Protecting food from contaminationThe majority of food businesses protected food from contamination. However, a small proportiondid not. Specific issues identified by the EHOs included:
More than one in ten (14%) businesses that used a cool room did not adequately protecttheir food in the cool room from contamination.
One in ten (8%) businesses storing raw food in the cool room did not have raw foodseparated from “ready-to-eat food”.
One in twenty (6%) businesses handling dry goods did not have adequate protection fromcontamination of their dry goods and one in twenty (4%) appeared to have pests in theirdry goods area.
Just under one in ten (8%) businesses that had food on display did not adequately protectthat food from contamination.
One in seven (15%) businesses with food on display which needed to be supervised, didnot have staff supervising displayed ready-to-eat food.
2000/2001 National Food Safety Benchmark CR&C 0413Australia New Zealand Food Authority Page ix
When displayed food was removed from display, over one in ten (14%) businesses mixedthe displayed food with new food for storage to be re-served the next day.
One in ten (9%) businesses did not separate the equipment used for preparing raw andready-to-eat food preparation or clean and sanitise that equipment between uses.
One in twenty (6%) businesses where staff handled ready-to-eat food with hands ratherthan utensils such as tongs were at risk of contamination from staff directly touching food.
Businesses may use gloves as an everyday practice to prevent food contamination. However, wearinggloves is not sufficient to completely protect food from contamination; gloves may actually increasethe risk of contamination if incorrectly used. Gloves should be changed when moving from one taskto the next and on the same occasions when hands should be washed. One in ten (9%) staff whowore gloves did not change gloves when necessary.
2.2.4 Personal hygieneStaff personal hygiene is critical in minimising the spread of foodborne disease. The survey addressedactual practices of personal hygiene as well as examining the adequacy of the hand washing facilities.Adequate facilities influenced the likelihood of good staff practices in regard to personal hygiene.While most food businesses were found to have staff following good personal hygiene practices, onein ten (9%) had staff who did not wash their hands when necessary and one in twenty (6%) had staffthat did not cover open wounds with waterproof dressings.The provision of appropriate hand washing facilities for staff handling food is critical to ensure staffcan maintain appropriate standards of personal hygiene. Just under one in five (17%) businesses didnot have sufficient hand washing facilities. One in ten businesses (10%) did not provide adequateaccess for employees, 7% did not supply soap or hand cleanser, 14% did not have warm runningwater, and 20% did not supply single use towels. Standard 3.2.2 indicates food handlers should usesoap or other effective means such as warm running water to wash their hands and thoroughly drytheir hands using a single use towel or in another way that will not transfer pathogenic organisms tothe hands.Just over one in ten (14%) food businesses with hand washing facilities did not show evidence ofrecent use of those facilities.

2000/2001 National Food Safety Benchmark CR&C 0413Australia New Zealand Food Authority Page x
2.2.5 Staff illnessOne fifth (21%) of businesses did not have a staff policy relating to staff sickness.
2.2.6 Cleaning and sanitisingCleaning and sanitising is an important aspect of food safety. Use of commercial or domesticdishwashers can help achieve safe practices. Only a minority of businesses used dish or glass washerswhere such facilities would have been appropriate. In a small proportion of cases, staff did not knowthe correct temperature required for effective sanitising using hot water.
DishwashersThree in ten (30%) businesses where a dishwasher was appropriate (i.e. businesses that needed to washutensils used for eating, drinking and food preparation) used a commercial dishwasher to wash andsanitise eating utensils. One in ten (12%) used a domestic dishwasher. Just under two in ten (16%)businesses used glass washers where a glass washer was appropriate to the business.One in ten (10%) commercial dishwashers were not working at the correct sanitising temperaturewhile two in ten (19%) domestic dishwashers were not working at the correct temperature.Staff were unsure of the correct sanitising temperature in 5% of businesses using a commercialdishwasher and 10% that used a domestic dishwasher.
SanitisingThree quarters (74%) of businesses used chemical sanitisers. When chemical sanitisers were used, onein ten (9%) did not use them appropriately.Nearly six in ten (57%) businesses used manual sanitising processes where manual sanitising wasappropriate. Nearly two thirds (60%) of businesses utilising manual sanitising processes did notmaintain the temperature of the hot water at the appropriate temperature (i.e. 77°C or above).Over one in ten (12%) businesses did not clean and sanitise food contact surfaces and utensils beforeusing them where it was appropriate to do so.
2.2.7 General assessment of food businessesThe final component of the EHO survey comprised a general assessment of the food businessessurveyed. 62% of EHO surveyed businesses were reported to have no problem areas. However, asmall proportion of businesses were identified as having problem areas:
one in ten (10%) food premises were not considered clean and well maintained; over one in ten (12%) businesses did not clean and sanitise food contact surfaces before
using utensils where such sanitation was appropriate; over one in ten (12%) EHO surveyed businesses identified food preparation, processing
and cooking areas as problematic; one in ten (10%) identified a cool room as a problem area; one in ten (10%) food premises showed evidence of pests; and one quarter (24%) did not have adequate pest control measures in place where such
controls were appropriate.

2000/2001 National Food Safety Benchmark CR&C 0413Australia New Zealand Food Authority Page xi
2.2.8 Food recall plansTwo thirds (66%) of businesses in the “wholesale/ manufacturing/ importing” sectors did not have awritten food recall plan. Businesses more likely to have a written food recall plans included high risklarger metropolitan businesses.
2.2.9 Food safety programsFood businesses are not currently required to have a food safety program. However, one in five(19%) were found to have written food safety programs. Businesses with food safety programs inplace were most likely to be classified as “ large businesses” and were more likely to have safe practiceschecking the temperature of food, owning a temperature probe and having a staff sickness policy andpest control program.
2.3 Comparison between the two survey sample groups
The sample for the two surveys was drawn to achieve a representative selection of food businesses.The sample for the CATI survey was randomly selected from the electronic Yellow Pages directoriesusing food business categories and filtered at the commencement of interview to ensure the businessmet the relevant specifications. The EHO survey was conducted using interviews with a randomselection of businesses in a random selection of 55 Local Government Areas (LGAs).
The EHO survey sample comprised primarily high and medium risk businesses with very few low riskbusinesses. This should be kept in mind when making comparisons with the CATI survey that had ahigher proportion of low risk businesses.
2.3.1 Business typeThe CATI and EHO samples contained similar types of business, which were proportionallydistributed across all States and Territories in both surveys. Just under two in ten businesses served orprovided food to “at risk” groups (CATI 17% and EHO 15%). One half of both CATI (52%) andEHO (50%) businesses surveyed were located in rural regions. The over-representation of rural foodbusinesses was a function of the sampling to ensure that sample segments were of sufficient size toenable confidence. In general, there was little difference by rural/ metropolitan region. Nine in tenCATI (93%) and EHO (90%) businesses surveyed were classified as “small businesses”.
Six in ten (60%) businesses in both surveys were medium risk. The EHO survey had a higherproportion of businesses that were classified as high risk (34%) compared to the CATI sample (15%).There were few (5%) businesses classified as low risk in the EHO survey with one in four (23%) of theCATI sample of the CATI sample were classified as low risk.

2000/2001 National Food Safety Benchmark CR&C 0413Australia New Zealand Food Authority Page xii
3 Reading this reportReading the tables
Questions are written in italics. Angle brackets <> around a word or phrase in the survey question indicate terms that may
be substituted in a CATI script. The base for each table is identified under the left hand column of the table. The base for each column is given in parentheses under the column header. “n/a” means that the particular cell is not applicable and no result can be reported. “-” means that there were no responses for the cell or the responses were too low to
provide a percentage. Subtotals are right justified and printed in parentheses. Proportions are rounded to the nearest whole percent.
A superscript capital letter in a column means that the survey estimate noted in thatcolumn is significantly greater (at the 95% confidence level) than comparable estimates
shown in the column(s) noted. The corresponding capital letters for comparison may befound in the column header.
Reading the graphs
The relevant survey questions are identified underneath the graph header. Each column is a percentage of the base. The base for the graphs refers to the total number of responses upon which the
percentages have been calculated. This is identified under the left hand corner of thegraph.
DisclaimerPlease note that, in accordance with our Company’s policy, we are obliged to advise that neither theCompany nor any member nor employee undertakes responsibility in any way whatsoever to anyperson or organisation (other than Australia New Zealand Food Authority) in respect of informationset out in this report, including any errors or omissions therein, arising through negligence orotherwise however caused.

2000/2001 National Food Safety Benchmark CR&C 0413Australia New Zealand Food Authority Page xiii
3.1 Acronyms used in this report
ANZFA Australia New Zealand Food Authority.
CATI Computer Assisted Telephone Interview.
EHO Environmental Health Officers (includes NSW Public HealthUnit Officers).
LGA Local Government Area.
PCS Priority Classification System. A system developed by ANZFA torank food businesses by exposure to risk.
PHU Public Health Unit.
SFO Senior Food Officers.
3.2 References
Australia New Zealand Food Authority. (ANZFA). (2001). Food Safety: The priority classification systemfor food businesses.
Australia New Zealand Food Authority. (ANZFA). (2001). Safe Food Australia 2nd edition. January2001: A Guide to the Food Safety Standards

2000/2001 National Food Safety Benchmark CR&C 0413Australia New Zealand Food Authority Page 1
4 Background and Objectives of the Project
4.1 Background to the Project1
There are four national Food Safety Standards. The Australia New Zealand Food Authority(ANZFA) developed these standards in consultation with State and Territory health authorities, thefood industry, and other interested organisations and individuals.
The four Food Safety Standards are: 3.1.1 Interpretation and Application; 3.2.1 Food Safety Programs; 3.2.2 Food Safety Practices and General Requirements; and 3.2.3 Food Premises and Equipment.
In July 2000, the Australia New Zealand Food Standards Council2 agreed to the adoption of Standards3.1.1, 3.2.2 and 3.2.3. These Food Safety Standards form part of the Australia New Zealand FoodStandards Code. They apply only in Australia.
The Australia New Zealand Food Standards Council had previously deferred consideration of thefourth standard, Standard 3.2.1 Food Safety Programs, and requested further study of the efficacy of theseprograms for a range of food businesses. Pending the results of this work, the Council agreed inNovember 2000 that Standard 3.2.1 should be adopted as a voluntary standard. It did so as someStates planned to proceed with the introduction of food safety programs without waiting for theresults of the study requested earlier by the Australia New Zealand Food Standards Council.
As a voluntary standard, Standard 3.2.1 Food Safety Programs will apply only in those States or Territoriesthat choose to implement this standard.
Standards 3.1.1, 3.2.2 and 3.2.3 become enforceable from February 2001, depending on the regulatorysituation in each State and Territory. The notification provision and the requirement that foodhandlers and supervisors have food safety skills and knowledge commensurate with their duties withinthe food business, both in Standard 3.2.2, come into effect from February 2002 to give businesses timeto comply with these requirements.
The Food Safety Standards will replace existing State and Territory food hygiene regulations. Theseregulations were nationally inconsistent and tended to be prescriptive and sometimes significantly outof date. They presented businesses with unnecessary costs and difficulties. In addition, they includedrequirements that could not be justified in terms of public health and safety.
The new standards reflect international best practice. Taken together, they are based on a preventativeapproach to the incidence of foodborne illness in Australia and are designed to help ensure that foodbusiness in Australia produce food that is safe to eat.
1 From Safe Food Australia 2nd edition, ANZFA, January 2001, p. 12 Ministers of Health from the States, Territories and Commonwealth of Australia and from New Zealand meet as
the Australia New Zealand Standards Council to approve food standards for Australia and New Zealand.

2000/2001 National Food Safety Benchmark CR&C 0413Australia New Zealand Food Authority Page 2
4.2 Objectives of the ProjectThe objectives of the study were to establish benchmark measures within Australian food business of:
the level of awareness and knowledge of safe food handling practices; and the extent to which safe food handling practices are used.
Two different methodologies were used to achieve these objectives.
1. A telephone survey of 1,200 food business owners or managers; and
2. An on-site survey of 483 food businesses conducted by Environmental Health Officers orPublic Health Unit Officers.
The telephone survey measured the level of awareness and the on-site survey measured the extent towhich safe food practices were applied.
Campbell Research & Consulting was commissioned to undertake the two surveys as part of anevaluation strategy to assess the effectiveness of the new Food Safety Standards. The current projectprovides benchmark, baseline data of knowledge prior to implementation of new food regulations thatprescribe safe food handling practices. Over the next few years ANZFA will conduct additionalsurveys to monitor change in food handling practices over time.
The questions in the current surveys are designed to measure broadly the key areas of safe foodhandling as outlined in the new Food Safety Standards (see Safe Food Australia, 2nd edition, ANZFA,January 2001), and target businesses handling potentially hazardous food.
The project was not conducted as a part of any formal inspection or enforcement regime, and theinformation gained will be used to inform future policy decisions and adjustments to the Food SafetyStandards setting system.
4.3 Questionnaire development
Questionnaires were developed around four of the five key result area identified in the new standards.These are:
temperature control; prevention from contamination; cleaning, sanitation and some testing; and personal hygiene and staff sickness policy.
In addition the questionnaires identified: information sources used by food businesses (CATI); training issues (CATI); food recall plans (EHO); and food safety programs (EHO).

2000/2001 National Food Safety Benchmark CR&C 0413Australia New Zealand Food Authority Page 3
4.4 Pilot
Prior to full enumeration, a pilot study for both the telephone and on-site EHO surveys wasconducted. A separate report was produced to summarise the methodological procedural outcomesfrom the pilot study for both the telephone and on site EHO surveys encompassing:
testing of project methodology; testing of flow, organisation and length of telephone and EHO surveys; and telephone interviewer and EHO feedback.
A copy of the full pilot report is included in Appendix E of this report.

2000/2001 National Food Safety Benchmark CR&C 0413Australia New Zealand Food Authority Page 4
5 Introduction to the project
5.1 Overview
5.1.1 Telephone surveysThe aim of the telephone survey was to obtain benchmark data on the extent to which food business“owners / managers3” were aware of safe food handling practices prior to implementation of the newFood Safety Standards. The questions were designed to assess the level of general knowledge aboutfood safety and food handling prior to implementation of the new Food Safety Standards.The telephone survey was designed to be implemented across a broad range of food service and foodbusiness types, and among “owners / managers” who were directly involved in overseeing thehandling and processing of food, particularly potentially hazardous food4.
5.1.2 On-site food business surveysThe aim of the EHO survey was to obtain benchmark data on the extent to which safe food handlingpractices were already being carried out within food businesses prior to implementation of the newFood Safety Standards. The questions were designed to be answered by Environmental HealthOfficers who have a high degree of specialist food handling knowledge. Owners, managers orsupervisors from the business could assist with the survey, but the intention was for the questions tobe answered based on what the surveying officer observed within the premises. (N.B. A note has beenadded in the text where a practice was not observed at the time of the survey).The EHO survey was designed to be conducted across a broad range of food service and foodbusiness categories taken from the electronic Yellow Pages. The sample of businesses was randomlyselected from food business categories where food regulations were likely to apply to achieve arepresentative national sample.
5.2 MethodologyPrior to the full scale project, pilot surveys were conducted with a sample of businesses using both theCATI and EHO methodologies. A full copy of the pilot report, including a detailed methodologysection, has been included in Appendix G of this report. The information presented here in Section5.2 outlines the methodology for the final project.
5.2.1 Sample selectionFor both the CATI and EHO surveys random lists of businesses were generated from the electronicYellow Pages. For the purposes of this project, food businesses were defined as:
Business directly involved in handling potentially hazardous food intended for human consumption.Medium to high risk businesses were targeted over low risk businesses (based on the ANZFApriority classification system). Manufacturers of flavourings, mixers, processing agents andbusinesses solely involved in storage or transport of pre-packaged foods (e.g. potato chips or softdrinks) were excluded from the surveys:
3 Target respondents were persons responsible for managing staff directly involved in food handling. In most small
businesses this was the owner/proprietor.4 Potentially hazardous food includes: cooked and raw meat, fish, egg, chicken and other poultry, desserts with
dairy or egg ingredients, rice and pasta salads, as well as other prepared salads.
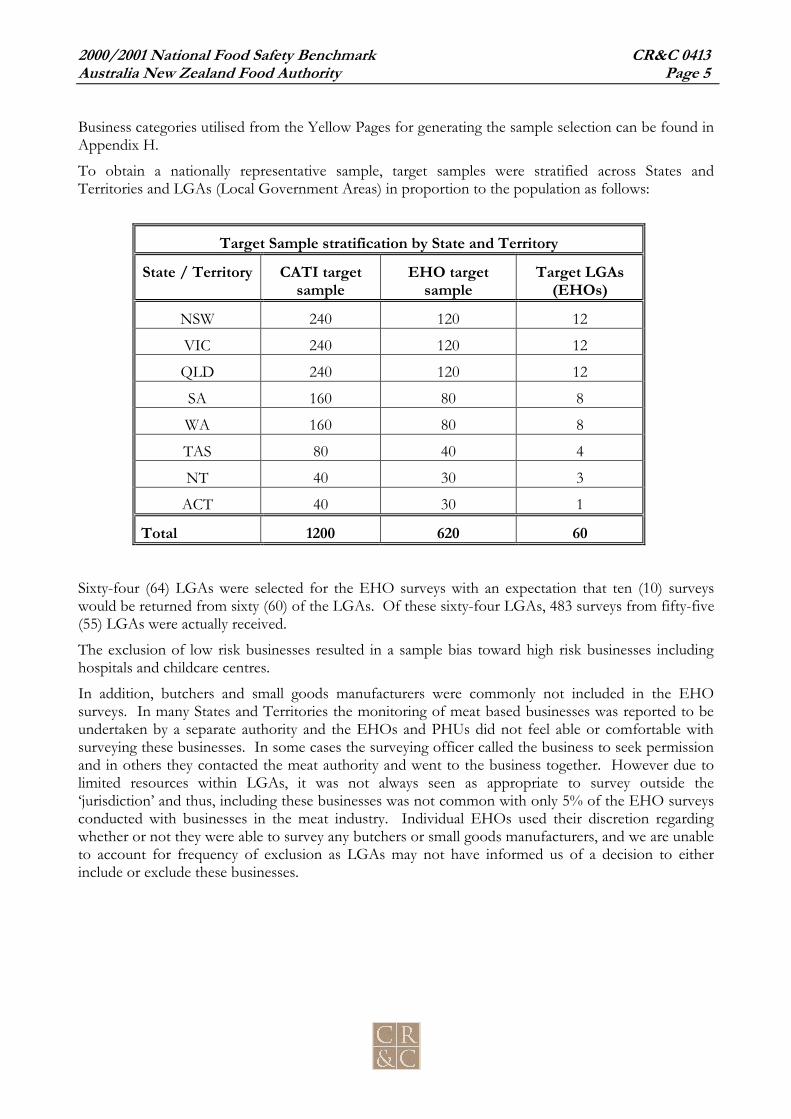
2000/2001 National Food Safety Benchmark CR&C 0413Australia New Zealand Food Authority Page 5
Business categories utilised from the Yellow Pages for generating the sample selection can be found inAppendix H.
To obtain a nationally representative sample, target samples were stratified across States andTerritories and LGAs (Local Government Areas) in proportion to the population as follows:
Target Sample stratification by State and Territory
State / Territory CATI targetsample
EHO targetsample
Target LGAs(EHOs)
NSW 240 120 12
VIC 240 120 12
QLD 240 120 12
SA 160 80 8
WA 160 80 8
TAS 80 40 4
NT 40 30 3
ACT 40 30 1
Total 1200 620 60
Sixty-four (64) LGAs were selected for the EHO surveys with an expectation that ten (10) surveyswould be returned from sixty (60) of the LGAs. Of these sixty-four LGAs, 483 surveys from fifty-five(55) LGAs were actually received.
The exclusion of low risk businesses resulted in a sample bias toward high risk businesses includinghospitals and childcare centres.
In addition, butchers and small goods manufacturers were commonly not included in the EHOsurveys. In many States and Territories the monitoring of meat based businesses was reported to beundertaken by a separate authority and the EHOs and PHUs did not feel able or comfortable withsurveying these businesses. In some cases the surveying officer called the business to seek permissionand in others they contacted the meat authority and went to the business together. However due tolimited resources within LGAs, it was not always seen as appropriate to survey outside the‘jurisdiction’ and thus, including these businesses was not common with only 5% of the EHO surveysconducted with businesses in the meat industry. Individual EHOs used their discretion regardingwhether or not they were able to survey any butchers or small goods manufacturers, and we are unableto account for frequency of exclusion as LGAs may not have informed us of a decision to eitherinclude or exclude these businesses.

2000/2001 National Food Safety Benchmark CR&C 0413Australia New Zealand Food Authority Page 6
5.2.2 ANZFA involvementAt the commencement of the project ANZFA established a project team with members external toANZFA to supplement the knowledge and expertise of ANZFA team members and the consultant.The team comprised representatives from State government (NSW, Queensland and Victoria), thefood industry (the Australian Food and Grocery Council and the Restaurant & Caterers Association)and the Food Policy Unit of the Commonwealth Department of Health and Aged Care.
ANZFA was involved at key points of the project including: formulating the questionnaires and briefing materials and obtaining comments and
suggestions on these materials from the Project Team; keeping the Project Team and Senior Food Officers of all States and Territories informed
of the progress of the project; assisting to obtain cooperation from LGAs; clarifying issues with LGAs and answering queries raised during the surveys by individual
EHOs; responding to queries from surveyed businesses; and seeking comments and suggestions from the Project Team on the reports of the pilot
surveys and the mains surveys.
In particular, ANZFA was instrumental in liasing with the States and Territories, as well as individualEHOs to gain co-operation for participating in the survey. At various points a representative fromANZFA provided progress summary to the Senior Food Officers.
5.2.3 Telephone survey methodologyAn electronic file of the Yellow Pages random business list was generated and telephone interviewerscalled businesses until target samples were achieved for each State and Territory. Individual targetswere not set for metropolitan and rural and regional businesses rather the allocation of businesses wasrandomised.
Interviewers were briefed extensively on definitions of terminology and the meaning of questions,however they were also instructed not to guide businesses into ‘correct’ responses. This wasparticularly important in undertaking a benchmark survey of this type where depth of knowledge andunderstanding were key measures. Hence, the survey identified particular areas where businesses hadless knowledge about food handling practices or the terminology used in standard food handlingdocumentation.
5.2.4 Telephone survey response rate resultsThe telephone interviews were conducted between February 13th and 26th 2001 and lasted on average13.8 minutes. Calls were made at all times of the day, seven days a week, avoiding peak mealpreparation and serving times. Businesses could also schedule call-back appointments at a time moresuitable for them.
Conducting interviews with food businesses during February (at the end of summer school holidays)was beneficial to the response rate, as this was a slow period in many food businesses.
The following table of call results illustrates that of a total sample of 12,157 business numbers, nearlyhalf (47%) were incorrect or out of date and 46% were able to be contacted. Seven per cent (7%) ofnumbers were not needed and therefore not called.

2000/2001 National Food Safety Benchmark CR&C 0413Australia New Zealand Food Authority Page 7
Of the correct food business numbers called, there was a 21% response rate, a small 8% of businessesrefused to participate before the survey began and 13% ended the interview after it had started.
Nearly half (46%) of businesses contacted asked to be called back at another time but did not refuseparticipation. Three per cent (3%) asked to be called back because the person appropriate to speakwith was not available.
A small proportion (2%) had language difficulties and could not participate because the survey wasonly conducted in English. Seven per cent (7%) of businesses indicated they were not eligible (e.g.not directly involved in food handling or preparation).
Call Results N %Total Sample 12,157Total Called 11,337Proceed with interview 1,200 21%Respondent not available during survey period 144 3%Refused - first level 470 8%Language difficulties 91 2%Ineligible does not qualify 397 7%Abandoned /stopped interview 752 13%Appointment / call backs 2,593 46%
Total contact made (46% of total sample) 5,647 100%Incorrect numbers/no contact
Change phone number 30 1%Business/Private number other expected 48 1%No answer 27 0%Answering machine 747 13%Busy/Engaged 26 0%Number disconnected 4 0%Fax 52 1%Dialer – busy 679 12%Dialer - no answer 3,421 60%Dialer - nuisance hangup 49 1%Dialer – incomplete 276 5%Dialer - site out of service 304 5%Dialer - new number dropped 6 0%Dialer – unknown error 21 0%
Total no contact (47% of total sample) 5,690 100%Note: When the survey quota of 1,200 was achieved, no further attempts were made to interview
“appointments”, “busy” or “no answer”. “Appointments” are generally loose arrangements where theinterviewer has identified a likely time to reach a respondent.Percentages do not add up to 100% due to rounding
2000/2001 National Food Safety Benchmark CR&C 0413Australia New Zealand Food Authority Page 8
5.2.5 EHO survey methodologyFood safety regulations are enforced primarily by Local Government Councils and specifically EHOsand PHUs within those Local Government Areas (LGAs). The first step in conducting the surveyswas to choose a random selection of the Local Government or Council Areas in which to conduct thesurveys.
To provide optimal confidence in results at the 95% confidence interval (see the discussion ofsampling error in Section 5.3 below) within breakdowns across States and Territories, a target of 600returned surveys was set. It was anticipated that in light of the on-going and impending changes inFood Safety Standards that EHOs/PHUs would be interested in undertaking the survey and thereforeco-operative.
It was also anticipated that each LGA would be able to undertake 10 surveys within a 2-4 week periodand therefore to obtain the optimal target of 600 returned surveys, a total of 64 LGAs were targeted.During sample generation, some of the LGAs were identified to have a very small number of staffand/or businesses and therefore 65 LGAs were ultimately included.
Selection of LGAs by State and Territory was stratified to be proportionately representative of thepopulation. A random sample of LGAs was generated in each State and Territory and the SeniorFood Officers in each State and Territory were notified of those LGAs to be included in the project.
Once LGAs were selected to participate, they were matched with postcodes and then random lists offood businesses within those postcodes were generated from the electronic Yellow Pages. A total of30 businesses were included in the sample for each LGA. To avoid sampling bias at the LGA levelonly 12 businesses were sent to each LGA at a time, and when that list was exhausted they wererequested to seek additional business names from Campbell Research & Consulting). This processidentified particular types of business to be excluded (e.g. butchers). Through this method CampbellResearch & Consulting maintained day to day contact with many LGAs and could gain a clearunderstanding of why specific businesses were not surveyed. Reasons for EHOs excluding a businesson their list included:
business no longer operating; type of business not applicable to the survey (e.g. no handling of potentially hazardous
food, see definition on page 4); business had recently been inspected and surveying officer did not want to ‘pester’ the
business; business located in another LGA (due to overlap of postcodes); or business located a long distance away from where the EHO/PHU was stationed and it
would not be feasible for them to attend the business during the survey period.
Information about the project, expected time lines and requirements from EHOs/PHUs was faxeddirectly from Campbell Research & Consulting to an EHO/PHU point of contact within each LGA.The information from Campbell Research & Consulting stressed the voluntary nature of participationand the importance of involvement.
Extensive briefing instructions and information about how to conduct the survey was provided to theEHOs, both in hard copy documents, and in a pre-prepared briefing video tape sent out to each LGA.While Campbell Research & Consulting constructed the briefing materials, ANZFA was intimatelyinvolved with on-going feedback to ensure instructional materials were correct and appropriate. Thisdetailed involvement included providing written instructions and definitions for most survey questionsdirectly on the survey form.
2000/2001 National Food Safety Benchmark CR&C 0413Australia New Zealand Food Authority Page 9
A key element of the EHO survey was the actual observation of practices. However food businesseswere not likely to undertake all practices within the one-hour site visit allowed for the survey. Onaverage, the interview took 54 minutes. Twelve percent (12%) took less than 30 minutes, and twentythree percent (23%) took longer than one hour. The survey relied on the competency, skill andexperience of EHOs to make the judgement about whether practice was undertaken safely. Where thepractice was not observed directly, EHOs identified the “not observed” status. This is reported in theEHO survey results.
5.2.6 EHO survey response ratesPreliminary faxed information was sent out to LGAs in late February 2001 and survey materials wereposted to LGAs in early March 2001. A much longer than expected survey return process followedand the final surveys were returned on May 30th, 2001.
Once the survey period commenced, telephone calls, faxes and emails were sent to all participatingLGAs on a regular basis to either provide additional information or follow-up on the status of thesurveying process. Some individual LGAs negotiated extensions to the survey returns when neededand these were accommodated where reasonable to ensure an adequate sample was obtained.
The primary issue delaying the return of surveys, or ultimately the number of surveys completed, wasthe availability of resources within each LGA. Some LGAs requested funding for an additional staffmember to complete the surveys, or responded they were unable to make the time to complete therequired number of surveys due to a lack of staff. No funding was supplied to the LGAs forconducting the surveys.
In a few LGAs, some EHOs and PHUs were particularly interested in the survey and volunteered toundertake more surveys than required.
By the end of the survey period some LGAs who did not have staff available at the beginning did havestaff appointed or available and subsequently asked to be included at that time.
Wherever possible interested LGAs were included and time lines extended. Reasons for extensions oftime lines and smaller numbers of surveys returned from various LGAs included:
allocation of priorities (such as outbreaks of illness, floods and other natural disasters); availability of staff (such as one EHO shared between multiple LGAs, or staff
resignations); lack of food based businesses; and restructuring of EHO duties and/or councils (such as combining councils and
restructuring roles and responsibilities).
In the end, 47 LGAs were represented in the sample and 499 surveys returned, including 16 that wereunusable due to inadequate information. A total of 483 surveys were included in the final sampleincluding 28 from the ACT, as there was only a single LGA in the ACT5. An overall 78% responserate was achieved from the original target sample of 620 surveys.
5 Although there is also only one LGA in the Northern Territory, the sample was able to be stratified by town /
urban areas.

2000/2001 National Food Safety Benchmark CR&C 0413Australia New Zealand Food Authority Page 10
5.2.7 Classification of Business Food Safety Risk (low, medium & high)Businesses have been classified into high, medium and low risk in accordance with the ANZFAPriority Classification System (PCS).
The PCS has been developed by ANZFA in consultation with Senior Food Officers from each Stateand Territory. The PCS classifies food businesses into priority ratings based on the risk that thebusiness presents to public health and safety. The system was intended for use by EHOs in the fieldand uses a short cut manual assignment of priority rating according to a table of business types. ThePCS classified businesses as high, medium or low risk according to a scoring system based on the foodtype, intended customer use, activity of the business, method of processing and customer base. ThePCS also specifies criteria for classifying businesses as ‘large’ or ‘small’.
This was the first time the PCS had been trialed in a survey where results were electronically coded.Some modifications to the questions were required for this purpose.
The CATI survey also used modified versions of these questions to include skip questions to eliminateineligible businesses and to shorten the telephone interview.
Once the surveys were completed, coding of risk classification of businesses was carried out manuallyusing the examples in the PCS and by using a formula in a Microsoft Excel spreadsheet. A separatespreadsheet formula was used for each of the CATI and EHO surveys.
Both PCS and the Excel formulas raised problems that are summarised below.
Overall, the problems encountered were largely due to insufficient detail obtained to determinewhether or not pathogen reduction processes were carried out on the foods before they were sold (e.g.cooking foods). Specifically, the problems were:
the information obtained from businesses was not specific enough. At times it wasdifficult to ascertain the level of production and preparation, and the processingundertaken by the business;
difficulty in knowing if foods were high risk – e.g. eggs in the shell are low risk but thequestion asked about eggs or egg products indicate higher risk; and
unexpectedly large numbers of high risk businesses were identified and may be due to:− businesses not understanding some of the questions relating to high risk businesses
e.g. a large proportion of “café / take-away” businesses indicated they catered off-site, however this may be interpreted as food delivery; or
− businesses stating they manufactured salami (automatic high risk classification)however this did not match the business type (e.g. school tuck shop).
The development and validation of the PCS tool is outside the scope of this project. However, anumber of issues have been identified in the responses to the PCS questions. These warrant a full anddetailed investigation.

2000/2001 National Food Safety Benchmark CR&C 0413Australia New Zealand Food Authority Page 11
5.3 Sampling error
The aim of selecting a sample is to be able to limit the cost of interviewing to a small and manageablenumber. However the objective is to make inferences about the population from which thesample is drawn.
In any sample survey a degree of sampling error will occur. The sampling error is the extent to whichthe survey responses can be generalised to the population from which the sample was drawn (i.e. foodbusinesses). As sample size increases, sampling error decreases. The technical term for sampling erroris standard error.
Error! Reference source not found. provides survey estimates 50%, 60%, 80% and 90% at the 95%confidence interval for the sample sizes in the Food Safety Standards EHO surveys and CATIinterviews. For example, if 50% of the EHO sample of 483 gave a particular response, we would be95% certain that between 45.4% and 54.5% of the entire population would give this response.
Table 16: Survey estimates of 50%, 60%, 80% and 90% at 95% confidence interval (CI)
Survey estimates of 50% and 60 at 95% confidence interval (CI)
Survey estimate of 50% Survey estimate of 60%
Sample size Confidenceinterval
Lowerband
Upperband
Confidenceinterval
Lowerband
Upperband
483(EHO surveys)
± 4.5% 45.5% 54.5% 4.4 55.6 64.4
1,200(CATI surveys)
± 2.8% 47.2% 52.8% 2.8 57.2 62.8
Survey estimates of 80% and 90% at 95% confidence interval (CI)
Survey estimate of 80% Survey estimate of 90%
Sample size Confidenceinterval
Lowerband
Upperband
Confidenceinterval
Lowerband
Upperband
483(EHO surveys)
± 3.6% 76.4% 83.6% 2.7 83.7 92.7
1,200(CATI surveys)
± 2.3% 77.7% 82.3% 1.7 88.3 91.7
For example, the EHO survey identified that 20% of businesses supplied potentially hazardous foodoff-site (Section 6.1.4). Using the survey estimate above, we could expect with 95% confidence thatbetween 16.4% and 23.6% of businesses would provide potentially hazardous food off-site.
6 Refer to Section 2, Reading this report for a full explanation of the tables contained in this report.
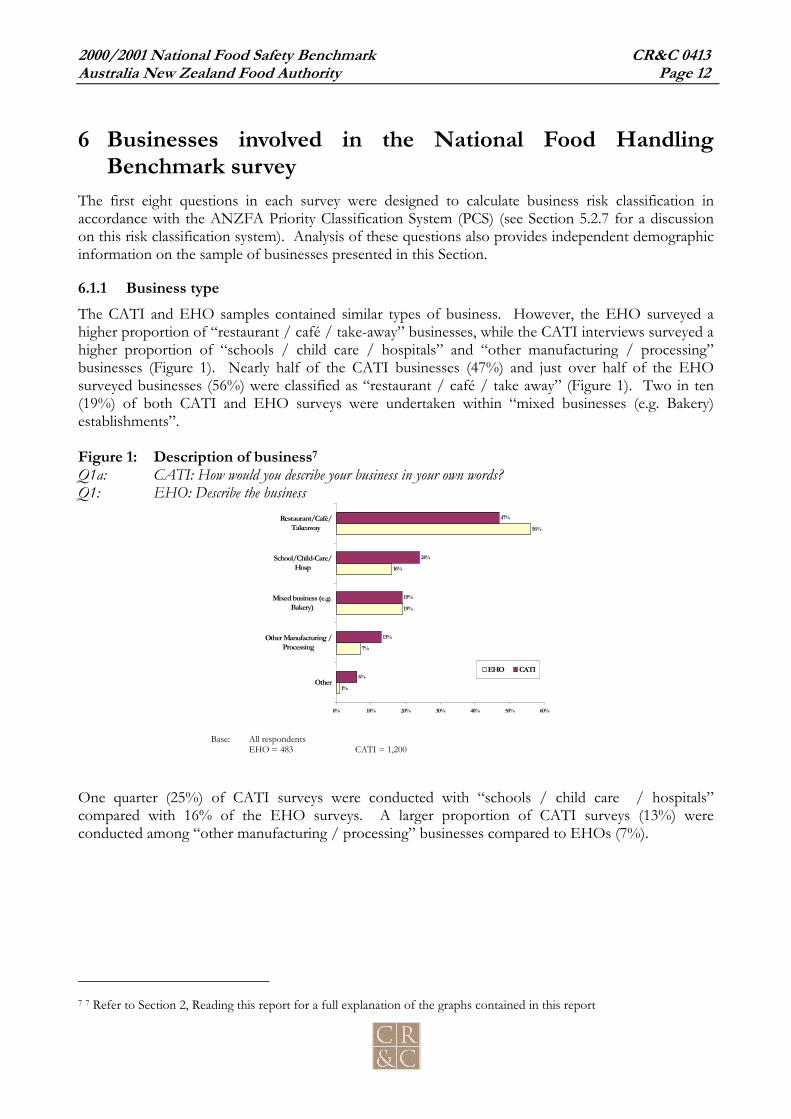
2000/2001 National Food Safety Benchmark CR&C 0413Australia New Zealand Food Authority Page 12
6 Businesses involved in the National Food HandlingBenchmark survey
The first eight questions in each survey were designed to calculate business risk classification inaccordance with the ANZFA Priority Classification System (PCS) (see Section 5.2.7 for a discussionon this risk classification system). Analysis of these questions also provides independent demographicinformation on the sample of businesses presented in this Section.
6.1.1 Business typeThe CATI and EHO samples contained similar types of business. However, the EHO surveyed ahigher proportion of “restaurant / café / take-away” businesses, while the CATI interviews surveyed ahigher proportion of “schools / child care / hospitals” and “other manufacturing / processing”businesses (Figure 1). Nearly half of the CATI businesses (47%) and just over half of the EHOsurveyed businesses (56%) were classified as “restaurant / café / take away” (Figure 1). Two in ten(19%) of both CATI and EHO surveys were undertaken within “mixed businesses (e.g. Bakery)establishments”.
Figure 1: Description of business7
Q1a: CATI: How would you describe your business in your own words?Q1: EHO: Describe the business
1%
7%
19%
16%
56%
6%
13%
19%
24%
47%
0% 10% 20% 30% 40% 50% 60%
Other
Other Manufacturing /Processing
Mixed business (e.g.Bakery)
School/Child-Care/Hosp
Restaurant/Café/Takeaway
EHO CATI
Base: All respondentsEHO = 483 CATI = 1,200
One quarter (25%) of CATI surveys were conducted with “schools / child care / hospitals”compared with 16% of the EHO surveys. A larger proportion of CATI surveys (13%) wereconducted among “other manufacturing / processing” businesses compared to EHOs (7%).
7 7 Refer to Section 2, Reading this report for a full explanation of the graphs contained in this report

2000/2001 National Food Safety Benchmark CR&C 0413Australia New Zealand Food Authority Page 13
6.1.2 Manufacturing, processing, catering and transport food businessesSimilar proportions of CATI (84%) and EHO surveyed businesses (87%) were involved in “othermanufacturing and/or processing” of food (Figure 2).
Figure 2: Manufacturing or processing of food8
Q1B: CATI: Do you manufacture any products at your business?Q5: CATI: Do you process, prepare or cook the food that you sell, distribute or transport?Q3: EHO: Does the business manufacture or process food before sale or distribution?
Base: All respondentsCATI = 1,200 EHO = 483
6.1.3 Food safety business classificationBusinesses were classified as low, medium or high risk according to a formula based on responses toquestions 1-8 in both of the two surveys. For a discussion of the priority classification system seeSection 5.2.7.
The distribution of risk in the two samples reflects the recruitment procedures that focussed on theinclusion of medium to high-risk businesses. Correct food handling procedures are less likely to berelevant for low risk businesses.
The recruitment of businesses into both surveys was based on excluding businesses where the foodstandards may not have applied, for example, service stations that sold only pre-packaged products.For the EHO survey, this decision was based on local knowledge. Consequently, there is a lowerproportion of low risk food businesses in the EHO survey compared to the CATI survey (see Figure3).
8 ‘Process’, in relation to food, means preparing food for sale including chopping, cooking, drying, fermenting,
heating, pasteurising, or a combination of these activities.
84% 87%
0%
10%20%
30%40%50%
60%70%
80%90%
100%
CATI EHO

2000/2001 National Food Safety Benchmark CR&C 0413Australia New Zealand Food Authority Page 14
Six in ten (60%) EHO and CATI businesses surveyed were classified as medium risk (Figure 3). Onethird (34%) of high risk businesses surveyed by the EHOs were classified as high risk, notably higherthan businesses that were interviewed through CATI (15%). One in four (23%) CATI businesses werelow risk compared to only 5% EHO surveyed businesses.
Figure 3: Business classification
Base: All respondentsCATI = 1,200 EHO = 483
6.1.4 Food supplied off-siteJust over one in ten (13%) CATI, and one in five (20%) EHO food service or retail businessesreported they sold “ready-to-eat (RTE) food off-site from where it was prepared” that is, wereinvolved in catering (Figure 4).
Figure 4: Business supplies food off-siteQ8B: CATI: Do you provide ready-to-eat food off-site from where you prepare it?Q8EHO: Does this business sell ready-to-eat potentially hazardous food at a different location from where it
is prepared?
Base: Business is a food service or retail businessCATI = 866 EHO = 431
13%20%
0%10%20%30%40%50%60%70%80%90%
100%
CATI EHO
60%
23%15%
5%
60%
34%
0%10%
20%30%
40%50%60%
70%80%90%
100%
Low Risk Medium Risk High Risk
CATI EHO

2000/2001 National Food Safety Benchmark CR&C 0413Australia New Zealand Food Authority Page 15
6.1.5 Food typesAn overview of the types of food handled by businesses revealed a broad cross-section of food typesin large proportions (Table 2). As the majority of businesses surveyed were “restaurant / café /takeaway” businesses, or “hospitals / schools / child care centres” this wide range of foods would beexpected.
An analysis of food types (Table 2) revealed that low risk businesses could still sell high risk foodssuch as:
raw meat, poultry or seafood; cooked or processed meat poultry or seafood; fermented or dried meat products; egg or egg products; dairy products; and/or prepared salads.
It also can be seen that there was a larger proportion of businesses supplying “prepared ready-to-eattable meals” among EHO surveyed businesses and larger proportions of most other food categorieswithin CATI surveyed businesses. This finding suggests that businesses self-report a larger range offood types than what EHOs might classify within the business.
Close to three-quarters of the businesses in the CATI survey produced or manufactured: cooked or processed meat poultry or seafood; soft drinks or juices; bread, pastries or cakes; egg or egg products; and dairy products.
Similar proportions of CATI and EHO surveyed businesses provided “meat pies, sausage rolls or hotdogs”, and “infant or baby food”.
In addition to the foods listed in Table 2, businesses were asked if they provided uncooked, fermentedcomminuted meat. Only 5% of CATI and 2% of EHO surveyed businesses reportedly handled thistype of food. In some States and Territories butchers and meat producers and processors are notregulated by EHOs or PHUs and some surveying officers informed Campbell Research & Consultingthat they were uncomfortable, unwilling or unable to survey meat producers and processors (SeeSection 5.2.1).

2000/2001 National Food Safety Benchmark CR&C 0413Australia New Zealand Food Authority Page 16
Table 2: Food type by business classificationQ2 CATI: We would like some specific information on the foods that you produce, do you provide, produce or
manufacture any of the following foods.EHO: Please list the food types that apply to this business.
High Risk Medium Risk Low Risk TotalCATI(185)
%A
EHO(166)
%B
CATI(719)
%C
EHO(291)
%D
CATI(280)
%E
EHO(26)*
%F
CATI(1,200)
%G
EHO(483)
%H
Prepared ready-to-eattable meals
61E 62 58E 56 11 0 47 55G
Frozen meals 22 20D 30AED 11 15 4 26H 14
Raw meat, poultry orseafood
51EB 38 47ED 30 38 F 0 46 H 31
Cooked/processed meat,poultry or seafood
83EB 42 83ED 38 43F 4 74 H 38
Fermented or dried meatproducts
43CEB 14 33ED 11 18 4 32 H 12
Meat pies, sausage rollsor hot dogs
61EB 49 58ED 49 25 4 51 47
Sandwiches or rolls 77EB 64D 72ED 49 18 0 60 H 52
Soft drinks / juices 78EB 67 88AED 69 54 38 79 H 67
Raw fruit and vegetables 78EB 48D 74ED 33 48 31 69 H 38
Processed fruit andvegetables
63CEB 46D 50ED 27 25 15 46 H 33
Confectionery 42 41 54AED 40 36 15 48 H 39
Infant or baby foods 18CE 21D 10 10 11 4 12 13
Bread, pastries or cakes 84EB 66D 83ED 51 48 38 75 H 55
Egg or egg products 83EB 51D 79ED 39 46 19 72 H 42
Dairy products 83EB 62D 83ED 52 51 27 76 H 54
Prepared salads 69EB 46D 64ED 36 13 0 53 H 37
Base: All respondentsNote: Letters in the cells represent statistically significant differences between columns (see page i for an explanation).• Sample too small to permit statistical significance testing

2000/2001 National Food Safety Benchmark CR&C 0413Australia New Zealand Food Authority Page 17
6.1.6 Providing food to “at risk” consumer groupsLess than two in ten CATI (17%) and EHO surveyed businesses (15%) served or provided food to “atrisk” groups including (Figure 5):
hospitals or sites where sick or frail people reside; nursing homes, hostels or other organisations serving elderly people; organisations serving pregnant women; or child care centres or other organisations serving children less than 5 years old.
Figure 5: Providing food to “at risk” consumer groupsQ6: CATI: Do you directly supply or manufacture food for the following organisations?Q7: EHO: Does the business directly supply or manufacture food for organisations catering to the sick, elderly,
children under 5 or pregnant women?
Base: All respondentsCATI = 1,200 EHO = 483
A breakdown of CATI businesses surveyed within each of these individual risk populationclassifications is presented in Table 3. Individual risk population categories were not classified withinthe EHO surveyed businesses.9
9 EHOs are more familiar with the definition of an “at risk” population due to their training in food safety and
therefore one general question about “at risk” populations was asked of them. Additionally, EHOs were briefed touse the same definition of “at risk”. This was reinforced on each questionnaire. To obtain a similar assessmentfrom CATI surveyed businesses, where the respondent could have very little understanding of “at risk” groups, thisquestion was broken down into population categories.
17% 15%
0%
10%20%
30%40%50%
60%70%
80%90%
100%
CATI EHO

2000/2001 National Food Safety Benchmark CR&C 0413Australia New Zealand Food Authority Page 18
Nearly all CATI and EHO surveyed businesses providing foods to “at risk” populations wereclassified as high risk businesses (Table 3), thus confirming appropriate application of the automatedrisk classification system. Four in ten (42%) of the EHO and eight in ten (77%) of the CATI surveyedbusinesses classified as high risk provided food to “at risk” populations. Differences betweenclassifications of businesses as low or medium risk are likely to be due to differences in the type offood supplied.
Table 3: Providing food to “at risk” consumer groups by business classificationQ6 CATI: Do you directly supply or manufacture food for the following organisations?
High RiskCATI(185)
%A
Medium RiskCATI(719)
%B
Low RiskCATI(280)
%C
Hospitals, or other sites where sickor frail people reside
24BC 4 4
Nursing homes, hostels or otherorganisations serving elderlypeople
46BC 3 5
Organisations serving pregnantwomen
8BC 1 1
Child care centres or otherorganisations serving childrenunder 5 years old
26BC 2 1
Net yes CATI 77% 8% 7%
High RiskEHO(166)
%A
Medium RiskEHO(291)
%B
Low RiskEHO(26)%C
Net yes EHO 42B 1 0Base: All respondentsNote: Letters in the cells represent statistically significant differences between columns (see page i for an explanation).

2000/2001 National Food Safety Benchmark CR&C 0413Australia New Zealand Food Authority Page 19
6.1.7 Location of businessSimilar proportions of businesses were interviewed in most States and Territories for both surveys(Figure 6). There were no significant differences between the two samples by either state or businesssize.
Figure 6: State location of business
Base: All respondentsCATI = 1,200 EHO = 483
Survey target samples were set to achieve a proportional representation of interviews in each statedepending on state population. Targets were more easily achieved on the CATI interviews wherebusinesses were selected through the telephone directory. EHO targets were more difficult to achieve,as the response rates were not known until survey return dates had passed. After this time, decisionsabout whether to extend the deadline to ensure better representation had to be made. In manyinstances individual councils were contacted to negotiate a reasonable extension of time where therewas a possibility of inclusion.One half of both CATI (52%) and EHO (50%) businesses surveyed were located in rural regions andvery similar proportions in metro regions (Figure 7). The over-representation of rural food businesseswas a function of the sampling to ensure that sample segments were of sufficient size to enableconfidence. In general, there was little difference by rural/ metropolitan region.
Figure 7: Rural/regional and metro
Base: All respondentsCATI = 1,200 EHO = 483
6%3%
20%20%
3%
13%7%
13%20%
8%5%8%19%15%
20% 18%
0%10%
20%30%
40%50%60%
70%80%90%
100%
VIC QLD NSW WA SA TAS NT ACT
CATI EHO
52% 50%48% 50%
0%10%
20%30%
40%50%60%
70%80%90%
100%
CATI EHO
Rural Metro
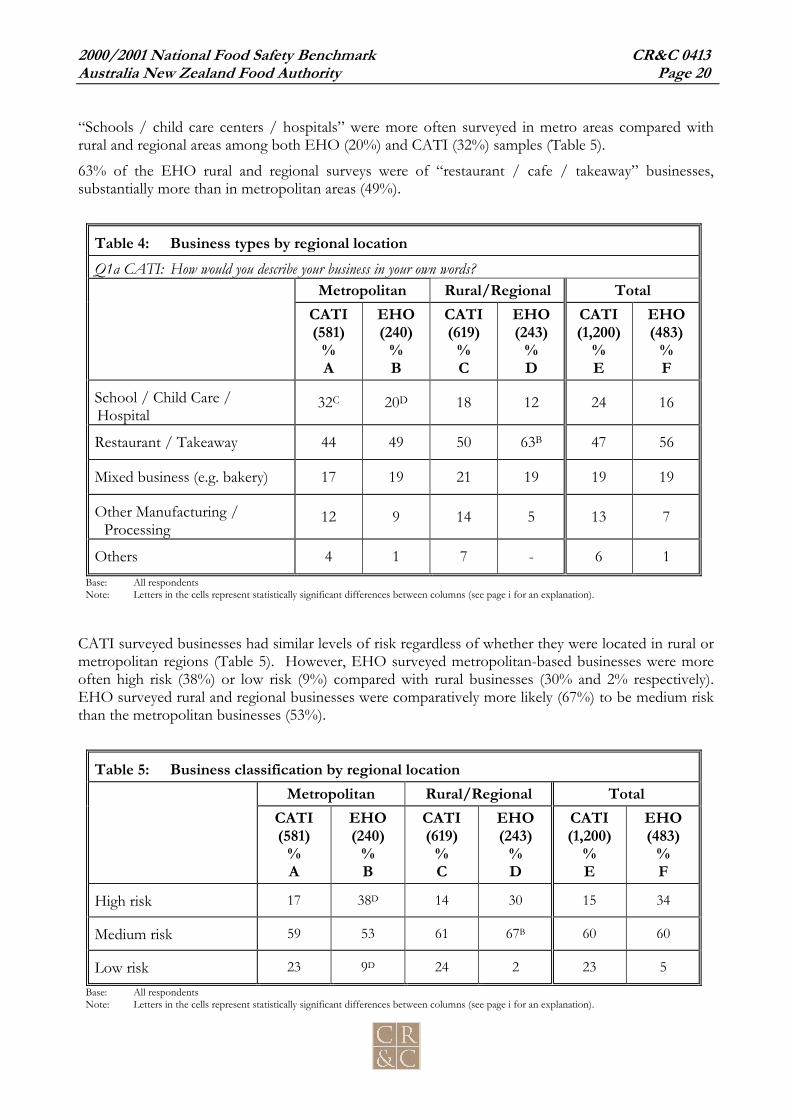
2000/2001 National Food Safety Benchmark CR&C 0413Australia New Zealand Food Authority Page 20
“Schools / child care centers / hospitals” were more often surveyed in metro areas compared withrural and regional areas among both EHO (20%) and CATI (32%) samples (Table 5).
63% of the EHO rural and regional surveys were of “restaurant / cafe / takeaway” businesses,substantially more than in metropolitan areas (49%).
Table 4: Business types by regional locationQ1a CATI: How would you describe your business in your own words?
Metropolitan Rural/Regional TotalCATI(581)
%A
EHO(240)
%B
CATI(619)
%C
EHO(243)
%D
CATI(1,200)
%E
EHO(483)
%F
School / Child Care /Hospital
32C 20D 18 12 24 16
Restaurant / Takeaway 44 49 50 63B 47 56
Mixed business (e.g. bakery) 17 19 21 19 19 19
Other Manufacturing /Processing
12 9 14 5 13 7
Others 4 1 7 - 6 1Base: All respondentsNote: Letters in the cells represent statistically significant differences between columns (see page i for an explanation).
CATI surveyed businesses had similar levels of risk regardless of whether they were located in rural ormetropolitan regions (Table 5). However, EHO surveyed metropolitan-based businesses were moreoften high risk (38%) or low risk (9%) compared with rural businesses (30% and 2% respectively).EHO surveyed rural and regional businesses were comparatively more likely (67%) to be medium riskthan the metropolitan businesses (53%).
Table 5: Business classification by regional locationMetropolitan Rural/Regional Total
CATI(581)
%A
EHO(240)
%B
CATI(619)
%C
EHO(243)
%D
CATI(1,200)
%E
EHO(483)
%F
High risk 17 38D 14 30 15 34
Medium risk 59 53 61 67B 60 60
Low risk 23 9D 24 2 23 5
Base: All respondentsNote: Letters in the cells represent statistically significant differences between columns (see page i for an explanation).

2000/2001 National Food Safety Benchmark CR&C 0413Australia New Zealand Food Authority Page 21
Among EHO surveyed businesses (Table 6), all of those surveyed in the Northern Territory (100%)were classified as rural and those in the ACT (100%) as metropolitan. Western Australia had acomparatively higher proportion of metropolitan-based businesses (72%).
Within the CATI survey (Table 6), Queensland and Tasmania had a larger proportion of interviewsamong rural based businesses while Western Australia and the ACT were over represented inmetropolitan areas.
Table 6: Regional location by stateNSW VIC QLD SA TAS WA ACT NT
CATI(240)
%A
EHO(94)%B
CATI(240)
%C
EHO(98)%D
CATI(240)
%E
EHO(74)%F
CATI(160)
%G
EHO(88)%H
CATI(80)%I
EHO(26)*
%J
CATI(160)
%K
EHO(39)%L
CATI(40)%M
EHO(27)*
%N
CATI(40)%O
EHO(37)%P
Metropolitan 48EI
56FP
50EI
49P
31 38P
56EIO
45P
30 62 66ACEI
O
72DFH
P
100ACE
GIK
O
100 35 0
Rural /regional
53KM
44 50KM
51L
69ACG
KM
62BL
44M
55L
70ACG
KM
38 34M
28 0 0 65GKM
100BDF
HL
Base: All respondentsNote: Letters in the cells represent statistically significant differences between columns (see page i for an explanation).* Sample too small to permit statistical significance testing
Comparing business type by state (Table 7) illustrates a few notable differences in each surveyedsample.
In the EHO sample, New South Wales (13%) had a larger proportion of “manufacturing &processing” businesses surveyed than Victoria (4%). Queensland (26%) EHOs surveyed more “mixedbusiness / bakery” business types compared to Western Australia (8%).
A smaller proportion of CATI surveys from Tasmania (14%) were among “schools/ child carecentres/ hospitals” compared to New South Wales (32%), South Australia (26%), Queensland (25%)and Western Australia (25%).
CATI Northern Territory surveys more often were undertaken in “restaurants/ café/ takeaways”(65%) compared to Queensland (48%), South Australia (43%) or Western Australia (39%).
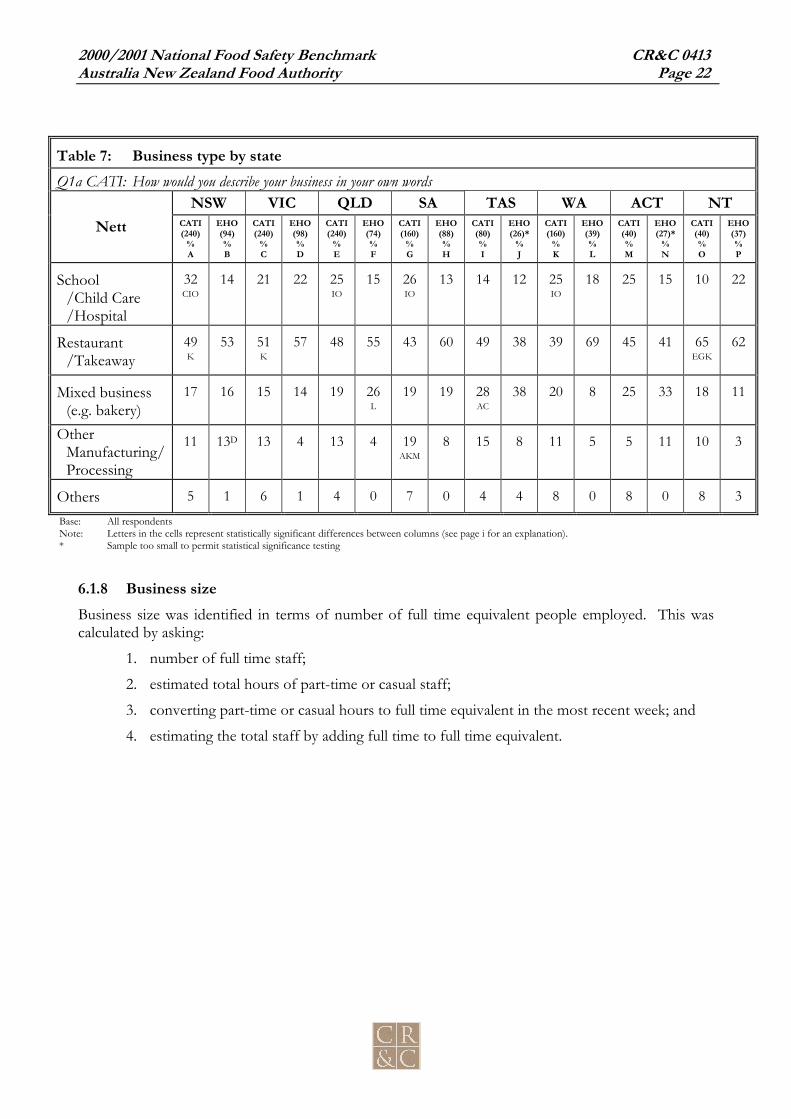
2000/2001 National Food Safety Benchmark CR&C 0413Australia New Zealand Food Authority Page 22
Table 7: Business type by stateQ1a CATI: How would you describe your business in your own words
NSW VIC QLD SA TAS WA ACT NTNett CATI
(240)%A
EHO(94)%B
CATI(240)
%C
EHO(98)%D
CATI(240)
%E
EHO(74)%F
CATI(160)
%G
EHO(88)%H
CATI(80)%I
EHO(26)*
%J
CATI(160)
%K
EHO(39)%L
CATI(40)%M
EHO(27)*
%N
CATI(40)%O
EHO(37)%P
School/Child Care/Hospital
32CIO
14 21 22 25IO
15 26IO
13 14 12 25IO
18 25 15 10 22
Restaurant/Takeaway
49K
53 51K
57 48 55 43 60 49 38 39 69 45 41 65EGK
62
Mixed business(e.g. bakery)
17 16 15 14 19 26L
19 19 28AC
38 20 8 25 33 18 11
OtherManufacturing/Processing
11 13D 13 4 13 4 19AKM
8 15 8 11 5 5 11 10 3
Others 5 1 6 1 4 0 7 0 4 4 8 0 8 0 8 3
Base: All respondentsNote: Letters in the cells represent statistically significant differences between columns (see page i for an explanation).* Sample too small to permit statistical significance testing
6.1.8 Business sizeBusiness size was identified in terms of number of full time equivalent people employed. This wascalculated by asking:
1. number of full time staff;
2. estimated total hours of part-time or casual staff;
3. converting part-time or casual hours to full time equivalent in the most recent week; and
4. estimating the total staff by adding full time to full time equivalent.
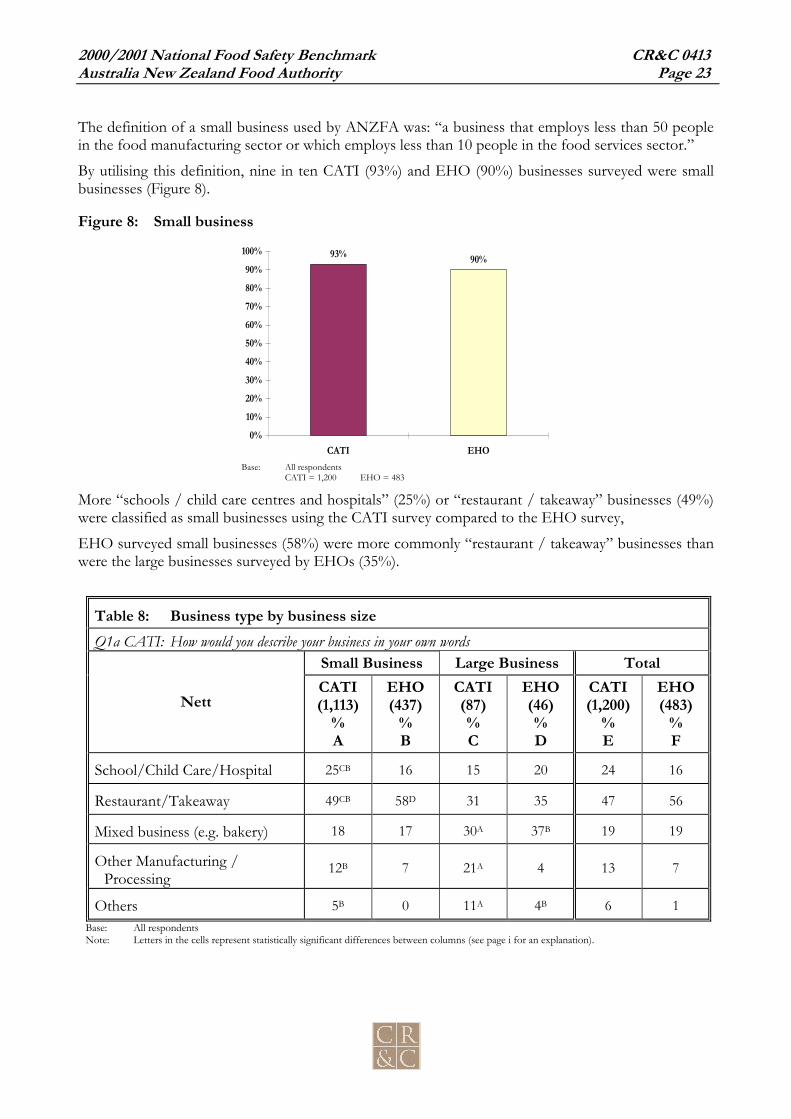
2000/2001 National Food Safety Benchmark CR&C 0413Australia New Zealand Food Authority Page 23
The definition of a small business used by ANZFA was: “a business that employs less than 50 peoplein the food manufacturing sector or which employs less than 10 people in the food services sector.”
By utilising this definition, nine in ten CATI (93%) and EHO (90%) businesses surveyed were smallbusinesses (Figure 8).
Figure 8: Small business
Base: All respondentsCATI = 1,200 EHO = 483
More “schools / child care centres and hospitals” (25%) or “restaurant / takeaway” businesses (49%)were classified as small businesses using the CATI survey compared to the EHO survey,
EHO surveyed small businesses (58%) were more commonly “restaurant / takeaway” businesses thanwere the large businesses surveyed by EHOs (35%).
Table 8: Business type by business sizeQ1a CATI: How would you describe your business in your own words
Small Business Large Business Total
NettCATI(1,113)
%A
EHO(437)
%B
CATI(87)%C
EHO(46)%D
CATI(1,200)
%E
EHO(483)
%F
School/Child Care/Hospital 25CB 16 15 20 24 16
Restaurant/Takeaway 49CB 58D 31 35 47 56
Mixed business (e.g. bakery) 18 17 30A 37B 19 19
Other Manufacturing /Processing
12B 7 21A 4 13 7
Others 5B 0 11A 4B 6 1Base: All respondentsNote: Letters in the cells represent statistically significant differences between columns (see page i for an explanation).
93% 90%
0%10%
20%30%
40%50%60%
70%80%90%
100%
CATI EHO
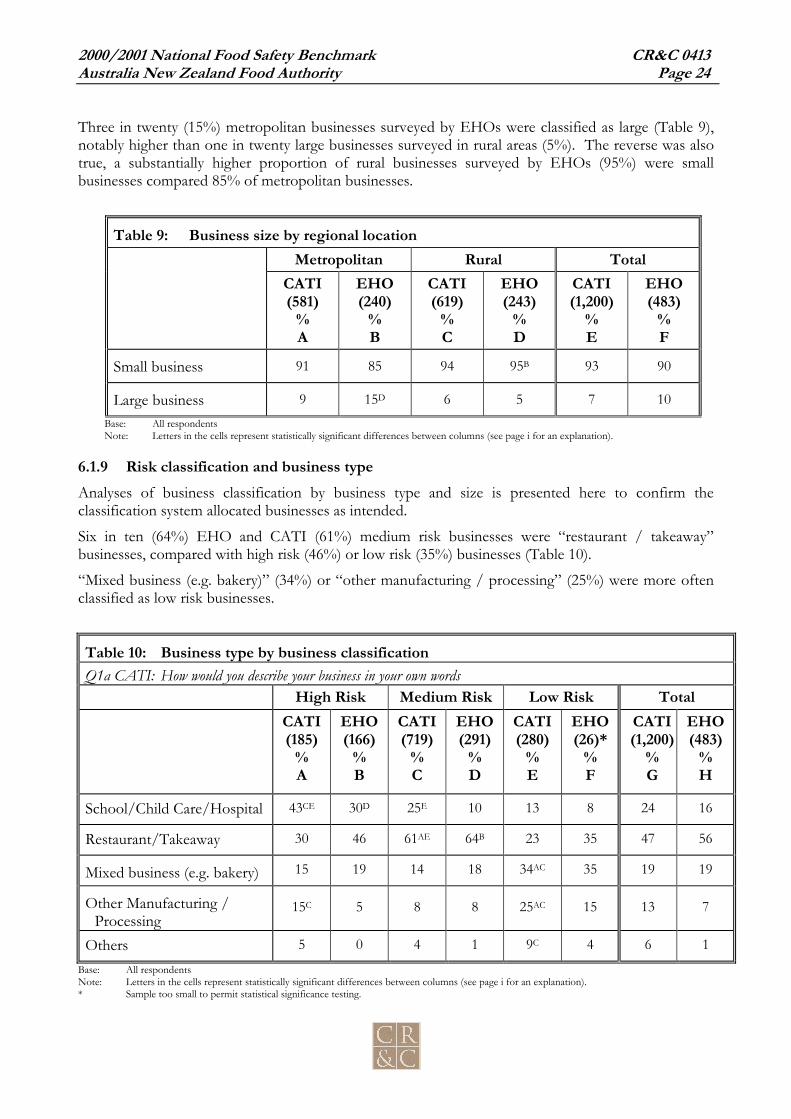
2000/2001 National Food Safety Benchmark CR&C 0413Australia New Zealand Food Authority Page 24
Three in twenty (15%) metropolitan businesses surveyed by EHOs were classified as large (Table 9),notably higher than one in twenty large businesses surveyed in rural areas (5%). The reverse was alsotrue, a substantially higher proportion of rural businesses surveyed by EHOs (95%) were smallbusinesses compared 85% of metropolitan businesses.
Table 9: Business size by regional locationMetropolitan Rural Total
CATI(581)
%A
EHO(240)
%B
CATI(619)
%C
EHO(243)
%D
CATI(1,200)
%E
EHO(483)
%F
Small business 91 85 94 95B 93 90
Large business 9 15D 6 5 7 10Base: All respondentsNote: Letters in the cells represent statistically significant differences between columns (see page i for an explanation).
6.1.9 Risk classification and business typeAnalyses of business classification by business type and size is presented here to confirm theclassification system allocated businesses as intended.
Six in ten (64%) EHO and CATI (61%) medium risk businesses were “restaurant / takeaway”businesses, compared with high risk (46%) or low risk (35%) businesses (Table 10).
“Mixed business (e.g. bakery)” (34%) or “other manufacturing / processing” (25%) were more oftenclassified as low risk businesses.
Table 10: Business type by business classificationQ1a CATI: How would you describe your business in your own words
High Risk Medium Risk Low Risk TotalCATI(185)
%A
EHO(166)
%B
CATI(719)
%C
EHO(291)
%D
CATI(280)
%E
EHO(26)*
%F
CATI(1,200)
%G
EHO(483)
%H
School/Child Care/Hospital 43CE 30D 25E 10 13 8 24 16
Restaurant/Takeaway 30 46 61AE 64B 23 35 47 56
Mixed business (e.g. bakery) 15 19 14 18 34AC 35 19 19
Other Manufacturing /Processing
15C 5 8 8 25AC 15 13 7
Others 5 0 4 1 9C 4 6 1
Base: All respondentsNote: Letters in the cells represent statistically significant differences between columns (see page i for an explanation).* Sample too small to permit statistical significance testing.

2000/2001 National Food Safety Benchmark CR&C 0413Australia New Zealand Food Authority Page 25
There were no notable differences in the proportion of risk categories of businesses surveyed acrossthe individual States / Territories (Table 11).
Table 11: State/ Territory by business classificationHigh Risk Medium Risk Low Risk Total
CATI(185)
%A
EHO(166)
%B
CATI(719)
%C
EHO(291)
%D
CATI(280)
%E
EHO(26)*
%F
CATI(1,200)
%G
EHO(483)
%H
New South Wales 23 16 21 19 16 42 20 19
Victoria 21 22 19 20 21 15 20 20
Queensland 20 19 20 14 20 0 20 15
South Australia 14 22 13 16 16 19 13 18
Tasmania 5 4 7 6 8 4 7 5
Western Australia 12 4 13 11 15 8 13 8
The Australian CapitalTerritory 5 5 3 5 2 8 3 6
Northern Territory 2 8 4 8 2 4 3 8
Base: All respondentsNote: Letters in the cells represent statistically significant differences between columns (see page i for an explanation).* Sample too small to permit statistical significance testing.

2000/2001 National Food Safety Benchmark CR&C 0413Australia New Zealand Food Authority Page 26
6.1.10 Type of respondentThree in ten CATI surveys were conducted with either “owners” (33%) or “senior managers” (29%).Other people involved were “food service or quality managers” (13%) or a “chef / kitchen hand”(12%).
EHO surveys, while intended to be based on observations rather than questions, were usuallyconducted in the presence of someone from the business. In nearly half (48%) of the surveys this wasthe “owner”. Senior management accompanied another three in ten (35%) EHOs. General staff wereless likely to be involved in EHO surveys probably due to the enforcement role EHOs have inconjunction with their position in the local council.
Figure 9: Title of respondent
Base: All respondentsCATI = 1,200 EHO = 483
Over half (54%) of CATI interviews were conducted with females who held a variety of positionswithin the organisations. Males interviewed were more likely than females to hold positions such as“owner/ proprietor/ licensee”, “senior manager” or “head/ executive chef”. Conversely, femaleswere more likely to be employed in positions such as “food service manager” or “other manager”.Women interviewed were more likely than men to be employed in businesses such as “schools/ childcare centres/ hospitals” Men and women were equally represented in “restaurant/ takeaway”businesses, and men were more likely to work in “mixed businesses (e.g. bakery” or “othermanufacturing/ processing”.
33% 29%
13% 12% 8%1%
48%
35%
1%11%
0%10%20%30%40%50%60%70%80%90%
100%
Owner/Licensee
SeniorManager
Food /Quality
Manager
Chef/Kitchenhand
Other
CATI EHO
2000/2001 National Food Safety Benchmark CR&C 0413Australia New Zealand Food Authority Page 27
7 Telephone survey among food businessesThe objective of the telephone survey was to identify the extent of knowledge about food safety issuesand practices in food businesses. The primary interviewing technique was to encourage businesses torespond, but not force them to guess. It was just as useful to identify the extent to which people donot know the answer to food handling questions as it was to identify correct and incorrect responses.
7.1 Temperature controlControlling the temperature of food is a critical element of food safety. Businesses can maintain foodsafely by keeping chilled food 5°C or below and hot food 60°C or hotter. Businesses were askedabout their temperature control practices and about their knowledge of the temperatures that weresuitable for keeping hot and cold food safe.
Food that has to be kept under temperature control is termed potentially hazardous food. However,in a short telephone interview with businesses that would be unfamiliar with this expression, generallyquestions referred to chilled or hot food. The report refers to these foods as ‘temperature sensitive’.
Some foods may be kept at refrigeration temperatures for quality rather than safety reasons forexample, whole fresh fruit and vegetables. The survey did not distinguish these from foods that werekept chilled for safety reasons.
7.1.1 Receiving hot and chilled foodBusinesses were asked if food was delivered to their business that had to be kept chilled or hot, howoften temperature checks were made of this food and how these checks were made. They were askedwhich foods they checked.
Nearly nine in ten (87%) businesses reported that they had foods delivered to their business that weretemperature sensitive10 and needed to be kept hot or cold (Figure 10).
Nine in ten businesses had hot and chilled foods delivered to their premises.
10 Temperature sensitive foods include foods that need to be kept chilled or hot to maintain quality.

2000/2001 National Food Safety Benchmark CR&C 0413Australia New Zealand Food Authority Page 28
Of businesses where hot or chilled foods were delivered, two in ten (22%) “never” checked thetemperature of foods that were delivered (Figure 11), and another one in ten (10%) “occasionally”checked the temperature of delivered foods.
Less than two in ten (18%) businesses receiving hot or chilled food regularly checked the temperatureof foods delivered.
Figure 10: Delivery of temperature sensitive food Figure 11: Frequency of checking temperature ofdelivered food
Q9a: Do you have foods delivered to your business that have to bekept chilled or hot?
Q9b: How often would you check the temperature of foodsdelivered? Would you check them?
Base: All respondents = 1,200 (CATI) Base: Have food delivered = 1,049 (CATI)
One fifth of businesses receiving hot or chilled food deliveries never checked thetemperature of food delivered to their premises.
87%
12%
0%10%
20%30%40%50%
60%70%80%
90%100%
Yes No
43%
18%
6%1%
22%10%
0%10%20%30%40%50%60%70%80%90%
100%
Always Regularly Occasionally Never Tempsensitive food
only
Don't know
87%
12%
0%10%
20%30%40%50%
60%70%80%
90%100%
Yes No
43%
18%
6%1%
22%10%
0%10%20%30%40%50%60%70%80%90%
100%
Always Regularly Occasionally Never Tempsensitive food
only
Don't know
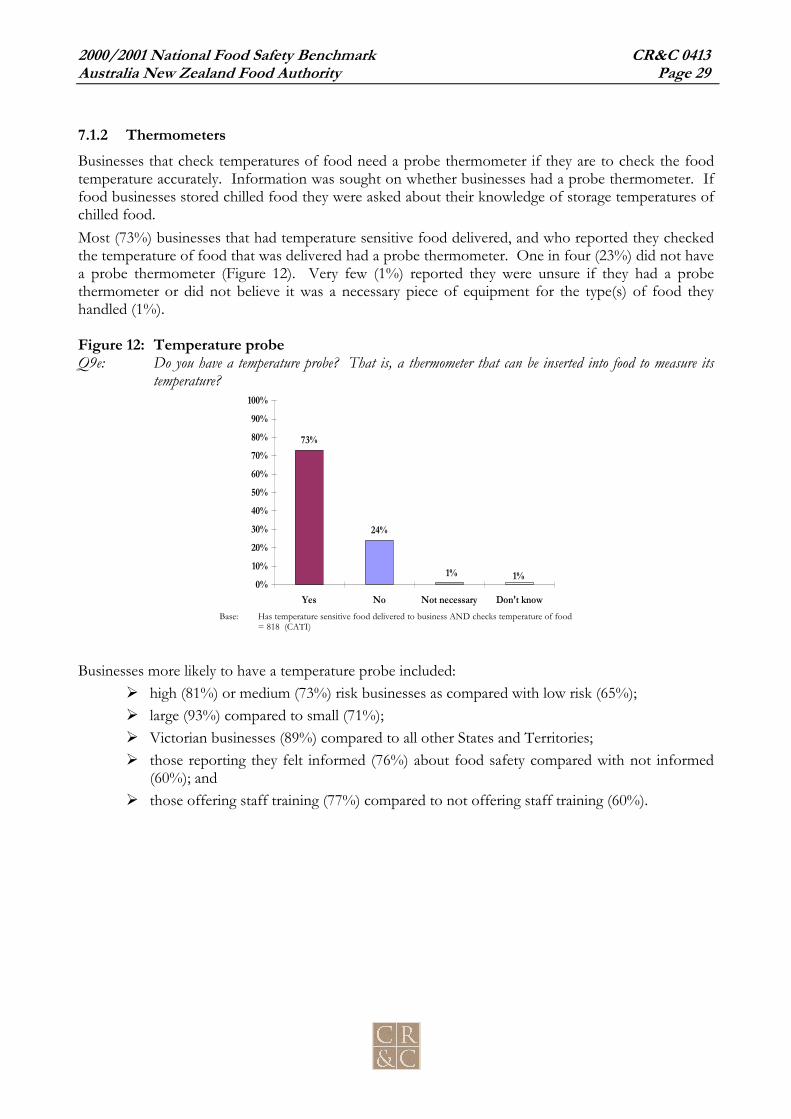
2000/2001 National Food Safety Benchmark CR&C 0413Australia New Zealand Food Authority Page 29
7.1.2 ThermometersBusinesses that check temperatures of food need a probe thermometer if they are to check the foodtemperature accurately. Information was sought on whether businesses had a probe thermometer. Iffood businesses stored chilled food they were asked about their knowledge of storage temperatures ofchilled food.Most (73%) businesses that had temperature sensitive food delivered, and who reported they checkedthe temperature of food that was delivered had a probe thermometer. One in four (23%) did not havea probe thermometer (Figure 12). Very few (1%) reported they were unsure if they had a probethermometer or did not believe it was a necessary piece of equipment for the type(s) of food theyhandled (1%).
Figure 12: Temperature probeQ9e: Do you have a temperature probe? That is, a thermometer that can be inserted into food to measure its
temperature?
Base: Has temperature sensitive food delivered to business AND checks temperature of food= 818 (CATI)
Businesses more likely to have a temperature probe included: high (81%) or medium (73%) risk businesses as compared with low risk (65%); large (93%) compared to small (71%); Victorian businesses (89%) compared to all other States and Territories; those reporting they felt informed (76%) about food safety compared with not informed
(60%); and those offering staff training (77%) compared to not offering staff training (60%).
73%
24%
1%1%0%
10%
20%30%
40%50%60%
70%80%90%
100%
Yes No Not necessary Don't know

2000/2001 National Food Safety Benchmark CR&C 0413Australia New Zealand Food Authority Page 30
7.1.3 Temperature check by business classification and business sizeComparing risk classifications and business size illustrated some difference in frequency of checkingthe temperature of food delivered to the business (Table 12). Small business were more likely “never”to check their food temperature (23%), when compared to large businesses (4%). Large businesses(72%) were more likely to “always” check temperatures compared to small businesses (41%).
Table 12: Check temperature of delivered food by business classification and business sizeQ9B: How often would you check the temperature of foods delivered?
Business classification Business sizeHigh Risk
(173)%A
Med Risk(661)
%B
Low Risk(200)
%C
Small(974)
%D
Large(75)%E
Total(1,049)
%F
Never 13 24A 25A 23E 4 22
Occasionally 9 11 8 10 11 10
Regularly, but not every delivery 21 16 21 18E 7 18
Always 50 42 42 41 72D 43
Only temperature sensitive food 5 6 4 6 5 6
Don’t know 2 1 2 1 1 1
One quarter of medium (24%) and low (25%) risk businesses receiving hot and chilled food “never”checked the temperature of food delivered to the business. High risk businesses were less likely toreport they “never” checked the temperature of the food (13%).
Nearly all businesses receiving hot/chilled food checked the temperature of food delivered to theirbusiness at least occasionally:
85% of high risk businesses; 75% of medium risk businesses; and 73% of low risk businesses.
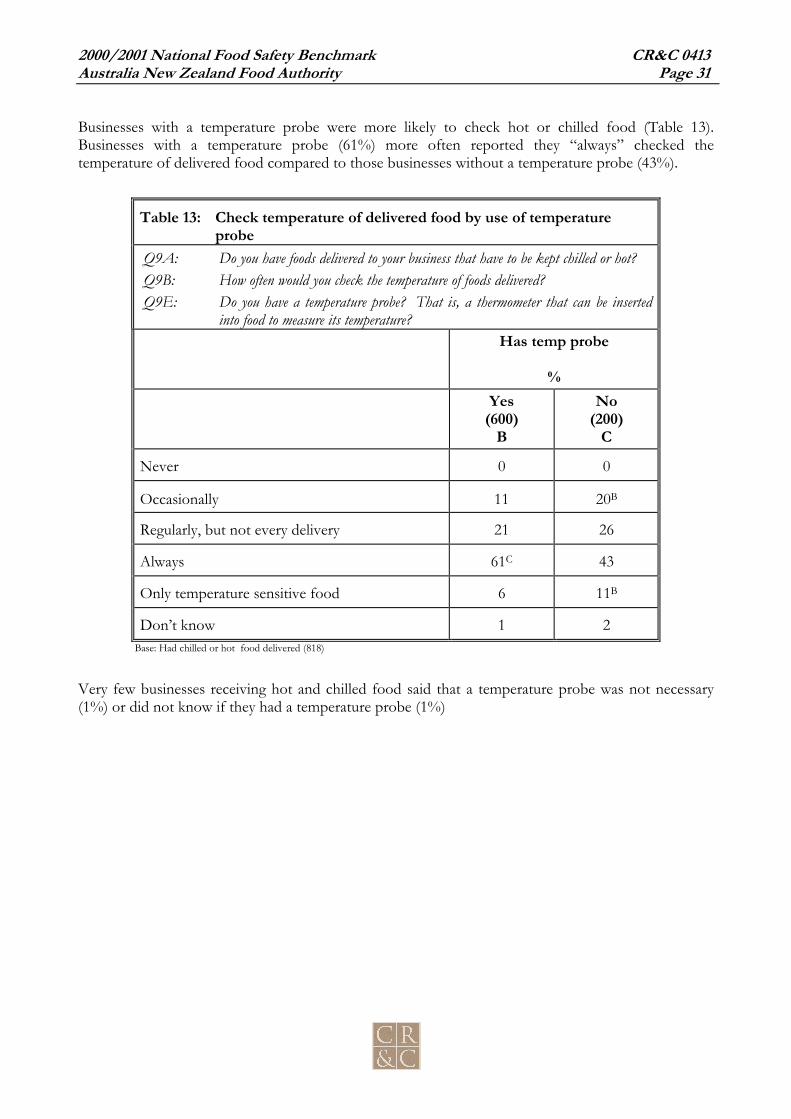
2000/2001 National Food Safety Benchmark CR&C 0413Australia New Zealand Food Authority Page 31
Businesses with a temperature probe were more likely to check hot or chilled food (Table 13).Businesses with a temperature probe (61%) more often reported they “always” checked thetemperature of delivered food compared to those businesses without a temperature probe (43%).
Table 13: Check temperature of delivered food by use of temperatureprobe
Q9A: Do you have foods delivered to your business that have to be kept chilled or hot?Q9B: How often would you check the temperature of foods delivered?Q9E: Do you have a temperature probe? That is, a thermometer that can be inserted
into food to measure its temperature?Has temp probe
%Yes
(600)B
No(200)
C
Never 0 0
Occasionally 11 20B
Regularly, but not every delivery 21 26
Always 61C 43
Only temperature sensitive food 6 11B
Don’t know 1 2Base: Had chilled or hot food delivered (818)
Very few businesses receiving hot and chilled food said that a temperature probe was not necessary(1%) or did not know if they had a temperature probe (1%)

2000/2001 National Food Safety Benchmark CR&C 0413Australia New Zealand Food Authority Page 32
Of businesses that checked the temperature of food, over one in ten (14%) checked the temperatureby “touch” and another one in ten (11%) checked the temperature by “looking at the appearance” ofthe food (Figure 13). A clear majority of seven in ten (72%), businesses that checked foodtemperature, reported they used a thermometer to check the temperature of foods delivered to theirbusiness.
Figure 13: Method for checking temperature ofdelivered food
Figure 14: Food types to check temperature whendelivered
Q9c: How do you check the temperature of the food? Q9d: Which type of foods would you check the temperature ofwhen delivered?
Base: Has hot or chilled food delivered to business AND checkstemperature of food = 818 (CATI)
Base: Has hot or chilled food delivered to business AND checkstemperature of food = 818 (CATI)
Total may be greater than 100% due to multiple responses Total may be greater than 100% due to multiple responses
Businesses were much more likely to check the temperature of chilled or frozen items compared tohot foods (Figure 14).
When asked which types of food a business checked the temperature: a majority of businesses (71%) checked the temperature of chilled food when it was
delivered; six in ten (60%) checked frozen food; over one in ten (13%) checked “all” foods; and one in ten (8%) checked “hot” foods.
One in ten businesses where hot or chilled food was delivered and the temperature waschecked, checked the temperature of foods by their appearance rather than by touch or a
thermometer.
72%
14% 11% 10% 6%
0%10%20%30%40%50%60%70%80%90%
100%
Thermometer Touch Appearance Gauge invehicle
Other
71%
60%
1%
29%
13%
2%8%
1%0%
10%
20%30%
40%50%60%
70%80%90%
100%
Chilled Frozen Fresh All Hot Dry Other None

2000/2001 National Food Safety Benchmark CR&C 0413Australia New Zealand Food Authority Page 33
High (65%) and medium (62%) risk businesses were more likely to check the temperature of frozenfood compared to low risk (46%) businesses (Table 14). Other than frozen food, no differences wereidentified by risk classification or business size.
Table 14: Temperature control for different types of food by business classification andbusiness size
Q9D: Which types of food do you check the temperature of when delivered?Business classification Business size
High Risk(151)
%A
Med Risk(503)
%B
Low risk(151)
%C
Small(746)
%D
Large(72)%E
Total(818)
%F
Chilled food 73 73 66 71 75 71
Frozen food 65C 62C 46 59 68 60
Fresh food 32 30 24 29 39 29
All foods 15 13 13 13 15 13
Hot food 9 9 5 8 7 8
Dry foods 2 3 0 2 1 2Base: Have hot or chilled food delivered & check temperature of food delivered (818)Note: Businesses where a risk classification has not been made have been excluded from this table

2000/2001 National Food Safety Benchmark CR&C 0413Australia New Zealand Food Authority Page 34
When considering the total population of businesses, those which were less likely to check thetemperature of delivered food were (Table 15):
businesses who did not feel informed on food safety regulations; businesses not providing staff training; and businesses where females responded to the survey.
Table 15: Check temperature of delivered food by staff knowledge and gender of respondentQ9B: How often would you check the temperature of foods delivered?Q24: How well informed do you feel about the current regulations about food safety?Q28A: Do you provide staff training on handling food safely?
Informed of foodsafety regulations Staff training Gender
Totalinformed
(850)%A
Notinformed
(193)%B
Yes(797)
%C
No(252)
%D
Male(484)
%E
Female(565)
%F
Total(1,049)
%G
Never 19 36A 18 36C 17 26E 22
Occasionally 9 15A 9 12 10 10 10
Regularly, but not every delivery 17 18 18 15 18 17 18
Always 49B 20 48D 28 47F 40 43
Only temperature sensitive food 5 8 5 8 6 5 6
Don’t know 1 4A 2 1 1 1 1
Base: Have hot or chilled food delivered (1,049)
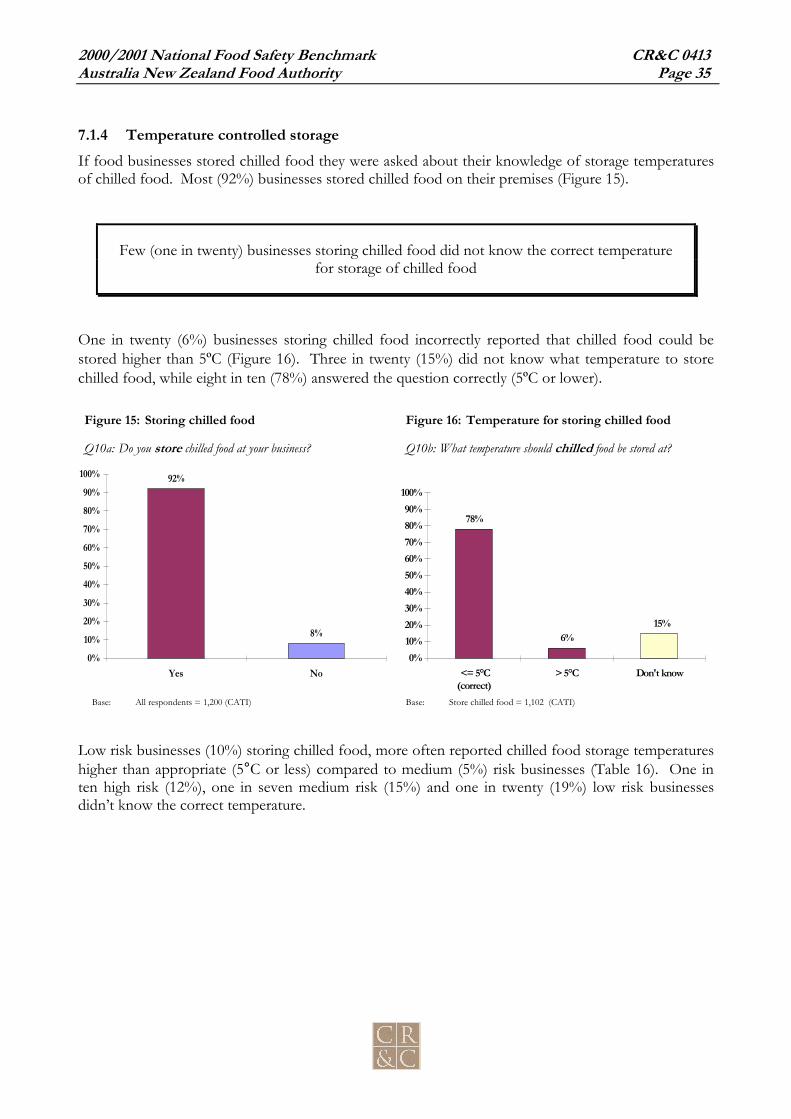
2000/2001 National Food Safety Benchmark CR&C 0413Australia New Zealand Food Authority Page 35
7.1.4 Temperature controlled storageIf food businesses stored chilled food they were asked about their knowledge of storage temperaturesof chilled food. Most (92%) businesses stored chilled food on their premises (Figure 15).
Few (one in twenty) businesses storing chilled food did not know the correct temperaturefor storage of chilled food
One in twenty (6%) businesses storing chilled food incorrectly reported that chilled food could bestored higher than 5ºC (Figure 16). Three in twenty (15%) did not know what temperature to storechilled food, while eight in ten (78%) answered the question correctly (5ºC or lower).
Figure 15: Storing chilled food Figure 16: Temperature for storing chilled food
Q10a: Do you store chilled food at your business? Q10b: What temperature should chilled food be stored at?
Base: All respondents = 1,200 (CATI) Base: Store chilled food = 1,102 (CATI)
Low risk businesses (10%) storing chilled food, more often reported chilled food storage temperatureshigher than appropriate (5°C or less) compared to medium (5%) risk businesses (Table 16). One inten high risk (12%), one in seven medium risk (15%) and one in twenty (19%) low risk businessesdidn’t know the correct temperature.
92%
8%
0%10%
20%30%
40%50%60%
70%80%90%
100%
Yes No
78%
6%15%
0%10%20%30%40%50%60%70%80%90%
100%
<= 5°C(correct)
> 5°C Don't know
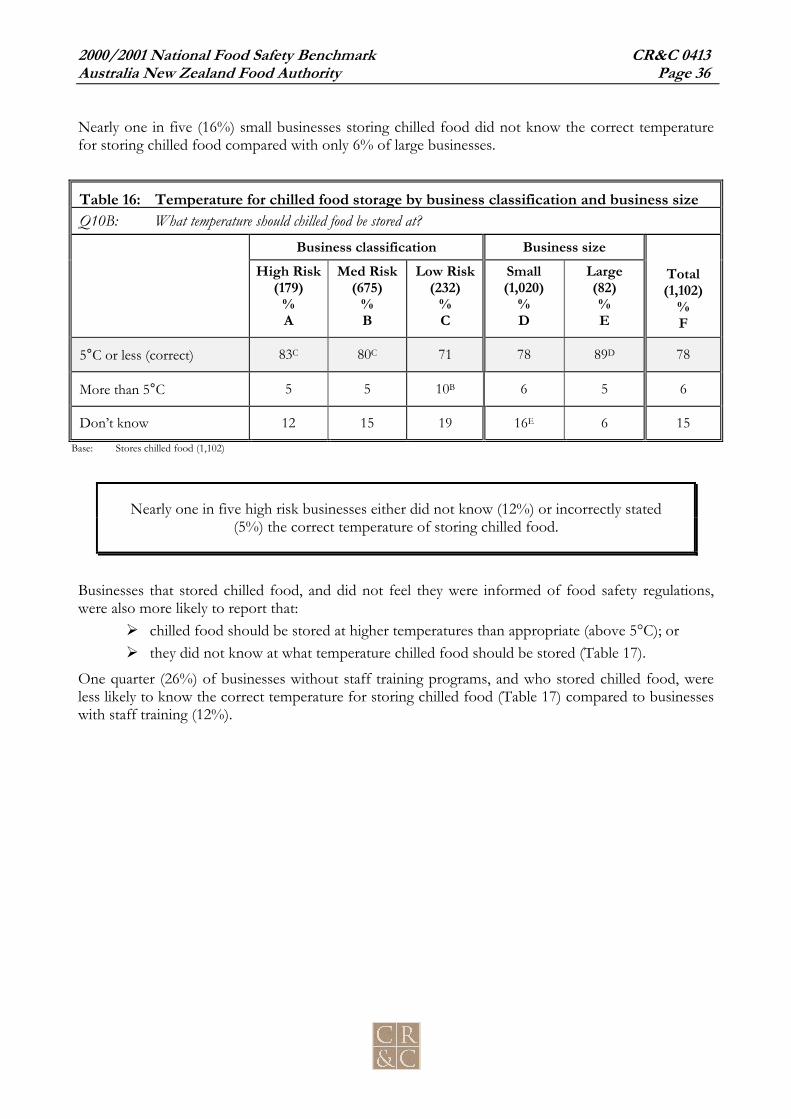
2000/2001 National Food Safety Benchmark CR&C 0413Australia New Zealand Food Authority Page 36
Nearly one in five (16%) small businesses storing chilled food did not know the correct temperaturefor storing chilled food compared with only 6% of large businesses.
Table 16: Temperature for chilled food storage by business classification and business sizeQ10B: What temperature should chilled food be stored at?
Business classification Business sizeHigh Risk
(179)%A
Med Risk(675)
%B
Low Risk(232)
%C
Small(1,020)
%D
Large(82)%E
Total(1,102)
%F
5°C or less (correct) 83C 80C 71 78 89D 78
More than 5°C 5 5 10B 6 5 6
Don’t know 12 15 19 16E 6 15
Base: Stores chilled food (1,102)
Nearly one in five high risk businesses either did not know (12%) or incorrectly stated(5%) the correct temperature of storing chilled food.
Businesses that stored chilled food, and did not feel they were informed of food safety regulations,were also more likely to report that:
chilled food should be stored at higher temperatures than appropriate (above 5°C); or they did not know at what temperature chilled food should be stored (Table 17).
One quarter (26%) of businesses without staff training programs, and who stored chilled food, wereless likely to know the correct temperature for storing chilled food (Table 17) compared to businesseswith staff training (12%).

2000/2001 National Food Safety Benchmark CR&C 0413Australia New Zealand Food Authority Page 37
One quarter (24%) of females in businesses storing chilled food did not know the correct temperaturecompared to males (4%). This reflects the positions typically held by women compared to men. Asdiscussed in Section 6.1.10, males were more often held positions such as “owner / proprietor”,“senior manager” or “head / executive chef”. Conversely females tended to hold less seniormanagement positions such as “food service manager” or “other manager”.
Table 17: Temperature for chilled food storage by staff knowledge and gender of respondentQ10B: What temperature should chilled food be stored at?Q24: How well informed do you feel about the current regulations about food safety?Q28A: Do you provide staff training on handling food safely?
Informed of food safetyregulations Staff training Gender
Total informed(897)
%A
Not informed(195)
%B
Yes(826)
%C
No(276)
%D
Male(494)
%E
Female(608)
%F
Total(1,102)
%G
5°C or less (correct) 82B 63 82D 67 89F 70 78
More than 5°C 5 11A 6 7 6 6 6
Don’t know 13 27A 12 26C 4 24E 15
Base: Stores chilled food (1,102)

2000/2001 National Food Safety Benchmark CR&C 0413Australia New Zealand Food Authority Page 38
7.1.5 Hot holding of foodIf food businesses held food hot in a display unit or similar they were asked what temperature the foodshould be held.
Four in ten (38%) businesses needed to hold hot food for periods of time (Figure 17). One quarter (23%) businesses needing to hold hot food either “did not know” the correct
temperature (19%), or stated a temperature too low (4%) for safely holding hot food (lower than60ºC) (Figure 18).
Eight in ten (77%) businesses holding hot food correctly indicated that hot food should be held ator above 60ºC.
Figure 17: Holding hot food Figure 18: Temperature for holding hot food
Q11a: Do you hold cooked food in a bain marie unit (orsomething similar) to keep food hot?
Q11b: What temperature should cooked food be held in a bainmarie unit (or something similar to keep food hot)?
Base: All respondents = 1,200 (CATI) Base: Holds hot food = 453 (CATI)
One quarter of businesses involved with holding hot food did not know, or incorrectlyidentified, the appropriate temperature for safely holding hot food.
38%
62%
0%10%
20%30%
40%50%60%
70%80%90%
100%
Yes No
77%
4%
19%
0%10%20%30%40%50%60%70%80%90%
100%
>= 60°C < 60°C Don't know
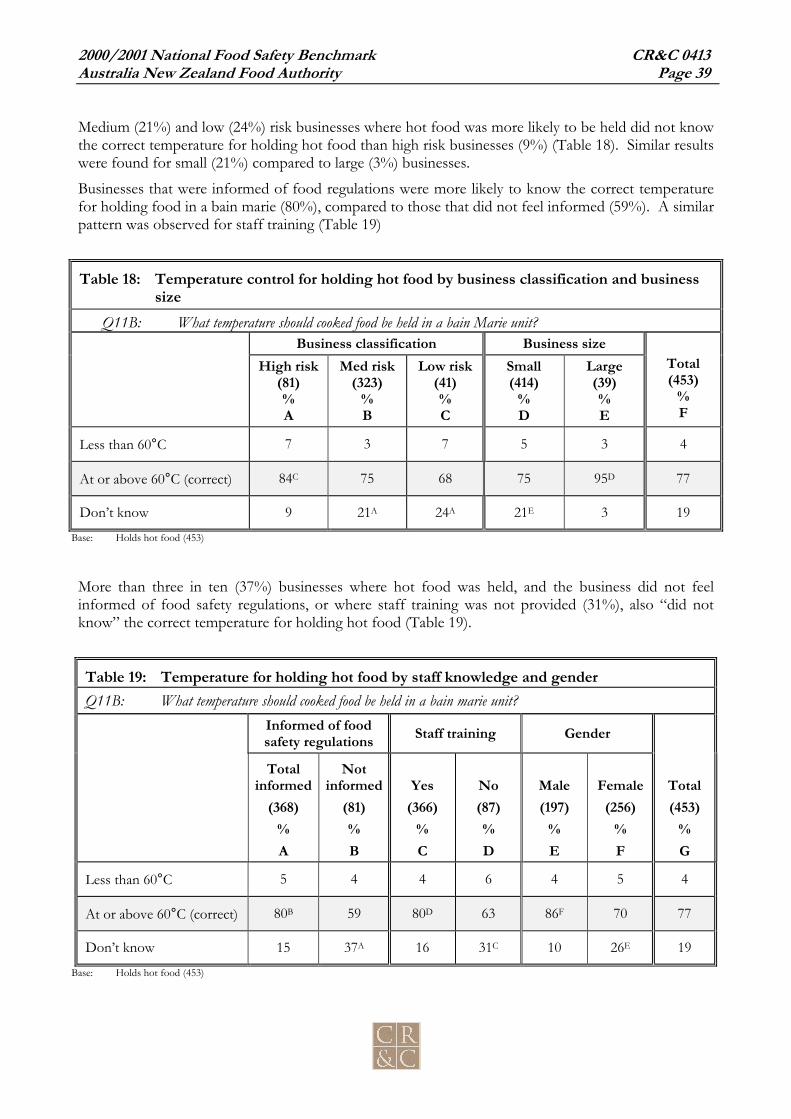
2000/2001 National Food Safety Benchmark CR&C 0413Australia New Zealand Food Authority Page 39
Medium (21%) and low (24%) risk businesses where hot food was more likely to be held did not knowthe correct temperature for holding hot food than high risk businesses (9%) (Table 18). Similar resultswere found for small (21%) compared to large (3%) businesses.
Businesses that were informed of food regulations were more likely to know the correct temperaturefor holding food in a bain marie (80%), compared to those that did not feel informed (59%). A similarpattern was observed for staff training (Table 19)
Table 18: Temperature control for holding hot food by business classification and businesssize
Q11B: What temperature should cooked food be held in a bain Marie unit?Business classification Business size
High risk(81)%A
Med risk(323)
%B
Low risk(41)%C
Small(414)
%D
Large(39)%E
Total(453)
%F
Less than 60°C 7 3 7 5 3 4
At or above 60°C (correct) 84C 75 68 75 95D 77
Don’t know 9 21A 24A 21E 3 19
Base: Holds hot food (453)
More than three in ten (37%) businesses where hot food was held, and the business did not feelinformed of food safety regulations, or where staff training was not provided (31%), also “did notknow” the correct temperature for holding hot food (Table 19).
Table 19: Temperature for holding hot food by staff knowledge and genderQ11B: What temperature should cooked food be held in a bain marie unit?
Informed of foodsafety regulations Staff training Gender
Totalinformed
(368)%A
Notinformed
(81)%B
Yes(366)
%C
No(87)%D
Male(197)
%E
Female(256)
%F
Total(453)
%G
Less than 60°C 5 4 4 6 4 5 4
At or above 60°C (correct) 80B 59 80D 63 86F 70 77
Don’t know 15 37A 16 31C 10 26E 19
Base: Holds hot food (453)

2000/2001 National Food Safety Benchmark CR&C 0413Australia New Zealand Food Authority Page 40
Female respondents (26%) were more likely than male respondents (10%) to report that they didn’tknow the temperature for holding hot food.
7.1.6 CoolingIf food is prepared and cooked in advance it needs to be cooled rapidly to be kept safe. This onlyapplies to food that may contain bacteria and which provides a medium for bacterial growth.However, to keep questions straightforward, if businesses cooked any types of food for later use, theywere asked some questions about cooling.
One third (31%) of businesses reported that they cooked food and cooled it for later re-use (Figure19).
Figure 19: Cooking food and cooling for re-useQ12a Do you cook food and then cool it for later use?
Base: All respondents = 1,200 (CATI)
One third of businesses cook food and cool it for later re-use.
A series of true/false questions were asked about the correct procedures for cooling food that hasbeen cooked.
The first four statements offered a series of choices on how much time it should take to reduce thetemperature of foods when cooling. A fifth statement asked businesses about the procedure forstoring food in containers when cooling.
All businesses involved with cooking and then cooling food were asked to respond true or false toeach of the following:
cooked food must be cooled from 60°- 21° within two hours (True); cooked food must be cooled from 60°- 21° within four hours (False); cooked food must be cooled from 21°- 5° within six hours (False) cooked food must be cooled from 21°- 5° within four hours (True); and large amounts of cooked food should be placed in small containers and put in a cool room
or refrigerator for cooling (True).
The comparative responses for statements on temperature and time of cooling food are presented inFigure 20.
31%
69%
0%10%
20%30%
40%50%60%
70%80%90%
100%
Yes No

2000/2001 National Food Safety Benchmark CR&C 0413Australia New Zealand Food Authority Page 41
Approximately half of businesses gave the correct response to each statement with the remainderbeing equally distributed between incorrect answers and “don’t know” (Figure 20).
Figure 20: Temperature and time for safely cooling cooked foodQ12b: Thinking about cooling or chilling hot or cooked food, can you tell me whether each of the following
statements are true or false? Cooked food must be cooled from…
Base: Cools cooked food for later re-use = 375 (CATI)
Three in ten businesses (29%) either did not know (10%) or incorrectly reported “false” (19%): that“large amounts of cooked food should be placed in small containers and put in a cool room orrefrigerator for cooling” (Figure 21).
Figure 21: Safely cooling large amounts of cooked foodQ12b: Thinking about cooling or chilling hot or cooked food, can you tell me whether each of the following
statements are true or false? Large amounts of cooked food should be placed in small containers and putin a cool room or refrigerator for cooling. (True)
Base: Cools cooked food for later re-use = 375 (CATI)
Three in ten businesses (29%) involved in cooling cooked food for later re-use did notknow that large amounts of food should be placed in small containers and put in a cool
room or refrigerator for cooling.
71%
19%10%
0%10%20%30%40%50%60%70%80%90%
100%
True False Don't know
46%
28% 30%
51%45% 48%
26%29%23%22%
27%25%
0%10%20%30%40%50%60%70%80%90%
100%
From 60°- 21° in2 hrs
(True)
From 60°- 21° in4 hrs
(False)
From 21°- 5° in 6hrs
(False)
From 21°- 5° in 4hrs
(True)
True False Don't know

2000/2001 National Food Safety Benchmark CR&C 0413Australia New Zealand Food Authority Page 42
Males more often than females reported the correct responses for cooling cooked foods, females weremore likely to report “don’t know”, as were businesses where staff training was not provided (Table20).
Table 20: Cooling/Chilling cooked food by staff knowledge and genderQ12B: Thinking about cooling or chilling HOT/COOKED food, can you tell me whether each of the following
statements are true or false?Cooked food must be cooled from 60 to 21 Celsius within two hours.
Informed of foodsafety regulations Staff training Gender
Totalinformed
(308)%A
Notinformed
(60)%B
Yes(305)
%C
No(70)%D
Male(194)
%E
Female(181)
%F
Total(375)
%G
True (correct) 48 37 48 39 53B 40 46
False 29 30 30 23 33 24 29
Don’t know 23 33 22 39C 14 36 25Q12B: Thinking about cooling or chilling HOT/COOKED food, can you tell me whether each of the following
statements are true or false?Cooked food must be cooled from 60 to 21 Celsius within four hours.
True 27 30 30 21 31 25 28
False (correct) 47 38 47 36 51F 38 45
Don’t know 26 32 24 43C 18 37E 27Q12B: Thinking about cooling or chilling HOT/COOKED food, can you tell me whether each of the following
statements are true or false?Cooked food must be cooled from 21 to 5 Celsius within six hours.
True 31 27 31 29 36F 24 30
False (correct) 50 45 50D 37 53F 43 48Q12B: Thinking about cooling or chilling HOT/COOKED food, can you tell me whether each of the following
statements are true or false?Cooked food must be cooled from 21 to 5 Celsius within four hours.
True (correct) 51 53 54D 40 60F 42 51
False 28 17 27 21 26 25 26
Don’t know 21 30 19 39C 14 33E 23Q12B: Thinking about cooling or chilling HOT/COOKED food, can you tell me whether each of the following
statements are true or false?Large amounts of cooked food should be placed in small containers and put in a cool room or refrigerator forcooling.
True (correct) 73 62 74D 59 69 73 71False 18 23 17 24 21 16 19Don’t know 8 15 9 17C 10 11 10
Base: Cooks food then cools for re-use (375)Note: Columns do not add to base because “don’t know” columns are not included.
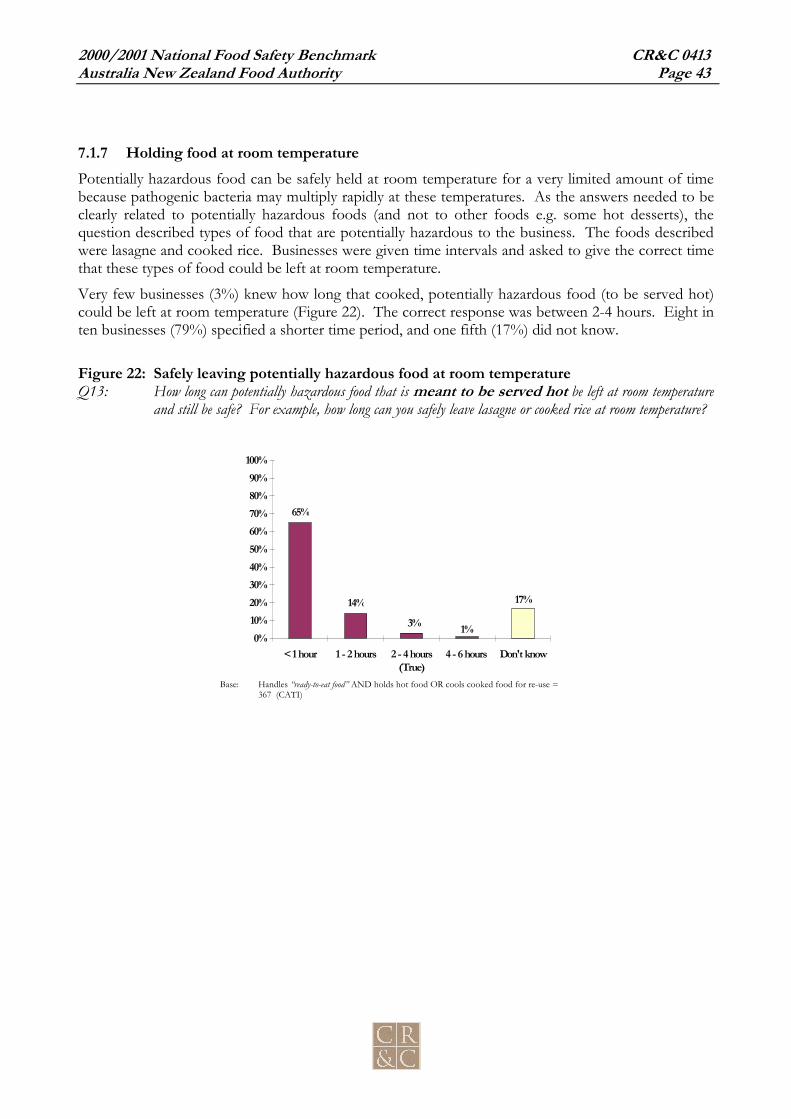
2000/2001 National Food Safety Benchmark CR&C 0413Australia New Zealand Food Authority Page 43
7.1.7 Holding food at room temperaturePotentially hazardous food can be safely held at room temperature for a very limited amount of timebecause pathogenic bacteria may multiply rapidly at these temperatures. As the answers needed to beclearly related to potentially hazardous foods (and not to other foods e.g. some hot desserts), thequestion described types of food that are potentially hazardous to the business. The foods describedwere lasagne and cooked rice. Businesses were given time intervals and asked to give the correct timethat these types of food could be left at room temperature.
Very few businesses (3%) knew how long that cooked, potentially hazardous food (to be served hot)could be left at room temperature (Figure 22). The correct response was between 2-4 hours. Eight inten businesses (79%) specified a shorter time period, and one fifth (17%) did not know.
Figure 22: Safely leaving potentially hazardous food at room temperatureQ13: How long can potentially hazardous food that is meant to be served hot be left at room temperature
and still be safe? For example, how long can you safely leave lasagne or cooked rice at room temperature?
Base: Handles “ready-to-eat food” AND holds hot food OR cools cooked food for re-use =367 (CATI)
65%
14% 17%
1%3%0%
10%20%30%40%50%60%70%80%90%
100%
< 1 hour 1 - 2 hours 2 - 4 hours(True)
4 - 6 hours Don't know

2000/2001 National Food Safety Benchmark CR&C 0413Australia New Zealand Food Authority Page 44
7.1.8 Ready to eat foods requiring refrigerationThe knowledge of businesses on the types of food that had to be kept refrigerated was checked.Specific foods were listedBusinesses involved in preparing or handling ready-to-eat foods were read out a list of ready-to-eatfoods and asked if they needed to be kept refrigerated in order to remain safe.The correct responses included the following foods that needed to be kept refrigerated:
lasagne; egg sandwiches; beef curry; or cooked rice.
The vast majority of businesses questioned would keep most prepared, ready-to-eat foods refrigeratedto ensure they remained safe (Figure 23). However approximately one in ten would not keep lasagne,egg sandwiches or beef curry in the fridge. Two in ten (19%) did not consider it necessary to keepcooked rice in the refrigerator.
Figure 23: Ready-to-eat foods needing refrigerationQ14: Which of the following foods need to be kept refrigerated to ensure they remain safe?
Base: Handles “ready-to-eat food” = 552 (CATI)
Two in ten businesses that handle ready-to-eat food did not report that it was important tokeep cooked rice refrigerated.
90% 90%
3%
89% 88%81%
84%
34%
0%10%20%30%40%50%60%70%80%90%
100%
Lasagne Cheddarcheese
Eggsandwich
Beefcurry
Salami Cookedrice
Peanutbutter
Don'tknow
(True) (True) (True) (True)

2000/2001 National Food Safety Benchmark CR&C 0413Australia New Zealand Food Authority Page 45
Females more often than males nominated the correct foods needing to be kept refrigerated to ensurethey remained safe (Table 21). Rural and regional based businesses were more aware of the need forthe refrigeration of cooked rice and beef curry when compared with metropolitan businesses. It isworth noting that while women were more likely to recognise the foods that require refrigeration, theywere less likely to know the temperature at which food should be refrigerated.
Table 21: Potentially hazardous food needing refrigeration by gender and regionQ14: Which of the following foods need to be kept refrigerated to ensure they remain safe?
Gender RegionMale(251)
%A
Female(301)
%B
Metropolitan(261)
%C
Regional(291)
%D
Total(552)
%E
Cooked rice 78 84A 78 85C 81
Salami 83 86 83 86 84
Lasagne 87 93A 89 91 90
Egg sandwich 86 92A 87 91 89
Peanut butter 28 39A 30 38C 34
Beef curry 85 89 84 90C 88
Cheddar cheese 84 94A 88 91 90
Don’t know 4B 1 3 3 3
Base: Handles ready to eat table meals (552)

2000/2001 National Food Safety Benchmark CR&C 0413Australia New Zealand Food Authority Page 46
7.2 Protecting food from contamination
Protecting food from contamination by staff, raw food and dirty equipment is a key food handlingpractice.
Businesses were asked two questions aimed at providing some information on current practices andon knowledge:
1) Whether employees wore gloves to handle food. Disposable gloves are sometimes used bybusinesses to prevent their staff transmitting micro organisms from hands. This gives anindication of the extent to which businesses claim to use gloves but could not, in a telephonesurvey, give any indication of whether the use was appropriate. However it could be cross-checked against other responses by the business for example, against those that provided stafftraining (indicating greater awareness of food safety issues) and whether the same gloves can beused for different food handling tasks.
2) A series of statements about contamination the business were asked to identify as were true orfalse.
7.2.1 Food handlingOne fifth (22%) of businesses reported their employees did not wear gloves when handling food(Figure 24). A small proportion did not believe gloves were necessary (3%) for their business or didnot know whether gloves were necessary (1%).
Figure 24: Gloves and food handlingQ20: Do employees wear gloves when handling foods?
Base: All respondents = 1,200 (CATI)
One fifth of businesses did not have employees wear gloves for food handling.
74%
22%
3% 1%0%
10%
20%30%
40%50%60%
70%80%90%
100%
Yes No Not applicable Don't know
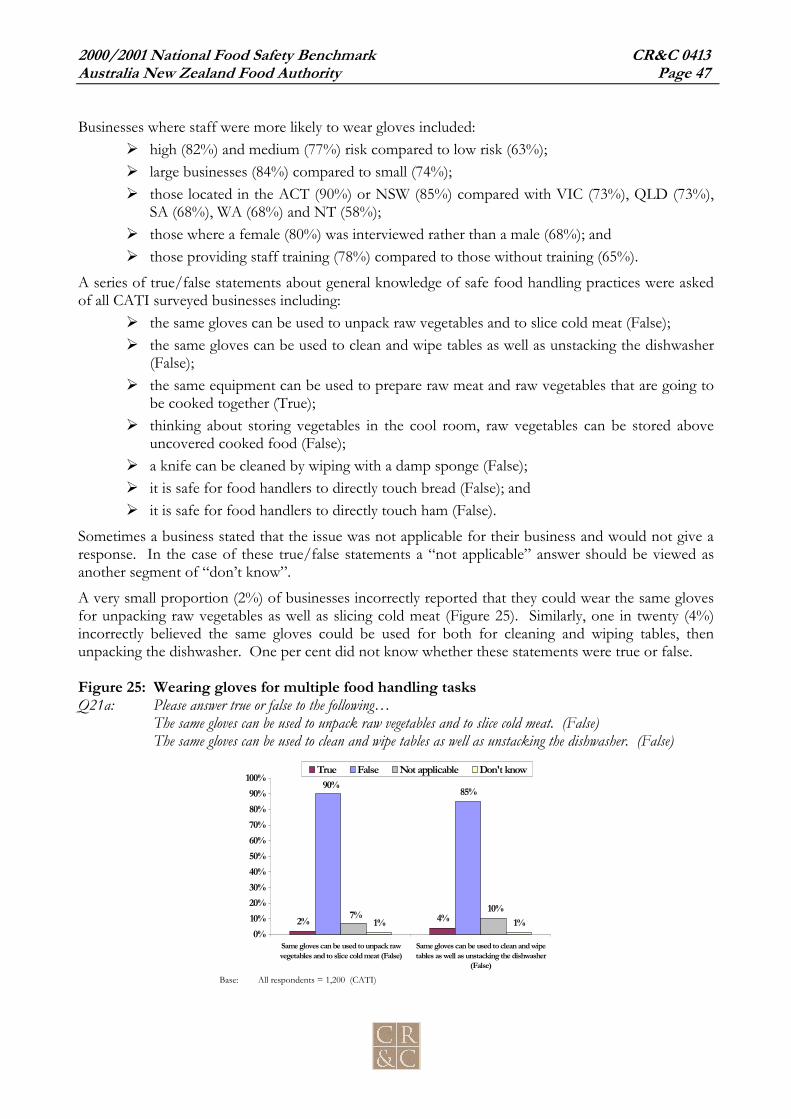
2000/2001 National Food Safety Benchmark CR&C 0413Australia New Zealand Food Authority Page 47
Businesses where staff were more likely to wear gloves included: high (82%) and medium (77%) risk compared to low risk (63%); large businesses (84%) compared to small (74%); those located in the ACT (90%) or NSW (85%) compared with VIC (73%), QLD (73%),
SA (68%), WA (68%) and NT (58%); those where a female (80%) was interviewed rather than a male (68%); and those providing staff training (78%) compared to those without training (65%).
A series of true/false statements about general knowledge of safe food handling practices were askedof all CATI surveyed businesses including:
the same gloves can be used to unpack raw vegetables and to slice cold meat (False); the same gloves can be used to clean and wipe tables as well as unstacking the dishwasher
(False); the same equipment can be used to prepare raw meat and raw vegetables that are going to
be cooked together (True); thinking about storing vegetables in the cool room, raw vegetables can be stored above
uncovered cooked food (False); a knife can be cleaned by wiping with a damp sponge (False); it is safe for food handlers to directly touch bread (False); and it is safe for food handlers to directly touch ham (False).
Sometimes a business stated that the issue was not applicable for their business and would not give aresponse. In the case of these true/false statements a “not applicable” answer should be viewed asanother segment of “don’t know”.
A very small proportion (2%) of businesses incorrectly reported that they could wear the same glovesfor unpacking raw vegetables as well as slicing cold meat (Figure 25). Similarly, one in twenty (4%)incorrectly believed the same gloves could be used for both for cleaning and wiping tables, thenunpacking the dishwasher. One per cent did not know whether these statements were true or false.
Figure 25: Wearing gloves for multiple food handling tasksQ21a: Please answer true or false to the following…
The same gloves can be used to unpack raw vegetables and to slice cold meat. (False)The same gloves can be used to clean and wipe tables as well as unstacking the dishwasher. (False)
Base: All respondents = 1,200 (CATI)
2% 4%
85%
1% 1%
90%
7% 10%
0%10%20%30%40%50%60%70%80%90%
100%
Same gloves can be used to unpack rawvegetables and to slice cold meat (False)
Same gloves can be used to clean and wipetables as well as unstacking the dishwasher
(False)
True False Not applicable Don't know

2000/2001 National Food Safety Benchmark CR&C 0413Australia New Zealand Food Authority Page 48
Less than one in ten (8%) businesses answered correctly that it was true they could “use the sameequipment to prepare meat and raw vegetables that were going to be cooked together” (Figure 26).Another 10% did not believe the question was relevant to them (9%) or did not know the answer(1%).
Fewer than one in ten (7%) incorrectly thought it was safe to store raw vegetables on a shelf aboveuncooked cooked food. In total, one in ten did not think it was an applicable question for them (12%)or did not know (3%) the answer to this statement.
Figure 26: Handling raw vegetables and cooked foodQ21a: Please answer True/ False to the following…
The same equipment can be used to prepare raw meat and raw vegetables that are going to be cookedtogether. (True)Thinking about storing vegetables in the cool room, raw vegetables can be stored above uncovered cookedfood. (False)
Base: All respondents = 1,200 (CATI)
The final few true/false statements dealt with contamination of food directly by handlers touching orcleaning food implements.
A substantial two in ten (21%) businesses surveyed incorrectly believed it was safe for food handlers todirectly touch bread and another 10% were unsure or felt the question was not applicable to them(Figure 27).
8% 7%
78%
2% 3%
81%
12%9%
0%10%20%30%40%50%60%70%80%90%
100%
Same equipment can be used to prepareraw meat and raw vegetables that are going
to be cooked together (True)
Raw vegetables can be stored aboveuncovered cooked food (False)
True False Not applicable Don't know
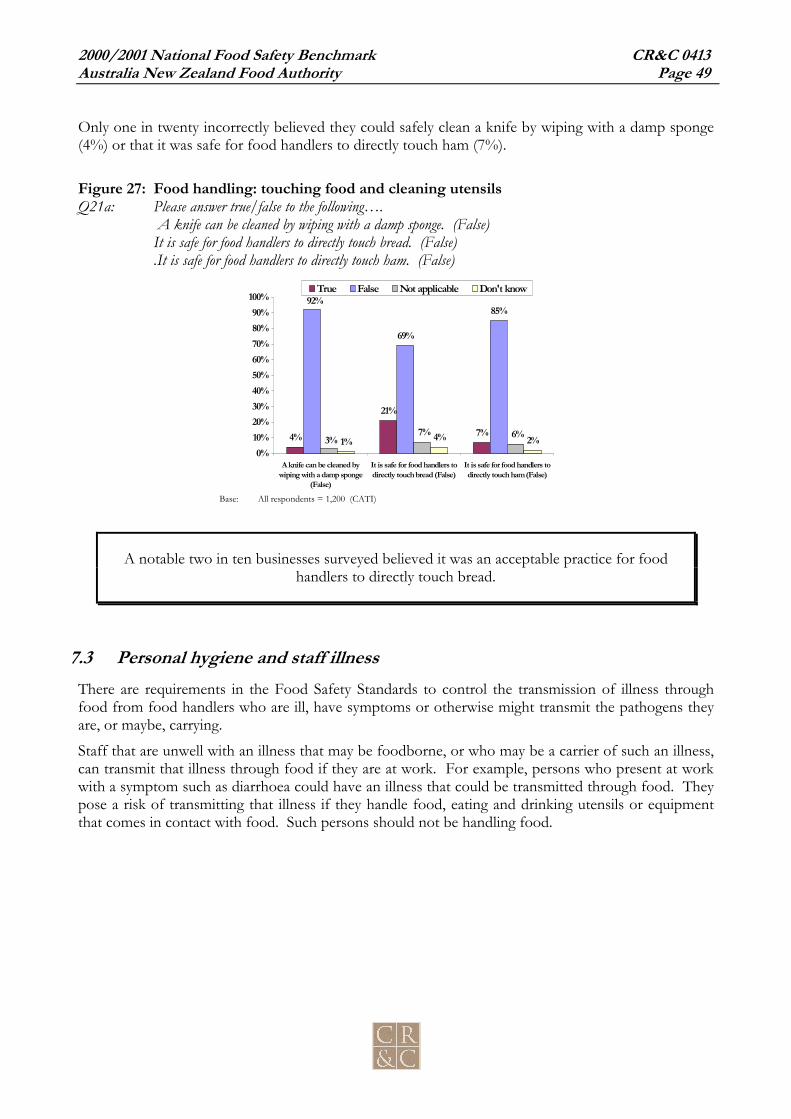
2000/2001 National Food Safety Benchmark CR&C 0413Australia New Zealand Food Authority Page 49
Only one in twenty incorrectly believed they could safely clean a knife by wiping with a damp sponge(4%) or that it was safe for food handlers to directly touch ham (7%).
Figure 27: Food handling: touching food and cleaning utensilsQ21a: Please answer true/false to the following….
A knife can be cleaned by wiping with a damp sponge. (False)It is safe for food handlers to directly touch bread. (False).It is safe for food handlers to directly touch ham. (False)
Base: All respondents = 1,200 (CATI)
A notable two in ten businesses surveyed believed it was an acceptable practice for foodhandlers to directly touch bread.
7.3 Personal hygiene and staff illnessThere are requirements in the Food Safety Standards to control the transmission of illness throughfood from food handlers who are ill, have symptoms or otherwise might transmit the pathogens theyare, or maybe, carrying.
Staff that are unwell with an illness that may be foodborne, or who may be a carrier of such an illness,can transmit that illness through food if they are at work. For example, persons who present at workwith a symptom such as diarrhoea could have an illness that could be transmitted through food. Theypose a risk of transmitting that illness if they handle food, eating and drinking utensils or equipmentthat comes in contact with food. Such persons should not be handling food.
4%
21%
7%
69%
85%
1% 4% 2%
92%
6%7%3%
0%10%20%30%40%50%60%70%80%90%
100%
A knife can be cleaned bywiping with a damp sponge
(False)
It is safe for food handlers todirectly touch bread (False)
It is safe for food handlers todirectly touch ham (False)
True False Not applicable Don't know

2000/2001 National Food Safety Benchmark CR&C 0413Australia New Zealand Food Authority Page 50
7.3.1 Food handlingThree food handling tasks were presented to businesses, the businesses were then asked whether anemployee with an illness of diarrhoea should avoid these tasks.
Half of the businesses interviewed reported that staff experiencing an illness of diarrhoea should not“handle unpackaged food” (52%), “serve food” (50%) or “set the table” (47%). The reverse was alsotrue; one half of businesses did not believe these tasks should be avoided (Figure 28).
In addition to the three tasks suggested: four in ten (37%) businesses gave an unprompted mention that employees with diarrhoea
should not be at work; and another 3% mentioned employees with diarrhoea should not undertake any tasks that
would involve food or food implements.
Figure 28: Safe food handling and staff illnessQ22: If you have an employee with diarrhoea, which of the following tasks should they avoid?
Base: All respondents = 1,200 (CATI)Total is greater than 100% due to multiple responses
Half of food businesses thought it would be acceptable for employees experiencingdiarrhoea to undertake food handling tasks such as “handling unpackaged food”, “serving
food” or “setting the table”.
4%
1%
2%
3%
37%
47%
50%
52%
0% 10% 20% 30% 40% 50% 60%
Not applicable
Other
Don't know
Anything to do with food /implements
Everything / shouldn't be at work
Setting tables(Avoid)
Serving food(Avoid)
Handling unpackaged fooddirectly(Avoid)
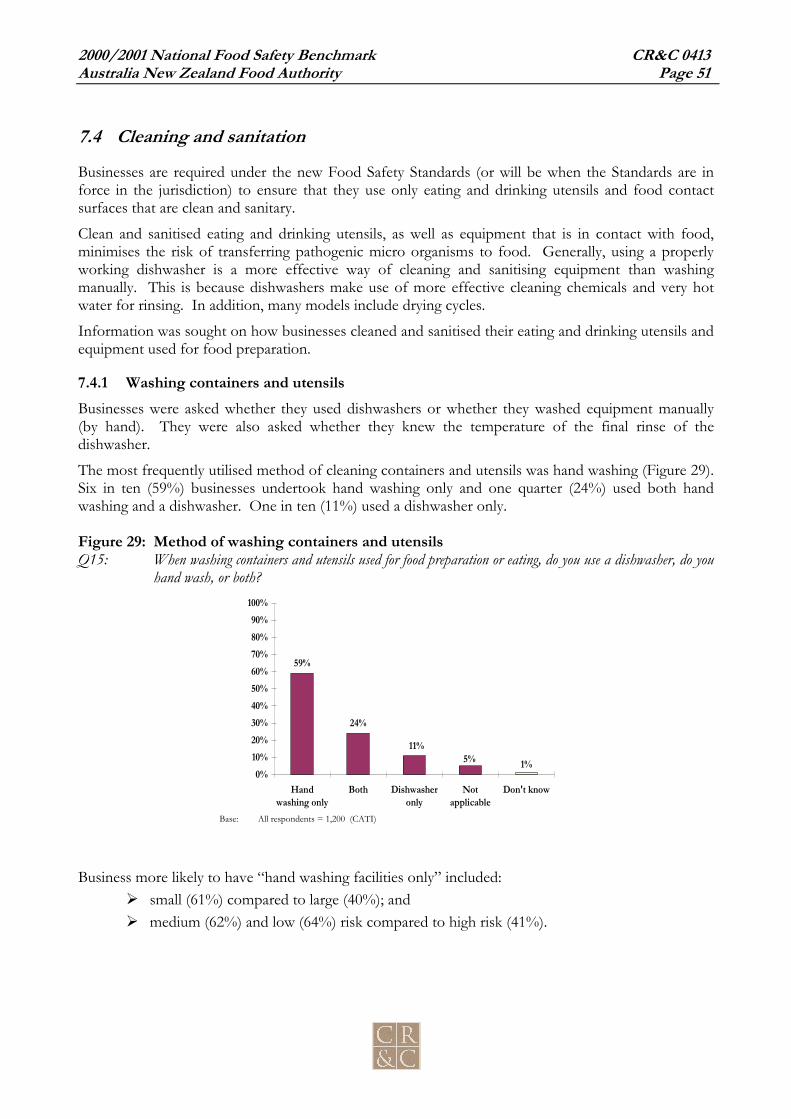
2000/2001 National Food Safety Benchmark CR&C 0413Australia New Zealand Food Authority Page 51
7.4 Cleaning and sanitation
Businesses are required under the new Food Safety Standards (or will be when the Standards are inforce in the jurisdiction) to ensure that they use only eating and drinking utensils and food contactsurfaces that are clean and sanitary.
Clean and sanitised eating and drinking utensils, as well as equipment that is in contact with food,minimises the risk of transferring pathogenic micro organisms to food. Generally, using a properlyworking dishwasher is a more effective way of cleaning and sanitising equipment than washingmanually. This is because dishwashers make use of more effective cleaning chemicals and very hotwater for rinsing. In addition, many models include drying cycles.
Information was sought on how businesses cleaned and sanitised their eating and drinking utensils andequipment used for food preparation.
7.4.1 Washing containers and utensilsBusinesses were asked whether they used dishwashers or whether they washed equipment manually(by hand). They were also asked whether they knew the temperature of the final rinse of thedishwasher.
The most frequently utilised method of cleaning containers and utensils was hand washing (Figure 29).Six in ten (59%) businesses undertook hand washing only and one quarter (24%) used both handwashing and a dishwasher. One in ten (11%) used a dishwasher only.
Figure 29: Method of washing containers and utensilsQ15: When washing containers and utensils used for food preparation or eating, do you use a dishwasher, do you
hand wash, or both?
Base: All respondents = 1,200 (CATI)
Business more likely to have “hand washing facilities only” included: small (61%) compared to large (40%); and medium (62%) and low (64%) risk compared to high risk (41%).
59%
24%
11%5% 1%
0%10%20%30%40%50%60%70%80%90%
100%
Handwashing only
Both Dishwasheronly
Notapplicable
Don't know

2000/2001 National Food Safety Benchmark CR&C 0413Australia New Zealand Food Authority Page 52
Six in ten businesses used hand washing for cleaning and sanitising containers and utensilsfor food preparation or eating.
One third (35%) of businesses using a dishwasher did not know the temperature of the final rinse oftheir dishwasher (Figure 30). Four in ten (39%) businesses reported a final rinse higher than 80°C.One in ten (9%) businesses reported temperatures too low to kill bacteria, that is below 70°C
Two in ten (19%) businesses reported a correct temperature of 70-80°C.
One third (36%) of businesses that used hand washing for food preparation materials did not knowwhat temperature of hot water would kill bacteria on utensils (Figure 31). One quarter of businessreported hand washing temperatures below 70°C; temperatures too low to kill bacteria.
Figure 30: Temperature of final rinse in dishwasher Figure 31: Hand washing and food safety
Q16: What is the temperature of the final rinse in your dishwasher? Q17: When hand washing, what temperature of hot water will killbacteria on food preparation utensils
Base: Business uses dishwasher = 418 (CATI) Base: Business hand washes = 992 (CATI)
7.4.2 Chemical sanitisersIf a business cleans and sanitises eating and drinking utensils and food contact surfaces by hand it canuse a chemical sanitiser to sanitise. Businesses that cleaned manually were asked whether they usedsanitisers and some questions to establish if they had knowledge of using the sanitisers.
2%7%
35%39%
17%
0%10%20%30%40%50%60%70%80%90%
100%
50°- 60° 60°-70° 70°-80° (Correct)
Over 80° Don't know
6%
18%13%
21%
2%1%
36%
0%10%20%30%40%50%60%70%80%90%
100%
50°- 60° 70°- 80° (Correct)
Boiling Don'tknow

2000/2001 National Food Safety Benchmark CR&C 0413Australia New Zealand Food Authority Page 53
One quarter (24%) of businesses “never” used a chemical sanitiser (Figure 32) for washing cups, platesand eating utensils. One in fourteen (7%) either were not sure if they used chemical sanitisers orreported the question was not applicable.
Chemical sanitisers were used by seven in ten food businesses either “always” (63%), or “sometimes”(6%).
Three in ten (30%) businesses believed that all chemical sanitisers should be mixed with hot water andone half (51%) correctly indicated this was false (Figure 33). One in seven (14%) did not know theanswer.
One third of businesses believe that all chemical sanitisers should be mixed with hotwater.
Figure 32: Use chemical sanitiser Figure 33: Mixing chemical sanitisers
Q18: Do you use a chemical sanitiser for washing cups, plates andeating utensils?
Q19a: All chemical sanitisers should be mixed with hot water.True or false?
Base: All respondents = 1,200 (CATI) Base: All respondents = 1,200 (CATI)
Two in ten (18%) businesses incorrectly believed that “detergent would kill micro-organisms” whileseven in ten (68%) correctly believed that “detergent would not kill micro-organisms” (Figure 34).
63%
24%
6%3% 3%1%
0%10%20%30%40%50%60%70%80%90%
100%
Always Never Sometimes Notapplicable
Notanswered
Don't know
30%
51%
14%5%
0%10%20%30%40%50%60%70%80%90%
100%
True False (Correct) Not applicable Don't know

2000/2001 National Food Safety Benchmark CR&C 0413Australia New Zealand Food Authority Page 54
Very few (4%) businesses incorrectly reported it was false that: “a dirty chopping board needed to bewashed before being sanitised” (Figure 35:). The correct response of “true” was given by nine in tenbusinesses (89%).
Figure 34: Detergent and micro-organisms Figure 35: Sanitising chopping boards
Q19b: Detergent kills micro-organisms. True or false? Q19c A dirty chopping board must be washed before beingsanitised. True or false?
Base: All respondents = 1,200 (CATI) Base: All respondents = 1,200 (CATI)
Businesses less likely to report that a “dirty chopping board needed to be washed before beingsanitised” included:
low risk (80%) compared to medium (92%) or high (93%) risk; and large (83%) compared to small (90%).
7.5 Staff trainingThe Food Safety Standards will, when the relevant provision comes into effect, require foodbusinesses to ensure that their staff have skills and knowledge in food safety and food hygiene mattersrelevant to the work carried out by the staff.The Standards do not specify how businesses must ensure that their staff have these skills andknowledge. There are many alternatives that range from formal training courses to in-house, on-the-job training. Businesses were asked whether they provided any staff training and the type of trainingprovided.
18%
68%
2%12%
0%10%20%30%40%50%60%70%80%90%
100%
True False (Correct) Not applicable Don't know
89%
4% 5%2%
0%10%20%30%40%50%60%70%80%90%
100%
True (Correct) False Not applicable Don't know

2000/2001 National Food Safety Benchmark CR&C 0413Australia New Zealand Food Authority Page 55
One quarter (26%) of businesses reported they did not provide staff training on food handling safety(Figure 36). Specific differences that appeared included:
provision of staff training was directly proportional to the level of risk associated with thebusiness, that is, businesses classified as having a high level of food safety risk more oftenreported provided staff training (90%) compared with medium (74%) or low risk (62%);
businesses supplying foods to high risk groups more often provided training (85%)compared to those businesses not providing foods to high risk groups (72%); and
regional differences were also apparent where metropolitan businesses more oftenprovided staff training (78%) compared with regional and rural businesses (70%).
Figure 36: Staff trainingQ28a: Do you provide staff training on handling food safely?
Base: All respondents = 1,200 (CATI)
Figure 37: Type of staff trainingQ28b: If yes, what kind of training? (all mentions)
Base: Provided staff training = 887 (CATI)
74%
26%
0%10%
20%30%
40%50%60%
70%80%90%
100%
Yes No
1%
2%
1%
3%
5%
5%
7%
28%
75%
0% 10% 20% 30% 40% 50% 60% 70% 80%
Not applicable (no employees)
Health / food safety inspectors
Food safety video
Informal / on the job
Circulate regulation documents
Food safety manager at workplace
Circulate brochures, pamphlets
Staff training programs (external)
Formal induction at workplace

2000/2001 National Food Safety Benchmark CR&C 0413Australia New Zealand Food Authority Page 56
High risk (43%) more often provide “external staff training” compared with medium(25%) and low (22%) risk businesses.
Metropolitan (78%) businesses were more likely to provide “induction training programs atthe workplace” compared to regional businesses (72%)
Business that supplied food to high risk groups (42%) tended to offer “staff trainingexternal to the workplace” compared to those not supplying high risk groups (24%).
Regional and rural businesses were more likely to provide “staff training external to theworkplace” (31%) compared to metropolitan business (24%).
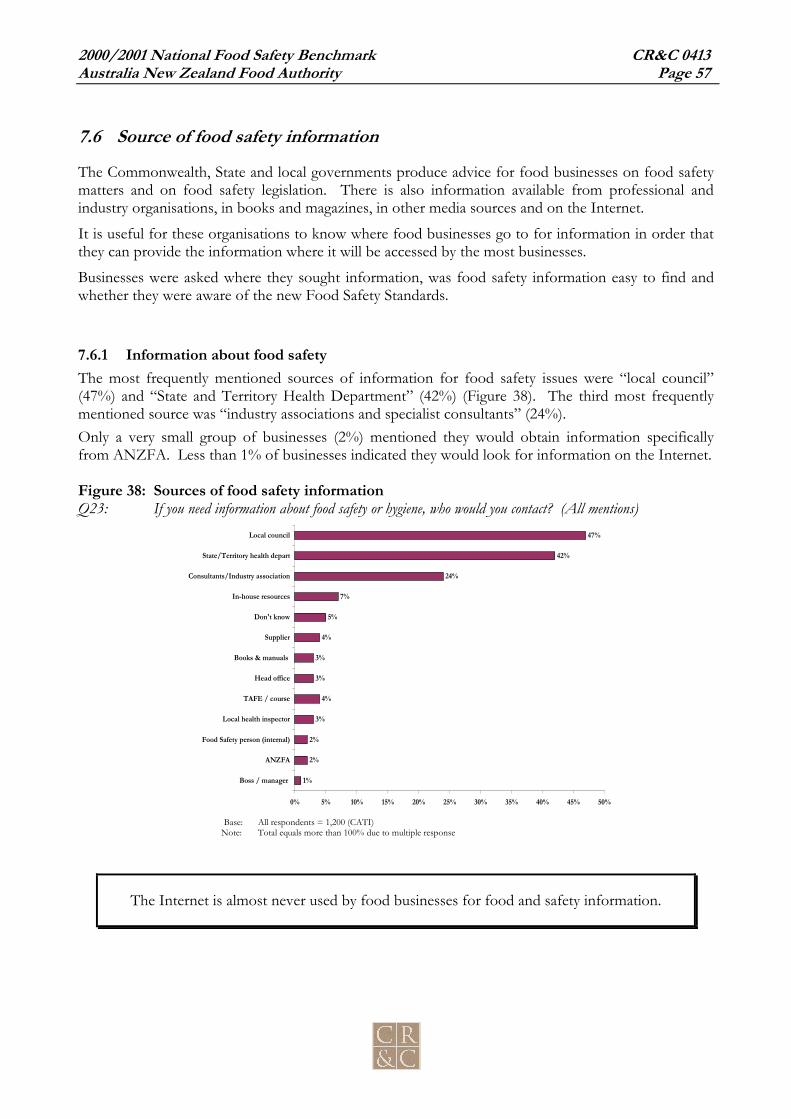
2000/2001 National Food Safety Benchmark CR&C 0413Australia New Zealand Food Authority Page 57
7.6 Source of food safety information
The Commonwealth, State and local governments produce advice for food businesses on food safetymatters and on food safety legislation. There is also information available from professional andindustry organisations, in books and magazines, in other media sources and on the Internet.
It is useful for these organisations to know where food businesses go to for information in order thatthey can provide the information where it will be accessed by the most businesses.
Businesses were asked where they sought information, was food safety information easy to find andwhether they were aware of the new Food Safety Standards.
7.6.1 Information about food safetyThe most frequently mentioned sources of information for food safety issues were “local council”(47%) and “State and Territory Health Department” (42%) (Figure 38). The third most frequentlymentioned source was “industry associations and specialist consultants” (24%).Only a very small group of businesses (2%) mentioned they would obtain information specificallyfrom ANZFA. Less than 1% of businesses indicated they would look for information on the Internet.
Figure 38: Sources of food safety informationQ23: If you need information about food safety or hygiene, who would you contact? (All mentions)
Base: All respondents = 1,200 (CATI)Note: Total equals more than 100% due to multiple response
The Internet is almost never used by food businesses for food and safety information.
1%
2%
2%
3%
4%
3%
3%
4%
5%
7%
24%
42%
47%
0% 5% 10% 15% 20% 25% 30% 35% 40% 45% 50%
Boss / manager
ANZFA
Food Safety person (internal)
Local health inspector
TAFE / course
Head office
Books & manuals
Supplier
Don't know
In-house resources
Consultants/Industry association
State/Territory health depart
Local council
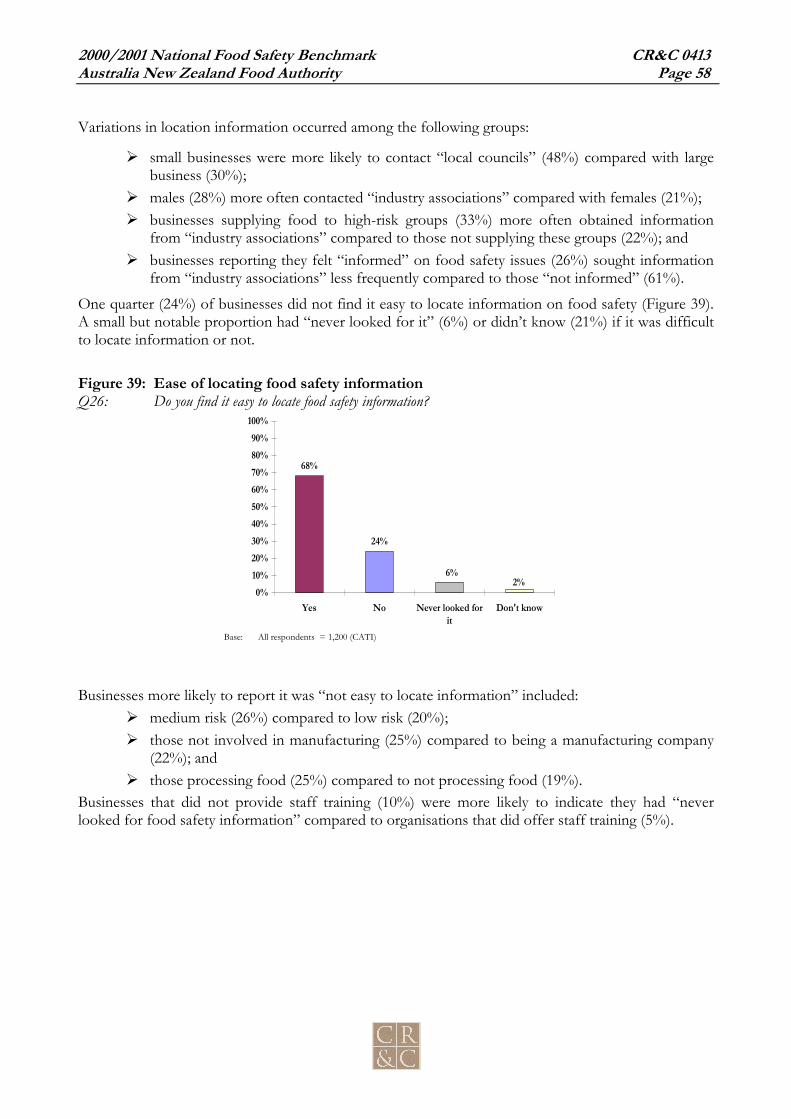
2000/2001 National Food Safety Benchmark CR&C 0413Australia New Zealand Food Authority Page 58
Variations in location information occurred among the following groups:
small businesses were more likely to contact “local councils” (48%) compared with largebusiness (30%);
males (28%) more often contacted “industry associations” compared with females (21%); businesses supplying food to high-risk groups (33%) more often obtained information
from “industry associations” compared to those not supplying these groups (22%); and businesses reporting they felt “informed” on food safety issues (26%) sought information
from “industry associations” less frequently compared to those “not informed” (61%).
One quarter (24%) of businesses did not find it easy to locate information on food safety (Figure 39).A small but notable proportion had “never looked for it” (6%) or didn’t know (21%) if it was difficultto locate information or not.
Figure 39: Ease of locating food safety informationQ26: Do you find it easy to locate food safety information?
Base: All respondents = 1,200 (CATI)
Businesses more likely to report it was “not easy to locate information” included: medium risk (26%) compared to low risk (20%); those not involved in manufacturing (25%) compared to being a manufacturing company
(22%); and those processing food (25%) compared to not processing food (19%).
Businesses that did not provide staff training (10%) were more likely to indicate they had “neverlooked for food safety information” compared to organisations that did offer staff training (5%).
68%
24%
6%2%
0%10%20%30%40%50%60%70%80%90%
100%
Yes No Never looked forit
Don't know
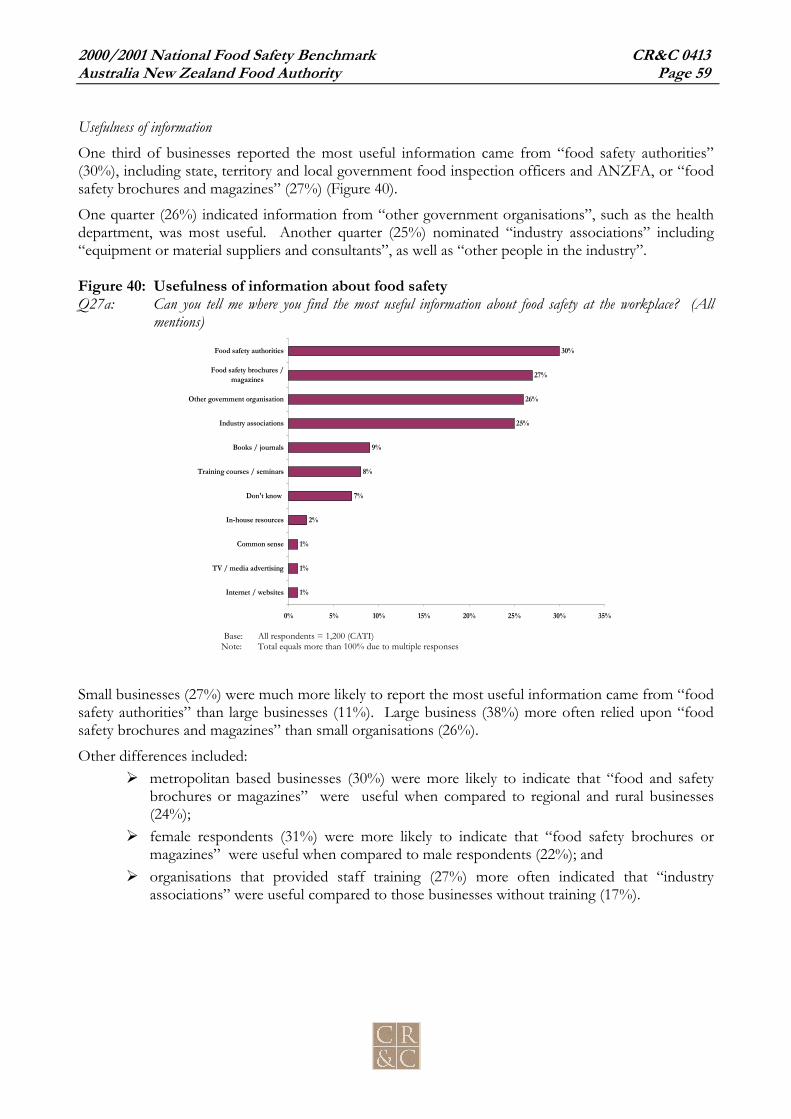
2000/2001 National Food Safety Benchmark CR&C 0413Australia New Zealand Food Authority Page 59
Usefulness of informationOne third of businesses reported the most useful information came from “food safety authorities”(30%), including state, territory and local government food inspection officers and ANZFA, or “foodsafety brochures and magazines” (27%) (Figure 40).
One quarter (26%) indicated information from “other government organisations”, such as the healthdepartment, was most useful. Another quarter (25%) nominated “industry associations” including“equipment or material suppliers and consultants”, as well as “other people in the industry”.
Figure 40: Usefulness of information about food safetyQ27a: Can you tell me where you find the most useful information about food safety at the workplace? (All
mentions)
Base: All respondents = 1,200 (CATI)Note: Total equals more than 100% due to multiple responses
Small businesses (27%) were much more likely to report the most useful information came from “foodsafety authorities” than large businesses (11%). Large business (38%) more often relied upon “foodsafety brochures and magazines” than small organisations (26%).
Other differences included: metropolitan based businesses (30%) were more likely to indicate that “food and safety
brochures or magazines” were useful when compared to regional and rural businesses(24%);
female respondents (31%) were more likely to indicate that “food safety brochures ormagazines” were useful when compared to male respondents (22%); and
organisations that provided staff training (27%) more often indicated that “industryassociations” were useful compared to those businesses without training (17%).
1%
1%
1%
2%
7%
8%
9%
25%
26%
27%
30%
0% 5% 10% 15% 20% 25% 30% 35%
Internet / websites
TV / media advertising
Common sense
In-house resources
Don't know
Training courses / seminars
Books / journals
Industry associations
Other government organisation
Food safety brochures /magazines
Food safety authorities

2000/2001 National Food Safety Benchmark CR&C 0413Australia New Zealand Food Authority Page 60
Two in ten businesses (20%) either reported they felt that they were “not informed” about food safetyor didn’t know if they were informed or not (Figure 41).
Figure 41: Informed about current food safety regulationQ24: How well informed do you feel about the current regulations about food safety?
Base: All respondents = 1,200 (CATI)
Businesses that more often felt “informed” on food safety issues included: large (89%) compared to small (80%); businesses located in ACT (88%), Western Australia (86%) or Victoria (86%), compared to
Queensland (77%) or South Australia (72%); and those providing staff training (83%) rather than not providing training (72%).
Figure 42: Awareness of new Food Safety StandardsQ25: Are you aware that the government is bringing in a new set of national Food Safety Standards from
February 2001?
Base: All respondents = 1,200 (CATI)
Four in ten (40%) businesses were not aware of the new Food Safety Standards coming into effect inFebruary 2001 (Figure 42).
Most (57%) businesses were aware that new regulations were to be introduced. Businesses in SouthAustralia were more likely to be aware of the new regulations in spite of being less informed.
57%
40%
3%0%
10%20%
30%40%50%
60%70%
80%90%
100%
Yes No Don't know
80%
14%5%
1%0%
10%20%30%40%50%60%70%80%90%
100%
Total informed Informed a little Not at allinformed
Don't know
2000/2001 National Food Safety Benchmark CR&C 0413Australia New Zealand Food Authority Page 61
Awareness varied across business types and categories, greater awareness occurred among: high risk (62%) businesses compared to low risk (52%); large organisation (69%) compared to small (56%); South Australian businesses (73%) compared to the other larger states (52% - 53%); and organisations manufacturing food (62%) as opposed to not manufacturing (53%).
2000/2001 National Food Safety Benchmark CR&C 0413Australia New Zealand Food Authority Page 62
8 EHO/PHU On-site surveys among food businessesOn-site surveys were completed by Environmental Health officers (EHO’s) or, in NSW, Public HealthUnit (PHU’s) officers. The on-site survey used the skills of these trained personnel, usually employedby local government, to assess food businesses. The officers were briefed to collect the survey data ina consistent manner.
EHOs were instructed to record responses based on their observations rather than questioning theproprietor or manager whenever possible. If a surveyor was unable to observe a practice because itdid not occur during their visit (such as food deliveries), they questioned someone responsible andknowledgeable (the owner or manager) to establish business practices in that situation. Wheninformation was sought from someone at the business the surveyor was to complete the question withthe appropriate answer (e.g. “yes/no”) and also circle “not observed”. Thus, “not observed” doesnot indicate that the element was not assessed, but that the information was based on discussion ratherthan observation of the practice. The percentage of “not observed” responses was dependent on thespecific task and the same percentage would not be expected for each task. That is, while one taskmay not have been observed, other tasks were observed.
In most cases responses were limited to “yes/no” choices, other questions provided a list of responseoptions appropriate to the question.
Responses presented in the graphs in this section of the report: nett yes (combined “yes” and “yes but not observed”); nett no (combined “no” and “no but not observed”); and not applicable (measure does not apply to this business, e.g. If a business does not have
food delivered the response to delivery outside business hours would be “not applicable”).
The percentage of “not observed” cases is identified under each graph.
8.1 Temperature control
Information was sought on the practices used by businesses to ensure that potentially hazardous foodis kept under temperature control during storage, display and transport. Businesses can maintainsafety by keeping chilled food 5°C or below, hot food 60°C or above or by ensuring that the time thatpotentially hazardous food is at another temperature is insufficient to allow bacteria to multiply tounsafe levels.
Businesses that were not storing, displaying or transporting potentially hazardous food at the abovetemperatures were asked whether they had an alternative system to ensure the time/temperature wassafe and whether they documented that system.
The EHO survey identified whether businesses cooked potentially hazardous food to the correcttemperature for an adequate time and whether reheating of food that was to be held hot was carriedout correctly. Temperature control of frozen food was also identified.
The EHOs identified whether businesses had a probe thermometer to measure temperature andwhether staff knew how to use it.
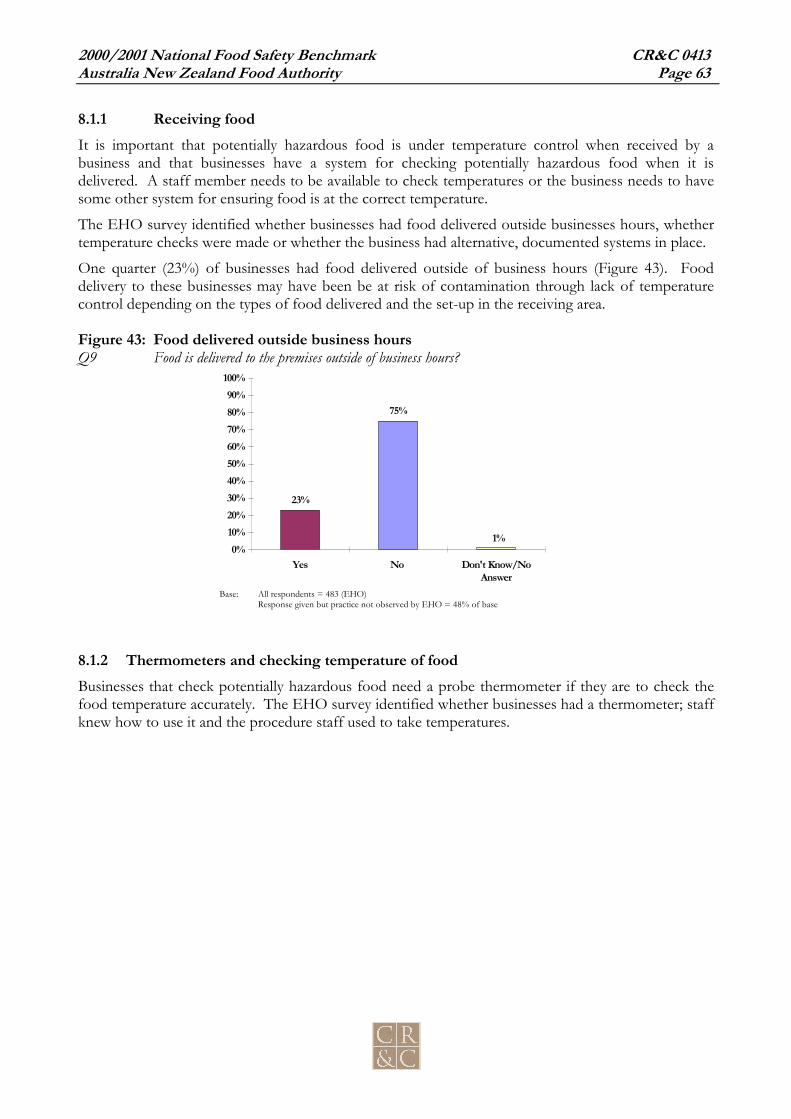
2000/2001 National Food Safety Benchmark CR&C 0413Australia New Zealand Food Authority Page 63
8.1.1 Receiving foodIt is important that potentially hazardous food is under temperature control when received by abusiness and that businesses have a system for checking potentially hazardous food when it isdelivered. A staff member needs to be available to check temperatures or the business needs to havesome other system for ensuring food is at the correct temperature.
The EHO survey identified whether businesses had food delivered outside businesses hours, whethertemperature checks were made or whether the business had alternative, documented systems in place.
One quarter (23%) of businesses had food delivered outside of business hours (Figure 43). Fooddelivery to these businesses may have been be at risk of contamination through lack of temperaturecontrol depending on the types of food delivered and the set-up in the receiving area.
Figure 43: Food delivered outside business hoursQ9 Food is delivered to the premises outside of business hours?
Base: All respondents = 483 (EHO)Response given but practice not observed by EHO = 48% of base
8.1.2 Thermometers and checking temperature of foodBusinesses that check potentially hazardous food need a probe thermometer if they are to check thefood temperature accurately. The EHO survey identified whether businesses had a thermometer; staffknew how to use it and the procedure staff used to take temperatures.
23%
75%
1%0%
10%20%30%40%50%60%70%80%90%
100%
Yes No Don't Know/NoAnswer
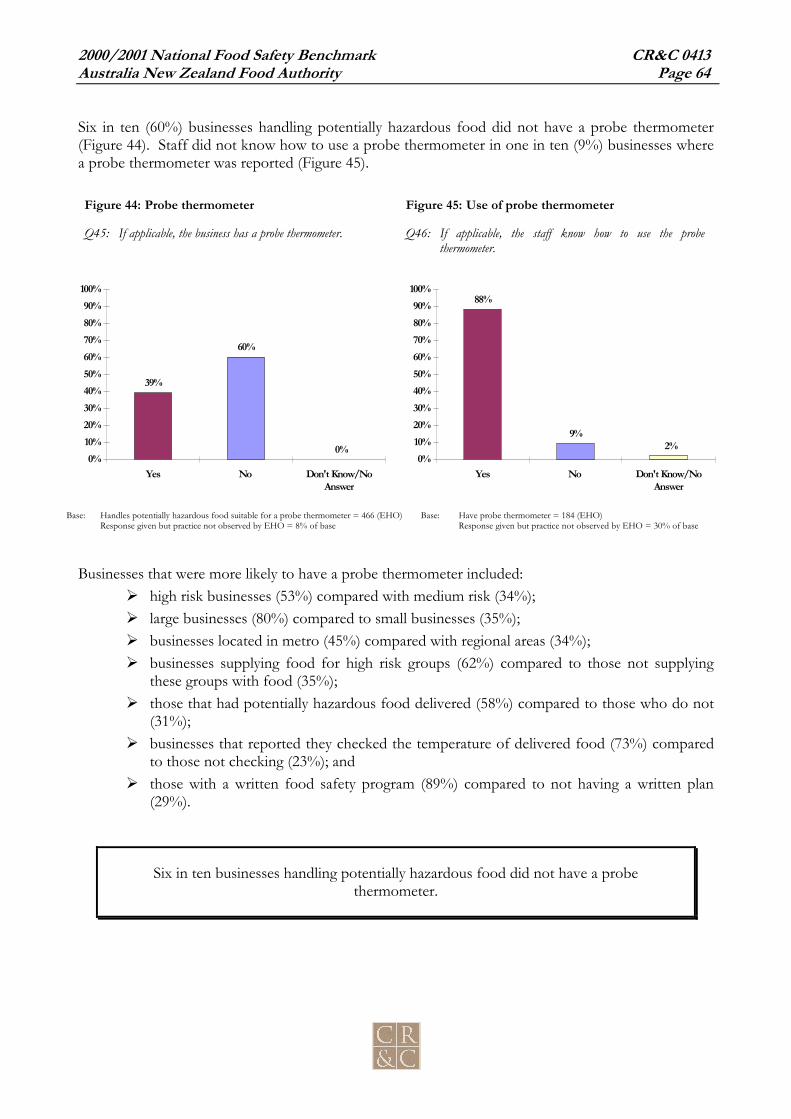
2000/2001 National Food Safety Benchmark CR&C 0413Australia New Zealand Food Authority Page 64
Six in ten (60%) businesses handling potentially hazardous food did not have a probe thermometer(Figure 44). Staff did not know how to use a probe thermometer in one in ten (9%) businesses wherea probe thermometer was reported (Figure 45).
Figure 44: Probe thermometer Figure 45: Use of probe thermometer
Q45: If applicable, the business has a probe thermometer. Q46: If applicable, the staff know how to use the probethermometer.
Base: Handles potentially hazardous food suitable for a probe thermometer = 466 (EHO) Base: Have probe thermometer = 184 (EHO)Response given but practice not observed by EHO = 8% of base Response given but practice not observed by EHO = 30% of base
Businesses that were more likely to have a probe thermometer included: high risk businesses (53%) compared with medium risk (34%); large businesses (80%) compared to small businesses (35%); businesses located in metro (45%) compared with regional areas (34%); businesses supplying food for high risk groups (62%) compared to those not supplying
these groups with food (35%); those that had potentially hazardous food delivered (58%) compared to those who do not
(31%); businesses that reported they checked the temperature of delivered food (73%) compared
to those not checking (23%); and those with a written food safety program (89%) compared to not having a written plan
(29%).
Six in ten businesses handling potentially hazardous food did not have a probethermometer.
39%
60%
0%0%
10%20%30%40%50%60%70%80%90%
100%
Yes No Don't Know/NoAnswer
88%
9%2%
0%10%20%30%40%50%60%70%80%90%
100%
Yes No Don't Know/NoAnswer

2000/2001 National Food Safety Benchmark CR&C 0413Australia New Zealand Food Authority Page 65
Checking the temperature of food was undertaken by variety of methods depending on the food typeand location where the check was carried out (Figure 46).
EHOs reported that six in ten (57%) businesses used “sight” when assessing food temperatures.Additionally “touch” was used by four in ten (43%) businesses.
Half (52%) of businesses used a temperature gauge located inside a vehicle, oven or other containerand one third (36%) used a thermometer.
Figure 46: Methods for checking food temperatureQ47 How do staff generally check the temperature of the food?
Base: All respondents = 483 (EHO)Total is greater than 100% due to multiple responses
One third of businesses checked the temperature of food with a thermometer.
“Other” methods for measuring food temperature among one in ten businesses included: experience (3%); time and invoice record of delivery (2%); temperature of equipment (1%); sound, taste, test, smell or routine checks (2%); or standard cooking procedures or manufacturers instructions (1%).
Comparing business types revealed: small businesses more often checked the temperature of food by the food’s “appearance”
(60%) or “touch” (45%) compared with large business (26% and 22% respectively); high risk businesses more often used a thermometer (49%) compared with medium risk
(30%); and non metropolitan based businesses more often utilised “appearance” (67%) compared with
metropolitan based businesses (47%).
57%52%
36%43%
0%10%20%30%40%50%60%70%80%90%
100%
Appearance -looking at it
Temp gauge indelivery vehicle,
fridge, oven
Touch Thermometer
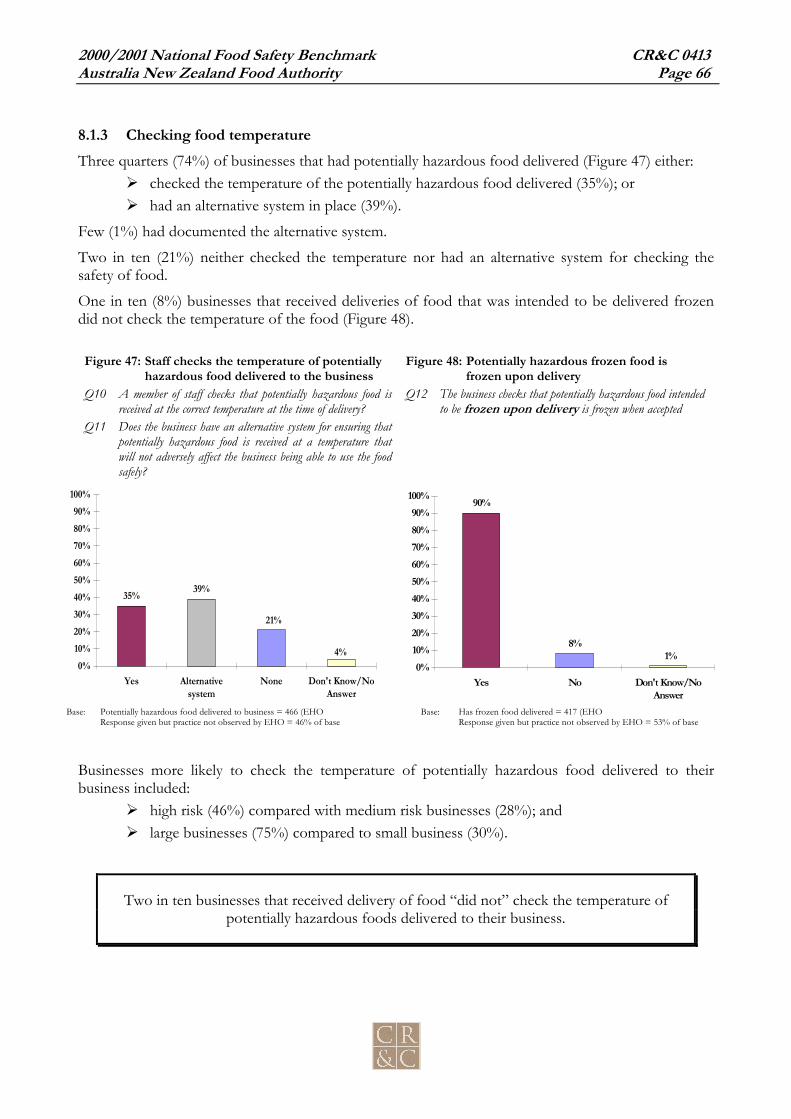
2000/2001 National Food Safety Benchmark CR&C 0413Australia New Zealand Food Authority Page 66
8.1.3 Checking food temperatureThree quarters (74%) of businesses that had potentially hazardous food delivered (Figure 47) either:
checked the temperature of the potentially hazardous food delivered (35%); or had an alternative system in place (39%).
Few (1%) had documented the alternative system.
Two in ten (21%) neither checked the temperature nor had an alternative system for checking thesafety of food.
One in ten (8%) businesses that received deliveries of food that was intended to be delivered frozendid not check the temperature of the food (Figure 48).
Figure 47: Staff checks the temperature of potentiallyhazardous food delivered to the business
Figure 48: Potentially hazardous frozen food isfrozen upon delivery
Q10 A member of staff checks that potentially hazardous food isreceived at the correct temperature at the time of delivery?
Q11 Does the business have an alternative system for ensuring thatpotentially hazardous food is received at a temperature thatwill not adversely affect the business being able to use the foodsafely?
Q12 The business checks that potentially hazardous food intendedto be frozen upon delivery is frozen when accepted
Base: Potentially hazardous food delivered to business = 466 (EHO Base: Has frozen food delivered = 417 (EHOResponse given but practice not observed by EHO = 46% of base Response given but practice not observed by EHO = 53% of base
Businesses more likely to check the temperature of potentially hazardous food delivered to theirbusiness included:
high risk (46%) compared with medium risk businesses (28%); and large businesses (75%) compared to small business (30%).
Two in ten businesses that received delivery of food “did not” check the temperature ofpotentially hazardous foods delivered to their business.
35% 39%
4%
21%
0%10%20%30%40%50%60%70%80%90%
100%
Yes Alternativesystem
None Don't Know/NoAnswer
90%
8%1%
0%10%20%30%40%50%60%70%80%90%
100%
Yes No Don't Know/NoAnswer

2000/2001 National Food Safety Benchmark CR&C 0413Australia New Zealand Food Authority Page 67
8.1.4 Temperature controlled storage of potentially hazardous food
Potentially hazardous food must be either stored chilled (5°C or below) or hot (60°C or above) or atanother temperature if the time the food is at that temperature is safe. The EHO survey identifiedwhether chilled food was stored chilled and whether there was adequate space in the cool room. Ifchilled food was not refrigerated, the EHOs asked whether the business had an alternative,documented system in place.
Nearly all businesses that stored potentially hazardous food that required chilling either stored thefood at the correct temperature11 (90%) or had an alternative system in place (Figure 49). A smallminority (1%) businesses had their alternative system documented to ensure effective usage of thesystem. Less than one in ten businesses (7%) did not store their chilled food at or below 5°C (Figure49).
Figure 49: Chilled potentially hazardous food stored at or below 5°CQ14 Chilled potentially hazardous food is stored at or below 5°CQ15 Does the business have an alternative system for ensuring that chilled potentially hazardous food is being
stored safely?Base: Stores chilled potentially hazardous food = 462 (EHO)
Response given but practice not observed by = 5%
The majority of businesses storing chilled potentially hazardous food kept their chilledfood at the correct temperature (5°C or lower), and fewer than one in ten businesses did
not correctly store chilled food.
11 The briefing for EHOs for this question stated that businesses may have another way of ensuring potentially
hazardous food was safe. See Attachment 3 in Appendix C for a description of alternative systems – using time as acontrol for potentially hazardous food.
90%
2% 1%7%
0%10%20%30%40%50%60%70%80%90%
100%
Yes Alternativesystem
None Don't Know/NoAnswer

2000/2001 National Food Safety Benchmark CR&C 0413Australia New Zealand Food Authority Page 68
Medium risk (88%) businesses were less likely to store chilled potentially hazardous food correctlywhen compared to high risk businesses (94%) (Table 22).
Table 22: Storing chilled potentially hazardous food by business classificationQ14: Chilled Potentially Hazardous Food is stored at or below 5°C
Business classification Business size
High Risk(163)
%A
Med Risk(283)
%B
Low Risk(16)%C
Small(417)
%D
Large(45)%E
Total(462)
%F
Nett yes 94B 88 94 90 89 90
Has an Alternative System 3 1 0 1 6 2
Has None 3 9 0 7 2 7
Don’t Know/No Answer 0 1 6 1 2 1Base: Stores chilled potentially hazardous food (462)
EHOs observed that one in twenty (6%) businesses utilising a cool room “did not have adequatestorage space” to accommodate their level of potentially hazardous food usage (Figure 50). The vastmajority of businesses, over nine in ten (94%), had adequate storage.
Figure 50: Adequate space for potentially hazardous food in cool roomQ17 There is adequate space to store potentially hazardous food in the cool room?
Base: Stores potentially hazardous food in store room = 454 (EHO)Response given but practice not observed by EHO = 2%
94%
6%0%
0%10%20%30%40%50%60%70%80%90%
100%
Yes No Don't Know/NoAnswer

2000/2001 National Food Safety Benchmark CR&C 0413Australia New Zealand Food Authority Page 69
8.1.5 Cooking potentially hazardous foodThe EHO survey identified whether potentially hazardous food was cooked for the correct amount oftime at the correct temperature. If the business did not check the time and temperature of cookingthe EHOs asked whether the business had another way of ensuring that the food was correctlycooked.
Five in ten (53%) businesses that cooked potentially hazardous food monitored that potentiallyhazardous food was cooked at the correct temperature and for the correct amount of time (Figure 51).
A further one third (33%) had an “alternative system” 12 in place to ensure food was correctly cooked.Documentation for ensuring that the alternative system was working effectively was observed in 2% ofthese businesses.
One in ten (11%) businesses did not have a system for ensuring the time and temperature of cookedpotentially hazardous food was appropriate to meet safe standards.
Figure 51: Potentially hazardous food cooked at correct temp for correct amount of timeQ24 Potentially hazardous food is cooked at the correct temperature for the correct amount of time.Q25 The business does not check the temperature and time at that temperature but has another way of ensuring
that food is correctly cooked.
Base: Cooks potentially hazardous food = 392 (EHO)Response given but practice not observed by =40%
Alternative systems for cooking potentially hazardous food (for the correct length of timeand at the correct temperature) were common among businesses – however few
businesses documented these systems. One in ten had no system at all.
12 The note of information on this question stated that businesses may have another way of ensuring potentially
hazardous food was safe. See Attachment 3 in Appendix C for a description of alternative systems – using time asa control for potentially hazardous food
53%
33%
2%11%
0%10%20%30%40%50%60%70%80%90%
100%
Yes Alternativesystem
None Don't know/noanswer

2000/2001 National Food Safety Benchmark CR&C 0413Australia New Zealand Food Authority Page 70
8.1.6 Hot holding of potentially hazardous foodThe EHO survey identified whether potentially hazardous hot food was stored at an appropriatetemperature, or whether the business had a safe alternative system.
Nearly all businesses that held potentially hazardous hot food, held that food at the correcttemperature (88%). 1% had an alternative system to do so.
One in twenty (5%) businesses, where hot food was held, did not hold potentially hazardous food atthe correct temperature (Figure 52).
Four per cent (4%) of businesses involved in holding hot food did not have the appropriateequipment (Figure 53).
Figure 52: Hot potentially hazardous food held atcorrect temperature
Figure 53: Appropriate equipment for holding hotpotentially hazardous food
Q21 Hot potentially hazardous food is being held at correcttemperatures
Q22 Does the business have an alternative system for ensuring thathot potentially hazardous food is being held safely?
Q23 There is appropriate and adequate equipment for holding hotpotentially hazardous food
Base: Holds hot food = 305 (EHO)13 Base: Holds hot food = 311 (EHO)Response given but practice not observed by EHO = 25% of base Response given but practice not observed by EHO = 4% of base
Four out of every one hundred businesses holding hot food did not have adequateequipment for holding hot food.
13 Responses for this question were recorded where the EHO deemed the item was applicable. It is not clear why
there is a discrepancy between the base for Q21 and Q23.
93%
4% 3%0%
10%20%30%40%50%60%70%80%90%
100%
Yes No Don't Know/NoAnswer
88%
1% 4%5%0%
10%20%30%40%50%60%70%80%90%
100%
Yes Alternativesystem
None Don't Know/NoAnswer

2000/2001 National Food Safety Benchmark CR&C 0413Australia New Zealand Food Authority Page 71
The majority of businesses held potentially hazardous hot food at the correct temperature. (Table 23).
Table 23: Holding hot potentially hazardous food by risk classification and business sizeQ21: Hot potentially hazardous food is held at correct temperature
Business classification Business sizeHigh risk
(112)%A
Med risk(190)
%B
Low risk(3)*%C
Small(270)
%D
Large(35)%E
Total(305)
%F
Nett yes 93 86 67 87 100D 88
Has an Alternative System 0 2 0 1 0 1
Has None 3 6 0 6 0 4
Don’t Know/No Answer 3 4 33 4 0 7
Base: Holds hot potentially hazardous food (305).* Sample too small to perform tests of statistical significance.
Businesses with a temperature probe (95%) were more likely to hold hot food at the correcttemperature (Table 24) compared to those without a temperature probe (83%). There were nonotable differences by region, or by whether or not a business had a written food safety program.
Table 24: Holding hot potentially hazardous food by temperature probe, region andwritten food safety program
Q21: Hot potentially hazardous food is held at correct temperature
Have temp probe Region Written safetyprogram
Yes(134)
%A
No(166)
%B
Metro(149)
%C
Regional(156)
%D
Yes(54)%E
No(235)
%F
Nett yes 95B 83 86 90 94 89
Has an Alternative System 0 2 1 1 0 1
Has None 3 8 6 4 0 6
Don’t Know/No Answer 2 6 6 5 5 3
Base: Holds hot potentially hazardous food (305)
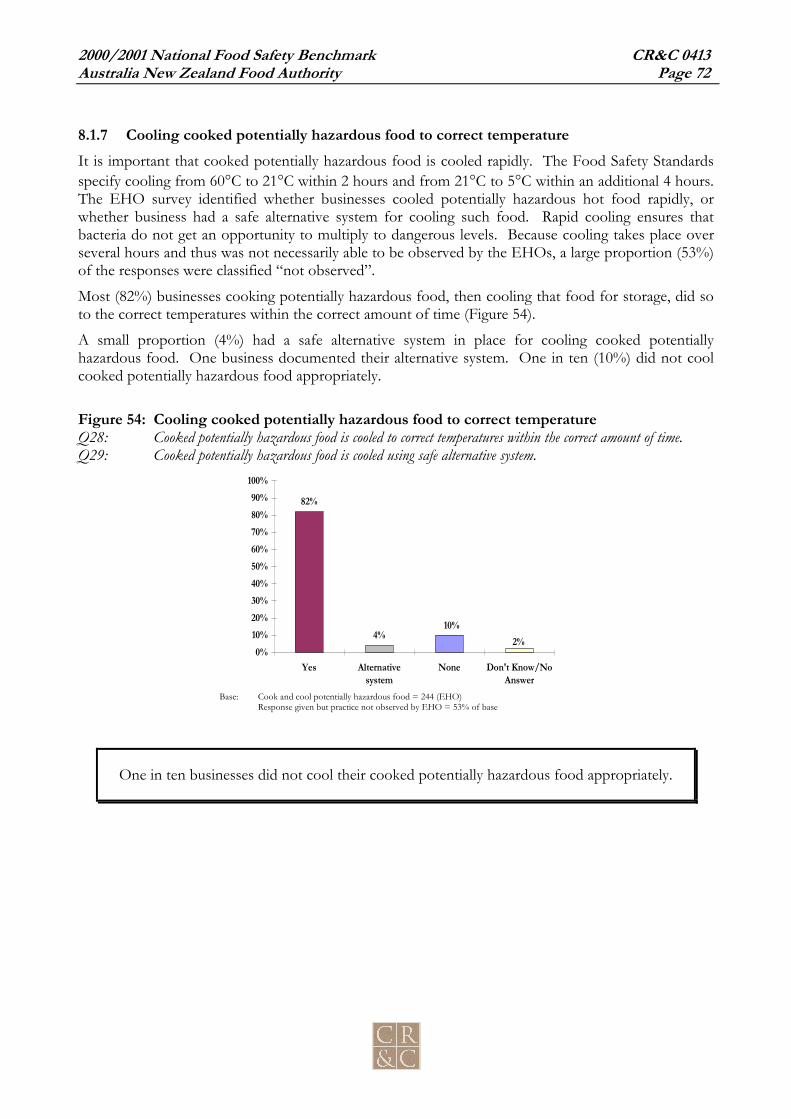
2000/2001 National Food Safety Benchmark CR&C 0413Australia New Zealand Food Authority Page 72
8.1.7 Cooling cooked potentially hazardous food to correct temperatureIt is important that cooked potentially hazardous food is cooled rapidly. The Food Safety Standardsspecify cooling from 60°C to 21°C within 2 hours and from 21°C to 5°C within an additional 4 hours.The EHO survey identified whether businesses cooled potentially hazardous hot food rapidly, orwhether business had a safe alternative system for cooling such food. Rapid cooling ensures thatbacteria do not get an opportunity to multiply to dangerous levels. Because cooling takes place overseveral hours and thus was not necessarily able to be observed by the EHOs, a large proportion (53%)of the responses were classified “not observed”.
Most (82%) businesses cooking potentially hazardous food, then cooling that food for storage, did soto the correct temperatures within the correct amount of time (Figure 54).
A small proportion (4%) had a safe alternative system in place for cooling cooked potentiallyhazardous food. One business documented their alternative system. One in ten (10%) did not coolcooked potentially hazardous food appropriately.
Figure 54: Cooling cooked potentially hazardous food to correct temperatureQ28: Cooked potentially hazardous food is cooled to correct temperatures within the correct amount of time.Q29: Cooked potentially hazardous food is cooled using safe alternative system.
Base: Cook and cool potentially hazardous food = 244 (EHO)Response given but practice not observed by EHO = 53% of base
One in ten businesses did not cool their cooked potentially hazardous food appropriately.
82%
4% 2%10%
0%10%20%30%40%50%60%70%80%90%
100%
Yes Alternativesystem
None Don't Know/NoAnswer

2000/2001 National Food Safety Benchmark CR&C 0413Australia New Zealand Food Authority Page 73
8.1.8 Reheating cooked and cooled potentially hazardous foodReheating potentially hazardous food must be carried out rapidly to ensure that bacteria do not get theopportunity to multiply to dangerous levels.
Nearly all (87%) businesses that reheated food that had been cooked then cooled, did so rapidly. Onein twenty (5%) businesses did not rapidly reheat potentially hazardous food (Figure 55). Few (2%) hadan alternative system for ensuring food was reheated safely. None of these businesses documentedtheir alternative system.
Figure 55: Cooked and cooled potentially hazardous food is reheated rapidlyQ26: Potentially hazardous food that has been cooked then cooled, and is being reheated for holding at hot
temperatures, is reheated rapidly.Q27: Does the business have an alternative system for ensuring potentially hazardous food is reheated safely?
Base: Q26 All respondents = 483 (EHO)Response given but practice not observed by EHO = 22%
One in twenty businesses did not rapidly reheat cooked food.
87%
2% 4%6%
0%10%20%30%40%50%60%70%80%90%
100%
Yes Alternativesystem
None Don't Know/NoAnswer

2000/2001 National Food Safety Benchmark CR&C 0413Australia New Zealand Food Authority Page 74
8.1.9 Display
Displayed potentially hazardous food must be kept either chilled (5°C or below) or hot (60°C orabove) or at another temperature if the time is safe. Temperature control of food on display wasassessed (Figure 56).Most businesses displayed potentially hazardous food at the correct temperature (82%) or had analternative system for safely displaying food (4%). Only two businesses documented this procedure.One in ten (9%) businesses displaying potentially hazardous food neither held it at the correcttemperature nor had an alternative system.
Figure 56: Potentially hazardous food on display is held at the correct temperatureQ32 Potentially hazardous food on display is held at the correct temperature.Q33 Does the business have an alternative system for ensuring potentially hazardous food is displayed safely?
Base: Q32 Displays potentially hazardous food = 273 (EHO)Response given but practice not observed by EHO = 16% of base
One in ten businesses displaying potentially hazardous food did not have a method forensuring the displayed food remained safe.
82%
4% 6%9%
0%10%20%30%40%50%60%70%80%90%
100%
Yes Alternativesystem
None Don't Know/NoAnswer

2000/2001 National Food Safety Benchmark CR&C 0413Australia New Zealand Food Authority Page 75
8.1.10 Transport of potentially hazardous food
Transported potentially hazardous food must be transported either chilled (5°C or below) or hot(60°C or above) or at another temperature if the time is safe. Businesses were asked abouttemperature control of food during transport.
Three in ten (28%) businesses transporting food also reported that they transported potentiallyhazardous food (Figure 57).
Eight in ten (81%) businesses transporting potentially hazardous food carried chilled food. Half (51%)carried hot food (Figure 58) and one third (34%) transported both hot and cold food.
Figure 57: Potentially hazardous food transported Figure 58: Type of potentially hazardous foodtransported
Q36: The business transports potentially hazardous food. Q37: If the business does transport potentially hazardous food,does it transport chilled, hot food or both?
Base: Transports food = 350 (EHO) Base: Transports potentially hazardous food = 99 (EHO)Response given but practice not observed by EHO = 13% of base Note: Multiple response possible
Three in ten businesses transporting food also reported they transported potentiallyhazardous food.
28%
69%
2%0%
10%20%30%40%50%60%70%80%90%
100%
Yes No Don't Know/NoAnswer
81%
51%
34%
0%10%20%30%40%50%60%70%80%90%
100%
Nett Chilled food Nett Hot food Both hot & chilledfood

2000/2001 National Food Safety Benchmark CR&C 0413Australia New Zealand Food Authority Page 76
Three in ten (29%) businesses transporting chilled potentially hazardous food used a refrigeratedvehicle and one quarter (25%) used eskies with ice (Figure 59). A further one quarter of businesses(28%) stated other forms of transport including:
delivery on plate, trolley, basket or box (8%); plastic bag (5%); insulated box (5%); insulated carry bag (4%); dry ice (1%); and foil (1%).
Figure 59: Method of transporting chilled potentiallyhazardous food
Figure 60: Maximum time of transporting chilledpotentially hazardous food
Q38: If chilled potentially hazardous food is transported, whatmethod is used?
Q39: If chilled potentially hazardous food is transported, what isthe maximum time of transportation?
Base: Transports chilled potentially hazardous food = 80 (EHO) Base: Transports chilled potentially hazardous food = 80 (EHO)Total is greater than 100% due to multiple responses
Three in four (75%) businesses reported they transport chilled potentially hazardous food in timeperiods of less than one hour (Figure 60). One in ten (10%) transported chilled potentially hazardousfood for time periods longer than four hours.
One quarter of businesses transporting chilled potentially hazardous food did not mentionuse of temperature control equipment ensuring food would stay chilled.
29% 25%
13%20%
0%10%20%30%40%50%60%70%80%90%
100%
Refrigeratedvehicle
Eskies with ice Van or vehicle Insulated vehicle
75%
11% 10%3%
0%10%20%30%40%50%60%70%80%90%
100%
Less than 1 hour 1 - 2 hours 2 - 3 hours more than 4hours
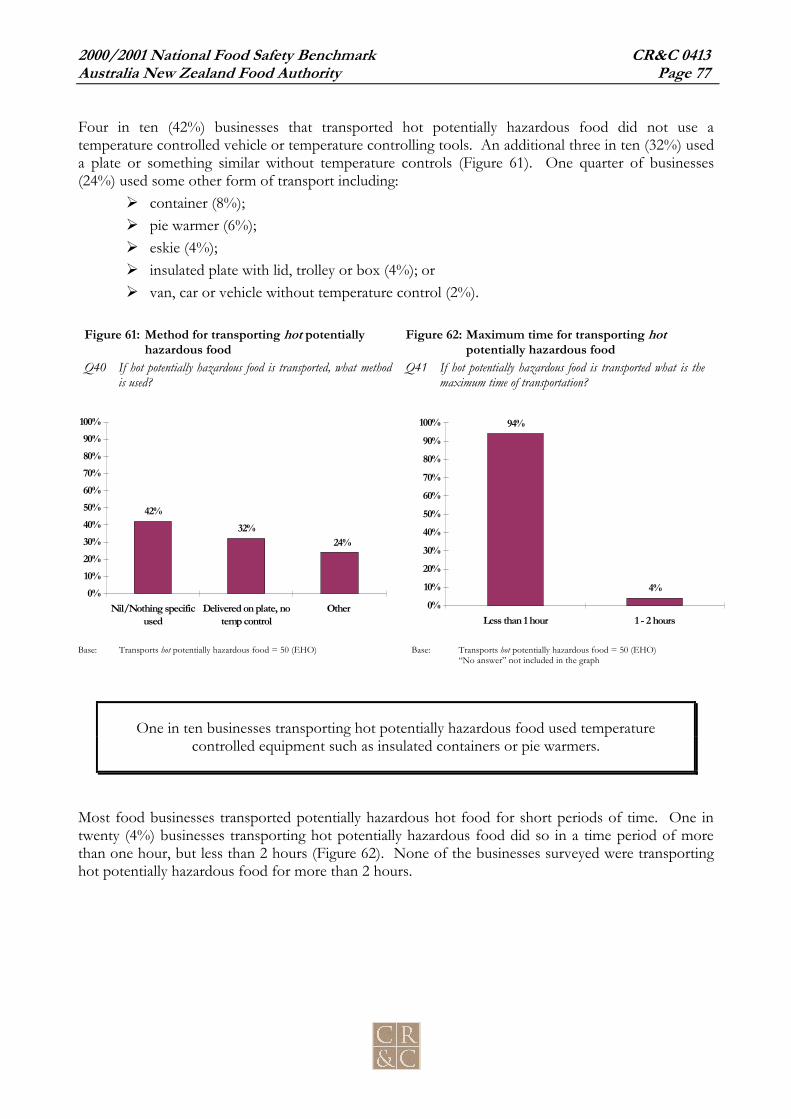
2000/2001 National Food Safety Benchmark CR&C 0413Australia New Zealand Food Authority Page 77
Four in ten (42%) businesses that transported hot potentially hazardous food did not use atemperature controlled vehicle or temperature controlling tools. An additional three in ten (32%) useda plate or something similar without temperature controls (Figure 61). One quarter of businesses(24%) used some other form of transport including:
container (8%); pie warmer (6%); eskie (4%); insulated plate with lid, trolley or box (4%); or van, car or vehicle without temperature control (2%).
Figure 61: Method for transporting hot potentiallyhazardous food
Figure 62: Maximum time for transporting hotpotentially hazardous food
Q40 If hot potentially hazardous food is transported, what methodis used?
Q41 If hot potentially hazardous food is transported what is themaximum time of transportation?
Base: Transports hot potentially hazardous food = 50 (EHO) Base: Transports hot potentially hazardous food = 50 (EHO)“No answer” not included in the graph
One in ten businesses transporting hot potentially hazardous food used temperaturecontrolled equipment such as insulated containers or pie warmers.
Most food businesses transported potentially hazardous hot food for short periods of time. One intwenty (4%) businesses transporting hot potentially hazardous food did so in a time period of morethan one hour, but less than 2 hours (Figure 62). None of the businesses surveyed were transportinghot potentially hazardous food for more than 2 hours.
42%32%
24%
0%10%20%30%40%50%60%70%80%90%
100%
Nil/Nothing specificused
Delivered on plate, notemp control
Other
94%
4%0%
10%
20%30%
40%50%
60%70%
80%90%
100%
Less than 1 hour 1 - 2 hours

2000/2001 National Food Safety Benchmark CR&C 0413Australia New Zealand Food Authority Page 78
Three in four (74%) businesses that transported potentially hazardous food did so at the correcttemperature. One in ten (9%) used an alternative system. Two in ten (21%) businesses transportingpotentially hazardous foods (chilled or hot) were not doing so at the correct temperature (Figure 63).
Figure 63: Potentially hazardous food transported at appropriate temperatureQ42: Potentially hazardous food is transported at the appropriate temperature.Q43: Does the business have an alternative system for ensuring potentially hazardous food is transported safely?
Base: Q42 Transports potentially hazardous food = 99 (EHO)
8.2 Protecting food from contamination
Pathogenic micro organisms from dirt, people, animals, pests or other food may contaminateunprotected food. Food may also be contaminated by chemicals from spillages or vapours and byphysical matter.
The EHO survey identified whether food was protected at all stages of handling in the business.These steps were: receiving, storage, processing, display and transport of food. Space for chilledstorage was checked for adequacy as insufficient space can not only affect cooling rates but increasethe risk of cross contamination.
Food storage in the cool room was checked to observe whether raw food was separated from cookedfood. Dry goods were checked to ensure they were free from pests.
Information on cleaning, sanitising, hand washing and covering of wounds was obtained to check thepossibilities of contamination of food during processing.
Displays of food for self service were checked to observe whether they were supervised, whetherseparate serving utensils were provided, and whether new batches were mixed with previous batches.
Protection from contamination was measured across five areas: at the time of receiving food; in storage areas; in food display areas; during food processing; and during transport of food.
74%
9% 12%3%
0%10%20%30%40%50%60%70%80%90%
100%
Yes Alternativesystem
None Don't Know/NoAnswer

2000/2001 National Food Safety Benchmark CR&C 0413Australia New Zealand Food Authority Page 79
8.2.1 Receiving food and protection from contaminationOne quarter (23%) of businesses had food delivered to their business outside of operational hours(Figure 64).
Regardless of whether food was delivered to the business during or after operational hours, 3% ofbusinesses where food was delivered had unprotected food in their delivery area (Figure 65).
Figure 64: Delivery of food outside business hours Figure 65: Protecting delivered food fromcontamination
Q9: Food is delivered to the premises outside of business hours Q13: Food received is protected from contamination
Base: All respondents = 483 (EHO) Base: Has food delivered = 456 (EHO)Response given but practice not observed by EHO = 48% of base Response given but practice not observed by EHO =46%
Very few (3%) businesses that had food delivered, had food that was unprotected fromcontamination when it was delivered.
23%
76%
1%0%
10%20%30%40%50%60%70%80%90%
100%
Yes No Don't Know/NoAnswer
96%
3% 1%0%
10%20%30%40%50%60%70%80%90%
100%
Yes No Don't Know/NoAnswer

2000/2001 National Food Safety Benchmark CR&C 0413Australia New Zealand Food Authority Page 80
94%
6%0%
0%10%20%30%40%50%60%70%80%90%
100%
Yes No Don't Know/NoAnswer
86%
14%
0%0%
10%20%30%40%50%60%70%80%90%
100%
Yes No Don't Know/NoAnswer
8.2.2 Food storage and protection from contaminationOne in ten (8%) businesses storing raw food in the cool room did not have raw food separated fromready-to-eat food.
Figure 66: Raw food separated in cool roomQ16: Raw food is separated from ready-to-eat food in the cool room
Base: Stores raw food in the cool room = 425 (EHO)Response given but practice not observed by EHO = 5% of base
One in twenty (6%) businesses utilising a cool room did not have adequate space in the cool room tostore potentially hazardous food (Figure 67).
More than one in seven (14%) businesses utilising a cool room did not adequately protect their food inthe cool room from contamination (Figure 68).
Figure 67: Adequate space for potentially hazardousfood in cool room
Figure 68: Protected from contamination in coolroom
Q17 There is adequate space to store potentially hazardous food inthe cool room.
Q18 All food is protected from contamination in the cool room?
Base: Utilised a cool room = 454 (EHO) Base: Utilised a cool room = 459 (EHO)Response given but practice not observed by EHO = 2% of base Response given but practice not observed by EHO = 2%
91%
8%1%
0%10%20%30%40%50%60%70%80%90%
100%
Yes No Don't Know/NoAnswer

2000/2001 National Food Safety Benchmark CR&C 0413Australia New Zealand Food Authority Page 81
One in twenty (6%) businesses handling dry goods did not have adequate protection fromcontamination of their dry goods and a similar proportion (4%) appeared to have problems with pestsin the dry goods areas (Figure 69), (Figure 70).
Figure 69: Dry goods protected from contamination Figure 70: Dry goods free from pests
Q19: Dry goods are protected from contamination? Q20: Dry goods appear to be free from pests.
Base: Handles dry goods = 467 (EHO) Base: Handles dry goods = 468 (EHO)Response given but practice not observed by EHO = 1% of base Response given but practice not observed by EHO = 2%
8.2.3 Display and protection from contaminationJust under one in ten (8%) businesses with food on display did not have their displayed foodadequately protected from contamination (Figure 71).
Figure 71: Protection of displayed foodQ30 Food on display is protected from contamination.
Base: Has food on display = 274 (EHO)Response given but practice not observed by EHO = 4% of base
93%
6%1%
0%10%20%30%40%50%60%70%80%90%
100%
Yes No Don't Know/NoAnswer
94%
4% 2%0%
10%20%30%40%50%60%70%80%90%
100%
Yes No Don't Know/NoAnswer
90%
8%2%
0%10%20%30%40%50%60%70%80%90%
100%
Yes No Don't Know/NoAnswer

2000/2001 National Food Safety Benchmark CR&C 0413Australia New Zealand Food Authority Page 82
One in seven (15%) businesses with food on display, and which needed to be supervised, did not havestaff supervising displayed ready-to-eat food (Figure 72).
When displayed food was removed from display, one in seven (14%) businesses mixed the displayedfood with new food for storage to re-serve the next day (Figure 73).
Figure 72: Displayed ready-to-eat food supervised bystaff
Figure 73: Food removed from display mixed withnew food
Q31: Displayed ready-to-eat food intended for self-service issupervised by staff.
Q34: Is food removed from display mixed with new batches of foodfor display on the next day?
Base: Have food on display needing supervision = 103 (EHO) Base: Has food on display = 294 (EHO)Response given but practice not observed by EHO = 27% of base Response given but practice not observed by EHO = 38%
Businesses more likely to remove food from display and mix it with new batches of food for displaythe next day included:
high risk (21%) businesses (who are also more likely to handle these types of food)compared with medium risk (11%) businesses;
those supplying ready-to-eat food off-site from where it was prepared (23%) comparedwith those not supplying ready-to-eat food off-site (11%); and
those with a written food safety program (24%) compared to those without a plan (13%).
83%
15%
2%0%
10%20%30%40%50%60%70%80%90%
100%
Yes No Don't Know/NoAnswer
14%
82%
4%0%
10%20%30%40%50%60%70%80%90%
100%
Yes No Don't Know/NoAnswer

2000/2001 National Food Safety Benchmark CR&C 0413Australia New Zealand Food Authority Page 83
8.2.4 Processing of food and protection from contaminationOne in ten (9%) businesses did not separate equipment used for preparing raw and ready-to-eat food,or sanitise that equipment between uses (Figure 74).
Figure 74: Separate equipment used for raw & ready-to-eat food?Q62 Separate equipment is used for preparing and processing raw and ready-to-eat food, or equipment is cleaned
and sanitised between these uses?
Base: Prepares & processes raw and ready-to-eat food = 418 (EHO)Response given but practice not observed by EHO = 36%
One in twenty businesses (6%) were at risk of contamination from staff directly touching food inbusinesses where staff handled ready-to-eat food with hands rather than utensils such as tongs (Figure75). One in ten (9%) staff who wore gloves did not change gloves when necessary (Figure 76).
Figure 75: Hands are not used to handle food Figure 76: Gloves are changed
Q64: Staff handle ready-to-eat food with utensils or other barriers(not hands)
Q65: Staff change gloves when necessary.
Base: Staff handle ready-to-eat food = 453 (EHO) Base: Staff wear gloves = 341 (EHO)Response given but practice not observed by EHO = 27% of base Response given but practice not observed by EHO = 47%
90%
9%0%
0%10%20%30%40%50%60%70%80%90%
100%
Yes No Don't Know/NoAnswer
94%
6%0%
0%10%20%30%40%50%60%70%80%90%
100%
Yes No Don't Know/NoAnswer
87%
9%3%
0%10%20%30%40%50%60%70%80%90%
100%
Yes No Don't Know/NoAnswer

2000/2001 National Food Safety Benchmark CR&C 0413Australia New Zealand Food Authority Page 84
One in ten (9%) businesses had staff who did not wash their hands when necessary (Figure 77).Additionally, one in twenty (6%) staff did not cover wounds appropriately (Figure 78).
Figure 77: Hand washing Figure 78: Wound covering
Q66 Staff wash hands when necessary. Q76 Staff cover open wounds with a waterproof dressing.
Base: All respondents = 483 (EHO) Base: All respondents = 483 (EHO)Response given but practice not observed by EHO = 49% of base Response given but practice not observed by EHO = 44%
Between one in ten and one in twenty businesses faced a risk of food contamination fromstaff through infrequent glove changing, using hands rather than utensils to touch food, or
infrequent wound covering.
8.2.5 Transport and protection from contaminationNearly all (99%) businesses transporting food had adequate protection from contamination duringtransportation (Figure 79).
Figure 79: Transport of foodQ44 Food is protected from contamination during transportation
Base: Transports food = 99 (EHO)Response given but practice not observed by EHO = 44% of base
1%
99%
0%0%
10%20%30%40%50%60%70%80%90%
100%
Yes No Don't Know/NoAnswer
88%
9%1%
0%10%20%30%40%50%60%70%80%90%
100%
Yes No Don't Know/NoAnswer
Document2
89%
6% 4%0%
10%20%30%40%50%60%70%80%90%
100%
Yes No Don't Know/NoAnswer

2000/2001 National Food Safety Benchmark CR&C 0413Australia New Zealand Food Authority Page 85
8.3 Personal hygiene and staff illnessStaff are a potential source of pathogenic micro organisms and foreign matter that could contaminatefood. The contamination may be from the food handlers body such as intestinal, respiratory or skinmicro organisms, or foreign material and micro organisms from clothing. Information was sought onhand washing practices and facilities, clothing worn by handlers, and the extent of the use of gloves.
Businesses were asked about their policies regarding staff that are ill and are at work. Staff that aresuffering from symptoms of illness that may be transmitted through food or are carriers of theseillnesses may contaminate food or surfaces that come in contact with food.
8.3.1 Hand washing facilitiesHand washing practices and ensuring that there are adequate facilities for hand washing are keycomponents of personal hygiene. Information was sought on whether staff members wash theirhands, which facilities they use and whether hand wash basins are available, are accessible and aresuitable equipped with soap, warm running water, towels etc. EHOs were asked to observe whetherhand basins showed signs of recent use.
Just under one in five (17%) businesses did not have sufficient hand washing facilities (Figure 80).
One in ten (10%) businesses did not provide their employees with adequate access to hand washfacilities (Figure 81).
Figure 80: Sufficient hand washing facilities Figure 81: Accessible hand washing
Q69 Sufficient hand washing facilities are provided. Q70 Hand washing facilities are accessible to employees
Base: All respondents = 483 (EHO) Base: All respondents = 483 (EHO)Response given but practice not observed by EHO = 1% of base Response given but practice not observed by EHO = 1%
Question not applicable = 2%
82%
17%
1%0%
10%20%30%40%50%60%70%80%90%
100%
Yes No Don't Know/NoAnswer
86%
10%1%
0%10%20%30%40%50%60%70%80%90%
100%
Yes No Don't Know/NoAnswer

2000/2001 National Food Safety Benchmark CR&C 0413Australia New Zealand Food Authority Page 86
Just under one in five businesses did not provide sufficient hand washing facilities forstaff.
Provision of appropriate facilities increased the likelihood of good practice. Nine in ten (92%)businesses with sufficient hand wash facilities had staff who washed their hands when necessary. Thiscompares to only seven in ten (70%) businesses without sufficient hand wash facilities where staffwashed their hands when necessary.
Staff working in businesses with sufficient hand washing facilities were more likely towash their hands when necessary.
Medium risk businesses more often had insufficient hand wash facilities (19%) and lack of access(13%) to hand wash facilities compared with high risk (12% and 5% respectively) (Table 25). Therewere no substantial differences according to business size.
Table 25: Hand wash facilities by business classification and business sizeBusiness classification Business size
High risk(166)
%A
Med risk(291)
%B
Low risk(26)%C
Small(437)
%D
Large(46)%E
Total(483)
%F
Q69: Sufficient hand washing facilities are providedNett Yes 88B 79 69 81 89 81
Nett No 12 19A 27 18 9 17
Not Observed 1 1 4 1 0 1
No Answer 0 1 4 1 0 2
Q70: Hand washing facilities are accessible to employees
Nett Yes 93B 83 81 85 96 86
Nett No 5 13A 15 11 2 10
Not Observed 1 - 4 1 0 1
No Answer 0 1 4 1 0 3Base: All respondents (483)
Sample to small to permit statistical significance testing

2000/2001 National Food Safety Benchmark CR&C 0413Australia New Zealand Food Authority Page 87
Significant differences observed between hand washing facility provision by State / Territory were: Businesses in South Australia (88%) and Victoria (89%) were more likely to provide hand
washing facilities when compared to businesses in New South Wales (76%). Businesses in Victoria (95%) were more likely to have hand washing facilities that are
accessible to employees when compared to businesses in ACT (86%).
Staff did not use the designated hand wash facilities in two in ten (19%) businesses.
Figure 82: Staff wash their hands in designated facilitiesQ67 When staff wash hands, they use the designated hand washing facilities.
77%
19%
1%0%
10%20%30%40%50%60%70%80%90%
100%
Yes No Don't Know/NoAnswer
Base: All respondents = 483 (EHO)Response given but practice not observed by EHO =361%Question not applicable = 2%
One fifth of businesses with designated staff hand wash facilities had staff who did notutilise these hand wash facilities.
Just under one in ten (7%) businesses did not supply soap or hand cleanser (Figure 83) and over one inten (14%) did not have warm running water in their hand washing facilities (Figure 84).
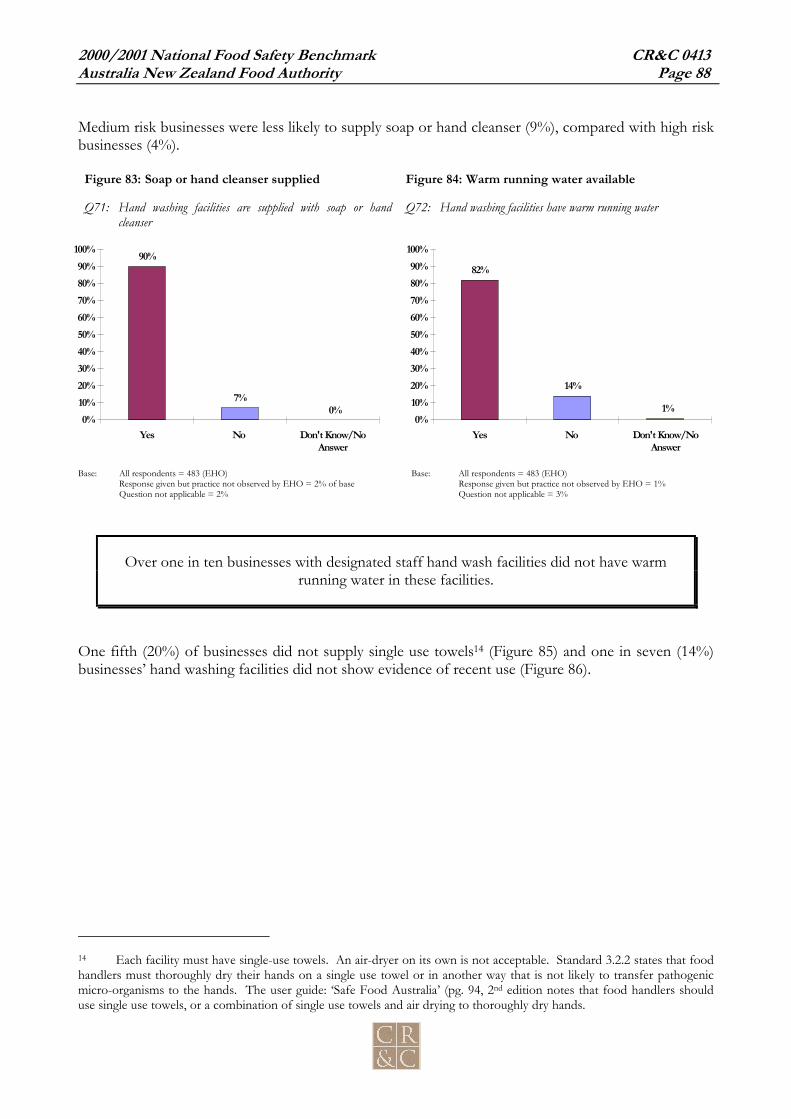
2000/2001 National Food Safety Benchmark CR&C 0413Australia New Zealand Food Authority Page 88
Medium risk businesses were less likely to supply soap or hand cleanser (9%), compared with high riskbusinesses (4%).
Figure 83: Soap or hand cleanser supplied Figure 84: Warm running water available
Q71: Hand washing facilities are supplied with soap or handcleanser
Q72: Hand washing facilities have warm running water
Base: All respondents = 483 (EHO) Base: All respondents = 483 (EHO)Response given but practice not observed by EHO = 2% of base Response given but practice not observed by EHO = 1%Question not applicable = 2% Question not applicable = 3%
Over one in ten businesses with designated staff hand wash facilities did not have warmrunning water in these facilities.
One fifth (20%) of businesses did not supply single use towels14 (Figure 85) and one in seven (14%)businesses’ hand washing facilities did not show evidence of recent use (Figure 86).
14 Each facility must have single-use towels. An air-dryer on its own is not acceptable. Standard 3.2.2 states that foodhandlers must thoroughly dry their hands on a single use towel or in another way that is not likely to transfer pathogenicmicro-organisms to the hands. The user guide: ‘Safe Food Australia’ (pg. 94, 2nd edition notes that food handlers shoulduse single use towels, or a combination of single use towels and air drying to thoroughly dry hands.
90%
7%0%
0%10%20%30%40%50%60%70%80%90%
100%
Yes No Don't Know/NoAnswer
82%
14%
1%0%
10%20%30%40%50%60%70%80%90%
100%
Yes No Don't Know/NoAnswer

2000/2001 National Food Safety Benchmark CR&C 0413Australia New Zealand Food Authority Page 89
Medium risk businesses were less likely to supply single use towels (25%) compared with high riskbusinesses (13%). Small businesses were less likely to supply single use towels (22%) when comparedwith large (4%) businesses.
Figure 85: Single use towels supplied Figure 86: Recent use of hand washing facilities
Q73: Hand washing facilities are supplied with single use towels Q74: Hand washing facilities show evidence of recent use.
Base: All respondents = 483 (EHO) Base: All respondents = 483 (EHO)Response given but practice not observed by EHO = 2% of base Response given but practice not observed by EHO = 3%Question not applicable = 2% Question not applicable = 4%
One fifth of medium risk and small businesses did not have single use towels available indesignated staff hand wash facilities.
77%
20%
1%0%
10%20%30%40%50%60%70%80%90%
100%
Yes No Don't Know/NoAnswer
78%
14%
3%0%
10%20%30%40%50%60%70%80%90%
100%
Yes No Don't Know/NoAnswer

2000/2001 National Food Safety Benchmark CR&C 0413Australia New Zealand Food Authority Page 90
Just under two in ten businesses (16%) had staff who did not wash and dry their hands correctly (Figure87). Staff employed in high risk businesses (86%) washed and dried their hands correctly more oftenthan staff employed in medium risk (78%) businesses.
Figure 87: Staff wash & dry hands correctlyQ68: When staff wash hands, they wash and dry their hands correctly
Base: All respondents = 483 (EHO)Response given but practice not observed by EHO = 48% of base
Just under two in ten (16%) of all businesses had staff who did not wash and dry theirhands correctly.
8.3.2 ClothingStaff were observed to see whether they wore clean outer clothing. Storage for personal clothing waschecked for adequacy. Staff did not wear clean outer clothing in only a small proportion (4%) ofbusinesses (Figure 88). Personal clothing was not stored appropriately in one out of fourteen (7%)businesses (Figure 89).
Figure 88: Staff wear clean outer clothing Figure 89: Personal clothing storage
Q63: Staff preparing and processing food are wearing ‘clean’outer clothing
Q85: Personal clothing is stored appropriately
Base All respondents = 483 (EHO) Base: All respondents = 483 (EHO)Response given but practice not observed by EHO = 8% of base Response given but practice not observed by EHO = 5%Question not applicable = 13% Question not applicable = 8%
80%
16% 20%
0%10%20%30%40%50%60%70%80%90%
100%
Yes No Don't Know/NoAnswer
82%
4% 0%0%
10%20%30%40%50%60%70%80%90%
100%
Yes No Don't Know/NoAnswer
83%
7%2%
0%10%20%30%40%50%60%70%80%90%
100%
Yes No Don't Know/NoAnswer

2000/2001 National Food Safety Benchmark CR&C 0413Australia New Zealand Food Authority Page 91
8.3.3 Staff sickness policiesBusinesses were asked whether they had a policy relating to staff that were unwell. One in five (21%)businesses did not have staff sickness policies (Figure 90).
Figure 90: Policy for unwell staffQ75: The business has a policy relating to staff who are unwell
76%
21%
1%0%
10%20%30%40%50%60%70%80%90%
100%
Yes No Don't Know/NoAnswer
Base: All respondents = 483 (EHO)Response given but practice not observed by EHO = 32%Question not applicable = 1%
Types of businesses without a staff sickness policy included: medium risk (25%) compared to high risk (12%); small businesses (20%) compared to large (7%); and those not supplying food to high risk groups (23%) compared to those who did supply
high risk groups (7%).
Additionally, staff sickness policies appeared in businesses where more caution was taken in relation tofood handling practices including:
checking the temperature (86%) of potentially hazardous food delivered to the premisescompared with those who did not check the temperature of potentially hazardous fooddelivered to the business (73%);
having a temperature probe (87%) compared to those without a probe (70%); having a written food safety program (94%) compared to those without a written food
safety program (74%); and having a “good” overall appearance (79%) compared with those not having a “good”
overall appearance (66%).
Staff sickness policies appeared more often within businesses where greater caution wastaken with food safety overall (including checking food temperature of delivered food,
having a temperature probe or the existence of a written food safety program).

2000/2001 National Food Safety Benchmark CR&C 0413Australia New Zealand Food Authority Page 92
8.4 Cleaning and sanitising
The EHO survey identified whether business cleaned and sanitised eating and drinking utensils andfood contact surfaces for example, chopping boards, using commercial dishwashers, glass washers,domestic models of dishwashers or whether they cleaned and sanitised manually.
If food businesses used such equipment, The EHOs identified the operating temperatures of theequipment.
The temperature of water used in manual cleaning and sanitising was also obtained and whether thebusiness used chemical sanitisers.
Effective cleaning and sanitising was assessed by identifying: the methods of washing and sanitising equipment used during food handling; as well as whether the equipment used was working appropriately.
8.4.1 Commercial dishwashersOne third (30%) of businesses where a dishwasher was appropriate (i.e. businesses that had a need towash eating, drinking or food preparation utensils) used a commercial dishwasher to wash and sanitiseeating utensils (Figure 90).
One in ten commercial dishwashers were not working at the correct sanitising temperature and one intwenty (5%) businesses were unsure of the temperature of the dishwasher (Figure 92). To answer yesto correct temperature, the final rinse or sanitising rinse must be 77ºC or above.
Figure 91: Use commercial dishwasher to wash andsanitise
Figure 92: Correct sanitising temperature
Q48: Business uses a commercial dishwasher to wash andsanitise eating and drinking utensils and food contact surfaces
Q49: Commercial dishwashers operates at the correct sanitisingtemperature
Base: Dishwasher appropriate to business = 399 (EHO) Base: Uses commercial dishwasher = 120 (EHO)Response given but practice not observed by EHO = 5% of base Response given but practice not observed by EHO = 25%
One in seven businesses using a commercial dishwasher either did not know the sanitisingtemperature or found it was not working at the correct temperature.
30%
69%
1%0%
10%20%30%40%50%60%70%80%90%
100%
Yes No Don't Know/NoAnswer
79%
10%5%
0%10%20%30%40%50%60%70%80%90%
100%
Yes No Don't Know/NoAnswer

2000/2001 National Food Safety Benchmark CR&C 0413Australia New Zealand Food Authority Page 93
Businesses that were more likely to use a commercial dishwasher included: large (55%) compared to small (27%); those supplying food to high risk groups (43%) compared to those not supplying these
groups (28%); those using chemical sanitisers (36%) compared to those not (10%) using chemical
sanitisers; and those with a written food safety program (45%) compared to those without a written food
safety program (28%).
8.4.2 Domestic dishwashersOver one in ten (13%) businesses where a dishwasher was appropriate (i.e. businesses that had a needto wash eating, drinking or food preparation utensils) used a domestic dishwasher and two in ten(21%) reported a domestic dishwasher was not applicable to the business (Figure 93).
One fifth (19%) of domestic dishwashers did not operate at the correct temperature (Figure 94). Onein ten did not know the sanitising temperature of their domestic dishwasher. The correct sanitisingtemperature for a final rinse or sanitising rinse is 77ºC.
Figure 93: Domestic dishwasher to sanitise eating &drinking utensils
Figure 94: Domestic dishwasher at correct temp
Q51: Business uses a domestic dishwasher to wash andsanitise eating and drinking utensils and food contact surfaces
Q52: Domestic dishwasher operates at correct temperature
Base: Dishwasher appropriate to business = 382 (EHO) Base: Uses domestic dishwasher = 48 (EHO)Response given but practice not observed by EHO = 3% of base Response given but practice not observed by EHO = 46%
One third of domestic dishwashers either did not work at the correct sanitisingtemperature, or the temperature was not known.
13%
85%
3%0%
10%20%30%40%50%60%70%80%90%
100%
Yes No Don't Know/NoAnswer
58%
19%12%
0%10%20%30%40%50%60%70%80%90%
100%
Yes No Don't Know/NoAnswer

2000/2001 National Food Safety Benchmark CR&C 0413Australia New Zealand Food Authority Page 94
8.4.3 Glass washersOne in seven (16%) businesses where a glass washer was appropriate to the business used glasswashers (Figure 95). Two in ten (19%) glass washers did not operate at the correct temperature andone in ten could not identify the sanitising temperature (Figure 96).
Figure 95: Glass washer to sanitise eating & drinkingutensils
Figure 96: Glass washers operate at correcttemperature
Q54: The business uses glass washers to sanitise using hot water Q55: Glass washers operate at the correct temperature
Base: Glass washer appropriate to business = 372 (EHO) Base: Uses glass washer = 59 (EHO)Response given but practice not observed by EHO = 5% of base Response given but practice not observed by EHO = 29% of base
One fifth of domestic dishwashers and glass washers did not operate at the correctsanitising temperature. Commercial dishwashers were a little better with only one in ten
not working at the correct temperature.
8.4.4 Chemical sanitisersOne quarter (24%) of businesses did not use chemical sanitisers (Figure 97) and in those cases wherethey were used, one in ten (9%) did not use them appropriately (Figure 98).
Figure 97: Chemical sanitisers used Figure 98: Appropriate use of sanitisers
Q57 The business uses chemical sanitisers for some or all of itsequipment
Q58 Chemical sanitisers are used appropriately
.Base: Chemical sanitiser appropriate to business = 453 (EHO) Base: Uses chemical sanitiser = 342 (EHO)Response given but practice not observed by EHO = 20% of base Response given but practice not observed by EHO = 45% of base
16%
82%
3%0%
10%20%30%40%50%60%70%80%90%
100%
Yes No Don't Know/NoAnswer
53%
19%10%
0%10%20%30%40%50%60%70%80%90%
100%
Yes No Don't Know/NoAnswer
75%
24%
1%0%
10%20%30%40%50%60%70%80%90%
100%
Yes No Don't Know/NoAnswer
87%
9%2%
0%10%20%30%40%50%60%70%80%90%
100%
Yes No Don't Know/NoAnswer

2000/2001 National Food Safety Benchmark CR&C 0413Australia New Zealand Food Authority Page 95
8.4.5 Manually sanitising using hot waterNearly six in ten (57%) businesses where manual sanitising was appropriate used manual sanitisingprocesses (Figure 99).
Figure 99: All equipment sanitised manuallyQ59 Business sanitises all or some of its equipment and surfaces Manually using hot water (without
chemicals) e.g. in a sink.
Base: Manually sanitising appropriate to business = 462 (EHO)Response given but practice not observed by EHO = 28% of base
Six in ten (60%) of businesses utilising manual sanitising processes did not hold the hot water at theappropriate temperature (e.g. 77°C or above) (Figure 100). Where the correct temperature was notused, two in ten had a temperature of between 60-64 °C and one quarter less than 59 °C (Figure 101).
Figure 100: Sanitising temperature is 77°C or above
Figure 101: Record of temperature
Q60: If business manually sanitises using hot water, the temperatureof the hot water used is 77°C or above
Q61: Record the temperature of the hot water (either at the tap orin the sink as appropriate).
Base: Uses manual sanitising processes = 263 (EHO) Base: Temperature of water for manual sanitation <77°C = 159 (EHO)Response given but practice not observed by EHO = 25% of base No response = 53% of base
57%
42%
1%0%
10%20%30%40%50%60%70%80%90%
100%
Yes No Don't Know/NoAnswer
31%
60%
4%0%
10%20%30%40%50%60%70%80%90%
100%
Yes No Don't Know/NoAnswer
21%16%
10%
0%10%20%30%
40%50%60%70%
80%90%
100%
60C - 64C 55C - 59 C Less than 55C

2000/2001 National Food Safety Benchmark CR&C 0413Australia New Zealand Food Authority Page 96
Businesses less likely to have the correct temperature of water used for manual sanitising included: regional (76%) compared with metropolitan (44%); those not checking the temperature of delivered food (66%) compared to those who did
check (53%); and those without a written food safety program (63%) compared to those with a written food
safety program (43%).
8.5 General assessment
The EHO survey identified some general information about the premises of food businesses.Observations included:
whether the premises were clean and if not, the problem areas were noted; whether lighting was adequate; whether ventilation was adequate; the presence of adequate equipment for processing food; that such equipment was cleaned and sanitised before use; and the safe storage of chemicals.
Information was sought on pest control at the business. Premises were checked to establish whetherthey were free from pests. Businesses were asked whether they contracted pest control companies orhad a pest control program.
8.5.1 EquipmentOne in ten (10%) businesses that prepared and processed food did not have adequate equipment15 forthese tasks (Figure 102).
Figure 102:Adequate equipment for food preparationQ35: There is adequate equipment for preparing and processing food.
Base: Prepares and processes food = 456 (EHO)Response given but practice not observed by EHO = 3% of base
15 See Attachment 4 in Appendix C for a description of assessing adequate equipment.
89%
10%1%
0%10%20%30%40%50%60%70%80%90%
100%
Yes No Don't Know/NoAnswer

2000/2001 National Food Safety Benchmark CR&C 0413Australia New Zealand Food Authority Page 97
8.5.2 Cleaning & sanitationOver one in ten (12%) businesses where it was appropriate to clean and sanitise food contact surfacesand utensils did not do so before using the surface or utensils (Figure 103).
Figure 103:Utensils are clean & sanitisedQ77: Food contact surfaces and utensils are clean and sanitised before use.
Base: Appropriate to clean and sanitise food contact surfaces = 467 (EHO)Response given but practice not observed by EHO = 18% of base
Across all businesses, one in ten (10%) were not considered clean and well maintained (Figure 104).Overall cleanliness rated lower among:
small business (11%) compared with large (2%); medium risk (13%) compared with high risk (7%) business; and businesses that consistently used fewer cautious food handling practices such as those:
− without a temperature probe (13%);− not providing sufficient hand wash facilities (27%);− not using chemical sanitisers (16%); and− without a written food safety program (11%).
87%
12%
0%0%
10%20%30%40%50%60%70%80%90%
100%
Yes No Don't Know/NoAnswer
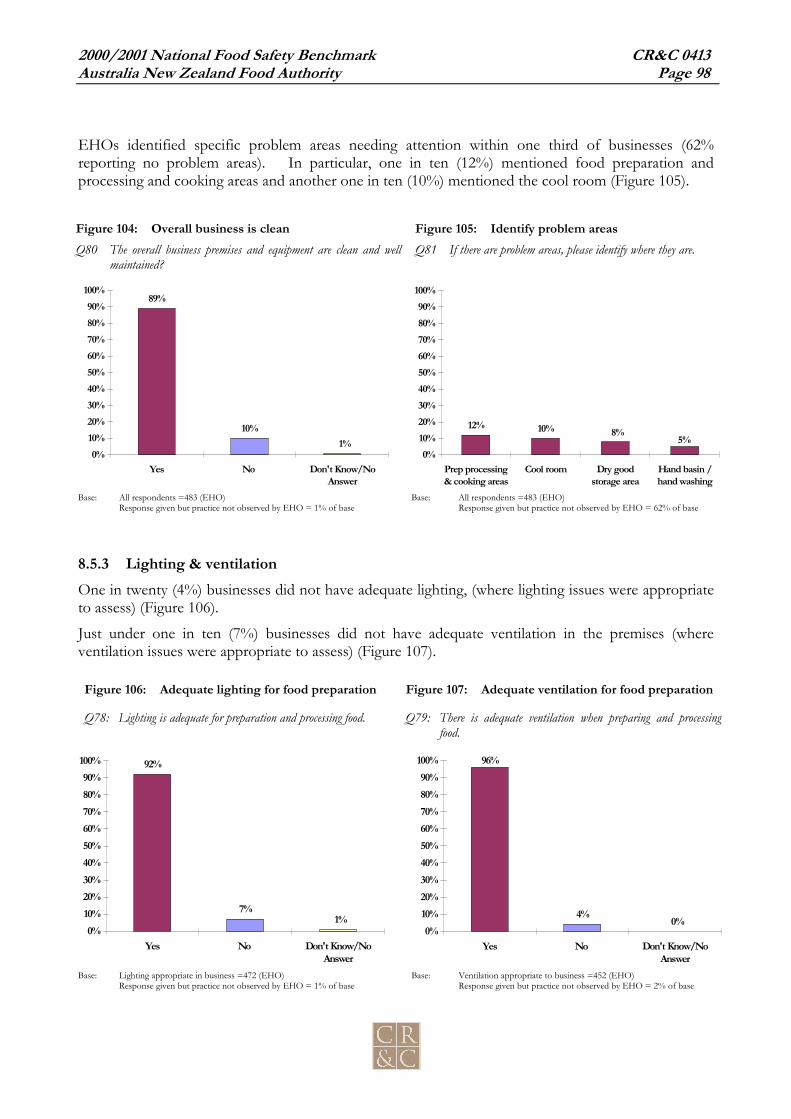
2000/2001 National Food Safety Benchmark CR&C 0413Australia New Zealand Food Authority Page 98
EHOs identified specific problem areas needing attention within one third of businesses (62%reporting no problem areas). In particular, one in ten (12%) mentioned food preparation andprocessing and cooking areas and another one in ten (10%) mentioned the cool room (Figure 105).
Figure 104: Overall business is clean Figure 105: Identify problem areasQ80 The overall business premises and equipment are clean and well
maintained?Q81 If there are problem areas, please identify where they are.
Base: All respondents =483 (EHO) Base: All respondents =483 (EHO)Response given but practice not observed by EHO = 1% of base Response given but practice not observed by EHO = 62% of base
8.5.3 Lighting & ventilationOne in twenty (4%) businesses did not have adequate lighting, (where lighting issues were appropriateto assess) (Figure 106).
Just under one in ten (7%) businesses did not have adequate ventilation in the premises (whereventilation issues were appropriate to assess) (Figure 107).
Figure 106: Adequate lighting for food preparation Figure 107: Adequate ventilation for food preparation
Q78: Lighting is adequate for preparation and processing food. Q79: There is adequate ventilation when preparing and processingfood.
Base: Lighting appropriate in business =472 (EHO) Base: Ventilation appropriate to business =452 (EHO)Response given but practice not observed by EHO = 1% of base Response given but practice not observed by EHO = 2% of base
92%
7%1%
0%10%20%30%40%50%60%70%80%90%
100%
Yes No Don't Know/NoAnswer
96%
4% 0%0%
10%20%30%40%50%60%70%80%90%
100%
Yes No Don't Know/NoAnswer
89%
10%1%
0%10%20%30%40%50%60%70%80%90%
100%
Yes No Don't Know/NoAnswer
12% 10%5%
8%
0%10%20%30%40%50%60%70%80%90%
100%
Prep processing& cooking areas
Cool room Dry goodstorage area
Hand basin /hand washing

2000/2001 National Food Safety Benchmark CR&C 0413Australia New Zealand Food Authority Page 99
8.5.4 Pest controlOne in ten (10%) food businesses showed evidence of pests (Figure 108). Where pest control wasappropriate, one quarter (24%) did not have adequate pest control measures in place (Figure 109)
Figure 108: Premises free of pests Figure 109: Has pest control
Q82: The premises is free of pests Q83: The business contracts a pest control company or has a pestcontrol program.
Base: All respondents =483 (EHO) Base: Pest control company appropriate to business =478 (EHO)Response given but practice not observed by EHO = 5% of base Response given but practice not observed by EHO = 18% of base
Businesses less likely to have pest control measures in place (if appropriate) included: small (26%) compared to large (2%); those not using chemical sanitisers (35%); those not undertaking some safe food handling practices such as:
− not checking the temperature of potentially hazardous food delivered to thebusiness (27%); and
− not having a written food safety program (26%).
74%
24%
1%0%
10%20%30%40%50%60%70%80%90%
100%
Yes No Don't Know/NoAnswer
89%
10%1%
0%10%20%30%40%50%60%70%80%90%
100%
Yes No Don't Know/NoAnswer

2000/2001 National Food Safety Benchmark CR&C 0413Australia New Zealand Food Authority Page 100
8.5.5 Chemical storageIn business where chemical use was an issue, one in twenty (6%) did not store chemicals safely (Figure110).
Figure 110: Chemicals are stored safelyQ84: Chemicals are stored safely
Base: Business stores chemicals = 476 (EHO)Response given but practice not observed by EHO = 3% of base
91%
6% 2%0%
10%20%30%40%50%60%70%80%90%
100%
Yes No Don't Know/NoAnswer

2000/2001 National Food Safety Benchmark CR&C 0413Australia New Zealand Food Authority Page 101
8.6 Food recall plans
When the Food Safety Standards come into effect in a State or Territory, business that are engaged inthe wholesale supply, manufacturing or importing of food will need to have developed plans to recallfood that has been released into the market and subsequently found to be unsafe.
These types of businesses were asked whether they had written food recall plans. No assessment ofthe adequacy of the plan was made.
Two thirds (66%) of “wholesale / manufacturing / importing” businesses did not have a written foodrecall plan (Figure 111). Businesses more likely to have a written food recall plan included:
those classified as high risk (39%) compared with medium risk (17%); and those having potentially hazardous food delivered (43%) compared to those not having
potentially hazardous food delivered (9%).
Figure 111: Wholesale/ Manufacturers/ Importers have food recall planQ86: If business is engaged in wholesale supply, manufacturing or importation of food, the
business has a written food recall plan.
Base: Wholesale/Manufacturing/Importing business 186 (EHO)Response given but practice not observed by EHO = 7% of base
In general, businesses undertaking other safe food handling precautions were more likely to have awritten food recall plan such as those with a:
temperature probe (48%) compared to those without a probe (2%); written food safety program (79%) compared to those without a program (6%); staff sickness policy (28%) compared to those without a policy (11%); and pest control program (30%) compared to those without a pest control program (12%).
Businesses more likely to have implemented other precautions to ensure safe foodhandling such as written food safety programs, staff sickness policies and pest control
programs were more likely to also have a written food recall plan.
25%
66%
10%
0%10%20%30%40%50%60%70%80%90%
100%
Yes No Don't Know/NoAnswer

2000/2001 National Food Safety Benchmark CR&C 0413Australia New Zealand Food Authority Page 102
8.7 Food safety programs
Most types of food business included in this survey are not required to have food safety programs inany of the States and Territories, except Victoria. In Victoria high risk business are required to have asafety program and it will be a requirements for all businesses (except those of minimal risk) from2002.
Businesses that use alternative temperature control systems in compliance with the temperaturecontrol requirements of Standard 3.2.2 can use a food safety program to demonstrate their system.
Businesses were asked whether they had a written food safety program. This program had to identifyfood safety hazards and ways to control and monitor these hazards. The adequacy of the program wasnot assessed.
Two in ten (19%) businesses did not have a written food safety program (Figure 112).
Businesses more likely to have a written food safety program included: high risk (32%) compared with medium risk (12%); large (54%) compared with small (15%); those based in Victoria (43%) compared with NSW (15%), Qld (14%) SA (12%) or NT
(3%);16
those supplying food to high risk groups (45%) compared to those who did not supplythese groups (14%); and
those having potentially hazardous food delivered to their business (31%) compared to nothaving potentially hazardous food delivered (10%).
Figure 112: Has written food safety programQ87: Business has a written food safety program
Base: Written food safety program applicable to business =463 (EHO)Response given but practice not observed by EHO = 5% of base
16 Victoria is the only state to require that all food businesses (except some with minimal risk) have to have written
food safety programs in place by January 2003. At the time the surveys were being undertaken many EHOs inVictoria were intending to visit businesses to assist with the implementation of the food safety programs.
19%
79%
2%0%
10%20%30%40%50%60%70%80%90%
100%
Yes No Don't Know/NoAnswer
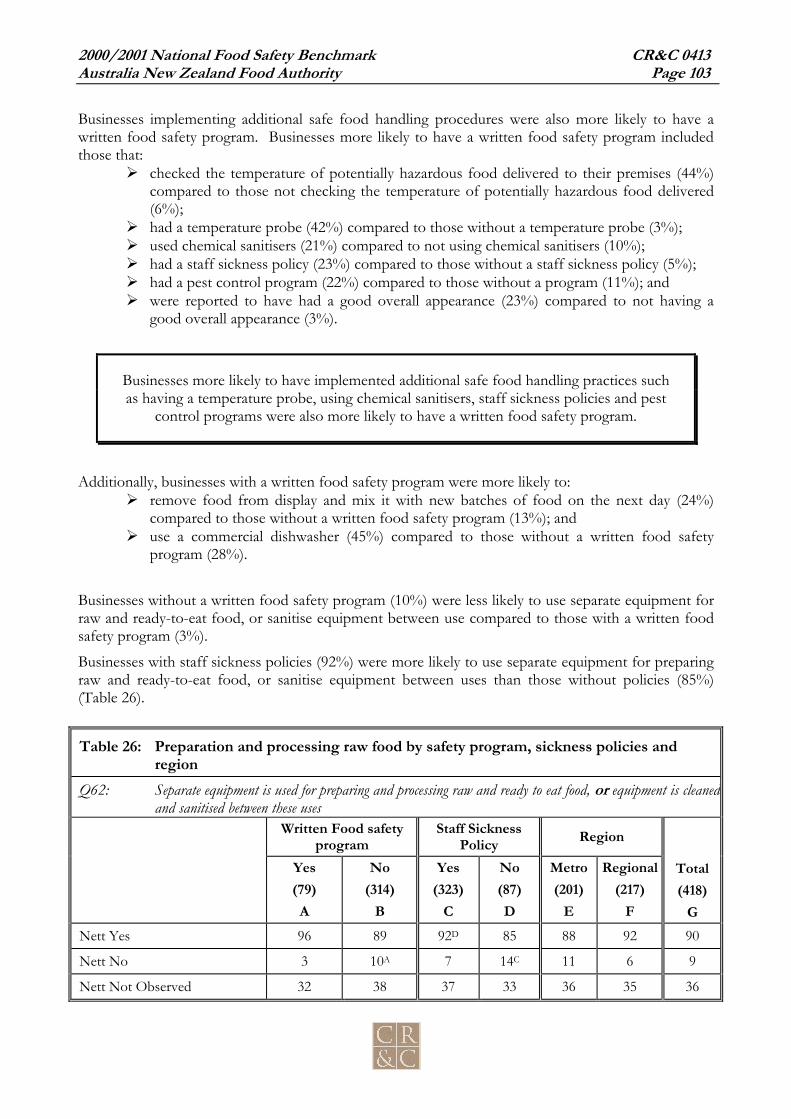
2000/2001 National Food Safety Benchmark CR&C 0413Australia New Zealand Food Authority Page 103
Businesses implementing additional safe food handling procedures were also more likely to have awritten food safety program. Businesses more likely to have a written food safety program includedthose that:
checked the temperature of potentially hazardous food delivered to their premises (44%)compared to those not checking the temperature of potentially hazardous food delivered(6%);
had a temperature probe (42%) compared to those without a temperature probe (3%); used chemical sanitisers (21%) compared to not using chemical sanitisers (10%); had a staff sickness policy (23%) compared to those without a staff sickness policy (5%); had a pest control program (22%) compared to those without a program (11%); and were reported to have had a good overall appearance (23%) compared to not having a
good overall appearance (3%).
Businesses more likely to have implemented additional safe food handling practices suchas having a temperature probe, using chemical sanitisers, staff sickness policies and pest
control programs were also more likely to have a written food safety program.
Additionally, businesses with a written food safety program were more likely to: remove food from display and mix it with new batches of food on the next day (24%)
compared to those without a written food safety program (13%); and use a commercial dishwasher (45%) compared to those without a written food safety
program (28%).
Businesses without a written food safety program (10%) were less likely to use separate equipment forraw and ready-to-eat food, or sanitise equipment between use compared to those with a written foodsafety program (3%).
Businesses with staff sickness policies (92%) were more likely to use separate equipment for preparingraw and ready-to-eat food, or sanitise equipment between uses than those without policies (85%)(Table 26).
Table 26: Preparation and processing raw food by safety program, sickness policies andregion
Q62: Separate equipment is used for preparing and processing raw and ready to eat food, or equipment is cleanedand sanitised between these uses
Written Food safetyprogram
Staff SicknessPolicy Region
Yes(79)A
No(314)
B
Yes(323)
C
No(87)D
Metro(201)
E
Regional(217)
F
Total(418)
GNett Yes 96 89 92D 85 88 92 90
Nett No 3 10A 7 14C 11 6 9
Nett Not Observed 32 38 37 33 36 35 36

2000/2001 National Food Safety Benchmark CR&C 0413Australia New Zealand Food Authority Page 104
No Answer 0 - - 0 - - -Base: Process raw and ready-to-eat food (418)

A.C.N. 073 813 144
E-mail: [email protected] 2, 45 Watkins Street, North Fitzroy PO Box 441, Clifton Hill, Victoria 3068
Telephone (03) 9482 4216 Facsimile (03) 9482 6799
Record business name: ______________________Phone number: ______________________Type of business: ______________________
INDTRODUCTION
“Good …<morning/afternoon/evening>… my nameis ………... from Campbell Research & Consulting.
We are doing a survey about food safety standards withANZFA, the Australia New Zealand Food Authority.
Can I please speak to the person who is responsible formanaging staff who handle food in the day-to-dayoperation of the business?
(For example, the OWNER/MANAGER orSUPERVISOR – in a school / college, TAFE oruniversity this may be someone in the CANTEEN orcafe.)
TO THE PERSON YOU ARE REFERRED TO SAY:
“Can I confirm that you are the person responsible formanaging staff who handle food in the day-to-dayoperation of the business? If so, what is your positionwith the business?
(Establish whether they are the owner/manager orsupervisor and if they are not, ask them who is the bestperson to speak to and how to get into contact with thisperson. PLEASE NOTE: in smaller businesses theremay not be any additional staff.)
Record title of person speaking with
_______________________________
(TRY TO GET A DIRECT TELEPHONE NUMBERIF RESPONDENT IS NOT AVAILABLE MAKE ANAPPOINTMENT TO CALL BACK.
TRY TO GET THE PERSON’S NAME ANDDIRECT TELEPHONE NUMBER.
WHEN RESPONDENT ANSWERS SAY)
“My name is ………... from Campbell Research &Consulting. We are conducting a confidential surveywith ANZFA, the Australia New Zealand FoodAuthority.
The survey is about food safety and hygiene standards inthe food industry. The information obtained through
these interviews will be used to evaluate the effectivenessof food safety and hygiene regulations and we wouldreally value your opinion.
Nothing you say in the interview will affect your businessin any way. The information you provide will bereported as a percentage only. Information aboutindividuals and businesses is removed from the data afterthis interview is complete.
(IF NECESSARY REASSURE BUSINESSOWNER/RESPONDENT THAT: The information inthis survey will NOT be used to issue an inspection onyour business.)
This survey has been approved by the Commonwealth GovernmentStatistical Clearing House. Would you like the approval number?
(If YES)
The approval number is 00611 -- 01You may phone the Statistical Clearing House to verify theapproval number. Would you like the phone number? IF YES –supply phone number (02) 6252 5285"
(IF RESPONDENT WANTS ADDITIONALINFORMATION ABOUT THE CLEARING HOUSEPROCESS)
The Statistical Clearing House disseminates information describingapproved surveys through the Commonwealth Register of Surveys ofBusinesses. This Register of Surveys is located on the Internet atwww.sch.abs.gov.au.
The interview will take no more than 12 minutes - can Iask you a few questions now?
(IF RESPONDENT HAS ANY QUESTIONS ABOUTTHE SURVEY:
Refer to Kristin Diemer at Campbell Research &Consulting on 03 9482-4216.)
(IF RESPONDENT WISHES TO SPEAK TO ANZFATO CONFIRM THE AUTHENTICITY OF THESURVEY PLEASE REFER TO:
ANZFA Janis Baines 02 6271 2234)

Food Safety CATI Survey CR&C 413ANZFA Page 2
Q0.“Q0. We are given a random list of food based
businesses and I do not have much informationabout what type of food you handle, so first ofall can I ask . . .
Does your business provide, produce,manufacture or process flavours, additives orprocessing aids for food?
(INTERVIEWER NOTE: processing aids areingredients that do not end up in the final food product)
1. Yes2. No3. DK/Not Sure
If NO (2) skip to Q1 and commence interview.If YES (1) or DK (3) go to Q0a.
Q0a.“Q0a. Does your business provide, produce,
manufacture or process any food intended forhuman consumption?
(INTERVIEWER NOTE: If business only transports orstores non-perishable items such as soft drinks, long lifemilk, dry goods that do not need to be kept cold or hotplease answer No and End interview)
1. Yes2. No3. DK/Not Sure
If NO (2) or DK (3) end interview.
“At this time we want to interview people inbusinesses who work with other types of food.Thank you very much for agreeing to participate inthe interview, but I can not include your business asthe questions will not be relevant.”
If YES (1) go to Q 1 and commence interview.
Q1A.“Q1A. How would you describe your business in your
own words?
(By that I mean, are you a butcher, bakery,seafood processor, childcare provider, servicestation, soft drink manufacturer etc.)
(INTERVIEWER NOTE: If respondent gives a simpleanswer like ‘manufacturer’ please try to get them toprovide more information.)
(Specify) ___________________
Q1B.“Q1B. Do you manufacture any products at your
business?
1. Yes2. No3. DK/Not Sure

Food Safety CATI Survey CR&C 413ANZFA Page 3
Q2.“Q2. We would like some specific information on the
foods you produce, do you provide, produce ormanufacture any of the following foods?”
(READ OUT - accept MULTIPLE response, pleaseprobe)
1. Prepared, ready –to-eat table meals (egchilled meals, restaurant meals, take-awayfoods hot pizza – any meals could behome delivered)
(IF NECESSARY SAY)
“Ready-to-eat” food are finished products and mean thatfood that is eaten in the same form it was sold, but doesnot include nuts in the shell or fruit/vegetables intendedfor further preparation by the consumer”
2. Frozen meals3. Raw meat, poultry or seafood4. Cooked /Processed meat, poultry or seafood5. Fermented or dried meat products (eg salami)6. Meat pies, sausage rolls or hot dogs7. Sandwiches or rolls8. Soft drinks/juices9. Raw fruit and vegetables10. Processed fruit and vegetables (eg fruit
salad, washed and packed lettuce, includingfrozen fruits and vegetables)
11. Confectionery12. Infant or baby foods13. Bread, pastries or cakes14. Egg or egg products15. Dairy products16. Prepared salads17. Other (Specify)18. DK/Not Sure
RANDOMFOR EACH
1. Yes2. No3. DK/Not Sure
Q3.“Q3. Can you tell me how many full-time staff you
employ for food handling / production and /or manufacturing last week?”
(Specify number) ____2. DK/Not Sure
Q4A.“Q4A. Have you also employed part-time or casual
staff for food handling / production and / ormanufacturing last week?”
1. Yes2. No3. DK/Not Sure
If NO (2) or DK (3) skip to Q5
Q4B.“Q4B. Can you estimate the number of hours in total
that your part-time or casual staff worked lastweek?”
(IF NECESSARY SAY)
“Well, what’s your best guess?”
(INTERVIEWER NOTE: Specify total number of part-time and casual hours together – add them together)
Total part-time and casual hours paid last week______ hours
2. DK/Not Sure / unable to calculate
Q5.“Q5. Do you process, prepare or cook the food that
you sell, distribute or transport?
(IF NECESSARY SAY)
By that I mean, do you prepare food for sale bychopping, cooking, drying, fermenting, heating,pasteurising or any combination?”
1. Yes2. No3. DK/Not Sure
Q6.“Q6. Do you directly supply or manufacture food for
the following organisations?
(INTERVIEWER NOTE: Businesses that would servethe general public, as well as these types of people as partof their everyday trade should not be included- eg asupermarket.)
(READ OUT - accept MULTIPLE response, pleaseprobe)
1. Hospitals, or other sites where sick or frailpeople reside

Food Safety CATI Survey CR&C 413ANZFA Page 4
2. Nursing homes, hostels or otherorganisations serving elderly people
3. Organisations serving pregnant women4. Child care centres or other organisations
serving Children under 5 years old5. DK/Not Sure6. No / none– not applicable
Ask Q7A & Q7B only if answered YES (1) to Q1BOthers skip to Q8A.
Q7A.“Q7A. Do you manufacture or produce products that
are not shelf stable?
(IF NECESSARY SAY)
By that I mean, products that are perishable andhave a short shelf life of only a few hours, daysor weeks.”
1. Yes2. No3. DK/Not Sure
Q7B.“Q7B. Do you manufacture or produce uncooked,
fermented, chopped meat products such assalami?”
(Interviewer notes IF NECESSARY:
These products may include Cacciatora,Calabrese, Casalingo, Felino, Mettwurst,Milano, Pepperoni, Salami, Spanish Chorizo,Toscano, Trevisan and Veneto. However,check whether any of the products beingproduced are uncooked products. If thebusiness only manufactures ‘heat treated’ or‘cooked’ products, then answer ‘no’ to thisquestion.
A product has been ‘heat treated’ if its coretemperature has been maintained at 55°C for aperiod of at least 20 minutes, or an equivalenttime and temperature.
A product has been ‘cooked’ if its coretemperature has been maintained at 65°C for aperiod of at least 10 minutes, or an equivalenttime and temperature.)
1. Yes2. No3. DK/Not Sure
Q8A.“Q8A. Is your business involved in catering?”
1. Yes2. No3. DK/Not Sure
IF NO (2), skip to Q9A
Q8B.“Q8B. Do you provide ready to eat food off-site from
where you prepare it?”
(IF NECESSARY REPEAT)
“Ready-to-eat” food means food that is eaten inthe same form it was sold, but does not includenuts in the shell or fruit/vegetables intended forfurther preparation by the consumer.
1. Yes2. No3. DK/Not Sure
The next few questions are about controlling thetemperature of food.
Q9A.“Q9A. Do you have foods delivered to your business
that have to be kept chilled or hot?”
1. Yes2. No3. DK/Not Sure
IF No (2) or DK (3) skip to Q10A
Q9B.“Q9B. How often would you check the temperature of
foods delivered? Would you check them . . ?
(READ OUT, accept ONE response)
1. Never2. Occasionally3. Regularly, but not every delivery4. Always5. Only foods that need to be kept at specific
temperatures (eg cold or hot food)6. DK/Not Sure
If NEVER (1) skip to Q10A others go to Q9C

Food Safety CATI Survey CR&C 413ANZFA Page 5
Q9C. “Q9C. How do you check the temperature of the
food?
(DO NOT READ OUT - accept MULTIPLE response,please probe – any other ways?)
1. By touch2. By appearance – looking at it3. Using a thermometer4. Temperature gauge in the delivery vehicle5. Other please specify
Q9D“Q9D. Which type of foods would you check the
temperature of when delivered?
(READ OUT - accept MULTIPLE response, pleaseprobe)
1. Fresh food2. Frozen food3. Hot food4. Chilled food5. Dry foods6. All food7. Other please specify
RANDOM
Q9E.“Q9E. Do you have a temperature probe? That is, a
thermometer that can be inserted into food tomeasure its temperature?
(DO NOT READ OUT, accept ONE response)
1. Yes2. No3. Not necessary for the type of food we receive4. DK/Not Sure
Q10A. “Q10A. Do you store chilled food at your business?”
1. Yes2. No3. DK/Not Sure
If NO (2) Skip to Q 11A
Q10B.“Q10B. What temperature should chilled food be stored
at?”
(Specify) ____ Celsius/Centigrade
OR, if necessary
(Specify) ____ Fahrenheit
2. DK/Not Sure3. Not applicable, do not have chilled food on
site
Q11A.“Q11A. Do you hold cooked food in a bain marie unit
(or something similar to keep food hot)?”
1. Yes2. No3. DK/Not Sure
If NO (2) Skip to Q 12A
Q11B.“Q11B. What temperature should cooked food be held in
a bain marie unit (or something similar to keepfood hot)?
(IF NECESSARY: “What is your best guess?”)
(Specify) ____ Celsius/Centigrade
OR, if necessary
(Specify) ____ Fahrenheit
2. DK/Not Sure3. Not applicable, DK, do not have cooked
food on site
Q12A.“Q12A. Do you cook food and then cool it for later
use?”
1. Yes2. No3. DK/Not Sure
If NO (2), Skip to Q 13

Food Safety CATI Survey CR&C 413ANZFA Page 6
Q12B“Q12B. Thinking about cooling or chilling hot/cooked
food, can you tell me whether each of thefollowing statements are true or false?”
(INTERVIEWER NOTE: Do not force a response,however do not encourage DK/not sure unlessrespondent is really unsure.)
1. Cooked food must be cooled from 60° to 21°Celsius within two hours
2. Cooked food must be cooled from 60° to 21°Celsius within four hours
3. Cooked food must be cooled from 21° to 5°Celsius within six hours
4. Cooked food must be cooled from 21° to 5°Celsius within four hours
5. Large amounts of cooked food should beplaced in small containers and put in acool room or refrigerator for cooling
RANDOMFOR EACH
1. True2. False3. DK/Not Sure
Ask Q13 if answer (1) in Q2 AND YES (1) in Q11aOR Q12aOthers skip to Q14.
Q13.“Q13. How long can potentially hazardous food that is
meant to be served hot be left at roomtemperature and still be safe? For example,how long can you safely leave lasagna or cookedrice at room temperature?”
(NOTE: Potentially hazardous foods include:cooked meat, fish egg or chicken and otherpoultry, desserts with dairy or egg ingredients,pasta salads and other prepared salads)
(DO NOT READ OUT - accept ONE response only,take highest time specified)
1. Less than 1 hour2. Between 1 to 2 hours3. Between 2 to 4 hours4. Between 4 to 6 hours5. Longer than 6 hours6. DK/Not Sure
Ask Q14 if answer 1 in Q2.Others skip to Q15.
Q14“Q14. Which of the following foods need to be kept
refrigerated to ensure they remain safe.”
(READ OUT, accept MULITPLE responses)
1. Cooked rice2. Salami3. Lasagne4. Egg sandwich5. Peanut butter6. Beef curry7. Cheddar cheese
RANDOM
The next few questions are about cleaning andsanitation.
Q15.“15. When washing containers and utensils used for
food preparation or eating, do you use adishwasher, do you hand wash, or both?”
(INTERVIEWER PLEASE NOTE: Thisquestion is about equipment that can be pickedup and moved for cleaning. If business onlycleans large vats or large equipment in its ownplace then specify in Not applicable)
(ACCEPT MULTIPLE RESPONSES)
1. Dishwasher2. Hand washing3. Not applicable please specify reason (eg No
dishes or equipment used / manufacturercleans large equipment in place)
4. DK/Not Sure
If HANDWASHING ONLY (2) skip to Q17If NOT APPLICABLE (3) skip to Q19If DISHWASHER (1) only, or DISHWASHER (1)AND HAND WASHING (2) go to Q16

Food Safety CATI Survey CR&C 413ANZFA Page 7
Q16.“16. What is the temperature of the final rinse in
your dishwasher?”
(READ OUT - accept ONE response only)
1. 50-60° Celsius2. 60-70° Celsius3. 70-80° Celsius4. Over 80° Celsius5. Other (Specify)6. DK/Not Sure
IF business washes dishes by HAND (2 In Q15)then ask Q17, otherwise skip to Q18
Q17.“17. When hand washing, what temperature of hot
water will kill bacteria on food preparationutensils?”
(READ OUT - accept ONE response only)
1. 50-60° Celsius2. 60-70° Celsius3. 70-80° Celsius4. Over 80° Celsius5. Other (Specify)6. DK/Not Sure
Ask Q18 if answer 1 in Q2.Others skip to Q19.
Q18.“18. Do you use a chemical sanitiser for washing
cups, plates and eating utensils?”
1. Always2. Sometimes3. Never4. DK/Not Sure5. Not applicable
Q19“Q19. Please answer true or false, to the following.
Although some of these statements may not beapplicable to your business, please answer asbest you can.”
(INTERVIEWER NOTE: Do not force a response,however do not encourage DK/not sure unlessrespondent is really unsure.)
1. All chemical sanitisers should be mixed withhot water.
2. Detergent kills micro-organisms.3. A dirty chopping board must be washed
before being sanitised.
RANDOMFOR EACH
1. True2. False3. DK/Not Sure4. Not applicable
The next few questions are about foodcontamination and personal hygiene.
Q20“20. Do employees wear gloves when handling food?
1. Yes2. No3. DK/Not Sure4. Not applicable for food business

Food Safety CATI Survey CR&C 413ANZFA Page 8
I am going to read a few statements and ask you totell me if they are true or false. Most of thesequestions are general food handling questions butsome may not be directly relevant to your business.
(INTERVIEWER NOTE: Do not force a response,however do not encourage DK/not sure unlessrespondent is really unsure.)
Q21A“21A. Please answer True / False to the following.”
1. The same gloves can be used to unpack rawvegetables and to slice cold meat.
2. The same gloves can be used to clean andwipe tables as well as unstacking thedishwasher.
3. The same equipment can be used to prepareraw meat and raw vegetables that are goingto be cooked together.
4. Thinking about storing vegetables in the coolroom, raw vegetables can be stored aboveuncovered cooked food
5 A knife can be cleaned by wiping with a dampsponge.
6. It is safe for food handlers to directly touchbread.
7. It is safe for food handlers to directly touchham.
RANDOMFOR EACH
1. True2. False3. DK/Not Sure4. Not applicable for this business
Q22“22. If you have an employee with diarrhoea, which
of the following tasks should they avoid?
(READ OUT - accept MULTIPLE responses)
1. Serving food2. Handling unpackaged food directly3. Setting tables4. DK/Not Sure5. Not applicable for this business6. Other specify (eg “would not come to work”)
RANDOM
Q23.“23. The last few questions ask how you keep up-to-
date about food safety issues.
If you need information about food safety orhygiene, who would you contact?”
(DO NOT READ - RECORD FIRST MENTIONED,THEN PROBE – Any one else?)
1. Local council2. Industry association (eg food retailers
association, restaurant & caterersassociation)
3. Chemical company supplying cleaningproducts
4. Another supplier5. Government health department in your state
or territory6. Other (Specify)7. DK/Not Sure
Q24.“24. How well informed do you feel about the
current regulations about food safety?
(READ OUT - accept ONE response only)
1. Not at all informed2. Informed a little3. Informed4. Well informed5. Very well informed6. DK/Not Sure

Food Safety CATI Survey CR&C 413ANZFA Page 9
Q25.“25. Are you aware that the government is bringing
in a new set of national food safety standardsfrom February 2001?”
(INTERVIEWER NOTE: they will not be required inall states at the same time)
1. Yes2. No3. DK/Not Sure
Q26.“Q26. Do you find it easy to locate food safety
information?”
1. Yes2. No3. Never Looked For It4. DK/Not Sure
Q27A.“27A. Can you tell me where you find the most useful
information about food safety issues at theworkplace?”
(DO NOT READ - RECORD FIRST MENTIONED,THEN PROBE – Anywhere else)
1. Health inspector / food safety inspector2. Suppliers of food equipment / materials3. Government department4. The Internet (probe which sites do they look
at – eg government sites?)5. ANZFA (Australian New Zealand Food
Authority)6. Food safety regulation documents7. Food safety brochures8. Food safety posters9. Industry associations (eg food retailers
association, restaurant & caterersassociation)
10. Employer associations11. Other people in the industry12. Trade magazines / journals13. Training courses14. Seminars15. TV/Media advertising16. Other (Specify)17. None / No Other18. DK/Not Sure
Q28A.“Q28A. Do you provide staff training on handling food
safely?”
1. Yes2. No
If YES (1) go to Q28BIf NO (2) skip to Q29

Food Safety CATI Survey CR&C 413ANZFA Page 10
Q28B.“28B. If yes, what kind of training?
(DO NOT READ - RECORD FIRST MENTIONED,THEN PROBE - Anything else)
1. Staff training programs (external to theworkplace)
2. Induction or training programs at theworkplace
3. Health inspectors / Food safety inspectors4. Food safety manager at the workplace5. Circulating food safety regulation documents6. Circulating, brochures, pamphlets, putting up
posters7. Trade magazines / journals8. Other (Specify)9. None / No Other10. DK/Not Sure11. Not applicable – no other employees
Q29.
Record Gender
This is the end of the interview, before I finish wouldyou like to give us any feedback on this survey or makeany comments on the questions that were asked?
END INTERVIEWThank you for your time. Just in case you missed it, myname is < … > from Campbell Research & Consulting.
If my supervisor would like to call you over the nextcouple of days to make sure you are happy with the waythe interview was conducted, could I record your firstname?
f:\jobs\413 food handling\questionnaires\cati questionnaire\413 catiquestionnaire final .doc
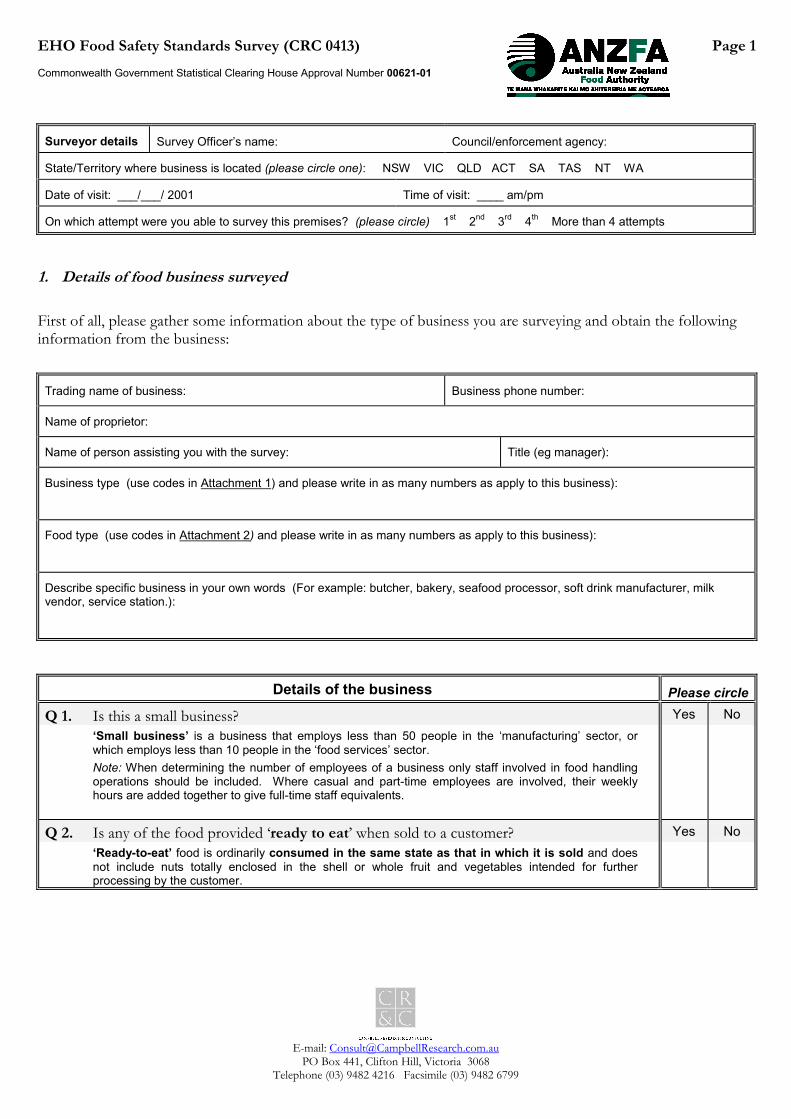
EHO Food Safety Standards Survey (CRC 0413) Page 1Commonwealth Government Statistical Clearing House Approval Number 00621-01
E-mail: [email protected] Box 441, Clifton Hill, Victoria 3068
Telephone (03) 9482 4216 Facsimile (03) 9482 6799
Surveyor details Survey Officer’s name: Council/enforcement agency:
State/Territory where business is located (please circle one): NSW VIC QLD ACT SA TAS NT WA
Date of visit: ___/___/ 2001 Time of visit: ____ am/pm
On which attempt were you able to survey this premises? (please circle) 1st 2nd 3rd 4th More than 4 attempts
1. Details of food business surveyed
First of all, please gather some information about the type of business you are surveying and obtain the followinginformation from the business:
Trading name of business: Business phone number:
Name of proprietor:
Name of person assisting you with the survey: Title (eg manager):
Business type (use codes in Attachment 1) and please write in as many numbers as apply to this business):
Food type (use codes in Attachment 2) and please write in as many numbers as apply to this business):
Describe specific business in your own words (For example: butcher, bakery, seafood processor, soft drink manufacturer, milkvendor, service station.):
Details of the business Please circle
Q 1. Is this a small business? Yes No‘Small business’ is a business that employs less than 50 people in the ‘manufacturing’ sector, orwhich employs less than 10 people in the ‘food services’ sector.Note: When determining the number of employees of a business only staff involved in food handlingoperations should be included. Where casual and part-time employees are involved, their weeklyhours are added together to give full-time staff equivalents.
Q 2. Is any of the food provided ‘ready to eat’ when sold to a customer? Yes No‘Ready-to-eat’ food is ordinarily consumed in the same state as that in which it is sold and doesnot include nuts totally enclosed in the shell or whole fruit and vegetables intended for furtherprocessing by the customer.
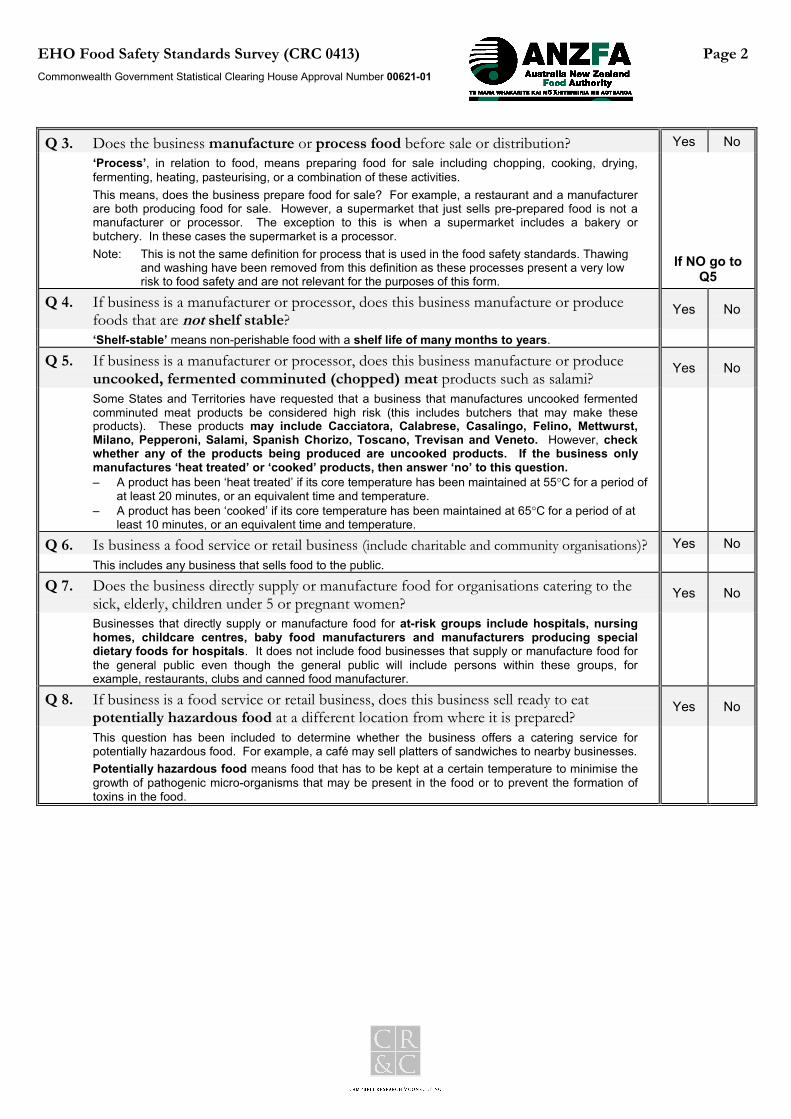
EHO Food Safety Standards Survey (CRC 0413) Page 2Commonwealth Government Statistical Clearing House Approval Number 00621-01
Q 3. Does the business manufacture or process food before sale or distribution? Yes No‘Process’, in relation to food, means preparing food for sale including chopping, cooking, drying,fermenting, heating, pasteurising, or a combination of these activities.This means, does the business prepare food for sale? For example, a restaurant and a manufacturerare both producing food for sale. However, a supermarket that just sells pre-prepared food is not amanufacturer or processor. The exception to this is when a supermarket includes a bakery orbutchery. In these cases the supermarket is a processor.Note: This is not the same definition for process that is used in the food safety standards. Thawing
and washing have been removed from this definition as these processes present a very low risk to food safety and are not relevant for the purposes of this form.
If NO go toQ5
Q 4. If business is a manufacturer or processor, does this business manufacture or producefoods that are not shelf stable?
Yes No
‘Shelf-stable’ means non-perishable food with a shelf life of many months to years.
Q 5. If business is a manufacturer or processor, does this business manufacture or produceuncooked, fermented comminuted (chopped) meat products such as salami?
Yes No
Some States and Territories have requested that a business that manufactures uncooked fermentedcomminuted meat products be considered high risk (this includes butchers that may make theseproducts). These products may include Cacciatora, Calabrese, Casalingo, Felino, Mettwurst,Milano, Pepperoni, Salami, Spanish Chorizo, Toscano, Trevisan and Veneto. However, checkwhether any of the products being produced are uncooked products. If the business onlymanufactures ‘heat treated’ or ‘cooked’ products, then answer ‘no’ to this question.– A product has been ‘heat treated’ if its core temperature has been maintained at 55°C for a period of
at least 20 minutes, or an equivalent time and temperature.– A product has been ‘cooked’ if its core temperature has been maintained at 65°C for a period of at
least 10 minutes, or an equivalent time and temperature.
Q 6. Is business a food service or retail business (include charitable and community organisations)? Yes NoThis includes any business that sells food to the public.
Q 7. Does the business directly supply or manufacture food for organisations catering to thesick, elderly, children under 5 or pregnant women?
Yes No
Businesses that directly supply or manufacture food for at-risk groups include hospitals, nursinghomes, childcare centres, baby food manufacturers and manufacturers producing specialdietary foods for hospitals. It does not include food businesses that supply or manufacture food forthe general public even though the general public will include persons within these groups, forexample, restaurants, clubs and canned food manufacturer.
Q 8. If business is a food service or retail business, does this business sell ready to eatpotentially hazardous food at a different location from where it is prepared?
Yes No
This question has been included to determine whether the business offers a catering service forpotentially hazardous food. For example, a café may sell platters of sandwiches to nearby businesses.Potentially hazardous food means food that has to be kept at a certain temperature to minimise thegrowth of pathogenic micro-organisms that may be present in the food or to prevent the formation oftoxins in the food.

EHO Food Safety Standards Survey (CRC 0413) Page 3Commonwealth Government Statistical Clearing House Approval Number 00621-01
2. Observations of food handling processes
The second section of the survey asks specific questions about food safety standards. Many of the questions over the nextfew pages also include explanations of what you should look for, or how to measure the issues in the question. Additionalinformation is included in the Appendices we have provided to you in a separate document.
For each question below, please observe the food business and record your observations of the food safety issues listed below.In some instances you will need to ask questions of someone at the food business, but for the most part we would like you torespond based on what you observe or measure.
Record your observations by CLEARLY circling the response in the appropriate column of the table for each question:− YES: agree with statement− NO: do not agree with statement− Not obs: element was not observed during visit− NA: element does not apply to the business
Note: If you have not observed a process please ask questions of an appropriate person in the business to be ableto respond to the question and ALSO circle “Not obs” as well as either “Yes” or “No”
Question and explanatory notes Please circle
Receiving foodQ 9. Food is delivered to the premises outside of business hours? Yes No Not obs N.A.
This question has been included to determine whether food is delivered whenthe business is closed.
Q 10. A member of staff checks that potentially hazardous food isreceived at the correct temperature at the time of delivery.
Yes No Not obs N.A.
Potentially hazardous food must be delivered at or below 5°C or, at or above60°C. Determine whether the temperature of potentially hazardous food ischecked with a thermometer when the food is delivered. If NO continue, YES/N.A. go to Q12
Q 11. Does the business have an alternative system for ensuring thatpotentially hazardous food is received at a temperature that will notadversely affect the business being able to use the food safely?
Yes No Not obs N.A.
If the business does not measure the temperature of the food it may haveanother way of ensuring that the food is delivered at or below 5°C, or at or above60°C. Alternatively it may accept food that is between 5°C and 60°C if satisfiedby the transport business delivering the food that the time the food has been atthis temperature will not affect its safety. If YES continue, NO/N.A. go to Q12
Q 11.a Does the business document that its alternative system is effective,in place and working?
Yes No Not obs N.A.
The system needs to be documented (it may be part of a food safety program).Ideally the two businesses should have previously determined acceptablearrangements for food delivery, (eg If transport times are documented as beingless than 2 hours, the correct temperatures could be safely deviated from). SeeAttachment 3 for information on the use of time as a control for potentiallyhazardous food.
Q 12. The business checks that potentially hazardous food that is intendedto be frozen upon delivery, is frozen when accepted.
Yes No Not obs N.A.
Determine whether the business assesses whether frozen potentially hazardousfood is being delivered frozen. This need not require the business to take atemperature. This could be assessed physically by handling or inspecting thefood to determine whether the food is frozen.
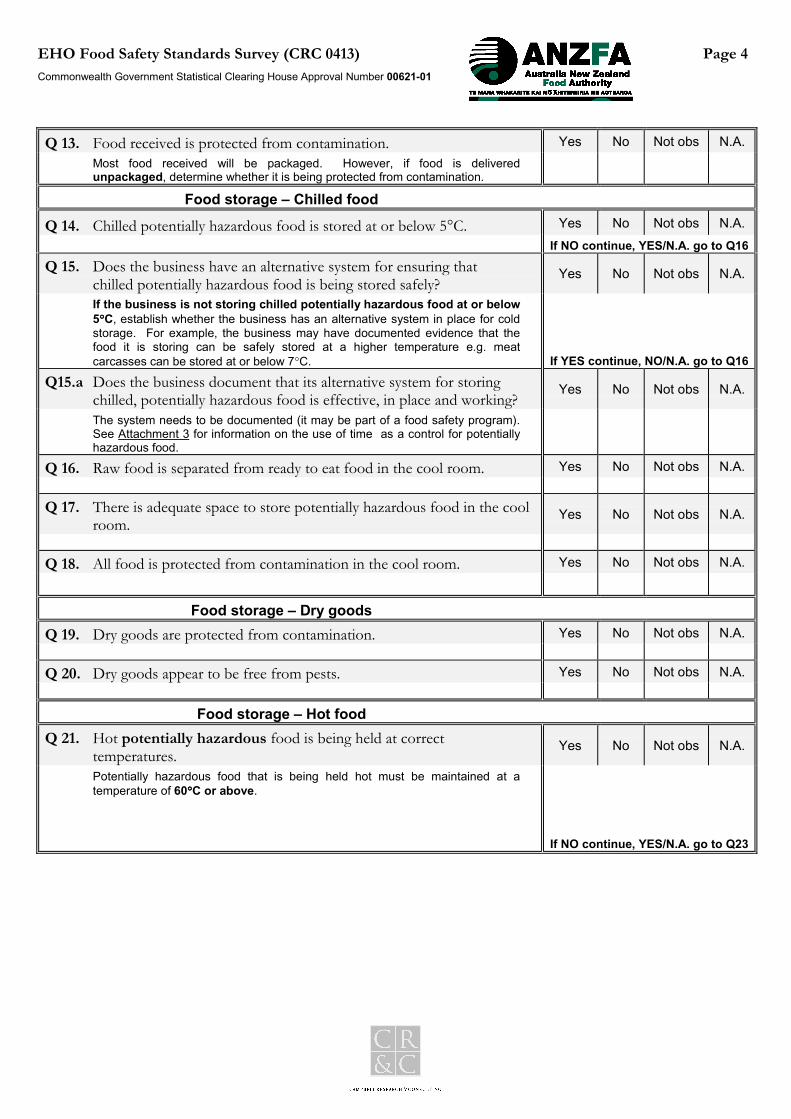
EHO Food Safety Standards Survey (CRC 0413) Page 4Commonwealth Government Statistical Clearing House Approval Number 00621-01
Q 13. Food received is protected from contamination. Yes No Not obs N.A.Most food received will be packaged. However, if food is deliveredunpackaged, determine whether it is being protected from contamination.
Food storage – Chilled food
Q 14. Chilled potentially hazardous food is stored at or below 5°C. Yes No Not obs N.A.If NO continue, YES/N.A. go to Q16
Q 15. Does the business have an alternative system for ensuring thatchilled potentially hazardous food is being stored safely?
Yes No Not obs N.A.
If the business is not storing chilled potentially hazardous food at or below5°°°°C, establish whether the business has an alternative system in place for coldstorage. For example, the business may have documented evidence that thefood it is storing can be safely stored at a higher temperature e.g. meatcarcasses can be stored at or below 7°C. If YES continue, NO/N.A. go to Q16
Q15.a Does the business document that its alternative system for storingchilled, potentially hazardous food is effective, in place and working?
Yes No Not obs N.A.
The system needs to be documented (it may be part of a food safety program).See Attachment 3 for information on the use of time as a control for potentiallyhazardous food.
Q 16. Raw food is separated from ready to eat food in the cool room. Yes No Not obs N.A.
Q 17. There is adequate space to store potentially hazardous food in the coolroom.
Yes No Not obs N.A.
Q 18. All food is protected from contamination in the cool room. Yes No Not obs N.A.
Food storage – Dry goodsQ 19. Dry goods are protected from contamination. Yes No Not obs N.A.
Q 20. Dry goods appear to be free from pests. Yes No Not obs N.A.
Food storage – Hot foodQ 21. Hot potentially hazardous food is being held at correct
temperatures.Yes No Not obs N.A.
Potentially hazardous food that is being held hot must be maintained at atemperature of 60°°°°C or above.
If NO continue, YES/N.A. go to Q23
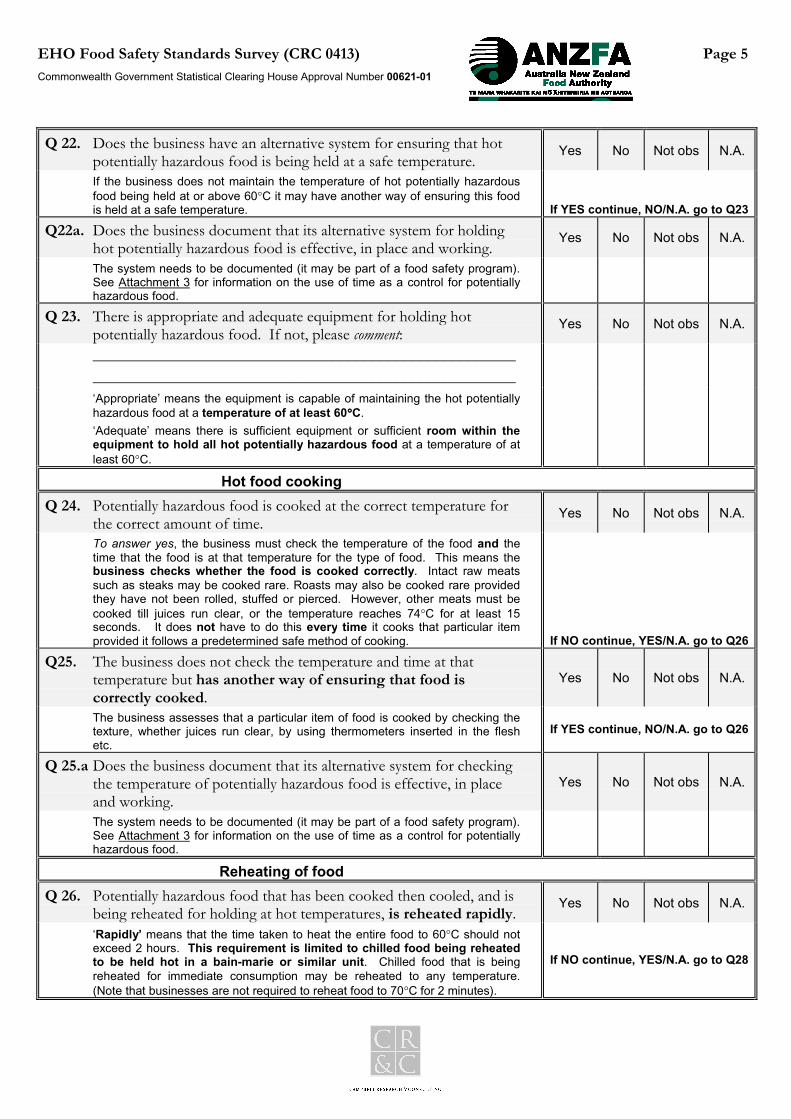
EHO Food Safety Standards Survey (CRC 0413) Page 5Commonwealth Government Statistical Clearing House Approval Number 00621-01
Q 22. Does the business have an alternative system for ensuring that hotpotentially hazardous food is being held at a safe temperature.
Yes No Not obs N.A.
If the business does not maintain the temperature of hot potentially hazardousfood being held at or above 60°C it may have another way of ensuring this foodis held at a safe temperature. If YES continue, NO/N.A. go to Q23
Q22a. Does the business document that its alternative system for holdinghot potentially hazardous food is effective, in place and working.
Yes No Not obs N.A.
The system needs to be documented (it may be part of a food safety program).See Attachment 3 for information on the use of time as a control for potentiallyhazardous food.
Q 23. There is appropriate and adequate equipment for holding hotpotentially hazardous food. If not, please comment:
Yes No Not obs N.A.
__________________________________________________________________________________________________________‘Appropriate’ means the equipment is capable of maintaining the hot potentiallyhazardous food at a temperature of at least 60°°°°C.‘Adequate’ means there is sufficient equipment or sufficient room within theequipment to hold all hot potentially hazardous food at a temperature of atleast 60°C.
Hot food cookingQ 24. Potentially hazardous food is cooked at the correct temperature for
the correct amount of time.Yes No Not obs N.A.
To answer yes, the business must check the temperature of the food and thetime that the food is at that temperature for the type of food. This means thebusiness checks whether the food is cooked correctly. Intact raw meatssuch as steaks may be cooked rare. Roasts may also be cooked rare providedthey have not been rolled, stuffed or pierced. However, other meats must becooked till juices run clear, or the temperature reaches 74°C for at least 15seconds. It does not have to do this every time it cooks that particular itemprovided it follows a predetermined safe method of cooking. If NO continue, YES/N.A. go to Q26
Q25. The business does not check the temperature and time at thattemperature but has another way of ensuring that food iscorrectly cooked.
Yes No Not obs N.A.
The business assesses that a particular item of food is cooked by checking thetexture, whether juices run clear, by using thermometers inserted in the fleshetc.
If YES continue, NO/N.A. go to Q26
Q 25.a Does the business document that its alternative system for checkingthe temperature of potentially hazardous food is effective, in placeand working.
Yes No Not obs N.A.
The system needs to be documented (it may be part of a food safety program).See Attachment 3 for information on the use of time as a control for potentiallyhazardous food.
Reheating of foodQ 26. Potentially hazardous food that has been cooked then cooled, and is
being reheated for holding at hot temperatures, is reheated rapidly.Yes No Not obs N.A.
‘Rapidly’ means that the time taken to heat the entire food to 60°C should notexceed 2 hours. This requirement is limited to chilled food being reheatedto be held hot in a bain-marie or similar unit. Chilled food that is beingreheated for immediate consumption may be reheated to any temperature.(Note that businesses are not required to reheat food to 70°C for 2 minutes).
If NO continue, YES/N.A. go to Q28
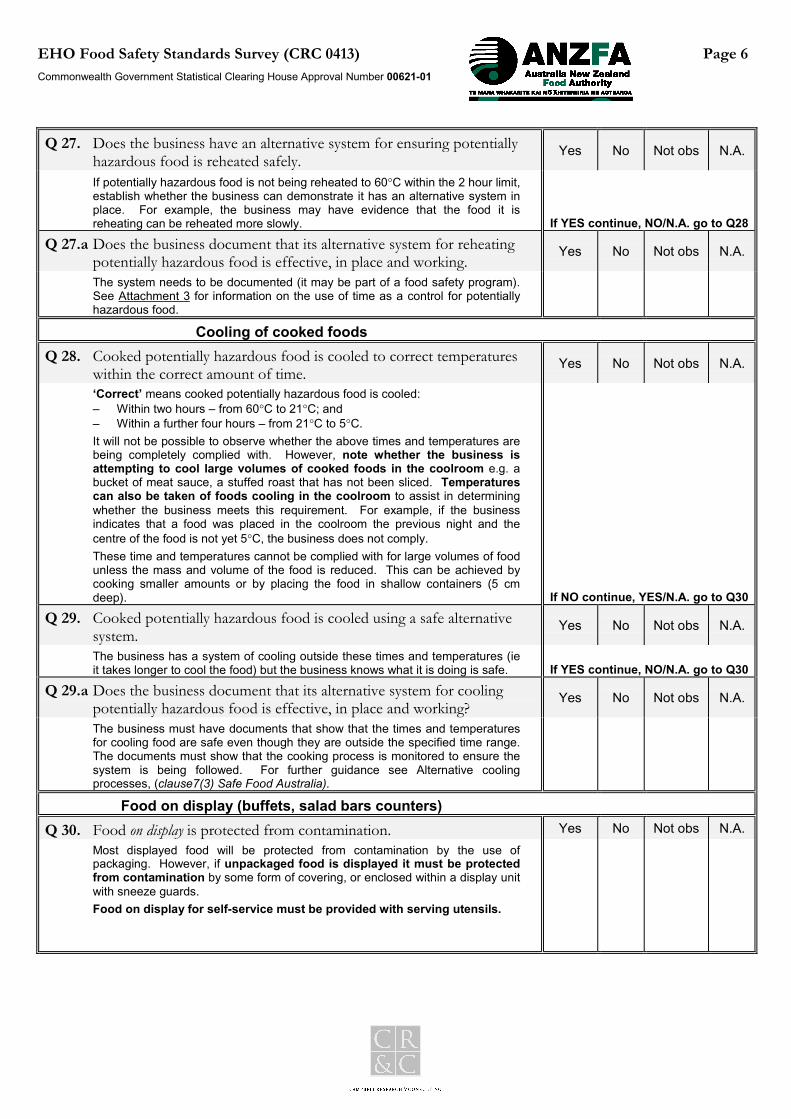
EHO Food Safety Standards Survey (CRC 0413) Page 6Commonwealth Government Statistical Clearing House Approval Number 00621-01
Q 27. Does the business have an alternative system for ensuring potentiallyhazardous food is reheated safely.
Yes No Not obs N.A.
If potentially hazardous food is not being reheated to 60°C within the 2 hour limit,establish whether the business can demonstrate it has an alternative system inplace. For example, the business may have evidence that the food it isreheating can be reheated more slowly. If YES continue, NO/N.A. go to Q28
Q 27.a Does the business document that its alternative system for reheatingpotentially hazardous food is effective, in place and working.
Yes No Not obs N.A.
The system needs to be documented (it may be part of a food safety program).See Attachment 3 for information on the use of time as a control for potentiallyhazardous food.
Cooling of cooked foodsQ 28. Cooked potentially hazardous food is cooled to correct temperatures
within the correct amount of time.Yes No Not obs N.A.
‘Correct’ means cooked potentially hazardous food is cooled:– Within two hours – from 60°C to 21°C; and– Within a further four hours – from 21°C to 5°C.It will not be possible to observe whether the above times and temperatures arebeing completely complied with. However, note whether the business isattempting to cool large volumes of cooked foods in the coolroom e.g. abucket of meat sauce, a stuffed roast that has not been sliced. Temperaturescan also be taken of foods cooling in the coolroom to assist in determiningwhether the business meets this requirement. For example, if the businessindicates that a food was placed in the coolroom the previous night and thecentre of the food is not yet 5°C, the business does not comply.These time and temperatures cannot be complied with for large volumes of foodunless the mass and volume of the food is reduced. This can be achieved bycooking smaller amounts or by placing the food in shallow containers (5 cmdeep). If NO continue, YES/N.A. go to Q30
Q 29. Cooked potentially hazardous food is cooled using a safe alternativesystem.
Yes No Not obs N.A.
The business has a system of cooling outside these times and temperatures (ieit takes longer to cool the food) but the business knows what it is doing is safe. If YES continue, NO/N.A. go to Q30
Q 29.a Does the business document that its alternative system for coolingpotentially hazardous food is effective, in place and working?
Yes No Not obs N.A.
The business must have documents that show that the times and temperaturesfor cooling food are safe even though they are outside the specified time range.The documents must show that the cooking process is monitored to ensure thesystem is being followed. For further guidance see Alternative coolingprocesses, (clause7(3) Safe Food Australia).
Food on display (buffets, salad bars counters)Q 30. Food on display is protected from contamination. Yes No Not obs N.A.
Most displayed food will be protected from contamination by the use ofpackaging. However, if unpackaged food is displayed it must be protectedfrom contamination by some form of covering, or enclosed within a display unitwith sneeze guards.Food on display for self-service must be provided with serving utensils.

EHO Food Safety Standards Survey (CRC 0413) Page 7Commonwealth Government Statistical Clearing House Approval Number 00621-01
Q 31. Displayed ready-to-eat food intended for self service is supervised bystaff.
Yes No Not obs N.A.
Ready-to-eat food that is intended for self-service must be supervised when it isin use. The supervision must be of a level that ensures that if a customercontaminates food or is likely to have contaminated it, the business isaware of this and can remove the food from display. This includes saladbars and self service displays of confectionery, bread, nuts and dried fruit.
Q 32. Potentially hazardous food on display is held at the correcttemperature.
Yes No Not obs N.A.
Potentially hazardous food must be displayed either at or below 5°C or at orabove 60°C. If NO continue, YES/N.A. go to Q34
Q 33 Does the business have an alternative system for ensuring potentiallyhazardous food is displayed safely.
Yes No Not obs N.A.
If potentially hazardous food is not being displayed at correcttemperatures, establish whether the business has an alternative system inplace. For example, the business may be using time as a control instead oftemperature e.g. meat filled sandwiches are displayed at ambient temperaturesover the luncheon period and stickers on the sandwiches or trays indicate howlong the sandwiches have been outside of refrigeration. See Attachment 3 forinformation on the use of time as a control for potentially hazardous food. If YES continue, NO/N.A. go to Q34
Q 33.a Does the business document that its alternative system for displayingpotentially hazardous food is effective, in place and working.
Yes No Not obs N.A.
The system needs to be documented (it may be part of a food safety program).See Attachment 3 for information on the use of time as a control for potentiallyhazardous food.
Q 34. Is food removed from display mixed with new batches of food fordisplay on the next day?
Yes No Not obs N.A.
To protect fresh batches of food from contamination, leftover food should notbe mixed with a new batch of food.
Adequate equipmentQ 35. There is adequate equipment for preparing and processing food. If
not, please comment:__________________________________________________________________________________________________________ Yes No Not obs N.A.‘Adequate’ means the premises is adequately equipped to handle food safely.For example, a food business that has insufficient cold storage for potentiallyhazardous food does not meet this requirement. See Attachment 4 for furtherinformation. If there is not adequate equipment, specify what is not adequateabove.
Transport of foodQ 36. The business transports potentially hazardous food. Yes No Not obs N.A.
If YES continue, NO/N.A. go to Q45
Q 37. If the business does transport potentially hazardous food, does ittransport chilled, hot food or both (please circle one only)?
(a) Chilled food(b) Hot food(c) Both chilled and hot food
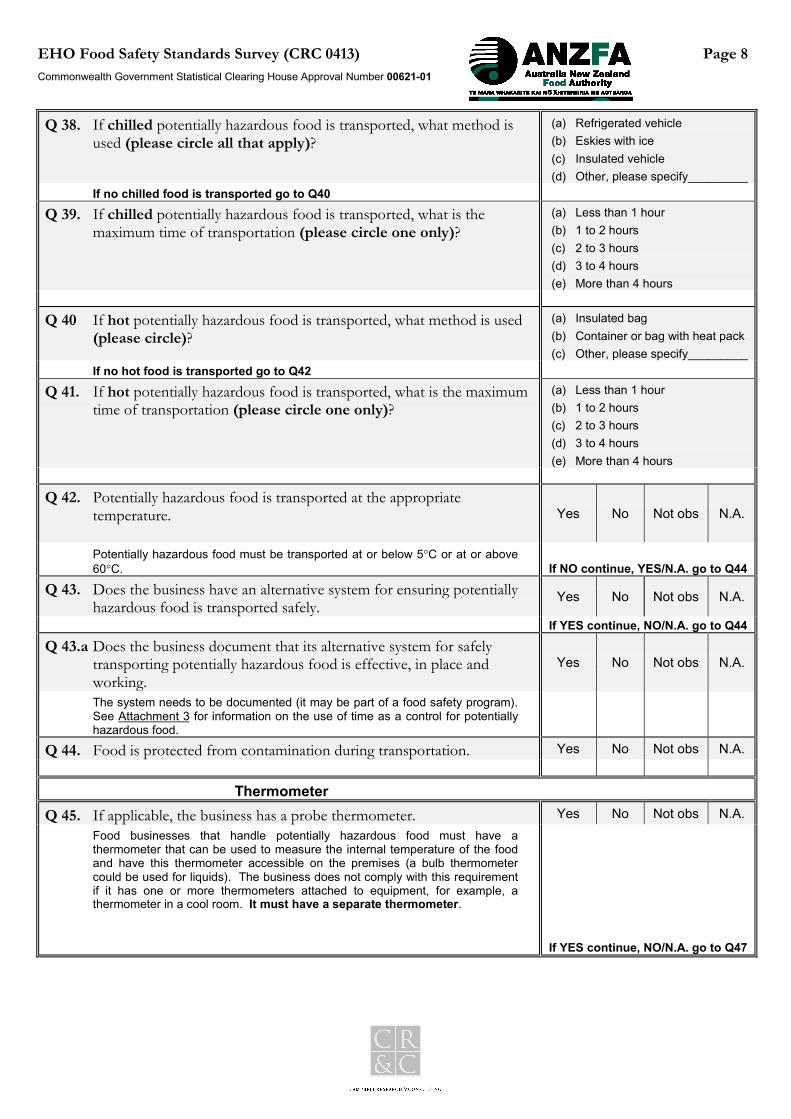
EHO Food Safety Standards Survey (CRC 0413) Page 8Commonwealth Government Statistical Clearing House Approval Number 00621-01
Q 38. If chilled potentially hazardous food is transported, what method isused (please circle all that apply)?
(a) Refrigerated vehicle(b) Eskies with ice(c) Insulated vehicle(d) Other, please specify_________
If no chilled food is transported go to Q40Q 39. If chilled potentially hazardous food is transported, what is the
maximum time of transportation (please circle one only)?(a) Less than 1 hour(b) 1 to 2 hours(c) 2 to 3 hours(d) 3 to 4 hours(e) More than 4 hours
Q 40 If hot potentially hazardous food is transported, what method is used(please circle)?
(a) Insulated bag(b) Container or bag with heat pack(c) Other, please specify_________
If no hot food is transported go to Q42
Q 41. If hot potentially hazardous food is transported, what is the maximumtime of transportation (please circle one only)?
(a) Less than 1 hour(b) 1 to 2 hours(c) 2 to 3 hours(d) 3 to 4 hours(e) More than 4 hours
Q 42. Potentially hazardous food is transported at the appropriatetemperature. Yes No Not obs N.A.
Potentially hazardous food must be transported at or below 5°C or at or above60°C. If NO continue, YES/N.A. go to Q44
Q 43. Does the business have an alternative system for ensuring potentiallyhazardous food is transported safely.
Yes No Not obs N.A.
If YES continue, NO/N.A. go to Q44
Q 43.a Does the business document that its alternative system for safelytransporting potentially hazardous food is effective, in place andworking.
Yes No Not obs N.A.
The system needs to be documented (it may be part of a food safety program).See Attachment 3 for information on the use of time as a control for potentiallyhazardous food.
Q 44. Food is protected from contamination during transportation. Yes No Not obs N.A.
ThermometerQ 45. If applicable, the business has a probe thermometer. Yes No Not obs N.A.
Food businesses that handle potentially hazardous food must have athermometer that can be used to measure the internal temperature of the foodand have this thermometer accessible on the premises (a bulb thermometercould be used for liquids). The business does not comply with this requirementif it has one or more thermometers attached to equipment, for example, athermometer in a cool room. It must have a separate thermometer.
If YES continue, NO/N.A. go to Q47
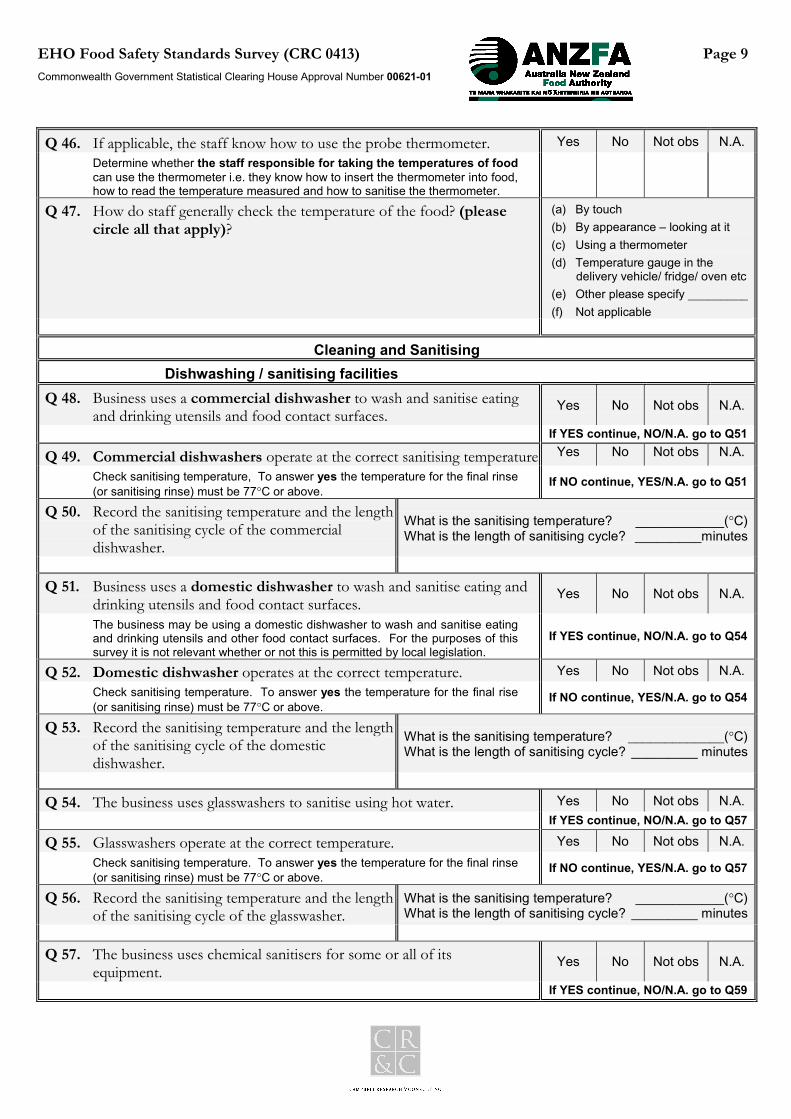
EHO Food Safety Standards Survey (CRC 0413) Page 9Commonwealth Government Statistical Clearing House Approval Number 00621-01
Q 46. If applicable, the staff know how to use the probe thermometer. Yes No Not obs N.A.Determine whether the staff responsible for taking the temperatures of foodcan use the thermometer i.e. they know how to insert the thermometer into food,how to read the temperature measured and how to sanitise the thermometer.
Q 47. How do staff generally check the temperature of the food? (pleasecircle all that apply)?
(a) By touch(b) By appearance – looking at it(c) Using a thermometer(d) Temperature gauge in the
delivery vehicle/ fridge/ oven etc(e) Other please specify _________(f) Not applicable
Cleaning and SanitisingDishwashing / sanitising facilities
Q 48. Business uses a commercial dishwasher to wash and sanitise eatingand drinking utensils and food contact surfaces.
Yes No Not obs N.A.
If YES continue, NO/N.A. go to Q51
Q 49. Commercial dishwashers operate at the correct sanitising temperature Yes No Not obs N.A.
Check sanitising temperature, To answer yes the temperature for the final rinse(or sanitising rinse) must be 77°C or above.
If NO continue, YES/N.A. go to Q51
Q 50. Record the sanitising temperature and the lengthof the sanitising cycle of the commercialdishwasher.
What is the sanitising temperature? ____________(°C)What is the length of sanitising cycle? _________minutes
Q 51. Business uses a domestic dishwasher to wash and sanitise eating anddrinking utensils and food contact surfaces.
Yes No Not obs N.A.
The business may be using a domestic dishwasher to wash and sanitise eatingand drinking utensils and other food contact surfaces. For the purposes of thissurvey it is not relevant whether or not this is permitted by local legislation.
If YES continue, NO/N.A. go to Q54
Q 52. Domestic dishwasher operates at the correct temperature. Yes No Not obs N.A.Check sanitising temperature. To answer yes the temperature for the final rise(or sanitising rinse) must be 77°C or above.
If NO continue, YES/N.A. go to Q54
Q 53. Record the sanitising temperature and the lengthof the sanitising cycle of the domesticdishwasher.
What is the sanitising temperature? _____________(°C)What is the length of sanitising cycle? _________ minutes
Q 54. The business uses glasswashers to sanitise using hot water. Yes No Not obs N.A.If YES continue, NO/N.A. go to Q57
Q 55. Glasswashers operate at the correct temperature. Yes No Not obs N.A.Check sanitising temperature. To answer yes the temperature for the final rinse(or sanitising rinse) must be 77°C or above.
If NO continue, YES/N.A. go to Q57
Q 56. Record the sanitising temperature and the lengthof the sanitising cycle of the glasswasher.
What is the sanitising temperature? ____________(°C)What is the length of sanitising cycle? _________ minutes
Q 57. The business uses chemical sanitisers for some or all of itsequipment.
Yes No Not obs N.A.
If YES continue, NO/N.A. go to Q59

EHO Food Safety Standards Survey (CRC 0413) Page 10Commonwealth Government Statistical Clearing House Approval Number 00621-01
Q 58. Chemical sanitisers are used appropriately. Yes No Not obs N.A.If chemical sanitisers are used for food contact surfaces and eating and drinkingutensils, establish whether the business is using sanitisers correctly i.e. correctconcentration, applying sanitisers to clean surfaces and using an appropriatesanitiser for the application.
Q 59. Business sanitises all or some of its equipment/surfaces manuallyusing hot water (without chemicals) eg in a sink.
Yes No Not obs N.A.
If YES continue, NO/N.A. go to Q62
Q 60. If business manually sanitises using hot water, the temperature ofthe hot water used is 77°C or above.
Yes No Not obs N.A.
We are determining what temperature businesses use for sanitising. If thebusiness holds utensils etc. directly under the tap, measure the temperature atthe tap. If business puts the utensils in a sink, measure the water temperatureduring use. For the purposes of the survey the legal requirement for watertemperature is not relevant.
If NO continue, YES/N.A. go to Q62
Q 61. Record the temperature of the hot water (either atthe tap or in the sink as appropriate)
Temperature of the hot water _______(°C)
Protecting food from contamination during processingQ 62. Separate equipment is used for preparing and processing raw and
ready to eat food, or equipment is cleaned and sanitised betweenthese uses.
Yes No Not obs N.A.
Q 63. Staff preparing and processing food are wearing ‘clean’ outerclothing.
Yes No Not obs N.A.
The outer clothing of food handlers must be of a level of cleanliness that isappropriate for the handling of food that is being conducted. This means,for example, that a butcher’s outer clothing is not expected to be as clean as afood handler’s making sandwiches.
Q 64. Staff handle ready to eat food with utensils or other barriers (nothands).
Yes No Not obs N.A.
Other barriers includes gloves and paper.
Q 65. Staff change gloves when necessary. Yes No Not obs N.A.Disposable gloves may be used for one task only. Once a glove is removed froma hand, it cannot be reused. Disposable gloves must be changed betweenhandling raw and ready-to-eat food. If a food handler is wearing gloves foraesthetic reasons i.e. he/she is not using them in contact with food, thisrequirement is not applicable.
Q 66. Staff wash hands when necessary. Yes No Not obs N.A.Food handlers must wash hands whenever their hands are likely to be a sourceof contamination including:– Between working with raw and ready-to-eat food– Immediately after using the toilet– Before handling exposed food– After smoking, coughing, sneezing, blowing nose, eating or drinking– After touching hair, scalp or body opening
Q 67. When staff wash hands, they use the designated hand washingfacilities.
Yes No Not obs N.A.
Please record whether food handlers use the designated hand washing facilitiesrather than the equipment washing sink.
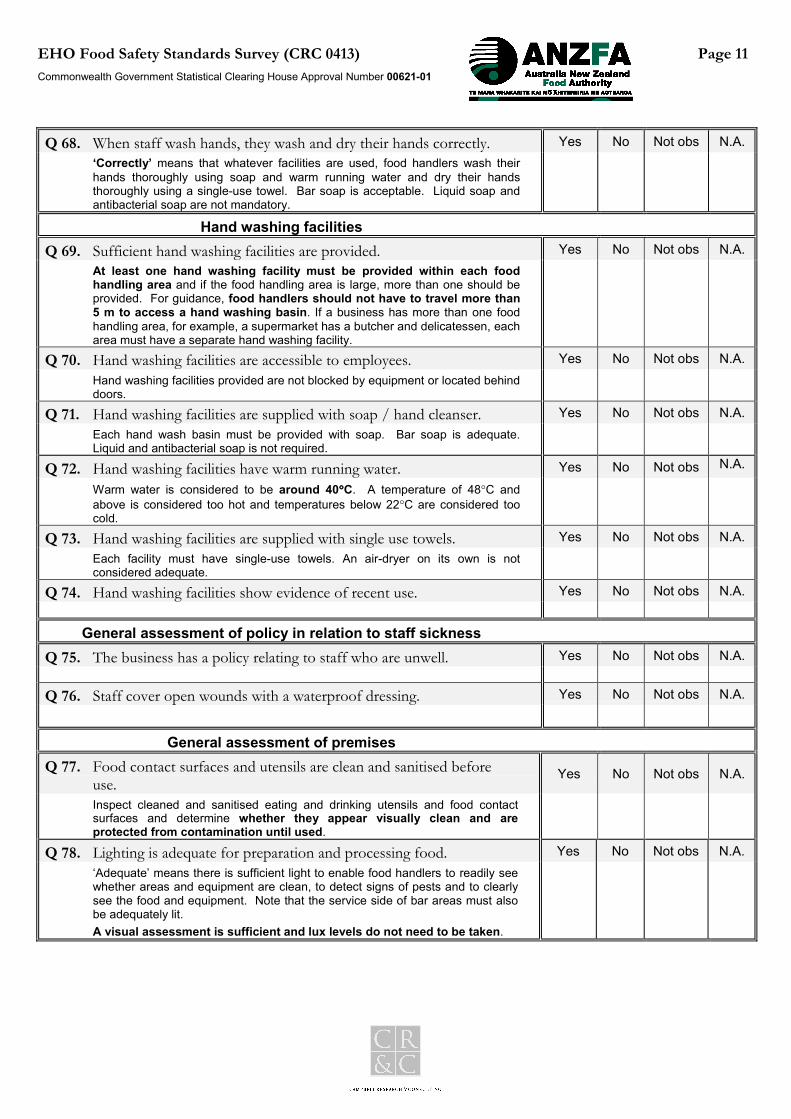
EHO Food Safety Standards Survey (CRC 0413) Page 11Commonwealth Government Statistical Clearing House Approval Number 00621-01
Q 68. When staff wash hands, they wash and dry their hands correctly. Yes No Not obs N.A.‘Correctly’ means that whatever facilities are used, food handlers wash theirhands thoroughly using soap and warm running water and dry their handsthoroughly using a single-use towel. Bar soap is acceptable. Liquid soap andantibacterial soap are not mandatory.
Hand washing facilitiesQ 69. Sufficient hand washing facilities are provided. Yes No Not obs N.A.
At least one hand washing facility must be provided within each foodhandling area and if the food handling area is large, more than one should beprovided. For guidance, food handlers should not have to travel more than5 m to access a hand washing basin. If a business has more than one foodhandling area, for example, a supermarket has a butcher and delicatessen, eacharea must have a separate hand washing facility.
Q 70. Hand washing facilities are accessible to employees. Yes No Not obs N.A.Hand washing facilities provided are not blocked by equipment or located behinddoors.
Q 71. Hand washing facilities are supplied with soap / hand cleanser. Yes No Not obs N.A.Each hand wash basin must be provided with soap. Bar soap is adequate.Liquid and antibacterial soap is not required.
Q 72. Hand washing facilities have warm running water. Yes No Not obs N.A.
Warm water is considered to be around 40°°°°C. A temperature of 48°C andabove is considered too hot and temperatures below 22°C are considered toocold.
Q 73. Hand washing facilities are supplied with single use towels. Yes No Not obs N.A.Each facility must have single-use towels. An air-dryer on its own is notconsidered adequate.
Q 74. Hand washing facilities show evidence of recent use. Yes No Not obs N.A.
General assessment of policy in relation to staff sicknessQ 75. The business has a policy relating to staff who are unwell. Yes No Not obs N.A.
Q 76. Staff cover open wounds with a waterproof dressing. Yes No Not obs N.A.
General assessment of premisesQ 77. Food contact surfaces and utensils are clean and sanitised before
use.Yes No Not obs N.A.
Inspect cleaned and sanitised eating and drinking utensils and food contactsurfaces and determine whether they appear visually clean and areprotected from contamination until used.
Q 78. Lighting is adequate for preparation and processing food. Yes No Not obs N.A.‘Adequate’ means there is sufficient light to enable food handlers to readily seewhether areas and equipment are clean, to detect signs of pests and to clearlysee the food and equipment. Note that the service side of bar areas must alsobe adequately lit.A visual assessment is sufficient and lux levels do not need to be taken.

EHO Food Safety Standards Survey (CRC 0413) Page 12Commonwealth Government Statistical Clearing House Approval Number 00621-01
Q 79. There is adequate ventilation when preparing and processing food. Yes No Not obs N.A.‘Adequate’ means that the ventilation system (whether natural or mechanical)removes all steam and fumes. The business does not comply with thisrequirement if there is evidence of condensation or grease on walls and/orceilings due to insufficient ventilation.
Q 80. The overall business premises and equipment are clean and wellmaintained?
Yes No Not obs N.A.
Q 81. If there are problem areas, please identify where they are (circle all thatapply).
(a) Food receiving area(b) Cool room(c) Dry goods storage area(d) Hot food holding equipment(e) Preparation, processing &
cooking areas(f) Other specify) ______________
Q 82. The premises is free of pests. Yes No Not obs N.A.
Q 83. The business contracts a pest control company or has a pest controlprogram.
Yes No Not obs N.A.
Q 84. Chemicals are stored safely. Yes No Not obs N.A.
Q 85. Personal clothing is stored appropriately. Yes No Not obs N.A.
Food recall and safety planQ 86. If business is engaged in wholesale supply, manufacturing or
importation of food, the business has a written food recall plan.Yes No Not obs N.A.
Q 87. Business has a written food safety program Yes No Not obs N.A.The answer is yes if the program identifies food safety hazards, and ways tocontrol and monitor these hazards. (There must be more than a set of workinstructions available at the premises). The adequacy of the program in terms ofthe food handling operations of the business or compliance with law need not beassessed.
Do you have any other comments about this business (food handling, equipment, business premises)
To help us improve our surveys in future, could you (the person conducting the survey) please write any commentsabout the process of completing this survey in the space below?
Length of time taken to complete survey: ___Hours ____Minutes

CAMPBELL RESEARCH & CONSULTING PTY LTD ACN 073 813 144 ABN 29 073 813 144SUITE 2, 45 WATKINS STREET, NORTH FITZROY, VICTORIA 3068 PO BOX 441, CLIFTON HILL, VICTORIA 3068
PHONE (03) 0482 4216 FAX (03) 9482 6799 [email protected]
Attachments to theFood Safety Standards Survey

Attachments to the EHO Food Safety Standards Survey Page 2
EHO Survey Attachment 1Codes for Question on Business Type
List of business types (more than one may be applicable)
1. Manufacturer/processor2. Retailer3. Food service4. Distributor/importer5. Packer6. Storage7. Transport8. Restaurant/café9. Snack bar/takeaway10. Caterer11. Meals-on-wheels12. Hotel/motel/guesthouse13. Pub/tavern14. Canteen/kitchen15. Hospital/nursing home16. Childcare centre17. Home delivery18. Mobile food operator19. Market stall20. Charitable or community organisation21. Temporary food premises
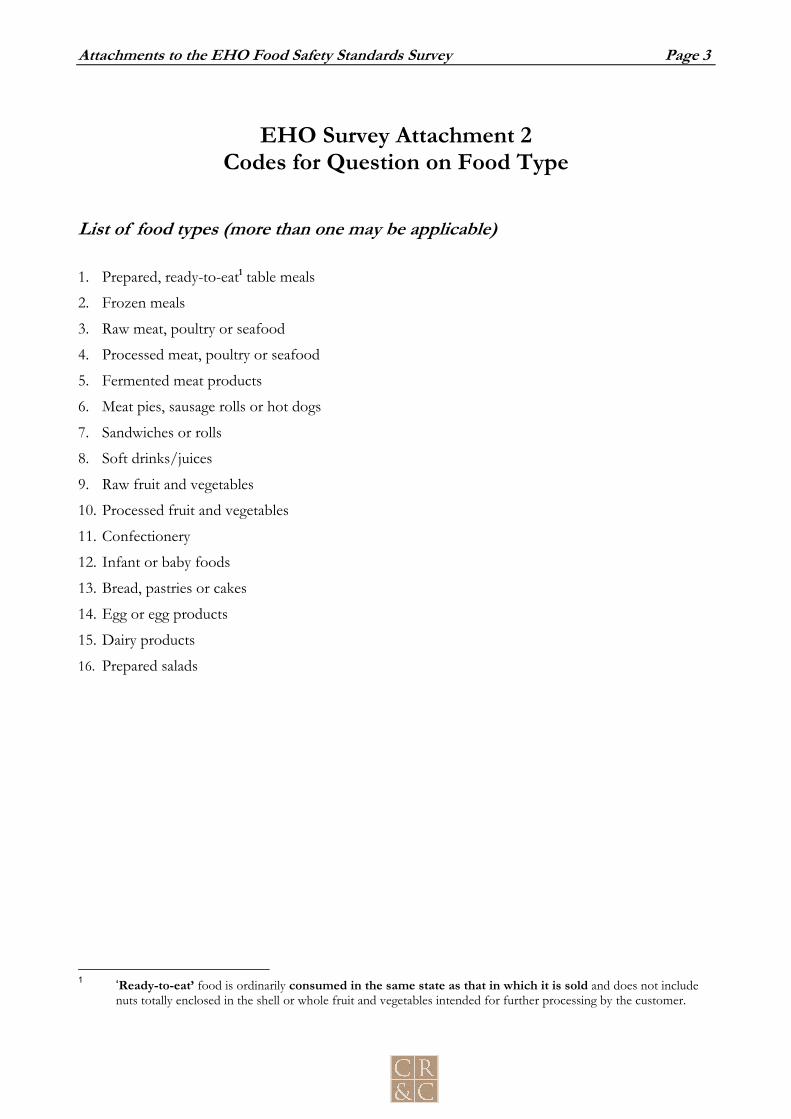
Attachments to the EHO Food Safety Standards Survey Page 3
EHO Survey Attachment 2Codes for Question on Food Type
List of food types (more than one may be applicable)
1. Prepared, ready-to-eat1 table meals
2. Frozen meals
3. Raw meat, poultry or seafood
4. Processed meat, poultry or seafood
5. Fermented meat products
6. Meat pies, sausage rolls or hot dogs
7. Sandwiches or rolls
8. Soft drinks/juices
9. Raw fruit and vegetables
10. Processed fruit and vegetables
11. Confectionery
12. Infant or baby foods
13. Bread, pastries or cakes
14. Egg or egg products
15. Dairy products
16. Prepared salads
1 ‘Ready-to-eat’ food is ordinarily consumed in the same state as that in which it is sold and does not include
nuts totally enclosed in the shell or whole fruit and vegetables intended for further processing by the customer.
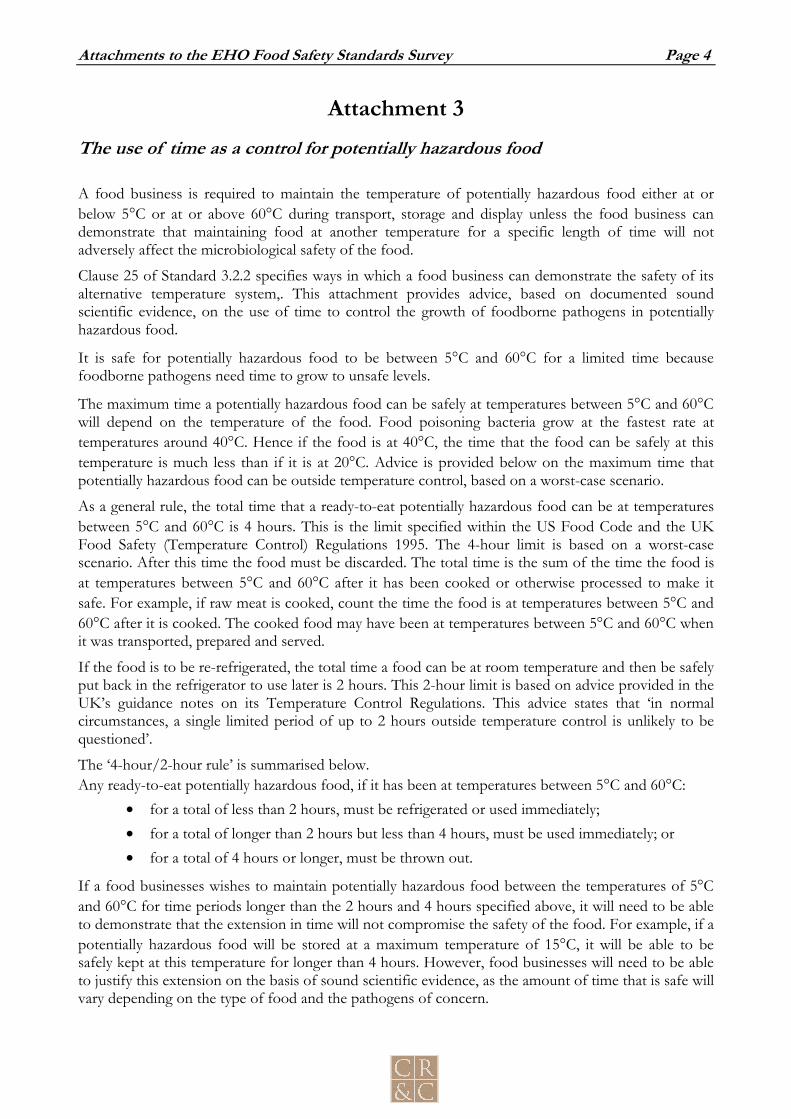
Attachments to the EHO Food Safety Standards Survey Page 4
Attachment 3The use of time as a control for potentially hazardous food
A food business is required to maintain the temperature of potentially hazardous food either at orbelow 5°C or at or above 60°C during transport, storage and display unless the food business candemonstrate that maintaining food at another temperature for a specific length of time will notadversely affect the microbiological safety of the food.
Clause 25 of Standard 3.2.2 specifies ways in which a food business can demonstrate the safety of itsalternative temperature system,. This attachment provides advice, based on documented soundscientific evidence, on the use of time to control the growth of foodborne pathogens in potentiallyhazardous food.
It is safe for potentially hazardous food to be between 5°C and 60°C for a limited time becausefoodborne pathogens need time to grow to unsafe levels.
The maximum time a potentially hazardous food can be safely at temperatures between 5°C and 60°Cwill depend on the temperature of the food. Food poisoning bacteria grow at the fastest rate attemperatures around 40°C. Hence if the food is at 40°C, the time that the food can be safely at thistemperature is much less than if it is at 20°C. Advice is provided below on the maximum time thatpotentially hazardous food can be outside temperature control, based on a worst-case scenario.
As a general rule, the total time that a ready-to-eat potentially hazardous food can be at temperaturesbetween 5°C and 60°C is 4 hours. This is the limit specified within the US Food Code and the UKFood Safety (Temperature Control) Regulations 1995. The 4-hour limit is based on a worst-casescenario. After this time the food must be discarded. The total time is the sum of the time the food isat temperatures between 5°C and 60°C after it has been cooked or otherwise processed to make itsafe. For example, if raw meat is cooked, count the time the food is at temperatures between 5°C and60°C after it is cooked. The cooked food may have been at temperatures between 5°C and 60°C whenit was transported, prepared and served.
If the food is to be re-refrigerated, the total time a food can be at room temperature and then be safelyput back in the refrigerator to use later is 2 hours. This 2-hour limit is based on advice provided in theUK’s guidance notes on its Temperature Control Regulations. This advice states that ‘in normalcircumstances, a single limited period of up to 2 hours outside temperature control is unlikely to bequestioned’.
The ‘4-hour/2-hour rule’ is summarised below.Any ready-to-eat potentially hazardous food, if it has been at temperatures between 5°C and 60°C:
• for a total of less than 2 hours, must be refrigerated or used immediately;• for a total of longer than 2 hours but less than 4 hours, must be used immediately; or• for a total of 4 hours or longer, must be thrown out.
If a food businesses wishes to maintain potentially hazardous food between the temperatures of 5°Cand 60°C for time periods longer than the 2 hours and 4 hours specified above, it will need to be ableto demonstrate that the extension in time will not compromise the safety of the food. For example, if apotentially hazardous food will be stored at a maximum temperature of 15°C, it will be able to besafely kept at this temperature for longer than 4 hours. However, food businesses will need to be ableto justify this extension on the basis of sound scientific evidence, as the amount of time that is safe willvary depending on the type of food and the pathogens of concern.
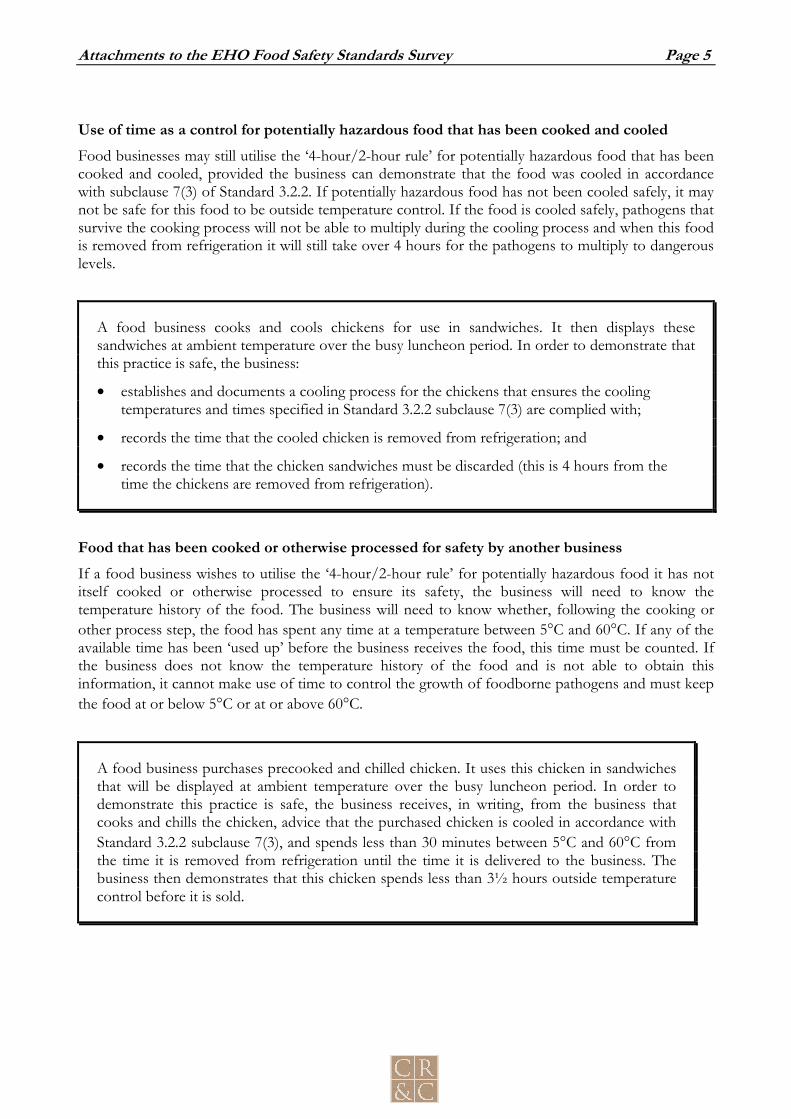
Attachments to the EHO Food Safety Standards Survey Page 5
Use of time as a control for potentially hazardous food that has been cooked and cooledFood businesses may still utilise the ‘4-hour/2-hour rule’ for potentially hazardous food that has beencooked and cooled, provided the business can demonstrate that the food was cooled in accordancewith subclause 7(3) of Standard 3.2.2. If potentially hazardous food has not been cooled safely, it maynot be safe for this food to be outside temperature control. If the food is cooled safely, pathogens thatsurvive the cooking process will not be able to multiply during the cooling process and when this foodis removed from refrigeration it will still take over 4 hours for the pathogens to multiply to dangerouslevels.
A food business cooks and cools chickens for use in sandwiches. It then displays thesesandwiches at ambient temperature over the busy luncheon period. In order to demonstrate thatthis practice is safe, the business:
• establishes and documents a cooling process for the chickens that ensures the coolingtemperatures and times specified in Standard 3.2.2 subclause 7(3) are complied with;
• records the time that the cooled chicken is removed from refrigeration; and
• records the time that the chicken sandwiches must be discarded (this is 4 hours from thetime the chickens are removed from refrigeration).
Food that has been cooked or otherwise processed for safety by another businessIf a food business wishes to utilise the ‘4-hour/2-hour rule’ for potentially hazardous food it has notitself cooked or otherwise processed to ensure its safety, the business will need to know thetemperature history of the food. The business will need to know whether, following the cooking orother process step, the food has spent any time at a temperature between 5°C and 60°C. If any of theavailable time has been ‘used up’ before the business receives the food, this time must be counted. Ifthe business does not know the temperature history of the food and is not able to obtain thisinformation, it cannot make use of time to control the growth of foodborne pathogens and must keepthe food at or below 5°C or at or above 60°C.
A food business purchases precooked and chilled chicken. It uses this chicken in sandwichesthat will be displayed at ambient temperature over the busy luncheon period. In order todemonstrate this practice is safe, the business receives, in writing, from the business thatcooks and chills the chicken, advice that the purchased chicken is cooled in accordance withStandard 3.2.2 subclause 7(3), and spends less than 30 minutes between 5°C and 60°C fromthe time it is removed from refrigeration until the time it is delivered to the business. Thebusiness then demonstrates that this chicken spends less than 3½ hours outside temperaturecontrol before it is sold.

Attachments to the EHO Food Safety Standards Survey Page 6
Attachment 4Criteria to assist with judging whether equipment is adequate
Type of operation carried out by business Criteria for judging adequacy
Cooking/processing Adequate equipment to ensure that the processreaches the temperature or other parameterrequired to destroy pathogens.
Cooling and refrigerated storage of potentiallyhazardous foods
Adequate equipment to cool food in accordancewith the requirements of Standard 3.2.2 and holdfood under temperature control.
Adequate refrigerated space to cater for largefunctions (if appropriate).
Displaying potentially hazardous foods Adequate refrigerated or hot display counters toensure that all displayed food is displayed inaccordance with temperature requirements ofStandard 3.2.2 and is protected fromcontamination.
Transporting chilled potentially hazardousfood
Refrigeration equipment, insulated containers orother containers if this equipment is appropriate onthe vehicle to ensure food is capable of beingmaintained at 5°C or below.
Washing fruit and vegetables Where food handling involves frequent washing offruit and vegetables a food preparation sink shouldbe installed.
Utensil and equipment washing and sanitising Double bowl or triple bowl sinks for sanitisingand/or dishwashers that sanitise.
Personal washing All staff have easy access to hand washing facilities.
Floor and general cleaning requirements Single bowl sink, cleaners sink, hose connections,curbed drain connected to the sewer or otherfacility for cleaning the equipment used for cleaningthe premises and for disposing of dirty water.
f:\jobs\413 food handling\reports\413 anzfa appendix d attachments to the survey _ eho.doc

Classification of food businesses
LIST OF FOOD BUSINESS CLASSIFICATIONS
1.1. Processors/ Manufacturers
Abattoir Low/Medium
Small businesses1 should be assigned alow classification and large businessesshould be assigned a mediumclassification.
Additives/preservatives/colours/culture/processing aids
Low
Baking compounds/powder Low
Biscuits Low
Boning rooms Low/Medium
Small businesses should be assigned a lowclassification and large businesses shouldbe assigned a medium classification.
Bottled Water Medium
Bread Low
Brewery Low
Cakes/desserts Medium
Chocolate & cocoa products Medium
Condiments Low
Confectionery Low
Cordial, syrups and toppings Low
Dairy2 Medium
Dessert mixes (dry) Low
Egg and egg products Medium
Flour/cereals3 Low
Fruit juices Medium
1 Refer to definitions.2 Includes milk, cheese, butter and yoghurt.3 Includes flour, rice, breakfast cereals and dried pasta.

Classification of food businesses
Fruit/vegetables/Legumes
Canned/Frozen Medium
Processed products Medium
Whole Low
Gelatine/jelly products Low
Ice confection Low
Ice cream Medium
Infant food High
Infant formula High
Liquor/alcoholic beverages Low
Meat
Raw unprocessed product Low
Canned Medium
Processed products Medium
Fermented meat products4 High
Boning rooms Low
Cold-stores Low
Margarine Low
Meat/vegetable pies Medium
Nuts and nut products Medium
Oil/fats Low
Pastry Low
Pickles Low
Poultry
Raw unprocessed product Low
Canned Medium
Processed products Medium
Prepared/packaged meals Medium
Salad Medium
4 Examples include cured and salted meat, dried meat, manufactured meat, sausages and sausage
meat and edible casings.

Classification of food businesses
Sauces5 Low/Medium
Businesses manufacturing shelf stableproducts should be assigned a lowclassification.
Businesses manufacturing productsrequiring refrigeration should be assigneda medium classification.
Seafood
Raw unprocessed product Low/High
Businesses selling raw product intendedfor further processing by the customershould be assigned a low classification.
Businesses selling raw product intendedfor consumption without furtherprocessing should be assigned a highclassification.
Canned Medium
Processed products Medium
Snack foods6 Low
Soft drink Low
Soya products7 Medium
Spices8 Low
Sugar and related products Low
Tea/coffee Low
Vinegar Low
Wineries Low
5 Examples include mayonnaise, tomato sauce, satay sauce, pasta sauce etc.6 Examples include chips, pretzels, muesli bars etc.7 Examples include tofu, soy burgers and sausages and all soy-based meat replacements.8 Includes salt and pepper.

Classification of food businesses
1.2. Food Service Sector
Airline caterers High
Bars Low
Cafes Medium
Caterers9 High
Child care centres High
Clubs Medium/High
Small businesses should be assigned amedium classification and largebusinesses should be assigned a highclassification.
Canteens10 Medium
Family day care High
Fast foods12 Medium
Home delivery High
Hospitals High
Meals on Wheels High
Motels/Hotels/Guesthouses Medium
Nursing homes High
Pre-schools High
Prison/military Medium
Pubs serving meals Medium
Restaurants Medium
Retirement villages High
School camps Medium
Take aways Medium
9 Includes mobile caterers and domestic-based operations.10 Examples include office, primary, high school and college canteens.12 Examples include McDonalds, KFC, Hungry Jacks, Red Rooster and Burger King.

Classification of food businesses
1.3. Retail
Bakery Low/Medium
Businesses only selling breads andpastries should be assigned a lowclassification.
Businesses selling pies, sausage rolls,quiches etc should be assigned a mediumclassification.
Butcher Low/Medium
Businesses only selling meat intended forcooking should be assigned a lowclassification.
Businesses selling ready to eat foods suchas salami should be assigned a mediumclassification.
Cake shop Medium
Cheese shop Medium
Delicatessens Medium/High
Businesses producing fermented meatproducts such as salami should beassigned a high classification.
Fruit and vegetable shop Low/Medium
Businesses processing fruit andvegetables such as in the production offruit and potato salads should be assigneda medium classification.
Health food shop Low
Hot dog vendor Medium
Ice creamery Medium
Liquor shop Low
Market stalls Classification is dependent on the type offood that is available for sale.
Milk vendor Low
Mobile food operators Medium
Movie theatres Low
Newsagents Low

Classification of food businesses
Poultry shop Low/Medium
Businesses only selling raw poultryintended for cooking should be assigneda low classification.
Businesses selling ready to eat foods suchas cooked poultry should be assigned amedium classification.
Sandwich shop Medium
Sausage sizzle Medium
Seafood Medium
Service station Low/Medium
Businesses only selling confectionary,snack foods and drinks should beassigned a low classification.
Businesses selling pies, sausage rolls,hotdogs etc should be assigned a mediumclassification.
Soft drink vendor Low
Sport centres/gyms Low
Supermarkets Medium

Classification of food businesses
1.4. Distributors/Importers
Businesses dealing with the distrubution or importation of prepackaged food should beassigned a low classification
Businesses dealing with the distrubution or importation of unpackaged food should beassigned a medium classification
1.5. Food transport businesses
Businesses dealing with the transport of prepackaged food should be assigned a lowclassification
Businesses dealing with the transport of unpackaged food should be assigned a mediumclassification
1.6. Definitions
High risk food: food that may contain pathogenic microorganisms and will support
formation of toxins or growth of pathogenic microorganisms.Examples are raw meat, fish, poultry and unpasteurised milk. Other examples include tofu, freshfilled pasta, meat pies, frankfurts, salami, cooked rice and lasagne (these foods pose a particularlyhigh risk if they are not processed or cooked adequately).
Medium risk food: food that may contain pathogenic microorganisms but will not normally
support their growth due to food characteristics; or food that is unlikely to contain pathogenic microorganisms due to food type
or processing but may support formation of toxins or growth of pathogenicmicroorganisms.
Examples are fruits and vegetables, orange juice, canned meats, pasteurised milk, dairy products,ice cream, peanut butter and milk based confectionery.
Low risk food: food that is unlikely to contain pathogenic microorganisms and will not
normally support their growth due to food characteristics.Examples are grains and cereals, bread, carbonated beverages, sugar-based confectionery, alcoholand fats and oils.
Small business: a business that employs less than 50 people in the ‘manufacturing’ sector or
which employs less than 10 people in the ‘services’ sector.
F:\Jobs\413 Food Handling\Reports\413 ANZFA appendix D risk classification for specialised businesses.doc

CAMPBELL RESEARCH & CONSULTING PTY LTD ACN 073 813 144 ABN 29 073 813 144SUITE 2, 45 WATKINS STREET, NORTH FITZROY, VICTORIA 3068 PO BOX 441, CLIFTON HILL, VICTORIA 3068
PHONE (03) 9482 4216 FAX (03) 9482 6799 [email protected]
Summary Report
Prepared for
Australia New Zealand Food Authority
Food Safety Survey Pilot ResultsMethodological Procedural Results
from the EHO and CATI Pilot surveys
55 Blackall StreetBarton ACT 2600
February 2001

Summary Report of Pilot Study DRAFT CR&C 0413Australia New Zealand Food Authority
Table of Contents
1. Background and Objectives of the Project .......................................................................11.1. Background to the Project ............................................................................................................. 11.2. Objectives of the Project ............................................................................................................... 21.3. Objectives of this Pilot Report...................................................................................................... 21.4. Disclaimer......................................................................................................................................... 2
2. The Telephone Interviews ................................................................................................32.1. An overview..................................................................................................................................... 32.2. Objectives of the telephone survey pilot ..................................................................................... 32.3. Pilot survey methodology .............................................................................................................. 32.4. Pilot telephone questionnaire response rate results ................................................................... 42.5. Pilot telephone survey results........................................................................................................ 5
2.5.1. Objective 1: Briefing the interviewers......................................................................... 52.5.2. Objective 2: Targeting appropriate businesses and respondents............................ 62.5.3. Objectives 3 – 5: Clarity of and flow of survey......................................................... 72.5.4. Objective 6: Length of questionnaire.......................................................................... 82.5.5. Objective 7: Estimate response rate........................................................................... 9
3. The Environmental Health Officer (EHO) survey ........................................................ 103.1. An overview................................................................................................................................... 103.2. Objectives of the EHO survey pilot .......................................................................................... 103.3. Pilot EHO survey methodology ................................................................................................. 103.4. Pilot EHO survey response rates................................................................................................ 113.5. Pilot EHO survey results ............................................................................................................. 11
3.5.1. Objective 1: Briefing procedures ............................................................................... 123.5.2. Objectives 2 - 4: Clarity, flow and organisation, ease of response, andmeasuring the issues...................................................................................................................... 133.5.3. Objective 5: Length of the survey ............................................................................. 163.5.4. Objective 6: Response issues...................................................................................... 17
Informed consent to enter the business..................................................................... 17
Responding to breaches of food safety regulations identified during the survey 17
4. Summary of issues addressed during the pilot phase..................................................... 184.1. Telephone interviews.................................................................................................................... 184.2. EHO surveys ................................................................................................................................. 18
5. Approval by the Australian Bureau of Statistics ............................................................. 18Appendix A: CATI Interview Form ..................................................................................... 19Appendix B: EHO Survey Form..........................................................................................20Appendix C: Information for businesses participating in the EHO survey........................ 21
f:\jobs\413 food handling\reports\413 pilot report ecopy v2.doc
Summary Report of Pilot Study DRAFT CR&C 0413Australia New Zealand Food Authority page 1
1. Background and Objectives of the Project1.1. Background to the Project
(Section 1.1 is an extract from Safe Food Australia 2nd edition, ANZFA, January 2001, p. 1)There are four national food safety standards. The Australia New Zealand Food Authority (ANZFA)developed these standards in consultation with State and Territory health authorities, the foodindustry, and other interested organisations and individuals.
The four food safety standards are:
3.1.1 Interpretation and Application; 3.2.1 Food Safety Programs; 3.2.2 Food Safety Practices and General Requirements; and 3.2.3 Food Premises and Equipment.
In July 2000, the Australian New Zealand Food Standards Council1 agreed to the adoption ofStandards 3.1.1, 3.2.2 and 3.2.3. These food safety standards form part of the Australia New ZealandFood Standards Code. They apply only in Australia.
The Australia New Zealand Food Standards Council had previously deferred consideration of thefourth standard, Standard 3.2.1 Food Safety Programs, and requested further study of the efficacy of theseprograms for a range of food businesses. Pending the results of this work, the Council agreed inNovember 2000 that Standard 3.2.1 should be adopted as a voluntary standard. It did so as someStates planned to proceed with the introduction of food safety programs without waiting for theresults of the study requested earlier by the Australia New Zealand Food Standards Council.
As a voluntary standard, Standard 3.2.1 Food Safety Programs will apply in only in those States orTerritories that choose to implement this standard.
Standards 3.1.1, 3.2.2 and 3.2.3 become enforceable from February 2001, depending on the regulatorysituation on each State and Territory. The notification provision and the requirement that foodhandlers and supervisors have food safety skills and knowledge commensurate with their duties withinthe food business, both in Standard 3.2.2, come in effect from February 2002 to give businesses timeto comply with these requirements.
The food safety standards will replace existing State and Territory and local government food hygieneregulations that were nationally inconsistent and that tended to be prescriptive and sometimessignificantly out of date. They presented businesses with unnecessary costs and difficulties. Inaddition, they included requirements that could not be justified in terms of public health and safety.
The new standards reflect international best practice. Taken together, they are based on a preventativeapproach to the incidence of food-borne illness in Australia and are designed to help ensure that foodbusiness in Australia produce food that is safe to eat.
1 Ministers of Health from the States, Territories and Commonwealth of Australia and from New Zealand meet as
the Australia New Zealand Standards Council to approve food standards for Australia and New Zealand.

Summary Report of Pilot Study DRAFT CR&C 0413Australia New Zealand Food Authority page 2
1.2. Objectives of the Project
An important element of this project is measurement of the current knowledge and practice of safefood handling in the food industry.
Campbell Research & Consulting has been commissioned to undertake two surveys as part of anevaluation strategy to assess the effectiveness of the new food safety standards. The current projectwill provide benchmark, baseline data of knowledge prior to implementation of new food regulationsthat prescribe safe food handling practices. Over the next few years ANZFA will conduct additionalsurveys to monitor change in food handling practices over time.
The questions in the current surveys are designed to measure broadly the key areas of safe foodhandling as outlined in the new Food Safety Standards (see Safe Food Australia, 2nd edition, ANZFA,January 2001), and target businesses handling potentially hazardous food. Two surveys will beconducted nationally as part of the initial benchmark research:
1. Telephone interviews with food business owners / managers of food handling staff; and2. On site surveys with food businesses by Environmental Health Officers (food safety
inspectors, or Public Health officers in NSW).
The project is not being conducted as a part of any formal inspection or enforcement regime, and theinformation gained will be used to inform future policy decisions and adjustments to the food safetystandards setting system.
1.3. Objectives of this Pilot Report
This report briefly summarises the methodological procedural outcomes from the pilot study for boththe telephone and on site EHO surveys encompassing:
Testing of project methodology; Testing of flow, organisation and length of telephone and EHO surveys; and Telephone interviewer and EHO feedback.
The overall objectives of the project will not be expanded upon in this report, and data in response tothe pilot surveys will not be analysed.
1.4. Disclaimer
Please note that, in accordance with our Company’s policy, we are obliged to advise that neither theCompany nor any member nor employee undertakes responsibility in any way whatsoever to anyperson or organisation (other than Australia New Zealand Food Authority) in respect of informationset out in this report, including any errors or omissions therein, arising through negligence orotherwise however caused.

Summary Report of Pilot Study DRAFT CR&C 0413Australia New Zealand Food Authority page 3
2. The Telephone Interviews2.1. An overview
The aim of the telephone survey is to obtain benchmark data on the extent to which food businessowners / managers2 are aware of safe food handling practices prior to implementation of the new foodsafety standards. The questions are designed to assess the level of general knowledge about foodsafety and food handling prior to implementation of the new food safety standards.
The telephone survey has been designed to be implemented across a broad range of food service /food business types, and among owners / managers who are directly involved in managing thehandling and processing of potentially hazardous food3.
2.2. Objectives of the telephone survey pilot
Pilot telephone surveys were conducted to assess the viability of the questions in the variety ofbusiness contexts likely to be encountered. In particular the pilot surveys were set up to identify:
1. Level of explanatory information for briefing the interviewers;2. Ability to target relevant businesses and respondents directly responsible for food
handling practices;3. Clarity and understanding of questions;4. Flow and sequence of questions;5. Ease of response;6. Length of questionnaire; and7. Estimate of potential response rate issues.
Each of these will be discussed in Section 2.5 below.
2.3. Pilot survey methodology
A sample of businesses was randomly chosen from the yellow pages for the pilot research. Categoriesof food business types were selected for their diversity. Targeting a diverse range of business typesenables detection of potential problems with various categories of business.
The food business categories chosen for the pilot study included:
food delicacies; food processing and packing; food products – manufacturing & processing; café;
2 Target respondents are persons responsible for managing staff who are directly involved in food handling. In
most small businesses this will be the owner/proprietor.3 Potentially hazardous food includes: cooked meat, fish, egg or chicken and other poultry, deserts with dairy or
egg ingredients, pasta salads and other prepared salads.

Summary Report of Pilot Study DRAFT CR&C 0413Australia New Zealand Food Authority page 4
catering and food consultants; delicatessens; kosher products; bakery; and butcher and small goods.
The policy for contacting businesses within categories was to ring every 9th business listed in thecategory until an interview was successful. The pilot began by targeting a single business within eachcategory and a second business in the same category was included where a need was established for asecond pilot test. Second surveys within categories were particularly relevant if the first businesssurveyed did not have a sufficient level of contact with handling unpackaged food.
As the pilot surveys were conducted the interviewer provided feedback on what worked well and whatdid not work in terms of:
Interviewing technique; Screening questions; Ability to contact appropriate person to interview; Structure and flow of survey questions; and Length of interview.
Ongoing revisions were made to the survey during the pilot to ensure the final survey was as smoothas possible. Pilot interviews were conducted by a single, high quality, interviewer to maintainconsistency during adjustment and trial of variations of the survey.
2.4. Pilot telephone questionnaire response rate results
Between Jan 15th and 19th 2001 twelve pilot telephone questionnaires were conducted in Victoriaacross a range of eight different categories including:
One interview in each of the following categories− food delicacies− food processing and packing− café− delicatessens− kosher products− bakery
Two interviews were undertaken in each of the following food business categories− food products− manufacturing & processing− catering and food consultants− butcher and small goods
There was an overall response rate of 48% of the total number of businesses contacted and 48% alsorefusing. Four per cent discontinued the survey. A detailed breakdown of the total number of callsmade (78) is as follows:
Sixty-three per cent (n=49) were established to be valid and appropriate contacts;

Summary Report of Pilot Study DRAFT CR&C 0413Australia New Zealand Food Authority page 5
− twenty-four per cent (n=12) of valid businesses contacted participated in the interview;− One business discontinued the survey as questions were not relevant;− three businesses had a language barrier and could not complete the interview;4− twenty-four per cent (n=12) of valid businesses contacted refused to participate in the
survey; and− remainder of businesses contacted (n=29 or 43%) were unavailable for the length of the
piloting period (too busy at the time of call, appropriate person away on holidays).
2.5. Pilot telephone survey results
Interviews were well received by respondents when questions were relevant to the business. It becameclear that detailed screener questions were needed to target businesses actively involved withprocessing and handling potentially hazardous food.
Refusal to participate was primarily related to work demands during busy periods, or the appropriateperson was unavailable during the pilot period.5 Many businesses were cooperative and able toschedule an appointment for a call-back if they were too busy at the time of the original call. Fewfood businesses had heard of the new food safety standards at the time of the pilot and thereforefound the survey informative and relevant.
2.5.1. Objective 1: Briefing the interviewers
Telephone interviewers are set the task of achieving interviews with particular respondent types andensuring the appropriate questions are asked in a consistent manner. The ability to meet these goals ispartly related to the sample supplied to the interviewers, and partly to the screening questionsconstructed to gain access to the correct person to interview.
Adequate information must be supplied to the interviewers to enable them to identify the correctperson within the business they are calling. This is achieved through interviewer briefing. Thebriefing includes clarification of specific terms and concepts
Two issues were particularly important for the interviewer briefings: Descriptions of the types of businesses included in the interview; and Definitions of common terms.
Definition of commonly used terms was the primary point of additional clarification needed forinterviewers. Terms requiring clarification during the pilot are outlined in Table 1.
4 Interviews in languages other than English (LOTE) were not scheduled for this project.5 The pilot surveys were conducted in mid January when many people take annual leave.
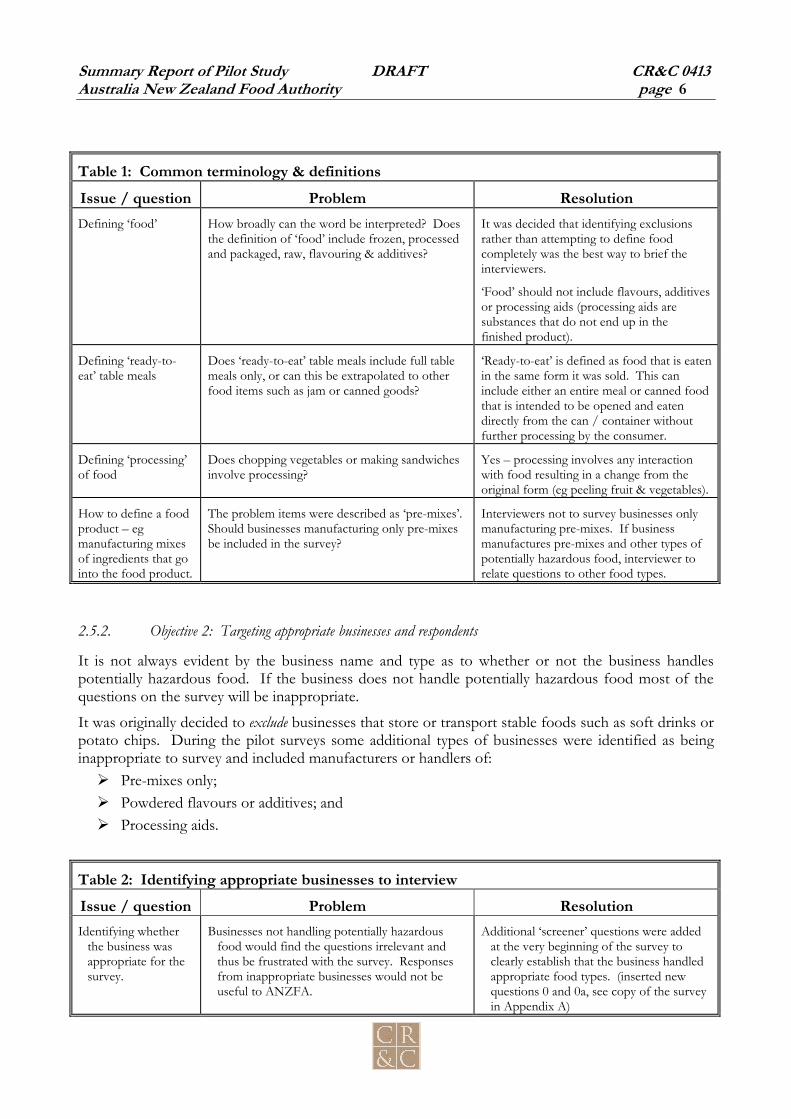
Summary Report of Pilot Study DRAFT CR&C 0413Australia New Zealand Food Authority page 6
Table 1: Common terminology & definitionsIssue / question Problem ResolutionDefining ‘food’ How broadly can the word be interpreted? Does
the definition of ‘food’ include frozen, processedand packaged, raw, flavouring & additives?
It was decided that identifying exclusionsrather than attempting to define foodcompletely was the best way to brief theinterviewers.
‘Food’ should not include flavours, additivesor processing aids (processing aids aresubstances that do not end up in thefinished product).
Defining ‘ready-to-eat’ table meals
Does ‘ready-to-eat’ table meals include full tablemeals only, or can this be extrapolated to otherfood items such as jam or canned goods?
‘Ready-to-eat’ is defined as food that is eatenin the same form it was sold. This caninclude either an entire meal or canned foodthat is intended to be opened and eatendirectly from the can / container withoutfurther processing by the consumer.
Defining ‘processing’of food
Does chopping vegetables or making sandwichesinvolve processing?
Yes – processing involves any interactionwith food resulting in a change from theoriginal form (eg peeling fruit & vegetables).
How to define a foodproduct – egmanufacturing mixesof ingredients that gointo the food product.
The problem items were described as ‘pre-mixes’.Should businesses manufacturing only pre-mixesbe included in the survey?
Interviewers not to survey businesses onlymanufacturing pre-mixes. If businessmanufactures pre-mixes and other types ofpotentially hazardous food, interviewer torelate questions to other food types.
2.5.2. Objective 2: Targeting appropriate businesses and respondents
It is not always evident by the business name and type as to whether or not the business handlespotentially hazardous food. If the business does not handle potentially hazardous food most of thequestions on the survey will be inappropriate.
It was originally decided to exclude businesses that store or transport stable foods such as soft drinks orpotato chips. During the pilot surveys some additional types of businesses were identified as beinginappropriate to survey and included manufacturers or handlers of:
Pre-mixes only; Powdered flavours or additives; and Processing aids.
Table 2: Identifying appropriate businesses to interviewIssue / question Problem ResolutionIdentifying whether
the business wasappropriate for thesurvey.
Businesses not handling potentially hazardousfood would find the questions irrelevant andthus be frustrated with the survey. Responsesfrom inappropriate businesses would not beuseful to ANZFA.
Additional ‘screener’ questions were addedat the very beginning of the survey toclearly establish that the business handledappropriate food types. (inserted newquestions 0 and 0a, see copy of the surveyin Appendix A)

Summary Report of Pilot Study DRAFT CR&C 0413Australia New Zealand Food Authority page 7
Interviewers asked to interview the person who managed staff directly responsible for handling foodand this was generally appropriate for the nature of the questions.
2.5.3. Objectives 3 – 5: Clarity of and flow of survey
Data is only as good as the clarity of questions. If a respondent does not understand what is beingasked then the response will not be accurate. Pilot testing identifies the sorts of issues respondentsneed more clarification with and allows the researchers to consider:
Adapting & clarifying questions; Changing question order; Adding or deleting questions or response options; and The amount of information interviewers need to respond to questions.
When assessing this telephone survey a few questions came across as being unclear, or whereresponses were difficult to handle over the telephone.
Table 3: Questionnaire constructionIssue / question Problem Resolution
Ensuring respondentsprovided adequate detailabout their businesswithout becomingfrustrated with thenumber of questionsasked.
When respondents describe their business, theparticular tasks or responsibilities involvedmay not be obvious (eg whether or not thebusiness transports goods). If asked for ageneral description about the business,respondents sometimes felt the interviewershould then also be aware of the tasksinvolved.
Questions about detailed tasks of thebusiness and description of the businesswere trialled using different sequences toensure maximum information with minimalfrustration to both interviewer andrespondent.
Asking respondents toestimate the number ofFT staff equivalentsbased on part-time &casual staff hours.
Respondents could not easily calculate thenumber of FT equivalents over the phone.
Changed question to simply estimate totalnumber of hours that part-time or casualstaff worked during the previous week(calculation based on a 7.5 hour day).
“Q8b Do you provideready to eat food off-sitefrom where you prepareit?”
This question was intended to identifycaterers, however some businesses involved inminimal catering were unsure whether toanswer yes or no.
First, before asking Q8b, Q8a was inserted:“Is your business involved in catering?” toensure all catering businesses wereidentified.
“Q9A Do you have foodsdelivered to yourbusiness?”
This question was meant to target temperaturesensitive food.
Question was further clarified to ensuretemperature sensitive food was targeted andworded as such:
“Q9A Do you have foods delivered to yourbusiness that have to be kept chilled orhot?”

Summary Report of Pilot Study DRAFT CR&C 0413Australia New Zealand Food Authority page 8
Table 3: Questionnaire construction (cont’d)Issue / question Problem Resolution
Questions regardingcorrect temperatures forstoring hot and coldfoods.
Businesses not involved in storingtemperature sensitive food found thesequestions difficult to answer.
To avoid respondents feeling they do nothave correct knowledge, a series of skipswere inserted so questions were only askedof appropriate businesses.
Assessing method ofmeasuring temperature ofdelivered food.
Question on the method of checkingtemperature of food was not included on firstsurveys.
Question inserted:
“Q9C. How do you check thetemperature of the food delivered to yourpremises?”
Questions about cleaningand washing dishes.
Different equipment is washed with differentmethods. Some businesses have large piecesof equipment, such as vats that can not be putthrough a dishwasher. Respondents find itdifficult to provide only one response.
Question modified to include multipleresponses. (Q15 – Q17)
Questions about washing‘dishes’.
Some businesses do not consider that theyhave dishes but have other equipment theyneed to wash such as storage containers, foodprep utensils or vats.
Question was rephrased to ask about“containers and utensils” used for foodpreparation and eating. (Q15-Q17)
Questions about cleaningand sanitising dishes andutensils used for eating.
Businesses not involved in providing food toeat and then washing the dishes were unableto respond.
To avoid respondents feeling they do nothave correct knowledge, a series of skipswere inserted so questions were only askedof appropriate businesses. (Q13 – Q18)
True / false questions arefrequently unknown.
Interviewer questions whether to encouragerespondents to offer their best guess, or prefera “don’t know” response?
Prefer respondent to indicate “don’t know”rather than guessing. This will provideinformation on the level of awareness.
Statements about coolingand heating to specifictemperatures withinspecific time periods
These statements were a little ambiguous andcomplex to absorb on the telephone.
Statements were clarified to include a rangeof temperatures. (Q12B)
Some questions withmultiple response optionswere complex.
Respondents found they could not easilyidentify the difference between the responsesto enable them to choose appropriately.
Some multiple response questions were re-worked to be constructed as true / falsestatements.
2.5.4. Objective 6: Length of questionnaire
The survey piloted in its original form took approximately 15 minutes to conduct. This was due to acombination of factors including:
Newness of the survey and interviewer needing time to feel comfortable; Need to refine some questions so they were easier for respondents to reply to, and thereforetake less time;
Inserting skips so respondents only answered questions relevant to them; Better screening out of inappropriate respondents; and Eliminating questions deemed to be less relevant to the project objectives.

Summary Report of Pilot Study DRAFT CR&C 0413Australia New Zealand Food Authority page 9
Throughout the pilot the survey review and refinement was undertaken so the interview could beconducted within 10 minutes. As discussed above, it was particularly important that questions flowedwell, the screener questions effectively identified appropriate businesses quickly, and that responseoptions were clear.
2.5.5. Objective 7: Estimate response rate
The pilot interviewer noted that most people contacted were willing to take part in the survey. Thereis much concern about food safety within the industry. Businesses generally want to ensure theycomply, yet are often not certain about the regulation applying to their business, or how to implementprocedures. Respondents appreciated the opportunity to gain more knowledge through the survey.Overall, the pilot achieved a 48% response rate. However, it is important to note that the pilot wastoo small to reliably predict response rates, but the level of cooperation from businesses contactedindicates a relatively high response rate would be achieved.
The issues impacting on likelihood of participation included: Available time to complete the survey; Absence of language barrier; Avoiding prime busy periods of the year; and Availability of appropriate person to speak with.
Different businesses have different ‘busy’ periods and it was important to identify which types ofbusinesses were best contacted at specific times. The one consistent problem of availability arose withcafés. Cafés were most likely to be “too busy” to participate at any time of the day. When a caféagreed to participate at a later time care was taken to schedule a call-back at the “best” time identified.
Accessing the appropriate person to speak with was a problem largely due to the time of year the pilotsurveys were being conducted. January, being after the Christmas rush, is often a slower period forfood businesses, as well as coinciding with Australian school holidays. This is the month when mostpeople take their annual leave.
It is anticipated that the main survey will be conducted after the primary holiday period and thus avoidthe compounded problem of lack of availability.

Summary Report of Pilot Study DRAFT CR&C 0413Australia New Zealand Food Authority page 10
3. The Environmental Health Officer (EHO) survey3.1. An overview
The aim of the EHO survey is to obtain benchmark data on the extent to which safe food handlingpractices are already being carried out within food businesses prior to implementation of the new foodsafety standards. The questions are designed to be answered by food safety inspectors who have ahigh degree of specialist food handling knowledge. Owners, managers or supervisors from thebusiness can assist with the survey, but the intention is for the questions to be answered based on whatthe surveying officer can observe within the premises.
The EHO survey is designed to be conducted across a broad range of food service / food businesscategories taken from the electronic Yellow Pages. The sample of businesses will be randomlyselected from these food business categories.
3.2. Objectives of the EHO survey pilot
Pilot EHO surveys were conducted to test both the application of the questions as well as the level ofcooperation from businesses. In particular, the pilot set out to assess the:
1. Briefing procedures;2. Clarity, flow and organisation of survey;3. Ease of response;4. Ability of EHOs to measure elements on the survey form (including EHO opinion of
questions);5. Length of time taken for the survey; and6. Estimate of response rate issues.
Each of these issues will be discussed in Section 3.5 below.
3.3. Pilot EHO survey methodology
Food safety regulations are State and territory legislations and are enforced, in the main, by localgovernment councils. The first step in conducting the pilot was to choose the local government /council areas in which to conduct the pilot surveys.
As the intension of the pilot was to test the questionnaire, rather than the sampling process, it wasdecided that the pilot areas should include:
Councils willing to be involved; Convenience for briefing surveying officers and subsequent debriefing feedback from theofficers after the pilot;
Councils flexible to complete the surveys within a short time frame; and A mix of urban and rural councils to identify issues specific to either group.
It was decided to include the ACT and Victoria in the pilot surveys. Victorian councils were selectedthrough the Victorian Department of Health by identifying councils who might be interested in beinginvolved. In the ACT a contact person already known to be interested in the project was approachedto participate.
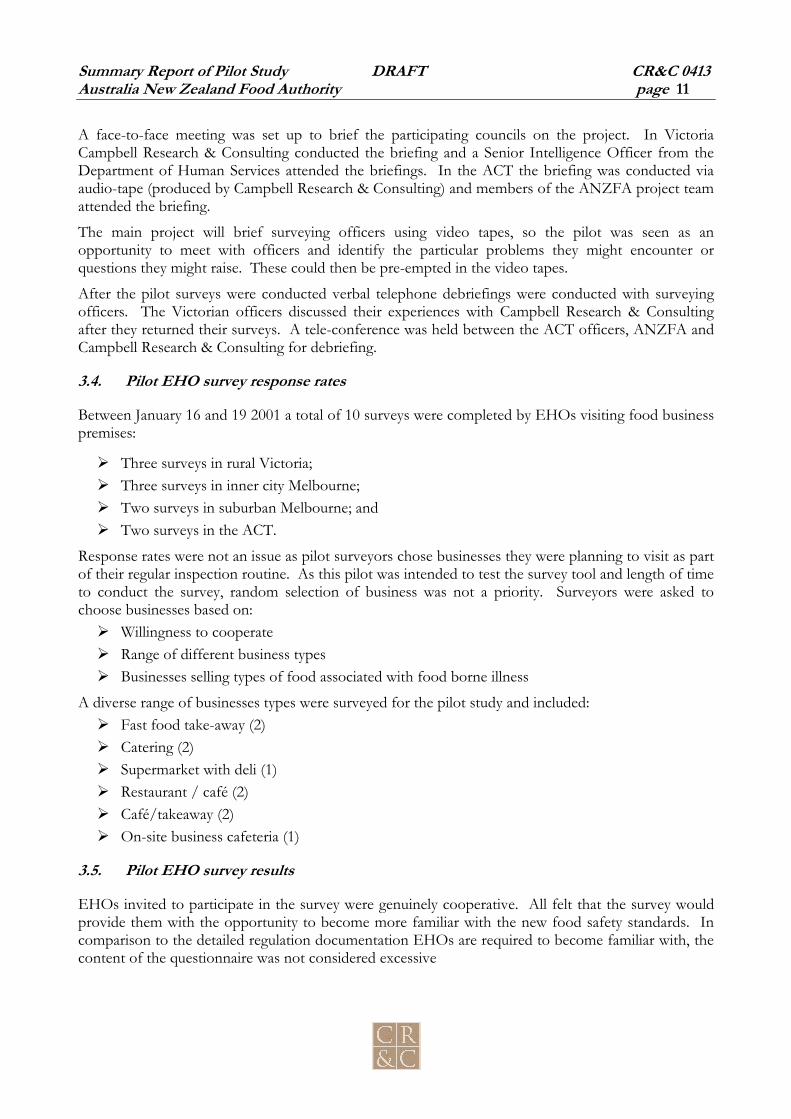
Summary Report of Pilot Study DRAFT CR&C 0413Australia New Zealand Food Authority page 11
A face-to-face meeting was set up to brief the participating councils on the project. In VictoriaCampbell Research & Consulting conducted the briefing and a Senior Intelligence Officer from theDepartment of Human Services attended the briefings. In the ACT the briefing was conducted viaaudio-tape (produced by Campbell Research & Consulting) and members of the ANZFA project teamattended the briefing.
The main project will brief surveying officers using video tapes, so the pilot was seen as anopportunity to meet with officers and identify the particular problems they might encounter orquestions they might raise. These could then be pre-empted in the video tapes.
After the pilot surveys were conducted verbal telephone debriefings were conducted with surveyingofficers. The Victorian officers discussed their experiences with Campbell Research & Consultingafter they returned their surveys. A tele-conference was held between the ACT officers, ANZFA andCampbell Research & Consulting for debriefing.
3.4. Pilot EHO survey response rates
Between January 16 and 19 2001 a total of 10 surveys were completed by EHOs visiting food businesspremises:
Three surveys in rural Victoria; Three surveys in inner city Melbourne; Two surveys in suburban Melbourne; and Two surveys in the ACT.
Response rates were not an issue as pilot surveyors chose businesses they were planning to visit as partof their regular inspection routine. As this pilot was intended to test the survey tool and length of timeto conduct the survey, random selection of business was not a priority. Surveyors were asked tochoose businesses based on:
Willingness to cooperate Range of different business types Businesses selling types of food associated with food borne illness
A diverse range of businesses types were surveyed for the pilot study and included: Fast food take-away (2) Catering (2) Supermarket with deli (1) Restaurant / café (2) Café/takeaway (2) On-site business cafeteria (1)
3.5. Pilot EHO survey results
EHOs invited to participate in the survey were genuinely cooperative. All felt that the survey wouldprovide them with the opportunity to become more familiar with the new food safety standards. Incomparison to the detailed regulation documentation EHOs are required to become familiar with, thecontent of the questionnaire was not considered excessive

Summary Report of Pilot Study DRAFT CR&C 0413Australia New Zealand Food Authority page 12
3.5.1. Objective 1: Briefing procedures
EHOs have been asked to undertake the survey due to the level of specialist knowledge required forassessing food handling practices. The goal of the briefing is to clarify specific issues to surveyingofficers so they view the questions similarly. Asking EHOs and food safety inspectors to conduct thesurveys involved relating three primary messages including:
Instructions on surveying techniques rather than ‘inspecting techniques’; Instructions on observing handling practices by the businesses rather than concentratingovermuch on the design and construction of the premises; and
Not engaging the business as to whether observed practices were contrary to either the currentregulations or the food safety standards.
Briefing procedures for the full-scale project are intended to include a video tape briefing session alongwith extensive notes. The purpose of the pilot briefing sessions was to extract as much informationfrom the EHOs in order to construct a useful, and extensive briefing video tape.
Campbell Research & Consulting briefed the Victorian EHOs in person. Thus allowing extensivediscussion of specific details of the research process and intention of questions. It was useful to meetthe EHOs to better understand the barriers they would face in the field.
Based on the face-to-face briefings in Victoria, Campbell Research & consulting created an audio tapefor the EHOs in the ACT. This was a test of the type of information, clarity of distance instructionand length of time needed for recording.
Feedback from both types of briefing will be utilised for the final video preparation for use across allsurveying LGAs.
The primary issues raised when briefing EHOs are outlined in Table 4 below.

Summary Report of Pilot Study DRAFT CR&C 0413Australia New Zealand Food Authority page 13
Table 4: Briefing the EHOsIssue / question Problem ResolutionAssessing importance
of reading throughall questions on thesurvey form.
There were mixed reactions from EHOs whencommencing the process of reading througheach question. EHOs expressed that they werefamiliar with most of the issues they expected tobe covered on the survey, often rushing throughthe first few questions.
However, once more ‘difficult’ or less familiarissues were raised the EHOs began toappreciate the necessity of running throughindividual questions.
At the beginning of the briefing it isimportant to state that most of thequestions, or at least an overview of eachsection on the survey will be covered inthe briefing. An explanation of thepurpose of this should be stressed due tothe variation of laws / regulations acrossstates / territories.
In addition, it is important to state thatissues unique to the new standards will bepointed out.
Businesses may refuseto participate.
EHOs may be inclined to utilise their inspectionauthority to gain entrance to food premises
The voluntary nature of the survey must bestressed to the business. An informationsheet, directed to the business, about thepurpose of the study is to be given to thebusiness at the start of the survey.
3.5.2. Objectives 2 - 4: Clarity, flow and organisation, ease of response, and measuring the issues
Assessment of the questions in the survey was not to evaluate the relevance of the questions, butrather the appropriateness of the questions under the surveying conditions within the field. That is,piloting officers evaluated the form in terms of:
Clarity of questions and methods of assessment required; Relevance of some questions and possible duplication; Whether information needed to complete the questions could be obtained within a reasonabletime frame;
Organisation of the questions and logical flow within and between sections; and Length of time to undertake the survey.
It is important that the surveying officers feel satisfied with the question design in order to gainmaximum cooperation and ensure surveyors see the value in the research. EHOs involved in the pilotstudy agreed questions contained in the survey were relevant to obtaining a good understanding of thenew food safety standards.
Of particular note, the survey was structured to be completed by the surveying EHO based onobservations of the premises. When observations could not be made, such as procedures notoccurring during the surveying period, surveyors are to ask someone at the business for a response tothe question. The person they ask the question of should be senior, and someone responsible for foodhandling tasks, or supervising staff responsible for food handling. The survey form should then becompleted by circling ‘yes’ or ‘no’, as well as ‘not observed’ (See copy of the EHO survey in AppendixB).
Generally EHOs found the survey clear to understand. Detailed suggestions for change andimprovement are outlined in Table 5 and the issues can be broadly summarised as:
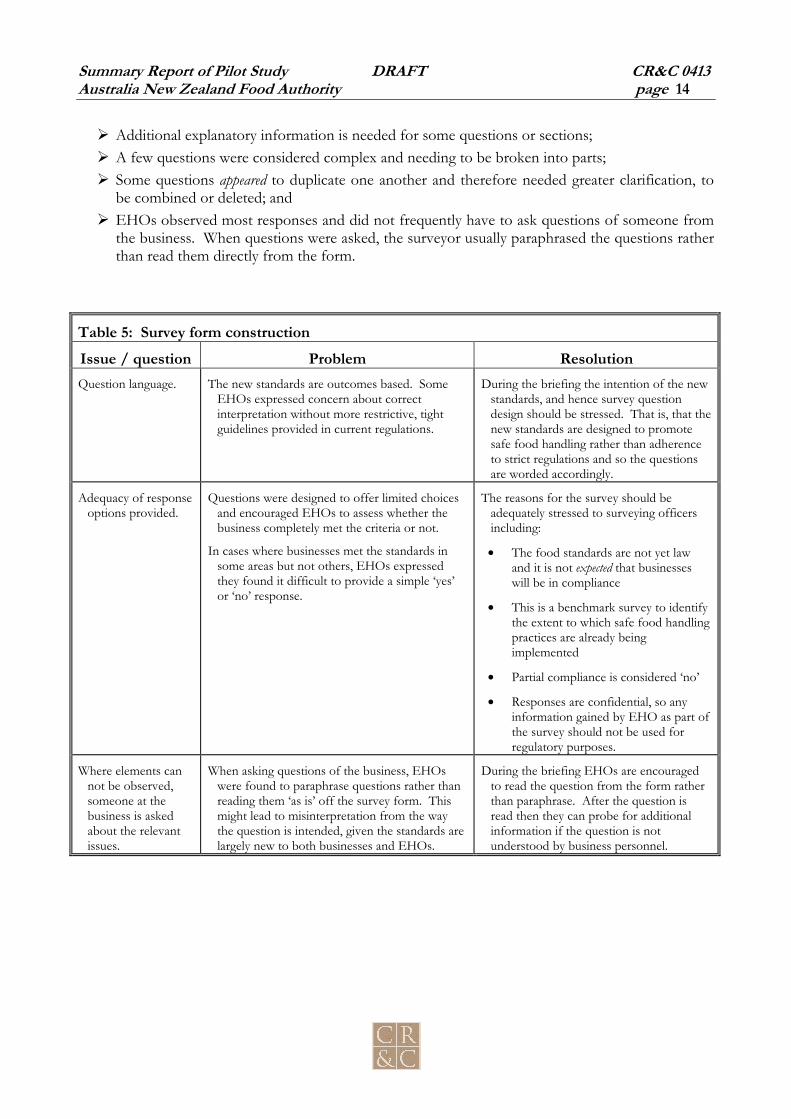
Summary Report of Pilot Study DRAFT CR&C 0413Australia New Zealand Food Authority page 14
Additional explanatory information is needed for some questions or sections; A few questions were considered complex and needing to be broken into parts; Some questions appeared to duplicate one another and therefore needed greater clarification, tobe combined or deleted; and
EHOs observed most responses and did not frequently have to ask questions of someone fromthe business. When questions were asked, the surveyor usually paraphrased the questions ratherthan read them directly from the form.
Table 5: Survey form constructionIssue / question Problem ResolutionQuestion language. The new standards are outcomes based. Some
EHOs expressed concern about correctinterpretation without more restrictive, tightguidelines provided in current regulations.
During the briefing the intention of the newstandards, and hence survey questiondesign should be stressed. That is, that thenew standards are designed to promotesafe food handling rather than adherenceto strict regulations and so the questionsare worded accordingly.
Adequacy of responseoptions provided.
Questions were designed to offer limited choicesand encouraged EHOs to assess whether thebusiness completely met the criteria or not.
In cases where businesses met the standards insome areas but not others, EHOs expressedthey found it difficult to provide a simple ‘yes’or ‘no’ response.
The reasons for the survey should beadequately stressed to surveying officersincluding:
• The food standards are not yet lawand it is not expected that businesseswill be in compliance
• This is a benchmark survey to identifythe extent to which safe food handlingpractices are already beingimplemented
• Partial compliance is considered ‘no’
• Responses are confidential, so anyinformation gained by EHO as part ofthe survey should not be used forregulatory purposes.
Where elements cannot be observed,someone at thebusiness is askedabout the relevantissues.
When asking questions of the business, EHOswere found to paraphrase questions rather thanreading them ‘as is’ off the survey form. Thismight lead to misinterpretation from the waythe question is intended, given the standards arelargely new to both businesses and EHOs.
During the briefing EHOs are encouragedto read the question from the form ratherthan paraphrase. After the question isread then they can probe for additionalinformation if the question is notunderstood by business personnel.

Summary Report of Pilot Study DRAFT CR&C 0413Australia New Zealand Food Authority page 15
Table 5: Survey form construction (cont’d)Issue / question Problem ResolutionResponses to
elements that arenot observed shouldbe circled as ‘yes’ or‘no’ as well as thecolumn ‘ notobserved’.
When ‘not observed’ was utilised, some officersdid not also circle ‘yes’ or ‘no’.
The importance of this instruction will beemphasised during the briefing.
Question order. 1. The order of the questions on the form doesnot necessarily match the order in whichEHOs complete the form. EHOs arefamiliar with inspecting premises in their ownway, and hence they may find they areskipping around questions, which may makeit difficult to complete.
2. EHOs requested notes of which questions to‘skip’ if appropriate. For example, if answer‘yes’ then skip to another question.
1. Given that EHOs will have individualstyles of inspecting premises, it wouldbe not be possible to design a surveycompatible with all EHOs. In addition,design of different business premisesmay influence what order questions arecompleted.
The issue should be raised during thebriefing, and EHOs encouraged tofamiliarise themselves with the sequenceof the form prior to conducting thesurvey. This way they can better locatethe questions they need as they areinspecting the premises.
2. Question ‘skips’ were inserted whereappropriate.
Understanding ofquestion, what wasbeing measured, andthe method ofmeasurement.
In some areas, EHOs were unsure of criteriaagainst which to assess adequacy for thepurposes of the survey.
While a great deal of explanatory information wasprovided within most questions on the survey,in some cases it was deemed insufficient, and inother cases it was not easily read by thesurveyors while in the field.
First, the survey form was re-evaluated foralternative formatting options to betterseparate the explanatory notes from thequestions. This allows EHOs to easilyidentify the question, then if it is not clearthey can read the explanatory notes.
Second, where additional explanatoryinformation was requested, it wasprovided.
• Original questions needing additionalexplanatory information included 15,20, 28 69, 71, 83, 91.
• Original questions needed clarificationincluded 12, 16, 29, 46, 68, 87. (cksamitising is here)

Summary Report of Pilot Study DRAFT CR&C 0413Australia New Zealand Food Authority page 16
Table 5: Survey form construction (cont’d)Issue / question Problem ResolutionDuplication of
questions.EHOs identified some questions they felt referred
to issues they had already covered.Assessment was made about whether they
question was phrased appropriately todifferentiate itself from others, or it wasdeleted.
• Original questions affected included 3,5, 8, 80, 81.
• “Skips’ were inserted so officers couldskip unnecessary questions dependingon previous responses.
Complexity ofquestions.
Some businesses were structured so that multipleelements had to be assessed through a singlequestion on the survey. These issues wereunable to be responded to in a single question.
Other questions combined elements that becametoo difficult to measure together when in thefield.
Assessment was made about whichquestions could be split into multiple shortquestions. Overall, the number ofquestions on the form is increased,however the speed of response is alsoincreased because of the greater simplicity.
• Original questions affected included 1,12, 28, 37, 41
Industry or areaspecific questions.
In very limited cases, a few issues deemedimportant to EHOs were identified as not beingcovered by the survey. For example, in areasnot utilising city regulated water supplies thesurvey does not ask about the purity of thewater.
ANZFA is to assess the overall usefulnessand appropriateness of includingadditional questions.
3.5.3. Objective 5: Length of the survey
The survey was developed with the aim of being conducted within 30 minutes. However when placedin the field, surveys took an average of one hour to complete, and ranged from 45 minutes to two anda half hours.
The increased length of survey time was in part due to lack of familiarity with the form. It wasincreased when there was also a lack of familiarity with the business, or when visiting complexbusinesses. For example, within larger premises where there were multiple food handling areas (egsupermarket with deli, butcher and bakery), the survey could take over two hours.
EHOs considered a one hour survey acceptable and would not mind a few longer visits whennecessary, as long as this did not occur with every survey. The general feedback was that surveyingofficers preferred to have a longer survey with more issues covered, as opposed to a shorter surveyform. It was on this basis that a decision was made to refine questions but not concentrate onshortening the survey.
It will be important to inform EHOs about the amount of time that they will need to undertake thesurveys - especially for the first few surveys.

Summary Report of Pilot Study DRAFT CR&C 0413Australia New Zealand Food Authority page 17
3.5.4. Objective 6: Response issues
During the pilot surveys, EHOs did not encounter any problems with business refusal to participate.In part this was due to the objective of the pilot to test the survey itself rather than consentprocedures. For the pilot, EHOs were instructed to approach businesses they were on good termswith or felt would be interested in the survey. When the main survey rolls out Campbell Research &Consulting will supply a random list of business names for surveying to the LGA. There are twoprimary issues EHOs will face that may affect response rates:
Obtaining informed consent to enter the business (may be affected by language barrier); and Responding to breaches of food safety regulations identified during the survey.
Informed consent to enter the business
Food businesses have a legal obligation to allow EHOs to be admitted into their premises forinspection purposes, however these powers cannot be used for this survey. While no issues aroseduring the pilot study, obtaining informed consent, for the purpose of the survey, from the proprietoror manager before entering the business will need to be emphasised during the briefing.
EHOs were provided with a letter explaining the purpose of the survey to give to someone at thebusiness prior to undertaking the survey (Appendix C). EHOs reported that this letter assisted themwith obtaining cooperation. EHOs also reported that most businesses want to comply with safe foodhandling practices but often are confused about what is involved and worried costs associated mightbe high.
Responding to breaches of food safety regulations identified during the survey
EHOs and other food safety officers are required to report any breaches of food safety they encounterwithin a food business. However it is important to the current project that businesses volunteer toparticipate without fear of implication. This is especially important because the survey covers areas offood safety handling that are not yet law.
Campbell Research & Consulting discussed this issue with EHOs during the pilot briefing and asked ifsurveying officers could deal with issues they were required to report after the survey was completed.EHOs did not see a problem with this approach and thought they could discuss the problem with thebusiness and suggest a return visit at a later date.
Summary Report of Pilot Study DRAFT CR&C 0413Australia New Zealand Food Authority page 18
4. Summary of issues addressed during the pilot phaseThe importance of piloting surveys is highlighted through identification of issues that were not clearuntil the surveys were used in the field.
As issues were raised, as discussed above, they were dealt with throughout the pilot period until thesurvey tools became free flowing. A summary of the issues raised and resolved with each of the twosurveys is included below.
4.1. Telephone interviews
Redesigning the critical first few questions to quickly classify business type and excludeinappropriate businesses;
Identifying appropriate skips of questions irrelevant to the type of businesses being surveyed;and
Identifying issues important to review during the briefing of interviewers for the projectincluding:
− Screening businesses and specific types of businesses for exclusion− Definitions of common terminology− Clarifying both questions and responses where respondents were finding it difficult
to answer
4.2. EHO surveys
Ensuring EHOs were comfortable completing areas of the survey covering food handlingpractices that had not yet become law;
Instructing EHOs to utilise their knowledge of safe food handling to assess the business, ratherthan strict adherence to regulations and laws;
− Instructing EHOs on methods of conducting a survey as opposed to an inspection; Ensuring businesses participate through informed consent; and Adjusting the survey form so that is was easy to read and respond to during a visit to thebusiness:
− Providing adequate explanation of terminology and methods of measuringunfamiliar elements
− Clear instructions on methods of utilising the response options− Adequate questions to cover the areas of issue
5. Approval by the Australian Bureau of StatisticsBoth surveys have been adjusted in accordance with the above mentioned changes. Approval fromthe Australian Bureau of Statistics Clearing House has been granted to proceed. The approval numberfor the telephone questionnaire is: 00611 – 01 and the approval number for EHO questionnaire is:00621 – 01.

Summary Report of Pilot Study DRAFT CR&C 0413Australia New Zealand Food Authority page 19
Appendix A: CATI Interview Form

Summary Report of Pilot Study DRAFT CR&C 0413Australia New Zealand Food Authority page 20
Appendix B: EHO Survey Form
Summary Report of Pilot Study DRAFT CR&C 0413Australia New Zealand Food Authority page 21
Appendix C: Information for businesses participating in theEHO survey

CAMPBELL RESEARCH & CONSULTING PTY LTD ACN 073 813 144 ABN 29 073 813 144SUITE 2, 45 WATKINS STREET, NORTH FITZROY, VICTORIA 3068 PO BOX 441, CLIFTON HILL, VICTORIA 3068
PHONE (03) 9482 4216 FAX (03) 9482 6799 [email protected]
Table 1: List of food business classifications to be included in the CATI sample
Categories
General Food– Suppliers, Manufacturers & Retail
Food &/Or General Store Supplies
Food &/Or General Stores
Food Brokers &/Or Agents
Supermarkets & Grocery Stores
Grocers – Wholesale
Food Products – Manufacturers And Processors
Health Foods & Products – Wholesalers & Manufacturers
Health Foods & Products – Retail
Coffee – Retail
Coffee – Wholesale
Frozen Foods – Wholesalers And Manufacturers
Frozen Foods – Retail
Canners
Dairy Products – Wholesale &/Or Manufactures
Dairies
Cheese & Cheese Products
Confectionery – Retail
Confectionery – Wholesalers &/Or Manufacturers
Cider – Manufacturers &/Or Distributors
Breweries
Drinking Water Supplies & Accessories
Spring Water Supplies & Accessories
Soft Drink Manufacturers &/or Distributors
Bakers & Pastry Cooks’ Supplies
Bakers
Doughnuts – Equipment &/Or Supplies
Pies, Pasties & Sausage Rolls Wholesalers &/Or Manufacturers
Jams & Preserves – Wholesalers &/Or Manufacturers
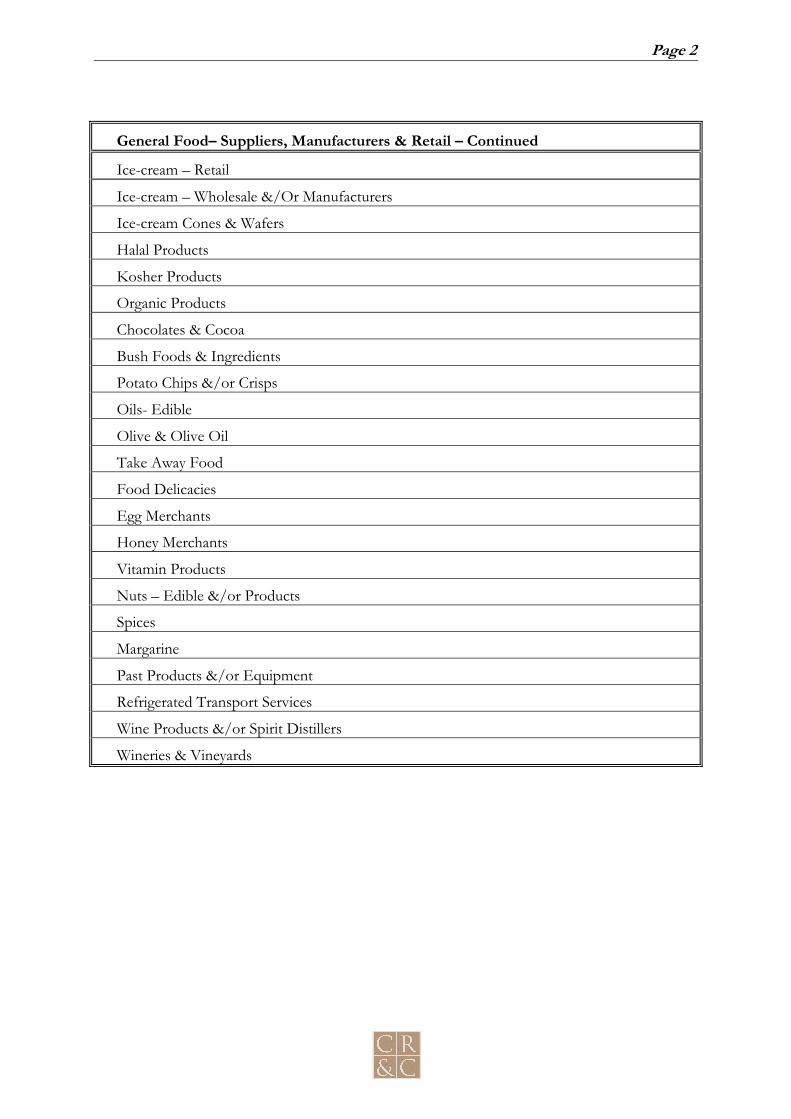
Page 2
General Food– Suppliers, Manufacturers & Retail – Continued
Ice-cream – Retail
Ice-cream – Wholesale &/Or Manufacturers
Ice-cream Cones & Wafers
Halal Products
Kosher Products
Organic Products
Chocolates & Cocoa
Bush Foods & Ingredients
Potato Chips &/or Crisps
Oils- Edible
Olive & Olive Oil
Take Away Food
Food Delicacies
Egg Merchants
Honey Merchants
Vitamin Products
Nuts – Edible &/or Products
Spices
Margarine
Past Products &/or Equipment
Refrigerated Transport Services
Wine Products &/or Spirit Distillers
Wineries & Vineyards

Page 3
Fruit, Vegetables & Grain
Fruit, Vegetables &/Or Grain Exporters
Fruit &/Or Berry Growers
Fruit Juice Merchants &/Or Processors
Fruit & Vegetable Packing &/Or Packs
Fruit & Vegetables – Wholesale
Fruit & Vegetables – Retail
Dried &/Or Glace Fruits
Grain & Produce – Wholesale
Rice Millers
Mushroom &/or Spawn Suppliers
Herbs
Meat And Seafood:
Meat Exporting &/Or Packing
Butchers – Retail
Butchers – Wholesale
Ham & Bacon Curers
Small Goods Wholesalers & Manufacturers
Game Farmers &.or Dealers
Fish & Seafood Production &/Or Processing
Fish & Seafoods – Retail
Fish & Seafoods – Wholesale
Poultry Farmers & Dealers
Poultry – Retail
Poultry Processing & Supplies
Oyster Suppliers &/Or Farmers

Page 4
Restaurants, Cafes And Catering:
Restaurants
Cafes
Delicatessens
Theatre Restaurants
Cake & Pastry Shops
Catering – Functions
Catering – Industrial & Commercial
Catering & Food Consultants
Hotels, Accommodation & Clubs
Clubs – Social & General
Clubs – Senior Citizens
Golf Clubs
Hotels
Motels
Holidays & Resorts
Health Holidays & Retreats
Bed & Breakfast Accommodation
Guest Houses
Guesthouses / Bed & Breakfast
Night Clubs & Discotheques
Wine Bars
Hospitals/Child Care Centres/Homes:
Homes & Hostels
Homes – Special Accommodation
Hospitals – Private
Hospitals – Public
Babies & Children’s Homes
Child Care Centres
Kindergartens &/Or Pre-schools
Nursing Homes
Residential Villages
Retirement Communities & Homes
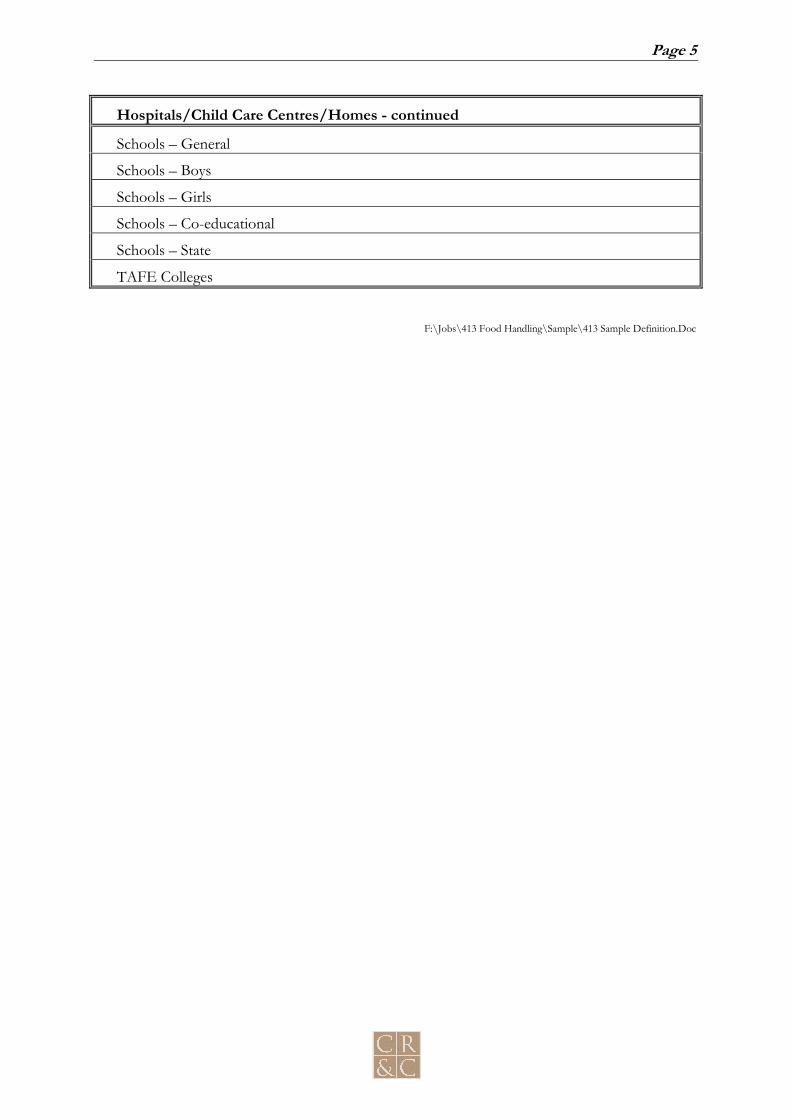
Page 5
Hospitals/Child Care Centres/Homes - continued
Schools – General
Schools – Boys
Schools – Girls
Schools – Co-educational
Schools – State
TAFE Colleges
F:\Jobs\413 Food Handling\Sample\413 Sample Definition.Doc
Related Documents


