Welcome message from author
This document is posted to help you gain knowledge. Please leave a comment to let me know what you think about it! Share it to your friends and learn new things together.
Transcript


2
Kenyan consumers acquire LPG kits to switch from biomass to LPG cooking
Photo credit: GLPGP
Kenyan women gather wood for cooking

Clean Cooking for Africa National Feasibility Study: LPG for Clean Cooking in Kenya
3
Citation
GLPGP (2019). National Feasibility Assessment: LPG for Clean Cooking in Kenya. New York: The Global LPG Partnership.

Clean Cooking for Africa National Feasibility Study: LPG for Clean Cooking in Kenya
4
Editorial Note: About the time frames used in this report
The analyses, findings and recommendations in this report address the timeframe 2019-2030. From the
vantage point of October 2019, given that there is the probability that all the steps set forth in this
Feasibility Study to be taken in 2019 and the immediate following years will not be accomplished on such a
timely basis, and that this might jeopardize the achievement of the projected LPG penetration rate and
usage volumes for household cooking by 2030, it would be worthwhile for the reader to consider the 2019-
2030 target years of activity to be Years 1-12.

Clean Cooking for Africa National Feasibility Study: LPG for Clean Cooking in Kenya
5
Contents
List of Tables ...................................................................................................................................................... 7 List of Figures .................................................................................................................................................... 9 Acknowledgements ......................................................................................................................................... 10 Glossary and Abbreviations ............................................................................................................................. 11 I. Introduction ....................................................................................................................................... 16 II. Executive Summary ............................................................................................................................ 19 III. LPG and the Clean Cooking Problem .................................................................................................. 31
1. The Clean Cooking Problem ............................................................................................................ 31 2. Clean Cooking for Africa Program Overview ................................................................................... 32 3. The Role of LPG ............................................................................................................................... 33
IV. A History of the LPG Sector and Government LPG Actions in Kenya ................................................. 38 V. LPG Enabling Environment ................................................................................................................. 44
4. Models of National LPG Systems .................................................................................................... 44 5. Conditions and Consequences of the BCRM LPG Market Model ................................................... 46 6. Critical Deviations from BCRM in Kenya and Planned Reforms ...................................................... 48 7. Kenya Market Model Scorecard ...................................................................................................... 52 8. Regulatory Agencies ........................................................................................................................ 55 9. Complementary Policy Initiatives ................................................................................................... 57 10. Pricing ............................................................................................................................................. 59 11. National LPG Planning Process 2012-2019 ..................................................................................... 67
VI. LPG Demand Potential to 2030 .......................................................................................................... 69 12. Demand Assessment ....................................................................................................................... 70 13. Qualitative Factors in the Geography of Future LPG Demand ...................................................... 103
VII. LPG Supply Chain Development and Planning ................................................................................. 110 14. The Value Chain and its Transition ................................................................................................ 110
VIII. Cylinder Investment to 2030 ............................................................................................................ 125 15. Investment at the Sector Level ..................................................................................................... 127 16. Investments at the Firm Level ....................................................................................................... 141
IX. Financing the Investments ............................................................................................................... 155 17. Financial and Investment Environment ........................................................................................ 155 18. Consumer Empowerment ............................................................................................................. 161 19. Investment Plan Overview ............................................................................................................ 171 20. Summary of Main Project Risks, Mitigations and Mitigation Sources .......................................... 193
X. Environmental, Health, Social and Economic Impact Potential ....................................................... 204 21. Detailed Impact Analysis and Findings ......................................................................................... 209
XI. Monitoring and Evaluation Framework ........................................................................................... 229 22. M&E Goals and Context ................................................................................................................ 230 23. ISLE Indicators for Monitoring and Evaluation .............................................................................. 234 24. ISLE Indicators Compiled ............................................................................................................... 242 25. Impact Evaluation of LPG Uptake for Household Cooking ............................................................ 259
XII. Recommendations for Further Action, Technical Assistance and Research..................................... 269 XIII. Annexes ............................................................................................................................................ 271
26. Detailed Methodology – Demographic Matching Demand Analysis ............................................ 271 27. Impact Assessment Calculations and Methodology ..................................................................... 273 28. Impact Assessment Data Sources and Values ............................................................................... 275 29. Profiles and Statistics of LPG Sector Actors in Kenya .................................................................... 283 30. Industry Data: Filling Plants and Bulk Transport .......................................................................... 289 31. LPG-Related Laws and Regulations ............................................................................................... 293 32. Conditions and Consequences of the CCCM LPG Market Model ................................................. 294 33. Note Regarding LPG Accounting Treatments ................................................................................ 296 34. Note Regarding Long-Term LPG Pricing and Availability ............................................................... 297

Clean Cooking for Africa National Feasibility Study: LPG for Clean Cooking in Kenya
6
35. About the NIHR CLEAN-AIR (Africa) Global Health Research Group ............................................. 298 36. About the Global LPG Partnership ................................................................................................ 299 37. Disclaimer and Safe-Harbor Statement ........................................................................................ 300

Clean Cooking for Africa National Feasibility Study: LPG for Clean Cooking in Kenya
7
List of Tables
Table 1. Capital investment requirements to 2030 for LPG sector scale-up ................................................... 21 Table 2. Key investment program characteristics and assumptions ............................................................... 27 Table 3. LPG national market model and structure scorecard: Kenya to the present .................................... 52 Table 4. LPG national market model and structure scorecard: Kenya under revised LN 121 ........................ 53 Table 5. Current and anticipated supply chain oversight matrix ..................................................................... 56 Table 6. Price structure modalities .................................................................................................................. 59 Table 7. Average annual LPG per capita consumption among LPG users (2016) ............................................ 78 Table 8. Total self-reported cylinders in household use, by cylinder size (2016) ............................................ 79 Table 9. Total self-reported cylinders possessed by households (2016) ......................................................... 80 Table 10. Summary of baseline LPG consumption in Kenya in 2016 ............................................................... 81 Table 11. Summary of reported end-user prices of LPG, charcoal, kerosene and firewood (2016) ............... 82 Table 12. Summary of retailer prices for LPG, charcoal, kerosene and firewood (2018) ................................ 82 Table 13. Data summary for relative cost of cooking analysis ........................................................................ 82 Table 14. Average marginal cost of cooking per household per day and year across different fuels ............. 83 Table 15. Amortized average cost of cooking per household across different fuels ....................................... 84 Table 16. Effect of demographic analysis on residential LPG consumption, 2016-2030 ................................. 89 Table 17. Impact of sufficiency of LPG availability on household LPG demand .............................................. 92 Table 18. LPG demand by households not currently using LPG, from equipment affordability measures ..... 94 Table 19. Estimated residential LPG demand, lower-bound scenario, by demand driver (2020-2030) ......... 95 Table 20. Estimated total LPG demand, upper-bound scenario, by demand driver (2020-2030) .................. 95 Table 21. Import volumes by source (2018) .................................................................................................. 117 Table 22. Non-AGOL LPG storage at the port of Mombasa ........................................................................... 118 Table 23. LPG Marketer self-reported volumes and associated market shares (7/2017-6/2018) ................ 119 Table 24. Count and capacities of storage/filling facilities by geographic location (2018) ........................... 120 Table 25. Planned inland storage and filing facilities .................................................................................... 123 Table 26. Filling network capacity utilization (2018) ..................................................................................... 123 Table 27. Bulk truck utilization (2018) ........................................................................................................... 124 Table 28. Capital investment requirement to 2030 for LPG sector scale-up ................................................. 125 Table 29. Estimated LPG consumption by county (2018) .............................................................................. 130 Table 30. Estimated residential consumption volumes and penetration (lower-bound) by county in 2030 131 Table 31. New cylinders required to serve 2030 demand, nationally and by county ................................... 132 Table 32. Summary of investment to 2030, by asset type ........................................................................... 135 Table 33. Total cylinder investment required to 2030 ................................................................................... 138 Table 34. Quantities of new cylinders and cages to 2030 ............................................................................. 140 Table 35. Composite LPG Marketer with cylinder investment: pro-forma financial data ............................ 146 Table 36. Composite LPG Marketer with cylinder investment: debt coverage, FCF, TV and equity IRR ...... 148 Table 37. Composite LPG Marketer with cylinder investment: IRR and debt service sensitivity ................. 149 Table 38. Composite LPG Marketer with cylinder investment: financial sensitivity to piracy ..................... 149 Table 39. PAYG LPG Marketer with cylinder/smartvalve investment: IRR and debt service sensitivity ....... 153 Table 40. Summary of LPG microfinance program status by country .......................................................... 161 Table 41. Overall target capitalization of LPG investment projects ............................................................... 173 Table 42. Capital investment requirements to 2030 for LPG sector scale-up ............................................... 174 Table 43. Summary of environment and climate impacts ............................................................................. 211 Table 44. Reduction in annual and cumulative CO2eq emissions.................................................................. 214 Table 45. Reduction in annual and cumulative BCeq emissions ................................................................... 215 Table 46. Summary of health benefits .......................................................................................................... 218 Table 47. DALYs that can be saved ................................................................................................................. 219 Table 48. Economic value of HAP-related deaths averted and DALYs saved ................................................. 221 Table 49. Cost savings per year from increased LPG consumption ............................................................... 224 Table 50. Summary of annual macro-economic impacts .............................................................................. 225 Table 51. Outline of impact categories for population projected to transition to LPG ................................. 259

Clean Cooking for Africa National Feasibility Study: LPG for Clean Cooking in Kenya
8
Table 52. Summary price of fuels in Kenya.................................................................................................... 271 Table 53. Relative price of LPG to other fuels ............................................................................................... 271 Table 54. OLS regression results .................................................................................................................... 272 Table 55. Average stove emissions factors for laboratory or simulated kitchen measurements .................. 275 Table 56. Identified studies measuring LPG exposure or kitchen concentration in Sub-Saharan Africa....... 278 Table 57. Cylinder market shares of active Kenyan LPG companies (2017) .................................................. 283 Table 58. Filling plant capacities and rotation rates by licensed company (2018) ........................................ 289 Table 59. Bulk LPG transport fleets by licensed company (2018) ................................................................. 290
ISLE TABLE 1: ISLE Indicators of LPG adoption and use ................................................................................. 243 ISLE TABLE 2: ISLE Indicators of LPG supply chain expansion and safety of the LPG market ........................ 247 ISLE TABLE 3: ISLE Safety indicators (occupational and household settings) ................................................ 257
Clean Cooking for Africa National Feasibility Study: LPG for Clean Cooking in Kenya
9
List of Figures
Figure 1. Average annual household cooking fuel cost with LPG, charcoal and firewood .............................. 20 Figure 2. Key characteristics of LPG, natural gas and electricity solutions ...................................................... 33 Figure 3. Comparative LPG adoption and use vs GDP in selected countries, by market model ..................... 45 Figure 4. Comparison of Kenya market model scorecard results – at present and post LN 121 reform......... 54 Figure 5. Current LPG price structure .............................................................................................................. 61 Figure 6. Prospective LPG price formula (OTS with revised margins) ............................................................. 64 Figure 7. Primary cooking fuel use in Kenyan households (2016) ................................................................... 74 Figure 8. Historical primary cooking fuel use in Kenyan households (2003-2016) ......................................... 74 Figure 9. Primary and secondary LPG use in Kenyan households in 2016 ...................................................... 75 Figure 10. Incidence of LPG stacking with other fuels in Kenyan households in 2016 ................................... 75 Figure 11. Maps of LPG use for cooking in 2016 ............................................................................................. 77 Figure 12. Average marginal cost of cooking per household per year across different fuels ......................... 83 Figure 13. Amortized average cost per day of cooking per household across different fuels ........................ 84 Figure 14. Scenarios of actual and forecasted residential LPG demand in Kenya (2016-2030) ...................... 86 Figure 15. LPG demand projection approach .................................................................................................. 89 Figure 16. Percentage of households using LPG by 2030, by demand driver ................................................. 97 Figure 17. Maps of scenarios of projected LPG demand in 2030 .................................................................... 98 Figure 18. Heat-map of Kenyan poverty, county by county (2013) ............................................................... 104 Figure 19. LPG penetration vs. GPD per capita ............................................................................................. 105 Figure 20. LPG penetration vs. households above the poverty line, by county ............................................ 106 Figure 21. LPG penetration vs. cellphone use, by county ............................................................................. 107 Figure 22. LPG penetration vs. television ownership, by county .................................................................. 107 Figure 23. LPG penetration vs. county population density ........................................................................... 108 Figure 24. LPG penetration in 2016 and in 2030 vs. television ownership in 2016, by county ..................... 109 Figure 25. Generalized LPG value chain (BCRM) ........................................................................................... 110 Figure 26. Generalized LPG value chain (BCRM) with operational flows ...................................................... 112 Figure 27. Existing Kenya LPG value chain ..................................................................................................... 112 Figure 28. Supply chain operational diagram showing the Cylinder Exchange Pool ..................................... 115 Figure 29. How pirate refillers break supply chain integrity and siphon away brand income ...................... 116 Figure 30. How pirate refillers divert distribution and retailing networks .................................................... 116 Figure 31. LPG Marketers by market share (7/2017-6/2018) ....................................................................... 119 Figure 32. Capacity map of Kenya filling/storage facilities (2018) ................................................................ 120 Figure 33. Map of Mwananchi Gas Project geographic coverage plan ......................................................... 121 Figure 34. Projected growth in LPG user populations by county (2030) ....................................................... 134 Figure 35. Examples of cylinder cages ........................................................................................................... 140 Figure 36. Composite LPG Marketer with cylinder investment: financial performance .............................. 144 Figure 37. Kenya NFCS Debt and Bank Credit to NFCS 2006-2016 ................................................................ 159 Figure 38. Top countries for blended capital financings (2018) .................................................................... 185 Figure 39. Large providers of risk mitigation products, by category ............................................................. 202 Figure 40. The number of trees used and trees saved per year.................................................................... 212 Figure 41. HAP-related deaths per year and deaths averted per year .......................................................... 220 Figure 42. HAP-related DALYs per year and DALYs saved per year ................................................................ 220 Figure 43. Average annual household cooking fuel cost with LPG, charcoal and firewood .......................... 223

Clean Cooking for Africa National Feasibility Study: LPG for Clean Cooking in Kenya
10
Acknowledgements
The two organizations whose financial cooperation and related support made this report possible are the
European Union through its Infrastructure Trust Fund, and the German development bank KfW, which has
acted as the primary financial underwriter and funds administrator for the Clean Cooking for Africa
Program.
Supplemental contributions of resources, particularly with respect to LPG microfinance projects in the
partnering countries, were gratefully obtained from the OPEC Fund for International Development and the
Clif Bar Foundation.
Important cooperation and information were gratefully obtained from the Kenya Ministry of Energy and
Petroleum, the Energy & Petroleum Regulatory Authority, the Kenya Ports Authority, the Petroleum
Institute of East Africa, and other Kenyan state agencies and public sector and private sector organizations
as referenced throughout this report.
The report reflects the combined advisory and planning work of a uniquely-qualified, exceptional,
multidisciplinary expert team over approximately 16 months. Its key members include: Mr Renzo Bee (LPG
market and industrial development, regulation), Mr Gilles Bruneval (LPG engineering and infrastructure
planning), Mr Derek Saleeby (blended finance), Mr Robert O’Brien (financial research), Ms Elizabeth
Muchiri (in-country coordination, research and microfinance), Dr Elisa Puzzolo (research methodologies,
monitoring and evaluation), Dr Nicole Rudner (editor) and the consultancy Dalberg Global Development
Advisors (demand and impacts assessments), with managerial support from Ms Meixi Gan, Mr John Hauge
and Mr Alex Evans of the Global LPG Partnership.
Innumerable other organizations and individuals inside and outside Kenya also contributed to this report,
regrettably too many to list individually here. Thanks and gratitude are given to all who contributed
knowledge, data, scrutiny, criticism, suggestions, resources and efforts from desks and in the field.
Wherever applicable, these contributions are cited throughout the body of this report.
Clean Cooking for Africa National Feasibility Study: LPG for Clean Cooking in Kenya
11
Glossary and Abbreviations
AfDB African Development Bank
AGOL Africa Gas and Oil Ltd. (a unit of MJ Group) Primary LPG importer in Kenya
BC Black Carbon
BCRM Branded Cylinder Recirculation Model Best-practice model for the structuring and regulation of LPG markets for growth, safety and bankability
1
CBK Central Bank of Kenya
CBR Central Bank of Kenya Reference Rate
CCA Clean Cooking Alliance (formerly, the Global Alliance for Clean Cookstoves)
CCCM Consumer-Controlled Cylinder Model
CDM Clean Development Mechanism
CEP Cylinder Exchange Pool
CMA Kenya Capital Markets Authority Securities and exchange regulator of Kenya
CO Carbon Monoxide
CO2 Carbon Dioxide
CRM See BCRM
DALYs Disability-Adjusted Life Years
DHS Demographic and Health Survey
DFI Development Finance Institution
EDA Energy Dealers Association An association of small-scale LPG distributors in Kenya
ERC See EPRA
EPRA Energy & Petroleum Regulatory Authority (formerly, the Energy Regulatory Commission)
EU-ITF European Union Infrastructure Trust Fund Primary source of financial cooperation funds supporting the Clean Cooking for Africa Program
FNGO Financial Non-Governmental Organization
fNRB Fraction of Non-renewable Biomass
GACC See CCA
GBD Global Burden of Disease
1 See www.wlpga.org/wp-content/uploads/2015/09/wlpga-guidelines-for-the-development-of-sustainable-lp-gas-markets.pdf

Clean Cooking for Africa National Feasibility Study: LPG for Clean Cooking in Kenya
12
GHG Greenhouse Gases
GLPGP The Global LPG Partnership The Project Execution Agency for the Clean Cooking for Africa Program
GS Gold Standard
GWP Global Warming Potential
HAP Household Air Pollution
HH Households
IAQG Indoor Air Quality Guidelines (defined by the World Health Organization)
IFI International Financial Institution
Institutional capital Pension funds, sovereign wealth funds, foundations, large family offices, DFIs, IFIs, MDBs, banks and proprietary capital
ISLE Indicators of Sustainable LPG Expansion
KfW KfW Development Bank Administrator of the EU-ITF financial cooperation funds supporting the Clean Cooking for Africa Program
kge or kgeq Kilogram-equivalent A measure used in expressing weighted-average cylinder sizes
KIHBS Kenya Integrated Household Budget Survey
KPA Kenya Ports Authority
KPC Kenya Pipeline Company
KPRL Kenya Petroleum Refineries Ltd.
KT Kilotonnes
LMICs Low and Middle Income Countries
LMC or LPGMC LPG Marketing Company
LPG Liquefied Petroleum Gas LPG is comprised of propane (C3H8), butane (C4H10), or a blend of both. LPG combusts to give heat with near-zero emissions. LPG is a gas when unpressurized and becomes a liquid under modest pressure across a wide range of temperatures. LPG is created as a by-product of oil and gas production and oil refining
LPGMC See LMC
M&E Monitoring and Evaluation
MDB Multilateral Development Bank
MICS Multiple Indicator Cluster Surveys
MFI Microfinance Institution
MJd Megajoules Delivered to a cooking pot
MoE Ministry of Energy and Petroleum
MoH Ministry of Health
MT Metric tonnes

Clean Cooking for Africa National Feasibility Study: LPG for Clean Cooking in Kenya
13
NAMA Nationally Appropriate Mitigation Action Climate change mitigation measures proposed by developing country governments to reduce emissions below 2020 business-as-usual levels and to contribute to domestic sustainable development, as called for in the Bali Action Plan of the UN Climate Change Conference of the Parties
NASI Nairobi All Shares Index Stock index of the Nairobi Stock Exchange (NSE)
NG Natural Gas Natural gas is comprised primarily of methane (CH4) and may contain fractional quantities of other gases such as LPG
NGLs Natural Gas Liquids Components of natural gas other than methane, which may be separated and handled distinctly from natural gas. LPG is a type of NGL
NIHR National Institute of Health Research
N2O Nitrous Oxide
NOCK National Oil Corporation of Kenya
NSE Nairobi Stock Exchange
OC Organic Carbon
OMC Oil Marketing Company
PAYG Pay-as-you-go
PDC Private and Development Capital
PIEA Petroleum Institute of East Africa
PM2.5 Particulate Matter of a diameter of up to 2.5 micrometres
PRG Partial Risk Guarantee
Quasi-equity Convertible debt, convertible securities, revenue shares, warrants
SDG United Nations Sustainable Development Goals See www.un.org/sustainabledevelopment/sustainable-development-goals
SEforAll Sustainable Energy for All UN-affiliated organization responsible to assist countries in achieving Sustainable Development Goal 7 (universal access to clean, modern energy)
SGS Société Générale de Surveillance A Swiss-domiciled international company in inspection and certification services
SSA Sub-Saharan Africa
TNMOC Total Non-Methane Organic Compounds
UN United Nations
Unit margin The profit to a seller from the sale price of (revenue from) one unit of a product less the variable costs associated with that product
USD United States Dollars
WHO World Health Organization

Clean Cooking for Africa National Feasibility Study: LPG for Clean Cooking in Kenya
14
WLPGA The World LPG Association The international trade association for the LPG industry

15
Cooking smoke-free for the public with a basic LPG burner and cylinder
Photo credit: GLPGP
Clean Cooking for Africa National Feasibility Study: LPG for Clean Cooking in Kenya
16
LPG and the vast, deadly, environmentally destructive “clean cooking problem”
2.8 billion people across the developing world have no access to clean, modern energy for their main
energy-consuming task: cooking. They rely instead on solid fuels like wood and charcoal, or on kerosene.
Their reliance on solid fuels causes millions of premature deaths each year, causes large-scale loss of
health, significantly harms forests, retards economic development and contributes to climate change. In
this report, this reliance, together with its severe, negative consequences, are called the Clean Cooking
Problem.
Addressing this 2.8-billion-person challenge became one of the pillars of United Nations Sustainable
Development Goal 7 (SDG7). It is also a stated policy priority of the governments of over 20 low- and
middle-income countries (LMICs), together representing one quarter of the world’s population.
The International Energy Agency, in its World Energy Outlook 2017, reported that if universal energy access
for cooking is to be achieved by 2030, it will be achieved for 1.4 billion of these 2.8 billion persons through
access to, and use of, LPG. That is, LPG would become the solution to the Clean Cooking Problem for,
potentially, half the world, over at least the next 12 years.
What is LPG?
Briefly, LPG is a gas with very high energy content, similar to natural gas, that can be transported very
efficiently in small, sturdy bottles, called cylinders, for combustion by consumers to create heat. LPG is
often called “cooking gas” in developing countries, where cooking is its primary use. Chemically, LPG is
comprised of the gases propane or butane, or a mix of the two. Approximately 2 billion people worldwide
are LPG users today, according to the World LPG Association, an international trade body.
The Clean Cooking for Africa Program
Supported by a grant from the European Union Infrastructure Trust Fund and administered by German
development bank KfW, the Global LPG Partnership undertook to address in detail the question of how
feasible and scalable LPG could be as a clean cooking energy solution in three partnering African countries,
and how such scale-up could be effectively carried out and financed across the full LPG value-chain.
These three countries are Kenya, Ghana and Cameroon.
Collectively, this multi-country effort is called the Clean Cooking for Africa Program. The program further
contemplates, where properly justified, to direct appropriate resources for implementing national-scale
LPG solutions.
The purpose of this report
This report, part of a series of five, examines the feasibility and potential role and scale of LPG as a major
clean cooking energy solution for Kenya through 2030. It also estimates the range of beneficial social,
Clean Cooking for Africa National Feasibility Study: LPG for Clean Cooking in Kenya
17
environmental and economic impacts potentially realized from deploying an LPG solution at scale in Kenya
through 2030.
The Government of Kenya has set a national policy goal of at least 35% of the population using LPG for
cooking by 2030, up from 20% in 2016.
The Clean Cooking for Africa report series also seeks to contribute meaningfully to the global evidence base
that informs energy-development debate and decision-making for addressing SDG7 and the Clean Cooking
Problem, and to highlight areas for follow-on research to strengthen the evidence base yet more.
Reliable data about LPG sectors and consumers in the LMICs is not yet plentiful. However, enough data
existed or were created through fieldwork to make a feasibility assessment possible in the three partner
countries. The sources of data and of assumptions used are referenced throughout this report to allow
interested readers to examine further and confirm for themselves the soundness of the report’s findings
and conclusions and the reasonableness of its recommendations.
For whom this report is written
This report is intended to provide evidence, analysis, guidance and recommendations to five main
categories of reader:
Policymakers and governmental agencies;
LPG industry participants, in particular those operating in Kenya;
Public sector and private sector investors;
Other stakeholders in the clean cooking and LPG sectors with respect to Kenya; and
The global research community.
The report attempts to balance the needs and interests of all five audiences.
Beyond 2030
The Clean Cooking for Africa Program limits its time horizon to 2030, on the premise that the LPG solution
is likely to be transitional. If the answer to the question of whether LPG is a viable, large-scale, rapidly
deployable, and overall socio-economically beneficial and environmentally and climate-benign solution to
the Clean Cooking Problem in many, or most, countries is yes through at least 2030, then LPG is at a
minimum a bridge to a fully renewable, clean, modern and effective cooking-energy solution that may
emerge in the future. With the entry into commercial markets of meaningful, competitively priced
quantities of bio-LPG during 2018, the lifespan of investments in LPG-based solutions for clean cooking may
well extend far beyond 2030.

Clean Cooking for Africa National Feasibility Study: LPG for Clean Cooking in Kenya
18
Inve
stm
ent
nee
d
Eco
no
mic
val
ue
o
f av
erte
d
GH
G e
mis
sio
ns
€ 0 € 200 € 400 € 600 € 800 € 1,000 Millions

Clean Cooking for Africa National Feasibility Study: LPG for Clean Cooking in Kenya
19
The Government of Kenya has set a policy goal of 35% of the population using LPG for cooking by 2030.
The main reasons are to reduce pressure on Kenya’s forests from use of unsustainably harvested wood fuels
and production of charcoal for cooking; to make substantial progress toward Sustainable Development Goal
7 (universal access to clean, modern energy); and to improve the lives of Kenya’s people and accelerate
Kenya’s development.
As of 2018, the most recent year with sufficiently reliable household fuel use data, approximately 20% of
Kenya’s population used LPG for cooking.
This report reviews Kenya’s progress, issues, and planning toward its policy goal; assesses under what
conditions and to what extent LPG expansion is most likely to be achieved; and presents a roadmap for
completing the enabling environment for, structuring the financing of, and specifying the implementation
of the essential investment project—over € 100 million to finance approximately 7 million new LPG
cylinders to 2030—to serve Kenya’s potential demand for LPG.
Demand
A key finding is that a significant portion of the LPG demand quantity in Kenya is supply-constrained by an
insufficient inventory of safely circulating cylinders. This is true of many Sub-Saharan African LPG markets
which have not yet reached a mature and sustainable stage. This indicates that LPG adoption can be
expanded significantly by increasing LPG availability to new consumers. A second key finding is that
additional measures, such as improved affordability and consumer education, would have additive effects
on both adoption and usage.
A detailed modelling of demand potential in Kenya indicates that the demand potential among candidate
households could reach between 38-41% of all households by 2030, if supply were unconstrained and
essential market reforms, investments and interventions made. These factors are discussed in more detail
in Part VI of this report.
The corresponding growth in residential LPG consumption would be in the range of 1.8X to 2.6X of the
2018 level, rising from approximately 213 KT in 2018 to between 392 KT and 550 KT in 2030.
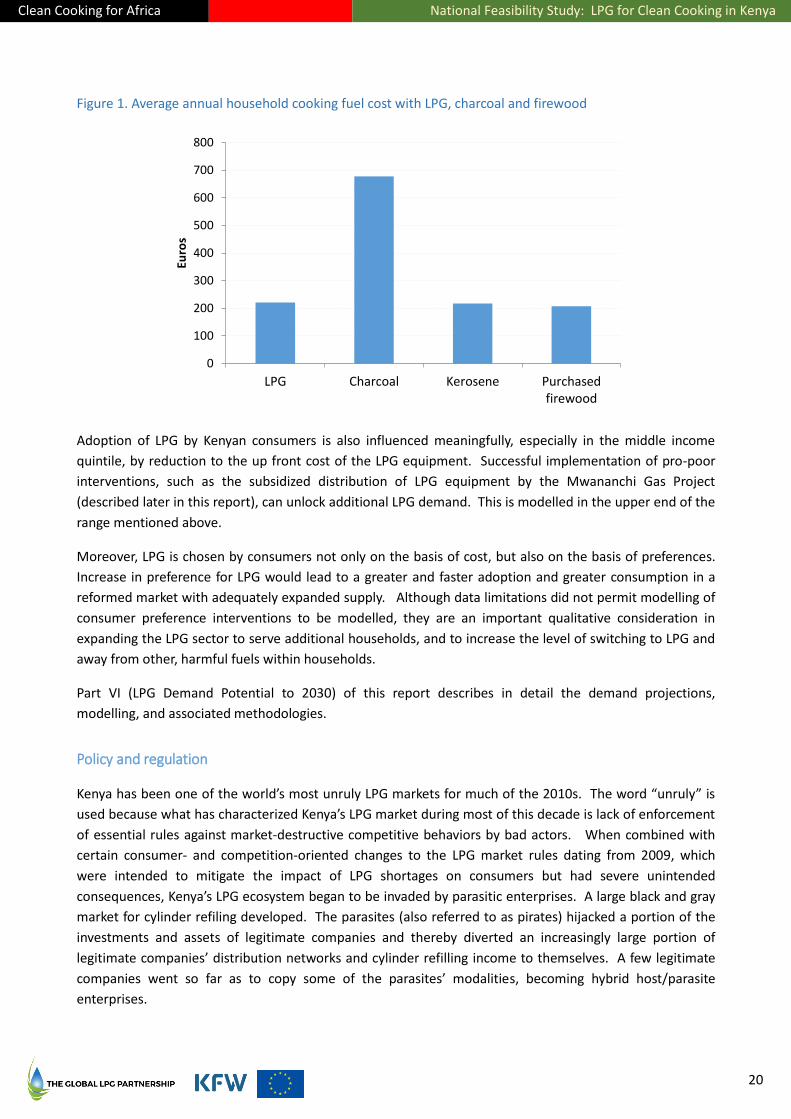
An examination of fuel costs and consumption data in representative locations throughout Kenya showed
that LPG competes favorably on a cost-per-meal basis with charcoal, kerosene and purchased firewood, on
average:
Clean Cooking for Africa National Feasibility Study: LPG for Clean Cooking in Kenya
20
Figure 1. Average annual household cooking fuel cost with LPG, charcoal and firewood
Adoption of LPG by Kenyan consumers is also influenced meaningfully, especially in the middle income
quintile, by reduction to the up front cost of the LPG equipment. Successful implementation of pro-poor
interventions, such as the subsidized distribution of LPG equipment by the Mwananchi Gas Project
(described later in this report), can unlock additional LPG demand. This is modelled in the upper end of the
range mentioned above.
Moreover, LPG is chosen by consumers not only on the basis of cost, but also on the basis of preferences.
Increase in preference for LPG would lead to a greater and faster adoption and greater consumption in a
reformed market with adequately expanded supply. Although data limitations did not permit modelling of
consumer preference interventions to be modelled, they are an important qualitative consideration in
expanding the LPG sector to serve additional households, and to increase the level of switching to LPG and
away from other, harmful fuels within households.
Part VI (LPG Demand Potential to 2030) of this report describes in detail the demand projections,
modelling, and associated methodologies.
Policy and regulation
Kenya has been one of the world’s most unruly LPG markets for much of the 2010s. The word “unruly” is
used because what has characterized Kenya’s LPG market during most of this decade is lack of enforcement
of essential rules against market-destructive competitive behaviors by bad actors. When combined with
certain consumer- and competition-oriented changes to the LPG market rules dating from 2009, which
were intended to mitigate the impact of LPG shortages on consumers but had severe unintended
consequences, Kenya’s LPG ecosystem began to be invaded by parasitic enterprises. A large black and gray
market for cylinder refiling developed. The parasites (also referred to as pirates) hijacked a portion of the
investments and assets of legitimate companies and thereby diverted an increasingly large portion of
legitimate companies’ distribution networks and cylinder refilling income to themselves. A few legitimate
companies went so far as to copy some of the parasites’ modalities, becoming hybrid host/parasite
enterprises.
0
100
200
300
400
500
600
700
800
LPG Charcoal Kerosene Purchasedfirewood
Euro
s

Clean Cooking for Africa National Feasibility Study: LPG for Clean Cooking in Kenya
21
Following several years of consultations with key stakeholders, local and international partners including
the Global LPG Partnership, and LPG policymakers, the Government determined in 2014 to update the
fundamental petroleum sector law governing LPG, called Legal Notice 121 (LN 1212), in order to address the
widespread stakeholder concerns about the unintended consequences of the market rules in effect and
their historically weak enforcement.
The LN 121 update was finalized in 2018 and, as of the date of this writing, pends official gazetting. After
gazetting, its changes will be implemented over a six-month transitional period, notionally to conclude by
year-end 2019. Except where otherwise noted, this report assumes that the revised LN 121 will be enacted
and put into effect by then, thereby making investments in LPG expansion more tenable—but with an
associated risk premium until Kenya creates a track record of effective enforcement (that is, Kenyan
authorities demonstrate that they will not overlook bad actors who, for example, might use corrupt
measures to try to avoid enforcement and prosecution).
Part V (LPG Enabling Environment) of this report discusses the nature and status of the policy and
regulatory reforms of LN 121, the rationale for these reforms, and anticipated consequences for safety,
supply availability, affordability, and bankability and growth financing for the LPG sector.
This is the critical risk for successful scale-up of LPG in Kenya for the medium and long term: having
sufficient, sustained rigor in legal and regulatory enforcement that, in consequence, would keep the
black/gray LPG market from continuing to impact negatively, and significantly, the safety of LPG cylinders
for all who handle them and the profitability of the legitimate, safety-compliant LPG companies. Before
any major program of strategic investments is undertaken, successful, demonstrated Government action
regarding the enabling environment, of which the reformed LN 121 will be a key pillar, is an essential
prerequisite.
Investments
Kenya has enough spare supply chain infrastructure capacity (importation, storage and filling) to serve all
demand scenarios to 2030, but the country has far too few LPG cylinders in circulation today to serve the
projected demand.
The total cylinder investment required to serve the projected demand, using the lower-bound demand
projection, is estimated at € 107 million to 2030. If consumption growth is greater than the lower-bound, a
corresponding increase in the total investment would be required.
Table 1. Capital investment requirements to 2030 for LPG sector scale-up
Category Existing Capacity Adequate to
Serve 2030 Demand Capital Requirement
(mm Euro)
Cylinders No € 106.6
Cylinder cages No € 6.0
Bottling plants and storage Yes N/A
Terminal facilities Yes N/A
Transportation assets Yes N/A
Total € 112.6
2 See kenyalaw.org/kl/index.php?id=709
Clean Cooking for Africa National Feasibility Study: LPG for Clean Cooking in Kenya
22
As is the case in all LPG markets worldwide, the key asset for LPG market expansion is the inventory of
cylinders, without which there can be no growth in residential LPG users.
However, the situation in Kenya is quite different from the situation in the other current focus countries of
the Clean Cooking for Africa Program with respect to non-cylinder LPG infrastructure. This reflects the fact
that Kenyan businesses have historically been able to finance LPG projects involving fixed infrastructure
assets (in certain cases, with the involvement of the Government) using their own balance sheets and/or
through access to private sector capital—perhaps accessed too easily, given the level of overcapacity in the
sector. Significantly, anecdotal evidence provided by numerous LPG small-and-medium-enterprise (SME)
companies active in Kenya indicates that much of the equity capital that is raised for their LPG projects is
raised through personal and family networks.
The twin issues of (i) access to, and costs and terms of, capital for cylinders, and (ii) illegal cross-filling of
cylinders and theft of cylinders by pirate operators, have been widely cited by Kenyan private sector LPG
executives as the core constraints on growth. Thus, cylinder inventory has expanded to date largely
through balance sheet-driven self-financing, with businesses tolerating the risk of, and managing to the
consequences of, pirate operators intervening in their cylinder recirculation networks.
The limited growth of cylinder inventory in Kenya has been further constrained by structural distribution
issues that affect private sector capacity to invest in cylinders. Key among these structural issues is the
national Cylinder Exchange Pool mechanism created by the LPG law and regulation enacted in 2009. As
mentioned above, that law and regulation are only now being reformed, with the first revision in ten years
to be put into effect by the end of 2019.
The aggregate cylinder investment of € 107 million could be largely self-financed from the cylinder deposit
payments made by consumers, as long as total new cylinder acquisition costs and total new cylinder
deposits remain in approximate balance year over year. A single initial tranche of external capital would
enable enough cylinder investment among participating LPG Marketers to start a cycle of deployments and
deposit collections that could, in principle, be self-perpetuating for as long as the market continues to
create new customers.
When the key leading indicator of market saturation used by the LPG industry, the cylinder rotation rate,
begins to trend downward, further investments made on a commercial basis would be slowed or stopped in
order to meet the financial return requirements of investors. Any further expansion of the value chain
would then depend on additive incentivizing measures put in place for industry and/or for consumers.
The scale of LPG investment and adoption deemed feasible by this report aligns with the Government’s
policy goal of 35% of the population using LPG by 2030. A measure of safety for achieving that goal can be
provided through preference-stimulating measures, such as affordability measures as well as consumer
educational measures. (True affordability means both adequate LPG cooking-solution economics for
consumers and adequate consumer understanding of those economics.) While such measures are outlined
later in this report, it was beyond its scope to detail them in depth.
It should be noted that the Government has funded and implemented a program (the Mwananchi Gas
Project) to deploy over 3-5 years at least 3 million3 small LPG cylinders at a subsidized cost to poorer
3 Initial project goals were 4.8 million 6kg cylinders deployed; this target was later scaled back to 3 million.
Clean Cooking for Africa National Feasibility Study: LPG for Clean Cooking in Kenya
23
Kenyans who are not otherwise served by the Kenyan LPG industry today. The Project is being
implemented by the National Oil Corporation of Kenya (NOCK). The program went live—and was then
paused—during 2018. If all the cylinders intended for deployment by that project were to create new,
ongoing LPG users, the governmental goal of 35% LPG adoption by 2030 would certainly be met when
combined with a business-as-usual growth rate for the rest of the LPG sector. However, initial results
indicate that the yield of new users from deployment of Mwananchi Gas cylinders was approximately 25%,
suggesting a maximum of 750,000 new users being created through that project as presently sized.
Given that the Government elected to address LPG adoption among poorer, more rural households through
the state-funded Mwananchi project, which does not involve the private sector, the investment aspects of
this report focus on private sector scale-up.
Part VII (LPG Supply Chain Development and Planning) of this report discusses private sector supply chain
development in detail.
Gross vs. net investment requirement
There are two main ways in which the total cylinder financing requirement would be less than the total
capital expenditure requirement.
The first way is for LPG Marketers to borrow internally against the cylinder deposits obtained from their
end-customers. In practice, the cylinder deposit amount in Kenya has been at or above 100% of the cost of
the cylinder to its Marketer. The deposit funds provided by the customers are, in principle, a liability of the
Marketer, to be returned to the consumer when s/he cancels service and returns the cylinder to the
Marketer. In practice, Marketers redeploy most or all of the consumer deposit funds internally. This makes
the consumer, in effect, a major financing source for Marketers. As modelled and discussed in Chapter 16
(beginning on page 141), this causes the net amount needed for cylinder financing to be closer to 13% of
the capital cost of the cylinders than 100%.
In practice, the financing requirement for cylinders will fall somewhere between the hypothetical net (a
floor value4) of approximately € 14 million (with zero piracy losses)5 and the gross of € 107 million.
The second way is for funding sources to re-invest their returned capital into later investment tranches after
recovering it from earlier tranches. This is mainly relevant for debt providers. It is not possible to estimate
in advance the extent to which the funders participating in a first tranche will participate equally in a later
tranche. However, to the extent that capital can be recycled across tranches, the total capital committed
will be a smaller quantum than if fresh capital were invested in the second tranche. From a funder’s
perspective, this would mean considerably less capital at risk, even if the total amount on offer over the
two tranches would be the larger amount.
4 The amount to be financed can never be as small in practice as the hypothetical net value, because of timing differences in the
outgoing and incoming cashflows related to acquisition and deployment of cylinders and collection of deposits, and because of churn in the customer base and the need to maintain a deposit reserve against the churn. Additionally, an uneven rate of growth (such as an exponential rate of growth), as some individual Marketers have projected regarding themselves, would amplify these timing effects.
5 At a 10% piracy loss rate (an arbitrary target for the sector), the floor value increases to € 23 million. At the historical peak loss
rate of 30% loss rate cited by local industry leaders, the floor value would be € 41 million.
Clean Cooking for Africa National Feasibility Study: LPG for Clean Cooking in Kenya
24
For purposes of this report, a tranche is a portfolio of initial investments to create the cylinder acquisition,
deployment and deposit-collecting cycle with specific firms willing and qualified to participate, scaled to
the national demand potential and the sustainable growth rate of the specific firms. A later tranche (or
tranches) could represent a different portfolio of firms, or could represent some or all of the same firms in
order to accelerate their rate of growth beyond the self-sustaining level of the cylinder-and-deposits cycle.
Tactical vs. strategic investing in Kenya
The dual—and competing—public sector and private sector ambitions to unlock and serve additional LPG
demand in Kenya, in combination with the uncertainty about the vigor with which the main LPG sector
regulator will enforce the new market rules of LN 121 (and crack down effectively on LPG piracy in general),
and the near-monopoly position of its main, privately-held LPG import terminal, mean that a strategic,
sector-wide LPG investment program, as would be set forth in a comprehensive national LPG master plan,
would be highly risky under present conditions, with the odds of a transformative national success
unreasonably low.
For these (and other) reasons, it was determined not to develop a companion Kenya LPG Investment and
Implementation report as of yet. As the situation in Kenya evolves, this could be reconsidered.
Notwithstanding this caution, LPG and clean cooking investor groups seeking to become active in Kenya,
taking into account the risks as well as the opportunities described in this report, could consider smaller-
scale, tactical investing to develop positions and optionality in the Kenyan LPG market and to extract
learnings that can inform larger scale, more systematic investments at a later stage of sector maturity.
However, no investment should be made at any point in the value chain without good assurance of
adequate capacities throughout the rest of the chain, including adequate demand, to sustain the
contemplated project or business expansion until—and ideally well beyond—monetization of the
investment.
Financing
Three important considerations in the financial structuring and arranging for the required investments are
Selection of specific, willing LPG sector companies that are well positioned to lead national LPG
expansion efforts that, in succeeding, could motivate the rest of the LPG sector to expand similarly.
The capacity of such LPG sector companies to absorb and deploy capital. The aggregate free
cashflows existing, or potentially existing, in the relevant main supply chain nodes over time affect
the capacity of companies at that node to absorb and deploy capital, and thus the rate at which
growth can occur and be sustained.
The financial return, risk characteristics, and counterparty risk related to the cylinder investments.
Because cylinders are a mobile asset, financing sources may be less willing to provide financing for
their acquisition and, when doing so, may seek higher rates of return, shorter loan tenors or
investment monetization periods, and/or greater security (when debt instruments are used) in
order to offset the risk. This is particularly important in Kenya, where property rights in cylinders in
the last decade have been problematic to enforce well due to the extent of black market activity.

Clean Cooking for Africa National Feasibility Study: LPG for Clean Cooking in Kenya
25
Improving the quality of the Branded Cylinder Recirculation Model as Kenya practices and enforces
it will mitigate many of these risks.
Any financing solution must take these factors into account.
The Kenya domestic financial sector (including friends-and-family networks) has historically had the
capacity, but has not had the willingness, to finance Kenya’s LPG value chain expansion to the level
described in this report. Therefore, external capital must be attracted. Providers of such capital must be
willing to price the risk of potentially weak or uneven future enforcement of reformed regulations and
market rules by the Government, rather than reject LPG investments altogether as too risky. Based on
GLPGP/Clean Cooking for Africa discussions with capital providers active in Kenya, capital could indeed be
mobilized with certain risk-sharing or guarantee instruments employed, and/or with a level of risk
premium.
As previously mentioned, the Government has chosen not to contribute any direct fiscal support to the
private sector for LPG expansion apart from governmental funding of the NOCK-executed Mwananchi Gas
Project and elimination of VAT on LPG fuel.
To assess the financing requirement in detail, five leading LPG companies which provided business
information on a voluntary, confidential basis were aggregated/averaged to create a generalized
representation of the private sector LPG actors interested to deploy outside capital to scale-up to serve the
projected future LPG demand. The investment need for the entire sector (excluding Mwananchi Gas) was
therefore calculated in two parts: (i) investment according to the metrics and projections of these five
companies (bounded by the growth rates of the lower and upper bound demand forecasts), and (ii) the
investment gap to be met by the remainder of the sector to serve the lower bound of the demand forecast
to 2030, after these five companies’ projected volumes are taken into account.
The recommended financing approach reflects 75% debt and 25% equity financing for cylinders, with the
debt calculated at a 10.2% interest rate (including a 280bp premium related to the regulatory enforcement
risk) and the equity at a target minimum 20% internal rate of return (IRR) in order to be attractive to both
domestic and international capital sources. (The investment model for the five companies in aggregate
predicts an equity IRR of 97%.) These financial estimates should be seen as indicative at this point in the
private sector planning process in Kenya.
A key role in creating capital affordability and mitigating risk can be played by concessional capital and risk-
mitigation products, such as from the global development system. Such capital may be deployed directly to
firms, semi-directly through intermediary special purpose financing vehicles, and/or indirectly through the
Kenya financial sector, as is most suitable for each concessional funding source.
Among consumers, there is vast potential to harness the mobile payments ecosystem in which Kenya is an
African leader. This potential is only starting to be tapped within the LPG sector. Consumer empowerment
activities, including in particular the microfinance pilot program for LPG consumer equipment launched
under the Clean Cooking for Africa program, represent an upside for unlocking additional LPG demand.
Part IX (Financing) of this report describes sectoral investment in cylinders from a financing and investing
perspective, discusses the financing issues, main risks and mitigations, and the most viable financial
structuring alternatives for the investments, including the role for blended capital, and presents findings to
date regarding consumer empowerment from LPG microfinance and other LPG business innovations.
Clean Cooking for Africa National Feasibility Study: LPG for Clean Cooking in Kenya
26
Staging of financing
As described in Part VII, the financing of major business expansions requires an initial, catalytic investment
that enables well-run LPG Marketers to acquire and deploy significant new inventory of cylinders, from
which the consumer deposits would be internally utilized to finance a follow-on wave of cylinders, the cycle
self-perpetuating year over year as long as the rate of absorption of the new cylinders by new customers
continues. The catalytic financing amount is estimated to be approximately € 14 million, if there were
universal participation from the Kenyan private sector. The consumer, therefore, becomes the financing
engine for the balance of approximately € 93 million, assuming that the historical Kenyan practice of
charging a consumer deposit amount equal to or greater than the cylinder cost continues unabated.
If the first five companies to volunteer interest and financial information for consideration by funding
sources are treated as a tranche, their investment need is about € 41 million, and the catalytic net financing
requirement is estimated at about € 5-6 million.
Certain important assumptions that affect the risk-reward characteristics and overall bankability of cylinder
investment in Kenya will become more certain over time, including: (i) effectiveness of ongoing
Governmental actions to improve the enabling environment, (ii) actual per-user LPG consumption levels
(that is, whether the consumption that develops tracks closer to the lower bound or to the upper bound of
the scenario projections of consumption volumes presented in this report), and (iii) for the longer term,
definition and completion of a second major LPG importation facility that would increase competitive
forces in that node of the supply chain and could support an evolution to an Open Tender System to further
drive down import pricing (see Chapter 10 beginning on page 59).
Major risks and mitigations
Chapter 20 of this Part discusses the major risks and means of mitigating them. Each main risk represents
an opportunity to improve the LPG ecosystem’s performance and bankability. Among the most important
are the following:
Political will to ensure effective enforcement of new national LPG regulations and rules, and to
eliminate (or reduce to a tolerable, non-destructive level) the black market in LPG;
Addressing bankability and financing challenges facing the private sector LPG Marketers in
attracting and deploying the initial capital for a sustained expansion of LPG cylinder inventories.
There is severe risk to the success of the cylinder-deployment/customer-deposit-financing cycle as long as
significant levels of pirate filling and black market retailing continue. While the Government and local
industry have made progress in addressing this issue, there is more still to be done, and they must continue
relentlessly to improve the environment for legitimate, compliant market players.
Investment program summary
The following table summarizes the key elements of the recommended investment program and its
assumptions.

Clean Cooking for Africa National Feasibility Study: LPG for Clean Cooking in Kenya
27
Table 2. Key investment program characteristics and assumptions
Total new user population to be served by 2030 17-19 million
Total capital investment requirement to 2030 € 113 million
Target leverage 75% notionally comprising 40% concessional, 35% non-concessional debt
New cylinders in circulation (6kgeq) 7.3 million
Major impacts to 2030 At least 2 billion trees saved
At least 216 million MT of CO2eq averted
At least 12,000 lives saved
Significant cost savings for households switching to LPG from charcoal and, in urban/periurban settings, from purchased firewood
Key assumptions At a minimum, the Government successfully enforces its reforms to the BCRM market model as enacted in the 2018 update to Legal Notice 121
The scale of black market and pirate filling activities is substantially reduced
End-user pricing of LPG fuel and equipment (including cylinder deposits) does not increase
Relative stability of long-term LPG commodity input price6
LPG can be made available over time, on a commercial basis, in underserved geographic areas (defined as those where LPG is already accessible within about 40 minutes of home by the user), but will not necessarily become commercially available where LPG has no presence today
7
Historical demographic and economic trends affecting household fuel purchasing behavior will continue in force
The Government’s Mwananchi Gas Project that aims to serve lower-income households through discounted LPG equipment will be restarted and achieve results in the range of 10-25% of its target households population, and will displace private sector LPG sales among those households
LPG asset costs will remain stable across the investment time horizon8
The Kenyan inflation rate and foreign exchange rates will not dramatically change
Adequate foreign currency supply will remain available to import LPG
6 The price of domestically produced and imported LPG is the same
7 This assumption is incorporated in the Feasibility Study demand scenario models and reflects that geographic areas with
effectively zero LPG penetration today are the areas which lack the necessary road networks for LPG distribution to occur, and/or lack an adequate cash economy to make LPG retailing viable there.
8 With respect to long term cost expectations for pay-as-you-go LPG smartvalves/smartmeters, see the Chapter 16 subsection
Pay-as-you-go Marketers beginning on page 150.

Clean Cooking for Africa National Feasibility Study: LPG for Clean Cooking in Kenya
28
Impacts
A key motivation of the Kenya Government to promote national LPG adoption and use; of the Global LPG
Partnership, the EU ITF and KfW to study, to assist, and potentially to direct resources to, Kenya’s LPG
transition and scale-up efforts; and of the global development community generally is to translate wisely
spent funds into demonstrated, significant social, environmental and economic impacts for the host
country.
This report examines scenarios of LPG market development through 2030 and estimates the expected
impacts from these against a business-as-usual case in the following categories. A lower-bound and upper-
bound scenario are shown here, covering the period 20209-2030:
Environmental:
Averted deforestation: 278 – 349 million trees saved annually relative to base case projections in
2030 and 2.0 – 2.7 billion trees cumulatively saved between 2020 and 2030
Carbon dioxide equivalent (CO2eq) emissions10 averted: 30 – 39 million MT of CO2eq emissions
reduced annually in 2030 and 216 – 311 million MT of CO2eq emissions averted cumulatively
between 2020 and 2030
Black Carbon equivalent (BCeq) emissions11 averted: 26 – 34 million MT of BCeq emissions averted
annually in 2030 and 187 – 276 million MT of BCeq emissions averted cumulatively between 2020
and 2030
The economic value of averted CO2eq emissions in terms of carbon financing: € 943 million –
€ 1.20 billion cumulatively between 2020 and 2030, using the 2018 prevailing price of carbon
Health:
Averted premature deaths: between 12,099 and 17,933 deaths could be averted cumulatively
between 2020 and 2030 due to increased LPG usage
Avoided Disability Adjusted Life Years (DALYs): 642,786 – 952,675 DALYs between 2020 and 2030
Value of labor time gained: € 33 million – € 48 million cumulatively between 2020 and 2030
Consumer economics:
Annual cost savings to consumers from switching to LPG from charcoal, purchased firewood and
kerosene: € 5 billion – € 6 billion as of 2030
9 For purposes of this analysis, it is assumed that LN 121, still pending as of this writing, will be put into effect by 2020, with
initial expansion investments also occurring in time to take effect in 2020. 10
CO2eq emissions include carbon dioxide equivalent emissions from carbon dioxide, methane, and nitrous oxide. These were calculated using IPCC conform standards.
11 BCeq emissions includes black carbon equivalent emissions from black carbon, organic carbon, carbon monoxide, and total
non-methane organic compounds.

Clean Cooking for Africa National Feasibility Study: LPG for Clean Cooking in Kenya
29
National economics:
Tax revenue (assuming no rate or law changes): Decrease of annual tax revenue of € 33 million –
€ 48 million as of 2030
Trade balance (assuming no rate or law changes): Increase of the trade deficit by Ksh 5 billion (€
44 million) and Ksh 8 billion (€ 71 million) as of 2030
Job creation: An unquantifiable increase in LPG sector jobs, but a loss of between 177,294 to
243,427 jobs (formal and informal) in the charcoal and woodfuel sectors as of 2030
Part X (Environmental, Health, Social and Economic Impact Potential) of this report describes in detail the
impact projections, modelling, and associated methodologies.
Monitoring and evaluation
Part XI (Monitoring and Evaluation ) of this report defines a set of indicators, called the ISLE indicators, for
tracking progress in Kenya’s LPG development and the social, environmental and economic impacts thereof.
This Part also provides current values for the indicators, where values were obtainable.
Recommendations
This report concludes with summary recommendations for further efforts (and corresponding resources) to
assist the Kenya Government and the Kenya private sector in further LPG planning; in preparation, financing
and implementation of key projects and business expansions; and for research efforts to strengthen the
evidence base regarding the proper role and potential of LPG as a clean cooking solution.
Conclusion
Kenya’s policy goal of achieving LPG use for cooking by 35% of its population by 2030, and delivering
meaningful social, environmental and development benefits to the country and its people, can be achieved
if (i) key reforms to the LPG market structure and regulation are well concluded and effectively
implemented and enforced and (ii) cylinder investments and deployments are carried out with capable and
bankable modalities and suitably designed financing structures. The target might be substantially exceeded
if, in addition, (iii) incentivizing measures to encourage LPG adoption and use, including consumer financial
empowerment measures and LPG affordability measures, are undertaken, and/or (iv) the yield on the
Government’s Mwananchi Gas Project, if relaunched, can be meaningfully improved.
For investments to be made with due prudence, a view must be taken by funding sources of the ability of
Kenyan authorities to adequately enforce Kenya’s new LPG regulatory regime in future, and this risk must
be properly priced and/or appropriately mitigated and managed (through financial mechanisms, through
transaction terms, and through sound business operations). This report provides a framework for funders
to form such a view.
Well-considered use of blended capital (private capital at market rates plus concessional capital, including
various risk-mitigation and guarantee products) can be important contributors to Kenya’s overall success, by
increasing access to capital generally, and to potentially more flexible capital more specifically. In addition,
the involvement of such capital providers can improve the formality of the investment process, by

Clean Cooking for Africa National Feasibility Study: LPG for Clean Cooking in Kenya
30
weighting the mobilization of capital toward professional, arms-length funding sources and away from
traditional self-financing or financing arranged via personal and family networks. This could increase the
scale and scope of funding opportunities and thereby the potential for businesses to expand.
Kenya’s liberalized LPG market (with respect to pricing) has made it practical for new entrants to attempt to
disrupt or expand the market using retooled cost structures or new business models. (Examples are
provided later in this report.) Among these are companies introducing a pay-as-you-go metered LPG
business model with LPG home-delivery service on a pilot-program basis. This approach—which in
principle represents a down-scaling of the metered utility service model used very successfully in the
residential LPG market in Japan—can provide operational advantages, consumer convenience, and
consumer cash management advantages. But this comes with an extremely large increase in capital
expenditure. The effect of this, given presently foreseeable economics, is that pay-as-you-go LPG
companies must choose between (i) achieving market-rate financial returns but sacrificing scale, and
(ii being price-competitive (on a per-kg basis) with the existing BCRM LPG distribution models in the market
in order to achieve better scale, but sacrificing the possibility to achieve market-rate financial returns. If
the choice is financial returns, the market potential is limited by the need to recover the vast capital outlays
through increases in pricing or through other user fees. If the choice is price-competition with existing
players, then financing to achieve scale would only be possible if done on a deeply concessional basis.
Clean Cooking for Africa National Feasibility Study: LPG for Clean Cooking in Kenya
31
1. The Clean Cooking Problem
The global community has recognized the central role of access to clean, modern energy for development
with the adoption of the 2030 Agenda for Sustainable Development by the United Nations in 2015.
With the second decade of the 21st Century nearly over, more than 3 billion people still suffer the harmful
and often fatal effects of cooking with solid fuels and kerosene. Household air pollution (HAP) caused by
burning these fuels far exceeds the safe levels defined in the World Health Organization (WHO) Indoor Air
Quality Guidelines (IAQG). According to WHO12, nearly 4 million people die prematurely each year from
these effects of HAP, and many more suffer from chronically worsened health. Recent evidence on the
relationships between HAP exposure and health risk indicates that levels of household particulate matter
must be reduced nearly to WHO guidelines levels if a large portion of this health burden is to be averted.
A major portion of the woodfuels and charcoal consumed for cooking purposes come from unsustainably
harvested biomass. This adds to already significant pressure on forest cover, in the form of increased
deforestation and forest degradation. Loss and degradation of forest cover may, in turn, weaken
agricultural productivity in adjacent land areas.
The pollutants from cooking with solid fuels also contribute to shorter-term climate warming through black
carbon and methane.
Obtaining and cooking with solid fuels is also more time consuming than obtaining and cooking with fuels
such as LPG, which are commercially obtainable (or are delivered to the home), provide “instant-on,
instant-off” heat energy for cooking, and require de minimis maintenance and cleaning of cooking
appliances and cooking areas.
In Sub-Saharan Africa (SSA), four of five people use wood fuel or charcoal as their main source of cooking
energy. In view of the rapid population growth in Africa (projected to more than double to 2.5 billion by
2050)13, the total number of solid fuel users will increase, together with all the associated negative health,
environmental and development consequences, unless urgent and effective action is taken.
In this context, a growing number of governments of countries in SSA and other regions have set ambitious
policy goals and plans for scaling up the use of liquefied petroleum gas (LPG) as a cooking fuel. Their
reasons include meeting the Sustainable Energy for All (SEforAll) goals and Sustainable Development Goal
(SDG) 7 of universal access to modern energy; improvements in public health from reduction of the health
burden from HAP caused by cooking with biomass and kerosene; improvements in quality of life for their
people; economic development; and forest protection.
All of these goals are applicable to Kenya.
12 WHO (2016). Burning Opportunity: Clean Household Energy for Health, Sustainable Development, and Wellbeing of Women
and Children Report. Geneva: World Health Organization. 13
United Nations, Department of Economic and Social Affairs, Population Division (2015). World Population Prospects: 2015 Revision, Key Findings and Advance Tables. Working Paper No. ESA/P/WP.241.
Clean Cooking for Africa National Feasibility Study: LPG for Clean Cooking in Kenya
32
2. Clean Cooking for Africa Program Overview
Government ministries and agencies and other relevant stakeholders in Kenya and in a number of other
countries have sought advice on the development of policies and investments required for enabling the
expansion of effective, safe, and sustainable markets for LPG cooking fuel.
For three in Sub-Saharan Africa, namely Kenya, Ghana and Cameroon, this support is being delivered
through the Clean Cooking for Africa Program of KfW, funded through the European Union–Infrastructure
Trust Fund and implemented by the Global LPG Partnership.
Countries seeking to achieve major transitions in household energy must respond to the needs, resources
and circumstances of their populations, which will vary markedly across urban and rural settings, by socio-
economic status, and over time. A variety of fuels and technologies may be required, with roles for both
modern fuels such as LPG and electricity, as well as improved biomass cooking technologies.
In recent years, LPG has been selected by a growing number of low and middle income country (LMIC)
governments to be the primary cooking fuel for expanded access to clean and modern energy for their
populations.
Kenya has undertaken major steps to improve policy, regulation and enforcement in the LPG sector from
the time it first joined the Global LPG Partnership as a partner country in 2012 through the time of this
writing. These steps, expected to conclude fully during 2019, should position Kenya to achieve major scale-
up of LPG adoption and use by its people, including a portion of its rural population, by 2030 as part of a
steady national transition to clean and modern energy for cooking for its people.
The Clean Cooking for Africa Program assists selected African partner countries in planning, financing and
executing national-scale transitions from the use of solid fuels and kerosene for cooking to clean, safe,
modern cooking using LPG. This assistance includes:
National planning processes, conducted in partnership with the partner-country governments and
relevant stakeholders, to create or enhance the enabling environment for successful, sustainable
LPG scale-up, and to plan and financially structure the required corresponding investments in LPG
infrastructure and distribution systems; and
Relevant studies to define and justify the proper role and scale for LPG as a national clean cooking
solution, whose findings may guide the planning of LPG transition.
This report reflects the results, through the date of its writing, of such planning and studies in Kenya.

Clean Cooking for Africa National Feasibility Study: LPG for Clean Cooking in Kenya
33
3. The Role of LPG
What is LPG?
According to the World LPG Association, LPG stands for “Liquefied Petroleum Gas”, whose acronym is
widely used to describe two prominent members of a family of light hydrocarbons called “Natural Gas
Liquids” (NGLs): propane (C3H8) and butane (C4H10), either individually or in a blend. While “liquefied gas”
may seem a self-contradiction, liquidity is the unique character of LPG that makes it a widely-used fuel. At
normal temperatures and pressure, LPG is gaseous. It changes to a liquid when subjected to modest
pressure or cooling. In liquid form, the tank pressure is about twice the pressure in a normal truck tire.
This makes LPG very safe when properly handled. LPG is a by-product of two large energy industries: the
processing of natural gas liquids and the refining of crude oil.
Thus, LPG is a supply-driven commodity. It must always be disposed of by its producers. Globally, the
market is cleared of surpluses by the petrochemical and plastics sector, which can use LPG as a feedstock.
Currently, a global surplus of LPG supply over demand is expected to persist to at least 203014.
In 2018, the first commercial quantities of bio-LPG were introduced into the global market at prices
competitive to NGL-sourced or refinery-sourced LPG.
LPG has a number of qualities which make it an effective, large-scale off-grid gas energy solution in
complement to the other large-scale clean energies, electricity and natural gas. This is summarized in the
following table:
Figure 2. Key characteristics of LPG, natural gas and electricity solutions15
Household Energy Source
Key Characteristics Primary Uses in
Developing Stage Energy Market
Primary Uses in Mature Energy Market
LPG Low capital intensity
Infrastructure quick to deploy
Affordable, especially in urban/peri-urban areas
Portable
Salable in small units
Safe (with proper systems and handling)
High heat delivery
Cooking/heating Non-urban cooking/heating
Industrial
Occasionally, transport
14 See the Annexes, Chapter 34 for a discussion of LPG pricing and availability beyond 2030.
15 GLPGP: World Gas Conference (2015)

Clean Cooking for Africa National Feasibility Study: LPG for Clean Cooking in Kenya
34
Household Energy Source
Key Characteristics Primary Uses in
Developing Stage Energy Market
Primary Uses in Mature Energy Market
Grid Electricity
High capital intensity
Time-consuming to deploy
Occasionally affordable
Safe (with proper systems)
Low-to-medium heat delivery
Urban lighting, cell phones, electrical appliances including cooking, mechanical work
Lighting, cell phones, electrical appliances including cooking/heating, mechanical work
Off-grid Electricity: Minigrids
High capital intensity per kw
Usually more costly than grid-based
Potentially rapid deployment
Small business use, cell phones, household lighting and low-power (non-cooking) electrical appliances
Small business use, cell phones, household electrical appliances, sometimes including cooking (with larger-scale systems)
Off-grid Electricity: Solar PV
Rapid deployment
Low to medium capital intensity per kw
Pay-as-you-go can be an option
Cell phones, household lighting and low-power (non-cooking) electrical appliances and productivity devices (e.g., sewing machines)
Cell phones, household lighting and low-power (non-cooking) electrical appliances and productivity devices (e.g., sewing machines)
Natural Gas Very high capital intensity
Time-consuming to deploy
Very affordable
Primarily grid-based
Safe (with proper systems and handling)
High heat delivery
Power generation Urban household cooking/heating
Power generation
Industrial and transport
LPG is an essential solution to achieve WHO emissions guidelines and to reduce pressure on forests
To achieve WHO guideline levels of particulate matter requires community-wide use of clean fuels. In the
transition towards universal use of clean fuels, countries will evaluate and execute on strategies that
address the energy needs of their varied populations over time, involving a portfolio of energy carriers and
technologies to meet cooking and other household needs.
In its Special Report: Health and Climate Change16, WHO states: “It is not necessarily straightforward to
choose the optimal household energy, and it may sometimes involve trade-offs. For example, while [LPG] is
a fossil fuel, it emits almost no particulate air pollution and emits less climate pollutants than many other
household energy sources. There may therefore be rapid health gains and sustainability if it replaces more
polluting fuels and technologies, as opposed to crowding out investment in renewable energy.” It is
16 WHO (2018). www.who.int/iris/handle/10665/276405

Clean Cooking for Africa National Feasibility Study: LPG for Clean Cooking in Kenya
35
therefore important for Kenya, and other LMICs, to define an optimal portfolio of energy carriers and
technologies for the household sector, which portfolio will require adjustment over time as relative
technological capabilities, scalability, and costs evolve.
Over the next one to two decades in Sub-Saharan Africa, this energy and technology mix is expected to
include LPG and, where feasible, reliable electricity capable of delivering the wattage necessary to cook and
to boil water. For those unable to transition quickly to clean liquid or gaseous fuels or to adequate
electricity supply, improved (e.g., rocket-type) and advanced (e.g., fan-assisted, pellet fueled) biomass
stoves are expected to have a transitional role, even though in daily use they do not deliver the emissions
levels called for by the WHO guidelines.
Among existing liquid and gaseous fuel options, LPG can make an important contribution. It has the
potential to deliver substantial benefits for health, climate, the environment, and development. As with
biomass fuels and stoves, building the enabling environment and developing an effective and cost-efficient
market and value-chain are required for success with LPG. Correct and safe handling and use of LPG is also
a key requirement.
A number of national governments, including India, Ghana, Kenya, and Cameroon, have made it a priority
to serve a majority of their populations with LPG for reasons including (i) addressing energy-related air
pollution, (ii) forest preservation and (iii) economic development.
LPG is benign for the climate
At a global level, however, the fact that LPG is created as a by-product of the production and refining of
fossil fuels requires evaluation of its environmental impacts.
Issues around the overall affordability and accessibility for poorer and more rural populations also need to
be addressed.
The findings described in this report indicate that the use of LPG instead of traditional biomass fuels and
kerosene in Kenya would contribute little or no net climate warming effect and would protect forest
resources. Lifecycle assessments (performed by others) have found that LPG as a cooking fuel performs
similarly to advanced biomass stoves for net CO2 emissions in settings where biomass fuel harvesting is
partially renewable, and better than these technologies for black carbon and other short-lived pollutants.
This is because (i) LPG has a lower Carbon-to-Hydrogen ratio (C:H of about 1 to 3) than any other
hydrocarbon fuel except for natural gas (e.g., coal has a C:H ratio of about 2 to 1); (ii) LPG combusts very
efficiently compared with other fuels, thereby keeping emissions lower; (iii) LPG has high completeness of
combustion, which results in black carbon and other climate-active pollutant emissions being much lower
than from biomass-burning stoves and open fires; (iv) LPG stove emissions performance generally remains
the same over time and is relatively independent of user-operating factors; and (v) LPG fuel supply places
no burden on forest resources.
Affordability of LPG
Where all or most cooking fuel is purchased, which occurs mainly in urban and peri-urban settings, LPG is
price competitive with kerosene, wood fuel, biomass pellets and charcoal on a cost-per-meal or cost-per-
month basis.
Clean Cooking for Africa National Feasibility Study: LPG for Clean Cooking in Kenya
36
These alternative fuels to LPG are typically bought in small daily quantities. While overall costs of LPG may
be similar or superior over time, the transaction size for refilling an LPG cylinder may be a barrier for some
low-income households. A number of options are available to address LPG refill transaction size. One that
is well-established is use of smaller (e.g., 3 kg) cylinders. Newer initiatives involving pay-as-you-go LPG use
and microfinance of, and/or mobile payment for, LPG refills are in early commercial operation in some SSA
countries. Some households may also need financial assistance or tools to cover the initial acquisition cost
of an LPG stove, cylinder and associated equipment, because traditional stoves are in general less costly
than the equipment required for cooking with LPG. (See Chapter 18 (Consumer Empowerment) beginning
on page 161 for more information.)
For poorer and more rural populations currently gathering all or most of their fuel, the initial and ongoing
costs for LPG refills can be barriers. Targeted subsidies or other forms of financial support, which
preferentially assist poorer households, have a role in facilitating acquisition and use of LPG for such
consumers. This type of targeted financial assistance is already a key component of policy on LPG access in
several countries with large scale LPG use, such as India, Brazil and Peru.
Creating a universal LPG refill price through regulatory measures (that is, a price that, through
transportation cross-subsidy, is the same for all consumers no matter where they are located in the
country) also benefits rural consumers, who tend to be both poorer and more remote from LPG refilling
facilities.
Proven technical and operational feasibility of LPG in LMICs
LPG is a well-established technology for cooking. The World LPG Association estimates that 2 billion people
use LPG for cooking, heating, and other uses. LPG has already become a large-scale solution for clean
cooking in a numerous low and middle income countries17.
Challenges for scaling up LPG on a national basis are addressable through effective policy, regulation and
enforcement of regulation, ensuring adequate supply, developing robust distribution networks (limited by
where the road network makes distribution viable), and, optionally, developing and implementing
sustainable fiscal policy to support more equitable access.
User benefits of LPG
For the user, the speed and controllability of LPG cooking, combined with the convenience of storage, result
in substantial convenience and time savings. This has particular implications for women, children, and
others currently engaged in collecting and cooking with biomass fuel and cleaning their cooking appliances
and cooking areas after use. The added convenience and time savings offer the potential for making more
of employment and education opportunities.
LPG may also be viewed culturally as an aspirational fuel that some households would use, if available,
based on their association of LPG with modernity—the “modern” of SDG7—even when cost savings from
17 A non-exhaustive list of examples of LMICs which have achieved safe and sustained use of LPG for cooking by no less than 50%
to upwards of 90% of their populations for cooking (and other uses) include Bolivia, Brazil, India, Indonesia, Malaysia, Morocco, Thailand and Vietnam. SSA countries which are approaching this range of LPG use include Cote d’Ivoire, Gabon and Senegal.

Clean Cooking for Africa National Feasibility Study: LPG for Clean Cooking in Kenya
37
LPG use do not arise for them. While it is not possible to quantify this factor from available data, and it is
excluded from this report’s analytics, desire for LPG as an aspirational energy choice frequently arises
anecdotally in interviews with Kenyan ian consumers, policymakers, industry veterans and other
stakeholders. (Many of which policymakers, industry veterans and other stakeholders being LPG consumers
as well.)

Clean Cooking for Africa National Feasibility Study: LPG for Clean Cooking in Kenya
38
The LPG business in Kenya started in 1963 following the commissioning of East African Oil Refineries Ltd.
(now Kenya Petroleum Refineries Ltd, or KPRL). In order to protect the refinery’s business, the Government
did not initially allow importation of petroleum products. From 1963 to 1971, the refinery was jointly
operated by Royal Dutch Shell, British Petroleum, Caltex and Esso. The LPG storage tanks at the refinery
were connected to storage tanks owned by the oil marketing companies (OMCs) via a 4-inch diameter
pipeline.
During that era, excess LPG from the refinery would sometimes be blended with other petroleum products
or flared into the atmosphere. Among consumers, there was widespread fear of LPG as a dangerous fuel.
Most households used charcoal, kerosene and firewood for cooking.
The situation evolved in the 1980s when consumer demand for LPG began to grow rapidly among the well-
educated (mainly university graduates) who wanted clean cooking and came to associate LPG with upper-
and middle-class living standards. A further factor was the relatively low cost of LPG, due to refinery
operations being subsidised and petroleum product prices being state-controlled. A third factor that
supported increased LPG demand was the rise of local manufacture of LPG cylinders, which made it easier
and less costly for Kenyan LPG companies to acquire cylinders in order to create new customers.
As the market grew, LPG shortages began to emerge, caused both by logistical and inventory imbalances in
the distribution system and by interruptions in refinery operations, such as production failures or
maintenance closedowns.
In 1994, the market was liberalised, subsidies were removed, and prices were freed of state control. The
OMCs decided to construct an LPG import pipeline at Shimanzi connected to their existing storage tanks.
From that time onward, the LPG industry started importing LPG by sea.
The OMCs would take turns to import LPG. The OMCs would transfer imported LPG to storage in upcountry
destinations. The main inland storage area was Nairobi, 500km from Mombasa.
Because of storage limitations at the port, and limitations on the rate at which LPG could be transferred
inland, LPG ships would have to perform discharges of LPG in on-off cycles: after discharging what could be
stored at the port, the ship would have to wait for more space (ullage) to become available, and these delays
would result in significant demurrage costs to the OMCs. (By 2013, demurrage costs were estimated by
GLPGP to have reached as high as USD 200 per tonne, or nearly 20% of the end-user cost of LPG.)
To minimise their demurrage losses, and also as a competitive strategy, the OMCs undertook selling some
of their imported LPG to so-called “resellers” in order to free up OMC storage space faster. These resellers
were expected to sell their LPG in bulk to commercial users, such as manufacturers and light and heavy
industry. These resellers started refilling and reselling LPG cylinders clandestinely (and illegally). Some
OMCs tacitly encouraged this, because it allowed them to offload and monetize their imported LPG more
rapidly. This was the start of illegal refilling in Kenya, which remains, in the view of the legitimate Kenyan
LPG industry, the single biggest threat to, and risk for, investments in the LPG business today.
Up to 2013, importation of petroleum products was restricted to those who import crude oil, with
minimum quantity requirement of 1.6 million tonnes. This requirement ensured that KRPL could produce
and sell at least 28,000MT of LPG annually.
Clean Cooking for Africa National Feasibility Study: LPG for Clean Cooking in Kenya
39
The limited import storage and declining production from KRPL caused LPG shortages to persist. The main
Marketers up through the early 2000s, Agip, Shell, Total, Caltex, and Esso (later ExxonMobil), differentiated
their LPG brands by cylinder color, cylinder size (variously 6kg, 12kg, 12.5kg, 13kg, 15kg) and choice of
valve. Different valves required differentiated regulators, which meant a customer could not change his/her
cylinder brand without changing (dismantling and re-assembling) the regulator as well.
This had three consequences. The first was that it was difficult for downstream players to act as general-
purpose refilling parasites, because they would have to invest in filling equipment for each type of valve in
the market. The second was that it helped the Marketers maintain control over their distribution
networks—and their customers—because the valve acted as a switching barrier. The third was that when
the distribution network for a particular brand ran low on filled cylinders—i.e., was in a state of shortage,
or low service level—the consumer found it quite cumbersome and time-consuming to return an empty
cylinder of that brand and then go to a rival vendor to obtain a full cylinder with a different brand, and
connect its different valve to the regulator (requiring its reassembly) and thereby to the stove.
In 2003, a new national government took power. In 2004, it commissioned a study on LPG. The study
recommended elimination of VAT on LPG, standardisation of cylinder valves and cylinder sizes and the
interchangeability of cylinder-brands across retail and filling networks.
The 2006 Energy Act established the Energy Regulatory Commission to oversee the petroleum sector,
including LPG. In 2008, NOCK entered the LPG market and achieved a sub-5% market share.
The 2004 study recommendations were translated into law in LN 121 in 2009. The interchangeability was
implemented through the creation of the LPG Cylinder Exchange Pool (CEO or Pool). This gave the retailer
the right to carry multiple cylinder brands, and the consumer the right to exchange a cylinder of Brand X for
one of Brand Y at his/her local retailer. In 2009, there were ten registered LPG brands active in Kenya.
This temporarily alleviated to an extent, and for a period of time, those shortages associated with logistical
or inventory management issues within a single LPG brand, although it did not, and could not, address
market-wide shortages18.
There were three unintended consequences.
The first was that it became incredibly easy for illegal, parasite refillers to gain control of cylinders and
divert them from recirculation under control of the brand-owner to recirculation under their own control.
This became so easy because all cylinders now had identical valves, meaning standard refilling equipment
could be used to refill any cylinder. This immediately increased by nearly an order of magnitude the
portion of the market that any parasite could invade, and it significantly lowered the barriers to entry for
any marketer/reseller—whether legitimate or parasitic. The second was that the CEP became a way for
Marketers to keep each other’s cylinders off the market. (This is discussed in more detail in Part V.) The
third was that some Marketers found themselves unable to pay their financial obligations to the CEP to
recover their in-Pool cylinders.
18 A severe and extraordinary example of a market-wide shortage was caused by the hijacking in 2010 of a Kenya-bound LPG ship
off the coast of Somalia. This resulted in the worst LPG shortage in the nation’s history, and made plain the need to expand national LPG storage capacity.
Clean Cooking for Africa National Feasibility Study: LPG for Clean Cooking in Kenya
40
The Government took two further actions, both in an attempt to address market-wide LPG shortages and,
ideally, to reduce LPG prices for consumers:
1. The Government encouraged the development of common user facilities for importation. This led
to a concession being granted to Africa Gas and Oil Ltd. (AGOL) to develop, on a public-private-
partnership model, a large, common-user LPG terminal accessible to all legitimate Marketers. The
key private sector partner, MJ Group, was an Indian grain trading house that had been successful in
controlling key grain storage and import-export assets in Kenya. The AGOL facilities became
operational in 2012. However, the facility suffered from design and execution issues which caused
it to fail to create significant cost savings, and it also chose to sell LPG not only to legitimate
Marketers but also to illegal (parasite) refillers. The AGOL terminal eventually became 100%
private-sector owned and operated. AGOL has slowly expanded its storage capacity and, step by
step, has been addressing its engineering and design issues, finally becoming the dominant LPG
importer for the country.
2. The Government developed a high-level plan for a Government-owned import and storage
facilities. From 2012, the Government advertised for tenders to construct a new import terminal in
Mombasa and inland storage facilities in Nairobi. These facilities are not needed from a capacity
standpoint, but would instead create an alternative to AGOL in accordance with the original vision
of a common-user facility that would not only create economies of scale but would also pass on the
benefits thereof to the Marketers and to the consumer. As of this writing, these plans remain in
the tender evaluation stage.
In 2011, a first-generation pay-as-you-go LPG service was introduced by Premier Energy under the Pima Gas
brand. Unlike the current, second generation of LPG pay-as-you-go, the Pima approach used refilling kiosks
which were widely criticized by industry (local and international) as emulating the Consumer Controlled
Cylinder Model (the CCCM market model—see Annex Chapter 32 (Conditions and Consequences of the
CCCM LPG Market Model) beginning on page 294 for a discussion of the problems created by CCCM) and as
being inherently unsafe. This experiment did not survive into the second generation of pay-as-you-go
services in Kenya, which is discussed further in Chapter 18 (Consumer Empowerment), which begins on
page 161.
In 2012, the Government of Kenya became one of the founding host-country partners in The Global LPG
Partnership. In 2013, GLPGP and Dalberg Advisors carried out a detailed assessment of the Kenya LPG
sector19 Although the assessment found that the LPG market was likely to continue to grow, it also found
that the extent of black market activities affected as much as 30% of the residential LPG market, with
regulation and regulatory enforcement being key barriers to future scale-up investment, market
sustainability, and safety.
Also in 2013, the KRPL refinery closed. From this point forward, all LPG in Kenya was imported, either by
sea into Mombasa or overland by road tanker from Tanzania.
The following year, the Government and the private sector (represented by the Petroleum Institute of East
Africa (PIEA), a regional trade body) agreed to co-fund a detailed investigation into black market LPG
activity in Kenya along the entire supply chain, from smuggling of imports overland from Tanzania to black-
19 GLPGP/ Dalberg (2013). See docs.google.com/file/d/0B8LwMP7Aq_siTEVTTExtZ2Q5T2c
Clean Cooking for Africa National Feasibility Study: LPG for Clean Cooking in Kenya
41
market retailing of illegally refilled cylinders. The Swiss inspection and certification company SGS won a
public tender to perform the investigation. A key finding from the SGS investigation, made known only to
key stakeholders at the time, was that nearly 70% of the LPG retailers in Kenya were selling illegally refilled
cylinders.
This finding stimulated a major effort by the Government, petroleum regulator, and the leading LPG
industry players to undertake a crackdown on illegal LPG cylinder refilling. It was determined that an
existing anti-counterfeiting law could be applied to impose very harsh penalties on illegal refillers. Many
saw their facilities bulldozed. (Some would bribe police to get advance notice of raids, thereby avoiding
detection; others once bulldozed would pop up again in another location.) Repeated enforcement actions
eventually created what industry leaders called a “climate of fear” among pirate refillers.
Several of the illegal refillers eventually were mainstreamed by applying for and obtaining an LPG license,
meeting its requirements, and reforming their practices. Others went out of business. As of this writing,
some still operate in the shadows at a lesser scale.
No data are available on the current extent of the black market LPG activity in Kenya.
In early 2015, the Ministry of Energy and Petroleum embarked on a six-year World Bank–funded technical
assistance project (called KEPTAP) to strengthen its capacity to manage the petroleum sector. Several
reforms and capacity-building actions, including the development of a revised LPG distribution model and
public awareness plan, emerged20.
In August 2015 the Ministry of Energy issued a document entitled Strategy and Action Plan for Bioenergy
and LPG Development in Kenya, in which the Government set a direction for the development of the LPG
sector, including the following elements for promoting LPG use by households and institutions:
A common-user LPG marine import and storage facility;
Strategic transition of households from kerosene, firewood, charcoal to LPG;
Inland LPG storage and distribution infrastructure;
Modification of firewood cookers and stoves in large and medium-sized governmental institutions
to use LPG and/or some other more efficient form of biomass cooking;
Reduction of taxes on LPG and LPG appliances.21
However, specific projects and objectives with respect to LPG were not defined.
In 2016, the Government convened a major workshop among relevant governmental agencies, Kenyan LPG
companies, and other partners, advisors and stakeholders including the Global LPG Partnership, to address
market reform issues. This workshop was strongly motivated by the rapid growth of the debt burdens of
many Marketers to the CEP. This debt burden, together with the corresponding accumulation of cylinders
in the Pool—cylinders that were no longer recirculating and thus could not generate revenue—represented
an existential risk to numerous LPG companies. The Energy Dealers Association (EDA), a trade group of
20 World Bank/ESMAP (2018)
21 Kenya MoE (2015)
Clean Cooking for Africa National Feasibility Study: LPG for Clean Cooking in Kenya
42
small-scale Marketers, resisted the called-for reforms because their competing business model was based
on the easy exchange of cylinders amongst one another, enabled by the LN 121 of 2009.
The outcome of the workshop was a set of initial recommendations for reform of LN 121.
In 2018 the EDA reversed its opposition to reform but successfully lobbied to have the CEP survive as an
opt-in program with corresponding inter-company exchange agreements, thereby allowing the EDA
members to create, in effect, an “EDA” cylinder brand and de facto a sort of LPG co-op amongst
themselves.
Also in 2018, Proto Energy Ltd. entered the Kenyan market with an initial 600,000 LPG cylinders and highly
aggressive end-user pricing. (Proto Energy’s market entry and disruption is discussed further in other Parts
of this report.)
As of this writing, there are 48 registered and active LPG cylinder brands in the country.
There are 64 storage-and-refilling facilities (most of which are severely underutilized), two storage-only
facilities, four pending applications for new import terminals, and seven new inland filling plants under
construction. From this, it is clear that there is enthusiasm—potentially, irrational enthusiasm—within the
Kenya LPG sector for adding infrastructure capacity, if not necessarily cylinder inventory.
In 2018, the Government also introduced a number of additional policies and programs in support of the
transition to LPG for cooking. These are detailed in Chapter 9 (Complementary Policy Initiatives) beginning
on page 57.
This is the backdrop against which this report’s assessments have been prepared, and from which this
report looks forward.
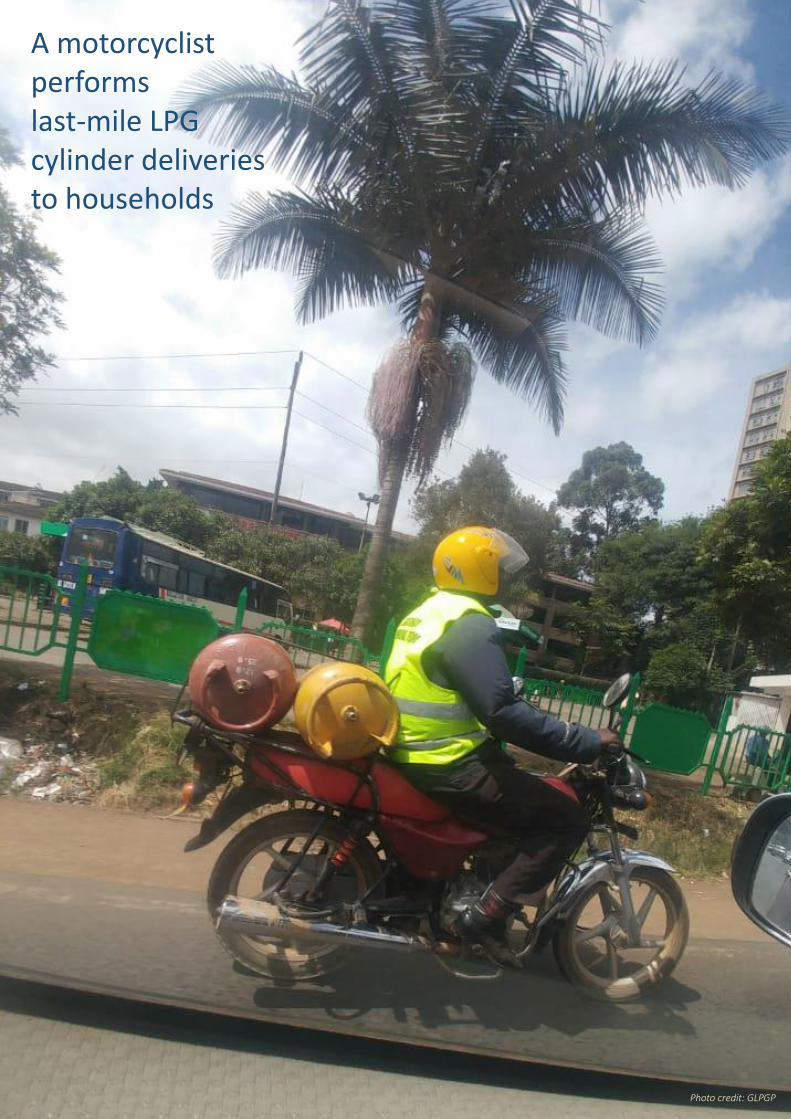
43
A motorcyclist performs last-mile LPG cylinder deliveries to households
Photo credit: GLPGP
Clean Cooking for Africa National Feasibility Study: LPG for Clean Cooking in Kenya
44
The Government of Kenya has determined to reform key aspects of the enabling environment for LPG to
improve safety, bankability, growth and oversight of its LPG sector. This involves strengthening the
country’s implementation of the Branded Cylinder Recirculation Model (BCRM). There are certain areas,
described below, where enhancements to Kenya’s BCRM are feasible; are desired by the LPG sector; have
been recommended by a Government-led, multistakeholder national LPG reform planning process
(including the GLPGP/Clean Cooking for Africa expert team); and have been accepted for eventual
implementation by the Government.
How the reforms to BCRM will affect the design of the supply chain is set forth in Part VII (LPG Supply Chain
Development and Planning).
4. Models of National LPG Systems
Globally there are two main models for organizing residential LPG markets: the Consumer-Controlled
Cylinder Model (CCCM) and the Branded Cylinder Recirculation Model (BCRM).
CCCM is used together with BCRM in the United States and Canada. CCCM is also used for a small portion
of the LPG market of Germany. It has been tried, or has been devolved into, in some developing countries.
Aspects of CCCM invaded the BRCM model in Brazil in the 1970s and resulted in a major increase in
accidents and fatalities that shook public confidence in LPG and risked market implosion, until BCRM was
properly reconstituted and enforced through concerted joint government-industry action. CCCM has been
attempted in Haiti without success. It is the dominant model in Nigeria, which has suffered decades of
boom-bust investment cycles in LPG with negligible growth in LPG use per capita, despite being a major
LPG producing country and one of Africa’s wealthier countries.
In all developing countries which have succeeded in achieving meaningful levels of residential LPG use per
capita, BCRM has been the model.
BCRM can be implemented rigorously (“strong form”) or loosely (“weak form”).
The following figure (Figure 3) shows LPG development progress, measured in kilograms per capita of
annual LPG use, plotted against GDP for a selection of developing countries, and categorizes these
according to the strength of their BCRM model. (A method of scoring BCRM strength is presented later in
this Part.)

Clean Cooking for Africa National Feasibility Study: LPG for Clean Cooking in Kenya
45
Figure 3. Comparative LPG adoption and use vs GDP in selected countries, by market model
*Ghana value excludes vehicular use of LPG
Bangladesh
Kenya
Ghana*
Senegal Cote d'Ivoire
India Nicaragua
Nigeria
0
2
4
6
8
10
12
14
16
0 500 1000 1500 2000 2500 3000
LPG
an
nu
al u
se p
er c
apit
a (k
g)
GDP per capita (USD)
Strong form of cylinder recirculation model Weak form, or other model

Clean Cooking for Africa National Feasibility Study: LPG for Clean Cooking in Kenya
46
5. Conditions and Consequences of the BCRM LPG Market Model
Everywhere else in the world, if implemented in a self-consistent, well-enforced, and adequately financed
way, BCRM eventually leads to widespread adoption of LPG with an acceptable level of safety (acceptable
to the consumers, industry and governments in question).
BCRM is endorsed and promulgated by the World LPG Association, the global LPG industry organization.
Examples of major successes in LPG market development using BCRM include: Brazil (starting in 1979
following a near-collapse of the LPG market due to enforcement failure that led to thousands of monthly
LPG fires and explosions), Morocco, Vietnam, Malaysia, India, Japan, Turkey and Senegal.
BCRM comprises a number of key principles which are listed below.
The LPG marketing company invests in, owns, inspects, maintains, and refills (away from populated
areas) its own, branded cylinders and is responsible and liable for their safety. The marketer is also
exclusively licensed by the government to market LPG. This linkage, between and among cylinder
investment, cylinder refill income over the cylinder’s life, liability for the cylinder’s safety, licensing,
and the brand, creates the needed incentives for LPG marketing companies to invest to expand
their cylinder inventories in order to create new customers and to spend to maintain safety
throughout the value chain.
The government must enforce the foregoing structure to ensure compliance by legitimate, licensed
players and to create significant disincentive (through inspection, legal prosecution, significant
penalties for conviction, and other means) for illegitimate players to coopt for their own ends the
cylinders of legitimate players, thereby breaking the linkage.
All cylinders in the market are branded cylinders.
The consumer obtains his/her first cylinder from a marketer’s distribution channel in exchange for a
deposit, which is typically set below the cost of the cylinder with a maximum percentage specified
by law or regulation. The cylinder remains the property of the marketer. When the consumer’s
LPG runs out or low, the consumer returns the empty cylinder to a refill point in the marketer’s
distribution network to exchange it for a full cylinder, at the prevailing price for a refill.
Margins, if regulated, must be adequate to cover the costs of the operation of the supply chain
across all its nodes, and to allow for adequate debt service, returns to equity investors, and
investment in growth.
Safety standards, in particular regarding the condition of cylinders and handling and transport of
LPG, must be defined clearly and well enforced.
Allowing cylinders to cross between marketers’ branded distribution networks is discouraged,
because it can lead to coopting and hoarding (taking off the market) of competitors’ brands of
cylinder.
BCRM is enhanced with certain optional characteristics, including:

Clean Cooking for Africa National Feasibility Study: LPG for Clean Cooking in Kenya
47
Industry consolidation, leading to fewer but more capable and bankable players which lead the
sector’s growth and help perpetuate essential BCRM practices. The presence of an effective LPG
trade association is also useful for the latter purpose.
Transportation cross-subsidy to cause prices paid by remote customers to equal prices paid by
centrally located customers.
Pro-poor mechanisms, which may include micropayment and pay-as-you-go schemes, targeted
subsidies, and the like.
Consolidation of regulatory authority regarding the LPG ecosystem into a small number of agencies,
or one LPG superagency. This facilitates business formation and expansion and facilitates effective
enforcement of BCRM and its elements.
Sharing of major infrastructure for storage and filling. If done and done well, this focuses
competition on acquiring and servicing customers, instead of on acquiring LPG.

Clean Cooking for Africa National Feasibility Study: LPG for Clean Cooking in Kenya
48
6. Critical Deviations from BCRM in Kenya and Planned Reforms
In Kenya, LN 121 (2009) included many key features of BCRM, but it weakened BCRM substantially by
creating a mechanism to facilitate cylinders being exchanged among marketers and their distribution
networks and requiring a single valve specification for all cylinders, among other measures. These
measures were intended to make it easy for consumers to switch seamlessly among LPG brands. Their aim
was to mitigate acute shortages in a given Brand X by enabling the consumer to swap a Brand X empty
cylinder freely for a Brand Y full cylinder.
The brand owners of X and Y would then return each others’ cylinders and true up deposit balances and
handling fees periodically.
These pro-consumer-choice measures also made it easy for pirate LPG refillers to co-opt for themselves and
refill the cylinders of the legitimate marketers with whom they competed, often through outright theft.
Combined with lax regulatory enforcement, this weakening of the BCRM led directly to the growth—
indeed, to the retail dominance—of a massive black market in LPG cylinder refilling.
In the past several years, Government and key LPG stakeholders have worked to strengthen the BCRM
model through (i) reforming LN 121 and (ii) improving regulatory enforcement.
Details about key impacts to the supply chain from forthcoming LN 121 reforms are discussed in Part VII
(LPG Supply Chain Development and Planning).
As of this writing, enforcement has improved substantially but is still inadequate from an investment and
safety perspective, due, in part, to alleged corruption that allows illegal refilling activities to continue, if at a
reduced level.
Illegal refilling is alleged to exist in Kenya both as an independent business (that is, various operations
compete entirely, on an illegal basis, with legitimate companies) and as a line of business within a
legitimate company (that is, some legitimate companies designated by the EPRA as fully compliant with
regulations are alleged to operate both legal and pirate operations, the latter concealed amidst the former).
Linkage between poor regulatory enforcement, LPG accessibility, and LPG price
Worldwide, the bane of efficient, widespread LPG distribution via cylinders is their illegal refilling by
illegitimate, often unlicensed, competitors. Such illegal actors break the linkage among cylinder
investment, responsibility for cylinder maintenance and safety, and the cashflow generated from cylinder
refilling.
The financial return on (i) investing in cylinders to create new customers, (ii) building a distribution
network, and (iii) acquiring and expanding a customer base is reduced directly by the loss of cylinders, retail
networks, and consumers to cylinder-refill piracy.
In its 2013 assessment of the Kenya LPG market, the Global LPG Partnership determined that the level of
cylinder asset diversion represented approximately 35% of the cylinder business in the country. The
subsequent Government-commissioned study carried out by SGS, the Swiss-based global inspection and
certifications company, revealed that illegally refilled cylinders had an approximately 70% share of the
national LPG retail network.
Clean Cooking for Africa National Feasibility Study: LPG for Clean Cooking in Kenya
49
The bad actors were driving out the good.
Because of rampant cylinder theft in support of illegal refilling operations, legitimate LPG marketers
invested mainly to replace lost cylinders, not to grow the market. Illegitimate LPG players did not invest in
cylinders at all, nor did they invest in cylinder safety, because safety liability remained with the original
brand-owner of the cylinder.
This caused two main results:
1. LPG was not as available to consumers as it could have been, because cylinder investment, now
harder for companies to justify financially, did not rise to keep pace with the growth of LPG
demand; and
2. LPG refill prices were higher than necessary, in part because legitimate LPG companies had to
recover the costs of their cylinder investments from a revenue stream reduced by the theft of the
cylinders and the associated refilling income streams—but with no reduction in liability for safety
incidents nor cylinder maintenance expenses22.
Starting in 2014 the Government cracked down on illegal refillers by utilizing an anti-counterfeiting statute
that had much more severe (and criminal) penalties than any LPG sector-specific laws. The period between
2014 and 2015 was marked by licensing of about 13 large, previously illegal refillers. The objective was to
mainstream the operations of these dealers to bring them into safety compliance and oversight, and to
minimize illegal refilling practices.
For such a company to become a licensed LPG Marketer, the requirements were:
Proof of ownership of 5,000 minimum cylinders of its own brand, irrespective of size.
Filling plant(s) complying with minimum safety requirements, such as the number of tanks, safety
distances, fire-fighting systems, escape routes, etc. Most of these were met by removing or re-
locating tanks and re-arranging site layouts.
Applying to the ERC23 for a license, including commitment to honor the cylinder exchange pool
rules (that is, accepting other Marketers’ cylinders, not refilling or tampering with those cylinders,
and giving them back to their brand owners, in exchange for their own cylinders or in exchange for
paying for them if in a “cylinder trade deficit” with the others).
Cylinder exchange pool (CEP)
It was noted among the legitimate LPG Marketers and PIEA that most of the newly-licensed Marketers from
2014 and 2015 did not fully comply with the rules, merely using their LPG license to access other
Marketers’ cylinders easily and openly. The licensing scheme exacerbated another problem as well: the
Marketers that did not engage in illegal refilling found themselves with debts arising from the CEP as they
22 One LPG sector managing director, speaking on condition of anonymity, stated (with mild exaggeration for sake of effect) that
his company saw most of its LPG cylinders only twice: once when first purchased, and once more many years later when returned for repair.
23 ERC was the former designation of the EPRA.

Clean Cooking for Africa National Feasibility Study: LPG for Clean Cooking in Kenya
50
surrendered their competitors’ cylinders to the Pool while receiving none of their own in return. This debt
burden created a financial crisis in the sector which resulted in a consensus decision to seek the end of the
CEP as part of the reform of LN 121. However, the CEP was ultimately not entirely ended by the finalized
LN 121 of 2019, which permits individual Marketers to carry on the CEP voluntarily amongst themselves.
LN 121 reforms
Starting in 2016, the Government and key stakeholders (including Global LPG Partnership experts)
consulted and debated reform of LN 121 to address the aforementioned unintended consequences of the
2009 revision of the law.
The Energy Dealers Association (EDA), a trade body for small-scale LPG companies, strongly resisted the
proposed reforms, which the EDA viewed as threatening to their informal LPG business model built upon
the easy interchange of cylinders amongst themselves. But, in 2018, the EDA reversed its position.
The Energy and Petroleum Regulatory Authority (EPRA) remained the sole slow-moving party with respect
to the reforms, imposing adjustments to key parameters that had achieved consensus among other
stakeholders.
The main reforms agreed by consensus (excluding changes made recently by ERPA) were as follows:
1. Marketers must maintain inventories of at least 30,000 cylinders, and must have adequate refilling
and storage facilities.
2. Marketers are defined (if imprecisely) as the owners of cylinders and registered cylinder brands.
3. The CEP is to be ended.
4. All supply chain nodes will require appropriate licensing by Government.
5. New entrants must perform feasibility studies.
6. Imported LPG is to be tested at the border.
The following remain key weaknesses of the revised LN 121:
1. There are multiple variants of Marketer license, which allow Marketers to import and export LPG
even when they do not have their own cylinder brand, storage, or filling facilities. This allows any
LPG marketing company to act as a “host” for illegal refillers, perpetuating one of the modes by
which pirate refillers could continue to survive.
2. Wholesale distributors are allowed to continue to operate in a brand-independent way, which
permits them to manipulate cylinder recirculation dynamics to suit their own interests, rather than
the interests of the Marketers who invest in and maintain the cylinders, and the interests of the
consumer.
3. The Kenya Bureau of Standards (KEBS), despite having acquired LPG testing equipment, does not
yet have the trained personnel needed to perform effective LPG testing at Kenya’s borders.
Moreover, the equipment is housed in Nairobi rather than at the border crossings.

Clean Cooking for Africa National Feasibility Study: LPG for Clean Cooking in Kenya
51
4. Bulk installations are not limited only to Marketers and to registered bulk customers such as
industrial facilities. This also creates opportunity for illegal refillers to flourish.
The following changes were applied by EPRA in the final version of LN 121 that is expected to be gazetted in
Q3 2019 and fully implemented by year-end 2019:
1. The cylinder ownership requirement for any given Marketer was reduced from 30,000 to 5,000.
This will allow many companies that do not have the critical mass of cylinders required to sustain
profitable business operations to enter the market or to remain in the market without
consolidation. This contributes to fragmentation, a high turnover of companies entering and
exiting the market (stranding cylinders which may be unsafe), and a breeding ground for increased
illegal refilling.
2. The CEP will be made opt-in, instead of being entirely ended. This was done to accommodate the
wishes of the EDA, whose members are expected to enter into agreements to exchange cylinders
amongst themselves using the CEP mechanism, becoming, in effect, a co-op of small LPG
companies. All the major LPG brands in Kenya are expected to stop the exchange of their cylinders
throughout their distribution networks.
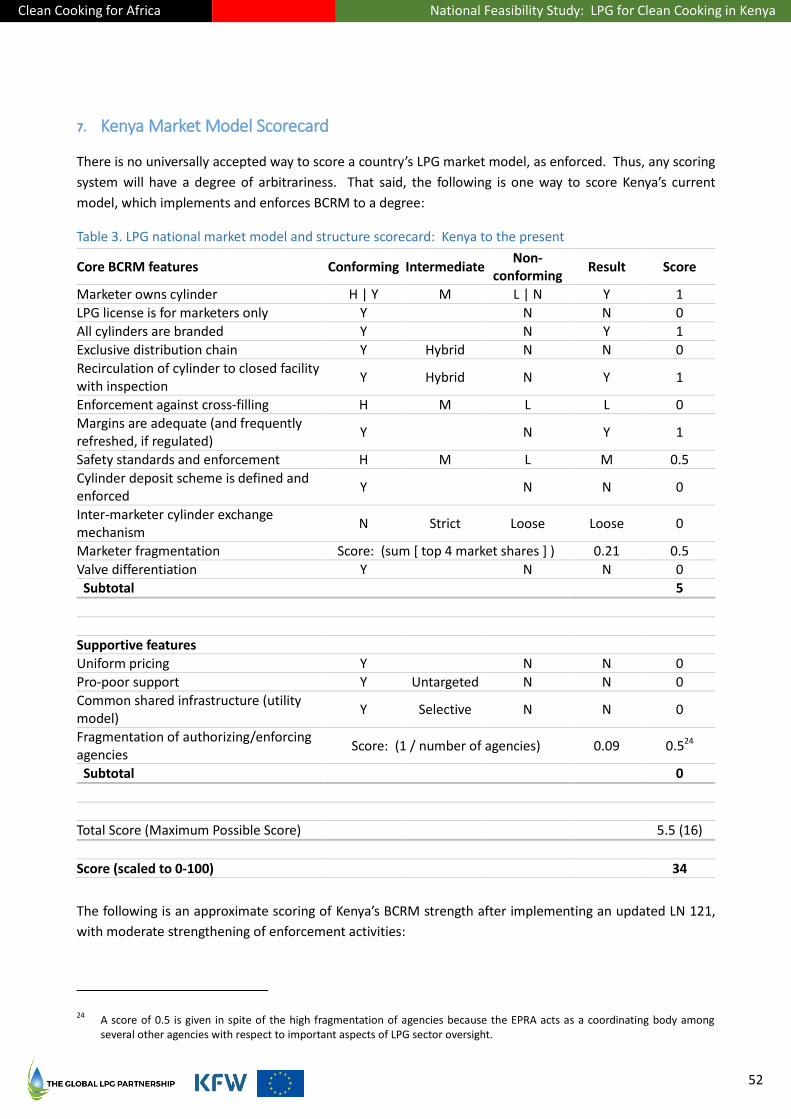
Clean Cooking for Africa National Feasibility Study: LPG for Clean Cooking in Kenya
52
7. Kenya Market Model Scorecard
There is no universally accepted way to score a country’s LPG market model, as enforced. Thus, any scoring
system will have a degree of arbitrariness. That said, the following is one way to score Kenya’s current
model, which implements and enforces BCRM to a degree:
Table 3. LPG national market model and structure scorecard: Kenya to the present
Core BCRM features Conforming Intermediate Non-
conforming Result Score
Marketer owns cylinder H | Y M L | N Y 1
LPG license is for marketers only Y N N 0
All cylinders are branded Y N Y 1
Exclusive distribution chain Y Hybrid N N 0
Recirculation of cylinder to closed facility with inspection
Y Hybrid N Y 1
Enforcement against cross-filling H M L L 0
Margins are adequate (and frequently refreshed, if regulated)
Y N Y 1
Safety standards and enforcement H M L M 0.5
Cylinder deposit scheme is defined and enforced
Y N N 0
Inter-marketer cylinder exchange mechanism
N Strict Loose Loose 0
Marketer fragmentation Score: (sum [ top 4 market shares ] ) 0.21 0.5
Valve differentiation Y N N 0
Subtotal 5
Supportive features
Uniform pricing Y N N 0
Pro-poor support Y Untargeted N N 0
Common shared infrastructure (utility model)
Y Selective N N 0
Fragmentation of authorizing/enforcing agencies
Score: (1 / number of agencies) 0.09 0.524
Subtotal 0
Total Score (Maximum Possible Score) 5.5 (16)
Score (scaled to 0-100) 34
The following is an approximate scoring of Kenya’s BCRM strength after implementing an updated LN 121,
with moderate strengthening of enforcement activities:
24 A score of 0.5 is given in spite of the high fragmentation of agencies because the EPRA acts as a coordinating body among
several other agencies with respect to important aspects of LPG sector oversight.

Clean Cooking for Africa National Feasibility Study: LPG for Clean Cooking in Kenya
53
Table 4. LPG national market model and structure scorecard: Kenya under revised LN 121
Core BCRM features Conforming Intermediate Non-
conforming Result Score
Marketer owns cylinder H | Y M L | N Y 1
LPG license is for marketers only Y N N 0
All cylinders are branded Y N Y 1
Exclusive distribution chain Y Hybrid N N 0
Recirculation of cylinder to closed facility with inspection
Y Hybrid N Y 1
Enforcement against cross-filling H M L M 0.5
Margins are adequate (and frequently refreshed, if regulated)
Y N Y 1
Safety standards and enforcement H M L M 0.5
Cylinder deposit scheme is defined and enforced
Y N N 0
Inter-marketer cylinder exchange mechanism
N Strict Loose Strict 0.5
Marketer fragmentation Score: (sum [ top 4 market shares ] ) 0.21 0
Valve differentiation Y N N 0
Subtotal 6
Supportive features
Uniform pricing Y N N 0
Pro-poor support Y Untargeted N N 0
Common shared infrastructure (utility model)
Y Selective N N 0
Fragmentation of authorizing/enforcing agencies
Score: (1 / number of agencies) 0.09 0.525
Subtotal 0
Total Score (Maximum Possible Score) 6.5 (16)
Score (scaled to 0-100) 41
A graphical comparison of scores (Figure 4) shows the increase toward the idealized model, if Kenya’s
planned reforms are implemented comprehensively and self-consistently and are enforced.
25 A score of 0.5 is given in spite of the high fragmentation of agencies because the EPRA acts as a coordinating body among
several other agencies with respect to important aspects of LPG sector oversight.

Clean Cooking for Africa National Feasibility Study: LPG for Clean Cooking in Kenya
54
Figure 4. Comparison of Kenya market model scorecard results – at present and post LN 121 reform
Visually, it may appear from the foregoing chart that Kenya’s LN 121 reforms make only a modest step
toward the BCRM ideal. However, taking three of the steps a bit further would cause the scoring to break
50%, crossing from weak-form to the incipience of strong-form of BCRM (noting that the scoring is
somewhat arbitrary to begin with). Those three steps are:
i. Improved enforcement against (illegal) cross-filling;
ii. Improved safety enforcement; and
iii. Ending of the CEP in its entirety, through the consolidation of most or all of the EDA members
into a single cylinder brand ownership structure. A consolidation strategy has been in
discussion within EDA in connection with EDA’s recent decision to switch its support in favor of
the LN 121 reforms.
The further step of tightening LPG Marketer licensing requirements to require greater cylinder inventories
and to combine cylinder ownership, refilling, and the right to access imported LPG in the Marketer node of
the supply chain would be a significant step into the “strong form” of BCRM.
Thus, the post-reform scoring above somewhat understates the new LPG enabling environment that Kenya
will be creating. However, it does properly reflect that effective enforcement will be key to the success of
the reforms and to the market growth and safety that the reforms are meant to support.
0
10
20
30
40
50
60
70
80
90
100
Pre Post Ideal
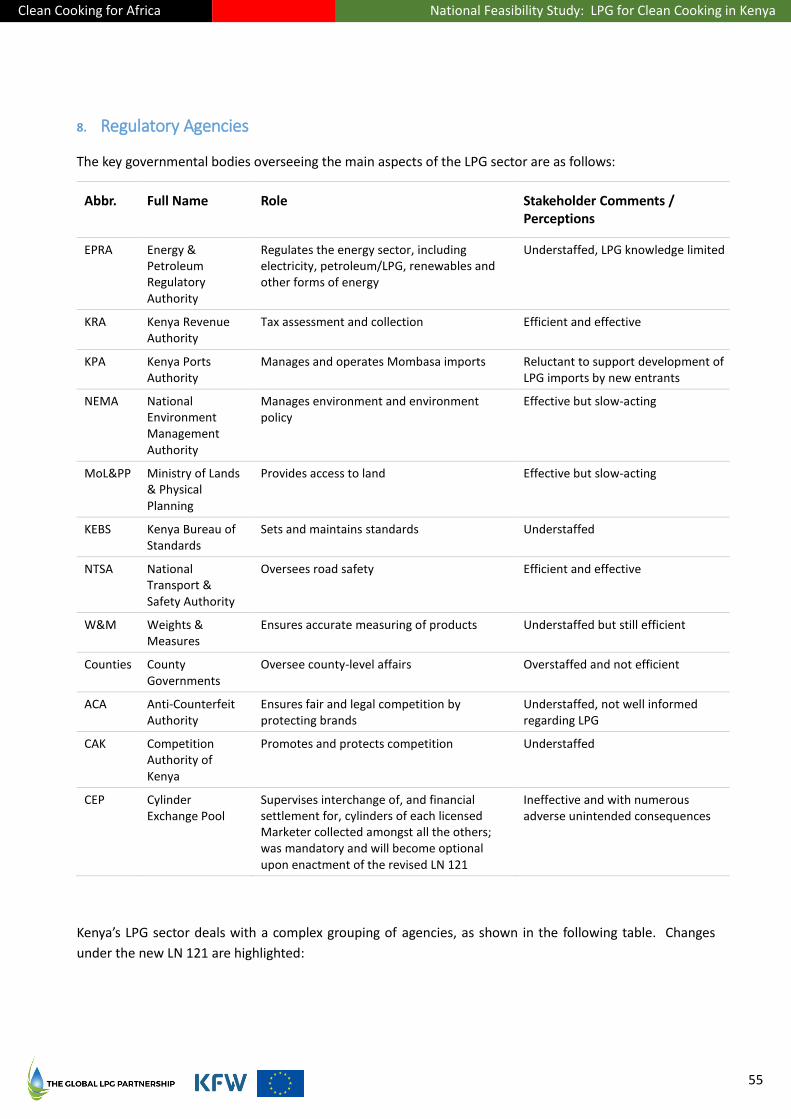
Clean Cooking for Africa National Feasibility Study: LPG for Clean Cooking in Kenya
55
8. Regulatory Agencies
The key governmental bodies overseeing the main aspects of the LPG sector are as follows:
Abbr. Full Name Role Stakeholder Comments / Perceptions
EPRA Energy & Petroleum Regulatory Authority
Regulates the energy sector, including electricity, petroleum/LPG, renewables and other forms of energy
Understaffed, LPG knowledge limited
KRA Kenya Revenue Authority
Tax assessment and collection Efficient and effective
KPA Kenya Ports Authority
Manages and operates Mombasa imports Reluctant to support development of LPG imports by new entrants
NEMA National Environment Management Authority
Manages environment and environment policy
Effective but slow-acting
MoL&PP Ministry of Lands & Physical Planning
Provides access to land Effective but slow-acting
KEBS Kenya Bureau of Standards
Sets and maintains standards Understaffed
NTSA National Transport & Safety Authority
Oversees road safety Efficient and effective
W&M Weights & Measures
Ensures accurate measuring of products Understaffed but still efficient
Counties County Governments
Oversee county-level affairs Overstaffed and not efficient
ACA Anti-Counterfeit Authority
Ensures fair and legal competition by protecting brands
Understaffed, not well informed regarding LPG
CAK Competition Authority of Kenya
Promotes and protects competition Understaffed
CEP Cylinder Exchange Pool
Supervises interchange of, and financial settlement for, cylinders of each licensed Marketer collected amongst all the others; was mandatory and will become optional upon enactment of the revised LN 121
Ineffective and with numerous adverse unintended consequences
Kenya’s LPG sector deals with a complex grouping of agencies, as shown in the following table. Changes
under the new LN 121 are highlighted:
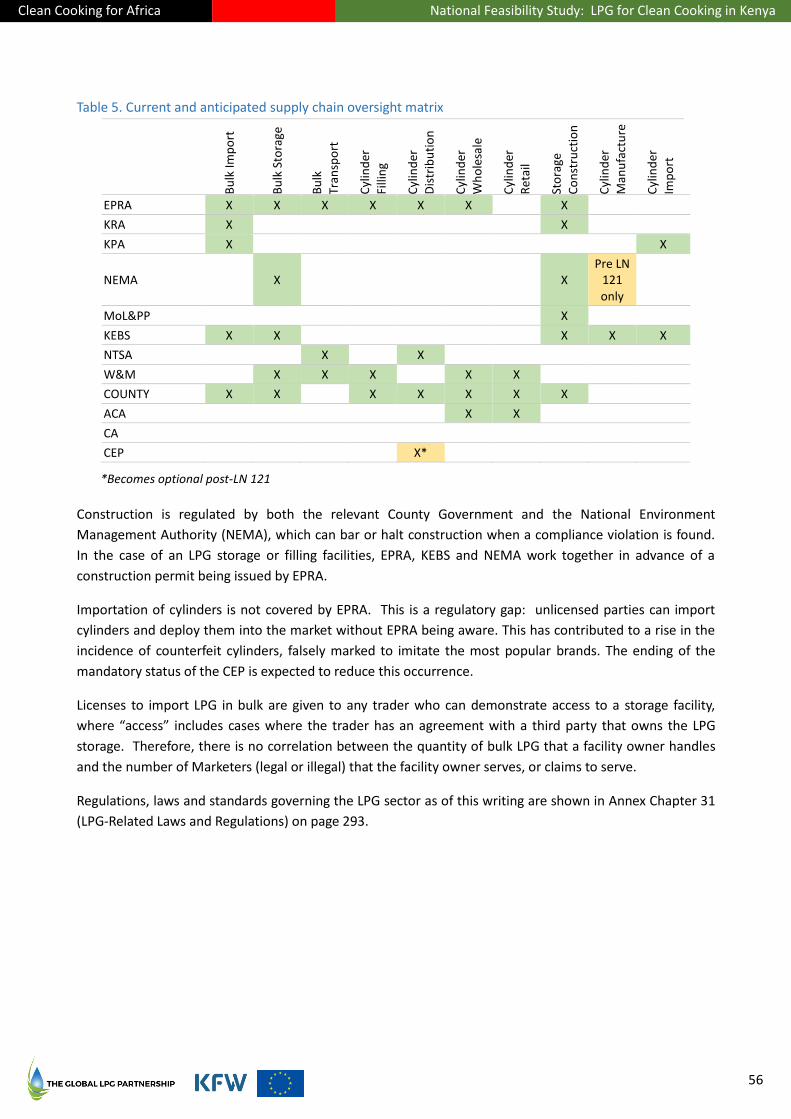
Clean Cooking for Africa National Feasibility Study: LPG for Clean Cooking in Kenya
56
Table 5. Current and anticipated supply chain oversight matrix
Bu
lk Im
po
rt
Bu
lk S
tora
ge
Bu
lk
Tran
spo
rt
Cyl
ind
er
Filli
ng
Cyl
ind
er
Dis
trib
uti
on
Cyl
ind
er
Wh
ole
sale
Cyl
ind
er
Ret
ail
Sto
rage
Co
nst
ruct
ion
Cyl
ind
er
Man
ufa
ctu
re
Cyl
ind
er
Imp
ort
EPRA X X X X X X X
KRA X X
KPA X X
NEMA X X Pre LN
121 only
MoL&PP X
KEBS X X X X X
NTSA X X
W&M X X X X X
COUNTY X X X X X X X
ACA X X
CA
CEP X*
*Becomes optional post-LN 121
Construction is regulated by both the relevant County Government and the National Environment
Management Authority (NEMA), which can bar or halt construction when a compliance violation is found.
In the case of an LPG storage or filling facilities, EPRA, KEBS and NEMA work together in advance of a
construction permit being issued by EPRA.
Importation of cylinders is not covered by EPRA. This is a regulatory gap: unlicensed parties can import
cylinders and deploy them into the market without EPRA being aware. This has contributed to a rise in the
incidence of counterfeit cylinders, falsely marked to imitate the most popular brands. The ending of the
mandatory status of the CEP is expected to reduce this occurrence.
Licenses to import LPG in bulk are given to any trader who can demonstrate access to a storage facility,
where “access” includes cases where the trader has an agreement with a third party that owns the LPG
storage. Therefore, there is no correlation between the quantity of bulk LPG that a facility owner handles
and the number of Marketers (legal or illegal) that the facility owner serves, or claims to serve.
Regulations, laws and standards governing the LPG sector as of this writing are shown in Annex Chapter 31
(LPG-Related Laws and Regulations) on page 293.

Clean Cooking for Africa National Feasibility Study: LPG for Clean Cooking in Kenya
57
9. Complementary Policy Initiatives
Taxes and duties
The Government has variously applied VAT to LPG, exempted LPG, and zero-rated LPG over time. LPG was
again exempted from VAT (at 16%) in mid-2016 and remains so as of this writing. VAT of 16% and import
duties of 25% remain in place on cylinders and accessories (gauges, valves, regulators, hoses).
The current LPG pricing regime is shown in Chapter 10 (Pricing) beginning on page 59.
Mwananchi Gas Project
The Government, working through NOCK, began offering LPG cooking equipment cost-free to poorer, rural
households through the Mwananchi Gas Project in 2018. The project objective was initially defined as
deploying 4.8 million cylinders of 6 kg size with burners and grills to poorer households over three years.
In its general concept, this program was similar to the Indian Pradhan Mantri Ujjwala Yojana (PMUY)
scheme, which directed subsidies on both LPG equipment and fuel to poor Indian households to empower
them to access and use LPG, supported by a major expansion of LPG distribution, retail and logistics
capacity. Since 2016, 58 million Indian households have gained access to LPG under the scheme26.
Conversely, in its initial rollout, the Kenya program did not develop the level of LPG cylinder and fuel
availability, retail density, and consumer uptake of the Indian program.
The Kenya program was adversely affected by five key issues:
1. Procurement problems. Imported cylinders had high defect rates and were subjected to recall after
an initial consumer deployment.
2. Corruption allegations. Media investigations led to allegations of corruption affecting the
procurement of the cylinders, among other aspects of the project.
3. Geographic and demographic mis-targeting. 75% of the recipients of LPG kits in NOCK’s target
communities did not want to switch to LPG and thus never refilled their Mwananchi cylinders.
4. Logistical capacity. NOCK were not fully prepared for the logistics (cylinder distribution and
refilling) required by the scale of the cylinder deployment.
5. Legal issues. Private sector competitors initiated legal action against the Government because it
had procured the Mwananchi project cylinders on its own account and then gave them to NOCK to
deploy, with no opportunity for NOCK’s competitors to benefit similarly or to compete for the
opportunity to do so. (By comparison, the Indian LPG market is almost entirely served by three
state-owned utility companies, which collectively implemented the distribution function of the
PMUY scheme under the direction of the Indian Ministry of Petroleum; in Kenya, the LPG market
share of NOCK is around 3%). The Kenyan private sector companies argued that the Government
26 www.pmujjwalayojana.com/about.html

Clean Cooking for Africa National Feasibility Study: LPG for Clean Cooking in Kenya
58
providing free cylinders to NOCK created an unfair (and illegal) competitive advantage for NOCK, to
their detriment.
The project was put on hold in 2018 in order to redesign it, to restart the cylinder procurement, and in
principle to allow the legal challenges to be adjudicated. The project objective was reset to 3 million
cylinders, back-loaded to later years. NOCK engaged a local consultancy to help define a new consumer
targeting strategy.
To improve logistics and cylinder management for the project, NOCK additionally engaged JamboPay, a
Kenyan online mobile phone gateway that allows users to make and receive payments via the phone, to
develop an app for managing Mwananchi LPG sales. Through the app, the sales person would record the
serial number of the cylinder, and the customer would be compelled to return the same cylinder when
empty to the designated retailer for exchange for a full cylinder. The serial number of the customer’s
replacement cylinder would be recorded with each exchange, in a cyclic fashion. This approach would allow
the company (NOCK in this example) to know the interval between refills for each customer, and therefore
plan more precisely for having the right number of filled cylinders on hand in each retail outlet. LPG
purchase patterns could also be monitored for seasonality.
As of this writing, the Mwananchi Gas Project has not been revived.
Biomass cookstove policy development
The Government has taken certain actions to support clean cooking apart from LPG, for benefit of the
portion of the population which LPG is not expected to reach. These include:
Prioritizing clean cooking generally as an mitigation action for achieving its emissions reduction
target under the Paris Climate Agreement; and
Reducing import duties on efficient cookstoves from 25% to 10% and zero-rating VAT on clean
cookstoves, raw materials for such stoves, and their accessories.
Kerosene pricing
In September 2018, the Government reduced VAT on kerosene from 16% to 8% on the one hand, and
applied an anti-adulteration levy of Ksh 18 per litre of kerosene on the other hand. The net effect was an
increase to the end-user price of kerosene by Ksh 10.7 (€ 0.95) per litre, an increase of about 9% overall.
The purpose of the levy was not to make kerosene less competitive to LPG per se, but rather to combat use
of LPG as an additive to diesel fuel.
Logging ban
During February 2018, the Government implemented a temporary ban on logging in public forests to
combat deforestation and to assuage public outcry that excessive logging was causing loss of water levels in
the country’s key rivers. The ban causes the availability of charcoal to fall rapidly and its price to rise. In
November 2018, the ban was extended for a further 12 months.

Clean Cooking for Africa National Feasibility Study: LPG for Clean Cooking in Kenya
59
10. Pricing
Primary objectives of the price structure in a developing LPG market are
To prevent price abuses by the distribution system; and
To balance fuel affordability for consumers with returns required by investors.
Additional objectives can include whether prices vary by distance from LPG sources, or not, and whether
the market will be a high-service or low-service market. High service, for example, could include in-home
exchange of a filled LPG cylinder for an empty cylinder (that is, home delivery). High service and low
service trade off forms of access and availability for the consumer (and stronger cylinder asset control for
the supply chain participants) against end-user fuel affordability.
Higher unit margins also strengthen three key investment factors in LPG companies:
1. The sustainable growth rate (the maximum rate at which customers may be added without creating
negative cashflow) of the enterprise is higher;
2. The breakeven volume for a new enterprise is lower, thus reducing the investment risk; and
3. The potential for generating required returns to investors and the capacity to service debt is
increased.
Unregulated pricing
Kenya has had unregulated LPG pricing since 1994, as shown in the table below.
Based on global LPG sector experience, there are six main choices of price system:
Table 6. Price structure modalities
LPG Price System Description Example Countries
Non-regulated The market sets its own prices Kenya, France, Italy, Germany
Regulated, fixed margins, International Parity Price (IPP)
27, no
subsidy
The government regularly updates the price structure as the applicable International Parity Price changes (typically monthly)
India, Indonesia, much of Latin and South America, Belgium, Spain
Regulated, fixed margins, actual sourced price, no subsidy
Maximum prices are revised regularly by each marketer as the international price is updated, according to the price formula (typically monthly)
Ghana, today
Regulated, fixed margins, common sourced price, no subsidy
The government regularly updates the price structure as the international price varies, per marketer
Kenya for petrol (not for LPG)
Regulated, fixed margins, fixed end-user price, IPP with variable subsidy
One permanent national end-user price remains in effect until the government chooses to revise the pricing formula
Morocco, Tunisia, Brazil, Argentina
27 IPP is a regional index price adjusted for standard cost of transportation from the regional price hub

Clean Cooking for Africa National Feasibility Study: LPG for Clean Cooking in Kenya
60
LPG Price System Description Example Countries
Regulated, fixed margins, variable end-user price, fixed subsidy on IPP formula
The government regularly updates the price, which is discounted by a fixed subsidy amount, as the IPP changes
Dominican Republic (prior to removal of subsidy)
LPG pricing and margins in Kenya are market-driven. In practice, the companies with the largest market
share in each supply chain node act as price leaders, ensuring adequate and stable margins (as perceived
by them) to cover costs and debt service (if any) and to generate an adequate return on investment.
This has had four main effects:
1. Rent-seeking. Companies with near-monopolistic positions or other forms of high negotiation
power along the supply chain extract margins that are significantly above Sub-Saharan African LPG
industry norms for the same functions. This applies both to the pricing of LPG fuel and the deposit
amount paid by consumers on cylinders.
2. Cost inefficiency. Due to the lack effective price-based competition (among legitimate firms)
pressuring companies to improve and streamline operations, there is significant inefficiency
(and/or tolerance of inefficiency) among some players. This is particularly evidenced by the vastly
underutilized filling and storage capacity of the country (see Part VIII (Cylinder Investment to 2030)
beginning on page 125 for details).
3. LPG end-user prices increase significantly with distance from the main arteries of the country’s LPG
distribution network.
4. There is room for operators that cut corners, such as not spending adequately (or at all) on safety
and maintenance, or that engage in illegal practices that provide cost advantages, to price below
the larger, legitimate and regulation-compliant, safety-conscious players in order to gain and
protect market share.
It also creates an opening for a new, legitimate entrant to take share and/or grow the market with a leaner
cost structure and more competitive pricing. An an example of this is mentioned below.
Since 2009, when critical LPG regulations defining the national LPG ecosystem were changed, there have
been two major developments intended to create efficiency, drive down costs, and reduce the end-user
LPG price, one of which appears to be doing so:
1. The Africa Gas and Oil Ltd. (AGOL) import terminal project, envisioned by the Government as a way
to reduce import costs through ending expensive demurrage costs at the port of Mombassa, and to
import LPG in larger vessels, giving AGOL/Kenya more options and stronger negotiating power with
international LPG suppliers and traders. The AGOL project was intended to address importation
cost inefficiencies. However, design and operational issues, and other factors, resulted in AGOL
being unable (or unwilling) to reduce its prices to its offtakers.
2. The recent entry into the Kenya market of Proto Energy, which has quickly gained market share by
offering an end-user LPG price substantially below that typically charged by the rest of the
(legitimate) industry, supported by effective vertical integration and a leaner, more efficient cost
structure. Proto has addressed head-on the twin issues of cost inefficiency (where it exists) and

Clean Cooking for Africa National Feasibility Study: LPG for Clean Cooking in Kenya
61
rent-seeking (where it exists). As of this writing, it is unknown whether the rest of the industry will
eventually respond to Proto’s efforts to reset the prevailing end-user market price of LPG through
reductions in their own pricing and improvements in their own cost structures, or not. The
implications of a sustained pricing reset equal to, or near to, the level Proto has been delivering is
taken up in more detail in Part VI (LPG Demand Potential to 2030) beginning on page 69.
For purposes of the analyses in this report, it is assumed that the pricing structure in Kenya will remain as it
presently is. However, the effect of decreased prices from enhanced competition (among other factors) is
considered in the demand analysis of Part VI. A move to semi-regulated pricing would in principle
(i) reduce or eliminate pricing excesses where they exist, (ii) equalize pricing nationally by cross-subsidizing
distance-based transportation costs, if so implemented, and (iii) notionally provide stability of margins for
investment and bankability purposes28.
Current pricing
The following figure shows the estimated price buildup presently in effect in Kenya, on average, noting that
all transactions in Kenya throughout the LPG supply chain are inherently negotiated case by case between
the parties involved. Additionally, individual companies may have operations at one node or at multiple
nodes in the supply chain.
Figure 5. Current LPG price structure
28 If future pricing regulations were to set maximum margins rather than fixed margins, the possibility of price wars is not
eliminated.
Imp
ort
er P
rice
(M
om
bas
a)
Bu
lk T
ran
spo
rt C
ost
(N
airo
bi)
Bu
lk T
ran
spo
rt M
argi
n
Tran
spo
rt L
oss
Cyl
ind
er F
illin
g C
ost
Cyl
ind
er M
ain
ten
ance
Co
sts
Dep
ot
Loss
Mar
kete
r M
argi
n
Loca
l Cyl
ind
er T
ran
spo
rt C
ost
Dis
trib
uto
r M
argi
n
Ret
aile
r M
argi
n
Cyl
ind
er T
ran
spo
rt C
ost
(N
yeri
)
0
200
400
600
800
1,000
1,200
1,400
1,600
Euro
s /
Ton
ne

Clean Cooking for Africa National Feasibility Study: LPG for Clean Cooking in Kenya
62
Price Element Amount
(€/T)29
Description
Importer Price (Mombasa) 689.3 Price charged to marketers by importer ex-Mombasa
Bulk Transport Cost (Nairobi) 28.2 Cost to transport LPG in bulk from Mombasa to the Nairobi area
Bulk Transport Margin 22.7 Margin obtained by the bulk transporter
Transport Loss 3.4 0.5% loss factor, borne by the Marketer
Cylinder Filling Cost 22.1 Cost to fill cylinder (based on 6kge size)
Cylinder Maintenance Costs 37.9 Cost of maintenance of the cylinder
Depot Loss 11.2 1.5% loss factor, borne by the Marketer
Marketer Margin 201.5 Margin obtained by the Marketer
Local Cylinder Transport Cost 33.7 Cost to transport cylinders within the service area of the filling
plant
Distributor Margin 99.8 Margin obtained by the distributor
Retailer Margin 167.9 Margin obtained by the retailer
Total (Nairobi area) 1,317.7
Net Cylinder Transport Cost (Nyeri)* 52.0 Cost to transport cylinders to a representative remote community
Total (Nyeri area)* 1,369.7 At 150 km from greater Nairobi
Home Delivery Charge 73.6
Price charged by third-party services that collect consumers' empty
LPG cylinders, take them to cylinder exchange points, and return
with filled cylinders
* Costs to transport cylinders outside of the local service zone around Nairobi, the main inland hub for LPG, average 27 Ksh/kg-km (€ 239/tonne-km). Data for Nyeri, which is located 150 km by road from Nairobi, are provided as a representative indication of how distance affects end-user price through cylinder transport cost. Note that it is generally disadvantageous to both the BCRM and its enforcement, and to realizing economies of scale, to create dense hub-and-spoke networks of small filling plants in an attempt to reduce last-km cylinder transport costs.
At the end-user level, prices are charged per kg for the amount of fuel in a full residential LPG cylinder,
rather than per tonne. End-user LPG pricing spans a range of 1.18 €/kg, a price level most often found
among small, niche players in Nairobi, to 1.55 €/kg, charged in remote areas by large-scale international
players such as OilLibya and Total, supported by their greater brand equity and supporting the greater cost
of transportation for remote areas and their relative cost of investment in, and emphasis on, overall
distribution network robustness30.
Recent market entrant Proto Energy has been disrupting this price structure with an end-user price, in the
Nairobi area for purposes of comparison, of approximately € 0.93/kg (Ksh 105). This pricing level is more
than 25% below the market average. Although Proto Energy has not disclosed internal financial data,
industry experts with knowledge of the situation view this aggressive pricing level as likely to be sustainable
for the company for both the medium and long term.
29 All amounts are prevailing averages compiled from surveys, interviews and/or requests for indicative quotations made with
multiple companies at each supply chain node. For the importer price, the prevailing AGOL price was used, AGOL being the dominant importer and thus the price-leader. Importers obtain LPG in USD, based an international reference price (the Saudi Aramco Contract Price) adjusted for ocean transport and other factors. Importation costs and margins are not transparent under the present Kenyan system. Pricing downstream of importation is in Ksh. Exchange rates applied: Ksh/Euro, 113.2; USD/Euro, 1.15.
30 For competitive reasons, Marketers were unwilling to disclose their internal price-setting calculations or strategies.

Clean Cooking for Africa National Feasibility Study: LPG for Clean Cooking in Kenya
63
Potential pricing reforms
While LPG pricing has been deregulated since 1994, LN 121 (2009) and the underlying Energy Act of 2006
permit LPG prices to be regulated. A new Energy Bill has been proposed, but not yet enacted, which would
provide for regulation of LPG pricing at the wholesale (distributor) level.
Accordingly, the Government has begun to study the possibility of moving to a partially regulated LPG price
over time. As of this writing, no details have been determined nor governmental guidance provided
regarding specific targets for cost elements or margins. The two price structures presented below are
therefore recommendations for use in forthcoming Government deliberations.
The first recommendation, as an interim step, is to move to an open tender system (OTS) pricing approach
for importation, provided a new terminal is constructed with which to implement it. (The present AGOL
terminal has not expressed interest or willingness to implement the OTS approach.) OTS, in principle,
would improve the competitiveness and transparency of LPG importation. This approach was implemented
in recent years in Tanzania with that very result.
The second recommendation is a longer-term switch to a semi-regulated pricing model, in which the price
of imported LPG is built up from the international reference price, and the costs covered and margins
allocated along the supply chain are defined as fixed or maximum amounts per tonne.
The service model is linked to the level of margins
A critical issue in setting unit margins through regulation is the service model intended for the country.
Margin choice implies service level. With high unit margins for the marketing/filling/distribution part of
the supply chain, services such as home delivery become viable. Indeed, home delivery already exists for a
small but unquantifiable portion of the urban market as an independently provided add-on service, utilizing
motorbikes. High unit margins, per industry norms, would be in the range € 200-400 per tonne.
With low unit margins, in a range of € 50-100 per tonne, only a basic service level is viable, and the focus of
the supply chain participants is, of commercial necessity, on increasing volume, both in order to cover fixed
costs (including any debt service) and, with additional volume, to generate financial returns to owners and
investors.
In the case of the prevailing average described above, the total of marketer, distributor and retailer margins
is approximately € 470/tonne, making a service-intensive model possible, to the extent that (i) marketers
and their distribution networks are willing to spend their margins on services in favor of delivering greater
returns to investors, and (ii) the cost of doing business in an environment with significant diversion and
theft of their cylinders is tolerably low. (Marketers were unwilling or unable to disclose the financial
consequences to them of such black-market activities.)
It is also recommended that the Government study the pricing reforms contemplated and recommended in
the other Clean Cooking for Africa countries with respect to models, issues, and implications of the
structuring and allocation of margins within an effective regulated price scheme.
The following two steps are recommended for Government consideration with respect to the possibility of
evolving to a semi-regulated pricing scheme for Kenya:
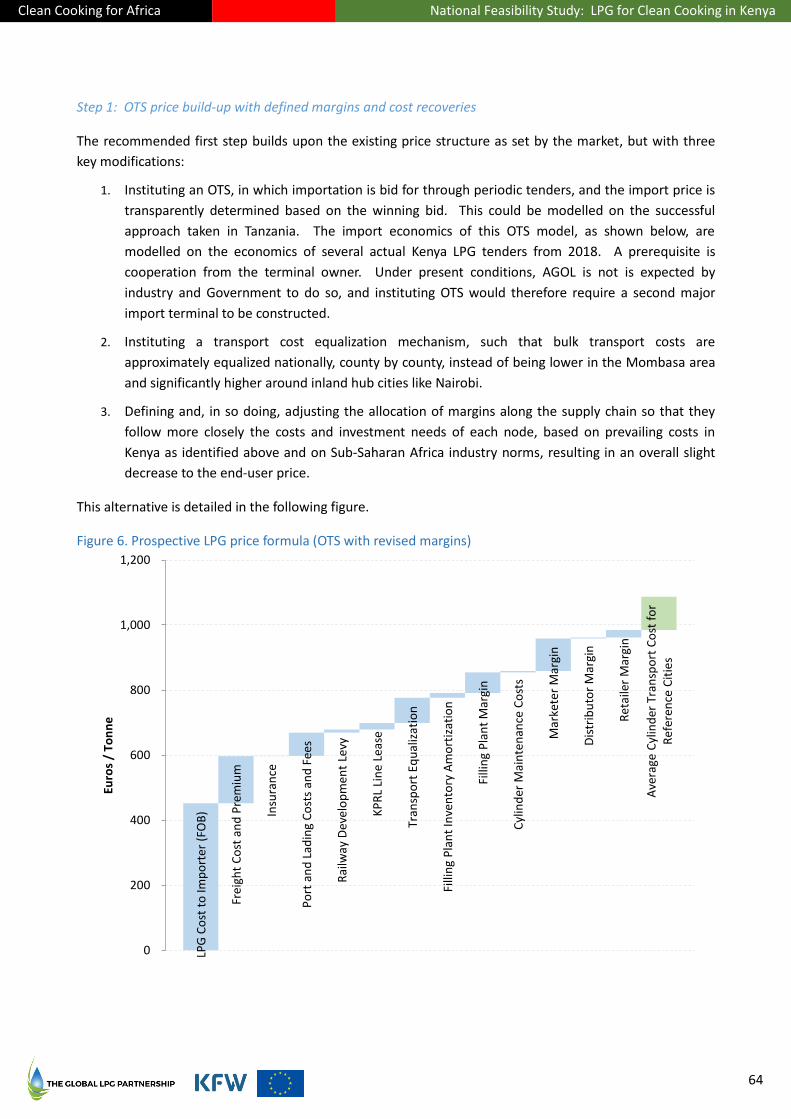
Clean Cooking for Africa National Feasibility Study: LPG for Clean Cooking in Kenya
64
Step 1: OTS price build-up with defined margins and cost recoveries
The recommended first step builds upon the existing price structure as set by the market, but with three
key modifications:
1. Instituting an OTS, in which importation is bid for through periodic tenders, and the import price is
transparently determined based on the winning bid. This could be modelled on the successful
approach taken in Tanzania. The import economics of this OTS model, as shown below, are
modelled on the economics of several actual Kenya LPG tenders from 2018. A prerequisite is
cooperation from the terminal owner. Under present conditions, AGOL is not is expected by
industry and Government to do so, and instituting OTS would therefore require a second major
import terminal to be constructed.
2. Instituting a transport cost equalization mechanism, such that bulk transport costs are
approximately equalized nationally, county by county, instead of being lower in the Mombasa area
and significantly higher around inland hub cities like Nairobi.
3. Defining and, in so doing, adjusting the allocation of margins along the supply chain so that they
follow more closely the costs and investment needs of each node, based on prevailing costs in
Kenya as identified above and on Sub-Saharan Africa industry norms, resulting in an overall slight
decrease to the end-user price.
This alternative is detailed in the following figure.
Figure 6. Prospective LPG price formula (OTS with revised margins)
LPG
Co
st t
o Im
po
rter
(FO
B)
Frei
ght
Co
st a
nd
Pre
miu
m
Insu
ran
ce
Po
rt a
nd
Lad
ing
Co
sts
and
Fee
s
Rai
lway
Dev
elo
pm
ent
Levy
KP
RL
Lin
e Le
ase
Tran
spo
rt E
qu
aliz
atio
n
Filli
ng
Pla
nt
Inve
nto
ry A
mo
rtiz
atio
n
Filli
ng
Pla
nt
Mar
gin
Cyl
ind
er M
ain
ten
ance
Co
sts
Mar
kete
r M
argi
n
Dis
trib
uto
r M
argi
n
Ret
aile
r M
argi
n
Ave
rage
Cyl
ind
er T
ran
spo
rt C
ost
fo
r R
efer
ence
Cit
ies
0
200
400
600
800
1,000
1,200
Euro
s /
Ton
ne
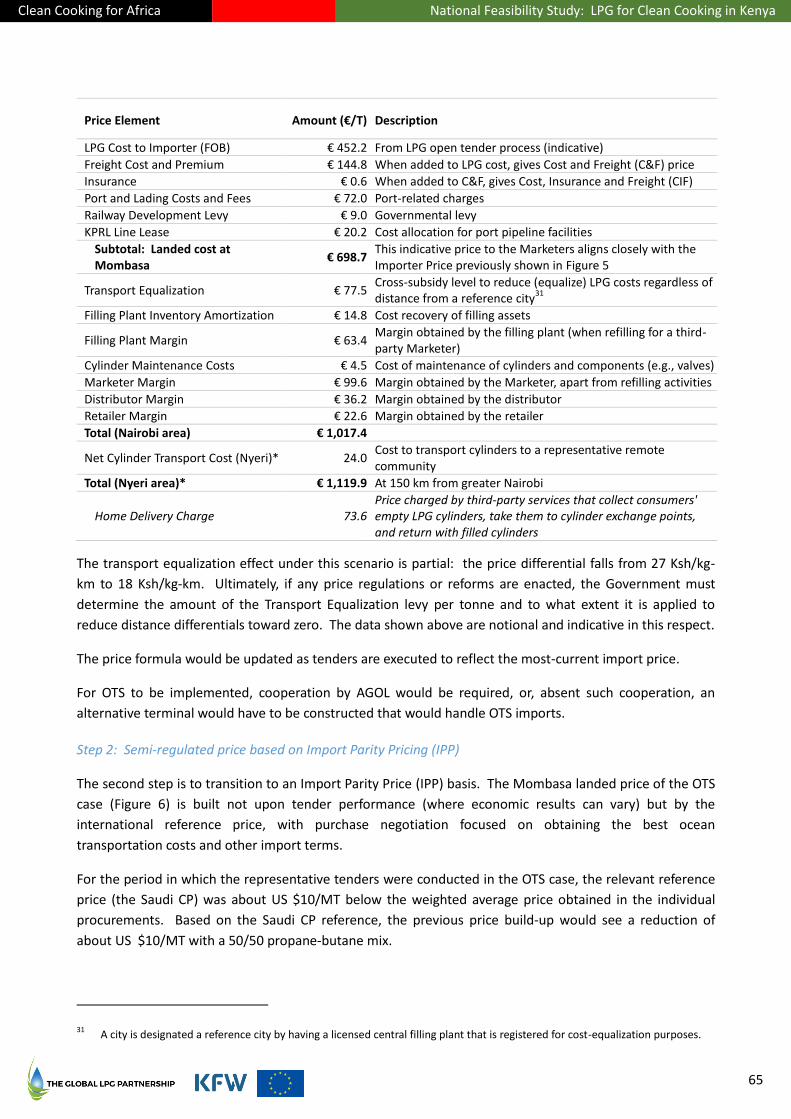
Clean Cooking for Africa National Feasibility Study: LPG for Clean Cooking in Kenya
65
Price Element Amount (€/T) Description
LPG Cost to Importer (FOB) € 452.2 From LPG open tender process (indicative)
Freight Cost and Premium € 144.8 When added to LPG cost, gives Cost and Freight (C&F) price
Insurance € 0.6 When added to C&F, gives Cost, Insurance and Freight (CIF)
Port and Lading Costs and Fees € 72.0 Port-related charges
Railway Development Levy € 9.0 Governmental levy
KPRL Line Lease € 20.2 Cost allocation for port pipeline facilities
Subtotal: Landed cost at Mombasa
€ 698.7 This indicative price to the Marketers aligns closely with the Importer Price previously shown in Figure 5
Transport Equalization € 77.5 Cross-subsidy level to reduce (equalize) LPG costs regardless of distance from a reference city
31
Filling Plant Inventory Amortization € 14.8 Cost recovery of filling assets
Filling Plant Margin € 63.4 Margin obtained by the filling plant (when refilling for a third-party Marketer)
Cylinder Maintenance Costs € 4.5 Cost of maintenance of cylinders and components (e.g., valves)
Marketer Margin € 99.6 Margin obtained by the Marketer, apart from refilling activities
Distributor Margin € 36.2 Margin obtained by the distributor
Retailer Margin € 22.6 Margin obtained by the retailer
Total (Nairobi area) € 1,017.4
Net Cylinder Transport Cost (Nyeri)* 24.0 Cost to transport cylinders to a representative remote community
Total (Nyeri area)* € 1,119.9 At 150 km from greater Nairobi
Home Delivery Charge 73.6 Price charged by third-party services that collect consumers' empty LPG cylinders, take them to cylinder exchange points, and return with filled cylinders
The transport equalization effect under this scenario is partial: the price differential falls from 27 Ksh/kg-
km to 18 Ksh/kg-km. Ultimately, if any price regulations or reforms are enacted, the Government must
determine the amount of the Transport Equalization levy per tonne and to what extent it is applied to
reduce distance differentials toward zero. The data shown above are notional and indicative in this respect.
The price formula would be updated as tenders are executed to reflect the most-current import price.
For OTS to be implemented, cooperation by AGOL would be required, or, absent such cooperation, an
alternative terminal would have to be constructed that would handle OTS imports.
Step 2: Semi-regulated price based on Import Parity Pricing (IPP)
The second step is to transition to an Import Parity Price (IPP) basis. The Mombasa landed price of the OTS
case (Figure 6) is built not upon tender performance (where economic results can vary) but by the
international reference price, with purchase negotiation focused on obtaining the best ocean
transportation costs and other import terms.
For the period in which the representative tenders were conducted in the OTS case, the relevant reference
price (the Saudi CP) was about US $10/MT below the weighted average price obtained in the individual
procurements. Based on the Saudi CP reference, the previous price build-up would see a reduction of
about US $10/MT with a 50/50 propane-butane mix.
31 A city is designated a reference city by having a licensed central filling plant that is registered for cost-equalization purposes.

Clean Cooking for Africa National Feasibility Study: LPG for Clean Cooking in Kenya
66
This approach to pricing would give the maximum transparency and would add stability by narrowing the
cost items subject to procurement negotiation. The price formula data would be updated monthly to
reflect the monthly changes to Saudi CP.
It is important to note that any LPG price regulation under the new Energy Bill would extend only to the
distributor (wholesale) level; market forces would continue to determine final pricing to the end-user.
If OTS is deemed un-implementable because of lack of cooperation from AGOL, or because it is not
justifiable to construct an alternative terminal to operate on an OTS basis, then the Government should
move directly to the IPP approach, bypassing the OTS step.
Cylinder deposits and deposit reform
The amount of the cylinder deposit collected by the distribution chain from a new consumer in Kenya is
also subject to market forces. Historically, these forces have been arrayed in favor of the marketer over the
consumer. In general, LPG Marketers in Kenya have followed a practice of charging the consumer at or
above the cylinder acquisition cost. (The NOCK Mwananchi Gas Project, wherein the cylinders are
subsidized for the consumer, is the major exception to this practice.)
This is done (i) because the marketers have the market power to do so, and, in part, (ii) to reduce the
financial impact from the loss of portions of their cylinder inventories to pirate refillers, as well as (iii) to
reduce the financial impact from some of their cylinders becoming stuck or stranded in the CEP, as
currently structured.
It is a widespread practice throughout Sub-Saharan Africa (and worldwide) that the cylinder deposit that
can be charged to a consumer is capped by national law or regulation. In highly developed LPG markets
such as Morocco’s, competitive forces have driven down the average cylinder deposit to about 20-25% of
the cost of a cylinder. In Cameroon, as another example, the maximum under law that can be charged to a
consumer for the cylinder deposit is 80% of the Marketer’s cost to acquire the cylinder.
It is recommended that the Government of Kenya institute such a cylinder deposit cap together with the
other reforms contemplated for LPG pricing.
The deposit entitles the consumer to possess a cylinder of a certain brand, and to have his/her cylinder
(typically a different one with each refill) refilled, inspected and maintained for safety by the LPG marketing
company. When the deposit is capped by law or regulation, the consumer is insulated from wholesale and
retail price mark-ups as well as from the full acquisition cost of the cylinder itself. The up-front cost to
become an LPG user is reduced in direct proportion to the deposit cap.
The consumer may recover his/her deposit by giving up the cylinder to the appropriate LPG marketer’s
retailer or distributor.
Encouraging cylinder deposit reform via financing
A second lever for encouraging deposit fees to be charged at below 100% of cylinder costs is for
concessional financing sources to develop a highly attractive cylinder financing package and structure,
which is made available to willing and qualified firms that agree to price their cylinder deposit fees
meaningfully below 100%. See Chapter 16, which begins on page 141, for a further discussion.
Clean Cooking for Africa National Feasibility Study: LPG for Clean Cooking in Kenya
67
11. National LPG Planning Process 2012-2019
As described in Part IV, the Government, the LPG sector and other relevant stakeholders and partners
undertook a series of steps to improve the LPG enabling environment and address problems and
weaknesses in the national LPG ecosystem that resulted as unintended consequences of prior policy and
regulatory decisions and the bad and illegal practices of some industry players.
Areas of assistance to MoE and EPRA through the Clean Cooking for Africa Program
Consistent with its long record of assistance to the Government of Kenya starting in 2011, GLPGP signed a
protocol with the MoE in 2012 to govern providing technical and finance-related support to the
Government and other relevant stakeholders, focusing on the following areas:
1. Planning for and implementing expanded LPG supply infrastructure and distribution networks;
2. Identifying low-cost financing solutions for LPG infrastructure and for consumer LPG microlending;
3. Improving supply chain design to drive down LPG costs to consumers;
4. Developing public education programs to encourage safe use of LPG for cooking and to explain the
benefits of LPG for households and society; and
5. Enhancing LPG policy and regulation.
As described earlier in this Part, work commenced in 2013 on several of these fronts.
Change in Governmental strategy for LPG sector expansion
Changes in the Government and within the senior ranks of the Ministry of Energy and Petroleum and the
Energy Regulatory Commission (now EPRA) during 2014-2015 resulted in a set of changes in Government
strategy regarding LPG sector development.
The main change was a shift in strategic focus from a private-sector-led expansion of the LPG sector to
having state enterprises take the lead in expanding it. In particular, the National Oil Company of Kenya
(NOCK) would spearhead widespread distribution of millions of smaller, subsidized LPG cylinders to poorer
Kenyan households—this became the Mwananchi Gas Project—and the Kenya Pipeline Company and
related agencies would evaluate creating new LPG importation and bulk storage as an alternative to AGOL,
which has dominated maritime LPG importation.
This change coincided with a major reform and restructuring effort for the Kenya petroleum sector as a
whole, with major outside funding obtained from the World Bank.
The private sector could choose to keep up with the state sector, or not.
The key state-backed intervention which emerged from the new governmental strategy was the
Mwananchi Gas Project, described in the preceding Part. Ironically for the Government, the private sector
is now challenging the legality of the Mwananchi Gas Project in the courts, while allegations of corruption
and mismanagement in the project have arisen and have been publicized in the Kenyan media. The yield
Clean Cooking for Africa National Feasibility Study: LPG for Clean Cooking in Kenya
68
on the project’s initial deployment of cylinders was about 25% (meaning, only one in four of the beneficiary
households became a repeat LPG customer).
To support the private sector along its own, parallel development track, the Government convened
multistakeholder efforts to define and enact an update to LN 121 intended to address, in part, some of the
unintended adverse consequences of the 2009 LPG-related laws. The GLPGP/Clean Cooking for Africa
expert team provided assistance, advice and comments to the Government and to other Kenyan
stakeholders throughout this process. The finalized LN 121 is to be put into force as of the end of 2019,
following an official six-month transition period.
Implications for LPG investment
Because the Government was funding the NOCK initiative directly, the Ministry of Energy recommended
that the Clean Cooking for Africa program devise appropriate means of supporting well-qualified private
sector initiatives (among LPG players other than NOCK) aimed at expanding the availability of LPG and, if
possible, making LPG more affordable as well. Additionally, in 2019 the state sector, including KPC and the
Kenya Port Authority (KPA), requested technical, operationally-oriented support for a variety of new
infrastructure projects from the GLPGP/Clean Cooking for Africa expert team.
In parallel, a number of private sector LPG companies (both existing and potential new entrants) sought out
GLPGP/Clean Cooking for Africa as a potential source of investment capital for their projects. Certain of
these, aggregated and disguised to protect their confidentiality, have been modelled in Part VIII.

Clean Cooking for Africa National Feasibility Study: LPG for Clean Cooking in Kenya
69
This Part32 provides an evidence base for use by investors, policymakers, industry and researchers to guide
the development of LPG infrastructure and distribution systems in Kenya and to guide development of
programs to support development of increased LPG demand relative to harmful cooking fuels like kerosene,
charcoal and firewood.
It comprises the results from modelling of a base case of LPG consumption, in which “business as usual” is
projected into the future; and lower and upper bound scenarios of the demand which could be unlocked
through expanding the availability of LPG (in cylinders) to consumers which do not presently use LPG. The
approach taken is to consider the characteristics which have given rise to the demand which was served in
2016, and to model how this demand would be reflected across (a) new users brought into the national LPG
value chain with investments in expanded cylinder inventory, and (b) concomitant growth in demand from
existing users.
The analysis presented in this Part utilizes as its primary data source the Kenya National Bureau of Statistics
household survey, the 2015/2016 Kenya Integrated Household Budget Survey (2015/2016 KIHBS), which is a
nationally representative population survey.
The demand modelling predicts that the governmental goal of 35% of the population using LPG for cooking
by 2030 is within reach, if enabling environment enhancements and investments as described in this
report—and others investments like them—are well and timely undertaken under good conditions of
regulatory enforcement. As mentioned in the Executive Summary (Part II of this report), the analysis
predicts that improving LPG availability, by itself, can be expected to have a major impact on the extent of
LPG adoption. Additional measures to increase consumer preference for LPG for cooking (compared with
wood, kerosene and charcoal) and to improve affordability of LPG equipment and/or fuel could further
boost consumption, increasing the overall societal benefits from LPG transition.
In view of the price disruption of the market status quo ante by new entrant Proto Energy, which has been
selling LPG at a per-kg refill price of over 25% below the prices of most other LPG Marketers, this Part also
examines how a competitively-driven resetting of the end-user price in the market, closer to the Proto
Energy price level, could impact overall LPG adoption and use.
32 The contents of Chapter 12 were developed with Dalberg Global Development Advisors under engagement to GLPGP, with
further analysis in Chapter ASDSDA performed by GLPGP.
Clean Cooking for Africa National Feasibility Study: LPG for Clean Cooking in Kenya
70
12. Demand Assessment
Summary
The assessment presents baseline consumption of LPG in Kenya in 2016 (the most recent year for which
comprehensive statistical data are available), and a forecast of potential demand for LPG as a household
fuel in 2020, 2025 and 2030. Forecasts are made reflecting a scenario of increased LPG availability to be
achieved through planned and/or potential additional market and regulatory reforms and large-scale
cylinder investment.
Data sources
The most recent Kenya National Bureau of Statistics household survey, the 2015/2016 Kenya Integrated Household Budget Survey (2015/2016 KIHBS), which is a nationally representative population survey, was the primary data source for the assessment. Pricing data were obtained through field surveying, industry and government interviews, and media coverage of pricing where specific to location and date.
Baseline residential LPG consumption (as household fuel) in 2016
The penetration of LPG has been increasing in Kenya. 13.4% of total households reported using LPG as a
primary fuel for cooking in the 2015/2016 KIHBS, compared to only 3.5% of households in the 2005/6
KIHBS. 31% of urban households and 3% of rural households consumed LPG as a primary fuel and 9% and
5% consumed LPG as a secondary fuel in 2016. Overall, most Kenyan households still rely on biomass fuel
for cooking, with 55% of households using firewood and 15% using charcoal as their main fuel for cooking.
This is especially pronounced in rural areas, where 84% use firewood and 9% charcoal. Kerosene is the
dominant cooking fuel in urban Kenya, with 33% of urban households using it as the primary cooking fuel.
In 2016, a total 151,900 MT of LPG was consumed in Kenya, rising to 222,300 MT in 201833. Approximately
143,000 MT of LPG was consumed by households in cylinders in 2016, which amounted to annual per
capita LPG consumption of 3.2 kg.
LPG consumption varies across urban and rural households. In 2016, urban and rural LPG users consumed
19 kg and 10 kg per capita per annum, respectively. Those households that cooked with LPG exclusively
(that is, they did not stack with another fuel) consumed 24 kg per capita per annum, which is consistent
with exclusive consumption levels in other, more-developed markets. Of the Kenyan households using LPG
in 2016, 70% used a 6 kg cylinder and 26% used a 13 kg cylinder. It was estimated that were 2.2 million LPG
cylinders being utilized at the household level in 2016 (excluding the float).
Forecasted demand for LPG in 2020, 2025, and 2030
LPG demand for household cooking was forecasted for 2020, 2025 and 2030 by analyzing the incremental
impact of four drivers of demand: (i) demographic trends, (ii) improved LPG availability (that is, LPG in
cylinders being made reliably available to consumers who did not previously have access to cylinders and
who are located in areas that are practical for LPG to serve), (iii) potential reductions in overall LPG prices
resulting from increased market-based price competition that began in 2018, and (iv) potentially improved
33 KNBS Economic Survey (2019); table 9.2

Clean Cooking for Africa National Feasibility Study: LPG for Clean Cooking in Kenya
71
affordability of LPG stoves and cylinder deposits for a portion of the poorer segment of the population
through the Mwananchi Gas Project. These drivers were combined to create the following scenarios:
Main Scenarios
This assessment examines two main scenarios:
1. Scenario 1: Base case scenario, extrapolating historical trends.
2. Scenario 2: Expanded availability scenario, based on implementation of planned reforms,
accelerated investment, and other interventions. This scenario has two sub-scenarios:
a. Lower-bound for expanded availability, incorporating demand growth from demographic
changes, as well as the impact of expanded LPG availability to serve latent demand.
b. Upper-bound for expanded availability, incorporating the same demand drivers as Scenario
2(a) (demographic changes and expanded LPG availability), as well as additional changes in
preferences from other interventions that result in additional households switching to LPG,
and an increase in per-user consumption of LPG.
The base case scenario assumes that LPG adoption increases in line with historical trends. In this scenario,
it is estimated that residential LPG consumption will grow to 359,657 MT by 2030. This equates to a
national per capita consumption of 5.6 kg.
Under conditions of sufficient availability, it is projected that residential LPG consumption for cooking will
grow from 213,400 MT in 201834 to between 392,477 MT and 549,887 MT by 2030. This equates to a per
capita consumption of between 6.15 kg and 8.61 kg across the entire population. The number of
households using LPG is projected to grow to between 6.59 million households in the lower bound case
(38% of all households) and 7.04 million households in the upper bound case (41% of all households) by
2030. The potential impact of availability was likely underestimated, because the data did not allow
modelling the impact of reducing distances travelled to the LPG cylinder retail point within each
demographic cluster, or improved local cylinder availability where cylinders are already present, but the
service level does not meet all the local demand.
As would be expected, the analysis shows that improving affordability and availability together has a
greater effect in Kenya than improving availability alone. Combining investments in improving accessibility
of fuel and cylinders and providing subsidies, loans, or other financial support mechanisms for the stove
and cylinder deposit has the potential to drive significant uptake of LPG use in Kenya.
Conclusion
Kenya’s LPG consumption has been rising for many years, despite recurring shortages of LPG cylinders and
fuel, with the proportion of households using LPG as their main source of cooking energy growing from
2.3% in 1999 to 13.4% in 2016. Additional investments to improve availability as well as affordability would
unlock latent demand. This would include investment in additional cylinders and expansion of distribution
networks, as well as policies and business models that lower the up-front stove and cylinder deposit costs
34 The 2018 value is calculated by applying 2016 ratios from the national household survey to 2018 residential LPG consumption
volume data assembled by GLPGP from governmental and industry sources.
Clean Cooking for Africa National Feasibility Study: LPG for Clean Cooking in Kenya
72
(such as by direct subsidy, as in the Mwananchi Gas Project). The ending of the national Cylinder Exchange
Pool (CEP) will also help to return stranded cylinders into circulation and improve operating conditions for
industry players.
Building on demographic changes, such investments could increase uptake by up to 4.7 million additional
households and increase annual LPG consumption to 549,887 MT in 2030 under the high-case scenario and
4.2 million additional households and 392,477 MT in a more conservative, low-case scenario.
Detailed analysis and findings
Using the latest available data, the following were estimated:
1. Residential penetration and consumption of LPG for household cooking in Kenya in 2016 (and
updated consumption for 2018) across urban and rural households.
2. Potential future demand for LPG in Kenya in 2020, 2025 and 2030 under a scenario of
sufficiency of LPG availability resulting from a systematically expanding LPG sector. This
includes additional cylinder availability, improved cylinder recirculation under a reformed
market structure, and no disruption to the refills supply.
The analysis that follows estimates LPG demand in Kenya between 2016 and 2030 under a number of
different conditions. First, an overview of the study and data used for the Kenya demand assessment is
provided. This is followed by an overview of baseline household LPG consumption in Kenya in 2016.
Finally, results from demand projections up to 2030 are presented.
Data sources
The modelling presented in this report relies on the most recent Kenya National Bureau of Statistics
household survey, the 2015/2016 Kenya Integrated Household Budget Survey (2015/2016 KIHBS). The
2015/2016 KIHBS is a nationally representative, population-based household survey that was conducted
over a 12-month period from September 2015 to August 2016. The KIHBS survey sampled 24,000
households drawn from 2,400 clusters across the country. Data were obtained from 21,773 households,
representing a response rate of 91.3%. The response rate for rural households was 93.6% while that for
urban households was 88.0%.
With regards to energy use, the 2015/2016 KIHBS captured data relevant for the demand assessment, as
follows:
Primary and secondary use: The survey asked respondents to list their main (primary) source of
energy for cooking as well as all the energy sources used in the last month and in the last twelve
months. Based on this, households using LPG as a secondary fuel could be identified as households
which list LPG as an energy source used in the preceding 12 months but do not list it as their main
source of energy for cooking.
Quantity and price of fuel: The survey asked respondents to report the number of units of fuel
used per month and the total amount paid for those units. From this, household annual fuel
consumption could be inferred by multiplying monthly usage by twelve. The average price paid by
households for each fuel (including LPG) was calculated by dividing cost of the units of fuel used

Clean Cooking for Africa National Feasibility Study: LPG for Clean Cooking in Kenya
73
per month by the number of units used. There are, however, limitations to using self-reported data,
as households do not always accurately estimate fuel consumption and unit prices for biomass and
charcoal compared to LPG.
Availability of fuel: The survey asked respondents how long it takes them to go to the nearest
source of fuel used, one-way in minutes. This variable can be used to infer the availability of LPG for
households that use LPG.
While the analysis heavily relied on household data from the KIHBS, it was supplemented with data from
other sources. Data on total and residential consumption of LPG (2014-2018) and cylinders in circulation
were derived from government and industry data.
Baseline consumption of LPG as a household cooking fuel In Kenya In 2016
Overview of Kenya household cooking fuel use in 2016
Kerosene and LPG are the dominant cooking fuels in Kenya’s urban areas, while firewood dominates rural
and peri-urban areas (see Figure 7). In 2016, 31% and 33% of urban Kenyan households used LPG and
kerosene as primary cooking fuels, respectively. Kerosene is currently the lowest-cost mainstream cooking
fuel in urban Kenya and is easily accessible, with over 1,500 kerosene dispensing points in Nairobi alone35.
However, LPG has increased in use from 3.5% of households nationally in 2006 (2005/2006 KIHBS) to 13.4%
in 2016 (2015/2016 KIHBS), as shown in Figure 8. In rural Kenya, 84% of households continued to depend
on firewood, and 49% of Kenya’s households36 collected firewood for free, in 2016.
35 Climate Development Knowledge Network (2018). “Scaling up clean cooking in urban Kenya with LPG & bio-ethanol.”
www.dalberg.com/our-ideas/cleaning-cooking-urban-kenya-lpg-and-bio-ethanol 36
KNBS (2016); 2015/2016 KIHBS.
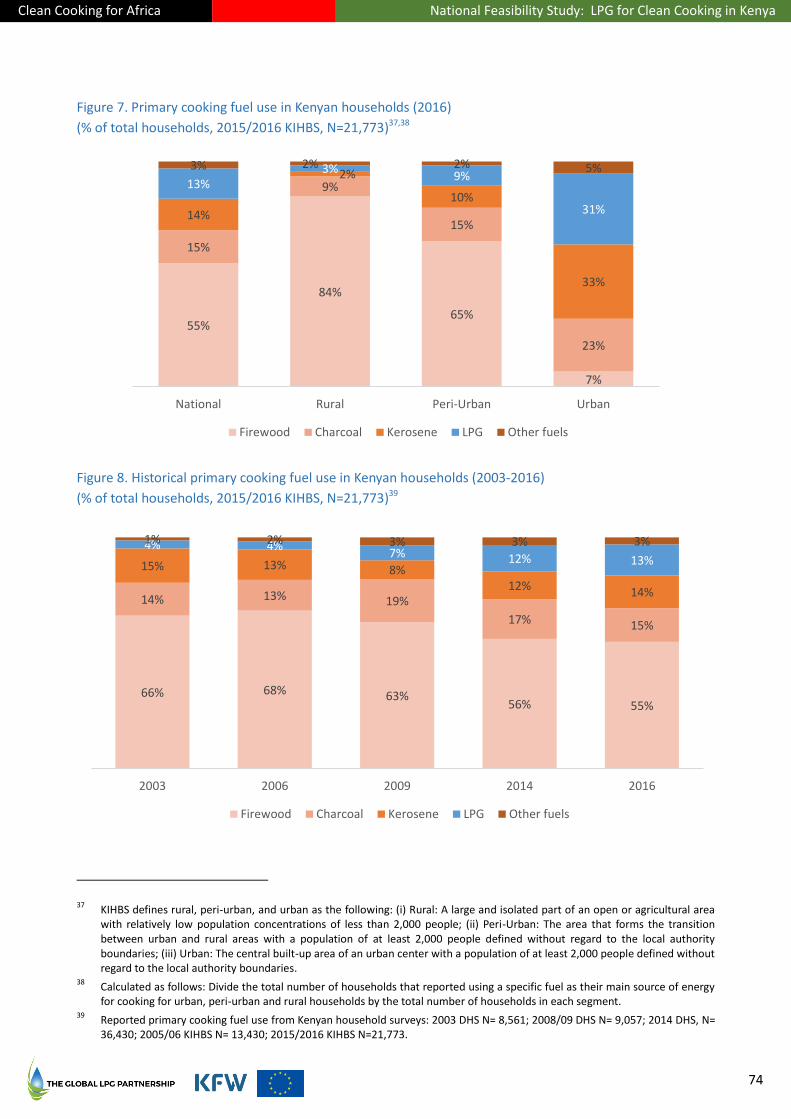
Clean Cooking for Africa National Feasibility Study: LPG for Clean Cooking in Kenya
74
Figure 7. Primary cooking fuel use in Kenyan households (2016)
(% of total households, 2015/2016 KIHBS, N=21,773)37,38
Figure 8. Historical primary cooking fuel use in Kenyan households (2003-2016)
(% of total households, 2015/2016 KIHBS, N=21,773)39
37 KIHBS defines rural, peri-urban, and urban as the following: (i) Rural: A large and isolated part of an open or agricultural area
with relatively low population concentrations of less than 2,000 people; (ii) Peri-Urban: The area that forms the transition between urban and rural areas with a population of at least 2,000 people defined without regard to the local authority boundaries; (iii) Urban: The central built-up area of an urban center with a population of at least 2,000 people defined without regard to the local authority boundaries.
38 Calculated as follows: Divide the total number of households that reported using a specific fuel as their main source of energy
for cooking for urban, peri-urban and rural households by the total number of households in each segment. 39
Reported primary cooking fuel use from Kenyan household surveys: 2003 DHS N= 8,561; 2008/09 DHS N= 9,057; 2014 DHS, N= 36,430; 2005/06 KIHBS N= 13,430; 2015/2016 KIHBS N=21,773.
55%
84%
65%
7%
15%
9%
15%
23%
14%
2%
10%
33%
13% 3%
9%
31%
3% 2% 2% 5%
National Rural Peri-Urban Urban
Firewood Charcoal Kerosene LPG Other fuels
66% 68% 63% 56% 55%
14% 13% 19%
17% 15%
15% 13% 8% 12% 14%
4% 4% 7% 12% 13%
1% 2% 3% 3% 3%
2003 2006 2009 2014 2016
Firewood Charcoal Kerosene LPG Other fuels

Clean Cooking for Africa National Feasibility Study: LPG for Clean Cooking in Kenya
75
Fuel stacking is widespread, with most households using LPG alongside other fuels, as shown in the
following two figures. In 2016, 31% of urban households used LPG as the primary cooking fuel40, and 9%
used LPG as a secondary cooking fuel41.
Figure 9. Primary and secondary LPG use in Kenyan households in 2016
(% of total households, 2015/2016 KIHBS, N=21,773)42
Figure 10. Incidence of LPG stacking with other fuels in Kenyan households in 2016
(% of total households, 2015/2016 KIHBS, N=21,773)43
40 Primary fuel is defined as the main cooking fuel used by a household.
41 Secondary fuel is defined as a fuel used for supplemental purposes, for example, as a backup fuel or for selective fuel-specific
cooking activities. 42
Calculated as follows: (i) Divide total number of households that reported LPG as their main source of energy for cooking by the total number of households in each segment to get the share of households using LPG as a primary fuel. (ii) Tabulate the total number of households that listed LPG as an energy source used in the last 12 months and subtract the households using LPG as a primary fuel, and divide this by the total number of households in each segment to get the share of households using LPG as a secondary fuel.
43 The total number of households that reported using LPG only (primary use), those that reported using LPG alongside other
fuels (primary and secondary) and those that did not report using LPG were tabulated and each divided by the total number of households in each segment.
13%
5%
8%
31%
7% 5.10%
8.02% 9%
National Rural Peri-urban Urban
LPG used as primary cooking fuel
LPG used as secondary cooking fuel22
70% 87%
68% 66%
30% 13%
31% 35%
National Rural Peri-Urban Urban
LPG + other fuel LPG only

Clean Cooking for Africa National Feasibility Study: LPG for Clean Cooking in Kenya
76
The overall LPG consumption data show a clear relationship between road infrastructure and LPG
consumption. This is seen through the high LPG consumption in regions located along the main road
infrastructure from Mombasa through Nairobi to Eldoret, compared to other regions as shown in Figure 11.
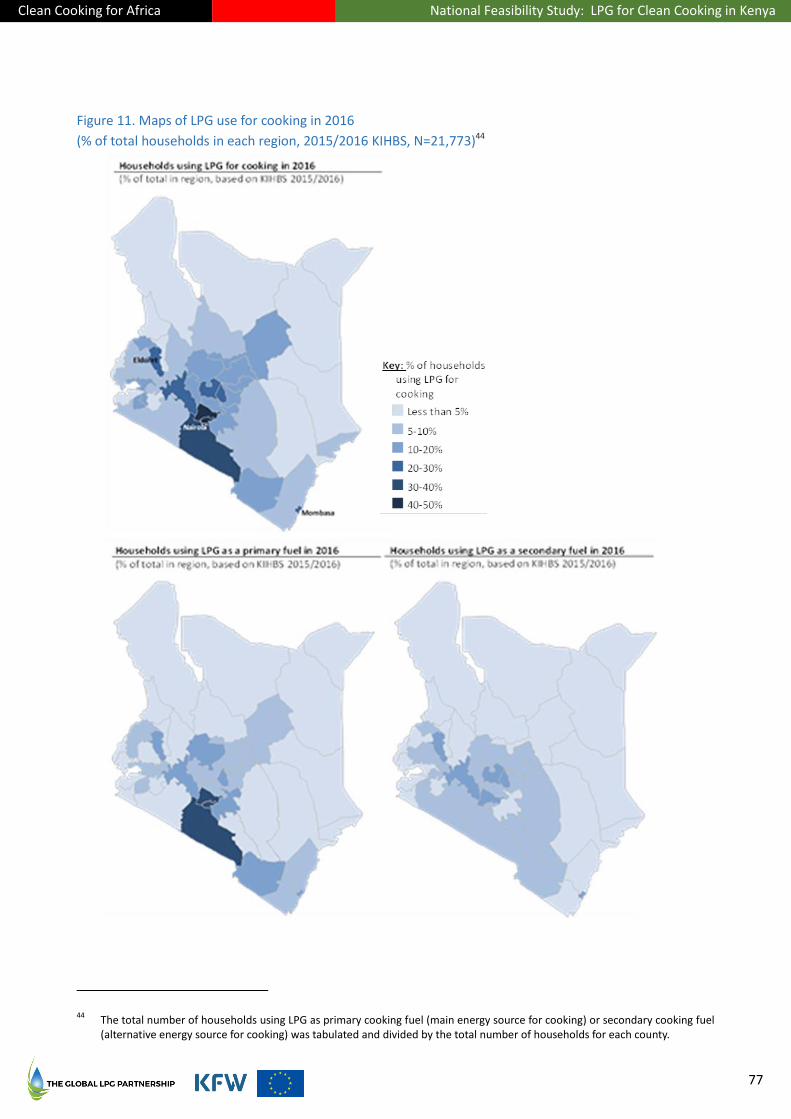
Clean Cooking for Africa National Feasibility Study: LPG for Clean Cooking in Kenya
77
Figure 11. Maps of LPG use for cooking in 2016
(% of total households in each region, 2015/2016 KIHBS, N=21,773)44
44 The total number of households using LPG as primary cooking fuel (main energy source for cooking) or secondary cooking fuel
(alternative energy source for cooking) was tabulated and divided by the total number of households for each county.

Clean Cooking for Africa National Feasibility Study: LPG for Clean Cooking in Kenya
78
Baseline residential consumption of LPG in 2016
The total and per capita LPG usage in 2016 were calculated using two approaches—a top-down approach
and a bottom-up approach. The top-down approach relied on aggregate national-level LPG consumption
data from the Petroleum Institute of East Africa (PIEA) and the bottom-up approach relied on the
2015/2016 KIHBS data to extrapolate LPG consumption to the general population. In this analysis, a “user”
is a member of a household that cooks with LPG.
Top down approach: Approximately 96% of total LPG consumption in 2016 was residential (145,842 MT of
151,900 MT), calculated by comparing 2016 national consumption data with the 2015/2016 KIHBS
household data. In 2017, total national LPG consumption increased to 189,300 MT, and in 2018, to 222,300
MT.45
Bottom-up approach: Using the 2015/2016 KIHBS data, reported average monthly LPG consumption per
household was multiplied by twelve and by the total number of households to calculate annual household
LPG consumption in 2016 of approximately 140,000 MT.
Conclusion: The two calculations are within 4% of one another. For purposes of the analyses which follow,
a starting point of the average of these calculations—approximately 143,000 MT of residential LPG
consumption in 2016—is used.
Residential consumption per capita among LPG users
Again, a top-down and bottom-up approach were used:
Top-down approach for LPG users: The estimated total residential LPG consumption in 2016 (143,000 MT)
was divided by the total number of households consuming LPG in 2016 (2.3 million) and the average
household size (4.0)46 to arrive at LPG consumption per capita among LPG users of 15.8 kg per annum.
Bottom-up approach for LPG users: The average consumption per capita (15.2 kg) per LPG users was
determined using fuel consumption data in the KIHBS 2015/2016 dataset.
The following table summarizes LPG consumption per capita among urban, peri-urban and rural LPG users
in 2016:
Table 7. Average annual LPG per capita consumption among LPG users (2016)
(Kilograms per capita, 2015/2016 KIHBS, N=21,773)
Fuel use Rural households Peri-urban households Urban households
Any use of LPG 10.4 12.8 18.7
Exclusive use of LPG 19.3 23.7 24.5
LPG is the primary cooking fuel 11.6 15.8 19.8
LPG is a secondary cooking fuel 9.6 9.4 14.5
45 KNBS Economic Survey (April 2019), PIEA (2019), and GLPGP research (2019)
46 2015/2016 KIHBS Basic Report

Clean Cooking for Africa National Feasibility Study: LPG for Clean Cooking in Kenya
79
According to the KIHBS data, annual per capita LPG consumption in households that use LPG exclusively is
in the range of 20-25 kg. This value is consistent with the average per capita consumption of LPG among
LPG users in well-developed LMIC LPG markets and represents a long-term consumption level toward which
Kenya’s market can be expected to evolve over time. As LPG becomes more affordable relative to
household incomes (which may rise over time), and relative to the costs of alternative fuels, and as
understanding of LPG benefits increases, the share of LPG in households’ cooking fuel mix can be expected
to increase toward the exclusive-use level. The presence of a market segment which cooks exclusively with
LPG is suggestive that Kenyan consumers can have, or can develop, a preference for the benefits of LPG,
outweighing concerns about LPG, if LPG is adequately and reliably available and is sufficiently affordable.
Comparing the estimates from the top-down and bottom-up approaches, LPG users consumed 15.2 kg per
capita in 2016 on average, indicating a prevalence of fuel stacking. As shown in Table 7 above, fuel stacking
was more pronounced among rural households than urban households. This is to be expected in view of
(i) rural LPG pricing being in general higher than urban pricing due to transportation cost differentials, (ii)
lower average rural income levels, (iii) general lower LPG availability in rural areas, and (iv) lower costs of
certain alternative fuels in rural areas, including especially the relatively easy availability of firewood
gathered for free.
The overall annual per capita LPG consumption nationally, including both users and non-users, was 3.1 kg in
2016. Within the overall urban population, it was 7.1 kg, and among rural users, 0.8 kg.
Cylinders in circulation
The 2015/2016 KIHBS data provide a breakdown of the sizes of the first, second and third LPG cylinder
possessed by households. In 2016, of Kenyan households using LPG, approximately 70% used the 6 kg
cylinder and 26% the 13 kg. Provided all households reported cylinder sizes for all the cylinders they
possessed (about which, see further discussion below), then it can be estimated 98% of households using
LPG possess one cylinder, and Kenyan households in 2016 possessed about 2.2 million cylinders, equivalent
to 2.9 million 6 kg-equivalent cylinders. These data do not capture any additional cylinders in circulation
that are not possessed by households, such as the national cylinder float. While specific data are not
available for the size of the float, industry stakeholders suggest that there could be as many as 9 million
cylinders in Kenya (float and cylinders possessed by households) as of 2017.
Table 8. Total self-reported cylinders in household use, by cylinder size (2016)
(2015/2016 KIHBS, N=21,773)
Size of LPG cylinder Rural units Urban units Total Rural % Urban % Total %
1 kg 2,645 6,007 8,652 1% 0% 0%
3 kg 14,736 42,348 57,084 3% 2% 3%
6 kg 324,931 1,204,467 1,529,398 73% 69% 70%
13 kg 94,089 471,064 565,153 21% 27% 26%
15 kg 8,539 17,768 26,307 2% 1% 1%
Unspecified 881 4,734 5615 0% 0% 0%
Totals 445,821 1,746,388 2,192,209 100% 100% 100%

Clean Cooking for Africa National Feasibility Study: LPG for Clean Cooking in Kenya
80
Table 9. Total self-reported cylinders possessed by households (2016)
(in 6 kge units; 2015/2016 KIHBS, N=21,773)
Measure Rural Urban Total
Total number of cylinders of all sizes 445,821 1,746,388 2,192,209
Total number of 6 kg equivalent cylinders 558,827 2,296,436 2,855,263
Total number of households using LPG 485,786 1,811,875 2,297,661
Total population using LPG47
2,186,038 5,979,188 8,165,226
Average number of cylinders per household48
0.92 0.96 0.95
Average number of 6 kge cylinders per household that uses LPG
1.15 1.27 1.24
Average number of users per 6 kge cylinder 3.91 2.60 2.86
Industry estimates of the number of cylinders in circulation in 2017 are derived from two sources:
(i) surveying of licensed LPG companies by PIEA regarding cylinder inventories in 2012 and (ii) data on
cylinder imports by the licensed LPG companies between 2013 and 2017. These values, taken together,
suggest that the total national inventory of residential cylinders as of 2017 could be as high as 7-9 million of
6 kge. This figure is, clearly, far removed from the number in homes attributable to the 2015/2016
household survey data.
The following are major factors which account in whole or in part for this gap:
1. Cylinders in the supply chain which are not in households. (For example, cylinders that are in the
hands of distributors, in inventory at retail exchange points, at filling plants, and sitting idle in the
CEP.) Reliable market-wide data on these other cylinders does not exist.
2. Export or re-export of cylinders to neighboring countries. This quantity is not tracked.
3. Smuggling of cylinders into or out of the country. This quantity is not tracked.
4. Scrapping or other disposal of old, damaged or unused cylinders. This quantity is not tracked.
5. Reliability of the household survey regarding possession of cylinders. For example, some
households in the survey dataset reported using LPG but did not report having an LPG cylinder in
the home.
Accordingly, the true number of residential LPG cylinders in Kenya is unknown, and falls in the (admittedly
wide) range of about 3 million units of 6 kge based on the household-reported survey data (which excludes
the float) to as much as 9 million based on industry-reported survey and importation data, including the
float.
47 The total population using LPG was calculated by using total number of households using LPG and average household size for
rural households (4.5) and urban households (3.3). 48
In the 2015/2016 KIHBS some households reported LPG use but did not report cylinder ownership hence the number of households that reported LPG use is slightly more that the number of cylinders reported.
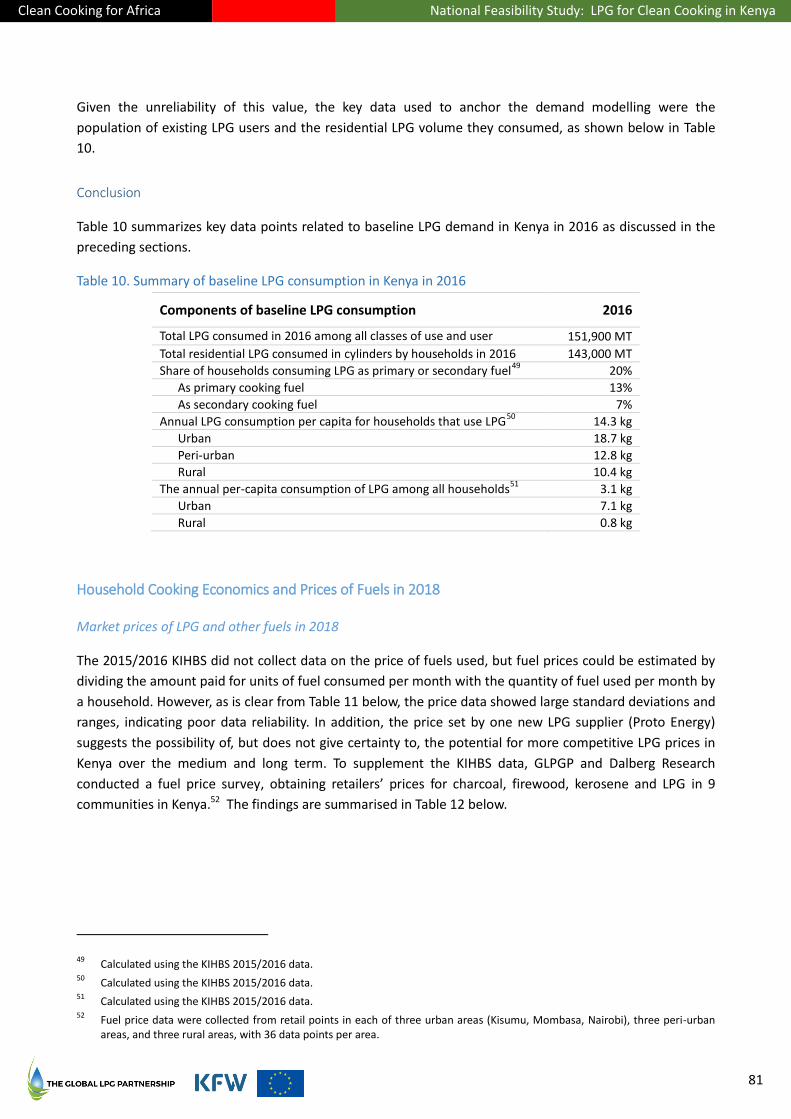
Clean Cooking for Africa National Feasibility Study: LPG for Clean Cooking in Kenya
81
Given the unreliability of this value, the key data used to anchor the demand modelling were the
population of existing LPG users and the residential LPG volume they consumed, as shown below in Table
10.
Conclusion
Table 10 summarizes key data points related to baseline LPG demand in Kenya in 2016 as discussed in the
preceding sections.
Table 10. Summary of baseline LPG consumption in Kenya in 2016
Components of baseline LPG consumption 2016
Total LPG consumed in 2016 among all classes of use and user 151,900 MT
Total residential LPG consumed in cylinders by households in 2016 143,000 MT
Share of households consuming LPG as primary or secondary fuel49
20%
As primary cooking fuel 13%
As secondary cooking fuel 7%
Annual LPG consumption per capita for households that use LPG50
14.3 kg
Urban 18.7 kg
Peri-urban 12.8 kg
Rural 10.4 kg
The annual per-capita consumption of LPG among all households51
3.1 kg
Urban 7.1 kg
Rural 0.8 kg
Household Cooking Economics and Prices of Fuels in 2018
Market prices of LPG and other fuels in 2018
The 2015/2016 KIHBS did not collect data on the price of fuels used, but fuel prices could be estimated by
dividing the amount paid for units of fuel consumed per month with the quantity of fuel used per month by
a household. However, as is clear from Table 11 below, the price data showed large standard deviations and
ranges, indicating poor data reliability. In addition, the price set by one new LPG supplier (Proto Energy)
suggests the possibility of, but does not give certainty to, the potential for more competitive LPG prices in
Kenya over the medium and long term. To supplement the KIHBS data, GLPGP and Dalberg Research
conducted a fuel price survey, obtaining retailers’ prices for charcoal, firewood, kerosene and LPG in 9
communities in Kenya.52 The findings are summarised in Table 12 below.
49 Calculated using the KIHBS 2015/2016 data.
50 Calculated using the KIHBS 2015/2016 data.
51 Calculated using the KIHBS 2015/2016 data.
52 Fuel price data were collected from retail points in each of three urban areas (Kisumu, Mombasa, Nairobi), three peri-urban
areas, and three rural areas, with 36 data points per area.
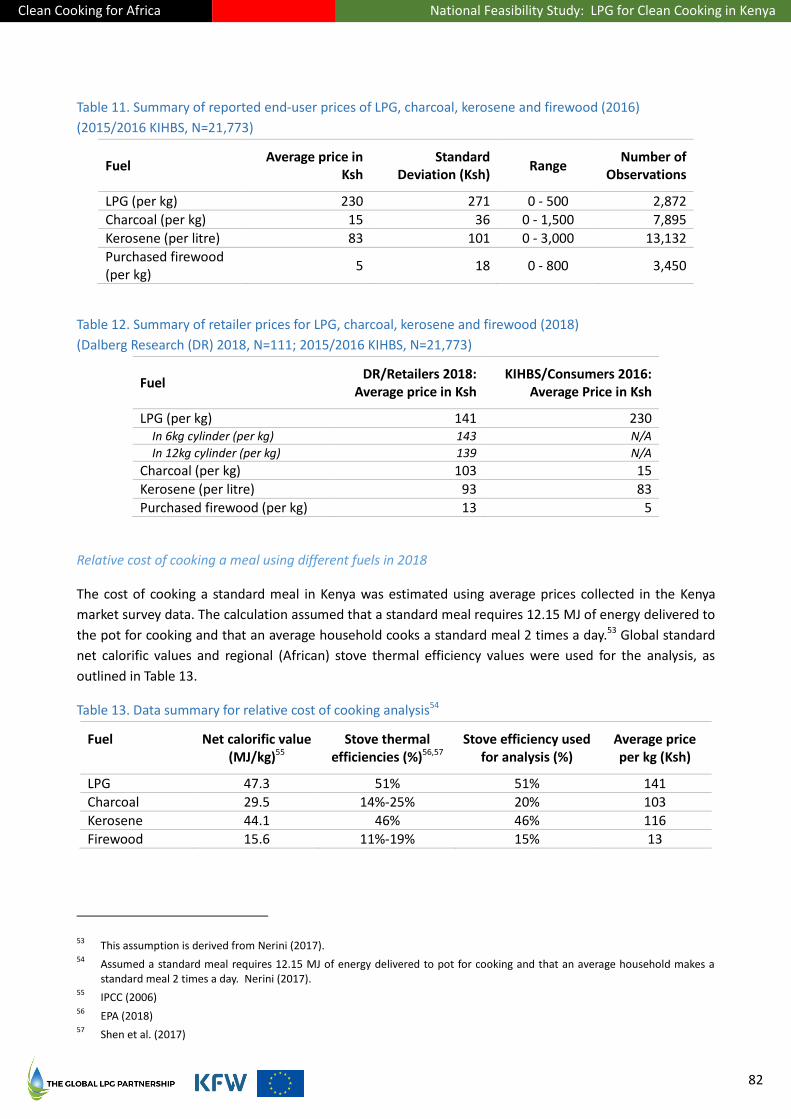
Clean Cooking for Africa National Feasibility Study: LPG for Clean Cooking in Kenya
82
Table 11. Summary of reported end-user prices of LPG, charcoal, kerosene and firewood (2016)
(2015/2016 KIHBS, N=21,773)
Fuel Average price in
Ksh Standard
Deviation (Ksh) Range
Number of Observations
LPG (per kg) 230 271 0 - 500 2,872
Charcoal (per kg) 15 36 0 - 1,500 7,895
Kerosene (per litre) 83 101 0 - 3,000 13,132
Purchased firewood (per kg)
5 18 0 - 800 3,450
Table 12. Summary of retailer prices for LPG, charcoal, kerosene and firewood (2018)
(Dalberg Research (DR) 2018, N=111; 2015/2016 KIHBS, N=21,773)
Fuel DR/Retailers 2018:
Average price in Ksh KIHBS/Consumers 2016:
Average Price in Ksh
LPG (per kg) 141 230 In 6kg cylinder (per kg) 143 N/A
In 12kg cylinder (per kg) 139 N/A
Charcoal (per kg) 103 15
Kerosene (per litre) 93 83
Purchased firewood (per kg) 13 5
Relative cost of cooking a meal using different fuels in 2018
The cost of cooking a standard meal in Kenya was estimated using average prices collected in the Kenya
market survey data. The calculation assumed that a standard meal requires 12.15 MJ of energy delivered to
the pot for cooking and that an average household cooks a standard meal 2 times a day.53 Global standard
net calorific values and regional (African) stove thermal efficiency values were used for the analysis, as
outlined in Table 13.
Table 13. Data summary for relative cost of cooking analysis54
Fuel Net calorific value (MJ/kg)55
Stove thermal efficiencies (%)56,57
Stove efficiency used for analysis (%)
Average price per kg (Ksh)
LPG 47.3 51% 51% 141
Charcoal 29.5 14%-25% 20% 103
Kerosene 44.1 46% 46% 116
Firewood 15.6 11%-19% 15% 13
53 This assumption is derived from Nerini (2017).
54 Assumed a standard meal requires 12.15 MJ of energy delivered to pot for cooking and that an average household makes a
standard meal 2 times a day. Nerini (2017). 55
IPCC (2006) 56
EPA (2018) 57
Shen et al. (2017)
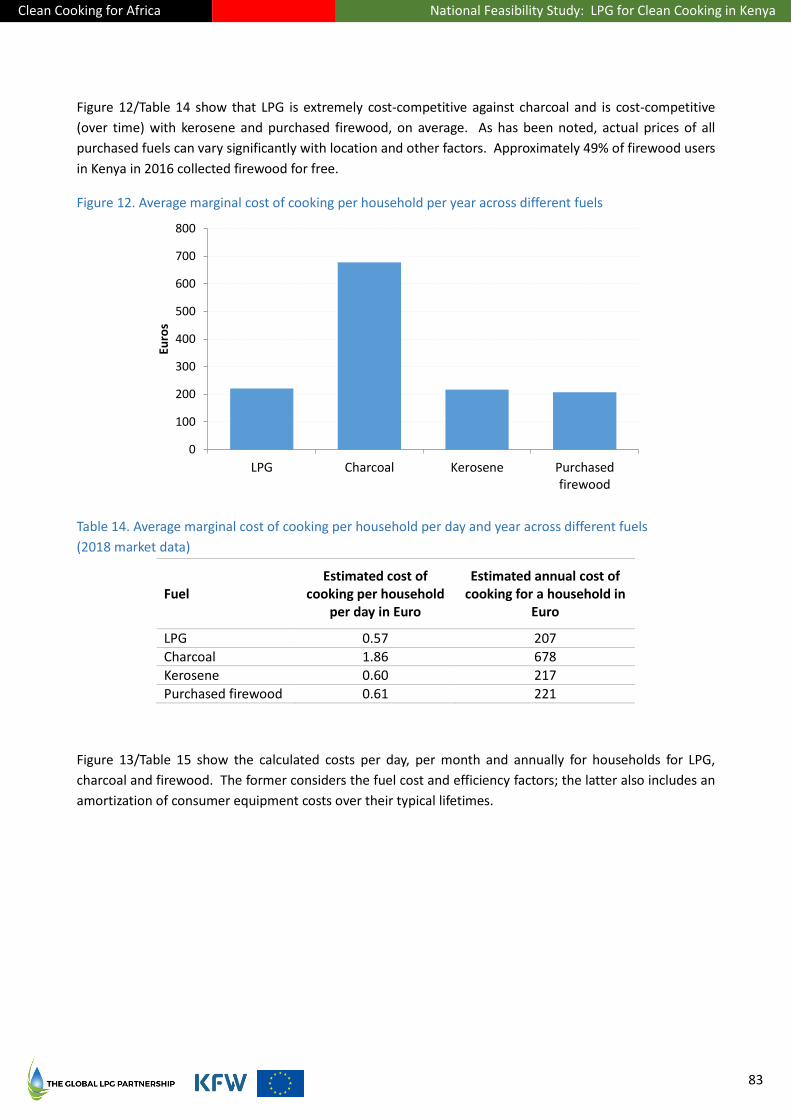
Clean Cooking for Africa National Feasibility Study: LPG for Clean Cooking in Kenya
83
Figure 12/Table 14 show that LPG is extremely cost-competitive against charcoal and is cost-competitive
(over time) with kerosene and purchased firewood, on average. As has been noted, actual prices of all
purchased fuels can vary significantly with location and other factors. Approximately 49% of firewood users
in Kenya in 2016 collected firewood for free.
Figure 12. Average marginal cost of cooking per household per year across different fuels
Table 14. Average marginal cost of cooking per household per day and year across different fuels
(2018 market data)
Fuel Estimated cost of
cooking per household per day in Euro
Estimated annual cost of cooking for a household in
Euro
LPG 0.57 207
Charcoal 1.86 678
Kerosene 0.60 217
Purchased firewood 0.61 221
Figure 13/Table 15 show the calculated costs per day, per month and annually for households for LPG,
charcoal and firewood. The former considers the fuel cost and efficiency factors; the latter also includes an
amortization of consumer equipment costs over their typical lifetimes.
0
100
200
300
400
500
600
700
800
LPG Charcoal Kerosene Purchasedfirewood
Euro
s
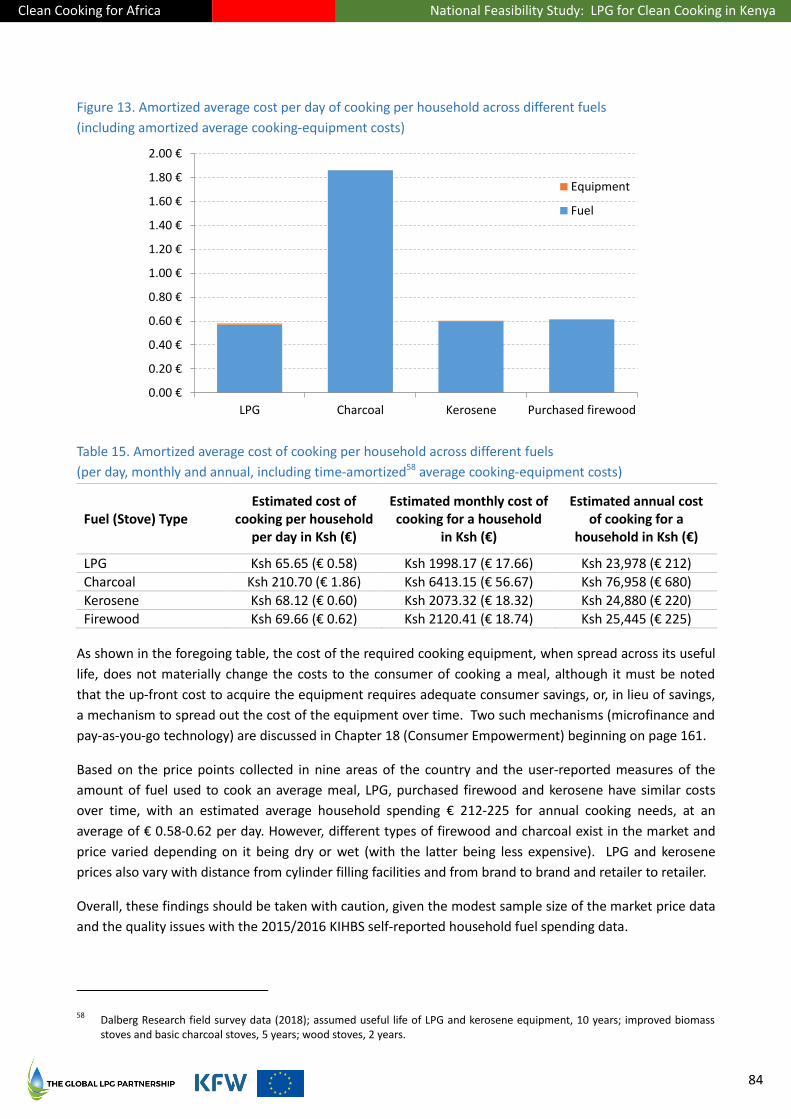
Clean Cooking for Africa National Feasibility Study: LPG for Clean Cooking in Kenya
84
Figure 13. Amortized average cost per day of cooking per household across different fuels
(including amortized average cooking-equipment costs)
Table 15. Amortized average cost of cooking per household across different fuels
(per day, monthly and annual, including time-amortized58 average cooking-equipment costs)
Fuel (Stove) Type Estimated cost of
cooking per household per day in Ksh (€)
Estimated monthly cost of cooking for a household
in Ksh (€)
Estimated annual cost of cooking for a
household in Ksh (€)
LPG Ksh 65.65 (€ 0.58) Ksh 1998.17 (€ 17.66) Ksh 23,978 (€ 212)
Charcoal Ksh 210.70 (€ 1.86) Ksh 6413.15 (€ 56.67) Ksh 76,958 (€ 680)
Kerosene Ksh 68.12 (€ 0.60) Ksh 2073.32 (€ 18.32) Ksh 24,880 (€ 220)
Firewood Ksh 69.66 (€ 0.62) Ksh 2120.41 (€ 18.74) Ksh 25,445 (€ 225)
As shown in the foregoing table, the cost of the required cooking equipment, when spread across its useful
life, does not materially change the costs to the consumer of cooking a meal, although it must be noted
that the up-front cost to acquire the equipment requires adequate consumer savings, or, in lieu of savings,
a mechanism to spread out the cost of the equipment over time. Two such mechanisms (microfinance and
pay-as-you-go technology) are discussed in Chapter 18 (Consumer Empowerment) beginning on page 161.
Based on the price points collected in nine areas of the country and the user-reported measures of the
amount of fuel used to cook an average meal, LPG, purchased firewood and kerosene have similar costs
over time, with an estimated average household spending € 212-225 for annual cooking needs, at an
average of € 0.58-0.62 per day. However, different types of firewood and charcoal exist in the market and
price varied depending on it being dry or wet (with the latter being less expensive). LPG and kerosene
prices also vary with distance from cylinder filling facilities and from brand to brand and retailer to retailer.
Overall, these findings should be taken with caution, given the modest sample size of the market price data
and the quality issues with the 2015/2016 KIHBS self-reported household fuel spending data.
58 Dalberg Research field survey data (2018); assumed useful life of LPG and kerosene equipment, 10 years; improved biomass
stoves and basic charcoal stoves, 5 years; wood stoves, 2 years.
0.00 €
0.20 €
0.40 €
0.60 €
0.80 €
1.00 €
1.20 €
1.40 €
1.60 €
1.80 €
2.00 €
LPG Charcoal Kerosene Purchased firewood
Equipment
Fuel
Clean Cooking for Africa National Feasibility Study: LPG for Clean Cooking in Kenya
85
Considerations regarding households that gather firewood for free
Among the 49% of firewood-using households that gather firewood for free, when they first choose to
adopt a paid fuel, it is equivalent on a fuel-cost basis for them to consider either LPG or kerosene, provided
the chosen fuel is accessible and reliably available in their community. However, the LPG up-front
equipment cost can be more than the kerosene up-front equipment cost, because the LPG equipment
includes not only a burner or stove (which may be broadly price-competitive with kerosene equivalents),
but also the LPG cylinder deposit. Therefore, providing mechanisms to reduce up-front switching costs for
households in firewood-gathering communities (such as the Mwananchi Gas Project has attempted to do)
can be expected to accelerate LPG adoption in this market segment.
It should be noted that, among such firewood-gathering households, LPG adoption does not mean the
same thing as LPG switching. Such households are expected to use LPG initially in place of firewood for
certain specific tasks and/or on certain occasions, with their use of LPG increasingly displacing their use of
firewood over time as they gain greater familiarity with LPG, as they gain improved appreciation of its
benefits, and as their income potentially grows.
Forecasted demand for LPG in 2020, 2025 and 2030
Overall approach to forecasting demand for LPG
This section forecasts household LPG demand in 2020, 2025 and 2030, extrapolating from the 2015/2016
KIHBS data. Three distinct drivers of demand were modelled:
i. National demographic changes (e.g., through population growth, urbanization and income
growth);
ii. Expanded availability of LPG through corresponding investment in cylinder availability,
infrastructure, and distribution systems;
iii. Changes in affordability of LPG equipment costs through supportive programs; and
iv. Reduction in the end-user price of LPG.
The incremental contributions of the four drivers of demand were combined to create three scenarios of
forecasted demand in 2030:
1. Scenario 1: Base case scenario, extrapolating historical trends. A critical assumption in this
scenario is that growth in cylinder investment will keep pace with the growth in demand.
2. Scenario 2: Expanded availability scenario, based on implementation of planned reforms,
accelerated investment, and other interventions. This scenario has two sub-scenarios:
a. Lower-bound for expanded availability, incorporating demand growth from demographic
changes, as well as the impact of expanded LPG availability to serve latent demand. In the
lower-bound scenario, the Mwananchi Gas Project is assumed to be marginally effective,
and the historical level of LPG usage per LPG user remains constant over time.
b. Upper-bound for expanded availability, incorporating the same demand drivers as Scenario
2(a) (demographic changes and expanded LPG availability), as well as additional changes in
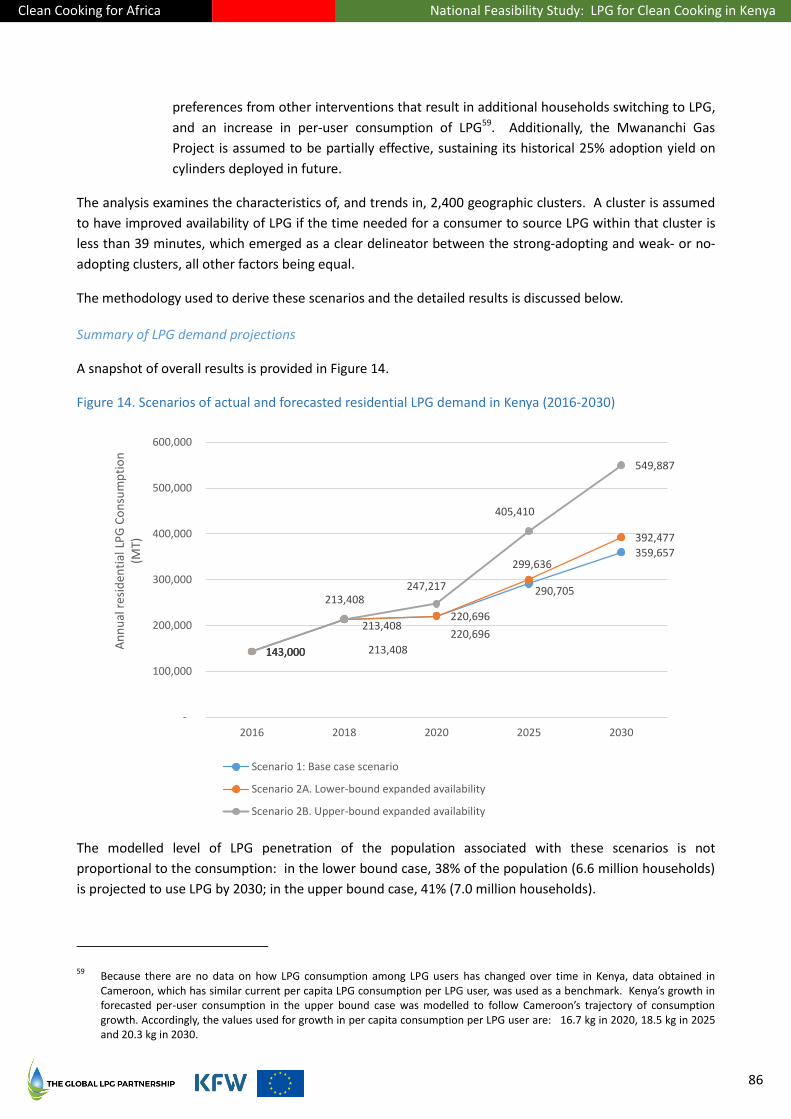
Clean Cooking for Africa National Feasibility Study: LPG for Clean Cooking in Kenya
86
preferences from other interventions that result in additional households switching to LPG,
and an increase in per-user consumption of LPG59. Additionally, the Mwananchi Gas
Project is assumed to be partially effective, sustaining its historical 25% adoption yield on
cylinders deployed in future.
The analysis examines the characteristics of, and trends in, 2,400 geographic clusters. A cluster is assumed
to have improved availability of LPG if the time needed for a consumer to source LPG within that cluster is
less than 39 minutes, which emerged as a clear delineator between the strong-adopting and weak- or no-
adopting clusters, all other factors being equal.
The methodology used to derive these scenarios and the detailed results is discussed below.
Summary of LPG demand projections
A snapshot of overall results is provided in Figure 14.
Figure 14. Scenarios of actual and forecasted residential LPG demand in Kenya (2016-2030)
The modelled level of LPG penetration of the population associated with these scenarios is not
proportional to the consumption: in the lower bound case, 38% of the population (6.6 million households)
is projected to use LPG by 2030; in the upper bound case, 41% (7.0 million households).
59 Because there are no data on how LPG consumption among LPG users has changed over time in Kenya, data obtained in
Cameroon, which has similar current per capita LPG consumption per LPG user, was used as a benchmark. Kenya’s growth in forecasted per-user consumption in the upper bound case was modelled to follow Cameroon’s trajectory of consumption growth. Accordingly, the values used for growth in per capita consumption per LPG user are: 16.7 kg in 2020, 18.5 kg in 2025 and 20.3 kg in 2030.
143,000
213,408 220,696
290,705
359,657
143,000 213,408
220,696
299,636
392,477
143,000
213,408 247,217
405,410
549,887
-
100,000
200,000
300,000
400,000
500,000
600,000
2016 2018 2020 2025 2030
An
nu
al r
esid
enti
al L
PG
Co
nsu
mp
tio
n
(MT)
Scenario 1: Base case scenario
Scenario 2A. Lower-bound expanded availability
Scenario 2B. Upper-bound expanded availability

Clean Cooking for Africa National Feasibility Study: LPG for Clean Cooking in Kenya
87
In absolute numbers, this is not trivial: about 1.7 million more people will benefit from LPG use in the
upper bound case vs. the lower bound case (many of which potentially adopting LPG as a result of pro-poor
affordability measures and programs, if they prove successful). These added users represent about 22% of
the total consumption difference between the upper and lower bound cases. But the main driver of the
consumption growth difference between the two scenarios is the amount of LPG used by LPG users by
2030.
It is important to note that the underlying data did not allow modelling of improved LPG accessibility from
reducing the consumer’s distance to the cylinder exchange point. Therefore, the effects of improving
availability (which are usually very significant in SSA countries with similar levels of LPG penetration) may
be understated in this analysis.
The foregoing findings suggest the following:
1. Kenya’s business-as-usual case, extrapolated forward, is very similar to the case for improving
availability of LPG. Therefore, the objective of reform and investment in the LPG sector must focus,
at a minimum, on ensuring that historical growth rates are possible to sustain through 2030 (or to
be slightly improved upon).
2. LPG demand growth is projected to be constrained during 2019-2020 and perhaps 2021, pending
the effects on investment in cylinders of the market reforms that are meant to address anti-growth
factors—in particular, to address (i) problems with the CEP as described in Chapter 6 and (ii)
accumulated barriers to growth, profitability, safety and investment caused by historical
proliferation of pirate filling and associated cylinder theft.
3. Maximizing social, economic, and environmental impact from LPG expansion requires – and can
potentially be achieved by – investments and interventions that cause LPG users to use more LPG
and less charcoal and firewood and kerosene.
Unquantified effects of the governmental ban on logging
It is important to note that the dataset utilized for modelling future demand was created prior to the 2018
ban on logging. That ban has reduced charcoal availability, increased charcoal prices, motivated increased
charcoal importation, and triggered a spike in LPG consumption that has coincided with the market entry of
Proto Energy with an additional 600,000 LPG cylinders. If the logging ban is perpetuated over the medium
or long term, it may significantly affect the foregoing LPG demand projections. Because no data exist
regarding the effects of the ban on household choices, economics and preferences regarding cooking fuels,
it was not possible to take account of the effects of the ban in the demand modelling.
Scenario 1: Base case demand
The base case demand scenario is based on extrapolation of historical consumption trends. The scenario
includes incremental investments in LPG infrastructure as per historical trends, although this does not take
into account recent market forces that have constrained such investment, such as the rapidly-growing debt
burden created by the CEP mechanism. The scenario assumes there will be no large-scale additional
investments or major new changes in policy. The applied historical growth rate of LPG consumption was
based on reported total and residential consumption from 2010 to 2018. Based on this, it was estimated
that in the base case scenario, domestic LPG consumption will grow from 143,000 MT in 2016 to 359,657
MT by 2030.
Clean Cooking for Africa National Feasibility Study: LPG for Clean Cooking in Kenya
88
Scenario 2: Detailed methodology and results for LPG demand forecasts unconstrained by limited LPG
availability
Overall approach
The methodology considered four demand drivers: demographic changes, expanded cylinder and fuel
availability (generally, meaning eliminating most shortages of cylinder refills and ensuring that households
that demand LPG can access it), potentially improving the affordability of LPG equipment for consumers,
and potentially reducing the end-user cost of LPG cylinder refills (i.e., the price of the LPG fuel).
The effect of each driver was modelled, and these effects then combined into scenarios to derive future
estimates of demand.
A propensity score matching approach was used to estimate latent demand for LPG. This matching
approach leverages data on observed characteristics and purchasing behavior of LPG-using households to
estimate the potential latent demand that is not being served for similar households that do not currently
use LPG, due to availability constraints. Details regarding this matching approach, as well as the parameters
and demand drivers that shape the various scenarios, are presented below.
The households in the 2015/2016 KIHBS data were divided into two groups:
Group 1: Households that do not currently use LPG
Group 1A: Households that are in clusters that do not have LPG availability
Group 1B: Households that are in clusters that have LPG availability
Group 2: Households that currently use LPG
Four different analyses were conducted to estimate potential growth pathways for LPG consumption under
different assumptions of market development and population growth dynamics. These analyses are
described below and laid out in Figure 15.
All households
1. Demographic changes: Estimated LPG consumption growth due to population growth,
urbanization, and income growth (without considering changes in availability or affordability).
Group 1
2. Group 1A – Expanded LPG availability analysis: Estimated latent demand for LPG among LPG non-
users in clusters where LPG is not sufficiently available today.
3. Group 1B – Affordability analysis: Estimated new demand among non-users of LPG living in clusters
where LPG is sufficiently available, resulting from interventions, projects and programs that
improve LPG affordability—in particular, the affordability of up-front costs—for such clusters, and
from marketing, awareness-raising, safety improvements, and other factors that may change
preferences.
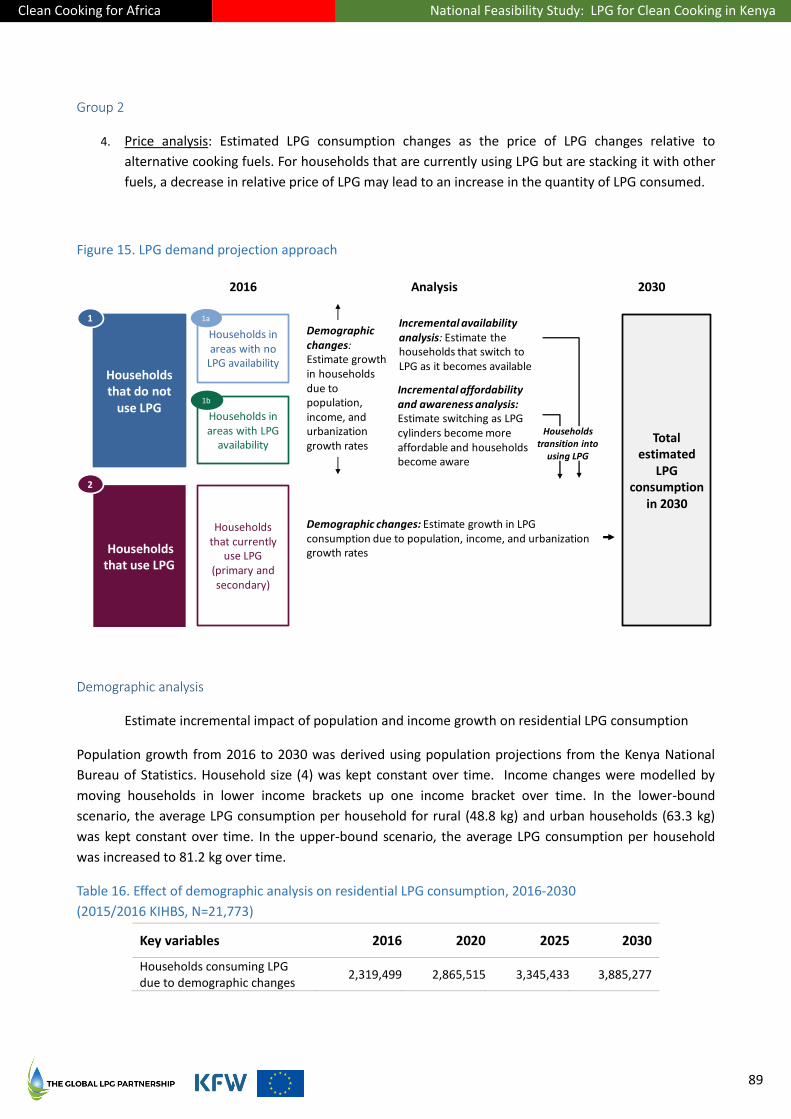
Clean Cooking for Africa National Feasibility Study: LPG for Clean Cooking in Kenya
89
Group 2
4. Price analysis: Estimated LPG consumption changes as the price of LPG changes relative to
alternative cooking fuels. For households that are currently using LPG but are stacking it with other
fuels, a decrease in relative price of LPG may lead to an increase in the quantity of LPG consumed.
Figure 15. LPG demand projection approach
Demographic analysis
Estimate incremental impact of population and income growth on residential LPG consumption
Population growth from 2016 to 2030 was derived using population projections from the Kenya National
Bureau of Statistics. Household size (4) was kept constant over time. Income changes were modelled by
moving households in lower income brackets up one income bracket over time. In the lower-bound
scenario, the average LPG consumption per household for rural (48.8 kg) and urban households (63.3 kg)
was kept constant over time. In the upper-bound scenario, the average LPG consumption per household
was increased to 81.2 kg over time.
Table 16. Effect of demographic analysis on residential LPG consumption, 2016-2030
(2015/2016 KIHBS, N=21,773)
Key variables 2016 2020 2025 2030
Households consuming LPG due to demographic changes
2,319,499 2,865,515 3,345,433 3,885,277
Households that do not
use LPG
Households that use LPG
Households in areas with no
LPG availability
Households in areas with LPG
availability
Households that currently
use LPG (primary and secondary)
Total estimated
LPG consumption
in 2030
Analysis2016 2030
1a
1b
1
2
Incremental availability analysis: Estimate the households that switch to LPG as it becomes available
Incremental affordability and awareness analysis:Estimate switching as LPG cylinders become more affordable and householdsbecome aware
Households transition into
using LPG
Demographic changes: Estimate growth in LPG consumption due to population, income, and urbanization growth rates
Demographic changes:Estimate growth in households due to population, income, and urbanization growth rates
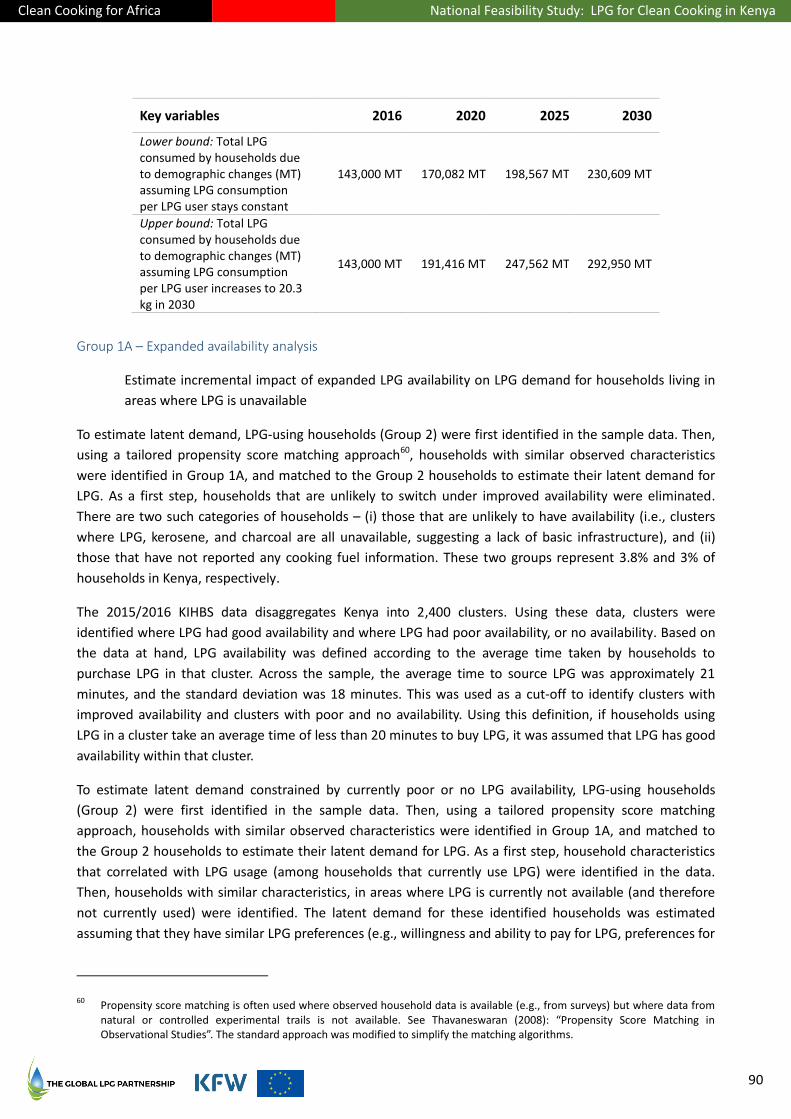
Clean Cooking for Africa National Feasibility Study: LPG for Clean Cooking in Kenya
90
Key variables 2016 2020 2025 2030
Lower bound: Total LPG consumed by households due to demographic changes (MT) assuming LPG consumption per LPG user stays constant
143,000 MT 170,082 MT 198,567 MT 230,609 MT
Upper bound: Total LPG consumed by households due to demographic changes (MT) assuming LPG consumption per LPG user increases to 20.3 kg in 2030
143,000 MT 191,416 MT 247,562 MT 292,950 MT
Group 1A – Expanded availability analysis
Estimate incremental impact of expanded LPG availability on LPG demand for households living in
areas where LPG is unavailable
To estimate latent demand, LPG-using households (Group 2) were first identified in the sample data. Then,
using a tailored propensity score matching approach60, households with similar observed characteristics
were identified in Group 1A, and matched to the Group 2 households to estimate their latent demand for
LPG. As a first step, households that are unlikely to switch under improved availability were eliminated.
There are two such categories of households – (i) those that are unlikely to have availability (i.e., clusters
where LPG, kerosene, and charcoal are all unavailable, suggesting a lack of basic infrastructure), and (ii)
those that have not reported any cooking fuel information. These two groups represent 3.8% and 3% of
households in Kenya, respectively.
The 2015/2016 KIHBS data disaggregates Kenya into 2,400 clusters. Using these data, clusters were
identified where LPG had good availability and where LPG had poor availability, or no availability. Based on
the data at hand, LPG availability was defined according to the average time taken by households to
purchase LPG in that cluster. Across the sample, the average time to source LPG was approximately 21
minutes, and the standard deviation was 18 minutes. This was used as a cut-off to identify clusters with
improved availability and clusters with poor and no availability. Using this definition, if households using
LPG in a cluster take an average time of less than 20 minutes to buy LPG, it was assumed that LPG has good
availability within that cluster.
To estimate latent demand constrained by currently poor or no LPG availability, LPG-using households
(Group 2) were first identified in the sample data. Then, using a tailored propensity score matching
approach, households with similar observed characteristics were identified in Group 1A, and matched to
the Group 2 households to estimate their latent demand for LPG. As a first step, household characteristics
that correlated with LPG usage (among households that currently use LPG) were identified in the data.
Then, households with similar characteristics, in areas where LPG is currently not available (and therefore
not currently used) were identified. The latent demand for these identified households was estimated
assuming that they have similar LPG preferences (e.g., willingness and ability to pay for LPG, preferences for
60 Propensity score matching is often used where observed household data is available (e.g., from surveys) but where data from
natural or controlled experimental trails is not available. See Thavaneswaran (2008): “Propensity Score Matching in Observational Studies”. The standard approach was modified to simplify the matching algorithms.
Clean Cooking for Africa National Feasibility Study: LPG for Clean Cooking in Kenya
91
LPG, fuel purchasing habits) given similar observed household characteristics. In effect, this matching
approach uses the observed consumer behaviour in locations where LPG is available to estimate the
consumer behaviour in locations where LPG is not currently available once LPG becomes available there.
The detailed methodology is provided in the Annexes (Chapter 26 beginning on page 271).
A logit regression on Group 2 was used to identify the household characteristics that predict LPG usage and
to estimate a probability of LPG usage per household. This regression considered three independent
variables that have been identified in previous literature as predictive of LPG usage: (i) household head
education, (ii) household income quintile, and (iii) household size. The coefficients from the regression
were then used to estimate the probability that a household of certain characteristics would use LPG. The
coefficients from the regression analysis were then used to calculate the probability of a household in
Group 1A using LPG, were it available. The households in Group 1A were matched to similar households in
Group 2 (current LPG users) to estimate the number of households that would use LPG in Group 1A, were
LPG available (that is, to estimate latent demand).
This estimation approach assumes that as LPG infrastructure is expanded, Group 1A would gradually gain
access to, and adopt, LPG over time. For example, some areas will have greater access to LPG in five years,
and others in ten years. As LPG becomes available for Group 1A households, certain households will start
using LPG and will move into Group 2 and others would move into group 1B (i.e., would still not use LPG,
even when available, likely due to other constraints such as affordability and preferences). To model the
phased roll-out and the resultant change in LPG consumption, three steps were taken:
(a) Determine the number of households that fall in Group 1A in 2020, 2025 and 2030, as LPG
availability increases in a phased approach across the country:
— The approach assumed a roll-out path for infrastructure development. This roll-out could be
faster or slower, depending on the different scenarios and policy considerations. This roll-out
path was modelled based on existing knowledge of how infrastructure development (based on
stakeholder interviews) has taken place in Kenya, as described below.
— The roll-out plan assumed that infrastructure development: (i) tends to begin in urban areas
and move to rural areas; (ii) tends to begin in areas where there is already some infrastructure
to build from; and (iii) tends to move from a point of origin outwards: for example, following
the Mombasa-Eldoret road, as may be inferred from the map in Figure 11 on page 77.
— Three variables were considered at a cluster level: (i) if the household is in an urban location;
(ii) the current LPG usage in the county where the household lies; and (iii) the average LPG
usage of all the neighbouring counties. This allowed modelling for points (i) and (ii) in the
paragraph above.
— These variables were combined to form a score for each household, using the following
equation that reflects these assumptions on the likely expansion path from areas with higher
average usage to areas with lower average usage:
𝑆𝑐𝑜𝑟𝑒 = 𝑤1(𝑈𝑟𝑏𝑎𝑛) + (𝐴𝑣𝑒𝑟𝑎𝑔𝑒 𝐿𝑃𝐺 𝑢𝑠𝑎𝑔𝑒 𝑖𝑛 𝑡ℎ𝑒 𝑑𝑖𝑠𝑡𝑟𝑖𝑐𝑡)
+ (𝐴𝑣𝑒𝑟𝑎𝑔𝑒 𝐿𝑃𝐺 𝑢𝑠𝑎𝑔𝑒 𝑖𝑛 𝑡ℎ𝑒 𝑝𝑟𝑜𝑣𝑖𝑛𝑐𝑒)
+ (𝐴𝑣𝑒𝑟𝑎𝑔𝑒 𝐿𝑃𝐺 𝑢𝑠𝑎𝑔𝑒 𝑖𝑛 𝑎𝑙𝑙 𝑛𝑒𝑖𝑔ℎ𝑏𝑜𝑢𝑟𝑖𝑛𝑔 𝑝𝑟𝑜𝑣𝑖𝑛𝑐𝑒𝑠)
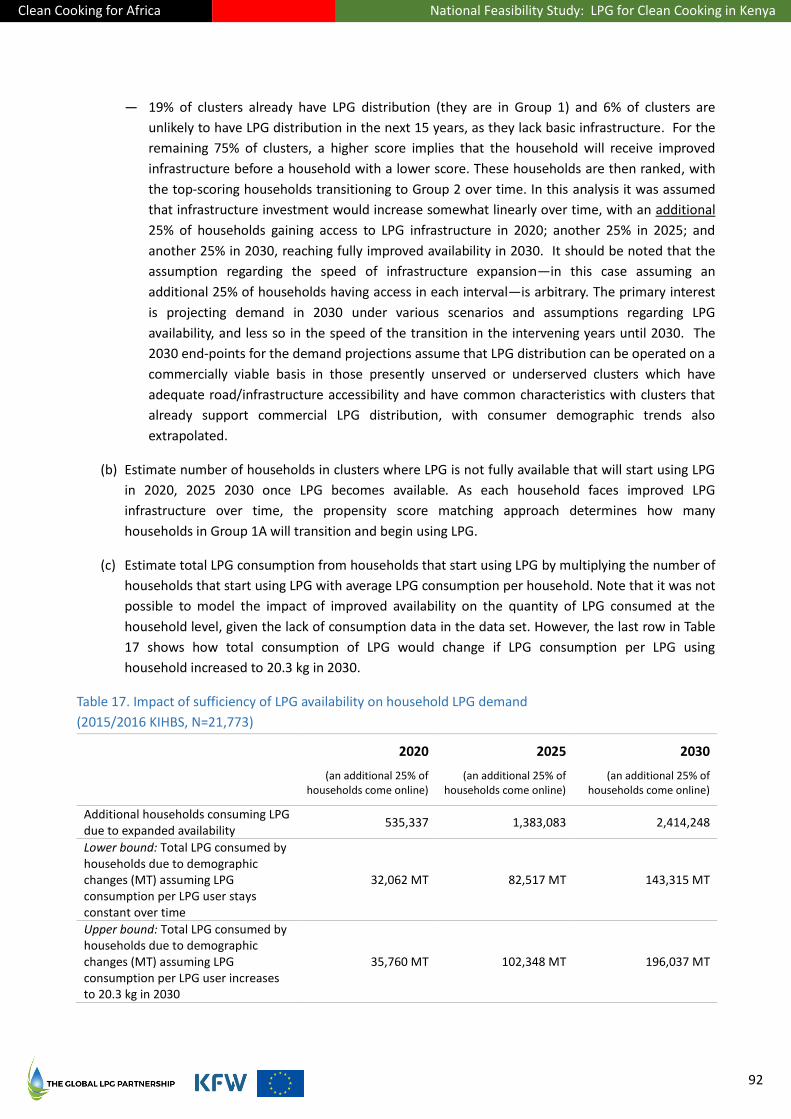
Clean Cooking for Africa National Feasibility Study: LPG for Clean Cooking in Kenya
92
— 19% of clusters already have LPG distribution (they are in Group 1) and 6% of clusters are
unlikely to have LPG distribution in the next 15 years, as they lack basic infrastructure. For the
remaining 75% of clusters, a higher score implies that the household will receive improved
infrastructure before a household with a lower score. These households are then ranked, with
the top-scoring households transitioning to Group 2 over time. In this analysis it was assumed
that infrastructure investment would increase somewhat linearly over time, with an additional
25% of households gaining access to LPG infrastructure in 2020; another 25% in 2025; and
another 25% in 2030, reaching fully improved availability in 2030. It should be noted that the
assumption regarding the speed of infrastructure expansion—in this case assuming an
additional 25% of households having access in each interval—is arbitrary. The primary interest
is projecting demand in 2030 under various scenarios and assumptions regarding LPG
availability, and less so in the speed of the transition in the intervening years until 2030. The
2030 end-points for the demand projections assume that LPG distribution can be operated on a
commercially viable basis in those presently unserved or underserved clusters which have
adequate road/infrastructure accessibility and have common characteristics with clusters that
already support commercial LPG distribution, with consumer demographic trends also
extrapolated.
(b) Estimate number of households in clusters where LPG is not fully available that will start using LPG
in 2020, 2025 2030 once LPG becomes available. As each household faces improved LPG
infrastructure over time, the propensity score matching approach determines how many
households in Group 1A will transition and begin using LPG.
(c) Estimate total LPG consumption from households that start using LPG by multiplying the number of
households that start using LPG with average LPG consumption per household. Note that it was not
possible to model the impact of improved availability on the quantity of LPG consumed at the
household level, given the lack of consumption data in the data set. However, the last row in Table
17 shows how total consumption of LPG would change if LPG consumption per LPG using
household increased to 20.3 kg in 2030.
Table 17. Impact of sufficiency of LPG availability on household LPG demand
(2015/2016 KIHBS, N=21,773)
2020
(an additional 25% of households come online)
2025
(an additional 25% of households come online)
2030
(an additional 25% of households come online)
Additional households consuming LPG due to expanded availability
535,337 1,383,083 2,414,248
Lower bound: Total LPG consumed by households due to demographic changes (MT) assuming LPG consumption per LPG user stays constant over time
32,062 MT 82,517 MT 143,315 MT
Upper bound: Total LPG consumed by households due to demographic changes (MT) assuming LPG consumption per LPG user increases to 20.3 kg in 2030
35,760 MT 102,348 MT 196,037 MT
Clean Cooking for Africa National Feasibility Study: LPG for Clean Cooking in Kenya
93
Group 1B – Change in preferences
Estimate additional LPG demand from households due primarily to improved affordability of LPG
equipment
The upfront cost of the LPG stove and cylinder is a barrier to LPG adoption among poorer households. For
the poorest households that have enough cash income needed to purchase cooking fuel, but have no
savings or savings capability, the size of the refill transaction can also be a barrier. A successful program
that improves the upfront affordability of the stove and cylinder, and/or reduces the size of refill
transaction, may empower some households that currently do not use LPG to start using LPG.
At present there are five main ways in which the upfront cost of the stove and cylinder deposit could be
reduced:
1. Capping the cylinder deposit as a percentage of the cylinder acquisition cost to the Marketer, which
is presently unlimited and averages around 105%. (For comparison, it is 80% in Cameroon.) This
mechanism is not presently included in the LN 121 revision and therefore was not modelled.
2. Elimination of import duties and eliminating or zero-rating VAT for all consumer LPG equipment, to
reduce its cost. This was not modelled.
3. Equipment subsidy. The Mwananchi Gas Project is the sole large-scale example of this in Kenya. As
described in Chapter 9 (Complementary Policy Initiatives) beginning on page 57, this project has
had numerous start-up and performance issues to date. Accordingly, certain assumptions based on
progress as well as aspiration for this project have been made and utilized in the demand scenarios,
as described further below.
4. LPG microfinance program. The GLPGP Bottled Gas for Better Life program in Kenya, described in
Chapter 18 (Consumer Empowerment) beginning on page 161, is piloting this approach. Because
the program is not yet concluded and, therefore, data from it were not yet available for use in the
Group 1B modelling.
5. Pay-as-you-go business model. While successful in Kenya and elsewhere for solar-PV-based off-grid
electricity systems, the pay-as-you-go model remains in an experimental, pilot stage in Kenya with
respect to LPG. Therefore, the possibility of pay-as-you-go models stimulating LPG adoption and
use (at scale) was not incorporated in the demand modelling.
The most recent lifetime goal of the Mwananchi Gas Project is to distribute 3 million cylinders to poorer
Kenyan households over the next five years. Among the results of its initial rollout were that only 25% of
targeted households transitioned to using LPG on an ongoing basis. The remaining households were either
unable to afford refills and/or did not know where to go to exchange their empty cylinders for filled ones.
Recently, the Ministry of Petroleum and Energy announced that the near-term aim of the project (once
relaunched) will be to distribute only 300,000 cylinders, using improved consumer targeting.61 Given that
61 In October 2018, the Government announced that it will only issue 300,000 households with cylinders and is uncertain how
many additional cylinders will be distributed. See www.standardmedia.co.ke/business/article/2001294776/state-scales-down-on-lpg-budget-spend

Clean Cooking for Africa National Feasibility Study: LPG for Clean Cooking in Kenya
94
the lowest two income quintiles in Kenya would struggle to afford either the equipment or the refills62, and
that the upper two income quintiles currently can afford LPG (whether or not they choose to buy it), the
third quintile was selected as the most effective target of the stove and cylinder subsidies for this project.
Based on this selection, the lower bound and upper bound demand scenarios were developed with the
following set of parameters:
Lower-bound: The Mwananchi Gas Project is marginally successful. The project distributes 300,000
cylinders (6% of the original 4.8 million cylinder target, 10% of the current 3 million target) to
households that can and do become long-term LPG users.
Upper-bound: The Mwananchi Gas Project is partially successful: The projected distributes 750,000
cylinders (25% of the current target) to households that can and so become long-term LPG-users.
The results are summarized in Table 18; interventions to improve equipment affordability could encourage
between approximately 300,000 and 750,000 households to adopt LPG and, in so doing, consume an
additional 18,500 to 60,900 MT of LPG in 2030.
Table 18. LPG demand by households not currently using LPG, from equipment affordability measures
(2015/2016 KIHBS, N=21m,73)
2020 2025 2030
New LPG-using households
Lower-bound: The Mwananchi Gas Project is marginally successful
300,000 300,000 300,000
Upper-bound: The Mwananchi Gas Project is partially successful
300,000 750,000 750,000
Associated incremental LPG consumption
Lower-bound: The Mwananchi Gas Project is marginally successful, and LPG consumption per LPG user stays constant over time
18,552 MT 18,552 MT 18,552 MT
Upper-bound: The Mwananchi Gas Project is partially successful and LPG consumption per LPG user increases gradually to 20.3 kg in 2030
63
20,040 MT 55,500 MT 60,900 MT
It should be noted that Mwananchi Gas is not the only program that could improve affordability for lower-
income households, it is merely the only active, fully funded program with aspiration to large scale.
Alternative mechanisms, such as LPG microfinance and, potentially, pay-as-you-go LPG (regarding these,
see Chapter 18), could also contribute to additional LPG penetration among less-affluent households by
62 Within the lowest two income quintiles, households can struggle to purchase sufficient food for the month. According to the
KIHBS 2015/2016 data, households in these segments report being the beneficiaries of relief food, skipping meals due to costs, and being unable to feed all household members daily within the month. In view of this, it is improbable that these households would be able to afford an asset purchase.
63 This usage amount may be in range of third income quintile Mwananchi Gas Project users by 2030, but it should be treated
with caution, because a number of the counties which are targeted for Mwananchi Gas are less affluent and more remote than the national average, and therefore may have greater non-LPG fuel stacking than the average. The initial two counties for the roll-out were Kajiado and Machakos. The remaining target counties are Kiambu, Meru, Nakuru, Nyandarua, Kisumu, Kakamega, Uasin Gichu (Eldoret), and Mombasa.

Clean Cooking for Africa National Feasibility Study: LPG for Clean Cooking in Kenya
95
2030. Because these two alternatives are still in the pilot stage and lack scalability evidence, they were not
included in these results.
Summary: Forecasted potential LPG demand in 2020, 2025, and 2030
The results of each of the analyses are summarized in Table 19 and Table 20.
Table 19. Estimated residential LPG demand, lower-bound scenario, by demand driver (2020-2030)
Drivers of incremental demand
Analysis Total annual residential LPG consumption (MT)
(Number of additional households consuming LPG)
2020 2025 2030
Demographic changes
Impact of population and income growth
170,082 MT (546,016 households
added)
198,567 MT (479,918 households
added)
230,609 MT (539,844 households
added)
Expanded availability
Additional impact of improved availability (and sufficient availability by 2030)
32,062 MT (535,337 households
added)
82,517MT (847,747 households
added)
143,315 MT (1,031,165
households added)
Improved affordability of equipment
Additional impact of subsidized stove and cylinder costs through 300,000 cylinders successfully distributed through the Mwananchi Gas Project (or a similar intervention)
18,552 MT (300,000 households
added)
18,552 MT (0 households added)
18,552 MT (0 households added)
Table 20. Estimated total LPG demand, upper-bound scenario, by demand driver (2020-2030)
Drivers of incremental demand
Analysis Total household LPG consumption (assuming 22.6kg LPG consumption per capita per LPG user rising to 25kg in 2025)
(Number of new households consuming LPG)
2020 2025 2030
Demographic changes
Impact of population and income growth
191,416 MT (546,016 households
added)
247,562 MT (479.918 households
added)
292,950 MT (539 844 households
added)
Expanded availability
Additional impact of improved availability (and sufficient availability by 2030)
35,760 MT (535,337 households
added)
102,348 MT (847,747 households
added)
196,037 MT (1,031,165
households added)
Improved affordability of equipment
Additional impact of subsidized stove and cylinder costs through 750,000 cylinders successfully distributed through the Mwananchi Gas Project (or a similar intervention)
20,400 MT (300,000 households
added)
55,500 MT (450,000 households
added)
60,900 MT (0 households added)
The above tables show that improving LPG availability does not by itself have a significant effect on
unlocking LPG demand in Kenya, as long as “business as usual” investment in new cylinders and in
distribution and retailing networks continues at historical levels. (That is not certain.) As mentioned
previously, it is however important to note that the underlying data did not allow modelling of improved
LPG accessibility based on reducing the consumer’s travel time/distance to the cylinder exchange point.
Clean Cooking for Africa National Feasibility Study: LPG for Clean Cooking in Kenya
96
Therefore, the effects on demand of improving availability from a time/distance standpoint, usually very
significant in SSA countries with similar levels of LPG penetration, may be understated.
The preceding analyses can be combined to form three different demand scenarios, as shown Figure 14 on
page 86.
Scenario 1: Base case
Forecasted LPG demand based on historical growth of LPG. Total annual LPG consumption for
household cooking is projected to grow to 359,657 MT by 2030 if such trends can be sustained,
resulting in national per capita consumption of 5.6kg per year.
Scenario 2: Expanded availability
2A. Lower-bound expanded availability scenario: Forecasted LPG demand based on demographic
changes, the impact of expanded LPG availability (but not reducing consumer travel time/distance
to LPG retail points), and a marginally effective cylinder/stove subsidy program for the poor. This
scenario assumes average annual LPG consumption per LPG users stays constant over time. Total
annual LPG consumption for household cooking is projected to grow to 392,477MT by 2030, with
6.6 million households consuming LPG in 2030. This represents an LPG usage penetration of 38% of
households and a national per capita consumption of 6.15 kg per year.
2B. Upper-bound expanded availability scenario: Forecasted LPG demand based on demographic
changes, the impact of expanded LPG availability (but not reducing consumer travel time/distance
to LPG retail points), and a partially effective cylinder/stove subsidy program for the poor. This
scenario also assumes annual LPG consumption per capita among LPG users will gradually increase
to 20.3 kg by 2030. Total annual LPG consumption for household cooking is projected to grow to
549,887 MT by 2030, with 7.04 million households consuming LPG in 2030. This represents an LPG
usage penetration of 41% of households and a national per capita LPG consumption of 8.61 kg per
year64.
The estimated range for total LPG consumption in 2030 under these scenarios represent a level of
consumption that is between 1.8 and 2.6 times the total consumption in 2018. Note that in both the base
case and the lower-bound estimate, the average LPG consumption per capita by LPG users has been kept
constant, in the absence of data about the growth rate of consumption among existing LPG users. The total
consumption in the base case scenario and lower-bound scenario could be larger if increases in LPG
consumption per capita by LPG users occur.
The following figure shows how the drivers and associated interventions add between 3% and 6% to the
level of LPG penetration in 2030 in the lower and upper bound scenarios, respectively, compared with the
business-as-usual extrapolation.
64 These consumption estimates assume that primary LPG users will, on average, continue to stack LPG with other fuels in 2030.

Clean Cooking for Africa National Feasibility Study: LPG for Clean Cooking in Kenya
97
Figure 16. Percentage of households using LPG by 2030, by demand driver
(LPG as primary or secondary cooking fuel)
Figure 17 below shows potential household LPG demand across Kenya’s counties in 2030. In the both lower
and upper bound cases, penetration increases northward. In the upper bound case, which includes an
assumption of greater effectiveness of the Mwananchi Gas Project, penetration increases more significantly
in the counties to be served by that project, and in the southern counties having generally greater
population densities.
35%
22% 22%
14% 14%
2% 4%
0%
5%
10%
15%
20%
25%
30%
35%
40%
45%
Scenario 1: Base case Scenario 2A: Lower bound frominterventions
Scenario 2B: Upper bound frominterventions
% o
f H
ou
seh
old
s th
at u
se L
PG
as
a p
rim
ary
fuel
Historical extrapolations Demographic changes Expanded LPG availability Equipment costs reduced
37%
55%
%% 46%
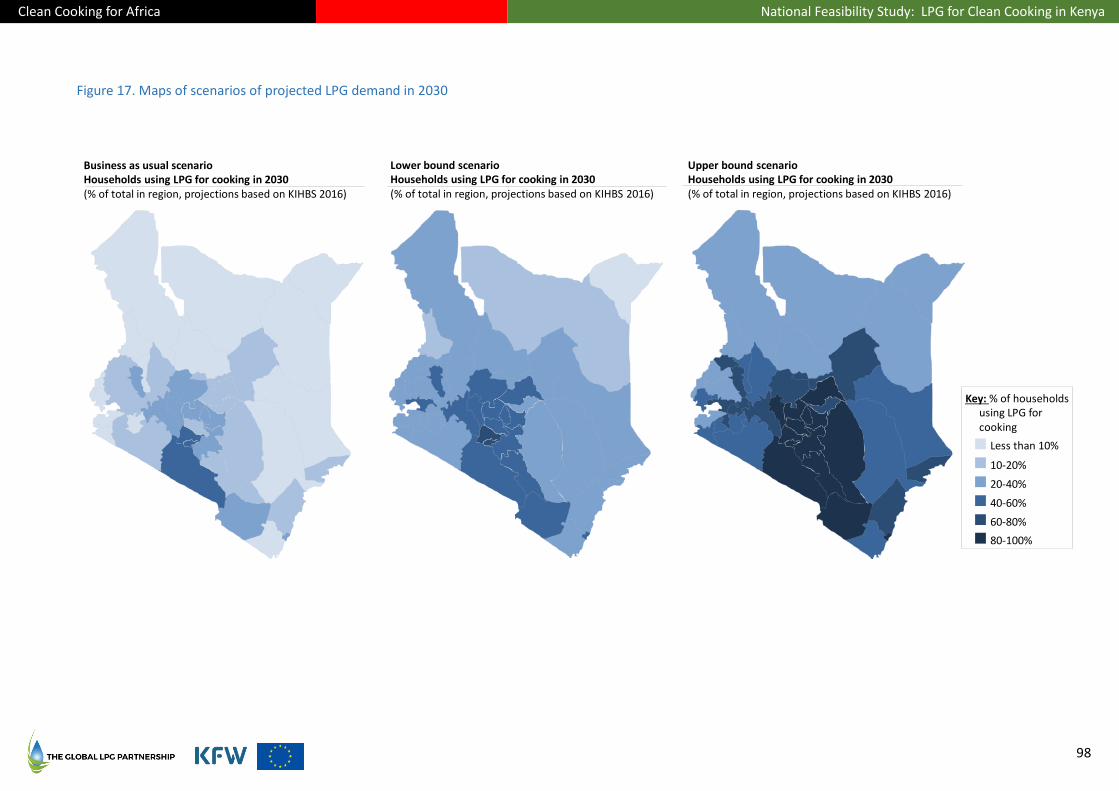
Clean Cooking for Africa National Feasibility Study: LPG for Clean Cooking in Kenya
98
Figure 17. Maps of scenarios of projected LPG demand in 2030
Lower bound scenarioHouseholds using LPG for cooking in 2030(% of total in region, projections based on KIHBS 2016)
Upper bound scenarioHouseholds using LPG for cooking in 2030(% of total in region, projections based on KIHBS 2016)
Business as usual scenarioHouseholds using LPG for cooking in 2030(% of total in region, projections based on KIHBS 2016)
Less than 10%
10-20%
20-40%
40-60%
60-80%
Key: % of households using LPG for cooking
80-100%

Clean Cooking for Africa National Feasibility Study: LPG for Clean Cooking in Kenya
99
Sensitivity of demand forecasts to LPG price changes
The demand forecasts outlined above do not separately model the impact of significant changes in fuel
prices, due to the lack of household-level consumption and price data in the KIHBS dataset. Conducting a
meaningful demand sensitivity analysis requires positing a forecast or view for not only how LPG prices may
be likely to evolve over time, but also a perspective on future prices for alternative fuels. Prices for certain
alternative fuels, such as charcoal, are also affected by governmental policies, such as the logging ban
presently in effect. It is also possible that the Government will implement regulation of LPG pricing (in
effect, capping the LPG end-user price relative to the import price) in future. Therefore, future relative
prices among cooking fuels will depend in part on the Government’s future policy priorities, factors that are
outside the scope of this analysis. While it is not possible to model the potential impact of relative price
changes of LPG compared to other fuels, given the absence of reliable data, the following discussion
provides approximate estimates of the sensitivity of demand to material, intermediate- and long-term
changes in LPG prices.
It should also be noted that LPG prices vary widely from seller to seller (including black market sellers) and
region to region within Kenya.
Because Kenya imports LPG at regional prices, a significant portion of the end-user price is determined by
the relative global and regional stability of LPG price indices. Global and regional prices are expected to
remain relatively stable well beyond 2030. The other main determinant of LPG prices is the costs covered
and mark-ups imposed by the country’s LPG companies, as discussed in detail in Chapter 10 (Pricing)
beginning on page 59. These costs and mark-ups may change due to market forces, governmental
interventions, and for other reasons. A recent disruption to the LPG price leadership of certain major LPG
brands was caused by Proto Energy Ltd., which has consistently priced LPG in its 600,000 new cylinders at
least 25% below the prevailing average price.
While significant change in the international price of LPG is not expected to occur during the forecasted
years, potential shifts in international pricing may occur, and these are problematic to predict. (See Annex
Chapter 32 on page 294 for a discussion of potential structural recalibration of international LPG prices
after 2030.)
All of this said, LPG prices in Kenya have declined steadily in recent years, with Proto Energy potentially
accelerating that trend. The price of LPG has not exceeded KES 180/kg (€ 1.54) since 2012. The average
price today, per the GLPGP-Dalberg Research survey, is KES 141/kg (€ 1.24).
Up until 2018, despite structural issues and destructive forms of competition (e.g., cylinder refill piracy),
despite a consensus among LPG industry executives that such issues are an impediment to investing in
cylinders to grow the market, and despite supply interruptions (such as by hijackings at sea), consumption
of LPG in cylinders has managed to grow overall.
A number of factors may cause LPG end-user prices to continue to fall in the future. These include:
Development of a second major LPG import terminal (or a series of lesser terminals) to compete
with the AGOL terminal. Several private-sector projects are in various stages of preparation and
approval. This should be done in conjunction with moving to an Open Tender System (OTS), as
follows.
Clean Cooking for Africa National Feasibility Study: LPG for Clean Cooking in Kenya
100
Using OTS for importation of LPG in the second major LPG-import terminal, and/or in the existing
main terminal owned by AGOL, if AGOL can be persuaded65 to adopt OTS. If implemented
effectively, as in neighboring Tanzania in recent years, OTS based importation will reduce the cost
of imported LPG through improved transparency and strengthened competition.
Resetting of price levels and pricing expectations by new entrants gaining and protecting significant
market shares, by operating with a leaner cost structure than entrenched rivals. As mentioned
above, Proto Energy Ltd. exemplifies this factor. (There is no guarantee that lower pricing levels will
be maintained permanently, whereas the effects of OTS and import terminal competition are likely
to be permanent.)
Potentially, Government regulation of pricing and margins, creating an upper limit on end-user
pricing relative to pure market-based pricing, thus eliminating price-gouging, reducing the average
price overall, and potentially also reducing the transportation-driven differential in prices between
the Mombasa-Nairobi urban corridor and the more remote and rural counties of Kenya.
Noting that the Proto Energy price level is a good 25% below the average and is being maintained, that the
recommended price-formula alternatives described in Chapter 10 are fully 15% below the present average
price (and also reduce the transportation effect on prices), and that these pricing alternatives identify
specific elements of the industry cost structure which can be made more efficient per benchmarking with
other SSA markets, the analysis which follows estimates the potential effect on demand from an end-user
price decrease by 2030, however caused, of 15%.
The impact of change in LPG price on LPG consumption was estimated using a range of price elasticities,
including an elasticity that was calculated using the KIHBS household data. For sake of due caution, it is
noted that the Kenya National Petroleum Development Plan (2017-2037) suggests that the price elasticities
for fuels, including LPG, are statistically insignificant, which would signify that demand is not very
responsive to price changes. However, the KIHBS data indicate that price elasticity is statistically significant,
although the magnitude of the impact is small.
According to the KIHBS data, a 100 KES decrease in LPG price would increase consumption by 0.26 kg
grams, all else being equal, reflecting a price elasticity of demand that is less than -0.1. The Clean Cooking
for Africa study of Ghana, by way of example, estimated a price elasticity of demand for LPG in 2017 closer
to -0.45.
Applying these elasticity estimates, a 15% decrease in LPG prices may increase LPG consumption by up to
7%. This corresponds to a 2030 consumption level of 419,950 MT in the lower bound scenario, and 588,379
MT in the upper bound demand scenario. Given the poor quality of the price data in the KIHBS, these
results should be interpreted with caution.
Potential effect of a targeted LPG fuel subsidy
Apart from market-wide reductions in LPG price, the Government may opt to provide a targeted subsidy to
the poor to offset their cost of LPG fuel.
65 This is not currently expected by local industry or Government; AGOL did not make representatives available for interviews for
this report.
Clean Cooking for Africa National Feasibility Study: LPG for Clean Cooking in Kenya
101
Targeted subsidy approach
Targeted subsidies have helped LPG sectors in some LMIC markets serve a portion of the households that
otherwise could not afford to use LPG as the primary cooking fuel on a steady basis. Kenya has not
subsidized petroleum products in any way for decades, and therefore does not have a subsidy
implementation capability to build upon. As a policy matter, reinstating a subsidy on LPG fuel is not being
considered, with the Government’s efforts focused mainly on reducing LPG equipment costs for the poor,
via the Mwananchi Gas Project.
Key issues related to subsidies include:
1. As usage grows, the subsidy grows, putting strain on the Government’s fiscal resources;
2. As usage grows, the Government’s ability to pay the subsidy timely may suffer, putting financial
strain on the intermediaries who obtain LPG at market price, sell it at the subsidized price, and then
are reimbursed the difference by the Government;
3. The subsidy can have unintended leakages (the subsidy is exploited by those who are not meant to
receive it, through subterfuge or other means), which inflates the subsidy amount and dilutes the
overall utility of the subsidy; and
4. The subsidy can create market distortions.
It should be noted that many LMICs, such as India, have a long history of using LPG fuel subsidies as an arm
of national development and social policy. Over several decades, India and countries like it have
demonstrated that it is possible to fine-tune their LPG subsidy systems to avoid the above-mentioned
issues. Should a future Government of Kenya determine that an LPG subsidy to benefit the poorest is
desirable, the Government can apply the targeting learnings from other LMICs to do so in a way that
minimizes the foregoing problems.
In view of the Government’s continuing policy against subsidizing any petroleum products, this study does
not explore the potential use of, and impact from, a new, targeted subsidy on LPG fuel for the poor.
Methodological limitations
The analysis is impacted by a few methodological limitations detailed below. It is important to note that
these limitations have led to an underestimation of total residential LPG demand in 2020, 2025, and 2030.
Availability analysis
There are two potential limitations in the methodology used for this analysis, both of which could
potentially underestimate the projected demand:
Infrastructure development: In this analysis, a roll-out plan and timing for infrastructure
development was assumed.
— Roll-out plan is based on the current understanding of cylinder deployments and
observations of past LPG cylinder deployments in Kenya. However, this could change due
to changes in Government priorities or market/competitive considerations, which would
affect the number of households transitioning to LPG at different points in time.
Clean Cooking for Africa National Feasibility Study: LPG for Clean Cooking in Kenya
102
— Timing for cylinder deployment was assumed, and different timings could result in a
different number of households transitioning to LPG (as demographic changes affect the
number of potential households).
Definition of availability: The analysis assumed that a cluster has improved availability if the time
to obtain LPG is less than 39 minutes. Given the varying sizes of clusters, this may not be accurate
for all clusters. The impact of availability relative to point of sale distance could not be modeled.
Cylinder availability could also not be modeled with the data at hand. This means that the
incremental impact of availability is likely an underestimation.
Affordability of equipment analysis
There are three potential limitations in the methodology used for this analysis:
Changes in upfront cost only: This analysis models the effect of reducing the upfront cost of the
cylinder and stove (through a subsidy), or changing the perception of the upfront cost, and does
not model changes in the monthly price of LPG. This was due to data limitations, as the price
elasticity of non-LPG users was not known and could not be modelled. It was assumed that the
more substantial barrier to entry was the upfront costs, so the possible changes of these costs were
modelled. This could result in an underestimation of demand if the price of LPG comes down.
Changes in the stove and cylinder subsidy over time: Only the planned subsidy of the Mwananchi
Gas Project was modelled, not the way in which it may change during roll-out. It was also assumed
that no alternative subsidized or discounted LPG equipment project will be introduced to co-exist
with it. It was assumed that the current Mwananchi subsidy of approximately 60% of the LPG
equipment cost to the consumer would stay constant over time. Additional measures, e.g.,
introduction of scalable pay-as-you-go business models or a change in the Mwananchi project
could change the estimates.
Household spending prioritization: The analysis uses an equivalently-priced asset (a television set)
and the household income score to model consumers’ ability to afford an LPG stove, cylinder
deposit and ongoing refills. However, this does not account for household spending priorities. For
example, a household with a lower income score may nevertheless choose to use LPG when
choosing to prioritize clean cooking. In the same way, a household within the specified score-range
may choose to prioritize a different type of asset expenditure and not use LPG. These variations
are not possible to model, because they vary on a household basis. The ranges specified are
believed to provide a reasonable calculation of estimated demand.

Clean Cooking for Africa National Feasibility Study: LPG for Clean Cooking in Kenya
103
13. Qualitative Factors in the Geography of Future LPG Demand
There are a number of correlations in the 2015/2016 KIHBS data, and other KNBS datasets66, that modify
qualitatively the commercial attractiveness (and viability) of each of Kenya’s 47 counties for new cylinder
deployments. These are discussed here.
LPG use compared to incomes above (APL) and below (BPL) the Kenya poverty line; LPG use and county GDP
A starting point for regional consideration is the map of Kenya’s poverty intensity, shown in Figure 18
below.
The map shows clearly that higher incomes, suggestive of greater propensity to purchase LPG were it
available, are clustered among the counties from the city of Mombasa in the southeast to Eldoret in the
West. These are the very counties where existing storage and filling capacity have already been deployed
by industry, as shown in Figure 32 on page 120. This corridor provides the critical mass of consumption
that currently supports (if with suboptimal asset intensity), and will support to 2030, the non-cylinder LPG
infrastructure in the country.
Of interest is that high county GDP is not necessarily a useful predictor of LPG penetration in the county.
Although recent county-level GDP data were not readily available for all counties as of this writing, GPD per
capita for the top ten counties is plotted against penetration of LPG for cooking in those counties in Figure
19 below. There is no correlation evident at all: the best curve-fitting r2 value is a statistically trivial .01.
66 Supplementary data sources: KNBS and the Society for International Development (SID): Exploring Kenya’s Inequality (2013);
Tuko (2018), see www.tuko.co.ke/262119-lists-counties-kenya-by-population-size-wealth-performance.html#262119
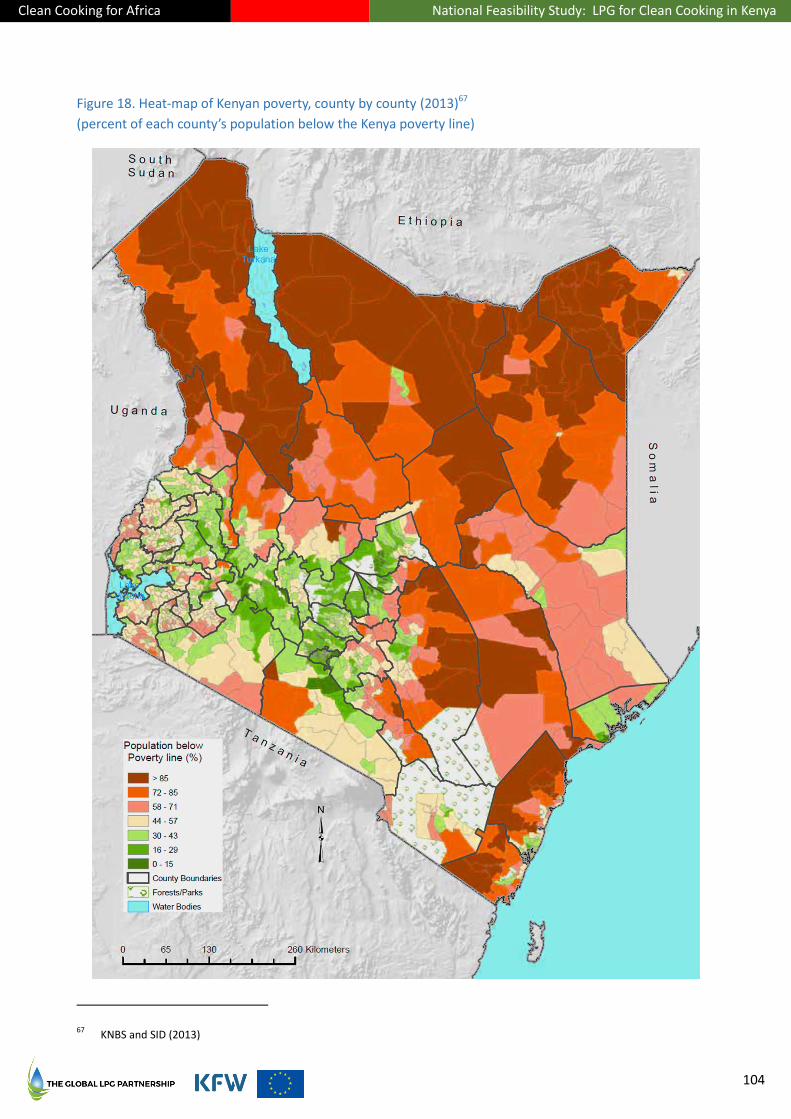
Clean Cooking for Africa National Feasibility Study: LPG for Clean Cooking in Kenya
104
Figure 18. Heat-map of Kenyan poverty, county by county (2013)67
(percent of each county’s population below the Kenya poverty line)
67 KNBS and SID (2013)

Clean Cooking for Africa National Feasibility Study: LPG for Clean Cooking in Kenya
105
Figure 19. LPG penetration vs. GPD per capita68
in the top 10 counties ranked by GDP/capita (each point one county)
LPG use in a county is not predicted by the county’s economic strength, among counties where GDP/capita
data were available.
Examining the rate of poverty (households above the poverty line (APL)), in Figure 20, the correlation is
much better (r2 of .60). The best-fit curve suggests that LPG penetration remains at low level in a county—
5-10%—until 50-60% of its population is above the poverty line, at which point LPG is suddenly much more
widely adopted, and further increases in the APL population match disproportionately rapid increases in
LPG adoption.
This may be caused by LPG being relatively unavailable in the counties with lower APL rates. It is not
possible to ascertain whether poverty causes LPG companies to stay away, or causes potential users to
reject LPG when offered, or some mix of both.
The findings of the demand modelling described in Part VI, beginning on age 69, indicate that there is
unserved or underserved LPG demand in all counties to varying degrees. Thus, an expectation among LPG
businesspersons that a county is “too poor” for LPG to be sold there—in amounts sufficient for commercial
viability—may be a self-fulfilling expectation, unduly retarding LPG companies’ efforts to expand
distribution there.
One must also keep in mind that under the present pricing modalities in Kenya, more remote locations
(which are also poorer locations, generally) have the highest LPG prices, due to transportation cost
differentials which are passed on to the end-user.
While the demand modelling indicates that price is a key driver of LPG adoption and use, the modelling also
indicates a very low elasticity of increase in LPG price and decrease in LPG adoption and use, but a modest
68 KIHBS (2016) and Tuko (2018)
0%
5%
10%
15%
20%
25%
30%
35%
40%
45%
$500 $700 $900 $1,100 $1,300 $1,500 $1,700 $1,900
Gas
Co
oke
r U
se
GDP/capita (top 10 counties)
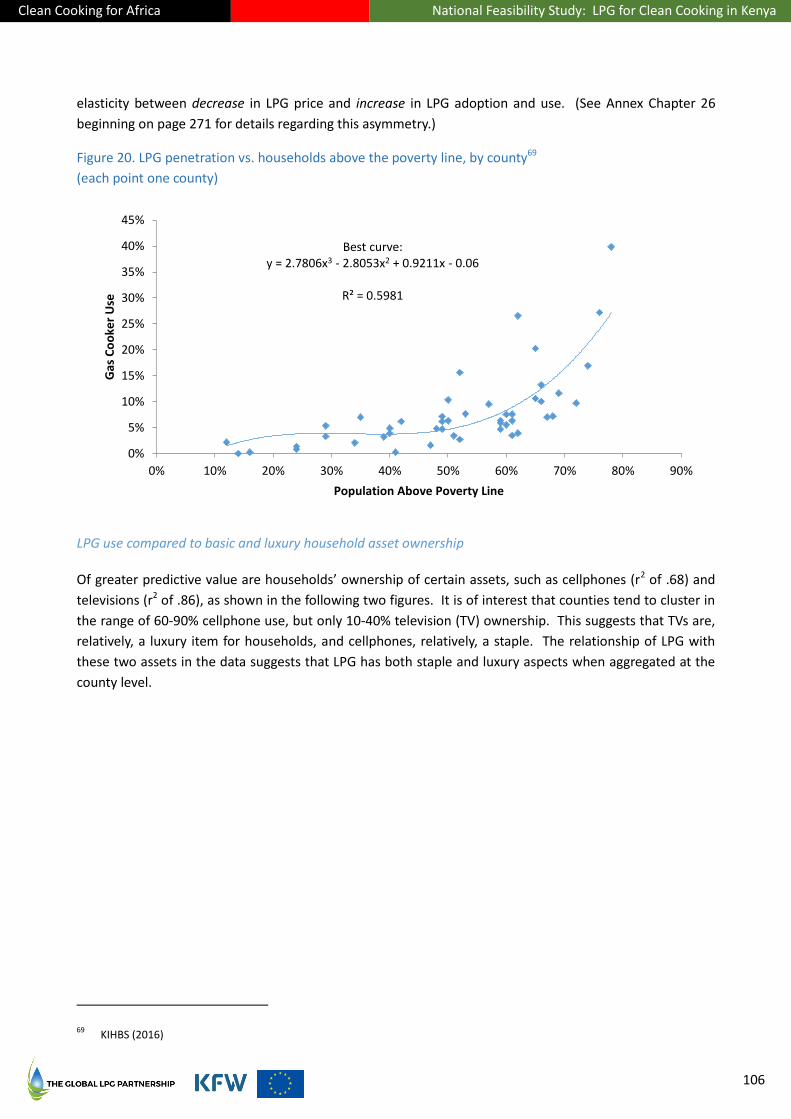
Clean Cooking for Africa National Feasibility Study: LPG for Clean Cooking in Kenya
106
elasticity between decrease in LPG price and increase in LPG adoption and use. (See Annex Chapter 26
beginning on page 271 for details regarding this asymmetry.)
Figure 20. LPG penetration vs. households above the poverty line, by county69
(each point one county)
LPG use compared to basic and luxury household asset ownership
Of greater predictive value are households’ ownership of certain assets, such as cellphones (r2 of .68) and
televisions (r2 of .86), as shown in the following two figures. It is of interest that counties tend to cluster in
the range of 60-90% cellphone use, but only 10-40% television (TV) ownership. This suggests that TVs are,
relatively, a luxury item for households, and cellphones, relatively, a staple. The relationship of LPG with
these two assets in the data suggests that LPG has both staple and luxury aspects when aggregated at the
county level.
69 KIHBS (2016)
Best curve: y = 2.7806x3 - 2.8053x2 + 0.9211x - 0.06
R² = 0.5981
0%
5%
10%
15%
20%
25%
30%
35%
40%
45%
0% 10% 20% 30% 40% 50% 60% 70% 80% 90%
Gas
Co
oke
r U
se
Population Above Poverty Line
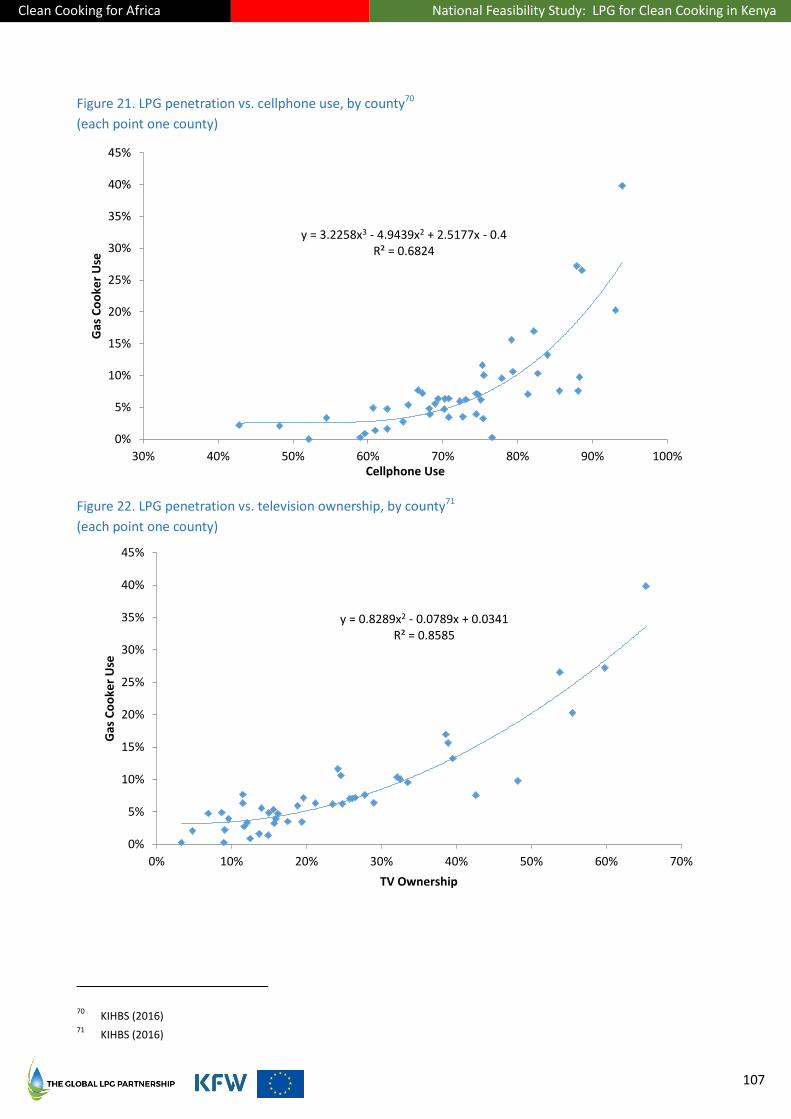
Clean Cooking for Africa National Feasibility Study: LPG for Clean Cooking in Kenya
107
Figure 21. LPG penetration vs. cellphone use, by county70
(each point one county)
Figure 22. LPG penetration vs. television ownership, by county71
(each point one county)
70 KIHBS (2016)
71 KIHBS (2016)
y = 3.2258x3 - 4.9439x2 + 2.5177x - 0.4 R² = 0.6824
0%
5%
10%
15%
20%
25%
30%
35%
40%
45%
30% 40% 50% 60% 70% 80% 90% 100%
Gas
Co
oke
r U
se
Cellphone Use
y = 0.8289x2 - 0.0789x + 0.0341 R² = 0.8585
0%
5%
10%
15%
20%
25%
30%
35%
40%
45%
0% 10% 20% 30% 40% 50% 60% 70%
Gas
Co
oke
r U
se
TV Ownership

Clean Cooking for Africa National Feasibility Study: LPG for Clean Cooking in Kenya
108
LPG use and population density
Interestingly, population density of the county, which when low might tend to decrease commercial
attractiveness of LPG operations, is not nearly as strongly correlated to LPG use as asset ownership. This is
shown in the next figure. Most counties have relatively low population densities, and yet among those with
densities at 100 persons/km2 and below, there is a range of LPG penetrations from 0% to 15% or more, in
one case nearly 30%. Counties with major urban centers, shown in the upper right quadrant, have
considerably more LPG use. From this, one can appreciate why LPG companies tend to focus first on urban
markets, and only secondarily on lower-density areas. However, population density has much less
explanatory power regarding LPG adoption at the county level (r2 .42) than factors like cellphone use or TV
ownership.
Figure 23. LPG penetration vs. county population density72
(2018 populations; each point one county)
Propensity matching and asset ownership compared
While LPG companies may not be able to make direct and easy use of such household survey data in
targeting geographic areas for expansion, as county-level trends are observed or reported regarding
consumer spending behaviours on such assets, those trends can be commercial indicators of where LPG can
make inroads.
The following figure compares the strongly predictive television ownership metric with the current LPG
penetration and the projected LPG penetration in 2030 from the propensity matching of Chapter 12:
72 KIHBS (2016) and Tuko (2018)
Best curve: y = 4E-09x2 + 2E-05x + 0.0637
R² = 0.4165
0%
5%
10%
15%
20%
25%
30%
35%
40%
45%
1 10 100 1,000 10,000
Gas
Co
oke
r U
se
Pouplation Density of County (persons/km2, log scale)
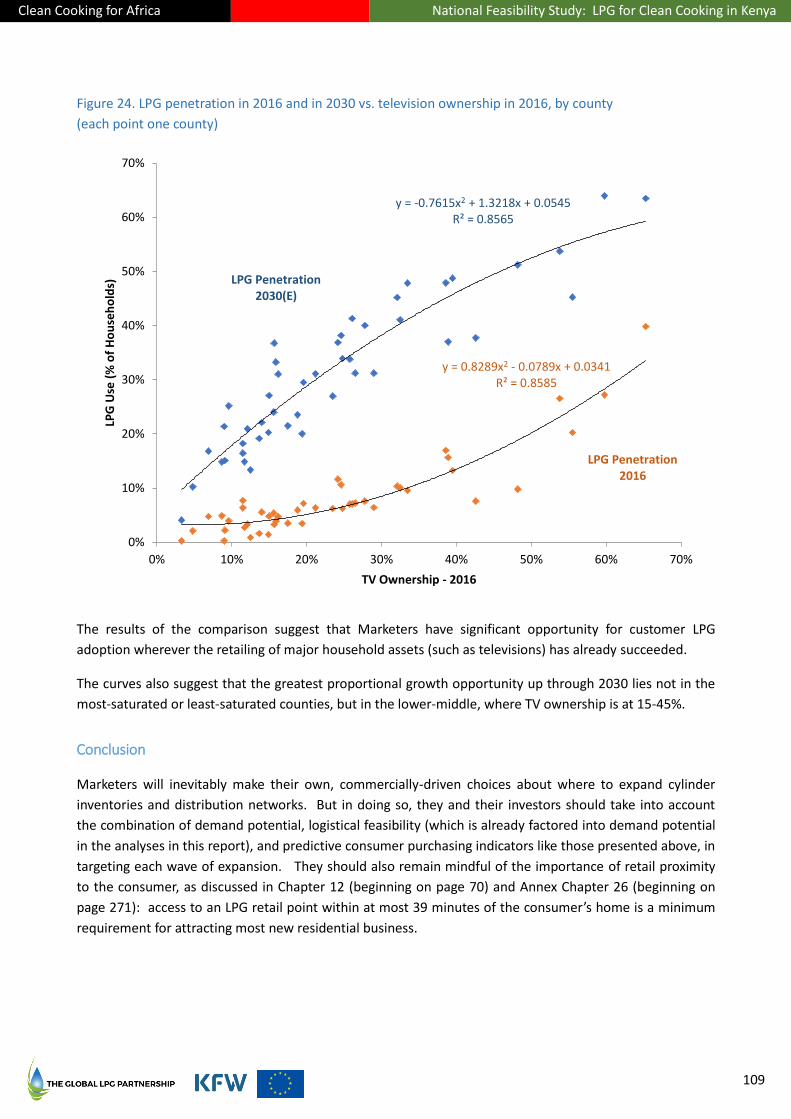
Clean Cooking for Africa National Feasibility Study: LPG for Clean Cooking in Kenya
109
Figure 24. LPG penetration in 2016 and in 2030 vs. television ownership in 2016, by county
(each point one county)
The results of the comparison suggest that Marketers have significant opportunity for customer LPG
adoption wherever the retailing of major household assets (such as televisions) has already succeeded.
The curves also suggest that the greatest proportional growth opportunity up through 2030 lies not in the
most-saturated or least-saturated counties, but in the lower-middle, where TV ownership is at 15-45%.
Conclusion
Marketers will inevitably make their own, commercially-driven choices about where to expand cylinder
inventories and distribution networks. But in doing so, they and their investors should take into account
the combination of demand potential, logistical feasibility (which is already factored into demand potential
in the analyses in this report), and predictive consumer purchasing indicators like those presented above, in
targeting each wave of expansion. They should also remain mindful of the importance of retail proximity
to the consumer, as discussed in Chapter 12 (beginning on page 70) and Annex Chapter 26 (beginning on
page 271): access to an LPG retail point within at most 39 minutes of the consumer’s home is a minimum
requirement for attracting most new residential business.
LPG Penetration 2030(E)
LPG Penetration 2016
y = -0.7615x2 + 1.3218x + 0.0545 R² = 0.8565
y = 0.8289x2 - 0.0789x + 0.0341 R² = 0.8585
0%
10%
20%
30%
40%
50%
60%
70%
0% 10% 20% 30% 40% 50% 60% 70%
LPG
Use
(%
of
Ho
use
ho
lds)
TV Ownership - 2016
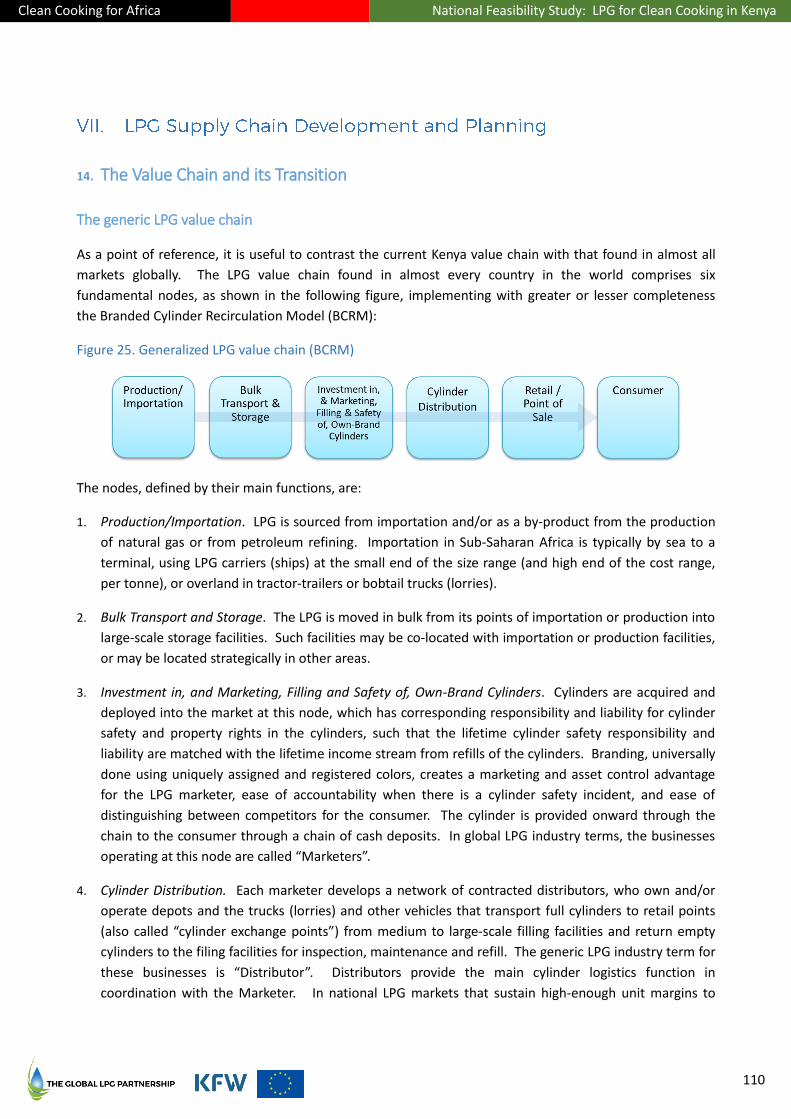
Clean Cooking for Africa National Feasibility Study: LPG for Clean Cooking in Kenya
110
14. The Value Chain and its Transition
The generic LPG value chain
As a point of reference, it is useful to contrast the current Kenya value chain with that found in almost all
markets globally. The LPG value chain found in almost every country in the world comprises six
fundamental nodes, as shown in the following figure, implementing with greater or lesser completeness
the Branded Cylinder Recirculation Model (BCRM):
Figure 25. Generalized LPG value chain (BCRM)
The nodes, defined by their main functions, are:
1. Production/Importation. LPG is sourced from importation and/or as a by-product from the production
of natural gas or from petroleum refining. Importation in Sub-Saharan Africa is typically by sea to a
terminal, using LPG carriers (ships) at the small end of the size range (and high end of the cost range,
per tonne), or overland in tractor-trailers or bobtail trucks (lorries).
2. Bulk Transport and Storage. The LPG is moved in bulk from its points of importation or production into
large-scale storage facilities. Such facilities may be co-located with importation or production facilities,
or may be located strategically in other areas.
3. Investment in, and Marketing, Filling and Safety of, Own-Brand Cylinders. Cylinders are acquired and
deployed into the market at this node, which has corresponding responsibility and liability for cylinder
safety and property rights in the cylinders, such that the lifetime cylinder safety responsibility and
liability are matched with the lifetime income stream from refills of the cylinders. Branding, universally
done using uniquely assigned and registered colors, creates a marketing and asset control advantage
for the LPG marketer, ease of accountability when there is a cylinder safety incident, and ease of
distinguishing between competitors for the consumer. The cylinder is provided onward through the
chain to the consumer through a chain of cash deposits. In global LPG industry terms, the businesses
operating at this node are called “Marketers”.
4. Cylinder Distribution. Each marketer develops a network of contracted distributors, who own and/or
operate depots and the trucks (lorries) and other vehicles that transport full cylinders to retail points
(also called “cylinder exchange points”) from medium to large-scale filling facilities and return empty
cylinders to the filing facilities for inspection, maintenance and refill. The generic LPG industry term for
these businesses is “Distributor”. Distributors provide the main cylinder logistics function in
coordination with the Marketer. In national LPG markets that sustain high-enough unit margins to

Clean Cooking for Africa National Feasibility Study: LPG for Clean Cooking in Kenya
111
support it, the distribution function may also include optional home delivery of filled cylinders and
pick-up of empty cylinders by the distributors.
5. Retail / Point of Sale. Also referred to as Cylinder Exchange Points, this node is where the consumer
interacts with the LPG cylinder distribution system. A new customer obtains his/her branded cylinder
by paying a cylinder deposit plus the purchase price of the LPG it contains. An already-existing LPG
customer brings his/her empty cylinder to a nearby retail location to exchange it, for the posted refill
price, for a full cylinder of the same brand. The empty cylinder is then “recirculated” to the filling
facility of the brand-owning Marketer by the distributor network, giving rise to the term “Cylinder
Recirculation Model”. A high density of retail points located conveniently near to the consumers,
supported by an adequate volume of cylinders, is critical to ensuring sufficient LPG availability to
stimulate and to serve LPG demand.
6. Consumer. A first-time user interacts with the retail node to obtain a new, filled cylinder of a given
brand, paying an initial cylinder deposit plus the cost of the fuel; an existing user exchanges his/her
empty cylinder there for a full one of the same brand, paying for the fuel cost.
Based on prevailing national policy, regulation, and market design, various nodes may be structured as
profit centers or cost centers. Vertical integration (a single company operating across multiple nodes) may
or may not be permitted. Competition may be focused on attracting and retaining consumers, and/or in
nodes further upstream from the consumer. (Examples of competition within the chain, not focused on
attracting and retaining consumers, can consist of competing to acquire and control supply of LPG in bulk,
competing for distribution and for retail presence, and interfering – legally or otherwise – with the cylinder
inventories and logistics of rivals to influence market shares.)
LMICs with very high levels of LPG penetration and use by their populations, such as India and Morocco,
have established the first two or three nodes (looking left to right) on a shared-asset utility model, as cost
centers, with either state or common industry ownership thereof. That approach has helped to shift the
focus of competition away from the interior of the supply chain to the acquiring and servicing of the
consumer in those countries.
There are many potential variations to the value chain structure; nodes may potentially be merged or
overlap, in whole or in part. Nevertheless, this basic structure, with good regulatory oversight, has been
shown to be sustainably scalable to serve 80%+ of the populations of numerous LMICs, and 95%+ in some,
while delivering adequate public safety over time.
The operation of the BCRM value chain may be diagrammed more explicitly as follows:

Clean Cooking for Africa National Feasibility Study: LPG for Clean Cooking in Kenya
112
Figure 26. Generalized LPG value chain (BCRM) with operational flows
As one moves from production/importation toward the consumer along the chain, the number of players
tends to increase, somewhat geometrically. This is indeed the case in Kenya, discussed below.
Existing Kenya LPG value chain
The Kenya LPG value chain originally operated under BCRM, described above and, in more detail, in Part IV
(beginning on page 38). Over many years, accelerated and codified by LN 121 (2007), Kenya’s value chain
slowly evolved into a distinctive variant of this generalized model. Kenya’s current value chain and its
operation are shown in the following figure:
Figure 27. Existing Kenya LPG value chain
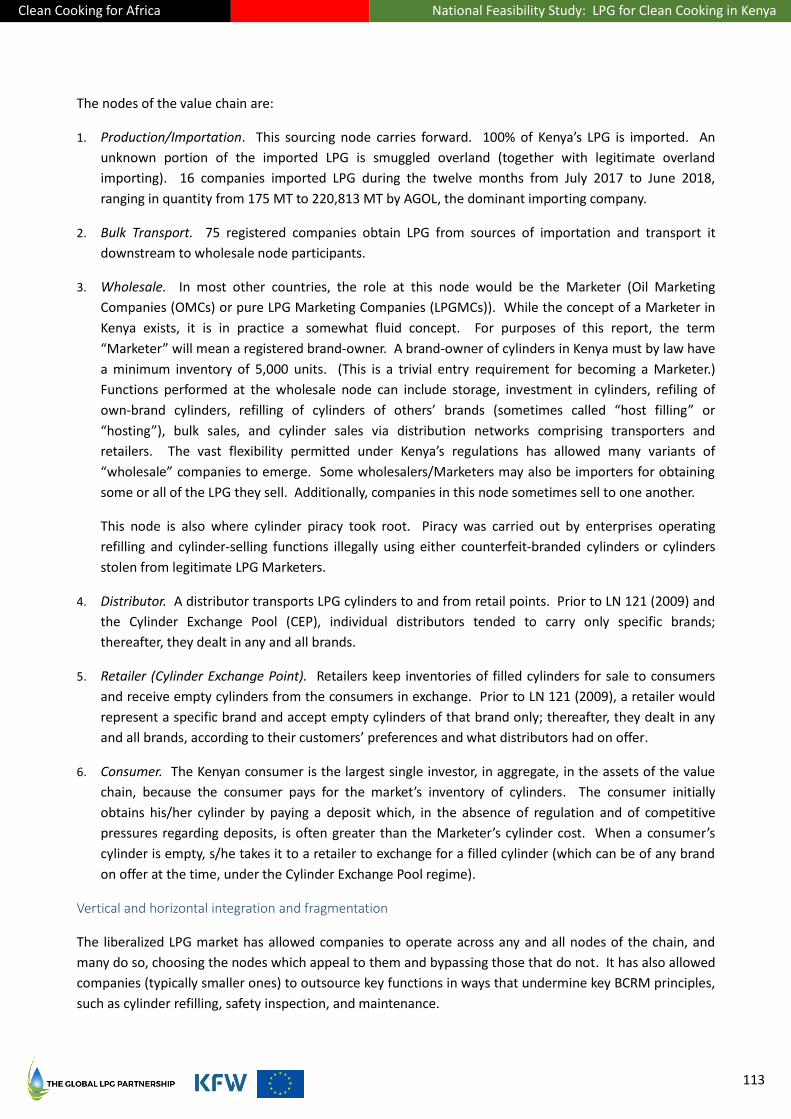
Clean Cooking for Africa National Feasibility Study: LPG for Clean Cooking in Kenya
113
The nodes of the value chain are:
1. Production/Importation. This sourcing node carries forward. 100% of Kenya’s LPG is imported. An
unknown portion of the imported LPG is smuggled overland (together with legitimate overland
importing). 16 companies imported LPG during the twelve months from July 2017 to June 2018,
ranging in quantity from 175 MT to 220,813 MT by AGOL, the dominant importing company.
2. Bulk Transport. 75 registered companies obtain LPG from sources of importation and transport it
downstream to wholesale node participants.
3. Wholesale. In most other countries, the role at this node would be the Marketer (Oil Marketing
Companies (OMCs) or pure LPG Marketing Companies (LPGMCs)). While the concept of a Marketer in
Kenya exists, it is in practice a somewhat fluid concept. For purposes of this report, the term
“Marketer” will mean a registered brand-owner. A brand-owner of cylinders in Kenya must by law have
a minimum inventory of 5,000 units. (This is a trivial entry requirement for becoming a Marketer.)
Functions performed at the wholesale node can include storage, investment in cylinders, refiling of
own-brand cylinders, refilling of cylinders of others’ brands (sometimes called “host filling” or
“hosting”), bulk sales, and cylinder sales via distribution networks comprising transporters and
retailers. The vast flexibility permitted under Kenya’s regulations has allowed many variants of
“wholesale” companies to emerge. Some wholesalers/Marketers may also be importers for obtaining
some or all of the LPG they sell. Additionally, companies in this node sometimes sell to one another.
This node is also where cylinder piracy took root. Piracy was carried out by enterprises operating
refilling and cylinder-selling functions illegally using either counterfeit-branded cylinders or cylinders
stolen from legitimate LPG Marketers.
4. Distributor. A distributor transports LPG cylinders to and from retail points. Prior to LN 121 (2009) and
the Cylinder Exchange Pool (CEP), individual distributors tended to carry only specific brands;
thereafter, they dealt in any and all brands.
5. Retailer (Cylinder Exchange Point). Retailers keep inventories of filled cylinders for sale to consumers
and receive empty cylinders from the consumers in exchange. Prior to LN 121 (2009), a retailer would
represent a specific brand and accept empty cylinders of that brand only; thereafter, they dealt in any
and all brands, according to their customers’ preferences and what distributors had on offer.
6. Consumer. The Kenyan consumer is the largest single investor, in aggregate, in the assets of the value
chain, because the consumer pays for the market’s inventory of cylinders. The consumer initially
obtains his/her cylinder by paying a deposit which, in the absence of regulation and of competitive
pressures regarding deposits, is often greater than the Marketer’s cylinder cost. When a consumer’s
cylinder is empty, s/he takes it to a retailer to exchange for a filled cylinder (which can be of any brand
on offer at the time, under the Cylinder Exchange Pool regime).
Vertical and horizontal integration and fragmentation
The liberalized LPG market has allowed companies to operate across any and all nodes of the chain, and
many do so, choosing the nodes which appeal to them and bypassing those that do not. It has also allowed
companies (typically smaller ones) to outsource key functions in ways that undermine key BCRM principles,
such as cylinder refilling, safety inspection, and maintenance.
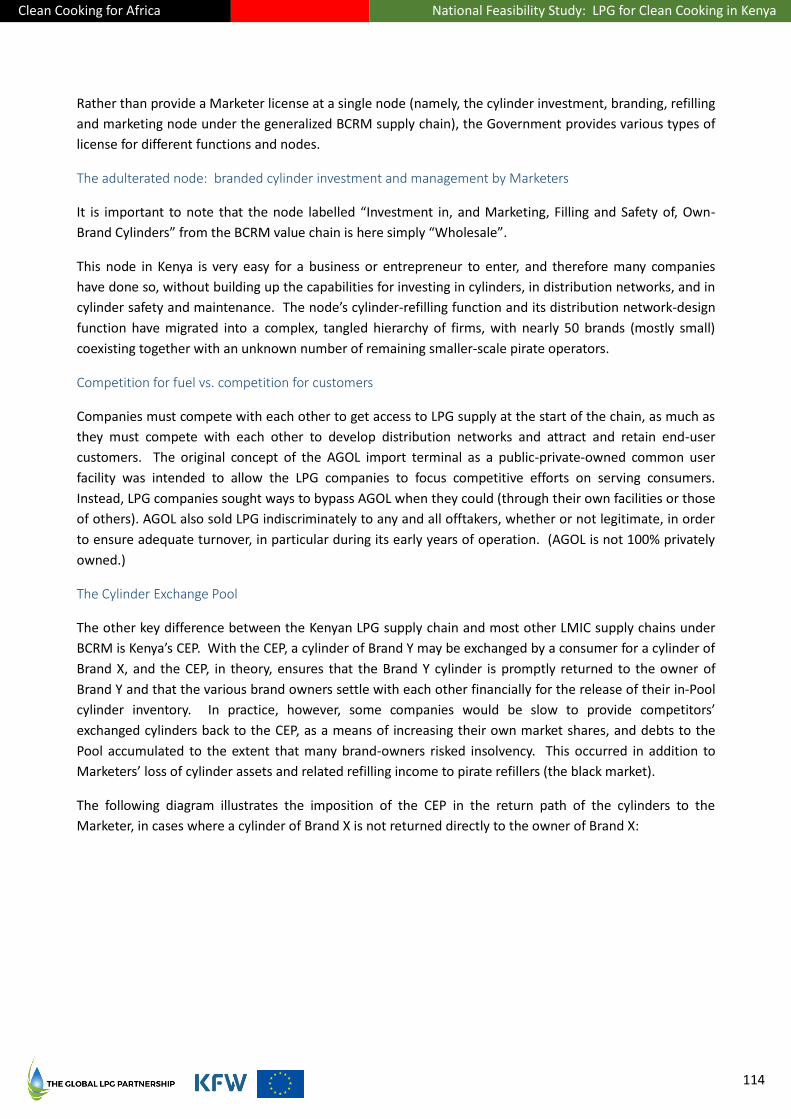
Clean Cooking for Africa National Feasibility Study: LPG for Clean Cooking in Kenya
114
Rather than provide a Marketer license at a single node (namely, the cylinder investment, branding, refilling
and marketing node under the generalized BCRM supply chain), the Government provides various types of
license for different functions and nodes.
The adulterated node: branded cylinder investment and management by Marketers
It is important to note that the node labelled “Investment in, and Marketing, Filling and Safety of, Own-
Brand Cylinders” from the BCRM value chain is here simply “Wholesale”.
This node in Kenya is very easy for a business or entrepreneur to enter, and therefore many companies
have done so, without building up the capabilities for investing in cylinders, in distribution networks, and in
cylinder safety and maintenance. The node’s cylinder-refilling function and its distribution network-design
function have migrated into a complex, tangled hierarchy of firms, with nearly 50 brands (mostly small)
coexisting together with an unknown number of remaining smaller-scale pirate operators.
Competition for fuel vs. competition for customers
Companies must compete with each other to get access to LPG supply at the start of the chain, as much as
they must compete with each other to develop distribution networks and attract and retain end-user
customers. The original concept of the AGOL import terminal as a public-private-owned common user
facility was intended to allow the LPG companies to focus competitive efforts on serving consumers.
Instead, LPG companies sought ways to bypass AGOL when they could (through their own facilities or those
of others). AGOL also sold LPG indiscriminately to any and all offtakers, whether or not legitimate, in order
to ensure adequate turnover, in particular during its early years of operation. (AGOL is not 100% privately
owned.)
The Cylinder Exchange Pool
The other key difference between the Kenyan LPG supply chain and most other LMIC supply chains under
BCRM is Kenya’s CEP. With the CEP, a cylinder of Brand Y may be exchanged by a consumer for a cylinder of
Brand X, and the CEP, in theory, ensures that the Brand Y cylinder is promptly returned to the owner of
Brand Y and that the various brand owners settle with each other financially for the release of their in-Pool
cylinder inventory. In practice, however, some companies would be slow to provide competitors’
exchanged cylinders back to the CEP, as a means of increasing their own market shares, and debts to the
Pool accumulated to the extent that many brand-owners risked insolvency. This occurred in addition to
Marketers’ loss of cylinder assets and related refilling income to pirate refillers (the black market).
The following diagram illustrates the imposition of the CEP in the return path of the cylinders to the
Marketer, in cases where a cylinder of Brand X is not returned directly to the owner of Brand X:
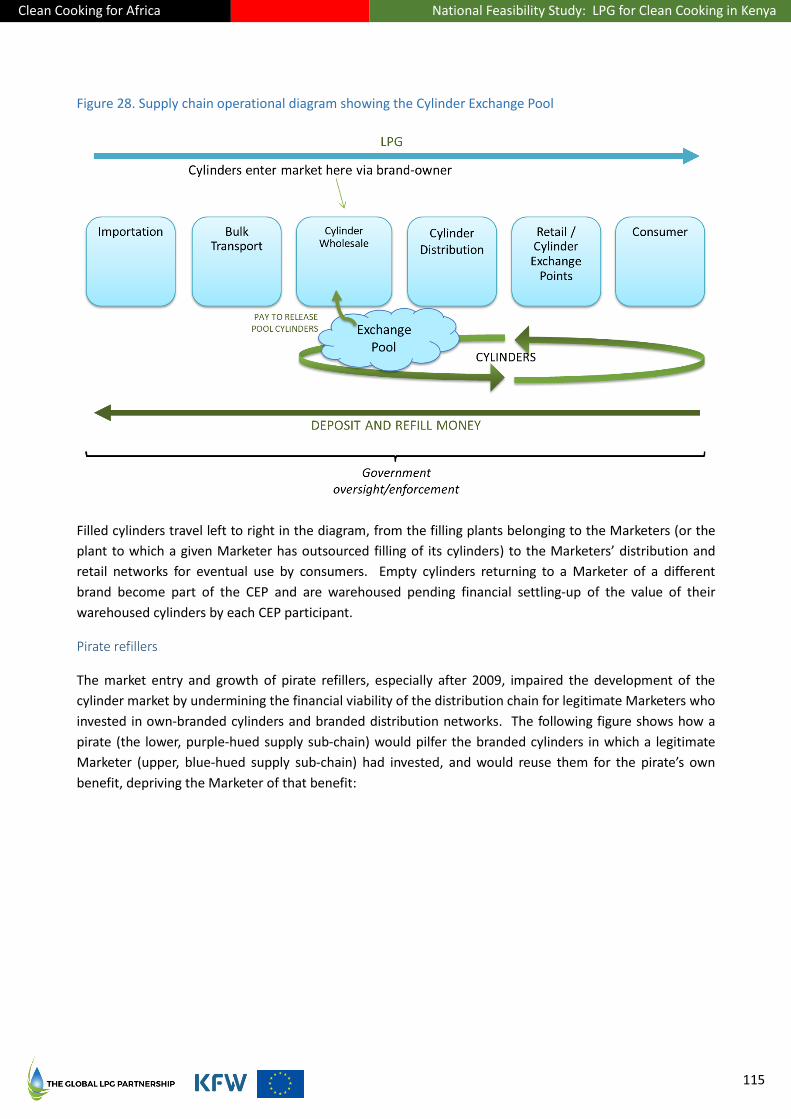
Clean Cooking for Africa National Feasibility Study: LPG for Clean Cooking in Kenya
115
Figure 28. Supply chain operational diagram showing the Cylinder Exchange Pool
Filled cylinders travel left to right in the diagram, from the filling plants belonging to the Marketers (or the
plant to which a given Marketer has outsourced filling of its cylinders) to the Marketers’ distribution and
retail networks for eventual use by consumers. Empty cylinders returning to a Marketer of a different
brand become part of the CEP and are warehoused pending financial settling-up of the value of their
warehoused cylinders by each CEP participant.
Pirate refillers
The market entry and growth of pirate refillers, especially after 2009, impaired the development of the
cylinder market by undermining the financial viability of the distribution chain for legitimate Marketers who
invested in own-branded cylinders and branded distribution networks. The following figure shows how a
pirate (the lower, purple-hued supply sub-chain) would pilfer the branded cylinders in which a legitimate
Marketer (upper, blue-hued supply sub-chain) had invested, and would reuse them for the pirate’s own
benefit, depriving the Marketer of that benefit:
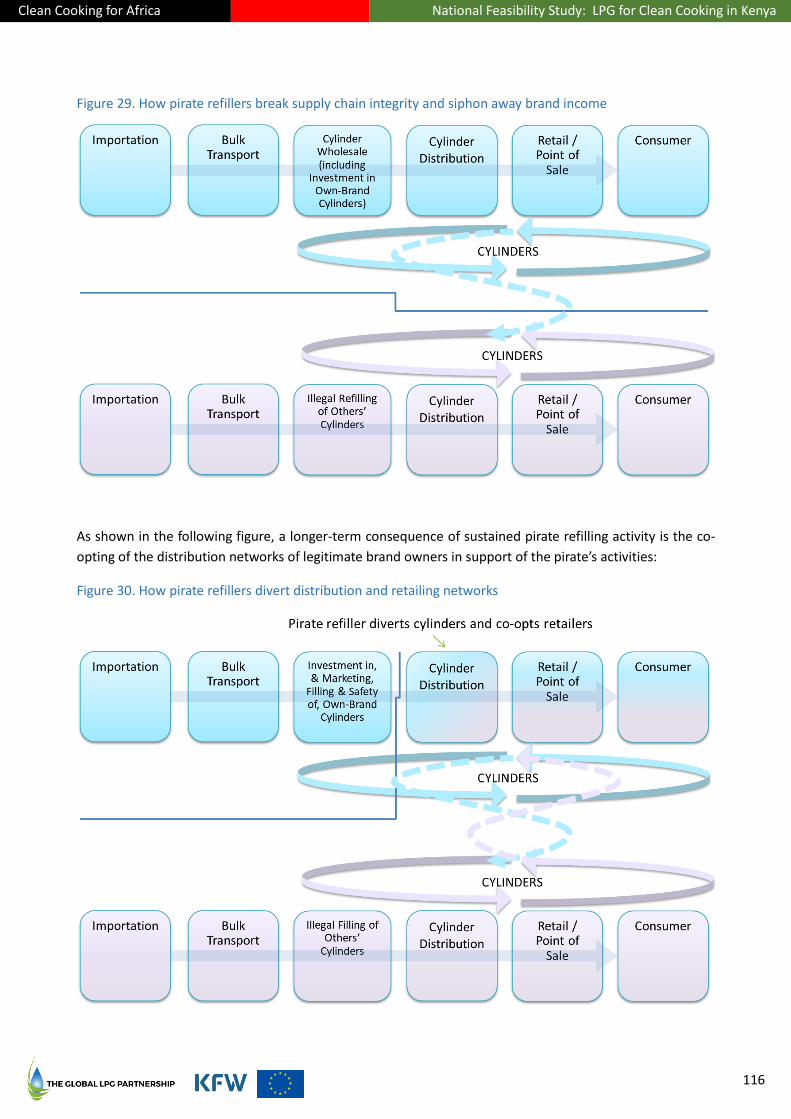
Clean Cooking for Africa National Feasibility Study: LPG for Clean Cooking in Kenya
116
Figure 29. How pirate refillers break supply chain integrity and siphon away brand income
As shown in the following figure, a longer-term consequence of sustained pirate refilling activity is the co-
opting of the distribution networks of legitimate brand owners in support of the pirate’s activities:
Figure 30. How pirate refillers divert distribution and retailing networks
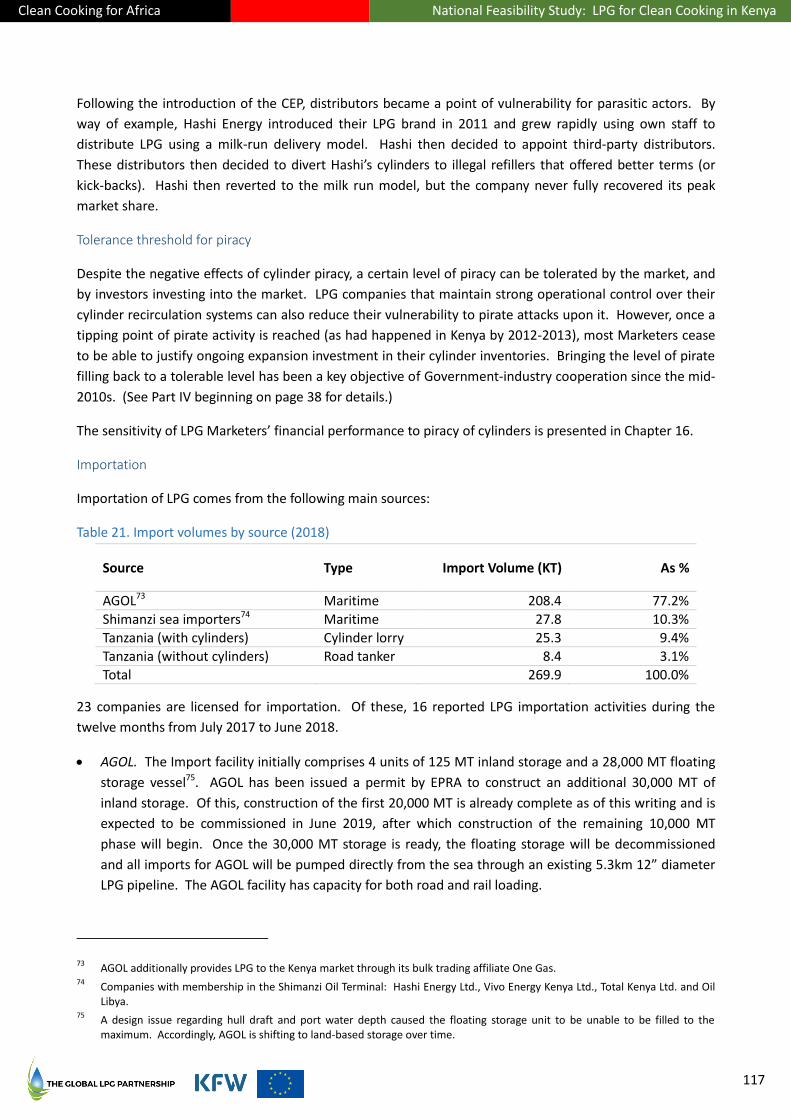
Clean Cooking for Africa National Feasibility Study: LPG for Clean Cooking in Kenya
117
Following the introduction of the CEP, distributors became a point of vulnerability for parasitic actors. By
way of example, Hashi Energy introduced their LPG brand in 2011 and grew rapidly using own staff to
distribute LPG using a milk-run delivery model. Hashi then decided to appoint third-party distributors.
These distributors then decided to divert Hashi’s cylinders to illegal refillers that offered better terms (or
kick-backs). Hashi then reverted to the milk run model, but the company never fully recovered its peak
market share.
Tolerance threshold for piracy
Despite the negative effects of cylinder piracy, a certain level of piracy can be tolerated by the market, and
by investors investing into the market. LPG companies that maintain strong operational control over their
cylinder recirculation systems can also reduce their vulnerability to pirate attacks upon it. However, once a
tipping point of pirate activity is reached (as had happened in Kenya by 2012-2013), most Marketers cease
to be able to justify ongoing expansion investment in their cylinder inventories. Bringing the level of pirate
filling back to a tolerable level has been a key objective of Government-industry cooperation since the mid-
2010s. (See Part IV beginning on page 38 for details.)
The sensitivity of LPG Marketers’ financial performance to piracy of cylinders is presented in Chapter 16.
Importation
Importation of LPG comes from the following main sources:
Table 21. Import volumes by source (2018)
Source Type Import Volume (KT) As %
AGOL73 Maritime 208.4 77.2%
Shimanzi sea importers74 Maritime 27.8 10.3%
Tanzania (with cylinders) Cylinder lorry 25.3 9.4%
Tanzania (without cylinders) Road tanker 8.4 3.1%
Total 269.9 100.0%
23 companies are licensed for importation. Of these, 16 reported LPG importation activities during the
twelve months from July 2017 to June 2018.
AGOL. The Import facility initially comprises 4 units of 125 MT inland storage and a 28,000 MT floating
storage vessel75. AGOL has been issued a permit by EPRA to construct an additional 30,000 MT of
inland storage. Of this, construction of the first 20,000 MT is already complete as of this writing and is
expected to be commissioned in June 2019, after which construction of the remaining 10,000 MT
phase will begin. Once the 30,000 MT storage is ready, the floating storage will be decommissioned
and all imports for AGOL will be pumped directly from the sea through an existing 5.3km 12” diameter
LPG pipeline. The AGOL facility has capacity for both road and rail loading.
73 AGOL additionally provides LPG to the Kenya market through its bulk trading affiliate One Gas.
74 Companies with membership in the Shimanzi Oil Terminal: Hashi Energy Ltd., Vivo Energy Kenya Ltd., Total Kenya Ltd. and Oil
Libya. 75
A design issue regarding hull draft and port water depth caused the floating storage unit to be unable to be filled to the maximum. Accordingly, AGOL is shifting to land-based storage over time.
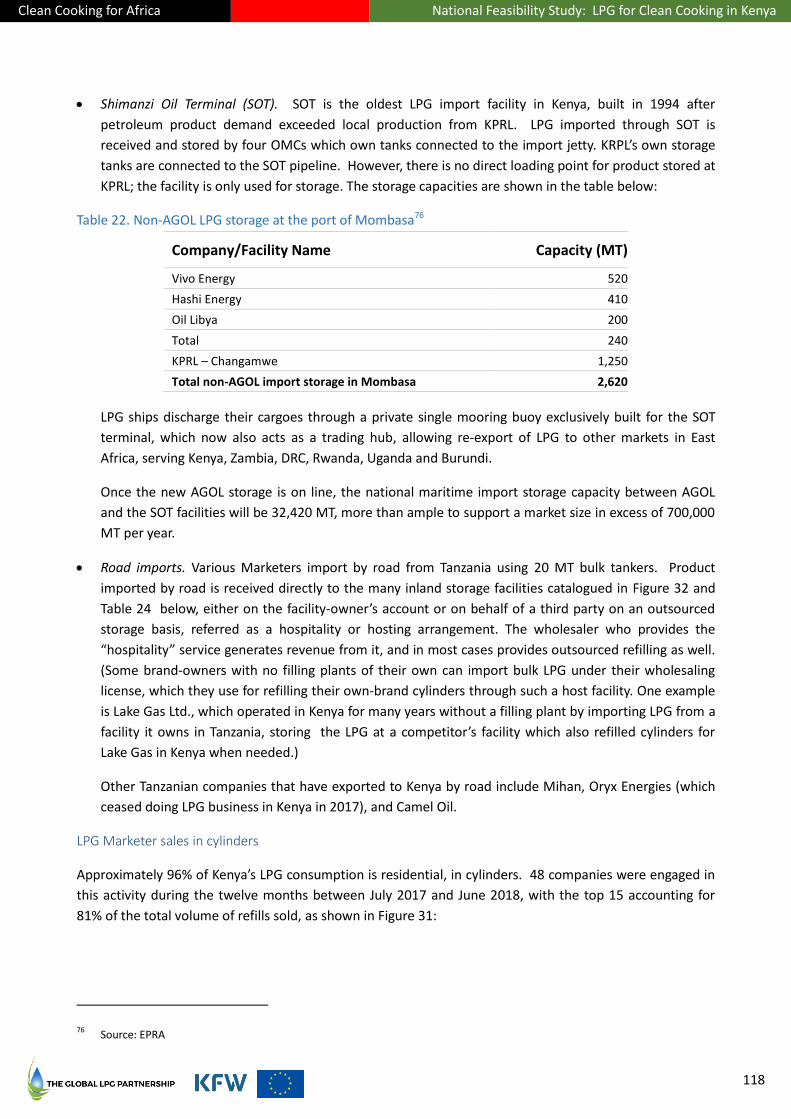
Clean Cooking for Africa National Feasibility Study: LPG for Clean Cooking in Kenya
118
Shimanzi Oil Terminal (SOT). SOT is the oldest LPG import facility in Kenya, built in 1994 after
petroleum product demand exceeded local production from KPRL. LPG imported through SOT is
received and stored by four OMCs which own tanks connected to the import jetty. KRPL’s own storage
tanks are connected to the SOT pipeline. However, there is no direct loading point for product stored at
KPRL; the facility is only used for storage. The storage capacities are shown in the table below:
Table 22. Non-AGOL LPG storage at the port of Mombasa76
Company/Facility Name Capacity (MT)
Vivo Energy 520
Hashi Energy 410
Oil Libya 200
Total 240
KPRL – Changamwe 1,250
Total non-AGOL import storage in Mombasa 2,620
LPG ships discharge their cargoes through a private single mooring buoy exclusively built for the SOT
terminal, which now also acts as a trading hub, allowing re-export of LPG to other markets in East
Africa, serving Kenya, Zambia, DRC, Rwanda, Uganda and Burundi.
Once the new AGOL storage is on line, the national maritime import storage capacity between AGOL
and the SOT facilities will be 32,420 MT, more than ample to support a market size in excess of 700,000
MT per year.
Road imports. Various Marketers import by road from Tanzania using 20 MT bulk tankers. Product
imported by road is received directly to the many inland storage facilities catalogued in Figure 32 and
Table 24 below, either on the facility-owner’s account or on behalf of a third party on an outsourced
storage basis, referred as a hospitality or hosting arrangement. The wholesaler who provides the
“hospitality” service generates revenue from it, and in most cases provides outsourced refilling as well.
(Some brand-owners with no filling plants of their own can import bulk LPG under their wholesaling
license, which they use for refilling their own-brand cylinders through such a host facility. One example
is Lake Gas Ltd., which operated in Kenya for many years without a filling plant by importing LPG from a
facility it owns in Tanzania, storing the LPG at a competitor’s facility which also refilled cylinders for
Lake Gas in Kenya when needed.)
Other Tanzanian companies that have exported to Kenya by road include Mihan, Oryx Energies (which
ceased doing LPG business in Kenya in 2017), and Camel Oil.
LPG Marketer sales in cylinders
Approximately 96% of Kenya’s LPG consumption is residential, in cylinders. 48 companies were engaged in
this activity during the twelve months between July 2017 and June 2018, with the top 15 accounting for
81% of the total volume of refills sold, as shown in Figure 31:
76 Source: EPRA

Clean Cooking for Africa National Feasibility Study: LPG for Clean Cooking in Kenya
119
Figure 31. LPG Marketers by market share (7/2017-6/2018)
Table 23. LPG Marketer self-reported volumes and associated market shares (7/2017-6/2018)77
Marketer Volume (kg) Market Share78
Kenolkobil Limited 11,912,764 12.6%
Solutions East Africa Limited (SEA) 11,460,465 12.1%
Total Kenya Limited 8,657,809 9.1%
Libya Oil 5,008,456 5.3%
Green Gas Company Limited 4,999,112 5.3%
Hashi Energy Limited 4,930,494 5.2%
Mapka Investment Limited 4,443,773 4.7%
Topline Traders Ltd 3,889,888 4.1%
Vivo Energy Kenya Limited 3,751,491 4.0%
Alfa Gas Limited 3,587,366 3.8%
Depar Limited 3,560,201 3.8%
National Oil Corporation Of Kenya 2,998,175 3.2%
Lake Gas Limited 2,966,198 3.1%
City Gas Limited 2,653,097 2.8%
Swift Energy Distributors Limited 1,869,000 2.0%
Subtotal—top 15 companies 76,688,288 80.8%
Others (33 companies) 18,183,663 19.2%
Total 94,871,951 100.0%
77
78 Amounts do not add exactly due to rounding. Source: EPRA (2018). Note that the volumes reported undercount total sales
via cylinders, because Marketers (a) misreport the categories of their sales, especially with respect to transfers of LPG made between competitors under hospitality/hosting arrangements, and (b) do not always report sales every month. However, the market shares are generally reliable and indicative.
Kenolkobil 12.6%
S.E.A. 12.1%
Total 9.1%
Oil Libya 5.3%
Green Gas 5.3%
Hashi Energy 5.2%
Mapka Investment
4.7%
Topline Traders 4.1%
Vivo Energy 4.0%
Alfa Gas 3.8%
Depar 3.8%
NOCK 3.2%
Lake Gas 3.1%
City Gas Limited 2.8%
Swift Energy Distributors
2.0%
Other 19.2%

Clean Cooking for Africa National Feasibility Study: LPG for Clean Cooking in Kenya
120
Filling and storage
Kenya had 64 storage/filling facilities in 2018. The following map shows their locations; the size of the circle
indicated the total storage capacity in that location:
Figure 32. Capacity map of Kenya filling/storage facilities (2018)
Capacities are shown in blue circles, whose area corresponds to the capacity in that location. The
Mombasa facilities (dominated by AGOL) are in light green, in order that smaller storage sites in nearby
Kwale and Kilifi (in blue) can be seen.
It should be noted that the small cluster of sites in the immediate surrounds of Nairobi were generally not
established in order to expand the market outside of Nairobi, but rather were established in order to
increase penetration of the Nairobi market from a location with a lower cost structure, easier access to
land, and less traffic and population surrounding the facility.
The following table gives the data presented on the map:
Table 24. Count and capacities of storage/filling facilities by geographic location (2018)
Location Number of
Facilities Total Storage Capacity (MT)
Mombasa 8 23,239
Nairobi 27 2,859
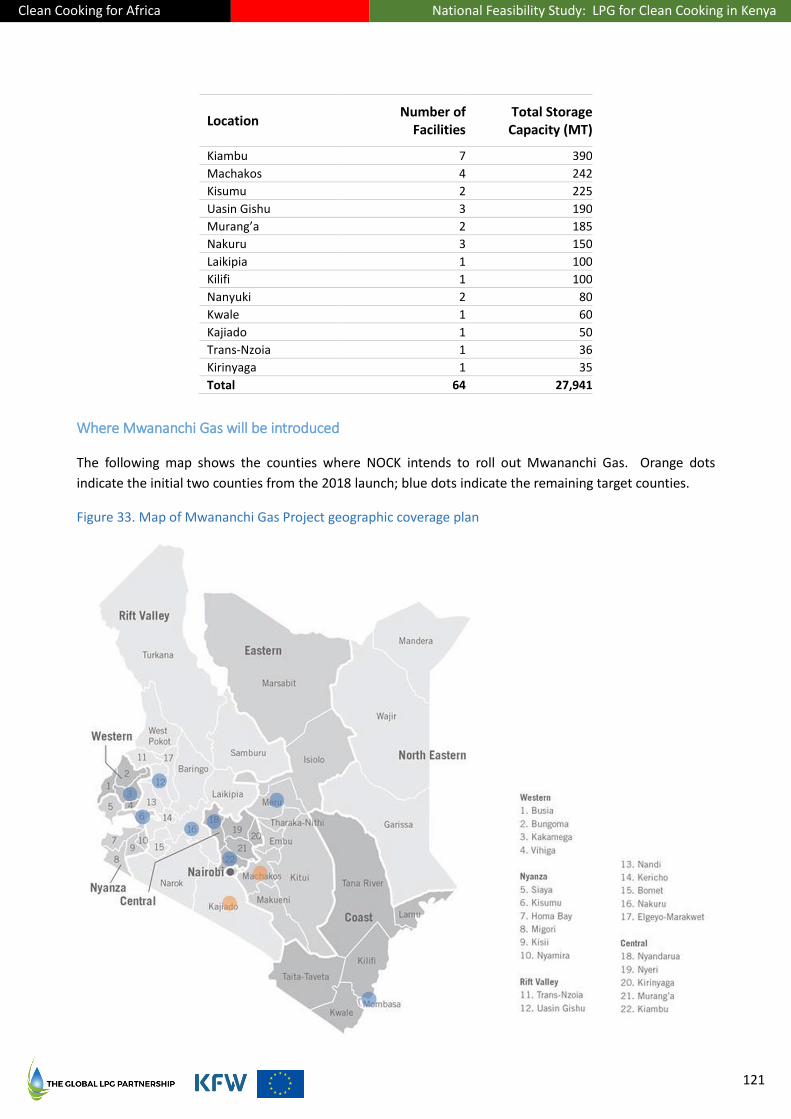
Clean Cooking for Africa National Feasibility Study: LPG for Clean Cooking in Kenya
121
Location Number of
Facilities Total Storage Capacity (MT)
Kiambu 7 390
Machakos 4 242
Kisumu 2 225
Uasin Gishu 3 190
Murang’a 2 185
Nakuru 3 150
Laikipia 1 100
Kilifi 1 100
Nanyuki 2 80
Kwale 1 60
Kajiado 1 50
Trans-Nzoia 1 36
Kirinyaga 1 35
Total 64 27,941
Where Mwananchi Gas will be introduced
The following map shows the counties where NOCK intends to roll out Mwananchi Gas. Orange dots
indicate the initial two counties from the 2018 launch; blue dots indicate the remaining target counties.
Figure 33. Map of Mwananchi Gas Project geographic coverage plan

Clean Cooking for Africa National Feasibility Study: LPG for Clean Cooking in Kenya
122
Most of the areas targeted by the Mwananchi project have existing LPG facilities (as presented in the map
in Figure 32 above). The three areas that do not are Kakamega, Meru and Nyandarua counties.
The future value chain under LN 121 (2019)
The elimination of the CEP (except on a voluntary basis among certain of the Energy Dealers Association
membership) will simplify the cylinder recirculation system and improve Marketer’s access to, and control
over, their cylinder assets. This will, to an extent, reverse the loss of asset control that facilitated and
exacerbated the rise of the LPG black market and illegal refill business during this decade.
The disparity between the roles permitted by license under the “wholesale” supply chain node and the
targeted definition of role and responsibility for the Marketer as the cylinder investor, brand owner, refiller,
and accountable party for cylinder safety, will remain unaddressed. However, the commonly expressed
view of the private sector leaders of Kenya’s LPG industry is that diligent, effective enforcement that cracks
down on, and severely penalized, illegal refilling of cylinders, supported by anti-counterfeiting and other
statutes, can and should restore sufficient “law and order” to the sector to justify expansion investment in
cylinders to keep pace with the development of demand.
Future importation, bulk storage, filling and transport capacity
The present national capacity in all categories except cylinder inventory are adequate in the near, medium
term and long term for the forecasted increase in importation, storage, and filling volumes under the
growth scenarios projected in Part VI of this report. Over time, if the anticipated consumption is exceeded,
adding capacity to these categories of infrastructure may be necessary, and should in turn be duly studied
and planned.
Nonetheless, in addition to the expanding importation capabilities mentioned earlier, several further
storage and filling facilities are planned, despite the present state of overcapacity. These include the
following:
Importation
KPC LPG import facility. The Kenya Pipeline Company, a state-owned enterprise, is developing plans
to construct at 25,000 MT LPT import facility on KPRL land. The Kenya Ports Authority has
incorporated plans for an LPG pipeline in the new Kipevu Oil Jetty, which is in final planning stages
as of this writing.
Private sector LPG import facilities. Multiple private companies have also announced plans to
develop additional import facilities, with their status summarized in the following table:
Company Location Capacity (MT)
Status
Inland Floating
Mansa LPG Liwatoni 1,000MT 10,000MT Awaiting review of licenses
Mombasa Gas Terminal (MGT) Likoni 22,000MT Obtained Environmental Impact Assessment
Focus LPG (TBD) 30,000MT Planning stage
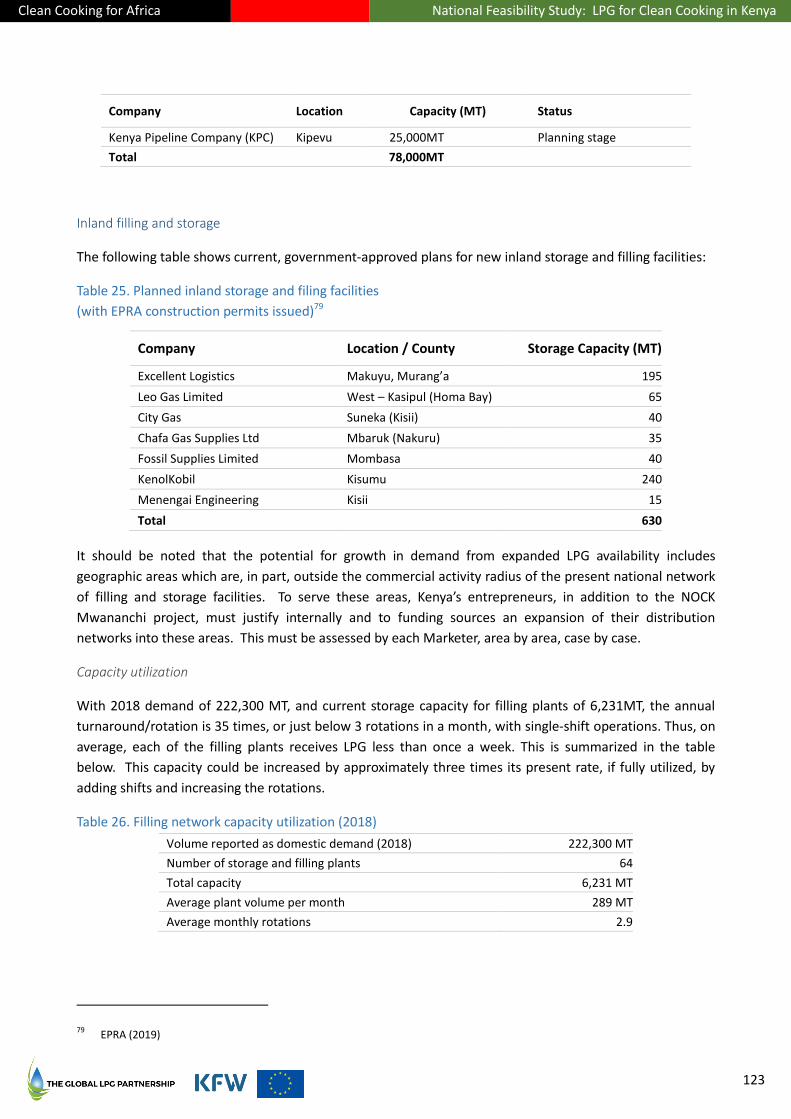
Clean Cooking for Africa National Feasibility Study: LPG for Clean Cooking in Kenya
123
Company Location Capacity (MT) Status
Kenya Pipeline Company (KPC) Kipevu 25,000MT Planning stage
Total 78,000MT
Inland filling and storage
The following table shows current, government-approved plans for new inland storage and filling facilities:
Table 25. Planned inland storage and filing facilities
(with EPRA construction permits issued)79
Company Location / County Storage Capacity (MT)
Excellent Logistics Makuyu, Murang’a 195
Leo Gas Limited West – Kasipul (Homa Bay) 65
City Gas Suneka (Kisii) 40
Chafa Gas Supplies Ltd Mbaruk (Nakuru) 35
Fossil Supplies Limited Mombasa 40
KenolKobil Kisumu 240
Menengai Engineering Kisii 15
Total 630
It should be noted that the potential for growth in demand from expanded LPG availability includes
geographic areas which are, in part, outside the commercial activity radius of the present national network
of filling and storage facilities. To serve these areas, Kenya’s entrepreneurs, in addition to the NOCK
Mwananchi project, must justify internally and to funding sources an expansion of their distribution
networks into these areas. This must be assessed by each Marketer, area by area, case by case.
Capacity utilization
With 2018 demand of 222,300 MT, and current storage capacity for filling plants of 6,231MT, the annual
turnaround/rotation is 35 times, or just below 3 rotations in a month, with single-shift operations. Thus, on
average, each of the filling plants receives LPG less than once a week. This is summarized in the table
below. This capacity could be increased by approximately three times its present rate, if fully utilized, by
adding shifts and increasing the rotations.
Table 26. Filling network capacity utilization (2018)
Volume reported as domestic demand (2018) 222,300 MT
Number of storage and filling plants 64
Total capacity 6,231 MT
Average plant volume per month 289 MT
Average monthly rotations 2.9
79 EPRA (2019)

Clean Cooking for Africa National Feasibility Study: LPG for Clean Cooking in Kenya
124
A detailed breakdown of the national filling plant network is included in Annex Chapter 30, Table 58 on
page 289.
Bulk transport
The EPRA register of licenced transporters comprises 95 transporters owning a total of 317 road tankers
(20 MT capacity) and 81 bobtails (capacities from 5 MT to 10 MT). The list of each of the transporters are
summarised in Annex Chapter 30 beginning on page 289.
Currently, all upcountry bulk transfers are done by road, as rail transport has not been functional since
2000. There are plans for rail transport in the long-term, and the current terminals can handle rail
transport once the LPG wagons, and the receiving infrastructure inland, are in place.
Based on the volume sold in 2018, the average monthly turnaround/rotation for the 317 tanker trucks is
3.2, which implies that some trucks take more than a week to load. Normally, a truck would take about
eight hours to cover the approximately 500 km from Mombasa to Nairobi.
Table 27. Bulk truck utilization (2018)
Volume imported 2018 (MT) 240,484.3
Total tanker trucks available for trucking from Mombasa 317
Bulk truck turnaround (annual) 37.9
Bulk truck turnaround (monthly) 3.2
The existing fleet of 317 road tankers can transport 771,367 MT per year, assuming that each truck takes on
average three days between Mombasa and the inland bulk LPG storage facilities.
A detailed breakdown of the national bulk transport fleet is included in Annex Chapter 30, Table 59 on page
290.
Conclusion
Kenya has more than enough infrastructure capacity to serve all foreseeable demand (including in the
upper bound case) through 2030, except for cylinders. Additional capacity will be required as the market
approaches 800,000 MT per annum, about 3.4 times its present size.
However, the inland storage and filling network is highly fragmented, and creating an opportunity for
consolidation to realize economics of scale in filling and certain aspects of logistics. LPG industry leaders in
Kenya anticipate that the ending of the CEP may encourage consolidation among the smaller players.

Clean Cooking for Africa National Feasibility Study: LPG for Clean Cooking in Kenya
125
This Part describes the cylinder investment requirement to serve the future demand potential identified in
this report. In so doing, the Government of Kenya’s policy goal of 35% of the population using LPG for
cooking by 2030 can also be achieved.
As previously described, there is enough overcapacity in Kenya’s LPG infrastructure to serve all scenarios of
projected future demand—except for cylinder inventory. The focus of this Part is therefore on the
investment for cylinder inventory expansion. This investment is examined from the perspective of five
leading private sector LPG companies that were willing to share and discuss their cylinder investment plans
and the associated financing considerations.
By extrapolating the investments and financing requirements of these five companies to the entire market,
based on their market shares, the total investment and financing need to 2030 can be estimated.
It is important to note three things:
1. The actual effects of the LN 121 (2019) law and regulatory reforms and of anticipated enhancement
of governmental oversight and enforcement in the LPG market are not certain;
2. The Mwananchi Gas Project, which may contribute meaningfully to LPG adoption in certain
counties after its retooling and relaunch, will be entirely funded by the state80;
3. LPG microfinance programs may have a meaningful effect on unlocking demand, although the
extent of this is not possible to predict until results are obtained later in 2019 from the first such
pilot program in Kenya, conducted under the Clean Cooking for Africa/GLPGP project.
With adequate investment in cylinders and their safe upkeep, Kenya would have an asset base with the
capacity and capability to address the national LPG demand potential to 2030.
The total investment requirement is summarized in the following table, based on the lower-bound demand
scenario of Part VI for sake of conservatism:
Table 28. Capital investment requirement to 2030 for LPG sector scale-up
Category Existing Capacity Adequate to
Serve 2030 Demand Capital Requirement
(mm Euro)
Cylinders, net of Mwananchi cylinders No € 106.6
Cylinder cages No € 6.0
Bottling plants and storage Yes N/A
Terminal facilities Yes N/A
Transportation assets Yes N/A
Total € 112.6
80 This assumes that legal challenges by the private sector to the Government’s funding modaility for the Mwananchi project will
not ultimately stop the project from proceeding.
Clean Cooking for Africa National Feasibility Study: LPG for Clean Cooking in Kenya
126
The total cylinder investment requirement was determined from an indicative procurement with the
present mix of cylinder sizes found in the Kenyan residential marketplace and the present ratio of imported
and locally produced residential cylinders.
Clean Cooking for Africa National Feasibility Study: LPG for Clean Cooking in Kenya
127
15. Investment at the Sector Level
This Chapter describes cylinder investment necessary over time to serve Kenya’s projected LPG demand in
aggregate, at the sector level, based on the lower-bound demand scenario for sake of conservatism. This
level of demand is also approximately consistent with the governmental goal of LPG use by 35% of the
population for cooking by 2030.
The key considerations include:
1. Quantity of demand. The lower-bound demand scenario for growth of the sector was used, as set
forth in Part VI (LPG Demand Potential to 2030) beginning on page 69. This case was chosen for
sake of conservatism, in part because the upper bound case assumes success from complementary,
state-funded investment that may be made through the paused Mwananchi Gas Project, possible
results from which are uncertain.
2. Financial returns available to investors and lenders. The financial returns of the investments are
consistent with identified requirements of anticipated participants in the capital stack, as described
in Part IX (Financing) beginning on page 155, taking into account a risk premium associated with
uncertainty about the Government’s ability to enforce fully and effectively the LN 121 reforms and
BCRM market model to suppress future cylinder piracy to a tolerable level.
3. Normative LPG industry operational and cost-structure ratios. The operational performance of the
supply chain nodes is consistent with LPG industry operating and costing norms for Sub-Saharan
Africa LPG markets where BCRM is practiced, and with aggregated data provided by a set of five
leading Kenyan LPG companies willing to do so.
4. Future growth dynamics. To the extent the demand estimates prove to be greater than actual
demand, the rate of investment can be slowed or halted in any year to rebalance supply, cylinder
inventory, and other aspects of supply-chain growth with actual demand and the actual rate of
demand growth. If demand estimates prove to be lower than actual demand, the rate of investment
can be accelerated up to the sustainable growth rate limit of the businesses in the supply chain, or
can be continued beyond 2030, to catch up to actual demand and, potentially, to the rate of demand
growth.
5. Contributions to the supply of refilled cylinders from specific LPG firms. In the case of five individual
LPG companies active in Kenya, representing about 25% market share by volume of the current
residential cylinder market, their actual cylinder investment plans are utilized to model their
contribution to the national cylinder inventory and national residential LPG sales to 2030. These
plans were in some cases adjusted with respect to time horizon or tonnage for consistency with past
results and current sector-wide benchmarks. In order to protect the confidentiality of certain of their
proprietary data used in this report’s analyses, the company names have been disguised and certain
data have been aggregated, averaged or composited, as applicable.
6. Contributions to the supply of filled cylinders from the rest of the sector. The remainder of the
projected demand potential is assumed to be served by the remaining Kenyan players, taken as a
group.
Clean Cooking for Africa National Feasibility Study: LPG for Clean Cooking in Kenya
128
Chapter 16 examines the investment economics and returns at the firm level, based on a composite of the
five LPG companies which provided internal data for the purpose.
Tactical vs. strategic investment
Kenya does not have a comprehensive LPG master plan to guide and coordinate strategic investments along
the LPG value chain, encompassing both the public sector (an important market actor in its own right) and
the private sector. Indeed, there is conflict between the plans and programs of the state and the plans and
initiatives and interests of the private sector with respect to LPG.
In addition, there is uncertainty about how effectively the EPRA, the main LPG sector regulator, will enforce
the new market rules of LN 121 and crack down on LPG piracy in general. The near-monopoly position of
the country’s main, privately-held LPG import terminal is also a concerning issue.
These factors mean that a strategic, sector-wide LPG investment program, as would be set forth in a
comprehensive national LPG master plan, would be difficult to undertake and highly risky under present
conditions, with inadequate odds of a transformative national success occurring.
Therefore, the discussion in subsequent Chapters focuses on tactical, near-term opportunities. LPG and
clean cooking investor groups seeking to become active in Kenya, taking into account the risks as well as the
opportunities described in this report, could consider smaller-scale, tactical investing to develop positions
and optionality in the Kenyan LPG market and to extract learnings that can inform larger scale, more
systematic investments at a later stage of sector maturity.
However, no investment should be made at any point in the LPG value chain without good assurance of
adequate capacities and capabilities throughout the rest of the chain—including adequate demand in the
target geography—that will sustain the contemplated project or business expansion up through
monetization of the investment, and, ideally, well beyond monetization.
Without cylinders, nothing
The key sector-wide metric for any investment program (both sector-wide or firm-specific) is the number of
cylinders required to be in circulation such that (i) the expected usage would be served reliably by the LPG
supply chain, and (ii) the supply chain would generate adequate cashflows to pay for required operations,
growth, and the anticipated financial returns required by investors and debt payments required by lenders.
The number of cylinders required is a function of
1. The number of users;
2. The frequency of refilling of their cylinders;
3. The mix of sizes of cylinders; and
4. How and how quickly the cylinders recirculate within the supply chain.
The investments are staged in a series of approximately linear steps to 2030, both to optimize returns and
minimize execution risk.
The number of users and their consumption level is projected in Part VI. As elsewhere in this document, a
“user” is a member of a household that uses LPG for cooking. The refill frequency is solved for through
Clean Cooking for Africa National Feasibility Study: LPG for Clean Cooking in Kenya
129
analysis of other operational, inventory and usage statistics, and is generally kept constant over time for
sake of conservatism. The industry term for this parameter is the cylinder rotation rate, which is a function
of multiple drivers that include gross and average consumption level by households, the mix of cylinder
sizes, the efficiency of the supply chain including its logistics, the level of diversion (loss, whether
temporary or permanent) of cylinders to competitive interventions (legal or illegal) and to mishandling in
distribution, the extent of ongoing cylinder maintenance and scrapping required, and other factors. The
rotation rate is a key metric for an LPG business to assess and predict the earnings generated by the
cylinder inventory it owns or manages. A declining rotation rate in a given geography is a leading indicator
of saturation of that geography’s LPG market, all other things being equal, and is a reason to slow or pause
further investment.
The main cylinder sizes in Kenya for households are 6kg and 13kg. The existing mix of sizes has been
assumed to continue in this analysis (which excludes the state-funded Mwananchi Gas Cylinders to be
distributed exclusively by NOCK). For purposes of the analysis, cylinders are defined using a measure of kge
(kg-equivalent). That is, a 6kg LPG cylinder (for example) is treated as equivalent to 0.461 13kge cylinders,
or 6/13ths of a 13kg cylinder. Conversely, a 13kg cylinder would be equivalent to 2.17 6 kge cylinders.
Where “kg” is used regarding cylinders, it indicates a specific cylinder size; where “kge” (or “kgeq”) is used,
it indicates a weighted average of sizes.
The combination of expected (and desired) LPG adoption and consumption rates by households, cylinder
rotation rates, associated cylinder inventory requirements, and other factors drives the sizing and costing of
the LPG cylinder inventory that will be required to serve future demand. The sector-level modelling of the
needed cylinder investments was performed nationally, because the cooperating LPG marketing companies
did not provide regional-level data about expansion plans or opportunities. The financial modelling
therefore was required to assume that the existing LPG distribution footprint in Kenya would deepen across
all regions, but could not make an estimation of how it might shift over time between and among regions.
Because transportation cost to more remote areas is recovered for the marketers/distributors through the
end-user LPG price, the effect on earnings of the location of customers is not material. The effect of
transportation price differentials on demand, however, is material and has been reflected in the aggregate
forecasts of demand.
Regional projection of LPG volumes
Ideally, the deployment of new cylinders by the LPG sector through 2030 would correspond to geographic
areas of underserved, and then unserved, demand through 2030. The demand modelling described in Part
VI projects how much LPG penetration will increase to 2030, county by county, if LPG is made adequately
available in that county.81
County breakdown of LPG consumption
It is, of course, not practical to dictate a geographic strategy to the LPG sector players: they will deploy
cylinders in the locations where they believe profits are most easily earned. However, the data presented
81 Good availability is defined for this purpose as LPG being available to the consumer, without shortages, within 39 minutes’
travel time. See Annex Chapter 26 for details.

Clean Cooking for Africa National Feasibility Study: LPG for Clean Cooking in Kenya
130
in Part VI and below may guide Marketers in prioritizing counties for expansion of their cylinder inventories
and distribution and retailing footprints.
The cylinder requirement to serve the projected demand is calculated for each county using a 2018
baseline of its residential LPG consumption and cylinders, the population served per existing cylinder, the
rate of population growth, the implied cylinder rotation rate, working stock requirements, and the
expected level of average penetration and consumption per LPG user in 2030 from the demand projections.
The factors are shown in the following set of tables:
Table 29. Estimated LPG consumption by county (2018)
County Population82
(000) LPG as primary fuel (%, 2016)83
Est. residential LPG use (MT)84
Est. persons/ cylinder
Baringo 760 4% 1,478 66
Bomet 991 5% 1,897 52
Bungoma 2,027 8% 6,269 16
Busia 607 5% 1,193 76
Elgeyo-Marakwet 506 2% 327 282
Embu 614 10% 2,626 29
Garissa 1,325 ~0% 127 961
Homabay 1,157 3% 1,275 71
Isiolo 170 7% 483 183
Kajiado 940 27% 10,073 8
Kakamega 2,064 4% 2,862 32
Kericho 1,038 7% 2,657 34
Kiambu 1,864 27% 20,466 3
Kilifi 1,429 7% 3,589 30
Kirinyaga 606 18% 4,149 16
Kisii 1,383 7% 3,456 26
Kisumu 1,163 7% 3,553 23
Kitui 1,205 4% 1,903 50
Kwale 837 5% 1,812 57
Laikipia 546 16% 3,444 22
Lamu 131 8% 380 233
Machakos 1,307 10% 5,034 16
Makueni 1,052 3% 1,376 67
Mandera 2,181 - - -
Marsabit 346 1% 121 818
Meru 1,613 12% 7,562 11
Migori 1,101 7% 2,818 35
Mombasa 1,209 19% 9,891 7
Murang'a 1,082 7% 3,075 23
Nairobi 4,370 41% 70,237 1
Nakuru 2,194 13% 11,724 6
Nandi 1,030 6% 2,311 41
Narok 1,164 6% 2,795 35
Nyamira 718 7% 2,079 42
82 Sources: UNICEF (2015), extrapolating from Kenya 2009 Census data; World Population Review (2019)
83 KIHBS (2016)
84 LPG consumption allocated according to the percentage of households in 2015/2016 KIHBS in each county using LPG as a
primary cooking fuel, normalized to the total 2018 residential volume of
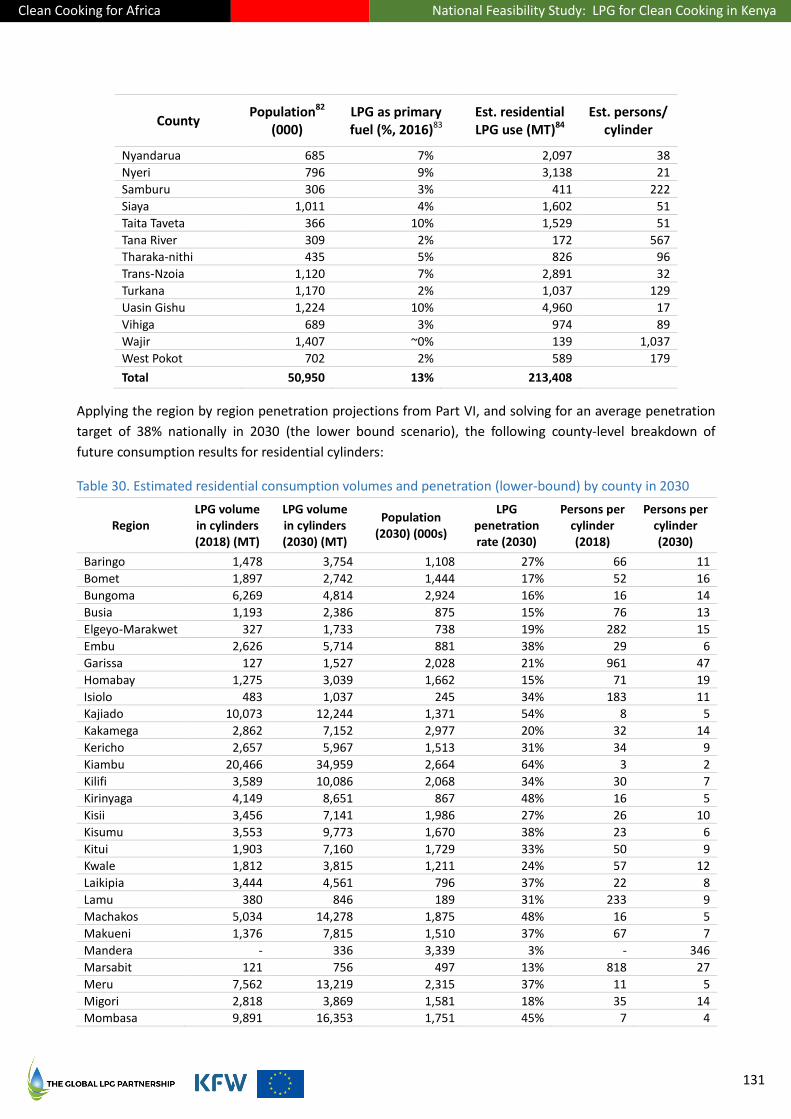
Clean Cooking for Africa National Feasibility Study: LPG for Clean Cooking in Kenya
131
County Population82
(000) LPG as primary fuel (%, 2016)83
Est. residential LPG use (MT)84
Est. persons/ cylinder
Nyandarua 685 7% 2,097 38
Nyeri 796 9% 3,138 21
Samburu 306 3% 411 222
Siaya 1,011 4% 1,602 51
Taita Taveta 366 10% 1,529 51
Tana River 309 2% 172 567
Tharaka-nithi 435 5% 826 96
Trans-Nzoia 1,120 7% 2,891 32
Turkana 1,170 2% 1,037 129
Uasin Gishu 1,224 10% 4,960 17
Vihiga 689 3% 974 89
Wajir 1,407 ~0% 139 1,037
West Pokot 702 2% 589 179
Total 50,950 13% 213,408
Applying the region by region penetration projections from Part VI, and solving for an average penetration
target of 38% nationally in 2030 (the lower bound scenario), the following county-level breakdown of
future consumption results for residential cylinders:
Table 30. Estimated residential consumption volumes and penetration (lower-bound) by county in 2030
Region LPG volume in cylinders (2018) (MT)
LPG volume in cylinders (2030) (MT)
Population (2030) (000s)
LPG penetration rate (2030)
Persons per cylinder (2018)
Persons per cylinder (2030)
Baringo 1,478 3,754 1,108 27% 66 11
Bomet 1,897 2,742 1,444 17% 52 16
Bungoma 6,269 4,814 2,924 16% 16 14
Busia 1,193 2,386 875 15% 76 13
Elgeyo-Marakwet 327 1,733 738 19% 282 15
Embu 2,626 5,714 881 38% 29 6
Garissa 127 1,527 2,028 21% 961 47
Homabay 1,275 3,039 1,662 15% 71 19
Isiolo 483 1,037 245 34% 183 11
Kajiado 10,073 12,244 1,371 54% 8 5
Kakamega 2,862 7,152 2,977 20% 32 14
Kericho 2,657 5,967 1,513 31% 34 9
Kiambu 20,466 34,959 2,664 64% 3 2
Kilifi 3,589 10,086 2,068 34% 30 7
Kirinyaga 4,149 8,651 867 48% 16 5
Kisii 3,456 7,141 1,986 27% 26 10
Kisumu 3,553 9,773 1,670 38% 23 6
Kitui 1,903 7,160 1,729 33% 50 9
Kwale 1,812 3,815 1,211 24% 57 12
Laikipia 3,444 4,561 796 37% 22 8
Lamu 380 846 189 31% 233 9
Machakos 5,034 14,278 1,875 48% 16 5
Makueni 1,376 7,815 1,510 37% 67 7
Mandera - 336 3,339 3% - 346
Marsabit 121 756 497 13% 818 27
Meru 7,562 13,219 2,315 37% 11 5
Migori 2,818 3,869 1,581 18% 35 14
Mombasa 9,891 16,353 1,751 45% 7 4
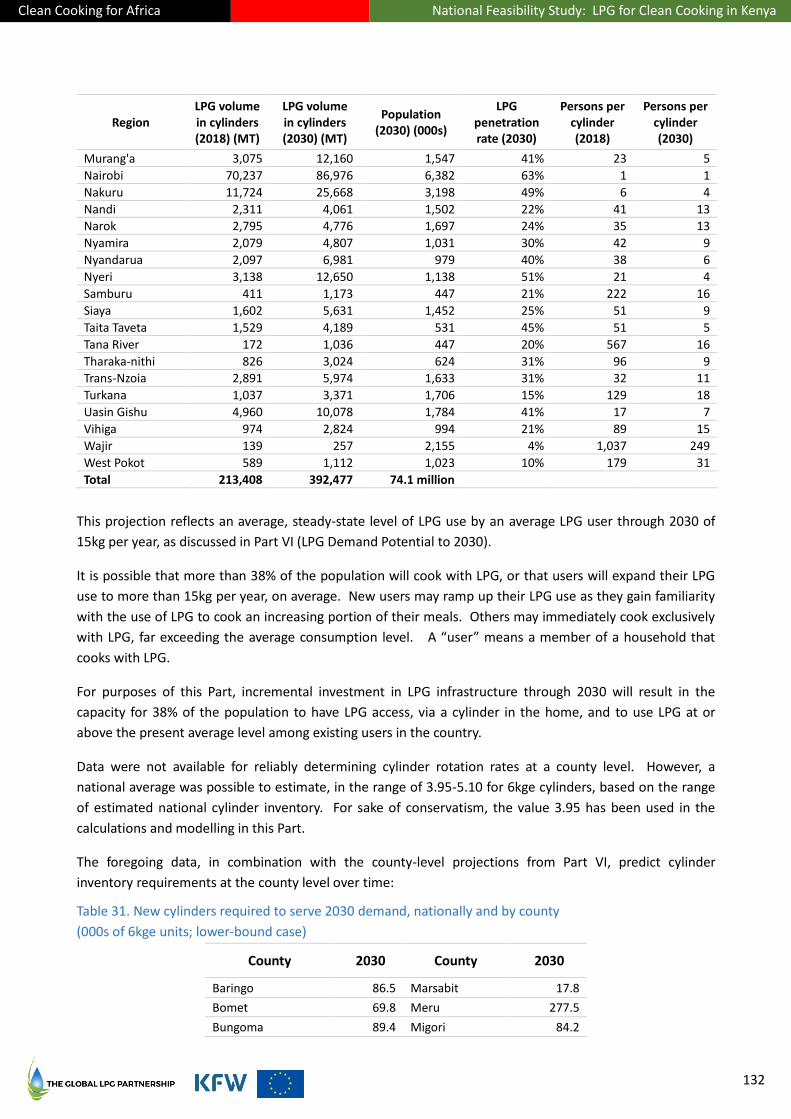
Clean Cooking for Africa National Feasibility Study: LPG for Clean Cooking in Kenya
132
Region LPG volume in cylinders (2018) (MT)
LPG volume in cylinders (2030) (MT)
Population (2030) (000s)
LPG penetration rate (2030)
Persons per cylinder (2018)
Persons per cylinder (2030)
Murang'a 3,075 12,160 1,547 41% 23 5
Nairobi 70,237 86,976 6,382 63% 1 1
Nakuru 11,724 25,668 3,198 49% 6 4
Nandi 2,311 4,061 1,502 22% 41 13
Narok 2,795 4,776 1,697 24% 35 13
Nyamira 2,079 4,807 1,031 30% 42 9
Nyandarua 2,097 6,981 979 40% 38 6
Nyeri 3,138 12,650 1,138 51% 21 4
Samburu 411 1,173 447 21% 222 16
Siaya 1,602 5,631 1,452 25% 51 9
Taita Taveta 1,529 4,189 531 45% 51 5
Tana River 172 1,036 447 20% 567 16
Tharaka-nithi 826 3,024 624 31% 96 9
Trans-Nzoia 2,891 5,974 1,633 31% 32 11
Turkana 1,037 3,371 1,706 15% 129 18
Uasin Gishu 4,960 10,078 1,784 41% 17 7
Vihiga 974 2,824 994 21% 89 15
Wajir 139 257 2,155 4% 1,037 249
West Pokot 589 1,112 1,023 10% 179 31
Total 213,408 392,477 74.1 million
This projection reflects an average, steady-state level of LPG use by an average LPG user through 2030 of
15kg per year, as discussed in Part VI (LPG Demand Potential to 2030).
It is possible that more than 38% of the population will cook with LPG, or that users will expand their LPG
use to more than 15kg per year, on average. New users may ramp up their LPG use as they gain familiarity
with the use of LPG to cook an increasing portion of their meals. Others may immediately cook exclusively
with LPG, far exceeding the average consumption level. A “user” means a member of a household that
cooks with LPG.
For purposes of this Part, incremental investment in LPG infrastructure through 2030 will result in the
capacity for 38% of the population to have LPG access, via a cylinder in the home, and to use LPG at or
above the present average level among existing users in the country.
Data were not available for reliably determining cylinder rotation rates at a county level. However, a
national average was possible to estimate, in the range of 3.95-5.10 for 6kge cylinders, based on the range
of estimated national cylinder inventory. For sake of conservatism, the value 3.95 has been used in the
calculations and modelling in this Part.
The foregoing data, in combination with the county-level projections from Part VI, predict cylinder
inventory requirements at the county level over time:
Table 31. New cylinders required to serve 2030 demand, nationally and by county
(000s of 6kge units; lower-bound case)
County 2030 County 2030
Baringo 86.5 Marsabit 17.8
Bomet 69.8 Meru 277.5
Bungoma 89.4 Migori 84.2
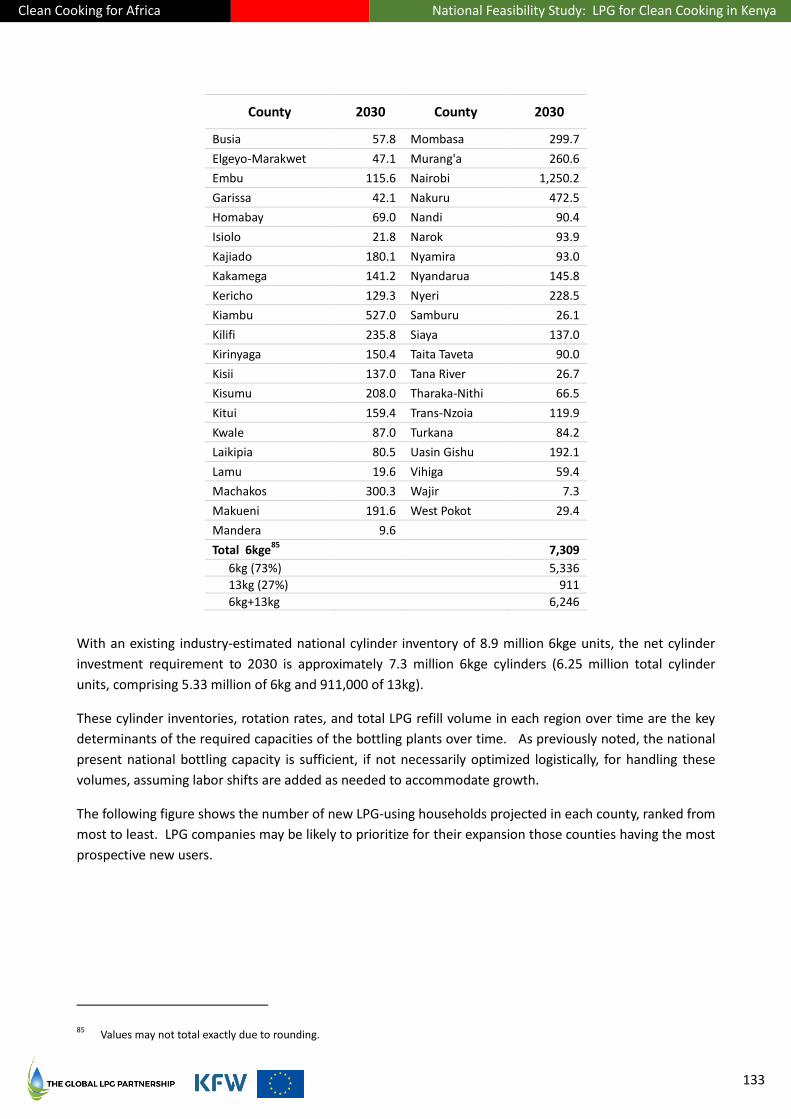
Clean Cooking for Africa National Feasibility Study: LPG for Clean Cooking in Kenya
133
County 2030 County 2030
Busia 57.8 Mombasa 299.7
Elgeyo-Marakwet 47.1 Murang'a 260.6
Embu 115.6 Nairobi 1,250.2
Garissa 42.1 Nakuru 472.5
Homabay 69.0 Nandi 90.4
Isiolo 21.8 Narok 93.9
Kajiado 180.1 Nyamira 93.0
Kakamega 141.2 Nyandarua 145.8
Kericho 129.3 Nyeri 228.5
Kiambu 527.0 Samburu 26.1
Kilifi 235.8 Siaya 137.0
Kirinyaga 150.4 Taita Taveta 90.0
Kisii 137.0 Tana River 26.7
Kisumu 208.0 Tharaka-Nithi 66.5
Kitui 159.4 Trans-Nzoia 119.9
Kwale 87.0 Turkana 84.2
Laikipia 80.5 Uasin Gishu 192.1
Lamu 19.6 Vihiga 59.4
Machakos 300.3 Wajir 7.3
Makueni 191.6 West Pokot 29.4
Mandera 9.6
Total 6kge85
7,309
6kg (73%) 5,336
13kg (27%) 911
6kg+13kg 6,246
With an existing industry-estimated national cylinder inventory of 8.9 million 6kge units, the net cylinder
investment requirement to 2030 is approximately 7.3 million 6kge cylinders (6.25 million total cylinder
units, comprising 5.33 million of 6kg and 911,000 of 13kg).
These cylinder inventories, rotation rates, and total LPG refill volume in each region over time are the key
determinants of the required capacities of the bottling plants over time. As previously noted, the national
present national bottling capacity is sufficient, if not necessarily optimized logistically, for handling these
volumes, assuming labor shifts are added as needed to accommodate growth.
The following figure shows the number of new LPG-using households projected in each county, ranked from
most to least. LPG companies may be likely to prioritize for their expansion those counties having the most
prospective new users.
85 Values may not total exactly due to rounding.
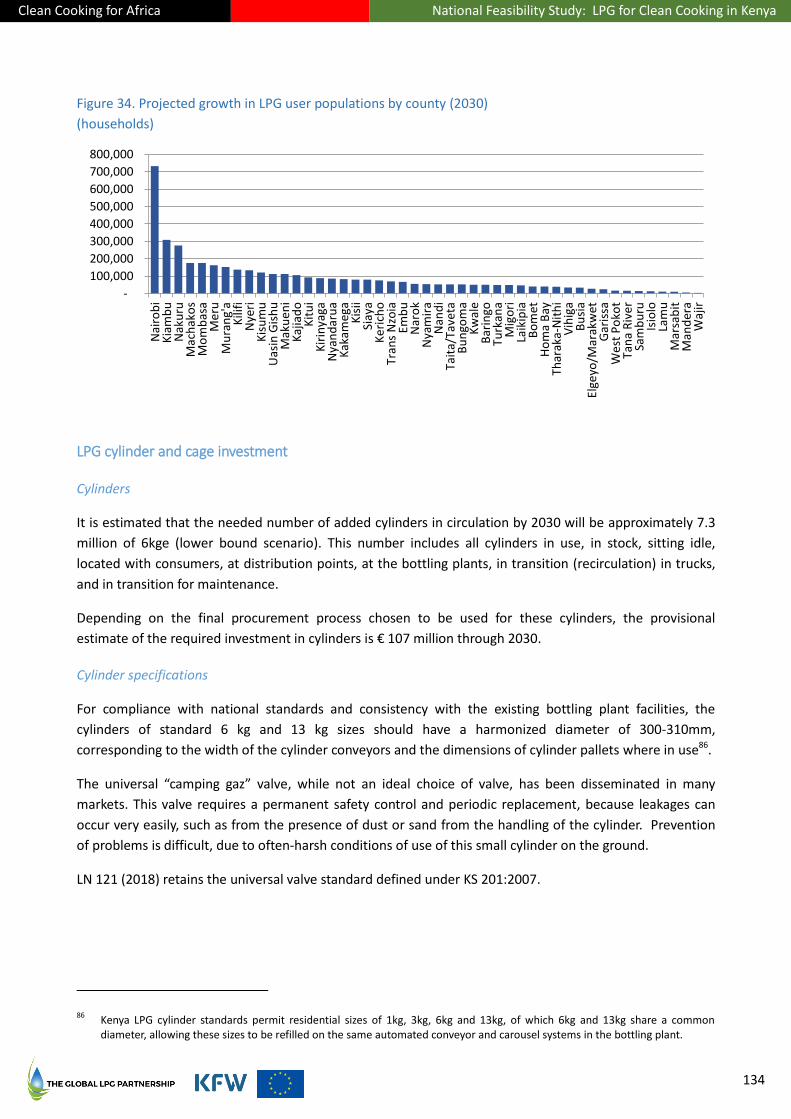
Clean Cooking for Africa National Feasibility Study: LPG for Clean Cooking in Kenya
134
Figure 34. Projected growth in LPG user populations by county (2030)
(households)
LPG cylinder and cage investment
Cylinders
It is estimated that the needed number of added cylinders in circulation by 2030 will be approximately 7.3
million of 6kge (lower bound scenario). This number includes all cylinders in use, in stock, sitting idle,
located with consumers, at distribution points, at the bottling plants, in transition (recirculation) in trucks,
and in transition for maintenance.
Depending on the final procurement process chosen to be used for these cylinders, the provisional
estimate of the required investment in cylinders is € 107 million through 2030.
Cylinder specifications
For compliance with national standards and consistency with the existing bottling plant facilities, the
cylinders of standard 6 kg and 13 kg sizes should have a harmonized diameter of 300-310mm,
corresponding to the width of the cylinder conveyors and the dimensions of cylinder pallets where in use86.
The universal “camping gaz” valve, while not an ideal choice of valve, has been disseminated in many
markets. This valve requires a permanent safety control and periodic replacement, because leakages can
occur very easily, such as from the presence of dust or sand from the handling of the cylinder. Prevention
of problems is difficult, due to often-harsh conditions of use of this small cylinder on the ground.
LN 121 (2018) retains the universal valve standard defined under KS 201:2007.
86 Kenya LPG cylinder standards permit residential sizes of 1kg, 3kg, 6kg and 13kg, of which 6kg and 13kg share a common
diameter, allowing these sizes to be refilled on the same automated conveyor and carousel systems in the bottling plant.
-
100,000
200,000
300,000
400,000
500,000
600,000
700,000
800,000N
airo
bi
Kia
mb
uN
aku
ruM
ach
ako
sM
om
bas
aM
eru
Mu
ran
g'a
Kili
fiN
yeri
Kis
um
uU
asin
Gis
hu
Mak
uen
iK
ajia
do
Kit
ui
Kir
inya
gaN
yan
dar
ua
Kak
ameg
aK
isii
Siay
aK
eri
cho
Tran
s N
zoia
Emb
uN
aro
kN
yam
ira
Nan
di
Tait
a/Ta
veta
Bu
ngo
ma
Kw
ale
Bar
ingo
Turk
ana
Mig
ori
Laik
ipia
Bo
met
Ho
ma
Bay
Thar
aka-
Nit
hi
Vih
iga
Bu
sia
Elge
yo/M
arak
wet
Gar
issa
We
st P
oko
tTa
na
Riv
er
Sam
bu
ruIs
iolo
Lam
uM
arsa
bit
Man
der
aW
ajir

Clean Cooking for Africa National Feasibility Study: LPG for Clean Cooking in Kenya
135
Cylinder distribution network investment in cages (display racks)
The responsibility for the implementation of the distribution network is defined, if somewhat loosely, in LN
121. OMCs and LPGMCs have the primary role of further developing distribution and retail-point networks
throughout the country.
In the retail network, an estimated 300,000 cylinders (four days’ consumption on a refill rotation basis)
should be stocked in safety cages, placed outside retail locations such as small shops and petrol stations.
The cost of the cages is estimated at approximately € 6 million, and would be borne by the retailers.
Limitations of underlying data
Due to the lack of availability of certain key data, such as the market volumes of LPG in cylinders per county
and the precise size and condition of the national cylinder inventory, the calculations in this Chapter were
based upon assumptions which may, upon further detailed investigation, require updating for improved
accuracy. It was beyond the scope of this reporting effort to perform a detailed audit and field survey for
bottom-up calculation of all key values and ratios.
Total investment
Set forth below are the components of the total cylinder investment (including cages) of € 113 million
through 2030. The following table provides a summary of the investment:
Table 32. Summary of investment to 2030, by asset type
Asset type Amount (€ mm)
Additional cylinders87
107 €
Display racks/cages 6 €
Total88
113 €
Investment in LPG cylinders can last for more than 20 years, if the BCRM is well enforced, and if its safety
rules and maintenance requirements are fully observed.
Overview of investment project assumptions and methodology
The assumptions and methodology are based on what participating LPG companies have indicated to
GLPGP, as described in detail in Chapter 14 and as follows:
1. LN 121 (2018) will be implemented by year-end 2019. For all practical purposes, the Cylinder
Exchange Pool will terminate, with only certain small players continuing to utilize the mechanism
on a voluntary basis, in order to function similarly to a de facto cooperative.
2. The OMCs and LPGMCs will own and/or contract with cylinder exchange points (CEPs), and in the
case of some firms will utilize a milk-run model.
87 Excludes the Mwananchi Gas Project cylinders projected to be used on an ongoing basis, because they are funded by the state.
88 Amount does not add exactly due to rounding.

Clean Cooking for Africa National Feasibility Study: LPG for Clean Cooking in Kenya
136
3. Pricing structure will remain as it is for purposes of analysis and forecasting. (Sensitivity to possible
future price reduction is also analyzed.)
4. The national LPG specification will remain as it is.
Methodology
The methodological approach used is to estimate the projected volume per county from 2018 to 2030,
described earlier in this Chapter, and introduce corresponding quantities of cylinders year after year.
The steps are:
1. Utilize the demand data and projections by county described in Part VI, cross-checked with 2016
and 2018 nationally aggregated sales of every Marketer combined with relevant parameters
regarding the cylinders’ operating cycle (supply-chain velocity and bufferage), to allocate the
projected cylinder inventory requirements and refill volumes for each county over time;
2. Annualize the cylinder investment, with a certain amount of front-loaded identified by the
participating private sector LPG companies, in order to maintain good stability in the year-over-year
pace of investment in order to help the sector to absorb and deploy capital and to grow with
minimum risk of operational and financial disruption or discontinuity;
3. Calculate the total cylinder inventory and investment required, concluding with 38% adoption and
use by 2030 in accordance with the lower bound consumption scenario, for sake of conservatism89;
4. Calculate the share of the total new cylinder inventory associated with the individual firms which
provided business plan and forecast data, as presented in the following Chapter;
5. Subtract the cylinder volume attributable to the Mwananchi Gas Project; and
6. Calculate the remainder of the required new cylinder inventory, which would be required to be
acquired and deployed by the remainder of the sector.
The non-Mwananchi cylinder quantities and schedule served as the basis for determining indicative
cylinder costing (on an imported basis).
Assumptions
The number of circulating cylinders (also called the “cylinder park”)
The official number of existing cylinders in circulation in Kenya is not available, since the OMCs and LPGMCs
have had, and still have, no responsibility for investment in cylinders and their maintenance. Moreover, the
cylinders are generic, purchased directly by the end-user from a shop supplied by a wholesaler. A cylinder
in circulation is any cylinder, in use or idle at home, in the plant, shop, or warehouse, or on a truck.
89 As discussed previously, the pace and scale of investment would, in practice, be adjusted in each year or each multiyear phase
(based on the type of asset), based on whether demand rises faster or slower than projected.
Clean Cooking for Africa National Feasibility Study: LPG for Clean Cooking in Kenya
137
Calculation of operating projections per county
Population
While projections could be made based on either households or persons (users) of LPG, for purposes of
calculating capacities and investment requirements, population has been used. That is because
consumption of LPG for cooking is linked to the number of meals cooked, which varies not with households
(each county having its own average household size), but with the number of persons across the using
households. Cylinders themselves, conversely, are linked to the count of households (or, more properly, to
the number of “kitchens”, in that the concept of a household, from a cooking standpoint, might involve
more than one family group at a time, with shared cooking duties).
LPG consumption for cooking
LPG volume for domestic use in cylinders in each county was calculated from the LPG penetration rate
reported in KIHBS, applied to the projected average annual consumption by LPG users of 15.2kg/capita
from the demand assessment.
The projected volume and penetration data are summarized in Table 30 on page 131, county by county.
Analysis of LPG cylinder requirements
Estimated number of cylinders necessary to serve the projected demand
The projected number of new cylinders required is presented in Table 31 on page 132.
The usual methodology used in the LPG industry is based on the average cylinder rotation rate (the average
annual number of refills per cylinder in inventory), which includes all the cylinders in the country. It directly
affects the financial return on the cylinder investment. The rotation rate is applied to one size-equivalent:
for Kenya, this is 6 kge (6 kg is the dominant size). It is necessary to convert all the other sizes to 6 kg
equivalent for purposes of the calculation.
The total number of existing cylinders is estimated at 8.9 million, out of which 70% were 6kg, 26% were
12.5kg, and 4% various other sizes. The average rotation rate for 2018 would be roughly 3.95 in 6kge
cylinders. The national result is consistent with early-stage LPG markets practicing BCRM. It is strongly
influenced by the regions around Nairobi, and more generally along the Mombassa-Eldoret corridor, where
the number of cylinders per household is higher compared to the other regions.
To be conservative in the modelling, very modest growth in the rotation rate was permitted year over year,
even though the rotation rate usually increases significantly with major additions of cylinders into a market.
This occurs because distribution system becomes more productive with larger scale and greater cylinder
velocity, allowing the distributors’ truck drivers to be more efficient in collecting empty cylinders. If the
rotation rate were to improve from 3.9 to 5.0, the number of cylinders required for investment would be
reduced by about 2 million.

Clean Cooking for Africa National Feasibility Study: LPG for Clean Cooking in Kenya
138
Total cylinder investment
The total number of additional cylinders (7.3 million of 6kge) to be invested should be seen as a flow of
annual investments rather than a one-time investment. In the present case, the average annual investment
level is about 660,000 cylinders per year.
This investment plan can self-adjust the pace of the investment downward, based on actual consumption
and the actual level of increase of the rotation rate, either for proper balancing of assets with consumption,
or to improve the return on investment through improved asset utilization with scale.
The following table details the staging of the overall cylinder investment:
Table 33. Total cylinder investment required to 2030
(€ mm; lower-bound demand scenario)
Cylinder category Annual 2020-2030 Total
Total new 6kge cylinders to serve projected demand 10.11 € 111.2 €
Investment avoided due to Mwananchi Gas Project90 (0.42 €) (4.6 €)
New 6kge cylinders net of Mwananchi Gas 9.78 € 106.6 €
New 6kge cylinder among companies providing business plans/forecasts (see Chapter 16)
3.71 € 40.8 €
New 6kge cylinders via all other market participants 5.98 € 65.8 €
Investment in cylinders is an annual process, adjusted according to market trends. The pace of investment
may be accelerated if consumption is greater than forecast, up to the sustainable growth rate of each firm,
90 For purposes of this report, the Mwananchi Gas Project is projected to deploy 300,000 cylinders successfully in the lower
bound consumption scenario and 750,000 in the upper bound scenario. For purposes of this table, the lower bound case is used.
Five specific LPG companies, €40.8mm
Mwananchi Gas Project, €4.6mm
All other market participants,
€65.8mm
Clean Cooking for Africa National Feasibility Study: LPG for Clean Cooking in Kenya
139
and decelerated if the market starts to saturate (that is, the demand for new cylinders stabilizes with
respect to demographic trends).
The investment calculation has been made on the basis of the following assumptions for the procurement
of new cylinders:
Import parity (CIF), import taxes and import audit service are not included;
The specifications of the cylinder (propane specs) are basic-level ones, and could be increased;
The valve is included and mounted;
The unit price for 6kge cylinders: 15.2 € (1,720 KES91).
Determining the number of cylinders in the working stock
To insure a fluid and efficient cylinder filling process and good availability of cylinders in the distribution
network for the end-user, the theoretical cylinder working stock in terms of maximum daily consumption,
taking seasonality into account, is as follows:
Pallets:
— In the BP: 1.5 days
— On the trucks (cylinder primary transport): 1 day
— In the warehouse or cylinder regional depot: 2 days
— On the trucks (secondary transport): 1 day
Cages:
— In the distribution network: 4 days
Overall, the working stock represents 9.5 days of consumption.
These figures assume that the equipment (bottling plant and trucks) are optimally used. If not, a minimum
stock is required (for example, an 800-cylinder truck will need a stock minimum of 800 cylinders).
The total number of cylinders in the working stock grows from approximately 1 million in 2018 to 1.9
million in 2030 and is included in the counts of existing cylinders and additional cylinders purchased.
Determining the number of cages (display racks)
The cylinders in the retail network will be presented in cages or display racks (see Figure 35 below). The
cages will be placed outside the retail shop, petrol station, dedicated gas-seller, etc., preferably in the
shade.
These cages will be designed to ensure the following functions:
Store the cylinders, preferably in a vertical position;
91 Exchange rate: 113.2 KES per Euro
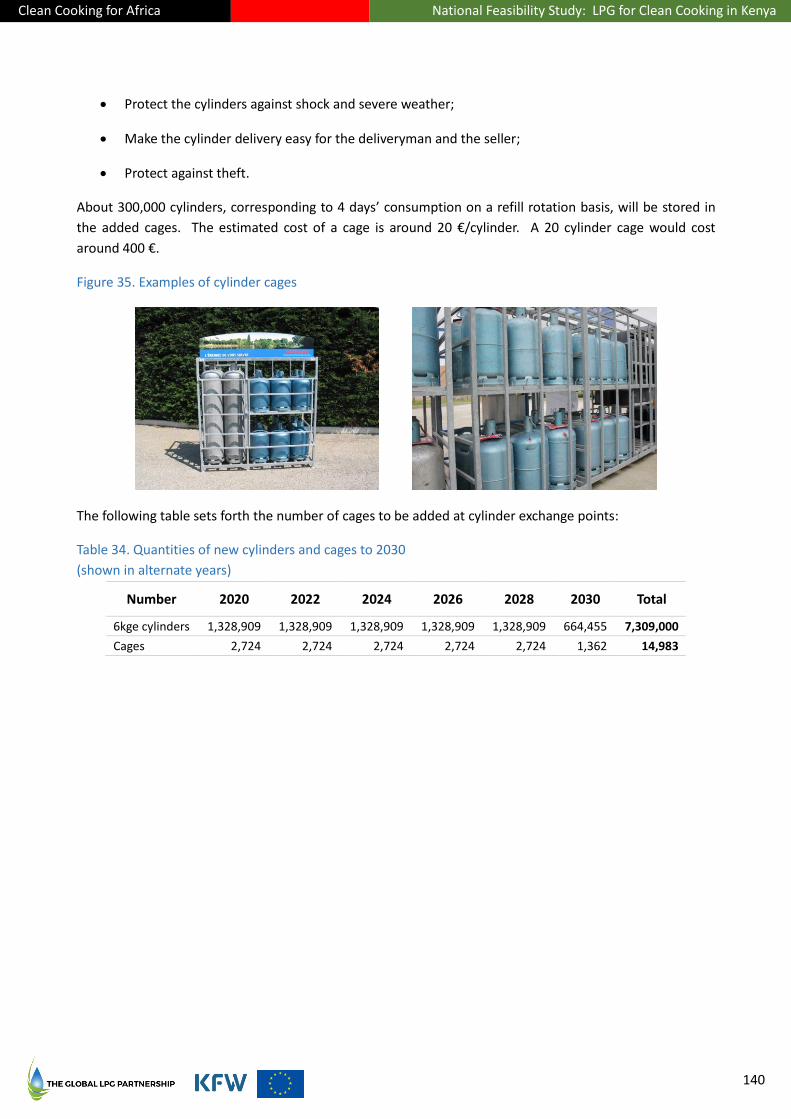
Clean Cooking for Africa National Feasibility Study: LPG for Clean Cooking in Kenya
140
Protect the cylinders against shock and severe weather;
Make the cylinder delivery easy for the deliveryman and the seller;
Protect against theft.
About 300,000 cylinders, corresponding to 4 days’ consumption on a refill rotation basis, will be stored in
the added cages. The estimated cost of a cage is around 20 €/cylinder. A 20 cylinder cage would cost
around 400 €.
Figure 35. Examples of cylinder cages
The following table sets forth the number of cages to be added at cylinder exchange points:
Table 34. Quantities of new cylinders and cages to 2030
(shown in alternate years)
Number 2020 2022 2024 2026 2028 2030 Total
6kge cylinders 1,328,909 1,328,909 1,328,909 1,328,909 1,328,909 664,455 7,309,000
Cages 2,724 2,724 2,724 2,724 2,724 1,362 14,983

Clean Cooking for Africa National Feasibility Study: LPG for Clean Cooking in Kenya
141
16. Investments at the Firm Level
This Chapter examines the economics of the sector-level investments at the firm level, based on five LPG
marketing companies (brand-owners) willing to provide internal planning data regarding potential cylinder
investment and business expansion, representing in aggregate about 17% of the LPG market by volume in
2018.
Their projected growth rate in aggregate slightly exceeds the projected lower-bound growth rate of the
sector as a whole, as presented in the demand analysis of Chapter 12, causing their projected market share
by volume to grow to about 19% by 2030. Because their growth projections are thus reasonable, prima
facie, the analysis at the firm level utilises their aggregated projections.
Methodology
In the ideal case, a majority of firms (by volume share) would volunteer financial information and business
plans showing how and where they would grow their businesses; this body of information would then drive
a bottom-up investment scenario. In Kenya, this was partially possible. Businesses were, in general,
unwilling to share proprietary internal business information, except to a recognized financing source
interested to discuss a transaction, and were, in general, concerned about violating applicable competition
law by disclosing internal financial or operating data that could eventually be viewed by the public.
That said, five firms in Kenya were willing to disclose a sufficient level of planning information regarding
future cylinder investment ambitions, on conditions of anonymity, to permit construction of a composite
model of their desired investments. It must be noted that no audited information was provided, and no
audit of internal data was possible to perform. Funding sources for such investments must, therefore,
conduct appropriate due diligence.
The composite model is initially scaled to the sum of the market shares of the five companies. It should be
noted that their cylinder investment plans, if financed, would cause a significant increase in their market
shares during the first several years, unless the rest of the market invests proportionately. Thus, the market
risk of their investments in aggregate is lowest when their competitors do not make proportional market-
expansion investments.
The composite involved accepting or making certain assumptions about future unit margins, potential costs of
capital (i.e., financial return requirements), and key operating parameters affecting the cash flow generation
potential and growth rates capacity of the firms. Where possible, the composite was benchmarked against
standard industry operating metrics in Sub-Saharan African LPG markets, and is in line with such
benchmarks.
Four of the five Marketers had business lines comprising exclusively, or almost exclusively, the sale of LPG in
residential cylinders. The fifth had a mix of residential cylinder business and bulk sales (at a lower margin)
to other Marketers (primarily) and to industrial and commercial bulk customers (secondarily).
The Marketers uniformly desired to make their investments in new cylinders more quickly than the eleven
years from 2020 to 2030, preferring a 5-7 year horizon. Their business strategies were based on the notion
of rapid increase in both volume and share, to be followed by a fresh evaluation around 2024-2026
regarding the attractiveness of continuing, increasing, slowing, or ending investment in additional cylinders.
Clean Cooking for Africa National Feasibility Study: LPG for Clean Cooking in Kenya
142
For modelling purposes, the cylinder investment window was made uniform at seven years (2020-2026).
Thus, the firms’ notional market shares peak in 2026 and begin to decline (relatively) starting in 2027.
The composite model assumes current average end-user LPG prices will persist. However, sensitivity
analysis was also performed to examine the effect on rates of return of various reductions in average
pricing driven by competition (as per the Proto Energy example of price competition mentioned in Chapter
10), if the firms in the composite are unable to proportionately rationalize their cost structures. The model
also includes a sensitivity analysis to the percentage of equity vs. debt utilized for the required cylinder
investment.
Finally, the pro-forma capital structure and costs of capital (debt and equity) used for modelling the firms’
capitalization and financial returns are based on the outcomes of detailed discussions with the major Kenya
banks and other financial sector institutions, with DFIs that are active in other sectors in Kenya, and with
investment groups contemplating investments in one or more of the five companies comprising the
composite, regarding relevant transaction benchmarks, terms, pricing of funds, and applicable lending and
investment policies and limitations.
LPG Marketer composite
The multi-firm composite is modelled on the basis of a combined initial 17% market share of the residential
cylinder refill market92. The aggregate investments in new cylinders across these firms, if executed, would
grow their combined volume share to about 23% at its peak. By compositing the firms, inter-firm variations
in pricing, costs and margins have been intentionally disguised.
Revenue is made primarily from the unit margin for filling of cylinders. Because Kenya has no legal cap on
the price for a cylinder deposit, it is common practice for the end-user to pay more than the value of the
cylinder to become an LPG customer. (In the Proto Energy case, it is believed within the industry that the
value of the cylinder is charged, but no premium.) The premium charged for the cylinder deposit above the
cylinder’s value is captured as a secondary stream of income.
Assumptions
The following are the main financial and operating assumptions:
Item Value
Initial market share of the composite firm 17%
Cost of cylinder (6kge) 15.2 €
Cylinder deposit premium (as % of cost) 5.1%
Net cylinder cost to marketer after deposit93 0%
Gross margin (per MT) € 201.5
Company income tax rate 20%
Tranches of capital increase (loans and equity) 1
Blended cost of debt 10.2%
92 Based on total LPG volume in cylinders for the period July 2017-June 2018. Source: EPRA
93 This presumes that the Marketer borrows internally against the cylinder deposits of its customers, with negligible need to
reserve against a sudden rash of consumers reclaiming their deposits (by returning their cylinders and cancelling service).

Clean Cooking for Africa National Feasibility Study: LPG for Clean Cooking in Kenya
143
Loan tenor 4 years
Minimum required rate of return to equity 20%
Capitalization: Non-concessional debt (at 12.7%94) Concessional debt (at 8%) Equity
35% 40% 25%
Ideally, the debt would be structured as lines of credit, which are drawn down to fund cylinder acquisitions
and repaid within 2-4 quarters as the cylinders are deployed into the market and the deposits received.
This approach would differ from the approach taken in the other Clean Cooking for Africa Project countries,
because in Kenya, the Marketers choose to, and are able to, recover the entire cost of the cylinder via the
consumer deposit. Thus, cylinder financing can be thought of as inventory working capital financing. (The
cylinder deposit is refundable to the end-consumer upon permanent return of his/her cylinder, but in
practice a permanently returned cylinder from customer A, despite requiring a cash outlay to customer A, is
quickly returned to the market to serve new customer B, who provides a fresh cash deposit. The working
capital required to handle customer churn is therefore minimal.)
The aforesaid parameters result in the following financial characteristics and performance of the composite
firm over time, with new investment in cylinders and associated revenues and costs added to the
composited existing business, carried forward:
94 9.9% plus 280bp governmental enforcement risk premium.
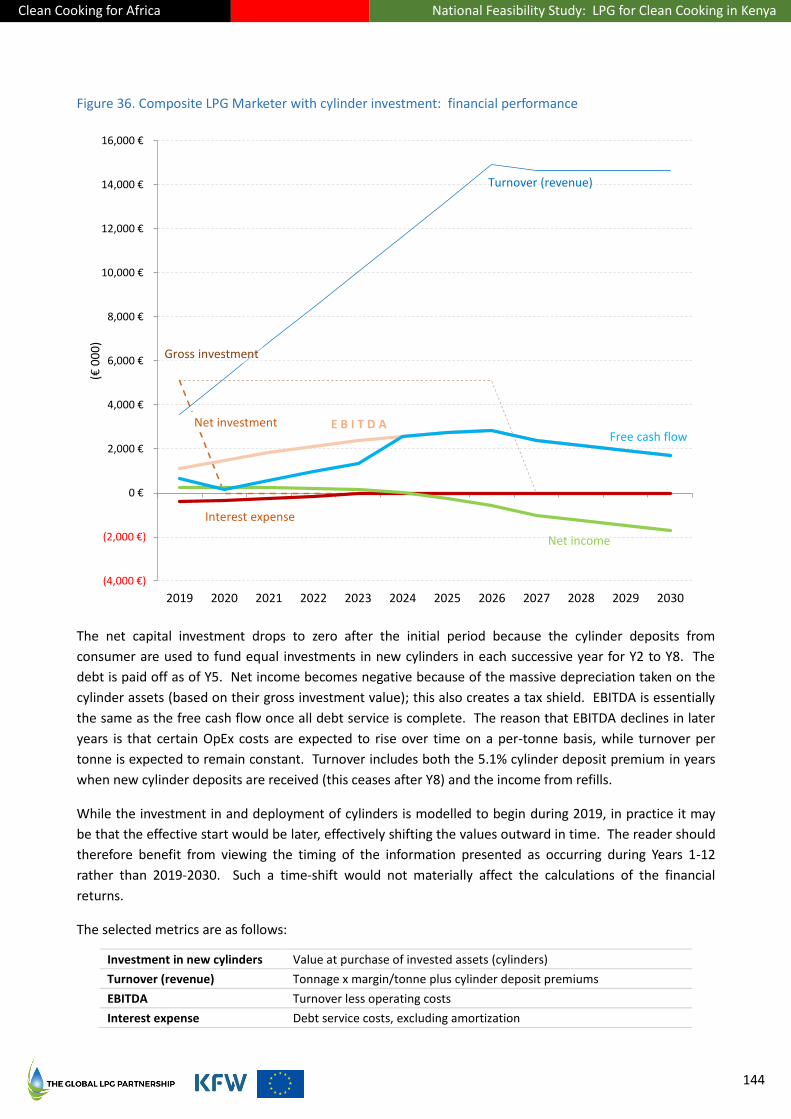
Clean Cooking for Africa National Feasibility Study: LPG for Clean Cooking in Kenya
144
Figure 36. Composite LPG Marketer with cylinder investment: financial performance
The net capital investment drops to zero after the initial period because the cylinder deposits from
consumer are used to fund equal investments in new cylinders in each successive year for Y2 to Y8. The
debt is paid off as of Y5. Net income becomes negative because of the massive depreciation taken on the
cylinder assets (based on their gross investment value); this also creates a tax shield. EBITDA is essentially
the same as the free cash flow once all debt service is complete. The reason that EBITDA declines in later
years is that certain OpEx costs are expected to rise over time on a per-tonne basis, while turnover per
tonne is expected to remain constant. Turnover includes both the 5.1% cylinder deposit premium in years
when new cylinder deposits are received (this ceases after Y8) and the income from refills.
While the investment in and deployment of cylinders is modelled to begin during 2019, in practice it may
be that the effective start would be later, effectively shifting the values outward in time. The reader should
therefore benefit from viewing the timing of the information presented as occurring during Years 1-12
rather than 2019-2030. Such a time-shift would not materially affect the calculations of the financial
returns.
The selected metrics are as follows:
Investment in new cylinders Value at purchase of invested assets (cylinders)
Turnover (revenue) Tonnage x margin/tonne plus cylinder deposit premiums
EBITDA Turnover less operating costs
Interest expense Debt service costs, excluding amortization
Gross investment
Net investment
Turnover (revenue)
E B I T D A
Interest expense
Net income
Free cash flow
(4,000 €)
(2,000 €)
0 €
2,000 €
4,000 €
6,000 €
8,000 €
10,000 €
12,000 €
14,000 €
16,000 €
2019 2020 2021 2022 2023 2024 2025 2026 2027 2028 2029 2030
(€ 0
00
)
Clean Cooking for Africa National Feasibility Study: LPG for Clean Cooking in Kenya
145
Taxes Corporate income tax
Net income EBITDA less depreciation95
, interest expense and taxes
Free cash flow Net income adjusted for non-cash charges
95 Note: The model assumes that the gross investment amount is useable for purposes of determining depreciation. Such
treatment would be subject to the approval of the actual firm’s accounting and tax advisors and the relevant tax authorities.

Clean Cooking for Africa National Feasibility Study: LPG for Clean Cooking in Kenya
146
Table 35. Composite LPG Marketer with cylinder investment: pro-forma financial data
(values in € 000s except as noted)
2019 2020 2021 2022 2023 2024 2025 2026 2027 2028 2029 2030 TOTALS
Existing Cylinder Inventory (000 units) 350 350
Cylinders Acquired & Deployed (000 units) 335 335 335 335 335 335 335 335 - - - - 2,680
Cost to acquire a cylinder (€) 15.2 15.2 15.2 15.2 15.2 15.2 15.2 15.2
Gross Capital Cost of Cylinders 5,099 5,099 5,099 5,099 5,099 5,099 5,099 5,099 - - - - 40,790
Tonnage 16 t 24 t 33 t 41 t 49 t 57 t 65 t 73 t 73 t 73 t 73 t 73 t 648 t
Turnover (Revenues) 3,574 5,194 6,814 8,434 10,054 11,674 13,294 14,914 14,653 14,653 14,653 14,653 132,566
Filling, maintenance & transport costs 1,780 2,651 3,522 4,393 5,263 6,134 7,005 7,876 7,876 7,876 7,876 7,876
General OPEX 674 1,054 1,470 1,925 2,422 2,964 3,554 4,195 4,405 4,625 4,857 5,099
Total OPEX 2,454 3,705 4,992 6,318 7,685 9,098 10,559 12,071 12,281 12,501 12,732 12,975 107,371
EBITDA 1,119 1,489 1,822 2,116 2,369 2,576 2,736 2,844 2,372 2,152 1,921 1,678 25,195
Depreciation (425) (850) (1,275) (1,700) (2,124) (2,549) (2,974) (3,399) (3,399) (3,399) (3,399) (3,399)
Operating Income (EBIT) 695 639 548 417 244 27 (239) (556) (1,027) (1,247) (1,478) (1,721) (3,698)
Interest Expense (389) (341) (243) (146) (49) - - - - - - -
Profit Before Taxes 305 298 304 271 196 27 (239) (556) (1,027) (1,247) (1,478) (1,721) (4,866)
Income Tax (61) (60) (61) (54) (39) (5) - - - - - -
Net Income (NI) 244 239 243 217 157 22 (239) (556) (1,027) (1,247) (1,478) (1,721) (5,146)

Clean Cooking for Africa National Feasibility Study: LPG for Clean Cooking in Kenya
147
The capitalization is structured as follows:
(in 000s) One-time
amount Subsequent
annual amounts Cumulative
total
Cylinder Investment 2019 or 2020 2020 or 2021 to
2026 or 2027
Debt 1,785 € 1,785 €
Concessional Debt 2,039 € 2,039 €
Debt amortization in years 1-4
Equity 1,275 € 1,275 €
Reuse of consumer cylinder deposits 5,099 € 35,691 €
Total to 2030 5.099 € 35,691 € 40,790 €
This initial €5.1 million catalyzes the subsequent funding from the consumer, via the receipt of cylinder
deposits that are recycled into additional cylinder deployments. The deposits thereby fund the remaining
investment requirement for deploying € 40.8 million in new cylinder assets by 2030.
For simplicity, the financial modelling does not address potential reserve requirements with respect to
consumer deposit liabilities. In practice, a cylinder returned upon cancellation of service would be
deployed almost immediately to a new customer, who pays his/her own deposit for it.
If additional LPG Marketers are invited to, and agree to, join in such a financing, amounts shown above
would increase accordingly, up to a maximum of € 107 million to serve 100% of the projected 2030
demand.
The following table shows debt service, EBITDA coverage of debt service, and free cash flows, and
calculations of notional terminal value in 2030 and the corresponding IRR for equity:
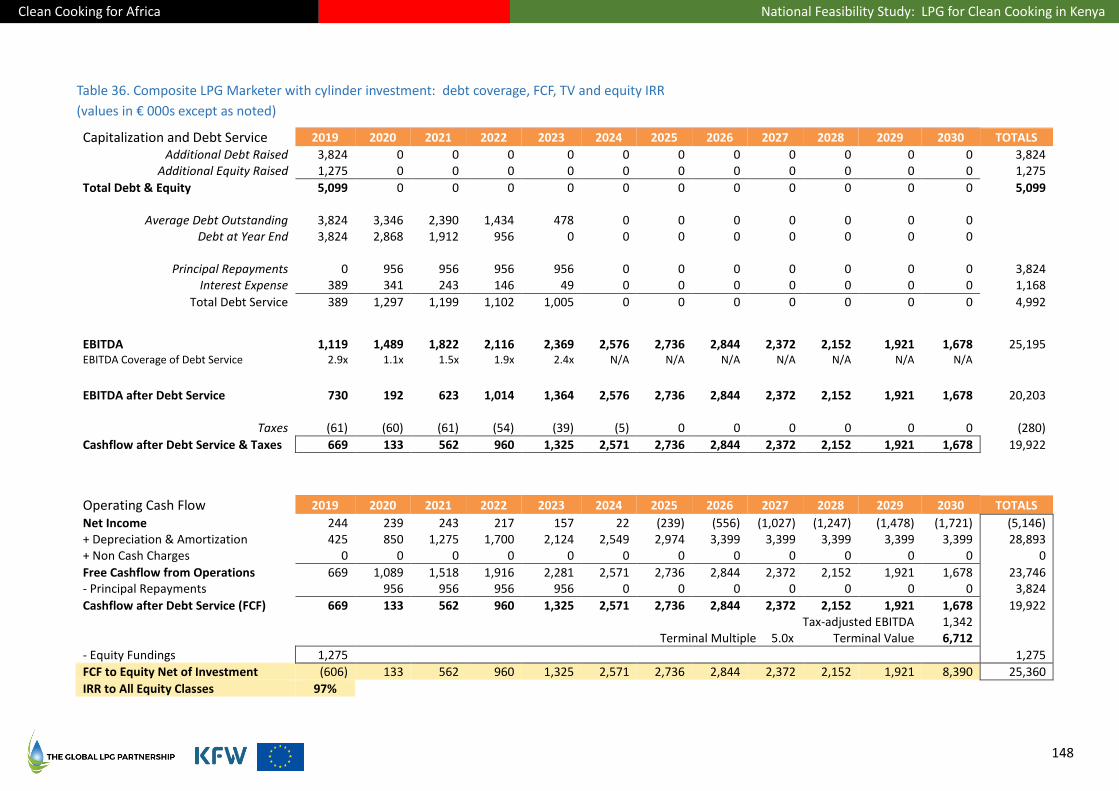
Clean Cooking for Africa National Feasibility Study: LPG for Clean Cooking in Kenya
148
Table 36. Composite LPG Marketer with cylinder investment: debt coverage, FCF, TV and equity IRR
(values in € 000s except as noted)
Capitalization and Debt Service 2019 2020 2021 2022 2023 2024 2025 2026 2027 2028 2029 2030 TOTALS
Additional Debt Raised 3,824 0 0 0 0 0 0 0 0 0 0 0 3,824 Additional Equity Raised 1,275 0 0 0 0 0 0 0 0 0 0 0 1,275
Total Debt & Equity 5,099 0 0 0 0 0 0 0 0 0 0 0 5,099
Average Debt Outstanding 3,824 3,346 2,390 1,434 478 0 0 0 0 0 0 0 Debt at Year End 3,824 2,868 1,912 956 0 0 0 0 0 0 0 0
Principal Repayments 0 956 956 956 956 0 0 0 0 0 0 0 3,824
Interest Expense 389 341 243 146 49 0 0 0 0 0 0 0 1,168
Total Debt Service 389 1,297 1,199 1,102 1,005 0 0 0 0 0 0 0 4,992
EBITDA 1,119 1,489 1,822 2,116 2,369 2,576 2,736 2,844 2,372 2,152 1,921 1,678 25,195 EBITDA Coverage of Debt Service 2.9x 1.1x 1.5x 1.9x 2.4x N/A N/A N/A N/A N/A N/A N/A
EBITDA after Debt Service 730 192 623 1,014 1,364 2,576 2,736 2,844 2,372 2,152 1,921 1,678 20,203
Taxes (61) (60) (61) (54) (39) (5) 0 0 0 0 0 0 (280)
Cashflow after Debt Service & Taxes 669 133 562 960 1,325 2,571 2,736 2,844 2,372 2,152 1,921 1,678 19,922
Operating Cash Flow 2019 2020 2021 2022 2023 2024 2025 2026 2027 2028 2029 2030 TOTALS
Net Income 244 239 243 217 157 22 (239) (556) (1,027) (1,247) (1,478) (1,721) (5,146) + Depreciation & Amortization 425 850 1,275 1,700 2,124 2,549 2,974 3,399 3,399 3,399 3,399 3,399 28,893 + Non Cash Charges 0 0 0 0 0 0 0 0 0 0 0 0 0
Free Cashflow from Operations 669 1,089 1,518 1,916 2,281 2,571 2,736 2,844 2,372 2,152 1,921 1,678 23,746 - Principal Repayments 956 956 956 956 0 0 0 0 0 0 0 3,824
Cashflow after Debt Service (FCF) 669 133 562 960 1,325 2,571 2,736 2,844 2,372 2,152 1,921 1,678 19,922 Tax-adjusted EBITDA 1,342 Terminal Multiple 5.0x Terminal Value 6,712
- Equity Fundings 1,275 1,275
FCF to Equity Net of Investment (606) 133 562 960 1,325 2,571 2,736 2,844 2,372 2,152 1,921 8,390 25,360
IRR to All Equity Classes 97%
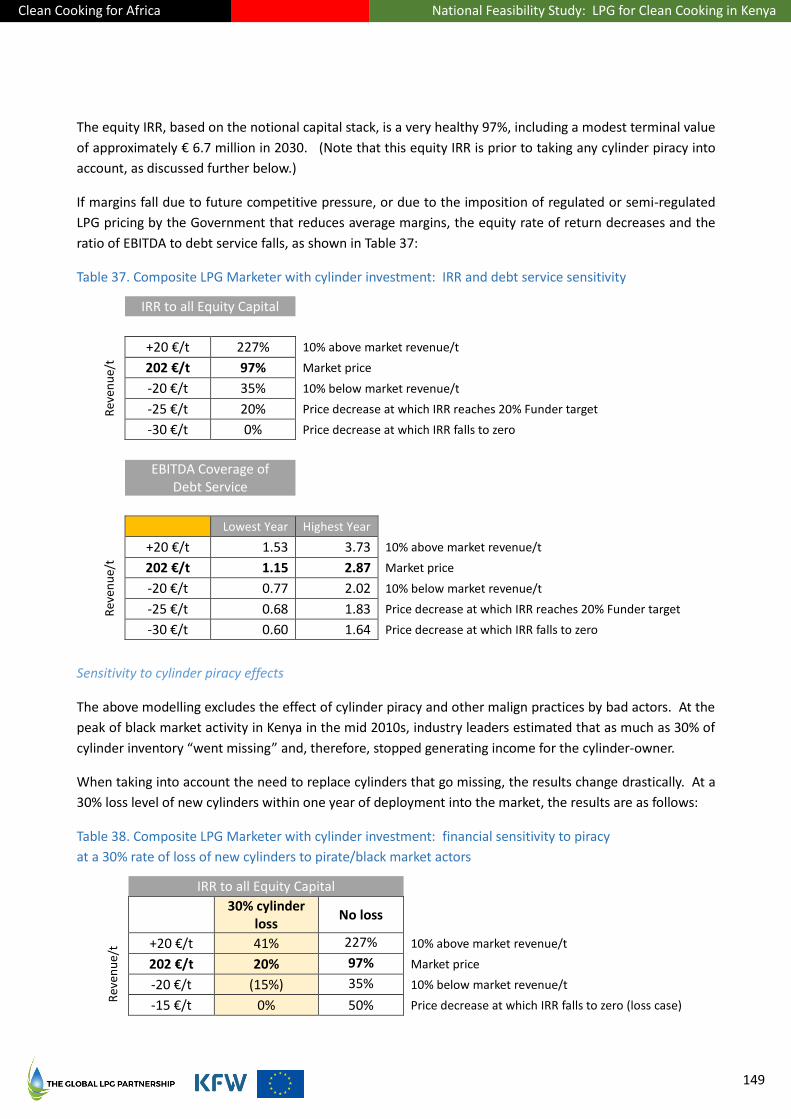
Clean Cooking for Africa National Feasibility Study: LPG for Clean Cooking in Kenya
149
The equity IRR, based on the notional capital stack, is a very healthy 97%, including a modest terminal value
of approximately € 6.7 million in 2030. (Note that this equity IRR is prior to taking any cylinder piracy into
account, as discussed further below.)
If margins fall due to future competitive pressure, or due to the imposition of regulated or semi-regulated
LPG pricing by the Government that reduces average margins, the equity rate of return decreases and the
ratio of EBITDA to debt service falls, as shown in Table 37:
Table 37. Composite LPG Marketer with cylinder investment: IRR and debt service sensitivity
IRR to all Equity Capital
Rev
enu
e/t
+20 €/t 227% 10% above market revenue/t
202 €/t 97% Market price
-20 €/t 35% 10% below market revenue/t
-25 €/t 20% Price decrease at which IRR reaches 20% Funder target
-30 €/t 0% Price decrease at which IRR falls to zero
EBITDA Coverage of
Debt Service
Lowest Year Highest Year
Rev
enu
e/t
+20 €/t 1.53 3.73 10% above market revenue/t
202 €/t 1.15 2.87 Market price
-20 €/t 0.77 2.02 10% below market revenue/t
-25 €/t 0.68 1.83 Price decrease at which IRR reaches 20% Funder target
-30 €/t 0.60 1.64 Price decrease at which IRR falls to zero
Sensitivity to cylinder piracy effects
The above modelling excludes the effect of cylinder piracy and other malign practices by bad actors. At the
peak of black market activity in Kenya in the mid 2010s, industry leaders estimated that as much as 30% of
cylinder inventory “went missing” and, therefore, stopped generating income for the cylinder-owner.
When taking into account the need to replace cylinders that go missing, the results change drastically. At a
30% loss level of new cylinders within one year of deployment into the market, the results are as follows:
Table 38. Composite LPG Marketer with cylinder investment: financial sensitivity to piracy
at a 30% rate of loss of new cylinders to pirate/black market actors
IRR to all Equity Capital
30% cylinder
loss No loss
Rev
enu
e/t +20 €/t 41% 227% 10% above market revenue/t
202 €/t 20% 97% Market price
-20 €/t (15%) 35% 10% below market revenue/t
-15 €/t 0% 50% Price decrease at which IRR falls to zero (loss case)

Clean Cooking for Africa National Feasibility Study: LPG for Clean Cooking in Kenya
150
EBITDA Coverage of
Debt Service
Lowest Year Highest Year
Rev
enu
e/t +20 €/t 0.84 1.96 10% above market revenue/t
202 €/t 0.64 1.51 Market price; IRR achieves 20% Funder target
-20 €/t 0.44 1.07 10% below market revenue/t
-15 €/t 0.50 1.20 Price decrease at which IRR falls to zero
As shown in Table 38, financial performance is seriously degraded by black market/pirate activities. Loss of
revenues from pirated cylinders can make it difficult or impossible to service debt or to meet otherwise
reasonable loan covenants, and the return on equity (with 75% leverage) is just at the threshold of being
attractive to equity Funders.
The possibility to encourage reform of cylinder deposits via financing offers
While it is recommended for Government to institute a regulatory cap on the amount of the cylinder
deposit that a customer must pay as a percentage of the cylinder’s cost, as is done in many other LMICs, it
may be possible for this to be encouraged on a voluntary basis by tying a highly attractive, concessional
cylinder financing package to a requirement that Marketers who participate in the financing offer cylinders
at a meaningfully discounted deposit fee.
As an example, If the cylinder deposit amount were required to be reduced, as a condition of such
financing, to 70% of the cost of the cylinder, and if all the debt employed were concessional, the IRR to
equity would be 35%, and EBITDA debt coverage ratio would range from 0.9x to 2.3x. In principle,
Marketers offering discounted cylinders would be at a competitive advantage to Marketers that do not do
so. It becomes more practical for Marketers to compete on cylinder deposit costs with the winding up of
the Cylinder Exchange Pool under the reformed LN 121.
Whether Marketers could be persuaded to forego equity upside in exchange for access to highly
concessional financing is uncertain. However, it is worthwhile to note that private sector LPG companies
initiated legal proceedings to contest the state’s use of state funding to achieve the same aim—namely,
discounting LPG cylinders to benefit lower-income Kenyans—via the Mwananchi Gas Project. They have
argued in the courts that state funds for lowering cylinder costs to consumers should be made available to
all legitimate LPG companies, not just to NOCK. (The Government has defended its position on the matter.)
Detailed discussions with LPG companies in Kenya regarding this concept have not been undertaken.
Pay-as-you-go Marketers
It is useful to consider the financial characteristics and performance of an LPG Marketer implementing a
pay-as-you-go (PAYG) business model.
In the absence of detailed financial and operating data from the pilot programs of Kenyan PAYG companies,
the financial model of the “traditional” LPG Marketer was adapted using disclosed and/or publicly available
information about differences in assets and cost structure between the two operating models.
Two sensitivities are analyzed in this section. In the first sensitivity case, the PAYG LPG Marketer attempts
to match the average price of a “traditional” LPG Marketer, without passing on its added PAYG asset costs
Clean Cooking for Africa National Feasibility Study: LPG for Clean Cooking in Kenya
151
to the consumer. In the second case, the analysis solves for the price premium (or other revenue
enhancement) that must be charged vs. “traditional” LPG Marketers’ end-user pricing by the PAYG LPG
Marketer, in order for the PAYG LPG Marketer to deliver similar financial returns (on a percentage basis) to
investors.
It should be noted that, because Kenya has no LPG pricing regulation, PAYG LPG companies are generally
free to experiment with a variety of pricing models, including subscription fees, sign-up fees, service call
fees, recurring equipment charges, and so on, in addition to charging a certain rate per kg (or smaller
amount) of LPG actually used. And, indeed, Kenya’s PAYG LPG companies have experimented with
combinations of these approaches during their pilot programs. Therefore, for purposes of analysis, all such
revenue-generating charges are treated as an averaged all-in cost per kg of LPG. The exception is that the
cost of the cylinder is deemed recovered through a deposit or deposit-like payment, just as with the
“traditional” LPG Marketer. This approach is consistent with the legal principles embodied in LN 121 (2018)
regarding cylinder ownership, is roughly consistent with evolving business practices in Kenya, and does not
disadvantage the PAYG LPG Marketer in the analysis by deferring or extending the time when the cost of
the PAYG cylinder is recovered from the end-consumer.
Other differences in firm economics are that PAYG LPG Marketers, by virtue of charging only for the actual
LPG used, forego the economic benefit of LPG gain (see Annex Chapter 33 (Note Regarding LPG Accounting
Treatments) on page 296 for its definition and discussion); they may have to spend additionally on service
calls to the consumer’s home to swap-out empty cylinders for filled ones; they may experience some
logistical cost savings through improved knowledge and predictive capability regarding when and where
cylinders must be swapped; and they may experience a reduced level of piracy through the geographic
tracking and control capabilities provided by wirelessly-communicating smartvalves. To understand the
extent that these differences can affect financial performance will require detailed analysis of internal,
proprietary financial and operating data from PAYG LPG companies, which data were not made available.
For purposes of the analysis, the costing and quantities of new cylinders (plus smartvalves/smartmeters)
for investment was kept the same but was spread out over twelve years instead of eight, which reduces the
rate of buildup of debt burden and debt service expense. Consumers were still assumed to cover 100% of
the PAYG LPG Marketer’s cylinder cost via their deposits, plus the same level of cylinder deposit premium as
paid to a “traditional” LPG Marketer (in practice, that might vary), but no deposit was assumed to be
collected toward the smartvalve/smartmeter. (That is, the investment cost of the smartvalves/smartmeters
must be recovered out of the company’s margins over time. Recovering this via higher pricing, or via
forgoing profits, was modelled as two different scenarios, each described below.) The unit cost to acquire
the smartvalve/smartmeter was assumed to start at €50 (a typical value cited by Kenyan PAYG LPG
companies as of this writing) and was dropped in stages over time to €35 on a purely aspirational basis, to
reflect the hopes of PAYG LPG firms for realizing economies of scale and other experience-curve cost
benefits in the manufacturing of ever-larger quantities of LPG smartvalves/smartmeters over time.
For purpose of the analysis, the possibility of losses of PAYG cylinders (and smartvalves), or interruption in
their income streams, due to piracy (or due to hacking) was not included. The question of how much
immunity PAYG LPG cylinders may have against piracy and other black market interference must be answered
through market experience over time, after (and if) the PAYG LPG model achieves meaningful scale.
Finally, all the debt used in financing the assets was assumed to be 100% concessional.
Clean Cooking for Africa National Feasibility Study: LPG for Clean Cooking in Kenya
152
These adjustments were done to attempt to reflect the most favorable, yet realistic, assumptions for
financing and financial performance of PAYG LPG Marketers. It must be noted that all other cost structure
assumptions are based on the composite model of a “traditional” LPG Marketer in Kenya and may be
different in the case of actual PAYG competitors. The following findings and conclusions are thus
hypothetical, but are useful as illustrations of the direction and magnitude of the implications of adding
smartvalves/smartmeters to the asset base of a PAYG LPG company.
Case 1: Competing on (average) price
With pricing set to the same level, on a per kg/per tonne basis, as charged on average by the “traditional”
LPG Marketers of the industry composite model, the equity IRR to the PAYG LPG Marketer, based on a
notional capital stack of 75% concessional debt and 25% equity, is -14% (negative 14%).
This does not mean the firm is never profitable. Once the PAYG LPG company stops investing in growth and
pays down its debts, it does generate a modest free cash flow and has a terminal value of, notionally, about
€560,000 per 1% of market share in 2030.
The EBITDA to debt service ratio ranges from about 0.15x to 0.4x during the investment period. This is not
likely to be deemed institutionally bankable without a substantial easing of terms (e.g., significantly
lengthened tenors and interest-only payment periods, further reduction of the interest rate, a major
component of grant funding, and similar), further emphasizing the importance of concessional capital in
making this business model sustainable under conditions of growth.
If margins fall due to future competitive pressure, or due to the imposition of regulated or semi-regulated
LPG pricing by the Government that reduces average margins, the equity rate of return and the capacity to
service debt decrease further.
Case 2: Increasing revenue per kg to achieve a positive IRR
Raising revenue per kg of sales volume can be accomplished in many ways: raising the end-user price for
each unit of LPG consumed, charging various service fees, charging sign-up fees, charging a recurring
subscription fee, charging rental fees for the equipment (in addition to whatever cylinder deposit is
collected), and other mechanisms. The analysis did not evaluate possible differences in results from the
various mechanisms to increase revenue that might be used. Rather, sensitivity of results to the overall
effect of higher revenue per kg was assessed.
Modelling with increased revenues per unit of volume indicates that IRR to equity becomes positive when
revenue/kg is increased by € 96 per tonne, which represents an approximately 7.3% premium over the
average end-user price in the Nairobi area, disregarding the significantly lower end-user pricing introduced
by Proto Energy during 2018. For the PAYG LPG Marketer itself, this represents an increase of 48% above
the unit margins obtained by non-PAYG competitors, on average.
This delivers an IRR to equity just above 0%, but does create a terminal value in 2030 of about € 2 million
per 1% of market share achieved. The EBITDA coverage of debt service has an improved but still
suboptimal ratio of between 0.3x and 0.9x over the twelve years of the investment period.
As mentioned previously, if margins fall due to future competitive pressure, or due to the imposition of
regulated or semi-regulated LPG pricing by the Government that reduces average margins, the equity rate
of return and the capacity to service debt decrease further.

Clean Cooking for Africa National Feasibility Study: LPG for Clean Cooking in Kenya
153
PAYG LPG financial sensitivity analysis
The following table shows the sensitivity of the hypothetical PAYG LPG Marketer’s financial results as
revenue per tonne and the amount of concessional debt vs. equity change:
Table 39. PAYG LPG Marketer with cylinder/smartvalve investment: IRR and debt service sensitivity
IRR to all Equity Capital
Rev
enu
e/t +20 €/t (8%) 10% above market revenue/t
202 €/t (14%) At market price
-20 €/t Incalculable 10% below market revenue/t
+96 €/t 0% At price that brings IRR up to 0%
EBITDA Coverage of Debt Service
Lowest year Highest year
Rev
enu
e/t +20 €/t 0.20 0.54 10% above market revenue/t
202 €/t 0.16 0.45 At market price
-20 €/t 0.11 0.33 10% below market revenue/t
+96 €/t 0.31 0.87 At price that brings IRR up to 0%
Comparative scale of investment and financing needs
On a “traditional” BCRM basis only, the total cylinder investment requirement for the sector has been
estimated at € 107 million to serve Kenya’s demand potential (lower bound case) to 2030. The aggregate
business plan of the composite (“traditional”) LPG Marketer presented in this Chapter, with combined
market share of about 17% at the start of the investment program, acquires and deploys cylinders
representing approximately € 41 million of that total.
If the composited business plan were switched to the pay-as-you-go model, utilizing the assumptions
mentioned above, the estimated amount to be invested in cylinders plus smartvalves/smartmeters would
be € 152 million instead of € 41 million to achieve the identical scale. That is an increase of about 3X.
The net amount to be externally financed, with consumers’ cylinder deposits used as a financing source,
and with a steady rate of year-on-year growth assumed, would be approximately € 112 million instead of
€ 5.1 million to achieve identical scale. That is an increase of about 20X.
While these numbers should be treated with caution, because they do not reflect actual operational and
financial data from PAYG LPG companies, they do illustrate how significant the financial differences are
likely to be between the PAYG LPG business model and the “traditional” BCRM model, based on presently
foreseeable costs of PAYG LPG smartvalves/smartmeters.
PAYG intellectual property (IP) licensing
It should also be noted that some PAYG LPG companies that have intellectual property (IP) related to the
PAYG technologies have expressed an interest in developing a parallel revenue stream from the licensing of
their IP (patents, know-how, etc.) to other LPG Marketers. Such a revenue stream could improve the
financial performance and bankability of those PAYG LPG Marketers that own relevant IP. However, it does
not improve the financial performance and bankability of those PAYG LPG Marketers who must license IP
Clean Cooking for Africa National Feasibility Study: LPG for Clean Cooking in Kenya
154
from the IP-owners; to the contrary, it adds an additional business cost for the licensees. Thus, at the
ecosystem level, spreading the cost of PAYG LPG equipment across IP-owning and IP-licensing PAYG LPG
companies has no net effect on the sector as a whole, it merely shifts the rents from one set of PAYG LPG
companies to another.
Conclusion
The nascent PAYG LPG subsector offers potentially useful capabilities, services and payment modes to a
certain subset of prospective LPG consumers, albeit with very significantly increased asset costs. The
critical questions are, how large will that consumer subset be over time, and with what financial risks and
results for the PAYG LPG Marketers and their investors in light of competitive forces?
PAYG LPG companies that compete by matching or approximating the average price per kg (over the
lifespan of the consumer) of traditional BCRM LPG companies are likely to be financeable only via
concessional capital, and the total quantum of investment to be financed increases by a large multiple vs.
traditional BCRM LPG companies, given what smartvalves cost now, and are expected to continue to cost in
the best possible future scenarios. The total cylinder/smartvalve investment requirement under the PAYG
model is likely to be 3X to achieve the same scale as the total cylinder investment for “traditional” BCRM
LPG modalities, and the net financing requirement could be as much as 20X higher.
PAYG LPG companies that do not attempt to compete with traditional LPG companies on average price per
kg, but instead target non-LPG users, may find themselves with limited scale-up potential. This could
happen for two reasons. First, because new PAYG LPG users may eventually choose to switch to a
traditional LPG company upon determining that their cost per kg is lower with the traditional company.
(This happened at a significant level for the first-generation PAYG LPG companies and their customers in
Kenya, during the early and mid 2010s.) Second, the number of households that are willing, and remain
willing, to pay significantly more per kg for PAYG LPG than they would pay for LPG provided by a traditional
BCRM firm – primarily because the cylinder refill cost under PAYG can be broken up into many small, daily
transactions rather than one larger, monthly to bimonthly transaction – may be a niche subset of the
overall household market for LPG.
The potential size of the addressable and retainable customer segments for PAYG LPG companies over the
long term are not currently possible to estimate from the limited available data. Also, the competitive
response of traditional LPG companies to PAYG LPG companies, if the PAYG LPG companies develop
meaningful market share at the expense of established players, is not possible to determine in advance.
To the extent they can obtain sufficiently patient, concessionary risk-capital to expand, the operational
experience gained while attempting to scale up—experience that tests the limits of their target market, of
competitive forces, and of profit potential—will begin to provide the answers.
PAYG LPG is thus a worthy business experiment.
But, like any commercial experiment, it is not guaranteed to become a major solution to achieving large-
scale LPG adoption and use. 2018 is seeing a second generation of PAYG LPG companies in Kenya define
and refine their value propositions to consumers, refine their market position, test their marketing and
operational approaches, debug their technologies, and attempt to scale. The first generation, from 2012,
did not survive.
Clean Cooking for Africa National Feasibility Study: LPG for Clean Cooking in Kenya
155
17. Financial and Investment Environment
GDP growth in Kenya was 5.7% in 2018 and is expected to rise to 6.0% in 2030, according to the World
Bank, maintaining an expected average of 6.2% per year to 2030, according to the Economist Intelligence
Unit.
Political and economic outlook96
Improved GDP growth in 2018 was driven by recovery in the agricultural sector, steady industrial expansion,
robust service sector performance, improved household consumption, and a developing recovery in private
investment. Household consumption has been supported by strong remittance inflows and improved
rainfall that has improved harvests and lowered food prices.
Inflation has been benign in the range of 5-10% per year for the last decade (with the recent and highly
relevant exception of charcoal, due to a new anti-logging policy), exchange rates have been stable, and
government reserves have been growing. Access to credit has been a growth limiter, with annual private
sector credit growth at just 4.3%.
The Government announced in 2017 a “Big Four” policy agenda that prioritizes food security, affordable
housing, health coverage, and manufacturing. Policy formulation has been gradual, with the most
significant progress made in the development of policies supporting affordable housing. According to the
World Bank (2019), additional structural reforms are needed to encourage crowding in of the private sector
in the Big Four areas, and generally.
On the supply side, services accounted for 52.5% of the 2018 growth, agriculture for 23.7%, and industry
23.8%. On the demand side, private consumption was the key growth driver. The public debt–to-GDP ratio
increased to 57% over the five years to June 2018 (the Government of Kenya is on a July-June fiscal year).
Half of public debt is external. The share of loans from nonconcessional sources has increased, partly from
a $2 billion Eurobond issued in February 2018. An IMF debt sustainability analysis in October 2018 elevated
the country’s risk of debt stress to moderate.
Tighter fiscal discipline reduced the fiscal deficit to approximately 6.7% of GDP in 2018, and the
Government share of GDP spending fell to 23.9% from 28.0% in 2017. To stimulate growth, the Central
Bank reduced the national interest rate cap to 9% in July 2018 from 9.5% in May. However, capping interest
rates can discourage savings, reduce credit access to the private sector (especially small and medium
enterprises), and impede banking sector competition, particularly by reducing smaller banks’ profitability.
The exchange rate was more stable in 2018 than in 2017. The current account deficit narrowed to an
estimated 5.8% of GDP in 2018 from 6.7% in 2017, due to an improved trade balance from increased
Kenyan manufacturing exports. Kenya’s gross official reserves reached $8.5 billion (5.6 months of imports)
in September 2018, a 7% increase over September 2017.
96 Sources: World Bank (2019); Economist Intelligence Unit (2019); African Development Bank (2019), Kenya Economic Outlook
and Bank Group Country Strategy Paper 2019-2023
Clean Cooking for Africa National Feasibility Study: LPG for Clean Cooking in Kenya
156
The Government plans to continue fiscal consolidation to restrain a rising deficit and stabilize public debt by
enhancing revenue, rationalizing expenditures through zero base budgeting, and reducing the cost of debt
by diversifying funding sources. Inflation is projected to be 5.5% in 2019 and 5.4% in 2020 as a result of
prudent monetary policy.
Kenya continues to face the challenges of inadequate infrastructure, high income inequality, and high
poverty exacerbated by high unemployment, which vary across locations and groups (such as young
people).
Kenya is exposed to risks related to external shocks, climate change, and security (particularly near its
border with Somalia). The population in extreme poverty (living on less than US$ 1.90 a day) declined from
46% in 2006 to 36% in 2016, but this trajectory is inadequate to eradicate extreme poverty by 2030.
The African Development Bank (AfDB) characterizes Kenya’s private sector as vibrant but structurally
dichotomous, having a formal business sector that is relatively healthy and productive but concentrated in
a few firms, and a massive, informal, low-productivity small business sector, which contributes 83% of
employment in the private sector. Large formal private sector entities exist mainly in financial and related
services, wholesale, and horticulture, tea, coffee and sugar cane production. The bulk of agricultural
production falls within the informal subsistence-oriented smallholder farming, largely concentrating in food
crops and nomadic livestock rearing. Kenya’s private sector has not reached its full productive capacity,
mainly due to persisting infrastructure deficits, increased perception of corruption, relatively weak
regulatory environment, and a shortage of appropriately trained workforce.
This notwithstanding, the 2018 global Doing Business indicators show Kenya moving upwards to rank 80 in
2017 from 92 in 2016 and 108 in 2015. Notable improvements include: starting a business made easier;
reduced delays for new electricity connections; property transfers made faster; and improved access to
credit information.
Growth has not been inclusive: there is a persistent high level of poverty and regional disparities, limited
access to basic services, inequality and unemployment, with youth, women and other vulnerable groups
particularly affected. However, there has been progress: relative poverty decreased to 36% in 2016 from
47% in 2006, and income inequality, measured by the Gini index, fell to 0.39 from 0.45 over the same
period.
Financial sector overview
The financial sector is regulated by the Capital Market Authority, the Central Bank of Kenya (CBK), insurance
regulatory authority, retirement benefit authority, Sacco society regulation authority and government
ministries for DFIs. The banking subsector accounts for about 60% of the total assets in the financial sector.
The 2017 Financial Sector Sustainability report of CBK found the banking sector to be resilient but with
challenges. These included liquidating one bank and placing two under receivership, and introducing the
interest-rate capping law.
The sector comprises 42 commercial banks, one mortgage lender, 13 microfinance banks, eight
representative offices of foreign banks, 73 foreign exchange bureaus, 19 money remittance providers, eight
non-operating bank holding companies and three credit reference bureaus.

Clean Cooking for Africa National Feasibility Study: LPG for Clean Cooking in Kenya
157
As of October 2018, the Nairobi All Share Index (NASI) market capitalization was KES 2.1 trillion (€ 18.5
billion), with net foreign investors dominating at 65% participation in 2017.
Mobile money transfer expanded to 71% of the population as of 2016.
Domestic debt is composed of commercial banks (51.1%); non-banks (44.4%) and the Central Bank of Kenya
(4.5%). The share of loans from commercial Banks has been increasing over time. External loans are
composed of commercial bank loans (34%), multilaterals (33%) and bilaterals (32%). The share of
commercial loans has increased relative to multilaterals. According AfDB, a sizable amount of commercial
debt matures during 2019 and will be refinanced. According to the IMF, on PV terms Kenya’s total debt
stock (domestic and external) and external debt are estimated at 48.5% and 22.5% of GDP, respectively.
This is lower than the World Bank/IMF benchmark of 74% for all debt and 50% for external debt.
The AfDB concluded that the main financing constraint in Kenya has not been the cost of finance per se, but
is structural bottlenecks that prevent efficient intermediation in the domestic financial sector.
(In the case of LPG, this is exacerbated by the fact that much of the historical private sector financing for
LPG has come from family-and-friends networks, the main exception being the balance-sheet-based
investing by a few larger, foreign-owned OMCs/LPGMCs. Multiple LPG Marketers that had utilized family-
and-friends financing networks in the past indicated in discussions that such sources of financing would not
be accessible in adequate quanta to drive the full growth potential of the sector over the next 8-10 years.)
Financial sector market intelligence and costs of debt
Recent market intelligence highlights that Kenya remains attractive on the sovereign borrowing front to
both domestic and international capital sources. This also serves as a starting point for consideration of the
interest rates applicable to Kenyan LPG companies. Typically, any non-sovereign debt of equivalent
maturity, not backed by some outside guarantee (stronger than that of the Government of Kenya), would
price at a higher coupon when a debt transaction is structured and priced. A guarantee that could lower
rates, possibly close to sovereign levels assuming high quality/low risk private sector borrowers in the LPG
sector, might come from DFIs or IFIs/MDBs like the AfDB, CDC, DEG, FMO, IFC, OPIC, or Swedfund. The
impact of guarantees, however, is necessarily limited to the quality of the underlying guaranteed entities.
Guarantees are therefore a supplement and later stage enhancement to stand-alone “bankability”.
Looking at recent Kenyan debt market trends, Reuters reports that as of February 2019, “Kenya was working
on a USD 1bn-equivalent syndicated loan, as reported. The loan offered a margin of 645bps over Libor on its
7-year USD 400m tranche. The 10-year USD 250m tranche offered a margin of Libor+695bps, as reported.”
The additional 7-year tranche’s terms were not disclosed. These would translate as of 29 February 2019 Libor
quotes at approximately 9.35% for the 7-year and approximately 9.85% for the 10-year.
In February 2019, the latest 10-year Government of Kenya debt was priced at 260bps (2.6%) over the 10-
year sovereign debt of 12 months prior. This suggests that private sector issuers, like LPG entities, should
expect to pay a coupon (at least for non-concessional Funders) higher than 9.85%.
For additional reference, as reported by Reuters in February 2019, Kenya issued two Eurobonds. They were
a USD 1bn 7.25% 2028 (10-year) bond and a USD 1bn 8.25% 2048 (30-year) bond. At the time of issuance,
Funders’ demand was USD 14bn or “7 times over subscription”. With this excess demand, and assumed
active secondary market trading, bond prices would be expected to rise and yields to fall. According to
Bloomberg bond pricing quotes as of 21 February 2019, this is indeed what happened. In addition, unlike
Clean Cooking for Africa National Feasibility Study: LPG for Clean Cooking in Kenya
158
the syndicated loans mentioned, bonds are typically more liquid, making their liquidity profile more
attractive and lowering the costs to Kenya.
Finally, again according to Reuters (18 February 2019), certain factors, outside of company-specific risks
associated with any of the LPG companies’ costs of future debt, could cause interest rate movements
explained by the following:
Kenya’s government faces increased refinancing or roll over risks as more domestic bonds mature
within the next year than in the past year, the ministry of finance said. The International Monetary
Fund bumped up the East African nation’s debt distress risk to moderate from low last October,
citing rising external commercial borrowing and growing interest payments on public debt. The
maturing of domestic debt is due to shorten, with 43 percent of the debt maturing in less than a
year, up from 38 percent the previous year, the Treasury said in a debt management strategy
document seen by Reuters on Monday after being sent to parliament by the Treasury on Thursday.
Market conditions had not been “supportive” of the government’s aim of lengthening the maturity
profile of the debt through issuance of longer-dated bonds in the 2017/18 (July-June) financial year,
the [finance] ministry said. “The 2019 local debt maturities account for $10.37 billion out of the
total outstanding local debt of $24.21 billion”, the ministry said in the document. “Whereas debt
redemptions are large in 2019, it is projected that over the medium term ... the level of
redemptions will decline,” it said.
Kenya’s domestic debt stands at 24.7 percent of GDP, roughly half of the total public debt of 50.3
percent of annual economic output, with the balance being made up of external financing from
creditors such as the World Bank and commercial lenders. “Slightly over two thirds of the external
debt was in the U.S. dollar, the ministry of finance said, adding it would seek to cut that exposure by
issuing debt in other currencies.” The government planned to diversify its sources of financing
through private placement of debt in local and foreign currencies as well as issuance of Islamic
bonds, green bonds and diaspora bonds, the Treasury said in the document.
The main conclusions from the foregoing are that there is affordable capital available (suitable to Kenyan
LPG Marketers and attractive to potential Funders) to fund the Kenya-specific LPG investments analyzed in
this report, through Blended Finance utilizing debt, equity, and risk mitigation tools.
The risk mitigation tools could lower debt and equity costs but presumably not lower than comparable
Government of Kenya debt structures, unless guaranteed by better credits such as DFIs or IFIs like the IFC.
Domestic financial sector capacity for LPG financing
Kenya has a relatively deep capital market ecosystem for Sub-Saharan Africa, both in private and public
securities-based financing activities. As such, the range of domestically sourced funding may be
comparatively larger than many other SSA markets. By SSA standards, Kenya has one of the top five capital
markets and is relatively well diversified among debt, convertible instruments, and equity (noting that
domestic LPG companies have not utilized this diversity well, historically speaking).
Its strength is useful for some of the funding needs of the LPG companies in the Kenyan value chain, if they
can be positioned appropriately to the financial sector. On the publicly-traded securities side, the US $21
billion Nairobi Stock Exchange (NSE) has had two listed energy companies (TOTAL Kenya Ltd. and KenolKobil

Clean Cooking for Africa National Feasibility Study: LPG for Clean Cooking in Kenya
159
ltd.) that have LPG operations. KenolKobil was recently taken private by France-based Rubis. The NSE has
approximately 64 listed companies and is relatively diversified by SSA standards. This suggests that if
operational financial scale, sound management, and believable business outlooks can be found around a
group of underlying Kenyan LPG-related entities, an SPV listed on the NSE for debt or equity might be
attractive to local and foreign institutional investors.
Pension funds in Kenya have the potential to be a major source of capital domestically. According to the
World Bank, in 2016, pension fund assets amounted to 12.75% of GDP in Kenya compared to (for example)
4.06% in Ghana. Pension funds could be a good target for financing LPG projects if the opportunities are
structured to mirror the predictable, fixed-income-like returns that pension funds favor because of their
liability management needs.
With regard to the capacity of Kenyan banks to make a difference in funding LPG projects domestically, they
have a relatively strong presence among SSA banks. According to the respective CBK reports and IMF data,
banks in Kenya had assets equivalent to 33% of GDP in 2017, comparing favorably to the SSA average of
28.5% at the end of 2016. Additional details of prospective Kenya financial sector funding sources for LPG
projects are detailed in Chapter 19 (Investment Plan Overview) beginning on page 171.
The following two charts (Figure 37), from the IMF Kenya Country Report of October 201897, show banks’
overall lending activity to non-financial commercial sector (NFCS) entities in Kenya. The Kenyan banks
remain demonstrably active in spite of the interest rate cap law from September 2016 onward. This
suggests that LPG entities should be able to approach banks successfully for some of their financing needs
if they and their means of capital raising (that is, the nature of the securities) are suitable for the banks. As
of this writing, one of the five LPG Marketers in the composite presented in Chapter 16 (Investments at the
Firm Level) (beginning on page 141) is approaching banks for cylinder funding, albeit under a sharia-
compliant approach.
Figure 37. Kenya NFCS Debt and Bank Credit to NFCS 2006-2016
(IMF (2018), citing CBK)
97 IMF (2018) #18/296.
KENYA
INTERNATIONAL MONETARY FUND 39
Figure 2. Kenya: Credit to NFCS Based on National Statistics, 2006–16
NFCS’ debt as a share of GDP grew over time…. …. mostly being bank-financed ….
…. with real estate becoming a more important sector…. ….. and foreign credit increasing.
Sources: Central Bank of Kenya; and IMF staff calculations.
B. Performance Based on Firm-Level Data
11. This section analyses a subsample of the NFCS in Kenya using publicly available data
derived from the annual financial reports for companies listed in the Nairobi Securities
Exchange (NSE). The number of companies in this analysis varies over time as new firms get listed
in the stock exchange while others get unregistered. The firm-level data are comprehensive and
allow for more in-depth analysis of the NFCS across different sectors and over time. As our sample
size varies, the analysis focuses on the use of performance ratios to facilitate comparison. The
sample size for this study, while small, is representative of the large corporates in Kenya, and
accounts for around 40 percent of total corporate debt outstanding.
Growth
12. Firm-level data confirms that listed companies experienced strong asset growth,
supporting the notion that the asset expansion allowed for increase in debt levels in the
aggregate corporate sector (Section A). The total assets of listed firms have been rising steadily
0
10
20
30
40
50
60
70
0
5
10
15
20
25
30
35
Growth Share of GDP Share of domestic credit (RHS)
Bank Credit to NFCS, 2006-16(Percent)
0.0
0.2
0.4
0.6
0.8
1.0
2006 2007 2008 2009 2010 2011 2012 2013 2014 2015 2016
Agriculture Manufacturing Trade
Construction Transport & comm. Real estate
Mining Business services Other activities
Sectoral Distribution of Credit, 2006-16(Percent)
0
1
2
3
4
5
6
7
8
9
0
5
10
15
20
25
30
35
2008 2009 2010 2011 2012 2013 2014 2015 2016
FX credit to total NFCS Credit NFCS FX credit to GDP (RHS)
Credit in Foreign Exchange, 2008-16 (Percent)

Clean Cooking for Africa National Feasibility Study: LPG for Clean Cooking in Kenya
160
Banks operating locally in Kenya had US $1.3bn of lending liquidity as of Q3 2018, according to Ecobank
research. Due to the CBK rate cap, this liquidity is being put into Treasury securities rather than being lent
out to enterprises. This has essentially turned off the flow of local bank financing into LPG. The cap might
be avoided, however, through investing into LPG indirectly, via certain forms of intermediary financing
vehicles that are discussed later in this Part.
Prior to the rate cap, the average interest rate charged by Kenyan banks to SMEs was 18%.98 To maintain
historical levels of return on equity (ROE) for their shareholders, Kenyan commercial banks had to begin
diversifying their income streams beyond traditional loans as of 2017.
98 Ibid.

Clean Cooking for Africa National Feasibility Study: LPG for Clean Cooking in Kenya
161
18. Consumer Empowerment
Microfinance program
In each partner country of the Clean Cooking for Africa Program, the Global LPG Partnership has engaged
with local partners to design and, where possible, launch and complete a pilot program in LPG
microfinance.
The purpose of these microfinance programs is to determine whether LPG demand and consumption can
be unlocked and sustained on a commercial basis through replicable, profitable microloans which help
consumers who cannot afford the full up-front cost of the equipment required to become an LPG user at
one go, or who may have seasonally variable incomes that make it difficult to do so except at particular
times of year.
These programs are collectively called “Bottled Gas for Better Life”.
The first instance was launched in 2017 in Southwest Cameroon. The Cameroon data obtained represent a
potential benchmark for the Kenyan program, which as of this writing awaits gathering and analysis of the
final results.
The following table summarizes the status of these programs across the three active Clean Cooking for
Africa partner countries as of this writing:
Table 40. Summary of LPG microfinance program status by country
Cameroon Kenya Ghana
Phase I Phase IA Phase II Phase IIA Phase I Phase I
Households 150 (target reached)
50 (target reached)
680 (target), 416 registered as of this writing
150 (target) 150 (target), 63 registered at time of reporting
150 (target)
Location One community in South West Cameroon
One community in South West Cameroon
10 communities across Centre, Littoral, South West, North West, West regions
TBD One community in Nyandarua County
One community in Brong Ahafo Region
Project period
March - October 2017
November 2017 - May 2018
April - April 2019 TBD August 2018 - June 2019
99
TBD
Status Complete Complete In progress Not yet started In progress Not yet started
99 Final data to be collected and analyzed during Q3 2019.

Clean Cooking for Africa National Feasibility Study: LPG for Clean Cooking in Kenya
162
Overview of Kenya microfinance sector
The microfinance sector is well established in Kenya. Although microfinance lending has existed in various
formats for many years in Kenya, it was more fully formalized when the Kenyan Micro Finance Act was
enacted in 2006 and implemented by the Central Bank of Kenya from 2008.100 Since that time, Kenya’s
microfinance sector has grown to accommodate 13 distinct, deposit-taking microfinance banks in 2018.101
Financial inclusion in Kenya has expanded in the years since 2006, with financial sector participation rising
from 26.7% to 75.3%. Data compiled by IMF102 through 2012 suggest similar positive trends along a
number of dimensions, up through that time:
42.3% of Kenyan adults had an account at a formal financial institution, compared to 24.2% across
SSA.
65.7% of Kenyan adults borrowed from a non-formal source, compared to 44.3% across
SSA (interestingly, at the income quintile level, 78.4% of the richest 20% of Kenyans had borrowed
from an informal source, and 51.3% of the poorest 20%).
68.2% of Kenyan adults used mobile banking, compared 14.5% across SSA.
Kenya’s microfinance sector includes a variety of formal and informal institutions including prudentially
regulated microfinance banks, formal credit-only MFIs and informal moneylenders, shopkeepers, and
affinity groups (such as credit associations and rotating savings groups, where a pooled fund is rotated
amongst individual members of the group for safekeeping). Kenya was a pioneer in the use of mobile
payment platforms such as M-PESA for microfinance loan repayments, which has expanded accessibility
and convenience to lower income households.103 Kenya also has a strong group savings and credit culture,
where people come together in groups called Savings and Credit Cooperatives (SACCOs) to save to buy
items ranging from household equipment to land and property. Banks open and maintain accounts for any
registered group of at least five people and provide loans to group members to finance their activities.
Kenyan MFIs have a history of offering financing and loans for energy services. Microfinancing of first-time
LPG cylinder and appliance purchases to certain market segments has been done successfully by some LPG
companies, such as Hashi Gas104, supported by established MFIs such as Equity Bank and by SACCOs. Loan
amounts for LPG equipment packages provided through such programs have ranged from Ksh 5,000
(US$ 49.50) for a 6kg filled cylinder and single-burner stove, to Ksh 11,000 (US$ 108.90) for a 13kg filled
cylinder and double-burner stove. Bottled Gas for Better Life in Kenya targeted a low-income area as yet
unserved by other programs. Unlike other programs, it also encourages the use of the larger, 13kg gas
cylinder and a double burner stove, which will allow users to use LPG for more or all of their cooking needs,
rather than merely adding LPG to their fuel stack as a supplement to other, unclean fuels.
100 Central Bank of Kenya, Kenya National Bureau of Statistics, FSD Kenya (2016), 2016 FinAccess Household Survey 101 Central Bank of Kenya (2018), Consultative Paper on the Review of the Microfinance Legislation 102
See https://www.imf.org/external/pubs/ft/wp/2015/wp15235.pdf 103 The Economist (2015), Why does Kenya lead the world in mobile money? 104 See: www.the-star.co.ke/news/2013/03/26/hashi-equity-unveil-lpg-cylinder-credit_c754442

Clean Cooking for Africa National Feasibility Study: LPG for Clean Cooking in Kenya
163
MFI revenues in Kenya have been affected by the regulatory cap introduced by the CBK in August 2016 on
the interest rates that can be charged by commercial banks.105 While data on the interest rates charged by
MFIs are not readily available, the lowered interest rates have affected MFI margins, leading to increased
credit screening criteria, which in turn reduced the number of borrowers from MFIs, leaving them with
lower revenues and income from which to meet their customers’ financing needs. Consequently, in June
2018, it was announced by the Government that it would consider repealing or reforming the interest-rate
cap, together with additional reforms to facilitate mobile payments. When enacted, such reforms can be
expected to improve future microfinance accessibility in Kenya.
Program design
The Clean Cooking for Africa/GLPGP Country Manager for Kenya held initial meetings with M-Kopa106,
Visionary Empowerment Programme (known as VEP)107, Choice Microfinance Bank108, and Equity Bank109,
as potential MFI partners for Bottled Gas for Better Life in Kenya. All four organizations expressed strong
interest in participating in the LPG microfinance program. M-Kopa and VEP, which had existing programs to
provide financing for improved biomass cookstoves, reported that their customers were increasingly asking
them for financing for LPG stoves.
A key criterion was selection of an MFI highly likely to be able to make LPG loans a part of its regular
lending portfolio, and thereby serve a large population across all regions of Kenya over time. GLPGP
selected Equity Bank as the partner MFI due to its significant nationwide footprint, its desire to move
quickly to organize a pilot, and its willingness to fully fund the loans with a partial GLPGP loan performance
guarantee (VEP, by contrast, required that GLPGP underwrite the entire loan
amount). Equity Bank is the largest bank in Kenya, with prior experience
financing LPG equipment for households. It has grown its customer base
largely by serving “base of the pyramid" customers. Unlike in Cameroon,
where the first pilot program of Bottled Gas for Better Life was conducted,
Equity Bank was willing to advance the loan funds directly to loan recipients,
with a 50% GLPGP guarantee on losses of principal on delinquent loans, after
recovery efforts had been made by Equity Bank.
With Equity Bank as the lead financial partner and the National Oil Company
of Kenya (NOCK) as the operational partner, the microfinance pilot program
was launched in August 2018, targeting 150 households, to encourage
household switching to LPG from biomass and kerosene for cooking. The
equipment package offered includes a double burner stove, a 13kg LPG
cylinder (6kg option also offered) and accessories.
105 Business Daily Africa (22 August 2018), Microbanks sink deeper into the red as income streams dry 106
A company providing consumer financing for solar home systems and improved biomass cookstoves in Kenya, Tanzania and Uganda.
107 A localized MFI serving women's groups in Thika, 40km from Nairobi. VEP finances household acquisition of solar lanterns,
improved biomass cookstoves and water tanks. 108
A small MFI serving the nomadic community of Masaai, just outside Nairobi. 109
The largest retail bank in Kenya, with branches throughout the country and with experience financing a range of household energy services.
Mwananchi Gas package with cylinder and affixed single burner ring
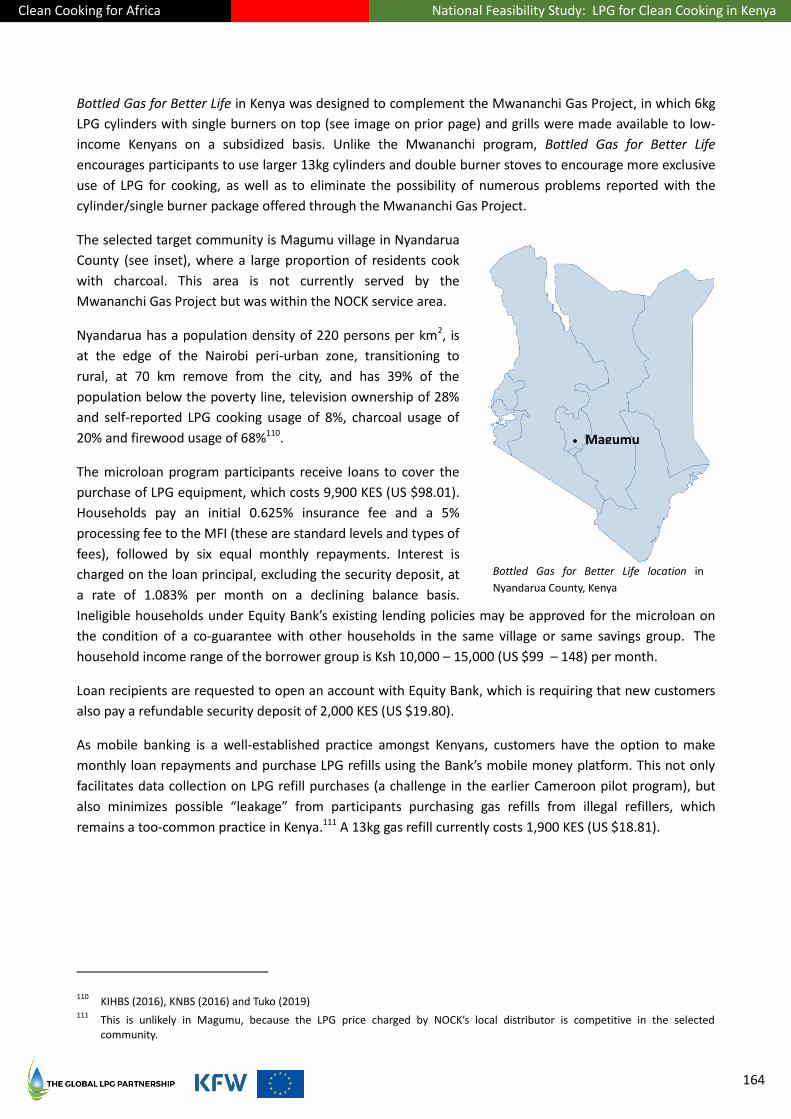
Clean Cooking for Africa National Feasibility Study: LPG for Clean Cooking in Kenya
164
Bottled Gas for Better Life in Kenya was designed to complement the Mwananchi Gas Project, in which 6kg
LPG cylinders with single burners on top (see image on prior page) and grills were made available to low-
income Kenyans on a subsidized basis. Unlike the Mwananchi program, Bottled Gas for Better Life
encourages participants to use larger 13kg cylinders and double burner stoves to encourage more exclusive
use of LPG for cooking, as well as to eliminate the possibility of numerous problems reported with the
cylinder/single burner package offered through the Mwananchi Gas Project.
The selected target community is Magumu village in Nyandarua
County (see inset), where a large proportion of residents cook
with charcoal. This area is not currently served by the
Mwananchi Gas Project but was within the NOCK service area.
Nyandarua has a population density of 220 persons per km2, is
at the edge of the Nairobi peri-urban zone, transitioning to
rural, at 70 km remove from the city, and has 39% of the
population below the poverty line, television ownership of 28%
and self-reported LPG cooking usage of 8%, charcoal usage of
20% and firewood usage of 68%110.
The microloan program participants receive loans to cover the
purchase of LPG equipment, which costs 9,900 KES (US $98.01).
Households pay an initial 0.625% insurance fee and a 5%
processing fee to the MFI (these are standard levels and types of
fees), followed by six equal monthly repayments. Interest is
charged on the loan principal, excluding the security deposit, at
a rate of 1.083% per month on a declining balance basis.
Ineligible households under Equity Bank’s existing lending policies may be approved for the microloan on
the condition of a co-guarantee with other households in the same village or same savings group. The
household income range of the borrower group is Ksh 10,000 – 15,000 (US $99 – 148) per month.
Loan recipients are requested to open an account with Equity Bank, which is requiring that new customers
also pay a refundable security deposit of 2,000 KES (US $19.80).
As mobile banking is a well-established practice amongst Kenyans, customers have the option to make
monthly loan repayments and purchase LPG refills using the Bank’s mobile money platform. This not only
facilitates data collection on LPG refill purchases (a challenge in the earlier Cameroon pilot program), but
also minimizes possible “leakage” from participants purchasing gas refills from illegal refillers, which
remains a too-common practice in Kenya.111 A 13kg gas refill currently costs 1,900 KES (US $18.81).
110 KIHBS (2016), KNBS (2016) and Tuko (2019)
111 This is unlikely in Magumu, because the LPG price charged by NOCK’s local distributor is competitive in the selected
community.
Magumu
Bottled Gas for Better Life location in
Nyandarua County, Kenya

Clean Cooking for Africa National Feasibility Study: LPG for Clean Cooking in Kenya
165
GLPGP, NOCK and Equity Bank jointly organized an awareness-raising
event (see image to left) in a central shopping mall in Magumu on 28 July
2018. Local women were recruited to demonstrate cooking of Kenyan
delicacies using LPG stoves. This included githeri, a slow-cooking staple
meal that many Kenyans perceive can only be cooked with charcoal or
firewood. Equity Bank staff explained the loan selection process and
repayment terms; the branch manager was well versed in the local dialect
and was able to explain the financing scheme. GLPGP and its partners had
publicized the event through women’s groups, churches, and schools.
A small number of attendees at the event expressed interest in
purchasing the LPG equipment via a “layaway plan”, paying in
installments without taking out a loan. These customers would open an
account with the NOCK distributor (becoming its customers) and pay for
the equipment in interest-free installments. Unlike loan recipients, this group would only receive their LPG
equipment upon payment in full of the entire amount due. However, all of this group of potential
customers eventually either took the Equity Bank loan, paid the full equipment cost upfront, or decided not
to participate.
Through 31 December 2018, 69 households had registered for the program and received LPG equipment,
after which time registrations were closed. Of these 69, 15 purchased the equipment on a cash basis
without taking the loan. The remaining 54 were accepted for loans by either Equity Bank (15) or by the
Social Economic Mobilisation Agency (SEMA), a community savings and loan association which offered to
fund loan (on the same terms) to their membership.
As of May 2019, 49 (90%) of the 54 borrower households had fully repaid their loans.
To boost registration and encourage more people to switch to cooking with LPG for the first time, the Clean
Cooking for Africa/GLPGP Country Manager held ongoing meetings beyond the official program launch with
in-area community groups and savings cooperatives. Program partners also agreed to review equipment
pricing and to consider offering a variety of equipment packages, such as an option to obtain 6kg instead of
13kg gas cylinders or a single burner stove instead of a double burner stove. All those who received
equipment to date received 13kg cylinders, but a few others indicated that they would prefer 6kg cylinders.
There was also community interest in LPG for heating, which the program partners agreed to explore for a
future microfinance pilot.
The average LPG usage among the participants was 12 kg per capita on an annualized basis, above the
national average per capita usage among existing rural LPG users (10.4 kg) and below that for existing
urban users (18.7 kg).
The main loan parameters were as follows:
Parameter Value / Description
Equipment 13 kg NOCK cylinder (filled), 2-burner stove, regulator and hose
Loan principal Ksh 9,900 (€ 87.5)
Repayment schedule 6 equal monthly payments
Cooking demonstration in Magumu, July 2018

Clean Cooking for Africa National Feasibility Study: LPG for Clean Cooking in Kenya
166
Parameter Value / Description
Fees 0.625% insurance fee
5% loan processing fee
Deposit Customers new to Equity Bank pay a refundable security deposit of Ksh 2,000
112
Interest rate 1.083% per month (13% annualized) on the loan principal (excluding security deposit), on a declining balance basis
NOCK LPG refill price Per 13 kg refill: Ksh 1,900 (€ 16.8)
Per kg: Ksh 146 (€ 1.29/kg)
Monitoring and evaluation
GLPGP, in partnership with the University of California, Berkeley, USA (UCB), and the University of Liverpool,
UK, obtained grant funds from the London School of Economics/International Growth Center to fund M&E
activities relating to the microloan program in Kenya. Study activities began in March 2019. The evaluation
is ongoing as of this writing, and will investigate:
i. Whether the provision of microloans for upfront LPG switching costs is effective in driving low-income Kenyan households to switch from solid fuels/kerosene to cooking with LPG;
ii. The effects of LPG adoption on health and time use;
iii. Whether a commercially acceptable percentage of the loans will be repaid so that lenders are encouraged to embark on a larger roll-out; and
iv. The household decision-making process in signing up for the loan and what population segment is the best target for lenders.
Equity Bank staff conducted baseline participant surveys designed by Clean Cooking for Africa/GLPGP to
collect data relating to demographics, cooking habits, and fuel use in the home. These baseline surveys will
supplement more comprehensive surveys to be led by the UCB team. LPG refill purchases will be monitored
to assess participants’ LPG usage over the life of the program. Changes in outcomes within the loan
recipient group will be compared with changes in outcomes in a control population in the same area who
heard of the program but did not take up the microloan, controlling for individual-level baseline
characteristics. These results were not yet available as of this writing.
Issues and lessons from Kenyan microloan program to date
Finalizing written agreements
Equity Bank asked for adjustments to the standard Memorandum of Understanding (MOU) for the project
provided by GLPGP, and accepted by NOCK, to be in line with the Bank’s existing lending policies. In
particular, a clause about Equity Bank repossessing LPG equipment from delinquent loan recipients was
removed (as repossession of household goods was against Bank policy). Negotiation around the Bank’s
requirements caused a delay of several months before the multiparty agreement could be executed.
112 In practice, the security deposit is typically applied to the final loan payment.
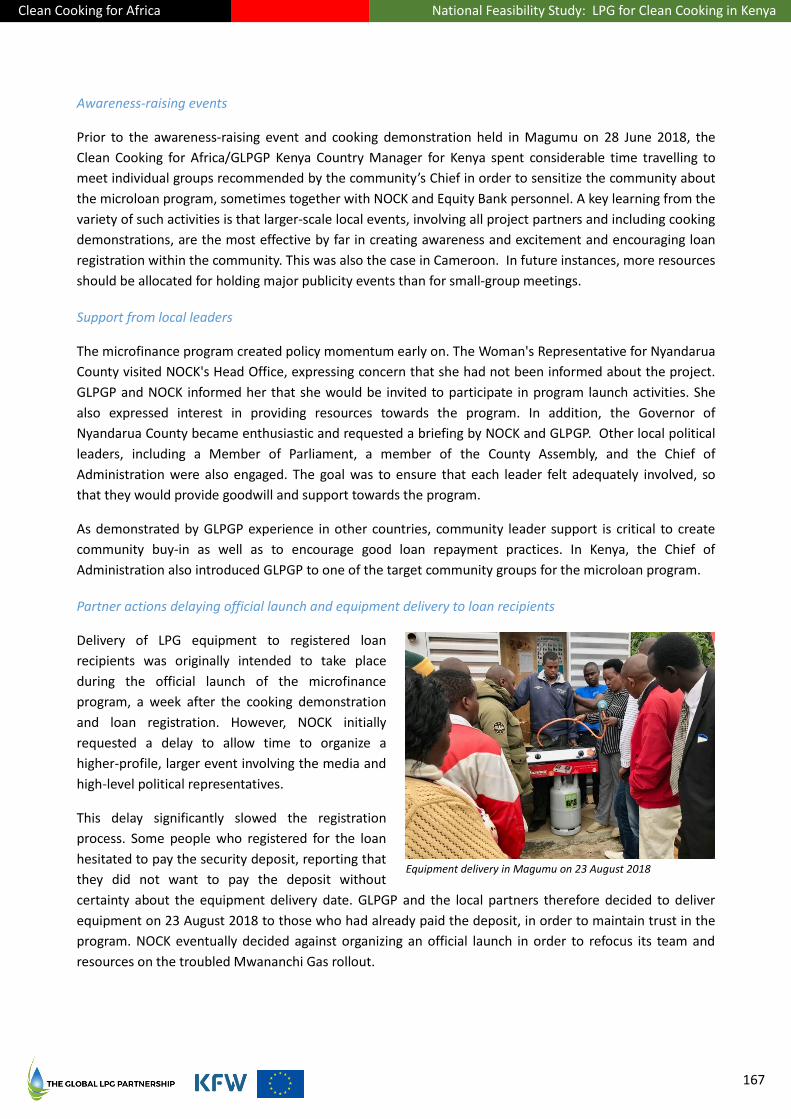
Clean Cooking for Africa National Feasibility Study: LPG for Clean Cooking in Kenya
167
Awareness-raising events
Prior to the awareness-raising event and cooking demonstration held in Magumu on 28 June 2018, the
Clean Cooking for Africa/GLPGP Kenya Country Manager for Kenya spent considerable time travelling to
meet individual groups recommended by the community’s Chief in order to sensitize the community about
the microloan program, sometimes together with NOCK and Equity Bank personnel. A key learning from the
variety of such activities is that larger-scale local events, involving all project partners and including cooking
demonstrations, are the most effective by far in creating awareness and excitement and encouraging loan
registration within the community. This was also the case in Cameroon. In future instances, more resources
should be allocated for holding major publicity events than for small-group meetings.
Support from local leaders
The microfinance program created policy momentum early on. The Woman's Representative for Nyandarua
County visited NOCK's Head Office, expressing concern that she had not been informed about the project.
GLPGP and NOCK informed her that she would be invited to participate in program launch activities. She
also expressed interest in providing resources towards the program. In addition, the Governor of
Nyandarua County became enthusiastic and requested a briefing by NOCK and GLPGP. Other local political
leaders, including a Member of Parliament, a member of the County Assembly, and the Chief of
Administration were also engaged. The goal was to ensure that each leader felt adequately involved, so
that they would provide goodwill and support towards the program.
As demonstrated by GLPGP experience in other countries, community leader support is critical to create
community buy-in as well as to encourage good loan repayment practices. In Kenya, the Chief of
Administration also introduced GLPGP to one of the target community groups for the microloan program.
Partner actions delaying official launch and equipment delivery to loan recipients
Delivery of LPG equipment to registered loan
recipients was originally intended to take place
during the official launch of the microfinance
program, a week after the cooking demonstration
and loan registration. However, NOCK initially
requested a delay to allow time to organize a
higher-profile, larger event involving the media and
high-level political representatives.
This delay significantly slowed the registration
process. Some people who registered for the loan
hesitated to pay the security deposit, reporting that
they did not want to pay the deposit without
certainty about the equipment delivery date. GLPGP and the local partners therefore decided to deliver
equipment on 23 August 2018 to those who had already paid the deposit, in order to maintain trust in the
program. NOCK eventually decided against organizing an official launch in order to refocus its team and
resources on the troubled Mwananchi Gas rollout.
Equipment delivery in Magumu on 23 August 2018

Clean Cooking for Africa National Feasibility Study: LPG for Clean Cooking in Kenya
168
Factors influencing loan registrations
Several people indicated interest in the microloan through Equity Bank but did not make the deposit. This
was partly due to NOCK’s delaying of the official program launch, as described above. The Clean Cooking for
Africa/GLPGP Country Manager also learned that some interested participants found Equity Bank’s
registration and screening process overly lengthy and unduly prohibitive. Other households were wary of
the loan offer, due to prior experiences where other banks/MFIs had raised the interest rate after a loan
had been approved. In addition, heavy rain and flooding contributed to the slow registration rate; Magumu
is an agricultural area where incomes are weather dependent.
Use of digital finance tools for data collection
Digital finance helped simplify data collection and stimulated better loan repayment practices. All of the
Equity Bank borrowers used mobile payments and, as of May 2019, all had paid their loans in full. This is
attributed not only to the Bank’s thorough credit screening or co-guarantee requirements, as applicable,
but also to the participants’ use of Equity Bank’s mobile banking platform. Mobile banking has allowed
participants to easily make or automate their repayments. In addition, participants were able to pay for LPG
refills using the same payment platform as they used to make loan payments, which has facilitated data
collection regarding LPG consumption.
Pay-as-you-go technologies
Pay-as-you-go technologies have been successful in off-grid lighting and electrification at shrinking
significantly the size of individual purchase transactions for the consumption of energy. This has made off-
grid electricity more affordable, on the dimension of transaction size, for households who find it difficult to
accumulate the savings necessary to make a larger, single purchase, such as to own solar PV home
equipment outright.
In LPG markets with unregulated end-user pricing and a strong mobile payments and wireless data services
environment, such as in urban East Africa, new and established LPG distribution companies have begun
experimenting with business models and technologies to apply the pay-as-you-go approach to LPG cylinder
refills.
Their business premise is that by making the size of individual purchase transactions much smaller (and
therefore much more frequent), many poor consumers who otherwise would not adopt and use LPG due to
the size of purchase transactions can be persuaded to do so.
Initial LPG pay-as-you-go pilot programs of a few thousand users are being carried out mainly by two
companies in Kenya: PayGo Energy and Envirofit. Pricing can involve both LPG refill charges and service
charges or subscription fees. The aggregate price per kg in the PayGo case has been above the market
average; Envirofit, conversely, has charged at approximately the market average, accepting a reduced
margin in consequence.
The latest generation of pay-as-you-go systems for LPG employ wirelessly Internet-connected “smart
valves” with embedded meters and controls which allow users to prepay for small quantities of LPG that
are then released by the smart valve until the prepayment amount is used up. This is similar in practice to
buying mobile phone minutes on a prepaid basis and then using them.
Clean Cooking for Africa National Feasibility Study: LPG for Clean Cooking in Kenya
169
The cost of such valves is in the typical range of € 50 to as much as € 90, which vastly multiplies the asset
intensity (i.e., the net CapEx) of an LPG distribution business which utilizes them. Unless and until those
costs decline very sharply, pay-as-you-go LPG companies may face significant challenges in generating
adequate profits and financial returns compared to traditional LPG marketing and distribution companies
serving the same market segments, or may have to price significantly higher (per kg) on average to recover
the added technology cost, thus reducing the size of the market they can serve.
To recover the added cost of the smart valve over a reasonable time period, there are two main
approaches, both of which are being used:
i. Charge the customer more, in some way. This can be through a subscription fee charged in
addition to the cost of the LPG consumed, or through a surcharge to the LPG fuel cost, or
both. This is possible to do in an LPG market with unregulated pricing, such as Kenya’s.
ii. Extract some level of operational savings by using the telemetry and usage data and
remote-control features of the smartvalves/meters to improve customer service, to
optimize logistics, and possibly to create barriers to piracy. In practice, such operational
benefits have not risen to a level at which, by themselves, they cost-justify the pay-as-you-
go technology.
In lieu of charging more and/or creating operational savings, a pay-as-you-go company can choose to
operate at margins below what is typical in the LPG sector as a whole, in order to remain price-competitive
with “traditional” LPG competitors. This, however, drives down their financial returns, creating a
potentially significant barrier for attracting investment capital, especially given the high risk and high risk
premium associated with Kenyan LPG investment as viewed and expressed by domestic and international
financing sources.
The pay-as-you-go LPG companies, both in Kenya and elsewhere, are making two strategic bets. It is too
early, as of this writing, to judge whether the bets will prove sound and lead to meaningful scale of
consumer adoption and use and to commercial success for at least some competitors. These bets are that:
i. A consumer who starts out as a pay-as-you-go customer of a given company will remain a
customer of that company over the long term. That is, will pay-as-you-go technology serve
an on-ramp to the national LPG system for new users, who eventually transition to the
traditional part of the LPG system (where the price per kg of LPG is lower, but the
transaction size is larger), or will they, mostly, remain pay-as-you-go customers for life?
For companies that seek to create business value from LPG service, this bet may be hedged
by operating a parallel LPG business on the traditional pay-as-you-refill model, so that
customers who transition from pay-as-you-go can remain brand loyal. For companies that
seek to create business value from selling the pay-as-you-go technology to other LPG
companies, the result from this bet will determine whether their market is a narrow, niche
market requiring a continual churn of the newest LPG users to survive, or whether it can
expand to a meaningful share of the total residential LPG market, country by country.
ii. The cost to acquire, deploy and use the pay-as-you-go technologies applicable to LPG will
fall rapidly and significantly with time, increased scale, and growth in smartvalve
production volumes.
Clean Cooking for Africa National Feasibility Study: LPG for Clean Cooking in Kenya
170
The results of a financial modelling of a notional pay-as-you-go LPG company are presented at the end of
Chapter 16 (Investments at the Firm Level), in the section Pay-as-you-go Marketers beginning on page 150,
which takes into account such firms’ increased asset intensity and various other business model
adaptations and cost and margin structure adjustments inherent to the pay-as-you-go approach.
This modelling has been done on a straw-man basis and therefore does not represent actual company
results or prospects. However, it is indicative of the core economic issue that determines whether pay-as-
you-go LPG companies will be massively scalable and bankable for the long term in an LPG market with
many established LPG players of size. The issue is a simple one: the financial returns from a pay-as-you-go
LPG company that seeks to, or is forced to, be price-competitive with “traditional” LPG companies are much
much lower – well below prevailing market rates for capital. Such pay-as-you-go LPG companies, under all
foreseeable margin and cost scenarios, can therefore scale up only with a very significant portion of their
capital from highly concessional sources.
Clean Cooking for Africa National Feasibility Study: LPG for Clean Cooking in Kenya
171
19. Investment Plan Overview
Distinct from other Clean Cooking for Africa partner countries assessed to date, in Kenya there is no
national LPG Master Plan to guide and to aggregate the critical-path investment projects across both public
and private sector. Therefore, the Clean Cooking for Africa/GLPGP expert team took the approach of
identifying and assessing funding needs among individual firms willing to engage in business planning and
financing discussions, and then approaching possible funding sources, in order to identify structures
attractive to both a critical mass of funding sources and to the operating companies.
The three greatest barriers to scale-up investment have been the following:
1. Illegal (pirate) refilling of cylinders in a black/gray market, as described in Part VII;
2. Limited access to financing by private sector Marketers for LPG cylinders at a scale and
a pace that would allow unmet residential demand to be fully served; and
3. Unintended consequences of the Cylinder Exchange Pool, leading to a significant
volume stranded off-market cylinders and severe financial distress for certain
Marketers.
The first—black market/pirate filling—must be solved through (i) LPG regulatory reform, which has taken an
important step forward with the enactment of LN 121 but must progress further, and (i) effective, ongoing
enforcement, which is uncertain and, therefore, a major risk.
Government action is thus highly important.
It should be noted that certain LPG smartmeter systems being piloted in Kenya have been designed and are
utilized in ways to create, in principle, a technological barrier to certain forms of piracy, but the extent to
which this barrier will be effective at scale is not known. Use of smartmeters also aggravates significantly
the issue of accessing financing, as described later in this Part.)
The second—access to financing—can be addressed in significant part through the use of financial
structuring options that solve or mitigate structural and other barriers that have kept LPG Marketers and
funding sources from attracting one another and consummating transactions.
The third—the unintended effects of the Cylinder Exchange Pool—has been substantially addressed
through the recently enacted regulatory reforms of LN 121.
Stimulating additional demand
Findings from the demand analysis regarding price sensitivity, plus preliminary evidence from LPG
microfinance and from the Mwananchi Gas Project, indicate that additional demand can be stimulated by
affordability measures for the LPG equipment and for LPG fuel. Because the Government has had a policy
of no direct, market-wide subsidy on hydrocarbon products, its interventions have been focused on
eliminating VAT on LPG fuel and on discounting LPG equipment via the Mwananchi Gas Project.
Additional measures, such LPG microfinance, use of mobile micropayments, and consumer education and
sensitization programs that stimulate demand by addressing consumer concerns, ignorance,
misperceptions and misunderstandings about LPG and its benefits, could all unlock additional demand.

Clean Cooking for Africa National Feasibility Study: LPG for Clean Cooking in Kenya
172
While it was beyond the scope of this report to define these demand-side interventions in detail, further
research and technical assistance could be appropriate to support the design and roll-out of such
consumer-focused initiatives and to assist the Mwananchi project to refocus, relaunch and succeed at a
justifiable scale.
Critical path of financing steps
Because the Government is pursuing and funding its own solution for LPG expansion in the form of the
Mwananchi Gas Project carried out by NOCK, and because there is no overall LPG Master Plan to guide and
support development of the entirety of the LPG sector, financing for the significantly larger private sector
side of the LPG supply chain expansion must be approached through engagement with selected individual
LPG Marketers. The key financing steps for this group are:
1. Assess the appropriateness and viability of candidate Marketers and their expansion plans on
the basis of their operating economics, balance sheet strength, management capability,
competitive positioning, geographic footprint (current and planned), safety record regarding
cylinders, brand value, operating model (especially with respect to defense against pirate
refillers), pricing power, cost structure, cash flow resiliency, maximum sustainable growth rate,
overall transparency and governance, and other relevant factors;
2. Select the appropriate funding structure(s) to optimize access to Funders at the most attractive
overall terms for these private sector companies;
3. Identify the leading Funders which can “crowd in” others;
4. Strengthen the “bankability” of the financing with sufficiently strong backstops such as
guarantees and risk mitigation tools; and, in parallel,
5. Obtain support and/or approvals as required from relevant ministries and agencies, as
applicable, regarding the chosen structuring and financing path and vehicles.
The foregoing steps have been initiated by the Clean Cooking for Africa/GLPGP expert team on an
exploratory basis with five LPG Marketers willing to engage on a confidential basis and with an array of
prospective Kenyan and international Funders (including amongst these Kenya Commercial Bank, Ecobank,
Barclays, and others) to ascertain, on a preliminary basis, the potential for transactions to be achieved.
Inevitably, no set of Funders can ultimately be engaged in depth until specific, concrete business plans are
completed to an adequate level by the specific recipients for the associated funding (that is, by the private
sector companies or consortia for each major expansion of an existing cylinder-based LPG business). Even
when an intermediary funding vehicle is established and used, the underlying soundness of the Marketers
as recipients of capital and executors of business expansion plans is critical for any transactions with
Funders to be executed.
Financing and investment rounds
The practice in Kenya of charging consumers a cylinder deposit fee greater than the cost of the cylinder
means that, once a Marketer has enough capital to deploy a significant initial quantity of cylinders into the
market to launch a growth strategy, the cylinder deposits can be recycled into the acquisition of follow on
rounds of equal or lesser quantities of cylinders in a self-sustaining cycle. The cycle ends or breaks only

Clean Cooking for Africa National Feasibility Study: LPG for Clean Cooking in Kenya
173
under certain circumstances, which can include (i) saturation of consumer demand for cylinders, (ii) a
sudden large-scale wave of customer cancellations of service, requiring the Marketer to repay the deposits,
or (iii) the need for the Marketer to satisfy a major financial obligation, such as a balloon payment on long
term debt that cannot otherwise be refinanced, which requires repurposing cylinder deposit funds on hand
for that purpose.
Accordingly, investment in major additions to the national cylinder inventory requires an initial, catalytic
financing round to initiate this cycle. (This is discussed in more detail in the following section.) Thereafter,
as long as the rate of growth is kept steady and cylinder costs and deposit amounts remain stable, firms can
use their cylinder deposits to finance ongoing growth until the cycle can no longer perpetuate itself.
An initial five Marketers, together representing 17% of current residential LPG sales in Kenya by volume,
have expressed interest in participating in such a financing round.
Potentially, additional Marketers could be added to the round, or could be considered for a follow-on round
at a later time. (It is also possible that participating Funders would determine, upon due diligence, that one
or more of the interested Marketers should not be part of the initial investing portfolio.) Marketers
involved in the initial round could also present plans in later years for a follow-on round to fund
acceleration of their growth rates beyond what the stream of cylinder deposits would support. Funders
could take into account regarding any follow-on round(s) the results achieved from the initial round and the
progress made by the Government (and industry) in suppressing black market activities and improving the
enabling environment overall.
The following table summarizes the financing needs:
Table 41. Overall target capitalization of LPG investment projects
(€ million)
To serve all
projected demand (lower bound case)
To fund composite business plan of
initial 5 Marketers
Total Cylinders (Gross Investment) 106.6 € 40.8 €
Notional Funding by Reusing Cylinder Deposits113
93.2 € 35.7 €
Potential Net Capital Investment (Floor) 13.4 € 5.1 €
Summary of assets requiring financing
The GLPGP.Clean Cooking for Africa expert team, upon detailed discussions with Kenyan governmental
agencies, domestic LPG sector leaders, and domestic and international financial sector entities, identified
the following € 112 million of capital expenditures over the 2019-30 period114 to serve the projected
demand potential (lower-bound case):
113 Assuming zero piracy losses.
114 Practically, the first year for the investments described in this Part may shift to 2020 from 2019. Such a shift does not
materially affect the financial characteristics of the investments in the underlying financial models.
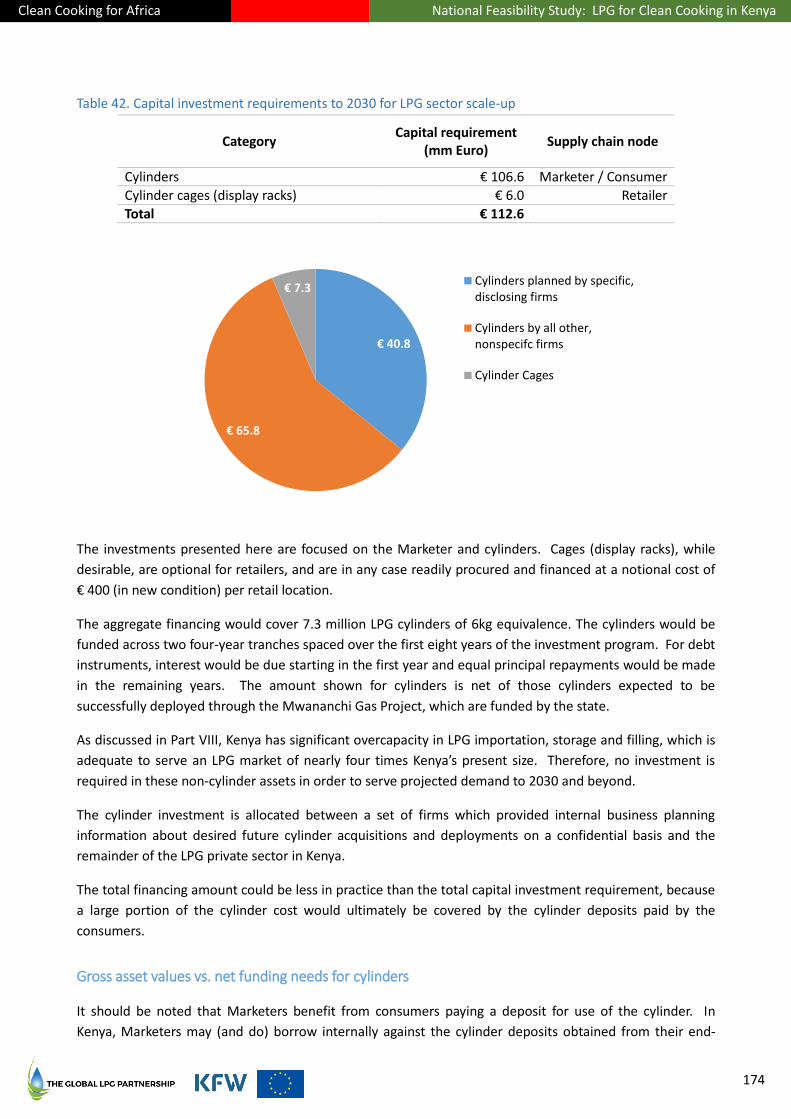
Clean Cooking for Africa National Feasibility Study: LPG for Clean Cooking in Kenya
174
Table 42. Capital investment requirements to 2030 for LPG sector scale-up
Category Capital requirement
(mm Euro) Supply chain node
Cylinders € 106.6 Marketer / Consumer
Cylinder cages (display racks) € 6.0 Retailer
Total € 112.6
The investments presented here are focused on the Marketer and cylinders. Cages (display racks), while
desirable, are optional for retailers, and are in any case readily procured and financed at a notional cost of
€ 400 (in new condition) per retail location.
The aggregate financing would cover 7.3 million LPG cylinders of 6kg equivalence. The cylinders would be
funded across two four-year tranches spaced over the first eight years of the investment program. For debt
instruments, interest would be due starting in the first year and equal principal repayments would be made
in the remaining years. The amount shown for cylinders is net of those cylinders expected to be
successfully deployed through the Mwananchi Gas Project, which are funded by the state.
As discussed in Part VIII, Kenya has significant overcapacity in LPG importation, storage and filling, which is
adequate to serve an LPG market of nearly four times Kenya’s present size. Therefore, no investment is
required in these non-cylinder assets in order to serve projected demand to 2030 and beyond.
The cylinder investment is allocated between a set of firms which provided internal business planning
information about desired future cylinder acquisitions and deployments on a confidential basis and the
remainder of the LPG private sector in Kenya.
The total financing amount could be less in practice than the total capital investment requirement, because
a large portion of the cylinder cost would ultimately be covered by the cylinder deposits paid by the
consumers.
Gross asset values vs. net funding needs for cylinders
It should be noted that Marketers benefit from consumers paying a deposit for use of the cylinder. In
Kenya, Marketers may (and do) borrow internally against the cylinder deposits obtained from their end-
€ 40.8
€ 65.8
€ 7.3 Cylinders planned by specific,disclosing firms
Cylinders by all other,nonspecifc firms
Cylinder Cages
Clean Cooking for Africa National Feasibility Study: LPG for Clean Cooking in Kenya
175
customers. There is no legal or regulatory limit on the amount the consumer is charged for a cylinder
deposit. In practice, most Marketers charge slightly above 100% of their cost to acquire the cylinder. The
funds provided by the customer are to be returned to the customer when s/he cancels service and returns
the cylinder to the Marketer. The Marketer should treat these funds on its books as a liability of the
Marketer to the depositor, although this is not uniformly done (particularly, some smaller firms improperly
treat the cylinder as a cost of goods sold). The internal reuse of these deposit funds makes the consumer,
in effect, the major financing source for Marketers. As presented in the Table 41 above, this effect causes
the net amount needed by Marketers for financing of new cylinders to approach zero. The actual
percentage will depend on the timing of cylinder acquisition vs. deposit collection, the rate of cylinder
inventory growth year over year, deposit liability reserve levels, cylinder losses and scrap rates, and other
factors, and is not possible to determine in advance.
However, the Marketers disclosing business planning and financial information for this analysis uniformly
indicated that access to working capital finance at the desired scale is highly problematic. If they could
obtain it (and on reasonable terms), the Marketers could roll over their cylinder financing every 3-6 months
using received cylinder deposit funds, once the needed initial working capital quantum is obtained. In this
way, they could expand their residential cylinder inventory and customer base steadily year over year
without any need to increase their level of financing (or credit) after the first year. (The financing situation
is different for Marketers that must invest in additional filling plant and storage capacity; this capital-
recycling approach applies solely to cylinder financing.)
This cycle could collapse if working capital could not be re-borrowed or if there were a sudden mass return
of cylinders by customers demanding their deposits back, as might occur after a major national safety
incident involving that Marketer’s brand.
Unfortunately for these Marketers, arranging working capital finance that fully funds an ongoing cycle of
major cylinder inventory expansion has been generally unsuccessful. Therefore, an alternative structuring
approach has been required, described in this Chapter.
In this report, the sector-level investment focus (Chapter 15) has been on the total asset values for
investment, and the firm-level focus (Chapter 16) on the net financing need of individual modalities.
Financial structuring and arranging approach
Kenya could utilize some of the same investment structures as other Clean Cooking for Africa Program
partner countries, albeit in a different priority that reflects Kenya’s different conditions.
To fund the cylinder investments, in an ideal (and hypothetical) case, each Marketer would obtain short-
term working capital loans to fund new cylinder inventory, repaying them with the cylinder deposits
obtained from consumers. This would be workable in Kenya, in theory, because the amount of the cylinder
deposit exceeds the cost to acquire the cylinder, and because the deposit is typically possible to receive, on
average, within 90 days of deploying the cylinder in the market.
However, because Marketers have reported that it is prohibitively difficult to arrange such financing in
practice, both with respect to access and to the financial terms, the alternative which both the prospective
modalities and the prospective international and domestic institutional funders (Funders) found workable
and potentially attractive was to provide the required cylinder inventory capital via longer-term
instruments; that is, as structural capital rather than as working capital.

Clean Cooking for Africa National Feasibility Study: LPG for Clean Cooking in Kenya
176
This approach “primes this pump”: the Marketers use the infusion of new capital to acquire a large step-
up quantity of cylinders and then recycle the resulting consumers deposit funds into the acquisition of yet
more cylinders, which, in turn, generate yet more deposits. Ideally, the operating cash flows from the
ongoing refilling of these cylinders allow the Marketer to repay the long-term debt in full within the loan
tenor, while generating adequate returns to equity. If operating cash flows prove insufficient, then the
structural debt that remains outstanding at the end of the loan period must be paid off with current-period
cylinder deposits (by not reinvesting them in new cylinders), or must be refinanced, or a combination.
To facilitate investing via such instruments, given especially that the total quantum of capital from funding
sources would likely be subdivided into investments (loans) made to many different modalities, it was
recommended to create a dedicated LPG financing vehicle for the purpose. Four types of financing vehicle
were considered to be potentially workable by Funders having potential interest in the LPG sector. These
are described in detail later in this Chapter.
Which vehicles and structures would ultimately be used to fund the various investments and would be
determined only after detailed discussion and negotiation of specific transactions with the Funders.
Important drivers in choosing among alternatives for financing the investments
Important requisites for choosing financing approaches and sources include:
1. Kenya’s targeted LPG-related funding needs should be well defined.
2. Adequate precedents: For example, Proto Energy Ltd. is backed by a major international private
equity firm, Emerging Capital Partners.
3. The funded entities or modalities among the Marketers behind the ultimate repayment
responsibilities should be able to demonstrate “bankability”.
4. The debt and equity (or other instruments) should reflect the blended capital that is most efficient,
to achieve the costs and structural terms most suited for the Kenyan LPG operators’ repayment
capabilities.
5. The risk and return needs (financial, liability management, etc.) of the Funders have to be factored
into the instruments for best success potential to be able to close with the Funders.
6. Attracting the participation of meaningful internal sources is a means to “crowd in” external
funding sources by providing a vote of confidence.
7. Operational cash flow predictability and managerial, operational and financial transparency should
be established to encourage faster and more positive responses from Funders.
8. There should be built-in risk mitigation: Escrow accounts, liquidity, governance by outside parties
(trustee agents such as banks and industry auditors) to monitor economic flows.
9. Respected, professional, and sector-experienced management for the funding vehicles is necessary.
Clean Cooking for Africa National Feasibility Study: LPG for Clean Cooking in Kenya
177
Funders’ issues to be addressed in funding the investments
The recommended approach for mobilizing funding, guarantees, and risk mitigation options is initially to
focus on sizable sources, as “leaders,” in building the capital and risk mitigation layers and “crowd in” other
Funders. This entails engaging both Kenyan and non-Kenyan sources. Ideally the approach will enable the
entities in the target markets to mobilize funding to build out the LPG cylinder inventory, and use
commercial and concessional capital (Blended Capital) to yield, in hard currency, an overall target debt
interest rate of just over 10% (which includes a market-based risk premium associated with long-term
regulatory enforcement uncertainty of LN 121 (2018)), and a target equity internal rate of return (IRR) of
around 20%. These rates are consistent with what capital providers to top-ranked investments are currently
realizing in target Sub-Saharan African markets and with an available recent Kenyan benchmark of
discussion between a private sector Marketer for cylinder financing with an international capital provider.
Key Funder issues to be considered include:
1. In building the specific capitalization mix from blended finance sources, one must be aware of the
particular characteristics of the targeted Funders, and take these into consideration. These include
but are not limited to:
a) Funders’ Own Liability and Fiduciary Requirements: Requirements for repaying or meeting
their funds sources’ repayment requirements. Pensions and insurance companies need to
match the weekly, monthly or other payment requirements of their clientele.
b) Other Competing Investment Opportunities: The range of structures and the risk-adjusted
returns being offered is considerable.
The opportunity cost of taking on an LPG-related investment versus other investments available
must be addressed. LPG-related investments are competing for domestic funds against government
securities and also other high-quality fixed income instruments.
2. For any of these LPG financing structures to be attractive, the funding vehicles must at a minimum
be able to attract investors with the correct blend of risk-adjusted prices, equity comparable
returns (meaning high and predictable cash flow), credit comfort (if debt or debt-like), and
maturities at least as attractive as those of comparable opportunities.
3. For the portion of the Kenya LPG sector development funded by such entities, the options must be
suited to take advantage of the structural expectations and realities in Kenya’s capital markets and
among foreign investors active in, or interested in entering, Kenya.
4. The Clean Cooking for Africa/GLPGP finance team determined from its face-to-face discussions and
market research with leading Kenyan and international investment groups and banks that there is a
preference for debt or fixed income-linked investment securities over equities (for reasons of
predictability of returns, transparency, and current income).
5. Local investors consistently express a preference for the relative transparency of debt and royalty-
linked instruments over traditional equity, with such instruments viewed as less problematic
(“fewer hassles”) and more predictable in their results and characteristics.
6. Given the industry-specific detail that must be mastered for effective assessment and due diligence
of LPG sector modalities, and given the relative small transaction sizes and relative high
Clean Cooking for Africa National Feasibility Study: LPG for Clean Cooking in Kenya
178
management time commitments for making an individual investment into any one modality,
grouping similar modalities (such as through an SPV or other aggregating structure) could facilitate
the deployment of capital into the LPG sector.
Recipient issues to be addressed
1. Local companies consistently express a preference for debt and royalty-linked instruments over
traditional equity because of concerns about potential change of control.
2. Where Sharia finance is applicable, royalty-based instruments may be the best compliant solution.
3. Local companies are willing to have investment vehicles act as intermediaries for Funders’ capital if
doing so improves access to capital and the terms of that capital.
Funder-recipient matching strategies: Top-down and bottom-up methodologies
The matching strategy requires identifying the availability and types of capital and risk mitigation sources
open to specific LPG initiatives. The investments and associated funding possibilities were examined
bottom-up and top-down for that purpose, as follows:
Bottom up
From the bottom up, the matching strategy begins with designing the LPG offerings, structured through
appropriate SPV’s, direct and project financing, pass-through investment vehicles, appropriate equity/debt
funds, etc., as described later in this Chapter. The offering design is intended to ensure that the quantum of
needed funding can be met. The strategy then includes determining, through modelling and sensitivity
analysis, the ability of the modalities (Marketers, etc.), to afford such capital, when/if accessible.
In doing this, it was desirable to attempt to assess the “fundability/bankability” of the LPG modalities, using
the multiple scalable entities as a benchmark. The analysis includes the ability of the targeted LPG entities
to accommodate these Funders’ requirements, as determined from initial discussions with various Funders
and research of Funders’ other investment and funding activities. By “to accommodate”, what is meant is to
satisfy the cost of funding, repayment terms and other structural terms, collateral and covenant
requirements that may be required, etc. One example is debt to equity (or other project value). In such an
instance, Funders may require 25% to 50% equity contribution relative to the funding debt value of the
underlying investment. The revenues, profits or cash flows of the initially targeted Kenyan entities must be
able to meet the equity return hurdle rates required by those Funders, and the interest and repayment
terms of debt.
Top down
From the top down, the analysis, conclusions and recommendations take into account the levels of local
funding activity from both private and public sources, and also those from the foreign (private and official
capital) flows that have been disclosed as flowing into Kenya. Macro-financing-related trends that both
influence and are results of the availability and pricing of domestic and foreign capital sources for Kenya
were evaluated. The findings are then translated as benchmarks for the LPG sector overall.

Clean Cooking for Africa National Feasibility Study: LPG for Clean Cooking in Kenya
179
Key factors for Funder-recipient matching
The key factors in assessing the availability of suitable capital providers for LPG-related operators in Kenya
included:
1. Size of potential commitments available;
2. Pricing (interest rates or fee structures);
3. Maturity options;
4. Amortization options;
5. Covenant flexibility;
6. Creativity of the structures offered in order to accommodate the realities of the businesses that
might borrow or seeking investment from the entities identified by the Team;
7. Risks of default based on the underlying borrowers’ profiles, so as not to overburden a company
with the wrong capital size, pricing, covenants or other features; and
8. Ability to ensure that the LPG sector’s leading candidates for successful financings and execution
are the first recipients of capital, such that the risk of default contagion impacting the “bankability”
of others in future is reduced.
Given existing trends in the Kenyan debt markets, it is expected that the blended costs of debt to Kenyan
LPG Marketers will be at least 8% concessional and 10% to 13% non-concessional for cylinder-related
funding (based on pricing trends conveyed by representative Funders). For the investment analysis, it was
assumed that the blended interest rate on debt could be approximately 10.2%, especially if guarantees can
be added. This said, the findings from discussions held with numerous actual debt funds active throughout
Africa were that they typically seek a range of 12% to 18% total return on structured debt. On equity,
Kenyan LPG companies would have to meet the typical 20% equity (or quasi-equity) returns targeted by
these Funders.
The conclusion, based on the sensitivity analysis conducted in Chapter 16, shows that, with debt to equity
ratios ranging from 50% debt/50% equity and up to 100% debt, representative LPG operating entities for
receipt of blended capital would be able to generate adequate cash flows to service both interest expense
of approximately 10.2% per annum minimum and an equity internal rate of return of at least 20% over the
life of the capitalization under a stable future outlook for LPG business performance.
For cylinder funding, debt or debt with equity links is the main targeted funding, so that operators are able
to meet the debt returns firstly. Equity is largely being provided by the operators themselves, or through
friends-and-family investment networks.
Potential for attracting Funders
Despite the unique risks associated with the Kenya LPG sector (discussed in the next Chapter), Kenyan LPG
companies are shown through the earlier Chapter’s analysis to have an opportunity to successfully attract
the needed funding and risk mitigation tools to expand their scale of service through accelerated
investment in residential cylinder inventory. This is due, in part, to Kenya being a leading investment

Clean Cooking for Africa National Feasibility Study: LPG for Clean Cooking in Kenya
180
destination for major concessional and non-concessional institutional capital that is aimed at African
opportunities.
These capital flows have been led by DFI-backed investment funds.
In addition, the local capital markets have numerous institutions that can be encouraged to co-fund along-
side these larger international Funders.
DFIs, IFIs, MDBs, and international institutional investors active in Kenyan opportunities range from
publicly-listed investments to direct private debt and equity. MDBs, such as the IBRD, IDA, AfDB, AsDB,
EBRD and IADB, had committed exposures of US $97.1 billion in 2018. European DFIs, such as BIO, CDC,
COFIDES, DEG, FINNFUND, FMO, IFU, Norfund, OeEB, PROPARCO, SBI, Sifern, SIMEST, SOFID, and
SWEDFUND committed US $19.6 billion as of 2017, and OPIC a further US $23.2 billion. IFIs contributed
additional funds.
These quanta indicate that substantial capital is available for the right opportunities, when they are well
planned, well structured, well packaged, and well presented.
Opportunity specifics
As described in Chapter 16 (beginning on page 141), five participating LPG Marketers currently representing
about 17% of the residential LPG market by volume, could support in aggregate approximately € 45 million
in debt financing, with a blended interest rate target of 10.2% based on a mix of 53% concessional and 47%
non-concessional debt. The spread to sovereign is 280bps, based on a recent benchmark quotation from
an international non-concessional Funder within this company group.
If DFI-linked guarantees can be employed, the funding costs could come down relative to the benchmark
spread.
On a composite basis, the five firms have adequate financial strength to absorb, utilize, cover and repay this
debt while expanding at a rate in excess of the overall rate of growth of the LPG sector, even under overall
conditions of improved LPG availability and affordability.
A possible challenge is that limiting investment to a portfolio of companies representing just 17% of the
market may be too small a transaction for some Funders.
Key characteristics of the analyzed entities include:
1. Aggregate market share of 17%;
2. Geographic coverage of diverse counties in Kenya, both urban and rural;
3. Demonstrated histories of profitable growth;
4. Expansion plans have been developed in anticipation of implementation by year-end 2019 of the
reformed LN 121 (2018);
5. Each is approximately comparable to, or greater in size than (so far), Proto Energy Ltd. (see The
Proto Energy case on page 187);

Clean Cooking for Africa National Feasibility Study: LPG for Clean Cooking in Kenya
181
6. Combined sales would grow to € 132 million (in the lower-bound demand projection case) as of
2030;
7. Corresponding cumulative EBITDA to 2030 would be € 25 million;
8. In aggregate their plans involve acquisition and deployment of 2.7 million 6kge cylinders,
comparable to the current ambition of the Mwananchi Gas Project (but with a net yield of nearly
100%, vs. 25% in the initial phase of the Mwananchi project); the total capital required for these
cylinders, before consumer deposits, is about € 41 million.
The analysis and modelling performed indicate that these firms could cover and repay interest and debt if
transactions are constructed to accommodate the cashflows needs of Funders (as well as the firms).
Beyond the five specific cases
To the extent financing for cylinder investment in these firms, in aggregate or in large part, can be
structured and executed, it creates the possibility to crowd-in additional Kenyan firms, with the potential to
include a majority or supermajority of the LPG sector over time, once competitors see the advantages of
participation gained by the initial grouping. Expansion of the total size of the financing over time would
also support expansion/renewal of initial investors’ exposures and/or crowding in of additional investors,
provided initial grouping produces acceptable results and the quality of the companies added for the
expansion phase remains similar to the quality of the initial grouping.
Additionally, consolidation among participating firms could be encouraged where operating synergies
and/or complementary market segments or distribution networks exist, in order to improve financial
performance, resiliency, and bankability.
Main structuring options
Based on discussions with leading Kenyan financial sector players, the assets and collateral of Marketers are
as important, or nearly so, as cash flows to the credit committees. Structuring must therefore take these
interests duly into account. Findings and indications from these discussions, together with analysis and
modelling of the cylinder investment plans and proposals of willing Kenyan LPG Marketers, recommends a
multi-tiered funding approach.
Factors including the probability of future demand being realized, regulatory risks, and various financial and
economic risks, must be addressed through a combination of structure, investment and lending terms,
guarantees, and other risk mitigation tools including the potential for a portfolio approach to loans and
investments by aggregating financing across a set of competitors.
Funders in general expressed interest to put money to work in the LPG sector in Kenya while, at the same
time, expressing concern and questions about how their money could be protected, such as through ring-
fencing for cylinder financing and cash flows generated by such financing. Cylinders, as a form of collateral,
are not given the same weight as fixed plant and equipment, or as inventory that is sold once and never
returned, because cylinders are both a mobile asset spending most of their lives with consumers or
distributors, and an asset that generates profit on a recurring basis (through refills) over a long useful life of
potentially 20 years or more.
Clean Cooking for Africa National Feasibility Study: LPG for Clean Cooking in Kenya
182
A ring-fencing mechanism of interest to the Funders is the creation of escrow mechanisms that repay them
regularly and frequently from the funds received by Marketers from consumer cylinder deposits. In Kenya,
distinctly from the practice (or the law) in many other SSA countries, it is a near-universal practice for the
consumer to pay a deposit value to obtain his/her first cylinder that includes a premium above the
Marketer’s cost to acquire the cylinder.
A deposit-driven cash flow waterfall of this sort creates improved predictability for Funders and has
financial characteristics that match other investment/financial products and projects with which they are
familiar and with which they have longstanding experience.
Wrapping such a mechanism in an SPV can both (i) increase bankability for interested banks, pensions,
insurance companies, mutual funds and specialized funds, by imposing standards for transparency,
accountability, controls, and procedures across the modalities, and by creating portfolio effects among
them, and (ii) provide a workaround to the CBK rate cap affecting direct loans to businesses.
Improving bankability could (and should) also entail use guarantees from DFIs or from affiliates or partners
of DFIs. As examples from other Clean Cooking for Africa partner countries, GuarantCo guaranteed 75% of
the credit, on behalf of pension funds and other investors, in connection with a bond listing by the Ghana
LPG storage company Quantum Terminals Group on the London Stock Exchange. In Cameroon, there are
similar, if smaller, examples of DFI guarantees used to credit-enhance private sector-funded projects.
Importantly, the cylinder financing need in Kenya is spread over multiple years (in this report, eight years
are modelled), allowing Funders to phase in their investments/funding over time if they choose. This
means that Funders may be able to roll over LPG loan exposures into a second tranche once the first
tranche is repaid. If the first tranche performs adequately, they may choose to increase their exposure in
the follow-on tranche. For example, a pension fund might buy into a four-year tranche to limit its time
exposure, while a DFI with a longer horizon might provide and hold debt for a substantially longer period.
The conclusion based on the aforesaid discussions is that it is probable that the required € 107 million of
blended capital could be mobilized internationally and locally and deployed, via one or more properly-
structured SPVs, into qualified Kenya private sector LPG companies.
It should be noted that the portion of the € 107 million anticipated to be deployable through the five
participating private sector LPG companies detailed Part VIII, based on their composite business expansion
plans, is € 40.8 million (through 2026/2027). To the extent the remaining Marketers desire to participate in
the structure as well, it could expand up to a total aggregate transaction size of € 107 million—or more, if
demand proves higher than the lower-bound projection case from Part VI.
In complement to domestic banks, other local investors such as pensions, insurance companies, and mutual
funds seek long term, fixed income investments. These investment feed bond markets and other fixed
income investments that back infrastructure and other national spending initiatives. According to the
World Bank, Kenya’s pension funds in 2016 held assets equal to approximately 13% of GDP.
Four options
The four options discussed below are the likeliest alternatives on the basis of preliminary discussions and
indications of interest from prospective international and Kenyan Funders, and on the basis of discussions
of their characteristics and relative advantages and disadvantages with participating Kenyan LPG
companies, in priority order.

Clean Cooking for Africa National Feasibility Study: LPG for Clean Cooking in Kenya
183
a) LPG (Vertical) SPVs, Listed or Non-listed. Create an SPV for cylinder investment
and lending. As with all four options, this option would depend on enhancement of
the “bankability” of the underlying entities to be funded and de-risked. This option
involves active outside oversight, such as through an escrow agent and specialist115,
and transparent involvement of capital expenditures entities. The level of official
market-based oversight – such as through the Kenya Capital Markets Authority
(CMA), if this SPV were listed, will also impact the level of appeal such a structure
will have to Funders.
b) LPG Non-Bank Financial Institution (NBFI). Create a new NBFI entity which could
finance specific LPG developments (and also could be listed). Kenya has a rich
tradition in NBFIs as well as micro-lending institutions, both mobile (M-Pesa) and
brick-and-mortar. The specific regulations and requirements will require research
beyond the scope of this analysis and report. An NBFI can also have a Sharia-
compliant window to satisfy that constituency within the LPG business community.
The logical initial players are those involved in building out financial inclusion,
innovative finance, capital markets and solutions for private/public sector
financing. GLPGP representatives engaged with Funders such as Equity Bank,
Sterling Bank, Kenya Commercial Bank, and Ecobank for initial dialogues. (Equity
Bank is also working with GLPGP in Kenya on the Bottled Gas for Better Life
microloan program.) Additional foreign financial players should include, but not be
limited to, AfDB, CDC, DBSA, DEG, FMO, IFC, Norfund, OPIC, Proparco (which has
expressed interest to fund when the right funding candidates are put forward) and
Swedfund.
c) Investment Funds (LPG infrastructure Development Fund (LID) and the LPG First
Cost Fund (FCF)). Clean Cooking for Africa/GLPGP could create two Investment
Funds that would act as aggregators and managers of DFI and other institutional
capital from major Funders. The LID Fund would be for the capital expenditures
and growth capital along the LPG supply chain. The concessional-rate FCF Fund
would be for the related SME working capital and microfinance needs. GLPGP has
been exploring the LID Fund with some pan-African fund managers. Because of the
FCF Fund’s mandate to facilitate accessible and affordable finance for SMEs and
consumers, it may be an earlier candidate to design and partner with a local
financial institution, such as Standard Bank, Barclays, EcoBank, or the Commercial
Bank of Kenya. This option is least likely to attract local capital, because local
institutional investors have little current activity in this area, and may having the
longest lead time to implement. However, it offers exposure to many types of
Funder that can only invest via funds, such as family offices, sovereign funds,
international pensions, and others.
d) “SPV-K (Kenya)” Listed. Create a general LPG sector growth SPV. The SPV would
fund the underlying modalities’ growth. Ideally, a portion of the LPG price
structure would be defined and allocated to cover the portion of the capital costs
115 Such as Clean Cooking for Africa/GLPGP
Clean Cooking for Africa National Feasibility Study: LPG for Clean Cooking in Kenya
184
borne by the SPV that the underlying modalities would not repay, thereby lowering
their net investment cost, asset intensity, and requirement for leverage. This would
necessitate pricing action by Government, and would be practical only in
connection with some level of future governmental regulation of LPG prices and/or
margins that does not exist today. DFI and other guarantors, such as the Africa
Guarantee Fund, could be brought in to support it.
These funding mechanisms will appeal to DFIs and IFIs trying to facilitate the broadening of local capital
markets in Kenya and the East African Community, especially if there is potential to attract additional
Kenyan institution capital into the capital stack. Ensuring that the individual commercial entities can be
made into a “bankable” group may be necessary to justify creating an NBFI.
A potential financing role for the Clean Cooking for Africa Program/GLPGP could be to provide the expert
resources to act as technical advisor to the SPV managerial companies, the NBFI and/or the Funds, to help
establish objective outside management and oversight of comfort to both large foreign and some domestic
institutional (debt and equity) providers, as well as risk mitigation sources.
Advantages and disadvantages of the options
In general, the following summarize the main advantages, risks/issues and mitigants for these four options:
Primary Advantages
a) They are potentially appealing to the Government because they facilitate more
domestic and foreign institutional investment into Kenya’ infrastructure and critical
social and business sector development.
b) They will also appeal to DFIs and IFIs who are trying to promote capital flows into
Kenya and emerging markets through innovative financial instruments. AfDB, CDC,
FMO, OPIC, and the IFC are active examples of groups to be approached to back
these instruments in some capacity. This can be through investment in the SPVs,
on-lending or funding the NBFI or parent company, investing as limited partners in
an Investment Fund (debt or equity funds), or providing guarantees. Some of these
groups have indicated their potential interest once the specifics are established
behind how such vehicles might be structured and operated and what entities
would receive the onward-invested or -loaned funds.
c) They can attract a wide range of local institutional investors such as pension funds,
mutual funds, insurance companies, private investment houses and foreign investors.
The Sharia-compliant aspect will be attractive to certain Funders.
d) The precedents for documentation and structuring have been established and
accepted for SPV and corporate related securities issuance and shelf registrations of
debt and equity, bonds, etc. This means that the primary targets among local market
institutional investors and foreign investors are familiar with the concepts involved.
e) They can be used to encourage consolidation among participating modalities, which
is both advantageous for regulatory enforcement (a key risk issue) and, potentially,
for the financial strength and managerial depth of the merged firms.
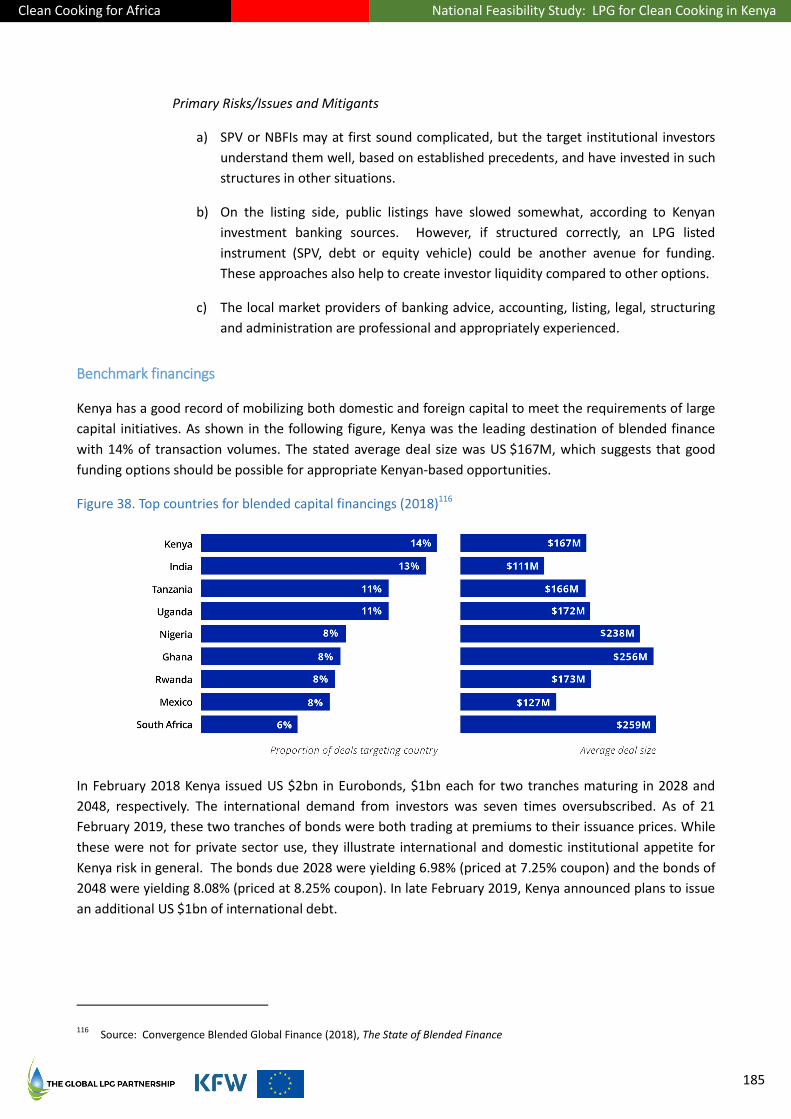
Clean Cooking for Africa National Feasibility Study: LPG for Clean Cooking in Kenya
185
Primary Risks/Issues and Mitigants
a) SPV or NBFIs may at first sound complicated, but the target institutional investors
understand them well, based on established precedents, and have invested in such
structures in other situations.
b) On the listing side, public listings have slowed somewhat, according to Kenyan
investment banking sources. However, if structured correctly, an LPG listed
instrument (SPV, debt or equity vehicle) could be another avenue for funding.
These approaches also help to create investor liquidity compared to other options.
c) The local market providers of banking advice, accounting, listing, legal, structuring
and administration are professional and appropriately experienced.
Benchmark financings
Kenya has a good record of mobilizing both domestic and foreign capital to meet the requirements of large
capital initiatives. As shown in the following figure, Kenya was the leading destination of blended finance
with 14% of transaction volumes. The stated average deal size was US $167M, which suggests that good
funding options should be possible for appropriate Kenyan-based opportunities.
Figure 38. Top countries for blended capital financings (2018)116
In February 2018 Kenya issued US $2bn in Eurobonds, $1bn each for two tranches maturing in 2028 and
2048, respectively. The international demand from investors was seven times oversubscribed. As of 21
February 2019, these two tranches of bonds were both trading at premiums to their issuance prices. While
these were not for private sector use, they illustrate international and domestic institutional appetite for
Kenya risk in general. The bonds due 2028 were yielding 6.98% (priced at 7.25% coupon) and the bonds of
2048 were yielding 8.08% (priced at 8.25% coupon). In late February 2019, Kenya announced plans to issue
an additional US $1bn of international debt.
116 Source: Convergence Blended Global Finance (2018), The State of Blended Finance
Clean Cooking for Africa National Feasibility Study: LPG for Clean Cooking in Kenya
186
The investors in the two issuances were analyzed to determine which might be suitable Funders for LPG
SPVs. In practice, the most suitable Funders will likely be DFIs, IFIs, certain private investment funds, banks
and local pension funds, based on the smaller scale of the LPG funding need.
In addition, major banks from outside Kenya involved in Blended Capital finance could be approached to
place debt into appropriately structured SVPs. For their local bank affiliates, such as Barclays or Standard
Bank, an SPV could prove an attractive lending pass-through option, because the banks would be investing
in a vehicle that yields a higher return than they could obtain otherwise directly. This is because, per the
September 2016 Central Bank of Kenya (CBK) mandated interest rate caps for lending domestically, ordinary
loans are capped at 4% above the CBK’s reference rate (CBR). When this law went into place, CBR was
10.5% for local funds, translating into a 14.5% lending cap. Today the cap approximates 13%, according to
local sources.
According to the IMF, World Bank, and other research sources interviewed by the Clean Cooking for
Africa/GLPGP expert team, banks are holding back on lending in Kenya because of these caps and are
instead placing their liquidity into “safe havens” like Kenyan treasury securities. According to research from
Ecobank, “1.3bn of commercial bank liquidity went into Treasury-issued risk-free debt (Treasury bills and
bonds), while the pace of onboarding real risks remained soft. The share of Treasury-issued debt securities,
as a proportion of asset book, grew from 26% in 4Q 2017 to 28% as of 2Q 2018.” According to a third
quarter 2018 analysis by Debtwire, before the introduction of the cap, loans had grown 21% year on year
through 2015. After the cap, loans grew by less than 7% year on year.
An SPV offering a yield above Treasury securities, potentially with guarantees from DFIs, should be
attractive to bank treasury officers and departments. This is an important consideration for the Funders for
structuring options for financing the cylinder investments.
Other benchmarks
Other helpful precedents emerged from discussions with, and research into, the largest and most
accommodative mix of blended capital from pivotal funding groups like DFIs, IFIs and MDBs as leads,
coupled with risk mitigation through face-to-face discussions, phone calls, and research. These include
identification and discussions of activities in the Kenyan markets or in other emerging markets that could
be instructive. Examples include:
1. The investment in Proto Energy Ltd. by Emerging Capital Partners (ECP), itself a private equity
investor funded in part by DFIs such as Proparco, DEG, AfDB, and OPIC.
2. New international institutional investment contemplated for one or more Kenyan LPG companies
to fund growth, about which indicative terms were obtained on a confidential basis for
benchmarking purposes. These served to confirm international Funder interest in providing capital
to Kenyan LPG Marketers, taking full account of the risks described in the next Chapter, and to
benchmark cost-of-funds assumptions used in the firm-level financial modelling of Chapter 16.
The logic for targeting marquee leaders in the blended capital and risk mitigation mix is that they will
enable mobilizing scale, and then serve as the catalyst for followers who ideally could lower the overall
blended cost of funding, be patient capital, and be well matched to the potential repayment abilities of the
LPG supply chain players that underlie the cash flows of the funding mechanisms (SPVs, NBFI, Investment
Funds etc.).

Clean Cooking for Africa National Feasibility Study: LPG for Clean Cooking in Kenya
187
This lead Funder approach is similar to typical syndicate and other “book-building efforts” in project finance
and other finance efforts. Analysis has led GLPGP to conclude that the financial markets of Kenya have
substantial options and a history of working effectively with outside capital providers.
A key question for Kenyan LPG is the extent to which concessional capital sources are critical to crowd-in
market-rate capital sources. Based on discussions held with prospective market-rate Funders, the answer
from their perspective tends to yes: Kenya LPG represents a high-risk situation, despite the buying-in of
early movers like ECP. The presence of development Funders provides an important level of comfort during
the near and medium term, when the success of Kenyan LPG legal and regulatory reforms and the
persistence and effectiveness of necessary enforcement actions are not yet clear.
As mentioned previously, investment at the present stage of LPG market maturity must be considered
tactically, with an appropriate portfolio strategy, in order to gain preliminary exposure, develop learnings,
test investment theses, and push the overall market, through a coalition (portfolio) of willing modalities,
toward effective business expansion with improved sector structure and improved sector behaviors overall.
The Proto Energy case
A direct example of the Kenya LPG sector tapping into investor desire to blend domestic and foreign capital
sources in the energy and infrastructure sectors is Kenyan LPG operator Proto Energy Ltd. (Proto). Proto
has been financed in part by the multi-billion-dollar African-focused and DFI-backed private equity firm
Emerging Capital Partners (ECP), based in Nairobi and headquartered in Washington, DC, USA. It is
reasonable to assume that a sponsor like ECP could raise side debt or related capital at attractive interest
rates and terms from its original DFI backers, to facilitate a lower cost of capital to future phases of an LPG
expansion project.
As an example of this approach, ECP did so for its African cellular telephone tower company, IHS Towers,
one of the largest mobile telecom infrastructure companies in Africa. For IHS, ECP led the syndication of
hundreds of millions of dollars, with capital sources from groups including the IFC, DFIs, regional and
international banks, and other private debt and equity investors.
The relevance to LPG in Kenya (and elsewhere) is that a group like ECP, that is involved with LPG in Kenya
through it Proto investment, has the ability to attract both major foreign commercial, impact, or non-
commercial (domestic and foreign) capital into the mix of financing for LPG development if the right
investment conditions—financial outlook as well as operating conditions—can be achieved. Such conditions
are also sufficiently attractive to interest local banks. Smaller players in LPG could conceivably attract local
bank financing interest with suitable guarantee structures arranged.
Because ECP has already backed a particular LPG competitor in Kenya, the Clean Cooking for Africa/GLPGP
team did not pursue deeper dialogue with ECP regarding other LPG Marketers desiring financing for
business expansion.

Clean Cooking for Africa National Feasibility Study: LPG for Clean Cooking in Kenya
188
Main characteristics of the recommended cylinder investment structure
Creation of SPV
An appropriate legal entity would be established in Kenya (SPV-K).117 SPV-K would like be a private limited
company, and not seen as a banking institution. SPV-K would pool the cylinder acquisitions of the
participating modalities to buy cylinder assets from manufacturers (domestic or foreign as appropriate) on
best possible terms. It would work with the Funders, Marketers, other relevant Kenyan companies, and
with state-owned enterprises (SOEs) where appropriate. The duration of the SPV would be according to the
mutual interest of the parties.
Across the Clean Cooking for Africa partner countries, it could be advantageous to have the Kenya SPV be
part of a multi-country SPV structure, for Funders to benefit from increased portfolio effects and
investment scale and to leverage scarce LPG-investment management and oversight expertise across
countries.
Loans and investments
In the context of cylinder financing, loans are the main and preferred instrument, given that equity needs
to offer upside that cylinder investment cannot fully provide by itself, that working capital finance for
cylinders, at scale, has been problematic to obtain, and that Kenyan LPG company owners are reluctant to
accept substantial new equity funding due to concerns about change of control. However, if the cylinder
investments can be structured with some form of revenue royalty as upside, generating equity-like returns
without potential control issues, some longer-horizon investors, such as local pensions, may consider use of
this kind of instrument as quasi-equity. This may also be effective as a means of Sharia financing
compliance, where applicable.
Asset ownership
The cylinders would be funded by the SPV. Ownership would remain with the SPV until full repayment. Any
funding would be structured to protect the capital providers with covenants and outside monitoring. For
example, cylinder repayment would be monitored by auditors or an escrow agent. When a financed
cylinder stock is deployed and deposits received against it, the SPV’s portion of the proceeds would be
transferred directly to the SPV’s account, ring-fencing the cashflow.
Financing
The financing approach reflects 35% non-concessional debt, 40% concessional debt and a notional starting
point of 25% equity financing (or quasi-equity), with the debt calculated at 10% to 13% non-concessional
and 8% concessional interest rates, respectively, with the equity having a minimum 20% IRR. These
financial cost estimates should be seen as merely indicative and not final rates and maturities. They are
intended to show the magnitude of the effects of the cost of financing on the repayment of the
borrowed/invested funds. These financing costs will ultimately depend on the financing requirements of
the Funders.
117 This could be a standalone entity, a not-for-profit subsidiary of or JV with GLPGP, a subsidiary or affiliate of an investment fund
such as the previously mentioned LID Fund, a PPP structure, or similar.

Clean Cooking for Africa National Feasibility Study: LPG for Clean Cooking in Kenya
189
Risk tools
To secure the eventual return of the Funders’ capital, the SPV will utilize guarantees and insurance. These
tools will protect committed capital but are unlikely to include interest or upside (in case of equity upside
lost). DFIs, IFIs and other private sources would provide these products, as appropriate.
Management fees
The SPV would be professionally managed by a senior management group of unconflicted, experienced LPG
and LPG-finance experts118. A monthly project implementation fee, to be determined, will be charged by
the SPV and GLPGP to cover administrative and operating costs of the SPV or GLPGP-K efforts.
Environmental/carbon finance
The potential carbon-market value from implementing what is described in this report is potentially €3-4
million per year, as discussed in Part X (Environmental, Health, Social and Economic Impact Potential)
beginning on page 204. However, monetizing that value as an additional financing source faces a significant
practical challenge, for which no solution can presently be envisioned. The challenge is that the ownership
of the carbon-credit value is attached to the consumers’ use of LPG for cooking, through displacement of
higher carbon-emitting fuels and technologies. This implies monetizing the carbon value from millions of
individual points of use, through an acceptable, practical, and cost-efficient means of measuring and
auditing the net carbon benefit from each. The monetized carbon value would also have to be
transferrable not to the end-user, but to the service providers along the LPG supply chain which make the
investments to be co-funded through that carbon value. The consumer would benefit from a reduced
cylinder deposit cost, by way of passthrough from the lower net cost to the service providers.
The CDM does not allow carbon credits for fossil fuels (since these are defined as non-renewable), and
therefore LPG is not eligible for carbon credits under CDM, despite the fact that overall the impact on
climate forcing is similar to or less than even the best biomass stoves when all emissions are considered.
Recent evaluation studies of CDM-approved, more efficient biomass stoves also demonstrate that there is a
substantial risk that these interventions fail to realize the expected fuelwood and associated-carbon
reductions under real-life conditions because of technology performance, fuel stacking (the ICS is used
together with the traditional stove instead of replacing it) and/or because of extra cooking tasks performed
due to previously suppressed demand. In addition, some improved stoves (including rocket and natural
draft stoves) have been shown to emit more BC and PM2.5 emissions than traditional biomass stoves and
open fires.
Gold Standard offers a possible path forward if the issue of end-user scale can be solved, as Gold Standard
includes the Kyoto Protocol gases and Black Carbon (BC), although it still does not include CO, SO2, OC and
NMHC.
A number of small-sized LPG projects have been funded through the Gold Standard carbon credit
mechanism. One example is the 9,000-stove Darfur Low Smoke Stoves Project implemented by Practical
Action and CarbonClear Ltd., which began stove dissemination in 2010. Each LPG stove in that project
118 This team could be drawn from GLPGP senior staff, on a multicountry basis.
Clean Cooking for Africa National Feasibility Study: LPG for Clean Cooking in Kenya
190
avoids about 4.6 tons of CO2 equivalent a year compared to traditional and improved mud wood stoves (15-
20% efficiencies) and to traditional and improved metal charcoal stoves (20-25% efficiencies).119
Should a practical mechanism arise for monetizing the carbon-credit value created by millions of added
users of LPG, and for deploying that value toward the financing of the supply chain expansion that makes
the carbon-credit value possible, it could lower both the cost of capital for the expansion and potentially
the cost that consumers incur to become new LPG users.
Specific roles for DFIs to increase impact and reduce risk
DFIs are well-positioned to help facilitate the national LPG cylinder inventory build-out described in this
report. Through their mandates, experienced teams, and range of tools, they can have a powerful effect
on the success of LPG ecosystems and the projects and companies within them. Useful and effective DFI
tools include grants, technical assistance, direct or indirect (through investment funds) funding,
debt/equity/hybrid funding, guarantees, risk mitigation structures, insurance, syndication with other DFIs
and IFIs, SPVs, IFC-led MCA/parallel loans, and political advocacy and influence including linkages (in which
governmental undertakings regarding LPG are linked as performance requirements to a larger, broader
portfolio of financing and financial cooperation).
The DFIs’ critical anchor role as catalyst Funder and accommodative capital provider can be essential for
moving the large quantum of capital needed for the country’s investments.
In addition to contributing financing to local modalities, DFIs can undertake some of the following key roles:
1. Provide large and diversified capital investment of their own;
2. Catalyze and crowd-in outside non-concessional, more risk-adverse co-funding;
3. Lower the cost of capital for various projects (where it makes sense to do so);
4. Introduce first-loss-protection for other investors (for example, Swedfund with SIDA taking a 50%
first loss);
5. Provide risk mitigation tools, such as guarantees (range of DFIs, MIGA) and private bond 144A
placement insurance (OPIC);
6. Provide hedging tools to help mitigate LPG price volatility and address currency risk;
7. Use financial influence in the country overall to ensure governmental performance of obligations;
8. Provide technical assistance funding to help the government and the sector develop capacity to
suppress black market activities;
9. Provide technical assistance to educate and create awareness of LPG benefits among consumers;
10. Underwrite a country’s initial LPG microfinance program on a concessional basis to demonstrate to
local financial firms that microfinance can be a legitimate commercial activity for them;
119 Carbon Clear (2016), The Gold Standard: Project Design Document for Gold Standard Voluntary Offset projects - Darfur
Efficient Cook-Stove Project. See mer.markit.com/br-reg/public/project.jsp?project_id=103000000002416.
Clean Cooking for Africa National Feasibility Study: LPG for Clean Cooking in Kenya
191
11. Help secure international LPG supply on more favorable terms, through bringing their balance
sheets to bear (e.g., AfDB offering letters of credit with concessional terms for use by Marketers to
acquire cylinders en masse);
12. Become a Funder to listed or non-local stock exchange listed SPVs and/or provide protections for
other investors/Funders; and
13. Support further work by the Clean Cooking for Africa expert team.
The financial modelling of the investment parameters, economic performance, and financial returns of the
key firm-level investments described in Chapter 16 (Investments at the Firm Level), which begins on page
141, includes co-funding with concessional debt for approximately 40% of the capital stack of the projects
sector-wide, both to ensure rates of return to equity investors are possible without risking over-leverage,
and to moderate the cost of debt in order to reduce the debt service burden on the LPG sector’s firms as
they consume capital and defer full profitability for the sake of growth.
The thesis for the DFI role is that DFIs have interest in the large health, environmental, social and
development impact that scaling up clean cooking can have on the target countries’ populations. To achieve
the desired impacts as efficiently as possible, DFIs welcome sizable, scalable, bankable funding
opportunities. Although the global LPG sector is over 100 years old, and LPG-for-impact has been the
subject of study by UNDP, WHO, and other organizations for many years, it is only recently—such as
through the efforts of the Clean Cooking for Africa program—that opportunities for LPG investment and
lending at scale are being identified, prepared, and structured for addition to the global flow of projects
suitable for DFI support. It is therefore recommended that DFIs include consideration of financial support
to LPG initiatives where LPG investment and lending opportunities are demonstrated to be feasible—such
as in Kenya, with BCRM well-implemented.
Development of LPG-specific investment funds
A second key role for DFIs is in contributing to indirect investment into such LPG opportunities, by
participating in the establishment and funding of an LPG-specific impact-investing fund. Such a fund would
aggregate and deploy LPG-focused global capital, including DFI capital, to high-impact, high-need LMICs for
prudent and justified LPG expansions and utilize the particular, deep domain expertise of the Clean Cooking
for Africa/GLPGP expert team in so doing. GLPGP and KfW have collaborated to design two such funds for
future implementation. These funds are the LPG Infrastructure and Distribution (LID) Fund, designed to
target LPG supply chain infrastructure as outlined in this report, and the First Costs Financing (FCF) Fund,
designed to underwrite microlending at scale to consumers for financing the up-front equipment costs
necessary to switch to LPG from charcoal and wood fuel. The first FCF fund and LID fund, at anywhere from
€ 100 million to € 300 million overall, could be conduits through which interested DFIs could align capital
for LPG impact-investing at scale with proven, impartial, dedicated LPG expertise. DFIs can potentially
provide General Partnership operating launch capital, as well as provide anchor Limited Partner funding
commitments. This can then facilitate additional funding sources joining the fund(s) alongside the DFI
sponsors.
KfW/DEG financing support via the Kenya financial sector
In Kenya, DEG has provided financing facilities to Equity Bank to provide loans to SMEs. This approach could
be adapted for LPG financing, using Equity Bank as a conduit for on-lending to LPG companies. Equity

Clean Cooking for Africa National Feasibility Study: LPG for Clean Cooking in Kenya
192
Bank’s management, presumed trusted by KfW/DEG, would be a sensible choice of fiduciary partner for on-
lending to LPG companies through a lending SPV or other appropriate structure as mentioned above, since
Equity Bank has been pre-vetted by KfW/DEG for other types of on-lending. Participation by one such DFI
in such an approach would, in turn, encourage the participation of others.
Clean Cooking for Africa National Feasibility Study: LPG for Clean Cooking in Kenya
193
20. Summary of Main Project Risks, Mitigations and Mitigation Sources
Main risks and mitigations
Risks may be grouped into several categories, which include:
Country risks (regulatory, political, other)
Industry
Economic
Consumer demand
Execution
Financing / Fund structure and operation
Investment process
Country risks
Regulatory and Enforcement Risks. The regulatory landscape in Kenya applicable to LPG is a critical
consideration. The industry and interested investors have viewed the reforms in LN 121 (2018), to take full
effect as of December 2019, as a major, long-awaited improvement that will unlock investment and in turn
boost consumption as new cylinders are obtained and deployed. (The regulatory scorecard presented in
Part V, Chapter 7 (beginning on page 52) is a useful assessment tool regarding the supportiveness of the
LPG regulatory environment and gaps to be diligenced and hedged against.) Once in effect, LN 121 (2018)
is expected by most Kenyan stakeholders to reduce to a tolerable level the incidence of pirate refilling.
However, for this to occur, governmental enforcement must be stepped up and sustained, and must be
relatively free from corruption. Investor groups evaluating LPG opportunities in Kenya have noted that this
enforcement risk need not be a barrier to investment or lending per se, but can be priced into the cost of
capital. (Per one live benchmark, the associated premium is 280bp.)
That said, the Clean Cooking for Africa/GLPGP team recommends that major new investment be considered
only when it is clear that enforcement capability and effectiveness have demonstrated their effectiveness in
the wake of the LN 121 implementation. (For this reason, among others, the investment program
described in this report should be considered as spanning Years 1-12, to start when the regulatory
enforcement environment has demonstrated effectiveness at reducing the pirate / black market activities in
the sector.)
Companies that exercise tight control over cylinder recirculation in their distribution networks, such as via a
milk-run model, can self-protect against pirate/black market activity operationally, and this will be
encouraged or required, where economically viable, among recipients of capital. (Such control can be
enhanced using smartmeters affixed to cylinders, albeit at a capital cost which, today, is itself a major
obstacle to achieving both scale and sufficient financial returns simultaneously.)
As part of investing, legal stabilization clauses will be sought in any contracts involving the Government.
Risk mitigation products may also be utilized where justifiable, as described later in this Chapter.
Clean Cooking for Africa National Feasibility Study: LPG for Clean Cooking in Kenya
194
Additionally, diligence would be undertaken to confirm that the regulatory frameworks for business rights
protection (including anti-counterfeiting), investment, and/or microlending are adequate. Use of qualified
locally-familiar counsel and accountancies will facilitate such diligence.
Price Regulation Risk. There is a risk that, eventually, the Government may impose some type of regulation
on LPG prices, which may include positive effects on consumption (such as equalizing inter-regional price
differentials due to transport distances) as well as potentially negative effects on profitability of firms, such
as by capping prices or capping the unit margins that can be earned. The LPG investing and corporate
community in Kenya would necessarily lobby the Government to minimize any adverse effects of such a
move, and to phase in such effects over a reasonably long transition period. Among companies receiving
financing, having an operational cost structure in place which is cash-flow resilient (up to a practical point)
to potential caps on prices or margins will be a form of self-protection against the possibility of future price
regulation by Government. (This is what Proto Energy have done: Proto were able to price below
competitors by devising a superior cost structure that includes vertical integration, by negotiating
particularly effectively for supply, and by developing a highly efficient distribution system. Any future
capping of end-user prices or unit margins would therefore likely reduce competitors’ pricing to the level
already charged by Proto.)
Additionally, concessional capital and risk tools would be utilized where available to offset reductions in
financial returns or debt service cashflows caused by a change to the national pricing scheme. Also,
companies facing such regulation in Kenya may be able to expand their activities in neighboring counties
where prices remain unregulated, to geographically diversify price-regulation risk.
Lastly, if a cylinder-acquiring fund and SPV are established and if the Government can be persuaded to
support a universal per-tonne charge that shifts a major part of the capital cost of new cylinders to a small
per-kg surcharge applied to the entire national LPG economic volume for up to 10 years, the cost of new
cylinders could fall significantly—on the order of 30-50%—thereby improving LPG companies’ economics
(in particular, their return on assets) to counteract the economic impact of price or unit margin caps. The
cylinder deposit paid by the consumer would also be reduced proportionally. While there can be no
assurance of such a universal capital-discounting fund mechanism being established, an argument would be
made to Government that, in exchange for price or unit margin caps (that would serve to benefit LPG
consumers at the expense of LPG companies), a cylinder-discounting mechanism should be provided. (This
would, in principle, put private sector LPG cylinders on a similar financial/cost footing to the state-
subsidized Mwananchi Gas Project cylinders being deployed by NOCK.)
Investing Environment Risks. Kenya has an overall favorable and improving investment environment, as
described earlier in this Part of the report. Country risk premiums may also be priced into the overall cost
of blended capital, based on the blend and the needs of the Funder sources.
A major issue affecting domestic lending is the CBK interest rate cap, which has severely limited Kenyan
commercial lending. In the preceding Chapter, it was described how this cap causes local lenders to be
unwilling to lend into the LPG sector. Therefore, an approach was presented to work around the cap with
respect to LPG lending, utilizing intermediary special purpose vehicles. Notwithstanding that alternative, if
Kenyan commercial lenders do choose to lend to the LPG sector under the current cap, their interest rate
will be considerably lower than its historical level.
An increase or an elimination of the cap could be offset in the capital stack by an increase in the proportion
of funding coming from concessional capital sources such as DFIs.
Clean Cooking for Africa National Feasibility Study: LPG for Clean Cooking in Kenya
195
Nationalization/Expropriation Risks. To the extent this risk is deemed material, standard project and other
insurance would be obtained where appropriate through bodies such as OPIC and MIGA; additional sources
and products are noted later in this chapter.
Government Nonperformance/Default on Contractual Obligations. In Kenya, while it is not anticipated that
the Government would be a partner in the cylinder investments discussed in this report, due to its parallel
initiative supporting Mwananchi Gas, there is the possibility, based on prior outreaches by NOCK, that
NOCK (which is state-funded and, in practice, accountable to the state via the state’s role in governance)
may partner with private sector firms to leverage their distribution networks for the relaunch of the
Mwananchi project. Were the Government to become involved in investment vehicles (as through a PPP or
the sort originally done with AGOL for its dominant LPG import terminal), whether for cylinders or for other
infrastructure (such as an alternative import terminal to the AGOL terminal), the Government may become
contractually committed to funding or other obligations related to projects and consumer access. If the
Government were to default, this could have numerous politically sensitive impacts on the general voting
public, once they are increasingly tied into the expanded LPG market. Performance guarantees by
Government and other key partners and counterparties should be provided for project completion and
operational finance commitments as conditions precedent to investment.
Political Risks. Sufficient political and business support are integral to scaling up LPG. To reduce political
risk, both local official and private sector partners must have a material stake in the success of local projects
which are not entirely private-sector sponsored. Political support can be developed by project sponsors
and Funders, and through linkages by DFIs (for example) to other lending activities in the country.
Regarding a shift in future political/policy for LPG investments, various third party insurance products can
be considered.
As described in Chapter 11 (National LPG Planning Process 201) beginning on page 67, there is risk
regarding complementary policies. For example, the present policy banning logging has made charcoal
much less available and less competitive to LPG, but if that policy is allowed to lapse or goes unenforced,
future LPG growth may slow. (Note that the LPG growth projections in this report do not take into account
the effect of the logging ban, since it is in principle a temporary ban.) Likewise, the present policy to
exempt LPG from VAT while applying VAT to charcoal and purchased firewood does affect LPG adoption and
consumption growth, and a change to that policy could reduce future LPG demand, requiring a slowdown
or pause in further cylinder investment. This risk can be mitigated by ongoing constructive dialogue
between Government and LPG stakeholders and through the continued building up of the global evidence
base (through continuing independent research) that LPG creates important social and environmental
benefits for the public when displacing charcoal and firewood for cooking.
Timing Risks for Governmental Decisions and Capacity-Building. The actions and investments described in
this report may be time-sensitive with respect to achieving intended scale and impacts by 2030 at a
manageable rate of growth, and delays in governmental decision-making and regulatory enforcement
capacity-building can increase the risk of financing occurring, and of under-performance against business
targets and on the financial parameters of the recommended investments. To the extent prerequisite
actions by Government are delayed, the best solution is to wait. If, after waiting, Funders and modalities
desire to catch up to the sector growth to 2030 as projected in this report, increased use of concessional
capital could permit acceleration of the scale-up of the sector by increasing its economically sustainable
growth rate. Additionally, use of funding structures and mechanisms such as those described in Chapter 19
(Investment Plan Overview) (beginning on page 171) could decrease investment lead times and increase
Clean Cooking for Africa National Feasibility Study: LPG for Clean Cooking in Kenya
196
the rate of transaction flows through project aggregation and risk-pooling; and by continued or renewed
technical assistance support (such as the support funded up through the time of this writing by the Clean
Cooking for Africa Program) to the Government to assist it in its analytical and decision-making processes
and its capacity-building.
Industry risk
LPG Supply, Demand, and Price Movements. As a global commodity, LPG may be subject to price
movements based on supply and demand dynamics outside of the internal market conditions of the
country. This could impact the availability of product in target markets, if prices rise too high. In Kenya, the
market sets prices, which creates both competitive risks to margins (some players choose to absorb more
volatility in input prices than others) and volume risks. (This is normal in commodity dependent
businesses.) Additionally, there has been a history of rare but significant import interruptions due to ocean
piracy. Generally, margins in Kenya are high by Sub-Saharan African norms, enabling companies to
withstand input price volatility relatively well (if they are not over-leveraged). Utilizing the recommended
structuring vehicles and blending capital will lower overall break-even margin points for infrastructure
assets and companies. In addition, underlying companies and projects will be expected to implement
appropriate contingency planning in their operations such as hedging of inputs, including LPG supply. Long
term supply contracts with diverse sources and buffer storage will serve as mitigants to these
disequilibriums. MIGA and USAID offer programs to insure commodity price risks and these may also be
employed, where justifiable.
Consultancy IHS Markit has forecast that global LPG supply will be in surplus at least through 2030, and
potentially to 2050, creating relative price stability during the expected investment horizon. See Annex
Chapter 32 beginning on page 294 for further discussion.
Additionally, commercial quantities of price-competitive bio-LPG have been introduced into the global
market in 2018; by 2030, such quantities could become a significant hedge against potential LPG supply or
price volatility.
Entering into long-term, price-capped contracts for LPG supply hedges further against LPG volume and
price risk.
While it is not needed from a capacity standpoint, the construction and efficient operation (as recently
proposed by the Kenya Pipeline Company (KPC) and Kenya Ports Authority (KPA)) of a new, large, open-
access LPG import terminal, which could implement OTS pricing and could act as a strong competitor to the
AGOL LPG import terminal, would mitigate the risk of shortages due to AGOL non-performance or mal-
performance and the risk of future price gouging / excessive rent-seeking by AGOL in order to favor one
LPG Marketer over another, or to disadvantage all Marketers in favor of its own marketing affiliate.
Lastly, aggressively low pricing from new entrants such as Proto Energy, and as may be introduced by
longer-standing players in Kenya in order to preserve or gain market share, could result in loss of market
share (or slowed growth) among LPG companies that do not, that choose not to, or that cannot afford to
match lower price points offered by competitors active in the same communities. This risk can be
operationally mitigated through focusing on cost efficiency in the supply and distribution chain, increased
marketing and customer service (to build customer loyalty), mergers among competitors to achieve
improved economies of scale and overall financial strength, and having adequate resiliency in cost structure
and cashflows to allow any price wars that may emerge in future to be seen safely through to the end. An
Clean Cooking for Africa National Feasibility Study: LPG for Clean Cooking in Kenya
197
additional, inherent mitigation is that, due to the price elasticity of LPG demand in Kenya, a reduction in
price will be offset partially by an increase in adoption of LPG by new customers and consumption of LPG
by both old and new customers.
Use of Monopoly Power by Dominant Importer. AGOL is the dominant importer of LPG in Kenya today and
has near-monopoly power in that node of the supply chain. This is partially mitigated by political leaders’
interest to keep LPG prices relatively stable in order to appease voters; political leaders can complain to
AGOL (even if they cannot control its governance) in lieu of compelling changes to AGOL’s behaviour
regarding any abuse of AGOL’s dominant position. As mentioned above, AGOL also has the possibility to
exercise its market power with respect to allocation of imported LPG among Marketers (including its own
affiliated Marketer) and setting prices (against which the much smaller SOT terminal facility is a partial
hedge for its participating companies). An important hedge to AGOL quantity and pricing power is the
ability to import LPG overland from Tanzania, such as done today by Lake Gas. Moreover, Tanzanian
exports to Kenya will be in a position to increase with the start of construction of a major €65 million inland
LPG storage facility announced by the Government of Tanzania in June 2019). See also the mitigations
discussed above under LPG Supply, Demand, and Price Movements,
Energy Alternatives. Price differentials could create a risk regarding substitute fuels at the end of the value
chain. Given the level of development of other fuel products, it is expected that the risk of substitution is
limited, except among the poorest. While that creates an impacts risk, the likely effect on investment
results is expected to be small, based on the modelling performed and presented in this report. In
addition, once businesses and consumers have invested in LPG equipment and adapted to them
operationally and behaviorally, respectively, a switching barrier (whether economic or psychological or
both) is created for abandoning LPG use. That is, LPG use is somewhat sticky, once begun. See also the
preceding subsection on Political Risk with respect to the logging ban policy.
Price Inequality Due to Distance. Because LPG prices are set by the market and transport cost is a material
component of price, end-user prices become higher and higher as LPG is sold farther and farther from the
main corridor of storage and bottling plant facilities in Kenya (see map in Figure 32 on page 120). This
effect, although taken into account in the demand forecasts of Part VI, nonetheless reduces LPG adoption
and use in more rural areas and in poorer communities compared with its potential, were their LPG pricing
similar to urban-corridor prices. This situation is not likely to be exacerbated in future, but it could be
improved through Government action to “universalise” the LPG price through transport cross-subsidy
(urban users, who are already better off economically, pay a bit more, while rural users pay significantly
less). The reason that urban users pay slightly more and rural users significantly less is that, on a volume
basis, most LPG is bought today in urban and peri-urban areas; the volume of LPG in rural areas to be cross-
subsidized in this manner will be significantly less, through 2030 and beyond, than the urban/peri-urban
volume. Such Government action could result from dialogue with relevant stakeholders regarding this
issue, and through advice provided to Government through the Clean Cooking for Africa Program/GLPGP
and through technical assistance guidance given by interested DFIs and MDBs.
Mwananchi Gas Project. If the Mwananchi Gas Project is extremely successful, it is likely to take business
away from private sector LPG companies operating in the same areas. While the Government’s objective
regarding Mwananchi is to focus on poorer, more rural households located where Kenya’s private sector
LPG companies do not provide LPG today, there is likely to be some unintended overlap if the project
expands toward its intended size (of 3 million deployed small, discounted cylinders), no matter how
carefully NOCK (as implementer) and NOCk’s rivals attempt to avoid one another geographically. If

Clean Cooking for Africa National Feasibility Study: LPG for Clean Cooking in Kenya
198
Mwananchi does succeed to a far greater level that past performance suggests it can, the private sector
LPG companies can adjust by refocusing their sales efforts into the middle and upper end of the market in
areas outside Mwananchi’s geographic scope, and to compete directly with NOCK in the areas where NOCK
cannot meet all the local demand by itself. Additionally, LPG operators that partner with microfinance
institutions (as in the Bottled Gas for Better Life program) can use such forms of consumer empowerment
to improve their competitiveness with the Mwananchi offering.
It should also be noted that a group of private sector LPG companies and civil society organizations has
sued the Government of Kenya in the courts, arguing that the state may not provide subsidies for LPG
equipment to NOCK alone, but must provide similar subsidies to all legitimate LPG companies. If their case
is lost, the status quo ante will continue; however, if their case is won, it may lead to either (i) Government
utilizing its Mwananchi funds in a way that benefits all players more evenly (which will mitigate Mwananchi
risk and encourage demand growth and improve LPG sector profitability overall), or (ii) restructuring the
Mwananchi project in a way that minimizes the competitive risk it poses, long term, to the private sector
LPG companies.
Economic risks
Interest Rate and Inflation Risks. Currency, interest rates120 and inflation changes may impact LPG
affordability and also the repayment performance of the LPG projects. Interest rate hedging and other
approaches can be utilized to insulate from adversely expanding spreads. Inflation should be priced into
contracts as appropriate, so as not to erode SPV/Fund performance. Currency hedging will be employed
under both project level and SPV/Fund level risk management policies.
Currency and Exchange Rate Risks. The income received by the investment vehicle(s) will typically be
denominated in the local currency of the project companies; however, the books and assets, capital
contributions, and distributions will be conducted in U.S. Dollars or Euros, as appropriate. Accordingly,
changes in currency exchange rates between USD/Euros and the Kenya Shilling may adversely affect the
U.S. Dollar/Euro value of investment vehicles and the income, interest and dividends or other distributions
it receives, gains and losses realized on the sale of investments and the amount of distributions, if any, to
be made.
Because imported LPG is priced in Dollars, and project companies’ turnover (revenue) is in local currency,
there is currency risk for the supply chain. However, Kenya’s exchange rate to the dollar and Euro has been
very stable. Currency hedging and derivative products may be employed to mitigate these risks for both
investors and operating companies.
Consumer-related risk
Lack of Demand. The amount of projected demand may not come into fruition for a variety of reasons,
including lack of awareness by consumers, affordability and accessibility. These potential issues can be
mitigated by the work that Clean Cooking for Africa/GLPGP will continue to do in Kenya (subject to
availability of resources), including working to create awareness of LPG benefits among consumers.
Additionally, the investments are staged over time, and can be accelerated or delayed/reduced based on
120 There is at present a cap on interest rates charged by domestic institutions

Clean Cooking for Africa National Feasibility Study: LPG for Clean Cooking in Kenya
199
leading indicators (including those specified in this report) signaling additional pent-up demand or early
saturation of the market.
It should be noted that the PIEA (the main industry body for petroleum products companies in Kenya)
announced the launch of a new national public awareness campaign about the benefits of using LPG for
cooking. The scale and duration of the campaign will be based on the level of funding provided by
donations from industry and charitable sources.
Consumer Repayment Risks (re: Microfinance Loans and Other Installment Payment Schemes). Credit risk in
large part will depend on both the selection of on-lending partners and consumer repayment behavior. The
analysis of the extension of credit will include diligence of the MFIs and their underlying approaches to
customer selection, credit policies, and the target market segments. As a practical matter, consumers will
not want to be cut off from LPG once they are using LPG for cooking and have acquired the appliances for
cooking and heating with LPG. Nevertheless, as a backstop, the use of blended capital that may be required
to underwrite or guarantee or partially guarantee MFI lending will lower the costs of lending, and first loss
arrangements with DFIs or other impact investors can protect the performance of the underlying lending
portfolio.
New MFI lending for LPG adoption will be piloted in carefully expanding phases, applying lessons from each
preceding phase to reduce the risks of later phases.
Ultimately, the aim of the Clean Cooking for Africa Program is for LPG microlending to transition to an
entirely local platform of partners with underwriting from one or more of them for the group’s activities,
thereby creating the option for early exit and monetization of microlending activities.
Because the rate cap for domestic lending presently in effect places downward pressure on MFI margins, it
is also expected that MFIs will increase the qualification criteria applied to prospective borrowers. This may
reduce the rate at which MFI lending expands during the period the rate cap remains in effect, but will also
improve the repayment characteristics of the loan portfolio that develops.
Execution risks
Execution Risks. Investment projects must be required to have competent, experienced management. The
funding vehicles (e.g., SPVs) must do the same121. Local partners that will be required, or are desired,
where they are competent and experienced will help address local execution risks at the operational and
local co-investment level. Ultimately, a sound governance system with international-standard financial
reporting at all levels will be among the most important tools for identifying execution risks and responding
quickly and appropriately to eliminate or reduce them.
LPG Distribution Execution Risk. The inability to reach the ultimate end users of LPG will be a gating decision
point regarding whether to invest in a particular geographic target area. This will also limit the success of
the investment vehicles but will protect from over stretching to serve untenable markets.
Counterfeiting, Piracy, and Issues around Safety. Local LPG industry and the management of the investment
vehicle(s) must address these issues to the extent they may arise. Good implementation of the BCRM
model (as described in this report and as improved under the reformed LN 121 (2018)) will significantly
121 The Clean Cooking for Africa/GLPGP LPG expert team may play such a role in the latter.
Clean Cooking for Africa National Feasibility Study: LPG for Clean Cooking in Kenya
200
derisk this issue. Part of the solution may also come from integrating fragmented operators in the
distribution chain vertically and horizontally, offering shared benefits from economic scale and market
power.
Price and Cost Structure Risks to Firms. If the Government chooses to regulate LPG pricing or unit margins
in future and allocates unit margins amongst the supply chain nodes in a way that ends up not adequately
covering the costs at a given node, for whatever reason, the risk of viability of the adversely affected firms
is increased. This risk can be addressed in two main ways: (i) The Government should carefully match its
pricing formula to the costs and financial requirements (of equity-holders and lenders) at each supply chain
node, to ensure adequacy at each node and to optimize the overall financial performance of the supply
chain (taking into account the analysis of Chapter 16 (Investments at the Firm Level) beginning on page
141, and balancing affordability for consumers against industry profit objectives); (ii) Utilizing the ISLE
indicators and consulting with industry and other stakeholders on an ongoing basis, the Government
should periodically revise its allocation of unit margins as necessary to ensure the viability and performance
of the value chain overall as the sector scales up, and as its conditions change.
Complexity of Coordination of Multiple Investment Projects. The quantity of parallel projects may introduce
complexity which could cause delays, overruns in project preparations costs, and execution challenges in
excess of projects taken individually. There can be no assurance that management and operation
companies can successfully manage such complexity. Conversely, the fact that the projects are all linked
through a master investment plan means that no one project will receive and deploy a quantum of growth
capital without strong assurance that the linked projects in the supply chain receive proportional, and well-
timed, quanta of growth capital, so that all projects are mutual reinforcing.
SPV/Fund/NBFI structural and operational risks and mitigants
No Operating History. These vehicle(s) are likely to be recently-formed entities, with no operating history.
This may be mitigated by the operating experience and expertise of the Clean Cooking for Africa/GLPGP
team, by experienced LPG operating managers on the ground, and by relevant in-country and international
project partners.
Liquidity of Investment. The investments may be illiquid, as with all private equity and long term debt
investments. The investors will be provided with distributions as appropriate and, if a critical mass of
investment is created, it will make the portfolio possible for an exchange listing (as discussed earlier in this
Part of the report) or potential financial sale. To the extent possible, the investment project agreements
will include terms that give options for forced monetizations or exit pathways under appropriate
conditions.
Long Term Investment. An investment in the vehicles is a medium- to long-term investment. The aim of
facilitating the creation of sustainable LPG platforms dictates a significant length of time between the initial
investment and the return of investment or realization of gains, if any. “Patient capital” will therefore have
a role to play in the capital stack.
Restrictions on Transfer and Withdrawal. There may be no market for the investment securities, absent an
exchange listing. In addition, investments in the SPVs/Funds/NBFIs may not be transferable or
withdrawable in the usual course of business.
Clean Cooking for Africa National Feasibility Study: LPG for Clean Cooking in Kenya
201
Asset Valuations. Valuations of the LPG assets will be determined by the management of the investment
vehicles working with outside valuation experts. The valuations will be based on audited financial
information to the extent possible, complemented by best-practice valuation methods and metrics used in
the LPG sector globally.
Investment process-related risks
Finding Investments. The ability to prepare projects and execute the investment strategy in reasonable time
frame given possible regulatory and other issues will be a major focus. Continuing diligence will permit
walking away from projects which cease to offer the return and risk profile meeting investor requirements
before significant amounts of capital have been deployed in them.
Ability to Realize Cash Returns and Exits. As with all investment vehicles, continued listings of the vehicles
on liquid exchanges, as well as underlying assets, plus trade sales and dividends, are not certain in time or
amount. The strategy of listing or shelf registration can mitigate these risks.
Country Development Risk. Part of the feasibility assessment in this report involved consideration of
favorable national developmental trends such as: attractive demographics; rising per capita income; credit
reach; urbanization; legal and political stability; progressive governmental policies for healthcare,
environment and development; growing foreign investment; development of infrastructure (in particular,
road networks), etc.
Environmental Hazards (Other Than LPG Accidents). The investments and projects will be implemented
following ADR and other best practices and global regulatory standards. In addition, the funds and projects
will take appropriate insurance policies against hazardous accidents and occurrences.
Wrong Investment Thesis. If the findings of, and conclusions from, this report are wrong, it will result in an
initial overinvestment in cylinders, but this is self-correcting by slowing the rate of future expansion of
cylinder inventory. If the cylinders were financed with short-term capital (e.g., working capital finance), the
corresponding risk of failure to repay debt timely following an overinvestment would be high; however,
utilizing the proposed long-term debt structure for cylinder finance, with principal repayment starting only
in year two, provides ample time-cushion to mitigate the risk of initial overinvestment in cylinders.
Management and advisors should continue to conduct detailed studies in advance of major capital
deployments to be maximally confident that the investment thesis is correct and investments are correctly
sized.
Risk mitigation sources
DFIs, MDBs, IFIs, private companies and others provide the risk mitigation tools profiled below.
Risk mitigation tools include guarantees, insurance, and other credit enhancements that are often used in
combination with impact or related funding to strengthen the creditworthiness of a funding recipient.
Many providers of capital also provide risk mitigation tools which offer potential efficiency in lining up the
right combinations of blended funding and risk mitigation for many products and services.
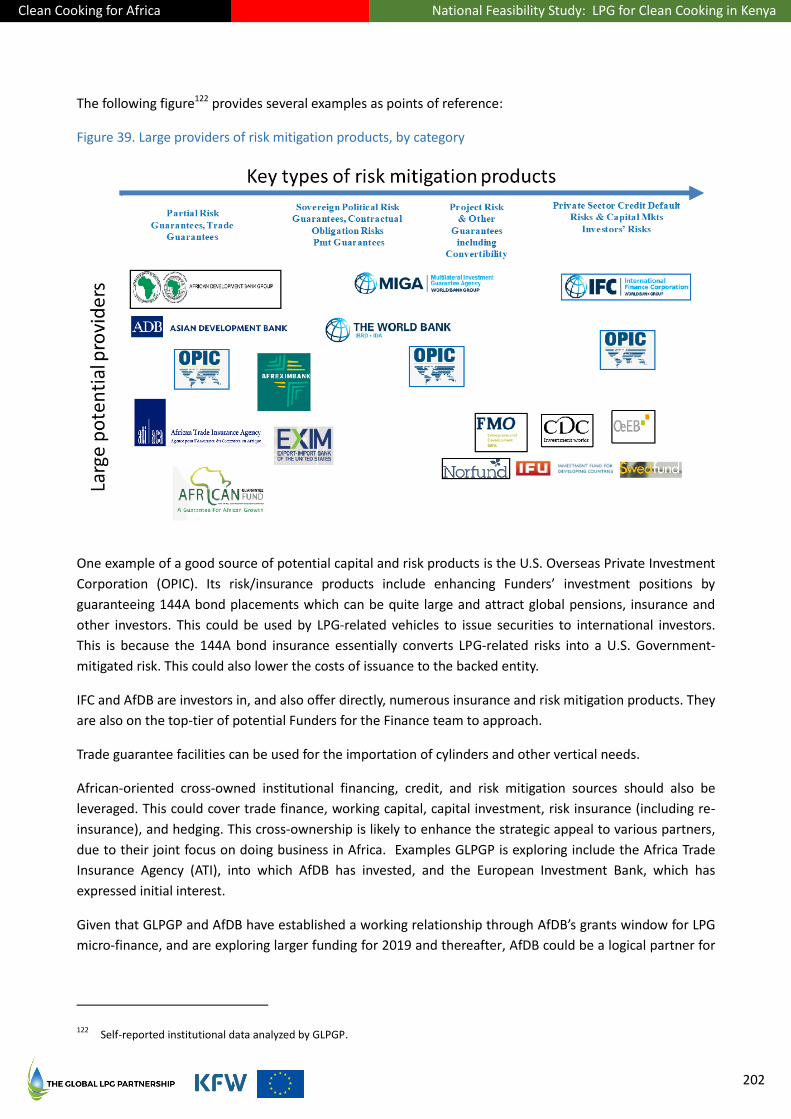
Clean Cooking for Africa National Feasibility Study: LPG for Clean Cooking in Kenya
202
The following figure122 provides several examples as points of reference:
Figure 39. Large providers of risk mitigation products, by category
One example of a good source of potential capital and risk products is the U.S. Overseas Private Investment
Corporation (OPIC). Its risk/insurance products include enhancing Funders’ investment positions by
guaranteeing 144A bond placements which can be quite large and attract global pensions, insurance and
other investors. This could be used by LPG-related vehicles to issue securities to international investors.
This is because the 144A bond insurance essentially converts LPG-related risks into a U.S. Government-
mitigated risk. This could also lower the costs of issuance to the backed entity.
IFC and AfDB are investors in, and also offer directly, numerous insurance and risk mitigation products. They
are also on the top-tier of potential Funders for the Finance team to approach.
Trade guarantee facilities can be used for the importation of cylinders and other vertical needs.
African-oriented cross-owned institutional financing, credit, and risk mitigation sources should also be
leveraged. This could cover trade finance, working capital, capital investment, risk insurance (including re-
insurance), and hedging. This cross-ownership is likely to enhance the strategic appeal to various partners,
due to their joint focus on doing business in Africa. Examples GLPGP is exploring include the Africa Trade
Insurance Agency (ATI), into which AfDB has invested, and the European Investment Bank, which has
expressed initial interest.
Given that GLPGP and AfDB have established a working relationship through AfDB’s grants window for LPG
micro-finance, and are exploring larger funding for 2019 and thereafter, AfDB could be a logical partner for
122 Self-reported institutional data analyzed by GLPGP.
Clean Cooking for Africa National Feasibility Study: LPG for Clean Cooking in Kenya
203
risk solutions as well. AfDB and ATI would be logical first partners to approach in terms of larger risk
mitigation tools for Kenya.
A two-tiered approach could be used, by accessing AfDB’s various risk mitigation tools such as trade
guarantees, insurance, and credit enhancements – either directly from AfDB or from proxies. Following one
AfDB investment into ATI, a statement from the then Director of Private Sector and Microfinance at AfDB
noted that “ATI uses innovative risk mitigation instruments to catalyze private sector financing into a range
of critical sectors from core infrastructure to trade finance.” This could be useful for GLPGP. Other active
groups like Sweden’s SIDA partner with USAID, IFC, DFIs and others to actively guarantee risks in
development areas that complement Sweden’s international development agenda. GLPGP will approach
SIDA as appropriate.
Another target might be the heavily DFI-backed AFC. As a member, Kenya is entitled to risk and funding
support from AFC, and issuing capital via AFC’s enhanced credit rating if appropriate projects are brought
forward. AFC is owned by numerous groups including very active DFIs such as AfDB, KfW, DEG, FMO, and
PROPARCO. This could be a logical grouping to approach.
In addition, FMO and OeEB have been involved with LPG related activities (FMO in Bangladesh – invested;
OeEB in Albania – commissioned studies). OeEB, while smaller among the European DFIs, is quite active
across debt, equity, quasi-equity, and grants. In addition, like AfDB, FMO and other DFIs, it could be
approached to provide credit lines for an NBFI.

Clean Cooking for Africa National Feasibility Study: LPG for Clean Cooking in Kenya
204
This Part123 provides an evidence base and estimation for use by investors, policymakers, industry and
researchers to guide the development of LPG infrastructure and distribution systems in Kenya.
Introduction: impact scenarios
The assessment utilizes the demand forecast scenarios presented in Part VI (LPG Demand Potential to 2030)
to calculate the potential social, environmental and development impacts through 2030 from each scenario
compared to the “business as usual” projection of LPG adoption and use from Part VI, under the
assumption that needed investments (as presented in Part VIII) will be successfully made to serve that
demand.
All of the scenario models take into account that improved biomass cookstoves (ICS) will seek to compete
with LPG.
The scenarios are:
Extrapolation of current practices and trends (base case) – LPG consumption will grow linearly
based on historic trends from 140,234 MT in 2016 to 230,609 MT by 2030 with 35% of the
population consuming LPG for cooking;
Lower-bound adoption and use scenario under expanded LPG availability – Under conditions of
demographic changes and improved LPG availability, residential LPG consumption could grow to
392,477 MT in 2030, with 38% of the population consuming LPG for cooking;
Upper-bound adoption and use scenario under expanded availability of LPG and improvements to
affordability – Under conditions of demographic changes, improved LPG availability and
affordability, residential LPG consumption for household cooking could grow to 450,111 million MT
by 2030, with 41% of the population consuming LPG for cooking.
Details for these scenarios are presented in Chapter 21 (Detailed Impact Analysis and Findings) beginning
on page 209.
The impacts may be greater if the average end-user LPG price decreases over time, in turn driving increased
LPG adoption and/or LPG use relative to other cooking fuels. As mentioned in Chapter 12 in the section
Sensitivity of demand forecasts to LPG price changes on page 99, an end-user price decrease of 15%,
whether resulting from a continuation of recently stronger competitive forces or from supply chain
efficiency improvements or from governmental price regulation—all of which are possible in future—would
result in a 7% increase in LPG use. The potential effect from this is noted where relevant in the detailed
presentation of impacts in Chapter 21 later in this Part.
123 The contents of this Part were developed with Dalberg Global Development Advisors under engagement to GLPGP.

Clean Cooking for Africa National Feasibility Study: LPG for Clean Cooking in Kenya
205
Data sources
The Kenya Integrated Household Budget Survey 2015/2016 (KIHBS) was the primary data source for the
assessment. The data alongside the demand scenarios were used to analyze and model the environmental,
health, gender, and macroeconomic impact from serving the potential demand for household cooking in
Kenya to 2030, taking into account the primary cooking fuel(s) previously used by new LPG users.
Each cooking fuel has its own characteristics in daily use with respect to health, environment, gender and
economic impacts.
It is important to note that the impact assessment presented in this report is calculated for scenarios where
LPG is made sufficiently available to serve the projected demand, relative to the base case projections. This
approach helps estimate the incremental impact of the investment to be made to cause LPG to be fully
available to Kenyan households that desire it over time, and are located in an area of Kenya where LPG is
feasible to be provided and used124.
Environmental impacts
Kenya’s greenhouse gas emissions profile is dominated by emissions from agriculture and land use (63% of
total emissions) and energy (31% of total).125 One of the contributing factors to land-use change and fuel
combustion is the use of biomass as fuels. The impact of households reducing cooking with charcoal and
firewood and increasing cooking with LPG can have many positive impacts on the environment and climate.
For this study, the environmental impacts from increased LPG use and correspondingly decreased charcoal
and firewood use (without major increase to charcoal exports) were calculated as:
Averted deforestation: 278 – 349 million trees saved annually relative to base case projections in
2030 and 2.0 – 2.7 billion trees cumulatively saved between 2020 and 2030
Carbon dioxide equivalent (CO2eq) emissions126 averted: 30 – 39 million MT of CO2eq emissions
reduced annually in 2030 and 216 – 311 million MT of CO2eq emissions averted cumulatively
between 2020 and 2030
Black Carbon equivalent (BCeq) emissions127 averted: 26 – 34 million MT of BCeq emissions
averted annually in 2030 and 187 – 276 million MT of BCeq emissions averted cumulatively
between 2020 and 2030
The economic value of averted CO2eq emissions in terms of carbon financing: € 943 million –
€ 1.20 billion cumulatively between 2020 and 2030, using the 2018 prevailing price of carbon
It was not possible to estimate the long-term cooling effects from some of the carbon dioxide equivalent
emissions such as nitrous oxide and sulphur dioxide.
124 For example, areas without good road access were not deemed feasible for new LPG demand to be served.
125 USAID (2017)
126 CO2eq emissions include carbon dioxide equivalent emissions from carbon dioxide, methane, and nitrous oxide. These were
calculated using IPCC conform standards. 127
BCeq emissions includes black carbon equivalent emissions from black carbon, organic carbon, carbon monoxide, and total non-methane organic compounds.
Clean Cooking for Africa National Feasibility Study: LPG for Clean Cooking in Kenya
206
Health impacts
Quantitative impacts
Transitioning from charcoal and firewood to LPG can have significant health impacts due to reduced
exposure to household air pollution (HAP) from burning solid fuels to meet household energy needs. HAP is
causally related to ischemic heart disease, stroke, chronic obstructive pulmonary disease, lung cancer in
adults, and acute lower respiratory infection in children (based on Global Burden of Disease (GBD) data)128,
plus several other conditions not included in GBD estimates (e.g. blindness in women). All these diseases
can result in premature death or a disability. For this study, the health impacts from increased LPG use (and
decreased charcoal and firewood use) were estimated by calculating (1) Deaths averted, and (2) Disability-
Adjusted Life Years (DALYs)129 saved due to reduced exposure to HAP from reparable fine particulate matter
(PM2.5).130 Impacts on both adults and children were estimated.
Overall, relative to base case projections, between 12,099 and 17,933 deaths could be averted cumulatively
between 2020 and 2030 due to increased LPG usage, based on the scenario. In addition, 642,786 – 952,675
DALYs could be saved depending on the LPG adoption scenario, relative to base case projections131. This
could result in a total economic value of labour of working age adults (from deaths averted and DALYs
saved) of € 33 million – € 48 million, relative to base case projections, based on prevailing wage rates.
Gender impacts
Qualitative impacts
Globally, it is estimated that women spend an average of 4.5 hours a day on unpaid work, more than
double the amount of time spent by men.132 Reducing the number of hours per day women spend on
unpaid work could have numerous financial and social benefits including allowing women to find more paid
work, pursue education and/or have more leisure time.133 LPG offers a significant time saving advantage to
charcoal and firewood (and other collected biomass) as it provides longer-term storage of LPG in cylinders
within the home and saves cooking and cleaning time.134
In all the demand projection scenarios, the firewood using households that were forecasted to transition to
LPG were almost exclusively purchasers of firewood, not collectors. Therefore, among firewood-collectors
in Kenya, time savings would be negligible. No data were available to estimate the reduction in time
previously spent purchasing charcoal daily or nearly daily (to the extent incremental to other shopping
time) caused by purchasing LPG on a multi-week cycle instead.
128 IMHE (2016)
129 The disability-adjusted life year (DALY) is a measure of the overall disease burden, expressed as the number of years lost due
to ill-health, disability, or premature death. 130
PM2.5 refers to air pollutant particulates with a diameter of 2.5 micrometers or less, small enough to invade even the smallest airways and produce respiratory and cardiovascular illness.
131 All scenarios include assumed rates of growth of the adoption of improved biomass cookstoves by charcoal and firewood
users, detailed in Annex Chapter 28 (Impact Assessment Data Sources and Values). 132
Gates, Melinda (2016) 133
Oxfam International (2017) 134
Brooks N. et al. (2016); Nautiyal S. (2013)

Clean Cooking for Africa National Feasibility Study: LPG for Clean Cooking in Kenya
207
There may be additional time saved when taking into consideration (i) the time saved from cooking with
LPG, and (ii) time saved cleaning (as pots, stoves, and the household cooking space are not blackened by
LPG). However, these effects were excluded from this analysis due to lack of available data.
While jobs will be created in the LPG sector, including for women, women are likely to experience reduced
employment and income opportunities in the informal charcoal sector as charcoal use for cooking is
displaced by LPG use. (There is already a reduction of such jobs underway, caused by the effect on charcoal
production and sales from the governmental ban on logging presently in effect.) Employment effects from
the ban may be significant, but were excluded from this analysis due to lack of available data.
An estimate of potential job losses in the biomass fuel sector is presented in the Macroeconomic impacts
section below.
Consumer household expenditure impacts
Quantitative impacts
Stove and fuel affordability are meaningful constraints to LPG initial adoption and sustained use, given
income and liquidity levels of Kenyan households. Yet, LPG could save households costs in the long run,
because LPG is more cost-efficient at delivering heat to pots than charcoal and purchased firewood in
Kenya. In Kenya, an older World Bank study estimated that spending on fuel comprised 5% (rural) to 6%
(urban) of average household income in 2005.135 Because the KIHBS 2015/2016 survey data on household
fuel expenditures were incomplete, the total fuel cost savings from using LPG was estimated using the 2018
GLPGP-Dalberg market survey. Under the scenarios of expanded LPG availability, the annual cost savings
to consumers is estimated as between € 5 – 6 billion in 2030, relative to the base case projections.
Macroeconomic impacts
Quantitative impacts
Increasing LPG usage within the country could affect the (1) tax revenue, (2) trade balance for the country’s
economy, and (3) total number of jobs across various fuel value chains. LPG is VAT zero-rated136 and is
entirely imported, while charcoal and firewood are subject to 16% VAT and kerosene to a Ksh 18/litre levy.
Assuming that current tax rates and status regarding these fuels remain unchanged over time, increased
LPG consumption, combined with reduced consumption of purchased firewood, charcoal and kerosene, will
impact national tax revenue on an annual basis by between Ksh 1.3 billion (€ 11 million) and Ksh 1.7 billion
(€ 14 million) in 2030, relative to base case projections.
Additionally, the national trade deficit could widen between Ksh 5 billion (€ 44 million) and Ksh 8 billion
(€ 71 million) in 2030, relative to base case projections.
LPG consumption growth displacing biomass fuel use could also drive job losses (formal and informal) in
the charcoal and firewood value chains. These range from 177,294 to 243,427 jobs potentially lost as of
135 World Bank (2010)
136 As discussed in Chapter 10, certain tasks/transactions that contribute to the retail LPG price are subject to VAT, but these are
not material to the macroeconomic impact calculations.

Clean Cooking for Africa National Feasibility Study: LPG for Clean Cooking in Kenya
208
2030, relative to base case projections. It was not possible with available data to model reliably the
number of jobs which could be created in the LPG sector. These LPG jobs would be mostly distribution-and
retail-related.
Unquantified impacts
Increasing the volume of LPG in the country will create additional formal economic activity (e.g., growth of
LPG businesses, staff of bulk depots, staff of filling plants, and transporters) which could positively affect
the tax revenue from corporate tax in the country. This effect was not captured/modelled in the analysis,
because of the lack of data on the corporate tax of different levels of the LPG value chain.
Other impact types
It is important to note that the assessment excluded a few potential avenues for impact that, if possible to
include, would likely have increased the amounts of the positive findings. One example is the impact of the
time saved by cooking with LPG and cleaning the LPG stoves and cookware and cooking space – relative to
other fuels and stoves. These types of impact could not be quantified due to a lack of reliable data.
The health analysis was restricted to the five GBD health outcomes while acknowledging that there is good
quality and emerging evidence of other health outcomes associated with HAP (e.g. cataracts, adverse
pregnancy outcomes, TB, etc.) and burns, which have not been included in this analysis.
Conclusion
The results summarized above demonstrate that successful scaling up LPG use has meaningful positive
impacts on three of five socio-economic impacts assessed: environment, health, and consumer household
expenditure, and a positive effect on women at the consumer and health levels but a likely net negative
effect on women from lost employment opportunities in the charcoal and firewood sectors.

Clean Cooking for Africa National Feasibility Study: LPG for Clean Cooking in Kenya
209
21. Detailed Impact Analysis and Findings
Impacts modelled, data used, and overall approach
This assessment estimated five different impacts of increased LPG adoption and use for household cooking
under the lower-bound and upper-bound adoption scenarios described above relative to base case
projections scenario:
Environment and climate impacts – the averted deforestation, carbon dioxide
equivalent emissions (considering carbon dioxide, methane, and nitrous oxide),
black carbon equivalent emissions (considering black carbon, organic carbon,
carbon monoxide, and total non-methane organic compounds), and the
economic value of averted CO2eq and BCeq emissions in terms of carbon
financing.
Health impact – the averted negative health impacts due to decreased burning
of firewood and charcoal and resultant household air pollution (HAP). This
includes the number of deaths averted, the disability-adjusted life years
(DALYs) saved, and the potential economic value that these individuals can now
realize from the five main GBD outcomes.
Gender impacts – the time that could be saved by women and other family
members by no longer needing to buy firewood and charcoal daily for
household cooking, and time saved from faster cooking with LPG. These
effects are not quantifiable. Health impacts as mentioned above will be
particularly important for women. There will be increases in employment of
women in the expanded LPG sector, particularly in LPG retail, but significant
loss of women’s jobs in the informal charcoal and firewood sectors.
Consumer household expenditure impacts – the cost savings/increase for the
household due to increased LPG adoption and reduced usage of other fuels.
Macro-economic impacts – the impact of increased LPG adoption on Kenya’s
tax base and trade balance, as well as the total job loss within the cooking
energy sector.
The assessment excluded certain potential mechanisms for impact, due to the lack of reliable data:
Under environmental impacts, the assessment does not consider cooling effects.
The health analysis is restricted to the five GBD health outcomes, while noting that there is good
quality and emerging evidence of other health outcomes associated with HAP (e.g. cataracts in women,
stillbirth and low birth weight, tuberculosis) as well as burns in adults and children.
Under gender impacts, this assessment does not consider the impact of the time saved from
purchasing charcoal and firewood relative to LPG, and the time saved by cooking on LPG stoves and
cleaning them (relative to other stoves) after increased LPG uptake.

Clean Cooking for Africa National Feasibility Study: LPG for Clean Cooking in Kenya
210
In consequence, the total positive impacts of transitioning to LPG may be underestimated.
Data used and overall approach
The 2015/16 Kenya Integrated Household Budget Survey (2015/16 KIHBS) was the primary data source for
the assessment. The 2015/16 KIHBS is a nationally representative, population-based household survey that
was conducted over a 12-month period from September 2015 to August 2016. The KIHBS survey sampled
24,000 households drawn from 2,400 clusters across the country. Data were obtained from 21,773
households, representing a response rate of 91.3%. The response rate for rural households was 93.6% while
that for urban households was 88.0%.137
In order to measure the impact from transition to LPG under the evaluated scenarios, it is important to
consider which fuel households would switch from, and how much LPG they would potentially consume in
future. Given the nature of the 2015/2016 KIHBS data, a number of common assumptions were required to
be made across the analyses:
Fuel transition: In 2016, four main fuels were used for cooking: LPG (13% of households used this
as a primary fuel); kerosene (14%); charcoal (15%); and firewood (55%). Given that only 3% of
households reported using another fuel for cooking in the KIHBS data, only firewood, charcoal,
kerosene and LPG were considered. It was assumed that as LPG becomes more widely available
over time, some households will begin using LPG as a primary fuel and will gradually stop using
charcoal, firewood and kerosene for cooking. The remaining charcoal, firewood and kerosene
households were projected from estimates of population growth over the specified time period.138
Fuel consumption: It was assumed that average energy consumption would increase annually by
1.6% based on the historical increase of energy consumption in Kenya. When households begin
using LPG, their LPG consumption would be equivalent to the average LPG consumption.139 It was
assumed that the only other change in LPG consumption for these households would be due to
shifts to more exclusive use of LPG. No other potential impacts on consumption were directly
modelled, including changes such as price variations and availability of other fuels.
It is important to note that the impact assessment presented in this report is calculated for scenarios where
LPG is more available (lower and upper bound) relative to base case projections. This approach helps
estimate the incremental impact of the investment to make LPG increasingly accessible to relevant Kenyan
households over time.
Environment and climate impacts
The impact of households changing their primary fuel from charcoal and firewood to LPG can have many
positive impacts on the environment and climate. For the purpose of this analysis, the environmental
impacts from increased LPG use (and decreased charcoal and firewood use) were estimated by calculating
137 KIHBS (2016)
138 Note that only the transition to LPG primary use for cooking was analysed.
139 Values were obtained for all fuel users (both primary and secondary use households).

Clean Cooking for Africa National Feasibility Study: LPG for Clean Cooking in Kenya
211
(1) averted deforestation; (2) carbon dioxide equivalent (CO2eq) emissions140 averted; (3) Black Carbon
equivalent (BCeq) emissions141 averted; and (4) the potential economic value of averted CO2eq and BCeq
emissions in terms of carbon financing.
Table 43. Summary of environment and climate impacts
from increased primary LPG consumption relative to base case scenario in 2030
Annual impact 2030 Lower-bound adoption scenario Upper-bound adoption scenario
Averted annual deforestation
278 million trees saved annually
(4.3 trees saved per capita)
350 million trees saved annually
(5.4 trees saved per capita)
Reduction in annual CO2eq emissions
30 million MT reduction in CO2eq emissions annually
(0.5 MT reduction per capita)
39 million MT reduction in CO2eq emissions annually
(0.6 MT reduction per capita)
Reduction in annual BCeq emissions
25 million MT reduction in BCeq emissions annually
(0.4 MT reduction per capita)
34 million MT reduction in BCeq emissions annually
(0.5 MT reduction per capita)
Economic value of annual averted CO2eq emissions
278 million trees saved annually
(4.3 trees saved per capita)
350 million trees saved annually
(5.4 trees saved per capita)
Cumulative impact 2020 - 2030 Lower-bound adoption scenario Upper-bound adoption scenario
Averted cumulative deforestation
2.0 billion trees saved 2.7 billion trees saved
Cumulative reduction in CO2eq emissions
216 million MT reduction in CO2eq emissions
311 million MT reduction in CO2eq emissions
Cumulative reduction in annual BCeq emissions
187 million MT reduction in BCeq emissions
276 million MT reduction in BCeq emissions
Cumulative economic value of averted CO2eq emissions
€ 943 million € 1.20 billion
The foregoing impacts could be increased by an amount in the vicinity of 7%, but not presently calculable
using available data, based on the actual demand response to a potential 15% reduction in the end-user
price of LPG over time.
Averted deforestation
Kenya loses 12,000 hectares of forest each year through deforestation. Although only 6% (3.467 million
hectares) of Kenya is covered in forest, the country has lost 250,000 hectares of forest between 1990 and
2010.142
A transition to LPG has the potential to significantly reduce the pace of forest degradation and
deforestation in Kenya. To calculate the potential averted deforestation from increased LPG uptake, the
140 CO2eq emissions includes carbon dioxide equivalent emissions from carbon dioxide, methane, and nitrous oxide.
141 BCeq emissions includes black carbon equivalent emissions from black carbon, organic carbon, carbon monoxide, and total
non-methane organic compounds. 142 FAO (2010)
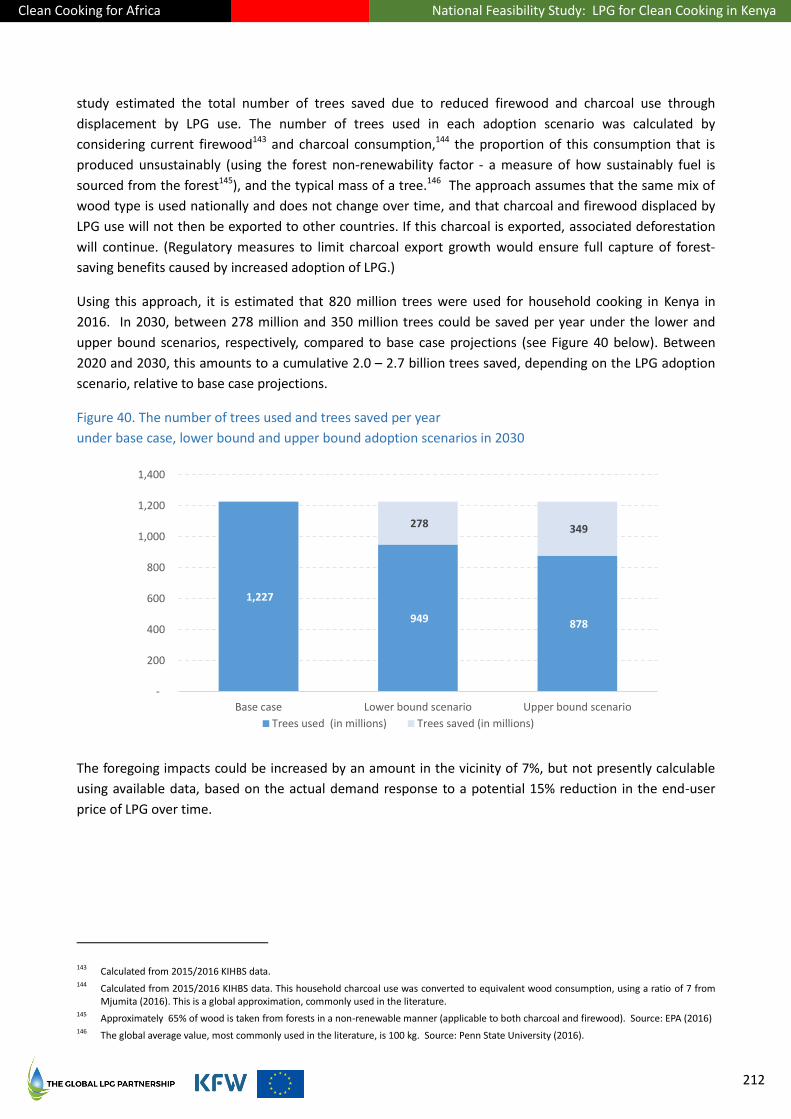
Clean Cooking for Africa National Feasibility Study: LPG for Clean Cooking in Kenya
212
study estimated the total number of trees saved due to reduced firewood and charcoal use through
displacement by LPG use. The number of trees used in each adoption scenario was calculated by
considering current firewood143 and charcoal consumption,144 the proportion of this consumption that is
produced unsustainably (using the forest non-renewability factor - a measure of how sustainably fuel is
sourced from the forest145), and the typical mass of a tree.146 The approach assumes that the same mix of
wood type is used nationally and does not change over time, and that charcoal and firewood displaced by
LPG use will not then be exported to other countries. If this charcoal is exported, associated deforestation
will continue. (Regulatory measures to limit charcoal export growth would ensure full capture of forest-
saving benefits caused by increased adoption of LPG.)
Using this approach, it is estimated that 820 million trees were used for household cooking in Kenya in
2016. In 2030, between 278 million and 350 million trees could be saved per year under the lower and
upper bound scenarios, respectively, compared to base case projections (see Figure 40 below). Between
2020 and 2030, this amounts to a cumulative 2.0 – 2.7 billion trees saved, depending on the LPG adoption
scenario, relative to base case projections.
Figure 40. The number of trees used and trees saved per year
under base case, lower bound and upper bound adoption scenarios in 2030
The foregoing impacts could be increased by an amount in the vicinity of 7%, but not presently calculable
using available data, based on the actual demand response to a potential 15% reduction in the end-user
price of LPG over time.
143 Calculated from 2015/2016 KIHBS data. 144 Calculated from 2015/2016 KIHBS data. This household charcoal use was converted to equivalent wood consumption, using a ratio of 7 from
Mjumita (2016). This is a global approximation, commonly used in the literature. 145 Approximately 65% of wood is taken from forests in a non-renewable manner (applicable to both charcoal and firewood). Source: EPA (2016) 146 The global average value, most commonly used in the literature, is 100 kg. Source: Penn State University (2016).
1,227
949 878
278 349
-
200
400
600
800
1,000
1,200
1,400
Base case Lower bound scenario Upper bound scenario
Trees used (in millions) Trees saved (in millions)

Clean Cooking for Africa National Feasibility Study: LPG for Clean Cooking in Kenya
213
Averted carbon emissions
Kenya’s greenhouse gas emissions profile is dominated by emissions from agriculture, excluding land-use
change and forestry (63% of total emissions), and energy (31% of total).147 Within energy, 25% of emissions
are attributable to fuel combustion.148 In 2013, Kenya emitted 60 million metric tonnes (MT) of total carbon
dioxide equivalent emissions (CO2eq).149 One of the contributing factors to land-use change and fuel
combustion is the use of biomass as fuel. The transition from charcoal and firewood to LPG for cooking will
decrease total and per capita carbon emissions through two mechanisms – decreased carbon emissions
from fuel use and decreased fuel production (charcoal and LPG).
The total CO2eq emissions from fuel use was calculated using the Gold Standard TPDDTEC Guidelines.150
This methodology estimates total CO2eq emissions by calculating the carbon dioxide equivalent emissions
of three particles – carbon dioxide (CO2), methane (CH4), and nitrous oxide (N2O) – and including global
warming potential (GWP) conversion factors.151
The CO2eq emissions for different fuel use were calculated by multiplying household level fuel
consumption152 by the net calorific value of the fuel and average stove efficiencies using global averages
obtained from literature.153 This results in the energy use per fuel (MJd), which was multiplied by the
CO2eq emissions factor (in g/MJd) to obtain the total CO2eq emissions (in grams, which were then
converted to metric tonnes). This methodology was used to calculate CO2eq emissions for the base case
projections scenarios, and the two full-availability adoption scenarios (lower and upper bound). The CO2eq
tonnage differential was calculated by subtracting the CO2eq emissions under the full availability scenarios
from CO2eq emissions in the base case projections scenario.
The total CO2eq emissions from fuel production was estimated using Kyoto Particles Emissions rates
calculated for the production of charcoal and LPG.154 It is important to note that in the case of LPG, given
that Kenya imports LPG and is expected to continue to do so to meet the forecasted demand, the emissions
from production of LPG may occur outside of Kenya. Since LPG is a by-product of the petroleum industry,
the emissions from fuel production would take place regardless of the increase in LPG consumption155.
Combining the CO2eq emissions from fuel use and fuel production, in 2018, an estimated 105.2 million MT
of CO2eq emissions were emitted in Kenya from fuel use for cooking. Table 44 shows that in 2030, 30 and
147 USAID (2017)
148 USAID (2016)
149 USAID (2016)
150 Gold Standard Methodology (2017)
151 CO2 emissions rate was multiplied by the applicable non-renewability factor, CH2 and N2O emissions rate were multiplied by
the global warming potential 100 factors (25 for CH4 and 298 for N2O). See all values in Annex Chapter 28. 152
Calculated from 2015/2016 KIHBS data. 153
Given the paucity of relevant field studies in Kenya, the study relied on global averages obtained from literature. See Annex Chapter 28 for details.
154 This methodology estimates total CO2eq emissions by calculating the CO2eq emissions of three particles – carbon dioxide,
methane, and nitrous oxide – and including global warming potential conversion factors. CO2 emissions rate was multiplied by the applicable non-renewability factor, CH2 and N2O emissions rate were multiplied by the global warming potential 100 factors (25 for CH4 and 298 for N2O). Source: EPA (2018).
155 Surplus LPG production globally is cleared from the market by the portions of the petrochemical and plastics industry which
utilize LPG as a feedstock. Sources: IHS Markit (2018), WLPGA (2018).
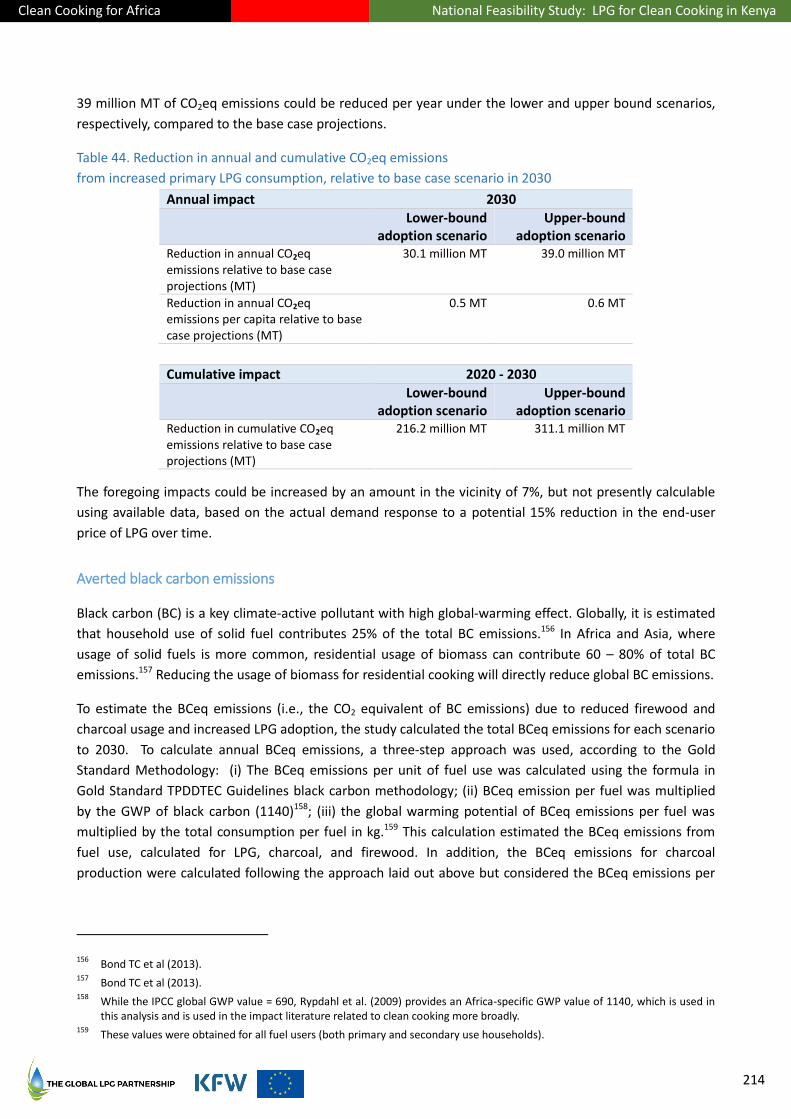
Clean Cooking for Africa National Feasibility Study: LPG for Clean Cooking in Kenya
214
39 million MT of CO2eq emissions could be reduced per year under the lower and upper bound scenarios,
respectively, compared to the base case projections.
Table 44. Reduction in annual and cumulative CO2eq emissions
from increased primary LPG consumption, relative to base case scenario in 2030
Annual impact 2030
Lower-bound adoption scenario
Upper-bound adoption scenario
Reduction in annual CO2eq emissions relative to base case projections (MT)
30.1 million MT 39.0 million MT
Reduction in annual CO2eq emissions per capita relative to base case projections (MT)
0.5 MT 0.6 MT
Cumulative impact 2020 - 2030
Lower-bound adoption scenario
Upper-bound adoption scenario
Reduction in cumulative CO2eq emissions relative to base case projections (MT)
216.2 million MT 311.1 million MT
The foregoing impacts could be increased by an amount in the vicinity of 7%, but not presently calculable
using available data, based on the actual demand response to a potential 15% reduction in the end-user
price of LPG over time.
Averted black carbon emissions
Black carbon (BC) is a key climate-active pollutant with high global-warming effect. Globally, it is estimated
that household use of solid fuel contributes 25% of the total BC emissions.156 In Africa and Asia, where
usage of solid fuels is more common, residential usage of biomass can contribute 60 – 80% of total BC
emissions.157 Reducing the usage of biomass for residential cooking will directly reduce global BC emissions.
To estimate the BCeq emissions (i.e., the CO2 equivalent of BC emissions) due to reduced firewood and
charcoal usage and increased LPG adoption, the study calculated the total BCeq emissions for each scenario
to 2030. To calculate annual BCeq emissions, a three-step approach was used, according to the Gold
Standard Methodology: (i) The BCeq emissions per unit of fuel use was calculated using the formula in
Gold Standard TPDDTEC Guidelines black carbon methodology; (ii) BCeq emission per fuel was multiplied
by the GWP of black carbon (1140)158; (iii) the global warming potential of BCeq emissions per fuel was
multiplied by the total consumption per fuel in kg.159 This calculation estimated the BCeq emissions from
fuel use, calculated for LPG, charcoal, and firewood. In addition, the BCeq emissions for charcoal
production were calculated following the approach laid out above but considered the BCeq emissions per
156 Bond TC et al (2013).
157 Bond TC et al (2013).
158 While the IPCC global GWP value = 690, Rypdahl et al. (2009) provides an Africa-specific GWP value of 1140, which is used in
this analysis and is used in the impact literature related to clean cooking more broadly. 159
These values were obtained for all fuel users (both primary and secondary use households).
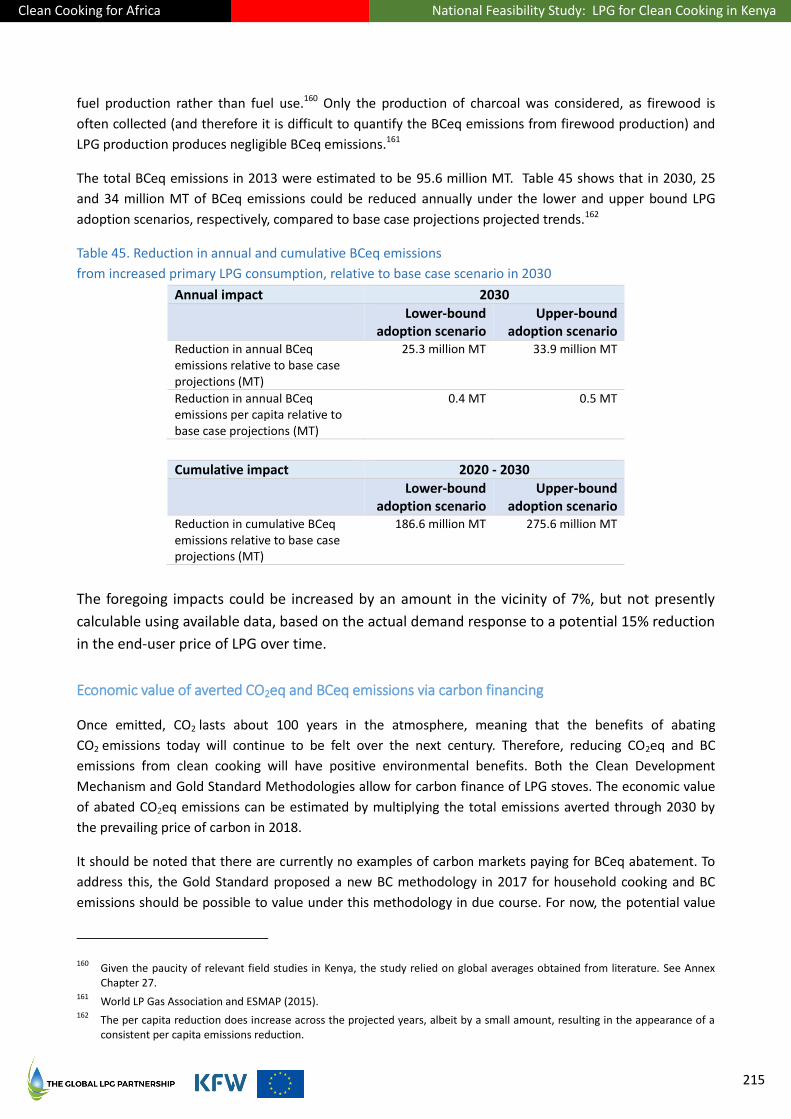
Clean Cooking for Africa National Feasibility Study: LPG for Clean Cooking in Kenya
215
fuel production rather than fuel use.160 Only the production of charcoal was considered, as firewood is
often collected (and therefore it is difficult to quantify the BCeq emissions from firewood production) and
LPG production produces negligible BCeq emissions.161
The total BCeq emissions in 2013 were estimated to be 95.6 million MT. Table 45 shows that in 2030, 25
and 34 million MT of BCeq emissions could be reduced annually under the lower and upper bound LPG
adoption scenarios, respectively, compared to base case projections projected trends.162
Table 45. Reduction in annual and cumulative BCeq emissions
from increased primary LPG consumption, relative to base case scenario in 2030
Annual impact 2030
Lower-bound adoption scenario
Upper-bound adoption scenario
Reduction in annual BCeq emissions relative to base case projections (MT)
25.3 million MT 33.9 million MT
Reduction in annual BCeq emissions per capita relative to base case projections (MT)
0.4 MT 0.5 MT
Cumulative impact 2020 - 2030
Lower-bound adoption scenario
Upper-bound adoption scenario
Reduction in cumulative BCeq emissions relative to base case projections (MT)
186.6 million MT 275.6 million MT
The foregoing impacts could be increased by an amount in the vicinity of 7%, but not presently
calculable using available data, based on the actual demand response to a potential 15% reduction
in the end-user price of LPG over time.
Economic value of averted CO2eq and BCeq emissions via carbon financing
Once emitted, CO2 lasts about 100 years in the atmosphere, meaning that the benefits of abating
CO2 emissions today will continue to be felt over the next century. Therefore, reducing CO2eq and BC
emissions from clean cooking will have positive environmental benefits. Both the Clean Development
Mechanism and Gold Standard Methodologies allow for carbon finance of LPG stoves. The economic value
of abated CO2eq emissions can be estimated by multiplying the total emissions averted through 2030 by
the prevailing price of carbon in 2018.
It should be noted that there are currently no examples of carbon markets paying for BCeq abatement. To
address this, the Gold Standard proposed a new BC methodology in 2017 for household cooking and BC
emissions should be possible to value under this methodology in due course. For now, the potential value
160 Given the paucity of relevant field studies in Kenya, the study relied on global averages obtained from literature. See Annex
Chapter 27. 161
World LP Gas Association and ESMAP (2015). 162
The per capita reduction does increase across the projected years, albeit by a small amount, resulting in the appearance of a consistent per capita emissions reduction.
Clean Cooking for Africa National Feasibility Study: LPG for Clean Cooking in Kenya
216
of BC abatement can be calculated by taking the CO2eq quantities of BC emissions (i.e., BCeq emissions)
and multiplying it by the prevailing price of carbon.
For both the estimations, there are two ways to determine the price of carbon:
1. Price carbon on prevailing carbon values – A 2017 review of global carbon prices found that clean
cookstove offsets from Africa were priced at an average of € 4.4/MT (US $5.1/MT) of CO2 (carbon
prices ranged from € 1.7 – 17.2 (US $2-20)163
2. Use a fair estimate of the price of carbon – The fair price of carbon in the market is predicted to be
€ 34 – 69 (US $40-80) per MT of CO2 by 2020 and € 43 - 86 (US $50-100) per tonne by 2030.164
However, these carbon prices are not reflected in any market. In fact, 85% of global carbon
emissions are currently not priced, and about three quarters of the emissions are priced at below
€ 8.6/MT (US $10/MT) of CO2.
Given that real carbon prices are consistently lower than the fair estimate of carbon price, the economic
value of reduced carbon was estimated using the observed prevailing carbon price in Africa of US $ 5.1/MT
(€ 4.4/MT) of CO2 and multiplying it by the carbon emissions averted.
The annual economic value of CO2 emissions and BCeq emissions averted in 2030 range between of € 131 –
€ 150 million and € 110 – € 131 million, respectively, relative to business as usual. The cumulative economic
value for CO2 emissions averted between 2020 and 2030, could range from € 943 million to € 1.2 billion,
depending on the adoption scenario, relative to base case projections. The cumulative economic value for
BCeq emissions averted between 2020 and 2030, could range from € 814 million to € 1.1 billion, depending
on the adoption scenario, relative to base case projections.
The foregoing impacts could be increased by an amount in the vicinity of 7%, but not presently calculable
using available data, based on the actual demand response to a potential 15% reduction in the end-user
price of LPG over time.
Health impacts
Transitioning from charcoal and firewood to LPG can have significant health benefits due to reduced
personal exposure to household air pollution (HAP) from burning solid fuels to meet household energy
needs. HAP is causally related to ischemic heart disease, stroke, chronic obstructive pulmonary disease
(COPD), lung cancer in adults, and acute lower respiratory infection in children (ALRI).165 All of these
diseases can result in premature death or a disability that can affect life expectancy. In 2013 in Kenya,
exposure to HAP from cooking with solid fuel resulted in 32,308 premature deaths and 1,664,849 Disability
Adjusted Life Years (DALY)s.166 A “DALY” is a measure of overall disease burden, expressed as the number of
years lost due to ill-health, disability or early death.167
163 World Bank (2017)
164 Stiglitz and Stern (2018)
165 Smith et al. (2015)
166 Based on outputs from the WHO: HAPIT model, version 3.1.1.
167 IHME (2016); WHO (2016)
Clean Cooking for Africa National Feasibility Study: LPG for Clean Cooking in Kenya
217
For the purpose of this study, the health benefits from increased LPG use offsetting charcoal and firewood
use was estimated by calculating (1) deaths averted, and (2) Disability-Adjusted Life Years (DALYs) saved due
to reduced HAP from fine particulate matter (PM2.5) exposure rates based on the five diseases included in
the GBD only.168 PM2.5 is one of a number of health-damaging products of incomplete fuel combustion that
are emitted at relatively high concentrations when wood, charcoal, and other solid fuels are burned in open
fires or cookstoves, but are negligibly emitted by combustion of LPG.
The World Health Organization (WHO) has published safe levels of PM2.5 for health, termed “air quality
guidelines.” The current recommended guideline for annual average PM2.5 level is 10 ug/m3 (annual
average). Recognizing the challenge of rapidly achieving such low concentrations of particulates, the WHO
has also identified three interim targets for PM2.5 concentrations that would offer some health protection to
support efforts towards meeting the WHO guidelines. The first (highest) of such targets is the interim-target
1 (IT-1), set at 35 ug/m3.
Compared with combustion of solid fuels in the home, LPG has a very clean emissions profile at point of
use that consistently delivers low emissions independently of the operation, age, or condition of the stove
used.169 As such, and in the absence of other indoor or ambient sources of pollution, it is reasonable to
assume that the concentrations of PM2.5 in households using LPG exclusively for cooking, will be below the
WHO annual average Interim Target 1 (35 ug/m3). Higher exposure rates reported in certain other studies
are likely due to background air pollution, including from neighbouring households that continue to rely on
polluting fuels and technologies, and/or from concurrent use of other, more polluting fuels in the homes
studied. Given that there are still relatively few field studies conducted in Sub Saharan Africa, which
carefully document fuel stacking and levels of ambient air pollution (see Annex Chapter 21 (Detailed Impact
Analysis and Findings) beginning on page 209), and that it was beyond the scope of this work to conduct a
systematic review of all published studies, the modelling uses the WHO IT-1 annual PM2.5 concentration as
a basis for assessing the health impacts of increased primary/exclusive LPG consumption in adults and
children.
In terms of pre-intervention exposure data, the study relied on published concentrations of PM2.5 exposure
for firewood and charcoal users taken from a systematic review of field studies conducted by Pope et al.
(2017) (see Annex Chapter 21). Pre- and post-intervention exposure values were inputted into the
Household Air Pollution Intervention Tool (HAPIT version 3.1.1)170, a tool based on established GBD
methods that is in widespread use for modelling health impacts of interventions to reduce HAP
exposure.171 This tool was used to estimate the deaths averted and DALYs saved in Kenya under each
scenario.172
168 PM2.5 refers to air pollutant particulates with a diameter of 2.5 micrometers or less, small enough to invade even the smallest
airways and produce respiratory and cardiovascular illness. 169
Smith K.R., et al. (2000); Zhang et al. (2000); MacCarty et al. (2010); Shen et al. (2018) 170
householdenergy.shinyapps.io/hapit3/ 171
The HAPIT model uses disease rates and relationships as described in the Institute for Health Metrics and Evaluation’s 2013 Global Burden of Disease and Comparative Risk Assessments efforts and estimates potential health changes due to interventions designed to lower household air pollution. See householdenergy.shinyapps.io/hapit3/#
172 A useful intervention lifespan of five years was assumed (with the results divided by five to obtain a per year output), and the
default values for Kenya were used, with a counterfactual of 7 ug/m3. This counterfactual is a measure of the ideal exposures, below which there is no risk to health.
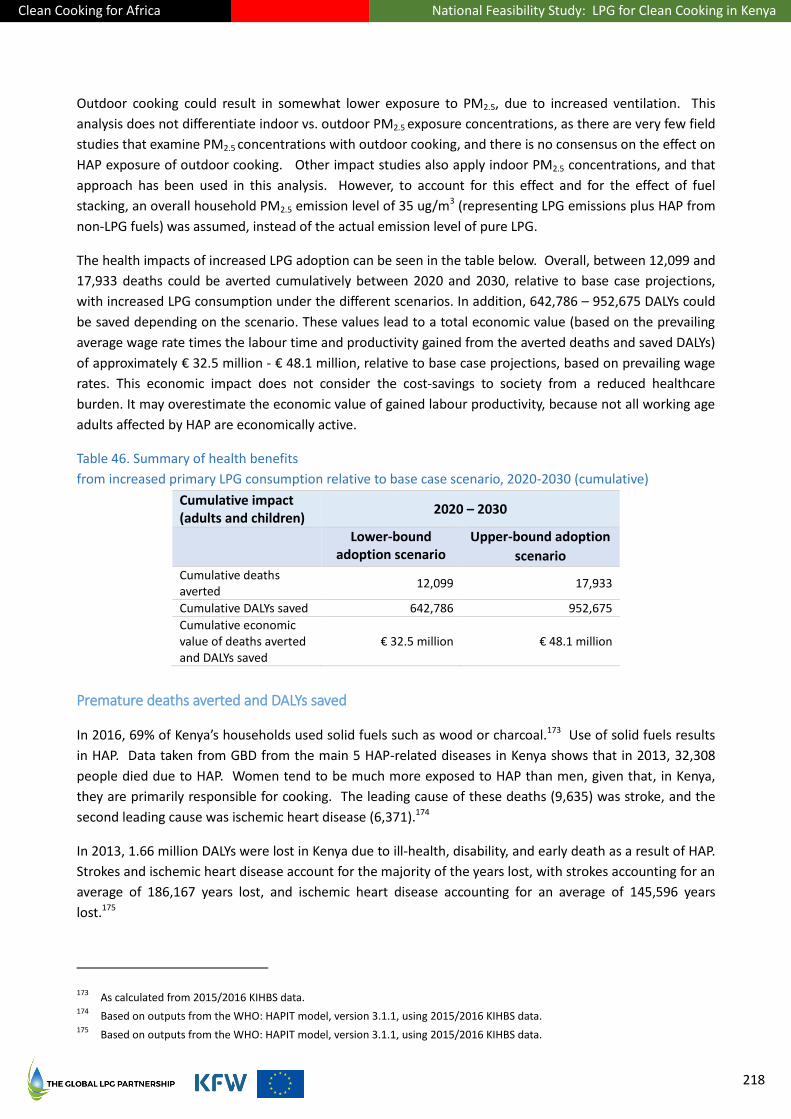
Clean Cooking for Africa National Feasibility Study: LPG for Clean Cooking in Kenya
218
Outdoor cooking could result in somewhat lower exposure to PM2.5, due to increased ventilation. This
analysis does not differentiate indoor vs. outdoor PM2.5 exposure concentrations, as there are very few field
studies that examine PM2.5 concentrations with outdoor cooking, and there is no consensus on the effect on
HAP exposure of outdoor cooking. Other impact studies also apply indoor PM2.5 concentrations, and that
approach has been used in this analysis. However, to account for this effect and for the effect of fuel
stacking, an overall household PM2.5 emission level of 35 ug/m3 (representing LPG emissions plus HAP from
non-LPG fuels) was assumed, instead of the actual emission level of pure LPG.
The health impacts of increased LPG adoption can be seen in the table below. Overall, between 12,099 and
17,933 deaths could be averted cumulatively between 2020 and 2030, relative to base case projections,
with increased LPG consumption under the different scenarios. In addition, 642,786 – 952,675 DALYs could
be saved depending on the scenario. These values lead to a total economic value (based on the prevailing
average wage rate times the labour time and productivity gained from the averted deaths and saved DALYs)
of approximately € 32.5 million - € 48.1 million, relative to base case projections, based on prevailing wage
rates. This economic impact does not consider the cost-savings to society from a reduced healthcare
burden. It may overestimate the economic value of gained labour productivity, because not all working age
adults affected by HAP are economically active.
Table 46. Summary of health benefits
from increased primary LPG consumption relative to base case scenario, 2020-2030 (cumulative)
Cumulative impact (adults and children)
2020 – 2030
Lower-bound adoption scenario
Upper-bound adoption
scenario
Cumulative deaths averted
12,099 17,933
Cumulative DALYs saved 642,786 952,675
Cumulative economic value of deaths averted and DALYs saved
€ 32.5 million € 48.1 million
Premature deaths averted and DALYs saved
In 2016, 69% of Kenya’s households used solid fuels such as wood or charcoal.173 Use of solid fuels results
in HAP. Data taken from GBD from the main 5 HAP-related diseases in Kenya shows that in 2013, 32,308
people died due to HAP. Women tend to be much more exposed to HAP than men, given that, in Kenya,
they are primarily responsible for cooking. The leading cause of these deaths (9,635) was stroke, and the
second leading cause was ischemic heart disease (6,371).174
In 2013, 1.66 million DALYs were lost in Kenya due to ill-health, disability, and early death as a result of HAP.
Strokes and ischemic heart disease account for the majority of the years lost, with strokes accounting for an
average of 186,167 years lost, and ischemic heart disease accounting for an average of 145,596 years
lost.175
173 As calculated from 2015/2016 KIHBS data.
174 Based on outputs from the WHO: HAPIT model, version 3.1.1, using 2015/2016 KIHBS data.
175 Based on outputs from the WHO: HAPIT model, version 3.1.1, using 2015/2016 KIHBS data.
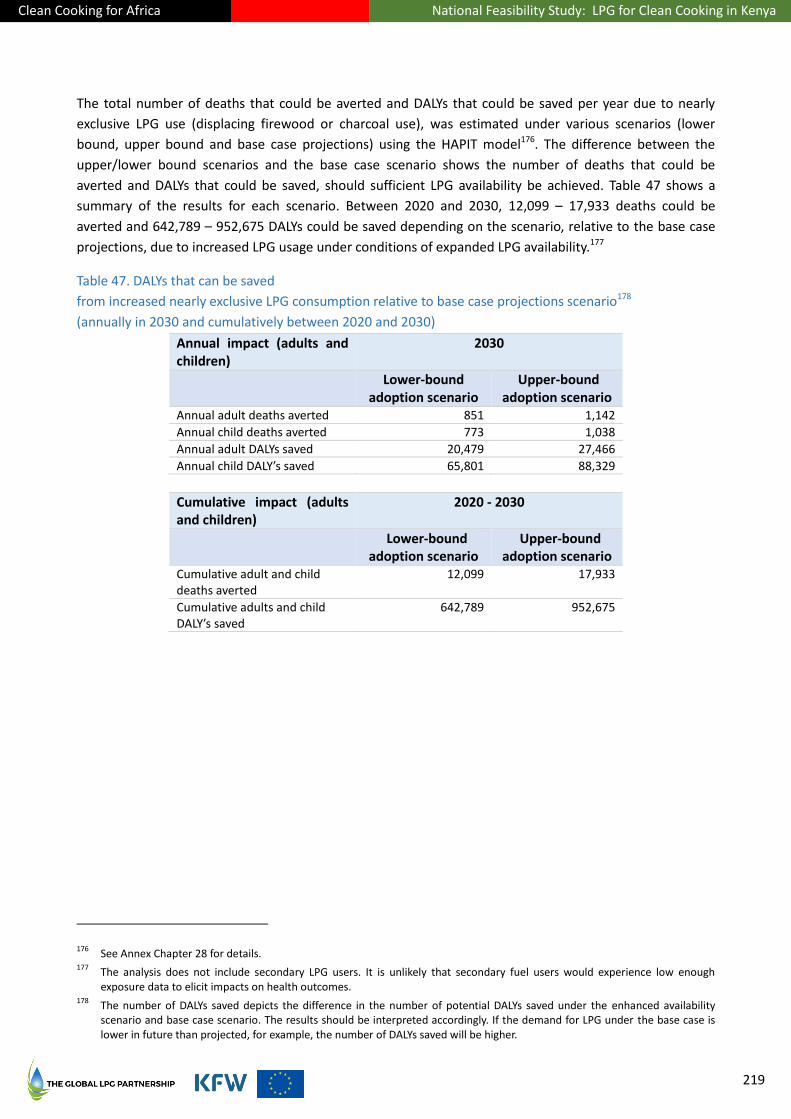
Clean Cooking for Africa National Feasibility Study: LPG for Clean Cooking in Kenya
219
The total number of deaths that could be averted and DALYs that could be saved per year due to nearly
exclusive LPG use (displacing firewood or charcoal use), was estimated under various scenarios (lower
bound, upper bound and base case projections) using the HAPIT model176. The difference between the
upper/lower bound scenarios and the base case scenario shows the number of deaths that could be
averted and DALYs that could be saved, should sufficient LPG availability be achieved. Table 47 shows a
summary of the results for each scenario. Between 2020 and 2030, 12,099 – 17,933 deaths could be
averted and 642,789 – 952,675 DALYs could be saved depending on the scenario, relative to the base case
projections, due to increased LPG usage under conditions of expanded LPG availability.177
Table 47. DALYs that can be saved
from increased nearly exclusive LPG consumption relative to base case projections scenario178
(annually in 2030 and cumulatively between 2020 and 2030)
Annual impact (adults and children)
2030
Lower-bound adoption scenario
Upper-bound adoption scenario
Annual adult deaths averted 851 1,142
Annual child deaths averted 773 1,038
Annual adult DALYs saved 20,479 27,466
Annual child DALY’s saved 65,801 88,329
Cumulative impact (adults and children)
2020 - 2030
Lower-bound adoption scenario
Upper-bound adoption scenario
Cumulative adult and child deaths averted
12,099 17,933
Cumulative adults and child DALY’s saved
642,789 952,675
176 See Annex Chapter 28 for details.
177 The analysis does not include secondary LPG users. It is unlikely that secondary fuel users would experience low enough
exposure data to elicit impacts on health outcomes. 178
The number of DALYs saved depicts the difference in the number of potential DALYs saved under the enhanced availability scenario and base case scenario. The results should be interpreted accordingly. If the demand for LPG under the base case is lower in future than projected, for example, the number of DALYs saved will be higher.
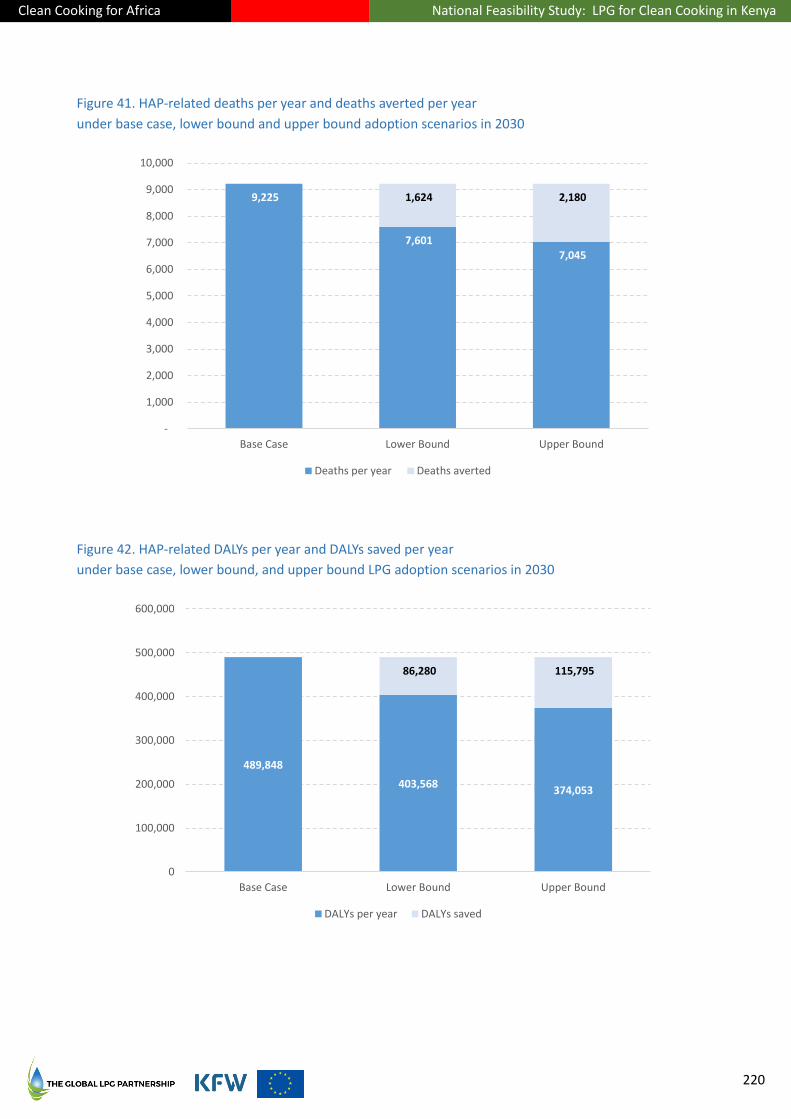
Clean Cooking for Africa National Feasibility Study: LPG for Clean Cooking in Kenya
220
Figure 41. HAP-related deaths per year and deaths averted per year
under base case, lower bound and upper bound adoption scenarios in 2030
Figure 42. HAP-related DALYs per year and DALYs saved per year
under base case, lower bound, and upper bound LPG adoption scenarios in 2030
9,225
7,601 7,045
1,624 2,180
-
1,000
2,000
3,000
4,000
5,000
6,000
7,000
8,000
9,000
10,000
Base Case Lower Bound Upper Bound
Deaths per year Deaths averted
489,848
403,568 374,053
86,280 115,795
0
100,000
200,000
300,000
400,000
500,000
600,000
Base Case Lower Bound Upper Bound
DALYs per year DALYs saved
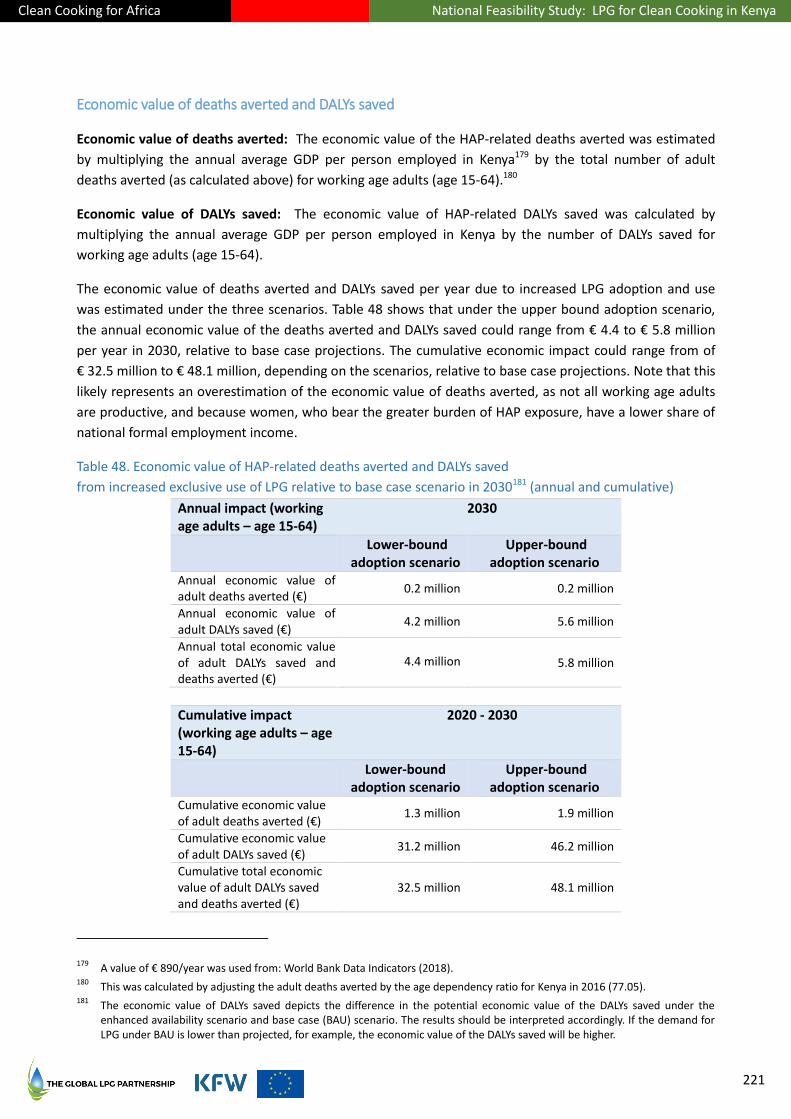
Clean Cooking for Africa National Feasibility Study: LPG for Clean Cooking in Kenya
221
Economic value of deaths averted and DALYs saved
Economic value of deaths averted: The economic value of the HAP-related deaths averted was estimated
by multiplying the annual average GDP per person employed in Kenya179 by the total number of adult
deaths averted (as calculated above) for working age adults (age 15-64).180
Economic value of DALYs saved: The economic value of HAP-related DALYs saved was calculated by
multiplying the annual average GDP per person employed in Kenya by the number of DALYs saved for
working age adults (age 15-64).
The economic value of deaths averted and DALYs saved per year due to increased LPG adoption and use
was estimated under the three scenarios. Table 48 shows that under the upper bound adoption scenario,
the annual economic value of the deaths averted and DALYs saved could range from € 4.4 to € 5.8 million
per year in 2030, relative to base case projections. The cumulative economic impact could range from of
€ 32.5 million to € 48.1 million, depending on the scenarios, relative to base case projections. Note that this
likely represents an overestimation of the economic value of deaths averted, as not all working age adults
are productive, and because women, who bear the greater burden of HAP exposure, have a lower share of
national formal employment income.
Table 48. Economic value of HAP-related deaths averted and DALYs saved
from increased exclusive use of LPG relative to base case scenario in 2030181 (annual and cumulative)
Annual impact (working age adults – age 15-64)
2030
Lower-bound adoption scenario
Upper-bound adoption scenario
Annual economic value of adult deaths averted (€)
0.2 million 0.2 million
Annual economic value of adult DALYs saved (€)
4.2 million 5.6 million
Annual total economic value of adult DALYs saved and deaths averted (€)
4.4 million
5.8 million
Cumulative impact (working age adults – age 15-64)
2020 - 2030
Lower-bound adoption scenario
Upper-bound adoption scenario
Cumulative economic value of adult deaths averted (€)
1.3 million 1.9 million
Cumulative economic value of adult DALYs saved (€)
31.2 million 46.2 million
Cumulative total economic value of adult DALYs saved and deaths averted (€)
32.5 million 48.1 million
179 A value of € 890/year was used from: World Bank Data Indicators (2018).
180 This was calculated by adjusting the adult deaths averted by the age dependency ratio for Kenya in 2016 (77.05).
181 The economic value of DALYs saved depicts the difference in the potential economic value of the DALYs saved under the
enhanced availability scenario and base case (BAU) scenario. The results should be interpreted accordingly. If the demand for LPG under BAU is lower than projected, for example, the economic value of the DALYs saved will be higher.

Clean Cooking for Africa National Feasibility Study: LPG for Clean Cooking in Kenya
222
Gender impacts
The 2015/2016 KIHBS indicates that collecting firewood takes an average of 32.6 minutes per household
per day in Kenya. Urban households using firewood spend an average of 18.9 minutes per day and rural
households 22.4 minutes per day collecting fuel. As charcoal is purchased locally, and LPG is purchased
infrequently relative to other fuels, it was assumed that the time taken to collect LPG is negligible relative
to the time taken to collect firewood. Therefore, only the value of time saved for households no longer
collecting firewood was estimated.
Through the demand modelling, it was possible to identify whether the firewood-using households that
could switch to LPG by 2030 collected firewood or purchased it. The modelling indicates that none of the
households that switched to LPG (as identified through the propensity matching approach) were
households that collected firewood. Therefore, their time savings from the transition to LPG in the
improved and full availability scenarios is projected to be negligible.
Note that there may be additional time saved when taking into consideration (i) the time saved from
cooking with LPG, and (ii) time saved cleaning (as pots, stoves, and the household cooking space are not
blackened by LPG). However, these effects were excluded from this analysis due to lack of available data.
Long-term potential for gender impact from LPG displacing collected firewood
While the impact in Kenya of LPG availability and promotion on firewood-collectors was modelled to be
negligible, in principle, a switch away from fuelwood collection for household energy purposes could have
significant effects, including time savings for women, particularly as inclusive economic development enables
more firewood-collecting persons to be able to participate in the cash-based energy economy over time.
Globally, it is estimated that women spend an average of 4.5 hours a day on unpaid work—more than
double the amount of time spent by men.182 The global value of this work is estimated at € 8.8 trillion,
equivalent to one-eighth of the entire world’s GDP. Reducing the number of hours per day spent by women
on unpaid work involving gathering fuel could have numerous benefits, both financial and social, including
allowing women to find more paid work, pursue education, or have more time for themselves and their
wellbeing.183 LPG potentially offers a significant time saving advantage to firewood (and other collected
biomass) as it provides storage of LPG in cylinders within the home, saving time spent collecting fuel.184 In
addition, LPG stoves can offer time savings from increased speed of cooking, including time saved from
having to start the fire, and reduced cleaning time as utensils are not blackened by smoke.185 Although the
number of studies quantifying the time spent on biomass collection activities and speed of cooking and
cleaning is limited, some studies from different settings show that households, and women in particular,
182 Gates, M. (2016)
183 Oxfam International (2017)
184 A study from India showed that the introduction of LPG reduced time spent on fuel collection from 2.2 to 0.2 hours per day. In
other studies, the time savings from LPG have been shown to be between 1.5 and 2 hours a day. Sources: Nautiyal S. (2013); Brooks N. et al. (2016).
185 Savings on cleaning time estimated as between 15 and 30 minutes in the following study: Chandar M, Tandon V. (2004);
Shashni S and Chander M. (2014).
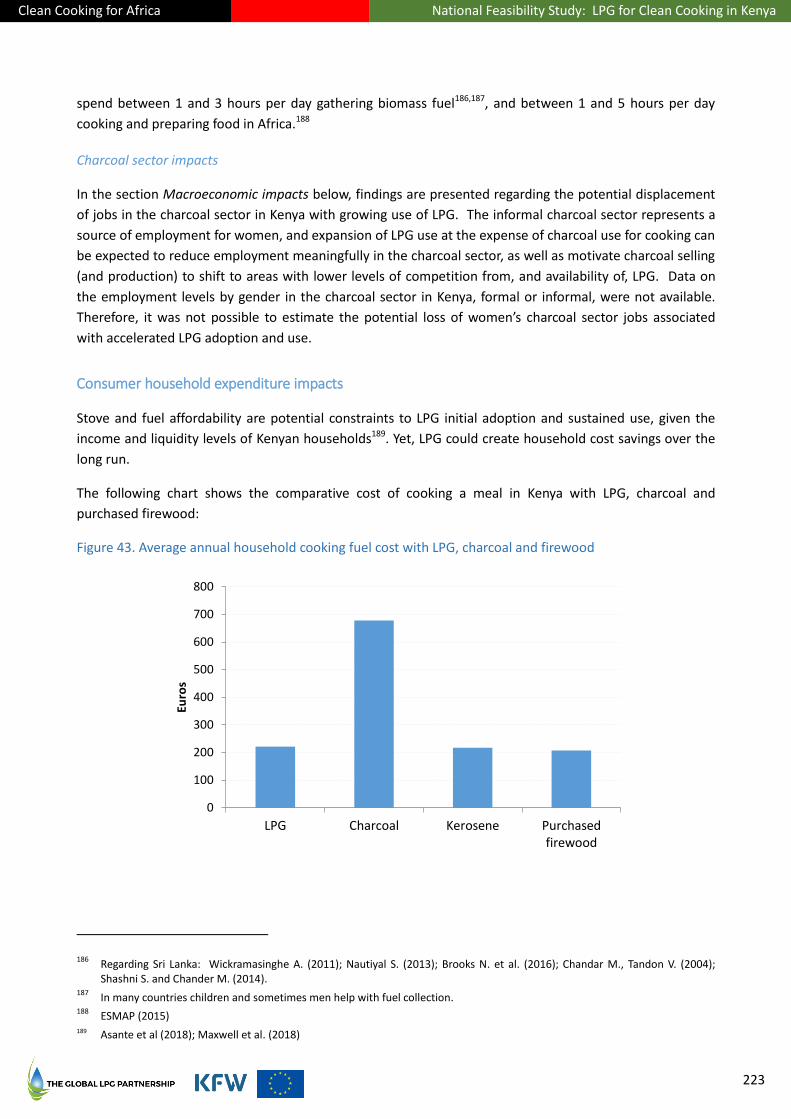
Clean Cooking for Africa National Feasibility Study: LPG for Clean Cooking in Kenya
223
spend between 1 and 3 hours per day gathering biomass fuel186,187, and between 1 and 5 hours per day
cooking and preparing food in Africa.188
Charcoal sector impacts
In the section Macroeconomic impacts below, findings are presented regarding the potential displacement
of jobs in the charcoal sector in Kenya with growing use of LPG. The informal charcoal sector represents a
source of employment for women, and expansion of LPG use at the expense of charcoal use for cooking can
be expected to reduce employment meaningfully in the charcoal sector, as well as motivate charcoal selling
(and production) to shift to areas with lower levels of competition from, and availability of, LPG. Data on
the employment levels by gender in the charcoal sector in Kenya, formal or informal, were not available.
Therefore, it was not possible to estimate the potential loss of women’s charcoal sector jobs associated
with accelerated LPG adoption and use.
Consumer household expenditure impacts
Stove and fuel affordability are potential constraints to LPG initial adoption and sustained use, given the
income and liquidity levels of Kenyan households189. Yet, LPG could create household cost savings over the
long run.
The following chart shows the comparative cost of cooking a meal in Kenya with LPG, charcoal and
purchased firewood:
Figure 43. Average annual household cooking fuel cost with LPG, charcoal and firewood
186 Regarding Sri Lanka: Wickramasinghe A. (2011); Nautiyal S. (2013); Brooks N. et al. (2016); Chandar M., Tandon V. (2004);
Shashni S. and Chander M. (2014). 187
In many countries children and sometimes men help with fuel collection. 188
ESMAP (2015) 189 Asante et al (2018); Maxwell et al. (2018)
0
100
200
300
400
500
600
700
800
LPG Charcoal Kerosene Purchasedfirewood
Euro
s

Clean Cooking for Africa National Feasibility Study: LPG for Clean Cooking in Kenya
224
LPG has a higher initial purchase price (in terms of the cost of the stove and cylinder) and larger, multi-
weekly refill transactions relative to daily or weekly woodfuel purchases. Over the lifecycle of the
equipment, however, the cost of fuel dominates household cooking economics, as shown in Figure 13 (page
84). Considering only the direct cash cost of cooking (what is paid for the equipment, amortized over its
lifetime, plus the fuel), LPG delivers more cooked meals per Kenyan shilling or Euro compared with
charcoal, and similar meals compared with purchased firewood and kerosene. However, other benefits of
LPG not captured in a direct cost calculation, such as speed (essentially zero ignition time, zero warm-up
time, zero dousing time, cleanliness and clean-up time), negligible smoke/emissions, and others, mean that
the cost-benefit comparison of LPG to firewood (considering such benefits) favors LPG for a portion of
households that use purchased firewood or kerosene for cooking.
Additional analysis regarding comparative household costs is presented in Part VI.
It is estimated that 7% of a household’s income in Africa is spent on energy, and additional incremental
spending is often viewed as unaffordable given competing essential household expenses, including food
and shelter.190 In Kenya, it is estimated that fuel comprised of 5% (rural) to 6% (urban) of household
expenditure in 2010.191 On average, the total expenditure on fuel varies by income, and similar-sized
households from different income quintiles tend to spend different amounts of money on fuel. The fuel
cost savings was calculated using the average cost of fuel per year per household to obtain the total fuel
costs under each adoption scenario. The average annual cost of cooking per household shows that, on
average, LPG provides cost savings for households using charcoal or purchased firewood and is
economically similar on an annualized basis to cooking with kerosene.192
In 2016, it was estimated that households in Kenya spent KES 1.79 billion on residential cooking fuel.193 The
table below shows that under the two LPG adoption scenarios, the annual cost savings to LPG consumers
could increase between KES 594 – 740 billion (€ 5.1 – 6.4 billion) in 2030, relative to the base case194.
Table 49. Cost savings per year from increased LPG consumption
relative to base case scenario in 2030
2030
Lower-bound adoption scenario
Upper-bound adoption scenario
Annual cost savings for all households switching from firewood and charcoal to LPG, relative to base case
KES 594 billion (€ 5.1 billion)
KES 740 billion (€ 6.4 billion)
The foregoing savings could be increased by an amount in the vicinity of 7%, but not presently
calculable using available data, based on the actual demand response to a potential 15% reduction
in the end-user price of LPG over time.
190 ESMAP (2015)
191 World Bank (2010) 192
KITE (2015). 193
Calculated using the total number of households and the annual cost of using different fuels in Kenya to obtain the total spent. 194
The expenditures on LPG of households that gather firewood for free were excluded from this calculation.

Clean Cooking for Africa National Feasibility Study: LPG for Clean Cooking in Kenya
225
Macroeconomic impacts
Increasing LPG usage within the country could affect the (1) tax revenue, (2) trade balance for the country’s
economy, and (3) total number of jobs across various fuel value chains. Kenya’s LPG is VAT zero-rated and is
entirely imported, while charcoal and firewood are subject to 16% VAT and kerosene to a Ksh 18/litre levy.
Assuming that current tax rates and status regarding these fuels remain unchanged over time, increased
LPG consumption, combined with reduced consumption of firewood, charcoal and kerosene will impact
national tax revenue. Assuming no major increase in the export of woodfuels, the result will be a decrease
an annual basis by between Ksh 1.3 billion (€ 11 million) and Ksh 1.7 billion (€ 14 million) in 2030, relative
to base case projections. This equates to a cumulative decrease in the national tax base of between Ksh 8.2
billion (€ 69.5 million) and Ksh 11.8 billion (€ 100.6 million) between 2020 and 2030, relative to base case
projections.
In 2016, Kenya imported 172,000 MT and exported 3,000 MT of LPG.195 The projected increases in LPG
importation could widen the national trade deficit between Ksh 5 billion (€ 44 million) and Ksh 8 billion
(€ 71 million) in 2030, relative to base case projections.
It is important to note that a wide uptake of LPG will result in job losses in charcoal and firewood value
chains, particularly in the informal sector. It was not possible with available data to model reliably the
number of jobs which could be created in the LPG sector. These LPG jobs would be mostly distribution-and
retail-related, and would likely be an order of magnitude lower than the jobs lost in the woodfuels sectors,
given the much lower labor intensity of LPG supply chains.
Table 50. Summary of annual macro-economic impacts
from increased primary LPG consumption relative to base case scenario in 2030
Annual impact 2030
Lower-bound adoption scenario
Upper-bound adoption scenario
Annual decrease in national tax base relative to base case projections
KES 1.3 billion € 11 million
KES 1.7 billion €14 million
Annual expansion of national trade deficit relative to base case projections
KES 5 billion € 44 million
KES 8 billion € 71 million
Net job creation in the LPG value chain relative to base case projections
Unquantifiable Unquantifiable
Net job losses in woodfuel value chains relative to base case projections
177,294 243,427
Tax revenue impact
The impact of increased LPG adoption will be felt on the KES 1.2 trillion196 tax base (in 2015) through
changes in total volume of taxes collected on competing fuels. (LPG is VAT zero-rated.) The net effect of
195 UN Data (2016)

Clean Cooking for Africa National Feasibility Study: LPG for Clean Cooking in Kenya
226
increased LPG consumption and decreased charcoal, firewood and kerosene use would be a decrease in the
combined value of these taxes collected in Kenya. Import taxes would be minimally affected: Imported
LPG is not subject to import duties, and Kenya does not import material quantities of charcoal or firewood.
Increasing the domestic consumption of LPG will create formal economic activity (e.g., LPG marketers, staff
of bulk depots, staff of filling plants, truckers, retailers, etc.) which could positively affect the tax revenue
from corporate tax in the country. This effect was not captured/modelled in the analysis.
To estimate the impact of fuel sales on the tax base (through 16% VAT on charcoal and purchased firewood
and the anti-adulteration levy on kerosene), the total quantity of fuel consumed in-country was multiplied
by the domestic sales price per kg of fuel197 and the various taxes or levies applicable to that fuel. Major
changes to prices and/or taxes and duties would change the tax revenues, but projecting how these might
change over time is beyond the scope of this work.
In 2016, the national tax revenue due to cooking fuels was calculated to be KES 2.47 billion (€ 21 million).198
The national tax revenue could decrease annually by KES 1.3 – 1.7 billion (€ 11 – 14 million) in 2030, relative
to the base case scenario.
This impact could be increased (that is, a greater loss of tax revenue could occur) by an amount in the
vicinity of 7%, but not presently calculable using available data, based on the actual demand response to a
potential 15% reduction in the end-user price of LPG over time, due to greater displacement of charcoal,
firewood and kerosene.
Trade balance impact
This study assumed that 100% importation of LPG and current production capacities of alternative fuels
would remain constant over the projected time frame. Given Kenya’s high forest cover, it was assumed that
production capacity would meet charcoal and firewood demand (if demand exceeded capacity in 2016). As
a result, Kenya’s trade balance, which in 2018 is at a deficit of € 7.6 billion199, would widen over time, as
ever larger volumes of LPG would need to be imported to meet demand. Domestic charcoal usage will
decrease, however, and could result in increased exports of charcoal if permitted by the Government. The
value of such charcoal exports would remain lower than the value of the LPG imports.
To estimate the impact on the trade balance, the study calculated the total impact of importing and
exporting different cooking fuels on the national trade balance under the various adoption scenarios (lower
bound, upper bound, and base case projections). The impact on the country’s trade balance was calculated
by determining exports of LPG and competing fuels and subtracting these from Kenya’s imports thereof.
The values of future exports and imports were estimated by keeping the price per kg of fuel
imported/exported constant over time. The difference between the base case projections scenario and the
upper/lower bound scenarios shows the impact to the national trade balance, should greater LPG
availability, accessibility and affordability be achieved.
196 OECD (2015)
197 This was held constant over time and calculated from domestic sales prices and applicable VAT and import duties.
198 As calculated from the 2015/2016 KIHBS data.
199 World Bank (2018)
Clean Cooking for Africa National Feasibility Study: LPG for Clean Cooking in Kenya
227
In 2016, cooking fuel represented KES 45.4 billion (€ 386 million) of the total trade deficit in that year,
representing 5.3% of the total trade balance in Kenya. The national annual trade balance could decrease
between KES 5 billion (€ 44 million) and KES 8 billion (€ 71 million) in 2030, relative to the base case
projections.
This impact could be increased (that is, the trade deficit further widened) by an amount in the vicinity of
7%, but not presently calculable using available data, based on the actual demand response to a potential
15% reduction in the end-user price of LPG over time.
Net job creation across fuel value chains
As LPG consumption increases, there will be a corresponding rise in employment in the LPG sector through
new jobs for the production and distribution of LPG to meet the increased demand. Simultaneously, jobs in
charcoal, firewood and kerosene will decrease with the declining demand for those fuels to meet
household energy needs. Given the challenges of accurately quantifying direct and indirect jobs (including
construction, maintenance, and staff of retail shops) in four fuel value chains, only long-term direct jobs
were considered in this analysis. Reliable estimates for the total number of jobs in the LPG value chain
could not be found and should be included as specific employment questions in future census and national
representative surveys to allow proper quantification. The analysis also does not consider short-term jobs
created from constructing the LPG distribution infrastructure (e.g. engineers, constructor workers, suppliers
of raw materials etc.).
The number of jobs lost through the charcoal and firewood value chains is estimated to range from
177,294 – 243,427 as of 2030. It is important to note that many of the charcoal and firewood jobs are in
the informal sector, often held by poor women. Job losses in this sector will therefore have negative impact
on their incomes until they obtain alternative sources of earnings.
The job losses among competing fuel supply chains could be greater by an amount in the vicinity of 7%, but
not presently calculable using available data, based on the actual LPG demand response to a potential 15%
reduction in the end-user price of LPG over time.
Unquantified impacts
The assessment excluded a few potential avenues for impact, due to the lack of reliable data, which in turn
may underestimate the total positive impacts of transitioning to LPG.
With respect to environmental impacts, the assessment does not consider cooling effects.
The health analysis is restricted to the five Global Burden of Disease health outcomes, while noting
that there is good quality and emerging evidence of other health outcomes associated with HAP
(e.g., cataracts in women, stillbirth and low birth weight, tuberculosis) as well as burns in adults
and children.
Under gender impacts, this assessment does not consider the impact of the time saved from
purchasing charcoal (to the extent a significant increment to other shopping activity) relative to
LPG, and the time saved by cooking on LPG stoves and cleaning them (relative to other stoves) after
increased LPG uptake.
Clean Cooking for Africa National Feasibility Study: LPG for Clean Cooking in Kenya
228
Under macro-economic analysis, the assessment does not account for the job gains in the LPG
sector as LPG adoption increases.
The results presented above demonstrate that successful scaling up LPG use has meaningful positive
impacts on three of five socio-economic impacts assessed: environment, health, and consumer household
expenditure, and multiple positive impacts for millions of women in their roles as cooks, family caretakers
and consumers, but potential negative effects for women employed in the charcoal and firewood sectors.
Calculations, methodology, data sources and values
Details of the calculation equations and methodology used in this Part are presented in the Annexes,
Chapter 27 (Impact Assessment Calculations and Methodology) beginning on page 273.
Details of the data sources and values are presented in the Annexes, Chapter 28 (Impact Assessment Data
Sources and Values) beginning on page 275.
Clean Cooking for Africa National Feasibility Study: LPG for Clean Cooking in Kenya
229
This Part is intended to set the basis for the creation of a monitoring and evaluation (M&E) framework to
measure progress and impacts of increased LPG access and use for cooking in Kenya over time. This is a
guidance document intended to be further developed through working closely with national organizations
and associated partners responsible for program monitoring and evaluation at the country level, and
subsequently implemented upon identification of appropriate resources.
In this Part, a set of indicators - the Indicators of Sustainable LPG Expansion (ISLE) – is described in order to
help the Government of Kenya (and the governments of other relevant countries) and other stakeholders
evaluate and report on progress in safely scaling up LPG adoption and sustained use at the household level.
For the Government of Kenya, it may specifically be used to monitor progress towards its Sustainable
Energy for All goal of 35% of the population using LPG for cooking by 2030.

Clean Cooking for Africa National Feasibility Study: LPG for Clean Cooking in Kenya
230
22. M&E Goals and Context
M&E of LPG in an impacts context
LPG has been highlighted by several international organizations, including the World Health Organization
(WHO) and the International Energy Agency (IEA), as one of the key fuels to be scaled up rapidly
throughout the developing world. This is because LPG is a clean burning and easily transportable fuel that
consistently achieves the best performing tier level for indoor emissions (Tier 4) under the International
Organization for Standardization, International Workshop Agreement 11 (ISO/IWA-11)200, in both laboratory
and field conditions. Its performance in the field does not normally vary with user operation and
equipment condition (which means that it burns cleanly not only initially but also over time). Nevertheless,
there may be variations in the levels of personal exposure reductions due to local circumstances (e.g.
ambient (outdoor) air pollution, fuel stacking etc.). For example, the benefits of LPG adoption in terms of
reduced household air pollution might be reduced due to cross-contamination from neighbouring
households’ continued use of polluting fuels/stoves, or LPG households not fully switching to using LPG for
a sufficient portion of cooking tasks.
Types of evaluations
This proposed M&E framework covers two aspects of an evaluation: process and impact.
1. The Process/outcome evaluation is intended to understand better the effectiveness of policies
and programs and to assess why particular interventions work or do not work. It measures
program effects on the target population by assessing the progress towards the program’s
outcome objectives and how the program has been implemented.
2. The Impact evaluation focuses on the results and ultimate effects of the intervention
program/policy in regard to achieving its goals for the target population.
The two types of evaluation go hand in hand. They draw from a mix of regularly collected data on key
aspects of an LPG national market, such as consumption, sales, distribution and safety, national population
surveys with questions on household energy use, and ad hoc data collection efforts and research activities.
The combination of different data gathering efforts is needed in order to quantify impacts in a more robust
way. Specifically, without very accurate information on LPG household consumption and sustained use (i.e.,
primary and secondary fuel use), it is not possible to evaluate and accurately quantify the health,
environmental, climate and other impacts of LPG uptake over time.
Population-based household surveys, conducted as part of ad hoc data collection efforts (e.g. research
projects or programs), will be a key component in complementing and enhancing the proposed set of
monitoring indicators that track LPG scale-up (see Chapters 23 and 24). Surveys and qualitative methods
(e.g., in-depth interviews and focus groups discussions) are, indeed, needed to capture the complexity of
cooking behavior, including fuel usage patterns and decreased use of traditional cookstoves and fuels. Such
200 Shen, et al. (2018). Evaluating the performance of household liquefied petroleum gas cookstoves. Environmental Science &
Technology, 52(2), 904–915.

Clean Cooking for Africa National Feasibility Study: LPG for Clean Cooking in Kenya
231
surveys and methods will also be necessary in capturing gender-related impacts of adoption and sustained
use of LPG, which are currently difficult to quantify.
Household energy questions in existing national representative surveys
A number of nationally representative surveys are conducted in Kenya at regular intervals, which are
instrumental in tracking national estimates of household energy use and model household air pollution
impacts. These include the:
i. Kenya Integrated Household Budget Survey, conducted every 10 years. This survey gathers
comprehensive and reliable data to assess the impact of development policies and programs on
living conditions. The last two rounds were conducted in 2005-2006 and 2015-2016;
ii. Kenya Population and Housing Census, conducted every 10 years. The last was completed in 2009;
iii. USAID’s Demographic and Health Survey (DHS), conducted every 5-6 years. The last was completed
in 2014; and
iv. UNICEF Multiple Indicator Cluster Surveys (MICS), conducted at various times; the last completed in
2000.
All the listed surveys include a small set of household energy questions, in most cases only a single question
on the main fuel used for household cooking. Often, the listed answer options and fuel categories are
different in different surveys, limiting comparability.
Given the importance of tracking progress towards Sustainable Development Goal 7 (SDG7) and,
specifically, SDG 7.1.2: Proportion of population with primary reliance on clean fuels and technologies, the
World Health Organization (WHO) and the World Bank have initiated in recent years a process of survey
harmonization to agree on a set of ‘harmonized’ household energy survey questions to be incorporated in
all the main nationally representative surveys. Once the revised and harmonized set of household energy
questions has been endorsed by statistical offices and major national surveys, it will be possible to track
household fuel use, and specifically LPG uptake more accurately (see later sections for further discussion).
For example, in a number of current surveys, LPG data is co-mingled with data about other gases (biogas
and natural gas), and no data on secondary fuel use is captured. Asking about primary and secondary fuel
use is, indeed, needed (i) to assess the concurrent use of multiple stoves and fuels, known as stove/fuel
stacking, and (ii) to quantify impacts better.
Why is an M&E plan needed?
This work is embedded in Kenyan Government’s efforts to scale up clean cooking to meet its SEforALL
target for access to clean household energy and to achieve the corresponding goals of the Government’s
Kenya Vision 2030. LPG is one of the clean fuels specifically promoted by the Government for household
cooking. As stated in Kenya SEforALL Action Agenda (2016), the LPG target is defined as 35.3% of Kenyan
households using LPG on an ongoing basis by 2030.
In conjunction with the launch (and possible relaunch) of the Mwananchi Gas Project by the National Oil
Corporation of Kenya (NOCK) with the support of the Ministry of Petroleum & Mining, the LPG penetration
target had been increased by the Government to 70% of households, doubling the initial SEforALL target.
(In practice, this was recognized to be a highly aspirational target, and it is in abeyance as of this writing
Clean Cooking for Africa National Feasibility Study: LPG for Clean Cooking in Kenya
232
due to the suspension of the Mwananchi project.) Although the Mwananchi project is being rethought, if
and when it is relaunched, it is expected to continue the basic premise of offering small cylinders with an
affixed ringtop burner and grill to eligible poor households at a substantially discounted price, or potentially
for free. The purpose of the equipment subsidy would continue to be reduced reliance among such
households on charcoal, kerosene and purchased woodfuels.
Taxes and duties on imported LPG cylinders have encouraged investment in domestic cylinder
manufacturing, and Kenya now has five new cylinder manufacturers, in addition to two longstanding ones.
(Of note, the Mwananchi Gas Project chose to procure cylinders from abroad.)
A properly designed and implemented M&E framework for LPG scaling up will allow national/international
stakeholders to:
i. Monitor progress with the implementation of agreed policy against program goals;
ii. Apply evidence-based adjustments to improve program performance and reach;
iii. Contribute (using harmonized survey questions) to the SDG7 and SEforAll global tracking; and
iv. Understand, quantify, and interpret the wider societal impacts (health, the environment, climate,
gender empowerment and economic development) of scaling up LPG uptake.
Steps in developing and implementing the LPG scale-up M&E plan in Kenya
The process of developing a national M&E plan for LPG scale up should begin during the initial stages of
program planning and implementation, in consultation with local stakeholders responsible for program
implementation, ministries and agencies with M&E expertise. The framework presented in this document
and developed under the EU/KfW-sponsored Clean Cooking for Africa Program should, therefore, be
considered as one of the initial steps in the process to help Kenyan authorities develop and implement a
full M&E plan, for which additional funding needs to be sought.
The proposed framework should be discussed and refined through stakeholder consultation and
participation by local implementers and M&E authorities, according to the following steps:
i. Conduct stakeholder consultation(s) convened by Kenyan authorities;
ii. Define processes for stakeholder involvement: identify the key local stakeholder(s) responsible for
overseeing and implementing the M&E plan, determine which local capacity is available (and can
also be strengthened), and identify which partners can support the process;
iii. Discuss and revise the proposed M&E framework and the ISLE indicators developed under the
Clean Cooking for Africa Program to determine elements to be monitored and evaluated;
iv. Identify available resources to implement the plan, including over which timeframe; this is a key
limiting factor that may influence how the plan is finalized and implemented;
v. Determine M&E methods for data and information collection: (a) develop a data collection plan
(including indicators to be collected, timing for data collection and analysis, tools, resources,
training provision for staff, etc.); (b) determine M&E responsibilities (data collection, supervision,
analysis, reporting, etc.);

Clean Cooking for Africa National Feasibility Study: LPG for Clean Cooking in Kenya
233
vi. Set M&E targets; and
vii. Define a reporting system for dissemination and utilization of results.
Status of the M&E planning process in Kenya
During the course of 2017/2018, Clean Cooking for Africa/GLPGP engaged in discussions about M&E for
LPG scale-up in Kenya through a research partnership with the University of Liverpool (UoL) and Moi
University. This work is part of a newly established UK National Institute of Health Research (NIHR) Global
Health Research Group – CLEAN-Air (Africa)201. The Group is conducting a 3-year research and capacity
building programme (2018-2020) to support population transition from polluting solid fuels and kerosene
for household energy to LPG (as a clean fuel) to address the substantial public health burden from mainly
non-communicable diseases caused and exacerbated by household air pollution. Focus countries for this
work include Kenya, Cameroon and Ghana. These countries were strategically chosen by UoL and GLPGP to
allow building of the research and evaluation components around the Clean Cooking for Africa Project and
these countries’ ongoing efforts to scale up LPG adoption and use.
Research and health-sector capacity building activities in Kenya under CLEAN-Air (Africa) began in the first
quarter of 2019, following completion of an initial scoping phase (April – October 2018) required by the
NIHR program (see Annex Chapter 35 beginning on on page 298 for more information on project goals and
main activities). The outputs of the CLEAN-Air (Africa) work will contribute directly to the M&E goals for
LPG scale up in Kenya.
In May 2018, representatives from the University of Liverpool, Moi University and GLPGP met with key
national stakeholders, including the Ministry of Petroleum & Mining and the Ministry of Health, to discuss
the program of activities under CLEAN-Air (Africa) to inform national policy.
201 www.liverpool.ac.uk/research/news/articles/research-group-launched-to-improve-clean-energy-access-in-africa
Clean Cooking for Africa National Feasibility Study: LPG for Clean Cooking in Kenya
234
23. ISLE Indicators for Monitoring and Evaluation
Indicators for Monitoring and Evaluation of LPG adoption, sustained use and infrastructure expansion over
time
The Indicators of Sustainable LPG Expansion (ISLE) developed by Clean Cooking for Africa/GLPGP consist of
a set of indicators to be routinely collected at the national level in order to inform the monitoring and
evaluation of scaling safe adoption and sustained use of LPG as a clean household cooking fuel and the
resulting social, environmental and economic impacts.
These indicators are the first step to conducting further, more detailed evaluation on different impact
categories with metrics presented in the final section of this chapter. These impact metrics measure the
extent and rate of the existing and projected social, health, environmental and economic impacts from
increased LPG adoption and use and associated economic activity, including number of jobs created and
lost across different fuel value chains. Quantifying impacts would require bespoke expertise and data
collection efforts, including monitoring concentrations of and personal exposure to health damaging air
pollutants such as fine particulate matter (PM2.5), in order to reliably project the health impacts of scaling
adoption of LPG over time.
Execution of this M&E plan aims to provide representative data which is sufficiently valid and precise for
the purposes of review efforts to achieve desired LPG scale and subsequent improvements to related
policies and actions. It is recommended to track the ISLE indicators on an annual basis (or as practical,
based on availability of national representative surveys), depending on available resources and survey data
already being collected.
As described in the section below, the proposed set of M&E indicators can be grouped into distinct
categories according to different aspects of LPG scale-up they intend to cover, for which bespoke data
collection efforts are required in most cases.
Categories of indicators
There are three main categories of ISLE indicators:
Category 1: LPG adoption and use (ISLE Table 1). This category measures the extent and rate of
expansion of LPG adoption and consumption through national consumption data and
nationally representative surveys
Category 2: LPG supply chain expansion and indicators of the safety of the LPG market (ISLE Table 2).
This category measures the extent and rate of build-out of the LPG supply chain and
associated investment, as well as the safety performance of the LPG sector
Category 3: LPG safety for households and occupational settings (ISLE Table 3. This category measures
injuries and burn incidents related to LPG fuel use in the population
While the Energy and Petroleum Regulatory Authority (ERPA), Kenya Revenue Authority (KRA) and others
(e.g., the Petroleum Institute of East Africa), already collect information on key LPG metrics on an annual
basis, such as LPG national consumption, national LPG production, LPG imports/exports, and several others,
additional important indicators are not currently tracked. These untracked indicators include, for example,
Clean Cooking for Africa National Feasibility Study: LPG for Clean Cooking in Kenya
235
LPG cylinder refill sales by cylinder size, the number of cylinders in circulation, the number of scrapped
cylinders, and number of jobs in the LPG supply chain (short-term and long-term), among others. In
addition, key indicators such as the number of LPG-related accidents at the occupational and household
level are not currently tracked. Such tracking would support planning and implementing improved safety
measures and improved consumer education. For example, the Kenya Department of Occupational Health
and Safety (DOSHS) has the mandate of collecting data relating to accidents, especially those resulting in
major injuries and fatalities. However, its focus is on industrial accidents, and household accidents are not
currently documented.
The ability to track all the proposed ISLE indicators depends on a number of factors: (i) endorsement by
national stakeholders following discussion and adaptation, (ii) availability of resources, and (iii) staff
capacity of the relevant agency/ies involved in the implementation and monitoring of LPG-related progress.
For example, in order to collect and track the ISLE safety indicators, it may be necessary to establish a
national surveillance system to record accidents from LPG and other fuels in both occupational and
household settings by involving the Health Sector.
Methodology used to develop the ISLE indicators
The proposed ISLE indicators have been developed between June 2016 and July 2018 through a stakeholder
consultation process with LPG industry experts (LPG policy and regulatory advisors, LPG business
developers and industry technical experts, GLPGP country managers in Kenya, Ghana and Cameroon among
others, financial experts (planning and investment) and public health experts (academics with expertise in
M&E and HAP/household energy use)). Starting with the review of existing literature on indicators to track
under SDG 7.1 ‘Ensure universal access to affordable, reliable and modern energy services by 2030’ and
indicators of household energy adoption202, two rounds of international expert consultations have been
conducted. The first consultation was hosted in 2016 in Frankfurt with the Clean Cooking for Africa Program
scientific advisory board, comprising leading public health and climate experts. This initial set of indicators
was then revisited, expanded and discussed during a consultation hosted with the KfW Clean Cooking for
Africa Program appointed technical experts and University of Liverpool public health experts in February
2018.
Following the consultations, the indicators were piloted in Kenya, Ghana and Cameroon to test the
feasibility and practicality of collecting the required data, to adjust and refine the indicator set. In a later
stage of the process, input from public health experts from US CDC was also sought and incorporated into
the proposed list, with focus on the safety indicators.
Additional piloting with specifically allocated resources is needed to further refine the ISLE Indicators’ list
and finalize a set of “essential” vs. “desirable” indicators.
Guiding principles
The development of the ISLE Indicators was guided by three key principles: (i) identifying and making the
best use of existing routine and annual data collection systems, (ii) collecting new data at minimal or no
202 See cleancookstoves.org/binary-data/RESOURCE/file/000/000/379-1.pdf

Clean Cooking for Africa National Feasibility Study: LPG for Clean Cooking in Kenya
236
extra cost and (iii) not excluding metrics that would require full cooperation in data sharing from private
sector players, which may result in added costs to conduct stakeholders interviews/surveys.
In the case of Kenya, data for 2017 presented in this document has been collected with support from the
EPRA, PIEA, and Ministry of Petroleum and Mining using existing sources and desk reviews. Some
information could not be obtained and supporting explanations are included in the ‘source and comments’
column of each table. The rationale for the indicator categories, and certain key features of the ISLE
indicators, are presented in the next sections.
Category 1: ISLE Indicators of LPG market expansion and household adoption and use
The Indicators proposed in ISLE Table 1 include some of the key performance indicators (KPIs) used by the
worldwide LPG industry, and indicators of population access to LPG that can be compiled through existing
data collection systems. These indicators should be collected on an annual basis (or as frequently as survey
information from nationally representative surveys is available, estimated as every 2-3 years). They would
serve to track progress towards the Kenyan Government’s goal of achieving 35% of the population using
LPG by 2030, and to the progress of LPG scale-up generally and the developmental, social and
environmental impacts of that progress.
Selected highlights on the proposed indicators:
Indicator 1.1 – Total LPG kg per capita
consumption per year – is the ‘gold standard’ or
preferred LPG industry KPI to track LPG market
expansion and uptake. It also allows international
comparisons of LPG penetration to be made (see
Box 1)203. However, this indicator would over-
estimate household use of LPG if other sectors
(e.g., industrial uses, such as in the case of Kenya)
also make up a substantial proportion of total LPG
consumption. For this reason, Indicator 1.2 on
residential LPG consumption should also be
jointly tracked.
Indicator 1.2 – Residential LPG kg per capita
consumption per year – is specific to the
residential sector and is based on consumption of
LPG in cylinders of 3-15 kg sizes (as compared to
larger cylinders, typically of 35-50 kg that are
used in institutional and commercial settings),
divided by the total population.
In Kenya, current cylinder sizes include 13 kg, 6 kg,
3 kg and 1 kg, with the 6 kg being the most popular size. However, small businesses such as
203 Source: WLPGA (2014). Guidelines for the Development of Sustainable LPG Markets – Transitioning-Stage Markets. Paris:
World LP Gas Association.
Box 1 – LPG market stage according to
international industry standards
Early stage/growth markets:
Defined as <10 kg per capita per
year.
Transitioning stage markets:
Defined as around 15 kg and aspiring
to increase (e.g., up to 40 kg capita
per year or more).
Mature/advanced stage markets:
Usually >15 kg/capita but not
necessarily defined by high LPG
consumption (some are well below
this). This market classification is
based on sophistication and diversity
of the LPG value chain as well as an
excellent overall safety record.

Clean Cooking for Africa National Feasibility Study: LPG for Clean Cooking in Kenya
237
roadside food-street vendors can also make use of cylinders of smaller capacity and their
consumption would be captured as part of the total residential consumption (unless a digitized
system is put in place for a more accurate tracking and monitoring; see later section in this Part
titled The role of a digital recording system for LPG tracking. Note that in most Sub-Saharan African
markets, the residential use of LPG is for cooking and not for heating purposes with LPG portable
heaters so the kg/capita of LPG residential consumption would effectively correspond to the
amount of LPG used for cooking. In addition, it is helpful to note that if the national LPG market is
primarily for residential use, the correspondent kg/capita value will be close to the total LPG
kg/capita consumption.
Indicator 2.1 – Percentage of population cooking primarily with LPG in a given year – and its sub
indicators (urban / rural primary usage), rely on nationally representative population-based surveys
that are used to monitor household energy use, including for SDG 7 reporting. Large-scale
nationally representative surveys (e.g., KIHBS, DHS, MICS, etc.), take place every 5 to 10 years.
However, due to their different frequency, it may be possible to track primary LPG use in a range of
2-3 years. This interval is appropriate for tracking purposes, as extremely large changes in
percentage of LPG use are unlikely to occur in periods of less than 2-3 years. These data,
complemented by indicator 2.2 below, provide the best means of tracking progress on LPG uptake
based on existing routine information. The suggested new question under the WHO-World Bank
survey harmonization process is designed to capture primary, secondary and tertiary fuel/stove use
as three answers are allowed. The proposed question is: ‘What does this household use for cooking
most of the time, including cooking food, making tea/coffee, boiling drinking water? Please tell me
the cookstove or device that is used for the most time, followed by the other cookstove(s) or
device(s) used most often, if applicable’.
Indicator 2.2 – Percentage of population using LPG for cooking (any use) per year – intends to
capture primary and secondary use of LPG for household cooking and boiling water. Secondary use
of LPG is common, particularly for households that have recently adopted LPG but do not yet use it
for all their cooking/boiling water needs. Lack of such secondary use recording may underestimate
total LPG household usage figures. By endorsing the full set of household energy questions,
countries will be able to track this indicator.
Indicator 2.3 – LPG consumption per LPG user (kg/capita among LPG using households) per year is
calculated as the total LPG consumption in the residential sector in a giving year, divided by the
percentage of households using LPG in the same year multiplied by the mean household average
size for the country. The accuracy for tracking this number depends on the accuracy of the
residential LPG consumption estimates (that may be a slight overestimate if it includes LPG use for
cooking by small commercial entities) and the number of households using LPG (whether primary
or secondary users, and the year the number of households is estimated for). Without a digitised
system that would allow to exactly know how many households are making use of LPG (and their
refilling patterns), national representative surveys should be used as an alternative source to
estimate household LPG consumption.
Indicators of LPG supply chain expansion and safety of the LPG market
The set of indicators presented in ISLE Table 2 is a selection of key metrics for tracking and recording LPG
infrastructure expansion, as well as detecting and responding to market dysfunctions (e.g. cross-filling of
Clean Cooking for Africa National Feasibility Study: LPG for Clean Cooking in Kenya
238
cylinders of different brands, interchangeability of cylinders etc., that are detrimental for LPG marketers).
Given Kenya’s history of widespread illegal cross-filling and interchangeability, and the reform of LN 121 to
help address these issues, it will be especially important for the Government and stakeholders to track
these measures of barriers to successful LPG market scale-up, safety and sustainability. This set of
indicators also contains a section on indicators for tracking economic development, including the quantity
of direct jobs created as a result of LPG market expansion.
Obtaining the information needed to compile this set of indicators may present challenges as most of the
data is not routinely collected and would need some bespoke data collection efforts. Challenges may
include: (i) obtaining information on cylinders in circulation from each private sector player (e.g. LPG
marketers operating under the CRM) for pooling into national estimates, due to private firms’ possible
concerns about this information being proprietary (e.g. see indicators 3.2 and 3.3); (ii) procuring the data, if
the information is scarce (e.g. on safety) and/or not currently compiled (e.g. indicator 5.2); and (iii) sourcing
the number of LPG-related jobs created under the different categories without asking each individual
company on a bespoke basis (e.g. indicators 5.3 and 5.4). It is anticipated that obtaining some of these data
will be labour intensive and require special data collection efforts and resources along with good technical
knowledge of the LPG sector. It is, therefore, strongly recommended that collection and compilation tasks
are assigned, in the first instance, to technical experts with a thorough understanding of the LPG system
and the private sector rules in the country.
The Government/EPRA may need to consider legislation on mandatory data reporting from all LPG
marketing companies and private sector players, especially on safety aspects.
Selected highlights:
ISLE Table 2, Section 3 – LPG supply infrastructure development: cylinders and bulk infrastructure,
includes a number of indicators and sub-indicators to track the number of cylinder assets added
and taken out from circulation and bulk infrastructure expansion. All the information regarding
cylinders is critical in terms of measuring both supply and demand (and safety). For example, with
regards to indicators 3.2 - 3.4, the best way to collect the total numbers of cylinder deployed,
scrapped and circulating into the market is to have numbers submitted by the individual LPG
marketers to an appointed body (e.g. EPRA or others) on a mandatory basis. Information about
cylinders which are imported should also be made available from customs duties, as a cross-check.
ISLE Table 2, Section 4 – LPG industry safety metrics: presents a recommended set of indicators for
tracking safety in relation to LPG use at all nodes in the value chain. The indicators are tailored for
countries operating under the BCRM, relevant to Kenya as it seeks to strengthen its implementation
of BCRM. Cylinder scrapping, testing and recertification are examples of standard industry
practices for ensuring safety, but national level monitoring or compilation of information is rarely
implemented in Sub-Saharan African settings. Stakeholder consultation will be key in this area to
determine what is possible to monitor and consider for inclusion, as the data is currently very
sparse. Strengthening safety monitoring and the use of good practices throughout the LPG value
chain is vital to protecting both LPG consumers and LPG operators and can help address the root
causes of LPG incidents and injuries.
ISLE Table 2, Section 5 – Economic aspects in relation to LPG expansion, include a selection of
indicators to capture the amount of investment in LPG infrastructure and the jobs created and lost
as a consequence of market expansion. While these data are critical to monitor contributions to

Clean Cooking for Africa National Feasibility Study: LPG for Clean Cooking in Kenya
239
national economic growth and mobilization of international capital, these are not currently
compiled and sourcing may pose challenges. Other indicators, such as the indirect jobs created by
LPG infrastructure expansion, are useful to include in the list, recognizing that obtaining reliable
information will be difficult; the wider impacts of LPG expansion on the macroeconomics should
not be underestimated or ignored. Similarly, systems to track the number of jobs in the charcoal
and firewood sectors over time should be put in place to monitor overall impacts on job
loss/creation at the national level. This requires an expanded set of indicators and information
sources, going beyond the focus of the ISLE indicators on LPG-related metrics.
The ISLE LPG supply chain expansion and safety indicators should be ideally compiled on an annual basis to
measure progress over time. Tracking of this information is valuable and necessary also for making
international comparisons about market expansion, especially for countries starting with similar LPG
market conditions and LPG consumption rates to Kenya.
Safety indicators in relation to LPG
ISLE Table 3 is specifically designed to track LPG-related explosions and accidents (burns and injuries) in
both home and occupational/institutions settings. Being able to track, monitor and report on safety-related
indicators is the first step to help prevent and intervene when such events occur.
Notwithstanding the importance of safety, recording, compiling and acting on the results of such data poses
certain challenges. Often, these actions are not possible to implement unless a specific surveillance system
coordinated by the health sector is put in place (e.g. at hospital’s level). It is therefore recommended that
national stakeholders in Kenya consider establishing such a mechanism for data gathering and reporting in
order to monitor safety accidents closely and put in place measures to address the root causes of LPG-
related safety accidents. The Ministry of Health, working together with fire services, may lead this process.
Note also that WHO has made available a Global Burn Registry (GBR) for health facilities, which collects
information on main risk factors, mechanisms, and risk groups for burn injuries requiring a hospital stay
(see www.who.int/violence_injury_prevention/burns/gbr/en/). Participation in the GBR would allow
standardized data collection from burn victims, help prioritizing prevention programs in Kenya and allow
global tracking of burn victims and their causes, including LPG-related burns and injuries.
The potential role of a digital recording system for LPG tracking
The advantages of setting up digital recording for LPG adopting households and businesses are multiple and
are summarized below. A prerequisite for such recording at the retail and consumer level is a digitized LPG
and/or payments system, such as already developed and in near-universal use in India, or such as are in
pilot phases by pay-as-you-go LPG providers in certain Sub-Saharan countries, including especially Kenya
and Tanzania. Kenya’s vast penetration of mobile payments and mobile money systems creates a strong
starting point for such digitalization, compared with most other Sub-Saharan African countries.
Several high-income and middle-income countries have been making use of digital databases over the years
for taxation and other purposes, and have been able to digitize LPG consumers’ data successfully. India,
Brazil, and El Salvador are just a few examples. This section presents the case of LPG data tracking in India,
one of the countries that most recently have embraced such digitalization (see
https://socialcops.com/case-studies/tracking-pmuy-beneficiaries-using-data-intelligence/).
Clean Cooking for Africa National Feasibility Study: LPG for Clean Cooking in Kenya
240
Under Indian law, LPG distributors must maintain an electronic register with names and addresses of
persons registered to obtain their first LPG cylinder and equipment (LPG connection) and subsequent refills.
Each household is registered with a unique identification number.
The advantages of such a digital recording system of LPG customers are multifold, and include:
i. Accurately tracking LPG household consumption as compared to LPG use by other sectors (e.g.
autogas, power generation, etc.) and by small and medium enterprises (e.g. food street vendors).
Monitoring refill patterns across consumers and over time is needed to understand factors
influencing refill rates and contribute to better delivery planning;
ii. Recording precisely the number and location of households using LPG – which is important for both
creating new distribution centres (sales outlets under the CRM) and creating potential for booking
of cylinder refills online or through mobile phone apps for home delivery;
iii. Tracking seasonal and other cyclical demand variations (e.g. tied to agricultural production) for
planning of distribution;
iv. Identifying gaps between refill requests and actual refills to identify bottlenecks in supply or under-
performing distributors;
v. Providing a tracking system for cylinders that LPG marketers and distributors can rely on to control
their cylinder assets;
vi. Tracking households that receive subsidized equipment/fuel as part of pro-poor initiatives (e.g.
PMUY program in India that provides free initial LPG equipment to below-poverty line women;
Mwananchi Gas will provide subsidized LPG equipment to poor households in Kenya once
relaunched); and
vii. Avoiding abuse of LPG subsidies as registered households are tracked and only one household
member is allowed to receive the subsidized equipment and LPG refills.
Overall, such a digital system provides a platform for benefit transfer to the right people at the right time,
and identify where processes are failing to deliver and need to be improved.
Regardless of specific hardware/software specifications, which go beyond the scope of this document, a
number of principles would need to be considered:
Security of the system for ensuring confidentiality of records;
Creation of unique ID systems tied to individual customers;
Ensuring standardization in data entry – for example, having village names spelled differently, or
addresses entered using more than one convention (e.g. village name + district name in one field
versus in two separate fields) would create problems later in ensuring households are assigned to
the right village in analysis;
Ability to easily export data into one or more widely used file formats and ability to select subsets
of data for export; and
Clean Cooking for Africa National Feasibility Study: LPG for Clean Cooking in Kenya
241
Data fields to distinguish different classes of customers (e.g. those benefiting from LPG subsidy /
subsidized equipment versus those who do not).
Role for mobile banking services for LPG purchasing and indicator tracking
Mobile banking has become the main mode of financial transactions in Kenya for middle and upper income
groups who already have bank accounts, as well as for unbanked population segments. The most successful
platform is M-Pesa, through which several mobile phone apps provide short-term loans.
Apart from cash transactions, mobile phones can also be used for tracking cylinders. For example, National
Oil Corporation of Kenya (NOCK) had engaged JamboPay, a local online mobile phone gateway that allows
users to make and receive payments on the phone, to develop an app for managing Mwananchi LPG sales.
Through the app, the sales person would record the serial number of the cylinder, and the customer would
be compelled to return the same cylinder when empty to the designated retailer for exchange for a full
cylinder. The serial number of the customer’s replacement cylinder would be recorded with each
exchange, in a cyclic fashion. This approach would allow the company (NOCK in this example) to know the
interval between refills for each customer, and therefore plan more precisely for having the right number of
filled cylinders on hand in each retail outlet. LPG purchase patterns can also be monitored for seasonality.
For other marketers, serial number tracking is a regulatory requirement under the new LN 121 (2019).
However, this is only a requirement at sales points, in case of accidents. There is no requirement to return
the same cylinder when purchasing a refill. Since a customer can borrow mobile money for purchases other
than LPG, the mobile app can assist only in monitoring purchase patterns.
Potential for additional indicators based on digital LPG records
Additional key indicators could be added to the current ISLE list if a certain condition, such as a unified
system for digital recording of LPG adopting households and businesses, is put in place. Two such examples
are as follows:
Average number of LPG 14.5kg cylinder refills-equivalent per year by household using LPG. This
indicator and potential sub-indicators (urban, rural and regional averages) would help to measure
primary and secondary LPG usage accurately across the national territory. This value could then be
compared to the number of refills that is needed as an indicator of primary use in the country to
ensure that the public health and other benefits from transition to LPG are achieved.
Percentage of calls to emergency service helpline for LPG incident complaints per year. This
indicator would contribute to safety and prompt intervention tracking and could assist LPG
companies in improving their services. It could be considered only if LPG marketing companies
operate an emergency service helpline as most middle and high-income countries do.
Final considerations
The proposed ISLE indicators are intended as a resource to be used in all countries that promote LPG as a
household fuel. They are particularly important to be adopted in low and middle-income settings that are
trying to create a robust monitoring system for LPG sustainable scale-up.
Clean Cooking for Africa National Feasibility Study: LPG for Clean Cooking in Kenya
242
24. ISLE Indicators Compiled
For Kenya, 2017 data, and 2018 data where available, have been collected and presented by the GLPGP
Clean Cooking for Africa Kenya team in ISLE Tables 1-3, using a wide range of sources. Existing gaps in the
available data result from a lack of systematic tracking.
The recommended set of ISLE indicators for Kenya should be considered provisional until endorsed by the
relevant authorities following appropriate national stakeholder consultation. As much as they have been
designed as a flexible tool to incorporate in-country variations, their added value is also as a harmonized
set of indicators for international comparison, and for reviewing trends over time at the country level.
Among the whole set of proposed indicators, an ‘essential’ set of indicators could be also prioritized for
regular annual updating and public reporting. The essential set should include a mix of indicators from the
three listed categories (including safety, if a national surveillance system can be successfully established).
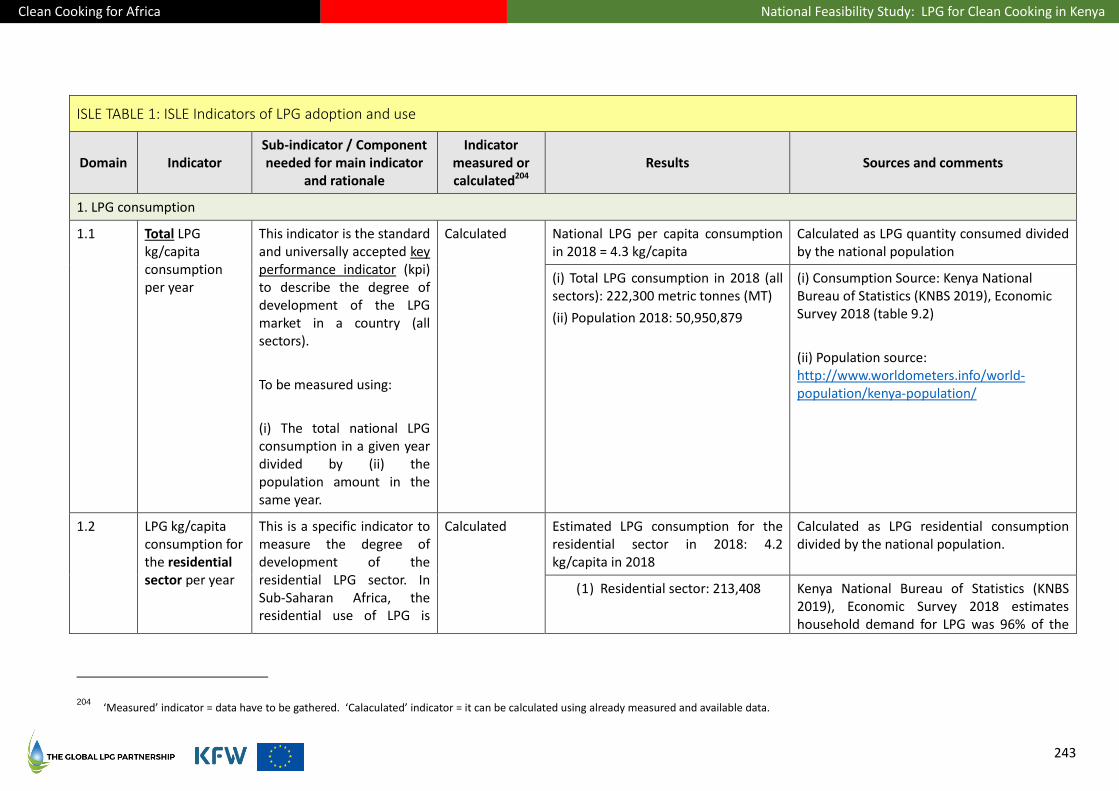
Clean Cooking for Africa National Feasibility Study: LPG for Clean Cooking in Kenya
243
ISLE TABLE 1: ISLE Indicators of LPG adoption and use
Domain Indicator Sub-indicator / Component needed for main indicator
and rationale
Indicator measured or calculated204
Results Sources and comments
1. LPG consumption
1.1 Total LPG kg/capita consumption per year
This indicator is the standard and universally accepted key performance indicator (kpi) to describe the degree of development of the LPG market in a country (all sectors).
To be measured using:
(i) The total national LPG consumption in a given year divided by (ii) the population amount in the same year.
Calculated National LPG per capita consumption in 2018 = 4.3 kg/capita
Calculated as LPG quantity consumed divided by the national population
(i) Total LPG consumption in 2018 (all sectors): 222,300 metric tonnes (MT)
(ii) Population 2018: 50,950,879
(i) Consumption Source: Kenya National Bureau of Statistics (KNBS 2019), Economic Survey 2018 (table 9.2)
(ii) Population source: http://www.worldometers.info/world-population/kenya-population/
1.2 LPG kg/capita consumption for the residential sector per year
This is a specific indicator to measure the degree of development of the residential LPG sector. In Sub-Saharan Africa, the residential use of LPG is
Calculated Estimated LPG consumption for the residential sector in 2018: 4.2 kg/capita in 2018
Calculated as LPG residential consumption divided by the national population.
(1) Residential sector: 213,408 Kenya National Bureau of Statistics (KNBS 2019), Economic Survey 2018 estimates household demand for LPG was 96% of the
204 ‘Measured’ indicator = data have to be gathered. ‘Calaculated’ indicator = it can be calculated using already measured and available data.

Clean Cooking for Africa National Feasibility Study: LPG for Clean Cooking in Kenya
244
ISLE TABLE 1: ISLE Indicators of LPG adoption and use
Domain Indicator Sub-indicator / Component needed for main indicator
and rationale
Indicator measured or calculated204
Results Sources and comments
almost exclusively for cooking/water boiling and not for heating purposes.
To be measured using:
(i) the total LPG consumption in the Residential sector in a given year (as compared to other sectors such as Industry; Transport; Refinery; Chemical and Agriculture), divided by (ii) the population amount in the same year.
total LPG demand in 2018.
(2) Transport/Autogas: none
(3) Commercial & Industrial: 8,892 MT
No separate figures available. Estimated as difference between total consumption and residential consumption
(4) Power Generation: none
2. Population cooking with LPG
2.1 Percentage of population cooking primarily on LPG in a given year
The source for this indicator and its sub-indicators are nationally representative surveys such as census, DHS, MICS, World Bank Multi-Tier Tracking Framework and others national surveys that are usually conducted every 5 to 10 years.
Measured Last publicly available data point from national representative survey (KIHBS): 13.4% as of 2015/2016.
New data on primary LPG usage to be released by GLSS 7 for 2016/2017. Pre-published figures show increase of LPG primary use to 24.5%.
Kenya Integrated Household Budget Survey (KIHBS) 2015/2016 by the Kenya Bureau of National Standards (KBNS), basic report
2.1.1 Percentage of URBAN population cooking primarily
Measured 31% of the urban population, 9% of the peri-urban population, and 3% of the rural population used LPG a
Source: Kenya Integrated Household Budget Survey (KIHBS) 2015/2016

Clean Cooking for Africa National Feasibility Study: LPG for Clean Cooking in Kenya
245
ISLE TABLE 1: ISLE Indicators of LPG adoption and use
Domain Indicator Sub-indicator / Component needed for main indicator
and rationale
Indicator measured or calculated204
Results Sources and comments
on LPG in a given year primary cooking fuel in 2015/2016
KIHBS defines rural, peri-urban, and urban as the following: (i) Rural: A large and isolated part of an open or agricultural area with relatively low population concentrations of less than 2,000 people; (ii) Urban: The central built-up area of an urban center with a population of at least 2,000 people defined without regard to the local authority boundaries; (iii) Peri-Urban: The area that forms the transition between urban and rural areas with a population of at least 2,000 people defined without regard to the local authority boundaries.
2.1.2 Percentage of RURAL population cooking primarily on LPG in a given year
Measured 2.4% in 2015-2016
2.2 Percentage of population using LPG for cooking (any use) in a given year
The source for this indicator and its sub-indicators would be nationally representative surveys that include question on secondary cookfuels (up to 2018, this was not included in DHS, MICS and other global surveys).
Measured 20.4% of the population used LPG (primary and secondary use) in 2015/2016
LPG used as a secondary cooking fuel: 7% in 2015/2016
Source: KIHBS 2015/2016
The KIHBS survey asks respondents to list their main (primary) source of energy for cooking as well as all the energy sources used in the last month and in the last twelve months. Based on this, households using LPG as a secondary fuel could be identified as households which list LPG as an energy source used in the preceding 12 months but do not list it as their main source of energy for cooking.
2.2.1 Percentage of URBAN population using LPG for cooking (any use) in a given year
Measured 55% of the urban made use of LPG in 2015/2016
LPG used as a secondary cooking fuel: 15% in 2015/2016
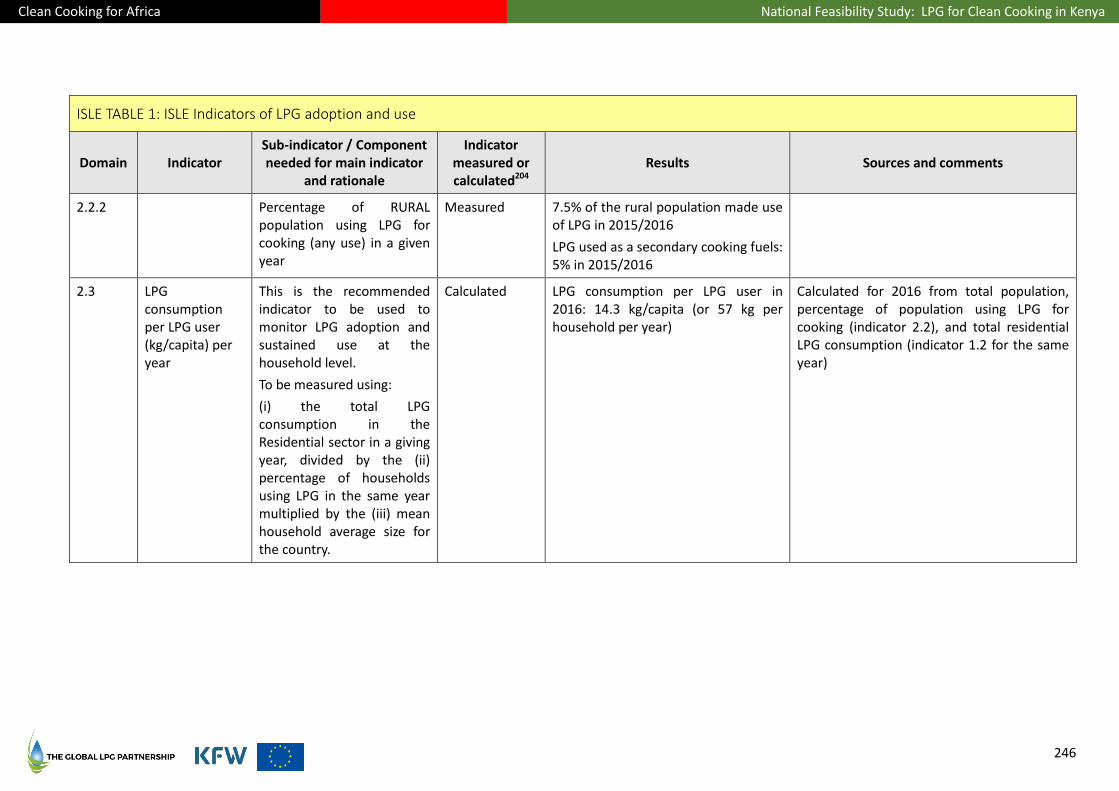
Clean Cooking for Africa National Feasibility Study: LPG for Clean Cooking in Kenya
246
ISLE TABLE 1: ISLE Indicators of LPG adoption and use
Domain Indicator Sub-indicator / Component needed for main indicator
and rationale
Indicator measured or calculated204
Results Sources and comments
2.2.2 Percentage of RURAL population using LPG for cooking (any use) in a given year
Measured 7.5% of the rural population made use of LPG in 2015/2016
LPG used as a secondary cooking fuels: 5% in 2015/2016
2.3 LPG consumption per LPG user (kg/capita) per year
This is the recommended indicator to be used to monitor LPG adoption and sustained use at the household level.
To be measured using:
(i) the total LPG consumption in the Residential sector in a giving year, divided by the (ii) percentage of households using LPG in the same year multiplied by the (iii) mean household average size for the country.
Calculated LPG consumption per LPG user in 2016: 14.3 kg/capita (or 57 kg per household per year)
Calculated for 2016 from total population, percentage of population using LPG for cooking (indicator 2.2), and total residential LPG consumption (indicator 1.2 for the same year)

Clean Cooking for Africa National Feasibility Study: LPG for Clean Cooking in Kenya
247
ISLE TABLE 2: ISLE Indicators of LPG supply chain expansion and safety of the LPG market
Domain Indicator
Sub-indicator / component
needed for main indicator
and rationale
Indicator
measured or
calculated
Results Sources used and comments
3. LPG infrastructure development: cylinders and bulk infrastructure
3.1 Amount and percentage of LPG produced and/or imported per year
1.3.1 Production Measured None
1.3.2 Import
Measured 240,484 MT in 2018 Kenya National Bureau of Statistics (KNBS), Economic Survey 2019 (Table 9.2)
3.2 Number of new cylinders deployed into the market per year (by cylinder size)
This indicator helps to understand the level of LPG market expansion. The more cylinders are injected into the market (i.e. new cylinders), the more the market is in expansion.
This indicator includes both imported and locally manufactured cylinders, by cylinder size.
Measured Total number of imported cylinders:
844,740 in 2017
• 3kg: 5,040 (0.6%)
• 6kg: 725,177 (85.8%)
• 13kg: 110,693 (13.1%)
• >20kg (commercial sizes): 3,870 (0.5%)
Additional cylinders were domestically produced, but this quantity was not reported
Data compiled from cylinder imports under HS Code 7311000 in 2017
3.3 Total number and percentage of cylinders being scrapped per year (by cylinder size)
This is an indicator of the end of a cylinder ‘lifecycle’; cylinders that are beyond repair needs to be scrapped.
If a maximum shelf life for a cylinder is prescribed, a
Measured About 500,000 cylinders in 2017 Comment: Revalidation of a cylinder takes place after approximately 8 years. The number of cylinders requiring revalidation is expected to increase; most cylinders now in circulation were injected after 2011 and are now due for revalidation.
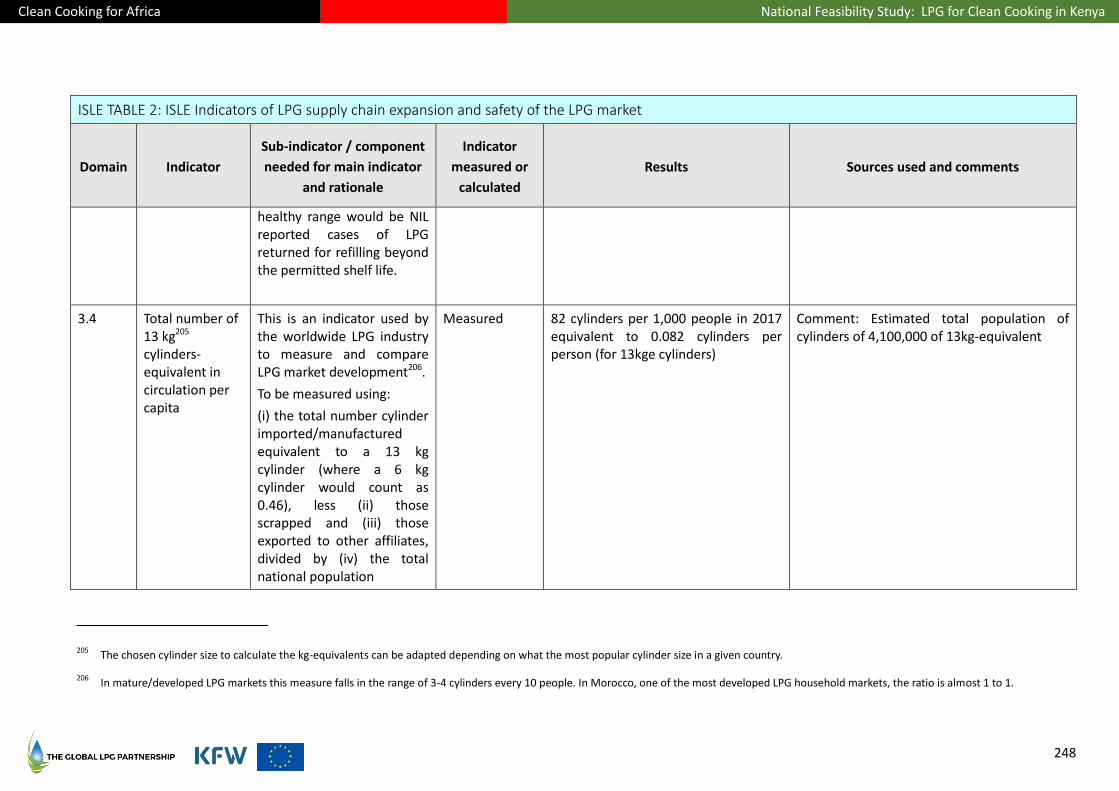
Clean Cooking for Africa National Feasibility Study: LPG for Clean Cooking in Kenya
248
ISLE TABLE 2: ISLE Indicators of LPG supply chain expansion and safety of the LPG market
Domain Indicator
Sub-indicator / component
needed for main indicator
and rationale
Indicator
measured or
calculated
Results Sources used and comments
healthy range would be NIL reported cases of LPG returned for refilling beyond the permitted shelf life.
3.4 Total number of 13 kg205 cylinders-equivalent in circulation per capita
This is an indicator used by the worldwide LPG industry to measure and compare LPG market development206.
To be measured using:
(i) the total number cylinder imported/manufactured equivalent to a 13 kg cylinder (where a 6 kg cylinder would count as 0.46), less (ii) those scrapped and (iii) those exported to other affiliates, divided by (iv) the total national population
Measured 82 cylinders per 1,000 people in 2017 equivalent to 0.082 cylinders per person (for 13kge cylinders)
Comment: Estimated total population of cylinders of 4,100,000 of 13kg-equivalent
205 The chosen cylinder size to calculate the kg-equivalents can be adapted depending on what the most popular cylinder size in a given country.
206 In mature/developed LPG markets this measure falls in the range of 3-4 cylinders every 10 people. In Morocco, one of the most developed LPG household markets, the ratio is almost 1 to 1.

Clean Cooking for Africa National Feasibility Study: LPG for Clean Cooking in Kenya
249
ISLE TABLE 2: ISLE Indicators of LPG supply chain expansion and safety of the LPG market
Domain Indicator
Sub-indicator / component
needed for main indicator
and rationale
Indicator
measured or
calculated
Results Sources used and comments
3.5 Cylinder rotation rate per year
This is a KPI used by the LPG industry as an indirect measure of LPG sustained use; the higher is the rotation rate in a country, the more households are refilling their cylinders and using LPG for most of their cooking.
To be measured using
(i) Quantity of LPG sold in a given year, (ii) divided by the number of 13 kg cylinder-equivalents
Calculated Calculated as about 4 213,408 MT x 1,000kg/MT divided by 4,100,000 cylinders, divided again by 13kg/cylinder
3.6 Total national LPG infrastructure capacity by type per year
3.6.1 Bulk transport – Bulk Road Vehicle (BRV)
Measured 75 transporters in 2017 Source: Energy & Petroleum Regulatory Authority (EPRA), Transport register
3.6.2 Bulk storage capacity in MT
Measured 28,557 MT in 2017
66 licensed companies
Source: EPRA, Companies Licensed for Storage of LPG in Bulk
3.6.3 Refilling capacity and number of bottling plants (or refilling stations) over the national territory
Measured List of bottling plants licensed to fill LPG into cylinders. Actual capacity not officially reported.
• Allied E.A Ltd (operational)
Source: EPRA
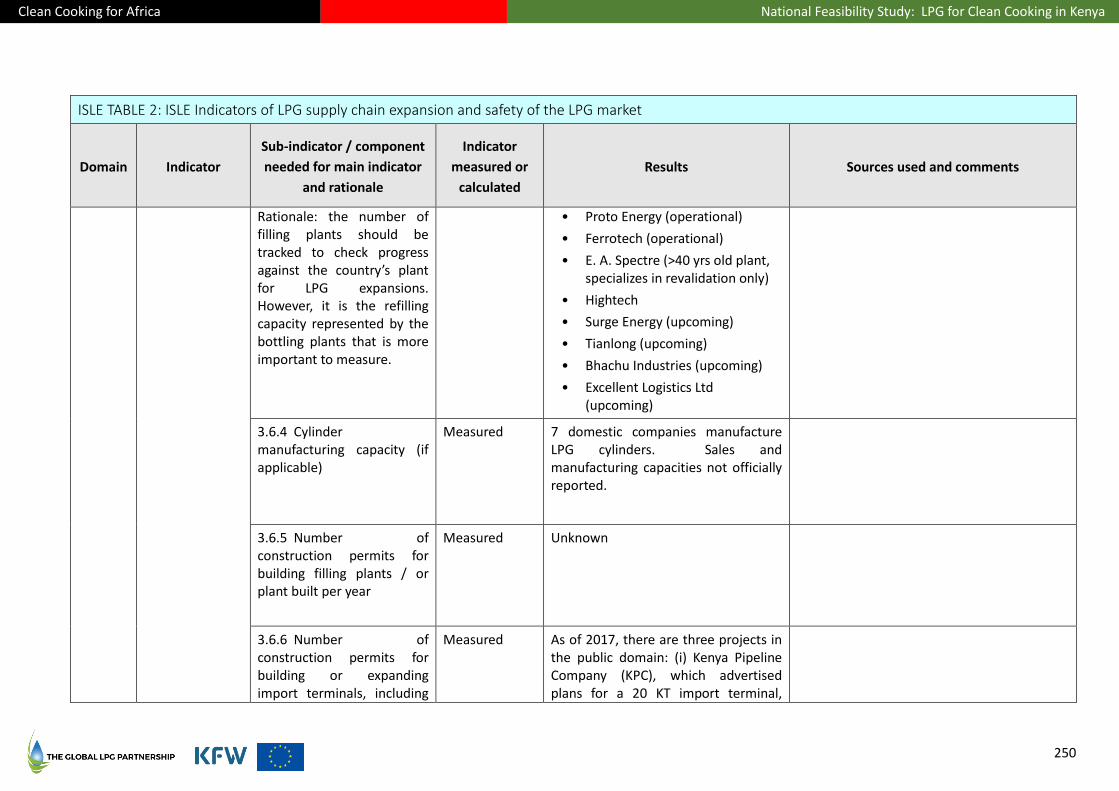
Clean Cooking for Africa National Feasibility Study: LPG for Clean Cooking in Kenya
250
ISLE TABLE 2: ISLE Indicators of LPG supply chain expansion and safety of the LPG market
Domain Indicator
Sub-indicator / component
needed for main indicator
and rationale
Indicator
measured or
calculated
Results Sources used and comments
Rationale: the number of filling plants should be tracked to check progress against the country’s plant for LPG expansions. However, it is the refilling capacity represented by the bottling plants that is more important to measure.
• Proto Energy (operational)
• Ferrotech (operational)
• E. A. Spectre (>40 yrs old plant, specializes in revalidation only)
• Hightech
• Surge Energy (upcoming)
• Tianlong (upcoming)
• Bhachu Industries (upcoming)
• Excellent Logistics Ltd (upcoming)
3.6.4 Cylinder manufacturing capacity (if applicable)
Measured 7 domestic companies manufacture LPG cylinders. Sales and manufacturing capacities not officially reported.
3.6.5 Number of construction permits for building filling plants / or plant built per year
Measured Unknown
3.6.6 Number of construction permits for building or expanding import terminals, including
Measured As of 2017, there are three projects in the public domain: (i) Kenya Pipeline Company (KPC), which advertised plans for a 20 KT import terminal,

Clean Cooking for Africa National Feasibility Study: LPG for Clean Cooking in Kenya
251
ISLE TABLE 2: ISLE Indicators of LPG supply chain expansion and safety of the LPG market
Domain Indicator
Sub-indicator / component
needed for main indicator
and rationale
Indicator
measured or
calculated
Results Sources used and comments
storage capacity, per year (ii) Mombasa Gas Terminal (MGT), which expressed interest in building 20 KT of import storage in Mombasa, and (iii) Taifa Gas.
3.7 Number of licensed marketers / cylinder brand owners per year
This indicator is a proxy for LPG industry consolidation/ fragmentation
Measured 45 licensed LPG Marketing brand-owners
Four additional cylinder brands are in circulation, but the brand-owning companies are no longer operating
Source: EPRA
Note: EPRA will appoint caretaker Marketers for the stranded brands after the revised LN 121 is implemented
3.8 Total number of authorized retail outlets per year
This indicator and its sub-indicator is an important measure to track LPG market expansion over the national territory and harder to reach regions. The more retail outlets are available, the more households can access LPG at relatively short distances.
Measured Unknown Comment: Retail businesses are licensed by County Governments under a single business permit that covers all items sold by small business owners, and is not specific to LPG.
Note: LPG cylinder retailers will be required to register as such when the revised LN 121 is implemented.
3.8.1 Total number of authorized retail outlets by region/province in a given year
Measured Unknown
4. LPG Industry safety metrics

Clean Cooking for Africa National Feasibility Study: LPG for Clean Cooking in Kenya
252
ISLE TABLE 2: ISLE Indicators of LPG supply chain expansion and safety of the LPG market
Domain Indicator
Sub-indicator / component
needed for main indicator
and rationale
Indicator
measured or
calculated
Results Sources used and comments
4.1 Percentage of LPG facilities (by type) audited by year
This indicator serves and its sub-indicators measure how compliant is the LPG system with safety norms and regulations
Measured Unknown
Most of the major LPG Marketets conduct internal safty audits of their own facilities
Comment: EPRA conducts audits before licenses are granted, but no periodic inspections occur. The National Environmental Management Authority requires environmental self-audits, but submission is not mandatory and is undertaken mostly by large companies only.
4.1.1 Percentage of LPG facilities (by type) in non-compliance
Measured Unknown
4.1.2 Percentage of LPG facilities (by type) in full compliance
Measured Unknown
4.2 Percentage of total cylinders being hydro tested per year
This is a measure for LPG safety in a market and regulatory compliance with safety norms. During hydro-testing a cylinder is examined to ensure it can safely hold its rated pressure.
Measured Unknown Comment: ERC does not routinely collect such information. Potential sources would include the LPG Cylinder Revalidation companies (e.g. East Africa Spectre)
4.3 Percentage of total cylinders being refurbished/ recertified per year
This is a measure for LPG safety in a market and regulatory compliance with safety norms.
Measured Unknown
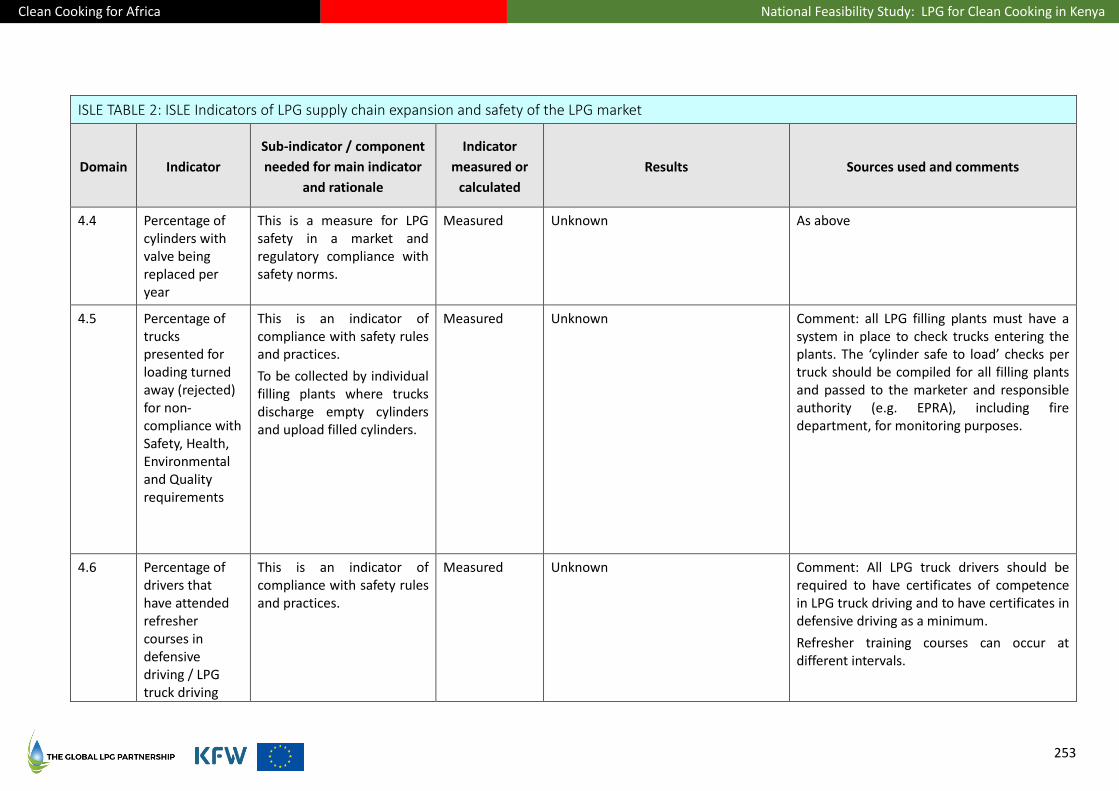
Clean Cooking for Africa National Feasibility Study: LPG for Clean Cooking in Kenya
253
ISLE TABLE 2: ISLE Indicators of LPG supply chain expansion and safety of the LPG market
Domain Indicator
Sub-indicator / component
needed for main indicator
and rationale
Indicator
measured or
calculated
Results Sources used and comments
4.4 Percentage of cylinders with valve being replaced per year
This is a measure for LPG safety in a market and regulatory compliance with safety norms.
Measured Unknown As above
4.5 Percentage of trucks presented for loading turned away (rejected) for non-compliance with Safety, Health, Environmental and Quality requirements
This is an indicator of compliance with safety rules and practices.
To be collected by individual filling plants where trucks discharge empty cylinders and upload filled cylinders.
Measured Unknown Comment: all LPG filling plants must have a system in place to check trucks entering the plants. The ‘cylinder safe to load’ checks per truck should be compiled for all filling plants and passed to the marketer and responsible authority (e.g. EPRA), including fire department, for monitoring purposes.
4.6 Percentage of drivers that have attended refresher courses in defensive driving / LPG truck driving
This is an indicator of compliance with safety rules and practices.
Measured Unknown Comment: All LPG truck drivers should be required to have certificates of competence in LPG truck driving and to have certificates in defensive driving as a minimum.
Refresher training courses can occur at different intervals.
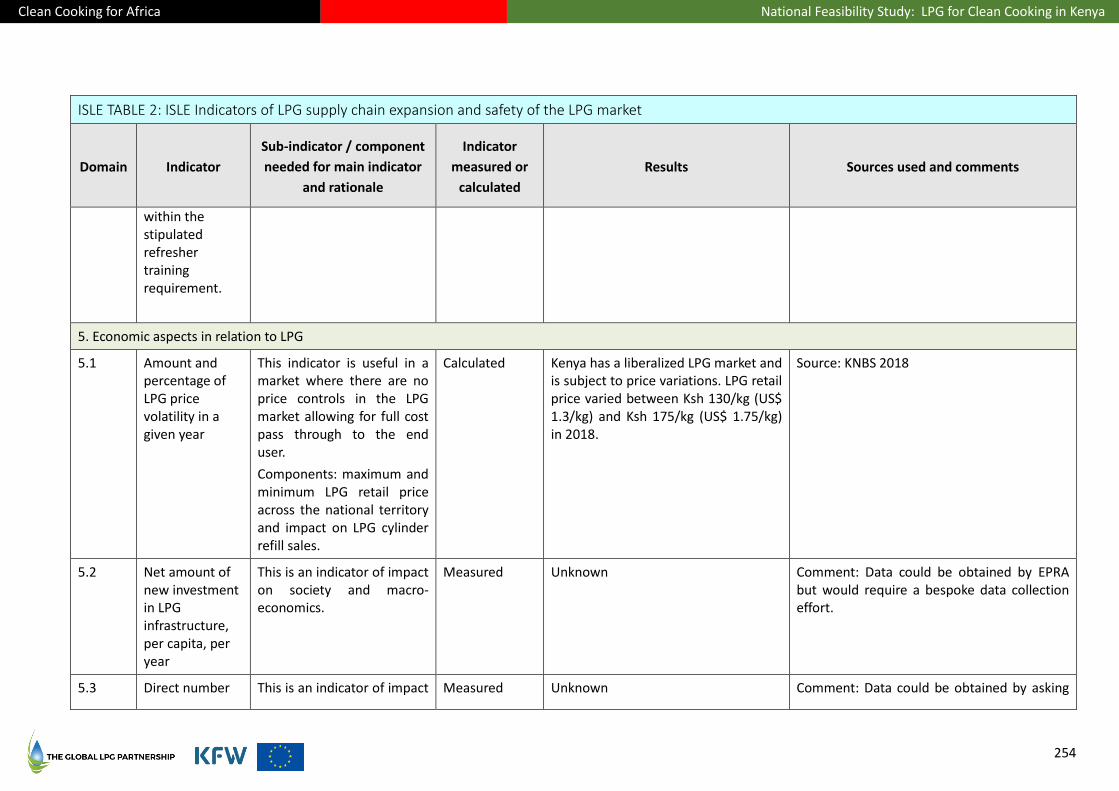
Clean Cooking for Africa National Feasibility Study: LPG for Clean Cooking in Kenya
254
ISLE TABLE 2: ISLE Indicators of LPG supply chain expansion and safety of the LPG market
Domain Indicator
Sub-indicator / component
needed for main indicator
and rationale
Indicator
measured or
calculated
Results Sources used and comments
within the stipulated refresher training requirement.
5. Economic aspects in relation to LPG
5.1 Amount and percentage of LPG price volatility in a given year
This indicator is useful in a market where there are no price controls in the LPG market allowing for full cost pass through to the end user.
Components: maximum and minimum LPG retail price across the national territory and impact on LPG cylinder refill sales.
Calculated Kenya has a liberalized LPG market and is subject to price variations. LPG retail price varied between Ksh 130/kg (US$ 1.3/kg) and Ksh 175/kg (US$ 1.75/kg) in 2018.
Source: KNBS 2018
5.2 Net amount of new investment in LPG infrastructure, per capita, per year
This is an indicator of impact on society and macro-economics.
Measured Unknown Comment: Data could be obtained by EPRA but would require a bespoke data collection effort.
5.3 Direct number This is an indicator of impact Measured Unknown Comment: Data could be obtained by asking
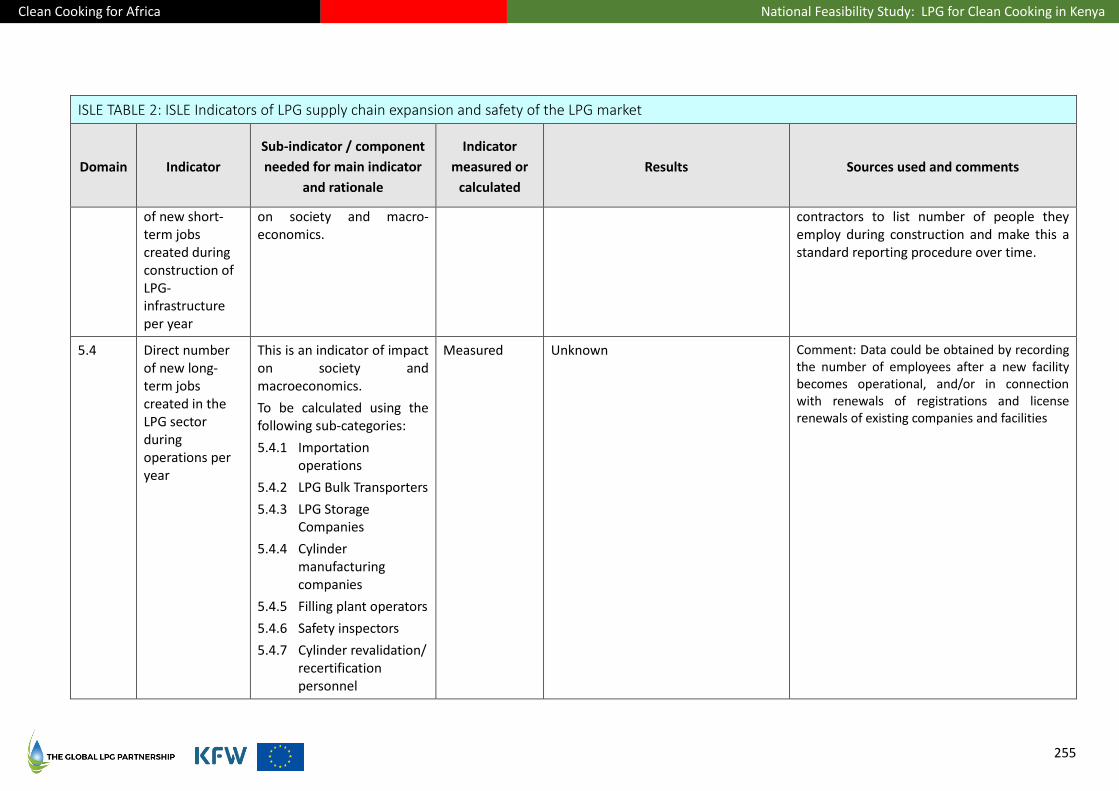
Clean Cooking for Africa National Feasibility Study: LPG for Clean Cooking in Kenya
255
ISLE TABLE 2: ISLE Indicators of LPG supply chain expansion and safety of the LPG market
Domain Indicator
Sub-indicator / component
needed for main indicator
and rationale
Indicator
measured or
calculated
Results Sources used and comments
of new short-term jobs created during construction of LPG-infrastructure per year
on society and macro-economics.
contractors to list number of people they employ during construction and make this a standard reporting procedure over time.
5.4 Direct number of new long-term jobs created in the LPG sector during operations per year
This is an indicator of impact on society and macroeconomics.
To be calculated using the following sub-categories:
5.4.1 Importation operations
5.4.2 LPG Bulk Transporters
5.4.3 LPG Storage Companies
5.4.4 Cylinder manufacturing companies
5.4.5 Filling plant operators
5.4.6 Safety inspectors
5.4.7 Cylinder revalidation/ recertification personnel
Measured Unknown Comment: Data could be obtained by recording the number of employees after a new facility becomes operational, and/or in connection with renewals of registrations and license renewals of existing companies and facilities

Clean Cooking for Africa National Feasibility Study: LPG for Clean Cooking in Kenya
256
ISLE TABLE 2: ISLE Indicators of LPG supply chain expansion and safety of the LPG market
Domain Indicator
Sub-indicator / component
needed for main indicator
and rationale
Indicator
measured or
calculated
Results Sources used and comments
5.4.8 LPG Distribution companies
5.4.9 LPG retailers
5.4.10 Consumer education/marketing.
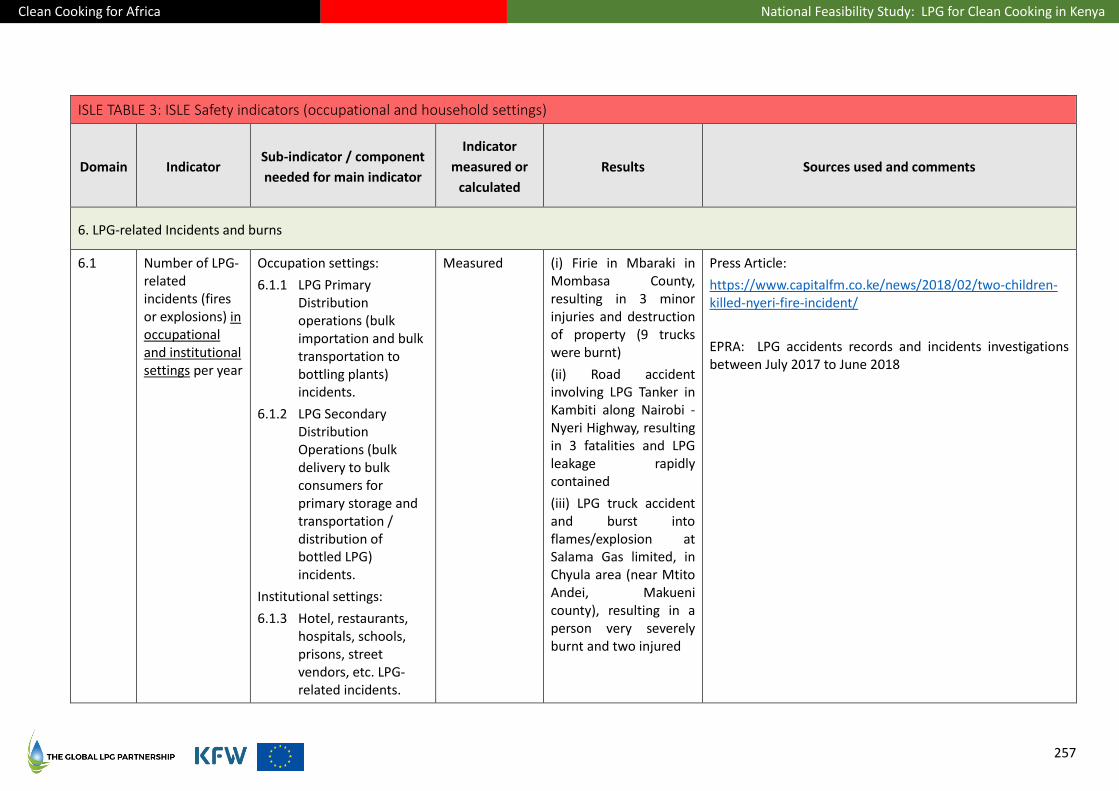
Clean Cooking for Africa National Feasibility Study: LPG for Clean Cooking in Kenya
257
ISLE TABLE 3: ISLE Safety indicators (occupational and household settings)
Domain Indicator Sub-indicator / component
needed for main indicator
Indicator
measured or
calculated
Results Sources used and comments
6. LPG-related Incidents and burns
6.1 Number of LPG-related incidents (fires or explosions) in occupational and institutional settings per year
Occupation settings:
6.1.1 LPG Primary Distribution operations (bulk importation and bulk transportation to bottling plants) incidents.
6.1.2 LPG Secondary Distribution Operations (bulk delivery to bulk consumers for primary storage and transportation / distribution of bottled LPG) incidents.
Institutional settings:
6.1.3 Hotel, restaurants, hospitals, schools, prisons, street vendors, etc. LPG-related incidents.
Measured (i) Firie in Mbaraki in Mombasa County, resulting in 3 minor injuries and destruction of property (9 trucks were burnt)
(ii) Road accident involving LPG Tanker in Kambiti along Nairobi -Nyeri Highway, resulting in 3 fatalities and LPG leakage rapidly contained
(iii) LPG truck accident and burst into flames/explosion at Salama Gas limited, in Chyula area (near Mtito Andei, Makueni county), resulting in a person very severely burnt and two injured
Press Article:
https://www.capitalfm.co.ke/news/2018/02/two-children-killed-nyeri-fire-incident/
EPRA: LPG accidents records and incidents investigations between July 2017 to June 2018
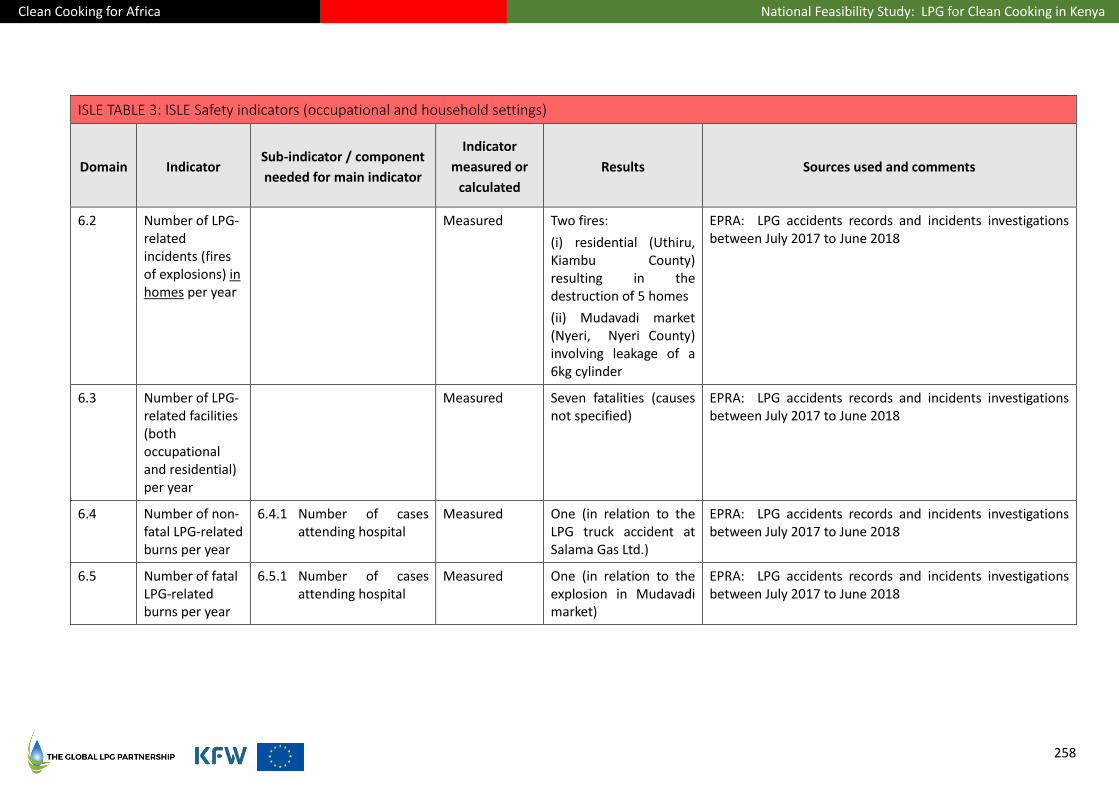
Clean Cooking for Africa National Feasibility Study: LPG for Clean Cooking in Kenya
258
ISLE TABLE 3: ISLE Safety indicators (occupational and household settings)
Domain Indicator Sub-indicator / component
needed for main indicator
Indicator
measured or
calculated
Results Sources used and comments
6.2 Number of LPG-related incidents (fires of explosions) in homes per year
Measured Two fires:
(i) residential (Uthiru, Kiambu County) resulting in the destruction of 5 homes
(ii) Mudavadi market (Nyeri, Nyeri County) involving leakage of a 6kg cylinder
EPRA: LPG accidents records and incidents investigations between July 2017 to June 2018
6.3 Number of LPG-related facilities (both occupational and residential) per year
Measured Seven fatalities (causes not specified)
EPRA: LPG accidents records and incidents investigations between July 2017 to June 2018
6.4 Number of non-fatal LPG-related burns per year
6.4.1 Number of cases attending hospital
Measured One (in relation to the LPG truck accident at Salama Gas Ltd.)
EPRA: LPG accidents records and incidents investigations between July 2017 to June 2018
6.5 Number of fatal LPG-related burns per year
6.5.1 Number of cases attending hospital
Measured One (in relation to the explosion in Mudavadi market)
EPRA: LPG accidents records and incidents investigations between July 2017 to June 2018
Clean Cooking for Africa National Feasibility Study: LPG for Clean Cooking in Kenya
259
25. Impact Evaluation of LPG Uptake for Household Cooking
Evaluation of impacts related to LPG adoption and sustained use for household cooking is recommended to
establish the effects of LPG uptake on individuals and society. Such evaluation is only possible when
accurate LPG household consumption figures and associated data are available at baseline and over time as
households make the transition to the adoption of LPG and/or more exclusively use. Designing and
implementing a systematic and rigorous tracking system through the ISLE indicators described earlier in this
document is the first key step needed in this process, although additional data collection and interpretation
are required to understand the impacts of expanding the LPG market.
In terms of impacts, LPG uptake for cooking by households has the potential to deliver a wide range of
benefits, chiefly on health, the environment and time saving. This is because LPG is a highly efficient and
clean-burning fuel at point of use, and it avoids depletion of forest resources where these are at risk from
household fuel demand.
For a comprehensive evaluation of key impacts, six categories of impacts can be considered and assessed
over time: (i) health, (ii) environment, (iii) climate, (iv) gender, (v) employment and (vi) macro-economic.
The table below provides an overview of the key metrics and methods for these six dimensions of impact
assessment. It is important to note that impacts are assessed by comparing the population transitioning to
LPG with those continuing to rely on traditional polluting fuels (e.g. charcoal, firewood, agricultural
residues, kerosene etc.).
Table 51. Outline of impact categories for population projected to transition to LPG
Categories of Impacts
Metric Comments and methodology
I. Health Deaths averted
per year
(estimates)
Household air pollution (HAP) is associated with several adverse
health effects on both adults and children due to exposure to
products of incomplete combustion, chiefly fine particulate matter
(PM2.5) and carbon monoxide (CO).
In the Global Burden of Disease (GBD) assessments, HAP is causally
related to six important diseases: ischemic heart disease, stroke,
chronic obstructive pulmonary disease, lung cancer, acute lower
respiratory infection in children, and cataract (women only).
Current estimates by the Institute of Health Metrics Evaluation
(IHME) show that HAP is responsible for around 2.6 million
premature deaths from the first five of these conditions each
year207. There is also evidence that HAP is associated with adverse
pregnancy outcomes such as low birth weight, tuberculosis, and
other conditions that are also seen with tobacco smoking, all of
which can result in premature death or a disability that can affect
quality of life and /or life expectancy.
207 www.healthdata.org

Clean Cooking for Africa National Feasibility Study: LPG for Clean Cooking in Kenya
260
Categories of Impacts
Metric Comments and methodology
Impacts of the transition to LPG as compared to continued reliance
on polluting fuels for household energy needs can be modeled
using the established GBD methods for HAP-associated health
outcomes (the HAPIT model)208. This model yields estimates of
premature deaths and Disability-adjusted Life Years (DALYs)
averted.
Input data: Ideally, use nationally representative measured
personal exposures to PM2.5 collected in the field for both
traditional fuels/stoves users and LPG-using homes (for primary
cooks and children using personal exposure monitors).
Alternatively, personal exposure rates to PM2.5 can be estimated by
measuring kitchen area concentrations and published
GBD/Comparative Risk Assessment (CRA) conversion ratios209.
Measuring kitchen PM2.5 concentrations, and especially personal
exposure levels, requires intensive field work and is resource
intensive.
Note: Directly measuring impacts on disease rates requires more
complex, longer study designs (multi-years), and is very expensive.
It is not expected that this will be possible for more routine
evaluation in most countries and settings, but where suitable
research infrastructure is available, this can be considered.
DALYs saved per
year (estimates)
Disability Adjusted Life Years (DALYs) is a standard measure used to
estimate disease burden. Adoption and sustained use of LPG can
result in DALYs saved due to reduced HAP exposure to PM2.5 for the
same five disease outcomes stated above as part of GBD.
Input data: Impacts of the transition to LPG on DALYs can be
modeled using the same approach and input data described above.
Cooking-related
burns (injuries
and deaths) per
year
Traditional household energy practices (i.e. use of open fires,
simple stoves, kerosene stoves, etc.) are linked to a high risk of
burns (e.g. from children falling into fires, spilled fuel, etc.). In
general, use of LPG is safer, but poor industry, retailer, or home
practices in terms of checking, replacing and using LPG can result in
fires and explosions with serious consequences.
Data needed: Information on fires, explosion and resulting burn
deaths and injuries at the country level may be obtained from a
range of sources, including the press/media, occupational accident
208 householdenergy.shinyapps.io/hapit3/
209 Smith et al. (2014). Millions dead: how do we know and what does it mean? Methods used in the comparative risk assessment
of household air pollution." Annu. Rev. Public Health 35: 185–206.
Clean Cooking for Africa National Feasibility Study: LPG for Clean Cooking in Kenya
261
Categories of Impacts
Metric Comments and methodology
reporting, and the health system. Thorough assessment of burns
injuries and death resulting from LPG use (and other causes) will
require the establishment of a burns surveillance system, located
within health facilities. Most commonly this is done in a sub-
sample of hospitals representing various settings, as instituting
nation-wide surveillance would be prohibitively resource intensive.
Cases of LPG-related burns should be tracked using the proposed
safety ISLE indicators (Table 3) on both households and
occupational settings.
Economic value
of deaths averted
and DALYs saved
There is no single standardized method to calculate the economic
value of the deaths and DALYs averted due to transition to clean
fuels for household cooking in developing countries.
An approach would be to stratify the population by 10-year age
bands and weight the GDP per capita for each age band by the
productive index for the age bands.
II. Environment Averted
deforestation
(number of trees
or total fuelwood
displaced)
Transition to cooking with LPG has the potential to significantly
reduce the pace of forest degradation and deforestation in
countries (or sub-regions) where household use of fuelwood and
charcoal for cooking is known to contribute to forest degradation.
The number of trees saved can be calculated based on avoided
fuelwood and charcoal use, considering the proportion of biomass
consumed that is produced unsustainably. Input data include:
firewood and charcoal consumption and export data, fraction of
nonrenewable biomass (fNRB) and typical mass of a tree.
III. Climate Averted carbon
dioxide emissions
and co-emitted
species
LPG combustion leads to some net CO2 emission but in most
situations this contribution is effectively offset by the avoidance of
net CO2 emissions from burning of non-renewable biomass fuel.
Carbon dioxide equivalents (CO2eq) include emissions from the
three main greengases – CO2, methane (CH4), and nitrous oxide
(N2O). CO2eq should be calculated based on fuelwood and charcoal
displaced from increased access to LPG, under different biomass
renewability scenarios. It is known that not all harvested fuelwood
is renewable, and the fraction of nonrenewable biomass (fNRB)
extracted is typically in the range of 27–34% on a global scale, with
large geographical variations. In East Africa for example, the fNRB
exceeds 50%210.
A higher fNRB would ascribe correspondingly higher emissions to
biomass fuels and a greater benefit of a switch to LPG.
210 Bailis et al. 2015. The carbon footprint of traditional woodfuels Nat. Clim. Change. 5 266–72
Clean Cooking for Africa National Feasibility Study: LPG for Clean Cooking in Kenya
262
Categories of Impacts
Metric Comments and methodology
Input data: Emission factors for technology/fuel combinations. LPG
consumption data to be obtained through the ISLE indicators
presented earlier in this document. Fuelwood and charcoal
consumption data to be obtained by census and nationally
representative surveys. Renewability data to be obtained from
published and widely accepted data sources such as the Geospatial
Analysis and Modelling of Non-Renewable Biomass (WISDOM)
model or others.
Averted black
carbon emissions
and co-emitted
species
Burning of biomass contributes to the emissions of short-lived
climate forcing products of incomplete combustion, such as black
carbon (BC) and other co-emitted species. Transition to fuels such
as LPG, which burn the fuel-carbon much more completely, can
therefore reduce emissions of these climate pollutants, which have
a warming impact in the short term.
The other chemical species emitted through incomplete
combustion of carbon fuels beyond BC include: carbon monoxide
(CO), organic carbon (OC) - a cooling agent, nitrogen oxides (NOx),
non-methane volatile organic compounds (NMVOCs), and others.
Calculations are based on emissions at point of use.
Input data: fuelwood and charcoal consumption data to be
obtained by census and nationally representative surveys. Stove
emissions data to be obtained by latest available literature.
Renewability data to be obtained from the Geospatial Analysis and
Modelling of Non-Renewable Biomass (WISDOM) model or other
published and widely accepted data sources.
Using the Gold Standard BC methodology211, climate-related
emission reductions are accounted for by comparing fuel
consumption in the intervention scenario (i.e. after adoption of
LPG for clean cooking) to the applicable baseline scenario (e.g.
biomass burnt in traditional low efficiency stoves or open fires).
Effects on global
temperature
Quantification of CO2eq and BCeq differentials from switching to
LPG, as compared to relying on traditional polluting fuels, can be
used to estimate the overall effect on the global temperature over
211 Gold Standard Quantification of Climate Related Emission Reductions of Black Carbon and Co-emitted Species due to the
Replacement of Less Efficient Cookstoves with Improved Efficiency Cookstoves.
Clean Cooking for Africa National Feasibility Study: LPG for Clean Cooking in Kenya
263
Categories of Impacts
Metric Comments and methodology
time (short-term and long-term).
An overall cooling effect due to LPG adoption for clean cooking is
expected in countries where the fraction of renewable biomass is
relatively low, as indicated by studies in India and Cameroon212,213.
IV. Gender Time savings
from cooking
with LPG per day
Use of LPG is expected to save time through faster cooking,
reheating of food and pot cleaning, if households primarily use LPG
for their daily cooking activities.
Input data: There is a need for population-based surveys in
countries—including Kenya—to track this impact as part of
bespoke data collection efforts. The Multi-Tier Tracking Framework
contains suitable survey questions that could be used across
countries for making the results comparable.
Time savings
from avoided fuel
purchasing per
day
Use of LPG is expected to reduce the need to purchase firewood
and charcoal daily, once households use LPG as their primary fuel
for their daily cooking activities. According to the findings
presented in Parts VI (LPG Demand Potential to 2030) and X
(Environmental, Health, Social and Economic Impact Potential), a
meaningful portion of the 49% of Kenyan firewood-using
households that currently gather firewood for free are modelled to
begin using LPG by 2030.
While the poorest firewood-collecting households may never adopt
LPG at all, those which do adopt LPG can be expected to use LPG
initially as a complementary fuel for certain tasks or during times of
year when dry firewood is scarce or difficult to keep dry. To the
extent there is switching to LPG from such households, this
measure quantifies one of the anticipated main motivators for
them to do so.
Input data: There is a need for population-based surveys in
countries to track this impact as part of bespoke data collection
efforts. The Multi-Tier Tracking contains suitable survey questions
that could be used across countries for making the results
comparable.
Economic value
of time saved
The time gained from faster cooking with LPG (including
preparation and clean-up), and, where applicable, from reduced
212 Singh et al. (2017). Environmental payoffs of LPG cooking in India. Environ. Res. Lett. https://doi.org/10.1088/1748-
9326/aa909d 213
Pope et al. (2018). Climate and health impacts of scaling adoption of LPG for clean cooking through the Cameroon LPG Master Plan. Policy brief.
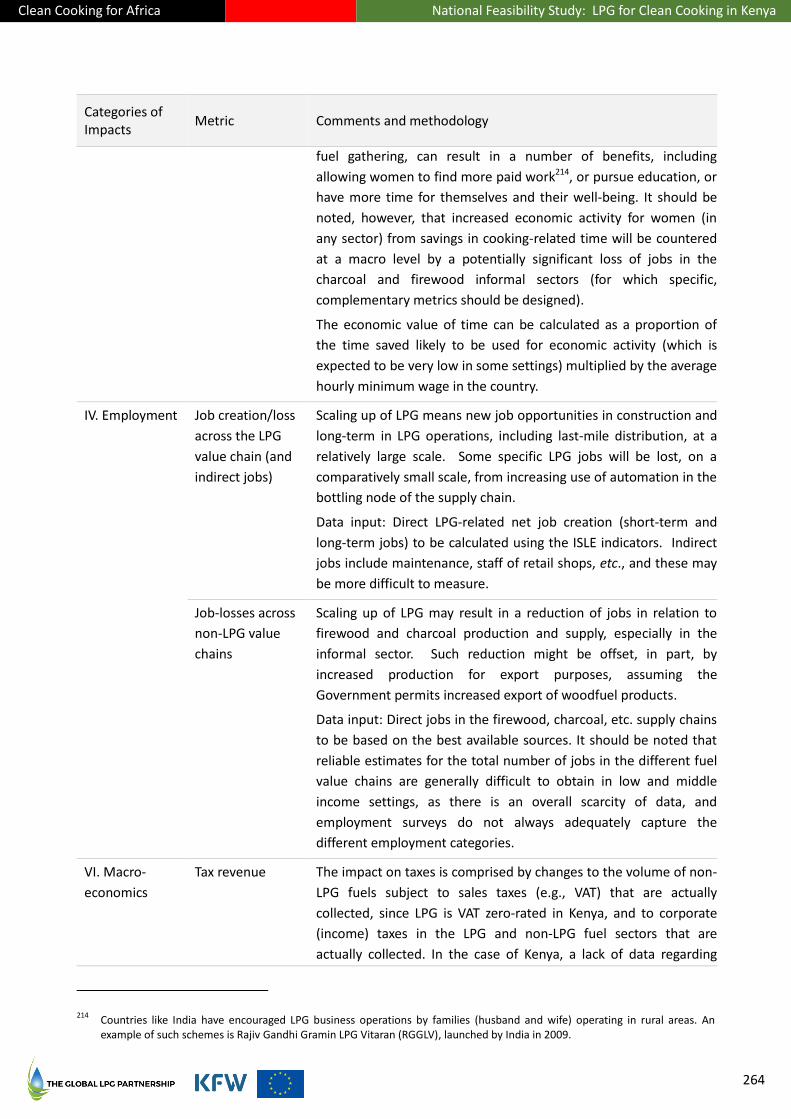
Clean Cooking for Africa National Feasibility Study: LPG for Clean Cooking in Kenya
264
Categories of Impacts
Metric Comments and methodology
fuel gathering, can result in a number of benefits, including
allowing women to find more paid work214, or pursue education, or
have more time for themselves and their well-being. It should be
noted, however, that increased economic activity for women (in
any sector) from savings in cooking-related time will be countered
at a macro level by a potentially significant loss of jobs in the
charcoal and firewood informal sectors (for which specific,
complementary metrics should be designed).
The economic value of time can be calculated as a proportion of
the time saved likely to be used for economic activity (which is
expected to be very low in some settings) multiplied by the average
hourly minimum wage in the country.
IV. Employment Job creation/loss
across the LPG
value chain (and
indirect jobs)
Scaling up of LPG means new job opportunities in construction and
long-term in LPG operations, including last-mile distribution, at a
relatively large scale. Some specific LPG jobs will be lost, on a
comparatively small scale, from increasing use of automation in the
bottling node of the supply chain.
Data input: Direct LPG-related net job creation (short-term and
long-term jobs) to be calculated using the ISLE indicators. Indirect
jobs include maintenance, staff of retail shops, etc., and these may
be more difficult to measure.
Job-losses across
non-LPG value
chains
Scaling up of LPG may result in a reduction of jobs in relation to
firewood and charcoal production and supply, especially in the
informal sector. Such reduction might be offset, in part, by
increased production for export purposes, assuming the
Government permits increased export of woodfuel products.
Data input: Direct jobs in the firewood, charcoal, etc. supply chains
to be based on the best available sources. It should be noted that
reliable estimates for the total number of jobs in the different fuel
value chains are generally difficult to obtain in low and middle
income settings, as there is an overall scarcity of data, and
employment surveys do not always adequately capture the
different employment categories.
VI. Macro-
economics
Tax revenue The impact on taxes is comprised by changes to the volume of non-
LPG fuels subject to sales taxes (e.g., VAT) that are actually
collected, since LPG is VAT zero-rated in Kenya, and to corporate
(income) taxes in the LPG and non-LPG fuel sectors that are
actually collected. In the case of Kenya, a lack of data regarding
214 Countries like India have encouraged LPG business operations by families (husband and wife) operating in rural areas. An
example of such schemes is Rajiv Gandhi Gramin LPG Vitaran (RGGLV), launched by India in 2009.

Clean Cooking for Africa National Feasibility Study: LPG for Clean Cooking in Kenya
265
Categories of Impacts
Metric Comments and methodology
corporate profitability across the supply chains of the various
cooking fuel alternatives did not allow evaluation of corporate tax
effects.
In most SSA countries, firewood and charcoal are informal
businesses. Therefore, the tax effects depend mainly on how, and
how much, LPG fuel and LPG businesses are taxed, and partially on
how, and how much, wood and charcoal products and businesses
are taxed.
The increasing replacement of wood and charcoal by LPG is
expected to lead to a reduction in national tax revenues, based on
the increased hydrocarbon sector-specific taxes and levies
collected on increased LPG volumes more than exceeding the
reduction in taxes collected on reduced sales by the tax-paying
wood and charcoal industries.
Increased use of LPG would create a larger corporate tax stream
from increased formal economic activity (LPG marketers, staff of
filling plants and bulk depots, etc.) and lead to higher corporate
taxes.
The net impact on tax revenues would depend on the foregoing
factors and the relative LPG and firewood/charcoal use.
Input data: To estimate the impact of fuel sales on the tax base
(including VAT and any additional levies), the total quantity of fuel
consumed in-country should be multiplied by the applicable taxes
and hydrocarbon-sector levies with respect to LPG (and kerosene),
and multiplied by the domestic sales price and applicable VAT per
fuel unit with respect to biomass fuels. To calculate the import tax
contribution, the total quantity of fuel imported (generally only
LPG and kerosene in SSA countries) should be multiplied by the
price per kg of fuel imported and the import duties per kg of fuel.
(In Kenya, this aspect can be disregarded for so long as LPG imports
remain not subject to import duties and woodfuels are not
imported.) The total imports and sales taxes and increased LPG
production would be added to obtain the total impact on the tax
base.
Measuring the increased use of LPG would depend on the ability to
isolate and calculate the commercial benefits of the different
effects mentioned above.
Trade balance In countries that import LPG, greater use of LPG may worsen the
trade balance. This might be partially offset by reduced usage of
charcoal for the domestic market and therefore its increased
availability for export. However, charcoal production for export
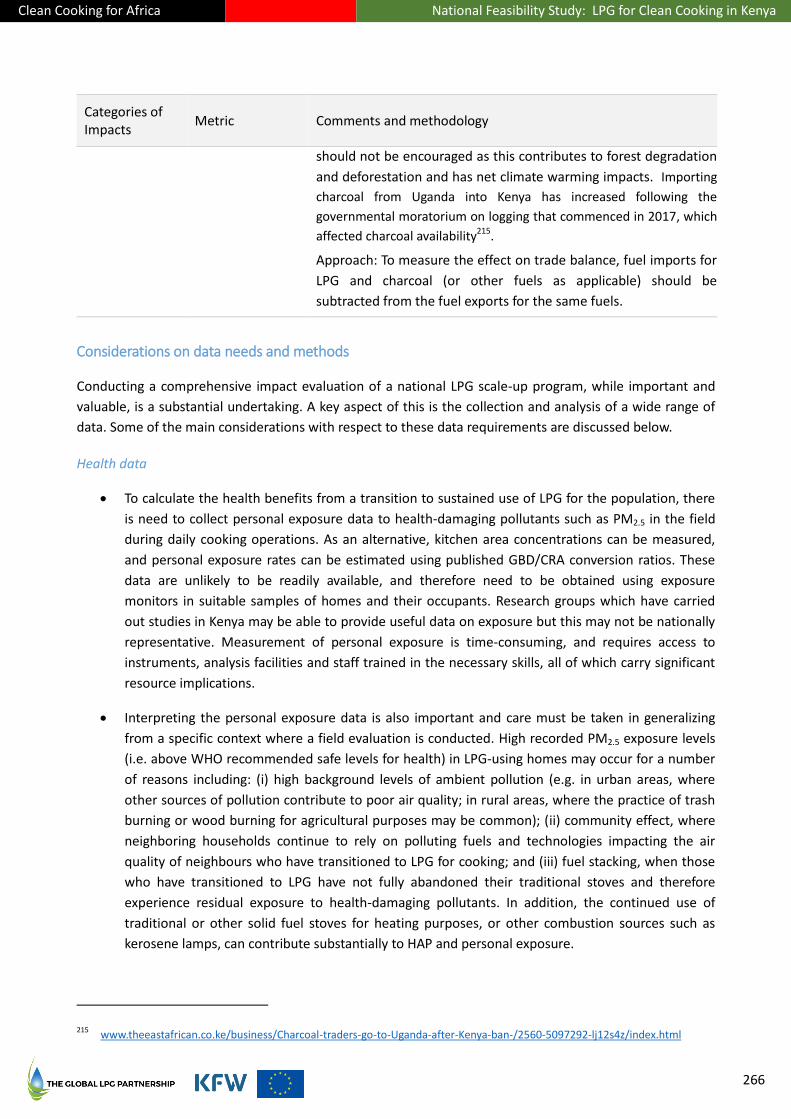
Clean Cooking for Africa National Feasibility Study: LPG for Clean Cooking in Kenya
266
Categories of Impacts
Metric Comments and methodology
should not be encouraged as this contributes to forest degradation
and deforestation and has net climate warming impacts. Importing
charcoal from Uganda into Kenya has increased following the
governmental moratorium on logging that commenced in 2017, which
affected charcoal availability215.
Approach: To measure the effect on trade balance, fuel imports for
LPG and charcoal (or other fuels as applicable) should be
subtracted from the fuel exports for the same fuels.
Considerations on data needs and methods
Conducting a comprehensive impact evaluation of a national LPG scale-up program, while important and
valuable, is a substantial undertaking. A key aspect of this is the collection and analysis of a wide range of
data. Some of the main considerations with respect to these data requirements are discussed below.
Health data
To calculate the health benefits from a transition to sustained use of LPG for the population, there
is need to collect personal exposure data to health-damaging pollutants such as PM2.5 in the field
during daily cooking operations. As an alternative, kitchen area concentrations can be measured,
and personal exposure rates can be estimated using published GBD/CRA conversion ratios. These
data are unlikely to be readily available, and therefore need to be obtained using exposure
monitors in suitable samples of homes and their occupants. Research groups which have carried
out studies in Kenya may be able to provide useful data on exposure but this may not be nationally
representative. Measurement of personal exposure is time-consuming, and requires access to
instruments, analysis facilities and staff trained in the necessary skills, all of which carry significant
resource implications.
Interpreting the personal exposure data is also important and care must be taken in generalizing
from a specific context where a field evaluation is conducted. High recorded PM2.5 exposure levels
(i.e. above WHO recommended safe levels for health) in LPG-using homes may occur for a number
of reasons including: (i) high background levels of ambient pollution (e.g. in urban areas, where
other sources of pollution contribute to poor air quality; in rural areas, where the practice of trash
burning or wood burning for agricultural purposes may be common); (ii) community effect, where
neighboring households continue to rely on polluting fuels and technologies impacting the air
quality of neighbours who have transitioned to LPG for cooking; and (iii) fuel stacking, when those
who have transitioned to LPG have not fully abandoned their traditional stoves and therefore
experience residual exposure to health-damaging pollutants. In addition, the continued use of
traditional or other solid fuel stoves for heating purposes, or other combustion sources such as
kerosene lamps, can contribute substantially to HAP and personal exposure.
215 www.theeastafrican.co.ke/business/Charcoal-traders-go-to-Uganda-after-Kenya-ban-/2560-5097292-lj12s4z/index.html

Clean Cooking for Africa National Feasibility Study: LPG for Clean Cooking in Kenya
267
Despite the importance of household fuels in causing burn deaths and injuries through contact with
fuel (e.g., solid fuels, kerosene and LPG), reliable data on such events and injuries are scarce. It is
therefore important that more effort, including by the Ministry of Health, is made to collect and
report such data.
Environmental and climate data
The ability to accurately project net emissions reductions associated with fuelwood and charcoal
displacement by LPG for cooking greatly depends on the input sources and biomass renewability scenarios.
Climate impacts from LPG adoption should consider both Kyoto (e.g. CO2, CH4) and non-Kyoto climate
pollutants (e.g., BC, OC, etc.). LPG use is associated with lower emissions of BC and other co-emitted
species, as well as almost no methane emissions. This is due to the fuel composition (LPG is made of
butane and propane) and higher efficiency of LPG stoves compared to traditional or simply manufactured
stoves. Conversely, biomass burning leads to CH4, BC and other non-Kyoto climate pollutant emissions,
which warm the climate in the short-term.
The input needed for the modeling would include:
Baseline emissions data of Kyoto gases and short-lived climate pollutants for the household sector
Emission factors (i.e., the mass of pollutant emitted for a given task)
Fuel use data for biomass consumption (renewable and non-renewable fractions). The literature
estimates reveal large uncertainties when it comes to the fNRB, particularly in low and middle-
income countries.
Gender, employment and macroeconomics
For these categories of impact, the necessary data are generally not readily available (e.g., for sections of
the fuel market operating informally, for the amount of time spent in collecting fuels). This means new data
collection work is required (i.e., through special surveys if routine ones such as the DHS do not include the
topics) or assumptions must be made. An example would be impacts on employment, data for which might
be included in routine national surveys. These would need to cover all of the relevant fuel value chains. In
some cases, it may be possible to rely on research studies to measure some of the impacts on a small scale
(e.g. for gender) and extrapolate on a national scale.
Resources needed to conduct an impact evaluation
Adequate funding is critical to ensure appropriate evaluation. The greater the need for primary data
collection (i.e. household surveys, stakeholder surveys to obtain accurate figures on number of jobs,
personal exposure monitoring etc.), the more resource-intense the evaluation will be. Selecting
representative study areas, applying rigorous study design methods and having access to digitized data are
the first ways to optimize costs. In addition, the evaluation team needs to include personnel with the
technical competence to implement the evaluation methods and amenability to training.
Governments and project implementers need to prioritize the information to be collected and what
impacts are to be assessed. It is beyond the scope of this document to make suggestions for prioritization.
Clean Cooking for Africa National Feasibility Study: LPG for Clean Cooking in Kenya
268
Conclusions
A properly designed impact evaluation can answer the question of whether a national LPG scale-up
program is achieving the program goals and the wider societal benefits. This would assist in decision-
making with regards to LPG market expansion. It would also inform the steps to reduce fuel/stove stacking,
to encourage safer practices in the home, and to retrain traditional fuel workers so they can contribute to
the clean fuel market.
For a national evaluation, a robust monitoring program that includes the collection of primary and
secondary data is an efficient way to help with impact assessment. A key consideration when designing,
planning and implementing an impact evaluation is to focus on what the program should achieve, and
concentrate the resources available on ensuring that the most relevant information is collected as
accurately as possible.
Annex
Please refer to Annex Chapter 30 on page 289 for further information about the CLEAN-AIR (Africa) Group.

Clean Cooking for Africa National Feasibility Study: LPG for Clean Cooking in Kenya
269
This Part summarizes recommendations for further actions, technical assistance or research which arose
during the national assessment process.
Recommendations for further action by Government and relevant stakeholders
1. After the new LN 121 has taken effect, Government and industry should reprise the investigation
previously carried out by SGS to measure the extent to which black market activities, including
illegal refilling, still exist.
2. A further round of LN 121 reform planning should be commenced in 2020 or 2021, after the 2019
reforms have had time to affect the market (or not, based on the level of enforcement), with a view
to a strengthening the remaining weak elements of LN 121 by 2025.
Recommendations for further technical assistance
1. This assessment should be refreshed after LN 121 has taken effect, enforcement experiences have
begun to accumulate, further progress has (or has not) occurred in the Mwananchi Gas Project, and
the independent evaluation of the GLPGP/Clean Cooking for Africa microfinance pilot project has
concluded.
2. Support for capacity-building regarding LPG regulatory enforcement.
3. Support and underwriting for LPG microfinance program expansion, assuming favorable results
from the conclusion of the pilot phase.
4. The potential role of bio-LPG in the Kenya market for the long term.
5. With investment funding prearranged (as a precondition of Kenyan business cooperation in sharing
proprietary information), evaluation of financial statements and business plans from a critical mass
of companies in the marketing nodes of the supply chain, to refine the projections of scale and
impact from this report, and to develop firm-specific investment cases for actual counterparties.
6. Per the request of KPA, KPRL and KPC made to GLPGP in Q2 2019, technical support for the detailed
EPC planning of new import, pipeline, and storage facilities.
7. Assessing the impact potential of targeted interventional mechanisms for increasing availability (on
a commercially viable basis) and affordability of LPG for the rural poor.
Recommendations for further research
1. Household surveying to address data gaps with respect to comparative fuel economics, and other
drivers of fuel-switching and fuel-stacking.
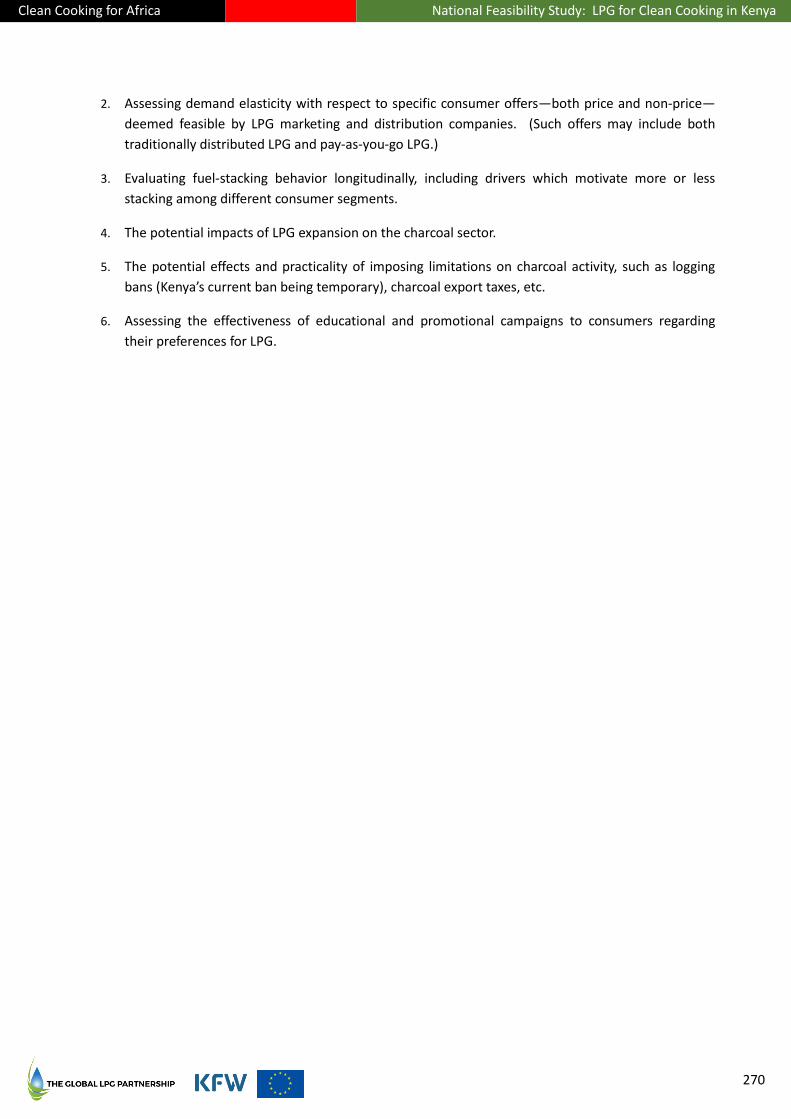
Clean Cooking for Africa National Feasibility Study: LPG for Clean Cooking in Kenya
270
2. Assessing demand elasticity with respect to specific consumer offers—both price and non-price—
deemed feasible by LPG marketing and distribution companies. (Such offers may include both
traditionally distributed LPG and pay-as-you-go LPG.)
3. Evaluating fuel-stacking behavior longitudinally, including drivers which motivate more or less
stacking among different consumer segments.
4. The potential impacts of LPG expansion on the charcoal sector.
5. The potential effects and practicality of imposing limitations on charcoal activity, such as logging
bans (Kenya’s current ban being temporary), charcoal export taxes, etc.
6. Assessing the effectiveness of educational and promotional campaigns to consumers regarding
their preferences for LPG.

Clean Cooking for Africa National Feasibility Study: LPG for Clean Cooking in Kenya
271
26. Detailed Methodology – Demographic Matching Demand Analysis
Impact on LPG demand of relative price changes
For households in clusters where LPG is available, the impact of pricing was modelled on the change in
quantity of LPG consumed (if the household already consumes LPG).
The modelling determined the impact of changes in relative price of LPG versus other commonly used fuels
among households currently using LPG and stacking LPG with other fuels, using the 2015/2016 KIHBS data.
OLS regression analysis was used to determine the impact of changes in relative price of LPG to prices of
charcoal, firewood and kerosene. The analysis was run separately for households that stack LPG with
charcoal, those that stack LPG with firewood, and those that stack LPG with kerosene. There are instances
where the same household stacks with more than one of these fuels, but this was not considered, as it
represents a very small portion of the households.
Table 52. Summary price of fuels in Kenya
(KES per kg/liter; 2018 GLPGP-Dalberg Research fuel price survey, N=111; 2015/2016 KIHBS, N=21,773)
Fuel Average price – 2018 (KES/unit) Average price – 2015/2016 (KES/unit)
Charcoal 103 15
Firewood 13 5
LPG 141 230
6 kg cylinder refill 858 N/A
13 kg cylinder refill 1,812 N/A
Kerosene 93 83
Table 53. Relative price of LPG to other fuels
(2015/2016 KIHBS, N=21,773)
LPG relative to: Mean relative
price Minimum
relative price Maximum
relative price
Standard deviation of
relative price
Number of households
Charcoal 46 0.25 4,828 189 1,547
Purchased firewood 534 0 27,692 2,705 227
Kerosene 3.6 0 50 3.4 1,029
The analysis showed that the relative price of LPG to the price of kerosene and the relative price of LPG to
the price of charcoal have statistically significant correlation to the quantity of LPG consumed by a
household. In particular, a 1% decrease in the relative price of LPG to the price of kerosene leads to an
increase in the quantity of LPG consumed by 0.3% for a household per month, while a 1% decrease in
relative price of LPG to the price of charcoal leads to an increase in the quantity of LPG consumed by 0.08%
for a household per month.

Clean Cooking for Africa National Feasibility Study: LPG for Clean Cooking in Kenya
272
The analysis also showed that the relative price of LPG to the price of firewood has no statistically
significant correlation to the quantity of LPG consumed by a household. It is believed that the statistical
insignificance of that result is due to limitations in the 2015/2016 KIHBS data given the high variation in
purchased firewood prices as well as a very small number of households (227) that stacked LPG with
firewood and reported both monthly quantity and cost data.
Given the limitations of the data, and in particular the large standard deviation in price data, it was not
possible to estimate the impact of changes in relative fuel price on the level of LPG consumed with high
accuracy and confidence.
Forecasting demand – impact of LPG price changes
Table 54. OLS regression results
(relationship between LPG availability and price and monthly household LPG consumption)
Variables Results
Price of LPG -0.00260*** (0.000391)
Time taken to purchase LPG (availability) 0.00402 (0.00328)
Household size 0.387*** (0.0556)
Urban household 0.436 (0.274)
Age of household head 0.00141 (0.00281)
Female household head -0.0939 (0.233)
Primary -0.305 (0.848)
Secondary -0.398 (0.833)
Tertiary -0.0977 (0.833)
Household income index 0.0367*** (0.00848)
Constant 1.679 (1.021)
Observations 2,773
R-squared 0.046
Standard errors shown in parentheses. *** p<0.01, ** p<0.05, * p<0.1

Clean Cooking for Africa National Feasibility Study: LPG for Clean Cooking in Kenya
273
27. Impact Assessment Calculations and Methodology
Environment and climate assessment
Averted deforestation
Averted deforestation was calculated as the difference between the number of trees used per year before
and after households begin using LPG as their primary fuel (i.e., the difference between the baseline and a
scenario). This was calculated as the sum of the number of trees necessary for firewood use and the
number of trees necessary for charcoal use.
The equivalent number of trees for firewood use and charcoal use was calculated using the equations
below.
𝑇𝑟𝑒𝑒𝑠(𝐹𝑖𝑟𝑒𝑤𝑜𝑜𝑑) = (𝐹𝑜𝑟𝑒𝑠𝑡 𝑛𝑜𝑛 𝑟𝑒𝑛𝑒𝑤𝑎𝑏𝑖𝑙𝑖𝑡𝑦) (𝐹𝑖𝑟𝑒𝑤𝑜𝑜𝑑 𝑐𝑜𝑛𝑠𝑢𝑚𝑝𝑡𝑖𝑜𝑛
𝑀𝑎𝑠𝑠 𝑝𝑒𝑟 𝑡𝑟𝑒𝑒)
= (82%) (𝐹𝑖𝑟𝑒𝑤𝑜𝑜𝑑 𝑐𝑜𝑛𝑠𝑢𝑚𝑝𝑡𝑖𝑜𝑛
100 𝑘𝑔/𝑡𝑟𝑒𝑒)
(1)
𝑇𝑟𝑒𝑒𝑠(𝐶ℎ𝑎𝑟𝑐𝑜𝑎𝑙)
= (𝐹𝑜𝑟𝑒𝑠𝑡 𝑛𝑜𝑛 𝑟𝑒𝑛𝑒𝑤𝑎𝑏𝑖𝑙𝑖𝑡𝑦)(𝑅𝑎𝑡𝑖𝑜 𝑐ℎ𝑎𝑟𝑐𝑜𝑎𝑙: 𝑤𝑜𝑜𝑑) (𝐶ℎ𝑎𝑟𝑐𝑜𝑎𝑙 𝑐𝑜𝑛𝑠𝑢𝑚𝑝𝑡𝑖𝑜𝑛
𝑀𝑎𝑠𝑠 𝑝𝑒𝑟 𝑡𝑟𝑒𝑒)
= (82%)(7) (𝐶ℎ𝑎𝑟𝑐𝑜𝑎𝑙 𝑐𝑜𝑛𝑠𝑢𝑚𝑝𝑡𝑖𝑜𝑛
100 𝑘𝑔/𝑡𝑟𝑒𝑒)
(2)
The forest non-renewability factor indicates what proportion of wood for fuel was unsustainably harvested.
Carbon emissions
The mass method considers the grams of particles per kilograms of fuel and stove.
In this method, the following equation was used to calculate the metric tonnes of carbon emissions per
household.
𝐶𝑂2(𝑒𝑞) = 10−6 [𝐹𝑢𝑒𝑙 𝑐𝑜𝑛𝑠𝑢𝑚𝑝𝑡𝑖𝑜𝑛
𝑁𝑢𝑚𝑏𝑒𝑟 𝑜𝑓 ℎ𝑜𝑢𝑠𝑒ℎ𝑜𝑙𝑑𝑠] [(𝐶𝑂2 𝑒𝑚𝑖𝑠𝑠𝑖𝑜𝑛𝑠 𝑓𝑎𝑐𝑡𝑜𝑟)(𝑁𝑜𝑛 𝑟𝑒𝑛𝑒𝑤𝑎𝑏𝑖𝑙𝑖𝑡𝑦)
+ (𝑁2𝑂 𝑒𝑚𝑖𝑠𝑠𝑖𝑜𝑛𝑠 𝑓𝑎𝑐𝑡𝑜𝑟)(𝐺𝑊𝑃𝑁2𝑂) + (𝐶𝐻4 𝑒𝑚𝑖𝑠𝑠𝑖𝑜𝑛𝑠 𝑓𝑎𝑐𝑡𝑜𝑟)(𝐺𝑊𝑃𝐶𝐻4)]
(3)
The emissions factors used vary depending on both fuel and stove, and the non-renewability factor was
dependent on the fuel used. All values used can be found in the annex. The global warming potential of
nitrous oxide and methane was 298 and 25, respectively216.
216 EPA: “Emissions Factors for Greenhouse Gas Inventories”, 2018
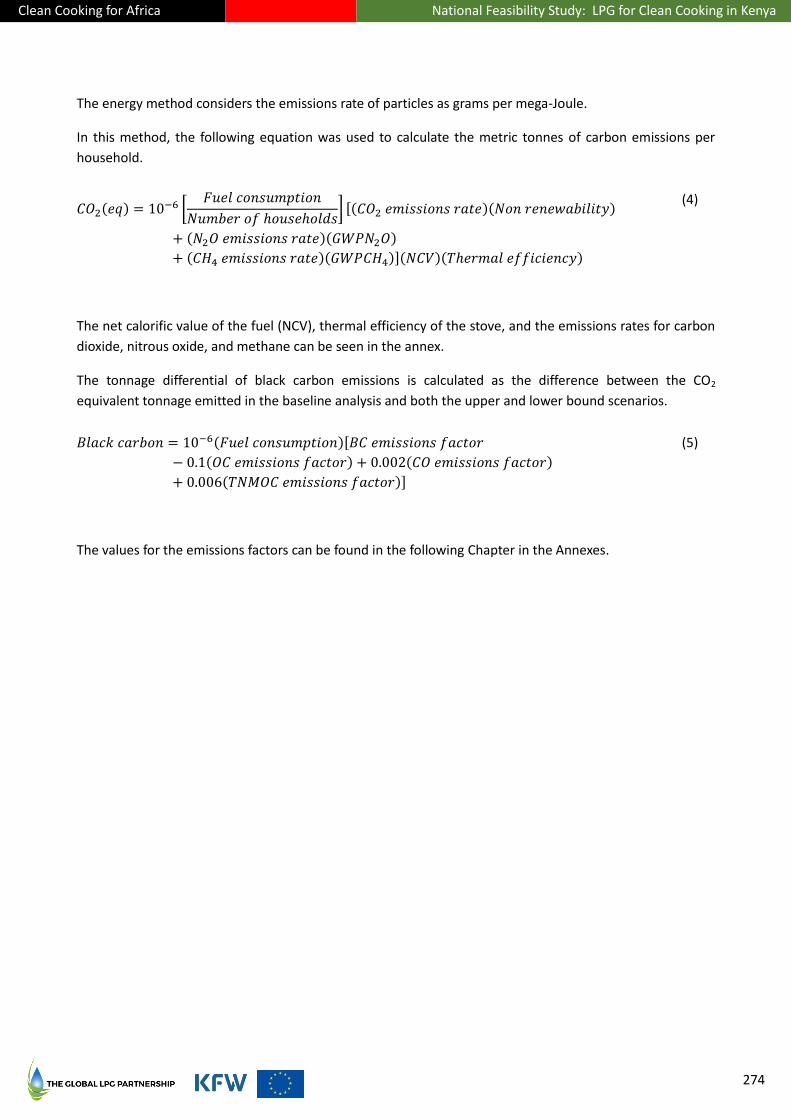
Clean Cooking for Africa National Feasibility Study: LPG for Clean Cooking in Kenya
274
The energy method considers the emissions rate of particles as grams per mega-Joule.
In this method, the following equation was used to calculate the metric tonnes of carbon emissions per
household.
𝐶𝑂2(𝑒𝑞) = 10−6 [𝐹𝑢𝑒𝑙 𝑐𝑜𝑛𝑠𝑢𝑚𝑝𝑡𝑖𝑜𝑛
𝑁𝑢𝑚𝑏𝑒𝑟 𝑜𝑓 ℎ𝑜𝑢𝑠𝑒ℎ𝑜𝑙𝑑𝑠] [(𝐶𝑂2 𝑒𝑚𝑖𝑠𝑠𝑖𝑜𝑛𝑠 𝑟𝑎𝑡𝑒)(𝑁𝑜𝑛 𝑟𝑒𝑛𝑒𝑤𝑎𝑏𝑖𝑙𝑖𝑡𝑦)
+ (𝑁2𝑂 𝑒𝑚𝑖𝑠𝑠𝑖𝑜𝑛𝑠 𝑟𝑎𝑡𝑒)(𝐺𝑊𝑃𝑁2𝑂)
+ (𝐶𝐻4 𝑒𝑚𝑖𝑠𝑠𝑖𝑜𝑛𝑠 𝑟𝑎𝑡𝑒)(𝐺𝑊𝑃𝐶𝐻4)](𝑁𝐶𝑉)(𝑇ℎ𝑒𝑟𝑚𝑎𝑙 𝑒𝑓𝑓𝑖𝑐𝑖𝑒𝑛𝑐𝑦)
(4)
The net calorific value of the fuel (NCV), thermal efficiency of the stove, and the emissions rates for carbon
dioxide, nitrous oxide, and methane can be seen in the annex.
The tonnage differential of black carbon emissions is calculated as the difference between the CO2
equivalent tonnage emitted in the baseline analysis and both the upper and lower bound scenarios.
𝐵𝑙𝑎𝑐𝑘 𝑐𝑎𝑟𝑏𝑜𝑛 = 10−6(𝐹𝑢𝑒𝑙 𝑐𝑜𝑛𝑠𝑢𝑚𝑝𝑡𝑖𝑜𝑛)[𝐵𝐶 𝑒𝑚𝑖𝑠𝑠𝑖𝑜𝑛𝑠 𝑓𝑎𝑐𝑡𝑜𝑟
− 0.1(𝑂𝐶 𝑒𝑚𝑖𝑠𝑠𝑖𝑜𝑛𝑠 𝑓𝑎𝑐𝑡𝑜𝑟) + 0.002(𝐶𝑂 𝑒𝑚𝑖𝑠𝑠𝑖𝑜𝑛𝑠 𝑓𝑎𝑐𝑡𝑜𝑟)
+ 0.006(𝑇𝑁𝑀𝑂𝐶 𝑒𝑚𝑖𝑠𝑠𝑖𝑜𝑛𝑠 𝑓𝑎𝑐𝑡𝑜𝑟)]
(5)
The values for the emissions factors can be found in the following Chapter in the Annexes.
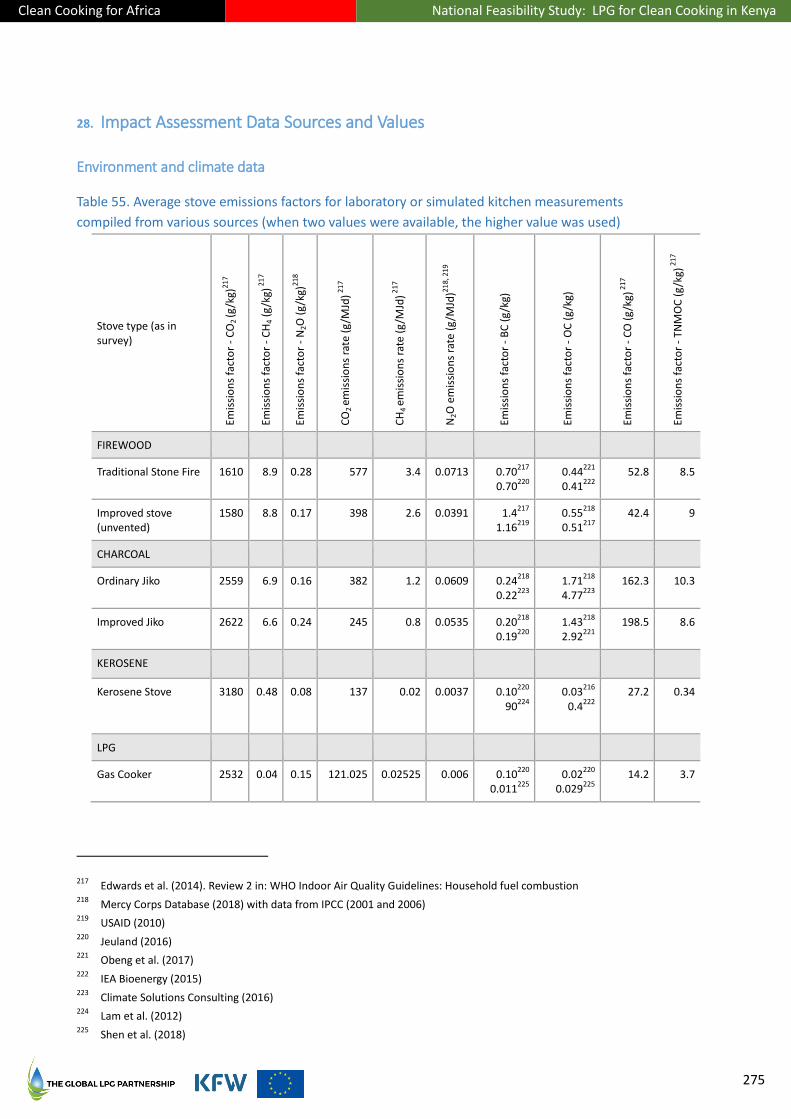
Clean Cooking for Africa National Feasibility Study: LPG for Clean Cooking in Kenya
275
28. Impact Assessment Data Sources and Values
Environment and climate data
Table 55. Average stove emissions factors for laboratory or simulated kitchen measurements
compiled from various sources (when two values were available, the higher value was used)
Stove type (as in survey)
Emis
sio
ns
fact
or
- C
O2
(g/k
g)21
7
Emis
sio
ns
fact
or
- C
H4
(g/k
g) 2
17
Emis
sio
ns
fact
or
- N
2O (
g/k
g)21
8
CO
2 em
issi
on
s ra
te (
g/M
Jd) 2
17
CH
4 em
issi
on
s ra
te (
g/M
Jd) 2
17
N2O
em
issi
on
s ra
te (
g/M
Jd)21
8, 2
19
Emis
sio
ns
fact
or
- B
C (
g/k
g)
Emis
sio
ns
fact
or
- O
C (
g/k
g)
Emis
sio
ns
fact
or
- C
O (
g/k
g) 2
17
Emis
sio
ns
fact
or
- TN
MO
C (
g/k
g) 2
17
FIREWOOD
Traditional Stone Fire 1610 8.9 0.28 577 3.4 0.0713 0.70217
0.70
220
0.44221
0.41
222
52.8 8.5
Improved stove (unvented)
1580 8.8 0.17 398 2.6 0.0391 1.4217
1.16
219
0.55218
0.51
217
42.4 9
CHARCOAL
Ordinary Jiko 2559 6.9 0.16 382 1.2 0.0609 0.24218
0.22
223
1.71218
4.77
223
162.3 10.3
Improved Jiko 2622 6.6 0.24 245 0.8 0.0535 0.20218
0.19
220
1.43218
2.92
221
198.5 8.6
KEROSENE
Kerosene Stove 3180 0.48 0.08 137 0.02 0.0037 0.10220
90224
0.03
216
0.4222
27.2 0.34
LPG
Gas Cooker 2532 0.04 0.15 121.025 0.02525 0.006 0.10220
0.011
225
0.02220
0.029
225
14.2 3.7
217 Edwards et al. (2014). Review 2 in: WHO Indoor Air Quality Guidelines: Household fuel combustion
218 Mercy Corps Database (2018) with data from IPCC (2001 and 2006)
219 USAID (2010)
220 Jeuland (2016)
221 Obeng et al. (2017)
222 IEA Bioenergy (2015)
223 Climate Solutions Consulting (2016)
224 Lam et al. (2012)
225 Shen et al. (2018)
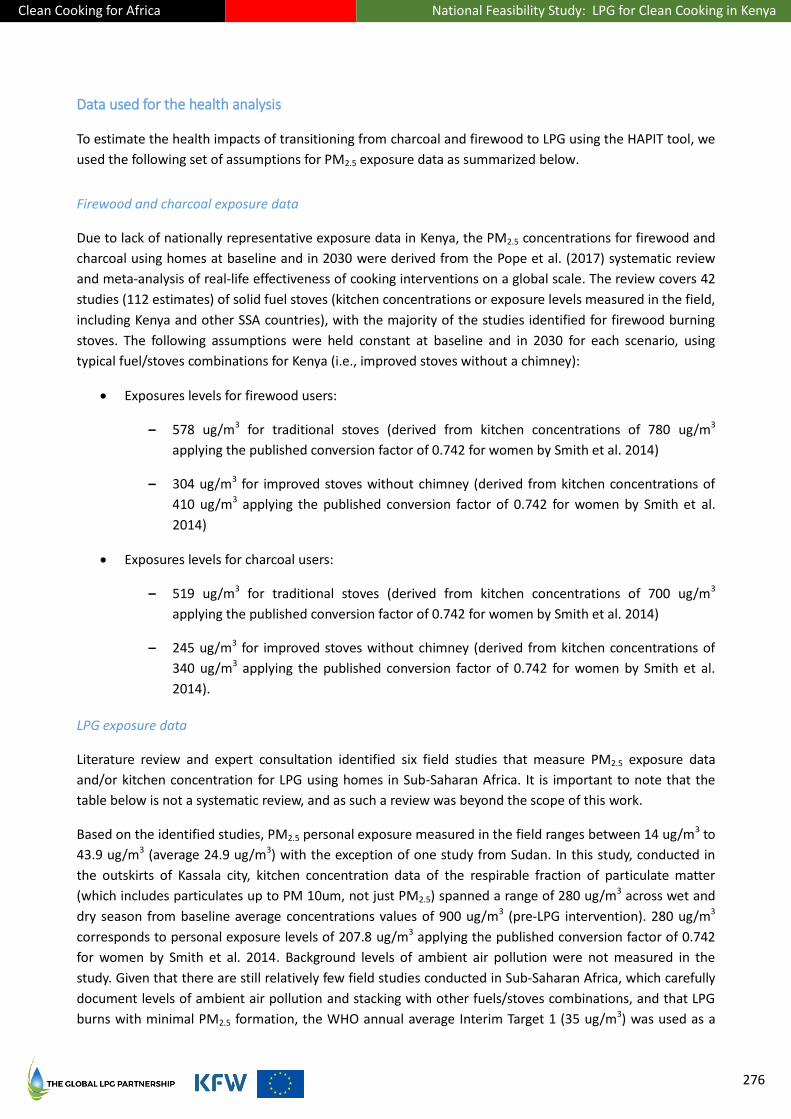
Clean Cooking for Africa National Feasibility Study: LPG for Clean Cooking in Kenya
276
Data used for the health analysis
To estimate the health impacts of transitioning from charcoal and firewood to LPG using the HAPIT tool, we
used the following set of assumptions for PM2.5 exposure data as summarized below.
Firewood and charcoal exposure data
Due to lack of nationally representative exposure data in Kenya, the PM2.5 concentrations for firewood and
charcoal using homes at baseline and in 2030 were derived from the Pope et al. (2017) systematic review
and meta-analysis of real-life effectiveness of cooking interventions on a global scale. The review covers 42
studies (112 estimates) of solid fuel stoves (kitchen concentrations or exposure levels measured in the field,
including Kenya and other SSA countries), with the majority of the studies identified for firewood burning
stoves. The following assumptions were held constant at baseline and in 2030 for each scenario, using
typical fuel/stoves combinations for Kenya (i.e., improved stoves without a chimney):
Exposures levels for firewood users:
– 578 ug/m3 for traditional stoves (derived from kitchen concentrations of 780 ug/m3
applying the published conversion factor of 0.742 for women by Smith et al. 2014)
– 304 ug/m3 for improved stoves without chimney (derived from kitchen concentrations of
410 ug/m3 applying the published conversion factor of 0.742 for women by Smith et al.
2014)
Exposures levels for charcoal users:
– 519 ug/m3 for traditional stoves (derived from kitchen concentrations of 700 ug/m3
applying the published conversion factor of 0.742 for women by Smith et al. 2014)
– 245 ug/m3 for improved stoves without chimney (derived from kitchen concentrations of
340 ug/m3 applying the published conversion factor of 0.742 for women by Smith et al.
2014).
LPG exposure data
Literature review and expert consultation identified six field studies that measure PM2.5 exposure data
and/or kitchen concentration for LPG using homes in Sub-Saharan Africa. It is important to note that the
table below is not a systematic review, and as such a review was beyond the scope of this work.
Based on the identified studies, PM2.5 personal exposure measured in the field ranges between 14 ug/m3 to
43.9 ug/m3 (average 24.9 ug/m3) with the exception of one study from Sudan. In this study, conducted in
the outskirts of Kassala city, kitchen concentration data of the respirable fraction of particulate matter
(which includes particulates up to PM 10um, not just PM2.5) spanned a range of 280 ug/m3 across wet and
dry season from baseline average concentrations values of 900 ug/m3 (pre-LPG intervention). 280 ug/m3
corresponds to personal exposure levels of 207.8 ug/m3 applying the published conversion factor of 0.742
for women by Smith et al. 2014. Background levels of ambient air pollution were not measured in the
study. Given that there are still relatively few field studies conducted in Sub-Saharan Africa, which carefully
document levels of ambient air pollution and stacking with other fuels/stoves combinations, and that LPG
burns with minimal PM2.5 formation, the WHO annual average Interim Target 1 (35 ug/m3) was used as a

Clean Cooking for Africa National Feasibility Study: LPG for Clean Cooking in Kenya
277
basis for assessing the health impacts of increased primary/exclusive LPG consumption. This value is based
on LPG being used in environments with other forms of household air pollution (such as from use of higher-
emissions fuels like charcoal and firewood in the same home, or in neighbouring homes).
Scenarios assumptions
It was beyond the scope of this study to model how firewood and charcoal using households might start
using improved firewood and improved charcoal stoves over time (if they did not transition to LPG). In
2013, 37.2% of households in Kenya used improved cookstoves (ICS) (the data are not disaggregated by
fuel).226
The Government of Kenya has set an ambitious target to have 100% of cooking performed with modern
cooking solutions by 2030 (of which, at least 35% of the population cooking with LPG). The Government
report included assumptions that include a doubling of growth of improved access and adoption of
improved firewood and charcoal stoves as of 2030 (with linear growth until 2030):
Firewood
— 2020 – 20% of households using improved stoves
— 2030 – 30% of households using improved stoves (of the projected % of households
under each scenario)
Charcoal
— 2020 – 56% of households using improved stoves (of the projected % of households
under each scenario)
— 2030 – 80% of households use improved stoves (of the projected % of households
under each scenario)
In addition, as it was not possible to predict how many biomass users will switch to LPG from traditional or
improved firewood/charcoal stoves, so an equal split was assumed:
Firewood
— 2020 – 50% of households that switch to LPG use improved stoves (of the projected %
of households under each scenario)
Charcoal
— 2020 – 50% of households that switch to LPG use improved stoves (of the projected %
of households under each scenario)
The ICS penetration rate did not emerge from the modelling as a major contributor to impacts. If starting
at 50% (as shown above), and the penetration is either cut in half (to 25%), or increased by half (to 75%),
the change in deaths averted and DALYs saved changes by only about 5% in either direction.
226 Sustainable Energy for All Kenya Action Agenda (2013)
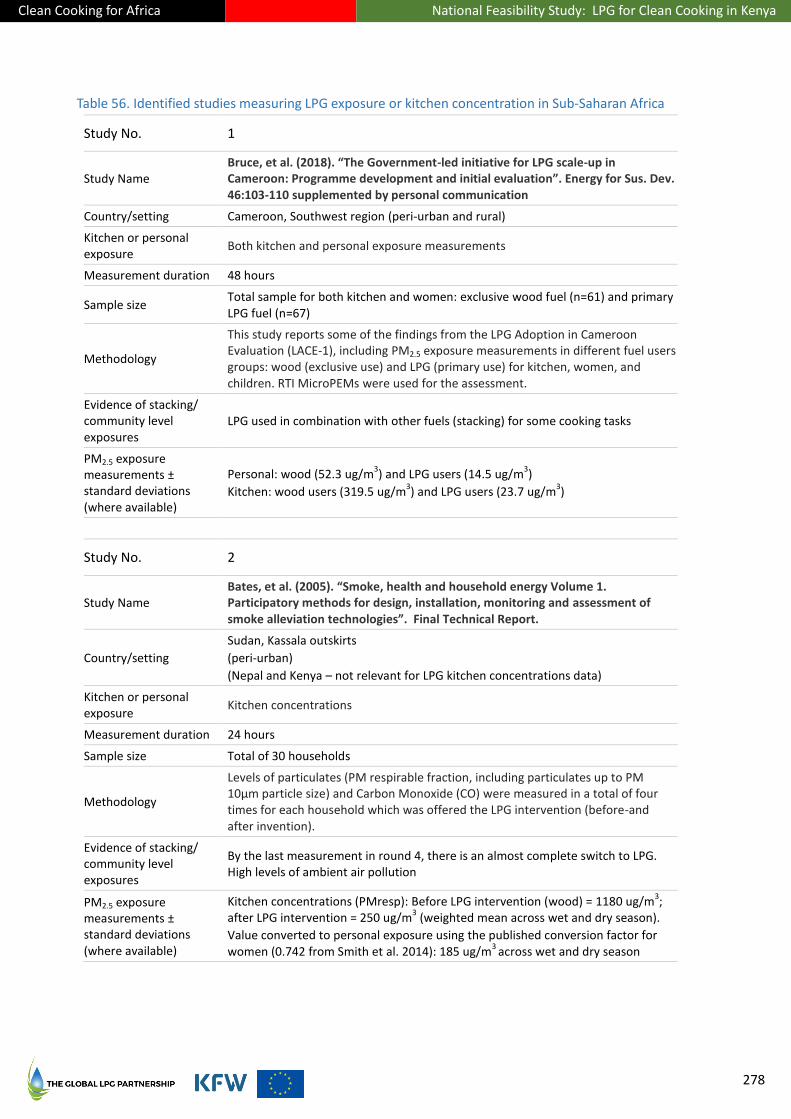
Clean Cooking for Africa National Feasibility Study: LPG for Clean Cooking in Kenya
278
Table 56. Identified studies measuring LPG exposure or kitchen concentration in Sub-Saharan Africa
Study No. 1
Study Name Bruce, et al. (2018). “The Government-led initiative for LPG scale-up in Cameroon: Programme development and initial evaluation”. Energy for Sus. Dev. 46:103-110 supplemented by personal communication
Country/setting Cameroon, Southwest region (peri-urban and rural)
Kitchen or personal exposure
Both kitchen and personal exposure measurements
Measurement duration 48 hours
Sample size Total sample for both kitchen and women: exclusive wood fuel (n=61) and primary LPG fuel (n=67)
Methodology
This study reports some of the findings from the LPG Adoption in Cameroon Evaluation (LACE-1), including PM2.5 exposure measurements in different fuel users groups: wood (exclusive use) and LPG (primary use) for kitchen, women, and children. RTI MicroPEMs were used for the assessment.
Evidence of stacking/ community level exposures
LPG used in combination with other fuels (stacking) for some cooking tasks
PM2.5 exposure measurements ± standard deviations (where available)
Personal: wood (52.3 ug/m3) and LPG users (14.5 ug/m
3)
Kitchen: wood users (319.5 ug/m3) and LPG users (23.7 ug/m
3)
Study No. 2
Study Name Bates, et al. (2005). “Smoke, health and household energy Volume 1. Participatory methods for design, installation, monitoring and assessment of smoke alleviation technologies”. Final Technical Report.
Country/setting
Sudan, Kassala outskirts
(peri-urban)
(Nepal and Kenya – not relevant for LPG kitchen concentrations data)
Kitchen or personal exposure
Kitchen concentrations
Measurement duration 24 hours
Sample size Total of 30 households
Methodology
Levels of particulates (PM respirable fraction, including particulates up to PM 10μm particle size) and Carbon Monoxide (CO) were measured in a total of four times for each household which was offered the LPG intervention (before-and after invention).
Evidence of stacking/ community level exposures
By the last measurement in round 4, there is an almost complete switch to LPG. High levels of ambient air pollution
PM2.5 exposure measurements ± standard deviations (where available)
Kitchen concentrations (PMresp): Before LPG intervention (wood) = 1180 ug/m3;
after LPG intervention = 250 ug/m3 (weighted mean across wet and dry season).
Value converted to personal exposure using the published conversion factor for women (0.742 from Smith et al. 2014): 185 ug/m
3 across wet and dry season
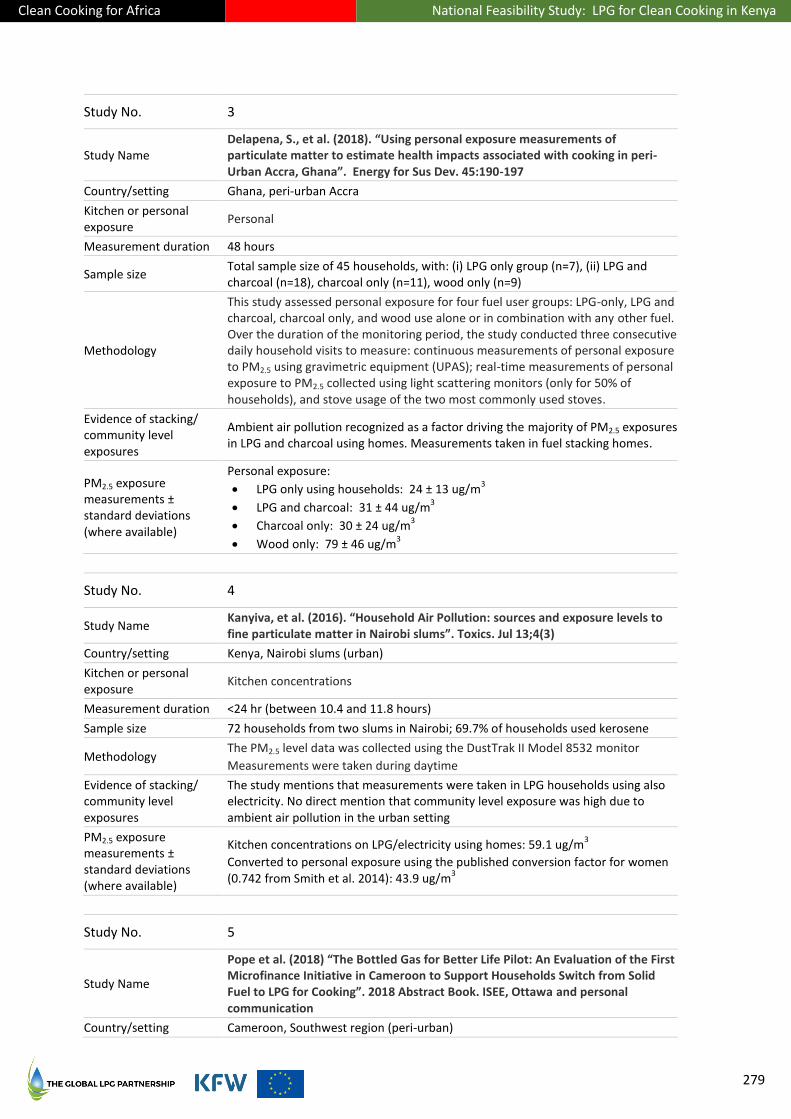
Clean Cooking for Africa National Feasibility Study: LPG for Clean Cooking in Kenya
279
Study No. 3
Study Name Delapena, S., et al. (2018). “Using personal exposure measurements of particulate matter to estimate health impacts associated with cooking in peri-Urban Accra, Ghana”. Energy for Sus Dev. 45:190-197
Country/setting Ghana, peri-urban Accra
Kitchen or personal exposure
Personal
Measurement duration 48 hours
Sample size Total sample size of 45 households, with: (i) LPG only group (n=7), (ii) LPG and charcoal (n=18), charcoal only (n=11), wood only (n=9)
Methodology
This study assessed personal exposure for four fuel user groups: LPG-only, LPG and charcoal, charcoal only, and wood use alone or in combination with any other fuel. Over the duration of the monitoring period, the study conducted three consecutive daily household visits to measure: continuous measurements of personal exposure to PM2.5 using gravimetric equipment (UPAS); real-time measurements of personal exposure to PM2.5 collected using light scattering monitors (only for 50% of households), and stove usage of the two most commonly used stoves.
Evidence of stacking/ community level exposures
Ambient air pollution recognized as a factor driving the majority of PM2.5 exposures in LPG and charcoal using homes. Measurements taken in fuel stacking homes.
PM2.5 exposure measurements ± standard deviations (where available)
Personal exposure:
LPG only using households: 24 ± 13 ug/m3
LPG and charcoal: 31 ± 44 ug/m3
Charcoal only: 30 ± 24 ug/m3
Wood only: 79 ± 46 ug/m3
Study No. 4
Study Name Kanyiva, et al. (2016). “Household Air Pollution: sources and exposure levels to fine particulate matter in Nairobi slums”. Toxics. Jul 13;4(3)
Country/setting Kenya, Nairobi slums (urban)
Kitchen or personal exposure
Kitchen concentrations
Measurement duration <24 hr (between 10.4 and 11.8 hours)
Sample size 72 households from two slums in Nairobi; 69.7% of households used kerosene
Methodology The PM2.5 level data was collected using the DustTrak II Model 8532 monitor
Measurements were taken during daytime
Evidence of stacking/ community level exposures
The study mentions that measurements were taken in LPG households using also electricity. No direct mention that community level exposure was high due to ambient air pollution in the urban setting
PM2.5 exposure measurements ± standard deviations (where available)
Kitchen concentrations on LPG/electricity using homes: 59.1 ug/m3
Converted to personal exposure using the published conversion factor for women (0.742 from Smith et al. 2014): 43.9 ug/m
3
Study No. 5
Study Name
Pope et al. (2018) “The Bottled Gas for Better Life Pilot: An Evaluation of the First Microfinance Initiative in Cameroon to Support Households Switch from Solid Fuel to LPG for Cooking”. 2018 Abstract Book. ISEE, Ottawa and personal communication
Country/setting Cameroon, Southwest region (peri-urban)

Clean Cooking for Africa National Feasibility Study: LPG for Clean Cooking in Kenya
280
Kitchen or personal exposure
Both kitchen and personal, before and after the LPG cooking equipment was introduced
Measurement duration 48 hours
Sample size 35 households using firewood at baseline and LPG at follow up (same households)
Methodology
This study assessed the impacts on exposure of a microfinance scheme (paid back over 6 months) for LPG start-up equipment (stove, equipment and gas; US$95). A subsample (n=35) of the total households who took up the loan (n=150) took part in exposure measurements at two data points: (i) before they start cooking on LPG, (ii) and around 6 months after they received their equipment through the microloan. RTI microPEMs used
Evidence of stacking/ community level exposures
Households used LPG as primary fuel after they bought the LPG equipment (no exclusivity of use)
PM2.5 exposure measurements ± standard deviations (where available)
Personal: Before LPG intervention (wood) = 73.8 μg/m3; after LPG
intervention = 29.4 μg/m3
Kitchen: Before LPG intervention (wood) = 314.0 μg/m3 geo mean; after LPG
intervention = 33.5 μg/m3
Study No. 6
Study Name Titcombe, et al. (2011). “Personal and indoor exposure to PM2.5 and polycyclic aromatic hydrocarbons in the southern highlands of Tanzania: a pilot-scale study”. Environmental Monitor and Assess., 180:461-476
Country/setting Tanzania, Njombe district (rural)
Kitchen or personal exposure
Personal
Measurement duration 7-8 hours
Sample size 72 households from two slums in Nairobi. Sample size: four households and one
school for each fuel or fuel mix. Measurements repeated three times.
Methodology
Data were collected in Njombe district where cooking is conducted indoors due to cool climate, and heavy seasonal rainfall. Kitchens are often poorly ventilated. Sampling sites were selected to represent typical cooking practices for different income groups, including stacking with other fuels. Measurements were collected using gravimetric Personal Microenvironment Aerosol Speciation Samplers (PMASS; MSP Corporation, Model 240 PMASS)
Evidence of stacking/ community level exposures
Discussion on stacking or community level exposures not reported
PM2.5 exposure measurements ± standard deviations (where available)
LPG only using: 14 ± 3 ug/m3
Kerosene/charcoal: 88 ± 42 ug/m3
Charcoal: 588 ± 347 ug/m3
Open wood fire: 1574 ± 287 ug/m3
Bibliography
Bond, T C et. al. 2013. “Bounding the role of black carbon in the climate system: A scientific assessment.”
J. Geophys. Res. Atmos 118 (11): 5380-5552.
MacCarty et. al. 2010. “Fuel use and emissions performance of fifty cooking stoves in the laboratory and
related benchmarks of performance.” Energy for Sustainable Development 14.
Rypdahl et. al. 2009. “Costs and global impacts of black carbon abatement strategies.” Tellus B 61 (4).
Clean Cooking for Africa National Feasibility Study: LPG for Clean Cooking in Kenya
281
Zhang et. al. 2000. “Greenhouse gases and other airborne pollutants from household stoves in China: a
database for emission factors.” Atmospheric Environment 34: 4537-4549.
Bates et al. 2005. “Smoke, health and household energy: Volume 1.”
Brooks, N et. al. 2016. “How much do alternative cookstoves reduce biomass fuel use? Evidence from
North India.” Resource and Energy Economics 43: 153-171.
Chandar , M, and V Tandon . 2004. “LPG: A Key to Empowerment of Hill Women.”
Climate Solutions Consulting. 2016. “Household air pollutions study, part 1: Black carbon emission factor
measurement for ethanol, charcoal and kerosene stoves in Kibera, Kenya.” https://climate-
solutions.net/images/Black-Carbon-EF-Report-30_10_2016.pdf.
EA Bioenergy . 2015. “Black carbon emissions from wood stoves.”
EPA. 2016. “Lifecycle assessment of cooking fuels in India, Kenya, and Ghana.”
EPA: “Emissions Factors for Greenhouse Gas Inventories”, 2018.
ESMAP . 2015. “The state of the global clean and improved cooking sector.”
FAO Stat. 2016. “Wood charcoal exports.”
Gold Standard Methodology . 2017. “Technologies and Practices to Displace Decentralized Thermal Energy
Consumption.”
Kanyiva, M, et al. 2016. “Household Air Pollution: Sources and Exposure Levels to Fine Particulate Matter
in Nairobi Slums.” Toxics 43 (2).
Kituyi, Evans & Marufu, Lackson & Huber, Beate & Wandiga, Shem & Jumba, Isaac & Andreae, Meinrat &
Helas, Günter. (2001). Biofuel consumption rates and patterns in Kenya. Biomass and Bioenergy.
20. 83-99. 10.1016/S0961-9534(00)00072-6.
Lam et al. 2012. “Household Light Makes Global Heat: High Black Carbon Emissions from Kerosene Wick
Lamps.” Environ Sci Technol. 46 (24).
Liousse et al. 2014. “Explosive growth in African combustion emissions from 2005 to 2030.” Environment
Research Letters 9 (3).
Mercy Corps Database. n.d. Carbon Emissions from Cooking Stoves Using a Variety of Fuels: A Handbook of
Experiences in Energy Conservation and Alternative Fuels.
National Petroleum Association (NPA). 2018. “Ex-refinery prices computation.”
http://www.npa.gov.gh/downloads/general.
Nautiyal, S et al. 2013. “Transition from Wood Fuel to LPG and Its Impact on Energy Conservation and
Health in the Central Himalayas, India.” J. Mountain Science 10.
Oxfam International. 2017. Why the majority of the worlds women are poor.
Pope, D et. al. 2016. “Real-life effectiveness of ‘improved’ stoves and clean fuels in reducing PM2.5 and
CO: Systematic review and meta-analysis.” Environ Int.
Clean Cooking for Africa National Feasibility Study: LPG for Clean Cooking in Kenya
282
Shen et. al. 2018. “Evaluating the Performance of Household Liquefied Petroleum Gas Cookstoves.”
Environ Sci Technol 16.
Smith et. al. 2015. “Millions dead: how do we know and what does it mean? Methods used in the
comparative risk assessment of household air pollution.” Annu. Rev. Public Health 185–206.
Smith, K et. al. 2000. “Greenhouse implications of household stoves: an analysis for India.” Annual Review
of Energy and the Environment 25: 741–763.
Sustainable Energy for All, "Kenya Action Agenda", 2013.
Titcombe, et al. 2011. “Personal and indoor exposure to PM2.5 and polycyclic aromatic hydrocarbons in
the southern highlands of Tanzania: a pilot-scale study.” Environmental Monitoring and
Assessment ( ) 180: 461-476.
United Nations Development Assistance Framework for Kenya (2018)
USAID. 2010. “Black carbon emissions in Asia: Sources, Impacts, and Abatement Opportunities.”
http://www.ccacoalition.org/en/resources/black-carbon-emissions-asia-sources-impacts-and-
abatement-opportunities.
Wickramasinghe A. (2011); Nautiyal S. (2013); Brooks N et al (2016); Chandar M, Tandon V. (2004);
Shashni S and Chander M. (2014).
World Bank. 2014. “Clean and improved cooking in Sub-Saharan Africa.”
World LP Gas Association. n.d. “Clearing the air: Black carbon, climate policy and LP gas.”
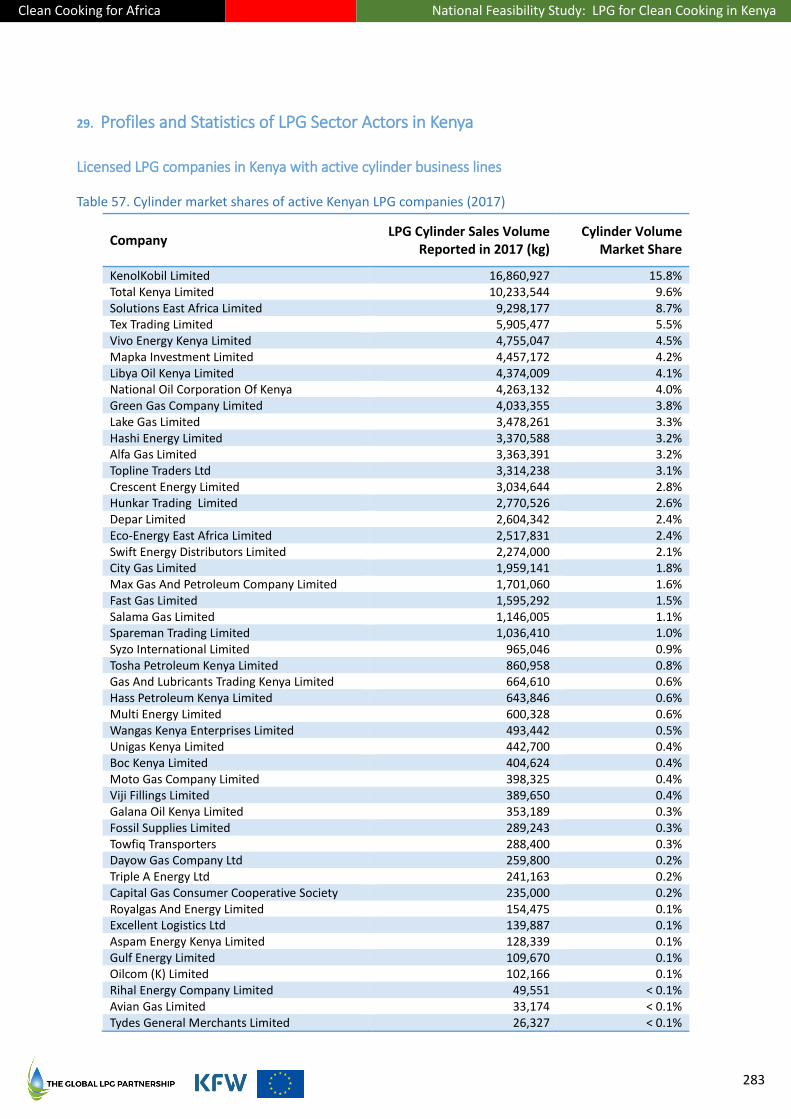
Clean Cooking for Africa National Feasibility Study: LPG for Clean Cooking in Kenya
283
29. Profiles and Statistics of LPG Sector Actors in Kenya
Licensed LPG companies in Kenya with active cylinder business lines
Table 57. Cylinder market shares of active Kenyan LPG companies (2017)
Company LPG Cylinder Sales Volume
Reported in 2017 (kg) Cylinder Volume
Market Share
KenolKobil Limited 16,860,927 15.8% Total Kenya Limited 10,233,544 9.6% Solutions East Africa Limited 9,298,177 8.7% Tex Trading Limited 5,905,477 5.5% Vivo Energy Kenya Limited 4,755,047 4.5% Mapka Investment Limited 4,457,172 4.2% Libya Oil Kenya Limited 4,374,009 4.1% National Oil Corporation Of Kenya 4,263,132 4.0% Green Gas Company Limited 4,033,355 3.8% Lake Gas Limited 3,478,261 3.3% Hashi Energy Limited 3,370,588 3.2% Alfa Gas Limited 3,363,391 3.2% Topline Traders Ltd 3,314,238 3.1% Crescent Energy Limited 3,034,644 2.8% Hunkar Trading Limited 2,770,526 2.6% Depar Limited 2,604,342 2.4% Eco-Energy East Africa Limited 2,517,831 2.4% Swift Energy Distributors Limited 2,274,000 2.1% City Gas Limited 1,959,141 1.8% Max Gas And Petroleum Company Limited 1,701,060 1.6% Fast Gas Limited 1,595,292 1.5% Salama Gas Limited 1,146,005 1.1% Spareman Trading Limited 1,036,410 1.0% Syzo International Limited 965,046 0.9% Tosha Petroleum Kenya Limited 860,958 0.8% Gas And Lubricants Trading Kenya Limited 664,610 0.6% Hass Petroleum Kenya Limited 643,846 0.6% Multi Energy Limited 600,328 0.6% Wangas Kenya Enterprises Limited 493,442 0.5% Unigas Kenya Limited 442,700 0.4% Boc Kenya Limited 404,624 0.4% Moto Gas Company Limited 398,325 0.4% Viji Fillings Limited 389,650 0.4% Galana Oil Kenya Limited 353,189 0.3% Fossil Supplies Limited 289,243 0.3% Towfiq Transporters 288,400 0.3% Dayow Gas Company Ltd 259,800 0.2% Triple A Energy Ltd 241,163 0.2% Capital Gas Consumer Cooperative Society 235,000 0.2% Royalgas And Energy Limited 154,475 0.1% Excellent Logistics Ltd 139,887 0.1% Aspam Energy Kenya Limited 128,339 0.1% Gulf Energy Limited 109,670 0.1% Oilcom (K) Limited 102,166 0.1% Rihal Energy Company Limited 49,551 < 0.1% Avian Gas Limited 33,174 < 0.1% Tydes General Merchants Limited 26,327 < 0.1%
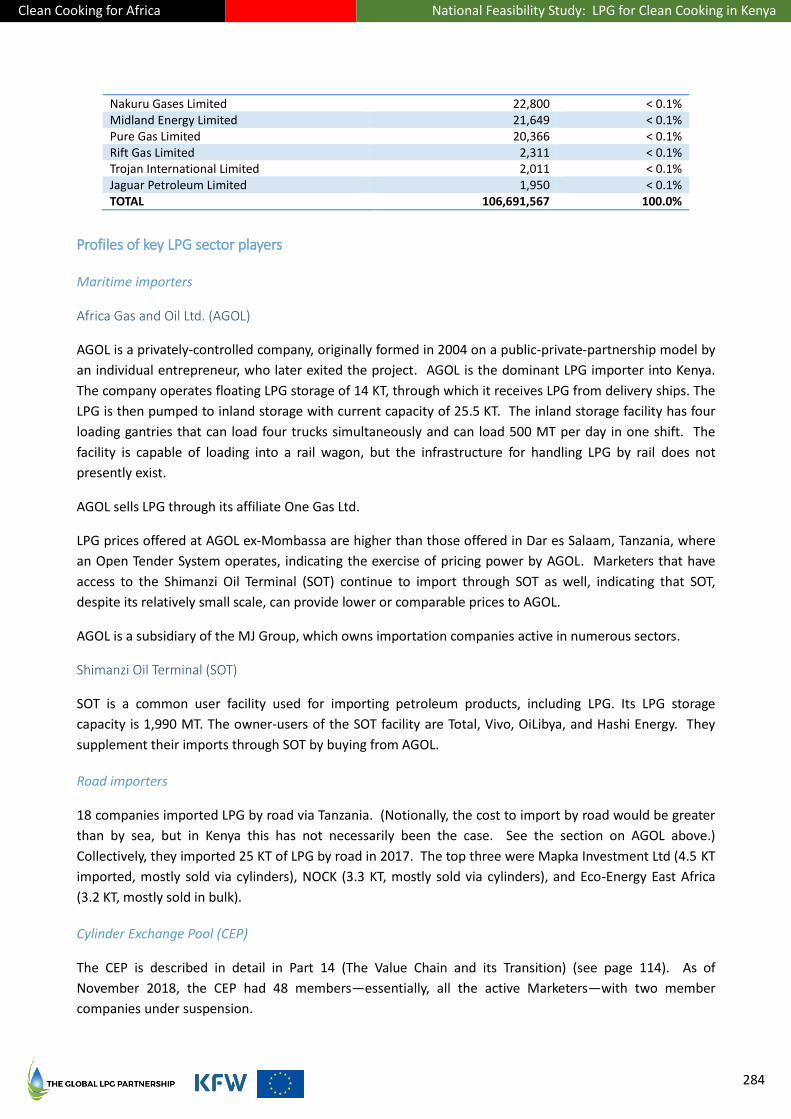
Clean Cooking for Africa National Feasibility Study: LPG for Clean Cooking in Kenya
284
Nakuru Gases Limited 22,800 < 0.1% Midland Energy Limited 21,649 < 0.1% Pure Gas Limited 20,366 < 0.1% Rift Gas Limited 2,311 < 0.1% Trojan International Limited 2,011 < 0.1% Jaguar Petroleum Limited 1,950 < 0.1% TOTAL 106,691,567 100.0%
Profiles of key LPG sector players
Maritime importers
Africa Gas and Oil Ltd. (AGOL)
AGOL is a privately-controlled company, originally formed in 2004 on a public-private-partnership model by
an individual entrepreneur, who later exited the project. AGOL is the dominant LPG importer into Kenya.
The company operates floating LPG storage of 14 KT, through which it receives LPG from delivery ships. The
LPG is then pumped to inland storage with current capacity of 25.5 KT. The inland storage facility has four
loading gantries that can load four trucks simultaneously and can load 500 MT per day in one shift. The
facility is capable of loading into a rail wagon, but the infrastructure for handling LPG by rail does not
presently exist.
AGOL sells LPG through its affiliate One Gas Ltd.
LPG prices offered at AGOL ex-Mombassa are higher than those offered in Dar es Salaam, Tanzania, where
an Open Tender System operates, indicating the exercise of pricing power by AGOL. Marketers that have
access to the Shimanzi Oil Terminal (SOT) continue to import through SOT as well, indicating that SOT,
despite its relatively small scale, can provide lower or comparable prices to AGOL.
AGOL is a subsidiary of the MJ Group, which owns importation companies active in numerous sectors.
Shimanzi Oil Terminal (SOT)
SOT is a common user facility used for importing petroleum products, including LPG. Its LPG storage
capacity is 1,990 MT. The owner-users of the SOT facility are Total, Vivo, OiLibya, and Hashi Energy. They
supplement their imports through SOT by buying from AGOL.
Road importers
18 companies imported LPG by road via Tanzania. (Notionally, the cost to import by road would be greater
than by sea, but in Kenya this has not necessarily been the case. See the section on AGOL above.)
Collectively, they imported 25 KT of LPG by road in 2017. The top three were Mapka Investment Ltd (4.5 KT
imported, mostly sold via cylinders), NOCK (3.3 KT, mostly sold via cylinders), and Eco-Energy East Africa
(3.2 KT, mostly sold in bulk).
Cylinder Exchange Pool (CEP)
The CEP is described in detail in Part 14 (The Value Chain and its Transition) (see page 114). As of
November 2018, the CEP had 48 members—essentially, all the active Marketers—with two member
companies under suspension.

Clean Cooking for Africa National Feasibility Study: LPG for Clean Cooking in Kenya
285
One of the suspended companies, Midland Energy Ltd., owner of the Midgas brand, was put under
statutory management (receivership) by EY Kenya, a unit of Ernest & Young, the global accountancy and
consultancy. It is anticipated that the other suspended member, Green Energy Ltd., will also be placed
under receivership. Under the reformed LN 121 (2018), LPG marketing companies unable to service their
customers will be given to a caretaker brand-owner that will operate the company until a new and capable
owner can take over.
Brands whose cylinders are still in the market but which are not members of the CEP are Q-Gas, Pan Gaz,
Circle of Light, and Eco Gas.
Under the reformed LN 121, the CEP will become voluntary, and it is expected that only small LPG players
will utilize the CEP mechanism in anticipation of consolidation amongst them (for example, into a
cooperative structure).
Major LPG Marketers
Total Kenya PLC
Total Kenya PLC is a public company traded on the Nairobi Stock Exchange, and is the local affiliate of the
Total Group, the France-based international oil and gas major. Total has been active in Kenya since 1955 and
has developed a widespread network of petrol stations.
Total has access to SOT, plus 400 MT of bulk storage to receive imported LPG in Mombassa and a further
300 MT of storage in Nairobi associated with a cylinder filling plant.
The Total brand of LPG is known as Totalgaz and is orange in colour. It is available in the standard sizes of
3kg, 6kg, 13kg for domestic users. Total was the first to deploy the now-popular 6kg cylinder in the Kenyan
market, under the brand name meko, which has now become a generic term for all 6kg cylinders in Kenya.
For the commercial sector, Total supplies 22.5kg and 50kg cylinders as well as bulk supplies in company-
owned tanks installed on large customers’ premises.
Total’s domestic cylinder gas is sold in the forecourts of its petrol stations, in branded containers located in
residential areas, and via appointed distributors. The Total brand’s popularity has made it a prime target for
illegal (pirate) refillers who access the cylinders, refill them, and sell at lower prices than Total does.
Recently, Total introduced a ‘scratch to reveal’ number on all its filled residential cylinders, which customers
can use to confirm the authenticity of the refill, in order to counter illegal refillers.
It is estimated that Total has slightly over one million cylinders in the Kenyan market.
ERC records indicate that Total sold a total of 13.7KT (9.5KT in cylinders and 4.2KT in bulk) from July 2017 to
June 2018.
More information is available at www.total.co.ke/totalgaz-kenya/about-totalgaz-lpg.html.
Hashi Energy Ltd.
Hashi Energy is a privately held local company, in operation since 1991. The company owns bulk storage in
Mombasa (410 MT), Eldoret (100 MT) and Kisumu (100 MT). Hashi previously owned a storage and filling
plant in Nairobi but sold it to Lake Gas Ltd. in 2016. Hashi is a participant in the SOT (about which, see
above).

Clean Cooking for Africa National Feasibility Study: LPG for Clean Cooking in Kenya
286
The Hashi gas brand was introduced in 2011 and grew rapidly through direct deliveries to retailers,
bypassing the petrol station forecourt networks of the major LPG players of that era.
Hashi’s cylinder population is estimated at over 1.3 million, with over 80% being 6 kg.
EPRA reports indicate annual sales of 8.5KT, of which 5.4KT was sold in cylinders and 3.1KT in bulk, for the
period July 2017 to June 2018.
Libya Oil Kenya Ltd. (LOKL)
LOKL is owned by the government of Libya, which acquired the assets of ExxonMobil in Kenya. LOKL is a
member of the Libya Oil Pan African Oil and Gas Company, and has operated in Kenya since 2004, when
Tamil acquired Mobil.
LOKL owns a 420 MT storage facility in Mombasa, which receives gas from SOT, in which LOKL is a
participant. LOKL also owns storage and filling facilities in Nairobi (100 MT) and Eldoret (60 MT).
Its LPG brand is called OiLibya (or Oil Libya) and Mpishi, is a maroon-brown colour, and is available in 6 kg
and 13 kg cylinders for residential use and 40 kg for commercial uses.
For distribution, LOKL uses petrol station forecourts and appointed distributors. Its cylinder population is
estimated to be about 700,000, with very modest additions every year.
EPRA records indicate sales of 6.8 KT (5.0 KT in cylinders and 1.8 KT in bulk) for the period July 2017 to June
2018.
Vivo Energy Ltd.
Vivo is a privately-held multinational oil and gas company which started operating in Kenya after acquiring
the assets of Shell Kenya. Vivo owns a 520 MT LPG storage facility with access to SOT, in which Vivo
participates. Vivo also owns storage and filling facilities in Nairobi (200 MT).
Its LPG brand is called Afrigas, whose colour is sky-blue, available in 6 kg and 13 kg cylinders for residential
use and 50 kg for commercial uses.
For distribution, Vivo uses petrol station forecourts and appointed distributors. Its cylinder population is
estimated to be about 900,000 with modest additions every year.
EPRA records indicate sales of 1.3 KT (0.98 KT in cylinders and 0.32 KT in bulk) for the period July 2017 to
June 2018.
KenolKobil Ltd.
KenolKobil was until recently a publicly listed (Nairobi Stock Exchange), indigenous petroleum products
company which has operated in Kenya for over 50 years. It was acquired in March 2019 by France’s Rubis
Energie. KenolKobil does not have an LPG import storage terminal at Mombasa and buys its LPG from
AGOL. The KenolKobil brand is known as K-gas, and is green in colour. The brand was introduced in 2002,
and following aggressive marketing, is now the number one brand in the residential market with 16% share
by volume in 2017. Its popularity makes it attractive to illegal (pirate) refillers, but their piracy has not
deterred the company from investing steadily in cylinders year over year. Pirates both steal K-gas cylinders
and offer green-coloured counterfeit cylinders on the market.
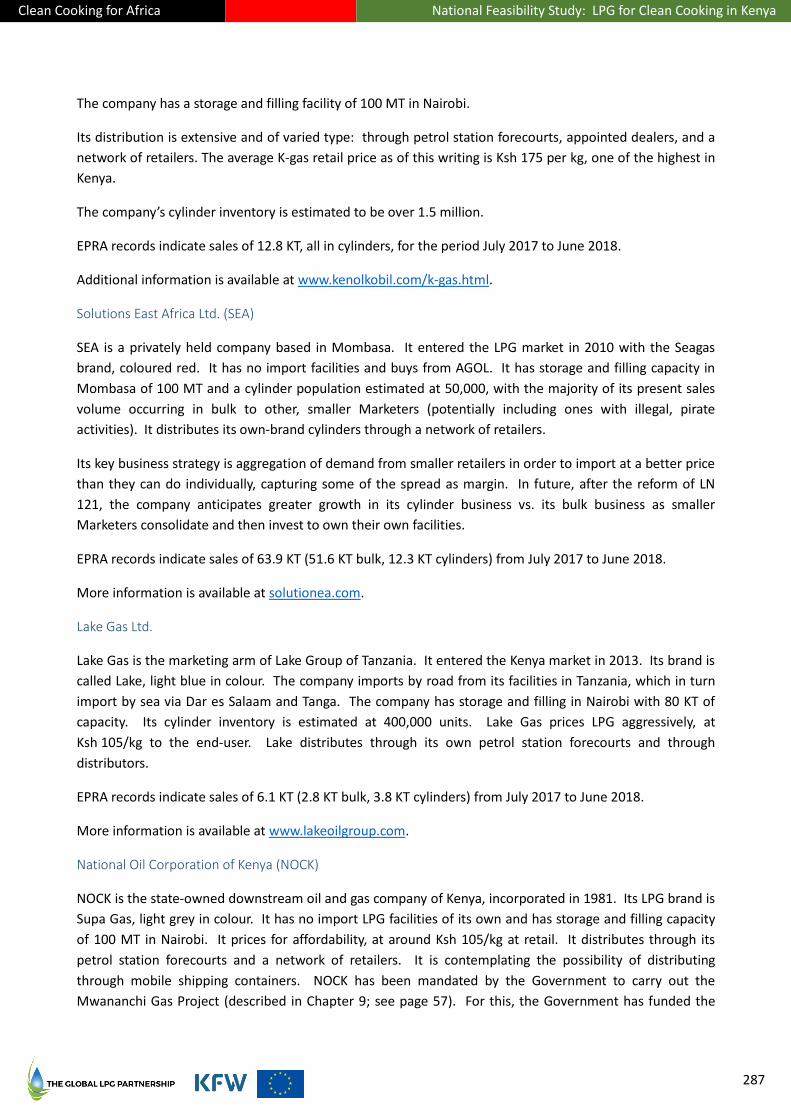
Clean Cooking for Africa National Feasibility Study: LPG for Clean Cooking in Kenya
287
The company has a storage and filling facility of 100 MT in Nairobi.
Its distribution is extensive and of varied type: through petrol station forecourts, appointed dealers, and a
network of retailers. The average K-gas retail price as of this writing is Ksh 175 per kg, one of the highest in
Kenya.
The company’s cylinder inventory is estimated to be over 1.5 million.
EPRA records indicate sales of 12.8 KT, all in cylinders, for the period July 2017 to June 2018.
Additional information is available at www.kenolkobil.com/k-gas.html.
Solutions East Africa Ltd. (SEA)
SEA is a privately held company based in Mombasa. It entered the LPG market in 2010 with the Seagas
brand, coloured red. It has no import facilities and buys from AGOL. It has storage and filling capacity in
Mombasa of 100 MT and a cylinder population estimated at 50,000, with the majority of its present sales
volume occurring in bulk to other, smaller Marketers (potentially including ones with illegal, pirate
activities). It distributes its own-brand cylinders through a network of retailers.
Its key business strategy is aggregation of demand from smaller retailers in order to import at a better price
than they can do individually, capturing some of the spread as margin. In future, after the reform of LN
121, the company anticipates greater growth in its cylinder business vs. its bulk business as smaller
Marketers consolidate and then invest to own their own facilities.
EPRA records indicate sales of 63.9 KT (51.6 KT bulk, 12.3 KT cylinders) from July 2017 to June 2018.
More information is available at solutionea.com.
Lake Gas Ltd.
Lake Gas is the marketing arm of Lake Group of Tanzania. It entered the Kenya market in 2013. Its brand is
called Lake, light blue in colour. The company imports by road from its facilities in Tanzania, which in turn
import by sea via Dar es Salaam and Tanga. The company has storage and filling in Nairobi with 80 KT of
capacity. Its cylinder inventory is estimated at 400,000 units. Lake Gas prices LPG aggressively, at
Ksh 105/kg to the end-user. Lake distributes through its own petrol station forecourts and through
distributors.
EPRA records indicate sales of 6.1 KT (2.8 KT bulk, 3.8 KT cylinders) from July 2017 to June 2018.
More information is available at www.lakeoilgroup.com.
National Oil Corporation of Kenya (NOCK)
NOCK is the state-owned downstream oil and gas company of Kenya, incorporated in 1981. Its LPG brand is
Supa Gas, light grey in colour. It has no import LPG facilities of its own and has storage and filling capacity
of 100 MT in Nairobi. It prices for affordability, at around Ksh 105/kg at retail. It distributes through its
petrol station forecourts and a network of retailers. It is contemplating the possibility of distributing
through mobile shipping containers. NOCK has been mandated by the Government to carry out the
Mwananchi Gas Project (described in Chapter 9; see page 57). For this, the Government has funded the

Clean Cooking for Africa National Feasibility Study: LPG for Clean Cooking in Kenya
288
cylinders at the Government’s expense. As of this writing, NOCK has been focused on improving its
targeting of consumers, and its sourcing of imported cylinders, for a restart of Mwananchi.
EPRA records indicate sales of 3.3 KT (0.3 KT in bulk and 3.3 KT in cylinders) for the period July 2017 to June
2018.
Proto Energy Ltd.
Proto entered the Kenya LPG market in April 2018 under the brand name PRO Gas, with a pink cylinder
colour. Proto buys its LPG from AGOL and has its own storage and filling facility in Murang’a with capacity
of 180 MT. Its cylinder population is estimated to be in the range of 700,000 to 1 million. Proto has priced
its LPG to consumers as low as Ksh 100/kg, stabilizing around Ksh 105. It distributes using its own trucks
and tuk-tuks (motorized three-wheel rickshaws) employing a milk-run model. Proto also owns its own
cylinder manufacturing facility.
Industry leaders foresee Proto rapidly challenging KenolKobil for market share leadership.
Per EPRA records, Proto’s highest sales month between April 2018 and December 2018 was October, with
1.7 KT of sales in cylinders.
Energy & Petroleum Regulatory Authority (EPRA)
The EPRA is the energy sector regulator in Kenya. LPG is included in EPRA’s remit. The authority of EPRA is
established in the Energy Act of 2019 in successorship of the former Energy Regulatory Commission (ERC),
as summarized below.
The functions of the Authority as provided in Section 10 of the Energy Act (2019) include:
a) Regulate—
i) Generation, importation, exportation, transmission, distribution, supply and use of electrical
energy with the exception of licensing of nuclear facilities;
ii) Importation, refining, exportation, transportation, storage and sale of petroleum and
petroleum products with the exception of crude oil;
iii) Production, conversion, distribution, supply, marketing and use of renewable energy; and
iv) Exploration, extraction, production, processing, transportation, storage exportation,
importation and sale of coal bed methane gas and other energy forms;
b) Regulate, monitor and supervise upstream petroleum operations in Kenya in accordance with the
law relating to petroleum, the regulations made thereunder and the relevant petroleum
agreement;
c) Provide such information and statistics in relation to upstream petroleum operations in Kenya to
the Cabinet Secretary responsible for matters relating to petroleum as may be required from time
to time;
d) Collect, maintain and manage upstream petroleum data; and
e) Receive, review and grant an application for a nonexclusive exploration.
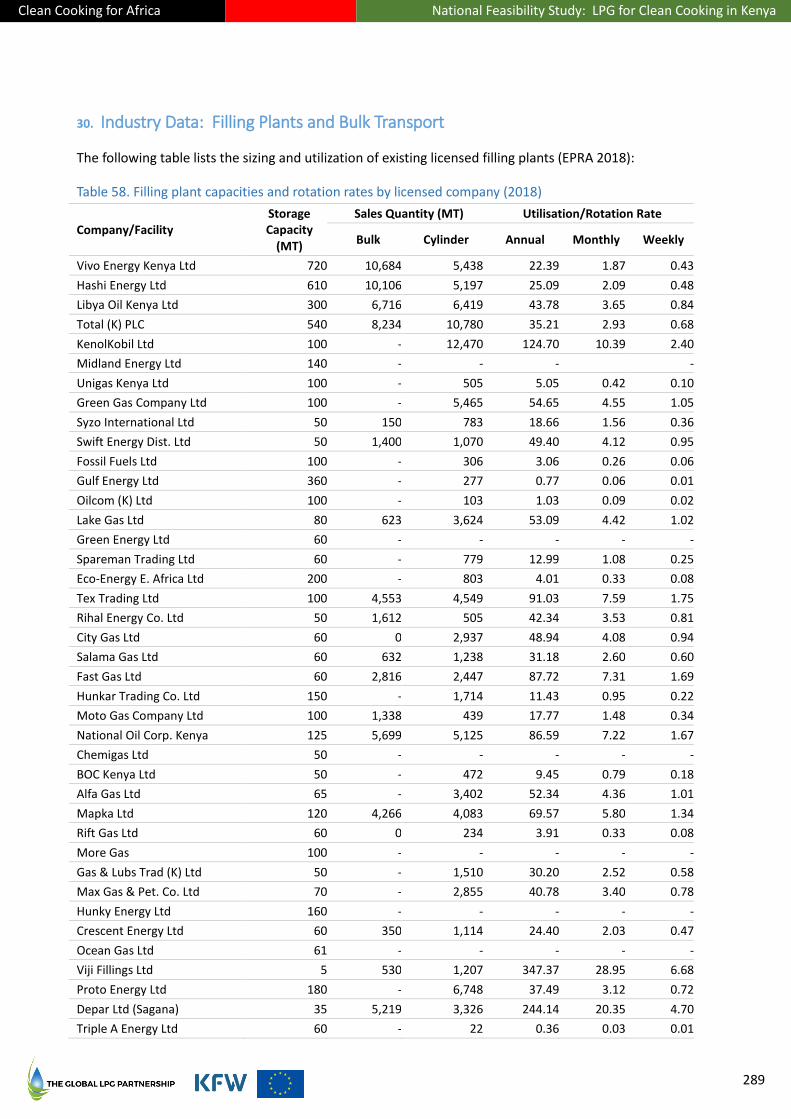
Clean Cooking for Africa National Feasibility Study: LPG for Clean Cooking in Kenya
289
30. Industry Data: Filling Plants and Bulk Transport
The following table lists the sizing and utilization of existing licensed filling plants (EPRA 2018):
Table 58. Filling plant capacities and rotation rates by licensed company (2018)
Company/Facility Storage Capacity
(MT)
Sales Quantity (MT) Utilisation/Rotation Rate
Bulk Cylinder Annual Monthly Weekly
Vivo Energy Kenya Ltd 720 10,684 5,438 22.39 1.87 0.43
Hashi Energy Ltd 610 10,106 5,197 25.09 2.09 0.48
Libya Oil Kenya Ltd 300 6,716 6,419 43.78 3.65 0.84
Total (K) PLC 540 8,234 10,780 35.21 2.93 0.68
KenolKobil Ltd 100 - 12,470 124.70 10.39 2.40
Midland Energy Ltd 140 - - - -
Unigas Kenya Ltd 100 - 505 5.05 0.42 0.10
Green Gas Company Ltd 100 - 5,465 54.65 4.55 1.05
Syzo International Ltd 50 150 783 18.66 1.56 0.36
Swift Energy Dist. Ltd 50 1,400 1,070 49.40 4.12 0.95
Fossil Fuels Ltd 100 - 306 3.06 0.26 0.06
Gulf Energy Ltd 360 - 277 0.77 0.06 0.01
Oilcom (K) Ltd 100 - 103 1.03 0.09 0.02
Lake Gas Ltd 80 623 3,624 53.09 4.42 1.02
Green Energy Ltd 60 - - - - -
Spareman Trading Ltd 60 - 779 12.99 1.08 0.25
Eco-Energy E. Africa Ltd 200 - 803 4.01 0.33 0.08
Tex Trading Ltd 100 4,553 4,549 91.03 7.59 1.75
Rihal Energy Co. Ltd 50 1,612 505 42.34 3.53 0.81
City Gas Ltd 60 0 2,937 48.94 4.08 0.94
Salama Gas Ltd 60 632 1,238 31.18 2.60 0.60
Fast Gas Ltd 60 2,816 2,447 87.72 7.31 1.69
Hunkar Trading Co. Ltd 150 - 1,714 11.43 0.95 0.22
Moto Gas Company Ltd 100 1,338 439 17.77 1.48 0.34
National Oil Corp. Kenya 125 5,699 5,125 86.59 7.22 1.67
Chemigas Ltd 50 - - - - -
BOC Kenya Ltd 50 - 472 9.45 0.79 0.18
Alfa Gas Ltd 65 - 3,402 52.34 4.36 1.01
Mapka Ltd 120 4,266 4,083 69.57 5.80 1.34
Rift Gas Ltd 60 0 234 3.91 0.33 0.08
More Gas 100 - - - - -
Gas & Lubs Trad (K) Ltd 50 - 1,510 30.20 2.52 0.58
Max Gas & Pet. Co. Ltd 70 - 2,855 40.78 3.40 0.78
Hunky Energy Ltd 160 - - - - -
Crescent Energy Ltd 60 350 1,114 24.40 2.03 0.47
Ocean Gas Ltd 61 - - - - -
Viji Fillings Ltd 5 530 1,207 347.37 28.95 6.68
Proto Energy Ltd 180 - 6,748 37.49 3.12 0.72
Depar Ltd (Sagana) 35 5,219 3,326 244.14 20.35 4.70
Triple A Energy Ltd 60 - 22 0.36 0.03 0.01

Clean Cooking for Africa National Feasibility Study: LPG for Clean Cooking in Kenya
290
Company/Facility Storage Capacity
(MT)
Sales Quantity (MT) Utilisation/Rotation Rate
Bulk Cylinder Annual Monthly Weekly
Smart Gas Energy Ltd 60 - - - - -
Nakuru Gases Ltd 60 105 591 11.61 0.97 0.22
Top Line Gas 30 - 6,770 225.66 18.81 4.34
Servanthood LDF 36 - - - - -
Nuru Energy Ltd 60 - - - - -
Robinmart Petroleum Co. 30 - - - - -
Kendall Energy 14 - - - - -
Green Valley Gas 14 - - - - -
Oxx Energy 20 - - - - -
Excellent Logistics Ltd 100 1,175 1,083 22.57 1.88 0.43
Multi energy Ltd 125 - - - - -
Avian Gas Limited 42 696 551 29.69 2.47 0.57
Royal Gas & Energy Ltd 20 0 947 47.37 3.95 0.91
Solutions East Africa Ltd 19 7,126 13,573 714.34 59.53 13.74
Wangas (K) Enter. Ltd 20 - 1,726 86.32 7.19 1.66
Eagle Gas 60 - - - - -
Ameken Minewest 20 - - - - -
Total 6,231 35 2.9
The following table lists the LPG bulk transport fleets by licensed company (EPRA 2019):
Table 59. Bulk LPG transport fleets by licensed company (2018)
Licence No. Name Fleet Quantity
Trailers (20 MT)
Bobtails Total
1374 Stegam Petroleum 1 1
1377 Multi-Trade International Ltd 4 0 4
1380 Abdi Aziz Ali Shree Agencies 2 2
1382 Lake Gas Ltd 1 2 3
1383 Spareman Trading Ltd 3 3
1386 Tydes Gen Marchants Ltd 2 2
1387 Moto Gas Co. Ltd 1 1
1388 Green Gas Co. Ltd 5 5
1389 Ong Logistics Ltd 5 5
1390 Roy Hauliers 8 4 12
1393 Suzo International 2 1 3
1397 Spyglass Enterprises 3 3
1400 Menengai Eng. & Petro. Services Ltd 4 3 7
1402 Proto Energy Ltd 10 1 11
1403 Mapka Investment Ltd 2 2
1404 Multi Energy Ltd 4 4
1405 Lunga Lunga Energy Ltd 1 1
1407 Multiple Hauliers (E.A.) Ltd 5 5
1410 Trinity Petroleum 4 4
1414 Ashur Ahmed Transporters Ltd 3 3

Clean Cooking for Africa National Feasibility Study: LPG for Clean Cooking in Kenya
291
Licence No. Name Fleet Quantity
1416 AK Investment Ltd 2 2
1421 Unigas Kenya Ltd 2 1 3
1424 Lunga Lunga Transporters Ltd 3 3
1425 Propa Capital Ltd 1 1
1427 Roy Transmotors Lts 22 2 24
1431 Chemigas Ltd 2 5 7
1432 Dakawou Transport Ltd 27 13 40
1433 Gaswal for Gaz Co. Ltd 2 2
1434 Triple A Hauliers 5 5
1435 City Gas Ltd 3 3
1446 North Gas Energy Ltd 2 2
1455 Alfa Gas Ltd 3 3
1459 Fossil Fuels Ltd 1 1
1461 Derdols Petroleum Ltd 4 4
1461 Fossil Supplies Ltd 1 1
1468 Topline Traders Ltd 6 6
1476 Intertropics Transporters 1 1
1486 Ragos Trading Co. Ltd 2 2
1502 Fleet Logistics Ltd 6 6
1496 Towfiq Transporters 7 7
1494 Osali Energy Enterprises 2 2
1500 Kendal Energy Solutions Ltd 1 1
1497 Depar Ltd 3 3
1506 Greenbelt Gas Ltd 1 1
1508 Dash Energy Ltd 1 1
1513 Geosmart Inv. Co. Ltd 1 1
1512 Midland Energy Ltd 2 2
1514 Pittsburgh Investment Ltd 1 1
1515 Awadh Omar Bayusuf & Sons Ltd 12 5 17
1523 Sibed Transport Co. Ltd 10 12 22
1527 Quickpoint Energy Ltd 5 5
1529 Hansley Investment Ltd 1 1
1535 Hunky Transporters Ltd 2 2
1544 Raanle Transprters Ltd 3 3
1535 Tobento Investment Ltd 1 1
1544 Rintell Distributors Ltd 1 1
1567 Safari Petroleum Ltd 1 1
1533 Brits Freighters Ltd 1 1
1570 Goal Energy Ltd 1 1
1581 MacKenzie Maritime (EA) Ltd 9 9
1573 Belsa Energy Ltd 2 2
1571 Five Star Gas Supplies Ltd 1 1
1572 Greatmount LPG Ltd 2 2
1580 Gazlin Energy Ltd 13 1 14
1582 AIVEO ltd 4 4
1584 Sieke Ltd 1 1
1051 Dayow Gas Co. Ltd 5 5
1275 Sade Logistics 2 2
1587 Togan Transporters Ltd 2 2
1251 Shurie Trucks Ltd 2 2
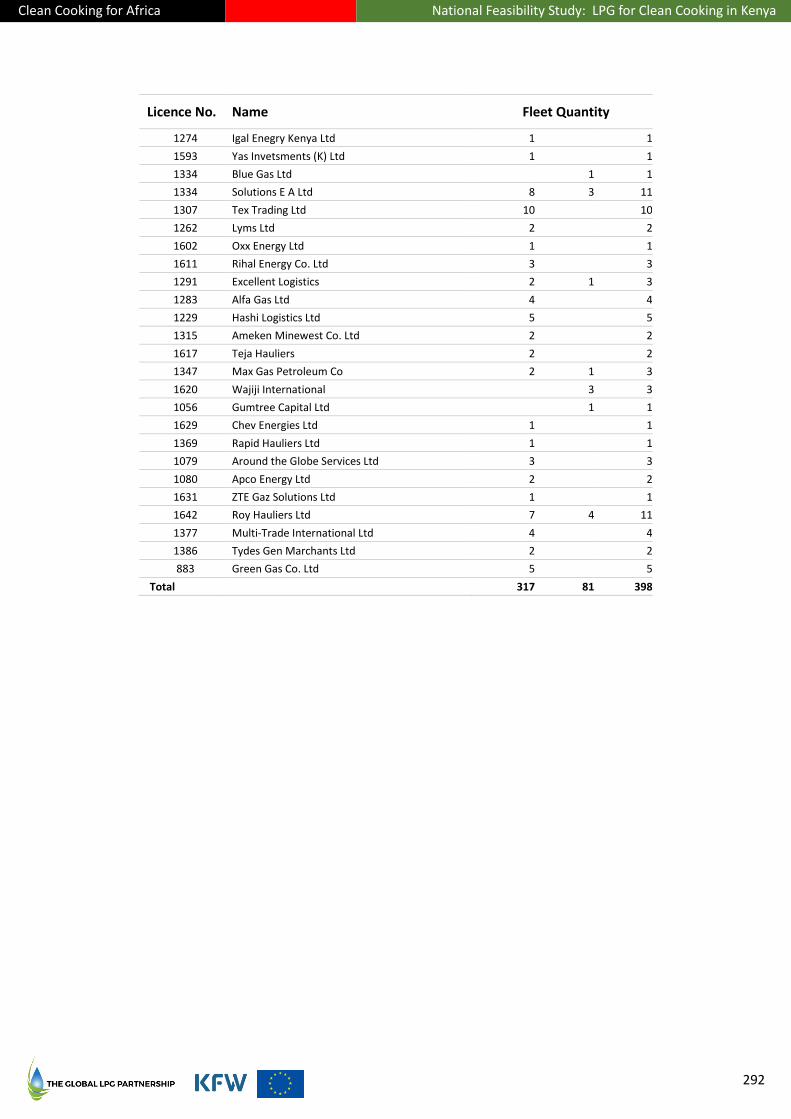
Clean Cooking for Africa National Feasibility Study: LPG for Clean Cooking in Kenya
292
Licence No. Name Fleet Quantity
1274 Igal Enegry Kenya Ltd 1 1
1593 Yas Invetsments (K) Ltd 1 1
1334 Blue Gas Ltd 1 1
1334 Solutions E A Ltd 8 3 11
1307 Tex Trading Ltd 10 10
1262 Lyms Ltd 2 2
1602 Oxx Energy Ltd 1 1
1611 Rihal Energy Co. Ltd 3 3
1291 Excellent Logistics 2 1 3
1283 Alfa Gas Ltd 4 4
1229 Hashi Logistics Ltd 5 5
1315 Ameken Minewest Co. Ltd 2 2
1617 Teja Hauliers 2 2
1347 Max Gas Petroleum Co 2 1 3
1620 Wajiji International 3 3
1056 Gumtree Capital Ltd 1 1
1629 Chev Energies Ltd 1 1
1369 Rapid Hauliers Ltd 1 1
1079 Around the Globe Services Ltd 3 3
1080 Apco Energy Ltd 2 2
1631 ZTE Gaz Solutions Ltd 1 1
1642 Roy Hauliers Ltd 7 4 11
1377 Multi-Trade International Ltd 4 4
1386 Tydes Gen Marchants Ltd 2 2
883 Green Gas Co. Ltd 5 5
Total 317 81 398
Clean Cooking for Africa National Feasibility Study: LPG for Clean Cooking in Kenya
293
31. LPG-Related Laws and Regulations
The following are key provisions of laws and standards for the LPG industry in Kenya as of this writing:
Finance Bill (2005)
Empowers Ministry of Finance, in accordance with EAC regulations, to zero-rate LPG imported through
the port of Mombasa and to apply a 15% surcharge on imports through neighboring countries
Requires gas importers to pay a 0.475% charge to KEBS for inspection and testing of imported gas
Energy Act (2006)
Establishes the ERC (now EPRA) to (i) regulate import, export, transport, refining, storage and sale of
petroleum and petroleum products, (ii) issue, renew, modify, suspend or revoke licenses and permits,
(iii) formulate, enforce and review environmental, health and safety standards
Establishes an Energy Tribunal to arbitrate disputes between the ERC and stakeholders in the energy
sector
Legal Notice 121 – LPG Regulations (2009)
Establishes the LPG Cylinder Exchange Pool (CEP), standardizes LPG cylinders, introduces a common
valve requirement for cylinders
Defines permitting requirements for siting of LPG facilities in a district, to be granted by the relevant
District Planning Authority
Increases rigor of LPG handling requirements throughout the LPG supply chain
Restricts certain unfair business practices
Kenya National Standards (periodic)
KS 03-9 Specifications for LPG
KS ISO 4706 Refillable welded steel cylinders and test pressures
KS 06-896 Specification for periodic inspection, testing and maintenance of transportable gas
containers
KS 201:2007 Unified (common) valve for LPG
KS 1938 Part 1-3 Handling, storage and distribution of LPG in domestic, commercial and industrial
installations
Legal Notice 121 – LPG Regulations (2018)
Taking effect in December 2019, makes the CEP voluntary and introduces various other reforms; the
universal valve regulation remains unaffected
Energy Act (2019)
Establishes the EPRA as successor to the ERC

Clean Cooking for Africa National Feasibility Study: LPG for Clean Cooking in Kenya
294
32. Conditions and Consequences of the CCCM LPG Market Model
In developing country contexts, this model has been shown to create a temporary surge in cylinder
inventory and LPG consumption followed eventually by debilitating market dysfunction, the cessation of
investment in new LPG cylinders, a rapid decline in cylinder safety, a corresponding rapid increase in fires
and explosions, a surge in black market LPG activity, and eventual market stagnation or implosion. At the
heart of CCCM is consumer ownership of, and control over, the LPG cylinder. This works well in America
and Canada because:
The consumer is very conscious of liability for cylinder safety, and will accept liability and the
responsibility that goes with it;
The consumer is well educated;
The consumer has a vehicle and is easily able to transport his/her cylinder for periodic inspection
and, when necessary, repair and recertification;
The consumer is universally willing to pay to replace a damaged, unsafe cylinder that requires
scrapping;
The potential penalties (governmental, from civil lawsuit, and in terms of access to and of
insurance) related to an LPG accident for which the consumer bears responsibility are very large,
and are very likely to be experienced in practice;
Corporations and SMEs in the U.S. and Canadian LPG sector are likewise very conscious of liability,
and they are almost always unwilling to take non-compliant actions or to make non-compliant
omissions in their activities, whether for the purpose of satisfying a consumer who does not want
to pay to replace his/her unsafe cylinder, or for the purpose of avoiding business costs related to
required safety practices;
Corporations and SMEs are also conscious of, and comply with, generally strong and well-enforced
consumer protection laws and competition laws that prohibit bad and unethical business practices;
Corporations and SMEs are conscious of, and comply with, strict and well-enforced licensing
requirements. One will almost never find an unlicensed or uncertified LPG business operating in
the U.S. and Canada, or a licensed operator acting in intentional violation of its license terms.
Most developing countries do not have the above preconditions for success with CCCM.
The cost of regulation under CCCM model is high, because hundreds (as in Ghana, for example) or
thousands (in America) of points of LPG cylinder refilling and exchange must be monitored for compliance.
When tried for the first time in a market where cylinders were previously not consumer-owned
and -controlled, CCCM has been shown to unlock pent-up demand for the first few years, but the seeds of
the LPG market’s stagnation or demise will have been planted.
The following are main reasons why CCCM has not worked over the long term in the other countries that
have tried it:
Clean Cooking for Africa National Feasibility Study: LPG for Clean Cooking in Kenya
295
Consumers will shop around for a refill point that does not require the consumer to replace or
repair an unsafe cylinder or valve at the consumer’s cost; this “shopping around” favors black
marketers, who as a group will disregard safety if it means getting paid to refill a given cylinder vs.
not refilling one.
Consumer control of cylinders makes it very easy for black market operators (who do not spend any
resources on cylinder safety) to interpose themselves in the supply chain to take business away
from legitimate market players. They do this by locating closer to the consumer than the nearest
legitimate player, charging a lower price, and thus stealing profits from the legitimate player who
used to serve that customer. This leads to the black marketeers driving out the good players, and
unsafe cylinders driving out the good cylinders. This in turn leads to market stagnation, higher
infrastructure investment risk, and increasing numbers of safety incidents—including fatalities.
Without strong institutions to inspect and enforce pro-safety market rules, these factors eventually
halt market growth.
Businesses seeking LPG customers in a new geographic area require as a precondition a critical
mass of initial customers to have cylinders to be refilled. Consumers in such an area who may wish
to become LPG users require as a precondition to purchasing LPG equipment the presence of a
reliable and trustworthy supplier who can refill their cylinders. Therefore, there is minimal
incentive for either the supplier or the consumer to start the process of buying and selling.
Note: In Kenya, the first generation (c. 2011) of pay-as-you-go LPG services, exemplified by the Pima Gas
brand of Premier Energy, introduced an LPG sub-ecosystem with the de facto characteristics of CCCM. This
proved unsustainable. A second, BRCM-oriented generation of pay-as-you-go services (c. 2017) has been in
a pilot phase in Kenya, exemplified by the offering from new entrant Envirofit.
Clean Cooking for Africa National Feasibility Study: LPG for Clean Cooking in Kenya
296
33. Note Regarding LPG Accounting Treatments
In the presentation of financial models for the LPG sector and firms operating in the LPG sector, for sake of
both conservatism and simplification, the following two financial statement/cashflow items have been
omitted, with certain implications:
1. LPG passthrough costs and arbitrage. The financial performance of an LPG company, by industry
convention, does not typically consider the asset value of the LPG fuel which it acquires and sells.
In this report, the portion of turnover (revenue) and the cost of goods sold (COGS) associated with
the LPG commodity itself are treated as equivalent and are effectively disregarded. That is, the
LPG company creates gross profit from the unit margins applicable to its LPG volumes. Accordingly,
what is presented in this report as “turnover” (or revenue) is in actuality the aggregate unit
margins, and the cost to acquire the LPG commodity is disregarded. While it is possible in principle
for an LPG company to “buy low and sell high”, by having sufficient storage to exploit time-based
arbitrage, that has not been considered in the economic and financial analysis of the LPG firms.
2. LPG gain. LPG gain is an LPG industry term for the small quantity of LPG that remains in returned
cylinders when customers return their “empty” cylinders to the cylinder recirculation system. This
amount may run to 1-3%. It is normative in the LPG industry that the LPG Marketer does not
provide a credit to the consumer for this leftover LPG quantity. This is a practical matter: it is not
operationally or economically feasible to measure the leftover quantity accurately and efficiently
across thousands of retail cylinder exchange points. Thus, the LPG Marketer gets a small head-start
on the refill of every cylinder that passes safety inspection at the filing plant. This head-start is a
potentially significant contributor to the profit stream of the Marketer, because it is effectively
“free LPG” to the Marketer, the value of which passes directly through to the Marketer’s pretax net
income. The notional value of the LPG gain has not been included in the financial modelling
presented in this report, in part because it is not practical to assign a specific, reliable value, and in
part in order to err on the side of conservative forecasting of firms’ financial performance.
Therefore, the financial rate of return generated by an expansion investment in an LPG Marketer
will, in practice, be somewhat higher than presented in this report’s financial models, and the cash
flow and debt service risk will be slightly lower than suggested by those models.
3. Kenyan treatment of cylinder deposits. Kenyan LPG companies do not practice a uniform
accounting treatment with respect to cylinder deposits. Under LN 121 and other applicable law,
the branded cylinder is deemed to be owned by the Marketer throughout the cylinder’s lifecycle.
Numerous leading Marketers provide receipts to their new customers for the cylinder deposit
amount as documentation the customer can use to reclaim the deposit upon cancelling service and
returning the cylinder that is in his/her possession at the time. The financial modelling in this
report (specifically, in Chapter 16 (Investments at the Firm Level)) reflects the legal framework
underpinning cylinder ownership: the cylinder is a long-term, depreciating asset of the Marketer,
and the deposit payment from the consumer is a liability (in effect, an interest-free demand note).
That liability is matched on the balance sheet by an equal increase in cash. The modelling does not
attempt to address reserving against deposit claims. Additionally, in Kenya the deposit includes a
VAT component, which benefits the Marketer (and should benefit the consumer as well upon
refunding of the deposit, although usually it is impractical for consumers to claim it). The modelling
does not calculate the VAT effect.

Clean Cooking for Africa National Feasibility Study: LPG for Clean Cooking in Kenya
297
34. Note Regarding Long-Term LPG Pricing and Availability
LPG pricing trends over spans of 10 years and beyond are not feasible to predict. Historically, global and
regional LPG prices tracked directionally with the long-term movements in global and regionally-applicable
crude oil price indices. Thus, price spikes of intermediate durations are possible. (The governments of
some LPG-using countries protect their populations from such spikes through price-stabilization
mechanisms.)
From the 2010s, LPG has increasingly tracked directionally with regional natural gas and LNG prices as
natural gas / LNG pricing decoupled from crude oil pricing in international markets.
It should be noted that the LPG market clearing function performed by the petrochemical / plastics sector
currently represents approximately 30-35% of total LPG global consumption. This segment is the most
price-sensitive of all consuming segments. Therefore, petrochemicals/plastics consumption may provide a
buffer that insulates LPG pricing to some degree for the other consuming sectors (residential, industrial,
etc.), if global LPG supply tightens after 2030.
This document assumes that LPG source pricing applicable to Kenya will remain relatively stable to 2030
and beyond. To estimate the effect of significant LPG price change on adoption and consumption on an
absolute basis, a sensitivity analysis has been included in the demand and impacts Parts of this report.
Across a 10+ year time scale, it was beyond the practical scope of the study and analysis presented in this
report to attempt to assess how relative price changes among LPG and the main Kenyan cooking energy
and technology alternatives might affect adoption and consumption beyond 2030.

Clean Cooking for Africa National Feasibility Study: LPG for Clean Cooking in Kenya
298
35. About the NIHR CLEAN-AIR (Africa) Global Health Research Group
Goals and outline of main activities
The CLEAN-AIR (Africa) National Institute of Health Research Group has four main objectives:
1. Inform strategies to support scaled equitable uptake (and sustained use) of clean fuels across the
population;
2. Quantify the impacts of scaled LPG adoption in line with governmental targets on health and
climate;
3. Develop capacity through strengthening health systems to address the burden of disease from
household air pollution in the partner countries; and
4. Facilitate engagement between the general public and policymakers as research is undertaken to
maximize the likelihood for success in national policies to scale LPG adoption and use.
Main research and capacity building activities under CLEAN-AIR (Africa) will include:
1. Understanding current fuel use patterns, drivers for fuel choice and associations with health in rural
and peri-urban communities (using surveys and qualitative methods);
2. Quantifying concentrations of, and exposure to, household air pollution (HAP) in households that
use LPG and those that do not, to model impacts on both health and climate;
3. Evaluating interventions to assist communities both to adopt LPG and to use it in a sustained way
(for example, using microfinance to support purchase of LPG equipment for cooking);
4. Promoting health sector capacity building activities around HAP for health professionals, in
collaboration with the World Health Organization (WHO) to inform the Clean Household Energy
Solutions Toolkit (CHEST); and
5. Using mixed-methods research methods, evaluate the proposed capacity building activities to bring
HAP to the health training agenda in order to help practitioners sensitize communities to change
their cooking fuels/ practices for prevention.
Clean Cooking for Africa National Feasibility Study: LPG for Clean Cooking in Kenya
299
36. About the Global LPG Partnership
The Global LPG Partnership (GLPGP) is a United Nations (UN)-backed, non-profit Public-Private Partnership
formed in 2012, under the UN Sustainable Energy for All initiative, to aggregate and deploy needed global
resources to help developing countries transition large populations rapidly and sustainably to liquefied
petroleum gas (LPG) for cooking.
GLPGP is evidenced-based and competition-neutral in its work.
GLPGP partners with host country governments at their invitation, and other relevant stakeholders, to
create national plans for rapid, sustainable scale-up of LPG infrastructure, distribution and demand. GLPGP
then assists with financing and implementation of key plan elements to transition the maximum viable
population to LPG for cooking.
Developing countries request GLPGP’s assistance to achieve the three main prerequisites for making LPG
widely available and affordable:
Plan and implement enhancements to government policies, regulations and regulatory
enforcement to create the enabling environment for a viable, scalable, sustainable LPG sector;
Provide knowledge and expansion capital to achieve critical mass of LPG supply, infrastructure and
distribution systems quickly and sustainably; and
Empower consumers, who can otherwise afford LPG fuel, to pay the upfront cost of appliances to
use LPG and thereby unlock additional demand.
More information is available at www.glpgp.org.

Clean Cooking for Africa National Feasibility Study: LPG for Clean Cooking in Kenya
300
37. Disclaimer and Safe-Harbor Statement
This document is not an investment prospectus nor a solicitation to buy or sell securities.
Certain portions of this document contain forward-looking statements that are based on expectations,
estimates, projections and assumptions. Words such as “expect,” “anticipate,” “plan,” “believe,”
“scheduled,” “estimate” and variations of these words and similar expressions are intended to identify
forward-looking statements, which include, but are not limited to, projections of supply, demand,
consumption, prices, policies, regulations, investment activity, economic and financial performance,
business performance, cash flows, contracts and tenders, and other projections. These statements are not
guarantees of future performance with respect to the parties associated with, or referred to in, such
statements. These statements involve certain risks and uncertainties, which are difficult to predict.
Therefore, actual future results and trends may differ materially from what is forecast in forward-looking
statements due to a variety of factors, which include, but are not limited to, changes in (i) government
policies and regulations, (ii) pricing, (iii) business strategies, (iv) the national and/or global economy, (v)
exchange rates, (vi) project costs, (vii) consumer demand or preferences for energy products and services,
(viii) competition conditions, (ix) market structures, (x) outcomes of litigations, (xi) outcomes of political
and legislative processes, and others.
All forward-looking statements speak only as of the date shown on the front page of this document, or, in
the case of any document incorporated by reference, the date of that document. The Clean Cooking for
African Project and GLPGP do not undertake any obligation to update or publicly release any revisions to
forward-looking statements to reflect events, circumstances or changes in expectations after the date of
this report.
Related Documents


![#CiveItUp LPG (LPG a) IOCL Cl / BPCL D / HPCL C] LPG àà àa … · · 2018-02-28iocl cl / bpcl d / hpcl c] lpg àà àa-r/àkft lpg àž lpg t:- lpg dgcc (poi) lpg 17 lpg id"](https://static.cupdf.com/doc/110x72/5ae5ebd07f8b9acc268cac07/civeitup-lpg-lpg-a-iocl-cl-bpcl-d-hpcl-c-lpg-a-cl-bpcl-d-hpcl-c.jpg)