Ranking of typical residential, commercial and industrial electric bills. NATIONAL ELECTRIC RATE STUDY 2018 Study

Welcome message from author
This document is posted to help you gain knowledge. Please leave a comment to let me know what you think about it! Share it to your friends and learn new things together.
Transcript

Ranking of typical residential, commercial and industrial electric bills.
NATIONAL ELECTRIC RATE STUDY 2018 Study

2018 National Rate Study Summary
2018 National Rate Study Summary
The Lincoln Electric System National Rate Study is a comprehensive report of electric rates across the country. The purpose of the study is to provide a typical bill comparison for both LES and our customers, monitor and benchmark the affordability of electric bills, and serves as a complement to the Regional Electric Utility Bill Comparison.
In 2018, Lincoln ranked 8th nationally overall, increasing eight spots from 16th. A
large part of this change is due to Lincoln Electric System rates being unchanged from 2017 to 2018, while other utilities implemented rate increases for a variety reasons. Many rate increases were to offset impacts from increased investment by utilities looking to lower grid congestion, improve grid modernization and energy efficiency, and capital projects in new energy sources. Looking forward to 2019, it is expected that numerous investor-owned utilities will be passing along tax decreases resulting from the passage of the Tax Reform Bill in late 2017 for 2018 taxes. The Tax Reform Bill decreases the corporate tax rate from the previous range of 15% to 35% to a flat rate of 21%.
In the residential sector,
Lincoln’s rank improved four spots from 10th to 6th lowest.
Fact Summary:
• The National Electric Rate
Study ranks residential, commercial and industrial electric rates of 100 cities across the nation. (1= Lowest Bill, 100 = Highest Bill)
• Rates used are those approved to be in effect January 1, 2018, including
seasonal differences. • Lincoln Electric System (LES) bills are calculated with rates that went into effect
January 1, 2018 and includes Payment in Lieu of Taxes and City Dividend for Utility Ownership.
• Bills for investor-owned utilities were collected from Edison Electric Institute’s
2018 Typical Winter Bills report. Bills for municipal/public power utilities were calculated using each respective utility’s published rate tariffs. Average bills are
LES

2018 National Rate Study Summary
2018 National Rate Study Summary
calculated using rates from a 12-month period to include seasonal rates. All bill data applies to one month of service.
• Lincoln ranks 8th overall, 6th in residential and 15th in commercial and industrial
combined. LES ranks in the top ten in 6 of 12 categories. Lincoln was 16th overall last year.
• Overall, there are more electric rate increases (67 percent) than decreases (30
percent). Three percent of utilities reported no changes in their average bill. Of the public power utilities, 50 percent reported increases and 50 percent reported decreases. Of the investor-owned utilities, 72 percent reported increases, 24 percent reported decreases, and 4 percent had no changes. LES reported a slight increase in bills due to rate restructuring.
• Looking at the real price of electricity (rates after adjustment for inflation),
Lincoln’s real price decreased by -1.97 percent.
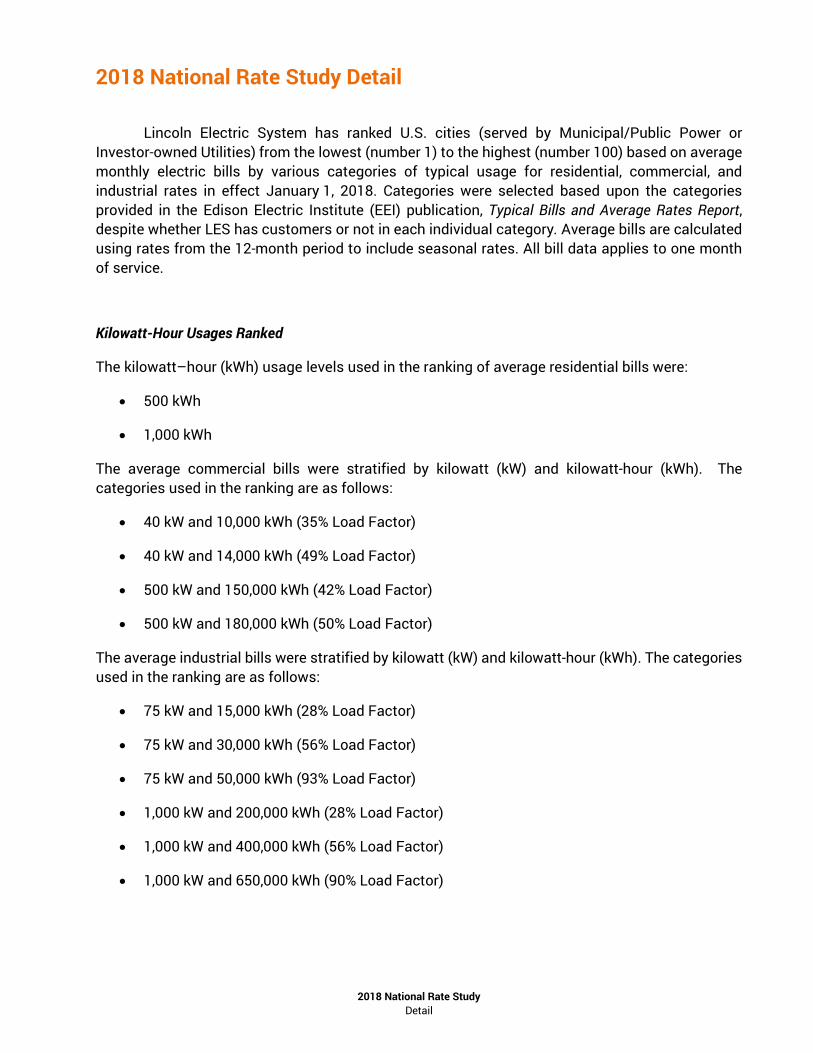
• LES residential customers using 1,000 kWh pay $96.42, which is 31 percent less than the study average of $139.98, while LES industrial customers using 1,000 kW and 400,000 kWh pay $31,080, 23 percent less than the study average of $40,614.

2018 National Rate Study Contents
2018 National Rate Study Contents
The 2018 National Rate Study is broken out into several sections:
Detail:
• Killowatt-Hour Usages Ranked
• Selection Criteria for Cities Included in the Ranking
• Overview of the Rate Study Methodology
• Source of Rate Data
Tables:
• Table 1: Summary of LES Ranking Compared to Other Cities
• Table 2: Highest and Lowest Overall Ranks
• Table 3: Major Rate Changes – Increases and Decreases
• Table 4: 10 Highest and Lowest Bills per Usage Category
Charts:
• Chart A: Sample Ranges of Typical Bills by Usage Category
• Chart B: Map – Average Residential Bill by State (1,000 kWh)
• Chart C: Rank of Average Residential Bill by State (1,000 kWh)
• Chart D: Map – Average Industrial Bill by State (1,000 kW and 400,000 kWh)
• Chart E: Rank of Average Industrial Bill by State (1,000 kW and 400,000 kWh)
• Chart F: Residential and Industrial Real Price Trends
Schedules:
• Schedule 1: Listing of average annual residential and commercial bills arranged by
state and city
• Schedule 2: Rankings of residential and commercial bills arranged by state and city
• Schedule 3: Listing of average annual industrial bills arranged by state and city
• Schedule 4: Rankings of industrial bills arranged by state and city
• Schedule 5: Index to Utilities in the Study
• Schedule 6: Overall Ranks
2018 National Rate Study Detail
2018 National Rate Study Detail
Lincoln Electric System has ranked U.S. cities (served by Municipal/Public Power or Investor-owned Utilities) from the lowest (number 1) to the highest (number 100) based on average monthly electric bills by various categories of typical usage for residential, commercial, and industrial rates in effect January 1, 2018. Categories were selected based upon the categories provided in the Edison Electric Institute (EEI) publication, Typical Bills and Average Rates Report, despite whether LES has customers or not in each individual category. Average bills are calculated using rates from the 12-month period to include seasonal rates. All bill data applies to one month of service.
Kilowatt-Hour Usages Ranked
The kilowatt–hour (kWh) usage levels used in the ranking of average residential bills were:
• 500 kWh
• 1,000 kWh
The average commercial bills were stratified by kilowatt (kW) and kilowatt-hour (kWh). The categories used in the ranking are as follows:
• 40 kW and 10,000 kWh (35% Load Factor)
• 40 kW and 14,000 kWh (49% Load Factor)
• 500 kW and 150,000 kWh (42% Load Factor)
• 500 kW and 180,000 kWh (50% Load Factor)
The average industrial bills were stratified by kilowatt (kW) and kilowatt-hour (kWh). The categories used in the ranking are as follows:
• 75 kW and 15,000 kWh (28% Load Factor)
• 75 kW and 30,000 kWh (56% Load Factor)
• 75 kW and 50,000 kWh (93% Load Factor)
• 1,000 kW and 200,000 kWh (28% Load Factor)
• 1,000 kW and 400,000 kWh (56% Load Factor)
• 1,000 kW and 650,000 kWh (90% Load Factor)

2018 National Rate Study Detail
2018 National Rate Study Detail
Source of Rate Data
LES obtained the majority of the data for investor-owned utilities from the Rate Regulation Department of the Edison Electric Institute (EEI) publication, Typical Bills and Average Rates Report, Winter 2018, bills as of January 1, 2018. Minnesota Power Company was the only investor-owned utility the EEI did not provide an annualized bill for the Winter 2018 report, thus in this report only their Winter 2018 rates were utilized. The data for municipal/public power utilities and investor-owned utilities not included in the EEI publication was obtained by modeling each utility’s typical bills from their published rate schedules. We performed no additional procedures to verify either the data obtained from the municipal/public power utilities survey or the EEI publication.
Detailed results of the rankings and utilities included can be found in the Schedules section of the report.

Table 1 2018 National Rate Study
2018 National Rate Study Tables
Category
2018 2017 ChangeResidential
1. 500 kWh 11 14 32. 1,000 kWh 6 10 4
Residential Survey Rank 6 10 4
Commercial and Industrial
3. 40 kW and 10,000 kWh (35% Load Factor) 2 3 14. 40 kW and 14,000 kWh (49% Load Factor) 3 10 75. 500 kW and 150,000 kWh (42% Load Factor) 43 45 26. 500 kW and 180,000 kWh (50% Load Factor) 34 33 -17. 75 kW and 15,000 kWh (28% Load Factor) 1 1 08. 75 kW and 30,000 kWh (56% Load Factor) 3 8 59. 75 kW and 50,000 kWh (93% Load Factor) 2 3 110. 1,000 kW and 200,000 kWh (28% Load Factor) 57 56 -111. 1,000 kW and 400,000 kWh (56% Load Factor) 24 28 412. 1,000 kW and 650,000 kWh (90% Load Factor) 12 15 3
Commercial and Industrial Survey Rank: 15 17 2
Overall Survey Rank: 8 16 8
Notes:- Ranks are from 1 (lowest rank) to 100 (highest rank)- Positive change indicates an improvement in rank
Survey Rank
LES Rankingas compared to surveyed cities

Table 2 2018 National Rate Study
2018 National Rate Study Tables
2018 Survey Rank City (2017 Rank)
Average Bill Difference from
2017
1 Boise, ID (5) 2%1 Tulsa, OK (2) 11%3 Tacoma, WA (3) 10%4 Davenport, IA (8) 3%5 Charlotte, NC (9) 1%6 Baton Rouge, LA (4) 11%7 Raleigh, NC (11) 5%8 Lincoln, NE (16) 0%9 Des Moines, IA (6) 14%
10 Amarillo, TX (7) 10%
2018 Survey Rank City (2017 Rank)
Average Bill Difference from
2017
91 New York City, NY (89) 8%92 Pawtucket, RI (88) 11%93 Bridgeport, CT (92) 6%94 Springfield, MA (90) 11%95 San Francisco, CA (96) 3%96 Cambridge, MA (93) 24%97 Boston, MA (95) 20%98 Fairbanks, AK (97) 15%99 San Diego, CA (99) 16%
100 Honolulu, HI (100) 7%
Highest and Lowest Overall Ranks

Table 3 2018 National Rate Study
2018 National Rate Study Tables
City
Average Bill Difference from
2017 ResidentialCommercial
and Industrial
Oklahoma City, OK 34% 16 1 20% 37%Cambridge, MA 24% 96 93 14% 26%Boston, MA 20% 97 95 11% 22%Reno, NV 19% 29 10 14% 20%San Diego, CA 16% 99 99 15% 16%Erie, PA 16% 56 34 9% 17%Fairbanks, AK 15% 98 97 13% 16%Buffalo, NY 15% 26 15 0% 18%Jackson, MS 14% 25 14 11% 15%Des Moines, IA 14% 9 6 11% 14%
City
Average Bill Difference from
2017 ResidentialCommercial
and Industrial
Anchorage, AK -20% 85 98 0% -24%Baltimore, MD -13% 47 73 -8% -14%Wilmington, DE -9% 12 30 -2% -11%Jacksonville, FL -8% 59 70 0% -10%Springfield, IL -8% 75 83 -7% -8%Philadelphia, PA -6% 19 38 -5% -6%Mesa, AZ -6% 37 49 1% -7%Cincinnati, OH -5% 24 40 -2% -5%Lansing, MI -5% 88 94 -4% -5%Albuquerque, NM -4% 60 66 -4% 0%
Overall Rank 2018 2017
Overall Rank 2018 2017
Average Bill Differences from 2017
Major Rate Changes - Increases
Major Rate Changes - Decreases
Average Bill Differences from 2017
- The top 10 bill decreases are driven in large part by lower fuel cost adjustments due to decreases in fuel purchase power rates. Some of these declines are due to utilities being able to implement rate decreases by January 2018 due to the Tax Reform Bill passed in December 2017.
- No single driver explains the top 10 bill increases, reasons range from increased investment in capital projects looking to lower grid congestion, implement grid modernization and energy efficiency, and projects in new energy sources, such as renewable energy generation. Rate increases not driven by investment projects were due to increases in fuel purchase power rates.

Table 4 2018 National Rate Study
2018 National Rate Study Tables
Rank City Bill Change Rank City Bill Change1 Spokane, WA $48.02 -0.2% 91 San Francisco, CA $114.24 17.6%2 Austin, TX $48.42 2.3% 92 Springfield, MA $114.82 8.7%3 Tulsa, OK $48.74 7.5% 93 Boston, MA $121.65 11.1%4 Baton Rouge, LA $49.69 8.4% 94 New York City, NY $124.76 8.3%5 Seattle, WA $50.05 6.3% 95 Los Angeles, CA $126.64 7.8%6 Boise, ID $53.40 2.6% 96 Cambridge, MA $126.66 14.1%7 Springfield, MO $53.70 3.5% 97 Bridgeport, CT $131.92 4.9%8 Duluth, MN $53.77 1.2% 98 Fairbanks, AK $132.24 12.8%9 Salt Lake City, UT $54.69 -1.1% 99 San Diego, CA $144.06 18.6%
10 Miami, FL $55.41 7.0% 100 Honolulu, HI $144.26 6.6%11 Lincoln, NE $56.08 1.8%
Rank City Bill Change Rank City Bill Change1 Detroit, MI $87.14 -47.0% 91 Springfield, MA $222.64 6.4%2 Spokane, WA $89.96 -2.8% 92 New York City, NY $232.99 9.0%3 Baton Rouge, LA $93.10 9.2% 93 Boston, MA $236.84 11.5%4 Springfield, MO $95.56 2.9% 94 Cambridge, MA $246.43 14.6%5 Tacoma, WA $96.29 13.8% 95 Fairbanks, AK $246.98 13.8%6 Lincoln, NE $96.42 -0.1% 96 San Francisco, CA $252.98 -1.7%7 Tulsa, OK $99.24 8.1% 97 Bridgeport, CT $253.80 5.0%8 Memphis, TN $101.61 -0.8% 98 Los Angeles, CA $269.69 54.3%9 Austin, TX $101.99 2.2% 99 Honolulu, HI $282.20 6.7%
10 Miami, FL $102.67 7.6% 100 San Diego, CA $360.81 11.3%
Rank City Bill Change Rank City Bill Change1 Omaha, NE $770 -4.2% 91 Bridgeport, CT $1,981 6.6%2 Lincoln, NE $774 0.0% 92 Springfield, MA $2,056 11.0%3 Boise, ID $779 1.4% 93 Pawtucket, RI $2,085 6.5%4 Tacoma, WA $815 3.1% 94 New York City, NY $2,146 8.1%5 Davenport, IA $873 2.1% 95 San Francisco, CA $2,175 2.2%6 Charlotte, NC $879 1.3% 96 Cambridge, MA $2,263 22.1%7 Baton Rouge, LA $881 9.9% 97 Fairbanks, AK $2,304 14.9%8 Tulsa, OK $885 8.5% 98 Boston, MA $2,419 18.3%9 Raleigh, NC $914 5.5% 99 Honolulu, HI $2,683 7.3%
10 Colorado Springs, CO $932 0.7% 100 San Diego, CA $2,955 15.6%
Rank City Bill Change Rank City Bill Change1 Boise, ID $991 1.5% 91 Bridgeport, CT $2,502 6.0%2 Omaha, NE $1,043 -7.2% 92 New York City, NY $2,541 8.3%3 Lincoln, NE $1,057 0.0% 93 Springfield, MA $2,615 12.2%4 Charlotte, NC $1,071 1.5% 94 Pawtucket, RI $2,716 6.4%5 Davenport, IA $1,080 2.4% 95 San Francisco, CA $2,756 1.5%6 Amarillo, TX $1,097 8.4% 96 Cambridge, MA $2,907 23.5%7 Raleigh, NC $1,111 5.4% 97 Boston, MA $3,055 19.9%8 Baton Rouge, LA $1,114 11.3% 98 Fairbanks, AK $3,218 15.0%9 Tacoma, WA $1,131 3.0% 99 San Diego, CA $3,405 16.2%
10 Wilmington, DE $1,138 -5.1% 100 Honolulu, HI $3,526 7.8%
10 Lowest Bills 10 Highest Bills
10 Lowest and Highest Bills
Residential: 500 kWh10 Lowest Bills 10 Highest Bills
Residential: 1,000 kWh
Commercial: 40 kW and 10,000 kWh10 Lowest Bills 10 Highest Bills
Commercial: 40 kW and 14,000 kWh10 Lowest Bills 10 Highest Bills

Table 4 2018 National Rate Study
2018 National Rate Study Tables
Rank City Bill Change Rank City Bill Change1 Tulsa, OK $9,806 12.6% 91 Pawtucket, RI $26,546 16.8%2 Davenport, IA $10,628 3.5% 92 Bridgeport, CT $26,821 11.9%3 Tacoma, WA $10,973 10.0% 93 Springfield, MA $27,962 9.7%4 Boise, ID $11,031 1.5% 94 New York City, NY $28,750 7.9%5 Des Moines, IA $11,265 15.7% 95 San Francisco, CA $30,493 1.8%6 Raleigh, NC $11,314 7.2% 96 Cambridge, MA $31,736 28.1%7 Wilmington, DE $11,333 -15.0% 97 Fairbanks, AK $33,534 15.5%8 Charlotte, NC $11,641 1.6% 98 Boston, MA $35,483 23.7%9 Baton Rouge, LA $11,884 11.5% 99 San Diego, CA $37,680 16.2%
10 Philadelphia, PA $11,916 -2.3% 100 Honolulu, HI $40,768 6.6%43 Lincoln, NE $14,948 0.1%
Rank City Bill Change Rank City Bill Change1 Tulsa, OK $11,079 13.4% 91 Bridgeport, CT $30,682 11.7%2 Davenport, IA $12,107 3.6% 92 Pawtucket, RI $30,955 17.0%3 Wilmington, DE $12,287 -16.0% 93 New York City, NY $31,713 8.0%4 Tacoma, WA $12,317 9.8% 94 Springfield, MA $31,878 9.9%5 Raleigh, NC $12,608 7.1% 95 San Francisco, CA $33,558 1.5%6 Boise, ID $12,625 1.5% 96 Cambridge, MA $36,715 29.0%7 Des Moines, IA $12,817 16.0% 97 Fairbanks, AK $38,806 16.1%8 Charlotte, NC $13,183 1.7% 98 Boston, MA $40,368 24.8%9 Philadelphia, PA $13,339 -2.4% 99 San Diego, CA $41,040 16.5%
10 Amarillo, TX $13,601 8.5% 100 Honolulu, HI $46,320 7.0%34 Lincoln, NE $15,788 0.1%
Rank City Bill Change Rank City Bill Change1 Lincoln, NE $1,127 0.0% 91 Bridgeport, CT $3,153 7.3%2 Boise, ID $1,267 2.0% 92 Pawtucket, RI $3,169 6.6%3 Miami, FL $1,303 -18.2% 93 Pueblo, CO $3,237 4.9%4 Tulsa, OK $1,314 8.6% 94 Springfield, MA $3,334 15.0%5 Seattle, WA $1,367 3.7% 95 San Francisco, CA $3,413 2.8%6 Tacoma, WA $1,374 11.7% 96 Cambridge, MA $3,661 20.8%7 Charlotte, NC $1,376 0.9% 97 Fairbanks, AK $3,738 1.0%8 Colorado Springs, CO $1,386 0.7% 98 Boston, MA $4,133 16.9%9 Baton Rouge, LA $1,389 9.3% 99 Honolulu, HI $4,146 7.0%
10 Davenport, IA $1,424 1.9% 100 San Diego, CA $4,998 15.1%
Rank City Bill Change Rank City Bill Change1 Amarillo, TX $1,953 6.0% 91 Manchester, NH $5,008 1.7%2 Tacoma, WA $2,047 10.7% 92 Bridgeport, CT $5,120 1.8%3 Lincoln, NE $2,054 0.0% 93 Springfield, MA $5,430 15.8%4 Boise, ID $2,073 2.2% 94 Pawtucket, RI $5,511 6.3%5 Raleigh, NC $2,103 5.5% 95 San Francisco, CA $5,591 1.3%6 Davenport, IA $2,202 2.5% 96 Cambridge, MA $6,077 23.9%7 Wilmington, DE $2,223 -6.0% 97 Fairbanks, AK $6,374 18.3%8 Charlotte, NC $2,249 1.4% 98 Boston, MA $6,517 20.0%9 Baton Rouge, LA $2,259 12.2% 99 San Diego, CA $6,684 16.3%
10 Omaha, NE $2,260 0.4% 100 Honolulu, HI $7,309 8.0%
Commercial: 500 kW and 150,000 kWh10 Lowest Bills 10 Highest Bills
Commercial: 500 kW and 180,000 kWh10 Lowest Bills 10 Highest Bills
Industrial: 75 kW and 15,000 kWh10 Lowest Bills 10 Highest Bills
Industrial: 75 kW and 30,000 kWh10 Lowest Bills 10 Highest Bills

Table 4 2018 National Rate Study
2018 National Rate Study Tables
Rank City Bill Change Rank City Bill Change1 Amarillo, TX $2,615 5.8% 91 Los Angeles, CA $7,500 8.9%2 Lincoln, NE $2,661 0.0% 92 Manchester, NH $7,571 1.6%3 Raleigh, NC $2,919 6.0% 93 Springfield, MA $8,225 16.2%4 Tacoma, WA $2,943 10.1% 94 San Francisco, CA $8,496 0.5%5 Colorado Springs, CO $3,003 -17.2% 95 Pawtucket, RI $8,634 6.2%6 Richmond, VA $3,030 7.6% 96 San Diego, CA $8,932 17.3%7 Charlotte, NC $3,051 1.9% 97 Cambridge, MA $9,298 25.6%8 Wilmington, DE $3,054 -6.1% 98 Boston, MA $9,696 21.8%9 Omaha, NE $3,131 0.4% 99 Fairbanks, AK $9,888 29.4%
10 Boise, ID $3,148 2.3% 100 Honolulu, HI $11,525 8.5%
Rank City Bill Change Rank City Bill Change1 Tulsa, OK $15,097 10.8% 91 Pueblo, CO $41,949 5.0%2 Philadelphia, PA $15,859 1.5% 92 Springfield, MA $42,109 9.1%3 Davenport, IA $16,151 3.4% 93 Bridgeport, CT $42,836 5.0%4 Boise, ID $16,561 2.2% 94 Burlington, VT $43,652 7.3%5 Des Moines, IA $16,844 15.3% 95 Cambridge, MA $47,631 25.6%6 Oklahoma City, OK $16,999 23.0% 96 San Francisco, CA $49,201 3.2%7 Jackson, MS $17,101 14.5% 97 Fairbanks, AK $49,466 13.8%8 Baton Rouge, LA $17,332 9.8% 98 Boston, MA $54,445 21.2%9 Tacoma, WA $17,389 10.1% 99 Honolulu, HI $62,192 5.7%
10 Charlotte, NC $17,615 1.4% 100 San Diego, CA $64,116 15.5%57 Lincoln, NE $25,682 0.0%
Rank City Bill Change Rank City Bill Change1 Tulsa, OK $23,586 14.1% 91 Bridgeport, CT $63,479 7.1%2 Philadelphia, PA $24,759 2.3% 92 Los Angeles, CA $64,810 9.0%3 Amarillo, TX $25,315 6.1% 93 Pawtucket, RI $67,756 16.9%4 Wilmington, DE $25,952 -16.6% 94 Springfield, MA $68,218 10.1%5 Davenport, IA $26,011 3.6% 95 San Francisco, CA $68,561 1.8%6 Boise, ID $26,109 2.5% 96 Cambridge, MA $80,821 29.2%7 Oklahoma City, OK $26,192 35.1% 97 Fairbanks, AK $84,612 16.5%8 Tacoma, WA $26,351 9.7% 98 San Diego, CA $86,514 16.7%9 Des Moines, IA $27,194 16.3% 99 Boston, MA $87,013 25.5%
10 Austin, TX $27,279 -18.8% 100 Honolulu, HI $99,210 7.2%24 Lincoln, NE $31,080 0.1%
Rank City Bill Change Rank City Bill Change1 Amarillo, TX $33,588 5.9% 91 Lansing, MI $92,490 -8.7%2 Wilmington, DE $34,095 -19.1% 92 San Francisco, CA $92,760 1.0%3 Tulsa, OK $34,198 15.9% 93 Los Angeles, CA $97,474 8.7%4 Austin, TX $34,644 -25.4% 94 Springfield, MA $100,854 10.6%5 Philadelphia, PA $35,884 2.7% 95 Pawtucket, RI $104,491 17.4%6 Richmond, VA $36,918 8.3% 96 San Diego, CA $114,512 17.5%7 Colorado Springs, CO $36,977 -7.8% 97 Cambridge, MA $122,308 31.0%8 Little Rock, AR $37,513 13.3% 98 Boston, MA $127,723 27.8%9 Tacoma, WA $37,554 9.4% 99 Fairbanks, AK $128,544 17.8%
10 Davenport, IA $37,603 3.8% 100 Honolulu, HI $145,481 8.0%12 Lincoln, NE $37,826 0.1%
Industrial: 75 kW and 50,000 kWh10 Lowest Bills 10 Highest Bills
Industrial: 1,000 kW and 200,000 kWh10 Lowest Bills 10 Highest Bills
Industrial: 1,000 kW and 400,000 kWh10 Lowest Bills 10 Highest Bills
Industrial: 1,000 kW and 650,000 kWh10 Lowest Bills 10 Highest Bills

Chart A 2018 National Rate Study
2018 National Rate Study Charts
$48.
02
$89.
96
$56.
08
$96.
42
$67.
50
$120
.93
$144
.26
$282
.20
$0
$100
$200
$300
$400
$500
500 kWh 1,000 kWh
Dol
lars
Sample Ranges of Residential Bills
Spokane, WA Lincoln, NE Wheeling, WV Honolulu, HI
$0.7
8
$0.9
9
$1.2
7
$2.0
7
$3.1
5
$0.7
7
$1.0
6
$1.1
3
$2.0
5
$2.6
6
$1.2
3
$1.6
3
$1.9
6 $3.4
8 $5.0
3
$2.6
8
$3.5
3
$4.1
5
$7.3
1
$11.
53
$0
$4
$8
$12
$16
$20
40 kW 10,000 kWh
40 kW14,000 kWh
75 kW15,000 kWh
75 kW30,000 kWh
75 kW50,000 kWh
Dol
lars
(Th
ousa
nds)
Sample Ranges of Commercial and Industrial Bills
Boise, ID Lincoln, NE Evansville, IN Honolulu, HI
$11.
03
$12.
62
$16.
56
$26.
11
$38.
04
$14.
95
$15.
79
$25.
68
$31.
08
$37.
83
$13.
68
$15.
45
$21.
30
$33.
11
$47.
87
$40.
77
$46.
32
$62.
19 $9
9.21
$145
.48
$0
$50
$100
$150
$200
$250
500 kW150,000 kWh
500 kW180,000 kWh
1,000 kW200,000 kWh
1,000 kW400,000 kWh
1,000 kW650,000 kWh
Dol
lars
(Th
ousa
nds)
Sample Ranges of Commercial and Industrial Bills
Boise, ID Lincoln, NE Evansville, IN Honolulu, HI
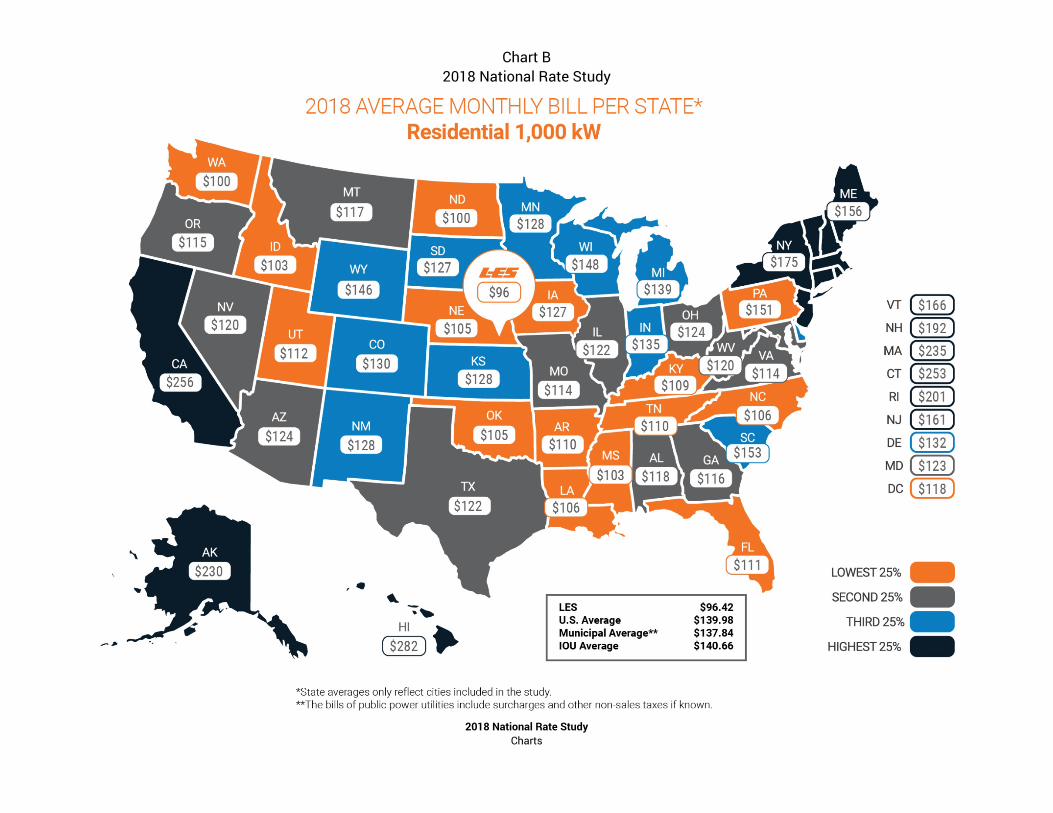
Chart B 2018 National Rate Study
2018 National Rate Study Charts

Chart C 2018 National Rate Study
2018 National Rate Study
Charts
Note: state averages only reflect cities that are included in the LES National Rate Study
Note: - Bills include surcharges and other non-sales tax
charges (if known) - The state averages only reflect cities that are
included in the LES National Rate Study
LES moved from 4th
lowest to 1st
lowest Nebraska moved from 11
th lowest to 7
th lowest
Reasons: - LES did not change rates from 2017 to 2018, while
other utilities increased rates due to upcoming capital projects and ongoing expense coverage
- Nebraska residential rates averaged ≈1.5% increase, while states with similar residential rates had increases between 2% and 10%

Chart D 2018 National Rate Study
2018 National Rate Study Charts

Chart E 2018 National Rate Study
2018 National Rate Study
Charts
Note: state averages only reflect cities that are included in the LES National Rate Study
LES moved from 15th lowest to 11th lowest Nebraska moved from 8th lowest to 9th lowest Reasons:
- LES did not change rates from 2017, while other utilities made changes in their fixed and variable rates making LES lower cost in comparison
Note: - Bills include surcharges and other non-sales tax
charges (if known) - The state averages only reflect cities that are
included in the LES National Rate Study

Chart F 2018 National Rate Study
2018 National Rate Study Charts
LES
$0
$10
$20
$30
$40
$50
$60
$7019
98
1999
2000
2001
2002
2003
2004
2005
2006
2007
2008
2009
2010
2011
2012
2013
2014
2015
2016
2017
2018
82/8
4 D
olla
rsResidential Real Price - 1,000 kWh
LES Study Avg. Investor-Owned Avg. Municipal/Pub Pwr Avg.
1.8%1.9%2.2%
-2.1%
LES
$0
$2
$4
$6
$8
$10
$12
$14
$16
$18
$20
1998
1999
2000
2001
2002
2003
2004
2005
2006
2007
2008
2009
2010
2011
2012
2013
2014
2015
2016
2017
2018
82/8
4 D
olla
rs (
Thou
sand
s)
Industrial Real Price - 1,000 kW and 400,000 kWh
LES Study Avg. Investor-Owned Avg. Municipal/Pub Pwr Avg.
-3.5%1.8%3.8%
-2.0%
2017 to2018 % real rate change
2017 to2018 % real rate change
Real price of electricity expressed in 1982-1984 dollars (thousands)
Real price of electricity expressed in 1982-1984 dollars

2018 National Rate Study Schedules
Schedule 1
M - Municipal or Public Power DistrictI - Investor-owned utility
40 kW 40 kW 500 kW 500 kWSTATE CITY 500 kWh 1,000 kWh 10,000 kWh 14,000 kWh 150,000 kWh 180,000 kWh
National Electric Rate Study
Average Annual Residential and Commercial BillsRates in Effect January 1, 2018
Arranged by State and City
Alabama Birmingham (I) 75.14$ 132.71$ 1,434$ 1,820$ 19,781$ 22,744$ Huntsville (M) 56.47 103.76 1,084 1,513 15,500 17,394
Alaska Anchorage (M) 109.94 213.33 1,750 2,060 23,305 25,628 Fairbanks (M) 132.24 246.98 2,304 3,218 33,534 38,806
Arizona Mesa (M) 68.18 116.60 1,069 1,373 12,865 14,944 Phoenix (I) 72.35 128.46 1,508 1,747 16,261 17,410 Tucson (I) 69.62 128.73 1,469 2,034 19,123 20,621
Arkansas Little Rock (I) 59.89 110.60 975 1,245 13,715 15,001 California Los Angeles (M) 126.64 269.69 1,835 2,358 25,886 29,806
Sacramento (M) 81.10 141.90 1,468 1,924 19,760 23,172 San Diego (I) 144.06 360.81 2,955 3,405 37,680 41,040 San Francisco (I) 114.24 252.98 2,175 2,756 30,493 33,558
Colorado Colorado Springs (M) 66.61 117.91 932 1,295 15,146 16,282 Denver (I) 56.33 111.47 1,262 1,404 16,162 17,224 Pueblo (I) 90.00 162.00 1,584 1,815 23,551 25,068
Connecticut Bridgeport (I) 131.92 253.80 1,981 2,502 26,821 30,682 Delaware Wilmington (I) 72.31 132.80 971 1,138 11,333 12,287 District of Columbia Washington (I) 63.71 118.59 1,231 1,658 21,365 24,185 Florida Jacksonville (M) 65.87 125.39 1,126 1,572 16,080 18,332
Miami (I) 55.41 102.67 1,009 1,227 14,162 15,660 Tampa (I) 61.53 106.00 1,035 1,249 13,882 15,491
Georgia Atlanta (I) 63.16 116.88 1,432 1,611 16,715 18,053 Hawaii Honolulu (I) 144.26 282.20 2,683 3,526 40,768 46,320 Idaho Boise (I) 53.40 103.82 779 991 11,031 12,625 Illinois Chicago (I) 71.78 126.96 1,069 1,369 14,741 16,945
Springfield (M) 63.62 118.31 1,422 1,839 20,564 23,370 Indiana Evansville (I) 82.04 153.06 1,228 1,634 13,677 15,448
Gary (I) 78.20 142.40 1,522 1,904 18,592 20,968 Indianapolis (I) 69.98 112.51 1,082 1,465 16,109 17,597

2018 National Rate Study Schedules
Schedule 1
M - Municipal or Public Power DistrictI - Investor-owned utility
40 kW 40 kW 500 kW 500 kWSTATE CITY 500 kWh 1,000 kWh 10,000 kWh 14,000 kWh 150,000 kWh 180,000 kWh
National Electric Rate Study
Average Annual Residential and Commercial BillsRates in Effect January 1, 2018
Arranged by State and City
Iowa Cedar Rapids (I) 88.86$ 156.28$ 1,305$ 1,807$ 18,855$ 22,615$ Davenport (I) 57.86 107.19 873 1,080 10,628 12,107 Des Moines (I) 63.48 117.83 957 1,187 11,265 12,817
Kansas Kansas City (M) 71.30 120.60 1,118 1,443 15,648 17,322 Overland Park (I) 70.69 127.38 1,245 1,520 16,681 18,620 Wichita (I) 77.07 138.06 976 1,333 16,342 17,552
Kentucky Lexington (I) 59.37 105.70 1,088 1,509 14,350 15,313 Louisville (I) 63.05 112.56 1,107 1,584 15,758 16,938
Louisiana Baton Rouge (I) 49.69 93.10 881 1,114 11,884 13,631 New Orleans (I) 65.22 120.81 1,176 1,533 16,137 18,501 Shreveport (I) 57.14 105.72 1,042 1,270 13,548 15,258
Maine Portland (I) 77.91 156.56 1,421 1,759 20,500 22,221 Maryland Baltimore (I) 65.64 123.38 1,102 1,519 14,505 17,038 Massachusetts Boston (I) 121.65 236.84 2,419 3,055 35,483 40,368
Cambridge (I) 126.66 246.43 2,263 2,907 31,736 36,715 Springfield (I) 114.82 222.64 2,056 2,615 27,962 31,878
Michigan Detroit (I) 80.84 87.14 1,253 1,695 16,007 17,171 Grand Rapids (I) 78.32 155.38 1,314 1,636 17,948 21,311 Lansing (M) 93.89 174.78 1,951 2,429 25,131 28,719
Minnesota Duluth (I) 53.77 112.05 1,106 1,446 14,304 16,333 Minneapolis (I) 76.50 144.57 1,272 1,546 17,302 19,353
Mississippi Jackson (I) 64.12 103.64 1,107 1,418 12,436 14,273 Missouri Kansas City (I) 83.29 139.43 1,400 1,710 19,071 21,236
Saint Louis (I) 61.14 108.64 959 1,390 12,150 13,877 Springfield (M) 53.70 95.56 1,009 1,178 13,440 14,709
Montana Billings (I) 60.74 117.37 1,191 1,505 15,763 18,071 Nebraska Lincoln (M) 56.08 96.42 774 1,057 14,948 15,788
Omaha (M) 70.30 114.77 770 1,043 12,779 14,085

2018 National Rate Study Schedules
Schedule 1
M - Municipal or Public Power DistrictI - Investor-owned utility
40 kW 40 kW 500 kW 500 kWSTATE CITY 500 kWh 1,000 kWh 10,000 kWh 14,000 kWh 150,000 kWh 180,000 kWh
National Electric Rate Study
Average Annual Residential and Commercial BillsRates in Effect January 1, 2018
Arranged by State and City
Nevada Las Vegas (I) 70.81$ 128.87$ 1,028$ 1,293$ 13,372$ 15,154$ Reno (I) 64.08 112.90 996 1,228 14,076 15,755
New Hampshire Manchester (I) 104.87 192.12 1,906 2,419 25,365 28,999 New Jersey Newark (I) 81.14 161.77 1,530 1,826 19,713 21,137 New Mexico Albuquerque (I) 59.40 128.60 1,216 1,696 16,310 17,521 New York Buffalo (I) 68.85 120.16 1,055 1,271 12,523 14,112
Hempstead (M) 93.90 172.53 1,739 2,215 25,612 29,468 New York City (I) 124.76 232.99 2,146 2,541 28,750 31,713
North Carolina Charlotte (I) 58.74 104.85 879 1,071 11,641 13,183 Raleigh (I) 59.97 108.27 914 1,111 11,314 12,608
North Dakota Fargo (I) 59.35 104.20 1,069 1,305 14,541 16,309 Ohio Cincinnati (I) 64.57 117.37 1,038 1,235 13,440 14,874
Cleveland (I) 67.23 130.23 1,268 1,536 14,537 16,504 Columbus (I) 68.77 125.78 1,169 1,444 16,102 18,146
Oklahoma Oklahoma City (I) 66.99 111.33 1,026 1,237 13,231 14,816 Tulsa (I) 48.74 99.24 885 1,171 9,806 11,079
Oregon Eugene (M) 63.36 109.19 959 1,209 13,108 14,979 Portland (I) 66.71 121.24 1,045 1,333 12,942 14,833
Pennsylvania Erie (I) 81.71 152.94 1,025 1,316 15,221 17,423 Philadelphia (I) 77.70 146.95 994 1,233 11,916 13,339 Pittsburgh (I) 84.32 153.76 1,098 1,404 15,779 17,419
Rhode Island Pawtucket (I) 104.27 201.64 2,085 2,716 26,546 30,955 South Carolina Columbia (I) 79.13 147.53 1,313 1,824 19,510 21,032
Myrtle Beach (M) 90.89 158.64 1,382 1,924 23,263 25,550 South Dakota Sioux Falls (I) 67.94 127.64 1,166 1,458 16,145 18,334 Tennessee Knoxville (M) 63.90 110.31 1,122 1,560 16,793 18,683
Memphis (M) 56.83 101.61 977 1,358 15,318 17,036 Nashville (M) 67.20 119.30 1,252 1,690 17,756 19,599

2018 National Rate Study Schedules
Schedule 1
M - Municipal or Public Power DistrictI - Investor-owned utility
40 kW 40 kW 500 kW 500 kWSTATE CITY 500 kWh 1,000 kWh 10,000 kWh 14,000 kWh 150,000 kWh 180,000 kWh
National Electric Rate Study
Average Annual Residential and Commercial BillsRates in Effect January 1, 2018
Arranged by State and City
Texas Austin (M) 48.42$ 101.99$ 1,063$ 1,287$ 14,794$ 16,268$ El Paso (I) 66.83 126.36 1,196 1,441 16,145 17,928 Amarillo (I) 75.46 137.79 954 1,097 12,527 13,601
Utah Salt Lake City (I) 54.69 112.45 1,126 1,278 14,342 15,479 Vermont Burlington (M) 85.07 166.12 1,825 2,187 24,604 27,322 Virginia Richmond (I) 62.30 115.74 1,035 1,245 13,721 14,544
Roanoke (I) 61.16 113.93 1,040 1,250 14,425 15,735 Washington Seattle (M) 50.05 116.32 960 1,344 12,799 15,010
Spokane (I) 48.02 89.96 1,226 1,517 14,093 16,272 Tacoma (M) 56.39 96.29 815 1,131 10,973 12,317
West Virginia Charleston (I) 67.50 120.93 1,061 1,331 14,750 16,599 Wheeling (I) 67.50 120.93 1,061 1,331 14,750 16,599
Wisconsin Madison (I) 86.11 153.21 1,462 1,749 18,543 20,652 Milwaukee (I) 80.09 144.18 1,304 1,703 17,325 19,218
Wyoming Cheyenne (I) 79.00 146.00 1,662 1,916 19,285 20,959

2018 National Rate Study Schedules
Schedule 2
M - Municipal or Public Power DistrictI - Investor-owned utility
75 kW 75 kW 75 kW 1,000 kW 1,000 kW 1,000 kWSTATE CITY 15,000 kWh 30,000 kWh 50,000 kWh 200,000 kWh 400,000 kWh 650,000 kWh
National Electric Rate Study
Rankings of Residential and Commercial BillsRates in Effect January 1, 2018
Arranged by State and City
Alabama Birmingham (I) 61 76 79 15 18 27 Huntsville (M) 54 51 47 51 59 62
Alaska Anchorage (M) 86 85 81 89 85 84 Fairbanks (M) 97 97 99 97 97 99
Arizona Mesa (M) 15 33 37 12 45 60 Phoenix (I) 79 64 51 68 48 35 Tucson (I) 72 80 84 77 69 63
Arkansas Little Rock (I) 19 30 35 29 30 8 California Los Angeles (M) 84 90 91 86 92 93
Sacramento (M) 70 83 86 50 79 83 San Diego (I) 100 99 96 100 98 96 San Francisco (I) 95 95 94 96 95 92
Colorado Colorado Springs (M) 8 39 5 64 32 7 Denver (I) 66 37 22 58 31 16 Pueblo (I) 93 82 74 91 83 81
Connecticut Bridgeport (I) 91 92 89 93 91 88 Delaware Wilmington (I) 20 7 8 19 4 2 District of Columbia Washington (I) 65 77 82 61 75 78 Florida Jacksonville (M) 50 58 61 56 63 67
Miami (I) 3 21 28 41 37 37 Tampa (I) 34 25 29 40 35 42
Georgia Atlanta (I) 74 53 38 78 72 57 Hawaii Honolulu (I) 99 100 100 99 100 100 Idaho Boise (I) 2 4 10 4 6 13 Illinois Chicago (I) 30 43 56 27 51 68
Springfield (M) 80 81 83 76 80 82 Indiana Evansville (I) 53 71 75 31 36 47
Gary (I) 75 79 78 73 78 79 Indianapolis (I) 63 50 40 65 62 52

2018 National Rate Study Schedules
Schedule 2
M - Municipal or Public Power DistrictI - Investor-owned utility
75 kW 75 kW 75 kW 1,000 kW 1,000 kW 1,000 kWSTATE CITY 15,000 kWh 30,000 kWh 50,000 kWh 200,000 kWh 400,000 kWh 650,000 kWh
National Electric Rate Study
Rankings of Residential and Commercial BillsRates in Effect January 1, 2018
Arranged by State and City
Iowa Cedar Rapids (I) 57 34 23 59 47 39 Davenport (I) 10 6 12 3 5 10 Des Moines (I) 18 14 25 5 9 20
Kansas Kansas City (M) 46 45 42 44 54 50 Overland Park (I) 58 57 52 70 68 65 Wichita (I) 13 41 63 71 52 38
Kentucky Lexington (I) 68 36 17 49 22 14 Louisville (I) 67 40 27 60 40 30
Louisiana Baton Rouge (I) 9 9 20 8 13 28 New Orleans (I) 45 63 70 47 67 76 Shreveport (I) 21 18 30 33 33 40
Maine Portland (I) 73 75 77 81 81 77 Maryland Baltimore (I) 22 49 62 26 58 74 Massachusetts Boston (I) 98 98 98 98 99 98
Cambridge (I) 96 96 97 95 96 97 Springfield (I) 94 93 93 92 94 94
Michigan Detroit (I) 44 65 45 48 50 36 Grand Rapids (I) 47 73 50 45 66 48 Lansing (M) 87 89 90 87 90 91
Minnesota Duluth (I) 39 55 69 30 49 58 Minneapolis (I) 60 61 48 66 73 69
Mississippi Jackson (I) 29 42 53 7 16 23 Missouri Kansas City (I) 69 69 71 83 82 72
Saint Louis (I) 17 13 16 14 17 24 Springfield (M) 31 12 11 36 21 25
Montana Billings (I) 51 60 68 23 42 56 Nebraska Lincoln (M) 1 3 2 57 24 12
Omaha (M) 11 10 9 22 14 22

2018 National Rate Study Schedules
Schedule 2
M - Municipal or Public Power DistrictI - Investor-owned utility
75 kW 75 kW 75 kW 1,000 kW 1,000 kW 1,000 kWSTATE CITY 15,000 kWh 30,000 kWh 50,000 kWh 200,000 kWh 400,000 kWh 650,000 kWh
National Electric Rate Study
Rankings of Residential and Commercial BillsRates in Effect January 1, 2018
Arranged by State and City
Nevada Las Vegas (I) 27 35 43 34 34 43 Reno (I) 24 24 33 42 44 46
New Hampshire Manchester (I) 89 91 92 85 89 90 New Jersey Newark (I) 81 78 76 79 71 61 New Mexico Albuquerque (I) 63 56 60 72 57 45 New York Buffalo (I) 37 27 31 18 19 31
Hempstead (M) 83 87 88 82 88 89 New York City (I) 90 88 87 90 87 87
North Carolina Charlotte (I) 7 8 7 10 12 15 Raleigh (I) 12 5 3 38 28 26
North Dakota Fargo (I) 32 28 26 39 41 41 Ohio Cincinnati (I) 33 15 19 35 28 33
Cleveland (I) 62 62 58 13 15 29 Columbus (I) 49 52 55 43 55 59
Oklahoma Oklahoma City (I) 26 16 24 6 7 11 Tulsa (I) 4 11 21 1 1 3
Oregon Eugene (M) 16 19 36 11 11 21 Portland (I) 25 38 49 17 27 44
Pennsylvania Erie (I) 78 70 72 20 39 55 Philadelphia (I) 28 26 34 2 2 5 Pittsburgh (I) 42 54 66 55 56 49
Rhode Island Pawtucket (I) 92 94 95 84 93 95 South Carolina Columbia (I) 52 74 67 62 61 51
Myrtle Beach (M) 85 84 80 88 84 85 South Dakota Sioux Falls (I) 43 46 46 46 60 64 Tennessee Knoxville (M) 76 67 64 63 65 70
Memphis (M) 56 48 44 53 53 54 Nashville (M) 77 66 59 74 74 71
2018 National Rate Study Schedules
Schedule 2
M - Municipal or Public Power DistrictI - Investor-owned utility
75 kW 75 kW 75 kW 1,000 kW 1,000 kW 1,000 kWSTATE CITY 15,000 kWh 30,000 kWh 50,000 kWh 200,000 kWh 400,000 kWh 650,000 kWh
National Electric Rate Study
Rankings of Residential and Commercial BillsRates in Effect January 1, 2018
Arranged by State and City
Texas Austin (M) 40 29 32 32 10 4 El Paso (I) 55 47 39 69 46 34 Amarillo (I) 14 1 1 16 3 1
Utah Salt Lake City (I) 48 22 15 54 38 32 Vermont Burlington (M) 88 86 85 94 86 86 Virginia Richmond (I) 41 17 6 52 20 6
Roanoke (I) 23 23 18 21 23 17 Washington Seattle (M) 5 20 41 37 70 80
Spokane (I) 38 44 54 28 43 53 Tacoma (M) 6 2 4 9 8 9
West Virginia Charleston (I) 35 31 13 24 25 18 Wheeling (I) 35 31 13 24 25 18
Wisconsin Madison (I) 71 68 73 75 76 75 Milwaukee (I) 59 59 57 67 64 66
Wyoming Cheyenne (I) 82 72 65 80 77 73

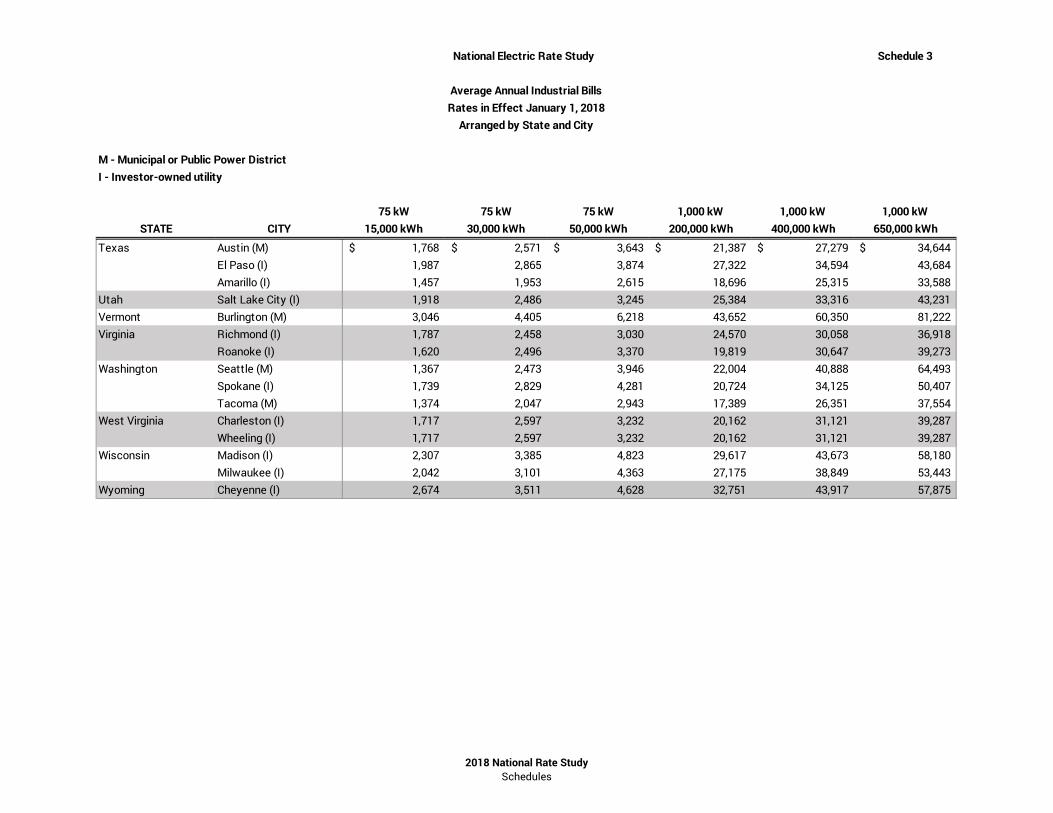
2018 National Rate Study Schedules
Schedule 3
M - Municipal or Public Power DistrictI - Investor-owned utility
75 kW 75 kW 75 kW 1,000 kW 1,000 kW 1,000 kWSTATE CITY 15,000 kWh 30,000 kWh 50,000 kWh 200,000 kWh 400,000 kWh 650,000 kWh
National Electric Rate Study
Average Annual Industrial BillsRates in Effect January 1, 2018
Arranged by State and City
Alabama Birmingham (I) 2,137$ 3,676$ 5,627$ 18,125$ 29,478$ 42,158$ Huntsville (M) 1,958 2,905 4,167 24,561 37,187 52,970
Alaska Anchorage (M) 2,952 4,114 5,663 41,055 55,771 74,166 Fairbanks (M) 3,738 6,374 9,888 49,466 84,612 128,544
Arizona Mesa (M) 1,530 2,600 3,752 17,794 34,392 52,317 Phoenix (I) 2,550 3,284 4,262 27,266 34,921 44,490 Tucson (I) 2,320 3,969 6,168 30,712 40,697 53,179
Arkansas Little Rock (I) 1,578 2,591 3,680 21,071 31,616 37,513 California Los Angeles (M) 2,927 4,887 7,500 38,679 64,810 97,474
Sacramento (M) 2,303 4,014 6,294 24,457 44,946 70,557 San Diego (I) 4,998 6,684 8,932 64,116 86,514 114,512 San Francisco (I) 3,413 5,591 8,496 49,201 68,561 92,760
Colorado Colorado Springs (M) 1,386 2,748 3,003 27,058 31,771 36,977 Denver (I) 2,196 2,727 3,435 25,897 31,631 39,038 Pueblo (I) 3,237 3,995 5,006 41,949 52,059 64,698
Connecticut Bridgeport (I) 3,153 5,120 7,210 42,836 63,479 89,283 Delaware Wilmington (I) 1,599 2,223 3,054 19,438 25,952 34,095 District of Columbia Washington (I) 2,156 3,691 5,739 26,698 43,261 63,335 Florida Jacksonville (M) 1,931 3,056 4,557 25,657 38,124 53,708
Miami (I) 1,303 2,481 3,569 23,256 33,239 45,273 Tampa (I) 1,709 2,513 3,586 22,368 33,093 46,498
Georgia Atlanta (I) 2,339 3,003 3,812 31,745 41,147 51,703 Hawaii Honolulu (I) 4,146 7,309 11,525 62,192 99,210 145,481 Idaho Boise (I) 1,267 2,073 3,148 16,561 26,109 38,044 Illinois Chicago (I) 1,690 2,812 4,308 20,695 35,389 53,750
Springfield (M) 2,583 3,986 5,857 30,683 46,770 66,879 Indiana Evansville (I) 1,957 3,479 5,032 21,300 33,108 47,869
Gary (I) 2,382 3,815 5,563 28,348 44,189 63,991 Indianapolis (I) 2,146 2,890 3,882 27,139 38,062 50,401

2018 National Rate Study Schedules
Schedule 3
M - Municipal or Public Power DistrictI - Investor-owned utility
75 kW 75 kW 75 kW 1,000 kW 1,000 kW 1,000 kWSTATE CITY 15,000 kWh 30,000 kWh 50,000 kWh 200,000 kWh 400,000 kWh 650,000 kWh
National Electric Rate Study
Average Annual Industrial BillsRates in Effect January 1, 2018
Arranged by State and City
Iowa Cedar Rapids (I) 2,019$ 2,652$ 3,495$ 26,429$ 34,863$ 45,406$ Davenport (I) 1,424 2,202 3,179 16,151 26,011 37,603 Des Moines (I) 1,561 2,422 3,507 16,844 27,194 39,344
Kansas Kansas City (M) 1,886 2,838 3,954 23,522 36,222 50,177 Overland Park (I) 2,032 3,043 4,274 27,408 39,907 53,412 Wichita (I) 1,452 2,791 4,577 27,560 35,446 45,302
Kentucky Lexington (I) 2,241 2,714 3,343 24,276 30,499 38,278 Louisville (I) 2,201 2,780 3,552 26,543 33,898 43,092
Louisiana Baton Rouge (I) 1,389 2,259 3,384 17,332 28,634 42,313 New Orleans (I) 1,863 3,203 4,734 24,043 39,799 58,327 Shreveport (I) 1,605 2,460 3,599 21,396 32,726 45,620
Maine Portland (I) 2,322 3,589 5,277 35,329 46,873 61,302 Maryland Baltimore (I) 1,617 2,884 4,572 20,210 36,975 57,932 Massachusetts Boston (I) 4,133 6,517 9,696 54,445 87,013 127,723
Cambridge (I) 3,661 6,077 9,298 47,631 80,821 122,308 Springfield (I) 3,334 5,430 8,225 42,109 68,218 100,854
Michigan Detroit (I) 1,858 3,296 4,056 24,261 35,212 44,513 Grand Rapids (I) 1,887 3,569 4,253 23,554 39,574 49,388 Lansing (M) 3,039 4,832 7,224 38,681 62,596 92,490
Minnesota Duluth (I) 1,746 3,019 4,716 21,299 35,183 52,096 Minneapolis (I) 2,105 3,131 4,169 27,174 41,383 55,093
Mississippi Jackson (I) 1,686 2,795 4,275 17,101 29,157 39,609 Missouri Kansas City (I) 2,281 3,410 4,737 36,636 48,373 57,456
Saint Louis (I) 1,558 2,421 3,337 17,960 29,221 40,408 Springfield (M) 1,696 2,331 3,177 22,000 30,460 41,035
Montana Billings (I) 1,933 3,109 4,677 19,923 33,936 51,453 Nebraska Lincoln (M) 1,127 2,054 2,661 25,682 31,080 37,826
Omaha (M) 1,430 2,260 3,131 19,851 28,899 39,564

2018 National Rate Study Schedules
Schedule 3
M - Municipal or Public Power DistrictI - Investor-owned utility
75 kW 75 kW 75 kW 1,000 kW 1,000 kW 1,000 kWSTATE CITY 15,000 kWh 30,000 kWh 50,000 kWh 200,000 kWh 400,000 kWh 650,000 kWh
National Electric Rate Study
Average Annual Industrial BillsRates in Effect January 1, 2018
Arranged by State and City
Nevada Las Vegas (I) 1,659$ 2,655$ 3,982$ 21,589$ 32,933$ 47,112$ Reno (I) 1,641 2,511 3,670 23,365 34,247 47,851
New Hampshire Manchester (I) 3,085 5,008 7,571 38,417 62,450 92,488 New Jersey Newark (I) 2,588 3,696 5,174 31,880 41,007 52,414 New Mexico Albuquerque (I) 2,146 3,038 4,553 27,589 36,880 47,316 New York Buffalo (I) 1,730 2,538 3,614 19,307 29,902 43,145
Hempstead (M) 2,767 4,552 6,933 35,959 61,057 92,430 New York City (I) 3,135 4,594 6,538 41,319 60,764 85,070
North Carolina Charlotte (I) 1,376 2,249 3,051 17,615 28,328 39,002 Raleigh (I) 1,451 2,103 2,919 22,252 31,590 41,782
North Dakota Fargo (I) 1,700 2,567 3,514 22,343 33,910 45,744 Ohio Cincinnati (I) 1,704 2,434 3,371 21,860 31,590 43,308
Cleveland (I) 2,141 3,144 4,482 17,857 28,981 42,885 Columbus (I) 1,921 2,943 4,306 23,423 36,280 52,311
Oklahoma Oklahoma City (I) 1,656 2,448 3,505 16,999 26,192 37,684 Tulsa (I) 1,314 2,283 3,417 15,097 23,586 34,198
Oregon Eugene (M) 1,531 2,466 3,714 17,622 27,324 39,452 Portland (I) 1,652 2,730 4,169 18,911 31,519 47,278
Pennsylvania Erie (I) 2,393 3,430 4,815 19,624 33,462 50,761 Philadelphia (I) 1,662 2,525 3,676 15,859 24,759 35,884 Pittsburgh (I) 1,808 3,018 4,632 25,566 36,495 50,157
Rhode Island Pawtucket (I) 3,169 5,511 8,634 38,367 67,756 104,491 South Carolina Columbia (I) 1,952 3,572 4,676 26,819 37,946 50,269
Myrtle Beach (M) 2,940 4,099 5,644 39,975 55,557 75,035 South Dakota Sioux Falls (I) 1,819 2,864 4,104 23,983 37,909 53,410 Tennessee Knoxville (M) 2,383 3,328 4,588 26,890 39,490 55,240
Memphis (M) 2,018 2,877 4,023 24,732 36,188 50,507 Nashville (M) 2,385 3,307 4,535 29,155 41,439 56,795
2018 National Rate Study Schedules
Schedule 3
M - Municipal or Public Power DistrictI - Investor-owned utility
75 kW 75 kW 75 kW 1,000 kW 1,000 kW 1,000 kWSTATE CITY 15,000 kWh 30,000 kWh 50,000 kWh 200,000 kWh 400,000 kWh 650,000 kWh
National Electric Rate Study
Average Annual Industrial BillsRates in Effect January 1, 2018
Arranged by State and City
Texas Austin (M) 1,768$ 2,571$ 3,643$ 21,387$ 27,279$ 34,644$ El Paso (I) 1,987 2,865 3,874 27,322 34,594 43,684 Amarillo (I) 1,457 1,953 2,615 18,696 25,315 33,588
Utah Salt Lake City (I) 1,918 2,486 3,245 25,384 33,316 43,231 Vermont Burlington (M) 3,046 4,405 6,218 43,652 60,350 81,222 Virginia Richmond (I) 1,787 2,458 3,030 24,570 30,058 36,918
Roanoke (I) 1,620 2,496 3,370 19,819 30,647 39,273 Washington Seattle (M) 1,367 2,473 3,946 22,004 40,888 64,493
Spokane (I) 1,739 2,829 4,281 20,724 34,125 50,407 Tacoma (M) 1,374 2,047 2,943 17,389 26,351 37,554
West Virginia Charleston (I) 1,717 2,597 3,232 20,162 31,121 39,287 Wheeling (I) 1,717 2,597 3,232 20,162 31,121 39,287
Wisconsin Madison (I) 2,307 3,385 4,823 29,617 43,673 58,180 Milwaukee (I) 2,042 3,101 4,363 27,175 38,849 53,443
Wyoming Cheyenne (I) 2,674 3,511 4,628 32,751 43,917 57,875

2018 National Rate Study Schedules
Schedule 4
M - Municipal or Public Power DistrictI - Investor-owned utility
40 kW 40 kW 500 kW 500 kWSTATE CITY 500 kWh 1,000 kWh 10,000 kWh 14,000 kWh 150,000 kWh 180,000 kWh
National Electric Rate Study
Rankings of Industrial BillsRates in Effect January 1, 2018
Arranged by State and City
Alabama Birmingham (I) 63 63 76 76 79 79Huntsville (M) 14 12 41 52 47 50
Alaska Anchorage (M) 90 90 86 85 84 85Fairbanks (M) 98 95 97 98 97 97
Arizona Mesa (M) 51 36 37 39 17 21Phoenix (I) 62 58 80 71 60 51Tucson (I) 54 60 79 84 74 69
Arkansas Little Rock (I) 22 24 17 20 26 23California Los Angeles (M) 95 98 88 88 90 90
Sacramento (M) 75 68 78 82 78 80San Diego (I) 99 100 100 99 99 99San Francisco (I) 91 96 95 95 95 95
Colorado Colorado Springs (M) 42 41 10 29 44 37Denver (I) 12 26 64 41 59 48Pueblo (I) 84 84 83 75 85 83
Connecticut Bridgeport (I) 97 97 91 91 92 91Delaware Wilmington (I) 61 64 16 10 7 3District of Columbia Washington (I) 34 43 60 65 82 82Florida Jacksonville (M) 41 52 50 60 53 61
Miami (I) 10 10 22 15 31 31Tampa (I) 27 18 27 22 28 30
Georgia Atlanta (I) 30 37 75 62 64 58Hawaii Honolulu (I) 100 99 99 100 100 100Idaho Boise (I) 6 13 3 1 4 6Illinois Chicago (I) 60 55 39 38 39 44
Springfield (M) 33 42 74 79 81 81Indiana Evansville (I) 78 76 59 63 25 28
Gary (I) 69 69 81 80 71 72Indianapolis (I) 55 29 40 49 55 56

2018 National Rate Study Schedules
Schedule 4
M - Municipal or Public Power DistrictI - Investor-owned utility
40 kW 40 kW 500 kW 500 kWSTATE CITY 500 kWh 1,000 kWh 10,000 kWh 14,000 kWh 150,000 kWh 180,000 kWh
National Electric Rate Study
Rankings of Industrial BillsRates in Effect January 1, 2018
Arranged by State and City
Iowa Cedar Rapids (I) 83 80 68 74 72 78Davenport (I) 17 19 5 5 2 2Des Moines (I) 32 40 12 13 5 7
Kansas Kansas City (M) 59 46 48 45 48 49Overland Park (I) 57 56 61 55 63 64Wichita (I) 66 66 18 34 62 55
Kentucky Lexington (I) 20 16 42 51 34 27Louisville (I) 29 30 46 61 49 43
Louisiana Baton Rouge (I) 4 3 7 8 9 11New Orleans (I) 39 47 54 56 56 63Shreveport (I) 16 17 31 24 24 26
Maine Portland (I) 68 81 73 73 80 77Maryland Baltimore (I) 40 51 44 54 36 46Massachusetts Boston (I) 93 93 98 97 98 98
Cambridge (I) 96 94 96 96 96 96Springfield (I) 92 91 92 93 93 94
Michigan Detroit (I) 74 1 63 67 52 47Grand Rapids (I) 70 79 70 64 69 76Lansing (M) 86 87 90 90 87 87
Minnesota Duluth (I) 8 27 45 47 32 39Minneapolis (I) 65 71 66 58 66 67
Mississippi Jackson (I) 37 11 46 43 12 15Missouri Kansas City (I) 79 67 72 70 73 75
Saint Louis (I) 25 21 13 40 11 12Springfield (M) 7 4 23 12 22 17
Montana Billings (I) 24 38 55 50 50 59Nebraska Lincoln (M) 11 6 2 3 43 34
Omaha (M) 56 33 1 2 15 13

2018 National Rate Study Schedules
Schedule 4
M - Municipal or Public Power DistrictI - Investor-owned utility
40 kW 40 kW 500 kW 500 kWSTATE CITY 500 kWh 1,000 kWh 10,000 kWh 14,000 kWh 150,000 kWh 180,000 kWh
National Electric Rate Study
Rankings of Industrial BillsRates in Effect January 1, 2018
Arranged by State and City
Nevada Las Vegas (I) 58 61 26 28 21 25Reno (I) 36 31 21 16 29 33
New Hampshire Manchester (I) 89 88 89 89 88 88New Jersey Newark (I) 76 83 82 78 77 74New Mexico Albuquerque (I) 21 59 57 68 61 54New York Buffalo (I) 53 45 33 25 13 14
Hempstead (M) 87 86 85 87 89 89New York City (I) 94 92 94 92 94 93
North Carolina Charlotte (I) 18 15 6 4 8 8Raleigh (I) 23 20 9 7 6 5
North Dakota Fargo (I) 19 14 38 30 38 38Ohio Cincinnati (I) 38 38 29 18 22 20
Cleveland (I) 47 62 65 57 37 40Columbus (I) 52 53 53 46 54 60
Oklahoma Oklahoma City (I) 45 25 25 19 20 18Tulsa (I) 3 7 8 11 1 1
Oregon Eugene (M) 31 22 14 14 19 22Portland (I) 43 50 32 35 18 19
Pennsylvania Erie (I) 77 75 24 31 45 53Philadelphia (I) 67 73 20 17 10 9Pittsburgh (I) 80 78 43 42 51 52
Rhode Island Pawtucket (I) 88 89 93 94 91 92South Carolina Columbia (I) 72 74 69 77 76 73
Myrtle Beach (M) 85 82 71 83 83 84South Dakota Sioux Falls (I) 50 57 52 48 58 62Tennessee Knoxville (M) 35 23 49 59 65 65
Memphis (M) 15 8 19 37 46 45Nashville (M) 46 44 62 66 68 68

2018 National Rate Study Schedules
Schedule 4
M - Municipal or Public Power DistrictI - Investor-owned utility
40 kW 40 kW 500 kW 500 kWSTATE CITY 500 kWh 1,000 kWh 10,000 kWh 14,000 kWh 150,000 kWh 180,000 kWh
National Electric Rate Study
Rankings of Industrial BillsRates in Effect January 1, 2018
Arranged by State and City
Texas Austin (M) 2 9 36 27 42 35El Paso (I) 44 54 56 44 57 57Amarillo (I) 64 65 11 6 14 10
Utah Salt Lake City (I) 9 28 51 26 33 29Vermont Burlington (M) 81 85 87 86 86 86Virginia Richmond (I) 28 34 28 21 27 16
Roanoke (I) 26 32 30 23 35 32Washington Seattle (M) 5 35 15 36 16 24
Spokane (I) 1 2 58 53 30 36Tacoma (M) 13 5 4 9 3 4
West Virginia Charleston (I) 48 48 34 32 40 41Wheeling (I) 48 48 34 32 40 41
Wisconsin Madison (I) 82 77 77 72 70 70Milwaukee (I) 73 70 67 69 67 66
Wyoming Cheyenne (I) 71 72 84 81 75 71

2018 National Rate Study Schedules
M - Municipal or Public Power DistrictI - Investor-owned utility
STATE CITY Name of Utility Utility Type
National Electric Rate Study Schedule 5 Index to Utilities in the Study
Alabama Birmingham Alabama Power Company IHuntsville City of Huntsville - (AL) M
Alaska Anchorage Municipal Light & Power MFairbanks Golden Valley Elec Assn Inc M
Arizona Mesa Salt River Project MPhoenix Arizona Public Service Company ITucson Tucson Electric Power Company I
Arkansas Little Rock Entergy Arkansas, Inc. ICalifornia Los Angeles Los Angeles Department of Water & Power M
Sacramento Sacramento Municipal Util Dist MSan Diego San Diego Gas & Electric Company ISan Francisco Pacific Gas & Electric Company I
Colorado Colorado Springs City of Colorado Springs - (CO) MDenver Public Service Company of Colorado IPueblo Black Hills/Colorado Electric (formerly Aquila Networks-WPE) I
Connecticut Bridgeport United Illuminating Company IDelaware Wilmington Delmarva Power IDistrict of Columbia Washington Potomac Electric Power Company IFlorida Jacksonville JEA M
Miami Florida Power & Light Company ITampa Tampa Electric Company I
Georgia Atlanta Georgia Power Company IHawaii Honolulu Hawaiian Electric Company IIdaho Boise Idaho Power Company IIllinois Chicago Commonwealth Edison Company I
Springfield City Water, Light & Power MIndiana Evansville Southern Indiana Gas & Electric Company I
Gary Northern Indiana Public Service Company IIndianapolis Indianapolis Power & Light Company I
Iowa Cedar Rapids Interstate Power & Light IDavenport MidAmerican Energy - East System IDes Moines MidAmerican Energy Co I
Kansas Kansas City Kansas City Board of Public Utilities MOverland Park Kansas City Power & Light Company IWichita Westar Energy Inc I
Kentucky Lexington Kentucky Utilities Company ILouisville Louisville Gas & Electric Company I
Louisiana Baton Rouge Entergy Gulf States, Inc. INew Orleans Entergy New Orleans, Inc. IShreveport Southwestern Electric Power Company I
Maine Portland Central Maine Power Co IMaryland Baltimore Baltimore Gas & Electric Company IMassachusetts Boston Boston Edison Company I
Cambridge Cambridge Electric Company ISpringfield Western Massachusetts Electric Company I

2018 National Rate Study Schedules
M - Municipal or Public Power DistrictI - Investor-owned utility
STATE CITY Name of Utility Utility Type
National Electric Rate Study Schedule 5 Index to Utilities in the Study
Michigan Detroit DTE Electric Company IGrand Rapids Consumers Energy ILansing Lansing Board of Water & Light M
Minnesota Duluth Minnesota Power Company IMinneapolis Northern States Power Co - Minnesota I
Mississippi Jackson Entergy Mississippi, Inc. IMissouri Kansas City Kansas City Power & Light Co I
Saint Louis AmerenUE ISpringfield City Utilities of Springfield - (MO) M
Montana Billings NorthWestern Energy (formerly Montana Power) INebraska Lincoln Lincoln Electric System M
Omaha Omaha Public Power District MNevada Las Vegas Nevada Power Company - NV Energy I
Reno Sierra Pacific Power Company - NV Energy INew Hampshire Manchester Public Service Company of New Hampshire INew Jersey Newark Public Service Electric & Gas Company INew Mexico Albuquerque Public Service Company of New Mexico INew York Buffalo National Grid (Niagara Mohawk Power Corporation) I
Hempstead PSEG Long Island MNew York City Consolidated Edison Company of New York I
North Carolina Charlotte Duke Energy Carolinas IRaleigh Duke Energy Progress, Inc. I
North Dakota Fargo Northern States Power Company (MN) IOhio Cincinnati Duke Energy Ohio I
Cleveland Cleveland Electric Illuminating Company IColumbus AEP (Columbus Southern Power Rate Area) I
Oklahoma Oklahoma City OG&E Electric Services ITulsa Public Service Company of Oklahoma I
Oregon Eugene Eugene Water & Electric Board MPortland Portland General Electric Company I
Pennsylvania Erie Pennsylvania Electric Company IPhiladelphia PECO Energy IPittsburgh Duquesne Light Company I
Rhode Island Pawtucket Narragansett Electric Company ISouth Carolina Columbia South Carolina Electric & Gas Company I
Myrtle Beach Santee Cooper MSouth Dakota Sioux Falls Northern States Power Company (MN) ITennessee Knoxville Knoxville Utilities Board M
Memphis Memphis Light, Gas and Water MNashville Nashville Electric Service M
Texas Austin Austin Energy MEl Paso El Paso Electric Company IAmarillo Southwestern Public Service I
Utah Salt Lake City PacifiCorp IVermont Burlington City of Burlington Electric - (VT) M

2018 National Rate Study Schedules
M - Municipal or Public Power DistrictI - Investor-owned utility
STATE CITY Name of Utility Utility Type
National Electric Rate Study Schedule 5 Index to Utilities in the Study
Virginia Richmond Dominion Virginia Power IRoanoke AEP (Appalachian Power Rate Area), Virginia I
Washington Seattle City of Seattle - (WA) MSpokane Avista Corp. ITacoma Tacoma Public Utilities M
West Virginia Charleston AEP (Appalachian Power Rate Area) IWheeling AEP (Wheeling Power Rate Area) I
Wisconsin Madison Madison Gas & Electric Company IMilwaukee We Energies (formerly Wisconsin Electric) I
Wyoming Cheyenne Cheyenne Light, Fuel & Power Company I

2018 National Rate Study Schedules
Study Rank City StateAverage Bill Difference
2017 to 2018
National Electric Rate Study Schedule 6 Overall Ranks
1 Boise ID 2%1 Tulsa OK 11%3 Tacoma WA 10%4 Davenport IA 3%5 Charlotte NC 1%6 Baton Rouge LA 11%7 Raleigh NC 5%8 Lincoln NE 0%9 Des Moines IA 14%
10 Amarillo TX 10%11 Omaha NE 0%12 Springfield MO 3%12 Wilmington DE -9%14 Saint Louis MO 3%15 Eugene OR -3%16 Oklahoma City OK 34%17 Little Rock AR 11%18 Miami FL 5%19 Philadelphia PA -6%20 Richmond VA 6%21 Austin TX -3%22 Roanoke VA -1%23 Shreveport LA 14%24 Cincinnati OH -5%25 Jackson MS 14%26 Buffalo NY 15%27 Tampa FL 2%28 Colorado Springs CO -4%29 Reno NV 19%30 Fargo ND 1%30 Seattle WA 9%32 Salt Lake City UT -1%33 Charleston WV 0%33 Wheeling WV 0%35 Lexington KY 7%36 Portland OR 1%37 Mesa AZ -6%38 Las Vegas NV 5%39 Spokane WA 0%40 Memphis TN -1%

2018 National Rate Study Schedules
Study Rank City StateAverage Bill Difference
2017 to 2018
National Electric Rate Study Schedule 6 Overall Ranks
41 Denver CO 0%42 Duluth MN 1%43 Louisville KY 6%44 Huntsville AL -3%45 Cleveland OH 7%46 Chicago IL 6%47 Baltimore MD -13%48 Billings MT -3%48 Kansas City KS 1%50 Wichita KS -4%51 Detroit MI -2%52 El Paso TX -3%53 Indianapolis IN 0%54 Columbus OH 7%55 Sioux Falls SD 9%56 Erie PA 16%57 Evansville IN -3%58 Pittsburgh PA 7%59 Jacksonville FL -8%60 Albuquerque NM -4%61 New Orleans LA 3%62 Atlanta GA 4%63 Knoxville TN 4%64 Birmingham AL 0%65 Cedar Rapids IA 8%66 Phoenix AZ 4%67 Overland Park KS 0%68 Grand Rapids MI 8%69 Minneapolis MN 1%70 Nashville TN 1%71 Milwaukee WI -1%72 Washington D.C. -1%73 Columbia SC 0%74 Tucson AZ 6%75 Springfield IL -8%76 Kansas City MO 11%77 Madison WI 0%78 Cheyenne WY 5%79 Gary IN 4%80 Sacramento CA -1%

2018 National Rate Study Schedules
Study Rank City StateAverage Bill Difference
2017 to 2018
National Electric Rate Study Schedule 6 Overall Ranks
81 Newark NJ -1%82 Portland ME 7%83 Myrtle Beach SC 2%84 Pueblo CO 9%85 Anchorage AK -20%86 Burlington VT 0%87 Hempstead NY 3%88 Lansing MI -5%89 Manchester NH 2%90 Los Angeles CA 12%91 New York City NY 8%92 Pawtucket RI 11%93 Bridgeport CT 6%94 Springfield MA 11%95 San Francisco CA 3%96 Cambridge MA 24%97 Boston MA 20%98 Fairbanks AK 15%99 San Diego CA 16%100 Honolulu HI 7%
Related Documents