NATIONAL EDUCATION CENSUS 2005 Government of Pakistan Ministry of Education Academy of Educational Planning and Management Statistics Division Federal Bureau of Statistics Islamabad 2006 PAKISTAN

Welcome message from author
This document is posted to help you gain knowledge. Please leave a comment to let me know what you think about it! Share it to your friends and learn new things together.
Transcript

NATIONAL EDUCATION CENSUS 2005
Government of Pakistan Ministry of Education
Academy of Educational Planning and Management Statistics Division Federal Bureau of Statistics
Islamabad 2006
PAKISTAN

i
FOREWORD
Education has emerged as a force and vehicle for the socio-economic development of the country. Investment on education contributes towards the accumulation of human capital resulting into shift to knowledge-based economy. Education is instrumental to poverty reduction by increasing the productivity of the poor, efficiency of labour, reducing fertility and improving health. This enables people to participate fully in the economic and social development of the country. It also enhances the capacity building of nation’s institutions resulting into good governance for planning and implementing national policies.
Availability of valid, reliable, comprehensive and up to date educational data are pre-requisite for policy formulation, its implementation and monitoring and evaluation. The lack of data or poor quality of data on the key aspects of education compels the decision-makers to make their decisions on estimation and intuition, which often do not bring the desired results. Moreover, data alone cannot solve any problem, properly collected and analyzed data facilitates planners and managers for making informed decisions for the efficiency and effectiveness of education system.
National Educational Management Information System (NEMIS) is maintaining national database in order to fulfill the information requirements of policy formulation, decision-making, interventions and resource allocation and of other national and international organizations. Present database is linked to public sector institutions only and thus cannot be considered comprehensive. Thus a complete national picture cannot emerge unless information in respect of all the above-mentioned educational institutions is collected. Therefore, the Ministry of Education decided to conduct First National Education Census (NEC) 2005 in collaboration with Federal Bureau of Statistics, Statistics Division to collect information from all categories of education institutions from pre-primary to tertiary levels. The census was initiated in November, 2005 and completed by 30th June 2006 within the shortest possible time. Through census information has been collected from all categories of education institutions including public and private sector institutions and Deeni Madaris.
The data collected through the NEC will facilitate the development of comprehensive data bank having information in respect of each education institutions functioning in the country. The information will help the decision-makers to use data for planning, management, monitoring and evaluation of the education system at various administrative levels. The data will provide base to develop vital education indicators, which will help the decision makers for necessary interventions in the education system.
I take due opportunity to appreciate the efforts made by Federal Bureau of Statistics, and Academy of Educational Planning and Management for organizing the census I also thank UNESCO and USAID for their support in this project.
Lt. General (R) Javed Ashraf Federal Minister for Education
Government of Pakistan

ii
PREFACE
National Education Management Information System (NEMIS) has been functioning in the Academy of Educational Planning and Management since 1993. The main functions of the NEMIS include collection, processing, storage, retrieval, analysis and dissemination of education data. However, NEMIS database only contains information regarding public schools while information in respect of private educational institutions, technical vocational institutions, professional colleges, universities and Deeni Madaris was partially available.
Pakistan has been signatory to a number of international declarations such as the basic right of education to all of its citizens, Millennium Development Goal and the Dakar World Education Forum 2000. The government has taken several policy measures and initiatives to achieve these international goals. To monitor the achievement of these goals, education data on key indicators are required which can also be made available to various national and international agencies for analysis and planning purposes.
Recognizing these aspects, the Ministry of Education decided to conduct a National Education Census (NEC) in collaboration with the Federal Bureau of Statistics. Through this census, the information has been collected from all categories of educational institutions functioning in the country. The census contains information in respect of the number of educational institutions, their management and type, location, gender, enrolment, availability of physical facilities and expenditures. Moreover, information in respect of each individual educational institution has been added in the database which now to be analyzed to see the progress made and to identify the policy interventions needed for achieving the objectives of the education reforms.
I appreciate the help and cooperation extended by Statistics Division for conducting the census in the shortest possible time. Particularly, my gratitude goes to Mr. Asad Elahi, Secretary, Statistics Division and his team for successfully completing the census. I am also grateful to the Academy of Educational Planning and Management and Ministry of Education’ teams for conducting the census, particularly Dr. Fayyaz, JEA (P&P Wing), Dr. Pervez Aslam Shami Izaz-e-Fazeelat, Project Director/DG AEPAM, Mr. Dawood Shah, Joint Director/Focal Person NEC, Mirza Tauhiduddin Ahmad, NEC Coordinator, Mr. T.M. Qureshi, DEA (P&P), Mr.Imamuddin Sheikh, TA and Miss. Sarwat Hamid Butt, Education Statistician, NEMIS for their services in completing the National Education Census.
Jehangir Bashar Federal Education Secretary

iii
PREFACE
Federal Bureau of Statistics (FBS), Statistics Division is an apex organization in the country for the collection of socio-economic data. It has well-established infrastructure throughout Pakistan, which is catering the needs of policy makers. Federal Bureau of Statistics has also undertaken activities related to education sector. It has conducted a Census of Private Educational Institutions in 2000. The Ministry of Education maintains database on education through its National Education Management Information System (NEMIS) with the collaboration of its counterparts- provincial education management information systems (EMISs). The Ministry of Education needed comprehensive database to cater the needs of educational planning and management because data of just public sector schools was not enough and data for private educational institutions which are growing very fast, has not been available regularly. To have comprehensive database information on the education sector the Ministry of Education planned to have a complete enumeration of all categories of institutions both in private & public sectors.
In view of this National Education Census 2005 was initiated by the Ministry of Education and Academy of Educational Planning and Management (AEPAM) and Statistics Division and FBS. The FBS was responsible for field operation and electronic data processing. Both FBS and AEPAM jointly made the preparation and launched the National Education Census 2005. The data has been collected from the entire country including FATA, ICT, Northern Areas and Azad Jammu and Kashmir. All types of educational institutions i.e. government, private and deeni madaris have been visited and information on the questionnaire has been collected by enumerators recruited particularly for National Education Census assignment. FBS data processing center processed the data and produced reports as per tabulation prepared by AEPAM.
I would like to pay compliment to my team members Mr. Khalid Mahmud, Deputy Director General, Mr. Bashir Ahmed Choudhary, Director, Mr. Muhammad Hanif Shakir, Chief Statistical Officer, Mohammad Afzal Arian, Deputy Director General and other staff of Regional offices and National Education Census.
Comments and Suggestions for the improvement of this report will be most welcome.
Asad Elahi Secretary
Statistical Division Federal Bureau of Statistics
Islamabad

iv
CONTENTS
Foreword
Preface
Executive Summary 1
National Education Census 2005 6
Major Features 14
Statistical Tables 32
Appendices I - III

v
LIST OF TABLES
Table No. Topic
Table 1 Educational Institutions (Public And Private) by Level, Enrolment and Teaching Staff
Table 1.1 Educational Institutions (Public) by Level, Enrolment and Teaching Staff
Table 1.2 Educational Institutions (Private) by Level, Enrolment and Teaching Staff
Table 2 Educational Institutions by Level, duration of Establishment of Institution
Table 3 Educational Institutions (Private) by Level, Enrolment, Teaching Staff and Expenditure
Table 4 Stage wise Enrolment in Public and Private Schools
Table 5 Educational Institutions by Management and Gender
Table 6 Educational Institutions of Semi Govt./Autonomous Institutions (Other Than Provincial
Education Departments) by gender
Table 7 Educational Institutions by Chain of Education System
Table 8 Private Educational Institutions by Registration Status and Gender
Table 9 Educational Institutions, Enrolment and Teachers by Gender and Shift
Table 10 Educational Institutions by Enrolment, Teachers and Medium of Instructions
Table 11 Educational Institutions (Public and Private) by Type and ownership of Building
Table 11.1 Educational Institutions (Public) by Type and ownership of Building
Table 11.2 Educational Institutions (Private) by Type and ownership of Building
Table 12 Educational Institutions by Type of Construction of Building, Sector and Gender
Table 13 Educational Institutions by Building Condition, Sector and Gender
Table 14 Enrolment In Educational Institutions (Public & Private) by Level and Gender
Table 14.1 Enrolment In Educational Institutions (Public) by Level and Gender
Table 14.2 Enrolment in Educational Institutions (Private) by Level and Gender
Table 15 Enrolment in Educational Institutions (Public and Private) by Level and type of
Institutions
Tale 15.1 Enrolment in Educational Institutions (Public) by Level and type of Institutions
Table 15.2 Enrolment in Educational Institutions (Private) by Level and type of Institutions
Table 16 Number of Non Functional and Refusal Institutions (Public and Private)
Table 16.1 Number of Non Functional and Refusal Institutions (Public)
Table 16.2 Number of Non Functional and Refusal Institutions (Private)
Table 17 Number of Institutions out of reference (Public and Private)
Table 17.1 Number of Institutions out of reference (Public)

vi
Table 17.2 Number of Institutions out of reference (Private)
Table 18 Enrolment in Schools (Up to Class 12) by Stage, Class, Type Of Schools and Gender
Table 19 Enrolment in Educational Institutions (Degree, Post Graduates and Others) by Stage,
Class, Sector and Gender
Table 20 Enrolment in Educational Institutions (Medical, Nursing and Pharmacy) by Stage, Class,
Sector and Gender
Table 21 Enrolment in Educational Institutions (Technical) by Stage, Class, Sector and Gender
Table 22 Enrolment in Educational Institutions (Fine Arts, Agriculture, Law, Education and Home
Economics) by Stage, Class, Sector and Gender
Table 23 Enrolment in Educational Institutions (Commerce, Business Administration and
Accountancy) by Stage, Class, Sector and Gender
Table 24 Enrolment in Educational Institutions (Tibbia, and Homeopathic) by Stage, Class, Sector
and Gender
Table 25 Enrolment in Vocational Institutions by duration of course, Sector and Gender
Table 26 Enrolment and Repeaters in Schools (Public & Private) by Class and Gender
Table 26.1 Enrolment and Repeaters in Schools (Public) by Class and Gender
Table 26.2 Enrolment and Repeaters in Schools (Private) by Class and Gender
Table 27 Teaching Staff (Public & Private) by Gender, Academic & Professional Qualifications
Table 27.1 Teaching Staff (Public) by Gender, Academic & Professional Qualifications
Table 27.2 Teaching Staff (Private) by Gender, Academic & Professional Qualifications
Table 28 Teaching Staff in Medical And Dental Institutions by Professional Qualification and
Gender
Table 29 Teaching Staff in Technical And Professional Institutions by Academic Qualification and
Gender
Table 30 Teaching Staff in Accountancy Institutions by Academic Qualification and Gender
Table 31 Teaching Staff (Public and Private) in Mono, Poly Techniques & Vocational Institutes by
Gender, Academic & Professional Qualification
Table 31.1 Teaching Staff (Public) in Mono, Poly Techniques & Vocational Institutes by Gender,
Academic & Professional Qualifications
Table 31.2 Teaching Staff (Private) in Mono, Poly Techniques & Vocational Institutes by Gender,
Academic & Professional Qualifications
Table 32 Teaching Staff in Homeopathic and Tibbia Institutions by Professional Qualifications and
Gender
Table 33 Teaching Staff in Colleges And Universities by Designation and Gender

vii
Table 34 Teaching Strength in Educational Institutions (Public and Private) by Level, Status of Post
and Gender
Table 34.1 Teaching Strength In Educational Institutions (Public) by Level, Status of Post and
Gender
Table 34.2 Teaching Strength In Educational Institutions (Private) by Level, Status of Post and
Gender
Table 35 Qualified Teachers by Selected Subjects, Gender and Sector (For General Education up to
High School only)
Table 36 Teaching and Non-Teaching Strength in Public and Private Educational Institutions by
Gender and status of Posts
Table 37 Number of Rooms in Educational Institutions by Type & Gender of Institution
Table 38 Educational Institutions by Availability of Building Facilities and Sector
Table 39 Educational Institutions by Availability of Basic Facilities and Sector
Table 40 Schools (Public and Private) by Level, Availability of Basic Facilities and Gender
Table 40.1 Schools (Public) by Level, Availability of Basic Facilities and Gender
Table 40.2 Schools (Private) by Level, Availability of Basic Facilities and Gender
Table 41 Schools (Public and Private) by Level, Gender and Availability of Instructional Material
Table 41.1 Schools (Public) by Level, Gender and Availability of Instructional Material
Table 41.2 Schools (Private) by Level, Gender and Availability of Instructional Material
Table 42 Schools (Public and Private) by Level, Gender and Availability of Furniture
Table 42.1 Schools (Public) by Level, Gender and Availability of Furniture
Table 42.2 Schools (Private) by Level, Gender and Availability of Furniture
Table 43 Schools (Public and Private) by Level, Gender and Availability of Apparatus
Table 43.1 Schools (Public) by Level, Gender and Availability of Apparatus
Table 43.2 Schools (Private) by Level, Gender and Availability of Apparatus
Table 44 School Committee by Gender and Sector
Table 45 Enrolment in Deeni Madaris by Level and Gender
Table 46 Deeni Madaris by Affiliation Status and Gender
Table 47 Deeni Madaris by Residential Status and Gender
Table 48 Teachers in Deeni Madaris by Academic & Professional Qualification and Gender
Table 49 Expenditure incurred in Educational Institutions (Private) by Level
Table 50 Receipts In Educational Institutions (Private) by Level

1
EXECUTIVE SUMMARY
The National Education Census (NEC) 2005 has been conducted for the first time in the history of Pakistan. Reliable, accurate and comprehensive database is a prerequisite for any type of planning. Obviously planning and management of education system at all levels also requires information based on the comprehensive database including all categories of educational institutions in the country. Thus the need for National Education Census was being felt from all quarters for more informed and visionary policy formulation, decision-making, efficiency, effective reforms and quality of education.
In the past incomplete database was being used which had partial information of private sector schools, colleges and universities, technical and vocational education, professional institutions, deeni madaris etc. There was no data to visualizing the total expenditure on education, as expenditure by the private sector was not available. Planning of education was affected because of the incomplete data, which is clear from the existing gap between planning and implementation. Even at international level our ranking among the countries of the world remained low due non-availability of complete data which sometime caused embarrassment for the authorities.
Keeping in view the multiple concerns the Ministry of Education decided to conduct National Education Census (NEC) 2005 in collaboration with Academy of Educational Planning and Management (AEPAM) and Federal Bureau of Statistics (FBS), Statistics Division. The census aimed at complete enumeration of all categories of educational institutions in the country and establishment of comprehensive National Data Bank on Education.
The National Education Census (NEC) covered 245,682 institutions which includes public and private schools, colleges and universities, professional institutions, vocational and technical institutions, mosque schools, deeni Madaris, non-formal basic education centres, distance education centres, special education institutions etc. The census has primarily focused to gather data on the level, type and management of the institution, enrolment, teaching staff and their qualifications and training, non-teaching staff, medium of instruction, building and other facilities available and expenditure. The data on different aspects of institutions have been collected for the year 2004-05.
Methodology
Following the model of Population Census 1998 the whole country was divided into 26,809 urban blocks and 50,582 villages.
Data collection tools were developed and pre-tested along with instructional manual for the use of field staff.
1100 enumerators were recruited and given training through master trainers before field operation.
Media campaign both print and electronic was launched simultaneously. All the Provincial Secretaries of Education, District Nazims and heads of the universities were contacted to facilitate and cooperate in the census.
Field operation that was initiated in November 2005 was completed in May 2006. The entire data collection activity was carried out through 34 Regional/Field Offices of FBS. The filled in questionnaires were retrieved back at Islamabad where editing process was carried out through a team of editors especially recruited and trained for the job. After cleaning and processing the data, reports were produced as per tabulation plan prepared by AEPAM.

2
In order to ensure complete coverage, accuracy and adherence to the timeframe a comprehensive monitoring process was devised by FBS and Ministry of Education. The teams of monitors of FBS and Ministry of Education continuously tracked the data collection process through out the country.
Information collected through census has been disaggregated by province/regions, level (primary, middle, secondary etc.), management (public, private etc.), location (urban/rural), gender (male/female) etc. Since this is the first comprehensive education census in the country therefore its results are not directly comparable with the data collected through administrative set up. However, where found necessary comparisons have been made with the available data from National Educational Management Information System (NEMIS) and other sources.
Major Features of NEC
National Education Census (NEC) 2005 is a milestone as its outcomes provides a comprehensive picture of education in Pakistan and complete enumeration of all the categories of educational institutions.
NEC data reveals that out of 26,809 urban blocks, 6149 were without institutions and out of 50,585 villages, 10,908 had no institutions.
The total number of institutions covered in the census is 245,682 out of which 164,579 are in public sector and 81,103 are in private sector.
From the covered institutions 12,737 (11,589 schools and 1,148 others (almost all are in public sector) have been reported as non-functional. The Sindh province has reported the largest share of non-functional institutions i.e. 7,442 around 58.5%. Similarly there were 4,126 and 1,028 cases of refusal and out of reference period respectively. The refusal cases are about 1.7% of the total, which is quite satisfactory for such type of census. After excluding non-functional, refusals and out of references cases the net number of institutions for which the data is collected is 227,791.
The over all enrolment in the institutions is recorded as 33.380 Millions with teaching staff of 1.357 Million. In 151,744 Public Institutions the enrolment and teaching staff have been reported as 21.258 and 0.724 Million respectively. Whereas the 76,047 institutions in Private Sector have 12.121 Million enrolment and 0.633 Million teaching staff. The results are further discussed below by type of institutions, enrolment, availability of facilities, buildings, medium of instruction, expenditure etc.
Schools
The census after excluding non-functional, refusal and out of reference has covered 201,092 schools (Pre-primary = 1081, Mosque = 14,123, Primary = 122,349, Middle = 38,449, Secondary = 25,090). If schools are disaggregated according to public and private sectors then 144,732 Public Schools (pre-primary = 287, Mosque = 14,035, Primary = 105,526, Middle = 14,334 and Secondary = 10,550) and 56,360 Private Schools (pre-primary=794, Mosque = 88, Primary = 16,823, Middle = 24,115 and Secondary = 14,540) have been covered. The public sector schools covered in census for the year 2004-05 are 156,864 compared to 159,613 schools of NEMIS. The enrolment in public sector schools is 19.65 Million compared to19.44 Million enrolment of NEMIS.
Inter and Degree Colleges
The census has reported 1,882 colleges in the entire country out of which 1,025 are in public sector and 857 in private sector. The enrolment is 1,158,489 out of which public colleges house 936,632 students. Among them 53% are females.

3
Universities
The total number of public and private universities and degree awarding institutions in Pakistan are 114 (2005-06). However, NEC 2005 covers information of 49 (31 public and 18 private) General Universities having 194,971 enrolments. Whereas technical/professional universities have been grouped along with related institutions.
Technical/Professional
The census has covered 1,324 Technical/Professional Institutions out of these 426 are in public and 898 in private sector. The total enrolment is reported as 361,534 out of which 103,179 are in public and 258355 is in private sector.
Vocational/Poly Technique
NEC has covered 3,059 vocational/poly technique institutions (916 public and 2,143 private). Similarly the overall enrolment is recorded as 238,687 (89,646 public and 149,041 private).
Non-Formal Basic Education (NFBE) Centres
The census has covered 4,831 NFBE centres whereas the Ministry of Education report indicates 10512. The less coverage may be due to their typical nature of functioning within the dwelling units without any proper identification as of other schools.
Deeni Madaris
It is the first time that Deeni Madaris have been individually enumerated through a census. Out of 12,979 Deeni Madaris, 12,153 Madaris provided the information and the enrolment is recorded as 1,549,242.
Availability of basic facilities in Public Institutions
In Public Sector Institutions 37.8% are without any Boundary wall, 32.3% without Drinking water, 56.4% without Electricity, 40.5% without Latrine and 6.8% without Building. The non-availability of basic facilities is predominately in schools and in rural areas.
Educational Institutions by Ownership and Condition of Building
The census has revealed that 83.3% of the public schools are in government buildings followed by 5.7% rent free. The private institutions are predominately housed either in rented (43.1%) or owned (42.8%) buildings followed by 11.6% in rent free.
Further 51.6% buildings of all the institutions are in satisfactory conditions and 42.7% need major or minor repair. However, 5.7% buildings have been reported in dangerous condition.
Medium of Instructions in Educational Institution
Public Sector Institutions predominantly (68.3%) follow Urdu as medium of instruction followed by 22.4% have Sindhi medium of instruction and only 1.4% have English as medium of instruction. In Sindh Public Schools in rural area almost all follow Sindhi as medium of instruction. In Private Sector 57.2% follow Urdu as medium of instruction and 28.4% institutions follow English.

4
Expenditure on Education
The census results indicate that expenditures in private sector institutions during 2004-05 are Rs. 35.91 billion which are three time higher as compared to last census of Private Educational Institutions conducted in 2001. The public Sector expenditure on education is about Rs.132 billion. The private sector spending on education is higher than reported in this census because about 9000 institutions have refused to provide the information on expenditures.
Basic Educational Indicators
In public sector institutions there are 140 students per institution against 159 in Private Sector. Similarly there are 29 students per teacher and 5 teachers per institution in public sector compared to 19 students per teacher and 8 teachers per institution in Private sector. Male vs Female student ratio indicates that 135 and 127 Male students against 100 Female students are studying in public and private institutions respectively.

5
NATIONAL EDUCATION CENSUS 2005

6
INTRODUCTION
Since the inception of Pakistan, the Ministry of Education is striving for quality education in the country. It is a fact that the educational activities have expanded many folds in the country and touching new dimensions. The planning, management and controlling of hydra-headed educational activities is not possible without reliable, accurate and comprehensive data. The Ministry of Education is constantly focusing its efforts to achieve vast proportion of its goals and also overcome the complexities in education system. It has addressed along with other areas the effective management of acquisition and supply of relevant information for educational planning and informed decision making.
Moreover, the quantitative statistical approach in educational planning and management is of utmost importance. Various dimensions of data have significant implications in planning for the future. Hence all the plans for improvement and expansion of the educational system need to be facilitated with relevant data for properly designing and casting. The feasibility of such plans depends on the adequacy and accuracy of the data collected and analyzed for making future projections. To cater for the needs and to have a comprehensive database on education the Ministry of Education decided to initiate National Education Census (NEC) 2005.
National Education Census (NEC) 2005 has been conducted for first time in the history of Pakistan for complete enumeration of all categories of institutions in the country.
Rationale
Following major facts formulated the basis for National Education Census:
· Lack of comprehensive National Data Bank on Education.
· Non-availability of public and private sector data on college education, technical and vocational education, teacher education, professional institutions, etc (engineering, medical, law, agriculture, home economics, etc.) universities and deeni madaris.
· Non-Visualization of expenditure on education by private sector.
· Embarrassment in the international circle due to insufficient information.
· Inappropriate reflection of Pakistan in international ranking (135).
· Concern of all Provincial Education Ministers and regional heads as well as planners and managers.
· Dependency and reliance on estimated data for Planning and decision-making.
· Incomplete data for computation of education indicators for EFA, MDGs, PRSP etc.
· Strengthening of education management information system and online dissemination.
Keeping in view the demand, needs and concerns for the requirement of data, the Ministry of Education launched National Education Census in November 2005 to achieve the following major objectives.
Objectives
Major objectives of the National Education Census are as under:
· Census/Enumeration of all categories of educational institutions in the country

7
· Establishment of comprehensive National Data Bank on Education and facilitating online service for sharing and dissemination
· Collect information of each and every institution in Pakistan
· Support decision makers and educational managers in planning, management, resource allocations, monitoring and evaluation of education sectors at different levels
· Cater the requirements of national and international agencies/institutions
Methodology
Following the model of Population Census 1998, the whole country was divided into 26,809 urban blocks and 50,582 villages.
Data collection tools were developed and pre-tested. A copy of the draft questionnaire was also provided to the UNESCO, for comments and assurance to meet the international standards. Necessary improvements were made in the questionnaire based on feedback. The Technical Advisory Committee approved the final version of the NEC questionnaire before printing.
The Academy of Educational Planning and Management (AEPAM) prepared Instructional Manual for the use of master trainers and field staff in collaboration with Federal Bureau of Statistics (FBS).
A three-day workshop was organized to train master trainers. The master trainers were drawn from the Regional and Field Offices of the FBS.
For data collection 1100 enumerators were recruited and special training programs of three days duration were organized in each Regional and Field Offices of the FBS. The master trainers conducted these training programs before launching the field operation.
Realizing the need for public awareness Media campaign both print and electronic was launched simultaneously. All the Provincial Secretaries for Education and District Nazims were requested to extend their cooperation in field operation.
Executive District Officers (Education), administrators of privately managed schools and heads of the universities were also contacted for their assistance and cooperation during the census.

8
NEC OPERATIONAL FRAMEWORK
The Federal Minister for Education inaugurated the field operation on November 22, 2005 at City School Campus, Islamabad. The FBS simultaneously initiated the field operation throughout the country to cover 26,809 urban blocks and 50,582 villages. The entire data collection activity was carried out through 34 Regional/Field Offices of Federal Bureau Statistics (FBS) and was completed in May 2006. Data of National Education Census was collected by combination of personal interview and record based techniques.
In order to ensure complete coverage, accuracy and adherence to timeframe a comprehensive monitoring process was devised by FBS and Ministry of Education. The teams of monitors of FBS and Ministry of Education continuously tracked the data collection process through out the country. Each supervisor checked 10% of the work of each enumerator. Moreover, working committee comprising
Need Analysis
Questionnaire Development
Printing Pre-testing of
Questionnaire Institutional Manual
Media Campaign
(Print & Electronic)
Coordinator Heads of Institutions
Prov. & Distt. Govts.
Monitoring
Tabulation Plan
Field Operation
Data Processing
Analysis of Reports
Training of Masters
Trainers
Training of Enumerators
Recruitment of Enumerators
(1100)
Recruitment and Training
of Editors and Coders

9
members of FBS and AEPAM regularly met twice a week to monitor the progress and resolve issues arising during the field operation.
For the presentation of data the tabulation plan was developed by the AEPAM in collaboration with FBS. The filled in questionnaires were retrieved back at Islamabad where editing process was carried out through a team of editors especially recruited and trained for the job. The FBS Data Processing Centre at Islamabad carried out the data cleaning and processing. The reports were produced as per tabulation plan prepared by the AEPAM.
Method of Data Collection
For the collection of data following method was followed:
1 The enumerators visited villages in rural areas and Enumeration Blocks in urban areas assigned to him/her by the concerned Regional/Field Office. The enumerators in a rural areas first met village headman or Patwari/Tapedar to locate the boundary of the village. He/she started his/her work from some well-known point in the village i.e. mosque, school etc. and proceeded in a systematic way in the enumeration area and filled-in the questionnaire of first educational institution which he/she found as per instructions. He/she recorded the particulars of the institution on the Listing Form as well which was already provided. After completing the enumeration of first institution he/she moved to the next institution and recorded this school on the Listing Form and filled in the questionnaire and so on. In urban area the enumerator identified the boundaries of enumeration block with the help of sketch map provided by the concerned Regional/Field Offices. The listing/enumeration was completed in the same manner as explained for Village.
2 Every enumerator was instructed to contact the head of the institution and if not available then the next senior. He/she showed the introductory letter issued by the Ministry of Education and explained briefly about the objectives of the census. Most of the information, which was sought, was based on the record of the institution. If institution authority indicated that they need little time to fetch the information from their record then enumerator visited the next institution and returned back as per agreement. Enumerators were advised to keep Manual of Instruction with them at the time of visit to the institutions so that if any thing needed can be explained and clarified.
3 After getting all information on the questionnaire the enumerator got the certificate signed from the responding authority of the institution.
4 Non-functional or closed institutions were reported after verifying from the responsible people of the area.
5 In case of refusal or reluctance to provide certain information the cases were brought into the notice of supervisor for assistance.
Coverage
The National Education Census covered all the educational institutions run by Government, Semi Government, Autonomous Departments, Armed Forces, Private, Community, trust, NGOs etc. as under:
1 Schools
2 Colleges
3 Universities
4 Professional institutions
10
5 Vocational and Technical institutions
6 Deeni Madaris
7 Mosque schools
8 Special Education institutions
9 Distance Education centres
10 Non-formal Basic Education centres etc.
Tuition Centers where students studying in other institutions come for additional coaching have not been covered. Educational Academies with independent certificate/degree programs have been included except those where students come from other institutions for additional coaching.
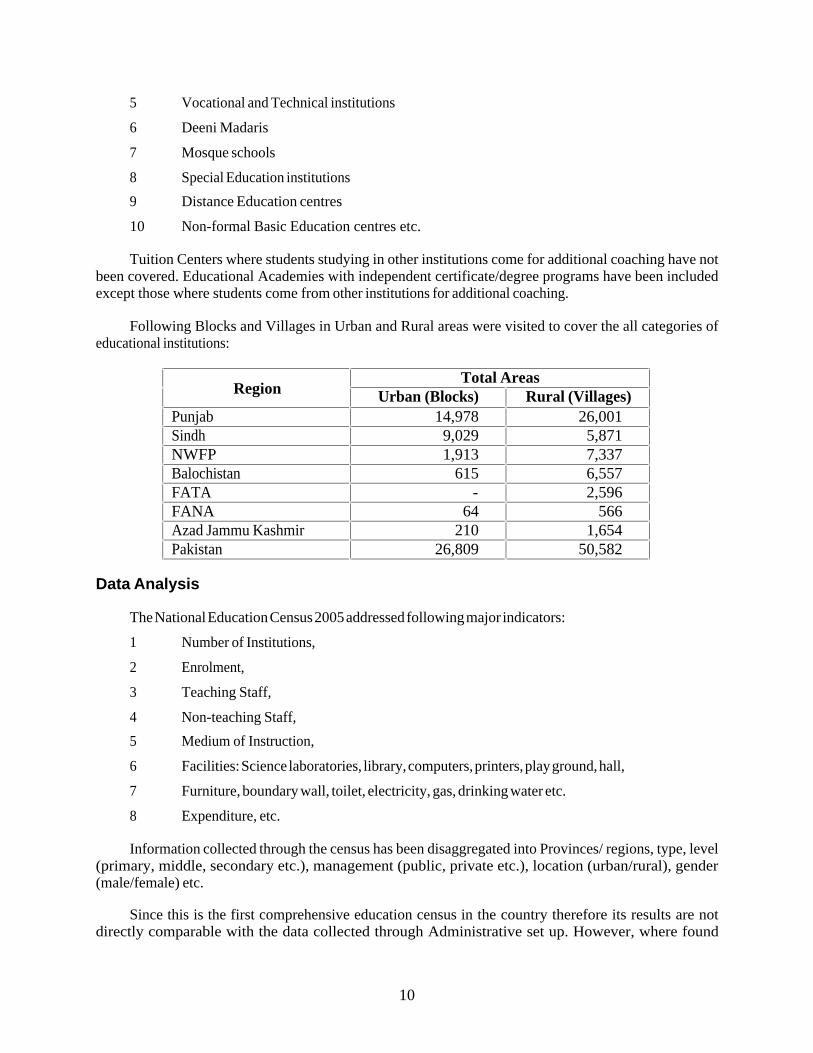
Following Blocks and Villages in Urban and Rural areas were visited to cover the all categories of educational institutions:
Total Areas
Region Urban (Blocks) Rural (Villages) Punjab 14,978 26,001 Sindh 9,029 5,871 NWFP 1,913 7,337 Balochistan 615 6,557 FATA - 2,596 FANA 64 566 Azad Jammu Kashmir 210 1,654 Pakistan 26,809 50,582
Data Analysis
The National Education Census 2005 addressed following major indicators:
1 Number of Institutions,
2 Enrolment,
3 Teaching Staff,
4 Non-teaching Staff,
5 Medium of Instruction,
6 Facilities: Science laboratories, library, computers, printers, play ground, hall,
7 Furniture, boundary wall, toilet, electricity, gas, drinking water etc.
8 Expenditure, etc.
Information collected through the census has been disaggregated into Provinces/ regions, type, level (primary, middle, secondary etc.), management (public, private etc.), location (urban/rural), gender (male/female) etc.
Since this is the first comprehensive education census in the country therefore its results are not directly comparable with the data collected through Administrative set up. However, where found

11
necessary comparisons have been made with the available data from National Education Management Information System (NEMIS) and other sources.
Reference Period
Reference Period for this census is 31st January 2005 for enrolment, teaching staff and building but
for expenditure the information was collected for the entire year i.e. from July 2004 to June 2005 (2004-2005).
Data Quality
In order to have quality data strong monitoring mechanism was devised and followed:
1 Supervisors in the Regional/Field Officers were required to check the 10% work of Enumerators
2 Teams from FBS headquarter were sent throughout field operations in all parts of the country to check the quality of work as well to ensure complete coverage.
3 Ministry of Education had also deputed their monitoring teams and these teams checked the field operations from all aspects i.e. coverage and quality.
Problems
· Winter Vacations
Field Operation was started on in November 2005 just after completing training of field staff. The Educational Institutions remained closed due to winter vacation for most of the time in December 2005 and January 2006 and in some northern areas up to 15
th March 2006, which caused delay in
data collection activities and its further processing.
· Reluctance (Non Co-operation)
Among the private institutions and Deeni Madaris a number of heads of educational institutions were reluctant to supply the information particularly regarding income and expenditure due to fear of tax imposition. Despite repeated clarifications that individual data will be kept confidential and that only aggregate data will be used for official purposes, even then some of the respondents were reluctant to supply the needed data.
Limitations
4 This census covered Public and Private educational institutions set up on 31st January 2005.
As such the institution established after 31st January 2006 were not included in the data.
5 Tuitions centres have not been included in this census.
6 There were problems in the identifications of NCHD and NFBE centres as majority of these are functioning in the already existing schools and dwelling units respectively without showing their own identity. This factor may have caused less reporting of these institutions.

12
MAJOR FEATURES
13
MAJOR FEATURES
The importance of educational statistics for successful planning and efficient administration in education can hardly be over-emphasized. The need for accurate and timely data is being increasingly felt in every sphere engaged in the task of educational planning and development.
To realize the goals it was felt that there was a need for data consolidation and interpretation at national, as well as provincial levels. Now since the district governments are functional, they need different data sets to prepare district plans, longitudinal studies in education as well as learning materials etc.
Further, within the context of EFA, MDG, commitments to international declarations and recent devolution on education reforms, it was desired that at various levels data on all categories of educational institutions be furnished to decision makers. Therefore, in order to facilitate in evidence-based formulation and result oriented program implementation and monitoring, efforts were made to carryout National Education Census (NEC) across the country.
After compilation and consolidation of NEC data, an attempt has been made to prepare national and provincial documents consisting of the comprehensive education data by level, type etc. It will help in computing education indicators for the preparation and implementation of educational development plans and its monitoring.
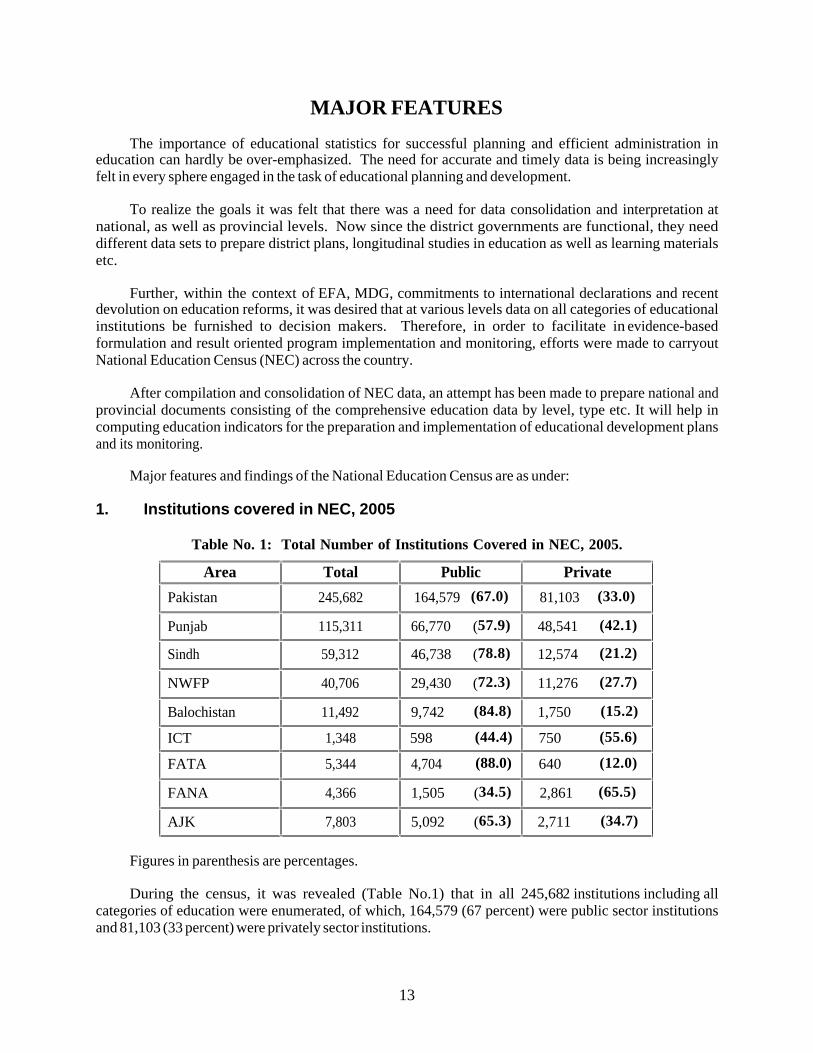
Major features and findings of the National Education Census are as under:
1. Institutions covered in NEC, 2005
Table No. 1: Total Number of Institutions Covered in NEC, 2005.
Area Total Public Private
Pakistan 245,682 164,579 (67.0) 81,103 (33.0)
Punjab 115,311 66,770 (57.9) 48,541 (42.1)
Sindh 59,312 46,738 (78.8) 12,574 (21.2)
NWFP 40,706 29,430 (72.3) 11,276 (27.7)
Balochistan 11,492 9,742 (84.8) 1,750 (15.2)
ICT 1,348 598 (44.4) 750 (55.6)
FATA 5,344 4,704 (88.0) 640 (12.0)
FANA 4,366 1,505 (34.5) 2,861 (65.5)
AJK 7,803 5,092 (65.3) 2,711 (34.7)
Figures in parenthesis are percentages.
During the census, it was revealed (Table No.1) that in all 245,682 institutions including all categories of education were enumerated, of which, 164,579 (67 percent) were public sector institutions and 81,103 (33 percent) were privately sector institutions.
14
The Area wise picture indicated that out of the total 245,682 educational institutions, 115,311 (47 percent) were in Punjab of which, 66,770 (58 percent) were public sector and 48,541 (42 percent) were private sector institutions.
Sindh shares 59,312 (24 percent) of the total institutions, out of which 46,738 (about 79 percent) were public sector and 12,574 (21 percent) were private sector institutions.
In NWFP, 40,706 (17 percent) were covered out of which 29,430 (72 percent) were public and 11,276 (28 percent) were private sector institutions.
In Balochistan, there were 11,492 (4.7 percent) institutions of which, 9,742 (about 85 percent) were public and 1,750 (15 percent) were private sector institutions.
In Islamabad Capital Territory (ICT), there were 1,348 (0.5 percent) institutions. Out of this 598 (44 percent) were public and 750 (56 percent) were private institutions.
In Federally Administered Tribal Area (FATA), there were 5,344 (2.2 percent) institutions of which, 4704 (88 percent) were public and 640 (12 percent) were private institutions.
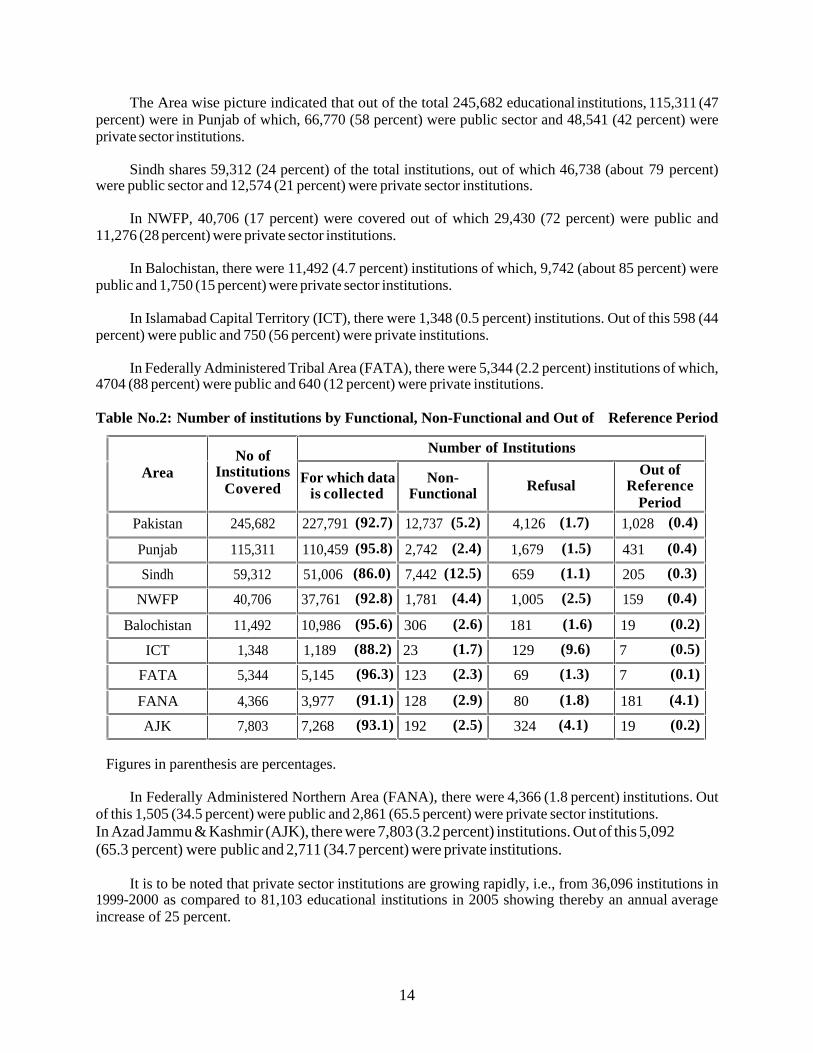
Table No.2: Number of institutions by Functional, Non-Functional and Out of Reference Period
Number of Institutions
Area No of
Institutions Covered
For which data is collected
Non-Functional
Refusal Out of
Reference Period
Pakistan 245,682 227,791 (92.7) 12,737 (5.2) 4,126 (1.7) 1,028 (0.4)
Punjab 115,311 110,459 (95.8) 2,742 (2.4) 1,679 (1.5) 431 (0.4)
Sindh 59,312 51,006 (86.0) 7,442 (12.5) 659 (1.1) 205 (0.3)
NWFP 40,706 37,761 (92.8) 1,781 (4.4) 1,005 (2.5) 159 (0.4)
Balochistan 11,492 10,986 (95.6) 306 (2.6) 181 (1.6) 19 (0.2)
ICT 1,348 1,189 (88.2) 23 (1.7) 129 (9.6) 7 (0.5)
FATA 5,344 5,145 (96.3) 123 (2.3) 69 (1.3) 7 (0.1)
FANA 4,366 3,977 (91.1) 128 (2.9) 80 (1.8) 181 (4.1)
AJK 7,803 7,268 (93.1) 192 (2.5) 324 (4.1) 19 (0.2)
Figures in parenthesis are percentages.
In Federally Administered Northern Area (FANA), there were 4,366 (1.8 percent) institutions. Out of this 1,505 (34.5 percent) were public and 2,861 (65.5 percent) were private sector institutions. In Azad Jammu & Kashmir (AJK), there were 7,803 (3.2 percent) institutions. Out of this 5,092 (65.3 percent) were public and 2,711 (34.7 percent) were private institutions.
It is to be noted that private sector institutions are growing rapidly, i.e., from 36,096 institutions in 1999-2000 as compared to 81,103 educational institutions in 2005 showing thereby an annual average increase of 25 percent.

15
2. Database of Functional and Non-Functional Institutions
The analysis of 245,682 institutions covered in the census (Table No.2), constitutes 227,791 (92.7 percent) those institutions for which data was collected; 12,737 (5.2 percent) institutions were non-functional; 4,126 (1.7 percent) were refusal cases and 1028 were (0.4) out of reference period new institutions.
In Punjab province, out of 115,311 institutions, 110,459 (95.8 percent) institutions were those for which data was collected. 2,742 (2.4 percent) were non-functional institutions, 1,679 (1.5 percent) refused cases and 431 (0.4 percent) were out of reference period.
In Sindh, out of 59,312 institutions, 51,006 (86 percent) institutions were those for which data was collected; 7,442 (12.5 percent) were non-functional, 659 (1.1 percent) were refusal cases and 205 (0.3 percent) were out of reference period institutions.
In NWFP, there were 40,706 institutions of which, 37761 (92.8 percent) were those for which data was collected; 1,781 (4.4 percent) were non-functional institutions; 1,005 (2.5 percent) were refusal cases and 159 (0.4 percent) were out of reference period.
In Balochistan, out of 11,492 educational institutions, 10,986 (95.6 percent) institutions were those for which data was collected; there were 306 (2.6 percent) non-functional institutions; 181 (1.6 percent) refusal cases and 19 (0.2 percent) were out of reference period institution.
It depicts from the Table No.2 that the highest refusal cases were reported in ICT (9.6%) followed by AJK (4.1 percent), (NWFP 2.5) percent and others remained within the range of 1.1% to 1.8% whereas the highest out of reference period institutions (i.e. new institutions) were found in FANA (4.1 percent) the remaining areas shows a very low percentage (i.e. 0.1% to 0.5%) in this respect.
3. Institutions by Location
It appears from the Table No.3 that out of 227,791 institutions for which the information is collected, 167,446 (73.5 percent) institutions were in rural areas and 60,345 (26.5 percent) were in urban. In Punjab out of 110,459 (48.5 percent) institutions, 77,054 (69.8 percent) were located in rural and 33,405(30.2) percent in urban.
Table No. 3: Number of Institutions by Location
Area Total Rural Urban
Pakistan 227,791 167,446 (73.5) 60,345 (26.5)
Punjab 110,459 77,054 (69.8) 33,405 (30.2)
Sindh 51,006 34,056 (66.8) 16,950 (33.2)
NWFP 37,761 31,849 (84.3) 5,912 (15.7)
Balochistan 10,986 9,093 (82.8) 1,893 (17.2)
ICT 1,189 618 (52.0) 571 (48.0)
FATA 5,145 5,145 (100.0) -
16
FANA 3,977 3,535 (88.9) 442 (11.1)
AJK 7,268 6,096 (83.9) 1,172 (16.1)
Figures in parenthesis are percentages.
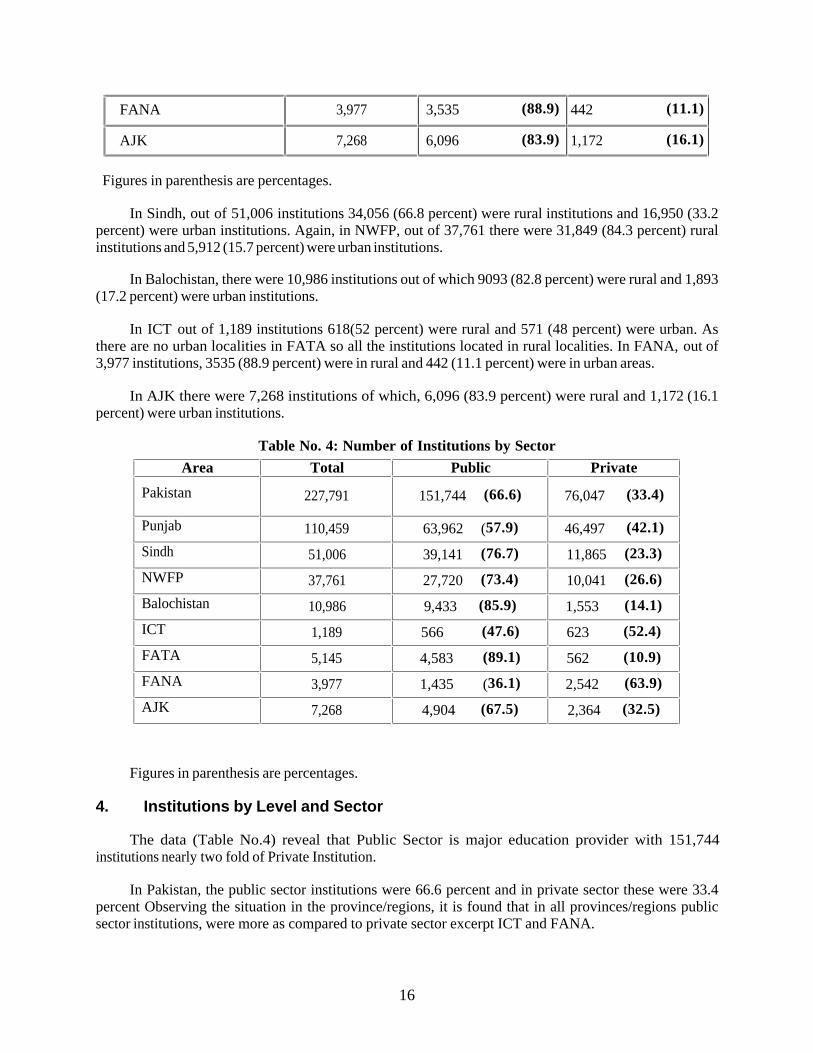
In Sindh, out of 51,006 institutions 34,056 (66.8 percent) were rural institutions and 16,950 (33.2 percent) were urban institutions. Again, in NWFP, out of 37,761 there were 31,849 (84.3 percent) rural institutions and 5,912 (15.7 percent) were urban institutions.
In Balochistan, there were 10,986 institutions out of which 9093 (82.8 percent) were rural and 1,893 (17.2 percent) were urban institutions.
In ICT out of 1,189 institutions 618(52 percent) were rural and 571 (48 percent) were urban. As there are no urban localities in FATA so all the institutions located in rural localities. In FANA, out of 3,977 institutions, 3535 (88.9 percent) were in rural and 442 (11.1 percent) were in urban areas.
In AJK there were 7,268 institutions of which, 6,096 (83.9 percent) were rural and 1,172 (16.1 percent) were urban institutions.
Table No. 4: Number of Institutions by Sector
Figures in parenthesis are percentages.
4. Institutions by Level and Sector
The data (Table No.4) reveal that Public Sector is major education provider with 151,744 institutions nearly two fold of Private Institution.
In Pakistan, the public sector institutions were 66.6 percent and in private sector these were 33.4 percent Observing the situation in the province/regions, it is found that in all provinces/regions public sector institutions, were more as compared to private sector excerpt ICT and FANA.
Area Total Public Private
Pakistan 227,791 151,744 (66.6) 76,047 (33.4)
Punjab 110,459 63,962 (57.9) 46,497 (42.1)
Sindh 51,006 39,141 (76.7) 11,865 (23.3)
NWFP 37,761 27,720 (73.4) 10,041 (26.6)
Balochistan 10,986 9,433 (85.9) 1,553 (14.1)
ICT 1,189 566 (47.6) 623 (52.4)
FATA 5,145 4,583 (89.1) 562 (10.9)
FANA 3,977 1,435 (36.1) 2,542 (63.9)
AJK 7,268 4,904 (67.5) 2,364 (32.5)

17
5. Institution by Level and Location
Table No.5 reveals that out of 227,791 institutions 1081 (0.5 percent) were pre-primary schools; 14,123 (6.2 percent) were mosque schools; 122,349 (53.7 percent) were primary schools; 38, 449 (16.9 percent) were middle and 25,090 (11.0 percent) were secondary schools and 12,153 (5.3 percent) were Deeni Madaris rest 14,546 (6.4%) were other institutions including British System of education, Inter and Degree Colleges, General Universities, Technical Professional, Vocational and Poly Techniques, NFBE and other institutes .
It is appeared that out of 227,791 institutions 167,446 (73.5 percent) were rural institutions and 60,345 (26.5 percent) were urban institutions.
Out of 1081 institutions 589 (54.5 percent) were rural pre-primary schools and 492 (45.5 percent) were urban schools.
Table No. 5: Number of Educational Institutions by Level and Location
Level of Institutions Total Rural Urban
Total 227,791 167,446 (73.5) 60,345 (26.5)
Pre-Primary 1,081 589 (54.5) 492 (45.5)
Mosque School 14,123 12,995 (92.0) 1,128 (8.0)
Primary 122,349 103,863 (84.9) 18,486 (15.1)
Middle 38,449 23,986 (62.4) 14,463 (37.6)
Secondary 25,090 11,971 (47.7) 13,119 (52.3)
British System 281 29 (10.3) 252 (89.7)
Inter and Degree College 1,882 470 (25.0) 1,412 (75.0)
General Universities 49 13 (26.5) 36 (73.5)
Technical /Professional 1,324 129 (9.7) 1,195 (90.3)
Vocational/Poly Technique 3,059 802 (26.2) 2,257 (73.8)
NFBE 4,831 3,726 (77.1) 1,105 (22.9)
Deeni Madaris 12,153 6,658 (54.8) 5,495 (45.2)
Others 3,120 2,215 (71.0) 905 (29.0)
Figures in parenthesis are percentages.
There were 14,123 mosque schools of which, 12,995 (92.0 percent) were in rural areas and 1,128 (8.0 percent) were in urban areas.
Out of 122,349 primary schools, 103,863 (84.9 percent) were rural schools whereas 18,486 (15.1 percent) were urban schools.
There were 38,449 middle schools out of which 23,986 (62.4 percent) were rural middle schools and 14,463 (37.6 percent) were urban middle schools.
Again, out of 25,090 secondary schools, 11,971 (47.7 percent) were rural secondary schools and 13,119 (52.3 percent) were in urban areas.

18
There were 12,153 Deeni Madaris out of which 6,658 (54.8 percent) were in rural areas and 5495 (45.2 percent) were in urban areas.
The remaining were 14,546 institutions out of which 7,384 (50.8%) were in rural areas and 7,162 (49.2%) were in urban areas.
6. Level of Institutions by Sector
Out of 122,349 Primary institutions (Table No. 6) 105,526 (86.2 percent) were in public sector where as 16,823 (13.8 percent) were in private. However, Middle and Secondary level schools were reported more in private sector as compared to public sector. Middle schools are 24,115 in private sector (62.7 percent) as compared to 14,334 (37.3 percent) in public sector. Similarly Secondary level schools were 14,540 (58.0 percent) and 10,550 (42.0 percent) in private and public sectors respectively.
It is observed that there were 1,882 colleges in the country of which, 1025 (54.5 percent) were in public sector and 857(45.5 percent) in the private sector.
It is also revealed that most of the Deeni Madaris were private (97.1 percent) as compared to public sector (2.9 percent).
Table No. 6: Number of Private and Public Educational Institutions by Level
Level of Institutions Total Public Private
Total 227,791 151,744 (66.6) 76,047 33.4)
Pre-Primary 1,081 287 (26.5) 794 (73.5)
Mosque School 14,123 14,035 (99.4) 88 (0.6)
Primary 122,349 105,526 (86.2) 16,823 (13.8)
Middle 38,449 14,334 (37.3) 24,115 (62.7)
Secondary 25,090 10,550 (42.0) 14,540 (58.0)
British System 281 11 (3.9) 270 (96.1)
Inter. and Degree Colleges 1,882 1,025 (54.5) 857 (45.5)
General Universities 49 31 (63.3) 18 (36.7)
Technical /Professional 1,324 426 (32.2) 898 (67.8)
Vocational/Poly Technique 3,059 916 (29.9) 2,143 (70.1)
NFBE 4,831 2,008 (41.6) 2,823 (58.4)
Deeni Madaris 12,153 354 (2.9) 11,799 (97.1)
Others 3,120 2,241 (71.8) 879 (28.2)
Figures in parenthesis are percentages.
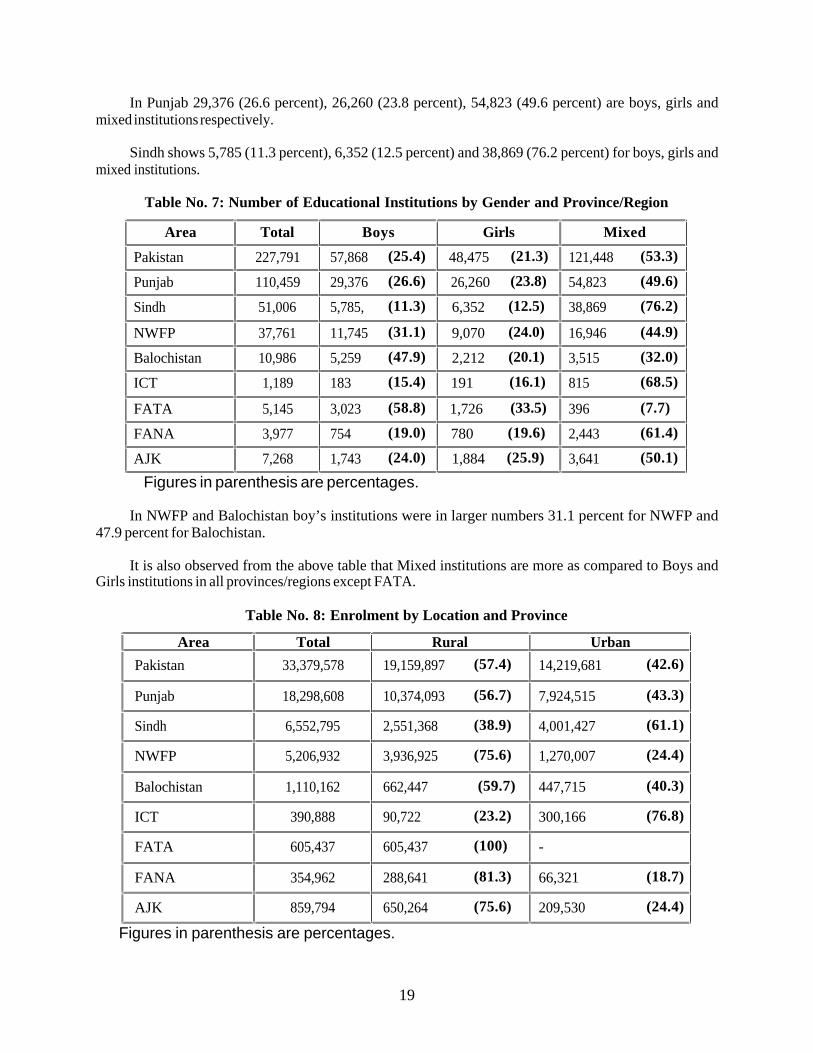
7. Institution by Gender
The Table No.7 indicates that out of 227,791institutions in the country, 57,868 (25.40 percent) were male institutions, 48,475 (21.3 percent) were female institutions and 121,448 (53.3 percent) were mixed institutions. In this census, the boys institutions were defined as the institutions where only boys are enrolled, girl’s institutions defined as where only girls are enrolled and mixed institutions defined as where both boys and girls are enrolled.
19
In Punjab 29,376 (26.6 percent), 26,260 (23.8 percent), 54,823 (49.6 percent) are boys, girls and mixed institutions respectively.
Sindh shows 5,785 (11.3 percent), 6,352 (12.5 percent) and 38,869 (76.2 percent) for boys, girls and mixed institutions.
Table No. 7: Number of Educational Institutions by Gender and Province/Region
Area Total Boys Girls Mixed
Pakistan 227,791 57,868 (25.4) 48,475 (21.3) 121,448 (53.3)
Punjab 110,459 29,376 (26.6) 26,260 (23.8) 54,823 (49.6)
Sindh 51,006 5,785, (11.3) 6,352 (12.5) 38,869 (76.2)
NWFP 37,761 11,745 (31.1) 9,070 (24.0) 16,946 (44.9)
Balochistan 10,986 5,259 (47.9) 2,212 (20.1) 3,515 (32.0)
ICT 1,189 183 (15.4) 191 (16.1) 815 (68.5)
FATA 5,145 3,023 (58.8) 1,726 (33.5) 396 (7.7)
FANA 3,977 754 (19.0) 780 (19.6) 2,443 (61.4)
AJK 7,268 1,743 (24.0) 1,884 (25.9) 3,641 (50.1)
Figures in parenthesis are percentages.
In NWFP and Balochistan boy’s institutions were in larger numbers 31.1 percent for NWFP and 47.9 percent for Balochistan.
It is also observed from the above table that Mixed institutions are more as compared to Boys and Girls institutions in all provinces/regions except FATA.
Table No. 8: Enrolment by Location and Province
Area Total Rural Urban
Pakistan 33,379,578 19,159,897 (57.4) 14,219,681 (42.6)
Punjab 18,298,608 10,374,093 (56.7) 7,924,515 (43.3)
Sindh 6,552,795 2,551,368 (38.9) 4,001,427 (61.1)
NWFP 5,206,932 3,936,925 (75.6) 1,270,007 (24.4)
Balochistan 1,110,162 662,447 (59.7) 447,715 (40.3)
ICT 390,888 90,722 (23.2) 300,166 (76.8)
FATA 605,437 605,437 (100) -
FANA 354,962 288,641 (81.3) 66,321 (18.7)
AJK 859,794 650,264 (75.6) 209,530 (24.4)
Figures in parenthesis are percentages.
20
8. Enrolment by Location
Table No.8 shows that the total enrolment was 33,379,578 out of which 19,159,897 (57.4 percent) was in rural areas whereas 14,219,681 (42.6 percent) was in urban areas.
The distribution of enrolment in each province indicates that Punjab enrolment was 18,298,608 (54.8 percent) out of the total enrolment 33,379,578 followed by Sindh 6,552,795 (19.6 percent); NWFP 5,206,932 (15.6 percent); Balochistan 1,110,162 (3.3 percent).
Province-wise urban and rural picture shows that the total enrolment of Punjab was 18,298,608 of which, 10,374,093 (56.7 percent) enrolment was in rural areas and 7,924,515 (43.3 percent) enrolment was in urban areas.
In Sindh, the total enrolment was 6,552,795. Out of this 2,551,368 (38.9 percent) was in rural areas whereas 4,001,427 (61.1 percent) was in urban areas.
In NWFP, there was a total enrolment of 5206,932 of which, 3,936,925 (75.6 percent) children were enrolled in rural areas and 1,270,007 (24.4 percent) were in urban areas.
The total enrolment in Balochistan was 1,110,162 of which, 662,447 (59.7) were enrolled in rural areas and 447,715 (40.3 percent) were in urban areas.
In ICT the total enrolment was 390,888 of which, 90,772 (23.2 percent) children were enrolled in rural areas and 300,166 (76.8 percent) in urban areas.
The enrolment in FATA was 605,437. As there are no urban localities in FATA so all the enrolment relates to rural areas.
In FANA, the total enrolment was 354,962 of which, 288,641 (81.3 percent) enrolment was in rural areas whereas 66,321 (18.7 percent) was in urban areas.
In AJK the total enrolment was 859,794 out of which 650,264 (75.6 percent) enrolment was in rural areas whereas 209,530 (24.4 percent) were in urban areas.
9. Enrolment by Gender
The gender situation of enrolment was analyzed in respect of each province. It was revealed (Table No.9) that out of 33,379,578 enrolment, the province of Punjab shared 18,298,608 (54.8 percent); Sindh 6,552,795 (19.6 percent), NWFP 5206,932 (15.6 percent); Balochistan 1,110,162 (3.3 percent). Four regions i.e., ICT, FATA, FANA and AJK shared 2211081 (6.6 percent).
From the data, the gender parity indices were determined. It is observed that in Punjab province the gender parity index (GPI) was 0.87 which means that against 100 boys there were 87 girls enrolled. This was followed by Sindh (0.70); NWFP (0.57); Balochistan (0.56); ICT (0.87); FATA (0.38); FANA (0.86) AND AJK (0.85). The minimum GPI was noticed in FATA, which may be due to their customs/culture and social taboos. The overall GPI was 0.76.

21
Table No. 9: Enrolment by Gender and Province
Province/Area Total Boys Girls
Pakistan 33,379,578 18,981,213 (56.9) 14,398,365 (43.1) Punjab 18,298,608 9,795,492 (53.5) 8,503,116 (46.5)
Sindh 6,552,795 3,844,929 (58.7) 2,707,866 (41.3)
NWFP 5,206,932 3,322,543 (63.8) 1,884,389 (36.2)
Balochistan 1,110,162 713,683 (64.3) 396,479 (35.7)
ICT 390,888 208,998 (53.5) 181,890 (46.5)
FATA 605,437 440,285 (72.7) 165,152 (27.3)
FANA 354,962 190,621 (53.7) 164,341 (46.3)
AJK 859,794 464,662 (54.0) 395,132 (46.0)
Figures in parenthesis are percentages.
Regarding the gender distribution, it was noted that in Punjab province out of 18,298,608 students 9,795,492 (53.5 percent) were boys and 8,503,116 (46.5 percent) were girls. In Sindh out of total 6552,795 students, 3,844,929 (58.7 percent) were boys and 27,07,866 (41.3 percent) were girls. In NWFP Province, there were 5,206,932 students of which, 3,322,543 (63.8 percent) were boys and 1,884,389 (36.2 percent) were girls. In Balochistan there were 1,110,162 students out of which 713,683 (64.3 percent) were boys and 396, 479 (35.7 percent) were girls. In ICT there were 390,888 students out of which 208,998 (53.5 percent) were boys and 181,890 (46.5 percent) were girls. In FATA there were 605,437 students of which, 440, 285 (72.7 percent) were males and 165,152 (27.3 percent) were females. In FANA, there were 354,962 students. Out of this 190,621 (53.7 percent) were males and 164, 341 (46.3 percent) were females. In AJK, there were 859,794 students of which, 464,662 (54.0 percent) were boys and 395,132 (46.0 percent) were girls.
10. Enrolment by Level and Gender
The proportion of enrolment at each level of institution was computed (Table No.10). It was noticed that out of 33,379,578 enrolled children 61,364 (0.18 percent) were enrolled in pre-primary. This was followed by mosque schools 802,904 (2.4 percent); Primary 12,433,240 (37.2 percent), middle school 6,652,870 (19.9 percent); and 9473,525 (28.4 percent) enrolled in secondary schools.
Table No. 10: Enrolment by level and Gender
Level of Institutions Total Girls Boys
Total 33,379,578 14,398,365 (43.1) 18,981,213 (56.9)
Pre-Primary 61,364 30,151 (49.1) 31,213 (50.9)
Mosque School 802,904 200,209 (24.9) 602,695 (75.1)
Primary 12,433,240 5,317,576 (42.7) 7,114,664 (57.3)
Middle 6,652,870 3,129,383 (47.0) 3,523,487 (53.0)
Secondary 9,473,525 4,024,174 (42.5) 5,449,351 (57.5)
British System 149,266 61,766 (41.4) 87,500 (58.6)

22
Inter and Degree Colleges 1,158,489 618,789 (53.4) 539,700 (46.6)
General Universities 194,971 63,110 (32.4) 131,861 (67.4)
Technical /Professional 361,534 103,179 (28.5) 258,355 (71.4)
Vocational/Poly Technique 238,687 89,646 (37.6) 149,041 (62.4)
NFBE 174,045 108,910 (62.6) 65,135 (37.4)
Deeni Madaris 1,549,242 586,663 (37.9) 962,579 (62.1)
Others 129,441 64,809 (50.1) 64,632 (49.9)
Figures in parenthesis are percentages.
1,158,489 students in inter and Degree colleges were enrolled which constitutes 3.5 percent of the total enrolment. In 49 General Universities it was 194,971 (0.6 percent). In Technical/Professional education the proportion was 1.08 percent. It is interesting that 1.55 million children were found enrolled in Deeni Madaris of which, 962,579 were boys.
The gender situation in respect of level of institutions was also analyzed. It is observed that in Pre-primary schools out of 61,364, there were 30,151 (49.1 percent) were girls and 31,213 (50.9 percent) were boys. In mosque Schools, out of 802, 904 there were 200,209 (24.9 percent) were girls and 602, 695 (75.1 percent) were boys. In Primary Schools out of 12,433,240 children there were 5,317,576 (42.7 percent) girls and 7,114,664 (57.3 percent) were boys. In middle school, there were 6,652,870 children of which, 3,129,383 (47.0 percent) were girls and 3,523,487 (53.0 percent) were boys. The secondary schools enrolment was 9,473,525 out of which 4,024,174 (42.5 percent) were girls and 5,449,351 (57.5 percent) were boys.
In Deeni Madaris out of 1,549,242 children 586,663 (37.9 percent) were girls and 962579 (62.1 percent) were boys.
11. Teaching Staff by Location
During the census, 227,791 educational institutions were enumerated in the country. In these institutions 1,356,802 teachers were providing education of which, 687,613 (50.7 percent) were in rural areas and 669,189 (49.3 percent) were in urban areas (Table No.11).
The Punjab province shares 716,768 (52.8 percent) teachers of which, 365,061 (50.9 percent) were in rural areas and 351,707 (49.1 percent) teachers in urban areas.
Table No. 11: Number of Teaching Staff by Location
Area No. Of Teachers Rural Urban Pakistan 1,356,802 687,613 (50.7) 669189 (49.3) Punjab 716,768 365,061 (50.9) 351707 (49.1) Sindh 290,749 84,495 (29.1) 206254 (70.9) NWFP 198,893 139,104 (69.9) 59789 (30.1) Balochistan 50,893 29,716 (58.4) 21177 (41.6) ICT 19,387 4,656 (24) 14731 (76.0) FATA 22,079 22,079 (100) - FANA 15,196 12,222 (80.4) 2974 (19.6) AJK 42,837 30,280 (70.7) 12557 (29.3)
Figures in parenthesis are percentages.

23
In Sindh 290,749 (21.4 percent) teachers were engaged in teaching out of which 84,495 (29.1 percent) were teaching in rural areas and 206,254 (70.9 percent) in urban areas.
In NWFP province 198,893 (14.6 percent) teachers were teaching, out of which 139,104 (69.9 percent) were in rural areas and 59,789 (30.1 percent) in urban areas.
In Balochistan province, there were 50,893 (3.8 percent) teachers were working of which, 29,716 (58.4 percent) were in rural areas and 21,177 (41.6 percent) in urban areas.
ICT shares 19,387 (1.4 percent) teachers out of which, 4656 (24 percent) were in rural areas and 14,731 (76 percent) in urban areas.
There were 22,079 (1.6 percent) teachers working in rural areas in FATA.
In (FANA), 15,196 (1.0) teachers were working of which, 12,222 (80.4 percent) were found teaching in rural areas and 2,974 (19.6 percent) in urban areas.
In AJK there were 42,837 (3.2 percent) teachers out of which 30,280 (70.7 percent) were teaching in rural areas and 12,557 (29.3 percent) were in urban areas.
12. Teaching Staff by Gender
The overall situation indicates (Table No.12) that out of 1,356,802 teachers there were 661,073 (48.7 percent) male teachers and 695,765 (51.3 percent) were females.
Table No. 12: Number of Teaching Staff by Gender
Area Total Male Female
Pakistan 1,356,802 661,037 (48.7) 695,765 (51.3)
Punjab 716,768 295,438 (41.2) 421,330 (58.8)
Sindh 290,749 145,673 (50.1) 145,076 (49.9)
NWFP 198,893 128,703 (64.7) 70,190 (35.3)
Balochistan 50,893 34,382 (67.6) 16,511 (32.4)
ICT 19,387 7,787 (40.2) 11,600 (50.8)
FATA 22,079 16,584 (75.1) 5,495 (24.9)
FANA 15,196 9,363 (61.6) 5,833 (38.4)
AJK 42,837 23,107 (53.9) 19,730 (46.1)
Figures in parenthesis are percentages.
In Punjab province, out of 716,768 teachers there were 295,438 (41.2 percent) male teachers whereas 421,330 (58.8 percent) female teachers. In Sindh, out of the total 290,749 teachers, there were 145,673 (50.1 percent) male teachers and 145,076 (49.9 percent) female teachers.
In NWFP, 198,893 teachers were found engaged. Out of which 128,703 (64.7 percent) were male teachers and 70,190 (35.3 percent) were female. There were 50,893 teachers in Balochistan. Out of which 34, 382 (67.6 percent) were males and 16,511 (32.4 percent) were females. 19,387 teachers were teaching in ICT. Out of which 7,787 (40.2 percent) were males and 11,600 (50.8 percent) were females.
24
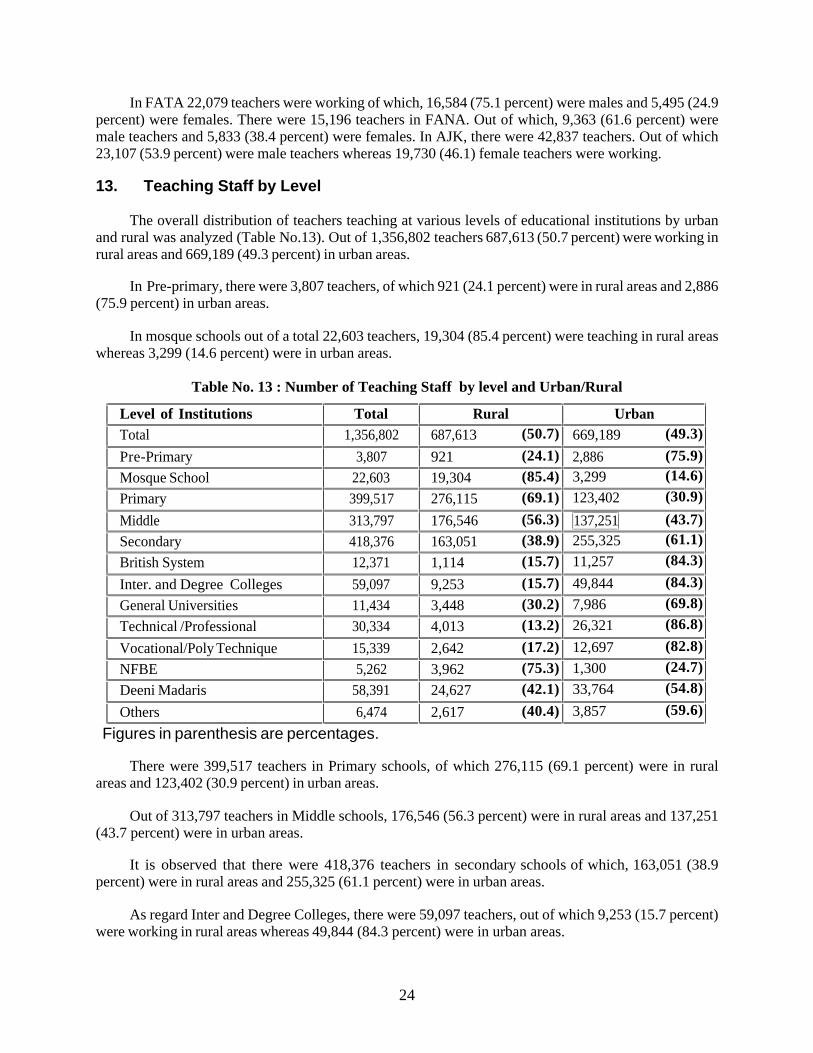
In FATA 22,079 teachers were working of which, 16,584 (75.1 percent) were males and 5,495 (24.9 percent) were females. There were 15,196 teachers in FANA. Out of which, 9,363 (61.6 percent) were male teachers and 5,833 (38.4 percent) were females. In AJK, there were 42,837 teachers. Out of which 23,107 (53.9 percent) were male teachers whereas 19,730 (46.1) female teachers were working.
13. Teaching Staff by Level
The overall distribution of teachers teaching at various levels of educational institutions by urban and rural was analyzed (Table No.13). Out of 1,356,802 teachers 687,613 (50.7 percent) were working in rural areas and 669,189 (49.3 percent) in urban areas.
In Pre-primary, there were 3,807 teachers, of which 921 (24.1 percent) were in rural areas and 2,886 (75.9 percent) in urban areas.
In mosque schools out of a total 22,603 teachers, 19,304 (85.4 percent) were teaching in rural areas whereas 3,299 (14.6 percent) were in urban areas.
Table No. 13 : Number of Teaching Staff by level and Urban/Rural
Level of Institutions Total Rural Urban
Total 1,356,802 687,613 (50.7) 669,189 (49.3)
Pre-Primary 3,807 921 (24.1) 2,886 (75.9)
Mosque School 22,603 19,304 (85.4) 3,299 (14.6)
Primary 399,517 276,115 (69.1) 123,402 (30.9)
Middle 313,797 176,546 (56.3) 137,251 (43.7)
Secondary 418,376 163,051 (38.9) 255,325 (61.1)
British System 12,371 1,114 (15.7) 11,257 (84.3)
Inter. and Degree Colleges 59,097 9,253 (15.7) 49,844 (84.3)
General Universities 11,434 3,448 (30.2) 7,986 (69.8)
Technical /Professional 30,334 4,013 (13.2) 26,321 (86.8)
Vocational/Poly Technique 15,339 2,642 (17.2) 12,697 (82.8)
NFBE 5,262 3,962 (75.3) 1,300 (24.7)
Deeni Madaris 58,391 24,627 (42.1) 33,764 (54.8)
Others 6,474 2,617 (40.4) 3,857 (59.6)
Figures in parenthesis are percentages.
There were 399,517 teachers in Primary schools, of which 276,115 (69.1 percent) were in rural areas and 123,402 (30.9 percent) in urban areas.
Out of 313,797 teachers in Middle schools, 176,546 (56.3 percent) were in rural areas and 137,251 (43.7 percent) were in urban areas.
It is observed that there were 418,376 teachers in secondary schools of which, 163,051 (38.9 percent) were in rural areas and 255,325 (61.1 percent) were in urban areas.
As regard Inter and Degree Colleges, there were 59,097 teachers, out of which 9,253 (15.7 percent) were working in rural areas whereas 49,844 (84.3 percent) were in urban areas.

25
In Technical/Professional institutions there were 30,334 teachers out of which 4,013 (13.2percent) teachers were in rural areas and 26,321 (86.8 percent) were in urban areas.
In Vocational / Poly Techniques Institutes there were 15,339 teachers of which 2,642 (17.2 percent) were in rural areas and 12,697 (82.8 percent) were in urban areas.
In Deeni Madaris, there are 58,391 teachers out of which 24,627 (42.1 percent) were in rural area and 33,764 (54.8 percent) were teaching in urban areas.
It is appeared that out of 1,356,802 teachers, the proportions of teachers in pre-primary were 3807 (0.28 percent), mosque schools 22,603 (1.67 percent), primary school teachers 399,517 (29.45 percent), middle school teachers 313,797 (23.12 percent), secondary school teachers 418,376 (30.83 percent).
Inter and degree Colleges teachers 59,097 (4.36 percent) and Deeni Madaris 58,301 (4.30 percent). The remaining levels (British system, Gen. University, Tech/Professional, Vocational/ Poly Tech, NFBE and others constitute 812,14 (5.98 percent).
14. Basic Facilities in the Institutions
The Table No.14 shows that 62 percent public educational institutions have boundary walls, 59 percent have latrine, 77 percent public schools have drinking water, 43 percent have electricity and 93 percent public schools have building.
The data indicates that 38 percent public educational institutions are without boundary walls, 41 percent are without latrine, 33 percent public schools are without drinking water, 57 percent are without electricity and 7 percent public schools are without building.
In public sector, out of 151,744 institutions 83.3 percent were housed in government buildings whereas 1.4 percent was in rented buildings. It was also noticed that 6.8 percent public institutions had no building.
Table No. 14: Number of Schools Public without Basic Facilities
Educational Institutions
Area Without Boundary
Walls
Without Drinking Water
Without Electricity
Without Latrine
Without Building
Punjab 18,339 13,690 32,189 22,206 3,433
Sindh 14,838 11,586 22,149 12,842 4,001
NWFP 9,014 9,774 13,716 10,392 1,214
Balochistan 5,447 5,621 6,950 6,137 585
ICT 51 32 20 39 -
FATA 1,275 2,013 2,045 2,079 292
FANA 748 1,085 1,033 738 36
AJK 3,769 2,965 3,531 2,783 215
Total 53,481 46,766 81,633 57,216 9,776
Percentage 37.8 32.3 56.4 40.5 6.8

26
15. Ownership of Building
The data reveal in Table No.15 that out of 227,791 institutions 55.9 percent institutions have government buildings while 15.3 percent were housed in rented building and 16 percent owned their own building, whereas 5 percent of the total institutions have no building.
It is interesting to note that in private sector the institutions were running in their “own buildings” and in “rented building” with same percentage of 43 whereas the percentage of private educational institutions running in “Govt. buildings” and “having no buildings” is same as 1.3.
Table No. 15: Distribution of Institutions by Ownership of Building & Management
Percentage of Institutions by Ownership of Building Type of Management
No. of Institutions Govt. Owned Rented Rent Free No Building
Total 227,791 55.9 16.1 15.3 7.7 5.0
Public 151,744 83.3 2.8 1.4 5.7 6.8 Private 76,047 1.3 42.8 43.1 11.6 1.3
16. Building Conditions
It emerges from the data in Table No.16 that the overall percentage of satisfactory condition of buildings of educational institutions was 51.6, whereas 26.7 percent needed minor repair, 16.0 percent required major repair and 5.7 percent educational institutions were housed in building, which was in dangerous conditions.
Table No. 16:Percentage Distribution of Educational Institutions by Building Condition
Area No. Of
Institutions Satisfactory
Need Minor Repair
Need Major Repair
Dangerous
Pakistan 216,490 51.6 26.7 16.0 5.7 Punjab 106,435 57.5 23.8 13.7 5.0 Sindh 46,862 46.8 28.2 18.9 6.1
NWFP 36,029 50.2 27.0 16.7 6.1 Balochistan 10,381 30.2 36.5 24.7 8.6 ICT 1,155 67.5 26.6 5.5 0.4 FATA 4,813 49.8 38.2 10.4 1.6
FANA 3,791 21.9 52.3 23.0 2.8
AJK 7,024 48.0 22.8 16.2 13.0
The least satisfactory conditions of educational institutions building were observed as 21.9 percent in FANA followed by AJK (13 percent).
17. Expenditure
The census results (Table No.17) indicate that expenditures in private sector institutions during 2004-05 are Rs.35.91 billion. The public Sector expenditure on education is about Rs.132 billion. The private sector spending on education is higher than reported as 9000 private institutions have refused to provide the information on expenditures. The total expenditure on education of all sectors is 11.44% and GDP is calculated to be 2.21%.

27
Table No. 17: Total Expenditure on Education 2004-2005
Sector Current (In Millions)
Development (In Millions)
Total (In Millions)
Federal Government 21,194.002 15,087.587 36,281.589 Provinces 77,437.441 19,199.924 96,637.365 Total (Public) 98,631.443 34,287.511 132,918.954 Total (Private) - - 35,914.0 Grand Total (Public +Private)
- - 168,832.954
Source: Ministry of Education and NEC
18. Educational Indicators
In public sector institutions there are 140 students per institution against 159 in Private Sector. Similarly there are 29 students per teacher and 5 teachers per institution in public sector compared to 19 students per teacher and 8 teachers per institution in Private sector. Male vs Female student ratio indicates that 135 and 127 Male students against 100 Female students are studying in public and private institutions respectively.
Table No. 18: Educational Indicators by Sector
Sector Male per 100 Female
Students
Students per Institution
Students per Teachers
Teachers per Institution
Total 132 147 25 6 Public 135 140 29 5 Private 127 159 19 8

28
STATISTICAL TABLES
29
APPENDICES

30
Appendix-I
GOVERNMENT OF PAKISTAN ACADEMY OF EDUCATIONAL PLANNING AND MANAGEMENT
AND Statistics Division
FEDERAL BUREAU OF STATISTICS
NATIONAL EDUCATION CENSUS 2005 1 The information required in this Census is obligatory under the Pakistan General Statistics
Act 1975.
2 It is assured that information supplied will be treated CONFIDENTIAL and be used to produce aggregate statistics and not made available to any individual, government agency/department for tax or any other purpose.
Section-1 Identification Particulars
1. Processing Code 2. Enumeration Block code 3. EMIS Institution Code (only for Govt. Institutions) 4. Serial No. of Institution
5. Name of Institution
6. Location & Complete Address
6.1 Village/Mohalla/St./H.No.
6.2 Union Council
6.3 City/Town
6.4 Tehsil/Taluka
6.5 District/Agency

31
7. Phone Number
8. Year of Establishment of Institution Month Year Please write the appropriate code Code
9. Status of Institution
1 Functional 2 Non Functional (If code = 2 `Non-functional’ go to next Institution
10. Institutions by type
01 Pre-
Primary School 11 Medical College 20
Education College/University
29 Accountancy Institute
02 Mosque
School 12 Medical University 21
Home Economics College
30 Poly Technique Institute
03 Primary School 13 Dental College/University
22 Business Management College/University
31 Mono Technique Institute
04 Middle/Elementary School 14 School/College of Medical Technology
23 Commerce College 32 Vocational Institute
05 Secondary/High School 15 Engineering College/University
24 IT College/University
33
Non Formal Basic Education (NFBE) Centre/School
06 Higher Secondary School 16 School/College of Nursing
25 Law College/University
34 Distance Education Centre
07 Intermediate College 17 Homeopathic College
26 Agriculture College/ University
35 Special Education
08 Degree College 18 Tibbia College 27 Veterinary/Animal Sciences institute
36 Deeni Madrassa
09 General University 19 Ayurvadic 28 Fine Arts College 37 Others (Specify)
10 British System
11. Institution by Management 01 Federal Govt. 04 Private 07 Community 10 Others (Specify)
02 Provincial Govt. 05 Trust 08 Armed Forces
03 Semi Govt./ Autonomous Body
06 Foundation 09 NGO’s
If code is 03,04,05,06 go to Q 11.1 other wise go to Q-12
11.1Please specify the name of department/chain………………………………………… (If Institutions by management mentioned in question 11 is Semi Govt/Autonomous Body/Private/Trust/Foundation write down the name of department/chain otherwise skip this) Name of Semi Government/Autonomous body in case code is 3 in Q-11
01 OPF 06 KRL Laboratories 11 Social Welfare deptt.
16 National Commission for Human Develop.
02 Railway 07 National Shipping Corporation
12 PTCL 17 Social Security/WWF
03 PIA 08 OGDC 13 Pakistan Ordinance Factories
18 TAVETA
04 WAPDA 09 Pakistan Steel Mills
14 Labour Deptt. 19 Other Deptt.(Specify)

32
05 Atomic Energy Commission
10 Local bodies/district Govt/City Govt.
15 Auqaf Deptt
Name of Chain of Education System in case code is 4,5,6 in Q-11
01 Beacon House Education System
06 FAST Institutes
11 Punjab Colleges 16 Ghazali Foundation
02 City School Education System
07 Hamdard Institutes 12 Raees-ul-Ahrar 17 READ Foundation
03 Froebels Education System 08 AIMS 13 Missionary Schools
18 Al-Khair
04 The Educators 09 Marjan Schools 14 Shaheen School System
19 Others (Specify)
05 Comsats Institutes of Information Technology
10 Tameer-e- Millat Foundation
15 Fauji Foundation
12. Registration Status (only for private institutions) (more than one box can be coded)
1 Registered 2 Recognized 3 Affiliated 4 Un-Registered 5 Others
13. Shifts
1 Morning 2 Evening 3 Both
14. Institutions by gender
1 Boys 2 Girls 3 Mixed
15. Medium of Instructions
1 Urdu 2 English 3 Arabic 4 Sindhi
5 Pushto 6 Punjabi 7 Balochi 8 Others
Section II Building Information & Instructional Material
1. Ownership of the Building
1 Government 2 Owned 3
Rente
d 4 Rent
Free 5
No Building (Go to Question-6)
2. Type of Construction
1 Pakka 2 Kacha 3 Mixed
3. Building Condition
1 Satisfactory 2 Needs Minor Repair
3 Needs major Repair
4 Dangerous
4. Number of Rooms (Please write down the numbers in the Boxes)
Total Rooms Total Class Rooms Head Teacher Room
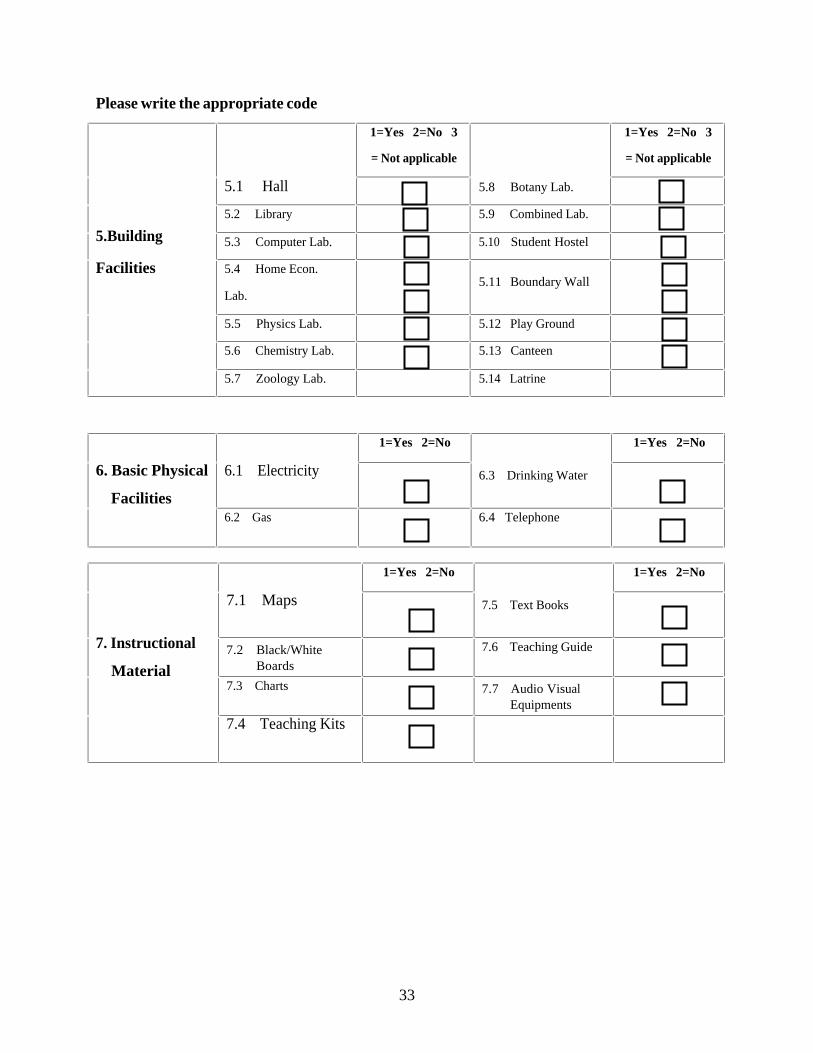
33
Please write the appropriate code
1=Yes 2=No 3
= Not applicable
1=Yes 2=No 3
= Not applicable
5.1 Hall 5.8 Botany Lab.
5.2 Library 5.9 Combined Lab.
5.3 Computer Lab. 5.10 Student Hostel
5.4 Home Econ.
Lab.
5.11 Boundary Wall
5.5 Physics Lab. 5.12 Play Ground
5.6 Chemistry Lab. 5.13 Canteen
5.Building
Facilities
5.7 Zoology Lab. 5.14 Latrine
1=Yes 2=No 1=Yes 2=No
6.1 Electricity 6.3 Drinking Water 6. Basic Physical
Facilities 6.2 Gas 6.4 Telephone
1=Yes 2=No 1=Yes 2=No
7.1 Maps 7.5 Text Books
7.2 Black/White Boards
7.6 Teaching Guide
7.3 Charts 7.7 Audio Visual Equipments
7. Instructional
Material
7.4 Teaching Kits

34
1=According to Requirement 2=Inadequate
3=Not available
1=According to Requirement 2=Inadequate
3=Not available 8.1 Tables for
Teachers
8.5 Benches for Students
8.2 Chairs for
Teachers
8.6 Tats for Students
8.3 Chairs for
Students
8.7 Carpets for
Students
8. Furniture
Available
8.4 Desk for Students 8.8 Almirahs
1=Yes 2=No
3=Not Applicable
1=Yes 2=No
3=Not Applicable
9.1 Computers 9.5 Chemicals & Chemistry Apparatus
9.2 Printers 9.6 Books in Library
9.3 Physics
Apparatus
9.6 Home Economic Material
9. Apparatus
Availability
9.4 Biology Material 9.8 Sports Material
Skip to Section VI on Page-15 for Deeni Madaress Enrolment and Teaching Staff. However, for Income & Expenditure for Deeni Madaress Section-V on Page-14 will be filled-in.

35
Section III Enrolment on 31st January 2005
Enrolment as on 31st January 2004
Enrolment as on 31st January 2005
Boys Girls Total Boys Girls Total Stages Class Code
1 2 3 4 5 6
1. General Education
Un-Admitted 310101
Prep Class 310102
Nursery Class 310103 Pre-Primary
Kachi 310104
Class 1 310201
Class 2 310202
Class 3 310203
Class 4 310204
Primary
Class 5 310205
Class 6 310301
Class 7 310302 Middle
Class 8 310303
Class 9 Science Group 310401
Class 9 Arts Group 310402
Class 9 Technical Stream 310403
Class 10 Science Group 310404
Class 10 Arts Group 310405
High
Class 10 Technical Stream 310406 (If enrolment by single age upto high level is available then fill table Enrolment by Single Age at Page-17)
Enrolment as on 31st
January 2005
Boys Girls Total Stages Class Code 1 2 3
Class 11 Science Group 310501
Class 11 Arts Group 310502
Class 12 Science Group 310503 Higher Secondary/Intermediate
Class 12 Arts Group 310504
Class 13 Science Group 310601
Class 13 Arts Group 310602
Class 14 Science Group 310603
Class 14 Arts Group 310604
B.A.Hon.1 310605
B.A. Hon.2 310606
B.A. Hon.3 310607
BSc. Hon.1 310608
BSc. Hon.2 310609
Degree
BSc. Hon.3 310610
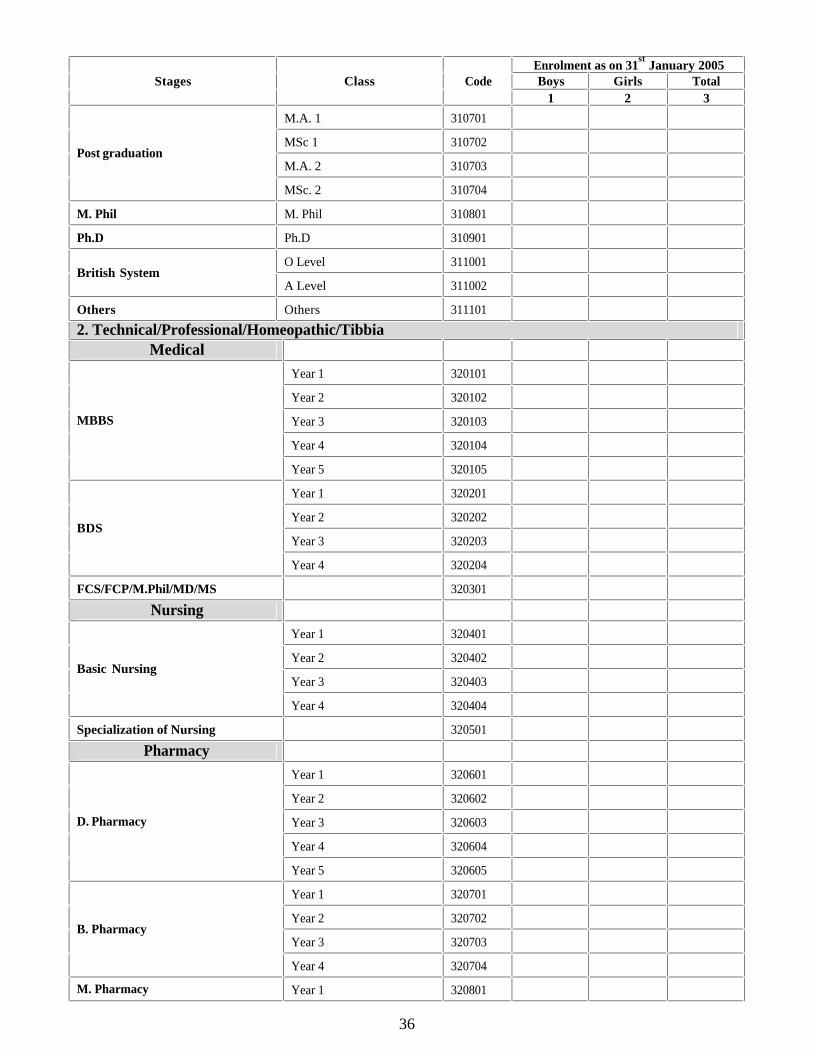
36
Enrolment as on 31
st January 2005
Boys Girls Total Stages Class Code
1 2 3
M.A. 1 310701
MSc 1 310702
M.A. 2 310703 Post graduation
MSc. 2 310704
M. Phil M. Phil 310801
Ph.D Ph.D 310901
O Level 311001 British System
A Level 311002
Others Others 311101
2. Technical/Professional/Homeopathic/Tibbia
Medical
Year 1 320101
Year 2 320102
Year 3 320103
Year 4 320104
MBBS
Year 5 320105
Year 1 320201
Year 2 320202
Year 3 320203 BDS
Year 4 320204
FCS/FCP/M.Phil/MD/MS 320301
Nursing
Year 1 320401
Year 2 320402
Year 3 320403 Basic Nursing
Year 4 320404
Specialization of Nursing 320501
Pharmacy
Year 1 320601
Year 2 320602
Year 3 320603
Year 4 320604
D. Pharmacy
Year 5 320605
Year 1 320701
Year 2 320702
Year 3 320703 B. Pharmacy
Year 4 320704
M. Pharmacy Year 1 320801

37
Year 2 320802
Enrolment as on 31st
January 2005
Boys Girls Total Stages Class Code
1 2 3
Medical Technology
Year 1 320901
Year 2 320902
Year 3 320903 Medical Technology
Year 4 320904
Veterinary/Animal Husbandry
Year 1 321001
Year 2 321002
Year 3 321003 Veterinary/Animal Husbandry
Year 4 321004
Year 1 321101 M.Sc
Year 2 321102
Engineering
Year 1 321201
Year 2 321202
Year 3 321203 B.Sc/BE
Year 4 321204
Year 1 321301 M.Sc Engineering
Year 2 321302
M. Phil Engineering 321401
Ph.D Engineering 321501
Information Technology
PGD Year 1 321601
Year 1 321701
Year 2 321702 I.T. (BCS/BSc/BSc Hon) in computer sciences
Year 3 321703
Year 1 321801 MCS/MSc Computer
Year 2 321802
M. Phil 321901
Ph.D 322001
Fine Arts
Year 1 322101
Year 2 322102
Year 3 322103 BSc/BA (Textile/Fashion/ Arts) etc.
Year 4 322104
Year 1 322201 MSc (Textile/Fashion/Arts etc).
Year 2 322202
M. Phil 322301

38
Ph.D 322302
Enrolment as on 31st
January 2005
Boys Girls Total Stage Class Code
1 2 3
Agriculture
Year 1 322401
Year 2 322402
Year 3 322403 BSc/BSc Hon.
Year 4 322404
Year 1 322501 MSc Agriculture
Year 2 322502
M. Phil 322601
Ph.D 322701
Commerce
Year 1 322801 D. Com/I. Com
Year 2 322802
Year 1 322901 B. Com
Year 2 322902
Year 1 323001 M. Com
Year 2 323002
M. Phil 323101
Ph.D 323201
Business Administration
Year 1 323301
Year 2 323302
Year 3 323303 BBA/BBA Hon.
Year 4 323304
Year 1 323401 MBA
Year 2 323402
M. Phil 323501
Ph.D 323601
Law
Year 1 323701
Year 2 323702 LLB
Year 3 323703
Year 1 323801 LLM
Year 2 323802
Bar at Law 323901
Education
B.Ed 324001
M.Ed 324101

39
Enrolment as on 31st
January 2005
Boys Girls Total Stages Class Code
1 2 3
Year 1 324201
Year 2 324202 BA/BSc Education
Year 3 324203
Year 1 324301 M.A. /MSc Education
Year 2 324402
M. Phil 324401
Ph.D 324501
Home Economics
Year 1 324601
Year 2 324602
Year 3 324603 BSc Hon.
Year 4 324604
Year 1 324701 MSc
Year 2 324702
Accountancy
Year 1 324801
Year 2 324802 CMA (Cost & Management Accountants)
Year 3 324803
Year 1 324901
Year 2 324902 CAT (Certified Accounting Technician)
Year 3 324903
Year 1 325001
Year 2 325002 ACCA (Association of Chartered Certified Accountants)
Year 3 325003
Year 1 325101
Year 2 325102 CIMA ( Chartered Institute of Management Accountants)
Year 3 325103
Year 1 325201
Year 2 325202 PIPFA (Pakistan Institute of Public Financial Accounts)
Year 3 325203
Year 1 325301
Year 2 325302
Year 3 325303 CA (Chartered Accountants)
Year 4 325304

40
Enrolment as on 31st January 2005
Boys Girls Total Stage Class Code
1 2 3
Tibbia
Year 1 325401
Year 2 325402
Year 3 325403 Hikmat/Tibb-e-jerahi
Year 4 325404
Ayurvadic System of Medicine
Year 1 325501
Year 2 325502
Year 3 325503 Ayurvadic degree
Year 4 325504
Homeopathic
Year 1 325601
Year 2 325602
Year 3 325603 B.DH
Year 4 325604
Post Graduate Diploma
Post Graduate Diploma Year 1 325701
3. Mono/Poly Technique/Vocational
Mono/Poly Technicque
Year 1 330101
Year 2 330102 Assoc ia te Eng ineer ing
Course Year 3 330103
B. Tech 330201
Vocational
Less than 3 months 330301
6 months 330302
6-9 months 330303 1. Industrial
9 months - 1 year 330304
Less than 3 months 330401
6 months 330402
6-9 months 330403
9 months - 1 year 330404
2. Para-Medical
1 Year + 330501
Less than 3 months 330601
6 months 330602
6-9 months 330603 3. Management
9 months - 1 year 330604

41
Enrolment as on 31st January 2005
Boys Girls Total Stages Class Codes
1 2 3
Less than 3 months 330701
6 months 330702
6-9 months 330703 4. Computer
9 months - 1 year 330704
Less than 3 months 330801
6 months 330802
6-9 months 330803 5. Home Sciences
9 months - 1 year 330804
PTC 330901
CT 330902 6. Education
Other certificate courses 330903
Less than 3 months 331001
6 months 331002
6-9 months 331003 6. Other Certificate courses
9 months - 1 year 331004
Any other
331101
331102
331103
331104
331105
331106
Any Other (Specify)
331107
4. Enrolment in Non-Formal Basic Education Centre/School (NFBE) and Distance Education Center Level of Education Male Female
NFBE Center
Distance Education Centre
Other Literacy Programme
5. Number of repeaters
Classes Gender
I II III IV V VI VII VIII IX TOTAL
Boys Repeaters 2003-04
Girls
42
Section IV Teaching Staff
1. Number of teaching staff (including Principal / Head Teacher/Chairman/Vice Chancellor) in educational institution
Please fill appropriate Box/Boxes from (i) to (vi) according to type of institution and type of teaching staff available
(i). Number of Teaching Staff by qualification including Principal/Head Teacher (in general education) 1. General Education (Code in institution by type Section-I question-10 is from 01 to 10 or from 33 to 35).
Professional Qualifications Academic Qualification Total
P.T.C. C.T B.ED M.ED OTHER
TRAINED UN-
TRAINED 1 2 3 4 5 6 7 8
Male
Matric
F.A.FS.c
B.A./B.Sc/B.Com/BCS
M.A./M.Sc/M.Com./MCS
M. Phil
Ph.D.
Others
Female
Matric
F.A.FS.c
B.A./B.Sc/B.Com/B.CS
M.A./M.Sc/M.Com./MCS
M. Phil
Ph.D.
Others
(ii). Medical/Dental Colleges & University (Code in institution by type Section-I question-10 is from 11 to 14).
Academic Qualification Gender
MBBS BDS FRCS/FRCP/ MRCP/MCPS
M.D. Ph.D Others Total
1 2 3 4 5 6 7 8 Male
Female

43
(iii). Teaching Staff in Technical/Professional College & University (Code in institution by type Section-I question-10 is 15 to 16 and from 20 to 28 or 37).
Academic Qualification Gender
Under Graduate Graduate Post Graduate M.Phil Ph.D Total 1 2 3 4 5 6 7
Male
Female
(iv). Teaching Staff in Institute of Accountancy (Code in institution by type Section-I question-10 is 29)
Academic Qualification
Gender BCS/PGD/ B.Com
M.A/M.Sc/ M.Com
CA/CMA/CAT /ACCA
ACA/ ACMA
FCA/ FCMA
M.Phil Ph.D Total
1 2 3 4 5 6 7 8 9 Male
Female
(v). Teaching Staff in Mono/Poly Techniques & Vocational Institutes (Code in institution by type Section-I question-10 is from 30 to 32).
Degree/Diploma Qualification Total Un-Trained
Less than 1 Year 1 Year 1 Year+ 1 2 3 4 5 6
Male
Matriculation
Intermediate
Graduate
Post Graduate
Female
Matriculation
Intermediate
Graduate
Post Graduate
(vi). Number of Teachers in Tibbia/Homeopathic/Ayureadic Colleges (Code in institution by type Section-I question-10 is from 17 to 19).
Qualification (Please Specify Male Female Total 1 2 3 4

44
2. Number of Teaching Staff by Designation (only for colleges/universities)
Gender Lecturer Assistant Professor
Associate Professor
Professor Total
1 2 3 4 5 7 Male
Female
3. Teaching Strength i) Filled in Head Teacher/Principal Post
1 Yes 2 No
ii) Strength of Teaching Staff Gender No of Sanctioned/
approved Posts No. of Filled in Posts Vacant Posts
Male
Female
Combined (Male & Female)
iii) Number of Qualified Teachers by Subject (only for general education upto High School other wise skip this)
Male Female Total i) Computer
ii) Science
iii) Mathematics
4. Strength of Non Teaching Staff Gender No of Sanctioned/
Approved Posts No. of Filled in Posts Vacant Posts
Combined
( M a l e &
Female)
1=Yes 2=No
5.1 PTA/SMC/PTSMC 5. School Committee
5.2 Functional Status
Note: PTA = Parent Teacher Association, SMC = School Management Committee, PTSMC = Parent Teachers School Management Committee

45
Section V Income & Expenditure
1. Expenditure Incurred during the Last Academic Year 2004-05
Sr.No. Head of Expenditure Amount in Rs.
1 Repair and Maintenance of Machinery & Equipment
2 Purchases of Equipment, Store & Stationery
3 Travelling/POL/Transport
4 Utilities (Electricity, Gas Water, Telephone, Postage)
5 Rent of Building
6 Repair and Maintenance of Building
7 Pay & Allowances of Teaching and Non Teaching Staff
8 All other expenditures
9 Total
2. Receipts during the last academic year 2004-05
Sr.No. Source Amount in Rs.
1 Student Admission Fee
2 Student Tuition Fee
3 Government Grant
i) in Cash
ii) in kind
4 Community Donation
i) in Cash
ii) in kind
5 Other Annual Receipts nec
Total
(For Deeni Madressa go to page-15-16 otherwise go to page-18)

46
Section VII Field Operation
Name of Respondent Designation Signature and Date Official Stamp
Particular Date Name Code Designation
Signature
Enumerated by:
Inspected by:
Checking/editing in the Regional/Field Office:
Despatched to Headquarter:
Received at Head Quarter
Section VIII Editing/Coding/Data Processing at Head quarter
Particular Date Name Code Designation
Signature
Edited by:
checked by:
Despatch to D.P. Centre:
Data entered by KPVO:
Respondents are at liberty to contact the following officers of FBS for further explanation, if required in filling of NEC Questionnaire or any other related matter. Mr. Khalid Mahmud, Deputy Director General Ph # 051-9208203 Fax No. 051-9203233 Mr. Bashir Ahmed Chaudhary, Director Ph # 051- 9261020 Fax No. 051-2250894
Mr. Muhammad Hanif Shakir, Chief Statistical Officer Ph # 051-9261596-99 Ext.30 Fax No. 051-2250894

47
Appendix-II
Government of Pakistan Federal Bureau of Statistics
Islamabad
National Education Census 2005-06
MONITORING REPORT Regional/Field Office _________________, District ____________________ Tehsil_________________
1. Name of Monitoring Officer ___________________________________________________________
2. Designation & Department :____________________________________________________________
_____________________________________________________________
3. Dates of Inspection: From: ______________________________ to ____________________________
4. Coverage of Institutions
S.No. Name of
City/Town/Village
P.C. Code NO.
No. of Schedules filled in by enumerator
Actual No. of Institutions
found during inspection
No. of Refusal Cases
No. of Non contact cases
1 2 3 4 5 6 7
5. Quality of Field Work/Quality of Data: ___________________________________________________
6. Problems faced during the census/enumeration _____________________________________________
_____________________________________________________________________________________

48
7. Suggestions for improvement: __________________________________________________________
_____________________________________________________________________________________
Signature of the Monitoring Officer: ___________________
Date: _______________________
49
Appendix-III
DEFINITIONS
Educational Institutions have been covered according to following definitions:
Pre-Primary
Educational institution sometime designed primarily to introduce very young children usually below 5 year to a school type environment. Upon completion of this programme children continue their primary education.
Mosque School
Teaching of organized or recognized education like primary, middle etc was given in the mosque.
Primary School
School having enrolment upto 5 (five) classes.
Middle School
School having enrolment upto 8 (eight) classes.
Secondary/High School
School having enrolment upto 10 (ten) classes.
Higher Secondary School
School having enrolment upto 12 (twelve) classes.
Intermediate College
College having XI & XII classes.
Degree / Post Graduate Colleges
College having upto XIV classes however, degree colleges offering post graduation education may also be included.
General University
The university offering general education. However, general education universities are also providing professional education such as Information Technology, Business Administration and in such case such universities were classified as general universities as they predominantly teach general education.
British System
School/College having British System of Education. The classes are O level or A level.

50
Professional/Technical Institutes Engineering College / University:
It includes only that institution/college/university who offers graduate/post graduate/M.Phil, Ph.D degree in any field of Engineering.
Medical College
Colleges designated for medical education and provide MBBS degree. (The institution providing medical qualification lower than this degree are included in vocational institutes).
Medical Universities
The university offering graduation and post graduation in Medicine/Surgery/ Dentistry etc.
Dental Colleges
Colleges offering bachelor and higher degree in dentistry.
Medical Technology School/Colleges
School/College of Medical Technology Colleges offering bachelor and higher degree in Medical Technology.
School/College of Nursing
School/Colleges designated for nursing education. The certificate courses are classified in vocational education.
Homeopathic College
The institutes offering doctor degree in Homeopathic like D.H. etc.
Tibbia College
The institutes offering degree on Hikmut, Jerahi, Tib etc. are included.
Education College / University
It includes only those institutions who offer Diploma/Degree in education like B.Ed, MA. (Edu), MSc (Edu), M.Phil (Edu) or Ph.D (Edu) etc. The certificate corse like PTC, CT are included in vocational.
Home Economics College/ University
The institutions which offer graduation/ post graduation degree in Home Economics/Fashion Designing, Preparation of Food etc. are included. The certificate course are included in vocational.
51
Business Management College/University
Institutions designated for Business Management Education e.g. BBA, MBA , M.Phil and Ph.D in Business Administration.
Commerce College/ University
Institutions designated for commerce education such as D.Com, I.Com, B.Com or M. Com ,M.Phil, Ph.D.etc.
IT College/ University
All those institutions designated for education in Computer Science at Graduation, Post Graduation or at Ph.D Level such as BCS, BSc (Computer Science), MCS, MSc (Computer Science) etc. Only those colleges/university included who are specifically providing Information Technology education. The IT Centre who only offer certificate courses fall under vocational institution.
Law College/ University
Institutions designated for Law Education such as LLB and LLM.
Agriculture College/ University
Institute designated for Agriculture Education such as BSc, MSc, M.Phil, Ph.D in Agriculture related subjects.
Veterinary/ Animal Sciences Institute
Institute/college/university designated for Veterinary/ Animal Sciences education such as Doctor of Veterinary Medicine (DVM) etc.
Fine Arts College/ University
The college/university designated for Fine Arts education such as B.Sc MSc Fine Arts, Textile Designing etc.
Accountancy Institute
Institute/college/university offering education in Management Accountancy such as Institute of Cost and Management Accountant of Pakistan (ICMAP), etc.
Poly Technique Institute
The institution which offer diploma in different engineering fields.
Mono Technique Institute
Institute offering diploma in only one engineering field.

52
Vocational
Some institutions may be providing vocational type of education and offer short term courses to enhance the working skills of the students and issue certificates. They are treated as vocational institutions. Vocational Institutions may be of following types:
1 Industrial Arts
2 Para-Medical
3 Management
4 Computers
5 Agriculture
6 Education
7 Special Education
8 Home Sciences
9 Others
Industrial Art
Industrial arts comprise wood works, carpet making, handicrafts, steel fixture, utensil making, weaving, printing, electrician, mechanic, welders etc.
Para Medical
Para Medical institutions are those wherein courses of Midwives, Dai, X-ray technician, laboratory technician, Dental technician, Ward boys, lady health visitors, Dispensers etc. are offered and certificate are issued.
Commercial/ Management
Institutions which offer management/commercial type of courses such as typing and short hand courses, book keeping, and letter writing etc.
Computer
Institutions which provide short courses of computers like M.S. Word, Power Point, Excel, Access, CorelDraw, Computer Languages etc.
Education
Institutions which offer certificate courses like PTC,CT etc .
Special Education
Institutions which offer certificate courses for Special Children.

53
Home Science
Pertain to preparation of different kind of foods (China foods, English foods, bread making etc), beautician, home decoration etc.
Others
All those institutions, which are not classified/covered above be covered here. For example courses like photo-graphy, painting, driving etc.
Non formal Basic Education Centre/ School (NFBE)
Any Organized educational activity outside the established formal system.
Distance Education Centre/ School
The institution, which provide education through correspondence in any media i.e. through Postal, Electronic Media, Broadcasting etc.
Special Education Centre
The institute/school designated for providing general education to special children such as duff, dumb, lamb etc.
Deeni Madaris
Deeni Madaris is that which provides formal religious education such as Ibtadiya/Sunviya/Hifiz etc. The mosque where only nazra Quran is taught are not included.
Others
Any other institute not classified above are mentioned here.
Income And Expenditure
Expenditure incurred during the academic year 2004-05
Repair & Maintenance of Machinery & Equipments
It includes expenditure incurred on repair & maintenance on the machinery & equipment (computer, photo-copy machine, fax machine, other machinery), furniture/fixture etc.
Purchases of Equipment, Store & Stationary Items
The expenses on the purchase of equipment/store/stationary, crockery etc.
Traveling/POL/Transport
Expenditure incurred on conveyance charges, transport charges, repair & maintenance of transport should be given. In case of hired transport, total amount given for hiring may also be given.
54
Utilities
Expenditure on water, gas, electricity, telephones, postage and other utilities be given.
Rent of building
Rent of building (only for rented building for private institutions) be given.
Repair & Maintenance of Building
White washing, distempering and other repair of the Building be noted. (In case of own building).
Pay & Allowances of Teaching and Non Teaching Staff
Pay and Allowances of the teaching and non teaching staff including the head teacher/principal be recorded. Allowance may include conveyance allowance, medical allowance, dearness allowance, house rent allowance, other compensatory allowances.
Receipt/Income – 2004-05 Student Admission Fee
It is the total of admission fee during the academic year 2004-05 which is taken for the admission of students at the time of their admission. Fee received in dollars be converted into rupees.
Student Tuition Fee
Total tuition fee received from the students during academic year 2004-05. Tuition fee in dollars be converted into rupees.
Government Grant in Cash
Grant received from Government in Cash during the academic year 2004-05.
Government Grant in Kind
The estimated cost of the furniture/fixture or other kinds received from the Government as a grant.
Community Donation in Cash
Grant received from community in cash during the academic year 2004-05.
Community Donation in kind
The estimated cost of the equipments, furniture/fixture or other kinds received from the community as a grant.
Other Annual Receipts
Income from fines, from renting/hiring of any machinery/equipments, income from providing transport to the students, sports, funds, library funds, computer fee charges examination fee, school leaving certificate charges, fines, mosque funds and disposal of equipment, furniture and fixture.

55
DEENI MADARIS 1. Enrolment by level in Deeni Madaris:
Students studying Nazra, Hifz, Ibtadaia, Mutwasat etc. by sex and levels.
2. a) Affiliation of Madaris
Affiliation of Madaris by Wafaq, Tanzeem, Rabta or with any other.
b) Accommodation Facilities
Accommodation facilities available in Madaris by local and non-local students.
3. Number of Teachers by Qualification
Teaching Staff by academic and religious education.
4. Non-Teaching Staff
Availability of non-teaching staff in Madaris.

TABLE 1: EDUCATIONAL INSTITUTIONS (PUBLIC AND PRIVATE) BY LEVEL, ENROLMENT AND TEACHING STAFF
Pakistan (Number) ------------------------------------------------------------------------------------------------------------------------------------------------- | Institutions | Enrolment | Teaching Staff Level of Institution |-----------------------------------|-------------------------------------|------------------------------------ | Total | Girls | Boys | Mixed | Total | Girls | Boys | Total | Female | Male -------------------------------------------------------------------------------------------------------------------------------------------------
All Areas
Total (a to h) 227,791 48,475 57,868 121,448 33,379,578 14,398,365 18,981,213 1,356,802 695,765 661,037
a. General 203,304 42,543 51,589 109,172 30,926,629 13,445,158 17,481,471 1,241,002 661,708 579,294
Pre-Primary 1,081 96 63 922 61,364 30,151 31,213 3,807 3,180 627
Mosque 14,123 163 4,288 9,672 802,904 200,209 602,695 22,603 912 21,691
Primary 122,349 30,078 33,309 58,962 12,433,240 5,317,576 7,115,664 399,517 188,995 210,522
Middle/Elementry 38,449 6,809 6,224 25,416 6,652,870 3,129,383 3,523,487 313,797 203,894 109,903
Secondry/High 22,955 3,946 6,460 12,549 8,323,046 3,506,466 4,816,580 368,119 203,096 165,023
Higher-Secondary 2,135 661 663 811 1,150,479 517,708 632,771 50,257 24,630 25,627
Intermediate College 747 264 208 275 201,328 80,885 120,443 15,119 6,703 8,416
Degree College 1,135 511 362 262 957,161 537,904 419,257 43,978 20,511 23,467
General University 49 4 1 44 194,971 63,110 131,861 11,434 3,439 7,995
British System 281 11 11 259 149,266 61,766 87,500 12,371 6,348 6,023
b. Technical/Professional 1,324 142 270 912 361,534 103,179 258,355 30,334 7,376 22,958
Medical College 30 3 1 26 16,910 9,326 7,584 3,275 1,034 2,241
Medical University 6 6 2,943 1,452 1,491 1,364 415 949
Dental College/University 6 6 815 549 266 300 115 185
School/College of Medical Techn 29 4 9 16 3,082 843 2,239 634 125 509
School/College of Nursing 74 54 10 10 7,296 5,341 1,955 479 356 123
Homeopathic College 122 4 4 114 19,958 6,694 13,264 1,172 376 796
Tibbia College 24 2 22 3,569 300 3,269 195 31 164
Education College/University 131 26 20 85 35,226 26,428 8,798 2,611 1,423 1,188
Home-Economics College 5 5 5,452 5,452 349 325 24
Business Management.C/U 52 1 2 49 13,151 3,460 9,691 1,577 338 1,239
Commerce College 378 29 150 199 124,611 17,001 107,610 6,093 876 5,217
Engineering College/University 33 5 28 39,686 5,970 33,716 3,675 434 3,241
IT College/University 293 14 56 223 39,172 8,591 30,581 4,334 864 3,470
Law College/University 71 3 68 17,830 4,049 13,781 1,447 268 1,179
Agriculture College/University 13 2 11 14,759 2,999 11,760 1,583 143 1,440
Veterinary/Animal Sciences inst 3 3 1,094 240 854 130 15 115
Fine-Arts College 20 20 3,005 1,459 1,546 373 103 270
Accountancy Institutes 34 2 6 26 12,975 3,025 9,950 743 135 608

TABLE 1: EDUCATIONAL INSTITUTIONS (PUBLIC AND PRIVATE) BY LEVEL, ENROLMENT AND TEACHING STAFF
Pakistan (Number)
-------------------------------------------------------------------------------------------------------------------------------------------------
| Institutions | Enrolment | Teaching Staff
Level of Institution |-----------------------------------|-------------------------------------|------------------------------------
| Total | Girls | Boys | Mixed | Total | Girls | Boys | Total | Female | Male
-------------------------------------------------------------------------------------------------------------------------------------------------
All Areas
c. Vocational/Polytech 3,059 1,475 685 899 238,687 89,646 149,041 15,339 4,759 10,580
Polytechnic Institute 151 12 121 18 55,763 2,703 53,060 3,422 241 3,181
Monotechnic Institute 49 3 27 19 5,923 719 5,204 396 37 359
Vocational Institute 2,859 1,460 537 862 177,001 86,224 90,777 11,521 4,481 7,040
d. NFBE 4,831 948 206 3,677 174,045 108,910 65,135 5,262 4,376 886
e. Distance Education 32 1 4 27 33,841 13,771 20,070 1,040 340 700
f. Special Education 218 9 20 189 13,122 4,929 8,193 1,629 961 668
g. Denni Madaris 12,153 1,929 4,178 6,046 1,549,242 586,663 962,579 58,391 14,248 44,143
h. Others n. e. c 2,870 1,428 916 526 82,478 46,109 36,369 3,805 1,997 1,808
-------------------------------------------------------------------------------------------------------------------------------------------------

TABLE 1: EDUCATIONAL INSTITUTIONS (PUBLIC AND PRIVATE) BY LEVEL, ENROLMENT AND TEACHING STAFF
Pakistan (Number)
-------------------------------------------------------------------------------------------------------------------------------------------------
| Institutions | Enrolment | Teaching Staff
Level of Institution |-----------------------------------|-------------------------------------|------------------------------------
| Total | Girls | Boys | Mixed | Total | Girls | Boys | Total | Female | Male
-------------------------------------------------------------------------------------------------------------------------------------------------
Rural Areas
Total (a to h) 167,446 38,761 47,833 80,852 19,159,897 7,639,535 11,520,362 687,613 278,383 409,230
a. General 153,916 35,616 44,389 73,911 18,177,325 7,246,987 10,930,338 649,752 267,585 382,167
Pre-Primary 589 78 60 451 23,048 11,661 11,387 921 551 370
Mosque 12,995 149 3,917 8,929 699,169 169,972 529,197 19,304 514 18,790
Primary 103,863 26,991 30,272 46,600 9,418,384 3,866,265 5,552,119 276,115 105,545 170,570
Middle/Elementry 23,986 5,715 5,184 13,087 3,942,037 1,829,248 2,112,789 176,546 96,851 79,695
Secondry/High 10,931 2,140 4,360 4,431 3,462,809 1,143,706 2,319,103 144,024 52,807 91,217
Higher-Secondary 1,040 351 415 274 448,096 162,384 285,712 19,027 6,719 12,308
Intermediate College 213 92 64 57 44,373 16,426 27,947 3,506 1,385 2,121
Degree College 257 98 114 45 92,466 28,741 63,725 5,747 1,855 3,892
General University 13 1 1 11 35,801 14,209 21,592 3,448 590 2,858
British System 29 1 2 26 11,142 4,375 6,767 1,114 768 346
b. Technical/Professional 129 6 48 75 36,038 9,185 26,853 4,013 654 3,359
Medical College 3 3 1,091 461 630 384 31 353
Medical University 2 2 1,723 941 782 1,174 331 843
Dental College/University 1 1 52 44 8 5 1 4
School/College of Medical Techn 3 2 1 393 150 243 33 7 26
School/College of Nursing 3 3 247 247 13 13
Homeopathic College 6 6 711 255 456 44 16 28
Tibbia College 1 1 45 2 43 6 1 5
Education College/University 12 2 5 5 7,014 4,595 2,419 156 41 115
Home-Economics College
Business Management.C/U 6 1 1 4 1,773 338 1,435 130 22 108
Commerce College 27 20 7 4,062 79 3,983 274 32 242
Engineering College/University 9 9 11,284 1,130 10,154 1,002 52 950
IT College/University 42 18 24 2,084 292 1,792 198 28 170
Law College/University 6 1 5 604 231 373 56 4 52
Agriculture College/University 6 1 5 4,361 403 3,958 493 57 436
Veterinary/Animal Sciences inst 1 1 22 1 21 21 6 15
Fine-Arts College
Accountancy Institutes 1 1 572 16 556 24 12 12
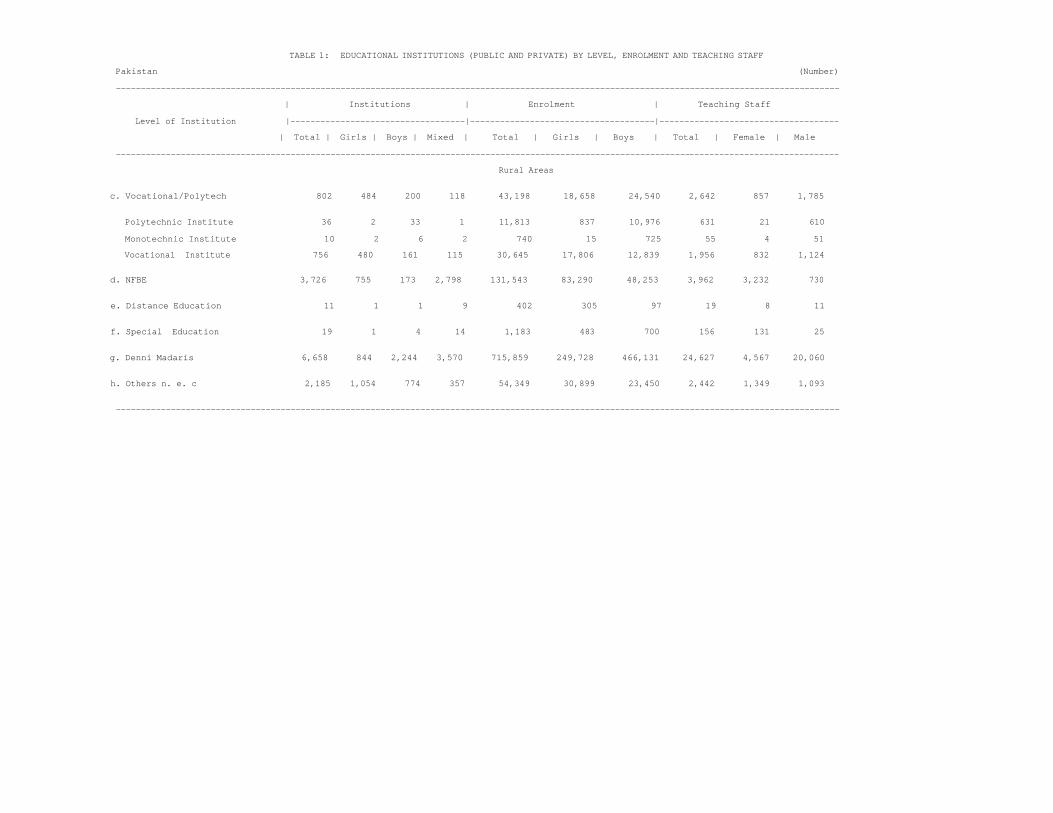
TABLE 1: EDUCATIONAL INSTITUTIONS (PUBLIC AND PRIVATE) BY LEVEL, ENROLMENT AND TEACHING STAFF
Pakistan (Number)
-------------------------------------------------------------------------------------------------------------------------------------------------
| Institutions | Enrolment | Teaching Staff
Level of Institution |-----------------------------------|-------------------------------------|------------------------------------
| Total | Girls | Boys | Mixed | Total | Girls | Boys | Total | Female | Male
-------------------------------------------------------------------------------------------------------------------------------------------------
Rural Areas
c. Vocational/Polytech 802 484 200 118 43,198 18,658 24,540 2,642 857 1,785
Polytechnic Institute 36 2 33 1 11,813 837 10,976 631 21 610
Monotechnic Institute 10 2 6 2 740 15 725 55 4 51
Vocational Institute 756 480 161 115 30,645 17,806 12,839 1,956 832 1,124
d. NFBE 3,726 755 173 2,798 131,543 83,290 48,253 3,962 3,232 730
e. Distance Education 11 1 1 9 402 305 97 19 8 11
f. Special Education 19 1 4 14 1,183 483 700 156 131 25
g. Denni Madaris 6,658 844 2,244 3,570 715,859 249,728 466,131 24,627 4,567 20,060
h. Others n. e. c 2,185 1,054 774 357 54,349 30,899 23,450 2,442 1,349 1,093
-------------------------------------------------------------------------------------------------------------------------------------------------

TABLE 1: EDUCATIONAL INSTITUTIONS (PUBLIC AND PRIVATE) BY LEVEL, ENROLMENT AND TEACHING STAFF
Pakistan (Number) ------------------------------------------------------------------------------------------------------------------------------------------------- | Institutions | Enrolment | Teaching Staff Level of Institution |-----------------------------------|-------------------------------------|------------------------------------ | Total | Girls | Boys | Mixed | Total | Girls | Boys | Total | Female | Male -------------------------------------------------------------------------------------------------------------------------------------------------
Urban Areas
Total (a to h) 60,345 9,714 10,035 40,596 14,219,681 6,758,830 7,460,851 669,189 417,382 251,807
a. General 49,388 6,927 7,200 35,261 12,749,304 6,198,171 6,551,133 591,250 394,123 197,127
Pre-Primary 492 18 3 471 38,316 18,490 19,826 2,886 2,629 257
Mosque 1,128 14 371 743 103,735 30,237 73,498 3,299 398 2,901
Primary 18,486 3,087 3,037 12,362 3,014,856 1,451,311 1,563,545 123,402 83,450 39,952
Middle/Elementry 14,463 1,094 1,040 12,329 2,710,833 1,300,135 1,410,698 137,251 107,043 30,208
Secondry/High 12,024 1,806 2,100 8,118 4,860,237 2,362,760 2,497,477 224,095 150,289 73,806
Higher-Secondary 1,095 310 248 537 702,383 355,324 347,059 31,230 17,911 13,319
Intermediate College 534 172 144 218 156,955 64,459 92,496 11,613 5,318 6,295
Degree College 878 413 248 217 864,695 509,163 355,532 38,231 18,656 19,575
General University 36 3 33 159,170 48,901 110,269 7,986 2,849 5,137
British System 252 10 9 233 138,124 57,391 80,733 11,257 5,580 5,677
b. Technical/Professional 1,195 136 222 837 325,496 93,994 231,502 26,321 6,722 19,599
Medical College 27 3 1 23 15,819 8,865 6,954 2,891 1,003 1,888
Medical University 4 4 1,220 511 709 190 84 106
Dental College/University 5 5 763 505 258 295 114 181
School/College of Medical Techn 26 4 7 15 2,689 693 1,996 601 118 483
School/College of Nursing 71 51 10 10 7,049 5,094 1,955 466 343 123
Homeopathic College 116 4 4 108 19,247 6,439 12,808 1,128 360 768
Tibbia College 23 2 21 3,524 298 3,226 189 30 159
Education College/University 119 24 15 80 28,212 21,833 6,379 2,455 1,382 1,073
Home-Economics College 5 5 5,452 5,452 349 325 24
Business Management.C/U 46 1 45 11,378 3,122 8,256 1,447 316 1,131
Commerce College 351 29 130 192 120,549 16,922 103,627 5,819 844 4,975
Engineering College/University 24 5 19 28,402 4,840 23,562 2,673 382 2,291
IT College/University 251 14 38 199 37,088 8,299 28,789 4,136 836 3,300
Law College/University 65 2 63 17,226 3,818 13,408 1,391 264 1,127
Agriculture College/University 7 1 6 10,398 2,596 7,802 1,090 86 1,004
Veterinary/Animal Sciences inst 2 2 1,072 239 833 109 9 100
Fine-Arts College 20 20 3,005 1,459 1,546 373 103 270
Accountancy Institutes 33 2 6 25 12,403 3,009 9,394 719 123 596

TABLE 1: EDUCATIONAL INSTITUTIONS (PUBLIC AND PRIVATE) BY LEVEL, ENROLMENT AND TEACHING STAFF
Pakistan (Number)
-------------------------------------------------------------------------------------------------------------------------------------------------
| Institutions | Enrolment | Teaching Staff
Level of Institution |-----------------------------------|-------------------------------------|------------------------------------
| Total | Girls | Boys | Mixed | Total | Girls | Boys | Total | Female | Male
-------------------------------------------------------------------------------------------------------------------------------------------------
Urban Areas
c. Vocational/Polytech 2,257 991 485 781 195,489 70,988 124,501 12,697 3,902 8,795
Polytechnic Institute 115 10 88 17 43,950 1,866 42,084 2,791 220 2,571
Monotechnic Institute 39 1 21 17 5,183 704 4,479 341 33 308
Vocational Institute 2,103 980 376 747 146,356 68,418 77,938 9,565 3,649 5,916
d. NFBE 1,105 193 33 879 42,502 25,620 16,882 1,300 1,144 156
e. Distance Education 21 3 18 33,439 13,466 19,973 1,021 332 689
f. Special Education 199 8 16 175 11,939 4,446 7,493 1,473 830 643
g. Denni Madaris 5,495 1,085 1,934 2,476 833,383 336,935 496,448 33,764 9,681 24,083
h. Others n. e. c 685 374 142 169 28,129 15,210 12,919 1,363 648 715
-------------------------------------------------------------------------------------------------------------------------------------------------
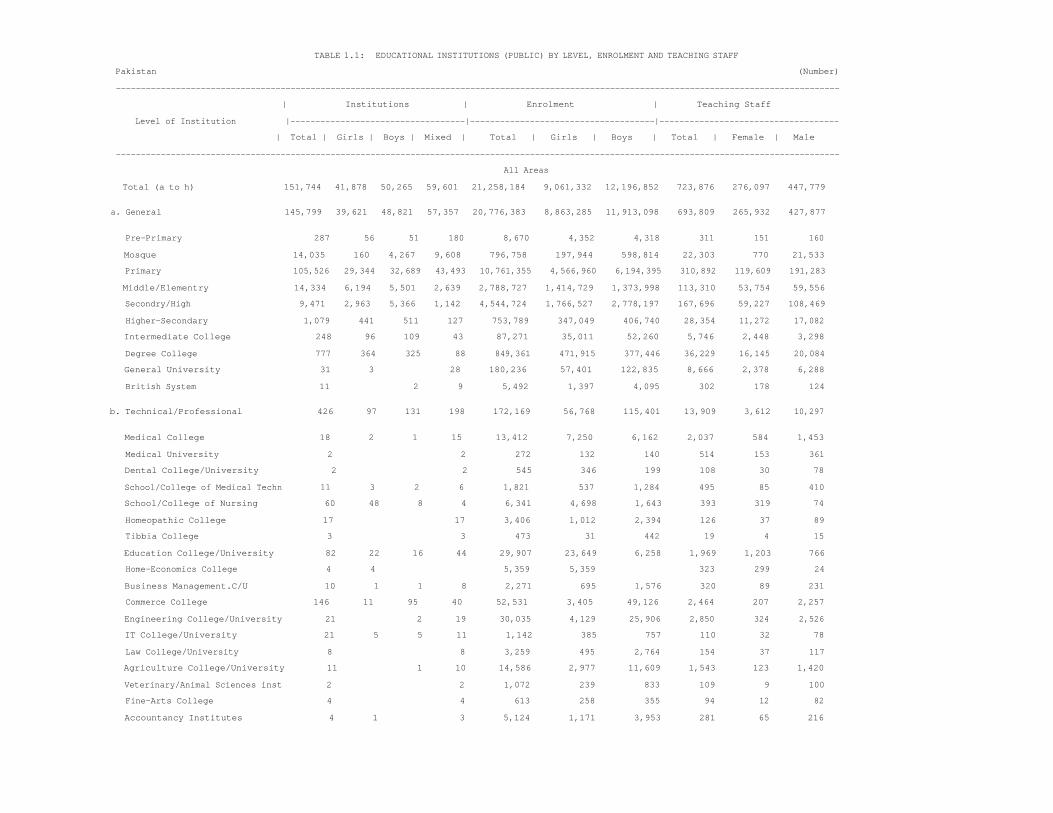
TABLE 1.1: EDUCATIONAL INSTITUTIONS (PUBLIC) BY LEVEL, ENROLMENT AND TEACHING STAFF
Pakistan (Number)
-------------------------------------------------------------------------------------------------------------------------------------------------
| Institutions | Enrolment | Teaching Staff
Level of Institution |-----------------------------------|-------------------------------------|------------------------------------
| Total | Girls | Boys | Mixed | Total | Girls | Boys | Total | Female | Male
-------------------------------------------------------------------------------------------------------------------------------------------------
All Areas
Total (a to h) 151,744 41,878 50,265 59,601 21,258,184 9,061,332 12,196,852 723,876 276,097 447,779
a. General 145,799 39,621 48,821 57,357 20,776,383 8,863,285 11,913,098 693,809 265,932 427,877
Pre-Primary 287 56 51 180 8,670 4,352 4,318 311 151 160
Mosque 14,035 160 4,267 9,608 796,758 197,944 598,814 22,303 770 21,533
Primary 105,526 29,344 32,689 43,493 10,761,355 4,566,960 6,194,395 310,892 119,609 191,283
Middle/Elementry 14,334 6,194 5,501 2,639 2,788,727 1,414,729 1,373,998 113,310 53,754 59,556
Secondry/High 9,471 2,963 5,366 1,142 4,544,724 1,766,527 2,778,197 167,696 59,227 108,469
Higher-Secondary 1,079 441 511 127 753,789 347,049 406,740 28,354 11,272 17,082
Intermediate College 248 96 109 43 87,271 35,011 52,260 5,746 2,448 3,298
Degree College 777 364 325 88 849,361 471,915 377,446 36,229 16,145 20,084
General University 31 3 28 180,236 57,401 122,835 8,666 2,378 6,288
British System 11 2 9 5,492 1,397 4,095 302 178 124
b. Technical/Professional 426 97 131 198 172,169 56,768 115,401 13,909 3,612 10,297
Medical College 18 2 1 15 13,412 7,250 6,162 2,037 584 1,453
Medical University 2 2 272 132 140 514 153 361
Dental College/University 2 2 545 346 199 108 30 78
School/College of Medical Techn 11 3 2 6 1,821 537 1,284 495 85 410
School/College of Nursing 60 48 8 4 6,341 4,698 1,643 393 319 74
Homeopathic College 17 17 3,406 1,012 2,394 126 37 89
Tibbia College 3 3 473 31 442 19 4 15
Education College/University 82 22 16 44 29,907 23,649 6,258 1,969 1,203 766
Home-Economics College 4 4 5,359 5,359 323 299 24
Business Management.C/U 10 1 1 8 2,271 695 1,576 320 89 231
Commerce College 146 11 95 40 52,531 3,405 49,126 2,464 207 2,257
Engineering College/University 21 2 19 30,035 4,129 25,906 2,850 324 2,526
IT College/University 21 5 5 11 1,142 385 757 110 32 78
Law College/University 8 8 3,259 495 2,764 154 37 117
Agriculture College/University 11 1 10 14,586 2,977 11,609 1,543 123 1,420
Veterinary/Animal Sciences inst 2 2 1,072 239 833 109 9 100
Fine-Arts College 4 4 613 258 355 94 12 82
Accountancy Institutes 4 1 3 5,124 1,171 3,953 281 65 216

TABLE 1.1: EDUCATIONAL INSTITUTIONS (PUBLIC) BY LEVEL, ENROLMENT AND TEACHING STAFF
Pakistan (Number)
-------------------------------------------------------------------------------------------------------------------------------------------------
| Institutions | Enrolment | Teaching Staff
Level of Institution |-----------------------------------|-------------------------------------|------------------------------------
| Total | Girls | Boys | Mixed | Total | Girls | Boys | Total | Female | Male
-------------------------------------------------------------------------------------------------------------------------------------------------
All Areas
c. Vocational/Polytech 916 545 239 132 103,752 37,243 66,509 7,887 2,421 5,466
Polytechnic Institute 80 10 65 5 39,290 2,267 37,023 2,263 181 2,082
Monotechnic Institute 26 19 7 4,702 302 4,400 239 3 236
Vocational Institute 810 535 155 120 59,760 34,674 25,086 5,385 2,237 3,148
d. NFBE 2,008 489 128 1,391 68,376 44,091 24,285 2,114 1,779 335
e. Distance Education 23 1 3 19 33,245 13,464 19,781 1,009 328 681
f. Special Education 146 7 14 125 8,220 3,128 5,092 890 423 467
g. Denni Madaris 354 51 156 147 44,780 14,808 29,972 1,802 367 1,435
h. Others n. e. c 2,072 1,067 773 232 51,259 28,545 22,714 2,456 1,235 1,221
-------------------------------------------------------------------------------------------------------------------------------------------------

TABLE 1.1: EDUCATIONAL INSTITUTIONS (PUBLIC) BY LEVEL, ENROLMENT AND TEACHING STAFF
Pakistan (Number)
-------------------------------------------------------------------------------------------------------------------------------------------------
| Institutions | Enrolment | Teaching Staff
Level of Institution |-----------------------------------|-------------------------------------|------------------------------------
| Total | Girls | Boys | Mixed | Total | Girls | Boys | Total | Female | Male
-------------------------------------------------------------------------------------------------------------------------------------------------
Rural Areas
Total (a to h) 132,008 35,436 44,021 52,551 14,623,207 5,740,400 8,882,807 475,721 154,623 321,098
a. General 128,285 34,099 43,045 51,141 14,456,829 5,664,498 8,792,331 467,195 151,525 315,670
Pre-Primary 273 46 50 177 8,142 3,929 4,213 295 137 158
Mosque 12,943 147 3,902 8,894 695,770 168,850 526,920 19,178 478 18,700
Primary 95,168 26,452 29,834 38,882 8,680,849 3,549,392 5,131,457 240,650 82,063 158,587
Middle/Elementry 12,317 5,366 4,732 2,219 2,163,466 1,078,990 1,084,476 90,078 40,034 50,044
Secondry/High 6,646 1,768 4,021 857 2,440,174 708,608 1,731,566 94,216 22,767 71,449
Higher-Secondary 654 231 353 70 338,490 115,353 223,137 13,496 3,737 9,759
Intermediate College 100 36 48 16 24,575 7,904 16,671 1,944 670 1,274
Degree College 174 52 105 17 74,446 18,437 56,009 4,465 1,141 3,324
General University 9 1 8 30,511 12,890 17,621 2,850 476 2,374
British System 1 1 406 145 261 23 22 1
b. Technical/Professional 57 6 29 22 27,195 6,898 20,297 2,595 335 2,260
Medical College 1 1 743 312 431 262 16 246
Medical University 1 1 262 131 131 500 150 350
Dental College/University
School/College of Medical Techn 1 1 71 71 4 4
School/College of Nursing 3 3 247 247 13 13
Homeopathic College 1 1 329 93 236 14 7 7
Tibbia College
Education College/University 11 2 5 4 6,943 4,557 2,386 150 39 111
Home-Economics College
Business Management.C/U 3 1 1 1 762 206 556 62 4 58
Commerce College 20 19 1 3,611 3,611 236 21 215
Engineering College/University 8 8 9,839 949 8,890 857 27 830
IT College/University 2 2 27 27 4 1 3
Law College/University
Agriculture College/University 6 1 5 4,361 403 3,958 493 57 436
Veterinary/Animal Sciences inst
Fine-Arts College
Accountancy Institutes

TABLE 1.1: EDUCATIONAL INSTITUTIONS (PUBLIC) BY LEVEL, ENROLMENT AND TEACHING STAFF
Pakistan (Number)
-------------------------------------------------------------------------------------------------------------------------------------------------
| Institutions | Enrolment | Teaching Staff
Level of Institution |-----------------------------------|-------------------------------------|------------------------------------
| Total | Girls | Boys | Mixed | Total | Girls | Boys | Total | Female | Male
------------------------------------------------------------------------------------------------------------------------------------------------- Rural Areas
c. Vocational/Polytech 260 158 67 35 22,197 7,252 14,945 1,520 379 1,141
Polytechnic Institute 24 1 23 9,915 720 9,195 485 14 471
Monotechnic Institute 6 5 1 725 725 48 48
Vocational Institute 230 157 39 34 11,557 6,532 5,025 987 365 622
d. NFBE 1,554 370 112 1,072 52,998 33,806 19,192 1,636 1,339 297
e. Distance Education 7 1 1 5 200 122 78 14 3 11
f. Special Education 9 1 2 6 315 128 187 37 23 14
g. Denni Madaris 230 27 103 100 26,912 8,291 18,621 961 141 820
h. Others n. e. c 1,606 774 662 170 36,561 19,405 17,156 1,763 878 885
-------------------------------------------------------------------------------------------------------------------------------------------------

TABLE 1.1: EDUCATIONAL INSTITUTIONS (PUBLIC) BY LEVEL, ENROLMENT AND TEACHING STAFF
Pakistan (Number)
-------------------------------------------------------------------------------------------------------------------------------------------------
| Institutions | Enrolment | Teaching Staff
Level of Institution |-----------------------------------|-------------------------------------|------------------------------------
| Total | Girls | Boys | Mixed | Total | Girls | Boys | Total | Female | Male
-------------------------------------------------------------------------------------------------------------------------------------------------
Urban Areas
Total (a to h) 19,736 6,442 6,244 7,050 6,634,977 3,320,932 3,314,045 248,155 121,474 126,681
a. General 17,514 5,522 5,776 6,216 6,319,554 3,198,787 3,120,767 226,614 114,407 112,207
Pre-Primary 14 10 1 3 528 423 105 16 14 2
Mosque 1,092 13 365 714 100,988 29,094 71,894 3,125 292 2,833
Primary 10,358 2,892 2,855 4,611 2,080,506 1,017,568 1,062,938 70,242 37,546 32,696
Middle/Elementry 2,017 828 769 420 625,261 335,739 289,522 23,232 13,720 9,512
Secondry/High 2,825 1,195 1,345 285 2,104,550 1,057,919 1,046,631 73,480 36,460 37,020
Higher-Secondary 425 210 158 57 415,299 231,696 183,603 14,858 7,535 7,323
Intermediate College 148 60 61 27 62,696 27,107 35,589 3,802 1,778 2,024
Degree College 603 312 220 71 774,915 453,478 321,437 31,764 15,004 16,760
General University 22 2 20 149,725 44,511 105,214 5,816 1,902 3,914
British System 10 2 8 5,086 1,252 3,834 279 156 123
b. Technical/Professional 369 91 102 176 144,974 49,870 95,104 11,314 3,277 8,037
Medical College 17 2 1 14 12,669 6,938 5,731 1,775 568 1,207
Medical University 1 1 10 1 9 14 3 11
Dental College/University 2 2 545 346 199 108 30 78
School/College of Medical Techn 10 3 1 6 1,750 537 1,213 491 85 406
School/College of Nursing 57 45 8 4 6,094 4,451 1,643 380 306 74
Homeopathic College 16 16 3,077 919 2,158 112 30 82
Tibbia College 3 3 473 31 442 19 4 15
Education College/University 71 20 11 40 22,964 19,092 3,872 1,819 1,164 655
Home-Economics College 4 4 5,359 5,359 323 299 24
Business Management.C/U 7 7 1,509 489 1,020 258 85 173
Commerce College 126 11 76 39 48,920 3,405 45,515 2,228 186 2,042
Engineering College/University 13 2 11 20,196 3,180 17,016 1,993 297 1,696
IT College/University 19 5 3 11 1,115 385 730 106 31 75
Law College/University 8 8 3,259 495 2,764 154 37 117
Agriculture College/University 5 5 10,225 2,574 7,651 1,050 66 984
Veterinary/Animal Sciences inst 2 2 1,072 239 833 109 9 100
Fine-Arts College 4 4 613 258 355 94 12 82
Accountancy Institutes 4 1 3 5,124 1,171 3,953 281 65 216

TABLE 1.1: EDUCATIONAL INSTITUTIONS (PUBLIC) BY LEVEL, ENROLMENT AND TEACHING STAFF
Pakistan (Number)
-------------------------------------------------------------------------------------------------------------------------------------------------
| Institutions | Enrolment | Teaching Staff
Level of Institution |-----------------------------------|-------------------------------------|------------------------------------
| Total | Girls | Boys | Mixed | Total | Girls | Boys | Total | Female | Male
-------------------------------------------------------------------------------------------------------------------------------------------------
Urban Areas
c. Vocational/Polytech 656 387 172 97 81,555 29,991 51,564 6,367 2,042 4,325
Polytechnic Institute 56 9 42 5 29,375 1,547 27,828 1,778 167 1,611
Monotechnic Institute 20 14 6 3,977 302 3,675 191 3 188
Vocational Institute 580 378 116 86 48,203 28,142 20,061 4,398 1,872 2,526
d. NFBE 454 119 16 319 15,378 10,285 5,093 478 440 38
e. Distance Education 16 2 14 33,045 13,342 19,703 995 325 670
f. Special Education 137 6 12 119 7,905 3,000 4,905 853 400 453
g. Denni Madaris 124 24 53 47 17,868 6,517 11,351 841 226 615
h. Others n. e. c 466 293 111 62 14,698 9,140 5,558 693 357 336
-------------------------------------------------------------------------------------------------------------------------------------------------

TABLE 1.2: EDUCATIONAL INSTITUTIONS (PRIVATE) BY LEVEL, ENROLMENT AND TEACHING STAFF
Pakistan (Number)
-------------------------------------------------------------------------------------------------------------------------------------------------
| Institutions | Enrolment | Teaching Staff
Level of Institution |-----------------------------------|-------------------------------------|------------------------------------
| Total | Girls | Boys | Mixed | Total | Girls | Boys | Total | Female | Male
-------------------------------------------------------------------------------------------------------------------------------------------------
All Areas
Total (a to h) 76,047 6,597 7,603 61,847 12,121,394 5,337,033 6,784,361 632,926 419,668 213,258
a. General 57,505 2,922 2,768 51,815 10,150,246 4,581,873 5,568,373 547,193 395,776 151,417
Pre-Primary 794 40 12 742 52,694 25,799 26,895 3,496 3,029 467
Mosque 88 3 21 64 6,146 2,265 3,881 300 142 158
Primary 16,823 734 620 15,469 1,671,885 750,616 921,269 88,625 69,386 19,239
Middle/Elementry 24,115 615 723 22,777 3,864,143 1,714,654 2,149,489 200,487 150,140 50,347
Secondry/High 13,484 983 1,094 11,407 3,778,322 1,739,939 2,038,383 200,423 143,869 56,554
Higher-Secondary 1,056 220 152 684 396,690 170,659 226,031 21,903 13,358 8,545
Intermediate College 499 168 99 232 114,057 45,874 68,183 9,373 4,255 5,118
Degree College 358 147 37 174 107,800 65,989 41,811 7,749 4,366 3,383
General University 18 1 1 16 14,735 5,709 9,026 2,768 1,061 1,707
British System 270 11 9 250 143,774 60,369 83,405 12,069 6,170 5,899
b. Technical/Professional 898 45 139 714 189,365 46,411 142,954 16,425 3,764 12,661
Medical College 12 1 11 3,498 2,076 1,422 1,238 450 788
Medical University 4 4 2,671 1,320 1,351 850 262 588
Dental College/University 4 4 270 203 67 192 85 107
School/College of Medical Techn 18 1 7 10 1,261 306 955 139 40 99
School/College of Nursing 14 6 2 6 955 643 312 86 37 49
Homeopathic College 105 4 4 97 16,552 5,682 10,870 1,046 339 707
Tibbia College 21 2 19 3,096 269 2,827 176 27 149
Education College/University 49 4 4 41 5,319 2,779 2,540 642 220 422
Home-Economics College 1 1 93 93 26 26
Business Management.C/U 42 1 41 10,880 2,765 8,115 1,257 249 1,008
Commerce College 232 18 55 159 72,080 13,596 58,484 3,629 669 2,960
Engineering College/University 12 3 9 9,651 1,841 7,810 825 110 715
IT College/University 272 9 51 212 38,030 8,206 29,824 4,224 832 3,392
Law College/University 63 3 60 14,571 3,554 11,017 1,293 231 1,062
Agriculture College/University 2 1 1 173 22 151 40 20 20
Veterinary/Animal Sciences inst 1 1 22 1 21 21 6 15
Fine-Arts College 16 16 2,392 1,201 1,191 279 91 188
Accountancy Institutes 30 1 6 23 7,851 1,854 5,997 462 70 392
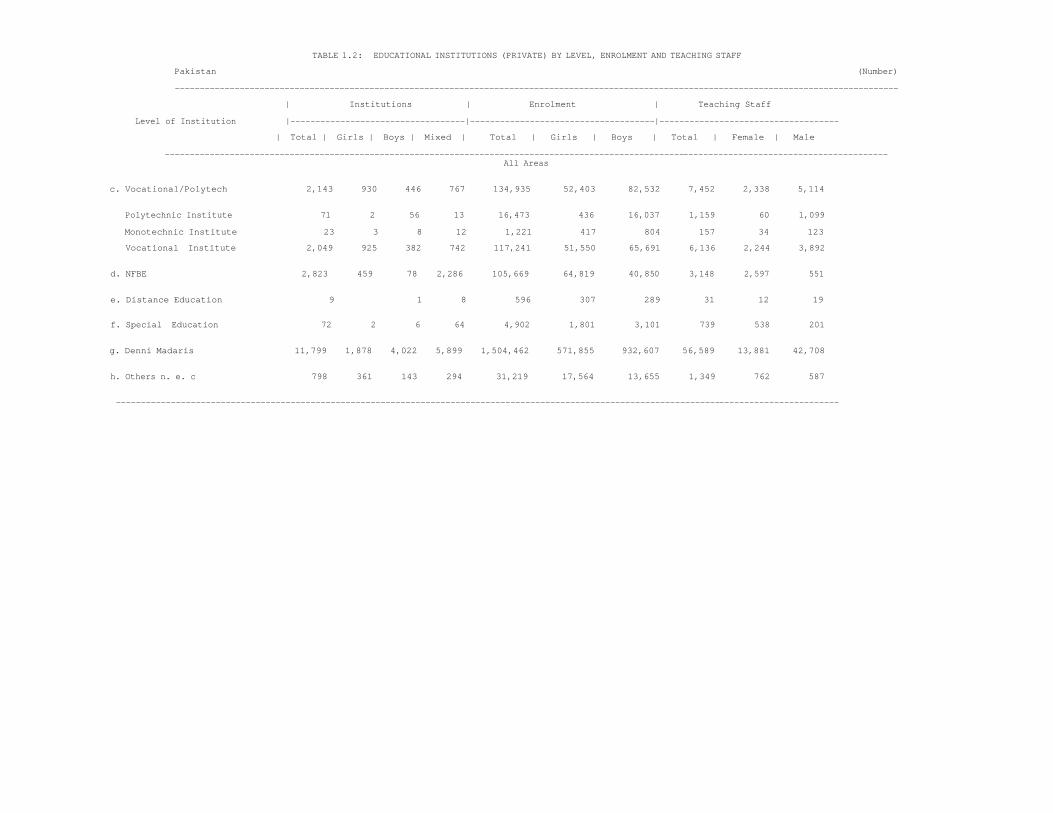
TABLE 1.2: EDUCATIONAL INSTITUTIONS (PRIVATE) BY LEVEL, ENROLMENT AND TEACHING STAFF
Pakistan (Number)
-------------------------------------------------------------------------------------------------------------------------------------------------
| Institutions | Enrolment | Teaching Staff
Level of Institution |-----------------------------------|-------------------------------------|------------------------------------
| Total | Girls | Boys | Mixed | Total | Girls | Boys | Total | Female | Male
------------------------------------------------------------------------------------------------------------------------------------------------- All Areas
c. Vocational/Polytech 2,143 930 446 767 134,935 52,403 82,532 7,452 2,338 5,114
Polytechnic Institute 71 2 56 13 16,473 436 16,037 1,159 60 1,099
Monotechnic Institute 23 3 8 12 1,221 417 804 157 34 123
Vocational Institute 2,049 925 382 742 117,241 51,550 65,691 6,136 2,244 3,892
d. NFBE 2,823 459 78 2,286 105,669 64,819 40,850 3,148 2,597 551
e. Distance Education 9 1 8 596 307 289 31 12 19
f. Special Education 72 2 6 64 4,902 1,801 3,101 739 538 201
g. Denni Madaris 11,799 1,878 4,022 5,899 1,504,462 571,855 932,607 56,589 13,881 42,708
h. Others n. e. c 798 361 143 294 31,219 17,564 13,655 1,349 762 587
-------------------------------------------------------------------------------------------------------------------------------------------------
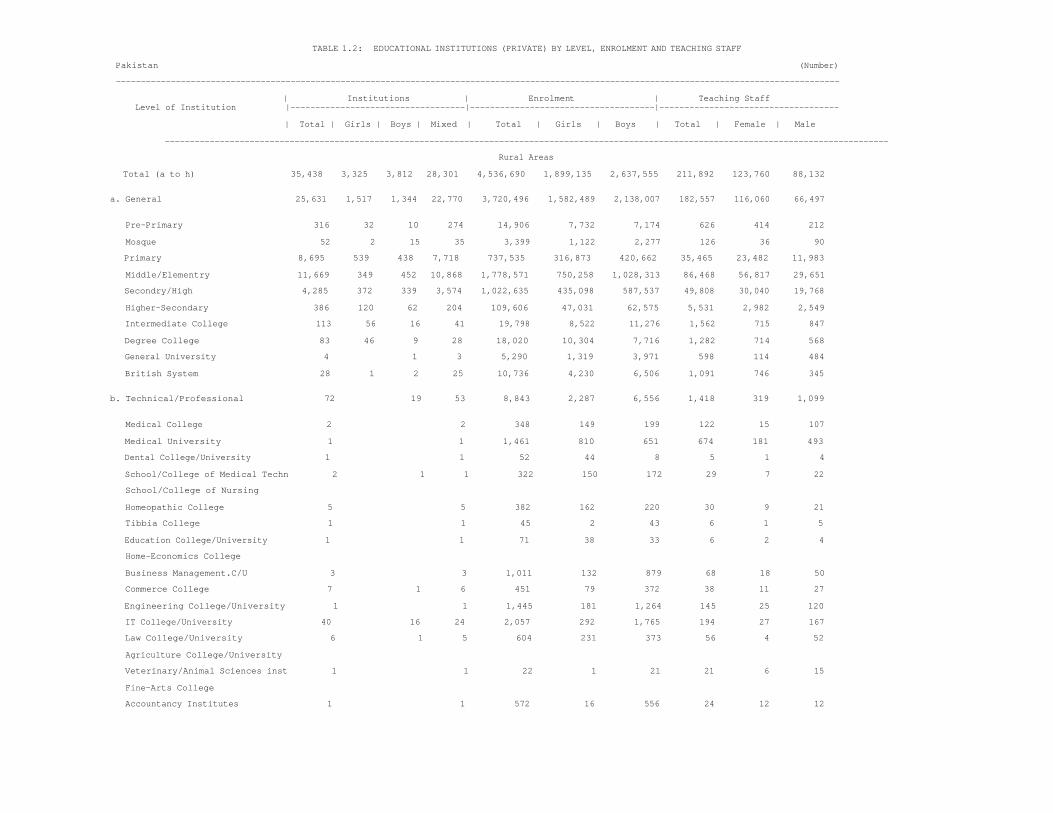
TABLE 1.2: EDUCATIONAL INSTITUTIONS (PRIVATE) BY LEVEL, ENROLMENT AND TEACHING STAFF
Pakistan (Number)
-------------------------------------------------------------------------------------------------------------------------------------------------
| Institutions | Enrolment | Teaching Staff Level of Institution |-----------------------------------|-------------------------------------|------------------------------------
| Total | Girls | Boys | Mixed | Total | Girls | Boys | Total | Female | Male
-------------------------------------------------------------------------------------------------------------------------------------------------
Rural Areas
Total (a to h) 35,438 3,325 3,812 28,301 4,536,690 1,899,135 2,637,555 211,892 123,760 88,132
a. General 25,631 1,517 1,344 22,770 3,720,496 1,582,489 2,138,007 182,557 116,060 66,497
Pre-Primary 316 32 10 274 14,906 7,732 7,174 626 414 212
Mosque 52 2 15 35 3,399 1,122 2,277 126 36 90
Primary 8,695 539 438 7,718 737,535 316,873 420,662 35,465 23,482 11,983
Middle/Elementry 11,669 349 452 10,868 1,778,571 750,258 1,028,313 86,468 56,817 29,651
Secondry/High 4,285 372 339 3,574 1,022,635 435,098 587,537 49,808 30,040 19,768
Higher-Secondary 386 120 62 204 109,606 47,031 62,575 5,531 2,982 2,549
Intermediate College 113 56 16 41 19,798 8,522 11,276 1,562 715 847
Degree College 83 46 9 28 18,020 10,304 7,716 1,282 714 568
General University 4 1 3 5,290 1,319 3,971 598 114 484
British System 28 1 2 25 10,736 4,230 6,506 1,091 746 345
b. Technical/Professional 72 19 53 8,843 2,287 6,556 1,418 319 1,099
Medical College 2 2 348 149 199 122 15 107
Medical University 1 1 1,461 810 651 674 181 493
Dental College/University 1 1 52 44 8 5 1 4
School/College of Medical Techn 2 1 1 322 150 172 29 7 22
School/College of Nursing
Homeopathic College 5 5 382 162 220 30 9 21
Tibbia College 1 1 45 2 43 6 1 5
Education College/University 1 1 71 38 33 6 2 4
Home-Economics College
Business Management.C/U 3 3 1,011 132 879 68 18 50
Commerce College 7 1 6 451 79 372 38 11 27
Engineering College/University 1 1 1,445 181 1,264 145 25 120
IT College/University 40 16 24 2,057 292 1,765 194 27 167
Law College/University 6 1 5 604 231 373 56 4 52
Agriculture College/University
Veterinary/Animal Sciences inst 1 1 22 1 21 21 6 15
Fine-Arts College
Accountancy Institutes 1 1 572 16 556 24 12 12

TABLE 1.2: EDUCATIONAL INSTITUTIONS (PRIVATE) BY LEVEL, ENROLMENT AND TEACHING STAFF
Pakistan (Number)
-------------------------------------------------------------------------------------------------------------------------------------------------
| Institutions | Enrolment | Teaching Staff
Level of Institution |-----------------------------------|-------------------------------------|------------------------------------
| Total | Girls | Boys | Mixed | Total | Girls | Boys | Total | Female | Male
-------------------------------------------------------------------------------------------------------------------------------------------------
Rural Areas
c. Vocational/Polytech 542 326 133 83 21,001 11,406 9,595 1,122 478 644
Polytechnic Institute 12 1 10 1 1,898 117 1,781 146 7 139
Monotechnic Institute 4 2 1 1 15 15 7 4 3
Vocational Institute 526 323 122 81 19,088 11,274 7,814 969 467 502
d. NFBE 2,172 385 61 1,726 78,545 49,484 29,061 2,326 1,893 433
e. Distance Education 4 4 202 183 19 5 5
f. Special Education 10 2 8 868 355 513 119 108 11
g. Denni Madaris 6,428 817 2,141 3,470 688,947 241,437 447,510 23,666 4,426 19,240
h. Others n. e. c 579 280 112 187 17,788 11,494 6,294 679 471 208
-------------------------------------------------------------------------------------------------------------------------------------------------
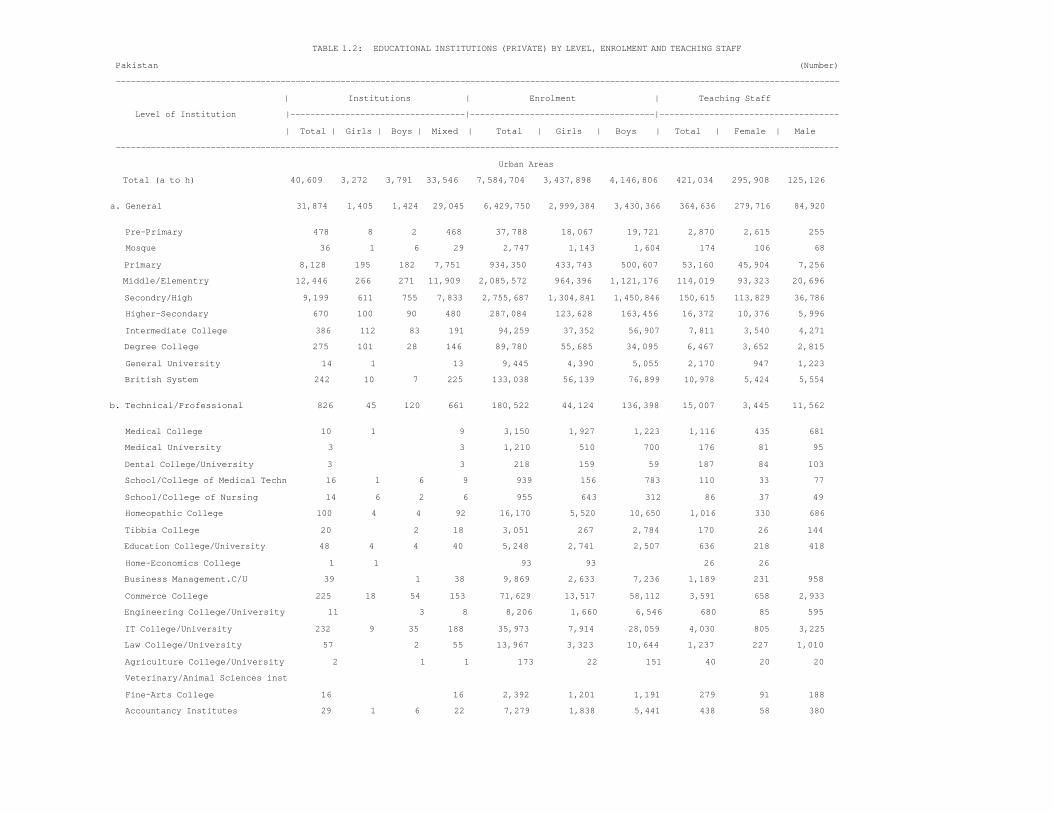
TABLE 1.2: EDUCATIONAL INSTITUTIONS (PRIVATE) BY LEVEL, ENROLMENT AND TEACHING STAFF
Pakistan (Number)
-------------------------------------------------------------------------------------------------------------------------------------------------
| Institutions | Enrolment | Teaching Staff
Level of Institution |-----------------------------------|-------------------------------------|------------------------------------
| Total | Girls | Boys | Mixed | Total | Girls | Boys | Total | Female | Male
-------------------------------------------------------------------------------------------------------------------------------------------------
Urban Areas
Total (a to h) 40,609 3,272 3,791 33,546 7,584,704 3,437,898 4,146,806 421,034 295,908 125,126
a. General 31,874 1,405 1,424 29,045 6,429,750 2,999,384 3,430,366 364,636 279,716 84,920
Pre-Primary 478 8 2 468 37,788 18,067 19,721 2,870 2,615 255
Mosque 36 1 6 29 2,747 1,143 1,604 174 106 68
Primary 8,128 195 182 7,751 934,350 433,743 500,607 53,160 45,904 7,256
Middle/Elementry 12,446 266 271 11,909 2,085,572 964,396 1,121,176 114,019 93,323 20,696
Secondry/High 9,199 611 755 7,833 2,755,687 1,304,841 1,450,846 150,615 113,829 36,786
Higher-Secondary 670 100 90 480 287,084 123,628 163,456 16,372 10,376 5,996
Intermediate College 386 112 83 191 94,259 37,352 56,907 7,811 3,540 4,271
Degree College 275 101 28 146 89,780 55,685 34,095 6,467 3,652 2,815
General University 14 1 13 9,445 4,390 5,055 2,170 947 1,223
British System 242 10 7 225 133,038 56,139 76,899 10,978 5,424 5,554
b. Technical/Professional 826 45 120 661 180,522 44,124 136,398 15,007 3,445 11,562
Medical College 10 1 9 3,150 1,927 1,223 1,116 435 681
Medical University 3 3 1,210 510 700 176 81 95
Dental College/University 3 3 218 159 59 187 84 103
School/College of Medical Techn 16 1 6 9 939 156 783 110 33 77
School/College of Nursing 14 6 2 6 955 643 312 86 37 49
Homeopathic College 100 4 4 92 16,170 5,520 10,650 1,016 330 686
Tibbia College 20 2 18 3,051 267 2,784 170 26 144
Education College/University 48 4 4 40 5,248 2,741 2,507 636 218 418
Home-Economics College 1 1 93 93 26 26
Business Management.C/U 39 1 38 9,869 2,633 7,236 1,189 231 958
Commerce College 225 18 54 153 71,629 13,517 58,112 3,591 658 2,933
Engineering College/University 11 3 8 8,206 1,660 6,546 680 85 595
IT College/University 232 9 35 188 35,973 7,914 28,059 4,030 805 3,225
Law College/University 57 2 55 13,967 3,323 10,644 1,237 227 1,010
Agriculture College/University 2 1 1 173 22 151 40 20 20
Veterinary/Animal Sciences inst
Fine-Arts College 16 16 2,392 1,201 1,191 279 91 188
Accountancy Institutes 29 1 6 22 7,279 1,838 5,441 438 58 380

TABLE 1.2: EDUCATIONAL INSTITUTIONS (PRIVATE) BY LEVEL, ENROLMENT AND TEACHING STAFF
Pakistan (Number)
-------------------------------------------------------------------------------------------------------------------------------------------------
| Institutions | Enrolment | Teaching Staff
Level of Institution |-----------------------------------|-------------------------------------|------------------------------------
| Total | Girls | Boys | Mixed | Total | Girls | Boys | Total | Female | Male
-------------------------------------------------------------------------------------------------------------------------------------------------
Urban Areas
c. Vocational/Polytech 1,601 604 313 684 113,934 40,997 72,937 6,330 1,860 4,470
Polytechnic Institute 59 1 46 12 14,575 319 14,256 1,013 53 960
Monotechnic Institute 19 1 7 11 1,206 402 804 150 30 120
Vocational Institute 1,523 602 260 661 98,153 40,276 57,877 5,167 1,777 3,390
d. NFBE 651 74 17 560 27,124 15,335 11,789 822 704 118
e. Distance Education 5 1 4 394 124 270 26 7 19
f. Special Education 62 2 4 56 4,034 1,446 2,588 620 430 190
g. Denni Madaris 5,371 1,061 1,881 2,429 815,515 330,418 485,097 32,923 9,455 23,468
h. Others n. e. c 219 81 31 107 13,431 6,070 7,361 670 291 379
-------------------------------------------------------------------------------------------------------------------------------------------------
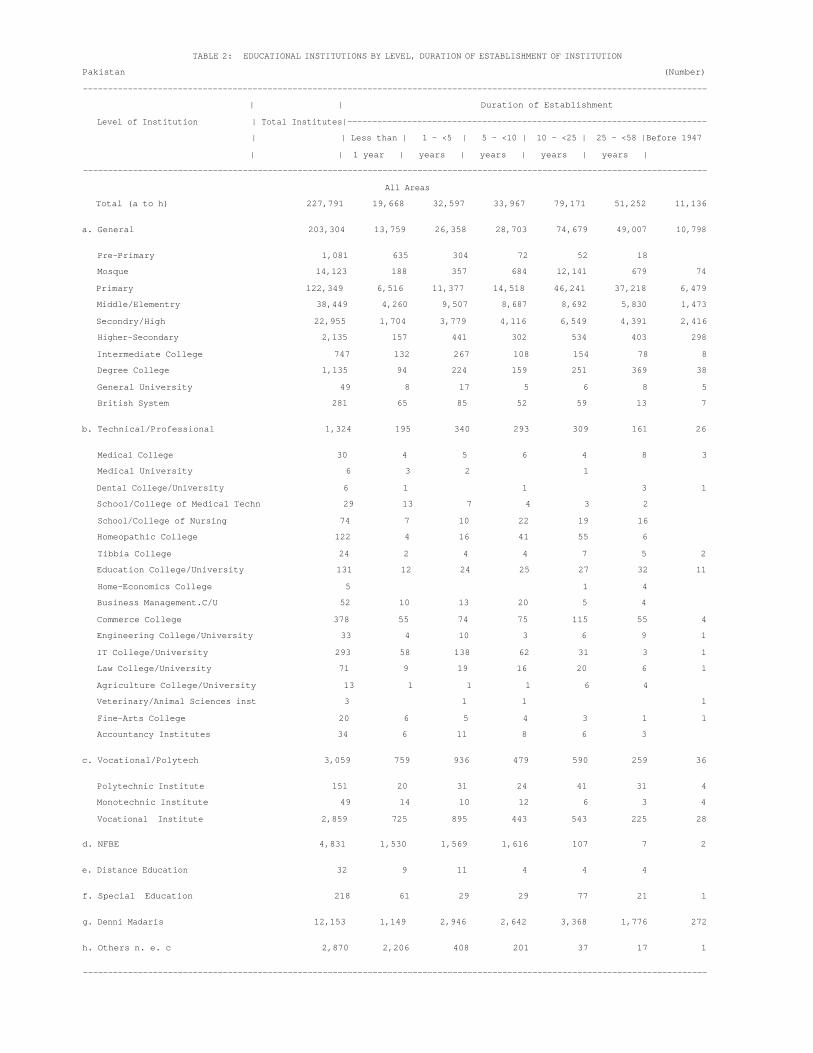
TABLE 2: EDUCATIONAL INSTITUTIONS BY LEVEL, DURATION OF ESTABLISHMENT OF INSTITUTION
Pakistan (Number)
-----------------------------------------------------------------------------------------------------------------------------
| | Duration of Establishment
Level of Institution | Total Institutes|------------------------------------------------------------------------
| | Less than | 1 - <5 | 5 - <10 | 10 - <25 | 25 - <58 |Before 1947
| | 1 year | years | years | years | years |
-----------------------------------------------------------------------------------------------------------------------------
All Areas
Total (a to h) 227,791 19,668 32,597 33,967 79,171 51,252 11,136
a. General 203,304 13,759 26,358 28,703 74,679 49,007 10,798
Pre-Primary 1,081 635 304 72 52 18
Mosque 14,123 188 357 684 12,141 679 74
Primary 122,349 6,516 11,377 14,518 46,241 37,218 6,479
Middle/Elementry 38,449 4,260 9,507 8,687 8,692 5,830 1,473
Secondry/High 22,955 1,704 3,779 4,116 6,549 4,391 2,416
Higher-Secondary 2,135 157 441 302 534 403 298
Intermediate College 747 132 267 108 154 78 8
Degree College 1,135 94 224 159 251 369 38
General University 49 8 17 5 6 8 5
British System 281 65 85 52 59 13 7
b. Technical/Professional 1,324 195 340 293 309 161 26
Medical College 30 4 5 6 4 8 3
Medical University 6 3 2 1
Dental College/University 6 1 1 3 1
School/College of Medical Techn 29 13 7 4 3 2
School/College of Nursing 74 7 10 22 19 16
Homeopathic College 122 4 16 41 55 6
Tibbia College 24 2 4 4 7 5 2
Education College/University 131 12 24 25 27 32 11
Home-Economics College 5 1 4
Business Management.C/U 52 10 13 20 5 4
Commerce College 378 55 74 75 115 55 4
Engineering College/University 33 4 10 3 6 9 1
IT College/University 293 58 138 62 31 3 1
Law College/University 71 9 19 16 20 6 1
Agriculture College/University 13 1 1 1 6 4
Veterinary/Animal Sciences inst 3 1 1 1
Fine-Arts College 20 6 5 4 3 1 1
Accountancy Institutes 34 6 11 8 6 3
c. Vocational/Polytech 3,059 759 936 479 590 259 36
Polytechnic Institute 151 20 31 24 41 31 4
Monotechnic Institute 49 14 10 12 6 3 4
Vocational Institute 2,859 725 895 443 543 225 28
d. NFBE 4,831 1,530 1,569 1,616 107 7 2
e. Distance Education 32 9 11 4 4 4
f. Special Education 218 61 29 29 77 21 1
g. Denni Madaris 12,153 1,149 2,946 2,642 3,368 1,776 272
h. Others n. e. c 2,870 2,206 408 201 37 17 1
-----------------------------------------------------------------------------------------------------------------------------

TABLE 2: EDUCATIONAL INSTITUTIONS BY LEVEL, DURATION OF ESTABLISHMENT OF INSTITUTION
Pakistan (Number)
-----------------------------------------------------------------------------------------------------------------------------
| | Duration of Establishment
Level of Institution | Total Institutes|------------------------------------------------------------------------
| | Less than | 1 - <5 | 5 - <10 | 10 - <25 | 25 - <58 |Before 1947
| | 1 year | years | years | years | years |
-----------------------------------------------------------------------------------------------------------------------------
Rural Area
Total (a to h) 167,446 11,537 19,402 22,504 63,217 41,821 8,965
a. General 153,916 7,758 15,846 19,571 61,035 40,881 8,825
Pre-Primary 589 400 171 8 8 2
Mosque 12,995 164 328 631 11,179 630 63
Primary 103,863 4,259 8,323 11,980 41,043 32,711 5,547
Middle/Elementry 23,986 2,168 5,182 5,111 5,488 4,765 1,272
Secondry/High 10,931 633 1,437 1,611 3,001 2,496 1,753
Higher-Secondary 1,040 69 238 137 221 190 185
Intermediate College 213 30 79 40 34 27 3
Degree College 257 27 74 45 53 57 1
General University 13 2 4 2 1 3 1
British System 29 6 10 6 7
b. Technical/Professional 129 29 36 22 26 15 1
Medical College 3 1 1 1
Medical University 2 1 1
Dental College/University 1 1
School/College of Medical Techn 3 2 1
School/College of Nursing 3 3
Homeopathic College 6 1 1 4
Tibbia College 1 1
Education College/University 12 2 4 3 3
Home-Economics College
Business Management.C/U 6 2 2 1 1
Commerce College 27 5 2 3 10 7
Engineering College/University 9 2 2 2 2 1
IT College/University 42 16 21 3 2
Law College/University 6 3 3
Agriculture College/University 6 1 3 2
Veterinary/Animal Sciences inst 1 1
Fine-Arts College
Accountancy Institutes 1 1
c. Vocational/Polytech 802 272 263 117 116 33 1
Polytechnic Institute 36 4 10 6 13 2 1
Monotechnic Institute 10 4 2 2 2
Vocational Institute 756 264 251 109 101 31
d. NFBE 3,726 1,185 1,265 1,193 78 4 1
e. Distance Education 11 4 6 1
f. Special Education 19 8 5 1 5
g. Denni Madaris 6,658 578 1,654 1,471 1,939 879 137
h. Others n. e. c 2,185 1,703 327 128 18 9
-----------------------------------------------------------------------------------------------------------------------------

TABLE 2: EDUCATIONAL INSTITUTIONS BY LEVEL, DURATION OF ESTABLISHMENT OF INSTITUTION
Pakistan (Number)
-----------------------------------------------------------------------------------------------------------------------------
| | Duration of Establishment
Level of Institution | Total Institutes|------------------------------------------------------------------------
| | Less than | 1 - <5 | 5 - <10 | 10 - <25 | 25 - <58 |Before 1947
| | 1 year | years | years | years | years |
-----------------------------------------------------------------------------------------------------------------------------
Urban Area
Total (a to h) 60,345 8,131 13,195 11,463 15,954 9,431 2,171
a. General 49,388 6,001 10,512 9,132 13,644 8,126 1,973
Pre-Primary 492 235 133 64 44 16
Mosque 1,128 24 29 53 962 49 11
Primary 18,486 2,257 3,054 2,538 5,198 4,507 932
Middle/Elementry 14,463 2,092 4,325 3,576 3,204 1,065 201
Secondry/High 12,024 1,071 2,342 2,505 3,548 1,895 663
Higher-Secondary 1,095 88 203 165 313 213 113
Intermediate College 534 102 188 68 120 51 5
Degree College 878 67 150 114 198 312 37
General University 36 6 13 3 5 5 4
British System 252 59 75 46 52 13 7
b. Technical/Professional 1,195 166 304 271 283 146 25
Medical College 27 3 5 5 4 7 3
Medical University 4 2 2
Dental College/University 5 1 1 2 1
School/College of Medical Techn 26 11 6 4 3 2
School/College of Nursing 71 7 10 19 19 16
Homeopathic College 116 4 15 40 51 6
Tibbia College 23 2 3 4 7 5 2
Education College/University 119 12 22 21 24 29 11
Home-Economics College 5 1 4
Business Management.C/U 46 8 11 20 4 3
Commerce College 351 50 72 72 105 48 4
Engineering College/University 24 2 8 1 4 9
IT College/University 251 42 117 59 29 3 1
Law College/University 65 9 16 13 20 6 1
Agriculture College/University 7 1 1 3 2
Veterinary/Animal Sciences inst 2 1 1
Fine-Arts College 20 6 5 4 3 1 1
Accountancy Institutes 33 6 11 7 6 3
c. Vocational/Polytech 2,257 487 673 362 474 226 35
Polytechnic Institute 115 16 21 18 28 29 3
Monotechnic Institute 39 10 8 10 4 3 4
Vocational Institute 2,103 461 644 334 442 194 28
d. NFBE 1,105 345 304 423 29 3 1
e. Distance Education 21 5 5 3 4 4
f. Special Education 199 53 24 28 72 21 1
g. Denni Madaris 5,495 571 1,292 1,171 1,429 897 135
h. Others n. e. c 685 503 81 73 19 8 1
-----------------------------------------------------------------------------------------------------------------------------

TABLE 3 : EDUCATIONAL INSTITUTIONS (PRIVATE) BY LEVEL, ENROLMENT, TEACHING STAFF AND EXPENDITURE
Pakistan (Number) ----------------------------------------------------------------------------------------------------------------------------- | Numbers | Rupees Level of Institution |-----------------------------------------------------------------|---------------------- | Institution | Enrolment | Teaching Staff | Expenditure -----------------------------------------------------------------------------------------------------------------------------
All Areas
Total (a to h) 76,047 12,121,394 632,926 35,914,012,702
a. General 57,505 10,150,246 547,193 28,590,554,038
Pre-Primary 794 52,694 3,496 210,072,330
Mosque 88 6,146 300 12,432,431
Primary 16,823 1,671,885 88,625 2,572,013,422
Middle/Elementry 24,115 3,864,143 200,487 5,724,520,758
Secondry/High 13,484 3,778,322 200,423 14,050,542,801
Higher-Secondary 1,056 396,690 21,903 2,192,757,962
Intermediate College 499 114,057 9,373 917,883,616
Degree College 358 107,800 7,749 1,021,581,796
General University 18 14,735 2,768 524,969,736
British System 270 143,774 12,069 1,363,779,186
b. Technical/Professional 898 189,365 16,425 3,424,446,562
Medical College 12 3,498 1,238 367,393,200
Medical University 4 2,671 850 1,093,084
Dental College/University 4 270 192 38,912,820
School/College of Medical Techn 18 1,261 139 12,307,743
School/College of Nursing 14 955 86 17,060,578
Homeopathic College 105 16,552 1,046 165,274,009
Tibbia College 21 3,096 176 18,452,975
Education College/University 49 5,319 642 115,094,700
Home-Economics College 1 93 26 11,090,051
Business Management.C/U 42 10,880 1,257 318,563,913
Commerce College 232 72,080 3,629 396,034,898
Engineering College/University 12 9,651 825 584,798,177
IT College/University 272 38,030 4,224 1,090,552,900
Law College/University 63 14,571 1,293 154,761,100
Agriculture College/University 2 173 40 12,739,502
Veterinary/Animal Sciences inst 1 22 21 1,641,236
Fine-Arts College 16 2,392 279 26,035,672
Accountancy Institutes 30 7,851 462 92,640,004
c. Vocational/Polytech 2,143 134,935 7,452 811,667,150
Polytechnic Institute 71 16,473 1,159 149,855,867
Monotechnic Institute 23 1,221 157 29,889,360
Vocational Institute 2,049 117,241 6,136 631,921,923
d. NFBE 2,823 105,669 3,148 61,055,455
e. Distance Education 9 596 31 3,766,851
f. Special Education 72 4,902 739 105,999,365
g. Denni Madaris 11,799 1,504,462 56,589 2,723,533,797
h. Others n. e. c 798 31,219 1,349 192,989,484 -----------------------------------------------------------------------------------------------------------------------------

TABLE 3 : EDUCATIONAL INSTITUTIONS (PRIVATE) BY LEVEL, ENROLMENT, TEACHING STAFF AND EXPENDITURE
Pakistan (Number) ----------------------------------------------------------------------------------------------------------------------------- | Numbers | Rupees Level of Institution |-----------------------------------------------------------------|---------------------- | Institution | Enrolment | Teaching Staff | Expenditure -----------------------------------------------------------------------------------------------------------------------------
Rural Areas
Total (a to h) 35,438 4,536,690 211,892 7,609,827,950
a. General 25,631 3,720,496 182,557 6,349,457,981
Pre-Primary 316 14,906 626 18,879,987
Mosque 52 3,399 126 4,428,562
Primary 8,695 737,535 35,465 837,725,364
Middle/Elementry 11,669 1,778,571 86,468 2,186,587,343
Secondry/High 4,285 1,022,635 49,808 1,781,823,198
Higher-Secondary 386 109,606 5,531 491,438,970
Intermediate College 113 19,798 1,562 231,200,411
Degree College 83 18,020 1,282 164,887,037
General University 4 5,290 598 249,435,640
British System 28 10,736 1,091 383,051,469
b. Technical/Professional 72 8,843 1,418 101,260,526
Medical College 2 348 122 21,001,038
Medical University 1 1,461 674 203,885
Dental College/University 1 52 5 216,300
School/College of Medical Techn 2 322 29 1,379,500
School/College of Nursing
Homeopathic College 5 382 30 1,991,332
Tibbia College 1 45 6 573,600
Education College/University 1 71 6 372,000
Home-Economics College
Business Management.C/U 3 1,011 68 42,454,978
Commerce College 7 451 38 4,476,712
Engineering College/University 1 1,445 145 125
IT College/University 40 2,057 194 17,056,224
Law College/University 6 604 56 6,429,596
Agriculture College/University
Veterinary/Animal Sciences inst 1 22 21 1,641,236
Fine-Arts College
Accountancy Institutes 1 572 24 3,464,000
c. Vocational/Polytech 542 21,001 1,122 73,600,236
Polytechnic Institute 12 1,898 146 22,465,304
Monotechnic Institute 4 15 7 214,000
Vocational Institute 526 19,088 969 50,920,932
d. NFBE 2,172 78,545 2,326 37,874,084
e. Distance Education 4 202 5 63,000
f. Special Education 10 868 119 29,261,594
g. Denni Madaris 6,428 688,947 23,666 1,007,886,485
h. Others n. e. c 579 17,788 679 10,424,044 -----------------------------------------------------------------------------------------------------------------------------
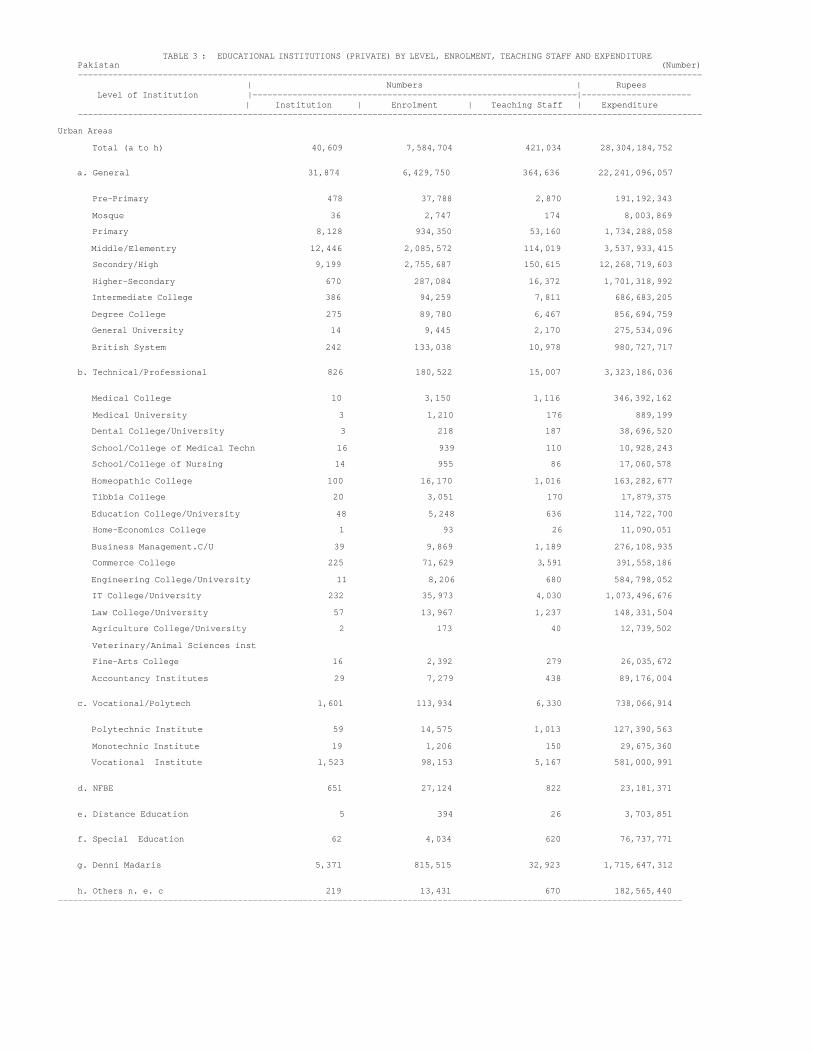
TABLE 3 : EDUCATIONAL INSTITUTIONS (PRIVATE) BY LEVEL, ENROLMENT, TEACHING STAFF AND EXPENDITURE Pakistan (Number) ----------------------------------------------------------------------------------------------------------------------------- | Numbers | Rupees Level of Institution |-----------------------------------------------------------------|---------------------- | Institution | Enrolment | Teaching Staff | Expenditure -----------------------------------------------------------------------------------------------------------------------------
Urban Areas
Total (a to h) 40,609 7,584,704 421,034 28,304,184,752
a. General 31,874 6,429,750 364,636 22,241,096,057
Pre-Primary 478 37,788 2,870 191,192,343
Mosque 36 2,747 174 8,003,869
Primary 8,128 934,350 53,160 1,734,288,058
Middle/Elementry 12,446 2,085,572 114,019 3,537,933,415
Secondry/High 9,199 2,755,687 150,615 12,268,719,603
Higher-Secondary 670 287,084 16,372 1,701,318,992
Intermediate College 386 94,259 7,811 686,683,205
Degree College 275 89,780 6,467 856,694,759
General University 14 9,445 2,170 275,534,096
British System 242 133,038 10,978 980,727,717
b. Technical/Professional 826 180,522 15,007 3,323,186,036
Medical College 10 3,150 1,116 346,392,162
Medical University 3 1,210 176 889,199
Dental College/University 3 218 187 38,696,520
School/College of Medical Techn 16 939 110 10,928,243
School/College of Nursing 14 955 86 17,060,578
Homeopathic College 100 16,170 1,016 163,282,677
Tibbia College 20 3,051 170 17,879,375
Education College/University 48 5,248 636 114,722,700
Home-Economics College 1 93 26 11,090,051
Business Management.C/U 39 9,869 1,189 276,108,935
Commerce College 225 71,629 3,591 391,558,186
Engineering College/University 11 8,206 680 584,798,052
IT College/University 232 35,973 4,030 1,073,496,676
Law College/University 57 13,967 1,237 148,331,504
Agriculture College/University 2 173 40 12,739,502
Veterinary/Animal Sciences inst
Fine-Arts College 16 2,392 279 26,035,672
Accountancy Institutes 29 7,279 438 89,176,004
c. Vocational/Polytech 1,601 113,934 6,330 738,066,914
Polytechnic Institute 59 14,575 1,013 127,390,563
Monotechnic Institute 19 1,206 150 29,675,360
Vocational Institute 1,523 98,153 5,167 581,000,991
d. NFBE 651 27,124 822 23,181,371
e. Distance Education 5 394 26 3,703,851
f. Special Education 62 4,034 620 76,737,771
g. Denni Madaris 5,371 815,515 32,923 1,715,647,312
h. Others n. e. c 219 13,431 670 182,565,440 -----------------------------------------------------------------------------------------------------------------------------

TABLE 4: STAGE WISE ENROLMENT IN PUBLIC AND PRIVATE SCHOOLS
Pakistan
-----------------------------------------------------------------------------------------------------------------------------------
| Enrolment by Type
Stages |------------------------------------------------------------------------------------------------
| Boys | Girls | Total
-----------------------------------------------------------------------------------------------------------------------------------
PUBLIC AND PRIVATE
1. Pre-Primary 3,573,562 3,028,384 6,601,946
2. Mosque 436,939 143,345 580,284
3. Primary 8,732,010 6,652,677 15,384,687
4. Middle/Elementry 2,868,070 2,074,904 4,942,974
5. High 1,228,281 879,496 2,107,777
6. Higher-Secondary 428,926 429,497 858,423
7. Total 17,267,788 13,208,303 30,476,091
PUBLIC
1. Pre-Primary 2,064,919 1,792,724 3,857,643
2. Mosque 434,790 142,235 577,025
3. Primary 5,964,066 4,430,182 10,394,248
4. Middle/Elementry 1,992,608 1,330,736 3,323,344
5. High 891,614 586,995 1,478,609
6. Higher-Secondary 352,187 355,965 708,152
7. Total 11,700,184 8,638,837 20,339,021
PRIVATE
1. Pre-Primary 1,508,643 1,235,660 2,744,303
2. Mosque 2,149 1,110 3,259
3. Primary 2,767,944 2,222,495 4,990,439
4. Middle/Elementry 875,462 744,168 1,619,630
5. High 336,667 292,501 629,168
6. Higher-Secondary 76,739 73,532 150,271
7. Total 5,567,604 4,569,466 10,137,070
-----------------------------------------------------------------------------------------------------------------------------------

TABLE 5: EDUCATIONAL INSTITUTIONS BY MANAGEMENT AND GENDER
(Number)
---------------------------------------------------------------------------------------------------------------------------
| Geographical Regions
Type/Gender of Institutions |----------------------------------------------------------------------------------------
| Pakistan
---------------------------------------------------------------------------------------------------------------------------
All Areas
All Institutions 227,791
Federal Government 6,931
Provincial Government 140,837
Semi/Autonomous Body 3,869
Armed Forces 107
NGO's 5,247
Foundation 1,678
Community 5,417
Trust 2,598
Private 59,236
Others 1,871
Girls Institutions 48,475
Federal Government 2,088
Provincial Government 38,655
Semi/Autonomous Body 1,128
Armed Forces 7
NGO's 1,074
Foundation 170
Community 1,096
Trust 339
Private 3,602
Others 316
Boys Institutions 57,868
Federal Government 3,364
Provincial Government 46,148
Semi/Autonomous Body 743
Armed Forces 10
NGO's 309
Foundation 96
Community 1,376
Trust 502
Private 4,871
Others 449
Mixed Institutions 121,448
Federal Government 1,479
Provincial Government 56,034
Semi/Autonomous Body 1,998
Armed Forces 90
NGO's 3,864

Foundation 1,412
Community 2,945
Trust 1,757
Private 50,763
Others 1,106
---------------------------------------------------------------------------------------------------------------------------
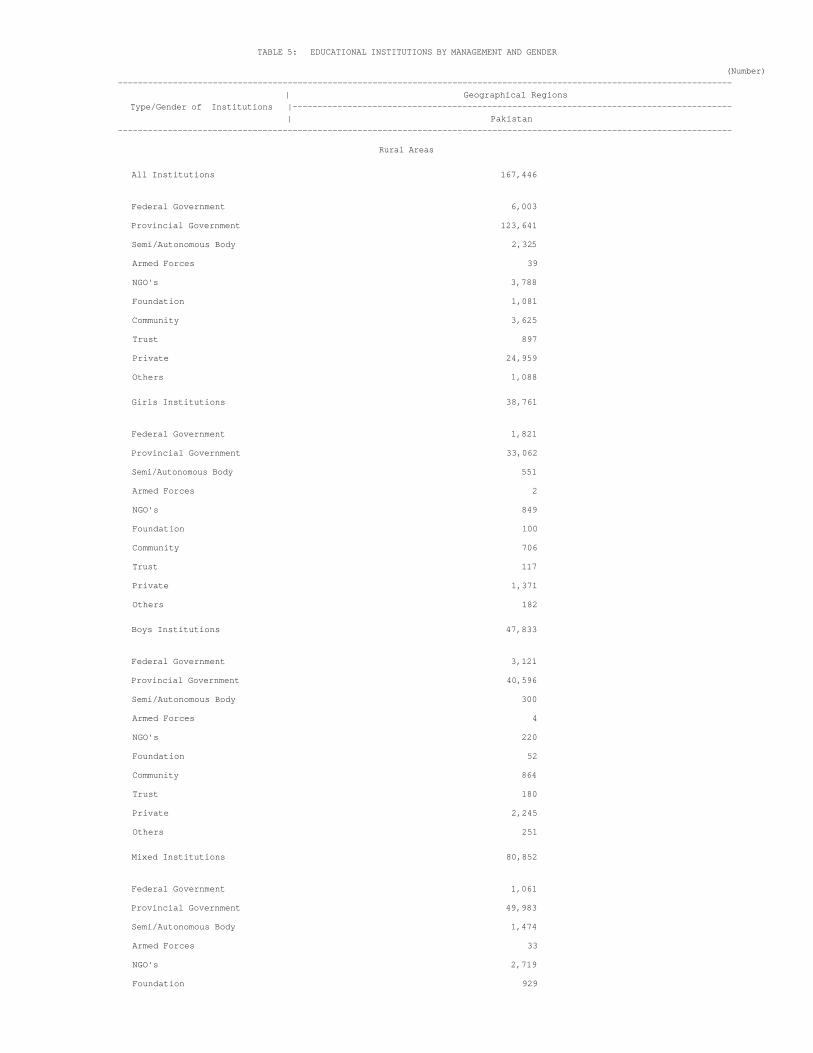
TABLE 5: EDUCATIONAL INSTITUTIONS BY MANAGEMENT AND GENDER
(Number)
---------------------------------------------------------------------------------------------------------------------------
| Geographical Regions
Type/Gender of Institutions |----------------------------------------------------------------------------------------
| Pakistan
---------------------------------------------------------------------------------------------------------------------------
Rural Areas
All Institutions 167,446
Federal Government 6,003
Provincial Government 123,641
Semi/Autonomous Body 2,325
Armed Forces 39
NGO's 3,788
Foundation 1,081
Community 3,625
Trust 897
Private 24,959
Others 1,088
Girls Institutions 38,761
Federal Government 1,821
Provincial Government 33,062
Semi/Autonomous Body 551
Armed Forces 2
NGO's 849
Foundation 100
Community 706
Trust 117
Private 1,371
Others 182
Boys Institutions 47,833
Federal Government 3,121
Provincial Government 40,596
Semi/Autonomous Body 300
Armed Forces 4
NGO's 220
Foundation 52
Community 864
Trust 180
Private 2,245
Others 251
Mixed Institutions 80,852
Federal Government 1,061
Provincial Government 49,983
Semi/Autonomous Body 1,474
Armed Forces 33
NGO's 2,719
Foundation 929

Community 2,055
Trust 600
Private 21,343
Others 655
---------------------------------------------------------------------------------------------------------------------------

TABLE 5: EDUCATIONAL INSTITUTIONS BY MANAGEMENT AND GENDER
(Number)
---------------------------------------------------------------------------------------------------------------------------
| Geographical Regions
Type/Gender of Institutions |----------------------------------------------------------------------------------------
| Pakistan
---------------------------------------------------------------------------------------------------------------------------
Urban Areas
All Institutions 60,345
Federal Government 928
Provincial Government 17,196
Semi/Autonomous Body 1,544
Armed Forces 68
NGO's 1,459
Foundation 597
Community 1,792
Trust 1,701
Private 34,277
Others 783
Girls Institutions 9,714
Federal Government 267
Provincial Government 5,593
Semi/Autonomous Body 577
Armed Forces 5
NGO's 225
Foundation 70
Community 390
Trust 222
Private 2,231
Others 134
Boys Institutions 10,035
Federal Government 243
Provincial Government 5,552
Semi/Autonomous Body 443
Armed Forces 6
NGO's 89
Foundation 44
Community 512
Trust 322
Private 2,626
Others 198
Mixed Institutions 40,596
Federal Government 418
Provincial Government 6,051
Semi/Autonomous Body 524
Armed Forces 57
NGO's 1,145
Foundation 483

Community 890
Trust 1,157
Private 29,420
Others 451
---------------------------------------------------------------------------------------------------------------------------

TABLE 6: EDUCATIONAL INSTITUTIONS OF SEMI GOVT./AUTONOMOUS INSTITUTIONS (OTHER THAN PROVINCIAL EDUCATION DEPARTMENTS) BY GENDER
Pakistan (Number)
---------------------------------------------------------------------------------------------------------------------------
| | | |
Department | All Institutions | Female Institutions | Male Institutions | Mixed Institutions
| | | |
---------------------------------------------------------------------------------------------------------------------------
All Areas
Total 3,869 1,128 743 1,998
OPF 27 3 4 20
Railway 52 15 9 28
PIA 2 2
WAPDA 36 8 12 16
Atomic Energy Commission 5 3 2
KRL Laboratories 1 1
National shipping Corporation
OGDC
Pakistan Steel Mills 2 1 1
Local/District/City Govt 1,373 433 376 564
Social Welfare Department 68 47 4 17
PTCL 6 2 4
Pakistan Ordinance Factories 4 1 1 2
Labour Department 18 5 6 7
Auqaf Department 19 6 9 4
NCHD 1,727 445 191 1,091
Social Security/WWF 7 5 2
TAVETA 72 21 39 12
Other Departments 450 133 91 226
---------------------------------------------------------------------------------------------------------------------------

TABLE 6: EDUCATIONAL INSTITUTIONS OF SEMI GOVT./AUTONOMOUS INSTITUTIONS (OTHER THAN PROVINCIAL EDUCATION DEPARTMENTS) BY GENDER
Pakistan (Number)
---------------------------------------------------------------------------------------------------------------------------
| | | |
Department | All Institutions | Female Institutions | Male Institutions | Mixed Institutions
| | | |
---------------------------------------------------------------------------------------------------------------------------
Rural Areas
Total 2,325 551 300 1,474
OPF 8 2 2 4
Railway 29 7 4 18
PIA
WAPDA 23 4 8 11
Atomic Energy Commission 5 3 2
KRL Laboratories 1 1
National shipping Corporation
OGDC
Pakistan Steel Mills
Local/District/City Govt 416 121 48 247
Social Welfare Department 33 25 2 6
PTCL
Pakistan Ordinance Factories
Labour Department 6 2 4
Auqaf Department 11 3 5 3
NCHD 1,515 303 172 1,040
Social Security/WWF 4 4
TAVETA 17 2 11 4
Other Departments 257 76 46 135
---------------------------------------------------------------------------------------------------------------------------

TABLE 6: EDUCATIONAL INSTITUTIONS OF SEMI GOVT./AUTONOMOUS INSTITUTIONS (OTHER THAN PROVINCIAL EDUCATION DEPARTMENTS)
BY GENDER
Pakistan (Number)
---------------------------------------------------------------------------------------------------------------------------
| | | |
Department | All Institutions | Female Institutions | Male Institutions | Mixed Institutions
| | | |
---------------------------------------------------------------------------------------------------------------------------
Urban Areas
Total 1,544 577 443 524
OPF 19 1 2 16
Railway 23 8 5 10
PIA 2 2
WAPDA 13 4 4 5
Atomic Energy Commission
KRL Laboratories
National shipping Corporation
OGDC
Pakistan Steel Mills 2 1 1
Local/District/City Govt 957 312 328 317
Social Welfare Department 35 22 2 11
PTCL 6 2 4
Pakistan Ordinance Factories 4 1 1 2
Labour Department 12 5 4 3
Auqaf Department 8 3 4 1
NCHD 212 142 19 51
Social Security/WWF 3 1 2
TAVETA 55 19 28 8
Other Departments 193 57 45 91
---------------------------------------------------------------------------------------------------------------------------

TABLE 7: EDUCATIONAL INSTITUTIONS BY CHAIN OF EDUCATION SYSTEM
Pakistan (Number)
---------------------------------------------------------------------------------------------------------------------------
| | | |
Chain of Education System | All Institutions | Female Institutions | Male Institutions | Mixed Institutions
| | | |
---------------------------------------------------------------------------------------------------------------------------
All Areas
Total 63,512 4,111 5,469 53,932
Beacon House 59 2 2 55
City School 144 4 4 136
Forebels 7 7
The Educators 164 6 10 148
COMSAT 14 7 7
FAST 2 1 1
Humdard 24 1 1 22
AIMS 12 1 11
Marjan Schools 47 4 2 41
Tameer-e-Millat 479 41 31 407
Punjab Colleges 63 16 9 38
Raees-ul-Ahrar 31 2 29
Missionary Schools 140 8 6 126
Shaheen 71 5 4 62
Fauji Foundation 168 40 17 111
Ghazali Foundation 289 14 20 255
READ Foundation 259 8 3 248
Al-Khair 44 2 7 35
Others 61,495 3,959 5,343 52,193
---------------------------------------------------------------------------------------------------------------------------

TABLE 7: EDUCATIONAL INSTITUTIONS BY CHAIN OF EDUCATION SYSTEM
Pakistan (Number)
---------------------------------------------------------------------------------------------------------------------------
| | | |
Chain of Education System | All Institutions | Female Institutions | Male Institutions | Mixed Institutions
| | | |
---------------------------------------------------------------------------------------------------------------------------
Rural Areas
Total 26,937 1,588 2,477 22,872
Beacon House 11 1 10
City School 11 1 10
Forebels 1 1
The Educators 26 2 24
COMSAT 8 5 3
FAST
Humdard 13 1 12
AIMS 4 4
Marjan Schools 17 2 15
Tameer-e-Millat 283 33 17 233
Punjab Colleges 19 5 3 11
Raees-ul-Ahrar 10 1 9
Missionary Schools 50 3 4 43
Shaheen 34 1 2 31
Fauji Foundation 63 11 7 45
Ghazali Foundation 232 12 16 204
READ Foundation 224 4 3 217
Al-Khair 11 2 9
Others 25,920 1,515 2,414 21,991
---------------------------------------------------------------------------------------------------------------------------
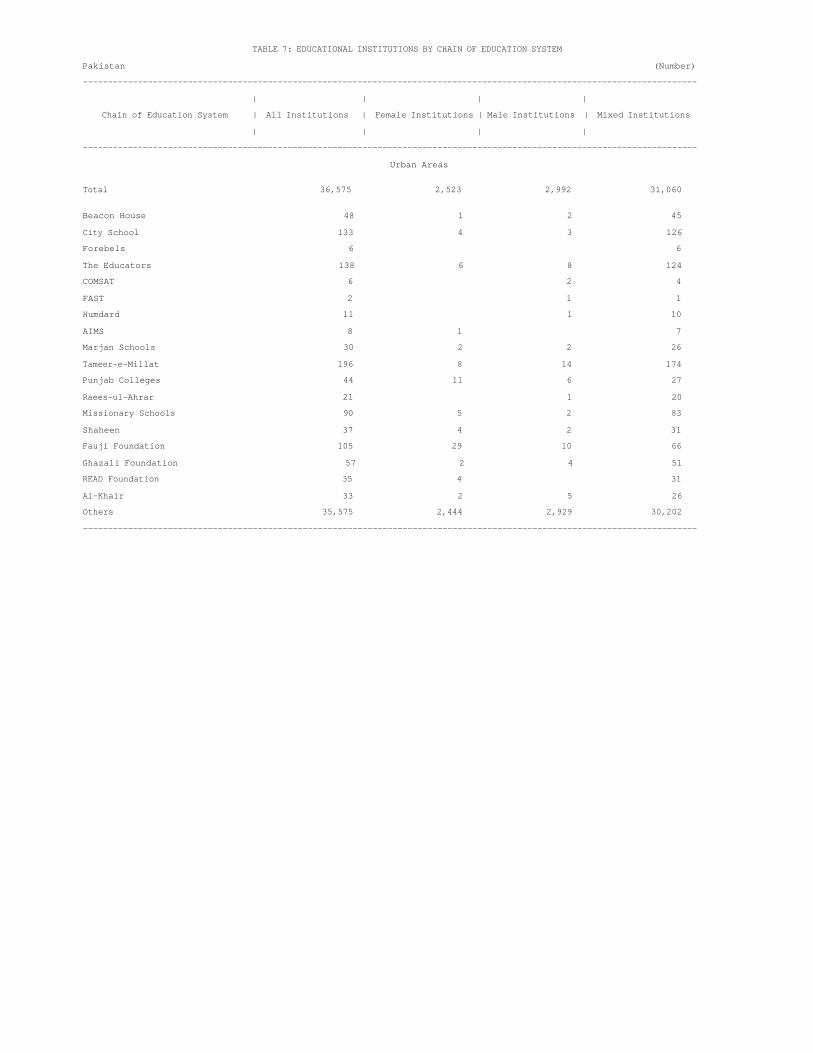
TABLE 7: EDUCATIONAL INSTITUTIONS BY CHAIN OF EDUCATION SYSTEM
Pakistan (Number)
---------------------------------------------------------------------------------------------------------------------------
| | | |
Chain of Education System | All Institutions | Female Institutions | Male Institutions | Mixed Institutions
| | | |
---------------------------------------------------------------------------------------------------------------------------
Urban Areas
Total 36,575 2,523 2,992 31,060
Beacon House 48 1 2 45
City School 133 4 3 126
Forebels 6 6
The Educators 138 6 8 124
COMSAT 6 2 4
FAST 2 1 1
Humdard 11 1 10
AIMS 8 1 7
Marjan Schools 30 2 2 26
Tameer-e-Millat 196 8 14 174
Punjab Colleges 44 11 6 27
Raees-ul-Ahrar 21 1 20
Missionary Schools 90 5 2 83
Shaheen 37 4 2 31
Fauji Foundation 105 29 10 66
Ghazali Foundation 57 2 4 51
READ Foundation 35 4 31
Al-Khair 33 2 5 26
Others 35,575 2,444 2,929 30,202
---------------------------------------------------------------------------------------------------------------------------

TABLE 8: PRIVATE EDUCATIONAL INSTITUTIONS BY REGISTRATION STATUS AND GENDER
(Number)
-----------------------------------------------------------------------------------------------------------------------------------
| All Areas | Rural Areas | Urban Areas
Region/ Reg status |-------------------------------|-------------------------------|--------------------------------
| Total | Girl | Boy | Mixed | Total | Girl | Boy | Mixed | Total | Girl | Boy | Mixed
-----------------------------------------------------------------------------------------------------------------------------------
Pakistan 76,047 6,597 7,603 61,847 35,438 3,325 3,812 28,301 40,609 3,272 3,791 33,546
a. Registered 59,040 4,814 5,764 48,462 26,726 2,339 2,769 21,618 32,314 2,475 2,995 26,844
Recognised 9,856 663 787 8,406 3,571 257 307 3,007 6,285 406 480 5,399
Affiliated 5,594 563 772 4,259 2,196 207 286 1,703 3,398 356 486 2,556
Other 43,590 3,588 4,205 35,797 20,959 1,875 2,176 16,908 22,631 1,713 2,029 18,889
b. Un-registered 17,007 1,783 1,839 13,385 8,712 986 1,043 6,683 8,295 797 796 6,702
Recognised 570 93 53 424 326 70 24 232 244 23 29 192
Affiliated 16,437 1,690 1,786 12,961 8,386 916 1,019 6,451 8,051 774 767 6,510
-----------------------------------------------------------------------------------------------------------------------------------

TABLE 9: EDUCATIONAL INSTITUTIONS, ENROLMENT AND TEACHERS BY GENDER AND SHIFT
Pakistan (Number)
----------------------------------------------------------------------------------------------------------------------------------------------------
| Total | Public | Private
Institution Gender/Shift |---------------------------------------|---------------------------------------|--------------------------------------
| Institution | Enrolment | Teachers | Institution | Enrolment | Teachers | Institution | Enrolment | Teachers
----------------------------------------------------------------------------------------------------------------------------------------------------
All Areas
All Institutions 227,791 33,379,578 1,356,802 151,744 21,258,184 723,876 76,047 12,121,394 632,926
Morning Shift 208,022 30,324,281 1,214,409 146,840 20,260,301 674,585 61,182 10,063,980 539,824
Evening Shift 8,026 746,881 37,443 3,761 364,944 18,833 4,265 381,937 18,610
Both Shifts 11,743 2,308,416 104,950 1,143 632,939 30,458 10,600 1,675,477 74,492
Girls Institutions 48,475 7,502,768 260,272 41,878 6,734,829 218,442 6,597 767,939 41,830
Morning Shift 44,002 7,027,505 237,817 39,932 6,482,221 207,192 4,070 545,284 30,625
Evening Shift 2,852 196,021 10,419 1,697 128,434 6,456 1,155 67,587 3,963
Both Shifts 1,621 279,242 12,036 249 124,174 4,794 1,372 155,068 7,242
Boys Institutions 57,868 9,424,679 350,566 50,265 8,310,984 297,631 7,603 1,113,695 52,935
Morning Shift 52,237 8,684,038 315,373 48,623 8,046,287 282,944 3,614 637,751 32,429
Evening Shift 2,024 176,677 9,544 1,286 111,245 6,396 738 65,432 3,148
Both Shifts 3,607 563,964 25,649 356 153,452 8,291 3,251 410,512 17,358
Mixed Institutions 121,448 16,452,131 745,964 59,601 6,212,371 207,803 61,847 10,239,760 538,161
Morning Shift 111,783 14,612,738 661,219 58,285 5,731,793 184,449 53,498 8,880,945 476,770
Evening Shift 3,150 374,183 17,480 778 125,265 5,981 2,372 248,918 11,499
Both Shifts 6,515 1,465,210 67,265 538 355,313 17,373 5,977 1,109,897 49,892
----------------------------------------------------------------------------------------------------------------------------------------------------

TABLE 9: EDUCATIONAL INSTITUTIONS, ENROLMENT AND TEACHERS BY GENDER AND SHIFT
Pakistan (Number)
----------------------------------------------------------------------------------------------------------------------------------------------------
| Total | Public | Private
Institution Gender/Shift |---------------------------------------|---------------------------------------|--------------------------------------
| Institution | Enrolment | Teachers | Institution | Enrolment | Teachers | Institution | Enrolment | Teachers
----------------------------------------------------------------------------------------------------------------------------------------------------
Rural Areas
All Institutions 167,446 19,159,897 687,613 132,008 14,623,207 475,721 35,438 4,536,690 211,892
Morning Shift 157,783 18,250,368 651,272 129,597 14,454,010 467,095 28,186 3,796,358 184,177
Evening Shift 4,413 250,026 10,814 1,959 78,369 3,603 2,454 171,657 7,211
Both Shifts 5,250 659,503 25,527 452 90,828 5,023 4,798 568,675 20,504
Girls Institutions 38,761 4,430,181 145,438 35,436 4,168,239 132,816 3,325 261,942 12,622
Morning Shift 36,340 4,287,036 138,891 34,293 4,113,084 130,369 2,047 173,952 8,522
Evening Shift 1,824 75,115 3,851 1,067 40,550 1,995 757 34,565 1,856
Both Shifts 597 68,030 2,696 76 14,605 452 521 53,425 2,244
Boys Institutions 47,833 6,522,798 227,278 44,021 6,049,136 207,491 3,812 473,662 19,787
Morning Shift 44,980 6,264,712 216,821 43,211 6,001,889 205,242 1,769 262,823 11,579
Evening Shift 1,084 49,195 2,131 675 21,848 1,044 409 27,347 1,087
Both Shifts 1,769 208,891 8,326 135 25,399 1,205 1,634 183,492 7,121
Mixed Institutions 80,852 8,206,918 314,897 52,551 4,405,832 135,414 28,301 3,801,086 179,483
Morning Shift 76,463 7,698,620 295,560 52,093 4,339,037 131,484 24,370 3,359,583 164,076
Evening Shift 1,505 125,716 4,832 217 15,971 564 1,288 109,745 4,268
Both Shifts 2,884 382,582 14,505 241 50,824 3,366 2,643 331,758 11,139
----------------------------------------------------------------------------------------------------------------------------------------------------

TABLE 9: EDUCATIONAL INSTITUTIONS, ENROLMENT AND TEACHERS BY GENDER AND SHIFT
Pakistan (Number)
----------------------------------------------------------------------------------------------------------------------------------------------------
| Total | Public | Private
Institution Gender/Shift |---------------------------------------|---------------------------------------|--------------------------------------
| Institution | Enrolment | Teachers | Institution | Enrolment | Teachers | Institution | Enrolment | Teachers
----------------------------------------------------------------------------------------------------------------------------------------------------
Urban Areas
All Institutions 60,345 14,219,681 669,189 19,736 6,634,977 248,155 40,609 7,584,704 421,034
Morning Shift 50,239 12,073,913 563,137 17,243 5,806,291 207,490 32,996 6,267,622 355,647
Evening Shift 3,613 496,855 26,629 1,802 286,575 15,230 1,811 210,280 11,399
Both Shifts 6,493 1,648,913 79,423 691 542,111 25,435 5,802 1,106,802 53,988
Girls Institutions 9,714 3,072,587 114,834 6,442 2,566,590 85,626 3,272 505,997 29,208
Morning Shift 7,662 2,740,469 98,926 5,639 2,369,137 76,823 2,023 371,332 22,103
Evening Shift 1,028 120,906 6,568 630 87,884 4,461 398 33,022 2,107
Both Shifts 1,024 211,212 9,340 173 109,569 4,342 851 101,643 4,998
Boys Institutions 10,035 2,901,881 123,288 6,244 2,261,848 90,140 3,791 640,033 33,148
Morning Shift 7,257 2,419,326 98,552 5,412 2,044,398 77,702 1,845 374,928 20,850
Evening Shift 940 127,482 7,413 611 89,397 5,352 329 38,085 2,061
Both Shifts 1,838 355,073 17,323 221 128,053 7,086 1,617 227,020 10,237
Mixed Institutions 40,596 8,245,213 431,067 7,050 1,806,539 72,389 33,546 6,438,674 358,678
Morning Shift 35,320 6,914,118 365,659 6,192 1,392,756 52,965 29,128 5,521,362 312,694
Evening Shift 1,645 248,467 12,648 561 109,294 5,417 1,084 139,173 7,231
Both Shifts 3,631 1,082,628 52,760 297 304,489 14,007 3,334 778,139 38,753
----------------------------------------------------------------------------------------------------------------------------------------------------

TABLE 10: EDUCATIONAL INSTITUTIONS BY ENROLMENT AND TEACHERS BY MEDIUM OF INSTRUCTIONS
Pakistan (Number)
-------------------------------------------------------------------------------------------------------------------------------------------
| Total | Public | Private
Institution Gender/ |--------------------------------------|-----------------------------------|-----------------------------------
Medium of Instruction | Institution| Enrolment | Teachers |Institution| Enrolment | Teachers |Institution| Enrolment |Teachers
-------------------------------------------------------------------------------------------------------------------------------------------
All Areas
All Institutions 227,791 33,379,578 1,356,802 151,744 21,258,184 723,876 76,047 12,121,394 632,926
Urdu 147,137 22,354,545 845,042 103,667 15,994,066 535,609 43,470 6,360,479 309,433
English 23,732 5,345,869 322,282 2,119 933,800 51,379 21,613 4,412,069 270,903
Arabic 7,150 915,973 34,869 411 73,580 3,239 6,739 842,393 31,630
Sindhi 35,334 3,071,852 101,843 33,998 2,910,020 94,628 1,336 161,832 7,215
Pashto 12,024 1,392,105 39,840 10,210 1,175,848 31,971 1,814 216,257 7,869
Punjabi 599 59,122 1,869 481 50,541 1,524 118 8,581 345
Balochi 84 7,129 282 44 3,372 136 40 3,757 146
Others 1,731 232,983 10,775 814 116,957 5,390 917 116,026 5,385
Girls Institutions 48,475 7,502,768 260,272 41,878 6,734,829 218,442 6,597 767,939 41,830
Urdu 37,946 6,188,889 206,621 33,746 5,735,881 182,840 4,200 453,008 23,781
English 1,275 405,872 22,200 570 242,748 10,624 705 163,124 11,576
Arabic 1,010 108,587 4,956 62 9,531 398 948 99,056 4,558
Sindhi 4,527 412,167 15,330 4,355 403,750 15,025 172 8,417 305
Pashto 3,208 331,304 8,890 2,826 301,326 7,860 382 29,978 1,030
Punjabi 140 11,118 368 106 9,606 297 34 1,512 71
Balochi 11 924 28 10 853 25 1 71 3
Others 358 43,907 1,879 203 31,134 1,373 155 12,773 506
Boys Institutions 57,868 9,424,679 350,566 50,265 8,310,984 297,631 7,603 1,113,695 52,935
Urdu 44,711 7,612,605 275,294 41,335 7,096,471 250,776 3,376 516,134 24,518
English 1,662 488,911 27,071 582 258,919 13,381 1,080 229,992 13,690
Arabic 2,275 247,352 10,100 138 15,742 659 2,137 231,610 9,441
Sindhi 3,855 429,327 16,909 3,757 415,542 16,336 98 13,785 573
Pashto 4,666 554,303 17,562 3,950 453,316 13,754 716 100,987 3,808
Punjabi 259 31,360 976 232 29,499 897 27 1,861 79
Balochi 25 2,257 94 16 1,141 50 9 1,116 44
Others 415 58,564 2,560 255 40,354 1,778 160 18,210 782
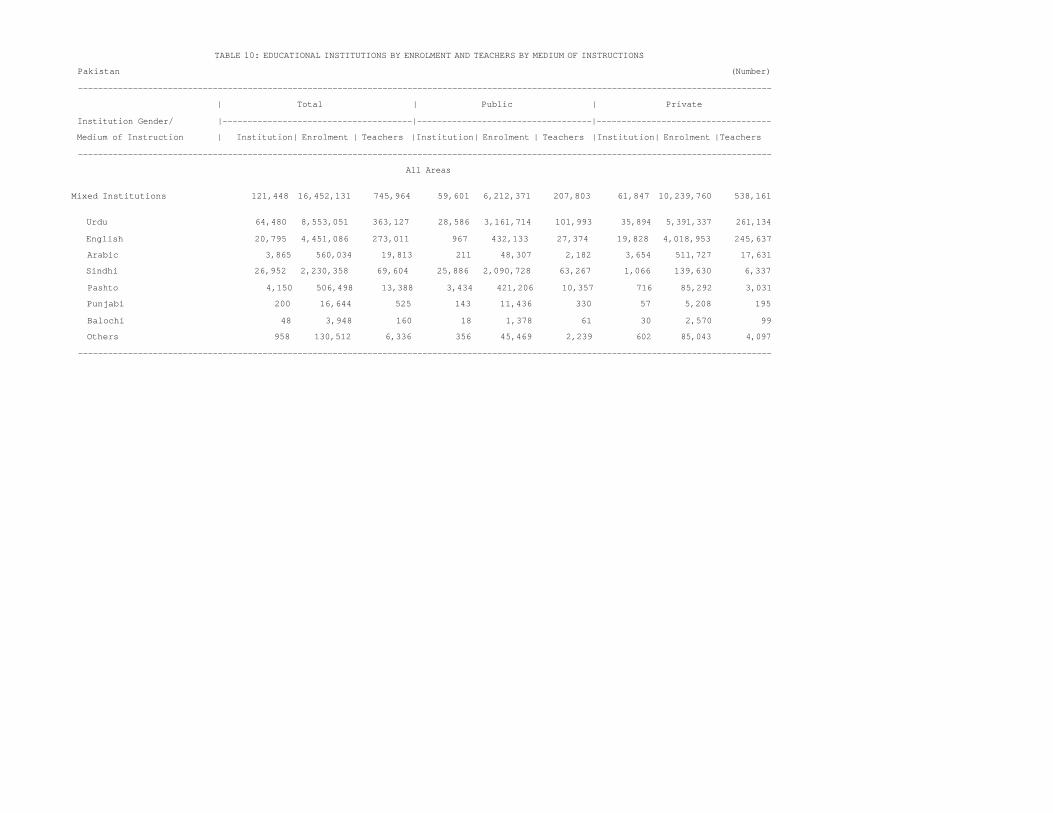
TABLE 10: EDUCATIONAL INSTITUTIONS BY ENROLMENT AND TEACHERS BY MEDIUM OF INSTRUCTIONS
Pakistan (Number)
-------------------------------------------------------------------------------------------------------------------------------------------
| Total | Public | Private
Institution Gender/ |--------------------------------------|-----------------------------------|-----------------------------------
Medium of Instruction | Institution| Enrolment | Teachers |Institution| Enrolment | Teachers |Institution| Enrolment |Teachers
-------------------------------------------------------------------------------------------------------------------------------------------
All Areas
Mixed Institutions 121,448 16,452,131 745,964 59,601 6,212,371 207,803 61,847 10,239,760 538,161
Urdu 64,480 8,553,051 363,127 28,586 3,161,714 101,993 35,894 5,391,337 261,134
English 20,795 4,451,086 273,011 967 432,133 27,374 19,828 4,018,953 245,637
Arabic 3,865 560,034 19,813 211 48,307 2,182 3,654 511,727 17,631
Sindhi 26,952 2,230,358 69,604 25,886 2,090,728 63,267 1,066 139,630 6,337
Pashto 4,150 506,498 13,388 3,434 421,206 10,357 716 85,292 3,031
Punjabi 200 16,644 525 143 11,436 330 57 5,208 195
Balochi 48 3,948 160 18 1,378 61 30 2,570 99
Others 958 130,512 6,336 356 45,469 2,239 602 85,043 4,097
-------------------------------------------------------------------------------------------------------------------------------------------

TABLE 10: EDUCATIONAL INSTITUTIONS BY ENROLMENT AND TEACHERS BY MEDIUM OF INSTRUCTIONS
Pakistan (Number)
-------------------------------------------------------------------------------------------------------------------------------------------
| Total | Public | Private
Institution Gender/ |--------------------------------------|-----------------------------------|-----------------------------------
Medium of Instruction | Institution| Enrolment | Teachers |Institution| Enrolment | Teachers |Institution| Enrolment |Teachers
-------------------------------------------------------------------------------------------------------------------------------------------
Rural Areas
All Institutions 167,446 19,159,897 687,613 132,008 14,623,207 475,721 35,438 4,536,690 211,892
Urdu 111,286 13,758,522 490,233 88,887 10,978,136 360,895 22,399 2,780,386 129,338
English 7,603 1,316,366 72,243 966 196,196 11,828 6,637 1,120,170 60,415
Arabic 3,922 422,511 14,905 322 57,177 2,543 3,600 365,334 12,362
Sindhi 31,925 2,281,669 70,401 31,123 2,221,424 68,051 802 60,245 2,350
Pashto 10,861 1,218,983 34,135 9,548 1,069,668 29,016 1,313 149,315 5,119
Punjabi 559 54,186 1,690 466 47,551 1,441 93 6,635 249
Balochi 66 4,882 192 39 2,867 114 27 2,015 78
Others 1,224 102,778 3,814 657 50,188 1,833 567 52,590 1,981
Girls Institutions 38,761 4,430,181 145,438 35,436 4,168,239 132,816 3,325 261,942 12,622
Urdu 30,866 3,750,654 123,819 28,650 3,579,983 115,068 2,216 170,671 8,751
English 427 53,751 2,589 255 33,765 1,304 172 19,986 1,285
Arabic 465 41,159 1,664 49 5,709 212 416 35,450 1,452
Sindhi 3,777 266,545 8,754 3,635 259,520 8,540 142 7,025 214
Pashto 2,838 288,455 7,569 2,588 269,051 6,945 250 19,404 624
Punjabi 129 10,671 343 105 9,423 293 24 1,248 50
Balochi 6 548 12 6 548 12
Others 253 18,398 688 148 10,240 442 105 8,158 246
Boys Institutions 47,833 6,522,798 227,278 44,021 6,049,136 207,491 3,812 473,662 19,787
Urdu 37,707 5,449,032 188,464 36,144 5,243,793 179,793 1,563 205,239 8,671
English 705 136,030 7,027 279 64,557 3,484 426 71,473 3,543
Arabic 1,218 118,273 4,641 109 12,233 484 1,109 106,040 4,157
Sindhi 3,394 279,971 10,037 3,350 275,227 9,840 44 4,744 197
Pashto 4,223 481,695 15,149 3,688 407,793 12,457 535 73,902 2,692
Punjabi 245 28,851 888 223 27,448 833 22 1,403 55
Balochi 19 1,263 55 15 941 41 4 322 14
Others 322 27,683 1,017 213 17,144 559 109 10,539 458

TABLE 10: EDUCATIONAL INSTITUTIONS BY ENROLMENT AND TEACHERS BY MEDIUM OF INSTRUCTIONS
Pakistan (Number)
-------------------------------------------------------------------------------------------------------------------------------------------
| Total | Public | Private
Institution Gender/ |--------------------------------------|-----------------------------------|-----------------------------------
Medium of Instruction | Institution| Enrolment | Teachers |Institution| Enrolment | Teachers |Institution| Enrolment |Teachers
-------------------------------------------------------------------------------------------------------------------------------------------
Rural Areas
Mixed Institutions 80,852 8,206,918 314,897 52,551 4,405,832 135,414 28,301 3,801,086 179,483
Urdu 42,713 4,558,836 177,950 24,093 2,154,360 66,034 18,620 2,404,476 111,916
English 6,471 1,126,585 62,627 432 97,874 7,040 6,039 1,028,711 55,587
Arabic 2,239 263,079 8,600 164 39,235 1,847 2,075 223,844 6,753
Sindhi 24,754 1,735,153 51,610 24,138 1,686,677 49,671 616 48,476 1,939
Pashto 3,800 448,833 11,417 3,272 392,824 9,614 528 56,009 1,803
Punjabi 185 14,664 459 138 10,680 315 47 3,984 144
Balochi 41 3,071 125 18 1,378 61 23 1,693 64
Others 649 56,697 2,109 296 22,804 832 353 33,893 1,277
-------------------------------------------------------------------------------------------------------------------------------------------

TABLE 10: EDUCATIONAL INSTITUTIONS BY ENROLMENT AND TEACHERS BY MEDIUM OF INSTRUCTIONS
Pakistan (Number)
-------------------------------------------------------------------------------------------------------------------------------------------
| Total | Public | Private
Institution Gender/ |--------------------------------------|-----------------------------------|-----------------------------------
Medium of Instruction | Institution| Enrolment | Teachers |Institution| Enrolment | Teachers |Institution| Enrolment |Teachers
-------------------------------------------------------------------------------------------------------------------------------------------
Urban Areas
All Institutions 60,345 14,219,681 669,189 19,736 6,634,977 248,155 40,609 7,584,704 421,034
Urdu 35,851 8,596,023 354,809 14,780 5,015,930 174,714 21,071 3,580,093 180,095
English 16,129 4,029,503 250,039 1,153 737,604 39,551 14,976 3,291,899 210,488
Arabic 3,228 493,462 19,964 89 16,403 696 3,139 477,059 19,268
Sindhi 3,409 790,183 31,442 2,875 688,596 26,577 534 101,587 4,865
Pashto 1,163 173,122 5,705 662 106,180 2,955 501 66,942 2,750
Punjabi 40 4,936 179 15 2,990 83 25 1,946 96
Balochi 18 2,247 90 5 505 22 13 1,742 68
Others 507 130,205 6,961 157 66,769 3,557 350 63,436 3,404
Girls Institutions 9,714 3,072,587 114,834 6,442 2,566,590 85,626 3,272 505,997 29,208
Urdu 7,080 2,438,235 82,802 5,096 2,155,898 67,772 1,984 282,337 15,030
English 848 352,121 19,611 315 208,983 9,320 533 143,138 10,291
Arabic 545 67,428 3,292 13 3,822 186 532 63,606 3,106
Sindhi 750 145,622 6,576 720 144,230 6,485 30 1,392 91
Pashto 370 42,849 1,321 238 32,275 915 132 10,574 406
Punjabi 11 447 25 1 183 4 10 264 21
Balochi 5 376 16 4 305 13 1 71 3
Others 105 25,509 1,191 55 20,894 931 50 4,615 260
Boys Institutions 10,035 2,901,881 123,288 6,244 2,261,848 90,140 3,791 640,033 33,148
Urdu 7,004 2,163,573 86,830 5,191 1,852,678 70,983 1,813 310,895 15,847
English 957 352,881 20,044 303 194,362 9,897 654 158,519 10,147
Arabic 1,057 129,079 5,459 29 3,509 175 1,028 125,570 5,284
Sindhi 461 149,356 6,872 407 140,315 6,496 54 9,041 376
Pashto 443 72,608 2,413 262 45,523 1,297 181 27,085 1,116
Punjabi 14 2,509 88 9 2,051 64 5 458 24
Balochi 6 994 39 1 200 9 5 794 30
Others 93 30,881 1,543 42 23,210 1,219 51 7,671 324

TABLE 10: EDUCATIONAL INSTITUTIONS BY ENROLMENT AND TEACHERS BY MEDIUM OF INSTRUCTIONS
Pakistan (Number)
-------------------------------------------------------------------------------------------------------------------------------------------
| Total | Public | Private
Institution Gender/ |--------------------------------------|-----------------------------------|-----------------------------------
Medium of Instruction | Institution| Enrolment | Teachers |Institution| Enrolment | Teachers |Institution| Enrolment |Teachers
-------------------------------------------------------------------------------------------------------------------------------------------
Urban Areas
Mixed Institutions 40,596 8,245,213 431,067 7,050 1,806,539 72,389 33,546 6,438,674 358,678
Urdu 21,767 3,994,215 185,177 4,493 1,007,354 35,959 17,274 2,986,861 149,218
English 14,324 3,324,501 210,384 535 334,259 20,334 13,789 2,990,242 190,050
Arabic 1,626 296,955 11,213 47 9,072 335 1,579 287,883 10,878
Sindhi 2,198 495,205 17,994 1,748 404,051 13,596 450 91,154 4,398
Pashto 350 57,665 1,971 162 28,382 743 188 29,283 1,228
Punjabi 15 1,980 66 5 756 15 10 1,224 51
Balochi 7 877 35 7 877 35
Others 309 73,815 4,227 60 22,665 1,407 249 51,150 2,820
-------------------------------------------------------------------------------------------------------------------------------------------

TABLE 11: EDUCATIONAL INSTITUTIONS (PUBLIC & PRIVATE) BY TYPE AND OWNERSHIP OF BUILDING
Pakistan (Number)
-----------------------------------------------------------------------------------------------------------------------------
Level of Institution | Total | Govt. | Owned | Rented | Rent Free | No Building
-----------------------------------------------------------------------------------------------------------------------------
All Areas
Total (a to h) 227,791 127,369 36,749 34,921 17,451 11,301
a. General 203,304 125,055 26,837 31,110 10,230 10,072
Pre-Primary 1,081 53 366 330 205 127
Mosque 14,123 7,204 478 86 2,739 3,616
Primary 122,349 92,624 9,522 8,785 5,409 6,009
Middle/Elementry 38,449 13,784 10,138 13,179 1,106 242
Secondry/High 22,955 9,207 5,668 7,394 628 58
Higher-Secondary 2,135 1,147 353 546 81 8
Intermediate College 747 259 147 303 34 4
Degree College 1,135 751 109 244 23 8
General University 49 22 15 11 1
British System 281 4 41 232 4
b. Technical/Professional 1,324 346 219 716 43
Medical College 30 16 8 6
Medical University 6 2 1 2 1
Dental College/University 6 2 2 1 1
School/College of Medical Techn 29 8 3 17 1
School/College of Nursing 74 59 9 4 2
Homeopathic College 122 4 23 89 6
Tibbia College 24 2 3 18 1
Education College/University 131 76 14 38 3
Home-Economics College 5 5
Business Management.C/U 52 8 17 27
Commerce College 378 102 34 236 6
Engineering College/University 33 19 5 9
IT College/University 293 16 64 198 15
Law College/University 71 9 25 33 4
Agriculture College/University 13 11 2
Veterinary/Animal Sciences inst 3 2 1
Fine-Arts College 20 3 2 15
Accountancy Institutes 34 2 8 21 3
c. Vocational/Polytech 3,059 655 615 1,526 241 22
Polytechnic Institute 151 72 28 50 1
Monotechnic Institute 49 27 7 14 1
Vocational Institute 2,859 556 580 1,462 239 22
d. NFBE 4,831 350 1,671 364 1,778 668
e. Distance Education 32 9 7 10 4 2
f. Special Education 218 91 26 88 12 1
g. Denni Madaris 12,153 331 6,634 961 3,988 239
h. Others n. e. c 2,870 532 740 146 1,155 297
-----------------------------------------------------------------------------------------------------------------------------

TABLE 11: EDUCATIONAL INSTITUTIONS (PUBLIC & PRIVATE) BY TYPE AND OWNERSHIP OF BUILDING
Pakistan (Number)
-----------------------------------------------------------------------------------------------------------------------------
Level of Institution | Total | Govt. | Owned | Rented | Rent Free | No Building
-----------------------------------------------------------------------------------------------------------------------------
Rural Areas
Total (a to h) 167,446 111,086 20,138 12,744 12,847 10,631
a. General 153,916 109,946 14,239 11,822 8,289 9,620
Pre-Primary 589 46 179 68 171 125
Mosque 12,995 6,689 429 50 2,430 3,397
Primary 103,863 83,805 5,923 3,736 4,608 5,791
Middle/Elementry 23,986 11,894 5,399 5,760 699 234
Secondry/High 10,931 6,542 2,083 1,930 320 56
Higher-Secondary 1,040 694 139 161 39 7
Intermediate College 213 105 40 52 13 3
Degree College 257 163 31 48 8 7
General University 13 8 4 1
British System 29 12 16 1
b. Technical/Professional 129 46 31 48 4
Medical College 3 1 1 1
Medical University 2 1 1
Dental College/University 1 1
School/College of Medical Techn 3 3
School/College of Nursing 3 3
Homeopathic College 6 1 1 4
Tibbia College 1 1
Education College/University 12 10 1 1
Home-Economics College
Business Management.C/U 6 2 4
Commerce College 27 16 10 1
Engineering College/University 9 7 2
IT College/University 42 16 23 3
Law College/University 6 4 2
Agriculture College/University 6 5 1
Veterinary/Animal Sciences inst 1 1
Fine-Arts College
Accountancy Institutes 1 1
c. Vocational/Polytech 802 162 192 311 123 14
Polytechnic Institute 36 22 8 6
Monotechnic Institute 10 7 1 2
Vocational Institute 756 133 183 303 123 14
d. NFBE 3,726 276 1,248 249 1,357 596
e. Distance Education 11 1 5 4 1
f. Special Education 19 5 6 7 1
g. Denni Madaris 6,658 177 3,837 268 2,204 172
h. Others n. e. c 2,185 473 580 39 866 227
-----------------------------------------------------------------------------------------------------------------------------

TABLE 11: EDUCATIONAL INSTITUTIONS (PUBLIC & PRIVATE) BY TYPE AND OWNERSHIP OF BUILDING
Pakistan (Number)
-----------------------------------------------------------------------------------------------------------------------------
Level of Institution | Total | Govt. | Owned | Rented | Rent Free | No Building
-----------------------------------------------------------------------------------------------------------------------------
Urban Areas
Total (a to h) 60,345 16,283 16,611 22,177 4,604 670
a. General 49,388 15,109 12,598 19,288 1,941 452
Pre-Primary 492 7 187 262 34 2
Mosque 1,128 515 49 36 309 219
Primary 18,486 8,819 3,599 5,049 801 218
Middle/Elementry 14,463 1,890 4,739 7,419 407 8
Secondry/High 12,024 2,665 3,585 5,464 308 2
Higher-Secondary 1,095 453 214 385 42 1
Intermediate College 534 154 107 251 21 1
Degree College 878 588 78 196 15 1
General University 36 14 11 10 1
British System 252 4 29 216 3
b. Technical/Professional 1,195 300 188 668 39
Medical College 27 15 7 5
Medical University 4 1 2 1
Dental College/University 5 2 1 1 1
School/College of Medical Techn 26 8 3 14 1
School/College of Nursing 71 56 9 4 2
Homeopathic College 116 3 22 85 6
Tibbia College 23 2 3 17 1
Education College/University 119 66 13 37 3
Home-Economics College 5 5
Business Management.C/U 46 6 13 27
Commerce College 351 86 34 226 5
Engineering College/University 24 12 5 7
IT College/University 251 16 48 175 12
Law College/University 65 9 21 31 4
Agriculture College/University 7 6 1
Veterinary/Animal Sciences inst 2 2
Fine-Arts College 20 3 2 15
Accountancy Institutes 33 2 7 21 3
c. Vocational/Polytech 2,257 493 423 1,215 118 8
Polytechnic Institute 115 50 20 44 1
Monotechnic Institute 39 20 6 12 1
Vocational Institute 2,103 423 397 1,159 116 8
d. NFBE 1,105 74 423 115 421 72
e. Distance Education 21 8 2 10 1
f. Special Education 199 86 20 81 12
g. Denni Madaris 5,495 154 2,797 693 1,784 67
h. Others n. e. c 685 59 160 107 289 70
-----------------------------------------------------------------------------------------------------------------------------

TABLE 11.1: EDUCATIONAL INSTITUTIONS (PUBLIC) BY TYPE AND OWNERSHIP OF BUILDING
Pakistan (Number) ----------------------------------------------------------------------------------------------------------------------------- Level of Institution | Total | Govt. | Owned | Rented | Rent Free | No Building -----------------------------------------------------------------------------------------------------------------------------
All Areas
Total (a to h) 151,744 126,357 4,225 2,174 8,636 10,352
a. General 145,799 124,678 2,828 1,669 6,838 9,786
Pre-Primary 287 37 86 2 85 77
Mosque 14,035 7,203 439 72 2,711 3,610
Primary 105,526 92,531 2,035 1,309 3,830 5,821
Middle/Elementry 14,334 13,756 113 116 127 222
Secondry/High 9,471 9,162 104 106 58 41
Higher-Secondary 1,079 1,026 16 24 8 5
Intermediate College 248 209 14 13 10 2
Degree College 777 730 14 16 9 8
General University 31 22 6 3
British System 11 2 1 8
b. Technical/Professional 426 314 23 82 7
Medical College 18 15 1 2
Medical University 2 2
Dental College/University 2 2
School/College of Medical Techn 11 8 1 1 1
School/College of Nursing 60 58 2
Homeopathic College 17 1 16
Tibbia College 3 2 1
Education College/University 82 72 2 6 2
Home-Economics College 4 4
Business Management.C/U 10 6 3 1
Commerce College 146 99 1 44 2
Engineering College/University 21 18 2 1
IT College/University 21 7 7 6 1
Law College/University 8 6 1 1
Agriculture College/University 11 10 1
Veterinary/Animal Sciences inst 2 2
Fine-Arts College 4 2 2
Accountancy Institutes 4 1 2 1
c. Vocational/Polytech 916 549 62 229 71 5
Polytechnic Institute 80 70 7 3
Monotechnic Institute 26 25 1
Vocational Institute 810 454 55 225 71 5
d. NFBE 2,008 236 657 93 722 300
e. Distance Education 23 9 1 7 4 2
f. Special Education 146 83 6 51 6
g. Denni Madaris 354 39 145 22 130 18
h. Others n. e. c 2,072 449 503 21 858 241
-----------------------------------------------------------------------------------------------------------------------------

TABLE 11.1: EDUCATIONAL INSTITUTIONS (PUBLIC) BY TYPE AND OWNERSHIP OF BUILDING
Pakistan (Number)
-----------------------------------------------------------------------------------------------------------------------------
Level of Institution | Total | Govt. | Owned | Rented | Rent Free | No Building
-----------------------------------------------------------------------------------------------------------------------------
Rural Areas
Total (a to h) 132,008 110,502 3,503 843 7,341 9,819
a. General 128,285 109,700 2,460 701 6,079 9,345
Pre-Primary 273 32 83 2 81 75
Mosque 12,943 6,689 408 44 2,410 3,392
Primary 95,168 83,720 1,819 563 3,459 5,607
Middle/Elementry 12,317 11,872 89 43 96 217
Secondry/High 6,646 6,514 47 22 23 40
Higher-Secondary 654 620 7 18 4 5
Intermediate College 100 89 2 4 3 2
Degree College 174 156 4 4 3 7
General University 9 8 1
British System 1 1
b. Technical/Professional 57 45 2 9 1
Medical College 1 1
Medical University 1 1
Dental College/University
School/College of Medical Techn 1 1
School/College of Nursing 3 3
Homeopathic College 1 1
Tibbia College
Education College/University 11 10 1
Home-Economics College
Business Management.C/U 3 2 1
Commerce College 20 16 3 1
Engineering College/University 8 7 1
IT College/University 2 1 1
Law College/University
Agriculture College/University 6 5 1
Veterinary/Animal Sciences inst
Fine-Arts College
Accountancy Institutes
c. Vocational/Polytech 260 132 31 52 42 3
Polytechnic Institute 24 21 1 2
Monotechnic Institute 6 6
Vocational Institute 230 105 30 50 42 3
d. NFBE 1,554 197 503 57 521 276
e. Distance Education 7 1 1 4 1
f. Special Education 9 4 1 4
g. Denni Madaris 230 21 100 8 85 16
h. Others n. e. c 1,606 402 405 12 609 178
-----------------------------------------------------------------------------------------------------------------------------

TABLE 11.1: EDUCATIONAL INSTITUTIONS (PUBLIC) BY TYPE AND OWNERSHIP OF BUILDING
Pakistan (Number)
-----------------------------------------------------------------------------------------------------------------------------
Level of Institution | Total | Govt. | Owned | Rented | Rent Free | No Building
----------------------------------------------------------------------------------------------------------------------------- Urban Areas
Total (a to h) 19,736 15,855 722 1,331 1,295 533
a. General 17,514 14,978 368 968 759 441
Pre-Primary 14 5 3 4 2
Mosque 1,092 514 31 28 301 218
Primary 10,358 8,811 216 746 371 214
Middle/Elementry 2,017 1,884 24 73 31 5
Secondry/High 2,825 2,648 57 84 35 1
Higher-Secondary 425 406 9 6 4
Intermediate College 148 120 12 9 7
Degree College 603 574 10 12 6 1
General University 22 14 5 3
British System 10 2 1 7
b. Technical/Professional 369 269 21 73 6
Medical College 17 14 1 2
Medical University 1 1
Dental College/University 2 2
School/College of Medical Techn 10 8 1 1
School/College of Nursing 57 55 2
Homeopathic College 16 1 15
Tibbia College 3 2 1
Education College/University 71 62 2 5 2
Home-Economics College 4 4
Business Management.C/U 7 4 2 1
Commerce College 126 83 1 41 1
Engineering College/University 13 11 2
IT College/University 19 7 6 5 1
Law College/University 8 6 1 1
Agriculture College/University 5 5
Veterinary/Animal Sciences inst 2 2
Fine-Arts College 4 2 2
Accountancy Institutes 4 1 2 1
c. Vocational/Polytech 656 417 31 177 29 2
Polytechnic Institute 56 49 6 1
Monotechnic Institute 20 19 1
Vocational Institute 580 349 25 175 29 2
d. NFBE 454 39 154 36 201 24
e. Distance Education 16 8 7 1
f. Special Education 137 79 5 47 6
g. Denni Madaris 124 18 45 14 45 2
h. Others n. e. c 466 47 98 9 249 63
-----------------------------------------------------------------------------------------------------------------------------

TABLE 11.2: EDUCATIONAL INSTITUTIONS (PRIVATE) BY TYPE AND OWNERSHIP OF BUILDING
Pakistan (Number)
-----------------------------------------------------------------------------------------------------------------------------
Level of Institution | Total | Govt. | Owned | Rented | Rent Free | No Building
-----------------------------------------------------------------------------------------------------------------------------
All Areas
Total (a to h) 76,047 1,012 32,524 32,747 8,815 949
a. General 57,505 377 24,009 29,441 3,392 286
Pre-Primary 794 16 280 328 120 50
Mosque 88 1 39 14 28 6
Primary 16,823 93 7,487 7,476 1,579 188
Middle/Elementry 24,115 28 10,025 13,063 979 20
Secondry/High 13,484 45 5,564 7,288 570 17
Higher-Secondary 1,056 121 337 522 73 3
Intermediate College 499 50 133 290 24 2
Degree College 358 21 95 228 14
General University 18 9 8 1
British System 270 2 40 224 4
b. Technical/Professional 898 32 196 634 36
Medical College 12 1 7 4
Medical University 4 1 2 1
Dental College/University 4 2 1 1
School/College of Medical Techn 18 2 16
School/College of Nursing 14 1 7 4 2
Homeopathic College 105 4 22 73 6
Tibbia College 21 3 17 1
Education College/University 49 4 12 32 1
Home-Economics College 1 1
Business Management.C/U 42 2 14 26
Commerce College 232 3 33 192 4
Engineering College/University 12 1 3 8
IT College/University 272 9 57 192 14
Law College/University 63 3 24 32 4
Agriculture College/University 2 1 1
Veterinary/Animal Sciences inst 1 1
Fine-Arts College 16 1 2 13
Accountancy Institutes 30 1 6 21 2
c. Vocational/Polytech 2,143 106 553 1,297 170 17
Polytechnic Institute 71 2 21 47 1
Monotechnic Institute 23 2 7 13 1
Vocational Institute 2,049 102 525 1,237 168 17
d. NFBE 2,823 114 1,014 271 1,056 368
e. Distance Education 9 6 3
f. Special Education 72 8 20 37 6 1
g. Denni Madaris 11,799 292 6,489 939 3,858 221
h. Others n. e. c 798 83 237 125 297 56
-----------------------------------------------------------------------------------------------------------------------------

TABLE 11.2: EDUCATIONAL INSTITUTIONS (PRIVATE) BY TYPE AND OWNERSHIP OF BUILDING
Pakistan (Number)
-----------------------------------------------------------------------------------------------------------------------------
Level of Institution | Total | Govt. | Owned | Rented | Rent Free | No Building
-----------------------------------------------------------------------------------------------------------------------------
Rural Areas
Total (a to h) 35,438 584 16,635 11,901 5,506 812
a. General 25,631 246 11,779 11,121 2,210 275
Pre-Primary 316 14 96 66 90 50
Mosque 52 21 6 20 5
Primary 8,695 85 4,104 3,173 1,149 184
Middle/Elementry 11,669 22 5,310 5,717 603 17
Secondry/High 4,285 28 2,036 1,908 297 16
Higher-Secondary 386 74 132 143 35 2
Intermediate College 113 16 38 48 10 1
Degree College 83 7 27 44 5
General University 4 3 1
British System 28 12 15 1
b. Technical/Professional 72 1 29 39 3
Medical College 2 1 1
Medical University 1 1
Dental College/University 1 1
School/College of Medical Techn 2 2
School/College of Nursing
Homeopathic College 5 1 1 3
Tibbia College 1 1
Education College/University 1 1
Home-Economics College
Business Management.C/U 3 3
Commerce College 7 7
Engineering College/University 1 1
IT College/University 40 15 22 3
Law College/University 6 4 2
Agriculture College/University
Veterinary/Animal Sciences inst 1 1
Fine-Arts College
Accountancy Institutes 1 1
c. Vocational/Polytech 542 30 161 259 81 11
Polytechnic Institute 12 1 7 4
Monotechnic Institute 4 1 1 2
Vocational Institute 526 28 153 253 81 11
d. NFBE 2,172 79 745 192 836 320
e. Distance Education 4 4
f. Special Education 10 1 5 3 1
g. Denni Madaris 6,428 156 3,737 260 2,119 156
h. Others n. e. c 579 71 175 27 257 49
-----------------------------------------------------------------------------------------------------------------------------

TABLE 11.2: EDUCATIONAL INSTITUTIONS (PRIVATE) BY TYPE AND OWNERSHIP OF BUILDING
Pakistan (Number)
-----------------------------------------------------------------------------------------------------------------------------
Level of Institution | Total | Govt. | Owned | Rented | Rent Free | No Building
-----------------------------------------------------------------------------------------------------------------------------
Urban Areas
Total (a to h) 40,609 428 15,889 20,846 3,309 137
a. General 31,874 131 12,230 18,320 1,182 11
Pre-Primary 478 2 184 262 30
Mosque 36 1 18 8 8 1
Primary 8,128 8 3,383 4,303 430 4
Middle/Elementry 12,446 6 4,715 7,346 376 3
Secondry/High 9,199 17 3,528 5,380 273 1
Higher-Secondary 670 47 205 379 38 1
Intermediate College 386 34 95 242 14 1
Degree College 275 14 68 184 9
General University 14 6 7 1
British System 242 2 28 209 3
b. Technical/Professional 826 31 167 595 33
Medical College 10 1 6 3
Medical University 3 2 1
Dental College/University 3 1 1 1
School/College of Medical Techn 16 2 14
School/College of Nursing 14 1 7 4 2
Homeopathic College 100 3 21 70 6
Tibbia College 20 3 16 1
Education College/University 48 4 11 32 1
Home-Economics College 1 1
Business Management.C/U 39 2 11 26
Commerce College 225 3 33 185 4
Engineering College/University 11 1 3 7
IT College/University 232 9 42 170 11
Law College/University 57 3 20 30 4
Agriculture College/University 2 1 1
Veterinary/Animal Sciences inst
Fine-Arts College 16 1 2 13
Accountancy Institutes 29 1 5 21 2
c. Vocational/Polytech 1,601 76 392 1,038 89 6
Polytechnic Institute 59 1 14 43 1
Monotechnic Institute 19 1 6 11 1
Vocational Institute 1,523 74 372 984 87 6
d. NFBE 651 35 269 79 220 48
e. Distance Education 5 2 3
f. Special Education 62 7 15 34 6
g. Denni Madaris 5,371 136 2,752 679 1,739 65
h. Others n. e. c 219 12 62 98 40 7
-----------------------------------------------------------------------------------------------------------------------------

TABLE 12: EDUCATIONAL INSTITUTIONS BY TYPE OF CONSTRUCTION OF BUILDING, TYPE OF INSTITUTION AND GENDER
(Number)
----------------------------------------------------------------------------------------------------------------------------
Geographical Region/ | All Institutions | Public Institutions | Private Institutions
Type of Construction |---------------------------------|---------------------------------|----------------------------------
of Building |All Areas|Rural Areas|Urban Areas|All Areas|Rural Areas|Urban Areas|All Areas|Rural Areas|Urban Areas
----------------------------------------------------------------------------------------------------------------------------
All Institutions
Pakistan 216,490 156,815 59,675 141,392 122,189 19,203 75,098 34,626 40,472
Pakka 174,103 121,716 52,387 114,137 97,742 16,395 59,966 23,974 35,992
Kacha 15,989 14,203 1,786 11,553 10,739 814 4,436 3,464 972
Mixed 26,398 20,896 5,502 15,702 13,708 1,994 10,696 7,188 3,508
Female Institutions
Total 54,932 45,119 9,813 47,440 41,386 6,054 7,492 3,733 3,759
Pakka 44,176 35,632 8,544 38,280 33,085 5,195 5,896 2,547 3,349
Kacha 3,729 3,358 371 3,185 2,920 265 544 438 106
Mixed 7,027 6,129 898 5,975 5,381 594 1,052 748 304
Male Institutions
Total 47,024 37,403 9,621 40,572 34,210 6,362 6,452 3,193 3,259
Pakka 39,155 30,693 8,462 34,119 28,585 5,534 5,036 2,108 2,928
Kacha 2,756 2,439 317 2,151 1,951 200 605 488 117
Mixed 5,113 4,271 842 4,302 3,674 628 811 597 214
Mixed Institutions
Total 114,534 74,293 40,241 53,380 46,593 6,787 61,154 27,700 33,454
Pakka 90,772 55,391 35,381 41,738 36,072 5,666 49,034 19,319 29,715
Kacha 9,504 8,406 1,098 6,217 5,868 349 3,287 2,538 749
Mixed 14,258 10,496 3,762 5,425 4,653 772 8,833 5,843 2,990
----------------------------------------------------------------------------------------------------------------------------
NOTE : No buildings are equal to Total institutions - Number of institutions having building

TABLE 13: EDUCATIONAL INSTITUTIONS BY BUILDING CONDITION, TYPE OF INSTITUTIONS AND GENDER
(Number)
--------------------------------------------------------------------------------------------------------------------------------
Geographical Region| All Institutions | Public Institutions | Private Institutions
/Building Condition|-----------------------------------|-----------------------------------|------------------------------------
| All Areas|Rural Areas|Urban Areas| All Areas|Rural Areas|Urban Areas| All Areas|Rural Areas|Urban Areas
--------------------------------------------------------------------------------------------------------------------------------
All Institutions
Pakistan 216,490 156,815 59,675 141,392 122,189 19,203 75,098 34,626 40,472
Satisfactory 111,713 68,630 43,083 56,132 46,613 9,519 55,581 22,017 33,564
Needs Minor Repair 57,756 47,351 10,405 43,651 38,604 5,047 14,105 8,747 5,358
Needs Major Repair 34,615 29,559 5,056 29,722 26,113 3,609 4,893 3,446 1,447
Dangerous 12,406 11,275 1,131 11,887 10,859 1,028 519 416 103
Female Institutions
Total 54,932 45,119 9,813 47,440 41,386 6,054 7,492 3,733 3,759
Satisfactory 23,886 17,902 5,984 18,575 15,633 2,942 5,311 2,269 3,042
Needs Minor Repair 16,087 14,020 2,067 14,700 13,118 1,582 1,387 902 485
Needs Major Repair 10,873 9,461 1,412 10,140 8,944 1,196 733 517 216
Dangerous 4,086 3,736 350 4,025 3,691 334 61 45 16
Male Institutions
Total 47,024 37,403 9,621 40,572 34,210 6,362 6,452 3,193 3,259
Satisfactory 22,596 16,626 5,970 17,885 14,659 3,226 4,711 1,967 2,744
Needs Minor Repair 13,446 11,385 2,061 12,266 10,586 1,680 1,180 799 381
Needs Major Repair 8,033 6,785 1,248 7,532 6,405 1,127 501 380 121
Dangerous 2,949 2,607 342 2,889 2,560 329 60 47 13
Mixed Institutions
Total 114,534 74,293 40,241 53,380 46,593 6,787 61,154 27,700 33,454
Satisfactory 65,231 34,102 31,129 19,672 16,321 3,351 45,559 17,781 27,778
Needs Minor Repair 28,223 21,946 6,277 16,685 14,900 1,785 11,538 7,046 4,492
Needs Major Repair 15,709 13,313 2,396 12,050 10,764 1,286 3,659 2,549 1,110
Dangerous 5,371 4,932 439 4,973 4,608 365 398 324 74

TABLE 14: ENROLMENT IN EDUCATIONAL INSTITUTIONS (PUBLIC & PRIVATE) BY LEVEL AND GENDER
Pakistan (Number)
-----------------------------------------------------------------------------------------------------------------------------------------------
| All Areas | Rural Areas | Urban Areas
Level of Institution |------------------------------------------------------------------------------------------------------------
| Total | Girls | Boys | Total | Girls | Boys | Total | Girls | Boys
-----------------------------------------------------------------------------------------------------------------------------------------------
Total (a to h) 33,379,578 14,398,365 18,981,213 19,159,897 7,639,535 11,520,362 14,219,681 6,758,830 7,460,851
a. General 30,926,629 13,445,158 17,481,471 18,177,325 7,246,987 10,930,338 12,749,304 6,198,171 6,551,133
Pre-Primary 61,364 30,151 31,213 23,048 11,661 11,387 38,316 18,490 19,826
Mosque 802,904 200,209 602,695 699,169 169,972 529,197 103,735 30,237 73,498
Primary 12,433,240 5,317,576 7,115,664 9,418,384 3,866,265 5,552,119 3,014,856 1,451,311 1,563,545
Middle/Elementry 6,652,870 3,129,383 3,523,487 3,942,037 1,829,248 2,112,789 2,710,833 1,300,135 1,410,698
Secondry/High 8,323,046 3,506,466 4,816,580 3,462,809 1,143,706 2,319,103 4,860,237 2,362,760 2,497,477
Higher-Secondary 1,150,479 517,708 632,771 448,096 162,384 285,712 702,383 355,324 347,059
Intermediate College 201,328 80,885 120,443 44,373 16,426 27,947 156,955 64,459 92,496
Degree College 957,161 537,904 419,257 92,466 28,741 63,725 864,695 509,163 355,532
General University 194,971 63,110 131,861 35,801 14,209 21,592 159,170 48,901 110,269
British System 149,266 61,766 87,500 11,142 4,375 6,767 138,124 57,391 80,733
b. Technical/Professional 361,534 103,179 258,355 36,038 9,185 26,853 325,496 93,994 231,502
Medical College 16,910 9,326 7,584 1,091 461 630 15,819 8,865 6,954
Medical University 2,943 1,452 1,491 1,723 941 782 1,220 511 709
Dental College/University 815 549 266 52 44 8 763 505 258
School/College of Medical Techn 3,082 843 2,239 393 150 243 2,689 693 1,996
School/College of Nursing 7,296 5,341 1,955 247 247 7,049 5,094 1,955
Homeopathic College 19,958 6,694 13,264 711 255 456 19,247 6,439 12,808
Tibbia College 3,569 300 3,269 45 2 43 3,524 298 3,226
Education College/University 35,226 26,428 8,798 7,014 4,595 2,419 28,212 21,833 6,379
Home-Economics College 5,452 5,452 5,452 5,452
Business Management.C/U 13,151 3,460 9,691 1,773 338 1,435 11,378 3,122 8,256
Commerce College 124,611 17,001 107,610 4,062 79 3,983 120,549 16,922 103,627
Engineering College/University 39,686 5,970 33,716 11,284 1,130 10,154 28,402 4,840 23,562
IT College/University 39,172 8,591 30,581 2,084 292 1,792 37,088 8,299 28,789
Law College/University 17,830 4,049 13,781 604 231 373 17,226 3,818 13,408
Agriculture College/University 14,759 2,999 11,760 4,361 403 3,958 10,398 2,596 7,802
Veterinary/Animal Sciences inst 1,094 240 854 22 1 21 1,072 239 833
Fine-Arts College 3,005 1,459 1,546 3,005 1,459 1,546
Accountancy Institutes 12,975 3,025 9,950 572 16 556 12,403 3,009 9,394

TABLE 14: ENROLMENT IN EDUCATIONAL INSTITUTIONS (PUBLIC & PRIVATE) BY LEVEL AND GENDER
Pakistan (Number)
-----------------------------------------------------------------------------------------------------------------------------------------------
| All Areas | Rural Areas | Urban Areas
Level of Institution |------------------------------------------------------------------------------------------------------------
| Total | Girls | Boys | Total | Girls | Boys | Total | Girls | Boys
-----------------------------------------------------------------------------------------------------------------------------------------------
c. Vocational/Polytech 238,687 89,646 149,041 43,198 18,658 24,540 195,489 70,988 124,501
Polytechnic Institute 55,763 2,703 53,060 11,813 837 10,976 43,950 1,866 42,084
Monotechnic Institute 5,923 719 5,204 740 15 725 5,183 704 4,479
Vocational Institute 177,001 86,224 90,777 30,645 17,806 12,839 146,356 68,418 77,938
d. NFBE 174,045 108,910 65,135 131,543 83,290 48,253 42,502 25,620 16,882
e. Distance Education 33,841 13,771 20,070 402 305 97 33,439 13,466 19,973
f. Special Education 13,122 4,929 8,193 1,183 483 700 11,939 4,446 7,493
g. Denni Madaris 1,549,242 586,663 962,579 715,859 249,728 466,131 833,383 336,935 496,448
h. Others n. e. c 82,478 46,109 36,369 54,349 30,899 23,450 28,129 15,210 12,919
-----------------------------------------------------------------------------------------------------------------------------------------------
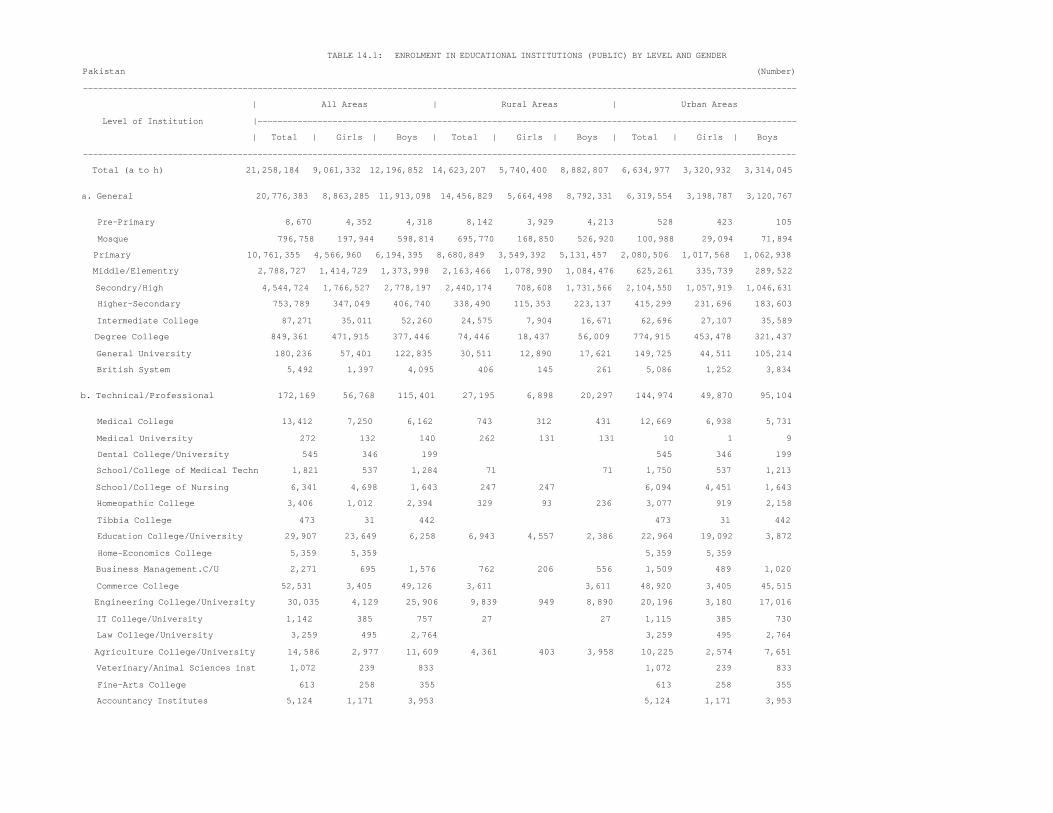
TABLE 14.1: ENROLMENT IN EDUCATIONAL INSTITUTIONS (PUBLIC) BY LEVEL AND GENDER
Pakistan (Number)
-----------------------------------------------------------------------------------------------------------------------------------------------
| All Areas | Rural Areas | Urban Areas
Level of Institution |------------------------------------------------------------------------------------------------------------
| Total | Girls | Boys | Total | Girls | Boys | Total | Girls | Boys
-----------------------------------------------------------------------------------------------------------------------------------------------
Total (a to h) 21,258,184 9,061,332 12,196,852 14,623,207 5,740,400 8,882,807 6,634,977 3,320,932 3,314,045
a. General 20,776,383 8,863,285 11,913,098 14,456,829 5,664,498 8,792,331 6,319,554 3,198,787 3,120,767
Pre-Primary 8,670 4,352 4,318 8,142 3,929 4,213 528 423 105
Mosque 796,758 197,944 598,814 695,770 168,850 526,920 100,988 29,094 71,894
Primary 10,761,355 4,566,960 6,194,395 8,680,849 3,549,392 5,131,457 2,080,506 1,017,568 1,062,938
Middle/Elementry 2,788,727 1,414,729 1,373,998 2,163,466 1,078,990 1,084,476 625,261 335,739 289,522
Secondry/High 4,544,724 1,766,527 2,778,197 2,440,174 708,608 1,731,566 2,104,550 1,057,919 1,046,631
Higher-Secondary 753,789 347,049 406,740 338,490 115,353 223,137 415,299 231,696 183,603
Intermediate College 87,271 35,011 52,260 24,575 7,904 16,671 62,696 27,107 35,589
Degree College 849,361 471,915 377,446 74,446 18,437 56,009 774,915 453,478 321,437
General University 180,236 57,401 122,835 30,511 12,890 17,621 149,725 44,511 105,214
British System 5,492 1,397 4,095 406 145 261 5,086 1,252 3,834
b. Technical/Professional 172,169 56,768 115,401 27,195 6,898 20,297 144,974 49,870 95,104
Medical College 13,412 7,250 6,162 743 312 431 12,669 6,938 5,731
Medical University 272 132 140 262 131 131 10 1 9
Dental College/University 545 346 199 545 346 199
School/College of Medical Techn 1,821 537 1,284 71 71 1,750 537 1,213
School/College of Nursing 6,341 4,698 1,643 247 247 6,094 4,451 1,643
Homeopathic College 3,406 1,012 2,394 329 93 236 3,077 919 2,158
Tibbia College 473 31 442 473 31 442
Education College/University 29,907 23,649 6,258 6,943 4,557 2,386 22,964 19,092 3,872
Home-Economics College 5,359 5,359 5,359 5,359
Business Management.C/U 2,271 695 1,576 762 206 556 1,509 489 1,020
Commerce College 52,531 3,405 49,126 3,611 3,611 48,920 3,405 45,515
Engineering College/University 30,035 4,129 25,906 9,839 949 8,890 20,196 3,180 17,016
IT College/University 1,142 385 757 27 27 1,115 385 730
Law College/University 3,259 495 2,764 3,259 495 2,764
Agriculture College/University 14,586 2,977 11,609 4,361 403 3,958 10,225 2,574 7,651
Veterinary/Animal Sciences inst 1,072 239 833 1,072 239 833
Fine-Arts College 613 258 355 613 258 355
Accountancy Institutes 5,124 1,171 3,953 5,124 1,171 3,953
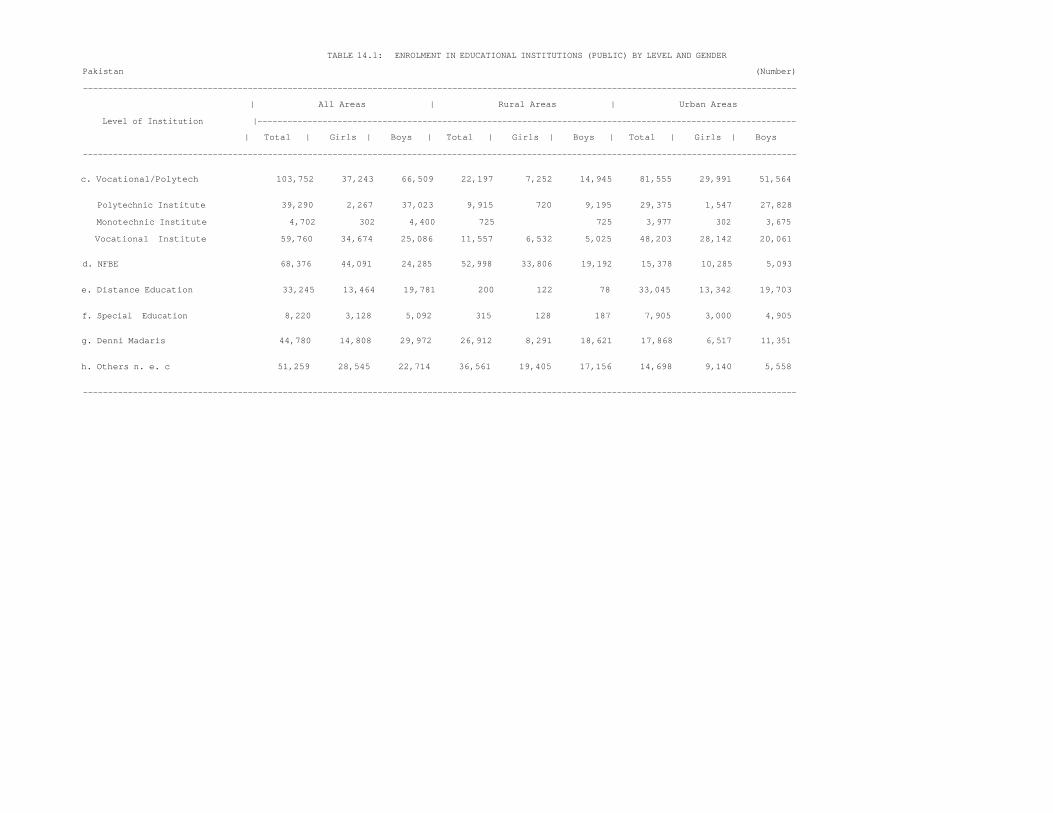
TABLE 14.1: ENROLMENT IN EDUCATIONAL INSTITUTIONS (PUBLIC) BY LEVEL AND GENDER
Pakistan (Number)
-----------------------------------------------------------------------------------------------------------------------------------------------
| All Areas | Rural Areas | Urban Areas
Level of Institution |------------------------------------------------------------------------------------------------------------
| Total | Girls | Boys | Total | Girls | Boys | Total | Girls | Boys
-----------------------------------------------------------------------------------------------------------------------------------------------
c. Vocational/Polytech 103,752 37,243 66,509 22,197 7,252 14,945 81,555 29,991 51,564
Polytechnic Institute 39,290 2,267 37,023 9,915 720 9,195 29,375 1,547 27,828
Monotechnic Institute 4,702 302 4,400 725 725 3,977 302 3,675
Vocational Institute 59,760 34,674 25,086 11,557 6,532 5,025 48,203 28,142 20,061
d. NFBE 68,376 44,091 24,285 52,998 33,806 19,192 15,378 10,285 5,093
e. Distance Education 33,245 13,464 19,781 200 122 78 33,045 13,342 19,703
f. Special Education 8,220 3,128 5,092 315 128 187 7,905 3,000 4,905
g. Denni Madaris 44,780 14,808 29,972 26,912 8,291 18,621 17,868 6,517 11,351
h. Others n. e. c 51,259 28,545 22,714 36,561 19,405 17,156 14,698 9,140 5,558
-----------------------------------------------------------------------------------------------------------------------------------------------

TABLE 14.2: ENROLMENT IN EDUCATIONAL INSTITUTIONS (PRIVATE) BY LEVEL AND GENDER
Pakistan (Number)
-----------------------------------------------------------------------------------------------------------------------------------------------
| All Areas | Rural Areas | Urban Areas
Level of Institution |------------------------------------------------------------------------------------------------------------
| Total | Girls | Boys | Total | Girls | Boys | Total | Girls | Boys
-----------------------------------------------------------------------------------------------------------------------------------------------
Total (a to h) 12,121,394 5,337,033 6,784,361 4,536,690 1,899,135 2,637,555 7,584,704 3,437,898 4,146,806
a. General 10,150,246 4,581,873 5,568,373 3,720,496 1,582,489 2,138,007 6,429,750 2,999,384 3,430,366
Pre-Primary 52,694 25,799 26,895 14,906 7,732 7,174 37,788 18,067 19,721
Mosque 6,146 2,265 3,881 3,399 1,122 2,277 2,747 1,143 1,604
Primary 1,671,885 750,616 921,269 737,535 316,873 420,662 934,350 433,743 500,607
Middle/Elementry 3,864,143 1,714,654 2,149,489 1,778,571 750,258 1,028,313 2,085,572 964,396 1,121,176
Secondry/High 3,778,322 1,739,939 2,038,383 1,022,635 435,098 587,537 2,755,687 1,304,841 1,450,846
Higher-Secondary 396,690 170,659 226,031 109,606 47,031 62,575 287,084 123,628 163,456
Intermediate College 114,057 45,874 68,183 19,798 8,522 11,276 94,259 37,352 56,907
Degree College 107,800 65,989 41,811 18,020 10,304 7,716 89,780 55,685 34,095
General University 14,735 5,709 9,026 5,290 1,319 3,971 9,445 4,390 5,055
British System 143,774 60,369 83,405 10,736 4,230 6,506 133,038 56,139 76,899
b. Technical/Professional 189,365 46,411 142,954 8,843 2,287 6,556 180,522 44,124 136,398
Medical College 3,498 2,076 1,422 348 149 199 3,150 1,927 1,223
Medical University 2,671 1,320 1,351 1,461 810 651 1,210 510 700
Dental College/University 270 203 67 52 44 8 218 159 59
School/College of Medical Techn 1,261 306 955 322 150 172 939 156 783
School/College of Nursing 955 643 312 955 643 312
Homeopathic College 16,552 5,682 10,870 382 162 220 16,170 5,520 10,650
Tibbia College 3,096 269 2,827 45 2 43 3,051 267 2,784
Education College/University 5,319 2,779 2,540 71 38 33 5,248 2,741 2,507
Home-Economics College 93 93 93 93
Business Management.C/U 10,880 2,765 8,115 1,011 132 879 9,869 2,633 7,236
Commerce College 72,080 13,596 58,484 451 79 372 71,629 13,517 58,112
Engineering College/University 9,651 1,841 7,810 1,445 181 1,264 8,206 1,660 6,546
IT College/University 38,030 8,206 29,824 2,057 292 1,765 35,973 7,914 28,059
Law College/University 14,571 3,554 11,017 604 231 373 13,967 3,323 10,644
Agriculture College/University 173 22 151 173 22 151
Veterinary/Animal Sciences inst 22 1 21 22 1 21
Fine-Arts College 2,392 1,201 1,191 2,392 1,201 1,191
Accountancy Institutes 7,851 1,854 5,997 572 16 556 7,279 1,838 5,441

TABLE 14.2: ENROLMENT IN EDUCATIONAL INSTITUTIONS (PRIVATE) BY LEVEL AND GENDER
Pakistan (Number)
-----------------------------------------------------------------------------------------------------------------------------------------------
| All Areas | Rural Areas | Urban Areas
Level of Institution |------------------------------------------------------------------------------------------------------------
| Total | Girls | Boys | Total | Girls | Boys | Total | Girls | Boys
-----------------------------------------------------------------------------------------------------------------------------------------------
c. Vocational/Polytech 134,935 52,403 82,532 21,001 11,406 9,595 113,934 40,997 72,937
Polytechnic Institute 16,473 436 16,037 1,898 117 1,781 14,575 319 14,256
Monotechnic Institute 1,221 417 804 15 15 1,206 402 804
Vocational Institute 117,241 51,550 65,691 19,088 11,274 7,814 98,153 40,276 57,877
d. NFBE 105,669 64,819 40,850 78,545 49,484 29,061 27,124 15,335 11,789
e. Distance Education 596 307 289 202 183 19 394 124 270
f. Special Education 4,902 1,801 3,101 868 355 513 4,034 1,446 2,588
g. Denni Madaris 1,504,462 571,855 932,607 688,947 241,437 447,510 815,515 330,418 485,097
h. Others n. e. c 31,219 17,564 13,655 17,788 11,494 6,294 13,431 6,070 7,361
-----------------------------------------------------------------------------------------------------------------------------------------------
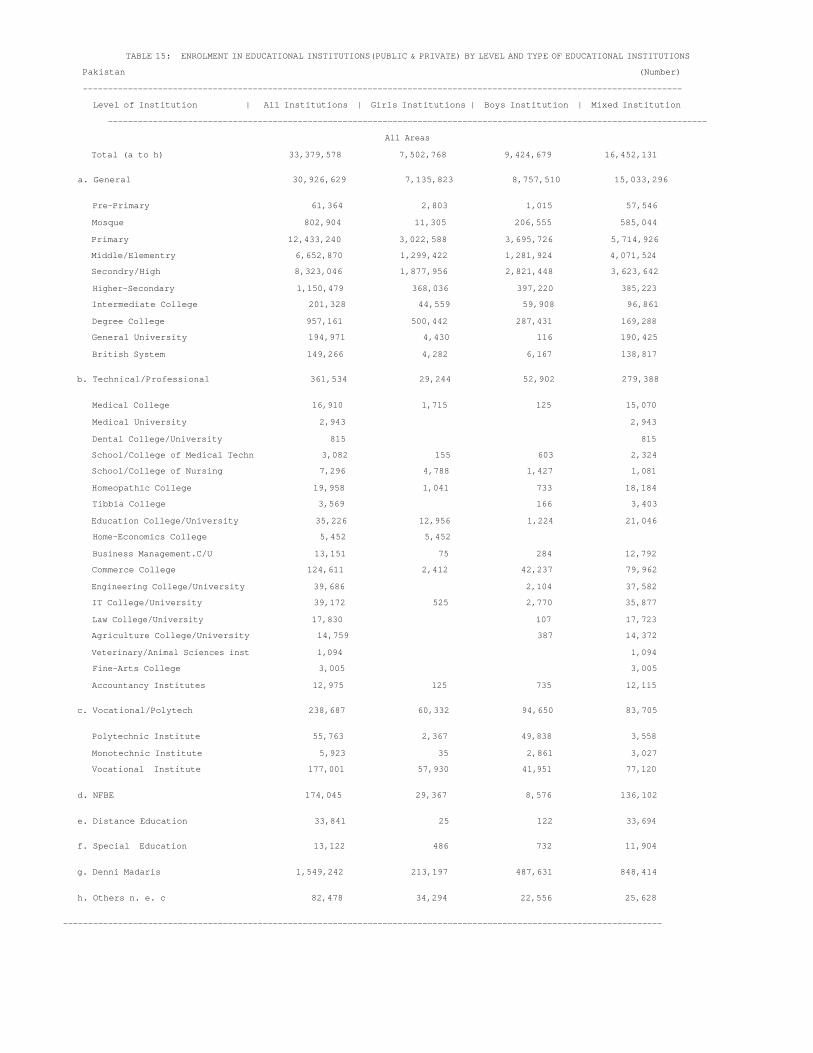
TABLE 15: ENROLMENT IN EDUCATIONAL INSTITUTIONS(PUBLIC & PRIVATE) BY LEVEL AND TYPE OF EDUCATIONAL INSTITUTIONS
Pakistan (Number)
------------------------------------------------------------------------------------------------------------------------
Level of Institution | All Institutions | Girls Institutions | Boys Institution | Mixed Institution
------------------------------------------------------------------------------------------------------------------------
All Areas
Total (a to h) 33,379,578 7,502,768 9,424,679 16,452,131
a. General 30,926,629 7,135,823 8,757,510 15,033,296
Pre-Primary 61,364 2,803 1,015 57,546
Mosque 802,904 11,305 206,555 585,044
Primary 12,433,240 3,022,588 3,695,726 5,714,926
Middle/Elementry 6,652,870 1,299,422 1,281,924 4,071,524
Secondry/High 8,323,046 1,877,956 2,821,448 3,623,642
Higher-Secondary 1,150,479 368,036 397,220 385,223
Intermediate College 201,328 44,559 59,908 96,861
Degree College 957,161 500,442 287,431 169,288
General University 194,971 4,430 116 190,425
British System 149,266 4,282 6,167 138,817
b. Technical/Professional 361,534 29,244 52,902 279,388
Medical College 16,910 1,715 125 15,070
Medical University 2,943 2,943
Dental College/University 815 815
School/College of Medical Techn 3,082 155 603 2,324
School/College of Nursing 7,296 4,788 1,427 1,081
Homeopathic College 19,958 1,041 733 18,184
Tibbia College 3,569 166 3,403
Education College/University 35,226 12,956 1,224 21,046
Home-Economics College 5,452 5,452
Business Management.C/U 13,151 75 284 12,792
Commerce College 124,611 2,412 42,237 79,962
Engineering College/University 39,686 2,104 37,582
IT College/University 39,172 525 2,770 35,877
Law College/University 17,830 107 17,723
Agriculture College/University 14,759 387 14,372
Veterinary/Animal Sciences inst 1,094 1,094
Fine-Arts College 3,005 3,005
Accountancy Institutes 12,975 125 735 12,115
c. Vocational/Polytech 238,687 60,332 94,650 83,705
Polytechnic Institute 55,763 2,367 49,838 3,558
Monotechnic Institute 5,923 35 2,861 3,027
Vocational Institute 177,001 57,930 41,951 77,120
d. NFBE 174,045 29,367 8,576 136,102
e. Distance Education 33,841 25 122 33,694
f. Special Education 13,122 486 732 11,904
g. Denni Madaris 1,549,242 213,197 487,631 848,414
h. Others n. e. c 82,478 34,294 22,556 25,628
------------------------------------------------------------------------------------------------------------------------

TABLE 15: ENROLMENT IN EDUCATIONAL INSTITUTIONS(PUBLIC & PRIVATE) BY LEVEL AND TYPE OF EDUCATIONAL INSTITUTIONS
Pakistan (Number)
------------------------------------------------------------------------------------------------------------------------
Level of Institution | All Institutions | Girls Institutions | Boys Institution | Mixed Institution
------------------------------------------------------------------------------------------------------------------------ Rural Areas
Total (a to h) 19,159,897 4,430,181 6,522,798 8,206,918
a. General 18,177,325 4,284,817 6,239,156 7,653,352
Pre-Primary 23,048 2,293 973 19,782
Mosque 699,169 10,039 182,915 506,215
Primary 9,418,384 2,405,163 3,116,808 3,896,413
Middle/Elementry 3,942,037 997,820 1,007,391 1,936,826
Secondry/High 3,462,809 712,709 1,651,215 1,098,885
Higher-Secondary 448,096 125,579 217,124 105,393
Intermediate College 44,373 8,926 13,340 22,107
Degree College 92,466 21,649 48,853 21,964
General University 35,801 34 116 35,651
British System 11,142 605 421 10,116
b. Technical/Professional 36,038 696 5,186 30,156
Medical College 1,091 1,091
Medical University 1,723 1,723
Dental College/University 52 52
School/College of Medical Techn 393 93 300
School/College of Nursing 247 247
Homeopathic College 711 711
Tibbia College 45 45
Education College/University 7,014 374 537 6,103
Home-Economics College
Business Management.C/U 1,773 75 154 1,544
Commerce College 4,062 3,321 741
Engineering College/University 11,284 11,284
IT College/University 2,084 794 1,290
Law College/University 604 17 587
Agriculture College/University 4,361 270 4,091
Veterinary/Animal Sciences inst 22 22
Fine-Arts College
Accountancy Institutes 572 572
c. Vocational/Polytech 43,198 16,028 20,332 6,838
Polytechnic Institute 11,813 813 10,975 25
Monotechnic Institute 740 15 600 125
Vocational Institute 30,645 15,200 8,757 6,688
d. NFBE 131,543 23,324 5,457 102,762
e. Distance Education 402 25 18 359
f. Special Education 1,183 80 114 989
g. Denni Madaris 715,859 80,382 234,508 400,969
h. Others n. e. c 54,349 24,829 18,027 11,493
------------------------------------------------------------------------------------------------------------------------

TABLE 15: ENROLMENT IN EDUCATIONAL INSTITUTIONS(PUBLIC & PRIVATE) BY LEVEL AND TYPE OF EDUCATIONAL INSTITUTIONS
Pakistan (Number)
------------------------------------------------------------------------------------------------------------------------
Level of Institution | All Institutions | Girls Institutions | Boys Institution | Mixed Institution
------------------------------------------------------------------------------------------------------------------------
Urban Areas
Total (a to h) 14,219,681 3,072,587 2,901,881 8,245,213
a. General 12,749,304 2,851,006 2,518,354 7,379,944
Pre-Primary 38,316 510 42 37,764
Mosque 103,735 1,266 23,640 78,829
Primary 3,014,856 617,425 578,918 1,818,513
Middle/Elementry 2,710,833 301,602 274,533 2,134,698
Secondry/High 4,860,237 1,165,247 1,170,233 2,524,757
Higher-Secondary 702,383 242,457 180,096 279,830
Intermediate College 156,955 35,633 46,568 74,754
Degree College 864,695 478,793 238,578 147,324
General University 159,170 4,396 154,774
British System 138,124 3,677 5,746 128,701
b. Technical/Professional 325,496 28,548 47,716 249,232
Medical College 15,819 1,715 125 13,979
Medical University 1,220 1,220
Dental College/University 763 763
School/College of Medical Techn 2,689 155 510 2,024
School/College of Nursing 7,049 4,541 1,427 1,081
Homeopathic College 19,247 1,041 733 17,473
Tibbia College 3,524 166 3,358
Education College/University 28,212 12,582 687 14,943
Home-Economics College 5,452 5,452
Business Management.C/U 11,378 130 11,248
Commerce College 120,549 2,412 38,916 79,221
Engineering College/University 28,402 2,104 26,298
IT College/University 37,088 525 1,976 34,587
Law College/University 17,226 90 17,136
Agriculture College/University 10,398 117 10,281
Veterinary/Animal Sciences inst 1,072 1,072
Fine-Arts College 3,005 3,005
Accountancy Institutes 12,403 125 735 11,543
c. Vocational/Polytech 195,489 44,304 74,318 76,867
Polytechnic Institute 43,950 1,554 38,863 3,533
Monotechnic Institute 5,183 20 2,261 2,902
Vocational Institute 146,356 42,730 33,194 70,432
d. NFBE 42,502 6,043 3,119 33,340
e. Distance Education 33,439 104 33,335
f. Special Education 11,939 406 618 10,915
g. Denni Madaris 833,383 132,815 253,123 447,445
h. Others n. e. c 28,129 9,465 4,529 14,135
------------------------------------------------------------------------------------------------------------------------

TABLE 15.1: ENROLMENT IN EDUCATIONAL INSTITUTIONS(PUBLIC) BY LEVEL AND TYPE OF EDUCATIONAL INSTITUTIONS
Pakistan (Number)
------------------------------------------------------------------------------------------------------------------------
Level of Institution | All Institutions | Girls Institutions | Boys Institution | Mixed Institution
------------------------------------------------------------------------------------------------------------------------
All Areas
Total (a to h) 21,258,184 6,734,829 8,310,984 6,212,371
a. General 20,776,383 6,633,105 8,178,199 5,965,079
Pre-Primary 8,670 1,000 785 6,885
Mosque 796,758 11,135 205,501 580,122
Primary 10,761,355 2,960,613 3,633,137 4,167,605
Middle/Elementry 2,788,727 1,217,200 1,154,204 417,323
Secondry/High 4,544,724 1,629,040 2,527,615 388,069
Higher-Secondary 753,789 328,297 340,546 84,946
Intermediate College 87,271 25,508 35,809 25,954
Degree College 849,361 457,833 278,003 113,525
General University 180,236 2,479 177,757
British System 5,492 2,599 2,893
b. Technical/Professional 172,169 25,302 36,450 110,417
Medical College 13,412 1,379 125 11,908
Medical University 272 272
Dental College/University 545 545
School/College of Medical Techn 1,821 108 196 1,517
School/College of Nursing 6,341 4,432 1,427 482
Homeopathic College 3,406 3,406
Tibbia College 473 473
Education College/University 29,907 12,760 959 16,188
Home-Economics College 5,359 5,359
Business Management.C/U 2,271 75 154 2,042
Commerce College 52,531 1,007 31,594 19,930
Engineering College/University 30,035 1,559 28,476
IT College/University 1,142 69 166 907
Law College/University 3,259 3,259
Agriculture College/University 14,586 270 14,316
Veterinary/Animal Sciences inst 1,072 1,072
Fine-Arts College 613 613
Accountancy Institutes 5,124 113 5,011
c. Vocational/Polytech 103,752 31,166 56,166 16,420
Polytechnic Institute 39,290 2,250 34,731 2,309
Monotechnic Institute 4,702 2,574 2,128
Vocational Institute 59,760 28,916 18,861 11,983
d. NFBE 68,376 14,616 3,902 49,858
e. Distance Education 33,245 25 52 33,168
f. Special Education 8,220 478 535 7,207
g. Denni Madaris 44,780 6,023 17,428 21,329
h. Others n. e. c 51,259 24,114 18,252 8,893
------------------------------------------------------------------------------------------------------------------------

TABLE 15.1: ENROLMENT IN EDUCATIONAL INSTITUTIONS(PUBLIC) BY LEVEL AND TYPE OF EDUCATIONAL INSTITUTIONS
Pakistan (Number)
------------------------------------------------------------------------------------------------------------------------
Level of Institution | All Institutions | Girls Institutions | Boys Institution | Mixed Institution
------------------------------------------------------------------------------------------------------------------------
Rural Areas
Total (a to h) 14,623,207 4,168,239 6,049,136 4,405,832
a. General 14,456,829 4,130,963 6,002,328 4,323,538
Pre-Primary 8,142 683 743 6,716
Mosque 695,770 9,936 182,074 503,760
Primary 8,680,849 2,371,409 3,078,316 3,231,124
Middle/Elementry 2,163,466 958,726 924,222 280,518
Secondry/High 2,440,174 658,876 1,562,237 219,061
Higher-Secondary 338,490 110,061 196,974 31,455
Intermediate College 24,575 5,244 11,046 8,285
Degree College 74,446 15,994 46,716 11,736
General University 30,511 34 30,477
British System 406 406
b. Technical/Professional 27,195 696 4,318 22,181
Medical College 743 743
Medical University 262 262
Dental College/University
School/College of Medical Techn 71 71
School/College of Nursing 247 247
Homeopathic College 329 329
Tibbia College
Education College/University 6,943 374 537 6,032
Home-Economics College
Business Management.C/U 762 75 154 533
Commerce College 3,611 3,259 352
Engineering College/University 9,839 9,839
IT College/University 27 27
Law College/University
Agriculture College/University 4,361 270 4,091
Veterinary/Animal Sciences inst
Fine-Arts College
Accountancy Institutes
c. Vocational/Polytech 22,197 5,968 13,387 2,842
Polytechnic Institute 9,915 720 9,195
Monotechnic Institute 725 600 125
Vocational Institute 11,557 5,248 3,592 2,717
d. NFBE 52,998 11,376 3,399 38,223
e. Distance Education 200 25 18 157
f. Special Education 315 80 58 177
g. Denni Madaris 26,912 2,201 10,723 13,988
h. Others n. e. c 36,561 16,930 14,905 4,726
------------------------------------------------------------------------------------------------------------------------

TABLE 15.1: ENROLMENT IN EDUCATIONAL INSTITUTIONS(PUBLIC) BY LEVEL AND TYPE OF EDUCATIONAL INSTITUTIONS
Pakistan (Number)
------------------------------------------------------------------------------------------------------------------------
Level of Institution | All Institutions | Girls Institutions | Boys Institution | Mixed Institution
------------------------------------------------------------------------------------------------------------------------
Urban Areas
Total (a to h) 6,634,977 2,566,590 2,261,848 1,806,539
a. General 6,319,554 2,502,142 2,175,871 1,641,541
Pre-Primary 528 317 42 169
Mosque 100,988 1,199 23,427 76,362
Primary 2,080,506 589,204 554,821 936,481
Middle/Elementry 625,261 258,474 229,982 136,805
Secondry/High 2,104,550 970,164 965,378 169,008
Higher-Secondary 415,299 218,236 143,572 53,491
Intermediate College 62,696 20,264 24,763 17,669
Degree College 774,915 441,839 231,287 101,789
General University 149,725 2,445 147,280
British System 5,086 2,599 2,487
b. Technical/Professional 144,974 24,606 32,132 88,236
Medical College 12,669 1,379 125 11,165
Medical University 10 10
Dental College/University 545 545
School/College of Medical Techn 1,750 108 125 1,517
School/College of Nursing 6,094 4,185 1,427 482
Homeopathic College 3,077 3,077
Tibbia College 473 473
Education College/University 22,964 12,386 422 10,156
Home-Economics College 5,359 5,359
Business Management.C/U 1,509 1,509
Commerce College 48,920 1,007 28,335 19,578
Engineering College/University 20,196 1,559 18,637
IT College/University 1,115 69 139 907
Law College/University 3,259 3,259
Agriculture College/University 10,225 10,225
Veterinary/Animal Sciences inst 1,072 1,072
Fine-Arts College 613 613
Accountancy Institutes 5,124 113 5,011
c. Vocational/Polytech 81,555 25,198 42,779 13,578
Polytechnic Institute 29,375 1,530 25,536 2,309
Monotechnic Institute 3,977 1,974 2,003
Vocational Institute 48,203 23,668 15,269 9,266
d. NFBE 15,378 3,240 503 11,635
e. Distance Education 33,045 34 33,011
f. Special Education 7,905 398 477 7,030
g. Denni Madaris 17,868 3,822 6,705 7,341
h. Others n. e. c 14,698 7,184 3,347 4,167
------------------------------------------------------------------------------------------------------------------------

TABLE 15.2: ENROLMENT IN EDUCATIONAL INSTITUTIONS(PRIVATE) BY LEVEL AND TYPE OF EDUCATIONAL INSTITUTIONS
Pakistan (Number)
------------------------------------------------------------------------------------------------------------------------
Level of Institution | All Institutions | Girls Institutions | Boys Institution | Mixed Institution
------------------------------------------------------------------------------------------------------------------------
All Areas
Total (a to h) 12,121,394 767,939 1,113,695 10,239,760
a. General 10,150,246 502,718 579,311 9,068,217
Pre-Primary 52,694 1,803 230 50,661
Mosque 6,146 170 1,054 4,922
Primary 1,671,885 61,975 62,589 1,547,321
Middle/Elementry 3,864,143 82,222 127,720 3,654,201
Secondry/High 3,778,322 248,916 293,833 3,235,573
Higher-Secondary 396,690 39,739 56,674 300,277
Intermediate College 114,057 19,051 24,099 70,907
Degree College 107,800 42,609 9,428 55,763
General University 14,735 1,951 116 12,668
British System 143,774 4,282 3,568 135,924
b. Technical/Professional 189,365 3,942 16,452 168,971
Medical College 3,498 336 3,162
Medical University 2,671 2,671
Dental College/University 270 270
School/College of Medical Techn 1,261 47 407 807
School/College of Nursing 955 356 599
Homeopathic College 16,552 1,041 733 14,778
Tibbia College 3,096 166 2,930
Education College/University 5,319 196 265 4,858
Home-Economics College 93 93
Business Management.C/U 10,880 130 10,750
Commerce College 72,080 1,405 10,643 60,032
Engineering College/University 9,651 545 9,106
IT College/University 38,030 456 2,604 34,970
Law College/University 14,571 107 14,464
Agriculture College/University 173 117 56
Veterinary/Animal Sciences inst 22 22
Fine-Arts College 2,392 2,392
Accountancy Institutes 7,851 12 735 7,104
c. Vocational/Polytech 134,935 29,166 38,484 67,285
Polytechnic Institute 16,473 117 15,107 1,249
Monotechnic Institute 1,221 35 287 899
Vocational Institute 117,241 29,014 23,090 65,137
d. NFBE 105,669 14,751 4,674 86,244
e. Distance Education 596 70 526
f. Special Education 4,902 8 197 4,697
g. Denni Madaris 1,504,462 207,174 470,203 827,085
h. Others n. e. c 31,219 10,180 4,304 16,735
------------------------------------------------------------------------------------------------------------------------

TABLE 15.2: ENROLMENT IN EDUCATIONAL INSTITUTIONS(PRIVATE) BY LEVEL AND TYPE OF EDUCATIONAL INSTITUTIONS
Pakistan (Number)
------------------------------------------------------------------------------------------------------------------------
Level of Institution | All Institutions | Girls Institutions | Boys Institution | Mixed Institution
------------------------------------------------------------------------------------------------------------------------
Rural Areas
Total (a to h) 4,536,690 261,942 473,662 3,801,086
a. General 3,720,496 153,854 236,828 3,329,814
Pre-Primary 14,906 1,610 230 13,066
Mosque 3,399 103 841 2,455
Primary 737,535 33,754 38,492 665,289
Middle/Elementry 1,778,571 39,094 83,169 1,656,308
Secondry/High 1,022,635 53,833 88,978 879,824
Higher-Secondary 109,606 15,518 20,150 73,938
Intermediate College 19,798 3,682 2,294 13,822
Degree College 18,020 5,655 2,137 10,228
General University 5,290 116 5,174
British System 10,736 605 421 9,710
b. Technical/Professional 8,843 868 7,975
Medical College 348 348
Medical University 1,461 1,461
Dental College/University 52 52
School/College of Medical Techn 322 22 300
School/College of Nursing
Homeopathic College 382 382
Tibbia College 45 45
Education College/University 71 71
Home-Economics College
Business Management.C/U 1,011 1,011
Commerce College 451 62 389
Engineering College/University 1,445 1,445
IT College/University 2,057 767 1,290
Law College/University 604 17 587
Agriculture College/University
Veterinary/Animal Sciences inst 22 22
Fine-Arts College
Accountancy Institutes 572 572
c. Vocational/Polytech 21,001 10,060 6,945 3,996
Polytechnic Institute 1,898 93 1,780 25
Monotechnic Institute 15 15
Vocational Institute 19,088 9,952 5,165 3,971
d. NFBE 78,545 11,948 2,058 64,539
e. Distance Education 202 202
f. Special Education 868 56 812
g. Denni Madaris 688,947 78,181 223,785 386,981
h. Others n. e. c 17,788 7,899 3,122 6,767
------------------------------------------------------------------------------------------------------------------------

TABLE 15.2: ENROLMENT IN EDUCATIONAL INSTITUTIONS(PRIVATE) BY LEVEL AND TYPE OF EDUCATIONAL INSTITUTIONS
Pakistan (Number)
------------------------------------------------------------------------------------------------------------------------
Level of Institution | All Institutions | Girls Institutions | Boys Institution | Mixed Institution
------------------------------------------------------------------------------------------------------------------------
Urban Areas
Total (a to h) 7,584,704 505,997 640,033 6,438,674
a. General 6,429,750 348,864 342,483 5,738,403
Pre-Primary 37,788 193 37,595
Mosque 2,747 67 213 2,467
Primary 934,350 28,221 24,097 882,032
Middle/Elementry 2,085,572 43,128 44,551 1,997,893
Secondry/High 2,755,687 195,083 204,855 2,355,749
Higher-Secondary 287,084 24,221 36,524 226,339
Intermediate College 94,259 15,369 21,805 57,085
Degree College 89,780 36,954 7,291 45,535
General University 9,445 1,951 7,494
British System 133,038 3,677 3,147 126,214
b. Technical/Professional 180,522 3,942 15,584 160,996
Medical College 3,150 336 2,814
Medical University 1,210 1,210
Dental College/University 218 218
School/College of Medical Techn 939 47 385 507
School/College of Nursing 955 356 599
Homeopathic College 16,170 1,041 733 14,396
Tibbia College 3,051 166 2,885
Education College/University 5,248 196 265 4,787
Home-Economics College 93 93
Business Management.C/U 9,869 130 9,739
Commerce College 71,629 1,405 10,581 59,643
Engineering College/University 8,206 545 7,661
IT College/University 35,973 456 1,837 33,680
Law College/University 13,967 90 13,877
Agriculture College/University 173 117 56
Veterinary/Animal Sciences inst
Fine-Arts College 2,392 2,392
Accountancy Institutes 7,279 12 735 6,532
c. Vocational/Polytech 113,934 19,106 31,539 63,289
Polytechnic Institute 14,575 24 13,327 1,224
Monotechnic Institute 1,206 20 287 899
Vocational Institute 98,153 19,062 17,925 61,166
d. NFBE 27,124 2,803 2,616 21,705
e. Distance Education 394 70 324
f. Special Education 4,034 8 141 3,885
g. Denni Madaris 815,515 128,993 246,418 440,104
h. Others n. e. c 13,431 2,281 1,182 9,968
------------------------------------------------------------------------------------------------------------------------

TABLE 16 NUMBER OF NON FUNCTIONAL AND REFUSAL INSTITUTIONS (PUBLIC & PRIVATE)
----------------------------------------------------------------------------------------------------------------------------------------------------------------------------------------------------
| TOTAL | NWFP | FATA | PUNJAB | SINDH | BALUCHISTAN | ISLAMABAD | NORTHREN AREAS | AZAD KASHMIR
INSTITUTION BY TYPE |-----------------|-----------------|-----------------|-----------------|-----------------|-----------------|-----------------|-----------------|-----------------
| T | NF | REF | T | NF | REF | T | NF | REF | T | NF | REF | T | NF | REF | T | NF | REF | T | NF | REF | T | NF | REF | T | NF | REF
----------------------------------------------------------------------------------------------------------------------------------------------------------------------------------------------------
Total (a to h) 16863 12737 4126 2786 1781 1005 192 123 69 4421 2742 1679 8101 7442 659 487 306 181 152 23 129 208 128 80 516 192 324
Pre-Primary 54 23 31 6 4 2 21 12 9 24 6 18 2 2 1 1
Mosque 1487 1463 24 147 145 2 2 2 583 565 18 715 713 2 3 2 1 8 8 2 2 27 26 1
Primary 10307 9401 906 978 816 162 108 99 9 2185 1742 443 6497 6328 169 307 286 21 20 2 18 20 20 192 128 64
Middle/Elementry 1592 550 1042 374 139 235 25 12 13 625 99 526 406 284 122 41 5 36 24 24 7 7 90 11 79
Secondry/High 528 132 396 79 44 35 3 2 1 214 48 166 143 24 119 22 6 16 11 11 6 6 50 8 42
Higher-Secondary 72 20 52 13 8 5 1 1 25 6 19 11 5 6 2 1 1 1 1 1 1 18 18
Intermediate College 50 7 43 10 2 8 22 3 19 7 7 4 2 2 1 1 2 2 4 4
Degree College 77 15 62 23 5 18 1 1 34 8 26 9 1 8 2 2 6 6 1 1 1 1
General University 23 1 22 1 1 4 1 3 3 3 3 3 12 12
British System 47 47 4 4 23 23 12 12 6 6 1 1 1 1
Medical College 5 5 1 1 1 1 2 2 1 1
Medical University 1 1 1 1
Dental College/University 1 1 1 1
School/College of Medical Techn 2 2 1 1 1 1
School/College of Nursing 2 2 1 1 1 1
Homeopathic College 1 1 1 1
Tibbia College 6 6 1 1 4 4 1 1
Ayuravadic
Education College/University 1 1 1 1
Home-Economics College 7 7 1 1 2 2 1 1 3 3
Business Management.C/U
Commerce College 7 1 6 1 1 3 1 2 2 2 1 1
Engineering College/University 13 1 12 4 4 6 1 5 3 3
IT College/University 42 1 41 17 17 7 1 6 6 6 10 10 1 1 1 1
Law College/University 7 7 3 3 4 4
Agriculture College/University 2 1 1 1 1 1 1
Veterinary/Animal Sciences inst
Fine-Arts College 2 1 1 2 1 1
Accountancy Institutes 2 2 1 1 1 1
Polytechnic Institute 6 3 3 3 1 2 1 1 2 1 1
Monotechnic Institute 5 3 2 1 1 1 1 2 1 1 1 1
Vocational Institute 561 67 494 154 12 142 1 1 242 28 214 74 17 57 5 5 28 3 25 19 2 17 38 5 33
d. NFBE 191 153 38 65 51 14 92 74 18 20 16 4 6 5 1 8 7 1
e. Distance Education 2 1 1 1 1 1 1
f. Special Education 6 4 2 1 1 5 4 1
g. Denni Madaris 753 45 708 263 19 244 43 2 41 138 7 131 111 9 102 98 3 95 14 1 13 17 1 16 69 3 66
h. Others n. e. c 1001 844 157 634 533 101 5 4 1 180 140 40 43 37 6 1 1 6 4 2 123 116 7 9 9
----------------------------------------------------------------------------------------------------------------------------------------------------------------------------------------------------

TABLE 16.1 NUMBER OF NON FUNCTIONAL AND REFUSAL INSTITUTIONS (PUBLIC)
----------------------------------------------------------------------------------------------------------------------------------------------------------------------------------------------------
| TOTAL | NWFP | FATA | PUNJAB | SINDH | BALUCHISTAN | ISLAMABAD | NORTHREN AREAS | AZAD KASHMIR
INSTITUTION BY TYPE |-----------------|-----------------|-----------------|-----------------|-----------------|-----------------|-----------------|-----------------|-----------------
| T | NF | REF | T | NF | REF | T | NF | REF | T | NF | REF | T | NF | REF | T | NF | REF | T | NF | REF | T | NF | REF | T | NF | REF
----------------------------------------------------------------------------------------------------------------------------------------------------------------------------------------------------
Total (a to h) 12455 12256 199 1623 1569 54 119 116 3 2715 2662 53 7433 7398 35 309 304 5 32 20 12 38 13 25 186 174 12
Pre-Primary 28 22 6 5 4 1 12 12 8 5 3 2 2 1 1
Mosque 1467 1461 6 145 145 2 2 568 563 5 714 713 1 2 2 8 8 2 2 26 26
Primary 9428 9371 57 822 809 13 96 96 1745 1729 16 6333 6325 8 287 286 1 6 2 4 11 11 128 124 4
Middle/Elementry 555 526 29 138 133 5 14 11 3 101 92 9 283 277 6 5 5 5 5 9 8 1
Secondry/High 127 115 12 43 43 2 2 40 37 3 24 23 1 6 5 1 3 3 2 2 7 5 2
Higher-Secondary 22 20 2 8 8 8 6 2 5 5 1 1
Intermediate College 6 5 1 1 1 2 2 2 2 1 1
Degree College 23 15 8 6 5 1 1 1 11 8 3 3 1 2 1 1 1 1
General University
British System 2 2 1 1 1 1
Medical College 2 2 2 2
Medical University
Dental College/University
School/College of Medical Techn
School/College of Nursing
Homeopathic College
Tibbia College
Ayuravadic
Education College/University
Home-Economics College
Business Management.C/U
Commerce College 2 1 1 2 1 1
Engineering College/University 2 1 1 1 1 1 1
IT College/University
Law College/University 1 1 1 1
Agriculture College/University 1 1 1 1
Veterinary/Animal Sciences inst
Fine-Arts College 1 1 1 1
Accountancy Institutes
Polytechnic Institute 3 3 1 1 1 1 1 1
Monotechnic Institute 3 2 1 1 1 2 1 1
Vocational Institute 69 54 15 15 12 3 26 20 6 15 13 2 4 2 2 3 2 1 6 5 1
d. NFBE 155 152 3 51 50 1 74 74 17 16 1 5 5 8 7 1
e. Distance Education 2 1 1 1 1 1 1
f. Special Education 4 4 4 4
g. Denni Madaris 41 25 16 15 7 8 5 4 1 9 7 2 5 3 2 1 1 1 1 5 2 3
h. Others n. e. c 511 476 35 372 350 22 3 3 114 107 7 13 11 2 3 2 1 4 1 3 2 2
----------------------------------------------------------------------------------------------------------------------------------------------------------------------------------------------------
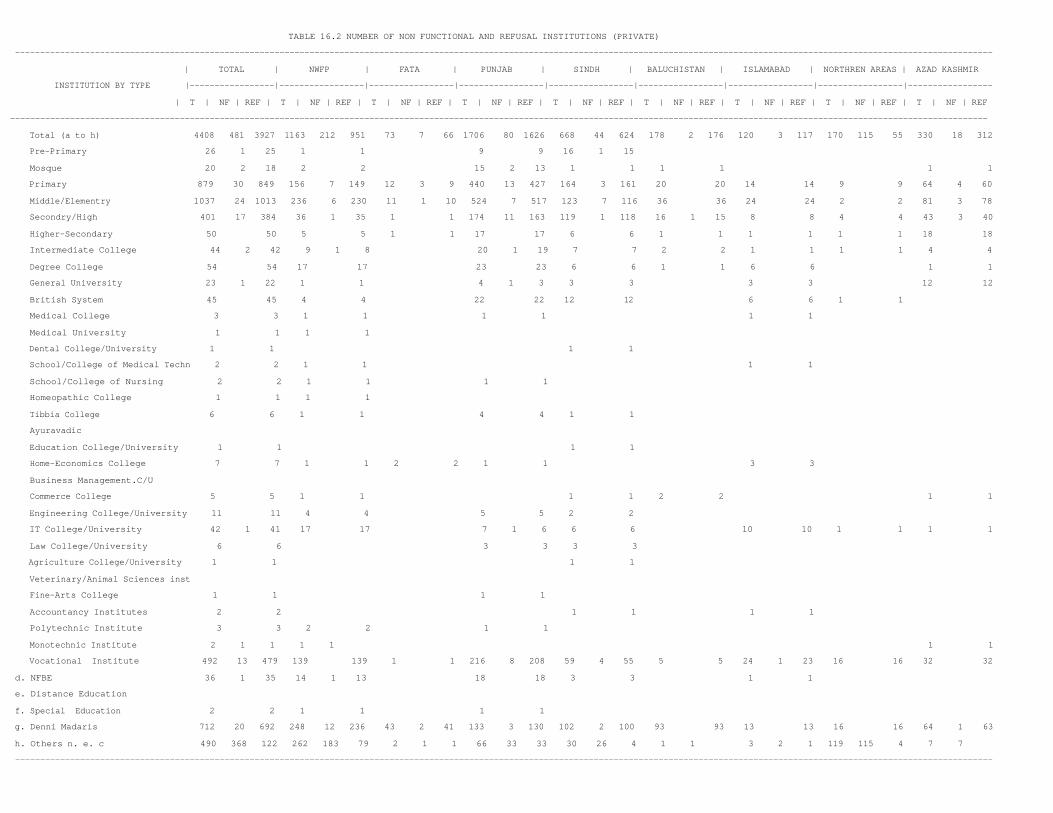
TABLE 16.2 NUMBER OF NON FUNCTIONAL AND REFUSAL INSTITUTIONS (PRIVATE)
----------------------------------------------------------------------------------------------------------------------------------------------------------------------------------------------------
| TOTAL | NWFP | FATA | PUNJAB | SINDH | BALUCHISTAN | ISLAMABAD | NORTHREN AREAS | AZAD KASHMIR
INSTITUTION BY TYPE |-----------------|-----------------|-----------------|-----------------|-----------------|-----------------|-----------------|-----------------|-----------------
| T | NF | REF | T | NF | REF | T | NF | REF | T | NF | REF | T | NF | REF | T | NF | REF | T | NF | REF | T | NF | REF | T | NF | REF
----------------------------------------------------------------------------------------------------------------------------------------------------------------------------------------------------
Total (a to h) 4408 481 3927 1163 212 951 73 7 66 1706 80 1626 668 44 624 178 2 176 120 3 117 170 115 55 330 18 312
Pre-Primary 26 1 25 1 1 9 9 16 1 15
Mosque 20 2 18 2 2 15 2 13 1 1 1 1 1 1
Primary 879 30 849 156 7 149 12 3 9 440 13 427 164 3 161 20 20 14 14 9 9 64 4 60
Middle/Elementry 1037 24 1013 236 6 230 11 1 10 524 7 517 123 7 116 36 36 24 24 2 2 81 3 78
Secondry/High 401 17 384 36 1 35 1 1 174 11 163 119 1 118 16 1 15 8 8 4 4 43 3 40
Higher-Secondary 50 50 5 5 1 1 17 17 6 6 1 1 1 1 1 1 18 18
Intermediate College 44 2 42 9 1 8 20 1 19 7 7 2 2 1 1 1 1 4 4
Degree College 54 54 17 17 23 23 6 6 1 1 6 6 1 1
General University 23 1 22 1 1 4 1 3 3 3 3 3 12 12
British System 45 45 4 4 22 22 12 12 6 6 1 1
Medical College 3 3 1 1 1 1 1 1
Medical University 1 1 1 1
Dental College/University 1 1 1 1
School/College of Medical Techn 2 2 1 1 1 1
School/College of Nursing 2 2 1 1 1 1
Homeopathic College 1 1 1 1
Tibbia College 6 6 1 1 4 4 1 1
Ayuravadic
Education College/University 1 1 1 1
Home-Economics College 7 7 1 1 2 2 1 1 3 3
Business Management.C/U
Commerce College 5 5 1 1 1 1 2 2 1 1
Engineering College/University 11 11 4 4 5 5 2 2
IT College/University 42 1 41 17 17 7 1 6 6 6 10 10 1 1 1 1
Law College/University 6 6 3 3 3 3
Agriculture College/University 1 1 1 1
Veterinary/Animal Sciences inst
Fine-Arts College 1 1 1 1
Accountancy Institutes 2 2 1 1 1 1
Polytechnic Institute 3 3 2 2 1 1
Monotechnic Institute 2 1 1 1 1 1 1
Vocational Institute 492 13 479 139 139 1 1 216 8 208 59 4 55 5 5 24 1 23 16 16 32 32
d. NFBE 36 1 35 14 1 13 18 18 3 3 1 1
e. Distance Education
f. Special Education 2 2 1 1 1 1
g. Denni Madaris 712 20 692 248 12 236 43 2 41 133 3 130 102 2 100 93 93 13 13 16 16 64 1 63
h. Others n. e. c 490 368 122 262 183 79 2 1 1 66 33 33 30 26 4 1 1 3 2 1 119 115 4 7 7
----------------------------------------------------------------------------------------------------------------------------------------------------------------------------------------------------

TABLE 17 NUMBER OF INSTITUTIONS OUT OF REFERENCE (PUBLIC & PRIVATE)
----------------------------------------------------------------------------------------------------------------------------------------------------------------------------------------------------
| TOTAL | NWFP | FATA | PUNJAB | SINDH | BALUCHISTAN | ISLAMABAD | NORTHREN AREAS | AZAD KASHMIR
INSTITUTION BY TYPE |-----------------|-----------------|-----------------|-----------------|-----------------|-----------------|-----------------|-----------------|-----------------
| T | FUN | NF | T | FUN | NF | T | FUN | NF | T | FUN | NF | T | FUN | NF | T | FUN | NF | T | FUN | NF | T | FUN | NF | T | FUN | NF
----------------------------------------------------------------------------------------------------------------------------------------------------------------------------------------------------
Total (a to h) 1028 1028 159 159 7 7 431 431 205 205 19 19 7 7 181 181 19 19
Pre-Primary 37 37 5 5 16 16 1 1 3 3 11 11 1 1
Mosque 3 3 1 1 1 1 1 1
Primary 213 213 24 24 1 1 103 103 43 43 15 15 2 2 19 19 6 6
Middle/Elementry 92 92 10 10 3 3 69 69 2 2 2 2 5 5 1 1
Secondry/High 64 64 2 2 1 1 48 48 2 2 1 1 10 10
Higher-Secondary 1 1 1 1
Intermediate College 2 2 1 1 1 1
Degree College 3 3 2 2 1 1
General University
British System
Medical College
Medical University
Dental College/University
School/College of Medical Techn
School/College of Nursing
Homeopathic College
Tibbia College
Ayuravadic
Education College/University
Home-Economics College
Business Management.C/U
Commerce College
Engineering College/University
IT College/University 2 2 1 1 1 1
Law College/University
Agriculture College/University
Veterinary/Animal Sciences inst
Fine-Arts College
Accountancy Institutes
Polytechnic Institute 1 1 1 1
Monotechnic Institute
Vocational Institute 78 78 12 12 1 1 27 27 4 4 1 1 30 30 3 3
d. NFBE 130 130 10 10 30 30 31 31 59 59
e. Distance Education
f. Special Education
g. Denni Madaris 73 73 12 12 21 21 8 8 1 1 1 1 22 22 8 8
h. Others n. e. c 329 329 83 83 1 1 112 112 110 110 23 23
----------------------------------------------------------------------------------------------------------------------------------------------------------------------------------------------------

TABLE 17.1 NUMBER OF INSTITUTIONS OUT OF REFERENCE (PUBLIC)
----------------------------------------------------------------------------------------------------------------------------------------------------------------------------------------------------
| TOTAL | NWFP | FATA | PUNJAB | SINDH | BALUCHISTAN | ISLAMABAD | NORTHREN AREAS | AZAD KASHMIR
INSTITUTION BY TYPE |-----------------|-----------------|-----------------|-----------------|-----------------|-----------------|-----------------|-----------------|-----------------
| T | FUN | NF | T | FUN | NF | T | FUN | NF | T | FUN | NF | T | FUN | NF | T | FUN | NF | T | FUN | NF | T | FUN | NF | T | FUN | NF
----------------------------------------------------------------------------------------------------------------------------------------------------------------------------------------------------
Total (a to h) 380 380 87 87 2 2 93 93 164 164 32 32 2 2
Pre-Primary 13 13 12 12 1 1
Mosque 3 3 1 1 1 1 1 1
Primary 40 40 2 2 1 1 32 32 5 5
Middle/Elementry 6 6 4 4 1 1 1 1
Secondry/High
Higher-Secondary
Intermediate College
Degree College
General University
British System
Medical College
Medical University
Dental College/University
School/College of Medical Techn
School/College of Nursing
Homeopathic College
Tibbia College
Ayuravadic
Education College/University
Home-Economics College
Business Management.C/U
Commerce College
Engineering College/University
IT College/University
Law College/University
Agriculture College/University
Veterinary/Animal Sciences inst
Fine-Arts College
Accountancy Institutes
Polytechnic Institute
Monotechnic Institute
Vocational Institute 10 10 1 1 2 2 1 1 5 5 1 1
d. NFBE 67 67 7 7 17 17 28 28 15 15
e. Distance Education
f. Special Education
g. Denni Madaris 1 1 1 1
h. Others n. e. c 240 240 74 74 1 1 60 60 101 101 4 4
----------------------------------------------------------------------------------------------------------------------------------------------------------------------------------------------------

TABLE 17.2 NUMBER OF INSTITUTIONS OUT OF REFERENCE (PRIVATE)
----------------------------------------------------------------------------------------------------------------------------------------------------------------------------------------------------
| TOTAL | NWFP | FATA | PUNJAB | SINDH | BALUCHISTAN | ISLAMABAD | NORTHREN AREAS | AZAD KASHMIR
INSTITUTION BY TYPE |-----------------|-----------------|-----------------|-----------------|-----------------|-----------------|-----------------|-----------------|-----------------
| T | FUN | NF | T | FUN | NF | T | FUN | NF | T | FUN | NF | T | FUN | NF | T | FUN | NF | T | FUN | NF | T | FUN | NF | T | FUN | NF
----------------------------------------------------------------------------------------------------------------------------------------------------------------------------------------------------
Total (a to h) 648 648 72 72 5 5 338 338 41 41 19 19 7 7 149 149 17 17
Pre-Primary 24 24 5 5 4 4 1 1 3 3 10 10 1 1
Mosque
Primary 173 173 22 22 1 1 102 102 11 11 15 15 2 2 14 14 6 6
Middle/Elementry 86 86 6 6 3 3 69 69 1 1 2 2 4 4 1 1
Secondry/High 64 64 2 2 1 1 48 48 2 2 1 1 10 10
Higher-Secondary 1 1 1 1
Intermediate College 2 2 1 1 1 1
Degree College 3 3 2 2 1 1
General University
British System
Medical College
Medical University
Dental College/University
School/College of Medical Techn
School/College of Nursing
Homeopathic College
Tibbia College
Ayuravadic
Education College/University
Home-Economics College
Business Management.C/U
Commerce College
Engineering College/University
IT College/University 2 2 1 1 1 1
Law College/University
Agriculture College/University
Veterinary/Animal Sciences inst
Fine-Arts College
Accountancy Institutes
Polytechnic Institute 1 1 1 1
Monotechnic Institute
Vocational Institute 68 68 12 12 25 25 3 3 1 1 25 25 2 2
d. NFBE 63 63 3 3 13 13 3 3 44 44
e. Distance Education
f. Special Education
g. Denni Madaris 72 72 12 12 21 21 8 8 1 1 1 1 22 22 7 7
h. Others n. e. c 89 89 9 9 52 52 9 9 19 19
----------------------------------------------------------------------------------------------------------------------------------------------------------------------------------------------------

TABLE 18 ENROLMENT IN SCHOOLS(UP TO CLASS 12) BY STAGE, CLASS, TYPE OF SCHOOLS AND GENDER
PAKISTAN (Number)
------------------------------------------------------------------------------------------------------------------------------------
|Sec III | All Institutions | Public Institutions | Private Institutions
Stage/Class |Year 2005|--------------------------------|--------------------------------|--------------------------------
|Codes | Total | Girls | Boys | Total | Girls | Boys | Total | Girls | Boys
------------------------------------------------------------------------------------------------------------------------------------
All Areas
Total(Pre Primary) 6,601,946 3,028,384 3,573,562 3,857,643 1,792,724 2,064,919 2,744,303 1,235,660 1,508,643
Un-Admitted 310101 628,878 234,759 394,119 522,329 189,359 332,970 106,549 45,400 61,149
Prep-Class 310102 997,552 457,879 539,673 89,170 43,756 45,414 908,382 414,123 494,259
Nursery Class 310103 1,743,578 817,474 926,104 460,665 239,360 221,305 1,282,913 578,114 704,799
Kachi 310104 3,231,938 1,518,272 1,713,666 2,785,479 1,320,249 1,465,230 446,459 198,023 248,436
Total(Primary) 15,964,971 6,796,022 9,168,949 10,971,273 4,572,417 6,398,856 4,993,698 2,223,605 2,770,093
Class 1 310201 4,353,541 1,879,612 2,473,929 3,140,004 1,340,016 1,799,988 1,213,537 539,596 673,941
Class 2 310202 3,424,026 1,464,183 1,959,843 2,337,095 980,709 1,356,386 1,086,931 483,474 603,457
Class 3 310203 3,021,446 1,287,094 1,734,352 2,031,309 846,482 1,184,827 990,137 440,612 549,525
Class 4 310204 2,750,075 1,161,896 1,588,179 1,856,543 764,016 1,092,527 893,532 397,880 495,652
Class 5 310205 2,415,883 1,003,237 1,412,646 1,606,322 641,194 965,128 809,561 362,043 447,518
Total(Middle) 4,942,974 2,074,904 2,868,070 3,323,344 1,330,736 1,992,608 1,619,630 744,168 875,462
Class 6 310301 1,879,866 789,123 1,090,743 1,275,309 514,158 761,151 604,557 274,965 329,592
Class 7 310302 1,621,023 679,757 941,266 1,087,853 434,958 652,895 533,170 244,799 288,371
Class 8 310303 1,442,085 606,024 836,061 960,182 381,620 578,562 481,903 224,404 257,499
Total(High) 2,107,777 879,496 1,228,281 1,478,609 586,995 891,614 629,168 292,501 336,667
Class 9(Science) 310401 723,654 238,891 484,763 475,318 135,786 339,532 248,336 103,105 145,231
Class 9(Arts) 310402 410,361 224,732 185,629 323,459 173,403 150,056 86,902 51,329 35,573
Class 9(Technical) 310403 21,820 7,381 14,439 14,390 4,089 10,301 7,430 3,292 4,138
Class 10(Science) 310404 599,313 205,150 394,163 391,249 116,822 274,427 208,064 88,328 119,736
Class 10(Arts) 310405 329,637 192,693 136,944 263,474 151,887 111,587 66,163 40,806 25,357
Class 10(Technical) 310406 22,992 10,649 12,343 10,719 5,008 5,711 12,273 5,641 6,632
Total(Higher Secondary 858,423 429,497 428,926 708,152 355,965 352,187 150,271 73,532 76,739
Class 11(Science) 310501 215,399 84,216 131,183 159,457 62,422 97,035 55,942 21,794 34,148
Class 11(Arts) 310502 240,326 143,528 96,798 211,933 124,906 87,027 28,393 18,622 9,771
Class 12(Science) 310503 183,399 72,222 111,177 141,126 55,531 85,595 42,273 16,691 25,582
Class 12(Arts) 310504 219,299 129,531 89,768 195,636 113,106 82,530 23,663 16,425 7,238
Total(British System) 7,699 4,123 3,576 807 7 800 6,892 4,116 2,776
O Level 311001 3,658 1,717 1,941 567 567 3,091 1,717 1,374
A Level 311002 4,041 2,406 1,635 240 7 233 3,801 2,399 1,402
------------------------------------------------------------------------------------------------------------------------------------

TABLE 18 ENROLMENT IN SCHOOLS(UP TO CLASS 12) BY STAGE, CLASS, TYPE OF SCHOOLS AND GENDER
PAKISTAN (Number)
------------------------------------------------------------------------------------------------------------------------------------
|Sec III | All Institutions | Public Institutions | Private Institutions
Stage/Class |Year 2005|--------------------------------|--------------------------------|--------------------------------
|Codes | Total | Girls | Boys | Total | Girls | Boys | Total | Girls | Boys
------------------------------------------------------------------------------------------------------------------------------------
Rural Areas
Total(Pre Primary) 4,297,707 1,906,342 2,391,365 3,239,440 1,456,884 1,782,556 1,058,267 449,458 608,809
Un-Admitted 310101 516,191 186,252 329,939 475,022 170,408 304,614 41,169 15,844 25,325
Prep-Class 310102 411,459 178,116 233,343 55,128 25,082 30,046 356,331 153,034 203,297
Nursery Class 310103 858,023 392,887 465,136 350,161 176,325 173,836 507,862 216,562 291,300
Kachi 310104 2,512,034 1,149,087 1,362,947 2,359,129 1,085,069 1,274,060 152,905 64,018 88,887
Total(Primary) 10,398,887 4,126,932 6,271,955 8,472,586 3,325,746 5,146,840 1,926,301 801,186 1,125,115
Class 1 310201 2,993,487 1,230,168 1,763,319 2,500,897 1,023,691 1,477,206 492,590 206,477 286,113
Class 2 310202 2,250,929 904,238 1,346,691 1,822,343 725,581 1,096,762 428,586 178,657 249,929
Class 3 310203 1,938,894 766,014 1,172,880 1,558,185 608,466 949,719 380,709 157,548 223,161
Class 4 310204 1,734,375 672,263 1,062,112 1,399,977 534,154 865,823 334,398 138,109 196,289
Class 5 310205 1,481,202 554,249 926,953 1,191,184 433,854 757,330 290,018 120,395 169,623
Total(Middle) 2,486,975 897,077 1,589,898 1,932,183 652,044 1,280,139 554,792 245,033 309,759
Class 6 310301 982,751 357,784 624,967 769,781 265,974 503,807 212,970 91,810 121,160
Class 7 310302 813,859 292,940 520,919 630,359 211,628 418,731 183,500 81,312 102,188
Class 8 310303 690,365 246,353 444,012 532,043 174,442 357,601 158,322 71,911 86,411
Total(High) 815,629 256,046 559,583 662,268 182,557 479,711 153,361 73,489 79,872
Class 9(Science) 310401 258,625 55,098 203,527 204,362 34,579 169,783 54,263 20,519 33,744
Class 9(Arts) 310402 188,734 82,935 105,799 159,150 63,616 95,534 29,584 19,319 10,265
Class 9(Technical) 310403 7,089 2,529 4,560 5,336 1,638 3,698 1,753 891 862
Class 10(Science) 310404 207,082 44,993 162,089 163,847 28,326 135,521 43,235 16,667 26,568
Class 10(Arts) 310405 148,074 68,234 79,840 125,905 53,194 72,711 22,169 15,040 7,129
Class 10(Technical) 310406 6,025 2,257 3,768 3,668 1,204 2,464 2,357 1,053 1,304
Total(Higher Secondary 125,374 41,149 84,225 98,410 28,183 70,227 26,964 12,966 13,998
Class 11(Science) 310501 30,265 6,169 24,096 21,515 3,612 17,903 8,750 2,557 6,193
Class 11(Arts) 310502 40,267 16,962 23,305 33,427 12,054 21,373 6,840 4,908 1,932
Class 12(Science) 310503 22,942 4,544 18,398 16,620 2,960 13,660 6,322 1,584 4,738
Class 12(Arts) 310504 31,900 13,474 18,426 26,848 9,557 17,291 5,052 3,917 1,135
Total(British System) 480 480 480 480
O Level 311001 140 140 140 140
A Level 311002 340 340 340 340
------------------------------------------------------------------------------------------------------------------------------------

TABLE 18 ENROLMENT IN SCHOOLS(UP TO CLASS 12) BY STAGE, CLASS, TYPE OF SCHOOLS AND GENDER
PAKISTAN (Number)
------------------------------------------------------------------------------------------------------------------------------------
|Sec III | All Institutions | Public Institutions | Private Institutions
Stage/Class |Year 2005|--------------------------------|--------------------------------|--------------------------------
|Codes | Total | Girls | Boys | Total | Girls | Boys | Total | Girls | Boys
------------------------------------------------------------------------------------------------------------------------------------
Urban Areas
Total(Pre Primary) 2,304,239 1,122,042 1,182,197 618,203 335,840 282,363 1,686,036 786,202 899,834
Un-Admitted 310101 112,687 48,507 64,180 47,307 18,951 28,356 65,380 29,556 35,824
Prep-Class 310102 586,093 279,763 306,330 34,042 18,674 15,368 552,051 261,089 290,962
Nursery Class 310103 885,555 424,587 460,968 110,504 63,035 47,469 775,051 361,552 413,499
Kachi 310104 719,904 369,185 350,719 426,350 235,180 191,170 293,554 134,005 159,549
Total(Primary) 5,566,084 2,669,090 2,896,994 2,498,687 1,246,671 1,252,016 3,067,397 1,422,419 1,644,978
Class 1 310201 1,360,054 649,444 710,610 639,107 316,325 322,782 720,947 333,119 387,828
Class 2 310202 1,173,097 559,945 613,152 514,752 255,128 259,624 658,345 304,817 353,528
Class 3 310203 1,082,552 521,080 561,472 473,124 238,016 235,108 609,428 283,064 326,364
Class 4 310204 1,015,700 489,633 526,067 456,566 229,862 226,704 559,134 259,771 299,363
Class 5 310205 934,681 448,988 485,693 415,138 207,340 207,798 519,543 241,648 277,895
Total(Middle) 2,455,999 1,177,827 1,278,172 1,391,161 678,692 712,469 1,064,838 499,135 565,703
Class 6 310301 897,115 431,339 465,776 505,528 248,184 257,344 391,587 183,155 208,432
Class 7 310302 807,164 386,817 420,347 457,494 223,330 234,164 349,670 163,487 186,183
Class 8 310303 751,720 359,671 392,049 428,139 207,178 220,961 323,581 152,493 171,088
Total(High) 1,292,148 623,450 668,698 816,341 404,438 411,903 475,807 219,012 256,795
Class 9(Science) 310401 465,029 183,793 281,236 270,956 101,207 169,749 194,073 82,586 111,487
Class 9(Arts) 310402 221,627 141,797 79,830 164,309 109,787 54,522 57,318 32,010 25,308
Class 9(Technical) 310403 14,731 4,852 9,879 9,054 2,451 6,603 5,677 2,401 3,276
Class 10(Science) 310404 392,231 160,157 232,074 227,402 88,496 138,906 164,829 71,661 93,168
Class 10(Arts) 310405 181,563 124,459 57,104 137,569 98,693 38,876 43,994 25,766 18,228
Class 10(Technical) 310406 16,967 8,392 8,575 7,051 3,804 3,247 9,916 4,588 5,328
Total(Higher Secondary 733,049 388,348 344,701 609,742 327,782 281,960 123,307 60,566 62,741
Class 11(Science) 310501 185,134 78,047 107,087 137,942 58,810 79,132 47,192 19,237 27,955
Class 11(Arts) 310502 200,059 126,566 73,493 178,506 112,852 65,654 21,553 13,714 7,839
Class 12(Science) 310503 160,457 67,678 92,779 124,506 52,571 71,935 35,951 15,107 20,844
Class 12(Arts) 310504 187,399 116,057 71,342 168,788 103,549 65,239 18,611 12,508 6,103
Total(British System) 7,219 3,643 3,576 807 7 800 6,412 3,636 2,776
O Level 311001 3,518 1,577 1,941 567 567 2,951 1,577 1,374
A Level 311002 3,701 2,066 1,635 240 7 233 3,461 2,059 1,402
------------------------------------------------------------------------------------------------------------------------------------

TABLE 19 ENROLMENT IN EDUCATIONAL INSTITUTIONS (DEGREE, POST GRADUATE AND OTHERS)
BY STAGE, CLASS, TYPE OF INSTITUTIONS AND GENDER
PAKISTAN (Number)
------------------------------------------------------------------------------------------------------------------------------------
|Sec III | All Institutions | Public Institutions | Private Institutions
Stage/Class |Year 2005|-----------------------------|-----------------------------|-----------------------------
|Codes | Total | Girls | Boys | Total | Girls | Boys | Total | Girls | Boys
------------------------------------------------------------------------------------------------------------------------------------
All Areas
Total(Degree Class) 324,687 197,765 126,922 295,526 179,171 116,355 29,161 18,594 10,567
Class 13(Science) 310601 43,433 21,270 22,163 39,982 19,032 20,950 3,451 2,238 1,213
Class 13(Arts) 310602 117,639 79,098 38,541 108,791 72,171 36,620 8,848 6,927 1,921
Class 14(Science) 310603 36,280 18,229 18,051 33,672 16,454 17,218 2,608 1,775 833
Class 14(Arts) 310604 89,414 61,921 27,493 81,410 55,920 25,490 8,004 6,001 2,003
B.A. Hon. 1 310605 9,963 5,658 4,305 9,440 5,404 4,036 523 254 269
B.A. Hon. 2 310606 7,344 4,244 3,100 7,110 4,098 3,012 234 146 88
B.A. Hon. 3 310607 1,689 345 1,344 1,468 267 1,201 221 78 143
B.Sc.Hon. 1 310608 10,030 4,307 5,723 9,434 4,089 5,345 596 218 378
B.Sc.Hon. 2 310609 3,886 1,562 2,324 3,674 1,430 2,244 212 132 80
B.Sc.Hon. 3 310610 5,009 1,131 3,878 545 306 239 4,464 825 3,639
Total(Post Graduate) 55,063 23,230 31,833 50,641 20,834 29,807 4,422 2,396 2,026
M.A. 1 310701 15,336 7,084 8,252 13,983 6,022 7,961 1,353 1,062 291
M.Sc. 1 310702 11,514 4,723 6,791 11,106 4,445 6,661 408 278 130
M.A. 2 310703 15,196 6,890 8,306 14,362 6,198 8,164 834 692 142
M.Sc. 2 310704 7,797 2,927 4,870 6,184 2,594 3,590 1,613 333 1,280
M.Phill 310801 2,859 1,231 1,628 2,645 1,200 1,445 214 31 183
Ph.D. 310901 2,361 375 1,986 2,361 375 1,986
Total(Others) 311101 217 97 120 202 88 114 15 9 6
------------------------------------------------------------------------------------------------------------------------------------

TABLE 19 ENROLMENT IN EDUCATIONAL INSTITUTIONS (DEGREE, POST GRADUATE AND OTHERS)
BY STAGE, CLASS, TYPE OF INSTITUTIONS AND GENDER
PAKISTAN (Number)
------------------------------------------------------------------------------------------------------------------------------------
|Sec III | All Institutions | Public Institutions | Private Institutions
Stage/Class |Year 2005|-----------------------------|-----------------------------|-----------------------------
|Codes | Total | Girls | Boys | Total | Girls | Boys | Total | Girls | Boys
------------------------------------------------------------------------------------------------------------------------------------
Rural Areas
Total(Degree Class) 23,995 9,199 14,796 20,765 6,697 14,068 3,230 2,502 728
Class 13(Science) 310601 3,987 1,160 2,827 3,599 896 2,703 388 264 124
Class 13(Arts) 310602 9,479 3,689 5,790 8,129 2,695 5,434 1,350 994 356
Class 14(Science) 310603 2,968 856 2,112 2,666 637 2,029 302 219 83
Class 14(Arts) 310604 6,567 2,965 3,602 5,500 2,048 3,452 1,067 917 150
B.A. Hon. 1 310605 91 61 30 41 21 20 50 40 10
B.A. Hon. 2 310606 64 44 20 21 6 15 43 38 5
B.A. Hon. 3 310607 31 30 1 1 1 30 30
B.Sc.Hon. 1 310608 450 248 202 450 248 202
B.Sc.Hon. 2 310609 213 66 147 213 66 147
B.Sc.Hon. 3 310610 145 80 65 145 80 65
Total(Post Graduate) 4,289 2,262 2,027 4,191 2,192 1,999 98 70 28
M.A. 1 310701 984 613 371 947 583 364 37 30 7
M.Sc. 1 310702 942 485 457 927 482 445 15 3 12
M.A. 2 310703 923 611 312 890 578 312 33 33
M.Sc. 2 310704 896 401 495 891 401 490 5 5
M.Phill 310801 390 128 262 382 124 258 8 4 4
Ph.D. 310901 154 24 130 154 24 130
Total(Others) 311101
------------------------------------------------------------------------------------------------------------------------------------

TABLE 19 ENROLMENT IN EDUCATIONAL INSTITUTIONS (DEGREE, POST GRADUATE AND OTHERS)
BY STAGE, CLASS, TYPE OF INSTITUTIONS AND GENDER
PAKISTAN (Number)
------------------------------------------------------------------------------------------------------------------------------------
|Sec III | All Institutions | Public Institutions | Private Institutions
Stage/Class |Year 2005|-----------------------------|-----------------------------|-----------------------------
|Codes | Total | Girls | Boys | Total | Girls | Boys | Total | Girls | Boys
------------------------------------------------------------------------------------------------------------------------------------
Urban Areas
Total(Degree Class) 300,692 188,566 112,126 274,761 172,474 102,287 25,931 16,092 9,839
Class 13(Science) 310601 39,446 20,110 19,336 36,383 18,136 18,247 3,063 1,974 1,089
Class 13(Arts) 310602 108,160 75,409 32,751 100,662 69,476 31,186 7,498 5,933 1,565
Class 14(Science) 310603 33,312 17,373 15,939 31,006 15,817 15,189 2,306 1,556 750
Class 14(Arts) 310604 82,847 58,956 23,891 75,910 53,872 22,038 6,937 5,084 1,853
B.A. Hon. 1 310605 9,872 5,597 4,275 9,399 5,383 4,016 473 214 259
B.A. Hon. 2 310606 7,280 4,200 3,080 7,089 4,092 2,997 191 108 83
B.A. Hon. 3 310607 1,658 315 1,343 1,467 267 1,200 191 48 143
B.Sc.Hon. 1 310608 9,580 4,059 5,521 8,984 3,841 5,143 596 218 378
B.Sc.Hon. 2 310609 3,673 1,496 2,177 3,461 1,364 2,097 212 132 80
B.Sc.Hon. 3 310610 4,864 1,051 3,813 400 226 174 4,464 825 3,639
Total(Post Graduate) 50,774 20,968 29,806 46,450 18,642 27,808 4,324 2,326 1,998
M.A. 1 310701 14,352 6,471 7,881 13,036 5,439 7,597 1,316 1,032 284
M.Sc. 1 310702 10,572 4,238 6,334 10,179 3,963 6,216 393 275 118
M.A. 2 310703 14,273 6,279 7,994 13,472 5,620 7,852 801 659 142
M.Sc. 2 310704 6,901 2,526 4,375 5,293 2,193 3,100 1,608 333 1,275
M.Phill 310801 2,469 1,103 1,366 2,263 1,076 1,187 206 27 179
Ph.D. 310901 2,207 351 1,856 2,207 351 1,856
Total(Others) 311101 217 97 120 202 88 114 15 9 6
------------------------------------------------------------------------------------------------------------------------------------

TABLE 20 ENROLMENT IN EDUCATIONAL INSTITUTIONS (MEDICAL, NURSING AND PHARMACY)
BY STAGE, CLASS, TYPE OF INSTITUTIONS AND GENDER
PAKISTAN (Number)
------------------------------------------------------------------------------------------------------------------------------------
|Sec III | All Institutions | Public Institutions | Private Institutions
Stage/Class |Year 2005|-----------------------------|-----------------------------|-----------------------------
|Codes | Total | Girls | Boys | Total | Girls | Boys | Total | Girls | Boys
------------------------------------------------------------------------------------------------------------------------------------
All Areas
Total(Medical) 19,457 11,128 8,329 12,735 7,364 5,371 6,722 3,764 2,958
MBBS Year 1 320101 3,670 2,112 1,558 2,456 1,448 1,008 1,214 664 550
MBBS Year 2 320102 3,445 1,973 1,472 2,248 1,328 920 1,197 645 552
MBBS Year 3 320103 4,139 2,353 1,786 2,434 1,447 987 1,705 906 799
MBBS Year 4 320104 2,970 1,686 1,284 2,042 1,188 854 928 498 430
MBBS Year 5 320105 2,959 1,655 1,304 2,256 1,254 1,002 703 401 302
BDS Year 1 320201 521 357 164 213 132 81 308 225 83
BDS Year 2 320202 404 262 142 203 129 74 201 133 68
BDS Year 3 320203 383 253 130 177 112 65 206 141 65
BDS Year 4 320204 413 243 170 189 108 81 224 135 89
FCS/FCP/M.Phill/MD/MS 320301 553 234 319 517 218 299 36 16 20
Total(Nursing) 7,843 5,690 2,153 6,495 4,727 1,768 1,348 963 385
Basic Nursing Year 1 320401 2,611 1,745 866 2,163 1,462 701 448 283 165
Basic Nursing Year 2 320402 2,378 1,595 783 1,972 1,308 664 406 287 119
Basic Nursing Year 3 320403 1,263 999 264 934 764 170 329 235 94
Basic Nursing Year 4 320404 1,030 908 122 890 773 117 140 135 5
Specialization in Nursing 320501 561 443 118 536 420 116 25 23 2
Total(Pharmacy) 11,181 3,402 7,779 8,008 2,185 5,823 3,173 1,217 1,956
D.Pharmacy Year 1 320601 1,833 774 1,059 1,244 447 797 589 327 262
D.Pharmacy Year 2 320602 823 319 504 429 83 346 394 236 158
D.Pharmacy Year 3 320603 369 59 310 339 48 291 30 11 19
D.Pharmacy Year 4 320604 222 222 222 222
D.Pharmacy Year 5 320605
B.Pharmacy Year 1 320701 1,137 303 834 1,137 303 834
B.Pharmacy Year 2 320702 577 109 468 577 109 468
B.Pharmacy Year 3 320703 829 222 607 660 147 513 169 75 94
B.Pharmacy Year 4 320704 490 116 374 397 67 330 93 49 44
M.Pharmacy Year 1 320801 56 20 36 56 20 36
M.Pharmacy Year 2 320802 9 1 8 9 1 8
Medical Technology Year 1 320901 2,068 612 1,456 1,058 370 688 1,010 242 768
Medical Technology Year 2 320902 1,316 397 919 721 230 491 595 167 428
Medical Technology Year 3 320903 698 231 467 545 170 375 153 61 92
Medical Technology Year 4 320904 754 239 515 614 190 424 140 49 91
Total(Veterinary/Animal Husb.) 2,956 433 2,523 2,811 371 2,440 145 62 83
DVM Year 1 321001 832 73 759 803 68 735 29 5 24
DVM Year 2 321002 600 49 551 571 45 526 29 4 25
DVM Year 3 321003 473 50 423 453 47 406 20 3 17
DVM Year 4 321004 343 73 270 276 23 253 67 50 17
M.Sc. Year 1 321101 569 163 406 569 163 406
M.Sc. Year 2 321102 139 25 114 139 25 114
------------------------------------------------------------------------------------------------------------------------------------
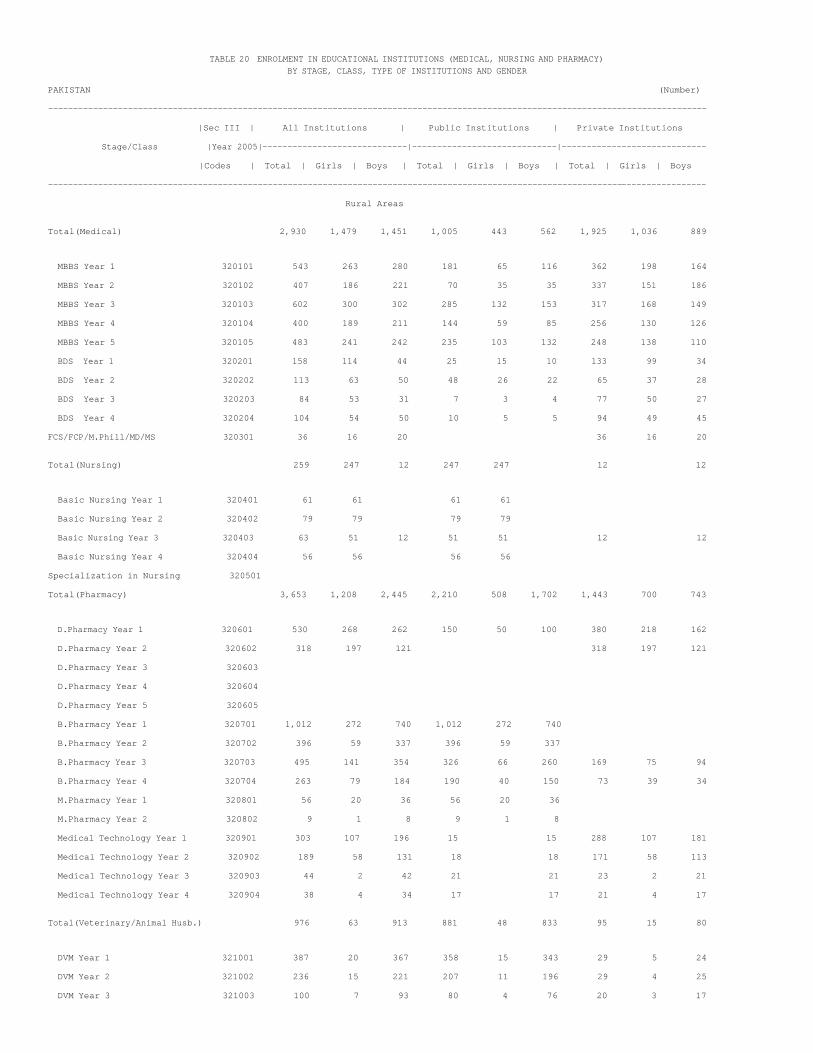
TABLE 20 ENROLMENT IN EDUCATIONAL INSTITUTIONS (MEDICAL, NURSING AND PHARMACY)
BY STAGE, CLASS, TYPE OF INSTITUTIONS AND GENDER
PAKISTAN (Number)
------------------------------------------------------------------------------------------------------------------------------------
|Sec III | All Institutions | Public Institutions | Private Institutions
Stage/Class |Year 2005|-----------------------------|-----------------------------|-----------------------------
|Codes | Total | Girls | Boys | Total | Girls | Boys | Total | Girls | Boys
------------------------------------------------------------------------------------------------------------------------------------
Rural Areas
Total(Medical) 2,930 1,479 1,451 1,005 443 562 1,925 1,036 889
MBBS Year 1 320101 543 263 280 181 65 116 362 198 164
MBBS Year 2 320102 407 186 221 70 35 35 337 151 186
MBBS Year 3 320103 602 300 302 285 132 153 317 168 149
MBBS Year 4 320104 400 189 211 144 59 85 256 130 126
MBBS Year 5 320105 483 241 242 235 103 132 248 138 110
BDS Year 1 320201 158 114 44 25 15 10 133 99 34
BDS Year 2 320202 113 63 50 48 26 22 65 37 28
BDS Year 3 320203 84 53 31 7 3 4 77 50 27
BDS Year 4 320204 104 54 50 10 5 5 94 49 45
FCS/FCP/M.Phill/MD/MS 320301 36 16 20 36 16 20
Total(Nursing) 259 247 12 247 247 12 12
Basic Nursing Year 1 320401 61 61 61 61
Basic Nursing Year 2 320402 79 79 79 79
Basic Nursing Year 3 320403 63 51 12 51 51 12 12
Basic Nursing Year 4 320404 56 56 56 56
Specialization in Nursing 320501
Total(Pharmacy) 3,653 1,208 2,445 2,210 508 1,702 1,443 700 743
D.Pharmacy Year 1 320601 530 268 262 150 50 100 380 218 162
D.Pharmacy Year 2 320602 318 197 121 318 197 121
D.Pharmacy Year 3 320603
D.Pharmacy Year 4 320604
D.Pharmacy Year 5 320605
B.Pharmacy Year 1 320701 1,012 272 740 1,012 272 740
B.Pharmacy Year 2 320702 396 59 337 396 59 337
B.Pharmacy Year 3 320703 495 141 354 326 66 260 169 75 94
B.Pharmacy Year 4 320704 263 79 184 190 40 150 73 39 34
M.Pharmacy Year 1 320801 56 20 36 56 20 36
M.Pharmacy Year 2 320802 9 1 8 9 1 8
Medical Technology Year 1 320901 303 107 196 15 15 288 107 181
Medical Technology Year 2 320902 189 58 131 18 18 171 58 113
Medical Technology Year 3 320903 44 2 42 21 21 23 2 21
Medical Technology Year 4 320904 38 4 34 17 17 21 4 17
Total(Veterinary/Animal Husb.) 976 63 913 881 48 833 95 15 80
DVM Year 1 321001 387 20 367 358 15 343 29 5 24
DVM Year 2 321002 236 15 221 207 11 196 29 4 25
DVM Year 3 321003 100 7 93 80 4 76 20 3 17

DVM Year 4 321004 106 7 99 89 4 85 17 3 14
M.Sc. Year 1 321101 92 7 85 92 7 85
M.Sc. Year 2 321102 55 7 48 55 7 48
------------------------------------------------------------------------------------------------------------------------------------

TABLE 20 ENROLMENT IN EDUCATIONAL INSTITUTIONS (MEDICAL, NURSING AND PHARMACY)
BY STAGE, CLASS, TYPE OF INSTITUTIONS AND GENDER
PAKISTAN (Number)
------------------------------------------------------------------------------------------------------------------------------------
|Sec III | All Institutions | Public Institutions | Private Institutions
Stage/Class |Year 2005|-----------------------------|-----------------------------|-----------------------------
|Codes | Total | Girls | Boys | Total | Girls | Boys | Total | Girls | Boys
------------------------------------------------------------------------------------------------------------------------------------
Urban Areas
Total(Medical) 16,527 9,649 6,878 11,730 6,921 4,809 4,797 2,728 2,069
MBBS Year 1 320101 3,127 1,849 1,278 2,275 1,383 892 852 466 386
MBBS Year 2 320102 3,038 1,787 1,251 2,178 1,293 885 860 494 366
MBBS Year 3 320103 3,537 2,053 1,484 2,149 1,315 834 1,388 738 650
MBBS Year 4 320104 2,570 1,497 1,073 1,898 1,129 769 672 368 304
MBBS Year 5 320105 2,476 1,414 1,062 2,021 1,151 870 455 263 192
BDS Year 1 320201 363 243 120 188 117 71 175 126 49
BDS Year 2 320202 291 199 92 155 103 52 136 96 40
BDS Year 3 320203 299 200 99 170 109 61 129 91 38
BDS Year 4 320204 309 189 120 179 103 76 130 86 44
FCS/FCP/M.Phill/MD/MS 320301 517 218 299 517 218 299
Total(Nursing) 7,584 5,443 2,141 6,248 4,480 1,768 1,336 963 373
Basic Nursing Year 1 320401 2,550 1,684 866 2,102 1,401 701 448 283 165
Basic Nursing Year 2 320402 2,299 1,516 783 1,893 1,229 664 406 287 119
Basic Nursing Year 3 320403 1,200 948 252 883 713 170 317 235 82
Basic Nursing Year 4 320404 974 852 122 834 717 117 140 135 5
Specialization in Nursing 320501 561 443 118 536 420 116 25 23 2
Total(Pharmacy) 7,528 2,194 5,334 5,798 1,677 4,121 1,730 517 1,213
D.Pharmacy Year 1 320601 1,303 506 797 1,094 397 697 209 109 100
D.Pharmacy Year 2 320602 505 122 383 429 83 346 76 39 37
D.Pharmacy Year 3 320603 369 59 310 339 48 291 30 11 19
D.Pharmacy Year 4 320604 222 222 222 222
D.Pharmacy Year 5 320605
B.Pharmacy Year 1 320701 125 31 94 125 31 94
B.Pharmacy Year 2 320702 181 50 131 181 50 131
B.Pharmacy Year 3 320703 334 81 253 334 81 253
B.Pharmacy Year 4 320704 227 37 190 207 27 180 20 10 10
M.Pharmacy Year 1 320801
M.Pharmacy Year 2 320802
Medical Technology Year 1 320901 1,765 505 1,260 1,043 370 673 722 135 587
Medical Technology Year 2 320902 1,127 339 788 703 230 473 424 109 315
Medical Technology Year 3 320903 654 229 425 524 170 354 130 59 71
Medical Technology Year 4 320904 716 235 481 597 190 407 119 45 74
Total(Veterinary/Animal Husb.) 1,980 370 1,610 1,930 323 1,607 50 47 3
DVM Year 1 321001 445 53 392 445 53 392
DVM Year 2 321002 364 34 330 364 34 330

DVM Year 3 321003 373 43 330 373 43 330
DVM Year 4 321004 237 66 171 187 19 168 50 47 3
M.Sc. Year 1 321101 477 156 321 477 156 321
M.Sc. Year 2 321102 84 18 66 84 18 66
------------------------------------------------------------------------------------------------------------------------------------

TABLE 21 ENROLMENT IN EDUCATIONAL INSTITUTIONS (TECHNICAL)
BY STAGE, CLASS, TYPE OF INSTITUTIONS AND GENDER
PAKISTAN (Number)
------------------------------------------------------------------------------------------------------------------------------------
|Sec III | All Institutions | Public Institutions | Private Institutions
Stage/Class |Year 2005|-----------------------------|-----------------------------|-----------------------------
|Codes | Total | Girls | Boys | Total | Girls | Boys | Total | Girls | Boys
------------------------------------------------------------------------------------------------------------------------------------
All Areas
Total(Engineering) 43,801 6,462 37,339 31,168 4,296 26,872 12,633 2,166 10,467
B.Sc./BE Year 1 321201 9,495 1,444 8,051 5,622 837 4,785 3,873 607 3,266
B.Sc./BE Year 2 321202 14,074 2,151 11,923 10,897 1,642 9,255 3,177 509 2,668
B.Sc./BE Year 3 321203 8,056 1,167 6,889 5,115 675 4,440 2,941 492 2,449
B.Sc./BE Year 4 321204 6,879 951 5,928 4,984 610 4,374 1,895 341 1,554
M.Sc.(Engg.) Year1 321301 3,418 422 2,996 3,280 399 2,881 138 23 115
M.Sc.(Engg.) Year2 321302 928 126 802 746 65 681 182 61 121
M.Phill(Engg.) 321401 680 183 497 310 58 252 370 125 245
Ph.D(Engg.) 321501 271 18 253 214 10 204 57 8 49
Total(Information Technology) 37,635 7,878 29,757 17,866 3,710 14,156 19,769 4,168 15,601
PGD 321601 5,133 1,323 3,810 962 317 645 4,171 1,006 3,165
BCS/B.Sc/B.Sc.Hon in IT Year 1 321701 8,530 1,558 6,972 3,361 537 2,824 5,169 1,021 4,148
BCS/B.Sc/B.Sc.Hon in IT Year 2 321702 5,340 1,132 4,208 1,361 418 943 3,979 714 3,265
BCS/B.Sc/B.Sc.Hon in IT Year 3 321703 9,619 1,763 7,856 5,637 960 4,677 3,982 803 3,179
MCS/M.Sc in IT Year 1 321801 5,523 1,023 4,500 4,433 767 3,666 1,090 256 834
MCS/M.Sc in IT Year 2 321802 2,778 931 1,847 1,870 675 1,195 908 256 652
M.Phill 321901 656 132 524 237 36 201 419 96 323
Ph.D 322001 56 16 40 5 5 51 16 35
Total(Mono/Poly Technic) 69,719 4,749 64,970 48,258 3,344 44,914 21,461 1,405 20,056
Ass. Engg. Course Year 1 330101 29,934 2,038 27,896 20,710 1,509 19,201 9,224 529 8,695
Ass. Engg. Course Year 2 330102 21,181 1,247 19,934 15,214 891 14,323 5,967 356 5,611
Ass. Engg. Course Year 3 330103 16,315 1,044 15,271 11,291 743 10,548 5,024 301 4,723
B. Tech 330201 2,289 420 1,869 1,043 201 842 1,246 219 1,027
------------------------------------------------------------------------------------------------------------------------------------

TABLE 21 ENROLMENT IN EDUCATIONAL INSTITUTIONS (TECHNICAL)
BY STAGE, CLASS, TYPE OF INSTITUTIONS AND GENDER
PAKISTAN (Number)
------------------------------------------------------------------------------------------------------------------------------------
|Sec III | All Institutions | Public Institutions | Private Institutions
Stage/Class |Year 2005|-----------------------------|-----------------------------|-----------------------------
|Codes | Total | Girls | Boys | Total | Girls | Boys | Total | Girls | Boys
------------------------------------------------------------------------------------------------------------------------------------
Rural Areas
Total(Engineering) 11,706 1,125 10,581 10,276 974 9,302 1,430 151 1,279
B.Sc./BE Year 1 321201 2,655 271 2,384 2,118 224 1,894 537 47 490
B.Sc./BE Year 2 321202 2,867 278 2,589 2,487 239 2,248 380 39 341
B.Sc./BE Year 3 321203 2,719 273 2,446 2,416 237 2,179 303 36 267
B.Sc./BE Year 4 321204 2,175 172 2,003 2,045 167 1,878 130 5 125
M.Sc.(Engg.) Year1 321301 878 77 801 841 74 767 37 3 34
M.Sc.(Engg.) Year2 321302 279 48 231 240 29 211 39 19 20
M.Phill(Engg.) 321401 46 2 44 42 42 4 2 2
Ph.D(Engg.) 321501 87 4 83 87 4 83
Total(Information Technology) 7,000 1,155 5,845 4,293 854 3,439 2,707 301 2,406
PGD 321601 584 91 493 369 63 306 215 28 187
BCS/B.Sc/B.Sc.Hon in IT Year 1 321701 1,797 303 1,494 976 188 788 821 115 706
BCS/B.Sc/B.Sc.Hon in IT Year 2 321702 935 151 784 500 111 389 435 40 395
BCS/B.Sc/B.Sc.Hon in IT Year 3 321703 1,517 216 1,301 795 144 651 722 72 650
MCS/M.Sc in IT Year 1 321801 1,358 262 1,096 1,095 237 858 263 25 238
MCS/M.Sc in IT Year 2 321802 584 112 472 480 102 378 104 10 94
M.Phill 321901 223 20 203 78 9 69 145 11 134
Ph.D 322001 2 2 2 2
Total(Mono/Poly Technic) 13,408 1,116 12,292 11,307 875 10,432 2,101 241 1,860
Ass. Engg. Course Year 1 330101 5,410 550 4,860 4,611 448 4,163 799 102 697
Ass. Engg. Course Year 2 330102 4,250 229 4,021 3,599 146 3,453 651 83 568
Ass. Engg. Course Year 3 330103 3,540 214 3,326 2,925 164 2,761 615 50 565
B. Tech 330201 208 123 85 172 117 55 36 6 30
------------------------------------------------------------------------------------------------------------------------------------

TABLE 21 ENROLMENT IN EDUCATIONAL INSTITUTIONS (TECHNICAL)
BY STAGE, CLASS, TYPE OF INSTITUTIONS AND GENDER
PAKISTAN (Number)
------------------------------------------------------------------------------------------------------------------------------------
|Sec III | All Institutions | Public Institutions | Private Institutions
Stage/Class |Year 2005|-----------------------------|-----------------------------|-----------------------------
|Codes | Total | Girls | Boys | Total | Girls | Boys | Total | Girls | Boys
------------------------------------------------------------------------------------------------------------------------------------
Urban Areas
Total(Engineering) 32,095 5,337 26,758 20,892 3,322 17,570 11,203 2,015 9,188
B.Sc./BE Year 1 321201 6,840 1,173 5,667 3,504 613 2,891 3,336 560 2,776
B.Sc./BE Year 2 321202 11,207 1,873 9,334 8,410 1,403 7,007 2,797 470 2,327
B.Sc./BE Year 3 321203 5,337 894 4,443 2,699 438 2,261 2,638 456 2,182
B.Sc./BE Year 4 321204 4,704 779 3,925 2,939 443 2,496 1,765 336 1,429
M.Sc.(Engg.) Year1 321301 2,540 345 2,195 2,439 325 2,114 101 20 81
M.Sc.(Engg.) Year2 321302 649 78 571 506 36 470 143 42 101
M.Phill(Engg.) 321401 634 181 453 268 58 210 366 123 243
Ph.D(Engg.) 321501 184 14 170 127 6 121 57 8 49
Total(Information Technology) 30,635 6,723 23,912 13,573 2,856 10,717 17,062 3,867 13,195
PGD 321601 4,549 1,232 3,317 593 254 339 3,956 978 2,978
BCS/B.Sc/B.Sc.Hon in IT Year 1 321701 6,733 1,255 5,478 2,385 349 2,036 4,348 906 3,442
BCS/B.Sc/B.Sc.Hon in IT Year 2 321702 4,405 981 3,424 861 307 554 3,544 674 2,870
BCS/B.Sc/B.Sc.Hon in IT Year 3 321703 8,102 1,547 6,555 4,842 816 4,026 3,260 731 2,529
MCS/M.Sc in IT Year 1 321801 4,165 761 3,404 3,338 530 2,808 827 231 596
MCS/M.Sc in IT Year 2 321802 2,194 819 1,375 1,390 573 817 804 246 558
M.Phill 321901 433 112 321 159 27 132 274 85 189
Ph.D 322001 54 16 38 5 5 49 16 33
Total(Mono/Poly Technic) 56,311 3,633 52,678 36,951 2,469 34,482 19,360 1,164 18,196
Ass. Engg. Course Year 1 330101 24,524 1,488 23,036 16,099 1,061 15,038 8,425 427 7,998
Ass. Engg. Course Year 2 330102 16,931 1,018 15,913 11,615 745 10,870 5,316 273 5,043
Ass. Engg. Course Year 3 330103 12,775 830 11,945 8,366 579 7,787 4,409 251 4,158
B. Tech 330201 2,081 297 1,784 871 84 787 1,210 213 997
------------------------------------------------------------------------------------------------------------------------------------
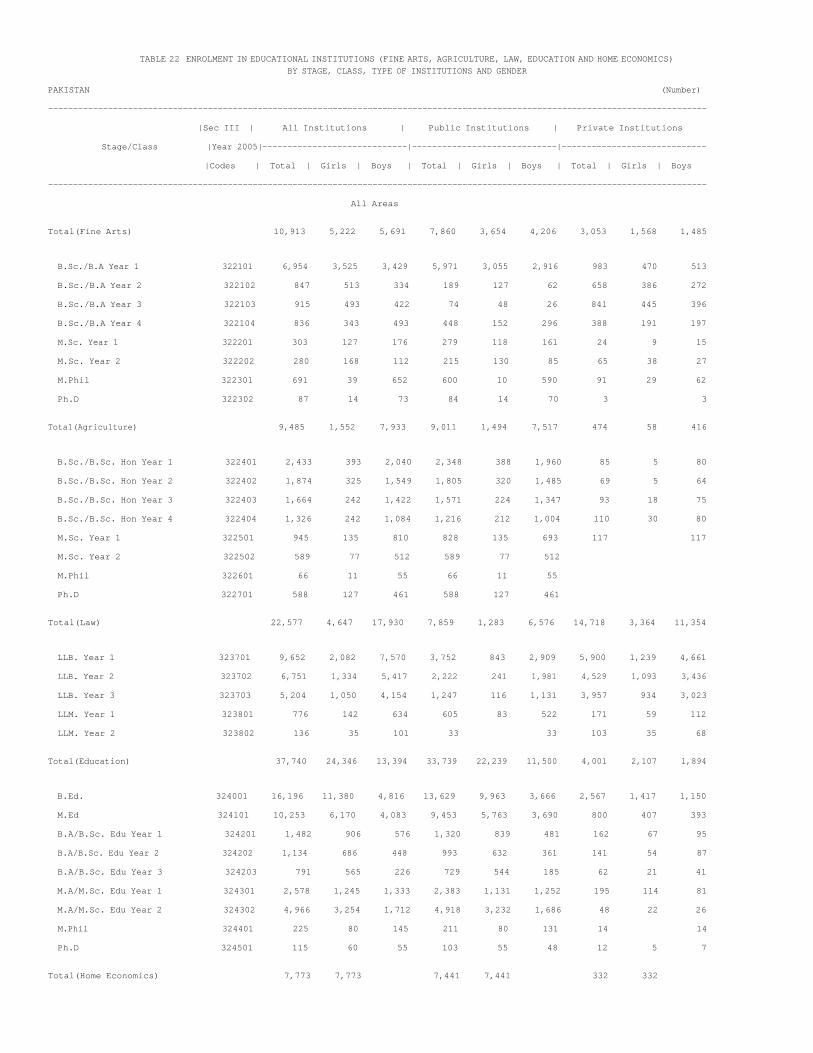
TABLE 22 ENROLMENT IN EDUCATIONAL INSTITUTIONS (FINE ARTS, AGRICULTURE, LAW, EDUCATION AND HOME ECONOMICS)
BY STAGE, CLASS, TYPE OF INSTITUTIONS AND GENDER
PAKISTAN (Number)
------------------------------------------------------------------------------------------------------------------------------------
|Sec III | All Institutions | Public Institutions | Private Institutions
Stage/Class |Year 2005|-----------------------------|-----------------------------|-----------------------------
|Codes | Total | Girls | Boys | Total | Girls | Boys | Total | Girls | Boys
------------------------------------------------------------------------------------------------------------------------------------
All Areas
Total(Fine Arts) 10,913 5,222 5,691 7,860 3,654 4,206 3,053 1,568 1,485
B.Sc./B.A Year 1 322101 6,954 3,525 3,429 5,971 3,055 2,916 983 470 513
B.Sc./B.A Year 2 322102 847 513 334 189 127 62 658 386 272
B.Sc./B.A Year 3 322103 915 493 422 74 48 26 841 445 396
B.Sc./B.A Year 4 322104 836 343 493 448 152 296 388 191 197
M.Sc. Year 1 322201 303 127 176 279 118 161 24 9 15
M.Sc. Year 2 322202 280 168 112 215 130 85 65 38 27
M.Phil 322301 691 39 652 600 10 590 91 29 62
Ph.D 322302 87 14 73 84 14 70 3 3
Total(Agriculture) 9,485 1,552 7,933 9,011 1,494 7,517 474 58 416
B.Sc./B.Sc. Hon Year 1 322401 2,433 393 2,040 2,348 388 1,960 85 5 80
B.Sc./B.Sc. Hon Year 2 322402 1,874 325 1,549 1,805 320 1,485 69 5 64
B.Sc./B.Sc. Hon Year 3 322403 1,664 242 1,422 1,571 224 1,347 93 18 75
B.Sc./B.Sc. Hon Year 4 322404 1,326 242 1,084 1,216 212 1,004 110 30 80
M.Sc. Year 1 322501 945 135 810 828 135 693 117 117
M.Sc. Year 2 322502 589 77 512 589 77 512
M.Phil 322601 66 11 55 66 11 55
Ph.D 322701 588 127 461 588 127 461
Total(Law) 22,577 4,647 17,930 7,859 1,283 6,576 14,718 3,364 11,354
LLB. Year 1 323701 9,652 2,082 7,570 3,752 843 2,909 5,900 1,239 4,661
LLB. Year 2 323702 6,751 1,334 5,417 2,222 241 1,981 4,529 1,093 3,436
LLB. Year 3 323703 5,204 1,050 4,154 1,247 116 1,131 3,957 934 3,023
LLM. Year 1 323801 776 142 634 605 83 522 171 59 112
LLM. Year 2 323802 136 35 101 33 33 103 35 68
Total(Education) 37,740 24,346 13,394 33,739 22,239 11,500 4,001 2,107 1,894
B.Ed. 324001 16,196 11,380 4,816 13,629 9,963 3,666 2,567 1,417 1,150
M.Ed 324101 10,253 6,170 4,083 9,453 5,763 3,690 800 407 393
B.A/B.Sc. Edu Year 1 324201 1,482 906 576 1,320 839 481 162 67 95
B.A/B.Sc. Edu Year 2 324202 1,134 686 448 993 632 361 141 54 87
B.A/B.Sc. Edu Year 3 324203 791 565 226 729 544 185 62 21 41
M.A/M.Sc. Edu Year 1 324301 2,578 1,245 1,333 2,383 1,131 1,252 195 114 81
M.A/M.Sc. Edu Year 2 324302 4,966 3,254 1,712 4,918 3,232 1,686 48 22 26
M.Phil 324401 225 80 145 211 80 131 14 14
Ph.D 324501 115 60 55 103 55 48 12 5 7
Total(Home Economics) 7,773 7,773 7,441 7,441 332 332

B.Sc. Hon Year 1 324601 4,121 4,121 4,004 4,004 117 117
B.Sc. Hon Year 2 324602 1,030 1,030 948 948 82 82
B.Sc. Hon Year 3 324603 899 899 850 850 49 49
B.Sc. Hon Year 4 324604 701 701 689 689 12 12
M.Sc. Hon Year 1 324701 643 643 613 613 30 30
M.Sc. Hon Year 2 324702 379 379 337 337 42 42
------------------------------------------------------------------------------------------------------------------------------------

TABLE 22 ENROLMENT IN EDUCATIONAL INSTITUTIONS (FINE ARTS, AGRICULTURE, LAW, EDUCATION AND HOME ECONOMICS)
BY STAGE, CLASS, TYPE OF INSTITUTIONS AND GENDER
PAKISTAN (Number)
------------------------------------------------------------------------------------------------------------------------------------
|Sec III | All Institutions | Public Institutions | Private Institutions
Stage/Class |Year 2005|-----------------------------|-----------------------------|-----------------------------
|Codes | Total | Girls | Boys | Total | Girls | Boys | Total | Girls | Boys
------------------------------------------------------------------------------------------------------------------------------------
Rural Areas
Total(Fine Arts) 6,679 3,047 3,632 6,470 3,003 3,467 209 44 165
B.Sc./B.A Year 1 322101 5,740 2,913 2,827 5,718 2,913 2,805 22 22
B.Sc./B.A Year 2 322102 18 7 11 7 7 11 11
B.Sc./B.A Year 3 322103 55 7 48 55 7 48
B.Sc./B.A Year 4 322104 58 4 54 58 4 54
M.Sc. Year 1 322201 61 46 15 37 37 24 9 15
M.Sc. Year 2 322202 59 46 13 24 22 2 35 24 11
M.Phil 322301 601 10 591 600 10 590 1 1
Ph.D 322302 87 14 73 84 14 70 3 3
Total(Agriculture) 3,546 472 3,074 3,193 416 2,777 353 56 297
B.Sc./B.Sc. Hon Year 1 322401 893 119 774 812 116 696 81 3 78
B.Sc./B.Sc. Hon Year 2 322402 787 117 670 718 112 606 69 5 64
B.Sc./B.Sc. Hon Year 3 322403 699 85 614 606 67 539 93 18 75
B.Sc./B.Sc. Hon Year 4 322404 324 67 257 214 37 177 110 30 80
M.Sc. Year 1 322501 393 36 357 393 36 357
M.Sc. Year 2 322502 313 32 281 313 32 281
M.Phil 322601 22 2 20 22 2 20
Ph.D 322701 115 14 101 115 14 101
Total(Law) 2,879 794 2,085 1,985 534 1,451 894 260 634
LLB. Year 1 323701 1,320 467 853 1,042 368 674 278 99 179
LLB. Year 2 323702 627 147 480 387 56 331 240 91 149
LLB. Year 3 323703 501 85 416 319 36 283 182 49 133
LLM. Year 1 323801 315 83 232 237 74 163 78 9 69
LLM. Year 2 323802 58 8 50 58 8 50
Total(Education) 2,970 1,207 1,763 2,648 1,123 1,525 322 84 238
B.Ed. 324001 1,194 476 718 1,142 452 690 52 24 28
M.Ed 324101 543 188 355 483 162 321 60 26 34
B.A/B.Sc. Edu Year 1 324201 363 98 265 302 83 219 61 15 46
B.A/B.Sc. Edu Year 2 324202 89 18 71 36 5 31 53 13 40
B.A/B.Sc. Edu Year 3 324203 46 5 41 26 5 21 20 20
M.A/M.Sc. Edu Year 1 324301 464 234 230 432 232 200 32 2 30
M.A/M.Sc. Edu Year 2 324302 231 180 51 201 176 25 30 4 26
M.Phil 324401 36 7 29 22 7 15 14 14
Ph.D 324501 4 1 3 4 1 3
Total(Home Economics) 3,511 3,511 3,335 3,335 176 176

B.Sc. Hon Year 1 324601 3,083 3,083 3,000 3,000 83 83
B.Sc. Hon Year 2 324602 62 62 62 62
B.Sc. Hon Year 3 324603 22 22 22 22
B.Sc. Hon Year 4 324604
M.Sc. Hon Year 1 324701 344 344 335 335 9 9
M.Sc. Hon Year 2 324702
------------------------------------------------------------------------------------------------------------------------------------

TABLE 22 ENROLMENT IN EDUCATIONAL INSTITUTIONS (FINE ARTS, AGRICULTURE, LAW, EDUCATION AND HOME ECONOMICS)
BY STAGE, CLASS, TYPE OF INSTITUTIONS AND GENDER
PAKISTAN (Number)
------------------------------------------------------------------------------------------------------------------------------------
|Sec III | All Institutions | Public Institutions | Private Institutions
Stage/Class |Year 2005|-----------------------------|-----------------------------|-----------------------------
|Codes | Total | Girls | Boys | Total | Girls | Boys | Total | Girls | Boys
------------------------------------------------------------------------------------------------------------------------------------
Urban Areas
Total(Fine Arts) 4,234 2,175 2,059 1,390 651 739 2,844 1,524 1,320
B.Sc./B.A Year 1 322101 1,214 612 602 253 142 111 961 470 491
B.Sc./B.A Year 2 322102 829 506 323 182 120 62 647 386 261
B.Sc./B.A Year 3 322103 860 486 374 74 48 26 786 438 348
B.Sc./B.A Year 4 322104 778 339 439 448 152 296 330 187 143
M.Sc. Year 1 322201 242 81 161 242 81 161
M.Sc. Year 2 322202 221 122 99 191 108 83 30 14 16
M.Phil 322301 90 29 61 90 29 61
Ph.D 322302
Total(Agriculture) 5,939 1,080 4,859 5,818 1,078 4,740 121 2 119
B.Sc./B.Sc. Hon Year 1 322401 1,540 274 1,266 1,536 272 1,264 4 2 2
B.Sc./B.Sc. Hon Year 2 322402 1,087 208 879 1,087 208 879
B.Sc./B.Sc. Hon Year 3 322403 965 157 808 965 157 808
B.Sc./B.Sc. Hon Year 4 322404 1,002 175 827 1,002 175 827
M.Sc. Year 1 322501 552 99 453 435 99 336 117 117
M.Sc. Year 2 322502 276 45 231 276 45 231
M.Phil 322601 44 9 35 44 9 35
Ph.D 322701 473 113 360 473 113 360
Total(Law) 19,698 3,853 15,845 5,874 749 5,125 13,824 3,104 10,720
LLB. Year 1 323701 8,332 1,615 6,717 2,710 475 2,235 5,622 1,140 4,482
LLB. Year 2 323702 6,124 1,187 4,937 1,835 185 1,650 4,289 1,002 3,287
LLB. Year 3 323703 4,703 965 3,738 928 80 848 3,775 885 2,890
LLM. Year 1 323801 461 59 402 368 9 359 93 50 43
LLM. Year 2 323802 78 27 51 33 33 45 27 18
Total(Education) 34,770 23,139 11,631 31,091 21,116 9,975 3,679 2,023 1,656
B.Ed. 324001 15,002 10,904 4,098 12,487 9,511 2,976 2,515 1,393 1,122
M.Ed 324101 9,710 5,982 3,728 8,970 5,601 3,369 740 381 359
B.A/B.Sc. Edu Year 1 324201 1,119 808 311 1,018 756 262 101 52 49
B.A/B.Sc. Edu Year 2 324202 1,045 668 377 957 627 330 88 41 47
B.A/B.Sc. Edu Year 3 324203 745 560 185 703 539 164 42 21 21
M.A/M.Sc. Edu Year 1 324301 2,114 1,011 1,103 1,951 899 1,052 163 112 51
M.A/M.Sc. Edu Year 2 324302 4,735 3,074 1,661 4,717 3,056 1,661 18 18
M.Phil 324401 189 73 116 189 73 116
Ph.D 324501 111 59 52 99 54 45 12 5 7
Total(Home Economics) 4,262 4,262 4,106 4,106 156 156

B.Sc. Hon Year 1 324601 1,038 1,038 1,004 1,004 34 34
B.Sc. Hon Year 2 324602 968 968 948 948 20 20
B.Sc. Hon Year 3 324603 877 877 850 850 27 27
B.Sc. Hon Year 4 324604 701 701 689 689 12 12
M.Sc. Hon Year 1 324701 299 299 278 278 21 21
M.Sc. Hon Year 2 324702 379 379 337 337 42 42
------------------------------------------------------------------------------------------------------------------------------------

TABLE 23 ENROLMENT IN EDUCATIONAL INSTITUTIONS (COMMERCE, BUSINESS ADMINISTRATION AND ACCOUNTANCY)
BY STAGE, CLASS, TYPE OF INSTITUTIONS AND GENDER
PAKISTAN (Number)
------------------------------------------------------------------------------------------------------------------------------------
|Sec III | All Institutions | Public Institutions | Private Institutions
Stage/Class |Year 2005|-----------------------------|-----------------------------|-----------------------------
|Codes | Total | Girls | Boys | Total | Girls | Boys | Total | Girls | Boys
------------------------------------------------------------------------------------------------------------------------------------
All Areas
Total(Commerce) 146,328 24,409 121,919 73,769 10,678 63,091 72,559 13,731 58,828
D.Com/I.Com Year 1 322801 39,419 4,705 34,714 20,237 2,057 18,180 19,182 2,648 16,534
D.Com/I.Com Year 2 322802 32,211 3,960 28,251 17,753 1,909 15,844 14,458 2,051 12,407
B.Com Year 1 322901 39,470 8,260 31,210 16,681 2,985 13,696 22,789 5,275 17,514
B.Com Year 2 322902 30,786 6,850 23,936 15,521 3,181 12,340 15,265 3,669 11,596
M.Com Year 1 323001 2,740 428 2,312 2,257 371 1,886 483 57 426
M.Com Year 2 323002 1,457 105 1,352 1,075 74 1,001 382 31 351
M.Phil 323101 151 65 86 151 65 86
Ph.D 323201 94 36 58 94 36 58
Total(Business Administration) 39,186 9,674 29,512 16,833 4,241 12,592 22,353 5,433 16,920
BBA/BBA Hon Year 1 323301 6,925 1,840 5,085 3,398 980 2,418 3,527 860 2,667
BBA/BBA Hon Year 2 323302 4,403 1,180 3,223 1,797 484 1,313 2,606 696 1,910
BBA/BBA Hon Year 3 323303 4,120 1,232 2,888 1,213 434 779 2,907 798 2,109
BBA/BBA Hon Year 4 323304 1,868 716 1,152 781 400 381 1,087 316 771
MBA Year 1 323401 9,393 2,236 7,157 3,418 907 2,511 5,975 1,329 4,646
MBA Year 2 323402 10,988 2,056 8,932 6,067 951 5,116 4,921 1,105 3,816
M.Phil 323501 1,274 325 949 51 15 36 1,223 310 913
Ph.D 323601 215 89 126 108 70 38 107 19 88
Total(Accountancy) 14,042 3,087 10,955 5,169 1,116 4,053 8,873 1,971 6,902
CMA Year 1 324801 2,687 437 2,250 2,179 411 1,768 508 26 482
CMA Year 2 324802 1,274 185 1,089 986 173 813 288 12 276
CMA Year 3 324803 275 40 235 179 35 144 96 5 91
CAT Year 1 324901 2,476 721 1,755 642 181 461 1,834 540 1,294
CAT Year 2 324902 1,733 489 1,244 685 173 512 1,048 316 732
CAT Year 3 324903 1,014 212 802 382 110 272 632 102 530
ACCA Year 1 325001 1,151 228 923 85 25 60 1,066 203 863
ACCA Year 2 325002 725 109 616 1 1 724 109 615
ACCA Year 3 325003 570 100 470 570 100 470
CIMA Year 1 325101 22 15 7 22 15 7
CIMA Year 2 325102 28 14 14 28 14 14
CIMA Year 3 325103 37 19 18 37 19 18
PIPFA Year 1 325201 123 21 102 123 21 102
PIPFA Year 2 325202 105 15 90 105 15 90
PIPFA Year 3 325203 109 17 92 109 17 92
CA Year 1 325301 827 212 615 827 212 615
CA Year 2 325302 390 107 283 390 107 283
CA Year 3 325303 301 78 223 6 1 5 295 77 218

CA Year 4 325304 195 68 127 24 7 17 171 61 110
------------------------------------------------------------------------------------------------------------------------------------

TABLE 23 ENROLMENT IN EDUCATIONAL INSTITUTIONS (COMMERCE, BUSINESS ADMINISTRATION AND ACCOUNTANCY)
BY STAGE, CLASS, TYPE OF INSTITUTIONS AND GENDER
PAKISTAN (Number)
------------------------------------------------------------------------------------------------------------------------------------
|Sec III | All Institutions | Public Institutions | Private Institutions
Stage/Class |Year 2005|-----------------------------|-----------------------------|-----------------------------
|Codes | Total | Girls | Boys | Total | Girls | Boys | Total | Girls | Boys
------------------------------------------------------------------------------------------------------------------------------------
Rural Areas
Total(Commerce) 8,077 567 7,510 7,042 388 6,654 1,035 179 856
D.Com/I.Com Year 1 322801 2,463 53 2,410 2,255 13 2,242 208 40 168
D.Com/I.Com Year 2 322802 1,989 37 1,952 1,815 9 1,806 174 28 146
B.Com Year 1 322901 1,322 100 1,222 985 50 935 337 50 287
B.Com Year 2 322902 1,272 115 1,157 995 72 923 277 43 234
M.Com Year 1 323001 749 223 526 734 218 516 15 5 10
M.Com Year 2 323002 225 29 196 201 16 185 24 13 11
M.Phil 323101 25 5 20 25 5 20
Ph.D 323201 32 5 27 32 5 27
Total(Business Administration) 8,518 1,684 6,834 4,834 1,087 3,747 3,684 597 3,087
BBA/BBA Hon Year 1 323301 2,551 474 2,077 1,757 356 1,401 794 118 676
BBA/BBA Hon Year 2 323302 1,197 174 1,023 595 72 523 602 102 500
BBA/BBA Hon Year 3 323303 708 176 532 380 77 303 328 99 229
BBA/BBA Hon Year 4 323304 222 51 171 94 13 81 128 38 90
MBA Year 1 323401 2,245 551 1,694 1,263 417 846 982 134 848
MBA Year 2 323402 1,469 243 1,226 686 140 546 783 103 680
M.Phil 323501 82 5 77 20 3 17 62 2 60
Ph.D 323601 44 10 34 39 9 30 5 1 4
Total(Accountancy) 921 42 879 100 100 821 42 779
CMA Year 1 324801 517 20 497 100 100 417 20 397
CMA Year 2 324802 276 11 265 276 11 265
CMA Year 3 324803 40 5 35 40 5 35
CAT Year 1 324901 7 2 5 7 2 5
CAT Year 2 324902
CAT Year 3 324903
ACCA Year 1 325001 11 11 11 11
ACCA Year 2 325002
ACCA Year 3 325003
CIMA Year 1 325101 2 2 2 2
CIMA Year 2 325102
CIMA Year 3 325103
PIPFA Year 1 325201
PIPFA Year 2 325202
PIPFA Year 3 325203
CA Year 1 325301 15 15 15 15
CA Year 2 325302 23 2 21 23 2 21
CA Year 3 325303 21 1 20 21 1 20

CA Year 4 325304 9 1 8 9 1 8
------------------------------------------------------------------------------------------------------------------------------------
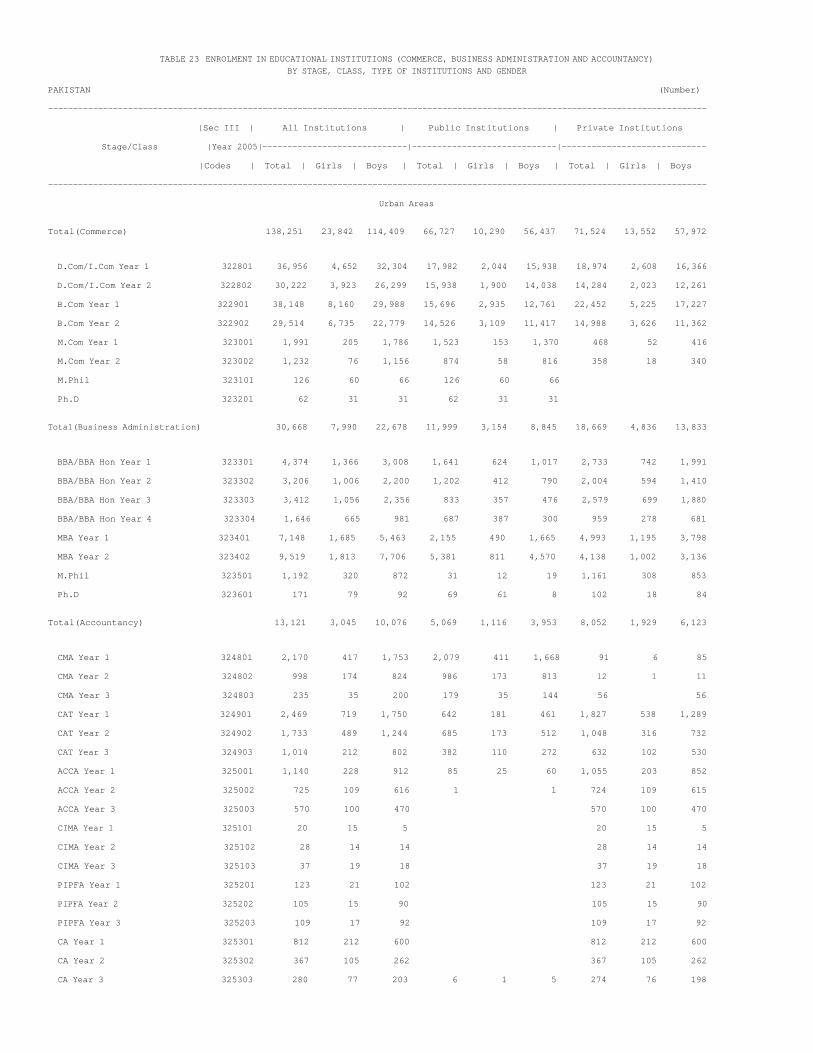
TABLE 23 ENROLMENT IN EDUCATIONAL INSTITUTIONS (COMMERCE, BUSINESS ADMINISTRATION AND ACCOUNTANCY)
BY STAGE, CLASS, TYPE OF INSTITUTIONS AND GENDER
PAKISTAN (Number)
------------------------------------------------------------------------------------------------------------------------------------
|Sec III | All Institutions | Public Institutions | Private Institutions
Stage/Class |Year 2005|-----------------------------|-----------------------------|-----------------------------
|Codes | Total | Girls | Boys | Total | Girls | Boys | Total | Girls | Boys
------------------------------------------------------------------------------------------------------------------------------------
Urban Areas
Total(Commerce) 138,251 23,842 114,409 66,727 10,290 56,437 71,524 13,552 57,972
D.Com/I.Com Year 1 322801 36,956 4,652 32,304 17,982 2,044 15,938 18,974 2,608 16,366
D.Com/I.Com Year 2 322802 30,222 3,923 26,299 15,938 1,900 14,038 14,284 2,023 12,261
B.Com Year 1 322901 38,148 8,160 29,988 15,696 2,935 12,761 22,452 5,225 17,227
B.Com Year 2 322902 29,514 6,735 22,779 14,526 3,109 11,417 14,988 3,626 11,362
M.Com Year 1 323001 1,991 205 1,786 1,523 153 1,370 468 52 416
M.Com Year 2 323002 1,232 76 1,156 874 58 816 358 18 340
M.Phil 323101 126 60 66 126 60 66
Ph.D 323201 62 31 31 62 31 31
Total(Business Administration) 30,668 7,990 22,678 11,999 3,154 8,845 18,669 4,836 13,833
BBA/BBA Hon Year 1 323301 4,374 1,366 3,008 1,641 624 1,017 2,733 742 1,991
BBA/BBA Hon Year 2 323302 3,206 1,006 2,200 1,202 412 790 2,004 594 1,410
BBA/BBA Hon Year 3 323303 3,412 1,056 2,356 833 357 476 2,579 699 1,880
BBA/BBA Hon Year 4 323304 1,646 665 981 687 387 300 959 278 681
MBA Year 1 323401 7,148 1,685 5,463 2,155 490 1,665 4,993 1,195 3,798
MBA Year 2 323402 9,519 1,813 7,706 5,381 811 4,570 4,138 1,002 3,136
M.Phil 323501 1,192 320 872 31 12 19 1,161 308 853
Ph.D 323601 171 79 92 69 61 8 102 18 84
Total(Accountancy) 13,121 3,045 10,076 5,069 1,116 3,953 8,052 1,929 6,123
CMA Year 1 324801 2,170 417 1,753 2,079 411 1,668 91 6 85
CMA Year 2 324802 998 174 824 986 173 813 12 1 11
CMA Year 3 324803 235 35 200 179 35 144 56 56
CAT Year 1 324901 2,469 719 1,750 642 181 461 1,827 538 1,289
CAT Year 2 324902 1,733 489 1,244 685 173 512 1,048 316 732
CAT Year 3 324903 1,014 212 802 382 110 272 632 102 530
ACCA Year 1 325001 1,140 228 912 85 25 60 1,055 203 852
ACCA Year 2 325002 725 109 616 1 1 724 109 615
ACCA Year 3 325003 570 100 470 570 100 470
CIMA Year 1 325101 20 15 5 20 15 5
CIMA Year 2 325102 28 14 14 28 14 14
CIMA Year 3 325103 37 19 18 37 19 18
PIPFA Year 1 325201 123 21 102 123 21 102
PIPFA Year 2 325202 105 15 90 105 15 90
PIPFA Year 3 325203 109 17 92 109 17 92
CA Year 1 325301 812 212 600 812 212 600
CA Year 2 325302 367 105 262 367 105 262
CA Year 3 325303 280 77 203 6 1 5 274 76 198

CA Year 4 325304 186 67 119 24 7 17 162 60 102
------------------------------------------------------------------------------------------------------------------------------------

TABLE 24 ENROLMENT IN EDUCATIONAL INSTITUTIONS (TIBBIA AND HOMEOPATHIC)
BY STAGE, CLASS, TYPE OF INSTITUTIONS AND GENDER
PAKISTAN (Number)
------------------------------------------------------------------------------------------------------------------------------------
|Sec III | All Institutions | Public Institutions | Private Institutions
Stage/Class |Year 2005|-----------------------------|-----------------------------|-----------------------------
|Codes | Total | Girls | Boys | Total | Girls | Boys | Total | Girls | Boys
------------------------------------------------------------------------------------------------------------------------------------
All Areas
Total(Tibbia) 3,569 300 3,269 473 31 442 3,096 269 2,827
Hikmat/Tibb-e-Jerahi Year 1 325401 922 81 841 152 9 143 770 72 698
Hikmat/Tibb-e-Jerahi Year 2 325402 872 76 796 115 7 108 757 69 688
Hikmat/Tibb-e-Jerahi Year 3 325403 907 86 821 119 10 109 788 76 712
Hikmat/Tibb-e-Jerahi Year 4 325404 868 57 811 87 5 82 781 52 729
Total(Homeopathic) 19,958 6,694 13,264 3,406 1,012 2,394 16,552 5,682 10,870
BDH Year 1 325601 5,508 1,864 3,644 873 251 622 4,635 1,613 3,022
BDH Year 2 325602 4,950 1,698 3,252 869 245 624 4,081 1,453 2,628
BDH Year 3 325603 4,850 1,616 3,234 767 246 521 4,083 1,370 2,713
BDH Year 4 325604 4,650 1,516 3,134 897 270 627 3,753 1,246 2,507
Total(Post Graduate Diploma) 104 44 60 60 44 16 44 44
PGD Year 1 325701 104 44 60 60 44 16 44 44
Total(NFBE) 174,045 65,135 131,543 127,381 48,253 42,502 90,439 16,882
Total(Distance Education) 33,466 19,900 402 13,564 97 33,064 13,568 19,803
Total(Other Literacy Programme) 50,620 20,645 40,205 44,197 17,450 10,415 15,753 3,195
------------------------------------------------------------------------------------------------------------------------------------

TABLE 24 ENROLMENT IN EDUCATIONAL INSTITUTIONS (TIBBIA AND HOMEOPATHIC)
BY STAGE, CLASS, TYPE OF INSTITUTIONS AND GENDER
PAKISTAN (Number)
------------------------------------------------------------------------------------------------------------------------------------
|Sec III | All Institutions | Public Institutions | Private Institutions
Stage/Class |Year 2005|-----------------------------|-----------------------------|-----------------------------
|Codes | Total | Girls | Boys | Total | Girls | Boys | Total | Girls | Boys
------------------------------------------------------------------------------------------------------------------------------------
Rural Areas
Total(Tibbia) 45 2 43 45 2 43
Hikmat/Tibb-e-Jerahi Year 1 325401 17 2 15 17 2 15
Hikmat/Tibb-e-Jerahi Year 2 325402 12 12 12 12
Hikmat/Tibb-e-Jerahi Year 3 325403 12 12 12 12
Hikmat/Tibb-e-Jerahi Year 4 325404 4 4 4 4
Total(Homeopathic) 711 255 456 329 93 236 382 162 220
BDH Year 1 325601 196 74 122 97 23 74 99 51 48
BDH Year 2 325602 186 64 122 72 19 53 114 45 69
BDH Year 3 325603 157 62 95 74 30 44 83 32 51
BDH Year 4 325604 172 55 117 86 21 65 86 34 52
Total(Post Graduate Diploma)
PGD Year 1 325701
Total(NFBE) 131,543 48,253 131,543 117,096 48,253 49,484
Total(Distance Education) 402 97 402 427 97 183
Total(Other Literacy Programme) 40,205 17,450 40,205 38,539 17,450 6,971
------------------------------------------------------------------------------------------------------------------------------------

TABLE 24 ENROLMENT IN EDUCATIONAL INSTITUTIONS (TIBBIA AND HOMEOPATHIC)
BY STAGE, CLASS, TYPE OF INSTITUTIONS AND GENDER
PAKISTAN (Number)
------------------------------------------------------------------------------------------------------------------------------------
|Sec III | All Institutions | Public Institutions | Private Institutions
Stage/Class |Year 2005|-----------------------------|-----------------------------|-----------------------------
|Codes | Total | Girls | Boys | Total | Girls | Boys | Total | Girls | Boys
------------------------------------------------------------------------------------------------------------------------------------
Urban Areas
Total(Tibbia) 3,524 298 3,226 473 31 442 3,051 267 2,784
Hikmat/Tibb-e-Jerahi Year 1 325401 905 79 826 152 9 143 753 70 683
Hikmat/Tibb-e-Jerahi Year 2 325402 860 76 784 115 7 108 745 69 676
Hikmat/Tibb-e-Jerahi Year 3 325403 895 86 809 119 10 109 776 76 700
Hikmat/Tibb-e-Jerahi Year 4 325404 864 57 807 87 5 82 777 52 725
Total(Homeopathic) 19,247 6,439 12,808 3,077 919 2,158 16,170 5,520 10,650
BDH Year 1 325601 5,312 1,790 3,522 776 228 548 4,536 1,562 2,974
BDH Year 2 325602 4,764 1,634 3,130 797 226 571 3,967 1,408 2,559
BDH Year 3 325603 4,693 1,554 3,139 693 216 477 4,000 1,338 2,662
BDH Year 4 325604 4,478 1,461 3,017 811 249 562 3,667 1,212 2,455
Total(Post Graduate Diploma) 104 44 60 60 44 16 44 44
PGD Year 1 325701 104 44 60 60 44 16 44 44
Total(NFBE) 42,502 16,882 10,285 42,502 40,955 16,882
Total(Distance Education) 33,064 19,803 13,137 33,064 13,385 19,803
Total(Other Literacy Programme) 10,415 3,195 5,658 10,415 8,782 3,195
------------------------------------------------------------------------------------------------------------------------------------
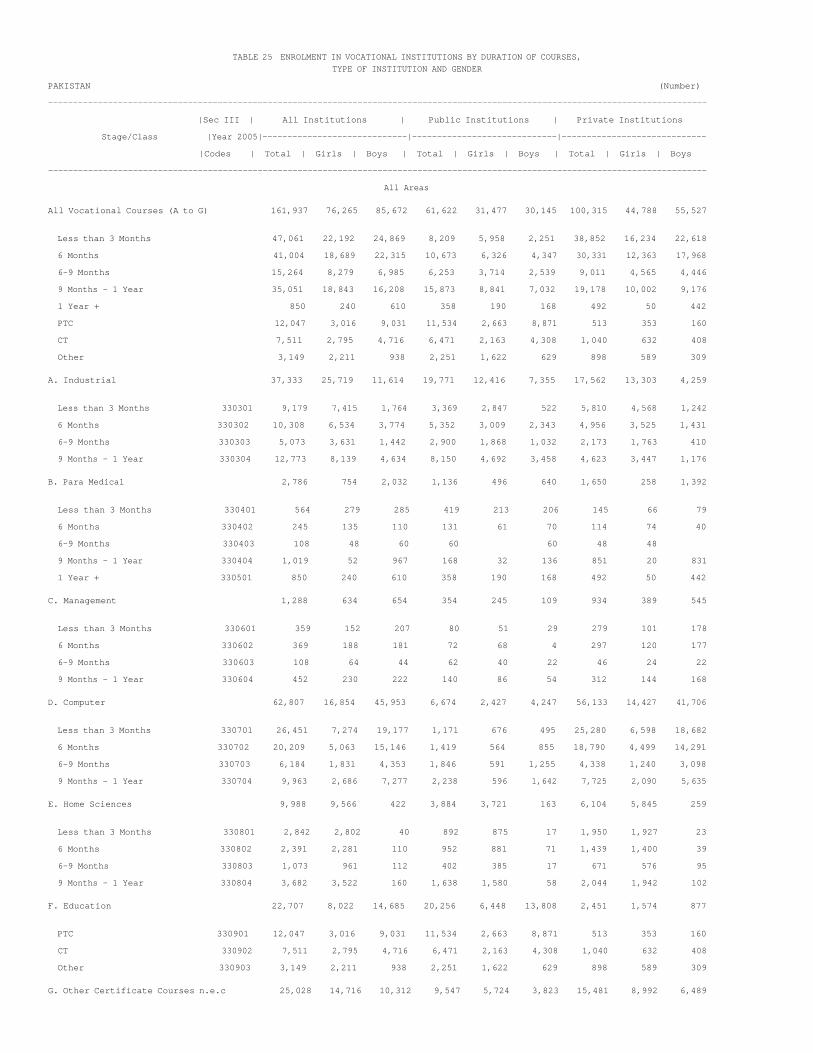
TABLE 25 ENROLMENT IN VOCATIONAL INSTITUTIONS BY DURATION OF COURSES,
TYPE OF INSTITUTION AND GENDER
PAKISTAN (Number)
------------------------------------------------------------------------------------------------------------------------------------
|Sec III | All Institutions | Public Institutions | Private Institutions
Stage/Class |Year 2005|-----------------------------|-----------------------------|-----------------------------
|Codes | Total | Girls | Boys | Total | Girls | Boys | Total | Girls | Boys
------------------------------------------------------------------------------------------------------------------------------------
All Areas
All Vocational Courses (A to G) 161,937 76,265 85,672 61,622 31,477 30,145 100,315 44,788 55,527
Less than 3 Months 47,061 22,192 24,869 8,209 5,958 2,251 38,852 16,234 22,618
6 Months 41,004 18,689 22,315 10,673 6,326 4,347 30,331 12,363 17,968
6-9 Months 15,264 8,279 6,985 6,253 3,714 2,539 9,011 4,565 4,446
9 Months - 1 Year 35,051 18,843 16,208 15,873 8,841 7,032 19,178 10,002 9,176
1 Year + 850 240 610 358 190 168 492 50 442
PTC 12,047 3,016 9,031 11,534 2,663 8,871 513 353 160
CT 7,511 2,795 4,716 6,471 2,163 4,308 1,040 632 408
Other 3,149 2,211 938 2,251 1,622 629 898 589 309
A. Industrial 37,333 25,719 11,614 19,771 12,416 7,355 17,562 13,303 4,259
Less than 3 Months 330301 9,179 7,415 1,764 3,369 2,847 522 5,810 4,568 1,242
6 Months 330302 10,308 6,534 3,774 5,352 3,009 2,343 4,956 3,525 1,431
6-9 Months 330303 5,073 3,631 1,442 2,900 1,868 1,032 2,173 1,763 410
9 Months - 1 Year 330304 12,773 8,139 4,634 8,150 4,692 3,458 4,623 3,447 1,176
B. Para Medical 2,786 754 2,032 1,136 496 640 1,650 258 1,392
Less than 3 Months 330401 564 279 285 419 213 206 145 66 79
6 Months 330402 245 135 110 131 61 70 114 74 40
6-9 Months 330403 108 48 60 60 60 48 48
9 Months - 1 Year 330404 1,019 52 967 168 32 136 851 20 831
1 Year + 330501 850 240 610 358 190 168 492 50 442
C. Management 1,288 634 654 354 245 109 934 389 545
Less than 3 Months 330601 359 152 207 80 51 29 279 101 178
6 Months 330602 369 188 181 72 68 4 297 120 177
6-9 Months 330603 108 64 44 62 40 22 46 24 22
9 Months - 1 Year 330604 452 230 222 140 86 54 312 144 168
D. Computer 62,807 16,854 45,953 6,674 2,427 4,247 56,133 14,427 41,706
Less than 3 Months 330701 26,451 7,274 19,177 1,171 676 495 25,280 6,598 18,682
6 Months 330702 20,209 5,063 15,146 1,419 564 855 18,790 4,499 14,291
6-9 Months 330703 6,184 1,831 4,353 1,846 591 1,255 4,338 1,240 3,098
9 Months - 1 Year 330704 9,963 2,686 7,277 2,238 596 1,642 7,725 2,090 5,635
E. Home Sciences 9,988 9,566 422 3,884 3,721 163 6,104 5,845 259
Less than 3 Months 330801 2,842 2,802 40 892 875 17 1,950 1,927 23
6 Months 330802 2,391 2,281 110 952 881 71 1,439 1,400 39
6-9 Months 330803 1,073 961 112 402 385 17 671 576 95
9 Months - 1 Year 330804 3,682 3,522 160 1,638 1,580 58 2,044 1,942 102
F. Education 22,707 8,022 14,685 20,256 6,448 13,808 2,451 1,574 877
PTC 330901 12,047 3,016 9,031 11,534 2,663 8,871 513 353 160
CT 330902 7,511 2,795 4,716 6,471 2,163 4,308 1,040 632 408
Other 330903 3,149 2,211 938 2,251 1,622 629 898 589 309
G. Other Certificate Courses n.e.c 25,028 14,716 10,312 9,547 5,724 3,823 15,481 8,992 6,489

Less than 3 Months 331001 7,666 4,270 3,396 2,278 1,296 982 5,388 2,974 2,414
6 Months 331002 7,482 4,488 2,994 2,747 1,743 1,004 4,735 2,745 1,990
6-9 Months 331003 2,718 1,744 974 983 830 153 1,735 914 821
9 Months - 1 Year 331004 7,162 4,214 2,948 3,539 1,855 1,684 3,623 2,359 1,264
------------------------------------------------------------------------------------------------------------------------------------
TABLE 25 ENROLMENT IN VOCATIONAL INSTITUTIONS BY DURATION OF COURSES,
TYPE OF INSTITUTION AND GENDER
PAKISTAN (Number)
------------------------------------------------------------------------------------------------------------------------------------
|Sec III | All Institutions | Public Institutions | Private Institutions
Stage/Class |Year 2005|-----------------------------|-----------------------------|-----------------------------
|Codes | Total | Girls | Boys | Total | Girls | Boys | Total | Girls | Boys
------------------------------------------------------------------------------------------------------------------------------------
Rural Areas
All Vocational Courses (A to G) 26,712 16,177 10,535 8,593 5,631 2,962 18,119 10,546 7,573
Less than 3 Months 7,628 4,482 3,146 1,708 1,254 454 5,920 3,228 2,692
6 Months 7,968 4,130 3,838 1,875 1,246 629 6,093 2,884 3,209
6-9 Months 3,073 2,114 959 1,106 750 356 1,967 1,364 603
9 Months - 1 Year 6,720 4,550 2,170 2,901 1,760 1,141 3,819 2,790 1,029
1 Year +
PTC 584 403 181 501 331 170 83 72 11
CT 315 144 171 295 130 165 20 14 6
Other 424 354 70 207 160 47 217 194 23
A. Industrial 10,189 8,529 1,660 4,302 3,031 1,271 5,887 5,498 389
Less than 3 Months 330301 2,603 2,368 235 825 704 121 1,778 1,664 114
6 Months 330302 2,664 2,162 502 1,120 699 421 1,544 1,463 81
6-9 Months 330303 1,634 1,395 239 704 507 197 930 888 42
9 Months - 1 Year 330304 3,288 2,604 684 1,653 1,121 532 1,635 1,483 152
B. Para Medical 142 15 127 127 127 15 15
Less than 3 Months 330401 130 3 127 127 127 3 3
6 Months 330402 4 4 4 4
6-9 Months 330403 5 5 5 5
9 Months - 1 Year 330404 3 3 3 3
1 Year + 330501
C. Management 169 145 24 91 67 24 78 78
Less than 3 Months 330601 20 20 15 15 5 5
6 Months 330602 31 31 25 25 6 6
6-9 Months 330603 11 11 11 11
9 Months - 1 Year 330604 107 83 24 51 27 24 56 56
D. Computer 7,795 1,153 6,642 695 173 522 7,100 980 6,120
Less than 3 Months 330701 2,749 498 2,251 146 72 74 2,603 426 2,177
6 Months 330702 3,135 315 2,820 175 40 135 2,960 275 2,685
6-9 Months 330703 787 124 663 151 15 136 636 109 527
9 Months - 1 Year 330704 1,124 216 908 223 46 177 901 170 731
E. Home Sciences 2,014 1,947 67 635 633 2 1,379 1,314 65
Less than 3 Months 330801 473 473 171 171 302 302
6 Months 330802 599 589 10 195 195 404 394 10
6-9 Months 330803 309 309 109 109 200 200
9 Months - 1 Year 330804 633 576 57 160 158 2 473 418 55
F. Education 1,323 901 422 1,003 621 382 320 280 40
PTC 330901 584 403 181 501 331 170 83 72 11
CT 330902 315 144 171 295 130 165 20 14 6
Other 330903 424 354 70 207 160 47 217 194 23
G. Other Certificate Courses n.e.c 5,080 3,487 1,593 1,740 1,106 634 3,340 2,381 959

Less than 3 Months 331001 1,653 1,120 533 424 292 132 1,229 828 401
6 Months 331002 1,535 1,029 506 360 287 73 1,175 742 433
6-9 Months 331003 327 270 57 142 119 23 185 151 34
9 Months - 1 Year 331004 1,565 1,068 497 814 408 406 751 660 91
------------------------------------------------------------------------------------------------------------------------------------

TABLE 25 ENROLMENT IN VOCATIONAL INSTITUTIONS BY DURATION OF COURSES,
TYPE OF INSTITUTION AND GENDER
PAKISTAN (Number)
------------------------------------------------------------------------------------------------------------------------------------
|Sec III | All Institutions | Public Institutions | Private Institutions
Stage/Class |Year 2005|-----------------------------|-----------------------------|-----------------------------
|Codes | Total | Girls | Boys | Total | Girls | Boys | Total | Girls | Boys
------------------------------------------------------------------------------------------------------------------------------------
Urban Areas
All Vocational Courses (A to G) 135,225 60,088 75,137 53,029 25,846 27,183 82,196 34,242 47,954
Less than 3 Months 39,433 17,710 21,723 6,501 4,704 1,797 32,932 13,006 19,926
6 Months 33,036 14,559 18,477 8,798 5,080 3,718 24,238 9,479 14,759
6-9 Months 12,191 6,165 6,026 5,147 2,964 2,183 7,044 3,201 3,843
9 Months - 1 Year 28,331 14,293 14,038 12,972 7,081 5,891 15,359 7,212 8,147
1 Year + 850 240 610 358 190 168 492 50 442
PTC 11,463 2,613 8,850 11,033 2,332 8,701 430 281 149
CT 7,196 2,651 4,545 6,176 2,033 4,143 1,020 618 402
Other 2,725 1,857 868 2,044 1,462 582 681 395 286
A. Industrial 27,144 17,190 9,954 15,469 9,385 6,084 11,675 7,805 3,870
Less than 3 Months 330301 6,576 5,047 1,529 2,544 2,143 401 4,032 2,904 1,128
6 Months 330302 7,644 4,372 3,272 4,232 2,310 1,922 3,412 2,062 1,350
6-9 Months 330303 3,439 2,236 1,203 2,196 1,361 835 1,243 875 368
9 Months - 1 Year 330304 9,485 5,535 3,950 6,497 3,571 2,926 2,988 1,964 1,024
B. Para Medical 2,644 739 1,905 1,009 496 513 1,635 243 1,392
Less than 3 Months 330401 434 276 158 292 213 79 142 63 79
6 Months 330402 241 131 110 131 61 70 110 70 40
6-9 Months 330403 103 43 60 60 60 43 43
9 Months - 1 Year 330404 1,016 49 967 168 32 136 848 17 831
1 Year + 330501 850 240 610 358 190 168 492 50 442
C. Management 1,119 489 630 263 178 85 856 311 545
Less than 3 Months 330601 339 132 207 65 36 29 274 96 178
6 Months 330602 338 157 181 47 43 4 291 114 177
6-9 Months 330603 97 53 44 62 40 22 35 13 22
9 Months - 1 Year 330604 345 147 198 89 59 30 256 88 168
D. Computer 55,012 15,701 39,311 5,979 2,254 3,725 49,033 13,447 35,586
Less than 3 Months 330701 23,702 6,776 16,926 1,025 604 421 22,677 6,172 16,505
6 Months 330702 17,074 4,748 12,326 1,244 524 720 15,830 4,224 11,606
6-9 Months 330703 5,397 1,707 3,690 1,695 576 1,119 3,702 1,131 2,571
9 Months - 1 Year 330704 8,839 2,470 6,369 2,015 550 1,465 6,824 1,920 4,904
E. Home Sciences 7,974 7,619 355 3,249 3,088 161 4,725 4,531 194
Less than 3 Months 330801 2,369 2,329 40 721 704 17 1,648 1,625 23
6 Months 330802 1,792 1,692 100 757 686 71 1,035 1,006 29
6-9 Months 330803 764 652 112 293 276 17 471 376 95
9 Months - 1 Year 330804 3,049 2,946 103 1,478 1,422 56 1,571 1,524 47
F. Education 21,384 7,121 14,263 19,253 5,827 13,426 2,131 1,294 837
PTC 330901 11,463 2,613 8,850 11,033 2,332 8,701 430 281 149
CT 330902 7,196 2,651 4,545 6,176 2,033 4,143 1,020 618 402
Other 330903 2,725 1,857 868 2,044 1,462 582 681 395 286
G. Other Certificate Courses n.e.c 19,948 11,229 8,719 7,807 4,618 3,189 12,141 6,611 5,530

Less than 3 Months 331001 6,013 3,150 2,863 1,854 1,004 850 4,159 2,146 2,013
6 Months 331002 5,947 3,459 2,488 2,387 1,456 931 3,560 2,003 1,557
6-9 Months 331003 2,391 1,474 917 841 711 130 1,550 763 787
9 Months - 1 Year 331004 5,597 3,146 2,451 2,725 1,447 1,278 2,872 1,699 1,173
------------------------------------------------------------------------------------------------------------------------------------

TABLE 26 ENROLMENT AND REPEATERS IN SCHOOLS (PUBLIC AND PRIVATE) BY CLASS AND GENDER
Pakistan (Number)
-----------------------------------------------------------------------------------------------------------
| Enrolment | Repeaters
Class |-----------------------------------|------------------------------------
| Total | Girls | Boys | Total | Girls | Boys
-----------------------------------------------------------------------------------------------------------
All Areas
Total 22,063,780 9,341,930 12,721,850 499,464 185,792 313,672
Class 1 4,353,541 1,879,612 2,473,929 110,739 42,451 68,288
Class 2 3,424,026 1,464,183 1,959,843 71,052 26,317 44,735
Class 3 3,021,446 1,287,094 1,734,352 62,104 23,747 38,357
Class 4 2,750,075 1,161,896 1,588,179 67,245 26,231 41,014
Class 5 2,415,883 1,003,237 1,412,646 55,892 18,829 37,063
Class 6 1,879,866 789,123 1,090,743 49,751 19,321 30,430
Class 7 1,621,023 679,757 941,266 36,123 13,779 22,344
Class 8 1,442,085 606,024 836,061 28,507 8,841 19,666
Class 9 1,155,835 471,004 684,831 18,051 6,276 11,775
Rural Areas
Total 13,340,310 5,164,571 8,175,739 347,760 119,236 228,524
Class 1 2,993,487 1,230,168 1,763,319 84,031 31,143 52,888
Class 2 2,250,929 904,238 1,346,691 51,777 18,263 33,514
Class 3 1,938,894 766,014 1,172,880 43,649 15,830 27,819
Class 4 1,734,375 672,263 1,062,112 47,609 17,492 30,117
Class 5 1,481,202 554,249 926,953 40,285 12,429 27,856
Class 6 982,751 357,784 624,967 31,938 10,547 21,391
Class 7 813,859 292,940 520,919 22,236 6,903 15,333
Class 8 690,365 246,353 444,012 16,861 4,127 12,734
Class 9 454,448 140,562 313,886 9,374 2,502 6,872
Urban Areas
Total 8,723,470 4,177,359 4,546,111 151,704 66,556 85,148
Class 1 1,360,054 649,444 710,610 26,708 11,308 15,400
Class 2 1,173,097 559,945 613,152 19,275 8,054 11,221
Class 3 1,082,552 521,080 561,472 18,455 7,917 10,538
Class 4 1,015,700 489,633 526,067 19,636 8,739 10,897
Class 5 934,681 448,988 485,693 15,607 6,400 9,207
Class 6 897,115 431,339 465,776 17,813 8,774 9,039
Class 7 807,164 386,817 420,347 13,887 6,876 7,011
Class 8 751,720 359,671 392,049 11,646 4,714 6,932
Class 9 701,387 330,442 370,945 8,677 3,774 4,903
-----------------------------------------------------------------------------------------------------------


TABLE 26.1 ENROLMENT AND REPEATERS IN SCHOOLS (PUBLIC) BY CLASS AND GENDER
Pakistan (Number)
-----------------------------------------------------------------------------------------------------------
| Enrolment | Repeaters
Class |-----------------------------------|------------------------------------
| Total | Girls | Boys | Total | Girls | Boys
-----------------------------------------------------------------------------------------------------------
All Areas
Total 15,107,784 6,216,431 8,891,353 417,241 154,547 262,694
Class 1 3,140,004 1,340,016 1,799,988 95,610 36,760 58,850
Class 2 2,337,095 980,709 1,356,386 58,906 21,801 37,105
Class 3 2,031,309 846,482 1,184,827 49,989 19,239 30,750
Class 4 1,856,543 764,016 1,092,527 55,544 21,830 33,714
Class 5 1,606,322 641,194 965,128 46,741 15,330 31,411
Class 6 1,275,309 514,158 761,151 42,245 16,442 25,803
Class 7 1,087,853 434,958 652,895 29,912 11,336 18,576
Class 8 960,182 381,620 578,562 23,248 6,764 16,484
Class 9 813,167 313,278 499,889 15,046 5,045 10,001
Rural Areas
Total 10,773,617 4,077,623 6,695,994 313,022 107,008 206,014
Class 1 2,500,897 1,023,691 1,477,206 77,085 28,653 48,432
Class 2 1,822,343 725,581 1,096,762 46,171 16,365 29,806
Class 3 1,558,185 608,466 949,719 38,314 14,009 24,305
Class 4 1,399,977 534,154 865,823 42,454 15,727 26,727
Class 5 1,191,184 433,854 757,330 36,349 10,994 25,355
Class 6 769,781 265,974 503,807 28,982 9,516 19,466
Class 7 630,359 211,628 418,731 19,944 6,069 13,875
Class 8 532,043 174,442 357,601 15,171 3,507 11,664
Class 9 368,848 99,833 269,015 8,552 2,168 6,384
Urban Areas
Total 4,334,167 2,138,808 2,195,359 104,219 47,539 56,680
Class 1 639,107 316,325 322,782 18,525 8,107 10,418
Class 2 514,752 255,128 259,624 12,735 5,436 7,299
Class 3 473,124 238,016 235,108 11,675 5,230 6,445
Class 4 456,566 229,862 226,704 13,090 6,103 6,987
Class 5 415,138 207,340 207,798 10,392 4,336 6,056
Class 6 505,528 248,184 257,344 13,263 6,926 6,337
Class 7 457,494 223,330 234,164 9,968 5,267 4,701
Class 8 428,139 207,178 220,961 8,077 3,257 4,820
Class 9 444,319 213,445 230,874 6,494 2,877 3,617
-----------------------------------------------------------------------------------------------------------

TABLE 26.2 ENROLMENT AND REPEATERS IN SCHOOLS (PRIVATE) BY CLASS AND GENDER
Pakistan (Number)
-----------------------------------------------------------------------------------------------------------
| Enrolment | Repeaters
Class |-----------------------------------|------------------------------------
| Total | Girls | Boys | Total | Girls | Boys
-----------------------------------------------------------------------------------------------------------
All Areas
Total 6,955,996 3,125,499 3,830,497 82,223 31,245 50,978
Class 1 1,213,537 539,596 673,941 15,129 5,691 9,438
Class 2 1,086,931 483,474 603,457 12,146 4,516 7,630
Class 3 990,137 440,612 549,525 12,115 4,508 7,607
Class 4 893,532 397,880 495,652 11,701 4,401 7,300
Class 5 809,561 362,043 447,518 9,151 3,499 5,652
Class 6 604,557 274,965 329,592 7,506 2,879 4,627
Class 7 533,170 244,799 288,371 6,211 2,443 3,768
Class 8 481,903 224,404 257,499 5,259 2,077 3,182
Class 9 342,668 157,726 184,942 3,005 1,231 1,774
Rural Areas
Total 2,566,693 1,086,948 1,479,745 34,738 12,228 22,510
Class 1 492,590 206,477 286,113 6,946 2,490 4,456
Class 2 428,586 178,657 249,929 5,606 1,898 3,708
Class 3 380,709 157,548 223,161 5,335 1,821 3,514
Class 4 334,398 138,109 196,289 5,155 1,765 3,390
Class 5 290,018 120,395 169,623 3,936 1,435 2,501
Class 6 212,970 91,810 121,160 2,956 1,031 1,925
Class 7 183,500 81,312 102,188 2,292 834 1,458
Class 8 158,322 71,911 86,411 1,690 620 1,070
Class 9 85,600 40,729 44,871 822 334 488
Urban Areas
Total 4,389,303 2,038,551 2,350,752 47,485 19,017 28,468
Class 1 720,947 333,119 387,828 8,183 3,201 4,982
Class 2 658,345 304,817 353,528 6,540 2,618 3,922
Class 3 609,428 283,064 326,364 6,780 2,687 4,093
Class 4 559,134 259,771 299,363 6,546 2,636 3,910
Class 5 519,543 241,648 277,895 5,215 2,064 3,151
Class 6 391,587 183,155 208,432 4,550 1,848 2,702
Class 7 349,670 163,487 186,183 3,919 1,609 2,310
Class 8 323,581 152,493 171,088 3,569 1,457 2,112
Class 9 257,068 116,997 140,071 2,183 897 1,286
-----------------------------------------------------------------------------------------------------------

TABLE 27 TEACHING STAFF (PUBLIC AND PRIVATE) BY GENDER, ACADEMIC AND PROFESSIONAL QUALIFICATION
Pakistan (Number)
----------------------------------------------------------------------------------------------------------------
| No. of | Attainment of Professional Qualification
Academic Qualification/Gender | Teaching |------------------------------------------------------------------
| Staff | | | | | Other |
| | P.T.C | C.T | B.Ed | M.Ed | Trained | Un-Trained
----------------------------------------------------------------------------------------------------------------
All Areas
Total 1,218,802 309,753 142,250 257,818 67,143 104,856 310,314
Matric 254,164 161,385 8 14 6 21,056 67,564
F.A/F.Sc. 289,019 88,661 68,355 31 4 23,091 102,563
B.A./B.Sc./B.Com./BCS 399,245 50,980 60,002 155,231 4 28,538 96,847
M.A./M.Sc./M.Com./MCS 259,161 8,438 13,674 101,822 65,847 23,135 38,939
M.Phill 4,176 82 121 540 836 1,618 512
Ph.D 1,410 24 13 69 242 690 152
Others 11,627 183 77 111 204 6,728 3,737
Female 655,883 142,134 69,364 123,621 23,714 51,117 230,632
Matric 148,762 81,243 9,376 55,404
F.A/F.Sc. 179,181 41,229 37,926 2 13,660 82,068
B.A./B.Sc./B.Com./BCS 216,002 17,495 26,889 81,538 16,039 69,455
M.A./M.Sc./M.Com./MCS 107,530 2,056 4,459 41,883 23,176 10,161 22,385
M.Phill 1,411 35 43 137 363 561 198
Ph.D 356 19 10 24 82 153 43
Others 2,641 57 37 37 93 1,167 1,079
Male 562,919 167,619 72,886 134,197 43,429 53,739 79,682
Matric 105,402 80,142 8 14 6 11,680 12,160
F.A/F.Sc. 109,838 47,432 30,429 29 4 9,431 20,495
B.A./B.Sc./B.Com./BCS 183,243 33,485 33,113 73,693 4 12,499 27,392
M.A./M.Sc./M.Com./MCS 151,631 6,382 9,215 59,939 42,671 12,974 16,554
M.Phill 2,765 47 78 403 473 1,057 314
Ph.D 1,054 5 3 45 160 537 109
Others 8,986 126 40 74 111 5,561 2,658
Total does not tally with Table No. 01

TABLE 27 TEACHING STAFF (PUBLIC AND PRIVATE) BY GENDER, ACADEMIC AND PROFESSIONAL QUALIFICATION
Pakistan (Number)
----------------------------------------------------------------------------------------------------------------
| No. of | Attainment of Professional Qualification
Academic Qualification/Gender | Teaching |------------------------------------------------------------------
| Staff | | | | | Other |
| | P.T.C | C.T | B.Ed | M.Ed | Trained | Un-Trained
----------------------------------------------------------------------------------------------------------------
Rural Areas
Total 649,375 224,054 87,724 134,435 30,626 50,612 111,801
Matric 175,769 123,128 4 10 14,720 35,549
F.A/F.Sc. 159,362 63,142 40,913 26 2 12,456 40,042
B.A./B.Sc./B.Com./BCS 189,185 33,335 37,881 78,528 4 10,864 25,829
M.A./M.Sc./M.Com./MCS 115,589 4,273 8,834 55,548 30,294 7,032 7,737
M.Phill 975 25 39 263 227 257 113
Ph.D 305 2 2 7 15 226 22
Others 8,190 149 51 53 84 5,057 2,509
Female 270,047 88,488 33,309 47,398 7,214 17,421 71,679
Matric 88,289 54,940 5,600 26,439
F.A/F.Sc. 77,009 24,010 18,268 5,737 27,491
B.A./B.Sc./B.Com./BCS 71,056 8,562 13,001 30,198 3,949 14,196
M.A./M.Sc./M.Com./MCS 32,233 928 2,009 17,151 7,146 1,485 3,015
M.Phill 180 5 10 40 57 26 26
Ph.D 25 1 2 15 1
Others 1,255 43 20 9 9 609 511
Male 379,328 135,566 54,415 87,037 23,412 33,191 40,122
Matric 87,480 68,188 4 10 9,120 9,110
F.A/F.Sc. 82,353 39,132 22,645 26 2 6,719 12,551
B.A./B.Sc./B.Com./BCS 118,129 24,773 24,880 48,330 4 6,915 11,633
M.A./M.Sc./M.Com./MCS 83,356 3,345 6,825 38,397 23,148 5,547 4,722
M.Phill 795 20 29 223 170 231 87
Ph.D 280 2 1 7 13 211 21
Others 6,935 106 31 44 75 4,448 1,998
Total does not tally with Table No. 01

TABLE 27 TEACHING STAFF (PUBLIC AND PRIVATE) BY GENDER, ACADEMIC AND PROFESSIONAL QUALIFICATION
Pakistan (Number)
----------------------------------------------------------------------------------------------------------------
| No. of | Attainment of Professional Qualification
Academic Qualification/Gender | Teaching |------------------------------------------------------------------
| Staff | | | | | Other |
| | P.T.C | C.T | B.Ed | M.Ed | Trained | Un-Trained
----------------------------------------------------------------------------------------------------------------
Urban Areas
Total 569,427 85,699 54,526 123,383 36,517 54,244 198,513
Matric 78,395 38,257 4 4 6 6,336 32,015
F.A/F.Sc. 129,657 25,519 27,442 5 2 10,635 62,521
B.A./B.Sc./B.Com./BCS 210,060 17,645 22,121 76,703 17,674 71,018
M.A./M.Sc./M.Com./MCS 143,572 4,165 4,840 46,274 35,553 16,103 31,202
M.Phill 3,201 57 82 277 609 1,361 399
Ph.D 1,105 22 11 62 227 464 130
Others 3,437 34 26 58 120 1,671 1,228
Female 385,836 53,646 36,055 76,223 16,500 33,696 158,953
Matric 60,473 26,303 3,776 28,965
F.A/F.Sc. 102,172 17,219 19,658 2 7,923 54,577
B.A./B.Sc./B.Com./BCS 144,946 8,933 13,888 51,340 12,090 55,259
M.A./M.Sc./M.Com./MCS 75,297 1,128 2,450 24,732 16,030 8,676 19,370
M.Phill 1,231 30 33 97 306 535 172
Ph.D 331 19 9 24 80 138 42
Others 1,386 14 17 28 84 558 568
Male 183,591 32,053 18,471 47,160 20,017 20,548 39,560
Matric 17,922 11,954 4 4 6 2,560 3,050
F.A/F.Sc. 27,485 8,300 7,784 3 2 2,712 7,944
B.A./B.Sc./B.Com./BCS 65,114 8,712 8,233 25,363 5,584 15,759
M.A./M.Sc./M.Com./MCS 68,275 3,037 2,390 21,542 19,523 7,427 11,832
M.Phill 1,970 27 49 180 303 826 227
Ph.D 774 3 2 38 147 326 88
Others 2,051 20 9 30 36 1,113 660
----------------------------------------------------------------------------------------------------------------
Total does not tally with Table No. 01

TABLE 27.1 TEACHING STAFF (PUBLIC) BY GENDER, ACADEMIC AND PROFESSIONAL QUALIFICATION
Pakistan (Number)
----------------------------------------------------------------------------------------------------------------
| No. of | Attainment of Professional Qualification
Academic Qualification/Gender | Teaching |------------------------------------------------------------------
| Staff | | | | | Other |
| | P.T.C | C.T | B.Ed | M.Ed | Trained | Un-Trained
----------------------------------------------------------------------------------------------------------------
All Areas
Total 672,306 254,600 97,184 171,672 54,303 52,695 32,096
Matric 167,581 143,619 8 14 6 13,634 8,768
F.A/F.Sc. 129,259 67,454 45,309 31 4 9,106 5,942
B.A./B.Sc./B.Com./BCS 196,330 38,431 41,674 96,884 4 10,772 6,331
M.A./M.Sc./M.Com./MCS 166,736 4,871 10,043 74,245 53,250 12,330 8,401
M.Phill 2,850 51 85 364 658 1,073 226
Ph.D 1,080 20 9 56 201 531 73
Others 8,470 154 56 78 180 5,249 2,355
Female 258,577 105,654 37,076 64,323 16,843 17,003 14,089
Matric 76,809 67,601 4,514 4,074
F.A/F.Sc. 52,644 25,804 19,868 2 3,563 2,846
B.A./B.Sc./B.Com./BCS 71,236 10,871 14,301 38,550 3,745 2,959
M.A./M.Sc./M.Com./MCS 55,383 1,297 2,841 25,641 16,404 4,030 3,736
M.Phill 914 15 39 81 289 366 76
Ph.D 263 19 8 24 69 106 19
Others 1,328 47 19 25 81 679 379
Male 413,729 148,946 60,108 107,349 37,460 35,692 18,007
Matric 90,772 76,018 8 14 6 9,120 4,694
F.A/F.Sc. 76,615 41,650 25,441 29 4 5,543 3,096
B.A./B.Sc./B.Com./BCS 125,094 27,560 27,373 58,334 4 7,027 3,372
M.A./M.Sc./M.Com./MCS 111,353 3,574 7,202 48,604 36,846 8,300 4,665
M.Phill 1,936 36 46 283 369 707 150
Ph.D 817 1 1 32 132 425 54
Others 7,142 107 37 53 99 4,570 1,976
Total does not tally with Table No. 01

TABLE 27.1 TEACHING STAFF (PUBLIC) BY GENDER, ACADEMIC AND PROFESSIONAL QUALIFICATION
Pakistan (Number)
----------------------------------------------------------------------------------------------------------------
| No. of | Attainment of Professional Qualification
Academic Qualification/Gender | Teaching |------------------------------------------------------------------
| Staff | | | | | Other |
| | P.T.C | C.T | B.Ed | M.Ed | Trained | Un-Trained
----------------------------------------------------------------------------------------------------------------
Rural Areas
Total 464,756 199,009 69,352 110,655 27,545 35,053 18,472
Matric 132,983 114,008 4 10 10,886 6,904
F.A/F.Sc. 96,462 52,781 31,630 26 2 7,031 4,027
B.A./B.Sc./B.Com./BCS 132,336 28,504 30,348 62,208 4 6,927 3,093
M.A./M.Sc./M.Com./MCS 95,029 3,560 7,297 48,149 27,245 5,359 2,419
M.Phill 792 23 35 218 202 214 70
Ph.D 258 1 2 5 12 210 18
Others 6,896 132 36 39 80 4,426 1,941
Female 152,009 73,078 21,867 34,172 6,057 9,163 6,367
Matric 55,177 48,581 3,304 2,889
F.A/F.Sc. 33,592 17,430 11,742 2,526 1,575
B.A./B.Sc./B.Com./BCS 38,164 6,322 8,576 20,107 1,892 954
M.A./M.Sc./M.Com./MCS 24,116 700 1,533 14,027 5,997 935 703
M.Phill 145 5 9 32 50 20 18
Ph.D 17 1 1 13 1
Others 798 40 6 6 9 473 227
Male 312,747 125,931 47,485 76,483 21,488 25,890 12,105
Matric 77,806 65,427 4 10 7,582 4,015
F.A/F.Sc. 62,870 35,351 19,888 26 2 4,505 2,452
B.A./B.Sc./B.Com./BCS 94,172 22,182 21,772 42,101 4 5,035 2,139
M.A./M.Sc./M.Com./MCS 70,913 2,860 5,764 34,122 21,248 4,424 1,716
M.Phill 647 18 26 186 152 194 52
Ph.D 241 1 1 5 11 197 17
Others 6,098 92 30 33 71 3,953 1,714
Total does not tally with Table No. 01
TABLE 27.1 TEACHING STAFF (PUBLIC) BY GENDER, ACADEMIC AND PROFESSIONAL QUALIFICATION
Pakistan (Number)
----------------------------------------------------------------------------------------------------------------
| No. of | Attainment of Professional Qualification
Academic Qualification/Gender | Teaching |------------------------------------------------------------------
| Staff | | | | | Other |
| | P.T.C | C.T | B.Ed | M.Ed | Trained | Un-Trained
----------------------------------------------------------------------------------------------------------------
Urban Areas
Total 207,550 55,591 27,832 61,017 26,758 17,642 13,624
Matric 34,598 29,611 4 4 6 2,748 1,864
F.A/F.Sc. 32,797 14,673 13,679 5 2 2,075 1,915
B.A./B.Sc./B.Com./BCS 63,994 9,927 11,326 34,676 3,845 3,238
M.A./M.Sc./M.Com./MCS 71,707 1,311 2,746 26,096 26,005 6,971 5,982
M.Phill 2,058 28 50 146 456 859 156
Ph.D 822 19 7 51 189 321 55
Others 1,574 22 20 39 100 823 414
Female 106,568 32,576 15,209 30,151 10,786 7,840 7,722
Matric 21,632 19,020 1,210 1,185
F.A/F.Sc. 19,052 8,374 8,126 2 1,037 1,271
B.A./B.Sc./B.Com./BCS 33,072 4,549 5,725 18,443 1,853 2,005
M.A./M.Sc./M.Com./MCS 31,267 597 1,308 11,614 10,407 3,095 3,033
M.Phill 769 10 30 49 239 346 58
Ph.D 246 19 7 24 68 93 18
Others 530 7 13 19 72 206 152
Male 100,982 23,015 12,623 30,866 15,972 9,802 5,902
Matric 12,966 10,591 4 4 6 1,538 679
F.A/F.Sc. 13,745 6,299 5,553 3 2 1,038 644
B.A./B.Sc./B.Com./BCS 30,922 5,378 5,601 16,233 1,992 1,233
M.A./M.Sc./M.Com./MCS 40,440 714 1,438 14,482 15,598 3,876 2,949
M.Phill 1,289 18 20 97 217 513 98
Ph.D 576 27 121 228 37
Others 1,044 15 7 20 28 617 262
----------------------------------------------------------------------------------------------------------------
Total does not tally with Table No. 01
TABLE 27.2 TEACHING STAFF (PRIVATE) BY GENDER, ACADEMIC AND PROFESSIONAL QUALIFICATION
Pakistan (Number)
----------------------------------------------------------------------------------------------------------------
| No. of | Attainment of Professional Qualification
Academic Qualification/Gender | Teaching |------------------------------------------------------------------
| Staff | | | | | Other |
| | P.T.C | C.T | B.Ed | M.Ed | Trained | Un-Trained
----------------------------------------------------------------------------------------------------------------
All Areas
Total 546,496 55,153 45,066 86,146 12,840 52,161 278,218
Matric 86,583 17,766 7,422 58,796
F.A/F.Sc. 159,760 21,207 23,046 13,985 96,621
B.A./B.Sc./B.Com./BCS 202,915 12,549 18,328 58,347 17,766 90,516
M.A./M.Sc./M.Com./MCS 92,425 3,567 3,631 27,577 12,597 10,805 30,538
M.Phill 1,326 31 36 176 178 545 286
Ph.D 330 4 4 13 41 159 79
Others 3,157 29 21 33 24 1,479 1,382
Female 397,306 36,480 32,288 59,298 6,871 34,114 216,543
Matric 71,953 13,642 4,862 51,330
F.A/F.Sc. 126,537 15,425 18,058 10,097 79,222
B.A./B.Sc./B.Com./BCS 144,766 6,624 12,588 42,988 12,294 66,496
M.A./M.Sc./M.Com./MCS 52,147 759 1,618 16,242 6,772 6,131 18,649
M.Phill 497 20 4 56 74 195 122
Ph.D 93 2 13 47 24
Others 1,313 10 18 12 12 488 700
Male 149,190 18,673 12,778 26,848 5,969 18,047 61,675
Matric 14,630 4,124 2,560 7,466
F.A/F.Sc. 33,223 5,782 4,988 3,888 17,399
B.A./B.Sc./B.Com./BCS 58,149 5,925 5,740 15,359 5,472 24,020
M.A./M.Sc./M.Com./MCS 40,278 2,808 2,013 11,335 5,825 4,674 11,889
M.Phill 829 11 32 120 104 350 164
Ph.D 237 4 2 13 28 112 55
Others 1,844 19 3 21 12 991 682
Total does not tally with Table No. 01

TABLE 27.2 TEACHING STAFF (PRIVATE) BY GENDER, ACADEMIC AND PROFESSIONAL QUALIFICATION
Pakistan (Number)
----------------------------------------------------------------------------------------------------------------
| No. of | Attainment of Professional Qualification
Academic Qualification/Gender | Teaching |------------------------------------------------------------------
| Staff | | | | | Other |
| | P.T.C | C.T | B.Ed | M.Ed | Trained | Un-Trained
----------------------------------------------------------------------------------------------------------------
Rural Areas
Total 184,619 25,045 18,372 23,780 3,081 15,559 93,329
Matric 42,786 9,120 3,834 28,645
F.A/F.Sc. 62,900 10,361 9,283 5,425 36,015
B.A./B.Sc./B.Com./BCS 56,849 4,831 7,533 16,320 3,937 22,736
M.A./M.Sc./M.Com./MCS 20,560 713 1,537 7,399 3,049 1,673 5,318
M.Phill 183 2 4 45 25 43 43
Ph.D 47 1 2 3 16 4
Others 1,294 17 15 14 4 631 568
Female 118,038 15,410 11,442 13,226 1,157 8,258 65,312
Matric 33,112 6,359 2,296 23,550
F.A/F.Sc. 43,417 6,580 6,526 3,211 25,916
B.A./B.Sc./B.Com./BCS 32,892 2,240 4,425 10,091 2,057 13,242
M.A./M.Sc./M.Com./MCS 8,117 228 476 3,124 1,149 550 2,312
M.Phill 35 1 8 7 6 8
Ph.D 8 1 2
Others 457 3 14 3 136 284
Male 66,581 9,635 6,930 10,554 1,924 7,301 28,017
Matric 9,674 2,761 1,538 5,095
F.A/F.Sc. 19,483 3,781 2,757 2,214 10,099
B.A./B.Sc./B.Com./BCS 23,957 2,591 3,108 6,229 1,880 9,494
M.A./M.Sc./M.Com./MCS 12,443 485 1,061 4,275 1,900 1,123 3,006
M.Phill 148 2 3 37 18 37 35
Ph.D 39 1 2 2 14 4
Others 837 14 1 11 4 495 284
Total does not tally with Table No. 01

TABLE 27.2 TEACHING STAFF (PRIVATE) BY GENDER, ACADEMIC AND PROFESSIONAL QUALIFICATION
Pakistan (Number)
----------------------------------------------------------------------------------------------------------------
| No. of | Attainment of Professional Qualification
Academic Qualification/Gender | Teaching |------------------------------------------------------------------
| Staff | | | | | Other |
| | P.T.C | C.T | B.Ed | M.Ed | Trained | Un-Trained
----------------------------------------------------------------------------------------------------------------
Urban Areas
Total 361,877 30,108 26,694 62,366 9,759 36,602 184,889
Matric 43,797 8,646 3,588 30,151
F.A/F.Sc. 96,860 10,846 13,763 8,560 60,606
B.A./B.Sc./B.Com./BCS 146,066 7,718 10,795 42,027 13,829 67,780
M.A./M.Sc./M.Com./MCS 71,865 2,854 2,094 20,178 9,548 9,132 25,220
M.Phill 1,143 29 32 131 153 502 243
Ph.D 283 3 4 11 38 143 75
Others 1,863 12 6 19 20 848 814
Female 279,268 21,070 20,846 46,072 5,714 25,856 151,231
Matric 38,841 7,283 2,566 27,780
F.A/F.Sc. 83,120 8,845 11,532 6,886 53,306
B.A./B.Sc./B.Com./BCS 111,874 4,384 8,163 32,897 10,237 53,254
M.A./M.Sc./M.Com./MCS 44,030 531 1,142 13,118 5,623 5,581 16,337
M.Phill 462 20 3 48 67 189 114
Ph.D 85 2 12 45 24
Others 856 7 4 9 12 352 416
Male 82,609 9,038 5,848 16,294 4,045 10,746 33,658
Matric 4,956 1,363 1,022 2,371
F.A/F.Sc. 13,740 2,001 2,231 1,674 7,300
B.A./B.Sc./B.Com./BCS 34,192 3,334 2,632 9,130 3,592 14,526
M.A./M.Sc./M.Com./MCS 27,835 2,323 952 7,060 3,925 3,551 8,883
M.Phill 681 9 29 83 86 313 129
Ph.D 198 3 2 11 26 98 51
Others 1,007 5 2 10 8 496 398
----------------------------------------------------------------------------------------------------------------
Total does not tally with Table No. 01

TABLE 28 TEACHING STAFF IN MEDICAL AND DENTAL INSTITUTIONS BY PROFESSIONAL
QUALIFICATION AND GENDER
Pakistan (Number)
----------------------------------------------------------------------------------------------------------------------------------
Professional | All Institutions | Public Institutions | Private Institutions
Qualification |--------------------------------|--------------------------------|---------------------------------
| Total | Female | Male | Total | Female | Male | Total | Female | Male
----------------------------------------------------------------------------------------------------------------------------------
All Areas
Total 3,262 846 2,416 1,637 314 1,323 1,625 532 1,093
MBBS 1,407 418 989 703 150 553 704 268 436
BDS 270 89 181 98 26 72 172 63 109
FRCS/FRCP/MRCP/MCPS 908 212 696 445 73 372 463 139 324
M.D. 159 36 123 104 19 85 55 17 38
Ph.D 125 19 106 78 14 64 47 5 42
Others 393 72 321 209 32 177 184 40 144
Rural Areas
Total 929 200 729 385 83 302 544 117 427
MBBS 320 89 231 84 36 48 236 53 183
BDS 103 27 76 55 15 40 48 12 36
FRCS/FRCP/MRCP/MCPS 313 51 262 149 18 131 164 33 131
M.D. 68 7 61 58 7 51 10 10
Ph.D 67 10 57 39 7 32 28 3 25
Others 58 16 42 58 16 42
Urban Areas
Total 2,333 646 1,687 1,252 231 1,021 1,081 415 666
MBBS 1,087 329 758 619 114 505 468 215 253
BDS 167 62 105 43 11 32 124 51 73
FRCS/FRCP/MRCP/MCPS 595 161 434 296 55 241 299 106 193
M.D. 91 29 62 46 12 34 45 17 28
Ph.D 58 9 49 39 7 32 19 2 17
Others 335 56 279 209 32 177 126 24 102
----------------------------------------------------------------------------------------------------------------------------------

TABLE 29 TEACHING STAFF IN TECHNICAL AND PROFESSIONAL INSTITUTIONS BY ACADEMIC
QUALIFICATION AND GENDER
Pakistan (Number)
----------------------------------------------------------------------------------------------------------------------------------
Academic | All Institutions | Public Institutions | Private Institutions
Qualification/Gender |--------------------------------|--------------------------------|---------------------------------
| Total | Female | Male | Total | Female | Male | Total | Female | Male
----------------------------------------------------------------------------------------------------------------------------------
All Areas
Total 18,568 5,550 13,018 8,763 3,063 5,700 9,805 2,487 7,318
Under Graduate 3,584 1,767 1,817 2,130 1,079 1,051 1,454 688 766
Graduate 4,069 1,310 2,759 2,194 782 1,412 1,875 528 1,347
Post Graduate 8,752 2,131 6,621 3,360 1,057 2,303 5,392 1,074 4,318
M.Phil 1,309 240 1,069 674 94 580 635 146 489
Ph.D 854 102 752 405 51 354 449 51 398
Others
Rural Areas
Total 3,968 1,551 2,417 2,861 1,010 1,851 1,107 541 566
Under Graduate 1,859 1,071 788 1,314 698 616 545 373 172
Graduate 926 307 619 702 203 499 224 104 120
Post Graduate 761 135 626 476 81 395 285 54 231
M.Phil 305 31 274 277 25 252 28 6 22
Ph.D 117 7 110 92 3 89 25 4 21
Others
Urban Areas
Total 14,600 3,999 10,601 5,902 2,053 3,849 8,698 1,946 6,752
Under Graduate 1,725 696 1,029 816 381 435 909 315 594
Graduate 3,143 1,003 2,140 1,492 579 913 1,651 424 1,227
Post Graduate 7,991 1,996 5,995 2,884 976 1,908 5,107 1,020 4,087
M.Phil 1,004 209 795 397 69 328 607 140 467
Ph.D 737 95 642 313 48 265 424 47 377
Others
----------------------------------------------------------------------------------------------------------------------------------
TABLE 30 TEACHING STAFF IN ACCOUNTANCY INSTITUTIONS BY ACADEMIC
QUALIFICATION AND GENDER
Pakistan (Number)
----------------------------------------------------------------------------------------------------------------------------------
Academic | All Institutions | Public Institutions | Private Institutions
Qualification/Gender |--------------------------------|--------------------------------|---------------------------------
| Total | Female | Male | Total | Female | Male | Total | Female | Male
----------------------------------------------------------------------------------------------------------------------------------
All Areas
Total 552 109 443 201 55 146 351 54 297
BCS/PGD/B.Com 76 16 60 51 16 35 25 25
M.A/M.Sc/ACCA 190 56 134 47 19 28 143 37 106
CA/CMA/CAT/ACCA 165 26 139 62 13 49 103 13 90
ACA/ACMA 91 8 83 35 5 30 56 3 53
FCA/FCMA 20 20 20 20
M.Phil 9 3 6 6 2 4 3 1 2
Ph.D 1 1 1 1
Rural Areas
Total 12 6 6 12 6 6
BCS/PGD/B.Com
M.A/M.Sc/ACCA 6 6 6 6
CA/CMA/CAT/ACCA 6 6 6 6
ACA/ACMA
FCA/FCMA
M.Phil
Ph.D
Urban Areas
Total 540 103 437 201 55 146 339 48 291
BCS/PGD/B.Com 76 16 60 51 16 35 25 25
M.A/M.Sc/ACCA 184 50 134 47 19 28 137 31 106
CA/CMA/CAT/ACCA 159 26 133 62 13 49 97 13 84
ACA/ACMA 91 8 83 35 5 30 56 3 53
FCA/FCMA 20 20 20 20
M.Phil 9 3 6 6 2 4 3 1 2
Ph.D 1 1 1 1
----------------------------------------------------------------------------------------------------------------------------------

TABLE 31 TEACHING STAFF (PUBLIC & PRIVATE) IN MONO, POLYTECHNIC AND VOCATIONAL INSTITUTES
BY GENDER, ACADEMIC AND PROFESSIONAL QUALIFICATIONS
Pakistan (Number)
------------------------------------------------------------------------------------------------------------------------------------
Gender/Academic | | Duration of Professional Qualification (Degree/Diploma) |
Qualification | Total |-------------------------------------------------------------------|Total Un-Trained
| | Total Trained |Less than 1 Year| 1 Year | 1 Year+ |
------------------------------------------------------------------------------------------------------------------------------------
All Areas
Total 14,607 12,664 2,129 3,536 6,999 1,943
Matriculation 4,494 3,886 803 936 2,147 608
Intermediate 3,256 2,834 587 921 1,326 422
Graduate 3,918 3,421 513 1,043 1,865 497
Post Graduate 2,939 2,523 226 636 1,661 416
Female 4,662 3,944 767 1,234 1,943 718
Matriculation 1,930 1,614 358 449 807 316
Intermediate 1,103 948 239 343 366 155
Graduate 931 813 135 287 391 118
Post Graduate 698 569 35 155 379 129
Male 9,945 8,720 1,362 2,302 5,056 1,225
Matriculation 2,564 2,272 445 487 1,340 292
Intermediate 2,153 1,886 348 578 960 267
Graduate 2,987 2,608 378 756 1,474 379
Post Graduate 2,241 1,954 191 481 1,282 287
Rural Areas
Total 2,592 2,216 380 721 1,115 376
Matriculation 1,001 843 178 226 439 158
Intermediate 690 605 137 237 231 85
Graduate 563 484 42 179 263 79
Post Graduate 338 284 23 79 182 54
Female 859 712 177 255 280 147
Matriculation 500 410 112 140 158 90
Intermediate 187 159 49 65 45 28
Graduate 103 88 11 34 43 15
Post Graduate 69 55 5 16 34 14
Male 1,733 1,504 203 466 835 229
Matriculation 501 433 66 86 281 68
Intermediate 503 446 88 172 186 57
Graduate 460 396 31 145 220 64
Post Graduate 269 229 18 63 148 40
Urban Areas
Total 12,015 10,448 1,749 2,815 5,884 1,567
Matriculation 3,493 3,043 625 710 1,708 450
Intermediate 2,566 2,229 450 684 1,095 337
Graduate 3,355 2,937 471 864 1,602 418
Post Graduate 2,601 2,239 203 557 1,479 362
Female 3,803 3,232 590 979 1,663 571
Matriculation 1,430 1,204 246 309 649 226
Intermediate 916 789 190 278 321 127

Graduate 828 725 124 253 348 103
Post Graduate 629 514 30 139 345 115
Male 8,212 7,216 1,159 1,836 4,221 996
Matriculation 2,063 1,839 379 401 1,059 224
Intermediate 1,650 1,440 260 406 774 210
Graduate 2,527 2,212 347 611 1,254 315
Post Graduate 1,972 1,725 173 418 1,134 247
------------------------------------------------------------------------------------------------------------------------------------
TABLE 31.1 TEACHING STAFF (PUBLIC) IN MONO, POLYTECHNIC AND VOCATIONAL INSTITUTES
BY GENDER, ACADEMIC AND PROFESSIONAL QUALIFICATIONS
Pakistan (Number)
------------------------------------------------------------------------------------------------------------------------------------
Gender/Academic | | Duration of Professional Qualification (Degree/Diploma) |
Qualification | Total |-------------------------------------------------------------------|Total Un-Trained
| | Total Trained |Less than 1 Year| 1 Year | 1 Year+ |
------------------------------------------------------------------------------------------------------------------------------------
All Areas
Total 7,325 6,524 856 1,496 4,172 801
Matriculation 2,715 2,470 403 473 1,594 245
Intermediate 1,558 1,403 214 429 760 155
Graduate 1,751 1,541 153 333 1,055 210
Post Graduate 1,301 1,110 86 261 763 191
Female 2,341 1,987 277 513 1,197 354
Matriculation 1,007 858 148 170 540 149
Intermediate 478 411 73 149 189 67
Graduate 420 368 41 103 224 52
Post Graduate 436 350 15 91 244 86
Male 4,984 4,537 579 983 2,975 447
Matriculation 1,708 1,612 255 303 1,054 96
Intermediate 1,080 992 141 280 571 88
Graduate 1,331 1,173 112 230 831 158
Post Graduate 865 760 71 170 519 105
Rural Areas
Total 1,469 1,323 192 399 732 146
Matriculation 531 481 80 87 314 50
Intermediate 392 364 78 153 133 28
Graduate 316 282 18 89 175 34
Post Graduate 230 196 16 70 110 34
Female 379 335 70 104 161 44
Matriculation 182 160 45 35 80 22
Intermediate 83 73 18 33 22 10
Graduate 53 52 4 20 28 1
Post Graduate 61 50 3 16 31 11
Male 1,090 988 122 295 571 102
Matriculation 349 321 35 52 234 28
Intermediate 309 291 60 120 111 18
Graduate 263 230 14 69 147 33
Post Graduate 169 146 13 54 79 23
Urban Areas
Total 5,856 5,201 664 1,097 3,440 655
Matriculation 2,184 1,989 323 386 1,280 195
Intermediate 1,166 1,039 136 276 627 127
Graduate 1,435 1,259 135 244 880 176
Post Graduate 1,071 914 70 191 653 157
Female 1,962 1,652 207 409 1,036 310
Matriculation 825 698 103 135 460 127
Intermediate 395 338 55 116 167 57

Graduate 367 316 37 83 196 51
Post Graduate 375 300 12 75 213 75
Male 3,894 3,549 457 688 2,404 345
Matriculation 1,359 1,291 220 251 820 68
Intermediate 771 701 81 160 460 70
Graduate 1,068 943 98 161 684 125
Post Graduate 696 614 58 116 440 82
------------------------------------------------------------------------------------------------------------------------------------

TABLE 31.2 TEACHING STAFF (PRIVATE) IN MONO, POLYTECHNIC AND VOCATIONAL INSTITUTES
BY GENDER, ACADEMIC AND PROFESSIONAL QUALIFICATIONS
Pakistan (Number)
------------------------------------------------------------------------------------------------------------------------------------
Gender/Academic | | Duration of Professional Qualification (Degree/Diploma) |
Qualification | Total |-------------------------------------------------------------------|Total Un-Trained
| | Total Trained |Less than 1 Year| 1 Year | 1 Year+ |
------------------------------------------------------------------------------------------------------------------------------------
All Areas
Total 7,282 6,140 1,273 2,040 2,827 1,142
Matriculation 1,779 1,416 400 463 553 363
Intermediate 1,698 1,431 373 492 566 267
Graduate 2,167 1,880 360 710 810 287
Post Graduate 1,638 1,413 140 375 898 225
Female 2,321 1,957 490 721 746 364
Matriculation 923 756 210 279 267 167
Intermediate 625 537 166 194 177 88
Graduate 511 445 94 184 167 66
Post Graduate 262 219 20 64 135 43
Male 4,961 4,183 783 1,319 2,081 778
Matriculation 856 660 190 184 286 196
Intermediate 1,073 894 207 298 389 179
Graduate 1,656 1,435 266 526 643 221
Post Graduate 1,376 1,194 120 311 763 182
Rural Areas
Total 1,123 893 188 322 383 230
Matriculation 470 362 98 139 125 108
Intermediate 298 241 59 84 98 57
Graduate 247 202 24 90 88 45
Post Graduate 108 88 7 9 72 20
Female 480 377 107 151 119 103
Matriculation 318 250 67 105 78 68
Intermediate 104 86 31 32 23 18
Graduate 50 36 7 14 15 14
Post Graduate 8 5 2 3 3
Male 643 516 81 171 264 127
Matriculation 152 112 31 34 47 40
Intermediate 194 155 28 52 75 39
Graduate 197 166 17 76 73 31
Post Graduate 100 83 5 9 69 17
Urban Areas
Total 6,159 5,247 1,085 1,718 2,444 912
Matriculation 1,309 1,054 302 324 428 255
Intermediate 1,400 1,190 314 408 468 210
Graduate 1,920 1,678 336 620 722 242
Post Graduate 1,530 1,325 133 366 826 205
Female 1,841 1,580 383 570 627 261
Matriculation 605 506 143 174 189 99
Intermediate 521 451 135 162 154 70

Graduate 461 409 87 170 152 52
Post Graduate 254 214 18 64 132 40
Male 4,318 3,667 702 1,148 1,817 651
Matriculation 704 548 159 150 239 156
Intermediate 879 739 179 246 314 140
Graduate 1,459 1,269 249 450 570 190
Post Graduate 1,276 1,111 115 302 694 165
------------------------------------------------------------------------------------------------------------------------------------

TABLE 32 TEACHING STAFF IN HOMEOPATHIC AND TIBBIA INSTITUTIONS BY PROFESSIONAL
QUALIFICATIONS AND GENDER
Pakistan (Number)
-----------------------------------------------------------------------------------------------------------------------------
Professional | All Institutions | Public Institutions | Private Institutions
Qualification |-----------------------------|-----------------------------|------------------------------
| Total | Female | Male | Total | Female | Male | Total | Female | Male
-----------------------------------------------------------------------------------------------------------------------------
All Areas
Homeopathic 965 320 645 88 24 64 877 296 581
Tibbia 128 20 108 19 4 15 109 16 93
Rural Areas
Homeopathic 37 16 21 14 7 7 23 9 14
Tibbia 6 1 5 6 1 5
Urban Areas
Homeopathic 928 304 624 74 17 57 854 287 567
Tibbia 122 19 103 19 4 15 103 15 88
-----------------------------------------------------------------------------------------------------------------------------
TABLE 33 TEACHING STAFF IN COLLEGES AND UNIVERSITIES BY DESIGNATION AND GENDER
Pakistan (Number)
----------------------------------------------------------------------------------------------------------------------------------
| All Institutions | Public Institutions | Private Institutions
Designation |--------------------------------|--------------------------------|---------------------------------
| Total | Female | Male | Total | Female | Male | Total | Female | Male
----------------------------------------------------------------------------------------------------------------------------------
All Areas
Total 43,516 15,233 28,283 31,696 11,342 20,354 11,820 3,891 7,929
Lecturer 26,255 10,035 16,220 17,622 6,863 10,759 8,633 3,172 5,461
Assistant Professor 10,264 3,222 7,042 8,617 2,834 5,783 1,647 388 1,259
Associate Professor 4,547 1,517 3,030 3,778 1,287 2,491 769 230 539
Professor 2,450 459 1,991 1,679 358 1,321 771 101 670
Rural Areas
Total 6,617 1,429 5,188 5,207 954 4,253 1,410 475 935
Lecturer 4,014 1,080 2,934 3,102 697 2,405 912 383 529
Assistant Professor 1,564 243 1,321 1,286 179 1,107 278 64 214
Associate Professor 573 65 508 489 57 432 84 8 76
Professor 466 41 425 330 21 309 136 20 116
Urban Areas
Total 36,899 13,804 23,095 26,489 10,388 16,101 10,410 3,416 6,994
Lecturer 22,241 8,955 13,286 14,520 6,166 8,354 7,721 2,789 4,932
Assistant Professor 8,700 2,979 5,721 7,331 2,655 4,676 1,369 324 1,045
Associate Professor 3,974 1,452 2,522 3,289 1,230 2,059 685 222 463
Professor 1,984 418 1,566 1,349 337 1,012 635 81 554
----------------------------------------------------------------------------------------------------------------------------------

TABLE 34 TEACHING STRENGTH IN EDUCATIONAL INSTITUTIONS (PUBLIC AND PRIVATE) BY LEVEL, NATURE OF POST AND GENDER
Pakistan (Number)
------------------------------------------------------------------------------------------------------------------------------------
| Nature of Post
|---------------------------------------------------------------------------------------------------
Level of Institution | Filled in | Vacant | Contract
|--------------------------------|--------------------------------|---------------------------------
| Total | Female | Male | Total | Female | Male | Total | Female | Male
------------------------------------------------------------------------------------------------------------------------------------
All Areas
Total (a to h) 1,356,802 695,765 661,037 92,770 37,430 55,340 50,875 22,409 28,466
a. General 1,241,002 661,708 579,294 89,700 36,518 53,182 47,921 21,083 26,838
Pre-Primary 3,807 3,180 627 50 33 17 261 141 120
Mosque 22,603 912 21,691 2,500 48 2,452 1,180 50 1,130
Primary 399,517 188,995 210,522 29,366 11,113 18,253 20,117 9,054 11,063
Middle/Elementry 313,797 203,894 109,903 22,304 12,109 10,195 12,469 6,303 6,166
Secondry/High 368,119 203,096 165,023 23,643 8,170 15,473 9,673 3,636 6,037
Higher-Secondary 50,257 24,630 25,627 6,267 2,593 3,674 1,341 481 860
Intermediate College 15,119 6,703 8,416 599 213 386 471 199 272
Degree College 43,978 20,511 23,467 4,890 2,228 2,662 1,969 1,131 838
General University 11,434 3,439 7,995 61 4 57 392 53 339
British System 12,371 6,348 6,023 20 7 13 48 35 13
b. Technical/Professional 30,334 7,376 22,958 1,094 336 758 797 209 588
Medical College 3,275 1,034 2,241 18 5 13 89 48 41
Medical University 1,364 415 949 12 12
Dental College/University 300 115 185 1 1
School/College of Medical Tech 634 125 509 7 7 4 4
School/College of Nursing 479 356 123 108 97 11 13 13
Homeopathic College 1,172 376 796 5 2 3
Tibbia College 195 31 164
Education College/University 2,611 1,423 1,188 322 161 161 81 58 23
Home-Economics College 349 325 24 40 40
Business Management.C/U 1,577 338 1,239 5 1 4 70 10 60
Commerce College 6,093 876 5,217 407 29 378 180 10 170
Engineering College/University 3,675 434 3,241 34 34 152 41 111
IT College/University 4,334 864 3,470 25 25 112 11 101
Law College/University 1,447 268 1,179 23 23 4 4
Agriculture College/University 1,583 143 1,440 24 24 5 3 2
Veterinary/Animal Sciences Ins 130 15 115 60 60
Fine-Arts College 373 103 270 3 1 2
Accountancy Institutes 743 135 608 1 1 86 15 71
c. Vocational/Polytech 15,339 4,759 10,580 1,501 344 1,157 681 268 413
Polytechnic Institute 3,422 241 3,181 535 18 517 198 7 191
Monotechnic Institute 396 37 359 185 185 16 16
Vocational Institute 11,521 4,481 7,040 781 326 455 467 261 206
d. NFBE 5,262 4,376 886 163 139 24 573 397 176
e. Distance Education 1,040 340 700 5 4 1
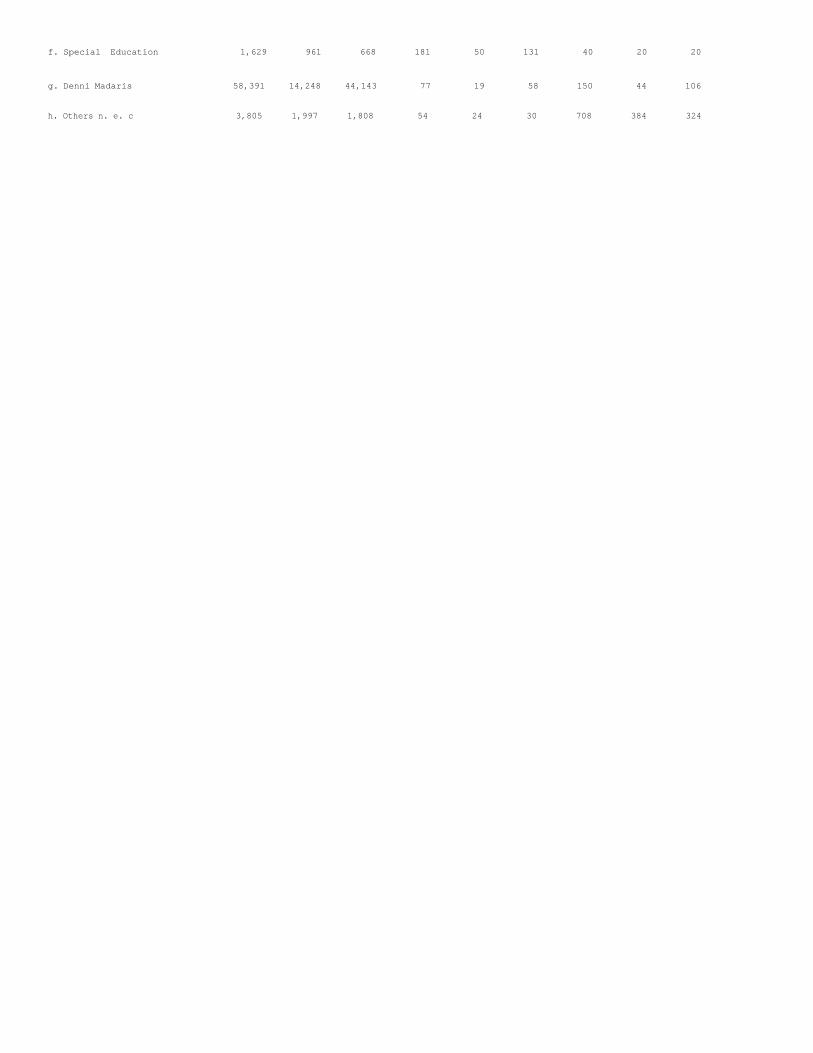
f. Special Education 1,629 961 668 181 50 131 40 20 20
g. Denni Madaris 58,391 14,248 44,143 77 19 58 150 44 106
h. Others n. e. c 3,805 1,997 1,808 54 24 30 708 384 324

TABLE 34 TEACHING STRENGTH IN EDUCATIONAL INSTITUTIONS (PUBLIC AND PRIVATE) BY LEVEL, NATURE OF POST AND GENDER
Pakistan (Number)
------------------------------------------------------------------------------------------------------------------------------------
| Nature of Post
|---------------------------------------------------------------------------------------------------
Level of Institution | Filled in | Vacant | Contract
|--------------------------------|--------------------------------|---------------------------------
| Total | Female | Male | Total | Female | Male | Total | Female | Male
------------------------------------------------------------------------------------------------------------------------------------
Rural Areas
Total (a to h) 687,613 278,383 409,230 68,795 25,729 43,066 39,089 15,476 23,613
a. General 649,752 267,585 382,167 68,181 25,616 42,565 37,579 14,680 22,899
Pre-Primary 921 551 370 23 8 15 210 90 120
Mosque 19,304 514 18,790 2,282 33 2,249 1,111 46 1,065
Primary 276,115 105,545 170,570 24,887 8,756 16,131 18,245 7,827 10,418
Middle/Elementry 176,546 96,851 79,695 19,553 10,482 9,071 10,057 4,503 5,554
Secondry/High 144,024 52,807 91,217 16,346 4,484 11,862 6,740 1,804 4,936
Higher-Secondary 19,027 6,719 12,308 4,113 1,559 2,554 711 207 504
Intermediate College 3,506 1,385 2,121 202 22 180 163 55 108
Degree College 5,747 1,855 3,892 769 270 499 342 148 194
General University 3,448 590 2,858 6 2 4
British System 1,114 768 346
b. Technical/Professional 4,013 654 3,359 112 6 106 83 10 73
Medical College 384 31 353
Medical University 1,174 331 843
Dental College/University 5 1 4
School/College of Medical Tech 33 7 26 4 4
School/College of Nursing 13 13 5 5
Homeopathic College 44 16 28 2 1 1
Tibbia College 6 1 5
Education College/University 156 41 115 9 9 6 2 4
Home-Economics College
Business Management.C/U 130 22 108 2 2 8 8
Commerce College 274 32 242 48 48 38 38
Engineering College/University 1,002 52 950 26 26
IT College/University 198 28 170 6 6 22 5 17
Law College/University 56 4 52
Agriculture College/University 493 57 436 14 14 5 3 2
Veterinary/Animal Sciences Ins 21 6 15
Fine-Arts College
Accountancy Institutes 24 12 12
c. Vocational/Polytech 2,642 857 1,785 365 47 318 168 54 114
Polytechnic Institute 631 21 610 191 5 186 45 1 44
Monotechnic Institute 55 4 51 44 44 15 15
Vocational Institute 1,956 832 1,124 130 42 88 108 53 55
d. NFBE 3,962 3,232 730 51 32 19 519 343 176
e. Distance Education 19 8 11 4 4
f. Special Education 156 131 25 2 2 12 12
g. Denni Madaris 24,627 4,567 20,060 56 16 40 89 33 56
h. Others n. e. c 2,442 1,349 1,093 28 10 18 635 340 295

TABLE 34 TEACHING STRENGTH IN EDUCATIONAL INSTITUTIONS (PUBLIC AND PRIVATE) BY LEVEL, NATURE OF POST AND GENDER
Pakistan (Number)
------------------------------------------------------------------------------------------------------------------------------------
| Nature of Post
|---------------------------------------------------------------------------------------------------
Level of Institution | Filled in | Vacant | Contract
|--------------------------------|--------------------------------|---------------------------------
| Total | Female | Male | Total | Female | Male | Total | Female | Male
------------------------------------------------------------------------------------------------------------------------------------
Urban Areas
Total (a to h) 669,189 417,382 251,807 23,975 11,701 12,274 11,786 6,933 4,853
a. General 591,250 394,123 197,127 21,519 10,902 10,617 10,342 6,403 3,939
Pre-Primary 2,886 2,629 257 27 25 2 51 51
Mosque 3,299 398 2,901 218 15 203 69 4 65
Primary 123,402 83,450 39,952 4,479 2,357 2,122 1,872 1,227 645
Middle/Elementry 137,251 107,043 30,208 2,751 1,627 1,124 2,412 1,800 612
Secondry/High 224,095 150,289 73,806 7,297 3,686 3,611 2,933 1,832 1,101
Higher-Secondary 31,230 17,911 13,319 2,154 1,034 1,120 630 274 356
Intermediate College 11,613 5,318 6,295 397 191 206 308 144 164
Degree College 38,231 18,656 19,575 4,121 1,958 2,163 1,627 983 644
General University 7,986 2,849 5,137 55 2 53 392 53 339
British System 11,257 5,580 5,677 20 7 13 48 35 13
b. Technical/Professional 26,321 6,722 19,599 982 330 652 714 199 515
Medical College 2,891 1,003 1,888 18 5 13 89 48 41
Medical University 190 84 106 12 12
Dental College/University 295 114 181 1 1
School/College of Medical Tech 601 118 483 7 7
School/College of Nursing 466 343 123 103 92 11 13 13
Homeopathic College 1,128 360 768 3 1 2
Tibbia College 189 30 159
Education College/University 2,455 1,382 1,073 313 161 152 75 56 19
Home-Economics College 349 325 24 40 40
Business Management.C/U 1,447 316 1,131 3 1 2 62 10 52
Commerce College 5,819 844 4,975 359 29 330 142 10 132
Engineering College/University 2,673 382 2,291 8 8 152 41 111
IT College/University 4,136 836 3,300 19 19 90 6 84
Law College/University 1,391 264 1,127 23 23 4 4
Agriculture College/University 1,090 86 1,004 10 10
Veterinary/Animal Sciences Ins 109 9 100 60 60
Fine-Arts College 373 103 270 3 1 2
Accountancy Institutes 719 123 596 1 1 86 15 71
c. Vocational/Polytech 12,697 3,902 8,795 1,136 297 839 513 214 299
Polytechnic Institute 2,791 220 2,571 344 13 331 153 6 147
Monotechnic Institute 341 33 308 141 141 1 1
Vocational Institute 9,565 3,649 5,916 651 284 367 359 208 151
d. NFBE 1,300 1,144 156 112 107 5 54 54

e. Distance Education 1,021 332 689 1 1
f. Special Education 1,473 830 643 179 48 131 28 8 20
g. Denni Madaris 33,764 9,681 24,083 21 3 18 61 11 50
h. Others n. e. c 1,363 648 715 26 14 12 73 44 29
------------------------------------------------------------------------------------------------------------------------------------

TABLE 34.1 TEACHING STRENGTH IN EDUCATIONAL INSTITUTIONS (PUBLIC) BY LEVEL, NATURE OF POST AND GENDER
Pakistan (Number)
------------------------------------------------------------------------------------------------------------------------------------
| Nature of Post
|---------------------------------------------------------------------------------------------------
Level of Institution | Filled in | Vacant | Contract
|--------------------------------|--------------------------------|---------------------------------
| Total | Female | Male | Total | Female | Male | Total | Female | Male
------------------------------------------------------------------------------------------------------------------------------------
All Areas
Total (a to h) 723,876 276,097 447,779 89,283 35,309 53,974 34,428 14,718 19,710
a. General 693,809 265,932 427,877 86,515 34,478 52,037 32,663 13,926 18,737
Pre-Primary 311 151 160 6 2 4 104 42 62
Mosque 22,303 770 21,533 2,494 45 2,449 1,166 49 1,117
Primary 310,892 119,609 191,283 28,546 10,545 18,001 16,814 7,392 9,422
Middle/Elementry 113,310 53,754 59,556 21,078 11,285 9,793 6,362 3,281 3,081
Secondry/High 167,696 59,227 108,469 22,819 7,638 15,181 5,244 1,799 3,445
Higher-Secondary 28,354 11,272 17,082 6,176 2,560 3,616 701 268 433
Intermediate College 5,746 2,448 3,298 571 200 371 172 77 95
Degree College 36,229 16,145 20,084 4,765 2,200 2,565 1,762 973 789
General University 8,666 2,378 6,288 60 3 57 338 45 293
British System 302 178 124
b. Technical/Professional 13,909 3,612 10,297 990 322 668 485 131 354
Medical College 2,037 584 1,453 8 8
Medical University 514 153 361
Dental College/University 108 30 78
School/College of Medical Tech 495 85 410 7 7
School/College of Nursing 393 319 74 99 92 7 10 10
Homeopathic College 126 37 89 2 1 1
Tibbia College 19 4 15
Education College/University 1,969 1,203 766 319 160 159 55 52 3
Home-Economics College 323 299 24 40 40
Business Management.C/U 320 89 231 2 2 8 8
Commerce College 2,464 207 2,257 403 29 374 146 10 136
Engineering College/University 2,850 324 2,526 34 34 152 41 111
IT College/University 110 32 78 2 2 25 25
Law College/University 154 37 117 4 4
Agriculture College/University 1,543 123 1,420 14 14 5 3 2
Veterinary/Animal Sciences Ins 109 9 100 60 60
Fine-Arts College 94 12 82
Accountancy Institutes 281 65 216 80 15 65
c. Vocational/Polytech 7,887 2,421 5,466 1,419 310 1,109 415 166 249
Polytechnic Institute 2,263 181 2,082 532 17 515 168 6 162
Monotechnic Institute 239 3 236 178 178 16 16
Vocational Institute 5,385 2,237 3,148 709 293 416 231 160 71
d. NFBE 2,114 1,779 335 142 124 18 283 210 73
e. Distance Education 1,009 328 681 2 1 1
f. Special Education 890 423 467 166 49 117 40 20 20
g. Denni Madaris 1,802 367 1,435 8 3 5 5 5
h. Others n. e. c 2,456 1,235 1,221 43 23 20 535 264 271

TABLE 34.1 TEACHING STRENGTH IN EDUCATIONAL INSTITUTIONS (PUBLIC) BY LEVEL, NATURE OF POST AND GENDER
Pakistan (Number)
------------------------------------------------------------------------------------------------------------------------------------
| Nature of Post
|---------------------------------------------------------------------------------------------------
Level of Institution | Filled in | Vacant | Contract
|--------------------------------|--------------------------------|---------------------------------
| Total | Female | Male | Total | Female | Male | Total | Female | Male
------------------------------------------------------------------------------------------------------------------------------------
Rural Areas
Total (a to h) 475,721 154,623 321,098 67,220 24,927 42,293 28,621 11,804 16,817
a. General 467,195 151,525 315,670 66,701 24,848 41,853 27,732 11,351 16,381
Pre-Primary 295 137 158 4 2 2 104 42 62
Mosque 19,178 478 18,700 2,278 32 2,246 1,098 45 1,053
Primary 240,650 82,063 158,587 24,433 8,504 15,929 15,881 6,894 8,987
Middle/Elementry 90,078 40,034 50,044 18,925 10,135 8,790 5,824 2,972 2,852
Secondry/High 94,216 22,767 71,449 16,034 4,346 11,688 3,989 1,100 2,889
Higher-Secondary 13,496 3,737 9,759 4,060 1,545 2,515 476 159 317
Intermediate College 1,944 670 1,274 202 22 180 48 17 31
Degree College 4,465 1,141 3,324 759 260 499 312 122 190
General University 2,850 476 2,374 6 2 4
British System 23 22 1
b. Technical/Professional 2,595 335 2,260 104 5 99 44 3 41
Medical College 262 16 246
Medical University 500 150 350
Dental College/University
School/College of Medical Tech 4 4
School/College of Nursing 13 13 5 5
Homeopathic College 14 7 7
Tibbia College
Education College/University 150 39 111 9 9
Home-Economics College
Business Management.C/U 62 4 58 2 2 8 8
Commerce College 236 21 215 48 48 29 29
Engineering College/University 857 27 830 26 26
IT College/University 4 1 3 2 2
Law College/University
Agriculture College/University 493 57 436 14 14 5 3 2
Veterinary/Animal Sciences Ins
Fine-Arts College
Accountancy Institutes
c. Vocational/Polytech 1,520 379 1,141 349 39 310 98 30 68
Polytechnic Institute 485 14 471 191 5 186 44 44
Monotechnic Institute 48 48 44 44 15 15
Vocational Institute 987 365 622 114 34 80 39 30 9
d. NFBE 1,636 1,339 297 37 22 15 252 179 73
e. Distance Education 14 3 11 1 1

f. Special Education 37 23 14 1 1 12 12
g. Denni Madaris 961 141 820 6 3 3 5 5
h. Others n. e. c 1,763 878 885 22 9 13 477 228 249

TABLE 34.1 TEACHING STRENGTH IN EDUCATIONAL INSTITUTIONS (PUBLIC) BY LEVEL, NATURE OF POST AND GENDER
Pakistan (Number)
------------------------------------------------------------------------------------------------------------------------------------
| Nature of Post
|---------------------------------------------------------------------------------------------------
Level of Institution | Filled in | Vacant | Contract
|--------------------------------|--------------------------------|---------------------------------
| Total | Female | Male | Total | Female | Male | Total | Female | Male
------------------------------------------------------------------------------------------------------------------------------------
Urban Areas
Total (a to h) 248,155 121,474 126,681 22,063 10,382 11,681 5,807 2,914 2,893
a. General 226,614 114,407 112,207 19,814 9,630 10,184 4,931 2,575 2,356
Pre-Primary 16 14 2 2 2
Mosque 3,125 292 2,833 216 13 203 68 4 64
Primary 70,242 37,546 32,696 4,113 2,041 2,072 933 498 435
Middle/Elementry 23,232 13,720 9,512 2,153 1,150 1,003 538 309 229
Secondry/High 73,480 36,460 37,020 6,785 3,292 3,493 1,255 699 556
Higher-Secondary 14,858 7,535 7,323 2,116 1,015 1,101 225 109 116
Intermediate College 3,802 1,778 2,024 369 178 191 124 60 64
Degree College 31,764 15,004 16,760 4,006 1,940 2,066 1,450 851 599
General University 5,816 1,902 3,914 54 1 53 338 45 293
British System 279 156 123
b. Technical/Professional 11,314 3,277 8,037 886 317 569 441 128 313
Medical College 1,775 568 1,207 8 8
Medical University 14 3 11
Dental College/University 108 30 78
School/College of Medical Tech 491 85 406 7 7
School/College of Nursing 380 306 74 94 87 7 10 10
Homeopathic College 112 30 82 2 1 1
Tibbia College 19 4 15
Education College/University 1,819 1,164 655 310 160 150 55 52 3
Home-Economics College 323 299 24 40 40
Business Management.C/U 258 85 173
Commerce College 2,228 186 2,042 355 29 326 117 10 107
Engineering College/University 1,993 297 1,696 8 8 152 41 111
IT College/University 106 31 75 2 2 23 23
Law College/University 154 37 117 4 4
Agriculture College/University 1,050 66 984
Veterinary/Animal Sciences Ins 109 9 100 60 60
Fine-Arts College 94 12 82
Accountancy Institutes 281 65 216 80 15 65
c. Vocational/Polytech 6,367 2,042 4,325 1,070 271 799 317 136 181
Polytechnic Institute 1,778 167 1,611 341 12 329 124 6 118
Monotechnic Institute 191 3 188 134 134 1 1
Vocational Institute 4,398 1,872 2,526 595 259 336 192 130 62
d. NFBE 478 440 38 105 102 3 31 31
e. Distance Education 995 325 670 1 1
f. Special Education 853 400 453 165 48 117 28 8 20
g. Denni Madaris 841 226 615 2 2
h. Others n. e. c 693 357 336 21 14 7 58 36 22
------------------------------------------------------------------------------------------------------------------------------------
TABLE 34.2 TEACHING STRENGTH IN EDUCATIONAL INSTITUTIONS (PRIVATE) BY LEVEL, NATURE OF POST AND GENDER
Pakistan (Number)
------------------------------------------------------------------------------------------------------------------------------------
| Nature of Post
|---------------------------------------------------------------------------------------------------
Level of Institution | Filled in | Vacant | Contract
|--------------------------------|--------------------------------|---------------------------------
| Total | Female | Male | Total | Female | Male | Total | Female | Male
------------------------------------------------------------------------------------------------------------------------------------
All Areas
Total (a to h) 632,926 419,668 213,258 3,487 2,121 1,366 16,447 7,691 8,756
a. General 547,193 395,776 151,417 3,185 2,040 1,145 15,258 7,157 8,101
Pre-Primary 3,496 3,029 467 44 31 13 157 99 58
Mosque 300 142 158 6 3 3 14 1 13
Primary 88,625 69,386 19,239 820 568 252 3,303 1,662 1,641
Middle/Elementry 200,487 150,140 50,347 1,226 824 402 6,107 3,022 3,085
Secondry/High 200,423 143,869 56,554 824 532 292 4,429 1,837 2,592
Higher-Secondary 21,903 13,358 8,545 91 33 58 640 213 427
Intermediate College 9,373 4,255 5,118 28 13 15 299 122 177
Degree College 7,749 4,366 3,383 125 28 97 207 158 49
General University 2,768 1,061 1,707 1 1 54 8 46
British System 12,069 6,170 5,899 20 7 13 48 35 13
b. Technical/Professional 16,425 3,764 12,661 104 14 90 312 78 234
Medical College 1,238 450 788 10 5 5 89 48 41
Medical University 850 262 588 12 12
Dental College/University 192 85 107 1 1
School/College of Medical Tech 139 40 99 4 4
School/College of Nursing 86 37 49 9 5 4 3 3
Homeopathic College 1,046 339 707 3 1 2
Tibbia College 176 27 149
Education College/University 642 220 422 3 1 2 26 6 20
Home-Economics College 26 26
Business Management.C/U 1,257 249 1,008 3 1 2 62 10 52
Commerce College 3,629 669 2,960 4 4 34 34
Engineering College/University 825 110 715
IT College/University 4,224 832 3,392 23 23 87 11 76
Law College/University 1,293 231 1,062 23 23
Agriculture College/University 40 20 20 10 10
Veterinary/Animal Sciences Ins 21 6 15
Fine-Arts College 279 91 188 3 1 2
Accountancy Institutes 462 70 392 1 1 6 6
c. Vocational/Polytech 7,452 2,338 5,114 82 34 48 266 102 164
Polytechnic Institute 1,159 60 1,099 3 1 2 30 1 29
Monotechnic Institute 157 34 123 7 7
Vocational Institute 6,136 2,244 3,892 72 33 39 236 101 135
d. NFBE 3,148 2,597 551 21 15 6 290 187 103
e. Distance Education 31 12 19 3 3

f. Special Education 739 538 201 15 1 14
g. Denni Madaris 56,589 13,881 42,708 69 16 53 145 44 101
h. Others n. e. c 1,349 762 587 11 1 10 173 120 53

TABLE 34.2 TEACHING STRENGTH IN EDUCATIONAL INSTITUTIONS (PRIVATE) BY LEVEL, NATURE OF POST AND GENDER
Pakistan (Number)
------------------------------------------------------------------------------------------------------------------------------------
| Nature of Post
|---------------------------------------------------------------------------------------------------
Level of Institution | Filled in | Vacant | Contract
|--------------------------------|--------------------------------|---------------------------------
| Total | Female | Male | Total | Female | Male | Total | Female | Male
------------------------------------------------------------------------------------------------------------------------------------
Rural Areas
Total (a to h) 211,892 123,760 88,132 1,575 802 773 10,468 3,672 6,796
a. General 182,557 116,060 66,497 1,480 768 712 9,847 3,329 6,518
Pre-Primary 626 414 212 19 6 13 106 48 58
Mosque 126 36 90 4 1 3 13 1 12
Primary 35,465 23,482 11,983 454 252 202 2,364 933 1,431
Middle/Elementry 86,468 56,817 29,651 628 347 281 4,233 1,531 2,702
Secondry/High 49,808 30,040 19,768 312 138 174 2,751 704 2,047
Higher-Secondary 5,531 2,982 2,549 53 14 39 235 48 187
Intermediate College 1,562 715 847 115 38 77
Degree College 1,282 714 568 10 10 30 26 4
General University 598 114 484
British System 1,091 746 345
b. Technical/Professional 1,418 319 1,099 8 1 7 39 7 32
Medical College 122 15 107
Medical University 674 181 493
Dental College/University 5 1 4
School/College of Medical Tech 29 7 22 4 4
School/College of Nursing
Homeopathic College 30 9 21 2 1 1
Tibbia College 6 1 5
Education College/University 6 2 4 6 2 4
Home-Economics College
Business Management.C/U 68 18 50
Commerce College 38 11 27 9 9
Engineering College/University 145 25 120
IT College/University 194 27 167 6 6 20 5 15
Law College/University 56 4 52
Agriculture College/University
Veterinary/Animal Sciences Ins 21 6 15
Fine-Arts College
Accountancy Institutes 24 12 12
c. Vocational/Polytech 1,122 478 644 16 8 8 70 24 46
Polytechnic Institute 146 7 139 1 1
Monotechnic Institute 7 4 3
Vocational Institute 969 467 502 16 8 8 69 23 46
d. NFBE 2,326 1,893 433 14 10 4 267 164 103
e. Distance Education 5 5 3 3

f. Special Education 119 108 11 1 1
g. Denni Madaris 23,666 4,426 19,240 50 13 37 84 33 51
h. Others n. e. c 679 471 208 6 1 5 158 112 46

TABLE 34.2 TEACHING STRENGTH IN EDUCATIONAL INSTITUTIONS (PRIVATE) BY LEVEL, NATURE OF POST AND GENDER
Pakistan (Number)
------------------------------------------------------------------------------------------------------------------------------------
| Nature of Post
|---------------------------------------------------------------------------------------------------
Level of Institution | Filled in | Vacant | Contract
|--------------------------------|--------------------------------|---------------------------------
| Total | Female | Male | Total | Female | Male | Total | Female | Male
------------------------------------------------------------------------------------------------------------------------------------
Urban Areas
Total (a to h) 421,034 295,908 125,126 1,912 1,319 593 5,979 4,019 1,960
a. General 364,636 279,716 84,920 1,705 1,272 433 5,411 3,828 1,583
Pre-Primary 2,870 2,615 255 25 25 51 51
Mosque 174 106 68 2 2 1 1
Primary 53,160 45,904 7,256 366 316 50 939 729 210
Middle/Elementry 114,019 93,323 20,696 598 477 121 1,874 1,491 383
Secondry/High 150,615 113,829 36,786 512 394 118 1,678 1,133 545
Higher-Secondary 16,372 10,376 5,996 38 19 19 405 165 240
Intermediate College 7,811 3,540 4,271 28 13 15 184 84 100
Degree College 6,467 3,652 2,815 115 18 97 177 132 45
General University 2,170 947 1,223 1 1 54 8 46
British System 10,978 5,424 5,554 20 7 13 48 35 13
b. Technical/Professional 15,007 3,445 11,562 96 13 83 273 71 202
Medical College 1,116 435 681 10 5 5 89 48 41
Medical University 176 81 95 12 12
Dental College/University 187 84 103 1 1
School/College of Medical Tech 110 33 77
School/College of Nursing 86 37 49 9 5 4 3 3
Homeopathic College 1,016 330 686 1 1
Tibbia College 170 26 144
Education College/University 636 218 418 3 1 2 20 4 16
Home-Economics College 26 26
Business Management.C/U 1,189 231 958 3 1 2 62 10 52
Commerce College 3,591 658 2,933 4 4 25 25
Engineering College/University 680 85 595
IT College/University 4,030 805 3,225 17 17 67 6 61
Law College/University 1,237 227 1,010 23 23
Agriculture College/University 40 20 20 10 10
Veterinary/Animal Sciences Ins
Fine-Arts College 279 91 188 3 1 2
Accountancy Institutes 438 58 380 1 1 6 6
c. Vocational/Polytech 6,330 1,860 4,470 66 26 40 196 78 118
Polytechnic Institute 1,013 53 960 3 1 2 29 29
Monotechnic Institute 150 30 120 7 7
Vocational Institute 5,167 1,777 3,390 56 25 31 167 78 89
d. NFBE 822 704 118 7 5 2 23 23
e. Distance Education 26 7 19

f. Special Education 620 430 190 14 14
g. Denni Madaris 32,923 9,455 23,468 19 3 16 61 11 50
h. Others n. e. c 670 291 379 5 5 15 8 7
------------------------------------------------------------------------------------------------------------------------------------

TABLE 35 QUALIFIED TEACHERS BY SELECTED SUBJECT, GENDER AND TYPE OF SCHOOLS
(FOR GENERAL EDUCATION UPTO HIGH SCHOOLS ONLY)
Pakistan (Number)
----------------------------------------------------------------------------------------------------------------------------------
| All Schools | Public Schools | Private Schools
Subject/Gender of Teacher |--------------------------------|--------------------------------|---------------------------------
| All | Rural | Urban | All | Rural | Urban | All | Rural | Urban
| Areas | Areas | Areas | Areas | Areas | Areas | Areas | Areas | Areas
----------------------------------------------------------------------------------------------------------------------------------
Total(Computer,Science & Maths)
Total 45,357 12,087 33,270 13,045 5,999 7,046 32,312 6,088 26,224
Female 22,809 3,817 18,992 4,578 1,542 3,036 18,231 2,275 15,956
Male 22,548 8,270 14,278 8,467 4,457 4,010 14,081 3,813 10,268
Computer
Total 8,396 1,621 6,775 1,066 408 658 7,330 1,213 6,117
Female 4,321 535 3,786 429 134 295 3,892 401 3,491
Male 4,075 1,086 2,989 637 274 363 3,438 812 2,626
Science
Total 22,553 6,557 15,996 8,000 3,767 4,233 14,553 2,790 11,763
Female 11,209 1,962 9,247 2,738 914 1,824 8,471 1,048 7,423
Male 11,344 4,595 6,749 5,262 2,853 2,409 6,082 1,742 4,340
Mathematics
Total 14,408 3,909 10,499 3,979 1,824 2,155 10,429 2,085 8,344
Female 7,279 1,320 5,959 1,411 494 917 5,868 826 5,042
Male 7,129 2,589 4,540 2,568 1,330 1,238 4,561 1,259 3,302
----------------------------------------------------------------------------------------------------------------------------------

TABLE 36 TEACHING AND NON-TEACHING STRENGTH IN PUBLIC & PRIVATE EDUCATIONAL INSTITUTIONS BY
GENDER AND NATURE OF POST
PAKISTAN (Number)
------------------------------------------------------------------------------------------------------------------------------------
TEACHING AND NON-TECHING | TOTAL (PUBLIC | POSTS IN PUBLIC INSTITUTIONS | PRIVATE
STAFF/GENDER | AND PRIVATE) |---------------------------------------------------------------| FILLED IN
| | SANCTIONED | FILLED IN | VACANT | CONTRACT | POSTS
------------------------------------------------------------------------------------------------------------------------------------
ALL AREAS
------------------------------------------------------------------------------------------------------------------------------------
TEACHING STAFF
TOTAL 1,356,802 813,159 723,876 89,283 34,428 632,926
FEMALE 695,765 311,406 276,097 35,309 14,718 419,668
MALE 661,037 501,753 447,779 53,974 19,710 213,258
NON-TEACHING STAFF 301,028 242,793 197,648 45,145 10,109 103,380
------------------------------------------------------------------------------------------------------------------------------------
RURAL AREAS
------------------------------------------------------------------------------------------------------------------------------------
TEACHING STAFF
TOTAL 687,613 542,941 475,721 67,220 28,621 211,892
FEMALE 278,383 179,550 154,623 24,927 11,804 123,760
MALE 409,230 363,391 321,098 42,293 16,817 88,132
NON-TEACHING STAFF 137,003 140,738 113,011 27,727 7,231 23,992
------------------------------------------------------------------------------------------------------------------------------------
URBAN AREAS
------------------------------------------------------------------------------------------------------------------------------------
TEACHING STAFF
TOTAL 669,189 270,218 248,155 22,063 5,807 421,034
FEMALE 417,382 131,856 121,474 10,382 2,914 295,908
MALE 251,807 138,362 126,681 11,681 2,893 125,126
NON-TEACHING STAFF 164,025 102,055 84,637 17,418 2,878 79,388

TABLE 37 NUMBER OF ROOMS IN EDUCATIONAL INSTITUTIONS BY TYPE AND GENDER OF INSTITUTIONS
------------------------------------------------------------------------------------------------------------------------------------
| ALL INSTITUTIONS | PUBLIC INSTITUTIONS | PRIVATE INSTITUTIONS
GEOGRAPHICAL |--------------------------------------------------------------------------------------------------
REGIONS/KIND OF ROOMS |ALL AREAS | RURAL | URBAN |ALL AREAS | RURAL | URBAN |ALL AREAS | RURAL | URBAN
| | AREAS | AREAS | | AREAS | AREAS | | AREAS | AREAS
------------------------------------------------------------------------------------------------------------------------------------
ALL INSTITUTIONS
------------------------------------------------------------------------------------------------------------------------------------
PAKISTAN
TOTAL ROOMS 1,281,066 704,725 576,341 613,258 440,137 173,121 667,808 264,588 403,220
CLASS ROOMS 993,885 543,984 449,901 503,172 368,260 134,912 490,713 175,724 314,989
HEAD TEACHER ROOM 101,194 54,030 47,164 45,235 32,898 12,337 55,959 21,132 34,827
OTHER ROOMS 185,987 106,711 79,276 64,851 38,979 25,872 121,136 67,732 53,404
------------------------------------------------------------------------------------------------------------------------------------
FEMALE INSTITUTIONS
------------------------------------------------------------------------------------------------------------------------------------
TOTAL ROOMS 313,528 213,695 99,833 248,637 184,382 64,255 64,891 29,313 35,578
CLASS ROOMS 244,440 169,279 75,161 201,505 151,516 49,989 42,935 17,763 25,172
HEAD TEACHER ROOM 23,348 16,295 7,053 18,466 14,268 4,198 4,882 2,027 2,855
OTHER ROOMS 45,740 28,121 17,619 28,666 18,598 10,068 17,074 9,523 7,551
------------------------------------------------------------------------------------------------------------------------------------
MALE INSTITUTIONS
------------------------------------------------------------------------------------------------------------------------------------
TOTAL ROOMS 236,487 149,363 87,124 189,131 129,518 59,613 47,356 19,845 27,511
CLASS ROOMS 186,390 119,436 66,954 154,741 108,328 46,413 31,649 11,108 20,541
HEAD TEACHER ROOM 18,317 11,867 6,450 14,873 10,640 4,233 3,444 1,227 2,217
OTHER ROOMS 31,780 18,060 13,720 19,517 10,550 8,967 12,263 7,510 4,753
------------------------------------------------------------------------------------------------------------------------------------
MIX INSTITUTIONS
------------------------------------------------------------------------------------------------------------------------------------
TOTAL ROOMS 731,051 341,667 389,384 175,490 126,237 49,253 555,561 215,430 340,131
CLASS ROOMS 563,055 255,269 307,786 146,926 108,416 38,510 416,129 146,853 269,276
HEAD TEACHER ROOM 59,529 25,868 33,661 11,896 7,990 3,906 47,633 17,878 29,755
OTHER ROOMS 108,467 60,530 47,937 16,668 9,831 6,837 91,799 50,699 41,100

TABLE 38 EDUCATIONAL INSTITUTIONS BY AVAILABILITY OF BUILDING FACILITIES AND TYPE OF INSTITUTIONS
PAKISTAN (Number)
------------------------------------------------------------------------------------------------------------------------------------
| ALL INSTITUTIONS | PUBLIC INSTITUTIONS | PRIVATE INSTITUTIONS
|--------------------------------------------------------------------------------------------------
BUILDING FACILITIES |ALL AREAS | RURAL | URBAN |ALL AREAS | RURAL | URBAN |ALL AREAS | RURAL | URBAN
| | AREAS | AREAS | | AREAS | AREAS | | AREAS | AREAS
------------------------------------------------------------------------------------------------------------------------------------
FACILITIES AVAILABLE
------------------------------------------------------------------------------------------------------------------------------------
HALL 287,79 119,24 168,55 97,09 60,28 36,81 190,70 58,96 131,74
LIBERARY 307,93 120,04 187,89 86,52 51,44 35,08 221,41 68,60 152,81
COMPUTER LAB 224,74 51,04 173,70 34,58 10,51 24,07 190,16 40,53 149,63
HOME ECONOMICS LAB 24,41 7,53 16,88 7,40 2,24 5,16 17,01 5,29 11,72
PHYSICS LAB 58,96 16,22 42,74 25,34 9,67 15,67 33,62 6,55 27,07
CHEMISTRY LAB 58,05 15,93 42,12 25,03 9,59 15,44 33,02 6,34 26,68
ZOOLOGY LAB 32,16 8,25 23,91 14,46 5,04 9,42 17,70 3,21 14,49
BOTANY LAB 33,04 9,15 23,89 14,80 5,47 9,33 18,24 3,68 14,56
COMBINED LAB 166,58 65,37 101,21 68,06 42,14 25,92 98,52 23,23 75,29
STUDENT HOSTEL 77,00 34,98 42,02 17,04 7,86 9,18 59,96 27,12 32,84
BOUNDRY WALL 1,521,76 1,004,95 516,81 879,11 718,55 160,56 642,65 286,40 356,25
PLAY GROUND 767,90 529,77 238,13 489,20 404,80 84,40 278,70 124,97 153,73
CANTEEN 356,83 121,21 235,62 57,19 27,44 29,75 299,64 93,77 205,87
LATRINE FOR STUDENT 1,524,64 975,74 548,90 841,76 682,93 158,83 682,88 292,81 390,07
------------------------------------------------------------------------------------------------------------------------------------
FACILITIES NOT AVAILABLE
------------------------------------------------------------------------------------------------------------------------------------
HALL 1,663,35 1,267,33 396,02 1,153,29 1,011,32 141,97 510,06 256,01 254,05
LIBERARY 1,633,13 1,258,80 374,33 1,151,64 1,009,75 141,89 481,49 249,05 232,44
COMPUTER LAB 1,419,24 1,080,44 338,80 984,07 851,36 132,71 435,17 229,08 206,09
HOME ECONOMICS LAB 466,86 263,74 203,12 191,56 149,33 42,23 275,30 114,41 160,89
PHYSICS LAB 265,45 147,30 118,15 130,33 99,68 30,65 135,12 47,62 87,50
CHEMISTRY LAB 263,22 145,62 117,60 129,41 98,70 30,71 133,81 46,92 86,89
ZOOLOGY LAB 247,32 133,92 113,40 122,84 91,68 31,16 124,48 42,24 82,24
BOTANY LAB 268,18 150,28 117,90 137,99 104,97 33,02 130,19 45,31 84,88
COMBINED LAB 310,83 201,04 109,79 173,30 140,25 33,05 137,53 60,79 76,74
STUDENT HOSTEL 1,342,78 948,38 394,40 863,81 738,10 125,71 478,97 210,28 268,69
BOUNDRY WALL 604,55 535,39 69,16 509,87 481,59 28,28 94,68 53,80 40,88
PLAY GROUND 1,331,23 991,17 340,06 884,50 781,80 102,70 446,73 209,37 237,36
CANTEEN 1,637,57 1,301,48 336,09 1,218,93 1,068,63 150,30 418,64 232,85 185,79
LATRINE FOR STUDENT 623,56 577,98 45,58 559,63 527,36 32,27 63,93 50,62 13,31
------------------------------------------------------------------------------------------------------------------------------------
FACILITIES NOT REQUIRED
------------------------------------------------------------------------------------------------------------------------------------
HALL 213,76 181,58 32,18 163,54 150,29 13,25 50,22 31,29 18,93
LIBERARY 223,84 189,31 34,53 175,76 160,70 15,06 48,08 28,61 19,47
COMPUTER LAB 520,92 436,67 84,25 395,27 360,02 35,25 125,65 76,65 49,00
HOME ECONOMICS LAB 1,673,63 1,296,88 376,75 1,214,96 1,070,32 144,64 458,67 226,56 232,11
PHYSICS LAB 1,840,49 1,404,63 435,86 1,258,25 1,112,54 145,71 582,24 292,09 290,15
CHEMISTRY LAB 1,843,63 1,406,60 437,03 1,259,48 1,113,60 145,88 584,15 293,00 291,15
ZOOLOGY LAB 1,885,42 1,425,98 459,44 1,276,62 1,125,17 151,45 608,80 300,81 307,99
BOTANY LAB 1,863,68 1,408,72 454,96 1,261,13 1,111,45 149,68 602,55 297,27 305,28
COMBINED LAB 1,687,49 1,301,74 385,75 1,172,56 1,039,50 133,06 514,93 262,24 252,69
STUDENT HOSTEL 745,12 584,79 160,33 533,07 475,93 57,14 212,05 108,86 103,19
BOUNDRY WALL 38,59 27,81 10,78 24,94 21,75 3,19 13,65 6,06 7,59
PLAY GROUND 65,77 47,21 18,56 40,22 35,29 4,93 25,55 11,92 13,63

CANTEEN 170,50 145,46 25,04 137,80 125,82 11,98 32,70 19,64 13,06
LATRINE FOR STUDENT 16,70 14,43 2,27 12,53 11,60 93 4,17 2,83 1,34
TABLE 39 EDUCATIONAL INSTITUTIONS BY AVAILABILITY OF BASIC FACILITIES AND TYPE OF INSTITUTIONS
PAKISTAN (Number)
------------------------------------------------------------------------------------------------------------------------------------
AVAILABILITY OF BASIC | ALL INSTITUTIONS | PUBLIC INSTITUTIONS | PRIVATE INSTITUTIONS
|--------------------------------------------------------------------------------------------------
FACILITIES |ALL AREAS | RURAL | URBAN |ALL AREAS | RURAL | URBAN |ALL AREAS | RURAL | URBAN
| | AREAS | AREAS | | AREAS | AREAS | | AREAS | AREAS
------------------------------------------------------------------------------------------------------------------------------------
TOTAL INSTITUTIONS
------------------------------------------------------------------------------------------------------------------------------------
ELECTRICITY
AVAILABLE 138,651 82,676 55,975 68,176 52,263 15,913 70,475 30,413 40,062
NOT AVAILABLE 89,140 84,770 4,370 83,568 79,745 3,823 5,572 5,025 547
GAS
AVAILABLE 23,161 3,064 20,097 3,604 1,132 2,472 19,557 1,932 17,625
NOT AVAILABLE 204,630 164,382 40,248 148,140 130,876 17,264 56,490 33,506 22,984
DRINKING WATER
AVAILABLE 174,644 118,285 56,359 103,403 86,670 16,733 71,241 31,615 39,626
NOT AVAILABLE 53,147 49,161 3,986 48,341 45,338 3,003 4,806 3,823 983
TELEPHONE
AVAILABLE 43,297 14,250 29,047 10,264 5,382 4,882 33,033 8,868 24,165
NOT AVAILABLE 184,494 153,196 31,298 141,480 126,626 14,854 43,014 26,570 16,444

TABLE 39 EDUCATIONAL INSTITUTIONS BY AVAILABILITY OF BASIC FACILITIES AND TYPE OF INSTITUTIONS
PAKISTAN (Number)
------------------------------------------------------------------------------------------------------------------------------------
AVAILABILITY OF BASIC | ALL INSTITUTIONS | PUBLIC INSTITUTIONS | PRIVATE INSTITUTIONS
|--------------------------------------------------------------------------------------------------
FACILITIES |ALL AREAS | RURAL | URBAN |ALL AREAS | RURAL | URBAN |ALL AREAS | RURAL | URBAN
| | AREAS | AREAS | | AREAS | AREAS | | AREAS | AREAS
------------------------------------------------------------------------------------------------------------------------------------
FEMALE INSTITUTIONS
------------------------------------------------------------------------------------------------------------------------------------
ELECTRICITY
AVAILABLE 31,957 23,065 8,892 24,980 19,808 5,172 6,977 3,257 3,720
NOT AVAILABLE 25,911 24,768 1,143 25,285 24,213 1,072 626 555 71
GAS
AVAILABLE 2,938 623 2,315 1,065 392 673 1,873 231 1,642
NOT AVAILABLE 54,930 47,210 7,720 49,200 43,629 5,571 5,730 3,581 2,149
DRINKING WATER
AVAILABLE 41,574 32,574 9,000 34,572 29,259 5,313 7,002 3,315 3,687
NOT AVAILABLE 16,294 15,259 1,035 15,693 14,762 931 601 497 104
TELEPHONE
AVAILABLE 7,800 3,654 4,146 4,486 2,643 1,843 3,314 1,011 2,303
NOT AVAILABLE 50,068 44,179 5,889 45,779 41,378 4,401 4,289 2,801 1,488
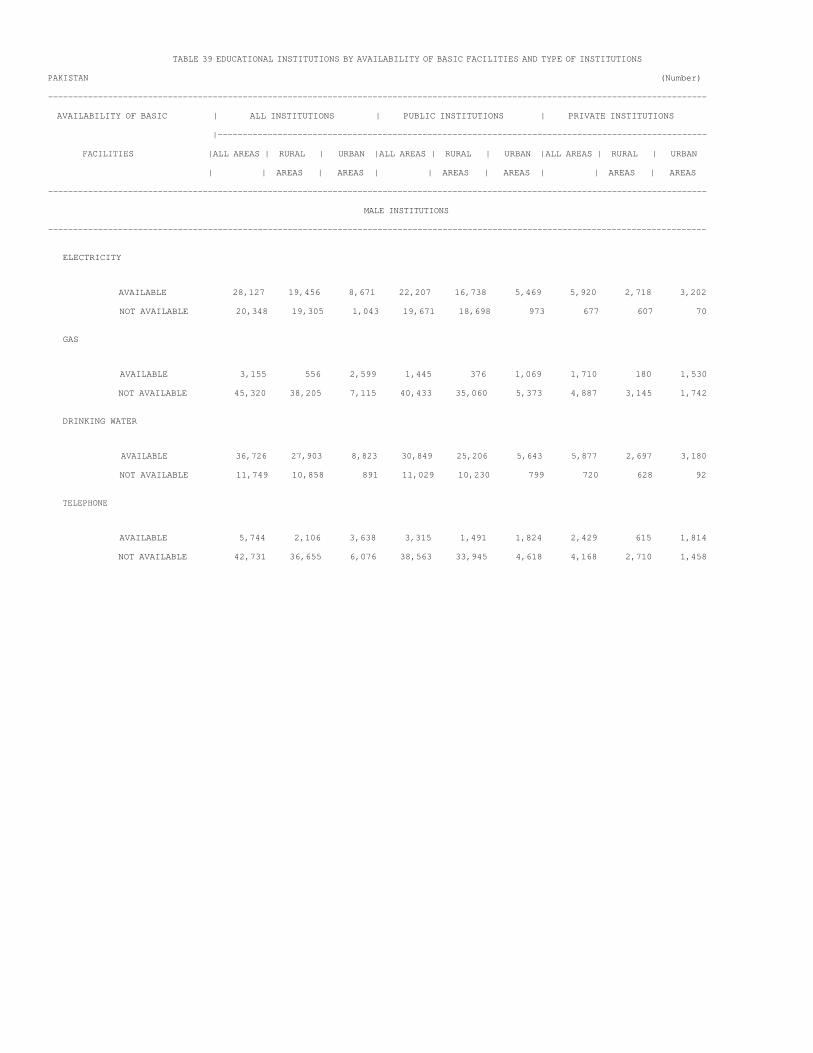
TABLE 39 EDUCATIONAL INSTITUTIONS BY AVAILABILITY OF BASIC FACILITIES AND TYPE OF INSTITUTIONS
PAKISTAN (Number)
------------------------------------------------------------------------------------------------------------------------------------
AVAILABILITY OF BASIC | ALL INSTITUTIONS | PUBLIC INSTITUTIONS | PRIVATE INSTITUTIONS
|--------------------------------------------------------------------------------------------------
FACILITIES |ALL AREAS | RURAL | URBAN |ALL AREAS | RURAL | URBAN |ALL AREAS | RURAL | URBAN
| | AREAS | AREAS | | AREAS | AREAS | | AREAS | AREAS
------------------------------------------------------------------------------------------------------------------------------------
MALE INSTITUTIONS
------------------------------------------------------------------------------------------------------------------------------------
ELECTRICITY
AVAILABLE 28,127 19,456 8,671 22,207 16,738 5,469 5,920 2,718 3,202
NOT AVAILABLE 20,348 19,305 1,043 19,671 18,698 973 677 607 70
GAS
AVAILABLE 3,155 556 2,599 1,445 376 1,069 1,710 180 1,530
NOT AVAILABLE 45,320 38,205 7,115 40,433 35,060 5,373 4,887 3,145 1,742
DRINKING WATER
AVAILABLE 36,726 27,903 8,823 30,849 25,206 5,643 5,877 2,697 3,180
NOT AVAILABLE 11,749 10,858 891 11,029 10,230 799 720 628 92
TELEPHONE
AVAILABLE 5,744 2,106 3,638 3,315 1,491 1,824 2,429 615 1,814
NOT AVAILABLE 42,731 36,655 6,076 38,563 33,945 4,618 4,168 2,710 1,458
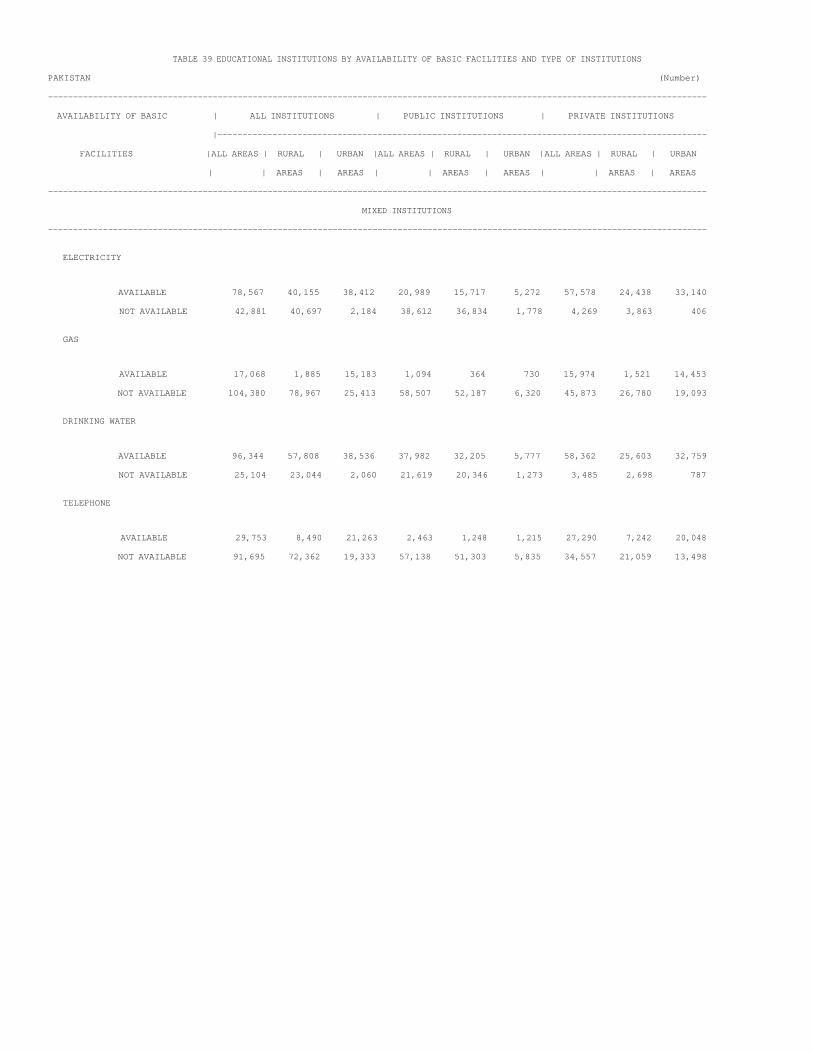
TABLE 39 EDUCATIONAL INSTITUTIONS BY AVAILABILITY OF BASIC FACILITIES AND TYPE OF INSTITUTIONS
PAKISTAN (Number)
------------------------------------------------------------------------------------------------------------------------------------
AVAILABILITY OF BASIC | ALL INSTITUTIONS | PUBLIC INSTITUTIONS | PRIVATE INSTITUTIONS
|--------------------------------------------------------------------------------------------------
FACILITIES |ALL AREAS | RURAL | URBAN |ALL AREAS | RURAL | URBAN |ALL AREAS | RURAL | URBAN
| | AREAS | AREAS | | AREAS | AREAS | | AREAS | AREAS
------------------------------------------------------------------------------------------------------------------------------------
MIXED INSTITUTIONS
------------------------------------------------------------------------------------------------------------------------------------
ELECTRICITY
AVAILABLE 78,567 40,155 38,412 20,989 15,717 5,272 57,578 24,438 33,140
NOT AVAILABLE 42,881 40,697 2,184 38,612 36,834 1,778 4,269 3,863 406
GAS
AVAILABLE 17,068 1,885 15,183 1,094 364 730 15,974 1,521 14,453
NOT AVAILABLE 104,380 78,967 25,413 58,507 52,187 6,320 45,873 26,780 19,093
DRINKING WATER
AVAILABLE 96,344 57,808 38,536 37,982 32,205 5,777 58,362 25,603 32,759
NOT AVAILABLE 25,104 23,044 2,060 21,619 20,346 1,273 3,485 2,698 787
TELEPHONE
AVAILABLE 29,753 8,490 21,263 2,463 1,248 1,215 27,290 7,242 20,048
NOT AVAILABLE 91,695 72,362 19,333 57,138 51,303 5,835 34,557 21,059 13,498

TABLE 40 SCHOOLS(PUBLIC AND PRIVATE) BY LEVEL, AVAILABILITY OF BASIC FACILITIES AND GENDER
PAKISTAN (Number)
------------------------------------------------------------------------------------------------------------------------------------
LEVEL OF SCHOOL/BASIC | ALL SCHOOLS | GIRL SCHOOLS | BOYS SCHOOLS | MIXED SCHOOLS
FACILITIES |------------------------------------------------------------------------------------------------
| AVAILABLE | NOT | AVAILABLE | NOT | AVAILABLE | NOT | AVAILABLE | NOT
| | AVAILABLE | | AVAILABLE | | AVAILABLE | | AVAILABLE
------------------------------------------------------------------------------------------------------------------------------------
ALL AREAS
------------------------------------------------------------------------------------------------------------------------------------
PRE-PRIMARY
ELECTRICTY 764 317 63 33 39 24 662 260
GAS 308 773 6 90 2 61 300 622
DRINKING WATER 884 197 79 17 43 20 762 160
TELEPHONE 367 714 4 92 3 60 360 562
MOSQUE
ELECTRICTY 3,565 10,558 65 98 979 3,309 2,521 7,151
GAS 121 14,002 3 160 40 4,248 78 9,594
DRINKING WATER 8,055 6,068 106 57 2,309 1,979 5,640 4,032
TELEPHONE 252 13,871 7 156 69 4,219 176 9,496
PRIMARY
ELECTRICTY 54,375 67,974 12,508 17,570 13,589 19,720 28,278 30,684
GAS 4,310 118,039 357 29,721 364 32,945 3,589 55,373
DRINKING WATER 83,821 38,528 20,598 9,480 21,597 11,712 41,626 17,336
TELEPHONE 7,302 115,047 674 29,404 751 32,558 5,877 53,085
MIDDLE/ELEMENTRY
ELECTRICTY 33,013 5,436 5,096 1,713 4,521 1,703 23,396 2,020
GAS 5,629 32,820 241 6,568 195 6,029 5,193 20,223
DRINKING WATER 34,516 3,933 5,671 1,138 4,889 1,335 23,956 1,460
TELEPHONE 11,137 27,312 476 6,333 553 5,671 10,108 15,308
SECONDRY/HIGH
ELECTRICTY 21,707 1,248 3,707 239 5,932 528 12,068 481
GAS 6,216 16,739 767 3,179 714 5,746 4,735 7,814
DRINKING WATER 21,532 1,423 3,623 323 5,821 639 12,088 461
TELEPHONE 13,045 9,910 1,892 2,054 3,107 3,353 8,046 4,503
HIGHER-SECONDRY
ELECTRICTY 2,072 63 646 15 631 32 795 16
GAS 537 1,598 142 519 85 578 310 501
DRINKING WATER 2,034 101 633 28 621 42 780 31
TELEPHONE 1,446 689 375 286 453 210 618 193

TABLE 40 SCHOOLS(PUBLIC AND PRIVATE) BY LEVEL, AVAILABILITY OF BASIC FACILITIES AND GENDER
PAKISTAN (Number)
------------------------------------------------------------------------------------------------------------------------------------
LEVEL OF SCHOOL/BASIC | ALL SCHOOLS | GIRL SCHOOLS | BOYS SCHOOLS | MIXED SCHOOLS
FACILITIES |------------------------------------------------------------------------------------------------
| AVAILABLE | NOT | AVAILABLE | NOT | AVAILABLE | NOT | AVAILABLE | NOT
| | AVAILABLE | | AVAILABLE | | AVAILABLE | | AVAILABLE
------------------------------------------------------------------------------------------------------------------------------------
RURAL AREAS
------------------------------------------------------------------------------------------------------------------------------------
PRE-PRIMARY
ELECTRICTY 122 165 41 15 33 18 48 132
GAS 5 282 3 53 51 2 178
DRINKING WATER 202 85 51 5 36 15 115 65
TELEPHONE 7 280 56 51 7 173
MOSQUE
ELECTRICTY 3,508 10,527 63 97 971 3,296 2,474 7,134
GAS 101 13,934 2 158 36 4,231 63 9,545
DRINKING WATER 7,987 6,048 104 56 2,295 1,972 5,588 4,020
TELEPHONE 235 13,800 6 154 68 4,199 161 9,447
PRIMARY
ELECTRICTY 39,416 66,110 11,987 17,357 13,143 19,546 14,286 29,207
GAS 1,036 104,490 297 29,047 291 32,398 448 43,045
DRINKING WATER 68,452 37,074 20,030 9,314 21,117 11,572 27,305 16,188
TELEPHONE 2,155 103,371 570 28,774 641 32,048 944 42,549
MIDDLE/ELEMENTRY
ELECTRICTY 9,772 4,562 4,539 1,655 3,866 1,635 1,367 1,272
GAS 307 14,027 133 6,061 95 5,406 79 2,560
DRINKING WATER 11,208 3,126 5,120 1,074 4,207 1,294 1,881 758
TELEPHONE 729 13,605 254 5,940 309 5,192 166 2,473
SECONDRY/HIGH
ELECTRICTY 8,492 979 2,765 198 4,851 515 876 266
GAS 860 8,611 416 2,547 324 5,042 120 1,022
DRINKING WATER 8,354 1,117 2,680 283 4,750 616 924 218
TELEPHONE 3,986 5,485 1,300 1,663 2,320 3,046 366 776
HIGHER-SECONDRY
ELECTRICTY 1,028 51 430 11 481 30 117 10
GAS 135 944 88 353 33 478 14 113
DRINKING WATER 998 81 415 26 475 36 108 19
TELEPHONE 701 378 269 172 345 166 87 40
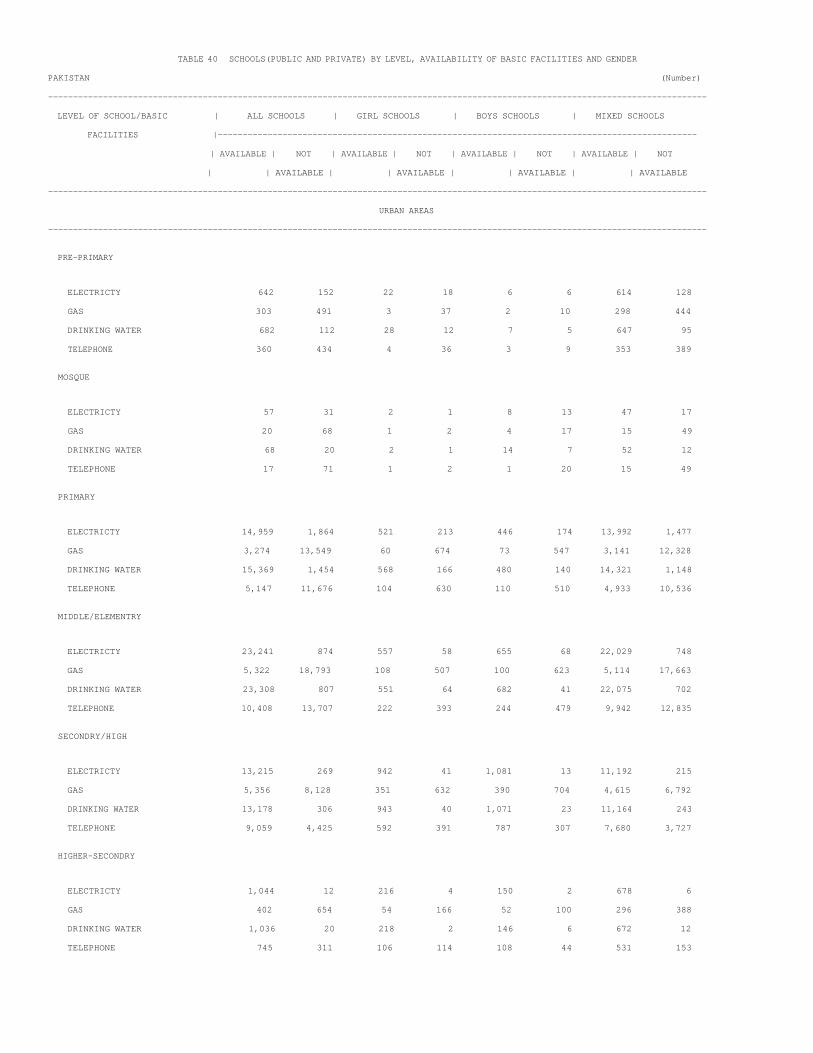
TABLE 40 SCHOOLS(PUBLIC AND PRIVATE) BY LEVEL, AVAILABILITY OF BASIC FACILITIES AND GENDER
PAKISTAN (Number)
------------------------------------------------------------------------------------------------------------------------------------
LEVEL OF SCHOOL/BASIC | ALL SCHOOLS | GIRL SCHOOLS | BOYS SCHOOLS | MIXED SCHOOLS
FACILITIES |------------------------------------------------------------------------------------------------
| AVAILABLE | NOT | AVAILABLE | NOT | AVAILABLE | NOT | AVAILABLE | NOT
| | AVAILABLE | | AVAILABLE | | AVAILABLE | | AVAILABLE
------------------------------------------------------------------------------------------------------------------------------------
URBAN AREAS
------------------------------------------------------------------------------------------------------------------------------------
PRE-PRIMARY
ELECTRICTY 642 152 22 18 6 6 614 128
GAS 303 491 3 37 2 10 298 444
DRINKING WATER 682 112 28 12 7 5 647 95
TELEPHONE 360 434 4 36 3 9 353 389
MOSQUE
ELECTRICTY 57 31 2 1 8 13 47 17
GAS 20 68 1 2 4 17 15 49
DRINKING WATER 68 20 2 1 14 7 52 12
TELEPHONE 17 71 1 2 1 20 15 49
PRIMARY
ELECTRICTY 14,959 1,864 521 213 446 174 13,992 1,477
GAS 3,274 13,549 60 674 73 547 3,141 12,328
DRINKING WATER 15,369 1,454 568 166 480 140 14,321 1,148
TELEPHONE 5,147 11,676 104 630 110 510 4,933 10,536
MIDDLE/ELEMENTRY
ELECTRICTY 23,241 874 557 58 655 68 22,029 748
GAS 5,322 18,793 108 507 100 623 5,114 17,663
DRINKING WATER 23,308 807 551 64 682 41 22,075 702
TELEPHONE 10,408 13,707 222 393 244 479 9,942 12,835
SECONDRY/HIGH
ELECTRICTY 13,215 269 942 41 1,081 13 11,192 215
GAS 5,356 8,128 351 632 390 704 4,615 6,792
DRINKING WATER 13,178 306 943 40 1,071 23 11,164 243
TELEPHONE 9,059 4,425 592 391 787 307 7,680 3,727
HIGHER-SECONDRY
ELECTRICTY 1,044 12 216 4 150 2 678 6
GAS 402 654 54 166 52 100 296 388
DRINKING WATER 1,036 20 218 2 146 6 672 12
TELEPHONE 745 311 106 114 108 44 531 153

TABLE 40.1 SCHOOLS(PUBLIC) BY LEVEL, AVAILABILITY OF BASIC FACILITIES AND GENDER
PAKISTAN (Number)
------------------------------------------------------------------------------------------------------------------------------------
LEVEL OF SCHOOL/BASIC | ALL SCHOOLS | GIRL SCHOOLS | BOYS SCHOOLS | MIXED SCHOOLS
FACILITIES |------------------------------------------------------------------------------------------------
| AVAILABLE | NOT | AVAILABLE | NOT | AVAILABLE | NOT | AVAILABLE | NOT
| | AVAILABLE | | AVAILABLE | | AVAILABLE | | AVAILABLE
------------------------------------------------------------------------------------------------------------------------------------
ALL AREAS
------------------------------------------------------------------------------------------------------------------------------------
PRE-PRIMARY
ELECTRICTY 281 308 47 31 36 24 198 253
GAS 18 571 78 1 59 17 434
DRINKING WATER 408 181 61 17 40 20 307 144
TELEPHONE 43 546 2 76 1 59 40 411
MOSQUE
ELECTRICTY 2,919 10,076 55 94 773 3,144 2,091 6,838
GAS 77 12,918 2 147 25 3,892 50 8,879
DRINKING WATER 7,201 5,794 94 55 2,034 1,883 5,073 3,856
TELEPHONE 212 12,783 5 144 62 3,855 145 8,784
PRIMARY
ELECTRICTY 38,909 64,954 10,231 16,760 11,325 18,947 17,353 29,247
GAS 979 102,884 215 26,776 216 30,056 548 46,052
DRINKING WATER 67,738 36,125 18,081 8,910 19,190 11,082 30,467 16,133
TELEPHONE 3,085 100,778 533 26,458 565 29,707 1,987 44,613
MIDDLE/ELEMENTRY
ELECTRICTY 18,847 5,139 4,094 1,621 3,560 1,624 11,193 1,894
GAS 755 23,231 76 5,639 66 5,118 613 12,474
DRINKING WATER 20,498 3,488 4,686 1,029 3,955 1,229 11,857 1,230
TELEPHONE 3,880 20,106 244 5,471 311 4,873 3,325 9,762
SECONDRY/HIGH
ELECTRICTY 9,829 1,102 1,937 203 3,881 479 4,011 420
GAS 504 10,427 75 2,065 99 4,261 330 4,101
DRINKING WATER 9,828 1,103 1,897 243 3,812 548 4,119 312
TELEPHONE 4,058 6,873 647 1,493 1,559 2,801 1,852 2,579
HIGHER-SECONDRY
ELECTRICTY 986 54 338 13 388 27 260 14
GAS 65 975 21 330 23 392 21 253
DRINKING WATER 965 75 332 19 381 34 252 22
TELEPHONE 561 479 145 206 258 157 158 116

TABLE 40.1 SCHOOLS(PUBLIC) BY LEVEL, AVAILABILITY OF BASIC FACILITIES AND GENDER
PAKISTAN (Number)
------------------------------------------------------------------------------------------------------------------------------------
LEVEL OF SCHOOL/BASIC | ALL SCHOOLS | GIRL SCHOOLS | BOYS SCHOOLS | MIXED SCHOOLS
FACILITIES |------------------------------------------------------------------------------------------------
| AVAILABLE | NOT | AVAILABLE | NOT | AVAILABLE | NOT | AVAILABLE | NOT
| | AVAILABLE | | AVAILABLE | | AVAILABLE | | AVAILABLE
------------------------------------------------------------------------------------------------------------------------------------
RURAL AREAS
------------------------------------------------------------------------------------------------------------------------------------
PRE-PRIMARY
ELECTRICTY 110 163 32 14 32 18 46 131
GAS 1 272 46 50 1 176
DRINKING WATER 188 85 41 5 35 15 112 65
TELEPHONE 6 267 46 50 6 171
MOSQUE
ELECTRICTY 2,893 10,050 54 93 768 3,134 2,071 6,823
GAS 75 12,868 2 145 24 3,878 49 8,845
DRINKING WATER 7,162 5,781 93 54 2,024 1,878 5,045 3,849
TELEPHONE 208 12,735 5 142 62 3,840 141 8,753
PRIMARY
ELECTRICTY 31,923 63,245 9,892 16,560 11,052 18,782 10,979 27,903
GAS 613 94,555 205 26,247 203 29,631 205 38,677
DRINKING WATER 60,256 34,912 17,696 8,756 18,883 10,951 23,677 15,205
TELEPHONE 1,679 93,489 495 25,957 533 29,301 651 38,231
MIDDLE/ELEMENTRY
ELECTRICTY 7,960 4,357 3,797 1,569 3,167 1,565 996 1,223
GAS 134 12,183 63 5,303 47 4,685 24 2,195
DRINKING WATER 9,423 2,894 4,392 974 3,536 1,196 1,495 724
TELEPHONE 449 11,868 170 5,196 206 4,526 73 2,146
SECONDRY/HIGH
ELECTRICTY 5,756 890 1,601 167 3,551 470 604 253
GAS 152 6,494 56 1,712 74 3,947 22 835
DRINKING WATER 5,709 937 1,559 209 3,489 532 661 196
TELEPHONE 2,069 4,577 528 1,240 1,376 2,645 165 692
HIGHER-SECONDRY
ELECTRICTY 611 43 222 9 328 25 61 9
GAS 26 628 12 219 11 342 3 67
DRINKING WATER 592 62 214 17 323 30 55 15
TELEPHONE 359 295 105 126 220 133 34 36

TABLE 40.1 SCHOOLS(PUBLIC) BY LEVEL, AVAILABILITY OF BASIC FACILITIES AND GENDER
PAKISTAN (Number)
------------------------------------------------------------------------------------------------------------------------------------
LEVEL OF SCHOOL/BASIC | ALL SCHOOLS | GIRL SCHOOLS | BOYS SCHOOLS | MIXED SCHOOLS
FACILITIES |------------------------------------------------------------------------------------------------
| AVAILABLE | NOT | AVAILABLE | NOT | AVAILABLE | NOT | AVAILABLE | NOT
| | AVAILABLE | | AVAILABLE | | AVAILABLE | | AVAILABLE
------------------------------------------------------------------------------------------------------------------------------------
URBAN AREAS
------------------------------------------------------------------------------------------------------------------------------------
PRE-PRIMARY
ELECTRICTY 171 145 15 17 4 6 152 122
GAS 17 299 32 1 9 16 258
DRINKING WATER 220 96 20 12 5 5 195 79
TELEPHONE 37 279 2 30 1 9 34 240
MOSQUE
ELECTRICTY 26 26 1 1 5 10 20 15
GAS 2 50 2 1 14 1 34
DRINKING WATER 39 13 1 1 10 5 28 7
TELEPHONE 4 48 2 15 4 31
PRIMARY
ELECTRICTY 6,986 1,709 339 200 273 165 6,374 1,344
GAS 366 8,329 10 529 13 425 343 7,375
DRINKING WATER 7,482 1,213 385 154 307 131 6,790 928
TELEPHONE 1,406 7,289 38 501 32 406 1,336 6,382
MIDDLE/ELEMENTRY
ELECTRICTY 10,887 782 297 52 393 59 10,197 671
GAS 621 11,048 13 336 19 433 589 10,279
DRINKING WATER 11,075 594 294 55 419 33 10,362 506
TELEPHONE 3,431 8,238 74 275 105 347 3,252 7,616
SECONDRY/HIGH
ELECTRICTY 4,073 212 336 36 330 9 3,407 167
GAS 352 3,933 19 353 25 314 308 3,266
DRINKING WATER 4,119 166 338 34 323 16 3,458 116
TELEPHONE 1,989 2,296 119 253 183 156 1,687 1,887
HIGHER-SECONDRY
ELECTRICTY 375 11 116 4 60 2 199 5
GAS 39 347 9 111 12 50 18 186
DRINKING WATER 373 13 118 2 58 4 197 7
TELEPHONE 202 184 40 80 38 24 124 80

TABLE 40.2 SCHOOLS(PRIVATE) BY LEVEL, AVAILABILITY OF BASIC FACILITIES AND GENDER
PAKISTAN (Number)
------------------------------------------------------------------------------------------------------------------------------------
LEVEL OF SCHOOL/BASIC | ALL SCHOOLS | GIRL SCHOOLS | BOYS SCHOOLS | MIXED SCHOOLS
FACILITIES |------------------------------------------------------------------------------------------------
| AVAILABLE | NOT | AVAILABLE | NOT | AVAILABLE | NOT | AVAILABLE | NOT
| | AVAILABLE | | AVAILABLE | | AVAILABLE | | AVAILABLE
------------------------------------------------------------------------------------------------------------------------------------
ALL AREAS
------------------------------------------------------------------------------------------------------------------------------------
PRE-PRIMARY
ELECTRICTY 483 9 16 2 3 464 7
GAS 290 202 6 12 1 2 283 188
DRINKING WATER 476 16 18 3 455 16
TELEPHONE 324 168 2 16 2 1 320 151
MOSQUE
ELECTRICTY 646 482 10 4 206 165 430 313
GAS 44 1,084 1 13 15 356 28 715
DRINKING WATER 854 274 12 2 275 96 567 176
TELEPHONE 40 1,088 2 12 7 364 31 712
PRIMARY
ELECTRICTY 15,466 3,020 2,277 810 2,264 773 10,925 1,437
GAS 3,331 15,155 142 2,945 148 2,889 3,041 9,321
DRINKING WATER 16,083 2,403 2,517 570 2,407 630 11,159 1,203
TELEPHONE 4,217 14,269 141 2,946 186 2,851 3,890 8,472
MIDDLE/ELEMENTRY
ELECTRICTY 14,166 297 1,002 92 961 79 12,203 126
GAS 4,874 9,589 165 929 129 911 4,580 7,749
DRINKING WATER 14,018 445 985 109 934 106 12,099 230
TELEPHONE 7,257 7,206 232 862 242 798 6,783 5,546
SECONDRY/HIGH
ELECTRICTY 11,878 146 1,770 36 2,051 49 8,057 61
GAS 5,712 6,312 692 1,114 615 1,485 4,405 3,713
DRINKING WATER 11,704 320 1,726 80 2,009 91 7,969 149
TELEPHONE 8,987 3,037 1,245 561 1,548 552 6,194 1,924
HIGHER-SECONDRY
ELECTRICTY 1,086 9 308 2 243 5 535 2
GAS 472 623 121 189 62 186 289 248
DRINKING WATER 1,069 26 301 9 240 8 528 9
TELEPHONE 885 210 230 80 195 53 460 77

TABLE 40.2 SCHOOLS(PRIVATE) BY LEVEL, AVAILABILITY OF BASIC FACILITIES AND GENDER
PAKISTAN (Number)
------------------------------------------------------------------------------------------------------------------------------------
LEVEL OF SCHOOL/BASIC | ALL SCHOOLS | GIRL SCHOOLS | BOYS SCHOOLS | MIXED SCHOOLS
FACILITIES |------------------------------------------------------------------------------------------------
| AVAILABLE | NOT | AVAILABLE | NOT | AVAILABLE | NOT | AVAILABLE | NOT
| | AVAILABLE | | AVAILABLE | | AVAILABLE | | AVAILABLE
------------------------------------------------------------------------------------------------------------------------------------
RURAL AREAS
------------------------------------------------------------------------------------------------------------------------------------
PRE-PRIMARY
ELECTRICTY 12 2 9 1 1 2 1
GAS 4 10 3 7 1 1 2
DRINKING WATER 14 10 1 3
TELEPHONE 1 13 10 1 1 2
MOSQUE
ELECTRICTY 615 477 9 4 203 162 403 311
GAS 26 1,066 13 12 353 14 700
DRINKING WATER 825 267 11 2 271 94 543 171
TELEPHONE 27 1,065 1 12 6 359 20 694
PRIMARY
ELECTRICTY 7,493 2,865 2,095 797 2,091 764 3,307 1,304
GAS 423 9,935 92 2,800 88 2,767 243 4,368
DRINKING WATER 8,196 2,162 2,334 558 2,234 621 3,628 983
TELEPHONE 476 9,882 75 2,817 108 2,747 293 4,318
MIDDLE/ELEMENTRY
ELECTRICTY 1,812 205 742 86 699 70 371 49
GAS 173 1,844 70 758 48 721 55 365
DRINKING WATER 1,785 232 728 100 671 98 386 34
TELEPHONE 280 1,737 84 744 103 666 93 327
SECONDRY/HIGH
ELECTRICTY 2,736 89 1,164 31 1,300 45 272 13
GAS 708 2,117 360 835 250 1,095 98 187
DRINKING WATER 2,645 180 1,121 74 1,261 84 263 22
TELEPHONE 1,917 908 772 423 944 401 201 84
HIGHER-SECONDRY
ELECTRICTY 417 8 208 2 153 5 56 1
GAS 109 316 76 134 22 136 11 46
DRINKING WATER 406 19 201 9 152 6 53 4
TELEPHONE 342 83 164 46 125 33 53 4

TABLE 40.2 SCHOOLS(PRIVATE) BY LEVEL, AVAILABILITY OF BASIC FACILITIES AND GENDER
PAKISTAN (Number)
------------------------------------------------------------------------------------------------------------------------------------
LEVEL OF SCHOOL/BASIC | ALL SCHOOLS | GIRL SCHOOLS | BOYS SCHOOLS | MIXED SCHOOLS
FACILITIES |------------------------------------------------------------------------------------------------
| AVAILABLE | NOT | AVAILABLE | NOT | AVAILABLE | NOT | AVAILABLE | NOT
| | AVAILABLE | | AVAILABLE | | AVAILABLE | | AVAILABLE
------------------------------------------------------------------------------------------------------------------------------------
URBAN AREAS
------------------------------------------------------------------------------------------------------------------------------------
PRE-PRIMARY
ELECTRICTY 471 7 7 1 2 462 6
GAS 286 192 3 5 1 1 282 186
DRINKING WATER 462 16 8 2 452 16
TELEPHONE 323 155 2 6 2 319 149
MOSQUE
ELECTRICTY 31 5 1 3 3 27 2
GAS 18 18 1 3 3 14 15
DRINKING WATER 29 7 1 4 2 24 5
TELEPHONE 13 23 1 1 5 11 18
PRIMARY
ELECTRICTY 7,973 155 182 13 173 9 7,618 133
GAS 2,908 5,220 50 145 60 122 2,798 4,953
DRINKING WATER 7,887 241 183 12 173 9 7,531 220
TELEPHONE 3,741 4,387 66 129 78 104 3,597 4,154
MIDDLE/ELEMENTRY
ELECTRICTY 12,354 92 260 6 262 9 11,832 77
GAS 4,701 7,745 95 171 81 190 4,525 7,384
DRINKING WATER 12,233 213 257 9 263 8 11,713 196
TELEPHONE 6,977 5,469 148 118 139 132 6,690 5,219
SECONDRY/HIGH
ELECTRICTY 9,142 57 606 5 751 4 7,785 48
GAS 5,004 4,195 332 279 365 390 4,307 3,526
DRINKING WATER 9,059 140 605 6 748 7 7,706 127
TELEPHONE 7,070 2,129 473 138 604 151 5,993 1,840
HIGHER-SECONDRY
ELECTRICTY 669 1 100 90 479 1
GAS 363 307 45 55 40 50 278 202
DRINKING WATER 663 7 100 88 2 475 5
TELEPHONE 543 127 66 34 70 20 407 73

TABLE 41 SCHOOLS(PUBLIC AND PRIVATE) BY LEVEL, GENDER AND AVAILABILITY OF INSTRUCTIONAL MATERIAL
PAKISTAN ALL AREAS (Number)
------------------------------------------------------------------------------------------------------------------------------------
LEVEL OF SCHOOL/BASIC | ALL SCHOOLS | GIRL SCHOOLS | BOYS SCHOOLS | MIXED SCHOOLS
FACILITIES |------------------------------------------------------------------------------------------------
| AVAILABLE | NOT | AVAILABLE | NOT | AVAILABLE | NOT | AVAILABLE | NOT
| | AVAILABLE | | AVAILABLE | | AVAILABLE | | AVAILABLE
------------------------------------------------------------------------------------------------------------------------------------
PRE-PRIMARY
MAPS 548 533 38 58 20 43 490 432
BLACK/WHITE BOARD 964 117 79 17 56 7 829 93
CHARTS 692 389 40 56 27 36 625 297
TEACHING KITS 446 635 21 75 21 42 404 518
TEXT BOOKS 723 358 65 31 50 13 608 314
TEACHING GUIDE 455 626 23 73 21 42 411 511
AUDIO/VISUAL EQUIPMENTS 192 889 2 94 2 61 188 734
OTHER 33 1,048 96 1 62 32 890
MOSQUE
MAPS 5,196 8,927 67 96 1,062 3,226 4,067 5,605
BLACK/WHITE BOARD 11,298 2,825 136 27 3,071 1,217 8,091 1,581
CHARTS 6,134 7,989 85 78 1,262 3,026 4,787 4,885
TEACHING KITS 2,105 12,018 26 137 629 3,659 1,450 8,222
TEXT BOOKS 10,357 3,766 124 39 2,867 1,421 7,366 2,306
TEACHING GUIDE 3,984 10,139 47 116 1,352 2,936 2,585 7,087
AUDIO/VISUAL EQUIPMENTS 124 13,999 5 158 27 4,261 92 9,580
OTHER 109 14,014 1 162 33 4,255 75 9,597
PRIMARY
MAPS 67,570 54,779 15,906 14,172 17,804 15,505 33,860 25,102
BLACK/WHITE BOARD 111,148 11,201 27,125 2,953 29,742 3,567 54,281 4,681
CHARTS 82,530 39,819 20,291 9,787 21,058 12,251 41,181 17,781
TEACHING KITS 38,213 84,136 10,106 19,972 11,475 21,834 16,632 42,330
TEXT BOOKS 92,707 29,642 23,163 6,915 25,176 8,133 44,368 14,594
TEACHING GUIDE 48,620 73,729 12,993 17,085 14,631 18,678 20,996 37,966
AUDIO/VISUAL EQUIPMENTS 3,937 118,412 655 29,423 572 32,737 2,710 56,252
OTHER 1,412 120,937 318 29,760 303 33,006 791 58,171
MIDDLE/ELEMENTRY
MAPS 25,553 12,896 4,026 2,783 3,772 2,452 17,755 7,661
BLACK/WHITE BOARD 37,111 1,338 6,408 401 5,767 457 24,936 480
CHARTS 31,868 6,581 5,348 1,461 4,514 1,710 22,006 3,410
TEACHING KITS 14,863 23,586 2,506 4,303 2,154 4,070 10,203 15,213
TEXT BOOKS 27,145 11,304 5,199 1,610 4,318 1,906 17,628 7,788
TEACHING GUIDE 17,151 21,298 3,030 3,779 2,576 3,648 11,545 13,871
AUDIO/VISUAL EQUIPMENTS 3,856 34,593 249 6,560 253 5,971 3,354 22,062
OTHER 874 37,575 101 6,708 86 6,138 687 24,729
SECONDRY/HIGH
MAPS 16,572 6,383 2,604 1,342 3,999 2,461 9,969 2,580
BLACK/WHITE BOARD 22,354 601 3,822 124 6,143 317 12,389 160
CHARTS 19,658 3,297 3,310 636 4,968 1,492 11,380 1,169
TEACHING KITS 10,982 11,973 1,637 2,309 2,394 4,066 6,951 5,598
TEXT BOOKS 17,386 5,569 3,018 928 4,643 1,817 9,725 2,824
TEACHING GUIDE 12,222 10,733 1,935 2,011 2,825 3,635 7,462 5,087
AUDIO/VISUAL EQUIPMENTS 4,516 18,439 465 3,481 700 5,760 3,351 9,198
OTHER 762 22,193 104 3,842 126 6,334 532 12,017
HIGHER-SECONDRY
MAPS 1,582 553 453 208 452 211 677 134
BLACK/WHITE BOARD 2,087 48 637 24 643 20 807 4
CHARTS 1,839 296 560 101 547 116 732 79
TEACHING KITS 1,028 1,107 273 388 278 385 477 334
TEXT BOOKS 1,615 520 489 172 488 175 638 173
TEACHING GUIDE 1,152 983 308 353 320 343 524 287
AUDIO/VISUAL EQUIPMENTS 470 1,665 80 581 110 553 280 531
OTHER 86 2,049 18 643 17 646 51 760

TABLE 41 SCHOOLS(PUBLIC AND PRIVATE) BY LEVEL, GENDER AND AVAILABILITY OF INSTRUCTIONAL MATERIAL
PAKISTAN RURAL AREAS (Number)
------------------------------------------------------------------------------------------------------------------------------------
LEVEL OF SCHOOL/BASIC | ALL SCHOOLS | GIRL SCHOOLS | BOYS SCHOOLS | MIXED SCHOOLS
FACILITIES |------------------------------------------------------------------------------------------------
| AVAILABLE | NOT | AVAILABLE | NOT | AVAILABLE | NOT | AVAILABLE | NOT
| | AVAILABLE | | AVAILABLE | | AVAILABLE | | AVAILABLE
------------------------------------------------------------------------------------------------------------------------------------
PRE-PRIMARY
MAPS 58 229 22 34 15 36 21 159
BLACK/WHITE BOARD 233 54 47 9 49 2 137 43
CHARTS 74 213 20 36 20 31 34 146
TEACHING KITS 43 244 13 43 16 35 14 166
TEXT BOOKS 171 116 41 15 43 8 87 93
TEACHING GUIDE 84 203 15 41 18 33 51 129
AUDIO/VISUAL EQUIPMENTS 3 284 1 55 51 2 178
OTHER 1 286 56 51 1 179
MOSQUE
MAPS 5,150 8,885 66 94 1,054 3,213 4,030 5,578
BLACK/WHITE BOARD 11,225 2,810 134 26 3,056 1,211 8,035 1,573
CHARTS 6,080 7,955 83 77 1,249 3,018 4,748 4,860
TEACHING KITS 2,085 11,950 25 135 626 3,641 1,434 8,174
TEXT BOOKS 10,305 3,730 121 39 2,853 1,414 7,331 2,277
TEACHING GUIDE 3,961 10,074 46 114 1,348 2,919 2,567 7,041
AUDIO/VISUAL EQUIPMENTS 120 13,915 4 156 27 4,240 89 9,519
OTHER 109 13,926 1 159 33 4,234 75 9,533
PRIMARY
MAPS 56,813 48,713 15,500 13,844 17,419 15,270 23,894 19,599
BLACK/WHITE BOARD 94,868 10,658 26,441 2,903 29,157 3,532 39,270 4,223
CHARTS 68,963 36,563 19,778 9,566 20,623 12,066 28,562 14,931
TEACHING KITS 31,881 73,645 9,891 19,453 11,272 21,417 10,718 32,775
TEXT BOOKS 81,367 24,159 22,675 6,669 24,747 7,942 33,945 9,548
TEACHING GUIDE 41,528 63,998 12,743 16,601 14,387 18,302 14,398 29,095
AUDIO/VISUAL EQUIPMENTS 2,152 103,374 617 28,727 526 32,163 1,009 42,484
OTHER 989 104,537 304 29,040 283 32,406 402 43,091
MIDDLE/ELEMENTRY
MAPS 8,376 5,958 3,609 2,585 3,267 2,234 1,500 1,139
BLACK/WHITE BOARD 13,334 1,000 5,813 381 5,059 442 2,462 177
CHARTS 10,606 3,728 4,839 1,355 3,922 1,579 1,845 794
TEACHING KITS 4,908 9,426 2,273 3,921 1,903 3,598 732 1,907
TEXT BOOKS 10,278 4,056 4,762 1,432 3,801 1,700 1,715 924
TEACHING GUIDE 5,899 8,435 2,755 3,439 2,264 3,237 880 1,759
AUDIO/VISUAL EQUIPMENTS 421 13,913 169 6,025 158 5,343 94 2,545
OTHER 199 14,135 88 6,106 69 5,432 42 2,597
SECONDRY/HIGH
MAPS 5,612 3,859 1,838 1,125 3,112 2,254 662 480
BLACK/WHITE BOARD 9,015 456 2,857 106 5,062 304 1,096 46
CHARTS 7,210 2,261 2,433 530 3,985 1,381 792 350
TEACHING KITS 3,269 6,202 1,130 1,833 1,814 3,552 325 817
TEXT BOOKS 6,768 2,703 2,265 698 3,784 1,582 719 423
TEACHING GUIDE 3,893 5,578 1,369 1,594 2,150 3,216 374 768
AUDIO/VISUAL EQUIPMENTS 646 8,825 203 2,760 356 5,010 87 1,055
OTHER 151 9,320 59 2,904 72 5,294 20 1,122
HIGHER-SECONDRY
MAPS 712 367 299 142 328 183 85 42
BLACK/WHITE BOARD 1,043 36 423 18 495 16 125 2

CHARTS 889 190 384 57 413 98 92 35
TEACHING KITS 434 645 191 250 206 305 37 90
TEXT BOOKS 777 302 333 108 372 139 72 55
TEACHING GUIDE 479 600 204 237 228 283 47 80
AUDIO/VISUAL EQUIPMENTS 123 956 39 402 60 451 24 103
OTHER 24 1,055 11 430 9 502 4 123
TABLE 41 SCHOOLS(PUBLIC AND PRIVATE) BY LEVEL, GENDER AND AVAILABILITY OF INSTRUCTIONAL MATERIAL
PAKISTAN URBAN AREAS (Number)
------------------------------------------------------------------------------------------------------------------------------------
LEVEL OF SCHOOL/BASIC | ALL SCHOOLS | GIRL SCHOOLS | BOYS SCHOOLS | MIXED SCHOOLS
FACILITIES |------------------------------------------------------------------------------------------------
| AVAILABLE | NOT | AVAILABLE | NOT | AVAILABLE | NOT | AVAILABLE | NOT
| | AVAILABLE | | AVAILABLE | | AVAILABLE | | AVAILABLE
------------------------------------------------------------------------------------------------------------------------------------
PRE-PRIMARY
MAPS 490 304 16 24 5 7 469 273
BLACK/WHITE BOARD 731 63 32 8 7 5 692 50
CHARTS 618 176 20 20 7 5 591 151
TEACHING KITS 403 391 8 32 5 7 390 352
TEXT BOOKS 552 242 24 16 7 5 521 221
TEACHING GUIDE 371 423 8 32 3 9 360 382
AUDIO/VISUAL EQUIPMENTS 189 605 1 39 2 10 186 556
OTHER 32 762 40 1 11 31 711
MOSQUE
MAPS 46 42 1 2 8 13 37 27
BLACK/WHITE BOARD 73 15 2 1 15 6 56 8
CHARTS 54 34 2 1 13 8 39 25
TEACHING KITS 20 68 1 2 3 18 16 48
TEXT BOOKS 52 36 3 14 7 35 29
TEACHING GUIDE 23 65 1 2 4 17 18 46
AUDIO/VISUAL EQUIPMENTS 4 84 1 2 21 3 61
OTHER 88 3 21 64
PRIMARY
MAPS 10,757 6,066 406 328 385 235 9,966 5,503
BLACK/WHITE BOARD 16,280 543 684 50 585 35 15,011 458
CHARTS 13,567 3,256 513 221 435 185 12,619 2,850
TEACHING KITS 6,332 10,491 215 519 203 417 5,914 9,555
TEXT BOOKS 11,340 5,483 488 246 429 191 10,423 5,046
TEACHING GUIDE 7,092 9,731 250 484 244 376 6,598 8,871
AUDIO/VISUAL EQUIPMENTS 1,785 15,038 38 696 46 574 1,701 13,768
OTHER 423 16,400 14 720 20 600 389 15,080
MIDDLE/ELEMENTRY
MAPS 17,177 6,938 417 198 505 218 16,255 6,522
BLACK/WHITE BOARD 23,777 338 595 20 708 15 22,474 303
CHARTS 21,262 2,853 509 106 592 131 20,161 2,616
TEACHING KITS 9,955 14,160 233 382 251 472 9,471 13,306
TEXT BOOKS 16,867 7,248 437 178 517 206 15,913 6,864
TEACHING GUIDE 11,252 12,863 275 340 312 411 10,665 12,112
AUDIO/VISUAL EQUIPMENTS 3,435 20,680 80 535 95 628 3,260 19,517
OTHER 675 23,440 13 602 17 706 645 22,132
SECONDRY/HIGH
MAPS 10,960 2,524 766 217 887 207 9,307 2,100
BLACK/WHITE BOARD 13,339 145 965 18 1,081 13 11,293 114
CHARTS 12,448 1,036 877 106 983 111 10,588 819
TEACHING KITS 7,713 5,771 507 476 580 514 6,626 4,781
TEXT BOOKS 10,618 2,866 753 230 859 235 9,006 2,401
TEACHING GUIDE 8,329 5,155 566 417 675 419 7,088 4,319
AUDIO/VISUAL EQUIPMENTS 3,870 9,614 262 721 344 750 3,264 8,143
OTHER 611 12,873 45 938 54 1,040 512 10,895
HIGHER-SECONDRY
MAPS 870 186 154 66 124 28 592 92
BLACK/WHITE BOARD 1,044 12 214 6 148 4 682 2

CHARTS 950 106 176 44 134 18 640 44
TEACHING KITS 594 462 82 138 72 80 440 244
TEXT BOOKS 838 218 156 64 116 36 566 118
TEACHING GUIDE 673 383 104 116 92 60 477 207
AUDIO/VISUAL EQUIPMENTS 347 709 41 179 50 102 256 428
OTHER 62 994 7 213 8 144 47 637

TABLE 41.1 SCHOOLS(PUBLIC) BY LEVEL, GENDER AND AVAILABILITY OF INSTRUCTIONAL MATERIAL
PAKISTAN ALL AREAS (Number)
------------------------------------------------------------------------------------------------------------------------------------
LEVEL OF SCHOOL/BASIC | ALL SCHOOLS | GIRL SCHOOLS | BOYS SCHOOLS | MIXED SCHOOLS
FACILITIES |------------------------------------------------------------------------------------------------
| AVAILABLE | NOT | AVAILABLE | NOT | AVAILABLE | NOT | AVAILABLE | NOT
| | AVAILABLE | | AVAILABLE | | AVAILABLE | | AVAILABLE
------------------------------------------------------------------------------------------------------------------------------------
PRE-PRIMARY
MAPS 178 411 31 47 18 42 129 322
BLACK/WHITE BOARD 489 100 65 13 53 7 371 80
CHARTS 252 337 34 44 25 35 193 258
TEACHING KITS 111 478 17 61 19 41 75 376
TEXT BOOKS 352 237 54 24 47 13 251 200
TEACHING GUIDE 180 409 19 59 19 41 142 309
AUDIO/VISUAL EQUIPMENTS 21 568 1 77 60 20 431
OTHER 6 583 78 1 59 5 446
MOSQUE
MAPS 4,783 8,212 60 89 960 2,957 3,763 5,166
BLACK/WHITE BOARD 10,368 2,627 124 25 2,779 1,138 7,465 1,464
CHARTS 5,612 7,383 75 74 1,129 2,788 4,408 4,521
TEACHING KITS 1,923 11,072 23 126 568 3,349 1,332 7,597
TEXT BOOKS 9,584 3,411 112 37 2,640 1,277 6,832 2,097
TEACHING GUIDE 3,633 9,362 41 108 1,227 2,690 2,365 6,564
AUDIO/VISUAL EQUIPMENTS 113 12,882 4 145 24 3,893 85 8,844
OTHER 106 12,889 1 148 32 3,885 73 8,856
PRIMARY
MAPS 55,917 47,946 14,073 12,918 16,098 14,174 25,746 20,854
BLACK/WHITE BOARD 93,452 10,411 24,208 2,783 26,931 3,341 42,313 4,287
CHARTS 67,987 35,876 17,974 9,017 18,954 11,318 31,059 15,541
TEACHING KITS 31,124 72,739 8,991 18,000 10,416 19,856 11,717 34,883
TEXT BOOKS 78,993 24,870 20,769 6,222 22,924 7,348 35,300 11,300
TEACHING GUIDE 40,605 63,258 11,610 15,381 13,317 16,955 15,678 30,922
AUDIO/VISUAL EQUIPMENTS 2,412 101,451 570 26,421 489 29,783 1,353 45,247
OTHER 998 102,865 273 26,718 266 30,006 459 46,141
MIDDLE/ELEMENTRY
MAPS 14,692 9,294 3,309 2,406 3,130 2,054 8,253 4,834
BLACK/WHITE BOARD 22,833 1,153 5,352 363 4,753 431 12,728 359
CHARTS 18,871 5,115 4,439 1,276 3,727 1,457 10,705 2,382
TEACHING KITS 7,962 16,024 2,083 3,632 1,800 3,384 4,079 9,008
TEXT BOOKS 16,487 7,499 4,349 1,366 3,616 1,568 8,522 4,565
TEACHING GUIDE 9,842 14,144 2,580 3,135 2,144 3,040 5,118 7,969
AUDIO/VISUAL EQUIPMENTS 1,341 22,645 164 5,551 161 5,023 1,016 12,071
OTHER 383 23,603 77 5,638 61 5,123 245 12,842
SECONDRY/HIGH
MAPS 6,890 4,041 1,297 843 2,535 1,825 3,058 1,373
BLACK/WHITE BOARD 10,462 469 2,046 94 4,091 269 4,325 106
CHARTS 8,637 2,294 1,719 421 3,236 1,124 3,682 749
TEACHING KITS 4,018 6,913 786 1,354 1,468 2,892 1,764 2,667
TEXT BOOKS 7,605 3,326 1,574 566 3,066 1,294 2,965 1,466
TEACHING GUIDE 4,844 6,087 983 1,157 1,779 2,581 2,082 2,349
AUDIO/VISUAL EQUIPMENTS 956 9,975 125 2,015 240 4,120 591 3,840
OTHER 192 10,739 37 2,103 52 4,308 103 4,328
HIGHER-SECONDRY
MAPS 699 341 223 128 276 139 200 74
BLACK/WHITE BOARD 1,002 38 332 19 398 17 272 2

CHARTS 860 180 291 60 339 76 230 44
TEACHING KITS 445 595 139 212 179 236 127 147
TEXT BOOKS 726 314 237 114 306 109 183 91
TEACHING GUIDE 499 541 158 193 194 221 147 127
AUDIO/VISUAL EQUIPMENTS 129 911 29 322 50 365 50 224
OTHER 26 1,014 6 345 8 407 12 262

TABLE 41.1 SCHOOLS(PUBLIC) BY LEVEL, GENDER AND AVAILABILITY OF INSTRUCTIONAL MATERIAL
PAKISTAN RURAL AREAS (Number)
------------------------------------------------------------------------------------------------------------------------------------
LEVEL OF SCHOOL/BASIC | ALL SCHOOLS | GIRL SCHOOLS | BOYS SCHOOLS | MIXED SCHOOLS
FACILITIES |------------------------------------------------------------------------------------------------
| AVAILABLE | NOT | AVAILABLE | NOT | AVAILABLE | NOT | AVAILABLE | NOT
| | AVAILABLE | | AVAILABLE | | AVAILABLE | | AVAILABLE
------------------------------------------------------------------------------------------------------------------------------------
PRE-PRIMARY
MAPS 55 218 19 27 15 35 21 156
BLACK/WHITE BOARD 222 51 39 7 48 2 135 42
CHARTS 72 201 18 28 20 30 34 143
TEACHING KITS 41 232 11 35 16 34 14 163
TEXT BOOKS 164 109 36 10 42 8 86 91
TEACHING GUIDE 83 190 14 32 18 32 51 126
AUDIO/VISUAL EQUIPMENTS 3 270 1 45 50 2 175
OTHER 1 272 46 50 1 176
MOSQUE
MAPS 4,754 8,189 60 87 952 2,950 3,742 5,152
BLACK/WHITE BOARD 10,325 2,618 123 24 2,767 1,135 7,435 1,459
CHARTS 5,582 7,361 74 73 1,119 2,783 4,389 4,505
TEACHING KITS 1,913 11,030 23 124 566 3,336 1,324 7,570
TEXT BOOKS 9,555 3,388 110 37 2,630 1,272 6,815 2,079
TEACHING GUIDE 3,624 9,319 41 106 1,225 2,677 2,358 6,536
AUDIO/VISUAL EQUIPMENTS 113 12,830 4 143 24 3,878 85 8,809
OTHER 106 12,837 1 146 32 3,870 73 8,821
PRIMARY
MAPS 50,859 44,309 13,787 12,665 15,835 13,999 21,237 17,645
BLACK/WHITE BOARD 85,177 9,991 23,713 2,739 26,518 3,316 34,946 3,936
CHARTS 61,504 33,664 17,610 8,842 18,652 11,182 25,242 13,640
TEACHING KITS 28,506 66,662 8,855 17,597 10,292 19,542 9,359 29,523
TEXT BOOKS 73,427 21,741 20,431 6,021 22,626 7,208 30,370 8,512
TEACHING GUIDE 37,433 57,735 11,448 15,004 13,157 16,677 12,828 26,054
AUDIO/VISUAL EQUIPMENTS 1,890 93,278 551 25,901 470 29,364 869 38,013
OTHER 853 94,315 265 26,187 256 29,578 332 38,550
MIDDLE/ELEMENTRY
MAPS 7,159 5,158 3,101 2,265 2,816 1,916 1,242 977
BLACK/WHITE BOARD 11,382 935 5,015 351 4,312 420 2,055 164
CHARTS 9,038 3,279 4,169 1,197 3,353 1,379 1,516 703
TEACHING KITS 4,201 8,116 1,978 3,388 1,655 3,077 568 1,651
TEXT BOOKS 8,775 3,542 4,118 1,248 3,282 1,450 1,375 844
TEACHING GUIDE 5,100 7,217 2,438 2,928 1,960 2,772 702 1,517
AUDIO/VISUAL EQUIPMENTS 330 11,987 143 5,223 121 4,611 66 2,153
OTHER 161 12,156 72 5,294 56 4,676 33 2,186
SECONDRY/HIGH
MAPS 3,774 2,872 1,055 713 2,274 1,747 445 412
BLACK/WHITE BOARD 6,261 385 1,691 77 3,756 265 814 43
CHARTS 4,907 1,739 1,423 345 2,947 1,074 537 320
TEACHING KITS 2,165 4,481 649 1,119 1,325 2,696 191 666
TEXT BOOKS 4,625 2,021 1,325 443 2,813 1,208 487 370
TEACHING GUIDE 2,634 4,012 810 958 1,596 2,425 228 629
AUDIO/VISUAL EQUIPMENTS 281 6,365 77 1,691 169 3,852 35 822
OTHER 84 6,562 31 1,737 42 3,979 11 846
HIGHER-SECONDRY
MAPS 419 235 148 83 228 125 43 27
BLACK/WHITE BOARD 625 29 218 13 339 14 68 2

CHARTS 534 120 199 32 288 65 47 23
TEACHING KITS 269 385 102 129 149 204 18 52
TEXT BOOKS 453 201 162 69 259 94 32 38
TEACHING GUIDE 289 365 110 121 157 196 22 48
AUDIO/VISUAL EQUIPMENTS 55 599 15 216 34 319 6 64
OTHER 13 641 4 227 7 346 2 68

TABLE 41.1 SCHOOLS(PUBLIC) BY LEVEL, GENDER AND AVAILABILITY OF INSTRUCTIONAL MATERIAL
PAKISTAN URBAN AREAS (Number)
------------------------------------------------------------------------------------------------------------------------------------
LEVEL OF SCHOOL/BASIC | ALL SCHOOLS | GIRL SCHOOLS | BOYS SCHOOLS | MIXED SCHOOLS
FACILITIES |------------------------------------------------------------------------------------------------
| AVAILABLE | NOT | AVAILABLE | NOT | AVAILABLE | NOT | AVAILABLE | NOT
| | AVAILABLE | | AVAILABLE | | AVAILABLE | | AVAILABLE
------------------------------------------------------------------------------------------------------------------------------------
PRE-PRIMARY
MAPS 123 193 12 20 3 7 108 166
BLACK/WHITE BOARD 267 49 26 6 5 5 236 38
CHARTS 180 136 16 16 5 5 159 115
TEACHING KITS 70 246 6 26 3 7 61 213
TEXT BOOKS 188 128 18 14 5 5 165 109
TEACHING GUIDE 97 219 5 27 1 9 91 183
AUDIO/VISUAL EQUIPMENTS 18 298 32 10 18 256
OTHER 5 311 32 1 9 4 270
MOSQUE
MAPS 29 23 2 8 7 21 14
BLACK/WHITE BOARD 43 9 1 1 12 3 30 5
CHARTS 30 22 1 1 10 5 19 16
TEACHING KITS 10 42 2 2 13 8 27
TEXT BOOKS 29 23 2 10 5 17 18
TEACHING GUIDE 9 43 2 2 13 7 28
AUDIO/VISUAL EQUIPMENTS 52 2 15 35
OTHER 52 2 15 35
PRIMARY
MAPS 5,058 3,637 286 253 263 175 4,509 3,209
BLACK/WHITE BOARD 8,275 420 495 44 413 25 7,367 351
CHARTS 6,483 2,212 364 175 302 136 5,817 1,901
TEACHING KITS 2,618 6,077 136 403 124 314 2,358 5,360
TEXT BOOKS 5,566 3,129 338 201 298 140 4,930 2,788
TEACHING GUIDE 3,172 5,523 162 377 160 278 2,850 4,868
AUDIO/VISUAL EQUIPMENTS 522 8,173 19 520 19 419 484 7,234
OTHER 145 8,550 8 531 10 428 127 7,591
MIDDLE/ELEMENTRY
MAPS 7,533 4,136 208 141 314 138 7,011 3,857
BLACK/WHITE BOARD 11,451 218 337 12 441 11 10,673 195
CHARTS 9,833 1,836 270 79 374 78 9,189 1,679
TEACHING KITS 3,761 7,908 105 244 145 307 3,511 7,357
TEXT BOOKS 7,712 3,957 231 118 334 118 7,147 3,721
TEACHING GUIDE 4,742 6,927 142 207 184 268 4,416 6,452
AUDIO/VISUAL EQUIPMENTS 1,011 10,658 21 328 40 412 950 9,918
OTHER 222 11,447 5 344 5 447 212 10,656
SECONDRY/HIGH
MAPS 3,116 1,169 242 130 261 78 2,613 961
BLACK/WHITE BOARD 4,201 84 355 17 335 4 3,511 63
CHARTS 3,730 555 296 76 289 50 3,145 429
TEACHING KITS 1,853 2,432 137 235 143 196 1,573 2,001
TEXT BOOKS 2,980 1,305 249 123 253 86 2,478 1,096
TEACHING GUIDE 2,210 2,075 173 199 183 156 1,854 1,720
AUDIO/VISUAL EQUIPMENTS 675 3,610 48 324 71 268 556 3,018
OTHER 108 4,177 6 366 10 329 92 3,482
HIGHER-SECONDRY
MAPS 280 106 75 45 48 14 157 47
BLACK/WHITE BOARD 377 9 114 6 59 3 204

CHARTS 326 60 92 28 51 11 183 21
TEACHING KITS 176 210 37 83 30 32 109 95
TEXT BOOKS 273 113 75 45 47 15 151 53
TEACHING GUIDE 210 176 48 72 37 25 125 79
AUDIO/VISUAL EQUIPMENTS 74 312 14 106 16 46 44 160
OTHER 13 373 2 118 1 61 10 194

TABLE 41.2 SCHOOLS(PRIVATE) BY LEVEL, GENDER AND AVAILABILITY OF INSTRUCTIONAL MATERIAL
PAKISTAN ALL AREAS (Number)
------------------------------------------------------------------------------------------------------------------------------------
LEVEL OF SCHOOL/BASIC | ALL SCHOOLS | GIRL SCHOOLS | BOYS SCHOOLS | MIXED SCHOOLS
FACILITIES |------------------------------------------------------------------------------------------------
| AVAILABLE | NOT | AVAILABLE | NOT | AVAILABLE | NOT | AVAILABLE | NOT
| | AVAILABLE | | AVAILABLE | | AVAILABLE | | AVAILABLE
------------------------------------------------------------------------------------------------------------------------------------
PRE-PRIMARY
MAPS 370 122 7 11 2 1 361 110
BLACK/WHITE BOARD 475 17 14 4 3 458 13
CHARTS 440 52 6 12 2 1 432 39
TEACHING KITS 335 157 4 14 2 1 329 142
TEXT BOOKS 371 121 11 7 3 357 114
TEACHING GUIDE 275 217 4 14 2 1 269 202
AUDIO/VISUAL EQUIPMENTS 171 321 1 17 2 1 168 303
OTHER 27 465 18 3 27 444
MOSQUE
MAPS 413 715 7 7 102 269 304 439
BLACK/WHITE BOARD 930 198 12 2 292 79 626 117
CHARTS 522 606 10 4 133 238 379 364
TEACHING KITS 182 946 3 11 61 310 118 625
TEXT BOOKS 773 355 12 2 227 144 534 209
TEACHING GUIDE 351 777 6 8 125 246 220 523
AUDIO/VISUAL EQUIPMENTS 11 1,117 1 13 3 368 7 736
OTHER 3 1,125 14 1 370 2 741
PRIMARY
MAPS 11,653 6,833 1,833 1,254 1,706 1,331 8,114 4,248
BLACK/WHITE BOARD 17,696 790 2,917 170 2,811 226 11,968 394
CHARTS 14,543 3,943 2,317 770 2,104 933 10,122 2,240
TEACHING KITS 7,089 11,397 1,115 1,972 1,059 1,978 4,915 7,447
TEXT BOOKS 13,714 4,772 2,394 693 2,252 785 9,068 3,294
TEACHING GUIDE 8,015 10,471 1,383 1,704 1,314 1,723 5,318 7,044
AUDIO/VISUAL EQUIPMENTS 1,525 16,961 85 3,002 83 2,954 1,357 11,005
OTHER 414 18,072 45 3,042 37 3,000 332 12,030
MIDDLE/ELEMENTRY
MAPS 10,861 3,602 717 377 642 398 9,502 2,827
BLACK/WHITE BOARD 14,278 185 1,056 38 1,014 26 12,208 121
CHARTS 12,997 1,466 909 185 787 253 11,301 1,028
TEACHING KITS 6,901 7,562 423 671 354 686 6,124 6,205
TEXT BOOKS 10,658 3,805 850 244 702 338 9,106 3,223
TEACHING GUIDE 7,309 7,154 450 644 432 608 6,427 5,902
AUDIO/VISUAL EQUIPMENTS 2,515 11,948 85 1,009 92 948 2,338 9,991
OTHER 491 13,972 24 1,070 25 1,015 442 11,887
SECONDRY/HIGH
MAPS 9,682 2,342 1,307 499 1,464 636 6,911 1,207
BLACK/WHITE BOARD 11,892 132 1,776 30 2,052 48 8,064 54
CHARTS 11,021 1,003 1,591 215 1,732 368 7,698 420
TEACHING KITS 6,964 5,060 851 955 926 1,174 5,187 2,931
TEXT BOOKS 9,781 2,243 1,444 362 1,577 523 6,760 1,358
TEACHING GUIDE 7,378 4,646 952 854 1,046 1,054 5,380 2,738
AUDIO/VISUAL EQUIPMENTS 3,560 8,464 340 1,466 460 1,640 2,760 5,358
OTHER 570 11,454 67 1,739 74 2,026 429 7,689
HIGHER-SECONDRY
MAPS 883 212 230 80 176 72 477 60
BLACK/WHITE BOARD 1,085 10 305 5 245 3 535 2
CHARTS 979 116 269 41 208 40 502 35
TEACHING KITS 583 512 134 176 99 149 350 187
TEXT BOOKS 889 206 252 58 182 66 455 82
TEACHING GUIDE 653 442 150 160 126 122 377 160
AUDIO/VISUAL EQUIPMENTS 341 754 51 259 60 188 230 307
OTHER 60 1,035 12 298 9 239 39 498

TABLE 41.2 SCHOOLS(PRIVATE) BY LEVEL, GENDER AND AVAILABILITY OF INSTRUCTIONAL MATERIAL
PAKISTAN RURAL AREAS (Number)
------------------------------------------------------------------------------------------------------------------------------------
LEVEL OF SCHOOL/BASIC | ALL SCHOOLS | GIRL SCHOOLS | BOYS SCHOOLS | MIXED SCHOOLS
FACILITIES |------------------------------------------------------------------------------------------------
| AVAILABLE | NOT | AVAILABLE | NOT | AVAILABLE | NOT | AVAILABLE | NOT
| | AVAILABLE | | AVAILABLE | | AVAILABLE | | AVAILABLE
------------------------------------------------------------------------------------------------------------------------------------
PRE-PRIMARY
MAPS 3 11 3 7 1 3
BLACK/WHITE BOARD 11 3 8 2 1 2 1
CHARTS 2 12 2 8 1 3
TEACHING KITS 2 12 2 8 1 3
TEXT BOOKS 7 7 5 5 1 1 2
TEACHING GUIDE 1 13 1 9 1 3
AUDIO/VISUAL EQUIPMENTS 14 10 1 3
OTHER 14 10 1 3
MOSQUE
MAPS 396 696 6 7 102 263 288 426
BLACK/WHITE BOARD 900 192 11 2 289 76 600 114
CHARTS 498 594 9 4 130 235 359 355
TEACHING KITS 172 920 2 11 60 305 110 604
TEXT BOOKS 750 342 11 2 223 142 516 198
TEACHING GUIDE 337 755 5 8 123 242 209 505
AUDIO/VISUAL EQUIPMENTS 7 1,085 13 3 362 4 710
OTHER 3 1,089 13 1 364 2 712
PRIMARY
MAPS 5,954 4,404 1,713 1,179 1,584 1,271 2,657 1,954
BLACK/WHITE BOARD 9,691 667 2,728 164 2,639 216 4,324 287
CHARTS 7,459 2,899 2,168 724 1,971 884 3,320 1,291
TEACHING KITS 3,375 6,983 1,036 1,856 980 1,875 1,359 3,252
TEXT BOOKS 7,940 2,418 2,244 648 2,121 734 3,575 1,036
TEACHING GUIDE 4,095 6,263 1,295 1,597 1,230 1,625 1,570 3,041
AUDIO/VISUAL EQUIPMENTS 262 10,096 66 2,826 56 2,799 140 4,471
OTHER 136 10,222 39 2,853 27 2,828 70 4,541
MIDDLE/ELEMENTRY
MAPS 1,217 800 508 320 451 318 258 162
BLACK/WHITE BOARD 1,952 65 798 30 747 22 407 13
CHARTS 1,568 449 670 158 569 200 329 91
TEACHING KITS 707 1,310 295 533 248 521 164 256
TEXT BOOKS 1,503 514 644 184 519 250 340 80
TEACHING GUIDE 799 1,218 317 511 304 465 178 242
AUDIO/VISUAL EQUIPMENTS 91 1,926 26 802 37 732 28 392
OTHER 38 1,979 16 812 13 756 9 411
SECONDRY/HIGH
MAPS 1,838 987 783 412 838 507 217 68
BLACK/WHITE BOARD 2,754 71 1,166 29 1,306 39 282 3
CHARTS 2,303 522 1,010 185 1,038 307 255 30
TEACHING KITS 1,104 1,721 481 714 489 856 134 151
TEXT BOOKS 2,143 682 940 255 971 374 232 53
TEACHING GUIDE 1,259 1,566 559 636 554 791 146 139
AUDIO/VISUAL EQUIPMENTS 365 2,460 126 1,069 187 1,158 52 233
OTHER 67 2,758 28 1,167 30 1,315 9 276
HIGHER-SECONDRY
MAPS 293 132 151 59 100 58 42 15
BLACK/WHITE BOARD 418 7 205 5 156 2 57

CHARTS 355 70 185 25 125 33 45 12
TEACHING KITS 165 260 89 121 57 101 19 38
TEXT BOOKS 324 101 171 39 113 45 40 17
TEACHING GUIDE 190 235 94 116 71 87 25 32
AUDIO/VISUAL EQUIPMENTS 68 357 24 186 26 132 18 39
OTHER 11 414 7 203 2 156 2 55

TABLE 41.2 SCHOOLS(PRIVATE) BY LEVEL, GENDER AND AVAILABILITY OF INSTRUCTIONAL MATERIAL
PAKISTAN URBAN AREAS (Number)
------------------------------------------------------------------------------------------------------------------------------------
LEVEL OF SCHOOL/BASIC | ALL SCHOOLS | GIRL SCHOOLS | BOYS SCHOOLS | MIXED SCHOOLS
FACILITIES |------------------------------------------------------------------------------------------------
| AVAILABLE | NOT | AVAILABLE | NOT | AVAILABLE | NOT | AVAILABLE | NOT
| | AVAILABLE | | AVAILABLE | | AVAILABLE | | AVAILABLE
------------------------------------------------------------------------------------------------------------------------------------
PRE-PRIMARY
MAPS 367 111 4 4 2 361 107
BLACK/WHITE BOARD 464 14 6 2 2 456 12
CHARTS 438 40 4 4 2 432 36
TEACHING KITS 333 145 2 6 2 329 139
TEXT BOOKS 364 114 6 2 2 356 112
TEACHING GUIDE 274 204 3 5 2 269 199
AUDIO/VISUAL EQUIPMENTS 171 307 1 7 2 168 300
OTHER 27 451 8 2 27 441
MOSQUE
MAPS 17 19 1 6 16 13
BLACK/WHITE BOARD 30 6 1 3 3 26 3
CHARTS 24 12 1 3 3 20 9
TEACHING KITS 10 26 1 1 5 8 21
TEXT BOOKS 23 13 1 4 2 18 11
TEACHING GUIDE 14 22 1 2 4 11 18
AUDIO/VISUAL EQUIPMENTS 4 32 1 6 3 26
OTHER 36 1 6 29
PRIMARY
MAPS 5,699 2,429 120 75 122 60 5,457 2,294
BLACK/WHITE BOARD 8,005 123 189 6 172 10 7,644 107
CHARTS 7,084 1,044 149 46 133 49 6,802 949
TEACHING KITS 3,714 4,414 79 116 79 103 3,556 4,195
TEXT BOOKS 5,774 2,354 150 45 131 51 5,493 2,258
TEACHING GUIDE 3,920 4,208 88 107 84 98 3,748 4,003
AUDIO/VISUAL EQUIPMENTS 1,263 6,865 19 176 27 155 1,217 6,534
OTHER 278 7,850 6 189 10 172 262 7,489
MIDDLE/ELEMENTRY
MAPS 9,644 2,802 209 57 191 80 9,244 2,665
BLACK/WHITE BOARD 12,326 120 258 8 267 4 11,801 108
CHARTS 11,429 1,017 239 27 218 53 10,972 937
TEACHING KITS 6,194 6,252 128 138 106 165 5,960 5,949
TEXT BOOKS 9,155 3,291 206 60 183 88 8,766 3,143
TEACHING GUIDE 6,510 5,936 133 133 128 143 6,249 5,660
AUDIO/VISUAL EQUIPMENTS 2,424 10,022 59 207 55 216 2,310 9,599
OTHER 453 11,993 8 258 12 259 433 11,476
SECONDRY/HIGH
MAPS 7,844 1,355 524 87 626 129 6,694 1,139
BLACK/WHITE BOARD 9,138 61 610 1 746 9 7,782 51
CHARTS 8,718 481 581 30 694 61 7,443 390
TEACHING KITS 5,860 3,339 370 241 437 318 5,053 2,780
TEXT BOOKS 7,638 1,561 504 107 606 149 6,528 1,305
TEACHING GUIDE 6,119 3,080 393 218 492 263 5,234 2,599
AUDIO/VISUAL EQUIPMENTS 3,195 6,004 214 397 273 482 2,708 5,125
OTHER 503 8,696 39 572 44 711 420 7,413
HIGHER-SECONDRY
MAPS 590 80 79 21 76 14 435 45
BLACK/WHITE BOARD 667 3 100 89 1 478 2
CHARTS 624 46 84 16 83 7 457 23
TEACHING KITS 418 252 45 55 42 48 331 149
TEXT BOOKS 565 105 81 19 69 21 415 65
TEACHING GUIDE 463 207 56 44 55 35 352 128
AUDIO/VISUAL EQUIPMENTS 273 397 27 73 34 56 212 268
OTHER 49 621 5 95 7 83 37 443
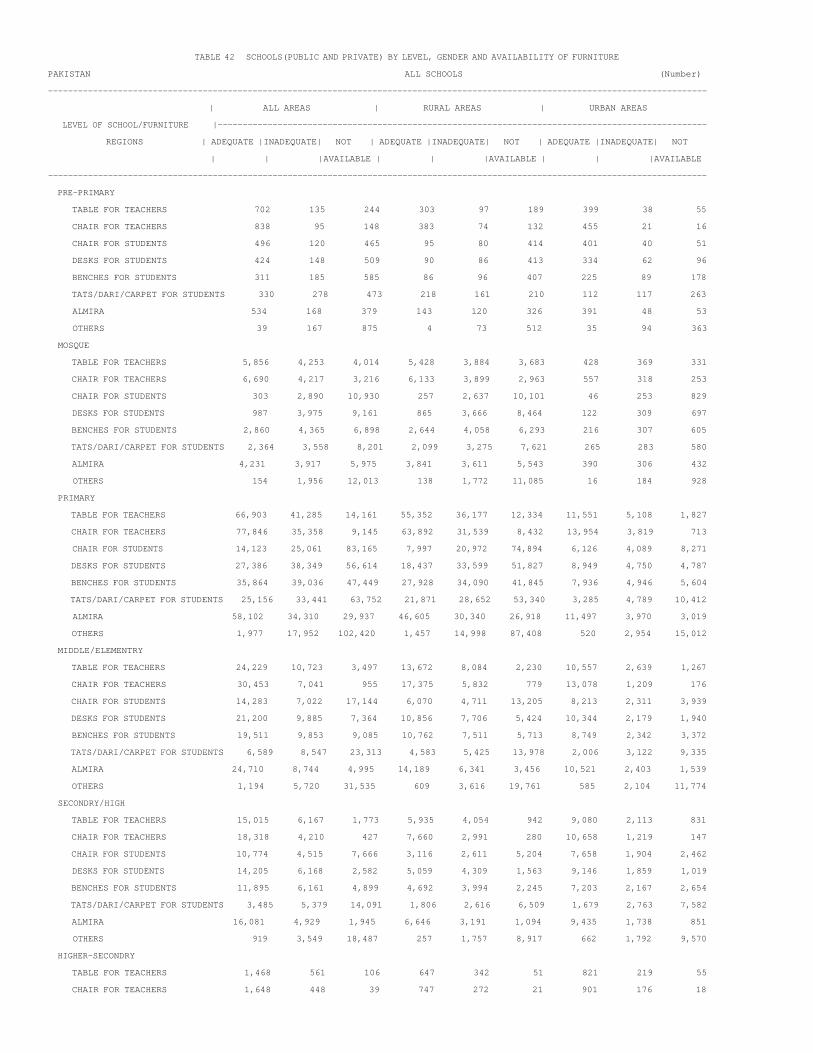
TABLE 42 SCHOOLS(PUBLIC AND PRIVATE) BY LEVEL, GENDER AND AVAILABILITY OF FURNITURE
PAKISTAN ALL SCHOOLS (Number)
------------------------------------------------------------------------------------------------------------------------------------
| ALL AREAS | RURAL AREAS | URBAN AREAS
LEVEL OF SCHOOL/FURNITURE |--------------------------------------------------------------------------------------------------
REGIONS | ADEQUATE |INADEQUATE| NOT | ADEQUATE |INADEQUATE| NOT | ADEQUATE |INADEQUATE| NOT
| | |AVAILABLE | | |AVAILABLE | | |AVAILABLE
------------------------------------------------------------------------------------------------------------------------------------
PRE-PRIMARY
TABLE FOR TEACHERS 702 135 244 303 97 189 399 38 55
CHAIR FOR TEACHERS 838 95 148 383 74 132 455 21 16
CHAIR FOR STUDENTS 496 120 465 95 80 414 401 40 51
DESKS FOR STUDENTS 424 148 509 90 86 413 334 62 96
BENCHES FOR STUDENTS 311 185 585 86 96 407 225 89 178
TATS/DARI/CARPET FOR STUDENTS 330 278 473 218 161 210 112 117 263
ALMIRA 534 168 379 143 120 326 391 48 53
OTHERS 39 167 875 4 73 512 35 94 363
MOSQUE
TABLE FOR TEACHERS 5,856 4,253 4,014 5,428 3,884 3,683 428 369 331
CHAIR FOR TEACHERS 6,690 4,217 3,216 6,133 3,899 2,963 557 318 253
CHAIR FOR STUDENTS 303 2,890 10,930 257 2,637 10,101 46 253 829
DESKS FOR STUDENTS 987 3,975 9,161 865 3,666 8,464 122 309 697
BENCHES FOR STUDENTS 2,860 4,365 6,898 2,644 4,058 6,293 216 307 605
TATS/DARI/CARPET FOR STUDENTS 2,364 3,558 8,201 2,099 3,275 7,621 265 283 580
ALMIRA 4,231 3,917 5,975 3,841 3,611 5,543 390 306 432
OTHERS 154 1,956 12,013 138 1,772 11,085 16 184 928
PRIMARY
TABLE FOR TEACHERS 66,903 41,285 14,161 55,352 36,177 12,334 11,551 5,108 1,827
CHAIR FOR TEACHERS 77,846 35,358 9,145 63,892 31,539 8,432 13,954 3,819 713
CHAIR FOR STUDENTS 14,123 25,061 83,165 7,997 20,972 74,894 6,126 4,089 8,271
DESKS FOR STUDENTS 27,386 38,349 56,614 18,437 33,599 51,827 8,949 4,750 4,787
BENCHES FOR STUDENTS 35,864 39,036 47,449 27,928 34,090 41,845 7,936 4,946 5,604
TATS/DARI/CARPET FOR STUDENTS 25,156 33,441 63,752 21,871 28,652 53,340 3,285 4,789 10,412
ALMIRA 58,102 34,310 29,937 46,605 30,340 26,918 11,497 3,970 3,019
OTHERS 1,977 17,952 102,420 1,457 14,998 87,408 520 2,954 15,012
MIDDLE/ELEMENTRY
TABLE FOR TEACHERS 24,229 10,723 3,497 13,672 8,084 2,230 10,557 2,639 1,267
CHAIR FOR TEACHERS 30,453 7,041 955 17,375 5,832 779 13,078 1,209 176
CHAIR FOR STUDENTS 14,283 7,022 17,144 6,070 4,711 13,205 8,213 2,311 3,939
DESKS FOR STUDENTS 21,200 9,885 7,364 10,856 7,706 5,424 10,344 2,179 1,940
BENCHES FOR STUDENTS 19,511 9,853 9,085 10,762 7,511 5,713 8,749 2,342 3,372
TATS/DARI/CARPET FOR STUDENTS 6,589 8,547 23,313 4,583 5,425 13,978 2,006 3,122 9,335
ALMIRA 24,710 8,744 4,995 14,189 6,341 3,456 10,521 2,403 1,539
OTHERS 1,194 5,720 31,535 609 3,616 19,761 585 2,104 11,774
SECONDRY/HIGH
TABLE FOR TEACHERS 15,015 6,167 1,773 5,935 4,054 942 9,080 2,113 831
CHAIR FOR TEACHERS 18,318 4,210 427 7,660 2,991 280 10,658 1,219 147
CHAIR FOR STUDENTS 10,774 4,515 7,666 3,116 2,611 5,204 7,658 1,904 2,462
DESKS FOR STUDENTS 14,205 6,168 2,582 5,059 4,309 1,563 9,146 1,859 1,019
BENCHES FOR STUDENTS 11,895 6,161 4,899 4,692 3,994 2,245 7,203 2,167 2,654
TATS/DARI/CARPET FOR STUDENTS 3,485 5,379 14,091 1,806 2,616 6,509 1,679 2,763 7,582
ALMIRA 16,081 4,929 1,945 6,646 3,191 1,094 9,435 1,738 851
OTHERS 919 3,549 18,487 257 1,757 8,917 662 1,792 9,570
HIGHER-SECONDRY
TABLE FOR TEACHERS 1,468 561 106 647 342 51 821 219 55
CHAIR FOR TEACHERS 1,648 448 39 747 272 21 901 176 18

CHAIR FOR STUDENTS 1,063 508 564 370 287 383 693 221 181
DESKS FOR STUDENTS 1,301 611 223 549 370 121 752 241 102
BENCHES FOR STUDENTS 1,036 600 499 495 345 200 541 255 299
TATS/DARI/CARPET FOR STUDENTS 290 539 1,306 147 258 635 143 281 671
ALMIRA 1,532 477 126 677 298 65 855 179 61
OTHERS 105 342 1,688 40 162 838 65 180 850

TABLE 42 SCHOOLS(PUBLIC AND PRIVATE) BY LEVEL, GENDER AND AVAILABILITY OF FURNITURE
PAKISTAN GIRLS SCHOOLS (Number)
------------------------------------------------------------------------------------------------------------------------------------
| ALL AREAS | RURAL AREAS | URBAN AREAS
LEVEL OF SCHOOL/FURNITURE |--------------------------------------------------------------------------------------------------
REGIONS | ADEQUATE |INADEQUATE| NOT | ADEQUATE |INADEQUATE| NOT | ADEQUATE |INADEQUATE| NOT
| | |AVAILABLE | | |AVAILABLE | | |AVAILABLE
------------------------------------------------------------------------------------------------------------------------------------
PRE-PRIMARY
TABLE FOR TEACHERS 43 7 13 41 7 12 2 1
CHAIR FOR TEACHERS 52 3 8 49 3 8 3
CHAIR FOR STUDENTS 5 6 52 3 6 51 2 1
DESKS FOR STUDENTS 6 2 55 4 2 54 2 1
BENCHES FOR STUDENTS 6 4 53 4 4 52 2 1
TATS/DARI/CARPET FOR STUDENTS 37 7 19 36 6 18 1 1 1
ALMIRA 17 8 38 15 8 37 2 1
OTHERS 1 8 54 8 52 1 2
MOSQUE
TABLE FOR TEACHERS 1,368 1,185 1,735 1,256 1,059 1,602 112 126 133
CHAIR FOR TEACHERS 1,780 1,119 1,389 1,606 1,018 1,293 174 101 96
CHAIR FOR STUDENTS 70 750 3,468 60 680 3,177 10 70 291
DESKS FOR STUDENTS 159 930 3,199 135 849 2,933 24 81 266
BENCHES FOR STUDENTS 353 904 3,031 322 822 2,773 31 82 258
TATS/DARI/CARPET FOR STUDENTS 939 1,071 2,278 850 985 2,082 89 86 196
ALMIRA 938 1,065 2,285 841 961 2,115 97 104 170
OTHERS 35 524 3,729 32 475 3,410 3 49 319
PRIMARY
TABLE FOR TEACHERS 15,626 13,517 4,166 14,100 12,321 3,851 1,526 1,196 315
CHAIR FOR TEACHERS 19,278 11,420 2,611 17,399 10,439 2,434 1,879 981 177
CHAIR FOR STUDENTS 1,763 7,062 24,484 1,363 6,225 22,684 400 837 1,800
DESKS FOR STUDENTS 4,970 11,843 16,496 4,091 10,719 15,462 879 1,124 1,034
BENCHES FOR STUDENTS 5,919 11,663 15,727 5,155 10,543 14,574 764 1,120 1,153
TATS/DARI/CARPET FOR STUDENTS 8,224 10,350 14,735 7,522 9,379 13,371 702 971 1,364
ALMIRA 14,614 10,107 8,588 12,982 9,315 7,975 1,632 792 613
OTHERS 449 4,875 27,985 392 4,432 25,448 57 443 2,537
MIDDLE/ELEMENTRY
TABLE FOR TEACHERS 2,994 2,645 585 2,406 2,294 484 588 351 101
CHAIR FOR TEACHERS 3,759 2,204 261 3,012 1,939 233 747 265 28
CHAIR FOR STUDENTS 832 1,569 3,823 578 1,231 3,375 254 338 448
DESKS FOR STUDENTS 2,005 2,768 1,451 1,495 2,386 1,303 510 382 148
BENCHES FOR STUDENTS 1,873 2,719 1,632 1,460 2,343 1,381 413 376 251
TATS/DARI/CARPET FOR STUDENTS 1,256 1,722 3,246 1,053 1,398 2,733 203 324 513
ALMIRA 3,353 2,025 846 2,698 1,742 744 655 283 102
OTHERS 133 920 5,171 98 744 4,342 35 176 829
SECONDRY/HIGH
TABLE FOR TEACHERS 3,182 2,746 532 1,904 2,113 343 1,278 633 189
CHAIR FOR TEACHERS 4,091 2,183 186 2,532 1,702 126 1,559 481 60
CHAIR FOR STUDENTS 1,506 1,738 3,216 655 1,203 2,502 851 535 714
DESKS FOR STUDENTS 2,788 2,980 692 1,503 2,347 510 1,285 633 182
BENCHES FOR STUDENTS 2,389 2,789 1,282 1,362 2,212 786 1,027 577 496
TATS/DARI/CARPET FOR STUDENTS 981 1,608 3,871 681 1,121 2,558 300 487 1,313
ALMIRA 3,881 2,060 519 2,407 1,598 355 1,474 462 164
OTHERS 179 1,016 5,265 81 699 3,580 98 317 1,685
HIGHER-SECONDRY
TABLE FOR TEACHERS 390 241 32 228 165 22 162 76 10
CHAIR FOR TEACHERS 439 214 10 262 145 8 177 69 2

CHAIR FOR STUDENTS 224 213 226 114 136 165 110 77 61
DESKS FOR STUDENTS 321 279 63 178 193 44 143 86 19
BENCHES FOR STUDENTS 273 253 137 168 181 66 105 72 71
TATS/DARI/CARPET FOR STUDENTS 89 162 412 63 109 243 26 53 169
ALMIRA 429 192 42 257 136 22 172 56 20
OTHERS 27 89 547 16 57 342 11 32 205

TABLE 42 SCHOOLS(PUBLIC AND PRIVATE) BY LEVEL, GENDER AND AVAILABILITY OF FURNITURE
PAKISTAN BOYS SCHOOLS (Number)
------------------------------------------------------------------------------------------------------------------------------------
| ALL AREAS | RURAL AREAS | URBAN AREAS
LEVEL OF SCHOOL/FURNITURE |--------------------------------------------------------------------------------------------------
REGIONS | ADEQUATE |INADEQUATE| NOT | ADEQUATE |INADEQUATE| NOT | ADEQUATE |INADEQUATE| NOT
| | |AVAILABLE | | |AVAILABLE | | |AVAILABLE
------------------------------------------------------------------------------------------------------------------------------------
PRE-PRIMARY
TABLE FOR TEACHERS 50 19 27 43 12 23 7 7 4
CHAIR FOR TEACHERS 67 15 14 56 10 12 11 5 2
CHAIR FOR STUDENTS 11 18 67 7 12 59 4 6 8
DESKS FOR STUDENTS 10 18 68 4 12 62 6 6 6
BENCHES FOR STUDENTS 6 20 70 4 13 61 2 7 9
TATS/DARI/CARPET FOR STUDENTS 54 22 20 47 19 12 7 3 8
ALMIRA 22 31 43 17 23 38 5 8 5
OTHERS 1 20 75 16 62 1 4 13
MOSQUE
TABLE FOR TEACHERS 74 47 42 68 44 37 6 3 5
CHAIR FOR TEACHERS 86 46 31 81 40 28 5 6 3
CHAIR FOR STUDENTS 6 43 114 5 40 104 1 3 10
DESKS FOR STUDENTS 28 45 90 24 42 83 4 3 7
BENCHES FOR STUDENTS 33 59 71 29 56 64 4 3 7
TATS/DARI/CARPET FOR STUDENTS 27 40 96 23 38 88 4 2 8
ALMIRA 58 52 53 52 46 51 6 6 2
OTHERS 25 138 22 127 3 11
PRIMARY
TABLE FOR TEACHERS 15,474 10,761 3,843 13,808 9,624 3,559 1,666 1,137 284
CHAIR FOR TEACHERS 17,922 9,347 2,809 15,986 8,365 2,640 1,936 982 169
CHAIR FOR STUDENTS 1,979 6,259 21,840 1,533 5,381 20,077 446 878 1,763
DESKS FOR STUDENTS 6,130 9,976 13,972 5,136 8,826 13,029 994 1,150 943
BENCHES FOR STUDENTS 7,213 10,128 12,737 6,285 8,974 11,732 928 1,154 1,005
TATS/DARI/CARPET FOR STUDENTS 7,188 8,584 14,306 6,497 7,630 12,864 691 954 1,442
ALMIRA 13,688 8,823 7,567 11,978 7,969 7,044 1,710 854 523
OTHERS 452 4,394 25,232 395 3,852 22,744 57 542 2,488
MIDDLE/ELEMENTRY
TABLE FOR TEACHERS 3,298 2,952 559 2,649 2,592 474 649 360 85
CHAIR FOR TEACHERS 3,897 2,619 293 3,158 2,295 262 739 324 31
CHAIR FOR STUDENTS 875 1,625 4,309 575 1,301 3,839 300 324 470
DESKS FOR STUDENTS 2,536 3,042 1,231 1,984 2,637 1,094 552 405 137
BENCHES FOR STUDENTS 2,440 2,955 1,414 1,960 2,570 1,185 480 385 229
TATS/DARI/CARPET FOR STUDENTS 1,077 1,787 3,945 889 1,471 3,355 188 316 590
ALMIRA 3,876 2,103 830 3,169 1,817 729 707 286 101
OTHERS 150 1,101 5,558 120 918 4,677 30 183 881
SECONDRY/HIGH
TABLE FOR TEACHERS 2,263 1,460 223 1,083 930 127 1,180 530 96
CHAIR FOR TEACHERS 2,682 1,183 81 1,346 740 54 1,336 443 27
CHAIR FOR STUDENTS 1,222 1,180 1,544 422 633 1,085 800 547 459
DESKS FOR STUDENTS 1,939 1,632 375 845 1,042 253 1,094 590 122
BENCHES FOR STUDENTS 1,656 1,570 720 773 995 372 883 575 348
TATS/DARI/CARPET FOR STUDENTS 612 1,067 2,267 330 562 1,248 282 505 1,019
ALMIRA 2,507 1,114 325 1,227 710 203 1,280 404 122
OTHERS 126 671 3,149 45 372 1,723 81 299 1,426
HIGHER-SECONDRY
TABLE FOR TEACHERS 435 204 22 218 121 12 217 83 10
CHAIR FOR TEACHERS 494 154 13 253 89 9 241 65 4

CHAIR FOR STUDENTS 259 180 222 107 97 147 152 83 75
DESKS FOR STUDENTS 392 215 54 195 123 33 197 92 21
BENCHES FOR STUDENTS 323 214 124 178 124 49 145 90 75
TATS/DARI/CARPET FOR STUDENTS 76 180 405 41 98 212 35 82 193
ALMIRA 443 180 38 220 112 19 223 68 19
OTHERS 21 120 520 8 65 278 13 55 242

TABLE 42 SCHOOLS(PUBLIC AND PRIVATE) BY LEVEL, GENDER AND AVAILABILITY OF FURNITURE
PAKISTAN MIX SCHOOLS (Number)
------------------------------------------------------------------------------------------------------------------------------------
| ALL AREAS | RURAL AREAS | URBAN AREAS
LEVEL OF SCHOOL/FURNITURE |--------------------------------------------------------------------------------------------------
REGIONS | ADEQUATE |INADEQUATE| NOT | ADEQUATE |INADEQUATE| NOT | ADEQUATE |INADEQUATE| NOT
| | |AVAILABLE | | |AVAILABLE | | |AVAILABLE
------------------------------------------------------------------------------------------------------------------------------------
PRE-PRIMARY
TABLE FOR TEACHERS 609 109 204 219 78 154 390 31 50
CHAIR FOR TEACHERS 719 77 126 278 61 112 441 16 14
CHAIR FOR STUDENTS 480 96 346 85 62 304 395 34 42
DESKS FOR STUDENTS 408 128 386 82 72 297 326 56 89
BENCHES FOR STUDENTS 299 161 462 78 79 294 221 82 168
TATS/DARI/CARPET FOR STUDENTS 239 249 434 135 136 180 104 113 254
ALMIRA 495 129 298 111 89 251 384 40 47
OTHERS 37 139 746 4 49 398 33 90 348
MOSQUE
TABLE FOR TEACHERS 4,414 3,021 2,237 4,104 2,781 2,044 310 240 193
CHAIR FOR TEACHERS 4,824 3,052 1,796 4,446 2,841 1,642 378 211 154
CHAIR FOR STUDENTS 227 2,097 7,348 192 1,917 6,820 35 180 528
DESKS FOR STUDENTS 800 3,000 5,872 706 2,775 5,448 94 225 424
BENCHES FOR STUDENTS 2,474 3,402 3,796 2,293 3,180 3,456 181 222 340
TATS/DARI/CARPET FOR STUDENTS 1,398 2,447 5,827 1,226 2,252 5,451 172 195 376
ALMIRA 3,235 2,800 3,637 2,948 2,604 3,377 287 196 260
OTHERS 119 1,407 8,146 106 1,275 7,548 13 132 598
PRIMARY
TABLE FOR TEACHERS 35,803 17,007 6,152 27,444 14,232 4,924 8,359 2,775 1,228
CHAIR FOR TEACHERS 40,646 14,591 3,725 30,507 12,735 3,358 10,139 1,856 367
CHAIR FOR STUDENTS 10,381 11,740 36,841 5,101 9,366 32,133 5,280 2,374 4,708
DESKS FOR STUDENTS 16,286 16,530 26,146 9,210 14,054 23,336 7,076 2,476 2,810
BENCHES FOR STUDENTS 22,732 17,245 18,985 16,488 14,573 15,539 6,244 2,672 3,446
TATS/DARI/CARPET FOR STUDENTS 9,744 14,507 34,711 7,852 11,643 27,105 1,892 2,864 7,606
ALMIRA 29,800 15,380 13,782 21,645 13,056 11,899 8,155 2,324 1,883
OTHERS 1,076 8,683 49,203 670 6,714 39,216 406 1,969 9,987
MIDDLE/ELEMENTRY
TABLE FOR TEACHERS 17,937 5,126 2,353 8,617 3,198 1,272 9,320 1,928 1,081
CHAIR FOR TEACHERS 22,797 2,218 401 11,205 1,598 284 11,592 620 117
CHAIR FOR STUDENTS 12,576 3,828 9,012 4,917 2,179 5,991 7,659 1,649 3,021
DESKS FOR STUDENTS 16,659 4,075 4,682 7,377 2,683 3,027 9,282 1,392 1,655
BENCHES FOR STUDENTS 15,198 4,179 6,039 7,342 2,598 3,147 7,856 1,581 2,892
TATS/DARI/CARPET FOR STUDENTS 4,256 5,038 16,122 2,641 2,556 7,890 1,615 2,482 8,232
ALMIRA 17,481 4,616 3,319 8,322 2,782 1,983 9,159 1,834 1,336
OTHERS 911 3,699 20,806 391 1,954 10,742 520 1,745 10,064
SECONDRY/HIGH
TABLE FOR TEACHERS 9,570 1,961 1,018 2,948 1,011 472 6,622 950 546
CHAIR FOR TEACHERS 11,545 844 160 3,782 549 100 7,763 295 60
CHAIR FOR STUDENTS 8,046 1,597 2,906 2,039 775 1,617 6,007 822 1,289
DESKS FOR STUDENTS 9,478 1,556 1,515 2,711 920 800 6,767 636 715
BENCHES FOR STUDENTS 7,850 1,802 2,897 2,557 787 1,087 5,293 1,015 1,810
TATS/DARI/CARPET FOR STUDENTS 1,892 2,704 7,953 795 933 2,703 1,097 1,771 5,250
ALMIRA 9,693 1,755 1,101 3,012 883 536 6,681 872 565
OTHERS 614 1,862 10,073 131 686 3,614 483 1,176 6,459
HIGHER-SECONDRY
TABLE FOR TEACHERS 643 116 52 201 56 17 442 60 35
CHAIR FOR TEACHERS 715 80 16 232 38 4 483 42 12

CHAIR FOR STUDENTS 580 115 116 149 54 71 431 61 45
DESKS FOR STUDENTS 588 117 106 176 54 44 412 63 62
BENCHES FOR STUDENTS 440 133 238 149 40 85 291 93 153
TATS/DARI/CARPET FOR STUDENTS 125 197 489 43 51 180 82 146 309
ALMIRA 660 105 46 200 50 24 460 55 22
OTHERS 57 133 621 16 40 218 41 93 403

TABLE 42.1 SCHOOLS(PUBLIC)BY LEVEL, GENDER AND AVAILABILITY OF FURNITURE
PAKISTAN ALL SCHOOLS (Number)
------------------------------------------------------------------------------------------------------------------------------------
| ALL AREAS | RURAL AREAS | URBAN AREAS
LEVEL OF SCHOOL/FURNITURE |--------------------------------------------------------------------------------------------------
REGIONS | ADEQUATE |INADEQUATE| NOT | ADEQUATE |INADEQUATE| NOT | ADEQUATE |INADEQUATE| NOT
| | |AVAILABLE | | |AVAILABLE | | |AVAILABLE
------------------------------------------------------------------------------------------------------------------------------------
PRE-PRIMARY
TABLE FOR TEACHERS 118 43 126 114 37 122 4 6 4
CHAIR FOR TEACHERS 170 32 85 160 30 83 10 2 2
CHAIR FOR STUDENTS 7 40 240 5 34 234 2 6 6
DESKS FOR STUDENTS 7 38 242 6 32 235 1 6 7
BENCHES FOR STUDENTS 8 40 239 7 34 232 1 6 7
TATS/DARI/CARPET FOR STUDENTS 124 74 89 117 70 86 7 4 3
ALMIRA 35 52 200 32 47 194 3 5 6
OTHERS 1 30 256 1 29 243 1 13
MOSQUE
TABLE FOR TEACHERS 5,803 4,235 3,997 5,397 3,873 3,673 406 362 324
CHAIR FOR TEACHERS 6,631 4,201 3,203 6,099 3,889 2,955 532 312 248
CHAIR FOR STUDENTS 279 2,870 10,886 249 2,626 10,068 30 244 818
DESKS FOR STUDENTS 961 3,949 9,125 855 3,649 8,439 106 300 686
BENCHES FOR STUDENTS 2,836 4,345 6,854 2,633 4,044 6,266 203 301 588
TATS/DARI/CARPET FOR STUDENTS 2,332 3,537 8,166 2,081 3,262 7,600 251 275 566
ALMIRA 4,185 3,899 5,951 3,818 3,599 5,526 367 300 425
OTHERS 152 1,939 11,944 138 1,760 11,045 14 179 899
PRIMARY
TABLE FOR TEACHERS 54,833 38,383 12,310 49,393 34,436 11,339 5,440 3,947 971
CHAIR FOR TEACHERS 62,872 34,028 8,626 56,492 30,607 8,069 6,380 3,421 557
CHAIR FOR STUDENTS 6,067 22,491 76,968 4,696 19,494 70,978 1,371 2,997 5,990
DESKS FOR STUDENTS 17,710 35,792 52,024 14,466 31,987 48,715 3,244 3,805 3,309
BENCHES FOR STUDENTS 27,213 36,275 42,038 23,968 32,483 38,717 3,245 3,792 3,321
TATS/DARI/CARPET FOR STUDENTS 21,739 29,899 53,888 19,677 26,763 48,728 2,062 3,136 5,160
ALMIRA 47,376 31,217 26,933 41,684 28,429 25,055 5,692 2,788 1,878
OTHERS 1,474 15,486 88,566 1,265 13,744 80,159 209 1,742 8,407
MIDDLE/ELEMENTRY
TABLE FOR TEACHERS 6,594 6,455 1,285 5,584 5,629 1,104 1,010 826 181
CHAIR FOR TEACHERS 7,984 5,677 673 6,749 4,955 613 1,235 722 60
CHAIR FOR STUDENTS 1,464 3,617 9,253 1,106 2,907 8,304 358 710 949
DESKS FOR STUDENTS 4,727 6,658 2,949 3,860 5,785 2,672 867 873 277
BENCHES FOR STUDENTS 4,443 6,486 3,405 3,719 5,637 2,961 724 849 444
TATS/DARI/CARPET FOR STUDENTS 2,291 3,825 8,218 1,932 3,205 7,180 359 620 1,038
ALMIRA 7,731 4,687 1,916 6,500 4,095 1,722 1,231 592 194
OTHERS 303 2,193 11,838 252 1,831 10,234 51 362 1,604
SECONDRY/HIGH
TABLE FOR TEACHERS 4,444 4,359 668 2,917 3,264 465 1,527 1,095 203
CHAIR FOR TEACHERS 5,549 3,665 257 3,735 2,726 185 1,814 939 72
CHAIR FOR STUDENTS 1,687 3,002 4,782 855 1,995 3,796 832 1,007 986
DESKS FOR STUDENTS 3,704 4,886 881 2,257 3,698 691 1,447 1,188 190
BENCHES FOR STUDENTS 3,021 4,508 1,942 1,917 3,422 1,307 1,104 1,086 635
TATS/DARI/CARPET FOR STUDENTS 1,337 2,509 5,625 920 1,742 3,984 417 767 1,641
ALMIRA 5,428 3,298 745 3,592 2,500 554 1,836 798 191
OTHERS 235 1,569 7,667 121 1,093 5,432 114 476 2,235
HIGHER-SECONDRY
TABLE FOR TEACHERS 609 430 40 350 276 28 259 154 12
CHAIR FOR TEACHERS 684 376 19 403 238 13 281 138 6

CHAIR FOR STUDENTS 311 389 379 155 231 268 156 158 111
DESKS FOR STUDENTS 512 501 66 282 324 48 230 177 18
BENCHES FOR STUDENTS 408 464 207 250 301 103 158 163 104
TATS/DARI/CARPET FOR STUDENTS 119 292 668 77 179 398 42 113 270
ALMIRA 682 345 52 392 234 28 290 111 24
OTHERS 35 181 863 19 108 527 16 73 336

TABLE 42.1 SCHOOLS(PUBLIC)BY LEVEL, GENDER AND AVAILABILITY OF FURNITURE
PAKISTAN GIRLS SCHOOLS (Number)
------------------------------------------------------------------------------------------------------------------------------------
| ALL AREAS | RURAL AREAS | URBAN AREAS
LEVEL OF SCHOOL/FURNITURE |--------------------------------------------------------------------------------------------------
REGIONS | ADEQUATE |INADEQUATE| NOT | ADEQUATE |INADEQUATE| NOT | ADEQUATE |INADEQUATE| NOT
| | |AVAILABLE | | |AVAILABLE | | |AVAILABLE
------------------------------------------------------------------------------------------------------------------------------------
PRE-PRIMARY
TABLE FOR TEACHERS 36 2 13 36 2 12 1
CHAIR FOR TEACHERS 42 2 7 41 2 7 1
CHAIR FOR STUDENTS 1 3 47 1 3 46 1
DESKS FOR STUDENTS 1 50 1 49 1
BENCHES FOR STUDENTS 1 50 1 49 1
TATS/DARI/CARPET FOR STUDENTS 35 2 14 34 2 14 1
ALMIRA 11 5 35 11 5 34 1
OTHERS 6 45 6 44 1
MOSQUE
TABLE FOR TEACHERS 1,357 1,182 1,728 1,248 1,056 1,598 109 126 130
CHAIR FOR TEACHERS 1,767 1,116 1,384 1,598 1,015 1,289 169 101 95
CHAIR FOR STUDENTS 68 749 3,450 59 679 3,164 9 70 286
DESKS FOR STUDENTS 156 924 3,187 134 843 2,925 22 81 262
BENCHES FOR STUDENTS 352 899 3,016 322 817 2,763 30 82 253
TATS/DARI/CARPET FOR STUDENTS 929 1,067 2,271 843 983 2,076 86 84 195
ALMIRA 929 1,063 2,275 834 960 2,108 95 103 167
OTHERS 35 522 3,710 32 473 3,397 3 49 313
PRIMARY
TABLE FOR TEACHERS 15,194 13,399 4,096 13,801 12,235 3,798 1,393 1,164 298
CHAIR FOR TEACHERS 18,778 11,329 2,582 17,053 10,368 2,413 1,725 961 169
CHAIR FOR STUDENTS 1,539 6,919 24,231 1,228 6,122 22,484 311 797 1,747
DESKS FOR STUDENTS 4,730 11,712 16,247 3,961 10,620 15,253 769 1,092 994
BENCHES FOR STUDENTS 5,724 11,525 15,440 5,040 10,448 14,346 684 1,077 1,094
TATS/DARI/CARPET FOR STUDENTS 7,998 10,188 14,503 7,347 9,268 13,219 651 920 1,284
ALMIRA 14,285 9,960 8,444 12,768 9,198 7,868 1,517 762 576
OTHERS 432 4,763 27,494 384 4,361 25,089 48 402 2,405
MIDDLE/ELEMENTRY
TABLE FOR TEACHERS 2,476 2,507 518 2,089 2,199 444 387 308 74
CHAIR FOR TEACHERS 3,131 2,124 246 2,636 1,875 221 495 249 25
CHAIR FOR STUDENTS 509 1,430 3,562 401 1,145 3,186 108 285 376
DESKS FOR STUDENTS 1,620 2,633 1,248 1,302 2,291 1,139 318 342 109
BENCHES FOR STUDENTS 1,530 2,590 1,381 1,278 2,256 1,198 252 334 183
TATS/DARI/CARPET FOR STUDENTS 993 1,563 2,945 862 1,303 2,567 131 260 378
ALMIRA 2,864 1,884 753 2,404 1,649 679 460 235 74
OTHERS 115 796 4,590 91 664 3,977 24 132 613
SECONDRY/HIGH
TABLE FOR TEACHERS 2,315 2,607 444 1,649 2,051 321 666 556 123
CHAIR FOR TEACHERS 3,074 2,129 163 2,228 1,674 119 846 455 44
CHAIR FOR STUDENTS 803 1,613 2,950 470 1,159 2,392 333 454 558
DESKS FOR STUDENTS 1,969 2,870 527 1,292 2,300 429 677 570 98
BENCHES FOR STUDENTS 1,684 2,669 1,013 1,160 2,166 695 524 503 318
TATS/DARI/CARPET FOR STUDENTS 749 1,403 3,214 569 1,060 2,392 180 343 822
ALMIRA 3,004 1,944 418 2,138 1,560 323 866 384 95
OTHERS 125 865 4,376 66 645 3,310 59 220 1,066
HIGHER-SECONDRY
TABLE FOR TEACHERS 272 215 24 184 151 18 88 64 6
CHAIR FOR TEACHERS 304 200 7 211 137 5 93 63 2

CHAIR FOR STUDENTS 130 195 186 84 129 140 46 66 46
DESKS FOR STUDENTS 226 257 28 145 184 24 81 73 4
BENCHES FOR STUDENTS 205 229 77 143 171 39 62 58 38
TATS/DARI/CARPET FOR STUDENTS 64 136 311 46 96 211 18 40 100
ALMIRA 313 169 29 212 124 17 101 45 12
OTHERS 20 74 417 12 53 288 8 21 129

TABLE 42.1 SCHOOLS(PUBLIC)BY LEVEL, GENDER AND AVAILABILITY OF FURNITURE
PAKISTAN BOYS SCHOOLS (Number)
------------------------------------------------------------------------------------------------------------------------------------
| ALL AREAS | RURAL AREAS | URBAN AREAS
LEVEL OF SCHOOL/FURNITURE |--------------------------------------------------------------------------------------------------
REGIONS | ADEQUATE |INADEQUATE| NOT | ADEQUATE |INADEQUATE| NOT | ADEQUATE |INADEQUATE| NOT
| | |AVAILABLE | | |AVAILABLE | | |AVAILABLE
------------------------------------------------------------------------------------------------------------------------------------
PRE-PRIMARY
TABLE FOR TEACHERS 25 12 19 23 7 16 2 5 3
CHAIR FOR TEACHERS 42 5 9 36 3 7 6 2 2
CHAIR FOR STUDENTS 1 10 45 5 41 1 5 4
DESKS FOR STUDENTS 1 11 44 6 40 1 5 4
BENCHES FOR STUDENTS 2 10 44 1 5 40 1 5 4
TATS/DARI/CARPET FOR STUDENTS 37 13 6 32 10 4 5 3 2
ALMIRA 13 17 26 11 13 22 2 4 4
OTHERS 11 45 11 35 10
MOSQUE
TABLE FOR TEACHERS 73 46 41 68 43 36 5 3 5
CHAIR FOR TEACHERS 84 46 30 80 40 27 4 6 3
CHAIR FOR STUDENTS 5 43 112 5 40 102 3 10
DESKS FOR STUDENTS 26 45 89 23 42 82 3 3 7
BENCHES FOR STUDENTS 31 59 70 28 56 63 3 3 7
TATS/DARI/CARPET FOR STUDENTS 26 40 94 23 38 86 3 2 8
ALMIRA 56 52 52 51 46 50 5 6 2
OTHERS 25 135 22 125 3 10
PRIMARY
TABLE FOR TEACHERS 15,004 10,598 3,742 13,485 9,485 3,482 1,519 1,113 260
CHAIR FOR TEACHERS 17,365 9,225 2,754 15,601 8,258 2,593 1,764 967 161
CHAIR FOR STUDENTS 1,762 6,121 21,461 1,405 5,284 19,763 357 837 1,698
DESKS FOR STUDENTS 5,895 9,810 13,639 5,016 8,697 12,739 879 1,113 900
BENCHES FOR STUDENTS 6,996 9,954 12,394 6,152 8,846 11,454 844 1,108 940
TATS/DARI/CARPET FOR STUDENTS 6,966 8,405 13,973 6,320 7,499 12,633 646 906 1,340
ALMIRA 13,324 8,652 7,368 11,748 7,829 6,875 1,576 823 493
OTHERS 434 4,298 24,612 383 3,784 22,285 51 514 2,327
MIDDLE/ELEMENTRY
TABLE FOR TEACHERS 2,840 2,847 507 2,410 2,514 442 430 333 65
CHAIR FOR TEACHERS 3,360 2,555 279 2,868 2,244 254 492 311 25
CHAIR FOR STUDENTS 605 1,517 4,072 466 1,237 3,663 139 280 409
DESKS FOR STUDENTS 2,156 2,934 1,104 1,803 2,567 996 353 367 108
BENCHES FOR STUDENTS 2,074 2,857 1,263 1,774 2,506 1,086 300 351 177
TATS/DARI/CARPET FOR STUDENTS 945 1,659 3,590 797 1,400 3,169 148 259 421
ALMIRA 3,469 1,985 740 2,960 1,739 667 509 246 73
OTHERS 132 1,003 5,059 114 852 4,400 18 151 659
SECONDRY/HIGH
TABLE FOR TEACHERS 1,486 1,313 164 820 845 103 666 468 61
CHAIR FOR TEACHERS 1,780 1,117 66 1,025 698 45 755 419 21
CHAIR FOR STUDENTS 619 1,038 1,306 256 561 951 363 477 355
DESKS FOR STUDENTS 1,188 1,516 259 604 981 183 584 535 76
BENCHES FOR STUDENTS 992 1,435 536 548 934 286 444 501 250
TATS/DARI/CARPET FOR STUDENTS 437 839 1,687 249 477 1,042 188 362 645
ALMIRA 1,745 985 233 967 645 156 778 340 77
OTHERS 85 510 2,368 42 305 1,421 43 205 947
HIGHER-SECONDRY
TABLE FOR TEACHERS 257 172 12 125 99 7 132 73 5
CHAIR FOR TEACHERS 299 133 9 151 74 6 148 59 3
CHAIR FOR STUDENTS 139 147 155 57 75 99 82 72 56
DESKS FOR STUDENTS 221 191 29 104 108 19 117 83 10
BENCHES FOR STUDENTS 180 190 71 94 111 26 86 79 45
TATS/DARI/CARPET FOR STUDENTS 47 124 270 26 69 136 21 55 134
ALMIRA 286 137 18 140 83 8 146 54 10
OTHERS 10 83 348 4 46 181 6 37 167

TABLE 42.1 SCHOOLS(PUBLIC)BY LEVEL, GENDER AND AVAILABILITY OF FURNITURE
PAKISTAN MIX SCHOOLS (Number)
------------------------------------------------------------------------------------------------------------------------------------
| ALL AREAS | RURAL AREAS | URBAN AREAS
LEVEL OF SCHOOL/FURNITURE |--------------------------------------------------------------------------------------------------
REGIONS | ADEQUATE |INADEQUATE| NOT | ADEQUATE |INADEQUATE| NOT | ADEQUATE |INADEQUATE| NOT
| | |AVAILABLE | | |AVAILABLE | | |AVAILABLE
------------------------------------------------------------------------------------------------------------------------------------
PRE-PRIMARY
TABLE FOR TEACHERS 57 29 94 55 28 94 2 1
CHAIR FOR TEACHERS 86 25 69 83 25 69 3
CHAIR FOR STUDENTS 5 27 148 4 26 147 1 1 1
DESKS FOR STUDENTS 6 26 148 6 25 146 1 2
BENCHES FOR STUDENTS 6 29 145 6 28 143 1 2
TATS/DARI/CARPET FOR STUDENTS 52 59 69 51 58 68 1 1 1
ALMIRA 11 30 139 10 29 138 1 1 1
OTHERS 1 13 166 1 12 164 1 2
MOSQUE
TABLE FOR TEACHERS 4,373 3,007 2,228 4,081 2,774 2,039 292 233 189
CHAIR FOR TEACHERS 4,780 3,039 1,789 4,421 2,834 1,639 359 205 150
CHAIR FOR STUDENTS 206 2,078 7,324 185 1,907 6,802 21 171 522
DESKS FOR STUDENTS 779 2,980 5,849 698 2,764 5,432 81 216 417
BENCHES FOR STUDENTS 2,453 3,387 3,768 2,283 3,171 3,440 170 216 328
TATS/DARI/CARPET FOR STUDENTS 1,377 2,430 5,801 1,215 2,241 5,438 162 189 363
ALMIRA 3,200 2,784 3,624 2,933 2,593 3,368 267 191 256
OTHERS 117 1,392 8,099 106 1,265 7,523 11 127 576
PRIMARY
TABLE FOR TEACHERS 24,635 14,386 4,472 22,107 12,716 4,059 2,528 1,670 413
CHAIR FOR TEACHERS 26,729 13,474 3,290 23,838 11,981 3,063 2,891 1,493 227
CHAIR FOR STUDENTS 2,766 9,451 31,276 2,063 8,088 28,731 703 1,363 2,545
DESKS FOR STUDENTS 7,085 14,270 22,138 5,489 12,670 20,723 1,596 1,600 1,415
BENCHES FOR STUDENTS 14,493 14,796 14,204 12,776 13,189 12,917 1,717 1,607 1,287
TATS/DARI/CARPET FOR STUDENTS 6,775 11,306 25,412 6,010 9,996 22,876 765 1,310 2,536
ALMIRA 19,767 12,605 11,121 17,168 11,402 10,312 2,599 1,203 809
OTHERS 608 6,425 36,460 498 5,599 32,785 110 826 3,675
MIDDLE/ELEMENTRY
TABLE FOR TEACHERS 1,278 1,101 260 1,085 916 218 193 185 42
CHAIR FOR TEACHERS 1,493 998 148 1,245 836 138 248 162 10
CHAIR FOR STUDENTS 350 670 1,619 239 525 1,455 111 145 164
DESKS FOR STUDENTS 951 1,091 597 755 927 537 196 164 60
BENCHES FOR STUDENTS 839 1,039 761 667 875 677 172 164 84
TATS/DARI/CARPET FOR STUDENTS 353 603 1,683 273 502 1,444 80 101 239
ALMIRA 1,398 818 423 1,136 707 376 262 111 47
OTHERS 56 394 2,189 47 315 1,857 9 79 332
SECONDRY/HIGH
TABLE FOR TEACHERS 643 439 60 448 368 41 195 71 19
CHAIR FOR TEACHERS 695 419 28 482 354 21 213 65 7
CHAIR FOR STUDENTS 265 351 526 129 275 453 136 76 73
DESKS FOR STUDENTS 547 500 95 361 417 79 186 83 16
BENCHES FOR STUDENTS 345 404 393 209 322 326 136 82 67
TATS/DARI/CARPET FOR STUDENTS 151 267 724 102 205 550 49 62 174
ALMIRA 679 369 94 487 295 75 192 74 19
OTHERS 25 194 923 13 143 701 12 51 222
HIGHER-SECONDRY
TABLE FOR TEACHERS 80 43 4 41 26 3 39 17 1
CHAIR FOR TEACHERS 81 43 3 41 27 2 40 16 1

CHAIR FOR STUDENTS 42 47 38 14 27 29 28 20 9
DESKS FOR STUDENTS 65 53 9 33 32 5 32 21 4
BENCHES FOR STUDENTS 23 45 59 13 19 38 10 26 21
TATS/DARI/CARPET FOR STUDENTS 8 32 87 5 14 51 3 18 36
ALMIRA 83 39 5 40 27 3 43 12 2
OTHERS 5 24 98 3 9 58 2 15 40
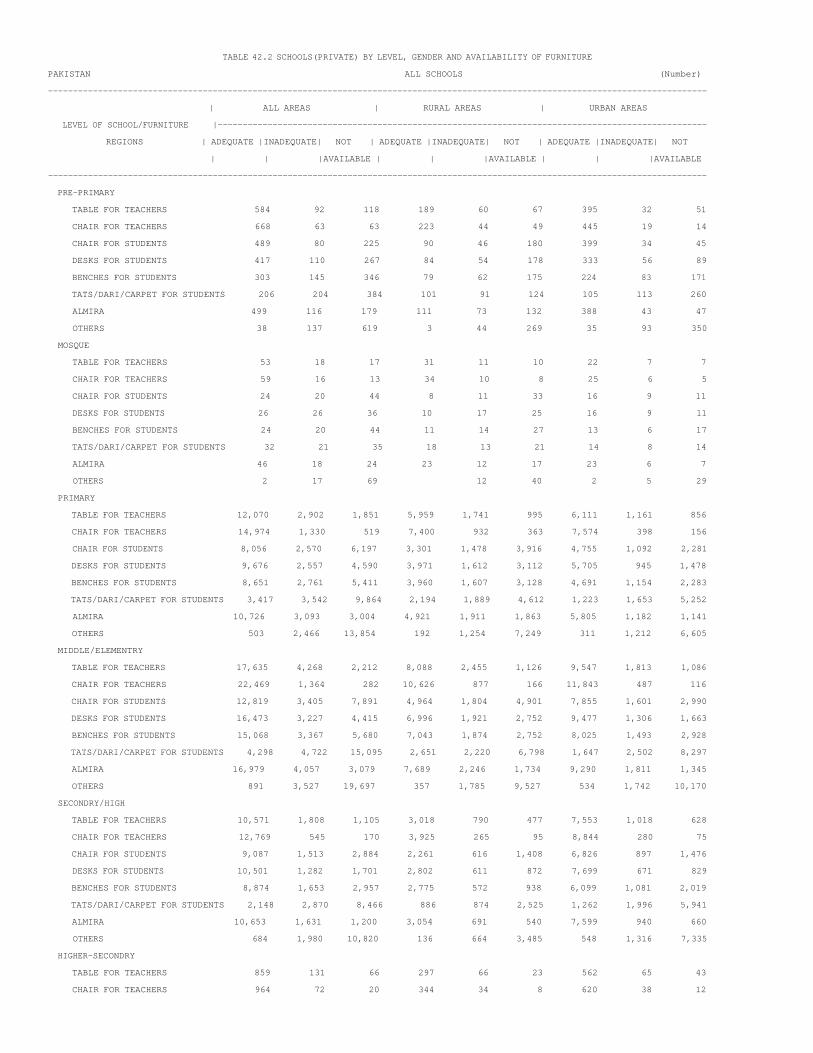
TABLE 42.2 SCHOOLS(PRIVATE) BY LEVEL, GENDER AND AVAILABILITY OF FURNITURE
PAKISTAN ALL SCHOOLS (Number)
------------------------------------------------------------------------------------------------------------------------------------
| ALL AREAS | RURAL AREAS | URBAN AREAS
LEVEL OF SCHOOL/FURNITURE |--------------------------------------------------------------------------------------------------
REGIONS | ADEQUATE |INADEQUATE| NOT | ADEQUATE |INADEQUATE| NOT | ADEQUATE |INADEQUATE| NOT
| | |AVAILABLE | | |AVAILABLE | | |AVAILABLE
------------------------------------------------------------------------------------------------------------------------------------
PRE-PRIMARY
TABLE FOR TEACHERS 584 92 118 189 60 67 395 32 51
CHAIR FOR TEACHERS 668 63 63 223 44 49 445 19 14
CHAIR FOR STUDENTS 489 80 225 90 46 180 399 34 45
DESKS FOR STUDENTS 417 110 267 84 54 178 333 56 89
BENCHES FOR STUDENTS 303 145 346 79 62 175 224 83 171
TATS/DARI/CARPET FOR STUDENTS 206 204 384 101 91 124 105 113 260
ALMIRA 499 116 179 111 73 132 388 43 47
OTHERS 38 137 619 3 44 269 35 93 350
MOSQUE
TABLE FOR TEACHERS 53 18 17 31 11 10 22 7 7
CHAIR FOR TEACHERS 59 16 13 34 10 8 25 6 5
CHAIR FOR STUDENTS 24 20 44 8 11 33 16 9 11
DESKS FOR STUDENTS 26 26 36 10 17 25 16 9 11
BENCHES FOR STUDENTS 24 20 44 11 14 27 13 6 17
TATS/DARI/CARPET FOR STUDENTS 32 21 35 18 13 21 14 8 14
ALMIRA 46 18 24 23 12 17 23 6 7
OTHERS 2 17 69 12 40 2 5 29
PRIMARY
TABLE FOR TEACHERS 12,070 2,902 1,851 5,959 1,741 995 6,111 1,161 856
CHAIR FOR TEACHERS 14,974 1,330 519 7,400 932 363 7,574 398 156
CHAIR FOR STUDENTS 8,056 2,570 6,197 3,301 1,478 3,916 4,755 1,092 2,281
DESKS FOR STUDENTS 9,676 2,557 4,590 3,971 1,612 3,112 5,705 945 1,478
BENCHES FOR STUDENTS 8,651 2,761 5,411 3,960 1,607 3,128 4,691 1,154 2,283
TATS/DARI/CARPET FOR STUDENTS 3,417 3,542 9,864 2,194 1,889 4,612 1,223 1,653 5,252
ALMIRA 10,726 3,093 3,004 4,921 1,911 1,863 5,805 1,182 1,141
OTHERS 503 2,466 13,854 192 1,254 7,249 311 1,212 6,605
MIDDLE/ELEMENTRY
TABLE FOR TEACHERS 17,635 4,268 2,212 8,088 2,455 1,126 9,547 1,813 1,086
CHAIR FOR TEACHERS 22,469 1,364 282 10,626 877 166 11,843 487 116
CHAIR FOR STUDENTS 12,819 3,405 7,891 4,964 1,804 4,901 7,855 1,601 2,990
DESKS FOR STUDENTS 16,473 3,227 4,415 6,996 1,921 2,752 9,477 1,306 1,663
BENCHES FOR STUDENTS 15,068 3,367 5,680 7,043 1,874 2,752 8,025 1,493 2,928
TATS/DARI/CARPET FOR STUDENTS 4,298 4,722 15,095 2,651 2,220 6,798 1,647 2,502 8,297
ALMIRA 16,979 4,057 3,079 7,689 2,246 1,734 9,290 1,811 1,345
OTHERS 891 3,527 19,697 357 1,785 9,527 534 1,742 10,170
SECONDRY/HIGH
TABLE FOR TEACHERS 10,571 1,808 1,105 3,018 790 477 7,553 1,018 628
CHAIR FOR TEACHERS 12,769 545 170 3,925 265 95 8,844 280 75
CHAIR FOR STUDENTS 9,087 1,513 2,884 2,261 616 1,408 6,826 897 1,476
DESKS FOR STUDENTS 10,501 1,282 1,701 2,802 611 872 7,699 671 829
BENCHES FOR STUDENTS 8,874 1,653 2,957 2,775 572 938 6,099 1,081 2,019
TATS/DARI/CARPET FOR STUDENTS 2,148 2,870 8,466 886 874 2,525 1,262 1,996 5,941
ALMIRA 10,653 1,631 1,200 3,054 691 540 7,599 940 660
OTHERS 684 1,980 10,820 136 664 3,485 548 1,316 7,335
HIGHER-SECONDRY
TABLE FOR TEACHERS 859 131 66 297 66 23 562 65 43
CHAIR FOR TEACHERS 964 72 20 344 34 8 620 38 12

CHAIR FOR STUDENTS 752 119 185 215 56 115 537 63 70
DESKS FOR STUDENTS 789 110 157 267 46 73 522 64 84
BENCHES FOR STUDENTS 628 136 292 245 44 97 383 92 195
TATS/DARI/CARPET FOR STUDENTS 171 247 638 70 79 237 101 168 401
ALMIRA 850 132 74 285 64 37 565 68 37
OTHERS 70 161 825 21 54 311 49 107 514

TABLE 42.2 SCHOOLS(PRIVATE) BY LEVEL, GENDER AND AVAILABILITY OF FURNITURE
PAKISTAN GIRLS SCHOOLS (Number)
------------------------------------------------------------------------------------------------------------------------------------
| ALL AREAS | RURAL AREAS | URBAN AREAS
LEVEL OF SCHOOL/FURNITURE |--------------------------------------------------------------------------------------------------
REGIONS | ADEQUATE |INADEQUATE| NOT | ADEQUATE |INADEQUATE| NOT | ADEQUATE |INADEQUATE| NOT
| | |AVAILABLE | | |AVAILABLE | | |AVAILABLE
------------------------------------------------------------------------------------------------------------------------------------
PRE-PRIMARY
TABLE FOR TEACHERS 7 5 5 5 2
CHAIR FOR TEACHERS 10 1 1 8 1 1 2
CHAIR FOR STUDENTS 4 3 5 2 3 5 2
DESKS FOR STUDENTS 6 1 5 4 1 5 2
BENCHES FOR STUDENTS 6 3 3 4 3 3 2
TATS/DARI/CARPET FOR STUDENTS 2 5 5 2 4 4 1 1
ALMIRA 6 3 3 4 3 3 2
OTHERS 1 2 9 2 8 1 1
MOSQUE
TABLE FOR TEACHERS 11 3 7 8 3 4 3 3
CHAIR FOR TEACHERS 13 3 5 8 3 4 5 1
CHAIR FOR STUDENTS 2 1 18 1 1 13 1 5
DESKS FOR STUDENTS 3 6 12 1 6 8 2 4
BENCHES FOR STUDENTS 1 5 15 5 10 1 5
TATS/DARI/CARPET FOR STUDENTS 10 4 7 7 2 6 3 2 1
ALMIRA 9 2 10 7 1 7 2 1 3
OTHERS 2 19 2 13 6
PRIMARY
TABLE FOR TEACHERS 432 118 70 299 86 53 133 32 17
CHAIR FOR TEACHERS 500 91 29 346 71 21 154 20 8
CHAIR FOR STUDENTS 224 143 253 135 103 200 89 40 53
DESKS FOR STUDENTS 240 131 249 130 99 209 110 32 40
BENCHES FOR STUDENTS 195 138 287 115 95 228 80 43 59
TATS/DARI/CARPET FOR STUDENTS 226 162 232 175 111 152 51 51 80
ALMIRA 329 147 144 214 117 107 115 30 37
OTHERS 17 112 491 8 71 359 9 41 132
MIDDLE/ELEMENTRY
TABLE FOR TEACHERS 518 138 67 317 95 40 201 43 27
CHAIR FOR TEACHERS 628 80 15 376 64 12 252 16 3
CHAIR FOR STUDENTS 323 139 261 177 86 189 146 53 72
DESKS FOR STUDENTS 385 135 203 193 95 164 192 40 39
BENCHES FOR STUDENTS 343 129 251 182 87 183 161 42 68
TATS/DARI/CARPET FOR STUDENTS 263 159 301 191 95 166 72 64 135
ALMIRA 489 141 93 294 93 65 195 48 28
OTHERS 18 124 581 7 80 365 11 44 216
SECONDRY/HIGH
TABLE FOR TEACHERS 867 139 88 255 62 22 612 77 66
CHAIR FOR TEACHERS 1,017 54 23 304 28 7 713 26 16
CHAIR FOR STUDENTS 703 125 266 185 44 110 518 81 156
DESKS FOR STUDENTS 819 110 165 211 47 81 608 63 84
BENCHES FOR STUDENTS 705 120 269 202 46 91 503 74 178
TATS/DARI/CARPET FOR STUDENTS 232 205 657 112 61 166 120 144 491
ALMIRA 877 116 101 269 38 32 608 78 69
OTHERS 54 151 889 15 54 270 39 97 619
HIGHER-SECONDRY
TABLE FOR TEACHERS 118 26 8 44 14 4 74 12 4
CHAIR FOR TEACHERS 135 14 3 51 8 3 84 6

CHAIR FOR STUDENTS 94 18 40 30 7 25 64 11 15
DESKS FOR STUDENTS 95 22 35 33 9 20 62 13 15
BENCHES FOR STUDENTS 68 24 60 25 10 27 43 14 33
TATS/DARI/CARPET FOR STUDENTS 25 26 101 17 13 32 8 13 69
ALMIRA 116 23 13 45 12 5 71 11 8
OTHERS 7 15 130 4 4 54 3 11 76

TABLE 42.2 SCHOOLS(PRIVATE) BY LEVEL, GENDER AND AVAILABILITY OF FURNITURE
PAKISTAN BOYS SCHOOLS (Number)
------------------------------------------------------------------------------------------------------------------------------------
| ALL AREAS | RURAL AREAS | URBAN AREAS
LEVEL OF SCHOOL/FURNITURE |--------------------------------------------------------------------------------------------------
REGIONS | ADEQUATE |INADEQUATE| NOT | ADEQUATE |INADEQUATE| NOT | ADEQUATE |INADEQUATE| NOT
| | |AVAILABLE | | |AVAILABLE | | |AVAILABLE
------------------------------------------------------------------------------------------------------------------------------------
PRE-PRIMARY
TABLE FOR TEACHERS 25 7 8 20 5 7 5 2 1
CHAIR FOR TEACHERS 25 10 5 20 7 5 5 3
CHAIR FOR STUDENTS 10 8 22 7 7 18 3 1 4
DESKS FOR STUDENTS 9 7 24 4 6 22 5 1 2
BENCHES FOR STUDENTS 4 10 26 3 8 21 1 2 5
TATS/DARI/CARPET FOR STUDENTS 17 9 14 15 9 8 2 6
ALMIRA 9 14 17 6 10 16 3 4 1
OTHERS 1 9 30 5 27 1 4 3
MOSQUE
TABLE FOR TEACHERS 1 1 1 1 1 1
CHAIR FOR TEACHERS 2 1 1 1 1
CHAIR FOR STUDENTS 1 2 2 1
DESKS FOR STUDENTS 2 1 1 1 1
BENCHES FOR STUDENTS 2 1 1 1 1
TATS/DARI/CARPET FOR STUDENTS 1 2 2 1
ALMIRA 2 1 1 1 1
OTHERS 3 2 1
PRIMARY
TABLE FOR TEACHERS 470 163 101 323 139 77 147 24 24
CHAIR FOR TEACHERS 557 122 55 385 107 47 172 15 8
CHAIR FOR STUDENTS 217 138 379 128 97 314 89 41 65
DESKS FOR STUDENTS 235 166 333 120 129 290 115 37 43
BENCHES FOR STUDENTS 217 174 343 133 128 278 84 46 65
TATS/DARI/CARPET FOR STUDENTS 222 179 333 177 131 231 45 48 102
ALMIRA 364 171 199 230 140 169 134 31 30
OTHERS 18 96 620 12 68 459 6 28 161
MIDDLE/ELEMENTRY
TABLE FOR TEACHERS 458 105 52 239 78 32 219 27 20
CHAIR FOR TEACHERS 537 64 14 290 51 8 247 13 6
CHAIR FOR STUDENTS 270 108 237 109 64 176 161 44 61
DESKS FOR STUDENTS 380 108 127 181 70 98 199 38 29
BENCHES FOR STUDENTS 366 98 151 186 64 99 180 34 52
TATS/DARI/CARPET FOR STUDENTS 132 128 355 92 71 186 40 57 169
ALMIRA 407 118 90 209 78 62 198 40 28
OTHERS 18 98 499 6 66 277 12 32 222
SECONDRY/HIGH
TABLE FOR TEACHERS 777 147 59 263 85 24 514 62 35
CHAIR FOR TEACHERS 902 66 15 321 42 9 581 24 6
CHAIR FOR STUDENTS 603 142 238 166 72 134 437 70 104
DESKS FOR STUDENTS 751 116 116 241 61 70 510 55 46
BENCHES FOR STUDENTS 664 135 184 225 61 86 439 74 98
TATS/DARI/CARPET FOR STUDENTS 175 228 580 81 85 206 94 143 374
ALMIRA 762 129 92 260 65 47 502 64 45
OTHERS 41 161 781 3 67 302 38 94 479
HIGHER-SECONDRY
TABLE FOR TEACHERS 178 32 10 93 22 5 85 10 5
CHAIR FOR TEACHERS 195 21 4 102 15 3 93 6 1

CHAIR FOR STUDENTS 120 33 67 50 22 48 70 11 19
DESKS FOR STUDENTS 171 24 25 91 15 14 80 9 11
BENCHES FOR STUDENTS 143 24 53 84 13 23 59 11 30
TATS/DARI/CARPET FOR STUDENTS 29 56 135 15 29 76 14 27 59
ALMIRA 157 43 20 80 29 11 77 14 9
OTHERS 11 37 172 4 19 97 7 18 75

TABLE 42.2 SCHOOLS(PRIVATE) BY LEVEL, GENDER AND AVAILABILITY OF FURNITURE
PAKISTAN MIX SCHOOLS (Number)
------------------------------------------------------------------------------------------------------------------------------------
| ALL AREAS | RURAL AREAS | URBAN AREAS
LEVEL OF SCHOOL/FURNITURE |--------------------------------------------------------------------------------------------------
REGIONS | ADEQUATE |INADEQUATE| NOT | ADEQUATE |INADEQUATE| NOT | ADEQUATE |INADEQUATE| NOT
| | |AVAILABLE | | |AVAILABLE | | |AVAILABLE
------------------------------------------------------------------------------------------------------------------------------------
PRE-PRIMARY
TABLE FOR TEACHERS 552 80 110 164 50 60 388 30 50
CHAIR FOR TEACHERS 633 52 57 195 36 43 438 16 14
CHAIR FOR STUDENTS 475 69 198 81 36 157 394 33 41
DESKS FOR STUDENTS 402 102 238 76 47 151 326 55 87
BENCHES FOR STUDENTS 293 132 317 72 51 151 221 81 166
TATS/DARI/CARPET FOR STUDENTS 187 190 365 84 78 112 103 112 253
ALMIRA 484 99 159 101 60 113 383 39 46
OTHERS 36 126 580 3 37 234 33 89 346
MOSQUE
TABLE FOR TEACHERS 41 14 9 23 7 5 18 7 4
CHAIR FOR TEACHERS 44 13 7 25 7 3 19 6 4
CHAIR FOR STUDENTS 21 19 24 7 10 18 14 9 6
DESKS FOR STUDENTS 21 20 23 8 11 16 13 9 7
BENCHES FOR STUDENTS 21 15 28 10 9 16 11 6 12
TATS/DARI/CARPET FOR STUDENTS 21 17 26 11 11 13 10 6 13
ALMIRA 35 16 13 15 11 9 20 5 4
OTHERS 2 15 47 10 25 2 5 22
PRIMARY
TABLE FOR TEACHERS 11,168 2,621 1,680 5,337 1,516 865 5,831 1,105 815
CHAIR FOR TEACHERS 13,917 1,117 435 6,669 754 295 7,248 363 140
CHAIR FOR STUDENTS 7,615 2,289 5,565 3,038 1,278 3,402 4,577 1,011 2,163
DESKS FOR STUDENTS 9,201 2,260 4,008 3,721 1,384 2,613 5,480 876 1,395
BENCHES FOR STUDENTS 8,239 2,449 4,781 3,712 1,384 2,622 4,527 1,065 2,159
TATS/DARI/CARPET FOR STUDENTS 2,969 3,201 9,299 1,842 1,647 4,229 1,127 1,554 5,070
ALMIRA 10,033 2,775 2,661 4,477 1,654 1,587 5,556 1,121 1,074
OTHERS 468 2,258 12,743 172 1,115 6,431 296 1,143 6,312
MIDDLE/ELEMENTRY
TABLE FOR TEACHERS 16,659 4,025 2,093 7,532 2,282 1,054 9,127 1,743 1,039
CHAIR FOR TEACHERS 21,304 1,220 253 9,960 762 146 11,344 458 107
CHAIR FOR STUDENTS 12,226 3,158 7,393 4,678 1,654 4,536 7,548 1,504 2,857
DESKS FOR STUDENTS 15,708 2,984 4,085 6,622 1,756 2,490 9,086 1,228 1,595
BENCHES FOR STUDENTS 14,359 3,140 5,278 6,675 1,723 2,470 7,684 1,417 2,808
TATS/DARI/CARPET FOR STUDENTS 3,903 4,435 14,439 2,368 2,054 6,446 1,535 2,381 7,993
ALMIRA 16,083 3,798 2,896 7,186 2,075 1,607 8,897 1,723 1,289
OTHERS 855 3,305 18,617 344 1,639 8,885 511 1,666 9,732
SECONDRY/HIGH
TABLE FOR TEACHERS 8,927 1,522 958 2,500 643 431 6,427 879 527
CHAIR FOR TEACHERS 10,850 425 132 3,300 195 79 7,550 230 53
CHAIR FOR STUDENTS 7,781 1,246 2,380 1,910 500 1,164 5,871 746 1,216
DESKS FOR STUDENTS 8,931 1,056 1,420 2,350 503 721 6,581 553 699
BENCHES FOR STUDENTS 7,505 1,398 2,504 2,348 465 761 5,157 933 1,743
TATS/DARI/CARPET FOR STUDENTS 1,741 2,437 7,229 693 728 2,153 1,048 1,709 5,076
ALMIRA 9,014 1,386 1,007 2,525 588 461 6,489 798 546
OTHERS 589 1,668 9,150 118 543 2,913 471 1,125 6,237
HIGHER-SECONDRY
TABLE FOR TEACHERS 563 73 48 160 30 14 403 43 34
CHAIR FOR TEACHERS 634 37 13 191 11 2 443 26 11

CHAIR FOR STUDENTS 538 68 78 135 27 42 403 41 36
DESKS FOR STUDENTS 523 64 97 143 22 39 380 42 58
BENCHES FOR STUDENTS 417 88 179 136 21 47 281 67 132
TATS/DARI/CARPET FOR STUDENTS 117 165 402 38 37 129 79 128 273
ALMIRA 577 66 41 160 23 21 417 43 20
OTHERS 52 109 523 13 31 160 39 78 363

TABLE 43 SCHOOLS(PUBLIC AND PRIVATE) BY LEVEL, GENDER AND AVAILABILITY OF APPARATUS
PAKISTAN ALL SCHOOLS (Number)
------------------------------------------------------------------------------------------------------------------------------------
| ALL AREAS | RURAL AREAS | URBAN AREAS
LEVEL OF SCHOOL/FURNITURE |--------------------------------------------------------------------------------------------------
REGIONS/KIND OF ROOMS |AVAILABLE | NOT | NOT |AVAILABLE | NOT | NOT |AVAILABLE | NOT | NOT
| |AVAILABLE |APPLICABLE| |AVAILABLE |APPLICABLE| |AVAILABLE |APPLICABLE
------------------------------------------------------------------------------------------------------------------------------------
PRE-PRIMARY
COMPUTERS 255 579 247 30 376 183 225 203 64
PRINTERS 161 616 304 14 356 219 147 260 85
PHYSICS APPARATUS 1,081 589 492
BIOLOGY MATERIAL 1,081 589 492
CHEMICAL/CHEMISTRY APPARATUS 1,081 589 492
BOOKS IN LIBERARY 123 628 330 14 391 184 109 237 146
HOME ECONOMICS MATERIAL 1,081 589 492
SPORTS MATERIAL 269 633 179 49 427 113 220 206 66
MOSQUE
COMPUTERS 36 9,743 4,344 19 8,939 4,037 17 804 307
PRINTERS 19 8,868 5,236 11 8,119 4,865 8 749 371
PHYSICS APPARATUS 14,123 12,995 1,128
BIOLOGY MATERIAL 14,123 12,995 1,128
CHEMICAL/CHEMISTRY APPARATUS 14,123 12,995 1,128
BOOKS IN LIBERARY 328 9,537 4,258 283 8,757 3,955 45 780 303
HOME ECONOMICS MATERIAL 14,123 12,995 1,128
SPORTS MATERIAL 134 11,515 2,474 104 10,586 2,305 30 929 169
PRIMARY
COMPUTERS 4,463 89,991 27,895 1,397 77,235 25,231 3,066 12,756 2,664
PRINTERS 2,053 84,557 35,739 523 71,201 32,139 1,530 13,356 3,600
PHYSICS APPARATUS 122,349 103,863 18,486
BIOLOGY MATERIAL 122,349 103,863 18,486
CHEMICAL/CHEMISTRY APPARATUS 122,349 103,863 18,486
BOOKS IN LIBERARY 11,207 81,546 29,596 8,648 69,600 25,615 2,559 11,946 3,981
HOME ECONOMICS MATERIAL 122,349 103,863 18,486
SPORTS MATERIAL 7,004 99,172 16,173 3,994 85,687 14,182 3,010 13,485 1,991
MIDDLE/ELEMENTRY
COMPUTERS 10,082 24,354 4,013 3,439 17,354 3,193 6,643 7,000 820
PRINTERS 4,512 28,061 5,876 1,330 18,159 4,497 3,182 9,902 1,379
PHYSICS APPARATUS 38,449 23,986 14,463
BIOLOGY MATERIAL 38,449 23,986 14,463
CHEMICAL/CHEMISTRY APPARATUS 38,449 23,986 14,463
BOOKS IN LIBERARY 10,719 22,364 5,366 5,937 14,612 3,437 4,782 7,752 1,929
HOME ECONOMICS MATERIAL 38,449 23,986 14,463
SPORTS MATERIAL 9,230 26,413 2,806 4,639 17,561 1,786 4,591 8,852 1,020
SECONDRY/HIGH
COMPUTERS 10,704 11,232 1,019 2,661 7,580 690 8,043 3,652 329
PRINTERS 7,442 13,959 1,554 1,553 8,351 1,027 5,889 5,608 527
PHYSICS APPARATUS 12,010 8,117 2,828 4,286 5,045 1,600 7,724 3,072 1,228
BIOLOGY MATERIAL 11,916 8,201 2,838 4,236 5,100 1,595 7,680 3,101 1,243
CHEMICAL/CHEMISTRY APPARATUS 12,259 7,894 2,802 4,394 4,951 1,586 7,865 2,943 1,216
BOOKS IN LIBERARY 13,205 8,760 990 5,496 4,911 524 7,709 3,849 466
HOME ECONOMICS MATERIAL 2,224 12,380 8,351 726 5,612 4,593 1,498 6,768 3,758
SPORTS MATERIAL 10,672 11,515 768 3,972 6,585 374 6,700 4,930 394
HIGHER-SECONDRY
COMPUTERS 1,171 906 58 378 624 38 793 282 20
PRINTERS 876 1,144 115 265 694 81 611 450 34

PHYSICS APPARATUS 1,346 628 161 553 391 96 793 237 65
BIOLOGY MATERIAL 1,339 634 162 548 396 96 791 238 66
CHEMICAL/CHEMISTRY APPARATUS 1,364 605 166 558 386 96 806 219 70
BOOKS IN LIBERARY 1,470 612 53 659 356 25 811 256 28
HOME ECONOMICS MATERIAL 291 1,127 717 106 543 391 185 584 326
SPORTS MATERIAL 1,200 869 66 486 517 37 714 352 29

TABLE 43 SCHOOLS(PUBLIC AND PRIVATE) BY LEVEL, GENDER AND AVAILABILITY OF APPARATUS
PAKISTAN GIRLS SCHOOLS (Number)
------------------------------------------------------------------------------------------------------------------------------------
| ALL AREAS | RURAL AREAS | URBAN AREAS
LEVEL OF SCHOOL/FURNITURE |--------------------------------------------------------------------------------------------------
REGIONS/KIND OF ROOMS |AVAILABLE | NOT | NOT |AVAILABLE | NOT | NOT |AVAILABLE | NOT | NOT
| |AVAILABLE |APPLICABLE| |AVAILABLE |APPLICABLE| |AVAILABLE |APPLICABLE
------------------------------------------------------------------------------------------------------------------------------------
PRE-PRIMARY
COMPUTERS 3 32 28 2 31 27 1 1 1
PRINTERS 1 31 31 1 29 30 2 1
PHYSICS APPARATUS 63 60 3
BIOLOGY MATERIAL 63 60 3
CHEMICAL/CHEMISTRY APPARATUS 63 60 3
BOOKS IN LIBERARY 1 37 25 37 23 1 2
HOME ECONOMICS MATERIAL 63 60 3
SPORTS MATERIAL 2 42 19 1 41 18 1 1 1
MOSQUE
COMPUTERS 6 2,800 1,482 2 2,545 1,370 4 255 112
PRINTERS 5 2,522 1,761 2 2,284 1,631 3 238 130
PHYSICS APPARATUS 4,288 3,917 371
BIOLOGY MATERIAL 4,288 3,917 371
CHEMICAL/CHEMISTRY APPARATUS 4,288 3,917 371
BOOKS IN LIBERARY 104 2,778 1,406 86 2,534 1,297 18 244 109
HOME ECONOMICS MATERIAL 4,288 3,917 371
SPORTS MATERIAL 32 3,475 781 27 3,171 719 5 304 62
PRIMARY
COMPUTERS 229 24,799 8,281 145 22,543 7,584 84 2,256 697
PRINTERS 125 22,736 10,448 71 20,619 9,582 54 2,117 866
PHYSICS APPARATUS 33,309 30,272 3,037
BIOLOGY MATERIAL 33,309 30,272 3,037
CHEMICAL/CHEMISTRY APPARATUS 33,309 30,272 3,037
BOOKS IN LIBERARY 2,957 22,279 8,073 2,681 20,221 7,370 276 2,058 703
HOME ECONOMICS MATERIAL 33,309 30,272 3,037
SPORTS MATERIAL 1,100 27,851 4,358 878 25,392 4,002 222 2,459 356
MIDDLE/ELEMENTRY
COMPUTERS 359 4,862 1,003 184 4,107 893 175 755 110
PRINTERS 151 4,748 1,325 69 3,939 1,176 82 809 149
PHYSICS APPARATUS 6,224 5,184 1,040
BIOLOGY MATERIAL 6,224 5,184 1,040
CHEMICAL/CHEMISTRY APPARATUS 6,224 5,184 1,040
BOOKS IN LIBERARY 1,486 3,750 988 1,248 3,107 829 238 643 159
HOME ECONOMICS MATERIAL 6,224 5,184 1,040
SPORTS MATERIAL 1,039 4,659 526 791 3,951 442 248 708 84
SECONDRY/HIGH
COMPUTERS 1,660 4,422 378 620 3,442 298 1,040 980 80
PRINTERS 1,208 4,703 549 410 3,515 435 798 1,188 114
PHYSICS APPARATUS 3,544 2,362 554 2,048 1,899 413 1,496 463 141
BIOLOGY MATERIAL 3,482 2,436 542 1,989 1,971 400 1,493 465 142
CHEMICAL/CHEMISTRY APPARATUS 3,658 2,272 530 2,121 1,844 395 1,537 428 135
BOOKS IN LIBERARY 3,982 2,220 258 2,521 1,660 179 1,461 560 79
HOME ECONOMICS MATERIAL 104 1,710 4,646 48 1,095 3,217 56 615 1,429
SPORTS MATERIAL 2,921 3,293 246 1,660 2,542 158 1,261 751 88
HIGHER-SECONDRY
COMPUTERS 294 355 14 142 264 9 152 91 5
PRINTERS 214 408 41 103 279 33 111 129 8

PHYSICS APPARATUS 451 176 36 253 133 29 198 43 7
BIOLOGY MATERIAL 447 179 37 253 132 30 194 47 7
CHEMICAL/CHEMISTRY APPARATUS 454 172 37 253 132 30 201 40 7
BOOKS IN LIBERARY 491 154 18 298 106 11 193 48 7
HOME ECONOMICS MATERIAL 8 197 458 4 116 295 4 81 163
SPORTS MATERIAL 386 252 25 217 178 20 169 74 5

TABLE 43 SCHOOLS(PUBLIC AND PRIVATE) BY LEVEL, GENDER AND AVAILABILITY OF APPARATUS
PAKISTAN BOYS SCHOOLS (Number)
------------------------------------------------------------------------------------------------------------------------------------
| ALL AREAS | RURAL AREAS | URBAN AREAS
LEVEL OF SCHOOL/FURNITURE |--------------------------------------------------------------------------------------------------
REGIONS/KIND OF ROOMS |AVAILABLE | NOT | NOT |AVAILABLE | NOT | NOT |AVAILABLE | NOT | NOT
| |AVAILABLE |APPLICABLE| |AVAILABLE |APPLICABLE| |AVAILABLE |APPLICABLE
------------------------------------------------------------------------------------------------------------------------------------
PRE-PRIMARY
COMPUTERS 3 62 31 1 56 21 2 6 10
PRINTERS 2 62 32 1 55 22 1 7 10
PHYSICS APPARATUS 96 78 18
BIOLOGY MATERIAL 96 78 18
CHEMICAL/CHEMISTRY APPARATUS 96 78 18
BOOKS IN LIBERARY 1 57 38 52 26 1 5 12
HOME ECONOMICS MATERIAL 96 78 18
SPORTS MATERIAL 3 66 27 60 18 3 6 9
MOSQUE
COMPUTERS 2 129 32 1 121 27 1 8 5
PRINTERS 1 123 39 116 33 1 7 6
PHYSICS APPARATUS 163 149 14
BIOLOGY MATERIAL 163 149 14
CHEMICAL/CHEMISTRY APPARATUS 163 149 14
BOOKS IN LIBERARY 5 122 36 4 112 33 1 10 3
HOME ECONOMICS MATERIAL 163 149 14
SPORTS MATERIAL 3 135 25 2 122 25 1 13
PRIMARY
COMPUTERS 163 22,593 7,322 86 20,141 6,764 77 2,452 558
PRINTERS 88 20,739 9,251 43 18,421 8,527 45 2,318 724
PHYSICS APPARATUS 30,078 26,991 3,087
BIOLOGY MATERIAL 30,078 26,991 3,087
CHEMICAL/CHEMISTRY APPARATUS 30,078 26,991 3,087
BOOKS IN LIBERARY 2,518 20,315 7,245 2,256 18,178 6,557 262 2,137 688
HOME ECONOMICS MATERIAL 30,078 26,991 3,087
SPORTS MATERIAL 1,117 25,075 3,886 885 22,573 3,533 232 2,502 353
MIDDLE/ELEMENTRY
COMPUTERS 265 5,521 1,023 106 4,706 903 159 815 120
PRINTERS 137 5,300 1,372 44 4,464 1,207 93 836 165
PHYSICS APPARATUS 6,809 5,715 1,094
BIOLOGY MATERIAL 6,809 5,715 1,094
CHEMICAL/CHEMISTRY APPARATUS 6,809 5,715 1,094
BOOKS IN LIBERARY 1,654 4,230 925 1,370 3,565 780 284 665 145
HOME ECONOMICS MATERIAL 6,809 5,715 1,094
SPORTS MATERIAL 873 5,456 480 636 4,671 408 237 785 72
SECONDRY/HIGH
COMPUTERS 1,148 2,578 220 278 1,708 154 870 870 66
PRINTERS 772 2,849 325 155 1,749 236 617 1,100 89
PHYSICS APPARATUS 1,697 1,773 476 614 1,201 325 1,083 572 151
BIOLOGY MATERIAL 1,689 1,777 480 604 1,206 330 1,085 571 150
CHEMICAL/CHEMISTRY APPARATUS 1,712 1,759 475 608 1,204 328 1,104 555 147
BOOKS IN LIBERARY 2,000 1,777 169 926 1,114 100 1,074 663 69
HOME ECONOMICS MATERIAL 725 2,670 551 288 1,561 291 437 1,109 260
SPORTS MATERIAL 1,474 2,342 130 562 1,512 66 912 830 64
HIGHER-SECONDRY
COMPUTERS 280 353 28 92 243 16 188 110 12
PRINTERS 197 424 40 60 261 30 137 163 10

PHYSICS APPARATUS 373 235 53 165 150 36 208 85 17
BIOLOGY MATERIAL 374 235 52 164 152 35 210 83 17
CHEMICAL/CHEMISTRY APPARATUS 377 229 55 165 150 36 212 79 19
BOOKS IN LIBERARY 406 244 11 189 157 5 217 87 6
HOME ECONOMICS MATERIAL 171 419 71 70 243 38 101 176 33
SPORTS MATERIAL 305 339 17 124 219 8 181 120 9
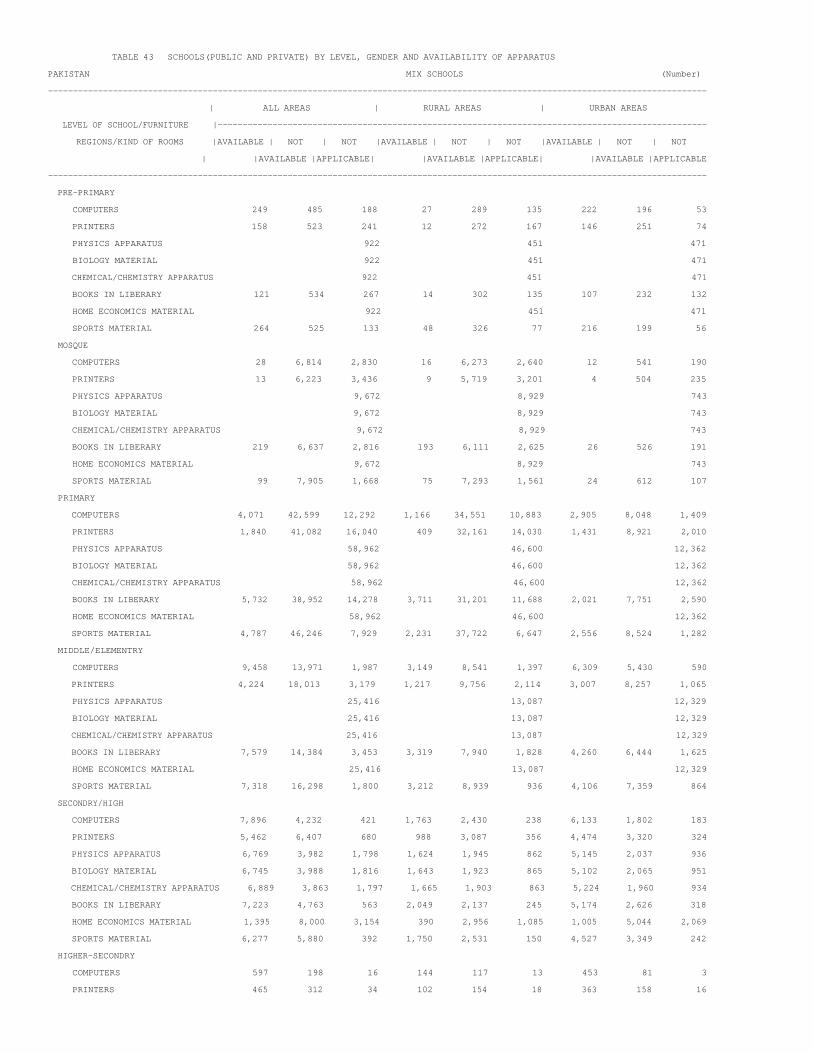
TABLE 43 SCHOOLS(PUBLIC AND PRIVATE) BY LEVEL, GENDER AND AVAILABILITY OF APPARATUS
PAKISTAN MIX SCHOOLS (Number)
------------------------------------------------------------------------------------------------------------------------------------
| ALL AREAS | RURAL AREAS | URBAN AREAS
LEVEL OF SCHOOL/FURNITURE |--------------------------------------------------------------------------------------------------
REGIONS/KIND OF ROOMS |AVAILABLE | NOT | NOT |AVAILABLE | NOT | NOT |AVAILABLE | NOT | NOT
| |AVAILABLE |APPLICABLE| |AVAILABLE |APPLICABLE| |AVAILABLE |APPLICABLE
------------------------------------------------------------------------------------------------------------------------------------
PRE-PRIMARY
COMPUTERS 249 485 188 27 289 135 222 196 53
PRINTERS 158 523 241 12 272 167 146 251 74
PHYSICS APPARATUS 922 451 471
BIOLOGY MATERIAL 922 451 471
CHEMICAL/CHEMISTRY APPARATUS 922 451 471
BOOKS IN LIBERARY 121 534 267 14 302 135 107 232 132
HOME ECONOMICS MATERIAL 922 451 471
SPORTS MATERIAL 264 525 133 48 326 77 216 199 56
MOSQUE
COMPUTERS 28 6,814 2,830 16 6,273 2,640 12 541 190
PRINTERS 13 6,223 3,436 9 5,719 3,201 4 504 235
PHYSICS APPARATUS 9,672 8,929 743
BIOLOGY MATERIAL 9,672 8,929 743
CHEMICAL/CHEMISTRY APPARATUS 9,672 8,929 743
BOOKS IN LIBERARY 219 6,637 2,816 193 6,111 2,625 26 526 191
HOME ECONOMICS MATERIAL 9,672 8,929 743
SPORTS MATERIAL 99 7,905 1,668 75 7,293 1,561 24 612 107
PRIMARY
COMPUTERS 4,071 42,599 12,292 1,166 34,551 10,883 2,905 8,048 1,409
PRINTERS 1,840 41,082 16,040 409 32,161 14,030 1,431 8,921 2,010
PHYSICS APPARATUS 58,962 46,600 12,362
BIOLOGY MATERIAL 58,962 46,600 12,362
CHEMICAL/CHEMISTRY APPARATUS 58,962 46,600 12,362
BOOKS IN LIBERARY 5,732 38,952 14,278 3,711 31,201 11,688 2,021 7,751 2,590
HOME ECONOMICS MATERIAL 58,962 46,600 12,362
SPORTS MATERIAL 4,787 46,246 7,929 2,231 37,722 6,647 2,556 8,524 1,282
MIDDLE/ELEMENTRY
COMPUTERS 9,458 13,971 1,987 3,149 8,541 1,397 6,309 5,430 590
PRINTERS 4,224 18,013 3,179 1,217 9,756 2,114 3,007 8,257 1,065
PHYSICS APPARATUS 25,416 13,087 12,329
BIOLOGY MATERIAL 25,416 13,087 12,329
CHEMICAL/CHEMISTRY APPARATUS 25,416 13,087 12,329
BOOKS IN LIBERARY 7,579 14,384 3,453 3,319 7,940 1,828 4,260 6,444 1,625
HOME ECONOMICS MATERIAL 25,416 13,087 12,329
SPORTS MATERIAL 7,318 16,298 1,800 3,212 8,939 936 4,106 7,359 864
SECONDRY/HIGH
COMPUTERS 7,896 4,232 421 1,763 2,430 238 6,133 1,802 183
PRINTERS 5,462 6,407 680 988 3,087 356 4,474 3,320 324
PHYSICS APPARATUS 6,769 3,982 1,798 1,624 1,945 862 5,145 2,037 936
BIOLOGY MATERIAL 6,745 3,988 1,816 1,643 1,923 865 5,102 2,065 951
CHEMICAL/CHEMISTRY APPARATUS 6,889 3,863 1,797 1,665 1,903 863 5,224 1,960 934
BOOKS IN LIBERARY 7,223 4,763 563 2,049 2,137 245 5,174 2,626 318
HOME ECONOMICS MATERIAL 1,395 8,000 3,154 390 2,956 1,085 1,005 5,044 2,069
SPORTS MATERIAL 6,277 5,880 392 1,750 2,531 150 4,527 3,349 242
HIGHER-SECONDRY
COMPUTERS 597 198 16 144 117 13 453 81 3
PRINTERS 465 312 34 102 154 18 363 158 16

PHYSICS APPARATUS 522 217 72 135 108 31 387 109 41
BIOLOGY MATERIAL 518 220 73 131 112 31 387 108 42
CHEMICAL/CHEMISTRY APPARATUS 533 204 74 140 104 30 393 100 44
BOOKS IN LIBERARY 573 214 24 172 93 9 401 121 15
HOME ECONOMICS MATERIAL 112 511 188 32 184 58 80 327 130
SPORTS MATERIAL 509 278 24 145 120 9 364 158 15
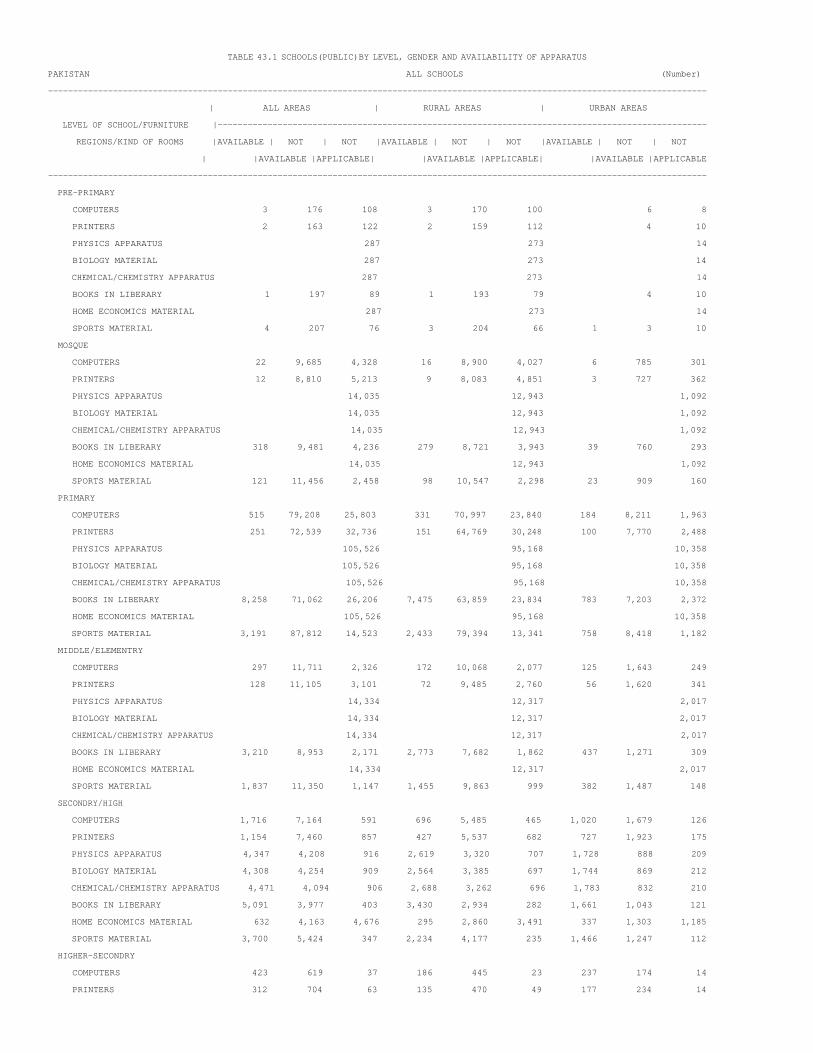
TABLE 43.1 SCHOOLS(PUBLIC)BY LEVEL, GENDER AND AVAILABILITY OF APPARATUS
PAKISTAN ALL SCHOOLS (Number)
------------------------------------------------------------------------------------------------------------------------------------
| ALL AREAS | RURAL AREAS | URBAN AREAS
LEVEL OF SCHOOL/FURNITURE |--------------------------------------------------------------------------------------------------
REGIONS/KIND OF ROOMS |AVAILABLE | NOT | NOT |AVAILABLE | NOT | NOT |AVAILABLE | NOT | NOT
| |AVAILABLE |APPLICABLE| |AVAILABLE |APPLICABLE| |AVAILABLE |APPLICABLE
------------------------------------------------------------------------------------------------------------------------------------
PRE-PRIMARY
COMPUTERS 3 176 108 3 170 100 6 8
PRINTERS 2 163 122 2 159 112 4 10
PHYSICS APPARATUS 287 273 14
BIOLOGY MATERIAL 287 273 14
CHEMICAL/CHEMISTRY APPARATUS 287 273 14
BOOKS IN LIBERARY 1 197 89 1 193 79 4 10
HOME ECONOMICS MATERIAL 287 273 14
SPORTS MATERIAL 4 207 76 3 204 66 1 3 10
MOSQUE
COMPUTERS 22 9,685 4,328 16 8,900 4,027 6 785 301
PRINTERS 12 8,810 5,213 9 8,083 4,851 3 727 362
PHYSICS APPARATUS 14,035 12,943 1,092
BIOLOGY MATERIAL 14,035 12,943 1,092
CHEMICAL/CHEMISTRY APPARATUS 14,035 12,943 1,092
BOOKS IN LIBERARY 318 9,481 4,236 279 8,721 3,943 39 760 293
HOME ECONOMICS MATERIAL 14,035 12,943 1,092
SPORTS MATERIAL 121 11,456 2,458 98 10,547 2,298 23 909 160
PRIMARY
COMPUTERS 515 79,208 25,803 331 70,997 23,840 184 8,211 1,963
PRINTERS 251 72,539 32,736 151 64,769 30,248 100 7,770 2,488
PHYSICS APPARATUS 105,526 95,168 10,358
BIOLOGY MATERIAL 105,526 95,168 10,358
CHEMICAL/CHEMISTRY APPARATUS 105,526 95,168 10,358
BOOKS IN LIBERARY 8,258 71,062 26,206 7,475 63,859 23,834 783 7,203 2,372
HOME ECONOMICS MATERIAL 105,526 95,168 10,358
SPORTS MATERIAL 3,191 87,812 14,523 2,433 79,394 13,341 758 8,418 1,182
MIDDLE/ELEMENTRY
COMPUTERS 297 11,711 2,326 172 10,068 2,077 125 1,643 249
PRINTERS 128 11,105 3,101 72 9,485 2,760 56 1,620 341
PHYSICS APPARATUS 14,334 12,317 2,017
BIOLOGY MATERIAL 14,334 12,317 2,017
CHEMICAL/CHEMISTRY APPARATUS 14,334 12,317 2,017
BOOKS IN LIBERARY 3,210 8,953 2,171 2,773 7,682 1,862 437 1,271 309
HOME ECONOMICS MATERIAL 14,334 12,317 2,017
SPORTS MATERIAL 1,837 11,350 1,147 1,455 9,863 999 382 1,487 148
SECONDRY/HIGH
COMPUTERS 1,716 7,164 591 696 5,485 465 1,020 1,679 126
PRINTERS 1,154 7,460 857 427 5,537 682 727 1,923 175
PHYSICS APPARATUS 4,347 4,208 916 2,619 3,320 707 1,728 888 209
BIOLOGY MATERIAL 4,308 4,254 909 2,564 3,385 697 1,744 869 212
CHEMICAL/CHEMISTRY APPARATUS 4,471 4,094 906 2,688 3,262 696 1,783 832 210
BOOKS IN LIBERARY 5,091 3,977 403 3,430 2,934 282 1,661 1,043 121
HOME ECONOMICS MATERIAL 632 4,163 4,676 295 2,860 3,491 337 1,303 1,185
SPORTS MATERIAL 3,700 5,424 347 2,234 4,177 235 1,466 1,247 112
HIGHER-SECONDRY
COMPUTERS 423 619 37 186 445 23 237 174 14
PRINTERS 312 704 63 135 470 49 177 234 14

PHYSICS APPARATUS 695 334 50 385 230 39 310 104 11
BIOLOGY MATERIAL 694 335 50 384 230 40 310 105 10
CHEMICAL/CHEMISTRY APPARATUS 710 318 51 389 226 39 321 92 12
BOOKS IN LIBERARY 755 305 19 443 199 12 312 106 7
HOME ECONOMICS MATERIAL 155 506 418 64 301 289 91 205 129
SPORTS MATERIAL 603 443 33 311 317 26 292 126 7

TABLE 43.1 SCHOOLS(PUBLIC)BY LEVEL, GENDER AND AVAILABILITY OF APPARATUS
PAKISTAN GIRLS SCHOOLS (Number)
------------------------------------------------------------------------------------------------------------------------------------
| ALL AREAS | RURAL AREAS | URBAN AREAS
LEVEL OF SCHOOL/FURNITURE |--------------------------------------------------------------------------------------------------
REGIONS/KIND OF ROOMS |AVAILABLE | NOT | NOT |AVAILABLE | NOT | NOT |AVAILABLE | NOT | NOT
| |AVAILABLE |APPLICABLE| |AVAILABLE |APPLICABLE| |AVAILABLE |APPLICABLE
------------------------------------------------------------------------------------------------------------------------------------
PRE-PRIMARY
COMPUTERS 1 25 25 1 25 24 1
PRINTERS 1 24 26 1 24 25 1
PHYSICS APPARATUS 51 50 1
BIOLOGY MATERIAL 51 50 1
CHEMICAL/CHEMISTRY APPARATUS 51 50 1
BOOKS IN LIBERARY 33 18 33 17 1
HOME ECONOMICS MATERIAL 51 50 1
SPORTS MATERIAL 1 34 16 1 34 15 1
MOSQUE
COMPUTERS 5 2,785 1,477 2 2,534 1,366 3 251 111
PRINTERS 5 2,507 1,755 2 2,274 1,626 3 233 129
PHYSICS APPARATUS 4,267 3,902 365
BIOLOGY MATERIAL 4,267 3,902 365
CHEMICAL/CHEMISTRY APPARATUS 4,267 3,902 365
BOOKS IN LIBERARY 103 2,764 1,400 86 2,522 1,294 17 242 106
HOME ECONOMICS MATERIAL 4,267 3,902 365
SPORTS MATERIAL 32 3,460 775 27 3,159 716 5 301 59
PRIMARY
COMPUTERS 151 24,379 8,159 120 22,224 7,490 31 2,155 669
PRINTERS 76 22,324 10,289 57 20,319 9,458 19 2,005 831
PHYSICS APPARATUS 32,689 29,834 2,855
BIOLOGY MATERIAL 32,689 29,834 2,855
CHEMICAL/CHEMISTRY APPARATUS 32,689 29,834 2,855
BOOKS IN LIBERARY 2,878 21,907 7,904 2,644 19,954 7,236 234 1,953 668
HOME ECONOMICS MATERIAL 32,689 29,834 2,855
SPORTS MATERIAL 977 27,441 4,271 814 25,084 3,936 163 2,357 335
MIDDLE/ELEMENTRY
COMPUTERS 126 4,442 933 75 3,825 832 51 617 101
PRINTERS 47 4,232 1,222 28 3,615 1,089 19 617 133
PHYSICS APPARATUS 5,501 4,732 769
BIOLOGY MATERIAL 5,501 4,732 769
CHEMICAL/CHEMISTRY APPARATUS 5,501 4,732 769
BOOKS IN LIBERARY 1,300 3,318 883 1,140 2,831 761 160 487 122
HOME ECONOMICS MATERIAL 5,501 4,732 769
SPORTS MATERIAL 825 4,201 475 661 3,661 410 164 540 65
SECONDRY/HIGH
COMPUTERS 943 4,092 331 447 3,298 276 496 794 55
PRINTERS 657 4,227 482 286 3,330 405 371 897 77
PHYSICS APPARATUS 2,763 2,156 447 1,854 1,803 364 909 353 83
BIOLOGY MATERIAL 2,713 2,219 434 1,798 1,875 348 915 344 86
CHEMICAL/CHEMISTRY APPARATUS 2,869 2,068 429 1,927 1,747 347 942 321 82
BOOKS IN LIBERARY 3,193 1,956 217 2,319 1,540 162 874 416 55
HOME ECONOMICS MATERIAL 65 1,369 3,932 41 995 2,985 24 374 947
SPORTS MATERIAL 2,260 2,908 198 1,488 2,387 146 772 521 52
HIGHER-SECONDRY
COMPUTERS 185 315 11 108 238 7 77 77 4
PRINTERS 131 351 29 78 252 23 53 99 6

PHYSICS APPARATUS 341 146 24 220 112 21 121 34 3
BIOLOGY MATERIAL 341 146 24 221 110 22 120 36 2
CHEMICAL/CHEMISTRY APPARATUS 345 142 24 220 111 22 125 31 2
BOOKS IN LIBERARY 383 118 10 261 84 8 122 34 2
HOME ECONOMICS MATERIAL 3 156 352 2 100 251 1 56 101
SPORTS MATERIAL 296 197 18 185 151 17 111 46 1
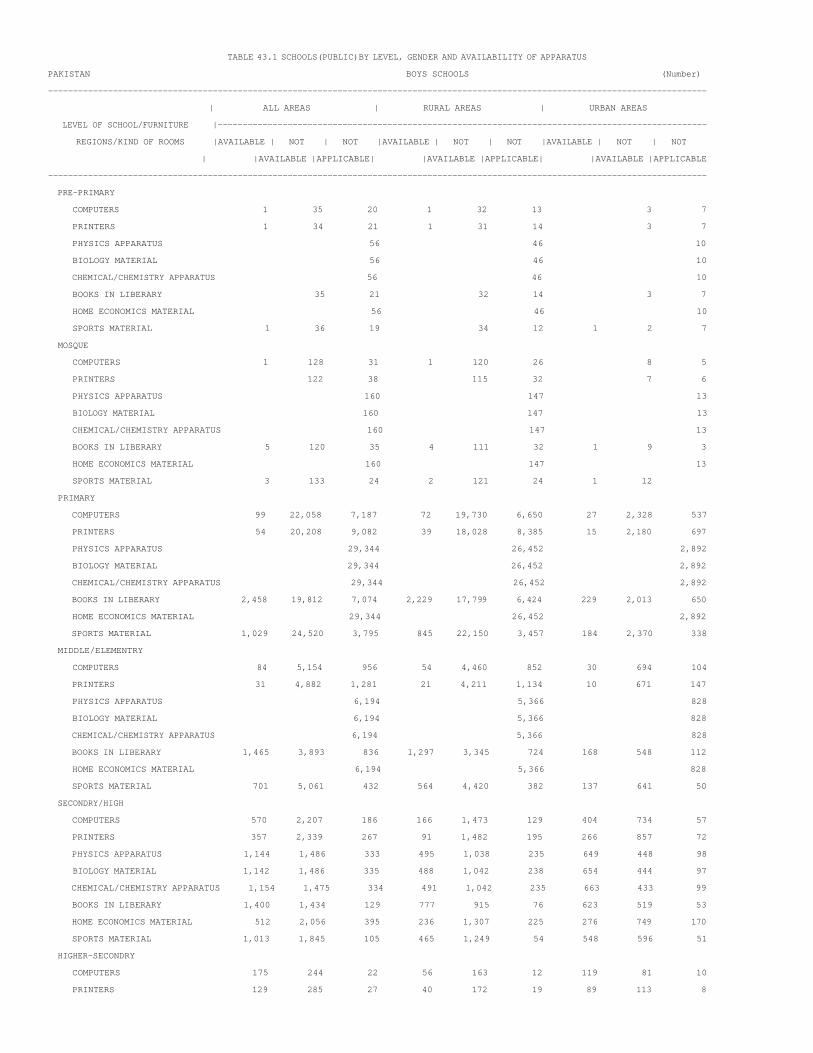
TABLE 43.1 SCHOOLS(PUBLIC)BY LEVEL, GENDER AND AVAILABILITY OF APPARATUS
PAKISTAN BOYS SCHOOLS (Number)
------------------------------------------------------------------------------------------------------------------------------------
| ALL AREAS | RURAL AREAS | URBAN AREAS
LEVEL OF SCHOOL/FURNITURE |--------------------------------------------------------------------------------------------------
REGIONS/KIND OF ROOMS |AVAILABLE | NOT | NOT |AVAILABLE | NOT | NOT |AVAILABLE | NOT | NOT
| |AVAILABLE |APPLICABLE| |AVAILABLE |APPLICABLE| |AVAILABLE |APPLICABLE
------------------------------------------------------------------------------------------------------------------------------------
PRE-PRIMARY
COMPUTERS 1 35 20 1 32 13 3 7
PRINTERS 1 34 21 1 31 14 3 7
PHYSICS APPARATUS 56 46 10
BIOLOGY MATERIAL 56 46 10
CHEMICAL/CHEMISTRY APPARATUS 56 46 10
BOOKS IN LIBERARY 35 21 32 14 3 7
HOME ECONOMICS MATERIAL 56 46 10
SPORTS MATERIAL 1 36 19 34 12 1 2 7
MOSQUE
COMPUTERS 1 128 31 1 120 26 8 5
PRINTERS 122 38 115 32 7 6
PHYSICS APPARATUS 160 147 13
BIOLOGY MATERIAL 160 147 13
CHEMICAL/CHEMISTRY APPARATUS 160 147 13
BOOKS IN LIBERARY 5 120 35 4 111 32 1 9 3
HOME ECONOMICS MATERIAL 160 147 13
SPORTS MATERIAL 3 133 24 2 121 24 1 12
PRIMARY
COMPUTERS 99 22,058 7,187 72 19,730 6,650 27 2,328 537
PRINTERS 54 20,208 9,082 39 18,028 8,385 15 2,180 697
PHYSICS APPARATUS 29,344 26,452 2,892
BIOLOGY MATERIAL 29,344 26,452 2,892
CHEMICAL/CHEMISTRY APPARATUS 29,344 26,452 2,892
BOOKS IN LIBERARY 2,458 19,812 7,074 2,229 17,799 6,424 229 2,013 650
HOME ECONOMICS MATERIAL 29,344 26,452 2,892
SPORTS MATERIAL 1,029 24,520 3,795 845 22,150 3,457 184 2,370 338
MIDDLE/ELEMENTRY
COMPUTERS 84 5,154 956 54 4,460 852 30 694 104
PRINTERS 31 4,882 1,281 21 4,211 1,134 10 671 147
PHYSICS APPARATUS 6,194 5,366 828
BIOLOGY MATERIAL 6,194 5,366 828
CHEMICAL/CHEMISTRY APPARATUS 6,194 5,366 828
BOOKS IN LIBERARY 1,465 3,893 836 1,297 3,345 724 168 548 112
HOME ECONOMICS MATERIAL 6,194 5,366 828
SPORTS MATERIAL 701 5,061 432 564 4,420 382 137 641 50
SECONDRY/HIGH
COMPUTERS 570 2,207 186 166 1,473 129 404 734 57
PRINTERS 357 2,339 267 91 1,482 195 266 857 72
PHYSICS APPARATUS 1,144 1,486 333 495 1,038 235 649 448 98
BIOLOGY MATERIAL 1,142 1,486 335 488 1,042 238 654 444 97
CHEMICAL/CHEMISTRY APPARATUS 1,154 1,475 334 491 1,042 235 663 433 99
BOOKS IN LIBERARY 1,400 1,434 129 777 915 76 623 519 53
HOME ECONOMICS MATERIAL 512 2,056 395 236 1,307 225 276 749 170
SPORTS MATERIAL 1,013 1,845 105 465 1,249 54 548 596 51
HIGHER-SECONDRY
COMPUTERS 175 244 22 56 163 12 119 81 10
PRINTERS 129 285 27 40 172 19 89 113 8

PHYSICS APPARATUS 271 149 21 126 92 13 145 57 8
BIOLOGY MATERIAL 273 148 20 127 92 12 146 56 8
CHEMICAL/CHEMISTRY APPARATUS 277 142 22 128 91 12 149 51 10
BOOKS IN LIBERARY 288 146 7 139 89 3 149 57 4
HOME ECONOMICS MATERIAL 141 265 35 55 155 21 86 110 14
SPORTS MATERIAL 228 203 10 93 133 5 135 70 5

TABLE 43.1 SCHOOLS(PUBLIC)BY LEVEL, GENDER AND AVAILABILITY OF APPARATUS
PAKISTAN MIX SCHOOLS (Number)
------------------------------------------------------------------------------------------------------------------------------------
| ALL AREAS | RURAL AREAS | URBAN AREAS
LEVEL OF SCHOOL/FURNITURE |--------------------------------------------------------------------------------------------------
REGIONS/KIND OF ROOMS |AVAILABLE | NOT | NOT |AVAILABLE | NOT | NOT |AVAILABLE | NOT | NOT
| |AVAILABLE |APPLICABLE| |AVAILABLE |APPLICABLE| |AVAILABLE |APPLICABLE
------------------------------------------------------------------------------------------------------------------------------------
PRE-PRIMARY
COMPUTERS 1 116 63 1 113 63 3
PRINTERS 105 75 104 73 1 2
PHYSICS APPARATUS 180 177 3
BIOLOGY MATERIAL 180 177 3
CHEMICAL/CHEMISTRY APPARATUS 180 177 3
BOOKS IN LIBERARY 1 129 50 1 128 48 1 2
HOME ECONOMICS MATERIAL 180 177 3
SPORTS MATERIAL 2 137 41 2 136 39 1 2
MOSQUE
COMPUTERS 16 6,772 2,820 13 6,246 2,635 3 526 185
PRINTERS 7 6,181 3,420 7 5,694 3,193 487 227
PHYSICS APPARATUS 9,608 8,894 714
BIOLOGY MATERIAL 9,608 8,894 714
CHEMICAL/CHEMISTRY APPARATUS 9,608 8,894 714
BOOKS IN LIBERARY 210 6,597 2,801 189 6,088 2,617 21 509 184
HOME ECONOMICS MATERIAL 9,608 8,894 714
SPORTS MATERIAL 86 7,863 1,659 69 7,267 1,558 17 596 101
PRIMARY
COMPUTERS 265 32,771 10,457 139 29,043 9,700 126 3,728 757
PRINTERS 121 30,007 13,365 55 26,422 12,405 66 3,585 960
PHYSICS APPARATUS 43,493 38,882 4,611
BIOLOGY MATERIAL 43,493 38,882 4,611
CHEMICAL/CHEMISTRY APPARATUS 43,493 38,882 4,611
BOOKS IN LIBERARY 2,922 29,343 11,228 2,602 26,106 10,174 320 3,237 1,054
HOME ECONOMICS MATERIAL 43,493 38,882 4,611
SPORTS MATERIAL 1,185 35,851 6,457 774 32,160 5,948 411 3,691 509
MIDDLE/ELEMENTRY
COMPUTERS 87 2,115 437 43 1,783 393 44 332 44
PRINTERS 50 1,991 598 23 1,659 537 27 332 61
PHYSICS APPARATUS 2,639 2,219 420
BIOLOGY MATERIAL 2,639 2,219 420
CHEMICAL/CHEMISTRY APPARATUS 2,639 2,219 420
BOOKS IN LIBERARY 445 1,742 452 336 1,506 377 109 236 75
HOME ECONOMICS MATERIAL 2,639 2,219 420
SPORTS MATERIAL 311 2,088 240 230 1,782 207 81 306 33
SECONDRY/HIGH
COMPUTERS 203 865 74 83 714 60 120 151 14
PRINTERS 140 894 108 50 725 82 90 169 26
PHYSICS APPARATUS 440 566 136 270 479 108 170 87 28
BIOLOGY MATERIAL 453 549 140 278 468 111 175 81 29
CHEMICAL/CHEMISTRY APPARATUS 448 551 143 270 473 114 178 78 29
BOOKS IN LIBERARY 498 587 57 334 479 44 164 108 13
HOME ECONOMICS MATERIAL 55 738 349 18 558 281 37 180 68
SPORTS MATERIAL 427 671 44 281 541 35 146 130 9
HIGHER-SECONDRY
COMPUTERS 63 60 4 22 44 4 41 16
PRINTERS 52 68 7 17 46 7 35 22

PHYSICS APPARATUS 83 39 5 39 26 5 44 13
BIOLOGY MATERIAL 80 41 6 36 28 6 44 13
CHEMICAL/CHEMISTRY APPARATUS 88 34 5 41 24 5 47 10
BOOKS IN LIBERARY 84 41 2 43 26 1 41 15 1
HOME ECONOMICS MATERIAL 11 85 31 7 46 17 4 39 14
SPORTS MATERIAL 79 43 5 33 33 4 46 10 1

TABLE 43.2 SCHOOLS(PRIVATE) BY LEVEL, GENDER AND AVAILABILITY OF APPARATUS
PAKISTAN ALL SCHOOLS (Number)
------------------------------------------------------------------------------------------------------------------------------------
| ALL AREAS | RURAL AREAS | URBAN AREAS
LEVEL OF SCHOOL/FURNITURE |--------------------------------------------------------------------------------------------------
REGIONS/KIND OF ROOMS |AVAILABLE | NOT | NOT |AVAILABLE | NOT | NOT |AVAILABLE | NOT | NOT
| |AVAILABLE |APPLICABLE| |AVAILABLE |APPLICABLE| |AVAILABLE |APPLICABLE
------------------------------------------------------------------------------------------------------------------------------------
PRE-PRIMARY
COMPUTERS 252 403 139 27 206 83 225 197 56
PRINTERS 159 453 182 12 197 107 147 256 75
PHYSICS APPARATUS 794 316 478
BIOLOGY MATERIAL 794 316 478
CHEMICAL/CHEMISTRY APPARATUS 794 316 478
BOOKS IN LIBERARY 122 431 241 13 198 105 109 233 136
HOME ECONOMICS MATERIAL 794 316 478
SPORTS MATERIAL 265 426 103 46 223 47 219 203 56
MOSQUE
COMPUTERS 14 58 16 3 39 10 11 19 6
PRINTERS 7 58 23 2 36 14 5 22 9
PHYSICS APPARATUS 88 52 36
BIOLOGY MATERIAL 88 52 36
CHEMICAL/CHEMISTRY APPARATUS 88 52 36
BOOKS IN LIBERARY 10 56 22 4 36 12 6 20 10
HOME ECONOMICS MATERIAL 88 52 36
SPORTS MATERIAL 13 59 16 6 39 7 7 20 9
PRIMARY
COMPUTERS 3,948 10,783 2,092 1,066 6,238 1,391 2,882 4,545 701
PRINTERS 1,802 12,018 3,003 372 6,432 1,891 1,430 5,586 1,112
PHYSICS APPARATUS 16,823 8,695 8,128
BIOLOGY MATERIAL 16,823 8,695 8,128
CHEMICAL/CHEMISTRY APPARATUS 16,823 8,695 8,128
BOOKS IN LIBERARY 2,949 10,484 3,390 1,173 5,741 1,781 1,776 4,743 1,609
HOME ECONOMICS MATERIAL 16,823 8,695 8,128
SPORTS MATERIAL 3,813 11,360 1,650 1,561 6,293 841 2,252 5,067 809
MIDDLE/ELEMENTRY
COMPUTERS 9,785 12,643 1,687 3,267 7,286 1,116 6,518 5,357 571
PRINTERS 4,384 16,956 2,775 1,258 8,674 1,737 3,126 8,282 1,038
PHYSICS APPARATUS 24,115 11,669 12,446
BIOLOGY MATERIAL 24,115 11,669 12,446
CHEMICAL/CHEMISTRY APPARATUS 24,115 11,669 12,446
BOOKS IN LIBERARY 7,509 13,411 3,195 3,164 6,930 1,575 4,345 6,481 1,620
HOME ECONOMICS MATERIAL 24,115 11,669 12,446
SPORTS MATERIAL 7,393 15,063 1,659 3,184 7,698 787 4,209 7,365 872
SECONDRY/HIGH
COMPUTERS 8,988 4,068 428 1,965 2,095 225 7,023 1,973 203
PRINTERS 6,288 6,499 697 1,126 2,814 345 5,162 3,685 352
PHYSICS APPARATUS 7,663 3,909 1,912 1,667 1,725 893 5,996 2,184 1,019
BIOLOGY MATERIAL 7,608 3,947 1,929 1,672 1,715 898 5,936 2,232 1,031
CHEMICAL/CHEMISTRY APPARATUS 7,788 3,800 1,896 1,706 1,689 890 6,082 2,111 1,006
BOOKS IN LIBERARY 8,114 4,783 587 2,066 1,977 242 6,048 2,806 345
HOME ECONOMICS MATERIAL 1,592 8,217 3,675 431 2,752 1,102 1,161 5,465 2,573
SPORTS MATERIAL 6,972 6,091 421 1,738 2,408 139 5,234 3,683 282
HIGHER-SECONDRY
COMPUTERS 748 287 21 192 179 15 556 108 6
PRINTERS 564 440 52 130 224 32 434 216 20

PHYSICS APPARATUS 651 294 111 168 161 57 483 133 54
BIOLOGY MATERIAL 645 299 112 164 166 56 481 133 56
CHEMICAL/CHEMISTRY APPARATUS 654 287 115 169 160 57 485 127 58
BOOKS IN LIBERARY 715 307 34 216 157 13 499 150 21
HOME ECONOMICS MATERIAL 136 621 299 42 242 102 94 379 197
SPORTS MATERIAL 597 426 33 175 200 11 422 226 22

TABLE 43.2 SCHOOLS(PRIVATE) BY LEVEL, GENDER AND AVAILABILITY OF APPARATUS
PAKISTAN GIRLS SCHOOLS (Number)
------------------------------------------------------------------------------------------------------------------------------------
| ALL AREAS | RURAL AREAS | URBAN AREAS
LEVEL OF SCHOOL/FURNITURE |--------------------------------------------------------------------------------------------------
REGIONS/KIND OF ROOMS |AVAILABLE | NOT | NOT |AVAILABLE | NOT | NOT |AVAILABLE | NOT | NOT
| |AVAILABLE |APPLICABLE| |AVAILABLE |APPLICABLE| |AVAILABLE |APPLICABLE
------------------------------------------------------------------------------------------------------------------------------------
PRE-PRIMARY
COMPUTERS 2 7 3 1 6 3 1 1
PRINTERS 7 5 5 5 2
PHYSICS APPARATUS 12 10 2
BIOLOGY MATERIAL 12 10 2
CHEMICAL/CHEMISTRY APPARATUS 12 10 2
BOOKS IN LIBERARY 1 4 7 4 6 1 1
HOME ECONOMICS MATERIAL 12 10 2
SPORTS MATERIAL 1 8 3 7 3 1 1
MOSQUE
COMPUTERS 1 15 5 11 4 1 4 1
PRINTERS 15 6 10 5 5 1
PHYSICS APPARATUS 21 15 6
BIOLOGY MATERIAL 21 15 6
CHEMICAL/CHEMISTRY APPARATUS 21 15 6
BOOKS IN LIBERARY 1 14 6 12 3 1 2 3
HOME ECONOMICS MATERIAL 21 15 6
SPORTS MATERIAL 15 6 12 3 3 3
PRIMARY
COMPUTERS 78 420 122 25 319 94 53 101 28
PRINTERS 49 412 159 14 300 124 35 112 35
PHYSICS APPARATUS 620 438 182
BIOLOGY MATERIAL 620 438 182
CHEMICAL/CHEMISTRY APPARATUS 620 438 182
BOOKS IN LIBERARY 79 372 169 37 267 134 42 105 35
HOME ECONOMICS MATERIAL 620 438 182
SPORTS MATERIAL 123 410 87 64 308 66 59 102 21
MIDDLE/ELEMENTRY
COMPUTERS 233 420 70 109 282 61 124 138 9
PRINTERS 104 516 103 41 324 87 63 192 16
PHYSICS APPARATUS 723 452 271
BIOLOGY MATERIAL 723 452 271
CHEMICAL/CHEMISTRY APPARATUS 723 452 271
BOOKS IN LIBERARY 186 432 105 108 276 68 78 156 37
HOME ECONOMICS MATERIAL 723 452 271
SPORTS MATERIAL 214 458 51 130 290 32 84 168 19
SECONDRY/HIGH
COMPUTERS 717 330 47 173 144 22 544 186 25
PRINTERS 551 476 67 124 185 30 427 291 37
PHYSICS APPARATUS 781 206 107 194 96 49 587 110 58
BIOLOGY MATERIAL 769 217 108 191 96 52 578 121 56
CHEMICAL/CHEMISTRY APPARATUS 789 204 101 194 97 48 595 107 53
BOOKS IN LIBERARY 789 264 41 202 120 17 587 144 24
HOME ECONOMICS MATERIAL 39 341 714 7 100 232 32 241 482
SPORTS MATERIAL 661 385 48 172 155 12 489 230 36
HIGHER-SECONDRY
COMPUTERS 109 40 3 34 26 2 75 14 1
PRINTERS 83 57 12 25 27 10 58 30 2

PHYSICS APPARATUS 110 30 12 33 21 8 77 9 4
BIOLOGY MATERIAL 106 33 13 32 22 8 74 11 5
CHEMICAL/CHEMISTRY APPARATUS 109 30 13 33 21 8 76 9 5
BOOKS IN LIBERARY 108 36 8 37 22 3 71 14 5
HOME ECONOMICS MATERIAL 5 41 106 2 16 44 3 25 62
SPORTS MATERIAL 90 55 7 32 27 3 58 28 4
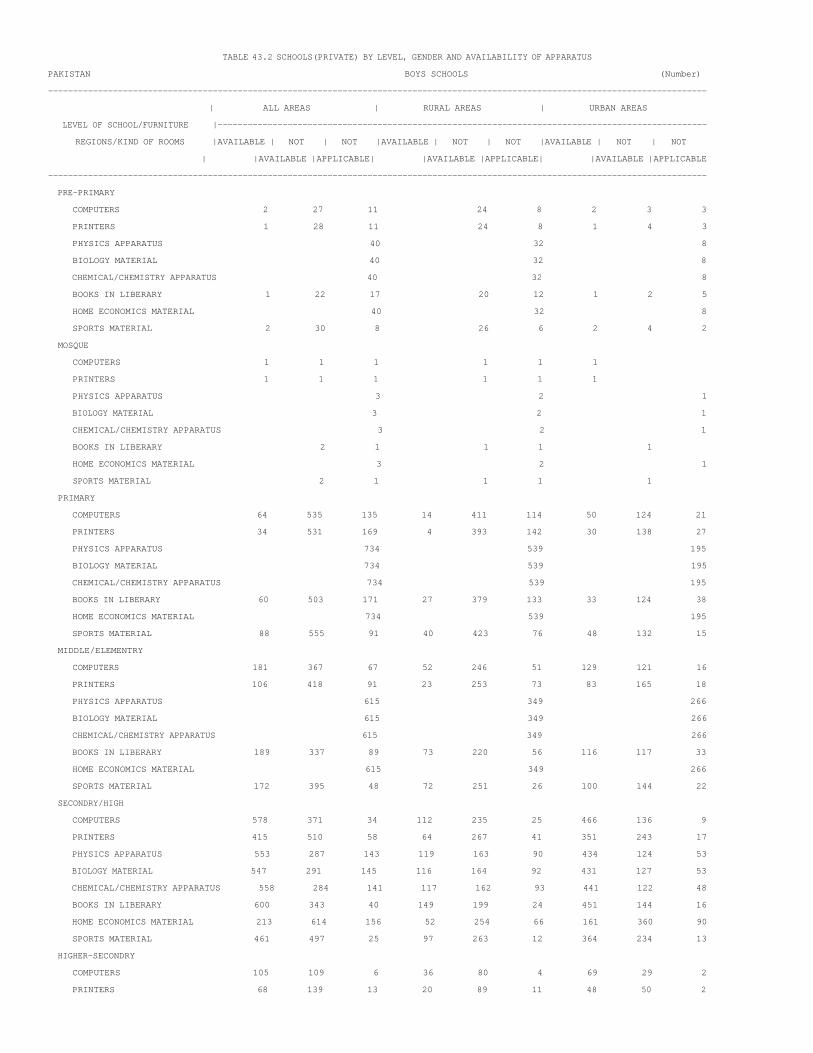
TABLE 43.2 SCHOOLS(PRIVATE) BY LEVEL, GENDER AND AVAILABILITY OF APPARATUS
PAKISTAN BOYS SCHOOLS (Number)
------------------------------------------------------------------------------------------------------------------------------------
| ALL AREAS | RURAL AREAS | URBAN AREAS
LEVEL OF SCHOOL/FURNITURE |--------------------------------------------------------------------------------------------------
REGIONS/KIND OF ROOMS |AVAILABLE | NOT | NOT |AVAILABLE | NOT | NOT |AVAILABLE | NOT | NOT
| |AVAILABLE |APPLICABLE| |AVAILABLE |APPLICABLE| |AVAILABLE |APPLICABLE
------------------------------------------------------------------------------------------------------------------------------------
PRE-PRIMARY
COMPUTERS 2 27 11 24 8 2 3 3
PRINTERS 1 28 11 24 8 1 4 3
PHYSICS APPARATUS 40 32 8
BIOLOGY MATERIAL 40 32 8
CHEMICAL/CHEMISTRY APPARATUS 40 32 8
BOOKS IN LIBERARY 1 22 17 20 12 1 2 5
HOME ECONOMICS MATERIAL 40 32 8
SPORTS MATERIAL 2 30 8 26 6 2 4 2
MOSQUE
COMPUTERS 1 1 1 1 1 1
PRINTERS 1 1 1 1 1 1
PHYSICS APPARATUS 3 2 1
BIOLOGY MATERIAL 3 2 1
CHEMICAL/CHEMISTRY APPARATUS 3 2 1
BOOKS IN LIBERARY 2 1 1 1 1
HOME ECONOMICS MATERIAL 3 2 1
SPORTS MATERIAL 2 1 1 1 1
PRIMARY
COMPUTERS 64 535 135 14 411 114 50 124 21
PRINTERS 34 531 169 4 393 142 30 138 27
PHYSICS APPARATUS 734 539 195
BIOLOGY MATERIAL 734 539 195
CHEMICAL/CHEMISTRY APPARATUS 734 539 195
BOOKS IN LIBERARY 60 503 171 27 379 133 33 124 38
HOME ECONOMICS MATERIAL 734 539 195
SPORTS MATERIAL 88 555 91 40 423 76 48 132 15
MIDDLE/ELEMENTRY
COMPUTERS 181 367 67 52 246 51 129 121 16
PRINTERS 106 418 91 23 253 73 83 165 18
PHYSICS APPARATUS 615 349 266
BIOLOGY MATERIAL 615 349 266
CHEMICAL/CHEMISTRY APPARATUS 615 349 266
BOOKS IN LIBERARY 189 337 89 73 220 56 116 117 33
HOME ECONOMICS MATERIAL 615 349 266
SPORTS MATERIAL 172 395 48 72 251 26 100 144 22
SECONDRY/HIGH
COMPUTERS 578 371 34 112 235 25 466 136 9
PRINTERS 415 510 58 64 267 41 351 243 17
PHYSICS APPARATUS 553 287 143 119 163 90 434 124 53
BIOLOGY MATERIAL 547 291 145 116 164 92 431 127 53
CHEMICAL/CHEMISTRY APPARATUS 558 284 141 117 162 93 441 122 48
BOOKS IN LIBERARY 600 343 40 149 199 24 451 144 16
HOME ECONOMICS MATERIAL 213 614 156 52 254 66 161 360 90
SPORTS MATERIAL 461 497 25 97 263 12 364 234 13
HIGHER-SECONDRY
COMPUTERS 105 109 6 36 80 4 69 29 2
PRINTERS 68 139 13 20 89 11 48 50 2

PHYSICS APPARATUS 102 86 32 39 58 23 63 28 9
BIOLOGY MATERIAL 101 87 32 37 60 23 64 27 9
CHEMICAL/CHEMISTRY APPARATUS 100 87 33 37 59 24 63 28 9
BOOKS IN LIBERARY 118 98 4 50 68 2 68 30 2
HOME ECONOMICS MATERIAL 30 154 36 15 88 17 15 66 19
SPORTS MATERIAL 77 136 7 31 86 3 46 50 4
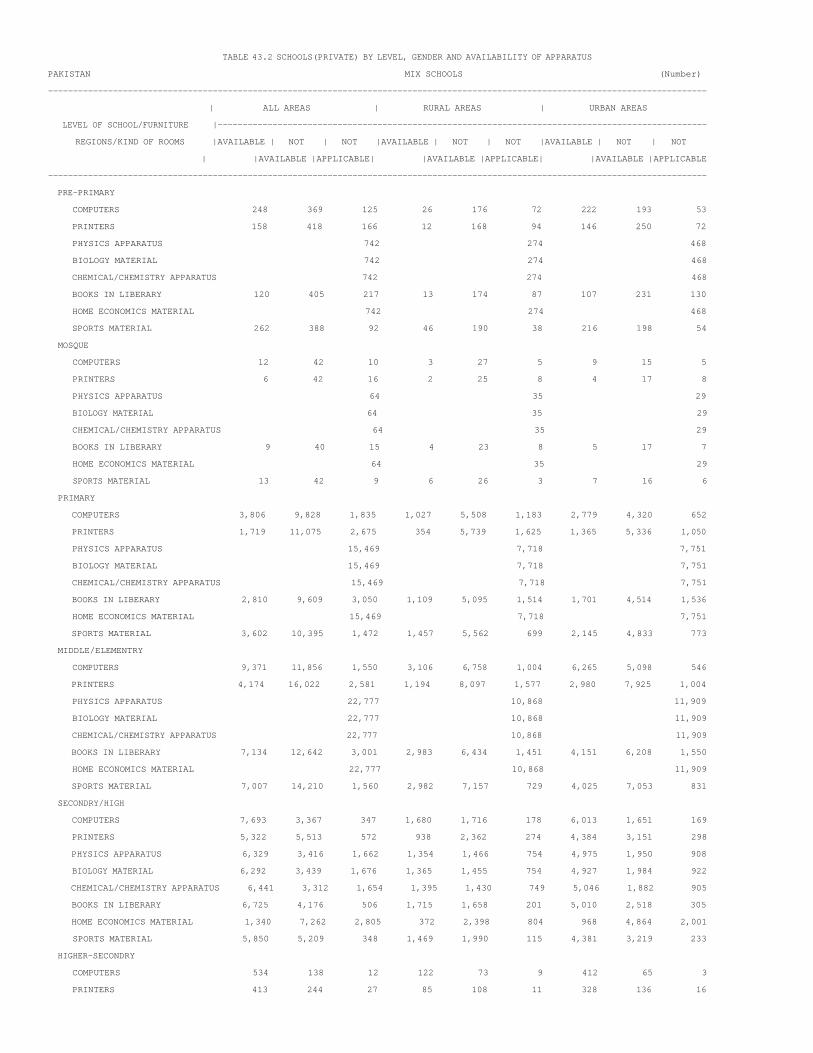
TABLE 43.2 SCHOOLS(PRIVATE) BY LEVEL, GENDER AND AVAILABILITY OF APPARATUS
PAKISTAN MIX SCHOOLS (Number)
------------------------------------------------------------------------------------------------------------------------------------
| ALL AREAS | RURAL AREAS | URBAN AREAS
LEVEL OF SCHOOL/FURNITURE |--------------------------------------------------------------------------------------------------
REGIONS/KIND OF ROOMS |AVAILABLE | NOT | NOT |AVAILABLE | NOT | NOT |AVAILABLE | NOT | NOT
| |AVAILABLE |APPLICABLE| |AVAILABLE |APPLICABLE| |AVAILABLE |APPLICABLE
------------------------------------------------------------------------------------------------------------------------------------
PRE-PRIMARY
COMPUTERS 248 369 125 26 176 72 222 193 53
PRINTERS 158 418 166 12 168 94 146 250 72
PHYSICS APPARATUS 742 274 468
BIOLOGY MATERIAL 742 274 468
CHEMICAL/CHEMISTRY APPARATUS 742 274 468
BOOKS IN LIBERARY 120 405 217 13 174 87 107 231 130
HOME ECONOMICS MATERIAL 742 274 468
SPORTS MATERIAL 262 388 92 46 190 38 216 198 54
MOSQUE
COMPUTERS 12 42 10 3 27 5 9 15 5
PRINTERS 6 42 16 2 25 8 4 17 8
PHYSICS APPARATUS 64 35 29
BIOLOGY MATERIAL 64 35 29
CHEMICAL/CHEMISTRY APPARATUS 64 35 29
BOOKS IN LIBERARY 9 40 15 4 23 8 5 17 7
HOME ECONOMICS MATERIAL 64 35 29
SPORTS MATERIAL 13 42 9 6 26 3 7 16 6
PRIMARY
COMPUTERS 3,806 9,828 1,835 1,027 5,508 1,183 2,779 4,320 652
PRINTERS 1,719 11,075 2,675 354 5,739 1,625 1,365 5,336 1,050
PHYSICS APPARATUS 15,469 7,718 7,751
BIOLOGY MATERIAL 15,469 7,718 7,751
CHEMICAL/CHEMISTRY APPARATUS 15,469 7,718 7,751
BOOKS IN LIBERARY 2,810 9,609 3,050 1,109 5,095 1,514 1,701 4,514 1,536
HOME ECONOMICS MATERIAL 15,469 7,718 7,751
SPORTS MATERIAL 3,602 10,395 1,472 1,457 5,562 699 2,145 4,833 773
MIDDLE/ELEMENTRY
COMPUTERS 9,371 11,856 1,550 3,106 6,758 1,004 6,265 5,098 546
PRINTERS 4,174 16,022 2,581 1,194 8,097 1,577 2,980 7,925 1,004
PHYSICS APPARATUS 22,777 10,868 11,909
BIOLOGY MATERIAL 22,777 10,868 11,909
CHEMICAL/CHEMISTRY APPARATUS 22,777 10,868 11,909
BOOKS IN LIBERARY 7,134 12,642 3,001 2,983 6,434 1,451 4,151 6,208 1,550
HOME ECONOMICS MATERIAL 22,777 10,868 11,909
SPORTS MATERIAL 7,007 14,210 1,560 2,982 7,157 729 4,025 7,053 831
SECONDRY/HIGH
COMPUTERS 7,693 3,367 347 1,680 1,716 178 6,013 1,651 169
PRINTERS 5,322 5,513 572 938 2,362 274 4,384 3,151 298
PHYSICS APPARATUS 6,329 3,416 1,662 1,354 1,466 754 4,975 1,950 908
BIOLOGY MATERIAL 6,292 3,439 1,676 1,365 1,455 754 4,927 1,984 922
CHEMICAL/CHEMISTRY APPARATUS 6,441 3,312 1,654 1,395 1,430 749 5,046 1,882 905
BOOKS IN LIBERARY 6,725 4,176 506 1,715 1,658 201 5,010 2,518 305
HOME ECONOMICS MATERIAL 1,340 7,262 2,805 372 2,398 804 968 4,864 2,001
SPORTS MATERIAL 5,850 5,209 348 1,469 1,990 115 4,381 3,219 233
HIGHER-SECONDRY
COMPUTERS 534 138 12 122 73 9 412 65 3
PRINTERS 413 244 27 85 108 11 328 136 16

PHYSICS APPARATUS 439 178 67 96 82 26 343 96 41
BIOLOGY MATERIAL 438 179 67 95 84 25 343 95 42
CHEMICAL/CHEMISTRY APPARATUS 445 170 69 99 80 25 346 90 44
BOOKS IN LIBERARY 489 173 22 129 67 8 360 106 14
HOME ECONOMICS MATERIAL 101 426 157 25 138 41 76 288 116
SPORTS MATERIAL 430 235 19 112 87 5 318 148 14

TABLE 44 SCHOOLS BY GENDER, SCHOOL COMMITTEE AND TYPE
PAKISTAN (Number)
------------------------------------------------------------------------------------------------------------------------------------
| ALL INSTITUTIONS | PUBLIC INSTITIONS | PRIVATE INSTITUTIONS
GENDER OF SCHOOLS/SCHOOL |--------------------------------------------------------------------------------------------------
COMMITTEE | ALL | RURAL | URBAN | ALL | RURAL | URBAN | ALL | RURAL | URBAN
| AREAS | AREAS | AREAS | AREAS | AREAS | AREAS | AREAS | AREAS | AREAS
------------------------------------------------------------------------------------------------------------------------------------
ALL SCHOOLS
TOTAL (A + B) 220,885 163,330 57,555 150,670 131,113 19,557 70,215 32,217 37,998
A. SCHOOL COMMITTEE EXIST 139,522 113,122 26,400 117,736 103,623 14,113 21,786 9,499 12,287
FUNCTIONAL 129,128 104,794 24,334 109,029 95,928 13,101 20,099 8,866 11,233
NON-FUNCTIONAL 10,394 8,328 2,066 8,707 7,695 1,012 1,687 633 1,054
B. SCHOOLCOMMITTEE NOT EXIST 81,363 50,208 31,155 32,934 27,490 5,444 48,429 22,718 25,711
GIRL SCHOOLS
TOTAL (A + B) 47,333 38,189 9,144 41,653 35,253 6,400 5,680 2,936 2,744
A. SCHOOL COMMITTEE EXIST 34,313 29,029 5,284 32,674 28,138 4,536 1,639 891 748
FUNCTIONAL 31,587 26,685 4,902 30,064 25,847 4,217 1,523 838 685
NON-FUNCTIONAL 2,726 2,344 382 2,610 2,291 319 116 53 63
B. SCHOOLCOMMITTEE NOT EXIST 13,020 9,160 3,860 8,979 7,115 1,864 4,041 2,045 1,996
BOYS SCHOOLS
TOTAL (A + B) 55,154 46,140 9,014 49,548 43,409 6,139 5,606 2,731 2,875
A. SCHOOL COMMITTEE EXIST 38,541 33,253 5,288 36,914 32,463 4,451 1,627 790 837
FUNCTIONAL 35,563 30,661 4,902 34,055 29,920 4,135 1,508 741 767
NON-FUNCTIONAL 2,978 2,592 386 2,859 2,543 316 119 49 70
B. SCHOOLCOMMITTEE NOT EXIST 16,613 12,887 3,726 12,634 10,946 1,688 3,979 1,941 2,038
MIXED SCHOOLS
TOTAL (A + B) 118,398 79,001 39,397 59,469 52,451 7,018 58,929 26,550 32,379
A. SCHOOL COMMITTEE EXIST 66,668 50,840 15,828 48,148 43,022 5,126 18,520 7,818 10,702
FUNCTIONAL 61,978 47,448 14,530 44,910 40,161 4,749 17,068 7,287 9,781
NON-FUNCTIONAL 4,690 3,392 1,298 3,238 2,861 377 1,452 531 921
B. SCHOOLCOMMITTEE NOT EXIST 51,730 28,161 23,569 11,321 9,429 1,892 40,409 18,732 21,677

TABLE 45 ENROLMENT IN DEENI MADARIS BY LEVEL AND GENDER
PAKISTAN (Number)
------------------------------------------------------------------------------------------------------------------------------------
| ALL AREAS | RURAL AREAS | URBAN AREAS
LEVEL/ GENDER OF MADARIS |--------------------------------------------------------------------------------------------------
| TOTAL | GIRLS | BOYS | TOTAL | GIRLS | BOYS | TOTAL | GIRLS | BOYS
------------------------------------------------------------------------------------------------------------------------------------
ALL MADARIS
------------------------------------------------------------------------------------------------------------------------------------
TOTAL 1,518,298 572,431 945,867 706,308 245,643 460,665 811,990 326,788 485,202
NAZRA 747,782 303,043 444,739 373,369 141,873 231,496 374,413 161,170 213,243
HIFZ 409,863 121,938 287,925 173,379 41,742 131,637 236,484 80,196 156,288
IBTIDIA 130,764 54,560 76,204 68,417 28,464 39,953 62,347 26,096 36,251
MUTAWASTA 57,968 20,671 37,297 28,594 10,236 18,358 29,374 10,435 18,939
SANIA-AAMA 52,993 22,207 30,786 21,208 8,007 13,201 31,785 14,200 17,585
SANIA KHASA 36,473 15,221 21,252 13,147 4,226 8,921 23,326 10,995 12,331
AALIA 25,338 9,834 15,504 8,068 2,506 5,562 17,270 7,328 9,942
AALMIA 21,552 8,318 13,234 5,436 2,076 3,360 16,116 6,242 9,874
TAKHASSUS 4,077 1,213 2,864 1,395 225 1,170 2,682 988 1,694
OTHERS 31,488 15,426 16,062 13,295 6,288 7,007 18,193 9,138 9,055
------------------------------------------------------------------------------------------------------------------------------------
GIRL MADRIS
------------------------------------------------------------------------------------------------------------------------------------
TOTAL 209,285 192,930 16,355 79,645 71,485 8,160 129,640 121,445 8,195
NAZRA 93,267 84,692 8,575 39,057 34,671 4,386 54,210 50,021 4,189
HIFZ 48,669 44,538 4,131 16,385 14,658 1,727 32,284 29,880 2,404
IBTIDIA 18,382 17,098 1,284 8,390 7,584 806 9,992 9,514 478
MUTAWASTA 9,821 8,988 833 4,145 3,714 431 5,676 5,274 402
SANIA-AAMA 12,722 12,245 477 4,005 3,782 223 8,717 8,463 254
SANIA KHASA 9,162 8,878 284 2,260 2,155 105 6,902 6,723 179
AALIA 6,049 5,709 340 1,519 1,286 233 4,530 4,423 107
AALMIA 4,649 4,526 123 1,304 1,234 70 3,345 3,292 53
TAKHASSUS 634 607 27 78 54 24 556 553 3
OTHERS 5,930 5,649 281 2,502 2,347 155 3,428 3,302 126
------------------------------------------------------------------------------------------------------------------------------------
BOYS MADARIS
------------------------------------------------------------------------------------------------------------------------------------
TOTAL 483,206 37,223 445,983 232,774 14,836 217,938 250,432 22,387 228,045
NAZRA 204,149 20,693 183,456 106,455 9,247 97,208 97,694 11,446 86,248
HIFZ 153,308 8,762 144,546 70,458 3,063 67,395 82,850 5,699 77,151
IBTIDIA 38,296 3,233 35,063 18,671 1,207 17,464 19,625 2,026 17,599
MUTAWASTA 21,810 1,134 20,676 10,417 450 9,967 11,393 684 10,709
SANIA-AAMA 21,241 927 20,314 8,868 338 8,530 12,373 589 11,784
SANIA KHASA 15,062 578 14,484 6,472 146 6,326 8,590 432 8,158
AALIA 11,062 428 10,634 4,041 94 3,947 7,021 334 6,687
AALMIA 7,976 508 7,468 2,550 88 2,462 5,426 420 5,006
TAKHASSUS 1,968 64 1,904 1,003 44 959 965 20 945
OTHERS 8,334 896 7,438 3,839 159 3,680 4,495 737 3,758
------------------------------------------------------------------------------------------------------------------------------------
MIXED MADARIS
------------------------------------------------------------------------------------------------------------------------------------
TOTAL 825,807 342,278 483,529 393,889 159,322 234,567 431,918 182,956 248,962
NAZRA 450,366 197,658 252,708 227,857 97,955 129,902 222,509 99,703 122,806
HIFZ 207,886 68,638 139,248 86,536 24,021 62,515 121,350 44,617 76,733
IBTIDIA 74,086 34,229 39,857 41,356 19,673 21,683 32,730 14,556 18,174
MUTAWASTA 26,337 10,549 15,788 14,032 6,072 7,960 12,305 4,477 7,828

SANIA-AAMA 19,030 9,035 9,995 8,335 3,887 4,448 10,695 5,148 5,547
SANIA KHASA 12,249 5,765 6,484 4,415 1,925 2,490 7,834 3,840 3,994
AALIA 8,227 3,697 4,530 2,508 1,126 1,382 5,719 2,571 3,148
AALMIA 8,927 3,284 5,643 1,582 754 828 7,345 2,530 4,815
TAKHASSUS 1,475 542 933 314 127 187 1,161 415 746
OTHERS 17,224 8,881 8,343 6,954 3,782 3,172 10,270 5,099 5,171

TABLE 46 DEENI MADARIS BY AFFILIATION STATUS AND GENDER
PAKISTAN (Number)
------------------------------------------------------------------------------------------------------------------------------------
AFFILIATION STATUS | TOTAL MADARIS | GIRLS MADARIS | BOYS MADARIS | MIXED MADARIS
------------------------------------------------------------------------------------------------------------------------------------
ALL AREAS
------------------------------------------------------------------------------------------------------------------------------------
TOTAL(A & B) 11,491 1,815 3,925 5,751
A. TOTAL (AFFILIATED) 7,948 1,249 2,817 3,882
AFFILIATED WITH WAFAQ 3,454 555 1,379 1,520
AFFILIATED WITH TANZEEM 2,654 439 833 1,382
AFFILIATED WITH RABTA 906 121 304 481
AFFILIATED WITH OTHER 934 134 301 499
B. TOTAL (NOT AFFILIATED) 3,543 566 1,108 1,869
------------------------------------------------------------------------------------------------------------------------------------
RURAL AREAS
------------------------------------------------------------------------------------------------------------------------------------
TOTAL(A & B) 6,270 805 2,106 3,359
A. TOTAL (AFFILIATED) 4,105 520 1,446 2,139
AFFILIATED WITH WAFAQ 1,711 214 723 774
AFFILIATED WITH TANZEEM 1,353 183 392 778
AFFILIATED WITH RABTA 473 50 150 273
AFFILIATED WITH OTHER 568 73 181 314
B. TOTAL (NOT AFFILIATED) 2,165 285 660 1,220
------------------------------------------------------------------------------------------------------------------------------------
URBAN AREAS
------------------------------------------------------------------------------------------------------------------------------------
TOTAL(A & B) 5,221 1,010 1,819 2,392
A. TOTAL (AFFILIATED) 3,843 729 1,371 1,743
AFFILIATED WITH WAFAQ 1,743 341 656 746
AFFILIATED WITH TANZEEM 1,301 256 441 604
AFFILIATED WITH RABTA 433 71 154 208
AFFILIATED WITH OTHER 366 61 120 185
B. TOTAL (NOT AFFILIATED) 1,378 281 448 649
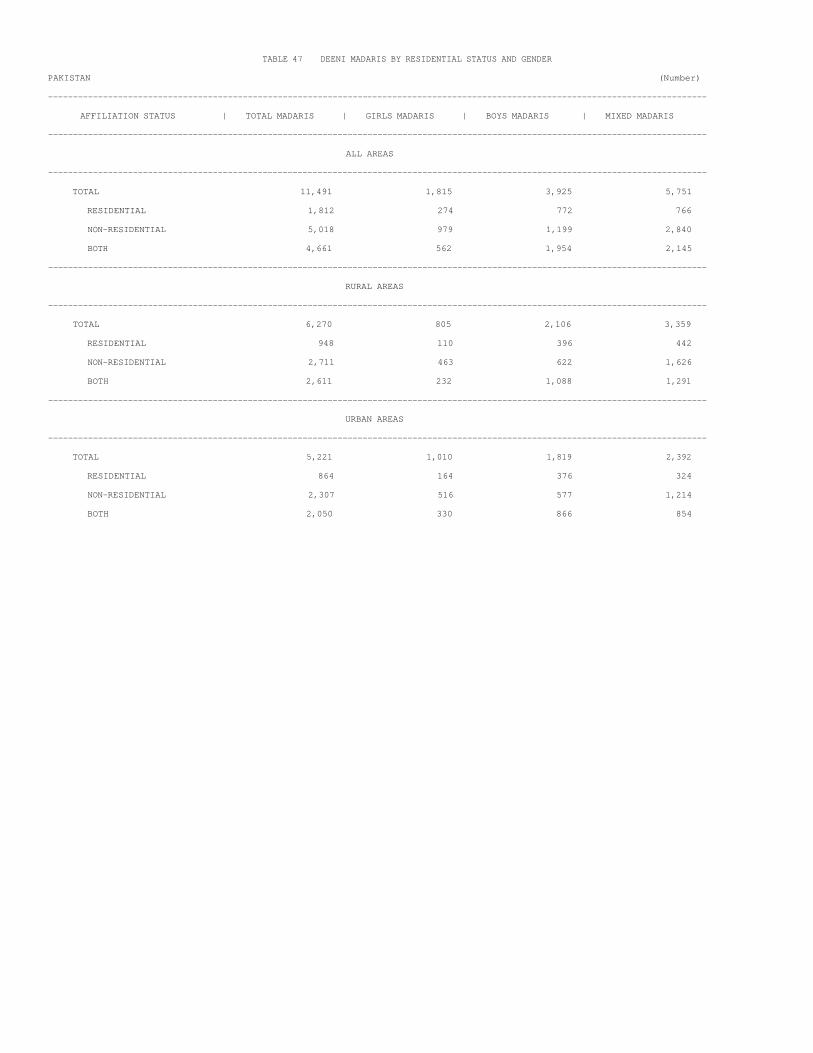
TABLE 47 DEENI MADARIS BY RESIDENTIAL STATUS AND GENDER
PAKISTAN (Number)
------------------------------------------------------------------------------------------------------------------------------------
AFFILIATION STATUS | TOTAL MADARIS | GIRLS MADARIS | BOYS MADARIS | MIXED MADARIS
------------------------------------------------------------------------------------------------------------------------------------
ALL AREAS
------------------------------------------------------------------------------------------------------------------------------------
TOTAL 11,491 1,815 3,925 5,751
RESIDENTIAL 1,812 274 772 766
NON-RESIDENTIAL 5,018 979 1,199 2,840
BOTH 4,661 562 1,954 2,145
------------------------------------------------------------------------------------------------------------------------------------
RURAL AREAS
------------------------------------------------------------------------------------------------------------------------------------
TOTAL 6,270 805 2,106 3,359
RESIDENTIAL 948 110 396 442
NON-RESIDENTIAL 2,711 463 622 1,626
BOTH 2,611 232 1,088 1,291
------------------------------------------------------------------------------------------------------------------------------------
URBAN AREAS
------------------------------------------------------------------------------------------------------------------------------------
TOTAL 5,221 1,010 1,819 2,392
RESIDENTIAL 864 164 376 324
NON-RESIDENTIAL 2,307 516 577 1,214
BOTH 2,050 330 866 854

TABLE 48 TEACHERS IN DEENI MADARIS BY ACADEMIC & PROFESSIONAL
QUALIFICATION AND GENDER
PAKISTAN (Number)
------------------------------------------------------------------------------------------------------------------------------------
| PROFESSIONAL QUALIFICATION OF TEACHERS
ACADEMIC |----------------------------------------------------------------------------------------------------
QUALIFICATION/ GENDER | TOTAL | HIFZ | DARS-NAZAMI | TAKHASUS | OTHERS
------------------------------------------------------------------------------------------------------------------------------------
ALL AREAS
------------------------------------------------------------------------------------------------------------------------------------
TOTAL 55,210 24,273 20,906 3,099 6,932
BELOW MATRIC 23,807 13,558 7,411 777 2,061
MATRIC 15,004 6,277 6,116 654 1,957
INTERMEDIATE 6,535 2,265 2,657 419 1,194
GRADUATE 4,586 1,178 1,977 500 931
POST GRADUATE 4,660 850 2,473 621 716
M.PHIL 378 82 183 64 49
PHD 240 63 89 64 24
OTHER
FEMALE 12,619 5,075 4,770 496 2,278
BELOW MATRIC 4,202 2,177 1,425 88 512
MATRIC 4,200 1,634 1,670 105 791
INTERMEDIATE 2,085 716 806 89 474
GRADUATE 1,227 351 440 104 332
POST GRADUATE 846 177 401 104 164
M.PHIL 54 20 24 5 5
PHD 5 4 1
OTHER
MALE 42,591 19,198 16,136 2,603 4,654
BELOW MATRIC 19,605 11,381 5,986 689 1,549
MATRIC 10,804 4,643 4,446 549 1,166
INTERMEDIATE 4,450 1,549 1,851 330 720
GRADUATE 3,359 827 1,537 396 599
POST GRADUATE 3,814 673 2,072 517 552
M.PHIL 324 62 159 59 44
PHD 235 63 85 63 24
OTHER

TABLE 48 TEACHERS IN DEENI MADARIS BY ACADEMIC & PROFESSIONAL
QUALIFICATION AND GENDER
PAKISTAN (Number)
------------------------------------------------------------------------------------------------------------------------------------
| PROFESSIONAL QUALIFICATION OF TEACHERS
ACADEMIC |----------------------------------------------------------------------------------------------------
QUALIFICATION/ GENDER | TOTAL | HIFZ | DARS-NAZAMI | TAKHASUS | OTHERS
------------------------------------------------------------------------------------------------------------------------------------
RURAL AREAS
------------------------------------------------------------------------------------------------------------------------------------
TOTAL 23,741 10,172 8,882 1,298 3,389
BELOW MATRIC 11,186 6,314 3,386 377 1,109
MATRIC 6,555 2,508 2,769 328 950
INTERMEDIATE 2,485 686 1,057 176 566
GRADUATE 1,737 353 779 163 442
POST GRADUATE 1,553 250 795 212 296
M.PHIL 134 34 60 22 18
PHD 91 27 36 20 8
OTHER
FEMALE 4,151 1,574 1,456 145 976
BELOW MATRIC 1,534 827 456 32 219
MATRIC 1,414 468 551 35 360
INTERMEDIATE 648 175 261 28 184
GRADUATE 374 86 109 21 158
POST GRADUATE 174 16 75 28 55
M.PHIL 6 2 4
PHD 1 1
OTHER
MALE 19,590 8,598 7,426 1,153 2,413
BELOW MATRIC 9,652 5,487 2,930 345 890
MATRIC 5,141 2,040 2,218 293 590
INTERMEDIATE 1,837 511 796 148 382
GRADUATE 1,363 267 670 142 284
POST GRADUATE 1,379 234 720 184 241
M.PHIL 128 32 56 22 18
PHD 90 27 36 19 8
OTHER
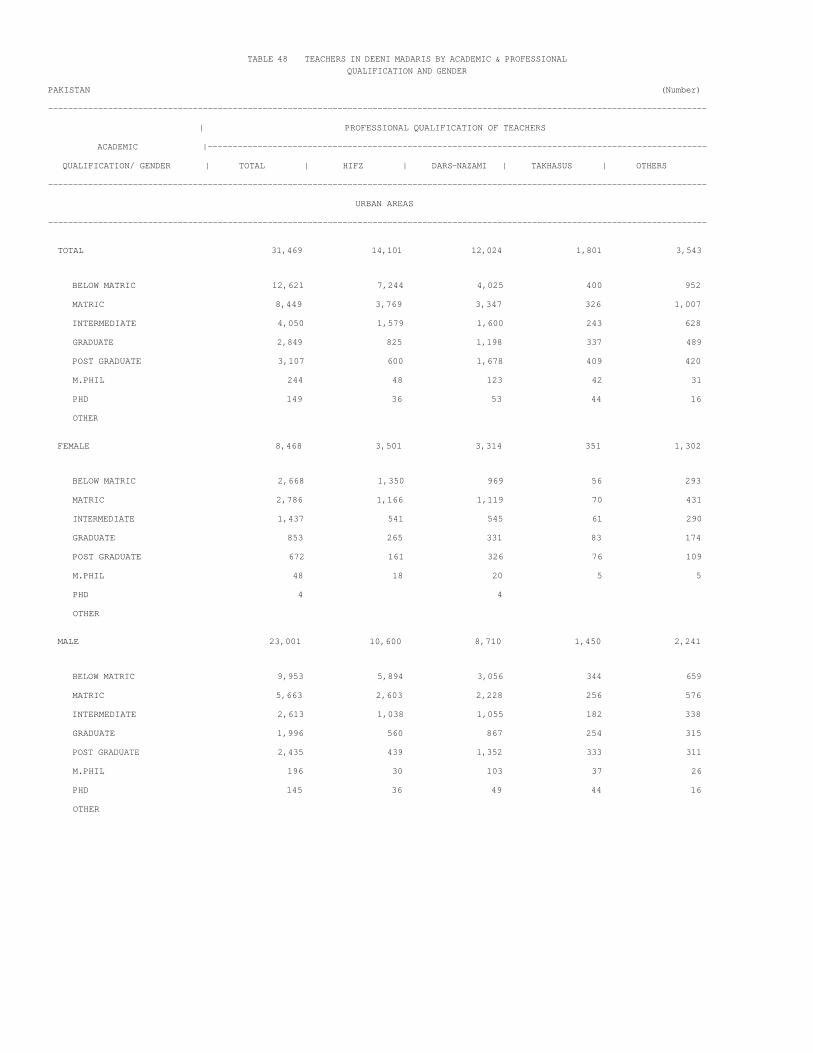
TABLE 48 TEACHERS IN DEENI MADARIS BY ACADEMIC & PROFESSIONAL
QUALIFICATION AND GENDER
PAKISTAN (Number)
------------------------------------------------------------------------------------------------------------------------------------
| PROFESSIONAL QUALIFICATION OF TEACHERS
ACADEMIC |----------------------------------------------------------------------------------------------------
QUALIFICATION/ GENDER | TOTAL | HIFZ | DARS-NAZAMI | TAKHASUS | OTHERS
------------------------------------------------------------------------------------------------------------------------------------
URBAN AREAS
------------------------------------------------------------------------------------------------------------------------------------
TOTAL 31,469 14,101 12,024 1,801 3,543
BELOW MATRIC 12,621 7,244 4,025 400 952
MATRIC 8,449 3,769 3,347 326 1,007
INTERMEDIATE 4,050 1,579 1,600 243 628
GRADUATE 2,849 825 1,198 337 489
POST GRADUATE 3,107 600 1,678 409 420
M.PHIL 244 48 123 42 31
PHD 149 36 53 44 16
OTHER
FEMALE 8,468 3,501 3,314 351 1,302
BELOW MATRIC 2,668 1,350 969 56 293
MATRIC 2,786 1,166 1,119 70 431
INTERMEDIATE 1,437 541 545 61 290
GRADUATE 853 265 331 83 174
POST GRADUATE 672 161 326 76 109
M.PHIL 48 18 20 5 5
PHD 4 4
OTHER
MALE 23,001 10,600 8,710 1,450 2,241
BELOW MATRIC 9,953 5,894 3,056 344 659
MATRIC 5,663 2,603 2,228 256 576
INTERMEDIATE 2,613 1,038 1,055 182 338
GRADUATE 1,996 560 867 254 315
POST GRADUATE 2,435 439 1,352 333 311
M.PHIL 196 30 103 37 26
PHD 145 36 49 44 16
OTHER

TABLE 49.2 EXPENDITURE INCURRED IN EDUCATIONAL INSTITUTIONS (PRIVATE) BY LEVEL
PAKISTAN ALL AREAS (In Rupees )
---------------------------------------------------------------------------------------------------------------------------------------------------------------------------------------------------
| | PAY/ALLOW | REPAIR & | REPAIR & | PURCHASE | TRAVELLING | | RENT OF | OTHER
LEVEL | TOTAL | TEACHING & | MAINTENANC | MAINTENANC | EQUIPMENT | POL/ | UTILITIES | BUILDING | EXPENDITURE
| | NON-TEACHING | OF MACHINARY | OF BUILDING | STORE AND | TRANSPORT | | |
| | STAFF | AND | | STATIONARY | | | |
| | | EQUIPMENT | | | | | |
---------------------------------------------------------------------------------------------------------------------------------------------------------------------------------------------------
TOTAL (A TO H) 35,914,012,702 21,063,555,241 669,096,277 1,259,689,762 4,896,986,081 423,817,190 2,094,625,559 2,446,923,778 3,059,318,814
A. GENERAL 28,590,554,038 17,099,746,570 474,193,772 889,704,513 4,543,366,493 294,550,756 1,490,807,958 2,112,086,310 1,686,097,666
PRE-PRIMARY 210,072,330 129,287,542 3,815,372 8,992,498 9,975,137 716,608 14,644,060 26,922,467 15,718,646
MOSQUE 12,432,431 7,925,508 201,250 2,178,885 385,348 8,100 559,890 733,450 440,000
PRIMARY 2,572,013,422 1,788,115,014 41,329,014 91,653,068 87,167,936 17,277,873 177,330,433 290,525,562 78,614,522
MIDDLE/ELEMENTRY 5,724,520,758 3,946,505,105 108,722,408 208,584,073 184,725,035 49,195,318 457,026,595 620,280,407 149,481,817
SECONDRY/HIGH 14,050,542,801 7,310,367,572 163,204,583 351,256,048 4,025,494,820 115,337,454 600,371,059 887,629,170 596,882,095
HIGHER SECONDARY 2,192,757,962 1,511,460,714 36,515,877 52,598,380 84,237,242 42,198,262 95,181,772 94,295,918 276,269,797
INTERMEDIATE COLLEGE 917,883,616 589,625,614 12,600,125 72,132,027 27,351,368 20,730,861 41,770,849 61,430,338 92,242,434
DEGREE COLLEGE 1,021,581,796 693,890,115 19,105,338 23,829,053 54,865,105 14,649,340 48,391,238 46,613,439 120,238,168
GENERAL UNIVERSITY 524,969,736 258,816,908 66,029,664 21,375,734 30,774,981 15,216,301 26,974,730 10,449,855 95,331,563
BRITISH SYSTEM 1,363,779,186 863,752,478 22,670,141 57,104,747 38,389,521 19,220,639 28,557,332 73,205,704 260,878,624
B. TECHNICAL/PROFESSIONAL 3,424,446,562 1,811,236,579 102,958,184 117,579,826 233,817,660 67,499,340 216,686,227 201,583,731 673,085,015
MEDICAL COLLEGE 367,393,200 172,082,408 8,976,970 14,774,234 10,557,382 9,241,557 15,085,630 14,623,874 122,051,145
MEDICAL UNIVERSITY 1,093,084 856,100 3,350 831 2,971 24,346 16,728 120,739 68,019
DENTAL COLLEGE UNIVERSITY 38,912,820 19,443,042 254,674 709,597 992,513 1,145,628 1,321,160 1,165,428 13,880,778
SCHOOL COLLEGE OF MEDICAL TEACHER 12,307,743 6,633,533 819,290 76,200 686,460 38,080 869,730 2,642,700 541,750
SCHOOL COLLEGE OF NURSING 17,060,578 9,437,438 98,548 443,097 228,438 480,354 1,562,106 429,900 4,380,697
HOMEOPATHIC COLLEGE 165,274,009 113,329,397 25,223,101 2,273,807 2,142,817 586,047 5,218,944 8,943,860 7,556,036
TIBBIA COLLEGE 18,452,975 12,876,493 638,121 78,654 378,703 88,740 1,257,308 1,568,698 1,566,258
EDUCATION COLLEGE UNIVERSITY 115,094,700 68,583,331 1,760,683 3,388,604 4,249,043 5,114,205 7,398,629 5,534,480 19,065,725
HOME ECONOMIC COLLEGE 11,090,051 10,935,051 15,000 140,000
BUSINESS MANAGEMENT C/U 318,563,913 157,875,756 22,452,369 3,502,079 17,374,030 7,903,306 20,406,156 27,918,679 61,131,538
COMMERCE COLLEGE 396,034,898 223,124,301 14,412,839 13,653,560 17,815,670 4,097,630 30,589,456 55,450,380 36,891,062
ENGINEERING COLLEGE UNIVERSITY 584,798,177 251,572,333 7,603,454 7,590,702 74,370,212 9,132,832 45,782,145 6,445,003 182,301,496
IT COLLEGE UNIVERSITY 1,090,552,900 587,617,961 14,839,958 63,461,170 96,933,445 21,605,841 69,924,848 55,974,178 180,195,499
LAW COLLEGE UNIVERSITY 154,761,100 98,000,966 3,600,996 4,833,139 3,403,958 6,116,759 7,649,144 9,621,500 21,534,638
AGRICULTURE COLLEGE UNIVERSITY 12,739,502 8,518,547 423,784 623,100 82,788 1,009,437 1,062,156 420,000 599,690
VETERINARY/ANIMAL SCIENCE INST. 1,641,236 1,554,106 25,000 2,130 60,000
FINE ART COLLEGE 26,035,672 16,799,000 451,200 585,476 1,091,100 146,940 2,403,840 2,779,000 1,779,116
ACCOUNTANCY INSTITUTES 92,640,004 51,996,816 1,398,847 1,585,576 3,468,130 767,638 5,996,117 7,945,312 19,481,568
C. VOCATIONAL/POLYTECH 811,667,150 546,101,201 21,031,286 11,769,804 43,234,199 6,136,222 60,883,851 78,167,916 44,342,671
POLYTECHNIC INSTITUTES 149,855,867 92,281,124 3,544,646 3,874,819 12,575,674 1,500,133 9,839,186 10,539,584 15,700,701
MONOTECHNIC INSTITUTE 29,889,360 22,916,600 388,900 293,600 824,960 514,000 2,990,800 1,911,000 49,500
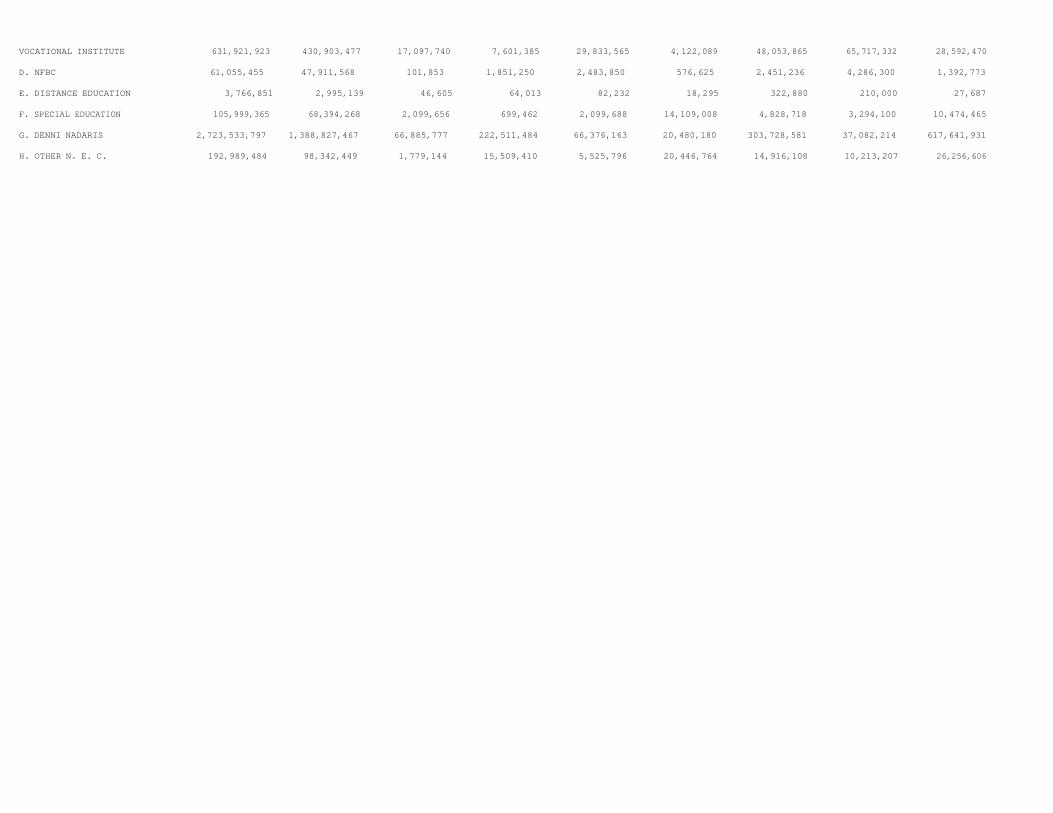
VOCATIONAL INSTITUTE 631,921,923 430,903,477 17,097,740 7,601,385 29,833,565 4,122,089 48,053,865 65,717,332 28,592,470
D. NFBC 61,055,455 47,911,568 101,853 1,851,250 2,483,850 576,625 2,451,236 4,286,300 1,392,773
E. DISTANCE EDUCATION 3,766,851 2,995,139 46,605 64,013 82,232 18,295 322,880 210,000 27,687
F. SPECIAL EDUCATION 105,999,365 68,394,268 2,099,656 699,462 2,099,688 14,109,008 4,828,718 3,294,100 10,474,465
G. DENNI NADARIS 2,723,533,797 1,388,827,467 66,885,777 222,511,484 66,376,163 20,480,180 303,728,581 37,082,214 617,641,931
H. OTHER N. E. C. 192,989,484 98,342,449 1,779,144 15,509,410 5,525,796 20,446,764 14,916,108 10,213,207 26,256,606

TABLE 49.2 EXPENDITURE INCURRED IN EDUCATIONAL INSTITUTIONS (PRIVATE) BY LEVEL
PAKISTAN RURAL AREAS (In Rupees )
---------------------------------------------------------------------------------------------------------------------------------------------------------------------------------------------------
| | PAY/ALLOW | REPAIR & | REPAIR & | PURCHASE | TRAVELLING | | RENT OF | OTHER
LEVEL | TOTAL | TEACHING & | MAINTENANC | MAINTENANC | EQUIPMENT | POL/ | UTILITIES | BUILDING | EXPENDITURE
| | NON-TEACHING | OF MACHINARY | OF BUILDING | STORE AND | TRANSPORT | | |
| | STAFF | AND | | STATIONARY | | | |
| | | EQUIPMENT | | | | | |
---------------------------------------------------------------------------------------------------------------------------------------------------------------------------------------------------
TOTAL (A TO H) 7,609,827,950 5,222,783,598 110,982,504 415,405,693 240,548,539 130,958,341 471,139,662 370,044,405 647,965,208
A. GENERAL 6,349,457,981 4,561,090,036 86,878,387 277,888,065 209,599,556 110,624,542 364,538,001 352,883,563 385,955,831
PRE-PRIMARY 18,879,987 15,195,578 284,500 356,815 493,070 29,100 541,264 1,107,010 872,650
MOSQUE 4,428,562 3,376,964 120,750 297,600 43,248 6,000 100,550 73,450 410,000
PRIMARY 837,725,364 655,001,093 8,804,441 32,107,438 26,241,045 6,025,890 35,525,079 54,745,829 19,274,549
MIDDLE/ELEMENTRY 2,186,587,343 1,593,324,773 25,477,976 80,947,218 73,883,679 21,168,804 194,134,409 152,523,040 45,127,444
SECONDRY/HIGH 1,781,823,198 1,330,681,490 25,755,170 70,040,826 54,624,182 40,779,795 73,907,750 109,250,856 76,783,129
HIGHER SECONDARY 491,438,970 309,636,212 7,934,225 14,969,081 16,009,621 23,027,101 26,188,070 14,598,222 79,076,438
INTERMEDIATE COLLEGE 231,200,411 111,386,894 2,451,634 49,042,119 7,034,062 3,947,303 10,299,278 6,407,546 40,631,575
DEGREE COLLEGE 164,887,037 123,681,346 2,243,315 9,587,943 4,083,574 3,059,291 5,078,934 4,207,006 12,945,628
GENERAL UNIVERSITY 249,435,640 139,136,640 10,430,000 5,576,000 19,811,000 8,060,000 13,686,000 939,000 51,797,000
BRITISH SYSTEM 383,051,469 279,669,046 3,376,376 14,963,025 7,376,075 4,521,258 5,076,667 9,031,604 59,037,418
B. TECHNICAL/PROFESSIONAL 101,260,526 43,698,987 3,513,915 7,625,674 4,564,302 5,399,163 8,816,839 5,865,622 21,776,024
MEDICAL COLLEGE 21,001,038 6,472,820 650,940 6,328,185 510,220 4,008,256 1,305,405 876,000 849,212
MEDICAL UNIVERSITY 203,885 96,100 1,684 831 2,638 24,346 9,528 739 68,019
DENTAL COLLEGE UNIVERSITY 216,300 210,000 5,000 1,300
SCHOOL COLLEGE OF MEDICAL TEACHER 1,379,500 624,000 50,000 51,500 168,000 286,000 200,000
SCHOOL COLLEGE OF NURSING
HOMEOPATHIC COLLEGE 1,991,332 1,308,600 16,000 31,606 36,571 8,322 279,638 204,000 106,595
TIBBIA COLLEGE 573,600 480,000 21,600 72,000
EDUCATION COLLEGE UNIVERSITY 372,000 300,000 12,000 60,000
HOME ECONOMIC COLLEGE
BUSINESS MANAGEMENT C/U 42,454,978 15,975,890 1,853,497 351,343 2,328,315 851,328 4,105,645 120,000 16,868,960
COMMERCE COLLEGE 4,476,712 2,196,812 238,000 116,000 548,000 6,000 349,900 987,000 35,000
ENGINEERING COLLEGE UNIVERSITY 125 57 12 3 9 3 41
IT COLLEGE UNIVERSITY 17,056,224 8,559,002 553,224 410,559 679,656 413,285 2,137,229 3,105,900 1,197,369
LAW COLLEGE UNIVERSITY 6,429,596 4,846,600 150,570 357,150 248,390 62,623 159,455 213,980 390,828
AGRICULTURE COLLEGE UNIVERSITY
VETERINARY/ANIMAL SCIENCE INST. 1,641,236 1,554,106 25,000 2,130 60,000
FINE ART COLLEGE
ACCOUNTANCY INSTITUTES 3,464,000 1,075,000 30,000 117,000 25,000 217,000 2,000,000
C. VOCATIONAL/POLYTECH 73,600,236 45,099,674 4,045,339 1,261,868 5,377,605 1,460,136 4,959,996 4,380,920 7,014,698
POLYTECHNIC INSTITUTES 22,465,304 11,692,015 907,560 345,948 1,362,262 620,306 1,427,648 541,000 5,568,565
MONOTECHNIC INSTITUTE 214,000 186,000 1,000 6,000 21,000

VOCATIONAL INSTITUTE 50,920,932 33,221,659 3,136,779 915,920 4,015,343 839,830 3,526,348 3,818,920 1,446,133
D. NFBC 37,874,084 33,972,998 58,300 745,350 584,527 68,430 1,028,856 1,115,100 300,523
E. DISTANCE EDUCATION 63,000 63,000
F. SPECIAL EDUCATION 29,261,594 17,588,189 601,832 29,370 173,570 7,317,981 870,670 516,000 2,163,982
G. DENNI NADARIS 1,007,886,485 512,432,752 15,729,231 127,547,466 19,966,189 6,072,369 90,666,398 4,954,300 230,517,780
H. OTHER N. E. C. 10,424,044 8,837,962 155,500 307,900 282,790 15,720 258,902 328,900 236,370

TABLE 49.2 EXPENDITURE INCURRED IN EDUCATIONAL INSTITUTIONS (PRIVATE) BY LEVEL
PAKISTAN URBAN AREAS (In Rupees )
---------------------------------------------------------------------------------------------------------------------------------------------------------------------------------------------------
| | PAY/ALLOW | REPAIR & | REPAIR & | PURCHASE | TRAVELLING | | RENT OF | OTHER
LEVEL | TOTAL | TEACHING & | MAINTENANC | MAINTENANC | EQUIPMENT | POL/ | UTILITIES | BUILDING | EXPENDITURE
| | NON-TEACHING | OF MACHINARY | OF BUILDING | STORE AND | TRANSPORT | | |
| | STAFF | AND | | STATIONARY | | | |
| | | EQUIPMENT | | | | | |
---------------------------------------------------------------------------------------------------------------------------------------------------------------------------------------------------
TOTAL (A TO H) 28,304,184,752 15,840,771,643 558,113,773 844,284,069 4,656,437,542 292,858,849 1,623,485,897 2,076,879,373 2,411,353,606
A. GENERAL 22,241,096,057 12,538,656,534 387,315,385 611,816,448 4,333,766,937 183,926,214 1,126,269,957 1,759,202,747 1,300,141,835
PRE-PRIMARY 191,192,343 114,091,964 3,530,872 8,635,683 9,482,067 687,508 14,102,796 25,815,457 14,845,996
MOSQUE 8,003,869 4,548,544 80,500 1,881,285 342,100 2,100 459,340 660,000 30,000
PRIMARY 1,734,288,058 1,133,113,921 32,524,573 59,545,630 60,926,891 11,251,983 141,805,354 235,779,733 59,339,973
MIDDLE/ELEMENTRY 3,537,933,415 2,353,180,332 83,244,432 127,636,855 110,841,356 28,026,514 262,892,186 467,757,367 104,354,373
SECONDRY/HIGH 12,268,719,603 5,979,686,082 137,449,413 281,215,222 3,970,870,638 74,557,659 526,463,309 778,378,314 520,098,966
HIGHER SECONDARY 1,701,318,992 1,201,824,502 28,581,652 37,629,299 68,227,621 19,171,161 68,993,702 79,697,696 197,193,359
INTERMEDIATE COLLEGE 686,683,205 478,238,720 10,148,491 23,089,908 20,317,306 16,783,558 31,471,571 55,022,792 51,610,859
DEGREE COLLEGE 856,694,759 570,208,769 16,862,023 14,241,110 50,781,531 11,590,049 43,312,304 42,406,433 107,292,540
GENERAL UNIVERSITY 275,534,096 119,680,268 55,599,664 15,799,734 10,963,981 7,156,301 13,288,730 9,510,855 43,534,563
BRITISH SYSTEM 980,727,717 584,083,432 19,293,765 42,141,722 31,013,446 14,699,381 23,480,665 64,174,100 201,841,206
B. TECHNICAL/PROFESSIONAL 3,323,186,036 1,767,537,592 99,444,269 109,954,152 229,253,358 62,100,177 207,869,388 195,718,109 651,308,991
MEDICAL COLLEGE 346,392,162 165,609,588 8,326,030 8,446,049 10,047,162 5,233,301 13,780,225 13,747,874 121,201,933
MEDICAL UNIVERSITY 889,199 760,000 1,666 333 7,200 120,000
DENTAL COLLEGE UNIVERSITY 38,696,520 19,233,042 254,674 709,597 987,513 1,145,628 1,319,860 1,165,428 13,880,778
SCHOOL COLLEGE OF MEDICAL TEACHER 10,928,243 6,009,533 769,290 76,200 634,960 38,080 701,730 2,356,700 341,750
SCHOOL COLLEGE OF NURSING 17,060,578 9,437,438 98,548 443,097 228,438 480,354 1,562,106 429,900 4,380,697
HOMEOPATHIC COLLEGE 163,282,677 112,020,797 25,207,101 2,242,201 2,106,246 577,725 4,939,306 8,739,860 7,449,441
TIBBIA COLLEGE 17,879,375 12,396,493 638,121 78,654 378,703 88,740 1,235,708 1,496,698 1,566,258
EDUCATION COLLEGE UNIVERSITY 114,722,700 68,283,331 1,760,683 3,388,604 4,237,043 5,114,205 7,338,629 5,534,480 19,065,725
HOME ECONOMIC COLLEGE 11,090,051 10,935,051 15,000 140,000
BUSINESS MANAGEMENT C/U 276,108,935 141,899,866 20,598,872 3,150,736 15,045,715 7,051,978 16,300,511 27,798,679 44,262,578
COMMERCE COLLEGE 391,558,186 220,927,489 14,174,839 13,537,560 17,267,670 4,091,630 30,239,556 54,463,380 36,856,062
ENGINEERING COLLEGE UNIVERSITY 584,798,052 251,572,276 7,603,454 7,590,702 74,370,200 9,132,829 45,782,136 6,445,000 182,301,455
IT COLLEGE UNIVERSITY 1,073,496,676 579,058,959 14,286,734 63,050,611 96,253,789 21,192,556 67,787,619 52,868,278 178,998,130
LAW COLLEGE UNIVERSITY 148,331,504 93,154,366 3,450,426 4,475,989 3,155,568 6,054,136 7,489,689 9,407,520 21,143,810
AGRICULTURE COLLEGE UNIVERSITY 12,739,502 8,518,547 423,784 623,100 82,788 1,009,437 1,062,156 420,000 599,690
VETERINARY/ANIMAL SCIENCE INST.
FINE ART COLLEGE 26,035,672 16,799,000 451,200 585,476 1,091,100 146,940 2,403,840 2,779,000 1,779,116
ACCOUNTANCY INSTITUTES 89,176,004 50,921,816 1,398,847 1,555,576 3,351,130 742,638 5,779,117 7,945,312 17,481,568
C. VOCATIONAL/POLYTECH 738,066,914 501,001,527 16,985,947 10,507,936 37,856,594 4,676,086 55,923,855 73,786,996 37,327,973
POLYTECHNIC INSTITUTES 127,390,563 80,589,109 2,637,086 3,528,871 11,213,412 879,827 8,411,538 9,998,584 10,132,136
MONOTECHNIC INSTITUTE 29,675,360 22,730,600 387,900 293,600 824,960 514,000 2,984,800 1,890,000 49,500

VOCATIONAL INSTITUTE 581,000,991 397,681,818 13,960,961 6,685,465 25,818,222 3,282,259 44,527,517 61,898,412 27,146,337
D. NFBC 23,181,371 13,938,570 43,553 1,105,900 1,899,323 508,195 1,422,380 3,171,200 1,092,250
E. DISTANCE EDUCATION 3,703,851 2,932,139 46,605 64,013 82,232 18,295 322,880 210,000 27,687
F. SPECIAL EDUCATION 76,737,771 50,806,079 1,497,824 670,092 1,926,118 6,791,027 3,958,048 2,778,100 8,310,483
G. DENNI NADARIS 1,715,647,312 876,394,715 51,156,546 94,964,018 46,409,974 14,407,811 213,062,183 32,127,914 387,124,151
H. OTHER N. E. C. 182,565,440 89,504,487 1,623,644 15,201,510 5,243,006 20,431,044 14,657,206 9,884,307 26,020,236

TABLE 50 RECEIPTS IN EDUCATIONAL INSTITUTIONS (PRIVATE) BY LEVEL
PAKISTAN ALL AREAS (In Rupees )
---------------------------------------------------------------------------------------------------------------------------------------------------------------------------------------------------
| | STUDENT FEE | STUDENT | GOVT. GRANTS | COMMUNITY DONATION | OTHER
LEVEL | TOTAL |-----------------------------------| FUNDS |-----------------------------------|-----------------------------------| RECEIPTS
| | ADMISSION | TUTION | | CASH | KIND | CASH | KIND | NEC
---------------------------------------------------------------------------------------------------------------------------------------------------------------------------------------------------
TOTAL (A TO H) 37,544,579,944 3,623,128,334 27,841,651,565 618,096,868 1,251,468,119 118,608,560 2,349,346,982 372,821,937 1,369,457,579
A. GENERAL 29,088,284,244 2,492,123,820 23,529,225,522 512,794,634 845,931,853 99,928,864 693,800,481 49,684,966 864,794,104
PRE-PRIMARY 230,661,447 23,031,471 180,475,759 2,454,747 10,316,187 897,580 4,004,920 564,120 8,916,663
MOSQUE 10,175,348 494,100 5,416,630 166,104 2,907,346 12,000 974,468 48,000 156,700
PRIMARY 2,853,363,072 238,286,593 2,219,666,922 42,664,569 141,202,244 10,788,453 130,423,997 9,079,919 61,250,375
MIDDLE/ELEMENTRY 6,674,163,843 575,609,686 5,606,568,385 96,428,321 130,246,647 7,549,998 140,879,330 14,160,240 102,721,236
SECONDRY/HIGH 12,702,932,097 1,022,632,722 10,654,939,504 193,995,442 200,241,693 11,716,748 320,705,074 14,704,301 283,996,613
HIGHER SECONDARY 2,470,951,320 198,834,381 1,883,370,594 68,721,022 138,793,402 2,000,000 40,396,250 3,877,240 134,958,431
INTERMEDIATE COLLEGE 936,962,023 117,150,831 745,622,165 14,781,677 6,691,416 310,000 19,452,098 5,627,500 27,326,336
DEGREE COLLEGE 1,026,081,682 124,356,798 688,486,863 15,273,848 82,142,909 52,325,085 33,554,188 1,573,646 28,368,345
GENERAL UNIVERSITY 610,893,568 90,106,900 199,159,004 285,900 133,171,545 14,329,000 85,646 173,755,573
BRITISH SYSTEM 1,572,099,844 101,620,338 1,345,519,696 78,023,004 218,464 3,324,510 50,000 43,343,832
B. TECHNICAL/PROFESSIONAL 4,635,125,475 950,504,836 3,198,598,841 23,783,187 193,146,973 1,443,903 56,518,047 2,034,514 209,095,174
MEDICAL COLLEGE 431,126,430 29,018,589 327,263,178 28,831 74,815,832
MEDICAL UNIVERSITY 844,009,816 14,400,000 829,603,259 6,557
DENTAL COLLEGE UNIVERSITY 39,581,925 11,141,401 28,224,224 216,300
SCHOOL COLLEGE OF MEDICAL TEACHER 15,452,520 5,188,800 10,003,720 110,000 150,000
SCHOOL COLLEGE OF NURSING 16,990,983 4,745,400 7,340,173 4,452,446 55,000 397,964
HOMEOPATHIC COLLEGE 103,559,562 25,632,033 66,934,947 2,829,492 2,498,821 1,642,201 4,022,068
TIBBIA COLLEGE 19,224,570 3,718,838 10,197,755 391,700 1,612,591 1,366,878 600,000 1,336,808
EDUCATION COLLEGE UNIVERSITY 98,696,705 14,825,480 35,630,417 75,686 513,600 17,012,522 115,000 30,524,000
HOME ECONOMIC COLLEGE 617,040 92,070 523,120 1,850
BUSINESS MANAGEMENT C/U 475,749,389 133,974,122 295,659,294 1,292,740 16,607,100 28,216,133
COMMERCE COLLEGE 494,769,107 69,558,778 394,823,907 9,110,624 6,032,812 6,702,100 965 8,539,921
ENGINEERING COLLEGE UNIVERSITY 612,639,176 26,406,000 533,454,149 5,404,750 7,500,050 2,231,000 37,643,227
IT COLLEGE UNIVERSITY 1,120,186,691 534,223,770 393,380,744 2,242,935 167,381,721 30,000 5,608,300 1,263,549 16,055,672
LAW COLLEGE UNIVERSITY 197,082,512 46,963,355 142,115,653 2,105,500 1,413,903 895,500 3,588,601
AGRICULTURE COLLEGE UNIVERSITY 10,802,148 2,800,000 180,510 7,558,547 263,091
VETERINARY/ANIMAL SCIENCE INST. 136,000 9,000 123,000 4,000
FINE ART COLLEGE 30,361,500 6,629,900 23,551,200 400 180,000
ACCOUNTANCY INSTITUTES 124,139,401 23,977,300 96,970,101 37,000 20,000 3,135,000
C. VOCATIONAL/POLYTECH 826,990,328 112,839,789 571,564,237 8,778,881 53,647,393 1,026,136 33,055,947 5,335,886 40,742,059
POLYTECHNIC INSTITUTES 195,303,780 27,863,928 152,701,137 1,498,000 5,492,000 659,335 7,089,380
MONOTECHNIC INSTITUTE 13,964,240 2,042,100 11,289,000 41,440 180,000 38,000 373,700
VOCATIONAL INSTITUTE 617,722,308 82,933,761 407,574,100 7,239,441 47,975,393 1,026,136 32,358,612 5,335,886 33,278,979
D. NFBC 48,559,579 633,869 10,318,714 1,549,781 10,555,292 922,952 16,682,968 976,320 6,919,683

E. DISTANCE EDUCATION 4,698,851 110,100 4,039,664 24,000 12,000 513,087
F. SPECIAL EDUCATION 88,336,224 893,110 29,344,548 1,653,834 19,748,491 4,249,609 22,524,334 3,849,622 6,072,676
G. DENNI NADARIS 2,650,288,401 61,080,741 315,449,630 68,292,597 125,192,241 10,811,146 1,520,351,882 310,602,183 238,507,981
H. OTHER N. E. C. 202,296,842 4,942,069 183,110,409 1,243,954 3,221,876 225,950 6,401,323 338,446 2,812,815

TABLE 50 RECEIPTS IN EDUCATIONAL INSTITUTIONS (PRIVATE) BY LEVEL
PAKISTAN RURAL AREAS (In Rupees )
---------------------------------------------------------------------------------------------------------------------------------------------------------------------------------------------------
| | STUDENT FEE | STUDENT | GOVT. GRANTS | COMMUNITY DONATION | OTHER
LEVEL | TOTAL |-----------------------------------| FUNDS |-----------------------------------|-----------------------------------| RECEIPTS
| | ADMISSION | TUTION | | CASH | KIND | CASH | KIND | NEC
---------------------------------------------------------------------------------------------------------------------------------------------------------------------------------------------------
TOTAL (A TO H) 8,151,754,767 532,667,659 5,702,026,813 121,717,268 378,177,031 16,042,393 844,452,447 155,936,528 400,734,628
A. GENERAL 6,933,982,269 487,483,757 5,486,624,656 104,337,261 303,097,295 8,069,294 236,610,128 19,159,164 288,600,714
PRE-PRIMARY 18,043,324 1,364,014 10,292,115 582,552 3,224,248 197,580 1,837,570 254,520 290,725
MOSQUE 3,662,662 77,500 1,497,040 7,204 1,328,410 12,000 600,308 33,000 107,200
PRIMARY 910,948,820 65,759,855 686,723,451 12,497,521 49,619,235 1,655,354 65,227,319 5,561,568 23,904,517
MIDDLE/ELEMENTRY 2,424,121,553 164,890,896 2,047,179,735 33,149,612 61,020,664 2,968,920 67,159,089 6,546,896 41,205,741
SECONDRY/HIGH 2,082,872,865 152,299,859 1,709,944,160 41,538,454 59,417,427 3,015,440 68,578,881 2,725,180 45,353,464
HIGHER SECONDARY 532,311,032 45,239,821 413,906,711 8,624,022 22,393,231 16,763,882 2,988,000 22,395,365
INTERMEDIATE COLLEGE 199,143,646 15,341,329 171,678,568 479,120 3,762,616 150,000 3,258,690 790,000 3,683,323
DEGREE COLLEGE 149,960,800 7,669,550 122,634,924 4,129,597 243,000 70,000 13,169,389 260,000 1,784,340
GENERAL UNIVERSITY 269,697,600 17,463,000 10,934,600 102,000,000 139,300,000
BRITISH SYSTEM 343,219,967 17,377,933 311,833,352 3,329,179 88,464 15,000 10,576,039
B. TECHNICAL/PROFESSIONAL 153,771,392 17,393,905 98,895,429 235,000 395,862 30,000 15,306,950 21,514,246
MEDICAL COLLEGE 56,120,000 5,600,000 50,520,000
MEDICAL UNIVERSITY 169,816 163,259 6,557
DENTAL COLLEGE UNIVERSITY 227,960 1,000 10,660 216,300
SCHOOL COLLEGE OF MEDICAL TEACHER 1,659,000 176,000 1,483,000
SCHOOL COLLEGE OF NURSING
HOMEOPATHIC COLLEGE 4,169,000 672,000 3,409,000 18,000 70,000
TIBBIA COLLEGE 505,400 85,000 420,400
EDUCATION COLLEGE UNIVERSITY 480,000 300,000 180,000
HOME ECONOMIC COLLEGE
BUSINESS MANAGEMENT C/U 62,280,936 4,821,000 27,164,019 11,418,550 18,877,367
COMMERCE COLLEGE 6,620,762 614,650 5,530,300 108,000 367,812
ENGINEERING COLLEGE UNIVERSITY 113 61 50 2
IT COLLEGE UNIVERSITY 12,617,405 2,703,255 5,325,730 120,000 10,000 30,000 3,888,400 540,020
LAW COLLEGE UNIVERSITY 6,978,000 2,412,000 4,566,000
AGRICULTURE COLLEGE UNIVERSITY
VETERINARY/ANIMAL SCIENCE INST. 136,000 9,000 123,000 4,000
FINE ART COLLEGE
ACCOUNTANCY INSTITUTES 1,807,000 7,000 1,800,000
C. VOCATIONAL/POLYTECH 81,419,026 15,354,325 44,767,659 1,274,340 5,823,971 381,136 7,448,133 289,740 6,079,722
POLYTECHNIC INSTITUTES 26,084,185 11,565,010 12,080,045 27,000 123,000 2,289,130
MONOTECHNIC INSTITUTE 45,600 27,600 18,000
VOCATIONAL INSTITUTE 55,289,241 3,789,315 32,660,014 1,247,340 5,823,971 381,136 7,307,133 289,740 3,790,592
D. NFBC 26,490,636 191,617 3,109,376 875,998 7,480,312 781,672 11,268,328 666,020 2,117,313

E. DISTANCE EDUCATION 47,400 600 10,800 24,000 12,000
F. SPECIAL EDUCATION 7,274,774 12,000 4,157,000 56,700 484,000 903,274 103,817 1,557,983
G. DENNI NADARIS 940,445,596 11,704,785 62,038,227 14,829,735 58,690,065 6,554,341 570,623,054 135,629,199 80,376,190
H. OTHER N. E. C. 8,323,674 526,670 2,423,666 108,234 2,181,526 225,950 2,280,580 88,588 488,460

TABLE 50 RECEIPTS IN EDUCATIONAL INSTITUTIONS (PRIVATE) BY LEVEL
PAKISTAN URBAN AREAS (In Rupees )
---------------------------------------------------------------------------------------------------------------------------------------------------------------------------------------------------
| | STUDENT FEE | STUDENT | GOVT. GRANTS | COMMUNITY DONATION | OTHER
LEVEL | TOTAL |-----------------------------------| FUNDS |-----------------------------------|-----------------------------------| RECEIPTS
| | ADMISSION | TUTION | | CASH | KIND | CASH | KIND | NEC
---------------------------------------------------------------------------------------------------------------------------------------------------------------------------------------------------
TOTAL (A TO H) 29,392,825,177 3,090,460,675 22,139,624,752 496,379,600 873,291,088 102,566,167 1,504,894,535 216,885,409 968,722,951
A. GENERAL 22,154,301,975 2,004,640,063 18,042,600,866 408,457,373 542,834,558 91,859,570 457,190,353 30,525,802 576,193,390
PRE-PRIMARY 212,618,123 21,667,457 170,183,644 1,872,195 7,091,939 700,000 2,167,350 309,600 8,625,938
MOSQUE 6,512,686 416,600 3,919,590 158,900 1,578,936 374,160 15,000 49,500
PRIMARY 1,942,414,252 172,526,738 1,532,943,471 30,167,048 91,583,009 9,133,099 65,196,678 3,518,351 37,345,858
MIDDLE/ELEMENTRY 4,250,042,290 410,718,790 3,559,388,650 63,278,709 69,225,983 4,581,078 73,720,241 7,613,344 61,515,495
SECONDRY/HIGH 10,620,059,232 870,332,863 8,944,995,344 152,456,988 140,824,266 8,701,308 252,126,193 11,979,121 238,643,149
HIGHER SECONDARY 1,938,640,288 153,594,560 1,469,463,883 60,097,000 116,400,171 2,000,000 23,632,368 889,240 112,563,066
INTERMEDIATE COLLEGE 737,818,377 101,809,502 573,943,597 14,302,557 2,928,800 160,000 16,193,408 4,837,500 23,643,013
DEGREE COLLEGE 876,120,882 116,687,248 565,851,939 11,144,251 81,899,909 52,255,085 20,384,799 1,313,646 26,584,005
GENERAL UNIVERSITY 341,195,968 72,643,900 188,224,404 285,900 31,171,545 14,329,000 85,646 34,455,573
BRITISH SYSTEM 1,228,879,877 84,242,405 1,033,686,344 74,693,825 130,000 3,309,510 50,000 32,767,793
B. TECHNICAL/PROFESSIONAL 4,481,354,083 933,110,931 3,099,703,412 23,548,187 192,751,111 1,413,903 41,211,097 2,034,514 187,580,928
MEDICAL COLLEGE 375,006,430 23,418,589 276,743,178 28,831 74,815,832
MEDICAL UNIVERSITY 843,840,000 14,400,000 829,440,000
DENTAL COLLEGE UNIVERSITY 39,353,965 11,140,401 28,213,564
SCHOOL COLLEGE OF MEDICAL TEACHER 13,793,520 5,012,800 8,520,720 110,000 150,000
SCHOOL COLLEGE OF NURSING 16,990,983 4,745,400 7,340,173 4,452,446 55,000 397,964
HOMEOPATHIC COLLEGE 99,390,562 24,960,033 63,525,947 2,829,492 2,480,821 1,642,201 3,952,068
TIBBIA COLLEGE 18,719,170 3,633,838 9,777,355 391,700 1,612,591 1,366,878 600,000 1,336,808
EDUCATION COLLEGE UNIVERSITY 98,216,705 14,525,480 35,450,417 75,686 513,600 17,012,522 115,000 30,524,000
HOME ECONOMIC COLLEGE 617,040 92,070 523,120 1,850
BUSINESS MANAGEMENT C/U 413,468,453 129,153,122 268,495,275 1,292,740 5,188,550 9,338,766
COMMERCE COLLEGE 488,148,345 68,944,128 389,293,607 9,002,624 5,665,000 6,702,100 965 8,539,921
ENGINEERING COLLEGE UNIVERSITY 612,639,063 26,406,000 533,454,088 5,404,750 7,500,000 2,231,000 37,643,225
IT COLLEGE UNIVERSITY 1,107,569,286 531,520,515 388,055,014 2,122,935 167,371,721 1,719,900 1,263,549 15,515,652
LAW COLLEGE UNIVERSITY 190,104,512 44,551,355 137,549,653 2,105,500 1,413,903 895,500 3,588,601
AGRICULTURE COLLEGE UNIVERSITY 10,802,148 2,800,000 180,510 7,558,547 263,091
VETERINARY/ANIMAL SCIENCE INST.
FINE ART COLLEGE 30,361,500 6,629,900 23,551,200 400 180,000
ACCOUNTANCY INSTITUTES 122,332,401 23,977,300 96,970,101 30,000 20,000 1,335,000
C. VOCATIONAL/POLYTECH 745,571,302 97,485,464 526,796,578 7,504,541 47,823,422 645,000 25,607,814 5,046,146 34,662,337
POLYTECHNIC INSTITUTES 169,219,595 16,298,918 140,621,092 1,471,000 5,492,000 536,335 4,800,250
MONOTECHNIC INSTITUTE 13,918,640 2,042,100 11,261,400 41,440 180,000 20,000 373,700
VOCATIONAL INSTITUTE 562,433,067 79,144,446 374,914,086 5,992,101 42,151,422 645,000 25,051,479 5,046,146 29,488,387
D. NFBC 22,068,943 442,252 7,209,338 673,783 3,074,980 141,280 5,414,640 310,300 4,802,370

E. DISTANCE EDUCATION 4,651,451 109,500 4,028,864 513,087
F. SPECIAL EDUCATION 81,061,450 881,110 25,187,548 1,597,134 19,264,491 4,249,609 21,621,060 3,745,805 4,514,693
G. DENNI NADARIS 1,709,842,805 49,375,956 253,411,403 53,462,862 66,502,176 4,256,805 949,728,828 174,972,984 158,131,791
H. OTHER N. E. C. 193,973,168 4,415,399 180,686,743 1,135,720 1,040,350 4,120,743 249,858 2,324,355
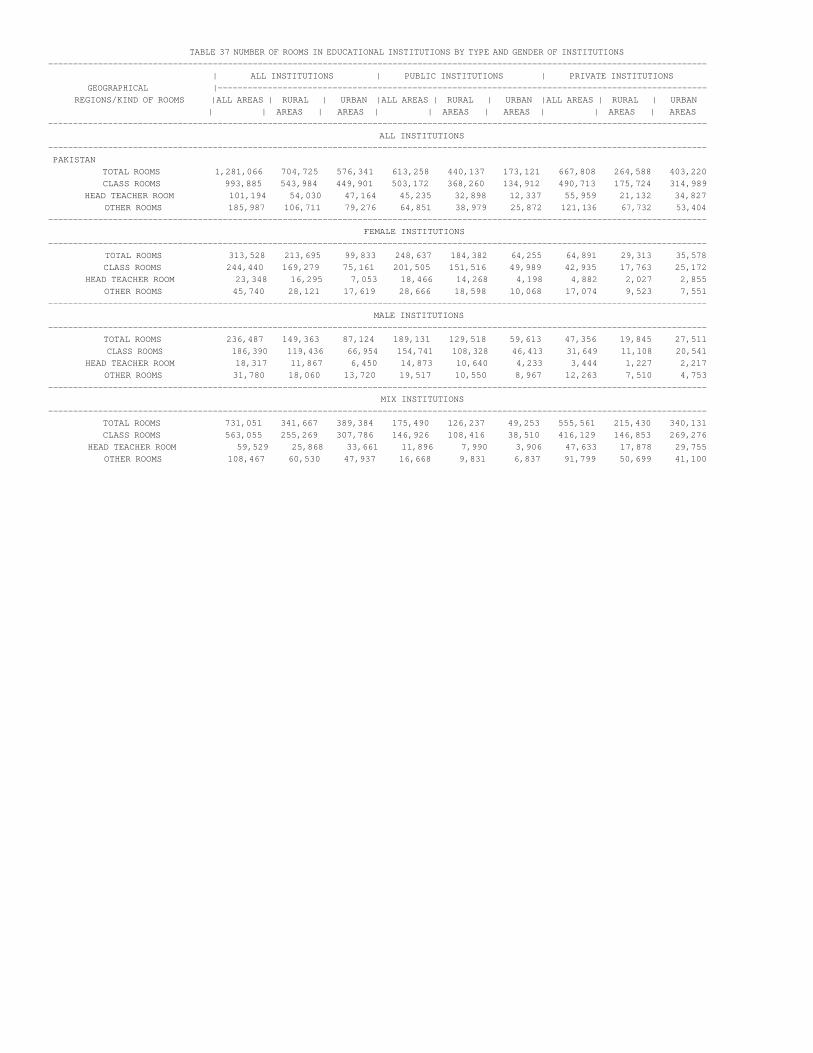
TABLE 37 NUMBER OF ROOMS IN EDUCATIONAL INSTITUTIONS BY TYPE AND GENDER OF INSTITUTIONS
------------------------------------------------------------------------------------------------------------------------------------
| ALL INSTITUTIONS | PUBLIC INSTITUTIONS | PRIVATE INSTITUTIONS
GEOGRAPHICAL |--------------------------------------------------------------------------------------------------
REGIONS/KIND OF ROOMS |ALL AREAS | RURAL | URBAN |ALL AREAS | RURAL | URBAN |ALL AREAS | RURAL | URBAN
| | AREAS | AREAS | | AREAS | AREAS | | AREAS | AREAS
------------------------------------------------------------------------------------------------------------------------------------
ALL INSTITUTIONS
------------------------------------------------------------------------------------------------------------------------------------
PAKISTAN
TOTAL ROOMS 1,281,066 704,725 576,341 613,258 440,137 173,121 667,808 264,588 403,220
CLASS ROOMS 993,885 543,984 449,901 503,172 368,260 134,912 490,713 175,724 314,989
HEAD TEACHER ROOM 101,194 54,030 47,164 45,235 32,898 12,337 55,959 21,132 34,827
OTHER ROOMS 185,987 106,711 79,276 64,851 38,979 25,872 121,136 67,732 53,404
------------------------------------------------------------------------------------------------------------------------------------
FEMALE INSTITUTIONS
------------------------------------------------------------------------------------------------------------------------------------
TOTAL ROOMS 313,528 213,695 99,833 248,637 184,382 64,255 64,891 29,313 35,578
CLASS ROOMS 244,440 169,279 75,161 201,505 151,516 49,989 42,935 17,763 25,172
HEAD TEACHER ROOM 23,348 16,295 7,053 18,466 14,268 4,198 4,882 2,027 2,855
OTHER ROOMS 45,740 28,121 17,619 28,666 18,598 10,068 17,074 9,523 7,551
------------------------------------------------------------------------------------------------------------------------------------
MALE INSTITUTIONS
------------------------------------------------------------------------------------------------------------------------------------
TOTAL ROOMS 236,487 149,363 87,124 189,131 129,518 59,613 47,356 19,845 27,511
CLASS ROOMS 186,390 119,436 66,954 154,741 108,328 46,413 31,649 11,108 20,541
HEAD TEACHER ROOM 18,317 11,867 6,450 14,873 10,640 4,233 3,444 1,227 2,217
OTHER ROOMS 31,780 18,060 13,720 19,517 10,550 8,967 12,263 7,510 4,753
------------------------------------------------------------------------------------------------------------------------------------
MIX INSTITUTIONS
------------------------------------------------------------------------------------------------------------------------------------
TOTAL ROOMS 731,051 341,667 389,384 175,490 126,237 49,253 555,561 215,430 340,131
CLASS ROOMS 563,055 255,269 307,786 146,926 108,416 38,510 416,129 146,853 269,276
HEAD TEACHER ROOM 59,529 25,868 33,661 11,896 7,990 3,906 47,633 17,878 29,755
OTHER ROOMS 108,467 60,530 47,937 16,668 9,831 6,837 91,799 50,699 41,100
Related Documents