National core maternity indicators

Welcome message from author
This document is posted to help you gain knowledge. Please leave a comment to let me know what you think about it! Share it to your friends and learn new things together.
Transcript
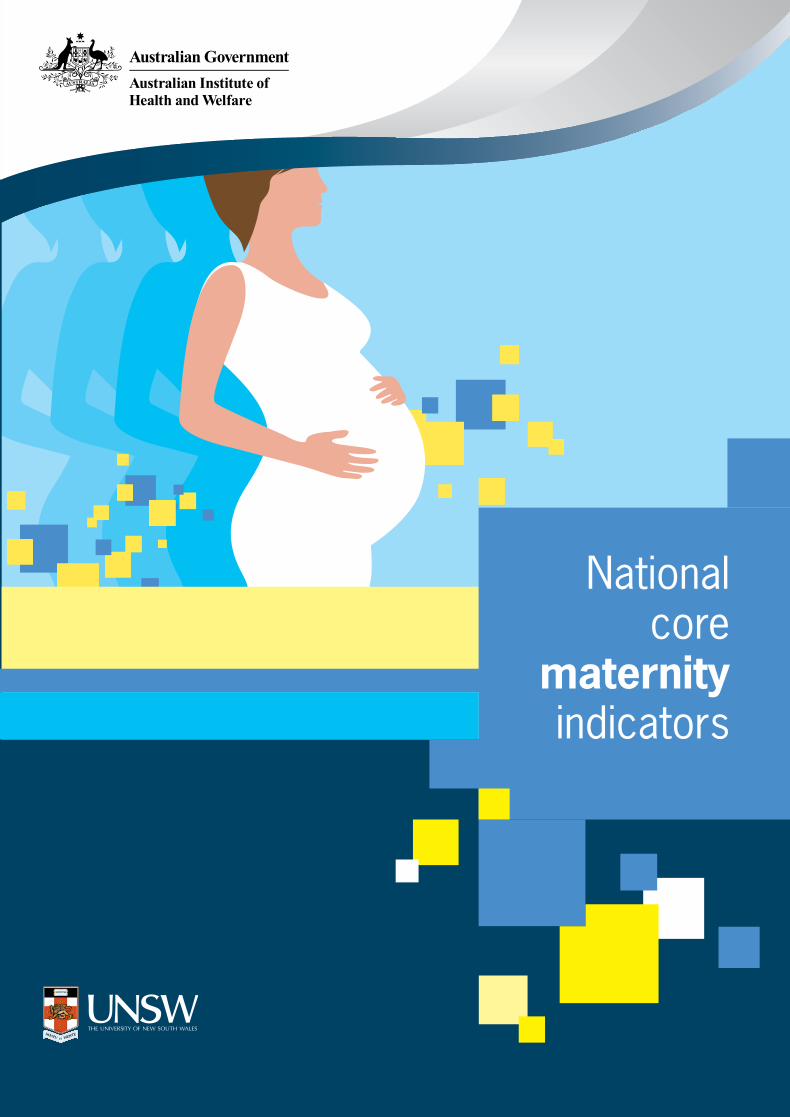
National core
maternity indicators
This is the first report of 10 national core maternity indicators for monitoring the quality of maternity care in Australia. National rates have decreased for smoking in pregnancy, episiotomy among women having their first baby and giving birth vaginally, and the proportion of babies born weighing less than 2,750 grams at or after 40 weeks. However, for some indicators, including induction of labour, caesarean section and instrumental vaginal birth, rates have increased and point to areas for possible further attention.
National core
maternity indicators
© Australian Institute of Health and Welfare and University of New South Wales 2013 This product, excluding the AIHW logo, Commonwealth Coat of Arms, UNSW logo and any material owned by a third party or protected by a trademark, has been released under a Creative Commons BY 3.0 (CCBY 3.0) licence. Excluded material owned by third parties may include, for example, design and layout, images obtained under licence from third parties and signatures. We have made all reasonable efforts to identify and label material owned by third parties. You may distribute, remix and build upon this work. However, you must attribute the AIHW and UNSW as the joint copyright holders of the work and use the standard attribution provided in compliance with the AIHW attribution policy available at <www.aihw.gov.au/copyright/>. The full terms and conditions of this licence are available at <http://creativecommons.org/licenses/by/3.0/au/>. Enquiries relating to copyright should be addressed to the Head of the Communications, Media and Marketing Unit, Australian Institute of Health and Welfare, GPO Box 570, Canberra ACT 2601. A complete list of the Institute’s publications is available from the Institute’s website <www.aihw.gov.au>. ISBN 978-1-74249-398-5 Suggested citation AIHW National Perinatal Epidemiology and Statistics Unit and AIHW 2013. National core maternity indicators. Cat. no. PER 58. Canberra: AIHW. Australian Institute of Health and Welfare Board Chair Dr Andrew Refshauge Director David Kalisch Any enquiries about or comments on this publication should be directed to: Communications, Media and Marketing Unit Australian Institute of Health and Welfare GPO Box 570 Canberra ACT 2601 Tel: (02) 6244 1032 Email: [email protected] Published by the Australian Institute of Health and Welfare Please note that there is the potential for minor revisions of data in this report. Please check the online version at <www.aihw.gov.au> for any amendments.
The Australian Institute of Health and Welfare is a major national agency which provides reliable, regular and relevant information and statistics
on Australia’s health and welfare. The Institute’s mission is authoritative information and statistics to promote better health and wellbeing.
iii
Contents
Acknowledgments iv
Abbreviations v
Symbols vi
Summary vii
Introduction 1
The national core maternity indicators 5
Appendix A: Expert Commentary Group 28
Appendix B: Methods 29
Appendix C: Indicator specifications 35
Glossary 45
References 46
List of tables 47
List of figures 48
iv
National core maternity indicators
AcknowledgmentsThe Australian Institute of Health and Welfare (AIHW) National Perinatal Epidemiology and Statistics Unit (NPESU) is a formally affiliated institution of the University of New South Wales (UNSW) and is co-located in the Perinatal and Reproductive Epidemiology Research Unit, School of Women’s and Children’s Health, Faculty of Medicine. We acknowledge the support of the NPESU by the School of Women’s and Children’s Health, the UNSW and the Sydney Children’s Hospital.
The main authors were Lisa Hilder and Michelle Bonello from NPESU, with assistance from Mary Beneforti and Melinda Petrie from the Children, Youth and Families Unit of the AIHW. They would like to thank the Expert Commentary Group for its valuable clinical advice and input on the report. In addition, the authors and Expert Commentary Group gratefully acknowledge the expert commentary for Indicator 9 contributed by Nolan McDonnell, Department of Anaesthesia and Pain Medicine, King Edward Memorial Hospital for Women, and Alicia Dennis, Chair of the Obstetric Anaesthesia Special interest group, a joint collaboration of the Royal Australian College of Obstetricians and Gynaecologists and the Australian and New Zealand Anaesthetic Societies.
This report could not have been prepared without the assistance of maternity staff in each state and territory and staff members of all state and territory health authorities who contributed their time, effort and expertise to collect and provide data for the National Perinatal Data Collection (NPDC).
The AIHW would like to acknowledge funding provided by the Australian Health Ministers’ Advisory Council (via the Maternity Services Inter-Jurisdictional Committee) for this project.

v
Abbreviations
ABS Australian Bureau of Statistics
ACHS Australian Council on Healthcare Standards
ACSQHC Australian Council (now Commission) on Safety and Quality in Health Care
ACT Australian Capital Territory
AHMAC Australian Health Ministers’ Advisory Council
AIHW Australian Institute of Health and Welfare
ASGC Australian Standard Geographical Classification
Aust Australia
BMI body mass index
CMIP Core Maternity Indicators Project
COAG Council of Australian Governments
DoHWA Department of Health, Western Australia
FaHCSIA Department of Families, Housing, Community Services and Indigenous Affairs
GA general anaesthetic
IGA Intergovernmental Agreement
IRSD Index of Relative Social Disadvantage
IUGR intrauterine growth restriction
KEMH King Edward Memorial Hospital
MSIJC Maternity Services Inter-Jurisdictional Committee
NMDS National Minimum Data Set
NHA National Healthcare Agreement
NIRA National Indigenous Reform Agreement
NPDC National Perinatal Data Collection
NPESU National Perinatal Epidemiology and Statistics Unit
NSW New South Wales
NT Northern Territory
Qld Queensland
RoGS Report on Government Services
SA South Australia
SEIFA Socioeconomic Index for Areas
SLA Statistical Local Area
Tas Tasmania
UNSW University of New South Wales
VDHS Victorian Department of Human Services
Vic Victoria
WA Western Australia
WHA Women’s Healthcare (formerly Hospitals) Australasia

vi
National core maternity indicators
Symbols
— nil or rounded to zero
. . not applicable
n.a. not available
n.p. not publishable because of small numbers, confidentiality or other concerns about the quality of the data
vii
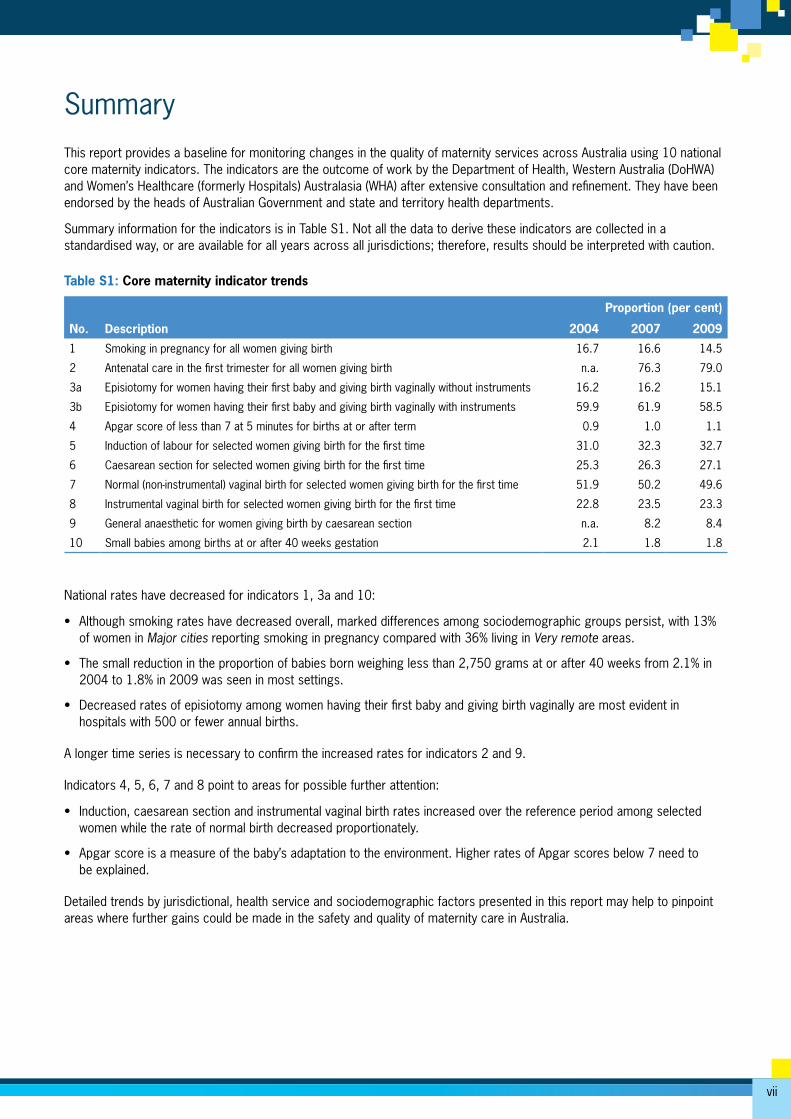
SummaryThis report provides a baseline for monitoring changes in the quality of maternity services across Australia using 10 national core maternity indicators. The indicators are the outcome of work by the Department of Health, Western Australia (DoHWA) and Women’s Healthcare (formerly Hospitals) Australasia (WHA) after extensive consultation and refinement. They have been endorsed by the heads of Australian Government and state and territory health departments.
Summary information for the indicators is in Table S1. Not all the data to derive these indicators are collected in a standardised way, or are available for all years across all jurisdictions; therefore, results should be interpreted with caution.
Table S1: Core maternity indicator trends
Description
Proportion (per cent)
No. 2004 2007 2009
1 Smoking in pregnancy for all women giving birth 16.7 16.6 14.5
2 Antenatal care in the first trimester for all women giving birth n.a. 76.3 79.0
3a Episiotomy for women having their first baby and giving birth vaginally without instruments 16.2 16.2 15.1
3b Episiotomy for women having their first baby and giving birth vaginally with instruments 59.9 61.9 58.5
4 Apgar score of less than 7 at 5 minutes for births at or after term 0.9 1.0 1.1
5 Induction of labour for selected women giving birth for the first time 31.0 32.3 32.7
6 Caesarean section for selected women giving birth for the first time 25.3 26.3 27.1
7 Normal (non-instrumental) vaginal birth for selected women giving birth for the first time 51.9 50.2 49.6
8 Instrumental vaginal birth for selected women giving birth for the first time 22.8 23.5 23.3
9 General anaesthetic for women giving birth by caesarean section n.a. 8.2 8.4
10 Small babies among births at or after 40 weeks gestation 2.1 1.8 1.8
National rates have decreased for indicators 1, 3a and 10:
• Although smoking rates have decreased overall, marked differences among sociodemographic groups persist, with 13% of women in Major cities reporting smoking in pregnancy compared with 36% living in Very remote areas.
• The small reduction in the proportion of babies born weighing less than 2,750 grams at or after 40 weeks from 2.1% in 2004 to 1.8% in 2009 was seen in most settings.
• Decreased rates of episiotomy among women having their first baby and giving birth vaginally are most evident in hospitals with 500 or fewer annual births.
A longer time series is necessary to confirm the increased rates for indicators 2 and 9.
Indicators 4, 5, 6, 7 and 8 point to areas for possible further attention:
• Induction, caesarean section and instrumental vaginal birth rates increased over the reference period among selected women while the rate of normal birth decreased proportionately.
• Apgar score is a measure of the baby’s adaptation to the environment. Higher rates of Apgar scores below 7 need to be explained.
Detailed trends by jurisdictional, health service and sociodemographic factors presented in this report may help to pinpoint areas where further gains could be made in the safety and quality of maternity care in Australia.

1
Introduction
This report extends the work undertaken by the Maternity Services Inter-Jurisdictional Committee (MSIJC) of the Australian Health Ministers’ Advisory Council (AHMAC) to develop a set of national core maternity indicators to monitor the quality of maternity care in Australia. Ten maternity indicators, for which data are available from the AIHW National Perinatal Data Collection, were proposed by the MSIJC Expert Working Group for reporting against national data. This provides a baseline to examine trends in maternity interventions and outcomes and the quality of maternity services in the years after the introduction of the National Maternity Services Plan (AHMC 2011). This is important as the Plan proposed major changes to the organisation of maternity care in Australia.
The foundation of the national core maternity indicatorsThe Douglas Inquiry into obstetric and gynaecological services provided between 1990 and 2000 at the King Edward Memorial Hospital (KEMH) for Women in Perth recommended that Australia establish an enquiry process with annual benchmarking and/or reporting of performance indicators for obstetric and gynaecological practice and outcomes (KEMH 2001). In 2002, Australian Health Ministers agreed to support a collaborative project coordinated by the Department of Health, Western Australia (DoHWA) to enable the analysis of comparative clinical performance data from tertiary obstetric and gynaecological hospitals in Australian jurisdictions (WHA 2007). In 2003, DoHWA conducted a three-month pilot project of maternity data benchmarking. This ‘proof of concept’ project demonstrated the potential to improve the quality of maternity care through benchmarking.
A national project to progress development of maternity indicators was funded by the Australian Council on Safety and Quality in Health Care (ACSQHC) in 2004. In 2005, the National Maternity Services Collaboration on Health Policy (now the Maternity Services Inter-Jurisdictional Committee) advised AHMAC that it would be necessary to identify and develop a set of national performance indicators. DoHWA then consulted with relevant agencies about the best approach to developing a national set of indicators.
These discussions established the Core Maternity Indicators Project (CMIP), which was undertaken by Women’s Healthcare (formerly Hospitals) Australasia (WHA) and DoHWA to develop a set of national maternity indicators with funding from ACSQHC. This extensive body of work aimed to ‘measure and evaluate safe and effective maternity care in a timely fashion’ (WHA 2007).
In 2008, AHMAC transferred responsibility for the management and continuity for CMIP from the ACSQHC to the MSIJC. The MSIJC’s role was to provide consistency on national maternity reporting of core maternity indicators. This project was also needed to identify an appropriate national repository for this information for ongoing coordinating, reporting and analysis.
The development of core maternity indicators aligns with the first recommendation of the National Review of Maternity Services undertaken by the Chief Nursing Officer on behalf of the Australian Government in 2008 that states:
That the Australian Government, in consultation with states and territories and key stakeholders, agree and implement arrangements for consistent, comprehensive national data collection, monitoring and review, for maternal and perinatal mortality and morbidity (Commonwealth of Australia 2009).
What are clinical indicators?The national core maternity indicators are clinical indicators that apply to the field of maternity care. A clinical indicator is specifically defined as a measure of the clinical management and outcome of care, and should be based on evidence that confirms the underlying causal relationship between a particular process or intervention and health outcome (WHA 2007).
Clinical indicators have a key role in the assessment, monitoring and evaluation of patient care. Most importantly, they allow for monitoring change in practice and outcomes relative to individual and peer organisations over time with the objective of improving patient care. A well-designed clinical indicator points to, or flags, a specific clinical issue, without necessarily providing a definitive answer (ACHS 2010). Clinical indicators are an important tool for assessing whether or not standards in patient care are being met.
2
National core maternity indicators
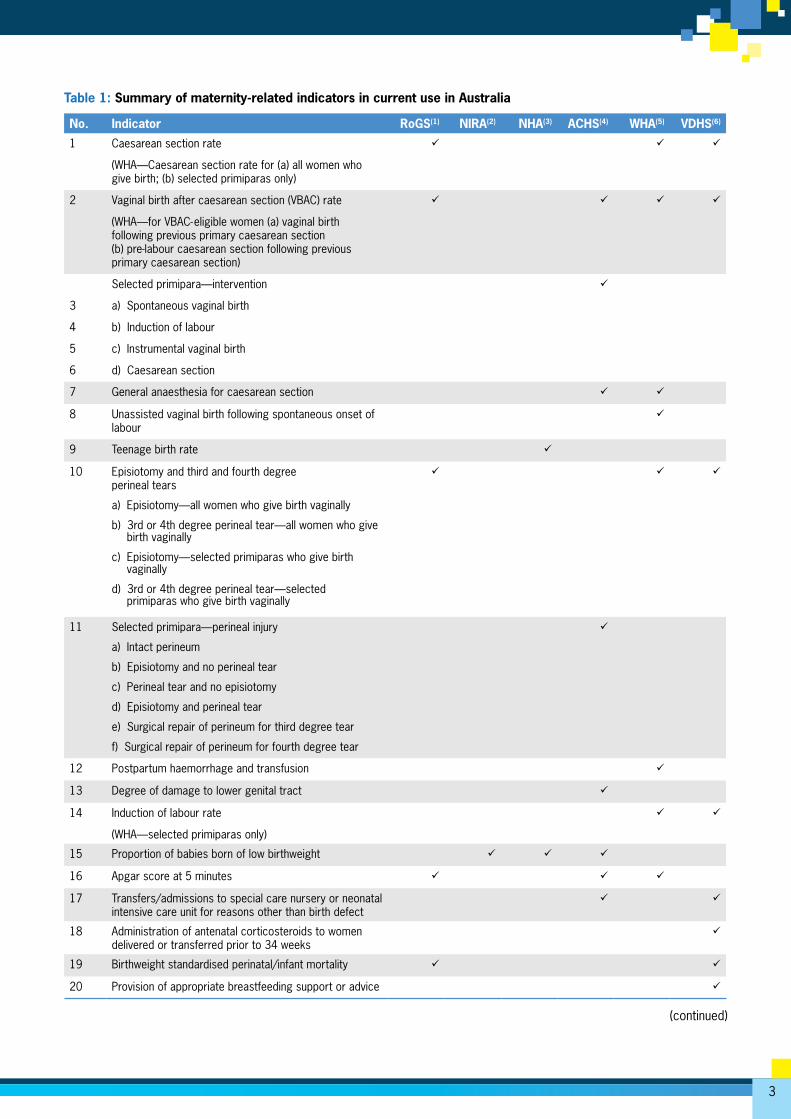
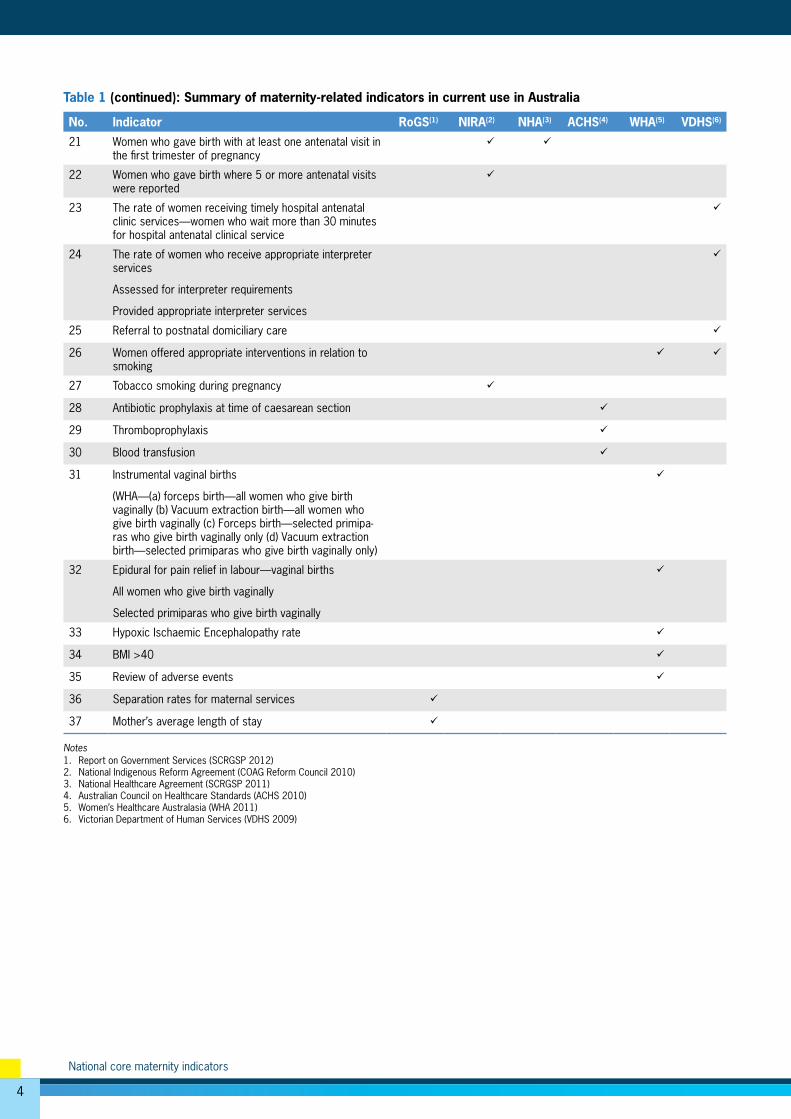
Current maternity indicator reporting in AustraliaA number of jurisdictions and professional organisations currently report on maternity services using clinical or performance indicators. This section provides an overview of that reporting (Table 1).
Australian Council on Healthcare Standards
The Australian Council on Healthcare Standards (ACHS) provides performance and outcomes services to health-care providers, and 700 health-care organisations participate in its Clinical Indicator Program in any 6-month period. Since 1989, the ACHS has been involved in developing clinical indicators in collaboration with Australian and New Zealand medical colleges, associations and societies, including the Royal Australian and New Zealand College of Obstetricians and Gynaecologists (ACHS 2010). Table 1 lists the 10 obstetric indicators reported by the ACHS.
Women’s Healthcare (formerly Hospitals) Australasia
Women’s Healthcare Australasia (WHA) is a multidisciplinary professional organisation for member hospitals and health services caring for women and babies in Australia and New Zealand. The WHA has been collecting and collating clinical indicator data from member hospitals and providing de-identified benchmarking reports, Benchmarking Maternity Care, since 1997. This report benchmarks clinical care processes and outcomes with peer hospitals in Australia and New Zealand and is distributed annually to members. Table 1 summarises the current maternity indicators produced by the WHA.
State government
In 2001, the Victorian Government released the report Measuring maternity care comprising a set of performance indicators for the hospital-based maternity services that span a range of domains of care, and include both process and outcome measures of the three phases of maternity care: antenatal, intrapartum and postnatal maternity care (VDHS 2009). Since 2003, all Victorian public hospitals that provide maternity care have been reporting yearly against a set of performance indicators, using data from the Victorian Perinatal Data Collection Unit, the Victorian Admitted Episodes Data Set and data provided directly from Victorian public hospitals to the Department of Human Services (VDHS 2009). Importantly, trend data have demonstrated change in the desired direction in some key indicators. Reporting annually maintains the focus on important aspects of the safety and quality of maternity care (VDHS 2009). The indicators are listed in Table 1.
National core maternity indicators are central to the policy framework developed in 2007 and implemented in Western Australia (DoHWA 2007). One objective of the framework is to report the national core maternity indicators across Western Australia (Joyce 2012).
National Healthcare Agreement
In November 2008, the Council of Australian Governments (COAG) endorsed a new Intergovernmental Agreement (IGA) on Federal Financial Relations that was subsequently reaffirmed in July 2011 (COAG 2009, COAG 2011). The IGA incorporates a number of National Agreements, which include the National Healthcare Agreement (NHA). Each National Agreement has a performance reporting framework that all jurisdictions are required to report against. The NHA includes three maternity indicators for which the data are derived from the Perinatal National Minimum Data Set (NMDS) (see Table 1). An annual report has been prepared since 2009 and initially reported on births that occurred in 2007. The most recent report is on births that occurred in 2009.
National Indigenous Reform Agreement
The IGA includes the National Indigenous Reform Agreement (NIRA). The NIRA has three maternity indicators that are reported for all jurisdictions (see Table 1). The data for indicator reporting are derived from the Perinatal NMDS. An annual report has been prepared since 2009, initially reporting on births that occurred in 2007. The most recent report is on births that occurred in 2009.
Report on Government Services
The Report on Government Services (RoGS) was commissioned in 1993 by Heads of Government (now COAG) to help improve the efficiency and effectiveness of government services. The RoGS is a tool for government and is now in its seventeenth year of annual reporting. The framework for performance indicators reported in the RoGS provides comparative information on efficiency, equity and effectiveness and distinguishes the outputs and outcomes of maternity services (SCRGSP 2012). The data for indicator reporting are derived from the state and territory perinatal data collections. Table 1 summarises the current maternity indicators produced for the RoGS.
3
Table 1: Summary of maternity-related indicators in current use in Australia
No. Indicator RoGS(1) NIRA(2) NHA(3) ACHS(4) WHA(5) VDHS(6)
1 Caesarean section rate
(WHA—Caesarean section rate for (a) all women who give birth; (b) selected primiparas only)
2 Vaginal birth after caesarean section (VBAC) rate
(WHA—for VBAC-eligible women (a) vaginal birth following previous primary caesarean section (b) pre-labour caesarean section following previous primary caesarean section)
3
4
5
6
Selected primipara—intervention
a) Spontaneous vaginal birth
b) Induction of labour
c) Instrumental vaginal birth
d) Caesarean section
7 General anaesthesia for caesarean section
8 Unassisted vaginal birth following spontaneous onset of labour
9 Teenage birth rate
10 Episiotomy and third and fourth degree perineal tears
a) Episiotomy—all women who give birth vaginally
b) 3rd or 4th degree perineal tear—all women who give birth vaginally
c) Episiotomy—selected primiparas who give birth vaginally
d) 3rd or 4th degree perineal tear—selected primiparas who give birth vaginally
11 Selected primipara—perineal injury
a) Intact perineum
b) Episiotomy and no perineal tear
c) Perineal tear and no episiotomy
d) Episiotomy and perineal tear
e) Surgical repair of perineum for third degree tear
f) Surgical repair of perineum for fourth degree tear
12 Postpartum haemorrhage and transfusion
13 Degree of damage to lower genital tract
14 Induction of labour rate
(WHA—selected primiparas only)
15 Proportion of babies born of low birthweight
16 Apgar score at 5 minutes
17 Transfers/admissions to special care nursery or neonatal intensive care unit for reasons other than birth defect
18 Administration of antenatal corticosteroids to women delivered or transferred prior to 34 weeks
19 Birthweight standardised perinatal/infant mortality
20 Provision of appropriate breastfeeding support or advice
(continued)
4
National core maternity indicators
Table 1 (continued): Summary of maternity-related indicators in current use in Australia
No. Indicator RoGS(1) NIRA(2) NHA(3) ACHS(4) WHA(5) VDHS(6)
21 Women who gave birth with at least one antenatal visit in the first trimester of pregnancy
22 Women who gave birth where 5 or more antenatal visits were reported
23 The rate of women receiving timely hospital antenatal clinic services—women who wait more than 30 minutes for hospital antenatal clinical service
24 The rate of women who receive appropriate interpreter services
Assessed for interpreter requirements
Provided appropriate interpreter services
25 Referral to postnatal domiciliary care
26 Women offered appropriate interventions in relation to smoking
27 Tobacco smoking during pregnancy
28 Antibiotic prophylaxis at time of caesarean section
29 Thromboprophylaxis
30 Blood transfusion
31 Instrumental vaginal births
(WHA—(a) forceps birth—all women who give birth vaginally (b) Vacuum extraction birth—all women who give birth vaginally (c) Forceps birth—selected primipa-ras who give birth vaginally only (d) Vacuum extraction birth—selected primiparas who give birth vaginally only)
32 Epidural for pain relief in labour—vaginal births
All women who give birth vaginally
Selected primiparas who give birth vaginally
33 Hypoxic Ischaemic Encephalopathy rate
34 BMI >40
35 Review of adverse events
36 Separation rates for maternal services
37 Mother’s average length of stay
Notes1. Report on Government Services (SCRGSP 2012)2. National Indigenous Reform Agreement (COAG Reform Council 2010)3. National Healthcare Agreement (SCRGSP 2011)4. Australian Council on Healthcare Standards (ACHS 2010)5. Women’s Healthcare Australasia (WHA 2011)6. Victorian Department of Human Services (VDHS 2009)
5
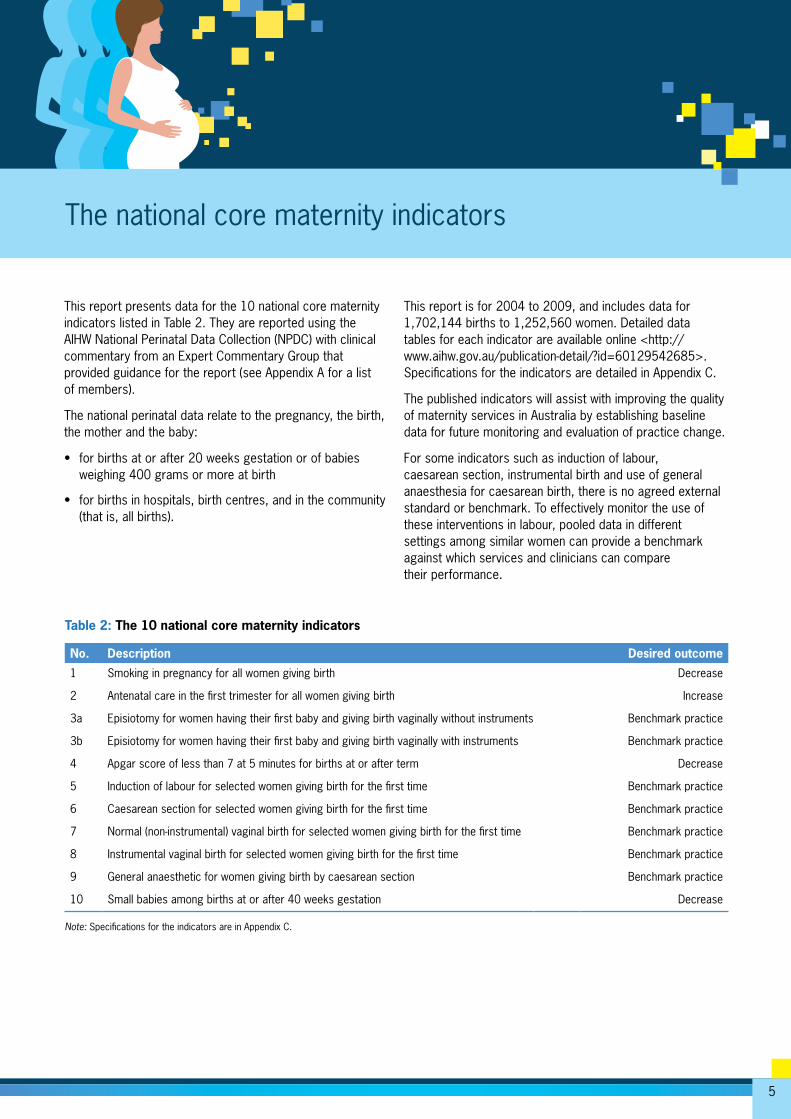
The national core maternity indicators
This report presents data for the 10 national core maternity indicators listed in Table 2. They are reported using the AIHW National Perinatal Data Collection (NPDC) with clinical commentary from an Expert Commentary Group that provided guidance for the report (see Appendix A for a list of members).
The national perinatal data relate to the pregnancy, the birth, the mother and the baby:
• for births at or after 20 weeks gestation or of babies weighing 400 grams or more at birth
• for births in hospitals, birth centres, and in the community (that is, all births).
This report is for 2004 to 2009, and includes data for 1,702,144 births to 1,252,560 women. Detailed data tables for each indicator are available online <http://www.aihw.gov.au/publication-detail/?id=60129542685>. Specifications for the indicators are detailed in Appendix C.
The published indicators will assist with improving the quality of maternity services in Australia by establishing baseline data for future monitoring and evaluation of practice change.
For some indicators such as induction of labour, caesarean section, instrumental birth and use of general anaesthesia for caesarean birth, there is no agreed external standard or benchmark. To effectively monitor the use of these interventions in labour, pooled data in different settings among similar women can provide a benchmark against which services and clinicians can compare their performance.
Table 2: The 10 national core maternity indicators
No. Description Desired outcome
1 Smoking in pregnancy for all women giving birth Decrease
2 Antenatal care in the first trimester for all women giving birth Increase
3a Episiotomy for women having their first baby and giving birth vaginally without instruments Benchmark practice
3b Episiotomy for women having their first baby and giving birth vaginally with instruments Benchmark practice
4 Apgar score of less than 7 at 5 minutes for births at or after term Decrease
5 Induction of labour for selected women giving birth for the first time Benchmark practice
6 Caesarean section for selected women giving birth for the first time Benchmark practice
7 Normal (non-instrumental) vaginal birth for selected women giving birth for the first time Benchmark practice
8 Instrumental vaginal birth for selected women giving birth for the first time Benchmark practice
9 General anaesthetic for women giving birth by caesarean section Benchmark practice
10 Small babies among births at or after 40 weeks gestation Decrease Note: Specifications for the indicators are in Appendix C.
6
National core maternity indicators
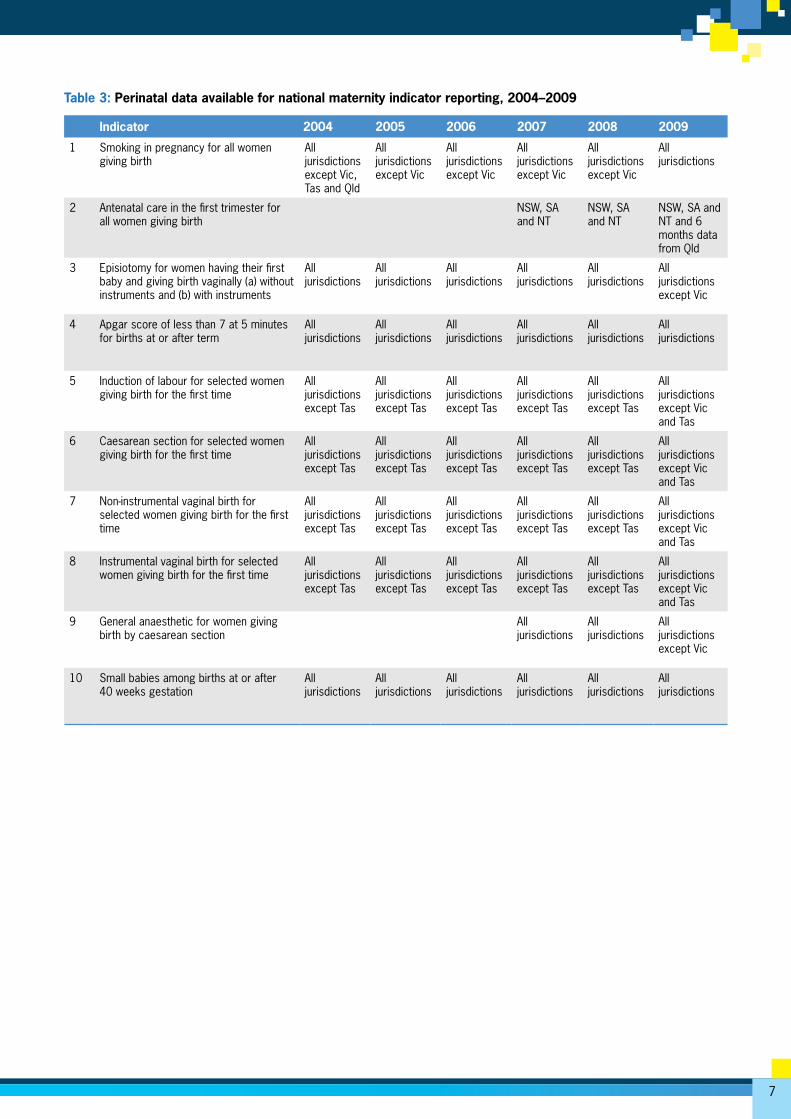
Data quality issuesThe NPDC includes data collected for the Perinatal NMDS, which uses agreed standards for data collection and regular reviews of compliance across all jurisdictions. Changes to all NMDSs are applied on a financial year basis from 1 July. Data collection practices can vary for the additional data provided on a voluntary basis. Information is not available from all jurisdictions to support the 10 indicators in all years. With the exception of indicators 4 and 10, the indicator values rely to some extent on non-NMDS data items.
Indicator 1 is not able to be reported as defined because the smoking data in the NPDC for the years reported do not support the division of the data into smoking in the first and second 20 weeks of pregnancy. Standard data items to support both parts of the indicator have been added to the Perinatal NMDS and will apply to data for births from 1 July 2010.
Data for indicators 2 and 9 are available from some jurisdictions from January 2007 onwards. These data have not been collected using a standard instrument. Further, data for Indicator 2 were missing for 7.5% of births in 2007, 3.1% in 2008 and 2.6% in 2009. The majority of records missing data were from South Australia where a number of hospitals did not provide data for gestation at first antenatal visit. As a consequence, only records with non-missing data are used to derive the indicator. The Australian Capital Territory has supplied data for gestation at first antenatal visit since 2007, but has not considered it to be of sufficient quality to support national reporting. A new data item for gestation at first antenatal visit has been added to the Perinatal NMDS for collection in births from 1 July 2010. Data for Indicator 9 are relatively complete, except for 2009 where data from Victoria were not available.
Tasmania has not provided data for presentation at caesarean birth, a criterion for selecting records for indicators 5 to 8. As a consequence, Tasmanian data were not included in reporting against these indicators.
At the time of preparation for this report, the NPDC included preliminary data for births in 2009 from Victoria for NMDS data items only. Thus, indicators 3, 5, 6, 7, 8 and 9 could not be reported for Victoria as data for perineal status, parity and anaesthesia were not available.
The item ‘Anaesthesia administered for operative delivery of the baby’ is currently under review to enable its inclusion as an item in the Perinatal NMDS. Non-standardised data from jurisdictional perinatal data for births from January 2007 onwards are available for use in the interim for reporting against Indicator 9.
Further detail of the source data is provided in the methods section in Appendix B. An overview of data available for reporting against each indicator is provided in Table 3.
7
Table 3: Perinatal data available for national maternity indicator reporting, 2004–2009
Indicator 2004 2005 2006 2007 2008 2009
1 Smoking in pregnancy for all women giving birth
All jurisdictions except Vic, Tas and Qld
All jurisdictions except Vic
All jurisdictions except Vic
All jurisdictions except Vic
All jurisdictions except Vic
All jurisdictions
2 Antenatal care in the first trimester for all women giving birth
NSW, SA and NT
NSW, SA and NT
NSW, SA and NT and 6 months data from Qld
3 Episiotomy for women having their first baby and giving birth vaginally (a) without instruments and (b) with instruments
All jurisdictions
All jurisdictions
All jurisdictions
All jurisdictions
All jurisdictions
All jurisdictions except Vic
4 Apgar score of less than 7 at 5 minutes for births at or after term
All jurisdictions
All jurisdictions
All jurisdictions
All jurisdictions
All jurisdictions
All jurisdictions
5 Induction of labour for selected women giving birth for the first time
All jurisdictions except Tas
All jurisdictions except Tas
All jurisdictions except Tas
All jurisdictions except Tas
All jurisdictions except Tas
All jurisdictions except Vic and Tas
6 Caesarean section for selected women giving birth for the first time
All jurisdictions except Tas
All jurisdictions except Tas
All jurisdictions except Tas
All jurisdictions except Tas
All jurisdictions except Tas
All jurisdictions except Vic and Tas
7 Non-instrumental vaginal birth for selected women giving birth for the first time
All jurisdictions except Tas
All jurisdictions except Tas
All jurisdictions except Tas
All jurisdictions except Tas
All jurisdictions except Tas
All jurisdictions except Vic and Tas
8 Instrumental vaginal birth for selected women giving birth for the first time
All jurisdictions except Tas
All jurisdictions except Tas
All jurisdictions except Tas
All jurisdictions except Tas
All jurisdictions except Tas
All jurisdictions except Vic and Tas
9 General anaesthetic for women giving birth by caesarean section
All jurisdictions
All jurisdictions
All jurisdictions except Vic
10 Small babies among births at or after 40 weeks gestation
All jurisdictions
All jurisdictions
All jurisdictions
All jurisdictions
All jurisdictions
All jurisdictions
8
National core maternity indicators
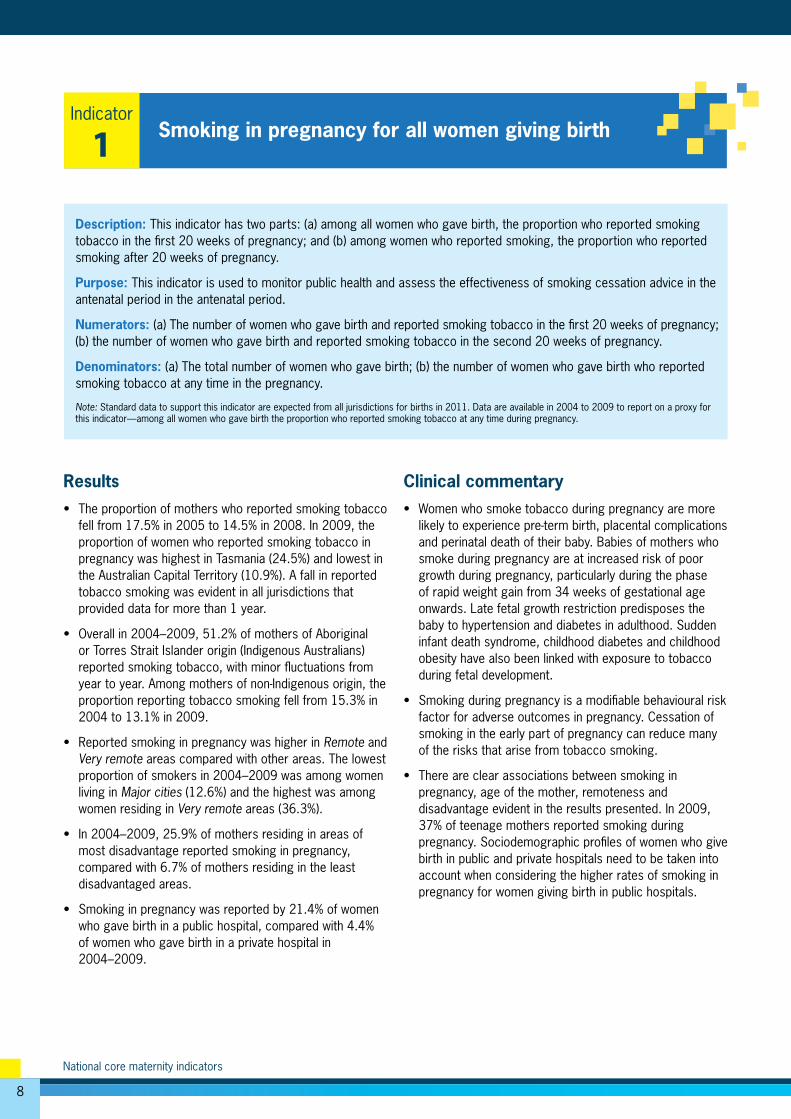
Results • The proportion of mothers who reported smoking tobacco
fell from 17.5% in 2005 to 14.5% in 2008. In 2009, the proportion of women who reported smoking tobacco in pregnancy was highest in Tasmania (24.5%) and lowest in the Australian Capital Territory (10.9%). A fall in reported tobacco smoking was evident in all jurisdictions that provided data for more than 1 year.
• Overall in 2004–2009, 51.2% of mothers of Aboriginal or Torres Strait Islander origin (Indigenous Australians) reported smoking tobacco, with minor fluctuations from year to year. Among mothers of non-Indigenous origin, the proportion reporting tobacco smoking fell from 15.3% in 2004 to 13.1% in 2009.
• Reported smoking in pregnancy was higher in Remote and Very remote areas compared with other areas. The lowest proportion of smokers in 2004–2009 was among women living in Major cities (12.6%) and the highest was among women residing in Very remote areas (36.3%).
• In 2004–2009, 25.9% of mothers residing in areas of most disadvantage reported smoking in pregnancy, compared with 6.7% of mothers residing in the least disadvantaged areas.
• Smoking in pregnancy was reported by 21.4% of women who gave birth in a public hospital, compared with 4.4% of women who gave birth in a private hospital in 2004–2009.
Clinical commentary • Women who smoke tobacco during pregnancy are more
likely to experience pre-term birth, placental complications and perinatal death of their baby. Babies of mothers who smoke during pregnancy are at increased risk of poor growth during pregnancy, particularly during the phase of rapid weight gain from 34 weeks of gestational age onwards. Late fetal growth restriction predisposes the baby to hypertension and diabetes in adulthood. Sudden infant death syndrome, childhood diabetes and childhood obesity have also been linked with exposure to tobacco during fetal development.
• Smoking during pregnancy is a modifiable behavioural risk factor for adverse outcomes in pregnancy. Cessation of smoking in the early part of pregnancy can reduce many of the risks that arise from tobacco smoking.
• There are clear associations between smoking in pregnancy, age of the mother, remoteness and disadvantage evident in the results presented. In 2009, 37% of teenage mothers reported smoking during pregnancy. Sociodemographic profiles of women who give birth in public and private hospitals need to be taken into account when considering the higher rates of smoking in pregnancy for women giving birth in public hospitals.
Smoking in pregnancy for all women giving birth
Description: This indicator has two parts: (a) among all women who gave birth, the proportion who reported smoking tobacco in the first 20 weeks of pregnancy; and (b) among women who reported smoking, the proportion who reported smoking after 20 weeks of pregnancy.
Purpose: This indicator is used to monitor public health and assess the effectiveness of smoking cessation advice in the antenatal period in the antenatal period.
Numerators: (a) The number of women who gave birth and reported smoking tobacco in the first 20 weeks of pregnancy; (b) the number of women who gave birth and reported smoking tobacco in the second 20 weeks of pregnancy.
Denominators: (a) The total number of women who gave birth; (b) the number of women who gave birth who reported smoking tobacco at any time in the pregnancy.
Note: Standard data to support this indicator are expected from all jurisdictions for births in 2011. Data are available in 2004 to 2009 to report on a proxy for this indicator—among all women who gave birth the proportion who reported smoking tobacco at any time during pregnancy.
Indicator
1
9
Notes1. There was no standardised collection across jurisdictions for the proxy data used to derive this indicator. Proxy data were not available from Queensland or
Tasmania in 2004. Provisional data were provided by Victoria for births in 2009. 2. Remoteness was assigned using the ABS Australian Standard Geographical Classification (ASGC) remoteness structure applied to Statistical Local Area
(SLA) or postal area of mother’s area of usual residence.3. Disadvantage quintile applies the ABS Socio-Economic Index for Areas (SEIFA) Index of Relative Social Disadvantage (IRSD) 2006 to mother’s area of usual
residence.Source: AIHW National Perinatal Data Collection 2004–2009.
Figure 1: Smoking in pregnancy for all women giving birth, 2004–2009
0
10
20
30
40
50
200920082007200620052004
AustNTACTTasSAWAQldVicNSW
State or territory of birth
Per cent60
Hospital annual number of births Hospital sector Mother's Indigenous status
Per cent
0
10
20
30
40
50
60
Non-IndigenousIndigenousPrivatePublic2001 ormore
1001 to2000
501 to1000
101 to500
Less than100
0
10
20
30
40
50
Q5Least disadvantage
Q4Q3Q2Q1Most disadvantage
Veryremote
RemoteOuterregional
Innerregional
Majorcities
Remoteness of mother's area of residence
Disadvantage quintile (Q) of mother's area of residence
Per cent60
10
National core maternity indicators
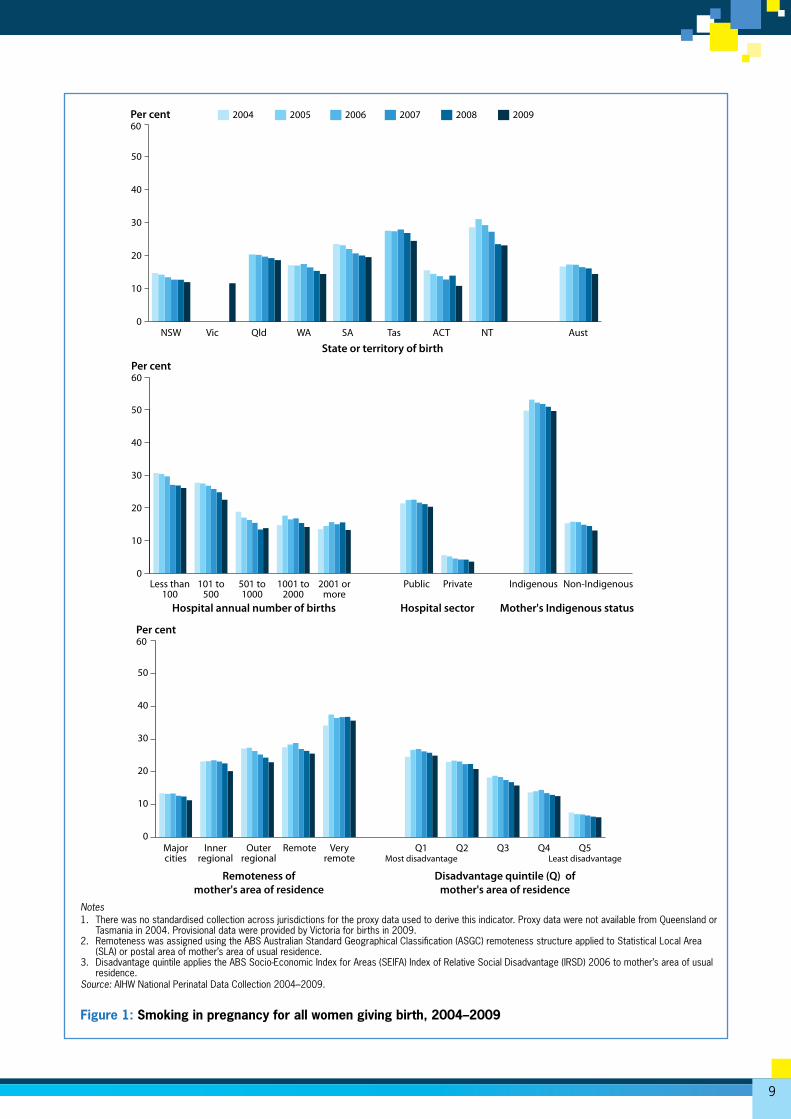
Results • Relatively more women in New South Wales (80.0%)
received antenatal care in the first trimester of pregnancy than in South Australia (74.6%), the Northern Territory (63.9%) and Queensland (57.4%—6 months of data in 2009). The proportions of women receiving antenatal care in the first trimester increased over time in South Australia and the Northern Territory, but not in New South Wales.
• The largest difference in the proportions of women receiving antenatal care in the first trimester is by remoteness of mother’s area of residence. In 2009, 4 out of 5 women resident in Major cities and Inner regional areas in New South Wales, South Australia and the Northern Territory received antenatal care in the first trimester, compared with 73.7% of women residing in Remote and 53.1% of women in Very remote areas.
• In 2009, 87.9% of women who gave birth in hospitals with between 501 and 1,000 births annually commenced antenatal care in the first trimester. For hospitals of all other sizes, at least three-quarters of women received antenatal care in the first trimester.
• In 2007–2009, a higher proportion of women who gave birth in a private hospital (90.5%) received antenatal care in the first trimester, compared with the proportion of women who gave birth in a public hospital (74.5%).
• Over the 3 years, a lower proportion of women resident in more disadvantaged areas (68.9%) received antenatal care in the first trimester, compared with 79.5% of women living in less disadvantaged areas.
• The proportion of Indigenous mothers receiving antenatal care in the first trimester increased from 52.0% in 2007 to 59.7% in 2009. This level of increase is comparable to that for non-Indigenous mothers.
Clinical commentary • Antenatal care is a system of regular assessments
by a midwife or doctor throughout the course of the pregnancy that provides the opportunity to promote healthy lifestyles, screen for and, if necessary, treat health problems to benefit both mother and baby. Commencing regular antenatal care in the first trimester (before 14 weeks gestational age) is associated with better maternal health in pregnancy, fewer interventions in late pregnancy and positive child health outcomes. To be accessible, antenatal care needs to be equitable, affordable and available to all women.
• The higher proportions of women who gave birth in the private sector who received antenatal care in the first trimester may reflect the more advantageous demographic profile of these women, compared with those who give birth in public hospitals.
Description: Among all women who gave birth, the proportion who commenced antenatal care in the first trimester (before 14 weeks gestation).
Purpose: This indicator is used to assess the accessibility of antenatal services.
Numerator: The number of women who had their first antenatal visit before 14 weeks gestation and went on to give birth.
Denominator: The number of all women who gave birth.
Note: Standard data to support this indicator are expected to be available for all jurisdictions for births in 2011 (see Appendix C). Data are available to report on this indicator from three jurisdictions—New South Wales, South Australia and the Northern Territory—using non-standard data items for births in 2007–2009. Queensland commenced collection using the standard data item for births from July 2009.
Indicator
2Antenatal care in the first trimester for all women giving birth
11
Notes1. Caution should be used when interpreting these results. There was no standardised collection across jurisdictions for the data used to derive this indicator.
Data were not available for all years from Victoria, Western Australia or Tasmania. The Australian Capital Territory did not consider its data suitable for national reporting. Data from Queensland were available from July 2009 onwards.
2. Records with missing or invalid data for gestational age at first antenatal visit were removed from the denominator. The valid range for gestational age is 3–46 weeks.
3. Remoteness was assigned using the ABS ASGC remoteness structure applied to SLA or postal area of mother’s area of usual residence.4. Disadvantage quintile applies the ABS SEIFA IRSD 2006 scores to mother’s area of usual residence.Source: National Perinatal Data Collection 2004–2009.
Figure 2: Antenatal care in the first trimester for all women giving birth, 2007–2009
0
20
40
60
80
100
NSW, SA, NTNTACTTasSAWAQldVicNSW
State or territory of birth
Per cent 200920082007
Non-IndigenousIndigenousPrivatePublic2001or more
1001 to2000
501 to1000
101 to500
Less than100
Hospital annual number of births Hospital sector Mother's Indigenous status
0
20
40
60
80
100Per cent
0Q5
Least disadvantageQ4Q3Q2Q1
Most disadvantageVery
remoteRemoteOuter
regionalInner
regionalMajorcities
Remoteness ofmother's area of residence
Disadvantage quintile (Q) of mother's area of residence
20
40
60
80
100Per cent
12
National core maternity indicators
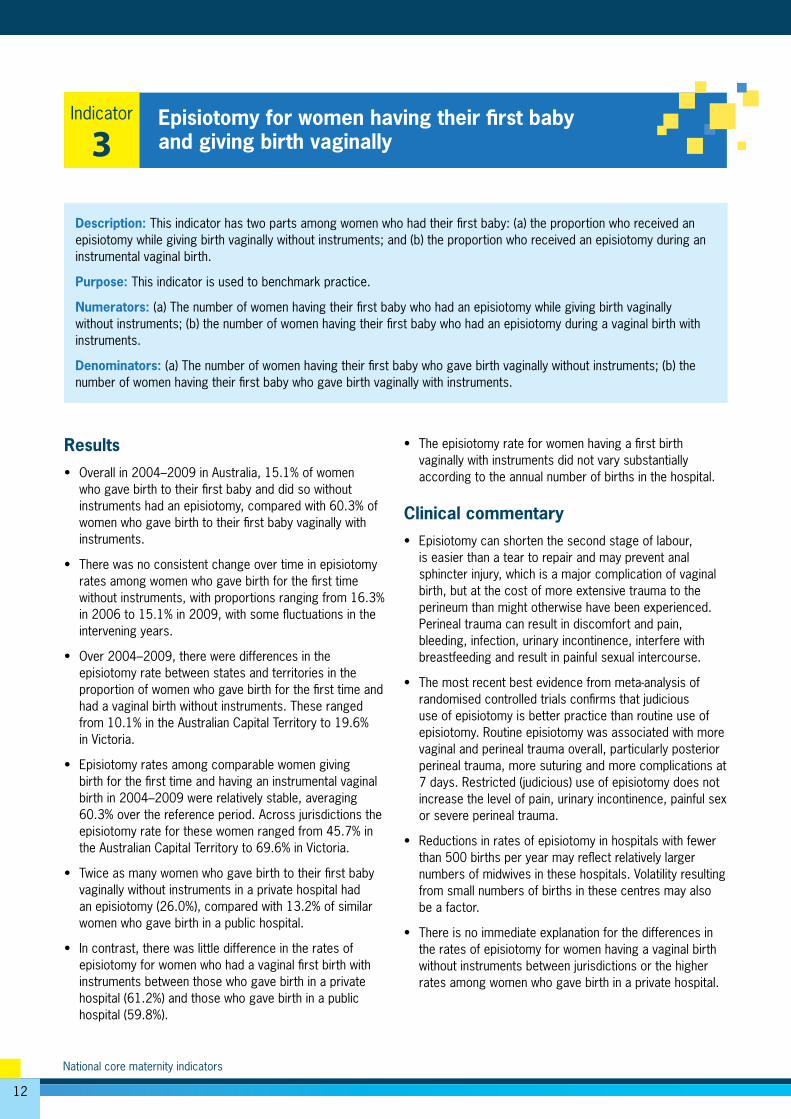
Results• Overall in 2004–2009 in Australia, 15.1% of women
who gave birth to their first baby and did so without instruments had an episiotomy, compared with 60.3% of women who gave birth to their first baby vaginally with instruments.
• There was no consistent change over time in episiotomy rates among women who gave birth for the first time without instruments, with proportions ranging from 16.3% in 2006 to 15.1% in 2009, with some fluctuations in the intervening years.
• Over 2004–2009, there were differences in the episiotomy rate between states and territories in the proportion of women who gave birth for the first time and had a vaginal birth without instruments. These ranged from 10.1% in the Australian Capital Territory to 19.6% in Victoria.
• Episiotomy rates among comparable women giving birth for the first time and having an instrumental vaginal birth in 2004–2009 were relatively stable, averaging 60.3% over the reference period. Across jurisdictions the episiotomy rate for these women ranged from 45.7% in the Australian Capital Territory to 69.6% in Victoria.
• Twice as many women who gave birth to their first baby vaginally without instruments in a private hospital had an episiotomy (26.0%), compared with 13.2% of similar women who gave birth in a public hospital.
• In contrast, there was little difference in the rates of episiotomy for women who had a vaginal first birth with instruments between those who gave birth in a private hospital (61.2%) and those who gave birth in a public hospital (59.8%).
• The episiotomy rate for women having a first birth vaginally with instruments did not vary substantially according to the annual number of births in the hospital.
Clinical commentary • Episiotomy can shorten the second stage of labour,
is easier than a tear to repair and may prevent anal sphincter injury, which is a major complication of vaginal birth, but at the cost of more extensive trauma to the perineum than might otherwise have been experienced. Perineal trauma can result in discomfort and pain, bleeding, infection, urinary incontinence, interfere with breastfeeding and result in painful sexual intercourse.
• The most recent best evidence from meta-analysis of randomised controlled trials confirms that judicious use of episiotomy is better practice than routine use of episiotomy. Routine episiotomy was associated with more vaginal and perineal trauma overall, particularly posterior perineal trauma, more suturing and more complications at 7 days. Restricted (judicious) use of episiotomy does not increase the level of pain, urinary incontinence, painful sex or severe perineal trauma.
• Reductions in rates of episiotomy in hospitals with fewer than 500 births per year may reflect relatively larger numbers of midwives in these hospitals. Volatility resulting from small numbers of births in these centres may also be a factor.
• There is no immediate explanation for the differences in the rates of episiotomy for women having a vaginal birth without instruments between jurisdictions or the higher rates among women who gave birth in a private hospital.
Description: This indicator has two parts among women who had their first baby: (a) the proportion who received an episiotomy while giving birth vaginally without instruments; and (b) the proportion who received an episiotomy during an instrumental vaginal birth.
Purpose: This indicator is used to benchmark practice.
Numerators: (a) The number of women having their first baby who had an episiotomy while giving birth vaginally without instruments; (b) the number of women having their first baby who had an episiotomy during a vaginal birth with instruments.
Denominators: (a) The number of women having their first baby who gave birth vaginally without instruments; (b) the number of women having their first baby who gave birth vaginally with instruments.
Episiotomy for women having their first baby and giving birth vaginally
Indicator
3
13
Note: Caution should be used when interpreting these results. There was no standardised collection across jurisdictions for the data used to derive this indicator. Data from Victoria were not available in 2009.
Source: AIHW National Perinatal Data Collection 2004–2009.
Figure 3: Episiotomy for women having their first baby and giving birth vaginally, 2004–2009
0
20
10
30
AustNTACTTasSAWAQldVicNSW
State or territory of birth
Per cent 200920082007200620052004
0PrivatePublic2001
or more1001 to
2000501 to1000
101 to500
Less than100
Hospital annual number of births Hospital sector
20
10
30Per cent
0
20
40
60
70
50
30
10
AustNTACTTasSAWAQldVicNSWState or territory of birth
Per cent 20092008200720062005200480
0PrivatePublic2001 or
more1001 to
2000501 to1000
101 to500
Less than100
Hospital annual number of births Hospital sector
20
40
60
70
50
30
10
Per cent80
Indicator 3(a) Episiotomy for a non-instumental vaginal first birth
Indicator 3(b) Episiotomy for an instumental vaginal first birth
14
National core maternity indicators
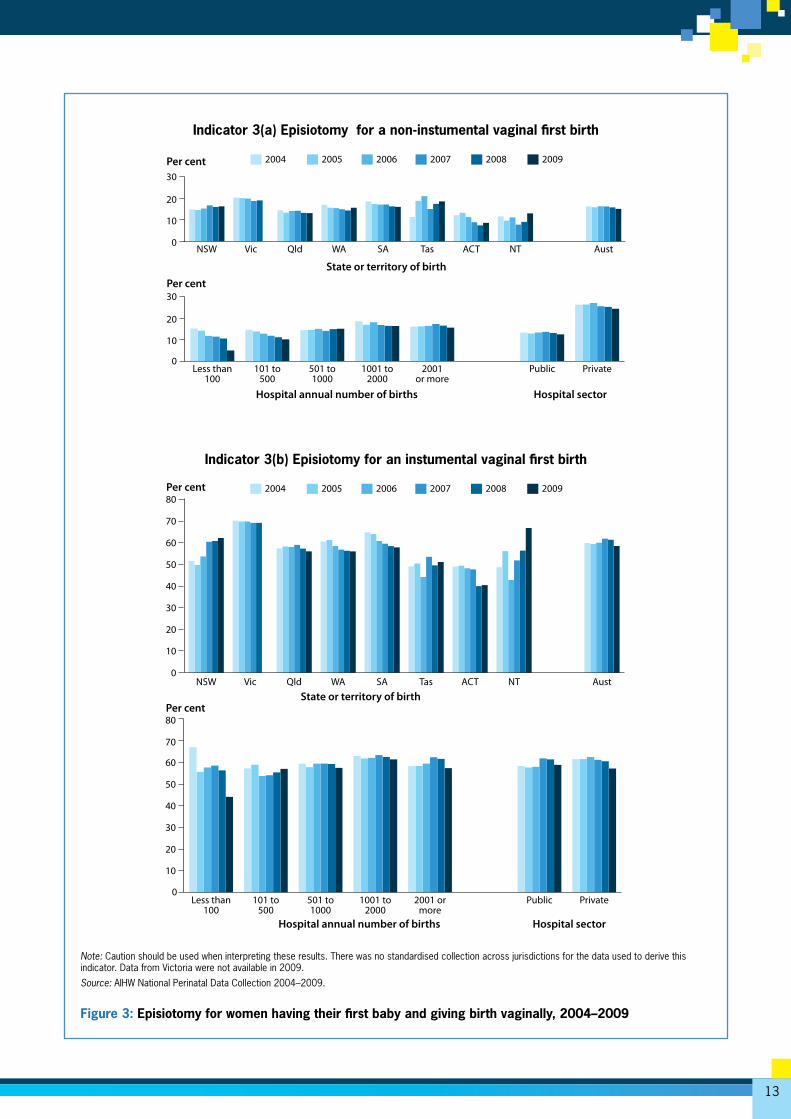
Results • In 2004–2009, 2,837 babies were born alive at term or
after term (from 37 completed weeks gestational age) in Australia, and had a poor Apgar score (less than 7 at 5 minutes), representing 0.9% of babies. The national proportion increased slightly from 0.9% in 2004 to 1.1% in 2009, however, there were yearly fluctuations.
• There is instability in the rates for this relatively uncommon condition when data are disaggregated across jurisdictions. In the Northern Territory in 2004–2009, 1.7% of liveborn babies were reported as having an Apgar score of less than 7, compared with 0.8% among babies in South Australia and Western Australia. From 2006 onwards, there was a tendency towards increased proportions of term babies with Apgar scores less than 7 in all jurisdictions except South Australia and Tasmania.
• There was no obvious variation in the proportion of babies with poor Apgar scores in hospitals with different numbers of annual births. Among smaller hospitals there was no change over time, but the proportion of term babies with a 5-minute Apgar score of less than 7 increased progressively from 2006 onwards in hospitals with 2,000 or more births.
• Across all years, there was a higher proportion overall, and a slight upward tendency over time, in the proportion of babies born in a public hospital with a poor Apgar score (1.1%), compared with similar babies born in a private hospital (0.6%).
• 1.4% of babies born alive at or after term to mothers of Indigenous origin in 2004–2009 had Apgar scores of less than 7 at 5 minutes, compared with 0.9% of comparable babies born to non-Indigenous mothers.
Clinical commentary • The Apgar score is a composite measure of the baby’s
skin colour, spontaneous and reflex activity, pulse rate and respiration at specific times after birth. The Apgar score 5 minutes after birth indicates how well the baby is adapting to the environment and should be 7 or more if the baby is adapting well. Apgar scores at 5 minutes of less than 7 are not specific to any condition and may reflect congenital abnormality, prematurity, perinatal infection, effects of drugs given to the mother for pain relief or anaesthesia, ineffective resuscitation or prolonged hypoxia before birth.
• Higher rates of Apgar scores of less than 7 at 5 minutes among babies born at or after term in births that follow labour are expected as a result of more varied and overall increased case complexity in this group compared with births with no labour.
• Increased case complexity, higher rates of maternal morbidity, especially diabetes, and maternal smoking during pregnancy, which negatively impacts fetal growth, will contribute to the higher rates of low Apgar scores observed for the babies of Indigenous mothers.
• The near double rate of Apgar score of less than 7 at 5 minutes for babies born at or after term in the Northern Territory will to some extent reflect the tenfold higher contribution of mothers of Indigenous origin to the Northern Territory maternity population compared with all other states.
• Case complexity is increased among public hospitals and larger hospitals as a result of transfers into tertiary level care of higher risk cases. The Australian Capital Territory birth population is disproportionately affected by such transfers of women from surrounding areas in New South Wales.
Description: The proportion of liveborn term infants with an Apgar score of less than 7 at 5 minutes.
Purpose: This indicator of the condition of the baby after birth provides an outcome measure of intrapartum care and resuscitation of the newborn.
Numerator: The number of babies born alive at term with an Apgar score less than 7 at 5 minutes.
Denominator: The number of live babies born at term.
Apgar score of less than 7 at 5 minutes for births at or after term
Indicator
4
15
Note: Provisional data were provided by Victoria for births in 2009.
Source: AIHW National Perinatal Data Collection 2004–2009.
Figure 4: Apgar score of less than 7 at 5 minutes for births at or after term, 2004–2009
0.0
0.5
1.0
1.5
2.0
2.5
AustNTACTTasSAWAQldVicNSW
State or territory of birth
Per cent 200920082007200620052004
0.0PrivatePublic2001 or
more1001 to
2000501 to1000
101 to500
Less than100
Hospital annual number of births Hospital sector
0.5
1.0
1.5
2.0
2.5Per cent
0.0Non-Indigenous IndigenousNo labourLabour
Labour / no labour Mother's Indigenous status
0.5
1.0
1.5
2.0
2.5Per cent
16
National core maternity indicators
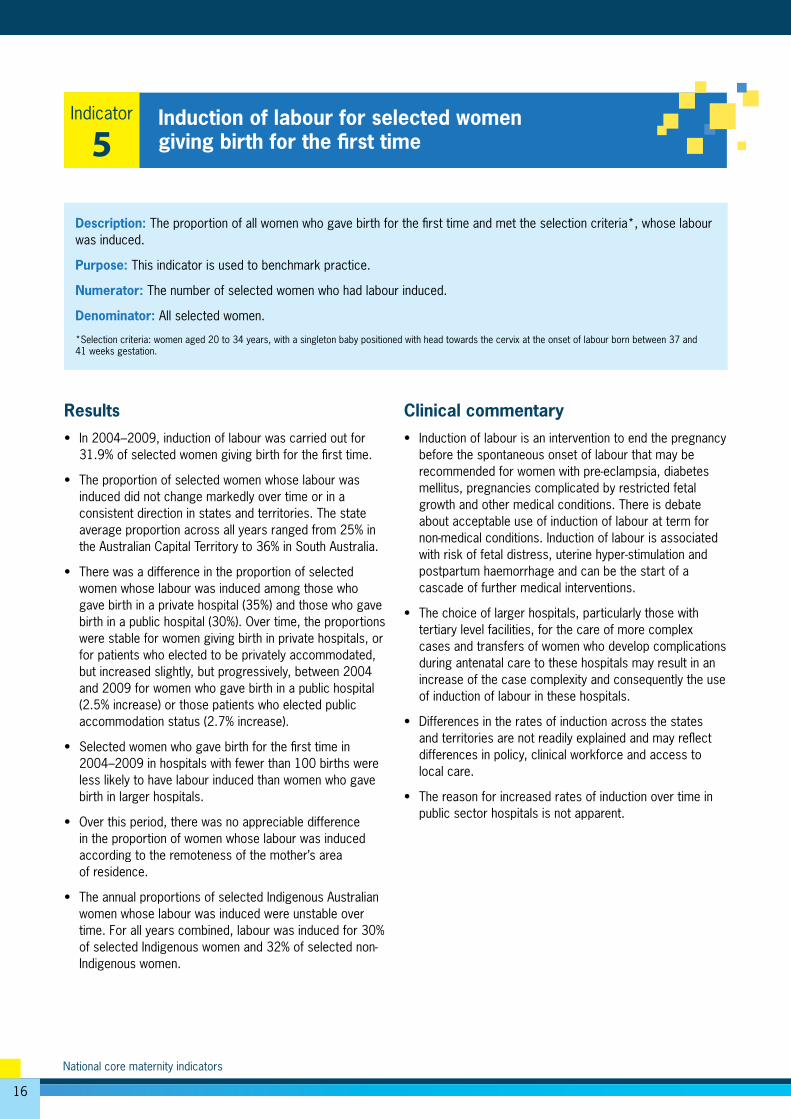
Results • In 2004–2009, induction of labour was carried out for
31.9% of selected women giving birth for the first time.
• The proportion of selected women whose labour was induced did not change markedly over time or in a consistent direction in states and territories. The state average proportion across all years ranged from 25% in the Australian Capital Territory to 36% in South Australia.
• There was a difference in the proportion of selected women whose labour was induced among those who gave birth in a private hospital (35%) and those who gave birth in a public hospital (30%). Over time, the proportions were stable for women giving birth in private hospitals, or for patients who elected to be privately accommodated, but increased slightly, but progressively, between 2004 and 2009 for women who gave birth in a public hospital (2.5% increase) or those patients who elected public accommodation status (2.7% increase).
• Selected women who gave birth for the first time in 2004–2009 in hospitals with fewer than 100 births were less likely to have labour induced than women who gave birth in larger hospitals.
• Over this period, there was no appreciable difference in the proportion of women whose labour was induced according to the remoteness of the mother’s area of residence.
• The annual proportions of selected Indigenous Australian women whose labour was induced were unstable over time. For all years combined, labour was induced for 30% of selected Indigenous women and 32% of selected non-Indigenous women.
Clinical commentary • Induction of labour is an intervention to end the pregnancy
before the spontaneous onset of labour that may be recommended for women with pre-eclampsia, diabetes mellitus, pregnancies complicated by restricted fetal growth and other medical conditions. There is debate about acceptable use of induction of labour at term for non-medical conditions. Induction of labour is associated with risk of fetal distress, uterine hyper-stimulation and postpartum haemorrhage and can be the start of a cascade of further medical interventions.
• The choice of larger hospitals, particularly those with tertiary level facilities, for the care of more complex cases and transfers of women who develop complications during antenatal care to these hospitals may result in an increase of the case complexity and consequently the use of induction of labour in these hospitals.
• Differences in the rates of induction across the states and territories are not readily explained and may reflect differences in policy, clinical workforce and access to local care.
• The reason for increased rates of induction over time in public sector hospitals is not apparent.
Description: The proportion of all women who gave birth for the first time and met the selection criteria*, whose labour was induced.
Purpose: This indicator is used to benchmark practice.
Numerator: The number of selected women who had labour induced.
Denominator: All selected women.
*Selection criteria: women aged 20 to 34 years, with a singleton baby positioned with head towards the cervix at the onset of labour born between 37 and 41 weeks gestation.
Induction of labour for selected women giving birth for the first time
Indicator
5
17
Notes1. Selection criteria: women aged 20 to 34 years, with a singleton baby positioned with head towards the cervix at the onset of labour born between 37 and
41 weeks gestation. Data for criteria to select women were not available from Victoria in 2009 and Tasmania for all years. 2. Remoteness was assigned using the ABS ASGC remoteness structure applied to SLA or postal area of mother’s area of usual residence.Source: AIHW National Perinatal Data Collection 2004–2009.
Figure 5: Induction of labour for selected women giving birth for the first time, 2004–2009
0
5
10
15
20
25
30
35
40
AustNTACTTasSAWAQldVicNSW
State or territory of birth
Per cent 200920082007200620052004
PrivatePublicPrivatePublic2001 ormore
1001 to2000
501 to1000
101 to500
Less than100
Hospital annual number of births Patient accommodationHospital sector
0
5
10
15
20
25
30
35
40Per cent
Non-IndigenousIndigenousVeryremote
RemoteOuterregional
Innerregional
Majorcities
Remoteness of mother's area of residence Mother's Indigenous status
0
5
10
15
20
25
30
35
40Per cent
18
National core maternity indicators
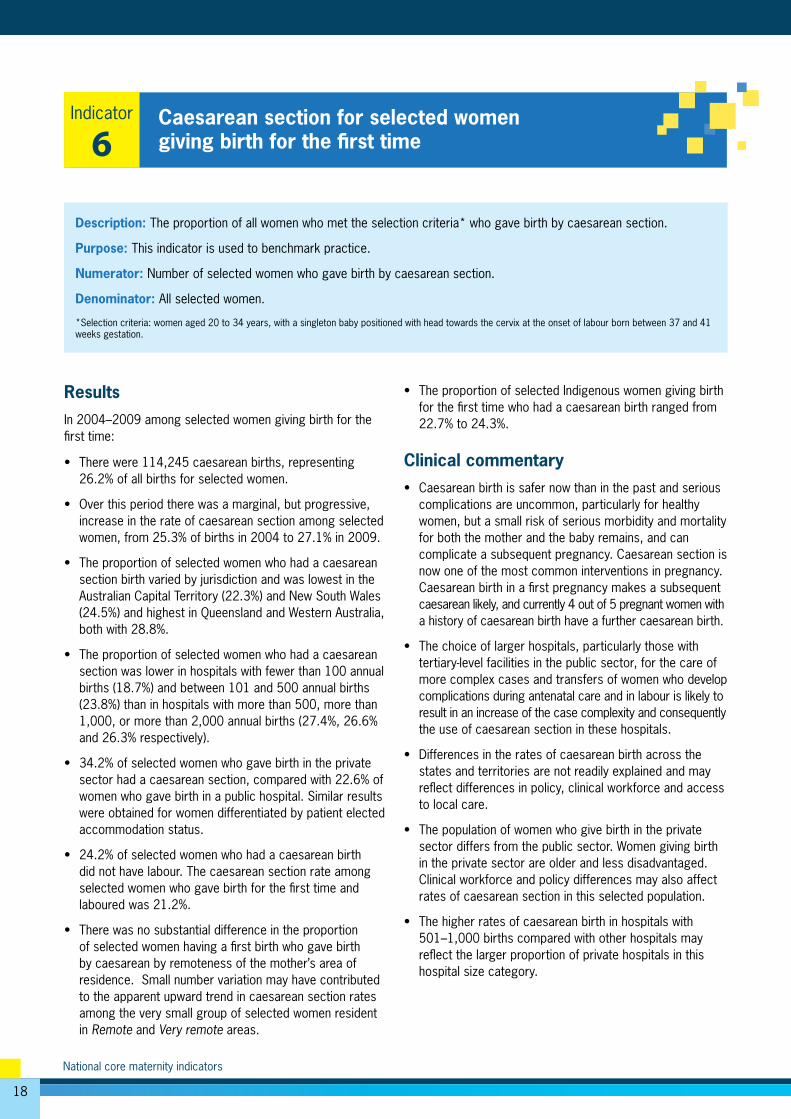
Results In 2004–2009 among selected women giving birth for the first time:
• There were 114,245 caesarean births, representing 26.2% of all births for selected women.
• Over this period there was a marginal, but progressive, increase in the rate of caesarean section among selected women, from 25.3% of births in 2004 to 27.1% in 2009.
• The proportion of selected women who had a caesarean section birth varied by jurisdiction and was lowest in the Australian Capital Territory (22.3%) and New South Wales (24.5%) and highest in Queensland and Western Australia, both with 28.8%.
• The proportion of selected women who had a caesarean section was lower in hospitals with fewer than 100 annual births (18.7%) and between 101 and 500 annual births (23.8%) than in hospitals with more than 500, more than 1,000, or more than 2,000 annual births (27.4%, 26.6% and 26.3% respectively).
• 34.2% of selected women who gave birth in the private sector had a caesarean section, compared with 22.6% of women who gave birth in a public hospital. Similar results were obtained for women differentiated by patient elected accommodation status.
• 24.2% of selected women who had a caesarean birth did not have labour. The caesarean section rate among selected women who gave birth for the first time and laboured was 21.2%.
• There was no substantial difference in the proportion of selected women having a first birth who gave birth by caesarean by remoteness of the mother’s area of residence. Small number variation may have contributed to the apparent upward trend in caesarean section rates among the very small group of selected women resident in Remote and Very remote areas.
• The proportion of selected Indigenous women giving birth for the first time who had a caesarean birth ranged from 22.7% to 24.3%.
Clinical commentary • Caesarean birth is safer now than in the past and serious
complications are uncommon, particularly for healthy women, but a small risk of serious morbidity and mortality for both the mother and the baby remains, and can complicate a subsequent pregnancy. Caesarean section is now one of the most common interventions in pregnancy. Caesarean birth in a first pregnancy makes a subsequent caesarean likely, and currently 4 out of 5 pregnant women with a history of caesarean birth have a further caesarean birth.
• The choice of larger hospitals, particularly those with tertiary-level facilities in the public sector, for the care of more complex cases and transfers of women who develop complications during antenatal care and in labour is likely to result in an increase of the case complexity and consequently the use of caesarean section in these hospitals.
• Differences in the rates of caesarean birth across the states and territories are not readily explained and may reflect differences in policy, clinical workforce and access to local care.
• The population of women who give birth in the private sector differs from the public sector. Women giving birth in the private sector are older and less disadvantaged. Clinical workforce and policy differences may also affect rates of caesarean section in this selected population.
• The higher rates of caesarean birth in hospitals with 501–1,000 births compared with other hospitals may reflect the larger proportion of private hospitals in this hospital size category.
Description: The proportion of all women who met the selection criteria* who gave birth by caesarean section.
Purpose: This indicator is used to benchmark practice.
Numerator: Number of selected women who gave birth by caesarean section.
Denominator: All selected women.
*Selection criteria: women aged 20 to 34 years, with a singleton baby positioned with head towards the cervix at the onset of labour born between 37 and 41 weeks gestation.
Caesarean section for selected women giving birth for the first time
Indicator
6
19
Notes1. Selection criteria: women aged 20 to 34 years, with a singleton baby positioned with head towards the cervix at the onset of labour born between 37 and
41 weeks gestation. Data for criteria to select women were not available from Victoria in 2009 and Tasmania for all years. 2. Remoteness was assigned using the ABS ASGC remoteness structure applied to SLA or postal area of mother’s area of usual residence.Source: AIHW National Perinatal Data Collection 2004–2009.
Figure 6: Caesarean section for selected women giving birth for the first time, 2004–2009
0
5
10
15
20
25
30
35
40
AustNTACTTasSAWAQldVicNSW
State or territory of birth
Per cent 200920082007200620052004
0PrivatePublicPrivatePublic2001 or
more1001 to
2000501 to1000
101 to500
Less than100
Hospital annual number of births Hospital sector Patient accommodation
5
10
15
20
25
30
35
40Per cent
0Non-IndigenousIndigenousVery
remoteRemoteOuter
regionalInner
regionalMajorcities
Labour
Remoteness of mother's area of residence Mother's Indigenous status
5
10
15
20
25
30
35
40Per cent
20
National core maternity indicators
Description: The proportion of women who gave birth for the first time and met the selection criteria*, who had a normal (non-instrumental) vaginal birth.
Purpose: This indicator is used to benchmark practice.
Numerator: Number of selected women who had a normal (non-instrumental) vaginal birth.
Denominator: All selected women.
*Selection criteria: women aged 20 to 34 years, with a singleton baby positioned with head towards the cervix at the onset of labour born between 37 and 41 weeks gestation.
Normal (non-instrumental) vaginal birth for selected women giving birth for the first time
Indicator
7
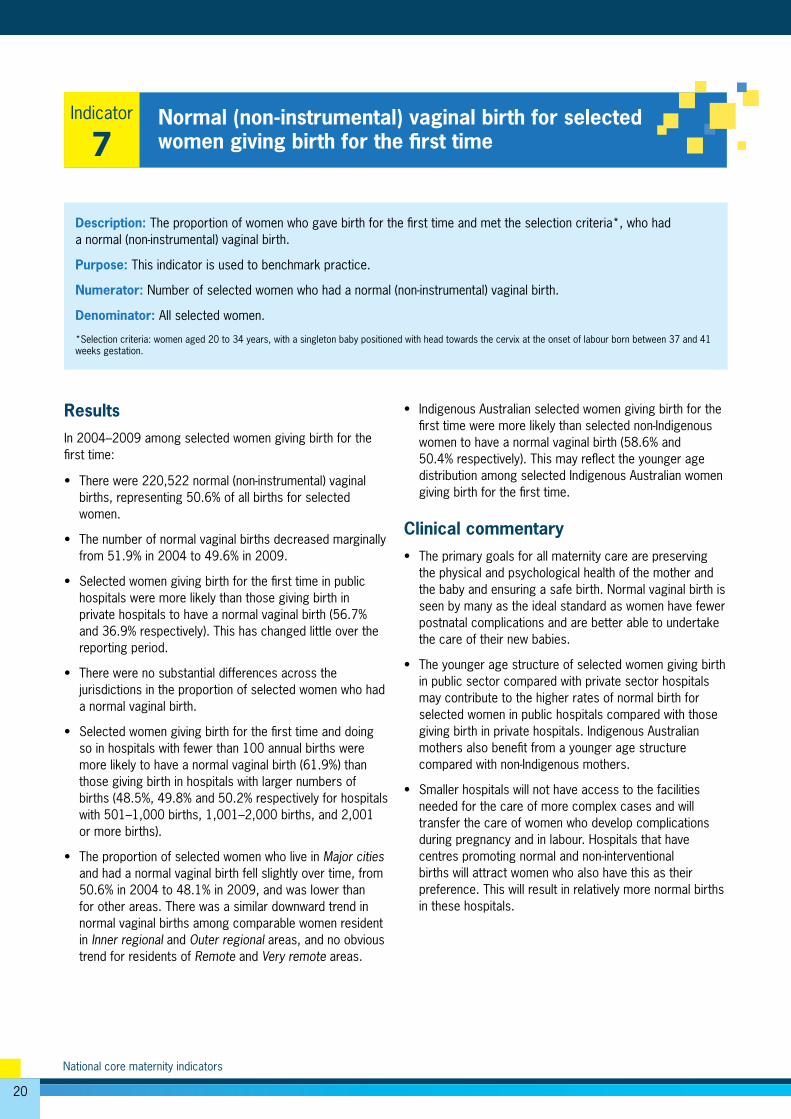
ResultsIn 2004–2009 among selected women giving birth for the first time:
• There were 220,522 normal (non-instrumental) vaginal births, representing 50.6% of all births for selected women.
• The number of normal vaginal births decreased marginally from 51.9% in 2004 to 49.6% in 2009.
• Selected women giving birth for the first time in public hospitals were more likely than those giving birth in private hospitals to have a normal vaginal birth (56.7% and 36.9% respectively). This has changed little over the reporting period.
• There were no substantial differences across the jurisdictions in the proportion of selected women who had a normal vaginal birth.
• Selected women giving birth for the first time and doing so in hospitals with fewer than 100 annual births were more likely to have a normal vaginal birth (61.9%) than those giving birth in hospitals with larger numbers of births (48.5%, 49.8% and 50.2% respectively for hospitals with 501–1,000 births, 1,001–2,000 births, and 2,001 or more births).
• The proportion of selected women who live in Major cities and had a normal vaginal birth fell slightly over time, from 50.6% in 2004 to 48.1% in 2009, and was lower than for other areas. There was a similar downward trend in normal vaginal births among comparable women resident in Inner regional and Outer regional areas, and no obvious trend for residents of Remote and Very remote areas.
• Indigenous Australian selected women giving birth for the first time were more likely than selected non-Indigenous women to have a normal vaginal birth (58.6% and 50.4% respectively). This may reflect the younger age distribution among selected Indigenous Australian women giving birth for the first time.
Clinical commentary • The primary goals for all maternity care are preserving
the physical and psychological health of the mother and the baby and ensuring a safe birth. Normal vaginal birth is seen by many as the ideal standard as women have fewer postnatal complications and are better able to undertake the care of their new babies.
• The younger age structure of selected women giving birth in public sector compared with private sector hospitals may contribute to the higher rates of normal birth for selected women in public hospitals compared with those giving birth in private hospitals. Indigenous Australian mothers also benefit from a younger age structure compared with non-Indigenous mothers.
• Smaller hospitals will not have access to the facilities needed for the care of more complex cases and will transfer the care of women who develop complications during pregnancy and in labour. Hospitals that have centres promoting normal and non-interventional births will attract women who also have this as their preference. This will result in relatively more normal births in these hospitals.
21
Notes1. Selection criteria: women aged 20 to 34 years, with a singleton baby positioned with head towards the cervix at the onset of labour born between 37 and
41 weeks gestation. Data for criteria to select women were not available from Victoria in 2009 and Tasmania for all years.2. Remoteness was assigned using the ABS ASGC remoteness structure applied to SLA or postal area of mother’s area of usual residence.Source: AIHW National Perinatal Data Collection 2004–2009.
Figure 7: Normal (non-instrumental) vaginal birth for selected women giving birth for the first time, 2004–2009
0
10
20
30
40
50
60
70
AustNTACTTasSAWAQldVicNSW
State or territory of birth
Per cent 200920082007200620052004
0PrivatePublicPrivatePublic2001 or
more1001 to
2000501 to1000
101 to500
Less than100
Hospital annual number of births Hospital sector Patient accommodation status
10
20
30
40
50
60
70Per cent
0Non-IndigenousIndigenousVery
remoteRemoteOuter
regionalInner
regionalMajorcities
Remoteness of mother's area of residence Mother's Indigenous status
10
20
30
40
50
60
70Per cent
22
National core maternity indicators
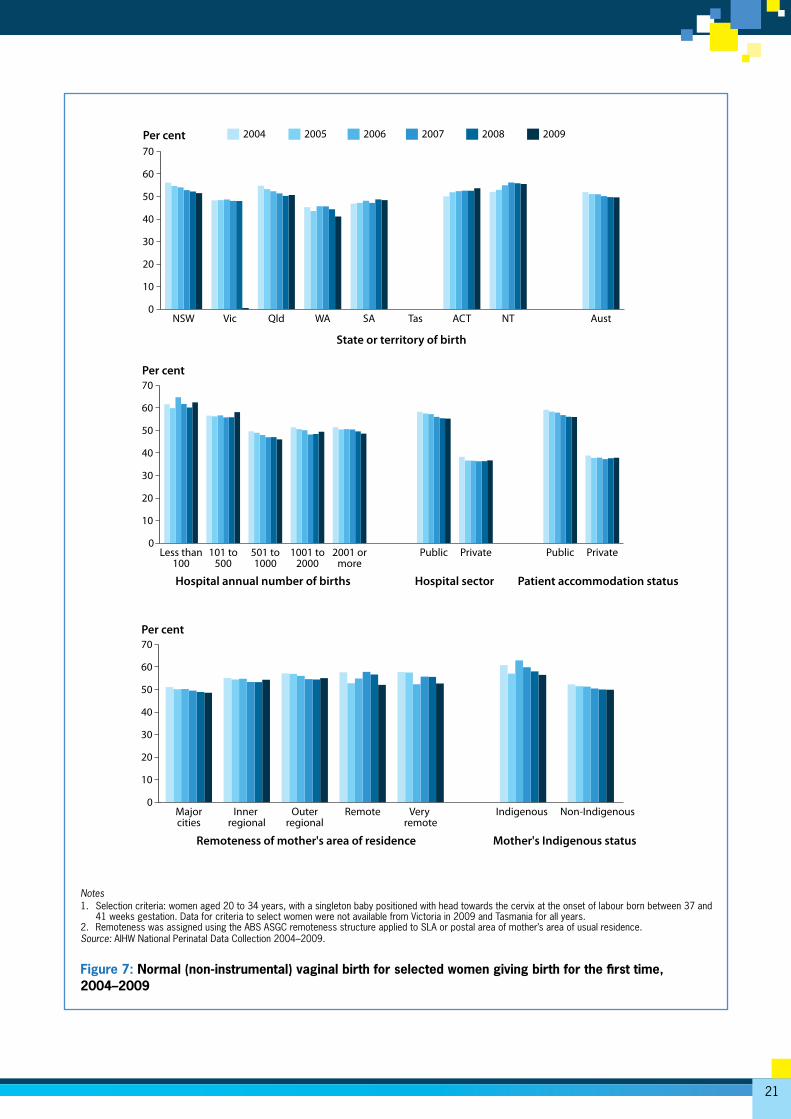
Results In 2004–2009 among selected women giving birth for the first time:
• There were 101,093 women (23.2%) who had an instrumental vaginal birth.
• The rates of instrumental vaginal birth increased from 22.8% to 23.3%.
• There was substantial variation between jurisdictions in the overall estimates in these years, which ranged from 17.9% in the Northern Territory to 27.0% in Western Australia. There was no consistent direction of change, with increases over time in New South Wales, Western Australia and Queensland, a decrease in the Australian Capital Territory and no consistent trends in South Australia and the Northern Territory.
• The proportion of instrumental births was lower for women who gave birth in hospitals with fewer than 100 annual births (19.4%) and between 101 and 500 annual births (19.6%) than in hospitals with more than 500 annual births, where the instrumental birth rate ranged from 23.4% to24.5%.
• 28.9% of women who gave birth in the private sector had a vaginal instrumental birth, compared with 20.7% of women who gave birth in a public hospital. Similar results were obtained for women with private and public patient elected accommodation status.
• Instrumental vaginal birth was more common for women living in Major cities (24.1%) than for women living in Remote (19.7%) and Very remote areas (18.8%).
• Indigenous women were less likely than non-Indigenous women to have an instrumental vaginal birth, with rates of 15.6% and 23.3% respectively.
Clinical commentary • Instruments such as vacuum or forceps can be used
to assist a mother at the end of labour or expedite the birth if the baby is showing signs of distress. The use of instruments is associated with both short-term and long-term complications for the mother and the baby, some of which can be serious. Judicious use of instruments is needed.
• The function of larger hospitals, particularly those with tertiary-level facilities in the public sector, which are predominantly located in major cities, includes the care of more complex cases and related transfers of women who develop complications during antenatal care and in labour. This will result in an increase of the case complexity and consequently the use of instruments for births in these hospitals.
• Instrumental vaginal birth is progressively more common among older age groups. The higher rates of instrumental vaginal birth among selected women who gave birth in the private sector may in part be due to their older ages compared with selected women who gave birth in public sector hospitals. The reasons for jurisdictional differences in the rates of instrumental vaginal birth are not immediately apparent but may reflect differences in policy, clinical workforce and access to local care.
• The higher rates of instrumental vaginal birth in hospitals with 501–1,000 births compared with other hospitals may reflect the larger proportion of private hospitals in this hospital size category. The practice is more common in private hospitals.
• The higher rates of non-Indigenous mothers having an instrumental vaginal birth compared with Indigenous mothers may reflect the higher use of private hospitals/private accommodation by non-Indigenous mothers.
Description: The proportion of all women who met the selection criteria* who had a vaginal birth with the assistance of instruments.
Purpose: This indicator is used to benchmark practice.
Numerator: Number of selected women who had a vaginal birth with the assistance of instruments.
Denominator: All selected women.
*Selection criteria: women aged 20 to 34 years, with a singleton baby positioned with head towards the cervix at the onset of labour born between 37 and 41 weeks gestation.
Instrumental vaginal birth for selected women giving birth for the first time
Indicator
8
23
Notes1. Selection criteria: women aged 20 to 34 years, with a singleton baby positioned with head towards the cervix at the onset of labour born between 37 and
41 weeks gestation. Data for criteria to select women were not available from Victoria in 2009 and Tasmania for all years. 2. Remoteness was assigned using the ABS ASGC remoteness structure applied to SLA or postal area of mother’s area of usual residence.Source: AIHW National Perinatal Data Collection 2004–2009.
Figure 8: Instrumental vaginal birth for selected women giving birth for the first time, 2004–2009
0
5
10
15
20
25
30
35
AustNTACTTasSAWAQldVicNSW
State or territory of birth
Per cent 200920082007200620052004
0PrivatePublicPrivatePublic2001 or
more1001 to
2000501 to1000
101 to500
Less than100
Hospital annual number of births Hospital sector Patient accommodation status
5
10
15
20
25
30
35Per cent
0Non-IndigenousIndigenousVery
remoteRemoteOuter
regionalInner
regionalMajorcities
Remoteness of mother's area of residence Mother's Indigenous status
5
10
15
20
25
30
35Per cent
24
National core maternity indicators
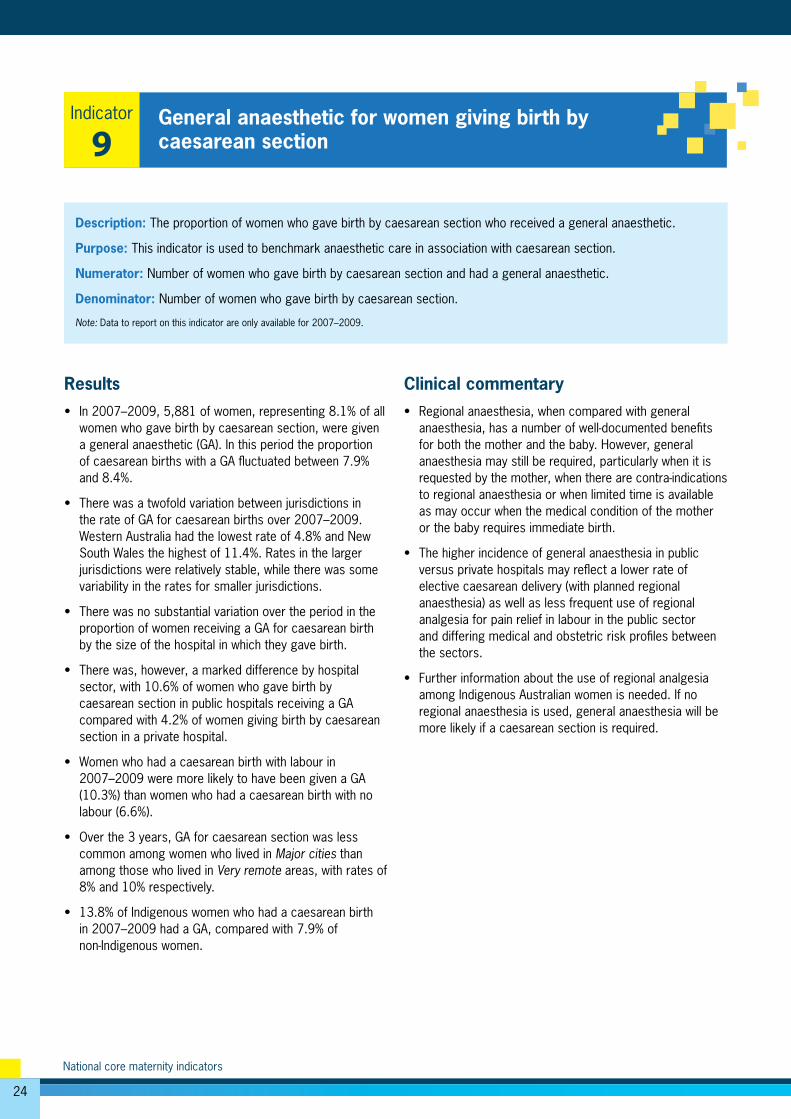
Results • In 2007–2009, 5,881 of women, representing 8.1% of all
women who gave birth by caesarean section, were given a general anaesthetic (GA). In this period the proportion of caesarean births with a GA fluctuated between 7.9% and 8.4%.
• There was a twofold variation between jurisdictions in the rate of GA for caesarean births over 2007–2009. Western Australia had the lowest rate of 4.8% and New South Wales the highest of 11.4%. Rates in the larger jurisdictions were relatively stable, while there was some variability in the rates for smaller jurisdictions.
• There was no substantial variation over the period in the proportion of women receiving a GA for caesarean birth by the size of the hospital in which they gave birth.
• There was, however, a marked difference by hospital sector, with 10.6% of women who gave birth by caesarean section in public hospitals receiving a GA compared with 4.2% of women giving birth by caesarean section in a private hospital.
• Women who had a caesarean birth with labour in 2007–2009 were more likely to have been given a GA (10.3%) than women who had a caesarean birth with no labour (6.6%).
• Over the 3 years, GA for caesarean section was less common among women who lived in Major cities than among those who lived in Very remote areas, with rates of 8% and 10% respectively.
• 13.8% of Indigenous women who had a caesarean birth in 2007–2009 had a GA, compared with 7.9% of non-Indigenous women.
Clinical commentary• Regional anaesthesia, when compared with general
anaesthesia, has a number of well-documented benefits for both the mother and the baby. However, general anaesthesia may still be required, particularly when it is requested by the mother, when there are contra-indications to regional anaesthesia or when limited time is available as may occur when the medical condition of the mother or the baby requires immediate birth.
• The higher incidence of general anaesthesia in public versus private hospitals may reflect a lower rate of elective caesarean delivery (with planned regional anaesthesia) as well as less frequent use of regional analgesia for pain relief in labour in the public sector and differing medical and obstetric risk profiles between the sectors.
• Further information about the use of regional analgesia among Indigenous Australian women is needed. If no regional anaesthesia is used, general anaesthesia will be more likely if a caesarean section is required.
Description: The proportion of women who gave birth by caesarean section who received a general anaesthetic.
Purpose: This indicator is used to benchmark anaesthetic care in association with caesarean section.
Numerator: Number of women who gave birth by caesarean section and had a general anaesthetic.
Denominator: Number of women who gave birth by caesarean section.
Note: Data to report on this indicator are only available for 2007–2009.
General anaesthetic for women giving birth by caesarean section
Indicator
9
25
Notes1. Caution should be used when interpreting these results. There was no standardised collection across jurisdictions for the data used to derive this indicator.
Data from Victoria were not available in 2009.2. Remoteness was assigned using the ABS ASGC remoteness structure applied to SLA or postal area of mother’s area of usual residence.Source: AIHW National Perinatal Data Collection 2004–2009.
Figure 9: General anaesthetic for women giving birth by caesarean section, 2004–2009
0
2
4
6
8
10
12
14
16
AustNTACTTasSAWAQldVicNSW
State or territory of birth
Per cent 200920082007200620052004
0No labourLabourPrivatePublic2001 or
more1001 to
2000501 to1000
101 to500
Less than100
Hospital annual number of births Hospital sector Labour/ No labour
2
4
6
8
10
12
14
16Per cent
0Non-IndigenousIndigenousVery
remoteRemoteOuter
regionalInner
regionalMajorcities
Remoteness of mother's area of residence Mother's Indigenous status
2
4
6
8
10
12
14
16Per cent
26
National core maternity indicators
Results • In 2004–2009, there were 13,781 babies born weighing
less than 2,750 grams, representing 1.9% of babies born at or after 40 weeks gestation.
• There was a downwards trend, but overall very little reduction in the proportion of small babies among births at or after 40 weeks, with proportions falling from 2.1% in 2004 to 1.8% in 2009.
• The proportion of small babies born at or after 40 weeks in the Northern Territory over 2004–2009 was 50% higher than the national average, with 3.0% of babies weighing less than 2,750g. Nearly 40% of births in the Northern Territory are to Indigenous Australian mothers, compared with less than 5% in other states and territories.
• A downward trend is evident in the proportion of small babies born to Indigenous Australian mothers after 40 weeks gestation, despite the volatility in rates that reflects the small numbers in this population. The decline from 5.7% in 2004 to 4.3% in 2009 compares with a more modest decline from 2.0% in 2004 to 1.7% in 2006 among babies born to non-Indigenous mothers.
• The proportion of small babies born at or after term increased with increasing remoteness of the mother’s area of usual residence. Over 2004–2009, women who lived in Very remote areas were more than twice as likely as those who lived in Major cities to give birth to a small baby at or after term, with proportions of 3.9% and 1.8% respectively.
• Similarly, the proportion of small babies at or after term increased with increasing disadvantage. Women living in the most disadvantaged areas (2.6%) were more likely than women resident in the least disadvantaged areas (1.4%) to have a small baby at or after term.
• The proportion of small babies declined over the reference period in all hospital groups. The largest decline was in hospitals with fewer than 100 annual births where
the proportion decreased from 3.1% in 2004 to 2.0% in 2009. Hospitals with more than 2,000 annual births had a relatively low rate at the beginning of the reference period and showed a smaller decline—from 2.0% to 1.8%.
• In 2004–2009, women who gave birth in a public hospital at or after 40 weeks gestation were more likely to have a small baby (2.1%), compared with similar women who gave birth in a private hospital.
• Over the reference period, there were relatively more female babies (2.4%) who were small than male babies (1.4%).
Clinical commentary • Birthweight is a key indicator of infant health that is used
both as an outcome measure for health and wellbeing of the mother in pregnancy and a principal determinant of a baby’s chance of prospective survival, good health, development and wellbeing. Babies born at or after 40 completed weeks of gestational age (280 or more days after the first day of the last menstrual period) with a birthweight less than 2,750 grams are likely to have intrauterine growth restriction (IUGR). Poor fetal growth is associated with increased risks of fetal death and compromise in labour. Late fetal growth restriction may predispose the baby to hypertension and diabetes in adulthood. A component of antenatal care in late pregnancy is monitoring fetal growth. Labour can be induced when a pregnancy is complicated by established IUGR.
• Further investigation is needed to better understand the drivers behind the overall lowering of the annual rates of very small babies born to Indigenous mothers at or after term over this period.
• Some babies whose intrauterine growth is normal are small, and female babies are normally smaller than male babies of the same gestational age. Use of sex-specific birthweight cut-off points would align this indicator more closely with growth restriction.
Description: The proportion of babies born at or after 40 weeks gestation who weighed less than 2,750 grams at birth.
Purpose: This indicator aims to identify intrauterine growth restriction for babies born at or after 40 weeks gestation. This indicator is used to benchmark practice.
Numerator: The number of babies born at or after 40 weeks gestation who weighed less than 2,750 grams at birth.
Denominator: The number of babies born at or after 40 weeks.
Small babies among births at or after 40 weeks gestation
Indicator
10
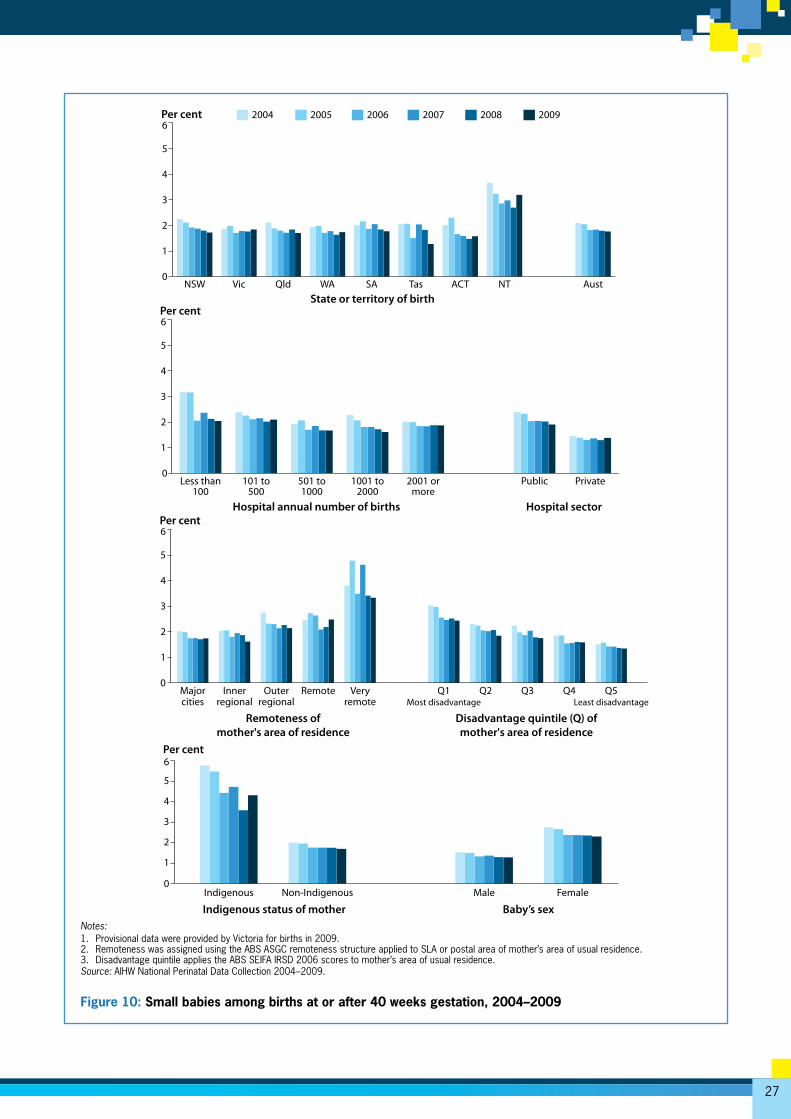
27
Notes:1. Provisional data were provided by Victoria for births in 2009.2. Remoteness was assigned using the ABS ASGC remoteness structure applied to SLA or postal area of mother’s area of usual residence.3. Disadvantage quintile applies the ABS SEIFA IRSD 2006 scores to mother’s area of usual residence.Source: AIHW National Perinatal Data Collection 2004–2009.
Figure 10: Small babies among births at or after 40 weeks gestation, 2004–2009
0
1
2
3
4
5
6
AustNTACTTasSAWAQldVicNSWState or territory of birth
Per cent 200920082007200620052004
0PrivatePublic2001 or
more1001 to
2000501 to1000
101 to500
Less than100
Hospital annual number of births Hospital sector
1
2
3
4
5
6Per cent
0Q5
Least disadvantageQ4Q3Q2Q1
Most disadvantageVery
remoteRemoteOuter
regionalInner
regionalMajorcities
Remoteness ofmother's area of residence
Disadvantage quintile (Q) of mother's area of residence
1
2
3
4
5
6Per cent
0FemaleMaleNon-IndigenousIndigenous
Indigenous status of mother Baby’s sex
1
2
3
4
5
6Per cent
28
National core maternity indicators
Appendix A: Expert Commentary Group
Dr Fadwa Al-Yaman (Chair), Australian Institute of Health and Welfare, Senior Executive, Social and Indigenous Group.
Ms Suzanne Cornes, Executive Director, Health Statistics Centre, Queensland Health and Chair of the National Perinatal Data Development Committee.
Professor David Ellwood, Deputy Dean and Professor of Obstetrics and Gynaecology, The Australian National University Medical School, The Canberra Hospital.
Professor Caroline Homer, Faculty of Nursing, Midwifery and Health, University of Technology Sydney.
Dr Janet Hornbuckle, Consultant in Maternal Fetal Medicine, Honorary Senior Lecturer in Obstetrics and Gynaecology, King Edward Memorial Hospital.
Professor Michael Humphrey, Clinical Adviser, Office of Rural and Remote Health, Senior Medical Coordinator, Obstetrics, Retrieval Services Queensland, Chair, Queensland Maternal and Perinatal Quality Council.
Associate Professor Christine Roberts, Obstetrics, Gynaecology and Neonatology, Kolling Institute of Medical Research.
Professor Elizabeth Sullivan, Director, National Perinatal and Epidemiology Statistics Unit.
29
Appendix B: Methods
Source data The AIHW National Perinatal Epidemiology and Statistics Unit (NPESU) compiled the National Perinatal Data Collection (NPDC) from data obtained from state and territory perinatal collections. Each state and territory has its own form and/or electronic system for collecting perinatal data. Information about all babies born at or after 20 weeks gestation or weighing 400g or more at birth (the weight expected of a baby at 20 weeks gestational age) in hospitals, birth centres, and in the community are collected by midwives and other staff from clinical and administrative records and information systems. A further series of validation checks are made before data are combined in the NPDC (Li et al. 2012).
A National Minimum Data Set (NMDS) is a core set of data elements for mandatory collection and reporting at a national level. An NMDS depends on a national agreement to collect uniform data and to supply it as part of a national collection (AIHW 2010). The standards make data collection activities more efficient by reducing duplication of effort by standardising core data items; more effective by ensuring that information to be collected is relevant and appropriate to its purpose; and more comparable and consistent for reporting purposes. An NMDS includes agreement on
specified data elements (discrete items of information or variables) and supporting data element concepts as well as the scope of the application of those data elements and the statistical units for collection. Definitions of all data elements that are included in the Perinatal NMDS are included in the AIHW’s online metadata registry, METeOR. Current definitions are available in the National health data dictionary (NHDD) Version 15 (AIHW 2010) and on METeOR online at <http://meteor.aihw.gov.au>. Versions 11 to 14 the NHDD were current at the time of collection of data for this report.
Each state and territory collects more information than is specified in the NMDS, and the NPESU requests some of these additional items, some of which are used to report against indicators in this report. These items may be collected differently and use different values for reporting. For more information about the quality of the collection, see the Maternity Information Matrix (<http://www.npesu.com.au/maternityinformation/dco.php?id=2>). Work to add key data items to the Perinatal NMDS has been undertaken by NPESU in consultation with the National Perinatal Data Development Committee. These include standardised data elements that will support reporting of indicators 1, 3 and 9 and indicators reported for selected women having a first birth.
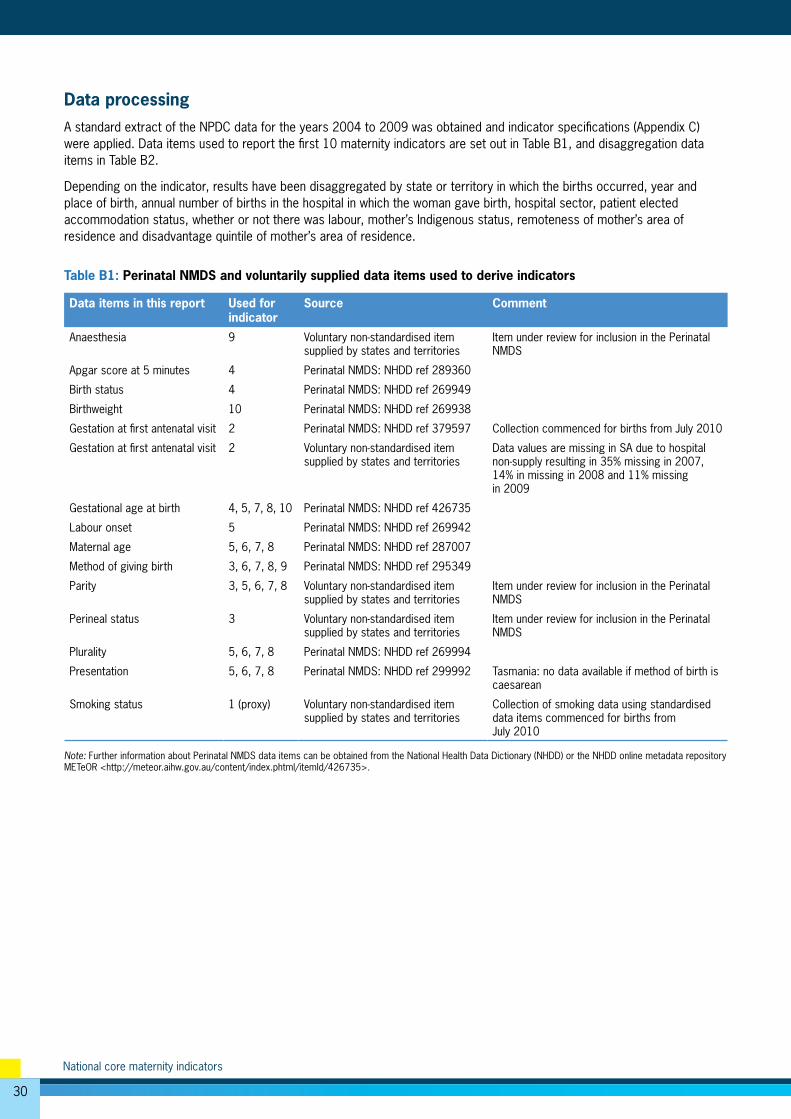
30
National core maternity indicators
Data processingA standard extract of the NPDC data for the years 2004 to 2009 was obtained and indicator specifications (Appendix C) were applied. Data items used to report the first 10 maternity indicators are set out in Table B1, and disaggregation data items in Table B2.
Depending on the indicator, results have been disaggregated by state or territory in which the births occurred, year and place of birth, annual number of births in the hospital in which the woman gave birth, hospital sector, patient elected accommodation status, whether or not there was labour, mother’s Indigenous status, remoteness of mother’s area of residence and disadvantage quintile of mother’s area of residence.
Table B1: Perinatal NMDS and voluntarily supplied data items used to derive indicators
Data items in this report Used for indicator
Source Comment
Anaesthesia 9 Voluntary non-standardised item supplied by states and territories
Item under review for inclusion in the Perinatal NMDS
Apgar score at 5 minutes 4 Perinatal NMDS: NHDD ref 289360
Birth status 4 Perinatal NMDS: NHDD ref 269949
Birthweight 10 Perinatal NMDS: NHDD ref 269938
Gestation at first antenatal visit 2 Perinatal NMDS: NHDD ref 379597 Collection commenced for births from July 2010
Gestation at first antenatal visit 2 Voluntary non-standardised item supplied by states and territories
Data values are missing in SA due to hospital non-supply resulting in 35% missing in 2007, 14% in missing in 2008 and 11% missing in 2009
Gestational age at birth 4, 5, 7, 8, 10 Perinatal NMDS: NHDD ref 426735
Labour onset 5 Perinatal NMDS: NHDD ref 269942
Maternal age 5, 6, 7, 8 Perinatal NMDS: NHDD ref 287007
Method of giving birth 3, 6, 7, 8, 9 Perinatal NMDS: NHDD ref 295349
Parity 3, 5, 6, 7, 8 Voluntary non-standardised item supplied by states and territories
Item under review for inclusion in the Perinatal NMDS
Perineal status 3 Voluntary non-standardised item supplied by states and territories
Item under review for inclusion in the Perinatal NMDS
Plurality 5, 6, 7, 8 Perinatal NMDS: NHDD ref 269994
Presentation 5, 6, 7, 8 Perinatal NMDS: NHDD ref 299992 Tasmania: no data available if method of birth is caesarean
Smoking status 1 (proxy) Voluntary non-standardised item supplied by states and territories
Collection of smoking data using standardised data items commenced for births from July 2010
Note: Further information about Perinatal NMDS data items can be obtained from the National Health Data Dictionary (NHDD) or the NHDD online metadata repository METeOR <http://meteor.aihw.gov.au/content/index.phtml/itemId/426735>.
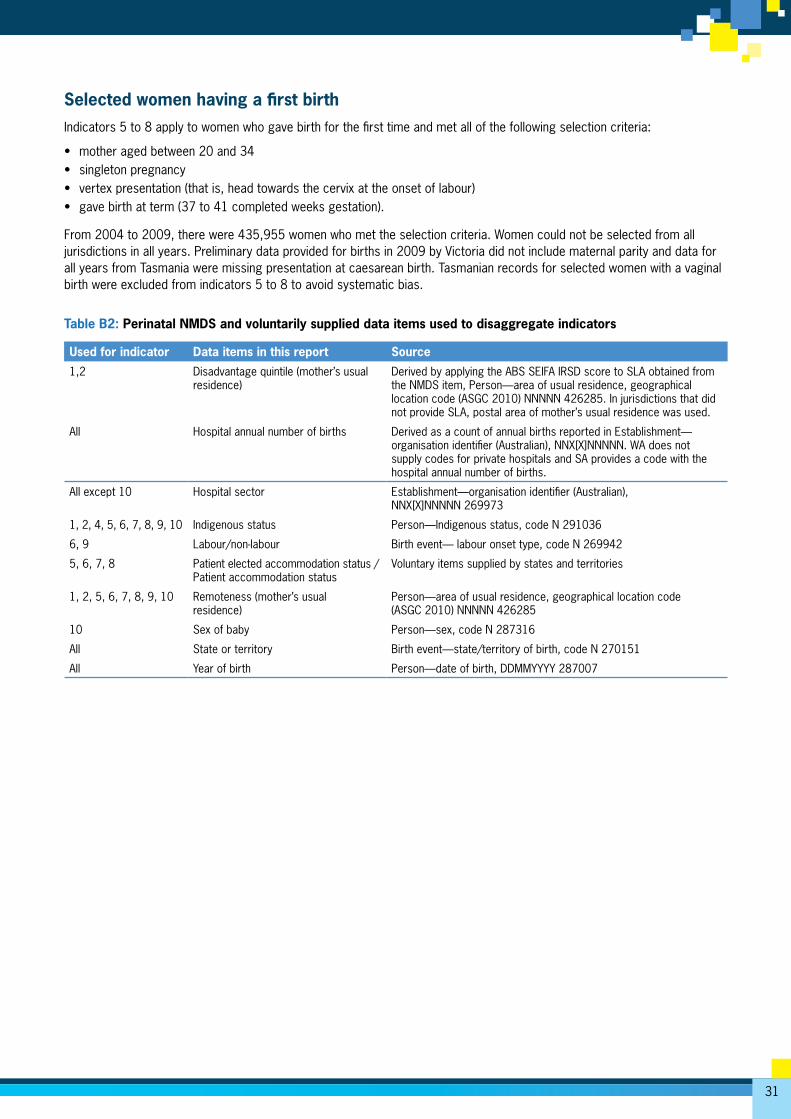
31
Selected women having a first birthIndicators 5 to 8 apply to women who gave birth for the first time and met all of the following selection criteria:
• mother aged between 20 and 34 • singleton pregnancy • vertex presentation (that is, head towards the cervix at the onset of labour) • gave birth at term (37 to 41 completed weeks gestation).
From 2004 to 2009, there were 435,955 women who met the selection criteria. Women could not be selected from all jurisdictions in all years. Preliminary data provided for births in 2009 by Victoria did not include maternal parity and data for all years from Tasmania were missing presentation at caesarean birth. Tasmanian records for selected women with a vaginal birth were excluded from indicators 5 to 8 to avoid systematic bias.
Table B2: Perinatal NMDS and voluntarily supplied data items used to disaggregate indicators
Used for indicator Data items in this report Source
1,2 Disadvantage quintile (mother’s usual residence)
Derived by applying the ABS SEIFA IRSD score to SLA obtained from the NMDS item, Person—area of usual residence, geographical location code (ASGC 2010) NNNNN 426285. In jurisdictions that did not provide SLA, postal area of mother’s usual residence was used.
All Hospital annual number of births Derived as a count of annual births reported in Establishment— organisation identifier (Australian), NNX[X]NNNNN. WA does not supply codes for private hospitals and SA provides a code with the hospital annual number of births.
All except 10 Hospital sector Establishment—organisation identifier (Australian), NNX[X]NNNNN 269973
1, 2, 4, 5, 6, 7, 8, 9, 10 Indigenous status Person—Indigenous status, code N 291036
6, 9 Labour/non-labour Birth event— labour onset type, code N 269942
5, 6, 7, 8 Patient elected accommodation status / Patient accommodation status
Voluntary items supplied by states and territories
1, 2, 5, 6, 7, 8, 9, 10 Remoteness (mother’s usual residence)
Person—area of usual residence, geographical location code (ASGC 2010) NNNNN 426285
10 Sex of baby Person—sex, code N 287316
All State or territory Birth event—state/territory of birth, code N 270151
All Year of birth Person—date of birth, DDMMYYYY 287007
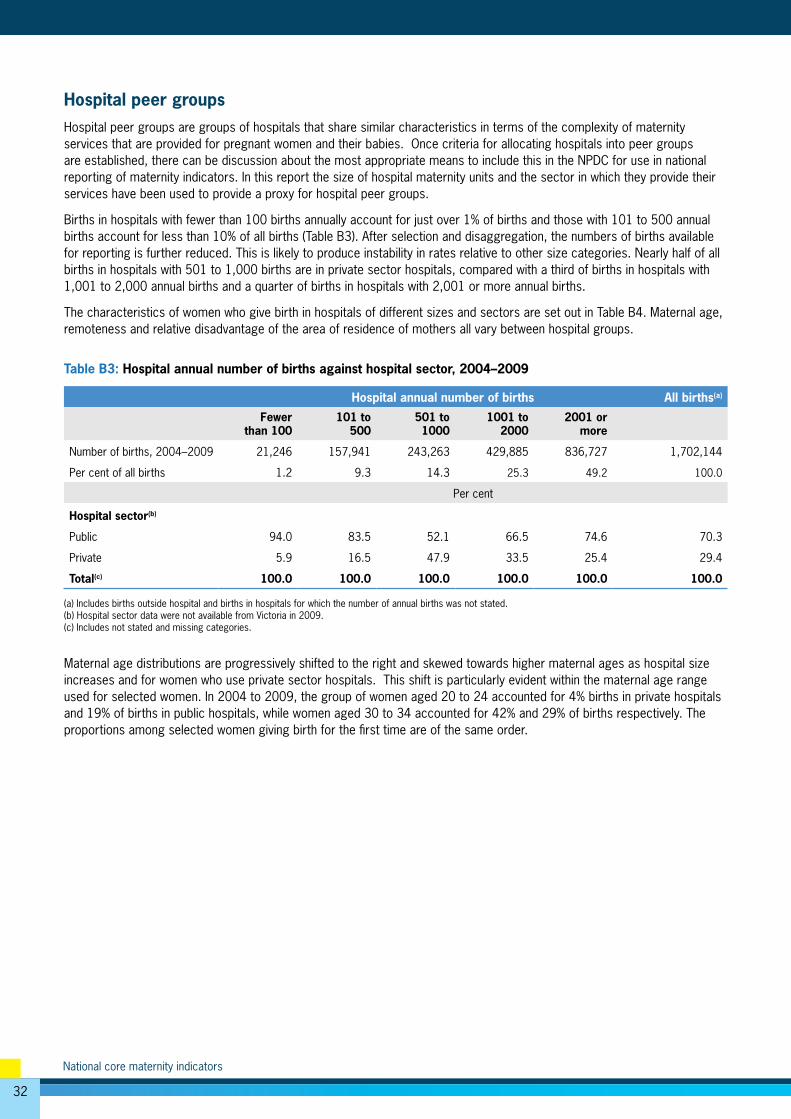
32
National core maternity indicators
Hospital peer groupsHospital peer groups are groups of hospitals that share similar characteristics in terms of the complexity of maternity services that are provided for pregnant women and their babies. Once criteria for allocating hospitals into peer groups are established, there can be discussion about the most appropriate means to include this in the NPDC for use in national reporting of maternity indicators. In this report the size of hospital maternity units and the sector in which they provide their services have been used to provide a proxy for hospital peer groups.
Births in hospitals with fewer than 100 births annually account for just over 1% of births and those with 101 to 500 annual births account for less than 10% of all births (Table B3). After selection and disaggregation, the numbers of births available for reporting is further reduced. This is likely to produce instability in rates relative to other size categories. Nearly half of all births in hospitals with 501 to 1,000 births are in private sector hospitals, compared with a third of births in hospitals with 1,001 to 2,000 annual births and a quarter of births in hospitals with 2,001 or more annual births.
The characteristics of women who give birth in hospitals of different sizes and sectors are set out in Table B4. Maternal age, remoteness and relative disadvantage of the area of residence of mothers all vary between hospital groups.
Table B3: Hospital annual number of births against hospital sector, 2004–2009
Hospital annual number of births All births(a)
Fewer than 100
101 to 500
501 to 1000
1001 to 2000
2001 or more
Number of births, 2004–2009 21,246 157,941 243,263 429,885 836,727 1,702,144
Per cent of all births 1.2 9.3 14.3 25.3 49.2 100.0
Per cent
Hospital sector(b)
Public 94.0 83.5 52.1 66.5 74.6 70.3
Private 5.9 16.5 47.9 33.5 25.4 29.4
Total(c) 100.0 100.0 100.0 100.0 100.0 100.0
(a) Includes births outside hospital and births in hospitals for which the number of annual births was not stated.(b) Hospital sector data were not available from Victoria in 2009.(c) Includes not stated and missing categories.
Maternal age distributions are progressively shifted to the right and skewed towards higher maternal ages as hospital size increases and for women who use private sector hospitals. This shift is particularly evident within the maternal age range used for selected women. In 2004 to 2009, the group of women aged 20 to 24 accounted for 4% births in private hospitals and 19% of births in public hospitals, while women aged 30 to 34 accounted for 42% and 29% of births respectively. The proportions among selected women giving birth for the first time are of the same order.
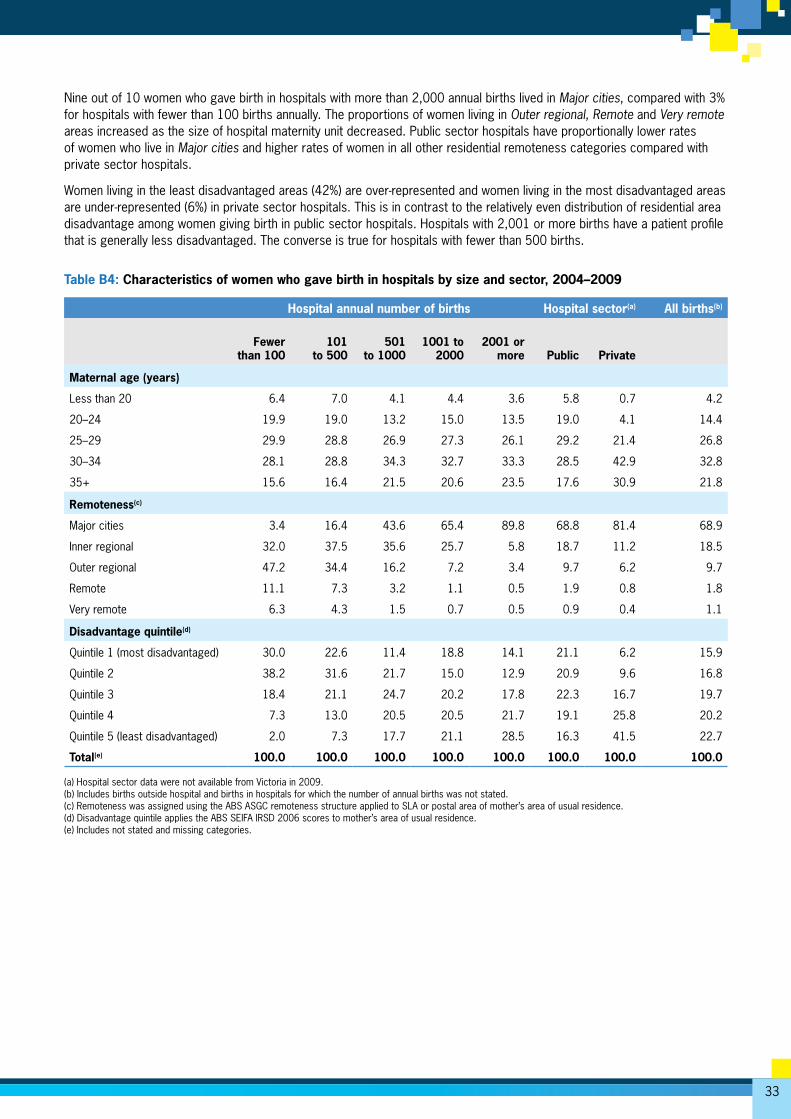
33
Nine out of 10 women who gave birth in hospitals with more than 2,000 annual births lived in Major cities, compared with 3% for hospitals with fewer than 100 births annually. The proportions of women living in Outer regional, Remote and Very remote areas increased as the size of hospital maternity unit decreased. Public sector hospitals have proportionally lower rates of women who live in Major cities and higher rates of women in all other residential remoteness categories compared with private sector hospitals.
Women living in the least disadvantaged areas (42%) are over-represented and women living in the most disadvantaged areas are under-represented (6%) in private sector hospitals. This is in contrast to the relatively even distribution of residential area disadvantage among women giving birth in public sector hospitals. Hospitals with 2,001 or more births have a patient profile that is generally less disadvantaged. The converse is true for hospitals with fewer than 500 births.
Table B4: Characteristics of women who gave birth in hospitals by size and sector, 2004–2009
Hospital annual number of births Hospital sector(a) All births(b)
Fewer
than 100101
to 500501
to 1000
1001 to
20002001 or
more Public Private
Maternal age (years)
Less than 20 6.4 7.0 4.1 4.4 3.6 5.8 0.7 4.2
20–24 19.9 19.0 13.2 15.0 13.5 19.0 4.1 14.4
25–29 29.9 28.8 26.9 27.3 26.1 29.2 21.4 26.8
30–34 28.1 28.8 34.3 32.7 33.3 28.5 42.9 32.8
35+ 15.6 16.4 21.5 20.6 23.5 17.6 30.9 21.8
Remoteness(c)
Major cities 3.4 16.4 43.6 65.4 89.8 68.8 81.4 68.9
Inner regional 32.0 37.5 35.6 25.7 5.8 18.7 11.2 18.5
Outer regional 47.2 34.4 16.2 7.2 3.4 9.7 6.2 9.7
Remote 11.1 7.3 3.2 1.1 0.5 1.9 0.8 1.8
Very remote 6.3 4.3 1.5 0.7 0.5 0.9 0.4 1.1
Disadvantage quintile(d)
Quintile 1 (most disadvantaged) 30.0 22.6 11.4 18.8 14.1 21.1 6.2 15.9
Quintile 2 38.2 31.6 21.7 15.0 12.9 20.9 9.6 16.8
Quintile 3 18.4 21.1 24.7 20.2 17.8 22.3 16.7 19.7
Quintile 4 7.3 13.0 20.5 20.5 21.7 19.1 25.8 20.2
Quintile 5 (least disadvantaged) 2.0 7.3 17.7 21.1 28.5 16.3 41.5 22.7
Total(e) 100.0 100.0 100.0 100.0 100.0 100.0 100.0 100.0
(a) Hospital sector data were not available from Victoria in 2009.(b) Includes births outside hospital and births in hospitals for which the number of annual births was not stated.(c) Remoteness was assigned using the ABS ASGC remoteness structure applied to SLA or postal area of mother’s area of usual residence.(d) Disadvantage quintile applies the ABS SEIFA IRSD 2006 scores to mother’s area of usual residence.(e) Includes not stated and missing categories.
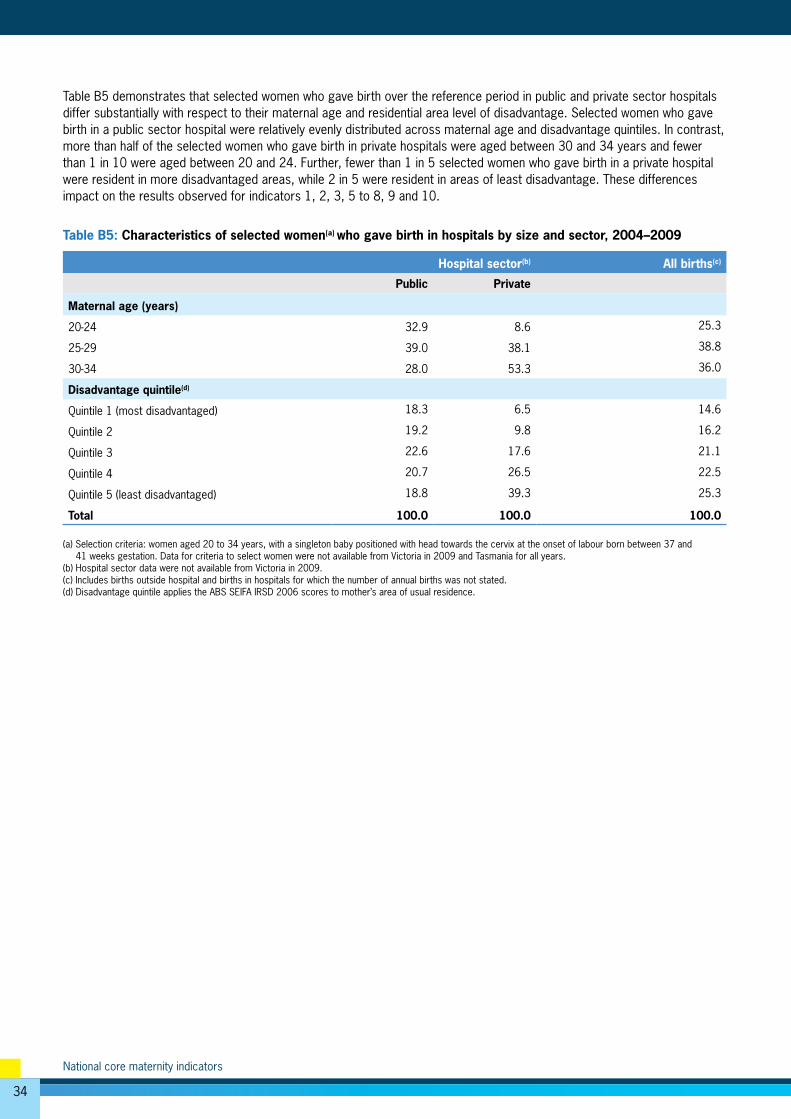
34
National core maternity indicators
Table B5 demonstrates that selected women who gave birth over the reference period in public and private sector hospitals differ substantially with respect to their maternal age and residential area level of disadvantage. Selected women who gave birth in a public sector hospital were relatively evenly distributed across maternal age and disadvantage quintiles. In contrast, more than half of the selected women who gave birth in private hospitals were aged between 30 and 34 years and fewer than 1 in 10 were aged between 20 and 24. Further, fewer than 1 in 5 selected women who gave birth in a private hospital were resident in more disadvantaged areas, while 2 in 5 were resident in areas of least disadvantage. These differences impact on the results observed for indicators 1, 2, 3, 5 to 8, 9 and 10.
Table B5: Characteristics of selected women(a) who gave birth in hospitals by size and sector, 2004–2009
Hospital sector(b) All births(c)
Public Private
Maternal age (years)
20-24 32.9 8.6 25.3
25-29 39.0 38.1 38.8
30-34 28.0 53.3 36.0
Disadvantage quintile(d)
Quintile 1 (most disadvantaged) 18.3 6.5 14.6
Quintile 2 19.2 9.8 16.2
Quintile 3 22.6 17.6 21.1
Quintile 4 20.7 26.5 22.5
Quintile 5 (least disadvantaged) 18.8 39.3 25.3
Total 100.0 100.0 100.0
(a) Selection criteria: women aged 20 to 34 years, with a singleton baby positioned with head towards the cervix at the onset of labour born between 37 and 41 weeks gestation. Data for criteria to select women were not available from Victoria in 2009 and Tasmania for all years. (b) Hospital sector data were not available from Victoria in 2009.(c) Includes births outside hospital and births in hospitals for which the number of annual births was not stated.(d) Disadvantage quintile applies the ABS SEIFA IRSD 2006 scores to mother’s area of usual residence.
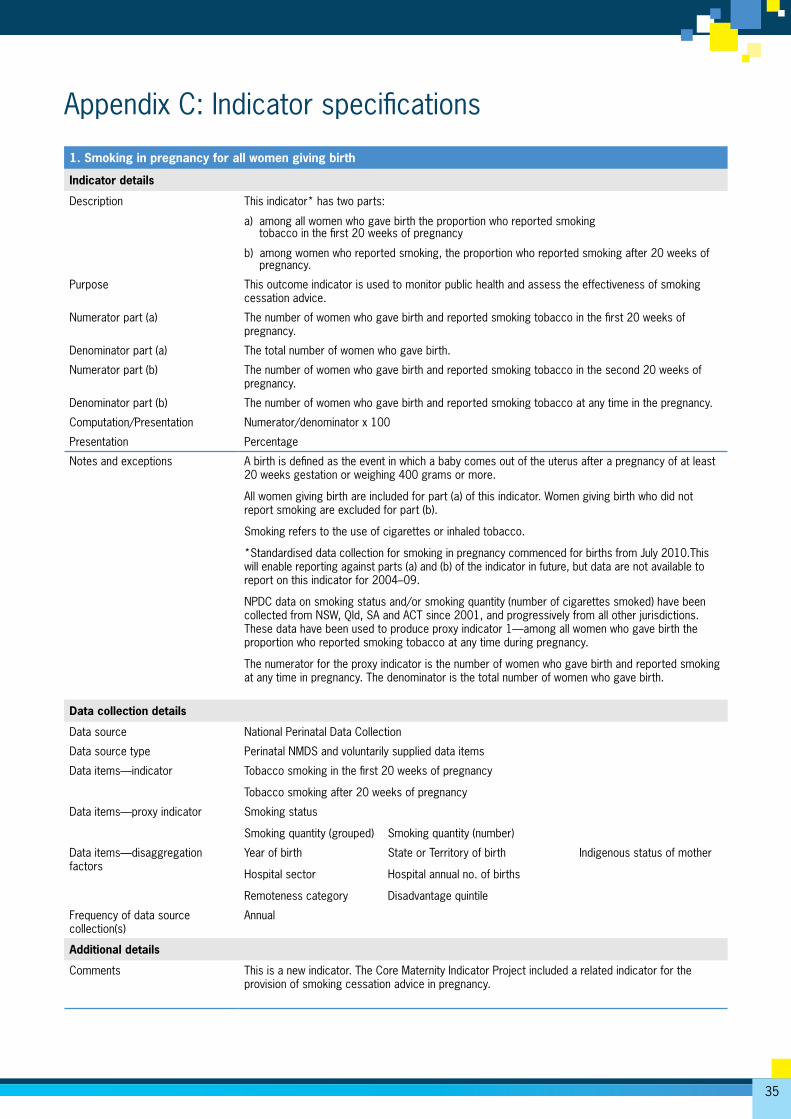
35
Appendix C: Indicator specifications
1. Smoking in pregnancy for all women giving birth
Indicator details
Description This indicator* has two parts:
a) among all women who gave birth the proportion who reported smoking tobacco in the first 20 weeks of pregnancy
b) among women who reported smoking, the proportion who reported smoking after 20 weeks of pregnancy.
Purpose This outcome indicator is used to monitor public health and assess the effectiveness of smoking cessation advice.
Numerator part (a) The number of women who gave birth and reported smoking tobacco in the first 20 weeks of pregnancy.
Denominator part (a) The total number of women who gave birth.
Numerator part (b) The number of women who gave birth and reported smoking tobacco in the second 20 weeks of pregnancy.
Denominator part (b) The number of women who gave birth and reported smoking tobacco at any time in the pregnancy.
Computation/Presentation Numerator/denominator x 100
Presentation Percentage
Notes and exceptions A birth is defined as the event in which a baby comes out of the uterus after a pregnancy of at least 20 weeks gestation or weighing 400 grams or more.
All women giving birth are included for part (a) of this indicator. Women giving birth who did not report smoking are excluded for part (b).
Smoking refers to the use of cigarettes or inhaled tobacco.
*Standardised data collection for smoking in pregnancy commenced for births from July 2010.This will enable reporting against parts (a) and (b) of the indicator in future, but data are not available to report on this indicator for 2004–09.
NPDC data on smoking status and/or smoking quantity (number of cigarettes smoked) have been collected from NSW, Qld, SA and ACT since 2001, and progressively from all other jurisdictions. These data have been used to produce proxy indicator 1—among all women who gave birth the proportion who reported smoking tobacco at any time during pregnancy.
The numerator for the proxy indicator is the number of women who gave birth and reported smoking at any time in pregnancy. The denominator is the total number of women who gave birth.
Data collection details
Data source National Perinatal Data Collection
Data source type Perinatal NMDS and voluntarily supplied data items
Data items—indicator Tobacco smoking in the first 20 weeks of pregnancy
Tobacco smoking after 20 weeks of pregnancy
Data items—proxy indicator Smoking status
Smoking quantity (grouped) Smoking quantity (number)
Data items—disaggregation factors
Year of birth State or Territory of birth Indigenous status of mother
Hospital sector Hospital annual no. of births
Remoteness category Disadvantage quintile
Frequency of data source collection(s)
Annual
Additional details
Comments This is a new indicator. The Core Maternity Indicator Project included a related indicator for the provision of smoking cessation advice in pregnancy.
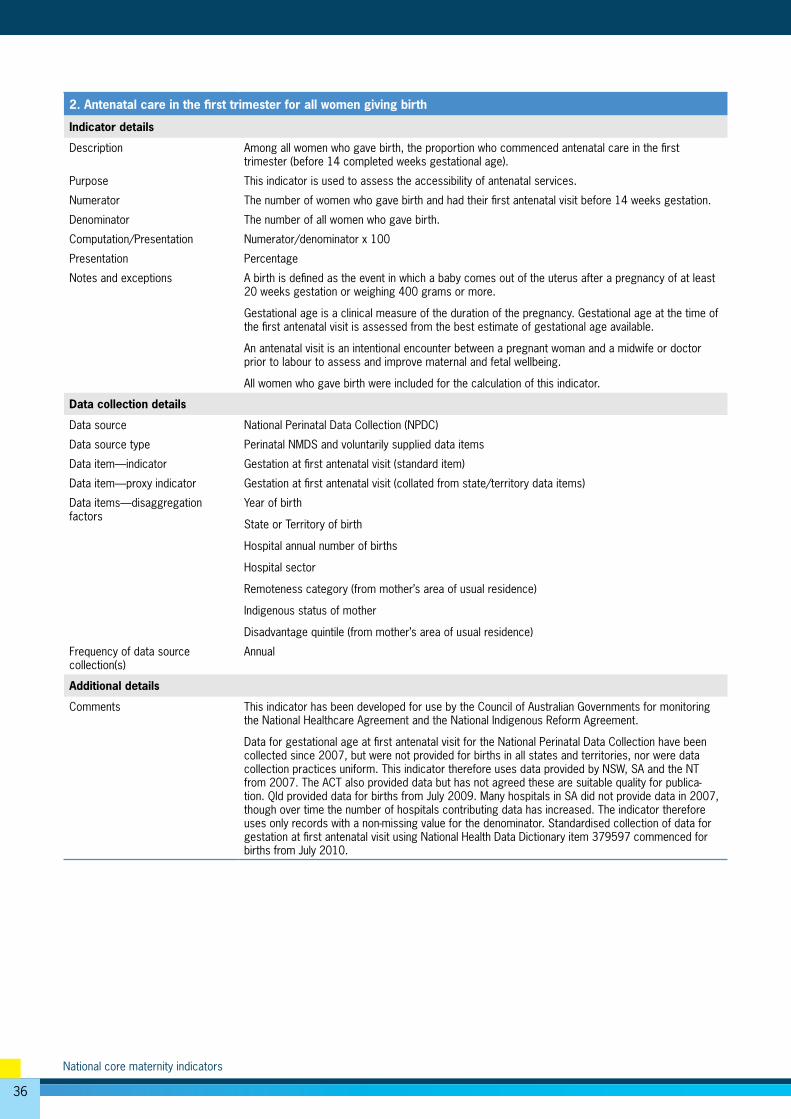
36
National core maternity indicators
2. Antenatal care in the first trimester for all women giving birth
Indicator details
Description Among all women who gave birth, the proportion who commenced antenatal care in the first trimester (before 14 completed weeks gestational age).
Purpose This indicator is used to assess the accessibility of antenatal services.
Numerator The number of women who gave birth and had their first antenatal visit before 14 weeks gestation.
Denominator The number of all women who gave birth.
Computation/Presentation Numerator/denominator x 100
Presentation Percentage
Notes and exceptions A birth is defined as the event in which a baby comes out of the uterus after a pregnancy of at least 20 weeks gestation or weighing 400 grams or more.
Gestational age is a clinical measure of the duration of the pregnancy. Gestational age at the time of the first antenatal visit is assessed from the best estimate of gestational age available.
An antenatal visit is an intentional encounter between a pregnant woman and a midwife or doctor prior to labour to assess and improve maternal and fetal wellbeing.
All women who gave birth were included for the calculation of this indicator.
Data collection details
Data source National Perinatal Data Collection (NPDC)
Data source type Perinatal NMDS and voluntarily supplied data items
Data item—indicator Gestation at first antenatal visit (standard item)
Data item—proxy indicator Gestation at first antenatal visit (collated from state/territory data items)
Data items—disaggregation factors
Year of birth
State or Territory of birth
Hospital annual number of births
Hospital sector
Remoteness category (from mother’s area of usual residence)
Indigenous status of mother
Disadvantage quintile (from mother’s area of usual residence)
Frequency of data source collection(s)
Annual
Additional details
Comments This indicator has been developed for use by the Council of Australian Governments for monitoring the National Healthcare Agreement and the National Indigenous Reform Agreement.
Data for gestational age at first antenatal visit for the National Perinatal Data Collection have been collected since 2007, but were not provided for births in all states and territories, nor were data collection practices uniform. This indicator therefore uses data provided by NSW, SA and the NT from 2007. The ACT also provided data but has not agreed these are suitable quality for publica-tion. Qld provided data for births from July 2009. Many hospitals in SA did not provide data in 2007, though over time the number of hospitals contributing data has increased. The indicator therefore uses only records with a non-missing value for the denominator. Standardised collection of data for gestation at first antenatal visit using National Health Data Dictionary item 379597 commenced for births from July 2010.
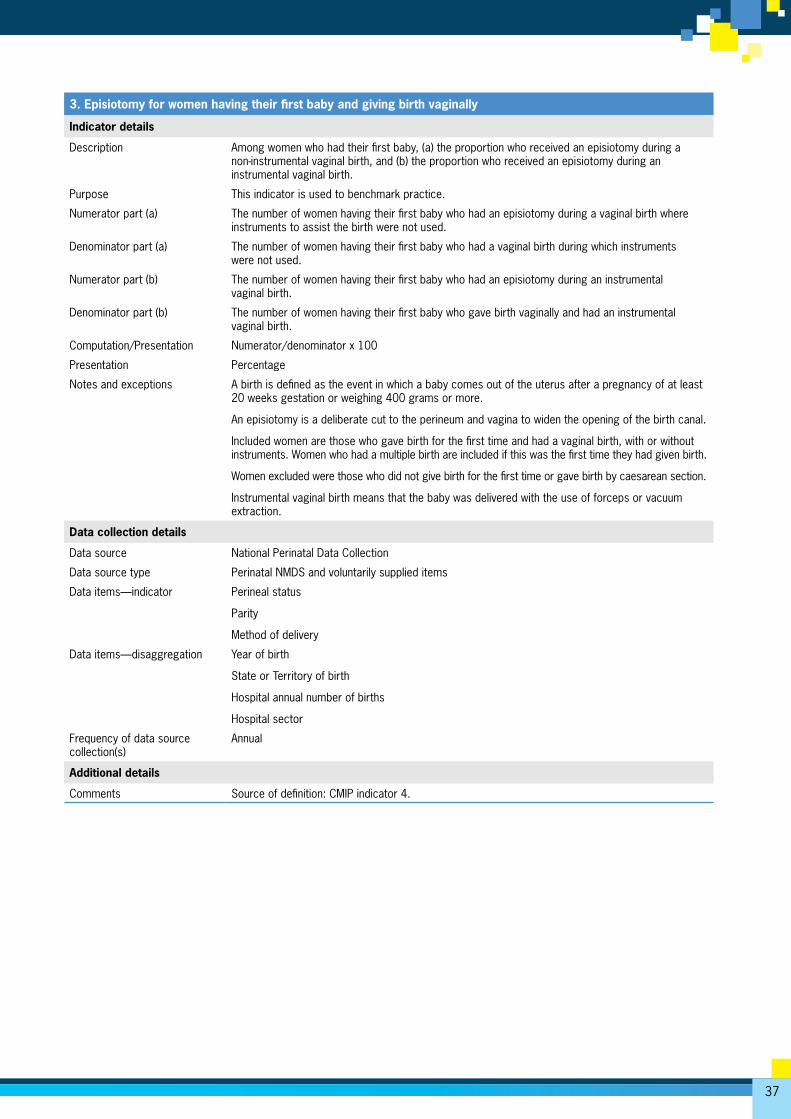
37
3. Episiotomy for women having their first baby and giving birth vaginally
Indicator details
Description Among women who had their first baby, (a) the proportion who received an episiotomy during a non-instrumental vaginal birth, and (b) the proportion who received an episiotomy during an instrumental vaginal birth.
Purpose This indicator is used to benchmark practice.
Numerator part (a) The number of women having their first baby who had an episiotomy during a vaginal birth where instruments to assist the birth were not used.
Denominator part (a) The number of women having their first baby who had a vaginal birth during which instruments were not used.
Numerator part (b) The number of women having their first baby who had an episiotomy during an instrumental vaginal birth.
Denominator part (b) The number of women having their first baby who gave birth vaginally and had an instrumental vaginal birth.
Computation/Presentation Numerator/denominator x 100
Presentation Percentage
Notes and exceptions A birth is defined as the event in which a baby comes out of the uterus after a pregnancy of at least 20 weeks gestation or weighing 400 grams or more.
An episiotomy is a deliberate cut to the perineum and vagina to widen the opening of the birth canal.
Included women are those who gave birth for the first time and had a vaginal birth, with or without instruments. Women who had a multiple birth are included if this was the first time they had given birth.
Women excluded were those who did not give birth for the first time or gave birth by caesarean section.
Instrumental vaginal birth means that the baby was delivered with the use of forceps or vacuum extraction.
Data collection details
Data source National Perinatal Data Collection
Data source type Perinatal NMDS and voluntarily supplied items
Data items—indicator Perineal status
Parity
Method of delivery
Data items—disaggregation Year of birth
State or Territory of birth
Hospital annual number of births
Hospital sector
Frequency of data source collection(s)
Annual
Additional details
Comments Source of definition: CMIP indicator 4.
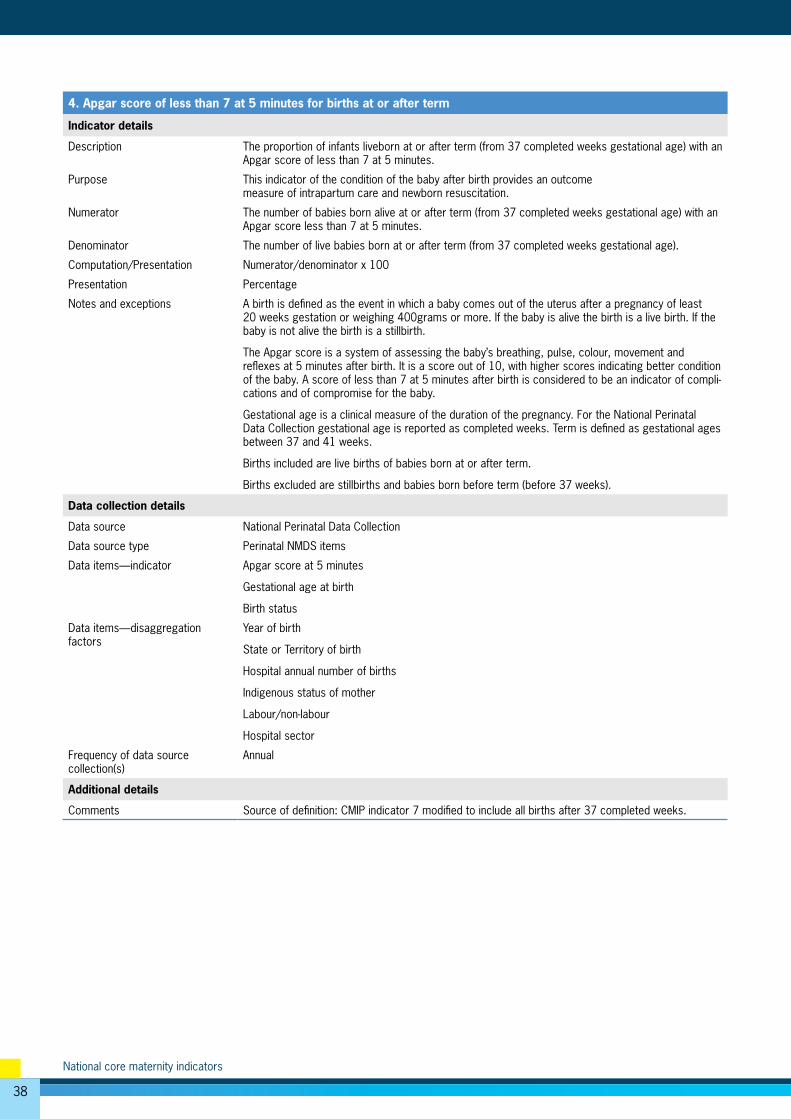
38
National core maternity indicators
4. Apgar score of less than 7 at 5 minutes for births at or after term
Indicator details
Description The proportion of infants liveborn at or after term (from 37 completed weeks gestational age) with an Apgar score of less than 7 at 5 minutes.
Purpose This indicator of the condition of the baby after birth provides an outcome measure of intrapartum care and newborn resuscitation.
Numerator The number of babies born alive at or after term (from 37 completed weeks gestational age) with an Apgar score less than 7 at 5 minutes.
Denominator The number of live babies born at or after term (from 37 completed weeks gestational age).
Computation/Presentation Numerator/denominator x 100
Presentation Percentage
Notes and exceptions A birth is defined as the event in which a baby comes out of the uterus after a pregnancy of least 20 weeks gestation or weighing 400grams or more. If the baby is alive the birth is a live birth. If the baby is not alive the birth is a stillbirth.
The Apgar score is a system of assessing the baby’s breathing, pulse, colour, movement and reflexes at 5 minutes after birth. It is a score out of 10, with higher scores indicating better condition of the baby. A score of less than 7 at 5 minutes after birth is considered to be an indicator of compli-cations and of compromise for the baby.
Gestational age is a clinical measure of the duration of the pregnancy. For the National Perinatal Data Collection gestational age is reported as completed weeks. Term is defined as gestational ages between 37 and 41 weeks.
Births included are live births of babies born at or after term.
Births excluded are stillbirths and babies born before term (before 37 weeks).
Data collection details
Data source National Perinatal Data Collection
Data source type Perinatal NMDS items
Data items—indicator Apgar score at 5 minutes
Gestational age at birth
Birth status
Data items—disaggregation factors
Year of birth
State or Territory of birth
Hospital annual number of births
Indigenous status of mother
Labour/non-labour
Hospital sector
Frequency of data source collection(s)
Annual
Additional details
Comments Source of definition: CMIP indicator 7 modified to include all births after 37 completed weeks.
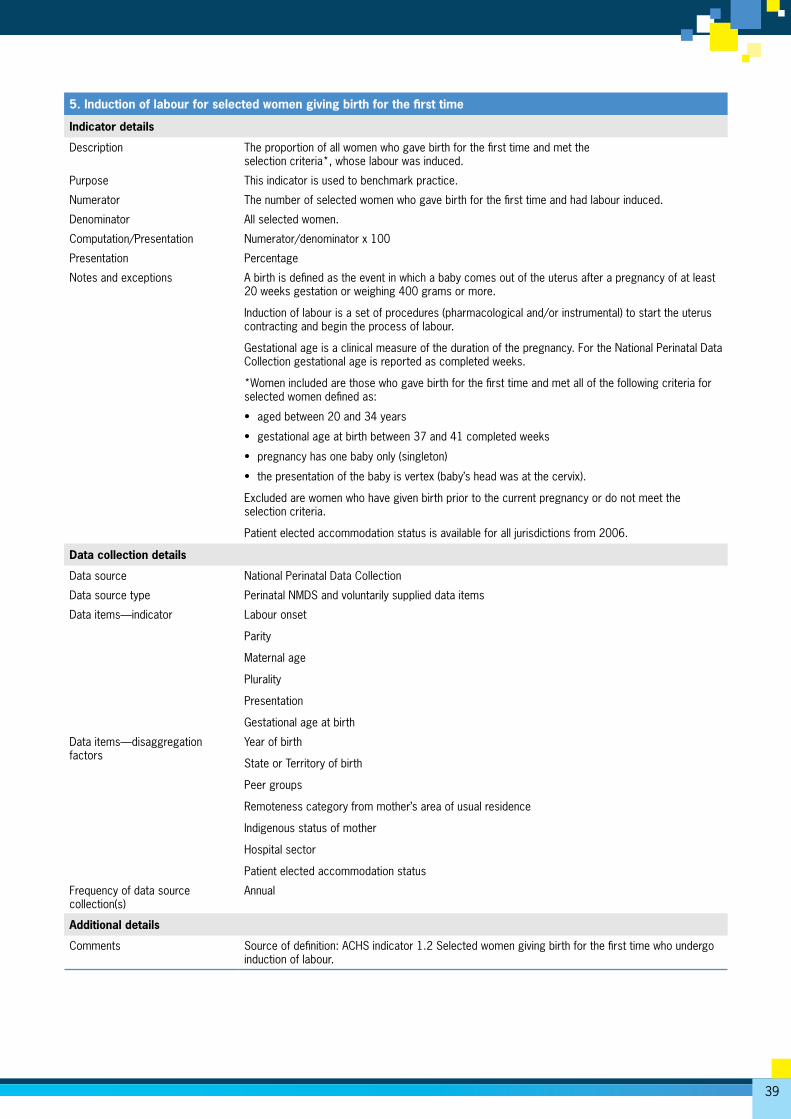
39
5. Induction of labour for selected women giving birth for the first time
Indicator details
Description The proportion of all women who gave birth for the first time and met the selection criteria*, whose labour was induced.
Purpose This indicator is used to benchmark practice.
Numerator The number of selected women who gave birth for the first time and had labour induced.
Denominator All selected women.
Computation/Presentation Numerator/denominator x 100
Presentation Percentage
Notes and exceptions A birth is defined as the event in which a baby comes out of the uterus after a pregnancy of at least 20 weeks gestation or weighing 400 grams or more.
Induction of labour is a set of procedures (pharmacological and/or instrumental) to start the uterus contracting and begin the process of labour.
Gestational age is a clinical measure of the duration of the pregnancy. For the National Perinatal Data Collection gestational age is reported as completed weeks.
*Women included are those who gave birth for the first time and met all of the following criteria for selected women defined as:
• aged between 20 and 34 years
• gestational age at birth between 37 and 41 completed weeks
• pregnancy has one baby only (singleton)
• the presentation of the baby is vertex (baby’s head was at the cervix).
Excluded are women who have given birth prior to the current pregnancy or do not meet the selection criteria.
Patient elected accommodation status is available for all jurisdictions from 2006.
Data collection details
Data source National Perinatal Data Collection
Data source type Perinatal NMDS and voluntarily supplied data items
Data items—indicator Labour onset
Parity
Maternal age
Plurality
Presentation
Gestational age at birth
Data items—disaggregation factors
Year of birth
State or Territory of birth
Peer groups
Remoteness category from mother’s area of usual residence
Indigenous status of mother
Hospital sector
Patient elected accommodation status
Frequency of data source collection(s)
Annual
Additional details
Comments Source of definition: ACHS indicator 1.2 Selected women giving birth for the first time who undergo induction of labour.
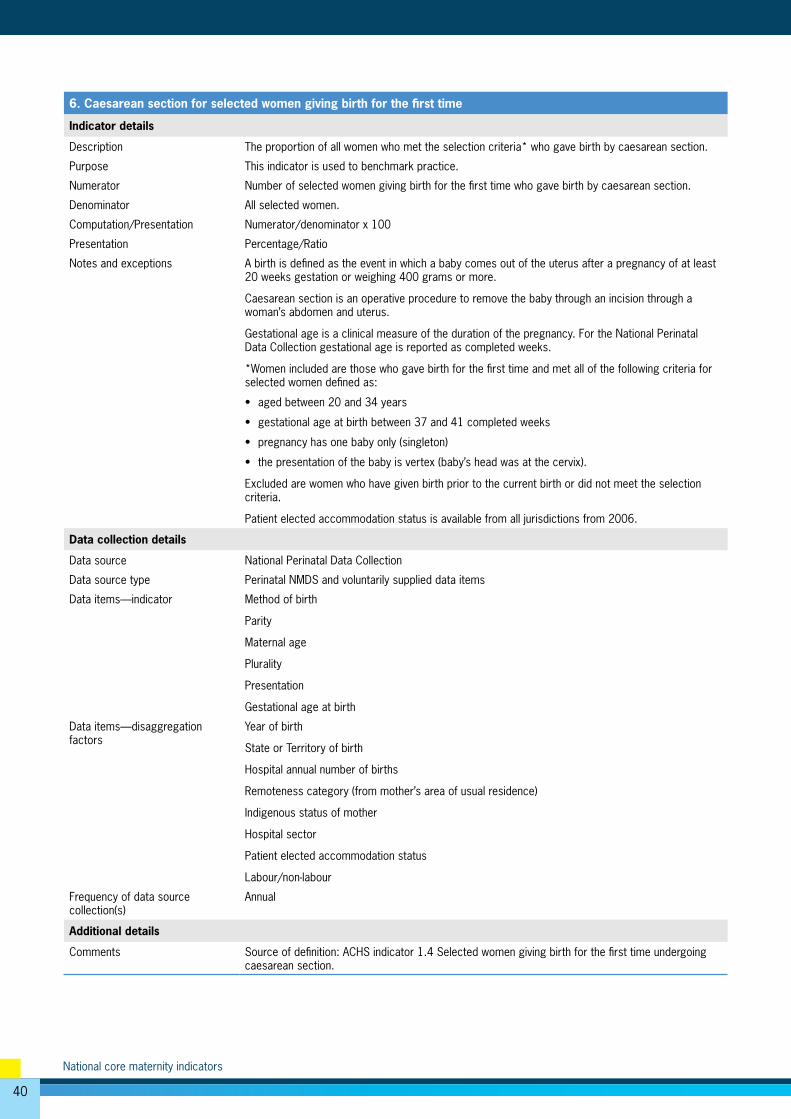
40
National core maternity indicators
6. Caesarean section for selected women giving birth for the first time
Indicator details
Description The proportion of all women who met the selection criteria* who gave birth by caesarean section.
Purpose This indicator is used to benchmark practice.
Numerator Number of selected women giving birth for the first time who gave birth by caesarean section.
Denominator All selected women.
Computation/Presentation Numerator/denominator x 100
Presentation Percentage/Ratio
Notes and exceptions A birth is defined as the event in which a baby comes out of the uterus after a pregnancy of at least 20 weeks gestation or weighing 400 grams or more.
Caesarean section is an operative procedure to remove the baby through an incision through a woman’s abdomen and uterus.
Gestational age is a clinical measure of the duration of the pregnancy. For the National Perinatal Data Collection gestational age is reported as completed weeks.
*Women included are those who gave birth for the first time and met all of the following criteria for selected women defined as:
• aged between 20 and 34 years
• gestational age at birth between 37 and 41 completed weeks
• pregnancy has one baby only (singleton)
• the presentation of the baby is vertex (baby’s head was at the cervix).
Excluded are women who have given birth prior to the current birth or did not meet the selection criteria.
Patient elected accommodation status is available from all jurisdictions from 2006.
Data collection details
Data source National Perinatal Data Collection
Data source type Perinatal NMDS and voluntarily supplied data items
Data items—indicator Method of birth
Parity
Maternal age
Plurality
Presentation
Gestational age at birth
Data items—disaggregation factors
Year of birth
State or Territory of birth
Hospital annual number of births
Remoteness category (from mother’s area of usual residence)
Indigenous status of mother
Hospital sector
Patient elected accommodation status
Labour/non-labour
Frequency of data source collection(s)
Annual
Additional details
Comments Source of definition: ACHS indicator 1.4 Selected women giving birth for the first time undergoing caesarean section.
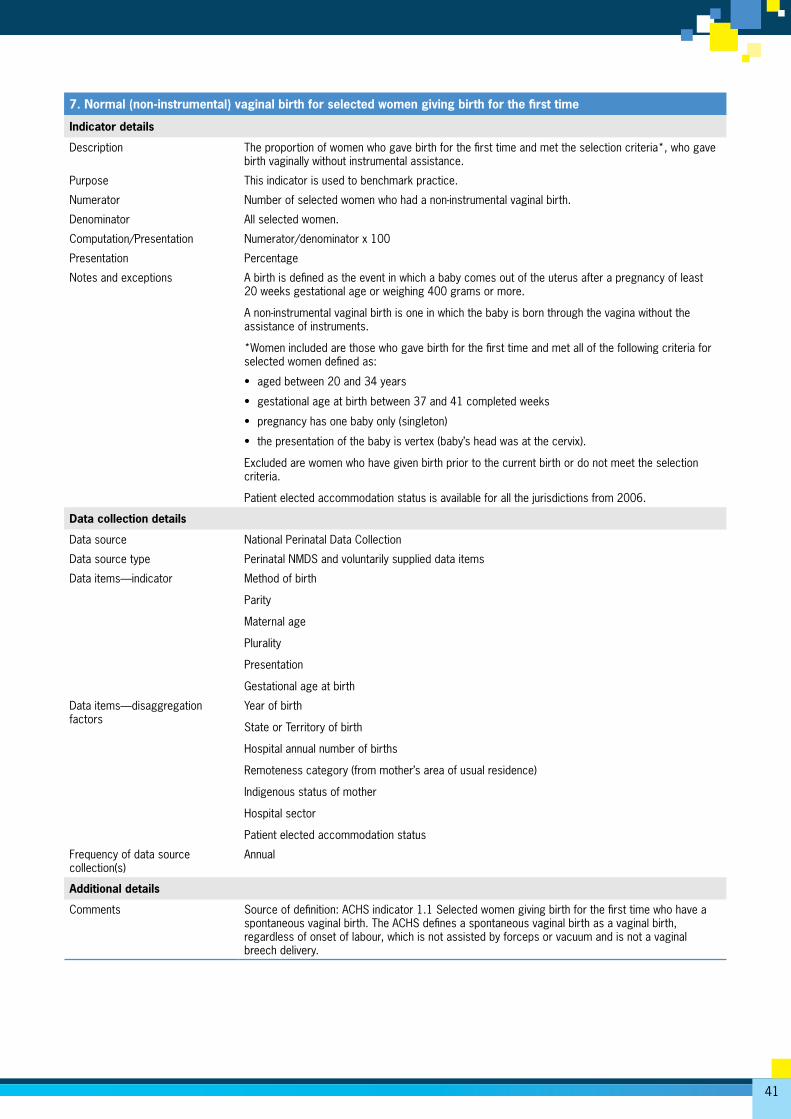
41
7. Normal (non-instrumental) vaginal birth for selected women giving birth for the first time
Indicator details
Description The proportion of women who gave birth for the first time and met the selection criteria*, who gave birth vaginally without instrumental assistance.
Purpose This indicator is used to benchmark practice.
Numerator Number of selected women who had a non-instrumental vaginal birth.
Denominator All selected women.
Computation/Presentation Numerator/denominator x 100
Presentation Percentage
Notes and exceptions A birth is defined as the event in which a baby comes out of the uterus after a pregnancy of least 20 weeks gestational age or weighing 400 grams or more.
A non-instrumental vaginal birth is one in which the baby is born through the vagina without the assistance of instruments.
*Women included are those who gave birth for the first time and met all of the following criteria for selected women defined as:
• aged between 20 and 34 years
• gestational age at birth between 37 and 41 completed weeks
• pregnancy has one baby only (singleton)
• the presentation of the baby is vertex (baby’s head was at the cervix).
Excluded are women who have given birth prior to the current birth or do not meet the selection criteria.
Patient elected accommodation status is available for all the jurisdictions from 2006.
Data collection details
Data source National Perinatal Data Collection
Data source type Perinatal NMDS and voluntarily supplied data items
Data items—indicator Method of birth
Parity
Maternal age
Plurality
Presentation
Gestational age at birth
Data items—disaggregation factors
Year of birth
State or Territory of birth
Hospital annual number of births
Remoteness category (from mother’s area of usual residence)
Indigenous status of mother
Hospital sector
Patient elected accommodation status
Frequency of data source collection(s)
Annual
Additional details
Comments Source of definition: ACHS indicator 1.1 Selected women giving birth for the first time who have a spontaneous vaginal birth. The ACHS defines a spontaneous vaginal birth as a vaginal birth, regardless of onset of labour, which is not assisted by forceps or vacuum and is not a vaginal breech delivery.
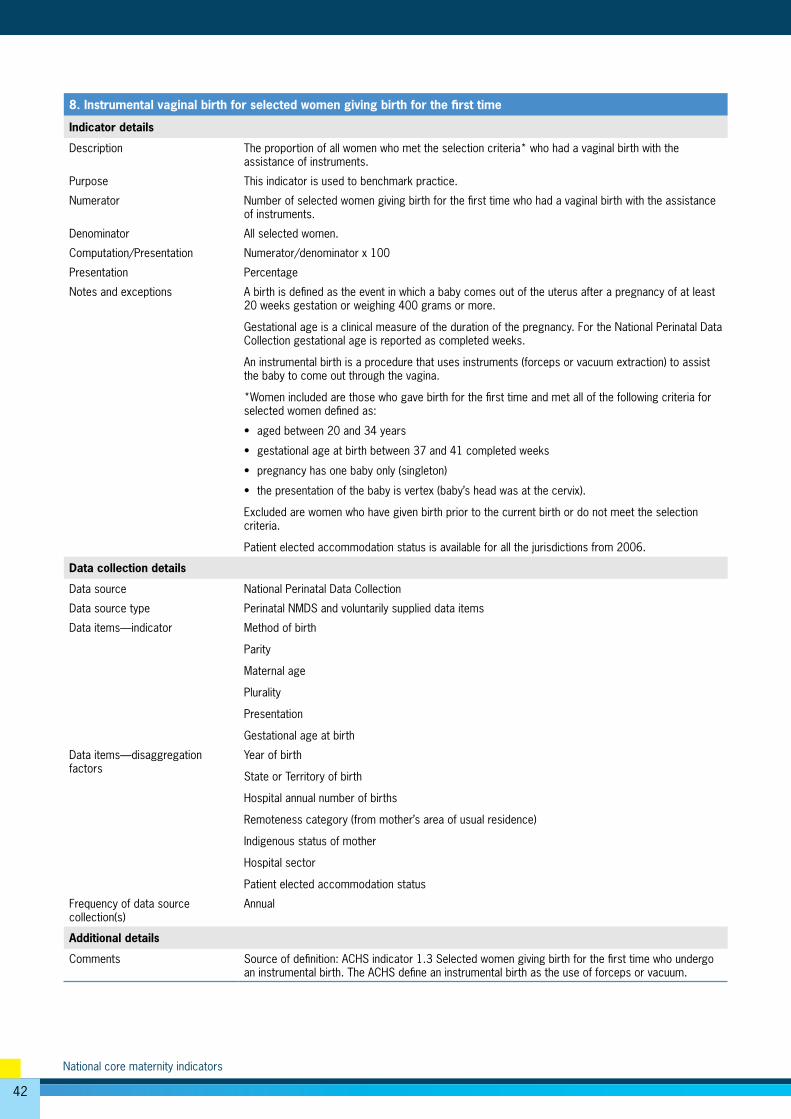
42
National core maternity indicators
8. Instrumental vaginal birth for selected women giving birth for the first time
Indicator details
Description The proportion of all women who met the selection criteria* who had a vaginal birth with the assistance of instruments.
Purpose This indicator is used to benchmark practice.
Numerator Number of selected women giving birth for the first time who had a vaginal birth with the assistance of instruments.
Denominator All selected women.
Computation/Presentation Numerator/denominator x 100
Presentation Percentage
Notes and exceptions A birth is defined as the event in which a baby comes out of the uterus after a pregnancy of at least 20 weeks gestation or weighing 400 grams or more.
Gestational age is a clinical measure of the duration of the pregnancy. For the National Perinatal Data Collection gestational age is reported as completed weeks.
An instrumental birth is a procedure that uses instruments (forceps or vacuum extraction) to assist the baby to come out through the vagina.
*Women included are those who gave birth for the first time and met all of the following criteria for selected women defined as:
• aged between 20 and 34 years
• gestational age at birth between 37 and 41 completed weeks
• pregnancy has one baby only (singleton)
• the presentation of the baby is vertex (baby’s head was at the cervix).
Excluded are women who have given birth prior to the current birth or do not meet the selection criteria.
Patient elected accommodation status is available for all the jurisdictions from 2006.
Data collection details
Data source National Perinatal Data Collection
Data source type Perinatal NMDS and voluntarily supplied data items
Data items—indicator Method of birth
Parity
Maternal age
Plurality
Presentation
Gestational age at birth
Data items—disaggregation factors
Year of birth
State or Territory of birth
Hospital annual number of births
Remoteness category (from mother’s area of usual residence)
Indigenous status of mother
Hospital sector
Patient elected accommodation status
Frequency of data source collection(s)
Annual
Additional details
Comments Source of definition: ACHS indicator 1.3 Selected women giving birth for the first time who undergo an instrumental birth. The ACHS define an instrumental birth as the use of forceps or vacuum.
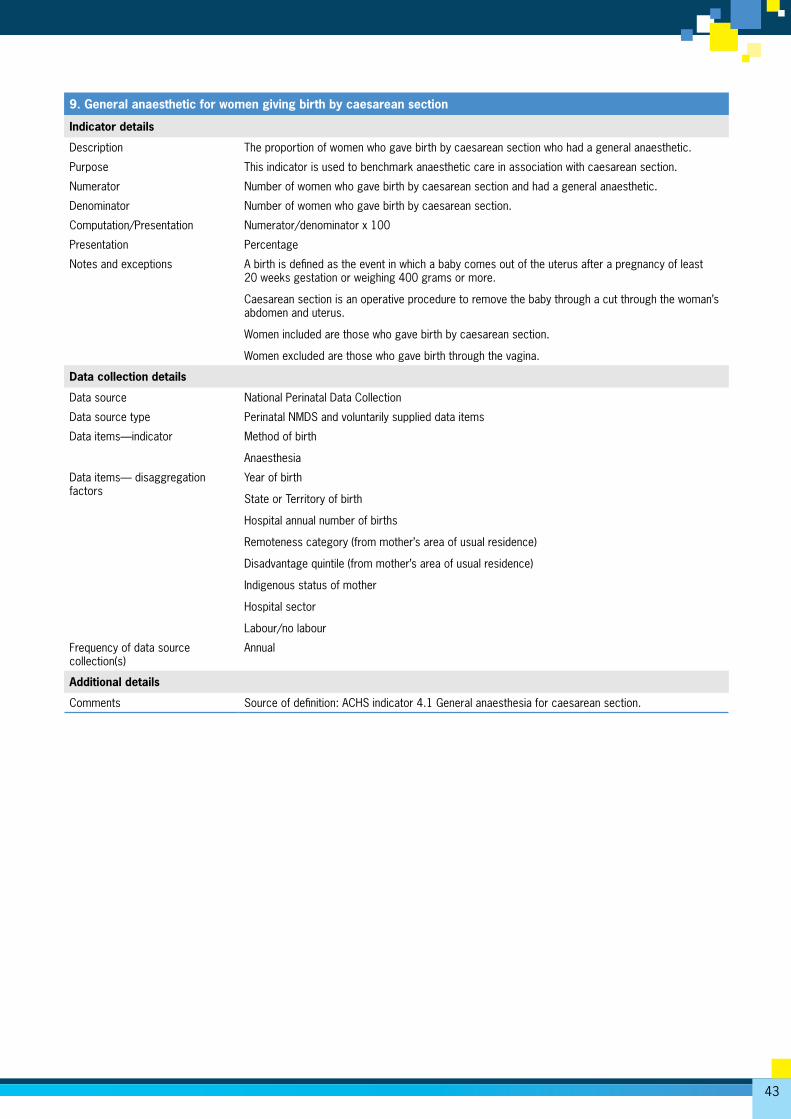
43
9. General anaesthetic for women giving birth by caesarean section
Indicator details
Description The proportion of women who gave birth by caesarean section who had a general anaesthetic.
Purpose This indicator is used to benchmark anaesthetic care in association with caesarean section.
Numerator Number of women who gave birth by caesarean section and had a general anaesthetic.
Denominator Number of women who gave birth by caesarean section.
Computation/Presentation Numerator/denominator x 100
Presentation Percentage
Notes and exceptions A birth is defined as the event in which a baby comes out of the uterus after a pregnancy of least 20 weeks gestation or weighing 400 grams or more.
Caesarean section is an operative procedure to remove the baby through a cut through the woman’s abdomen and uterus.
Women included are those who gave birth by caesarean section.
Women excluded are those who gave birth through the vagina.
Data collection details
Data source National Perinatal Data Collection
Data source type Perinatal NMDS and voluntarily supplied data items
Data items—indicator Method of birth
Anaesthesia
Data items— disaggregation factors
Year of birth
State or Territory of birth
Hospital annual number of births
Remoteness category (from mother’s area of usual residence)
Disadvantage quintile (from mother’s area of usual residence)
Indigenous status of mother
Hospital sector
Labour/no labour
Frequency of data source collection(s)
Annual
Additional details
Comments Source of definition: ACHS indicator 4.1 General anaesthesia for caesarean section.
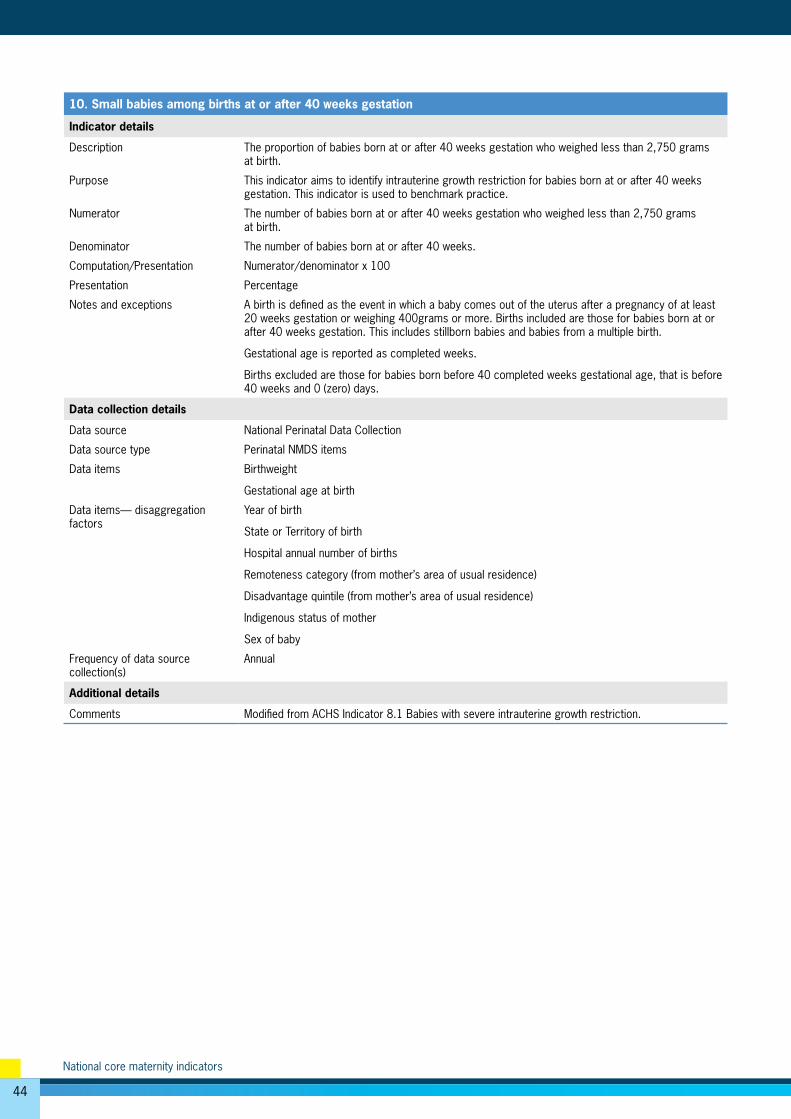
44
National core maternity indicators
10. Small babies among births at or after 40 weeks gestation
Indicator details
Description The proportion of babies born at or after 40 weeks gestation who weighed less than 2,750 grams at birth.
Purpose This indicator aims to identify intrauterine growth restriction for babies born at or after 40 weeks gestation. This indicator is used to benchmark practice.
Numerator The number of babies born at or after 40 weeks gestation who weighed less than 2,750 grams at birth.
Denominator The number of babies born at or after 40 weeks.
Computation/Presentation Numerator/denominator x 100
Presentation Percentage
Notes and exceptions A birth is defined as the event in which a baby comes out of the uterus after a pregnancy of at least 20 weeks gestation or weighing 400grams or more. Births included are those for babies born at or after 40 weeks gestation. This includes stillborn babies and babies from a multiple birth.
Gestational age is reported as completed weeks.
Births excluded are those for babies born before 40 completed weeks gestational age, that is before 40 weeks and 0 (zero) days.
Data collection details
Data source National Perinatal Data Collection
Data source type Perinatal NMDS items
Data items Birthweight
Gestational age at birth
Data items— disaggregation factors
Year of birth
State or Territory of birth
Hospital annual number of births
Remoteness category (from mother’s area of usual residence)
Disadvantage quintile (from mother’s area of usual residence)
Indigenous status of mother
Sex of baby
Frequency of data source collection(s)
Annual
Additional details
Comments Modified from ACHS Indicator 8.1 Babies with severe intrauterine growth restriction.
45
GlossaryApgar score: The Apgar score is a system of assessing the baby’s breathing, pulse, colour, movement and reflexes at 5 minutes after birth. It is a score out of 10, with higher scores indicating better condition of the baby. A score of less than 7 at 5 minutes after birth is considered to be an indicator of complications and of compromise for the baby.
Benchmarking: A continuous process of measuring quality or performance against agreed standards. In the absence of an agreed standard a pooled measure can be used to measure performance.
Birth: An event in which a baby comes out of the uterus after a pregnancy of at least 20 weeks gestation or weighing 400 grams or more.
Caesarean section: An operative procedure to remove the baby through a cut through the woman’s abdomen and uterus.
Episiotomy: An episiotomy is a deliberate cut to the perineum and vagina to widen the opening of the birth canal.
Gestational age: Gestational age is the best clinical estimate of the duration of pregnancy at a specific point in time, based on the first day of the last menstrual period, ultrasound or physical examination of the baby. Gestational age in the National Perinatal Data Collection is reported as completed weeks.
Indigenous: A person of Aboriginal and/or Torres Strait Islander descent who identifies as an Aboriginal and/or Torres Strait Islander.
Induction of labour: Labour started by artificial means.
Instrumental birth: A vaginal birth where forceps of vacuum extraction was used.
Intrauterine growth restriction: Poor growth of a fetus during pregnancy that is detected clinically during pregnancy or after birth.
Intrapartum care: Care provided during labour.
Labour: The physiological process by which a vaginal birth occurs that commences at the onset of regular uterine contractions that act to produce progressive cervical dilatation, and is distinct from spurious labour or pre-labour rupture of membranes.
Normal (non-instrumental) birth: A vaginal birth, regardless of onset of labour, which is not assisted by forceps or vacuum and is not a vaginal breech delivery.
Perinatal: Pertaining to, or occurring in, the period shortly before or after birth (usually up to 28 days after).
Perineal tear: Tear of the skin and/or underlying tissues of the perineum that is classified by degree, with first-degree tears involving perineal skin and tissues immediately beneath the skin and fourth-degree tears involving the deep tissues of the anus or the rectum.
Pre-term birth: Birth from 20 weeks and before 37 weeks gestational age.
Primipara: A woman who has given birth for the first time.
Regional anaesthesia: Application of agents to peripheral nerve tissues (outside the brain) to suppress the sensation of pain. Epidural and spinal anaesthesia are forms of regional anaesthesia used during labour and childbirth for which appropriate injection into tissues of the spinal column suppresses pain sensation from the abdomen.
Term: Pregnancy duration between 37 and 41 weeks of gestational age.
Vaginal birth: A birth in which the baby and afterbirth (placenta) are expelled from the uterus through the vagina.
46
National core maternity indicators
ReferencesACHS (Australian Council on Healthcare Standards) 2010. Australasian clinical indicator report: 2001-2009: determining the potential to improve quality of care: 11th Edition. Sydney: ACHS.
AHMC (Australian Health Ministers’ Conference) 2011. National Maternity Services Plan. Canberra: Australian Government Department of Health and Ageing.
AIHW (Australian Institute of Health and Welfare) 2010. National health data dictionary, version 15. National health data dictionary series. Cat. no. HWI 107. Canberra: AIHW.
COAG (Council of Australian Governments) 2009. Communiqué meeting 30 April 2009. Australian Government. Viewed 8 May 2012, <www.coag.gov.au/coag_meeting_outcomes/2009-04-30/index.cfm>.
COAG 2011. Intergovernmental Agreement on Federal Financial Relations. Australian Government. Viewed 8 May 2012, <www.federalfinancialrelations.gov.au/content/intergovernmental_agreements.aspx>.
COAG Reform Council 2010. National Indigenous Reform Agreement: baseline performance report for 2008-09. Sydney: COAG Reform Council.
Commonwealth of Australia 2009. Improving maternity services in Australia: report of the maternity services review. Canberra: Commonwealth of Australia.
DoHWA (Department of Health, Western Australia) 2007. Improving maternity services: working together across Western Australia: a policy framework. Government of Western Australia, Department of Health. Viewed 20 June 2012, <http://www.healthnetworks.health.wa.gov.au/modelsofcare/docs/Improving_Matenrity_Services_Framework.pdf>
Joyce A, Hutchinson M 2012. Western Australia’s mothers and babies, 2010: twenty-eighth annual report of the Western Australian midwives’ notification system. Western Australia: Department of Health.
KEMH (King Edward Memorial Hospital) 2001. Inquiry into obstetric and gynaecological services at King Edward Memorial Hospital 1990–2000. Final report November 2001. Government of Western Australia, Department of Health. Viewed 8 May 2012, <http://www.kemh.health.wa.gov.au/general/KEMH_Inquiry/volume1.pdf>.
Li Z, Zeki R, Hilder L & Sullivan EA 2012. Australia’s mothers and babies 2010. Perinatal statistics series no. 27. Cat. no. PER 57. Canberra: AIHW National Perinatal Epidemiology and Statistics Unit.
SCRGSP (Steering Committee for the Review of Government Service Provision) 2011. National Agreement Performance Information 2010-11: National Healthcare Agreement. Canberra: Productivity Commission.
SCRGSP 2012. Report on Government Services 2012. Canberra: Productivity Commission.
VDHS (Victorian Government Department of Human Services) 2009. Victorian maternity services performance indicators complete set for 2007–08. VDHS. Viewed 8 May 2012, <http://www.health.vic.gov.au/maternitycare/progs.htm#perform>.
WHA (Women’s Healthcare Australasia—formerly Women’s Hospitals Australasia) 2007. Supporting excellence in maternity care: the core maternity indicators project: findings from the core maternity indicators project. Canberra: WHA.
WHA 2011. Benchmarking maternity care 2010–2011: indicator specifications. Canberra: WHA.
47
List of tablesTable S1: Core maternity indicator trends vii
Table 1: Summary of maternity-related indicators in current use in Australia 3
Table 2: The 10 national core maternity indicators 5
Table 3: Perinatal data available for national maternity indicator reporting, 2004–09 7
Table B1: Perinatal NMDS and voluntarily supplied data items used to derive indicators 30
Table B2: Perinatal NMDS and voluntarily supplied data items used to disaggregate indicators 31
Table B3: Hospital annual number of births against hospital sector, 2004–2009 32
Table B4: Characteristics of women who gave birth in hospitals by size and sector, 2004–2009 33
Table B5: Characteristics of selected women who gave birth in hospitals by size and sector, 2004–2009 34
48
National core maternity indicators
List of figuresFigure 1: Smoking in pregnancy for all women giving birth, 2004–2009 9
Figure 2: Antenatal care in the first trimester for all women giving birth, 2007–2009 11
Figure 3: Episiotomy for women having their first baby and giving birth vaginally, 2004–2009 13
Figure 4: Apgar score of less than 7 at 5 minutes for births at or after term, 2004–2009 15
Figure 5: Induction of labour for selected women giving birth for the first time, 2004–2009 17
Figure 6: Caesarean section for selected women giving birth for the first time, 2004–2009 19
Figure 7: Normal (non-instrumental) vaginal birth for selected women giving birth for the first time, 2004–2009 21
Figure 8: Instrumental vaginal birth for selected women giving birth for the first time, 2004–2009 23
Figure 9: General anaesthetic for women giving birth by caesarean section, 2004–2009 25
Figure 10: Small babies among births at or after 40 weeks gestation, 2004–2009 27

National core
maternity indicators
This is the first report of 10 national core maternity indicators for monitoring the quality of maternity care in Australia. National rates have decreased for smoking in pregnancy, episiotomy among women having their first baby and giving birth vaginally, and the proportion of babies born weighing less than 2,750 grams at or after 40 weeks. However, for some indicators, including induction of labour, caesarean section and instrumental vaginal birth, rates have increased and point to areas for possible further attention.
Related Documents