NASA Z I--,- Z TECHNICAL NOTE NASA TN D-4142 A WIND-TUNNEL INVESTIGATION OF A 7-FOOT-DIAMETER DUCTED PROPELLER by Kenneth IV. Mort and Berl Ga,-,o _'1_8 "_ Ames Research Center '_ __ " 8 (THRU) i (ACCESSION NUMBER) _ , Moffett Field, Calif. /-_,_.%_/ /,ooo_, / / ,oCL (NASA CR OR TMX OR AD NtJMBE;R) NATIONAl. AERONAUTICS AND SPACEADMINISTRATION • WASHINGTON, D. C. ° AUGUST 1967 https://ntrs.nasa.gov/search.jsp?R=19670025554 2020-04-01T19:18:14+00:00Z

Welcome message from author
This document is posted to help you gain knowledge. Please leave a comment to let me know what you think about it! Share it to your friends and learn new things together.
Transcript

NASA
ZI--,-
Z
TECHNICAL NOTE NASA TN D-4142
A WIND-TUNNEL INVESTIGATION OF A
7-FOOT-DIAMETER DUCTED PROPELLER
by Kenneth IV. Mort and Berl Ga,-,o _'1_8 "_Ames Research Center ' _ _ _ " 8 (THRU)
i(ACCESSION NUMBER)
_ ,Moffett Field, Calif. /-_,_.%_/ /,ooo_,// ,oCL
(NASA CR OR TMX OR AD NtJMBE;R)
NATIONAl. AERONAUTICS AND SPACEADMINISTRATION • WASHINGTON, D. C. ° AUGUST 1967
https://ntrs.nasa.gov/search.jsp?R=19670025554 2020-04-01T19:18:14+00:00Z

/

NASA TN D-4142
A WIND-TUNNEL INVESTIGATION OF A 7-FOOT-DIAMETER
DUCTED PROPELLER
By Kenneth W. Mort and Berl Gamse
Ames Research Center
Moffett Field, Calif.
NATIONAL AERONAUTICS AND SPACE ADMINISTRATION
For sale by the Clearinghouse for Federal Scientific and Technical Information
Springfield, Virginia 22151 - CFSTI price $3.00


A WIND-TUNNEL INVESTIGATION OF A 7-FOOT-DIAMETER
DUCTED PROPELLER
By Kenneth W. Mort and Berl Gamse
Ames Research Center
SUMMARY
Power, free-stream velocity, blade angle, and duct angle of attack were
varied to define the aerodynamic characteristics of a full-scale ducted pro-
peller. Dynamic pressure ranged from 0 to 106 psf, rotational velocity from
1200 to 2590 rpm, blade angle from 14° to 49° , and power from 0 to 1250 hp.
The results indicate that the ducted propeller achieved a maximum figure
of merit of 81 percent and a maximum propulsive efficiency of 74 percent.
Stall boundaries for both the upstream and downstream duct lips were
based on pressure distributions. It was found that for a representative
V/STOL configuration employing this ducted fan the upstream lip could stall
at low power and at high duct angles; however, stall of the downstream lip
did not appear to be likely.
INTRODUCTION
Experimental information concerning the performance of large-scale
ducted propellers suitable for lifting and propelling VTOL aircraft has been
very meager. Therefore, an investigation of a 7-foot-diameter ducted propel-
ler was made in the Ames 40- by 80-Foot Wind Tunnel.
The test objectives were (i) to define the aerodynamic characteristics
of the ducted propeller; (2) to evaluate the propulsive performance; (3) to
define the onset of upstream (or lower) and downstream (or upper) duct lip
stall; and (4) to define the aerodynamic characteristics of the duct exit
vane •
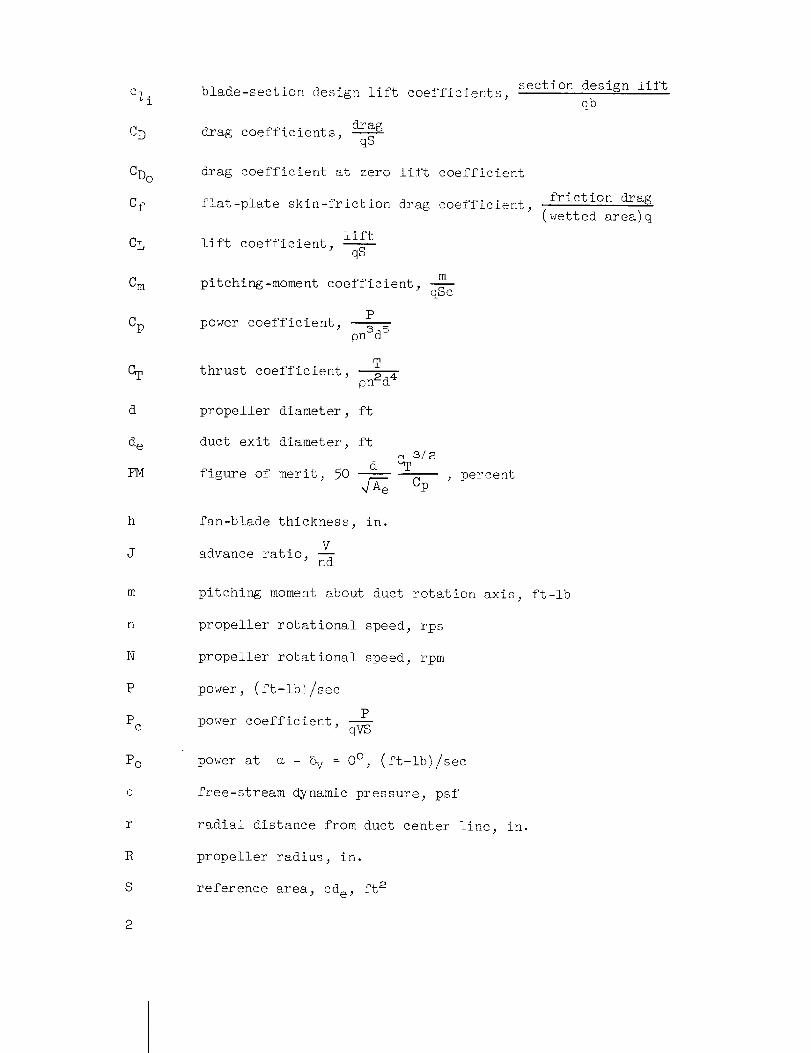
NOTAT ION
A e net exit area, (shroud exit area) minus (exit vane blockage area),ft2
fan blade chord, in.
c shroud chord, ft
czi
CD
CDo
Cf
CL
Cm
Cp
%
d
de
FM
h
J
m
n
N
P
PC
Po
q
r
R
S
blade-section design lift coefficients,
drag
drag coefficients, qS
section design lift
qb
drag coefficient at zero lift coefficient
friction drag
flat-plate skin-friction drag coefficient, (wetted area) q
li ftlift coefficient,
qS
m
pitching-moment coefficient,qSc
power coefficient_P
pnSd 5
thrust coefficient,T
pn2d 4
propeller diameter, ft
duct exit diameter, ft
figure of merit, 50CTs/2
Cp, percent
fan-blade thickness, in.
Vadvance ratio, n--d
pitching moment about duct rotation axis, ft-lb
propeller rotational speed, rps
propeller rotational speed, rpm
power, (ft-lb)/sec
power coefficient,P
qVS
power at _ = 5v = 0O, (ft-lb)/sec
free-stream dynamic pressure, psf
radial distance from duct center line, in.
propeller radius, in.
reference area, Cde, ft2

SHP
T
Tc
To
V
Ve
V_
X
_v
q
P
input power, hp
thrust, ib
To
thrust coefficient_ q-_
thrust at a = 5v = 0°, ib
free-stream velocity, fps
computed velocity at duct exit, fps
free-stream velocity, knots
chordwise distance from duct leading edge, in.
angle of attack, deg
propeller blade angle at 3/4 radius station, deg
exit vane deflection (see fig. 2(a)), deg
propulsive efficiency, _J × i00, percent
air density, slugs/ft 3
MODEL AND APPARATUS
General Model Description
The ducted propeller model was essentially a full-scale duplicate of
those used on the Bell Aerosystems Co. X-22A airplane. The general arrange-
ment of the model in the wind tunnel is shown in figure i. Model dimensions
are given in figure 2 and in table I, and propeller blade characteristics in
figure 3.
Propeller Drive System
The propeller was driven by a 1500-hp electric motor through a right-
angle gear box. The motor speed could be varied continuously from 0 to
3000 revolutions per minute.
Instrument at ion
Forces and moments on the ducted propeller were measured by the
wind-tunnel six-component balance. The forces and moments on the wing

fairing and support structure were not transmitted to the balance and hencewere not measured. Press_tre orifices were located on the shroud in thepositions shownin figure 2(b).
The power input to the ducted propeller was determined from the motoroutput torque and rotational speed. The torque _s measuredby a strain-gagebalance.
TESTS
The propeller blade angle, rotational velocity, and free-streamdynamic pressure were set and the duct angle of attack wasvaried during thetests. The blade angles ranged from 14° to 49° , the dynamic pressures rangedfrom 0 to 106 psf, and the rotational velocities ranged from 1200 to 2590 rpm.
During most of the tests the exit vane was in place, but a few testswere madewith the vane off. Exit vane deflections from -17° to +20° wereexamined.
REDUCTIONOFDATA
Correct ions
No corrections for wind-tunnel wall effects were applied to the databecause they were not significant. No corrections were madefor gear boxlosses because they were estimated to be on the order of 1/2 percent of theinput power.
Accuracy of Measuring Devices
The various measuring devices used were accurate within the followinglimits which include errors in reading and reducing the data as well as theerrors of the device itself.
LiftDragPitching momentMotor input torqueRotational speedFree-stream dynamic pressure
Angle of attackPropeller blade angleExit vane deflection
±3 ib±3 lb±i00 ft-lb
±15 ft-lb
±0.5 rps
±0.i psf for values < 20 psf
±1/2 percent for val_es > 20 psf
±0.5 °
±0.5 °i2 o
4

RESULTS AND DISCUSSION
Basic Aerodynamic Characteristics
Thrust and power coefficient results at _ = 0 °.- The ducted fan thrust
and power coefficients (CT and Cp) in figure 4 are for the exit vane installed
at zero deflection (_ = 0°). The results in figure 5 were obtained with and
without the exit vane at Sv = 0°" The configuration with the exit vane isconsidered the basic configuration because the amount of duct diffusion
selected was based on the presence of the vane. The propulsive efficiency
and static efficiency were better with the vane. (The static efficiency was
better because at J = O, Cp was the same with and without the vane, whileCT was lower without the exit vane.)
From the results of figure 4 the variations in thrust coefficient appear
to be regular for blade angles from 14° to about 39 ° , but at 44 ° the value at
zero advance ratio is low and remained low until the advance ratio exceeded
about 0.7. This was probably because significant portions of the blades were
stalled. At 49 ° the blades appeared to remain stalled until the advance
ratio exceeded about i.
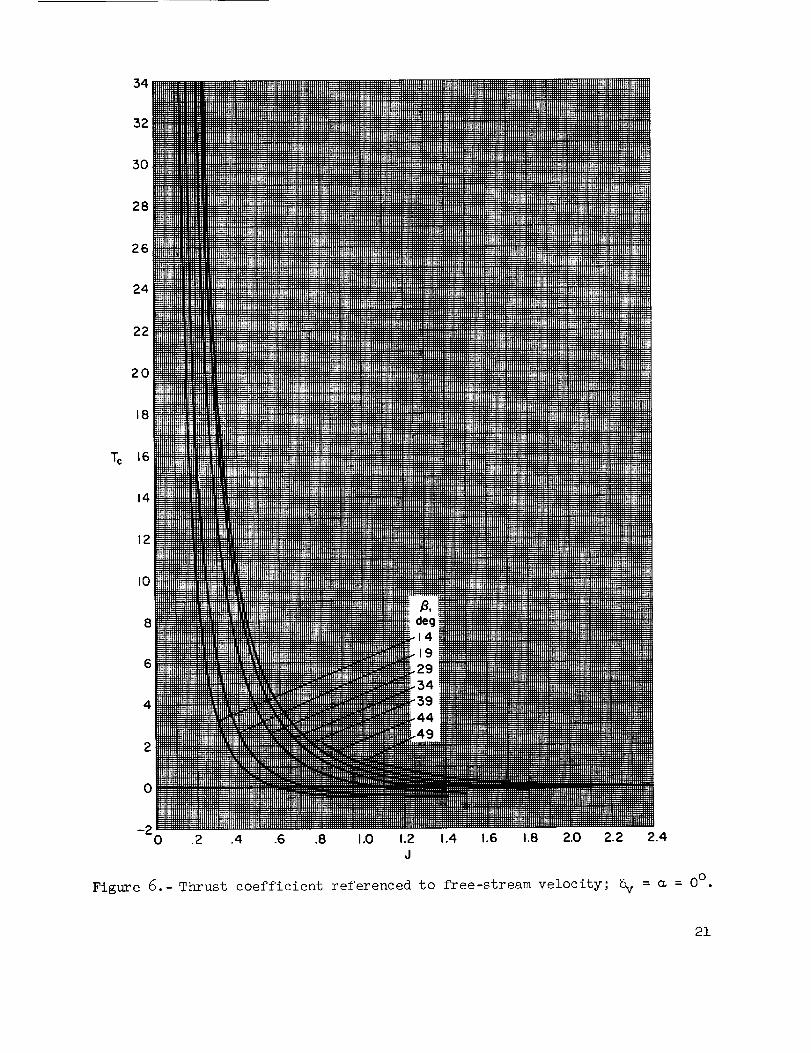
The coefficients in figures 4 and 5 are referenced to rotational veloc-
ity. Thrust coefficient referenced to free-stream velocity was determined
from the results of figure 4, and is shown in figure 6. This thrust coeffi-
cient, Tc, which was obtained at zero angle of attack and zero exit vane
deflection, is used in subsequent figures as a correlation parameter instead
of advance ratio and blade angle.
Basic aerodynamic characteristics at _ _ 0°. - The basic aerodynamic
characteristics are presented in figure 7 for several values of Tc ._ Lift
coefficient is plotted as a function of duct angle of attack, drag coeffi-
cient, and pitching moment, and power coefficient Pc is plotted as a func-
tion of _. The results in figure 7 are for several exit vane deflections
and in figure 8 for the exit vane out.
Figure 9 shows the aerodynamic characteristics with the propeller removed
and with the exit vane at _ = 0 °. As shown, the variation of CD with CLCL2
is consistent with the expression CD = CDo + to maximum CL as (delc)was found for the small-scale ring wings of reference i. This suggests that
the presence of the exit vane did not affect the induced drag.
iThe rotational velocity and blade angle at which the test was conducted
are also included to allow determination of the actual test conditions if
desired.

Evaluation of the Static and Propulsive Efficiency
Efficiency.- The static efficiency and propulsive efficiency computed
from the faired curves of figure 4 are presented in figure I0. The static
efficiency is shown in figure iO(a) as the figure of merit (based on net exit
area) plotted against blade angle. The maximum figure of merit achieved was
about 81 percent. The propulsive efficiency is presented in figure lO(b);
the maximum achieved was 74 percent.
These values of efficiency were compared with those achieved by the
ducted propellers of references 2 and 3. The ducted propeller of reference 2
and the "static" ducted propeller configuration of reference 3 were designed
to produce good static efficiency. (The "static" configuration of ref. 3 had
a large bellmouth inlet.l The "cruise" ducted fan configuration of refer-
ence 3 was designed to produce good high-speed efficiency. Comparison with
these models indicated that the 7-foot model achieved very good static effi-
ciency (the model of ref. 2 achieved a figure of merit of 7 8 percent and
the "static" model of ref. 3, 80 percent) and fair propulsive efficiency
(the propulsive efficiency of the "cruise" configuration of ref. 3 was
80 percent).
These results suggest that the design of the 7-foot model was a good
compromise in satisfying both the low-speed and high-speed design require-
ments. However, it appears that some improvement in propulsive efficiency
should be possible. In the next section the experimental results will be
compared with theoretical considerations, and it will be shown that improve-
ments in the propulsive efficiency would necessitate a reduction in the drag
of the duct, centerbody, struts, etc.
Comparison with theory.- From the results of figure 4, the maximum thrust
which could be achieved was determined as a function of free-stream velocity
for a constant input power equal to the design value of 1250 hp. The results
are presented in figure ii with the theoretical thrust for comparison. This
theoretical thrust was computed according to "ideal momentum ducted fan
theory" using zero duct drag and a propeller efficiency of 90 percent based
on the air velocity at the propeller. (This efficiency is an average, over
the velocity range shown_ of the values estimated using ref. 4. The estimated
variation over the velocity range was about ±3 percent.) For free-stream
velocities up to about i00 kmots the thrust obtained experimentally follows
the ideal curve reasonably well. However, as velocity is increased further
the difference between the experimental curve and ideal curve increases
because of the drag of the duct, centerbody, strut, etc. This is shown in
figure ii by a curve which was obtained by subtracting the propeller-out drag
data of figure 9 from the ideal curve. 2 The resulting curve compares rather
well with the experimental thrust curve. Hence, it may be concluded that the
drag of the duct, centerbody, struts_ etc., causes the reduction in thrust
shown at high forward speeds. It may also be concluded that the propeller
2The increase in drag due to the higher intermal velocity when the pro-
peller is present is negligible compared to the total duct drag. Hence, the
propeller-out drag is representative of the total duct drag _ith the propeller
present.

efficiency is approximately 90 percent as wasassumedsince the measuredthrust agrees well with that predicted using a propeller efficiency of90 percent and propeller-out duct drag.
To estimate how muchof the drag in figure ii was due to shroud friction,the friction drag of the shroud was estimated and an increment subtractedfrom the ideal curve. The resulting curve, also shownin figure ii, representsthe best possible thrust v_ich could be approaehed if the ducted propellerwere designed exclusively for high speed. Because of the large differemce
between this curve and the experimental curve, it is evident that the major
portion of the experimentally determined drag is not due to shroud friction
drag, and suggests the possibility for making large reductions in drag and
hence increasing the propulsive efficiency.
Examination of the Exit Vane Performance
The exit vane aerodynamic characteristics at zero free-stream velocity
are presented in figure 12 by showing lift, thrust, pitching moment, and power
as functions of 5v. The exit vane performance for free-stream velocities
greater than zero was determined from the results of figure 7 and is presented
in figure 13 for four values of T c. Here ACL, Z_CD, ACm, and Z_Pc are shown
as functions of %v. These results may be analyzed assuming the vane causes alinear variation in the force normal to the duct axis. This force can then be
resolved in the lift and drag directions. If this is done it is found that at
negative values of %v the AC L and Z_CD variations with _ are greater
than would be expected. However, at positive values of _v the _C L and Z_CD
variations with _v are less than would be expected as a is increased. For
example, at Tc = 5 and _ = 50 ° , AC L is essentially zero for positive values
of _¢. The variation in lhCm with _r in the results of' figure 13 is small
and hence less important than that for AC L and hCD, particularly if the
moment reference is very far from the ducted fan as for the four ducted
propeller V/STOL configuration of references 5 and 6.
Duct Lip Stall
Stall of both the upstream (or lower) duct lip and downstream (or upper)
duct lip was investigated. Stall of the upstream lip is of primary concern
because it is more heavily loaded and would result in a larger reduction in
lift when stalled. In addition, stall of this lip affects the propeller load-
ing asymmetrically. Stall of this lip will be considered first cud im moredetail.
Upstream or lower lip stall.- Flow separation was established on thebasis of pressure distributions. A sample is shown in figure 14. As can be
seen, separation occurred initially on the inside surface very close to the
propeller. As angle of attack was increased the separated area increased
forward until finally the flow separated over the entire upstream lip. In
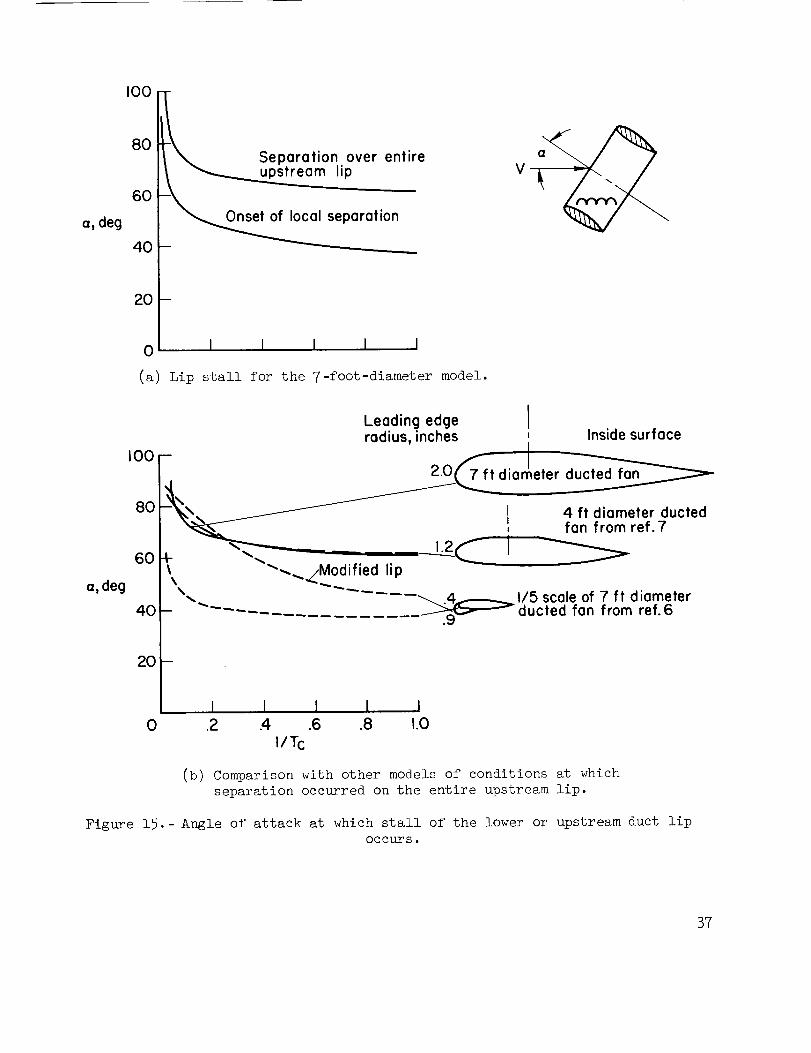
figure 15(a) the angle of attack at which separation initially occurred and
the angle of attack at which the flow separated over the entire upstream lip
are shown as functions of the reciprocal of T c. This correlation was

obtained for blade angles of 19° and 29° and is considered valid for allblade angles between these values. On examination, the data in figure 7 showthat no large changes in forces, moments,and power accompaniedthe onset oflocal flow separation, but did accompanyseparation of the entire lip.
The propeller blade stresses were monitored during the investigation oflip stall. With the onset of flow separation there was only a small rise instress level. As the angle of attack was increased, the stresses increasedgradually. With the entire upstream lip stalled the stresses were still wellbelow critical.
The angle of attack at which separation occurred on the entire upstreamlip is shownin figure 15(b) for the present tests and for the small-scaleresults of references 6 and 7. (The 4-foot model of reference 7 was not ascaled model of the 7-foot model, but the contour of this duct is very simi-lar as the drawings show.) The flow over the entire lip of the 7-foot modeland the 4-foot model separated at very nearly the sameangle of attack, butthere is a large difference between the results shownfor the large-scalemodels and those for the i/5-scale model. The difference indicates a large-scale effect and suggests that there is a critical lip radius above whichincreases in radius do not delay separation significantly and below whichseparation will occur at muchlower duct angles of attack.
Downstream or upper lip stall.- Occurrence of separation on the down-
stream duct lip was also determined from pressure distributions. The angle
of attack at which separation occurred over the entire downstream lip is
shown in figure 16. In addition, the small-scale results of reference 6 are
presented. These results also indicate a large-scale effect. (A stall
boundary for the downstream lip was not established for the model of ref. 7.)
The data in figure 7 indicate that separation on this lip was not accompanied
by any detectable changes in forces, moments, and power nor was buffeting
evident during these tests. Consequently, separation on the downstream lip
was not considered nearly as critical as separation on the upstream duct lip.
Significance of lip stall boundaries.- The significance of the duct lip
stall boundaries is examined in figure 17 which presents duct angle of attack
as a function of forward velocity for the four ducted propeller V/STOL config-uration of references 5 and 6. The duct angle of attack for trimmed condi-
tions was obtained using a lift force of 3750 pounds (one-fourth of the
design gross weight of 15,000 ib). The lift and drag of the vehicle exclu-
sive of the ducted propellers were neglected, equal duct angles were assumed,
and trim drag was neglected. The effect of these assumptions is small for
this vehicle at the low velocities where the lip may stall. In addition to
the trim curve, the curves at which lip stall occurs are shown. From these
results it can be concluded that upstream duct lip separation may occur on
the simulated vehicle in level flight. However, complete separation of this
lip will not occur. (Of course, at low power and at high duct angles, as in
descending flight, complete separation of the upstream lip may occur.) Down-
stream lip stall probably would not be encountered by this type of vehicle.
8

CONCLUDING REMARKS
The ducted propeller had a maximum figure of merit of 81 percent and a
maximum propulsive efficiency of about 74 percent. If the shroud, centerbody,
struts, etc., had been designed primarily for high forward velocities, this
propulsive efficiency could have been significantly higher. This can be con-
cluded from the fact that the drag with the propeller out was significantly
higher than the estimated shroud friction drag. (The friction drag of the
other components is small compared to that of the shroud.)
Examination of the exit vane aerodynamic characteristics indicated that
at positive vane deflections the variations in CL and CD with vane deflec-
tion were significantly lower than would be expected as the angle of attackwas increased.
Stall of both the upstream and downstream duct lips was examined. The
significance of the stall was examined for a four ducted propeller V/STOL con-
figuration employing this ducted propeller. It was found that the onset of
flow separation on the upstream lip will be encountered; however, complete
separation on this lip will be encountered only during conditions of low power
and high duct angle of attack corresponding to high rates of descent. Flow
separation on the downstream lip would probably not be encountered by this
type of vehicle.
Ames Research Center
National Aeronautics and Space Administration
Moffett Field, Calif., 94035, June 6, 1967
721-03-00-05-00-21
9

REFERENCES
1,
21
o
o
.
.
7,
Fletcher, Herman S. : Experimental Investigation of Lift, Drag, and
Pitching Moment of Five Annular Airfoils. NACA TN 4117, 1957.
Mort, Kenneth W.: Performance Characteristics of a L-Foot-Diameter
Ducted Fan at Zero Angle of Attack for Several Fan Blade Angles.NASA TN D-3122, 1965.
Grose, Ronald M.: Wind Tunnel Tests of Shrouded Propellers at Mach
Numbers From 0 to 0.60. WADC TR 58-604, United Aircraft Corp., 1958.
Anon.: Generalized Method of Shrouded Propeller Performance Estimation.
Hamilton Standard Division of United Aircraft Corporation. Publicationnumber PDB 6220.
Giulianetti, Demo J.; Biggers, James C.; and Maki_ Ralph L.: Longitudinal
and Lateral-Directional Aerodynamic Characteristics of a Large-Scale,V/STOL Model With Four Tilting Ducted Fans Arranged in a Dual Tandem
Configttration. NASA TN D-3490, 1966.
Spreemann, Kenneth P.: Wind-Tunnel Investigation of Longitudinal Aerody-
namic Characteristics of a Powered Four-Duct-Propeller VTOL Model in
Transition. NASA TN D-3192, 1966.
Mort, Kenneth W.; and Yaggy_ Paul F.: Aerodynamic Characteristics of a
4-Foot-Diameter Ducted Fan Mounted on the Tip of a Semispan Wing.NASA TN D-1301, 1962.
i0

TABLEI.- BASICDIMENSIONSOFDUPEDPROPELLER
DuctImside diameter at propeller, in .................. $4.75Maximumexternal diameter, in ................... 101.56Chord, im............................. 49Exit diameter, in ......................... 93-3Net exit area, sq ft ....................... 44.08Net area at propeller, sq ft .................... 37.84Duct rotation station, percent of duct chord ............ 64
28.6Propeller station, percent of duct chord ..............Propeller
Diameter, ft ............................ 7Tip clesrance, in ......................... 0.4Numberof blades .......................... 3Integrated design lift coefficient ................ 0.43Total activity factor ....................... 504
Exit vaneArea, sq ft ............................ 31.8Thickness, in ........................... 5.3Hinge line, percent of duct chord ................. 85.2
ii

12

(a) 3/4 front view with duct at 90° angle of attack.A-32844
Figure i.- X-22A ducted propeller model mounted in the Ames 40- by 80-FootWind Tunnel.
13
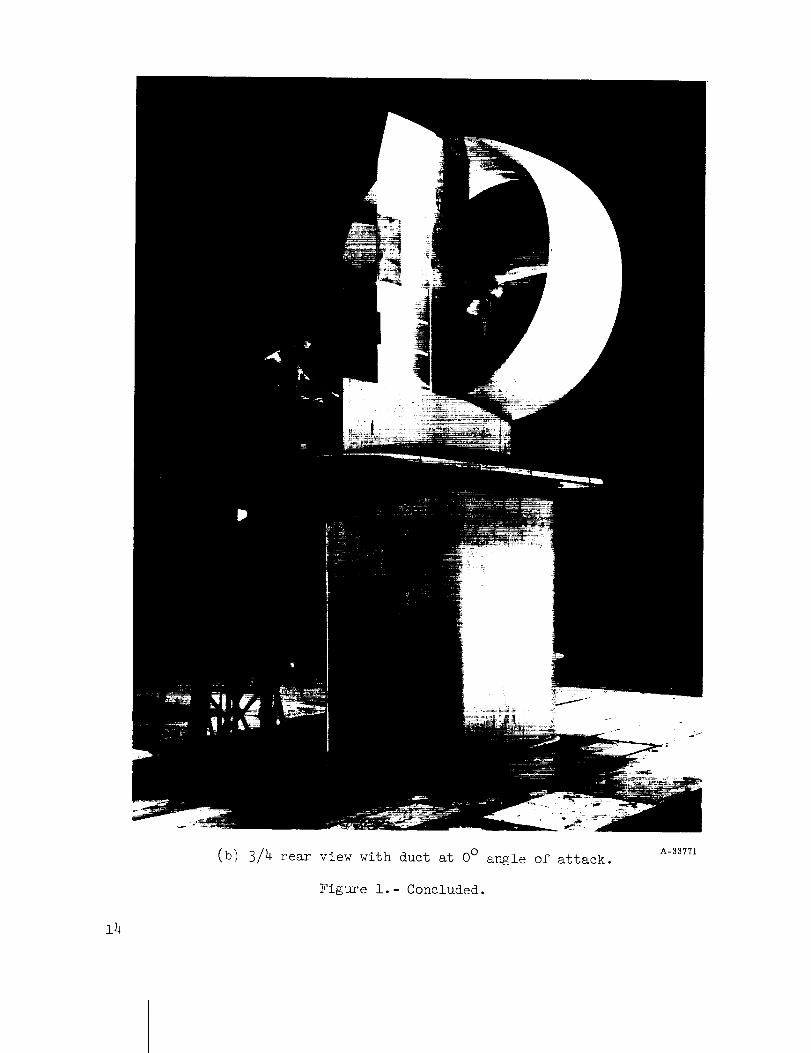
(b) 3/4 rear view with duct at 0 ° angle of attack.
Figure i.- Concluded.
A-33771
14

I tro
co
Q)
I'I
I I_X--v.
I I
0 e,le,d --
¢-
._ f-
_ .-=__ w
_.1 L +ii
Q.
13_
c-._
00
II
0t-
O
-r-
0 0
-_ noc-O
121
¢-¢0
¢-.°_
ffl
0
r-
E
U_
_ °or-t
c6
h
0
b_.r-I
15

r
l
4Z625
Propeller
14.00
17,750
19.60
21.520
Radius
42.375
t duct
4900
All dimensionsin inches.
D72
46.65
Outside surface ordinates
X r
0 47.625
.613 48.695
1.225 49.096
2.450 49.609
3.675 49.955
4.900 50.2057.350 50.5359.800 50.710
10.250
12.250 50.779
14.700 50.76317.75019.600 50.552
23.70024.500 50.164
29.400 49.64934.300 49.058
39.200 49.344
44.100 47.57646.550 47.16049.000 46.722
Pressure orifice location
Number
I
23
45
67
8
9I0II1213
14
151617
1819
Location, percent chordInside Outside
0
t2.5
5I0
1525
35
507090
9070
50
352515
51.8
(b) Shroud dimensions.
Figure 2.- Continued.
16

w
!
.§
-I-
0,.oh
4o
_c_
c_
N
-0
%0
4._
Z"
cJ
o_D
I
c;
.r--I
17

O0
I
!1':)'lueJo!I}aoo I;!Iu6!sep uo!Ioas apDIEI
I I I I I I i
6ap '8' 'el6U0 ep01q uo4
0 0 0 0 0 0
/ ' ' l
i
/
0h.-
0
I
@,-4bO
0CO
_)
IOJit)
O0
O0
h.-
'u!'q 'pJo4o eP01q uo_-I
I I I I I I IO0 _t" 0 _ o,I CO _t"eJ e_l (xj -- --_ 0 0
q/q 'o!loJ pJoqo o_ sseu_0!q±
_OOC
t-
O.I.,4,-
o
no
r_
Od
0CO
I0
dJ
_H
c_)
o
,_ o
4_
(u o
o•_ 4_
o
_54_ ._i
._ 4_t_
,0 0
-_ 0._i
4_ o
0 CO
•_I c64_
0°_ °_
© o
,x_ e?
_1 .r4
_4-_o
_3
r_
bl).r-4
1.8

.8
.7
.6
.5
.4
CT . 5
.2
0
-.I
.8 -.2
.7
.6
.5
.4
Cp
.5
.2
0
-.2 0 .2 .4 .6 .8 1.0 1.2 1.4 1.6 1,8 2__.0 2.2J
Figure 4.- Ducted propeller thrust and power coefficient referenced to
rotational velocity with the exit vane; 5v = _ = 0°"
19

.6
.5
.4
.3
CT
.2
.I
0
-.I
.3
.2
Cp .I
0
-.I
8O
6O
"q, percent 40
2O
0 .2 .4 .6 .8 1.0 1.2d
Figure 5.- Ducted propeller thrust and power coefficient and propulsive
efficiency with and without the exit vane at _v = _ = 0°"
2O
34
32
3O
28
26
24
22
2O
18
Tc 16
14
12
I0
8
6
4
2
0
-20 .2 .4 .6 .8 1.0 1.2 1.4 1.6 1.8 2.0 2.2 2.4
J
Figure 6.- Thrust coefficient referenced to free-stream velocity; _v = _ = 0°"
21

0o
o
0
(p
o
0 0 0 0 0 0 0 0 0 0 0 0 0O,,J -- 0 0'_ CO _ _.0 LeD _ _ C_I --
rlU
i
00
II
.r-t
r.O
(1)
_3
.r-tXI1)
_3
@
ocH
.,-i
..pr./.j
.¢-i
_J
c)c_
c_
.r-I
0
!
t_o._
_2
GO ,_- 0 LO O,J CO '_" 0 _.0O,J 0,_ --
._1
o.J GO 0

O
O
O
Or_
o
O
O
OI
C_
"O
6
O
O
_d
o
OCD
I
OO
II
r8
4o
Or.D
I
®
b_.r4
23

0 0 0 0 0 0 0 0 0 0-- 0 o_ Go I'-- _D _f) _ fo o,I
0 D 0 <_ A
_I" _- ro _ o_ o_ o_ --
o
0 0
0:co
o
o0Od
O0T
0
Eco o
o_
O
0co
0
o
0o3
0
I
!
00I
LO
T
0
CO0dI
o_
(D
0 .r_
_ 0r_)
II!
_0.el
24

0 0 0 0 0 0 0 0 0 0 0 0-- 0 _ co 1_ I.D i_ _" r_ o_1 --
a__
@
o
0oJ
00T
0
Ec.)
0o
N
0D
0
a
GOI
T
I
o
0 _0 t_l co ._- 0 (9 0J Ix) _I- 0 IT
_J
o0_-4I
11
-g
{D
o
I
(1)
b_.r-4
25

0 0 0 0
0
o
0
0
0
I
00I
0
I
o
11
_c_v
®
c!
4_
oc_
I
®
bD.,-i
26

o
o
0 0 0 0 0 0 0 0 0 0 0 0OJ -- 0 O_ CO I'-- _D u'} _}- _ {x.I --
0
0
d_P
CO
OJ
_D
0
E(D
i a_P
oJ
i
_D
T
0cO
0
00_-t 0
CDII
I
b2).r-t
27

0
g
0 0 0 0 0 0 0_I -- 0 0_ CO I_- _O
0 0 0 0 0 0_ _ C_I --
_i--_ • '..........
............ '' ,.,,ii_illi_ii_ill
.............:=::::::::::: ..............
...................... ................... ..........[_IIII_I ::z
...... i_ii_i_ii :::::_:::::::::::: .................
::::::::::::::: ...............................................................................
co
0
?@
0
o00d
iI
q-_v
(Dn_
,-tc)
0C_)
I
taoo_-i
28

0 0 0 0 0 0 0 0 0 0 0 0 0___ _ -- _o 0_ 00 _- _o Lo _- r_ oJ --
00
000
o_"13
o
0c_
0
0
0
I
o
cO
-p.r-IXc)
Q_
-p.r-I
O*r-I-p
._I
.I.)C_)CO
.r-t
o,%
I
(1)
b_.r-t
(%1 OO _I" 0 _D O_ CO _" 0 _ 0_1 GO _1"_I- q- KI" rO r_) 0,I o,l o,J -- --
_i0
0
29

I
0
0
3O

IO0
9O
8O
7O
6O¢-
50e_
U_4O
5O
2O
I0
0 I0 20 .50 40 50/9, deg
(a) Figure of merit as a function of blade angle.
Figure i0.- Figure of merit and propulsive efficiency computed from the
curves of figure 4.
31

©
-- 0
0-- .r-I
°c__--_ _ o
_Dq_0 i
S,r--t4-_ ©e..)
b- _ bDr+_ -rt
_ a3
0
.r-I0°r-I
°e4t¢_ m
0
00
0 0 0b'-
0 0
_,u_o.led ' &
0 01','3
00,,I
0 0
32

gO
OOO
OOO0,J
g
O
OOro
(kl u_
O
r-
OLO
OO
O
O
OLgk
Od
q_O
©
O
_o
40
OO
O_H
4o
O,H®
CD
r.D!
cD_D
_H
O
O
O
_H
40
!
tao°_t
33

4
Lift
To
.2
0
1.2 -.2
.8 2
I
m
TO c
0
1.4 -I
P
.6-40 -20 0 20 40
8 v, deg
Figure 12.- Effects of exit vane deflection on the aerodynamic characteristics
at zero free-stream velocity; _ = 0 o, B = 19 ° .
34

4
AC L 0
-2
Tc a, deg
40 3050
60
0-30
50,40
0-30
40
50
0-3040
0-3040
0-304O
0-3040
ACo
-4 4
2
0
6050
40
30__20 4.0,50
-2
2-4
aCm 0
-2 8
0I0
20 - 50 0__ I0
0 - 60 :20- 50
0-40 0-40
4
AP_ 0
0-405060
0-50
D-40 0-40
-4- 20 0 20 -20 0 20 - 20 0 20 -20 0 20
By, deg
Figure 13.- Summary of exit vane aerodynamic characteristics determined from
the results of figure 7 for several thrust coefficients; AC L defined as
CL less C L at zero vane deflectiom; ACD_ ACm_ and Z_Pc similarly
defined.
35

_DIV')
o_1 cO I_- 0 I.D od cO _1"le) od oJ oJ m D
0Jnss0Jd O!LUDU_p LUDOJIS-OOJ-i
(aJnssaJd O!J,OJ,S LuoeJ,_s-aaJ-i)-(aJnssaJd 0!$o_s 1000-1)
0
00
0o_
000
0
0_o
g
0
0oJ
0
0
0
I
2o
"ECD0L_
CDQ.
c_0
om
0
_Ho
¢D
cH
m
.r-4
,r'-I
oo
o,r-_ II
%
g_
c_ o•,-4 cO
_di1)
o
I1)
o _• r-I ,r..l
m -0°r-'l r_
r./)(1)%
_3
°_gk
I
b9°r-i
36
a, deg
I00
8O
6O
4O
2O
0
Separation over entireupstream lip
k ,ocal eooro,'o 1
I I I I I
(a) Lip stall for the 7-foot-diameter model.
a, deg
I00-
8O
6O
4O
20-
\\
1
Leading edge Iradius, inches , Inside surface
__.__--t diametar d_
I 4 ft diameter ductedfan from ref.7
_--_Modified lip
""-'----2E__4J--.--_---- __-_'_" I/5 scale of 7 ft diameterducted fan from ref.6
I I I I I0 .2 .4 .6 .8 1.0
I/Tc
(b) Comparison with other models of conditions at which
separation occurred on the entire upstream lip.
Figure 15.- Angle of attack at which stall of the lower or upstream duct lip
oc cD_rs,
37

!
II
IIII
II
III
I
/ f
I _ / I I I0 0 0 0 00 O0 _0 _ oJ
0
C
E8
OU
O
O
,r-I
,-t
4_
_3®
4a
o
o
oP_
o%
.r-i4-_
©
(1)
4._
o
m
o
O
o.,-t
_3
Or_
_3
_d
-O4_
O
®
I
,.c;r---t
o
.r-t
38

OO
Oco
IO_D
IO
IO
O-- O
O
Oco
_O
O(9
O
_ Oro
_ O0J
CH0
O._4OC$
hO
00
0E_cO
®rq
I_®P_
0
0
0
o
P_
4o(3
oCH
40®
0CH (D
(DCH_--t (D
_3
o3
(/1
.r-t,-t
o
Oo-0
.,-4
!
(D
.rl
NASA-Langley, 1967 -- i A-2511 39


"The aeronautical and space activities of the United States shall be
conducted so as to contribute . . . to the expansion o] human knowl-
edge of phenomena in the atmosphere attd space. The Administration
shall provide [or the widest practicable and appropriate dissemination
of in[ormation concerning its activities and the results thereof."
--NATIONAL AERONAUTICS AND SPAC_ ACT OF 1958
NASA SCIENTIFIC AND TECHNICAL PUBLICATIONS
TECHNICAL REPORTS: Scientific and technical information considered
important, complete, and a lasting contribution to existing knowledge.
TECHNICAL NOTES: Information less broad in scope but nevertheless ofimportance as a contribution to existing knowledge.
TECHNICAL MEMORANDUMS: Information receiving limited distribu-
tion because of preliminary data, security classification, or other reasons.
CONTRACTOR REPORTS: Scientific and technical information generatedunder a NASA contract or grant and considered an important contribution to
existing knowledge.
TECHNICAL TRANSLATIONS: Information published in a foreign
language considered to merit NASA distribution in English.
SPECIAL PUBLICATIONS: Information derived from or of value to NASA
activities. Publications include conference proceedings, monographs, data
compilations, handbooks, sourcebooks, and special bibliographies.
TECHNOLOGY UTILIZATION PUBLICATIONS: Information on tech-
nology used by NASA that may be of particular interest in commercial and other
non-aerospace applications. Publications include Tech Briefs, Technology
Utilization Reports and Notes, and Technology Surveys.
Details on the availabiJity of these publications may be obtained from:
SCIENTIFIC AND TECHNICAL INFORMATION DIVISION
NATIONAL AERONAUTICS AND SPACE ADMINISTRATION
Washington, D.C. _0546
Related Documents